db Advisory Multibrands - Fundsquare
124
db Advisory Multibrands Annual Report 2018 n db Advisory Multibrands – BlackRock Flexible Diversified Allocation n db Advisory Multibrands – db Credit Selection n db Advisory Multibrands – db Selected Managers n db Advisory Multibrands – db World Selection Plus n db Advisory Multibrands – Franklin Templeton Global Conservative Portfolio n db Advisory Multibrands – GAM Absolute Return Strategy Fund n db Advisory Multibrands – Invesco Multi Asset Risk Diversified n db Advisory Multibrands – JPMorgan Emerging Markets Active Allocation n db Advisory Multibrands – Pictet Multi Asset Flexible Allocation n db Advisory Multibrands – PIMCO Euro Coupon Bond Fund n db Advisory Multibrands – PIMCO High Income Global Credit Fund Investment Company with Variable Capital incorporated under Luxembourg Law
-
Upload
khangminh22 -
Category
Documents
-
view
0 -
download
0
Transcript of db Advisory Multibrands - Fundsquare
db Advisory MultibrandsAnnual Report 2018
n db Advisory Multibrands – BlackRock Flexible Diversified Allocation
n db Advisory Multibrands – db Credit Selection
n db Advisory Multibrands – db Selected Managers
n db Advisory Multibrands – db World Selection Plus
n db Advisory Multibrands – Franklin Templeton Global Conservative Portfolio
n db Advisory Multibrands – GAM Absolute Return Strategy Fund
n db Advisory Multibrands – Invesco Multi Asset Risk Diversified
n db Advisory Multibrands – JPMorgan Emerging Markets Active Allocation
n db Advisory Multibrands – Pictet Multi Asset Flexible Allocation
n db Advisory Multibrands – PIMCO Euro Coupon Bond Fund
n db Advisory Multibrands – PIMCO High Income Global Credit Fund
Investment Company with Variable Capital incorporated under Luxembourg Law

1
Contents
Annual report 2018 for the period from January 1, 2018 through December 31, 2018
General information .................................................................................................. 2
Annual report db Advisory Multibrands db Advisory Multibrands – BlackRock Flexible Diversified Allocation ....................... 6
db Advisory Multibrands – db Credit Selection ......................................................... 8
db Advisory Multibrands – db Selected Managers ................................................... 10
db Advisory Multibrands – db World Selection Plus ................................................. 12
db Advisory Multibrands – Franklin Templeton Global Conservative Portfolio ........... 14
db Advisory Multibrands – GAM Absolute Return Strategy Fund ............................. 17
db Advisory Multibrands – Invesco Multi Asset Risk Diversified .............................. 19
db Advisory Multibrands – JPMorgan Emerging Markets Active Allocation ............. 21
db Advisory Multibrands – Pictet Multi Asset Flexible Allocation ............................. 23
db Advisory Multibrands – PIMCO Euro Coupon Bond Fund ................................... 25
db Advisory Multibrands – PIMCO High Income Global Credit Fund ....................... 28
Annual financial statements Investment portfolio and statement of income and expenses ................................. 32
Supplementary information Remuneration Disclosure ......................................................................................... 114
Information pursuant to Regulation (EU) 2015/2365 ................................................. 116
Report of the Réviseur d‘Entreprises agréé ............................................................. 117

2
General information
The funds described in this report are sub-funds of a SICAV (Société d’Investisse-ment à Capital Variable) incorporated under Luxembourg law.
PerformanceThe investment return, or performance, of a mutual fund investment is measured by the change in value of the fund’s shares. The net asset values per share (= redemption prices) with the addition of intervening distributions, which are, for example, reinvested free of charge within the scope of investment accounts at DWS Investment S.A. are used as the
basis for calculating the value. Past performance is not a guide to future results. The corre-sponding benchmark – if available – is also presented in the report. All financial data in this publication is as of December 31, 2018 (unless otherwise stated).
Sales prospectusesFund shares are purchased on the basis of the current sales prospectus and the key investor information document as well as the articles of incorporation and by-laws of the SICAV, in combination with the latest audited annual report and any semi-annual report that is more recent than the latest annual report.
Issue and redemption pricesThe current issue and redemp-tion prices and all other infor-mation for shareholders may be requested at any time at the registered office of the Man-agement Company and from the paying agents. In addition, the issue and redemption prices are published in every country of distribution through appropriate media (such as the Internet, electronic information systems, newspapers, etc.).
Special notice for business investors:
Adjustment of share profits due to European Court of Justice (ECJ) ruling in the STEKO Industrie montage GmbH case
In the STEKO Industriemontage GmbH case (C-377/07), the European Court of Justice (ECJ) ruled that the provision in the German Corporate Tax Act (Körperschaftsteuergesetz (KStG)) for the transition from the corporate tax imputation system to the half-income procedure in 2001 is unlawful under European law. The prohibition on corporations to have profit reductions in connection with holdings in foreign companies made relevant for tax purposes pursuant to sec-tion 8b (3) KStG already applied in 2001 pursuant to section 34 KStG, while it only applied for profit reductions in connection with holdings in domestic companies in 2002. In the view of the European Court of Justice, this contra-venes the principle of free movement of capital.
The transitional provisions in the KStG applied accordingly for fund investments pursuant to the German Capital In-vestment Companies Act (Gesetz über Kapitalanlagegesellschaften (KAGG)) (sections 40 and 40a in conjunction with section 43 (14)). The ruling may become important, particularly for the purposes of taking profit reductions into ac-count in the calculation of share profits pursuant to section 40a KAGG. The Federal Finance Court (Bundesfinanzhof (BFH)) decided in a judgment dated October 28, 2009, (Ref. I R 27/08) that the STEKO case does in principle have implications for fund investments. In the German Federal Ministry of Finance letter of February 1, 2011, “Application of the BFH judgment of October 28, 2009 – I R 27/08 to share profits (“STEKO case”)”, the tax authority sets out the conditions under which in its opinion an adjustment of share profits is possible based on the STEKO case.
In view of possible measures based on the STEKO case, we recommend that investors who have shares in business assets consult a tax advisor.
3
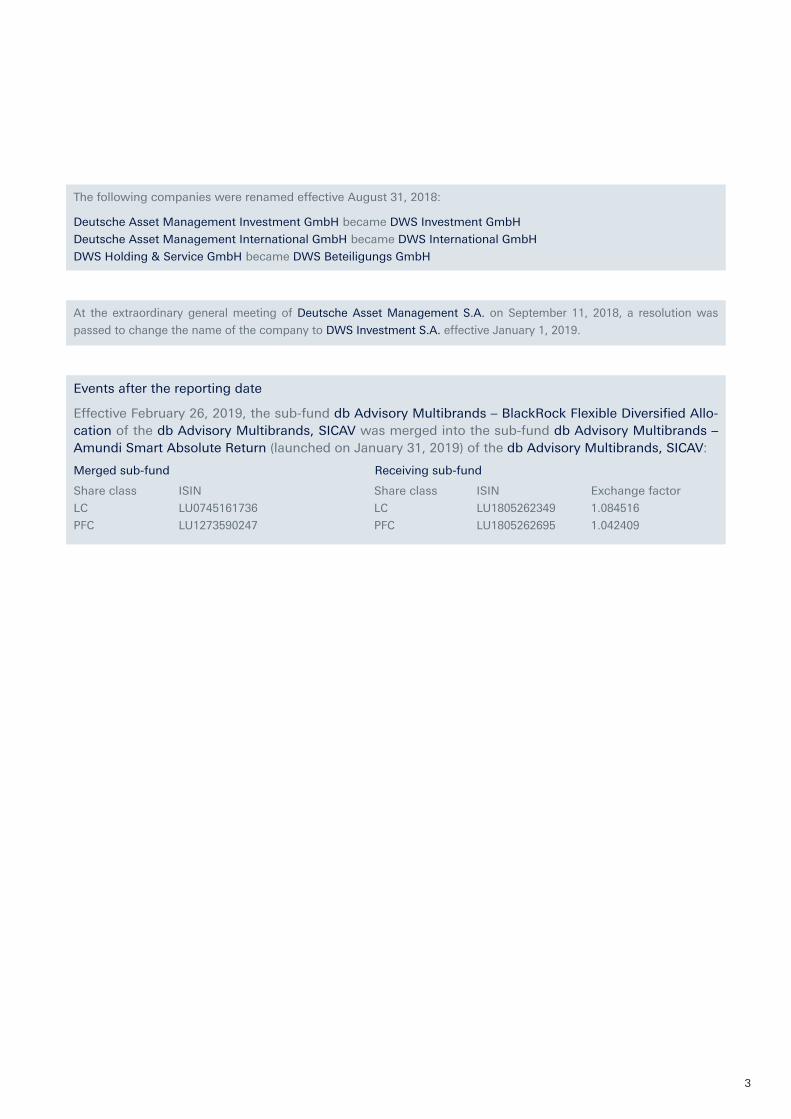
The following companies were renamed effective August 31, 2018:
Deutsche Asset Management Investment GmbH became DWS Investment GmbH
Deutsche Asset Management International GmbH became DWS International GmbH
DWS Holding & Service GmbH became DWS Beteiligungs GmbH
At the extraordinary general meeting of Deutsche Asset Management S.A. on September 11, 2018, a resolution was
passed to change the name of the company to DWS Investment S.A. effective January 1, 2019.
Events after the reporting date
Effective February 26, 2019, the sub-fund db Advisory Multibrands – BlackRock Flexible Diversified Allo-cation of the db Advisory Multibrands, SICAV was merged into the sub-fund db Advisory Multibrands – Amundi Smart Absolute Return (launched on January 31, 2019) of the db Advisory Multibrands, SICAV:
Merged sub-fund Receiving sub-fund
Share class ISIN Share class ISIN Exchange factor
LC LU0745161736 LC LU1805262349 1.084516
PFC LU1273590247 PFC LU1805262695 1.042409


Annual report
6
db Advisory Multibrands – BlackRock Flexible Diversified Allocation
Investment objective and performance in the reporting periodThe objective of the invest-ment policy of db Advisory Multibrands – BlackRock Flex-ible Diversified Allocation is to achieve long-term growth with a low tolerance for capital loss. To this end, the sub-fund invests worldwide in equities, fixed income securities, invest-ment funds, derivatives, cash, deposits and money market instruments. The sub-fund aims to achieve the investment objective primarily through investments in funds. The sub-fund may invest up to 75% of its net assets in instruments that invest in global equities, or up to 75% of its net assets in instruments that invest world-wide in fixed income. Up to 20% of its net assets may be invested in alternatives, includ-ing open-ended real estate investment funds, commod-ities, hedge funds and struc-tured products thereof. The proportion of open-ended real estate funds and hedge funds is limited to not more than 10% of the sub-fund’s net assets.
In 2018, volatility in global mar-kets was provoked by several factors including increased trade tensions between the US and China, evidence of a slow-down in economic growth, the transition from quantitative eas-ing to quantitative tightening particularly in the US, and ele-vated political uncertainty. Lin-gering fears over a disordered Brexit in the UK and the partial shutdown of the US Federal Government towards the end of the year, further dampened
investor sentiment in the final few weeks of the year. Globally, 2018 delivered negative returns for stocks and bonds. Decem-ber’s market moves failed to provide the respite that many investors were seeking. Against this backdrop, the sub-fund returned -6.6% per share (LC share class, BVI method, in euro) in the 2018 fiscal year.
Investment policy in the reporting periodAgainst a backdrop of over 90% of all assets being in neg-ative territory for the reporting period, the portfolio held up well reflecting the dynamic asset allocation and flexibility in terms of the range of asset classes and instruments avail-able to invest.
The portfolio began the fiscal year constructively positioned.
However, given the extent of flows into equity markets during the first three weeks of January 2018 the sub-fund’s management decided to take some profits late in the month and introduced some hedg-ing and additional diversifying strategies into the portfolio. This worked particularly well during February 2018 as market volatility experienced its largest single spike since the global financial crisis. The position in options contributed particularly well to the portfolio during this period.
Markets stabilised somewhat over the early spring months and hence the portfolio be-nefited from adding back risk during the period. However, as trade tensions began to build between the U.S. and China in May/June 2018, the
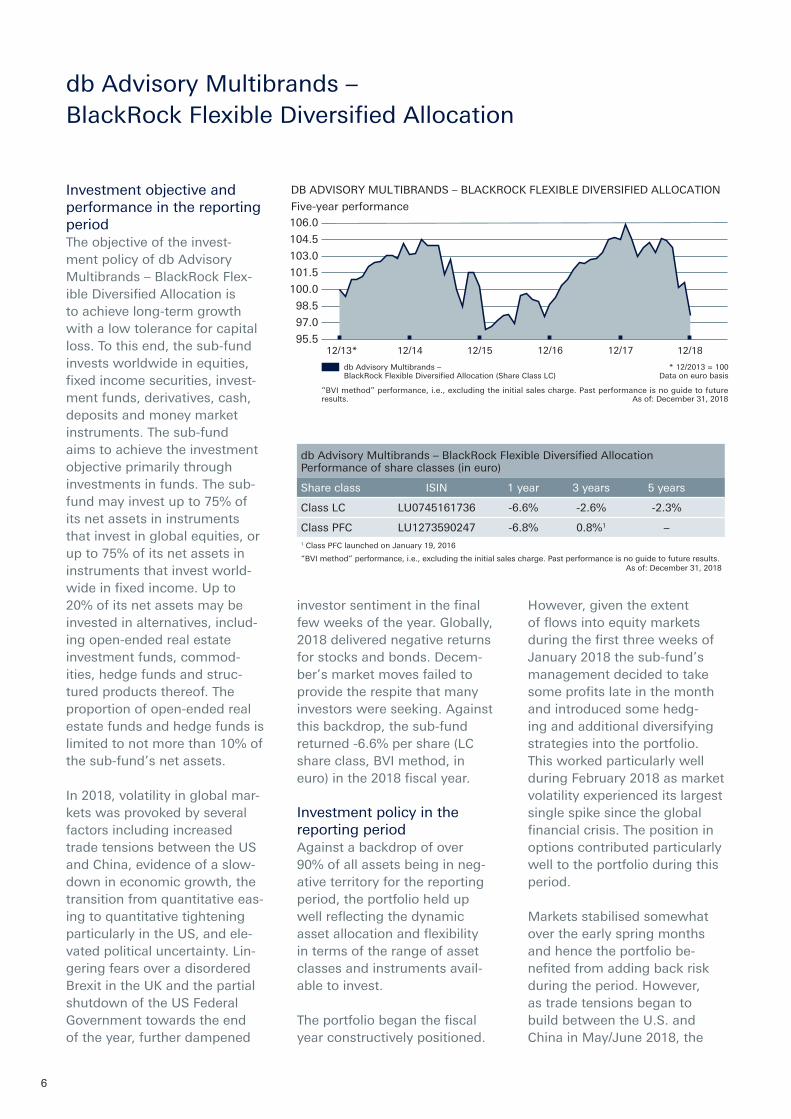
DB ADVISORY MULTIBRANDS – BLACKROCK FLEXIBLE DIVERSIFIED ALLOCATION
Five-year performance106.0
104.5
103.0
101.5
100.0
98.5
97.0
95.5
db Advisory Multibrands –BlackRock Flexible Diversified Allocation (Share Class LC)
“BVI method” performance, i.e., excluding the initial sales charge. Past performance is no guide to futureresults. As of: December 31, 2018
* 12/2013 = 100Data on euro basis
12/13* 12/15 12/1812/16 12/1712/14
db Advisory Multibrands – BlackRock Flexible Diversified Allocation Performance of share classes (in euro)
Share class ISIN 1 year 3 years 5 years
Class LC LU0745161736 -6.6% -2.6% -2.3%
Class PFC LU1273590247 -6.8% 0.8%1 –1 Class PFC launched on January 19, 2016
“BVI method” performance, i.e., excluding the initial sales charge. Past performance is no guide to future results. As of: December 31, 2018
7
management believed that European and Emerging Market assets could be vulnerable and reduced exposure to Europe and hedged out a proportion of our Emerging Market expo-sure in response. The reduction in European exposure also reflected rising political uncer-tainty in Italy and Germany and softer macroeconomic data. Having added a position in German Bunds when yields were close to 0.8% p.a. in early March 2018, the sub-fund took profits on the position at the end of May 2018 at the height of political uncertainty in Ital-ian politics given evidence that investors were switching from Italian government bonds (BTPs) into Bunds. The rapid switch had triggered a sharp fall in yields which the sub-fund’s management deemed to be an attractive exit point.
Over the summer 2018, as the U.S. Dollar strengthened against a background of rising interest rates, the management felt conditions for Emerging Markets could be challenged and hedged out virtually all of the exposure. This proved helpful as following a run on the Turkish Lira and a sharp rise in interest rates in Argentina (to combat the inflation hike – rates increased from 12.5% p.a. to 47% p.a. over a ten-day period) which in turn triggered a near 20% fall in the Argentin-ian Peso, there was contagion across the wider Emerging Market universe. This allowed the sub-fund to take profits in relative value FX positions such as short South African Rand vs Taiwan Dollar.
The final quarter of the fiscal year was characterised by a sharp correction in risk assets. Technology stocks in the U.S. were a key area of weakness but investors also began to focus on the slowdown in the global economy. The extent to which future earnings growth could be negatively impacted by supply chain issues (given the deteriorating trade rela-tionship between the U.S. and China) also came under scru-tiny. Global bonds remained under pressure early in the quarter against a backdrop of rising U.S. interest rates and the conclusion of the European Central Bank’s bond-buying programme. However, as the quarter progressed, rising doubts over global economic growth and mounting expec-tations that the Fed may curb its monetary tightening plans triggered a rally in bonds. The sub-fund added to the govern-ment bond exposure through U.S. treasury notes early in the quarter, and took profits by trimming half of the position in early December 2018. The port-folio also replaced some of the developed market credit expo-sure with U.S. Dollar denomi-nated emerging market debt. The sub-fund’s management believed the sell-off in these assets was overdone and that the portfolio had an opportunity to take advantage of an attrac-tive entry point. The sub-fund also implemented a position in gold, adding further resilience to the portfolio.
8
db Advisory Multibrands – db Credit Selection
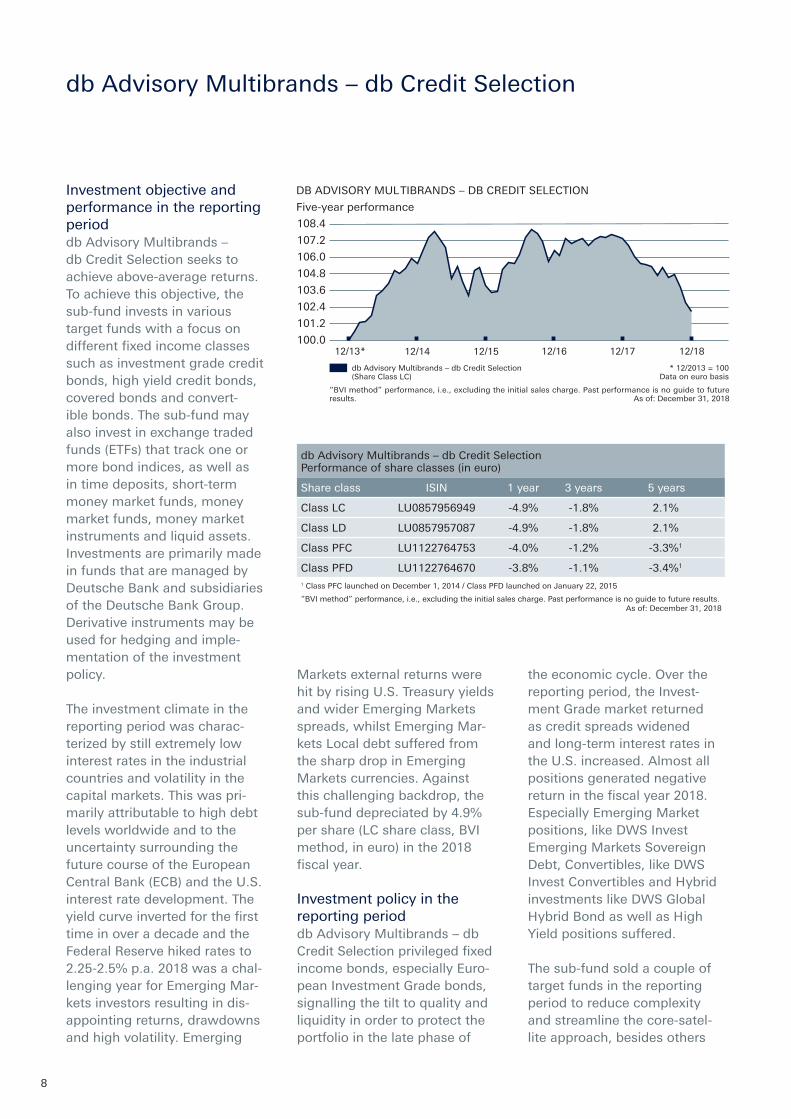
Investment objective and performance in the reporting perioddb Advisory Multibrands – db Credit Selection seeks to achieve above-average returns. To achieve this objective, the sub-fund invests in various target funds with a focus on different fixed income classes such as investment grade credit bonds, high yield credit bonds, covered bonds and convert-ible bonds. The sub-fund may also invest in exchange traded funds (ETFs) that track one or more bond indices, as well as in time deposits, short-term money market funds, money market funds, money market instruments and liquid assets. Investments are primarily made in funds that are managed by Deutsche Bank and subsidiaries of the Deutsche Bank Group. Derivative instruments may be used for hedging and imple-mentation of the investment policy. The investment climate in the reporting period was charac-terized by still extremely low interest rates in the industrial countries and volatility in the capital markets. This was pri-marily attributable to high debt levels worldwide and to the uncertainty surrounding the future course of the European Central Bank (ECB) and the U.S. interest rate development. The yield curve inverted for the first time in over a decade and the Federal Reserve hiked rates to 2.25-2.5% p.a. 2018 was a chal-lenging year for Emerging Mar-kets investors resulting in dis-appointing returns, drawdowns and high volatility. Emerging
Markets external returns were hit by rising U.S. Treasury yields and wider Emerging Markets spreads, whilst Emerging Mar-kets Local debt suffered from the sharp drop in Emerging Markets currencies. Against this challenging backdrop, the sub-fund depreciated by 4.9% per share (LC share class, BVI method, in euro) in the 2018 fiscal year.
Investment policy in the reporting perioddb Advisory Multibrands – db Credit Selection privileged fixed income bonds, especially Euro-pean Investment Grade bonds, signalling the tilt to quality and liquidity in order to protect the portfolio in the late phase of
the economic cycle. Over the reporting period, the Invest-ment Grade market returned as credit spreads widened and long-term interest rates in the U.S. increased. Almost all positions generated negative return in the fiscal year 2018. Especially Emerging Market positions, like DWS Invest Emerging Markets Sovereign Debt, Convertibles, like DWS Invest Convertibles and Hybrid investments like DWS Global Hybrid Bond as well as High Yield positions suffered.
The sub-fund sold a couple of target funds in the reporting period to reduce complexity and streamline the core-satel-lite approach, besides others
DB ADVISORY MULTIBRANDS – DB CREDIT SELECTION
Five-year performance
108.4
107.2
106.0
104.8
103.6
102.4
101.2
100.0
db Advisory Multibrands – db Credit Selection(Share Class LC)
“BVI method” performance, i.e., excluding the initial sales charge. Past performance is no guide to futureresults. As of: December 31, 2018
* 12/2013 = 100Data on euro basis
12/13* 12/16 12/1812/1712/14 12/15
db Advisory Multibrands – db Credit Selection Performance of share classes (in euro)
Share class ISIN 1 year 3 years 5 years
Class LC LU0857956949 -4.9% -1.8% 2.1%
Class LD LU0857957087 -4.9% -1.8% 2.1%
Class PFC LU1122764753 -4.0% -1.2% -3.3%1
Class PFD LU1122764670 -3.8% -1.1% -3.4%1
1 Class PFC launched on December 1, 2014 / Class PFD launched on January 22, 2015
“BVI method” performance, i.e., excluding the initial sales charge. Past performance is no guide to future results. As of: December 31, 2018
9
Neuberger Berman High Yield Bond Fund, Deutsche Extra Bond Total Return, db x-track-ers II - iBoxx USD Liquid Asia Ex-Japan, iShares Euro Corpo-rate Bond Large Cap or DWS Invest Euro-Gov Bond.
Several new investments were added to the portfolio in the fiscal year 2018 e.g. the target fund BlueBay Global Sovereign Opportunities, a liquid alterna-tive fund investing globally long and short in fixed income mar-kets, introduced to bring more balance and diversification to the portfolio fixed income hold-ings. Schroder International Selection Fund - Euro Corporate Bond was one of the best, most consistent European investment grade credit strategies intro-duced to further enhance credit selection alpha in the overall portfolio.
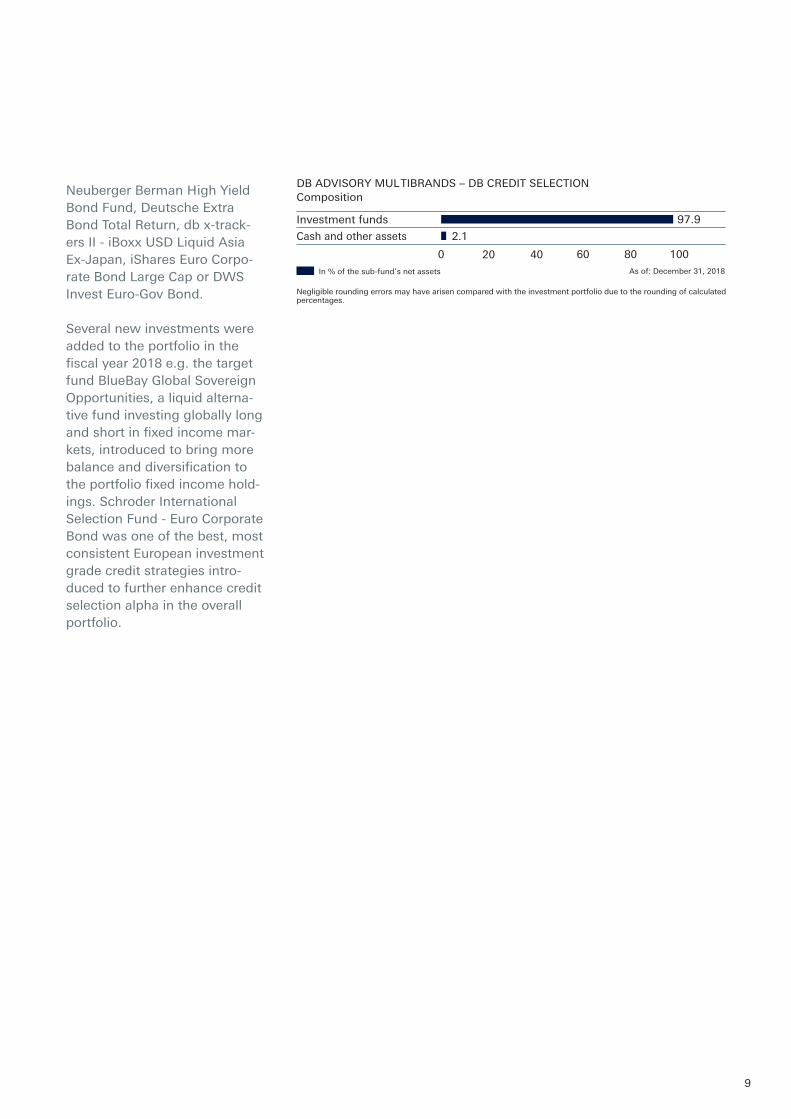
DB ADVISORY MULTIBRANDS – DB CREDIT SELECTIONComposition
Investment funds
Cash and other assets
97.9
2.1
In % of the sub-fund’s net assets
0 20 60 8040As of: December 31, 2018
100
Negligible rounding errors may have arisen compared with the investment portfolio due to the rounding of calculatedpercentages.
10
db Advisory Multibrands – db Selected Managers
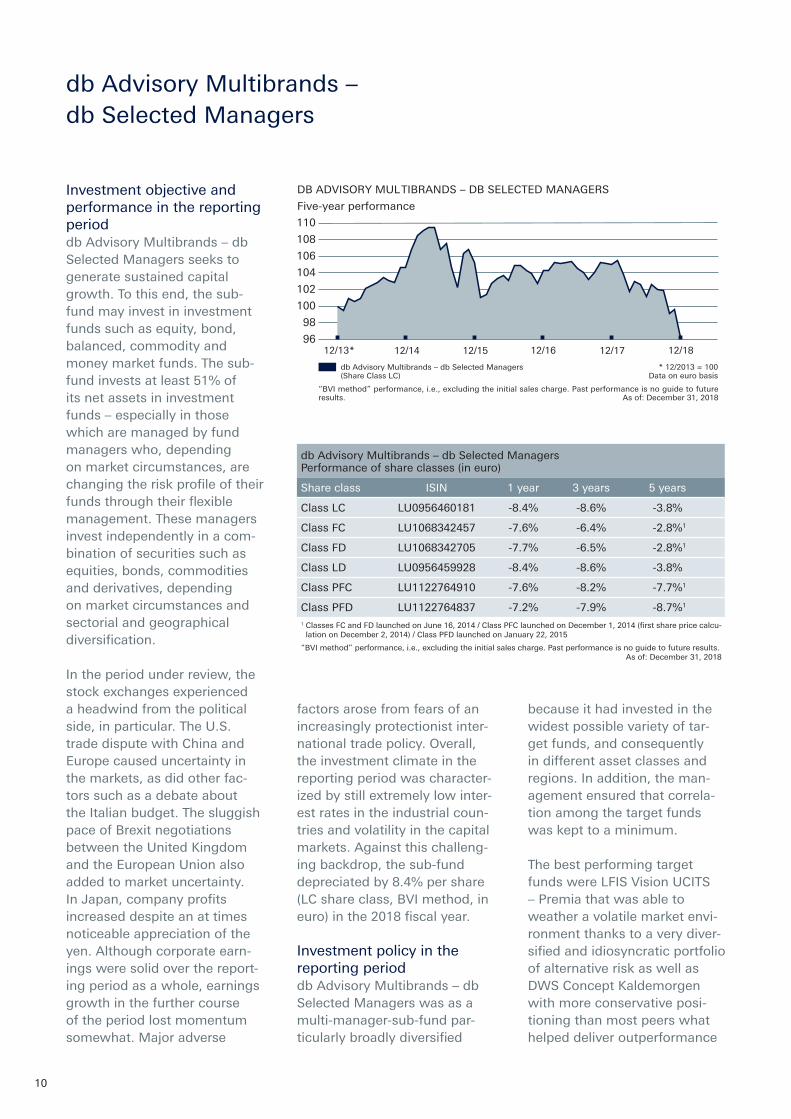
Investment objective and performance in the reporting perioddb Advisory Multibrands – db Selected Managers seeks to generate sustained capital growth. To this end, the sub-fund may invest in investment funds such as equity, bond, balanced, commodity and money market funds. The sub-fund invests at least 51% of its net assets in investment funds – especially in those which are managed by fund managers who, depending on market circumstances, are changing the risk profile of their funds through their flexible management. These managers invest independently in a com-bination of securities such as equities, bonds, commodities and derivatives, depending on market circumstances and sectorial and geographical diversification.
In the period under review, the stock exchanges experienced a headwind from the political side, in particular. The U.S. trade dispute with China and Europe caused uncertainty in the markets, as did other fac-tors such as a debate about the Italian budget. The sluggish pace of Brexit negotiations between the United Kingdom and the European Union also added to market uncertainty. In Japan, company profits increased despite an at times noticeable appreciation of the yen. Although corporate earn-ings were solid over the report-ing period as a whole, earnings growth in the further course of the period lost momentum somewhat. Major adverse
factors arose from fears of an increasingly protectionist inter-national trade policy. Overall, the investment climate in the reporting period was character-ized by still extremely low inter-est rates in the industrial coun-tries and volatility in the capital markets. Against this challeng-ing backdrop, the sub-fund depreciated by 8.4% per share (LC share class, BVI method, in euro) in the 2018 fiscal year.
Investment policy in the reporting perioddb Advisory Multibrands – db Selected Managers was as a multi-manager-sub-fund par-ticularly broadly diversified
because it had invested in the widest possible variety of tar-get funds, and consequently in different asset classes and regions. In addition, the man-agement ensured that correla-tion among the target funds was kept to a minimum.
The best performing target funds were LFIS Vision UCITS – Premia that was able to weather a volatile market envi-ronment thanks to a very diver-sified and idiosyncratic portfolio of alternative risk as well as DWS Concept Kaldemorgen with more conservative posi-tioning than most peers what helped deliver outperformance
DB ADVISORY MULTIBRANDS – DB SELECTED MANAGERS
Five-year performance
110
108
106
104
102
100
98
96
db Advisory Multibrands – db Selected Managers(Share Class LC)
“BVI method” performance, i.e., excluding the initial sales charge. Past performance is no guide to futureresults. As of: December 31, 2018
* 12/2013 = 100Data on euro basis
12/13* 12/16 12/1812/1712/14 12/15
db Advisory Multibrands – db Selected Managers Performance of share classes (in euro)
Share class ISIN 1 year 3 years 5 years
Class LC LU0956460181 -8.4% -8.6% -3.8%
Class FC LU1068342457 -7.6% -6.4% -2.8%1
Class FD LU1068342705 -7.7% -6.5% -2.8%1
Class LD LU0956459928 -8.4% -8.6% -3.8%
Class PFC LU1122764910 -7.6% -8.2% -7.7%1
Class PFD LU1122764837 -7.2% -7.9% -8.7%1
1 Classes FC and FD launched on June 16, 2014 / Class PFC launched on December 1, 2014 (first share price calcu-lation on December 2, 2014) / Class PFD launched on January 22, 2015
“BVI method” performance, i.e., excluding the initial sales charge. Past performance is no guide to future results. As of: December 31, 2018
11
through the fiscal year. On the other side, the worst per-forming target fund was Stan-dard Life Investments Global SICAV – Global Absolute Return Strategies Fund where many of the relative value positions did not work like in European financials, global Energy com-panies and in some Emerging Markets. The portfolio position was completely sold in Decem-ber 2018 after the sub-fund´s management lost conviction in the investment process and to some extent in the risk man-agement implementation and genesis of many of the relative value positions of this target fund. AQR Style Premia also disappointed especially hit by underperformance of the value factor in equity markets and in the U.S. more specifically.
The target fund Flossbach von Storch – Multi Asset – Defen-sive was entirely sold due to portfolio diversification as the sub-fund was already holding the same firm balanced target fund.
The sub-fund added the LFIS Vision UCITS – Premia to the portfolio with its innova-tive alternative risk premium strategy introduced mostly for diversification purposes. Another investment newly added to the portfolio was M&G (Lux) Dynamic, a solid multi asset target fund with a dynamic approach and good performance also in difficult market environments. To diver-sify the portfolio db Advisory Multibrands – db Selected Managers also bought Janus Henderson Balanced Fund, a
very good multi asset balanced fund with consistent risk/return profile.
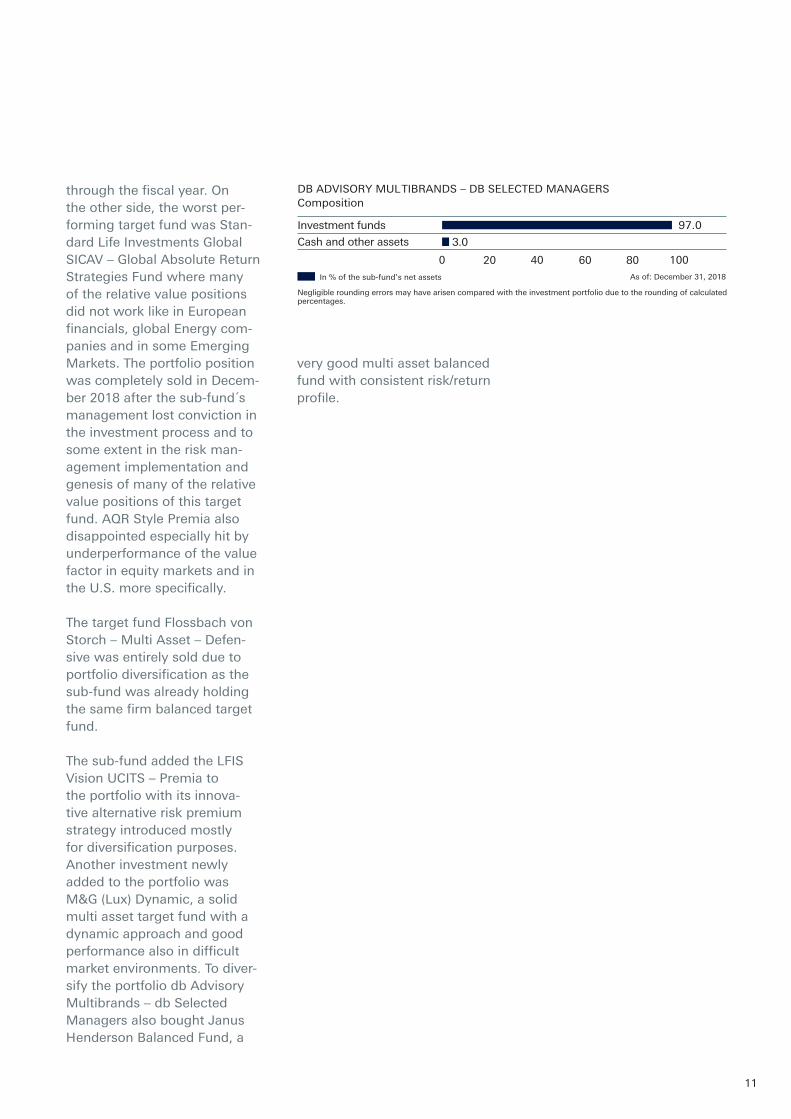
DB ADVISORY MULTIBRANDS – DB SELECTED MANAGERSComposition
Investment funds
Cash and other assets 3.0
97.0
In % of the sub-fund’s net assets
0 20 60 8040As of: December 31, 2018
100
Negligible rounding errors may have arisen compared with the investment portfolio due to the rounding of calculatedpercentages.
12
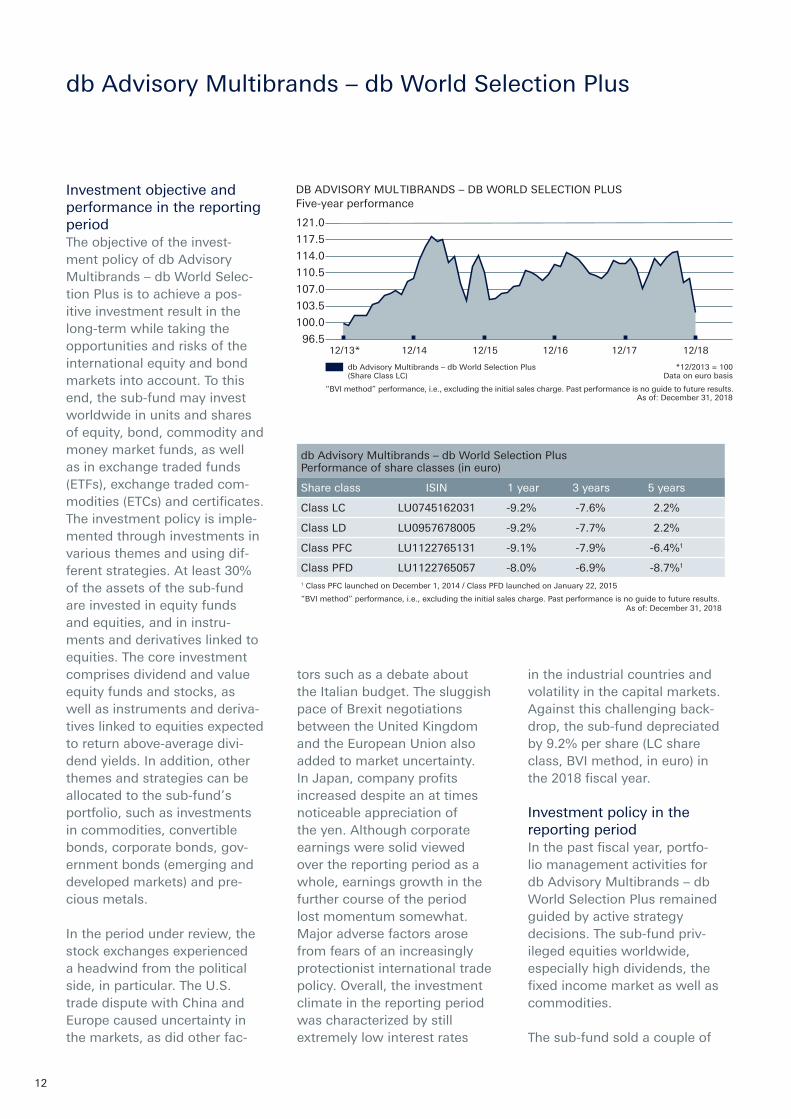
db Advisory Multibrands – db World Selection Plus
Investment objective and performance in the reporting periodThe objective of the invest-ment policy of db Advisory Multibrands – db World Selec-tion Plus is to achieve a pos-itive investment result in the long-term while taking the opportunities and risks of the international equity and bond markets into account. To this end, the sub-fund may invest worldwide in units and shares of equity, bond, commodity and money market funds, as well as in exchange traded funds (ETFs), exchange traded com-modities (ETCs) and certificates. The investment policy is imple-mented through investments in various themes and using dif-ferent strategies. At least 30% of the assets of the sub-fund are invested in equity funds and equities, and in instru-ments and derivatives linked to equities. The core investment comprises dividend and value equity funds and stocks, as well as instruments and deriva-tives linked to equities expected to return above-average divi-dend yields. In addition, other themes and strategies can be allocated to the sub-fund’s portfolio, such as investments in commodities, convertible bonds, corporate bonds, gov-ernment bonds (emerging and developed markets) and pre-cious metals.
In the period under review, the stock exchanges experienced a headwind from the political side, in particular. The U.S. trade dispute with China and Europe caused uncertainty in the markets, as did other fac-
tors such as a debate about the Italian budget. The sluggish pace of Brexit negotiations between the United Kingdom and the European Union also added to market uncertainty. In Japan, company profits increased despite an at times noticeable appreciation of the yen. Although corporate earnings were solid viewed over the reporting period as a whole, earnings growth in the further course of the period lost momentum somewhat. Major adverse factors arose from fears of an increasingly protectionist international trade policy. Overall, the investment climate in the reporting period was characterized by still extremely low interest rates
in the industrial countries and volatility in the capital markets. Against this challenging back-drop, the sub-fund depreciated by 9.2% per share (LC share class, BVI method, in euro) in the 2018 fiscal year.
Investment policy in the reporting periodIn the past fiscal year, portfo-lio management activities for db Advisory Multibrands – db World Selection Plus remained guided by active strategy decisions. The sub-fund priv-ileged equities worldwide, especially high dividends, the fixed income market as well as commodities.
The sub-fund sold a couple of
DB ADVISORY MULTIBRANDS – DB WORLD SELECTION PLUSFive-year performance
121.0
117.5
114.0
110.5
107.0
103.5
100.0
96.5
db Advisory Multibrands – db World Selection Plus(Share Class LC)
“BVI method” performance, i.e., excluding the initial sales charge. Past performance is no guide to future results.As of: December 31, 2018
*12/2013 = 100Data on euro basis
12/13* 12/14 12/1812/16 12/1712/15
db Advisory Multibrands – db World Selection Plus Performance of share classes (in euro)
Share class ISIN 1 year 3 years 5 years
Class LC LU0745162031 -9.2% -7.6% 2.2%
Class LD LU0957678005 -9.2% -7.7% 2.2%
Class PFC LU1122765131 -9.1% -7.9% -6.4%1
Class PFD LU1122765057 -8.0% -6.9% -8.7%1
1 Class PFC launched on December 1, 2014 / Class PFD launched on January 22, 2015
“BVI method” performance, i.e., excluding the initial sales charge. Past performance is no guide to future results. As of: December 31, 2018
13
target funds in the reporting period to reduce complexity and streamline the core-satel-lite approach, besides others db x-trackers - MSCI EM ASIA INDEX, Deutsche Invest II Asian Top Dividend, Neuberger Ber-man High Yield Bond Fund or Deutsche Invest II Japan Top Dividend. On the other site, the sub-fund newly invested mainly in the core bucket Equity High Dividend e.g. Old Mutual Global Equity Income Fund (new fund name: Merian Global Equity Income Fund). Systematic fac-tors drove the global equity income strategy of the target fund further enhancing the defensive income element of the target portfolio equity quota. To diversify the portfolio in the fourth quarter 2018, the sub-fund also added the target fund db Physical Gold ETC.
As there were several episodes of volatility, almost all positions generated negative return in the fiscal year 2018. Especially positions in the core bucket High Dividend Yield like Artemis Global Equity Income Fund or Invesco Global Equity Income Fund and positions in the satel-lite bucket Equity Themes like DWS Invest Global Thematic, iShares Healthcare Innovation, iShares Digitalisation as well as Emerging Market positions, like DWS Invest Emerging Mar-kets Sovereign Debt suffered. On the relative basis, db Advi-sory Multibrands – db World Selection Plus benefitted in particular from investments in target funds Lyxor USD Float-ing Rates Note, db Physical Gold and DWS Invest CROCI US Dividends due to outperfor-
mance of defensive and income oriented plays in a stressed market environment.
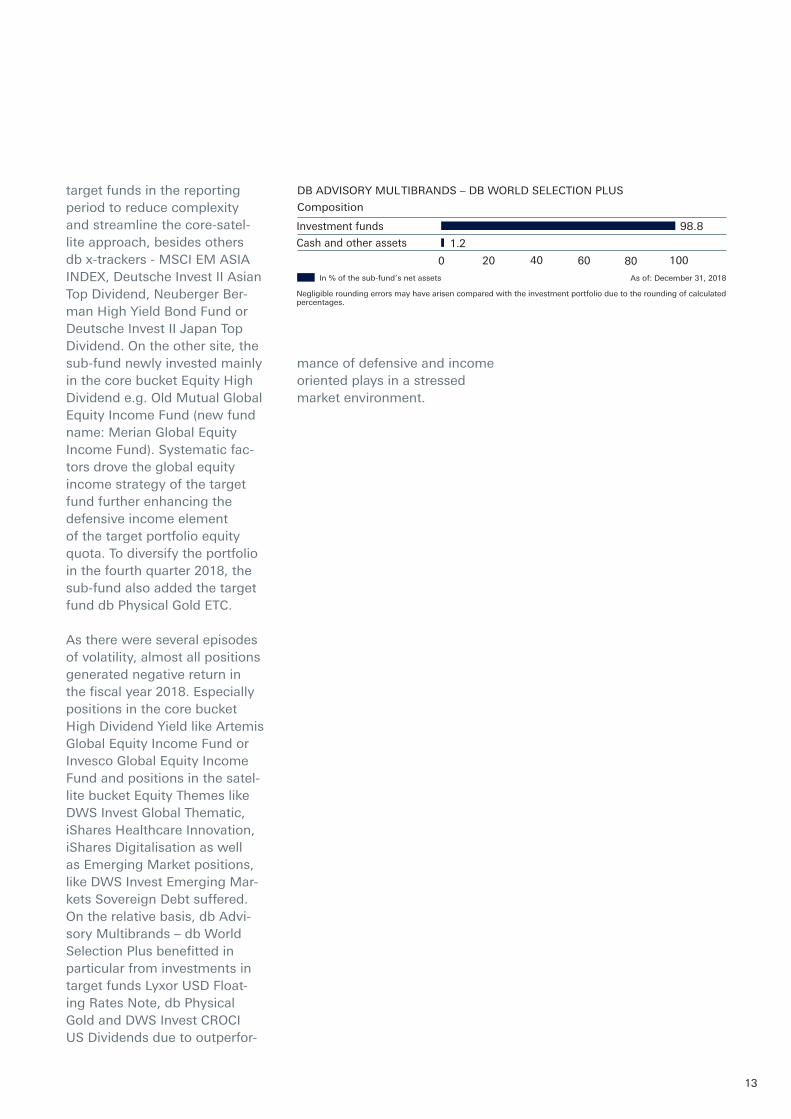
DB ADVISORY MULTIBRANDS – DB WORLD SELECTION PLUS
Composition
Investment funds
Cash and other assets
98.8
In % of the sub-fund’s net assets
1.2WKN: 921 994
ISIN: LU0105045388WKN: 921 994
ISIN: LU0105045388WKN: 921 994
ISIN: LU0105045388
0As of: December 31, 2018
40 60 100
Negligible rounding errors may have arisen compared with the investment portfolio due to the rounding of calculatedpercentages.
20 80
14
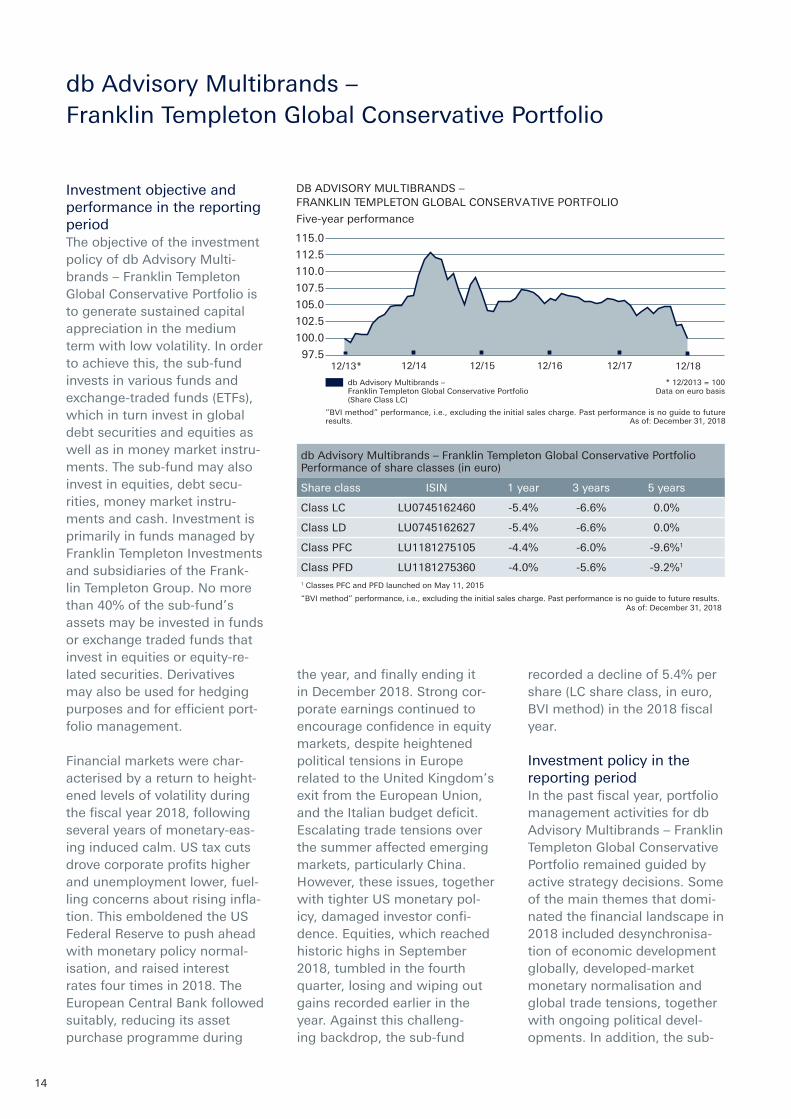
db Advisory Multibrands – Franklin Templeton Global Conservative Portfolio
Investment objective and performance in the reporting periodThe objective of the investment policy of db Advisory Multi-brands – Franklin Templeton Global Conservative Portfolio is to generate sustained capital appreciation in the medium term with low volatility. In order to achieve this, the sub-fund invests in various funds and exchange-traded funds (ETFs), which in turn invest in global debt securities and equities as well as in money market instru-ments. The sub-fund may also invest in equities, debt secu-rities, money market instru-ments and cash. Investment is primarily in funds managed by Franklin Templeton Investments and subsidiaries of the Frank-lin Templeton Group. No more than 40% of the sub-fund’s assets may be invested in funds or exchange traded funds that invest in equities or equity-re-lated securities. Derivatives may also be used for hedging purposes and for efficient port-folio management.
Financial markets were char-acterised by a return to height-ened levels of volatility during the fiscal year 2018, following several years of monetary-eas-ing induced calm. US tax cuts drove corporate profits higher and unemployment lower, fuel-ling concerns about rising infla-tion. This emboldened the US Federal Reserve to push ahead with monetary policy normal-isation, and raised interest rates four times in 2018. The European Central Bank followed suitably, reducing its asset purchase programme during
the year, and finally ending it in December 2018. Strong cor-porate earnings continued to encourage confidence in equity markets, despite heightened political tensions in Europe related to the United Kingdom’s exit from the European Union, and the Italian budget deficit. Escalating trade tensions over the summer affected emerging markets, particularly China. However, these issues, together with tighter US monetary pol-icy, damaged investor confi-dence. Equities, which reached historic highs in September 2018, tumbled in the fourth quarter, losing and wiping out gains recorded earlier in the year. Against this challeng-ing backdrop, the sub-fund
recorded a decline of 5.4% per share (LC share class, in euro, BVI method) in the 2018 fiscal year.
Investment policy in the reporting periodIn the past fiscal year, portfolio management activities for db Advisory Multibrands – Franklin Templeton Global Conservative Portfolio remained guided by active strategy decisions. Some of the main themes that domi-nated the financial landscape in 2018 included desynchronisa-tion of economic development globally, developed-market monetary normalisation and global trade tensions, together with ongoing political devel-opments. In addition, the sub-
DB ADVISORY MULTIBRANDS –FRANKLIN TEMPLETON GLOBAL CONSERVATIVE PORTFOLIO
Five-year performance
115.0
112.5
110.0
107.5
105.0
102.5
100.0
97.5
db Advisory Multibrands –Franklin Templeton Global Conservative Portfolio(Share Class LC)
“BVI method” performance, i.e., excluding the initial sales charge. Past performance is no guide to futureresults. As of: December 31, 2018
* 12/2013 = 100Data on euro basis
12/13* 12/14 12/1812/1712/1612/15
db Advisory Multibrands – Franklin Templeton Global Conservative Portfolio Performance of share classes (in euro)
Share class ISIN 1 year 3 years 5 years
Class LC LU0745162460 -5.4% -6.6% 0.0%
Class LD LU0745162627 -5.4% -6.6% 0.0%
Class PFC LU1181275105 -4.4% -6.0% -9.6%1
Class PFD LU1181275360 -4.0% -5.6% -9.2%1
1 Classes PFC and PFD launched on May 11, 2015
“BVI method” performance, i.e., excluding the initial sales charge. Past performance is no guide to future results. As of: December 31, 2018
15
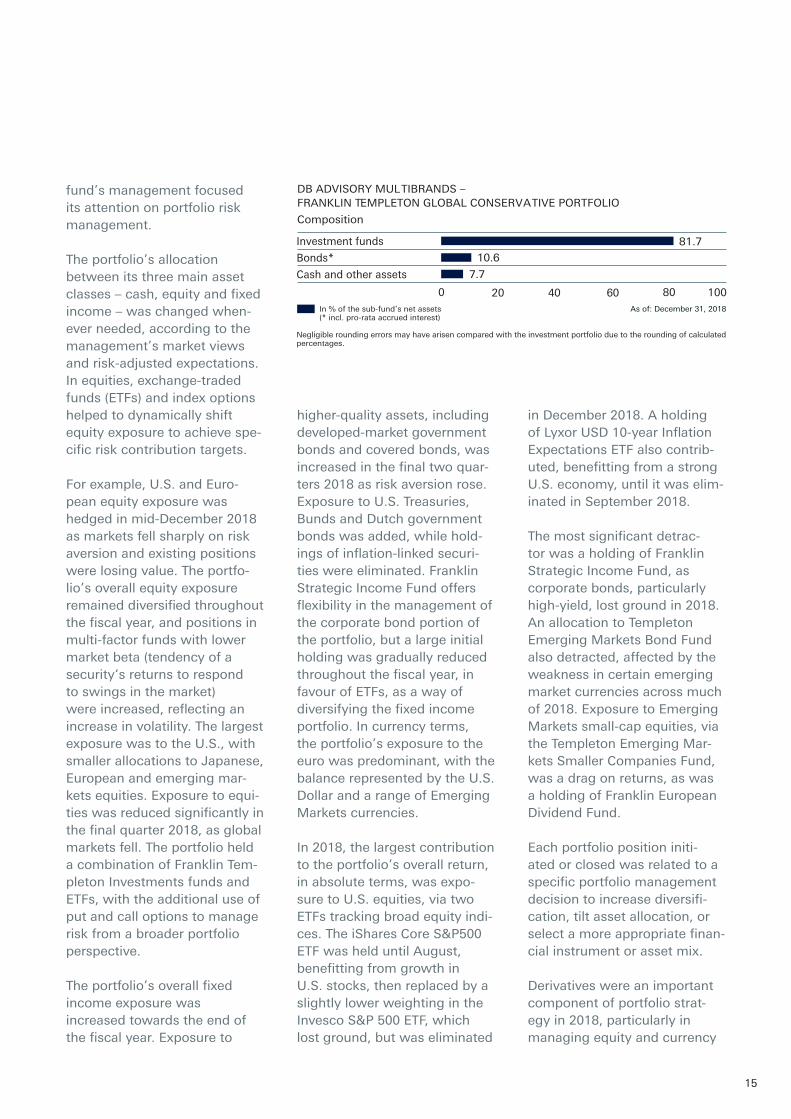
DB ADVISORY MULTIBRANDS –FRANKLIN TEMPLETON GLOBAL CONSERVATIVE PORTFOLIO
Composition
Investment funds
Bonds*
Cash and other assets
81.710.6
7.7
As of: December 31, 2018In % of the sub-fund’s net assets(* incl. pro-rata accrued interest)
0 10020 40 60 80
Negligible rounding errors may have arisen compared with the investment portfolio due to the rounding of calculatedpercentages.
fund’s management focused its attention on portfolio risk management.
The portfolio’s allocation between its three main asset classes – cash, equity and fixed income – was changed when-ever needed, according to the management’s market views and risk-adjusted expectations. In equities, exchange-traded funds (ETFs) and index options helped to dynamically shift equity exposure to achieve spe-cific risk contribution targets.
For example, U.S. and Euro-pean equity exposure was hedged in mid-December 2018 as markets fell sharply on risk aversion and existing positions were losing value. The portfo-lio’s overall equity exposure remained diversified throughout the fiscal year, and positions in multi-factor funds with lower market beta (tendency of a security‘s returns to respond to swings in the market) were increased, reflecting an increase in volatility. The largest exposure was to the U.S., with smaller allocations to Japanese, European and emerging mar-kets equities. Exposure to equi-ties was reduced significantly in the final quarter 2018, as global markets fell. The portfolio held a combination of Franklin Tem-pleton Investments funds and ETFs, with the additional use of put and call options to manage risk from a broader portfolio perspective.
The portfolio’s overall fixed income exposure was increased towards the end of the fiscal year. Exposure to
higher-quality assets, including developed-market government bonds and covered bonds, was increased in the final two quar-ters 2018 as risk aversion rose. Exposure to U.S. Treasuries, Bunds and Dutch government bonds was added, while hold-ings of inflation-linked securi-ties were eliminated. Franklin Strategic Income Fund offers flexibility in the management of the corporate bond portion of the portfolio, but a large initial holding was gradually reduced throughout the fiscal year, in favour of ETFs, as a way of diversifying the fixed income portfolio. In currency terms, the portfolio’s exposure to the euro was predominant, with the balance represented by the U.S. Dollar and a range of Emerging Markets currencies.
In 2018, the largest contribution to the portfolio’s overall return, in absolute terms, was expo-sure to U.S. equities, via two ETFs tracking broad equity indi-ces. The iShares Core S&P500 ETF was held until August, benefitting from growth in U.S. stocks, then replaced by a slightly lower weighting in the Invesco S&P 500 ETF, which lost ground, but was eliminated
in December 2018. A holding of Lyxor USD 10-year Inflation Expectations ETF also contrib-uted, benefitting from a strong U.S. economy, until it was elim-inated in September 2018.
The most significant detrac-tor was a holding of Franklin Strategic Income Fund, as corporate bonds, particularly high-yield, lost ground in 2018. An allocation to Templeton Emerging Markets Bond Fund also detracted, affected by the weakness in certain emerging market currencies across much of 2018. Exposure to Emerging Markets small-cap equities, via the Templeton Emerging Mar-kets Smaller Companies Fund, was a drag on returns, as was a holding of Franklin European Dividend Fund.
Each portfolio position initi-ated or closed was related to a specific portfolio management decision to increase diversifi-cation, tilt asset allocation, or select a more appropriate finan-cial instrument or asset mix.
Derivatives were an important component of portfolio strat-egy in 2018, particularly in managing equity and currency

16
exposures. Put and call option contracts on the EuroStoxx 50 and S&P 500 indices were initiated and closed several times to efficiently manage equity exposure and overall portfolio risk. Currency forward contracts were used to hedge exposure to currencies such as the U.S. Dollar and the Japa-nese yen. Both equity options and currency hedges detracted modestly from returns.
17
db Advisory Multibrands – GAM Absolute Return Strategy Fund
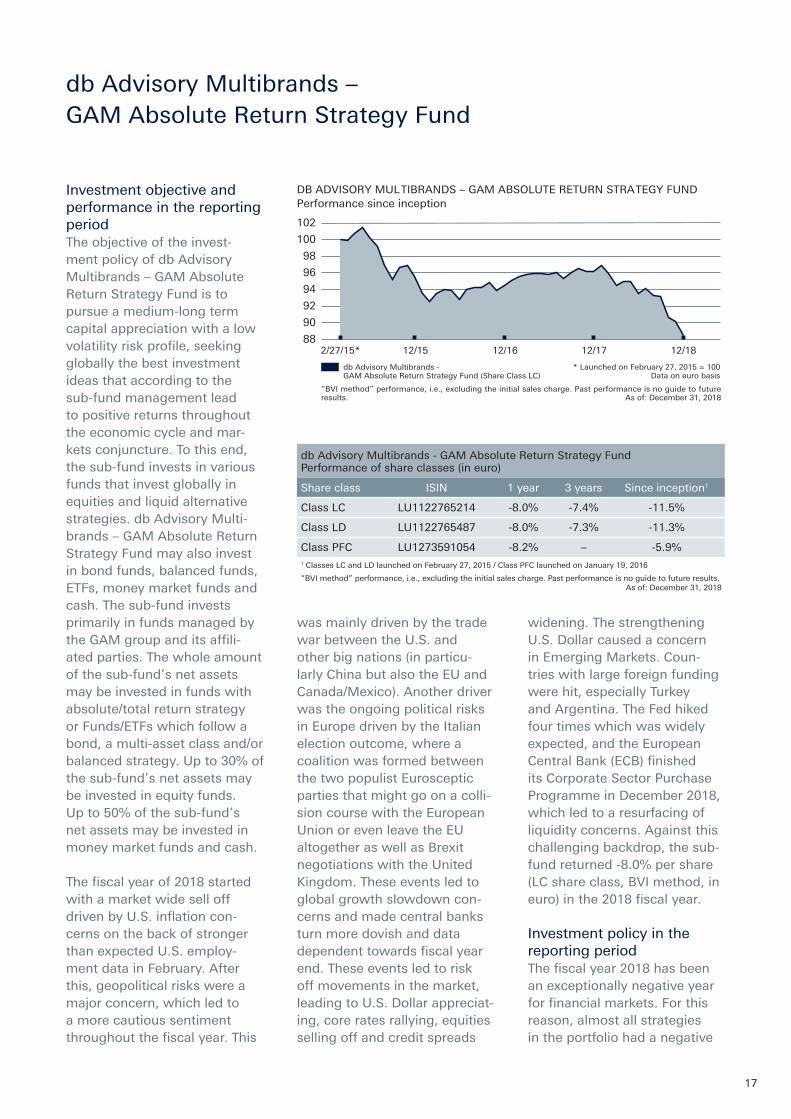
Investment objective and performance in the reporting periodThe objective of the invest-ment policy of db Advisory Multibrands – GAM Absolute Return Strategy Fund is to pursue a medium-long term capital appreciation with a low volatility risk profile, seeking globally the best investment ideas that according to the sub-fund management lead to positive returns throughout the economic cycle and mar-kets conjuncture. To this end, the sub-fund invests in various funds that invest globally in equities and liquid alternative strategies. db Advisory Multi-brands – GAM Absolute Return Strategy Fund may also invest in bond funds, balanced funds, ETFs, money market funds and cash. The sub-fund invests primarily in funds managed by the GAM group and its affili-ated parties. The whole amount of the sub-fund’s net assets may be invested in funds with absolute/total return strategy or Funds/ETFs which follow a bond, a multi-asset class and/or balanced strategy. Up to 30% of the sub-fund’s net assets may be invested in equity funds. Up to 50% of the sub-fund’s net assets may be invested in money market funds and cash.
The fiscal year of 2018 started with a market wide sell off driven by U.S. inflation con-cerns on the back of stronger than expected U.S. employ-ment data in February. After this, geopolitical risks were a major concern, which led to a more cautious sentiment throughout the fiscal year. This
was mainly driven by the trade war between the U.S. and other big nations (in particu-larly China but also the EU and Canada/Mexico). Another driver was the ongoing political risks in Europe driven by the Italian election outcome, where a coalition was formed between the two populist Eurosceptic parties that might go on a colli-sion course with the European Union or even leave the EU altogether as well as Brexit negotiations with the United Kingdom. These events led to global growth slowdown con-cerns and made central banks turn more dovish and data dependent towards fiscal year end. These events led to risk off movements in the market, leading to U.S. Dollar appreciat-ing, core rates rallying, equities selling off and credit spreads
widening. The strengthening U.S. Dollar caused a concern in Emerging Markets. Coun-tries with large foreign funding were hit, especially Turkey and Argentina. The Fed hiked four times which was widely expected, and the European Central Bank (ECB) finished its Corporate Sector Purchase Programme in December 2018, which led to a resurfacing of liquidity concerns. Against this challenging backdrop, the sub-fund returned -8.0% per share (LC share class, BVI method, in euro) in the 2018 fiscal year.
Investment policy in the reporting periodThe fiscal year 2018 has been an exceptionally negative year for financial markets. For this reason, almost all strategies in the portfolio had a negative
DB ADVISORY MULTIBRANDS – GAM ABSOLUTE RETURN STRATEGY FUNDPerformance since inception
102
100
98
96
94
92
90
88
db Advisory Multibrands -GAM Absolute Return Strategy Fund (Share Class LC)
“BVI method” performance, i.e., excluding the initial sales charge. Past performance is no guide to futureresults. As of: December 31, 2018
* Launched on February 27, 2015 = 100Data on euro basis
2/27/15* 12/17 12/1812/15 12/16
db Advisory Multibrands - GAM Absolute Return Strategy Fund Performance of share classes (in euro)
Share class ISIN 1 year 3 years Since inception1
Class LC LU1122765214 -8.0% -7.4% -11.5%
Class LD LU1122765487 -8.0% -7.3% -11.3%
Class PFC LU1273591054 -8.2% – -5.9%1 Classes LC and LD launched on February 27, 2015 / Class PFC launched on January 19, 2016
“BVI method” performance, i.e., excluding the initial sales charge. Past performance is no guide to future results. As of: December 31, 2018
18
performance. Equity exposure had a negative impact on the sub-fund’s performance, in par-ticular European and Emerging Markets equity. Over the last 12 months, the sub-fund wit-nessed market reversals and style rotations, the end of the new normal (zero real rates) and the return of volatility. All these factors had a nega-tive impact also on the long/short equity strategy, which detracted the most. Overall, all the absolute return bond strategies also ended the fis-cal year in negative territory. Most of the sub-fund’s nega-tive performance came from alternative strategies (equity long/short and absolute return bond). Sector rotations, spreads widening and geopolitical ten-sions affected all asset classes, including government bonds. On the relative basis, the best performing strategies have been short-term credit and ABS, which ended the fiscal year with a small loss.
The asset allocation has been quite conservative during the fiscal year, with an equity exposure below 20%. Given the great uncertainties, related to geopolitical risks and slow-ing global growth prospects, since mid-July 2018 the sub-fund’s management decided to adopt an even more prudent approach, increasing cash and short-term bonds exposure, from 2% to almost 30% of the sub-fund’s net assets. During the reporting period, the sub-fund sold the entire position of the European long/short equity market neutral strategy (at a loss), due to disappoint-
ing performance. Sector rota-tions and increased volatility affected most of the equity alternative strategies, in par-ticular the ones that focus on fundamentals.
Suspension of issuance and redemptions of shares
On the basis of article 13.1 of the articles of association of the Company, the Board of Directors of the Company has decided to suspend the issue and redemption of shares of the sub-fund db Advisory Multi-brands – GAM Absolute Return Strategy Fund as per August 10, 2018 in order to protect the interests of the shareholders of the sub-fund and ensure equal treatment of all shareholders.
The reason for this decision was that two target fund invest-ments of the sub-fund (GAM Multibond - Absolute Return Bond Fund Defender (in liqui-dation) and GAM Multibond - Absolute Return Bond Plus (in liquidation); both amounting to almost 25% of the sub-fund’s net asset value at the beginning of the target fund’s liquidation process) experienced large outflows due to the suspen-sion of a key fund manager. The redemption of shares of those target funds has been
suspended, making these posi-tions illiquid in the sub-fund. Since the target fund’s liqui-dation process started, 92% of the GAM Multibond – Absolute Return Bond Fund Defender (in liquidation) and 89% of the GAM Multibond – Absolute Return Bond Plus (in liquida-tion) shares have been returned to clients until end of the reporting period.
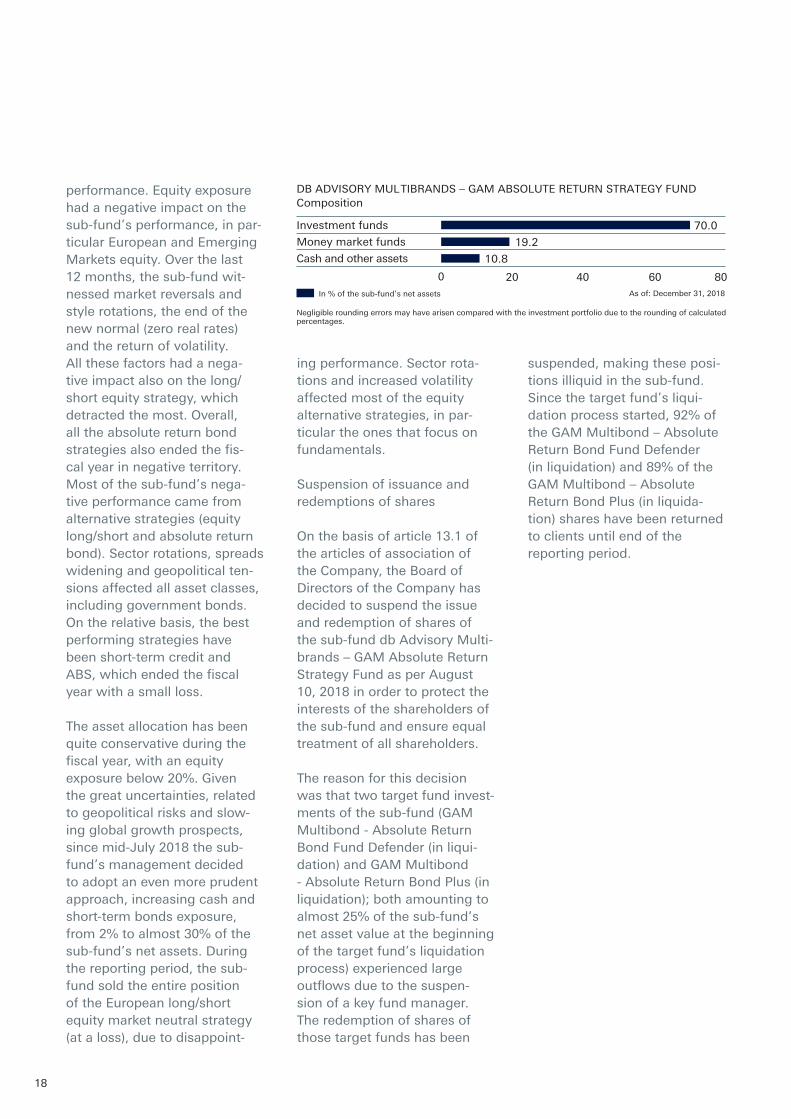
DB ADVISORY MULTIBRANDS – GAM ABSOLUTE RETURN STRATEGY FUNDComposition
70.0
19.2
Investment funds
Money market funds
Cash and other assets 10.8
In % of the sub-fund’s net assets
0 4020As of: December 31, 2018
60
Negligible rounding errors may have arisen compared with the investment portfolio due to the rounding of calculatedpercentages.
80
19
db Advisory Multibrands – Invesco Multi Asset Risk Diversified
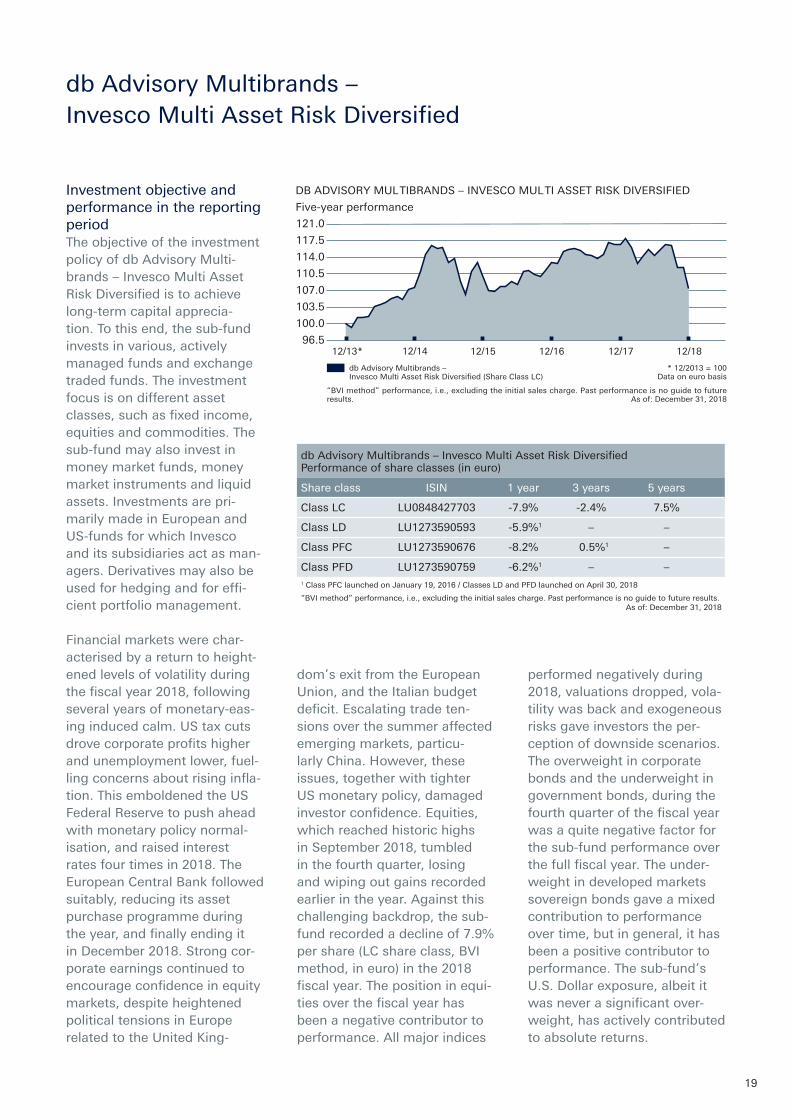
Investment objective and performance in the reporting periodThe objective of the investment policy of db Advisory Multi-brands – Invesco Multi Asset Risk Diversified is to achieve long-term capital apprecia-tion. To this end, the sub-fund invests in various, actively managed funds and exchange traded funds. The investment focus is on different asset classes, such as fixed income, equities and commodities. The sub-fund may also invest in money market funds, money market instruments and liquid assets. Investments are pri-marily made in European and US-funds for which Invesco and its subsidiaries act as man-agers. Derivatives may also be used for hedging and for effi-cient portfolio management.
Financial markets were char-acterised by a return to height-ened levels of volatility during the fiscal year 2018, following several years of monetary-eas-ing induced calm. US tax cuts drove corporate profits higher and unemployment lower, fuel-ling concerns about rising infla-tion. This emboldened the US Federal Reserve to push ahead with monetary policy normal-isation, and raised interest rates four times in 2018. The European Central Bank followed suitably, reducing its asset purchase programme during the year, and finally ending it in December 2018. Strong cor-porate earnings continued to encourage confidence in equity markets, despite heightened political tensions in Europe related to the United King-
dom’s exit from the European Union, and the Italian budget deficit. Escalating trade ten-sions over the summer affected emerging markets, particu-larly China. However, these issues, together with tighter US monetary policy, damaged investor confidence. Equities, which reached historic highs in September 2018, tumbled in the fourth quarter, losing and wiping out gains recorded earlier in the year. Against this challenging backdrop, the sub-fund recorded a decline of 7.9% per share (LC share class, BVI method, in euro) in the 2018 fiscal year. The position in equi-ties over the fiscal year has been a negative contributor to performance. All major indices
performed negatively during 2018, valuations dropped, vola-tility was back and exogeneous risks gave investors the per-ception of downside scenarios. The overweight in corporate bonds and the underweight in government bonds, during the fourth quarter of the fiscal year was a quite negative factor for the sub-fund performance over the full fiscal year. The under-weight in developed markets sovereign bonds gave a mixed contribution to performance over time, but in general, it has been a positive contributor to performance. The sub-fund’s U.S. Dollar exposure, albeit it was never a significant over-weight, has actively contributed to absolute returns.
DB ADVISORY MULTIBRANDS – INVESCO MULTI ASSET RISK DIVERSIFIED
Five-year performance
121.0
117.5
114.0
110.5
107.0
103.5
100.0
96.5
db Advisory Multibrands –Invesco Multi Asset Risk Diversified (Share Class LC)
“BVI method” performance, i.e., excluding the initial sales charge. Past performance is no guide to futureresults. As of: December 31, 2018
* 12/2013 = 100Data on euro basis
12/13* 12/14 12/1812/1712/1612/15
db Advisory Multibrands – Invesco Multi Asset Risk Diversified Performance of share classes (in euro)
Share class ISIN 1 year 3 years 5 years
Class LC LU0848427703 -7.9% -2.4% 7.5%
Class LD LU1273590593 -5.9%1 – –
Class PFC LU1273590676 -8.2% 0.5%1 –
Class PFD LU1273590759 -6.2%1 – –1 Class PFC launched on January 19, 2016 / Classes LD and PFD launched on April 30, 2018
“BVI method” performance, i.e., excluding the initial sales charge. Past performance is no guide to future results. As of: December 31, 2018
20
Investment policy in the reporting periodThe asset allocation choices were consistent to the assess-ment of the overall macroeco-nomic environment and they were managed through an opportunistic tilt during the fiscal year, as there were sev-eral episodes of volatility. Even if on one hand they had a neg-ative impact on the portfolio, they were actively managed to exploit them tactically to round up positions. The elements that limited the sub-fund perfor-mance relative to the market were the deep equity correction on Global equity markets – and the exposure to Eurozone equi-ties, which in some period of the fiscal year, especially in the second half, had a quite lack-lustre performance. The sector positioning was a consequence of the sub-funds picking and the geographic asset alloca-tion in the portfolio. Over the fiscal year, major overweight positions were in financials, consumer cyclicals and indus-trials, while the most significant underweight was in Govern-ment bonds.
db Advisory Multibrands – Invesco Multi Asset Risk Diver-sified privileged corporate bonds, both High Yield and Investment Grade, over Gov-ernment bonds. The reasons were they were better sources of income, especially during a period of declining government yields, and their spread offered some protection at times of increasing yields. Even if the sub-fund closed with a small underweight position in equi-ties in 2018, the preference
in geographic terms went to the U.S. then Emerging Mar-kets, Europe (especially the Euro Area), and Japan. In the fixed income sector, the man-agement privileged corporate bonds, especially high yield, both in the U.S. and in the Eurozone, whilst underweight-ing significantly the govern-ment bonds, especially in the Euro Area. Within fixed income, the portfolio had reduced the exposure to Emerging Market bonds throughout the fiscal year.
The largest overweight posi-tions on sector level were Consumer Cyclical, Industrials and Financials while the most significant underweight was in Government bonds. The biggest underweight was gov-ernment bonds, especially in Europe. In a period where the FED increased interest rates and economic growth started embedding future downside scenarios, and while in Europe the monetary policy remained largely accommodative, the current level of offered yields resulted as not attractive enough to overweight expo-sures. For the same reason (spreads and higher yields can provide investors with some protection in the event of risk-free rate increases, such as the
current ones that are related to economic improvements), the sub-fund overweighted the corporate bond markets, both Investment Grade and High Yield.
The best performing invest-ments in the portfolio for the whole fiscal year 2018 were the Invesco Nasdaq Eq ETF UCITS, while among funds, the Ossiam Shiller Barclays Cape. Practically unchanged but still a positive contributor was the Invesco Euro Ultra Short Term Debt Fund. The worst perform-ing funds in Euro terms were the Invesco Asia Equity Fund and the Invesco Pan European Structured Equity Fund. But for the first mentioned fund in U.S. Dollar terms, the performance was slightly better, so the cur-rency had a translation impact here.
In the reporting period, the management exited the posi-tions in the Invesco Global Smaller Companies Fund, the iShares Automation & Robot-ics ETF and the India Bond Fund. The reasons for this were related to the new addi-tions. For the U.S. market and the European market with a cyclical bias the sub-fund pre-ferred other alternatives which were more targeted. The new
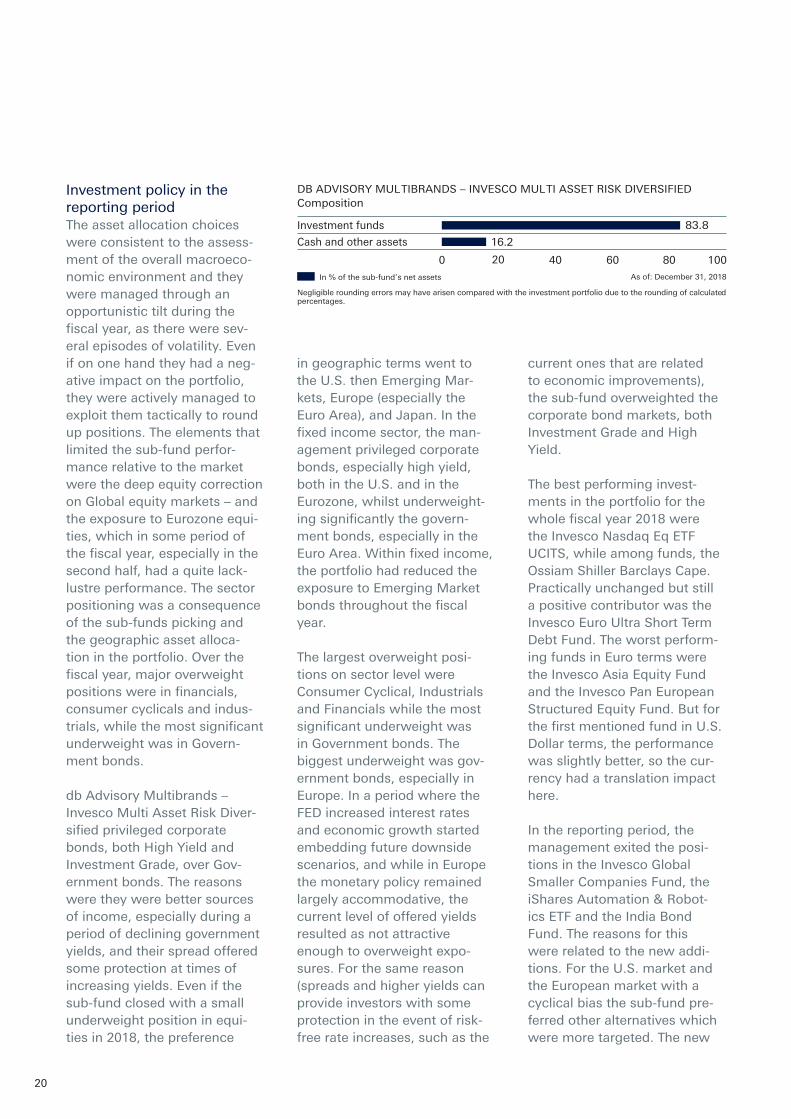
DB ADVISORY MULTIBRANDS – INVESCO MULTI ASSET RISK DIVERSIFIEDComposition
Investment funds
Cash and other assets
83.8
In % of the sub-fund’s net assets
0As of: December 31, 2018
20 10040
Negligible rounding errors may have arisen compared with the investment portfolio due to the rounding of calculatedpercentages.
60
16.2
80
21
db Advisory Multibrands – JPMorgan Emerging Markets Active Allocation
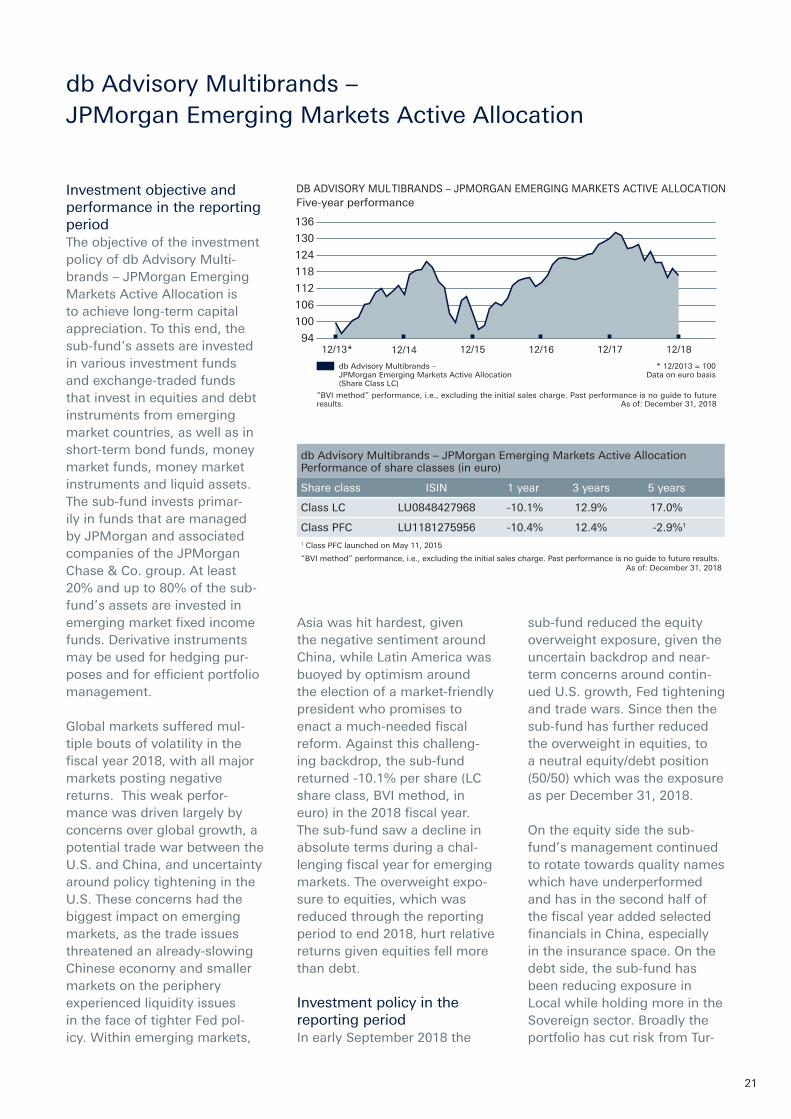
Investment objective and performance in the reporting periodThe objective of the investment policy of db Advisory Multi-brands – JPMorgan Emerging Markets Active Allocation is to achieve long-term capital appreciation. To this end, the sub-fund‘s assets are invested in various investment funds and exchange-traded funds that invest in equities and debt instruments from emerging market countries, as well as in short-term bond funds, money market funds, money market instruments and liquid assets. The sub-fund invests primar-ily in funds that are managed by JPMorgan and associated companies of the JPMorgan Chase & Co. group. At least 20% and up to 80% of the sub-fund’s assets are invested in emerging market fixed income funds. Derivative instruments may be used for hedging pur-poses and for efficient portfolio management.
Global markets suffered mul-tiple bouts of volatility in the fiscal year 2018, with all major markets posting negative returns. This weak perfor-mance was driven largely by concerns over global growth, a potential trade war between the U.S. and China, and uncertainty around policy tightening in the U.S. These concerns had the biggest impact on emerging markets, as the trade issues threatened an already-slowing Chinese economy and smaller markets on the periphery experienced liquidity issues in the face of tighter Fed pol-icy. Within emerging markets,
Asia was hit hardest, given the negative sentiment around China, while Latin America was buoyed by optimism around the election of a market-friendly president who promises to enact a much-needed fiscal reform. Against this challeng-ing backdrop, the sub-fund returned -10.1% per share (LC share class, BVI method, in euro) in the 2018 fiscal year. The sub-fund saw a decline in absolute terms during a chal-lenging fiscal year for emerging markets. The overweight expo-sure to equities, which was reduced through the reporting period to end 2018, hurt relative returns given equities fell more than debt.
Investment policy in the reporting periodIn early September 2018 the
sub-fund reduced the equity overweight exposure, given the uncertain backdrop and near-term concerns around contin-ued U.S. growth, Fed tightening and trade wars. Since then the sub-fund has further reduced the overweight in equities, to a neutral equity/debt position (50/50) which was the exposure as per December 31, 2018.
On the equity side the sub-fund’s management continued to rotate towards quality names which have underperformed and has in the second half of the fiscal year added selected financials in China, especially in the insurance space. On the debt side, the sub-fund has been reducing exposure in Local while holding more in the Sovereign sector. Broadly the portfolio has cut risk from Tur-
DB ADVISORY MULTIBRANDS – JPMORGAN EMERGING MARKETS ACTIVE ALLOCATIONFive-year performance
136
130
124
118
112
106
100
94
db Advisory Multibrands –JPMorgan Emerging Markets Active Allocation(Share Class LC)
“BVI method” performance, i.e., excluding the initial sales charge. Past performance is no guide to futureresults. As of: December 31, 2018
* 12/2013 = 100Data on euro basis
12/13* 12/1812/16 12/1712/1512/14
db Advisory Multibrands – JPMorgan Emerging Markets Active Allocation Performance of share classes (in euro)
Share class ISIN 1 year 3 years 5 years
Class LC LU0848427968 -10.1% 12.9% 17.0%
Class PFC LU1181275956 -10.4% 12.4% -2.9%1
1 Class PFC launched on May 11, 2015
“BVI method” performance, i.e., excluding the initial sales charge. Past performance is no guide to future results. As of: December 31, 2018
22
key and Argentina, whilst hold-ing China exposure.
Yield as a style has been more resilient in challenged market conditions. Additionally, expo-sure to China has contributed in aggregate. Through the fiscal year, value has been created within emerging markets and here the sub-fund favours sov-ereign exposure and, from a local standpoint, markets with higher real yields such as Bra-zil, South Africa, Russia and India. More growth orientated equity names, particularly in the technology sector, lagged the broader market as many companies saw their earnings growth slow and disappoint.
db Advisory Multibrands – JPMorgan Emerging Markets Active Allocation continued to display a disciplined approach to portfolio construction and rotated out of strong perform-ers, or names where the initial investment thesis had changed. As long-term investor, the sub-fund continued to take the opportunity to increase invest-ment into laggard markets or areas which have seen signs of market weakness, yet where the investment opportunity remains attractive, for example adding to China, where sub-fund´s management found a number of attractively valued ideas especially through the second half of the fiscal year 2018.
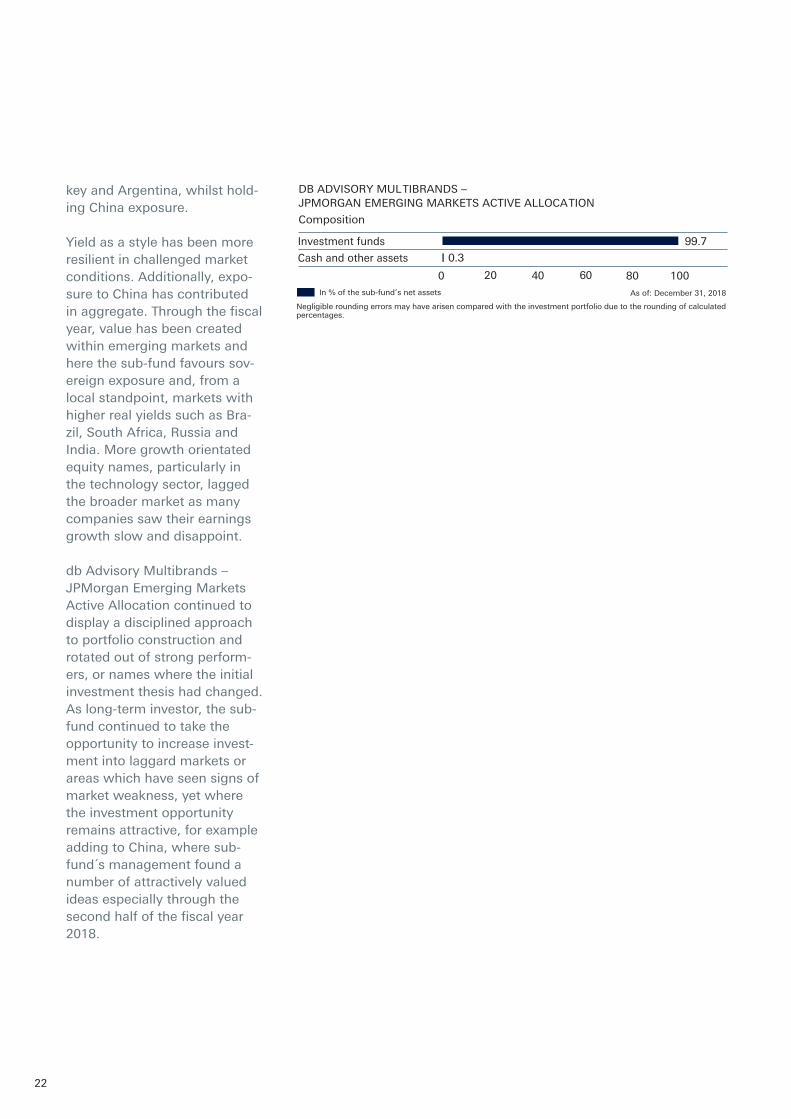
DB ADVISORY MULTIBRANDS –JPMORGAN EMERGING MARKETS ACTIVE ALLOCATION
Composition
Investment funds
Cash and other assets
99.7
0.3
WKN: 921 994ISIN: LU0105045388
WKN: 921 994ISIN: LU0105045388
WKN: 921 994ISIN: LU0105045388
In % of the sub-fund’s net assets
0As of: December 31, 2018
20 40 60 80
Negligible rounding errors may have arisen compared with the investment portfolio due to the rounding of calculatedpercentages.
100
23
db Advisory Multibrands – Pictet Multi Asset Flexible Allocation
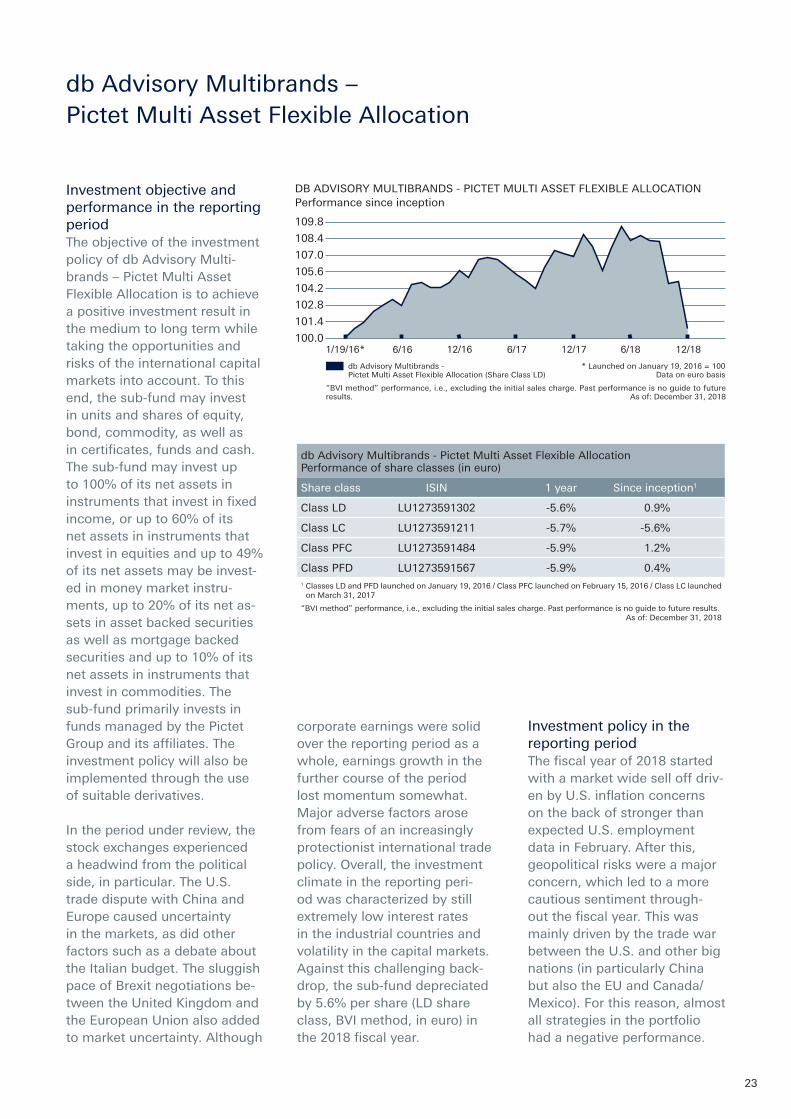
Investment objective and performance in the reporting periodThe objective of the investment policy of db Advisory Multi-brands – Pictet Multi Asset Flexible Allocation is to achieve a positive investment result in the medium to long term while taking the opportunities and risks of the international capital markets into account. To this end, the sub-fund may invest in units and shares of equity, bond, commodity, as well as in certificates, funds and cash. The sub-fund may invest up to 100% of its net assets in instruments that invest in fixed income, or up to 60% of its net assets in instruments that invest in equities and up to 49% of its net assets may be invest-ed in money market instru-ments, up to 20% of its net as-sets in asset backed securities as well as mortgage backed securities and up to 10% of its net assets in instruments that invest in commodities. The sub-fund primarily invests in funds managed by the Pictet Group and its affiliates. The investment policy will also be implemented through the use of suitable derivatives.
In the period under review, the stock exchanges experienced a headwind from the political side, in particular. The U.S. trade dispute with China and Europe caused uncertainty in the markets, as did other factors such as a debate about the Italian budget. The sluggish pace of Brexit negotiations be-tween the United Kingdom and the European Union also added to market uncertainty. Although
corporate earnings were solid over the reporting period as a whole, earnings growth in the further course of the period lost momentum somewhat. Major adverse factors arose from fears of an increasingly protectionist international trade policy. Overall, the investment climate in the reporting peri-od was characterized by still extremely low interest rates in the industrial countries and volatility in the capital markets. Against this challenging back-drop, the sub-fund depreciated by 5.6% per share (LD share class, BVI method, in euro) in the 2018 fiscal year.
Investment policy in the reporting periodThe fiscal year of 2018 started with a market wide sell off driv-en by U.S. inflation concerns on the back of stronger than expected U.S. employment data in February. After this, geopolitical risks were a major concern, which led to a more cautious sentiment through-out the fiscal year. This was mainly driven by the trade war between the U.S. and other big nations (in particularly China but also the EU and Canada/Mexico). For this reason, almost all strategies in the portfolio had a negative performance.
DB ADVISORY MULTIBRANDS - PICTET MULTI ASSET FLEXIBLE ALLOCATIONPerformance since inception
109.8
108.4
107.0
105.6
104.2
102.8
101.4
100.0
db Advisory Multibrands -Pictet Multi Asset Flexible Allocation (Share Class LD)
“BVI method” performance, i.e., excluding the initial sales charge. Past performance is no guide to futureresults. As of: December 31, 2018
* Launched on January 19, 2016 = 100Data on euro basis
1/19/16* 12/186/186/16 12/16 6/17 12/17
db Advisory Multibrands - Pictet Multi Asset Flexible Allocation Performance of share classes (in euro)
Share class ISIN 1 year Since inception1
Class LD LU1273591302 -5.6% 0.9%
Class LC LU1273591211 -5.7% -5.6%
Class PFC LU1273591484 -5.9% 1.2%
Class PFD LU1273591567 -5.9% 0.4%1 Classes LD and PFD launched on January 19, 2016 / Class PFC launched on February 15, 2016 / Class LC launched
on March 31, 2017
“BVI method” performance, i.e., excluding the initial sales charge. Past performance is no guide to future results. As of: December 31, 2018
24
Equity exposure had a negative impact on sub-fund’s perfor-mance, in particular European equity. Over the last 12 months, the sub-fund witnessed market reversals, the end of the new normal (zero real rates) and the return of volatility. Overall, all the bond strategies ended the fiscal year in negative territo-ry. Sector rotations, spreads widening and geopolitical ten-sions affected all asset classes, including government bonds. Also due to the ongoing politi-cal risks in Europe driven by the Italian election outcome, where a coalition was formed between the two populist Eurosceptic parties that might go on a colli-sion course with the European Union or even leave the euro altogether as well as Brexit negotiations with the United Kingdom. These events led to global growth slowdown con-cerns and made central banks turn more dovish and data dependent towards fiscal year end. These events led to risk off movements in the market, leading to U.S. Dollar appreciat-ing, core rates rallying, equities selling off and credit spreads widening. The Fed hiked four times which was widely ex-pected, and the European Central Bank (ECB) finished its Corporate Sector Purchase Programme in December 2018 which led to a resurfacing of liquidity concerns.
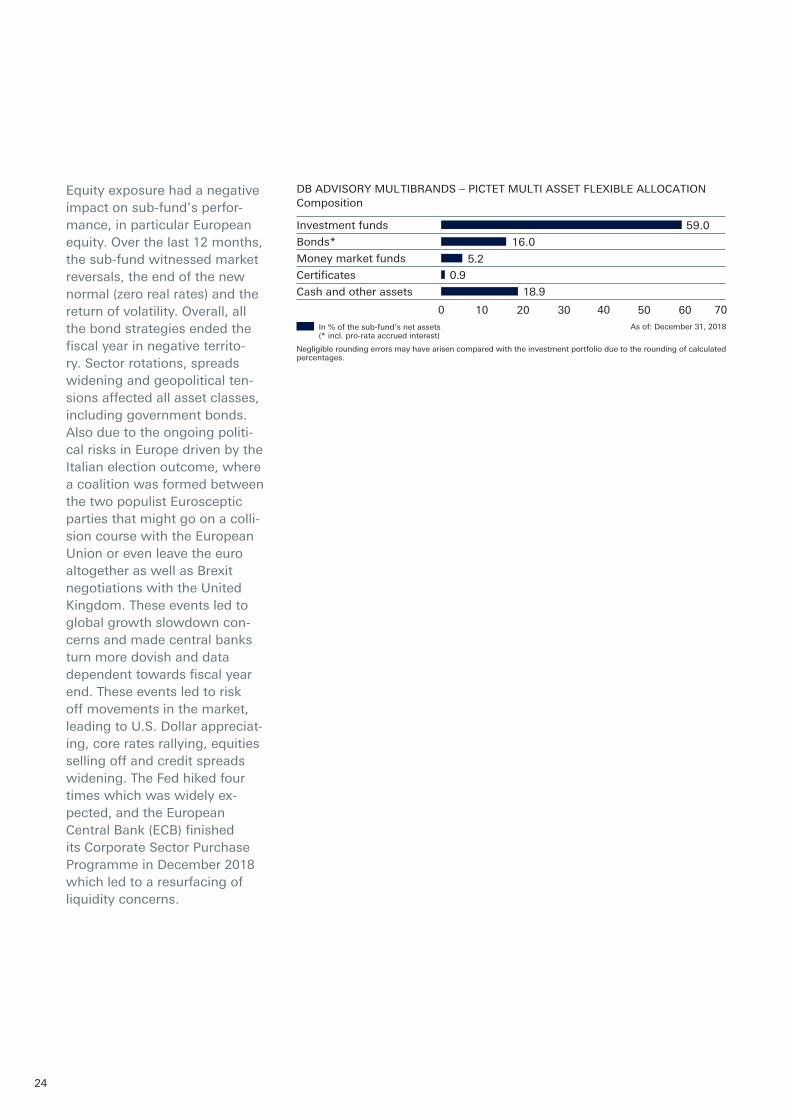
DB ADVISORY MULTIBRANDS – PICTET MULTI ASSET FLEXIBLE ALLOCATIONComposition
Investment funds
Bonds*
Money market funds
Certificates
Cash and other assets
16.0
59.0
5.2
0.9
18.9
In % of the sub-fund’s net assets(* incl. pro-rata accrued interest)
0 10As of: December 31, 2018
Negligible rounding errors may have arisen compared with the investment portfolio due to the rounding of calculatedpercentages.
7050 604020 30
25
db Advisory Multibrands – PIMCO Euro Coupon Bond Fund
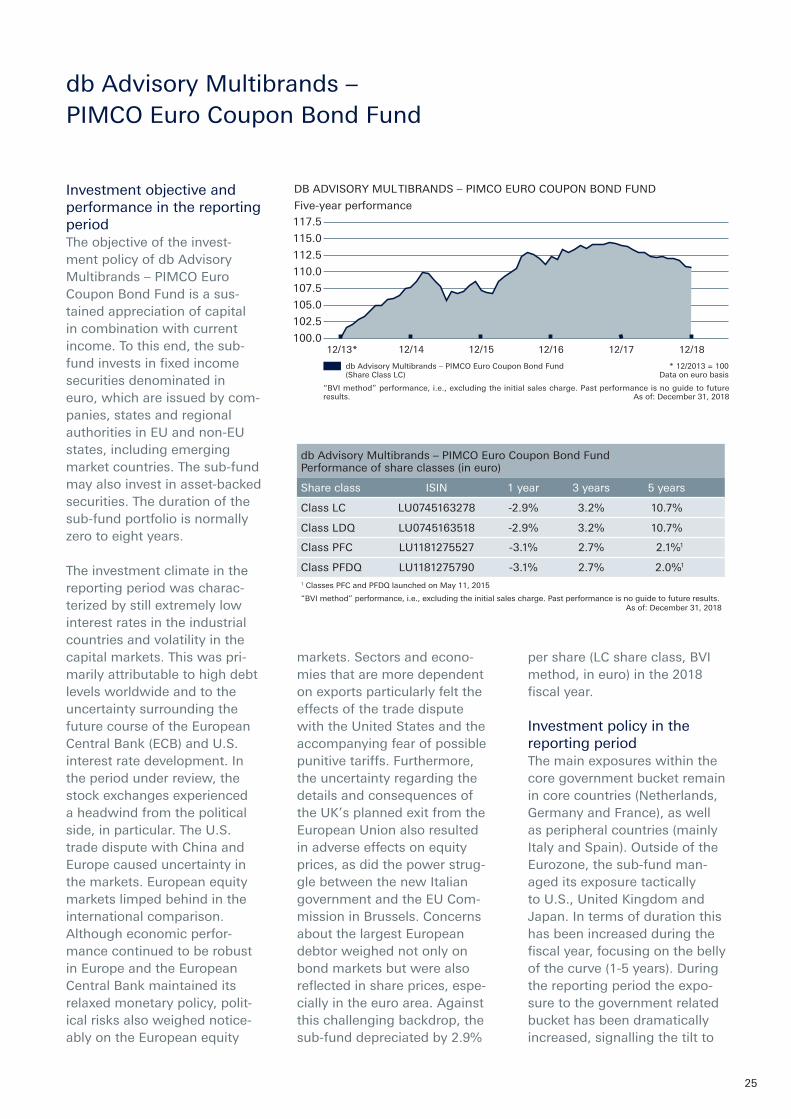
Investment objective and performance in the reporting periodThe objective of the invest-ment policy of db Advisory Multibrands – PIMCO Euro Coupon Bond Fund is a sus-tained appreciation of capital in combination with current income. To this end, the sub-fund invests in fixed income securities denominated in euro, which are issued by com-panies, states and regional authorities in EU and non-EU states, including emerging market countries. The sub-fund may also invest in asset-backed securities. The duration of the sub-fund portfolio is normally zero to eight years.
The investment climate in the reporting period was charac-terized by still extremely low interest rates in the industrial countries and volatility in the capital markets. This was pri-marily attributable to high debt levels worldwide and to the uncertainty surrounding the future course of the European Central Bank (ECB) and U.S. interest rate development. In the period under review, the stock exchanges experienced a headwind from the political side, in particular. The U.S. trade dispute with China and Europe caused uncertainty in the markets. European equity markets limped behind in the international comparison. Although economic perfor-mance continued to be robust in Europe and the European Central Bank maintained its relaxed monetary policy, polit-ical risks also weighed notice-ably on the European equity
markets. Sectors and econo-mies that are more dependent on exports particularly felt the effects of the trade dispute with the United States and the accompanying fear of possible punitive tariffs. Furthermore, the uncertainty regarding the details and consequences of the UK’s planned exit from the European Union also resulted in adverse effects on equity prices, as did the power strug-gle between the new Italian government and the EU Com-mission in Brussels. Concerns about the largest European debtor weighed not only on bond markets but were also reflected in share prices, espe-cially in the euro area. Against this challenging backdrop, the sub-fund depreciated by 2.9%
per share (LC share class, BVI method, in euro) in the 2018 fiscal year.
Investment policy in the reporting periodThe main exposures within the core government bucket remain in core countries (Netherlands, Germany and France), as well as peripheral countries (mainly Italy and Spain). Outside of the Eurozone, the sub-fund man-aged its exposure tactically to U.S., United Kingdom and Japan. In terms of duration this has been increased during the fiscal year, focusing on the belly of the curve (1-5 years). During the reporting period the expo-sure to the government related bucket has been dramatically increased, signalling the tilt to
DB ADVISORY MULTIBRANDS – PIMCO EURO COUPON BOND FUND
Five-year performance117.5
115.0
112.5
110.0
107.5
105.0
102.5
100.0
db Advisory Multibrands – PIMCO Euro Coupon Bond Fund(Share Class LC)
“BVI method” performance, i.e., excluding the initial sales charge. Past performance is no guide to futureresults. As of: December 31, 2018
* 12/2013 = 100Data on euro basis
12/13* 12/16 12/1812/1712/1512/14
db Advisory Multibrands – PIMCO Euro Coupon Bond Fund Performance of share classes (in euro)
Share class ISIN 1 year 3 years 5 years
Class LC LU0745163278 -2.9% 3.2% 10.7%
Class LDQ LU0745163518 -2.9% 3.2% 10.7%
Class PFC LU1181275527 -3.1% 2.7% 2.1%1
Class PFDQ LU1181275790 -3.1% 2.7% 2.0%1
1 Classes PFC and PFDQ launched on May 11, 2015
“BVI method” performance, i.e., excluding the initial sales charge. Past performance is no guide to future results. As of: December 31, 2018
26
quality and liquidity in order to protect the portfolio in the late phase of the economic cycle.
Within spread strategies the sub-fund gradually increased its exposure to investment grade during the fiscal year, focusing mainly on quality issuances with high liquidity levels in their balance sheet, with an over-weight on automotive, banks and financials. The main under-weights remain electric utility, integrate oil and life insurance.
Exposure to spread strategies was the main detractor of the fiscal year 2018 performance, given the generalised widen-ing in spreads of 2018 (both in Investment Grade High Yield sectors). Over the period the Investment Grade market returned as credit spreads wid-ened and long-term interest rates in the U.S. increased; in terms of sectors Telecom and Banking outperformed while Tobacco and financial compa-nies underperformed. The High Yield market underperformed as well, with a widening in spreads – the worst performing sector was Energy.
db Advisory Multibrands – PIMCO Euro Coupon Bond Fund has been an active user of most types of financial derivative securities, albeit in a prudent or conservative way. The sub-fund may engage in transactions in financial derivative instruments principally for investment and/or for hedging purposes.
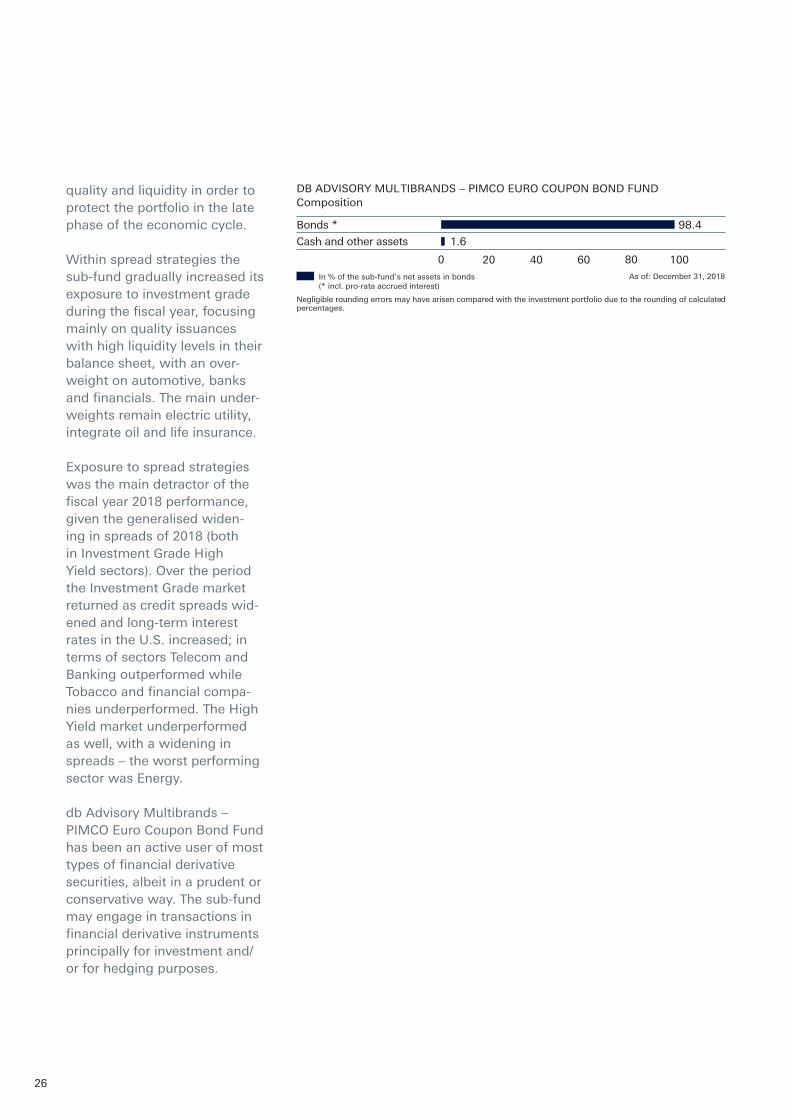
DB ADVISORY MULTIBRANDS – PIMCO EURO COUPON BOND FUNDComposition
Bonds *
Cash and other assets 1.6
98.4
In % of the sub-fund’s net assets in bonds(* incl. pro-rata accrued interest)
0 20 60 8040As of: December 31, 2018
100
Negligible rounding errors may have arisen compared with the investment portfolio due to the rounding of calculatedpercentages.
27
main additions to the portfo-lio in 2018 were the Ossiam ETF Stoxx Europe 600 and the Invesco Global Buyback Achievers UCITS ETF, added to maintain a more specific expo-sure to the area, by reducing the positioning to more specific sectors.
The sub-fund manager used derivatives both for exposure or hedging purposes (e.g. Topix futures, Euro and U.S. Dollar futures).
28
db Advisory Multibrands – PIMCO High Income Global Credit Fund
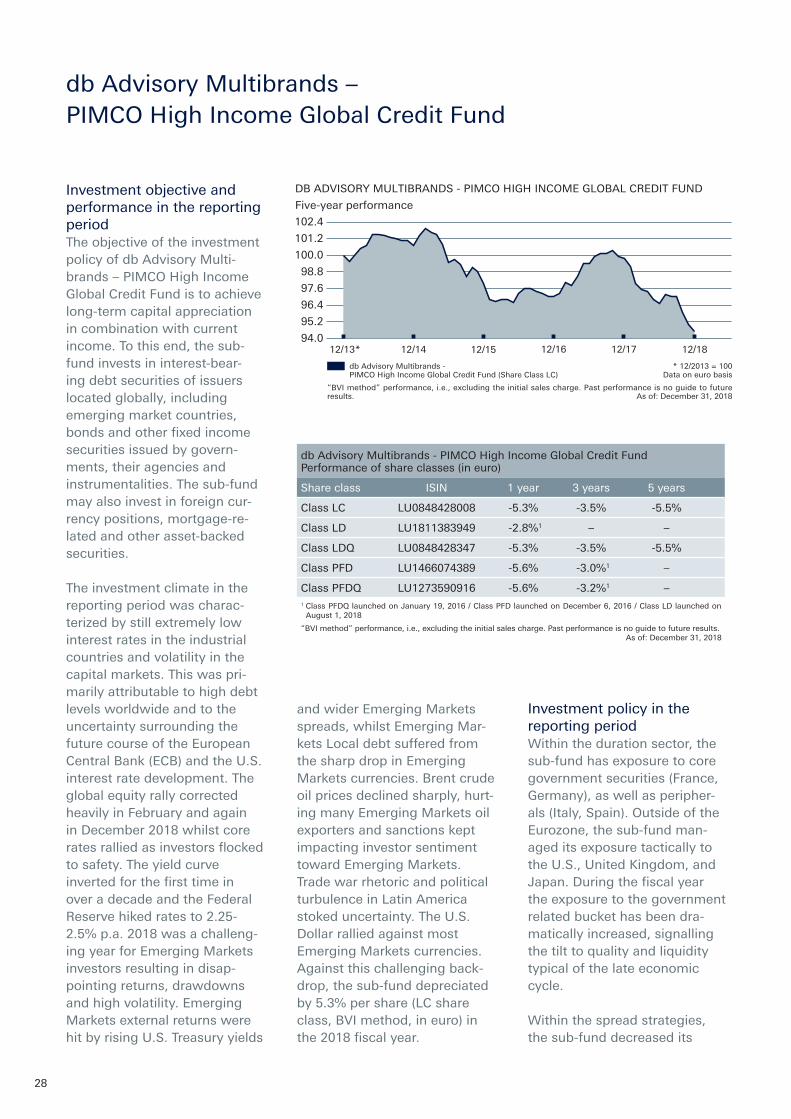
Investment objective and performance in the reporting periodThe objective of the investment policy of db Advisory Multi-brands – PIMCO High Income Global Credit Fund is to achieve long-term capital appreciation in combination with current income. To this end, the sub-fund invests in interest-bear-ing debt securities of issuers located globally, including emerging market countries, bonds and other fixed income securities issued by govern-ments, their agencies and instrumentalities. The sub-fund may also invest in foreign cur-rency positions, mortgage-re-lated and other asset-backed securities.
The investment climate in the reporting period was charac-terized by still extremely low interest rates in the industrial countries and volatility in the capital markets. This was pri-marily attributable to high debt levels worldwide and to the uncertainty surrounding the future course of the European Central Bank (ECB) and the U.S. interest rate development. The global equity rally corrected heavily in February and again in December 2018 whilst core rates rallied as investors flocked to safety. The yield curve inverted for the first time in over a decade and the Federal Reserve hiked rates to 2.25-2.5% p.a. 2018 was a challeng-ing year for Emerging Markets investors resulting in disap-pointing returns, drawdowns and high volatility. Emerging Markets external returns were hit by rising U.S. Treasury yields
and wider Emerging Markets spreads, whilst Emerging Mar-kets Local debt suffered from the sharp drop in Emerging Markets currencies. Brent crude oil prices declined sharply, hurt-ing many Emerging Markets oil exporters and sanctions kept impacting investor sentiment toward Emerging Markets. Trade war rhetoric and political turbulence in Latin America stoked uncertainty. The U.S. Dollar rallied against most Emerging Markets currencies. Against this challenging back-drop, the sub-fund depreciated by 5.3% per share (LC share class, BVI method, in euro) in the 2018 fiscal year.
Investment policy in the reporting periodWithin the duration sector, the sub-fund has exposure to core government securities (France, Germany), as well as peripher-als (Italy, Spain). Outside of the Eurozone, the sub-fund man-aged its exposure tactically to the U.S., United Kingdom, and Japan. During the fiscal year the exposure to the government related bucket has been dra-matically increased, signalling the tilt to quality and liquidity typical of the late economic cycle.
Within the spread strategies, the sub-fund decreased its
DB ADVISORY MULTIBRANDS - PIMCO HIGH INCOME GLOBAL CREDIT FUND
Five-year performance
102.4
101.2
100.0
98.8
97.6
96.4
95.2
94.0
db Advisory Multibrands -PIMCO High Income Global Credit Fund (Share Class LC)
* 12/2013 = 100Data on euro basis
12/13* 12/14 12/1812/15
“BVI method” performance, i.e., excluding the initial sales charge. Past performance is no guide to futureresults. As of: December 31, 2018
12/16 12/17
db Advisory Multibrands - PIMCO High Income Global Credit Fund Performance of share classes (in euro)
Share class ISIN 1 year 3 years 5 years
Class LC LU0848428008 -5.3% -3.5% -5.5%
Class LD LU1811383949 -2.8%1 – –
Class LDQ LU0848428347 -5.3% -3.5% -5.5%
Class PFD LU1466074389 -5.6% -3.0%1 –
Class PFDQ LU1273590916 -5.6% -3.2%1 –1 Class PFDQ launched on January 19, 2016 / Class PFD launched on December 6, 2016 / Class LD launched on
August 1, 2018
“BVI method” performance, i.e., excluding the initial sales charge. Past performance is no guide to future results. As of: December 31, 2018
29
exposure to the investment grade bucket over the fiscal year, given the poor perfor-mance of the credit markets, focusing on quality issuances with high liquidity levels in their balance sheet. In the High Yield sector, the allocation remained broadly unchanged, with a preference for senior secured bonds and high quality bank loans, which provide attractive carry while they rank high up in the capital structure. The main overweights were represented by banks and other financials, consumer finance and media; electrical utility, healthcare and technology were the main underweights.
Exposure to spread strategies was the main detractor of the fiscal year 2018 performance, given the generalised widen-ing in spreads of 2018 (both in Investment Grade and High Yield sectors). Over the period the Investment Grade market returned as credit spreads wid-ened and long-term interest rates in the U.S. increased; in terms of sectors telecom and banking outperformed while tobacco and financial compa-nies underperformed.
db Advisory Multibrands – PIMCO High Income Global Credit Fund has been an active user of most types of financial derivative securities, albeit in a prudent or conservative way. The sub-fund may engage in transactions in financial deriva-tive instruments principally for investment and/or for hedging purposes.
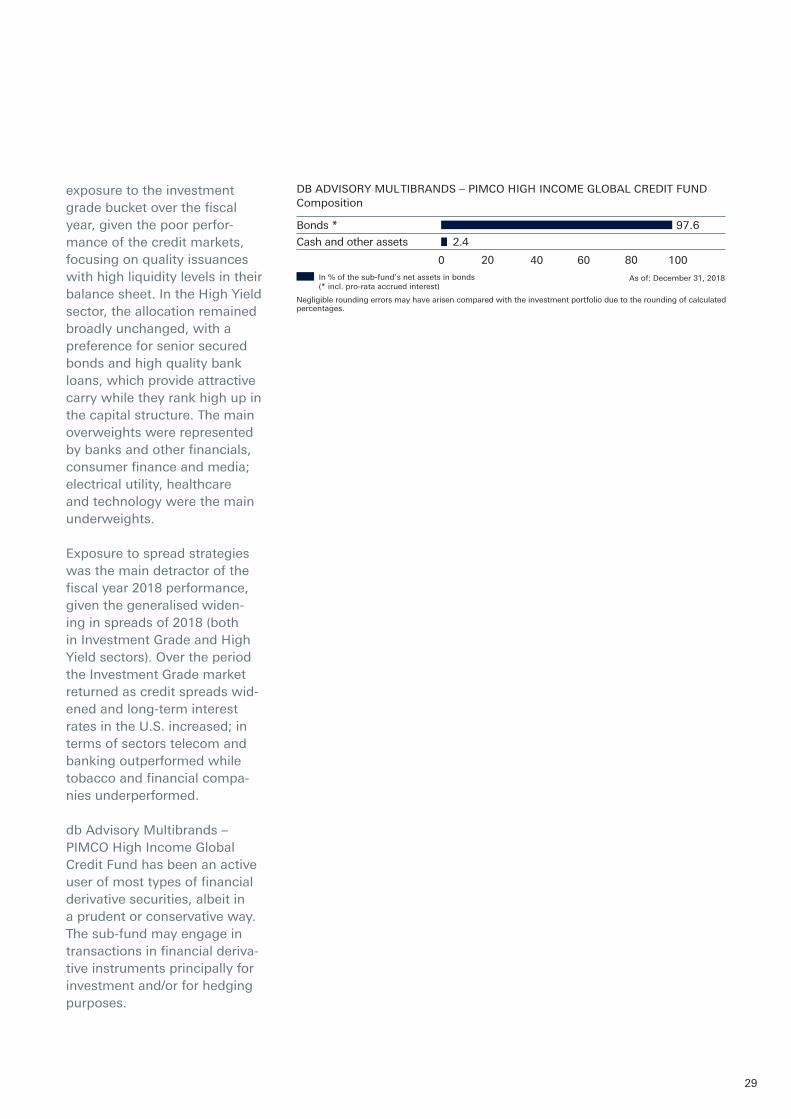
DB ADVISORY MULTIBRANDS – PIMCO HIGH INCOME GLOBAL CREDIT FUNDComposition
Bonds *
Cash and other assets 2.4
97.6
In % of the sub-fund’s net assets in bonds(* incl. pro-rata accrued interest)
20 40 60 80
As of: December 31, 2018
100
Negligible rounding errors may have arisen compared with the investment portfolio due to the rounding of calculatedpercentages.
0


Annual financial statements with investment portfolio and statement of income
and expenses
The format used for complete dates
in securities descriptions in the investment
portfolio is “day/month/year”.
32
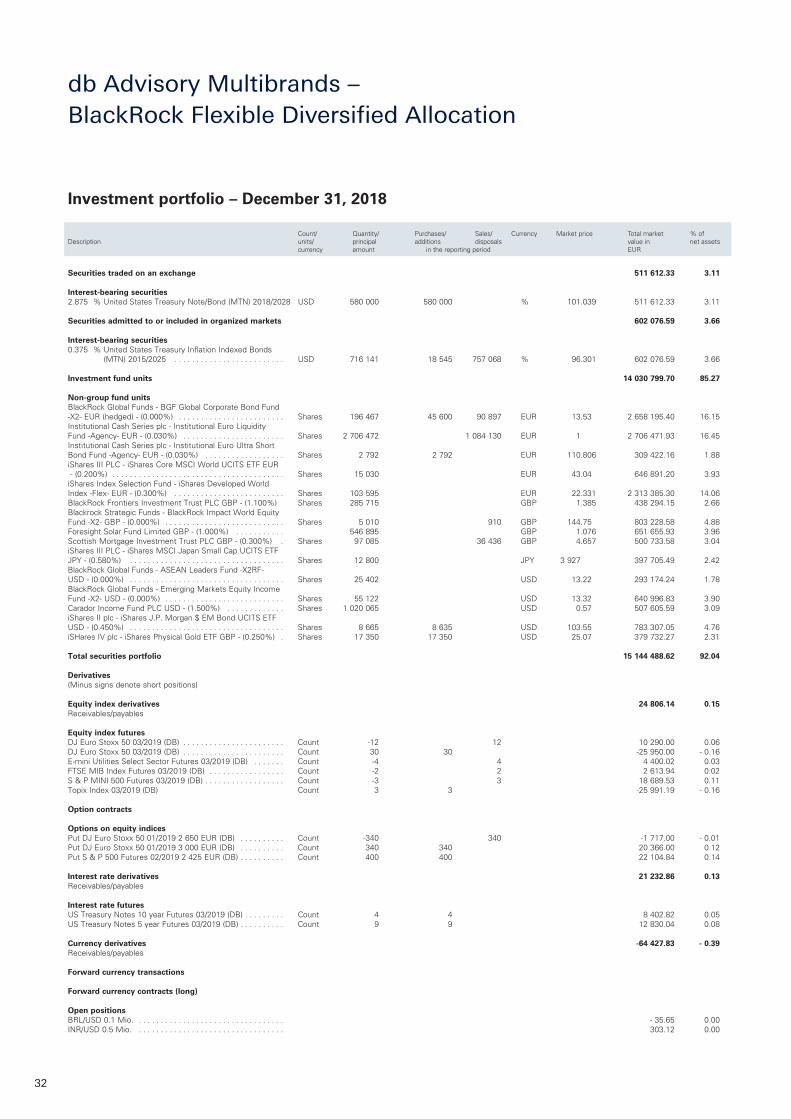
Securities traded on an exchange 511 612.33 3.11 Interest-bearing securities2.875 % United States Treasury Note/Bond (MTN) 2018/2028 USD 580 000 580 000 % 101.039 511 612.33 3.11
Securities admitted to or included in organized markets 602 076.59 3.66 Interest-bearing securities0.375 % United States Treasury Inflation Indexed Bonds
(MTN) 2015/2025 . . . . . . . . . . . . . . . . . . . . . . . . . USD 716 141 18 545 757 068 % 96.301 602 076.59 3.66
Investment fund units 14 030 799.70 85.27 Non-group fund units BlackRock Global Funds - BGF Global Corporate Bond Fund -X2- EUR (hedged) - (0.000%) . . . . . . . . . . . . . . . . . . . . . . . . Shares 196 467 45 600 90 897 EUR 13.53 2 658 195.40 16.15Institutional Cash Series plc - Institutional Euro Liquidity Fund -Agency- EUR - (0.030%) . . . . . . . . . . . . . . . . . . . . . . . Shares 2 706 472 1 084 130 EUR 1 2 706 471.93 16.45Institutional Cash Series plc - Institutional Euro Ultra Short Bond Fund -Agency- EUR - (0.030%) . . . . . . . . . . . . . . . . . . Shares 2 792 2 792 EUR 110.806 309 422.16 1.88iShares III PLC - iShares Core MSCI World UCITS ETF EUR - (0.200%) . . . . . . . . . . . . . . . . . . . . . . . . . . . . . . . . . . . . . . . Shares 15 030 EUR 43.04 646 891.20 3.93iShares Index Selection Fund - iShares Developed World Index -Flex- EUR - (0.300%) . . . . . . . . . . . . . . . . . . . . . . . . . Shares 103 595 EUR 22.331 2 313 385.30 14.06BlackRock Frontiers Investment Trust PLC GBP - (1.100%) Shares 285 715 GBP 1.385 438 294.15 2.66Blackrock Strategic Funds - BlackRock Impact World Equity Fund -X2- GBP - (0.000%) . . . . . . . . . . . . . . . . . . . . . . . . . . . Shares 5 010 910 GBP 144.75 803 228.58 4.88Foresight Solar Fund Limited GBP - (1.000%) . . . . . . . . . . . 546 895 GBP 1.076 651 655.93 3.96Scottish Mortgage Investment Trust PLC GBP - (0.300%) . Shares 97 085 36 436 GBP 4.657 500 733.58 3.04iShares III PLC - iShares MSCI Japan Small Cap UCITS ETF JPY - (0.580%) . . . . . . . . . . . . . . . . . . . . . . . . . . . . . . . . . . . Shares 12 800 JPY 3 927 397 705.49 2.42BlackRock Global Funds - ASEAN Leaders Fund -X2RF- USD - (0.000%) . . . . . . . . . . . . . . . . . . . . . . . . . . . . . . . . . . . Shares 25 402 USD 13.22 293 174.24 1.78BlackRock Global Funds - Emerging Markets Equity Income Fund -X2- USD - (0.000%) . . . . . . . . . . . . . . . . . . . . . . . . . . . Shares 55 122 USD 13.32 640 996.83 3.90Carador Income Fund PLC USD - (1.500%) . . . . . . . . . . . . . Shares 1 020 065 USD 0.57 507 605.59 3.09iShares II plc - iShares J.P. Morgan $ EM Bond UCITS ETF USD - (0.450%) . . . . . . . . . . . . . . . . . . . . . . . . . . . . . . . . . . . Shares 8 665 8 635 USD 103.55 783 307.05 4.76iSHares IV plc - iShares Physical Gold ETF GBP - (0.250%) . Shares 17 350 17 350 USD 25.07 379 732.27 2.31
Total securities portfolio 15 144 488.62 92.04 Derivatives(Minus signs denote short positions) Equity index derivatives 24 806.14 0.15Receivables/payables Equity index futuresDJ Euro Stoxx 50 03/2019 (DB) . . . . . . . . . . . . . . . . . . . . . . . Count -12 12 10 290.00 0.06DJ Euro Stoxx 50 03/2019 (DB) . . . . . . . . . . . . . . . . . . . . . . . Count 30 30 -25 950.00 - 0.16E-mini Utilities Select Sector Futures 03/2019 (DB) . . . . . . . Count -4 4 4 400.02 0.03FTSE MIB Index Futures 03/2019 (DB) . . . . . . . . . . . . . . . . . Count -2 2 2 613.94 0.02S & P MINI 500 Futures 03/2019 (DB) . . . . . . . . . . . . . . . . . . Count -3 3 18 689.53 0.11Topix Index 03/2019 (DB) Count 3 3 -25 991.19 - 0.16
Option contracts
Options on equity indicesPut DJ Euro Stoxx 50 01/2019 2 650 EUR (DB) . . . . . . . . . . Count -340 340 -1 717.00 - 0.01Put DJ Euro Stoxx 50 01/2019 3 000 EUR (DB) . . . . . . . . . . Count 340 340 20 366.00 0.12Put S & P 500 Futures 02/2019 2 425 EUR (DB) . . . . . . . . . . Count 400 400 22 104.84 0.14
Interest rate derivatives 21 232.86 0.13Receivables/payables Interest rate futuresUS Treasury Notes 10 year Futures 03/2019 (DB) . . . . . . . . . Count 4 4 8 402.82 0.05US Treasury Notes 5 year Futures 03/2019 (DB) . . . . . . . . . . Count 9 9 12 830.04 0.08
Currency derivatives -64 427.83 - 0.39Receivables/payables Forward currency transactions Forward currency contracts (long)
Open positionsBRL/USD 0.1 Mio. . . . . . . . . . . . . . . . . . . . . . . . . . . . . . . . . . - 35.65 0.00INR/USD 0.5 Mio. . . . . . . . . . . . . . . . . . . . . . . . . . . . . . . . . . 303.12 0.00
Investment portfolio – December 31, 2018
Count/ Quantity/ Purchases/ Sales/ Currency Market price Total market % ofDescription units/ principal additions disposals value in net assets currency amount in the reporting period EUR
db Advisory Multibrands – BlackRock Flexible Diversified Allocation
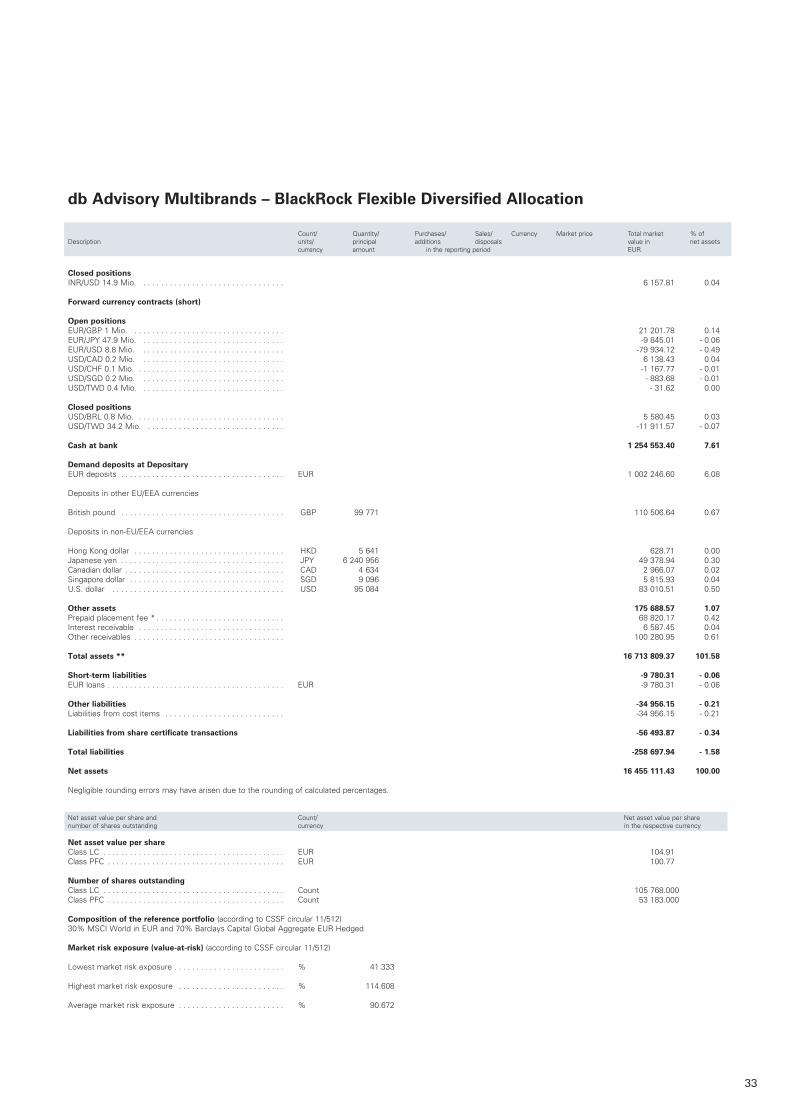
33
Closed positions INR/USD 14.9 Mio. . . . . . . . . . . . . . . . . . . . . . . . . . . . . . . . . 6 157.81 0.04
Forward currency contracts (short) Open positionsEUR/GBP 1 Mio. . . . . . . . . . . . . . . . . . . . . . . . . . . . . . . . . . . 21 201.78 0.14EUR/JPY 47.9 Mio. . . . . . . . . . . . . . . . . . . . . . . . . . . . . . . . . -9 845.01 - 0.06EUR/USD 8.8 Mio. . . . . . . . . . . . . . . . . . . . . . . . . . . . . . . . . -79 934.12 - 0.49USD/CAD 0.2 Mio. . . . . . . . . . . . . . . . . . . . . . . . . . . . . . . . . 6 138.43 0.04USD/CHF 0.1 Mio. . . . . . . . . . . . . . . . . . . . . . . . . . . . . . . . . . -1 167.77 - 0.01USD/SGD 0.2 Mio. . . . . . . . . . . . . . . . . . . . . . . . . . . . . . . . . - 883.68 - 0.01USD/TWD 0.4 Mio. . . . . . . . . . . . . . . . . . . . . . . . . . . . . . . . . - 31.62 0.00
Closed positions USD/BRL 0.8 Mio. . . . . . . . . . . . . . . . . . . . . . . . . . . . . . . . . . 5 580.45 0.03USD/TWD 34.2 Mio. . . . . . . . . . . . . . . . . . . . . . . . . . . . . . . . -11 911.57 - 0.07
Cash at bank 1 254 553.40 7.61 Demand deposits at Depositary EUR deposits . . . . . . . . . . . . . . . . . . . . . . . . . . . . . . . . . . . . . EUR 1 002 246.60 6.08
Deposits in other EU/EEA currencies British pound . . . . . . . . . . . . . . . . . . . . . . . . . . . . . . . . . . . . . GBP 99 771 110 506.64 0.67 Deposits in non-EU/EEA currencies Hong Kong dollar . . . . . . . . . . . . . . . . . . . . . . . . . . . . . . . . . . HKD 5 641 628.71 0.00Japanese yen . . . . . . . . . . . . . . . . . . . . . . . . . . . . . . . . . . . . . JPY 6 240 956 49 378.94 0.30Canadian dollar . . . . . . . . . . . . . . . . . . . . . . . . . . . . . . . . . . . . CAD 4 634 2 966.07 0.02Singapore dollar . . . . . . . . . . . . . . . . . . . . . . . . . . . . . . . . . . . SGD 9 096 5 815.93 0.04U.S. dollar . . . . . . . . . . . . . . . . . . . . . . . . . . . . . . . . . . . . . . . USD 95 084 83 010.51 0.50 Other assets 175 688.57 1.07Prepaid placement fee * . . . . . . . . . . . . . . . . . . . . . . . . . . . . . 68 820.17 0.42Interest receivable . . . . . . . . . . . . . . . . . . . . . . . . . . . . . . . . . 6 587.45 0.04Other receivables . . . . . . . . . . . . . . . . . . . . . . . . . . . . . . . . . . 100 280.95 0.61 Total assets ** 16 713 809.37 101.58 Short-term liabilities -9 780.31 - 0.06EUR loans . . . . . . . . . . . . . . . . . . . . . . . . . . . . . . . . . . . . . . . . EUR -9 780.31 - 0.06 Other liabilities -34 956.15 - 0.21Liabilities from cost items . . . . . . . . . . . . . . . . . . . . . . . . . . . -34 956.15 - 0.21 Liabilities from share certificate transactions -56 493.87 - 0.34 Total liabilities -258 697.94 - 1.58 Net assets 16 455 111.43 100.00 Negligible rounding errors may have arisen due to the rounding of calculated percentages. Net asset value per share and Count/ Net asset value per sharenumber of shares outstanding currency in the respective currency
Net asset value per share Class LC . . . . . . . . . . . . . . . . . . . . . . . . . . . . . . . . . . . . . . . . . EUR 104.91Class PFC . . . . . . . . . . . . . . . . . . . . . . . . . . . . . . . . . . . . . . . . EUR 100.77 Number of shares outstanding Class LC . . . . . . . . . . . . . . . . . . . . . . . . . . . . . . . . . . . . . . . . . Count 105 768.000Class PFC . . . . . . . . . . . . . . . . . . . . . . . . . . . . . . . . . . . . . . . . Count 53 183.000 Composition of the reference portfolio (according to CSSF circular 11/512)30% MSCI World in EUR and 70% Barclays Capital Global Aggregate EUR Hedged
Market risk exposure (value-at-risk) (according to CSSF circular 11/512) Lowest market risk exposure . . . . . . . . . . . . . . . . . . . . . . . . . % 41.333 Highest market risk exposure . . . . . . . . . . . . . . . . . . . . . . . . % 114.608 Average market risk exposure . . . . . . . . . . . . . . . . . . . . . . . . % 90.672
db Advisory Multibrands – BlackRock Flexible Diversified Allocation
Count/ Quantity/ Purchases/ Sales/ Currency Market price Total market % ofDescription units/ principal additions disposals value in net assets currency amount in the reporting period EUR
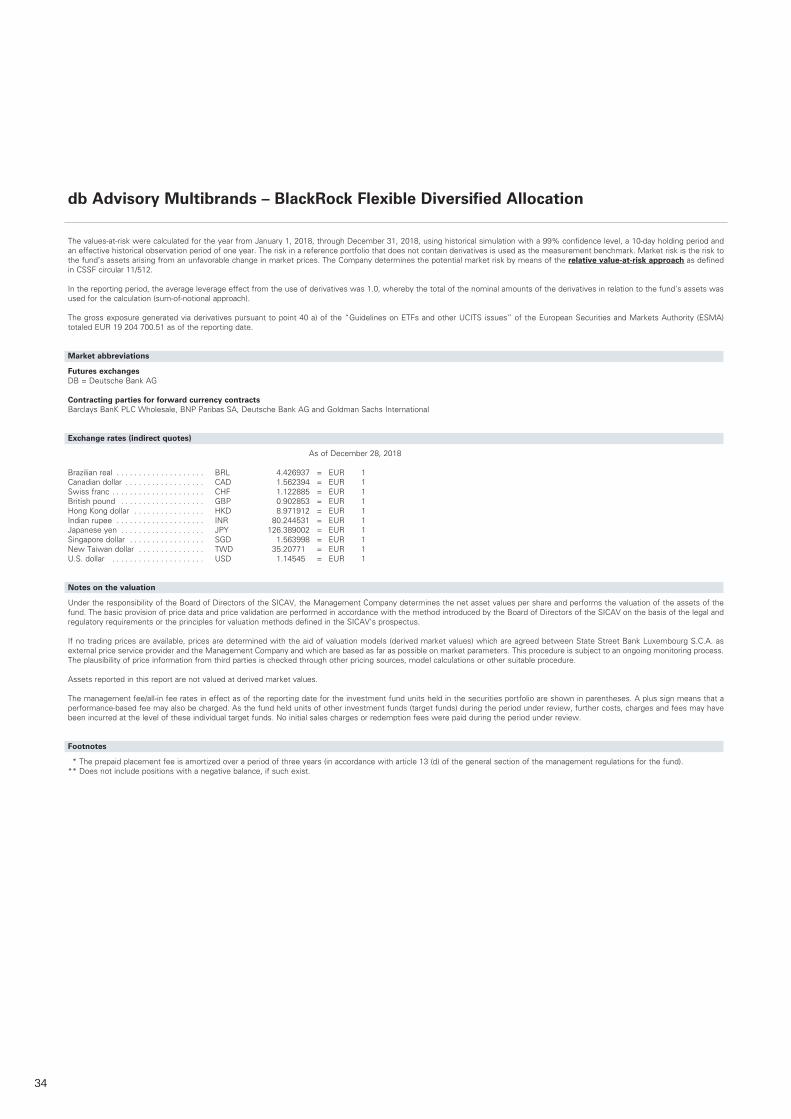
34
The values-at-risk were calculated for the year from January 1, 2018, through December 31, 2018, using historical simulation with a 99% confidence level, a 10-day holding period and an effective historical observation period of one year. The risk in a reference portfolio that does not contain derivatives is used as the measurement benchmark. Market risk is the risk to the fund’s assets arising from an unfavorable change in market prices. The Company determines the potential market risk by means of the relative value-at-risk approach as defined in CSSF circular 11/512. In the reporting period, the average leverage effect from the use of derivatives was 1.0, whereby the total of the nominal amounts of the derivatives in relation to the fund’s assets was used for the calculation (sum-of-notional approach). The gross exposure generated via derivatives pursuant to point 40 a) of the “Guidelines on ETFs and other UCITS issues” of the European Securities and Markets Authority (ESMA) totaled EUR 19 204 700.51 as of the reporting date.
Market abbreviations
Futures exchangesDB = Deutsche Bank AG
Contracting parties for forward currency contractsBarclays BanK PLC Wholesale, BNP Paribas SA, Deutsche Bank AG and Goldman Sachs International
Exchange rates (indirect quotes)
As of December 28, 2018 Brazilian real . . . . . . . . . . . . . . . . . . . . BRL 4.426937 = EUR 1Canadian dollar . . . . . . . . . . . . . . . . . . CAD 1.562394 = EUR 1Swiss franc . . . . . . . . . . . . . . . . . . . . . CHF 1.122885 = EUR 1British pound . . . . . . . . . . . . . . . . . . . GBP 0.902853 = EUR 1Hong Kong dollar . . . . . . . . . . . . . . . . HKD 8.971912 = EUR 1Indian rupee . . . . . . . . . . . . . . . . . . . . INR 80.244531 = EUR 1Japanese yen . . . . . . . . . . . . . . . . . . . JPY 126.389002 = EUR 1Singapore dollar . . . . . . . . . . . . . . . . . SGD 1.563998 = EUR 1New Taiwan dollar . . . . . . . . . . . . . . . TWD 35.20771 = EUR 1U.S. dollar . . . . . . . . . . . . . . . . . . . . . USD 1.14545 = EUR 1
Notes on the valuation
Under the responsibility of the Board of Directors of the SICAV, the Management Company determines the net asset values per share and performs the valuation of the assets of the fund. The basic provision of price data and price validation are performed in accordance with the method introduced by the Board of Directors of the SICAV on the basis of the legal and regulatory requirements or the principles for valuation methods defined in the SICAV’s prospectus. If no trading prices are available, prices are determined with the aid of valuation models (derived market values) which are agreed between State Street Bank Luxembourg S.C.A. as external price service provider and the Management Company and which are based as far as possible on market parameters. This procedure is subject to an ongoing monitoring process. The plausibility of price information from third parties is checked through other pricing sources, model calculations or other suitable procedure. Assets reported in this report are not valued at derived market values. The management fee/all-in fee rates in effect as of the reporting date for the investment fund units held in the securities portfolio are shown in parentheses. A plus sign means that a performance-based fee may also be charged. As the fund held units of other investment funds (target funds) during the period under review, further costs, charges and fees may have been incurred at the level of these individual target funds. No initial sales charges or redemption fees were paid during the period under review.
Footnotes
* The prepaid placement fee is amortized over a period of three years (in accordance with article 13 (d) of the general section of the management regulations for the fund). ** Does not include positions with a negative balance, if such exist.
db Advisory Multibrands – BlackRock Flexible Diversified Allocation
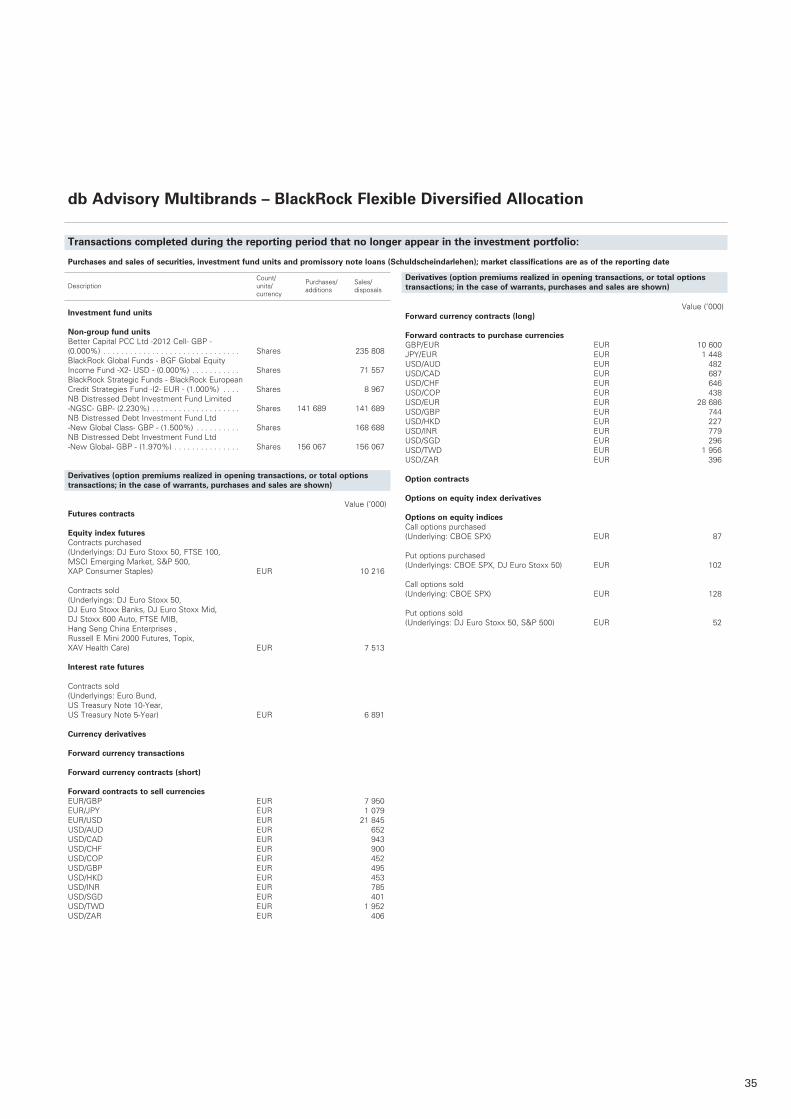
35
Transactions completed during the reporting period that no longer appear in the investment portfolio:
Purchases and sales of securities, investment fund units and promissory note loans (Schuldscheindarlehen); market classifications are as of the reporting date
Count/ Purchases/ Sales/ Description units/ additions disposals currency
Investment fund units
Non-group fund unitsBetter Capital PCC Ltd -2012 Cell- GBP - (0.000%) . . . . . . . . . . . . . . . . . . . . . . . . . . . . . . . Shares 235 808BlackRock Global Funds - BGF Global Equity Income Fund -X2- USD - (0.000%) . . . . . . . . . . . Shares 71 557BlackRock Strategic Funds - BlackRock European Credit Strategies Fund -I2- EUR - (1.000%) . . . . Shares 8 967NB Distressed Debt Investment Fund Limited -NGSC- GBP- (2.230%) . . . . . . . . . . . . . . . . . . . . Shares 141 689 141 689NB Distressed Debt Investment Fund Ltd -New Global Class- GBP - (1.500%) . . . . . . . . . . Shares 168 688NB Distressed Debt Investment Fund Ltd -New Global- GBP - (1.970%) . . . . . . . . . . . . . . . Shares 156 067 156 067
Derivatives (option premiums realized in opening transactions, or total options transactions; in the case of warrants, purchases and sales are shown) Value (’000)Futures contracts
Equity index futures Contracts purchased (Underlyings: DJ Euro Stoxx 50, FTSE 100, MSCI Emerging Market, S&P 500, XAP Consumer Staples) EUR 10 216 Contracts sold (Underlyings: DJ Euro Stoxx 50, DJ Euro Stoxx Banks, DJ Euro Stoxx Mid, DJ Stoxx 600 Auto, FTSE MIB, Hang Seng China Enterprises , Russell E Mini 2000 Futures, Topix, XAV Health Care) EUR 7 513
Interest rate futures Contracts sold (Underlyings: Euro Bund, US Treasury Note 10-Year, US Treasury Note 5-Year) EUR 6 891 Currency derivatives Forward currency transactions Forward currency contracts (short) Forward contracts to sell currencies EUR/GBP EUR 7 950EUR/JPY EUR 1 079EUR/USD EUR 21 845USD/AUD EUR 652USD/CAD EUR 943USD/CHF EUR 900USD/COP EUR 452USD/GBP EUR 495USD/HKD EUR 453USD/INR EUR 785USD/SGD EUR 401USD/TWD EUR 1 952USD/ZAR EUR 406
Value (’000)Forward currency contracts (long)
Forward contracts to purchase currenciesGBP/EUR EUR 10 600JPY/EUR EUR 1 448USD/AUD EUR 482USD/CAD EUR 687USD/CHF EUR 646USD/COP EUR 438USD/EUR EUR 28 686USD/GBP EUR 744USD/HKD EUR 227USD/INR EUR 779USD/SGD EUR 296USD/TWD EUR 1 956USD/ZAR EUR 396 Option contracts
Options on equity index derivatives
Options on equity indicesCall options purchased (Underlying: CBOE SPX) EUR 87 Put options purchased (Underlyings: CBOE SPX, DJ Euro Stoxx 50) EUR 102 Call options sold (Underlying: CBOE SPX) EUR 128 Put options sold (Underlyings: DJ Euro Stoxx 50, S&P 500) EUR 52
db Advisory Multibrands – BlackRock Flexible Diversified Allocation
Derivatives (option premiums realized in opening transactions, or total options transactions; in the case of warrants, purchases and sales are shown)
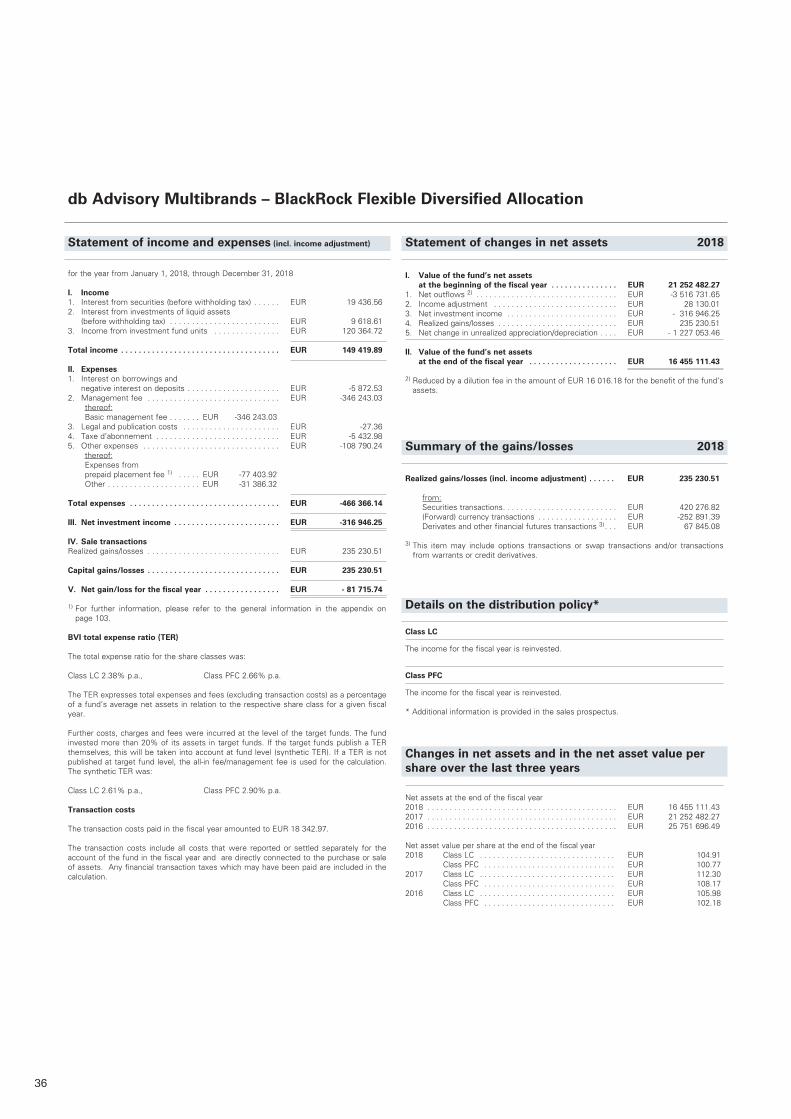
36
db Advisory Multibrands – BlackRock Flexible Diversified Allocation
Statement of changes in net assets 2018
I. Value of the fund’s net assets at the beginning of the fiscal year . . . . . . . . . . . . . . . EUR 21 252 482.27
1. Net outflows 2) . . . . . . . . . . . . . . . . . . . . . . . . . . . . . . . . EUR -3 516 731.652. Income adjustment . . . . . . . . . . . . . . . . . . . . . . . . . . . . EUR 28 130.013. Net investment income . . . . . . . . . . . . . . . . . . . . . . . . . EUR - 316 946.254. Realized gains/losses . . . . . . . . . . . . . . . . . . . . . . . . . . . EUR 235 230.515. Net change in unrealized appreciation/depreciation . . . . EUR - 1 227 053.46
II. Value of the fund’s net assets at the end of the fiscal year . . . . . . . . . . . . . . . . . . . . EUR 16 455 111.43
2) Reduced by a dilution fee in the amount of EUR 16 016.18 for the benefit of the fund‘s assets.
Realized gains/losses (incl. income adjustment) . . . . . . EUR 235 230.51 from: Securities transactions . . . . . . . . . . . . . . . . . . . . . . . . . . EUR 420 276.82 (Forward) currency transactions . . . . . . . . . . . . . . . . . . EUR -252 891.39 Derivates and other financial futures transactions 3) . . . EUR 67 845.08
3) This item may include options transactions or swap transactions and/or transactions from warrants or credit derivatives.
Summary of the gains/losses 2018
for the year from January 1, 2018, through December 31, 2018
I. Income1. Interest from securities (before withholding tax) . . . . . . EUR 19 436.562. Interest from investments of liquid assets (before withholding tax) . . . . . . . . . . . . . . . . . . . . . . . . . EUR 9 618.613. Income from investment fund units . . . . . . . . . . . . . . . EUR 120 364.72 Total income . . . . . . . . . . . . . . . . . . . . . . . . . . . . . . . . . . . . EUR 149 419.89
II. Expenses1. Interest on borrowings and negative interest on deposits . . . . . . . . . . . . . . . . . . . . . EUR -5 872.532. Management fee . . . . . . . . . . . . . . . . . . . . . . . . . . . . . . EUR -346 243.03 thereof: Basic management fee . . . . . . . EUR -346 243.033. Legal and publication costs . . . . . . . . . . . . . . . . . . . . . . EUR -27.364. Taxe d’abonnement . . . . . . . . . . . . . . . . . . . . . . . . . . . . EUR -5 432.985. Other expenses . . . . . . . . . . . . . . . . . . . . . . . . . . . . . . . EUR -108 790.24 thereof: Expenses from
prepaid placement fee 1) . . . . . EUR -77 403.92 Other . . . . . . . . . . . . . . . . . . . . . EUR -31 386.32
Total expenses . . . . . . . . . . . . . . . . . . . . . . . . . . . . . . . . . . EUR -466 366.14
III. Net investment income . . . . . . . . . . . . . . . . . . . . . . . . EUR -316 946.25 IV. Sale transactionsRealized gains/losses . . . . . . . . . . . . . . . . . . . . . . . . . . . . . . EUR 235 230.51
Capital gains/losses . . . . . . . . . . . . . . . . . . . . . . . . . . . . . . EUR 235 230.51
V. Net gain/loss for the fiscal year . . . . . . . . . . . . . . . . . EUR - 81 715.74
1) For further information, please refer to the general information in the appendix on page 103.
BVI total expense ratio (TER)
The total expense ratio for the share classes was:
Class LC 2.38% p.a., Class PFC 2.66% p.a.
The TER expresses total expenses and fees (excluding transaction costs) as a percentage of a fund’s average net assets in relation to the respective share class for a given fiscal year.
Further costs, charges and fees were incurred at the level of the target funds. The fund invested more than 20% of its assets in target funds. If the target funds publish a TER themselves, this will be taken into account at fund level (synthetic TER). If a TER is not published at target fund level, the all-in fee/management fee is used for the calculation. The synthetic TER was:
Class LC 2.61% p.a., Class PFC 2.90% p.a.
Transaction costs
The transaction costs paid in the fiscal year amounted to EUR 18 342.97. The transaction costs include all costs that were reported or settled separately for the account of the fund in the fiscal year and are directly connected to the purchase or sale of assets. Any financial transaction taxes which may have been paid are included in the calculation.
Statement of income and expenses (incl. income adjustment)
Details on the distribution policy*
Class LC
The income for the fiscal year is reinvested.
Class PFC
The income for the fiscal year is reinvested.
* Additional information is provided in the sales prospectus.
Changes in net assets and in the net asset value per share over the last three years
Net assets at the end of the fiscal year2018 . . . . . . . . . . . . . . . . . . . . . . . . . . . . . . . . . . . . . . . . . . . EUR 16 455 111.432017 . . . . . . . . . . . . . . . . . . . . . . . . . . . . . . . . . . . . . . . . . . . EUR 21 252 482.272016 . . . . . . . . . . . . . . . . . . . . . . . . . . . . . . . . . . . . . . . . . . . EUR 25 751 696.49
Net asset value per share at the end of the fiscal year 2018 Class LC . . . . . . . . . . . . . . . . . . . . . . . . . . . . . . . EUR 104.91 Class PFC . . . . . . . . . . . . . . . . . . . . . . . . . . . . . . EUR 100.772017 Class LC . . . . . . . . . . . . . . . . . . . . . . . . . . . . . . . EUR 112.30 Class PFC . . . . . . . . . . . . . . . . . . . . . . . . . . . . . . EUR 108.172016 Class LC . . . . . . . . . . . . . . . . . . . . . . . . . . . . . . . EUR 105.98 Class PFC . . . . . . . . . . . . . . . . . . . . . . . . . . . . . . EUR 102.18
37
Transactions processed for the account of the fund’s assets via closely related companies (based on major holdings of the Deutsche Bank Group)
The share of transactions conducted for the account of the investment fund’s assets via brokers that are closely related companies and persons (share of 5% and above), amounted to 9.32% of all transactions. The total volume was EUR 851 013.16.
Placement fee / Dilution adjustment
In the reporting period the fund paid a placement fee of 2.9% of the fund’s net assets to the sales agent. This was calculated on the subscription date. This placement fee serves in particular as compensation for distribution. The gross amount of the placement fee was paid on the subscription date and simultaneously recognized in the fund’s net assets as prepaid expenses. These are amortized on a daily basis over a period of three years from the subscription date. The remaining position for prepaid expenses per share on any valuation is calculated on a daily basis by multiplying the net assets of the fund by a factor. The relevant factor is determined by the linear reduction of the placement fee by a certain percentage on a daily basis over three years from the subscription date. The prepaid expenses position fluctuates during the three years from the subscription date, since it depends on both the fund’s net assets and the predetermined factor. In addition, a dilution adjustment of up to 3% based on the gross redemption amount was charged for the benefit of the fund’s net assets in the reporting period (to be paid by the shareholder). Further details on the placement fee and the dilution adjustment can be found in the corresponding section of the fund’s sales prospectus.
db Advisory Multibrands – BlackRock Flexible Diversified Allocation
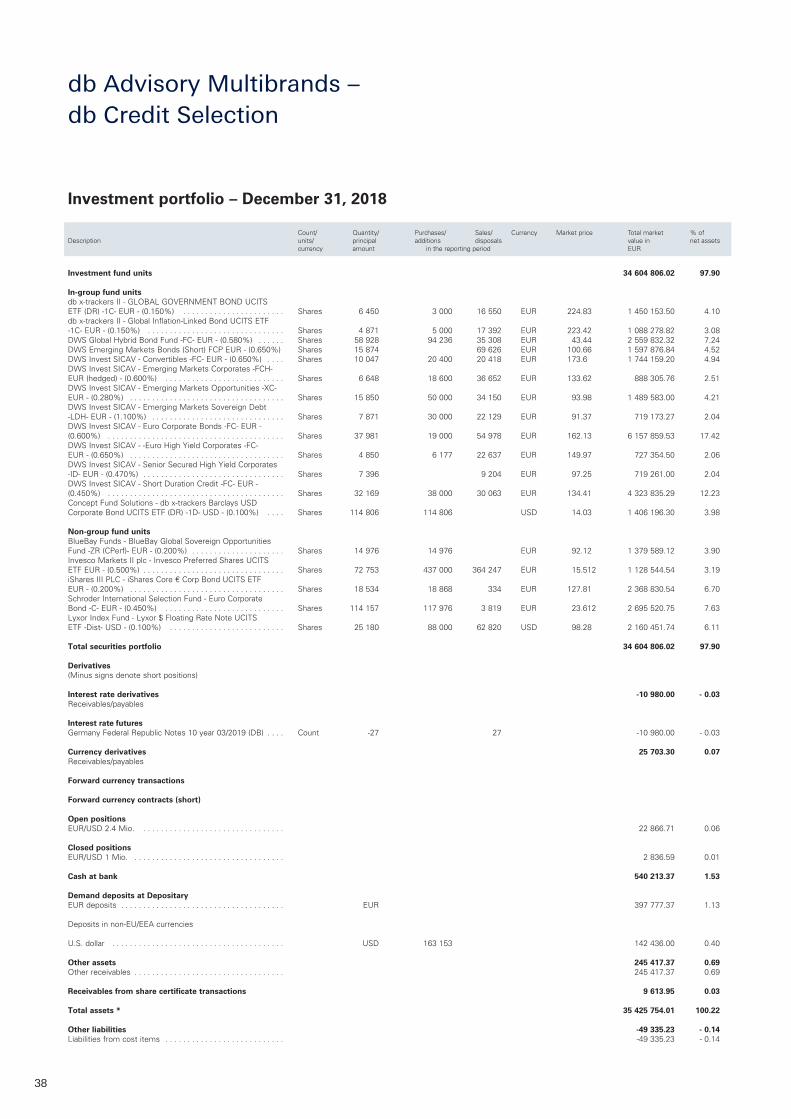
38
Investment fund units 34 604 806.02 97.90 In-group fund units db x-trackers II - GLOBAL GOVERNMENT BOND UCITS ETF (DR) -1C- EUR - (0.150%) . . . . . . . . . . . . . . . . . . . . . . . Shares 6 450 3 000 16 550 EUR 224.83 1 450 153.50 4.10db x-trackers II - Global Inflation-Linked Bond UCITS ETF -1C- EUR - (0.150%) . . . . . . . . . . . . . . . . . . . . . . . . . . . . . . . Shares 4 871 5 000 17 392 EUR 223.42 1 088 278.82 3.08DWS Global Hybrid Bond Fund -FC- EUR - (0.580%) . . . . . . Shares 58 928 94 236 35 308 EUR 43.44 2 559 832.32 7.24DWS Emerging Markets Bonds (Short) FCP EUR - (0.650%) Shares 15 874 69 626 EUR 100.66 1 597 876.84 4.52DWS Invest SICAV - Convertibles -FC- EUR - (0.650%) . . . . Shares 10 047 20 400 20 418 EUR 173.6 1 744 159.20 4.94DWS Invest SICAV - Emerging Markets Corporates -FCH- EUR (hedged) - (0.600%) . . . . . . . . . . . . . . . . . . . . . . . . . . . Shares 6 648 18 600 36 652 EUR 133.62 888 305.76 2.51DWS Invest SICAV - Emerging Markets Opportunities -XC- EUR - (0.280%) . . . . . . . . . . . . . . . . . . . . . . . . . . . . . . . . . . . Shares 15 850 50 000 34 150 EUR 93.98 1 489 583.00 4.21DWS Invest SICAV - Emerging Markets Sovereign Debt -LDH- EUR - (1.100%) . . . . . . . . . . . . . . . . . . . . . . . . . . . . . . Shares 7 871 30 000 22 129 EUR 91.37 719 173.27 2.04DWS Invest SICAV - Euro Corporate Bonds -FC- EUR - (0.600%) . . . . . . . . . . . . . . . . . . . . . . . . . . . . . . . . . . . . . . . . Shares 37 981 19 000 54 978 EUR 162.13 6 157 859.53 17.42DWS Invest SICAV - -Euro High Yield Corporates -FC- EUR - (0.650%) . . . . . . . . . . . . . . . . . . . . . . . . . . . . . . . . . . . Shares 4 850 6 177 22 637 EUR 149.97 727 354.50 2.06DWS Invest SICAV - Senior Secured High Yield Corporates -ID- EUR - (0.470%) . . . . . . . . . . . . . . . . . . . . . . . . . . . . . . . . Shares 7 396 9 204 EUR 97.25 719 261.00 2.04DWS Invest SICAV - Short Duration Credit -FC- EUR - (0.450%) . . . . . . . . . . . . . . . . . . . . . . . . . . . . . . . . . . . . . . . . Shares 32 169 38 000 30 063 EUR 134.41 4 323 835.29 12.23Concept Fund Solutions - db x-trackers Barclays USD Corporate Bond UCITS ETF (DR) -1D- USD - (0.100%) . . . . Shares 114 806 114 806 USD 14.03 1 406 196.30 3.98 Non-group fund units BlueBay Funds - BlueBay Global Sovereign Opportunities Fund -ZR (CPerf)- EUR - (0.200%) . . . . . . . . . . . . . . . . . . . . . Shares 14 976 14 976 EUR 92.12 1 379 589.12 3.90Invesco Markets II plc - Invesco Preferred Shares UCITS ETF EUR - (0.500%) . . . . . . . . . . . . . . . . . . . . . . . . . . . . . . . . Shares 72 753 437 000 364 247 EUR 15.512 1 128 544.54 3.19iShares III PLC - iShares Core € Corp Bond UCITS ETF EUR - (0.200%) . . . . . . . . . . . . . . . . . . . . . . . . . . . . . . . . . . . Shares 18 534 18 868 334 EUR 127.81 2 368 830.54 6.70Schroder International Selection Fund - Euro Corporate Bond -C- EUR - (0.450%) . . . . . . . . . . . . . . . . . . . . . . . . . . . Shares 114 157 117 976 3 819 EUR 23.612 2 695 520.75 7.63Lyxor Index Fund - Lyxor $ Floating Rate Note UCITS ETF -Dist- USD - (0.100%) . . . . . . . . . . . . . . . . . . . . . . . . . . Shares 25 180 88 000 62 820 USD 98.28 2 160 451.74 6.11 Total securities portfolio 34 604 806.02 97.90 Derivatives (Minus signs denote short positions) Interest rate derivatives -10 980.00 - 0.03Receivables/payables
Interest rate futuresGermany Federal Republic Notes 10 year 03/2019 (DB) . . . . Count -27 27 -10 980.00 - 0.03
Currency derivatives 25 703.30 0.07Receivables/payables Forward currency transactions
Forward currency contracts (short)
Open positionsEUR/USD 2.4 Mio. . . . . . . . . . . . . . . . . . . . . . . . . . . . . . . . . 22 866.71 0.06
Closed positions EUR/USD 1 Mio. . . . . . . . . . . . . . . . . . . . . . . . . . . . . . . . . . . 2 836.59 0.01
Cash at bank 540 213.37 1.53 Demand deposits at DepositaryEUR deposits . . . . . . . . . . . . . . . . . . . . . . . . . . . . . . . . . . . . . EUR 397 777.37 1.13
Deposits in non-EU/EEA currencies U.S. dollar . . . . . . . . . . . . . . . . . . . . . . . . . . . . . . . . . . . . . . . USD 163 153 142 436.00 0.40 Other assets 245 417.37 0.69Other receivables . . . . . . . . . . . . . . . . . . . . . . . . . . . . . . . . . . 245 417.37 0.69 Receivables from share certificate transactions 9 613.95 0.03 Total assets * 35 425 754.01 100.22
Other liabilities -49 335.23 - 0.14Liabilities from cost items . . . . . . . . . . . . . . . . . . . . . . . . . . . -49 335.23 - 0.14
Investment portfolio – December 31, 2018
Count/ Quantity/ Purchases/ Sales/ Currency Market price Total market % ofDescription units/ principal additions disposals value in net assets currency amount in the reporting period EUR
db Advisory Multibrands – db Credit Selection
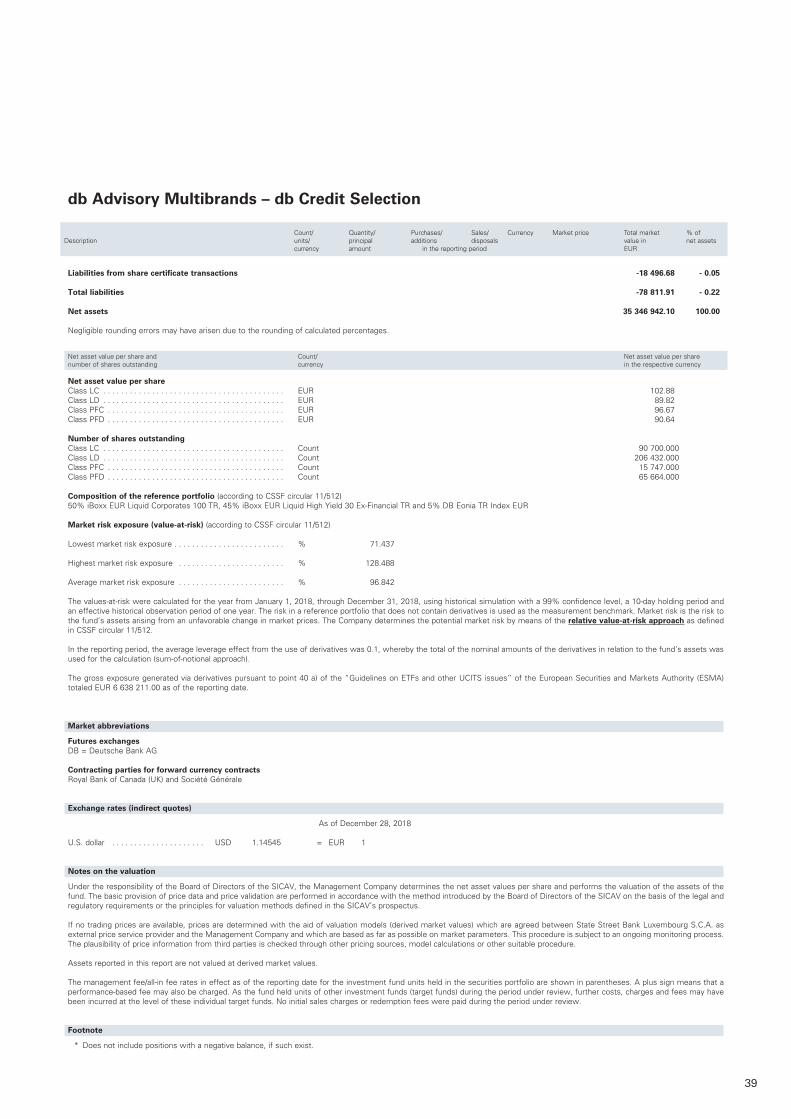
39
Liabilities from share certificate transactions -18 496.68 - 0.05 Total liabilities -78 811.91 - 0.22 Net assets 35 346 942.10 100.00
Negligible rounding errors may have arisen due to the rounding of calculated percentages.
Net asset value per share and Count/ Net asset value per sharenumber of shares outstanding currency in the respective currency
Net asset value per share Class LC . . . . . . . . . . . . . . . . . . . . . . . . . . . . . . . . . . . . . . . . . EUR 102.88Class LD . . . . . . . . . . . . . . . . . . . . . . . . . . . . . . . . . . . . . . . . . EUR 89.82Class PFC . . . . . . . . . . . . . . . . . . . . . . . . . . . . . . . . . . . . . . . . EUR 96.67Class PFD . . . . . . . . . . . . . . . . . . . . . . . . . . . . . . . . . . . . . . . . EUR 90.64 Number of shares outstanding Class LC . . . . . . . . . . . . . . . . . . . . . . . . . . . . . . . . . . . . . . . . . Count 90 700.000Class LD . . . . . . . . . . . . . . . . . . . . . . . . . . . . . . . . . . . . . . . . . Count 206 432.000Class PFC . . . . . . . . . . . . . . . . . . . . . . . . . . . . . . . . . . . . . . . . Count 15 747.000Class PFD . . . . . . . . . . . . . . . . . . . . . . . . . . . . . . . . . . . . . . . . Count 65 664.000
Composition of the reference portfolio (according to CSSF circular 11/512)50% iBoxx EUR Liquid Corporates 100 TR, 45% iBoxx EUR Liquid High Yield 30 Ex-Financial TR and 5% DB Eonia TR Index EUR
Market risk exposure (value-at-risk) (according to CSSF circular 11/512) Lowest market risk exposure . . . . . . . . . . . . . . . . . . . . . . . . . % 71.437 Highest market risk exposure . . . . . . . . . . . . . . . . . . . . . . . . % 128.488 Average market risk exposure . . . . . . . . . . . . . . . . . . . . . . . . % 96.842
The values-at-risk were calculated for the year from January 1, 2018, through December 31, 2018, using historical simulation with a 99% confidence level, a 10-day holding period and an effective historical observation period of one year. The risk in a reference portfolio that does not contain derivatives is used as the measurement benchmark. Market risk is the risk to the fund’s assets arising from an unfavorable change in market prices. The Company determines the potential market risk by means of the relative value-at-risk approach as defined in CSSF circular 11/512.
In the reporting period, the average leverage effect from the use of derivatives was 0.1, whereby the total of the nominal amounts of the derivatives in relation to the fund’s assets was used for the calculation (sum-of-notional approach).
The gross exposure generated via derivatives pursuant to point 40 a) of the “Guidelines on ETFs and other UCITS issues” of the European Securities and Markets Authority (ESMA) totaled EUR 6 638 211.00 as of the reporting date.
Market abbreviations
Futures exchangesDB = Deutsche Bank AG
Contracting parties for forward currency contractsRoyal Bank of Canada (UK) and Société Générale Exchange rates (indirect quotes)
As of December 28, 2018 U.S. dollar . . . . . . . . . . . . . . . . . . . . . USD 1.14545 = EUR 1
Notes on the valuation
Under the responsibility of the Board of Directors of the SICAV, the Management Company determines the net asset values per share and performs the valuation of the assets of the fund. The basic provision of price data and price validation are performed in accordance with the method introduced by the Board of Directors of the SICAV on the basis of the legal and regulatory requirements or the principles for valuation methods defined in the SICAV’s prospectus.
If no trading prices are available, prices are determined with the aid of valuation models (derived market values) which are agreed between State Street Bank Luxembourg S.C.A. as external price service provider and the Management Company and which are based as far as possible on market parameters. This procedure is subject to an ongoing monitoring process. The plausibility of price information from third parties is checked through other pricing sources, model calculations or other suitable procedure.
Assets reported in this report are not valued at derived market values.
The management fee/all-in fee rates in effect as of the reporting date for the investment fund units held in the securities portfolio are shown in parentheses. A plus sign means that a performance-based fee may also be charged. As the fund held units of other investment funds (target funds) during the period under review, further costs, charges and fees may have been incurred at the level of these individual target funds. No initial sales charges or redemption fees were paid during the period under review.
Footnote
* Does not include positions with a negative balance, if such exist.
db Advisory Multibrands – db Credit Selection
Count/ Quantity/ Purchases/ Sales/ Currency Market price Total market % ofDescription units/ principal additions disposals value in net assets currency amount in the reporting period EUR
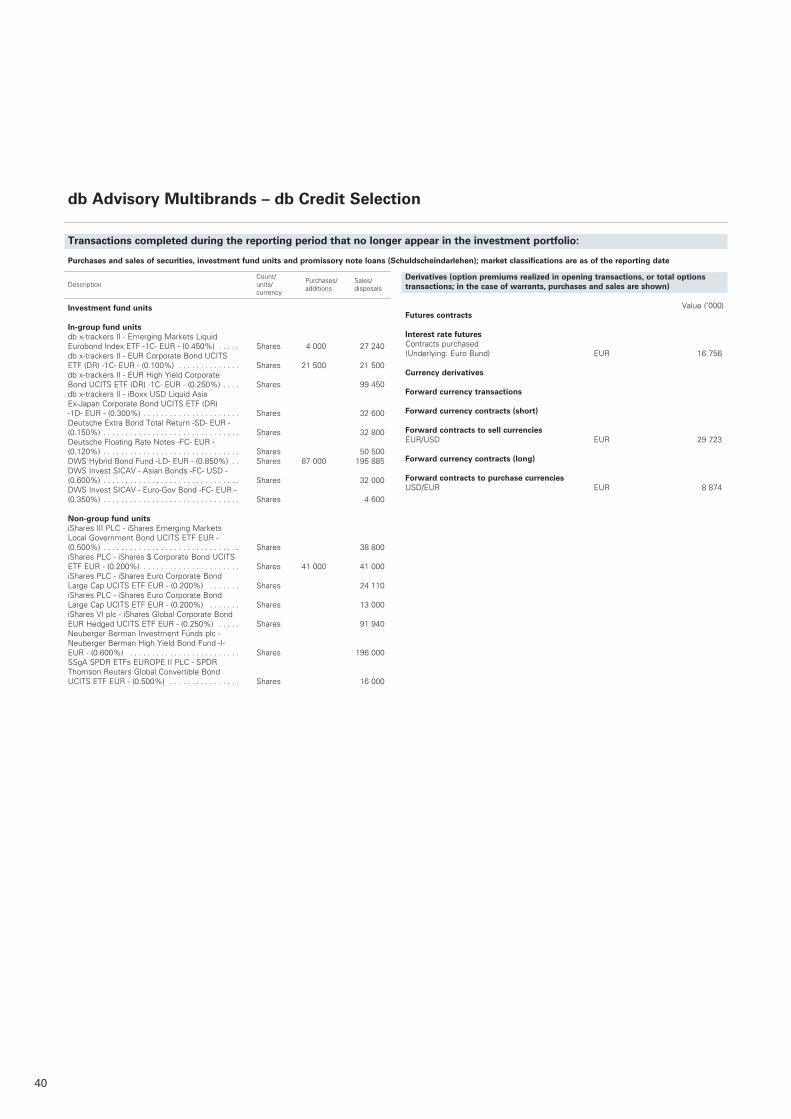
40
Investment fund units
In-group fund units db x-trackers II - Emerging Markets Liquid Eurobond Index ETF -1C- EUR - (0.450%) . . . . . Shares 4 000 27 240db x-trackers II - EUR Corporate Bond UCITS ETF (DR) -1C- EUR - (0.100%) . . . . . . . . . . . . . . Shares 21 500 21 500db x-trackers II - EUR High Yield Corporate Bond UCITS ETF (DR) -1C- EUR - (0.250%) . . . . Shares 99 450db x-trackers II - iBoxx USD Liquid Asia Ex-Japan Corporate Bond UCITS ETF (DR) -1D- EUR - (0.300%) . . . . . . . . . . . . . . . . . . . . . . Shares 32 600Deutsche Extra Bond Total Return -SD- EUR - (0.150%) . . . . . . . . . . . . . . . . . . . . . . . . . . . . . . . Shares 32 800Deutsche Floating Rate Notes -FC- EUR - (0.120%) . . . . . . . . . . . . . . . . . . . . . . . . . . . . . . . Shares 50 500DWS Hybrid Bond Fund -LD- EUR - (0.850%) . . Shares 87 000 195 885DWS Invest SICAV - Asian Bonds -FC- USD - (0.600%) . . . . . . . . . . . . . . . . . . . . . . . . . . . . . . . Shares 32 000DWS Invest SICAV - Euro-Gov Bond -FC- EUR - (0.350%) . . . . . . . . . . . . . . . . . . . . . . . . . . . . . . . Shares 4 600
Non-group fund unitsiShares III PLC - iShares Emerging Markets Local Government Bond UCITS ETF EUR - (0.500%) . . . . . . . . . . . . . . . . . . . . . . . . . . . . . . . Shares 38 800iShares PLC - iShares $ Corporate Bond UCITS ETF EUR - (0.200%) . . . . . . . . . . . . . . . . . . . . . . Shares 41 000 41 000iShares PLC - iShares Euro Corporate Bond Large Cap UCITS ETF EUR - (0.200%) . . . . . . . Shares 24 110iShares PLC - iShares Euro Corporate Bond Large Cap UCITS ETF EUR - (0.200%) . . . . . . . Shares 13 000iShares VI plc - iShares Global Corporate Bond EUR Hedged UCITS ETF EUR - (0.250%) . . . . . Shares 91 940Neuberger Berman Investment Funds plc - Neuberger Berman High Yield Bond Fund -I- EUR - (0.600%) . . . . . . . . . . . . . . . . . . . . . . . . . Shares 196 000SSgA SPDR ETFs EUROPE II PLC - SPDR Thomson Reuters Global Convertible Bond UCITS ETF EUR - (0.500%) . . . . . . . . . . . . . . . . Shares 16 000
Count/ Purchases/ Sales/ Description units/ additions disposals currency
db Advisory Multibrands – db Credit Selection
Transactions completed during the reporting period that no longer appear in the investment portfolio:
Purchases and sales of securities, investment fund units and promissory note loans (Schuldscheindarlehen); market classifications are as of the reporting date
Derivatives (option premiums realized in opening transactions, or total options transactions; in the case of warrants, purchases and sales are shown)
Value (’000)Futures contracts
Interest rate futuresContracts purchased(Underlying: Euro Bund) EUR 16 756
Currency derivatives
Forward currency transactions
Forward currency contracts (short)
Forward contracts to sell currenciesEUR/USD EUR 29 723
Forward currency contracts (long)
Forward contracts to purchase currenciesUSD/EUR EUR 8 874
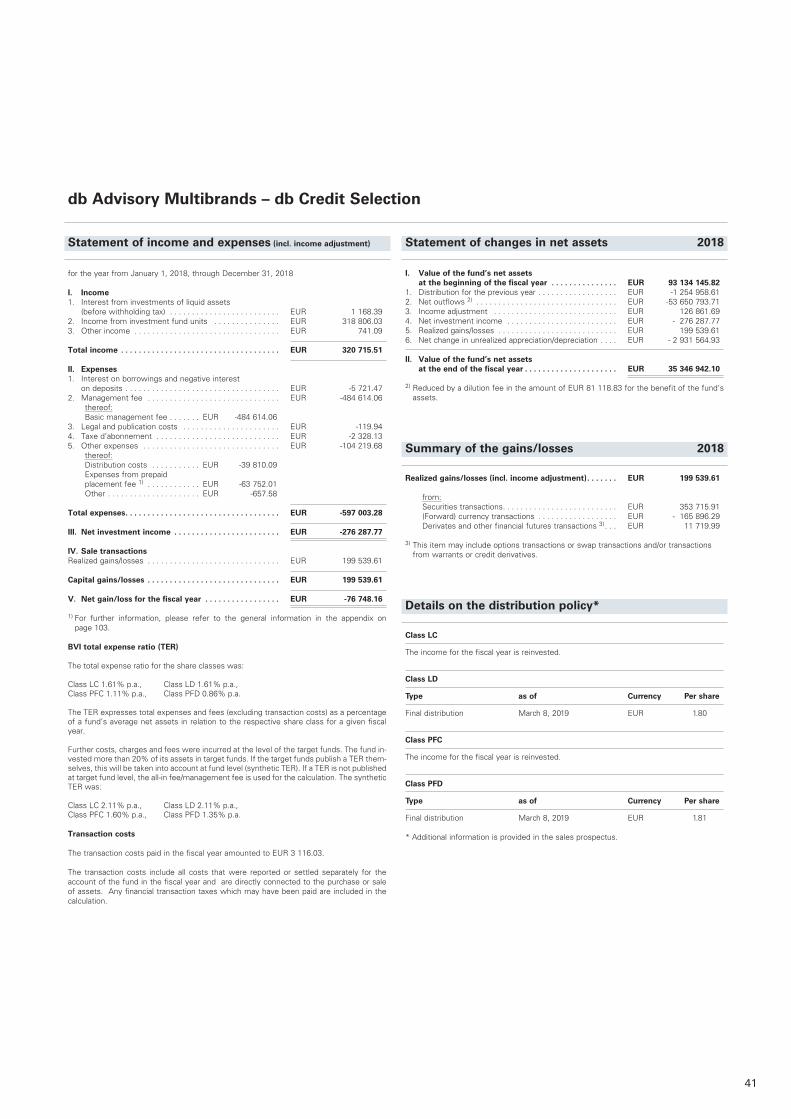
41
db Advisory Multibrands – db Credit Selection
Statement of income and expenses (incl. income adjustment)
I. Value of the fund’s net assets at the beginning of the fiscal year . . . . . . . . . . . . . . . EUR 93 134 145.82
1. Distribution for the previous year . . . . . . . . . . . . . . . . . . EUR -1 254 958.612. Net outflows 2) . . . . . . . . . . . . . . . . . . . . . . . . . . . . . . . . EUR -53 650 793.713. Income adjustment . . . . . . . . . . . . . . . . . . . . . . . . . . . . EUR 126 861.694. Net investment income . . . . . . . . . . . . . . . . . . . . . . . . . EUR - 276 287.775. Realized gains/losses . . . . . . . . . . . . . . . . . . . . . . . . . . . EUR 199 539.616. Net change in unrealized appreciation/depreciation . . . . EUR - 2 931 564.93
II. Value of the fund’s net assets at the end of the fiscal year . . . . . . . . . . . . . . . . . . . . . EUR 35 346 942.10
2) Reduced by a dilution fee in the amount of EUR 81 118.83 for the benefit of the fund‘s assets.
Summary of the gains/losses 2018
Realized gains/losses (incl. income adjustment) . . . . . . . EUR 199 539.61
from: Securities transactions . . . . . . . . . . . . . . . . . . . . . . . . . . EUR 353 715.91 (Forward) currency transactions . . . . . . . . . . . . . . . . . . EUR - 165 896.29 Derivates and other financial futures transactions 3) . . . EUR 11 719.99
3) This item may include options transactions or swap transactions and/or transactions from warrants or credit derivatives.
Details on the distribution policy*
Class LC
The income for the fiscal year is reinvested.
Class LD
Type as of Currency Per share
Final distribution March 8, 2019 EUR 1.80
Class PFC
The income for the fiscal year is reinvested.
Class PFD
Type as of Currency Per share
Final distribution March 8, 2019 EUR 1.81 * Additional information is provided in the sales prospectus.
Statement of changes in net assets 2018
for the year from January 1, 2018, through December 31, 2018
I. Income1. Interest from investments of liquid assets (before withholding tax) . . . . . . . . . . . . . . . . . . . . . . . . . EUR 1 168.392. Income from investment fund units . . . . . . . . . . . . . . . EUR 318 806.033. Other income . . . . . . . . . . . . . . . . . . . . . . . . . . . . . . . . . EUR 741.09
Total income . . . . . . . . . . . . . . . . . . . . . . . . . . . . . . . . . . . . EUR 320 715.51
II. Expenses1. Interest on borrowings and negative interest on deposits . . . . . . . . . . . . . . . . . . . . . . . . . . . . . . . . . . . EUR -5 721.472. Management fee . . . . . . . . . . . . . . . . . . . . . . . . . . . . . . EUR -484 614.06 thereof: Basic management fee . . . . . . . EUR -484 614.063. Legal and publication costs . . . . . . . . . . . . . . . . . . . . . . EUR -119.944. Taxe d’abonnement . . . . . . . . . . . . . . . . . . . . . . . . . . . . EUR -2 328.135. Other expenses . . . . . . . . . . . . . . . . . . . . . . . . . . . . . . . EUR -104 219.68 thereof: Distribution costs . . . . . . . . . . . EUR -39 810.09 Expenses from prepaid
placement fee 1) . . . . . . . . . . . . EUR -63 752.01 Other . . . . . . . . . . . . . . . . . . . . . EUR -657.58
Total expenses . . . . . . . . . . . . . . . . . . . . . . . . . . . . . . . . . . . EUR -597 003.28
III. Net investment income . . . . . . . . . . . . . . . . . . . . . . . . EUR -276 287.77
IV. Sale transactionsRealized gains/losses . . . . . . . . . . . . . . . . . . . . . . . . . . . . . . EUR 199 539.61
Capital gains/losses . . . . . . . . . . . . . . . . . . . . . . . . . . . . . . EUR 199 539.61
V. Net gain/loss for the fiscal year . . . . . . . . . . . . . . . . . EUR -76 748.16
1) For further information, please refer to the general information in the appendix on page 103.
BVI total expense ratio (TER) The total expense ratio for the share classes was:
Class LC 1.61% p.a., Class LD 1.61% p.a.,Class PFC 1.11% p.a., Class PFD 0.86% p.a.
The TER expresses total expenses and fees (excluding transaction costs) as a percentage of a fund’s average net assets in relation to the respective share class for a given fiscal year.
Further costs, charges and fees were incurred at the level of the target funds. The fund in-vested more than 20% of its assets in target funds. If the target funds publish a TER them-selves, this will be taken into account at fund level (synthetic TER). If a TER is not published at target fund level, the all-in fee/management fee is used for the calculation. The synthetic TER was: Class LC 2.11% p.a., Class LD 2.11% p.a.,Class PFC 1.60% p.a., Class PFD 1.35% p.a.
Transaction costs The transaction costs paid in the fiscal year amounted to EUR 3 116.03. The transaction costs include all costs that were reported or settled separately for the account of the fund in the fiscal year and are directly connected to the purchase or sale of assets. Any financial transaction taxes which may have been paid are included in the calculation.
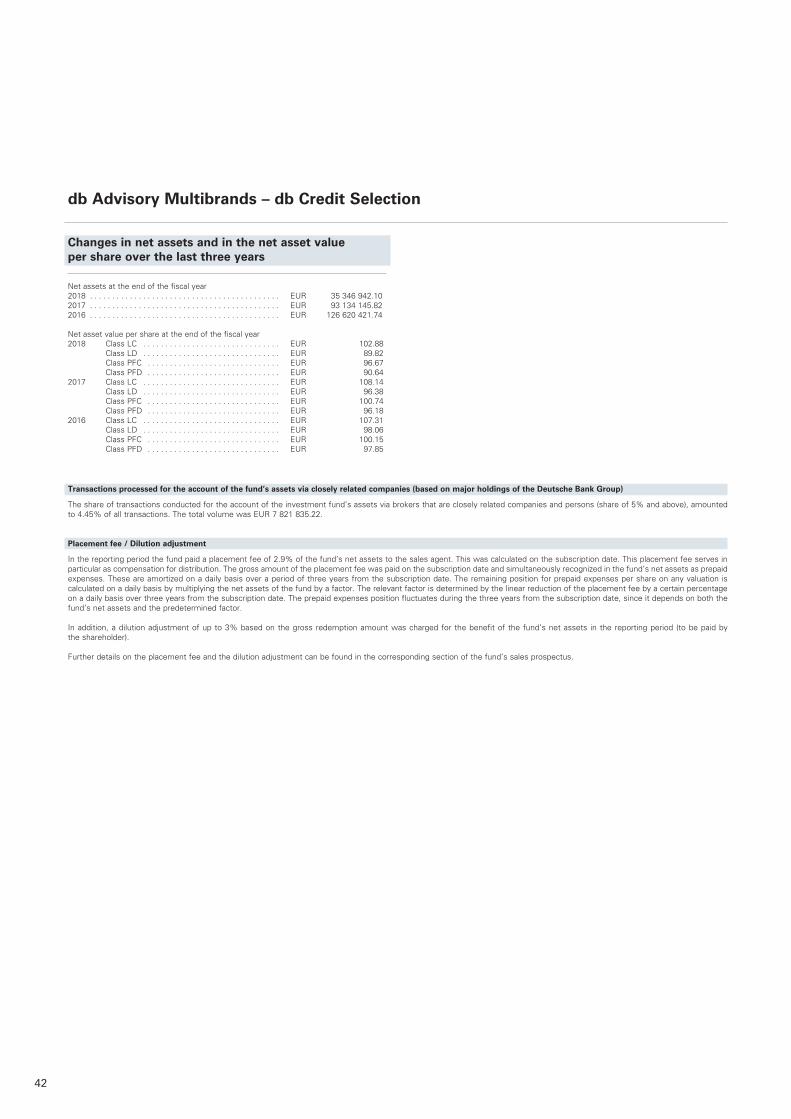
42
Changes in net assets and in the net asset value per share over the last three years
Net assets at the end of the fiscal year 2018 . . . . . . . . . . . . . . . . . . . . . . . . . . . . . . . . . . . . . . . . . . . EUR 35 346 942 .102017 . . . . . . . . . . . . . . . . . . . . . . . . . . . . . . . . . . . . . . . . . . . EUR 93 134 145 .822016 . . . . . . . . . . . . . . . . . . . . . . . . . . . . . . . . . . . . . . . . . . . EUR 126 620 421 .74
Net asset value per share at the end of the fiscal year2018 Class LC . . . . . . . . . . . . . . . . . . . . . . . . . . . . . . . EUR 102 .88 Class LD . . . . . . . . . . . . . . . . . . . . . . . . . . . . . . . EUR 89 .82 Class PFC . . . . . . . . . . . . . . . . . . . . . . . . . . . . . . EUR 96 .67 Class PFD . . . . . . . . . . . . . . . . . . . . . . . . . . . . . . EUR 90 .642017 Class LC . . . . . . . . . . . . . . . . . . . . . . . . . . . . . . . EUR 108 .14 Class LD . . . . . . . . . . . . . . . . . . . . . . . . . . . . . . . EUR 96 .38 Class PFC . . . . . . . . . . . . . . . . . . . . . . . . . . . . . . EUR 100 .74 Class PFD . . . . . . . . . . . . . . . . . . . . . . . . . . . . . . EUR 96 .182016 Class LC . . . . . . . . . . . . . . . . . . . . . . . . . . . . . . . EUR 107 .31 Class LD . . . . . . . . . . . . . . . . . . . . . . . . . . . . . . . EUR 98 .06 Class PFC . . . . . . . . . . . . . . . . . . . . . . . . . . . . . . EUR 100 .15 Class PFD . . . . . . . . . . . . . . . . . . . . . . . . . . . . . . EUR 97 .85
Transactions processed for the account of the fund’s assets via closely related companies (based on major holdings of the Deutsche Bank Group)
The share of transactions conducted for the account of the investment fund’s assets via brokers that are closely related companies and persons (share of 5% and above), amounted to 4 .45% of all transactions . The total volume was EUR 7 821 835 .22 .
Placement fee / Dilution adjustment
In the reporting period the fund paid a placement fee of 2 .9% of the fund’s net assets to the sales agent . This was calculated on the subscription date . This placement fee serves in particular as compensation for distribution . The gross amount of the placement fee was paid on the subscription date and simultaneously recognized in the fund’s net assets as prepaid expenses . These are amortized on a daily basis over a period of three years from the subscription date . The remaining position for prepaid expenses per share on any valuation is calculated on a daily basis by multiplying the net assets of the fund by a factor . The relevant factor is determined by the linear reduction of the placement fee by a certain percentage on a daily basis over three years from the subscription date . The prepaid expenses position fluctuates during the three years from the subscription date, since it depends on both the fund’s net assets and the predetermined factor . In addition, a dilution adjustment of up to 3% based on the gross redemption amount was charged for the benefit of the fund’s net assets in the reporting period (to be paid by the shareholder) . Further details on the placement fee and the dilution adjustment can be found in the corresponding section of the fund’s sales prospectus .
db Advisory Multibrands – db Credit Selection
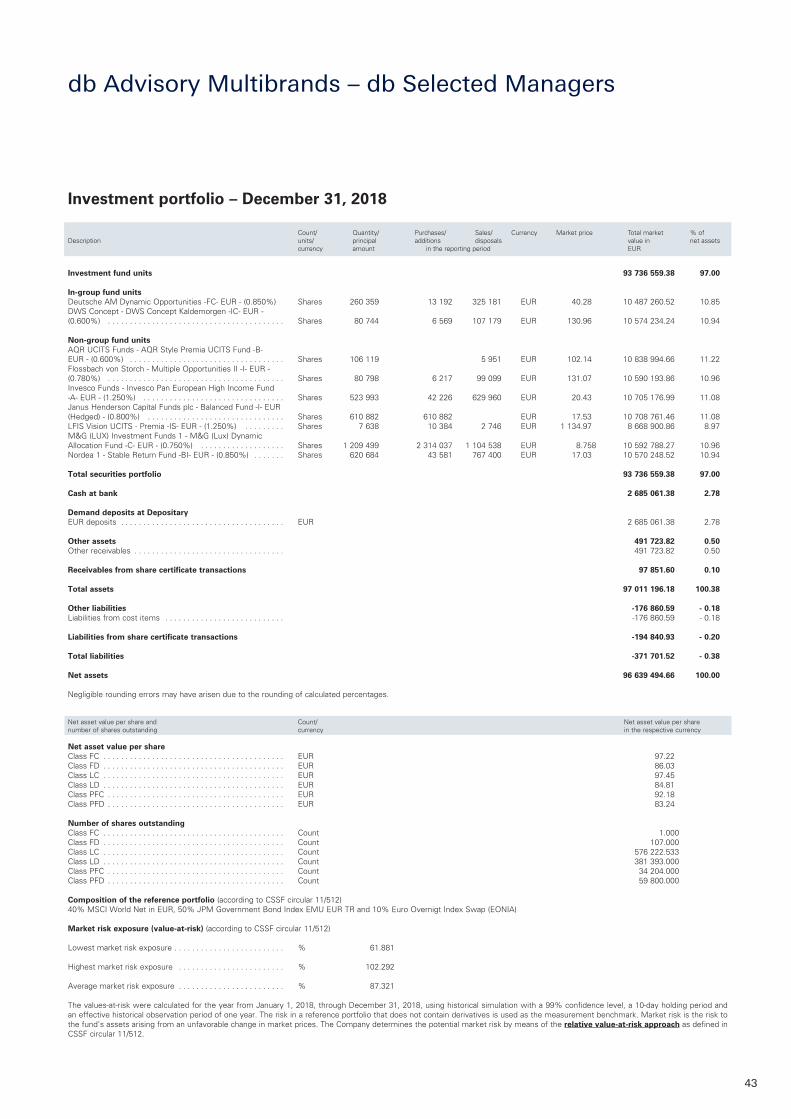
43
Investment fund units 93 736 559.38 97.00 In-group fund unitsDeutsche AM Dynamic Opportunities -FC- EUR - (0.850%) Shares 260 359 13 192 325 181 EUR 40.28 10 487 260.52 10.85DWS Concept - DWS Concept Kaldemorgen -IC- EUR - (0.600%) . . . . . . . . . . . . . . . . . . . . . . . . . . . . . . . . . . . . . . . . Shares 80 744 6 569 107 179 EUR 130.96 10 574 234.24 10.94
Non-group fund unitsAQR UCITS Funds - AQR Style Premia UCITS Fund -B- EUR - (0.600%) . . . . . . . . . . . . . . . . . . . . . . . . . . . . . . . . . . . Shares 106 119 5 951 EUR 102.14 10 838 994.66 11.22Flossbach von Storch - Multiple Opportunities II -I- EUR - (0.780%) . . . . . . . . . . . . . . . . . . . . . . . . . . . . . . . . . . . . . . . . Shares 80 798 6 217 99 099 EUR 131.07 10 590 193.86 10.96Invesco Funds - Invesco Pan European High Income Fund -A- EUR - (1.250%) . . . . . . . . . . . . . . . . . . . . . . . . . . . . . . . . Shares 523 993 42 226 629 960 EUR 20.43 10 705 176.99 11.08Janus Henderson Capital Funds plc - Balanced Fund -I- EUR (Hedged) - (0.800%) . . . . . . . . . . . . . . . . . . . . . . . . . . . . . . . Shares 610 882 610 882 EUR 17.53 10 708 761.46 11.08LFIS Vision UCITS - Premia -IS- EUR - (1.250%) . . . . . . . . . Shares 7 638 10 384 2 746 EUR 1 134.97 8 668 900.86 8.97M&G (LUX) Investment Funds 1 - M&G (Lux) Dynamic Allocation Fund -C- EUR - (0.750%) . . . . . . . . . . . . . . . . . . . Shares 1 209 499 2 314 037 1 104 538 EUR 8.758 10 592 788.27 10.96Nordea 1 - Stable Return Fund -BI- EUR - (0.850%) . . . . . . . Shares 620 684 43 581 767 400 EUR 17.03 10 570 248.52 10.94 Total securities portfolio 93 736 559.38 97.00 Cash at bank 2 685 061.38 2.78 Demand deposits at Depositary EUR deposits . . . . . . . . . . . . . . . . . . . . . . . . . . . . . . . . . . . . . EUR 2 685 061.38 2.78 Other assets 491 723.82 0.50Other receivables . . . . . . . . . . . . . . . . . . . . . . . . . . . . . . . . . . 491 723.82 0.50 Receivables from share certificate transactions 97 851.60 0.10 Total assets 97 011 196.18 100.38 Other liabilities -176 860.59 - 0.18Liabilities from cost items . . . . . . . . . . . . . . . . . . . . . . . . . . . -176 860.59 - 0.18 Liabilities from share certificate transactions -194 840.93 - 0.20 Total liabilities -371 701.52 - 0.38 Net assets 96 639 494.66 100.00 Negligible rounding errors may have arisen due to the rounding of calculated percentages. Net asset value per share and Count/ Net asset value per sharenumber of shares outstanding currency in the respective currency
Net asset value per share Class FC . . . . . . . . . . . . . . . . . . . . . . . . . . . . . . . . . . . . . . . . . EUR 97.22Class FD . . . . . . . . . . . . . . . . . . . . . . . . . . . . . . . . . . . . . . . . . EUR 86.03Class LC . . . . . . . . . . . . . . . . . . . . . . . . . . . . . . . . . . . . . . . . . EUR 97.45Class LD . . . . . . . . . . . . . . . . . . . . . . . . . . . . . . . . . . . . . . . . . EUR 84.81Class PFC . . . . . . . . . . . . . . . . . . . . . . . . . . . . . . . . . . . . . . . . EUR 92.18Class PFD . . . . . . . . . . . . . . . . . . . . . . . . . . . . . . . . . . . . . . . . EUR 83.24 Number of shares outstanding Class FC . . . . . . . . . . . . . . . . . . . . . . . . . . . . . . . . . . . . . . . . . Count 1.000Class FD . . . . . . . . . . . . . . . . . . . . . . . . . . . . . . . . . . . . . . . . . Count 107.000Class LC . . . . . . . . . . . . . . . . . . . . . . . . . . . . . . . . . . . . . . . . . Count 576 222.533Class LD . . . . . . . . . . . . . . . . . . . . . . . . . . . . . . . . . . . . . . . . . Count 381 393.000Class PFC . . . . . . . . . . . . . . . . . . . . . . . . . . . . . . . . . . . . . . . . Count 34 204.000Class PFD . . . . . . . . . . . . . . . . . . . . . . . . . . . . . . . . . . . . . . . . Count 59 800.000 Composition of the reference portfolio (according to CSSF circular 11/512)40% MSCI World Net in EUR, 50% JPM Government Bond Index EMU EUR TR and 10% Euro Overnigt Index Swap (EONIA) Market risk exposure (value-at-risk) (according to CSSF circular 11/512) Lowest market risk exposure . . . . . . . . . . . . . . . . . . . . . . . . . % 61.881 Highest market risk exposure . . . . . . . . . . . . . . . . . . . . . . . . % 102.292 Average market risk exposure . . . . . . . . . . . . . . . . . . . . . . . . % 87.321
The values-at-risk were calculated for the year from January 1, 2018, through December 31, 2018, using historical simulation with a 99% confidence level, a 10-day holding period and an effective historical observation period of one year. The risk in a reference portfolio that does not contain derivatives is used as the measurement benchmark. Market risk is the risk to the fund’s assets arising from an unfavorable change in market prices. The Company determines the potential market risk by means of the relative value-at-risk approach as defined in CSSF circular 11/512.
Investment portfolio – December 31, 2018
Count/ Quantity/ Purchases/ Sales/ Currency Market price Total market % ofDescription units/ principal additions disposals value in net assets currency amount in the reporting period EUR
db Advisory Multibrands – db Selected Managers
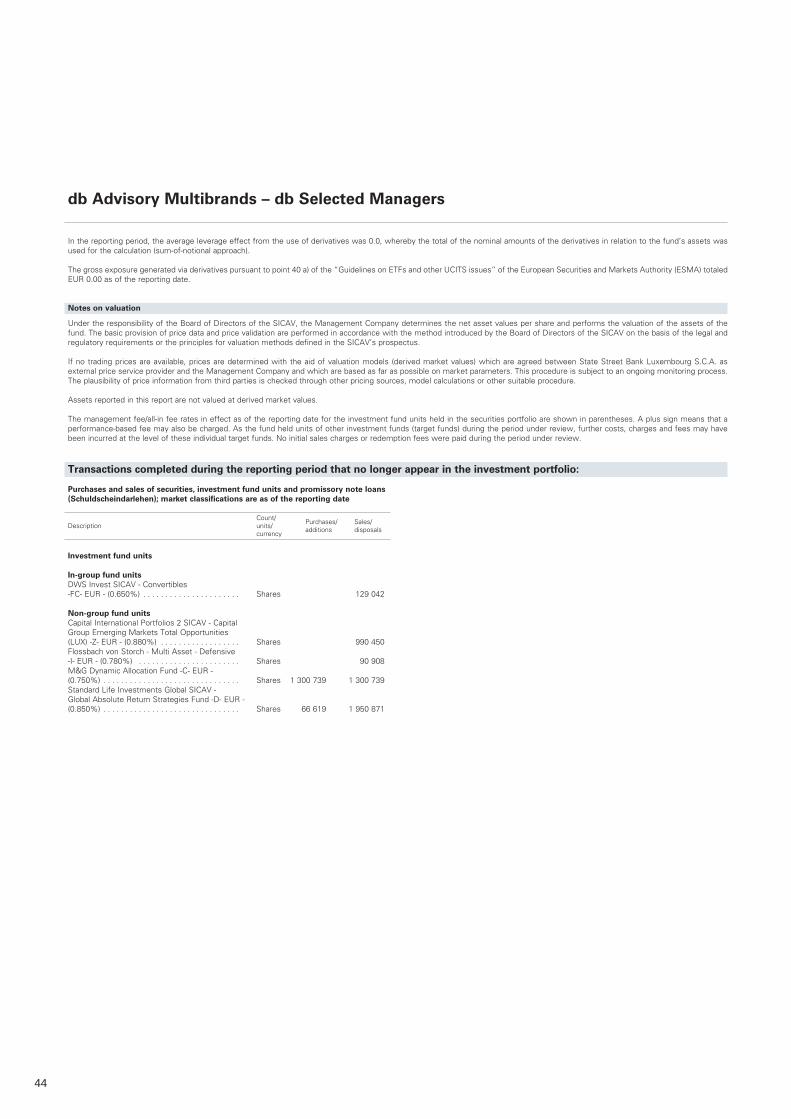
44
In the reporting period, the average leverage effect from the use of derivatives was 0.0, whereby the total of the nominal amounts of the derivatives in relation to the fund’s assets was used for the calculation (sum-of-notional approach). The gross exposure generated via derivatives pursuant to point 40 a) of the “Guidelines on ETFs and other UCITS issues” of the European Securities and Markets Authority (ESMA) totaled EUR 0.00 as of the reporting date.
Notes on valuation
Under the responsibility of the Board of Directors of the SICAV, the Management Company determines the net asset values per share and performs the valuation of the assets of the fund. The basic provision of price data and price validation are performed in accordance with the method introduced by the Board of Directors of the SICAV on the basis of the legal and regulatory requirements or the principles for valuation methods defined in the SICAV’s prospectus. If no trading prices are available, prices are determined with the aid of valuation models (derived market values) which are agreed between State Street Bank Luxembourg S.C.A. as external price service provider and the Management Company and which are based as far as possible on market parameters. This procedure is subject to an ongoing monitoring process. The plausibility of price information from third parties is checked through other pricing sources, model calculations or other suitable procedure. Assets reported in this report are not valued at derived market values. The management fee/all-in fee rates in effect as of the reporting date for the investment fund units held in the securities portfolio are shown in parentheses. A plus sign means that a performance-based fee may also be charged. As the fund held units of other investment funds (target funds) during the period under review, further costs, charges and fees may have been incurred at the level of these individual target funds. No initial sales charges or redemption fees were paid during the period under review.
Transactions completed during the reporting period that no longer appear in the investment portfolio: Purchases and sales of securities, investment fund units and promissory note loans (Schuldscheindarlehen); market classifications are as of the reporting date
db Advisory Multibrands – db Selected Managers
Count/ Purchases/ Sales/ Description units/ additions disposals currency
Investment fund units
In-group fund units DWS Invest SICAV - Convertibles -FC- EUR - (0.650%) . . . . . . . . . . . . . . . . . . . . . . Shares 129 042
Non-group fund unitsCapital International Portfolios 2 SICAV - Capital Group Emerging Markets Total Opportunities (LUX) -Z- EUR - (0.880%) . . . . . . . . . . . . . . . . . . Shares 990 450Flossbach von Storch - Multi Asset - Defensive -I- EUR - (0.780%) . . . . . . . . . . . . . . . . . . . . . . . Shares 90 908M&G Dynamic Allocation Fund -C- EUR - (0.750%) . . . . . . . . . . . . . . . . . . . . . . . . . . . . . . . Shares 1 300 739 1 300 739Standard Life Investments Global SICAV - Global Absolute Return Strategies Fund -D- EUR - (0.850%) . . . . . . . . . . . . . . . . . . . . . . . . . . . . . . . Shares 66 619 1 950 871
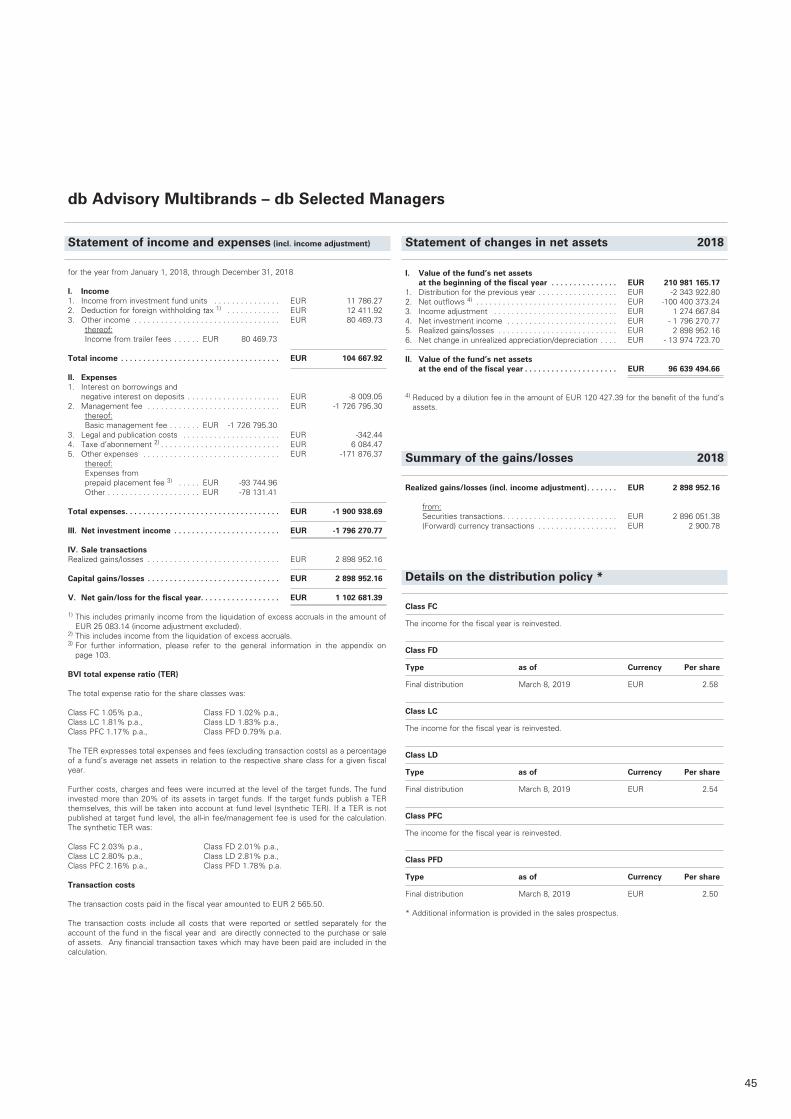
45
db Advisory Multibrands – db Selected Managers
I. Value of the fund’s net assets at the beginning of the fiscal year . . . . . . . . . . . . . . . EUR 210 981 165.17
1. Distribution for the previous year . . . . . . . . . . . . . . . . . . EUR -2 343 922.802. Net outflows 4) . . . . . . . . . . . . . . . . . . . . . . . . . . . . . . . . EUR -100 400 373.243. Income adjustment . . . . . . . . . . . . . . . . . . . . . . . . . . . . EUR 1 274 667.844. Net investment income . . . . . . . . . . . . . . . . . . . . . . . . . EUR - 1 796 270.775. Realized gains/losses . . . . . . . . . . . . . . . . . . . . . . . . . . . EUR 2 898 952.166. Net change in unrealized appreciation/depreciation . . . . EUR - 13 974 723.70 II. Value of the fund’s net assets at the end of the fiscal year . . . . . . . . . . . . . . . . . . . . . EUR 96 639 494.66
4) Reduced by a dilution fee in the amount of EUR 120 427.39 for the benefit of the fund‘s assets.
Summary of the gains/losses 2018
Realized gains/losses (incl. income adjustment) . . . . . . . EUR 2 898 952.16
from: Securities transactions . . . . . . . . . . . . . . . . . . . . . . . . . . EUR 2 896 051.38 (Forward) currency transactions . . . . . . . . . . . . . . . . . . EUR 2 900.78
Details on the distribution policy *
Class FC
The income for the fiscal year is reinvested.
Class FD
Type as of Currency Per share
Final distribution March 8, 2019 EUR 2.58
Class LC
The income for the fiscal year is reinvested.
Class LD
Type as of Currency Per share
Final distribution March 8, 2019 EUR 2.54
Class PFC
The income for the fiscal year is reinvested.
Class PFD
Type as of Currency Per share
Final distribution March 8, 2019 EUR 2.50 * Additional information is provided in the sales prospectus.
Statement of changes in net assets 2018Statement of income and expenses (incl. income adjustment)
for the year from January 1, 2018, through December 31, 2018
I. Income1. Income from investment fund units . . . . . . . . . . . . . . . EUR 11 786.272. Deduction for foreign withholding tax 1) . . . . . . . . . . . . EUR 12 411.923. Other income . . . . . . . . . . . . . . . . . . . . . . . . . . . . . . . . . EUR 80 469.73 thereof: Income from trailer fees . . . . . . EUR 80 469.73
Total income . . . . . . . . . . . . . . . . . . . . . . . . . . . . . . . . . . . . EUR 104 667.92
II. Expenses1. Interest on borrowings and negative interest on deposits . . . . . . . . . . . . . . . . . . . . . EUR -8 009.052. Management fee . . . . . . . . . . . . . . . . . . . . . . . . . . . . . . EUR -1 726 795.30 thereof: Basic management fee . . . . . . . EUR -1 726 795.303. Legal and publication costs . . . . . . . . . . . . . . . . . . . . . . EUR -342.444. Taxe d’abonnement 2) . . . . . . . . . . . . . . . . . . . . . . . . . . . EUR 6 084.475. Other expenses . . . . . . . . . . . . . . . . . . . . . . . . . . . . . . . EUR -171 876.37 thereof: Expenses from
prepaid placement fee 3) . . . . . EUR -93 744.96 Other . . . . . . . . . . . . . . . . . . . . . EUR -78 131.41
Total expenses . . . . . . . . . . . . . . . . . . . . . . . . . . . . . . . . . . . EUR -1 900 938.69
III. Net investment income . . . . . . . . . . . . . . . . . . . . . . . . EUR -1 796 270.77
IV. Sale transactionsRealized gains/losses . . . . . . . . . . . . . . . . . . . . . . . . . . . . . . EUR 2 898 952.16 Capital gains/losses . . . . . . . . . . . . . . . . . . . . . . . . . . . . . . EUR 2 898 952.16
V. Net gain/loss for the fiscal year. . . . . . . . . . . . . . . . . . EUR 1 102 681.39
1) This includes primarily income from the liquidation of excess accruals in the amount of EUR 25 083.14 (income adjustment excluded).
2) This includes income from the liquidation of excess accruals.3) For further information, please refer to the general information in the appendix on
page 103. BVI total expense ratio (TER)
The total expense ratio for the share classes was: Class FC 1.05% p.a., Class FD 1.02% p.a., Class LC 1.81% p.a., Class LD 1.83% p.a., Class PFC 1.17% p.a., Class PFD 0.79% p.a.
The TER expresses total expenses and fees (excluding transaction costs) as a percentage of a fund’s average net assets in relation to the respective share class for a given fiscal year. Further costs, charges and fees were incurred at the level of the target funds. The fund invested more than 20% of its assets in target funds. If the target funds publish a TER themselves, this will be taken into account at fund level (synthetic TER). If a TER is not published at target fund level, the all-in fee/management fee is used for the calculation. The synthetic TER was:
Class FC 2.03% p.a., Class FD 2.01% p.a., Class LC 2.80% p.a., Class LD 2.81% p.a., Class PFC 2.16% p.a., Class PFD 1.78% p.a.
Transaction costs
The transaction costs paid in the fiscal year amounted to EUR 2 565.50. The transaction costs include all costs that were reported or settled separately for the account of the fund in the fiscal year and are directly connected to the purchase or sale of assets. Any financial transaction taxes which may have been paid are included in the calculation.
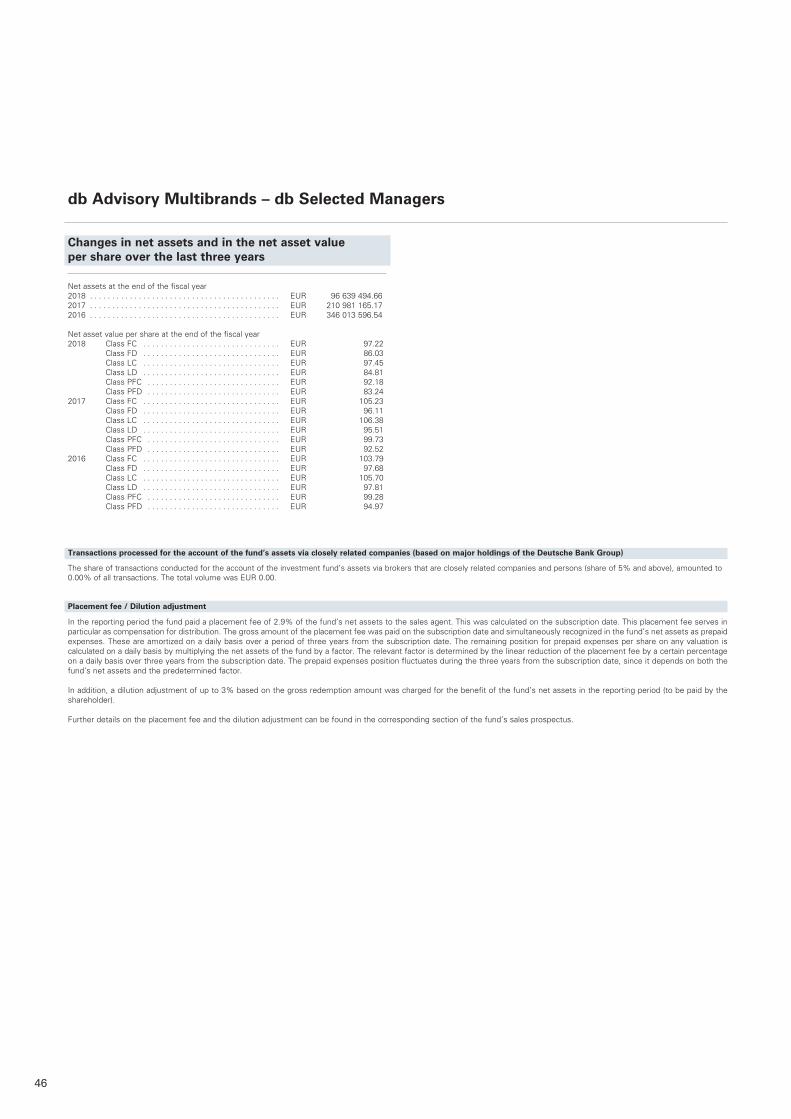
46
Changes in net assets and in the net asset value per share over the last three years
Net assets at the end of the fiscal year2018 . . . . . . . . . . . . . . . . . . . . . . . . . . . . . . . . . . . . . . . . . . . EUR 96 639 494 .662017 . . . . . . . . . . . . . . . . . . . . . . . . . . . . . . . . . . . . . . . . . . . EUR 210 981 165 .172016 . . . . . . . . . . . . . . . . . . . . . . . . . . . . . . . . . . . . . . . . . . . EUR 346 013 596 .54
Net asset value per share at the end of the fiscal year 2018 Class FC . . . . . . . . . . . . . . . . . . . . . . . . . . . . . . . EUR 97 .22 Class FD . . . . . . . . . . . . . . . . . . . . . . . . . . . . . . . EUR 86 .03 Class LC . . . . . . . . . . . . . . . . . . . . . . . . . . . . . . . EUR 97 .45 Class LD . . . . . . . . . . . . . . . . . . . . . . . . . . . . . . . EUR 84 .81 Class PFC . . . . . . . . . . . . . . . . . . . . . . . . . . . . . . EUR 92 .18 Class PFD . . . . . . . . . . . . . . . . . . . . . . . . . . . . . . EUR 83 .242017 Class FC . . . . . . . . . . . . . . . . . . . . . . . . . . . . . . . EUR 105 .23 Class FD . . . . . . . . . . . . . . . . . . . . . . . . . . . . . . . EUR 96 .11 Class LC . . . . . . . . . . . . . . . . . . . . . . . . . . . . . . . EUR 106 .38 Class LD . . . . . . . . . . . . . . . . . . . . . . . . . . . . . . . EUR 95 .51 Class PFC . . . . . . . . . . . . . . . . . . . . . . . . . . . . . . EUR 99 .73 Class PFD . . . . . . . . . . . . . . . . . . . . . . . . . . . . . . EUR 92 .522016 Class FC . . . . . . . . . . . . . . . . . . . . . . . . . . . . . . . EUR 103 .79 Class FD . . . . . . . . . . . . . . . . . . . . . . . . . . . . . . . EUR 97 .68 Class LC . . . . . . . . . . . . . . . . . . . . . . . . . . . . . . . EUR 105 .70 Class LD . . . . . . . . . . . . . . . . . . . . . . . . . . . . . . . EUR 97 .81 Class PFC . . . . . . . . . . . . . . . . . . . . . . . . . . . . . . EUR 99 .28 Class PFD . . . . . . . . . . . . . . . . . . . . . . . . . . . . . . EUR 94 .97
Transactions processed for the account of the fund’s assets via closely related companies (based on major holdings of the Deutsche Bank Group)
The share of transactions conducted for the account of the investment fund’s assets via brokers that are closely related companies and persons (share of 5% and above), amounted to 0 .00% of all transactions . The total volume was EUR 0 .00 .
Placement fee / Dilution adjustment
In the reporting period the fund paid a placement fee of 2 .9% of the fund’s net assets to the sales agent . This was calculated on the subscription date . This placement fee serves in particular as compensation for distribution . The gross amount of the placement fee was paid on the subscription date and simultaneously recognized in the fund’s net assets as prepaid expenses . These are amortized on a daily basis over a period of three years from the subscription date . The remaining position for prepaid expenses per share on any valuation is calculated on a daily basis by multiplying the net assets of the fund by a factor . The relevant factor is determined by the linear reduction of the placement fee by a certain percentage on a daily basis over three years from the subscription date . The prepaid expenses position fluctuates during the three years from the subscription date, since it depends on both the fund’s net assets and the predetermined factor . In addition, a dilution adjustment of up to 3% based on the gross redemption amount was charged for the benefit of the fund’s net assets in the reporting period (to be paid by the shareholder) . Further details on the placement fee and the dilution adjustment can be found in the corresponding section of the fund’s sales prospectus .
db Advisory Multibrands – db Selected Managers
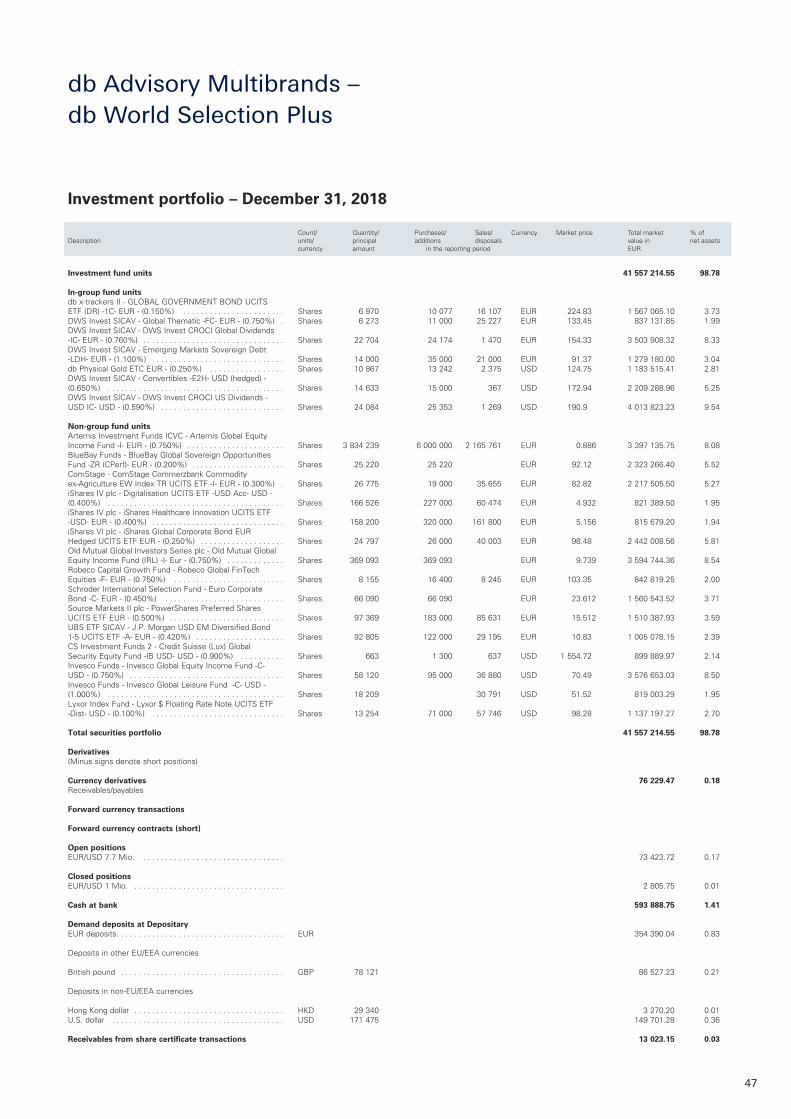
47
Investment fund units 41 557 214.55 98.78 In-group fund units db x-trackers II - GLOBAL GOVERNMENT BOND UCITS ETF (DR) -1C- EUR - (0.150%) . . . . . . . . . . . . . . . . . . . . . . . Shares 6 970 10 077 16 107 EUR 224.83 1 567 065.10 3.73DWS Invest SICAV - Global Thematic -FC- EUR - (0.750%) . Shares 6 273 11 000 25 227 EUR 133.45 837 131.85 1.99DWS Invest SICAV - DWS Invest CROCI Global Dividends -IC- EUR - (0.760%) . . . . . . . . . . . . . . . . . . . . . . . . . . . . . . . . Shares 22 704 24 174 1 470 EUR 154.33 3 503 908.32 8.33DWS Invest SICAV - Emerging Markets Sovereign Debt -LDH- EUR - (1.100%) . . . . . . . . . . . . . . . . . . . . . . . . . . . . . . Shares 14 000 35 000 21 000 EUR 91.37 1 279 180.00 3.04db Physical Gold ETC EUR - (0.250%) . . . . . . . . . . . . . . . . . Shares 10 867 13 242 2 375 USD 124.75 1 183 515.41 2.81DWS Invest SICAV - Convertibles -E2H- USD (hedged) - (0.650%) . . . . . . . . . . . . . . . . . . . . . . . . . . . . . . . . . . . . . . . . Shares 14 633 15 000 367 USD 172.94 2 209 288.96 5.25DWS Invest SICAV - DWS Invest CROCI US Dividends - USD IC- USD - (0.590%) . . . . . . . . . . . . . . . . . . . . . . . . . . . . Shares 24 084 25 353 1 269 USD 190.9 4 013 823.23 9.54 Non-group fund units Artemis Investment Funds ICVC - Artemis Global Equity Income Fund -I- EUR - (0.750%) . . . . . . . . . . . . . . . . . . . . . . Shares 3 834 239 6 000 000 2 165 761 EUR 0.886 3 397 135.75 8.08BlueBay Funds - BlueBay Global Sovereign Opportunities Fund -ZR (CPerf)- EUR - (0.200%) . . . . . . . . . . . . . . . . . . . . . Shares 25 220 25 220 EUR 92.12 2 323 266.40 5.52ComStage - ComStage Commerzbank Commodity ex-Agriculture EW Index TR UCITS ETF -I- EUR - (0.300%) . Shares 26 775 19 000 35 655 EUR 82.82 2 217 505.50 5.27iShares IV plc - Digitalisation UCITS ETF -USD Acc- USD - (0.400%) . . . . . . . . . . . . . . . . . . . . . . . . . . . . . . . . . . . . . . . . Shares 166 526 227 000 60 474 EUR 4.932 821 389.50 1.95iShares IV plc - iShares Healthcare Innovation UCITS ETF -USD- EUR - (0.400%) . . . . . . . . . . . . . . . . . . . . . . . . . . . . . . Shares 158 200 320 000 161 800 EUR 5.156 815 679.20 1.94iShares VI plc - iShares Global Corporate Bond EUR Hedged UCITS ETF EUR - (0.250%) . . . . . . . . . . . . . . . . . . . Shares 24 797 26 000 40 003 EUR 98.48 2 442 008.56 5.81Old Mutual Global Investors Series plc - Old Mutual Global Equity Income Fund (IRL) -I- Eur - (0.750%) . . . . . . . . . . . . . Shares 369 093 369 093 EUR 9.739 3 594 744.36 8.54Robeco Capital Growth Fund - Robeco Global FinTech Equities -F- EUR - (0.750%) . . . . . . . . . . . . . . . . . . . . . . . . . Shares 8 155 16 400 8 245 EUR 103.35 842 819.25 2.00Schroder International Selection Fund - Euro Corporate Bond -C- EUR - (0.450%) . . . . . . . . . . . . . . . . . . . . . . . . . . . Shares 66 090 66 090 EUR 23.612 1 560 543.52 3.71Source Markets II plc - PowerShares Preferred Shares UCITS ETF EUR - (0.500%) . . . . . . . . . . . . . . . . . . . . . . . . . . Shares 97 369 183 000 85 631 EUR 15.512 1 510 387.93 3.59UBS ETF SICAV - J.P. Morgan USD EM Diversified Bond 1-5 UCITS ETF -A- EUR - (0.420%) . . . . . . . . . . . . . . . . . . . . Shares 92 805 122 000 29 195 EUR 10.83 1 005 078.15 2.39CS Investment Funds 2 - Credit Suisse (Lux) Global Security Equity Fund -IB USD- USD - (0.900%) . . . . . . . . . . Shares 663 1 300 637 USD 1 554.72 899 889.97 2.14Invesco Funds - Invesco Global Equity Income Fund -C- USD - (0.750%) . . . . . . . . . . . . . . . . . . . . . . . . . . . . . . . . . . . Shares 58 120 95 000 36 880 USD 70.49 3 576 653.03 8.50Invesco Funds - Invesco Global Leisure Fund -C- USD - (1.000%) . . . . . . . . . . . . . . . . . . . . . . . . . . . . . . . . . . . . . . . . Shares 18 209 30 791 USD 51.52 819 003.29 1.95Lyxor Index Fund - Lyxor $ Floating Rate Note UCITS ETF -Dist- USD - (0.100%) . . . . . . . . . . . . . . . . . . . . . . . . . . . . . . Shares 13 254 71 000 57 746 USD 98.28 1 137 197.27 2.70
Total securities portfolio 41 557 214.55 98.78
Derivatives(Minus signs denote short positions)
Currency derivatives 76 229.47 0.18Receivables/payables
Forward currency transactions
Forward currency contracts (short)
Open positionsEUR/USD 7.7 Mio. . . . . . . . . . . . . . . . . . . . . . . . . . . . . . . . . 73 423.72 0.17
Closed positionsEUR/USD 1 Mio. . . . . . . . . . . . . . . . . . . . . . . . . . . . . . . . . . . 2 805.75 0.01
Cash at bank 593 888.75 1.41 Demand deposits at Depositary EUR deposits . . . . . . . . . . . . . . . . . . . . . . . . . . . . . . . . . . . . . . EUR 354 390.04 0.83 Deposits in other EU/EEA currencies British pound . . . . . . . . . . . . . . . . . . . . . . . . . . . . . . . . . . . . . GBP 78 121 86 527.23 0.21
Deposits in non-EU/EEA currencies Hong Kong dollar . . . . . . . . . . . . . . . . . . . . . . . . . . . . . . . . . . HKD 29 340 3 270.20 0.01U.S. dollar . . . . . . . . . . . . . . . . . . . . . . . . . . . . . . . . . . . . . . . USD 171 475 149 701.28 0.36 Receivables from share certificate transactions 13 023.15 0.03
Investment portfolio – December 31, 2018
Count/ Quantity/ Purchases/ Sales/ Currency Market price Total market % ofDescription units/ principal additions disposals value in net assets currency amount in the reporting period EUR
db Advisory Multibrands – db World Selection Plus
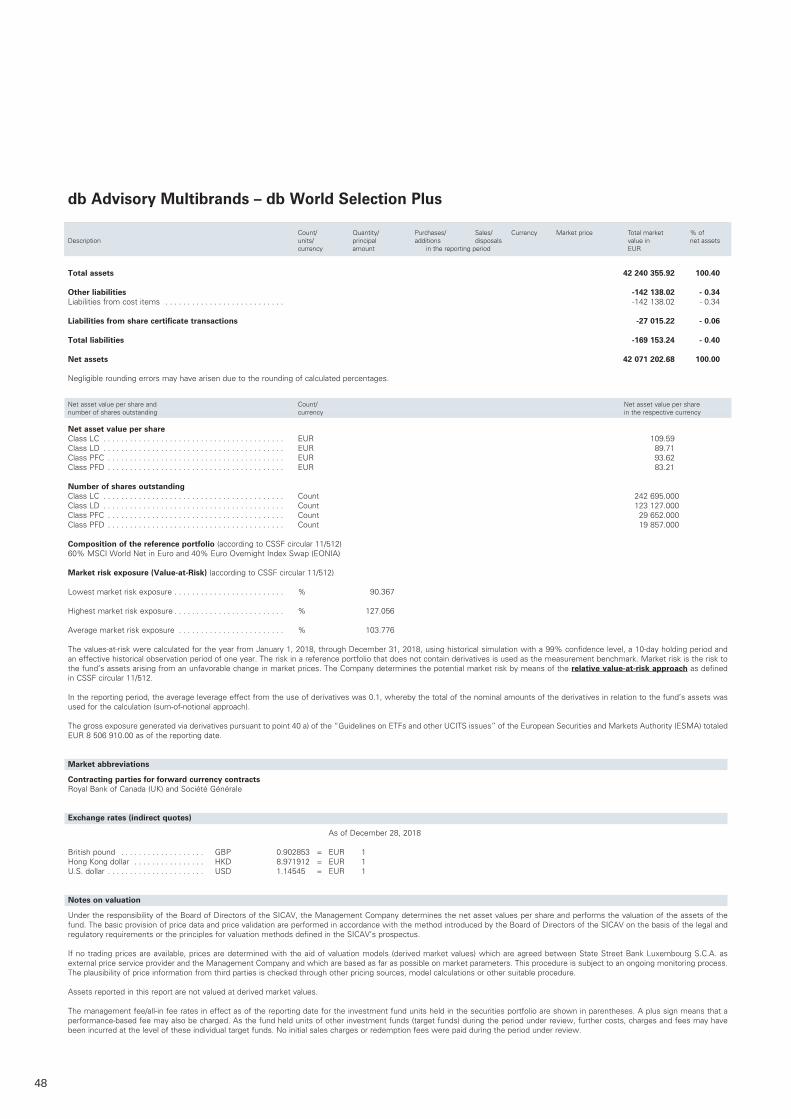
48
Total assets 42 240 355.92 100.40 Other liabilities -142 138.02 - 0.34Liabilities from cost items . . . . . . . . . . . . . . . . . . . . . . . . . . . -142 138 .02 - 0 .34 Liabilities from share certificate transactions -27 015.22 - 0.06
Total liabilities -169 153.24 - 0.40 Net assets 42 071 202.68 100.00 Negligible rounding errors may have arisen due to the rounding of calculated percentages .
Net asset value per share and Count/ Net asset value per sharenumber of shares outstanding currency in the respective currency
Net asset value per share Class LC . . . . . . . . . . . . . . . . . . . . . . . . . . . . . . . . . . . . . . . . . EUR 109 .59Class LD . . . . . . . . . . . . . . . . . . . . . . . . . . . . . . . . . . . . . . . . . EUR 89 .71Class PFC . . . . . . . . . . . . . . . . . . . . . . . . . . . . . . . . . . . . . . . . EUR 93 .62Class PFD . . . . . . . . . . . . . . . . . . . . . . . . . . . . . . . . . . . . . . . . EUR 83 .21 Number of shares outstanding Class LC . . . . . . . . . . . . . . . . . . . . . . . . . . . . . . . . . . . . . . . . . Count 242 695 .000Class LD . . . . . . . . . . . . . . . . . . . . . . . . . . . . . . . . . . . . . . . . . Count 123 127 .000Class PFC . . . . . . . . . . . . . . . . . . . . . . . . . . . . . . . . . . . . . . . . Count 29 652 .000Class PFD . . . . . . . . . . . . . . . . . . . . . . . . . . . . . . . . . . . . . . . . Count 19 857 .000 Composition of the reference portfolio (according to CSSF circular 11/512) 60% MSCI World Net in Euro and 40% Euro Overnight Index Swap (EONIA) Market risk exposure (Value-at-Risk) (according to CSSF circular 11/512) Lowest market risk exposure . . . . . . . . . . . . . . . . . . . . . . . . . % 90 .367
Highest market risk exposure . . . . . . . . . . . . . . . . . . . . . . . . . % 127 .056
Average market risk exposure . . . . . . . . . . . . . . . . . . . . . . . . % 103 .776 The values-at-risk were calculated for the year from January 1, 2018, through December 31, 2018, using historical simulation with a 99% confidence level, a 10-day holding period and an effective historical observation period of one year . The risk in a reference portfolio that does not contain derivatives is used as the measurement benchmark . Market risk is the risk to the fund’s assets arising from an unfavorable change in market prices . The Company determines the potential market risk by means of the relative value-at-risk approach as defined in CSSF circular 11/512 .
In the reporting period, the average leverage effect from the use of derivatives was 0 .1, whereby the total of the nominal amounts of the derivatives in relation to the fund’s assets was used for the calculation (sum-of-notional approach) .
The gross exposure generated via derivatives pursuant to point 40 a) of the “Guidelines on ETFs and other UCITS issues” of the European Securities and Markets Authority (ESMA) totaled EUR 8 506 910 .00 as of the reporting date .
Market abbreviations
Contracting parties for forward currency contractsRoyal Bank of Canada (UK) and Société Générale
Exchange rates (indirect quotes)
As of December 28, 2018 British pound . . . . . . . . . . . . . . . . . . . GBP 0 .902853 = EUR 1Hong Kong dollar . . . . . . . . . . . . . . . . HKD 8 .971912 = EUR 1U .S . dollar . . . . . . . . . . . . . . . . . . . . . . USD 1 .14545 = EUR 1
Notes on valuation
Under the responsibility of the Board of Directors of the SICAV, the Management Company determines the net asset values per share and performs the valuation of the assets of the fund . The basic provision of price data and price validation are performed in accordance with the method introduced by the Board of Directors of the SICAV on the basis of the legal and regulatory requirements or the principles for valuation methods defined in the SICAV’s prospectus .
If no trading prices are available, prices are determined with the aid of valuation models (derived market values) which are agreed between State Street Bank Luxembourg S .C .A . as external price service provider and the Management Company and which are based as far as possible on market parameters . This procedure is subject to an ongoing monitoring process . The plausibility of price information from third parties is checked through other pricing sources, model calculations or other suitable procedure .
Assets reported in this report are not valued at derived market values .
The management fee/all-in fee rates in effect as of the reporting date for the investment fund units held in the securities portfolio are shown in parentheses . A plus sign means that a performance-based fee may also be charged . As the fund held units of other investment funds (target funds) during the period under review, further costs, charges and fees may have been incurred at the level of these individual target funds . No initial sales charges or redemption fees were paid during the period under review .
db Advisory Multibrands – db World Selection Plus
Count/ Quantity/ Purchases/ Sales/ Currency Market price Total market % ofDescription units/ principal additions disposals value in net assets currency amount in the reporting period EUR
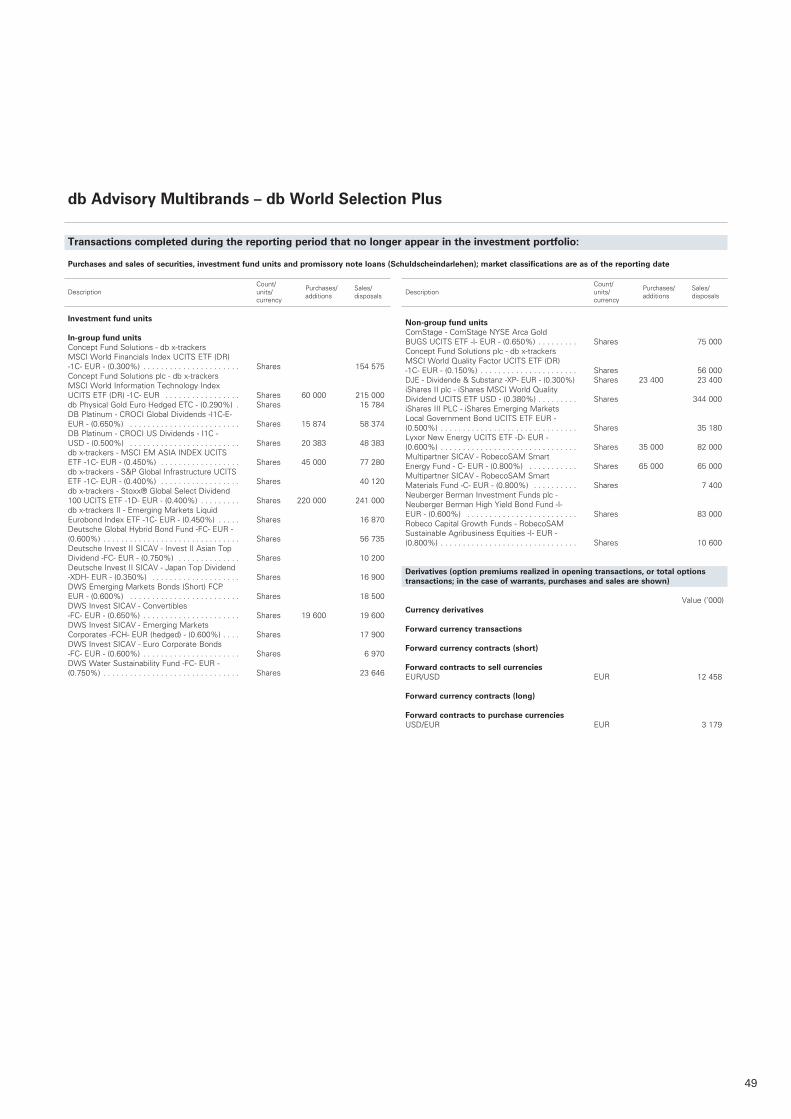
49
Transactions completed during the reporting period that no longer appear in the investment portfolio: Purchases and sales of securities, investment fund units and promissory note loans (Schuldscheindarlehen); market classifications are as of the reporting date
Investment fund units
In-group fund units Concept Fund Solutions - db x-trackers MSCI World Financials Index UCITS ETF (DR) -1C- EUR - (0.300%) . . . . . . . . . . . . . . . . . . . . . . Shares 154 575Concept Fund Solutions plc - db x-trackers MSCI World Information Technology Index UCITS ETF (DR) -1C- EUR . . . . . . . . . . . . . . . . . Shares 60 000 215 000db Physical Gold Euro Hedged ETC - (0.290%) . Shares 15 784DB Platinum - CROCI Global Dividends -I1C-E- EUR - (0.650%) . . . . . . . . . . . . . . . . . . . . . . . . . Shares 15 874 58 374DB Platinum - CROCI US Dividends - I1C - USD - (0.500%) . . . . . . . . . . . . . . . . . . . . . . . . . Shares 20 383 48 383db x-trackers - MSCI EM ASIA INDEX UCITS ETF -1C- EUR - (0.450%) . . . . . . . . . . . . . . . . . . Shares 45 000 77 280db x-trackers - S&P Global Infrastructure UCITS ETF -1C- EUR - (0.400%) . . . . . . . . . . . . . . . . . . Shares 40 120db x-trackers - Stoxx® Global Select Dividend 100 UCITS ETF -1D- EUR - (0.400%) . . . . . . . . . Shares 220 000 241 000db x-trackers II - Emerging Markets Liquid Eurobond Index ETF -1C- EUR - (0.450%) . . . . . Shares 16 870Deutsche Global Hybrid Bond Fund -FC- EUR - (0.600%) . . . . . . . . . . . . . . . . . . . . . . . . . . . . . . . Shares 56 735Deutsche Invest II SICAV - Invest II Asian Top Dividend -FC- EUR - (0.750%) . . . . . . . . . . . . . . Shares 10 200Deutsche Invest II SICAV - Japan Top Dividend -XDH- EUR - (0.350%) . . . . . . . . . . . . . . . . . . . . Shares 16 900DWS Emerging Markets Bonds (Short) FCP EUR - (0.600%) . . . . . . . . . . . . . . . . . . . . . . . . . Shares 18 500DWS Invest SICAV - Convertibles -FC- EUR - (0.650%) . . . . . . . . . . . . . . . . . . . . . . Shares 19 600 19 600DWS Invest SICAV - Emerging Markets Corporates -FCH- EUR (hedged) - (0.600%) . . . . Shares 17 900DWS Invest SICAV - Euro Corporate Bonds -FC- EUR - (0.600%) . . . . . . . . . . . . . . . . . . . . . . Shares 6 970DWS Water Sustainability Fund -FC- EUR - (0.750%) . . . . . . . . . . . . . . . . . . . . . . . . . . . . . . . Shares 23 646
db Advisory Multibrands – db World Selection Plus
Non-group fund unitsComStage - ComStage NYSE Arca Gold BUGS UCITS ETF -I- EUR - (0.650%) . . . . . . . . . Shares 75 000Concept Fund Solutions plc - db x-trackers MSCI World Quality Factor UCITS ETF (DR) -1C- EUR - (0.150%) . . . . . . . . . . . . . . . . . . . . . . Shares 56 000DJE - Dividende & Substanz -XP- EUR - (0.300%) Shares 23 400 23 400iShares II plc - iShares MSCI World Quality Dividend UCITS ETF USD - (0.380%) . . . . . . . . . Shares 344 000iShares III PLC - iShares Emerging Markets Local Government Bond UCITS ETF EUR - (0.500%) . . . . . . . . . . . . . . . . . . . . . . . . . . . . . . . Shares 35 180Lyxor New Energy UCITS ETF -D- EUR - (0.600%) . . . . . . . . . . . . . . . . . . . . . . . . . . . . . . . Shares 35 000 82 000Multipartner SICAV - RobecoSAM Smart Energy Fund - C- EUR - (0.800%) . . . . . . . . . . . Shares 65 000 65 000Multipartner SICAV - RobecoSAM Smart Materials Fund -C- EUR - (0.800%) . . . . . . . . . . Shares 7 400Neuberger Berman Investment Funds plc - Neuberger Berman High Yield Bond Fund -I- EUR - (0.600%) . . . . . . . . . . . . . . . . . . . . . . . . . Shares 83 000Robeco Capital Growth Funds - RobecoSAM Sustainable Agribusiness Equities -I- EUR - (0.800%) . . . . . . . . . . . . . . . . . . . . . . . . . . . . . . . Shares 10 600
Derivatives (option premiums realized in opening transactions, or total options transactions; in the case of warrants, purchases and sales are shown)
Value (’000)Currency derivatives
Forward currency transactions Forward currency contracts (short)
Forward contracts to sell currencies EUR/USD EUR 12 458
Forward currency contracts (long)
Forward contracts to purchase currencies USD/EUR EUR 3 179
Count/ Purchases/ Sales/ Description units/ additions disposals currency
Count/ Purchases/ Sales/ Description units/ additions disposals currency
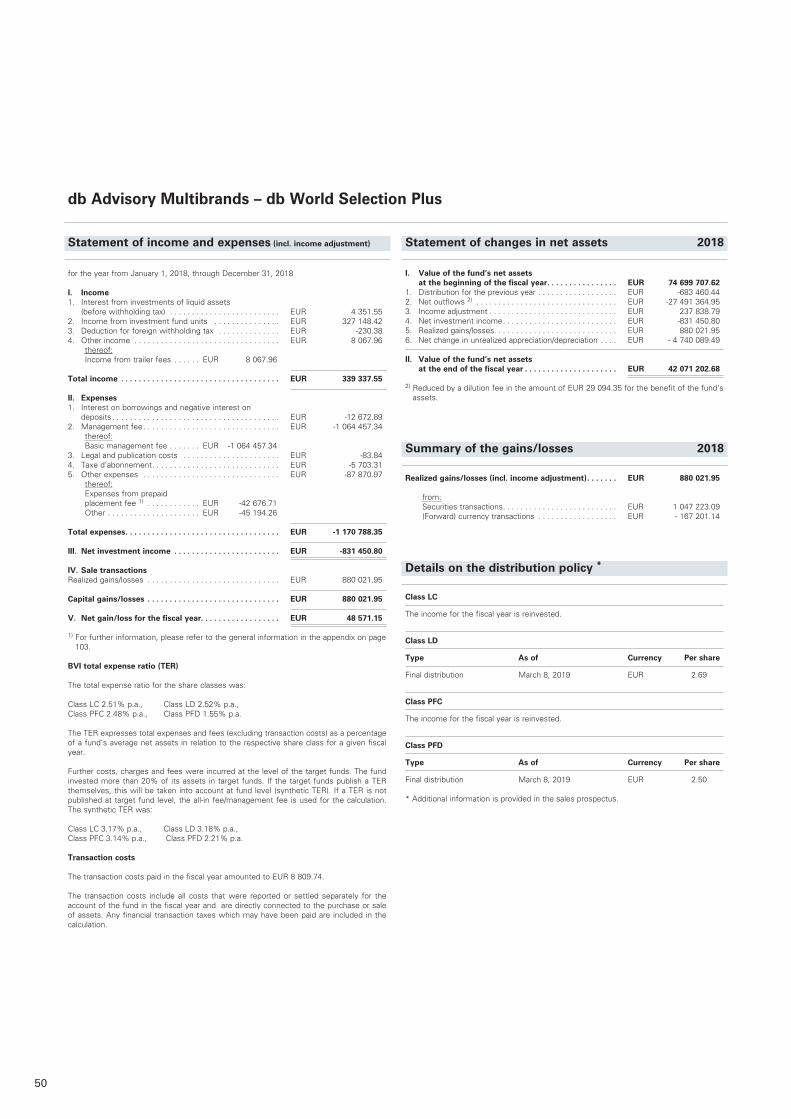
50
db Advisory Multibrands – db World Selection Plus
Statement of income and expenses (incl. income adjustment)
I. Value of the fund’s net assets at the beginning of the fiscal year . . . . . . . . . . . . . . . . EUR 74 699 707.621. Distribution for the previous year . . . . . . . . . . . . . . . . . . EUR -683 460.44 2. Net outflows 2) . . . . . . . . . . . . . . . . . . . . . . . . . . . . . . . . EUR -27 491 364.953. Income adjustment . . . . . . . . . . . . . . . . . . . . . . . . . . . . . EUR 237 838.794. Net investment income . . . . . . . . . . . . . . . . . . . . . . . . . . EUR -831 450.805. Realized gains/losses. . . . . . . . . . . . . . . . . . . . . . . . . . . . EUR 880 021.956. Net change in unrealized appreciation/depreciation . . . . EUR - 4 740 089.49
II. Value of the fund’s net assets at the end of the fiscal year . . . . . . . . . . . . . . . . . . . . . EUR 42 071 202.68
2) Reduced by a dilution fee in the amount of EUR 29 094.35 for the benefit of the fund‘s assets.
Summary of the gains/losses 2018
Realized gains/losses (incl. income adjustment) . . . . . . . EUR 880 021.95
from: Securities transactions . . . . . . . . . . . . . . . . . . . . . . . . . . EUR 1 047 223.09 (Forward) currency transactions . . . . . . . . . . . . . . . . . . EUR - 167 201.14
Details on the distribution policy *
Class LC
The income for the fiscal year is reinvested.
Class LD
Type As of Currency Per share
Final distribution March 8, 2019 EUR 2.69
Class PFC
The income for the fiscal year is reinvested.
Class PFD
Type As of Currency Per share
Final distribution March 8, 2019 EUR 2.50
* Additional information is provided in the sales prospectus.
Statement of changes in net assets 2018
for the year from January 1, 2018, through December 31, 2018
I. Income1. Interest from investments of liquid assets
(before withholding tax) . . . . . . . . . . . . . . . . . . . . . . . . . EUR 4 351.552. Income from investment fund units . . . . . . . . . . . . . . . EUR 327 148.423. Deduction for foreign withholding tax . . . . . . . . . . . . . . EUR -230.384. Other income . . . . . . . . . . . . . . . . . . . . . . . . . . . . . . . . . EUR 8 067.96 thereof: Income from trailer fees . . . . . . EUR 8 067.96
Total income . . . . . . . . . . . . . . . . . . . . . . . . . . . . . . . . . . . . EUR 339 337.55
II. Expenses1. Interest on borrowings and negative interest on deposits . . . . . . . . . . . . . . . . . . . . . . . . . . . . . . . . . . . . . . EUR -12 672.892. Management fee . . . . . . . . . . . . . . . . . . . . . . . . . . . . . . . EUR -1 064 457.34 thereof: Basic management fee . . . . . . . EUR -1 064 457.343. Legal and publication costs . . . . . . . . . . . . . . . . . . . . . . EUR -83.844. Taxe d’abonnement . . . . . . . . . . . . . . . . . . . . . . . . . . . . . EUR -5 703.315. Other expenses . . . . . . . . . . . . . . . . . . . . . . . . . . . . . . . EUR -87 870.97 thereof: Expenses from prepaid
placement fee 1) . . . . . . . . . . . . EUR -42 676.71 Other . . . . . . . . . . . . . . . . . . . . . EUR -45 194.26
Total expenses . . . . . . . . . . . . . . . . . . . . . . . . . . . . . . . . . . . EUR -1 170 788.35
III. Net investment income . . . . . . . . . . . . . . . . . . . . . . . . EUR -831 450.80
IV. Sale transactionsRealized gains/losses . . . . . . . . . . . . . . . . . . . . . . . . . . . . . . EUR 880 021.95
Capital gains/losses . . . . . . . . . . . . . . . . . . . . . . . . . . . . . . EUR 880 021.95
V. Net gain/loss for the fiscal year. . . . . . . . . . . . . . . . . . EUR 48 571.15
1) For further information, please refer to the general information in the appendix on page 103.
BVI total expense ratio (TER) The total expense ratio for the share classes was: Class LC 2.51% p.a., Class LD 2.52% p.a., Class PFC 2.48% p.a., Class PFD 1.55% p.a. The TER expresses total expenses and fees (excluding transaction costs) as a percentage of a fund’s average net assets in relation to the respective share class for a given fiscal year.
Further costs, charges and fees were incurred at the level of the target funds. The fund invested more than 20% of its assets in target funds. If the target funds publish a TER themselves, this will be taken into account at fund level (synthetic TER). If a TER is not published at target fund level, the all-in fee/management fee is used for the calculation. The synthetic TER was: Class LC 3.17% p.a., Class LD 3.18% p.a., Class PFC 3.14% p.a., Class PFD 2.21% p.a.
Transaction costs The transaction costs paid in the fiscal year amounted to EUR 8 809.74.
The transaction costs include all costs that were reported or settled separately for the account of the fund in the fiscal year and are directly connected to the purchase or sale of assets. Any financial transaction taxes which may have been paid are included in the calculation.
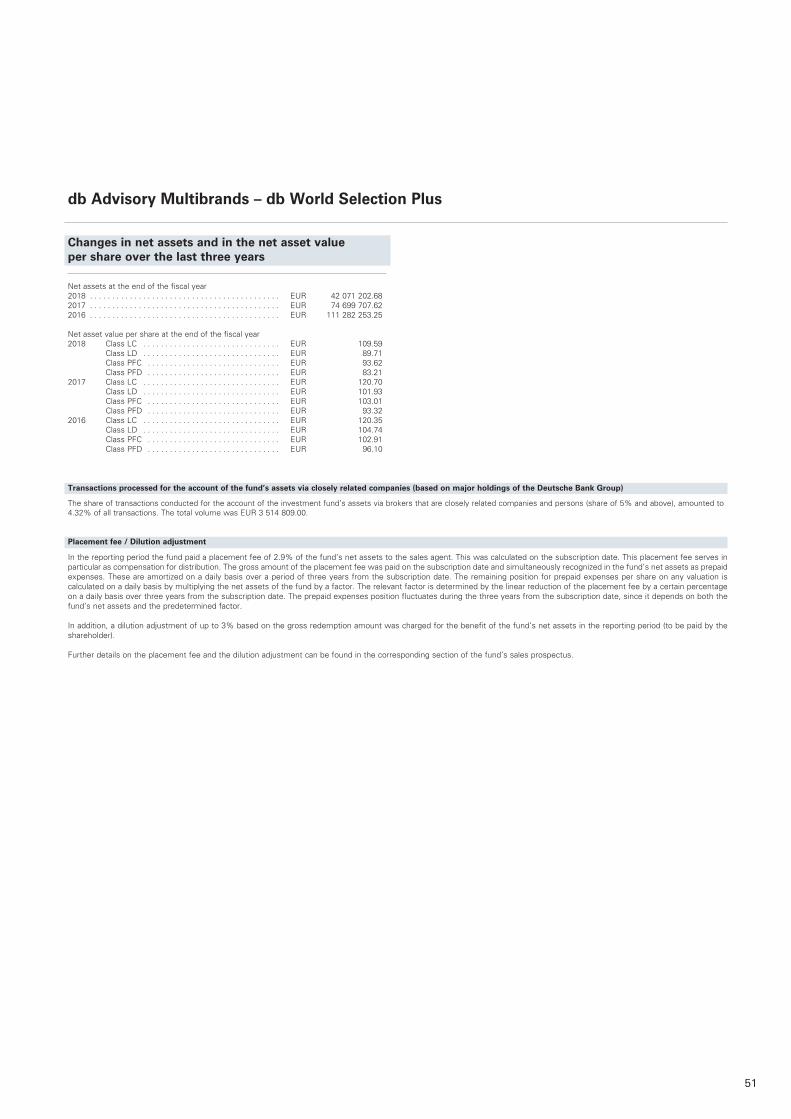
51
Changes in net assets and in the net asset value per share over the last three years
Net assets at the end of the fiscal year2018 . . . . . . . . . . . . . . . . . . . . . . . . . . . . . . . . . . . . . . . . . . . EUR 42 071 202 .682017 . . . . . . . . . . . . . . . . . . . . . . . . . . . . . . . . . . . . . . . . . . . EUR 74 699 707 .622016 . . . . . . . . . . . . . . . . . . . . . . . . . . . . . . . . . . . . . . . . . . . EUR 111 282 253 .25
Net asset value per share at the end of the fiscal year2018 Class LC . . . . . . . . . . . . . . . . . . . . . . . . . . . . . . . EUR 109 .59 Class LD . . . . . . . . . . . . . . . . . . . . . . . . . . . . . . . EUR 89 .71 Class PFC . . . . . . . . . . . . . . . . . . . . . . . . . . . . . . EUR 93 .62 Class PFD . . . . . . . . . . . . . . . . . . . . . . . . . . . . . . EUR 83 .212017 Class LC . . . . . . . . . . . . . . . . . . . . . . . . . . . . . . . EUR 120 .70 Class LD . . . . . . . . . . . . . . . . . . . . . . . . . . . . . . . EUR 101 .93 Class PFC . . . . . . . . . . . . . . . . . . . . . . . . . . . . . . EUR 103 .01 Class PFD . . . . . . . . . . . . . . . . . . . . . . . . . . . . . . EUR 93 .322016 Class LC . . . . . . . . . . . . . . . . . . . . . . . . . . . . . . . EUR 120 .35 Class LD . . . . . . . . . . . . . . . . . . . . . . . . . . . . . . . EUR 104 .74 Class PFC . . . . . . . . . . . . . . . . . . . . . . . . . . . . . . EUR 102 .91 Class PFD . . . . . . . . . . . . . . . . . . . . . . . . . . . . . . EUR 96 .10
Transactions processed for the account of the fund’s assets via closely related companies (based on major holdings of the Deutsche Bank Group)
The share of transactions conducted for the account of the investment fund’s assets via brokers that are closely related companies and persons (share of 5% and above), amounted to 4 .32% of all transactions . The total volume was EUR 3 514 809 .00 .
Placement fee / Dilution adjustment
In the reporting period the fund paid a placement fee of 2 .9% of the fund’s net assets to the sales agent . This was calculated on the subscription date . This placement fee serves in particular as compensation for distribution . The gross amount of the placement fee was paid on the subscription date and simultaneously recognized in the fund’s net assets as prepaid expenses . These are amortized on a daily basis over a period of three years from the subscription date . The remaining position for prepaid expenses per share on any valuation is calculated on a daily basis by multiplying the net assets of the fund by a factor . The relevant factor is determined by the linear reduction of the placement fee by a certain percentage on a daily basis over three years from the subscription date . The prepaid expenses position fluctuates during the three years from the subscription date, since it depends on both the fund’s net assets and the predetermined factor .
In addition, a dilution adjustment of up to 3% based on the gross redemption amount was charged for the benefit of the fund’s net assets in the reporting period (to be paid by the shareholder) .
Further details on the placement fee and the dilution adjustment can be found in the corresponding section of the fund’s sales prospectus .
db Advisory Multibrands – db World Selection Plus
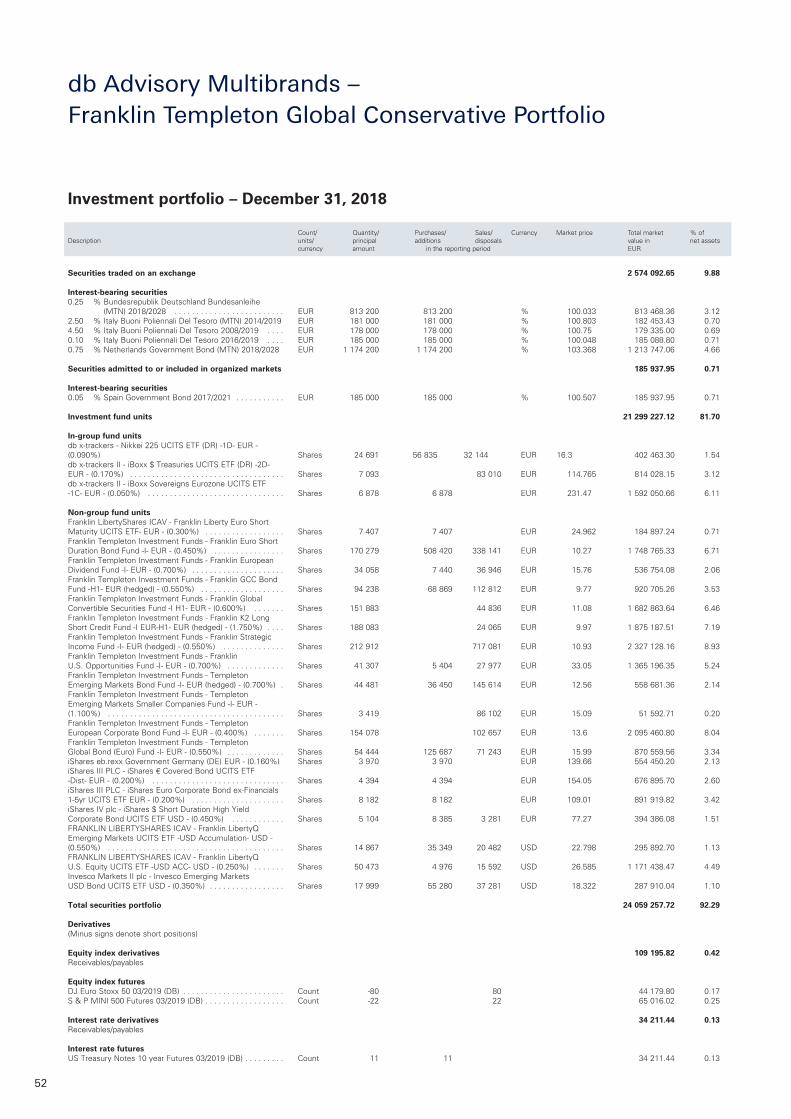
52
Securities traded on an exchange 2 574 092.65 9.88 Interest-bearing securities 0.25 % Bundesrepublik Deutschland Bundesanleihe
(MTN) 2018/2028 . . . . . . . . . . . . . . . . . . . . . . . . . EUR 813 200 813 200 % 100.033 813 468.36 3.122.50 % Italy Buoni Poliennali Del Tesoro (MTN) 2014/2019 EUR 181 000 181 000 % 100.803 182 453.43 0.704.50 % Italy Buoni Poliennali Del Tesoro 2008/2019 . . . . EUR 178 000 178 000 % 100.75 179 335.00 0.690.10 % Italy Buoni Poliennali Del Tesoro 2016/2019 . . . . EUR 185 000 185 000 % 100.048 185 088.80 0.710.75 % Netherlands Government Bond (MTN) 2018/2028 EUR 1 174 200 1 174 200 % 103.368 1 213 747.06 4.66
Securities admitted to or included in organized markets 185 937.95 0.71
Interest-bearing securities 0.05 % Spain Government Bond 2017/2021 . . . . . . . . . . . EUR 185 000 185 000 % 100.507 185 937.95 0.71
Investment fund units 21 299 227.12 81.70
In-group fund units db x-trackers - Nikkei 225 UCITS ETF (DR) -1D- EUR - (0.090%) Shares 24 691 56 835 32 144 EUR 16.3 402 463.30 1.54 db x-trackers II - iBoxx $ Treasuries UCITS ETF (DR) -2D- EUR - (0.170%) . . . . . . . . . . . . . . . . . . . . . . . . . . . . . . . . . . . Shares 7 093 83 010 EUR 114.765 814 028.15 3.12 db x-trackers II - iBoxx Sovereigns Eurozone UCITS ETF -1C- EUR - (0.050%) . . . . . . . . . . . . . . . . . . . . . . . . . . . . . . . Shares 6 878 6 878 EUR 231.47 1 592 050.66 6.11
Non-group fund units Franklin LibertyShares ICAV - Franklin Liberty Euro Short Maturity UCITS ETF- EUR - (0.300%) . . . . . . . . . . . . . . . . . . Shares 7 407 7 407 EUR 24.962 184 897.24 0.71Franklin Templeton Investment Funds - Franklin Euro Short Duration Bond Fund -I- EUR - (0.450%) . . . . . . . . . . . . . . . . Shares 170 279 508 420 338 141 EUR 10.27 1 748 765.33 6.71Franklin Templeton Investment Funds - Franklin European Dividend Fund -I- EUR - (0.700%) . . . . . . . . . . . . . . . . . . . . . Shares 34 058 7 440 36 946 EUR 15.76 536 754.08 2.06Franklin Templeton Investment Funds - Franklin GCC Bond Fund -H1- EUR (hedged) - (0.550%) . . . . . . . . . . . . . . . . . . . Shares 94 238 68 869 112 812 EUR 9.77 920 705.26 3.53Franklin Templeton Investment Funds - Franklin Global Convertible Securities Fund -I H1- EUR - (0.600%) . . . . . . . Shares 151 883 44 836 EUR 11.08 1 682 863.64 6.46Franklin Templeton Investment Funds - Franklin K2 Long Short Credit Fund -I EUR-H1- EUR (hedged) - (1.750%) . . . . Shares 188 083 24 065 EUR 9.97 1 875 187.51 7.19Franklin Templeton Investment Funds - Franklin Strategic Income Fund -I- EUR (hedged) - (0.550%) . . . . . . . . . . . . . . Shares 212 912 717 081 EUR 10.93 2 327 128.16 8.93Franklin Templeton Investment Funds - Franklin U.S. Opportunities Fund -I- EUR - (0.700%) . . . . . . . . . . . . . Shares 41 307 5 404 27 977 EUR 33.05 1 365 196.35 5.24Franklin Templeton Investment Funds - Templeton Emerging Markets Bond Fund -I- EUR (hedged) - (0.700%) . Shares 44 481 36 450 145 614 EUR 12.56 558 681.36 2.14Franklin Templeton Investment Funds - Templeton Emerging Markets Smaller Companies Fund -I- EUR - (1.100%) . . . . . . . . . . . . . . . . . . . . . . . . . . . . . . . . . . . . . . . . Shares 3 419 86 102 EUR 15.09 51 592.71 0.20Franklin Templeton Investment Funds - Templeton European Corporate Bond Fund -I- EUR - (0.400%) . . . . . . . Shares 154 078 102 657 EUR 13.6 2 095 460.80 8.04Franklin Templeton Investment Funds - Templeton Global Bond (Euro) Fund -I- EUR - (0.550%) . . . . . . . . . . . . . Shares 54 444 125 687 71 243 EUR 15.99 870 559.56 3.34iShares eb.rexx Government Germany (DE) EUR - (0.160%) Shares 3 970 3 970 EUR 139.66 554 450.20 2.13iShares III PLC - iShares € Covered Bond UCITS ETF -Dist- EUR - (0.200%) . . . . . . . . . . . . . . . . . . . . . . . . . . . . . . Shares 4 394 4 394 EUR 154.05 676 895.70 2.60iShares III PLC - iShares Euro Corporate Bond ex-Financials 1-5yr UCITS ETF EUR - (0.200%) . . . . . . . . . . . . . . . . . . . . . Shares 8 182 8 182 EUR 109.01 891 919.82 3.42iShares IV plc - iShares $ Short Duration High Yield Corporate Bond UCITS ETF USD - (0.450%) . . . . . . . . . . . . Shares 5 104 8 385 3 281 EUR 77.27 394 386.08 1.51FRANKLIN LIBERTYSHARES ICAV - Franklin LibertyQ Emerging Markets UCITS ETF -USD Accumulation- USD - (0.550%) . . . . . . . . . . . . . . . . . . . . . . . . . . . . . . . . . . . . . . . . Shares 14 867 35 349 20 482 USD 22.798 295 892.70 1.13FRANKLIN LIBERTYSHARES ICAV - Franklin LibertyQ U.S. Equity UCITS ETF -USD ACC- USD - (0.250%) . . . . . . . Shares 50 473 4 976 15 592 USD 26.585 1 171 438.47 4.49Invesco Markets II plc - Invesco Emerging Markets USD Bond UCITS ETF USD - (0.350%) . . . . . . . . . . . . . . . . . Shares 17 999 55 280 37 281 USD 18.322 287 910.04 1.10 Total securities portfolio 24 059 257.72 92.29 Derivatives (Minus signs denote short positions)
Equity index derivatives 109 195.82 0.42Receivables/payables
Equity index futuresDJ Euro Stoxx 50 03/2019 (DB) . . . . . . . . . . . . . . . . . . . . . . . Count -80 80 44 179.80 0.17S & P MINI 500 Futures 03/2019 (DB) . . . . . . . . . . . . . . . . . . Count -22 22 65 016.02 0.25 Interest rate derivatives 34 211.44 0.13Receivables/payables
Interest rate futuresUS Treasury Notes 10 year Futures 03/2019 (DB) . . . . . . . . . Count 11 11 34 211.44 0.13
Investment portfolio – December 31, 2018
Count/ Quantity/ Purchases/ Sales/ Currency Market price Total market % ofDescription units/ principal additions disposals value in net assets currency amount in the reporting period EUR
db Advisory Multibrands – Franklin Templeton Global Conservative Portfolio
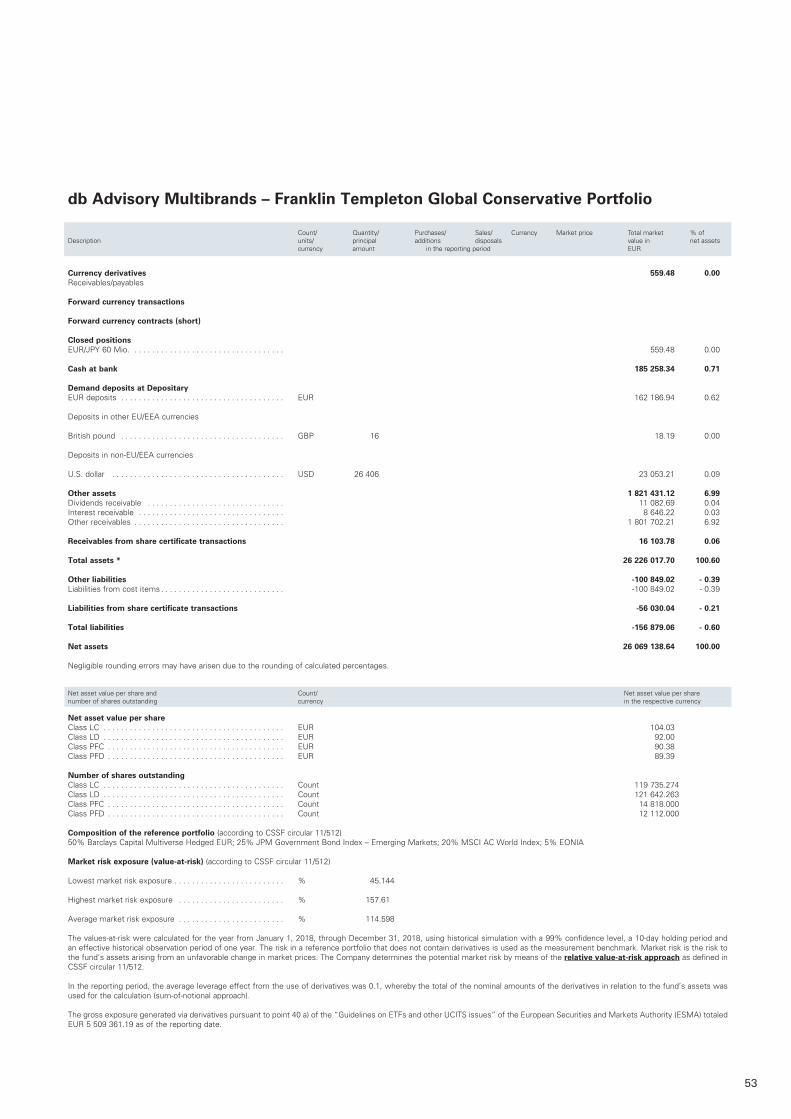
53
Currency derivatives 559.48 0.00Receivables/payables
Forward currency transactions
Forward currency contracts (short)
Closed positionsEUR/JPY 60 Mio. . . . . . . . . . . . . . . . . . . . . . . . . . . . . . . . . . . 559.48 0.00
Cash at bank 185 258.34 0.71 Demand deposits at Depositary EUR deposits . . . . . . . . . . . . . . . . . . . . . . . . . . . . . . . . . . . . . EUR 162 186.94 0.62
Deposits in other EU/EEA currencies
British pound . . . . . . . . . . . . . . . . . . . . . . . . . . . . . . . . . . . . . GBP 16 18.19 0.00
Deposits in non-EU/EEA currencies
U.S. dollar . . . . . . . . . . . . . . . . . . . . . . . . . . . . . . . . . . . . . . . USD 26 406 23 053.21 0.09
Other assets 1 821 431.12 6.99Dividends receivable . . . . . . . . . . . . . . . . . . . . . . . . . . . . . . . 11 082.69 0.04Interest receivable . . . . . . . . . . . . . . . . . . . . . . . . . . . . . . . . . 8 646.22 0.03Other receivables . . . . . . . . . . . . . . . . . . . . . . . . . . . . . . . . . . 1 801 702.21 6.92
Receivables from share certificate transactions 16 103.78 0.06 Total assets * 26 226 017.70 100.60 Other liabilities -100 849.02 - 0.39Liabilities from cost items . . . . . . . . . . . . . . . . . . . . . . . . . . . . -100 849.02 - 0.39 Liabilities from share certificate transactions -56 030.04 - 0.21
Total liabilities -156 879.06 - 0.60 Net assets 26 069 138.64 100.00 Negligible rounding errors may have arisen due to the rounding of calculated percentages.
Net asset value per share and Count/ Net asset value per sharenumber of shares outstanding currency in the respective currency
Net asset value per share Class LC . . . . . . . . . . . . . . . . . . . . . . . . . . . . . . . . . . . . . . . . . EUR 104.03Class LD . . . . . . . . . . . . . . . . . . . . . . . . . . . . . . . . . . . . . . . . . EUR 92.00Class PFC . . . . . . . . . . . . . . . . . . . . . . . . . . . . . . . . . . . . . . . . EUR 90.38Class PFD . . . . . . . . . . . . . . . . . . . . . . . . . . . . . . . . . . . . . . . . EUR 89.39 Number of shares outstanding Class LC . . . . . . . . . . . . . . . . . . . . . . . . . . . . . . . . . . . . . . . . . Count 119 735.274Class LD . . . . . . . . . . . . . . . . . . . . . . . . . . . . . . . . . . . . . . . . . Count 121 642.263Class PFC . . . . . . . . . . . . . . . . . . . . . . . . . . . . . . . . . . . . . . . . Count 14 818.000Class PFD . . . . . . . . . . . . . . . . . . . . . . . . . . . . . . . . . . . . . . . . Count 12 112.000 Composition of the reference portfolio (according to CSSF circular 11/512) 50% Barclays Capital Multiverse Hedged EUR; 25% JPM Government Bond Index – Emerging Markets; 20% MSCI AC World Index; 5% EONIA
Market risk exposure (value-at-risk) (according to CSSF circular 11/512) Lowest market risk exposure . . . . . . . . . . . . . . . . . . . . . . . . . % 45.144 Highest market risk exposure . . . . . . . . . . . . . . . . . . . . . . . . % 157.61 Average market risk exposure . . . . . . . . . . . . . . . . . . . . . . . . % 114.598
The values-at-risk were calculated for the year from January 1, 2018, through December 31, 2018, using historical simulation with a 99% confidence level, a 10-day holding period and an effective historical observation period of one year. The risk in a reference portfolio that does not contain derivatives is used as the measurement benchmark. Market risk is the risk to the fund’s assets arising from an unfavorable change in market prices. The Company determines the potential market risk by means of the relative value-at-risk approach as defined in CSSF circular 11/512.
In the reporting period, the average leverage effect from the use of derivatives was 0.1, whereby the total of the nominal amounts of the derivatives in relation to the fund’s assets was used for the calculation (sum-of-notional approach).
The gross exposure generated via derivatives pursuant to point 40 a) of the “Guidelines on ETFs and other UCITS issues” of the European Securities and Markets Authority (ESMA) totaled EUR 5 509 361.19 as of the reporting date.
db Advisory Multibrands – Franklin Templeton Global Conservative Portfolio
Count/ Quantity/ Purchases/ Sales/ Currency Market price Total market % ofDescription units/ principal additions disposals value in net assets currency amount in the reporting period EUR
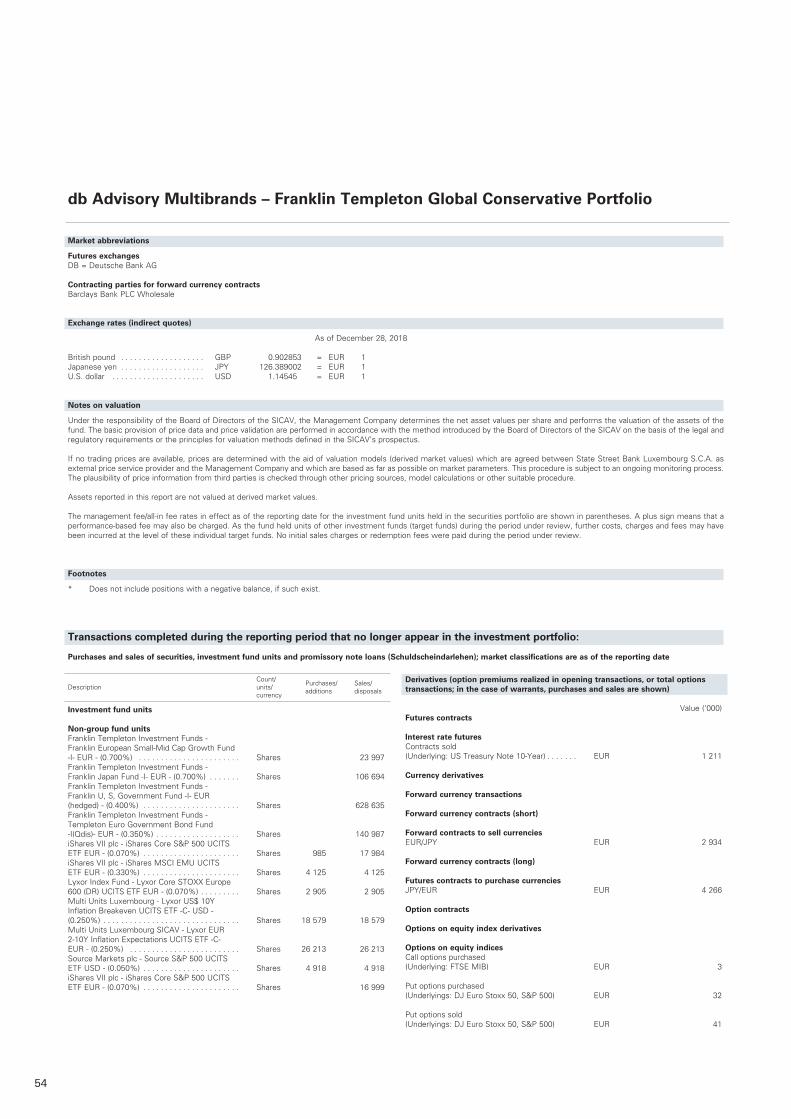
54
db Advisory Multibrands – Franklin Templeton Global Conservative Portfolio
Count/ Purchases/ Sales/ Description units/ additions disposals currency
Investment fund units Non-group fund units Franklin Templeton Investment Funds - Franklin European Small-Mid Cap Growth Fund -I- EUR - (0.700%) . . . . . . . . . . . . . . . . . . . . . . . Shares 23 997Franklin Templeton Investment Funds - Franklin Japan Fund -I- EUR - (0.700%) . . . . . . . Shares 106 694Franklin Templeton Investment Funds - Franklin U, S, Government Fund -I- EUR (hedged) - (0.400%) . . . . . . . . . . . . . . . . . . . . . . Shares 628 635Franklin Templeton Investment Funds - Templeton Euro Government Bond Fund -I(Qdis)- EUR - (0.350%) . . . . . . . . . . . . . . . . . . . Shares 140 987iShares VII plc - iShares Core S&P 500 UCITS ETF EUR - (0.070%) . . . . . . . . . . . . . . . . . . . . . . Shares 985 17 984iShares VII plc - iShares MSCI EMU UCITS ETF EUR - (0.330%) . . . . . . . . . . . . . . . . . . . . . . Shares 4 125 4 125Lyxor Index Fund - Lyxor Core STOXX Europe 600 (DR) UCITS ETF EUR - (0.070%) . . . . . . . . . Shares 2 905 2 905Multi Units Luxembourg - Lyxor US$ 10Y Inflation Breakeven UCITS ETF -C- USD - (0.250%) . . . . . . . . . . . . . . . . . . . . . . . . . . . . . . . Shares 18 579 18 579Multi Units Luxembourg SICAV - Lyxor EUR 2-10Y Inflation Expectations UCITS ETF -C- EUR - (0.250%) . . . . . . . . . . . . . . . . . . . . . . . . . Shares 26 213 26 213Source Markets plc - Source S&P 500 UCITS ETF USD - (0.050%) . . . . . . . . . . . . . . . . . . . . . . Shares 4 918 4 918iShares VII plc - iShares Core S&P 500 UCITS ETF EUR - (0.070%) . . . . . . . . . . . . . . . . . . . . . . Shares 16 999
Derivatives (option premiums realized in opening transactions, or total options transactions; in the case of warrants, purchases and sales are shown)
Value (’000) Futures contracts Interest rate futures Contracts sold (Underlying: US Treasury Note 10-Year) . . . . . . . EUR 1 211 Currency derivatives
Forward currency transactions
Forward currency contracts (short)
Forward contracts to sell currenciesEUR/JPY EUR 2 934 Forward currency contracts (long) Futures contracts to purchase currencies JPY/EUR EUR 4 266
Option contracts Options on equity index derivatives Options on equity indices Call options purchased (Underlying: FTSE MIB) EUR 3 Put options purchased (Underlyings: DJ Euro Stoxx 50, S&P 500) EUR 32 Put options sold (Underlyings: DJ Euro Stoxx 50, S&P 500) EUR 41
Transactions completed during the reporting period that no longer appear in the investment portfolio:
Purchases and sales of securities, investment fund units and promissory note loans (Schuldscheindarlehen); market classifications are as of the reporting date
Market abbreviations
Futures exchangesDB = Deutsche Bank AG
Contracting parties for forward currency contracts Barclays Bank PLC Wholesale
Exchange rates (indirect quotes)
As of December 28, 2018 British pound . . . . . . . . . . . . . . . . . . . GBP 0.902853 = EUR 1Japanese yen . . . . . . . . . . . . . . . . . . . JPY 126.389002 = EUR 1U.S. dollar . . . . . . . . . . . . . . . . . . . . . USD 1.14545 = EUR 1 Notes on valuation
Under the responsibility of the Board of Directors of the SICAV, the Management Company determines the net asset values per share and performs the valuation of the assets of the fund. The basic provision of price data and price validation are performed in accordance with the method introduced by the Board of Directors of the SICAV on the basis of the legal and regulatory requirements or the principles for valuation methods defined in the SICAV’s prospectus.
If no trading prices are available, prices are determined with the aid of valuation models (derived market values) which are agreed between State Street Bank Luxembourg S.C.A. as external price service provider and the Management Company and which are based as far as possible on market parameters. This procedure is subject to an ongoing monitoring process. The plausibility of price information from third parties is checked through other pricing sources, model calculations or other suitable procedure.
Assets reported in this report are not valued at derived market values.
The management fee/all-in fee rates in effect as of the reporting date for the investment fund units held in the securities portfolio are shown in parentheses. A plus sign means that a performance-based fee may also be charged. As the fund held units of other investment funds (target funds) during the period under review, further costs, charges and fees may have been incurred at the level of these individual target funds. No initial sales charges or redemption fees were paid during the period under review.
Footnotes
* Does not include positions with a negative balance, if such exist.
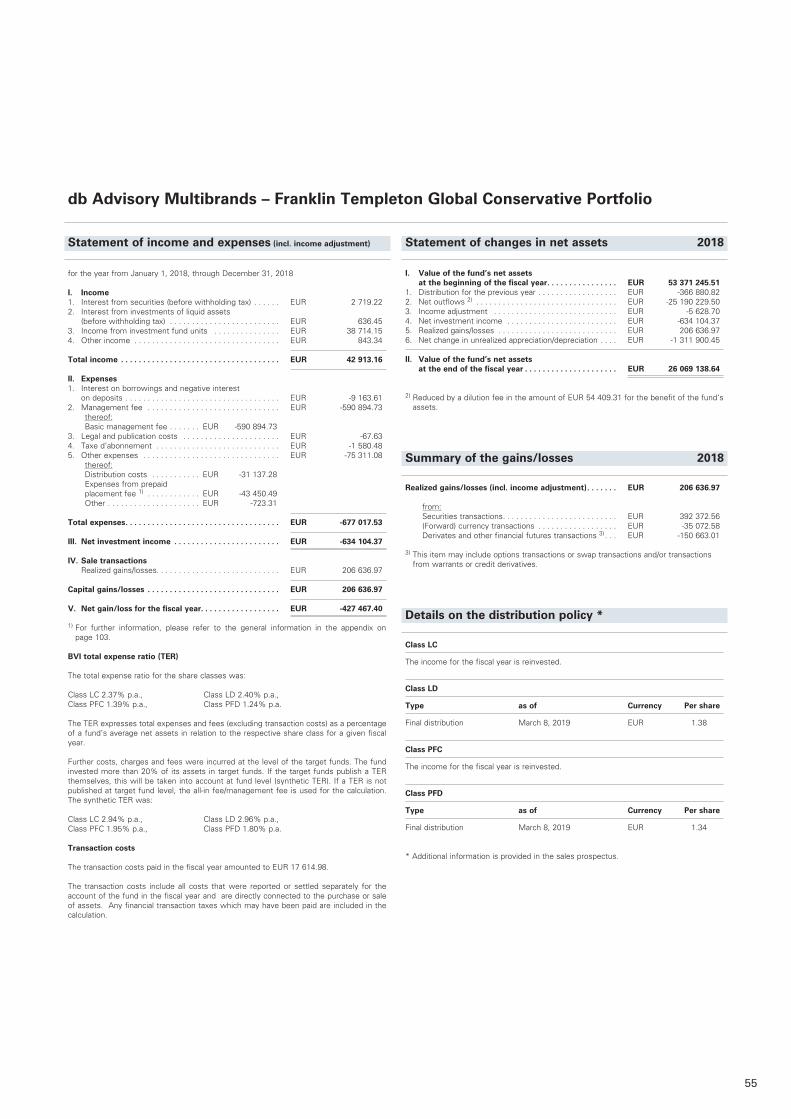
55
db Advisory Multibrands – Franklin Templeton Global Conservative Portfolio
Statement of income and expenses (incl. income adjustment)
I. Value of the fund’s net assets at the beginning of the fiscal year . . . . . . . . . . . . . . . . EUR 53 371 245.51
1. Distribution for the previous year . . . . . . . . . . . . . . . . . . EUR -366 880.822. Net outflows 2) . . . . . . . . . . . . . . . . . . . . . . . . . . . . . . . . EUR -25 190 229.503. Income adjustment . . . . . . . . . . . . . . . . . . . . . . . . . . . . EUR -5 628.704. Net investment income . . . . . . . . . . . . . . . . . . . . . . . . . EUR -634 104.375. Realized gains/losses . . . . . . . . . . . . . . . . . . . . . . . . . . . EUR 206 636.976. Net change in unrealized appreciation/depreciation . . . . EUR -1 311 900.45
II. Value of the fund’s net assets at the end of the fiscal year . . . . . . . . . . . . . . . . . . . . . EUR 26 069 138.64
2) Reduced by a dilution fee in the amount of EUR 54 409.31 for the benefit of the fund‘s assets.
Summary of the gains/losses 2018
Realized gains/losses (incl. income adjustment) . . . . . . . EUR 206 636.97
from: Securities transactions . . . . . . . . . . . . . . . . . . . . . . . . . . EUR 392 372.56 (Forward) currency transactions . . . . . . . . . . . . . . . . . . EUR -35 072.58 Derivates and other financial futures transactions 3) . . . EUR -150 663.01
3) This item may include options transactions or swap transactions and/or transactions from warrants or credit derivatives.
Details on the distribution policy *
Class LC
The income for the fiscal year is reinvested.
Class LD
Type as of Currency Per share
Final distribution March 8, 2019 EUR 1.38
Class PFC
The income for the fiscal year is reinvested.
Class PFD
Type as of Currency Per share
Final distribution March 8, 2019 EUR 1.34 * Additional information is provided in the sales prospectus.
Statement of changes in net assets 2018
for the year from January 1, 2018, through December 31, 2018
I. Income1. Interest from securities (before withholding tax) . . . . . . EUR 2 719.222. Interest from investments of liquid assets (before withholding tax) . . . . . . . . . . . . . . . . . . . . . . . . . EUR 636.453. Income from investment fund units . . . . . . . . . . . . . . . EUR 38 714.154. Other income . . . . . . . . . . . . . . . . . . . . . . . . . . . . . . . . . EUR 843.34
Total income . . . . . . . . . . . . . . . . . . . . . . . . . . . . . . . . . . . . EUR 42 913.16
II. Expenses1. Interest on borrowings and negative interest on deposits . . . . . . . . . . . . . . . . . . . . . . . . . . . . . . . . . . . EUR -9 163.612. Management fee . . . . . . . . . . . . . . . . . . . . . . . . . . . . . . EUR -590 894.73 thereof: Basic management fee . . . . . . . EUR -590 894.733. Legal and publication costs . . . . . . . . . . . . . . . . . . . . . . EUR -67.634. Taxe d’abonnement . . . . . . . . . . . . . . . . . . . . . . . . . . . . EUR -1 580.485. Other expenses . . . . . . . . . . . . . . . . . . . . . . . . . . . . . . . EUR -75 311.08 thereof: Distribution costs . . . . . . . . . . . EUR -31 137.28 Expenses from prepaid
placement fee 1) . . . . . . . . . . . . EUR -43 450.49 Other . . . . . . . . . . . . . . . . . . . . . EUR -723.31
Total expenses . . . . . . . . . . . . . . . . . . . . . . . . . . . . . . . . . . . EUR -677 017.53
III. Net investment income . . . . . . . . . . . . . . . . . . . . . . . . EUR -634 104.37
IV. Sale transactions Realized gains/losses. . . . . . . . . . . . . . . . . . . . . . . . . . . . EUR 206 636.97
Capital gains/losses . . . . . . . . . . . . . . . . . . . . . . . . . . . . . . EUR 206 636.97
V. Net gain/loss for the fiscal year. . . . . . . . . . . . . . . . . . EUR -427 467.40
1) For further information, please refer to the general information in the appendix on page 103.
BVI total expense ratio (TER) The total expense ratio for the share classes was: Class LC 2.37% p.a., Class LD 2.40% p.a., Class PFC 1.39% p.a., Class PFD 1.24% p.a.
The TER expresses total expenses and fees (excluding transaction costs) as a percentage of a fund’s average net assets in relation to the respective share class for a given fiscal year.
Further costs, charges and fees were incurred at the level of the target funds. The fund invested more than 20% of its assets in target funds. If the target funds publish a TER themselves, this will be taken into account at fund level (synthetic TER). If a TER is not published at target fund level, the all-in fee/management fee is used for the calculation. The synthetic TER was:
Class LC 2.94% p.a., Class LD 2.96% p.a.,Class PFC 1.95% p.a., Class PFD 1.80% p.a.
Transaction costs The transaction costs paid in the fiscal year amounted to EUR 17 614.98.
The transaction costs include all costs that were reported or settled separately for the account of the fund in the fiscal year and are directly connected to the purchase or sale of assets. Any financial transaction taxes which may have been paid are included in the calculation.
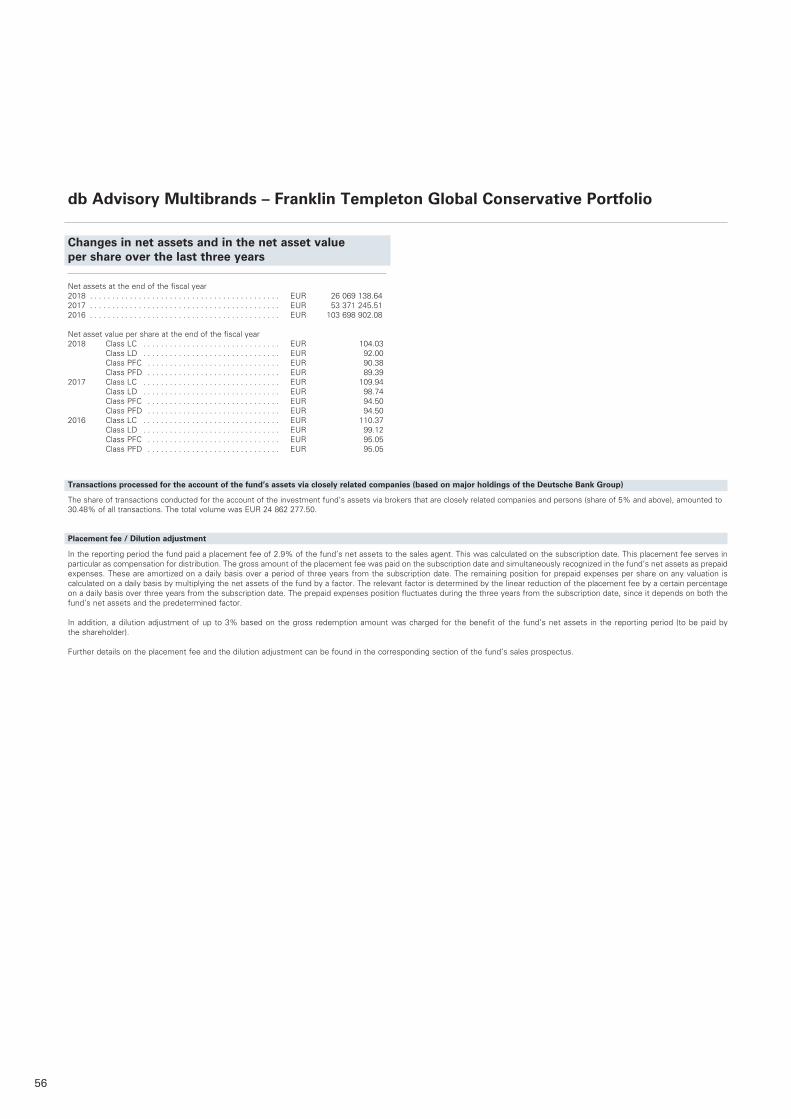
56
Changes in net assets and in the net asset value per share over the last three years
Net assets at the end of the fiscal year2018 . . . . . . . . . . . . . . . . . . . . . . . . . . . . . . . . . . . . . . . . . . . EUR 26 069 138 .642017 . . . . . . . . . . . . . . . . . . . . . . . . . . . . . . . . . . . . . . . . . . . EUR 53 371 245 .512016 . . . . . . . . . . . . . . . . . . . . . . . . . . . . . . . . . . . . . . . . . . . EUR 103 698 902 .08
Net asset value per share at the end of the fiscal year 2018 Class LC . . . . . . . . . . . . . . . . . . . . . . . . . . . . . . . EUR 104 .03 Class LD . . . . . . . . . . . . . . . . . . . . . . . . . . . . . . . EUR 92 .00 Class PFC . . . . . . . . . . . . . . . . . . . . . . . . . . . . . . EUR 90 .38 Class PFD . . . . . . . . . . . . . . . . . . . . . . . . . . . . . . EUR 89 .392017 Class LC . . . . . . . . . . . . . . . . . . . . . . . . . . . . . . . EUR 109 .94 Class LD . . . . . . . . . . . . . . . . . . . . . . . . . . . . . . . EUR 98 .74 Class PFC . . . . . . . . . . . . . . . . . . . . . . . . . . . . . . EUR 94 .50 Class PFD . . . . . . . . . . . . . . . . . . . . . . . . . . . . . . EUR 94 .502016 Class LC . . . . . . . . . . . . . . . . . . . . . . . . . . . . . . . EUR 110 .37 Class LD . . . . . . . . . . . . . . . . . . . . . . . . . . . . . . . EUR 99 .12 Class PFC . . . . . . . . . . . . . . . . . . . . . . . . . . . . . . EUR 95 .05 Class PFD . . . . . . . . . . . . . . . . . . . . . . . . . . . . . . EUR 95 .05
Transactions processed for the account of the fund’s assets via closely related companies (based on major holdings of the Deutsche Bank Group)
The share of transactions conducted for the account of the investment fund’s assets via brokers that are closely related companies and persons (share of 5% and above), amounted to 30 .48% of all transactions . The total volume was EUR 24 862 277 .50 .
Placement fee / Dilution adjustment
In the reporting period the fund paid a placement fee of 2 .9% of the fund’s net assets to the sales agent . This was calculated on the subscription date . This placement fee serves in particular as compensation for distribution . The gross amount of the placement fee was paid on the subscription date and simultaneously recognized in the fund’s net assets as prepaid expenses . These are amortized on a daily basis over a period of three years from the subscription date . The remaining position for prepaid expenses per share on any valuation is calculated on a daily basis by multiplying the net assets of the fund by a factor . The relevant factor is determined by the linear reduction of the placement fee by a certain percentage on a daily basis over three years from the subscription date . The prepaid expenses position fluctuates during the three years from the subscription date, since it depends on both the fund’s net assets and the predetermined factor . In addition, a dilution adjustment of up to 3% based on the gross redemption amount was charged for the benefit of the fund’s net assets in the reporting period (to be paid by the shareholder) . Further details on the placement fee and the dilution adjustment can be found in the corresponding section of the fund’s sales prospectus .
db Advisory Multibrands – Franklin Templeton Global Conservative Portfolio
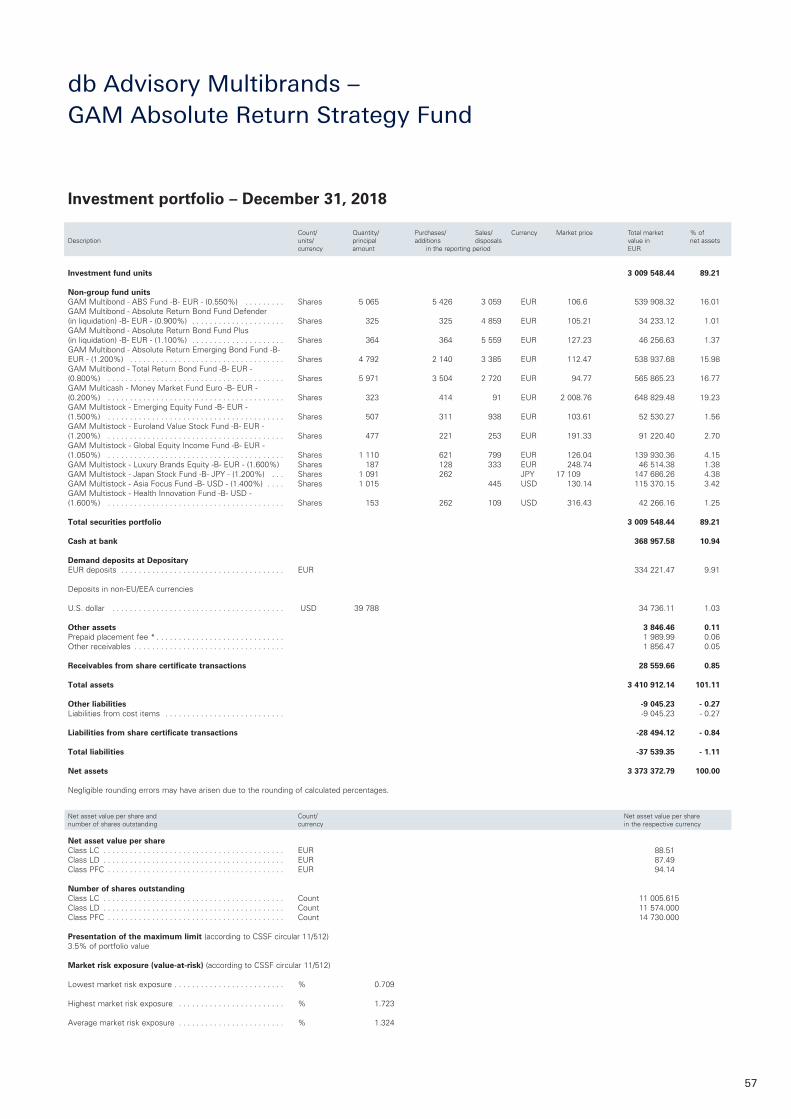
57
Investment fund units 3 009 548.44 89.21 Non-group fund unitsGAM Multibond - ABS Fund -B- EUR - (0.550%) . . . . . . . . . Shares 5 065 5 426 3 059 EUR 106.6 539 908.32 16.01GAM Multibond - Absolute Return Bond Fund Defender (in liquidation) -B- EUR - (0.900%) . . . . . . . . . . . . . . . . . . . . . Shares 325 325 4 859 EUR 105.21 34 233.12 1.01GAM Multibond - Absolute Return Bond Fund Plus (in liquidation) -B- EUR - (1.100%) . . . . . . . . . . . . . . . . . . . . . Shares 364 364 5 559 EUR 127.23 46 256.63 1.37GAM Multibond - Absolute Return Emerging Bond Fund -B- EUR - (1.200%) . . . . . . . . . . . . . . . . . . . . . . . . . . . . . . . . . . . Shares 4 792 2 140 3 385 EUR 112.47 538 937.68 15.98GAM Multibond - Total Return Bond Fund -B- EUR - (0.800%) . . . . . . . . . . . . . . . . . . . . . . . . . . . . . . . . . . . . . . . . Shares 5 971 3 504 2 720 EUR 94.77 565 865.23 16.77GAM Multicash - Money Market Fund Euro -B- EUR - (0.200%) . . . . . . . . . . . . . . . . . . . . . . . . . . . . . . . . . . . . . . . . Shares 323 414 91 EUR 2 008.76 648 829.48 19.23GAM Multistock - Emerging Equity Fund -B- EUR - (1.500%) . . . . . . . . . . . . . . . . . . . . . . . . . . . . . . . . . . . . . . . . Shares 507 311 938 EUR 103.61 52 530.27 1.56GAM Multistock - Euroland Value Stock Fund -B- EUR - (1.200%) . . . . . . . . . . . . . . . . . . . . . . . . . . . . . . . . . . . . . . . . Shares 477 221 253 EUR 191.33 91 220.40 2.70GAM Multistock - Global Equity Income Fund -B- EUR - (1.050%) . . . . . . . . . . . . . . . . . . . . . . . . . . . . . . . . . . . . . . . . Shares 1 110 621 799 EUR 126.04 139 930.36 4.15GAM Multistock - Luxury Brands Equity -B- EUR - (1.600%) Shares 187 128 333 EUR 248.74 46 514.38 1.38GAM Multistock - Japan Stock Fund -B- JPY - (1.200%) . . . Shares 1 091 262 JPY 17 109 147 686.26 4.38GAM Multistock - Asia Focus Fund -B- USD - (1.400%) . . . . Shares 1 015 445 USD 130.14 115 370.15 3.42GAM Multistock - Health Innovation Fund -B- USD - (1.600%) . . . . . . . . . . . . . . . . . . . . . . . . . . . . . . . . . . . . . . . . Shares 153 262 109 USD 316.43 42 266.16 1.25
Total securities portfolio 3 009 548.44 89.21
Cash at bank 368 957.58 10.94
Demand deposits at Depositary EUR deposits . . . . . . . . . . . . . . . . . . . . . . . . . . . . . . . . . . . . . EUR 334 221.47 9.91
Deposits in non-EU/EEA currencies
U.S. dollar . . . . . . . . . . . . . . . . . . . . . . . . . . . . . . . . . . . . . . . USD 39 788 34 736.11 1.03 Other assets 3 846.46 0.11Prepaid placement fee * . . . . . . . . . . . . . . . . . . . . . . . . . . . . . 1 989.99 0.06Other receivables . . . . . . . . . . . . . . . . . . . . . . . . . . . . . . . . . . 1 856.47 0.05 Receivables from share certificate transactions 28 559.66 0.85
Total assets 3 410 912.14 101.11
Other liabilities -9 045.23 - 0.27Liabilities from cost items . . . . . . . . . . . . . . . . . . . . . . . . . . . -9 045.23 - 0.27 Liabilities from share certificate transactions -28 494.12 - 0.84
Total liabilities -37 539.35 - 1.11 Net assets 3 373 372.79 100.00 Negligible rounding errors may have arisen due to the rounding of calculated percentages.
Net asset value per share and Count/ Net asset value per sharenumber of shares outstanding currency in the respective currency
Net asset value per share Class LC . . . . . . . . . . . . . . . . . . . . . . . . . . . . . . . . . . . . . . . . . EUR 88.51Class LD . . . . . . . . . . . . . . . . . . . . . . . . . . . . . . . . . . . . . . . . . EUR 87.49Class PFC . . . . . . . . . . . . . . . . . . . . . . . . . . . . . . . . . . . . . . . . EUR 94.14 Number of shares outstanding Class LC . . . . . . . . . . . . . . . . . . . . . . . . . . . . . . . . . . . . . . . . . Count 11 005.615Class LD . . . . . . . . . . . . . . . . . . . . . . . . . . . . . . . . . . . . . . . . . Count 11 574.000Class PFC . . . . . . . . . . . . . . . . . . . . . . . . . . . . . . . . . . . . . . . . Count 14 730.000
Presentation of the maximum limit (according to CSSF circular 11/512)3.5% of portfolio value
Market risk exposure (value-at-risk) (according to CSSF circular 11/512) Lowest market risk exposure . . . . . . . . . . . . . . . . . . . . . . . . . % 0.709 Highest market risk exposure . . . . . . . . . . . . . . . . . . . . . . . . % 1.723 Average market risk exposure . . . . . . . . . . . . . . . . . . . . . . . . % 1.324
Investment portfolio – December 31, 2018
Count/ Quantity/ Purchases/ Sales/ Currency Market price Total market % ofDescription units/ principal additions disposals value in net assets currency amount in the reporting period EUR
db Advisory Multibrands – GAM Absolute Return Strategy Fund
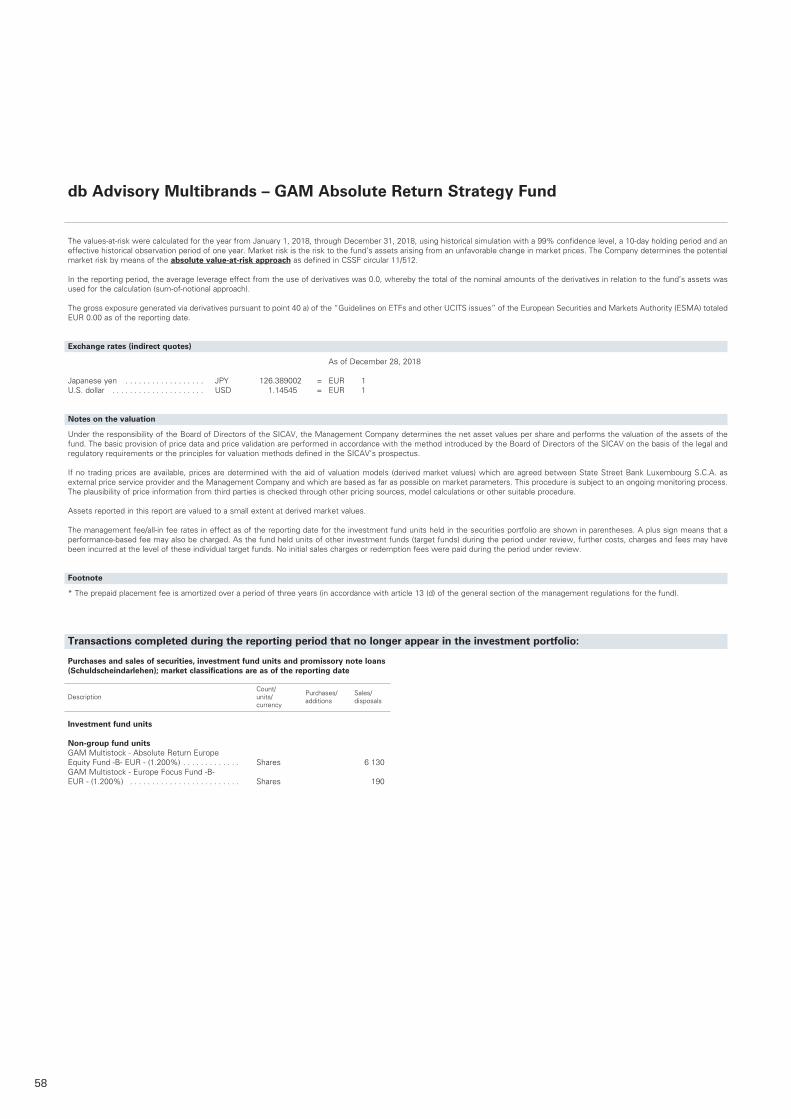
58
The values-at-risk were calculated for the year from January 1, 2018, through December 31, 2018, using historical simulation with a 99% confidence level, a 10-day holding period and an effective historical observation period of one year. Market risk is the risk to the fund’s assets arising from an unfavorable change in market prices. The Company determines the potential market risk by means of the absolute value-at-risk approach as defined in CSSF circular 11/512.
In the reporting period, the average leverage effect from the use of derivatives was 0.0, whereby the total of the nominal amounts of the derivatives in relation to the fund’s assets was used for the calculation (sum-of-notional approach).
The gross exposure generated via derivatives pursuant to point 40 a) of the “Guidelines on ETFs and other UCITS issues” of the European Securities and Markets Authority (ESMA) totaled EUR 0.00 as of the reporting date.
Exchange rates (indirect quotes)
As of December 28, 2018 Japanese yen . . . . . . . . . . . . . . . . . . JPY 126.389002 = EUR 1 U.S. dollar . . . . . . . . . . . . . . . . . . . . . USD 1.14545 = EUR 1
Notes on the valuation
Under the responsibility of the Board of Directors of the SICAV, the Management Company determines the net asset values per share and performs the valuation of the assets of the fund. The basic provision of price data and price validation are performed in accordance with the method introduced by the Board of Directors of the SICAV on the basis of the legal and regulatory requirements or the principles for valuation methods defined in the SICAV’s prospectus.
If no trading prices are available, prices are determined with the aid of valuation models (derived market values) which are agreed between State Street Bank Luxembourg S.C.A. as external price service provider and the Management Company and which are based as far as possible on market parameters. This procedure is subject to an ongoing monitoring process. The plausibility of price information from third parties is checked through other pricing sources, model calculations or other suitable procedure.
Assets reported in this report are valued to a small extent at derived market values.
The management fee/all-in fee rates in effect as of the reporting date for the investment fund units held in the securities portfolio are shown in parentheses. A plus sign means that a performance-based fee may also be charged. As the fund held units of other investment funds (target funds) during the period under review, further costs, charges and fees may have been incurred at the level of these individual target funds. No initial sales charges or redemption fees were paid during the period under review.
Footnote
* The prepaid placement fee is amortized over a period of three years (in accordance with article 13 (d) of the general section of the management regulations for the fund).
db Advisory Multibrands – GAM Absolute Return Strategy Fund
Count/ Purchases/ Sales/ Description units/ additions disposals currency
Transactions completed during the reporting period that no longer appear in the investment portfolio:
Purchases and sales of securities, investment fund units and promissory note loans (Schuldscheindarlehen); market classifications are as of the reporting date
Investment fund units
Non-group fund unitsGAM Multistock - Absolute Return Europe Equity Fund -B- EUR - (1.200%) . . . . . . . . . . . . . Shares 6 130GAM Multistock - Europe Focus Fund -B- EUR - (1.200%) . . . . . . . . . . . . . . . . . . . . . . . . . Shares 190
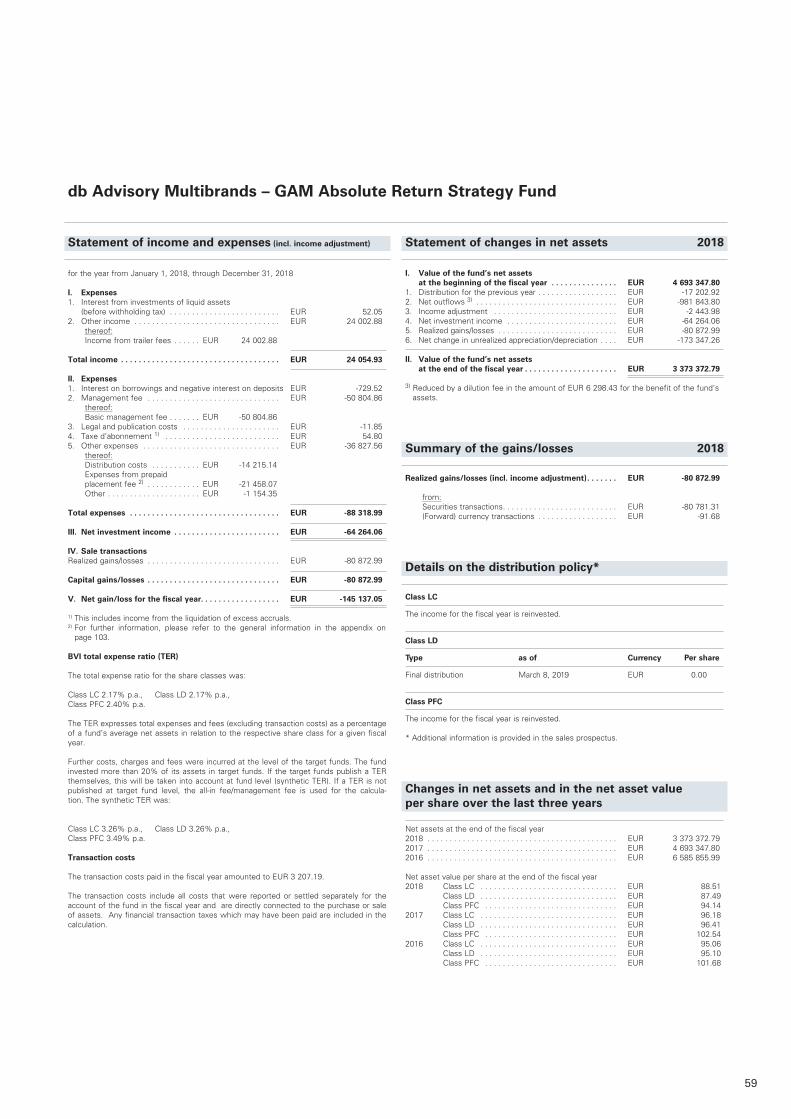
59
Statement of income and expenses (incl. income adjustment)
I. Value of the fund’s net assets at the beginning of the fiscal year . . . . . . . . . . . . . . . EUR 4 693 347.80
1. Distribution for the previous year . . . . . . . . . . . . . . . . . . EUR -17 202.922. Net outflows 3) . . . . . . . . . . . . . . . . . . . . . . . . . . . . . . . . EUR -981 843.803. Income adjustment . . . . . . . . . . . . . . . . . . . . . . . . . . . . EUR -2 443.984. Net investment income . . . . . . . . . . . . . . . . . . . . . . . . . EUR -64 264.065. Realized gains/losses . . . . . . . . . . . . . . . . . . . . . . . . . . . EUR -80 872.996. Net change in unrealized appreciation/depreciation . . . . EUR -173 347.26
II. Value of the fund’s net assets at the end of the fiscal year . . . . . . . . . . . . . . . . . . . . . EUR 3 373 372.79
3) Reduced by a dilution fee in the amount of EUR 6 298.43 for the benefit of the fund‘s assets.
Summary of the gains/losses 2018
Realized gains/losses (incl. income adjustment) . . . . . . . EUR -80 872.99
from: Securities transactions . . . . . . . . . . . . . . . . . . . . . . . . . . EUR -80 781.31 (Forward) currency transactions . . . . . . . . . . . . . . . . . . EUR -91.68
Details on the distribution policy*
Class LC
The income for the fiscal year is reinvested.
Class LD
Type as of Currency Per share
Final distribution March 8, 2019 EUR 0.00
Class PFC
The income for the fiscal year is reinvested. * Additional information is provided in the sales prospectus.
Changes in net assets and in the net asset value per share over the last three years
Net assets at the end of the fiscal year 2018 . . . . . . . . . . . . . . . . . . . . . . . . . . . . . . . . . . . . . . . . . . . EUR 3 373 372.792017 . . . . . . . . . . . . . . . . . . . . . . . . . . . . . . . . . . . . . . . . . . . EUR 4 693 347.802016 . . . . . . . . . . . . . . . . . . . . . . . . . . . . . . . . . . . . . . . . . . . EUR 6 585 855.99
Net asset value per share at the end of the fiscal year 2018 Class LC . . . . . . . . . . . . . . . . . . . . . . . . . . . . . . . EUR 88.51 Class LD . . . . . . . . . . . . . . . . . . . . . . . . . . . . . . . EUR 87.49 Class PFC . . . . . . . . . . . . . . . . . . . . . . . . . . . . . . EUR 94.142017 Class LC . . . . . . . . . . . . . . . . . . . . . . . . . . . . . . . EUR 96.18 Class LD . . . . . . . . . . . . . . . . . . . . . . . . . . . . . . . EUR 96.41 Class PFC . . . . . . . . . . . . . . . . . . . . . . . . . . . . . . EUR 102.542016 Class LC . . . . . . . . . . . . . . . . . . . . . . . . . . . . . . . EUR 95.06 Class LD . . . . . . . . . . . . . . . . . . . . . . . . . . . . . . . EUR 95.10 Class PFC . . . . . . . . . . . . . . . . . . . . . . . . . . . . . . EUR 101.68
Statement of changes in net assets 2018
for the year from January 1, 2018, through December 31, 2018
I. Expenses1. Interest from investments of liquid assets (before withholding tax) . . . . . . . . . . . . . . . . . . . . . . . . . EUR 52.052. Other income . . . . . . . . . . . . . . . . . . . . . . . . . . . . . . . . . EUR 24 002.88 thereof: Income from trailer fees . . . . . . EUR 24 002.88
Total income . . . . . . . . . . . . . . . . . . . . . . . . . . . . . . . . . . . . EUR 24 054.93
II. Expenses1. Interest on borrowings and negative interest on deposits EUR -729.522. Management fee . . . . . . . . . . . . . . . . . . . . . . . . . . . . . . EUR -50 804.86 thereof: Basic management fee . . . . . . . EUR -50 804.863. Legal and publication costs . . . . . . . . . . . . . . . . . . . . . . EUR -11.854. Taxe d’abonnement 1) . . . . . . . . . . . . . . . . . . . . . . . . . . EUR 54.805. Other expenses . . . . . . . . . . . . . . . . . . . . . . . . . . . . . . . EUR -36 827.56 thereof: Distribution costs . . . . . . . . . . . EUR -14 215.14 Expenses from prepaid
placement fee 2) . . . . . . . . . . . . EUR -21 458.07 Other . . . . . . . . . . . . . . . . . . . . . EUR -1 154.35
Total expenses . . . . . . . . . . . . . . . . . . . . . . . . . . . . . . . . . . EUR -88 318.99
III. Net investment income . . . . . . . . . . . . . . . . . . . . . . . . EUR -64 264.06
IV. Sale transactionsRealized gains/losses . . . . . . . . . . . . . . . . . . . . . . . . . . . . . . EUR -80 872.99
Capital gains/losses . . . . . . . . . . . . . . . . . . . . . . . . . . . . . . EUR -80 872.99
V. Net gain/loss for the fiscal year. . . . . . . . . . . . . . . . . . EUR -145 137.05
1) This includes income from the liquidation of excess accruals.2) For further information, please refer to the general information in the appendix on
page 103.
BVI total expense ratio (TER) The total expense ratio for the share classes was:
Class LC 2.17% p.a., Class LD 2.17% p.a.,Class PFC 2.40% p.a. The TER expresses total expenses and fees (excluding transaction costs) as a percentage of a fund’s average net assets in relation to the respective share class for a given fiscal year. Further costs, charges and fees were incurred at the level of the target funds. The fund invested more than 20% of its assets in target funds. If the target funds publish a TER themselves, this will be taken into account at fund level (synthetic TER). If a TER is not published at target fund level, the all-in fee/management fee is used for the calcula-tion. The synthetic TER was: Class LC 3.26% p.a., Class LD 3.26% p.a.,Class PFC 3.49% p.a.
Transaction costs
The transaction costs paid in the fiscal year amounted to EUR 3 207.19.
The transaction costs include all costs that were reported or settled separately for the account of the fund in the fiscal year and are directly connected to the purchase or sale of assets. Any financial transaction taxes which may have been paid are included in the calculation.
db Advisory Multibrands – GAM Absolute Return Strategy Fund
60
Transactions processed for the account of the fund’s assets via closely related companies (based on major holdings of the Deutsche Bank Group)
The share of transactions conducted for the account of the investment fund’s assets via brokers that are closely related companies and persons (share of 5% and above), amounted to 0.00% of all transactions. The total volume was EUR 0.00.
Placement fee / Dilution adjustment
In the reporting period the fund paid a placement fee of 2.9% of the fund’s net assets to the sales agent. This was calculated on the subscription date. This placement fee serves in particular as compensation for distribution. The gross amount of the placement fee was paid on the subscription date and simultaneously recognized in the fund’s net assets as prepaid expenses. These are amortized on a daily basis over a period of three years from the subscription date. The remaining position for prepaid expenses per share on any valuation is calculated on a daily basis by multiplying the net assets of the fund by a factor. The relevant factor is determined by the linear reduction of the placement fee by a certain percentage on a daily basis over three years from the subscription date. The prepaid expenses position fluctuates during the three years from the subscription date, since it depends on both the fund’s net assets and the predetermined factor. In addition, a dilution adjustment of up to 3% based on the gross redemption amount was charged for the benefit of the fund’s net assets in the reporting period (to be paid by the shareholder). Further details on the placement fee and the dilution adjustment can be found in the corresponding section of the fund’s sales prospectus.
db Advisory Multibrands – GAM Absolute Return Strategy Fund
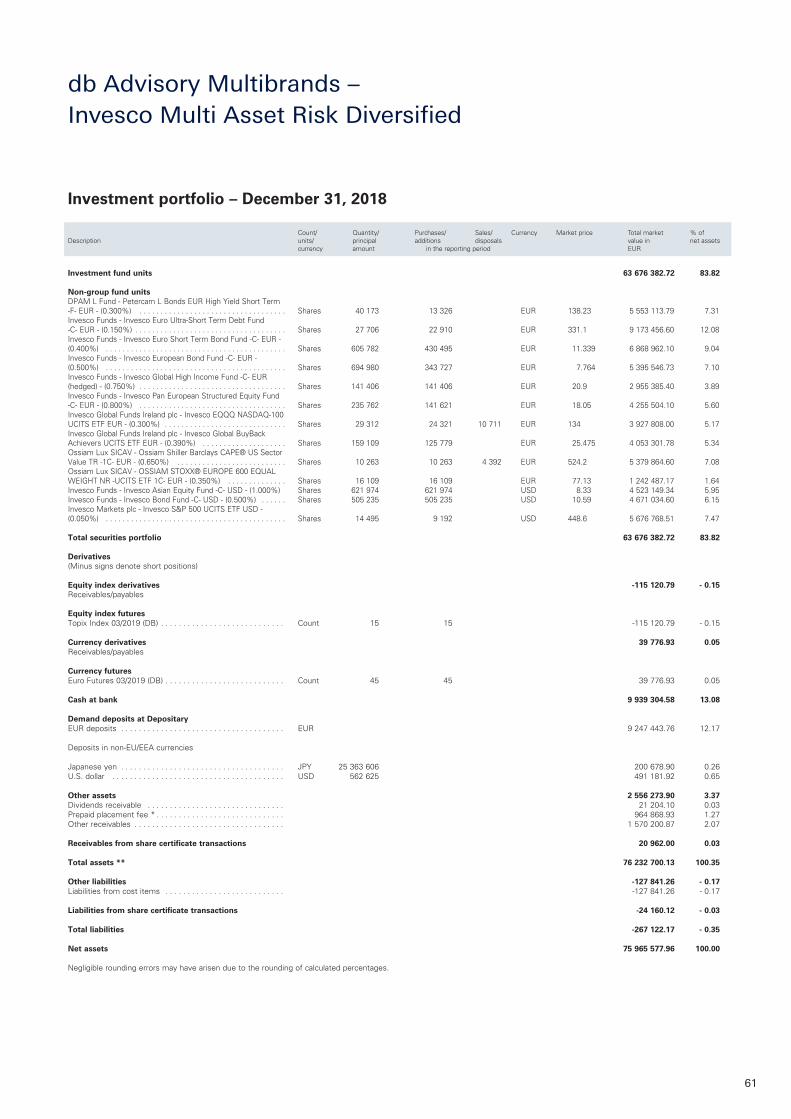
61
Investment fund units 63 676 382.72 83.82 Non-group fund units DPAM L Fund - Petercam L Bonds EUR High Yield Short Term -F- EUR - (0.300%) . . . . . . . . . . . . . . . . . . . . . . . . . . . . . . . . . . . Shares 40 173 13 326 EUR 138.23 5 553 113.79 7.31Invesco Funds - Invesco Euro Ultra-Short Term Debt Fund -C- EUR - (0.150%) . . . . . . . . . . . . . . . . . . . . . . . . . . . . . . . . . . . . Shares 27 706 22 910 EUR 331.1 9 173 456.60 12.08Invesco Funds - Invesco Euro Short Term Bond Fund -C- EUR - (0.400%) . . . . . . . . . . . . . . . . . . . . . . . . . . . . . . . . . . . . . . . . . . . Shares 605 782 430 495 EUR 11.339 6 868 962.10 9.04Invesco Funds - Invesco European Bond Fund -C- EUR - (0.500%) . . . . . . . . . . . . . . . . . . . . . . . . . . . . . . . . . . . . . . . . . . . Shares 694 980 343 727 EUR 7.764 5 395 546.73 7.10Invesco Funds - Invesco Global High Income Fund -C- EUR (hedged) - (0.750%) . . . . . . . . . . . . . . . . . . . . . . . . . . . . . . . . . . . Shares 141 406 141 406 EUR 20.9 2 955 385.40 3.89Invesco Funds - Invesco Pan European Structured Equity Fund -C- EUR - (0.800%) . . . . . . . . . . . . . . . . . . . . . . . . . . . . . . . . . . . Shares 235 762 141 621 EUR 18.05 4 255 504.10 5.60Invesco Global Funds Ireland plc - Invesco EQQQ NASDAQ-100 UCITS ETF EUR - (0.300%) . . . . . . . . . . . . . . . . . . . . . . . . . . . . . Shares 29 312 24 321 10 711 EUR 134 3 927 808.00 5.17Invesco Global Funds Ireland plc - Invesco Global BuyBack Achievers UCITS ETF EUR - (0.390%) . . . . . . . . . . . . . . . . . . . . Shares 159 109 125 779 EUR 25.475 4 053 301.78 5.34Ossiam Lux SICAV - Ossiam Shiller Barclays CAPE® US Sector Value TR -1C- EUR - (0.650%) . . . . . . . . . . . . . . . . . . . . . . . . . . Shares 10 263 10 263 4 392 EUR 524.2 5 379 864.60 7.08Ossiam Lux SICAV - OSSIAM STOXX® EUROPE 600 EQUAL WEIGHT NR -UCITS ETF 1C- EUR - (0.350%) . . . . . . . . . . . . . . Shares 16 109 16 109 EUR 77.13 1 242 487.17 1.64Invesco Funds - Invesco Asian Equity Fund -C- USD - (1.000%) Shares 621 974 621 974 USD 8.33 4 523 149.34 5.95Invesco Funds - Invesco Bond Fund -C- USD - (0.500%) . . . . . . Shares 505 235 505 235 USD 10.59 4 671 034.60 6.15Invesco Markets plc - Invesco S&P 500 UCITS ETF USD - (0.050%) . . . . . . . . . . . . . . . . . . . . . . . . . . . . . . . . . . . . . . . . . . . Shares 14 495 9 192 USD 448.6 5 676 768.51 7.47 Total securities portfolio 63 676 382.72 83.82 Derivatives (Minus signs denote short positions) Equity index derivatives -115 120.79 - 0.15Receivables/payables
Equity index futures Topix Index 03/2019 (DB) . . . . . . . . . . . . . . . . . . . . . . . . . . . . Count 15 15 -115 120.79 - 0.15 Currency derivatives 39 776.93 0.05Receivables/payables Currency futures Euro Futures 03/2019 (DB) . . . . . . . . . . . . . . . . . . . . . . . . . . . Count 45 45 39 776.93 0.05 Cash at bank 9 939 304.58 13.08 Demand deposits at Depositary EUR deposits . . . . . . . . . . . . . . . . . . . . . . . . . . . . . . . . . . . . . EUR 9 247 443.76 12.17 Deposits in non-EU/EEA currencies Japanese yen . . . . . . . . . . . . . . . . . . . . . . . . . . . . . . . . . . . . . JPY 25 363 606 200 678.90 0.26U.S. dollar . . . . . . . . . . . . . . . . . . . . . . . . . . . . . . . . . . . . . . . USD 562 625 491 181.92 0.65 Other assets 2 556 273.90 3.37Dividends receivable . . . . . . . . . . . . . . . . . . . . . . . . . . . . . . . 21 204.10 0.03Prepaid placement fee * . . . . . . . . . . . . . . . . . . . . . . . . . . . . . 964 868.93 1.27Other receivables . . . . . . . . . . . . . . . . . . . . . . . . . . . . . . . . . . 1 570 200.87 2.07 Receivables from share certificate transactions 20 962.00 0.03 Total assets ** 76 232 700.13 100.35 Other liabilities -127 841.26 - 0.17Liabilities from cost items . . . . . . . . . . . . . . . . . . . . . . . . . . . -127 841.26 - 0.17 Liabilities from share certificate transactions -24 160.12 - 0.03 Total liabilities -267 122.17 - 0.35 Net assets 75 965 577.96 100.00 Negligible rounding errors may have arisen due to the rounding of calculated percentages.
Investment portfolio – December 31, 2018
Count/ Quantity/ Purchases/ Sales/ Currency Market price Total market % ofDescription units/ principal additions disposals value in net assets currency amount in the reporting period EUR
db Advisory Multibrands – Invesco Multi Asset Risk Diversified
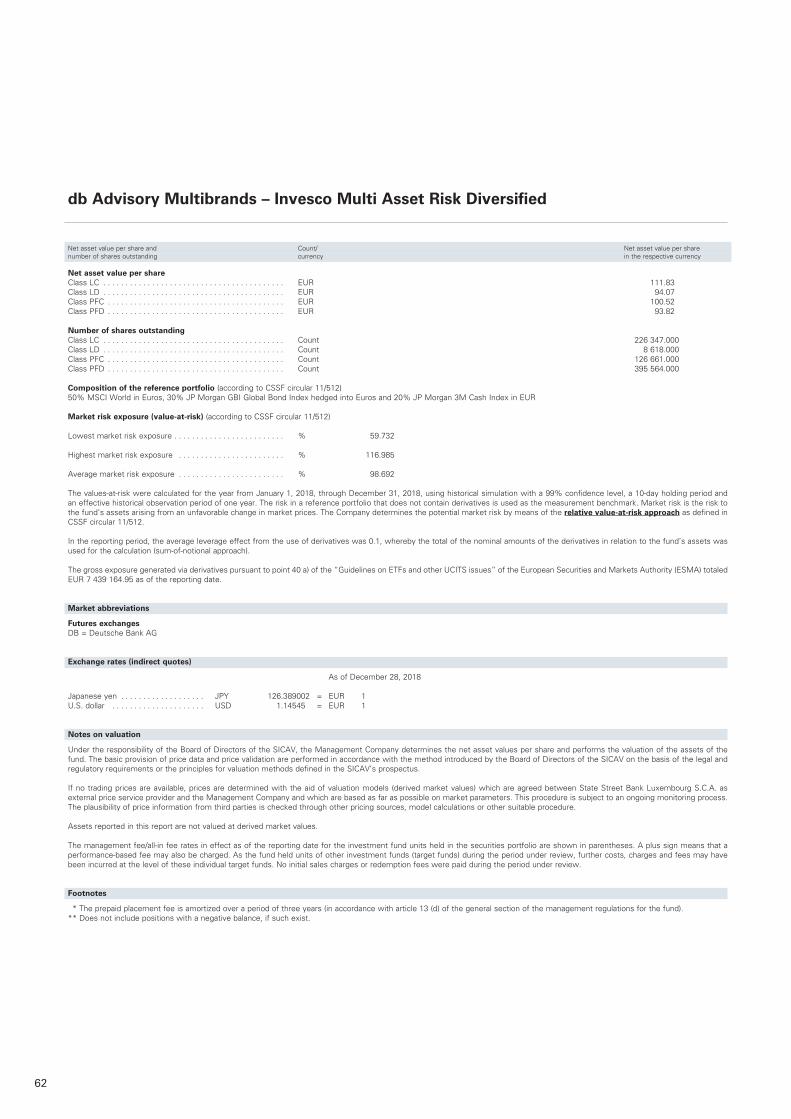
62
Net asset value per share and Count/ Net asset value per sharenumber of shares outstanding currency in the respective currency
Net asset value per share Class LC . . . . . . . . . . . . . . . . . . . . . . . . . . . . . . . . . . . . . . . . . EUR 111 .83Class LD . . . . . . . . . . . . . . . . . . . . . . . . . . . . . . . . . . . . . . . . . EUR 94 .07Class PFC . . . . . . . . . . . . . . . . . . . . . . . . . . . . . . . . . . . . . . . . EUR 100 .52Class PFD . . . . . . . . . . . . . . . . . . . . . . . . . . . . . . . . . . . . . . . . EUR 93 .82 Number of shares outstanding Class LC . . . . . . . . . . . . . . . . . . . . . . . . . . . . . . . . . . . . . . . . . Count 226 347 .000Class LD . . . . . . . . . . . . . . . . . . . . . . . . . . . . . . . . . . . . . . . . . Count 8 618 .000Class PFC . . . . . . . . . . . . . . . . . . . . . . . . . . . . . . . . . . . . . . . . Count 126 661 .000Class PFD . . . . . . . . . . . . . . . . . . . . . . . . . . . . . . . . . . . . . . . . Count 395 564 .000 Composition of the reference portfolio (according to CSSF circular 11/512) 50% MSCI World in Euros, 30% JP Morgan GBI Global Bond Index hedged into Euros and 20% JP Morgan 3M Cash Index in EUR Market risk exposure (value-at-risk) (according to CSSF circular 11/512) Lowest market risk exposure . . . . . . . . . . . . . . . . . . . . . . . . . % 59 .732 Highest market risk exposure . . . . . . . . . . . . . . . . . . . . . . . . % 116 .985 Average market risk exposure . . . . . . . . . . . . . . . . . . . . . . . . % 98 .692
The values-at-risk were calculated for the year from January 1, 2018, through December 31, 2018, using historical simulation with a 99% confidence level, a 10-day holding period and an effective historical observation period of one year . The risk in a reference portfolio that does not contain derivatives is used as the measurement benchmark . Market risk is the risk to the fund’s assets arising from an unfavorable change in market prices . The Company determines the potential market risk by means of the relative value-at-risk approach as defined in CSSF circular 11/512 . In the reporting period, the average leverage effect from the use of derivatives was 0 .1, whereby the total of the nominal amounts of the derivatives in relation to the fund’s assets was used for the calculation (sum-of-notional approach) . The gross exposure generated via derivatives pursuant to point 40 a) of the “Guidelines on ETFs and other UCITS issues” of the European Securities and Markets Authority (ESMA) totaled EUR 7 439 164 .95 as of the reporting date .
Market abbreviations
Futures exchanges DB = Deutsche Bank AG Exchange rates (indirect quotes)
As of December 28, 2018 Japanese yen . . . . . . . . . . . . . . . . . . . JPY 126 .389002 = EUR 1U .S . dollar . . . . . . . . . . . . . . . . . . . . . USD 1 .14545 = EUR 1
Notes on valuation
Under the responsibility of the Board of Directors of the SICAV, the Management Company determines the net asset values per share and performs the valuation of the assets of the fund . The basic provision of price data and price validation are performed in accordance with the method introduced by the Board of Directors of the SICAV on the basis of the legal and regulatory requirements or the principles for valuation methods defined in the SICAV’s prospectus . If no trading prices are available, prices are determined with the aid of valuation models (derived market values) which are agreed between State Street Bank Luxembourg S .C .A . as external price service provider and the Management Company and which are based as far as possible on market parameters . This procedure is subject to an ongoing monitoring process . The plausibility of price information from third parties is checked through other pricing sources, model calculations or other suitable procedure . Assets reported in this report are not valued at derived market values . The management fee/all-in fee rates in effect as of the reporting date for the investment fund units held in the securities portfolio are shown in parentheses . A plus sign means that a performance-based fee may also be charged . As the fund held units of other investment funds (target funds) during the period under review, further costs, charges and fees may have been incurred at the level of these individual target funds . No initial sales charges or redemption fees were paid during the period under review .
Footnotes
* The prepaid placement fee is amortized over a period of three years (in accordance with article 13 (d) of the general section of the management regulations for the fund) . ** Does not include positions with a negative balance, if such exist .
db Advisory Multibrands – Invesco Multi Asset Risk Diversified
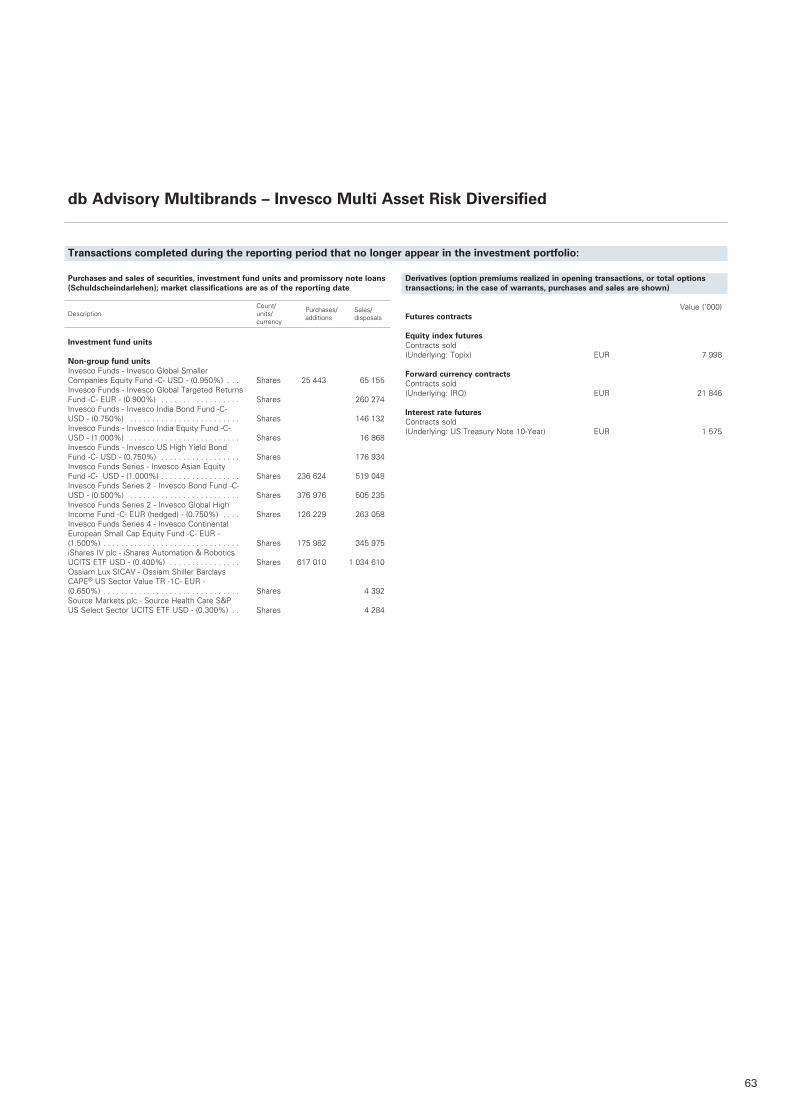
63
Transactions completed during the reporting period that no longer appear in the investment portfolio:
db Advisory Multibrands – Invesco Multi Asset Risk Diversified
Purchases and sales of securities, investment fund units and promissory note loans (Schuldscheindarlehen); market classifications are as of the reporting date
Count/ Purchases/ Sales/ Description units/ additions disposals currency
Investment fund units
Non-group fund unitsInvesco Funds - Invesco Global Smaller Companies Equity Fund -C- USD - (0.950%) . . . Shares 25 443 65 155Invesco Funds - Invesco Global Targeted Returns Fund -C- EUR - (0.900%) . . . . . . . . . . . . . . . . . . Shares 260 274Invesco Funds - Invesco India Bond Fund -C- USD - (0.750%) . . . . . . . . . . . . . . . . . . . . . . . . . Shares 146 132Invesco Funds - Invesco India Equity Fund -C- USD - (1.000%) . . . . . . . . . . . . . . . . . . . . . . . . . Shares 16 868Invesco Funds - Invesco US High Yield Bond Fund -C- USD - (0.750%) . . . . . . . . . . . . . . . . . . Shares 176 934Invesco Funds Series - Invesco Asian Equity Fund -C- USD - (1.000%) . . . . . . . . . . . . . . . . . . Shares 236 624 519 048Invesco Funds Series 2 - Invesco Bond Fund -C- USD - (0.500%) . . . . . . . . . . . . . . . . . . . . . . . . . Shares 376 976 505 235Invesco Funds Series 2 - Invesco Global High Income Fund -C- EUR (hedged) - (0.750%) . . . . Shares 126 229 263 058Invesco Funds Series 4 - Invesco Continental European Small Cap Equity Fund -C- EUR - (1.500%) . . . . . . . . . . . . . . . . . . . . . . . . . . . . . . . Shares 175 982 345 975iShares IV plc - iShares Automation & Robotics UCITS ETF USD - (0.400%) . . . . . . . . . . . . . . . . Shares 617 010 1 034 610Ossiam Lux SICAV - Ossiam Shiller Barclays CAPE® US Sector Value TR -1C- EUR - (0.650%) . . . . . . . . . . . . . . . . . . . . . . . . . . . . . . . Shares 4 392Source Markets plc - Source Health Care S&P US Select Sector UCITS ETF USD - (0.300%) . . Shares 4 284
Derivatives (option premiums realized in opening transactions, or total options transactions; in the case of warrants, purchases and sales are shown)
Value (’000) Futures contracts
Equity index futures Contracts sold (Underlying: Topix) EUR 7 998 Forward currency contracts Contracts sold (Underlying: IRO) EUR 21 846 Interest rate futures Contracts sold (Underlying: US Treasury Note 10-Year) EUR 1 575
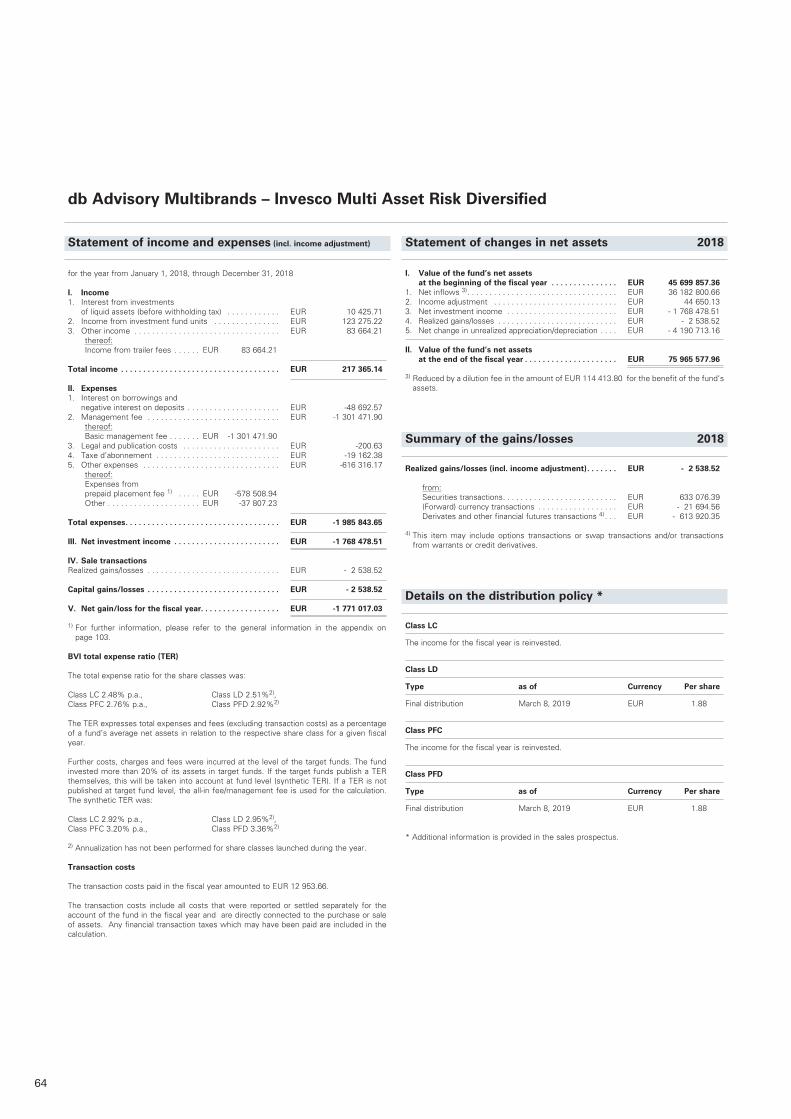
64
db Advisory Multibrands – Invesco Multi Asset Risk Diversified
Statement of income and expenses (incl. income adjustment)
I. Value of the fund’s net assets at the beginning of the fiscal year . . . . . . . . . . . . . . . EUR 45 699 857.361. Net inflows 3) . . . . . . . . . . . . . . . . . . . . . . . . . . . . . . . . . . EUR 36 182 800.662. Income adjustment . . . . . . . . . . . . . . . . . . . . . . . . . . . . EUR 44 650.133. Net investment income . . . . . . . . . . . . . . . . . . . . . . . . . EUR - 1 768 478.514. Realized gains/losses . . . . . . . . . . . . . . . . . . . . . . . . . . . EUR - 2 538.525. Net change in unrealized appreciation/depreciation . . . . EUR - 4 190 713.16
II. Value of the fund’s net assets at the end of the fiscal year . . . . . . . . . . . . . . . . . . . . . EUR 75 965 577.96
3) Reduced by a dilution fee in the amount of EUR 114 413.80 for the benefit of the fund‘s assets.
Summary of the gains/losses 2018
Realized gains/losses (incl. income adjustment) . . . . . . . EUR - 2 538.52
from: Securities transactions . . . . . . . . . . . . . . . . . . . . . . . . . . EUR 633 076.39 (Forward) currency transactions . . . . . . . . . . . . . . . . . . EUR - 21 694.56 Derivates and other financial futures transactions 4) . . . EUR - 613 920.35
4) This item may include options transactions or swap transactions and/or transactions from warrants or credit derivatives.
Details on the distribution policy *
Class LC
The income for the fiscal year is reinvested.
Class LD
Type as of Currency Per share
Final distribution March 8, 2019 EUR 1.88
Class PFC
The income for the fiscal year is reinvested.
Class PFD
Type as of Currency Per share
Final distribution March 8, 2019 EUR 1.88
* Additional information is provided in the sales prospectus.
Statement of changes in net assets 2018
for the year from January 1, 2018, through December 31, 2018
I. Income1. Interest from investments of liquid assets (before withholding tax) . . . . . . . . . . . . EUR 10 425.712. Income from investment fund units . . . . . . . . . . . . . . . EUR 123 275.223. Other income . . . . . . . . . . . . . . . . . . . . . . . . . . . . . . . . . EUR 83 664.21 thereof: Income from trailer fees . . . . . . EUR 83 664.21
Total income . . . . . . . . . . . . . . . . . . . . . . . . . . . . . . . . . . . . EUR 217 365.14
II. Expenses1. Interest on borrowings and negative interest on deposits . . . . . . . . . . . . . . . . . . . . . EUR -48 692.572. Management fee . . . . . . . . . . . . . . . . . . . . . . . . . . . . . . EUR -1 301 471.90 thereof: Basic management fee . . . . . . . EUR -1 301 471.903. Legal and publication costs . . . . . . . . . . . . . . . . . . . . . . EUR -200.634. Taxe d’abonnement . . . . . . . . . . . . . . . . . . . . . . . . . . . . EUR -19 162.385. Other expenses . . . . . . . . . . . . . . . . . . . . . . . . . . . . . . . EUR -616 316.17 thereof: Expenses from
prepaid placement fee 1) . . . . . EUR -578 508.94 Other . . . . . . . . . . . . . . . . . . . . . EUR -37 807.23
Total expenses . . . . . . . . . . . . . . . . . . . . . . . . . . . . . . . . . . . EUR -1 985 843.65
III. Net investment income . . . . . . . . . . . . . . . . . . . . . . . . EUR -1 768 478.51
IV. Sale transactionsRealized gains/losses . . . . . . . . . . . . . . . . . . . . . . . . . . . . . . EUR - 2 538.52
Capital gains/losses . . . . . . . . . . . . . . . . . . . . . . . . . . . . . . EUR - 2 538.52
V. Net gain/loss for the fiscal year. . . . . . . . . . . . . . . . . . EUR -1 771 017.03
1) For further information, please refer to the general information in the appendix on page 103.
BVI total expense ratio (TER)
The total expense ratio for the share classes was:
Class LC 2.48% p.a., Class LD 2.51%2), Class PFC 2.76% p.a., Class PFD 2.92%2)
The TER expresses total expenses and fees (excluding transaction costs) as a percentage of a fund’s average net assets in relation to the respective share class for a given fiscal year. Further costs, charges and fees were incurred at the level of the target funds. The fund invested more than 20% of its assets in target funds. If the target funds publish a TER themselves, this will be taken into account at fund level (synthetic TER). If a TER is not published at target fund level, the all-in fee/management fee is used for the calculation. The synthetic TER was:
Class LC 2.92% p.a., Class LD 2.95%2), Class PFC 3.20% p.a., Class PFD 3.36%2)
2) Annualization has not been performed for share classes launched during the year.
Transaction costs
The transaction costs paid in the fiscal year amounted to EUR 12 953.66. The transaction costs include all costs that were reported or settled separately for the account of the fund in the fiscal year and are directly connected to the purchase or sale of assets. Any financial transaction taxes which may have been paid are included in the calculation.
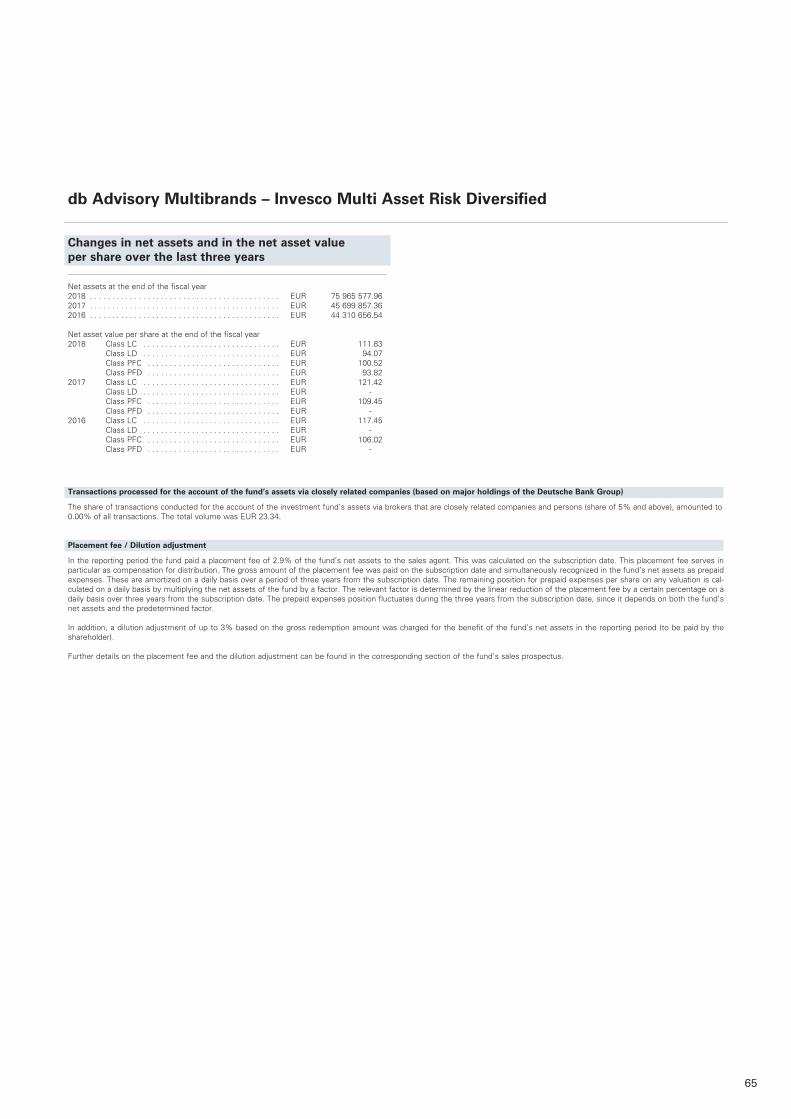
65
Changes in net assets and in the net asset value per share over the last three years
Net assets at the end of the fiscal year2018 . . . . . . . . . . . . . . . . . . . . . . . . . . . . . . . . . . . . . . . . . . . EUR 75 965 577 .962017 . . . . . . . . . . . . . . . . . . . . . . . . . . . . . . . . . . . . . . . . . . . EUR 45 699 857 .362016 . . . . . . . . . . . . . . . . . . . . . . . . . . . . . . . . . . . . . . . . . . . EUR 44 310 656 .54
Net asset value per share at the end of the fiscal year 2018 Class LC . . . . . . . . . . . . . . . . . . . . . . . . . . . . . . . EUR 111 .83 Class LD . . . . . . . . . . . . . . . . . . . . . . . . . . . . . . . EUR 94 .07 Class PFC . . . . . . . . . . . . . . . . . . . . . . . . . . . . . . EUR 100 .52 Class PFD . . . . . . . . . . . . . . . . . . . . . . . . . . . . . . EUR 93 .822017 Class LC . . . . . . . . . . . . . . . . . . . . . . . . . . . . . . . EUR 121 .42 Class LD . . . . . . . . . . . . . . . . . . . . . . . . . . . . . . . EUR - Class PFC . . . . . . . . . . . . . . . . . . . . . . . . . . . . . . EUR 109 .45 Class PFD . . . . . . . . . . . . . . . . . . . . . . . . . . . . . . EUR -2016 Class LC . . . . . . . . . . . . . . . . . . . . . . . . . . . . . . . EUR 117 .45 Class LD . . . . . . . . . . . . . . . . . . . . . . . . . . . . . . . EUR - Class PFC . . . . . . . . . . . . . . . . . . . . . . . . . . . . . . EUR 106 .02 Class PFD . . . . . . . . . . . . . . . . . . . . . . . . . . . . . . EUR -
db Advisory Multibrands – Invesco Multi Asset Risk Diversified
Transactions processed for the account of the fund’s assets via closely related companies (based on major holdings of the Deutsche Bank Group)
The share of transactions conducted for the account of the investment fund’s assets via brokers that are closely related companies and persons (share of 5% and above), amounted to 0 .00% of all transactions . The total volume was EUR 23 .34 .
Placement fee / Dilution adjustment
In the reporting period the fund paid a placement fee of 2 .9% of the fund’s net assets to the sales agent . This was calculated on the subscription date . This placement fee serves in particular as compensation for distribution . The gross amount of the placement fee was paid on the subscription date and simultaneously recognized in the fund’s net assets as prepaid expenses . These are amortized on a daily basis over a period of three years from the subscription date . The remaining position for prepaid expenses per share on any valuation is cal-culated on a daily basis by multiplying the net assets of the fund by a factor . The relevant factor is determined by the linear reduction of the placement fee by a certain percentage on a daily basis over three years from the subscription date . The prepaid expenses position fluctuates during the three years from the subscription date, since it depends on both the fund’s net assets and the predetermined factor . In addition, a dilution adjustment of up to 3% based on the gross redemption amount was charged for the benefit of the fund’s net assets in the reporting period (to be paid by the shareholder) . Further details on the placement fee and the dilution adjustment can be found in the corresponding section of the fund’s sales prospectus .
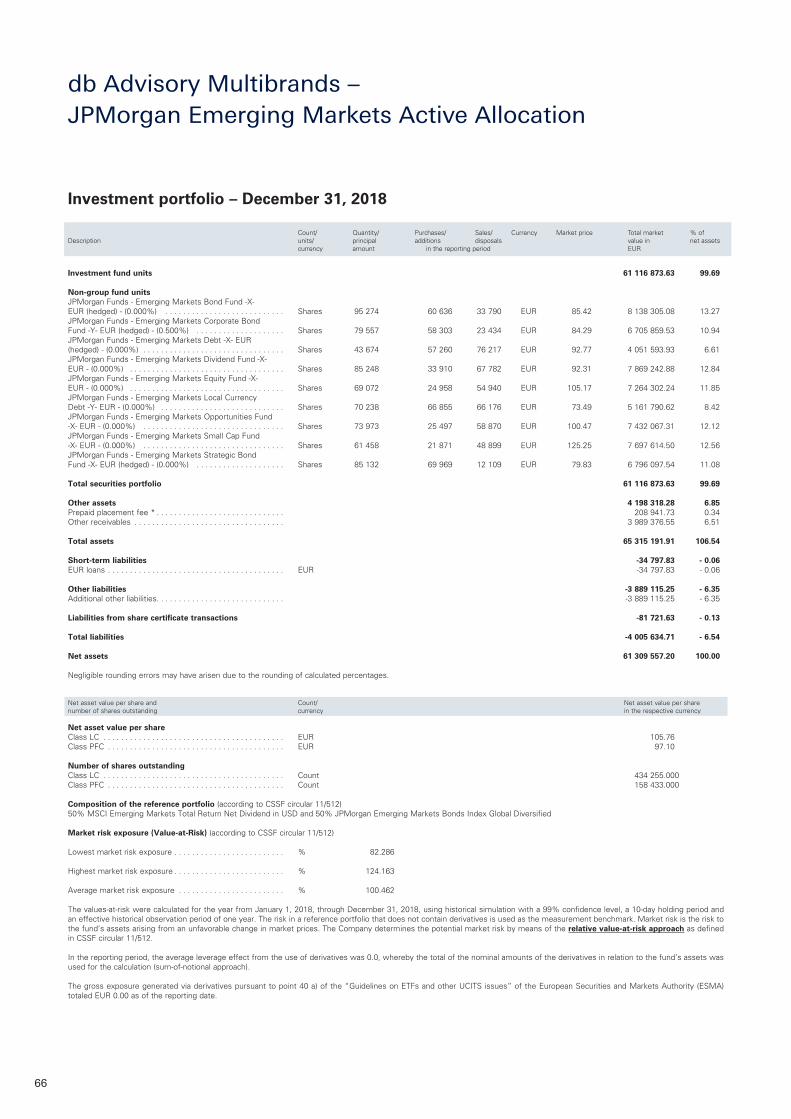
66
Investment fund units 61 116 873.63 99.69
Non-group fund units JPMorgan Funds - Emerging Markets Bond Fund -X- EUR (hedged) - (0.000%) . . . . . . . . . . . . . . . . . . . . . . . . . . . Shares 95 274 60 636 33 790 EUR 85.42 8 138 305.08 13.27JPMorgan Funds - Emerging Markets Corporate Bond Fund -Y- EUR (hedged) - (0.500%) . . . . . . . . . . . . . . . . . . . . Shares 79 557 58 303 23 434 EUR 84.29 6 705 859.53 10.94JPMorgan Funds - Emerging Markets Debt -X- EUR (hedged) - (0.000%) . . . . . . . . . . . . . . . . . . . . . . . . . . . . . . . . Shares 43 674 57 260 76 217 EUR 92.77 4 051 593.93 6.61JPMorgan Funds - Emerging Markets Dividend Fund -X- EUR - (0.000%) . . . . . . . . . . . . . . . . . . . . . . . . . . . . . . . . . . . Shares 85 248 33 910 67 782 EUR 92.31 7 869 242.88 12.84JPMorgan Funds - Emerging Markets Equity Fund -X- EUR - (0.000%) . . . . . . . . . . . . . . . . . . . . . . . . . . . . . . . . . . . Shares 69 072 24 958 54 940 EUR 105.17 7 264 302.24 11.85JPMorgan Funds - Emerging Markets Local Currency Debt -Y- EUR - (0.000%) . . . . . . . . . . . . . . . . . . . . . . . . . . . . Shares 70 238 66 855 66 176 EUR 73.49 5 161 790.62 8.42JPMorgan Funds - Emerging Markets Opportunities Fund -X- EUR - (0.000%) . . . . . . . . . . . . . . . . . . . . . . . . . . . . . . . . Shares 73 973 25 497 58 870 EUR 100.47 7 432 067.31 12.12JPMorgan Funds - Emerging Markets Small Cap Fund -X- EUR - (0.000%) . . . . . . . . . . . . . . . . . . . . . . . . . . . . . . . . Shares 61 458 21 871 48 899 EUR 125.25 7 697 614.50 12.56JPMorgan Funds - Emerging Markets Strategic Bond Fund -X- EUR (hedged) - (0.000%) . . . . . . . . . . . . . . . . . . . . Shares 85 132 69 969 12 109 EUR 79.83 6 796 097.54 11.08
Total securities portfolio 61 116 873.63 99.69
Other assets 4 198 318.28 6.85Prepaid placement fee * . . . . . . . . . . . . . . . . . . . . . . . . . . . . . 208 941.73 0.34Other receivables . . . . . . . . . . . . . . . . . . . . . . . . . . . . . . . . . . 3 989 376.55 6.51
Total assets 65 315 191.91 106.54
Short-term liabilities -34 797.83 - 0.06EUR loans . . . . . . . . . . . . . . . . . . . . . . . . . . . . . . . . . . . . . . . . EUR -34 797.83 - 0.06
Other liabilities -3 889 115.25 - 6.35Additional other liabilities . . . . . . . . . . . . . . . . . . . . . . . . . . . . . -3 889 115.25 - 6.35
Liabilities from share certificate transactions -81 721.63 - 0.13
Total liabilities -4 005 634.71 - 6.54
Net assets 61 309 557.20 100.00
Negligible rounding errors may have arisen due to the rounding of calculated percentages.
Net asset value per share and Count/ Net asset value per sharenumber of shares outstanding currency in the respective currency
Net asset value per share Class LC . . . . . . . . . . . . . . . . . . . . . . . . . . . . . . . . . . . . . . . . . EUR 105.76Class PFC . . . . . . . . . . . . . . . . . . . . . . . . . . . . . . . . . . . . . . . . EUR 97.10 Number of shares outstanding Class LC . . . . . . . . . . . . . . . . . . . . . . . . . . . . . . . . . . . . . . . . . Count 434 255.000Class PFC . . . . . . . . . . . . . . . . . . . . . . . . . . . . . . . . . . . . . . . . Count 158 433.000 Composition of the reference portfolio (according to CSSF circular 11/512)50% MSCI Emerging Markets Total Return Net Dividend in USD and 50% JPMorgan Emerging Markets Bonds Index Global Diversified Market risk exposure (Value-at-Risk) (according to CSSF circular 11/512)
Lowest market risk exposure . . . . . . . . . . . . . . . . . . . . . . . . . % 82.286
Highest market risk exposure . . . . . . . . . . . . . . . . . . . . . . . . . % 124.163
Average market risk exposure . . . . . . . . . . . . . . . . . . . . . . . . % 100.462 The values-at-risk were calculated for the year from January 1, 2018, through December 31, 2018, using historical simulation with a 99% confidence level, a 10-day holding period and an effective historical observation period of one year. The risk in a reference portfolio that does not contain derivatives is used as the measurement benchmark. Market risk is the risk to the fund’s assets arising from an unfavorable change in market prices. The Company determines the potential market risk by means of the relative value-at-risk approach as defined in CSSF circular 11/512.
In the reporting period, the average leverage effect from the use of derivatives was 0.0, whereby the total of the nominal amounts of the derivatives in relation to the fund’s assets was used for the calculation (sum-of-notional approach).
The gross exposure generated via derivatives pursuant to point 40 a) of the “Guidelines on ETFs and other UCITS issues” of the European Securities and Markets Authority (ESMA) totaled EUR 0.00 as of the reporting date.
Investment portfolio – December 31, 2018
Count/ Quantity/ Purchases/ Sales/ Currency Market price Total market % ofDescription units/ principal additions disposals value in net assets currency amount in the reporting period EUR
db Advisory Multibrands – JPMorgan Emerging Markets Active Allocation

67
Notes on valuation
Under the responsibility of the Board of Directors of the SICAV, the Management Company determines the net asset values per share and performs the valuation of the assets of the fund. The basic provision of price data and price validation are performed in accordance with the method introduced by the Board of Directors of the SICAV on the basis of the legal and regulatory requirements or the principles for valuation methods defined in the SICAV’s prospectus.
If no trading prices are available, prices are determined with the aid of valuation models (derived market values) which are agreed between State Street Bank Luxembourg S.C.A. as external price service provider and the Management Company and which are based as far as possible on market parameters. This procedure is subject to an ongoing monitoring process. The plausibility of price information from third parties is checked through other pricing sources, model calculations or other suitable procedure.
Assets reported in this report are not valued at derived market values.
The management fee/all-in fee rates in effect as of the reporting date for the investment fund units held in the securities portfolio are shown in parentheses. A plus sign means that a performance-based fee may also be charged. As the fund held units of other investment funds (target funds) during the period under review, further costs, charges and fees may have been incurred at the level of these individual target funds. No initial sales charges or redemption fees were paid during the period under review.
Footnote
* The prepaid placement fee is amortized over a period of three years (in accordance with article 13 (d) of the general section of the management regulations for the fund).
db Advisory Multibrands – JPMorgan Emerging Markets Active Allocation
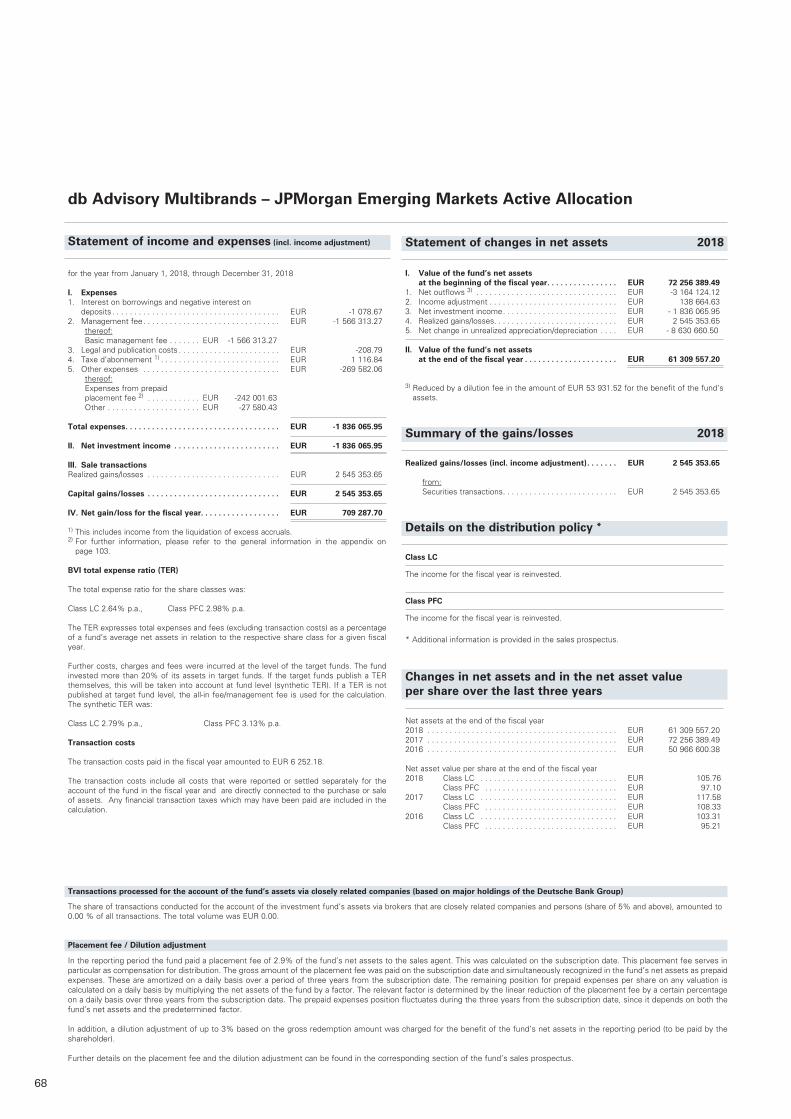
68
db Advisory Multibrands – JPMorgan Emerging Markets Active Allocation
Statement of income and expenses (incl. income adjustment)
I. Value of the fund’s net assets at the beginning of the fiscal year . . . . . . . . . . . . . . . . EUR 72 256 389.49
1. Net outflows 3) . . . . . . . . . . . . . . . . . . . . . . . . . . . . . . . . EUR -3 164 124.122. Income adjustment . . . . . . . . . . . . . . . . . . . . . . . . . . . . . EUR 138 664.633. Net investment income . . . . . . . . . . . . . . . . . . . . . . . . . . EUR - 1 836 065.954. Realized gains/losses. . . . . . . . . . . . . . . . . . . . . . . . . . . . EUR 2 545 353.655. Net change in unrealized appreciation/depreciation . . . . EUR - 8 630 660.50
II. Value of the fund’s net assets at the end of the fiscal year . . . . . . . . . . . . . . . . . . . . . EUR 61 309 557.20
3) Reduced by a dilution fee in the amount of EUR 53 931.52 for the benefit of the fund‘s assets.
Summary of the gains/losses 2018
Realized gains/losses (incl. income adjustment) . . . . . . . EUR 2 545 353.65
from: Securities transactions . . . . . . . . . . . . . . . . . . . . . . . . . . EUR 2 545 353.65
Details on the distribution policy *
Class LC
The income for the fiscal year is reinvested.
Class PFC
The income for the fiscal year is reinvested.
* Additional information is provided in the sales prospectus.
Changes in net assets and in the net asset value per share over the last three years
Net assets at the end of the fiscal year2018 . . . . . . . . . . . . . . . . . . . . . . . . . . . . . . . . . . . . . . . . . . . EUR 61 309 557.202017 . . . . . . . . . . . . . . . . . . . . . . . . . . . . . . . . . . . . . . . . . . . EUR 72 256 389.492016 . . . . . . . . . . . . . . . . . . . . . . . . . . . . . . . . . . . . . . . . . . . EUR 50 966 600.38
Net asset value per share at the end of the fiscal year 2018 Class LC . . . . . . . . . . . . . . . . . . . . . . . . . . . . . . . EUR 105.76 Class PFC . . . . . . . . . . . . . . . . . . . . . . . . . . . . . . EUR 97.102017 Class LC . . . . . . . . . . . . . . . . . . . . . . . . . . . . . . . EUR 117.58 Class PFC . . . . . . . . . . . . . . . . . . . . . . . . . . . . . . EUR 108.332016 Class LC . . . . . . . . . . . . . . . . . . . . . . . . . . . . . . . EUR 103.31 Class PFC . . . . . . . . . . . . . . . . . . . . . . . . . . . . . . EUR 95.21
Statement of changes in net assets 2018
for the year from January 1, 2018, through December 31, 2018
I. Expenses1. Interest on borrowings and negative interest on
deposits . . . . . . . . . . . . . . . . . . . . . . . . . . . . . . . . . . . . . . EUR -1 078.672. Management fee . . . . . . . . . . . . . . . . . . . . . . . . . . . . . . . EUR -1 566 313.27 thereof: Basic management fee . . . . . . . EUR -1 566 313.273. Legal and publication costs . . . . . . . . . . . . . . . . . . . . . . . EUR -208.794. Taxe d’abonnement 1) . . . . . . . . . . . . . . . . . . . . . . . . . . . EUR 1 116.845. Other expenses . . . . . . . . . . . . . . . . . . . . . . . . . . . . . . . EUR -269 582.06 thereof: Expenses from prepaid
placement fee 2) . . . . . . . . . . . . EUR -242 001.63 Other . . . . . . . . . . . . . . . . . . . . . EUR -27 580.43
Total expenses . . . . . . . . . . . . . . . . . . . . . . . . . . . . . . . . . . . EUR -1 836 065.95
II. Net investment income . . . . . . . . . . . . . . . . . . . . . . . . EUR -1 836 065.95
III. Sale transactionsRealized gains/losses . . . . . . . . . . . . . . . . . . . . . . . . . . . . . . EUR 2 545 353.65
Capital gains/losses . . . . . . . . . . . . . . . . . . . . . . . . . . . . . . EUR 2 545 353.65
IV. Net gain/loss for the fiscal year. . . . . . . . . . . . . . . . . . EUR 709 287.70
1) This includes income from the liquidation of excess accruals.2) For further information, please refer to the general information in the appendix on
page 103.
BVI total expense ratio (TER)
The total expense ratio for the share classes was:
Class LC 2.64% p.a., Class PFC 2.98% p.a.
The TER expresses total expenses and fees (excluding transaction costs) as a percentage of a fund’s average net assets in relation to the respective share class for a given fiscal year.
Further costs, charges and fees were incurred at the level of the target funds. The fund invested more than 20% of its assets in target funds. If the target funds publish a TER themselves, this will be taken into account at fund level (synthetic TER). If a TER is not published at target fund level, the all-in fee/management fee is used for the calculation. The synthetic TER was:
Class LC 2.79% p.a., Class PFC 3.13% p.a.
Transaction costs
The transaction costs paid in the fiscal year amounted to EUR 6 252.18.
The transaction costs include all costs that were reported or settled separately for the account of the fund in the fiscal year and are directly connected to the purchase or sale of assets. Any financial transaction taxes which may have been paid are included in the calculation.
Transactions processed for the account of the fund’s assets via closely related companies (based on major holdings of the Deutsche Bank Group)
The share of transactions conducted for the account of the investment fund’s assets via brokers that are closely related companies and persons (share of 5% and above), amounted to 0.00 % of all transactions. The total volume was EUR 0.00.
Placement fee / Dilution adjustment
In the reporting period the fund paid a placement fee of 2.9% of the fund’s net assets to the sales agent. This was calculated on the subscription date. This placement fee serves in particular as compensation for distribution. The gross amount of the placement fee was paid on the subscription date and simultaneously recognized in the fund’s net assets as prepaid expenses. These are amortized on a daily basis over a period of three years from the subscription date. The remaining position for prepaid expenses per share on any valuation is calculated on a daily basis by multiplying the net assets of the fund by a factor. The relevant factor is determined by the linear reduction of the placement fee by a certain percentage on a daily basis over three years from the subscription date. The prepaid expenses position fluctuates during the three years from the subscription date, since it depends on both the fund’s net assets and the predetermined factor.
In addition, a dilution adjustment of up to 3% based on the gross redemption amount was charged for the benefit of the fund’s net assets in the reporting period (to be paid by the shareholder).
Further details on the placement fee and the dilution adjustment can be found in the corresponding section of the fund’s sales prospectus.
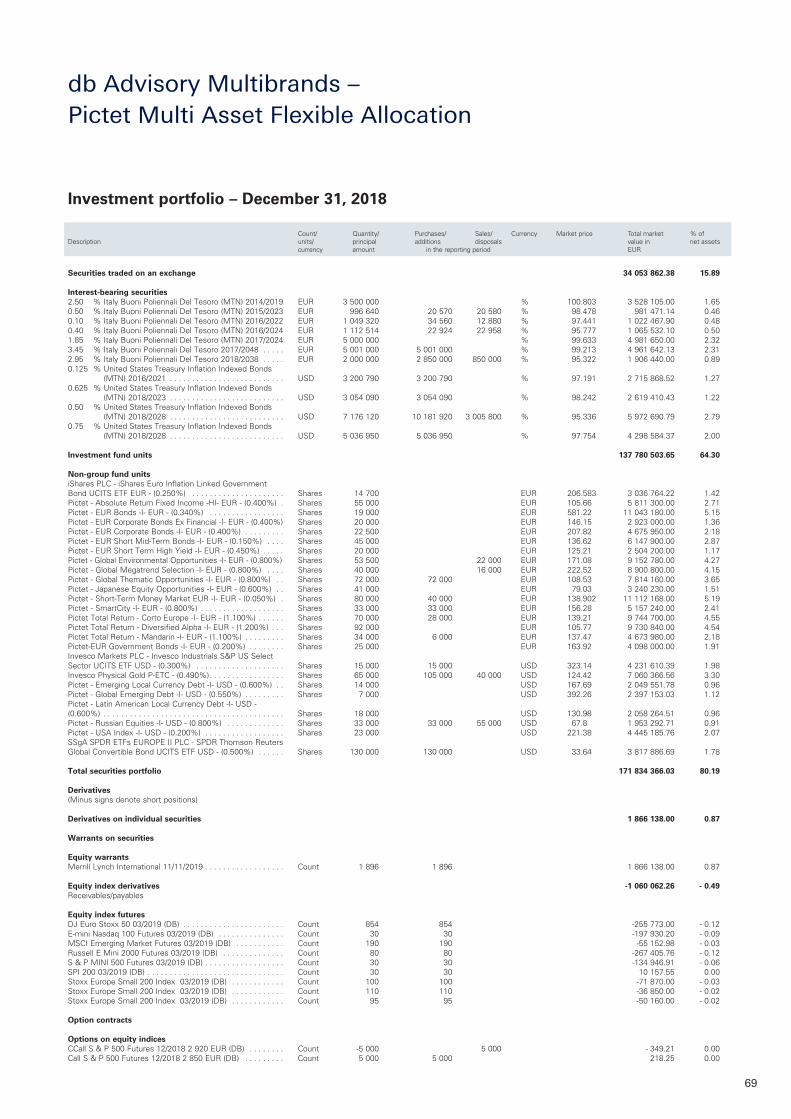
69
Securities traded on an exchange 34 053 862.38 15.89 Interest-bearing securities 2.50 % Italy Buoni Poliennali Del Tesoro (MTN) 2014/2019 EUR 3 500 000 % 100.803 3 528 105.00 1.650.50 % Italy Buoni Poliennali Del Tesoro (MTN) 2015/2023 EUR 996 640 20 570 20 580 % 98.478 981 471.14 0.460.10 % Italy Buoni Poliennali Del Tesoro (MTN) 2016/2022 EUR 1 049 320 34 560 12 880 % 97.441 1 022 467.90 0.480.40 % Italy Buoni Poliennali Del Tesoro (MTN) 2016/2024 EUR 1 112 514 22 924 22 958 % 95.777 1 065 532.10 0.501.85 % Italy Buoni Poliennali Del Tesoro (MTN) 2017/2024 EUR 5 000 000 % 99.633 4 981 650.00 2.323.45 % Italy Buoni Poliennali Del Tesoro 2017/2048 . . . . . EUR 5 001 000 5 001 000 % 99.213 4 961 642.13 2.312.95 % Italy Buoni Poliennali Del Tesoro 2018/2038 . . . . . EUR 2 000 000 2 850 000 850 000 % 95.322 1 906 440.00 0.890.125 % United States Treasury Inflation Indexed Bonds
(MTN) 2016/2021 . . . . . . . . . . . . . . . . . . . . . . . . . . USD 3 200 790 3 200 790 % 97.191 2 715 868.52 1.270.625 % United States Treasury Inflation Indexed Bonds
(MTN) 2018/2023 . . . . . . . . . . . . . . . . . . . . . . . . . . USD 3 054 090 3 054 090 % 98.242 2 619 410.43 1.220.50 % United States Treasury Inflation Indexed Bonds
(MTN) 2018/2028 . . . . . . . . . . . . . . . . . . . . . . . . . . USD 7 176 120 10 181 920 3 005 800 % 95.336 5 972 690.79 2.790.75 % United States Treasury Inflation Indexed Bonds
(MTN) 2018/2028 . . . . . . . . . . . . . . . . . . . . . . . . . . USD 5 036 950 5 036 950 % 97.754 4 298 584.37 2.00
Investment fund units 137 780 503.65 64.30
Non-group fund unitsiShares PLC - iShares Euro Inflation Linked Government Bond UCITS ETF EUR - (0.250%) . . . . . . . . . . . . . . . . . . . . . Shares 14 700 EUR 206.583 3 036 764.22 1.42Pictet - Absolute Return Fixed Income -HI- EUR - (0.400%) . Shares 55 000 EUR 105.66 5 811 300.00 2.71Pictet - EUR Bonds -I- EUR - (0.340%) . . . . . . . . . . . . . . . . . Shares 19 000 EUR 581.22 11 043 180.00 5.15Pictet - EUR Corporate Bonds Ex Financial -I- EUR - (0.400%) Shares 20 000 EUR 146.15 2 923 000.00 1.36Pictet - EUR Corporate Bonds -I- EUR - (0.400%) . . . . . . . . . Shares 22 500 EUR 207.82 4 675 950.00 2.18Pictet - EUR Short Mid-Term Bonds -I- EUR - (0.150%) . . . . Shares 45 000 EUR 136.62 6 147 900.00 2.87Pictet - EUR Short Term High Yield -I- EUR - (0.450%) . . . . . Shares 20 000 EUR 125.21 2 504 200.00 1.17Pictet - Global Environmental Opportunities -I- EUR - (0.800%) Shares 53 500 22 000 EUR 171.08 9 152 780.00 4.27Pictet - Global Megatrend Selection -I- EUR - (0.800%) . . . . Shares 40 000 16 000 EUR 222.52 8 900 800.00 4.15Pictet - Global Thematic Opportunities -I- EUR - (0.800%) . . Shares 72 000 72 000 EUR 108.53 7 814 160.00 3.65Pictet - Japanese Equity Opportunities -I- EUR - (0.600%) . . Shares 41 000 EUR 79.03 3 240 230.00 1.51Pictet - Short-Term Money Market EUR -I- EUR - (0.050%) . Shares 80 000 40 000 EUR 138.902 11 112 168.00 5.19Pictet - SmartCity -I- EUR - (0.800%) . . . . . . . . . . . . . . . . . . . Shares 33 000 33 000 EUR 156.28 5 157 240.00 2.41Pictet Total Return - Corto Europe -I- EUR - (1.100%) . . . . . . Shares 70 000 28 000 EUR 139.21 9 744 700.00 4.55Pictet Total Return - Diversified Alpha -I- EUR - (1.200%) . . . Shares 92 000 EUR 105.77 9 730 840.00 4.54Pictet Total Return - Mandarin -I- EUR - (1.100%) . . . . . . . . . Shares 34 000 6 000 EUR 137.47 4 673 980.00 2.18Pictet-EUR Government Bonds -I- EUR - (0.200%) . . . . . . . . Shares 25 000 EUR 163.92 4 098 000.00 1.91Invesco Markets PLC - Invesco Industrials S&P US Select Sector UCITS ETF USD - (0.300%) . . . . . . . . . . . . . . . . . . . . Shares 15 000 15 000 USD 323.14 4 231 610.39 1.98Invesco Physical Gold P-ETC - (0.490%) . . . . . . . . . . . . . . . . . Shares 65 000 105 000 40 000 USD 124.42 7 060 366.56 3.30Pictet - Emerging Local Currency Debt -I- USD - (0.600%) . . Shares 14 000 USD 167.69 2 049 551.78 0.96Pictet - Global Emerging Debt -I- USD - (0.550%) . . . . . . . . . Shares 7 000 USD 392.26 2 397 153.03 1.12Pictet - Latin American Local Currency Debt -I- USD - (0.600%) . . . . . . . . . . . . . . . . . . . . . . . . . . . . . . . . . . . . . . . . . Shares 18 000 USD 130.98 2 058 264.51 0.96Pictet - Russian Equities -I- USD - (0.800%) . . . . . . . . . . . . . Shares 33 000 33 000 55 000 USD 67.8 1 953 292.71 0.91Pictet - USA Index -I- USD - (0.200%) . . . . . . . . . . . . . . . . . . Shares 23 000 USD 221.38 4 445 185.76 2.07SSgA SPDR ETFs EUROPE II PLC - SPDR Thomson Reuters Global Convertible Bond UCITS ETF USD - (0.500%) . . . . . . Shares 130 000 130 000 USD 33.64 3 817 886.69 1.78
Total securities portfolio 171 834 366.03 80.19 Derivatives (Minus signs denote short positions) Derivatives on individual securities 1 866 138.00 0.87 Warrants on securities
Equity warrantsMerrill Lynch International 11/11/2019 . . . . . . . . . . . . . . . . . . Count 1 896 1 896 1 866 138.00 0.87
Equity index derivatives -1 060 062.26 - 0.49Receivables/payables Equity index futuresDJ Euro Stoxx 50 03/2019 (DB) . . . . . . . . . . . . . . . . . . . . . . . Count 854 854 -255 773.00 - 0.12E-mini Nasdaq 100 Futures 03/2019 (DB) . . . . . . . . . . . . . . . Count 30 30 -197 930.20 - 0.09MSCI Emerging Market Futures 03/2019 (DB) . . . . . . . . . . . Count 190 190 -55 152.98 - 0.03Russell E Mini 2000 Futures 03/2019 (DB) . . . . . . . . . . . . . . Count 80 80 -267 405.76 - 0.12S & P MINI 500 Futures 03/2019 (DB) . . . . . . . . . . . . . . . . . . Count 30 30 -134 946.91 - 0.06SPI 200 03/2019 (DB) . . . . . . . . . . . . . . . . . . . . . . . . . . . . . . . Count 30 30 10 157.55 0.00Stoxx Europe Small 200 Index 03/2019 (DB) . . . . . . . . . . . . Count 100 100 -71 870.00 - 0.03Stoxx Europe Small 200 Index 03/2019 (DB) . . . . . . . . . . . . Count 110 110 -36 850.00 - 0.02Stoxx Europe Small 200 Index 03/2019 (DB) . . . . . . . . . . . . Count 95 95 -50 160.00 - 0.02
Option contracts
Options on equity indicesCCall S & P 500 Futures 12/2018 2 920 EUR (DB) . . . . . . . . Count -5 000 5 000 - 349.21 0.00Call S & P 500 Futures 12/2018 2 850 EUR (DB) . . . . . . . . . Count 5 000 5 000 218.25 0.00
Investment portfolio – December 31, 2018
Count/ Quantity/ Purchases/ Sales/ Currency Market price Total market % ofDescription units/ principal additions disposals value in net assets currency amount in the reporting period EUR
db Advisory Multibrands – Pictet Multi Asset Flexible Allocation
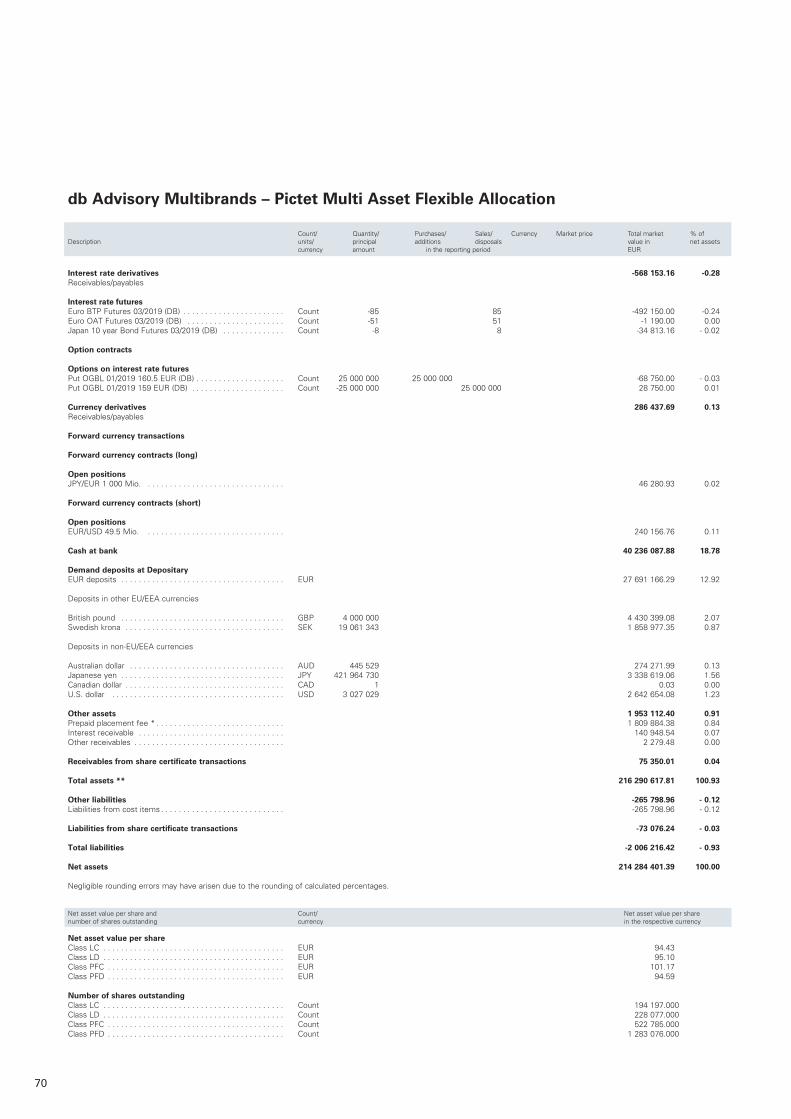
70
Interest rate derivatives -568 153.16 -0.28Receivables/payables
Interest rate futures Euro BTP Futures 03/2019 (DB) . . . . . . . . . . . . . . . . . . . . . . . Count -85 85 -492 150 .00 -0 .24Euro OAT Futures 03/2019 (DB) . . . . . . . . . . . . . . . . . . . . . . Count -51 51 -1 190 .00 0 .00Japan 10 year Bond Futures 03/2019 (DB) . . . . . . . . . . . . . . Count -8 8 -34 813 .16 - 0 .02
Option contracts
Options on interest rate futuresPut OGBL 01/2019 160 .5 EUR (DB) . . . . . . . . . . . . . . . . . . . . Count 25 000 000 25 000 000 -68 750 .00 - 0 .03Put OGBL 01/2019 159 EUR (DB) . . . . . . . . . . . . . . . . . . . . . Count -25 000 000 25 000 000 28 750 .00 0 .01
Currency derivatives 286 437.69 0.13Receivables/payables Forward currency transactions Forward currency contracts (long)
Open positionsJPY/EUR 1 000 Mio . . . . . . . . . . . . . . . . . . . . . . . . . . . . . . . . 46 280 .93 0 .02
Forward currency contracts (short)
Open positionsEUR/USD 49 .5 Mio . . . . . . . . . . . . . . . . . . . . . . . . . . . . . . . . 240 156 .76 0 .11 Cash at bank 40 236 087.88 18.78 Demand deposits at Depositary EUR deposits . . . . . . . . . . . . . . . . . . . . . . . . . . . . . . . . . . . . . EUR 27 691 166 .29 12 .92 Deposits in other EU/EEA currencies British pound . . . . . . . . . . . . . . . . . . . . . . . . . . . . . . . . . . . . . GBP 4 000 000 4 430 399 .08 2 .07Swedish krona . . . . . . . . . . . . . . . . . . . . . . . . . . . . . . . . . . . . SEK 19 061 343 1 858 977 .35 0 .87
Deposits in non-EU/EEA currencies
Australian dollar . . . . . . . . . . . . . . . . . . . . . . . . . . . . . . . . . . . AUD 445 529 274 271 .99 0 .13Japanese yen . . . . . . . . . . . . . . . . . . . . . . . . . . . . . . . . . . . . . JPY 421 964 730 3 338 619 .06 1 .56Canadian dollar . . . . . . . . . . . . . . . . . . . . . . . . . . . . . . . . . . . . CAD 1 0 .03 0 .00U .S . dollar . . . . . . . . . . . . . . . . . . . . . . . . . . . . . . . . . . . . . . . USD 3 027 029 2 642 654 .08 1 .23 Other assets 1 953 112.40 0.91Prepaid placement fee * . . . . . . . . . . . . . . . . . . . . . . . . . . . . . 1 809 884 .38 0 .84Interest receivable . . . . . . . . . . . . . . . . . . . . . . . . . . . . . . . . . 140 948 .54 0 .07Other receivables . . . . . . . . . . . . . . . . . . . . . . . . . . . . . . . . . . 2 279 .48 0 .00 Receivables from share certificate transactions 75 350.01 0.04
Total assets ** 216 290 617.81 100.93 Other liabilities -265 798.96 - 0.12Liabilities from cost items . . . . . . . . . . . . . . . . . . . . . . . . . . . . -265 798 .96 - 0 .12 Liabilities from share certificate transactions -73 076.24 - 0.03
Total liabilities -2 006 216.42 - 0.93 Net assets 214 284 401.39 100.00 Negligible rounding errors may have arisen due to the rounding of calculated percentages . Net asset value per share and Count/ Net asset value per sharenumber of shares outstanding currency in the respective currency
Net asset value per share Class LC . . . . . . . . . . . . . . . . . . . . . . . . . . . . . . . . . . . . . . . . . EUR 94 .43Class LD . . . . . . . . . . . . . . . . . . . . . . . . . . . . . . . . . . . . . . . . . EUR 95 .10Class PFC . . . . . . . . . . . . . . . . . . . . . . . . . . . . . . . . . . . . . . . . EUR 101 .17Class PFD . . . . . . . . . . . . . . . . . . . . . . . . . . . . . . . . . . . . . . . . EUR 94 .59 Number of shares outstanding Class LC . . . . . . . . . . . . . . . . . . . . . . . . . . . . . . . . . . . . . . . . . Count 194 197 .000Class LD . . . . . . . . . . . . . . . . . . . . . . . . . . . . . . . . . . . . . . . . . Count 228 077 .000Class PFC . . . . . . . . . . . . . . . . . . . . . . . . . . . . . . . . . . . . . . . . Count 522 785 .000Class PFD . . . . . . . . . . . . . . . . . . . . . . . . . . . . . . . . . . . . . . . . Count 1 283 076 .000
db Advisory Multibrands – Pictet Multi Asset Flexible Allocation
Count/ Quantity/ Purchases/ Sales/ Currency Market price Total market % ofDescription units/ principal additions disposals value in net assets currency amount in the reporting period EUR
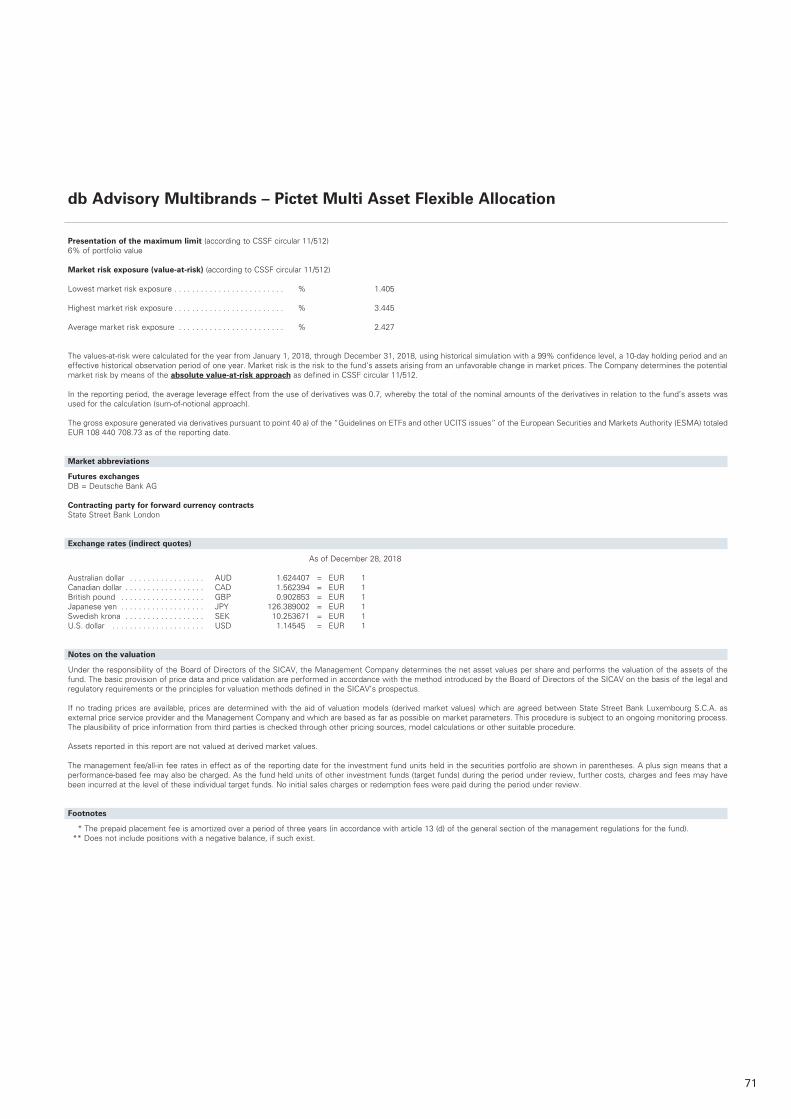
71
Presentation of the maximum limit (according to CSSF circular 11/512)6% of portfolio value
Market risk exposure (value-at-risk) (according to CSSF circular 11/512) Lowest market risk exposure . . . . . . . . . . . . . . . . . . . . . . . . . % 1 .405 Highest market risk exposure . . . . . . . . . . . . . . . . . . . . . . . . . % 3 .445 Average market risk exposure . . . . . . . . . . . . . . . . . . . . . . . . % 2 .427 The values-at-risk were calculated for the year from January 1, 2018, through December 31, 2018, using historical simulation with a 99% confidence level, a 10-day holding period and an effective historical observation period of one year . Market risk is the risk to the fund’s assets arising from an unfavorable change in market prices . The Company determines the potential market risk by means of the absolute value-at-risk approach as defined in CSSF circular 11/512 .
In the reporting period, the average leverage effect from the use of derivatives was 0 .7, whereby the total of the nominal amounts of the derivatives in relation to the fund’s assets was used for the calculation (sum-of-notional approach) .
The gross exposure generated via derivatives pursuant to point 40 a) of the “Guidelines on ETFs and other UCITS issues” of the European Securities and Markets Authority (ESMA) totaled EUR 108 440 708 .73 as of the reporting date .
Market abbreviations
Futures exchangesDB = Deutsche Bank AG
Contracting party for forward currency contractsState Street Bank London
Exchange rates (indirect quotes)
As of December 28, 2018 Australian dollar . . . . . . . . . . . . . . . . . AUD 1 .624407 = EUR 1Canadian dollar . . . . . . . . . . . . . . . . . . CAD 1 .562394 = EUR 1British pound . . . . . . . . . . . . . . . . . . . GBP 0 .902853 = EUR 1Japanese yen . . . . . . . . . . . . . . . . . . . JPY 126 .389002 = EUR 1Swedish krona . . . . . . . . . . . . . . . . . . SEK 10 .253671 = EUR 1U .S . dollar . . . . . . . . . . . . . . . . . . . . . USD 1 .14545 = EUR 1
Notes on the valuation
Under the responsibility of the Board of Directors of the SICAV, the Management Company determines the net asset values per share and performs the valuation of the assets of the fund . The basic provision of price data and price validation are performed in accordance with the method introduced by the Board of Directors of the SICAV on the basis of the legal and regulatory requirements or the principles for valuation methods defined in the SICAV’s prospectus .
If no trading prices are available, prices are determined with the aid of valuation models (derived market values) which are agreed between State Street Bank Luxembourg S .C .A . as external price service provider and the Management Company and which are based as far as possible on market parameters . This procedure is subject to an ongoing monitoring process . The plausibility of price information from third parties is checked through other pricing sources, model calculations or other suitable procedure .
Assets reported in this report are not valued at derived market values .
The management fee/all-in fee rates in effect as of the reporting date for the investment fund units held in the securities portfolio are shown in parentheses . A plus sign means that a performance-based fee may also be charged . As the fund held units of other investment funds (target funds) during the period under review, further costs, charges and fees may have been incurred at the level of these individual target funds . No initial sales charges or redemption fees were paid during the period under review .
Footnotes
* The prepaid placement fee is amortized over a period of three years (in accordance with article 13 (d) of the general section of the management regulations for the fund) . ** Does not include positions with a negative balance, if such exist .
db Advisory Multibrands – Pictet Multi Asset Flexible Allocation
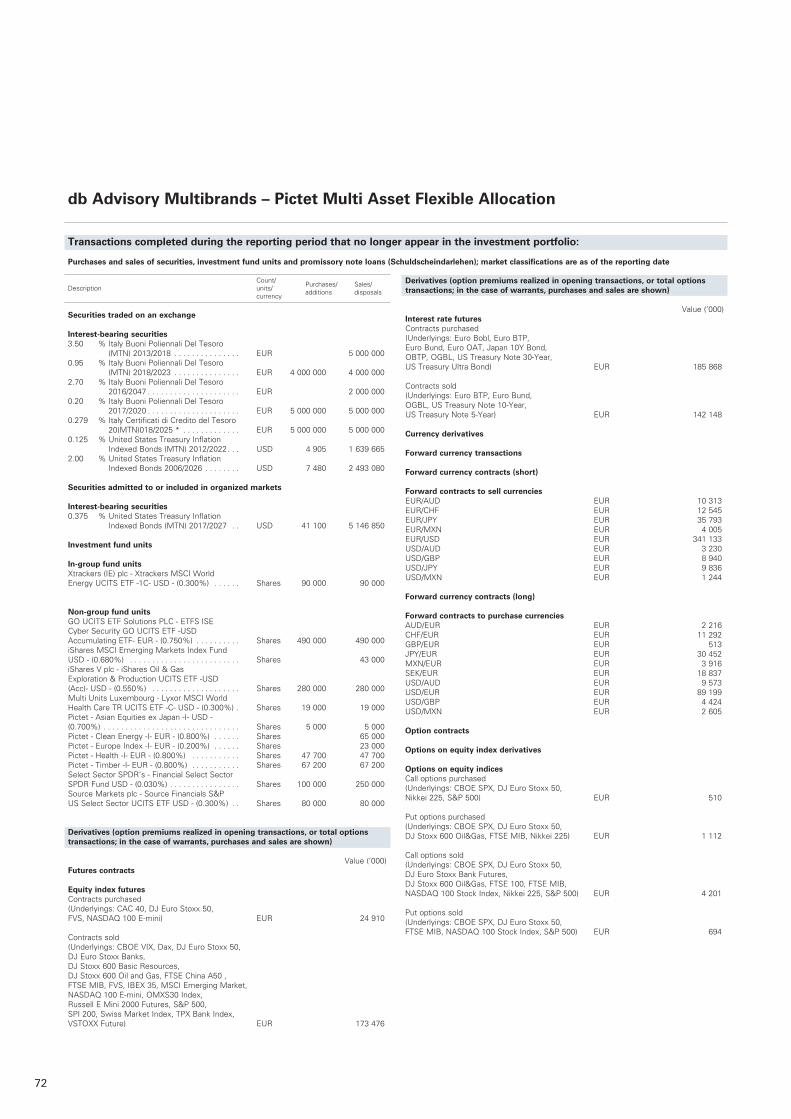
72
Transactions completed during the reporting period that no longer appear in the investment portfolio:
Purchases and sales of securities, investment fund units and promissory note loans (Schuldscheindarlehen); market classifications are as of the reporting date
db Advisory Multibrands – Pictet Multi Asset Flexible Allocation
Count/ Purchases/ Sales/ Description units/ additions disposals currency
Securities traded on an exchange
Interest-bearing securities3.50 % Italy Buoni Poliennali Del Tesoro
(MTN) 2013/2018 . . . . . . . . . . . . . . . EUR 5 000 0000.95 % Italy Buoni Poliennali Del Tesoro
(MTN) 2018/2023 . . . . . . . . . . . . . . . EUR 4 000 000 4 000 0002.70 % Italy Buoni Poliennali Del Tesoro
2016/2047 . . . . . . . . . . . . . . . . . . . . . EUR 2 000 0000.20 % Italy Buoni Poliennali Del Tesoro
2017/2020 . . . . . . . . . . . . . . . . . . . . . EUR 5 000 000 5 000 0000.279 % Italy Certificati di Credito del Tesoro
20(MTN)018/2025 * . . . . . . . . . . . . . EUR 5 000 000 5 000 0000.125 % United States Treasury Inflation
Indexed Bonds (MTN) 2012/2022 . . . USD 4 905 1 639 6652.00 % United States Treasury Inflation
Indexed Bonds 2006/2026 . . . . . . . . USD 7 480 2 493 080
Securities admitted to or included in organized markets
Interest-bearing securities0.375 % United States Treasury Inflation
Indexed Bonds (MTN) 2017/2027 . . USD 41 100 5 146 850
Investment fund units
In-group fund unitsXtrackers (IE) plc - Xtrackers MSCI World Energy UCITS ETF -1C- USD - (0.300%) . . . . . . Shares 90 000 90 000
Non-group fund unitsGO UCITS ETF Solutions PLC - ETFS ISE Cyber Security GO UCITS ETF -USD Accumulating ETF- EUR - (0.750%) . . . . . . . . . . Shares 490 000 490 000iShares MSCI Emerging Markets Index Fund USD - (0.680%) . . . . . . . . . . . . . . . . . . . . . . . . . Shares 43 000iShares V plc - iShares Oil & Gas Exploration & Production UCITS ETF -USD (Acc)- USD - (0.550%) . . . . . . . . . . . . . . . . . . . . Shares 280 000 280 000Multi Units Luxembourg - Lyxor MSCI World Health Care TR UCITS ETF -C- USD - (0.300%) . Shares 19 000 19 000Pictet - Asian Equities ex Japan -I- USD - (0.700%) . . . . . . . . . . . . . . . . . . . . . . . . . . . . . . . Shares 5 000 5 000Pictet - Clean Energy -I- EUR - (0.800%) . . . . . . Shares 65 000Pictet - Europe Index -I- EUR - (0.200%) . . . . . . Shares 23 000Pictet - Health -I- EUR - (0.800%) . . . . . . . . . . . Shares 47 700 47 700Pictet - Timber -I- EUR - (0.800%) . . . . . . . . . . . Shares 67 200 67 200Select Sector SPDR‘s - Financial Select Sector SPDR Fund USD - (0.030%) . . . . . . . . . . . . . . . . Shares 100 000 250 000Source Markets plc - Source Financials S&P US Select Sector UCITS ETF USD - (0.300%) . . Shares 80 000 80 000
Derivatives (option premiums realized in opening transactions, or total options transactions; in the case of warrants, purchases and sales are shown)
Value (’000)Futures contracts
Equity index futures Contracts purchased (Underlyings: CAC 40, DJ Euro Stoxx 50, FVS, NASDAQ 100 E-mini) EUR 24 910 Contracts sold (Underlyings: CBOE VIX, Dax, DJ Euro Stoxx 50, DJ Euro Stoxx Banks, DJ Stoxx 600 Basic Resources, DJ Stoxx 600 Oil and Gas, FTSE China A50 , FTSE MIB, FVS, IBEX 35, MSCI Emerging Market, NASDAQ 100 E-mini, OMXS30 Index, Russell E Mini 2000 Futures, S&P 500, SPI 200, Swiss Market Index, TPX Bank Index, VSTOXX Future) EUR 173 476
Derivatives (option premiums realized in opening transactions, or total options transactions; in the case of warrants, purchases and sales are shown)
Value (’000)Interest rate futures Contracts purchased (Underlyings: Euro Bobl, Euro BTP, Euro Bund, Euro OAT, Japan 10Y Bond, OBTP, OGBL, US Treasury Note 30-Year, US Treasury Ultra Bond) EUR 185 868 Contracts sold (Underlyings: Euro BTP, Euro Bund, OGBL, US Treasury Note 10-Year, US Treasury Note 5-Year) EUR 142 148
Currency derivatives
Forward currency transactions
Forward currency contracts (short)
Forward contracts to sell currencies EUR/AUD EUR 10 313EUR/CHF EUR 12 545EUR/JPY EUR 35 793EUR/MXN EUR 4 005EUR/USD EUR 341 133USD/AUD EUR 3 230USD/GBP EUR 8 940USD/JPY EUR 9 836USD/MXN EUR 1 244 Forward currency contracts (long)
Forward contracts to purchase currencies AUD/EUR EUR 2 216CHF/EUR EUR 11 292GBP/EUR EUR 513JPY/EUR EUR 30 452MXN/EUR EUR 3 916SEK/EUR EUR 18 837USD/AUD EUR 9 573USD/EUR EUR 89 199USD/GBP EUR 4 424USD/MXN EUR 2 605 Option contracts
Options on equity index derivatives
Options on equity indicesCall options purchased (Underlyings: CBOE SPX, DJ Euro Stoxx 50, Nikkei 225, S&P 500) EUR 510
Put options purchased (Underlyings: CBOE SPX, DJ Euro Stoxx 50, DJ Stoxx 600 Oil&Gas, FTSE MIB, Nikkei 225) EUR 1 112
Call options sold (Underlyings: CBOE SPX, DJ Euro Stoxx 50, DJ Euro Stoxx Bank Futures, DJ Stoxx 600 Oil&Gas, FTSE 100, FTSE MIB, NASDAQ 100 Stock Index, Nikkei 225, S&P 500) EUR 4 201
Put options sold (Underlyings: CBOE SPX, DJ Euro Stoxx 50, FTSE MIB, NASDAQ 100 Stock Index, S&P 500) EUR 694
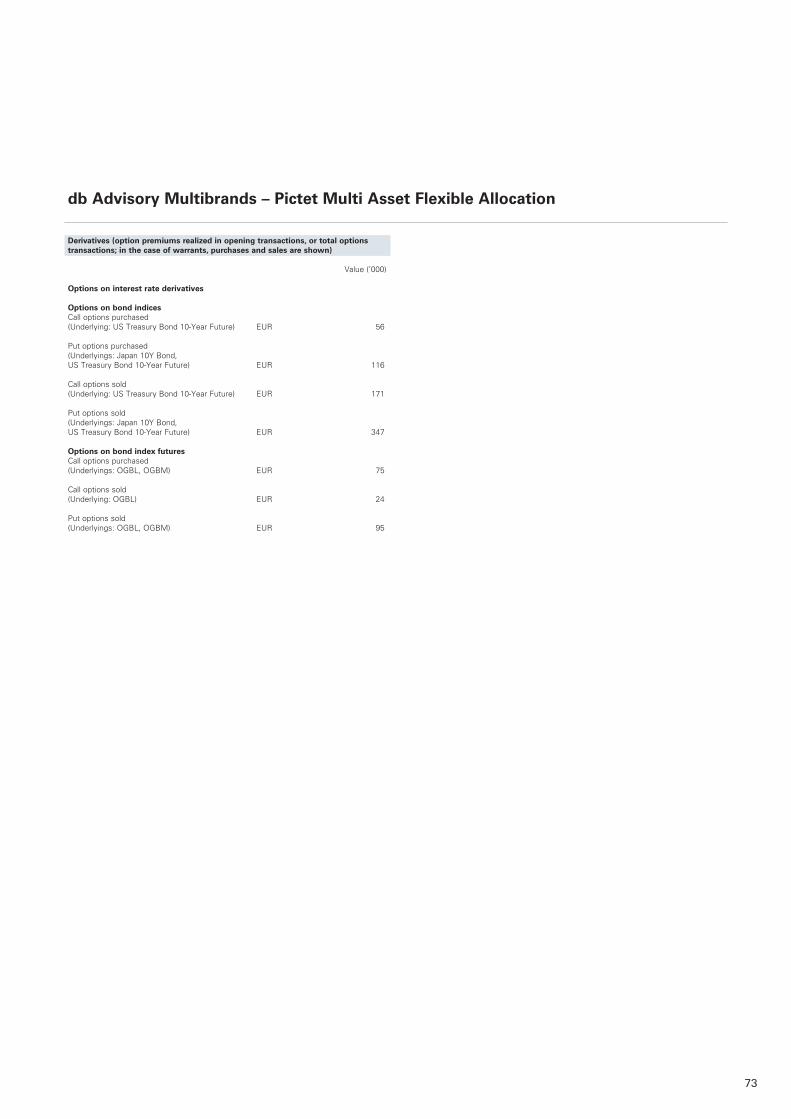
73
db Advisory Multibrands – Pictet Multi Asset Flexible Allocation
Derivatives (option premiums realized in opening transactions, or total options transactions; in the case of warrants, purchases and sales are shown)
Value (’000) Options on interest rate derivatives
Options on bond indicesCall options purchased (Underlying: US Treasury Bond 10-Year Future) EUR 56
Put options purchased (Underlyings: Japan 10Y Bond, US Treasury Bond 10-Year Future) EUR 116 Call options sold (Underlying: US Treasury Bond 10-Year Future) EUR 171
Put options sold (Underlyings: Japan 10Y Bond, US Treasury Bond 10-Year Future) EUR 347
Options on bond index futuresCall options purchased (Underlyings: OGBL, OGBM) EUR 75 Call options sold(Underlying: OGBL) EUR 24
Put options sold (Underlyings: OGBL, OGBM) EUR 95
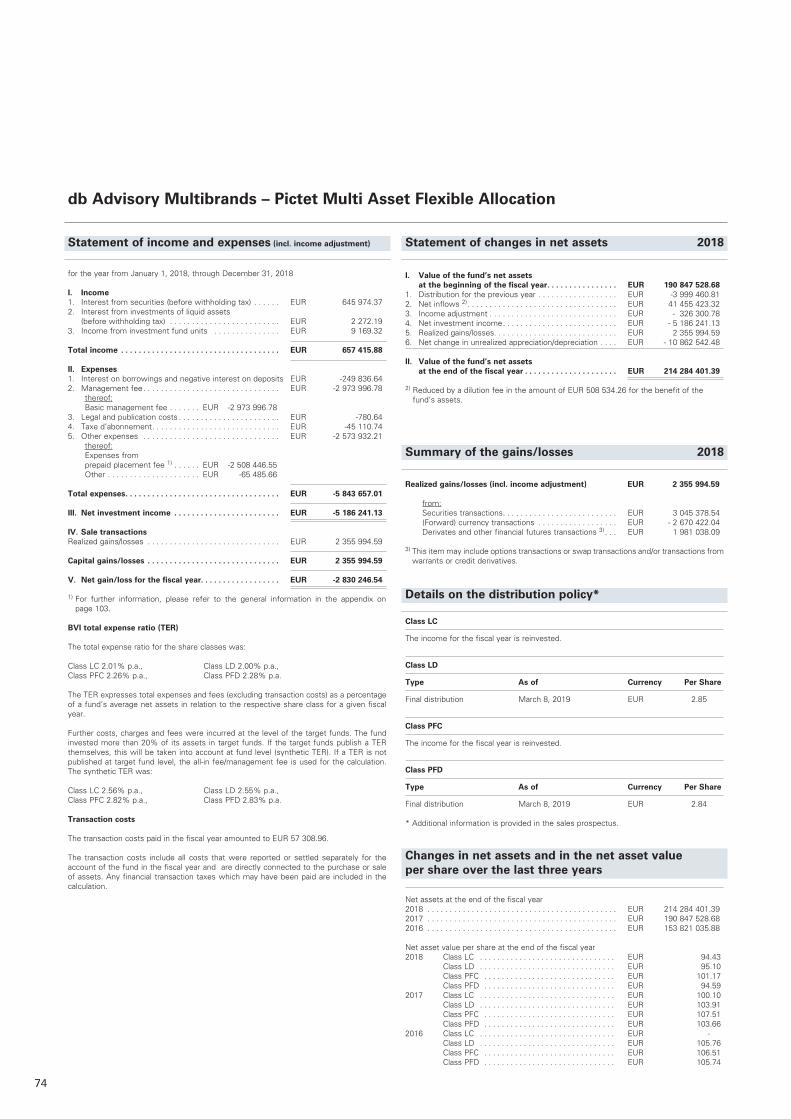
74
db Advisory Multibrands – Pictet Multi Asset Flexible Allocation
Statement of changes in net assets 2018
I. Value of the fund’s net assets at the beginning of the fiscal year . . . . . . . . . . . . . . . . EUR 190 847 528.68
1. Distribution for the previous year . . . . . . . . . . . . . . . . . . EUR -3 999 460.812. Net inflows 2) . . . . . . . . . . . . . . . . . . . . . . . . . . . . . . . . . . EUR 41 455 423.323. Income adjustment . . . . . . . . . . . . . . . . . . . . . . . . . . . . . EUR - 326 300.784. Net investment income . . . . . . . . . . . . . . . . . . . . . . . . . . EUR - 5 186 241.135. Realized gains/losses. . . . . . . . . . . . . . . . . . . . . . . . . . . . EUR 2 355 994.596. Net change in unrealized appreciation/depreciation . . . . EUR - 10 862 542.48
II. Value of the fund’s net assets at the end of the fiscal year . . . . . . . . . . . . . . . . . . . . . EUR 214 284 401.39
2) Reduced by a dilution fee in the amount of EUR 508 534.26 for the benefit of the fund‘s assets.
Realized gains/losses (incl. income adjustment) EUR 2 355 994.59 from: Securities transactions . . . . . . . . . . . . . . . . . . . . . . . . . . EUR 3 045 378.54 (Forward) currency transactions . . . . . . . . . . . . . . . . . . EUR - 2 670 422.04 Derivates and other financial futures transactions 3) . . . EUR 1 981 038.09
3) This item may include options transactions or swap transactions and/or transactions from warrants or credit derivatives.
Summary of the gains/losses 2018
for the year from January 1, 2018, through December 31, 2018
I. Income1. Interest from securities (before withholding tax) . . . . . . EUR 645 974.372. Interest from investments of liquid assets
(before withholding tax) . . . . . . . . . . . . . . . . . . . . . . . . . EUR 2 272.193. Income from investment fund units . . . . . . . . . . . . . . . EUR 9 169.32 Total income . . . . . . . . . . . . . . . . . . . . . . . . . . . . . . . . . . . . EUR 657 415.88
II. Expenses1. Interest on borrowings and negative interest on deposits EUR -249 836.642. Management fee . . . . . . . . . . . . . . . . . . . . . . . . . . . . . . . EUR -2 973 996.78 thereof: Basic management fee . . . . . . . EUR -2 973 996.783. Legal and publication costs . . . . . . . . . . . . . . . . . . . . . . . EUR -780.644. Taxe d’abonnement . . . . . . . . . . . . . . . . . . . . . . . . . . . . . EUR -45 110.745. Other expenses . . . . . . . . . . . . . . . . . . . . . . . . . . . . . . . EUR -2 573 932.21 thereof: Expenses from
prepaid placement fee 1) . . . . . . EUR -2 508 446.55 Other . . . . . . . . . . . . . . . . . . . . . EUR -65 485.66
Total expenses . . . . . . . . . . . . . . . . . . . . . . . . . . . . . . . . . . . EUR -5 843 657.01
III. Net investment income . . . . . . . . . . . . . . . . . . . . . . . . EUR -5 186 241.13 IV. Sale transactionsRealized gains/losses . . . . . . . . . . . . . . . . . . . . . . . . . . . . . . EUR 2 355 994.59
Capital gains/losses . . . . . . . . . . . . . . . . . . . . . . . . . . . . . . EUR 2 355 994.59
V. Net gain/loss for the fiscal year. . . . . . . . . . . . . . . . . . EUR -2 830 246.54
1) For further information, please refer to the general information in the appendix on page 103.
BVI total expense ratio (TER)
The total expense ratio for the share classes was:
Class LC 2.01% p.a., Class LD 2.00% p.a., Class PFC 2.26% p.a., Class PFD 2.28% p.a.
The TER expresses total expenses and fees (excluding transaction costs) as a percentage of a fund’s average net assets in relation to the respective share class for a given fiscal year.
Further costs, charges and fees were incurred at the level of the target funds. The fund invested more than 20% of its assets in target funds. If the target funds publish a TER themselves, this will be taken into account at fund level (synthetic TER). If a TER is not published at target fund level, the all-in fee/management fee is used for the calculation. The synthetic TER was:
Class LC 2.56% p.a., Class LD 2.55% p.a., Class PFC 2.82% p.a., Class PFD 2.83% p.a.
Transaction costs
The transaction costs paid in the fiscal year amounted to EUR 57 308.96.
The transaction costs include all costs that were reported or settled separately for the account of the fund in the fiscal year and are directly connected to the purchase or sale of assets. Any financial transaction taxes which may have been paid are included in the calculation.
Statement of income and expenses (incl. income adjustment)
Details on the distribution policy*
Class LC
The income for the fiscal year is reinvested.
Class LD
Type As of Currency Per Share
Final distribution March 8, 2019 EUR 2.85
Class PFC
The income for the fiscal year is reinvested.
Class PFD
Type As of Currency Per Share
Final distribution March 8, 2019 EUR 2.84 * Additional information is provided in the sales prospectus.
Changes in net assets and in the net asset value per share over the last three years
Net assets at the end of the fiscal year2018 . . . . . . . . . . . . . . . . . . . . . . . . . . . . . . . . . . . . . . . . . . . EUR 214 284 401.392017 . . . . . . . . . . . . . . . . . . . . . . . . . . . . . . . . . . . . . . . . . . . EUR 190 847 528.682016 . . . . . . . . . . . . . . . . . . . . . . . . . . . . . . . . . . . . . . . . . . . EUR 153 821 035.88
Net asset value per share at the end of the fiscal year 2018 Class LC . . . . . . . . . . . . . . . . . . . . . . . . . . . . . . . EUR 94.43 Class LD . . . . . . . . . . . . . . . . . . . . . . . . . . . . . . . EUR 95.10 Class PFC . . . . . . . . . . . . . . . . . . . . . . . . . . . . . . EUR 101.17 Class PFD . . . . . . . . . . . . . . . . . . . . . . . . . . . . . . EUR 94.592017 Class LC . . . . . . . . . . . . . . . . . . . . . . . . . . . . . . . EUR 100.10 Class LD . . . . . . . . . . . . . . . . . . . . . . . . . . . . . . . EUR 103.91 Class PFC . . . . . . . . . . . . . . . . . . . . . . . . . . . . . . EUR 107.51 Class PFD . . . . . . . . . . . . . . . . . . . . . . . . . . . . . . EUR 103.662016 Class LC . . . . . . . . . . . . . . . . . . . . . . . . . . . . . . . EUR - Class LD . . . . . . . . . . . . . . . . . . . . . . . . . . . . . . . EUR 105.76 Class PFC . . . . . . . . . . . . . . . . . . . . . . . . . . . . . . EUR 106.51 Class PFD . . . . . . . . . . . . . . . . . . . . . . . . . . . . . . EUR 105.74
75
db Advisory Multibrands – Pictet Multi Asset Flexible Allocation
Transactions processed for the account of the fund’s assets via closely related companies (based on major holdings of the Deutsche Bank Group)
The share of transactions conducted for the account of the investment fund’s assets via brokers that are closely related companies and persons (share of 5% and above), amounted to 4.75% of all transactions. The total volume was EUR 13 381 007.44.
Placement fee / Dilution adjustment
In the reporting period the fund paid a placement fee of 2.9% of the fund’s net assets to the sales agent. This was calculated on the subscription date. This placement fee serves in particular as compensation for distribution. The gross amount of the placement fee was paid on the subscription date and simultaneously recognized in the fund’s net assets as prepaid expenses. These are amortized on a daily basis over a period of three years from the subscription date. The remaining position for prepaid expenses per share on any valu-ation is calculated on a daily basis by multiplying the net assets of the fund by a factor. The relevant factor is determined by the linear reduction of the placement fee by a certain percentage on a daily basis over three years from the subscription date. The prepaid expenses position fluctuates during the three years from the subscription date, since it depends on both the fund’s net assets and the predetermined factor.
In addition, a dilution adjustment of up to 3% based on the gross redemption amount was charged for the benefit of the fund’s net assets in the reporting period (to be paid by the shareholder).
Further details on the placement fee and the dilution adjustment can be found in the corresponding section of the fund’s sales prospectus.
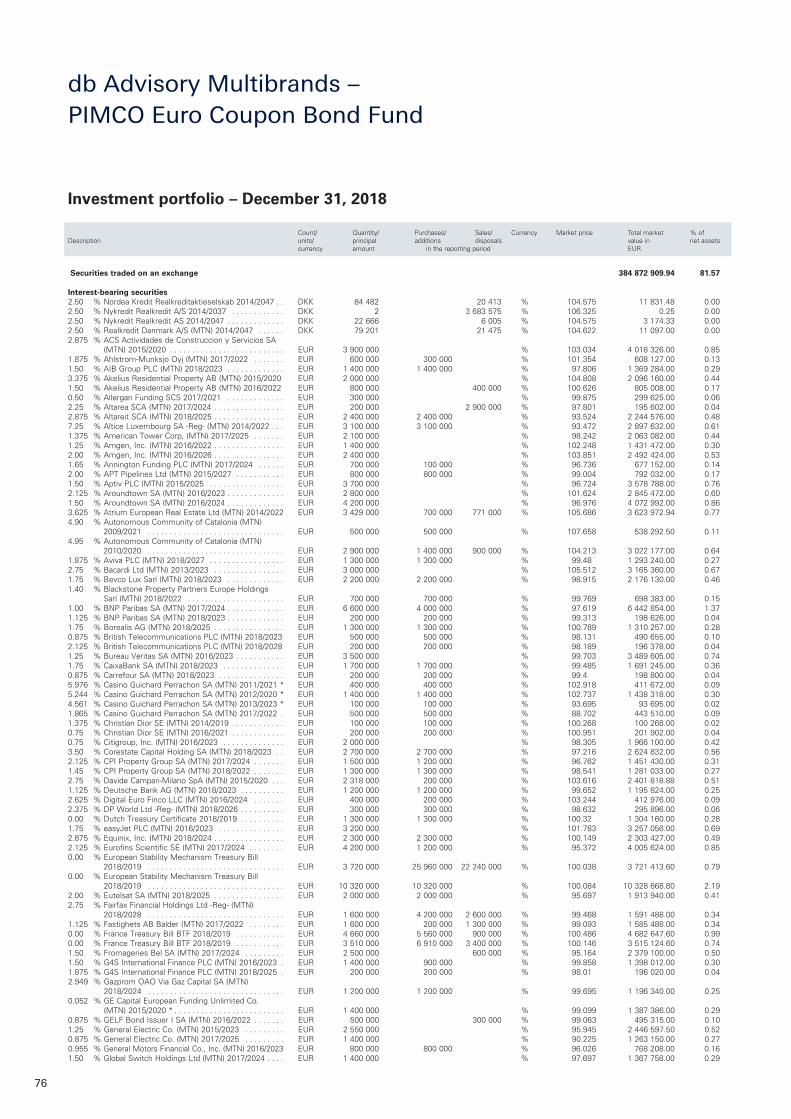
76
Securities traded on an exchange 384 872 909.94 81.57 Interest-bearing securities2.50 % Nordea Kredit Realkreditaktieselskab 2014/2047 . . DKK 84 482 20 413 % 104.575 11 831.48 0.002.50 % Nykredit Realkredit A/S 2014/2037 . . . . . . . . . . . . DKK 2 3 683 575 % 106.325 0.25 0.002.50 % Nykredit Realkredit AS 2014/2047 . . . . . . . . . . . . . DKK 22 666 6 005 % 104.575 3 174.33 0.002.50 % Realkredit Danmark A/S (MTN) 2014/2047 . . . . . . DKK 79 201 21 475 % 104.622 11 097.00 0.002.875 % ACS Actividades de Construccion y Servicios SA
(MTN) 2015/2020 . . . . . . . . . . . . . . . . . . . . . . . . . . EUR 3 900 000 % 103.034 4 018 326.00 0.851.875 % Ahlstrom-Munksjo Oyj (MTN) 2017/2022 . . . . . . . EUR 600 000 300 000 % 101.354 608 127.00 0.131.50 % AIB Group PLC (MTN) 2018/2023 . . . . . . . . . . . . . EUR 1 400 000 1 400 000 % 97.806 1 369 284.00 0.293.375 % Akelius Residential Property AB (MTN) 2015/2020 EUR 2 000 000 % 104.808 2 096 160.00 0.441.50 % Akelius Residential Property AB (MTN) 2016/2022 EUR 800 000 400 000 % 100.626 805 008.00 0.170.50 % Allergan Funding SCS 2017/2021 . . . . . . . . . . . . . EUR 300 000 % 99.875 299 625.00 0.062.25 % Altarea SCA (MTN) 2017/2024 . . . . . . . . . . . . . . . . EUR 200 000 2 900 000 % 97.801 195 602.00 0.042.875 % Altareit SCA (MTN) 2018/2025 . . . . . . . . . . . . . . . . EUR 2 400 000 2 400 000 % 93.524 2 244 576.00 0.487.25 % Altice Luxembourg SA -Reg- (MTN) 2014/2022 . . . EUR 3 100 000 3 100 000 % 93.472 2 897 632.00 0.611.375 % American Tower Corp, (MTN) 2017/2025 . . . . . . . EUR 2 100 000 % 98.242 2 063 082.00 0.441.25 % Amgen, Inc. (MTN) 2016/2022 . . . . . . . . . . . . . . . . EUR 1 400 000 % 102.248 1 431 472.00 0.302.00 % Amgen, Inc. (MTN) 2016/2026 . . . . . . . . . . . . . . . . EUR 2 400 000 % 103.851 2 492 424.00 0.531.65 % Annington Funding PLC (MTN) 2017/2024 . . . . . . EUR 700 000 100 000 % 96.736 677 152.00 0.142.00 % APT Pipelines Ltd (MTN) 2015/2027 . . . . . . . . . . . EUR 800 000 800 000 % 99.004 792 032.00 0.171.50 % Aptiv PLC (MTN) 2015/2025 . . . . . . . . . . . . . . . . . EUR 3 700 000 % 96.724 3 578 788.00 0.762.125 % Aroundtown SA (MTN) 2016/2023 . . . . . . . . . . . . . EUR 2 800 000 % 101.624 2 845 472.00 0.601.50 % Aroundtown SA (MTN) 2016/2024 . . . . . . . . . . . . . EUR 4 200 000 % 96.976 4 072 992.00 0.863.625 % Atrium European Real Estate Ltd (MTN) 2014/2022 EUR 3 429 000 700 000 771 000 % 105.686 3 623 972.94 0.774.90 % Autonomous Community of Catalonia (MTN)
2009/2021 . . . . . . . . . . . . . . . . . . . . . . . . . . . . . . . EUR 500 000 500 000 % 107.658 538 292.50 0.114.95 % Autonomous Community of Catalonia (MTN)
2010/2020 . . . . . . . . . . . . . . . . . . . . . . . . . . . . . . . EUR 2 900 000 1 400 000 900 000 % 104.213 3 022 177.00 0.641.875 % Aviva PLC (MTN) 2018/2027 . . . . . . . . . . . . . . . . . EUR 1 300 000 1 300 000 % 99.48 1 293 240.00 0.272.75 % Bacardi Ltd (MTN) 2013/2023 . . . . . . . . . . . . . . . . EUR 3 000 000 % 105.512 3 165 360.00 0.671.75 % Bevco Lux Sarl (MTN) 2018/2023 . . . . . . . . . . . . . EUR 2 200 000 2 200 000 % 98.915 2 176 130.00 0.461.40 % Blackstone Property Partners Europe Holdings
Sarl (MTN) 2018/2022 . . . . . . . . . . . . . . . . . . . . . . EUR 700 000 700 000 % 99.769 698 383.00 0.151.00 % BNP Paribas SA (MTN) 2017/2024 . . . . . . . . . . . . . EUR 6 600 000 4 000 000 % 97.619 6 442 854.00 1.371.125 % BNP Paribas SA (MTN) 2018/2023 . . . . . . . . . . . . . EUR 200 000 200 000 % 99.313 198 626.00 0.041.75 % Borealis AG (MTN) 2018/2025 . . . . . . . . . . . . . . . . EUR 1 300 000 1 300 000 % 100.789 1 310 257.00 0.280.875 % British Telecommunications PLC (MTN) 2018/2023 EUR 500 000 500 000 % 98.131 490 655.00 0.102.125 % British Telecommunications PLC (MTN) 2018/2028 EUR 200 000 200 000 % 98.189 196 378.00 0.041.25 % Bureau Veritas SA (MTN) 2016/2023 . . . . . . . . . . . EUR 3 500 000 % 99.703 3 489 605.00 0.741.75 % CaixaBank SA (MTN) 2018/2023 . . . . . . . . . . . . . . EUR 1 700 000 1 700 000 % 99.485 1 691 245.00 0.360.875 % Carrefour SA (MTN) 2018/2023 . . . . . . . . . . . . . . . EUR 200 000 200 000 % 99.4 198 800.00 0.045.976 % Casino Guichard Perrachon SA (MTN) 2011/2021 * EUR 400 000 400 000 % 102.918 411 672.00 0.095.244 % Casino Guichard Perrachon SA (MTN) 2012/2020 * EUR 1 400 000 1 400 000 % 102.737 1 438 318.00 0.304.561 % Casino Guichard Perrachon SA (MTN) 2013/2023 * EUR 100 000 100 000 % 93.695 93 695.00 0.021.865 % Casino Guichard Perrachon SA (MTN) 2017/2022 . EUR 500 000 500 000 % 88.702 443 510.00 0.091.375 % Christian Dior SE (MTN) 2014/2019 . . . . . . . . . . . . EUR 100 000 100 000 % 100.268 100 268.00 0.020.75 % Christian Dior SE (MTN) 2016/2021 . . . . . . . . . . . . EUR 200 000 200 000 % 100.951 201 902.00 0.040.75 % Citigroup, Inc. (MTN) 2016/2023 . . . . . . . . . . . . . . EUR 2 000 000 % 98.305 1 966 100.00 0.423.50 % Corestate Capital Holding SA (MTN) 2018/2023 . . EUR 2 700 000 2 700 000 % 97.216 2 624 832.00 0.562.125 % CPI Property Group SA (MTN) 2017/2024 . . . . . . . EUR 1 500 000 1 200 000 % 96.762 1 451 430.00 0.311.45 % CPI Property Group SA (MTN) 2018/2022 . . . . . . . EUR 1 300 000 1 300 000 % 98.541 1 281 033.00 0.272.75 % Davide Campari-Milano SpA (MTN) 2015/2020 . . . EUR 2 318 000 200 000 % 103.616 2 401 818.88 0.511.125 % Deutsche Bank AG (MTN) 2018/2023 . . . . . . . . . . EUR 1 200 000 1 200 000 % 99.652 1 195 824.00 0.252.625 % Digital Euro Finco LLC (MTN) 2016/2024 . . . . . . . EUR 400 000 200 000 % 103.244 412 976.00 0.092.375 % DP World Ltd -Reg- (MTN) 2018/2026 . . . . . . . . . . EUR 300 000 300 000 % 98.632 295 896.00 0.060.00 % Dutch Treasury Certificate 2018/2019 . . . . . . . . . . EUR 1 300 000 1 300 000 % 100.32 1 304 160.00 0.281.75 % easyJet PLC (MTN) 2016/2023 . . . . . . . . . . . . . . . EUR 3 200 000 % 101.783 3 257 056.00 0.692.875 % Equinix, Inc. (MTN) 2018/2024 . . . . . . . . . . . . . . . . EUR 2 300 000 2 300 000 % 100.149 2 303 427.00 0.492.125 % Eurofins Scientific SE (MTN) 2017/2024 . . . . . . . . EUR 4 200 000 1 200 000 % 95.372 4 005 624.00 0.850.00 % European Stability Mechanism Treasury Bill
2018/2019 . . . . . . . . . . . . . . . . . . . . . . . . . . . . . . . EUR 3 720 000 25 960 000 22 240 000 % 100.038 3 721 413.60 0.790.00 % European Stability Mechanism Treasury Bill
2018/2019 . . . . . . . . . . . . . . . . . . . . . . . . . . . . . . . EUR 10 320 000 10 320 000 % 100.084 10 328 668.80 2.192.00 % Eutelsat SA (MTN) 2018/2025 . . . . . . . . . . . . . . . . EUR 2 000 000 2 000 000 % 95.697 1 913 940.00 0.412.75 % Fairfax Financial Holdings Ltd -Reg- (MTN)
2018/2028 . . . . . . . . . . . . . . . . . . . . . . . . . . . . . . . EUR 1 600 000 4 200 000 2 600 000 % 99.468 1 591 488.00 0.341.125 % Fastighets AB Balder (MTN) 2017/2022 . . . . . . . . EUR 1 600 000 200 000 1 300 000 % 99.093 1 585 488.00 0.340.00 % France Treasury Bill BTF 2018/2019 . . . . . . . . . . . EUR 4 660 000 5 560 000 900 000 % 100.486 4 682 647.60 0.990.00 % France Treasury Bill BTF 2018/2019 . . . . . . . . . . . EUR 3 510 000 6 910 000 3 400 000 % 100.146 3 515 124.60 0.741.50 % Fromageries Bel SA (MTN) 2017/2024 . . . . . . . . . EUR 2 500 000 600 000 % 95.164 2 379 100.00 0.501.50 % G4S International Finance PLC (MTN) 2016/2023 . EUR 1 400 000 900 000 % 99.858 1 398 012.00 0.301.875 % G4S International Finance PLC (MTN) 2018/2025 . EUR 200 000 200 000 % 98.01 196 020.00 0.042.949 % Gazprom OAO Via Gaz Capital SA (MTN)
2018/2024 . . . . . . . . . . . . . . . . . . . . . . . . . . . . . . . EUR 1 200 000 1 200 000 % 99.695 1 196 340.00 0.250.052 % GE Capital European Funding Unlimited Co.
(MTN) 2015/2020 * . . . . . . . . . . . . . . . . . . . . . . . . . EUR 1 400 000 % 99.099 1 387 386.00 0.290.875 % GELF Bond Issuer I SA (MTN) 2016/2022 . . . . . . . EUR 500 000 300 000 % 99.063 495 315.00 0.101.25 % General Electric Co. (MTN) 2015/2023 . . . . . . . . . EUR 2 550 000 % 95.945 2 446 597.50 0.520.875 % General Electric Co. (MTN) 2017/2025 . . . . . . . . . EUR 1 400 000 % 90.225 1 263 150.00 0.270.955 % General Motors Financial Co., Inc. (MTN) 2016/2023 EUR 800 000 800 000 % 96.026 768 208.00 0.161.50 % Global Switch Holdings Ltd (MTN) 2017/2024 . . . . EUR 1 400 000 % 97.697 1 367 758.00 0.29
Investment portfolio – December 31, 2018
Count/ Quantity/ Purchases/ Sales/ Currency Market price Total market % ofDescription units/ principal additions disposals value in net assets currency amount in the reporting period EUR
db Advisory Multibrands – PIMCO Euro Coupon Bond Fund
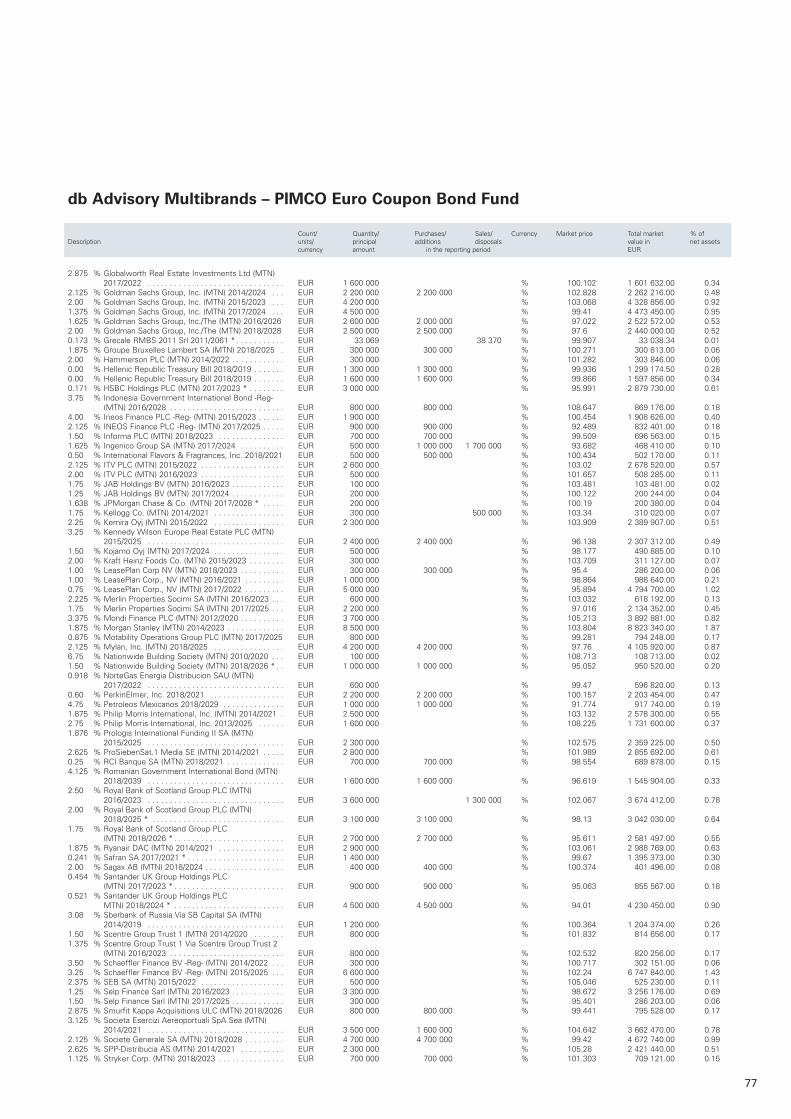
77
2.875 % Globalworth Real Estate Investments Ltd (MTN) 2017/2022 . . . . . . . . . . . . . . . . . . . . . . . . . . . . . . . EUR 1 600 000 % 100.102 1 601 632.00 0.34
2.125 % Goldman Sachs Group, Inc. (MTN) 2014/2024 . . . EUR 2 200 000 2 200 000 % 102.828 2 262 216.00 0.482.00 % Goldman Sachs Group, Inc. (MTN) 2015/2023 . . . EUR 4 200 000 % 103.068 4 328 856.00 0.921.375 % Goldman Sachs Group, Inc. (MTN) 2017/2024 . . . EUR 4 500 000 % 99.41 4 473 450.00 0.951.625 % Goldman Sachs Group, Inc./The (MTN) 2016/2026 EUR 2 600 000 2 000 000 % 97.022 2 522 572.00 0.532.00 % Goldman Sachs Group, Inc./The (MTN) 2018/2028 EUR 2 500 000 2 500 000 % 97.6 2 440 000.00 0.520.173 % Grecale RMBS 2011 Srl 2011/2061 * . . . . . . . . . . . EUR 33 069 38 370 % 99.907 33 038.34 0.011.875 % Groupe Bruxelles Lambert SA (MTN) 2018/2025 . EUR 300 000 300 000 % 100.271 300 813.00 0.062.00 % Hammerson PLC (MTN) 2014/2022 . . . . . . . . . . . . EUR 300 000 % 101.282 303 846.00 0.060.00 % Hellenic Republic Treasury Bill 2018/2019 . . . . . . . EUR 1 300 000 1 300 000 % 99.936 1 299 174.50 0.280.00 % Hellenic Republic Treasury Bill 2018/2019 . . . . . . . EUR 1 600 000 1 600 000 % 99.866 1 597 856.00 0.340.171 % HSBC Holdings PLC (MTN) 2017/2023 * . . . . . . . . EUR 3 000 000 % 95.991 2 879 730.00 0.613.75 % Indonesia Government International Bond -Reg-
(MTN) 2016/2028 . . . . . . . . . . . . . . . . . . . . . . . . . . EUR 800 000 800 000 % 108.647 869 176.00 0.184.00 % Ineos Finance PLC -Reg- (MTN) 2015/2023 . . . . . . EUR 1 900 000 % 100.454 1 908 626.00 0.402.125 % INEOS Finance PLC -Reg- (MTN) 2017/2025 . . . . . EUR 900 000 900 000 % 92.489 832 401.00 0.181.50 % Informa PLC (MTN) 2018/2023 . . . . . . . . . . . . . . . EUR 700 000 700 000 % 99.509 696 563.00 0.151.625 % Ingenico Group SA (MTN) 2017/2024 . . . . . . . . . . EUR 500 000 1 000 000 1 700 000 % 93.682 468 410.00 0.100.50 % International Flavors & Fragrances, Inc. 2018/2021 EUR 500 000 500 000 % 100.434 502 170.00 0.112.125 % ITV PLC (MTN) 2015/2022 . . . . . . . . . . . . . . . . . . . EUR 2 600 000 % 103.02 2 678 520.00 0.572.00 % ITV PLC (MTN) 2016/2023 . . . . . . . . . . . . . . . . . . . EUR 500 000 % 101.657 508 285.00 0.111.75 % JAB Holdings BV (MTN) 2016/2023 . . . . . . . . . . . . EUR 100 000 % 103.481 103 481.00 0.021.25 % JAB Holdings BV (MTN) 2017/2024 . . . . . . . . . . . . EUR 200 000 % 100.122 200 244.00 0.041.638 % JPMorgan Chase & Co. (MTN) 2017/2028 * . . . . . EUR 200 000 % 100.19 200 380.00 0.041.75 % Kellogg Co. (MTN) 2014/2021 . . . . . . . . . . . . . . . . EUR 300 000 500 000 % 103.34 310 020.00 0.072.25 % Kemira Oyj (MTN) 2015/2022 . . . . . . . . . . . . . . . . EUR 2 300 000 % 103.909 2 389 907.00 0.513.25 % Kennedy Wilson Europe Real Estate PLC (MTN)
2015/2025 . . . . . . . . . . . . . . . . . . . . . . . . . . . . . . . EUR 2 400 000 2 400 000 % 96.138 2 307 312.00 0.491.50 % Kojamo Oyj (MTN) 2017/2024 . . . . . . . . . . . . . . . . EUR 500 000 % 98.177 490 885.00 0.102.00 % Kraft Heinz Foods Co. (MTN) 2015/2023 . . . . . . . . EUR 300 000 % 103.709 311 127.00 0.071.00 % LeasePlan Corp NV (MTN) 2018/2023 . . . . . . . . . . EUR 300 000 300 000 % 95.4 286 200.00 0.061.00 % LeasePlan Corp., NV (MTN) 2016/2021 . . . . . . . . . EUR 1 000 000 % 98.864 988 640.00 0.210.75 % LeasePlan Corp., NV (MTN) 2017/2022 . . . . . . . . . EUR 5 000 000 % 95.894 4 794 700.00 1.022.225 % Merlin Properties Socimi SA (MTN) 2016/2023 . . . EUR 600 000 % 103.032 618 192.00 0.131.75 % Merlin Properties Socimi SA (MTN) 2017/2025 . . . EUR 2 200 000 % 97.016 2 134 352.00 0.453.375 % Mondi Finance PLC (MTN) 2012/2020 . . . . . . . . . . EUR 3 700 000 % 105.213 3 892 881.00 0.821.875 % Morgan Stanley (MTN) 2014/2023 . . . . . . . . . . . . . EUR 8 500 000 % 103.804 8 823 340.00 1.870.875 % Motability Operations Group PLC (MTN) 2017/2025 EUR 800 000 % 99.281 794 248.00 0.172.125 % Mylan, Inc. (MTN) 2018/2025 . . . . . . . . . . . . . . . . EUR 4 200 000 4 200 000 % 97.76 4 105 920.00 0.876.75 % Nationwide Building Society (MTN) 2010/2020 . . . EUR 100 000 % 108.713 108 713.00 0.021.50 % Nationwide Building Society (MTN) 2018/2026 * . . EUR 1 000 000 1 000 000 % 95.052 950 520.00 0.200.918 % NorteGas Energia Distribucion SAU (MTN)
2017/2022 . . . . . . . . . . . . . . . . . . . . . . . . . . . . . . . EUR 600 000 % 99.47 596 820.00 0.130.60 % PerkinElmer, Inc. 2018/2021 . . . . . . . . . . . . . . . . . EUR 2 200 000 2 200 000 % 100.157 2 203 454.00 0.474.75 % Petroleos Mexicanos 2018/2029 . . . . . . . . . . . . . . EUR 1 000 000 1 000 000 % 91.774 917 740.00 0.191.875 % Philip Morris International, Inc. (MTN) 2014/2021 . EUR 2 500 000 % 103.132 2 578 300.00 0.552.75 % Philip Morris International, Inc. 2013/2025 . . . . . . EUR 1 600 000 % 108.225 1 731 600.00 0.371.876 % Prologis International Funding II SA (MTN)
2015/2025 . . . . . . . . . . . . . . . . . . . . . . . . . . . . . . . EUR 2 300 000 % 102.575 2 359 225.00 0.502.625 % ProSiebenSat.1 Media SE (MTN) 2014/2021 . . . . . EUR 2 800 000 % 101.989 2 855 692.00 0.610.25 % RCI Banque SA (MTN) 2018/2021 . . . . . . . . . . . . . EUR 700 000 700 000 % 98.554 689 878.00 0.154.125 % Romanian Government International Bond (MTN)
2018/2039 . . . . . . . . . . . . . . . . . . . . . . . . . . . . . . . EUR 1 600 000 1 600 000 % 96.619 1 545 904.00 0.332.50 % Royal Bank of Scotland Group PLC (MTN)
2016/2023 . . . . . . . . . . . . . . . . . . . . . . . . . . . . . . . EUR 3 600 000 1 300 000 % 102.067 3 674 412.00 0.782.00 % Royal Bank of Scotland Group PLC (MTN)
2018/2025 * . . . . . . . . . . . . . . . . . . . . . . . . . . . . . . EUR 3 100 000 3 100 000 % 98.13 3 042 030.00 0.641.75 % Royal Bank of Scotland Group PLC
(MTN) 2018/2026 * . . . . . . . . . . . . . . . . . . . . . . . . . EUR 2 700 000 2 700 000 % 95.611 2 581 497.00 0.551.875 % Ryanair DAC (MTN) 2014/2021 . . . . . . . . . . . . . . . EUR 2 900 000 % 103.061 2 988 769.00 0.630.241 % Safran SA 2017/2021 * . . . . . . . . . . . . . . . . . . . . . . EUR 1 400 000 % 99.67 1 395 373.00 0.302.00 % Sagax AB (MTN) 2018/2024 . . . . . . . . . . . . . . . . . . EUR 400 000 400 000 % 100.374 401 496.00 0.080.454 % Santander UK Group Holdings PLC
(MTN) 2017/2023 * . . . . . . . . . . . . . . . . . . . . . . . . . EUR 900 000 900 000 % 95.063 855 567.00 0.180.521 % Santander UK Group Holdings PLC
MTN) 2018/2024 * . . . . . . . . . . . . . . . . . . . . . . . . . EUR 4 500 000 4 500 000 % 94.01 4 230 450.00 0.903.08 % Sberbank of Russia Via SB Capital SA (MTN)
2014/2019 . . . . . . . . . . . . . . . . . . . . . . . . . . . . . . . EUR 1 200 000 % 100.364 1 204 374.00 0.261.50 % Scentre Group Trust 1 (MTN) 2014/2020 . . . . . . . EUR 800 000 % 101.832 814 656.00 0.171.375 % Scentre Group Trust 1 Via Scentre Group Trust 2
(MTN) 2016/2023 . . . . . . . . . . . . . . . . . . . . . . . . . . EUR 800 000 % 102.532 820 256.00 0.173.50 % Schaeffler Finance BV -Reg- (MTN) 2014/2022 . . . EUR 300 000 % 100.717 302 151.00 0.063.25 % Schaeffler Finance BV -Reg- (MTN) 2015/2025 . . . EUR 6 600 000 % 102.24 6 747 840.00 1.432.375 % SEB SA (MTN) 2015/2022 . . . . . . . . . . . . . . . . . . . EUR 500 000 % 105.046 525 230.00 0.111.25 % Selp Finance Sarl (MTN) 2016/2023 . . . . . . . . . . . . EUR 3 300 000 % 98.672 3 256 176.00 0.691.50 % Selp Finance Sarl (MTN) 2017/2025 . . . . . . . . . . . . EUR 300 000 % 95.401 286 203.00 0.062.875 % Smurfit Kappa Acquisitions ULC (MTN) 2018/2026 EUR 800 000 800 000 % 99.441 795 528.00 0.173.125 % Societa Esercizi Aereoportuali SpA Sea (MTN)
2014/2021 . . . . . . . . . . . . . . . . . . . . . . . . . . . . . . . EUR 3 500 000 1 600 000 % 104.642 3 662 470.00 0.782.125 % Societe Generale SA (MTN) 2018/2028 . . . . . . . . . EUR 4 700 000 4 700 000 % 99.42 4 672 740.00 0.992.625 % SPP-Distribucia AS (MTN) 2014/2021 . . . . . . . . . . EUR 2 300 000 % 105.28 2 421 440.00 0.511.125 % Stryker Corp. (MTN) 2018/2023 . . . . . . . . . . . . . . . EUR 700 000 700 000 % 101.303 709 121.00 0.15
db Advisory Multibrands – PIMCO Euro Coupon Bond Fund
Count/ Quantity/ Purchases/ Sales/ Currency Market price Total market % ofDescription units/ principal additions disposals value in net assets currency amount in the reporting period EUR
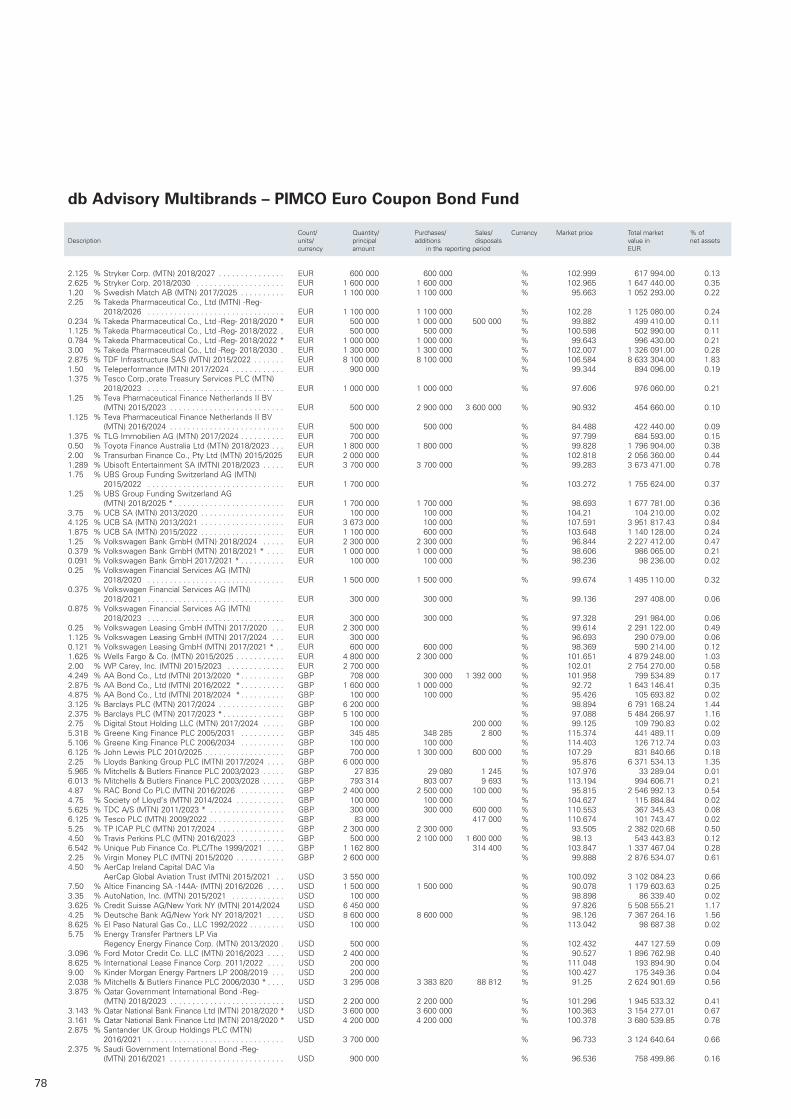
78
2.125 % Stryker Corp. (MTN) 2018/2027 . . . . . . . . . . . . . . . EUR 600 000 600 000 % 102.999 617 994.00 0.132.625 % Stryker Corp. 2018/2030 . . . . . . . . . . . . . . . . . . . . EUR 1 600 000 1 600 000 % 102.965 1 647 440.00 0.351.20 % Swedish Match AB (MTN) 2017/2025 . . . . . . . . . . EUR 1 100 000 1 100 000 % 95.663 1 052 293.00 0.222.25 % Takeda Pharmaceutical Co., Ltd (MTN) -Reg-
2018/2026 . . . . . . . . . . . . . . . . . . . . . . . . . . . . . . . EUR 1 100 000 1 100 000 % 102.28 1 125 080.00 0.240.234 % Takeda Pharmaceutical Co., Ltd -Reg- 2018/2020 * EUR 500 000 1 000 000 500 000 % 99.882 499 410.00 0.111.125 % Takeda Pharmaceutical Co., Ltd -Reg- 2018/2022 . EUR 500 000 500 000 % 100.598 502 990.00 0.110.784 % Takeda Pharmaceutical Co., Ltd -Reg- 2018/2022 * EUR 1 000 000 1 000 000 % 99.643 996 430.00 0.213.00 % Takeda Pharmaceutical Co., Ltd -Reg- 2018/2030 . EUR 1 300 000 1 300 000 % 102.007 1 326 091.00 0.282.875 % TDF Infrastructure SAS (MTN) 2015/2022 . . . . . . . EUR 8 100 000 8 100 000 % 106.584 8 633 304.00 1.831.50 % Teleperformance (MTN) 2017/2024 . . . . . . . . . . . . EUR 900 000 % 99.344 894 096.00 0.191.375 % Tesco Corp.,orate Treasury Services PLC (MTN)
2018/2023 . . . . . . . . . . . . . . . . . . . . . . . . . . . . . . . EUR 1 000 000 1 000 000 % 97.606 976 060.00 0.211.25 % Teva Pharmaceutical Finance Netherlands II BV
(MTN) 2015/2023 . . . . . . . . . . . . . . . . . . . . . . . . . . EUR 500 000 2 900 000 3 600 000 % 90.932 454 660.00 0.101.125 % Teva Pharmaceutical Finance Netherlands II BV
(MTN) 2016/2024 . . . . . . . . . . . . . . . . . . . . . . . . . . EUR 500 000 500 000 % 84.488 422 440.00 0.091.375 % TLG Immobilien AG (MTN) 2017/2024 . . . . . . . . . . EUR 700 000 % 97.799 684 593.00 0.150.50 % Toyota Finance Australia Ltd (MTN) 2018/2023 . . . EUR 1 800 000 1 800 000 % 99.828 1 796 904.00 0.382.00 % Transurban Finance Co., Pty Ltd (MTN) 2015/2025 EUR 2 000 000 % 102.818 2 056 360.00 0.441.289 % Ubisoft Entertainment SA (MTN) 2018/2023 . . . . . EUR 3 700 000 3 700 000 % 99.283 3 673 471.00 0.781.75 % UBS Group Funding Switzerland AG (MTN)
2015/2022 . . . . . . . . . . . . . . . . . . . . . . . . . . . . . . . EUR 1 700 000 % 103.272 1 755 624.00 0.371.25 % UBS Group Funding Switzerland AG
(MTN) 2018/2025 * . . . . . . . . . . . . . . . . . . . . . . . . . EUR 1 700 000 1 700 000 % 98.693 1 677 781.00 0.363.75 % UCB SA (MTN) 2013/2020 . . . . . . . . . . . . . . . . . . . EUR 100 000 100 000 % 104.21 104 210.00 0.024.125 % UCB SA (MTN) 2013/2021 . . . . . . . . . . . . . . . . . . . EUR 3 673 000 100 000 % 107.591 3 951 817.43 0.841.875 % UCB SA (MTN) 2015/2022 . . . . . . . . . . . . . . . . . . . EUR 1 100 000 600 000 % 103.648 1 140 128.00 0.241.25 % Volkswagen Bank GmbH (MTN) 2018/2024 . . . . . EUR 2 300 000 2 300 000 % 96.844 2 227 412.00 0.470.379 % Volkswagen Bank GmbH (MTN) 2018/2021 * . . . . EUR 1 000 000 1 000 000 % 98.606 986 065.00 0.210.091 % Volkswagen Bank GmbH 2017/2021 * . . . . . . . . . . EUR 100 000 100 000 % 98.236 98 236.00 0.020.25 % Volkswagen Financial Services AG (MTN)
2018/2020 . . . . . . . . . . . . . . . . . . . . . . . . . . . . . . . EUR 1 500 000 1 500 000 % 99.674 1 495 110.00 0.320.375 % Volkswagen Financial Services AG (MTN)
2018/2021 . . . . . . . . . . . . . . . . . . . . . . . . . . . . . . . EUR 300 000 300 000 % 99.136 297 408.00 0.060.875 % Volkswagen Financial Services AG (MTN)
2018/2023 . . . . . . . . . . . . . . . . . . . . . . . . . . . . . . . EUR 300 000 300 000 % 97.328 291 984.00 0.060.25 % Volkswagen Leasing GmbH (MTN) 2017/2020 . . . EUR 2 300 000 % 99.614 2 291 122.00 0.491.125 % Volkswagen Leasing GmbH (MTN) 2017/2024 . . . EUR 300 000 % 96.693 290 079.00 0.060.121 % Volkswagen Leasing GmbH (MTN) 2017/2021 * . . EUR 600 000 600 000 % 98.369 590 214.00 0.121.625 % Wells Fargo & Co. (MTN) 2015/2025 . . . . . . . . . . . EUR 4 800 000 2 300 000 % 101.651 4 879 248.00 1.032.00 % WP Carey, Inc. (MTN) 2015/2023 . . . . . . . . . . . . . EUR 2 700 000 % 102.01 2 754 270.00 0.584.249 % AA Bond Co., Ltd (MTN) 2013/2020 * . . . . . . . . . . GBP 708 000 300 000 1 392 000 % 101.958 799 534.89 0.172.875 % AA Bond Co., Ltd (MTN) 2016/2022 * . . . . . . . . . . GBP 1 600 000 1 000 000 % 92.72 1 643 146.41 0.354.875 % AA Bond Co., Ltd (MTN) 2018/2024 * . . . . . . . . . . GBP 100 000 100 000 % 95.426 105 693.82 0.023.125 % Barclays PLC (MTN) 2017/2024 . . . . . . . . . . . . . . . GBP 6 200 000 % 98.894 6 791 168.24 1.442.375 % Barclays PLC (MTN) 2017/2023 * . . . . . . . . . . . . . . GBP 5 100 000 % 97.088 5 484 266.97 1.162.75 % Digital Stout Holding LLC (MTN) 2017/2024 . . . . . GBP 100 000 200 000 % 99.125 109 790.83 0.025.318 % Greene King Finance PLC 2005/2031 . . . . . . . . . . GBP 345 485 348 285 2 800 % 115.374 441 489.11 0.095.106 % Greene King Finance PLC 2006/2034 . . . . . . . . . . GBP 100 000 100 000 % 114.403 126 712.74 0.036.125 % John Lewis PLC 2010/2025 . . . . . . . . . . . . . . . . . . GBP 700 000 1 300 000 600 000 % 107.29 831 840.66 0.182.25 % Lloyds Banking Group PLC (MTN) 2017/2024 . . . . GBP 6 000 000 % 95.876 6 371 534.13 1.355.965 % Mitchells & Butlers Finance PLC 2003/2023 . . . . . GBP 27 835 29 080 1 245 % 107.976 33 289.04 0.016.013 % Mitchells & Butlers Finance PLC 2003/2028 . . . . . GBP 793 314 803 007 9 693 % 113.194 994 606.71 0.214.87 % RAC Bond Co PLC (MTN) 2016/2026 . . . . . . . . . . GBP 2 400 000 2 500 000 100 000 % 95.815 2 546 992.13 0.544.75 % Society of Lloyd’s (MTN) 2014/2024 . . . . . . . . . . . GBP 100 000 100 000 % 104.627 115 884.84 0.025.625 % TDC A/S (MTN) 2011/2023 * . . . . . . . . . . . . . . . . . GBP 300 000 300 000 600 000 % 110.553 367 345.43 0.086.125 % Tesco PLC (MTN) 2009/2022 . . . . . . . . . . . . . . . . . GBP 83 000 417 000 % 110.674 101 743.47 0.025.25 % TP ICAP PLC (MTN) 2017/2024 . . . . . . . . . . . . . . . GBP 2 300 000 2 300 000 % 93.505 2 382 020.68 0.504.50 % Travis Perkins PLC (MTN) 2016/2023 . . . . . . . . . . GBP 500 000 2 100 000 1 600 000 % 98.13 543 443.83 0.126.542 % Unique Pub Finance Co. PLC/The 1999/2021 . . . . GBP 1 162 800 314 400 % 103.847 1 337 467.04 0.282.25 % Virgin Money PLC (MTN) 2015/2020 . . . . . . . . . . . GBP 2 600 000 % 99.888 2 876 534.07 0.614.50 % AerCap Ireland Capital DAC Via
AerCap Global Aviation Trust (MTN) 2015/2021 . . USD 3 550 000 % 100.092 3 102 084.23 0.667.50 % Altice Financing SA -144A- (MTN) 2016/2026 . . . . USD 1 500 000 1 500 000 % 90.078 1 179 603.63 0.253.35 % AutoNation, Inc. (MTN) 2015/2021 . . . . . . . . . . . . USD 100 000 % 98.898 86 339.40 0.023.625 % Credit Suisse AG/New York NY (MTN) 2014/2024 USD 6 450 000 % 97.826 5 508 555.21 1.174.25 % Deutsche Bank AG/New York NY 2018/2021 . . . . USD 8 600 000 8 600 000 % 98.126 7 367 264.16 1.568.625 % El Paso Natural Gas Co., LLC 1992/2022 . . . . . . . . USD 100 000 % 113.042 98 687.38 0.025.75 % Energy Transfer Partners LP Via
Regency Energy Finance Corp. (MTN) 2013/2020 . USD 500 000 % 102.432 447 127.59 0.093.096 % Ford Motor Credit Co. LLC (MTN) 2016/2023 . . . . USD 2 400 000 % 90.527 1 896 762.98 0.408.625 % International Lease Finance Corp. 2011/2022 . . . . USD 200 000 % 111.048 193 894.90 0.049.00 % Kinder Morgan Energy Partners LP 2008/2019 . . . USD 200 000 % 100.427 175 349.36 0.042.038 % Mitchells & Butlers Finance PLC 2006/2030 * . . . . USD 3 295 008 3 383 820 88 812 % 91.25 2 624 901.69 0.563.875 % Qatar Government International Bond -Reg-
(MTN) 2018/2023 . . . . . . . . . . . . . . . . . . . . . . . . . . USD 2 200 000 2 200 000 % 101.296 1 945 533.32 0.413.143 % Qatar National Bank Finance Ltd (MTN) 2018/2020 * USD 3 600 000 3 600 000 % 100.363 3 154 277.01 0.673.161 % Qatar National Bank Finance Ltd (MTN) 2018/2020 * USD 4 200 000 4 200 000 % 100.378 3 680 539.85 0.782.875 % Santander UK Group Holdings PLC (MTN)
2016/2021 . . . . . . . . . . . . . . . . . . . . . . . . . . . . . . . USD 3 700 000 % 96.733 3 124 640.64 0.662.375 % Saudi Government International Bond -Reg-
(MTN) 2016/2021 . . . . . . . . . . . . . . . . . . . . . . . . . . USD 900 000 % 96.536 758 499.86 0.16
db Advisory Multibrands – PIMCO Euro Coupon Bond Fund
Count/ Quantity/ Purchases/ Sales/ Currency Market price Total market % ofDescription units/ principal additions disposals value in net assets currency amount in the reporting period EUR
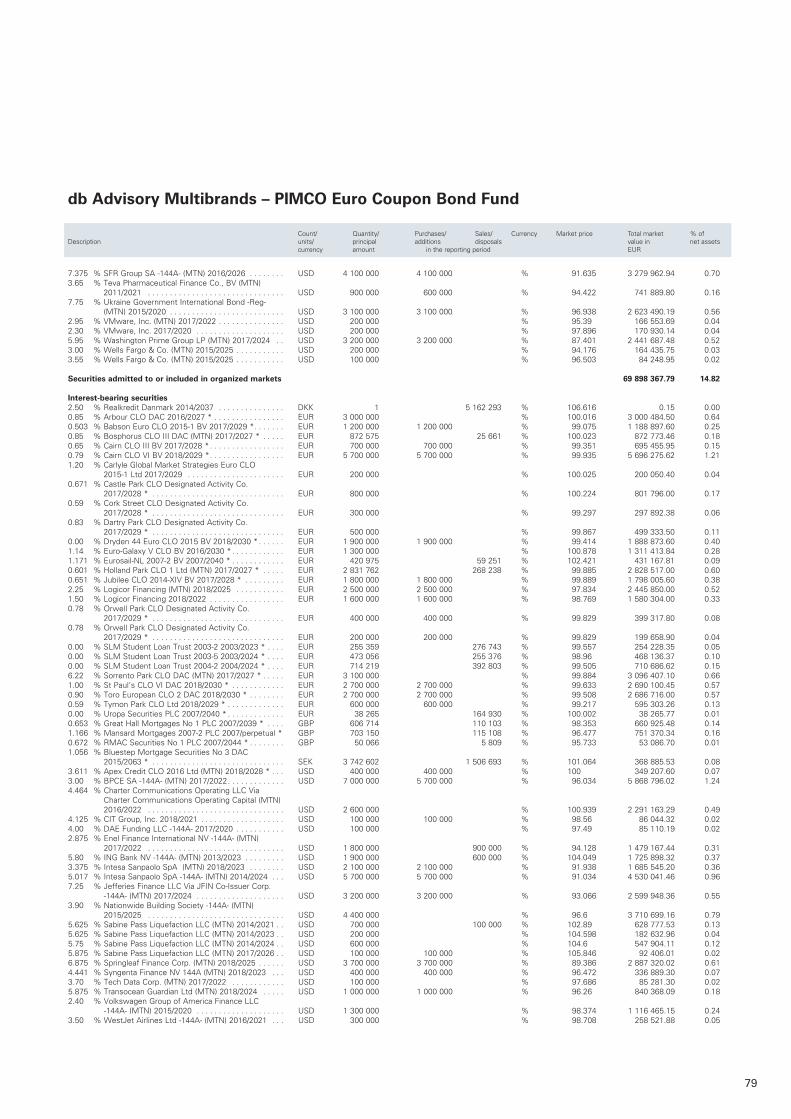
79
7.375 % SFR Group SA -144A- (MTN) 2016/2026 . . . . . . . . USD 4 100 000 4 100 000 % 91.635 3 279 962.94 0.703.65 % Teva Pharmaceutical Finance Co., BV (MTN)
2011/2021 . . . . . . . . . . . . . . . . . . . . . . . . . . . . . . . USD 900 000 600 000 % 94.422 741 889.80 0.167.75 % Ukraine Government International Bond -Reg-
(MTN) 2015/2020 . . . . . . . . . . . . . . . . . . . . . . . . . . USD 3 100 000 3 100 000 % 96.938 2 623 490.19 0.562.95 % VMware, Inc. (MTN) 2017/2022 . . . . . . . . . . . . . . . USD 200 000 % 95.39 166 553.69 0.042.30 % VMware, Inc. 2017/2020 . . . . . . . . . . . . . . . . . . . . USD 200 000 % 97.896 170 930.14 0.045.95 % Washington Prime Group LP (MTN) 2017/2024 . . USD 3 200 000 3 200 000 % 87.401 2 441 687.48 0.523.00 % Wells Fargo & Co. (MTN) 2015/2025 . . . . . . . . . . . USD 200 000 % 94.176 164 435.75 0.033.55 % Wells Fargo & Co. (MTN) 2015/2025 . . . . . . . . . . . USD 100 000 % 96.503 84 248.95 0.02
Securities admitted to or included in organized markets 69 898 367.79 14.82 Interest-bearing securities2.50 % Realkredit Danmark 2014/2037 . . . . . . . . . . . . . . . DKK 1 5 162 293 % 106.616 0.15 0.000.85 % Arbour CLO DAC 2016/2027 * . . . . . . . . . . . . . . . . EUR 3 000 000 % 100.016 3 000 484.50 0.640.503 % Babson Euro CLO 2015-1 BV 2017/2029 * . . . . . . . EUR 1 200 000 1 200 000 % 99.075 1 188 897.60 0.250.85 % Bosphorus CLO III DAC (MTN) 2017/2027 * . . . . . EUR 872 575 25 661 % 100.023 872 773.46 0.180.65 % Cairn CLO III BV 2017/2028 * . . . . . . . . . . . . . . . . . EUR 700 000 700 000 % 99.351 695 455.95 0.150.79 % Cairn CLO VI BV 2018/2029 * . . . . . . . . . . . . . . . . . EUR 5 700 000 5 700 000 % 99.935 5 696 275.62 1.211.20 % Carlyle Global Market Strategies Euro CLO
2015-1 Ltd 2017/2029 . . . . . . . . . . . . . . . . . . . . . . EUR 200 000 % 100.025 200 050.40 0.040.671 % Castle Park CLO Designated Activity Co.
2017/2028 * . . . . . . . . . . . . . . . . . . . . . . . . . . . . . . EUR 800 000 % 100.224 801 796.00 0.170.59 % Cork Street CLO Designated Activity Co.
2017/2028 * . . . . . . . . . . . . . . . . . . . . . . . . . . . . . . EUR 300 000 % 99.297 297 892.38 0.060.83 % Dartry Park CLO Designated Activity Co.
2017/2029 * . . . . . . . . . . . . . . . . . . . . . . . . . . . . . . EUR 500 000 % 99.867 499 333.50 0.110.00 % Dryden 44 Euro CLO 2015 BV 2018/2030 * . . . . . . EUR 1 900 000 1 900 000 % 99.414 1 888 873.60 0.401.14 % Euro-Galaxy V CLO BV 2016/2030 * . . . . . . . . . . . . EUR 1 300 000 % 100.878 1 311 413.84 0.281.171 % Eurosail-NL 2007-2 BV 2007/2040 * . . . . . . . . . . . . EUR 420 975 59 251 % 102.421 431 167.81 0.090.601 % Holland Park CLO 1 Ltd (MTN) 2017/2027 * . . . . . EUR 2 831 762 268 238 % 99.885 2 828 517.00 0.600.651 % Jubilee CLO 2014-XIV BV 2017/2028 * . . . . . . . . . EUR 1 800 000 1 800 000 % 99.889 1 798 005.60 0.382.25 % Logicor Financing (MTN) 2018/2025 . . . . . . . . . . . EUR 2 500 000 2 500 000 % 97.834 2 445 850.00 0.521.50 % Logicor Financing 2018/2022 . . . . . . . . . . . . . . . . . EUR 1 600 000 1 600 000 % 98.769 1 580 304.00 0.330.78 % Orwell Park CLO Designated Activity Co.
2017/2029 * . . . . . . . . . . . . . . . . . . . . . . . . . . . . . . EUR 400 000 400 000 % 99.829 399 317.80 0.080.78 % Orwell Park CLO Designated Activity Co.
2017/2029 * . . . . . . . . . . . . . . . . . . . . . . . . . . . . . . EUR 200 000 200 000 % 99.829 199 658.90 0.040.00 % SLM Student Loan Trust 2003-2 2003/2023 * . . . . EUR 255 359 276 743 % 99.557 254 228.35 0.050.00 % SLM Student Loan Trust 2003-5 2003/2024 * . . . . EUR 473 056 255 376 % 98.96 468 136.37 0.100.00 % SLM Student Loan Trust 2004-2 2004/2024 * . . . . EUR 714 219 392 803 % 99.505 710 686.62 0.156.22 % Sorrento Park CLO DAC (MTN) 2017/2027 * . . . . . EUR 3 100 000 % 99.884 3 096 407.10 0.661.00 % St Paul‘s CLO VI DAC 2018/2030 * . . . . . . . . . . . . EUR 2 700 000 2 700 000 % 99.633 2 690 100.45 0.570.90 % Toro European CLO 2 DAC 2018/2030 * . . . . . . . . EUR 2 700 000 2 700 000 % 99.508 2 686 716.00 0.570.59 % Tymon Park CLO Ltd 2018/2029 * . . . . . . . . . . . . . EUR 600 000 600 000 % 99.217 595 303.26 0.130.00 % Uropa Securities PLC 2007/2040 * . . . . . . . . . . . . . EUR 38 265 164 930 % 100.002 38 265.77 0.010.653 % Great Hall Mortgages No 1 PLC 2007/2039 * . . . . GBP 606 714 110 103 % 98.353 660 925.48 0.141.166 % Mansard Mortgages 2007-2 PLC 2007/perpetual * GBP 703 150 115 108 % 96.477 751 370.34 0.160.672 % RMAC Securities No 1 PLC 2007/2044 * . . . . . . . . GBP 50 066 5 809 % 95.733 53 086.70 0.011.056 % Bluestep Mortgage Securities No 3 DAC
2015/2063 * . . . . . . . . . . . . . . . . . . . . . . . . . . . . . . SEK 3 742 602 1 506 693 % 101.064 368 885.53 0.083.611 % Apex Credit CLO 2016 Ltd (MTN) 2018/2028 * . . . USD 400 000 400 000 % 100 349 207.60 0.073.00 % BPCE SA -144A- (MTN) 2017/2022 . . . . . . . . . . . . . USD 7 000 000 5 700 000 % 96.034 5 868 796.02 1.244.464 % Charter Communications Operating LLC Via
Charter Communications Operating Capital (MTN) 2016/2022 . . . . . . . . . . . . . . . . . . . . . . . . . . . . . . . USD 2 600 000 % 100.939 2 291 163.29 0.49
4.125 % CIT Group, Inc. 2018/2021 . . . . . . . . . . . . . . . . . . . USD 100 000 100 000 % 98.56 86 044.32 0.024.00 % DAE Funding LLC -144A- 2017/2020 . . . . . . . . . . . USD 100 000 % 97.49 85 110.19 0.022.875 % Enel Finance International NV -144A- (MTN)
2017/2022 . . . . . . . . . . . . . . . . . . . . . . . . . . . . . . . USD 1 800 000 900 000 % 94.128 1 479 167.44 0.315.80 % ING Bank NV -144A- (MTN) 2013/2023 . . . . . . . . . USD 1 900 000 600 000 % 104.049 1 725 898.32 0.373.375 % Intesa Sanpaolo SpA (MTN) 2018/2023 . . . . . . . . USD 2 100 000 2 100 000 % 91.938 1 685 545.20 0.365.017 % Intesa Sanpaolo SpA -144A- (MTN) 2014/2024 . . . USD 5 700 000 5 700 000 % 91.034 4 530 041.46 0.967.25 % Jefferies Finance LLC Via JFIN Co-Issuer Corp.
-144A- (MTN) 2017/2024 . . . . . . . . . . . . . . . . . . . . USD 3 200 000 3 200 000 % 93.066 2 599 948.36 0.553.90 % Nationwide Building Society -144A- (MTN)
2015/2025 . . . . . . . . . . . . . . . . . . . . . . . . . . . . . . . USD 4 400 000 % 96.6 3 710 699.16 0.795.625 % Sabine Pass Liquefaction LLC (MTN) 2014/2021 . . USD 700 000 100 000 % 102.89 628 777.53 0.135.625 % Sabine Pass Liquefaction LLC (MTN) 2014/2023 . . USD 200 000 % 104.598 182 632.96 0.045.75 % Sabine Pass Liquefaction LLC (MTN) 2014/2024 . . USD 600 000 % 104.6 547 904.11 0.125.875 % Sabine Pass Liquefaction LLC (MTN) 2017/2026 . . USD 100 000 100 000 % 105.846 92 406.01 0.026.875 % Springleaf Finance Corp. (MTN) 2018/2025 . . . . . . USD 3 700 000 3 700 000 % 89.386 2 887 320.02 0.614.441 % Syngenta Finance NV 144A (MTN) 2018/2023 . . . USD 400 000 400 000 % 96.472 336 889.30 0.073.70 % Tech Data Corp. (MTN) 2017/2022 . . . . . . . . . . . . USD 100 000 % 97.686 85 281.30 0.025.875 % Transocean Guardian Ltd (MTN) 2018/2024 . . . . . USD 1 000 000 1 000 000 % 96.26 840 368.09 0.182.40 % Volkswagen Group of America Finance LLC
-144A- (MTN) 2015/2020 . . . . . . . . . . . . . . . . . . . . USD 1 300 000 % 98.374 1 116 465.15 0.243.50 % WestJet Airlines Ltd -144A- (MTN) 2016/2021 . . . USD 300 000 % 98.708 258 521.88 0.05
db Advisory Multibrands – PIMCO Euro Coupon Bond Fund
Count/ Quantity/ Purchases/ Sales/ Currency Market price Total market % ofDescription units/ principal additions disposals value in net assets currency amount in the reporting period EUR
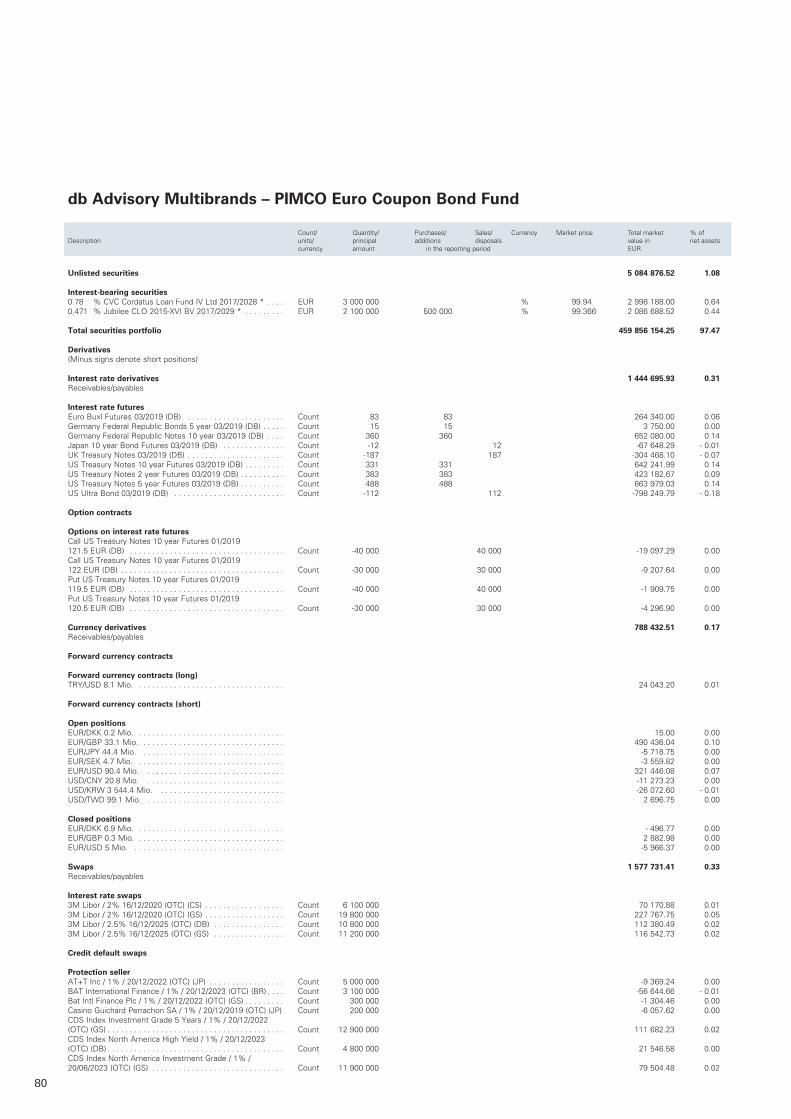
80
Unlisted securities 5 084 876.52 1.08
Interest-bearing securities0.78 % CVC Cordatus Loan Fund IV Ltd 2017/2028 * . . . . EUR 3 000 000 % 99.94 2 998 188.00 0.640.471 % Jubilee CLO 2015-XVI BV 2017/2029 * . . . . . . . . . EUR 2 100 000 500 000 % 99.366 2 086 688.52 0.44
Total securities portfolio 459 856 154.25 97.47 Derivatives (Minus signs denote short positions) Interest rate derivatives 1 444 695.93 0.31Receivables/payables Interest rate futuresEuro Buxl Futures 03/2019 (DB) . . . . . . . . . . . . . . . . . . . . . . Count 83 83 264 340.00 0.06Germany Federal Republic Bonds 5 year 03/2019 (DB) . . . . . Count 15 15 3 750.00 0.00Germany Federal Republic Notes 10 year 03/2019 (DB) . . . . Count 360 360 652 080.00 0.14Japan 10 year Bond Futures 03/2019 (DB) . . . . . . . . . . . . . . Count -12 12 -67 648.29 - 0.01UK Treasury Notes 03/2019 (DB) . . . . . . . . . . . . . . . . . . . . . . Count -187 187 -304 468.10 - 0.07US Treasury Notes 10 year Futures 03/2019 (DB) . . . . . . . . . Count 331 331 642 241.99 0.14US Treasury Notes 2 year Futures 03/2019 (DB) . . . . . . . . . . Count 383 383 423 182.67 0.09US Treasury Notes 5 year Futures 03/2019 (DB) . . . . . . . . . . Count 488 488 663 979.03 0.14US Ultra Bond 03/2019 (DB) . . . . . . . . . . . . . . . . . . . . . . . . . Count -112 112 -798 249.79 - 0.18
Option contracts
Options on interest rate futuresCall US Treasury Notes 10 year Futures 01/2019 121.5 EUR (DB) . . . . . . . . . . . . . . . . . . . . . . . . . . . . . . . . . . . Count -40 000 40 000 -19 097.29 0.00Call US Treasury Notes 10 year Futures 01/2019 122 EUR (DB) . . . . . . . . . . . . . . . . . . . . . . . . . . . . . . . . . . . . . Count -30 000 30 000 -9 207.64 0.00Put US Treasury Notes 10 year Futures 01/2019 119.5 EUR (DB) . . . . . . . . . . . . . . . . . . . . . . . . . . . . . . . . . . . Count -40 000 40 000 -1 909.75 0.00Put US Treasury Notes 10 year Futures 01/2019 120.5 EUR (DB) . . . . . . . . . . . . . . . . . . . . . . . . . . . . . . . . . . . Count -30 000 30 000 -4 296.90 0.00 Currency derivatives 788 432.51 0.17Receivables/payables
Forward currency contracts Forward currency contracts (long) TRY/USD 8.1 Mio. . . . . . . . . . . . . . . . . . . . . . . . . . . . . . . . . . 24 043.20 0.01
Forward currency contracts (short) Open positionsEUR/DKK 0.2 Mio. . . . . . . . . . . . . . . . . . . . . . . . . . . . . . . . . . 15.00 0.00EUR/GBP 33.1 Mio. . . . . . . . . . . . . . . . . . . . . . . . . . . . . . . . . 490 436.04 0.10EUR/JPY 44.4 Mio. . . . . . . . . . . . . . . . . . . . . . . . . . . . . . . . . -5 718.75 0.00EUR/SEK 4.7 Mio. . . . . . . . . . . . . . . . . . . . . . . . . . . . . . . . . . -3 559.82 0.00EUR/USD 90.4 Mio. . . . . . . . . . . . . . . . . . . . . . . . . . . . . . . . 321 446.08 0.07USD/CNY 20.8 Mio. . . . . . . . . . . . . . . . . . . . . . . . . . . . . . . . -11 273.23 0.00USD/KRW 3 544.4 Mio. . . . . . . . . . . . . . . . . . . . . . . . . . . . . -26 072.60 - 0.01USD/TWD 99.1 Mio. . . . . . . . . . . . . . . . . . . . . . . . . . . . . . . . 2 696.75 0.00
Closed positionsEUR/DKK 6.9 Mio. . . . . . . . . . . . . . . . . . . . . . . . . . . . . . . . . . - 496.77 0.00EUR/GBP 0.3 Mio. . . . . . . . . . . . . . . . . . . . . . . . . . . . . . . . . . 2 882.98 0.00EUR/USD 5 Mio. . . . . . . . . . . . . . . . . . . . . . . . . . . . . . . . . . . -5 966.37 0.00 Swaps 1 577 731.41 0.33Receivables/payables Interest rate swaps 3M Libor / 2% 16/12/2020 (OTC) (CS) . . . . . . . . . . . . . . . . . . Count 6 100 000 70 170.88 0.013M Libor / 2% 16/12/2020 (OTC) (GS) . . . . . . . . . . . . . . . . . . Count 19 800 000 227 767.75 0.053M Libor / 2.5% 16/12/2025 (OTC) (DB) . . . . . . . . . . . . . . . . Count 10 800 000 112 380.49 0.023M Libor / 2.5% 16/12/2025 (OTC) (GS) . . . . . . . . . . . . . . . . Count 11 200 000 116 542.73 0.02 Credit default swaps Protection seller AT+T Inc / 1% / 20/12/2022 (OTC) (JP) . . . . . . . . . . . . . . . . . Count 5 000 000 -9 369.24 0.00BAT International Finance / 1% / 20/12/2023 (OTC) (BR) . . . . Count 3 100 000 -56 644.66 - 0.01Bat Intl Finance Plc / 1% / 20/12/2022 (OTC) (GS) . . . . . . . . . Count 300 000 -1 304.46 0.00Casino Guichard Perrachon SA / 1% / 20/12/2019 (OTC) (JP) Count 200 000 -6 057.62 0.00CDS Index Investment Grade 5 Years / 1% / 20/12/2022 (OTC) (GS) . . . . . . . . . . . . . . . . . . . . . . . . . . . . . . . . . . . . . . . . Count 12 900 000 111 682.23 0.02CDS Index North America High Yield / 1% / 20/12/2023 (OTC) (DB) . . . . . . . . . . . . . . . . . . . . . . . . . . . . . . . . . . . . . . . . Count 4 800 000 21 546.58 0.00CDS Index North America Investment Grade / 1% / 20/06/2023 (OTC) (GS) . . . . . . . . . . . . . . . . . . . . . . . . . . . . . . Count 11 900 000 79 504.48 0.02
db Advisory Multibrands – PIMCO Euro Coupon Bond Fund
Count/ Quantity/ Purchases/ Sales/ Currency Market price Total market % ofDescription units/ principal additions disposals value in net assets currency amount in the reporting period EUR
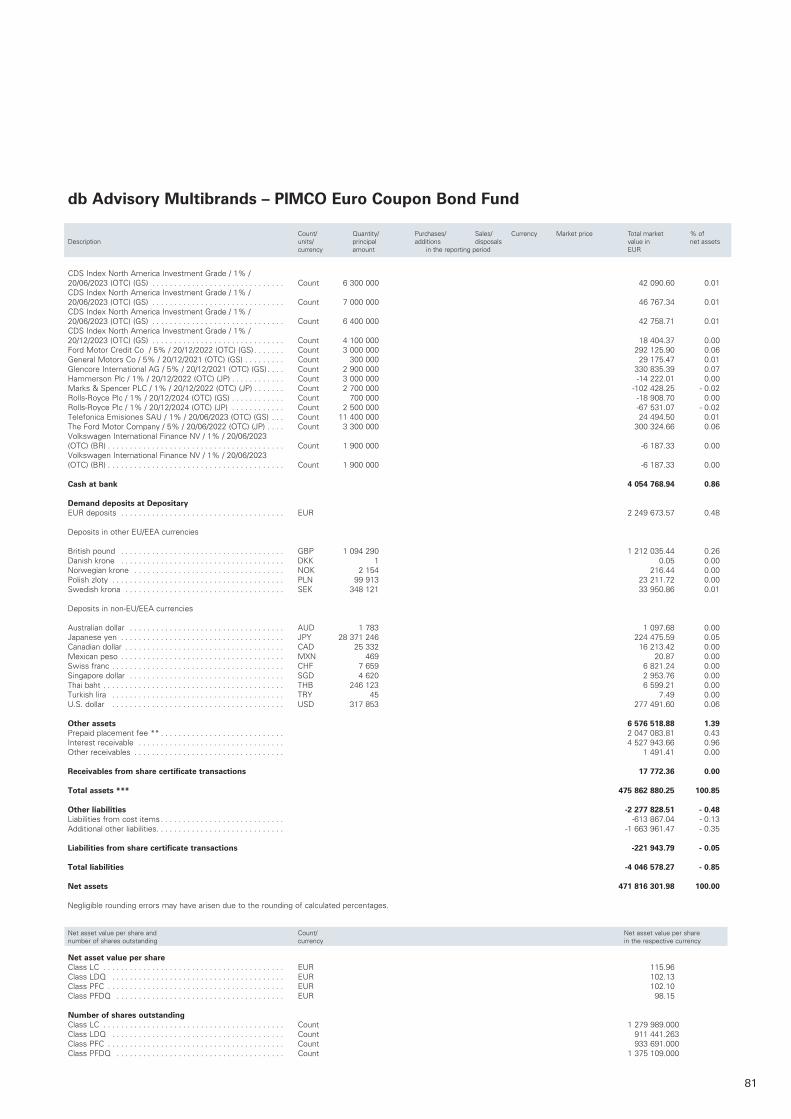
81
CDS Index North America Investment Grade / 1% / 20/06/2023 (OTC) (GS) . . . . . . . . . . . . . . . . . . . . . . . . . . . . . . Count 6 300 000 42 090 .60 0 .01CDS Index North America Investment Grade / 1% / 20/06/2023 (OTC) (GS) . . . . . . . . . . . . . . . . . . . . . . . . . . . . . . Count 7 000 000 46 767 .34 0 .01CDS Index North America Investment Grade / 1% / 20/06/2023 (OTC) (GS) . . . . . . . . . . . . . . . . . . . . . . . . . . . . . . Count 6 400 000 42 758 .71 0 .01CDS Index North America Investment Grade / 1% / 20/12/2023 (OTC) (GS) . . . . . . . . . . . . . . . . . . . . . . . . . . . . . . Count 4 100 000 18 404 .37 0 .00Ford Motor Credit Co / 5% / 20/12/2022 (OTC) (GS) . . . . . . . Count 3 000 000 292 125 .90 0 .06General Motors Co / 5% / 20/12/2021 (OTC) (GS) . . . . . . . . . Count 300 000 29 175 .47 0 .01Glencore International AG / 5% / 20/12/2021 (OTC) (GS) . . . . Count 2 900 000 330 835 .39 0 .07Hammerson Plc / 1% / 20/12/2022 (OTC) (JP) . . . . . . . . . . . . Count 3 000 000 -14 222 .01 0 .00Marks & Spencer PLC / 1% / 20/12/2022 (OTC) (JP) . . . . . . . Count 2 700 000 -102 428 .25 - 0 .02Rolls-Royce Plc / 1% / 20/12/2024 (OTC) (GS) . . . . . . . . . . . . Count 700 000 -18 908 .70 0 .00Rolls-Royce Plc / 1% / 20/12/2024 (OTC) (JP) . . . . . . . . . . . . Count 2 500 000 -67 531 .07 - 0 .02Telefonica Emisiones SAU / 1% / 20/06/2023 (OTC) (GS) . . . Count 11 400 000 24 494 .50 0 .01The Ford Motor Company / 5% / 20/06/2022 (OTC) (JP) . . . . Count 3 300 000 300 324 .66 0 .06Volkswagen International Finance NV / 1% / 20/06/2023 (OTC) (BR) . . . . . . . . . . . . . . . . . . . . . . . . . . . . . . . . . . . . . . . . Count 1 900 000 -6 187 .33 0 .00Volkswagen International Finance NV / 1% / 20/06/2023 (OTC) (BR) . . . . . . . . . . . . . . . . . . . . . . . . . . . . . . . . . . . . . . . . Count 1 900 000 -6 187 .33 0 .00
Cash at bank 4 054 768.94 0.86 Demand deposits at Depositary EUR deposits . . . . . . . . . . . . . . . . . . . . . . . . . . . . . . . . . . . . . EUR 2 249 673 .57 0 .48 Deposits in other EU/EEA currencies British pound . . . . . . . . . . . . . . . . . . . . . . . . . . . . . . . . . . . . . GBP 1 094 290 1 212 035 .44 0 .26Danish krone . . . . . . . . . . . . . . . . . . . . . . . . . . . . . . . . . . . . . DKK 1 0 .05 0 .00Norwegian krone . . . . . . . . . . . . . . . . . . . . . . . . . . . . . . . . . . NOK 2 154 216 .44 0 .00Polish zloty . . . . . . . . . . . . . . . . . . . . . . . . . . . . . . . . . . . . . . . PLN 99 913 23 211 .72 0 .00Swedish krona . . . . . . . . . . . . . . . . . . . . . . . . . . . . . . . . . . . . SEK 348 121 33 950 .86 0 .01 Deposits in non-EU/EEA currencies Australian dollar . . . . . . . . . . . . . . . . . . . . . . . . . . . . . . . . . . . AUD 1 783 1 097 .68 0 .00Japanese yen . . . . . . . . . . . . . . . . . . . . . . . . . . . . . . . . . . . . . JPY 28 371 246 224 475 .59 0 .05Canadian dollar . . . . . . . . . . . . . . . . . . . . . . . . . . . . . . . . . . . . CAD 25 332 16 213 .42 0 .00Mexican peso . . . . . . . . . . . . . . . . . . . . . . . . . . . . . . . . . . . . . MXN 469 20 .87 0 .00Swiss franc . . . . . . . . . . . . . . . . . . . . . . . . . . . . . . . . . . . . . . . CHF 7 659 6 821 .24 0 .00Singapore dollar . . . . . . . . . . . . . . . . . . . . . . . . . . . . . . . . . . . SGD 4 620 2 953 .76 0 .00Thai baht . . . . . . . . . . . . . . . . . . . . . . . . . . . . . . . . . . . . . . . . . THB 246 123 6 599 .21 0 .00Turkish lira . . . . . . . . . . . . . . . . . . . . . . . . . . . . . . . . . . . . . . . TRY 45 7 .49 0 .00U .S . dollar . . . . . . . . . . . . . . . . . . . . . . . . . . . . . . . . . . . . . . . USD 317 853 277 491 .60 0 .06 Other assets 6 576 518.88 1.39Prepaid placement fee ** . . . . . . . . . . . . . . . . . . . . . . . . . . . . 2 047 083 .81 0 .43Interest receivable . . . . . . . . . . . . . . . . . . . . . . . . . . . . . . . . . 4 527 943 .66 0 .96Other receivables . . . . . . . . . . . . . . . . . . . . . . . . . . . . . . . . . . 1 491 .41 0 .00 Receivables from share certificate transactions 17 772.36 0.00 Total assets *** 475 862 880.25 100.85 Other liabilities -2 277 828.51 - 0.48Liabilities from cost items . . . . . . . . . . . . . . . . . . . . . . . . . . . . -613 867 .04 - 0 .13Additional other liabilities . . . . . . . . . . . . . . . . . . . . . . . . . . . . . -1 663 961 .47 - 0 .35 Liabilities from share certificate transactions -221 943.79 - 0.05 Total liabilities -4 046 578.27 - 0.85
Net assets 471 816 301.98 100.00 Negligible rounding errors may have arisen due to the rounding of calculated percentages .
Net asset value per share and Count/ Net asset value per sharenumber of shares outstanding currency in the respective currency
Net asset value per share Class LC . . . . . . . . . . . . . . . . . . . . . . . . . . . . . . . . . . . . . . . . . EUR 115 .96Class LDQ . . . . . . . . . . . . . . . . . . . . . . . . . . . . . . . . . . . . . . . EUR 102 .13Class PFC . . . . . . . . . . . . . . . . . . . . . . . . . . . . . . . . . . . . . . . . EUR 102 .10Class PFDQ . . . . . . . . . . . . . . . . . . . . . . . . . . . . . . . . . . . . . . EUR 98 .15
Number of shares outstandingClass LC . . . . . . . . . . . . . . . . . . . . . . . . . . . . . . . . . . . . . . . . . Count 1 279 989 .000Class LDQ . . . . . . . . . . . . . . . . . . . . . . . . . . . . . . . . . . . . . . . Count 911 441 .263Class PFC . . . . . . . . . . . . . . . . . . . . . . . . . . . . . . . . . . . . . . . . Count 933 691 .000Class PFDQ . . . . . . . . . . . . . . . . . . . . . . . . . . . . . . . . . . . . . . Count 1 375 109 .000
db Advisory Multibrands – PIMCO Euro Coupon Bond Fund
Count/ Quantity/ Purchases/ Sales/ Currency Market price Total market % ofDescription units/ principal additions disposals value in net assets currency amount in the reporting period EUR
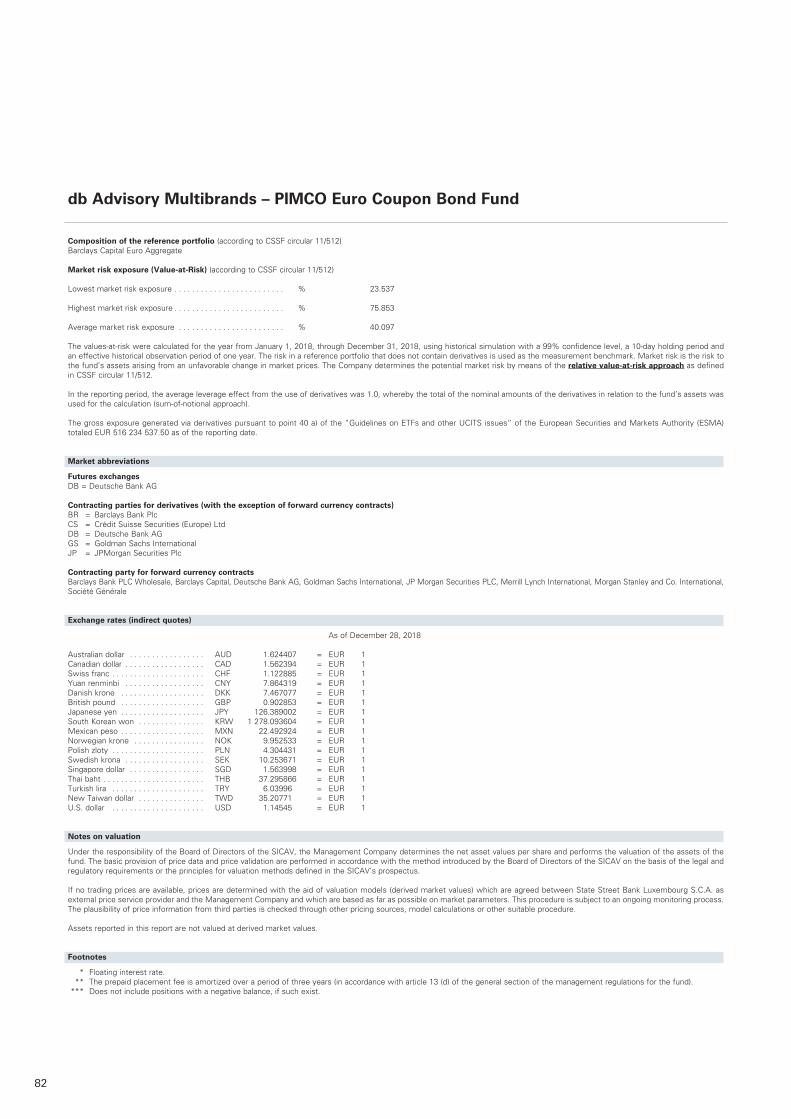
82
Composition of the reference portfolio (according to CSSF circular 11/512)Barclays Capital Euro Aggregate
Market risk exposure (Value-at-Risk) (according to CSSF circular 11/512) Lowest market risk exposure . . . . . . . . . . . . . . . . . . . . . . . . . % 23 .537 Highest market risk exposure . . . . . . . . . . . . . . . . . . . . . . . . . % 75 .853 Average market risk exposure . . . . . . . . . . . . . . . . . . . . . . . . % 40 .097 The values-at-risk were calculated for the year from January 1, 2018, through December 31, 2018, using historical simulation with a 99% confidence level, a 10-day holding period and an effective historical observation period of one year . The risk in a reference portfolio that does not contain derivatives is used as the measurement benchmark . Market risk is the risk to the fund’s assets arising from an unfavorable change in market prices . The Company determines the potential market risk by means of the relative value-at-risk approach as defined in CSSF circular 11/512 .
In the reporting period, the average leverage effect from the use of derivatives was 1 .0, whereby the total of the nominal amounts of the derivatives in relation to the fund’s assets was used for the calculation (sum-of-notional approach) .
The gross exposure generated via derivatives pursuant to point 40 a) of the “Guidelines on ETFs and other UCITS issues” of the European Securities and Markets Authority (ESMA) totaled EUR 516 234 537 .50 as of the reporting date .
Market abbreviations
Futures exchangesDB = Deutsche Bank AG
Contracting parties for derivatives (with the exception of forward currency contracts)BR = Barclays Bank PlcCS = Crédit Suisse Securities (Europe) LtdDB = Deutsche Bank AGGS = Goldman Sachs InternationalJP = JPMorgan Securities Plc
Contracting party for forward currency contractsBarclays Bank PLC Wholesale, Barclays Capital, Deutsche Bank AG, Goldman Sachs International, JP Morgan Securities PLC, Merrill Lynch International, Morgan Stanley and Co . International, Société Générale
Exchange rates (indirect quotes)
As of December 28, 2018
Australian dollar . . . . . . . . . . . . . . . . . AUD 1 .624407 = EUR 1Canadian dollar . . . . . . . . . . . . . . . . . . CAD 1 .562394 = EUR 1Swiss franc . . . . . . . . . . . . . . . . . . . . . CHF 1 .122885 = EUR 1Yuan renminbi . . . . . . . . . . . . . . . . . . CNY 7 .864319 = EUR 1Danish krone . . . . . . . . . . . . . . . . . . . DKK 7 .467077 = EUR 1British pound . . . . . . . . . . . . . . . . . . . GBP 0 .902853 = EUR 1Japanese yen . . . . . . . . . . . . . . . . . . . JPY 126 .389002 = EUR 1South Korean won . . . . . . . . . . . . . . . KRW 1 278 .093604 = EUR 1Mexican peso . . . . . . . . . . . . . . . . . . . MXN 22 .492924 = EUR 1Norwegian krone . . . . . . . . . . . . . . . . NOK 9 .952533 = EUR 1Polish zloty . . . . . . . . . . . . . . . . . . . . . PLN 4 .304431 = EUR 1Swedish krona . . . . . . . . . . . . . . . . . . SEK 10 .253671 = EUR 1Singapore dollar . . . . . . . . . . . . . . . . . SGD 1 .563998 = EUR 1Thai baht . . . . . . . . . . . . . . . . . . . . . . . THB 37 .295866 = EUR 1Turkish lira . . . . . . . . . . . . . . . . . . . . . TRY 6 .03996 = EUR 1New Taiwan dollar . . . . . . . . . . . . . . . TWD 35 .20771 = EUR 1U .S . dollar . . . . . . . . . . . . . . . . . . . . . USD 1 .14545 = EUR 1
Notes on valuation
Under the responsibility of the Board of Directors of the SICAV, the Management Company determines the net asset values per share and performs the valuation of the assets of the fund . The basic provision of price data and price validation are performed in accordance with the method introduced by the Board of Directors of the SICAV on the basis of the legal and regulatory requirements or the principles for valuation methods defined in the SICAV’s prospectus .
If no trading prices are available, prices are determined with the aid of valuation models (derived market values) which are agreed between State Street Bank Luxembourg S .C .A . as external price service provider and the Management Company and which are based as far as possible on market parameters . This procedure is subject to an ongoing monitoring process . The plausibility of price information from third parties is checked through other pricing sources, model calculations or other suitable procedure .
Assets reported in this report are not valued at derived market values .
Footnotes
* Floating interest rate . ** The prepaid placement fee is amortized over a period of three years (in accordance with article 13 (d) of the general section of the management regulations for the fund) . *** Does not include positions with a negative balance, if such exist .
db Advisory Multibrands – PIMCO Euro Coupon Bond Fund
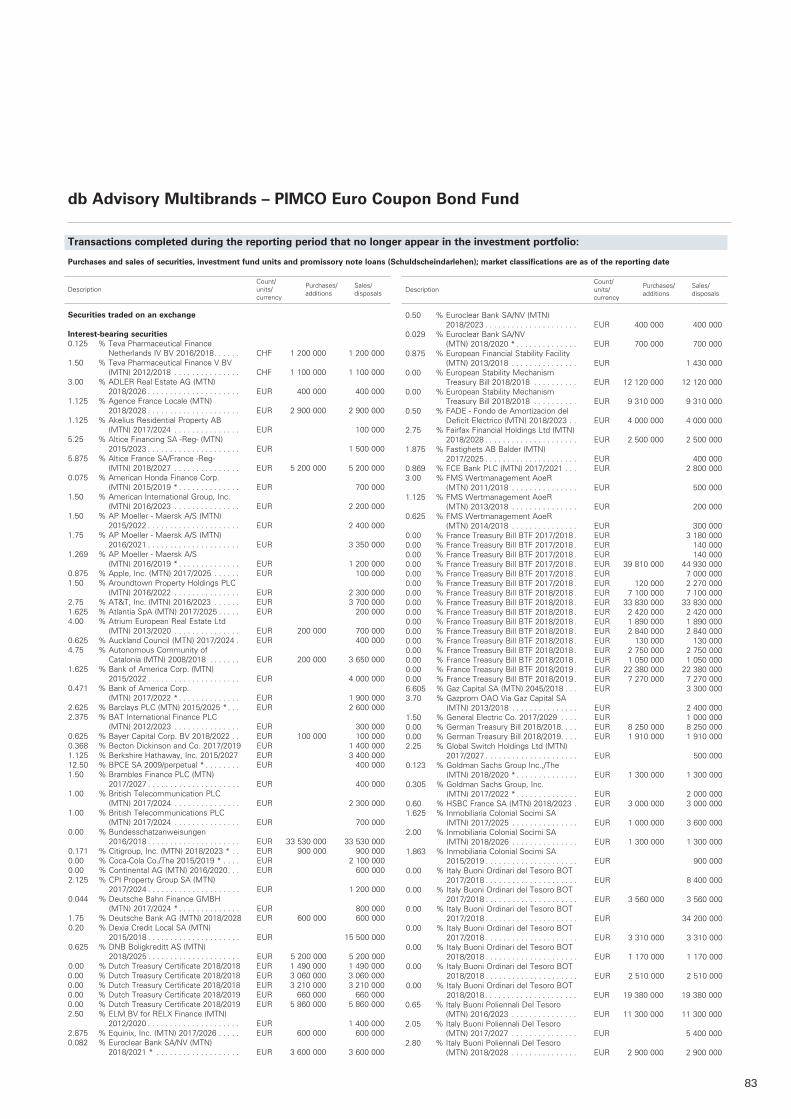
83
Transactions completed during the reporting period that no longer appear in the investment portfolio:
Purchases and sales of securities, investment fund units and promissory note loans (Schuldscheindarlehen); market classifications are as of the reporting date
Count/ Purchases/ Sales/ Description units/ additions disposals currency
Securities traded on an exchange
Interest-bearing securities0.125 % Teva Pharmaceutical Finance
Netherlands IV BV 2016/2018 . . . . . . CHF 1 200 000 1 200 0001.50 % Teva Pharmaceutical Finance V BV
(MTN) 2012/2018 . . . . . . . . . . . . . . . CHF 1 100 000 1 100 0003.00 % ADLER Real Estate AG (MTN)
2018/2026 . . . . . . . . . . . . . . . . . . . . . EUR 400 000 400 0001.125 % Agence France Locale (MTN)
2018/2028 . . . . . . . . . . . . . . . . . . . . . EUR 2 900 000 2 900 0001.125 % Akelius Residential Property AB
(MTN) 2017/2024 . . . . . . . . . . . . . . . EUR 100 0005.25 % Altice Financing SA -Reg- (MTN)
2015/2023 . . . . . . . . . . . . . . . . . . . . . EUR 1 500 0005.875 % Altice France SA/France -Reg-
(MTN) 2018/2027 . . . . . . . . . . . . . . . EUR 5 200 000 5 200 0000.075 % American Honda Finance Corp.
(MTN) 2015/2019 * . . . . . . . . . . . . . . EUR 700 0001.50 % American International Group, Inc.
(MTN) 2016/2023 . . . . . . . . . . . . . . . EUR 2 200 0001.50 % AP Moeller - Maersk A/S (MTN)
2015/2022 . . . . . . . . . . . . . . . . . . . . . EUR 2 400 0001.75 % AP Moeller - Maersk A/S (MTN)
2016/2021 . . . . . . . . . . . . . . . . . . . . . EUR 3 350 0001.269 % AP Moeller - Maersk A/S
(MTN) 2016/2019 * . . . . . . . . . . . . . . EUR 1 200 0000.875 % Apple, Inc. (MTN) 2017/2025 . . . . . . EUR 100 0001.50 % Aroundtown Property Holdings PLC
(MTN) 2016/2022 . . . . . . . . . . . . . . . EUR 2 300 0002.75 % AT&T, Inc. (MTN) 2016/2023 . . . . . . EUR 3 700 0001.625 % Atlantia SpA (MTN) 2017/2025 . . . . . EUR 200 0004.00 % Atrium European Real Estate Ltd
(MTN) 2013/2020 . . . . . . . . . . . . . . . EUR 200 000 700 0000.625 % Auckland Council (MTN) 2017/2024 . EUR 400 0004.75 % Autonomous Community of
Catalonia (MTN) 2008/2018 . . . . . . . EUR 200 000 3 650 0001.625 % Bank of America Corp. (MTN)
2015/2022 . . . . . . . . . . . . . . . . . . . . . EUR 4 000 0000.471 % Bank of America Corp.
(MTN) 2017/2022 * . . . . . . . . . . . . . . EUR 1 900 0002.625 % Barclays PLC (MTN) 2015/2025 * . . . EUR 2 600 0002.375 % BAT International Finance PLC
(MTN) 2012/2023 . . . . . . . . . . . . . . . EUR 300 0000.625 % Bayer Capital Corp. BV 2018/2022 . . EUR 100 000 100 0000.368 % Becton Dickinson and Co. 2017/2019 EUR 1 400 0001.125 % Berkshire Hathaway, Inc. 2015/2027 EUR 3 400 00012.50 % BPCE SA 2009/perpetual * . . . . . . . . EUR 400 0001.50 % Brambles Finance PLC (MTN)
2017/2027 . . . . . . . . . . . . . . . . . . . . . EUR 400 0001.00 % British Telecommunication PLC
(MTN) 2017/2024 . . . . . . . . . . . . . . . EUR 2 300 0001.00 % British Telecommunications PLC
(MTN) 2017/2024 . . . . . . . . . . . . . . . EUR 700 0000.00 % Bundesschatzanweisungen
2016/2018 . . . . . . . . . . . . . . . . . . . . . EUR 33 530 000 33 530 0000.171 % Citigroup, Inc. (MTN) 2018/2023 * . . EUR 900 000 900 0000.00 % Coca-Cola Co./The 2015/2019 * . . . . EUR 2 100 0000.00 % Continental AG (MTN) 2016/2020 . . . EUR 600 0002.125 % CPI Property Group SA (MTN)
2017/2024 . . . . . . . . . . . . . . . . . . . . . EUR 1 200 0000.044 % Deutsche Bahn Finance GMBH
(MTN) 2017/2024 * . . . . . . . . . . . . . . EUR 800 0001.75 % Deutsche Bank AG (MTN) 2018/2028 EUR 600 000 600 0000.20 % Dexia Credit Local SA (MTN)
2015/2018 . . . . . . . . . . . . . . . . . . . . . EUR 15 500 0000.625 % DNB Boligkreditt AS (MTN)
2018/2025 . . . . . . . . . . . . . . . . . . . . . EUR 5 200 000 5 200 0000.00 % Dutch Treasury Certificate 2018/2018 EUR 1 490 000 1 490 0000.00 % Dutch Treasury Certificate 2018/2018 EUR 3 060 000 3 060 0000.00 % Dutch Treasury Certificate 2018/2018 EUR 3 210 000 3 210 0000.00 % Dutch Treasury Certificate 2018/2019 EUR 660 000 660 0000.00 % Dutch Treasury Certificate 2018/2019 EUR 5 860 000 5 860 0002.50 % ELM BV for RELX Finance (MTN)
2012/2020 . . . . . . . . . . . . . . . . . . . . . EUR 1 400 0002.875 % Equinix, Inc. (MTN) 2017/2026 . . . . . EUR 600 000 600 0000.082 % Euroclear Bank SA/NV (MTN)
2018/2021 * . . . . . . . . . . . . . . . . . . . EUR 3 600 000 3 600 000
0.50 % Euroclear Bank SA/NV (MTN) 2018/2023 . . . . . . . . . . . . . . . . . . . . . EUR 400 000 400 000
0.029 % Euroclear Bank SA/NV (MTN) 2018/2020 * . . . . . . . . . . . . . . EUR 700 000 700 000
0.875 % European Financial Stability Facility (MTN) 2013/2018 . . . . . . . . . . . . . . . EUR 1 430 000
0.00 % European Stability Mechanism Treasury Bill 2018/2018 . . . . . . . . . . EUR 12 120 000 12 120 000
0.00 % European Stability Mechanism Treasury Bill 2018/2018 . . . . . . . . . . EUR 9 310 000 9 310 000
0.50 % FADE - Fondo de Amortizacion del Deficit Electrico (MTN) 2018/2023 . . EUR 4 000 000 4 000 000
2.75 % Fairfax Financial Holdings Ltd (MTN) 2018/2028 . . . . . . . . . . . . . . . . . . . . . EUR 2 500 000 2 500 000
1.875 % Fastighets AB Balder (MTN) 2017/2025 . . . . . . . . . . . . . . . . . . . . . EUR 400 000
0.869 % FCE Bank PLC (MTN) 2017/2021 . . . EUR 2 800 0003.00 % FMS Wertmanagement AoeR
(MTN) 2011/2018 . . . . . . . . . . . . . . . EUR 500 0001.125 % FMS Wertmanagement AoeR
(MTN) 2013/2018 . . . . . . . . . . . . . . . EUR 200 0000.625 % FMS Wertmanagement AoeR
(MTN) 2014/2018 . . . . . . . . . . . . . . . EUR 300 0000.00 % France Treasury Bill BTF 2017/2018 . EUR 3 180 0000.00 % France Treasury Bill BTF 2017/2018 . EUR 140 0000.00 % France Treasury Bill BTF 2017/2018 . EUR 140 0000.00 % France Treasury Bill BTF 2017/2018 . EUR 39 810 000 44 930 0000.00 % France Treasury Bill BTF 2017/2018 . EUR 7 000 0000.00 % France Treasury Bill BTF 2017/2018 . EUR 120 000 2 270 0000.00 % France Treasury Bill BTF 2018/2018 . EUR 7 100 000 7 100 0000.00 % France Treasury Bill BTF 2018/2018 . EUR 33 830 000 33 830 0000.00 % France Treasury Bill BTF 2018/2018 . EUR 2 420 000 2 420 0000.00 % France Treasury Bill BTF 2018/2018 . EUR 1 890 000 1 890 0000.00 % France Treasury Bill BTF 2018/2018 . EUR 2 840 000 2 840 0000.00 % France Treasury Bill BTF 2018/2018 . EUR 130 000 130 0000.00 % France Treasury Bill BTF 2018/2018 . EUR 2 750 000 2 750 0000.00 % France Treasury Bill BTF 2018/2018 . EUR 1 050 000 1 050 0000.00 % France Treasury Bill BTF 2018/2019 . EUR 22 380 000 22 380 0000.00 % France Treasury Bill BTF 2018/2019 . EUR 7 270 000 7 270 0006.605 % Gaz Capital SA (MTN) 2045/2018 . . . EUR 3 300 0003.70 % Gazprom OAO Via Gaz Capital SA
(MTN) 2013/2018 . . . . . . . . . . . . . . . EUR 2 400 0001.50 % General Electric Co. 2017/2029 . . . . EUR 1 000 0000.00 % German Treasury Bill 2018/2018 . . . . EUR 8 250 000 8 250 0000.00 % German Treasury Bill 2018/2019 . . . . EUR 1 910 000 1 910 0002.25 % Global Switch Holdings Ltd (MTN)
2017/2027 . . . . . . . . . . . . . . . . . . . . . EUR 500 0000.123 % Goldman Sachs Group Inc.,/The
(MTN) 2018/2020 * . . . . . . . . . . . . . . EUR 1 300 000 1 300 0000.305 % Goldman Sachs Group, Inc.
(MTN) 2017/2022 * . . . . . . . . . . . . . . EUR 2 000 0000.60 % HSBC France SA (MTN) 2018/2023 . EUR 3 000 000 3 000 0001.625 % Inmobiliaria Colonial Socimi SA
(MTN) 2017/2025 . . . . . . . . . . . . . . . EUR 1 000 000 3 600 0002.00 % Inmobiliaria Colonial Socimi SA
(MTN) 2018/2026 . . . . . . . . . . . . . . . EUR 1 300 000 1 300 0001.863 % Inmobiliaria Colonial Socimi SA
2015/2019 . . . . . . . . . . . . . . . . . . . . . EUR 900 0000.00 % Italy Buoni Ordinari del Tesoro BOT
2017/2018 . . . . . . . . . . . . . . . . . . . . . EUR 8 400 0000.00 % Italy Buoni Ordinari del Tesoro BOT
2017/2018 . . . . . . . . . . . . . . . . . . . . . EUR 3 560 000 3 560 0000.00 % Italy Buoni Ordinari del Tesoro BOT
2017/2018 . . . . . . . . . . . . . . . . . . . . . EUR 34 200 0000.00 % Italy Buoni Ordinari del Tesoro BOT
2017/2018 . . . . . . . . . . . . . . . . . . . . . EUR 3 310 000 3 310 0000.00 % Italy Buoni Ordinari del Tesoro BOT
2018/2018 . . . . . . . . . . . . . . . . . . . . . EUR 1 170 000 1 170 0000.00 % Italy Buoni Ordinari del Tesoro BOT
2018/2018 . . . . . . . . . . . . . . . . . . . . . EUR 2 510 000 2 510 0000.00 % Italy Buoni Ordinari del Tesoro BOT
2018/2018 . . . . . . . . . . . . . . . . . . . . . EUR 19 380 000 19 380 0000.65 % Italy Buoni Poliennali Del Tesoro
(MTN) 2016/2023 . . . . . . . . . . . . . . . EUR 11 300 000 11 300 0002.05 % Italy Buoni Poliennali Del Tesoro
(MTN) 2017/2027 . . . . . . . . . . . . . . . EUR 5 400 0002.80 % Italy Buoni Poliennali Del Tesoro
(MTN) 2018/2028 . . . . . . . . . . . . . . . EUR 2 900 000 2 900 000
db Advisory Multibrands – PIMCO Euro Coupon Bond Fund
Count/ Purchases/ Sales/ Description units/ additions disposals currency
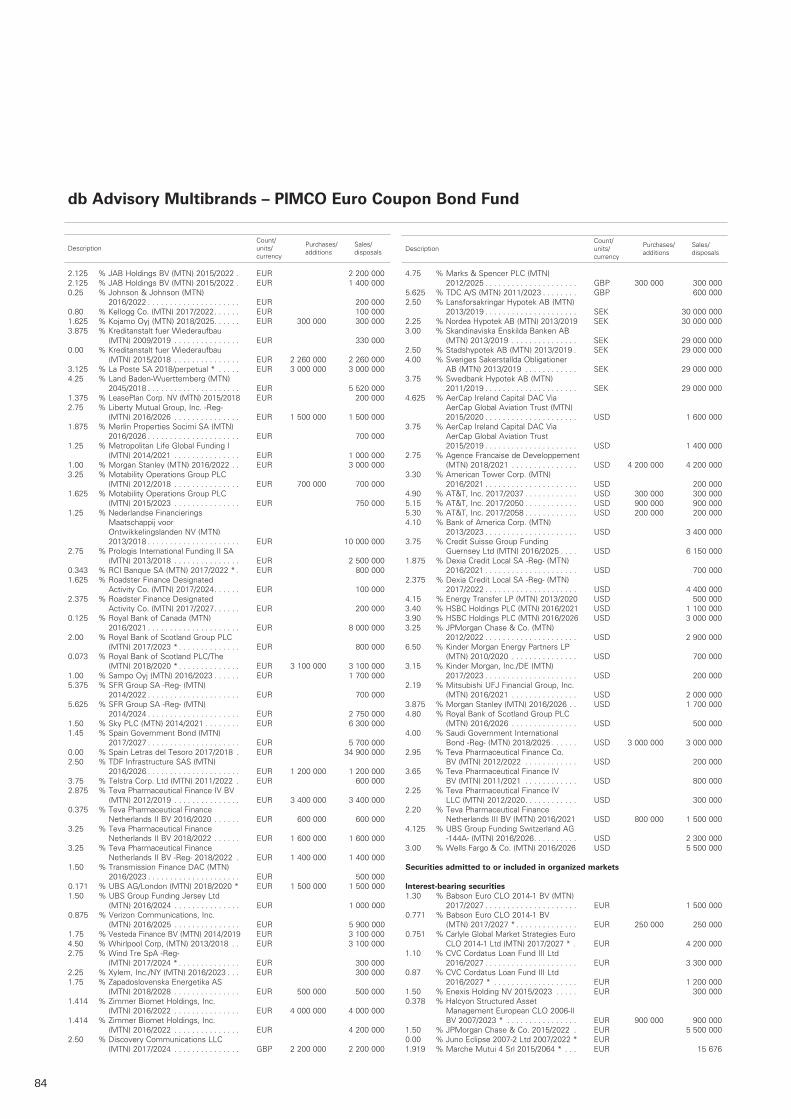
84
Count/ Purchases/ Sales/ Description units/ additions disposals currency
2.125 % JAB Holdings BV (MTN) 2015/2022 . EUR 2 200 0002.125 % JAB Holdings BV (MTN) 2015/2022 . EUR 1 400 0000.25 % Johnson & Johnson (MTN)
2016/2022 . . . . . . . . . . . . . . . . . . . . . EUR 200 0000.80 % Kellogg Co. (MTN) 2017/2022 . . . . . . EUR 100 0001.625 % Kojamo Oyj (MTN) 2018/2025 . . . . . . EUR 300 000 300 0003.875 % Kreditanstalt fuer Wiederaufbau
(MTN) 2009/2019 . . . . . . . . . . . . . . . EUR 330 0000.00 % Kreditanstalt fuer Wiederaufbau
(MTN) 2015/2018 . . . . . . . . . . . . . . . EUR 2 260 000 2 260 0003.125 % La Poste SA 2018/perpetual * . . . . . EUR 3 000 000 3 000 0004.25 % Land Baden-Wuerttemberg (MTN)
2045/2018 . . . . . . . . . . . . . . . . . . . . . EUR 5 520 0001.375 % LeasePlan Corp. NV (MTN) 2015/2018 EUR 200 0002.75 % Liberty Mutual Group, Inc. -Reg-
(MTN) 2016/2026 . . . . . . . . . . . . . . . EUR 1 500 000 1 500 0001.875 % Merlin Properties Socimi SA (MTN)
2016/2026 . . . . . . . . . . . . . . . . . . . . . EUR 700 0001.25 % Metropolitan Life Global Funding I
(MTN) 2014/2021 . . . . . . . . . . . . . . . EUR 1 000 0001.00 % Morgan Stanley (MTN) 2016/2022 . . EUR 3 000 0003.25 % Motability Operations Group PLC
(MTN) 2012/2018 . . . . . . . . . . . . . . . EUR 700 000 700 0001.625 % Motability Operations Group PLC
(MTN) 2015/2023 . . . . . . . . . . . . . . . EUR 750 0001.25 % Nederlandse Financierings
Maatschappij voor Ontwikkelingslanden NV (MTN) 2013/2018 . . . . . . . . . . . . . . . . . . . . . EUR 10 000 000
2.75 % Prologis International Funding II SA (MTN) 2013/2018 . . . . . . . . . . . . . . . EUR 2 500 000
0.343 % RCI Banque SA (MTN) 2017/2022 * . EUR 800 0001.625 % Roadster Finance Designated
Activity Co. (MTN) 2017/2024 . . . . . . EUR 100 0002.375 % Roadster Finance Designated
Activity Co. (MTN) 2017/2027 . . . . . . EUR 200 0000.125 % Royal Bank of Canada (MTN)
2016/2021 . . . . . . . . . . . . . . . . . . . . . EUR 8 000 0002.00 % Royal Bank of Scotland Group PLC
(MTN) 2017/2023 * . . . . . . . . . . . . . . EUR 800 0000.073 % Royal Bank of Scotland PLC/The
(MTN) 2018/2020 * . . . . . . . . . . . . . . EUR 3 100 000 3 100 0001.00 % Sampo Oyj (MTN) 2016/2023 . . . . . . EUR 1 700 0005.375 % SFR Group SA -Reg- (MTN)
2014/2022 . . . . . . . . . . . . . . . . . . . . . EUR 700 0005.625 % SFR Group SA -Reg- (MTN)
2014/2024 . . . . . . . . . . . . . . . . . . . . . EUR 2 750 0001.50 % Sky PLC (MTN) 2014/2021 . . . . . . . . EUR 6 300 0001.45 % Spain Government Bond (MTN)
2017/2027 . . . . . . . . . . . . . . . . . . . . . EUR 5 700 0000.00 % Spain Letras del Tesoro 2017/2018 . EUR 34 900 0002.50 % TDF Infrastructure SAS (MTN)
2016/2026 . . . . . . . . . . . . . . . . . . . . . EUR 1 200 000 1 200 0003.75 % Telstra Corp. Ltd (MTN) 2011/2022 . EUR 600 0002.875 % Teva Pharmaceutical Finance IV BV
(MTN) 2012/2019 . . . . . . . . . . . . . . . EUR 3 400 000 3 400 0000.375 % Teva Pharmaceutical Finance
Netherlands II BV 2016/2020 . . . . . . EUR 600 000 600 0003.25 % Teva Pharmaceutical Finance
Netherlands II BV 2018/2022 . . . . . . EUR 1 600 000 1 600 0003.25 % Teva Pharmaceutical Finance
Netherlands II BV -Reg- 2018/2022 . EUR 1 400 000 1 400 0001.50 % Transmission Finance DAC (MTN)
2016/2023 . . . . . . . . . . . . . . . . . . . . . EUR 500 0000.171 % UBS AG/London (MTN) 2018/2020 * EUR 1 500 000 1 500 0001.50 % UBS Group Funding Jersey Ltd
(MTN) 2016/2024 . . . . . . . . . . . . . . . EUR 1 000 0000.875 % Verizon Communications, Inc.
(MTN) 2016/2025 . . . . . . . . . . . . . . . EUR 5 900 0001.75 % Vesteda Finance BV (MTN) 2014/2019 EUR 3 100 0004.50 % Whirlpool Corp, (MTN) 2013/2018 . . EUR 3 100 0002.75 % Wind Tre SpA -Reg-
(MTN) 2017/2024 * . . . . . . . . . . . . . . EUR 300 0002.25 % Xylem, Inc./NY (MTN) 2016/2023 . . . EUR 300 0001.75 % Zapadoslovenska Energetika AS
(MTN) 2018/2028 . . . . . . . . . . . . . . . EUR 500 000 500 0001.414 % Zimmer Biomet Holdings, Inc.
(MTN) 2016/2022 . . . . . . . . . . . . . . . EUR 4 000 000 4 000 0001.414 % Zimmer Biomet Holdings, Inc.
(MTN) 2016/2022 . . . . . . . . . . . . . . . EUR 4 200 0002.50 % Discovery Communications LLC
(MTN) 2017/2024 . . . . . . . . . . . . . . . GBP 2 200 000 2 200 000
4.75 % Marks & Spencer PLC (MTN) 2012/2025 . . . . . . . . . . . . . . . . . . . . . GBP 300 000 300 000
5.625 % TDC A/S (MTN) 2011/2023 . . . . . . . . GBP 600 0002.50 % Lansforsakringar Hypotek AB (MTN)
2013/2019 . . . . . . . . . . . . . . . . . . . . . SEK 30 000 0002.25 % Nordea Hypotek AB (MTN) 2013/2019 SEK 30 000 0003.00 % Skandinaviska Enskilda Banken AB
(MTN) 2013/2019 . . . . . . . . . . . . . . . SEK 29 000 0002.50 % Stadshypotek AB (MTN) 2013/2019 . SEK 29 000 0004.00 % Sveriges Sakerstallda Obligationer
AB (MTN) 2013/2019 . . . . . . . . . . . . SEK 29 000 0003.75 % Swedbank Hypotek AB (MTN)
2011/2019 . . . . . . . . . . . . . . . . . . . . . SEK 29 000 0004.625 % AerCap Ireland Capital DAC Via
AerCap Global Aviation Trust (MTN) 2015/2020 . . . . . . . . . . . . . . . . . . . . . USD 1 600 000
3.75 % AerCap Ireland Capital DAC Via AerCap Global Aviation Trust 2015/2019 . . . . . . . . . . . . . . . . . . . . . USD 1 400 000
2.75 % Agence Francaise de Developpement (MTN) 2018/2021 . . . . . . . . . . . . . . . USD 4 200 000 4 200 000
3.30 % American Tower Corp. (MTN) 2016/2021 . . . . . . . . . . . . . . . . . . . . . USD 200 000
4.90 % AT&T, Inc. 2017/2037 . . . . . . . . . . . . USD 300 000 300 0005.15 % AT&T, Inc. 2017/2050 . . . . . . . . . . . . USD 900 000 900 0005.30 % AT&T, Inc. 2017/2058 . . . . . . . . . . . . USD 200 000 200 0004.10 % Bank of America Corp. (MTN)
2013/2023 . . . . . . . . . . . . . . . . . . . . . USD 3 400 0003.75 % Credit Suisse Group Funding
Guernsey Ltd (MTN) 2016/2025 . . . . USD 6 150 0001.875 % Dexia Credit Local SA -Reg- (MTN)
2016/2021 . . . . . . . . . . . . . . . . . . . . . USD 700 0002.375 % Dexia Credit Local SA -Reg- (MTN)
2017/2022 . . . . . . . . . . . . . . . . . . . . . USD 4 400 0004.15 % Energy Transfer LP (MTN) 2013/2020 USD 500 0003.40 % HSBC Holdings PLC (MTN) 2016/2021 USD 1 100 0003.90 % HSBC Holdings PLC (MTN) 2016/2026 USD 3 000 0003.25 % JPMorgan Chase & Co. (MTN)
2012/2022 . . . . . . . . . . . . . . . . . . . . . USD 2 900 0006.50 % Kinder Morgan Energy Partners LP
(MTN) 2010/2020 . . . . . . . . . . . . . . . USD 700 0003.15 % Kinder Morgan, Inc./DE (MTN)
2017/2023 . . . . . . . . . . . . . . . . . . . . . USD 200 0002.19 % Mitsubishi UFJ Financial Group, Inc.
(MTN) 2016/2021 . . . . . . . . . . . . . . . USD 2 000 0003.875 % Morgan Stanley (MTN) 2016/2026 . . USD 1 700 0004.80 % Royal Bank of Scotland Group PLC
(MTN) 2016/2026 . . . . . . . . . . . . . . . USD 500 0004.00 % Saudi Government International
Bond -Reg- (MTN) 2018/2025 . . . . . . USD 3 000 000 3 000 0002.95 % Teva Pharmaceutical Finance Co.
BV (MTN) 2012/2022 . . . . . . . . . . . . USD 200 0003.65 % Teva Pharmaceutical Finance IV
BV (MTN) 2011/2021 . . . . . . . . . . . . USD 800 0002.25 % Teva Pharmaceutical Finance IV
LLC (MTN) 2012/2020 . . . . . . . . . . . . USD 300 0002.20 % Teva Pharmaceutical Finance
Netherlands III BV (MTN) 2016/2021 USD 800 000 1 500 0004.125 % UBS Group Funding Switzerland AG
-144A- (MTN) 2016/2026 . . . . . . . . . . USD 2 300 0003.00 % Wells Fargo & Co. (MTN) 2016/2026 USD 5 500 000
Securities admitted to or included in organized markets
Interest-bearing securities1.30 % Babson Euro CLO 2014-1 BV (MTN)
2017/2027 . . . . . . . . . . . . . . . . . . . . . EUR 1 500 0000.771 % Babson Euro CLO 2014-1 BV
(MTN) 2017/2027 * . . . . . . . . . . . . . . EUR 250 000 250 0000.751 % Carlyle Global Market Strategies Euro
CLO 2014-1 Ltd (MTN) 2017/2027 * . EUR 4 200 0001.10 % CVC Cordatus Loan Fund III Ltd
2016/2027 . . . . . . . . . . . . . . . . . . . . . EUR 3 300 0000.87 % CVC Cordatus Loan Fund III Ltd
2016/2027 * . . . . . . . . . . . . . . . . . . . EUR 1 200 0001.50 % Enexis Holding NV 2015/2023 . . . . . EUR 300 0000.378 % Halcyon Structured Asset
Management European CLO 2006-II BV 2007/2023 * . . . . . . . . . . . . . . . . EUR 900 000 900 000
1.50 % JPMorgan Chase & Co. 2015/2022 . EUR 5 500 0000.00 % Juno Eclipse 2007-2 Ltd 2007/2022 * EUR 1.919 % Marche Mutui 4 Srl 2015/2064 * . . . EUR 15 676
Count/ Purchases/ Sales/ Description units/ additions disposals currency
db Advisory Multibrands – PIMCO Euro Coupon Bond Fund
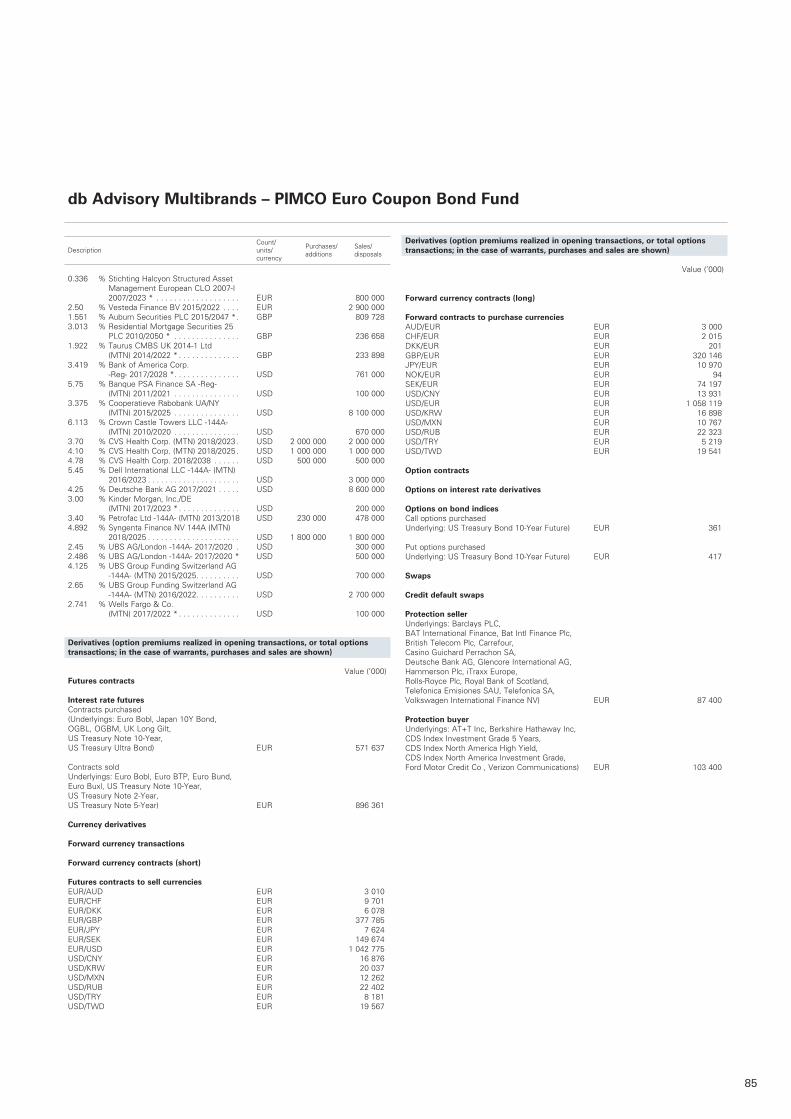
85
0.336 % Stichting Halcyon Structured Asset Management European CLO 2007-I 2007/2023 * . . . . . . . . . . . . . . . . . . . EUR 800 000
2.50 % Vesteda Finance BV 2015/2022 . . . . EUR 2 900 0001.551 % Auburn Securities PLC 2015/2047 * . GBP 809 7283.013 % Residential Mortgage Securities 25
PLC 2010/2050 * . . . . . . . . . . . . . . . GBP 236 6581.922 % Taurus CMBS UK 2014-1 Ltd
(MTN) 2014/2022 * . . . . . . . . . . . . . . GBP 233 8983.419 % Bank of America Corp.
-Reg- 2017/2028 * . . . . . . . . . . . . . . . USD 761 0005.75 % Banque PSA Finance SA -Reg-
(MTN) 2011/2021 . . . . . . . . . . . . . . . USD 100 0003.375 % Cooperatieve Rabobank UA/NY
(MTN) 2015/2025 . . . . . . . . . . . . . . . USD 8 100 0006.113 % Crown Castle Towers LLC -144A-
(MTN) 2010/2020 . . . . . . . . . . . . . . . USD 670 0003.70 % CVS Health Corp. (MTN) 2018/2023 . USD 2 000 000 2 000 0004.10 % CVS Health Corp. (MTN) 2018/2025 . USD 1 000 000 1 000 0004.78 % CVS Health Corp. 2018/2038 . . . . . . USD 500 000 500 0005.45 % Dell International LLC -144A- (MTN)
2016/2023 . . . . . . . . . . . . . . . . . . . . . USD 3 000 0004.25 % Deutsche Bank AG 2017/2021 . . . . . USD 8 600 0003.00 % Kinder Morgan, Inc./DE
(MTN) 2017/2023 * . . . . . . . . . . . . . . USD 200 0003.40 % Petrofac Ltd -144A- (MTN) 2013/2018 USD 230 000 478 0004.892 % Syngenta Finance NV 144A (MTN)
2018/2025 . . . . . . . . . . . . . . . . . . . . . USD 1 800 000 1 800 0002.45 % UBS AG/London -144A- 2017/2020 . USD 300 0002.486 % UBS AG/London -144A- 2017/2020 * USD 500 0004.125 % UBS Group Funding Switzerland AG
-144A- (MTN) 2015/2025 . . . . . . . . . . USD 700 0002.65 % UBS Group Funding Switzerland AG
-144A- (MTN) 2016/2022 . . . . . . . . . . USD 2 700 0002.741 % Wells Fargo & Co.
(MTN) 2017/2022 * . . . . . . . . . . . . . . USD 100 000
Derivatives (option premiums realized in opening transactions, or total options transactions; in the case of warrants, purchases and sales are shown)
Value (’000)Futures contracts Interest rate futures Contracts purchased (Underlyings: Euro Bobl, Japan 10Y Bond, OGBL, OGBM, UK Long Gilt, US Treasury Note 10-Year, US Treasury Ultra Bond) EUR 571 637 Contracts sold Underlyings: Euro Bobl, Euro BTP, Euro Bund, Euro Buxl, US Treasury Note 10-Year, US Treasury Note 2-Year, US Treasury Note 5-Year) EUR 896 361 Currency derivatives
Forward currency transactions
Forward currency contracts (short) Futures contracts to sell currencies EUR/AUD EUR 3 010EUR/CHF EUR 9 701EUR/DKK EUR 6 078EUR/GBP EUR 377 785EUR/JPY EUR 7 624EUR/SEK EUR 149 674EUR/USD EUR 1 042 775USD/CNY EUR 16 876USD/KRW EUR 20 037USD/MXN EUR 12 262USD/RUB EUR 22 402USD/TRY EUR 8 181USD/TWD EUR 19 567
Derivatives (option premiums realized in opening transactions, or total options transactions; in the case of warrants, purchases and sales are shown)
Value (’000)
Forward currency contracts (long)
Forward contracts to purchase currencies AUD/EUR EUR 3 000CHF/EUR EUR 2 015DKK/EUR EUR 201GBP/EUR EUR 320 146JPY/EUR EUR 10 970NOK/EUR EUR 94SEK/EUR EUR 74 197USD/CNY EUR 13 931USD/EUR EUR 1 058 119USD/KRW EUR 16 898USD/MXN EUR 10 767USD/RUB EUR 22 323USD/TRY EUR 5 219USD/TWD EUR 19 541
Option contracts Options on interest rate derivatives Options on bond indices Call options purchased Underlying: US Treasury Bond 10-Year Future) EUR 361 Put options purchased Underlying: US Treasury Bond 10-Year Future) EUR 417
Swaps Credit default swaps Protection seller Underlyings: Barclays PLC, BAT International Finance, Bat Intl Finance Plc, British Telecom Plc, Carrefour, Casino Guichard Perrachon SA, Deutsche Bank AG, Glencore International AG, Hammerson Plc, iTraxx Europe, Rolls-Royce Plc, Royal Bank of Scotland, Telefonica Emisiones SAU, Telefonica SA, Volkswagen International Finance NV) EUR 87 400
Protection buyer Underlyings: AT+T Inc, Berkshire Hathaway Inc, CDS Index Investment Grade 5 Years, CDS Index North America High Yield, CDS Index North America Investment Grade, Ford Motor Credit Co , Verizon Communications) EUR 103 400
db Advisory Multibrands – PIMCO Euro Coupon Bond Fund
Count/ Purchases/ Sales/ Description units/ additions disposals currency
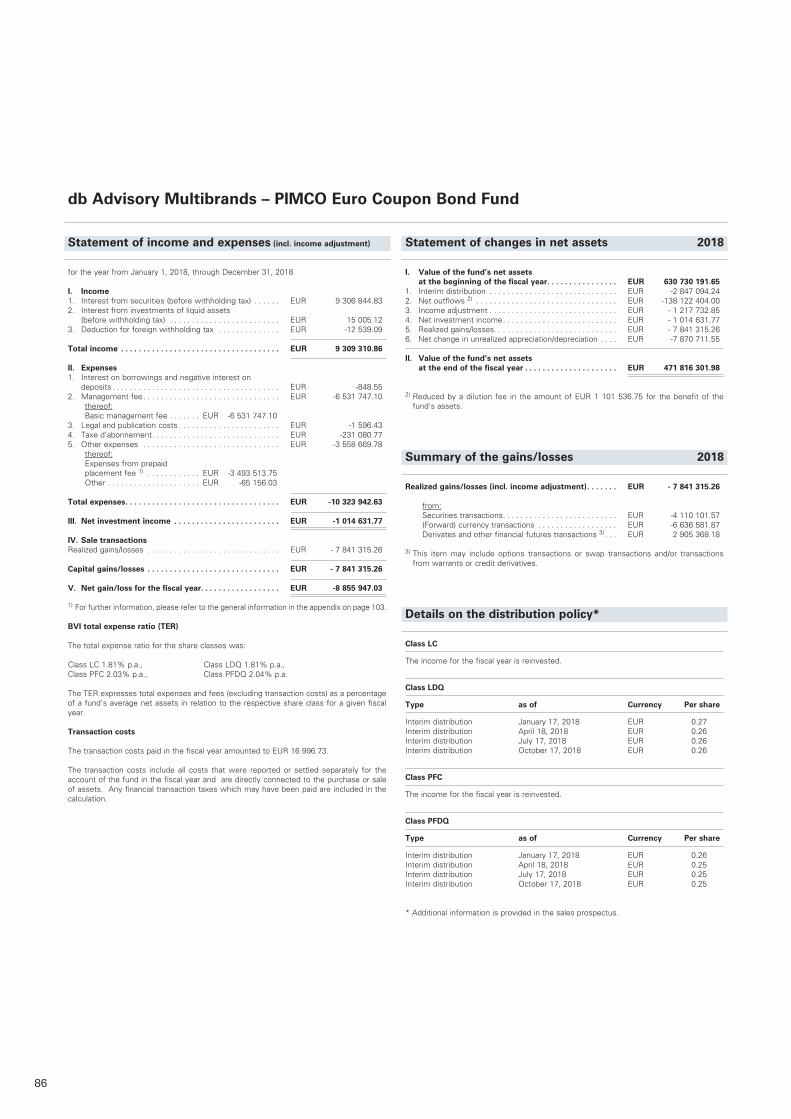
86
Statement of income and expenses (incl. income adjustment)
for the year from January 1, 2018, through December 31, 2018
I. Income1. Interest from securities (before withholding tax) . . . . . . EUR 9 306 844.832. Interest from investments of liquid assets
(before withholding tax) . . . . . . . . . . . . . . . . . . . . . . . . . EUR 15 005.123. Deduction for foreign withholding tax . . . . . . . . . . . . . . EUR -12 539.09
Total income . . . . . . . . . . . . . . . . . . . . . . . . . . . . . . . . . . . . EUR 9 309 310.86
II. Expenses1. Interest on borrowings and negative interest on deposits . . . . . . . . . . . . . . . . . . . . . . . . . . . . . . . . . . . . . . EUR -848.552. Management fee . . . . . . . . . . . . . . . . . . . . . . . . . . . . . . . EUR -6 531 747.10 thereof: Basic management fee . . . . . . . EUR -6 531 747.103. Legal and publication costs . . . . . . . . . . . . . . . . . . . . . . . EUR -1 596.434. Taxe d’abonnement . . . . . . . . . . . . . . . . . . . . . . . . . . . . . EUR -231 080.775. Other expenses . . . . . . . . . . . . . . . . . . . . . . . . . . . . . . . EUR -3 558 669.78 thereof: Expenses from prepaid placement fee 1) . . . . . . . . . . . . EUR -3 493 513.75 Other . . . . . . . . . . . . . . . . . . . . . EUR -65 156.03
Total expenses . . . . . . . . . . . . . . . . . . . . . . . . . . . . . . . . . . . EUR -10 323 942.63
III. Net investment income . . . . . . . . . . . . . . . . . . . . . . . . EUR -1 014 631.77
IV. Sale transactionsRealized gains/losses . . . . . . . . . . . . . . . . . . . . . . . . . . . . . . EUR - 7 841 315.26
Capital gains/losses . . . . . . . . . . . . . . . . . . . . . . . . . . . . . . EUR - 7 841 315.26
V. Net gain/loss for the fiscal year. . . . . . . . . . . . . . . . . . EUR -8 855 947.03 1) For further information, please refer to the general information in the appendix on page 103.
BVI total expense ratio (TER)
The total expense ratio for the share classes was:
Class LC 1.81% p.a., Class LDQ 1.81% p.a., Class PFC 2.03% p.a., Class PFDQ 2.04% p.a.
The TER expresses total expenses and fees (excluding transaction costs) as a percentage of a fund’s average net assets in relation to the respective share class for a given fiscal year.
Transaction costs
The transaction costs paid in the fiscal year amounted to EUR 16 996.73.
The transaction costs include all costs that were reported or settled separately for the account of the fund in the fiscal year and are directly connected to the purchase or sale of assets. Any financial transaction taxes which may have been paid are included in the calculation.
Statement of changes in net assets 2018
I. Value of the fund’s net assets at the beginning of the fiscal year . . . . . . . . . . . . . . . . EUR 630 730 191.65
1. Interim distribution . . . . . . . . . . . . . . . . . . . . . . . . . . . . . EUR -2 847 094.242. Net outflows 2) . . . . . . . . . . . . . . . . . . . . . . . . . . . . . . . . EUR -138 122 404.003. Income adjustment . . . . . . . . . . . . . . . . . . . . . . . . . . . . . EUR - 1 217 732.854. Net investment income . . . . . . . . . . . . . . . . . . . . . . . . . . EUR - 1 014 631.775. Realized gains/losses. . . . . . . . . . . . . . . . . . . . . . . . . . . . EUR - 7 841 315.266. Net change in unrealized appreciation/depreciation . . . . EUR -7 870 711.55
II. Value of the fund’s net assets at the end of the fiscal year . . . . . . . . . . . . . . . . . . . . . EUR 471 816 301.98
2) Reduced by a dilution fee in the amount of EUR 1 101 536.75 for the benefit of the fund‘s assets.
Summary of the gains/losses 2018
Realized gains/losses (incl. income adjustment) . . . . . . . EUR - 7 841 315.26
from: Securities transactions . . . . . . . . . . . . . . . . . . . . . . . . . . EUR -4 110 101.57 (Forward) currency transactions . . . . . . . . . . . . . . . . . . EUR -6 636 581.87 Derivates and other financial futures transactions 3) . . . EUR 2 905 368.18
3) This item may include options transactions or swap transactions and/or transactions from warrants or credit derivatives.
Details on the distribution policy*
Class LC
The income for the fiscal year is reinvested.
Class LDQ
Type as of Currency Per share
Interim distribution January 17, 2018 EUR 0.27Interim distribution April 18, 2018 EUR 0.26Interim distribution July 17, 2018 EUR 0.26Interim distribution October 17, 2018 EUR 0.26
Class PFC
The income for the fiscal year is reinvested.
Class PFDQ
Type as of Currency Per share
Interim distribution January 17, 2018 EUR 0.26Interim distribution April 18, 2018 EUR 0.25Interim distribution July 17, 2018 EUR 0.25Interim distribution October 17, 2018 EUR 0.25 * Additional information is provided in the sales prospectus.
db Advisory Multibrands – PIMCO Euro Coupon Bond Fund
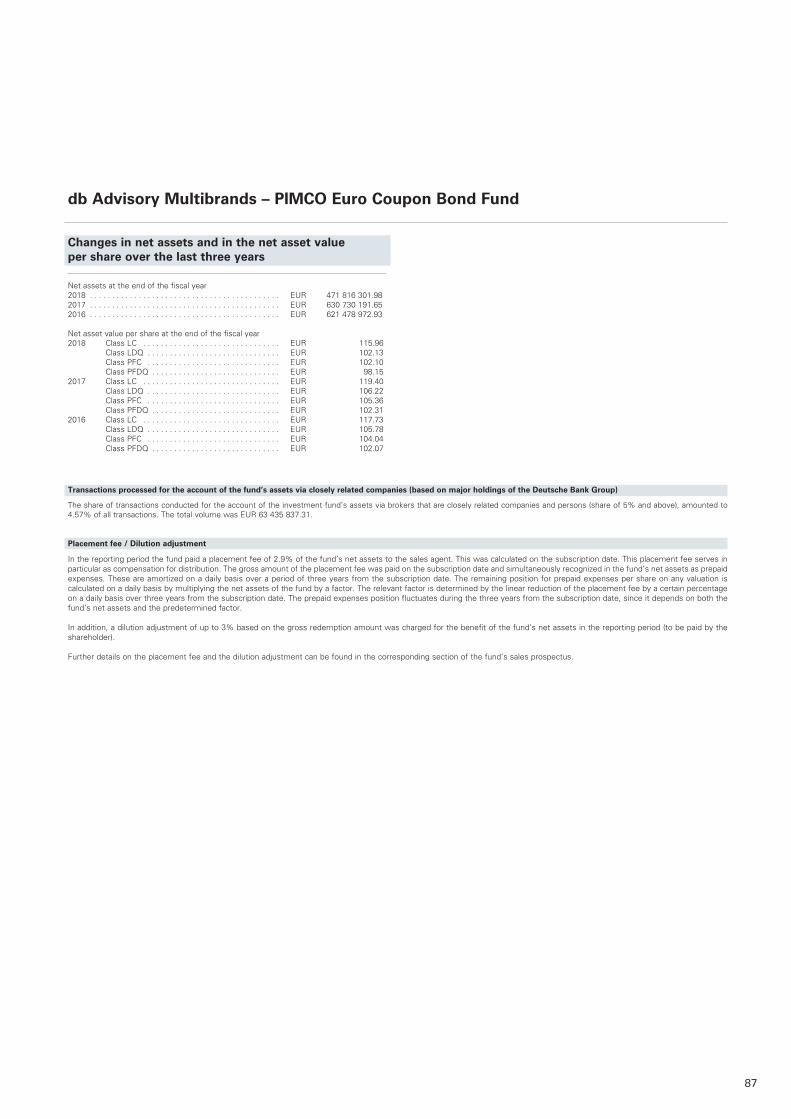
87
Changes in net assets and in the net asset value per share over the last three years
Net assets at the end of the fiscal year 2018 . . . . . . . . . . . . . . . . . . . . . . . . . . . . . . . . . . . . . . . . . . . EUR 471 816 301 .982017 . . . . . . . . . . . . . . . . . . . . . . . . . . . . . . . . . . . . . . . . . . . EUR 630 730 191 .652016 . . . . . . . . . . . . . . . . . . . . . . . . . . . . . . . . . . . . . . . . . . . EUR 621 478 972 .93
Net asset value per share at the end of the fiscal year 2018 Class LC . . . . . . . . . . . . . . . . . . . . . . . . . . . . . . . EUR 115 .96 Class LDQ . . . . . . . . . . . . . . . . . . . . . . . . . . . . . . EUR 102 .13 Class PFC . . . . . . . . . . . . . . . . . . . . . . . . . . . . . . EUR 102 .10 Class PFDQ . . . . . . . . . . . . . . . . . . . . . . . . . . . . . EUR 98 .152017 Class LC . . . . . . . . . . . . . . . . . . . . . . . . . . . . . . . EUR 119 .40 Class LDQ . . . . . . . . . . . . . . . . . . . . . . . . . . . . . . EUR 106 .22 Class PFC . . . . . . . . . . . . . . . . . . . . . . . . . . . . . . EUR 105 .36 Class PFDQ . . . . . . . . . . . . . . . . . . . . . . . . . . . . . EUR 102 .312016 Class LC . . . . . . . . . . . . . . . . . . . . . . . . . . . . . . . EUR 117 .73 Class LDQ . . . . . . . . . . . . . . . . . . . . . . . . . . . . . . EUR 105 .78 Class PFC . . . . . . . . . . . . . . . . . . . . . . . . . . . . . . EUR 104 .04 Class PFDQ . . . . . . . . . . . . . . . . . . . . . . . . . . . . . EUR 102 .07
db Advisory Multibrands – PIMCO Euro Coupon Bond Fund
Transactions processed for the account of the fund’s assets via closely related companies (based on major holdings of the Deutsche Bank Group)
The share of transactions conducted for the account of the investment fund’s assets via brokers that are closely related companies and persons (share of 5% and above), amounted to 4 .57% of all transactions . The total volume was EUR 63 435 837 .31 .
Placement fee / Dilution adjustment
In the reporting period the fund paid a placement fee of 2 .9% of the fund’s net assets to the sales agent . This was calculated on the subscription date . This placement fee serves in particular as compensation for distribution . The gross amount of the placement fee was paid on the subscription date and simultaneously recognized in the fund’s net assets as prepaid expenses . These are amortized on a daily basis over a period of three years from the subscription date . The remaining position for prepaid expenses per share on any valuation is calculated on a daily basis by multiplying the net assets of the fund by a factor . The relevant factor is determined by the linear reduction of the placement fee by a certain percentage on a daily basis over three years from the subscription date . The prepaid expenses position fluctuates during the three years from the subscription date, since it depends on both the fund’s net assets and the predetermined factor .
In addition, a dilution adjustment of up to 3% based on the gross redemption amount was charged for the benefit of the fund’s net assets in the reporting period (to be paid by the shareholder) .
Further details on the placement fee and the dilution adjustment can be found in the corresponding section of the fund’s sales prospectus .
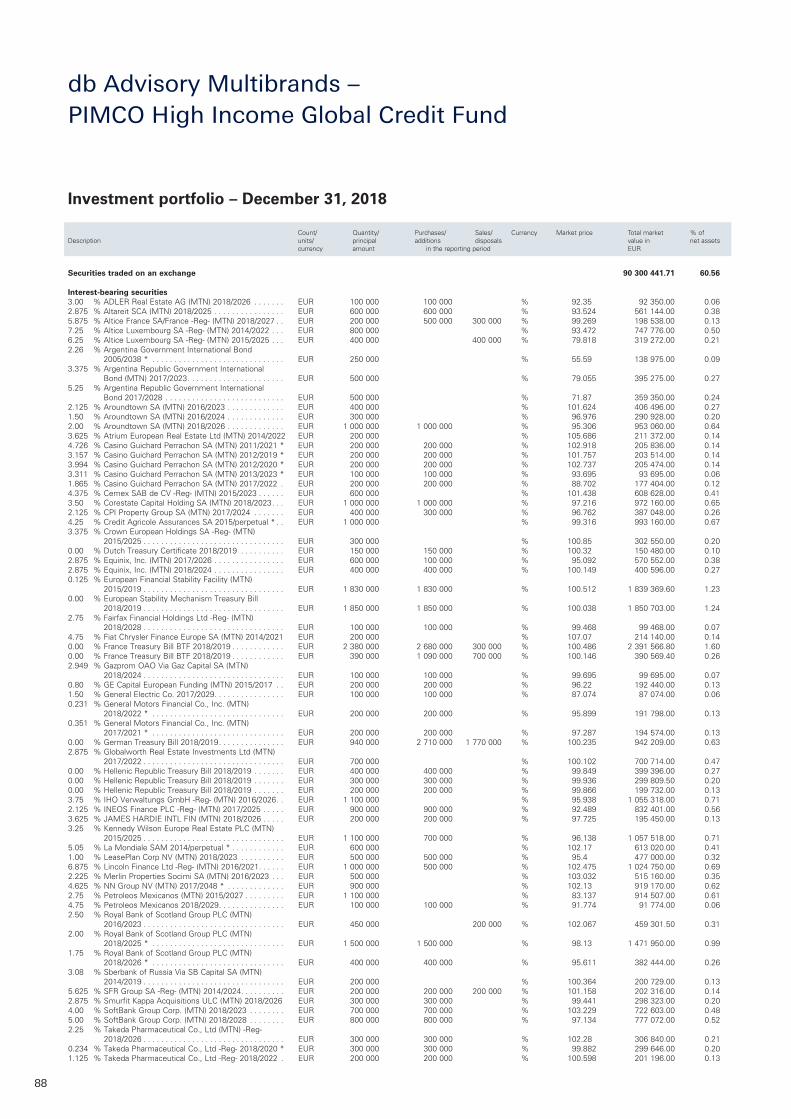
88
Securities traded on an exchange 90 300 441.71 60.56 Interest-bearing securities3.00 % ADLER Real Estate AG (MTN) 2018/2026 . . . . . . . EUR 100 000 100 000 % 92.35 92 350.00 0.062.875 % Altareit SCA (MTN) 2018/2025 . . . . . . . . . . . . . . . . EUR 600 000 600 000 % 93.524 561 144.00 0.385.875 % Altice France SA/France -Reg- (MTN) 2018/2027 . . EUR 200 000 500 000 300 000 % 99.269 198 538.00 0.137.25 % Altice Luxembourg SA -Reg- (MTN) 2014/2022 . . . EUR 800 000 % 93.472 747 776.00 0.506.25 % Altice Luxembourg SA -Reg- (MTN) 2015/2025 . . . EUR 400 000 400 000 % 79.818 319 272.00 0.212.26 % Argentina Government International Bond
2005/2038 * . . . . . . . . . . . . . . . . . . . . . . . . . . . . . . EUR 250 000 % 55.59 138 975.00 0.093.375 % Argentina Republic Government International
Bond (MTN) 2017/2023 . . . . . . . . . . . . . . . . . . . . . . EUR 500 000 % 79.055 395 275.00 0.275.25 % Argentina Republic Government International
Bond 2017/2028 . . . . . . . . . . . . . . . . . . . . . . . . . . . EUR 500 000 % 71.87 359 350.00 0.242.125 % Aroundtown SA (MTN) 2016/2023 . . . . . . . . . . . . . EUR 400 000 % 101.624 406 496.00 0.271.50 % Aroundtown SA (MTN) 2016/2024 . . . . . . . . . . . . . EUR 300 000 % 96.976 290 928.00 0.202.00 % Aroundtown SA (MTN) 2018/2026 . . . . . . . . . . . . . EUR 1 000 000 1 000 000 % 95.306 953 060.00 0.643.625 % Atrium European Real Estate Ltd (MTN) 2014/2022 EUR 200 000 % 105.686 211 372.00 0.144.726 % Casino Guichard Perrachon SA (MTN) 2011/2021 * EUR 200 000 200 000 % 102.918 205 836.00 0.143.157 % Casino Guichard Perrachon SA (MTN) 2012/2019 * EUR 200 000 200 000 % 101.757 203 514.00 0.143.994 % Casino Guichard Perrachon SA (MTN) 2012/2020 * EUR 200 000 200 000 % 102.737 205 474.00 0.143.311 % Casino Guichard Perrachon SA (MTN) 2013/2023 * EUR 100 000 100 000 % 93.695 93 695.00 0.061.865 % Casino Guichard Perrachon SA (MTN) 2017/2022 . EUR 200 000 200 000 % 88.702 177 404.00 0.124.375 % Cemex SAB de CV -Reg- (MTN) 2015/2023 . . . . . . EUR 600 000 % 101.438 608 628.00 0.413.50 % Corestate Capital Holding SA (MTN) 2018/2023 . . . EUR 1 000 000 1 000 000 % 97.216 972 160.00 0.652.125 % CPI Property Group SA (MTN) 2017/2024 . . . . . . . EUR 400 000 300 000 % 96.762 387 048.00 0.264.25 % Credit Agricole Assurances SA 2015/perpetual * . . EUR 1 000 000 % 99.316 993 160.00 0.673.375 % Crown European Holdings SA -Reg- (MTN)
2015/2025 . . . . . . . . . . . . . . . . . . . . . . . . . . . . . . . . EUR 300 000 % 100.85 302 550.00 0.200.00 % Dutch Treasury Certificate 2018/2019 . . . . . . . . . . EUR 150 000 150 000 % 100.32 150 480.00 0.102.875 % Equinix, Inc. (MTN) 2017/2026 . . . . . . . . . . . . . . . . EUR 600 000 100 000 % 95.092 570 552.00 0.382.875 % Equinix, Inc. (MTN) 2018/2024 . . . . . . . . . . . . . . . . EUR 400 000 400 000 % 100.149 400 596.00 0.270.125 % European Financial Stability Facility (MTN)
2015/2019 . . . . . . . . . . . . . . . . . . . . . . . . . . . . . . . . EUR 1 830 000 1 830 000 % 100.512 1 839 369.60 1.230.00 % European Stability Mechanism Treasury Bill
2018/2019 . . . . . . . . . . . . . . . . . . . . . . . . . . . . . . . . EUR 1 850 000 1 850 000 % 100.038 1 850 703.00 1.242.75 % Fairfax Financial Holdings Ltd -Reg- (MTN)
2018/2028 . . . . . . . . . . . . . . . . . . . . . . . . . . . . . . . . EUR 100 000 100 000 % 99.468 99 468.00 0.074.75 % Fiat Chrysler Finance Europe SA (MTN) 2014/2021 EUR 200 000 % 107.07 214 140.00 0.140.00 % France Treasury Bill BTF 2018/2019 . . . . . . . . . . . . EUR 2 380 000 2 680 000 300 000 % 100.486 2 391 566.80 1.600.00 % France Treasury Bill BTF 2018/2019 . . . . . . . . . . . . EUR 390 000 1 090 000 700 000 % 100.146 390 569.40 0.262.949 % Gazprom OAO Via Gaz Capital SA (MTN)
2018/2024 . . . . . . . . . . . . . . . . . . . . . . . . . . . . . . . . EUR 100 000 100 000 % 99.695 99 695.00 0.070.80 % GE Capital European Funding (MTN) 2015/2017 . . EUR 200 000 200 000 % 96.22 192 440.00 0.131.50 % General Electric Co. 2017/2029 . . . . . . . . . . . . . . . . EUR 100 000 100 000 % 87.074 87 074.00 0.060.231 % General Motors Financial Co., Inc. (MTN)
2018/2022 * . . . . . . . . . . . . . . . . . . . . . . . . . . . . . . EUR 200 000 200 000 % 95.899 191 798.00 0.130.351 % General Motors Financial Co., Inc. (MTN)
2017/2021 * . . . . . . . . . . . . . . . . . . . . . . . . . . . . . . EUR 200 000 200 000 % 97.287 194 574.00 0.130.00 % German Treasury Bill 2018/2019 . . . . . . . . . . . . . . . EUR 940 000 2 710 000 1 770 000 % 100.235 942 209.00 0.632.875 % Globalworth Real Estate Investments Ltd (MTN)
2017/2022 . . . . . . . . . . . . . . . . . . . . . . . . . . . . . . . . EUR 700 000 % 100.102 700 714.00 0.470.00 % Hellenic Republic Treasury Bill 2018/2019 . . . . . . . EUR 400 000 400 000 % 99.849 399 396.00 0.270.00 % Hellenic Republic Treasury Bill 2018/2019 . . . . . . . EUR 300 000 300 000 % 99.936 299 809.50 0.200.00 % Hellenic Republic Treasury Bill 2018/2019 . . . . . . . EUR 200 000 200 000 % 99.866 199 732.00 0.133.75 % IHO Verwaltungs GmbH -Reg- (MTN) 2016/2026 . . EUR 1 100 000 % 95.938 1 055 318.00 0.712.125 % INEOS Finance PLC -Reg- (MTN) 2017/2025 . . . . . EUR 900 000 900 000 % 92.489 832 401.00 0.563.625 % JAMES HARDIE INTL FIN (MTN) 2018/2026 . . . . . EUR 200 000 200 000 % 97.725 195 450.00 0.133.25 % Kennedy Wilson Europe Real Estate PLC (MTN)
2015/2025 . . . . . . . . . . . . . . . . . . . . . . . . . . . . . . . . EUR 1 100 000 700 000 % 96.138 1 057 518.00 0.715.05 % La Mondiale SAM 2014/perpetual * . . . . . . . . . . . . EUR 600 000 % 102.17 613 020.00 0.411.00 % LeasePlan Corp NV (MTN) 2018/2023 . . . . . . . . . . EUR 500 000 500 000 % 95.4 477 000.00 0.326.875 % Lincoln Finance Ltd -Reg- (MTN) 2016/2021 . . . . . . EUR 1 000 000 500 000 % 102.475 1 024 750.00 0.692.225 % Merlin Properties Socimi SA (MTN) 2016/2023 . . . EUR 500 000 % 103.032 515 160.00 0.354.625 % NN Group NV (MTN) 2017/2048 * . . . . . . . . . . . . . EUR 900 000 % 102.13 919 170.00 0.622.75 % Petroleos Mexicanos (MTN) 2015/2027 . . . . . . . . . EUR 1 100 000 % 83.137 914 507.00 0.614.75 % Petroleos Mexicanos 2018/2029 . . . . . . . . . . . . . . . EUR 100 000 100 000 % 91.774 91 774.00 0.062.50 % Royal Bank of Scotland Group PLC (MTN)
2016/2023 . . . . . . . . . . . . . . . . . . . . . . . . . . . . . . . . EUR 450 000 200 000 % 102.067 459 301.50 0.312.00 % Royal Bank of Scotland Group PLC (MTN)
2018/2025 * . . . . . . . . . . . . . . . . . . . . . . . . . . . . . . EUR 1 500 000 1 500 000 % 98.13 1 471 950.00 0.991.75 % Royal Bank of Scotland Group PLC (MTN)
2018/2026 * . . . . . . . . . . . . . . . . . . . . . . . . . . . . . . EUR 400 000 400 000 % 95.611 382 444.00 0.263.08 % Sberbank of Russia Via SB Capital SA (MTN)
2014/2019 . . . . . . . . . . . . . . . . . . . . . . . . . . . . . . . . EUR 200 000 % 100.364 200 729.00 0.135.625 % SFR Group SA -Reg- (MTN) 2014/2024 . . . . . . . . . . EUR 200 000 200 000 200 000 % 101.158 202 316.00 0.142.875 % Smurfit Kappa Acquisitions ULC (MTN) 2018/2026 EUR 300 000 300 000 % 99.441 298 323.00 0.204.00 % SoftBank Group Corp. (MTN) 2018/2023 . . . . . . . . EUR 700 000 700 000 % 103.229 722 603.00 0.485.00 % SoftBank Group Corp. (MTN) 2018/2028 . . . . . . . . EUR 800 000 800 000 % 97.134 777 072.00 0.522.25 % Takeda Pharmaceutical Co., Ltd (MTN) -Reg-
2018/2026 . . . . . . . . . . . . . . . . . . . . . . . . . . . . . . . . EUR 300 000 300 000 % 102.28 306 840.00 0.210.234 % Takeda Pharmaceutical Co., Ltd -Reg- 2018/2020 * EUR 300 000 300 000 % 99.882 299 646.00 0.201.125 % Takeda Pharmaceutical Co., Ltd -Reg- 2018/2022 . EUR 200 000 200 000 % 100.598 201 196.00 0.13
Investment portfolio – December 31, 2018
Count/ Quantity/ Purchases/ Sales/ Currency Market price Total market % ofDescription units/ principal additions disposals value in net assets currency amount in the reporting period EUR
db Advisory Multibrands – PIMCO High Income Global Credit Fund
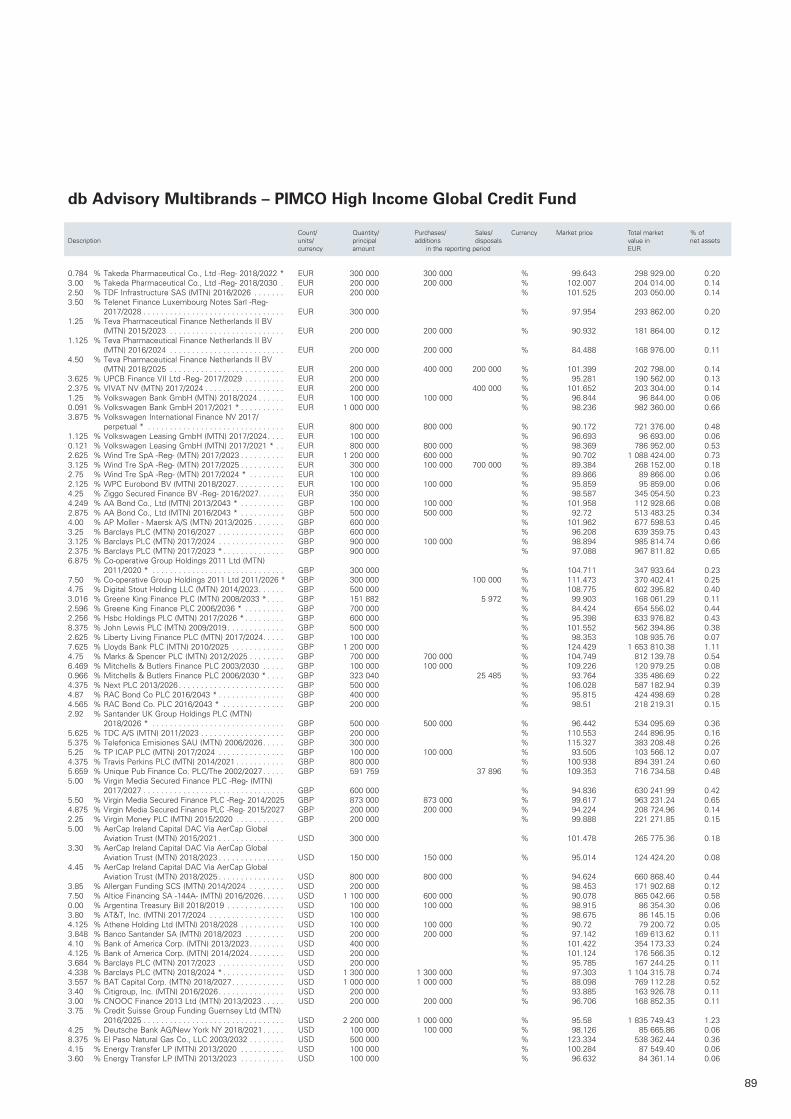
89
0.784 % Takeda Pharmaceutical Co., Ltd -Reg- 2018/2022 * EUR 300 000 300 000 % 99.643 298 929.00 0.203.00 % Takeda Pharmaceutical Co., Ltd -Reg- 2018/2030 . EUR 200 000 200 000 % 102.007 204 014.00 0.142.50 % TDF Infrastructure SAS (MTN) 2016/2026 . . . . . . . EUR 200 000 % 101.525 203 050.00 0.143.50 % Telenet Finance Luxembourg Notes Sarl -Reg-
2017/2028 . . . . . . . . . . . . . . . . . . . . . . . . . . . . . . . . EUR 300 000 % 97.954 293 862.00 0.201.25 % Teva Pharmaceutical Finance Netherlands II BV
(MTN) 2015/2023 . . . . . . . . . . . . . . . . . . . . . . . . . . EUR 200 000 200 000 % 90.932 181 864.00 0.121.125 % Teva Pharmaceutical Finance Netherlands II BV
(MTN) 2016/2024 . . . . . . . . . . . . . . . . . . . . . . . . . . EUR 200 000 200 000 % 84.488 168 976.00 0.114.50 % Teva Pharmaceutical Finance Netherlands II BV
(MTN) 2018/2025 . . . . . . . . . . . . . . . . . . . . . . . . . . EUR 200 000 400 000 200 000 % 101.399 202 798.00 0.143.625 % UPCB Finance VII Ltd -Reg- 2017/2029 . . . . . . . . . EUR 200 000 % 95.281 190 562.00 0.132.375 % VIVAT NV (MTN) 2017/2024 . . . . . . . . . . . . . . . . . . EUR 200 000 400 000 % 101.652 203 304.00 0.141.25 % Volkswagen Bank GmbH (MTN) 2018/2024 . . . . . . EUR 100 000 100 000 % 96.844 96 844.00 0.060.091 % Volkswagen Bank GmbH 2017/2021 * . . . . . . . . . . EUR 1 000 000 % 98.236 982 360.00 0.663.875 % Volkswagen International Finance NV 2017/
perpetual * . . . . . . . . . . . . . . . . . . . . . . . . . . . . . . . EUR 800 000 800 000 % 90.172 721 376.00 0.481.125 % Volkswagen Leasing GmbH (MTN) 2017/2024 . . . . EUR 100 000 % 96.693 96 693.00 0.060.121 % Volkswagen Leasing GmbH (MTN) 2017/2021 * . . EUR 800 000 800 000 % 98.369 786 952.00 0.532.625 % Wind Tre SpA -Reg- (MTN) 2017/2023 . . . . . . . . . . EUR 1 200 000 600 000 % 90.702 1 088 424.00 0.733.125 % Wind Tre SpA -Reg- (MTN) 2017/2025 . . . . . . . . . . EUR 300 000 100 000 700 000 % 89.384 268 152.00 0.182.75 % Wind Tre SpA -Reg- (MTN) 2017/2024 * . . . . . . . . EUR 100 000 % 89.866 89 866.00 0.062.125 % WPC Eurobond BV (MTN) 2018/2027 . . . . . . . . . . . EUR 100 000 100 000 % 95.859 95 859.00 0.064.25 % Ziggo Secured Finance BV -Reg- 2016/2027 . . . . . . EUR 350 000 % 98.587 345 054.50 0.234.249 % AA Bond Co., Ltd (MTN) 2013/2043 * . . . . . . . . . . GBP 100 000 100 000 % 101.958 112 928.66 0.082.875 % AA Bond Co., Ltd (MTN) 2016/2043 * . . . . . . . . . . GBP 500 000 500 000 % 92.72 513 483.25 0.344.00 % AP Moller - Maersk A/S (MTN) 2013/2025 . . . . . . . GBP 600 000 % 101.962 677 598.53 0.453.25 % Barclays PLC (MTN) 2016/2027 . . . . . . . . . . . . . . . GBP 600 000 % 96.208 639 359.75 0.433.125 % Barclays PLC (MTN) 2017/2024 . . . . . . . . . . . . . . . GBP 900 000 100 000 % 98.894 985 814.74 0.662.375 % Barclays PLC (MTN) 2017/2023 * . . . . . . . . . . . . . . GBP 900 000 % 97.088 967 811.82 0.656.875 % Co-operative Group Holdings 2011 Ltd (MTN)
2011/2020 * . . . . . . . . . . . . . . . . . . . . . . . . . . . . . . GBP 300 000 % 104.711 347 933.64 0.237.50 % Co-operative Group Holdings 2011 Ltd 2011/2026 * GBP 300 000 100 000 % 111.473 370 402.41 0.254.75 % Digital Stout Holding LLC (MTN) 2014/2023 . . . . . . GBP 500 000 % 108.775 602 395.82 0.403.016 % Greene King Finance PLC (MTN) 2008/2033 * . . . . GBP 151 882 5 972 % 99.903 168 061.29 0.112.596 % Greene King Finance PLC 2006/2036 * . . . . . . . . . GBP 700 000 % 84.424 654 556.02 0.442.256 % Hsbc Holdings PLC (MTN) 2017/2026 * . . . . . . . . . GBP 600 000 % 95.398 633 976.82 0.438.375 % John Lewis PLC (MTN) 2009/2019 . . . . . . . . . . . . . GBP 500 000 % 101.552 562 394.86 0.382.625 % Liberty Living Finance PLC (MTN) 2017/2024 . . . . . GBP 100 000 % 98.353 108 935.76 0.077.625 % Lloyds Bank PLC (MTN) 2010/2025 . . . . . . . . . . . . GBP 1 200 000 % 124.429 1 653 810.38 1.114.75 % Marks & Spencer PLC (MTN) 2012/2025 . . . . . . . . GBP 700 000 700 000 % 104.749 812 139.78 0.546.469 % Mitchells & Butlers Finance PLC 2003/2030 . . . . . GBP 100 000 100 000 % 109.226 120 979.25 0.080.966 % Mitchells & Butlers Finance PLC 2006/2030 * . . . . GBP 323 040 25 485 % 93.764 335 486.69 0.224.375 % Next PLC 2013/2026 . . . . . . . . . . . . . . . . . . . . . . . . GBP 500 000 % 106.028 587 182.94 0.394.87 % RAC Bond Co PLC 2016/2043 * . . . . . . . . . . . . . . . GBP 400 000 % 95.815 424 498.69 0.284.565 % RAC Bond Co. PLC 2016/2043 * . . . . . . . . . . . . . . GBP 200 000 % 98.51 218 219.31 0.152.92 % Santander UK Group Holdings PLC (MTN)
2018/2026 * . . . . . . . . . . . . . . . . . . . . . . . . . . . . . . GBP 500 000 500 000 % 96.442 534 095.69 0.365.625 % TDC A/S (MTN) 2011/2023 . . . . . . . . . . . . . . . . . . . GBP 200 000 % 110.553 244 896.95 0.165.375 % Telefonica Emisiones SAU (MTN) 2006/2026 . . . . . GBP 300 000 % 115.327 383 208.48 0.265.25 % TP ICAP PLC (MTN) 2017/2024 . . . . . . . . . . . . . . . GBP 100 000 100 000 % 93.505 103 566.12 0.074.375 % Travis Perkins PLC (MTN) 2014/2021 . . . . . . . . . . . GBP 800 000 % 100.938 894 391.24 0.605.659 % Unique Pub Finance Co. PLC/The 2002/2027 . . . . . GBP 591 759 37 896 % 109.353 716 734.58 0.485.00 % Virgin Media Secured Finance PLC -Reg- (MTN)
2017/2027 . . . . . . . . . . . . . . . . . . . . . . . . . . . . . . . . GBP 600 000 % 94.836 630 241.99 0.425.50 % Virgin Media Secured Finance PLC -Reg- 2014/2025 GBP 873 000 873 000 % 99.617 963 231.24 0.654.875 % Virgin Media Secured Finance PLC -Reg- 2015/2027 GBP 200 000 200 000 % 94.224 208 724.96 0.142.25 % Virgin Money PLC (MTN) 2015/2020 . . . . . . . . . . . GBP 200 000 % 99.888 221 271.85 0.155.00 % AerCap Ireland Capital DAC Via AerCap Global
Aviation Trust (MTN) 2015/2021 . . . . . . . . . . . . . . . USD 300 000 % 101.478 265 775.36 0.183.30 % AerCap Ireland Capital DAC Via AerCap Global
Aviation Trust (MTN) 2018/2023 . . . . . . . . . . . . . . . USD 150 000 150 000 % 95.014 124 424.20 0.084.45 % AerCap Ireland Capital DAC Via AerCap Global
Aviation Trust (MTN) 2018/2025 . . . . . . . . . . . . . . . USD 800 000 800 000 % 94.624 660 868.40 0.443.85 % Allergan Funding SCS (MTN) 2014/2024 . . . . . . . . USD 200 000 % 98.453 171 902.68 0.127.50 % Altice Financing SA -144A- (MTN) 2016/2026 . . . . . USD 1 100 000 600 000 % 90.078 865 042.66 0.580.00 % Argentina Treasury Bill 2018/2019 . . . . . . . . . . . . . USD 100 000 100 000 % 98.915 86 354.30 0.063.80 % AT&T, Inc. (MTN) 2017/2024 . . . . . . . . . . . . . . . . . USD 100 000 % 98.675 86 145.15 0.064.125 % Athene Holding Ltd (MTN) 2018/2028 . . . . . . . . . . USD 100 000 100 000 % 90.72 79 200.72 0.053.848 % Banco Santander SA (MTN) 2018/2023 . . . . . . . . . USD 200 000 200 000 % 97.142 169 613.62 0.114.10 % Bank of America Corp. (MTN) 2013/2023 . . . . . . . . USD 400 000 % 101.422 354 173.33 0.244.125 % Bank of America Corp. (MTN) 2014/2024 . . . . . . . . USD 200 000 % 101.124 176 566.35 0.123.684 % Barclays PLC (MTN) 2017/2023 . . . . . . . . . . . . . . . USD 200 000 % 95.785 167 244.25 0.114.338 % Barclays PLC (MTN) 2018/2024 * . . . . . . . . . . . . . . USD 1 300 000 1 300 000 % 97.303 1 104 315.78 0.743.557 % BAT Capital Corp. (MTN) 2018/2027 . . . . . . . . . . . . USD 1 000 000 1 000 000 % 88.098 769 112.28 0.523.40 % Citigroup, Inc. (MTN) 2016/2026 . . . . . . . . . . . . . . . USD 200 000 % 93.885 163 926.78 0.113.00 % CNOOC Finance 2013 Ltd (MTN) 2013/2023 . . . . . USD 200 000 200 000 % 96.706 168 852.35 0.113.75 % Credit Suisse Group Funding Guernsey Ltd (MTN)
2016/2025 . . . . . . . . . . . . . . . . . . . . . . . . . . . . . . . . USD 2 200 000 1 000 000 % 95.58 1 835 749.43 1.234.25 % Deutsche Bank AG/New York NY 2018/2021 . . . . . USD 100 000 100 000 % 98.126 85 665.86 0.068.375 % El Paso Natural Gas Co., LLC 2003/2032 . . . . . . . . USD 500 000 % 123.334 538 362.44 0.364.15 % Energy Transfer LP (MTN) 2013/2020 . . . . . . . . . . USD 100 000 % 100.284 87 549.40 0.063.60 % Energy Transfer LP (MTN) 2013/2023 . . . . . . . . . . USD 100 000 % 96.632 84 361.14 0.06
Count/ Quantity/ Purchases/ Sales/ Currency Market price Total market % ofDescription units/ principal additions disposals value in net assets currency amount in the reporting period EUR
db Advisory Multibrands – PIMCO High Income Global Credit Fund
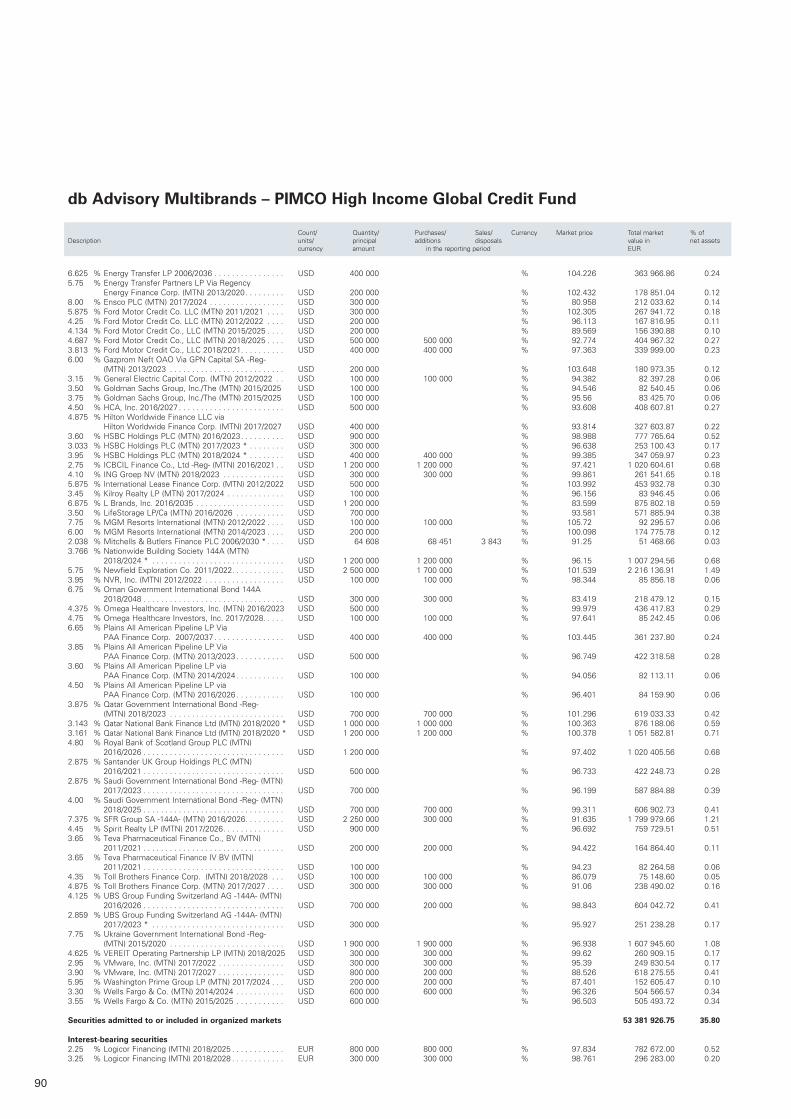
90
6.625 % Energy Transfer LP 2006/2036 . . . . . . . . . . . . . . . . USD 400 000 % 104.226 363 966.86 0.245.75 % Energy Transfer Partners LP Via Regency
Energy Finance Corp. (MTN) 2013/2020 . . . . . . . . . USD 200 000 % 102.432 178 851.04 0.128.00 % Ensco PLC (MTN) 2017/2024 . . . . . . . . . . . . . . . . . USD 300 000 % 80.958 212 033.62 0.145.875 % Ford Motor Credit Co. LLC (MTN) 2011/2021 . . . . USD 300 000 % 102.305 267 941.72 0.184.25 % Ford Motor Credit Co. LLC (MTN) 2012/2022 . . . . USD 200 000 % 96.113 167 816.95 0.114.134 % Ford Motor Credit Co., LLC (MTN) 2015/2025 . . . . USD 200 000 % 89.569 156 390.88 0.104.687 % Ford Motor Credit Co., LLC (MTN) 2018/2025 . . . . USD 500 000 500 000 % 92.774 404 967.32 0.273.813 % Ford Motor Credit Co., LLC 2018/2021 . . . . . . . . . . USD 400 000 400 000 % 97.363 339 999.00 0.236.00 % Gazprom Neft OAO Via GPN Capital SA -Reg-
(MTN) 2013/2023 . . . . . . . . . . . . . . . . . . . . . . . . . . USD 200 000 % 103.648 180 973.35 0.123.15 % General Electric Capital Corp. (MTN) 2012/2022 . . USD 100 000 100 000 % 94.382 82 397.28 0.063.50 % Goldman Sachs Group, Inc./The (MTN) 2015/2025 USD 100 000 % 94.546 82 540.45 0.063.75 % Goldman Sachs Group, Inc./The (MTN) 2015/2025 USD 100 000 % 95.56 83 425.70 0.064.50 % HCA, Inc. 2016/2027 . . . . . . . . . . . . . . . . . . . . . . . . USD 500 000 % 93.608 408 607.81 0.274.875 % Hilton Worldwide Finance LLC via
Hilton Worldwide Finance Corp. (MTN) 2017/2027 USD 400 000 % 93.814 327 603.87 0.223.60 % HSBC Holdings PLC (MTN) 2016/2023 . . . . . . . . . . USD 900 000 % 98.988 777 765.64 0.523.033 % HSBC Holdings PLC (MTN) 2017/2023 * . . . . . . . . USD 300 000 % 96.638 253 100.43 0.173.95 % HSBC Holdings PLC (MTN) 2018/2024 * . . . . . . . . USD 400 000 400 000 % 99.385 347 059.97 0.232.75 % ICBCIL Finance Co., Ltd -Reg- (MTN) 2016/2021 . . USD 1 200 000 1 200 000 % 97.421 1 020 604.61 0.684.10 % ING Groep NV (MTN) 2018/2023 . . . . . . . . . . . . . . USD 300 000 300 000 % 99.861 261 541.65 0.185.875 % International Lease Finance Corp. (MTN) 2012/2022 USD 500 000 % 103.992 453 932.78 0.303.45 % Kilroy Realty LP (MTN) 2017/2024 . . . . . . . . . . . . . USD 100 000 % 96.156 83 946.45 0.066.875 % L Brands, Inc. 2016/2035 . . . . . . . . . . . . . . . . . . . . USD 1 200 000 % 83.599 875 802.18 0.593.50 % LifeStorage LP/Ca (MTN) 2016/2026 . . . . . . . . . . . USD 700 000 % 93.581 571 885.94 0.387.75 % MGM Resorts International (MTN) 2012/2022 . . . . USD 100 000 100 000 % 105.72 92 295.57 0.066.00 % MGM Resorts International (MTN) 2014/2023 . . . . USD 200 000 % 100.098 174 775.78 0.122.038 % Mitchells & Butlers Finance PLC 2006/2030 * . . . . USD 64 608 68 451 3 843 % 91.25 51 468.66 0.033.766 % Nationwide Building Society 144A (MTN)
2018/2024 * . . . . . . . . . . . . . . . . . . . . . . . . . . . . . . USD 1 200 000 1 200 000 % 96.15 1 007 294.56 0.685.75 % Newfield Exploration Co. 2011/2022 . . . . . . . . . . . . USD 2 500 000 1 700 000 % 101.539 2 216 136.91 1.493.95 % NVR, Inc. (MTN) 2012/2022 . . . . . . . . . . . . . . . . . . USD 100 000 100 000 % 98.344 85 856.18 0.066.75 % Oman Government International Bond 144A
2018/2048 . . . . . . . . . . . . . . . . . . . . . . . . . . . . . . . . USD 300 000 300 000 % 83.419 218 479.12 0.154.375 % Omega Healthcare Investors, Inc. (MTN) 2016/2023 USD 500 000 % 99.979 436 417.83 0.294.75 % Omega Healthcare Investors, Inc. 2017/2028. . . . . USD 100 000 100 000 % 97.641 85 242.45 0.066.65 % Plains All American Pipeline LP Via
PAA Finance Corp. 2007/2037 . . . . . . . . . . . . . . . . USD 400 000 400 000 % 103.445 361 237.80 0.243.85 % Plains All American Pipeline LP Via
PAA Finance Corp. (MTN) 2013/2023 . . . . . . . . . . . USD 500 000 % 96.749 422 318.58 0.283.60 % Plains All American Pipeline LP via
PAA Finance Corp. (MTN) 2014/2024 . . . . . . . . . . . USD 100 000 % 94.056 82 113.11 0.064.50 % Plains All American Pipeline LP via
PAA Finance Corp. (MTN) 2016/2026 . . . . . . . . . . . USD 100 000 % 96.401 84 159.90 0.063.875 % Qatar Government International Bond -Reg-
(MTN) 2018/2023 . . . . . . . . . . . . . . . . . . . . . . . . . . USD 700 000 700 000 % 101.296 619 033.33 0.423.143 % Qatar National Bank Finance Ltd (MTN) 2018/2020 * USD 1 000 000 1 000 000 % 100.363 876 188.06 0.593.161 % Qatar National Bank Finance Ltd (MTN) 2018/2020 * USD 1 200 000 1 200 000 % 100.378 1 051 582.81 0.714.80 % Royal Bank of Scotland Group PLC (MTN)
2016/2026 . . . . . . . . . . . . . . . . . . . . . . . . . . . . . . . . USD 1 200 000 % 97.402 1 020 405.56 0.682.875 % Santander UK Group Holdings PLC (MTN)
2016/2021 . . . . . . . . . . . . . . . . . . . . . . . . . . . . . . . . USD 500 000 % 96.733 422 248.73 0.282.875 % Saudi Government International Bond -Reg- (MTN)
2017/2023 . . . . . . . . . . . . . . . . . . . . . . . . . . . . . . . . USD 700 000 % 96.199 587 884.88 0.394.00 % Saudi Government International Bond -Reg- (MTN)
2018/2025 . . . . . . . . . . . . . . . . . . . . . . . . . . . . . . . . USD 700 000 700 000 % 99.311 606 902.73 0.417.375 % SFR Group SA -144A- (MTN) 2016/2026 . . . . . . . . . USD 2 250 000 300 000 % 91.635 1 799 979.66 1.214.45 % Spirit Realty LP (MTN) 2017/2026 . . . . . . . . . . . . . . USD 900 000 % 96.692 759 729.51 0.513.65 % Teva Pharmaceutical Finance Co., BV (MTN)
2011/2021 . . . . . . . . . . . . . . . . . . . . . . . . . . . . . . . . USD 200 000 200 000 % 94.422 164 864.40 0.113.65 % Teva Pharmaceutical Finance IV BV (MTN)
2011/2021 . . . . . . . . . . . . . . . . . . . . . . . . . . . . . . . . USD 100 000 % 94.23 82 264.58 0.064.35 % Toll Brothers Finance Corp. (MTN) 2018/2028 . . . USD 100 000 100 000 % 86.079 75 148.60 0.054.875 % Toll Brothers Finance Corp. (MTN) 2017/2027 . . . . USD 300 000 300 000 % 91.06 238 490.02 0.164.125 % UBS Group Funding Switzerland AG -144A- (MTN)
2016/2026 . . . . . . . . . . . . . . . . . . . . . . . . . . . . . . . . USD 700 000 200 000 % 98.843 604 042.72 0.412.859 % UBS Group Funding Switzerland AG -144A- (MTN)
2017/2023 * . . . . . . . . . . . . . . . . . . . . . . . . . . . . . . USD 300 000 % 95.927 251 238.28 0.177.75 % Ukraine Government International Bond -Reg-
(MTN) 2015/2020 . . . . . . . . . . . . . . . . . . . . . . . . . . USD 1 900 000 1 900 000 % 96.938 1 607 945.60 1.084.625 % VEREIT Operating Partnership LP (MTN) 2018/2025 USD 300 000 300 000 % 99.62 260 909.15 0.172.95 % VMware, Inc. (MTN) 2017/2022 . . . . . . . . . . . . . . . USD 300 000 300 000 % 95.39 249 830.54 0.173.90 % VMware, Inc. (MTN) 2017/2027 . . . . . . . . . . . . . . . USD 800 000 200 000 % 88.526 618 275.55 0.415.95 % Washington Prime Group LP (MTN) 2017/2024 . . . USD 200 000 200 000 % 87.401 152 605.47 0.103.30 % Wells Fargo & Co. (MTN) 2014/2024 . . . . . . . . . . . USD 600 000 600 000 % 96.326 504 566.57 0.343.55 % Wells Fargo & Co. (MTN) 2015/2025 . . . . . . . . . . . USD 600 000 % 96.503 505 493.72 0.34
Securities admitted to or included in organized markets 53 381 926.75 35.80
Interest-bearing securities2.25 % Logicor Financing (MTN) 2018/2025 . . . . . . . . . . . . EUR 800 000 800 000 % 97.834 782 672.00 0.523.25 % Logicor Financing (MTN) 2018/2028 . . . . . . . . . . . . EUR 300 000 300 000 % 98.761 296 283.00 0.20
Count/ Quantity/ Purchases/ Sales/ Currency Market price Total market % ofDescription units/ principal additions disposals value in net assets currency amount in the reporting period EUR
db Advisory Multibrands – PIMCO High Income Global Credit Fund
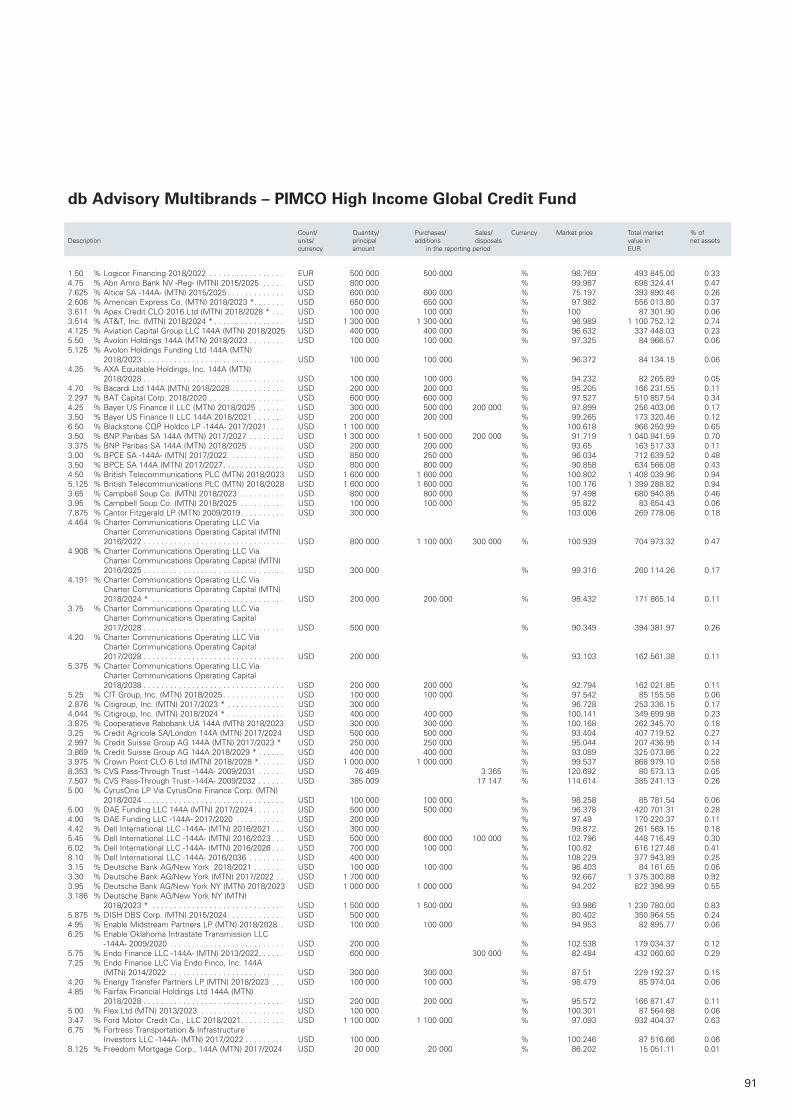
91
db Advisory Multibrands – PIMCO High Income Global Credit Fund
Count/ Quantity/ Purchases/ Sales/ Currency Market price Total market % ofDescription units/ principal additions disposals value in net assets currency amount in the reporting period EUR
1.50 % Logicor Financing 2018/2022 . . . . . . . . . . . . . . . . . EUR 500 000 500 000 % 98.769 493 845.00 0.334.75 % Abn Amro Bank NV -Reg- (MTN) 2015/2025 . . . . . USD 800 000 % 99.987 698 324.41 0.477.625 % Altice SA -144A- (MTN) 2015/2025 . . . . . . . . . . . . . USD 600 000 600 000 % 75.197 393 890.46 0.262.606 % American Express Co. (MTN) 2018/2023 * . . . . . . . USD 650 000 650 000 % 97.982 556 013.80 0.373.611 % Apex Credit CLO 2016 Ltd (MTN) 2018/2028 * . . . USD 100 000 100 000 % 100 87 301.90 0.063.514 % AT&T, Inc. (MTN) 2018/2024 * . . . . . . . . . . . . . . . . USD 1 300 000 1 300 000 % 96.989 1 100 752.12 0.744.125 % Aviation Capital Group LLC 144A (MTN) 2018/2025 USD 400 000 400 000 % 96.632 337 448.03 0.235.50 % Avolon Holdings 144A (MTN) 2018/2023 . . . . . . . . USD 100 000 100 000 % 97.325 84 966.57 0.065.125 % Avolon Holdings Funding Ltd 144A (MTN)
2018/2023 . . . . . . . . . . . . . . . . . . . . . . . . . . . . . . . . USD 100 000 100 000 % 96.372 84 134.15 0.064.35 % AXA Equitable Holdings, Inc. 144A (MTN)
2018/2028 . . . . . . . . . . . . . . . . . . . . . . . . . . . . . . . . USD 100 000 100 000 % 94.232 82 265.89 0.054.70 % Bacardi Ltd 144A (MTN) 2018/2028 . . . . . . . . . . . . USD 200 000 200 000 % 95.205 166 231.55 0.112.297 % BAT Capital Corp. 2018/2020 . . . . . . . . . . . . . . . . . USD 600 000 600 000 % 97.527 510 857.54 0.344.25 % Bayer US Finance II LLC (MTN) 2018/2025 . . . . . . USD 300 000 500 000 200 000 % 97.899 256 403.06 0.173.50 % Bayer US Finance II LLC 144A 2018/2021 . . . . . . . USD 200 000 200 000 % 99.265 173 320.46 0.126.50 % Blackstone CQP Holdco LP -144A- 2017/2021 . . . . USD 1 100 000 % 100.618 966 250.99 0.653.50 % BNP Paribas SA 144A (MTN) 2017/2027 . . . . . . . . USD 1 300 000 1 500 000 200 000 % 91.719 1 040 941.59 0.703.375 % BNP Paribas SA 144A (MTN) 2018/2025 . . . . . . . . USD 200 000 200 000 % 93.65 163 517.33 0.113.00 % BPCE SA -144A- (MTN) 2017/2022 . . . . . . . . . . . . . USD 850 000 250 000 % 96.034 712 639.52 0.483.50 % BPCE SA 144A (MTN) 2017/2027 . . . . . . . . . . . . . . USD 800 000 800 000 % 90.858 634 566.08 0.434.50 % British Telecommunications PLC (MTN) 2018/2023 USD 1 600 000 1 600 000 % 100.802 1 408 039.96 0.945.125 % British Telecommunications PLC (MTN) 2018/2028 USD 1 600 000 1 600 000 % 100.176 1 399 288.82 0.943.65 % Campbell Soup Co. (MTN) 2018/2023 . . . . . . . . . . USD 800 000 800 000 % 97.498 680 940.85 0.463.95 % Campbell Soup Co. (MTN) 2018/2025 . . . . . . . . . . USD 100 000 100 000 % 95.822 83 654.43 0.067.875 % Cantor Fitzgerald LP (MTN) 2009/2019 . . . . . . . . . . USD 300 000 % 103.006 269 778.06 0.184.464 % Charter Communications Operating LLC Via
Charter Communications Operating Capital (MTN) 2016/2022 . . . . . . . . . . . . . . . . . . . . . . . . . . . . . . . . USD 800 000 1 100 000 300 000 % 100.939 704 973.32 0.47
4.908 % Charter Communications Operating LLC Via Charter Communications Operating Capital (MTN) 2016/2025 . . . . . . . . . . . . . . . . . . . . . . . . . . . . . . . . USD 300 000 % 99.316 260 114.26 0.17
4.191 % Charter Communications Operating LLC Via Charter Communications Operating Capital (MTN) 2018/2024 * . . . . . . . . . . . . . . . . . . . . . . . . . . . . . . USD 200 000 200 000 % 98.432 171 865.14 0.11
3.75 % Charter Communications Operating LLC Via Charter Communications Operating Capital 2017/2028 . . . . . . . . . . . . . . . . . . . . . . . . . . . . . . . . USD 500 000 % 90.349 394 381.97 0.26
4.20 % Charter Communications Operating LLC Via Charter Communications Operating Capital 2017/2028 . . . . . . . . . . . . . . . . . . . . . . . . . . . . . . . . USD 200 000 % 93.103 162 561.38 0.11
5.375 % Charter Communications Operating LLC Via Charter Communications Operating Capital 2018/2038 . . . . . . . . . . . . . . . . . . . . . . . . . . . . . . . . USD 200 000 200 000 % 92.794 162 021.85 0.11
5.25 % CIT Group, Inc. (MTN) 2018/2025 . . . . . . . . . . . . . . USD 100 000 100 000 % 97.542 85 155.58 0.062.876 % Citigroup, Inc. (MTN) 2017/2023 * . . . . . . . . . . . . . USD 300 000 % 96.728 253 336.15 0.174.044 % Citigroup, Inc. (MTN) 2018/2024 * . . . . . . . . . . . . . USD 400 000 400 000 % 100.141 349 699.98 0.233.875 % Cooperatieve Rabobank UA 144A (MTN) 2018/2023 USD 300 000 300 000 % 100.168 262 345.70 0.183.25 % Credit Agricole SA/London 144A (MTN) 2017/2024 USD 500 000 500 000 % 93.404 407 719.52 0.272.997 % Credit Suisse Group AG 144A (MTN) 2017/2023 * USD 250 000 250 000 % 95.044 207 436.95 0.143.869 % Credit Suisse Group AG 144A 2018/2029 * . . . . . . USD 400 000 400 000 % 93.089 325 073.86 0.223.975 % Crown Point CLO 6 Ltd (MTN) 2018/2028 * . . . . . . USD 1 000 000 1 000 000 % 99.537 868 979.10 0.588.353 % CVS Pass-Through Trust -144A- 2009/2031 . . . . . . USD 76 469 3 365 % 120.692 80 573.13 0.057.507 % CVS Pass-Through Trust -144A- 2009/2032 . . . . . . USD 385 009 17 147 % 114.614 385 241.13 0.265.00 % CyrusOne LP Via CyrusOne Finance Corp. (MTN)
2018/2024 . . . . . . . . . . . . . . . . . . . . . . . . . . . . . . . . USD 100 000 100 000 % 98.258 85 781.54 0.065.00 % DAE Funding LLC 144A (MTN) 2017/2024 . . . . . . . USD 500 000 500 000 % 96.378 420 701.31 0.284.00 % DAE Funding LLC -144A- 2017/2020 . . . . . . . . . . . USD 200 000 % 97.49 170 220.37 0.114.42 % Dell International LLC -144A- (MTN) 2016/2021 . . . USD 300 000 % 99.872 261 569.15 0.185.45 % Dell International LLC -144A- (MTN) 2016/2023 . . . USD 500 000 600 000 100 000 % 102.796 448 716.49 0.306.02 % Dell International LLC -144A- (MTN) 2016/2026 . . . USD 700 000 100 000 % 100.82 616 127.48 0.418.10 % Dell International LLC -144A- 2016/2036 . . . . . . . . USD 400 000 % 108.229 377 943.89 0.253.15 % Deutsche Bank AG/New York 2018/2021 . . . . . . . USD 100 000 100 000 % 96.403 84 161.65 0.063.30 % Deutsche Bank AG/New York (MTN) 2017/2022 . . USD 1 700 000 % 92.667 1 375 300.88 0.923.95 % Deutsche Bank AG/New York NY (MTN) 2018/2023 USD 1 000 000 1 000 000 % 94.202 822 396.99 0.553.186 % Deutsche Bank AG/New York NY (MTN)
2018/2023 * . . . . . . . . . . . . . . . . . . . . . . . . . . . . . . USD 1 500 000 1 500 000 % 93.986 1 230 780.00 0.835.875 % DISH DBS Corp. (MTN) 2015/2024 . . . . . . . . . . . . . USD 500 000 % 80.402 350 964.55 0.244.95 % Enable Midstream Partners LP (MTN) 2018/2028 . USD 100 000 100 000 % 94.953 82 895.77 0.066.25 % Enable Oklahoma Intrastate Transmission LLC
-144A- 2009/2020 . . . . . . . . . . . . . . . . . . . . . . . . . . USD 200 000 % 102.538 179 034.37 0.125.75 % Endo Finance LLC -144A- (MTN) 2013/2022 . . . . . . USD 600 000 300 000 % 82.484 432 060.60 0.297.25 % Endo Finance LLC Via Endo Finco, Inc. 144A
(MTN) 2014/2022 . . . . . . . . . . . . . . . . . . . . . . . . . . USD 300 000 300 000 % 87.51 229 192.37 0.154.20 % Energy Transfer Partners LP (MTN) 2018/2023 . . . USD 100 000 100 000 % 98.479 85 974.04 0.064.85 % Fairfax Financial Holdings Ltd 144A (MTN)
2018/2028 . . . . . . . . . . . . . . . . . . . . . . . . . . . . . . . . USD 200 000 200 000 % 95.572 166 871.47 0.115.00 % Flex Ltd (MTN) 2013/2023 . . . . . . . . . . . . . . . . . . . USD 100 000 % 100.301 87 564.68 0.063.47 % Ford Motor Credit Co., LLC 2018/2021 . . . . . . . . . . USD 1 100 000 1 100 000 % 97.093 932 404.37 0.636.75 % Fortress Transportation & Infrastructure
Investors LLC -144A- (MTN) 2017/2022 . . . . . . . . . USD 100 000 % 100.246 87 516.66 0.068.125 % Freedom Mortgage Corp., 144A (MTN) 2017/2024 USD 20 000 20 000 % 86.202 15 051.11 0.01
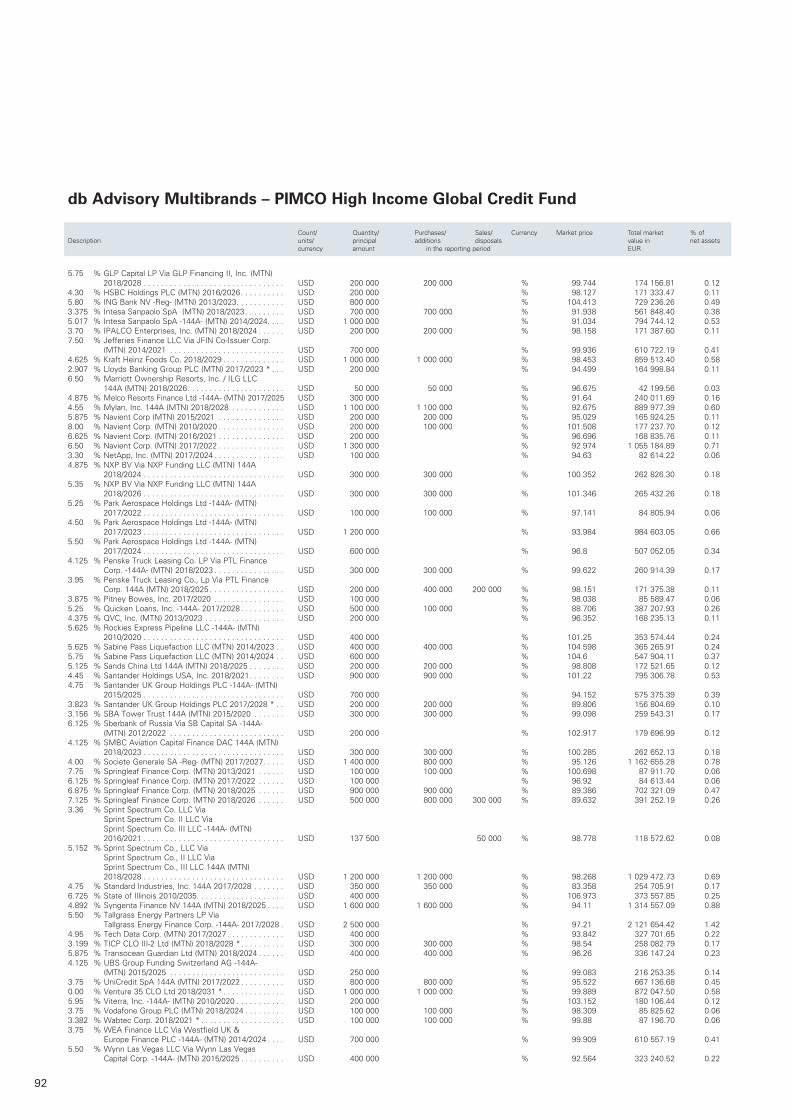
92
5.75 % GLP Capital LP Via GLP Financing II, Inc. (MTN) 2018/2028 . . . . . . . . . . . . . . . . . . . . . . . . . . . . . . . . USD 200 000 200 000 % 99.744 174 156.81 0.12
4.30 % HSBC Holdings PLC (MTN) 2016/2026 . . . . . . . . . . USD 200 000 % 98.127 171 333.47 0.115.80 % ING Bank NV -Reg- (MTN) 2013/2023 . . . . . . . . . . . USD 800 000 % 104.413 729 236.26 0.493.375 % Intesa Sanpaolo SpA (MTN) 2018/2023 . . . . . . . . . USD 700 000 700 000 % 91.938 561 848.40 0.385.017 % Intesa Sanpaolo SpA -144A- (MTN) 2014/2024 . . . . USD 1 000 000 % 91.034 794 744.12 0.533.70 % IPALCO Enterprises, Inc. (MTN) 2018/2024 . . . . . . USD 200 000 200 000 % 98.158 171 387.60 0.117.50 % Jefferies Finance LLC Via JFIN Co-Issuer Corp.
(MTN) 2014/2021 . . . . . . . . . . . . . . . . . . . . . . . . . . USD 700 000 % 99.936 610 722.19 0.414.625 % Kraft Heinz Foods Co. 2018/2029 . . . . . . . . . . . . . . USD 1 000 000 1 000 000 % 98.453 859 513.40 0.582.907 % Lloyds Banking Group PLC (MTN) 2017/2023 * . . . USD 200 000 % 94.499 164 998.84 0.116.50 % Marriott Ownership Resorts, Inc. / ILG LLC
144A (MTN) 2018/2026 . . . . . . . . . . . . . . . . . . . . . . USD 50 000 50 000 % 96.675 42 199.56 0.034.875 % Melco Resorts Finance Ltd -144A- (MTN) 2017/2025 USD 300 000 % 91.64 240 011.69 0.164.55 % Mylan, Inc. 144A (MTN) 2018/2028 . . . . . . . . . . . . USD 1 100 000 1 100 000 % 92.675 889 977.39 0.605.875 % Navient Corp (MTN) 2015/2021 . . . . . . . . . . . . . . . USD 200 000 200 000 % 95.029 165 924.25 0.118.00 % Navient Corp. (MTN) 2010/2020 . . . . . . . . . . . . . . . USD 200 000 100 000 % 101.508 177 237.70 0.126.625 % Navient Corp. (MTN) 2016/2021 . . . . . . . . . . . . . . . USD 200 000 % 96.696 168 835.76 0.116.50 % Navient Corp. (MTN) 2017/2022 . . . . . . . . . . . . . . . USD 1 300 000 % 92.974 1 055 184.89 0.713.30 % NetApp, Inc. (MTN) 2017/2024 . . . . . . . . . . . . . . . . USD 100 000 % 94.63 82 614.22 0.064.875 % NXP BV Via NXP Funding LLC (MTN) 144A
2018/2024 . . . . . . . . . . . . . . . . . . . . . . . . . . . . . . . . USD 300 000 300 000 % 100.352 262 826.30 0.185.35 % NXP BV Via NXP Funding LLC (MTN) 144A
2018/2026 . . . . . . . . . . . . . . . . . . . . . . . . . . . . . . . . USD 300 000 300 000 % 101.346 265 432.26 0.185.25 % Park Aerospace Holdings Ltd -144A- (MTN)
2017/2022 . . . . . . . . . . . . . . . . . . . . . . . . . . . . . . . . USD 100 000 100 000 % 97.141 84 805.94 0.064.50 % Park Aerospace Holdings Ltd -144A- (MTN)
2017/2023 . . . . . . . . . . . . . . . . . . . . . . . . . . . . . . . . USD 1 200 000 % 93.984 984 603.05 0.665.50 % Park Aerospace Holdings Ltd -144A- (MTN)
2017/2024 . . . . . . . . . . . . . . . . . . . . . . . . . . . . . . . . USD 600 000 % 96.8 507 052.05 0.344.125 % Penske Truck Leasing Co. LP Via PTL Finance
Corp. -144A- (MTN) 2018/2023 . . . . . . . . . . . . . . . . USD 300 000 300 000 % 99.622 260 914.39 0.173.95 % Penske Truck Leasing Co., Lp Via PTL Finance
Corp. 144A (MTN) 2018/2025 . . . . . . . . . . . . . . . . . USD 200 000 400 000 200 000 % 98.151 171 375.38 0.113.875 % Pitney Bowes, Inc. 2017/2020 . . . . . . . . . . . . . . . . USD 100 000 % 98.038 85 589.47 0.065.25 % Quicken Loans, Inc. -144A- 2017/2028 . . . . . . . . . . USD 500 000 100 000 % 88.706 387 207.93 0.264.375 % QVC, Inc. (MTN) 2013/2023 . . . . . . . . . . . . . . . . . . USD 200 000 % 96.352 168 235.13 0.115.625 % Rockies Express Pipeline LLC -144A- (MTN)
2010/2020 . . . . . . . . . . . . . . . . . . . . . . . . . . . . . . . . USD 400 000 % 101.25 353 574.44 0.245.625 % Sabine Pass Liquefaction LLC (MTN) 2014/2023 . . USD 400 000 400 000 % 104.598 365 265.91 0.245.75 % Sabine Pass Liquefaction LLC (MTN) 2014/2024 . . USD 600 000 % 104.6 547 904.11 0.375.125 % Sands China Ltd 144A (MTN) 2018/2025 . . . . . . . . USD 200 000 200 000 % 98.808 172 521.65 0.124.45 % Santander Holdings USA, Inc. 2018/2021 . . . . . . . . USD 900 000 900 000 % 101.22 795 306.78 0.534.75 % Santander UK Group Holdings PLC -144A- (MTN)
2015/2025 . . . . . . . . . . . . . . . . . . . . . . . . . . . . . . . . USD 700 000 % 94.152 575 375.39 0.393.823 % Santander UK Group Holdings PLC 2017/2028 * . . USD 200 000 200 000 % 89.806 156 804.69 0.103.156 % SBA Tower Trust 144A (MTN) 2015/2020 . . . . . . . USD 300 000 300 000 % 99.098 259 543.31 0.176.125 % Sberbank of Russia Via SB Capital SA -144A-
(MTN) 2012/2022 . . . . . . . . . . . . . . . . . . . . . . . . . . USD 200 000 % 102.917 179 696.99 0.124.125 % SMBC Aviation Capital Finance DAC 144A (MTN)
2018/2023 . . . . . . . . . . . . . . . . . . . . . . . . . . . . . . . . USD 300 000 300 000 % 100.285 262 652.13 0.184.00 % Societe Generale SA -Reg- (MTN) 2017/2027 . . . . . USD 1 400 000 800 000 % 95.126 1 162 655.28 0.787.75 % Springleaf Finance Corp. (MTN) 2013/2021 . . . . . . USD 100 000 100 000 % 100.698 87 911.70 0.066.125 % Springleaf Finance Corp. (MTN) 2017/2022 . . . . . . USD 100 000 % 96.92 84 613.44 0.066.875 % Springleaf Finance Corp. (MTN) 2018/2025 . . . . . . USD 900 000 900 000 % 89.386 702 321.09 0.477.125 % Springleaf Finance Corp. (MTN) 2018/2026 . . . . . . USD 500 000 800 000 300 000 % 89.632 391 252.19 0.263.36 % Sprint Spectrum Co. LLC Via
Sprint Spectrum Co. II LLC Via Sprint Spectrum Co. III LLC -144A- (MTN) 2016/2021 . . . . . . . . . . . . . . . . . . . . . . . . . . . . . . . . USD 137 500 50 000 % 98.778 118 572.62 0.08
5.152 % Sprint Spectrum Co., LLC Via Sprint Spectrum Co., II LLC Via Sprint Spectrum Co., III LLC 144A (MTN) 2018/2028 . . . . . . . . . . . . . . . . . . . . . . . . . . . . . . . . USD 1 200 000 1 200 000 % 98.268 1 029 472.73 0.69
4.75 % Standard Industries, Inc. 144A 2017/2028 . . . . . . . USD 350 000 350 000 % 83.358 254 705.91 0.176.725 % State of Illinois 2010/2035 . . . . . . . . . . . . . . . . . . . . USD 400 000 % 106.973 373 557.85 0.254.892 % Syngenta Finance NV 144A (MTN) 2018/2025 . . . . USD 1 600 000 1 600 000 % 94.11 1 314 557.09 0.885.50 % Tallgrass Energy Partners LP Via
Tallgrass Energy Finance Corp. -144A- 2017/2028 . USD 2 500 000 % 97.21 2 121 654.42 1.424.95 % Tech Data Corp. (MTN) 2017/2027 . . . . . . . . . . . . . USD 400 000 % 93.842 327 701.65 0.223.199 % TICP CLO III-2 Ltd (MTN) 2018/2028 * . . . . . . . . . . USD 300 000 300 000 % 98.54 258 082.79 0.175.875 % Transocean Guardian Ltd (MTN) 2018/2024 . . . . . . USD 400 000 400 000 % 96.26 336 147.24 0.234.125 % UBS Group Funding Switzerland AG -144A-
(MTN) 2015/2025 . . . . . . . . . . . . . . . . . . . . . . . . . . USD 250 000 % 99.083 216 253.35 0.143.75 % UniCredit SpA 144A (MTN) 2017/2022 . . . . . . . . . . USD 800 000 800 000 % 95.522 667 136.68 0.450.00 % Venture 35 CLO Ltd 2018/2031 * . . . . . . . . . . . . . . USD 1 000 000 1 000 000 % 99.889 872 047.50 0.585.95 % Viterra, Inc. -144A- (MTN) 2010/2020 . . . . . . . . . . . USD 200 000 % 103.152 180 106.44 0.123.75 % Vodafone Group PLC (MTN) 2018/2024 . . . . . . . . . USD 100 000 100 000 % 98.309 85 825.62 0.063.382 % Wabtec Corp. 2018/2021 * . . . . . . . . . . . . . . . . . . . USD 100 000 100 000 % 99.88 87 196.70 0.063.75 % WEA Finance LLC Via Westfield UK &
Europe Finance PLC -144A- (MTN) 2014/2024 . . . . USD 700 000 % 99.909 610 557.19 0.415.50 % Wynn Las Vegas LLC Via Wynn Las Vegas
Capital Corp. -144A- (MTN) 2015/2025 . . . . . . . . . . USD 400 000 % 92.564 323 240.52 0.22
Count/ Quantity/ Purchases/ Sales/ Currency Market price Total market % ofDescription units/ principal additions disposals value in net assets currency amount in the reporting period EUR
db Advisory Multibrands – PIMCO High Income Global Credit Fund
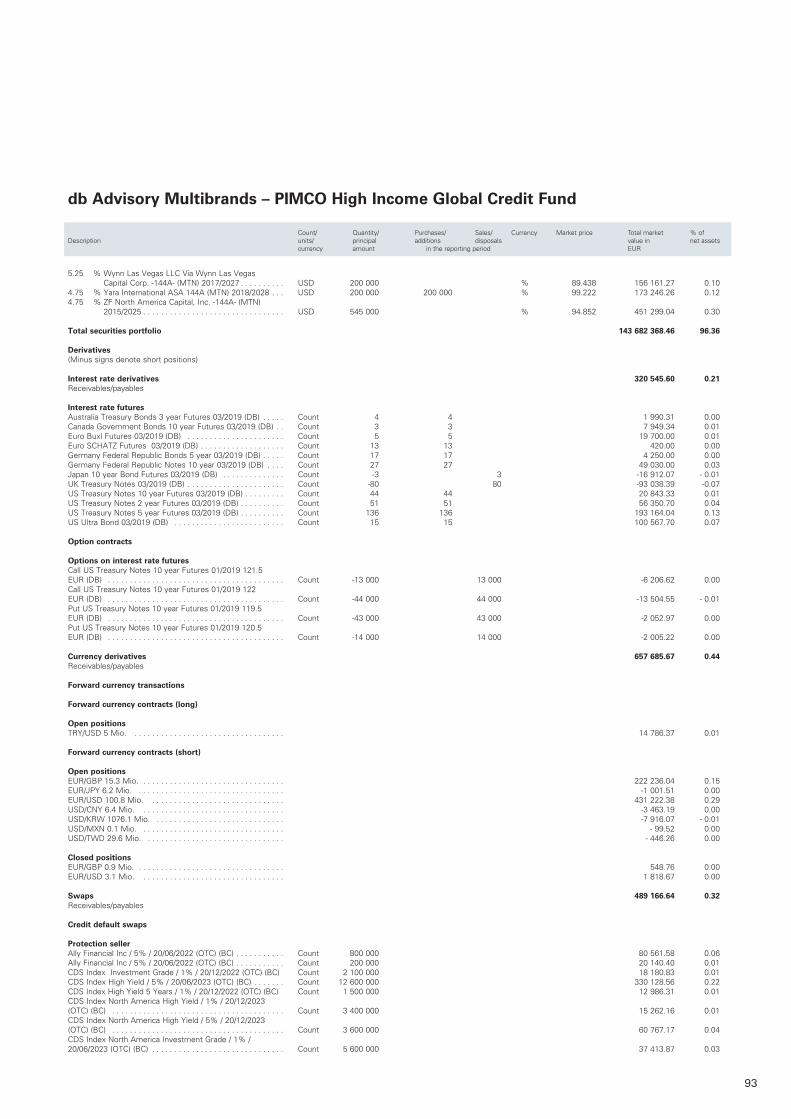
93
db Advisory Multibrands – PIMCO High Income Global Credit Fund
Count/ Quantity/ Purchases/ Sales/ Currency Market price Total market % ofDescription units/ principal additions disposals value in net assets currency amount in the reporting period EUR
5.25 % Wynn Las Vegas LLC Via Wynn Las Vegas Capital Corp. -144A- (MTN) 2017/2027 . . . . . . . . . . USD 200 000 % 89.438 156 161.27 0.10
4.75 % Yara International ASA 144A (MTN) 2018/2028 . . . USD 200 000 200 000 % 99.222 173 246.26 0.124.75 % ZF North America Capital, Inc. -144A- (MTN)
2015/2025 . . . . . . . . . . . . . . . . . . . . . . . . . . . . . . . . USD 545 000 % 94.852 451 299.04 0.30
Total securities portfolio 143 682 368.46 96.36 Derivatives(Minus signs denote short positions)
Interest rate derivatives 320 545.60 0.21Receivables/payables
Interest rate futuresAustralia Treasury Bonds 3 year Futures 03/2019 (DB) . . . . . Count 4 4 1 990.31 0.00Canada Government Bonds 10 year Futures 03/2019 (DB) . . Count 3 3 7 949.34 0.01Euro Buxl Futures 03/2019 (DB) . . . . . . . . . . . . . . . . . . . . . . Count 5 5 19 700.00 0.01Euro SCHATZ Futures 03/2019 (DB) . . . . . . . . . . . . . . . . . . . Count 13 13 420.00 0.00Germany Federal Republic Bonds 5 year 03/2019 (DB) . . . . . Count 17 17 4 250.00 0.00Germany Federal Republic Notes 10 year 03/2019 (DB) . . . . Count 27 27 49 030.00 0.03Japan 10 year Bond Futures 03/2019 (DB) . . . . . . . . . . . . . . Count -3 3 -16 912.07 - 0.01UK Treasury Notes 03/2019 (DB) . . . . . . . . . . . . . . . . . . . . . . Count -80 80 -93 038.39 -0.07US Treasury Notes 10 year Futures 03/2019 (DB) . . . . . . . . . Count 44 44 20 843.33 0.01US Treasury Notes 2 year Futures 03/2019 (DB) . . . . . . . . . . Count 51 51 56 350.70 0.04US Treasury Notes 5 year Futures 03/2019 (DB) . . . . . . . . . . Count 136 136 193 164.04 0.13US Ultra Bond 03/2019 (DB) . . . . . . . . . . . . . . . . . . . . . . . . . Count 15 15 100 567.70 0.07
Option contracts
Options on interest rate futuresCall US Treasury Notes 10 year Futures 01/2019 121.5 EUR (DB) . . . . . . . . . . . . . . . . . . . . . . . . . . . . . . . . . . . . . . . . Count -13 000 13 000 -6 206.62 0.00Call US Treasury Notes 10 year Futures 01/2019 122 EUR (DB) . . . . . . . . . . . . . . . . . . . . . . . . . . . . . . . . . . . . . . . . Count -44 000 44 000 -13 504.55 - 0.01Put US Treasury Notes 10 year Futures 01/2019 119.5 EUR (DB) . . . . . . . . . . . . . . . . . . . . . . . . . . . . . . . . . . . . . . . . Count -43 000 43 000 -2 052.97 0.00Put US Treasury Notes 10 year Futures 01/2019 120.5 EUR (DB) . . . . . . . . . . . . . . . . . . . . . . . . . . . . . . . . . . . . . . . . Count -14 000 14 000 -2 005.22 0.00
Currency derivatives 657 685.67 0.44Receivables/payables
Forward currency transactions
Forward currency contracts (long)
Open positionsTRY/USD 5 Mio. . . . . . . . . . . . . . . . . . . . . . . . . . . . . . . . . . . 14 786.37 0.01
Forward currency contracts (short)
Open positionsEUR/GBP 15.3 Mio. . . . . . . . . . . . . . . . . . . . . . . . . . . . . . . . . 222 236.04 0.15EUR/JPY 6.2 Mio. . . . . . . . . . . . . . . . . . . . . . . . . . . . . . . . . . -1 001.51 0.00EUR/USD 100.8 Mio. . . . . . . . . . . . . . . . . . . . . . . . . . . . . . . 431 222.38 0.29USD/CNY 6.4 Mio. . . . . . . . . . . . . . . . . . . . . . . . . . . . . . . . . -3 463.19 0.00USD/KRW 1076.1 Mio. . . . . . . . . . . . . . . . . . . . . . . . . . . . . . -7 916.07 - 0.01USD/MXN 0.1 Mio. . . . . . . . . . . . . . . . . . . . . . . . . . . . . . . . . - 99.52 0.00USD/TWD 29.6 Mio. . . . . . . . . . . . . . . . . . . . . . . . . . . . . . . . - 446.26 0.00 Closed positionsEUR/GBP 0.9 Mio. . . . . . . . . . . . . . . . . . . . . . . . . . . . . . . . . . 548.76 0.00EUR/USD 3.1 Mio. . . . . . . . . . . . . . . . . . . . . . . . . . . . . . . . . 1 818.67 0.00
Swaps 489 166.64 0.32Receivables/payables
Credit default swaps
Protection sellerAlly Financial Inc / 5% / 20/06/2022 (OTC) (BC) . . . . . . . . . . . Count 800 000 80 561.58 0.06Ally Financial Inc / 5% / 20/06/2022 (OTC) (BC) . . . . . . . . . . . Count 200 000 20 140.40 0.01CDS Index Investment Grade / 1% / 20/12/2022 (OTC) (BC) Count 2 100 000 18 180.83 0.01CDS Index High Yield / 5% / 20/06/2023 (OTC) (BC) . . . . . . . Count 12 600 000 330 128.56 0.22CDS Index High Yield 5 Years / 1% / 20/12/2022 (OTC) (BC) Count 1 500 000 12 986.31 0.01CDS Index North America High Yield / 1% / 20/12/2023 (OTC) (BC) . . . . . . . . . . . . . . . . . . . . . . . . . . . . . . . . . . . . . . . Count 3 400 000 15 262.16 0.01CDS Index North America High Yield / 5% / 20/12/2023 (OTC) (BC) . . . . . . . . . . . . . . . . . . . . . . . . . . . . . . . . . . . . . . . Count 3 600 000 60 767.17 0.04CDS Index North America Investment Grade / 1% / 20/06/2023 (OTC) (BC) . . . . . . . . . . . . . . . . . . . . . . . . . . . . . . Count 5 600 000 37 413.87 0.03
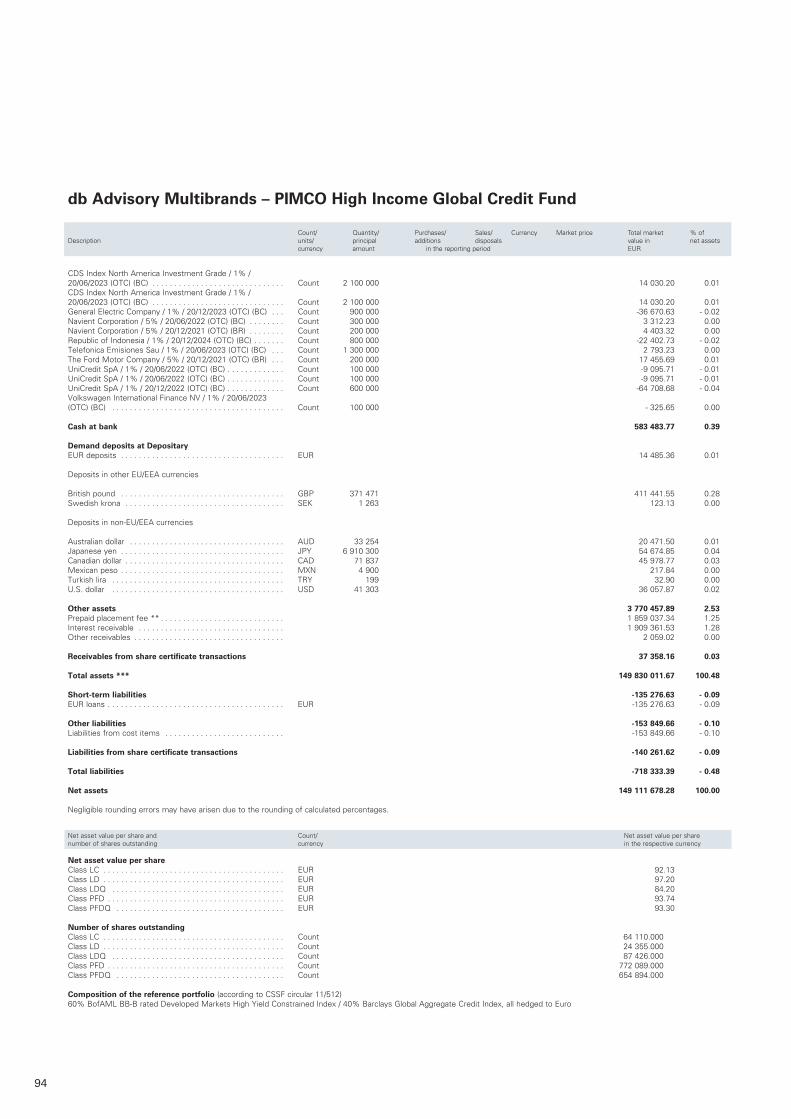
94
CDS Index North America Investment Grade / 1% / 20/06/2023 (OTC) (BC) . . . . . . . . . . . . . . . . . . . . . . . . . . . . . . Count 2 100 000 14 030 .20 0 .01CDS Index North America Investment Grade / 1% / 20/06/2023 (OTC) (BC) . . . . . . . . . . . . . . . . . . . . . . . . . . . . . . Count 2 100 000 14 030 .20 0 .01General Electric Company / 1% / 20/12/2023 (OTC) (BC) . . . Count 900 000 -36 670 .63 - 0 .02Navient Corporation / 5% / 20/06/2022 (OTC) (BC) . . . . . . . . Count 300 000 3 312 .23 0 .00Navient Corporation / 5% / 20/12/2021 (OTC) (BR) . . . . . . . . Count 200 000 4 403 .32 0 .00Republic of Indonesia / 1% / 20/12/2024 (OTC) (BC) . . . . . . . Count 800 000 -22 402 .73 - 0 .02Telefonica Emisiones Sau / 1% / 20/06/2023 (OTC) (BC) . . . Count 1 300 000 2 793 .23 0 .00The Ford Motor Company / 5% / 20/12/2021 (OTC) (BR) . . . Count 200 000 17 455 .69 0 .01UniCredit SpA / 1% / 20/06/2022 (OTC) (BC) . . . . . . . . . . . . . Count 100 000 -9 095 .71 - 0 .01UniCredit SpA / 1% / 20/06/2022 (OTC) (BC) . . . . . . . . . . . . . Count 100 000 -9 095 .71 - 0 .01UniCredit SpA / 1% / 20/12/2022 (OTC) (BC) . . . . . . . . . . . . . Count 600 000 -64 708 .68 - 0 .04Volkswagen International Finance NV / 1% / 20/06/2023 (OTC) (BC) . . . . . . . . . . . . . . . . . . . . . . . . . . . . . . . . . . . . . . . Count 100 000 - 325 .65 0 .00
Cash at bank 583 483.77 0.39 Demand deposits at DepositaryEUR deposits . . . . . . . . . . . . . . . . . . . . . . . . . . . . . . . . . . . . . EUR 14 485 .36 0 .01 Deposits in other EU/EEA currencies
British pound . . . . . . . . . . . . . . . . . . . . . . . . . . . . . . . . . . . . . GBP 371 471 411 441 .55 0 .28Swedish krona . . . . . . . . . . . . . . . . . . . . . . . . . . . . . . . . . . . . SEK 1 263 123 .13 0 .00
Deposits in non-EU/EEA currencies
Australian dollar . . . . . . . . . . . . . . . . . . . . . . . . . . . . . . . . . . . AUD 33 254 20 471 .50 0 .01Japanese yen . . . . . . . . . . . . . . . . . . . . . . . . . . . . . . . . . . . . . JPY 6 910 300 54 674 .85 0 .04Canadian dollar . . . . . . . . . . . . . . . . . . . . . . . . . . . . . . . . . . . . CAD 71 837 45 978 .77 0 .03Mexican peso . . . . . . . . . . . . . . . . . . . . . . . . . . . . . . . . . . . . . MXN 4 900 217 .84 0 .00Turkish lira . . . . . . . . . . . . . . . . . . . . . . . . . . . . . . . . . . . . . . . TRY 199 32 .90 0 .00U .S . dollar . . . . . . . . . . . . . . . . . . . . . . . . . . . . . . . . . . . . . . . USD 41 303 36 057 .87 0 .02
Other assets 3 770 457.89 2.53Prepaid placement fee ** . . . . . . . . . . . . . . . . . . . . . . . . . . . . 1 859 037 .34 1 .25Interest receivable . . . . . . . . . . . . . . . . . . . . . . . . . . . . . . . . . 1 909 361 .53 1 .28Other receivables . . . . . . . . . . . . . . . . . . . . . . . . . . . . . . . . . . 2 059 .02 0 .00 Receivables from share certificate transactions 37 358.16 0.03
Total assets *** 149 830 011.67 100.48 Short-term liabilities -135 276.63 - 0.09EUR loans . . . . . . . . . . . . . . . . . . . . . . . . . . . . . . . . . . . . . . . . EUR -135 276 .63 - 0 .09
Other liabilities -153 849.66 - 0.10Liabilities from cost items . . . . . . . . . . . . . . . . . . . . . . . . . . . -153 849 .66 - 0 .10
Liabilities from share certificate transactions -140 261.62 - 0.09 Total liabilities -718 333.39 - 0.48 Net assets 149 111 678.28 100.00 Negligible rounding errors may have arisen due to the rounding of calculated percentages .
Net asset value per share and Count/ Net asset value per sharenumber of shares outstanding currency in the respective currency
Net asset value per share Class LC . . . . . . . . . . . . . . . . . . . . . . . . . . . . . . . . . . . . . . . . . EUR 92 .13Class LD . . . . . . . . . . . . . . . . . . . . . . . . . . . . . . . . . . . . . . . . . EUR 97 .20Class LDQ . . . . . . . . . . . . . . . . . . . . . . . . . . . . . . . . . . . . . . . EUR 84 .20Class PFD . . . . . . . . . . . . . . . . . . . . . . . . . . . . . . . . . . . . . . . . EUR 93 .74Class PFDQ . . . . . . . . . . . . . . . . . . . . . . . . . . . . . . . . . . . . . . EUR 93 .30 Number of shares outstanding Class LC . . . . . . . . . . . . . . . . . . . . . . . . . . . . . . . . . . . . . . . . . Count 64 110 .000Class LD . . . . . . . . . . . . . . . . . . . . . . . . . . . . . . . . . . . . . . . . . Count 24 355 .000Class LDQ . . . . . . . . . . . . . . . . . . . . . . . . . . . . . . . . . . . . . . . Count 87 426 .000Class PFD . . . . . . . . . . . . . . . . . . . . . . . . . . . . . . . . . . . . . . . . Count 772 089 .000Class PFDQ . . . . . . . . . . . . . . . . . . . . . . . . . . . . . . . . . . . . . . Count 654 894 .000 Composition of the reference portfolio (according to CSSF circular 11/512) 60% BofAML BB-B rated Developed Markets High Yield Constrained Index / 40% Barclays Global Aggregate Credit Index, all hedged to Euro
db Advisory Multibrands – PIMCO High Income Global Credit Fund
Count/ Quantity/ Purchases/ Sales/ Currency Market price Total market % ofDescription units/ principal additions disposals value in net assets currency amount in the reporting period EUR
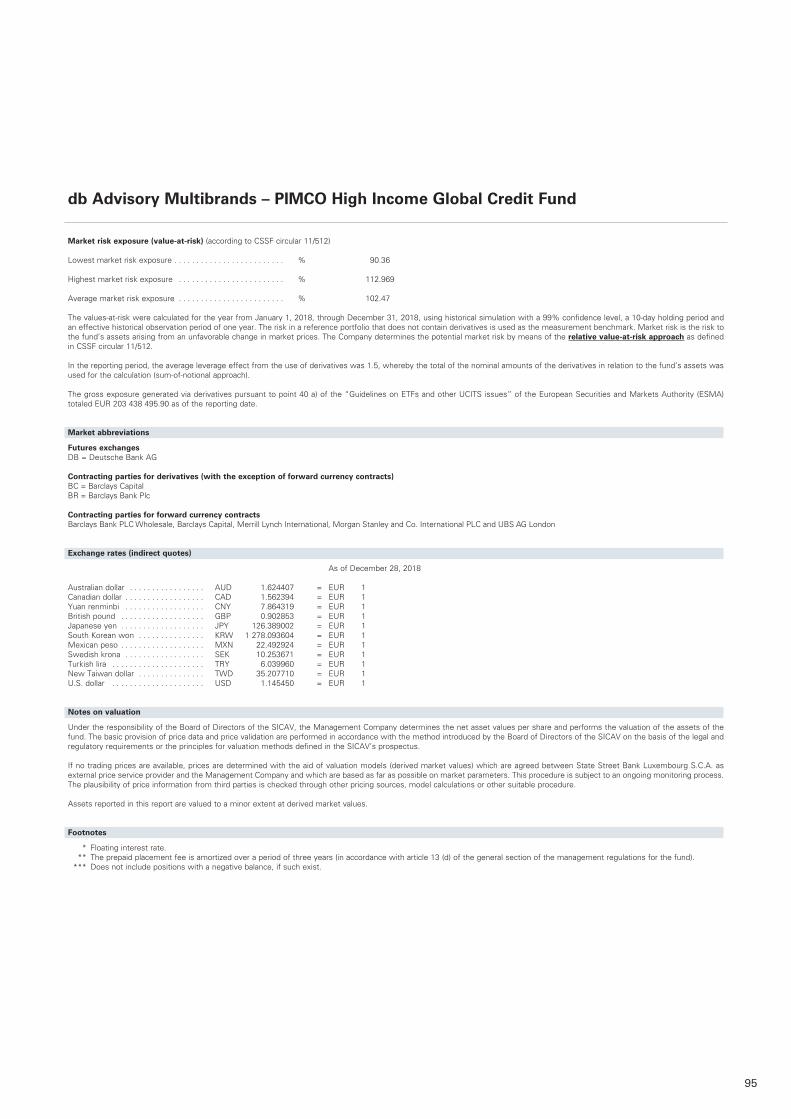
95
Market risk exposure (value-at-risk) (according to CSSF circular 11/512) Lowest market risk exposure . . . . . . . . . . . . . . . . . . . . . . . . . % 90 .36
Highest market risk exposure . . . . . . . . . . . . . . . . . . . . . . . . % 112 .969
Average market risk exposure . . . . . . . . . . . . . . . . . . . . . . . . % 102 .47
The values-at-risk were calculated for the year from January 1, 2018, through December 31, 2018, using historical simulation with a 99% confidence level, a 10-day holding period and an effective historical observation period of one year . The risk in a reference portfolio that does not contain derivatives is used as the measurement benchmark . Market risk is the risk to the fund’s assets arising from an unfavorable change in market prices . The Company determines the potential market risk by means of the relative value-at-risk approach as defined in CSSF circular 11/512 .
In the reporting period, the average leverage effect from the use of derivatives was 1 .5, whereby the total of the nominal amounts of the derivatives in relation to the fund’s assets was used for the calculation (sum-of-notional approach) .
The gross exposure generated via derivatives pursuant to point 40 a) of the “Guidelines on ETFs and other UCITS issues” of the European Securities and Markets Authority (ESMA) totaled EUR 203 438 495 .90 as of the reporting date .
Market abbreviations
Futures exchangesDB = Deutsche Bank AG
Contracting parties for derivatives (with the exception of forward currency contracts)BC = Barclays CapitalBR = Barclays Bank Plc
Contracting parties for forward currency contractsBarclays Bank PLC Wholesale, Barclays Capital, Merrill Lynch International, Morgan Stanley and Co . International PLC and UBS AG London
Exchange rates (indirect quotes)
As of December 28, 2018 Australian dollar . . . . . . . . . . . . . . . . . AUD 1 .624407 = EUR 1Canadian dollar . . . . . . . . . . . . . . . . . . CAD 1 .562394 = EUR 1Yuan renminbi . . . . . . . . . . . . . . . . . . CNY 7 .864319 = EUR 1British pound . . . . . . . . . . . . . . . . . . . GBP 0 .902853 = EUR 1Japanese yen . . . . . . . . . . . . . . . . . . . JPY 126 .389002 = EUR 1South Korean won . . . . . . . . . . . . . . . KRW 1 278 .093604 = EUR 1Mexican peso . . . . . . . . . . . . . . . . . . . MXN 22 .492924 = EUR 1Swedish krona . . . . . . . . . . . . . . . . . . SEK 10 .253671 = EUR 1Turkish lira . . . . . . . . . . . . . . . . . . . . . TRY 6 .039960 = EUR 1New Taiwan dollar . . . . . . . . . . . . . . . TWD 35 .207710 = EUR 1U .S . dollar . . . . . . . . . . . . . . . . . . . . . USD 1 .145450 = EUR 1
Notes on valuation
Under the responsibility of the Board of Directors of the SICAV, the Management Company determines the net asset values per share and performs the valuation of the assets of the fund . The basic provision of price data and price validation are performed in accordance with the method introduced by the Board of Directors of the SICAV on the basis of the legal and regulatory requirements or the principles for valuation methods defined in the SICAV’s prospectus .
If no trading prices are available, prices are determined with the aid of valuation models (derived market values) which are agreed between State Street Bank Luxembourg S .C .A . as external price service provider and the Management Company and which are based as far as possible on market parameters . This procedure is subject to an ongoing monitoring process . The plausibility of price information from third parties is checked through other pricing sources, model calculations or other suitable procedure .
Assets reported in this report are valued to a minor extent at derived market values .
Footnotes
* Floating interest rate . ** The prepaid placement fee is amortized over a period of three years (in accordance with article 13 (d) of the general section of the management regulations for the fund) . *** Does not include positions with a negative balance, if such exist .
db Advisory Multibrands – PIMCO High Income Global Credit Fund
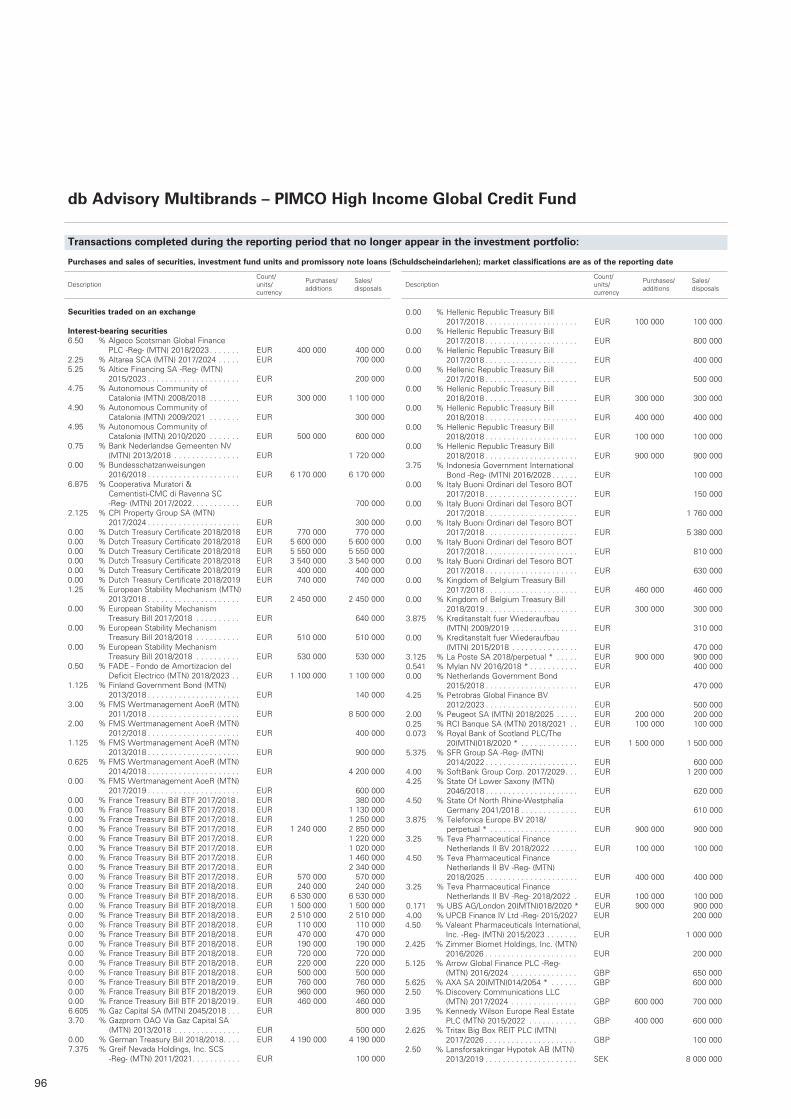
96
Transactions completed during the reporting period that no longer appear in the investment portfolio:
Purchases and sales of securities, investment fund units and promissory note loans (Schuldscheindarlehen); market classifications are as of the reporting date
Count/ Purchases/ Sales/ Description units/ additions disposals currency
Count/ Purchases/ Sales/ Description units/ additions disposals currency
Securities traded on an exchange Interest-bearing securities 6.50 % Algeco Scotsman Global Finance
PLC -Reg- (MTN) 2018/2023 . . . . . . . EUR 400 000 400 0002.25 % Altarea SCA (MTN) 2017/2024 . . . . . EUR 700 0005.25 % Altice Financing SA -Reg- (MTN)
2015/2023 . . . . . . . . . . . . . . . . . . . . . EUR 200 0004.75 % Autonomous Community of
Catalonia (MTN) 2008/2018 . . . . . . . EUR 300 000 1 100 0004.90 % Autonomous Community of
Catalonia (MTN) 2009/2021 . . . . . . . EUR 300 0004.95 % Autonomous Community of
Catalonia (MTN) 2010/2020 . . . . . . . EUR 500 000 600 0000.75 % Bank Nederlandse Gemeenten NV
(MTN) 2013/2018 . . . . . . . . . . . . . . . EUR 1 720 0000.00 % Bundesschatzanweisungen
2016/2018 . . . . . . . . . . . . . . . . . . . . . EUR 6 170 000 6 170 0006.875 % Cooperativa Muratori &
Cementisti-CMC di Ravenna SC -Reg- (MTN) 2017/2022 . . . . . . . . . . . EUR 700 000
2.125 % CPI Property Group SA (MTN) 2017/2024 . . . . . . . . . . . . . . . . . . . . . EUR 300 000
0.00 % Dutch Treasury Certificate 2018/2018 EUR 770 000 770 0000.00 % Dutch Treasury Certificate 2018/2018 EUR 5 600 000 5 600 0000.00 % Dutch Treasury Certificate 2018/2018 EUR 5 550 000 5 550 0000.00 % Dutch Treasury Certificate 2018/2018 EUR 3 540 000 3 540 0000.00 % Dutch Treasury Certificate 2018/2019 EUR 400 000 400 0000.00 % Dutch Treasury Certificate 2018/2019 EUR 740 000 740 0001.25 % European Stability Mechanism (MTN)
2013/2018 . . . . . . . . . . . . . . . . . . . . . EUR 2 450 000 2 450 0000.00 % European Stability Mechanism
Treasury Bill 2017/2018 . . . . . . . . . . EUR 640 0000.00 % European Stability Mechanism
Treasury Bill 2018/2018 . . . . . . . . . . EUR 510 000 510 0000.00 % European Stability Mechanism
Treasury Bill 2018/2018 . . . . . . . . . . EUR 530 000 530 0000.50 % FADE - Fondo de Amortizacion del
Deficit Electrico (MTN) 2018/2023 . . EUR 1 100 000 1 100 0001.125 % Finland Government Bond (MTN)
2013/2018 . . . . . . . . . . . . . . . . . . . . . EUR 140 0003.00 % FMS Wertmanagement AoeR (MTN)
2011/2018 . . . . . . . . . . . . . . . . . . . . . EUR 8 500 0002.00 % FMS Wertmanagement AoeR (MTN)
2012/2018 . . . . . . . . . . . . . . . . . . . . . EUR 400 0001.125 % FMS Wertmanagement AoeR (MTN)
2013/2018 . . . . . . . . . . . . . . . . . . . . . EUR 900 0000.625 % FMS Wertmanagement AoeR (MTN)
2014/2018 . . . . . . . . . . . . . . . . . . . . . EUR 4 200 0000.00 % FMS Wertmanagement AoeR (MTN)
2017/2019 . . . . . . . . . . . . . . . . . . . . . EUR 600 0000.00 % France Treasury Bill BTF 2017/2018 . EUR 380 0000.00 % France Treasury Bill BTF 2017/2018 . EUR 1 130 0000.00 % France Treasury Bill BTF 2017/2018 . EUR 1 250 0000.00 % France Treasury Bill BTF 2017/2018 . EUR 1 240 000 2 850 0000.00 % France Treasury Bill BTF 2017/2018 . EUR 1 220 0000.00 % France Treasury Bill BTF 2017/2018 . EUR 1 020 0000.00 % France Treasury Bill BTF 2017/2018 . EUR 1 460 0000.00 % France Treasury Bill BTF 2017/2018 . EUR 2 340 0000.00 % France Treasury Bill BTF 2017/2018 . EUR 570 000 570 0000.00 % France Treasury Bill BTF 2018/2018 . EUR 240 000 240 0000.00 % France Treasury Bill BTF 2018/2018 . EUR 6 530 000 6 530 0000.00 % France Treasury Bill BTF 2018/2018 . EUR 1 500 000 1 500 0000.00 % France Treasury Bill BTF 2018/2018 . EUR 2 510 000 2 510 0000.00 % France Treasury Bill BTF 2018/2018 . EUR 110 000 110 0000.00 % France Treasury Bill BTF 2018/2018 . EUR 470 000 470 0000.00 % France Treasury Bill BTF 2018/2018 . EUR 190 000 190 0000.00 % France Treasury Bill BTF 2018/2018 . EUR 720 000 720 0000.00 % France Treasury Bill BTF 2018/2018 . EUR 220 000 220 0000.00 % France Treasury Bill BTF 2018/2018 . EUR 500 000 500 0000.00 % France Treasury Bill BTF 2018/2019 . EUR 760 000 760 0000.00 % France Treasury Bill BTF 2018/2019 . EUR 960 000 960 0000.00 % France Treasury Bill BTF 2018/2019 . EUR 460 000 460 0006.605 % Gaz Capital SA (MTN) 2045/2018 . . . EUR 800 0003.70 % Gazprom OAO Via Gaz Capital SA
(MTN) 2013/2018 . . . . . . . . . . . . . . . EUR 500 0000.00 % German Treasury Bill 2018/2018 . . . . EUR 4 190 000 4 190 0007.375 % Greif Nevada Holdings, Inc. SCS
-Reg- (MTN) 2011/2021 . . . . . . . . . . . EUR 100 000
0.00 % Hellenic Republic Treasury Bill 2017/2018 . . . . . . . . . . . . . . . . . . . . . EUR 100 000 100 000
0.00 % Hellenic Republic Treasury Bill 2017/2018 . . . . . . . . . . . . . . . . . . . . . EUR 800 000
0.00 % Hellenic Republic Treasury Bill 2017/2018 . . . . . . . . . . . . . . . . . . . . . EUR 400 000
0.00 % Hellenic Republic Treasury Bill 2017/2018 . . . . . . . . . . . . . . . . . . . . . EUR 500 000
0.00 % Hellenic Republic Treasury Bill 2018/2018 . . . . . . . . . . . . . . . . . . . . . EUR 300 000 300 000
0.00 % Hellenic Republic Treasury Bill 2018/2018 . . . . . . . . . . . . . . . . . . . . . EUR 400 000 400 000
0.00 % Hellenic Republic Treasury Bill 2018/2018 . . . . . . . . . . . . . . . . . . . . . EUR 100 000 100 000
0.00 % Hellenic Republic Treasury Bill 2018/2018 . . . . . . . . . . . . . . . . . . . . . EUR 900 000 900 000
3.75 % Indonesia Government International Bond -Reg- (MTN) 2016/2028 . . . . . . EUR 100 000
0.00 % Italy Buoni Ordinari del Tesoro BOT 2017/2018 . . . . . . . . . . . . . . . . . . . . . EUR 150 000
0.00 % Italy Buoni Ordinari del Tesoro BOT 2017/2018 . . . . . . . . . . . . . . . . . . . . . EUR 1 760 000
0.00 % Italy Buoni Ordinari del Tesoro BOT 2017/2018 . . . . . . . . . . . . . . . . . . . . . EUR 5 380 000
0.00 % Italy Buoni Ordinari del Tesoro BOT 2017/2018 . . . . . . . . . . . . . . . . . . . . . EUR 810 000
0.00 % Italy Buoni Ordinari del Tesoro BOT 2017/2018 . . . . . . . . . . . . . . . . . . . . . EUR 630 000
0.00 % Kingdom of Belgium Treasury Bill 2017/2018 . . . . . . . . . . . . . . . . . . . . . EUR 460 000 460 000
0.00 % Kingdom of Belgium Treasury Bill 2018/2019 . . . . . . . . . . . . . . . . . . . . . EUR 300 000 300 000
3.875 % Kreditanstalt fuer Wiederaufbau (MTN) 2009/2019 . . . . . . . . . . . . . . . EUR 310 000
0.00 % Kreditanstalt fuer Wiederaufbau (MTN) 2015/2018 . . . . . . . . . . . . . . . EUR 470 000
3.125 % La Poste SA 2018/perpetual * . . . . . EUR 900 000 900 0000.541 % Mylan NV 2016/2018 * . . . . . . . . . . . EUR 400 0000.00 % Netherlands Government Bond
2015/2018 . . . . . . . . . . . . . . . . . . . . . EUR 470 0004.25 % Petrobras Global Finance BV
2012/2023 . . . . . . . . . . . . . . . . . . . . . EUR 500 0002.00 % Peugeot SA (MTN) 2018/2025 . . . . . EUR 200 000 200 0000.25 % RCI Banque SA (MTN) 2018/2021 . . EUR 100 000 100 0000.073 % Royal Bank of Scotland PLC/The
20(MTN)018/2020 * . . . . . . . . . . . . . EUR 1 500 000 1 500 0005.375 % SFR Group SA -Reg- (MTN)
2014/2022 . . . . . . . . . . . . . . . . . . . . . EUR 600 0004.00 % SoftBank Group Corp. 2017/2029 . . . EUR 1 200 0004.25 % State Of Lower Saxony (MTN)
2046/2018 . . . . . . . . . . . . . . . . . . . . . EUR 620 0004.50 % State Of North Rhine-Westphalia
Germany 2041/2018 . . . . . . . . . . . . . EUR 610 0003.875 % Telefonica Europe BV 2018/
perpetual * . . . . . . . . . . . . . . . . . . . . EUR 900 000 900 0003.25 % Teva Pharmaceutical Finance
Netherlands II BV 2018/2022 . . . . . . EUR 100 000 100 0004.50 % Teva Pharmaceutical Finance
Netherlands II BV -Reg- (MTN) 2018/2025 . . . . . . . . . . . . . . . . . . . . . EUR 400 000 400 000
3.25 % Teva Pharmaceutical Finance Netherlands II BV -Reg- 2018/2022 . EUR 100 000 100 000
0.171 % UBS AG/London 20(MTN)018/2020 * EUR 900 000 900 0004.00 % UPCB Finance IV Ltd -Reg- 2015/2027 EUR 200 0004.50 % Valeant Pharmaceuticals International,
Inc. -Reg- (MTN) 2015/2023 . . . . . . . EUR 1 000 0002.425 % Zimmer Biomet Holdings, Inc. (MTN)
2016/2026 . . . . . . . . . . . . . . . . . . . . . EUR 200 0005.125 % Arrow Global Finance PLC -Reg-
(MTN) 2016/2024 . . . . . . . . . . . . . . . GBP 650 0005.625 % AXA SA 20(MTN)014/2054 * . . . . . . GBP 600 0002.50 % Discovery Communications LLC
(MTN) 2017/2024 . . . . . . . . . . . . . . . GBP 600 000 700 0003.95 % Kennedy Wilson Europe Real Estate
PLC (MTN) 2015/2022 . . . . . . . . . . . GBP 400 000 600 0002.625 % Tritax Big Box REIT PLC (MTN)
2017/2026 . . . . . . . . . . . . . . . . . . . . . GBP 100 0002.50 % Lansforsakringar Hypotek AB (MTN)
2013/2019 . . . . . . . . . . . . . . . . . . . . . SEK 8 000 000
db Advisory Multibrands – PIMCO High Income Global Credit Fund
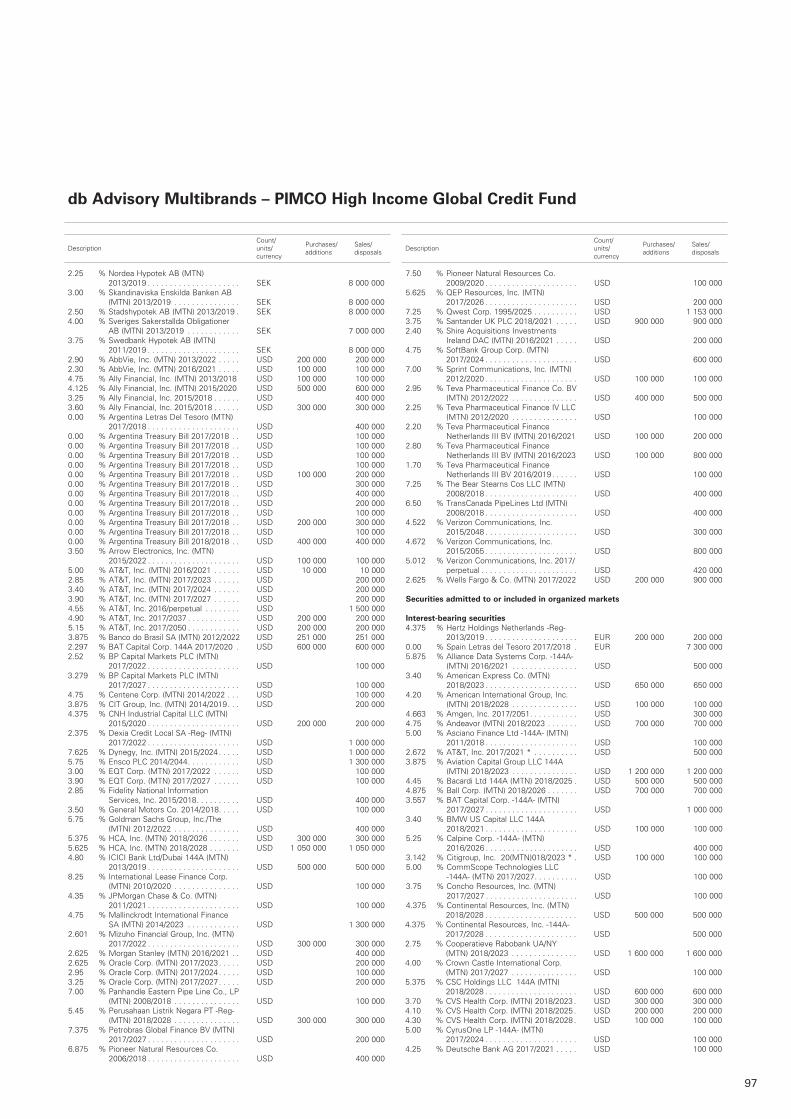
97
Count/ Purchases/ Sales/ Description units/ additions disposals currency
2.25 % Nordea Hypotek AB (MTN) 2013/2019 . . . . . . . . . . . . . . . . . . . . . SEK 8 000 000
3.00 % Skandinaviska Enskilda Banken AB (MTN) 2013/2019 . . . . . . . . . . . . . . . SEK 8 000 000
2.50 % Stadshypotek AB (MTN) 2013/2019 . SEK 8 000 0004.00 % Sveriges Sakerstallda Obligationer
AB (MTN) 2013/2019 . . . . . . . . . . . . SEK 7 000 0003.75 % Swedbank Hypotek AB (MTN)
2011/2019 . . . . . . . . . . . . . . . . . . . . . SEK 8 000 0002.90 % AbbVie, Inc. (MTN) 2013/2022 . . . . . USD 200 000 200 0002.30 % AbbVie, Inc. (MTN) 2016/2021 . . . . . USD 100 000 100 0004.75 % Ally Financial, Inc. (MTN) 2013/2018 USD 100 000 100 0004.125 % Ally Financial, Inc. (MTN) 2015/2020 USD 500 000 600 0003.25 % Ally Financial, Inc. 2015/2018 . . . . . . USD 400 0003.60 % Ally Financial, Inc. 2015/2018 . . . . . . USD 300 000 300 0000.00 % Argentina Letras Del Tesoro (MTN)
2017/2018 . . . . . . . . . . . . . . . . . . . . . USD 400 0000.00 % Argentina Treasury Bill 2017/2018 . . USD 100 0000.00 % Argentina Treasury Bill 2017/2018 . . USD 100 0000.00 % Argentina Treasury Bill 2017/2018 . . USD 100 0000.00 % Argentina Treasury Bill 2017/2018 . . USD 100 0000.00 % Argentina Treasury Bill 2017/2018 . . USD 100 000 200 0000.00 % Argentina Treasury Bill 2017/2018 . . USD 300 0000.00 % Argentina Treasury Bill 2017/2018 . . USD 400 0000.00 % Argentina Treasury Bill 2017/2018 . . USD 200 0000.00 % Argentina Treasury Bill 2017/2018 . . USD 100 0000.00 % Argentina Treasury Bill 2017/2018 . . USD 200 000 300 0000.00 % Argentina Treasury Bill 2017/2018 . . USD 100 0000.00 % Argentina Treasury Bill 2018/2018 . . USD 400 000 400 0003.50 % Arrow Electronics, Inc. (MTN)
2015/2022 . . . . . . . . . . . . . . . . . . . . . USD 100 000 100 0005.00 % AT&T, Inc. (MTN) 2016/2021 . . . . . . USD 10 000 10 0002.85 % AT&T, Inc. (MTN) 2017/2023 . . . . . . USD 200 0003.40 % AT&T, Inc. (MTN) 2017/2024 . . . . . . USD 200 0003.90 % AT&T, Inc. (MTN) 2017/2027 . . . . . . USD 200 0004.55 % AT&T, Inc. 2016/perpetual . . . . . . . . USD 1 500 0004.90 % AT&T, Inc. 2017/2037 . . . . . . . . . . . . USD 200 000 200 0005.15 % AT&T, Inc. 2017/2050 . . . . . . . . . . . . USD 200 000 200 0003.875 % Banco do Brasil SA (MTN) 2012/2022 USD 251 000 251 0002.297 % BAT Capital Corp. 144A 2017/2020 . USD 600 000 600 0002.52 % BP Capital Markets PLC (MTN)
2017/2022 . . . . . . . . . . . . . . . . . . . . . USD 100 0003.279 % BP Capital Markets PLC (MTN)
2017/2027 . . . . . . . . . . . . . . . . . . . . . USD 100 0004.75 % Centene Corp. (MTN) 2014/2022 . . . USD 100 0003.875 % CIT Group, Inc. (MTN) 2014/2019 . . . USD 200 0004.375 % CNH Industrial Capital LLC (MTN)
2015/2020 . . . . . . . . . . . . . . . . . . . . . USD 200 000 200 0002.375 % Dexia Credit Local SA -Reg- (MTN)
2017/2022 . . . . . . . . . . . . . . . . . . . . . USD 1 000 0007.625 % Dynegy, Inc. (MTN) 2015/2024 . . . . . USD 1 000 0005.75 % Ensco PLC 2014/2044 . . . . . . . . . . . . USD 1 300 0003.00 % EQT Corp. (MTN) 2017/2022 . . . . . . USD 100 0003.90 % EQT Corp. (MTN) 2017/2027 . . . . . . USD 100 0002.85 % Fidelity National Information
Services, Inc. 2015/2018 . . . . . . . . . . USD 400 0003.50 % General Motors Co. 2014/2018 . . . . . USD 100 0005.75 % Goldman Sachs Group, Inc./The
(MTN) 2012/2022 . . . . . . . . . . . . . . . USD 400 0005.375 % HCA, Inc. (MTN) 2018/2026 . . . . . . . USD 300 000 300 0005.625 % HCA, Inc. (MTN) 2018/2028 . . . . . . . USD 1 050 000 1 050 0004.80 % ICICI Bank Ltd/Dubai 144A (MTN)
2013/2019 . . . . . . . . . . . . . . . . . . . . . USD 500 000 500 0008.25 % International Lease Finance Corp.
(MTN) 2010/2020 . . . . . . . . . . . . . . . USD 100 0004.35 % JPMorgan Chase & Co. (MTN)
2011/2021 . . . . . . . . . . . . . . . . . . . . . USD 100 0004.75 % Mallinckrodt International Finance
SA (MTN) 2014/2023 . . . . . . . . . . . . USD 1 300 0002.601 % Mizuho Financial Group, Inc. (MTN)
2017/2022 . . . . . . . . . . . . . . . . . . . . . USD 300 000 300 0002.625 % Morgan Stanley (MTN) 2016/2021 . . USD 400 0002.625 % Oracle Corp. (MTN) 2017/2023 . . . . . USD 200 0002.95 % Oracle Corp. (MTN) 2017/2024 . . . . . USD 100 0003.25 % Oracle Corp. (MTN) 2017/2027 . . . . . USD 200 0007.00 % Panhandle Eastern Pipe Line Co., LP
(MTN) 2008/2018 . . . . . . . . . . . . . . . USD 100 0005.45 % Perusahaan Listrik Negara PT -Reg-
(MTN) 2018/2028 . . . . . . . . . . . . . . . USD 300 000 300 0007.375 % Petrobras Global Finance BV (MTN)
2017/2027 . . . . . . . . . . . . . . . . . . . . . USD 200 0006.875 % Pioneer Natural Resources Co.
2006/2018 . . . . . . . . . . . . . . . . . . . . . USD 400 000
7.50 % Pioneer Natural Resources Co. 2009/2020 . . . . . . . . . . . . . . . . . . . . . USD 100 000
5.625 % QEP Resources, Inc. (MTN) 2017/2026 . . . . . . . . . . . . . . . . . . . . . USD 200 000
7.25 % Qwest Corp. 1995/2025 . . . . . . . . . . USD 1 153 0003.75 % Santander UK PLC 2018/2021 . . . . . USD 900 000 900 0002.40 % Shire Acquisitions Investments
Ireland DAC (MTN) 2016/2021 . . . . . USD 200 0004.75 % SoftBank Group Corp. (MTN)
2017/2024 . . . . . . . . . . . . . . . . . . . . . USD 600 0007.00 % Sprint Communications, Inc. (MTN)
2012/2020 . . . . . . . . . . . . . . . . . . . . . USD 100 000 100 0002.95 % Teva Pharmaceutical Finance Co. BV
(MTN) 2012/2022 . . . . . . . . . . . . . . . USD 400 000 500 0002.25 % Teva Pharmaceutical Finance IV LLC
(MTN) 2012/2020 . . . . . . . . . . . . . . . USD 100 0002.20 % Teva Pharmaceutical Finance
Netherlands III BV (MTN) 2016/2021 USD 100 000 200 0002.80 % Teva Pharmaceutical Finance
Netherlands III BV (MTN) 2016/2023 USD 100 000 800 0001.70 % Teva Pharmaceutical Finance
Netherlands III BV 2016/2019 . . . . . . USD 100 0007.25 % The Bear Stearns Cos LLC (MTN)
2008/2018 . . . . . . . . . . . . . . . . . . . . . USD 400 0006.50 % TransCanada PipeLines Ltd (MTN)
2008/2018 . . . . . . . . . . . . . . . . . . . . . USD 400 0004.522 % Verizon Communications, Inc.
2015/2048 . . . . . . . . . . . . . . . . . . . . . USD 300 0004.672 % Verizon Communications, Inc.
2015/2055 . . . . . . . . . . . . . . . . . . . . . USD 800 0005.012 % Verizon Communications, Inc. 2017/
perpetual . . . . . . . . . . . . . . . . . . . . . . USD 420 0002.625 % Wells Fargo & Co. (MTN) 2017/2022 USD 200 000 900 000 Securities admitted to or included in organized markets
Interest-bearing securities 4.375 % Hertz Holdings Netherlands -Reg-
2013/2019 . . . . . . . . . . . . . . . . . . . . . EUR 200 000 200 0000.00 % Spain Letras del Tesoro 2017/2018 . EUR 7 300 0005.875 % Alliance Data Systems Corp. -144A-
(MTN) 2016/2021 . . . . . . . . . . . . . . . USD 500 0003.40 % American Express Co. (MTN)
2018/2023 . . . . . . . . . . . . . . . . . . . . . USD 650 000 650 0004.20 % American International Group, Inc.
(MTN) 2018/2028 . . . . . . . . . . . . . . . USD 100 000 100 0004.663 % Amgen, Inc. 2017/2051 . . . . . . . . . . . USD 300 0004.75 % Andeavor (MTN) 2018/2023 . . . . . . . USD 700 000 700 0005.00 % Asciano Finance Ltd -144A- (MTN)
2011/2018 . . . . . . . . . . . . . . . . . . . . . USD 100 0002.672 % AT&T, Inc. 2017/2021 * . . . . . . . . . . USD 500 0003.875 % Aviation Capital Group LLC 144A
(MTN) 2018/2023 . . . . . . . . . . . . . . . USD 1 200 000 1 200 0004.45 % Bacardi Ltd 144A (MTN) 2018/2025 . USD 500 000 500 0004.875 % Ball Corp. (MTN) 2018/2026 . . . . . . . USD 700 000 700 0003.557 % BAT Capital Corp. -144A- (MTN)
2017/2027 . . . . . . . . . . . . . . . . . . . . . USD 1 000 0003.40 % BMW US Capital LLC 144A
2018/2021 . . . . . . . . . . . . . . . . . . . . . USD 100 000 100 0005.25 % Calpine Corp. -144A- (MTN)
2016/2026 . . . . . . . . . . . . . . . . . . . . . USD 400 0003.142 % Citigroup, Inc. 20(MTN)018/2023 * . USD 100 000 100 0005.00 % CommScope Technologies LLC
-144A- (MTN) 2017/2027 . . . . . . . . . . USD 100 0003.75 % Concho Resources, Inc. (MTN)
2017/2027 . . . . . . . . . . . . . . . . . . . . . USD 100 0004.375 % Continental Resources, Inc. (MTN)
2018/2028 . . . . . . . . . . . . . . . . . . . . . USD 500 000 500 0004.375 % Continental Resources, Inc. -144A-
2017/2028 . . . . . . . . . . . . . . . . . . . . . USD 500 0002.75 % Cooperatieve Rabobank UA/NY
(MTN) 2018/2023 . . . . . . . . . . . . . . . USD 1 600 000 1 600 0004.00 % Crown Castle International Corp.
(MTN) 2017/2027 . . . . . . . . . . . . . . . USD 100 0005.375 % CSC Holdings LLC 144A (MTN)
2018/2028 . . . . . . . . . . . . . . . . . . . . . USD 600 000 600 0003.70 % CVS Health Corp. (MTN) 2018/2023 . USD 300 000 300 0004.10 % CVS Health Corp. (MTN) 2018/2025 . USD 200 000 200 0004.30 % CVS Health Corp. (MTN) 2018/2028 . USD 100 000 100 0005.00 % CyrusOne LP -144A- (MTN)
2017/2024 . . . . . . . . . . . . . . . . . . . . . USD 100 0004.25 % Deutsche Bank AG 2017/2021 . . . . . USD 100 000
db Advisory Multibrands – PIMCO High Income Global Credit Fund
Count/ Purchases/ Sales/ Description units/ additions disposals currency
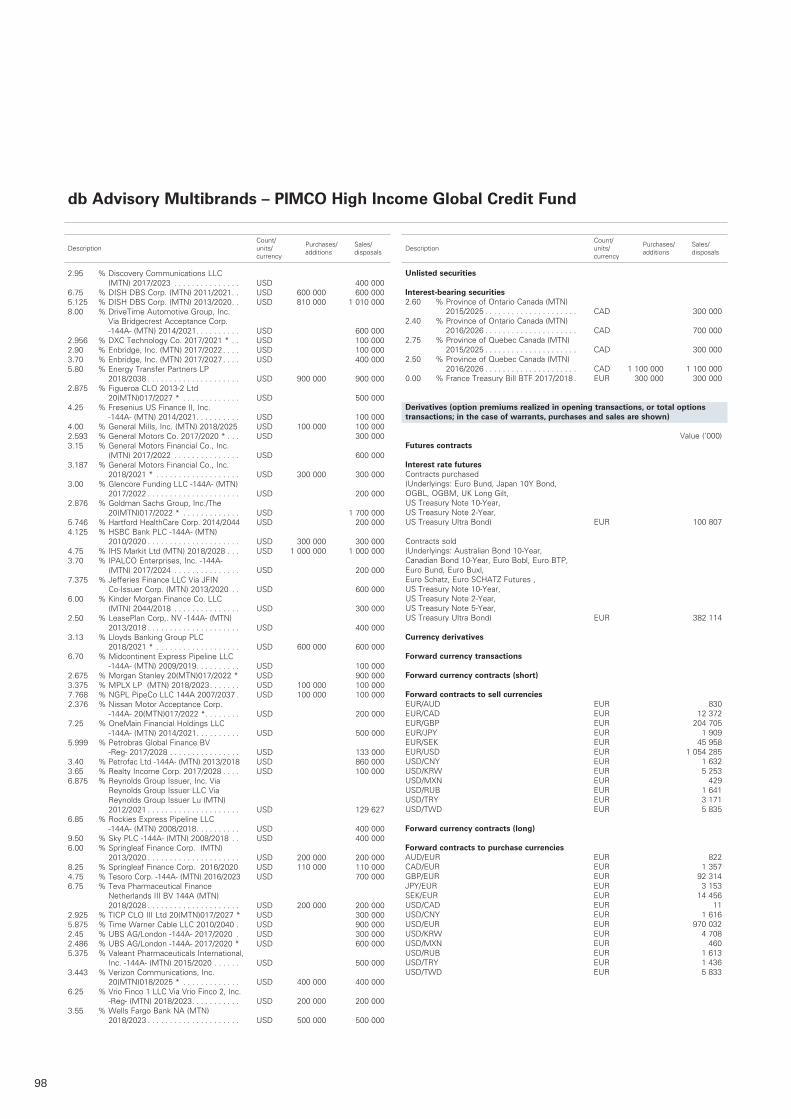
98
Unlisted securities
Interest-bearing securities2.60 % Province of Ontario Canada (MTN)
2015/2025 . . . . . . . . . . . . . . . . . . . . . CAD 300 0002.40 % Province of Ontario Canada (MTN)
2016/2026 . . . . . . . . . . . . . . . . . . . . . CAD 700 0002.75 % Province of Quebec Canada (MTN)
2015/2025 . . . . . . . . . . . . . . . . . . . . . CAD 300 0002.50 % Province of Quebec Canada (MTN)
2016/2026 . . . . . . . . . . . . . . . . . . . . . CAD 1 100 000 1 100 0000.00 % France Treasury Bill BTF 2017/2018 . EUR 300 000 300 000
Derivatives (option premiums realized in opening transactions, or total options transactions; in the case of warrants, purchases and sales are shown)
Value (’000) Futures contracts
Interest rate futures Contracts purchased (Underlyings: Euro Bund, Japan 10Y Bond, OGBL, OGBM, UK Long Gilt, US Treasury Note 10-Year, US Treasury Note 2-Year, US Treasury Ultra Bond) EUR 100 807 Contracts sold (Underlyings: Australian Bond 10-Year, Canadian Bond 10-Year, Euro Bobl, Euro BTP, Euro Bund, Euro Buxl, Euro Schatz, Euro SCHATZ Futures , US Treasury Note 10-Year, US Treasury Note 2-Year, US Treasury Note 5-Year, US Treasury Ultra Bond) EUR 382 114 Currency derivatives
Forward currency transactions
Forward currency contracts (short) Forward contracts to sell currenciesEUR/AUD EUR 830EUR/CAD EUR 12 372EUR/GBP EUR 204 705EUR/JPY EUR 1 909EUR/SEK EUR 45 958EUR/USD EUR 1 054 285USD/CNY EUR 1 632USD/KRW EUR 5 253USD/MXN EUR 429USD/RUB EUR 1 641USD/TRY EUR 3 171USD/TWD EUR 5 835 Forward currency contracts (long) Forward contracts to purchase currenciesAUD/EUR EUR 822CAD/EUR EUR 1 357GBP/EUR EUR 92 314JPY/EUR EUR 3 153SEK/EUR EUR 14 456USD/CAD EUR 11USD/CNY EUR 1 616USD/EUR EUR 970 032USD/KRW EUR 4 708USD/MXN EUR 460USD/RUB EUR 1 613USD/TRY EUR 1 436USD/TWD EUR 5 833
2.95 % Discovery Communications LLC (MTN) 2017/2023 . . . . . . . . . . . . . . . USD 400 000
6.75 % DISH DBS Corp. (MTN) 2011/2021 . . USD 600 000 600 0005.125 % DISH DBS Corp. (MTN) 2013/2020 . . USD 810 000 1 010 0008.00 % DriveTime Automotive Group, Inc.
Via Bridgecrest Acceptance Corp. -144A- (MTN) 2014/2021 . . . . . . . . . . USD 600 000
2.956 % DXC Technology Co. 2017/2021 * . . USD 100 0002.90 % Enbridge, Inc. (MTN) 2017/2022 . . . . USD 100 0003.70 % Enbridge, Inc. (MTN) 2017/2027 . . . . USD 400 0005.80 % Energy Transfer Partners LP
2018/2038 . . . . . . . . . . . . . . . . . . . . . USD 900 000 900 0002.875 % Figueroa CLO 2013-2 Ltd
20(MTN)017/2027 * . . . . . . . . . . . . . USD 500 0004.25 % Fresenius US Finance II, Inc.
-144A- (MTN) 2014/2021 . . . . . . . . . . USD 100 0004.00 % General Mills, Inc. (MTN) 2018/2025 USD 100 000 100 0002.593 % General Motors Co. 2017/2020 * . . . USD 300 0003.15 % General Motors Financial Co., Inc.
(MTN) 2017/2022 . . . . . . . . . . . . . . . USD 600 0003.187 % General Motors Financial Co., Inc.
2018/2021 * . . . . . . . . . . . . . . . . . . . USD 300 000 300 0003.00 % Glencore Funding LLC -144A- (MTN)
2017/2022 . . . . . . . . . . . . . . . . . . . . . USD 200 0002.876 % Goldman Sachs Group, Inc./The
20(MTN)017/2022 * . . . . . . . . . . . . . USD 1 700 0005.746 % Hartford HealthCare Corp. 2014/2044 USD 200 0004.125 % HSBC Bank PLC -144A- (MTN)
2010/2020 . . . . . . . . . . . . . . . . . . . . . USD 300 000 300 0004.75 % IHS Markit Ltd (MTN) 2018/2028 . . . USD 1 000 000 1 000 0003.70 % IPALCO Enterprises, Inc. -144A-
(MTN) 2017/2024 . . . . . . . . . . . . . . . USD 200 0007.375 % Jefferies Finance LLC Via JFIN
Co-Issuer Corp. (MTN) 2013/2020 . . USD 600 0006.00 % Kinder Morgan Finance Co. LLC
(MTN) 2044/2018 . . . . . . . . . . . . . . . USD 300 0002.50 % LeasePlan Corp,. NV -144A- (MTN)
2013/2018 . . . . . . . . . . . . . . . . . . . . . USD 400 0003.13 % Lloyds Banking Group PLC
2018/2021 * . . . . . . . . . . . . . . . . . . . USD 600 000 600 0006.70 % Midcontinent Express Pipeline LLC
-144A- (MTN) 2009/2019 . . . . . . . . . . USD 100 0002.675 % Morgan Stanley 20(MTN)017/2022 * USD 900 0003.375 % MPLX LP (MTN) 2018/2023 . . . . . . . USD 100 000 100 0007.768 % NGPL PipeCo LLC 144A 2007/2037 . USD 100 000 100 0002.376 % Nissan Motor Acceptance Corp.
-144A- 20(MTN)017/2022 * . . . . . . . . USD 200 0007.25 % OneMain Financial Holdings LLC
-144A- (MTN) 2014/2021 . . . . . . . . . . USD 500 0005.999 % Petrobras Global Finance BV
-Reg- 2017/2028 . . . . . . . . . . . . . . . . USD 133 0003.40 % Petrofac Ltd -144A- (MTN) 2013/2018 USD 860 0003.65 % Realty Income Corp. 2017/2028 . . . . USD 100 0006.875 % Reynolds Group Issuer, Inc. Via
Reynolds Group Issuer LLC Via Reynolds Group Issuer Lu (MTN) 2012/2021 . . . . . . . . . . . . . . . . . . . . . USD 129 627
6.85 % Rockies Express Pipeline LLC -144A- (MTN) 2008/2018 . . . . . . . . . . USD 400 000
9.50 % Sky PLC -144A- (MTN) 2008/2018 . . USD 400 0006.00 % Springleaf Finance Corp. (MTN)
2013/2020 . . . . . . . . . . . . . . . . . . . . . USD 200 000 200 0008.25 % Springleaf Finance Corp. 2016/2020 USD 110 000 110 0004.75 % Tesoro Corp. -144A- (MTN) 2016/2023 USD 700 0006.75 % Teva Pharmaceutical Finance
Netherlands III BV 144A (MTN) 2018/2028 . . . . . . . . . . . . . . . . . . . . . USD 200 000 200 000
2.925 % TICP CLO III Ltd 20(MTN)017/2027 * USD 300 0005.875 % Time Warner Cable LLC 2010/2040 . USD 900 0002.45 % UBS AG/London -144A- 2017/2020 . USD 300 0002.486 % UBS AG/London -144A- 2017/2020 * USD 600 0005.375 % Valeant Pharmaceuticals International,
Inc. -144A- (MTN) 2015/2020 . . . . . . USD 500 0003.443 % Verizon Communications, Inc.
20(MTN)018/2025 * . . . . . . . . . . . . . USD 400 000 400 0006.25 % Vrio Finco 1 LLC Via Vrio Finco 2, Inc.
-Reg- (MTN) 2018/2023 . . . . . . . . . . . USD 200 000 200 0003.55 % Wells Fargo Bank NA (MTN)
2018/2023 . . . . . . . . . . . . . . . . . . . . . USD 500 000 500 000
db Advisory Multibrands – PIMCO High Income Global Credit Fund
Count/ Purchases/ Sales/ Description units/ additions disposals currency
Count/ Purchases/ Sales/ Description units/ additions disposals currency
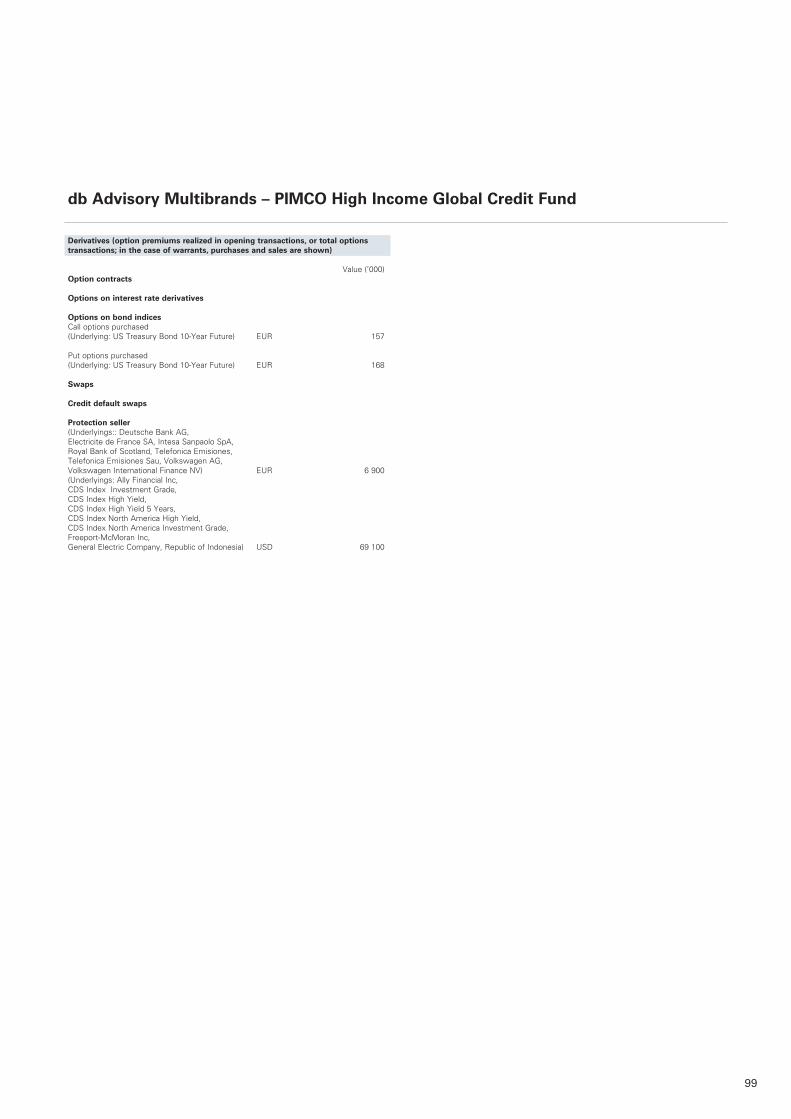
99
Derivatives (option premiums realized in opening transactions, or total options transactions; in the case of warrants, purchases and sales are shown)
Value (’000) Option contracts Options on interest rate derivatives Options on bond indices Call options purchased (Underlying: US Treasury Bond 10-Year Future) EUR 157 Put options purchased (Underlying: US Treasury Bond 10-Year Future) EUR 168 Swaps Credit default swaps Protection seller (Underlyings:: Deutsche Bank AG, Electricite de France SA, Intesa Sanpaolo SpA, Royal Bank of Scotland, Telefonica Emisiones, Telefonica Emisiones Sau, Volkswagen AG, Volkswagen International Finance NV) EUR 6 900(Underlyings: Ally Financial Inc, CDS Index Investment Grade, CDS Index High Yield, CDS Index High Yield 5 Years, CDS Index North America High Yield, CDS Index North America Investment Grade, Freeport-McMoran Inc, General Electric Company, Republic of Indonesia) USD 69 100
db Advisory Multibrands – PIMCO High Income Global Credit Fund
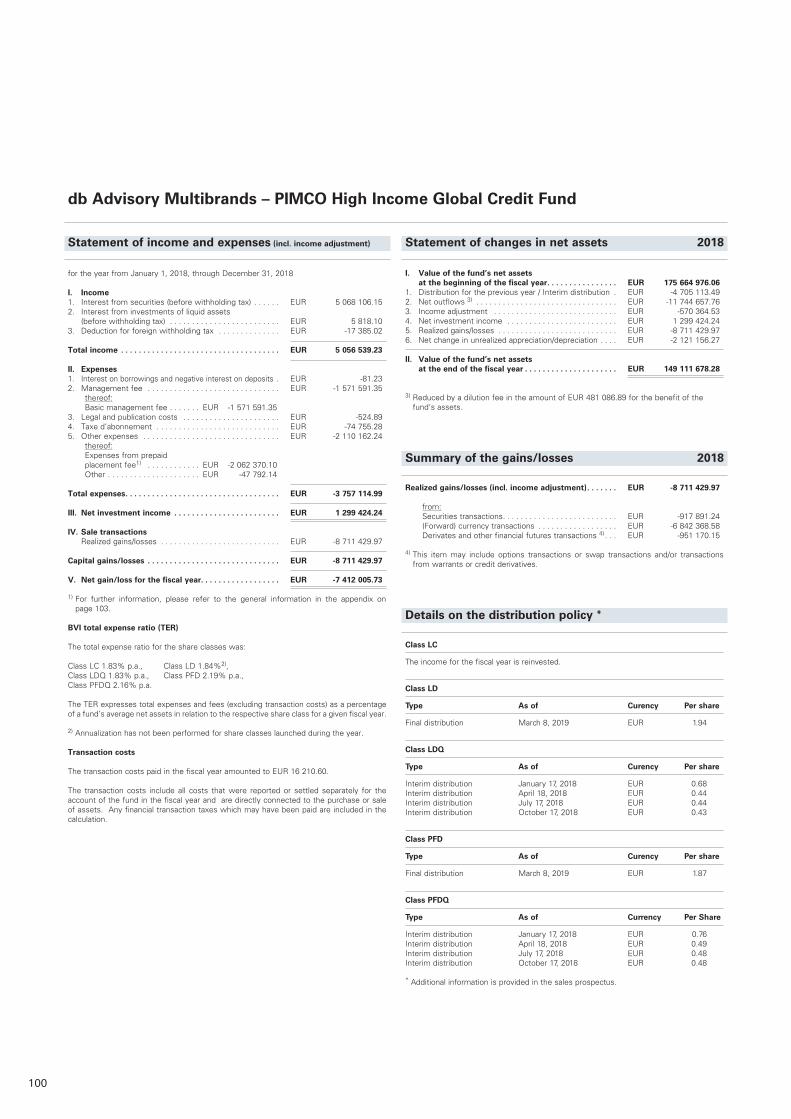
100
Statement of income and expenses (incl. income adjustment)
I. Value of the fund’s net assets at the beginning of the fiscal year . . . . . . . . . . . . . . . . EUR 175 664 976.061. Distribution for the previous year / Interim distribution . EUR -4 705 113.492. Net outflows 3) . . . . . . . . . . . . . . . . . . . . . . . . . . . . . . . . EUR -11 744 657.763. Income adjustment . . . . . . . . . . . . . . . . . . . . . . . . . . . . EUR -570 364.534. Net investment income . . . . . . . . . . . . . . . . . . . . . . . . . EUR 1 299 424.245. Realized gains/losses . . . . . . . . . . . . . . . . . . . . . . . . . . . EUR -8 711 429.976. Net change in unrealized appreciation/depreciation . . . . EUR -2 121 156.27
II. Value of the fund’s net assets at the end of the fiscal year . . . . . . . . . . . . . . . . . . . . . EUR 149 111 678.28
3) Reduced by a dilution fee in the amount of EUR 481 086.89 for the benefit of the fund‘s assets.
Summary of the gains/losses 2018
Realized gains/losses (incl. income adjustment) . . . . . . . EUR -8 711 429.97
from: Securities transactions . . . . . . . . . . . . . . . . . . . . . . . . . . EUR -917 891.24 (Forward) currency transactions . . . . . . . . . . . . . . . . . . EUR -6 842 368.58 Derivates and other financial futures transactions 4) . . . EUR -951 170.15
4) This item may include options transactions or swap transactions and/or transactions from warrants or credit derivatives.
Details on the distribution policy *
Class LC
The income for the fiscal year is reinvested.
Class LD
Type As of Curency Per share
Final distribution March 8, 2019 EUR 1.94
Class LDQ
Type As of Curency Per share
Interim distribution January 17, 2018 EUR 0.68Interim distribution April 18, 2018 EUR 0.44Interim distribution July 17, 2018 EUR 0.44Interim distribution October 17, 2018 EUR 0.43
Class PFD
Type As of Curency Per share
Final distribution March 8, 2019 EUR 1.87
Class PFDQ
Type As of Currency Per Share
Interim distribution January 17, 2018 EUR 0.76Interim distribution April 18, 2018 EUR 0.49Interim distribution July 17, 2018 EUR 0.48Interim distribution October 17, 2018 EUR 0.48
* Additional information is provided in the sales prospectus.
Statement of changes in net assets 2018
for the year from January 1, 2018, through December 31, 2018
I. Income1. Interest from securities (before withholding tax) . . . . . . EUR 5 068 106.152. Interest from investments of liquid assets
(before withholding tax) . . . . . . . . . . . . . . . . . . . . . . . . . EUR 5 818.103. Deduction for foreign withholding tax . . . . . . . . . . . . . . EUR -17 385.02
Total income . . . . . . . . . . . . . . . . . . . . . . . . . . . . . . . . . . . . EUR 5 056 539.23
II. Expenses1. Interest on borrowings and negative interest on deposits . EUR -81.232. Management fee . . . . . . . . . . . . . . . . . . . . . . . . . . . . . . EUR -1 571 591.35 thereof: Basic management fee . . . . . . . EUR -1 571 591.353. Legal and publication costs . . . . . . . . . . . . . . . . . . . . . . EUR -524.894. Taxe d’abonnement . . . . . . . . . . . . . . . . . . . . . . . . . . . . EUR -74 755.285. Other expenses . . . . . . . . . . . . . . . . . . . . . . . . . . . . . . . EUR -2 110 162.24 thereof: Expenses from prepaid
placement fee1) . . . . . . . . . . . . EUR -2 062 370.10 Other . . . . . . . . . . . . . . . . . . . . . EUR -47 792.14
Total expenses . . . . . . . . . . . . . . . . . . . . . . . . . . . . . . . . . . . EUR -3 757 114.99
III. Net investment income . . . . . . . . . . . . . . . . . . . . . . . . EUR 1 299 424.24
IV. Sale transactions Realized gains/losses . . . . . . . . . . . . . . . . . . . . . . . . . . . EUR -8 711 429.97
Capital gains/losses . . . . . . . . . . . . . . . . . . . . . . . . . . . . . . EUR -8 711 429.97
V. Net gain/loss for the fiscal year. . . . . . . . . . . . . . . . . . EUR -7 412 005.73
1) For further information, please refer to the general information in the appendix on page 103.
BVI total expense ratio (TER) The total expense ratio for the share classes was:
Class LC 1.83% p.a., Class LD 1.84%2), Class LDQ 1.83% p.a., Class PFD 2.19% p.a., Class PFDQ 2.16% p.a. The TER expresses total expenses and fees (excluding transaction costs) as a percentage of a fund’s average net assets in relation to the respective share class for a given fiscal year.
2) Annualization has not been performed for share classes launched during the year.
Transaction costs The transaction costs paid in the fiscal year amounted to EUR 16 210.60.
The transaction costs include all costs that were reported or settled separately for the account of the fund in the fiscal year and are directly connected to the purchase or sale of assets. Any financial transaction taxes which may have been paid are included in the calculation.
db Advisory Multibrands – PIMCO High Income Global Credit Fund
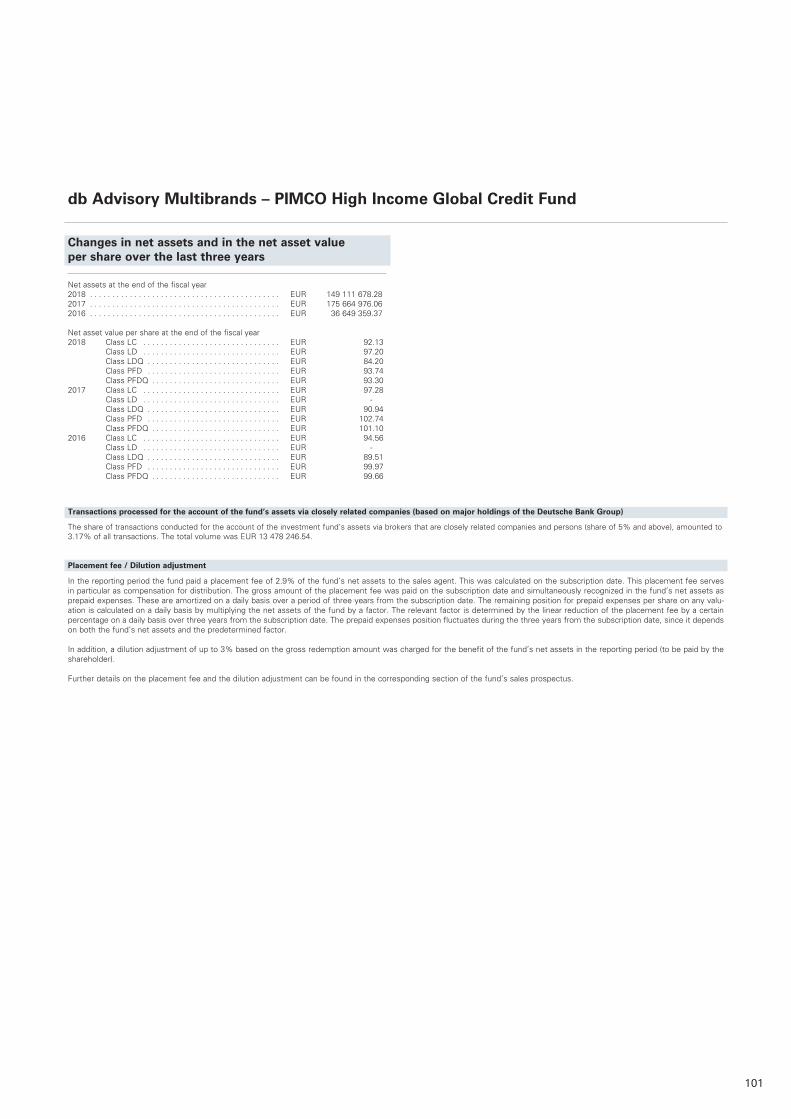
101
Changes in net assets and in the net asset value per share over the last three years
Net assets at the end of the fiscal year2018 . . . . . . . . . . . . . . . . . . . . . . . . . . . . . . . . . . . . . . . . . . . EUR 149 111 678 .282017 . . . . . . . . . . . . . . . . . . . . . . . . . . . . . . . . . . . . . . . . . . . EUR 175 664 976 .062016 . . . . . . . . . . . . . . . . . . . . . . . . . . . . . . . . . . . . . . . . . . . EUR 36 649 359 .37
Net asset value per share at the end of the fiscal year 2018 Class LC . . . . . . . . . . . . . . . . . . . . . . . . . . . . . . . EUR 92 .13 Class LD . . . . . . . . . . . . . . . . . . . . . . . . . . . . . . . EUR 97 .20 Class LDQ . . . . . . . . . . . . . . . . . . . . . . . . . . . . . . EUR 84 .20 Class PFD . . . . . . . . . . . . . . . . . . . . . . . . . . . . . . EUR 93 .74 Class PFDQ . . . . . . . . . . . . . . . . . . . . . . . . . . . . . EUR 93 .302017 Class LC . . . . . . . . . . . . . . . . . . . . . . . . . . . . . . . EUR 97 .28 Class LD . . . . . . . . . . . . . . . . . . . . . . . . . . . . . . . EUR - Class LDQ . . . . . . . . . . . . . . . . . . . . . . . . . . . . . . EUR 90 .94 Class PFD . . . . . . . . . . . . . . . . . . . . . . . . . . . . . . EUR 102 .74 Class PFDQ . . . . . . . . . . . . . . . . . . . . . . . . . . . . . EUR 101 .102016 Class LC . . . . . . . . . . . . . . . . . . . . . . . . . . . . . . . EUR 94 .56 Class LD . . . . . . . . . . . . . . . . . . . . . . . . . . . . . . . EUR - Class LDQ . . . . . . . . . . . . . . . . . . . . . . . . . . . . . . EUR 89 .51 Class PFD . . . . . . . . . . . . . . . . . . . . . . . . . . . . . . EUR 99 .97 Class PFDQ . . . . . . . . . . . . . . . . . . . . . . . . . . . . . EUR 99 .66
Transactions processed for the account of the fund’s assets via closely related companies (based on major holdings of the Deutsche Bank Group)
The share of transactions conducted for the account of the investment fund’s assets via brokers that are closely related companies and persons (share of 5% and above), amounted to 3 .17% of all transactions . The total volume was EUR 13 478 246 .54 .
Placement fee / Dilution adjustment
In the reporting period the fund paid a placement fee of 2 .9% of the fund’s net assets to the sales agent . This was calculated on the subscription date . This placement fee serves in particular as compensation for distribution . The gross amount of the placement fee was paid on the subscription date and simultaneously recognized in the fund’s net assets as prepaid expenses . These are amortized on a daily basis over a period of three years from the subscription date . The remaining position for prepaid expenses per share on any valu-ation is calculated on a daily basis by multiplying the net assets of the fund by a factor . The relevant factor is determined by the linear reduction of the placement fee by a certain percentage on a daily basis over three years from the subscription date . The prepaid expenses position fluctuates during the three years from the subscription date, since it depends on both the fund’s net assets and the predetermined factor .
In addition, a dilution adjustment of up to 3% based on the gross redemption amount was charged for the benefit of the fund’s net assets in the reporting period (to be paid by the shareholder) .
Further details on the placement fee and the dilution adjustment can be found in the corresponding section of the fund’s sales prospectus .
db Advisory Multibrands – PIMCO High Income Global Credit Fund

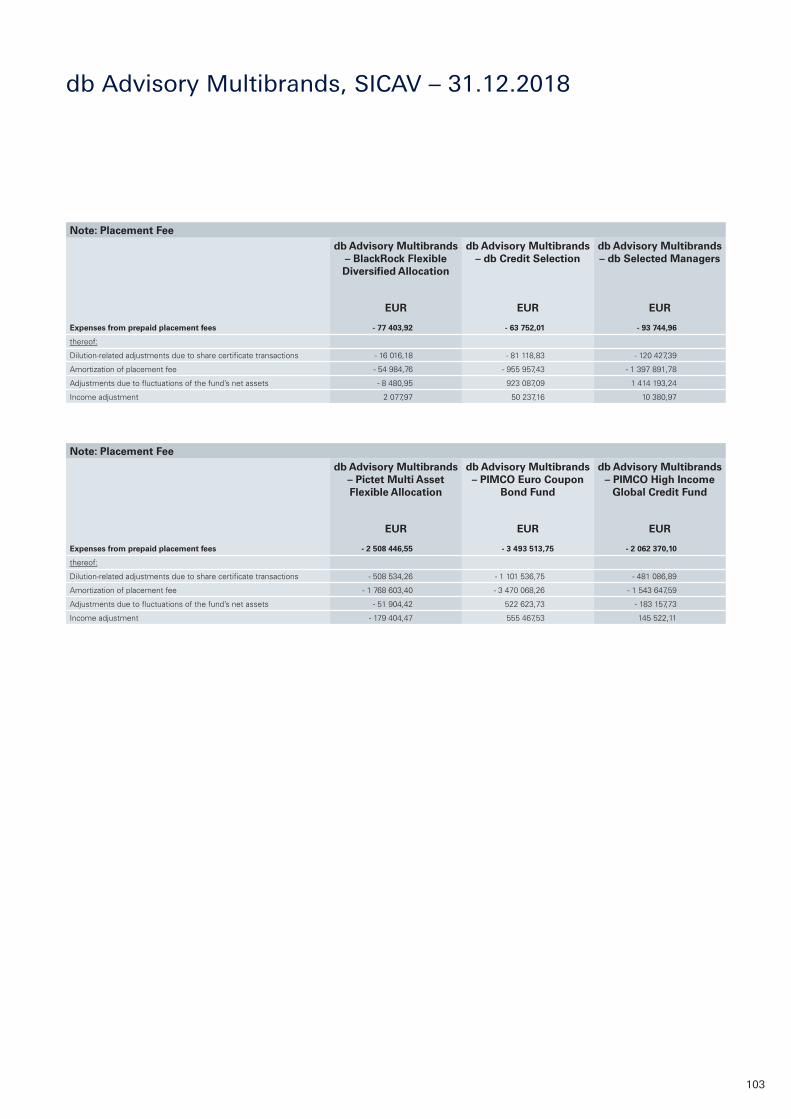
103
Note: Placement Feedb Advisory Multibrands
– BlackRock Flexible Diversified Allocation
db Advisory Multibrands – db Credit Selection
db Advisory Multibrands – db Selected Managers
EUR EUR EUR
Expenses from prepaid placement fees - 77 403,92 - 63 752,01 - 93 744,96
thereof:
Dilution-related adjustments due to share certificate transactions - 16 016,18 - 81 118,83 - 120 427,39
Amortization of placement fee - 54 984,76 - 955 957,43 - 1 397 891,78
Adjustments due to fluctuations of the fund’s net assets - 8 480,95 923 087,09 1 414 193,24
Income adjustment 2 077,97 50 237,16 10 380,97
Note: Placement Feedb Advisory Multibrands
– Pictet Multi Asset Flexible Allocation
db Advisory Multibrands – PIMCO Euro Coupon
Bond Fund
db Advisory Multibrands – PIMCO High Income
Global Credit Fund
EUR EUR EUR
Expenses from prepaid placement fees - 2 508 446,55 - 3 493 513,75 - 2 062 370,10
thereof:
Dilution-related adjustments due to share certificate transactions - 508 534,26 - 1 101 536,75 - 481 086,89
Amortization of placement fee - 1 768 603,40 - 3 470 068,26 - 1 543 647,59
Adjustments due to fluctuations of the fund’s net assets - 51 904,42 522 623,73 - 183 157,73
Income adjustment - 179 404,47 555 467,53 145 522,11
db Advisory Multibrands, SICAV – 31.12.2018
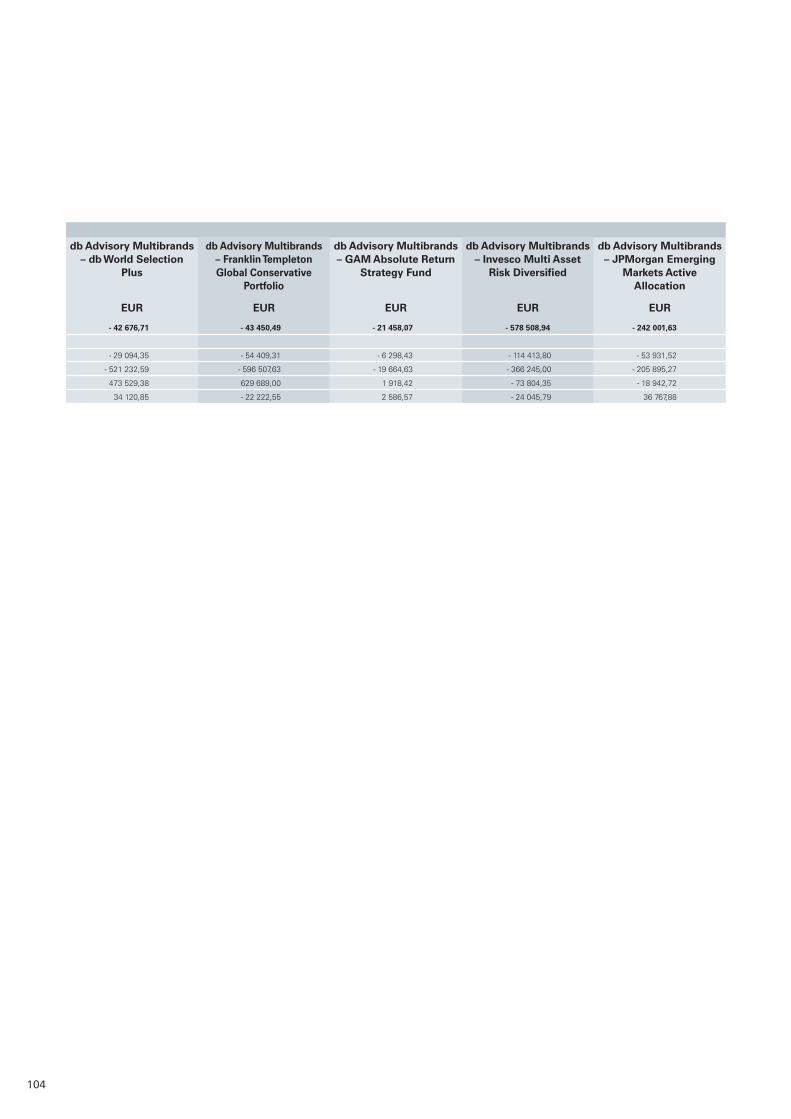
104
db Advisory Multibrands – db World Selection
Plus
db Advisory Multibrands – Franklin Templeton Global Conservative
Portfolio
db Advisory Multibrands – GAM Absolute Return
Strategy Fund
db Advisory Multibrands – Invesco Multi Asset
Risk Diversified
db Advisory Multibrands – JPMorgan Emerging
Markets Active Allocation
EUR EUR EUR EUR EUR
- 42 676,71 - 43 450,49 - 21 458,07 - 578 508,94 - 242 001,63
- 29 094,35 - 54 409,31 - 6 298,43 - 114 413,80 - 53 931,52
- 521 232,59 - 596 507,63 - 19 664,63 - 366 245,00 - 205 895,27
473 529,38 629 689,00 1 918,42 - 73 804,35 - 18 942,72
34 120,85 - 22 222,55 2 586,57 - 24 045,79 36 767,88

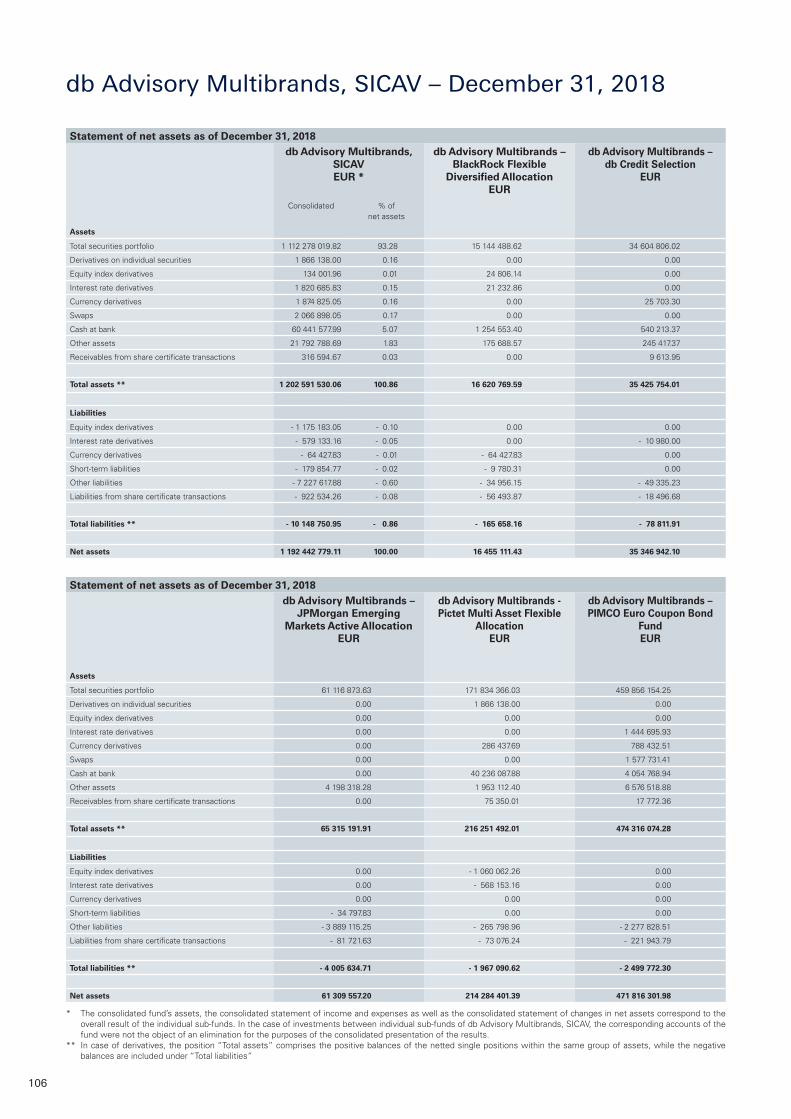
106
db Advisory Multibrands, SICAV – December 31, 2018
Statement of net assets as of December 31, 2018db Advisory Multibrands,
SICAVEUR *
db Advisory Multibrands – BlackRock Flexible
Diversified AllocationEUR
db Advisory Multibrands – db Credit Selection
EUR
Consolidated % ofnet assets
Assets
Total securities portfolio 1 112 278 019.82 93.28 15 144 488.62 34 604 806.02
Derivatives on individual securities 1 866 138.00 0.16 0.00 0.00
Equity index derivatives 134 001.96 0.01 24 806.14 0.00
Interest rate derivatives 1 820 685.83 0.15 21 232.86 0.00
Currency derivatives 1 874 825.05 0.16 0.00 25 703.30
Swaps 2 066 898.05 0.17 0.00 0.00
Cash at bank 60 441 577.99 5.07 1 254 553.40 540 213.37
Other assets 21 792 788.69 1.83 175 688.57 245 417.37
Receivables from share certificate transactions 316 594.67 0.03 0.00 9 613.95
Total assets ** 1 202 591 530.06 100.86 16 620 769.59 35 425 754.01
Liabilities
Equity index derivatives - 1 175 183.05 - 0.10 0.00 0.00
Interest rate derivatives - 579 133.16 - 0.05 0.00 - 10 980.00
Currency derivatives - 64 427.83 - 0.01 - 64 427.83 0.00
Short-term liabilities - 179 854.77 - 0.02 - 9 780.31 0.00
Other liabilities - 7 227 617.88 - 0.60 - 34 956.15 - 49 335.23
Liabilities from share certificate transactions - 922 534.26 - 0.08 - 56 493.87 - 18 496.68
Total liabilities ** - 10 148 750.95 - 0.86 - 165 658.16 - 78 811.91
Net assets 1 192 442 779.11 100.00 16 455 111.43 35 346 942.10
Statement of net assets as of December 31, 2018db Advisory Multibrands –
JPMorgan Emerging Markets Active Allocation
EUR
db Advisory Multibrands - Pictet Multi Asset Flexible
AllocationEUR
db Advisory Multibrands – PIMCO Euro Coupon Bond
FundEUR
Assets
Total securities portfolio 61 116 873.63 171 834 366.03 459 856 154.25
Derivatives on individual securities 0.00 1 866 138.00 0.00
Equity index derivatives 0.00 0.00 0.00
Interest rate derivatives 0.00 0.00 1 444 695.93
Currency derivatives 0.00 286 437.69 788 432.51
Swaps 0.00 0.00 1 577 731.41
Cash at bank 0.00 40 236 087.88 4 054 768.94
Other assets 4 198 318.28 1 953 112.40 6 576 518.88
Receivables from share certificate transactions 0.00 75 350.01 17 772.36
Total assets ** 65 315 191.91 216 251 492.01 474 316 074.28
Liabilities
Equity index derivatives 0.00 - 1 060 062.26 0.00
Interest rate derivatives 0.00 - 568 153.16 0.00
Currency derivatives 0.00 0.00 0.00
Short-term liabilities - 34 797.83 0.00 0.00
Other liabilities - 3 889 115.25 - 265 798.96 - 2 277 828.51
Liabilities from share certificate transactions - 81 721.63 - 73 076.24 - 221 943.79
Total liabilities ** - 4 005 634.71 - 1 967 090.62 - 2 499 772.30
Net assets 61 309 557.20 214 284 401.39 471 816 301.98
* The consolidated fund’s assets, the consolidated statement of income and expenses as well as the consolidated statement of changes in net assets correspond to the overall result of the individual sub-funds. In the case of investments between individual sub-funds of db Advisory Multibrands, SICAV, the corresponding accounts of the fund were not the object of an elimination for the purposes of the consolidated presentation of the results.
** In case of derivatives, the position “Total assets” comprises the positive balances of the netted single positions within the same group of assets, while the negative balances are included under “Total liabilities”
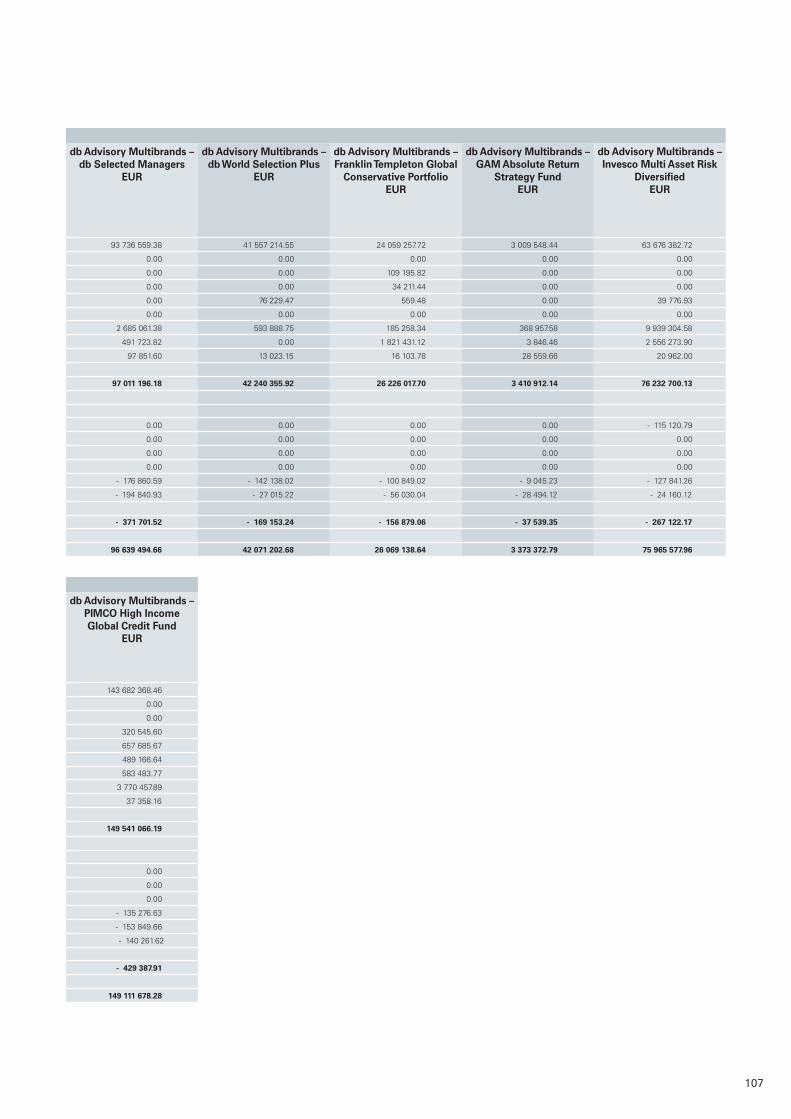
107
db Advisory Multibrands – db Selected Managers
EUR
db Advisory Multibrands – db World Selection Plus
EUR
db Advisory Multibrands – Franklin Templeton Global
Conservative PortfolioEUR
db Advisory Multibrands – GAM Absolute Return
Strategy FundEUR
db Advisory Multibrands – Invesco Multi Asset Risk
DiversifiedEUR
93 736 559.38 41 557 214.55 24 059 257.72 3 009 548.44 63 676 382.72
0.00 0.00 0.00 0.00 0.00
0.00 0.00 109 195.82 0.00 0.00
0.00 0.00 34 211.44 0.00 0.00
0.00 76 229.47 559.48 0.00 39 776.93
0.00 0.00 0.00 0.00 0.00
2 685 061.38 593 888.75 185 258.34 368 957.58 9 939 304.58
491 723.82 0.00 1 821 431.12 3 846.46 2 556 273.90
97 851.60 13 023.15 16 103.78 28 559.66 20 962.00
97 011 196.18 42 240 355.92 26 226 017.70 3 410 912.14 76 232 700.13
0.00 0.00 0.00 0.00 - 115 120.79
0.00 0.00 0.00 0.00 0.00
0.00 0.00 0.00 0.00 0.00
0.00 0.00 0.00 0.00 0.00
- 176 860.59 - 142 138.02 - 100 849.02 - 9 045.23 - 127 841.26
- 194 840.93 - 27 015.22 - 56 030.04 - 28 494.12 - 24 160.12
- 371 701.52 - 169 153.24 - 156 879.06 - 37 539.35 - 267 122.17
96 639 494.66 42 071 202.68 26 069 138.64 3 373 372.79 75 965 577.96
db Advisory Multibrands – PIMCO High Income Global Credit Fund
EUR
143 682 368.46
0.00
0.00
320 545.60
657 685.67
489 166.64
583 483.77
3 770 457.89
37 358.16
149 541 066.19
0.00
0.00
0.00
- 135 276.63
- 153 849.66
- 140 261.62
- 429 387.91
149 111 678.28
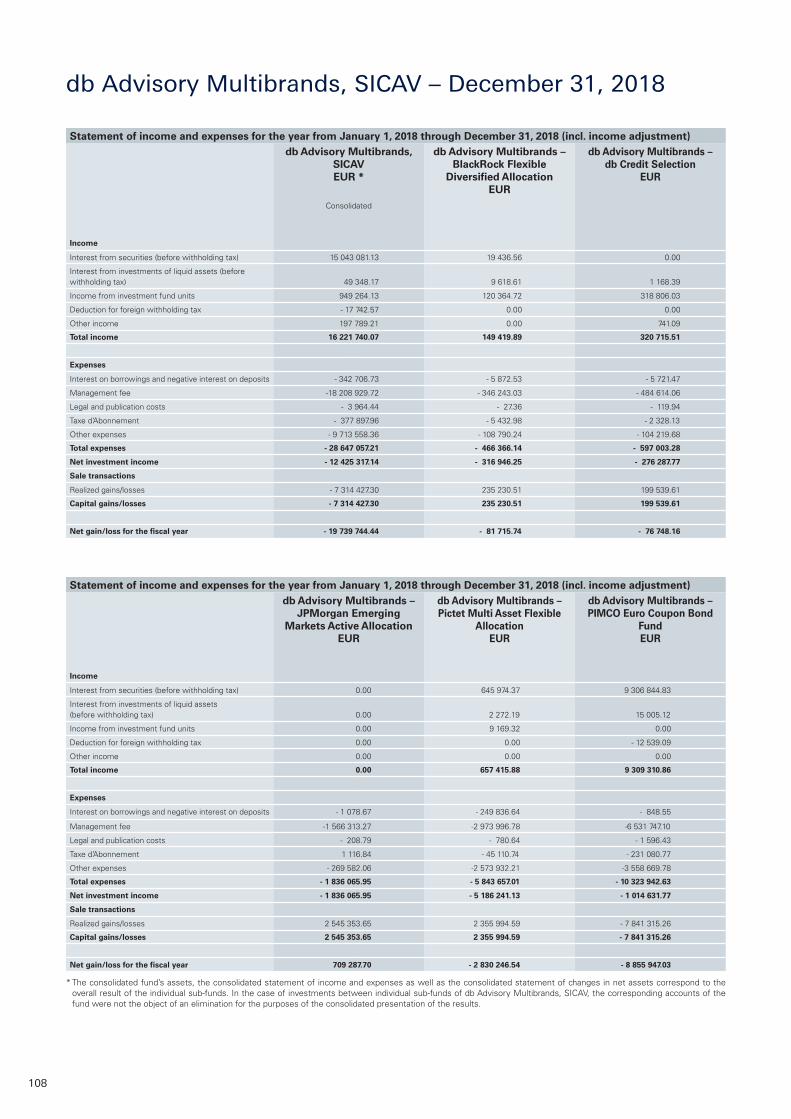
108
db Advisory Multibrands, SICAV – December 31, 2018
Statement of income and expenses for the year from January 1, 2018 through December 31, 2018 (incl. income adjustment)db Advisory Multibrands,
SICAVEUR *
db Advisory Multibrands – BlackRock Flexible
Diversified AllocationEUR
db Advisory Multibrands – db Credit Selection
EUR
Consolidated
Income
Interest from securities (before withholding tax) 15 043 081.13 19 436.56 0.00
Interest from investments of liquid assets (before withholding tax)
49 348.17
9 618.61
1 168.39
Income from investment fund units 949 264.13 120 364.72 318 806.03
Deduction for foreign withholding tax - 17 742.57 0.00 0.00
Other income 197 789.21 0.00 741.09
Total income 16 221 740.07 149 419.89 320 715.51
Expenses
Interest on borrowings and negative interest on deposits - 342 706.73 - 5 872.53 - 5 721.47
Management fee -18 208 929.72 - 346 243.03 - 484 614.06
Legal and publication costs - 3 964.44 - 27.36 - 119.94
Taxe d’Abonnement - 377 897.96 - 5 432.98 - 2 328.13
Other expenses - 9 713 558.36 - 108 790.24 - 104 219.68
Total expenses - 28 647 057.21 - 466 366.14 - 597 003.28
Net investment income - 12 425 317.14 - 316 946.25 - 276 287.77
Sale transactions
Realized gains/losses - 7 314 427.30 235 230.51 199 539.61
Capital gains/losses - 7 314 427.30 235 230.51 199 539.61
Net gain/loss for the fiscal year - 19 739 744.44 - 81 715.74 - 76 748.16
Statement of income and expenses for the year from January 1, 2018 through December 31, 2018 (incl. income adjustment)db Advisory Multibrands –
JPMorgan Emerging Markets Active Allocation
EUR
db Advisory Multibrands – Pictet Multi Asset Flexible
AllocationEUR
db Advisory Multibrands – PIMCO Euro Coupon Bond
FundEUR
Income
Interest from securities (before withholding tax) 0.00 645 974.37 9 306 844.83
Interest from investments of liquid assets (before withholding tax)
0.00
2 272.19
15 005.12
Income from investment fund units 0.00 9 169.32 0.00
Deduction for foreign withholding tax 0.00 0.00 - 12 539.09
Other income 0.00 0.00 0.00
Total income 0.00 657 415.88 9 309 310.86
Expenses
Interest on borrowings and negative interest on deposits - 1 078.67 - 249 836.64 - 848.55
Management fee -1 566 313.27 -2 973 996.78 -6 531 747.10
Legal and publication costs - 208.79 - 780.64 - 1 596.43
Taxe d’Abonnement 1 116.84 - 45 110.74 - 231 080.77
Other expenses - 269 582.06 -2 573 932.21 -3 558 669.78
Total expenses - 1 836 065.95 - 5 843 657.01 - 10 323 942.63
Net investment income - 1 836 065.95 - 5 186 241.13 - 1 014 631.77
Sale transactions
Realized gains/losses 2 545 353.65 2 355 994.59 - 7 841 315.26
Capital gains/losses 2 545 353.65 2 355 994.59 - 7 841 315.26
Net gain/loss for the fiscal year 709 287.70 - 2 830 246.54 - 8 855 947.03
* The consolidated fund’s assets, the consolidated statement of income and expenses as well as the consolidated statement of changes in net assets correspond to the overall result of the individual sub-funds. In the case of investments between individual sub-funds of db Advisory Multibrands, SICAV, the corresponding accounts of the fund were not the object of an elimination for the purposes of the consolidated presentation of the results.
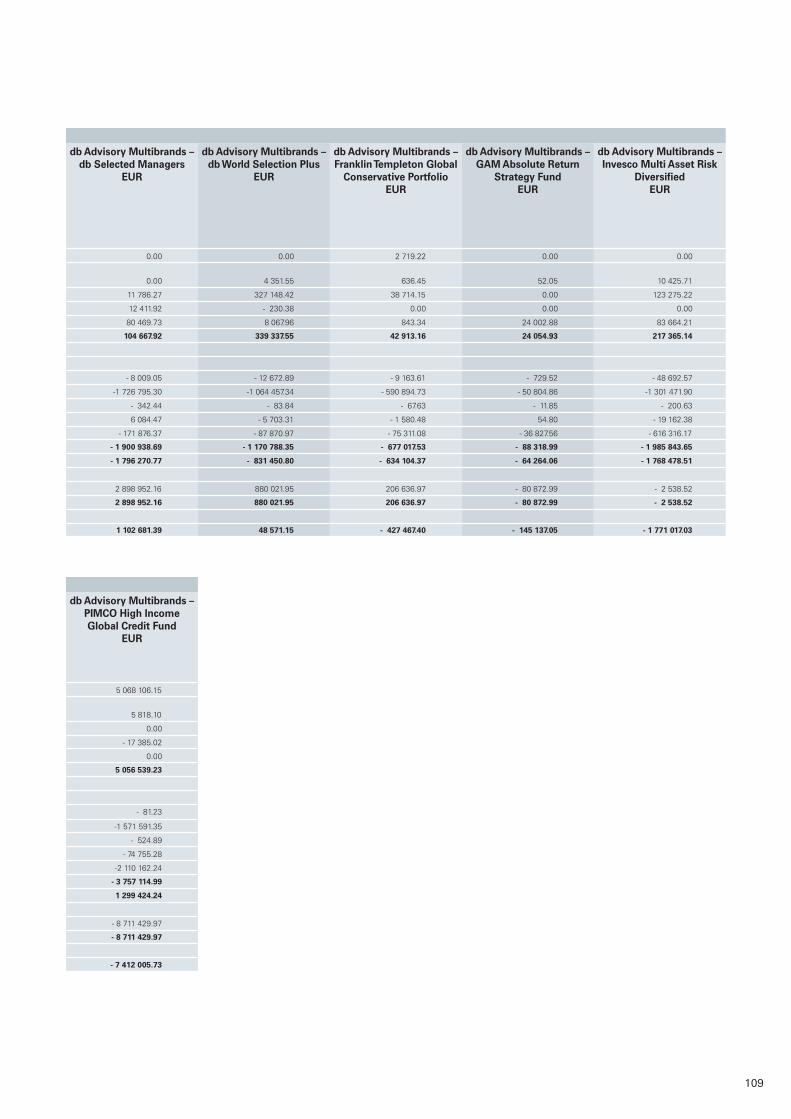
109
db Advisory Multibrands – db Selected Managers
EUR
db Advisory Multibrands – db World Selection Plus
EUR
db Advisory Multibrands – Franklin Templeton Global
Conservative PortfolioEUR
db Advisory Multibrands – GAM Absolute Return
Strategy FundEUR
db Advisory Multibrands – Invesco Multi Asset Risk
DiversifiedEUR
0.00 0.00 2 719.22 0.00 0.00
0.00
4 351.55
636.45
52.05
10 425.71
11 786.27 327 148.42 38 714.15 0.00 123 275.22
12 411.92 - 230.38 0.00 0.00 0.00
80 469.73 8 067.96 843.34 24 002.88 83 664.21
104 667.92 339 337.55 42 913.16 24 054.93 217 365.14
- 8 009.05 - 12 672.89 - 9 163.61 - 729.52 - 48 692.57
-1 726 795.30 -1 064 457.34 - 590 894.73 - 50 804.86 -1 301 471.90
- 342.44 - 83.84 - 67.63 - 11.85 - 200.63
6 084.47 - 5 703.31 - 1 580.48 54.80 - 19 162.38
- 171 876.37 - 87 870.97 - 75 311.08 - 36 827.56 - 616 316.17
- 1 900 938.69 - 1 170 788.35 - 677 017.53 - 88 318.99 - 1 985 843.65
- 1 796 270.77 - 831 450.80 - 634 104.37 - 64 264.06 - 1 768 478.51
2 898 952.16 880 021.95 206 636.97 - 80 872.99 - 2 538.52
2 898 952.16 880 021.95 206 636.97 - 80 872.99 - 2 538.52
1 102 681.39 48 571.15 - 427 467.40 - 145 137.05 - 1 771 017.03
db Advisory Multibrands – PIMCO High Income Global Credit Fund
EUR
5 068 106.15
5 818.10
0.00
- 17 385.02
0.00
5 056 539.23
- 81.23
-1 571 591.35
- 524.89
- 74 755.28
-2 110 162.24
- 3 757 114.99
1 299 424.24
- 8 711 429.97
- 8 711 429.97
- 7 412 005.73
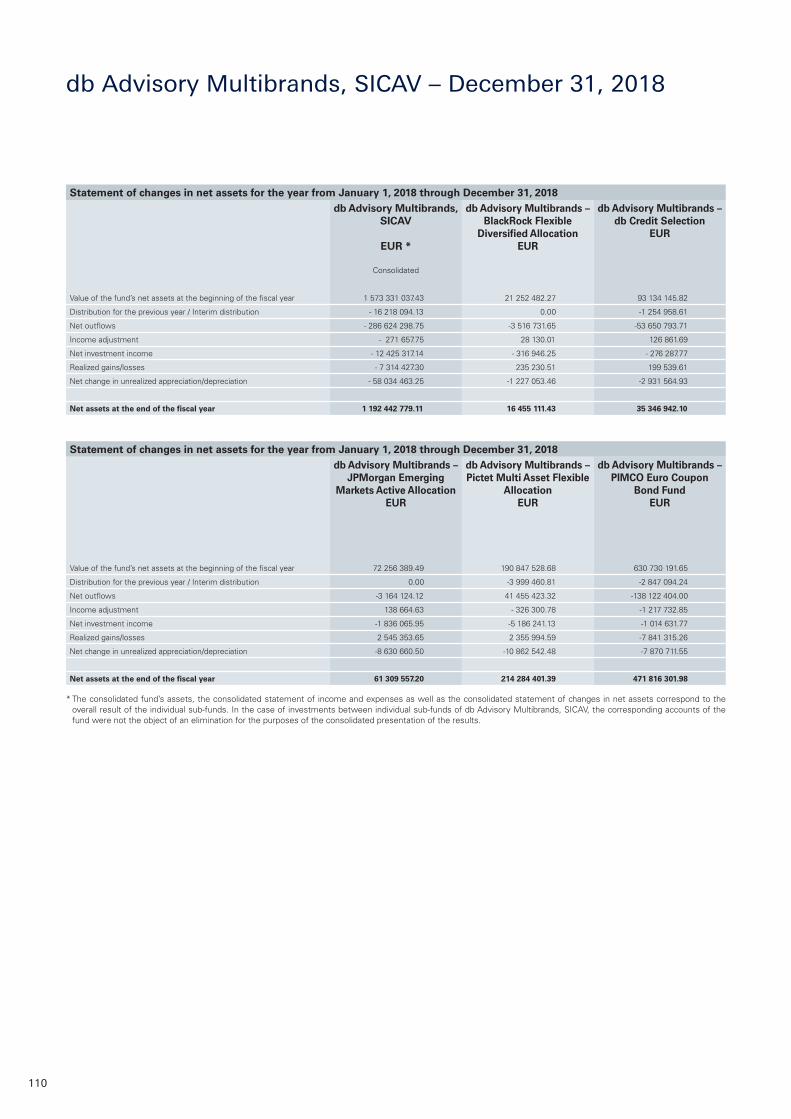
110
db Advisory Multibrands, SICAV – December 31, 2018
Statement of changes in net assets for the year from January 1, 2018 through December 31, 2018db Advisory Multibrands,
SICAV
EUR *
Consolidated
db Advisory Multibrands – BlackRock Flexible
Diversified AllocationEUR
db Advisory Multibrands – db Credit Selection
EUR
Value of the fund’s net assets at the beginning of the fiscal year 1 573 331 037.43 21 252 482.27 93 134 145.82
Distribution for the previous year / Interim distribution - 16 218 094.13 0.00 -1 254 958.61
Net outflows - 286 624 298.75 -3 516 731.65 -53 650 793.71
Income adjustment - 271 657.75 28 130.01 126 861.69
Net investment income - 12 425 317.14 - 316 946.25 - 276 287.77
Realized gains/losses - 7 314 427.30 235 230.51 199 539.61
Net change in unrealized appreciation/depreciation - 58 034 463.25 -1 227 053.46 -2 931 564.93
Net assets at the end of the fiscal year 1 192 442 779.11 16 455 111.43 35 346 942.10
Statement of changes in net assets for the year from January 1, 2018 through December 31, 2018db Advisory Multibrands –
JPMorgan Emerging Markets Active Allocation
EUR
db Advisory Multibrands – Pictet Multi Asset Flexible
AllocationEUR
db Advisory Multibrands – PIMCO Euro Coupon
Bond FundEUR
Value of the fund’s net assets at the beginning of the fiscal year 72 256 389.49 190 847 528.68 630 730 191.65
Distribution for the previous year / Interim distribution 0.00 -3 999 460.81 -2 847 094.24
Net outflows -3 164 124.12 41 455 423.32 -138 122 404.00
Income adjustment 138 664.63 - 326 300.78 -1 217 732.85
Net investment income -1 836 065.95 -5 186 241.13 -1 014 631.77
Realized gains/losses 2 545 353.65 2 355 994.59 -7 841 315.26
Net change in unrealized appreciation/depreciation -8 630 660.50 -10 862 542.48 -7 870 711.55
Net assets at the end of the fiscal year 61 309 557.20 214 284 401.39 471 816 301.98
* The consolidated fund’s assets, the consolidated statement of income and expenses as well as the consolidated statement of changes in net assets correspond to the overall result of the individual sub-funds. In the case of investments between individual sub-funds of db Advisory Multibrands, SICAV, the corresponding accounts of the fund were not the object of an elimination for the purposes of the consolidated presentation of the results.
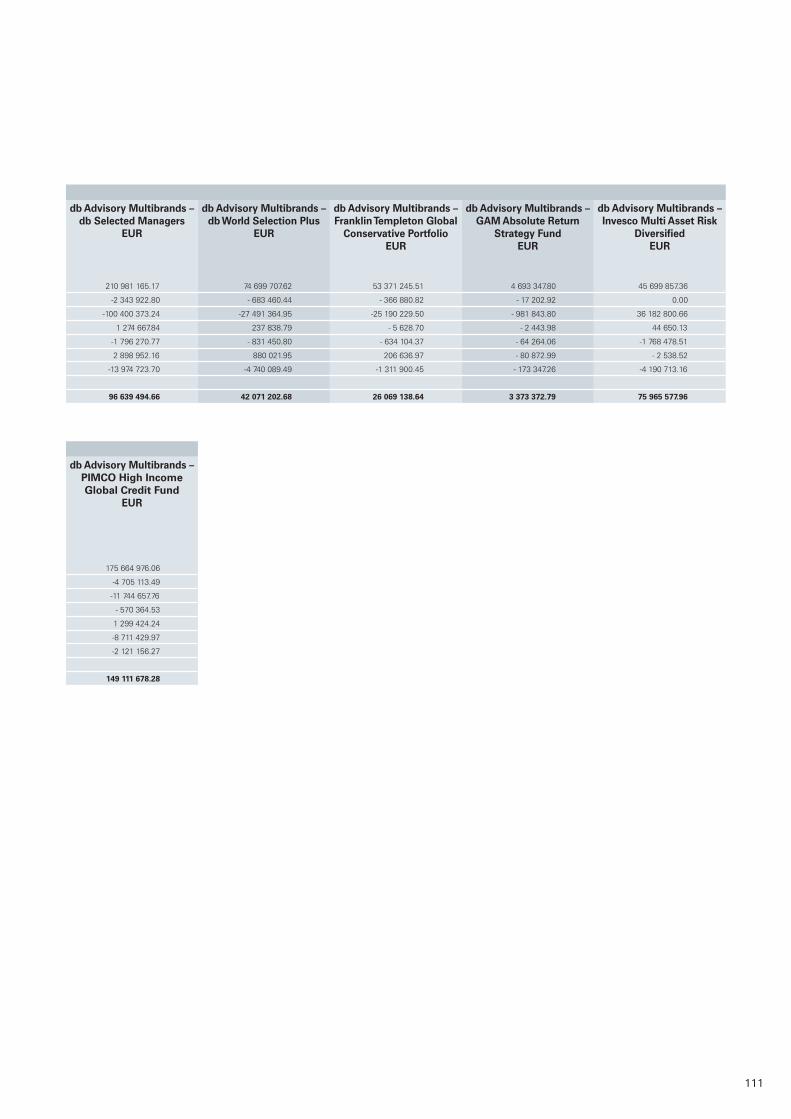
111
db Advisory Multibrands – db Selected Managers
EUR
db Advisory Multibrands – db World Selection Plus
EUR
db Advisory Multibrands – Franklin Templeton Global
Conservative PortfolioEUR
db Advisory Multibrands – GAM Absolute Return
Strategy FundEUR
db Advisory Multibrands – Invesco Multi Asset Risk
DiversifiedEUR
210 981 165.17 74 699 707.62 53 371 245.51 4 693 347.80 45 699 857.36
-2 343 922.80 - 683 460.44 - 366 880.82 - 17 202.92 0.00
-100 400 373.24 -27 491 364.95 -25 190 229.50 - 981 843.80 36 182 800.66
1 274 667.84 237 838.79 - 5 628.70 - 2 443.98 44 650.13
-1 796 270.77 - 831 450.80 - 634 104.37 - 64 264.06 -1 768 478.51
2 898 952.16 880 021.95 206 636.97 - 80 872.99 - 2 538.52
-13 974 723.70 -4 740 089.49 -1 311 900.45 - 173 347.26 -4 190 713.16
96 639 494.66 42 071 202.68 26 069 138.64 3 373 372.79 75 965 577.96
db Advisory Multibrands – PIMCO High Income Global Credit Fund
EUR
175 664 976.06
-4 705 113.49
-11 744 657.76
- 570 364.53
1 299 424.24
-8 711 429.97
-2 121 156.27
149 111 678.28


Supplementary information
114
The DWS Investment S.A. (the “Company”) is a subsidiary in DWS Group GmbH & Co. KGaA (DWS KGaA), Frankfurt, one of the world’s leading asset managers providing a broad range of investment products and services across all major asset classes as well as solutions aligned to growth trends to its clients globally.
Since 23 March 2018, DWS KGaA is a publicly traded company listed on the Frankfurt Stock Exchange, which is majority owned by Deutsche Bank AG.
As a result of the sector specific legislation under UCITS V (Undertakings for Collective Investment in Transferable Securities Directive V) and in accordance with Sec. 1 and Sec. 27 of the German “Institutsvergütungsverordnung” (InstVV), the Company is carved-out from Deutsche Bank Group’s (DB Group) compensation policy and strategy. DWS KGaA and its subsidiaries (DWS Group) have established their own compensation governance, policy, and structures, including a DWS group-wide guideline of identifying “Material Risk Takers” (“MRTs”) at Company level as well as DWS Group level in line with the criteria stated in UCITS V and in the guidelines the on sound remuneration policies under UCITS published by the European Securities and Markets Authority (“ESMA Guidelines”).
Governance Structure
DWS Group is managed through its General Partner, the DWS Management GmbH. The General Partner has eight Managing Directors who serve as the Executive Board (“EB”) of DWS Group. The Executive Board – supported by the DWS Compensation Committee (“DCC”) – is responsible for establishing and operating the compensation system for employees. It is overseen by the DWS KGaA Supervisory Board which has established a Remuneration Committee (“RC”). The RC reviews the compensation system of the DWS Group’s employees and its appropriateness.
The DCC is mandated to develop and design sustainable compensation frameworks and operating principles, to prepare recommendations on total compensation levels, and to ensure appropriate compensation and benefits governance and oversight for DWS Group. The DCC establishes quantitative and qualitative factors to assess performance as a basis for compensa-tion related decisions and makes appropriate recommendations to the EB regarding the annual Variable Compensation pool and its allocation across the business areas and Infrastructure functions. In order to maintain its independence, only EB members without any responsibility for the Investment Group or for the Coverage Group are members of the DCC. The DCC comprises the Chief Executive Officer (“CEO”), Chief Financial Officer (“CFO”), Chief Control Officer (“CCO”), Chief Operating Officer (“COO”) and the Global Head of HR as Voting Mem-bers. The Head of Performance & Reward is a nonvoting member. The membership of the CCO ensures that Control Functions such as Compliance, Anti-Financial Crime, and Risk Manage-ment are appropriately involved in the design and application of DWS’ remuneration systems in the context of the tasks and functions assigned to them, to ensure that the remuneration systems do not create conflicts of interests, and to review the effects on the risk profile of DWS Group. The DCC reviews the remuneration framework of DWS Group regularly, at least annually, which includes the principles applying to the Company, and assesses if substantial changes or amendments due to irregularities have to be made.
The DCC works in cooperation with committees at DB Group level, in particular the DB Senior Executive Compensation Committee (“SECC”) and continues to leverage certain DB control committees, delegated committees of SECC such as Compensation Operating Committee (COC), Employee Investment Plan Investment Committee (EIP IC), Forfeiture and Suspension Review Committee (FSRC), Group Compensation Oversight Committee (GCOC) and Pension Risk Committee (PRC).
The internal annual review at DWS Group level concluded the design of the remuneration system to be appropriate, no significant irregularities were recognized.
Compensation Structure
The employees of the Company are subject to the compensation standards and principles as outlined in the DWS Compensation Policy. The policy is reviewed on an annual basis. As part of the Compensation Policy, DWS Group, including the Company, employs a Total Compensation (“TC”) philosophy which comprises Fixed Pay (“FP”) and Variable Compensation (“VC”).
DWS Group ensures an appropriate relationship between FP and VC across all categories and groups of employees. TC structures and levels reflect the Sub-Divisional and regional compen-sation structures, internal relativities, and market data, and assist in seeking consistency across DWS Group. One of the main objectives of DWS Group’s strategy is to align reward for sustainable performance at all levels of DWS Group whilst enhancing the transparency of compensation decisions and their impact on shareholders and employees with regard to DWS Group and DB Group performance. Achieving a sustainable balance between employee, shareholder and client interests is a key aspect of DWS’ Group compensation strategy.
FP is used to compensate employees for their skills, experience and competencies, commensurate with the requirements, size and scope of their role. The appropriate level of FP is deter-mined with reference to the prevailing market rates for each role, internal comparisons and applicable regulatory requirements.
VC is a discretionary compensation element that enables DWS Group to provide additional reward to employees for their performance and behaviours without encouraging excessive risk-taking. VC determination considers sound risk measures by taking into account DWS Group Risk Appetite as well as DWS Group affordability and financial situation and providing for a fully flexible policy on granting or “not-granting” VC. VC generally consists of two elements – the “Group Component” and the “Individual Component”. There continues to be no guarantee of VC in an existing employment relationship.
2018 is considered as a transitional year in the light of forming a DWS Group Compensation Framework. Therefore the Group Component is determined based upon the performance of four equally weighted Key Performance Indicators (KPIs) at DB Group level: Common Equity Tier 1 (“CET1”) capital ratio, leverage ratio, adjusted costs and post-tax return on tangible equity (“RoTE”). These four KPIs represent important metrics for the capital, risk, cost and the revenue profile of DB Group and provide a good indication of its sustainable performance.
With the “Group Component”, DWS Group and the Company aim to recognise that every employee contributes to DWS Group’s and thereby to DB Group’s success.
Depending on eligibility, the “Individual Component” is delivered either in the form of Individual VC (IVC) or a Recognition Award. IVC takes into consideration a number of financial and non-financial factors, relativities within the employee’s peer group and retention considerations. The Recognition Award provides the opportunity to acknowledge and reward outstanding contri-butions made by employees outside the scope of IVC eligibility (these are generally employees at lower hierarchical levels). Generally, there are two nomination cycles per year.
Both Group and IVC may be awarded in cash, share-based or fund-based instruments under the DWS Group deferral arrangements. DWS Group retains the right to reduce the total amount of VC, including the Group Component, to zero in cases of significant misconduct, performance-related measures, disciplinary outcomes or unsatisfactory conduct or behaviour by the employee subject to applicable local law.
Remuneration Disclosure
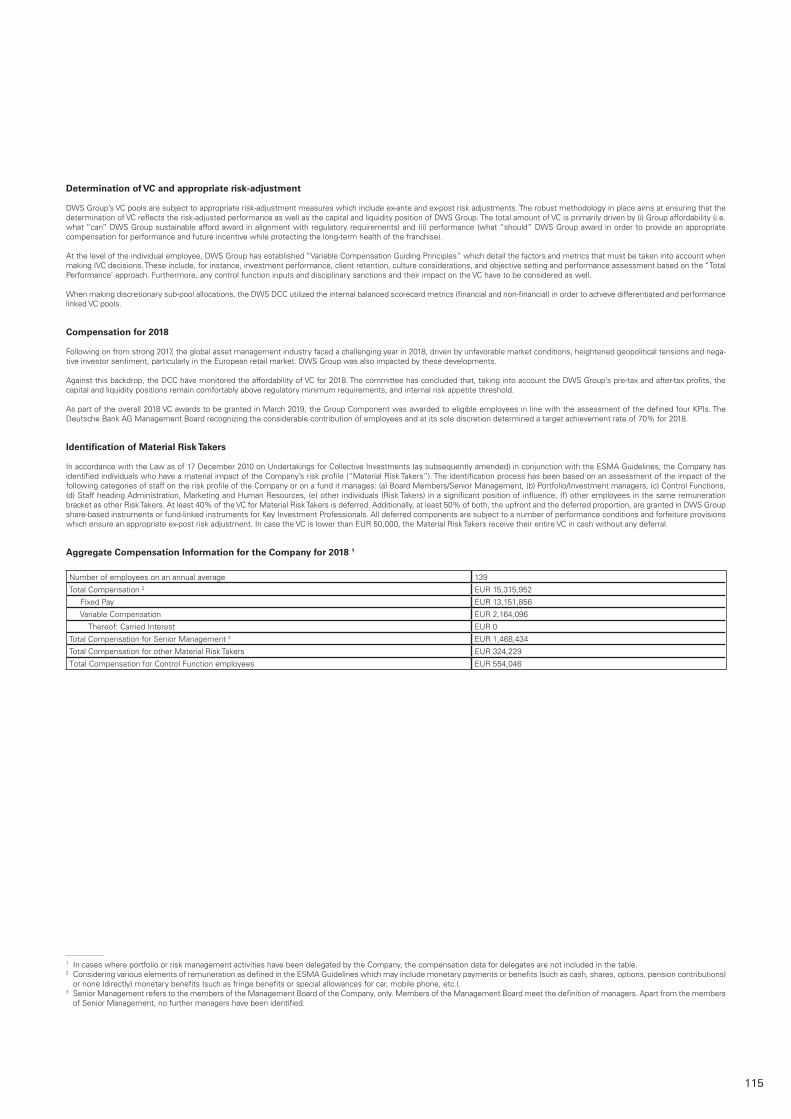
115
Determination of VC and appropriate risk-adjustment
DWS Group’s VC pools are subject to appropriate risk-adjustment measures which include ex-ante and ex-post risk adjustments. The robust methodology in place aims at ensuring that the determination of VC reflects the risk-adjusted performance as well as the capital and liquidity position of DWS Group. The total amount of VC is primarily driven by (i) Group affordability (i.e. what “can” DWS Group sustainable afford award in alignment with regulatory requirements) and (ii) performance (what “should” DWS Group award in order to provide an appropriate compensation for performance and future incentive while protecting the long-term health of the franchise).
At the level of the individual employee, DWS Group has established “Variable Compensation Guiding Principles” which detail the factors and metrics that must be taken into account when making IVC decisions. These include, for instance, investment performance, client retention, culture considerations, and objective setting and performance assessment based on the “Total Performance’ approach. Furthermore, any control function inputs and disciplinary sanctions and their impact on the VC have to be considered as well.
When making discretionary sub-pool allocations, the DWS DCC utilized the internal balanced scorecard metrics (financial and non-financial) in order to achieve differentiated and performance linked VC pools.
Compensation for 2018
Following on from strong 2017, the global asset management industry faced a challenging year in 2018, driven by unfavorable market conditions, heightened geopolitical tensions and nega-tive investor sentiment, particularly in the European retail market. DWS Group was also impacted by these developments.
Against this backdrop, the DCC have monitored the affordability of VC for 2018. The committee has concluded that, taking into account the DWS Group’s pre-tax and after-tax profits, the capital and liquidity positions remain comfortably above regulatory minimum requirements, and internal risk appetite threshold.
As part of the overall 2018 VC awards to be granted in March 2019, the Group Component was awarded to eligible employees in line with the assessment of the defined four KPIs. The Deutsche Bank AG Management Board recognizing the considerable contribution of employees and at its sole discretion determined a target achievement rate of 70% for 2018.
Identification of Material Risk Takers
In accordance with the Law as of 17 December 2010 on Undertakings for Collective Investments (as subsequently amended) in conjunction with the ESMA Guidelines, the Company has identified individuals who have a material impact of the Company’s risk profile (“Material Risk Takers”). The identification process has been based on an assessment of the impact of the following categories of staff on the risk profile of the Company or on a fund it manages: (a) Board Members/Senior Management, (b) Portfolio/Investment managers, (c) Control Functions, (d) Staff heading Administration, Marketing and Human Resources, (e) other individuals (Risk Takers) in a significant position of influence, (f) other employees in the same remuneration bracket as other Risk Takers. At least 40% of the VC for Material Risk Takers is deferred. Additionally, at least 50% of both, the upfront and the deferred proportion, are granted in DWS Group share-based instruments or fund-linked instruments for Key Investment Professionals. All deferred components are subject to a number of performance conditions and forfeiture provisions which ensure an appropriate ex-post risk adjustment. In case the VC is lower than EUR 50,000, the Material Risk Takers receive their entire VC in cash without any deferral.
Aggregate Compensation Information for the Company for 2018 1
Number of employees on an annual average 139
Total Compensation 2 EUR 15,315,952
Fixed Pay EUR 13,151,856
Variable Compensation EUR 2,164,096
Thereof: Carried Interest EUR 0
Total Compensation for Senior Management 3 EUR 1,468,434
Total Compensation for other Material Risk Takers EUR 324,229
Total Compensation for Control Function employees EUR 554,046
1 In cases where portfolio or risk management activities have been delegated by the Company, the compensation data for delegates are not included in the table.2 Considering various elements of remuneration as defined in the ESMA Guidelines which may include monetary payments or benefits (such as cash, shares, options, pension contributions)
or none (directly) monetary benefits (such as fringe benefits or special allowances for car, mobile phone, etc.).3 Senior Management refers to the members of the Management Board of the Company, only. Members of the Management Board meet the definition of managers. Apart from the members
of Senior Management, no further managers have been identified.
116
Information according to Regulation (EU) 2015/2365 on the transparency of securities financing transactions, and the re-use and amending Regulation (EU) No 648/2012 – Certificate in Section A
In the reporting period, there were no securities financing transactions for the following funds according to the above mentioned regulation:
db Advisory Multibrands - BlackRock Flexible Diversified Allocationdb Advisory Multibrands - db Credit Selectiondb Advisory Multibrands - db Selected Managersdb Advisory Multibrands - db World Selection Plusdb Advisory Multibrands - Franklin Templeton Global Conservative Portfoliodb Advisory Multibrands - GAM Absolute Return Strategy Funddb Advisory Multibrands - Invesco Multi Asset Risk Diversifieddb Advisory Multibrands - JPMorgan Emerging Markets Active Allocationdb Advisory Multibrands - Pictet Multi Asset Flexible Allocationdb Advisory Multibrands - PIMCO Euro Coupon Bond Funddb Advisory Multibrands - PIMCO High Income Global Credit Fund
117
To the Shareholders ofdb Advisory Multibrands, SICAV2, Boulevard Konrad AdenauerL-1115 Luxembourg
REPORT OF THE REVISEUR D’ENTREPRISES AGREE
Report on the audit of the financial statements
OpinionWe have audited the accompanying financial statements of db Advisory Multibrands, SICAV (the “Fund”) and each of its sub-funds, which comprise the statement of net assets including the statement of invest-ments in securities and other net assets as at 31 December 2018 and the statement of income and expens-es and the statement of changes in net assets for the year then ended, and explanatory information to the financial statements, including a summary of significant accounting policies.
In our opinion, the accompanying financial statements give a true and fair view of the financial position of db Advisory Multibrands, SICAV as at 31 December 2018 and of the results of their operations and changes in their net assets for the year then ended in accordance with Luxembourg legal and regulatory require-ments relating to the preparation and presentation of the financial statements.
Basis for opinionWe conducted our audit in accordance with the Law of 23 July 2016 on the audit profession (“Law of 23 July 2016”) and with International Standards on Auditing (“ISAs”) as adopted for Luxembourg by the Commis-sion de Surveillance du Secteur Financier (“CSSF”). Our responsibilities under the Law of 23 July 2016 and ISAs are further described in the «Responsibilities of “Réviseur d’Entreprises agréé” for the audit of the fi-nancial statements» section of our report. We are also independent of the Fund in accordance with the In-ternational Ethics Standards Board for Accountants’ Code of Ethics for Professional Accountants (“IESBA Code”) as adopted for Luxembourg by the CSSF together with the ethical requirements that are relevant to our audit of the financial statements, and have fulfilled our other ethical responsibilities under those ethical requirements. We believe that the audit evidence we have obtained is sufficient and appropriate to provide a basis for our opinion.
Other informationThe Board of Directors of the Fund is responsible for the other information. The other information comprises the information stated in the annual report but does not include the financial statements and our report of “Réviseur d’Entreprises agréé” thereon.
Our opinion on the financial statements does not cover the other information and we do not express any form of assurance conclusion thereon.
KPMG Luxembourg, Société coopérative Tel: +352 22 51 51 139, Avenue John F. Kennedy Fax: +352 22 51 71L-1855 Luxembourg Email: [email protected] Internet: www.kpmg.lu
KPMG Luxembourg, Société coopérative, a Luxembourg entity and a T.V.A. LU 27351518member firm of the KPMG network of independent member firms R.C.S. Luxembourg B 149133affiliated with KPMG International Cooperative (”KPMG International“), a Swiss entity
118
In connection with our audit of the financial statements, our responsibility is to read the other information and, in doing so, consider whether the other information is materially inconsistent with the financial state-ments or our knowledge obtained in the audit or otherwise appears to be materially misstated. If, based on the work we have performed, we conclude that there is a material misstatement of this other information, we are required to report this fact. We have nothing to report in this regard.
Responsibilities of Board of Directors of the Fund for the financial statementsThe Board of Directors of the Fund is responsible for the preparation and fair presentation of these financial statements in accordance with Luxembourg legal and regulatory requirements relating to the preparation and presentation of the financial statements, and for such internal control as the Board of Directors of the Fund determines is necessary to enable the preparation of financial statements that are free from material misstatement, whether due to fraud or error.
In preparing the financial statements, the Board of Directors of the Fund is responsible for assessing the Fund’s ability and each of its sub-funds’ to continue as a going concern, disclosing, as applicable, matters related to going concern and using the going concern basis of accounting unless the Board of Directors of the Fund either intends to liquidate the Fund or close any of its sub-funds or to cease operations, or has no realistic alternative but to do so.
Responsibilities of the “Réviseur d’Entreprises agréé” for the audit of the financial statementsThe objectives of our audit are to obtain reasonable assurance about whether the financial statements as a whole are free from material misstatement, whether due to fraud or error, and to issue a report of “Réviseur d’Entreprises agréé” that includes our opinion. Reasonable assurance is a high level of assurance, but is not a guarantee that an audit conducted in accordance with the Law of 23 July 2016 and with ISAs as adopted for Luxembourg by the CSSF will always detect a material misstatement when it exists. Misstatements can arise from fraud or error and are considered material if, individually or in the aggregate, they could reason-ably be expected to influence the economic decisions of users taken on the basis of these financial state-ments.
As part of an audit in accordance with the Law of 23 July 2016 and with ISAs as adopted for Luxembourg by the CSSF, we exercise professional judgement and maintain professional scepticism throughout the audit.
119
We also:
• Identify and assess the risks of material misstatement of the financial statements, whether due to fraud or error, design and perform audit procedures responsive to those risks, and obtain audit evidence that is sufficient and appropriate to provide a basis for our opinion. The risk of not detecting a material misstate-ment resulting from fraud is higher than for one resulting from error, as fraud may involve collusion, forg-ery, intentional omissions, misrepresentations, or the override of internal control.
• Obtain an understanding of internal control relevant to the audit in order to design audit procedures that are appropriate in the circumstances, but not for the purpose of expressing an opinion on the effective-ness of the Fund’s internal control.
• Evaluate the appropriateness of accounting policies used and the reasonableness of accounting estimates and related disclosures made by the Board of Directors of the Fund.
• Conclude on the appropriateness of Board of Directors of the Fund’s use of the going concern basis of accounting and, based on the audit evidence obtained, whether a material uncertainty exists related to events or conditions that may cast significant doubt on the Fund’s or any of its sub-funds’ ability to con-tinue as a going concern. If we conclude that a material uncertainty exists, we are required to draw atten-tion in our report of “Réviseur d’Entreprises agréé” to the related disclosures in the financial statements or, if such disclosures are inadequate, to modify our opinion. Our conclusions are based on the audit evi-dence obtained up to the date of our report of “Réviseur d’Entreprises agréé”. However, future events or conditions may cause the Fund or any of its sub-funds to cease to continue as a going concern.
• Evaluate the overall presentation, structure and content of the financial statements, including the disclo-sures, and whether the financial statements represent the underlying transactions and events in a manner that achieves fair presentation.
We communicate with those charged with governance regarding, among other matters, the planned scope and timing of the audit and significant audit findings, including any significant deficiencies in internal con-trol that we identify during our audit.
Luxembourg, 8 April 2019 KPMG Luxembourg Société coopérative Cabinet de révision agréé
Harald Thönes
Investment Company
db Advisory Multibrands, SICAV2, Boulevard Konrad Adenauer1115 Luxembourg, LuxembourgRC B 167 637
Board of Directors of the Investment Company
Niklas SeifertChairman DWS Investment S.A., Luxembourg
Stephan Scholl (until December 31,2018)DWS International GmbHFrankfurt/Main
Sven SendmeyerDWS Investment GmbH, Frankfurt/Main
Thilo Hubertus WendenburgIndependent MemberFrankfurt/Main
Promoter, Management Company, Head Office, Transfer Agent and Main Distributor
DWS Investment S.A.2, Boulevard Konrad Adenauer1115 Luxembourg, LuxembourgEquity capital as of December 31, 2018:EUR 288.6 million before profit appropriation
At the extraordinary general meeting of Deutsche Asset Management S.A. on September 11, 2018, a resolution was passed to change the name of the company to DWS Investment S.A. effective January 1, 2019.
Supervisory Board of the Management Company
Holger NaumannChairmanDWS Investment GmbH, Frankfurt/Main
Nathalie Bausch (until January 31, 2018)Deutsche Bank Luxembourg S.A., Luxembourg
Yves Dermaux (until June 5, 2018)Deutsche Bank AG,London
Stefan KreuzkampDWS Investment GmbH, Frankfurt/Main
Frank KringsDeutsche Bank Luxembourg S.A., Luxembourg
Dr. Matthias LiermannDWS Investment GmbH, Frankfurt/Main
Claire Peel (since August 1, 2018)DWS Management GmbH,Frankfurt/Main
Nikolaus von Tippelskirch (since August 1, 2018)DWS Management GmbH,Frankfurt/Main
Management Board of the Management Company
Manfred BauerChairmanDWS Investment S.A., Luxembourg
Nathalie Bausch (since February 1, 2018)DWS Investment S.A., Luxembourg
Ralf Rauch (until April 30, 2018)DWS Investment GmbH, Frankfurt/Main
Barbara SchotsDWS Investment S.A., Luxembourg
Fund Manager
For the sub-funds db Advisory Multibrands – PIMCO Euro Coupon Bond Fund and db Advisory Multibrands – PIMCO High Income Global Credit Fund:
DWS Investment GmbHMainzer Landstraße 11–1760329 Frankfurt/Main, Germany
Acting as sub-fund manager for these sub-funds:PIMCO Deutschland GmbHSeidlstraße 24–24a80335 Munich, Germany
For the sub-fund db Advisory Multibrands – Franklin Templeton Global Conservative Portfolio:
DWS Investment GmbHMainzer Landstraße 11–1760329 Frankfurt/Main, Germany
Acting as sub-fund manager for this sub-fund:Franklin Templeton InternationalServices S.à r.l.8A, rue Albert Borschette1246 Luxembourg, Luxembourg
For the sub-fund db Advisory Multibrands – BlackRock Flexible Diversified Allocation:
DWS Investment GmbHMainzer Landstraße 11–1760329 Frankfurt/Main
Acting as sub-fund manager for this sub-fund:BlackRock Investment Management (UK) LtdDrapers Gardens12 Throgmorton AvenueLondon EC2N 2DL, United Kingdom
For the sub-fund db Advisory Multibrands – Invesco Multi Asset Risk Diversified:
DWS Investment GmbHMainzer Landstraße 11–1760329 Frankfurt/Main, Germany
Acting as sub-fund manager for this sub-fund:Invesco Asset Management S.A.16–18, rue de Londres75009 Paris, France
For the sub-fund db Advisory Multibrands – JPMorgan Emerging Markets Active Allocation:
DWS Investment GmbHMainzer Landstraße 11–1760329 Frankfurt/Main, Germany
Acting as sub-fund manager for this sub-fund:JPMorgan Asset Management (UK) LimitedFinsbury Dials20 Finsbury StreetLondon EC2Y 9AQ, United Kingdom
For the sub-fund db Advisory Multibrands – GAM Absolute Return Strategy Fund:
DWS Investment GmbHMainzer Landstraße 11–1760329 Frankfurt/Main, Germany
Acting as sub-fund manager for this sub-fund:GAM (Italia) SGR S.p.A.Via Duccio di Boninsegna, 1020145 Milano, Italy
For the sub-fund db Advisory Multibrands – Pictet Multi Asset Flexible Allocation:
DWS Investment GmbHMainzer Landstraße 11–1760329 Frankfurt/Main, Germany
Acting as sub-fund manager for this sub-fund:Pictet Asset Management Ltd – Italian BranchVia Della Moscova 320121 Milano, Italy
For all other sub-funds:
DWS Investment GmbHMainzer Landstr. 11-1760329 Frankfurt/Main, Germany

Auditor
KPMG LuxembourgSociété coopérative39, Avenue John F. Kennedy1855 Luxembourg, Luxembourg
Depositary
State Street Bank Luxembourg S.C.A.49, Avenue John F. Kennedy1855 Luxembourg, Luxembourg
Sales, Information and Paying Agent
LUXEMBOURGDeutsche Bank Luxembourg S.A.2, Boulevard Konrad Adenauer1115 Luxembourg, Luxembourg
As of: February 28, 2019

db Advisory Multibrands, SICAV2, Boulevard Konrad Adenauer1115 Luxembourg, LuxembourgRC B 167 637Tel.: +352 4 21 01-1 Fax: +352 4 21 01-9 00