Annual Report SEB Fund 4 - Fundsquare
34
R.C.S K 52 Annual Report SEB Fund 4 Status: 31 December 2016 R.C.S K 52 SIEIB
-
Upload
khangminh22 -
Category
Documents
-
view
2 -
download
0
Transcript of Annual Report SEB Fund 4 - Fundsquare

R.C.S K 52
Annual Report
SEB Fund 4
Status: 31 December 2016
R.C.S K 52 SIEIB

Notice
The sole legally binding basis for the purchase of units
of the Fund described in this report is the latest valid
Sales Prospectus with its terms of contract.
NoticeThe sole legally binding basis for the purchase of unitsof the Fund described in this report is the latest ValidSales Prospectus with its terms of contract.

1
Page
Additional Information to the Investors in the Federal Republic of Germany 2
Organisation 3
General Information 5
Management Report 7
Schedule of Investments:
SEB Fund 4 - SEB Short Bond Fund EUR 9
SEB Fund 4 - SEB Short Bond Fund SEK 12
SEB Fund 4 - SEB Short Bond Fund USD 15
Combined Statement of Operations 16
Combined Statement of Changes in Net Assets 17
Combined Statement of Net Assets 18
Statistical Information 19
Notes to the Financial Statements 23
Audit Report 27
Risk Disclosure (unaudited) 29
Remuneration Disclosure (unaudited) 30
Table of Contents
Additional Information to the Investors in the Federal Republic of GermanyOrganisationGeneral Information
Management Report
Schedule of Investments:
SEB Fund 4 - SEB Short Bond Fund EURSEB Fund 4 - SEB Short Bond Fund SEKSEB Fund 4 - SEB Short Bond Fund USD
Combined Statement of OperationsCombined Statement of Changes in Net AssetsCombined Statement of Net AssetsStatistical Information
Notes to the Financial Statements
Audit ReportRisk Disclosure (unaudited)
Remuneration Disclosure (unaudited)
Page
\'lU'IbJl\)
12
15
16
17
18
19
23
27
29
30

2
Units in circulation:
The following Sub-Fund is publicly approved for distribution in Germany:
SEB Fund 4 - SEB Short Bond Fund EUR
The following Sub-Funds are not distributed in Germany:
SEB Fund 4 - SEB Short Bond Fund SEK
SEB Fund 4 - SEB Short Bond Fund USD
The information disclosed above is as at 31 December 2016 and this may change after the year end. The current Sub-
Funds in circulation and the current registrations per unit class are visible in the distribution matrix on
www.sebgroup.lu.
Additional Information to the Investors in the Federal Republicof GermanyAs at 31 December 2016
Units in circulation:
The following Sub-Fund is publicly approved for distribution in Germany:0 SEB Fund 4 - SEB Short Bond Fund EUR
The following Sub-Funds are not distributed in Germany:0 SEB Fund 4 - SEB Short Bond Fund SEK0 SEB Fund 4 - SEB Short Bond Fund USD
The information disclosed above is as at 31 December 2016 and this may change after the year end. The current Sub-Funds in circulation and the current registrations per unit class are Visible in the distribution matrix onwww.sebgroup.lu.

3
Management Company: SEB Investment Management AB (since 2 November 2016)
Sveavägen 8
SE-106 40 Stockholm
SEB Asset Management S.A. (until 2 November 2016)
4, rue Peternelchen
L-2370 Howald, Luxembourg
Board of Directors of
the Management Company
Chairperson
William Paus
Head of Skandinaviska Enskilda Banken AB (publ)
Oslo Branch
Norway
Members
Magnus Wallberg
Chief Financial Officer
Life and Investment Management Division
Skandinaviska Enskilda Banken AB (publ)
Sweden
Johan Wigh
Advokat, Törngren Magnell
Sandemarsvägen 18
122 60 Enskede
Sweden
Karin S. Thorburn
Professor in Finance at the
Norwegian School of Economics
Starefossveien 58 A
5019 Bergen, Norway
Branch of the Management Company: SEB Investment Management AB, Luxembourg Branch (since 2 November 2016)
4, rue Peternelchen
L-2370 Howald
Central Administration (including the
administrative, registrar and transfer
agent function) and Paying Agent in
Luxembourg:
The Bank of New York Mellon (Luxembourg) S.A.
2-4, rue Eugène Ruppert
L-2453 Luxembourg
Investment Manager: SEB Investment Management AB
Sveavägen 8
SE-106 40 Stockholm, Sweden
Depositary: Skandinaviska Enskilda Banken S.A.
4, rue Peternelchen
L-2370 Howald, Luxembourg Auditor of the Fund:
PricewaterhouseCoopers, Société coopérative
2, rue Gerhard Mercator
L-2182 Luxembourg
Organisation
Management Company:
Board of Directors ofthe Management Company
Branch of the Management Company:
Central Administration (including theadministrative, registrar and transferagent function) and Paying Agent inLuxembourg:
Investment Manager:
Depositary:
Auditor of the Fund:
SEB Investment Management AB (since 2 November 2016)Sveavéigen 8SE-106 40 Stockholm
SEB Asset Management S.A. (until 2 November 2016)4, rue PeternelchenL-2370 Howald, Luxembourg
ChairpersonWilliam PausHead of Skandinaviska Enskilda Banken AB (publ)Oslo BranchNorway
MembersMagnus WallbergChief Financial OfficerLife and Investment Management DivisionSkandinaviska Enskilda Banken AB (publ)Sweden
]ohan WighAdvokat, Torngren MagnellSandemarsvagen 18122 60 EnskedeSweden
Karin S. ThorburnProfessor in Finance at theNorwegian School of EconomicsStarefossveien 58 A5019 Bergen, Norway
SEB Investment Management AB, Luxembourg Branch (since 2 November 2016)4, rue PeternelchenL-2370 Howald
The Bank of New York Mellon (Luxembourg) S.A.2-4, rue Eugene RuppertL-2453 Luxembourg
SEB Investment Management ABSveavagen 8SE-106 40 Stockholm, Sweden
Skandinaviska Enskilda Banken S.A.4, rue PeternelchenL-2370 Howald, Luxembourg
PricewaterhouseCoopers, Société coopérative2, rue Gerhard MercatorL-2182 Luxembourg

4
Auditor of the Management Company:
PricewaterhouseCoopers AB
Torsgatan 21
SE-113 97 Stockholm
Global Distributor: Skandinaviska Enskilda Banken AB (publ)
Kungsträdgårdsgatan 8
SE-106 40 Stockholm, Sweden
Representatives and Paying
Agents outside Luxembourg: The full list of representatives and paying agents outside Luxembourg can be
obtained, free of any charge, at the registered office of the Management Company, at
the address of the Branch and on the website of the Branch.
Auditor of the Management Company: PricewaterhouseCoopers ABTorsgatan 21SE-113 97 Stockholm
Global Distributor: Skandinaviska Enskilda Banken AB (publ)Kungstradgardsgatan 8SE-106 40 Stockholm, Sweden
Representatives and Paying The full list of representatives and paying agents outside Luxembourg can beAgents outside Luxembourg: obtained, free of any charge, at the registered office of the Management Company, at
the address of the Branch and on the website of the Branch.

5
SEB Fund 4 is an open-ended common fund ("FCP" - "Fonds Commun de Placement") governed by Part I of the
Luxembourg Law on Undertakings for Collective Investment of 17 December 2010, as amended (the “Law”). The Fund
qualifies as an Undertaking for Collective Investment in Transferable Securities (UCITS). The Fund was set up on 21
September 1987 for an undetermined duration. The Management Regulations lastly modified with effect from 2
November 2016, have been published in the Recueil Electronique des Sociétés et Associations (RESA) on 3 November 2016.
The Fund is registered in Luxembourg at the Luxembourg Register of Commerce under the number K 52. The
Management Company was established on 19 May 1978 in the form of a Swedish limited liability company (AB). The
Management Company is authorised by Finansinspektionen for the management of UCITS and for the discretionary
management of financial instruments and investment portfolios under the Swedish UCITS Act (SFS 2004:46). The
Management Company is also authorised as an alternative investment fund manager to manage alternative
investment funds under the Swedish AIFM Act (SFS 2013:561).
The Management Company has delegated parts of the Central Administration as further detailed hereafter, including
the administrative, registrar and transfer agent functions - under its continued responsibility and control - at its own
expenses to The Bank of New York Mellon (Luxembourg) S.A., 2-4, rue Eugène Ruppert, L-2453 Luxembourg. This
company was incorporated in Luxembourg as a “société anonyme” on 15 December 1998 and is an indirect wholly-
owned subsidiary of The Bank of New York Mellon Corporation. It is registered with the Luxembourg Trade and
Companies' Register under Corporate Identity Number B 67654 (the “Administrative Agent” and "Registrar and
Transfer Agent”).
In the capacity of Administrative Agent, it carries out certain administrative duties related to the administration of the
Fund including the calculation of the NAV of the unit and the provision of account services for the Fund.
In its capacity as Registrar and Transfer Agent, it will process all subscriptions, redemptions and transfers of units, and
will register these transactions in the Unitholders' register of the Fund.
The main objective of each Sub-Fund will be to invest directly and/or indirectly in transferable securities and other
Eligible Assets, with the purpose of spreading investment risks and achieving long-term capital growth. The
investment objectives of the Sub-Funds will be carried out in compliance with the investment restrictions set forth in
the latest prospectus.
At present, three Sub-Funds are at the Unitholders’ disposal:
SEB Fund 4 - SEB Short Bond Fund EUR
SEB Fund 4 - SEB Short Bond Fund SEK
SEB Fund 4 - SEB Short Bond Fund USD
Unless otherwise laid down in part II of the Prospectus "The Sub-Funds", the Management Company may decide to
issue, for each Sub-Fund, capitalisation Units ("C" Units) and distribution Units ("D" Units).
The "C" Units will reinvest their income, if any. The "D" Units may pay a dividend to its Unitholders, upon decision of
the Management Company. Dividends are paid annually, except for these Sub-Funds where the Management
Company would decide on a monthly, quarterly or semi-annual dividend payment.
General Information
SEB Fund 4 is an open-ended common fund ("FCP" - "Fonds Commun de Placement") governed by Part I of theLuxembourg Law on Undertakings for Collective Investment of 17 December 2010, as amended (the ”Law"). The Fundqualifies as an Undertaking for Collective Investment in Transferable Securities (UCITS). The Fund was set up on 21September 1987 for an undetermined duration. The Management Regulations lastly modified with effect from 2November 2016, have been published in the Recueil Electronique des Sociétés et Associations (RESA) on 3 November 2016.The Fund is registered in Luxembourg at the Luxembourg Register of Commerce under the number K 52. TheManagement Company was established on 19 May 1978 in the form of a Swedish limited liability company (AB). TheManagement Company is authorised by Finansinspektionen for the management of UCITS and for the discretionarymanagement of financial instruments and investment portfolios under the Swedish UCITS Act (SFS 2004246). TheManagement Company is also authorised as an alternative investment fund manager to manage alternativeinvestment funds under the Swedish AIFM Act (SFS 20132561).
The Management Company has delegated parts of the Central Administration as further detailed hereafter, includingthe administrative, registrar and transfer agent functions - under its continued responsibility and control - at its ownexpenses to The Bank of New York Mellon (Luxembourg) S.A., 2-4, rue Eugene Ruppert, L-2453 Luxembourg. Thiscompany was incorporated in Luxembourg as a ”société anonyme” on 15 December 1998 and is an indirect wholly-owned subsidiary of The Bank of New York Mellon Corporation. It is registered with the Luxembourg Trade andCompanies' Register under Corporate Identity Number B 67654 (the ”Administrative Agent" and "Registrar andTransfer Agent”).
In the capacity of Administrative Agent, it carries out certain administrative duties related to the administration of theFund including the calculation of the NAV of the unit and the provision of account services for the Fund.
In its capacity as Registrar and Transfer Agent, it will process all subscriptions, redemptions and transfers of units, andwill register these transactions in the Unitholders' register of the Fund.
The main objective of each Sub-Fund will be to invest directly and/or indirectly in transferable securities and otherEligible Assets, with the purpose of spreading investment risks and achieving long-term capital growth. Theinvestment objectives of the Sub-Funds will be carried out in compliance with the investment restrictions set forth inthe latest prospectus.
At present, three Sub-Funds are at the Unitholders' disposal:
0 SEB Fund 4 - SEB Short Bond Fund EUR0 SEB Fund 4 - SEB Short Bond Fund SEK0 SEB Fund 4 - SEB Short Bond Fund USD
Unless otherwise laid down in part II of the Prospectus "The Sub-Funds", the Management Company may decide toissue, for each Sub-Fund, capitalisation Units ("C" Units) and distribution Units ("D" Units).
The "C" Units will reinvest their income, if any. The "D" Units may pay a dividend to its Unitholders, upon decision ofthe Management Company. Dividends are paid annually, except for these Sub-Funds where the ManagementCompany would decide on a monthly, quarterly or semi-annual dividend payment.

6
Currently, the following unit classes are offered for the Sub-Funds:
SEB Fund 4 - SEB Short Bond Fund EUR
o Capitalisation units (“C (EUR)” units) LU0088160774
o Distribution units (“D (EUR)” units) LU0397075192
o Capitalisation units (‘’IC (EUR)” units) LU1267950506
o Distribution units (‘’ID (EUR)” units) LU1267950761
SEB Fund 4 - SEB Short Bond Fund SEK
o Capitalisation units (“C (SEK)” units) LU0037255535
o Distribution units (“D (SEK)’’ units) LU0961016192
o Capitalisation units (“HNWC (SEK)” units) LU0455700707
o Distribution units (“HNWD (SEK)”units) LU0455700889
o Capitalisation units (“IC (SEK)’’ units) LU0961016275
SEB Fund 4 - SEB Short Bond Fund USD
o Capitalisation units (“C (USD)” units) LU0011924932
The base currency of the Fund is US Dollar. The Currency of the Sub-Fund SEB Fund 4 - SEB Short Bond Fund EUR is
euro. The currency of the Sub-Fund SEB Fund 4 - SEB Short Bond Fund SEK is Swedish Krona. The currency of the
Sub-Fund SEB Fund 4 - SEB Short Bond Fund USD is US Dollar.
The issue and redemption prices, which are computed daily on bank business days in Luxembourg, except 24
December and 31 December ("Valuation date"), can be obtained from the registered offices of the Management
Company, the Depositary and the Paying Agent.
In addition, the Net Asset Value, fact sheets and other informational material is published on the SEB Luxembourg
website www.sebgroup.lu (http://www.sebgroup.lu). When registered in other countries, the publication media might
differ according to the regulatory requirements. Information about ongoing charges can be found in the Key Investor
Information Document (“KIID”).
The audited annual and un-audited semi-annual reports of the Fund may be obtained, free of charge at the registered
office of the Management Company, at the address of its Branch and on the Website. These reports as well as copies of
the Prospectus, the Management Regulations and the KIID are available, free of charge, at the registered office of the
Management Company, at the address of the Branch and on the website.
Currently, the following unit classes are offered for the Sub-Funds:
0 SEB Fund 4 - SEB Short Bond Fund EUR0 Capitalisation units (”C (EUR)" units) LU00881607740 Distribution units (”D (EUR)" units) LU0397075192o Capitalisation units ("IC (EUR)" units) LU12679505060 Distribution units ("ID (EUR)" units) LU1267950761
0 SEB Fund 4 - SEB Short Bond Fund SEK0 Capitalisation units (”C (SEK)" units) LU00372555350 Distribution units (”D (SEK)" units) LU0961016192o Capitalisation units (”HNWC (SEK)" units) LU04557007070 Distribution units (”HNWD (SEK)"units) LU0455700889o Capitalisation units (”IC (SEK)" units) LU0961016275
0 SEB Fund 4 - SEB Short Bond Fund USD0 Capitalisation units (”C (USD)” units) LU0011924932
The base currency of the Fund is US Dollar. The Currency of the Sub-Fund SEB Fund 4 - SEB Short Bond Fund EUR iseuro. The currency of the Sub-Fund SEB Fund 4 - SEB Short Bond Fund SEK is Swedish Krona. The currency of theSub-Fund SEB Fund 4 - SEB Short Bond Fund USD is US Dollar.
The issue and redemption prices, which are computed daily on bank business days in Luxembourg, except 24December and 31 December ("Valuation date"), can be obtained from the registered offices of the ManagementCompany, the Depositary and the Paying Agent.
In addition, the Net Asset Value, fact sheets and other informational material is published on the SEB Luxembourgwebsite www.sebgroup.lu (http://www.sebgroup.lu). When registered in other countries, the publication media mightdiffer according to the regulatory requirements. Information about ongoing charges can be found in the Key InvestorInformation Document (”KIID”).
The audited annual and un-audited semi-annual reports of the Fund may be obtained, free of charge at the registeredoffice of the Management Company, at the address of its Branch and on the Website. These reports as well as copies ofthe Prospectus, the Management Regulations and the KIID are available, free of charge, at the registered office of theManagement Company, at the address of the Branch and on the website.

7
Dear Unitholders,
With this report, we want to give you an overview of the general economic environment, the development of the most
important capital markets, our investment policy and the performance of our Fund SEB Fund 4.
This annual report covers the financial year from 1 January 2016 to 31 December 2016.
We would like to thank you for your confidence and will do everything within our power to justify your decision of
investing in our Fund.
A year of politics
2016 has been, above all, a year of political upheaval. Events such as the UK’s decision to leave the EU (Brexit), the
election of Donald Trump as US president, and Italy’s rejection of constitutional reform all illustrate general
dissatisfaction with the political environment.
Before the results of these three electoral events were available, the market consensus was that the respective election
results would lead to a correction in the equity markets. The primary arguments were as follows: Brexit would have a
negative impact on the already fragile EU growth rates by increasing uncertainty regarding the future of Europe; the
election of Trump would decrease global growth by increasing uncertainty regarding future US policy and Trump’s
election promise to renegotiate existing trade agreements, and, finally, the Italian referendum would rekindle the euro
crisis of 2011-2013 by spotlighting the fundamental political weakness of Europe. Despite the forecasts and
discussions, the financial markets and the global economy proved to be highly resilient. The latter displayed such
resiliency that growth forecasts for 2017 were revised higher following the US election and predictions about a restart
of the business cycle emerged.
However, 2016 turned out to be a year where US equities closed at all-time high levels, nominal rates ended up at
higher levels than at the beginning of the year, and the US Federal Reserve (the Fed) made an upwards revision, for
the first time ever, of their official estimates for the next year’s policy rates. Keep in mind that 2012 was the first time
the Fed published these estimates. In general, 2016 was much more positive than expected. This is particularly true for
market participants who from the beginning of the year believed in the likelihood of Brexit, Trump, and Italy’s no to
reform.
In the following paragraphs we present our view of global growth and monetary policy. We discuss the implications
of a Trump presidency, and, finally, we present our outlook for the financial markets in 2017.
Global growth
The most notable development in terms of growth in 2016 was the uptick that materialised in Q4. This uptick was a
stark contrast to the first three quarters of the year where growth had failed to gain momentum and the global
economy appeared to be increasingly fragile. This upswing was so strong and broad-based in terms of geography and
sectors, that growth forecasts for 2017 were revised higher. This has led the market to believe the business cycle will
continue in a similar manner, keeping the next recession a few years away.
It is not easy to pinpoint the exact cause of the sudden revival of the global economy. It started to materialise in the
months following Brexit and prior to the US election. One could even argue that the US election results have acted as a
growth factor in terms of planned fiscal stimulus. Regardless of the exact cause of the global revival, the growth
pattern followed that of a normal recovery: first we saw strength in the sentiment indicators for manufacturing
companies; then this spread to non-manufacturing sectors. Finally, growth was also apparent in real production and
consumption numbers. At the end of Q4 the US economy appeared to be growing by more than 2.5% (Atlanta Federal
Reserve estimate); a figure last surpassed in 2014.
Although many of the positive surprises in terms of growth appeared in the US, it is important to note that the
recovery was generally broad based across the globe. As such, we saw stronger data from both Europe and emerging
markets. It is especially worth noting that emerging markets in Asia gained speed thanks to the global trade recovery
Management Report
Dear Unitholders,
With this report, we want to give you an overview of the general economic environment, the development of the mostimportant capital markets, our investment policy and the performance of our Fund SEB Fund 4.
This annual report covers the financial year from 1 Ianuary 2016 to 31 December 2016.
We would like to thank you for your confidence and will do everything within our power to justify your decision ofinvesting in our Fund.
A year of politics
2016 has been, above all, a year of political upheaval. Events such as the UK's decision to leave the EU (Brexit), theelection of Donald Trump as US president, and Italy's rejection of constitutional reform all illustrate generaldissatisfaction with the political environment.
Before the results of these three electoral events were available, the market consensus was that the respective electionresults would lead to a correction in the equity markets. The primary arguments were as follows: Brexit would have anegative impact on the already fragile EU growth rates by increasing uncertainty regarding the future of Europe; theelection of Trump would decrease global growth by increasing uncertainty regarding future US policy and Trump'selection promise to renegotiate existing trade agreements, and, finally, the Italian referendum would rekindle the eurocrisis of 2011-2013 by spotlighting the fundamental political weakness of Europe. Despite the forecasts anddiscussions, the financial markets and the global economy proved to be highly resilient. The latter displayed suchresiliency that growth forecasts for 2017 were revised higher following the US election and predictions about a restartof the business cycle emerged.
However, 2016 turned out to be a year where US equities closed at all-time high levels, nominal rates ended up athigher levels than at the beginning of the year, and the US Federal Reserve (the Fed) made an upwards revision, forthe first time ever, of their official estimates for the next year's policy rates. Keep in mind that 2012 was the first timethe Fed published these estimates. In general, 2016 was much more positive than expected. This is particularly true formarket participants who from the beginning of the year believed in the likelihood of Brexit, Trump, and Italy's no toreform.
In the following paragraphs we present our view of global growth and monetary policy. We discuss the implicationsof a Trump presidency, and, finally, we present our outlook for the financial markets in 2017.
Global growth
The most notable development in terms of growth in 2016 was the uptick that materialised in Q4. This uptick was astark contrast to the first three quarters of the year where growth had failed to gain momentum and the globaleconomy appeared to be increasingly fragile. This upswing was so strong and broad-based in terms of geography andsectors, that growth forecasts for 2017 were revised higher. This has led the market to believe the business cycle willcontinue in a similar manner, keeping the next recession a few years away.
It is not easy to pinpoint the exact cause of the sudden revival of the global economy. It started to materialise in themonths following Brexit and prior to the US election. One could even argue that the US election results have acted as agrowth factor in terms of planned fiscal stimulus. Regardless of the exact cause of the global revival, the growthpattern followed that of a normal recovery: first we saw strength in the sentiment indicators for manufacturingcompanies; then this spread to non-manufacturing sectors. Finally, growth was also apparent in real production andconsumption numbers. At the end of Q4 the US economy appeared to be growing by more than 2.5% (Atlanta FederalReserve estimate); a figure last surpassed in 2014.
Although many of the positive surprises in terms of growth appeared in the US, it is important to note that therecovery was generally broad based across the globe. As such, we saw stronger data from both Europe and emergingmarkets. It is especially worth noting that emerging markets in Asia gained speed thanks to the global trade recovery
8
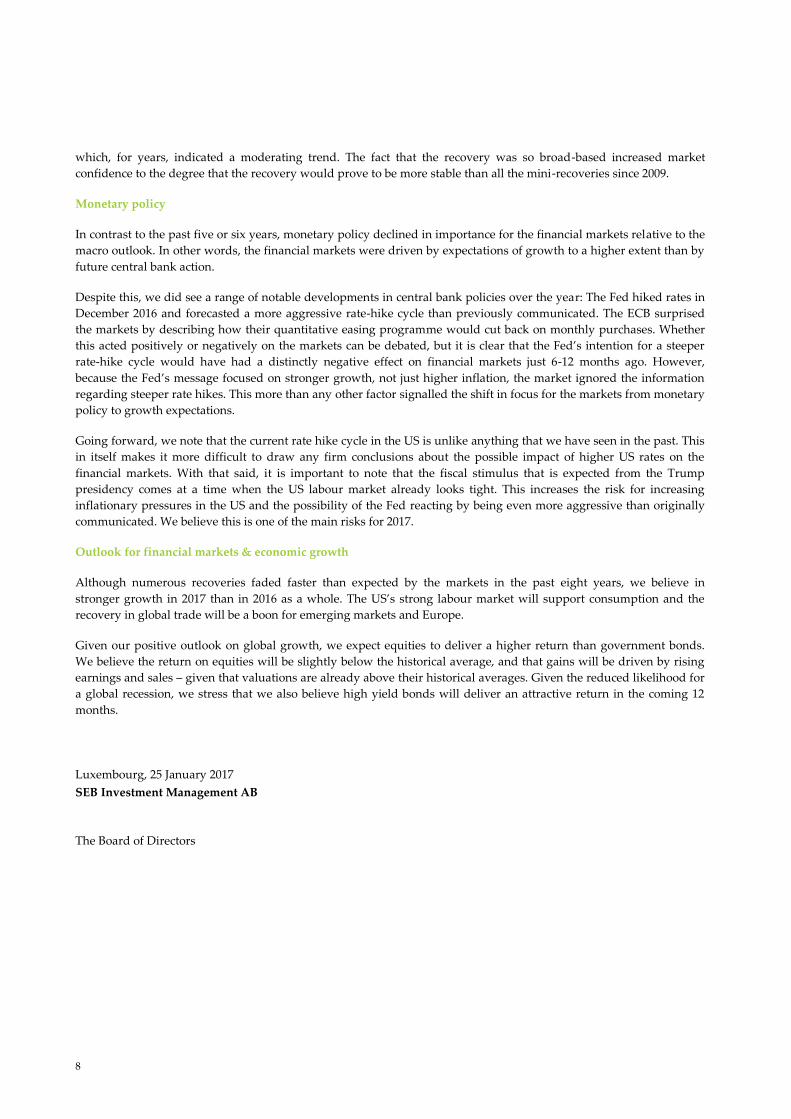
which, for years, indicated a moderating trend. The fact that the recovery was so broad-based increased market
confidence to the degree that the recovery would prove to be more stable than all the mini-recoveries since 2009.
Monetary policy
In contrast to the past five or six years, monetary policy declined in importance for the financial markets relative to the
macro outlook. In other words, the financial markets were driven by expectations of growth to a higher extent than by
future central bank action.
Despite this, we did see a range of notable developments in central bank policies over the year: The Fed hiked rates in
December 2016 and forecasted a more aggressive rate-hike cycle than previously communicated. The ECB surprised
the markets by describing how their quantitative easing programme would cut back on monthly purchases. Whether
this acted positively or negatively on the markets can be debated, but it is clear that the Fed’s intention for a steeper
rate-hike cycle would have had a distinctly negative effect on financial markets just 6-12 months ago. However,
because the Fed’s message focused on stronger growth, not just higher inflation, the market ignored the information
regarding steeper rate hikes. This more than any other factor signalled the shift in focus for the markets from monetary
policy to growth expectations.
Going forward, we note that the current rate hike cycle in the US is unlike anything that we have seen in the past. This
in itself makes it more difficult to draw any firm conclusions about the possible impact of higher US rates on the
financial markets. With that said, it is important to note that the fiscal stimulus that is expected from the Trump
presidency comes at a time when the US labour market already looks tight. This increases the risk for increasing
inflationary pressures in the US and the possibility of the Fed reacting by being even more aggressive than originally
communicated. We believe this is one of the main risks for 2017.
Outlook for financial markets & economic growth
Although numerous recoveries faded faster than expected by the markets in the past eight years, we believe in
stronger growth in 2017 than in 2016 as a whole. The US’s strong labour market will support consumption and the
recovery in global trade will be a boon for emerging markets and Europe.
Given our positive outlook on global growth, we expect equities to deliver a higher return than government bonds.
We believe the return on equities will be slightly below the historical average, and that gains will be driven by rising
earnings and sales – given that valuations are already above their historical averages. Given the reduced likelihood for
a global recession, we stress that we also believe high yield bonds will deliver an attractive return in the coming 12
months.
Luxembourg, 25 January 2017
SEB Investment Management AB
The Board of Directors
which, for years, indicated a moderating trend. The fact that the recovery was so broad-based increased marketconfidence to the degree that the recovery would prove to be more stable than all the mini-recoveries since 2009.
Monetary policy
In contrast to the past five or six years, monetary policy declined in importance for the financial markets relative to themacro outlook. In other words, the financial markets were driven by expectations of growth to a higher extent than byfuture central bank action.
Despite this, we did see a range of notable developments in central bank policies over the year: The Fed hiked rates inDecember 2016 and forecasted a more aggressive rate-hike cycle than previously communicated. The ECB surprisedthe markets by describing how their quantitative easing programme would cut back on monthly purchases. Whetherthis acted positively or negatively on the markets can be debated, but it is clear that the Fed's intention for a steeperrate-hike cycle would have had a distinctly negative effect on financial markets just 6-12 months ago. However,because the Fed's message focused on stronger growth, not just higher inflation, the market ignored the informationregarding steeper rate hikes. This more than any other factor signalled the shift in focus for the markets from monetarypolicy to growth expectations.
Going forward, we note that the current rate hike cycle in the US is unlike anything that we have seen in the past. Thisin itself makes it more difficult to draw any firm conclusions about the possible impact of higher US rates on thefinancial markets. With that said, it is important to note that the fiscal stimulus that is expected from the Trumppresidency comes at a time when the US labour market already looks tight. This increases the risk for increasinginflationary pressures in the US and the possibility of the Fed reacting by being even more aggressive than originallycommunicated. We believe this is one of the main risks for 2017.
Outlook for financial markets 8: economic growth
Although numerous recoveries faded faster than expected by the markets in the past eight years, we believe instronger growth in 2017 than in 2016 as a whole. The US's strong labour market will support consumption and therecovery in global trade will be a boon for emerging markets and Europe.
Given our positive outlook on global growth, we expect equities to deliver a higher return than government bonds.We believe the return on equities will be slightly below the historical average, and that gains will be driven by risingearnings and sales — given that valuations are already above their historical averages. Given the reduced likelihood fora global recession, we stress that we also believe high yield bonds will deliver an attractive return in the coming 12months.
Luxembourg, 25 Ianuary 2017SEE Investment Management AB
The Board of Directors

9
Schedule of InvestmentsAs at 31 December 2016
SEB Fund 4 — SEB Short Bond Fund EUR
Security description Maturity Total holdings Currency Unit Market % ofprice* value in Net
EUR Assets
Bonds indicated in 1,000 currency units
Transferable securities admitted to an official stock exchange listing
Bonds
Belgium0.00 % Anheuser-Busch |nBev SA/NV FRN 19/10/18 300 EUR 100.121 300,362.31 0.361.25 % Anheuser-Busch |nBev SA/NV 24/03/17 1,000 EUR 100.280 1,002,797.80 1.222.00 % Anheuser-Busch |nBev SA/NV 16/12/19 400 EUR 105.976 423,902.24 0.51
Total Belgium 1,727,062.35 2.09
Denmark0.04 % Danske Bank A/S FRN 19/11/18 800 EUR 100.294 802,355.76 0.973.88 % Danske Bank A/S 28/02/17 1,000 EUR 100.624 1,006,235.10 1.220.00 % Nykredit Bank A/S FRN 05/12/17 1,600 EUR 100.049 1,600,784.00 1.94
Total Denmark 3,409,374.86 4.13
France0.25 % Banque Federative du Credit Mutuel SA 14/06/19 600 EUR 100.515 603,087.96 0.731.63 % Banque Federative du Credit Mutuel SA 11/01/18 1,300 EUR 101.680 1,321,836.62 1.600.24 % BNP Paribas SA FRN 20/05/19 850 EUR 100.829 857,045.40 1.042.50 % BNP Paribas SA 23/08/19 300 EUR 106.404 319,212.66 0.393.00 % BNP Paribas SA 24/02/17 450 EUR 100.453 452,038.28 0.550.35 % BPCE SA FRN 28/05/18 1,500 EUR 100.665 1,509,974.40 1.835.38 % Electricite de France SA 29/05/20 1,400 EUR 117.924 1,650,942.02 2.002.25 % Engie SA 01/06/18 1,000 EUR 103.175 1,031,749.50 1.250.24 % HSBC France SA FRN 27/11/19 600 EUR 100.900 605,398.02 0.731.88 % HSBC France SA 16/01/20 1,200 EUR 105.504 1,266,046.44 1.532.25 % Societe Generale SA 23/01/20 1,700 EUR 106.459 1,809,806.74 2.196.25 % Suez 08/04/19 1,300 EUR 114.378 1,486,918.42 1.800.00 % Total Capital International SA FRN 19/03/20 1,800 EUR 100.081 1,801,456.74 2.184.13 % Vinci SA 20/02/17 2,000 EUR 100.128 2,002,567.80 2.43
Total France 16,718,081.00 20.25
Germany0.18 % Daimler AG FRN 24/06/19 400 EUR 100.515 402,060.00 0.490.23 % Daimler AG FRN 12/01/19 200 EUR 100.470 200,940.00 0.240.63 % Daimler AG 05/03/20 250 EUR 101.746 254,365.05 0.314.13 % Daimler AG 19/01/17 950 EUR 100.098 950,929.77 1.152.13 % MAN SE 13/03/17 1,750 EUR 100.384 1,756,718.08 2.135.77 % Muenchener Rueckversicherungs-Gesellschaft AG in
Muenchen FRN Perpetual 1,600 EUR 102.019 1,632,298.72 1.98Total Germany 5,197,311.62 6.30
Ireland7.50 % Cloverie Plc for Zurich Insurance Co Ltd FRN 24/07/39 1,300 EUR 115.757 1,504,845.29 1.82Total Ireland 1,504,845.29 1.82
Luxembourg2.13 % KBC IFIMA SA 10/09/18 1,800 EUR 103.637 1,865,473.74 2.26
Total Luxembourg 1,865,473.74 2.26
Netherlands2.63 % ABB Finance BV 26/03/19 1,700 EUR 105.903 1,800,345.22 2.180.49 % ABN AMRO Bank NV FRN 06/03/19 1,500 EUR 101.299 1,519,489.20 1.844.75 % ABN AMRO Bank NV 11/01/19 300 EUR 109.663 328,990.35 0.400.88 % Achmea Bank NV 17/09/18 1.800 EUR 101.405 1,825,291.80 2.214.38 % Allianz Finance II BV FRN Perpetual 1,600 EUR 99.928 1,598,842.72 1.940.00 % BMW Finance NV FRN 01/06/18 800 EUR 99.588 796,702.40 0.960.50 % BMW Finance NV 05/09/18 1,300 EUR 100.891 1,311,587.55 1.59

10
SEB Fund 4 — SEB Short Bond Fund EUR
Security description Maturity Total holdings Currency Unit Market % ofprice* value in Net
EUR Assets
0.00 % Cooperatieve Rabobank UA FRN 29/05/20 1,300 EUR 100.363 1,304,717.70 1.584.13 % Cooperatieve Rabobank UA 14/01/20 500 EUR 112.389 561,946.40 0.680.34 % ING Bank NV FRN 05/06/17 1,300 EUR 100.245 1,303,184.87 1.581.25 % ING Bank NV 13/12/19 500 EUR 103.548 517,741.75 0.630.08 % Shell International Finance BV FRN 15/09/19 1,600 EUR 100.408 1,606,532.64 1.95Total Netherlands 14,475,372.60 17.54
Norway0.16 % DNB Bank ASA FRN 04/04/18 400 EUR 99.764 399,054.80 0.484.75 % DNB Bank ASA FRN 08/03/22 1,400 EUR 100.770 1,410,783.22 1.71
Total Norway 1,809,838.02 2.19
Spain4.25 % Bankia SA 25/05/18 700 EUR 105.902 741,311.06 0.905.00 % Bankia SA 28/06/19 1,000 EUR 112.111 1,121,106.30 1.364.00 % Santander International Debt SAU 27/03/17 1,000 EUR 100.917 1,009,170.50 1.224.13 % Santander International Debt SAU 04/10/17 300 EUR 103.195 309,585.87 0.37Total Spain 3,181,173.73 3.85
Sweden2.63 % Atlas Copco AB 15/03/19 1,300 EUR 105.781 1,375,158.46 1.674.00 % Nordea Bank AB 11/07/19 800 EUR 110.150 881,199.28 1.074.63 % Nordea Bank AB FRN 15/02/22 950 EUR 100.446 954,236.15 1.160.15 % Skandinaviska Enskilda Banken AB FRN 15/09/20 250 EUR 100.791 251,978.38 0.310.29 % Skandinaviska Enskilda Banken AB FRN 26/05/20 700 EUR 101.181 708,265.53 0.863.88 % Skandinaviska Enskilda Banken AB 12/04/17 1,000 EUR 101.133 1,011,325.00 1.222.25 % Svenska Handelsbanken AB 14/06/18 1,000 EUR 103.335 1,033,347.50 1.253.38 % Svenska Handelsbanken AB 17/07/17 300 EUR 101.902 305,706.21 0.370.19 % Swedbank AB FRN 18/08/20 2,000 EUR 100.910 2,013,197.20 2.44
Total Sweden 8,539,413.71 10.35
Switzerland1.38 % Credit Suisse AG/London 29/11/19 1,100 EUR 103.481 1,138,287.37 1.383.88 % Credit Suisse AG/London 25/01/17 900 EUR 100.238 902,140.11 1.094.75 % UBS AG/Jersey 07/06/17 1,000 EUR 102.135 1,021,352.10 1.240.50 % UBS AG/London 15/05/18 500 EUR 100.747 503,737.05 0.61
Total Switzerland 3,565,516.63 4.32
United Kingdom3.83 % BP Capital Markets Plc 06/10/17 1,300 EUR 103.005 1,339,063.83 1.622.25 % Coventry Building Society 04/12/17 1,300 EUR 102.055 1,326,715.78 1.611.13 % Diageo Finance Plc 20/05/19 1,300 EUR 102.723 1,335,393.02 1.624.60 % Heathrow Funding Ltd 15/02/18 500 EUR 105.090 525,448.95 0.641.88 % Lloyds Bank Plc 10/10/18 500 EUR 103.429 517,145.65 0.635.38 % Lloyds Bank Plc 03/09/19 1,000 EUR 114.445 1,144,451.10 1.390.19 % Nationwide Building Society FRN 02/11/18 300 EUR 100.367 301,102.47 0.361.63 % Nationwide Building Society 03/04/19 1,600 EUR 103.360 1,653,766.72 2.000.31 % Santander UK Plc FRN 22/05/19 1,600 EUR 100.624 1,609,984.48 1.950.08 % Standard Chartered Plc FRN 13/06/17 216 EUR 100.045 216,097.46 0.26Total United Kingdom 9,969,169.46 12.08
Total Bonds EUR 71,962,633.01 87.18
Total Transferable securities admitted to an official stock exchange listing EUR 71,962,633.01 87.18
10

11
SEB Fund 4 — SEB Short Bond Fund EUR
Security description Maturity Total holdings Currency Unit Market % ofprice* valuein Net
EUR Assets
Bonds indicated in 1,000 currency units
Other Transferable Securities
Bonds
Cayman Islands0.00 % Sigma Finance FRN** 30/03/12 800 EUR 0.000 0.00 0.00
Total Cayman Islands 0.00 0.00
Total Bonds EUR 0.00 0.00
Total Other Transferable Securities EUR 0.00 0.00
Total Portfolio EUR 71,962,633.01 87.18
Cash at bankCash at bank 9,305,379.57 11.27Total Cash at bank 9,305,379.57 11.27
Other assetsInterest receivable on bonds 1,033,034.39 1.25Receivable on subscriptions 316,905.09 0.39Other assets 404.79 0.00Total other assets 1,350,344.27 1.64
LiabilitiesManagement fees (19,844.68) (0.03)Payable on redemptions (51,456.29) (0.06)Bank interest payable on cash accounts (20.17) (0.00)Other liabilities (3,842.63) (0.00)Total liabilities (75,163.77) (0.09)
Total Net Assets as at 31 December 2016 EUR 82,543,l93.08 100.00* Bond prices expressed in %.** Position fairvalued by the Management Company.
A list of changes in the assets held during thefinancial year under review is available free of charge from SEB Investment Management AB.
The accompanying notes are an integral part of these financial statements.
11

12
ö
Schedule of InvestmentsAs at 31 December 2016
SEB Fund 4 — SEB Short Bond Fund SEK
Security description Maturity Total holdings Currency Unit Market % ofprice* value in Net
SEK Assets
Bonds indicated in 1,000 currency units
Transferable securities admitted to an official stock exchange listing andlor dealt within another regulated market
Bonds
Finland0.38 % Fortum OYJ FRN 20/03/18 70.000 SEK 100.511 70.357.700.00 1.74
Total Finland 70.357.700.00 1.74
Norway0.27 % DNB Bank ASA FRN 07/05/18 62,000 SEK 100.306 62.189.720.00 1.541.59 % DNB Bank ASA FRN 25/01/17 104,000 SEK 100.133 104.138.320.00 2.58
Total Norway 166.328.040.00 4.12
Sweden0.00 % Akademiska Hus AB FRN 21/08/19 60.000 SEK 100.004 60.002.400.00 1.490.53 % Electrolux AB FRN 26/03/18 9.000 SEK 100.740 9,066,600.00 0.220.42 % Foervaltnings AB Framtiden FRN 30/10/17 50.000 SEK 100.380 50.190.000.00 1.240.09 % Fortum Varme Holding samagt med Stockholms stad
AB FRN 17/09/18 25.000 SEK 100.180 25.045.000.00 0.620.03 % Hemso Fastighets AB FRN 12/03/18 10.000 SEK 100.190 10.019.000.00 0.250.39 % Hemso Fastighets AB FRN 16/03/20 24.000 SEK 100.950 24.228.000.00 0.601.25 % Hemso Fastighets AB FRN 24/10/18 30.000 SEK 101.957 30.587.100.00 0.760.13 % Holmen AB FRN 20/09/17 10.000 SEK 100.150 10.015.000.00 0.250.23 % lndustrivarden AB FRN 12/01/18 50.000 SEK 100.171 50.085.500.00 1.240.63 % |nvest0rAB FRN 26/06/17 131.000 SEK 100.365 131.478.150.00 3.261.48 % Lansforsakringar AB FRN 09/10/17 50.000 SEK 101.192 50.596.000.00 1.250.19 % Lansforsakringar Bank AB FRN 18/11/18 50.000 SEK 100.538 50.269.000.00 1.250.05 % Nordea Bank AB FRN 18/02/19 50.000 SEK 100.433 50.216.500.00 1.240.18 % Nordea Bank AB FRN 08/05/18 50.000 SEK 100.458 50.229.000.00 1.241.19 % Nordea Bank AB FRN 17/02/17 86.000 SEK 100.187 86.160.820.00 2.132.00 % Nordea Hypotek AB 20/06/18 337.000 SEK 103.470 348.693.900.00 8.640.00 % Rikshem AB FRN 03/11/17 28.000 SEK 99.957 27.987.960.00 0.690.50 % Rikshem AB FRN 18/10/19 82.000 SEK 100.951 82.779.820.00 2.050.00 % SBAB Bank AB FRN 29/01/18 50.000 SEK 100.117 50.058.500.00 1.240.00 % Scania CV AB FRN 03/12/18 70.000 SEK 99.581 69.706.700.00 1.730.41 % Scania CV AB FRN 02/10/17 10.000 SEK 100.340 10.034.000.00 0.250.00 % Skandinaviska Enskilda Banken AB FRN 16/01/17 110.000 SEK 100.012 110.013.200.00 2.723.00 % Skandinaviska Enskilda Banken AB 20/06/18 220,000 SEK 104.944 230.876.800.00 5.723.00 % Stadshypotek AB 21/03/18 769.000 SEK 104.204 801.328.760.00 19.856.00 % Stadshypotek AB 21/06/17 50.000 SEK 103.081 51.540.500.00 1.283.75 % Swedbank Hypotek AB 20/12/17 450,000 SEK 104.089 468.400.500.00 11.600.00 % Swedbank Sjuharad AB FRN 13/11/17 70.000 SEK 99.868 69.907.600.00 1.730.03 % Swedbank Sjuharad AB FRN 28/06/18 20.000 SEK 99.969 19.993.800.00 0.500.04 % Volvo Treasury AB FRN 13/06/18 25.000 SEK 100.126 25.031.500.00 0.620.08 % Volvo Treasury AB FRN 11/09/17 50.000 SEK 100.085 50.042.500.00 1.240.00 % Volvofinans Bank AB FRN 27/03/19 70.000 SEK 99.748 69.823.600.00 1.730.12 % Volvofinans Bank AB FRN 30/04/18 30.000 SEK 100.124 30.037.200.00 0.740.36 % Volvofinans Bank AB FRN 25/04/19 10.000 SEK 100.557 10.055.700.00 0.250.24 % Willhem AB FRN 17/06/19 40.000 SEK 100.505 40.202.000.00 1.000.57 % Willhem AB FRN 09/06/21 4.000 SEK 101.259 4,050,360.00 0.10
Total Sweden 3.258,752,970.00 80.72
Total Bonds SEK 3.495.438.7l0.00 86.58
Money Market InstrumentsCommercial Papers
Sweden0.00 % FC Holmen 21/02/17 20,000,000 SEK 100.020 20.003.910.99 0.490.00 % Hemsii 17/02/17 40,000,000 SEK 100.031 40.012.308.23 0.99
12

13
SEB Fund 4 — SEB Short Bond Fund SEK
Security description Maturity Total holdings Currency Unit Market % ofprice* value in Net
SEK Assets
0.00 % Holmen 22/02/17 20,000,000 SEK 100.020 20,003,960.78 0.500.00 % Kraftringen 27/01/17 60,000,000 SEK 100.010 60,006,067.28 1.490.00 % Willhem 11/01/17 50,000,000 SEK 100.005 50,002,466.79 1.24
Total Sweden 190,028,714.07 4.71
Total Commercial Papers SEK 190,028,714.07 4.71
Total Money Market Instruments SEK 190,028,714.07 4.71
Total Transferable securities admitted to an official stock exchange listing andlordealt within another regulated market SEK 3,685,467,424.07 91.29
Bonds indicated in 1,000 currency units
Other Transferable Securities
Bonds
Sweden0.10 % Lejonfastigheter AB FRN 20/06/18 60,000 SEK 100.422 60,253,200.00 1.490.03 % Stangastaden AB FRN 27/03/17 75,000 SEK 100.042 75,031,500.00 1.860.12 % Stangastaden AB FRN 05/06/18 50,000 SEK 100.475 50,237,500.00 1.240.20 % Uppsalahem AB FRN 07/02/18 80,000 SEK 100.343 80,274,400.00 1.99
Total Sweden 265,796.600.00 6.58
Total Bonds SEK 265,796.600.00 6.58
Total Other Transferable Securities SEK 265,796,600.00 6.58
Total Portfolio SEK 3,951,264.024.07 97.87
13

14
SEB Fund 4 — SEB Short Bond Fund SEK
Market % ofvalue in Net
SEK Assets
Cash at bankCash at bank 58.367.394.05 1.45Total Cash at bank 58.367.394.05 1.45
Other assetsInterest receivable on bonds 27,733,043.20 0.68Receivable on sale of securities 60.207.600.00 1.49Receivable on subscriptions 2,715,807.98 0.07Total other assets 90.656.451.18 2.24
LiabilitiesManagement fees (618,425.59) (0.01)Payable on purchase of securities (60,262,800.00) (1.49)Payable on redemptions (1,912,668.10) (0.05)Bank interest payable on cash accounts (44,768.10) (0.00)Other liabilities (264,243.51) (0.01)Total liabilities (63,l02,905.30) (1.56)
Total Net Assets as at 31 December 2016 SEK 4.037.184,964.00 100.00* Bond prices expressed in %.
A list of changes in the assets held during the financial year under review is available free of charge from SEB Investment Management AB.
The accompanying notes are an integral part of these financial statements.
14

15
Schedule of InvestmentsAs at 31 December 2016
SEB Fund 4 — SEB Short Bond Fund USD
Security description Maturity Total holdings Currency Unit Market % ofprice* value in Net
USD Assets
Bonds indicated in 1,000 currency units
Transferable securities admitted to an official stock exchange listing
Bonds
United States of America0.50 % United States Treasury Note/Bond 31/01/17 19,000 USD 99.992 l8,998,516.10 16.730.50 % United States Treasury Note/Bond 28/02/17 10,000 USD 100.000 10,000,000.00 8.810.50 % United States Treasury Note/Bond 31/03/17 8,000 USD 100.000 8,000,000.00 7.040.63 % United States Treasury Note/Bond 31/05/17 10,000 USD 100.031 10,003,125.00 8.810.63 % United States Treasury Note/Bond 31/08/17 11,000 USD 99.945 10,993,984.10 9.680.63 % United States Treasury Note/Bond 30/09/17 11,000 USD 99.883 10,987,109.10 9.670.63 % United States Treasury Note/Bond 30/11/17 14,000 USD 99.789 13,970,463.40 12.300.75 % United States Treasury Note/Bond 31/10/17 14,000 USD 99.945 13,992,343.40 12.321.00 % United States Treasury Note/Bond 15/12/17 14,000 USD 100.141 14,019,683.20 12.35
Total United States of America 110,965,234.30 97.71
Total Bonds USD 1l0,965,234.30 97.71
Total Transferable securities admitted to an official stock exchange listing USD 110,965,234.30 97.71
Total Portfolio USD 1l0,965,234.30 97.71
Cash at bankCash at bank 3,106,803.37 2.74Total Cash at bank 3,106,803.37 2.74
Other assetsInterest receivable on bonds 141,654.49 0.12Bank interest receivable on cash accounts 2,673.79 0.00Receivable on subscriptions 67,219.09 0.06Total other assets 211,547.37 0.18
LiabilitiesBank overdraft (303,690.96) (0.27)Management fees (39,350.49) (0.02)Payable on redemptions (372,098.31) (0.33)Other liabilities (7,716.59) (0.01)Total liabilities (722,856.35) (0.63)
Total Net Assets as at 31 December 2016 USD 113,560,728.69 100.00* Bond prices expressed in %.
A list of changes in the assets held during the financial year under review is available free of charge from SEB Investment Management AB.
The accompanying notes are an integral part of these financial statements.
15

The accompanying notes are an integral part of these financial statements.
16
2
3
Combined Statement of OperationsFor the year ended 31 December 2016
SEB Fund 4 - SEB Fund 4 - SEB Fund 4 - SEB Fund 4 -
SEB Short Bond SEB Short Bond SEB Short Bond CombinedFund EUR Fund SEK Fund USD
EUR SEK USD USDIncomeInterest on bonds (note 1) 1,601,703.06 104,367,248.98 657,551.75 13,780,432.25Bank interest on cash accounts 5.15 0.28 5,311.13 5,316.59Total income 1,601,713.21 104,367,249.26 662,862.88 13.785.748.84
ExpensesManagement fees (note 2) 241,135.40 9,745,146.91 492,368.64 1,814,299.07Taxe d'abonnement (note 3) 38,092.54 2,656,083.35 63,851.98 395,004.99Bank interest on cash accounts 115.41 247,344.76 331.07 27,549.22Other expenses 5,875.49 316,567.24 9,961.38 50,838.72Total expenses 285,218.84 12,965,142.26 566,513.07 2,287,692.00
Net income for the year 1,316,494.37 91,402,107.00 96,349.81 11.498.056.84
The accompanying notes are an integral part of these financial statements.
16

The accompanying notes are an integral part of these financial statements.
17
– –
–
– – –
Combined Statement of Changes in Net AssetsFor the year ended 31 December 2016
SEB Fund4— SEB Fund4— SEB Fund4— SEB Fund4—SEB Short Bond SEB Short Bond SEB Short Bond Combined
Fund EUR Fund SEK Fund USDEUR SEK USD USD
Net Assets at the beginning of the year 64,446,956.74 5,247,841,606.55 149,393,658.94 846,277.608.91Net income for the year 1,316,494.37 91,402,107.00 96,349.81 11.498.056.84Net realised gain I (loss) on:- sales of securities 326,970.36 (31,286,866.19) 98,044.08 (2,984,506.66)- foreign exchange (19,214.92) 98,439.54 (34,745.41) (44,229.98)Total net realised gainl(loss) 307,755.44 (31,188,426.65) 63,298.67 (3,028,736.64)
Change in net unrealised appreciation I (depreciation) on:- securities (1,292,594.65) (66,988,608.49) (10,583.66) (8,712,602.08)- forward foreign exchange contracts — (238,896.54) — (26,170.92)
Total change in net unrealised depreciation (1,292,594.65) (67,227,505.03) (10,583.66) (8,738,773.00)
Increase I (decrease) in Net Assets as a result of operations 331,655.16 (7,013,824.68) 149,064.82 (269,452.80)Proceeds on issues of units l23,267,385.79 1,759,814,934.69 122,l73,547.75 444,986,387.67
Payment on redemptions of units (105,497,652.50) (2,960,879,269.90) (158,155,542.82) (593,799,865.61)
Dividends paid (5,152.11) (2,578,482.66) — (287,905.24)
Foreign exchange differences — — — (54,006,466.99)
Total Net Assets as at 31 December 2016 82,543,l93.08 4,037,l84,964.00 l13,560.728.69 642,900,305.94
The accompanying notes are an integral part of these financial statements.
17

The accompanying notes are an integral part of these financial statements.
18
– –
– – –
– – –
– – –
– – –
– – –
– – –
– – –
– – –
– – –
– – –
– – –
– – –
– – –
– – –
– – –
– – –
– – –
– – –
– – –
– – –
Combined Statement of Net AssetsAs at 31 December 2016
SEB Fund 4 - SEB Fund 4 - SEB Fund 4 - SEB Fund 4 -
SEB Short Bond SEB Short Bond SEB Short Bond CombinedFund EUR Fund SEK Fund USD
EUR SEK USD USDAssetsPortfolio at cost 73,806,970.00 3,973,161,150.01 110,942,148.49 624,052,708.52Unrealised appreciation / (depreciation) (1,844,336.99) (21,897,125.94) 23,085.81 (4,321,194.72)Portfolio at market value (note 1) 71,962,633.01 3,951,264,024.07 l10,965,234.30 619,731,513.80Receivable interest and / or dividends 1,033,034.39 27,733,043.20 144,328.28 4,272,139.42Cash at bank 9,305,379.57 58,367,394.05 3,106,803.37 19,316,529.91Other assets 317,309.88 62,923,407.98 67,219.09 7,295,135.02Total Assets 82,618,356.85 4,100,287,869.30 114.283.585.04 650,615.318.15
LiabilitiesBank overdraft — — (303,690.96) (303,690.96)Other liabilities (75,163.77) (63,102,905.30) (419,165.39) (7,411,321.25)Total Liabilities (75,163.77) (63,102,905.30) (722,856.35) (7,715,012.21)
Total Net Assets as at 31 December 2016 82,543,l93.08 4,037,184,964.00 l13,560.728.69 642,900,305.94
"C (EUR)" units outstanding as at 31 December 2016 61,781,637.5540 — — —
"C (SEK)" units outstanding as at 31 December 2016 — 142,185,092.092O — —
"C (USD)" units outstanding as at 31 December 2016 — — 46,908,651.0380 —
"D (EUR)" units outstanding as at 31 December 2016 843,179.7840 — — —
"D (SEK)" units outstanding as at 31 December 2016 — 10,752,579.731O — —
"HNWC (SEK)" units outstanding as at 31 December 2016 — 41,255,539.6580 — —
"HNWD (SEK)" units outstanding as at 31 December 2016 — 12,155,897.8930 — —
"|C (EUR)" units outstanding as at 31 December 2016 29,146.9670 — — —
"|C (SEK)" units outstanding as at 31 December 2016 — 6,876,325.l910 — —
"|D (EUR)" units outstanding as at 31 December 2016 10.0210 — — —
Net Asset Value per "C (EUR)" unit as at 31 December 2016 1.282 — — —
Net Asset Value per "C (SEK)" unit as at 31 December 2016 — 23.062 — —
Net Asset Value per "C (USD)" unit as at 31 December 2016 — — 2.421 —
Net Asset Value per "D (EUR)" unit as at 31 December 2016 0.471 — — —
Net Asset Value per "D (SEK)" unit as at 31 December 2016 — 8.109 — —
Net Asset Value per "HNWC (SEK)" unit as at 31 December 2016 — 11.812 — —
Net Asset Value per "HNWD (SEK)" unit as at 31 December 2016 — 9.408 — —
Net Asset Value per "|C (EUR)" unit as at 31 December 2016 100.365 — — —
Net Asset Value per "|C (SEK)" unit as at 31 December 2016 — 10.066 — —
Net Asset Value per "|D (EUR)" unit as at 31 December 2016 100.146 — — —
The accompanying notes are an integral part of these financial statements.
18

The accompanying notes are an integral part of these financial statements.
19
n
– – –
– – –
– – –
– – –
– – –
– – –
– – –
– – –
– – –
– – –
– – –
– – –
– – –
– – –
– – –
– – –
– – –
– – –
– – –
– – –
– – –
– – –
– – –
– – – –
– – –
– – –
– – –
– – –
– – –
– – – –
– – –
– – –
– – –
Statistical InformationAs at 31 December 2016
SEB Fund 4 - SEB Fund 4 - SEB Fund 4 - SEB Fund 4 -
SEB Short Bond SEB Short Bond SEB Short Bond CombinedFund EUR Fund SEK Fund USD
EUR SEK USD USD
Number of "C (EUR)" units outstandingas at 31 December 2016 61.781.637.5540 — — —
as at 31 December 2015 50.203.549.4630 — — —
as at 31 December 2014 48.469.387.5710 — — —
Number of "C (SEK)" units outstandingas at 31 December 2016 — 142.185.092.0920 — —
as at 31 December 2015 — 150.989.477.0610 — —
as at 31 December 2014 — 193.902.742.3410 — —
Number of "C (USD)" units outstandingas at 31 December 2016 — — 46.908.651.0380 —
as at 31 December 2015 — — 61,768,190.2530 —
as at 31 December 2014 — — 48.749.201.8520 —
Number of "D (EUR)" units outstandingas at 31 December 2016 843.179.7840 — — —
as at 31 December 2015 724.736.7760 — — —
as at 31 December 2014 899.570.4810 — — —
Number of "D (SEK)" units outstandingas at 31 December 2016 — 10.752.579.7310 — —
as at 31 December 2015 — 12.598.439.560O — —
as at 31 December 2014 — 12.136.347.1690 — —
Number of "HNWC (SEK)" units outstandingas at 31 December 2016 — 41.255.539.6580 — —
as at 31 December 2015 — 102.965.689.6980 — —
as at 31 December 2014 — 140.867.745.1450 — —
Number of "HNWD (SEK)" units outstandingas at 31 December 2016 — 12.155.897.8930 — —
as at 31 December 2015 — 34,643,221.7700 — —
as at 31 December 2014 — 39.675.617.1280 — —
Number of ''IC (EUR)" units outstandingas at 31 December 2016 29.146.9670 — — —
as at 31 December 2015 10.0000 — — —as at 31 December 2014 — — — —
Number of ''IC (SEK)" units outstandingas at 31 December 2016 — 6.876.325.1910 — —
as at 31 December 2015 — 10.924.535.2530 — —
as at 31 December 2014 — 1.000.0000 — —
Number of ''ID (EUR)" units outstandingas at 31 December 2016 10.0210 — — —as at 31 December 2015 10.0000 — — —as at 31 December 2014 — — — —
Total Net Assetsas at 31 December 2016 82.543.193.08 4.037.184.964.00 113.560.728.69 642.900.305.94as at 31 December 2015 64.446.956.74 5.247,841.606.55 149.393.658.94 846.277.608.91as at 31 December 2014 62.408.604.92 6.659.337.581.71 118.436.218.13 1.053.723.099.39
Net Asset Value per "C (EUR)" unitas at 31 December 2016 1.282 — — —as at 31 December 2015 1.277 — — —as at 31 December 2014 1.279 — — —
The accompanying notes are an integral part of these financial statements.
19

The accompanying notes are an integral part of these financial statements.
20
– – –
– – –
– – –
– – –
– – –
– – –
– – –
– – –
– – –
– – –
– – –
– – –
– – –
– – –
– – –
– – –
– – –
– – –
– – –
– – –
– – – –
– – –
– – –
– – –
– – –
– – –
– – – –
" "
– – –
– – –
– – –
" "
– – –
– – –
– – –
" "
– – –
– – –
– – –
SEB Fund 4 -
SEB Short BondFund EUR
EUR
SEB Fund 4 -
SEB Short BondFund SEK
SEK
SEB Fund 4 -
SEB Short BondFund USD
USD
SEB Fund 4 -
Combined
USD
Net Asset Value per "C (SEK)" unitas at 31 December 2016as at 31 December 2015as at 31 December 2014Net Asset Value per "C (USD)" unitas at 31 December 2016as at 31 December 2015as at 31 December 2014Net Asset Value per "D (EUR)" unitas at 31 December 2016as at 31 December 2015as at 31 December 2014Net Asset Value per "D (SEK)" unitas at 31 December 2016as at 31 December 2015as at 31 December 2014Net Asset Value per "HNWC (SEK)" unitas at 31 December 2016as at 31 December 2015as at 31 December 2014Net Asset Value per "HNWD (SEK)" unitas at 31 December 2016as at 31 December 2015as at 31 December 2014Net Asset Value per "|C (EUR)" unitas at 31 December 2016as at 31 December 2015as at 31 December 2014Net Asset Value per "|C (SEK)" unitas at 31 December 2016as at 31 December 2015as at 31 December 2014Net Asset Value per "|D (EUR)" unitas at 31 December 2016as at 31 December 2015as at 31 December 2014Performance in % "C (EUR)" units *)as at 31 December 2016as at 31 December 2015as at 31 December 2014Performance in % "C (SEK)" units *)as at 31 December 2016as at 31 December 2015as at 31 December 2014Performance in % "C (USD)" units *)as at 31 December 2016as at 31 December 2015as at 31 December 2014
0.4710.4750.485
100.36599.908
100.14699.891
0.4(0.2)
0.6
The accompanying notes are an integral part of these financial statements.
20
23.06223.10123.216
8.1098.1228.283
11.81211.82711.870
9.4089.5209.705
10.06610.06910.098
2.4212.4192.430

The accompanying notes are an integral part of these financial statements.
21
" "
– – –
– – –
– – –
" "
– – –
– – –
– – –
" "
– – –
– – –
– – –
" "
– – –
– – –
– – –
" "
– – –
– – –
– – – –
" "
– – –
– – –
– – –
" "
– – –
– – –
– – – –
– – –
– – –
– – –
– – – –
– – –
– – –
– – –
– – –
– – –
– – –
– – – –
– – – –
SEB Fund 4 -
SEB Short BondFund EUR
EUR
SEB Fund 4 -
SEB Short BondFund SEK
SEK
SEB Fund 4 -
SEB Short BondFund USD
USD
SEB Fund 4 -
Combined
USD
Performance in % "D (EUR)" units **)as at 31 December 2016as at 31 December 2015as at 31 December 2014Performance in % "D (SEK)" units **)as at 31 December 2016as at 31 December 2015as at 31 December 2014Performance in % "HNWC (SEK)" units *)as at 31 December 2016as at 31 December 2015as at 31 December 2014Performance in % "HNWD (SEK)" units **)as at 31 December 2016as at 31 December 2015as at 31 December 2014Performance in % "IC (EUR)" units *)as at 31 December 2016as at 31 December 2015as at 31 December 2014Performance in % "IC (SEK)" units *)as at 31 December 2016as at 31 December 2015as at 31 December 2014Performance in % "ID (EUR)" units **)as at 31 December 2016as at 31 December 2015as at 31 December 2014Dividend paid per D (EUR) unit201620152014
Dividend paid per D (SEK) unit201620152014
Dividend paid per HNWD (SEK) unit201620152014
Dividend paid per ID (EUR) unit201620152014
0.4(0.2)
0.7
0.5*****)
0.5******)
0.00580.00910.0083
The accompanying notes are an integral part of these financial statements.
(03)0.8
0.12000.1685
0.10000.15000.1972
21

The accompanying notes are an integral part of these financial statements.
22
– – –
– – –
– – –
– – –
– – –
– – –
– – –
– – –
– – –
– – –
–
–
–
SEB Fund4- SEB Fund4- SEB Fund4- SEB Fund4-SEB Short Bond SEB Short Bond SEB Short Bond Combined
Fund EUR Fund SEK Fund USDEUR SEK USD USD
Ongoing Charges (Unaudited)***) in %01/01/2016 - 31/12/2016 "C (EUR)" units 0.35 — — —
01/01/2016 - 31/12/2016 "C (SEK)" units — 0.26 — —
01/01/2016 - 31/12/2016 "C (USD)" units — — 0.46 —
01/01/2016 - 31/12/2016 "D (EUR)" units 0.35 — — —
01/01/2016 - 31/12/2016 "D (SEK)" units — 0.26 — —
01/01/2016 - 31/12/2016 "HNWC (SEK)" units — 0.22 — —
01/01/2016 - 31/12/2016 "HNWD (SEK)" units — 0.21 — —
01/01/2016 - 31/12/2016 "IC (EUR)" units 0.24 — — —
01/01/2016 - 31/12/2016 "IC (SEK)" units — 0.12 — —
01/01/2016 - 31/12/2016 "ID (EUR)" units 0.27 — — —
Portfolio Turnover Rate (Unaudited) ****) (PTR) in %01/01/2016 - 31/12/2016 (197.4) 273.4 21.2 —
*) Performance is calculated by the following formula: ((NAV / Unit as at 31/12/2016) / (NAV / Unit as at 31/12/2015) — 1) * 100**) Performance is calculated by the following formula: ((NAV / Unit as at 31/12/2016 + dividend / Unit paid during the year) / (NAV / Unit as at 31/12/2015)-1) * 100***) Ongoing Charges for the purposes of the financial statements are calculated by the following formula: (Expenses deducted from the assets includingthe depositary transaction fees but excluding bank interest on cash accounts and success fees on tax reclaim] average TNA) * 100. The Ongoing Charges ofthis financial report are dated 31 December 2016 and might differ from the Ongoing Charges published in the KIID.****) PTR is calculated by the following formula: ((Total 1 — Total 2) / average TNA) *100*****) IC (EUR) launched on 20 November 2015 at a price of EUR 100. Performance is calculated by the following formula: ((NAV / Units as at 31/12/2015)/(Initial subscription price of EUR 100) - 1) * 100.******) ID (EUR) launched on 20 November 2015 at a price of EUR 100. Performance is calculated by the following formula: ((NAV / Units as at 31/12/2015+dividend/Unit Paid during the year) / (Initial subscription price of EUR 100) - 1) * 100.
NA V = Net Asset ValueTNA = Total NetAssetsTotal] = Total ofsecurities transactions for the year under review (purchases + sales)Total 2 = Total of subscribed and redeemed units for the year under review (subscriptions + redemptions)
The accompanying notes are an integral part of these financial statements.
22
23
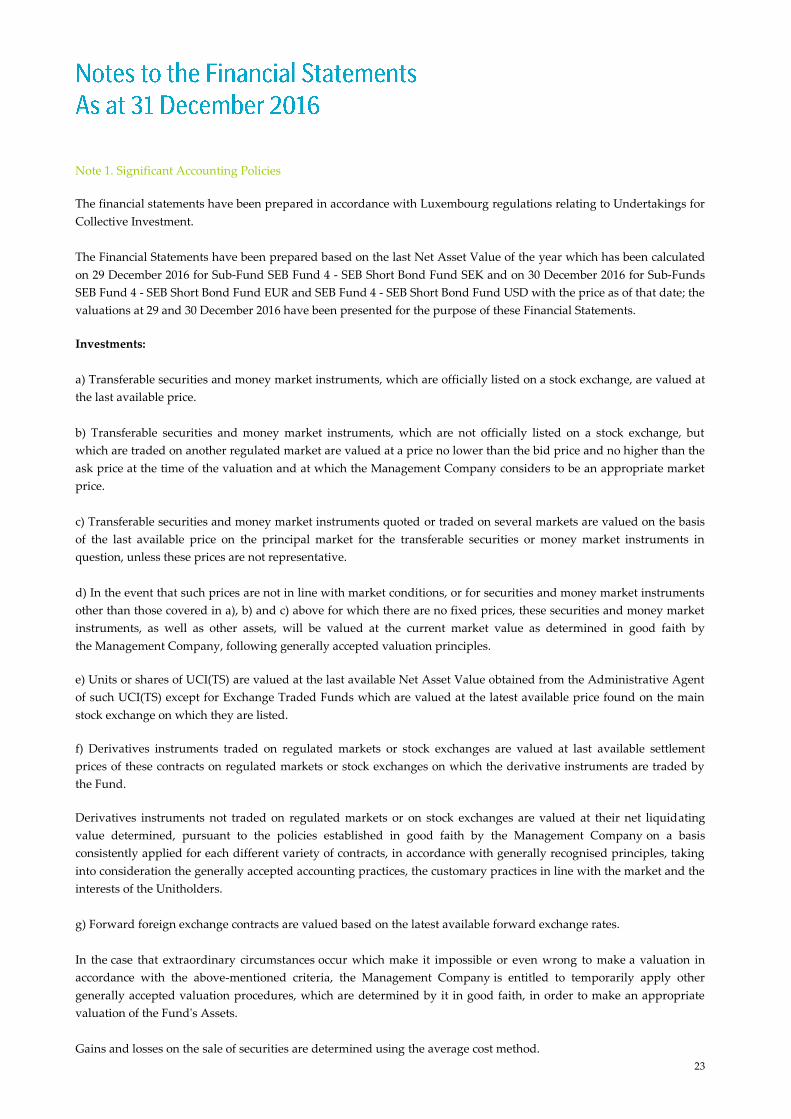
Note 1. Significant Accounting Policies
The financial statements have been prepared in accordance with Luxembourg regulations relating to Undertakings for
Collective Investment.
The Financial Statements have been prepared based on the last Net Asset Value of the year which has been calculated
on 29 December 2016 for Sub-Fund SEB Fund 4 - SEB Short Bond Fund SEK and on 30 December 2016 for Sub-Funds
SEB Fund 4 - SEB Short Bond Fund EUR and SEB Fund 4 - SEB Short Bond Fund USD with the price as of that date; the
valuations at 29 and 30 December 2016 have been presented for the purpose of these Financial Statements.
Investments:
a) Transferable securities and money market instruments, which are officially listed on a stock exchange, are valued at
the last available price.
b) Transferable securities and money market instruments, which are not officially listed on a stock exchange, but
which are traded on another regulated market are valued at a price no lower than the bid price and no higher than the
ask price at the time of the valuation and at which the Management Company considers to be an appropriate market
price.
c) Transferable securities and money market instruments quoted or traded on several markets are valued on the basis
of the last available price on the principal market for the transferable securities or money market instruments in
question, unless these prices are not representative.
d) In the event that such prices are not in line with market conditions, or for securities and money market instruments
other than those covered in a), b) and c) above for which there are no fixed prices, these securities and money market
instruments, as well as other assets, will be valued at the current market value as determined in good faith by
the Management Company, following generally accepted valuation principles.
e) Units or shares of UCI(TS) are valued at the last available Net Asset Value obtained from the Administrative Agent
of such UCI(TS) except for Exchange Traded Funds which are valued at the latest available price found on the main
stock exchange on which they are listed.
f) Derivatives instruments traded on regulated markets or stock exchanges are valued at last available settlement
prices of these contracts on regulated markets or stock exchanges on which the derivative instruments are traded by
the Fund.
Derivatives instruments not traded on regulated markets or on stock exchanges are valued at their net liquidating
value determined, pursuant to the policies established in good faith by the Management Company on a basis
consistently applied for each different variety of contracts, in accordance with generally recognised principles, taking
into consideration the generally accepted accounting practices, the customary practices in line with the market and the
interests of the Unitholders.
g) Forward foreign exchange contracts are valued based on the latest available forward exchange rates.
In the case that extraordinary circumstances occur which make it impossible or even wrong to make a valuation in
accordance with the above-mentioned criteria, the Management Company is entitled to temporarily apply other
generally accepted valuation procedures, which are determined by it in good faith, in order to make an appropriate
valuation of the Fund's Assets.
Gains and losses on the sale of securities are determined using the average cost method.
Notes to the Financial StatementsAs at 31 December 2016
Note 1. Significant Accounting Policies
The financial statements have been prepared in accordance with Luxembourg regulations relating to Undertakings forCollective Investment.
The Financial Statements have been prepared based on the last Net Asset Value of the year which has been calculatedon 29 December 2016 for Sub-Fund SEB Fund 4 - SEB Short Bond Fund SEK and on 30 December 2016 for Sub-FundsSEB Fund 4 - SEB Short Bond Fund EUR and SEB Fund 4 - SEB Short Bond Fund USD with the price as of that date; thevaluations at 29 and 30 December 2016 have been presented for the purpose of these Financial Statements.
Investments:
a) Transferable securities and money market instruments, which are officially listed on a stock exchange, are valued atthe last available price.
b) Transferable securities and money market instruments, which are not officially listed on a stock exchange, butwhich are traded on another regulated market are valued at a price no lower than the bid price and no higher than theask price at the time of the valuation and at which the Management Company considers to be an appropriate marketprice.
c) Transferable securities and money market instruments quoted or traded on several markets are valued on the basisof the last available price on the principal market for the transferable securities or money market instruments inquestion, unless these prices are not representative.
d) In the event that such prices are not in line with market conditions, or for securities and money market instrumentsother than those covered in a), b) and C) above for which there are no fixed prices, these securities and money marketinstruments, as well as other assets, will be valued at the Current market value as determined in good faith bythe Management Company, following generally accepted valuation principles.
e) Units or shares of UCI(TS) are valued at the last available Net Asset Value obtained from the Administrative Agentof such UCI(TS) except for Exchange Traded Funds which are valued at the latest available price found on the mainstock exchange on which they are listed.
f) Derivatives instruments traded on regulated markets or stock exchanges are valued at last available settlementprices of these contracts on regulated markets or stock exchanges on which the derivative instruments are traded bythe Fund.
Derivatives instruments not traded on regulated markets or on stock exchanges are valued at their net liquidatingvalue determined, pursuant to the policies established in good faith by the Management Company on a basisconsistently applied for each different variety of contracts, in accordance with generally recognised principles, takinginto consideration the generally accepted accounting practices, the customary practices in line with the market and theinterests of the Unitholders.
g) Forward foreign exchange contracts are valued based on the latest available forward exchange rates.
In the case that extraordinary circumstances occur which make it impossible or even wrong to make a valuation inaccordance with the above-mentioned criteria, the Management Company is entitled to temporarily apply othergenerally accepted valuation procedures, which are determined by it in good faith, in order to make an appropriatevaluation of the Fund's Assets.
Gains and losses on the sale of securities are determined using the average cost method.23

24
Swing pricing:
The Investment Manager needs to perform transactions in order to uphold the desired asset allocation as a result of the
flows in and out of the Sub-Funds. While performing these transactions brokerage and transaction costs will occur.
Acting in the Unitholders' interest, the Net Asset Value will be adjusted if on any Valuation Day the aggregate
transactions in units of all Classes of a Sub-Fund result in a net increase or decrease of units which exceeds a threshold
set by the Board of Directors of the Management Company from time to time (relating to the cost of market dealing for
the Sub-Fund), the Net Asset Value per unit of the relevant Sub-Fund will be adjusted to reflect both the estimated
fiscal charges and dealing costs (brokerage and transaction costs) that may be incurred by the Sub-Fund and the
estimated bid/offer spread of the assets in which the respective Sub-Fund invests following the net movement of
units of the Sub-Fund. The adjustment will be an addition when the net movement results in an increase of all units of
the Sub-Fund and a deduction when it results in a decrease. Adjustments made during the year are recorded in
“Proceeds on issue of units” and “Payment on redemptions of units” in the Combined Statement of Changes in Net
Assets.
No swing pricing adjustment has been applied to the year end Net Asset Value per unit calculated on 29 December
2016 and 30 December 2016.
Currency translation:
All assets denominated in a different currency to the respective Sub-Funds' currency are converted into this respective
Sub-Funds' currency at the last available exchange rate.
Separate accounts are maintained for the Sub-Fund in the currency in which the Net Asset Value per unit to which it
relates is expressed (the "accounting currency").
Transactions denominated in a currency other than the accounting currency are recorded on the basis of exchange
rates prevailing on the date they occur or accrue to the Sub-Fund.
Assets and liabilities, expressed in a currency other than the accounting currency, are translated on the basis of
exchange rates ruling at the balance sheet date.
The consolidated total is translated into USD at the year end date exchange rate.
As at 29 December 2016, the exchange rates were as follows for SEB Fund 4 – SEB Short Bond Fund SEK:
1 EUR = 1.045697431 USD
1 NOK = 0.115333478 USD
1 SEK = 0.109549165 USD
As at 30 December 2016, the exchange rates were as follows for SEB Fund 4 – SEB Short Bond Fund EUR and SEB Fund
4 – SEB Short Bond Fund USD:
1 EUR = 1.054833624 USD
1 NOK = 0.116115356 USD
1 SEK = 0.110400614 USD
Income:
Interest income and bank interest income are recognised on an accrual basis. Dividends are recorded on the ex-
dividend date. This income is shown net of any withholding taxes and adjusted accordingly when tax reclaims apply.
Swing pricing:
The Investment Manager needs to perform transactions in order to uphold the desired asset allocation as a result of theflows in and out of the Sub-Funds. While performing these transactions brokerage and transaction costs will occur.Acting in the Unitholders' interest, the Net Asset Value will be adjusted if on any Valuation Day the aggregatetransactions in units of all Classes of a Sub-Fund result in a net increase or decrease of units which exceeds a thresholdset by the Board of Directors of the Management Company from time to time (relating to the cost of market dealing forthe Sub-Fund), the Net Asset Value per unit of the relevant Sub-Fund will be adjusted to reflect both the estimatedfiscal charges and dealing costs (brokerage and transaction costs) that may be incurred by the Sub-Fund and theestimated bid/offer spread of the assets in which the respective Sub-Fund invests following the net movement ofunits of the Sub-Fund. The adjustment will be an addition when the net movement results in an increase of all units ofthe Sub-Fund and a deduction when it results in a decrease. Adjustments made during the year are recorded in”Proceeds on issue of units" and ”Payment on redemptions of units" in the Combined Statement of Changes in NetAssets.
No swing pricing adjustment has been applied to the year end Net Asset Value per unit calculated on 29 December2016 and 30 December 2016.
Currency translation:
All assets denominated in a different currency to the respective Sub-Funds’ currency are converted into this respectiveSub-Funds‘ currency at the last available exchange rate.
Separate accounts are maintained for the Sub-Fund in the currency in which the Net Asset Value per unit to which itrelates is expressed (the "accounting currency").
Transactions denominated in a currency other than the accounting currency are recorded on the basis of exchangerates prevailing on the date they occur or accrue to the Sub-Fund.
Assets and liabilities, expressed in a Currency other than the accounting currency, are translated on the basis ofexchange rates ruling at the balance sheet date.
The consolidated total is translated into USD at the year end date exchange rate.
As at 29 December 2016, the exchange rates were as follows for SEB Fund 4 — SEB Short Bond Fund SEK:
1 EUR = 1.045697431 USD1 NOK = 0.115333478 USD1 SEK = 0.109549165 USD
As at 30 December 2016, the exchange rates were as follows for SEB Fund 4 — SEB Short Bond Fund EUR and SEE Fund4 — SEB Short Bond Fund USD:
1 EUR = 1054833624 USD1 NOK = 0.116115356 USD1 SEK = 0.110400614 USD
Income:
Interest income and bank interest income are recognised on an accrual basis. Dividends are recorded on the ex-dividend date. This income is shown net of any withholding taxes and adjusted accordingly when tax reclaims apply.
24

25
Note 2. Management Fees
In payment for its services, the Management Company receives an annual rate of:
0.30% is charged on SEB Fund 4 - SEB Short Bond Fund EUR “C” (EUR) units (maximum rate: 0.40%)
0.30% is charged on SEB Fund 4 - SEB Short Bond Fund EUR “D” (EUR) units (maximum rate: 0.40%)
0.25% is charged on SEB Fund 4 - SEB Short Bond Fund EUR ‘’IC” (EUR) units (maximum rate: 0.40%)
0.25% is charged on SEB Fund 4 - SEB Short Bond Fund EUR ‘’ID” (EUR) units (maximum rate: 0.40%)
0.20% is charged on SEB Fund 4 - SEB Short Bond Fund SEK “C” (SEK) units (maximum rate: 0.40%)
0.20% is charged on SEB Fund 4 - SEB Short Bond Fund SEK “D” (SEK) units (maximum rate: 0.40%)
0.15% is charged on SEB Fund 4 - SEB Short Bond Fund SEK “HNWC” (SEK) units (maximum rate: 0.40%)
0.15% is charged on SEB Fund 4 - SEB Short Bond Fund SEK “HNWD” (SEK) units (maximum rate: 0.40%)
0.10% is charged on SEB Fund 4 - SEB Short Bond Fund SEK “IC” (SEK) units (maximum rate: 0.40%)
0.40% is charged on SEB Fund 4 - SEB Short Bond Fund USD “C” (USD) units (maximum rate: 0.40%)
A twelfth of this rate is being payable at the end of each month and based on the average Net Assets of each Sub-Fund
calculated daily during the relevant month.
The Management Company pays accounting, administration and depositary fees on behalf of the fund.
Note 3. Taxation
The Fund is liable in Luxembourg to a subscription tax ("taxe d'abonnement") of 0.05% or 0.01% (as applicable) per
annum of its NAV, such tax being payable quarterly on the basis of the value of the aggregate Net Assets of the Sub-
Funds at the end of the relevant calendar quarter. Investments by a Sub-Fund in shares or units of another
Luxembourg undertaking for collective investment which are also subject to the taxe d’abonnement are excluded from
the NAV of the Sub-Fund serving as basis for the calculation of this tax to be paid by the Sub-Fund.
No stamp duty or other tax is payable in Luxembourg on the issue of units.
Interest, dividend and other income realised by a Sub-Fund on the sale of securities of non-Luxembourg issuers, may
be subject to withholding and other taxes levied by the jurisdictions in which the income is sourced.
Note 4. Transaction Fees
Transaction fees incurred by the Fund relating to the purchase or sale of transferable securities, money market
instruments, derivatives or other eligible assets are mainly composed of depositary fees and broker fees. Most of the
transaction fees are included in the transaction price used to calculate the realised and unrealised gain/(loss) on
securities. In line with bond market practice, a bid-offer spread is applied when buying or selling securities and other
financial instruments. Consequently, in any given transaction, there will be a difference between the purchase and sale
prices quoted by the broker, which represents the broker's remuneration.
As at 31 December 2016, the transaction fees were as follows:
SEB Fund 4 - SEB Short Bond Fund EUR 1,675.00 EUR
SEB Fund 4 - SEB Short Bond Fund SEK 17,228.86 SEK
SEB Fund 4 - SEB Short Bond Fund USD 784.27 USD
Note 5. Significant Events during the year
Prospectus
A new prospectus was issued in November 2016.
Note 2. Management Fees
In payment for its services, the Management Company receives an annual rate of:
0 0.30% is charged on SEB Fund 4 - SEB Short Bond Fund EUR ”C" (EUR) units (maximum rate: 0.40%)0 0.30% is charged on SEB Fund 4 - SEB Short Bond Fund EUR ”D" (EUR) units (maximum rate: 0.40%)0 0.25% is charged on SEB Fund 4 - SEB Short Bond Fund EUR ”IC" (EUR) units (maximum rate: 0.40%)0 0.25% is charged on SEB Fund 4 - SEB Short Bond Fund EUR "ID" (EUR) units (maximum rate: 0.40%)0 0.20% is charged on SEB Fund 4 - SEB Short Bond Fund SEK ”C” (SEK) units (maximum rate: 0.40%)0 0.20% is charged on SEB Fund 4 - SEB Short Bond Fund SEK ”D" (SEK) units (maximum rate: 0.40%)0 0.15% is charged on SEB Fund 4 - SEB Short Bond Fund SEK ”HNWC" (SEK) units (maximum rate: 0.40%)0 0.15% is charged on SEB Fund 4 - SEB Short Bond Fund SEK ”HNWD" (SEK) units (maxirnum rate: 0.40%)0 0.10% is charged on SEB Fund 4 - SEB Short Bond Fund SEK ”IC" (SEK) units (maximum rate: 0.40%)0 0.40% is charged on SEB Fund 4 - SEB Short Bond Fund USD ”C" (USD) units (maximum rate: 0.40%)
A twelfth of this rate is being payable at the end of each month and based on the average Net Assets of each Sub-Fundcalculated daily during the relevant month.
The Management Company pays accounting, administration and depositary fees on behalf of the fund.
Note 3. Taxation
The Fund is liable in Luxembourg to a subscription tax ("taxe d’abonnement") of 0.05% or 0.01% (as applicable) perannum of its NAV, such tax being payable quarterly on the basis of the value of the aggregate Net Assets of the Sub-Funds at the end of the relevant calendar quarter. Investments by a Sub-Fund in shares or units of anotherLuxembourg undertaking for collective investment which are also subject to the taxe d’abonnement are excluded fromthe NAV of the Sub-Fund serving as basis for the calculation of this tax to be paid by the Sub-Fund.
No stamp duty or other tax is payable in Luxembourg on the issue of units.
Interest, dividend and other income realised by a Sub-Fund on the sale of securities of non-Luxembourg issuers, maybe subject to withholding and other taxes levied by the jurisdictions in which the income is sourced.
Note 4. Transaction Fees
Transaction fees incurred by the Fund relating to the purchase or sale of transferable securities, money marketinstruments, derivatives or other eligible assets are mainly composed of depositary fees and broker fees. Most of thetransaction fees are included in the transaction price used to calculate the realised and unrealised gain/(loss) onsecurities. In line with bond market practice, a bid-offer spread is applied when buying or selling securities and otherfinancial instruments. Consequently, in any given transaction, there will be a difference between the purchase and saleprices quoted by the broker, which represents the broker's remuneration.
As at 31 December 2016, the transaction fees were as follows:
SEB Fund 4 - SEB Short Bond Fund EUR 1,675.00 EURSEB Fund 4 - SEB Short Bond Fund SEK 17,228.86 SEKSEB Fund 4 - SEB Short Bond Fund USD 784.27 USD
Note 5. Significant Events during the year
ProspectusA new prospectus was issued in November 2016.
25

26
Directors
There were changes to the Board of Directors of the Management Company during the year. Please refer to the
Organisation Section on page 3 for details.
Branch
SEB Asset Management S.A. (SEB AM) merged with SEB Investment Management AB (SEB IM AB) on 2 November
2016.
On 1 June 2016, the Luxembourg Memorial C has been replaced by RESA (Recueil Electronique des Sociétés et
Associations), the new official electronic platform of central publication regarding companies and associations.
Note 6. Subsequent Events after the year end
Effective 1 April 2017, BNY Mellon has merged its legal entity The Bank of New York Mellon (Luxembourg) S.A., into
The Bank of New York Mellon SA/NV (The European Bank).
DirectorsThere were changes to the Board of Directors of the Management Company during the year. Please refer to theOrganisation Section on page 3 for details.
BranchSEB Asset Management SA. (SEB AM) merged with SEB Investment Management AB (SEB IM AB) on 2 November2016.
On 1 ]une 2016, the Luxembourg Memorial C has been replaced by RESA (Recueil Electronique des Sociétés etAssociations), the new official electronic platform of central publication regarding companies and associations.
Note 6. Subsequent Events after the year end
Effective 1 April 2017, BNY Mellon has merged its legal entity The Bank of New York Mellon (Luxembourg) S.A., intoThe Bank of New York Mellon SA/NV (The European Bank).
26

27
To the Unitholders of
SEB Fund 4
We have audited the accompanying financial statements of SEB Fund 4 and of each of its Sub-Funds, which comprise
the Combined Statement of Net Assets and the Schedule of Investments as at 31 December 2016 and the Combined
Statement of Operations and the Combined Statement of Changes in Net Assets for the year then ended, and a
summary of significant accounting policies and other explanatory notes to the financial statements.
Responsibility of the Board of Directors of the Management Company for the financial statements
The Board of Directors of the Management Company is responsible for the preparation and fair presentation of these
financial statements in accordance with Luxembourg legal and regulatory requirements relating to the preparation of
the financial statements and for such internal control as the Board of Directors of the Management Company
determines is necessary to enable the preparation of financial statements that are free from material misstatement,
whether due to fraud or error.
Responsibility of the “Réviseur d’entreprises agréé”
Our responsibility is to express an opinion on these financial statements based on our audit. We conducted our audit
in accordance with International Standards on Auditing as adopted for Luxembourg by the “Commission de
Surveillance du Secteur Financier”. Those standards require that we comply with ethical requirements and plan and
perform the audit to obtain reasonable assurance about whether the financial statements are free from material
misstatement.
An audit involves performing procedures to obtain audit evidence about the amounts and disclosures in the financial
statements. The procedures selected depend on the judgment of the “Réviseur d’entreprises agréé”, including the
assessment of the risks of material misstatement of the financial statements, whether due to fraud or error. In making
those risk assessments, the “Réviseur d’entreprises agréé” considers internal control relevant to the entity’s
preparation and fair presentation of the financial statements in order to design audit procedures that are appropriate
in the circumstances, but not for the purpose of expressing an opinion on the effectiveness of the entity’s internal
control. An audit also includes evaluating the appropriateness of accounting policies used and the reasonableness of
accounting estimates made by the Board of Directors of the Management Company, as well as evaluating the overall
presentation of the financial statements.
We believe that the audit evidence we have obtained is sufficient and appropriate to provide a basis for our audit
opinion.
............................................................................................................................. ............................................................................................................................. .................. PricewaterhouseCoopers, Société coopérative, 2 rue Gerhard Mercator, B.P.1443, L-1014 Luxembourg T: +352 494848 1, F:+352 494848 2900, www.pwc.lu Cabinet de révision agréé. Expert-comptable (autorisation gouvernementale n°10028256) R.C.S. Luxembourg B 65 477 - TVA LU25482518
JPWC
Audit Report
To the Unitholders ofSEB Fund 4
We have audited the accompanying financial statements of SEB Fund 4 and of each of its Sub-Funds, which comprisethe Combined Statement of Net Assets and the Schedule of Investments as at 31 December 2016 and the CombinedStatement of Operations and the Combined Statement of Changes in Net Assets for the year then ended, and asummary of significant accounting policies and other explanatory notes to the financial statements.
Responsibility of the Board ofDirectors of the Management Company for thefinancial statements
The Board of Directors of the Management Company is responsible for the preparation and fair presentation of thesefinancial statements in accordance with Luxembourg legal and regulatory requirements relating to the preparation ofthe financial statements and for such internal control as the Board of Directors of the Management Companydetermines is necessary to enable the preparation of financial statements that are free from material misstatement,whether due to fraud or error.
Responsibility of the ”Re'viseur d'entreprises agréé”
Our responsibility is to express an opinion on these financial statements based on our audit. We conducted our auditin accordance with Ir1ternational Standards on Auditing as adopted for Luxembourg by the ”Commission deSurveillance du Secteur Financier”. Those standards require that we comply with ethical requirements and plan andperform the audit to obtain reasonable assurance about whether the financial statements are free from materialmisstatement.
An audit involves performing procedures to obtain audit evidence about the amounts and disclosures in the financialstatements. The procedures selected depend on the judgment of the ”Réviseur d'entreprises agréé”, including theassessment of the risks of material misstatement of the financial statements, whether due to fraud or error. In makingthose risk assessments, the ”Réviseur d'entreprises agréé" considers internal control relevant to the entity'spreparation and fair presentation of the financial statements in order to design audit procedures that are appropriatein the circumstances, but not for the purpose of expressing an opinion on the effectiveness of the entity's internalcontrol. An audit also includes evaluating the appropriateness of accounting policies used and the reasonableness ofaccounting estimates made by the Board of Directors of the Management Company, as well as evaluating the overallpresentation of the financial statements.
We believe that the audit evidence we have obtained is sufficient and appropriate to provide a basis for our auditopinion.
PricewaterhouseCoopers, Société coopérative, 2 rue Gerhard Mercator, B.P.1443, L—1014 LuxembourgT: +352 494848 I, F.'+352 494848 2900, www.pwc.lu
Cabinet de révision agréé. Expert-camptable (autorisation guu ye: nementale n°1 0028256)R. C.S. Luxembourg B 65 477 - TVA LU254825I8
27

pwc
Opinion
In our opinion, the financial statements give a true and fair View of the financial position of SEB Fund 4 and of each ofits Sub-Funds as of 31 December 2016, and of the results of their operations and changes in their net assets for the yearthen ended in accordance with Luxembourg legal and regulatory requirements relating to the preparation of thefinancial statements.
Other information
The Board of Directors of the Management Company is responsible for the other information. The other informationcomprises the information included in the annual report but does not include the financial statements and our auditreport thereon.
Our opinion on the financial statements does not cover the other information and we do not express any form ofassurance conclusion thereon.
In connection with our audit of the financial statements, our responsibility is to read the other information and, indoing so, consider whether the other information is materially inconsistent with the financial statements or ourknowledge obtained in the audit or otherwise appears to be materially misstated. If, based on the work we haveperformed, we conclude that there is a material misstatement of this other information, we are required to report thisfact. We have nothing to report in this regard.
PricewaterhouseCoopers, Sociéte coopérative Luxembourg, 4 April 2017Represented by
Q77/\Thierry Blondeau
28

29
Risk Management systems
The risk monitoring is based on the risk management process adopted by the Board of the Management Company and
is performed independently from the portfolio management. No changes have been applied to the risk management
procedures.
The Investment Manager calculates the leverage on a gross and on a commitment method. The gross method converts
all positions on derivative financial instruments into equivalent positions in the underlying assets, while the
commitment method applies the same while allowing netting and hedging arrangements.
Fund Gross Method Leverage
Limit Minimum Average Maximum
SEB Fund 4 –
SEB Short Bond Fund EUR 100% 0.00% 0.02% 2.38%
SEB Fund 4 –
SEB Short Bond Fund SEK 100% 0.00% 0.17% 0.39%
SEB Fund 4 –
SEB Short Bond Fund USD 100% 0.00% 0.03% 1.80%
Risk Disclosure (unaudited)
Risk Management systems
The risk monitoring is based on the risk management process adopted by the Board of the Management Company andis performed independently from the portfolio management. No changes have been applied to the risk managementprocedures.
The Investment Manager calculates the leverage on a gross and on a commitment method. The gross method convertsall positions on derivative financial instruments into equivalent positions in the underlying assets, while thecommitment method applies the same while allowing netting and hedging arrangements.
Fund Gross Method Leverage
Limit Minimum Average MaximumSEB Fund 4 —
1 00 . 00 . 200 2. 00SEB Short Bond Fund EUR 00 / 0 00 / 0 0 / 38 /
SEB Fund 4 — 0 O 0 0SEB Short Bond Fund SEK 100 A» 0.00 A) 0.17 /o 0.39 /o
SEB Fund 4 — 0 O 0 0SEB Short Bond Fund USD 100 A: 0.00 A) 0.03 A» 1.80 /o
29

30
SEB IM AB (the Fund Company) wishes to encourage and incite good performance and sound behaviour, as well as to
endeavour to achieve balanced risk-taking that is aligned with the interests of fund unitholders.
The Fund Company has a long-term vision regarding the employment conditions of its staff. Total remuneration shall
contribute to developing the Fund Company's competitiveness and profitability through the Company being able to
attract, retain, motivate and reward competent and skilful employees. In order to achieve this objective, the Fund
Company's board of directors has adopted a remuneration policy based on Swedish and international regulations. The
purpose of the remuneration policy is to ensure that the Fund Company has a remuneration system that is adapted to
the fund unitholders' long-term interests and the Fund Company's strategy and values.
The remuneration policy is based on the remuneration model that is applied at Group level, and is built on SEB's
values. The Fund Company's remuneration policy is reviewed at least annually. The Fund Company's current
remuneration policy is based on a risk analysis that has been prepared by the Fund Company's risk control
department.
The Fund Company’s remuneration structure is based on three components:
• Fixed remuneration (basic salary)
• Variable remuneration
• Pensions and other benefits
The remuneration components are used to achieve a competitive individual level of remuneration with an appropriate
balance between fixed and variable remuneration.
The fixed remuneration component is individually adapted further to predetermined internal and external appraisals.
The level of the fixed remuneration is based on the employee's experience, long-term performance and behaviour.
All employees at the Fund Company are embraced by SEB's collective profit sharing model that has a predetermined
maximum outcome. The remuneration is established based on SEB's earnings and customer satisfaction.
Remuneration to employees in control departments (internal audit, risk control, and observance of regulations) is
established by the board of directors further to proposals from the Fund Company's remuneration committee.
Remuneration shall be based on objective grounds related to the employee's role and tasks, and be independent of the
business unit that the control department scrutinises.
Employees in departments that have a monitoring function, such as internal auditing, risk control or compliance, are
not to receive any other variable remuneration over and above SEB's profit sharing.
The Fund Company applies the grandfather principle to all remuneration, which means all decisions are to be
approved by, at the least, the manager for the manager of the employee concerned.
Variable remuneration
The Fund Company uses variable remuneration in order to develop and reward performance and behaviour that
create both short-term and long-term value for the fund unitholders and the Fund Company. Variable remuneration is
an important aspect of designing a flexible remuneration system. Variable remuneration is composed of both cash and
shares in investment funds or financial instruments which achieve the equivalent common interests as shares in the
relevant investment funds.
The principles for variable remuneration adopted by the Fund Company are established with the objective of
reflecting the Fund Company's low risk tolerance and being compatible with the Fund's prevailing risk profiles, fund
rules, discretionary mandates, as well as internal and external regulations. The variable remuneration shall be based
on the employee's performance and behaviour from a several-year perspective, as well as the performance and
economic results of the employee's team, the Fund Company and SEB as a whole.
Remuneration Disclosure (unaudited)
SEB IM AB (the Fund Company) wishes to encourage and incite good performance and sound behaviour, as well as toendeavour to achieve balanced risk-taking that is aligned with the interests of fund unitholders.
The Fund Company has a long-term vision regarding the employment conditions of its staff. Total remuneration shallcontribute to developing the Fund Company's competitiveness and profitability through the Company being able toattract, retain, motivate and reward competent and skilful employees. In order to achieve this objective, the FundCompany's board of directors has adopted a remuneration policy based on Swedish and international regulations. Thepurpose of the remuneration policy is to ensure that the Fund Company has a remuneration system that is adapted tothe fund unitholders' long-term interests and the Fund Company's strategy and values.
The remuneration policy is based on the remuneration model that is applied at Group level, and is built on SEB'svalues. The Fund Company's remuneration policy is reviewed at least annually. The Fund Company's currentremuneration policy is based on a risk analysis that has been prepared by the Fund Company's risk controldepartment.
The Fund Company's remuneration structure is based on three components:0 Fixed remuneration (basic salary)0 Variable remuneration0 Pensions and other benefits
The remuneration components are used to achieve a competitive individual level of remuneration with an appropriatebalance between fixed and variable remuneration.
The fixed remuneration component is individually adapted further to predetermined internal and external appraisals.The level of the fixed remuneration is based on the employee's experience, long-term performance and behaviour.
All employees at the Fund Company are embraced by SEB's collective profit sharing model that has a predeterminedmaximum outcome. The remuneration is established based on SEB's earnings and customer satisfaction.
Remuneration to employees in control departments (internal audit, risk control, and observance of regulations) isestablished by the board of directors further to proposals from the Fund Company's remuneration committee.Remuneration shall be based on objective grounds related to the employee's role and tasks, and be independent of thebusiness unit that the control department scrutinises.
Employees in departments that have a monitoring function, such as internal auditing, risk control or compliance, arenot to receive any other variable remuneration over and above SEB's profit sharing.
The Fund Company applies the grandfather principle to all remuneration, which means all decisions are to beapproved by, at the least, the manager for the manager of the employee concerned.
Variable remunerationThe Fund Company uses variable remuneration in order to develop and reward performance and behaviour thatcreate both short-term and long-term value for the fund unitholders and the Fund Company. Variable remuneration isan important aspect of designing a flexible remuneration system. Variable remuneration is composed of both cash andshares in investment funds or financial instruments which achieve the equivalent common interests as shares in therelevant investment funds.
The principles for variable remuneration adopted by the Fund Company are established with the objective ofreflecting the Fund Company's low risk tolerance and being compatible with the Fund's prevailing risk profiles, fundrules, discretionary mandates, as well as internal and external regulations. The variable remuneration shall be basedon the employee's performance and behaviour from a several-year perspective, as well as the performance andeconomic results of the employee's team, the Fund Company and SEB as a whole.
30

31
At the same time as obtaining a sound balance between fixed and variable remuneration, the payment of variable
remuneration shall be related to the Fund Company's risk policy and creation of value for the fund unitholders. This
implies that certain maximum levels and deferment of payment shall apply to different personnel categories. For
employees in positions that have a significant influence on the Fund Company's or the managed funds’ risk profile, the
maximum variable remuneration may not exceed 100 percent of the fixed remuneration. The variable remuneration is
to be deferred by 40 to 60 percent for a minimum of three years. At least 50 percent of the variable remuneration is to
consist of shares in investment funds or instruments which achieve the same common interests as shares in the
relevant securities funds. Variable remuneration in the form of fund shares will be subject to retention policy for at
least one year. This retention policy applies to variable compensation whether or not it is deferred.
The Fund Company also applies a special remuneration model for certain employees who manage funds and
discretionary mandates. The remuneration model for these persons is based on a structure with distinct rules for
maximum outcome of remuneration, deferment of remuneration as well as rules regarding downward
adjustment/reduction of remuneration.
Payment of deferred remuneration shall only be made if such is motivated based on the Fund Company's economic
situation and the performance of the Fund Company, the relevant division and the employee.
Reduction or downward adjustment of deferred variable remuneration shall apply should losses, increased risks and
costs arise during the deferment period, which includes for example taking into consideration the employee's
observance of external and internal regulations. Reduction or downward adjustment shall also take place should
payment be deemed unwarrantable in view of the Fund Company's financial situation.
The variable remuneration system shall be continuously reviewed in order to ensure that it does not create any
unsuitable behaviour and contribute to excessive risk-taking.
The remuneration committee
The Fund Company has appointed a remuneration committee with the task of independently appraising the
remuneration policy. The remuneration committee shall be responsible for preparing decisions regarding
remuneration that are to be adopted by the board of directors, and intervene if a decision could imply consequences
for the Fund Company's risks and risk management. The remuneration committee is an independent body composed
of the board of directors' independent members.
Follow up
The CEO, the deputy CEO and the board of directors shall ensure that the remuneration policy is operationally
applied. The remuneration policy shall be reviewed annually by the internal audit department or by an independent
auditing firm. In order to ensure that the Fund Company's remuneration system is applied in accordance with the
remuneration policy, the remuneration system and the payment of remuneration shall be reviewed annually by
internal or external auditors.
Regulated staff Paid remuneration and benefits, 2016
(thousand)
USD
- Employees in leading strategic positions 2,125 - Employees responsible for control 193 - Risk-takers 11,548 - Employees whose total remuneration amounts to or exceeds the total - - - -
- remuneration to any of the Executive Board -
Total remuneration paid (thousand)
USD
- All employees (fixed remuneration) 16,634 - All employees (variable remuneration) 2,572
Number of employees during the year 138
At the same time as obtaining a sound balance between fixed and variable remuneration, the payment of variableremuneration shall be related to the Fund Company's risk policy and creation of value for the fund unitholders. Thisimplies that certain maximum levels and deferment of payment shall apply to different personnel categories. Foremployees in positions that have a significant influence on the Fund Company's or the managed funds’ risk profile, themaximum variable remuneration may not exceed 100 percent of the fixed remuneration. The variable remuneration isto be deferred by 40 to 60 percent for a minimum of three years. At least 50 percent of the variable remuneration is toconsist of shares in investment funds or instruments which achieve the same common interests as shares in therelevant securities funds. Variable remuneration in the form of fund shares will be subject to retention policy for atleast one year. This retention policy applies to variable compensation whether or not it is deferred.
The Fund Company also applies a special remuneration model for certain employees who manage funds anddiscretionary mandates. The remuneration model for these persons is based on a structure with distinct rules formaximum outcome of remuneration, deferment of remuneration as well as rules regarding downwardadjustment/reduction of remuneration.
Payment of deferred remuneration shall only be made if such is motivated based on the Fund Company's economicsituation and the performance of the Fund Company, the relevant division and the employee.
Reduction or downward adjustment of deferred variable remuneration shall apply should losses, increased risks andcosts arise during the deferment period, which includes for example taking into consideration the employee'sobservance of external and internal regulations. Reduction or downward adjustment shall also take place shouldpayment be deemed unwarrantable in View of the Fund Company's financial situation.
The variable remuneration system shall be continuously reviewed in order to ensure that it does not create anyunsuitable behaviour and contribute to excessive risk-taking.
The remuneration committeeThe Fund Company has appointed a remuneration committee with the task of independently appraising theremuneration policy. The remuneration committee shall be responsible for preparing decisions regardingremuneration that are to be adopted by the board of directors, and intervene if a decision could imply consequencesfor the Fund Company's risks and risk management. The remuneration committee is an independent body composedof the board of directors’ independent members.
Follow uThe CEO}: the deputy CEO and the board of directors shall ensure that the remuneration policy is operationallyapplied. The remuneration policy shall be reviewed annually by the internal audit department or by an independentauditing firm. In order to ensure that the Fund Company's remuneration system is applied in accordance with theremuneration policy, the remuneration system and the payment of remuneration shall be reviewed annually byinternal or external auditors.
Regulated staff Paid remuneration and benefits, 2016(thousand)
USD- Employees in leading strategic positions 2,125- Employees responsible for control 193- Risk-takers 11,548- Employees whose total remuneration amounts to or exceeds the total -
remuneration to any of the Executive Board
Total remuneration paid(thousand)
USD- All employees (fixed remuneration) 16,634- All employees (variable remuneration) 2,572
Number ofemployees during the year 138
31

32
SEB Investment Management AB
4, rue Peternelchen, L-2370 Howald, Luxembourg
Postal address: PO Box 2053, L-1020 Luxembourg
Phone +352 - 26 23 1; Fax +352 - 26 23 25 55
www.sebgroup.lu
SEB Investment Management AB4, rue Peternelchen, L-2370 Howald, LuxembourgPostal address: PO Box 2053, L-1020 LuxembourgPhone +352 - 26 23 1; Fax +352 - 26 23 25 55www.sebgroup.lu