Morgan Stanley Investment Funds - Fundsquare
196
Morgan Stanley Investment Funds Société d’Investissement à Capital Variable incorporated under the laws of Luxembourg Annual Report December 31, 2009 INVESTMENT MANAGEMENT R.C.S. Luxembourg: B-29.192
-
Upload
khangminh22 -
Category
Documents
-
view
1 -
download
0
Transcript of Morgan Stanley Investment Funds - Fundsquare
Morgan Stanley Investment Funds
Société d’Investissement à Capital Variableincorporated under the laws of Luxembourg
Annual ReportDecember 31, 2009
INVESTMENT MANAGEMENT
R.C.S. Luxembourg: B-29.192

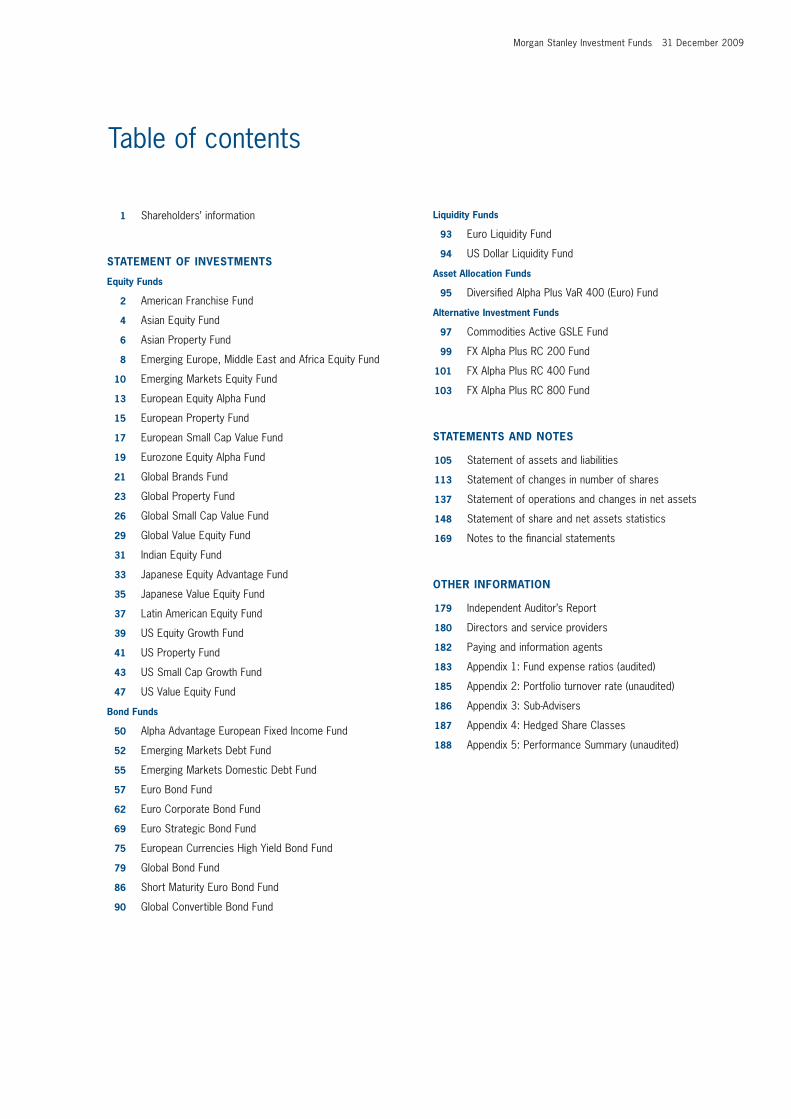
Morgan Stanley Investment Funds 31 December 2009
1 Shareholders’ information
STATEMENT OF INVESTMENTS
Equity Funds
2 American Franchise Fund
4 Asian Equity Fund
6 Asian Property Fund
8 Emerging Europe, Middle East and Africa Equity Fund
10 Emerging Markets Equity Fund
13 European Equity Alpha Fund
15 European Property Fund
17 European Small Cap Value Fund
19 Eurozone Equity Alpha Fund
21 Global Brands Fund
23 Global Property Fund
26 Global Small Cap Value Fund
29 Global Value Equity Fund
31 Indian Equity Fund
33 Japanese Equity Advantage Fund
35 Japanese Value Equity Fund
37 Latin American Equity Fund
39 US Equity Growth Fund
41 US Property Fund
43 US Small Cap Growth Fund
47 US Value Equity Fund
Bond Funds
50 Alpha Advantage European Fixed Income Fund
52 Emerging Markets Debt Fund
55 Emerging Markets Domestic Debt Fund
57 Euro Bond Fund
62 Euro Corporate Bond Fund
69 Euro Strategic Bond Fund
75 European Currencies High Yield Bond Fund
79 Global Bond Fund
86 Short Maturity Euro Bond Fund
90 Global Convertible Bond Fund
Liquidity Funds
93 Euro Liquidity Fund
94 US Dollar Liquidity Fund
Asset Allocation Funds
95 Diversifi ed Alpha Plus VaR 400 (Euro) Fund
Alternative Investment Funds
97 Commodities Active GSLE Fund
99 FX Alpha Plus RC 200 Fund
101 FX Alpha Plus RC 400 Fund
103 FX Alpha Plus RC 800 Fund
STATEMENTS AND NOTES
105 Statement of assets and liabilities
113 Statement of changes in number of shares
137 Statement of operations and changes in net assets
148 Statement of share and net assets statistics
169 Notes to the fi nancial statements
OTHER INFORMATION
179 Independent Auditor’s Report
180 Directors and service providers
182 Paying and information agents
183 Appendix 1: Fund expense ratios (audited)
185 Appendix 2: Portfolio turnover rate (unaudited)
186 Appendix 3: Sub-Advisers
187 Appendix 4: Hedged Share Classes
188 Appendix 5: Performance Summary (unaudited)
Table of contents
1 Morgan Stanley Investment Funds 31 December 2009
The annual general meeting of shareholders of the Company is held at the registered offi ce of the Company and will be held on the second Tuesday of the month of May at 10.30 am, or if such day is not a bank business day on the following bank business day.
Notices of all general meetings are sent by mail to all registered shareholders at their registered address at least 8 days prior to the meeting. Such notices will indicate the time and place of the meeting as well as the conditions of admission thereto. Said notices will also contain the agenda and requirements of Luxembourg law with regard to the necessary quorum and majorities at the meeting. To the extent required by law, further notices will be published in the Mémorial C, Recueil des Sociétés et Associations du Journal Offi ciel du Grand-Duché de Luxembourg and in one Luxembourg newspaper.
Audited fi nancial statements in respect of the preceding fi nancial year are made available at the registered offi ce of the Company and are available to shareholders upon request. In addition, unaudited semi-annual reports are also made available at the registered offi ce.
The Company’s fi nancial year end is 31 December.
Any other notices relevant to the Company are also published in a Luxembourg newspaper or mailed to affected shareholders.
The net asset value per share of each Class of Share is available on each dealing day during Luxembourg business hours at the registered offi ce of the Company. Net asset value per share information is also available from market information providers, such as Bloomberg and Morningstar, as well as being available at www.morganstanleyinvestmentfunds.com.
No subscriptions can be received on the basis of fi nancial reports. Subscriptions are only valid if made on the basis of the current prospectus supplemented by the latest annual report and the most recent semi-annual report, if published thereafter.
In Switzerland, Bank Morgan Stanley A.G. carries out the functions of Swiss representative of the Company as well as those of paying agent. The prospectus, simplifi ed prospectus, the articles of association, the annual and semi-annual reports of the Company may be obtained, upon request and free of charge, at the Swiss representative’s registered offi ce, Bank Morgan Stanley A.G., Bahnhofstrasse 92, 8001 Zurich, Switzerland.
In Switzerland, the list of the purchases and sales of investments which the Company has undertaken during the fi nancial year can be obtained, upon request and free of charge, from the Swiss representative, Bank Morgan Stanley A.G., Bahnhofstrasse 92, 8001 Zurich, Switzerland.
The investment aims set out in this annual report are summaries only. The complete investment objectives and policies for each Fund are set out in the Company’s current prospectus.
Shareholders’ information
Morgan Stanley Investment Funds 31 December 2009 2
American Franchise Fund
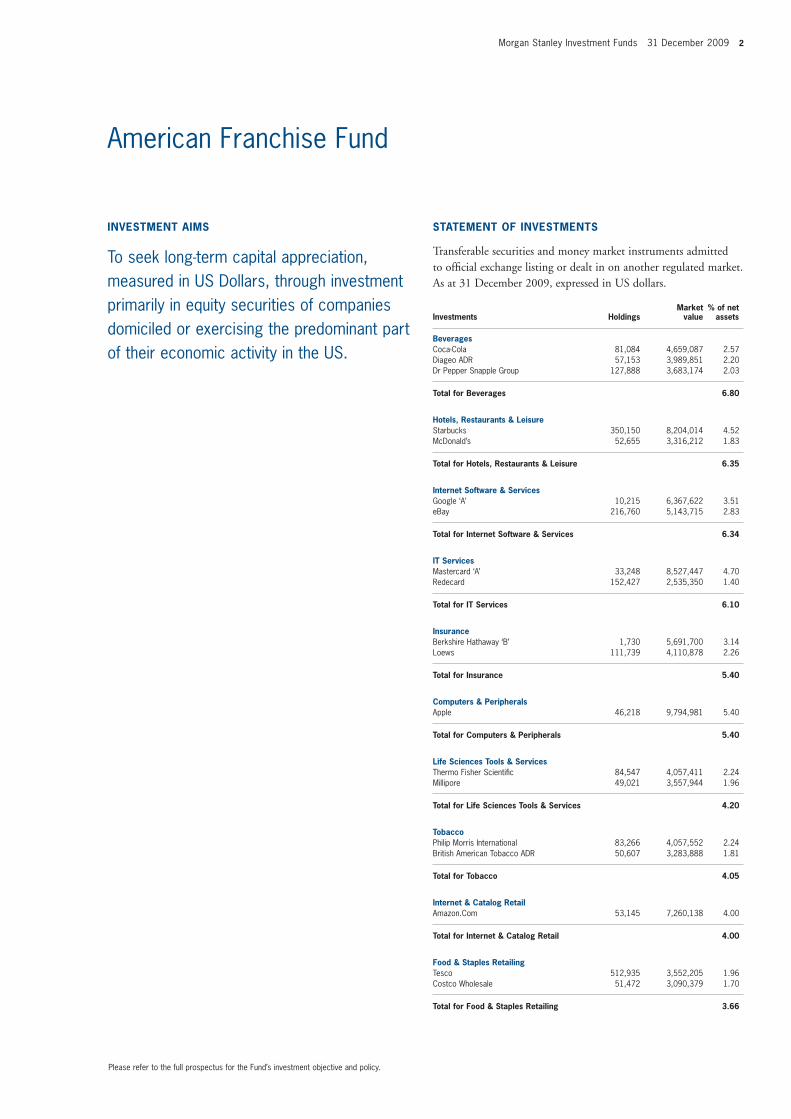
Beverages Coca-Cola 81,084 4,659,087 2.57Diageo ADR 57,153 3,989,851 2.20Dr Pepper Snapple Group 127,888 3,683,174 2.03
Total for Beverages 6.80
Hotels, Restaurants & Leisure Starbucks 350,150 8,204,014 4.52McDonald’s 52,655 3,316,212 1.83
Total for Hotels, Restaurants & Leisure 6.35
Internet Software & Services Google ‘A’ 10,215 6,367,622 3.51eBay 216,760 5,143,715 2.83
Total for Internet Software & Services 6.34
IT Services Mastercard ‘A’ 33,248 8,527,447 4.70Redecard 152,427 2,535,350 1.40
Total for IT Services 6.10
Insurance Berkshire Hathaway ‘B’ 1,730 5,691,700 3.14Loews 111,739 4,110,878 2.26
Total for Insurance 5.40
Computers & Peripherals Apple 46,218 9,794,981 5.40
Total for Computers & Peripherals 5.40
Life Sciences Tools & Services Thermo Fisher Scientifi c 84,547 4,057,411 2.24Millipore 49,021 3,557,944 1.96
Total for Life Sciences Tools & Services 4.20
Tobacco Philip Morris International 83,266 4,057,552 2.24British American Tobacco ADR 50,607 3,283,888 1.81
Total for Tobacco 4.05
Internet & Catalog Retail Amazon.Com 53,145 7,260,138 4.00
Total for Internet & Catalog Retail 4.00
Food & Staples Retailing Tesco 512,935 3,552,205 1.96Costco Wholesale 51,472 3,090,379 1.70
Total for Food & Staples Retailing 3.66
INVESTMENT AIMS
To seek long-term capital appreciation, measured in US Dollars, through investment primarily in equity securities of companies domiciled or exercising the predominant part of their economic activity in the US.
STATEMENT OF INVESTMENTS
Transferable securities and money market instruments admitted to offi cial exchange listing or dealt in on another regulated market. As at 31 December 2009, expressed in US dollars.
Investments HoldingsMarket
value% of net
assets
Please refer to the full prospectus for the Fund’s investment objective and policy.
3 Morgan Stanley Investment Funds 31 December 2009
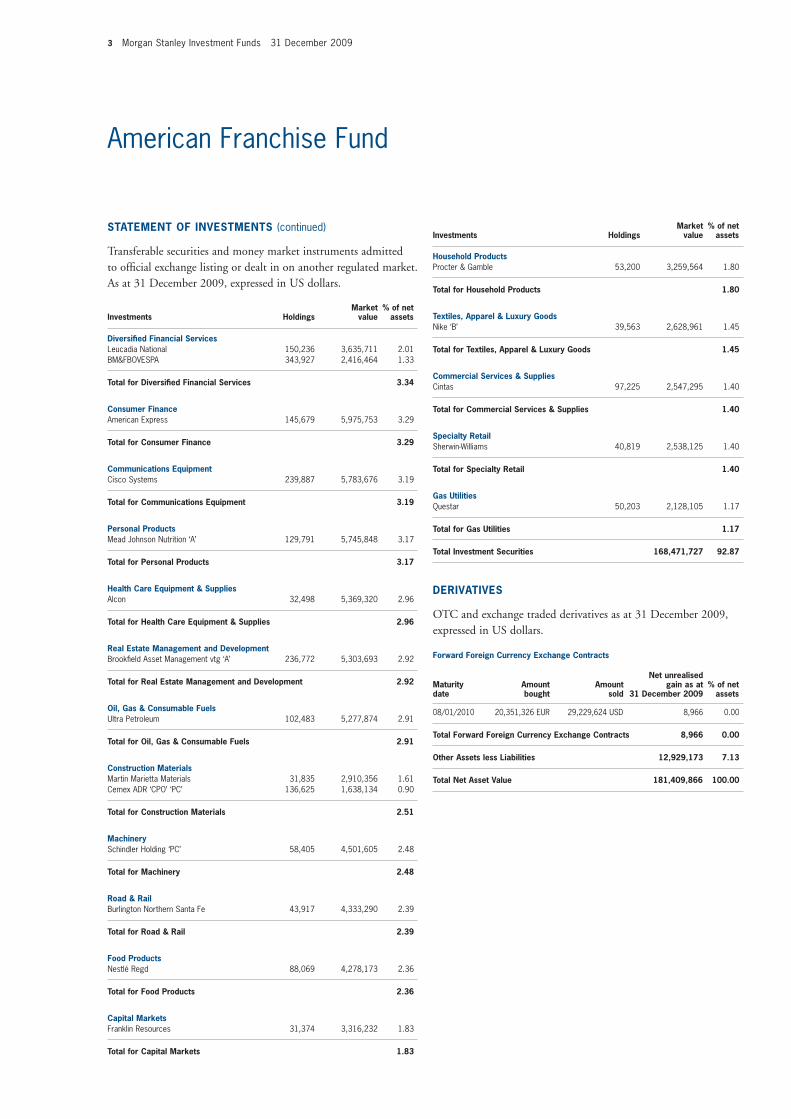
American Franchise Fund
STATEMENT OF INVESTMENTS (continued)
Transferable securities and money market instruments admitted to offi cial exchange listing or dealt in on another regulated market. As at 31 December 2009, expressed in US dollars.
Investments HoldingsMarket
value% of net
assets
Diversifi ed Financial Services Leucadia National 150,236 3,635,711 2.01BM&FBOVESPA 343,927 2,416,464 1.33
Total for Diversifi ed Financial Services 3.34
Consumer Finance American Express 145,679 5,975,753 3.29
Total for Consumer Finance 3.29
Communications Equipment Cisco Systems 239,887 5,783,676 3.19
Total for Communications Equipment 3.19
Personal Products Mead Johnson Nutrition ‘A’ 129,791 5,745,848 3.17
Total for Personal Products 3.17
Health Care Equipment & Supplies Alcon 32,498 5,369,320 2.96
Total for Health Care Equipment & Supplies 2.96
Real Estate Management and Development Brookfi eld Asset Management vtg ‘A’ 236,772 5,303,693 2.92
Total for Real Estate Management and Development 2.92
Oil, Gas & Consumable Fuels Ultra Petroleum 102,483 5,277,874 2.91
Total for Oil, Gas & Consumable Fuels 2.91
Construction Materials Martin Marietta Materials 31,835 2,910,356 1.61Cemex ADR ‘CPO’ ‘PC’ 136,625 1,638,134 0.90
Total for Construction Materials 2.51
Machinery Schindler Holding ‘PC’ 58,405 4,501,605 2.48
Total for Machinery 2.48
Road & Rail Burlington Northern Santa Fe 43,917 4,333,290 2.39
Total for Road & Rail 2.39
Food Products Nestlé Regd 88,069 4,278,173 2.36
Total for Food Products 2.36
Capital Markets Franklin Resources 31,374 3,316,232 1.83
Total for Capital Markets 1.83
Household Products Procter & Gamble 53,200 3,259,564 1.80
Total for Household Products 1.80
Textiles, Apparel & Luxury Goods Nike ‘B’ 39,563 2,628,961 1.45
Total for Textiles, Apparel & Luxury Goods 1.45
Commercial Services & Supplies Cintas 97,225 2,547,295 1.40
Total for Commercial Services & Supplies 1.40
Specialty Retail Sherwin-Williams 40,819 2,538,125 1.40
Total for Specialty Retail 1.40
Gas Utilities Questar 50,203 2,128,105 1.17
Total for Gas Utilities 1.17
Total Investment Securities 168,471,727 92.87
DERIVATIVES
OTC and exchange traded derivatives as at 31 December 2009, expressed in US dollars.
Forward Foreign Currency Exchange Contracts
Maturity date
Amount bought
Amount sold
Net unrealisedgain as at
31 December 2009 % of net
assets 08/01/2010 20,351,326 EUR 29,229,624 USD 8,966 0.00
Total Forward Foreign Currency Exchange Contracts 8,966 0.00
Other Assets less Liabilities 12,929,173 7.13
Total Net Asset Value 181,409,866 100.00
Investments HoldingsMarket
value% of net
assets
Morgan Stanley Investment Funds 31 December 2009 4
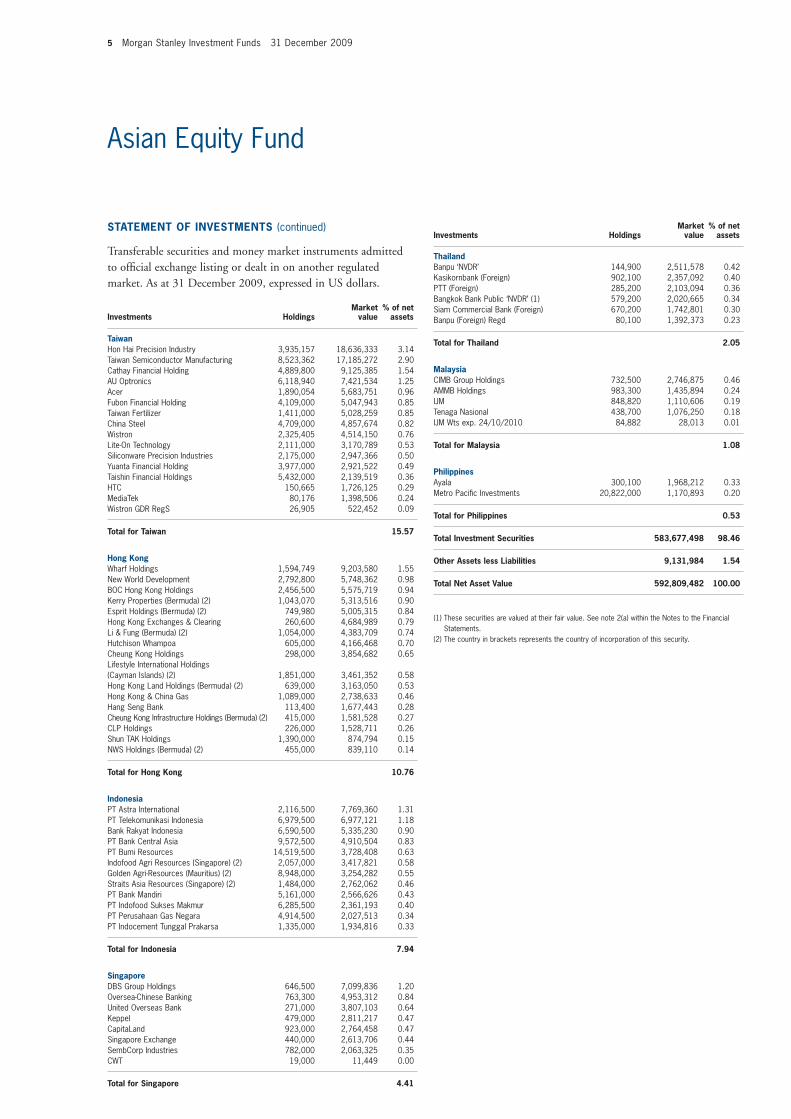
Asian Equity Fund
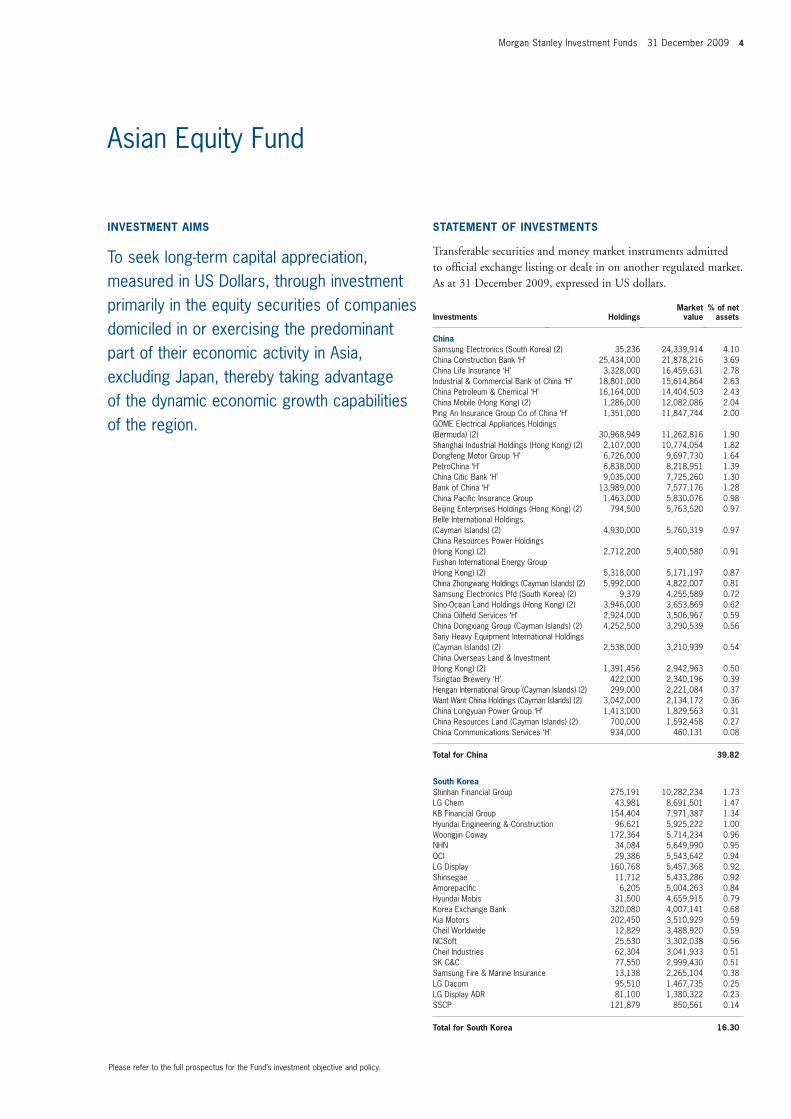
ChinaSamsung Electronics (South Korea) (2) 35,236 24,339,914 4.10China Construction Bank ‘H’ 25,434,000 21,878,216 3.69China Life Insurance ‘H’ 3,328,000 16,459,631 2.78Industrial & Commercial Bank of China ‘H’ 18,801,000 15,614,864 2.63China Petroleum & Chemical ‘H’ 16,164,000 14,404,503 2.43China Mobile (Hong Kong) (2) 1,286,000 12,082,086 2.04Ping An Insurance Group Co of China ‘H’ 1,351,000 11,847,744 2.00GOME Electrical Appliances Holdings (Bermuda) (2) 30,968,949 11,262,816 1.90Shanghai Industrial Holdings (Hong Kong) (2) 2,107,000 10,774,054 1.82Dongfeng Motor Group ‘H’ 6,726,000 9,697,730 1.64PetroChina ‘H’ 6,838,000 8,218,951 1.39China Citic Bank ‘H’ 9,035,000 7,725,260 1.30Bank of China ‘H’ 13,989,000 7,577,176 1.28China Pacifi c Insurance Group 1,463,000 5,830,076 0.98Beijing Enterprises Holdings (Hong Kong) (2) 794,500 5,763,520 0.97Belle International Holdings (Cayman Islands) (2) 4,930,000 5,760,319 0.97China Resources Power Holdings (Hong Kong) (2) 2,712,200 5,400,580 0.91Fushan International Energy Group (Hong Kong) (2) 5,318,000 5,171,197 0.87China Zhongwang Holdings (Cayman Islands) (2) 5,992,000 4,822,007 0.81Samsung Electronics Pfd (South Korea) (2) 9,379 4,255,589 0.72Sino-Ocean Land Holdings (Hong Kong) (2) 3,946,000 3,653,869 0.62China Oilfi eld Services ‘H’ 2,924,000 3,506,967 0.59China Dongxiang Group (Cayman Islands) (2) 4,252,500 3,290,539 0.56Sany Heavy Equipment International Holdings (Cayman Islands) (2) 2,538,000 3,210,939 0.54China Overseas Land & Investment (Hong Kong) (2) 1,391,456 2,942,963 0.50Tsingtao Brewery ‘H’ 422,000 2,340,196 0.39Hengan International Group (Cayman Islands) (2) 299,000 2,221,084 0.37Want Want China Holdings (Cayman Islands) (2) 3,042,000 2,134,172 0.36China Longyuan Power Group ‘H’ 1,413,000 1,829,563 0.31China Resources Land (Cayman Islands) (2) 700,000 1,592,458 0.27China Communications Services ‘H’ 934,000 460,131 0.08
Total for China 39.82
South Korea Shinhan Financial Group 275,191 10,282,234 1.73LG Chem 43,981 8,691,501 1.47KB Financial Group 154,404 7,971,387 1.34Hyundai Engineering & Construction 96,621 5,925,222 1.00Woongjin Coway 172,364 5,714,234 0.96NHN 34,084 5,649,990 0.95OCI 29,386 5,543,642 0.94LG Display 160,768 5,457,368 0.92Shinsegae 11,712 5,433,286 0.92Amorepacifi c 6,205 5,004,263 0.84Hyundai Mobis 31,500 4,659,915 0.79Korea Exchange Bank 320,080 4,007,141 0.68Kia Motors 202,450 3,510,929 0.59Cheil Worldwide 12,829 3,488,920 0.59NCSoft 25,530 3,302,038 0.56Cheil Industries 62,304 3,041,933 0.51SK C&C 77,550 2,999,430 0.51Samsung Fire & Marine Insurance 13,138 2,265,104 0.38LG Dacom 95,510 1,467,735 0.25LG Display ADR 81,100 1,380,322 0.23SSCP 121,879 850,561 0.14
Total for South Korea 16.30
INVESTMENT AIMS
To seek long-term capital appreciation, measured in US Dollars, through investment primarily in the equity securities of companies domiciled in or exercising the predominant part of their economic activity in Asia, excluding Japan, thereby taking advantage of the dynamic economic growth capabilities of the region.
STATEMENT OF INVESTMENTS
Transferable securities and money market instruments admitted to offi cial exchange listing or dealt in on another regulated market. As at 31 December 2009, expressed in US dollars.
Investments HoldingsMarket
value% of net
assets
Please refer to the full prospectus for the Fund’s investment objective and policy.
5 Morgan Stanley Investment Funds 31 December 2009
STATEMENT OF INVESTMENTS (continued)
Transferable securities and money market instruments admitted to offi cial exchange listing or dealt in on another regulated market. As at 31 December 2009, expressed in US dollars.
Investments HoldingsMarket
value% of net
assets
Investments HoldingsMarket
value% of net
assets
Taiwan Hon Hai Precision Industry 3,935,157 18,636,333 3.14Taiwan Semiconductor Manufacturing 8,523,362 17,185,272 2.90Cathay Financial Holding 4,889,800 9,125,385 1.54AU Optronics 6,118,940 7,421,534 1.25Acer 1,890,054 5,683,751 0.96Fubon Financial Holding 4,109,000 5,047,943 0.85Taiwan Fertilizer 1,411,000 5,028,259 0.85China Steel 4,709,000 4,857,674 0.82Wistron 2,325,405 4,514,150 0.76Lite-On Technology 2,111,000 3,170,789 0.53Siliconware Precision Industries 2,175,000 2,947,366 0.50Yuanta Financial Holding 3,977,000 2,921,522 0.49Taishin Financial Holdings 5,432,000 2,139,519 0.36HTC 150,665 1,726,125 0.29MediaTek 80,176 1,398,506 0.24Wistron GDR RegS 26,905 522,452 0.09
Total for Taiwan 15.57
Hong Kong Wharf Holdings 1,594,749 9,203,580 1.55New World Development 2,792,800 5,748,362 0.98BOC Hong Kong Holdings 2,456,500 5,575,719 0.94Kerry Properties (Bermuda) (2) 1,043,070 5,313,516 0.90Esprit Holdings (Bermuda) (2) 749,980 5,005,315 0.84Hong Kong Exchanges & Clearing 260,600 4,684,989 0.79Li & Fung (Bermuda) (2) 1,054,000 4,383,709 0.74Hutchison Whampoa 605,000 4,166,468 0.70Cheung Kong Holdings 298,000 3,854,682 0.65Lifestyle International Holdings (Cayman Islands) (2) 1,851,000 3,461,352 0.58Hong Kong Land Holdings (Bermuda) (2) 639,000 3,163,050 0.53Hong Kong & China Gas 1,089,000 2,738,633 0.46Hang Seng Bank 113,400 1,677,443 0.28Cheung Kong Infrastructure Holdings (Bermuda) (2) 415,000 1,581,528 0.27CLP Holdings 226,000 1,528,711 0.26Shun TAK Holdings 1,390,000 874,794 0.15NWS Holdings (Bermuda) (2) 455,000 839,110 0.14
Total for Hong Kong 10.76
Indonesia PT Astra International 2,116,500 7,769,360 1.31PT Telekomunikasi Indonesia 6,979,500 6,977,121 1.18Bank Rakyat Indonesia 6,590,500 5,335,230 0.90PT Bank Central Asia 9,572,500 4,910,504 0.83PT Bumi Resources 14,519,500 3,728,408 0.63Indofood Agri Resources (Singapore) (2) 2,057,000 3,417,821 0.58Golden Agri-Resources (Mauritius) (2) 8,948,000 3,254,282 0.55Straits Asia Resources (Singapore) (2) 1,484,000 2,762,062 0.46PT Bank Mandiri 5,161,000 2,566,626 0.43PT Indofood Sukses Makmur 6,285,500 2,361,193 0.40PT Perusahaan Gas Negara 4,914,500 2,027,513 0.34PT Indocement Tunggal Prakarsa 1,335,000 1,934,816 0.33
Total for Indonesia 7.94
Singapore DBS Group Holdings 646,500 7,099,836 1.20Oversea-Chinese Banking 763,300 4,953,312 0.84United Overseas Bank 271,000 3,807,103 0.64Keppel 479,000 2,811,217 0.47CapitaLand 923,000 2,764,458 0.47Singapore Exchange 440,000 2,613,706 0.44SembCorp Industries 782,000 2,063,325 0.35CWT 19,000 11,449 0.00
Total for Singapore 4.41
Thailand Banpu ‘NVDR’ 144,900 2,511,578 0.42Kasikornbank (Foreign) 902,100 2,357,092 0.40PTT (Foreign) 285,200 2,103,094 0.36Bangkok Bank Public ‘NVDR’ (1) 579,200 2,020,665 0.34Siam Commercial Bank (Foreign) 670,200 1,742,801 0.30Banpu (Foreign) Regd 80,100 1,392,373 0.23
Total for Thailand 2.05
Malaysia CIMB Group Holdings 732,500 2,746,875 0.46AMMB Holdings 983,300 1,435,894 0.24IJM 848,820 1,110,606 0.19Tenaga Nasional 438,700 1,076,250 0.18IJM Wts exp. 24/10/2010 84,882 28,013 0.01
Total for Malaysia 1.08
Philippines Ayala 300,100 1,968,212 0.33Metro Pacifi c Investments 20,822,000 1,170,893 0.20
Total for Philippines 0.53
Total Investment Securities 583,677,498 98.46
Other Assets less Liabilities 9,131,984 1.54
Total Net Asset Value 592,809,482 100.00
(1) These securities are valued at their fair value. See note 2(a) within the Notes to the Financial Statements.
(2) The country in brackets represents the country of incorporation of this security.
Asian Equity Fund
Morgan Stanley Investment Funds 31 December 2009 6
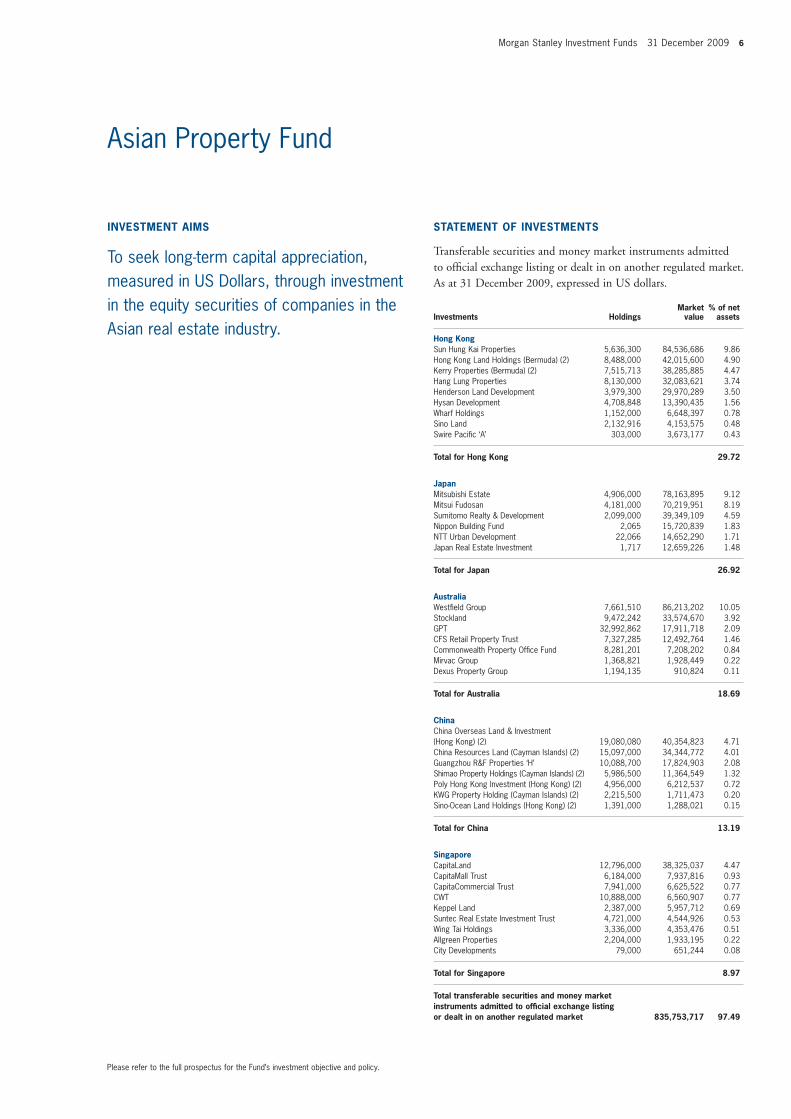
Asian Property Fund
Hong Kong Sun Hung Kai Properties 5,636,300 84,536,686 9.86Hong Kong Land Holdings (Bermuda) (2) 8,488,000 42,015,600 4.90Kerry Properties (Bermuda) (2) 7,515,713 38,285,885 4.47Hang Lung Properties 8,130,000 32,083,621 3.74Henderson Land Development 3,979,300 29,970,289 3.50Hysan Development 4,708,848 13,390,435 1.56Wharf Holdings 1,152,000 6,648,397 0.78Sino Land 2,132,916 4,153,575 0.48Swire Pacifi c ‘A’ 303,000 3,673,177 0.43
Total for Hong Kong 29.72
Japan Mitsubishi Estate 4,906,000 78,163,895 9.12Mitsui Fudosan 4,181,000 70,219,951 8.19Sumitomo Realty & Development 2,099,000 39,349,109 4.59Nippon Building Fund 2,065 15,720,839 1.83NTT Urban Development 22,066 14,652,290 1.71Japan Real Estate Investment 1,717 12,659,226 1.48
Total for Japan 26.92
Australia Westfi eld Group 7,661,510 86,213,202 10.05Stockland 9,472,242 33,574,670 3.92GPT 32,992,862 17,911,718 2.09CFS Retail Property Trust 7,327,285 12,492,764 1.46Commonwealth Property Offi ce Fund 8,281,201 7,208,202 0.84Mirvac Group 1,368,821 1,928,449 0.22Dexus Property Group 1,194,135 910,824 0.11
Total for Australia 18.69
China China Overseas Land & Investment (Hong Kong) (2) 19,080,080 40,354,823 4.71China Resources Land (Cayman Islands) (2) 15,097,000 34,344,772 4.01Guangzhou R&F Properties ‘H’ 10,088,700 17,824,903 2.08Shimao Property Holdings (Cayman Islands) (2) 5,986,500 11,364,549 1.32Poly Hong Kong Investment (Hong Kong) (2) 4,956,000 6,212,537 0.72KWG Property Holding (Cayman Islands) (2) 2,215,500 1,711,473 0.20Sino-Ocean Land Holdings (Hong Kong) (2) 1,391,000 1,288,021 0.15
Total for China 13.19
Singapore CapitaLand 12,796,000 38,325,037 4.47CapitaMall Trust 6,184,000 7,937,816 0.93CapitaCommercial Trust 7,941,000 6,625,522 0.77CWT 10,888,000 6,560,907 0.77Keppel Land 2,387,000 5,957,712 0.69Suntec Real Estate Investment Trust 4,721,000 4,544,926 0.53Wing Tai Holdings 3,336,000 4,353,476 0.51Allgreen Properties 2,204,000 1,933,195 0.22City Developments 79,000 651,244 0.08
Total for Singapore 8.97
Total transferable securities and money market instruments admitted to offi cial exchange listing or dealt in on another regulated market 835,753,717 97.49
INVESTMENT AIMS
To seek long-term capital appreciation, measured in US Dollars, through investment in the equity securities of companies in the Asian real estate industry.
STATEMENT OF INVESTMENTS
Transferable securities and money market instruments admitted to offi cial exchange listing or dealt in on another regulated market. As at 31 December 2009, expressed in US dollars.
Investments HoldingsMarket
value% of net
assets
Please refer to the full prospectus for the Fund’s investment objective and policy.

7 Morgan Stanley Investment Funds 31 December 2009
STATEMENT OF INVESTMENTS (continued)
Other transferable securities and money market instruments not admitted to offi cial exchange listing or dealt in on another regulated market. As at 31 December 2009, expressed in US dollars.
Investments HoldingsMarket
value% of net
assets
Malta BGP Holdings 33,894,130 0 0.00
Total for Malta 0.00
Total other transferable securities and money market instruments not admitted to offi cial exchange listing or dealt in on another regulated market 0 0.00
Total Investment Securities 835,753,717 97.49
Other Assets less Liabilities 21,558,196 2.51
Total Net Asset Value 857,311,913 100.00
(2) The country in brackets represents the country of incorporation of this security.
Asian Property Fund
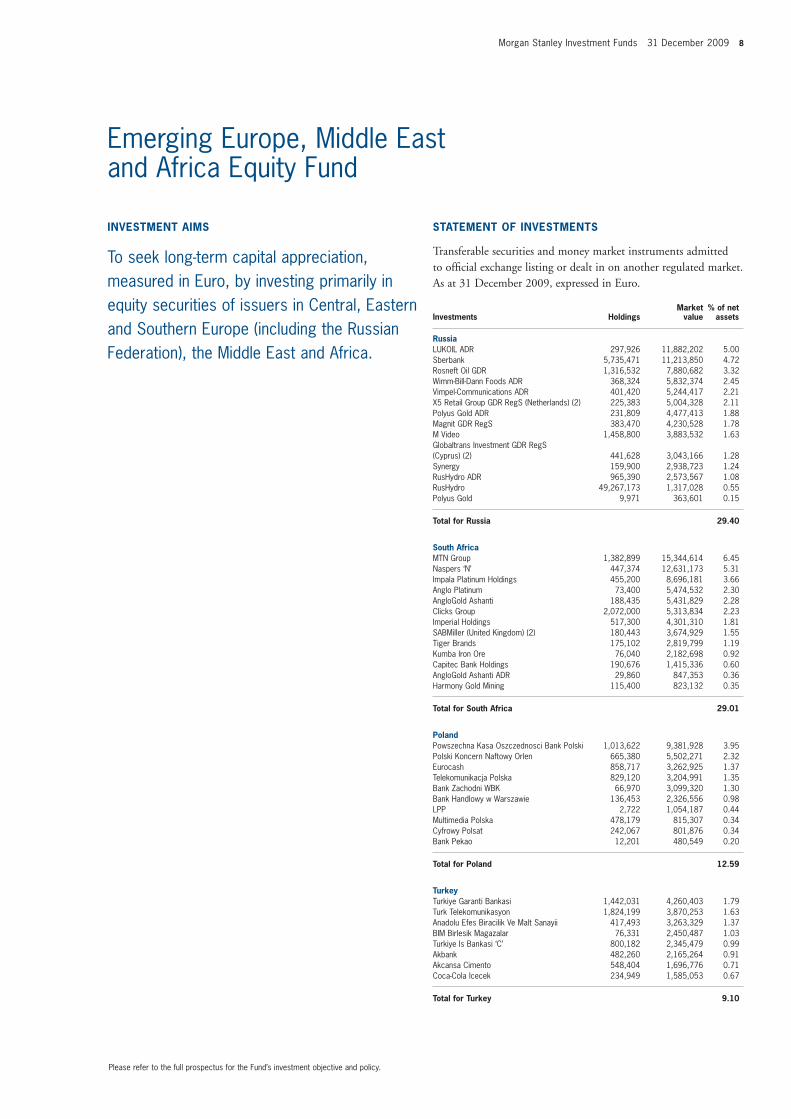
Morgan Stanley Investment Funds 31 December 2009 8
Russia LUKOIL ADR 297,926 11,882,202 5.00Sberbank 5,735,471 11,213,850 4.72Rosneft Oil GDR 1,316,532 7,880,682 3.32Wimm-Bill-Dann Foods ADR 368,324 5,832,374 2.45Vimpel-Communications ADR 401,420 5,244,417 2.21X5 Retail Group GDR RegS (Netherlands) (2) 225,383 5,004,328 2.11Polyus Gold ADR 231,809 4,477,413 1.88Magnit GDR RegS 383,470 4,230,528 1.78M Video 1,458,800 3,883,532 1.63Globaltrans Investment GDR RegS (Cyprus) (2) 441,628 3,043,166 1.28Synergy 159,900 2,938,723 1.24RusHydro ADR 965,390 2,573,567 1.08RusHydro 49,267,173 1,317,028 0.55Polyus Gold 9,971 363,601 0.15
Total for Russia 29.40
South Africa MTN Group 1,382,899 15,344,614 6.45Naspers ‘N’ 447,374 12,631,173 5.31Impala Platinum Holdings 455,200 8,696,181 3.66Anglo Platinum 73,400 5,474,532 2.30AngloGold Ashanti 188,435 5,431,829 2.28Clicks Group 2,072,000 5,313,834 2.23Imperial Holdings 517,300 4,301,310 1.81SABMiller (United Kingdom) (2) 180,443 3,674,929 1.55Tiger Brands 175,102 2,819,799 1.19Kumba Iron Ore 76,040 2,182,698 0.92Capitec Bank Holdings 190,676 1,415,336 0.60AngloGold Ashanti ADR 29,860 847,353 0.36Harmony Gold Mining 115,400 823,132 0.35
Total for South Africa 29.01
Poland Powszechna Kasa Oszczednosci Bank Polski 1,013,622 9,381,928 3.95Polski Koncern Naftowy Orlen 665,380 5,502,271 2.32Eurocash 858,717 3,262,925 1.37Telekomunikacja Polska 829,120 3,204,991 1.35Bank Zachodni WBK 66,970 3,099,320 1.30Bank Handlowy w Warszawie 136,453 2,326,556 0.98LPP 2,722 1,054,187 0.44Multimedia Polska 478,179 815,307 0.34Cyfrowy Polsat 242,067 801,876 0.34Bank Pekao 12,201 480,549 0.20
Total for Poland 12.59
Turkey Turkiye Garanti Bankasi 1,442,031 4,260,403 1.79Turk Telekomunikasyon 1,824,199 3,870,253 1.63Anadolu Efes Biracilik Ve Malt Sanayii 417,493 3,263,329 1.37BIM Birlesik Magazalar 76,331 2,450,487 1.03Turkiye Is Bankasi ‘C’ 800,182 2,345,479 0.99Akbank 482,260 2,165,264 0.91Akcansa Cimento 548,404 1,696,776 0.71Coca-Cola Icecek 234,949 1,585,053 0.67
Total for Turkey 9.10
INVESTMENT AIMS
To seek long-term capital appreciation, measured in Euro, by investing primarily in equity securities of issuers in Central, Eastern and Southern Europe (including the Russian Federation), the Middle East and Africa.
STATEMENT OF INVESTMENTS
Transferable securities and money market instruments admitted to offi cial exchange listing or dealt in on another regulated market. As at 31 December 2009, expressed in Euro.
Investments HoldingsMarket
value% of net
assets
Emerging Europe, Middle East and Africa Equity Fund
Please refer to the full prospectus for the Fund’s investment objective and policy.
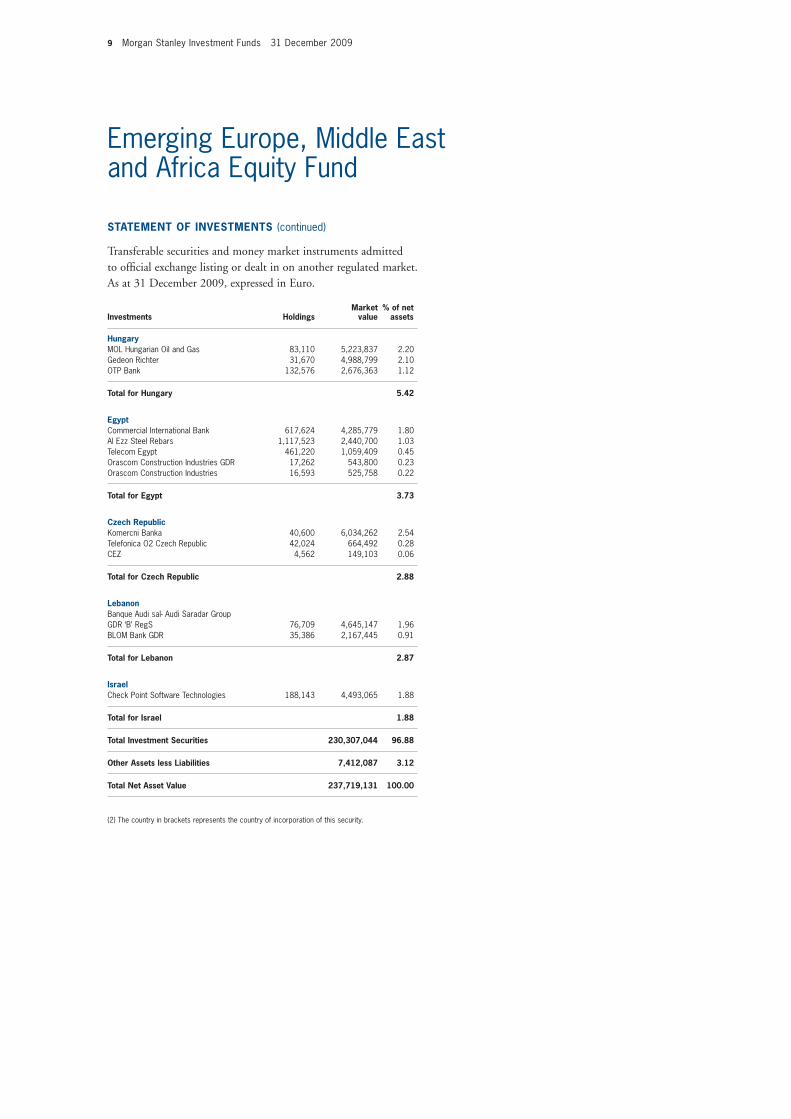
9 Morgan Stanley Investment Funds 31 December 2009
STATEMENT OF INVESTMENTS (continued)
Transferable securities and money market instruments admitted to offi cial exchange listing or dealt in on another regulated market. As at 31 December 2009, expressed in Euro.
Investments HoldingsMarket
value% of net
assets
Hungary MOL Hungarian Oil and Gas 83,110 5,223,837 2.20Gedeon Richter 31,670 4,988,799 2.10OTP Bank 132,576 2,676,363 1.12
Total for Hungary 5.42
Egypt Commercial International Bank 617,624 4,285,779 1.80Al Ezz Steel Rebars 1,117,523 2,440,700 1.03Telecom Egypt 461,220 1,059,409 0.45Orascom Construction Industries GDR 17,262 543,800 0.23Orascom Construction Industries 16,593 525,758 0.22
Total for Egypt 3.73
Czech Republic Komercni Banka 40,600 6,034,262 2.54Telefonica O2 Czech Republic 42,024 664,492 0.28CEZ 4,562 149,103 0.06
Total for Czech Republic 2.88
Lebanon Banque Audi sal- Audi Saradar Group GDR ‘B’ RegS 76,709 4,645,147 1.96BLOM Bank GDR 35,386 2,167,445 0.91
Total for Lebanon 2.87
Israel Check Point Software Technologies 188,143 4,493,065 1.88
Total for Israel 1.88
Total Investment Securities 230,307,044 96.88
Other Assets less Liabilities 7,412,087 3.12
Total Net Asset Value 237,719,131 100.00
(2) The country in brackets represents the country of incorporation of this security.
Emerging Europe, Middle East and Africa Equity Fund
Morgan Stanley Investment Funds 31 December 2009 10
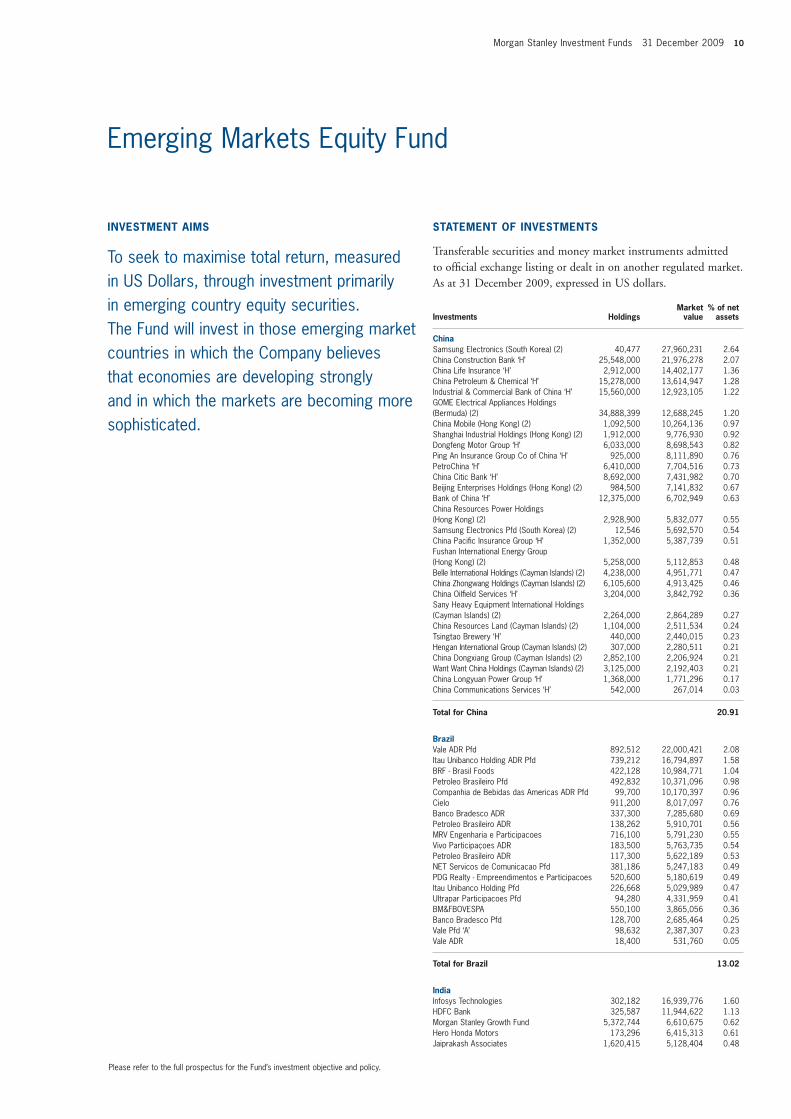
Emerging Markets Equity Fund
China Samsung Electronics (South Korea) (2) 40,477 27,960,231 2.64China Construction Bank ‘H’ 25,548,000 21,976,278 2.07China Life Insurance ‘H’ 2,912,000 14,402,177 1.36China Petroleum & Chemical ‘H’ 15,278,000 13,614,947 1.28Industrial & Commercial Bank of China ‘H’ 15,560,000 12,923,105 1.22GOME Electrical Appliances Holdings (Bermuda) (2) 34,888,399 12,688,245 1.20China Mobile (Hong Kong) (2) 1,092,500 10,264,136 0.97Shanghai Industrial Holdings (Hong Kong) (2) 1,912,000 9,776,930 0.92Dongfeng Motor Group ‘H’ 6,033,000 8,698,543 0.82Ping An Insurance Group Co of China ‘H’ 925,000 8,111,890 0.76PetroChina ‘H’ 6,410,000 7,704,516 0.73China Citic Bank ‘H’ 8,692,000 7,431,982 0.70Beijing Enterprises Holdings (Hong Kong) (2) 984,500 7,141,832 0.67Bank of China ‘H’ 12,375,000 6,702,949 0.63China Resources Power Holdings (Hong Kong) (2) 2,928,900 5,832,077 0.55Samsung Electronics Pfd (South Korea) (2) 12,546 5,692,570 0.54China Pacifi c Insurance Group ‘H’ 1,352,000 5,387,739 0.51Fushan International Energy Group (Hong Kong) (2) 5,258,000 5,112,853 0.48Belle International Holdings (Cayman Islands) (2) 4,238,000 4,951,771 0.47China Zhongwang Holdings (Cayman Islands) (2) 6,105,600 4,913,425 0.46China Oilfi eld Services ‘H’ 3,204,000 3,842,792 0.36Sany Heavy Equipment International Holdings (Cayman Islands) (2) 2,264,000 2,864,289 0.27China Resources Land (Cayman Islands) (2) 1,104,000 2,511,534 0.24Tsingtao Brewery ‘H’ 440,000 2,440,015 0.23Hengan International Group (Cayman Islands) (2) 307,000 2,280,511 0.21China Dongxiang Group (Cayman Islands) (2) 2,852,100 2,206,924 0.21Want Want China Holdings (Cayman Islands) (2) 3,125,000 2,192,403 0.21China Longyuan Power Group ‘H’ 1,368,000 1,771,296 0.17China Communications Services ‘H’ 542,000 267,014 0.03
Total for China 20.91
Brazil Vale ADR Pfd 892,512 22,000,421 2.08Itau Unibanco Holding ADR Pfd 739,212 16,794,897 1.58BRF - Brasil Foods 422,128 10,984,771 1.04Petroleo Brasileiro Pfd 492,832 10,371,096 0.98Companhia de Bebidas das Americas ADR Pfd 99,700 10,170,397 0.96Cielo 911,200 8,017,097 0.76Banco Bradesco ADR 337,300 7,285,680 0.69Petroleo Brasileiro ADR 138,262 5,910,701 0.56MRV Engenharia e Participacoes 716,100 5,791,230 0.55Vivo Participaçoes ADR 183,500 5,763,735 0.54Petroleo Brasileiro ADR 117,300 5,622,189 0.53NET Servicos de Comunicacao Pfd 381,186 5,247,183 0.49PDG Realty - Empreendimentos e Participacoes 520,600 5,180,619 0.49Itau Unibanco Holding Pfd 226,668 5,029,989 0.47Ultrapar Participacoes Pfd 94,280 4,331,959 0.41BM&FBOVESPA 550,100 3,865,056 0.36Banco Bradesco Pfd 128,700 2,685,464 0.25Vale Pfd ‘A’ 98,632 2,387,307 0.23Vale ADR 18,400 531,760 0.05
Total for Brazil 13.02
India Infosys Technologies 302,182 16,939,776 1.60HDFC Bank 325,587 11,944,622 1.13Morgan Stanley Growth Fund 5,372,744 6,610,675 0.62Hero Honda Motors 173,296 6,415,313 0.61Jaiprakash Associates 1,620,415 5,128,404 0.48
STATEMENT OF INVESTMENTS
Transferable securities and money market instruments admitted to offi cial exchange listing or dealt in on another regulated market. As at 31 December 2009, expressed in US dollars.
Investments HoldingsMarket
value% of net
assets
INVESTMENT AIMS
To seek to maximise total return, measured in US Dollars, through investment primarily in emerging country equity securities. The Fund will invest in those emerging market countries in which the Company believes that economies are developing strongly and in which the markets are becoming more sophisticated.
Please refer to the full prospectus for the Fund’s investment objective and policy.
11 Morgan Stanley Investment Funds 31 December 2009
Emerging Markets Equity Fund
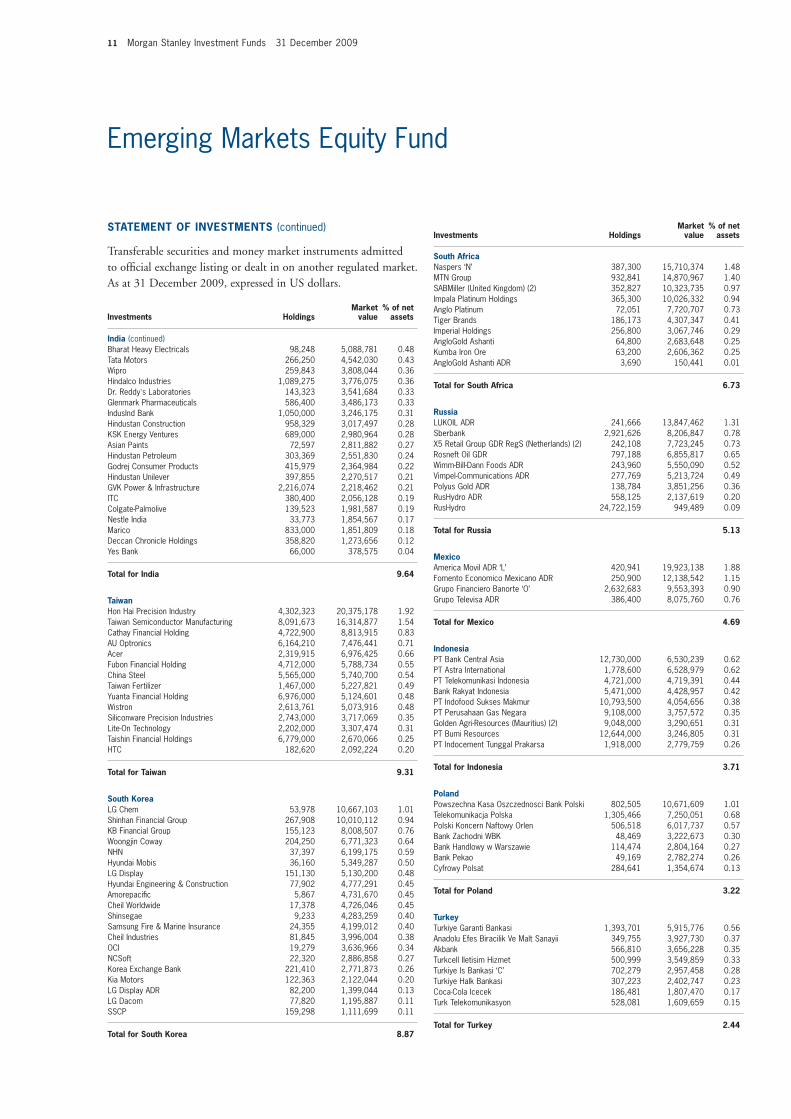
STATEMENT OF INVESTMENTS (continued)
Transferable securities and money market instruments admitted to offi cial exchange listing or dealt in on another regulated market. As at 31 December 2009, expressed in US dollars.
Investments HoldingsMarket
value% of net
assets
India (continued)Bharat Heavy Electricals 98,248 5,088,781 0.48Tata Motors 266,250 4,542,030 0.43Wipro 259,843 3,808,044 0.36Hindalco Industries 1,089,275 3,776,075 0.36Dr. Reddy’s Laboratories 143,323 3,541,684 0.33Glenmark Pharmaceuticals 586,400 3,486,173 0.33IndusInd Bank 1,050,000 3,246,175 0.31Hindustan Construction 958,329 3,017,497 0.28KSK Energy Ventures 689,000 2,980,964 0.28Asian Paints 72,597 2,811,882 0.27Hindustan Petroleum 303,369 2,551,830 0.24Godrej Consumer Products 415,979 2,364,984 0.22Hindustan Unilever 397,855 2,270,517 0.21GVK Power & Infrastructure 2,216,074 2,218,462 0.21ITC 380,400 2,056,128 0.19Colgate-Palmolive 139,523 1,981,587 0.19Nestle India 33,773 1,854,567 0.17Marico 833,000 1,851,809 0.18Deccan Chronicle Holdings 358,820 1,273,656 0.12Yes Bank 66,000 378,575 0.04
Total for India 9.64
Taiwan Hon Hai Precision Industry 4,302,323 20,375,178 1.92Taiwan Semiconductor Manufacturing 8,091,673 16,314,877 1.54Cathay Financial Holding 4,722,900 8,813,915 0.83AU Optronics 6,164,210 7,476,441 0.71Acer 2,319,915 6,976,425 0.66Fubon Financial Holding 4,712,000 5,788,734 0.55China Steel 5,565,000 5,740,700 0.54Taiwan Fertilizer 1,467,000 5,227,821 0.49Yuanta Financial Holding 6,976,000 5,124,601 0.48Wistron 2,613,761 5,073,916 0.48Siliconware Precision Industries 2,743,000 3,717,069 0.35Lite-On Technology 2,202,000 3,307,474 0.31Taishin Financial Holdings 6,779,000 2,670,066 0.25HTC 182,620 2,092,224 0.20
Total for Taiwan 9.31
South Korea LG Chem 53,978 10,667,103 1.01Shinhan Financial Group 267,908 10,010,112 0.94KB Financial Group 155,123 8,008,507 0.76Woongjin Coway 204,250 6,771,323 0.64NHN 37,397 6,199,175 0.59Hyundai Mobis 36,160 5,349,287 0.50LG Display 151,130 5,130,200 0.48Hyundai Engineering & Construction 77,902 4,777,291 0.45Amorepacifi c 5,867 4,731,670 0.45Cheil Worldwide 17,378 4,726,046 0.45Shinsegae 9,233 4,283,259 0.40Samsung Fire & Marine Insurance 24,355 4,199,012 0.40Cheil Industries 81,845 3,996,004 0.38OCI 19,279 3,636,966 0.34NCSoft 22,320 2,886,858 0.27Korea Exchange Bank 221,410 2,771,873 0.26Kia Motors 122,363 2,122,044 0.20LG Display ADR 82,200 1,399,044 0.13LG Dacom 77,820 1,195,887 0.11SSCP 159,298 1,111,699 0.11
Total for South Korea 8.87
South Africa Naspers ‘N’ 387,300 15,710,374 1.48MTN Group 932,841 14,870,967 1.40SABMiller (United Kingdom) (2) 352,827 10,323,735 0.97Impala Platinum Holdings 365,300 10,026,332 0.94Anglo Platinum 72,051 7,720,707 0.73Tiger Brands 186,173 4,307,347 0.41Imperial Holdings 256,800 3,067,746 0.29AngloGold Ashanti 64,800 2,683,648 0.25Kumba Iron Ore 63,200 2,606,362 0.25AngloGold Ashanti ADR 3,690 150,441 0.01
Total for South Africa 6.73
Russia LUKOIL ADR 241,666 13,847,462 1.31Sberbank 2,921,626 8,206,847 0.78X5 Retail Group GDR RegS (Netherlands) (2) 242,108 7,723,245 0.73Rosneft Oil GDR 797,188 6,855,817 0.65Wimm-Bill-Dann Foods ADR 243,960 5,550,090 0.52Vimpel-Communications ADR 277,769 5,213,724 0.49Polyus Gold ADR 138,784 3,851,256 0.36RusHydro ADR 558,125 2,137,619 0.20RusHydro 24,722,159 949,489 0.09
Total for Russia 5.13
Mexico America Movil ADR ‘L’ 420,941 19,923,138 1.88Fomento Economico Mexicano ADR 250,900 12,138,542 1.15Grupo Financiero Banorte ‘O’ 2,632,683 9,553,393 0.90Grupo Televisa ADR 386,400 8,075,760 0.76
Total for Mexico 4.69
Indonesia PT Bank Central Asia 12,730,000 6,530,239 0.62PT Astra International 1,778,600 6,528,979 0.62PT Telekomunikasi Indonesia 4,721,000 4,719,391 0.44Bank Rakyat Indonesia 5,471,000 4,428,957 0.42PT Indofood Sukses Makmur 10,793,500 4,054,656 0.38PT Perusahaan Gas Negara 9,108,000 3,757,572 0.35Golden Agri-Resources (Mauritius) (2) 9,048,000 3,290,651 0.31PT Bumi Resources 12,644,000 3,246,805 0.31PT Indocement Tunggal Prakarsa 1,918,000 2,779,759 0.26
Total for Indonesia 3.71
Poland Powszechna Kasa Oszczednosci Bank Polski 802,505 10,671,609 1.01Telekomunikacja Polska 1,305,466 7,250,051 0.68Polski Koncern Naftowy Orlen 506,518 6,017,737 0.57Bank Zachodni WBK 48,469 3,222,673 0.30Bank Handlowy w Warszawie 114,474 2,804,164 0.27Bank Pekao 49,169 2,782,274 0.26Cyfrowy Polsat 284,641 1,354,674 0.13
Total for Poland 3.22
Turkey Turkiye Garanti Bankasi 1,393,701 5,915,776 0.56Anadolu Efes Biracilik Ve Malt Sanayii 349,755 3,927,730 0.37Akbank 566,810 3,656,228 0.35Turkcell Iletisim Hizmet 500,999 3,549,859 0.33Turkiye Is Bankasi ‘C’ 702,279 2,957,458 0.28Turkiye Halk Bankasi 307,223 2,402,747 0.23Coca-Cola Icecek 186,481 1,807,470 0.17Turk Telekomunikasyon 528,081 1,609,659 0.15
Total for Turkey 2.44
Investments HoldingsMarket
value% of net
assets
Morgan Stanley Investment Funds 31 December 2009 12
Investments HoldingsMarket
value% of net
assets
Emerging Markets Equity Fund
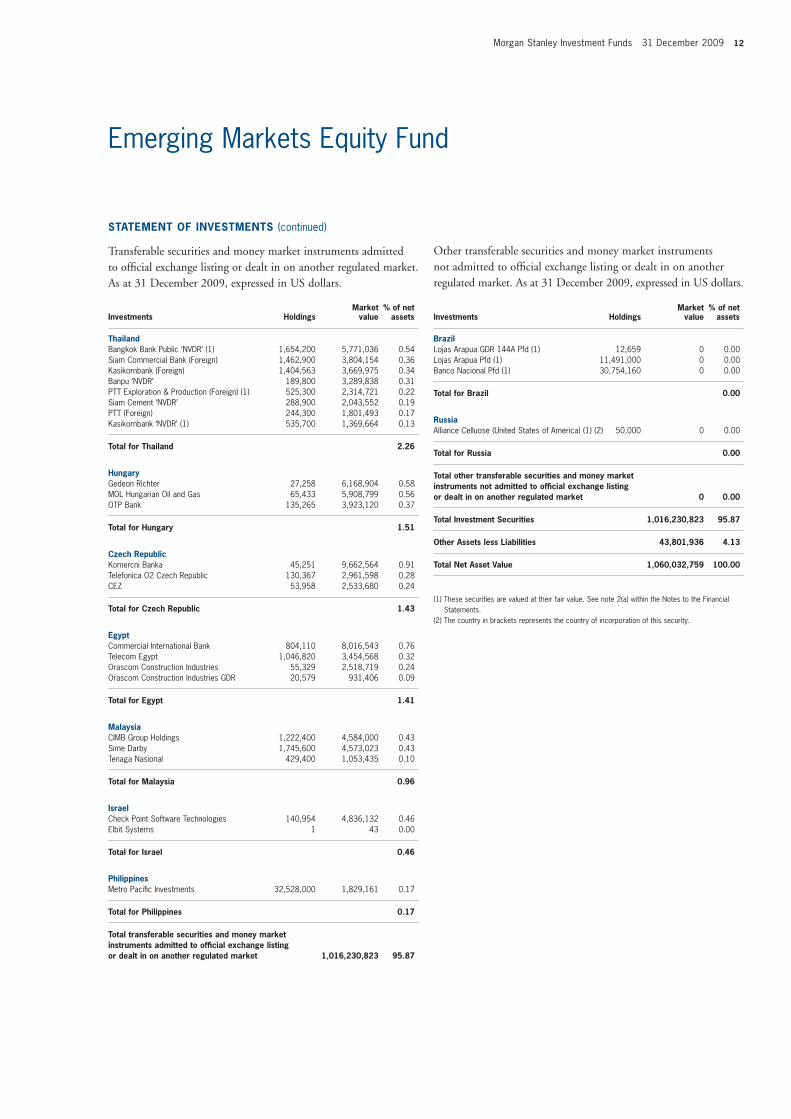
STATEMENT OF INVESTMENTS (continued)
Transferable securities and money market instruments admitted to offi cial exchange listing or dealt in on another regulated market. As at 31 December 2009, expressed in US dollars.
Investments HoldingsMarket
value% of net
assets
Other transferable securities and money market instruments not admitted to offi cial exchange listing or dealt in on another regulated market. As at 31 December 2009, expressed in US dollars.
Thailand Bangkok Bank Public ‘NVDR’ (1) 1,654,200 5,771,036 0.54Siam Commercial Bank (Foreign) 1,462,900 3,804,154 0.36Kasikornbank (Foreign) 1,404,563 3,669,975 0.34Banpu ‘NVDR’ 189,800 3,289,838 0.31PTT Exploration & Production (Foreign) (1) 525,300 2,314,721 0.22Siam Cement ‘NVDR’ 288,900 2,043,552 0.19PTT (Foreign) 244,300 1,801,493 0.17Kasikornbank ‘NVDR’ (1) 535,700 1,369,664 0.13
Total for Thailand 2.26
Hungary Gedeon Richter 27,258 6,168,904 0.58MOL Hungarian Oil and Gas 65,433 5,908,799 0.56OTP Bank 135,265 3,923,120 0.37
Total for Hungary 1.51
Czech Republic Komercni Banka 45,251 9,662,564 0.91Telefonica O2 Czech Republic 130,367 2,961,598 0.28CEZ 53,958 2,533,680 0.24
Total for Czech Republic 1.43
Egypt Commercial International Bank 804,110 8,016,543 0.76Telecom Egypt 1,046,820 3,454,568 0.32Orascom Construction Industries 55,329 2,518,719 0.24Orascom Construction Industries GDR 20,579 931,406 0.09
Total for Egypt 1.41
Malaysia CIMB Group Holdings 1,222,400 4,584,000 0.43Sime Darby 1,745,600 4,573,023 0.43Tenaga Nasional 429,400 1,053,435 0.10
Total for Malaysia 0.96
Israel Check Point Software Technologies 140,954 4,836,132 0.46Elbit Systems 1 43 0.00
Total for Israel 0.46
Philippines Metro Pacifi c Investments 32,528,000 1,829,161 0.17
Total for Philippines 0.17
Total transferable securities and money market instruments admitted to offi cial exchange listing or dealt in on another regulated market 1,016,230,823 95.87
Brazil Lojas Arapua GDR 144A Pfd (1) 12,659 0 0.00Lojas Arapua Pfd (1) 11,491,000 0 0.00Banco Nacional Pfd (1) 30,754,160 0 0.00
Total for Brazil 0.00
Russia Alliance Celluose (United States of America) (1) (2) 50,000 0 0.00
Total for Russia 0.00
Total other transferable securities and money market instruments not admitted to offi cial exchange listing or dealt in on another regulated market 0 0.00
Total Investment Securities 1,016,230,823 95.87
Other Assets less Liabilities 43,801,936 4.13
Total Net Asset Value 1,060,032,759 100.00
(1) These securities are valued at their fair value. See note 2(a) within the Notes to the Financial Statements.
(2) The country in brackets represents the country of incorporation of this security.
13 Morgan Stanley Investment Funds 31 December 2009
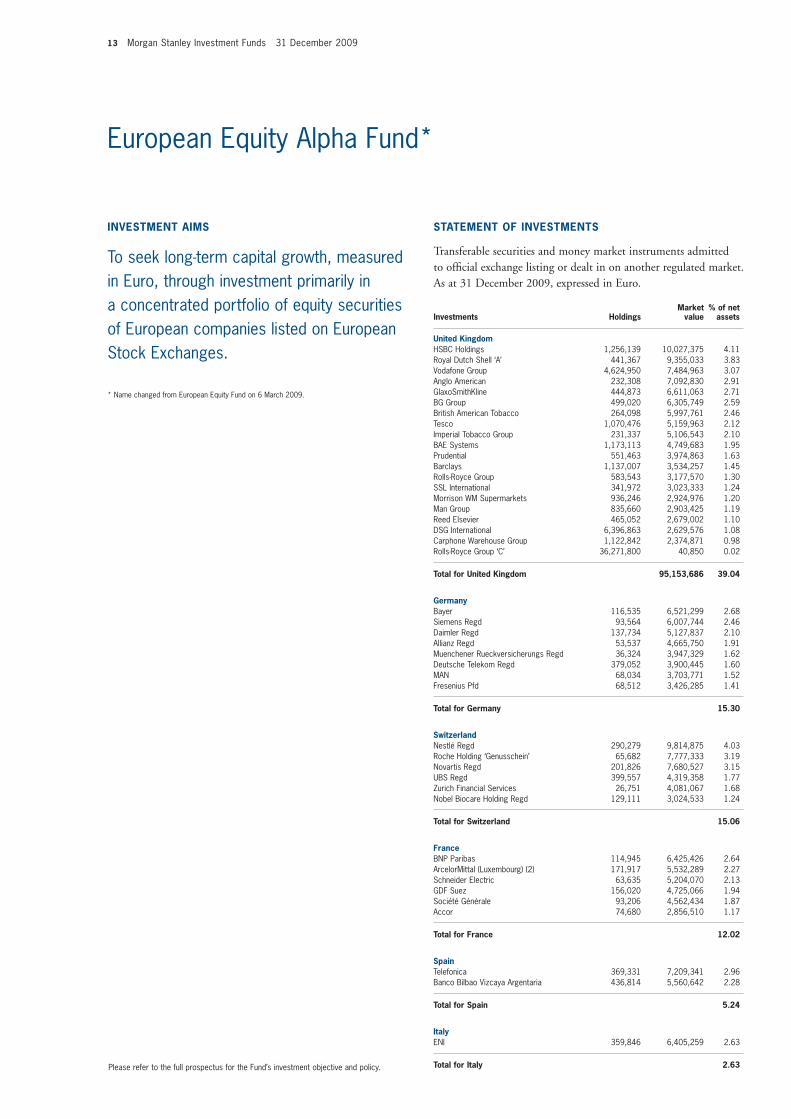
European Equity Alpha Fund*
United KingdomHSBC Holdings 1,256,139 10,027,375 4.11Royal Dutch Shell ‘A’ 441,367 9,355,033 3.83Vodafone Group 4,624,950 7,484,963 3.07Anglo American 232,308 7,092,830 2.91GlaxoSmithKline 444,873 6,611,063 2.71BG Group 499,020 6,305,749 2.59British American Tobacco 264,098 5,997,761 2.46Tesco 1,070,476 5,159,963 2.12Imperial Tobacco Group 231,337 5,106,543 2.10BAE Systems 1,173,113 4,749,683 1.95Prudential 551,463 3,974,863 1.63Barclays 1,137,007 3,534,257 1.45Rolls-Royce Group 583,543 3,177,570 1.30SSL International 341,972 3,023,333 1.24Morrison WM Supermarkets 936,246 2,924,976 1.20Man Group 835,660 2,903,425 1.19Reed Elsevier 465,052 2,679,002 1.10DSG International 6,396,863 2,629,576 1.08Carphone Warehouse Group 1,122,842 2,374,871 0.98Rolls-Royce Group ‘C’ 36,271,800 40,850 0.02
Total for United Kingdom 95,153,686 39.04
Germany Bayer 116,535 6,521,299 2.68Siemens Regd 93,564 6,007,744 2.46Daimler Regd 137,734 5,127,837 2.10Allianz Regd 53,537 4,665,750 1.91Muenchener Rueckversicherungs Regd 36,324 3,947,329 1.62Deutsche Telekom Regd 379,052 3,900,445 1.60MAN 68,034 3,703,771 1.52Fresenius Pfd 68,512 3,426,285 1.41
Total for Germany 15.30
Switzerland Nestlé Regd 290,279 9,814,875 4.03Roche Holding ‘Genusschein’ 65,682 7,777,333 3.19Novartis Regd 201,826 7,680,527 3.15UBS Regd 399,557 4,319,358 1.77Zurich Financial Services 26,751 4,081,067 1.68Nobel Biocare Holding Regd 129,111 3,024,533 1.24
Total for Switzerland 15.06
France BNP Paribas 114,945 6,425,426 2.64ArcelorMittal (Luxembourg) (2) 171,917 5,532,289 2.27Schneider Electric 63,635 5,204,070 2.13GDF Suez 156,020 4,725,066 1.94Société Générale 93,206 4,562,434 1.87Accor 74,680 2,856,510 1.17
Total for France 12.02
Spain Telefonica 369,331 7,209,341 2.96Banco Bilbao Vizcaya Argentaria 436,814 5,560,642 2.28
Total for Spain 5.24
Italy ENI 359,846 6,405,259 2.63
Total for Italy 2.63
INVESTMENT AIMS
To seek long-term capital growth, measured in Euro, through investment primarily in a concentrated portfolio of equity securities of European companies listed on European Stock Exchanges.
STATEMENT OF INVESTMENTS
Transferable securities and money market instruments admitted to offi cial exchange listing or dealt in on another regulated market. As at 31 December 2009, expressed in Euro.
Investments HoldingsMarket
value% of net
assets
* Name changed from European Equity Fund on 6 March 2009.
Please refer to the full prospectus for the Fund’s investment objective and policy.
Morgan Stanley Investment Funds 31 December 2009 14
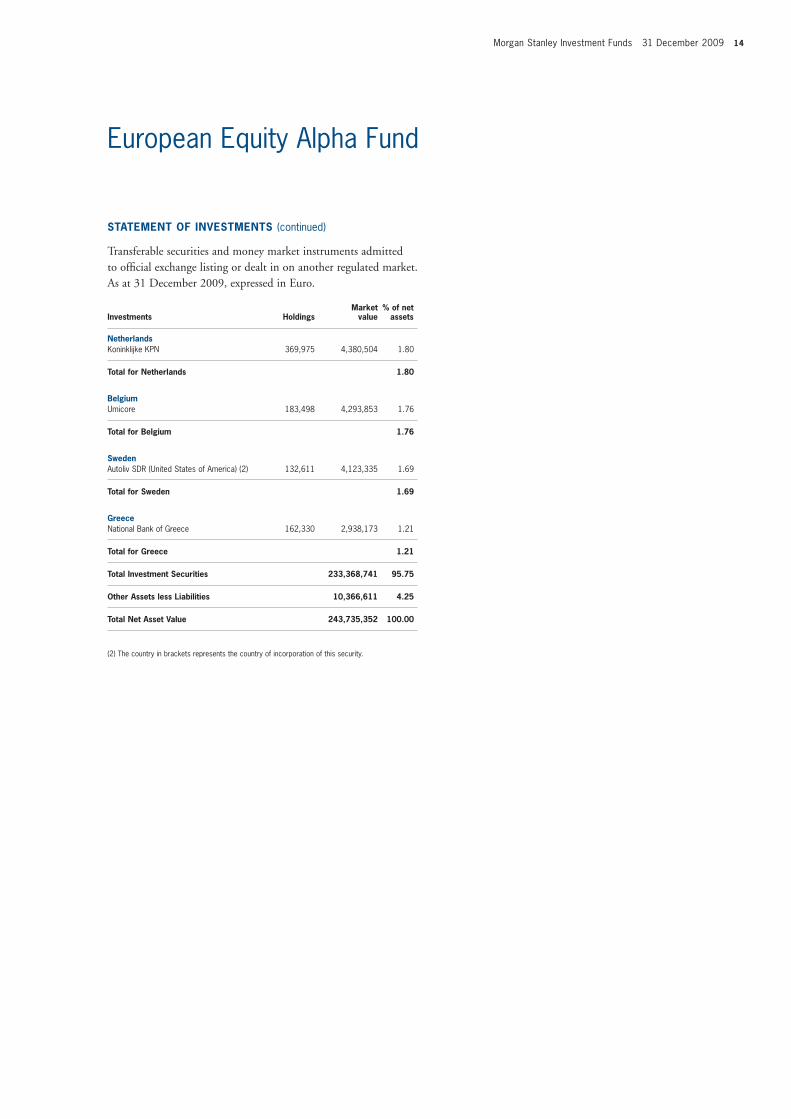
European Equity Alpha Fund
STATEMENT OF INVESTMENTS (continued)
Transferable securities and money market instruments admitted to offi cial exchange listing or dealt in on another regulated market. As at 31 December 2009, expressed in Euro.
Investments HoldingsMarket
value% of net
assets
Netherlands Koninklijke KPN 369,975 4,380,504 1.80
Total for Netherlands 1.80
Belgium Umicore 183,498 4,293,853 1.76
Total for Belgium 1.76
Sweden Autoliv SDR (United States of America) (2) 132,611 4,123,335 1.69
Total for Sweden 1.69
Greece National Bank of Greece 162,330 2,938,173 1.21
Total for Greece 1.21
Total Investment Securities 233,368,741 95.75
Other Assets less Liabilities 10,366,611 4.25
Total Net Asset Value 243,735,352 100.00
(2) The country in brackets represents the country of incorporation of this security.
15 Morgan Stanley Investment Funds 31 December 2009
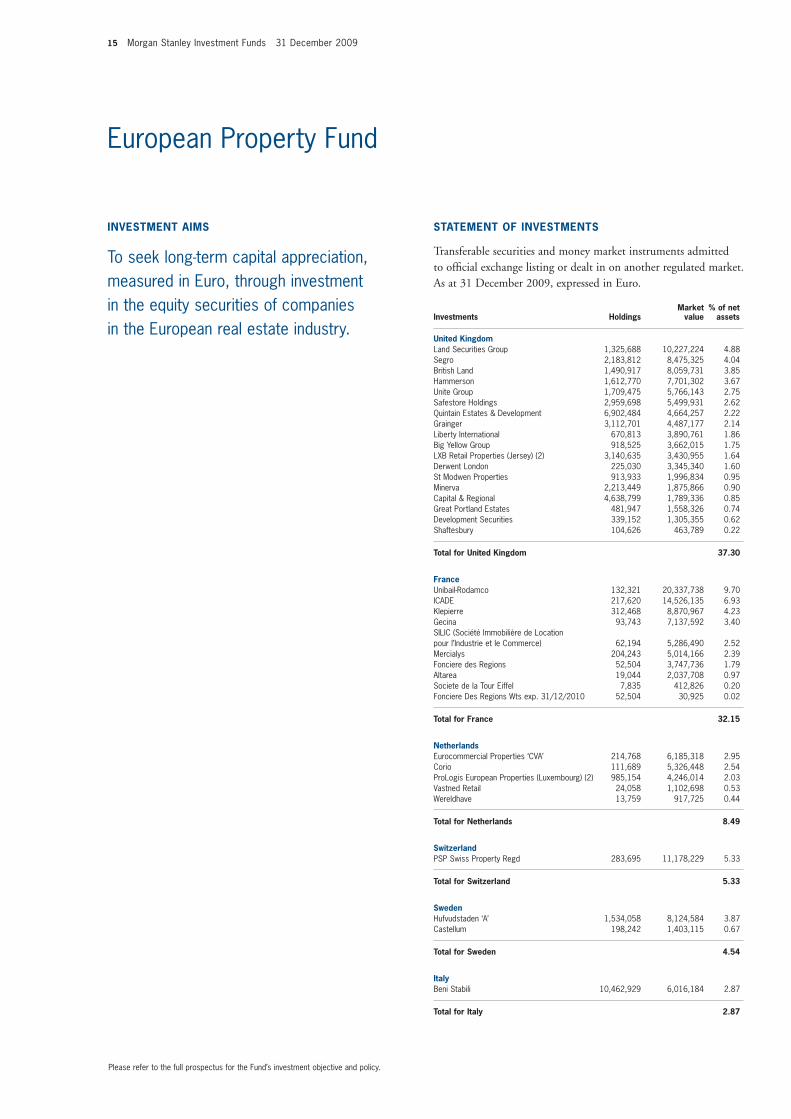
European Property Fund
United Kingdom Land Securities Group 1,325,688 10,227,224 4.88Segro 2,183,812 8,475,325 4.04British Land 1,490,917 8,059,731 3.85Hammerson 1,612,770 7,701,302 3.67Unite Group 1,709,475 5,766,143 2.75Safestore Holdings 2,959,698 5,499,931 2.62Quintain Estates & Development 6,902,484 4,664,257 2.22Grainger 3,112,701 4,487,177 2.14Liberty International 670,813 3,890,761 1.86Big Yellow Group 918,525 3,662,015 1.75LXB Retail Properties (Jersey) (2) 3,140,635 3,430,955 1.64Derwent London 225,030 3,345,340 1.60St Modwen Properties 913,933 1,996,834 0.95Minerva 2,213,449 1,875,866 0.90Capital & Regional 4,638,799 1,789,336 0.85Great Portland Estates 481,947 1,558,326 0.74Development Securities 339,152 1,305,355 0.62Shaftesbury 104,626 463,789 0.22
Total for United Kingdom 37.30
France Unibail-Rodamco 132,321 20,337,738 9.70ICADE 217,620 14,526,135 6.93Klepierre 312,468 8,870,967 4.23Gecina 93,743 7,137,592 3.40SILIC (Société Immobilière de Location pour l’Industrie et le Commerce) 62,194 5,286,490 2.52Mercialys 204,243 5,014,166 2.39Fonciere des Regions 52,504 3,747,736 1.79Altarea 19,044 2,037,708 0.97Societe de la Tour Eiffel 7,835 412,826 0.20Fonciere Des Regions Wts exp. 31/12/2010 52,504 30,925 0.02
Total for France 32.15
Netherlands Eurocommercial Properties ‘CVA’ 214,768 6,185,318 2.95Corio 111,689 5,326,448 2.54ProLogis European Properties (Luxembourg) (2) 985,154 4,246,014 2.03Vastned Retail 24,058 1,102,698 0.53Wereldhave 13,759 917,725 0.44
Total for Netherlands 8.49
Switzerland PSP Swiss Property Regd 283,695 11,178,229 5.33
Total for Switzerland 5.33
Sweden Hufvudstaden ‘A’ 1,534,058 8,124,584 3.87Castellum 198,242 1,403,115 0.67
Total for Sweden 4.54
Italy Beni Stabili 10,462,929 6,016,184 2.87
Total for Italy 2.87
INVESTMENT AIMS
To seek long-term capital appreciation, measured in Euro, through investment in the equity securities of companies in the European real estate industry.
STATEMENT OF INVESTMENTS
Transferable securities and money market instruments admitted to offi cial exchange listing or dealt in on another regulated market. As at 31 December 2009, expressed in Euro.
Investments HoldingsMarket
value% of net
assets
Please refer to the full prospectus for the Fund’s investment objective and policy.
Morgan Stanley Investment Funds 31 December 2009 16
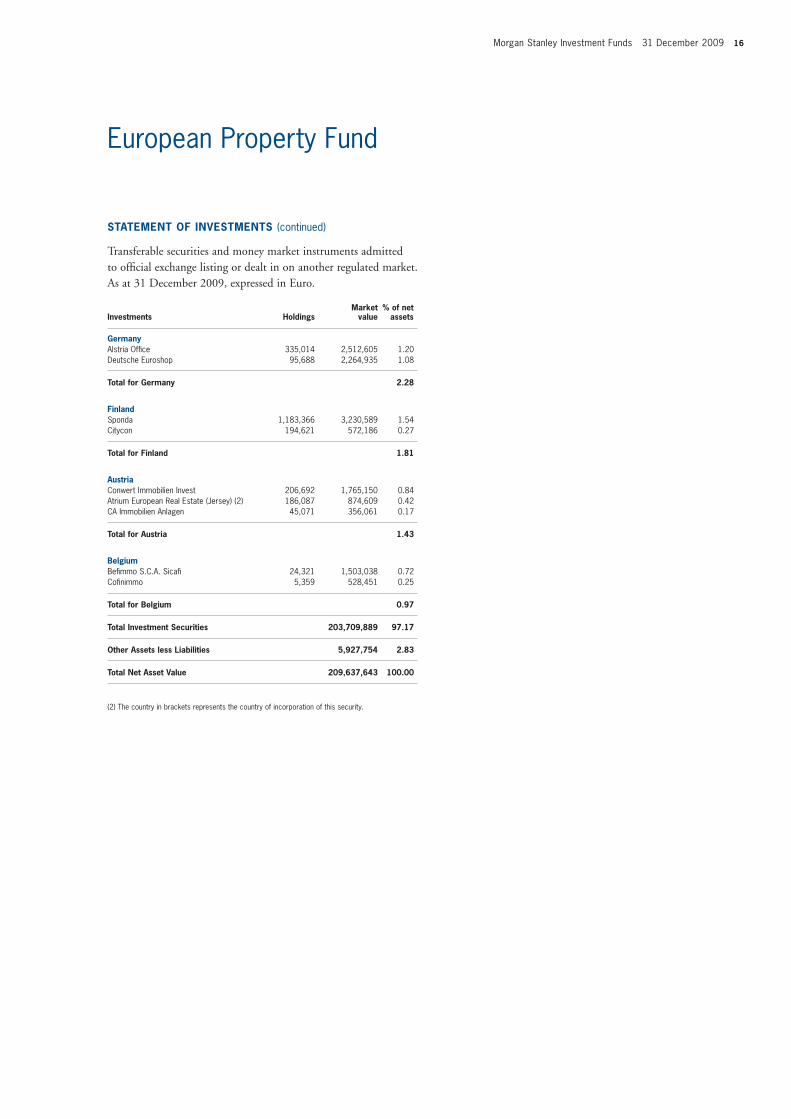
European Property Fund
STATEMENT OF INVESTMENTS (continued)
Transferable securities and money market instruments admitted to offi cial exchange listing or dealt in on another regulated market. As at 31 December 2009, expressed in Euro.
Investments HoldingsMarket
value% of net
assets
Germany Alstria Offi ce 335,014 2,512,605 1.20Deutsche Euroshop 95,688 2,264,935 1.08
Total for Germany 2.28
Finland Sponda 1,183,366 3,230,589 1.54Citycon 194,621 572,186 0.27
Total for Finland 1.81
Austria Conwert Immobilien Invest 206,692 1,765,150 0.84Atrium European Real Estate (Jersey) (2) 186,087 874,609 0.42CA Immobilien Anlagen 45,071 356,061 0.17
Total for Austria 1.43
Belgium Befi mmo S.C.A. Sicafi 24,321 1,503,038 0.72Cofi nimmo 5,359 528,451 0.25
Total for Belgium 0.97
Total Investment Securities 203,709,889 97.17
Other Assets less Liabilities 5,927,754 2.83
Total Net Asset Value 209,637,643 100.00
(2) The country in brackets represents the country of incorporation of this security.
17 Morgan Stanley Investment Funds 31 December 2009
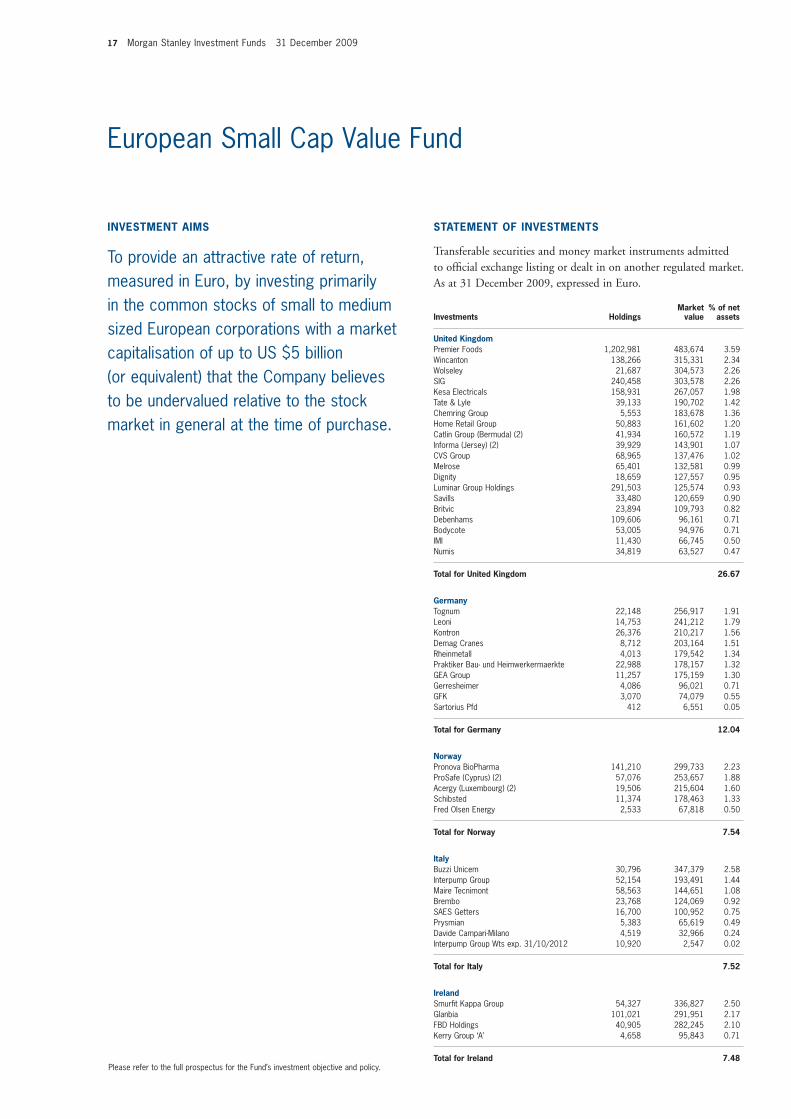
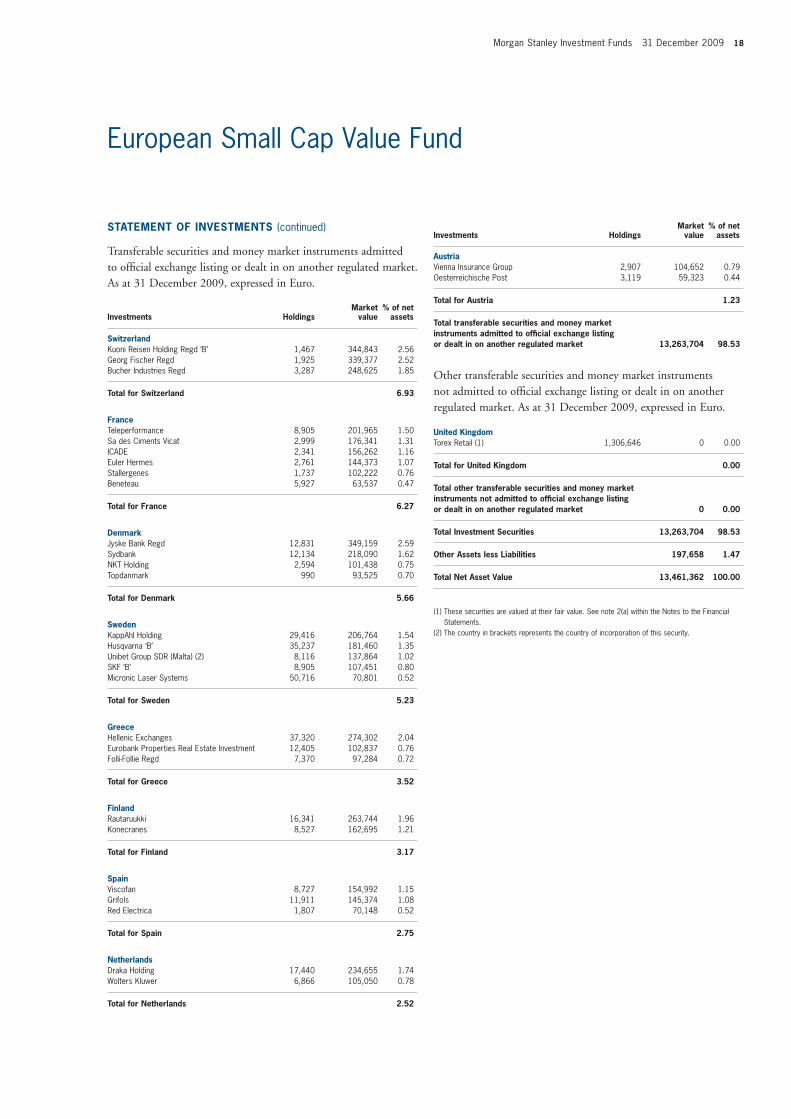
European Small Cap Value Fund
United Kingdom Premier Foods 1,202,981 483,674 3.59Wincanton 138,266 315,331 2.34Wolseley 21,687 304,573 2.26SIG 240,458 303,578 2.26Kesa Electricals 158,931 267,057 1.98Tate & Lyle 39,133 190,702 1.42Chemring Group 5,553 183,678 1.36Home Retail Group 50,883 161,602 1.20Catlin Group (Bermuda) (2) 41,934 160,572 1.19Informa (Jersey) (2) 39,929 143,901 1.07CVS Group 68,965 137,476 1.02Melrose 65,401 132,581 0.99Dignity 18,659 127,557 0.95Luminar Group Holdings 291,503 125,574 0.93Savills 33,480 120,659 0.90Britvic 23,894 109,793 0.82Debenhams 109,606 96,161 0.71Bodycote 53,005 94,976 0.71IMI 11,430 66,745 0.50Numis 34,819 63,527 0.47
Total for United Kingdom 26.67
Germany Tognum 22,148 256,917 1.91Leoni 14,753 241,212 1.79Kontron 26,376 210,217 1.56Demag Cranes 8,712 203,164 1.51Rheinmetall 4,013 179,542 1.34Praktiker Bau- und Heimwerkermaerkte 22,988 178,157 1.32GEA Group 11,257 175,159 1.30Gerresheimer 4,086 96,021 0.71GFK 3,070 74,079 0.55Sartorius Pfd 412 6,551 0.05
Total for Germany 12.04
Norway Pronova BioPharma 141,210 299,733 2.23ProSafe (Cyprus) (2) 57,076 253,657 1.88Acergy (Luxembourg) (2) 19,506 215,604 1.60Schibsted 11,374 178,463 1.33Fred Olsen Energy 2,533 67,818 0.50
Total for Norway 7.54
Italy Buzzi Unicem 30,796 347,379 2.58Interpump Group 52,154 193,491 1.44Maire Tecnimont 58,563 144,651 1.08Brembo 23,768 124,069 0.92SAES Getters 16,700 100,952 0.75Prysmian 5,383 65,619 0.49Davide Campari-Milano 4,519 32,966 0.24Interpump Group Wts exp. 31/10/2012 10,920 2,547 0.02
Total for Italy 7.52
Ireland Smurfi t Kappa Group 54,327 336,827 2.50Glanbia 101,021 291,951 2.17FBD Holdings 40,905 282,245 2.10Kerry Group ‘A’ 4,658 95,843 0.71
Total for Ireland 7.48
INVESTMENT AIMS
To provide an attractive rate of return, measured in Euro, by investing primarily in the common stocks of small to medium sized European corporations with a market capitalisation of up to US $5 billion (or equivalent) that the Company believes to be undervalued relative to the stock market in general at the time of purchase.
Please refer to the full prospectus for the Fund’s investment objective and policy.
STATEMENT OF INVESTMENTS
Transferable securities and money market instruments admitted to offi cial exchange listing or dealt in on another regulated market. As at 31 December 2009, expressed in Euro.
Investments HoldingsMarket
value% of net
assets
Morgan Stanley Investment Funds 31 December 2009 18
European Small Cap Value Fund
STATEMENT OF INVESTMENTS (continued)
Transferable securities and money market instruments admitted to offi cial exchange listing or dealt in on another regulated market. As at 31 December 2009, expressed in Euro.
Investments HoldingsMarket
value% of net
assets
Investments HoldingsMarket
value% of net
assets
Switzerland Kuoni Reisen Holding Regd ‘B’ 1,467 344,843 2.56Georg Fischer Regd 1,925 339,377 2.52Bucher Industries Regd 3,287 248,625 1.85
Total for Switzerland 6.93
France Teleperformance 8,905 201,965 1.50Sa des Ciments Vicat 2,999 176,341 1.31ICADE 2,341 156,262 1.16Euler Hermes 2,761 144,373 1.07Stallergenes 1,737 102,222 0.76Beneteau 5,927 63,537 0.47
Total for France 6.27
Denmark Jyske Bank Regd 12,831 349,159 2.59Sydbank 12,134 218,090 1.62NKT Holding 2,594 101,438 0.75Topdanmark 990 93,525 0.70
Total for Denmark 5.66
Sweden KappAhl Holding 29,416 206,764 1.54Husqvarna ‘B’ 35,237 181,460 1.35Unibet Group SDR (Malta) (2) 8,116 137,864 1.02SKF ‘B’ 8,905 107,451 0.80Micronic Laser Systems 50,716 70,801 0.52
Total for Sweden 5.23
Greece Hellenic Exchanges 37,320 274,302 2.04Eurobank Properties Real Estate Investment 12,405 102,837 0.76Folli-Follie Regd 7,370 97,284 0.72
Total for Greece 3.52
Finland Rautaruukki 16,341 263,744 1.96Konecranes 8,527 162,695 1.21
Total for Finland 3.17
Spain Viscofan 8,727 154,992 1.15Grifols 11,911 145,374 1.08Red Electrica 1,807 70,148 0.52
Total for Spain 2.75
Netherlands Draka Holding 17,440 234,655 1.74Wolters Kluwer 6,866 105,050 0.78
Total for Netherlands 2.52
Austria Vienna Insurance Group 2,907 104,652 0.79Oesterreichische Post 3,119 59,323 0.44
Total for Austria 1.23
Total transferable securities and money market instruments admitted to offi cial exchange listing or dealt in on another regulated market 13,263,704 98.53
Other transferable securities and money market instruments not admitted to offi cial exchange listing or dealt in on another regulated market. As at 31 December 2009, expressed in Euro.
United Kingdom Torex Retail (1) 1,306,646 0 0.00
Total for United Kingdom 0.00
Total other transferable securities and money market instruments not admitted to offi cial exchange listing or dealt in on another regulated market 0 0.00
Total Investment Securities 13,263,704 98.53
Other Assets less Liabilities 197,658 1.47
Total Net Asset Value 13,461,362 100.00
(1) These securities are valued at their fair value. See note 2(a) within the Notes to the Financial Statements.
(2) The country in brackets represents the country of incorporation of this security.
19 Morgan Stanley Investment Funds 31 December 2009
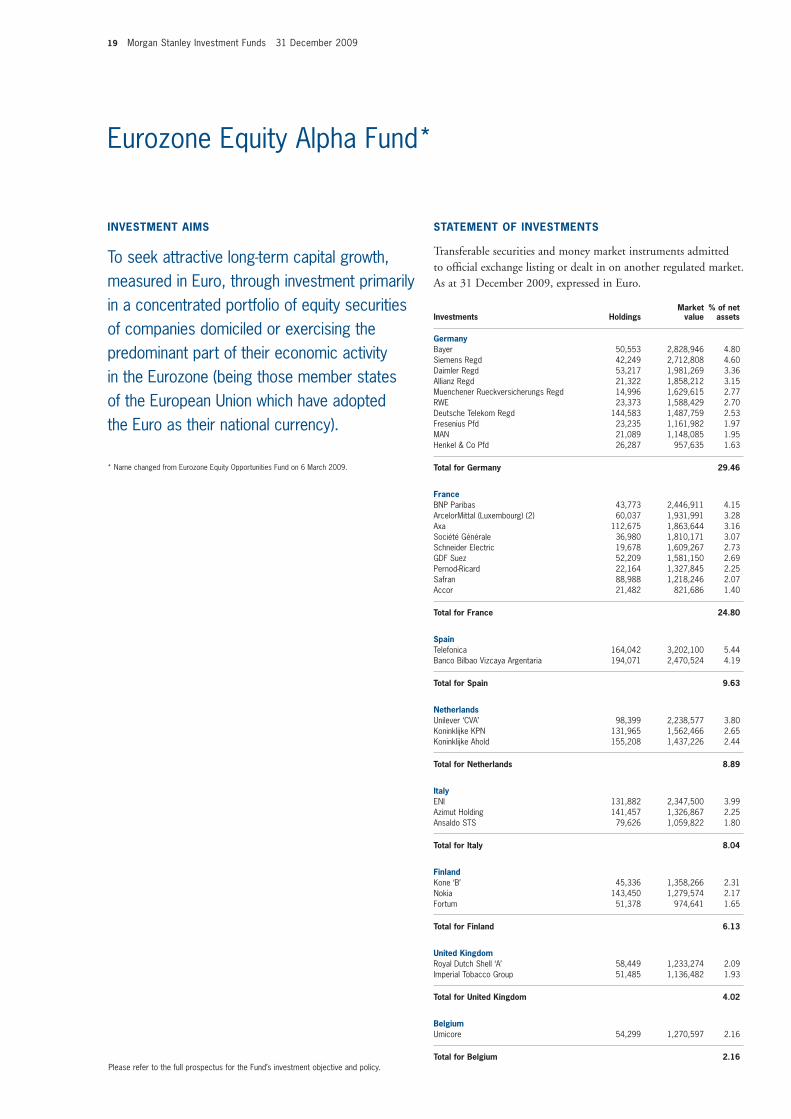
Eurozone Equity Alpha Fund*
Germany Bayer 50,553 2,828,946 4.80Siemens Regd 42,249 2,712,808 4.60Daimler Regd 53,217 1,981,269 3.36Allianz Regd 21,322 1,858,212 3.15Muenchener Rueckversicherungs Regd 14,996 1,629,615 2.77RWE 23,373 1,588,429 2.70Deutsche Telekom Regd 144,583 1,487,759 2.53Fresenius Pfd 23,235 1,161,982 1.97MAN 21,089 1,148,085 1.95Henkel & Co Pfd 26,287 957,635 1.63
Total for Germany 29.46
France BNP Paribas 43,773 2,446,911 4.15ArcelorMittal (Luxembourg) (2) 60,037 1,931,991 3.28Axa 112,675 1,863,644 3.16Société Générale 36,980 1,810,171 3.07Schneider Electric 19,678 1,609,267 2.73GDF Suez 52,209 1,581,150 2.69Pernod-Ricard 22,164 1,327,845 2.25Safran 88,988 1,218,246 2.07Accor 21,482 821,686 1.40
Total for France 24.80
Spain Telefonica 164,042 3,202,100 5.44Banco Bilbao Vizcaya Argentaria 194,071 2,470,524 4.19
Total for Spain 9.63
Netherlands Unilever ‘CVA’ 98,399 2,238,577 3.80Koninklijke KPN 131,965 1,562,466 2.65Koninklijke Ahold 155,208 1,437,226 2.44
Total for Netherlands 8.89
Italy ENI 131,882 2,347,500 3.99Azimut Holding 141,457 1,326,867 2.25Ansaldo STS 79,626 1,059,822 1.80
Total for Italy 8.04
Finland Kone ‘B’ 45,336 1,358,266 2.31Nokia 143,450 1,279,574 2.17Fortum 51,378 974,641 1.65
Total for Finland 6.13
United Kingdom Royal Dutch Shell ‘A’ 58,449 1,233,274 2.09Imperial Tobacco Group 51,485 1,136,482 1.93
Total for United Kingdom 4.02
Belgium Umicore 54,299 1,270,597 2.16
Total for Belgium 2.16
INVESTMENT AIMS
To seek attractive long-term capital growth, measured in Euro, through investment primarily in a concentrated portfolio of equity securities of companies domiciled or exercising the predominant part of their economic activity in the Eurozone (being those member states of the European Union which have adopted the Euro as their national currency).
STATEMENT OF INVESTMENTS
Transferable securities and money market instruments admitted to offi cial exchange listing or dealt in on another regulated market. As at 31 December 2009, expressed in Euro.
Investments HoldingsMarket
value% of net
assets
* Name changed from Eurozone Equity Opportunities Fund on 6 March 2009.
Please refer to the full prospectus for the Fund’s investment objective and policy.
Morgan Stanley Investment Funds 31 December 2009 20
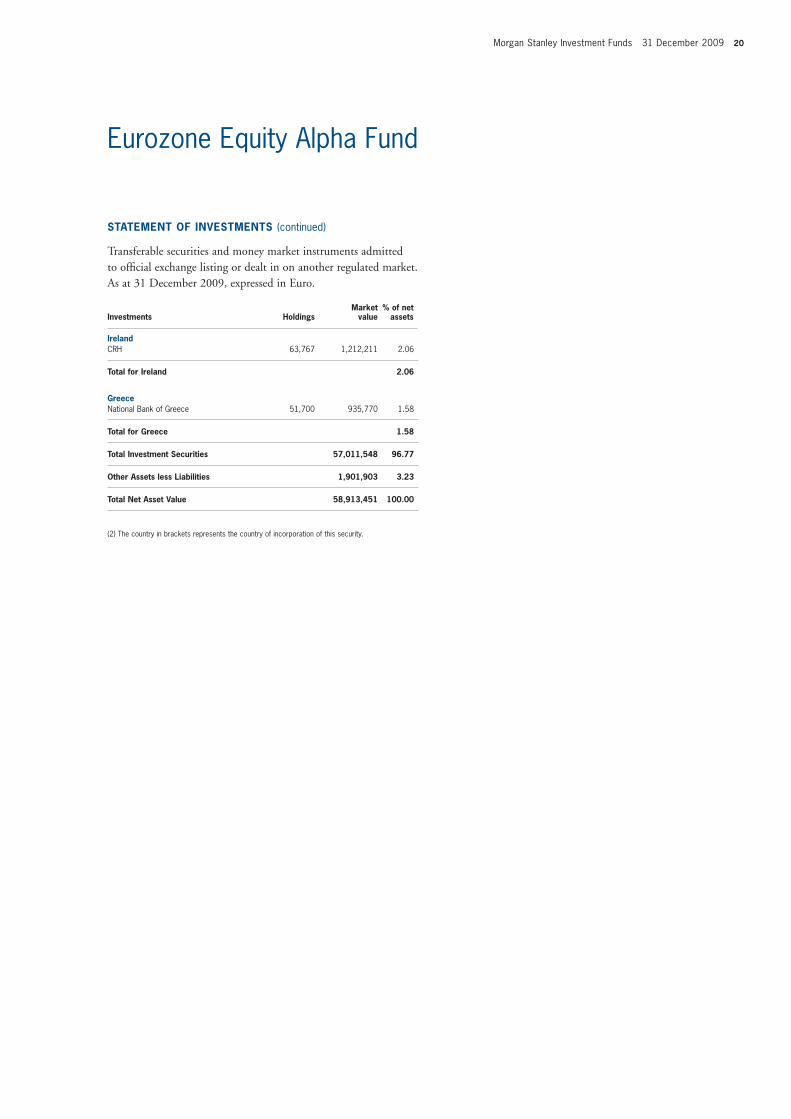
Eurozone Equity Alpha Fund
STATEMENT OF INVESTMENTS (continued)
Transferable securities and money market instruments admitted to offi cial exchange listing or dealt in on another regulated market. As at 31 December 2009, expressed in Euro.
Investments HoldingsMarket
value% of net
assets
Ireland CRH 63,767 1,212,211 2.06
Total for Ireland 2.06
Greece National Bank of Greece 51,700 935,770 1.58
Total for Greece 1.58
Total Investment Securities 57,011,548 96.77
Other Assets less Liabilities 1,901,903 3.23
Total Net Asset Value 58,913,451 100.00
(2) The country in brackets represents the country of incorporation of this security.
21 Morgan Stanley Investment Funds 31 December 2009
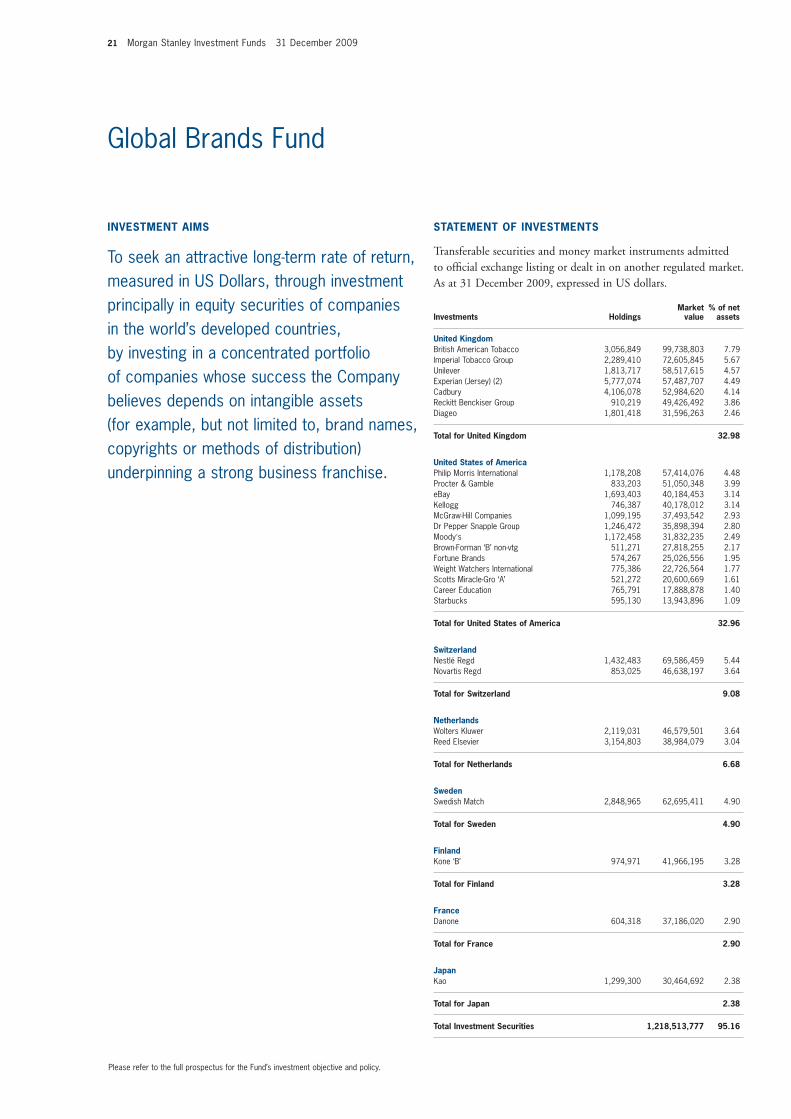
Global Brands Fund
United Kingdom British American Tobacco 3,056,849 99,738,803 7.79Imperial Tobacco Group 2,289,410 72,605,845 5.67Unilever 1,813,717 58,517,615 4.57Experian (Jersey) (2) 5,777,074 57,487,707 4.49Cadbury 4,106,078 52,984,620 4.14Reckitt Benckiser Group 910,219 49,426,492 3.86Diageo 1,801,418 31,596,263 2.46
Total for United Kingdom 32.98
United States of America Philip Morris International 1,178,208 57,414,076 4.48Procter & Gamble 833,203 51,050,348 3.99eBay 1,693,403 40,184,453 3.14Kellogg 746,387 40,178,012 3.14McGraw-Hill Companies 1,099,195 37,493,542 2.93Dr Pepper Snapple Group 1,246,472 35,898,394 2.80Moody’s 1,172,458 31,832,235 2.49Brown-Forman ‘B’ non-vtg 511,271 27,818,255 2.17Fortune Brands 574,267 25,026,556 1.95Weight Watchers International 775,386 22,726,564 1.77Scotts Miracle-Gro ‘A’ 521,272 20,600,669 1.61Career Education 765,791 17,888,878 1.40Starbucks 595,130 13,943,896 1.09
Total for United States of America 32.96
Switzerland Nestlé Regd 1,432,483 69,586,459 5.44Novartis Regd 853,025 46,638,197 3.64
Total for Switzerland 9.08
Netherlands Wolters Kluwer 2,119,031 46,579,501 3.64Reed Elsevier 3,154,803 38,984,079 3.04
Total for Netherlands 6.68
Sweden Swedish Match 2,848,965 62,695,411 4.90
Total for Sweden 4.90
Finland Kone ‘B’ 974,971 41,966,195 3.28
Total for Finland 3.28
France Danone 604,318 37,186,020 2.90
Total for France 2.90
Japan Kao 1,299,300 30,464,692 2.38
Total for Japan 2.38
Total Investment Securities 1,218,513,777 95.16
INVESTMENT AIMS
To seek an attractive long-term rate of return, measured in US Dollars, through investment principally in equity securities of companies in the world’s developed countries, by investing in a concentrated portfolio of companies whose success the Company believes depends on intangible assets (for example, but not limited to, brand names, copyrights or methods of distribution) underpinning a strong business franchise.
STATEMENT OF INVESTMENTS
Transferable securities and money market instruments admitted to offi cial exchange listing or dealt in on another regulated market. As at 31 December 2009, expressed in US dollars.
Investments HoldingsMarket
value% of net
assets
Please refer to the full prospectus for the Fund’s investment objective and policy.
Morgan Stanley Investment Funds 31 December 2009 22
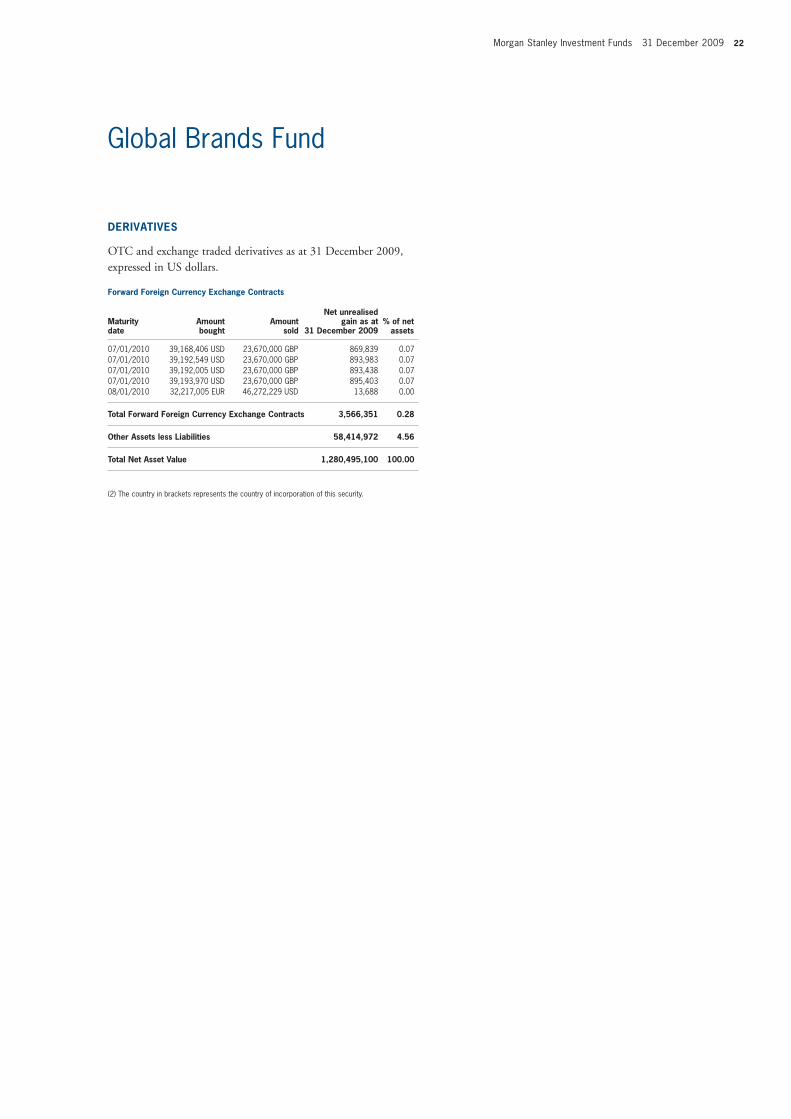
Global Brands Fund
DERIVATIVES
OTC and exchange traded derivatives as at 31 December 2009, expressed in US dollars.
Forward Foreign Currency Exchange Contracts
Maturity date
Amount bought
Amount sold
Net unrealisedgain as at
31 December 2009 % of net
assets 07/01/2010 39,168,406 USD 23,670,000 GBP 869,839 0.0707/01/2010 39,192,549 USD 23,670,000 GBP 893,983 0.0707/01/2010 39,192,005 USD 23,670,000 GBP 893,438 0.0707/01/2010 39,193,970 USD 23,670,000 GBP 895,403 0.0708/01/2010 32,217,005 EUR 46,272,229 USD 13,688 0.00
Total Forward Foreign Currency Exchange Contracts 3,566,351 0.28
Other Assets less Liabilities 58,414,972 4.56
Total Net Asset Value 1,280,495,100 100.00
(2) The country in brackets represents the country of incorporation of this security.
23 Morgan Stanley Investment Funds 31 December 2009
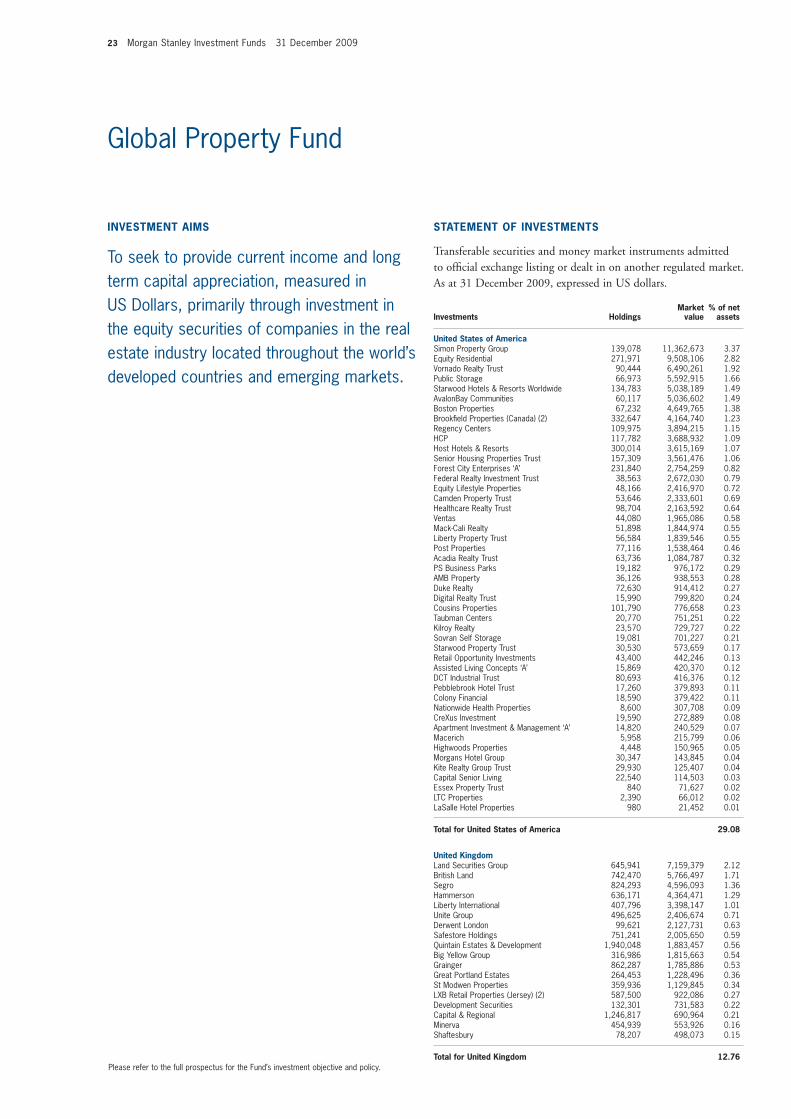
Global Property Fund
United States of America Simon Property Group 139,078 11,362,673 3.37Equity Residential 271,971 9,508,106 2.82Vornado Realty Trust 90,444 6,490,261 1.92Public Storage 66,973 5,592,915 1.66Starwood Hotels & Resorts Worldwide 134,783 5,038,189 1.49AvalonBay Communities 60,117 5,036,602 1.49Boston Properties 67,232 4,649,765 1.38Brookfi eld Properties (Canada) (2) 332,647 4,164,740 1.23Regency Centers 109,975 3,894,215 1.15HCP 117,782 3,688,932 1.09Host Hotels & Resorts 300,014 3,615,169 1.07Senior Housing Properties Trust 157,309 3,561,476 1.06Forest City Enterprises ‘A’ 231,840 2,754,259 0.82Federal Realty Investment Trust 38,563 2,672,030 0.79Equity Lifestyle Properties 48,166 2,416,970 0.72Camden Property Trust 53,646 2,333,601 0.69Healthcare Realty Trust 98,704 2,163,592 0.64Ventas 44,080 1,965,086 0.58Mack-Cali Realty 51,898 1,844,974 0.55Liberty Property Trust 56,584 1,839,546 0.55Post Properties 77,116 1,538,464 0.46Acadia Realty Trust 63,736 1,084,787 0.32PS Business Parks 19,182 976,172 0.29AMB Property 36,126 938,553 0.28Duke Realty 72,630 914,412 0.27Digital Realty Trust 15,990 799,820 0.24Cousins Properties 101,790 776,658 0.23Taubman Centers 20,770 751,251 0.22Kilroy Realty 23,570 729,727 0.22Sovran Self Storage 19,081 701,227 0.21Starwood Property Trust 30,530 573,659 0.17Retail Opportunity Investments 43,400 442,246 0.13Assisted Living Concepts ‘A’ 15,869 420,370 0.12DCT Industrial Trust 80,693 416,376 0.12Pebblebrook Hotel Trust 17,260 379,893 0.11Colony Financial 18,590 379,422 0.11Nationwide Health Properties 8,600 307,708 0.09CreXus Investment 19,590 272,889 0.08Apartment Investment & Management ‘A’ 14,820 240,529 0.07Macerich 5,958 215,799 0.06Highwoods Properties 4,448 150,965 0.05Morgans Hotel Group 30,347 143,845 0.04Kite Realty Group Trust 29,930 125,407 0.04Capital Senior Living 22,540 114,503 0.03Essex Property Trust 840 71,627 0.02LTC Properties 2,390 66,012 0.02LaSalle Hotel Properties 980 21,452 0.01
Total for United States of America 29.08
United Kingdom Land Securities Group 645,941 7,159,379 2.12British Land 742,470 5,766,497 1.71Segro 824,293 4,596,093 1.36Hammerson 636,171 4,364,471 1.29Liberty International 407,796 3,398,147 1.01Unite Group 496,625 2,406,674 0.71Derwent London 99,621 2,127,731 0.63Safestore Holdings 751,241 2,005,650 0.59Quintain Estates & Development 1,940,048 1,883,457 0.56Big Yellow Group 316,986 1,815,663 0.54Grainger 862,287 1,785,886 0.53Great Portland Estates 264,453 1,228,496 0.36St Modwen Properties 359,936 1,129,845 0.34LXB Retail Properties (Jersey) (2) 587,500 922,086 0.27Development Securities 132,301 731,583 0.22Capital & Regional 1,246,817 690,964 0.21Minerva 454,939 553,926 0.16Shaftesbury 78,207 498,073 0.15
Total for United Kingdom 12.76
INVESTMENT AIMS
To seek to provide current income and long term capital appreciation, measured in US Dollars, primarily through investment in the equity securities of companies in the real estate industry located throughout the world’s developed countries and emerging markets.
STATEMENT OF INVESTMENTS
Transferable securities and money market instruments admitted to offi cial exchange listing or dealt in on another regulated market. As at 31 December 2009, expressed in US dollars.
Investments HoldingsMarket
value% of net
assets
Please refer to the full prospectus for the Fund’s investment objective and policy.

Morgan Stanley Investment Funds 31 December 2009 24
Hong Kong Sun Hung Kai Properties 1,154,700 17,318,899 5.13Hong Kong Land Holdings (Bermuda) (2) 1,687,000 8,350,650 2.48Kerry Properties (Bermuda) (2) 988,911 5,037,623 1.49Henderson Land Development 611,000 4,601,776 1.36Hang Lung Properties 1,105,000 4,360,689 1.29Hysan Development 550,755 1,566,168 0.47Wharf Holdings 89,000 513,635 0.15Sino Land 148,770 289,710 0.09Swire Pacifi c ‘A’ 3,000 36,368 0.01
Total for Hong Kong 12.47
Japan Mitsubishi Estate 724,000 11,534,990 3.42Mitsui Fudosan 617,000 10,362,523 3.07Sumitomo Realty & Development 340,000 6,373,843 1.89Nippon Building Fund 284 2,162,091 0.64Japan Real Estate Investment 221 1,629,405 0.48NTT Urban Development 2,346 1,557,794 0.46
Total for Japan 9.96
France Unibail-Rodamco 88,079 19,449,674 5.76ICADE 51,560 4,944,590 1.47Klepierre 64,338 2,624,213 0.78SILIC (Société Immobilière de Location pour l’Industrie et le Commerce) 18,829 2,299,388 0.68Fonciere des Regions 15,497 1,589,243 0.47Mercialys 28,986 1,022,365 0.30Gecina 8,115 887,703 0.26Fonciere Des Regions Wts exp. 31/12/2010 15,497 13,114 0.01
Total for France 9.73
Australia Westfi eld Group 1,179,173 13,268,961 3.93Stockland 1,331,148 4,718,297 1.40GPT 4,719,188 2,562,032 0.76CFS Retail Property Trust 964,802 1,644,954 0.49Commonwealth Property Offi ce Fund 1,185,799 1,032,154 0.31Mirvac Group 201,744 284,225 0.08Dexus Property Group 176,680 134,762 0.04
Total for Australia 7.01
China China Overseas Land & Investment (Hong Kong) (2) 2,995,280 6,335,088 1.88China Resources Land (Cayman Islands) (2) 1,581,000 3,596,680 1.07Guangzhou R&F Properties ‘H’ 1,097,800 1,939,613 0.57Shimao Property Holdings (Cayman Islands) (2) 649,000 1,232,037 0.36Poly Hong Kong Investment (Hong Kong) (2) 731,000 916,337 0.27KWG Property Holding (Cayman Islands) (2) 320,000 247,200 0.07Sino-Ocean Land Holdings (Hong Kong) (2) 201,500 186,583 0.06
Total for China 4.28
Singapore CapitaLand 1,784,000 5,343,222 1.59CapitaMall Trust 1,038,000 1,332,383 0.40CapitaCommercial Trust 1,145,000 955,323 0.28Keppel Land 352,000 878,557 0.26Wing Tai Holdings 447,000 583,335 0.17Suntec Real Estate Investment Trust 566,000 544,891 0.16Allgreen Properties 312,000 273,665 0.08City Developments 12,000 98,923 0.03
Total for Singapore 2.97
STATEMENT OF INVESTMENTS (continued)
Transferable securities and money market instruments admitted to offi cial exchange listing or dealt in on another regulated market. As at 31 December 2009, expressed in US dollars.
Investments HoldingsMarket
value% of net
assets
Investments HoldingsMarket
value% of net
assets
Netherlands Corio 54,778 3,753,182 1.11Eurocommercial Properties ‘CVA’ 63,588 2,631,078 0.78ProLogis European Properties (Luxembourg) (2) 196,779 1,218,490 0.36Vastned Retail 11,708 770,985 0.23Wereldhave 8,014 767,965 0.23
Total for Netherlands 2.71
Switzerland PSP Swiss Property Regd 86,303 4,885,548 1.45Allreal Holding Regd 3,067 365,048 0.11
Total for Switzerland 1.56
Sweden Hufvudstaden ‘A’ 310,561 2,363,047 0.71Castellum 91,256 927,951 0.27
Total for Sweden 0.98
Italy Beni Stabili 2,352,788 1,943,644 0.57
Total for Italy 0.57
Canada RioCan Real Estate Investment Trust 77,945 1,456,638 0.43Extendicare Real Estate Investment Trust 22,920 206,297 0.06
Total for Canada 0.49
Brazil BR Malls Participaçoes 132,100 1,628,993 0.48
Total for Brazil 0.48
Germany Deutsche Euroshop 27,564 937,360 0.28Alstria Offi ce 61,145 658,853 0.19
Total for Germany 0.47
Finland Sponda 378,105 1,483,000 0.44
Total for Finland 0.44
Belgium Befi mmo S.C.A. Sicafi 9,870 876,338 0.26
Total for Belgium 0.26
Austria Conwert Immobilien Invest 62,439 766,090 0.23
Total for Austria 0.23
Total transferable securities and money market instruments admitted to offi cial exchange listing or dealt in on another regulated market 325,487,678 96.45
Global Property Fund
25 Morgan Stanley Investment Funds 31 December 2009
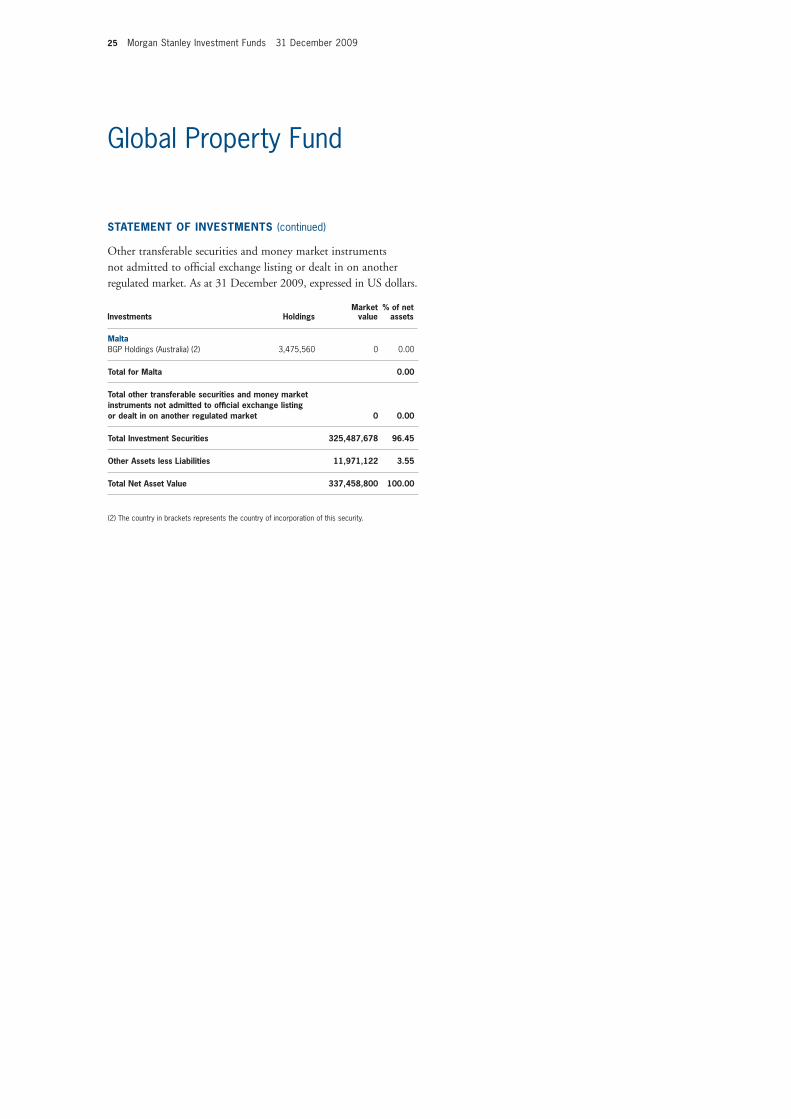
Malta BGP Holdings (Australia) (2) 3,475,560 0 0.00
Total for Malta 0.00
Total other transferable securities and money market instruments not admitted to offi cial exchange listing or dealt in on another regulated market 0 0.00
Total Investment Securities 325,487,678 96.45
Other Assets less Liabilities 11,971,122 3.55
Total Net Asset Value 337,458,800 100.00
(2) The country in brackets represents the country of incorporation of this security.
STATEMENT OF INVESTMENTS (continued)
Other transferable securities and money market instruments not admitted to offi cial exchange listing or dealt in on another regulated market. As at 31 December 2009, expressed in US dollars.
Investments HoldingsMarket
value% of net
assets
Global Property Fund
Morgan Stanley Investment Funds 31 December 2009 26
STATEMENT OF INVESTMENTS
Transferable securities and money market instruments admitted to offi cial exchange listing or dealt in on another regulated market. As at 31 December 2009, expressed in US dollars.
Investments HoldingsMarket
value% of net
assets
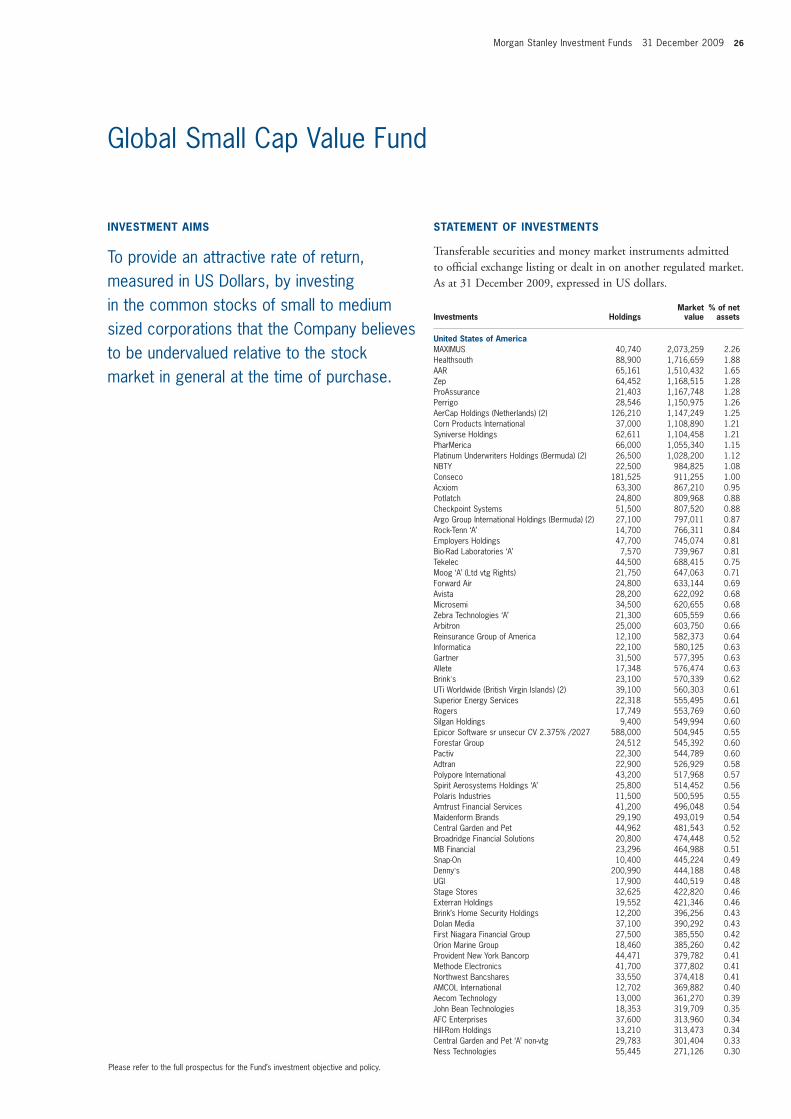
Global Small Cap Value Fund
United States of America MAXIMUS 40,740 2,073,259 2.26Healthsouth 88,900 1,716,659 1.88AAR 65,161 1,510,432 1.65Zep 64,452 1,168,515 1.28ProAssurance 21,403 1,167,748 1.28Perrigo 28,546 1,150,975 1.26AerCap Holdings (Netherlands) (2) 126,210 1,147,249 1.25Corn Products International 37,000 1,108,890 1.21Syniverse Holdings 62,611 1,104,458 1.21PharMerica 66,000 1,055,340 1.15Platinum Underwriters Holdings (Bermuda) (2) 26,500 1,028,200 1.12NBTY 22,500 984,825 1.08Conseco 181,525 911,255 1.00Acxiom 63,300 867,210 0.95Potlatch 24,800 809,968 0.88Checkpoint Systems 51,500 807,520 0.88Argo Group International Holdings (Bermuda) (2) 27,100 797,011 0.87Rock-Tenn ‘A’ 14,700 766,311 0.84Employers Holdings 47,700 745,074 0.81Bio-Rad Laboratories ‘A’ 7,570 739,967 0.81Tekelec 44,500 688,415 0.75Moog ‘A’ (Ltd vtg Rights) 21,750 647,063 0.71Forward Air 24,800 633,144 0.69Avista 28,200 622,092 0.68Microsemi 34,500 620,655 0.68Zebra Technologies ‘A’ 21,300 605,559 0.66Arbitron 25,000 603,750 0.66Reinsurance Group of America 12,100 582,373 0.64Informatica 22,100 580,125 0.63Gartner 31,500 577,395 0.63Allete 17,348 576,474 0.63Brink’s 23,100 570,339 0.62UTi Worldwide (British Virgin Islands) (2) 39,100 560,303 0.61Superior Energy Services 22,318 555,495 0.61Rogers 17,749 553,769 0.60Silgan Holdings 9,400 549,994 0.60Epicor Software sr unsecur CV 2.375% /2027 588,000 504,945 0.55Forestar Group 24,512 545,392 0.60Pactiv 22,300 544,789 0.60Adtran 22,900 526,929 0.58Polypore International 43,200 517,968 0.57Spirit Aerosystems Holdings ‘A’ 25,800 514,452 0.56Polaris Industries 11,500 500,595 0.55Amtrust Financial Services 41,200 496,048 0.54Maidenform Brands 29,190 493,019 0.54Central Garden and Pet 44,962 481,543 0.52Broadridge Financial Solutions 20,800 474,448 0.52MB Financial 23,296 464,988 0.51Snap-On 10,400 445,224 0.49Denny’s 200,990 444,188 0.48UGI 17,900 440,519 0.48Stage Stores 32,625 422,820 0.46Exterran Holdings 19,552 421,346 0.46Brink’s Home Security Holdings 12,200 396,256 0.43Dolan Media 37,100 390,292 0.43First Niagara Financial Group 27,500 385,550 0.42Orion Marine Group 18,460 385,260 0.42Provident New York Bancorp 44,471 379,782 0.41Methode Electronics 41,700 377,802 0.41Northwest Bancshares 33,550 374,418 0.41AMCOL International 12,702 369,882 0.40Aecom Technology 13,000 361,270 0.39John Bean Technologies 18,353 319,709 0.35AFC Enterprises 37,600 313,960 0.34Hill-Rom Holdings 13,210 313,473 0.34Central Garden and Pet ‘A’ non-vtg 29,783 301,404 0.33Ness Technologies 55,445 271,126 0.30
INVESTMENT AIMS
To provide an attractive rate of return, measured in US Dollars, by investing in the common stocks of small to medium sized corporations that the Company believes to be undervalued relative to the stock market in general at the time of purchase.
Please refer to the full prospectus for the Fund’s investment objective and policy.

27 Morgan Stanley Investment Funds 31 December 2009
Global Small Cap Value Fund
STATEMENT OF INVESTMENTS (continued)
Transferable securities and money market instruments admitted to offi cial exchange listing or dealt in on another regulated market. As at 31 December 2009, expressed in US dollars.
Investments HoldingsMarket
value% of net
assets
Investments HoldingsMarket
value% of net
assets
United States of America (continued)Quanex Building Products 10,200 175,338 0.19HEICO ‘A’ 4,300 153,897 0.17Cytec Industries 3,400 125,562 0.14Validus Holdings (Bermuda) (2) 2,700 73,278 0.08
Total for United States of America 49.04
Japan Japan Securities Finance 170,708 1,313,942 1.43Miraial 32,800 876,844 0.96Tokyo Tomin Bank 62,619 853,854 0.93Jaccs 360,000 849,983 0.93Fuji Machine Manufacturing 65,300 809,499 0.88Chuo Mitsui Trust Holdings 233,000 781,140 0.85Yachiyo Bank 33,800 763,754 0.83Axell 20,300 717,835 0.78Fuyo General Lease 33,300 701,042 0.76Taiheiyo Cement 598,000 683,310 0.75Union Tool 20,700 545,558 0.60Mori Seiki 56,200 505,847 0.55Sumitomo Osaka Cement 330,030 505,181 0.55Toei Animation 28,900 504,337 0.55Vantec 328 479,449 0.52Shinkawa 28,200 445,331 0.49TOC 115,500 438,250 0.48Daibiru 58,600 420,693 0.46Ohara 20,800 354,255 0.39Leopalace21 83,500 343,840 0.38Sawada Holdings 75,200 279,665 0.31Alpha Systems 13,300 247,584 0.27THK 11,900 210,126 0.23Harmonic Drive Systems 87 197,402 0.22Sun Frontier Fudousan 1,245 194,892 0.21Nakanishi 2,414 192,549 0.21Hikari Tsushin 10,581 191,615 0.21Osaki Engineering 177 171,753 0.19Okinawa Cellular Telephone 102 171,515 0.19Maxvalu Tokai 12,700 144,858 0.16St Marc Holdings 5,000 136,624 0.15Nihon Micro Coating 55,100 74,308 0.08
Total for Japan 16.50
United Kingdom Premier Foods 1,806,637 1,043,593 1.14Wincanton 195,571 640,798 0.70Tate & Lyle 78,693 550,953 0.60Wolseley 26,480 534,289 0.58Chemring Group 9,130 433,877 0.47Informa (Jersey) (2) 83,792 433,855 0.47SIG 233,241 423,060 0.46Kesa Electricals 155,433 375,236 0.41CVS Group 127,857 366,176 0.40Smurfi t Kappa Group (Ireland) (2) 36,647 331,700 0.36Home Retail Group 57,824 263,845 0.29Britvic 35,345 233,335 0.26Luminar Group Holdings 365,177 226,010 0.25Savills 43,550 225,491 0.25Catlin Group (Bermuda) (2) 38,731 213,074 0.23Dignity 21,309 209,288 0.23Melrose 71,028 206,868 0.23Bodycote 71,031 182,856 0.20Debenhams 75,548 95,225 0.10
Total for United Kingdom 7.63
Germany Tognum 29,454 490,872 0.54Rheinmetall 6,845 439,983 0.48Leoni 18,470 433,861 0.47Gerresheimer 12,050 406,838 0.45Demag Cranes 11,654 390,454 0.43GEA Group 14,772 330,229 0.36Kontron 25,876 296,293 0.32Sartorius Pfd 11,380 259,959 0.28GFK 5,937 205,821 0.23Praktiker Bau- und Heimwerkermaerkte 17,376 193,472 0.21
Total for Germany 3.77
Norway Acergy (Luxembourg) (2) 36,025 572,083 0.62Schibsted 24,328 548,411 0.60ProSafe (Cyprus) (2) 85,491 545,859 0.60Pronova BioPharma 162,493 495,530 0.54Fred Olsen Energy 5,812 223,564 0.25
Total for Norway 2.61
Ireland Icon ADR 25,700 560,774 0.61Glanbia 130,464 541,695 0.59Smurfi t Kappa Group 58,225 518,642 0.57FBD Holdings 42,989 426,160 0.47Kerry Group ‘A’ 6,681 197,501 0.22
Total for Ireland 2.46
Australia Iluka Resources 157,373 505,563 0.55BlueScope Steel 162,252 452,806 0.49CSR 229,241 371,305 0.41Pacifi c Brands 259,962 263,603 0.29Goodman Fielder 159,241 232,919 0.25Infomedia 781,794 224,494 0.25
Total for Australia 2.24
Italy Buzzi Unicem 40,621 658,303 0.72Interpump Group 86,107 458,964 0.50Brembo 36,651 274,867 0.30Maire Tecnimont 62,023 220,098 0.24Davide Campari-Milano 9,767 102,365 0.11SAES Getters 7,964 69,166 0.08Interpump Group Wts exp. 31/10/2012 18,080 6,058 0.01
Total for Italy 1.96
Denmark Jyske Bank Regd 22,203 868,041 0.95Sydbank 12,050 311,161 0.34NKT Holding 5,414 304,169 0.33Topdanmark 1,442 195,715 0.21
Total for Denmark 1.83
Switzerland Kuoni Reisen Holding Regd ‘B’ 1,662 561,291 0.61Bucher Industries Regd 3,865 420,011 0.46Georg Fischer Regd 1,233 312,307 0.34
Total for Switzerland 1.41
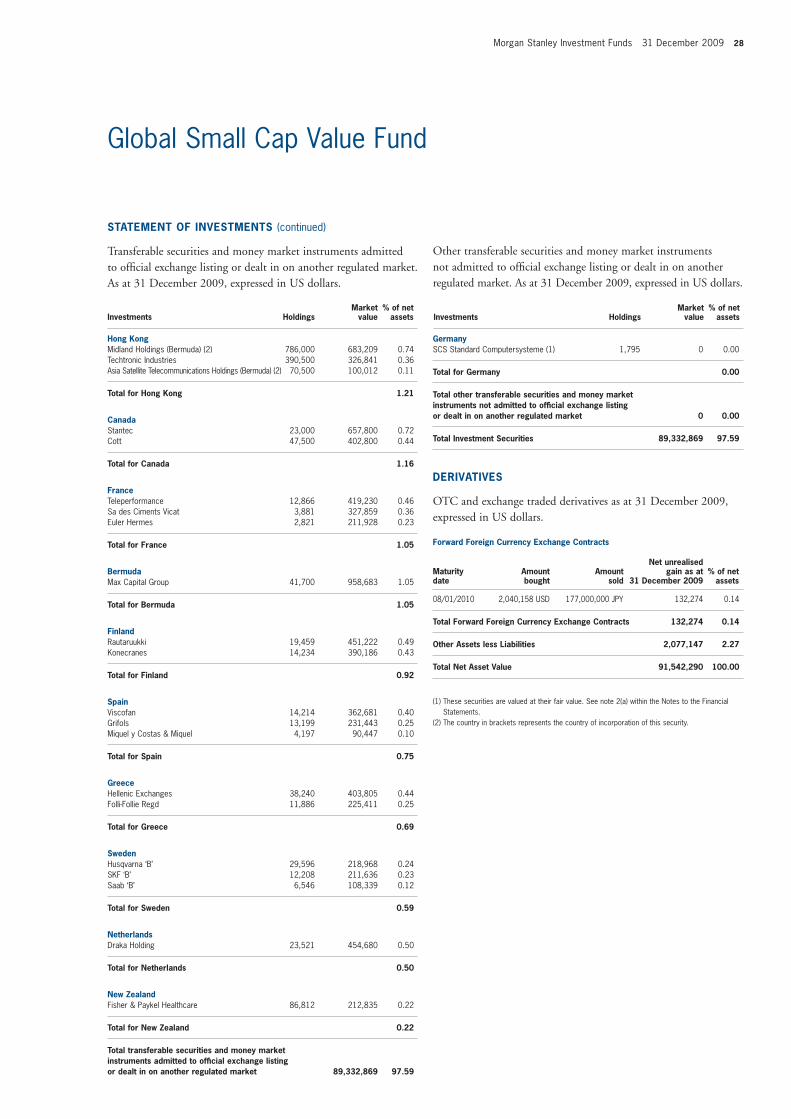
Morgan Stanley Investment Funds 31 December 2009 28
Global Small Cap Value Fund
STATEMENT OF INVESTMENTS (continued)
Transferable securities and money market instruments admitted to offi cial exchange listing or dealt in on another regulated market. As at 31 December 2009, expressed in US dollars.
Investments HoldingsMarket
value% of net
assets
Hong Kong Midland Holdings (Bermuda) (2) 786,000 683,209 0.74Techtronic Industries 390,500 326,841 0.36Asia Satellite Telecommunications Holdings (Bermuda) (2) 70,500 100,012 0.11
Total for Hong Kong 1.21
Canada Stantec 23,000 657,800 0.72Cott 47,500 402,800 0.44
Total for Canada 1.16
France Teleperformance 12,866 419,230 0.46Sa des Ciments Vicat 3,881 327,859 0.36Euler Hermes 2,821 211,928 0.23
Total for France 1.05
Bermuda Max Capital Group 41,700 958,683 1.05
Total for Bermuda 1.05
Finland Rautaruukki 19,459 451,222 0.49Konecranes 14,234 390,186 0.43
Total for Finland 0.92
Spain Viscofan 14,214 362,681 0.40Grifols 13,199 231,443 0.25Miquel y Costas & Miquel 4,197 90,447 0.10
Total for Spain 0.75
Greece Hellenic Exchanges 38,240 403,805 0.44Folli-Follie Regd 11,886 225,411 0.25
Total for Greece 0.69
Sweden Husqvarna ‘B’ 29,596 218,968 0.24SKF ‘B’ 12,208 211,636 0.23Saab ‘B’ 6,546 108,339 0.12
Total for Sweden 0.59
Netherlands Draka Holding 23,521 454,680 0.50
Total for Netherlands 0.50
New Zealand Fisher & Paykel Healthcare 86,812 212,835 0.22
Total for New Zealand 0.22
Total transferable securities and money market instruments admitted to offi cial exchange listing or dealt in on another regulated market 89,332,869 97.59
Germany SCS Standard Computersysteme (1) 1,795 0 0.00
Total for Germany 0.00
Total other transferable securities and money market instruments not admitted to offi cial exchange listing or dealt in on another regulated market 0 0.00
Total Investment Securities 89,332,869 97.59
DERIVATIVES
OTC and exchange traded derivatives as at 31 December 2009, expressed in US dollars.
Forward Foreign Currency Exchange Contracts
Maturity date
Amount bought
Amount sold
Net unrealisedgain as at
31 December 2009 % of net
assets 08/01/2010 2,040,158 USD 177,000,000 JPY 132,274 0.14
Total Forward Foreign Currency Exchange Contracts 132,274 0.14
Other Assets less Liabilities 2,077,147 2.27
Total Net Asset Value 91,542,290 100.00
(1) These securities are valued at their fair value. See note 2(a) within the Notes to the Financial Statements.
(2) The country in brackets represents the country of incorporation of this security.
Other transferable securities and money market instruments not admitted to offi cial exchange listing or dealt in on another regulated market. As at 31 December 2009, expressed in US dollars.
Investments HoldingsMarket
value% of net
assets
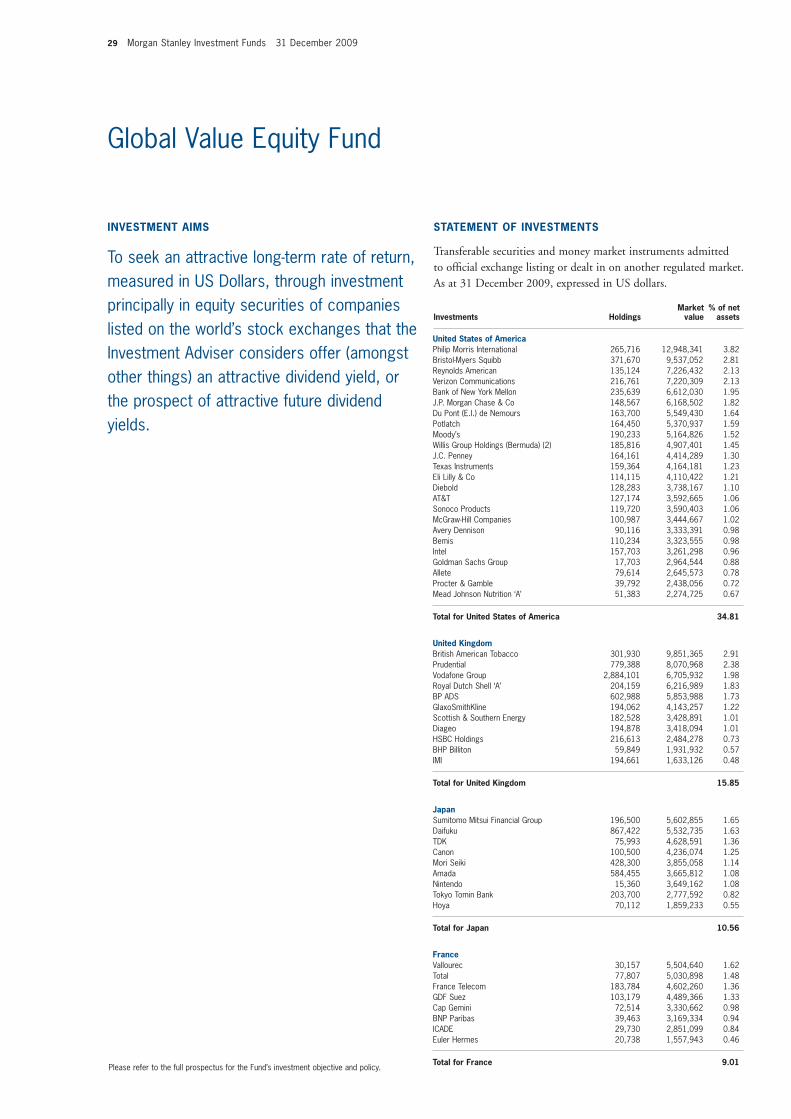
29 Morgan Stanley Investment Funds 31 December 2009
Global Value Equity Fund
United States of America Philip Morris International 265,716 12,948,341 3.82Bristol-Myers Squibb 371,670 9,537,052 2.81Reynolds American 135,124 7,226,432 2.13Verizon Communications 216,761 7,220,309 2.13Bank of New York Mellon 235,639 6,612,030 1.95J.P. Morgan Chase & Co 148,567 6,168,502 1.82Du Pont (E.I.) de Nemours 163,700 5,549,430 1.64Potlatch 164,450 5,370,937 1.59Moody’s 190,233 5,164,826 1.52Willis Group Holdings (Bermuda) (2) 185,816 4,907,401 1.45J.C. Penney 164,161 4,414,289 1.30Texas Instruments 159,364 4,164,181 1.23Eli Lilly & Co 114,115 4,110,422 1.21Diebold 128,283 3,738,167 1.10AT&T 127,174 3,592,665 1.06Sonoco Products 119,720 3,590,403 1.06McGraw-Hill Companies 100,987 3,444,667 1.02Avery Dennison 90,116 3,333,391 0.98Bemis 110,234 3,323,555 0.98Intel 157,703 3,261,298 0.96Goldman Sachs Group 17,703 2,964,544 0.88Allete 79,614 2,645,573 0.78Procter & Gamble 39,792 2,438,056 0.72Mead Johnson Nutrition ‘A’ 51,383 2,274,725 0.67
Total for United States of America 34.81
United Kingdom British American Tobacco 301,930 9,851,365 2.91Prudential 779,388 8,070,968 2.38Vodafone Group 2,884,101 6,705,932 1.98Royal Dutch Shell ‘A’ 204,159 6,216,989 1.83BP ADS 602,988 5,853,988 1.73GlaxoSmithKline 194,062 4,143,257 1.22Scottish & Southern Energy 182,528 3,428,891 1.01Diageo 194,878 3,418,094 1.01HSBC Holdings 216,613 2,484,278 0.73BHP Billiton 59,849 1,931,932 0.57IMI 194,661 1,633,126 0.48
Total for United Kingdom 15.85
Japan Sumitomo Mitsui Financial Group 196,500 5,602,855 1.65Daifuku 867,422 5,532,735 1.63TDK 75,993 4,628,591 1.36Canon 100,500 4,236,074 1.25Mori Seiki 428,300 3,855,058 1.14Amada 584,455 3,665,812 1.08Nintendo 15,360 3,649,162 1.08Tokyo Tomin Bank 203,700 2,777,592 0.82Hoya 70,112 1,859,233 0.55
Total for Japan 10.56
France Vallourec 30,157 5,504,640 1.62Total 77,807 5,030,898 1.48France Telecom 183,784 4,602,260 1.36GDF Suez 103,179 4,489,366 1.33Cap Gemini 72,514 3,330,662 0.98BNP Paribas 39,463 3,169,334 0.94ICADE 29,730 2,851,099 0.84Euler Hermes 20,738 1,557,943 0.46
Total for France 9.01
INVESTMENT AIMS
To seek an attractive long-term rate of return, measured in US Dollars, through investment principally in equity securities of companies listed on the world’s stock exchanges that the Investment Adviser considers offer (amongst other things) an attractive dividend yield, or the prospect of attractive future dividend yields.
STATEMENT OF INVESTMENTS
Transferable securities and money market instruments admitted to offi cial exchange listing or dealt in on another regulated market. As at 31 December 2009, expressed in US dollars.
Investments HoldingsMarket
value% of net
assets
Please refer to the full prospectus for the Fund’s investment objective and policy.

Morgan Stanley Investment Funds 31 December 2009 30
Global Value Equity Fund
STATEMENT OF INVESTMENTS (continued)
Transferable securities and money market instruments admitted to offi cial exchange listing or dealt in on another regulated market. As at 31 December 2009, expressed in US dollars.
Investments HoldingsMarket
value% of net
assets
Investments HoldingsMarket
value% of net
assets
Netherlands Reed Elsevier 570,580 7,050,689 2.08Wolters Kluwer 311,618 6,849,834 2.02Unilever ‘CVA’ 126,462 4,133,401 1.22Akzo Nobel 35,541 2,369,265 0.70
Total for Netherlands 6.02
Switzerland Novartis Regd 136,713 7,474,632 2.21Nestlé Regd 84,534 4,106,451 1.21Kuoni Reisen Holding Regd ‘B’ 6,433 2,172,554 0.64
Total for Switzerland 4.06
Germany E.ON 115,538 4,851,988 1.43Deutsche Post 184,709 3,578,534 1.06Siemens Regd 24,770 2,285,045 0.67
Total for Germany 3.16
Ireland CRH 353,269 9,648,365 2.85
Total for Ireland 2.85
Italy ENI 329,257 8,420,175 2.48
Total for Italy 2.48
Singapore Singapore Post 4,546,000 3,274,235 0.97ComfortDelgro 2,789,000 3,261,756 0.96
Total for Singapore 1.93
Taiwan Acer 1,888,000 5,677,574 1.68
Total for Taiwan 1.68
Finland Rautaruukki 157,077 3,642,355 1.08Konecranes 64,345 1,763,840 0.52
Total for Finland 1.60
Spain Telefonica 142,208 3,988,136 1.18
Total for Spain 1.18
Austria Telekom Austria 223,075 3,188,894 0.94
Total for Austria 0.94
Greece National Bank of Greece 120,980 3,145,997 0.93
Total for Greece 0.93
Total Investment Securities 328,967,050 97.06
DERIVATIVES
OTC and exchange traded derivatives as at 31 December 2009, expressed in US dollars.
Forward Foreign Currency Exchange Contracts
Maturity date
Amount bought
Amount sold
Net unrealisedgain/(loss) as at
31 December 2009 % of net
assets 06/01/2010 18,772,000 EUR 26,956,592 USD 13,066 0.0006/01/2010 5,626,000 GBP 8,932,344 USD 170,698 0.0506/01/2010 28,112,572 USD 18,772,000 EUR 1,142,913 0.3406/01/2010 9,350,187 USD 5,626,000 GBP 247,145 0.0708/02/2010 27,085,759 USD 18,863,000 EUR (13,326) 0.0008/02/2010 10,132,183 USD 6,383,000 GBP (193,676) (0.06)
Total Forward Foreign Currency Exchange Contracts 1,366,820 0.40
Other Assets less Liabilities 8,611,233 2.54
Total Net Asset Value 338,945,103 100.00
(2) The country in brackets represents the country of incorporation of this security.
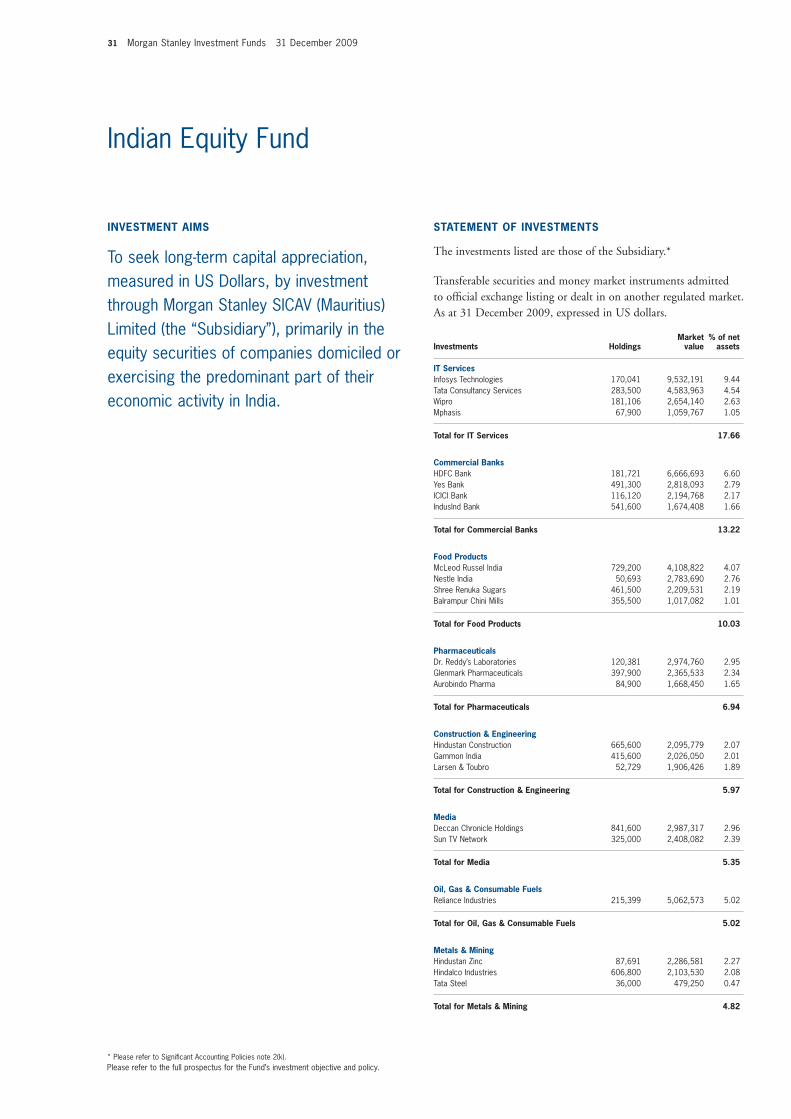
31 Morgan Stanley Investment Funds 31 December 2009
Indian Equity Fund
IT Services Infosys Technologies 170,041 9,532,191 9.44Tata Consultancy Services 283,500 4,583,963 4.54Wipro 181,106 2,654,140 2.63Mphasis 67,900 1,059,767 1.05
Total for IT Services 17.66
Commercial Banks HDFC Bank 181,721 6,666,693 6.60Yes Bank 491,300 2,818,093 2.79ICICI Bank 116,120 2,194,768 2.17IndusInd Bank 541,600 1,674,408 1.66
Total for Commercial Banks 13.22
Food Products McLeod Russel India 729,200 4,108,822 4.07Nestle India 50,693 2,783,690 2.76Shree Renuka Sugars 461,500 2,209,531 2.19Balrampur Chini Mills 355,500 1,017,082 1.01
Total for Food Products 10.03
Pharmaceuticals Dr. Reddy’s Laboratories 120,381 2,974,760 2.95Glenmark Pharmaceuticals 397,900 2,365,533 2.34Aurobindo Pharma 84,900 1,668,450 1.65
Total for Pharmaceuticals 6.94
Construction & Engineering Hindustan Construction 665,600 2,095,779 2.07Gammon India 415,600 2,026,050 2.01Larsen & Toubro 52,729 1,906,426 1.89
Total for Construction & Engineering 5.97
Media Deccan Chronicle Holdings 841,600 2,987,317 2.96Sun TV Network 325,000 2,408,082 2.39
Total for Media 5.35
Oil, Gas & Consumable Fuels Reliance Industries 215,399 5,062,573 5.02
Total for Oil, Gas & Consumable Fuels 5.02
Metals & Mining Hindustan Zinc 87,691 2,286,581 2.27Hindalco Industries 606,800 2,103,530 2.08Tata Steel 36,000 479,250 0.47
Total for Metals & Mining 4.82
INVESTMENT AIMS
To seek long-term capital appreciation, measured in US Dollars, by investment through Morgan Stanley SICAV (Mauritius) Limited (the “Subsidiary”), primarily in the equity securities of companies domiciled or exercising the predominant part of their economic activity in India.
STATEMENT OF INVESTMENTS
The investments listed are those of the Subsidiary.*
Transferable securities and money market instruments admitted to offi cial exchange listing or dealt in on another regulated market. As at 31 December 2009, expressed in US dollars.
Investments HoldingsMarket
value% of net
assets
* Please refer to Signifi cant Accounting Policies note 2(k). Please refer to the full prospectus for the Fund’s investment objective and policy.
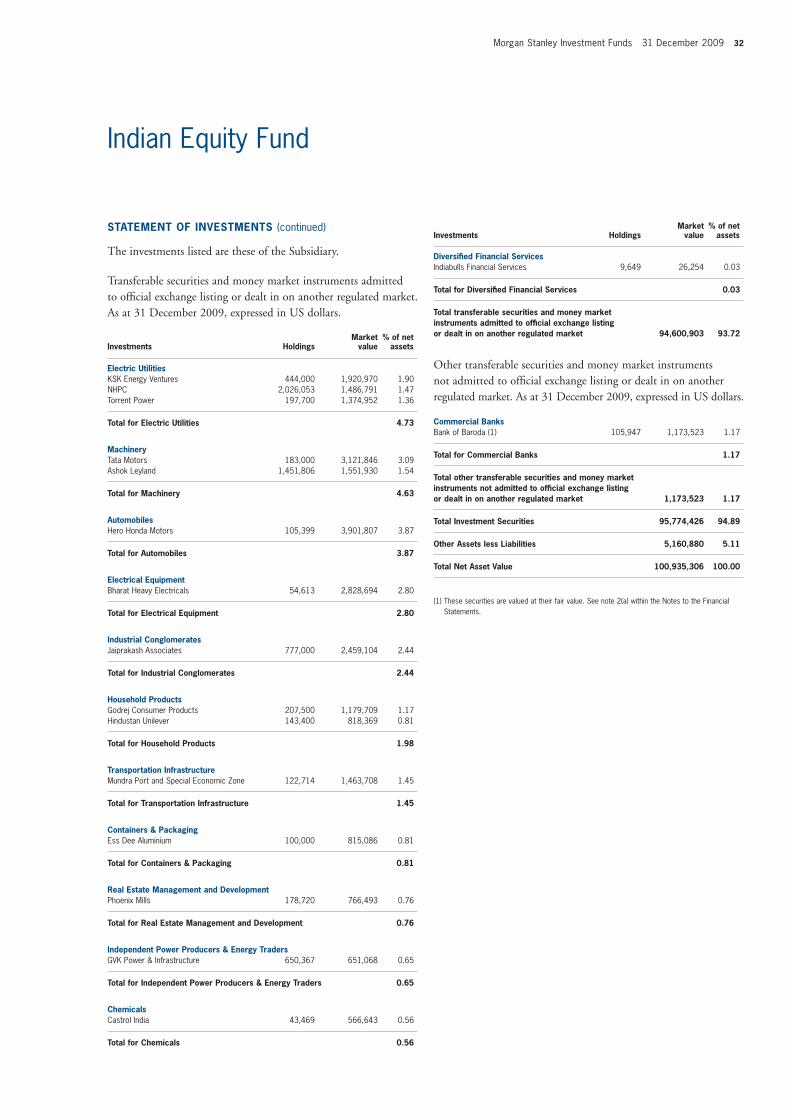
Morgan Stanley Investment Funds 31 December 2009 32
Indian Equity Fund
STATEMENT OF INVESTMENTS (continued)
The investments listed are these of the Subsidiary.
Transferable securities and money market instruments admitted to offi cial exchange listing or dealt in on another regulated market. As at 31 December 2009, expressed in US dollars.
Investments HoldingsMarket
value% of net
assets
Electric Utilities KSK Energy Ventures 444,000 1,920,970 1.90NHPC 2,026,053 1,486,791 1.47Torrent Power 197,700 1,374,952 1.36
Total for Electric Utilities 4.73
Machinery Tata Motors 183,000 3,121,846 3.09Ashok Leyland 1,451,806 1,551,930 1.54
Total for Machinery 4.63
Automobiles Hero Honda Motors 105,399 3,901,807 3.87
Total for Automobiles 3.87
Electrical Equipment Bharat Heavy Electricals 54,613 2,828,694 2.80
Total for Electrical Equipment 2.80
Industrial Conglomerates Jaiprakash Associates 777,000 2,459,104 2.44
Total for Industrial Conglomerates 2.44
Household Products Godrej Consumer Products 207,500 1,179,709 1.17Hindustan Unilever 143,400 818,369 0.81
Total for Household Products 1.98
Transportation Infrastructure Mundra Port and Special Economic Zone 122,714 1,463,708 1.45
Total for Transportation Infrastructure 1.45
Containers & Packaging Ess Dee Aluminium 100,000 815,086 0.81
Total for Containers & Packaging 0.81
Real Estate Management and Development Phoenix Mills 178,720 766,493 0.76
Total for Real Estate Management and Development 0.76
Independent Power Producers & Energy Traders GVK Power & Infrastructure 650,367 651,068 0.65
Total for Independent Power Producers & Energy Traders 0.65
Chemicals Castrol India 43,469 566,643 0.56
Total for Chemicals 0.56
Diversifi ed Financial Services Indiabulls Financial Services 9,649 26,254 0.03
Total for Diversifi ed Financial Services 0.03
Total transferable securities and money market instruments admitted to offi cial exchange listing or dealt in on another regulated market 94,600,903 93.72
Other transferable securities and money market instruments not admitted to offi cial exchange listing or dealt in on another regulated market. As at 31 December 2009, expressed in US dollars.
Commercial Banks Bank of Baroda (1) 105,947 1,173,523 1.17
Total for Commercial Banks 1.17
Total other transferable securities and money market instruments not admitted to offi cial exchange listing or dealt in on another regulated market 1,173,523 1.17
Total Investment Securities 95,774,426 94.89
Other Assets less Liabilities 5,160,880 5.11
Total Net Asset Value 100,935,306 100.00
(1) These securities are valued at their fair value. See note 2(a) within the Notes to the Financial Statements.
Investments HoldingsMarket
value% of net
assets
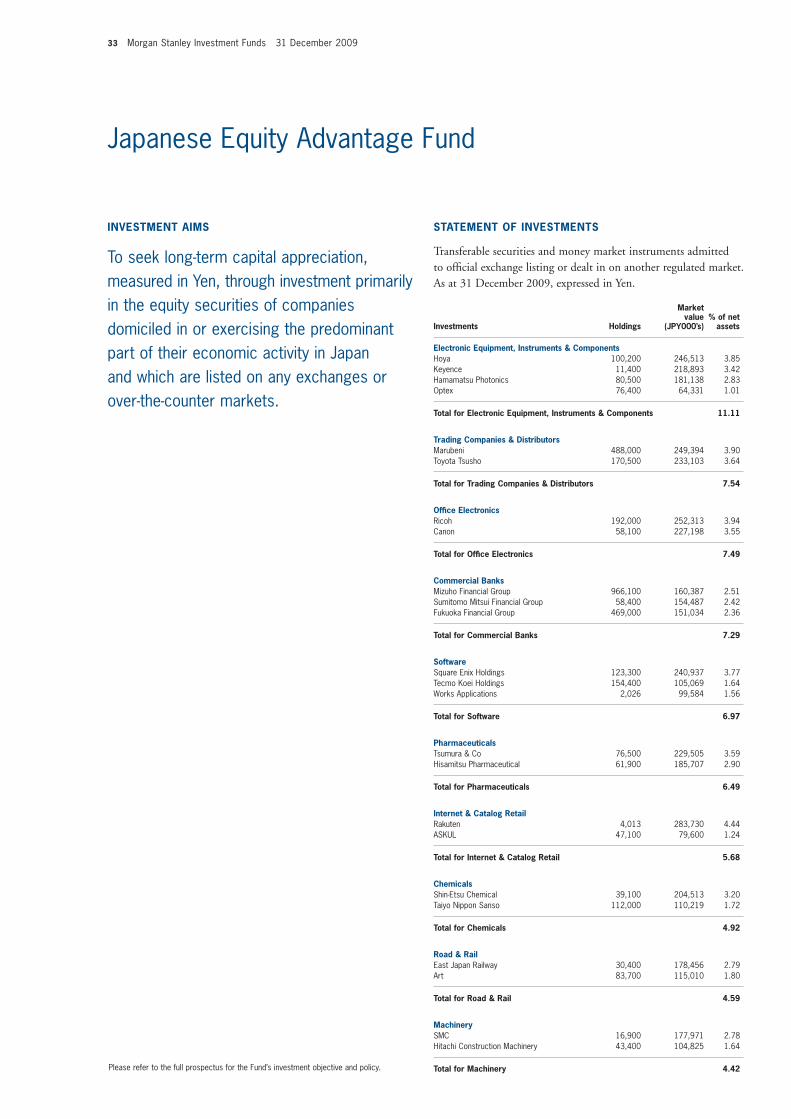
33 Morgan Stanley Investment Funds 31 December 2009
Electronic Equipment, Instruments & Components Hoya 100,200 246,513 3.85Keyence 11,400 218,893 3.42Hamamatsu Photonics 80,500 181,138 2.83Optex 76,400 64,331 1.01
Total for Electronic Equipment, Instruments & Components 11.11
Trading Companies & Distributors Marubeni 488,000 249,394 3.90Toyota Tsusho 170,500 233,103 3.64
Total for Trading Companies & Distributors 7.54
Offi ce Electronics Ricoh 192,000 252,313 3.94Canon 58,100 227,198 3.55
Total for Offi ce Electronics 7.49
Commercial Banks Mizuho Financial Group 966,100 160,387 2.51Sumitomo Mitsui Financial Group 58,400 154,487 2.42Fukuoka Financial Group 469,000 151,034 2.36
Total for Commercial Banks 7.29
Software Square Enix Holdings 123,300 240,937 3.77Tecmo Koei Holdings 154,400 105,069 1.64Works Applications 2,026 99,584 1.56
Total for Software 6.97
Pharmaceuticals Tsumura & Co 76,500 229,505 3.59Hisamitsu Pharmaceutical 61,900 185,707 2.90
Total for Pharmaceuticals 6.49
Internet & Catalog Retail Rakuten 4,013 283,730 4.44ASKUL 47,100 79,600 1.24
Total for Internet & Catalog Retail 5.68
Chemicals Shin-Etsu Chemical 39,100 204,513 3.20Taiyo Nippon Sanso 112,000 110,219 1.72
Total for Chemicals 4.92
Road & Rail East Japan Railway 30,400 178,456 2.79Art 83,700 115,010 1.80
Total for Road & Rail 4.59
Machinery SMC 16,900 177,971 2.78Hitachi Construction Machinery 43,400 104,825 1.64
Total for Machinery 4.42
STATEMENT OF INVESTMENTS
Transferable securities and money market instruments admitted to offi cial exchange listing or dealt in on another regulated market. As at 31 December 2009, expressed in Yen.
Investments Holdings
Market value
(JPY000’s)% of net
assets
Japanese Equity Advantage Fund
INVESTMENT AIMS
To seek long-term capital appreciation, measured in Yen, through investment primarily in the equity securities of companies domiciled in or exercising the predominant part of their economic activity in Japan and which are listed on any exchanges or over-the-counter markets.
Please refer to the full prospectus for the Fund’s investment objective and policy.
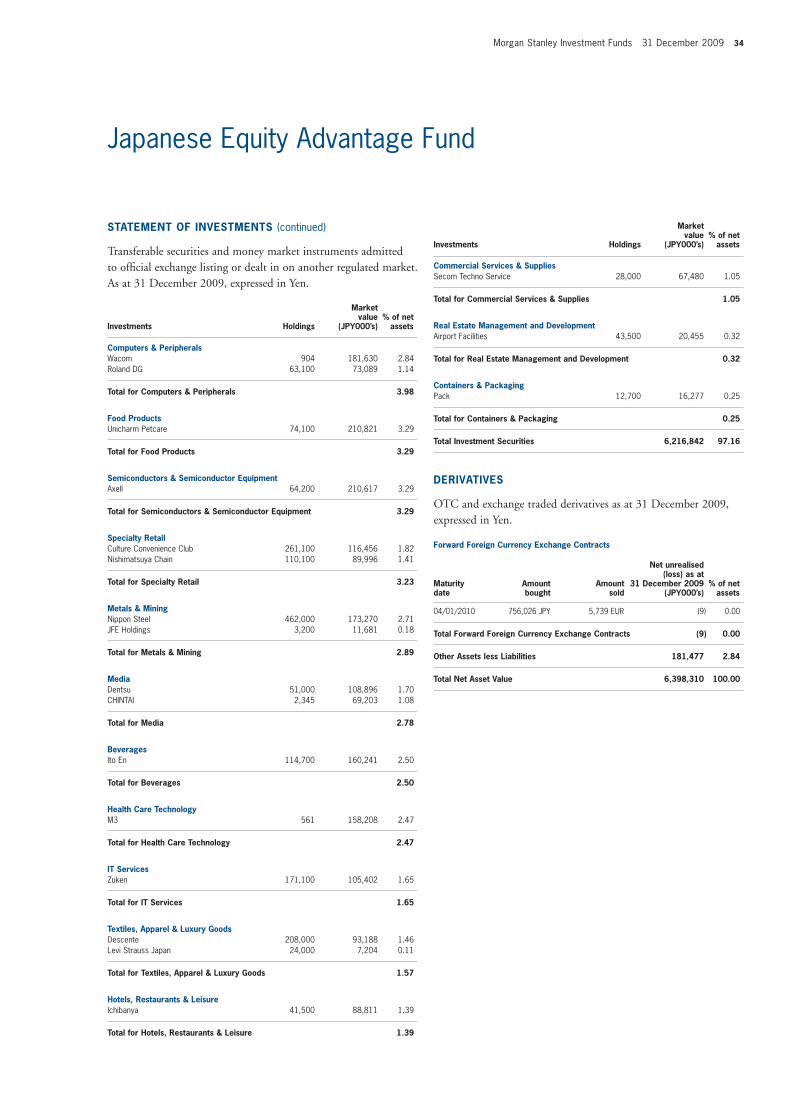
Morgan Stanley Investment Funds 31 December 2009 34
Japanese Equity Advantage Fund
STATEMENT OF INVESTMENTS (continued)
Transferable securities and money market instruments admitted to offi cial exchange listing or dealt in on another regulated market. As at 31 December 2009, expressed in Yen.
Investments Holdings
Market value
(JPY000’s)% of net
assets
Investments Holdings
Market value
(JPY000’s)% of net
assets
Computers & Peripherals Wacom 904 181,630 2.84Roland DG 63,100 73,089 1.14
Total for Computers & Peripherals 3.98
Food Products Unicharm Petcare 74,100 210,821 3.29
Total for Food Products 3.29
Semiconductors & Semiconductor Equipment Axell 64,200 210,617 3.29
Total for Semiconductors & Semiconductor Equipment 3.29
Specialty Retail Culture Convenience Club 261,100 116,456 1.82Nishimatsuya Chain 110,100 89,996 1.41
Total for Specialty Retail 3.23
Metals & Mining Nippon Steel 462,000 173,270 2.71JFE Holdings 3,200 11,681 0.18
Total for Metals & Mining 2.89
Media Dentsu 51,000 108,896 1.70CHINTAI 2,345 69,203 1.08
Total for Media 2.78
Beverages Ito En 114,700 160,241 2.50
Total for Beverages 2.50
Health Care Technology M3 561 158,208 2.47
Total for Health Care Technology 2.47
IT Services Zuken 171,100 105,402 1.65
Total for IT Services 1.65
Textiles, Apparel & Luxury Goods Descente 208,000 93,188 1.46Levi Strauss Japan 24,000 7,204 0.11
Total for Textiles, Apparel & Luxury Goods 1.57
Hotels, Restaurants & Leisure Ichibanya 41,500 88,811 1.39
Total for Hotels, Restaurants & Leisure 1.39
Commercial Services & Supplies Secom Techno Service 28,000 67,480 1.05
Total for Commercial Services & Supplies 1.05
Real Estate Management and Development Airport Facilities 43,500 20,455 0.32
Total for Real Estate Management and Development 0.32
Containers & Packaging Pack 12,700 16,277 0.25
Total for Containers & Packaging 0.25
Total Investment Securities 6,216,842 97.16
DERIVATIVES
OTC and exchange traded derivatives as at 31 December 2009, expressed in Yen.
Forward Foreign Currency Exchange Contracts
Maturity date
Amount bought
Amount sold
Net unrealised(loss) as at
31 December 2009(JPY000’s)
% of net assets
04/01/2010 756,026 JPY 5,739 EUR (9) 0.00
Total Forward Foreign Currency Exchange Contracts (9) 0.00
Other Assets less Liabilities 181,477 2.84
Total Net Asset Value 6,398,310 100.00
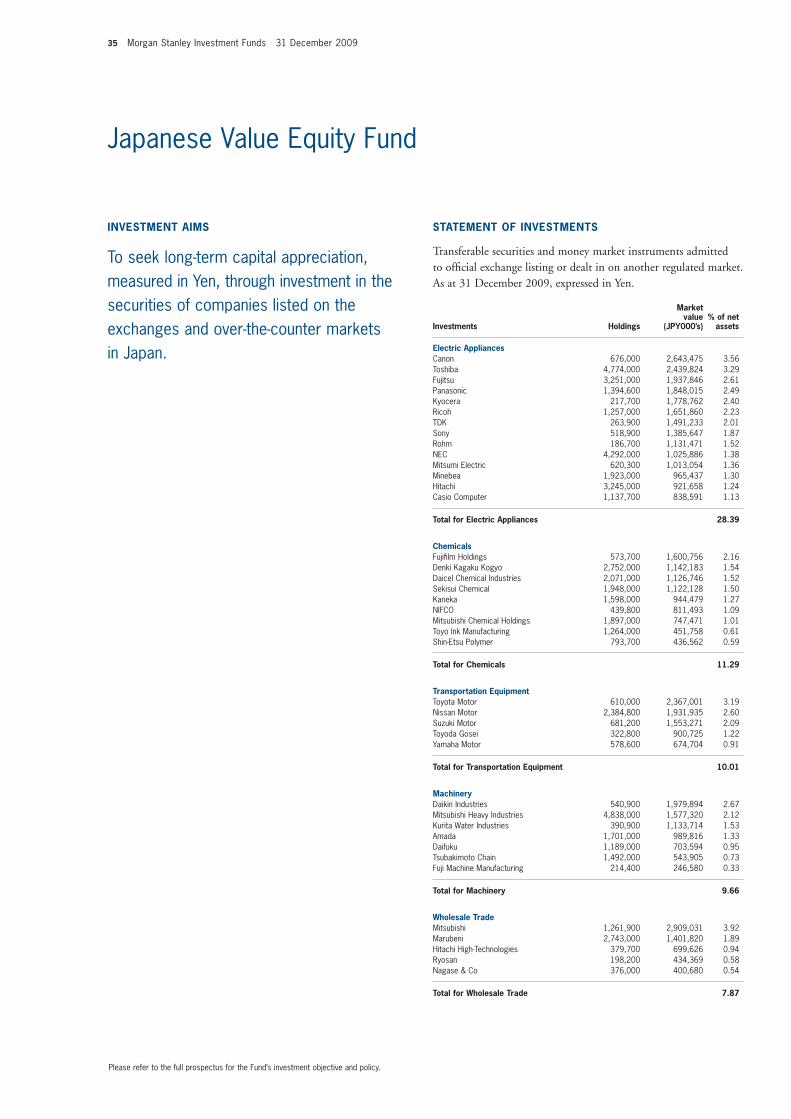
35 Morgan Stanley Investment Funds 31 December 2009
Japanese Value Equity Fund
Electric Appliances Canon 676,000 2,643,475 3.56Toshiba 4,774,000 2,439,824 3.29Fujitsu 3,251,000 1,937,846 2.61Panasonic 1,394,600 1,848,015 2.49Kyocera 217,700 1,778,762 2.40Ricoh 1,257,000 1,651,860 2.23TDK 263,900 1,491,233 2.01Sony 518,900 1,385,647 1.87Rohm 186,700 1,131,471 1.52NEC 4,292,000 1,025,886 1.38Mitsumi Electric 620,300 1,013,054 1.36Minebea 1,923,000 965,437 1.30Hitachi 3,245,000 921,658 1.24Casio Computer 1,137,700 838,591 1.13
Total for Electric Appliances 28.39
Chemicals Fujifi lm Holdings 573,700 1,600,756 2.16Denki Kagaku Kogyo 2,752,000 1,142,183 1.54Daicel Chemical Industries 2,071,000 1,126,746 1.52Sekisui Chemical 1,948,000 1,122,128 1.50Kaneka 1,598,000 944,479 1.27NIFCO 439,800 811,493 1.09Mitsubishi Chemical Holdings 1,897,000 747,471 1.01Toyo Ink Manufacturing 1,264,000 451,758 0.61Shin-Etsu Polymer 793,700 436,562 0.59
Total for Chemicals 11.29
Transportation Equipment Toyota Motor 610,000 2,367,001 3.19Nissan Motor 2,384,800 1,931,935 2.60Suzuki Motor 681,200 1,553,271 2.09Toyoda Gosei 322,800 900,725 1.22Yamaha Motor 578,600 674,704 0.91
Total for Transportation Equipment 10.01
Machinery Daikin Industries 540,900 1,979,894 2.67Mitsubishi Heavy Industries 4,838,000 1,577,320 2.12Kurita Water Industries 390,900 1,133,714 1.53Amada 1,701,000 989,816 1.33Daifuku 1,189,000 703,594 0.95Tsubakimoto Chain 1,492,000 543,905 0.73Fuji Machine Manufacturing 214,400 246,580 0.33
Total for Machinery 9.66
Wholesale Trade Mitsubishi 1,261,900 2,909,031 3.92Marubeni 2,743,000 1,401,820 1.89Hitachi High-Technologies 379,700 699,626 0.94Ryosan 198,200 434,369 0.58Nagase & Co 376,000 400,680 0.54
Total for Wholesale Trade 7.87
INVESTMENT AIMS
To seek long-term capital appreciation, measured in Yen, through investment in the securities of companies listed on the exchanges and over-the-counter markets in Japan.
STATEMENT OF INVESTMENTS
Transferable securities and money market instruments admitted to offi cial exchange listing or dealt in on another regulated market. As at 31 December 2009, expressed in Yen.
Investments Holdings
Market value
(JPY000’s)% of net
assets
Please refer to the full prospectus for the Fund’s investment objective and policy.
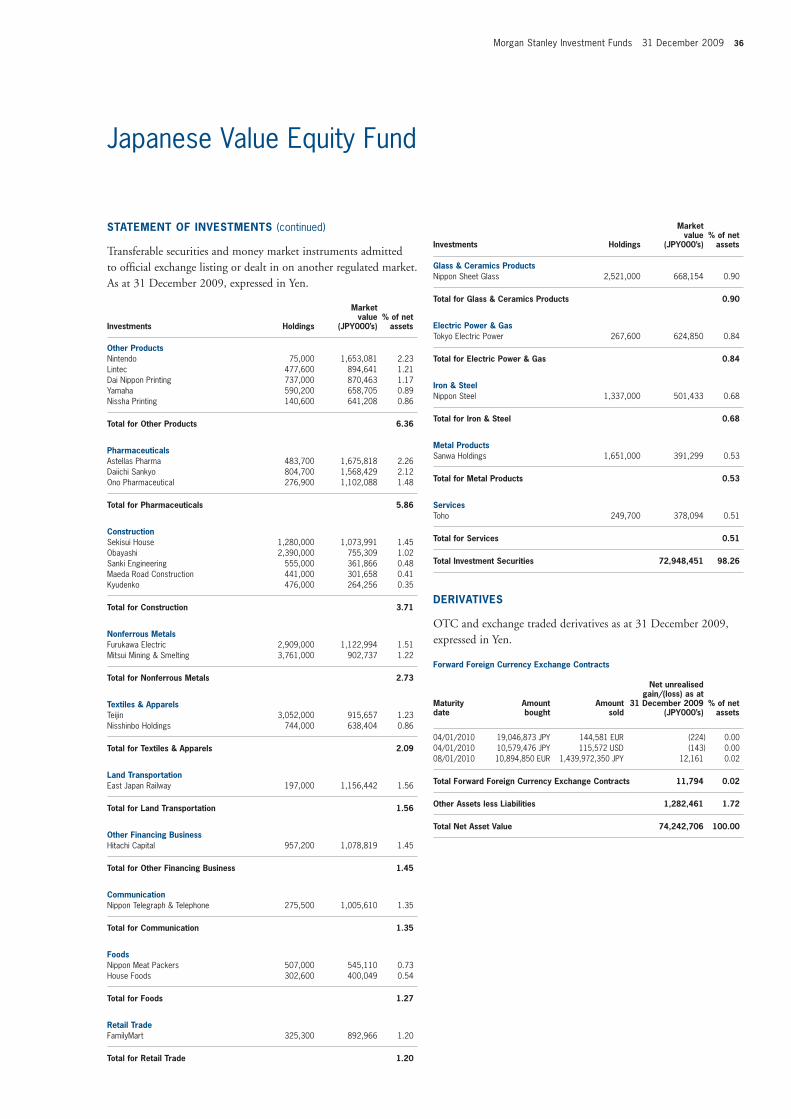
Morgan Stanley Investment Funds 31 December 2009 36
Japanese Value Equity Fund
STATEMENT OF INVESTMENTS (continued)
Transferable securities and money market instruments admitted to offi cial exchange listing or dealt in on another regulated market. As at 31 December 2009, expressed in Yen.
Investments Holdings
Market value
(JPY000’s)% of net
assets
Investments Holdings
Market value
(JPY000’s)% of net
assets
Other Products Nintendo 75,000 1,653,081 2.23Lintec 477,600 894,641 1.21Dai Nippon Printing 737,000 870,463 1.17Yamaha 590,200 658,705 0.89Nissha Printing 140,600 641,208 0.86
Total for Other Products 6.36
Pharmaceuticals Astellas Pharma 483,700 1,675,818 2.26Daiichi Sankyo 804,700 1,568,429 2.12Ono Pharmaceutical 276,900 1,102,088 1.48
Total for Pharmaceuticals 5.86
Construction Sekisui House 1,280,000 1,073,991 1.45Obayashi 2,390,000 755,309 1.02Sanki Engineering 555,000 361,866 0.48Maeda Road Construction 441,000 301,658 0.41Kyudenko 476,000 264,256 0.35
Total for Construction 3.71
Nonferrous Metals Furukawa Electric 2,909,000 1,122,994 1.51Mitsui Mining & Smelting 3,761,000 902,737 1.22
Total for Nonferrous Metals 2.73
Textiles & Apparels Teijin 3,052,000 915,657 1.23Nisshinbo Holdings 744,000 638,404 0.86
Total for Textiles & Apparels 2.09
Land Transportation East Japan Railway 197,000 1,156,442 1.56
Total for Land Transportation 1.56
Other Financing Business Hitachi Capital 957,200 1,078,819 1.45
Total for Other Financing Business 1.45
Communication Nippon Telegraph & Telephone 275,500 1,005,610 1.35
Total for Communication 1.35
Foods Nippon Meat Packers 507,000 545,110 0.73House Foods 302,600 400,049 0.54
Total for Foods 1.27
Retail Trade FamilyMart 325,300 892,966 1.20
Total for Retail Trade 1.20
Glass & Ceramics Products Nippon Sheet Glass 2,521,000 668,154 0.90
Total for Glass & Ceramics Products 0.90
Electric Power & Gas Tokyo Electric Power 267,600 624,850 0.84
Total for Electric Power & Gas 0.84
Iron & Steel Nippon Steel 1,337,000 501,433 0.68
Total for Iron & Steel 0.68
Metal Products Sanwa Holdings 1,651,000 391,299 0.53
Total for Metal Products 0.53
Services Toho 249,700 378,094 0.51
Total for Services 0.51
Total Investment Securities 72,948,451 98.26
DERIVATIVES
OTC and exchange traded derivatives as at 31 December 2009, expressed in Yen.
Forward Foreign Currency Exchange Contracts
Maturity date
Amount bought
Amount sold
Net unrealisedgain/(loss) as at
31 December 2009(JPY000’s)
% of net assets
04/01/2010 19,046,873 JPY 144,581 EUR (224) 0.0004/01/2010 10,579,476 JPY 115,572 USD (143) 0.0008/01/2010 10,894,850 EUR 1,439,972,350 JPY 12,161 0.02
Total Forward Foreign Currency Exchange Contracts 11,794 0.02
Other Assets less Liabilities 1,282,461 1.72
Total Net Asset Value 74,242,706 100.00
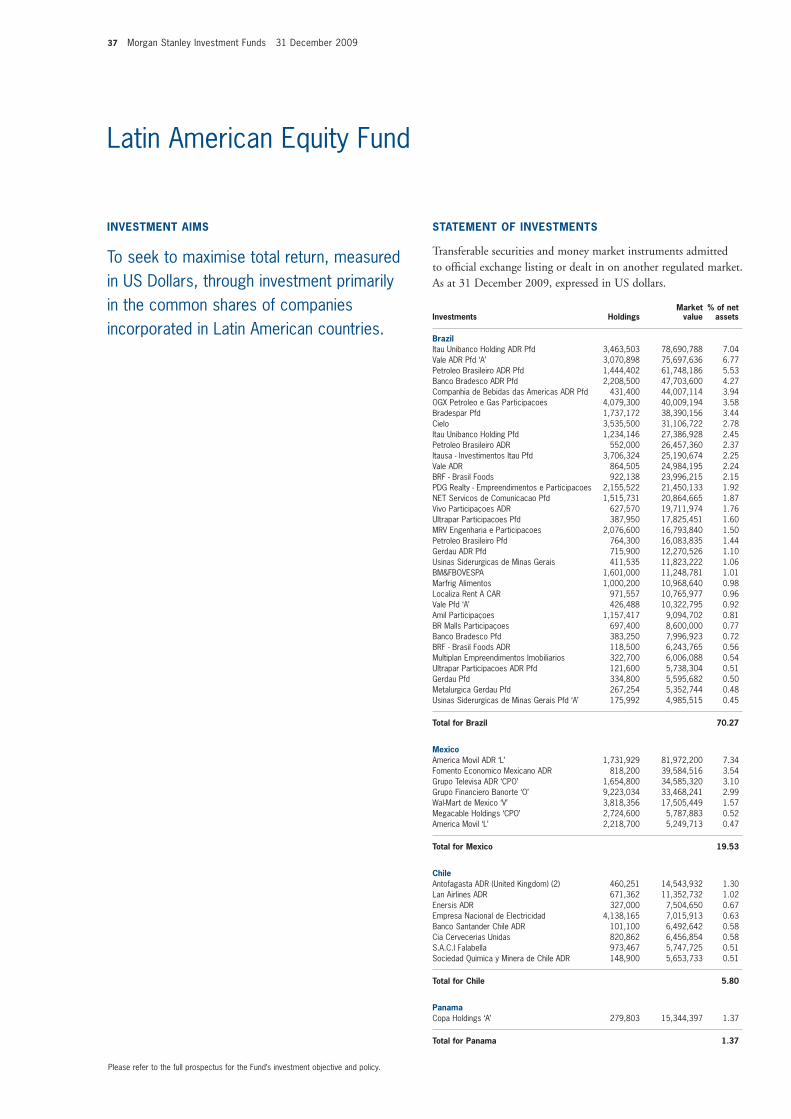
37 Morgan Stanley Investment Funds 31 December 2009
Latin American Equity Fund
Brazil Itau Unibanco Holding ADR Pfd 3,463,503 78,690,788 7.04Vale ADR Pfd ‘A’ 3,070,898 75,697,636 6.77Petroleo Brasileiro ADR Pfd 1,444,402 61,748,186 5.53Banco Bradesco ADR Pfd 2,208,500 47,703,600 4.27Companhia de Bebidas das Americas ADR Pfd 431,400 44,007,114 3.94OGX Petroleo e Gas Participacoes 4,079,300 40,009,194 3.58Bradespar Pfd 1,737,172 38,390,156 3.44Cielo 3,535,500 31,106,722 2.78Itau Unibanco Holding Pfd 1,234,146 27,386,928 2.45Petroleo Brasileiro ADR 552,000 26,457,360 2.37Itausa - Investimentos Itau Pfd 3,706,324 25,190,674 2.25Vale ADR 864,505 24,984,195 2.24BRF - Brasil Foods 922,138 23,996,215 2.15PDG Realty - Empreendimentos e Participacoes 2,155,522 21,450,133 1.92NET Servicos de Comunicacao Pfd 1,515,731 20,864,665 1.87Vivo Participaçoes ADR 627,570 19,711,974 1.76Ultrapar Participacoes Pfd 387,950 17,825,451 1.60MRV Engenharia e Participacoes 2,076,600 16,793,840 1.50Petroleo Brasileiro Pfd 764,300 16,083,835 1.44Gerdau ADR Pfd 715,900 12,270,526 1.10Usinas Siderurgicas de Minas Gerais 411,535 11,823,222 1.06BM&FBOVESPA 1,601,000 11,248,781 1.01Marfrig Alimentos 1,000,200 10,968,640 0.98Localiza Rent A CAR 971,557 10,765,977 0.96Vale Pfd ‘A’ 426,488 10,322,795 0.92Amil Participaçoes 1,157,417 9,094,702 0.81BR Malls Participaçoes 697,400 8,600,000 0.77Banco Bradesco Pfd 383,250 7,996,923 0.72BRF - Brasil Foods ADR 118,500 6,243,765 0.56Multiplan Empreendimentos Imobiliarios 322,700 6,006,088 0.54Ultrapar Participacoes ADR Pfd 121,600 5,738,304 0.51Gerdau Pfd 334,800 5,595,682 0.50Metalurgica Gerdau Pfd 267,254 5,352,744 0.48Usinas Siderurgicas de Minas Gerais Pfd ‘A’ 175,992 4,985,515 0.45
Total for Brazil 70.27
Mexico America Movil ADR ‘L’ 1,731,929 81,972,200 7.34Fomento Economico Mexicano ADR 818,200 39,584,516 3.54Grupo Televisa ADR ‘CPO’ 1,654,800 34,585,320 3.10Grupo Financiero Banorte ‘O’ 9,223,034 33,468,241 2.99Wal-Mart de Mexico ‘V’ 3,818,356 17,505,449 1.57Megacable Holdings ‘CPO’ 2,724,600 5,787,883 0.52America Movil ‘L’ 2,218,700 5,249,713 0.47
Total for Mexico 19.53
Chile Antofagasta ADR (United Kingdom) (2) 460,251 14,543,932 1.30Lan Airlines ADR 671,362 11,352,732 1.02Enersis ADR 327,000 7,504,650 0.67Empresa Nacional de Electricidad 4,138,165 7,015,913 0.63Banco Santander Chile ADR 101,100 6,492,642 0.58Cia Cervecerias Unidas 820,862 6,456,854 0.58S.A.C.I Falabella 973,467 5,747,725 0.51Sociedad Quimica y Minera de Chile ADR 148,900 5,653,733 0.51
Total for Chile 5.80
Panama Copa Holdings ‘A’ 279,803 15,344,397 1.37
Total for Panama 1.37
INVESTMENT AIMS
To seek to maximise total return, measured in US Dollars, through investment primarily in the common shares of companies incorporated in Latin American countries.
STATEMENT OF INVESTMENTS
Transferable securities and money market instruments admitted to offi cial exchange listing or dealt in on another regulated market. As at 31 December 2009, expressed in US dollars.
Investments HoldingsMarket
value% of net
assets
Please refer to the full prospectus for the Fund’s investment objective and policy.
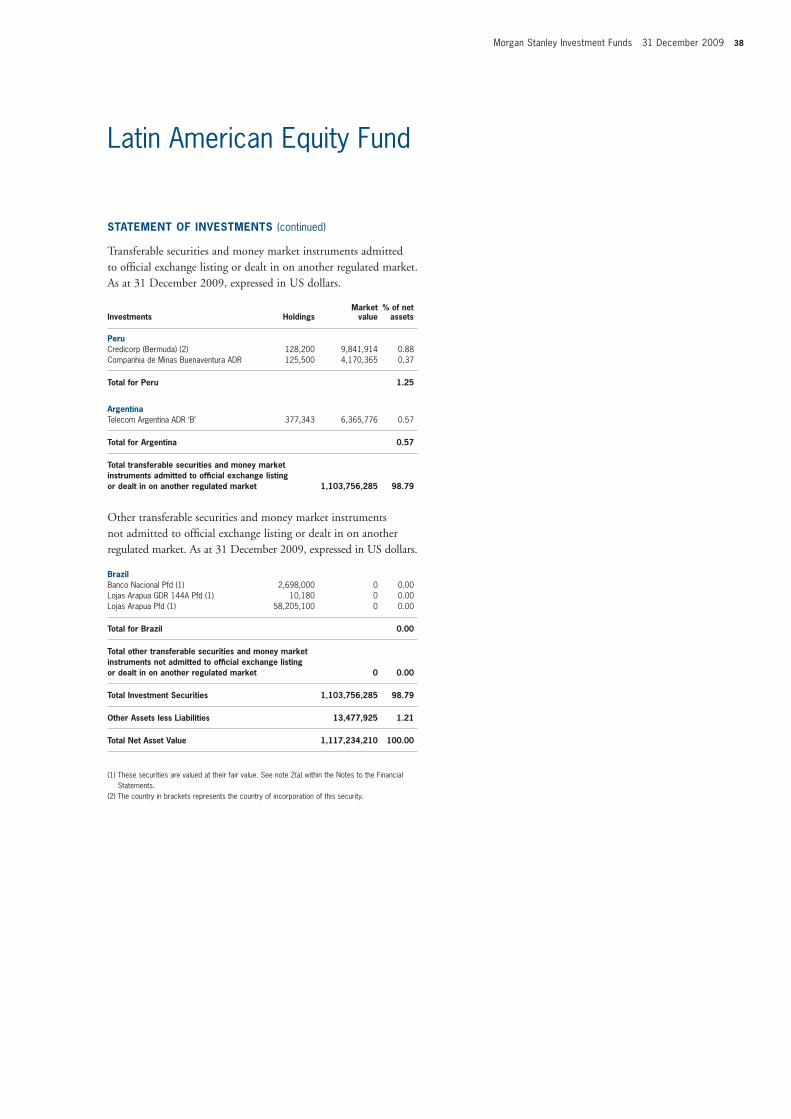
Morgan Stanley Investment Funds 31 December 2009 38
Latin American Equity Fund
STATEMENT OF INVESTMENTS (continued)
Transferable securities and money market instruments admitted to offi cial exchange listing or dealt in on another regulated market. As at 31 December 2009, expressed in US dollars.
Investments HoldingsMarket
value% of net
assets
Peru Credicorp (Bermuda) (2) 128,200 9,841,914 0.88Companhia de Minas Buenaventura ADR 125,500 4,170,365 0.37
Total for Peru 1.25
Argentina Telecom Argentina ADR ‘B’ 377,343 6,365,776 0.57
Total for Argentina 0.57
Total transferable securities and money market instruments admitted to offi cial exchange listing or dealt in on another regulated market 1,103,756,285 98.79
Other transferable securities and money market instruments not admitted to offi cial exchange listing or dealt in on another regulated market. As at 31 December 2009, expressed in US dollars.
Brazil Banco Nacional Pfd (1) 2,698,000 0 0.00Lojas Arapua GDR 144A Pfd (1) 10,180 0 0.00Lojas Arapua Pfd (1) 58,205,100 0 0.00
Total for Brazil 0.00
Total other transferable securities and money market instruments not admitted to offi cial exchange listing or dealt in on another regulated market 0 0.00
Total Investment Securities 1,103,756,285 98.79
Other Assets less Liabilities 13,477,925 1.21
Total Net Asset Value 1,117,234,210 100.00
(1) These securities are valued at their fair value. See note 2(a) within the Notes to the Financial Statements.
(2) The country in brackets represents the country of incorporation of this security.
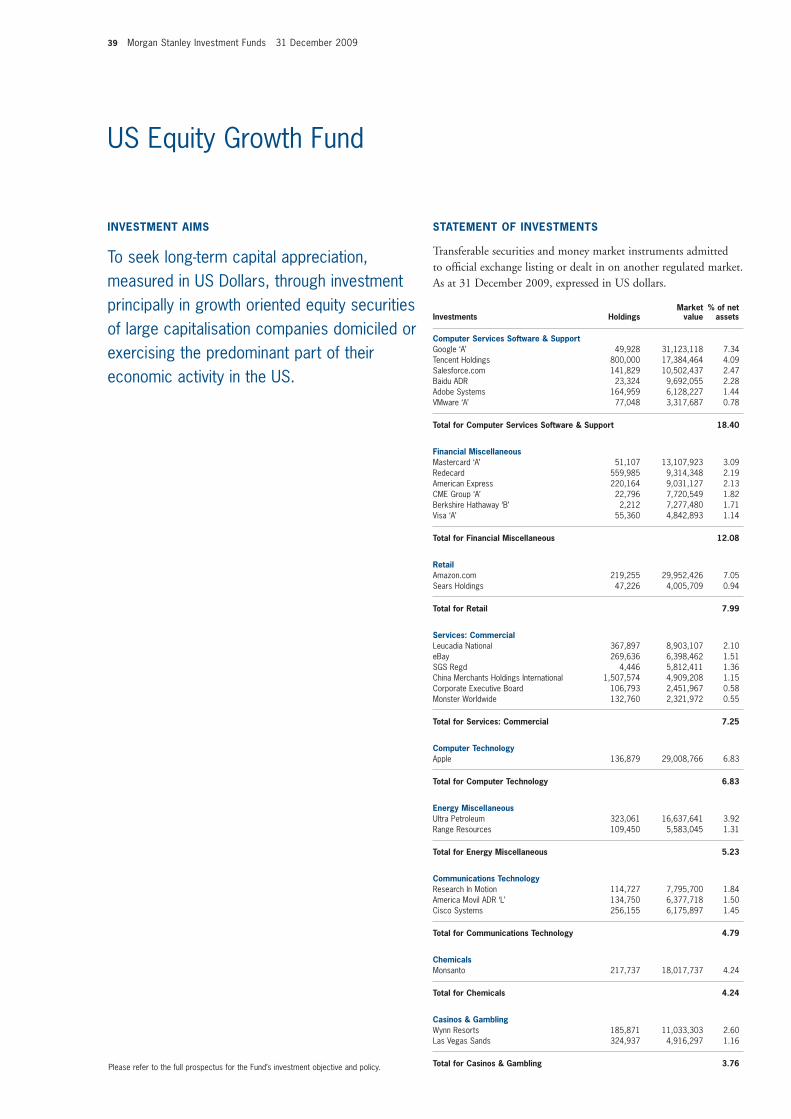
39 Morgan Stanley Investment Funds 31 December 2009
US Equity Growth Fund
Computer Services Software & Support Google ‘A’ 49,928 31,123,118 7.34Tencent Holdings 800,000 17,384,464 4.09Salesforce.com 141,829 10,502,437 2.47Baidu ADR 23,324 9,692,055 2.28Adobe Systems 164,959 6,128,227 1.44VMware ‘A’ 77,048 3,317,687 0.78
Total for Computer Services Software & Support 18.40
Financial Miscellaneous Mastercard ‘A’ 51,107 13,107,923 3.09Redecard 559,985 9,314,348 2.19American Express 220,164 9,031,127 2.13CME Group ‘A’ 22,796 7,720,549 1.82Berkshire Hathaway ‘B’ 2,212 7,277,480 1.71Visa ‘A’ 55,360 4,842,893 1.14
Total for Financial Miscellaneous 12.08
Retail Amazon.com 219,255 29,952,426 7.05Sears Holdings 47,226 4,005,709 0.94
Total for Retail 7.99
Services: Commercial Leucadia National 367,897 8,903,107 2.10eBay 269,636 6,398,462 1.51SGS Regd 4,446 5,812,411 1.36China Merchants Holdings International 1,507,574 4,909,208 1.15Corporate Executive Board 106,793 2,451,967 0.58Monster Worldwide 132,760 2,321,972 0.55
Total for Services: Commercial 7.25
Computer Technology Apple 136,879 29,008,766 6.83
Total for Computer Technology 6.83
Energy Miscellaneous Ultra Petroleum 323,061 16,637,641 3.92Range Resources 109,450 5,583,045 1.31
Total for Energy Miscellaneous 5.23
Communications Technology Research In Motion 114,727 7,795,700 1.84America Movil ADR ‘L’ 134,750 6,377,718 1.50Cisco Systems 256,155 6,175,897 1.45
Total for Communications Technology 4.79
Chemicals Monsanto 217,737 18,017,737 4.24
Total for Chemicals 4.24
Casinos & Gambling Wynn Resorts 185,871 11,033,303 2.60Las Vegas Sands 324,937 4,916,297 1.16
Total for Casinos & Gambling 3.76
INVESTMENT AIMS
To seek long-term capital appreciation, measured in US Dollars, through investment principally in growth oriented equity securities of large capitalisation companies domiciled or exercising the predominant part of their economic activity in the US.
STATEMENT OF INVESTMENTS
Transferable securities and money market instruments admitted to offi cial exchange listing or dealt in on another regulated market. As at 31 December 2009, expressed in US dollars.
Investments HoldingsMarket
value% of net
assets
Please refer to the full prospectus for the Fund’s investment objective and policy.
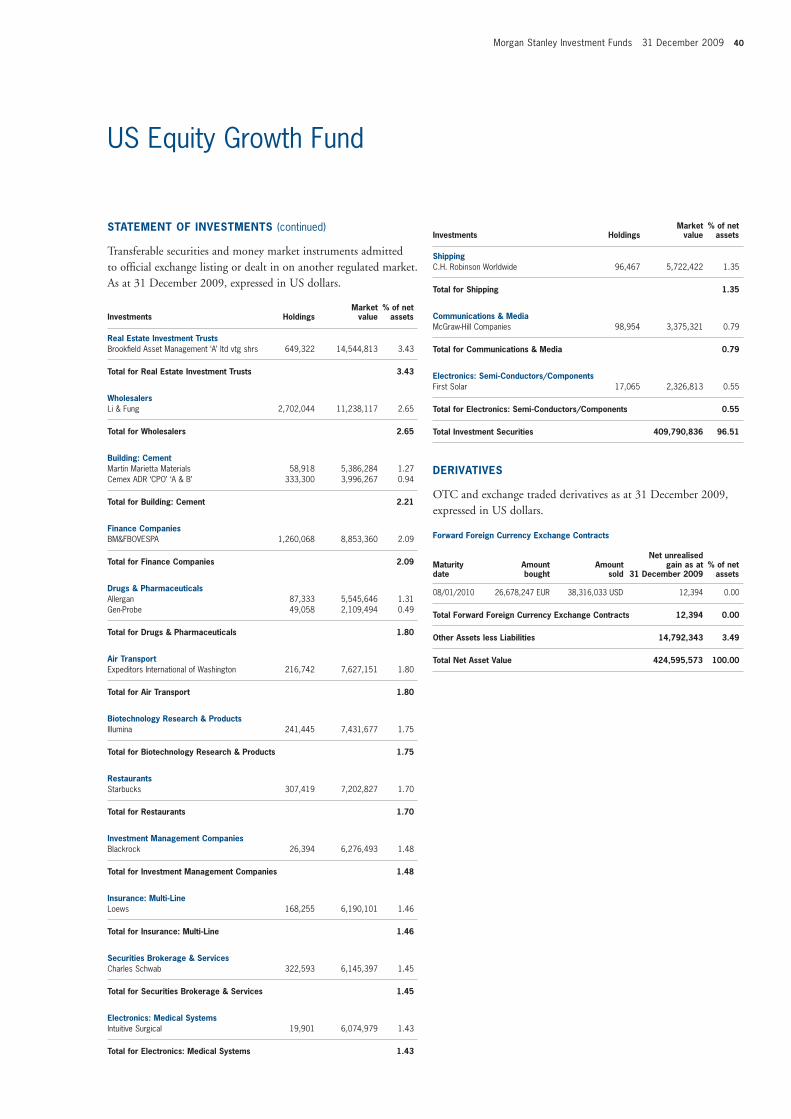
Morgan Stanley Investment Funds 31 December 2009 40
US Equity Growth Fund
STATEMENT OF INVESTMENTS (continued)
Transferable securities and money market instruments admitted to offi cial exchange listing or dealt in on another regulated market. As at 31 December 2009, expressed in US dollars.
Investments HoldingsMarket
value% of net
assets
Investments HoldingsMarket
value% of net
assets
Real Estate Investment Trusts Brookfi eld Asset Management ‘A’ ltd vtg shrs 649,322 14,544,813 3.43
Total for Real Estate Investment Trusts 3.43
Wholesalers Li & Fung 2,702,044 11,238,117 2.65
Total for Wholesalers 2.65
Building: Cement Martin Marietta Materials 58,918 5,386,284 1.27Cemex ADR ‘CPO’ ‘A & B’ 333,300 3,996,267 0.94
Total for Building: Cement 2.21
Finance Companies BM&FBOVESPA 1,260,068 8,853,360 2.09
Total for Finance Companies 2.09
Drugs & Pharmaceuticals Allergan 87,333 5,545,646 1.31Gen-Probe 49,058 2,109,494 0.49
Total for Drugs & Pharmaceuticals 1.80
Air Transport Expeditors International of Washington 216,742 7,627,151 1.80
Total for Air Transport 1.80
Biotechnology Research & Products Illumina 241,445 7,431,677 1.75
Total for Biotechnology Research & Products 1.75
Restaurants Starbucks 307,419 7,202,827 1.70
Total for Restaurants 1.70
Investment Management Companies Blackrock 26,394 6,276,493 1.48
Total for Investment Management Companies 1.48
Insurance: Multi-Line Loews 168,255 6,190,101 1.46
Total for Insurance: Multi-Line 1.46
Securities Brokerage & Services Charles Schwab 322,593 6,145,397 1.45
Total for Securities Brokerage & Services 1.45
Electronics: Medical Systems Intuitive Surgical 19,901 6,074,979 1.43
Total for Electronics: Medical Systems 1.43
Shipping C.H. Robinson Worldwide 96,467 5,722,422 1.35
Total for Shipping 1.35
Communications & Media McGraw-Hill Companies 98,954 3,375,321 0.79
Total for Communications & Media 0.79
Electronics: Semi-Conductors/Components First Solar 17,065 2,326,813 0.55
Total for Electronics: Semi-Conductors/Components 0.55
Total Investment Securities 409,790,836 96.51
DERIVATIVES
OTC and exchange traded derivatives as at 31 December 2009, expressed in US dollars.
Forward Foreign Currency Exchange Contracts
Maturity date
Amount bought
Amount sold
Net unrealisedgain as at
31 December 2009 % of net
assets 08/01/2010 26,678,247 EUR 38,316,033 USD 12,394 0.00
Total Forward Foreign Currency Exchange Contracts 12,394 0.00
Other Assets less Liabilities 14,792,343 3.49
Total Net Asset Value 424,595,573 100.00
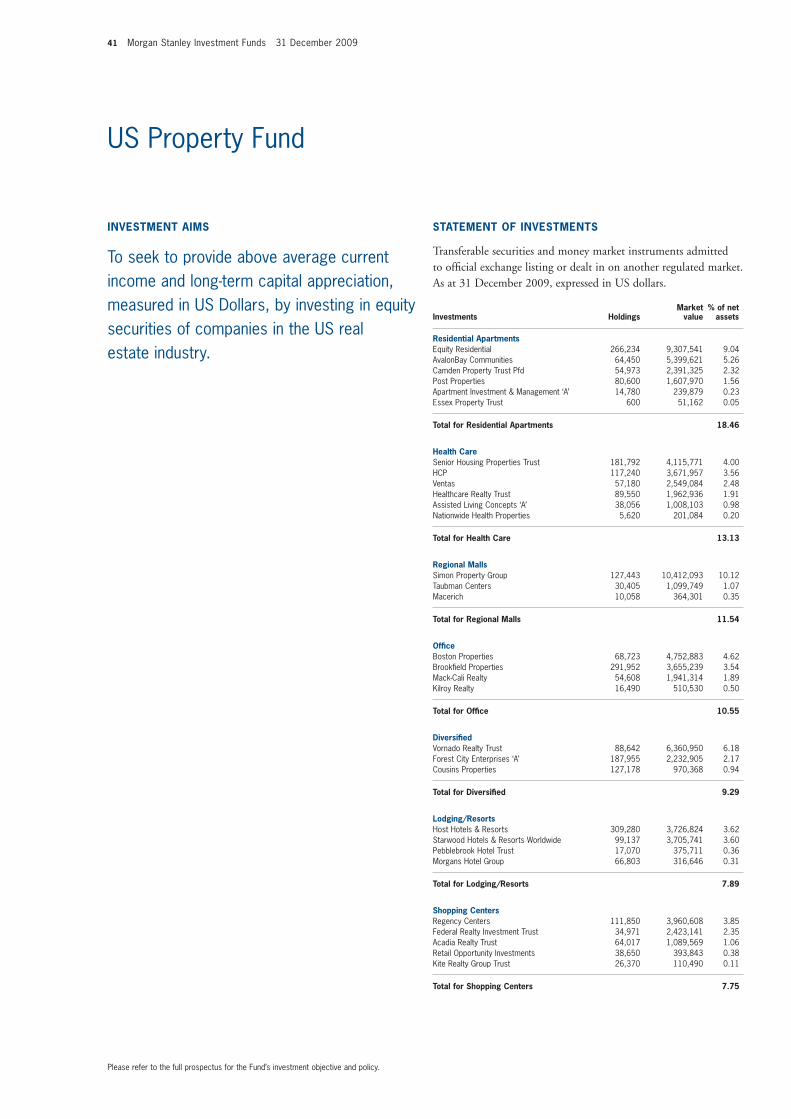
41 Morgan Stanley Investment Funds 31 December 2009
US Property Fund
INVESTMENT AIMS
To seek to provide above average current income and long-term capital appreciation, measured in US Dollars, by investing in equity securities of companies in the US real estate industry.
STATEMENT OF INVESTMENTS
Transferable securities and money market instruments admitted to offi cial exchange listing or dealt in on another regulated market. As at 31 December 2009, expressed in US dollars.
Investments HoldingsMarket
value% of net
assets
Residential Apartments Equity Residential 266,234 9,307,541 9.04AvalonBay Communities 64,450 5,399,621 5.26Camden Property Trust Pfd 54,973 2,391,325 2.32Post Properties 80,600 1,607,970 1.56Apartment Investment & Management ‘A’ 14,780 239,879 0.23Essex Property Trust 600 51,162 0.05
Total for Residential Apartments 18.46
Health Care Senior Housing Properties Trust 181,792 4,115,771 4.00HCP 117,240 3,671,957 3.56Ventas 57,180 2,549,084 2.48Healthcare Realty Trust 89,550 1,962,936 1.91Assisted Living Concepts ‘A’ 38,056 1,008,103 0.98Nationwide Health Properties 5,620 201,084 0.20
Total for Health Care 13.13
Regional Malls Simon Property Group 127,443 10,412,093 10.12Taubman Centers 30,405 1,099,749 1.07Macerich 10,058 364,301 0.35
Total for Regional Malls 11.54
Offi ce Boston Properties 68,723 4,752,883 4.62Brookfi eld Properties 291,952 3,655,239 3.54Mack-Cali Realty 54,608 1,941,314 1.89Kilroy Realty 16,490 510,530 0.50
Total for Offi ce 10.55
Diversifi ed Vornado Realty Trust 88,642 6,360,950 6.18Forest City Enterprises ‘A’ 187,955 2,232,905 2.17Cousins Properties 127,178 970,368 0.94
Total for Diversifi ed 9.29
Lodging/Resorts Host Hotels & Resorts 309,280 3,726,824 3.62Starwood Hotels & Resorts Worldwide 99,137 3,705,741 3.60Pebblebrook Hotel Trust 17,070 375,711 0.36Morgans Hotel Group 66,803 316,646 0.31
Total for Lodging/Resorts 7.89
Shopping Centers Regency Centers 111,850 3,960,608 3.85Federal Realty Investment Trust 34,971 2,423,141 2.35Acadia Realty Trust 64,017 1,089,569 1.06Retail Opportunity Investments 38,650 393,843 0.38Kite Realty Group Trust 26,370 110,490 0.11
Total for Shopping Centers 7.75
Please refer to the full prospectus for the Fund’s investment objective and policy.
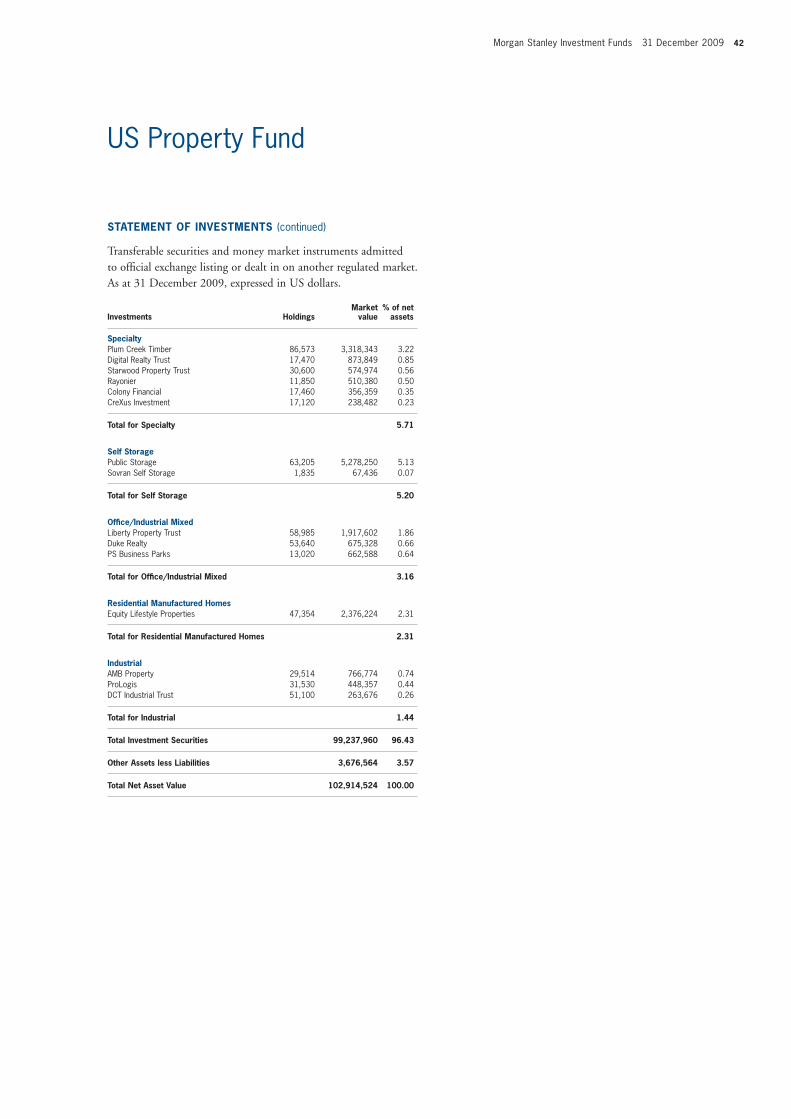
Morgan Stanley Investment Funds 31 December 2009 42
US Property Fund
STATEMENT OF INVESTMENTS (continued)
Transferable securities and money market instruments admitted to offi cial exchange listing or dealt in on another regulated market. As at 31 December 2009, expressed in US dollars.
Investments HoldingsMarket
value% of net
assets
Specialty Plum Creek Timber 86,573 3,318,343 3.22Digital Realty Trust 17,470 873,849 0.85Starwood Property Trust 30,600 574,974 0.56Rayonier 11,850 510,380 0.50Colony Financial 17,460 356,359 0.35CreXus Investment 17,120 238,482 0.23
Total for Specialty 5.71
Self Storage Public Storage 63,205 5,278,250 5.13Sovran Self Storage 1,835 67,436 0.07
Total for Self Storage 5.20
Offi ce/Industrial Mixed Liberty Property Trust 58,985 1,917,602 1.86Duke Realty 53,640 675,328 0.66PS Business Parks 13,020 662,588 0.64
Total for Offi ce/Industrial Mixed 3.16
Residential Manufactured Homes Equity Lifestyle Properties 47,354 2,376,224 2.31
Total for Residential Manufactured Homes 2.31
Industrial AMB Property 29,514 766,774 0.74ProLogis 31,530 448,357 0.44DCT Industrial Trust 51,100 263,676 0.26
Total for Industrial 1.44
Total Investment Securities 99,237,960 96.43
Other Assets less Liabilities 3,676,564 3.57
Total Net Asset Value 102,914,524 100.00
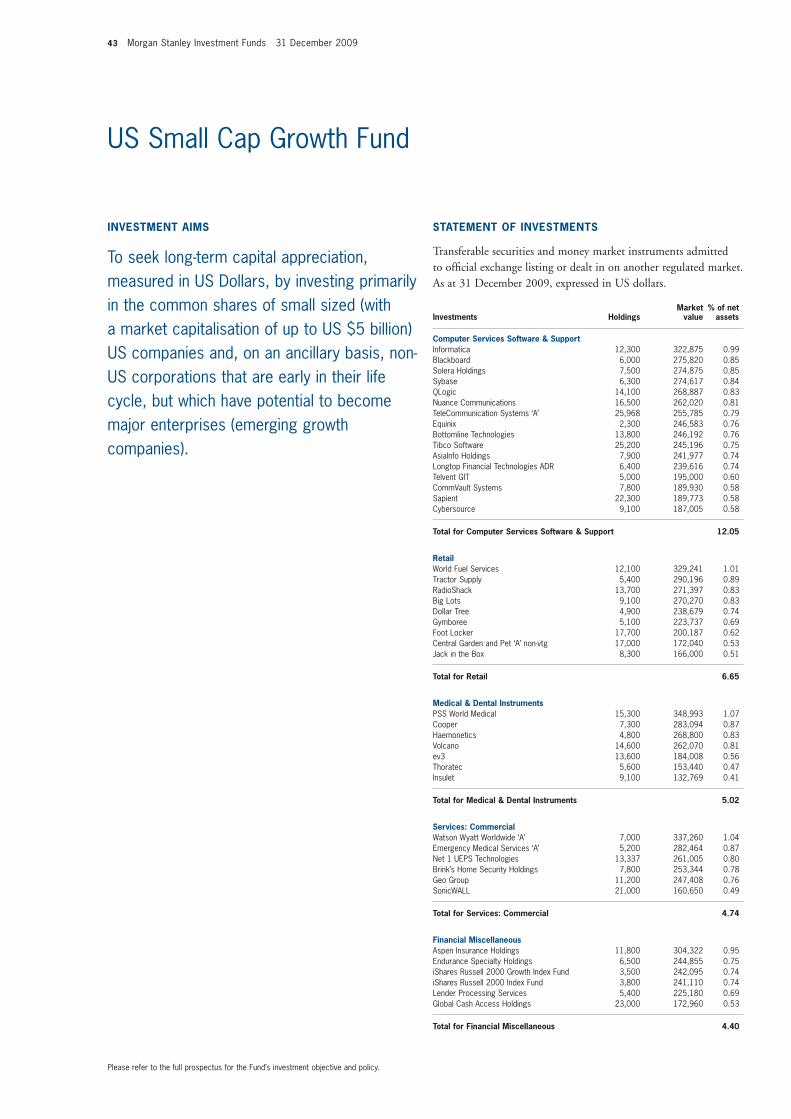
43 Morgan Stanley Investment Funds 31 December 2009
US Small Cap Growth Fund
INVESTMENT AIMS
To seek long-term capital appreciation, measured in US Dollars, by investing primarily in the common shares of small sized (with a market capitalisation of up to US $5 billion) US companies and, on an ancillary basis, non-US corporations that are early in their life cycle, but which have potential to become major enterprises (emerging growth companies).
STATEMENT OF INVESTMENTS
Transferable securities and money market instruments admitted to offi cial exchange listing or dealt in on another regulated market. As at 31 December 2009, expressed in US dollars.
Investments HoldingsMarket
value% of net
assets
Computer Services Software & Support Informatica 12,300 322,875 0.99Blackboard 6,000 275,820 0.85Solera Holdings 7,500 274,875 0.85Sybase 6,300 274,617 0.84QLogic 14,100 268,887 0.83Nuance Communications 16,500 262,020 0.81TeleCommunication Systems ‘A’ 25,968 255,785 0.79Equinix 2,300 246,583 0.76Bottomline Technologies 13,800 246,192 0.76Tibco Software 25,200 245,196 0.75AsiaInfo Holdings 7,900 241,977 0.74Longtop Financial Technologies ADR 6,400 239,616 0.74Telvent GIT 5,000 195,000 0.60CommVault Systems 7,800 189,930 0.58Sapient 22,300 189,773 0.58Cybersource 9,100 187,005 0.58
Total for Computer Services Software & Support 12.05
Retail World Fuel Services 12,100 329,241 1.01Tractor Supply 5,400 290,196 0.89RadioShack 13,700 271,397 0.83Big Lots 9,100 270,270 0.83Dollar Tree 4,900 238,679 0.74Gymboree 5,100 223,737 0.69Foot Locker 17,700 200,187 0.62Central Garden and Pet ‘A’ non-vtg 17,000 172,040 0.53Jack in the Box 8,300 166,000 0.51
Total for Retail 6.65
Medical & Dental Instruments PSS World Medical 15,300 348,993 1.07Cooper 7,300 283,094 0.87Haemonetics 4,800 268,800 0.83Volcano 14,600 262,070 0.81ev3 13,600 184,008 0.56Thoratec 5,600 153,440 0.47Insulet 9,100 132,769 0.41
Total for Medical & Dental Instruments 5.02
Services: Commercial Watson Wyatt Worldwide ‘A’ 7,000 337,260 1.04Emergency Medical Services ‘A’ 5,200 282,464 0.87Net 1 UEPS Technologies 13,337 261,005 0.80Brink’s Home Security Holdings 7,800 253,344 0.78Geo Group 11,200 247,408 0.76SonicWALL 21,000 160,650 0.49
Total for Services: Commercial 4.74
Financial Miscellaneous Aspen Insurance Holdings 11,800 304,322 0.95Endurance Specialty Holdings 6,500 244,855 0.75iShares Russell 2000 Growth Index Fund 3,500 242,095 0.74iShares Russell 2000 Index Fund 3,800 241,110 0.74Lender Processing Services 5,400 225,180 0.69Global Cash Access Holdings 23,000 172,960 0.53
Total for Financial Miscellaneous 4.40
Please refer to the full prospectus for the Fund’s investment objective and policy.
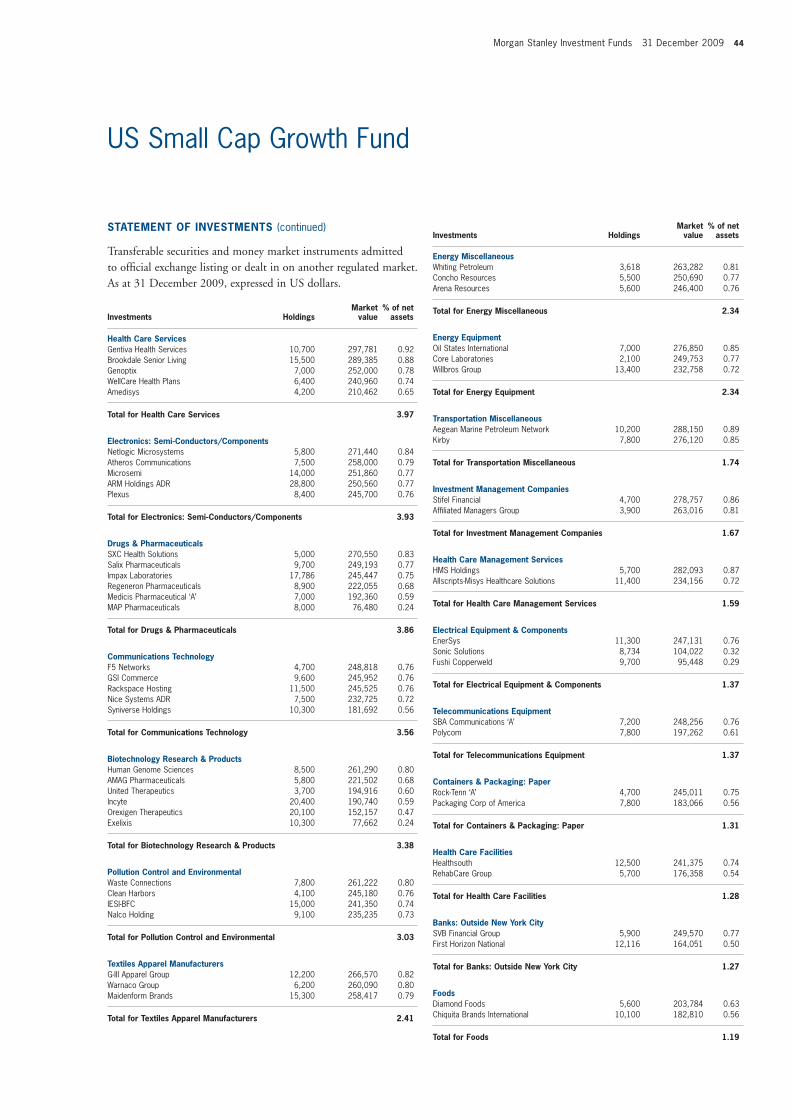
Morgan Stanley Investment Funds 31 December 2009 44
US Small Cap Growth Fund
STATEMENT OF INVESTMENTS (continued)
Transferable securities and money market instruments admitted to offi cial exchange listing or dealt in on another regulated market. As at 31 December 2009, expressed in US dollars.
Investments HoldingsMarket
value% of net
assets
Investments HoldingsMarket
value% of net
assets
Health Care Services Gentiva Health Services 10,700 297,781 0.92Brookdale Senior Living 15,500 289,385 0.88Genoptix 7,000 252,000 0.78WellCare Health Plans 6,400 240,960 0.74Amedisys 4,200 210,462 0.65
Total for Health Care Services 3.97
Electronics: Semi-Conductors/Components Netlogic Microsystems 5,800 271,440 0.84Atheros Communications 7,500 258,000 0.79Microsemi 14,000 251,860 0.77ARM Holdings ADR 28,800 250,560 0.77Plexus 8,400 245,700 0.76
Total for Electronics: Semi-Conductors/Components 3.93
Drugs & Pharmaceuticals SXC Health Solutions 5,000 270,550 0.83Salix Pharmaceuticals 9,700 249,193 0.77Impax Laboratories 17,786 245,447 0.75Regeneron Pharmaceuticals 8,900 222,055 0.68Medicis Pharmaceutical ‘A’ 7,000 192,360 0.59MAP Pharmaceuticals 8,000 76,480 0.24
Total for Drugs & Pharmaceuticals 3.86
Communications Technology F5 Networks 4,700 248,818 0.76GSI Commerce 9,600 245,952 0.76Rackspace Hosting 11,500 245,525 0.76Nice Systems ADR 7,500 232,725 0.72Syniverse Holdings 10,300 181,692 0.56
Total for Communications Technology 3.56
Biotechnology Research & Products Human Genome Sciences 8,500 261,290 0.80AMAG Pharmaceuticals 5,800 221,502 0.68United Therapeutics 3,700 194,916 0.60Incyte 20,400 190,740 0.59Orexigen Therapeutics 20,100 152,157 0.47Exelixis 10,300 77,662 0.24
Total for Biotechnology Research & Products 3.38
Pollution Control and Environmental Waste Connections 7,800 261,222 0.80Clean Harbors 4,100 245,180 0.76IESI-BFC 15,000 241,350 0.74Nalco Holding 9,100 235,235 0.73
Total for Pollution Control and Environmental 3.03
Textiles Apparel Manufacturers G-III Apparel Group 12,200 266,570 0.82Warnaco Group 6,200 260,090 0.80Maidenform Brands 15,300 258,417 0.79
Total for Textiles Apparel Manufacturers 2.41
Energy Miscellaneous Whiting Petroleum 3,618 263,282 0.81Concho Resources 5,500 250,690 0.77Arena Resources 5,600 246,400 0.76
Total for Energy Miscellaneous 2.34
Energy Equipment Oil States International 7,000 276,850 0.85Core Laboratories 2,100 249,753 0.77Willbros Group 13,400 232,758 0.72
Total for Energy Equipment 2.34
Transportation Miscellaneous Aegean Marine Petroleum Network 10,200 288,150 0.89Kirby 7,800 276,120 0.85
Total for Transportation Miscellaneous 1.74
Investment Management Companies Stifel Financial 4,700 278,757 0.86Affi liated Managers Group 3,900 263,016 0.81
Total for Investment Management Companies 1.67
Health Care Management Services HMS Holdings 5,700 282,093 0.87Allscripts-Misys Healthcare Solutions 11,400 234,156 0.72
Total for Health Care Management Services 1.59
Electrical Equipment & Components EnerSys 11,300 247,131 0.76Sonic Solutions 8,734 104,022 0.32Fushi Copperweld 9,700 95,448 0.29
Total for Electrical Equipment & Components 1.37
Telecommunications Equipment SBA Communications ‘A’ 7,200 248,256 0.76Polycom 7,800 197,262 0.61
Total for Telecommunications Equipment 1.37
Containers & Packaging: Paper Rock-Tenn ‘A’ 4,700 245,011 0.75Packaging Corp of America 7,800 183,066 0.56
Total for Containers & Packaging: Paper 1.31
Health Care Facilities Healthsouth 12,500 241,375 0.74RehabCare Group 5,700 176,358 0.54
Total for Health Care Facilities 1.28
Banks: Outside New York City SVB Financial Group 5,900 249,570 0.77First Horizon National 12,116 164,051 0.50
Total for Banks: Outside New York City 1.27
Foods Diamond Foods 5,600 203,784 0.63Chiquita Brands International 10,100 182,810 0.56
Total for Foods 1.19
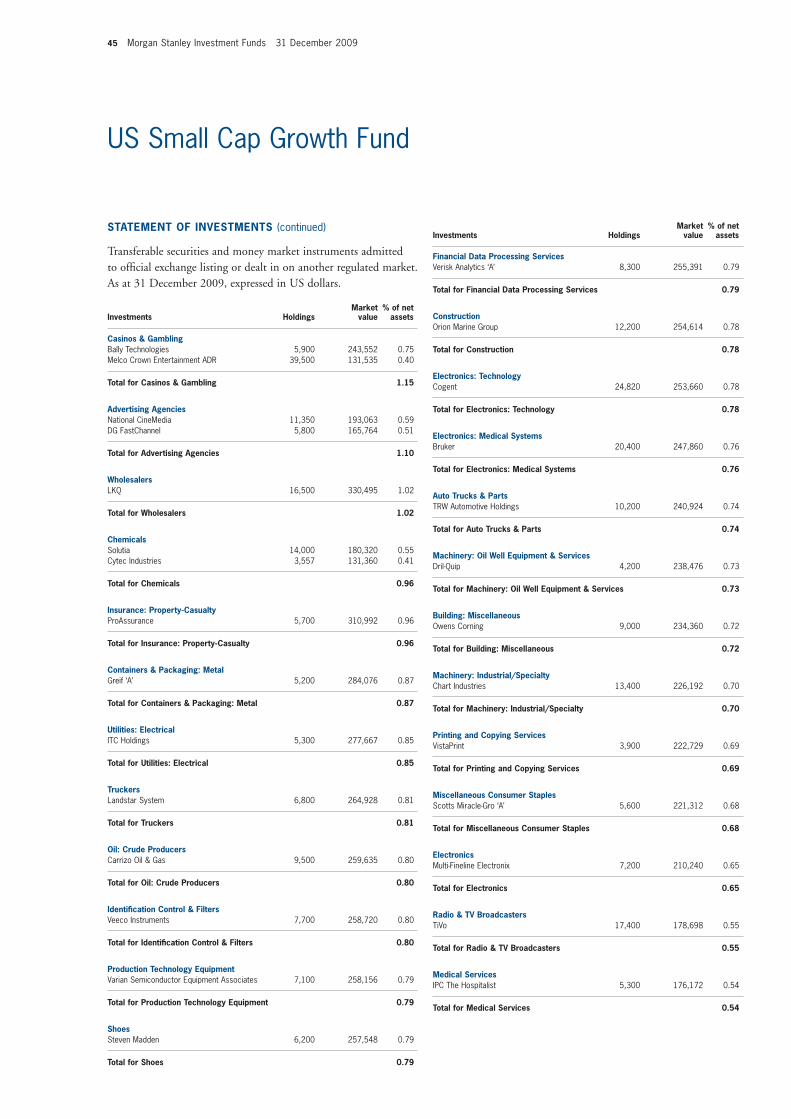
45 Morgan Stanley Investment Funds 31 December 2009
US Small Cap Growth Fund
STATEMENT OF INVESTMENTS (continued)
Transferable securities and money market instruments admitted to offi cial exchange listing or dealt in on another regulated market. As at 31 December 2009, expressed in US dollars.
Investments HoldingsMarket
value% of net
assets
Casinos & Gambling Bally Technologies 5,900 243,552 0.75Melco Crown Entertainment ADR 39,500 131,535 0.40
Total for Casinos & Gambling 1.15
Advertising Agencies National CineMedia 11,350 193,063 0.59DG FastChannel 5,800 165,764 0.51
Total for Advertising Agencies 1.10
Wholesalers LKQ 16,500 330,495 1.02
Total for Wholesalers 1.02
Chemicals Solutia 14,000 180,320 0.55Cytec Industries 3,557 131,360 0.41
Total for Chemicals 0.96
Insurance: Property-Casualty ProAssurance 5,700 310,992 0.96
Total for Insurance: Property-Casualty 0.96
Containers & Packaging: Metal Greif ‘A’ 5,200 284,076 0.87
Total for Containers & Packaging: Metal 0.87
Utilities: Electrical ITC Holdings 5,300 277,667 0.85
Total for Utilities: Electrical 0.85
Truckers Landstar System 6,800 264,928 0.81
Total for Truckers 0.81
Oil: Crude Producers Carrizo Oil & Gas 9,500 259,635 0.80
Total for Oil: Crude Producers 0.80
Identifi cation Control & Filters Veeco Instruments 7,700 258,720 0.80
Total for Identifi cation Control & Filters 0.80
Production Technology Equipment Varian Semiconductor Equipment Associates 7,100 258,156 0.79
Total for Production Technology Equipment 0.79
Shoes Steven Madden 6,200 257,548 0.79
Total for Shoes 0.79
Investments HoldingsMarket
value% of net
assets
Financial Data Processing Services Verisk Analytics ‘A’ 8,300 255,391 0.79
Total for Financial Data Processing Services 0.79
Construction Orion Marine Group 12,200 254,614 0.78
Total for Construction 0.78
Electronics: Technology Cogent 24,820 253,660 0.78
Total for Electronics: Technology 0.78
Electronics: Medical Systems Bruker 20,400 247,860 0.76
Total for Electronics: Medical Systems 0.76
Auto Trucks & Parts TRW Automotive Holdings 10,200 240,924 0.74
Total for Auto Trucks & Parts 0.74
Machinery: Oil Well Equipment & Services Dril-Quip 4,200 238,476 0.73
Total for Machinery: Oil Well Equipment & Services 0.73
Building: Miscellaneous Owens Corning 9,000 234,360 0.72
Total for Building: Miscellaneous 0.72
Machinery: Industrial/Specialty Chart Industries 13,400 226,192 0.70
Total for Machinery: Industrial/Specialty 0.70
Printing and Copying Services VistaPrint 3,900 222,729 0.69
Total for Printing and Copying Services 0.69
Miscellaneous Consumer Staples Scotts Miracle-Gro ‘A’ 5,600 221,312 0.68
Total for Miscellaneous Consumer Staples 0.68
Electronics Multi-Fineline Electronix 7,200 210,240 0.65
Total for Electronics 0.65
Radio & TV Broadcasters TiVo 17,400 178,698 0.55
Total for Radio & TV Broadcasters 0.55
Medical Services IPC The Hospitalist 5,300 176,172 0.54
Total for Medical Services 0.54
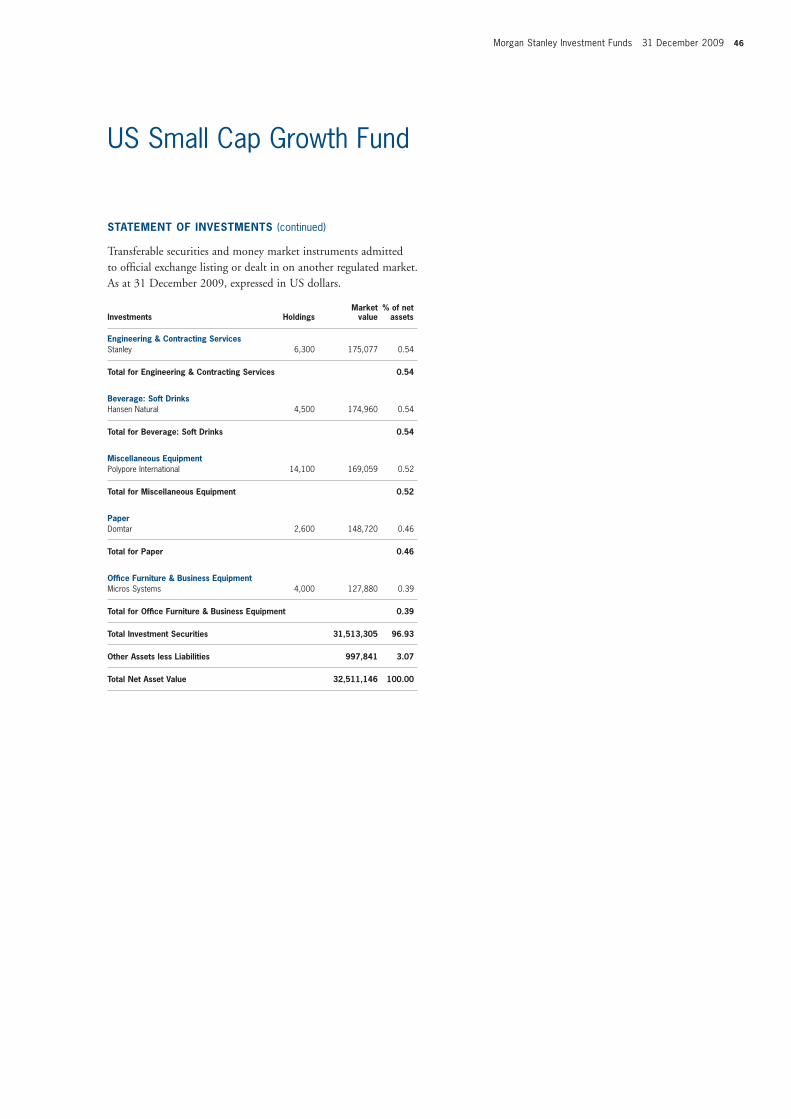
Morgan Stanley Investment Funds 31 December 2009 46
US Small Cap Growth Fund
STATEMENT OF INVESTMENTS (continued)
Transferable securities and money market instruments admitted to offi cial exchange listing or dealt in on another regulated market. As at 31 December 2009, expressed in US dollars.
Investments HoldingsMarket
value% of net
assets
Engineering & Contracting Services Stanley 6,300 175,077 0.54
Total for Engineering & Contracting Services 0.54
Beverage: Soft Drinks Hansen Natural 4,500 174,960 0.54
Total for Beverage: Soft Drinks 0.54
Miscellaneous Equipment Polypore International 14,100 169,059 0.52
Total for Miscellaneous Equipment 0.52
Paper Domtar 2,600 148,720 0.46
Total for Paper 0.46
Offi ce Furniture & Business Equipment Micros Systems 4,000 127,880 0.39
Total for Offi ce Furniture & Business Equipment 0.39
Total Investment Securities 31,513,305 96.93
Other Assets less Liabilities 997,841 3.07
Total Net Asset Value 32,511,146 100.00
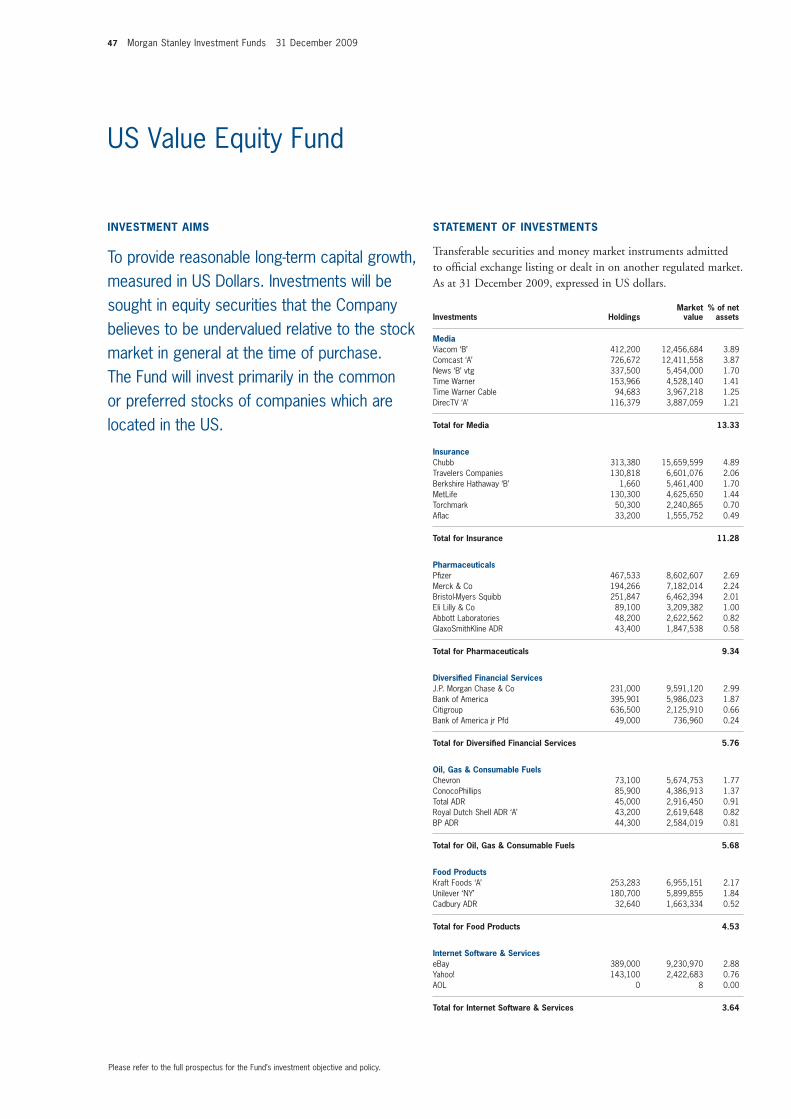
47 Morgan Stanley Investment Funds 31 December 2009
US Value Equity Fund
Media Viacom ‘B’ 412,200 12,456,684 3.89Comcast ‘A’ 726,672 12,411,558 3.87News ‘B’ vtg 337,500 5,454,000 1.70Time Warner 153,966 4,528,140 1.41Time Warner Cable 94,683 3,967,218 1.25DirecTV ‘A’ 116,379 3,887,059 1.21
Total for Media 13.33
Insurance Chubb 313,380 15,659,599 4.89Travelers Companies 130,818 6,601,076 2.06Berkshire Hathaway ‘B’ 1,660 5,461,400 1.70MetLife 130,300 4,625,650 1.44Torchmark 50,300 2,240,865 0.70Afl ac 33,200 1,555,752 0.49
Total for Insurance 11.28
Pharmaceuticals Pfi zer 467,533 8,602,607 2.69Merck & Co 194,266 7,182,014 2.24Bristol-Myers Squibb 251,847 6,462,394 2.01Eli Lilly & Co 89,100 3,209,382 1.00Abbott Laboratories 48,200 2,622,562 0.82GlaxoSmithKline ADR 43,400 1,847,538 0.58
Total for Pharmaceuticals 9.34
Diversifi ed Financial Services J.P. Morgan Chase & Co 231,000 9,591,120 2.99Bank of America 395,901 5,986,023 1.87Citigroup 636,500 2,125,910 0.66Bank of America jr Pfd 49,000 736,960 0.24
Total for Diversifi ed Financial Services 5.76
Oil, Gas & Consumable Fuels Chevron 73,100 5,674,753 1.77ConocoPhillips 85,900 4,386,913 1.37Total ADR 45,000 2,916,450 0.91Royal Dutch Shell ADR ‘A’ 43,200 2,619,648 0.82BP ADR 44,300 2,584,019 0.81
Total for Oil, Gas & Consumable Fuels 5.68
Food Products Kraft Foods ‘A’ 253,283 6,955,151 2.17Unilever ‘NY’ 180,700 5,899,855 1.84Cadbury ADR 32,640 1,663,334 0.52
Total for Food Products 4.53
Internet Software & Services eBay 389,000 9,230,970 2.88Yahoo! 143,100 2,422,683 0.76AOL 0 8 0.00
Total for Internet Software & Services 3.64
INVESTMENT AIMS
To provide reasonable long-term capital growth, measured in US Dollars. Investments will be sought in equity securities that the Company believes to be undervalued relative to the stock market in general at the time of purchase. The Fund will invest primarily in the common or preferred stocks of companies which are located in the US.
STATEMENT OF INVESTMENTS
Transferable securities and money market instruments admitted to offi cial exchange listing or dealt in on another regulated market. As at 31 December 2009, expressed in US dollars.
Investments HoldingsMarket
value% of net
assets
Please refer to the full prospectus for the Fund’s investment objective and policy.
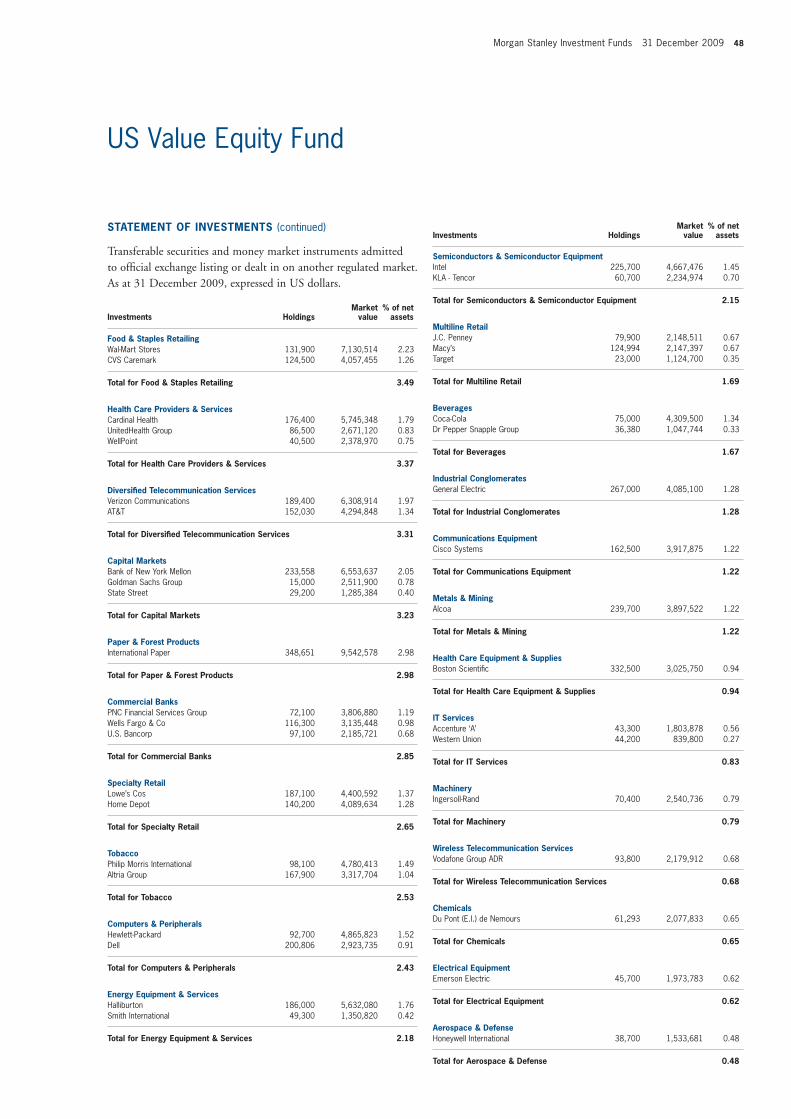
Morgan Stanley Investment Funds 31 December 2009 48
US Value Equity Fund
STATEMENT OF INVESTMENTS (continued)
Transferable securities and money market instruments admitted to offi cial exchange listing or dealt in on another regulated market. As at 31 December 2009, expressed in US dollars.
Investments HoldingsMarket
value% of net
assets
Investments HoldingsMarket
value% of net
assets
Food & Staples Retailing Wal-Mart Stores 131,900 7,130,514 2.23CVS Caremark 124,500 4,057,455 1.26
Total for Food & Staples Retailing 3.49
Health Care Providers & Services Cardinal Health 176,400 5,745,348 1.79UnitedHealth Group 86,500 2,671,120 0.83WellPoint 40,500 2,378,970 0.75
Total for Health Care Providers & Services 3.37
Diversifi ed Telecommunication Services Verizon Communications 189,400 6,308,914 1.97AT&T 152,030 4,294,848 1.34
Total for Diversifi ed Telecommunication Services 3.31
Capital Markets Bank of New York Mellon 233,558 6,553,637 2.05Goldman Sachs Group 15,000 2,511,900 0.78State Street 29,200 1,285,384 0.40
Total for Capital Markets 3.23
Paper & Forest Products International Paper 348,651 9,542,578 2.98
Total for Paper & Forest Products 2.98
Commercial Banks PNC Financial Services Group 72,100 3,806,880 1.19Wells Fargo & Co 116,300 3,135,448 0.98U.S. Bancorp 97,100 2,185,721 0.68
Total for Commercial Banks 2.85
Specialty Retail Lowe’s Cos 187,100 4,400,592 1.37Home Depot 140,200 4,089,634 1.28
Total for Specialty Retail 2.65
Tobacco Philip Morris International 98,100 4,780,413 1.49Altria Group 167,900 3,317,704 1.04
Total for Tobacco 2.53
Computers & Peripherals Hewlett-Packard 92,700 4,865,823 1.52Dell 200,806 2,923,735 0.91
Total for Computers & Peripherals 2.43
Energy Equipment & Services Halliburton 186,000 5,632,080 1.76Smith International 49,300 1,350,820 0.42
Total for Energy Equipment & Services 2.18
Semiconductors & Semiconductor Equipment Intel 225,700 4,667,476 1.45KLA - Tencor 60,700 2,234,974 0.70
Total for Semiconductors & Semiconductor Equipment 2.15
Multiline Retail J.C. Penney 79,900 2,148,511 0.67Macy’s 124,994 2,147,397 0.67Target 23,000 1,124,700 0.35
Total for Multiline Retail 1.69
Beverages Coca-Cola 75,000 4,309,500 1.34Dr Pepper Snapple Group 36,380 1,047,744 0.33
Total for Beverages 1.67
Industrial Conglomerates General Electric 267,000 4,085,100 1.28
Total for Industrial Conglomerates 1.28
Communications Equipment Cisco Systems 162,500 3,917,875 1.22
Total for Communications Equipment 1.22
Metals & Mining Alcoa 239,700 3,897,522 1.22
Total for Metals & Mining 1.22
Health Care Equipment & Supplies Boston Scientifi c 332,500 3,025,750 0.94
Total for Health Care Equipment & Supplies 0.94
IT Services Accenture ‘A’ 43,300 1,803,878 0.56Western Union 44,200 839,800 0.27
Total for IT Services 0.83
Machinery Ingersoll-Rand 70,400 2,540,736 0.79
Total for Machinery 0.79
Wireless Telecommunication Services Vodafone Group ADR 93,800 2,179,912 0.68
Total for Wireless Telecommunication Services 0.68
Chemicals Du Pont (E.I.) de Nemours 61,293 2,077,833 0.65
Total for Chemicals 0.65
Electrical Equipment Emerson Electric 45,700 1,973,783 0.62
Total for Electrical Equipment 0.62
Aerospace & Defense Honeywell International 38,700 1,533,681 0.48
Total for Aerospace & Defense 0.48
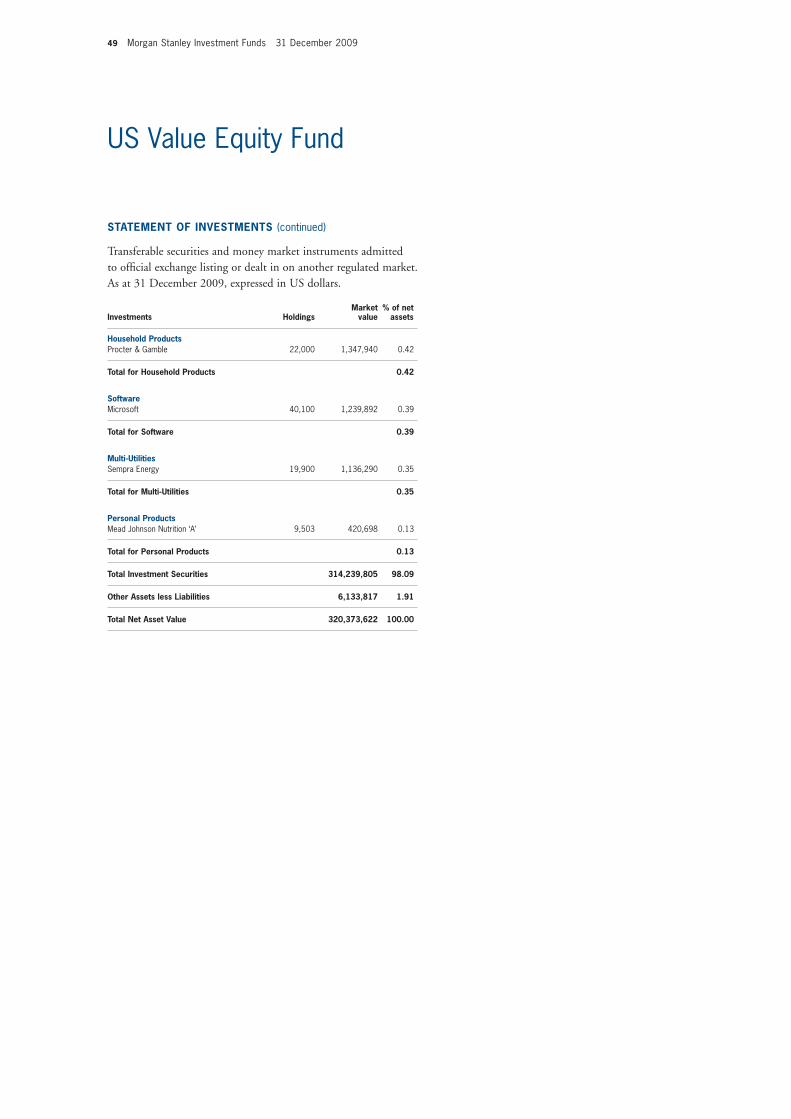
49 Morgan Stanley Investment Funds 31 December 2009
US Value Equity Fund
STATEMENT OF INVESTMENTS (continued)
Transferable securities and money market instruments admitted to offi cial exchange listing or dealt in on another regulated market. As at 31 December 2009, expressed in US dollars.
Investments HoldingsMarket
value% of net
assets
Household Products Procter & Gamble 22,000 1,347,940 0.42
Total for Household Products 0.42
Software Microsoft 40,100 1,239,892 0.39
Total for Software 0.39
Multi-Utilities Sempra Energy 19,900 1,136,290 0.35
Total for Multi-Utilities 0.35
Personal Products Mead Johnson Nutrition ‘A’ 9,503 420,698 0.13
Total for Personal Products 0.13
Total Investment Securities 314,239,805 98.09
Other Assets less Liabilities 6,133,817 1.91
Total Net Asset Value 320,373,622 100.00
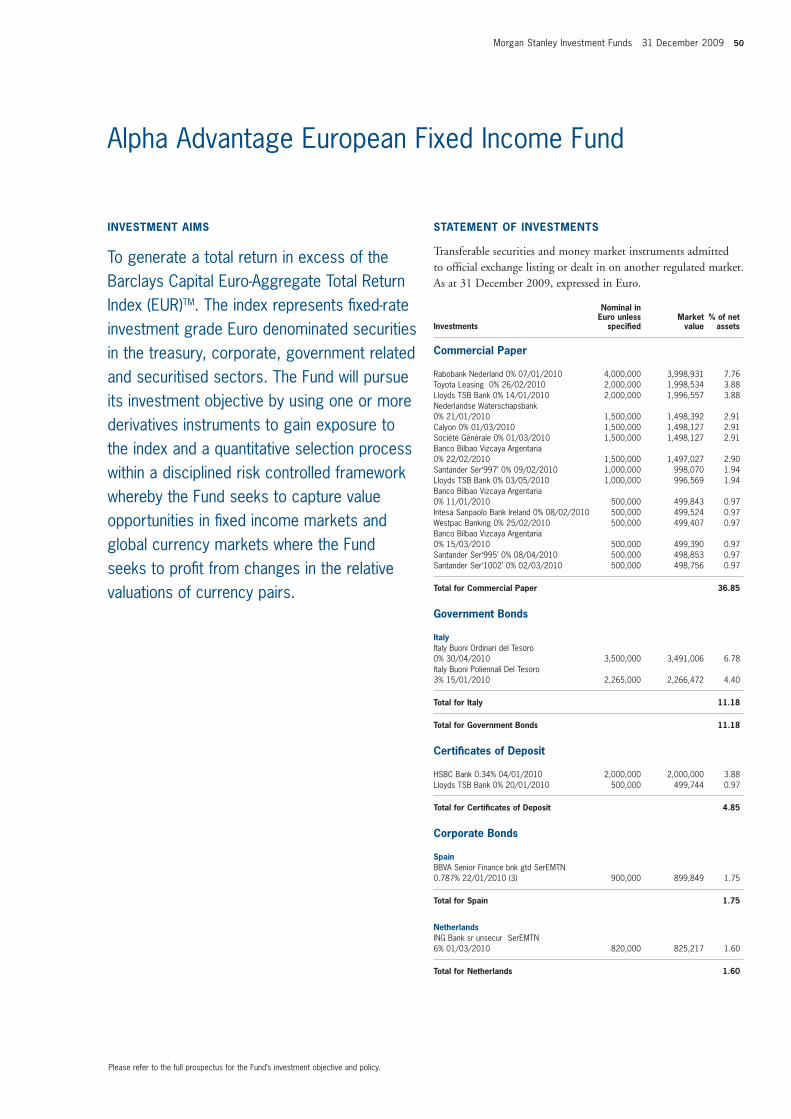
Morgan Stanley Investment Funds 31 December 2009 50
INVESTMENT AIMS
To generate a total return in excess of the Barclays Capital Euro-Aggregate Total Return Index (EUR)TM. The index represents fi xed-rate investment grade Euro denominated securities in the treasury, corporate, government related and securitised sectors. The Fund will pursue its investment objective by using one or more derivatives instruments to gain exposure to the index and a quantitative selection process within a disciplined risk controlled framework whereby the Fund seeks to capture value opportunities in fi xed income markets and global currency markets where the Fund seeks to profi t from changes in the relative valuations of currency pairs.
Alpha Advantage European Fixed Income Fund
Please refer to the full prospectus for the Fund’s investment objective and policy.
Commercial Paper
Rabobank Nederland 0% 07/01/2010 4,000,000 3,998,931 7.76Toyota Leasing 0% 26/02/2010 2,000,000 1,998,534 3.88Lloyds TSB Bank 0% 14/01/2010 2,000,000 1,996,557 3.88Nederlandse Waterschapsbank 0% 21/01/2010 1,500,000 1,498,392 2.91Calyon 0% 01/03/2010 1,500,000 1,498,127 2.91Société Générale 0% 01/03/2010 1,500,000 1,498,127 2.91Banco Bilbao Vizcaya Argentaria 0% 22/02/2010 1,500,000 1,497,027 2.90Santander Ser‘997’ 0% 09/02/2010 1,000,000 998,070 1.94Lloyds TSB Bank 0% 03/05/2010 1,000,000 996,569 1.94Banco Bilbao Vizcaya Argentaria 0% 11/01/2010 500,000 499,843 0.97Intesa Sanpaolo Bank Ireland 0% 08/02/2010 500,000 499,524 0.97Westpac Banking 0% 25/02/2010 500,000 499,407 0.97Banco Bilbao Vizcaya Argentaria 0% 15/03/2010 500,000 499,390 0.97Santander Ser‘995’ 0% 08/04/2010 500,000 498,853 0.97Santander Ser‘1002’ 0% 02/03/2010 500,000 498,756 0.97
Total for Commercial Paper 36.85
Government Bonds
Italy Italy Buoni Ordinari del Tesoro 0% 30/04/2010 3,500,000 3,491,006 6.78Italy Buoni Poliennali Del Tesoro 3% 15/01/2010 2,265,000 2,266,472 4.40
Total for Italy 11.18
Total for Government Bonds 11.18
Certifi cates of Deposit
HSBC Bank 0.34% 04/01/2010 2,000,000 2,000,000 3.88Lloyds TSB Bank 0% 20/01/2010 500,000 499,744 0.97
Total for Certifi cates of Deposit 4.85
Corporate Bonds
Spain BBVA Senior Finance bnk gtd SerEMTN 0.787% 22/01/2010 (3) 900,000 899,849 1.75
Total for Spain 1.75
Netherlands ING Bank sr unsecur SerEMTN 6% 01/03/2010 820,000 825,217 1.60
Total for Netherlands 1.60
STATEMENT OF INVESTMENTS
Transferable securities and money market instruments admitted to offi cial exchange listing or dealt in on another regulated market. As at 31 December 2009, expressed in Euro.
Investments
Nominal in Euro unless
specifi ed Market
value% of net
assets
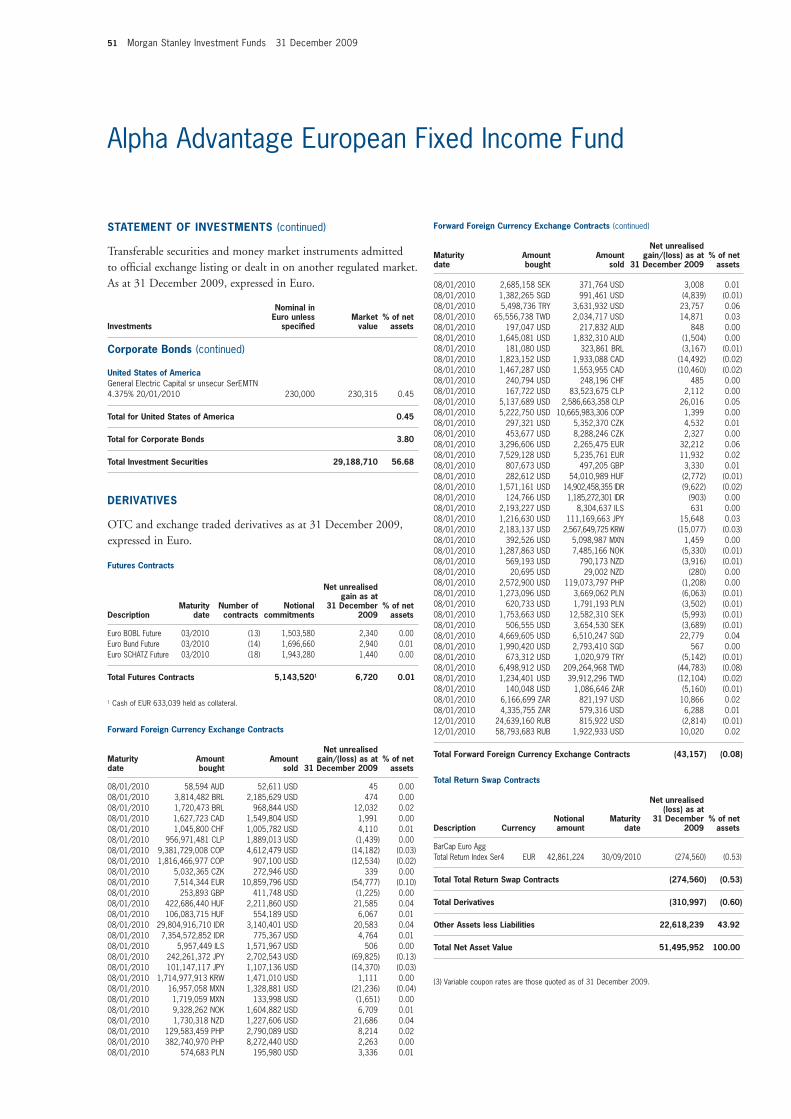
51 Morgan Stanley Investment Funds 31 December 2009
Alpha Advantage European Fixed Income Fund
Corporate Bonds (continued)
United States of America General Electric Capital sr unsecur SerEMTN 4.375% 20/01/2010 230,000 230,315 0.45
Total for United States of America 0.45
Total for Corporate Bonds 3.80
Total Investment Securities 29,188,710 56.68
DERIVATIVES
OTC and exchange traded derivatives as at 31 December 2009, expressed in Euro.
Futures Contracts
DescriptionMaturity
dateNumber of contracts
Notional commitments
Net unrealisedgain as at
31 December 2009
% of net assets
Euro BOBL Future 03/2010 (13) 1,503,580 2,340 0.00Euro Bund Future 03/2010 (14) 1,696,660 2,940 0.01Euro SCHATZ Future 03/2010 (18) 1,943,280 1,440 0.00
Total Futures Contracts 5,143,5201 6,720 0.01
1 Cash of EUR 633,039 held as collateral.
Forward Foreign Currency Exchange Contracts
Maturity date
Amount bought
Amount sold
Net unrealisedgain/(loss) as at
31 December 2009 % of net
assets 08/01/2010 58,594 AUD 52,611 USD 45 0.0008/01/2010 3,814,482 BRL 2,185,629 USD 474 0.0008/01/2010 1,720,473 BRL 968,844 USD 12,032 0.0208/01/2010 1,627,723 CAD 1,549,804 USD 1,991 0.0008/01/2010 1,045,800 CHF 1,005,782 USD 4,110 0.0108/01/2010 956,971,481 CLP 1,889,013 USD (1,439) 0.0008/01/2010 9,381,729,008 COP 4,612,479 USD (14,182) (0.03)08/01/2010 1,816,466,977 COP 907,100 USD (12,534) (0.02)08/01/2010 5,032,365 CZK 272,946 USD 339 0.0008/01/2010 7,514,344 EUR 10,859,796 USD (54,777) (0.10)08/01/2010 253,893 GBP 411,748 USD (1,225) 0.0008/01/2010 422,686,440 HUF 2,211,860 USD 21,585 0.0408/01/2010 106,083,715 HUF 554,189 USD 6,067 0.0108/01/2010 29,804,916,710 IDR 3,140,401 USD 20,583 0.0408/01/2010 7,354,572,852 IDR 775,367 USD 4,764 0.0108/01/2010 5,957,449 ILS 1,571,967 USD 506 0.0008/01/2010 242,261,372 JPY 2,702,543 USD (69,825) (0.13)08/01/2010 101,147,117 JPY 1,107,136 USD (14,370) (0.03)08/01/2010 1,714,977,913 KRW 1,471,010 USD 1,111 0.0008/01/2010 16,957,058 MXN 1,328,881 USD (21,236) (0.04)08/01/2010 1,719,059 MXN 133,998 USD (1,651) 0.0008/01/2010 9,328,262 NOK 1,604,882 USD 6,709 0.0108/01/2010 1,730,318 NZD 1,227,606 USD 21,686 0.0408/01/2010 129,583,459 PHP 2,790,089 USD 8,214 0.0208/01/2010 382,740,970 PHP 8,272,440 USD 2,263 0.0008/01/2010 574,683 PLN 195,980 USD 3,336 0.01
08/01/2010 2,685,158 SEK 371,764 USD 3,008 0.0108/01/2010 1,382,265 SGD 991,461 USD (4,839) (0.01)08/01/2010 5,498,736 TRY 3,631,932 USD 23,757 0.0608/01/2010 65,556,738 TWD 2,034,717 USD 14,871 0.0308/01/2010 197,047 USD 217,832 AUD 848 0.0008/01/2010 1,645,081 USD 1,832,310 AUD (1,504) 0.0008/01/2010 181,080 USD 323,861 BRL (3,167) (0.01)08/01/2010 1,823,152 USD 1,933,088 CAD (14,492) (0.02)08/01/2010 1,467,287 USD 1,553,955 CAD (10,460) (0.02)08/01/2010 240,794 USD 248,196 CHF 485 0.0008/01/2010 167,722 USD 83,523,675 CLP 2,112 0.0008/01/2010 5,137,689 USD 2,586,663,358 CLP 26,016 0.0508/01/2010 5,222,750 USD 10,665,983,306 COP 1,399 0.0008/01/2010 297,321 USD 5,352,370 CZK 4,532 0.0108/01/2010 453,677 USD 8,288,246 CZK 2,327 0.0008/01/2010 3,296,606 USD 2,265,475 EUR 32,212 0.0608/01/2010 7,529,128 USD 5,235,761 EUR 11,932 0.0208/01/2010 807,673 USD 497,205 GBP 3,330 0.0108/01/2010 282,612 USD 54,010,989 HUF (2,772) (0.01)08/01/2010 1,571,161 USD 14,902,458,355 IDR (9,622) (0.02)08/01/2010 124,766 USD 1,185,272,301 IDR (903) 0.0008/01/2010 2,193,227 USD 8,304,637 ILS 631 0.0008/01/2010 1,216,630 USD 111,169,663 JPY 15,648 0.0308/01/2010 2,183,137 USD 2,567,649,725 KRW (15,077) (0.03)08/01/2010 392,526 USD 5,098,987 MXN 1,459 0.0008/01/2010 1,287,863 USD 7,485,166 NOK (5,330) (0.01)08/01/2010 569,193 USD 790,173 NZD (3,916) (0.01)08/01/2010 20,695 USD 29,002 NZD (280) 0.0008/01/2010 2,572,900 USD 119,073,797 PHP (1,208) 0.0008/01/2010 1,273,096 USD 3,669,062 PLN (6,063) (0.01)08/01/2010 620,733 USD 1,791,193 PLN (3,502) (0.01)08/01/2010 1,753,663 USD 12,582,310 SEK (5,993) (0.01)08/01/2010 506,555 USD 3,654,530 SEK (3,689) (0.01)08/01/2010 4,669,605 USD 6,510,247 SGD 22,779 0.0408/01/2010 1,990,420 USD 2,793,410 SGD 567 0.0008/01/2010 673,312 USD 1,020,979 TRY (5,142) (0.01)08/01/2010 6,498,912 USD 209,264,968 TWD (44,783) (0.08)08/01/2010 1,234,401 USD 39,912,296 TWD (12,104) (0.02)08/01/2010 140,048 USD 1,086,646 ZAR (5,160) (0.01)08/01/2010 6,166,699 ZAR 821,197 USD 10,866 0.0208/01/2010 4,335,755 ZAR 579,316 USD 6,288 0.0112/01/2010 24,639,160 RUB 815,922 USD (2,814) (0.01)12/01/2010 58,793,683 RUB 1,922,933 USD 10,020 0.02
Total Forward Foreign Currency Exchange Contracts (43,157) (0.08)
Total Return Swap Contracts
Description Currency Notional amount
Maturity date
Net unrealised(loss) as at
31 December 2009
% of net assets
BarCap Euro Agg Total Return Index Ser4 EUR 42,861,224 30/09/2010 (274,560) (0.53)
Total Total Return Swap Contracts (274,560) (0.53)
Total Derivatives (310,997) (0.60)
Other Assets less Liabilities 22,618,239 43.92
Total Net Asset Value 51,495,952 100.00
(3) Variable coupon rates are those quoted as of 31 December 2009.
Forward Foreign Currency Exchange Contracts (continued)
Maturity date
Amount bought
Amount sold
Net unrealisedgain/(loss) as at
31 December 2009 % of net
assets
STATEMENT OF INVESTMENTS (continued)
Transferable securities and money market instruments admitted to offi cial exchange listing or dealt in on another regulated market. As at 31 December 2009, expressed in Euro.
Investments
Nominal in Euro unless
specifi ed Market
value% of net
assets
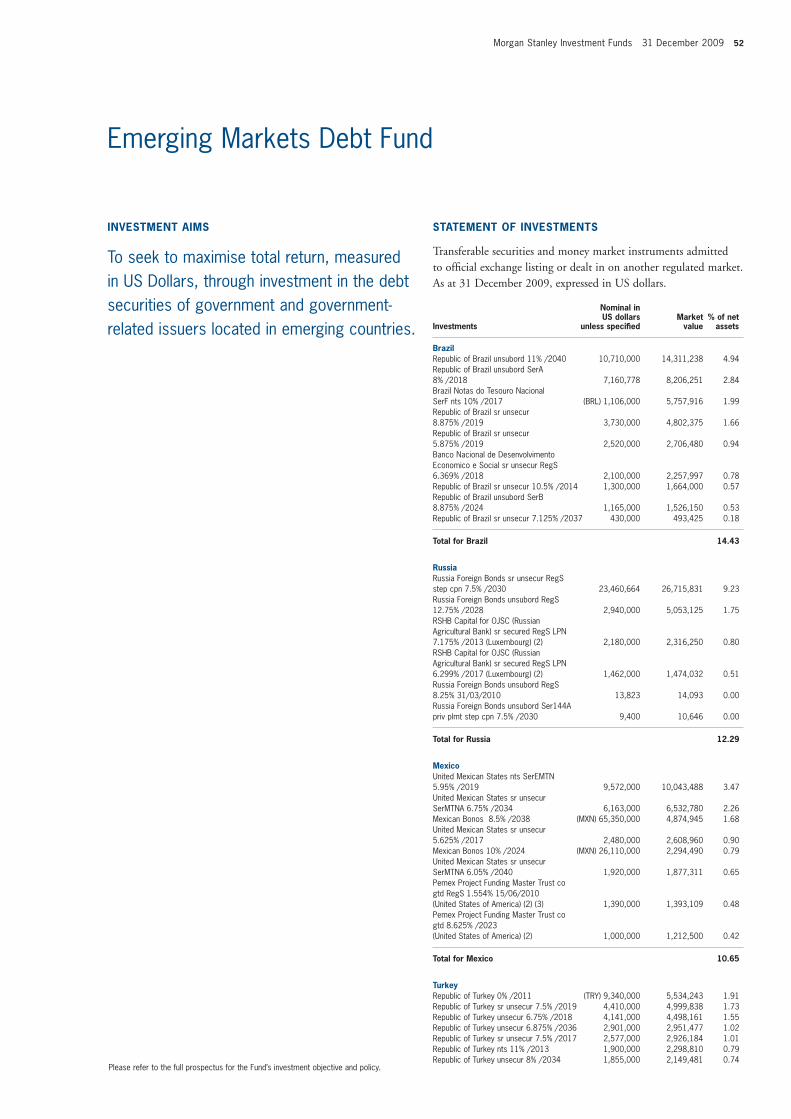
Morgan Stanley Investment Funds 31 December 2009 52
Emerging Markets Debt Fund
BrazilRepublic of Brazil unsubord 11% /2040 10,710,000 14,311,238 4.94Republic of Brazil unsubord SerA 8% /2018 7,160,778 8,206,251 2.84Brazil Notas do Tesouro Nacional SerF nts 10% /2017 (BRL) 1,106,000 5,757,916 1.99Republic of Brazil sr unsecur 8.875% /2019 3,730,000 4,802,375 1.66Republic of Brazil sr unsecur 5.875% /2019 2,520,000 2,706,480 0.94Banco Nacional de Desenvolvimento Economico e Social sr unsecur RegS 6.369% /2018 2,100,000 2,257,997 0.78Republic of Brazil sr unsecur 10.5% /2014 1,300,000 1,664,000 0.57Republic of Brazil unsubord SerB 8.875% /2024 1,165,000 1,526,150 0.53Republic of Brazil sr unsecur 7.125% /2037 430,000 493,425 0.18
Total for Brazil 14.43
RussiaRussia Foreign Bonds sr unsecur RegS step cpn 7.5% /2030 23,460,664 26,715,831 9.23Russia Foreign Bonds unsubord RegS 12.75% /2028 2,940,000 5,053,125 1.75RSHB Capital for OJSC (Russian Agricultural Bank) sr secured RegS LPN 7.175% /2013 (Luxembourg) (2) 2,180,000 2,316,250 0.80RSHB Capital for OJSC (Russian Agricultural Bank) sr secured RegS LPN 6.299% /2017 (Luxembourg) (2) 1,462,000 1,474,032 0.51Russia Foreign Bonds unsubord RegS 8.25% 31/03/2010 13,823 14,093 0.00Russia Foreign Bonds unsubord Ser144A priv plmt step cpn 7.5% /2030 9,400 10,646 0.00
Total for Russia 12.29
MexicoUnited Mexican States nts SerEMTN 5.95% /2019 9,572,000 10,043,488 3.47United Mexican States sr unsecur SerMTNA 6.75% /2034 6,163,000 6,532,780 2.26Mexican Bonos 8.5% /2038 (MXN) 65,350,000 4,874,945 1.68United Mexican States sr unsecur 5.625% /2017 2,480,000 2,608,960 0.90Mexican Bonos 10% /2024 (MXN) 26,110,000 2,294,490 0.79United Mexican States sr unsecur SerMTNA 6.05% /2040 1,920,000 1,877,311 0.65Pemex Project Funding Master Trust co gtd RegS 1.554% 15/06/2010 (United States of America) (2) (3) 1,390,000 1,393,109 0.48Pemex Project Funding Master Trust co gtd 8.625% /2023 (United States of America) (2) 1,000,000 1,212,500 0.42
Total for Mexico 10.65
TurkeyRepublic of Turkey 0% /2011 (TRY) 9,340,000 5,534,243 1.91Republic of Turkey sr unsecur 7.5% /2019 4,410,000 4,999,838 1.73Republic of Turkey unsecur 6.75% /2018 4,141,000 4,498,161 1.55Republic of Turkey unsecur 6.875% /2036 2,901,000 2,951,477 1.02Republic of Turkey sr unsecur 7.5% /2017 2,577,000 2,926,184 1.01Republic of Turkey nts 11% /2013 1,900,000 2,298,810 0.79Republic of Turkey unsecur 8% /2034 1,855,000 2,149,481 0.74
INVESTMENT AIMS
To seek to maximise total return, measured in US Dollars, through investment in the debt securities of government and government-related issuers located in emerging countries.
STATEMENT OF INVESTMENTS
Transferable securities and money market instruments admitted to offi cial exchange listing or dealt in on another regulated market. As at 31 December 2009, expressed in US dollars.
Investments
Nominal in US dollars
unless specifi ed Market
value% of net
assets
Please refer to the full prospectus for the Fund’s investment objective and policy.
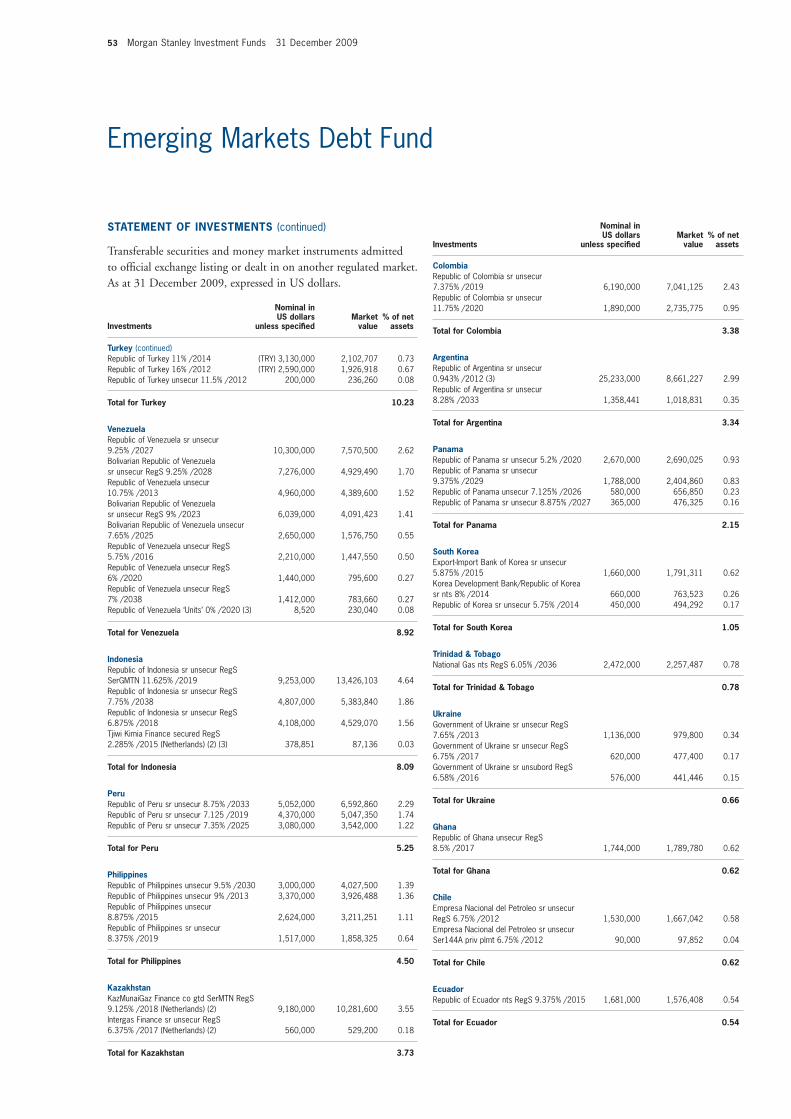
53 Morgan Stanley Investment Funds 31 December 2009
Emerging Markets Debt Fund
STATEMENT OF INVESTMENTS (continued)
Transferable securities and money market instruments admitted to offi cial exchange listing or dealt in on another regulated market. As at 31 December 2009, expressed in US dollars.
Investments
Nominal in US dollars
unless specifi ed Market
value% of net
assets
Investments
Nominal in US dollars
unless specifi ed Market
value% of net
assets
Turkey (continued)Republic of Turkey 11% /2014 (TRY) 3,130,000 2,102,707 0.73Republic of Turkey 16% /2012 (TRY) 2,590,000 1,926,918 0.67Republic of Turkey unsecur 11.5% /2012 200,000 236,260 0.08
Total for Turkey 10.23
VenezuelaRepublic of Venezuela sr unsecur 9.25% /2027 10,300,000 7,570,500 2.62Bolivarian Republic of Venezuela sr unsecur RegS 9.25% /2028 7,276,000 4,929,490 1.70Republic of Venezuela unsecur 10.75% /2013 4,960,000 4,389,600 1.52Bolivarian Republic of Venezuela sr unsecur RegS 9% /2023 6,039,000 4,091,423 1.41Bolivarian Republic of Venezuela unsecur 7.65% /2025 2,650,000 1,576,750 0.55Republic of Venezuela unsecur RegS 5.75% /2016 2,210,000 1,447,550 0.50Republic of Venezuela unsecur RegS 6% /2020 1,440,000 795,600 0.27Republic of Venezuela unsecur RegS 7% /2038 1,412,000 783,660 0.27Republic of Venezuela ‘Units’ 0% /2020 (3) 8,520 230,040 0.08
Total for Venezuela 8.92
Indonesia Republic of Indonesia sr unsecur RegS SerGMTN 11.625% /2019 9,253,000 13,426,103 4.64Republic of Indonesia sr unsecur RegS 7.75% /2038 4,807,000 5,383,840 1.86Republic of Indonesia sr unsecur RegS 6.875% /2018 4,108,000 4,529,070 1.56Tjiwi Kimia Finance secured RegS 2.285% /2015 (Netherlands) (2) (3) 378,851 87,136 0.03
Total for Indonesia 8.09
Peru Republic of Peru sr unsecur 8.75% /2033 5,052,000 6,592,860 2.29Republic of Peru sr unsecur 7.125 /2019 4,370,000 5,047,350 1.74Republic of Peru sr unsecur 7.35% /2025 3,080,000 3,542,000 1.22
Total for Peru 5.25
Philippines Republic of Philippines unsecur 9.5% /2030 3,000,000 4,027,500 1.39Republic of Philippines unsecur 9% /2013 3,370,000 3,926,488 1.36Republic of Philippines unsecur 8.875% /2015 2,624,000 3,211,251 1.11Republic of Philippines sr unsecur 8.375% /2019 1,517,000 1,858,325 0.64
Total for Philippines 4.50
Kazakhstan KazMunaiGaz Finance co gtd SerMTN RegS 9.125% /2018 (Netherlands) (2) 9,180,000 10,281,600 3.55Intergas Finance sr unsecur RegS 6.375% /2017 (Netherlands) (2) 560,000 529,200 0.18
Total for Kazakhstan 3.73
Colombia Republic of Colombia sr unsecur 7.375% /2019 6,190,000 7,041,125 2.43Republic of Colombia sr unsecur 11.75% /2020 1,890,000 2,735,775 0.95
Total for Colombia 3.38
Argentina Republic of Argentina sr unsecur 0.943% /2012 (3) 25,233,000 8,661,227 2.99Republic of Argentina sr unsecur 8.28% /2033 1,358,441 1,018,831 0.35
Total for Argentina 3.34
Panama Republic of Panama sr unsecur 5.2% /2020 2,670,000 2,690,025 0.93Republic of Panama sr unsecur 9.375% /2029 1,788,000 2,404,860 0.83Republic of Panama unsecur 7.125% /2026 580,000 656,850 0.23Republic of Panama sr unsecur 8.875% /2027 365,000 476,325 0.16
Total for Panama 2.15
South Korea Export-Import Bank of Korea sr unsecur 5.875% /2015 1,660,000 1,791,311 0.62Korea Development Bank/Republic of Korea sr nts 8% /2014 660,000 763,523 0.26Republic of Korea sr unsecur 5.75% /2014 450,000 494,292 0.17
Total for South Korea 1.05
Trinidad & Tobago National Gas nts RegS 6.05% /2036 2,472,000 2,257,487 0.78
Total for Trinidad & Tobago 0.78
Ukraine Government of Ukraine sr unsecur RegS 7.65% /2013 1,136,000 979,800 0.34Government of Ukraine sr unsecur RegS 6.75% /2017 620,000 477,400 0.17Government of Ukraine sr unsubord RegS 6.58% /2016 576,000 441,446 0.15
Total for Ukraine 0.66
Ghana Republic of Ghana unsecur RegS 8.5% /2017 1,744,000 1,789,780 0.62
Total for Ghana 0.62
Chile Empresa Nacional del Petroleo sr unsecur RegS 6.75% /2012 1,530,000 1,667,042 0.58Empresa Nacional del Petroleo sr unsecur Ser144A priv plmt 6.75% /2012 90,000 97,852 0.04
Total for Chile 0.62
Ecuador Republic of Ecuador nts RegS 9.375% /2015 1,681,000 1,576,408 0.54
Total for Ecuador 0.54
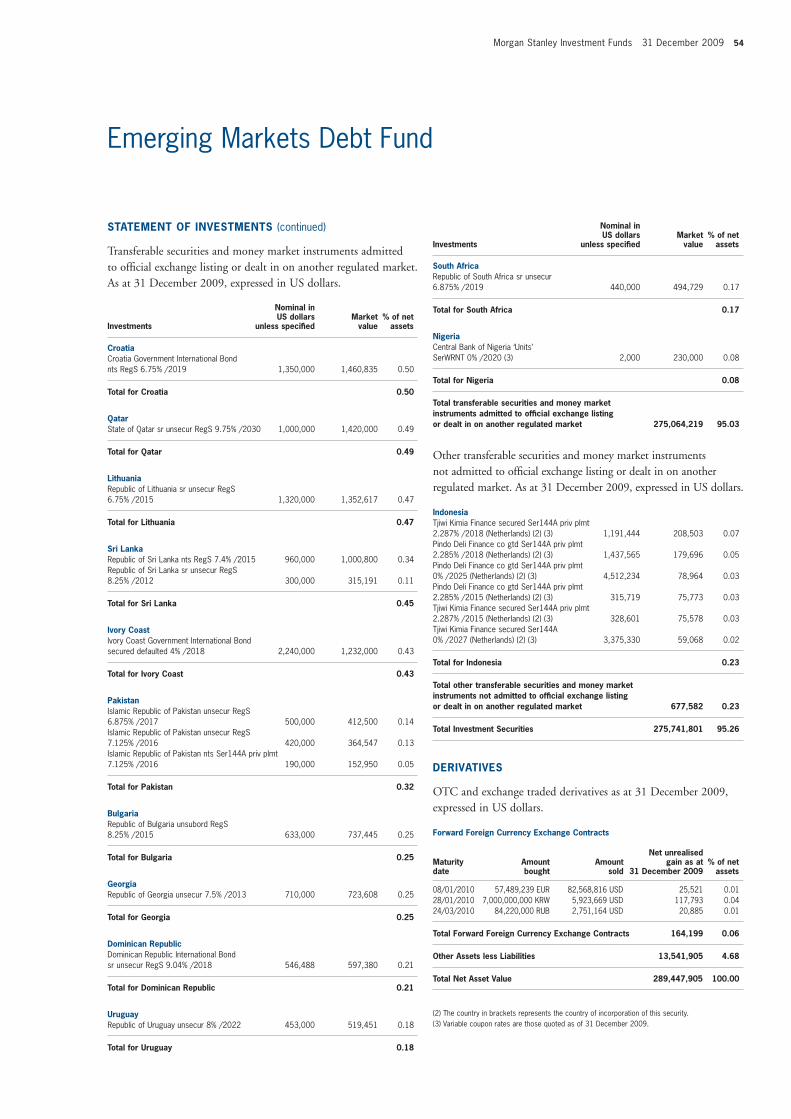
Morgan Stanley Investment Funds 31 December 2009 54
Emerging Markets Debt Fund
Croatia Croatia Government International Bond nts RegS 6.75% /2019 1,350,000 1,460,835 0.50
Total for Croatia 0.50
Qatar State of Qatar sr unsecur RegS 9.75% /2030 1,000,000 1,420,000 0.49
Total for Qatar 0.49
Lithuania Republic of Lithuania sr unsecur RegS 6.75% /2015 1,320,000 1,352,617 0.47
Total for Lithuania 0.47
Sri Lanka Republic of Sri Lanka nts RegS 7.4% /2015 960,000 1,000,800 0.34Republic of Sri Lanka sr unsecur RegS 8.25% /2012 300,000 315,191 0.11
Total for Sri Lanka 0.45
Ivory Coast Ivory Coast Government International Bond secured defaulted 4% /2018 2,240,000 1,232,000 0.43
Total for Ivory Coast 0.43
Pakistan Islamic Republic of Pakistan unsecur RegS 6.875% /2017 500,000 412,500 0.14Islamic Republic of Pakistan unsecur RegS 7.125% /2016 420,000 364,547 0.13Islamic Republic of Pakistan nts Ser144A priv plmt 7.125% /2016 190,000 152,950 0.05
Total for Pakistan 0.32
Bulgaria Republic of Bulgaria unsubord RegS 8.25% /2015 633,000 737,445 0.25
Total for Bulgaria 0.25
Georgia Republic of Georgia unsecur 7.5% /2013 710,000 723,608 0.25
Total for Georgia 0.25
Dominican Republic Dominican Republic International Bond sr unsecur RegS 9.04% /2018 546,488 597,380 0.21
Total for Dominican Republic 0.21
Uruguay Republic of Uruguay unsecur 8% /2022 453,000 519,451 0.18
Total for Uruguay 0.18
STATEMENT OF INVESTMENTS (continued)
Transferable securities and money market instruments admitted to offi cial exchange listing or dealt in on another regulated market. As at 31 December 2009, expressed in US dollars.
Investments
Nominal in US dollars
unless specifi ed Market
value% of net
assets
South Africa Republic of South Africa sr unsecur 6.875% /2019 440,000 494,729 0.17
Total for South Africa 0.17
Nigeria Central Bank of Nigeria ‘Units’ SerWRNT 0% /2020 (3) 2,000 230,000 0.08
Total for Nigeria 0.08
Total transferable securities and money market instruments admitted to offi cial exchange listing or dealt in on another regulated market 275,064,219 95.03
Other transferable securities and money market instruments not admitted to offi cial exchange listing or dealt in on another regulated market. As at 31 December 2009, expressed in US dollars.
Indonesia Tjiwi Kimia Finance secured Ser144A priv plmt 2.287% /2018 (Netherlands) (2) (3) 1,191,444 208,503 0.07Pindo Deli Finance co gtd Ser144A priv plmt 2.285% /2018 (Netherlands) (2) (3) 1,437,565 179,696 0.05Pindo Deli Finance co gtd Ser144A priv plmt 0% /2025 (Netherlands) (2) (3) 4,512,234 78,964 0.03Pindo Deli Finance co gtd Ser144A priv plmt 2.285% /2015 (Netherlands) (2) (3) 315,719 75,773 0.03Tjiwi Kimia Finance secured Ser144A priv plmt 2.287% /2015 (Netherlands) (2) (3) 328,601 75,578 0.03Tjiwi Kimia Finance secured Ser144A 0% /2027 (Netherlands) (2) (3) 3,375,330 59,068 0.02
Total for Indonesia 0.23
Total other transferable securities and money market instruments not admitted to offi cial exchange listing or dealt in on another regulated market 677,582 0.23
Total Investment Securities 275,741,801 95.26
DERIVATIVES
OTC and exchange traded derivatives as at 31 December 2009, expressed in US dollars.
Forward Foreign Currency Exchange Contracts
Maturity date
Amount bought
Amount sold
Net unrealisedgain as at
31 December 2009 % of net
assets 08/01/2010 57,489,239 EUR 82,568,816 USD 25,521 0.0128/01/2010 7,000,000,000 KRW 5,923,669 USD 117,793 0.0424/03/2010 84,220,000 RUB 2,751,164 USD 20,885 0.01
Total Forward Foreign Currency Exchange Contracts 164,199 0.06
Other Assets less Liabilities 13,541,905 4.68
Total Net Asset Value 289,447,905 100.00
(2) The country in brackets represents the country of incorporation of this security.(3) Variable coupon rates are those quoted as of 31 December 2009.
Investments
Nominal in US dollars
unless specifi ed Market
value% of net
assets
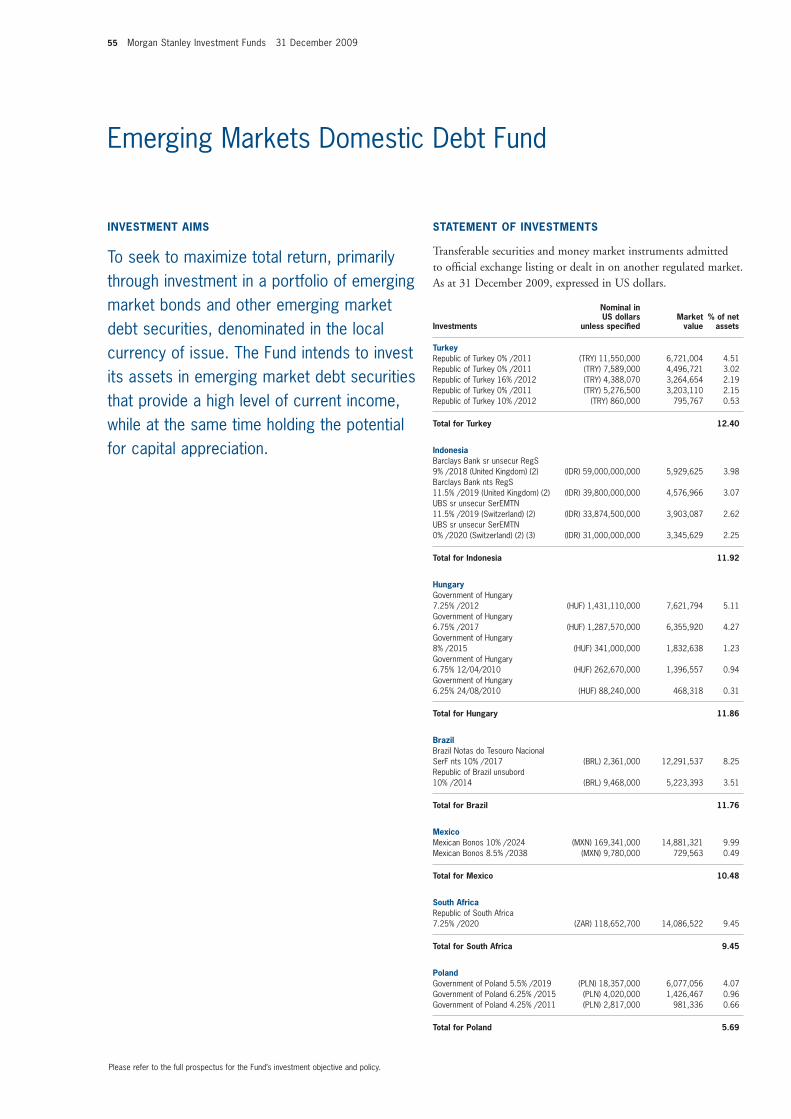
55 Morgan Stanley Investment Funds 31 December 2009
Emerging Markets Domestic Debt Fund
Turkey Republic of Turkey 0% /2011 (TRY) 11,550,000 6,721,004 4.51Republic of Turkey 0% /2011 (TRY) 7,589,000 4,496,721 3.02Republic of Turkey 16% /2012 (TRY) 4,388,070 3,264,654 2.19Republic of Turkey 0% /2011 (TRY) 5,276,500 3,203,110 2.15Republic of Turkey 10% /2012 (TRY) 860,000 795,767 0.53
Total for Turkey 12.40
Indonesia Barclays Bank sr unsecur RegS 9% /2018 (United Kingdom) (2) (IDR) 59,000,000,000 5,929,625 3.98Barclays Bank nts RegS 11.5% /2019 (United Kingdom) (2) (IDR) 39,800,000,000 4,576,966 3.07UBS sr unsecur SerEMTN 11.5% /2019 (Switzerland) (2) (IDR) 33,874,500,000 3,903,087 2.62UBS sr unsecur SerEMTN 0% /2020 (Switzerland) (2) (3) (IDR) 31,000,000,000 3,345,629 2.25
Total for Indonesia 11.92
Hungary Government of Hungary 7.25% /2012 (HUF) 1,431,110,000 7,621,794 5.11Government of Hungary 6.75% /2017 (HUF) 1,287,570,000 6,355,920 4.27Government of Hungary 8% /2015 (HUF) 341,000,000 1,832,638 1.23Government of Hungary 6.75% 12/04/2010 (HUF) 262,670,000 1,396,557 0.94Government of Hungary 6.25% 24/08/2010 (HUF) 88,240,000 468,318 0.31
Total for Hungary 11.86
Brazil Brazil Notas do Tesouro Nacional SerF nts 10% /2017 (BRL) 2,361,000 12,291,537 8.25Republic of Brazil unsubord 10% /2014 (BRL) 9,468,000 5,223,393 3.51
Total for Brazil 11.76
Mexico Mexican Bonos 10% /2024 (MXN) 169,341,000 14,881,321 9.99Mexican Bonos 8.5% /2038 (MXN) 9,780,000 729,563 0.49
Total for Mexico 10.48
South Africa Republic of South Africa 7.25% /2020 (ZAR) 118,652,700 14,086,522 9.45
Total for South Africa 9.45
Poland Government of Poland 5.5% /2019 (PLN) 18,357,000 6,077,056 4.07Government of Poland 6.25% /2015 (PLN) 4,020,000 1,426,467 0.96Government of Poland 4.25% /2011 (PLN) 2,817,000 981,336 0.66
Total for Poland 5.69
INVESTMENT AIMS
To seek to maximize total return, primarily through investment in a portfolio of emerging market bonds and other emerging market debt securities, denominated in the local currency of issue. The Fund intends to invest its assets in emerging market debt securities that provide a high level of current income, while at the same time holding the potential for capital appreciation.
STATEMENT OF INVESTMENTS
Transferable securities and money market instruments admitted to offi cial exchange listing or dealt in on another regulated market. As at 31 December 2009, expressed in US dollars.
Investments
Nominal in US dollars
unless specifi ed Market
value% of net
assets
Please refer to the full prospectus for the Fund’s investment objective and policy.
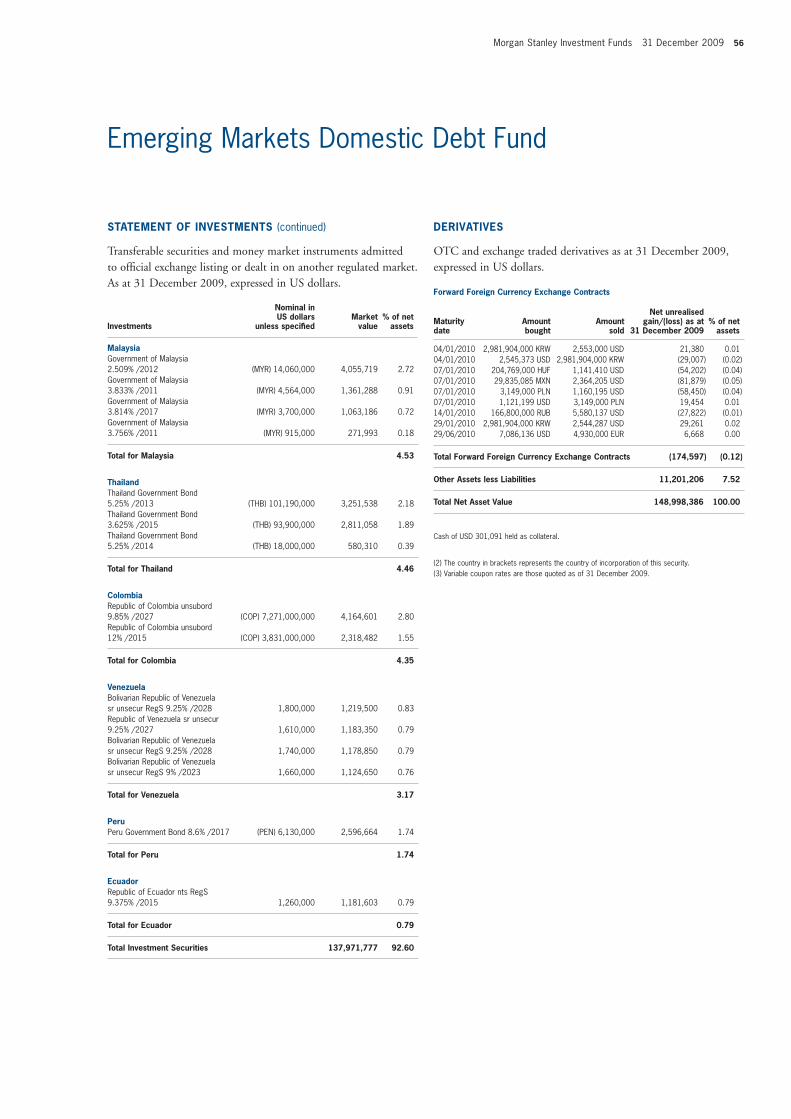
Morgan Stanley Investment Funds 31 December 2009 56
Emerging Markets Domestic Debt Fund
STATEMENT OF INVESTMENTS (continued)
Transferable securities and money market instruments admitted to offi cial exchange listing or dealt in on another regulated market. As at 31 December 2009, expressed in US dollars.
Investments
Nominal in US dollars
unless specifi ed Market
value% of net
assets
Malaysia Government of Malaysia 2.509% /2012 (MYR) 14,060,000 4,055,719 2.72Government of Malaysia 3.833% /2011 (MYR) 4,564,000 1,361,288 0.91Government of Malaysia 3.814% /2017 (MYR) 3,700,000 1,063,186 0.72Government of Malaysia 3.756% /2011 (MYR) 915,000 271,993 0.18
Total for Malaysia 4.53
Thailand Thailand Government Bond 5.25% /2013 (THB) 101,190,000 3,251,538 2.18Thailand Government Bond 3.625% /2015 (THB) 93,900,000 2,811,058 1.89Thailand Government Bond 5.25% /2014 (THB) 18,000,000 580,310 0.39
Total for Thailand 4.46
Colombia Republic of Colombia unsubord 9.85% /2027 (COP) 7,271,000,000 4,164,601 2.80Republic of Colombia unsubord 12% /2015 (COP) 3,831,000,000 2,318,482 1.55
Total for Colombia 4.35
Venezuela Bolivarian Republic of Venezuela sr unsecur RegS 9.25% /2028 1,800,000 1,219,500 0.83Republic of Venezuela sr unsecur 9.25% /2027 1,610,000 1,183,350 0.79Bolivarian Republic of Venezuela sr unsecur RegS 9.25% /2028 1,740,000 1,178,850 0.79Bolivarian Republic of Venezuela sr unsecur RegS 9% /2023 1,660,000 1,124,650 0.76
Total for Venezuela 3.17
Peru Peru Government Bond 8.6% /2017 (PEN) 6,130,000 2,596,664 1.74
Total for Peru 1.74
Ecuador Republic of Ecuador nts RegS 9.375% /2015 1,260,000 1,181,603 0.79
Total for Ecuador 0.79
Total Investment Securities 137,971,777 92.60
DERIVATIVES
OTC and exchange traded derivatives as at 31 December 2009, expressed in US dollars.
Forward Foreign Currency Exchange Contracts
Maturity date
Amount bought
Amount sold
Net unrealisedgain/(loss) as at
31 December 2009 % of net
assets 04/01/2010 2,981,904,000 KRW 2,553,000 USD 21,380 0.0104/01/2010 2,545,373 USD 2,981,904,000 KRW (29,007) (0.02)07/01/2010 204,769,000 HUF 1,141,410 USD (54,202) (0.04)07/01/2010 29,835,085 MXN 2,364,205 USD (81,879) (0.05)07/01/2010 3,149,000 PLN 1,160,195 USD (58,450) (0.04)07/01/2010 1,121,199 USD 3,149,000 PLN 19,454 0.0114/01/2010 166,800,000 RUB 5,580,137 USD (27,822) (0.01)29/01/2010 2,981,904,000 KRW 2,544,287 USD 29,261 0.0229/06/2010 7,086,136 USD 4,930,000 EUR 6,668 0.00
Total Forward Foreign Currency Exchange Contracts (174,597) (0.12)
Other Assets less Liabilities 11,201,206 7.52
Total Net Asset Value 148,998,386 100.00
Cash of USD 301,091 held as collateral.
(2) The country in brackets represents the country of incorporation of this security.(3) Variable coupon rates are those quoted as of 31 December 2009.
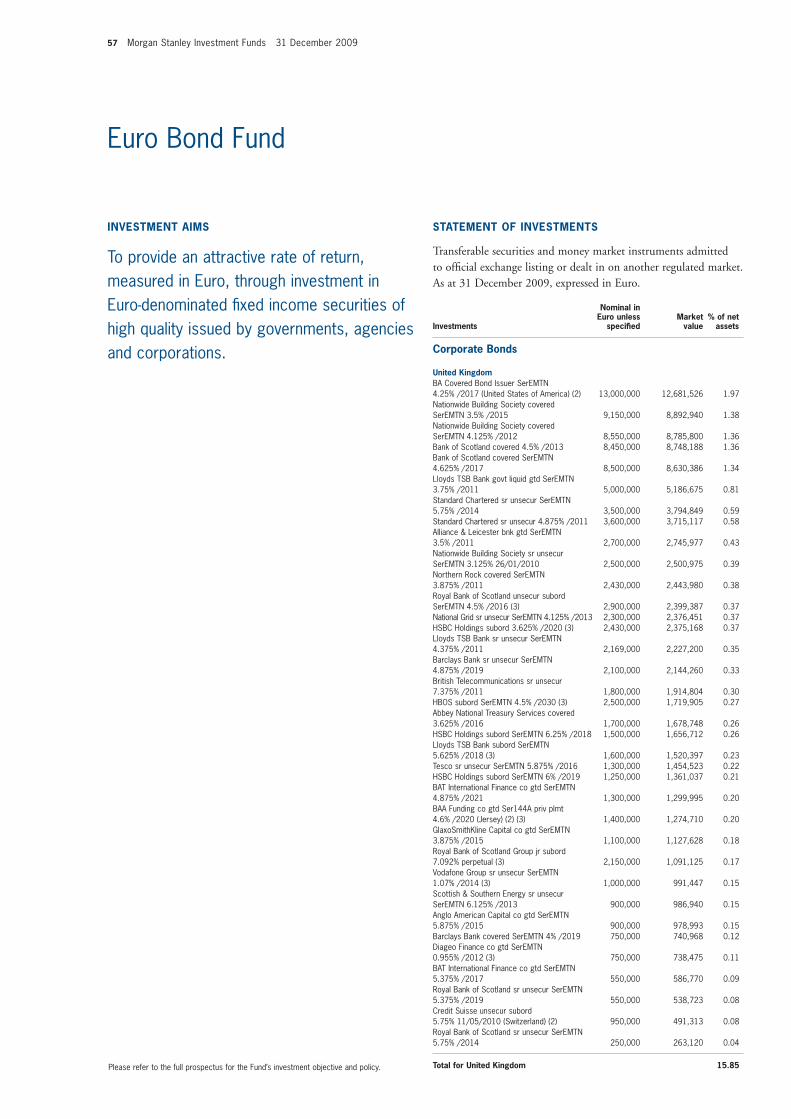
57 Morgan Stanley Investment Funds 31 December 2009
Euro Bond Fund
Corporate Bonds
United KingdomBA Covered Bond Issuer SerEMTN 4.25% /2017 (United States of America) (2) 13,000,000 12,681,526 1.97Nationwide Building Society covered SerEMTN 3.5% /2015 9,150,000 8,892,940 1.38Nationwide Building Society covered SerEMTN 4.125% /2012 8,550,000 8,785,800 1.36Bank of Scotland covered 4.5% /2013 8,450,000 8,748,188 1.36Bank of Scotland covered SerEMTN 4.625% /2017 8,500,000 8,630,386 1.34Lloyds TSB Bank govt liquid gtd SerEMTN 3.75% /2011 5,000,000 5,186,675 0.81Standard Chartered sr unsecur SerEMTN 5.75% /2014 3,500,000 3,794,849 0.59Standard Chartered sr unsecur 4.875% /2011 3,600,000 3,715,117 0.58Alliance & Leicester bnk gtd SerEMTN 3.5% /2011 2,700,000 2,745,977 0.43Nationwide Building Society sr unsecur SerEMTN 3.125% 26/01/2010 2,500,000 2,500,975 0.39Northern Rock covered SerEMTN 3.875% /2011 2,430,000 2,443,980 0.38Royal Bank of Scotland unsecur subord SerEMTN 4.5% /2016 (3) 2,900,000 2,399,387 0.37National Grid sr unsecur SerEMTN 4.125% /2013 2,300,000 2,376,451 0.37HSBC Holdings subord 3.625% /2020 (3) 2,430,000 2,375,168 0.37Lloyds TSB Bank sr unsecur SerEMTN 4.375% /2011 2,169,000 2,227,200 0.35Barclays Bank sr unsecur SerEMTN 4.875% /2019 2,100,000 2,144,260 0.33British Telecommunications sr unsecur 7.375% /2011 1,800,000 1,914,804 0.30HBOS subord SerEMTN 4.5% /2030 (3) 2,500,000 1,719,905 0.27Abbey National Treasury Services covered 3.625% /2016 1,700,000 1,678,748 0.26HSBC Holdings subord SerEMTN 6.25% /2018 1,500,000 1,656,712 0.26Lloyds TSB Bank subord SerEMTN 5.625% /2018 (3) 1,600,000 1,520,397 0.23Tesco sr unsecur SerEMTN 5.875% /2016 1,300,000 1,454,523 0.22HSBC Holdings subord SerEMTN 6% /2019 1,250,000 1,361,037 0.21BAT International Finance co gtd SerEMTN 4.875% /2021 1,300,000 1,299,995 0.20BAA Funding co gtd Ser144A priv plmt 4.6% /2020 (Jersey) (2) (3) 1,400,000 1,274,710 0.20GlaxoSmithKline Capital co gtd SerEMTN 3.875% /2015 1,100,000 1,127,628 0.18Royal Bank of Scotland Group jr subord 7.092% perpetual (3) 2,150,000 1,091,125 0.17Vodafone Group sr unsecur SerEMTN 1.07% /2014 (3) 1,000,000 991,447 0.15Scottish & Southern Energy sr unsecur SerEMTN 6.125% /2013 900,000 986,940 0.15Anglo American Capital co gtd SerEMTN 5.875% /2015 900,000 978,993 0.15Barclays Bank covered SerEMTN 4% /2019 750,000 740,968 0.12Diageo Finance co gtd SerEMTN 0.955% /2012 (3) 750,000 738,475 0.11BAT International Finance co gtd SerEMTN 5.375% /2017 550,000 586,770 0.09Royal Bank of Scotland sr unsecur SerEMTN 5.375% /2019 550,000 538,723 0.08Credit Suisse unsecur subord 5.75% 11/05/2010 (Switzerland) (2) 950,000 491,313 0.08Royal Bank of Scotland sr unsecur SerEMTN 5.75% /2014 250,000 263,120 0.04
Total for United Kingdom 15.85
INVESTMENT AIMS
To provide an attractive rate of return, measured in Euro, through investment in Euro-denominated fi xed income securities of high quality issued by governments, agencies and corporations.
STATEMENT OF INVESTMENTS
Transferable securities and money market instruments admitted to offi cial exchange listing or dealt in on another regulated market. As at 31 December 2009, expressed in Euro.
Investments
Nominal in Euro unless
specifi ed Market
value% of net
assets
Please refer to the full prospectus for the Fund’s investment objective and policy.
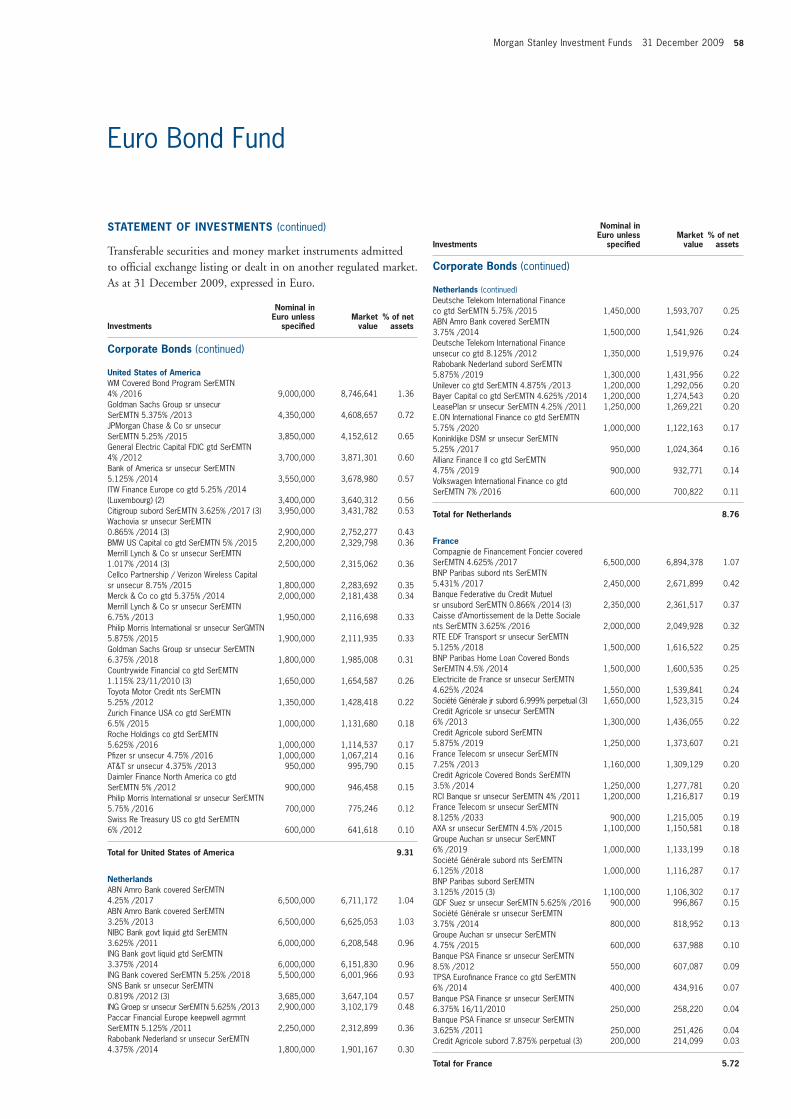
Morgan Stanley Investment Funds 31 December 2009 58
Euro Bond Fund
STATEMENT OF INVESTMENTS (continued)
Transferable securities and money market instruments admitted to offi cial exchange listing or dealt in on another regulated market. As at 31 December 2009, expressed in Euro.
Investments
Nominal in Euro unless
specifi ed Market
value% of net
assets
Investments
Nominal in Euro unless
specifi ed Market
value% of net
assets
Corporate Bonds (continued)
United States of America WM Covered Bond Program SerEMTN 4% /2016 9,000,000 8,746,641 1.36Goldman Sachs Group sr unsecur SerEMTN 5.375% /2013 4,350,000 4,608,657 0.72JPMorgan Chase & Co sr unsecur SerEMTN 5.25% /2015 3,850,000 4,152,612 0.65General Electric Capital FDIC gtd SerEMTN 4% /2012 3,700,000 3,871,301 0.60Bank of America sr unsecur SerEMTN 5.125% /2014 3,550,000 3,678,980 0.57ITW Finance Europe co gtd 5.25% /2014 (Luxembourg) (2) 3,400,000 3,640,312 0.56Citigroup subord SerEMTN 3.625% /2017 (3) 3,950,000 3,431,782 0.53Wachovia sr unsecur SerEMTN 0.865% /2014 (3) 2,900,000 2,752,277 0.43BMW US Capital co gtd SerEMTN 5% /2015 2,200,000 2,329,798 0.36Merrill Lynch & Co sr unsecur SerEMTN 1.017% /2014 (3) 2,500,000 2,315,062 0.36Cellco Partnership / Verizon Wireless Capital sr unsecur 8.75% /2015 1,800,000 2,283,692 0.35Merck & Co co gtd 5.375% /2014 2,000,000 2,181,438 0.34Merrill Lynch & Co sr unsecur SerEMTN 6.75% /2013 1,950,000 2,116,698 0.33Philip Morris International sr unsecur SerGMTN 5.875% /2015 1,900,000 2,111,935 0.33Goldman Sachs Group sr unsecur SerEMTN 6.375% /2018 1,800,000 1,985,008 0.31Countrywide Financial co gtd SerEMTN 1.115% 23/11/2010 (3) 1,650,000 1,654,587 0.26Toyota Motor Credit nts SerEMTN 5.25% /2012 1,350,000 1,428,418 0.22Zurich Finance USA co gtd SerEMTN 6.5% /2015 1,000,000 1,131,680 0.18Roche Holdings co gtd SerEMTN 5.625% /2016 1,000,000 1,114,537 0.17Pfi zer sr unsecur 4.75% /2016 1,000,000 1,067,214 0.16AT&T sr unsecur 4.375% /2013 950,000 995,790 0.15Daimler Finance North America co gtd SerEMTN 5% /2012 900,000 946,458 0.15Philip Morris International sr unsecur SerEMTN 5.75% /2016 700,000 775,246 0.12Swiss Re Treasury US co gtd SerEMTN 6% /2012 600,000 641,618 0.10
Total for United States of America 9.31
NetherlandsABN Amro Bank covered SerEMTN 4.25% /2017 6,500,000 6,711,172 1.04ABN Amro Bank covered SerEMTN 3.25% /2013 6,500,000 6,625,053 1.03NIBC Bank govt liquid gtd SerEMTN 3.625% /2011 6,000,000 6,208,548 0.96ING Bank govt liquid gtd SerEMTN 3.375% /2014 6,000,000 6,151,830 0.96ING Bank covered SerEMTN 5.25% /2018 5,500,000 6,001,966 0.93SNS Bank sr unsecur SerEMTN 0.819% /2012 (3) 3,685,000 3,647,104 0.57ING Groep sr unsecur SerEMTN 5.625% /2013 2,900,000 3,102,179 0.48Paccar Financial Europe keepwell agrmnt SerEMTN 5.125% /2011 2,250,000 2,312,899 0.36Rabobank Nederland sr unsecur SerEMTN 4.375% /2014 1,800,000 1,901,167 0.30
Corporate Bonds (continued)
Netherlands (continued)Deutsche Telekom International Finance co gtd SerEMTN 5.75% /2015 1,450,000 1,593,707 0.25ABN Amro Bank covered SerEMTN 3.75% /2014 1,500,000 1,541,926 0.24Deutsche Telekom International Finance unsecur co gtd 8.125% /2012 1,350,000 1,519,976 0.24Rabobank Nederland subord SerEMTN 5.875% /2019 1,300,000 1,431,956 0.22Unilever co gtd SerEMTN 4.875% /2013 1,200,000 1,292,056 0.20Bayer Capital co gtd SerEMTN 4.625% /2014 1,200,000 1,274,543 0.20LeasePlan sr unsecur SerEMTN 4.25% /2011 1,250,000 1,269,221 0.20E.ON International Finance co gtd SerEMTN 5.75% /2020 1,000,000 1,122,163 0.17Koninklijke DSM sr unsecur SerEMTN 5.25% /2017 950,000 1,024,364 0.16Allianz Finance II co gtd SerEMTN 4.75% /2019 900,000 932,771 0.14Volkswagen International Finance co gtd SerEMTN 7% /2016 600,000 700,822 0.11
Total for Netherlands 8.76
France Compagnie de Financement Foncier covered SerEMTN 4.625% /2017 6,500,000 6,894,378 1.07BNP Paribas subord nts SerEMTN 5.431% /2017 2,450,000 2,671,899 0.42Banque Federative du Credit Mutuel sr unsubord SerEMTN 0.866% /2014 (3) 2,350,000 2,361,517 0.37Caisse d’Amortissement de la Dette Sociale nts SerEMTN 3.625% /2016 2,000,000 2,049,928 0.32RTE EDF Transport sr unsecur SerEMTN 5.125% /2018 1,500,000 1,616,522 0.25BNP Paribas Home Loan Covered Bonds SerEMTN 4.5% /2014 1,500,000 1,600,535 0.25Electricite de France sr unsecur SerEMTN 4.625% /2024 1,550,000 1,539,841 0.24Société Générale jr subord 6.999% perpetual (3) 1,650,000 1,523,315 0.24Credit Agricole sr unsecur SerEMTN 6% /2013 1,300,000 1,436,055 0.22Credit Agricole subord SerEMTN 5.875% /2019 1,250,000 1,373,607 0.21France Telecom sr unsecur SerEMTN 7.25% /2013 1,160,000 1,309,129 0.20Credit Agricole Covered Bonds SerEMTN 3.5% /2014 1,250,000 1,277,781 0.20RCI Banque sr unsecur SerEMTN 4% /2011 1,200,000 1,216,817 0.19France Telecom sr unsecur SerEMTN 8.125% /2033 900,000 1,215,005 0.19AXA sr unsecur SerEMTN 4.5% /2015 1,100,000 1,150,581 0.18Groupe Auchan sr unsecur SerEMNT 6% /2019 1,000,000 1,133,199 0.18Société Générale subord nts SerEMTN 6.125% /2018 1,000,000 1,116,287 0.17BNP Paribas subord SerEMTN 3.125% /2015 (3) 1,100,000 1,106,302 0.17GDF Suez sr unsecur SerEMTN 5.625% /2016 900,000 996,867 0.15Société Générale sr unsecur SerEMTN 3.75% /2014 800,000 818,952 0.13Groupe Auchan sr unsecur SerEMTN 4.75% /2015 600,000 637,988 0.10Banque PSA Finance sr unsecur SerEMTN 8.5% /2012 550,000 607,087 0.09TPSA Eurofi nance France co gtd SerEMTN 6% /2014 400,000 434,916 0.07Banque PSA Finance sr unsecur SerEMTN 6.375% 16/11/2010 250,000 258,220 0.04Banque PSA Finance sr unsecur SerEMTN 3.625% /2011 250,000 251,426 0.04Credit Agricole subord 7.875% perpetual (3) 200,000 214,099 0.03
Total for France 5.72
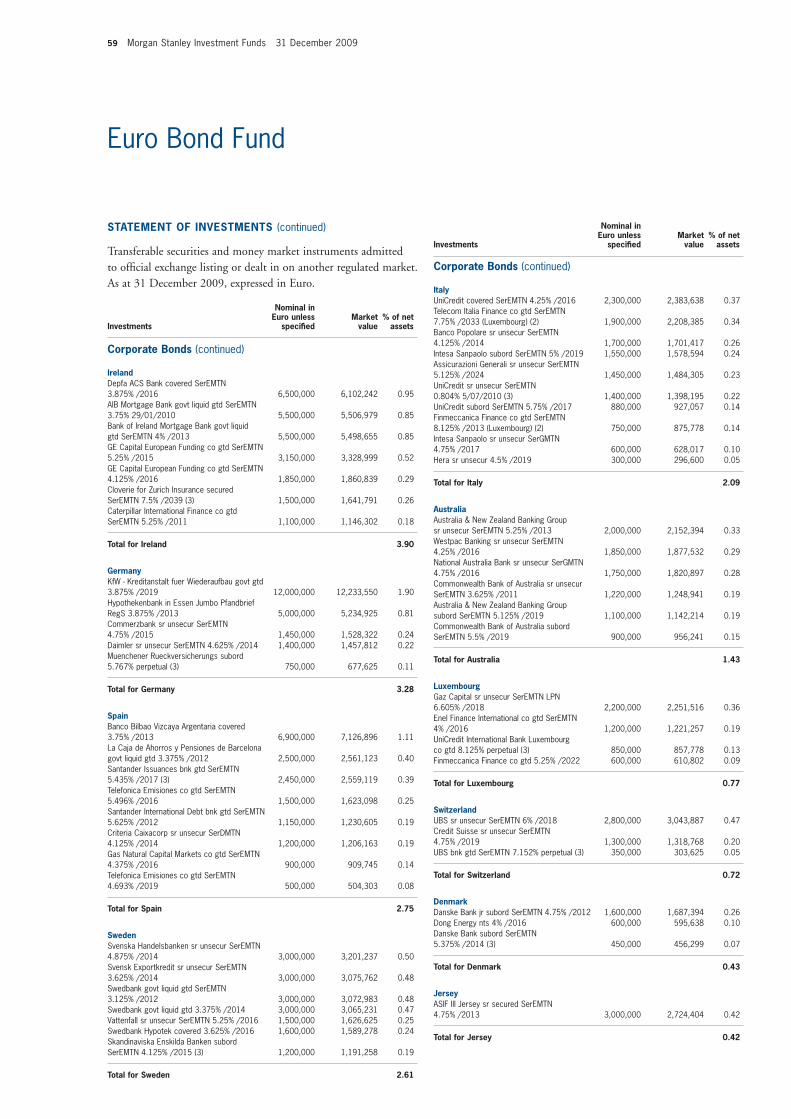
59 Morgan Stanley Investment Funds 31 December 2009
Euro Bond Fund
STATEMENT OF INVESTMENTS (continued)
Transferable securities and money market instruments admitted to offi cial exchange listing or dealt in on another regulated market. As at 31 December 2009, expressed in Euro.
Investments
Nominal in Euro unless
specifi ed Market
value% of net
assets
Corporate Bonds (continued)
Ireland Depfa ACS Bank covered SerEMTN 3.875% /2016 6,500,000 6,102,242 0.95AIB Mortgage Bank govt liquid gtd SerEMTN 3.75% 29/01/2010 5,500,000 5,506,979 0.85Bank of Ireland Mortgage Bank govt liquid gtd SerEMTN 4% /2013 5,500,000 5,498,655 0.85GE Capital European Funding co gtd SerEMTN 5.25% /2015 3,150,000 3,328,999 0.52GE Capital European Funding co gtd SerEMTN 4.125% /2016 1,850,000 1,860,839 0.29Cloverie for Zurich Insurance secured SerEMTN 7.5% /2039 (3) 1,500,000 1,641,791 0.26Caterpillar International Finance co gtd SerEMTN 5.25% /2011 1,100,000 1,146,302 0.18
Total for Ireland 3.90
Germany KfW - Kreditanstalt fuer Wiederaufbau govt gtd 3.875% /2019 12,000,000 12,233,550 1.90Hypothekenbank in Essen Jumbo Pfandbrief RegS 3.875% /2013 5,000,000 5,234,925 0.81Commerzbank sr unsecur SerEMTN 4.75% /2015 1,450,000 1,528,322 0.24Daimler sr unsecur SerEMTN 4.625% /2014 1,400,000 1,457,812 0.22Muenchener Rueckversicherungs subord 5.767% perpetual (3) 750,000 677,625 0.11
Total for Germany 3.28
Spain Banco Bilbao Vizcaya Argentaria covered 3.75% /2013 6,900,000 7,126,896 1.11La Caja de Ahorros y Pensiones de Barcelona govt liquid gtd 3.375% /2012 2,500,000 2,561,123 0.40Santander Issuances bnk gtd SerEMTN 5.435% /2017 (3) 2,450,000 2,559,119 0.39Telefonica Emisiones co gtd SerEMTN 5.496% /2016 1,500,000 1,623,098 0.25Santander International Debt bnk gtd SerEMTN 5.625% /2012 1,150,000 1,230,605 0.19Criteria Caixacorp sr unsecur SerDMTN 4.125% /2014 1,200,000 1,206,163 0.19Gas Natural Capital Markets co gtd SerEMTN 4.375% /2016 900,000 909,745 0.14Telefonica Emisiones co gtd SerEMTN 4.693% /2019 500,000 504,303 0.08
Total for Spain 2.75
Sweden Svenska Handelsbanken sr unsecur SerEMTN 4.875% /2014 3,000,000 3,201,237 0.50Svensk Exportkredit sr unsecur SerEMTN 3.625% /2014 3,000,000 3,075,762 0.48Swedbank govt liquid gtd SerEMTN 3.125% /2012 3,000,000 3,072,983 0.48Swedbank govt liquid gtd 3.375% /2014 3,000,000 3,065,231 0.47Vattenfall sr unsecur SerEMTN 5.25% /2016 1,500,000 1,626,625 0.25Swedbank Hypotek covered 3.625% /2016 1,600,000 1,589,278 0.24Skandinaviska Enskilda Banken subord SerEMTN 4.125% /2015 (3) 1,200,000 1,191,258 0.19
Total for Sweden 2.61
Corporate Bonds (continued)
Italy UniCredit covered SerEMTN 4.25% /2016 2,300,000 2,383,638 0.37Telecom Italia Finance co gtd SerEMTN 7.75% /2033 (Luxembourg) (2) 1,900,000 2,208,385 0.34Banco Popolare sr unsecur SerEMTN 4.125% /2014 1,700,000 1,701,417 0.26Intesa Sanpaolo subord SerEMTN 5% /2019 1,550,000 1,578,594 0.24Assicurazioni Generali sr unsecur SerEMTN 5.125% /2024 1,450,000 1,484,305 0.23UniCredit sr unsecur SerEMTN 0.804% 5/07/2010 (3) 1,400,000 1,398,195 0.22UniCredit subord SerEMTN 5.75% /2017 880,000 927,057 0.14Finmeccanica Finance co gtd SerEMTN 8.125% /2013 (Luxembourg) (2) 750,000 875,778 0.14Intesa Sanpaolo sr unsecur SerGMTN 4.75% /2017 600,000 628,017 0.10Hera sr unsecur 4.5% /2019 300,000 296,600 0.05
Total for Italy 2.09
Australia Australia & New Zealand Banking Group sr unsecur SerEMTN 5.25% /2013 2,000,000 2,152,394 0.33Westpac Banking sr unsecur SerEMTN 4.25% /2016 1,850,000 1,877,532 0.29National Australia Bank sr unsecur SerGMTN 4.75% /2016 1,750,000 1,820,897 0.28Commonwealth Bank of Australia sr unsecur SerEMTN 3.625% /2011 1,220,000 1,248,941 0.19Australia & New Zealand Banking Group subord SerEMTN 5.125% /2019 1,100,000 1,142,214 0.19Commonwealth Bank of Australia subord SerEMTN 5.5% /2019 900,000 956,241 0.15
Total for Australia 1.43
Luxembourg Gaz Capital sr unsecur SerEMTN LPN 6.605% /2018 2,200,000 2,251,516 0.36Enel Finance International co gtd SerEMTN 4% /2016 1,200,000 1,221,257 0.19UniCredit International Bank Luxembourg co gtd 8.125% perpetual (3) 850,000 857,778 0.13Finmeccanica Finance co gtd 5.25% /2022 600,000 610,802 0.09
Total for Luxembourg 0.77
Switzerland UBS sr unsecur SerEMTN 6% /2018 2,800,000 3,043,887 0.47Credit Suisse sr unsecur SerEMTN 4.75% /2019 1,300,000 1,318,768 0.20UBS bnk gtd SerEMTN 7.152% perpetual (3) 350,000 303,625 0.05
Total for Switzerland 0.72
Denmark Danske Bank jr subord SerEMTN 4.75% /2012 1,600,000 1,687,394 0.26Dong Energy nts 4% /2016 600,000 595,638 0.10Danske Bank subord SerEMTN 5.375% /2014 (3) 450,000 456,299 0.07
Total for Denmark 0.43
Jersey ASIF III Jersey sr secured SerEMTN 4.75% /2013 3,000,000 2,724,404 0.42
Total for Jersey 0.42
Investments
Nominal in Euro unless
specifi ed Market
value% of net
assets
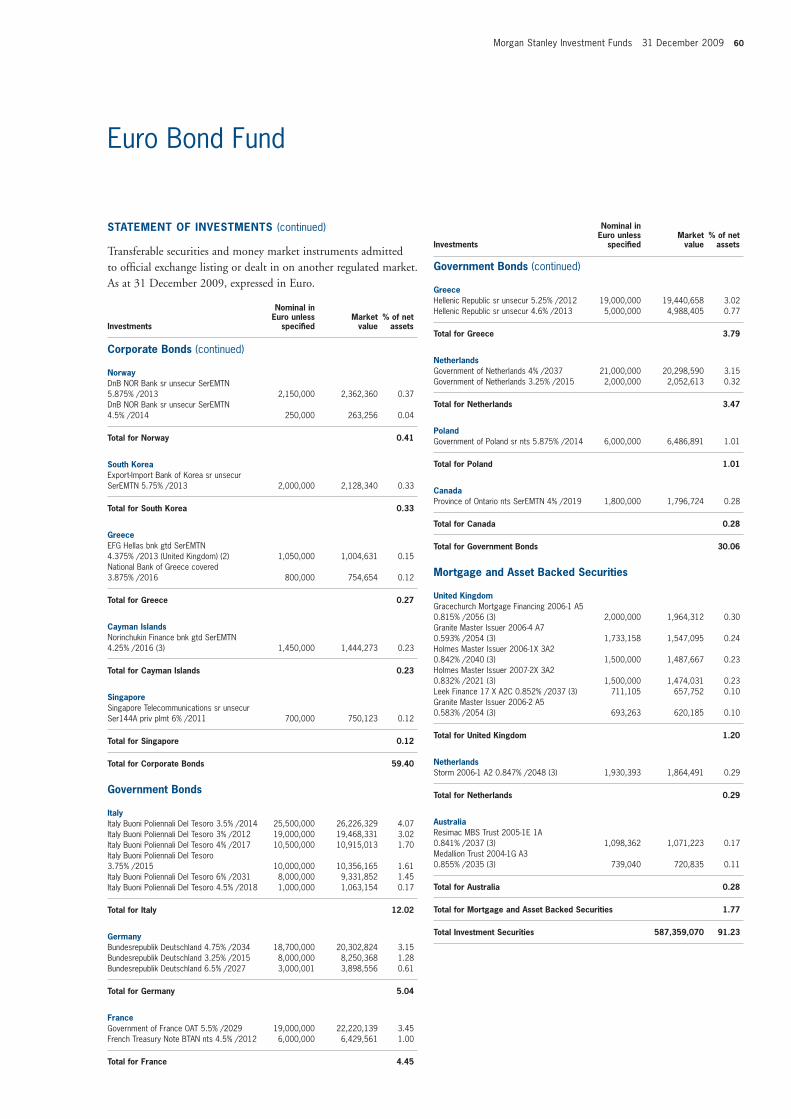
Morgan Stanley Investment Funds 31 December 2009 60
Euro Bond Fund
STATEMENT OF INVESTMENTS (continued)
Transferable securities and money market instruments admitted to offi cial exchange listing or dealt in on another regulated market. As at 31 December 2009, expressed in Euro.
Investments
Nominal in Euro unless
specifi ed Market
value% of net
assets
Corporate Bonds (continued)
Norway DnB NOR Bank sr unsecur SerEMTN 5.875% /2013 2,150,000 2,362,360 0.37DnB NOR Bank sr unsecur SerEMTN 4.5% /2014 250,000 263,256 0.04
Total for Norway 0.41
South Korea Export-Import Bank of Korea sr unsecur SerEMTN 5.75% /2013 2,000,000 2,128,340 0.33
Total for South Korea 0.33
Greece EFG Hellas bnk gtd SerEMTN 4.375% /2013 (United Kingdom) (2) 1,050,000 1,004,631 0.15National Bank of Greece covered 3.875% /2016 800,000 754,654 0.12
Total for Greece 0.27
Cayman Islands Norinchukin Finance bnk gtd SerEMTN 4.25% /2016 (3) 1,450,000 1,444,273 0.23
Total for Cayman Islands 0.23
Singapore Singapore Telecommunications sr unsecur Ser144A priv plmt 6% /2011 700,000 750,123 0.12
Total for Singapore 0.12
Total for Corporate Bonds 59.40
Government Bonds
Italy Italy Buoni Poliennali Del Tesoro 3.5% /2014 25,500,000 26,226,329 4.07Italy Buoni Poliennali Del Tesoro 3% /2012 19,000,000 19,468,331 3.02Italy Buoni Poliennali Del Tesoro 4% /2017 10,500,000 10,915,013 1.70Italy Buoni Poliennali Del Tesoro 3.75% /2015 10,000,000 10,356,165 1.61Italy Buoni Poliennali Del Tesoro 6% /2031 8,000,000 9,331,852 1.45Italy Buoni Poliennali Del Tesoro 4.5% /2018 1,000,000 1,063,154 0.17
Total for Italy 12.02
Germany Bundesrepublik Deutschland 4.75% /2034 18,700,000 20,302,824 3.15Bundesrepublik Deutschland 3.25% /2015 8,000,000 8,250,368 1.28Bundesrepublik Deutschland 6.5% /2027 3,000,001 3,898,556 0.61
Total for Germany 5.04
France Government of France OAT 5.5% /2029 19,000,000 22,220,139 3.45French Treasury Note BTAN nts 4.5% /2012 6,000,000 6,429,561 1.00
Total for France 4.45
Government Bonds (continued)
Greece Hellenic Republic sr unsecur 5.25% /2012 19,000,000 19,440,658 3.02Hellenic Republic sr unsecur 4.6% /2013 5,000,000 4,988,405 0.77
Total for Greece 3.79
Netherlands Government of Netherlands 4% /2037 21,000,000 20,298,590 3.15Government of Netherlands 3.25% /2015 2,000,000 2,052,613 0.32
Total for Netherlands 3.47
Poland Government of Poland sr nts 5.875% /2014 6,000,000 6,486,891 1.01
Total for Poland 1.01
Canada Province of Ontario nts SerEMTN 4% /2019 1,800,000 1,796,724 0.28
Total for Canada 0.28
Total for Government Bonds 30.06
Mortgage and Asset Backed Securities
United Kingdom Gracechurch Mortgage Financing 2006-1 A5 0.815% /2056 (3) 2,000,000 1,964,312 0.30Granite Master Issuer 2006-4 A7 0.593% /2054 (3) 1,733,158 1,547,095 0.24Holmes Master Issuer 2006-1X 3A2 0.842% /2040 (3) 1,500,000 1,487,667 0.23Holmes Master Issuer 2007-2X 3A2 0.832% /2021 (3) 1,500,000 1,474,031 0.23Leek Finance 17 X A2C 0.852% /2037 (3) 711,105 657,752 0.10Granite Master Issuer 2006-2 A5 0.583% /2054 (3) 693,263 620,185 0.10
Total for United Kingdom 1.20
Netherlands Storm 2006-1 A2 0.847% /2048 (3) 1,930,393 1,864,491 0.29
Total for Netherlands 0.29
Australia Resimac MBS Trust 2005-1E 1A 0.841% /2037 (3) 1,098,362 1,071,223 0.17Medallion Trust 2004-1G A3 0.855% /2035 (3) 739,040 720,835 0.11
Total for Australia 0.28
Total for Mortgage and Asset Backed Securities 1.77
Total Investment Securities 587,359,070 91.23
Investments
Nominal in Euro unless
specifi ed Market
value% of net
assets
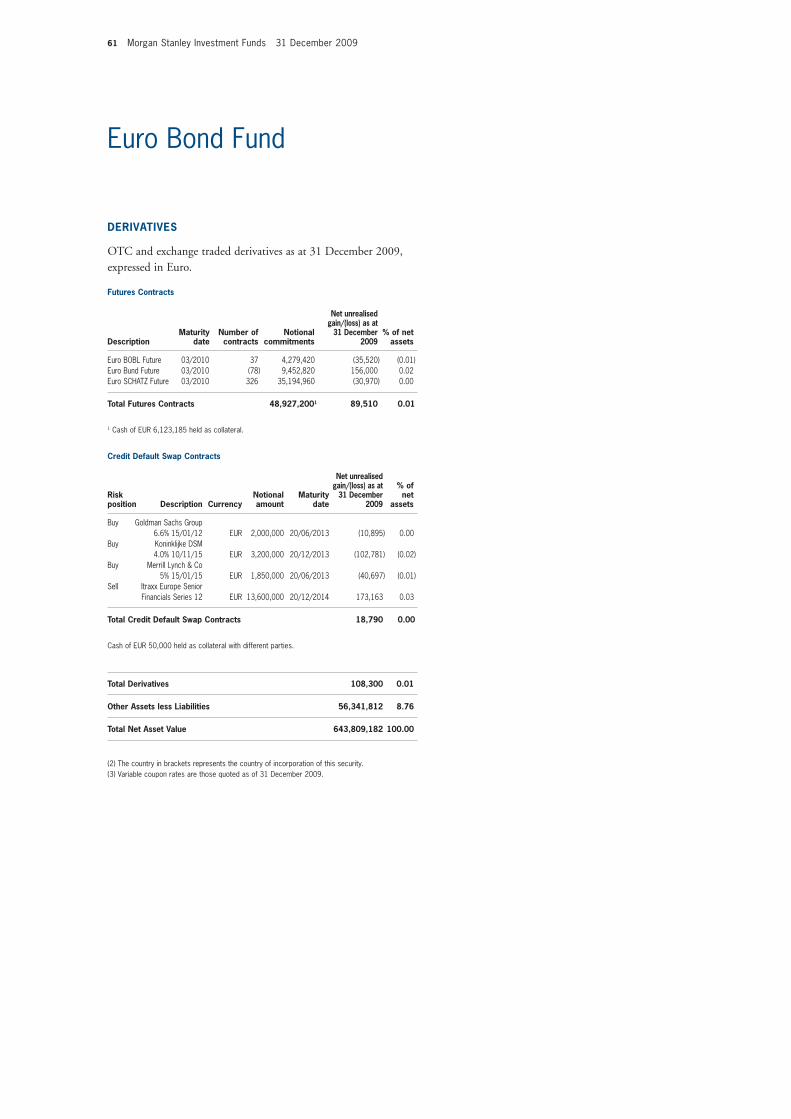
61 Morgan Stanley Investment Funds 31 December 2009
Euro Bond Fund
DERIVATIVES
OTC and exchange traded derivatives as at 31 December 2009, expressed in Euro.
Futures Contracts
DescriptionMaturity
dateNumber of contracts
Notional commitments
Net unrealised gain/(loss) as at
31 December 2009
% of net assets
Euro BOBL Future 03/2010 37 4,279,420 (35,520) (0.01)Euro Bund Future 03/2010 (78) 9,452,820 156,000 0.02Euro SCHATZ Future 03/2010 326 35,194,960 (30,970) 0.00
Total Futures Contracts 48,927,2001 89,510 0.01
1 Cash of EUR 6,123,185 held as collateral.
Credit Default Swap Contracts
Risk position Description Currency
Notional amount
Maturity date
Net unrealised gain/(loss) as at
31 December 2009
% of net
assets Buy Goldman Sachs Group 6.6% 15/01/12 EUR 2,000,000 20/06/2013 (10,895) 0.00 Buy Koninklijke DSM 4.0% 10/11/15 EUR 3,200,000 20/12/2013 (102,781) (0.02)Buy Merrill Lynch & Co 5% 15/01/15 EUR 1,850,000 20/06/2013 (40,697) (0.01)Sell Itraxx Europe Senior Financials Series 12 EUR 13,600,000 20/12/2014 173,163 0.03
Total Credit Default Swap Contracts 18,790 0.00
Cash of EUR 50,000 held as collateral with different parties.
Total Derivatives 108,300 0.01
Other Assets less Liabilities 56,341,812 8.76
Total Net Asset Value 643,809,182 100.00
(2) The country in brackets represents the country of incorporation of this security.(3) Variable coupon rates are those quoted as of 31 December 2009.
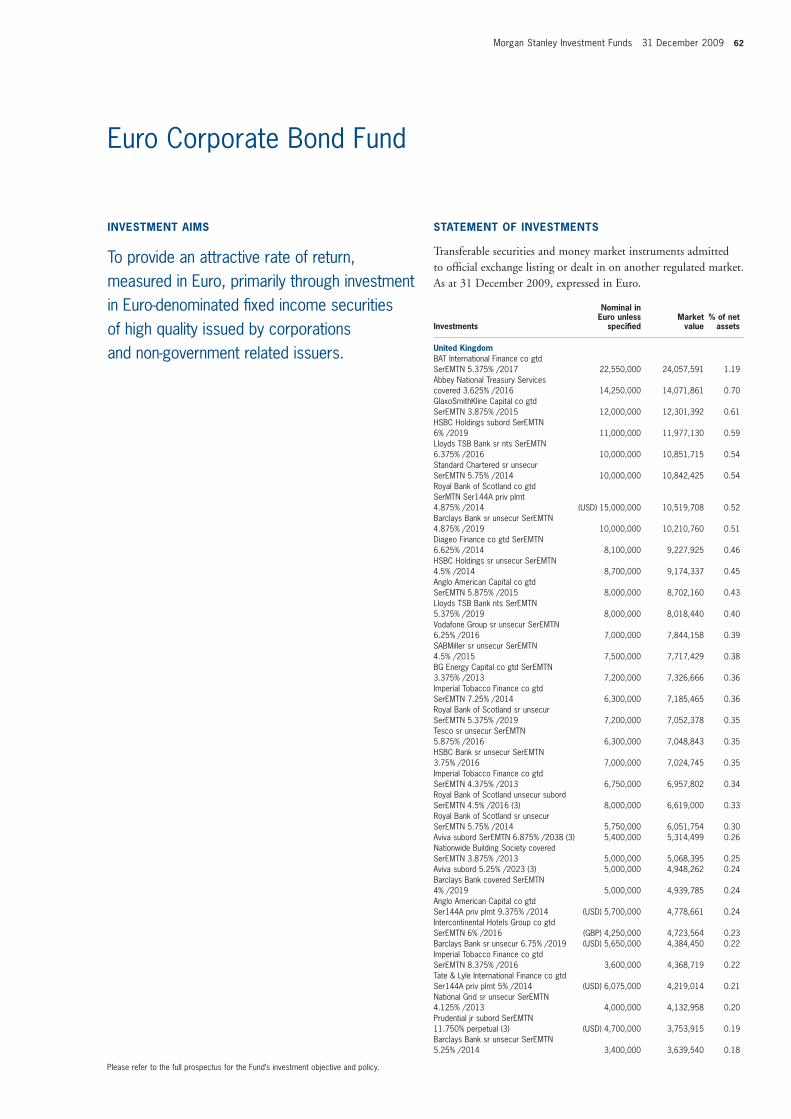
Morgan Stanley Investment Funds 31 December 2009 62
Euro Corporate Bond Fund
INVESTMENT AIMS
To provide an attractive rate of return, measured in Euro, primarily through investment in Euro-denominated fi xed income securities of high quality issued by corporations and non-government related issuers.
STATEMENT OF INVESTMENTS
Transferable securities and money market instruments admitted to offi cial exchange listing or dealt in on another regulated market. As at 31 December 2009, expressed in Euro.
Investments
Nominal in Euro unless
specifi ed Market
value% of net
assets
United KingdomBAT International Finance co gtd SerEMTN 5.375% /2017 22,550,000 24,057,591 1.19Abbey National Treasury Services covered 3.625% /2016 14,250,000 14,071,861 0.70GlaxoSmithKline Capital co gtd SerEMTN 3.875% /2015 12,000,000 12,301,392 0.61HSBC Holdings subord SerEMTN 6% /2019 11,000,000 11,977,130 0.59Lloyds TSB Bank sr nts SerEMTN 6.375% /2016 10,000,000 10,851,715 0.54Standard Chartered sr unsecur SerEMTN 5.75% /2014 10,000,000 10,842,425 0.54Royal Bank of Scotland co gtd SerMTN Ser144A priv plmt 4.875% /2014 (USD) 15,000,000 10,519,708 0.52Barclays Bank sr unsecur SerEMTN 4.875% /2019 10,000,000 10,210,760 0.51Diageo Finance co gtd SerEMTN 6.625% /2014 8,100,000 9,227,925 0.46HSBC Holdings sr unsecur SerEMTN 4.5% /2014 8,700,000 9,174,337 0.45Anglo American Capital co gtd SerEMTN 5.875% /2015 8,000,000 8,702,160 0.43Lloyds TSB Bank nts SerEMTN 5.375% /2019 8,000,000 8,018,440 0.40Vodafone Group sr unsecur SerEMTN 6.25% /2016 7,000,000 7,844,158 0.39SABMiller sr unsecur SerEMTN 4.5% /2015 7,500,000 7,717,429 0.38BG Energy Capital co gtd SerEMTN 3.375% /2013 7,200,000 7,326,666 0.36Imperial Tobacco Finance co gtd SerEMTN 7.25% /2014 6,300,000 7,185,465 0.36Royal Bank of Scotland sr unsecur SerEMTN 5.375% /2019 7,200,000 7,052,378 0.35Tesco sr unsecur SerEMTN 5.875% /2016 6,300,000 7,048,843 0.35HSBC Bank sr unsecur SerEMTN 3.75% /2016 7,000,000 7,024,745 0.35Imperial Tobacco Finance co gtd SerEMTN 4.375% /2013 6,750,000 6,957,802 0.34Royal Bank of Scotland unsecur subord SerEMTN 4.5% /2016 (3) 8,000,000 6,619,000 0.33Royal Bank of Scotland sr unsecur SerEMTN 5.75% /2014 5,750,000 6,051,754 0.30Aviva subord SerEMTN 6.875% /2038 (3) 5,400,000 5,314,499 0.26Nationwide Building Society covered SerEMTN 3.875% /2013 5,000,000 5,068,395 0.25Aviva subord 5.25% /2023 (3) 5,000,000 4,948,262 0.24Barclays Bank covered SerEMTN 4% /2019 5,000,000 4,939,785 0.24Anglo American Capital co gtd Ser144A priv plmt 9.375% /2014 (USD) 5,700,000 4,778,661 0.24Intercontinental Hotels Group co gtd SerEMTN 6% /2016 (GBP) 4,250,000 4,723,564 0.23Barclays Bank sr unsecur 6.75% /2019 (USD) 5,650,000 4,384,450 0.22Imperial Tobacco Finance co gtd SerEMTN 8.375% /2016 3,600,000 4,368,719 0.22Tate & Lyle International Finance co gtd Ser144A priv plmt 5% /2014 (USD) 6,075,000 4,219,014 0.21National Grid sr unsecur SerEMTN 4.125% /2013 4,000,000 4,132,958 0.20Prudential jr subord SerEMTN 11.750% perpetual (3) (USD) 4,700,000 3,753,915 0.19Barclays Bank sr unsecur SerEMTN 5.25% /2014 3,400,000 3,639,540 0.18
Please refer to the full prospectus for the Fund’s investment objective and policy.
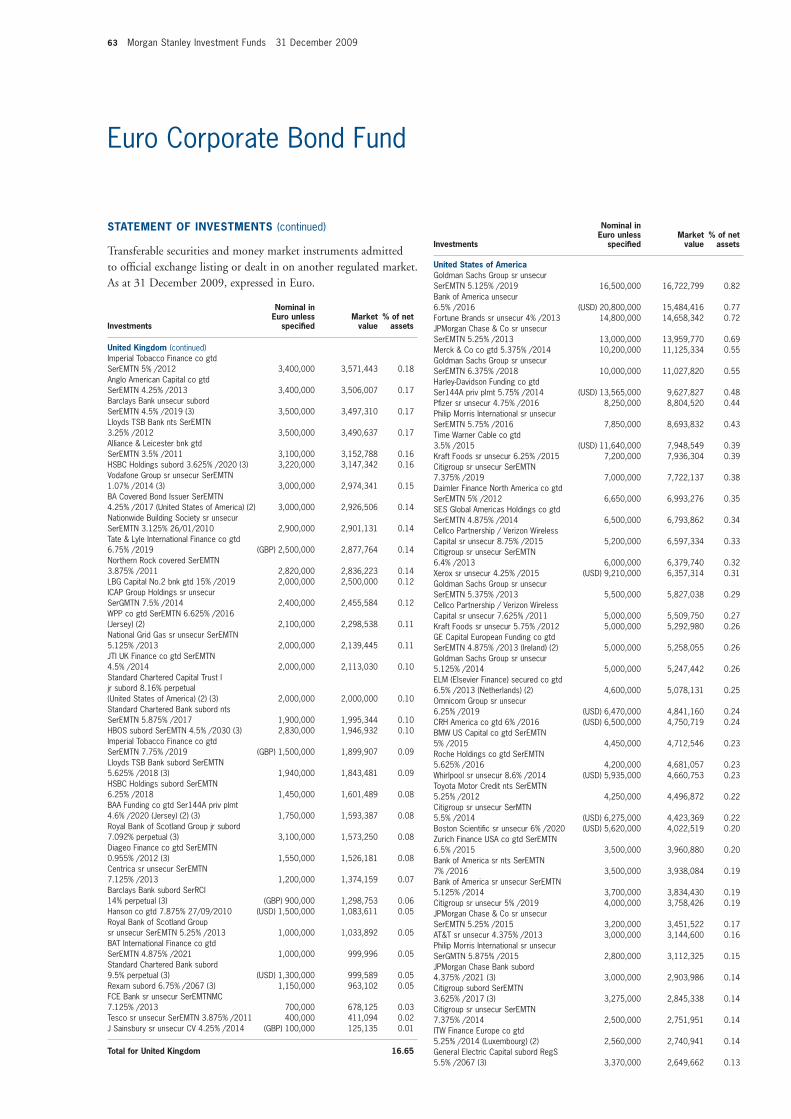
63 Morgan Stanley Investment Funds 31 December 2009
Euro Corporate Bond Fund
Investments
Nominal in Euro unless
specifi ed Market
value% of net
assets
STATEMENT OF INVESTMENTS (continued)
Transferable securities and money market instruments admitted to offi cial exchange listing or dealt in on another regulated market. As at 31 December 2009, expressed in Euro.
Investments
Nominal in Euro unless
specifi ed Market
value% of net
assets
United Kingdom (continued)Imperial Tobacco Finance co gtd SerEMTN 5% /2012 3,400,000 3,571,443 0.18Anglo American Capital co gtd SerEMTN 4.25% /2013 3,400,000 3,506,007 0.17Barclays Bank unsecur subord SerEMTN 4.5% /2019 (3) 3,500,000 3,497,310 0.17Lloyds TSB Bank nts SerEMTN 3.25% /2012 3,500,000 3,490,637 0.17Alliance & Leicester bnk gtd SerEMTN 3.5% /2011 3,100,000 3,152,788 0.16HSBC Holdings subord 3.625% /2020 (3) 3,220,000 3,147,342 0.16Vodafone Group sr unsecur SerEMTN 1.07% /2014 (3) 3,000,000 2,974,341 0.15BA Covered Bond Issuer SerEMTN 4.25% /2017 (United States of America) (2) 3,000,000 2,926,506 0.14Nationwide Building Society sr unsecur SerEMTN 3.125% 26/01/2010 2,900,000 2,901,131 0.14Tate & Lyle International Finance co gtd 6.75% /2019 (GBP) 2,500,000 2,877,764 0.14Northern Rock covered SerEMTN 3.875% /2011 2,820,000 2,836,223 0.14LBG Capital No.2 bnk gtd 15% /2019 2,000,000 2,500,000 0.12ICAP Group Holdings sr unsecur SerGMTN 7.5% /2014 2,400,000 2,455,584 0.12WPP co gtd SerEMTN 6.625% /2016 (Jersey) (2) 2,100,000 2,298,538 0.11National Grid Gas sr unsecur SerEMTN 5.125% /2013 2,000,000 2,139,445 0.11JTI UK Finance co gtd SerEMTN 4.5% /2014 2,000,000 2,113,030 0.10Standard Chartered Capital Trust I jr subord 8.16% perpetual (United States of America) (2) (3) 2,000,000 2,000,000 0.10Standard Chartered Bank subord nts SerEMTN 5.875% /2017 1,900,000 1,995,344 0.10HBOS subord SerEMTN 4.5% /2030 (3) 2,830,000 1,946,932 0.10Imperial Tobacco Finance co gtd SerEMTN 7.75% /2019 (GBP) 1,500,000 1,899,907 0.09Lloyds TSB Bank subord SerEMTN 5.625% /2018 (3) 1,940,000 1,843,481 0.09HSBC Holdings subord SerEMTN 6.25% /2018 1,450,000 1,601,489 0.08BAA Funding co gtd Ser144A priv plmt 4.6% /2020 (Jersey) (2) (3) 1,750,000 1,593,387 0.08Royal Bank of Scotland Group jr subord 7.092% perpetual (3) 3,100,000 1,573,250 0.08Diageo Finance co gtd SerEMTN 0.955% /2012 (3) 1,550,000 1,526,181 0.08Centrica sr unsecur SerEMTN 7.125% /2013 1,200,000 1,374,159 0.07Barclays Bank subord SerRCI 14% perpetual (3) (GBP) 900,000 1,298,753 0.06Hanson co gtd 7.875% 27/09/2010 (USD) 1,500,000 1,083,611 0.05Royal Bank of Scotland Group sr unsecur SerEMTN 5.25% /2013 1,000,000 1,033,892 0.05BAT International Finance co gtd SerEMTN 4.875% /2021 1,000,000 999,996 0.05Standard Chartered Bank subord 9.5% perpetual (3) (USD) 1,300,000 999,589 0.05Rexam subord 6.75% /2067 (3) 1,150,000 963,102 0.05FCE Bank sr unsecur SerEMTNMC 7.125% /2013 700,000 678,125 0.03Tesco sr unsecur SerEMTN 3.875% /2011 400,000 411,094 0.02J Sainsbury sr unsecur CV 4.25% /2014 (GBP) 100,000 125,135 0.01
Total for United Kingdom 16.65
United States of AmericaGoldman Sachs Group sr unsecur SerEMTN 5.125% /2019 16,500,000 16,722,799 0.82Bank of America unsecur 6.5% /2016 (USD) 20,800,000 15,484,416 0.77Fortune Brands sr unsecur 4% /2013 14,800,000 14,658,342 0.72JPMorgan Chase & Co sr unsecur SerEMTN 5.25% /2013 13,000,000 13,959,770 0.69Merck & Co co gtd 5.375% /2014 10,200,000 11,125,334 0.55Goldman Sachs Group sr unsecur SerEMTN 6.375% /2018 10,000,000 11,027,820 0.55Harley-Davidson Funding co gtd Ser144A priv plmt 5.75% /2014 (USD) 13,565,000 9,627,827 0.48Pfi zer sr unsecur 4.75% /2016 8,250,000 8,804,520 0.44Philip Morris International sr unsecur SerEMTN 5.75% /2016 7,850,000 8,693,832 0.43Time Warner Cable co gtd 3.5% /2015 (USD) 11,640,000 7,948,549 0.39Kraft Foods sr unsecur 6.25% /2015 7,200,000 7,936,304 0.39Citigroup sr unsecur SerEMTN 7.375% /2019 7,000,000 7,722,137 0.38Daimler Finance North America co gtd SerEMTN 5% /2012 6,650,000 6,993,276 0.35SES Global Americas Holdings co gtd SerEMTN 4.875% /2014 6,500,000 6,793,862 0.34Cellco Partnership / Verizon Wireless Capital sr unsecur 8.75% /2015 5,200,000 6,597,334 0.33Citigroup sr unsecur SerEMTN 6.4% /2013 6,000,000 6,379,740 0.32Xerox sr unsecur 4.25% /2015 (USD) 9,210,000 6,357,314 0.31Goldman Sachs Group sr unsecur SerEMTN 5.375% /2013 5,500,000 5,827,038 0.29Cellco Partnership / Verizon Wireless Capital sr unsecur 7.625% /2011 5,000,000 5,509,750 0.27Kraft Foods sr unsecur 5.75% /2012 5,000,000 5,292,980 0.26GE Capital European Funding co gtd SerEMTN 4.875% /2013 (Ireland) (2) 5,000,000 5,258,055 0.26Goldman Sachs Group sr unsecur 5.125% /2014 5,000,000 5,247,442 0.26ELM (Elsevier Finance) secured co gtd 6.5% /2013 (Netherlands) (2) 4,600,000 5,078,131 0.25Omnicom Group sr unsecur 6.25% /2019 (USD) 6,470,000 4,841,160 0.24CRH America co gtd 6% /2016 (USD) 6,500,000 4,750,719 0.24BMW US Capital co gtd SerEMTN 5% /2015 4,450,000 4,712,546 0.23Roche Holdings co gtd SerEMTN 5.625% /2016 4,200,000 4,681,057 0.23Whirlpool sr unsecur 8.6% /2014 (USD) 5,935,000 4,660,753 0.23Toyota Motor Credit nts SerEMTN 5.25% /2012 4,250,000 4,496,872 0.22Citigroup sr unsecur SerMTN 5.5% /2014 (USD) 6,275,000 4,423,369 0.22Boston Scientifi c sr unsecur 6% /2020 (USD) 5,620,000 4,022,519 0.20Zurich Finance USA co gtd SerEMTN 6.5% /2015 3,500,000 3,960,880 0.20Bank of America sr nts SerEMTN 7% /2016 3,500,000 3,938,084 0.19Bank of America sr unsecur SerEMTN 5.125% /2014 3,700,000 3,834,430 0.19Citigroup sr unsecur 5% /2019 4,000,000 3,758,426 0.19JPMorgan Chase & Co sr unsecur SerEMTN 5.25% /2015 3,200,000 3,451,522 0.17AT&T sr unsecur 4.375% /2013 3,000,000 3,144,600 0.16Philip Morris International sr unsecur SerGMTN 5.875% /2015 2,800,000 3,112,325 0.15JPMorgan Chase Bank subord 4.375% /2021 (3) 3,000,000 2,903,986 0.14Citigroup subord SerEMTN 3.625% /2017 (3) 3,275,000 2,845,338 0.14Citigroup sr unsecur SerEMTN 7.375% /2014 2,500,000 2,751,951 0.14ITW Finance Europe co gtd 5.25% /2014 (Luxembourg) (2) 2,560,000 2,740,941 0.14General Electric Capital subord RegS 5.5% /2067 (3) 3,370,000 2,649,662 0.13
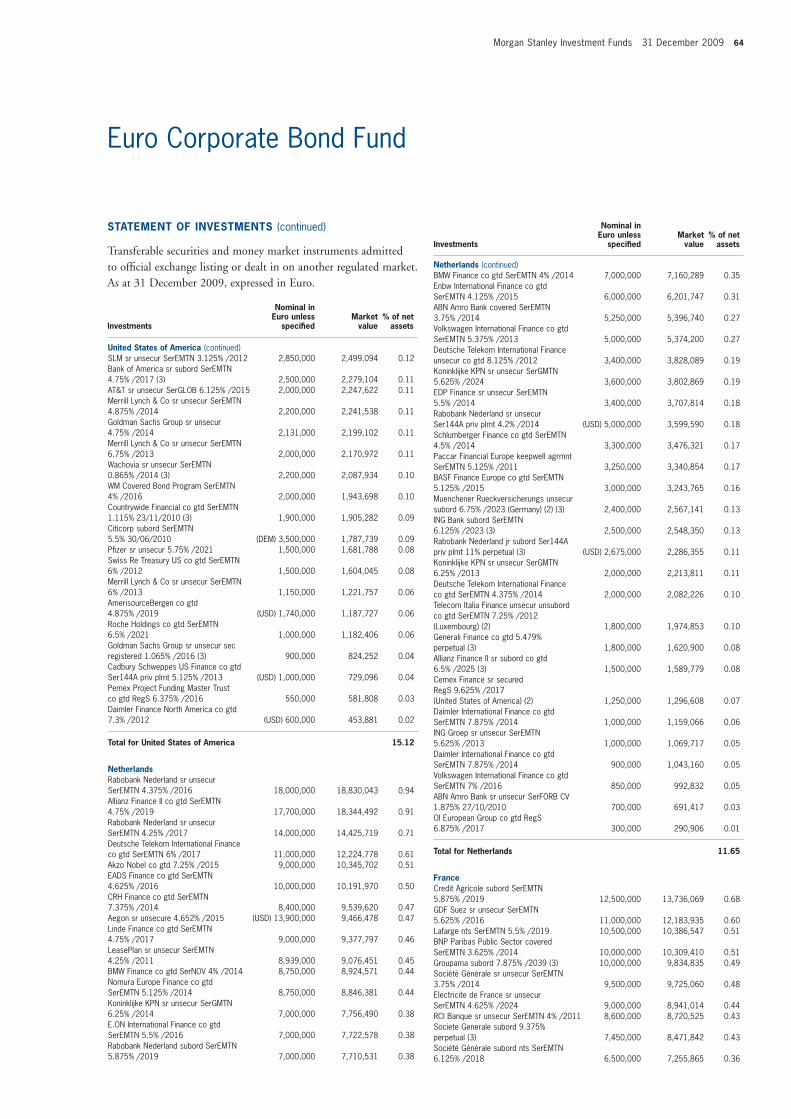
Morgan Stanley Investment Funds 31 December 2009 64
Euro Corporate Bond Fund
Investments
Nominal in Euro unless
specifi ed Market
value% of net
assets
United States of America (continued)SLM sr unsecur SerEMTN 3.125% /2012 2,850,000 2,499,094 0.12Bank of America sr subord SerEMTN 4.75% /2017 (3) 2,500,000 2,279,104 0.11AT&T sr unsecur SerGLOB 6.125% /2015 2,000,000 2,247,622 0.11Merrill Lynch & Co sr unsecur SerEMTN 4.875% /2014 2,200,000 2,241,538 0.11Goldman Sachs Group sr unsecur 4.75% /2014 2,131,000 2,199,102 0.11Merrill Lynch & Co sr unsecur SerEMTN 6.75% /2013 2,000,000 2,170,972 0.11Wachovia sr unsecur SerEMTN 0.865% /2014 (3) 2,200,000 2,087,934 0.10WM Covered Bond Program SerEMTN 4% /2016 2,000,000 1,943,698 0.10Countrywide Financial co gtd SerEMTN 1.115% 23/11/2010 (3) 1,900,000 1,905,282 0.09Citicorp subord SerEMTN 5.5% 30/06/2010 (DEM) 3,500,000 1,787,739 0.09Pfi zer sr unsecur 5.75% /2021 1,500,000 1,681,788 0.08Swiss Re Treasury US co gtd SerEMTN 6% /2012 1,500,000 1,604,045 0.08Merrill Lynch & Co sr unsecur SerEMTN 6% /2013 1,150,000 1,221,757 0.06AmerisourceBergen co gtd 4.875% /2019 (USD) 1,740,000 1,187,727 0.06Roche Holdings co gtd SerEMTN 6.5% /2021 1,000,000 1,182,406 0.06Goldman Sachs Group sr unsecur sec registered 1.065% /2016 (3) 900,000 824,252 0.04Cadbury Schweppes US Finance co gtd Ser144A priv plmt 5.125% /2013 (USD) 1,000,000 729,096 0.04Pemex Project Funding Master Trust co gtd RegS 6.375% /2016 550,000 581,808 0.03Daimler Finance North America co gtd 7.3% /2012 (USD) 600,000 453,881 0.02
Total for United States of America 15.12
NetherlandsRabobank Nederland sr unsecur SerEMTN 4.375% /2016 18,000,000 18,830,043 0.94Allianz Finance II co gtd SerEMTN 4.75% /2019 17,700,000 18,344,492 0.91Rabobank Nederland sr unsecur SerEMTN 4.25% /2017 14,000,000 14,425,719 0.71Deutsche Telekom International Finance co gtd SerEMTN 6% /2017 11,000,000 12,224,778 0.61Akzo Nobel co gtd 7.25% /2015 9,000,000 10,345,702 0.51EADS Finance co gtd SerEMTN 4.625% /2016 10,000,000 10,191,970 0.50CRH Finance co gtd SerEMTN 7.375% /2014 8,400,000 9,539,620 0.47Aegon sr unsecure 4.652% /2015 (USD) 13,900,000 9,466,478 0.47Linde Finance co gtd SerEMTN 4.75% /2017 9,000,000 9,377,797 0.46LeasePlan sr unsecur SerEMTN 4.25% /2011 8,939,000 9,076,451 0.45BMW Finance co gtd SerNOV 4% /2014 8,750,000 8,924,571 0.44Nomura Europe Finance co gtd SerEMTN 5.125% /2014 8,750,000 8,846,381 0.44Koninklijke KPN sr unsecur SerGMTN 6.25% /2014 7,000,000 7,756,490 0.38E.ON International Finance co gtd SerEMTN 5.5% /2016 7,000,000 7,722,578 0.38Rabobank Nederland subord SerEMTN 5.875% /2019 7,000,000 7,710,531 0.38
Netherlands (continued)BMW Finance co gtd SerEMTN 4% /2014 7,000,000 7,160,289 0.35Enbw International Finance co gtd SerEMTN 4.125% /2015 6,000,000 6,201,747 0.31ABN Amro Bank covered SerEMTN 3.75% /2014 5,250,000 5,396,740 0.27Volkswagen International Finance co gtd SerEMTN 5.375% /2013 5,000,000 5,374,200 0.27Deutsche Telekom International Finance unsecur co gtd 8.125% /2012 3,400,000 3,828,089 0.19Koninklijke KPN sr unsecur SerGMTN 5.625% /2024 3,600,000 3,802,869 0.19EDP Finance sr unsecur SerEMTN 5.5% /2014 3,400,000 3,707,814 0.18Rabobank Nederland sr unsecur Ser144A priv plmt 4.2% /2014 (USD) 5,000,000 3,599,590 0.18Schlumberger Finance co gtd SerEMTN 4.5% /2014 3,300,000 3,476,321 0.17Paccar Financial Europe keepwell agrmnt SerEMTN 5.125% /2011 3,250,000 3,340,854 0.17BASF Finance Europe co gtd SerEMTN 5.125% /2015 3,000,000 3,243,765 0.16Muenchener Rueckversicherungs unsecur subord 6.75% /2023 (Germany) (2) (3) 2,400,000 2,567,141 0.13ING Bank subord SerEMTN 6.125% /2023 (3) 2,500,000 2,548,350 0.13Rabobank Nederland jr subord Ser144A priv plmt 11% perpetual (3) (USD) 2,675,000 2,286,355 0.11Koninklijke KPN sr unsecur SerGMTN 6.25% /2013 2,000,000 2,213,811 0.11Deutsche Telekom International Finance co gtd SerEMTN 4.375% /2014 2,000,000 2,082,226 0.10Telecom Italia Finance unsecur unsubord co gtd SerEMTN 7.25% /2012 (Luxembourg) (2) 1,800,000 1,974,853 0.10Generali Finance co gtd 5.479% perpetual (3) 1,800,000 1,620,900 0.08Allianz Finance II sr subord co gtd 6.5% /2025 (3) 1,500,000 1,589,779 0.08Cemex Finance sr secured RegS 9.625% /2017 (United States of America) (2) 1,250,000 1,296,608 0.07Daimler International Finance co gtd SerEMTN 7.875% /2014 1,000,000 1,159,066 0.06ING Groep sr unsecur SerEMTN 5.625% /2013 1,000,000 1,069,717 0.05Daimler International Finance co gtd SerEMTN 7.875% /2014 900,000 1,043,160 0.05Volkswagen International Finance co gtd SerEMTN 7% /2016 850,000 992,832 0.05ABN Amro Bank sr unsecur SerFORB CV 1.875% 27/10/2010 700,000 691,417 0.03OI European Group co gtd RegS 6.875% /2017 300,000 290,906 0.01
Total for Netherlands 11.65
FranceCredit Agricole subord SerEMTN 5.875% /2019 12,500,000 13,736,069 0.68GDF Suez sr unsecur SerEMTN 5.625% /2016 11,000,000 12,183,935 0.60Lafarge nts SerEMTN 5.5% /2019 10,500,000 10,386,547 0.51BNP Paribas Public Sector covered SerEMTN 3.625% /2014 10,000,000 10,309,410 0.51Groupama subord 7.875% /2039 (3) 10,000,000 9,834,835 0.49Société Générale sr unsecur SerEMTN 3.75% /2014 9,500,000 9,725,060 0.48Electricite de France sr unsecur SerEMTN 4.625% /2024 9,000,000 8,941,014 0.44RCI Banque sr unsecur SerEMTN 4% /2011 8,600,000 8,720,525 0.43Societe Generale subord 9.375% perpetual (3) 7,450,000 8,471,842 0.43Société Générale subord nts SerEMTN 6.125% /2018 6,500,000 7,255,865 0.36
STATEMENT OF INVESTMENTS (continued)
Transferable securities and money market instruments admitted to offi cial exchange listing or dealt in on another regulated market. As at 31 December 2009, expressed in Euro.
Investments
Nominal in Euro unless
specifi ed Market
value% of net
assets
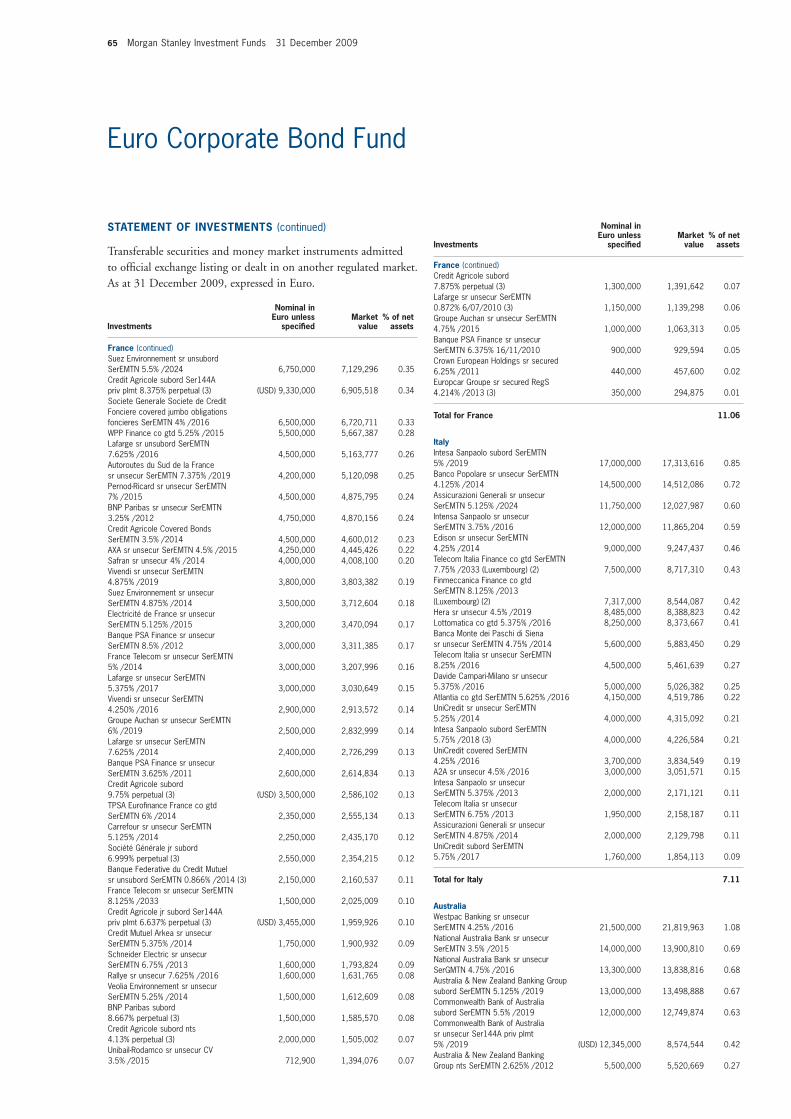
65 Morgan Stanley Investment Funds 31 December 2009
Euro Corporate Bond Fund
France (continued)Suez Environnement sr unsubord SerEMTN 5.5% /2024 6,750,000 7,129,296 0.35Credit Agricole subord Ser144A priv plmt 8.375% perpetual (3) (USD) 9,330,000 6,905,518 0.34Societe Generale Societe de Credit Fonciere covered jumbo obligations foncieres SerEMTN 4% /2016 6,500,000 6,720,711 0.33WPP Finance co gtd 5.25% /2015 5,500,000 5,667,387 0.28Lafarge sr unsubord SerEMTN 7.625% /2016 4,500,000 5,163,777 0.26Autoroutes du Sud de la France sr unsecur SerEMTN 7.375% /2019 4,200,000 5,120,098 0.25Pernod-Ricard sr unsecur SerEMTN 7% /2015 4,500,000 4,875,795 0.24BNP Paribas sr unsecur SerEMTN 3.25% /2012 4,750,000 4,870,156 0.24Credit Agricole Covered Bonds SerEMTN 3.5% /2014 4,500,000 4,600,012 0.23AXA sr unsecur SerEMTN 4.5% /2015 4,250,000 4,445,426 0.22Safran sr unsecur 4% /2014 4,000,000 4,008,100 0.20Vivendi sr unsecur SerEMTN 4.875% /2019 3,800,000 3,803,382 0.19Suez Environnement sr unsecur SerEMTN 4.875% /2014 3,500,000 3,712,604 0.18Electricité de France sr unsecur SerEMTN 5.125% /2015 3,200,000 3,470,094 0.17Banque PSA Finance sr unsecur SerEMTN 8.5% /2012 3,000,000 3,311,385 0.17France Telecom sr unsecur SerEMTN 5% /2014 3,000,000 3,207,996 0.16Lafarge sr unsecur SerEMTN 5.375% /2017 3,000,000 3,030,649 0.15Vivendi sr unsecur SerEMTN 4.250% /2016 2,900,000 2,913,572 0.14Groupe Auchan sr unsecur SerEMTN 6% /2019 2,500,000 2,832,999 0.14Lafarge sr unsecur SerEMTN 7.625% /2014 2,400,000 2,726,299 0.13Banque PSA Finance sr unsecur SerEMTN 3.625% /2011 2,600,000 2,614,834 0.13Credit Agricole subord 9.75% perpetual (3) (USD) 3,500,000 2,586,102 0.13TPSA Eurofi nance France co gtd SerEMTN 6% /2014 2,350,000 2,555,134 0.13Carrefour sr unsecur SerEMTN 5.125% /2014 2,250,000 2,435,170 0.12Société Générale jr subord 6.999% perpetual (3) 2,550,000 2,354,215 0.12Banque Federative du Credit Mutuel sr unsubord SerEMTN 0.866% /2014 (3) 2,150,000 2,160,537 0.11France Telecom sr unsecur SerEMTN 8.125% /2033 1,500,000 2,025,009 0.10Credit Agricole jr subord Ser144A priv plmt 6.637% perpetual (3) (USD) 3,455,000 1,959,926 0.10Credit Mutuel Arkea sr unsecur SerEMTN 5.375% /2014 1,750,000 1,900,932 0.09Schneider Electric sr unsecur SerEMTN 6.75% /2013 1,600,000 1,793,824 0.09Rallye sr unsecur 7.625% /2016 1,600,000 1,631,765 0.08Veolia Environnement sr unsecur SerEMTN 5.25% /2014 1,500,000 1,612,609 0.08BNP Paribas subord 8.667% perpetual (3) 1,500,000 1,585,570 0.08Credit Agricole subord nts 4.13% perpetual (3) 2,000,000 1,505,002 0.07Unibail-Rodamco sr unsecur CV 3.5% /2015 712,900 1,394,076 0.07
France (continued)Credit Agricole subord 7.875% perpetual (3) 1,300,000 1,391,642 0.07Lafarge sr unsecur SerEMTN 0.872% 6/07/2010 (3) 1,150,000 1,139,298 0.06Groupe Auchan sr unsecur SerEMTN 4.75% /2015 1,000,000 1,063,313 0.05Banque PSA Finance sr unsecur SerEMTN 6.375% 16/11/2010 900,000 929,594 0.05Crown European Holdings sr secured 6.25% /2011 440,000 457,600 0.02Europcar Groupe sr secured RegS 4.214% /2013 (3) 350,000 294,875 0.01
Total for France 11.06
ItalyIntesa Sanpaolo subord SerEMTN 5% /2019 17,000,000 17,313,616 0.85Banco Popolare sr unsecur SerEMTN 4.125% /2014 14,500,000 14,512,086 0.72Assicurazioni Generali sr unsecur SerEMTN 5.125% /2024 11,750,000 12,027,987 0.60Intensa Sanpaolo sr unsecur SerEMTN 3.75% /2016 12,000,000 11,865,204 0.59Edison sr unsecur SerEMTN 4.25% /2014 9,000,000 9,247,437 0.46Telecom Italia Finance co gtd SerEMTN 7.75% /2033 (Luxembourg) (2) 7,500,000 8,717,310 0.43Finmeccanica Finance co gtd SerEMTN 8.125% /2013 (Luxembourg) (2) 7,317,000 8,544,087 0.42Hera sr unsecur 4.5% /2019 8,485,000 8,388,823 0.42Lottomatica co gtd 5.375% /2016 8,250,000 8,373,667 0.41Banca Monte dei Paschi di Siena sr unsecur SerEMTN 4.75% /2014 5,600,000 5,883,450 0.29Telecom Italia sr unsecur SerEMTN 8.25% /2016 4,500,000 5,461,639 0.27Davide Campari-Milano sr unsecur 5.375% /2016 5,000,000 5,026,382 0.25Atlantia co gtd SerEMTN 5.625% /2016 4,150,000 4,519,786 0.22UniCredit sr unsecur SerEMTN 5.25% /2014 4,000,000 4,315,092 0.21Intesa Sanpaolo subord SerEMTN 5.75% /2018 (3) 4,000,000 4,226,584 0.21UniCredit covered SerEMTN 4.25% /2016 3,700,000 3,834,549 0.19A2A sr unsecur 4.5% /2016 3,000,000 3,051,571 0.15Intesa Sanpaolo sr unsecur SerEMTN 5.375% /2013 2,000,000 2,171,121 0.11Telecom Italia sr unsecur SerEMTN 6.75% /2013 1,950,000 2,158,187 0.11Assicurazioni Generali sr unsecur SerEMTN 4.875% /2014 2,000,000 2,129,798 0.11UniCredit subord SerEMTN 5.75% /2017 1,760,000 1,854,113 0.09
Total for Italy 7.11
AustraliaWestpac Banking sr unsecur SerEMTN 4.25% /2016 21,500,000 21,819,963 1.08National Australia Bank sr unsecur SerEMTN 3.5% /2015 14,000,000 13,900,810 0.69National Australia Bank sr unsecur SerGMTN 4.75% /2016 13,300,000 13,838,816 0.68Australia & New Zealand Banking Group subord SerEMTN 5.125% /2019 13,000,000 13,498,888 0.67Commonwealth Bank of Australia subord SerEMTN 5.5% /2019 12,000,000 12,749,874 0.63Commonwealth Bank of Australia sr unsecur Ser144A priv plmt 5% /2019 (USD) 12,345,000 8,574,544 0.42Australia & New Zealand Banking Group nts SerEMTN 2.625% /2012 5,500,000 5,520,669 0.27
STATEMENT OF INVESTMENTS (continued)
Transferable securities and money market instruments admitted to offi cial exchange listing or dealt in on another regulated market. As at 31 December 2009, expressed in Euro.
Investments
Nominal in Euro unless
specifi ed Market
value% of net
assets
Investments
Nominal in Euro unless
specifi ed Market
value% of net
assets
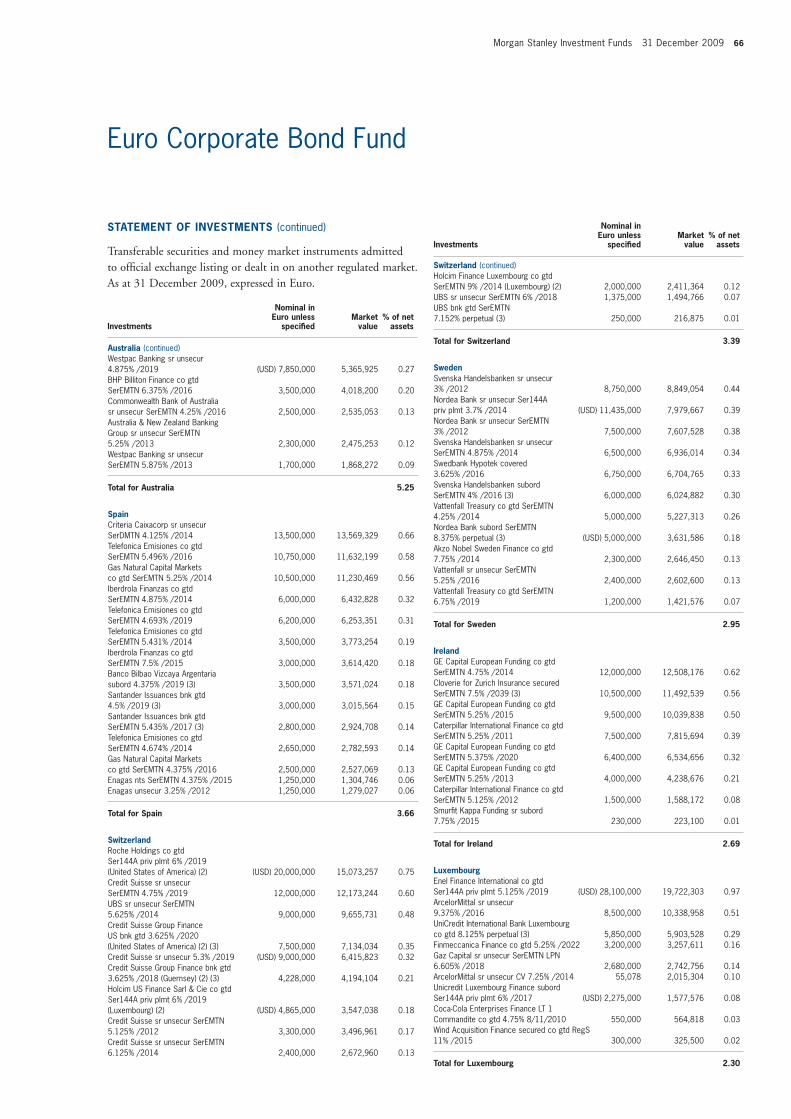
Morgan Stanley Investment Funds 31 December 2009 66
Euro Corporate Bond Fund
Investments
Nominal in Euro unless
specifi ed Market
value% of net
assets
Australia (continued)Westpac Banking sr unsecur 4.875% /2019 (USD) 7,850,000 5,365,925 0.27BHP Billiton Finance co gtd SerEMTN 6.375% /2016 3,500,000 4,018,200 0.20Commonwealth Bank of Australia sr unsecur SerEMTN 4.25% /2016 2,500,000 2,535,053 0.13Australia & New Zealand Banking Group sr unsecur SerEMTN 5.25% /2013 2,300,000 2,475,253 0.12Westpac Banking sr unsecur SerEMTN 5.875% /2013 1,700,000 1,868,272 0.09
Total for Australia 5.25
SpainCriteria Caixacorp sr unsecur SerDMTN 4.125% /2014 13,500,000 13,569,329 0.66Telefonica Emisiones co gtd SerEMTN 5.496% /2016 10,750,000 11,632,199 0.58Gas Natural Capital Markets co gtd SerEMTN 5.25% /2014 10,500,000 11,230,469 0.56Iberdrola Finanzas co gtd SerEMTN 4.875% /2014 6,000,000 6,432,828 0.32Telefonica Emisiones co gtd SerEMTN 4.693% /2019 6,200,000 6,253,351 0.31Telefonica Emisiones co gtd SerEMTN 5.431% /2014 3,500,000 3,773,254 0.19Iberdrola Finanzas co gtd SerEMTN 7.5% /2015 3,000,000 3,614,420 0.18Banco Bilbao Vizcaya Argentaria subord 4.375% /2019 (3) 3,500,000 3,571,024 0.18Santander Issuances bnk gtd 4.5% /2019 (3) 3,000,000 3,015,564 0.15Santander Issuances bnk gtd SerEMTN 5.435% /2017 (3) 2,800,000 2,924,708 0.14Telefonica Emisiones co gtd SerEMTN 4.674% /2014 2,650,000 2,782,593 0.14Gas Natural Capital Markets co gtd SerEMTN 4.375% /2016 2,500,000 2,527,069 0.13Enagas nts SerEMTN 4.375% /2015 1,250,000 1,304,746 0.06Enagas unsecur 3.25% /2012 1,250,000 1,279,027 0.06
Total for Spain 3.66
SwitzerlandRoche Holdings co gtd Ser144A priv plmt 6% /2019 (United States of America) (2) (USD) 20,000,000 15,073,257 0.75Credit Suisse sr unsecur SerEMTN 4.75% /2019 12,000,000 12,173,244 0.60UBS sr unsecur SerEMTN 5.625% /2014 9,000,000 9,655,731 0.48Credit Suisse Group Finance US bnk gtd 3.625% /2020 (United States of America) (2) (3) 7,500,000 7,134,034 0.35Credit Suisse sr unsecur 5.3% /2019 (USD) 9,000,000 6,415,823 0.32Credit Suisse Group Finance bnk gtd 3.625% /2018 (Guernsey) (2) (3) 4,228,000 4,194,104 0.21Holcim US Finance Sarl & Cie co gtd Ser144A priv plmt 6% /2019 (Luxembourg) (2) (USD) 4,865,000 3,547,038 0.18Credit Suisse sr unsecur SerEMTN 5.125% /2012 3,300,000 3,496,961 0.17Credit Suisse sr unsecur SerEMTN 6.125% /2014 2,400,000 2,672,960 0.13
Switzerland (continued)Holcim Finance Luxembourg co gtd SerEMTN 9% /2014 (Luxembourg) (2) 2,000,000 2,411,364 0.12UBS sr unsecur SerEMTN 6% /2018 1,375,000 1,494,766 0.07UBS bnk gtd SerEMTN 7.152% perpetual (3) 250,000 216,875 0.01
Total for Switzerland 3.39
SwedenSvenska Handelsbanken sr unsecur 3% /2012 8,750,000 8,849,054 0.44Nordea Bank sr unsecur Ser144A priv plmt 3.7% /2014 (USD) 11,435,000 7,979,667 0.39Nordea Bank sr unsecur SerEMTN 3% /2012 7,500,000 7,607,528 0.38Svenska Handelsbanken sr unsecur SerEMTN 4.875% /2014 6,500,000 6,936,014 0.34Swedbank Hypotek covered 3.625% /2016 6,750,000 6,704,765 0.33Svenska Handelsbanken subord SerEMTN 4% /2016 (3) 6,000,000 6,024,882 0.30Vattenfall Treasury co gtd SerEMTN 4.25% /2014 5,000,000 5,227,313 0.26Nordea Bank subord SerEMTN 8.375% perpetual (3) (USD) 5,000,000 3,631,586 0.18Akzo Nobel Sweden Finance co gtd 7.75% /2014 2,300,000 2,646,450 0.13Vattenfall sr unsecur SerEMTN 5.25% /2016 2,400,000 2,602,600 0.13Vattenfall Treasury co gtd SerEMTN 6.75% /2019 1,200,000 1,421,576 0.07
Total for Sweden 2.95
IrelandGE Capital European Funding co gtd SerEMTN 4.75% /2014 12,000,000 12,508,176 0.62Cloverie for Zurich Insurance secured SerEMTN 7.5% /2039 (3) 10,500,000 11,492,539 0.56GE Capital European Funding co gtd SerEMTN 5.25% /2015 9,500,000 10,039,838 0.50Caterpillar International Finance co gtd SerEMTN 5.25% /2011 7,500,000 7,815,694 0.39GE Capital European Funding co gtd SerEMTN 5.375% /2020 6,400,000 6,534,656 0.32GE Capital European Funding co gtd SerEMTN 5.25% /2013 4,000,000 4,238,676 0.21Caterpillar International Finance co gtd SerEMTN 5.125% /2012 1,500,000 1,588,172 0.08Smurfi t Kappa Funding sr subord 7.75% /2015 230,000 223,100 0.01
Total for Ireland 2.69
LuxembourgEnel Finance International co gtd Ser144A priv plmt 5.125% /2019 (USD) 28,100,000 19,722,303 0.97ArcelorMittal sr unsecur 9.375% /2016 8,500,000 10,338,958 0.51UniCredit International Bank Luxembourg co gtd 8.125% perpetual (3) 5,850,000 5,903,528 0.29Finmeccanica Finance co gtd 5.25% /2022 3,200,000 3,257,611 0.16Gaz Capital sr unsecur SerEMTN LPN 6.605% /2018 2,680,000 2,742,756 0.14ArcelorMittal sr unsecur CV 7.25% /2014 55,078 2,015,304 0.10Unicredit Luxembourg Finance subord Ser144A priv plmt 6% /2017 (USD) 2,275,000 1,577,576 0.08Coca-Cola Enterprises Finance LT 1 Commandite co gtd 4.75% 8/11/2010 550,000 564,818 0.03Wind Acquisition Finance secured co gtd RegS 11% /2015 300,000 325,500 0.02
Total for Luxembourg 2.30
STATEMENT OF INVESTMENTS (continued)
Transferable securities and money market instruments admitted to offi cial exchange listing or dealt in on another regulated market. As at 31 December 2009, expressed in Euro.
Investments
Nominal in Euro unless
specifi ed Market
value% of net
assets
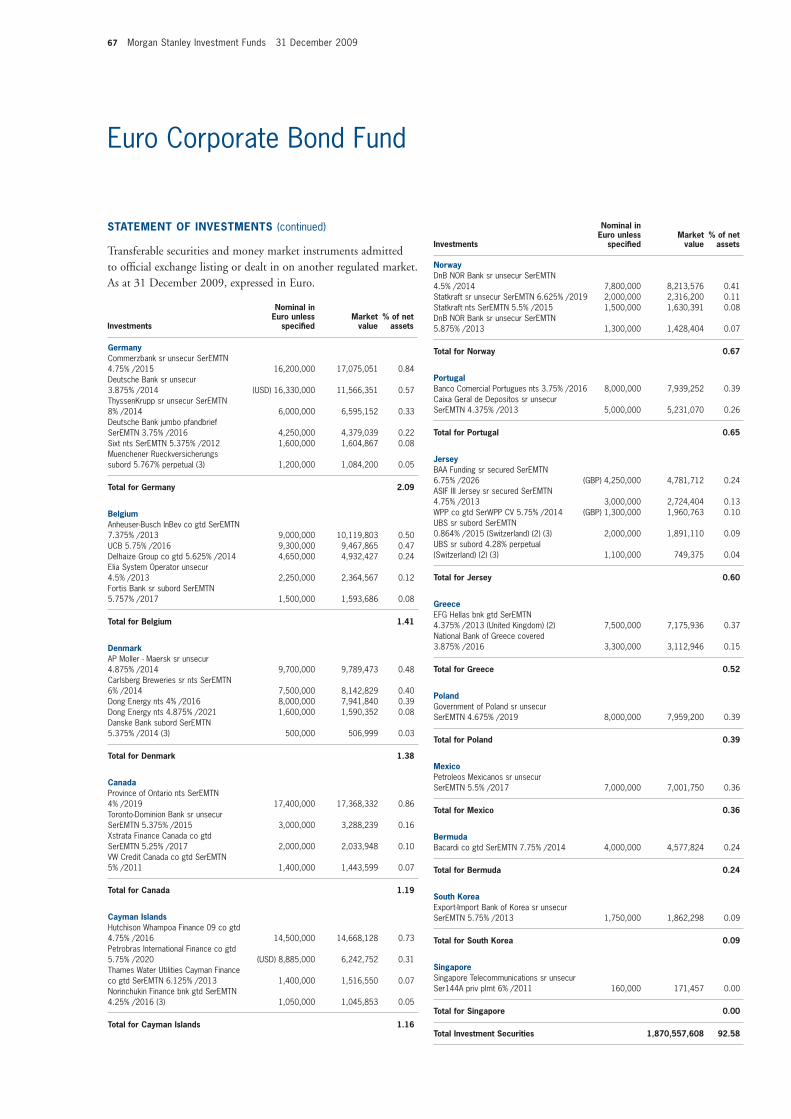
67 Morgan Stanley Investment Funds 31 December 2009
Euro Corporate Bond Fund
Investments
Nominal in Euro unless
specifi ed Market
value% of net
assets
GermanyCommerzbank sr unsecur SerEMTN 4.75% /2015 16,200,000 17,075,051 0.84Deutsche Bank sr unsecur 3.875% /2014 (USD) 16,330,000 11,566,351 0.57ThyssenKrupp sr unsecur SerEMTN 8% /2014 6,000,000 6,595,152 0.33Deutsche Bank jumbo pfandbrief SerEMTN 3.75% /2016 4,250,000 4,379,039 0.22Sixt nts SerEMTN 5.375% /2012 1,600,000 1,604,867 0.08Muenchener Rueckversicherungs subord 5.767% perpetual (3) 1,200,000 1,084,200 0.05
Total for Germany 2.09
BelgiumAnheuser-Busch InBev co gtd SerEMTN 7.375% /2013 9,000,000 10,119,803 0.50UCB 5.75% /2016 9,300,000 9,467,865 0.47Delhaize Group co gtd 5.625% /2014 4,650,000 4,932,427 0.24Elia System Operator unsecur 4.5% /2013 2,250,000 2,364,567 0.12Fortis Bank sr subord SerEMTN 5.757% /2017 1,500,000 1,593,686 0.08
Total for Belgium 1.41
DenmarkAP Moller - Maersk sr unsecur 4.875% /2014 9,700,000 9,789,473 0.48Carlsberg Breweries sr nts SerEMTN 6% /2014 7,500,000 8,142,829 0.40Dong Energy nts 4% /2016 8,000,000 7,941,840 0.39Dong Energy nts 4.875% /2021 1,600,000 1,590,352 0.08Danske Bank subord SerEMTN 5.375% /2014 (3) 500,000 506,999 0.03
Total for Denmark 1.38
CanadaProvince of Ontario nts SerEMTN 4% /2019 17,400,000 17,368,332 0.86Toronto-Dominion Bank sr unsecur SerEMTN 5.375% /2015 3,000,000 3,288,239 0.16Xstrata Finance Canada co gtd SerEMTN 5.25% /2017 2,000,000 2,033,948 0.10VW Credit Canada co gtd SerEMTN 5% /2011 1,400,000 1,443,599 0.07
Total for Canada 1.19
Cayman IslandsHutchison Whampoa Finance 09 co gtd 4.75% /2016 14,500,000 14,668,128 0.73Petrobras International Finance co gtd 5.75% /2020 (USD) 8,885,000 6,242,752 0.31Thames Water Utilities Cayman Finance co gtd SerEMTN 6.125% /2013 1,400,000 1,516,550 0.07Norinchukin Finance bnk gtd SerEMTN 4.25% /2016 (3) 1,050,000 1,045,853 0.05
Total for Cayman Islands 1.16
NorwayDnB NOR Bank sr unsecur SerEMTN 4.5% /2014 7,800,000 8,213,576 0.41Statkraft sr unsecur SerEMTN 6.625% /2019 2,000,000 2,316,200 0.11Statkraft nts SerEMTN 5.5% /2015 1,500,000 1,630,391 0.08DnB NOR Bank sr unsecur SerEMTN 5.875% /2013 1,300,000 1,428,404 0.07
Total for Norway 0.67
PortugalBanco Comercial Portugues nts 3.75% /2016 8,000,000 7,939,252 0.39Caixa Geral de Depositos sr unsecur SerEMTN 4.375% /2013 5,000,000 5,231,070 0.26
Total for Portugal 0.65
JerseyBAA Funding sr secured SerEMTN 6.75% /2026 (GBP) 4,250,000 4,781,712 0.24ASIF III Jersey sr secured SerEMTN 4.75% /2013 3,000,000 2,724,404 0.13WPP co gtd SerWPP CV 5.75% /2014 (GBP) 1,300,000 1,960,763 0.10UBS sr subord SerEMTN 0.864% /2015 (Switzerland) (2) (3) 2,000,000 1,891,110 0.09UBS sr subord 4.28% perpetual (Switzerland) (2) (3) 1,100,000 749,375 0.04
Total for Jersey 0.60
GreeceEFG Hellas bnk gtd SerEMTN 4.375% /2013 (United Kingdom) (2) 7,500,000 7,175,936 0.37National Bank of Greece covered 3.875% /2016 3,300,000 3,112,946 0.15
Total for Greece 0.52
PolandGovernment of Poland sr unsecur SerEMTN 4.675% /2019 8,000,000 7,959,200 0.39
Total for Poland 0.39
MexicoPetroleos Mexicanos sr unsecur SerEMTN 5.5% /2017 7,000,000 7,001,750 0.36
Total for Mexico 0.36
BermudaBacardi co gtd SerEMTN 7.75% /2014 4,000,000 4,577,824 0.24
Total for Bermuda 0.24
South KoreaExport-Import Bank of Korea sr unsecur SerEMTN 5.75% /2013 1,750,000 1,862,298 0.09
Total for South Korea 0.09
SingaporeSingapore Telecommunications sr unsecur Ser144A priv plmt 6% /2011 160,000 171,457 0.00
Total for Singapore 0.00
Total Investment Securities 1,870,557,608 92.58
STATEMENT OF INVESTMENTS (continued)
Transferable securities and money market instruments admitted to offi cial exchange listing or dealt in on another regulated market. As at 31 December 2009, expressed in Euro.
Investments
Nominal in Euro unless
specifi ed Market
value% of net
assets
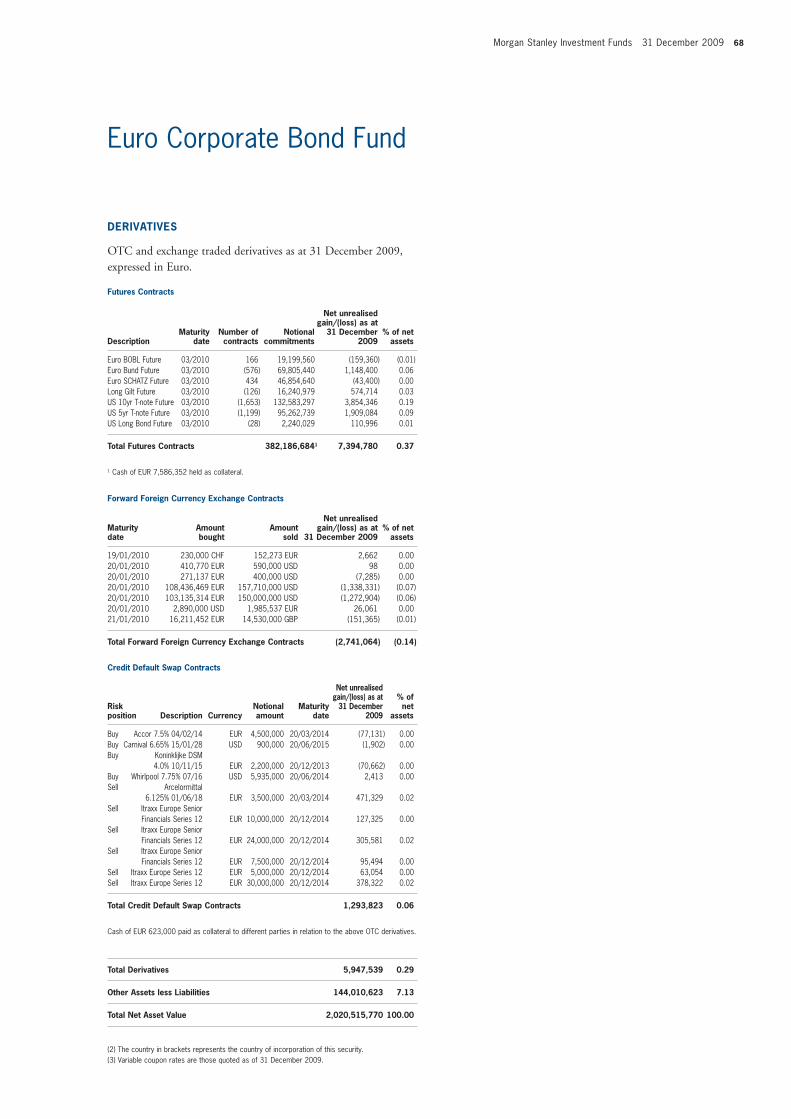
Morgan Stanley Investment Funds 31 December 2009 68
Euro Corporate Bond Fund
DERIVATIVES
OTC and exchange traded derivatives as at 31 December 2009, expressed in Euro.
Futures Contracts
DescriptionMaturity
dateNumber of contracts
Notional commitments
Net unrealisedgain/(loss) as at
31 December 2009
% of net assets
Euro BOBL Future 03/2010 166 19,199,560 (159,360) (0.01)Euro Bund Future 03/2010 (576) 69,805,440 1,148,400 0.06Euro SCHATZ Future 03/2010 434 46,854,640 (43,400) 0.00Long Gilt Future 03/2010 (126) 16,240,979 574,714 0.03US 10yr T-note Future 03/2010 (1,653) 132,583,297 3,854,346 0.19US 5yr T-note Future 03/2010 (1,199) 95,262,739 1,909,084 0.09US Long Bond Future 03/2010 (28) 2,240,029 110,996 0.01
Total Futures Contracts 382,186,6841 7,394,780 0.37
1 Cash of EUR 7,586,352 held as collateral.
Forward Foreign Currency Exchange Contracts
Maturity date
Amount bought
Amount sold
Net unrealisedgain/(loss) as at
31 December 2009 % of net
assets 19/01/2010 230,000 CHF 152,273 EUR 2,662 0.0020/01/2010 410,770 EUR 590,000 USD 98 0.0020/01/2010 271,137 EUR 400,000 USD (7,285) 0.0020/01/2010 108,436,469 EUR 157,710,000 USD (1,338,331) (0.07)20/01/2010 103,135,314 EUR 150,000,000 USD (1,272,904) (0.06)20/01/2010 2,890,000 USD 1,985,537 EUR 26,061 0.0021/01/2010 16,211,452 EUR 14,530,000 GBP (151,365) (0.01)
Total Forward Foreign Currency Exchange Contracts (2,741,064) (0.14)
Credit Default Swap Contracts
Risk position Description Currency
Notional amount
Maturity date
Net unrealised gain/(loss) as at
31 December 2009
% of net
assets Buy Accor 7.5% 04/02/14 EUR 4,500,000 20/03/2014 (77,131) 0.00 Buy Carnival 6.65% 15/01/28 USD 900,000 20/06/2015 (1,902) 0.00 Buy Koninklijke DSM 4.0% 10/11/15 EUR 2,200,000 20/12/2013 (70,662) 0.00 Buy Whirlpool 7.75% 07/16 USD 5,935,000 20/06/2014 2,413 0.00 Sell Arcelormittal 6.125% 01/06/18 EUR 3,500,000 20/03/2014 471,329 0.02 Sell Itraxx Europe Senior Financials Series 12 EUR 10,000,000 20/12/2014 127,325 0.00 Sell Itraxx Europe Senior Financials Series 12 EUR 24,000,000 20/12/2014 305,581 0.02 Sell Itraxx Europe Senior Financials Series 12 EUR 7,500,000 20/12/2014 95,494 0.00 Sell Itraxx Europe Series 12 EUR 5,000,000 20/12/2014 63,054 0.00 Sell Itraxx Europe Series 12 EUR 30,000,000 20/12/2014 378,322 0.02
Total Credit Default Swap Contracts 1,293,823 0.06
Cash of EUR 623,000 paid as collateral to different parties in relation to the above OTC derivatives.
Total Derivatives 5,947,539 0.29
Other Assets less Liabilities 144,010,623 7.13
Total Net Asset Value 2,020,515,770 100.00
(2) The country in brackets represents the country of incorporation of this security.(3) Variable coupon rates are those quoted as of 31 December 2009.
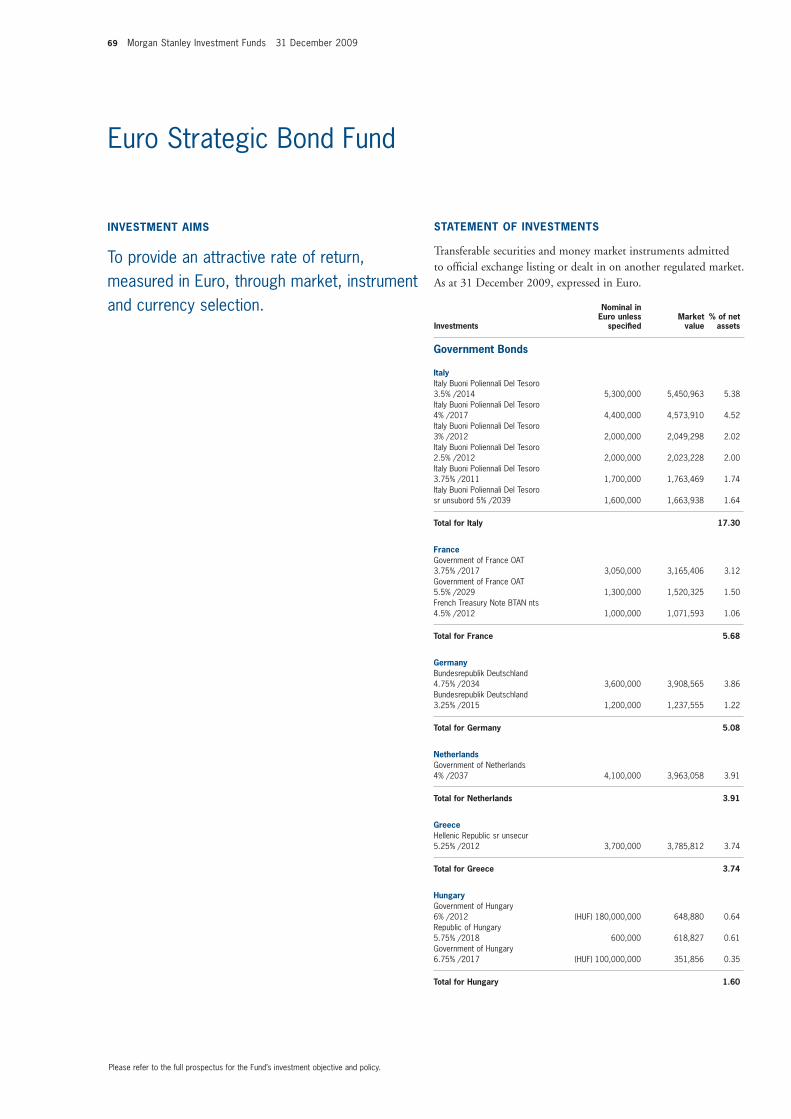
69 Morgan Stanley Investment Funds 31 December 2009
Euro Strategic Bond Fund
INVESTMENT AIMS
To provide an attractive rate of return, measured in Euro, through market, instrument and currency selection.
STATEMENT OF INVESTMENTS
Transferable securities and money market instruments admitted to offi cial exchange listing or dealt in on another regulated market. As at 31 December 2009, expressed in Euro.
Investments
Nominal in Euro unless
specifi ed Market
value% of net
assets
Government Bonds
Italy Italy Buoni Poliennali Del Tesoro 3.5% /2014 5,300,000 5,450,963 5.38Italy Buoni Poliennali Del Tesoro 4% /2017 4,400,000 4,573,910 4.52Italy Buoni Poliennali Del Tesoro 3% /2012 2,000,000 2,049,298 2.02Italy Buoni Poliennali Del Tesoro 2.5% /2012 2,000,000 2,023,228 2.00Italy Buoni Poliennali Del Tesoro 3.75% /2011 1,700,000 1,763,469 1.74Italy Buoni Poliennali Del Tesoro sr unsubord 5% /2039 1,600,000 1,663,938 1.64
Total for Italy 17.30
France Government of France OAT 3.75% /2017 3,050,000 3,165,406 3.12Government of France OAT 5.5% /2029 1,300,000 1,520,325 1.50French Treasury Note BTAN nts 4.5% /2012 1,000,000 1,071,593 1.06
Total for France 5.68
Germany Bundesrepublik Deutschland 4.75% /2034 3,600,000 3,908,565 3.86Bundesrepublik Deutschland 3.25% /2015 1,200,000 1,237,555 1.22
Total for Germany 5.08
Netherlands Government of Netherlands 4% /2037 4,100,000 3,963,058 3.91
Total for Netherlands 3.91
Greece Hellenic Republic sr unsecur 5.25% /2012 3,700,000 3,785,812 3.74
Total for Greece 3.74
Hungary Government of Hungary 6% /2012 (HUF) 180,000,000 648,880 0.64Republic of Hungary 5.75% /2018 600,000 618,827 0.61Government of Hungary 6.75% /2017 (HUF) 100,000,000 351,856 0.35
Total for Hungary 1.60
Please refer to the full prospectus for the Fund’s investment objective and policy.
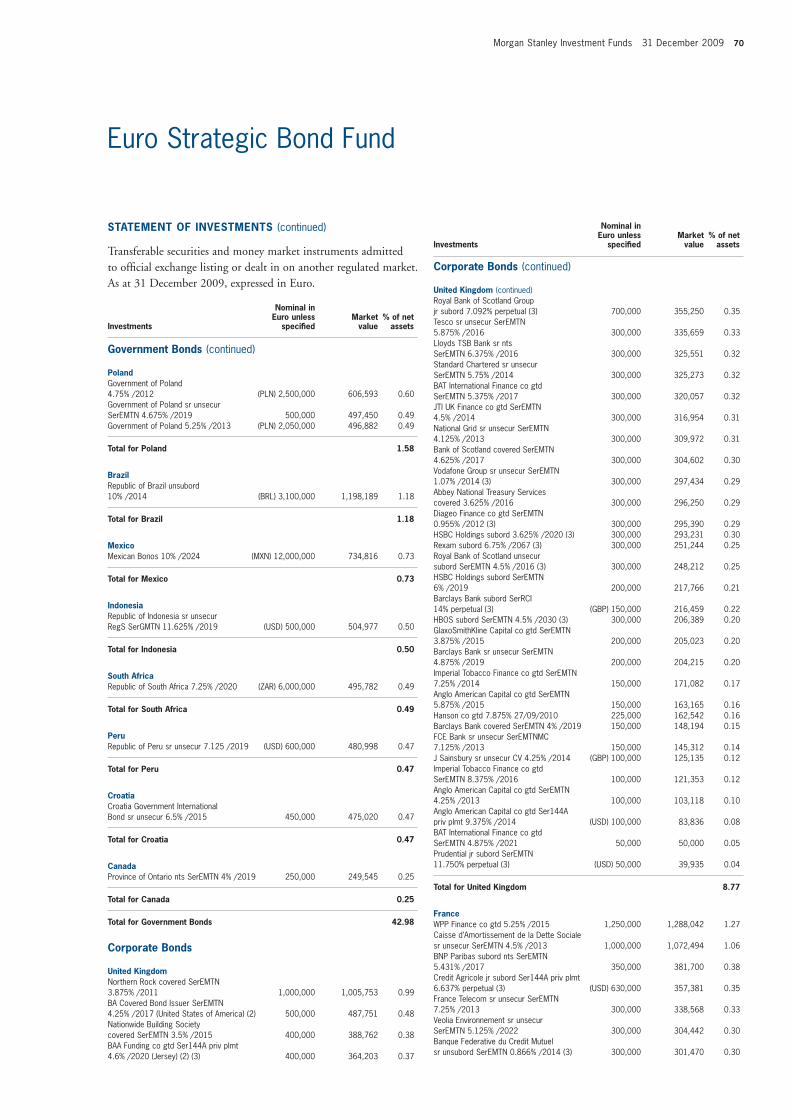
Morgan Stanley Investment Funds 31 December 2009 70
Euro Strategic Bond Fund
Investments
Nominal in Euro unless
specifi ed Market
value% of net
assets
STATEMENT OF INVESTMENTS (continued)
Transferable securities and money market instruments admitted to offi cial exchange listing or dealt in on another regulated market. As at 31 December 2009, expressed in Euro.
Investments
Nominal in Euro unless
specifi ed Market
value% of net
assets
Corporate Bonds (continued)
United Kingdom (continued)Royal Bank of Scotland Group jr subord 7.092% perpetual (3) 700,000 355,250 0.35Tesco sr unsecur SerEMTN 5.875% /2016 300,000 335,659 0.33Lloyds TSB Bank sr nts SerEMTN 6.375% /2016 300,000 325,551 0.32Standard Chartered sr unsecur SerEMTN 5.75% /2014 300,000 325,273 0.32BAT International Finance co gtd SerEMTN 5.375% /2017 300,000 320,057 0.32JTI UK Finance co gtd SerEMTN 4.5% /2014 300,000 316,954 0.31National Grid sr unsecur SerEMTN 4.125% /2013 300,000 309,972 0.31Bank of Scotland covered SerEMTN 4.625% /2017 300,000 304,602 0.30Vodafone Group sr unsecur SerEMTN 1.07% /2014 (3) 300,000 297,434 0.29Abbey National Treasury Services covered 3.625% /2016 300,000 296,250 0.29Diageo Finance co gtd SerEMTN 0.955% /2012 (3) 300,000 295,390 0.29HSBC Holdings subord 3.625% /2020 (3) 300,000 293,231 0.30Rexam subord 6.75% /2067 (3) 300,000 251,244 0.25Royal Bank of Scotland unsecur subord SerEMTN 4.5% /2016 (3) 300,000 248,212 0.25HSBC Holdings subord SerEMTN 6% /2019 200,000 217,766 0.21Barclays Bank subord SerRCI 14% perpetual (3) (GBP) 150,000 216,459 0.22HBOS subord SerEMTN 4.5% /2030 (3) 300,000 206,389 0.20GlaxoSmithKline Capital co gtd SerEMTN 3.875% /2015 200,000 205,023 0.20Barclays Bank sr unsecur SerEMTN 4.875% /2019 200,000 204,215 0.20Imperial Tobacco Finance co gtd SerEMTN 7.25% /2014 150,000 171,082 0.17Anglo American Capital co gtd SerEMTN 5.875% /2015 150,000 163,165 0.16Hanson co gtd 7.875% 27/09/2010 225,000 162,542 0.16Barclays Bank covered SerEMTN 4% /2019 150,000 148,194 0.15FCE Bank sr unsecur SerEMTNMC 7.125% /2013 150,000 145,312 0.14J Sainsbury sr unsecur CV 4.25% /2014 (GBP) 100,000 125,135 0.12Imperial Tobacco Finance co gtd SerEMTN 8.375% /2016 100,000 121,353 0.12Anglo American Capital co gtd SerEMTN 4.25% /2013 100,000 103,118 0.10Anglo American Capital co gtd Ser144A priv plmt 9.375% /2014 (USD) 100,000 83,836 0.08BAT International Finance co gtd SerEMTN 4.875% /2021 50,000 50,000 0.05Prudential jr subord SerEMTN 11.750% perpetual (3) (USD) 50,000 39,935 0.04
Total for United Kingdom 8.77
France WPP Finance co gtd 5.25% /2015 1,250,000 1,288,042 1.27Caisse d’Amortissement de la Dette Sociale sr unsecur SerEMTN 4.5% /2013 1,000,000 1,072,494 1.06BNP Paribas subord nts SerEMTN 5.431% /2017 350,000 381,700 0.38Credit Agricole jr subord Ser144A priv plmt 6.637% perpetual (3) (USD) 630,000 357,381 0.35France Telecom sr unsecur SerEMTN 7.25% /2013 300,000 338,568 0.33Veolia Environnement sr unsecur SerEMTN 5.125% /2022 300,000 304,442 0.30Banque Federative du Credit Mutuel sr unsubord SerEMTN 0.866% /2014 (3) 300,000 301,470 0.30
Government Bonds (continued)
Poland Government of Poland 4.75% /2012 (PLN) 2,500,000 606,593 0.60Government of Poland sr unsecur SerEMTN 4.675% /2019 500,000 497,450 0.49Government of Poland 5.25% /2013 (PLN) 2,050,000 496,882 0.49
Total for Poland 1.58
Brazil Republic of Brazil unsubord 10% /2014 (BRL) 3,100,000 1,198,189 1.18
Total for Brazil 1.18
Mexico Mexican Bonos 10% /2024 (MXN) 12,000,000 734,816 0.73
Total for Mexico 0.73
Indonesia Republic of Indonesia sr unsecur RegS SerGMTN 11.625% /2019 (USD) 500,000 504,977 0.50
Total for Indonesia 0.50
South Africa Republic of South Africa 7.25% /2020 (ZAR) 6,000,000 495,782 0.49
Total for South Africa 0.49
Peru Republic of Peru sr unsecur 7.125 /2019 (USD) 600,000 480,998 0.47
Total for Peru 0.47
Croatia Croatia Government International Bond sr unsecur 6.5% /2015 450,000 475,020 0.47
Total for Croatia 0.47
Canada Province of Ontario nts SerEMTN 4% /2019 250,000 249,545 0.25
Total for Canada 0.25
Total for Government Bonds 42.98
Corporate Bonds
United KingdomNorthern Rock covered SerEMTN 3.875% /2011 1,000,000 1,005,753 0.99BA Covered Bond Issuer SerEMTN 4.25% /2017 (United States of America) (2) 500,000 487,751 0.48Nationwide Building Society covered SerEMTN 3.5% /2015 400,000 388,762 0.38BAA Funding co gtd Ser144A priv plmt 4.6% /2020 (Jersey) (2) (3) 400,000 364,203 0.37
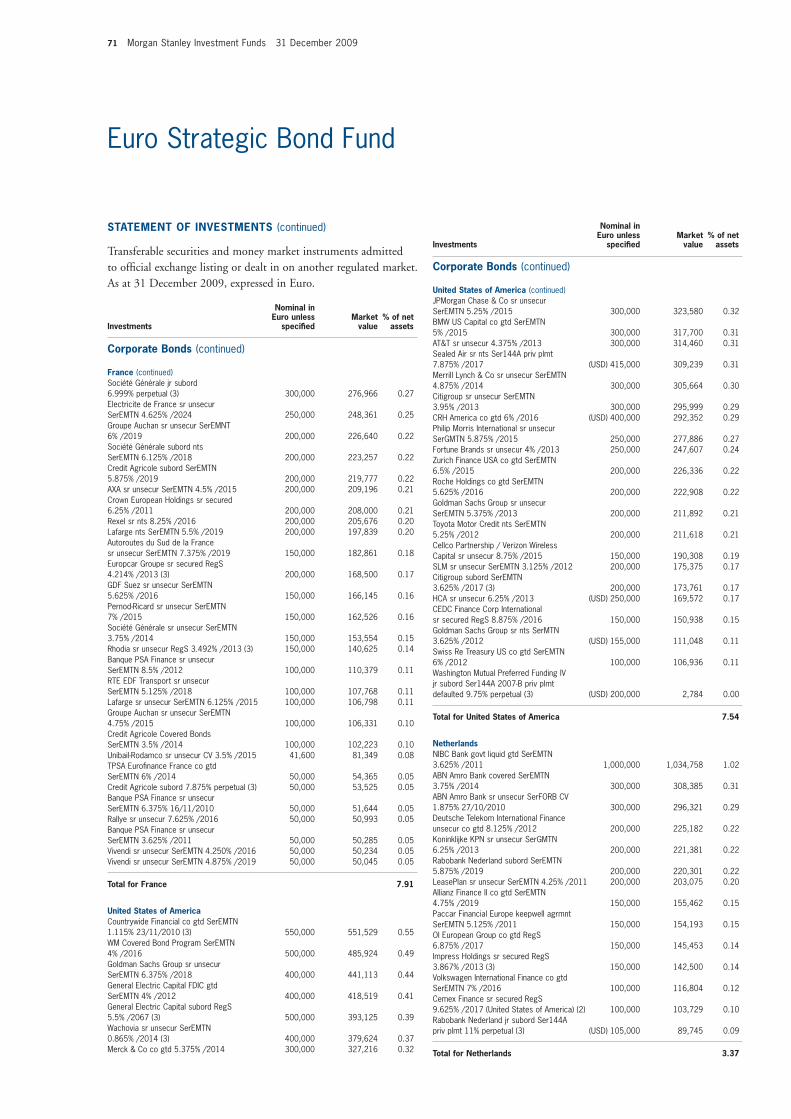
71 Morgan Stanley Investment Funds 31 December 2009
Investments
Nominal in Euro unless
specifi ed Market
value% of net
assets
Corporate Bonds (continued)
France (continued)Société Générale jr subord 6.999% perpetual (3) 300,000 276,966 0.27Electricite de France sr unsecur SerEMTN 4.625% /2024 250,000 248,361 0.25Groupe Auchan sr unsecur SerEMNT 6% /2019 200,000 226,640 0.22Société Générale subord nts SerEMTN 6.125% /2018 200,000 223,257 0.22Credit Agricole subord SerEMTN 5.875% /2019 200,000 219,777 0.22AXA sr unsecur SerEMTN 4.5% /2015 200,000 209,196 0.21Crown European Holdings sr secured 6.25% /2011 200,000 208,000 0.21Rexel sr nts 8.25% /2016 200,000 205,676 0.20Lafarge nts SerEMTN 5.5% /2019 200,000 197,839 0.20Autoroutes du Sud de la France sr unsecur SerEMTN 7.375% /2019 150,000 182,861 0.18Europcar Groupe sr secured RegS 4.214% /2013 (3) 200,000 168,500 0.17GDF Suez sr unsecur SerEMTN 5.625% /2016 150,000 166,145 0.16Pernod-Ricard sr unsecur SerEMTN 7% /2015 150,000 162,526 0.16Société Générale sr unsecur SerEMTN 3.75% /2014 150,000 153,554 0.15Rhodia sr unsecur RegS 3.492% /2013 (3) 150,000 140,625 0.14Banque PSA Finance sr unsecur SerEMTN 8.5% /2012 100,000 110,379 0.11RTE EDF Transport sr unsecur SerEMTN 5.125% /2018 100,000 107,768 0.11Lafarge sr unsecur SerEMTN 6.125% /2015 100,000 106,798 0.11Groupe Auchan sr unsecur SerEMTN 4.75% /2015 100,000 106,331 0.10Credit Agricole Covered Bonds SerEMTN 3.5% /2014 100,000 102,223 0.10Unibail-Rodamco sr unsecur CV 3.5% /2015 41,600 81,349 0.08TPSA Eurofi nance France co gtd SerEMTN 6% /2014 50,000 54,365 0.05Credit Agricole subord 7.875% perpetual (3) 50,000 53,525 0.05Banque PSA Finance sr unsecur SerEMTN 6.375% 16/11/2010 50,000 51,644 0.05Rallye sr unsecur 7.625% /2016 50,000 50,993 0.05Banque PSA Finance sr unsecur SerEMTN 3.625% /2011 50,000 50,285 0.05Vivendi sr unsecur SerEMTN 4.250% /2016 50,000 50,234 0.05Vivendi sr unsecur SerEMTN 4.875% /2019 50,000 50,045 0.05
Total for France 7.91
United States of America Countrywide Financial co gtd SerEMTN 1.115% 23/11/2010 (3) 550,000 551,529 0.55WM Covered Bond Program SerEMTN 4% /2016 500,000 485,924 0.49Goldman Sachs Group sr unsecur SerEMTN 6.375% /2018 400,000 441,113 0.44General Electric Capital FDIC gtd SerEMTN 4% /2012 400,000 418,519 0.41General Electric Capital subord RegS 5.5% /2067 (3) 500,000 393,125 0.39Wachovia sr unsecur SerEMTN 0.865% /2014 (3) 400,000 379,624 0.37Merck & Co co gtd 5.375% /2014 300,000 327,216 0.32
Euro Strategic Bond Fund
STATEMENT OF INVESTMENTS (continued)
Transferable securities and money market instruments admitted to offi cial exchange listing or dealt in on another regulated market. As at 31 December 2009, expressed in Euro.
Investments
Nominal in Euro unless
specifi ed Market
value% of net
assets
Corporate Bonds (continued)
United States of America (continued)JPMorgan Chase & Co sr unsecur SerEMTN 5.25% /2015 300,000 323,580 0.32BMW US Capital co gtd SerEMTN 5% /2015 300,000 317,700 0.31AT&T sr unsecur 4.375% /2013 300,000 314,460 0.31Sealed Air sr nts Ser144A priv plmt 7.875% /2017 (USD) 415,000 309,239 0.31Merrill Lynch & Co sr unsecur SerEMTN 4.875% /2014 300,000 305,664 0.30Citigroup sr unsecur SerEMTN 3.95% /2013 300,000 295,999 0.29CRH America co gtd 6% /2016 (USD) 400,000 292,352 0.29Philip Morris International sr unsecur SerGMTN 5.875% /2015 250,000 277,886 0.27Fortune Brands sr unsecur 4% /2013 250,000 247,607 0.24Zurich Finance USA co gtd SerEMTN 6.5% /2015 200,000 226,336 0.22Roche Holdings co gtd SerEMTN 5.625% /2016 200,000 222,908 0.22Goldman Sachs Group sr unsecur SerEMTN 5.375% /2013 200,000 211,892 0.21Toyota Motor Credit nts SerEMTN 5.25% /2012 200,000 211,618 0.21Cellco Partnership / Verizon Wireless Capital sr unsecur 8.75% /2015 150,000 190,308 0.19SLM sr unsecur SerEMTN 3.125% /2012 200,000 175,375 0.17Citigroup subord SerEMTN 3.625% /2017 (3) 200,000 173,761 0.17HCA sr unsecur 6.25% /2013 (USD) 250,000 169,572 0.17CEDC Finance Corp International sr secured RegS 8.875% /2016 150,000 150,938 0.15Goldman Sachs Group sr nts SerMTN 3.625% /2012 (USD) 155,000 111,048 0.11Swiss Re Treasury US co gtd SerEMTN 6% /2012 100,000 106,936 0.11Washington Mutual Preferred Funding IV jr subord Ser144A 2007-B priv plmt defaulted 9.75% perpetual (3) (USD) 200,000 2,784 0.00
Total for United States of America 7.54
Netherlands NIBC Bank govt liquid gtd SerEMTN 3.625% /2011 1,000,000 1,034,758 1.02ABN Amro Bank covered SerEMTN 3.75% /2014 300,000 308,385 0.31ABN Amro Bank sr unsecur SerFORB CV 1.875% 27/10/2010 300,000 296,321 0.29Deutsche Telekom International Finance unsecur co gtd 8.125% /2012 200,000 225,182 0.22Koninklijke KPN sr unsecur SerGMTN 6.25% /2013 200,000 221,381 0.22Rabobank Nederland subord SerEMTN 5.875% /2019 200,000 220,301 0.22LeasePlan sr unsecur SerEMTN 4.25% /2011 200,000 203,075 0.20Allianz Finance II co gtd SerEMTN 4.75% /2019 150,000 155,462 0.15Paccar Financial Europe keepwell agrmnt SerEMTN 5.125% /2011 150,000 154,193 0.15OI European Group co gtd RegS 6.875% /2017 150,000 145,453 0.14Impress Holdings sr secured RegS 3.867% /2013 (3) 150,000 142,500 0.14Volkswagen International Finance co gtd SerEMTN 7% /2016 100,000 116,804 0.12Cemex Finance sr secured RegS 9.625% /2017 (United States of America) (2) 100,000 103,729 0.10Rabobank Nederland jr subord Ser144A priv plmt 11% perpetual (3) (USD) 105,000 89,745 0.09
Total for Netherlands 3.37
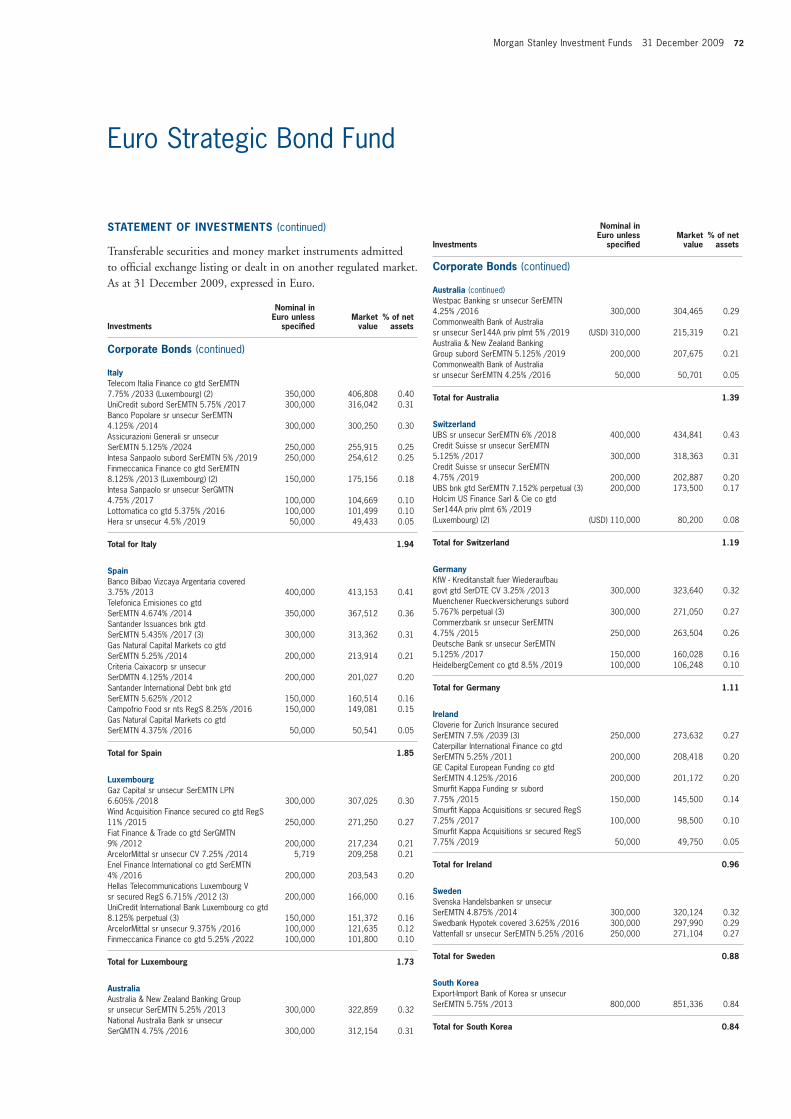
Morgan Stanley Investment Funds 31 December 2009 72
Investments
Nominal in Euro unless
specifi ed Market
value% of net
assets
Corporate Bonds (continued)
Italy Telecom Italia Finance co gtd SerEMTN 7.75% /2033 (Luxembourg) (2) 350,000 406,808 0.40UniCredit subord SerEMTN 5.75% /2017 300,000 316,042 0.31Banco Popolare sr unsecur SerEMTN 4.125% /2014 300,000 300,250 0.30Assicurazioni Generali sr unsecur SerEMTN 5.125% /2024 250,000 255,915 0.25Intesa Sanpaolo subord SerEMTN 5% /2019 250,000 254,612 0.25Finmeccanica Finance co gtd SerEMTN 8.125% /2013 (Luxembourg) (2) 150,000 175,156 0.18Intesa Sanpaolo sr unsecur SerGMTN 4.75% /2017 100,000 104,669 0.10Lottomatica co gtd 5.375% /2016 100,000 101,499 0.10Hera sr unsecur 4.5% /2019 50,000 49,433 0.05
Total for Italy 1.94
Spain Banco Bilbao Vizcaya Argentaria covered 3.75% /2013 400,000 413,153 0.41Telefonica Emisiones co gtd SerEMTN 4.674% /2014 350,000 367,512 0.36Santander Issuances bnk gtd SerEMTN 5.435% /2017 (3) 300,000 313,362 0.31Gas Natural Capital Markets co gtd SerEMTN 5.25% /2014 200,000 213,914 0.21Criteria Caixacorp sr unsecur SerDMTN 4.125% /2014 200,000 201,027 0.20Santander International Debt bnk gtd SerEMTN 5.625% /2012 150,000 160,514 0.16Campofrio Food sr nts RegS 8.25% /2016 150,000 149,081 0.15Gas Natural Capital Markets co gtd SerEMTN 4.375% /2016 50,000 50,541 0.05
Total for Spain 1.85
Luxembourg Gaz Capital sr unsecur SerEMTN LPN 6.605% /2018 300,000 307,025 0.30Wind Acquisition Finance secured co gtd RegS 11% /2015 250,000 271,250 0.27Fiat Finance & Trade co gtd SerGMTN 9% /2012 200,000 217,234 0.21ArcelorMittal sr unsecur CV 7.25% /2014 5,719 209,258 0.21Enel Finance International co gtd SerEMTN 4% /2016 200,000 203,543 0.20Hellas Telecommunications Luxembourg V sr secured RegS 6.715% /2012 (3) 200,000 166,000 0.16UniCredit International Bank Luxembourg co gtd 8.125% perpetual (3) 150,000 151,372 0.16ArcelorMittal sr unsecur 9.375% /2016 100,000 121,635 0.12Finmeccanica Finance co gtd 5.25% /2022 100,000 101,800 0.10
Total for Luxembourg 1.73
Australia Australia & New Zealand Banking Group sr unsecur SerEMTN 5.25% /2013 300,000 322,859 0.32National Australia Bank sr unsecur SerGMTN 4.75% /2016 300,000 312,154 0.31
Euro Strategic Bond Fund
STATEMENT OF INVESTMENTS (continued)
Transferable securities and money market instruments admitted to offi cial exchange listing or dealt in on another regulated market. As at 31 December 2009, expressed in Euro.
Investments
Nominal in Euro unless
specifi ed Market
value% of net
assets
Corporate Bonds (continued)
Australia (continued)Westpac Banking sr unsecur SerEMTN 4.25% /2016 300,000 304,465 0.29Commonwealth Bank of Australia sr unsecur Ser144A priv plmt 5% /2019 (USD) 310,000 215,319 0.21Australia & New Zealand Banking Group subord SerEMTN 5.125% /2019 200,000 207,675 0.21Commonwealth Bank of Australia sr unsecur SerEMTN 4.25% /2016 50,000 50,701 0.05
Total for Australia 1.39
Switzerland UBS sr unsecur SerEMTN 6% /2018 400,000 434,841 0.43Credit Suisse sr unsecur SerEMTN 5.125% /2017 300,000 318,363 0.31Credit Suisse sr unsecur SerEMTN 4.75% /2019 200,000 202,887 0.20UBS bnk gtd SerEMTN 7.152% perpetual (3) 200,000 173,500 0.17Holcim US Finance Sarl & Cie co gtd Ser144A priv plmt 6% /2019 (Luxembourg) (2) (USD) 110,000 80,200 0.08
Total for Switzerland 1.19
Germany KfW - Kreditanstalt fuer Wiederaufbau govt gtd SerDTE CV 3.25% /2013 300,000 323,640 0.32Muenchener Rueckversicherungs subord 5.767% perpetual (3) 300,000 271,050 0.27Commerzbank sr unsecur SerEMTN 4.75% /2015 250,000 263,504 0.26Deutsche Bank sr unsecur SerEMTN 5.125% /2017 150,000 160,028 0.16HeidelbergCement co gtd 8.5% /2019 100,000 106,248 0.10
Total for Germany 1.11
Ireland Cloverie for Zurich Insurance secured SerEMTN 7.5% /2039 (3) 250,000 273,632 0.27Caterpillar International Finance co gtd SerEMTN 5.25% /2011 200,000 208,418 0.20GE Capital European Funding co gtd SerEMTN 4.125% /2016 200,000 201,172 0.20Smurfi t Kappa Funding sr subord 7.75% /2015 150,000 145,500 0.14Smurfi t Kappa Acquisitions sr secured RegS 7.25% /2017 100,000 98,500 0.10Smurfi t Kappa Acquisitions sr secured RegS 7.75% /2019 50,000 49,750 0.05
Total for Ireland 0.96
Sweden Svenska Handelsbanken sr unsecur SerEMTN 4.875% /2014 300,000 320,124 0.32Swedbank Hypotek covered 3.625% /2016 300,000 297,990 0.29Vattenfall sr unsecur SerEMTN 5.25% /2016 250,000 271,104 0.27
Total for Sweden 0.88
South Korea Export-Import Bank of Korea sr unsecur SerEMTN 5.75% /2013 800,000 851,336 0.84
Total for South Korea 0.84
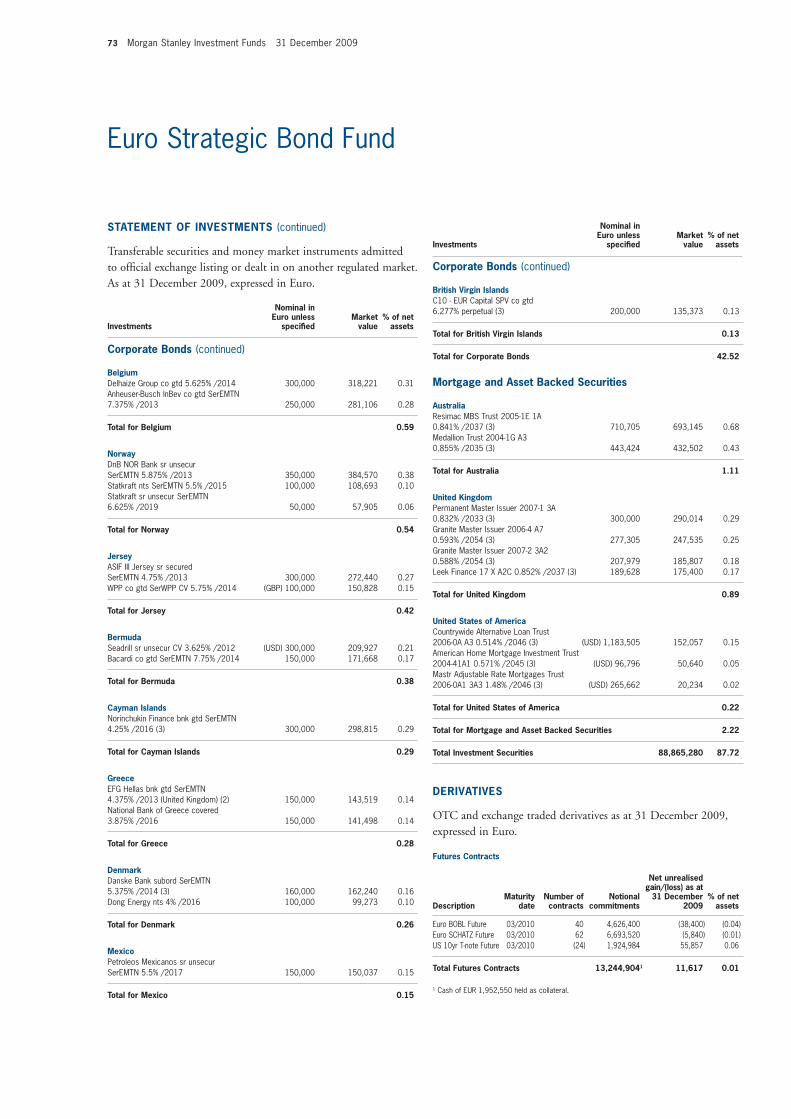
73 Morgan Stanley Investment Funds 31 December 2009
Euro Strategic Bond Fund
Investments
Nominal in Euro unless
specifi ed Market
value% of net
assets
Corporate Bonds (continued)
Belgium Delhaize Group co gtd 5.625% /2014 300,000 318,221 0.31Anheuser-Busch InBev co gtd SerEMTN 7.375% /2013 250,000 281,106 0.28
Total for Belgium 0.59
Norway DnB NOR Bank sr unsecur SerEMTN 5.875% /2013 350,000 384,570 0.38Statkraft nts SerEMTN 5.5% /2015 100,000 108,693 0.10Statkraft sr unsecur SerEMTN 6.625% /2019 50,000 57,905 0.06
Total for Norway 0.54
Jersey ASIF III Jersey sr secured SerEMTN 4.75% /2013 300,000 272,440 0.27WPP co gtd SerWPP CV 5.75% /2014 (GBP) 100,000 150,828 0.15
Total for Jersey 0.42
Bermuda Seadrill sr unsecur CV 3.625% /2012 (USD) 300,000 209,927 0.21Bacardi co gtd SerEMTN 7.75% /2014 150,000 171,668 0.17
Total for Bermuda 0.38
Cayman Islands Norinchukin Finance bnk gtd SerEMTN 4.25% /2016 (3) 300,000 298,815 0.29
Total for Cayman Islands 0.29
Greece EFG Hellas bnk gtd SerEMTN 4.375% /2013 (United Kingdom) (2) 150,000 143,519 0.14National Bank of Greece covered 3.875% /2016 150,000 141,498 0.14
Total for Greece 0.28
Denmark Danske Bank subord SerEMTN 5.375% /2014 (3) 160,000 162,240 0.16Dong Energy nts 4% /2016 100,000 99,273 0.10
Total for Denmark 0.26
Mexico Petroleos Mexicanos sr unsecur SerEMTN 5.5% /2017 150,000 150,037 0.15
Total for Mexico 0.15
STATEMENT OF INVESTMENTS (continued)
Transferable securities and money market instruments admitted to offi cial exchange listing or dealt in on another regulated market. As at 31 December 2009, expressed in Euro.
Investments
Nominal in Euro unless
specifi ed Market
value% of net
assets
Corporate Bonds (continued)
British Virgin Islands C10 - EUR Capital SPV co gtd 6.277% perpetual (3) 200,000 135,373 0.13
Total for British Virgin Islands 0.13
Total for Corporate Bonds 42.52
Mortgage and Asset Backed Securities
Australia Resimac MBS Trust 2005-1E 1A 0.841% /2037 (3) 710,705 693,145 0.68Medallion Trust 2004-1G A3 0.855% /2035 (3) 443,424 432,502 0.43
Total for Australia 1.11
United Kingdom Permanent Master Issuer 2007-1 3A 0.832% /2033 (3) 300,000 290,014 0.29Granite Master Issuer 2006-4 A7 0.593% /2054 (3) 277,305 247,535 0.25Granite Master Issuer 2007-2 3A2 0.588% /2054 (3) 207,979 185,807 0.18Leek Finance 17 X A2C 0.852% /2037 (3) 189,628 175,400 0.17
Total for United Kingdom 0.89
United States of America Countrywide Alternative Loan Trust 2006-0A A3 0.514% /2046 (3) (USD) 1,183,505 152,057 0.15American Home Mortgage Investment Trust 2004-41A1 0.571% /2045 (3) (USD) 96,796 50,640 0.05Mastr Adjustable Rate Mortgages Trust 2006-0A1 3A3 1.48% /2046 (3) (USD) 265,662 20,234 0.02
Total for United States of America 0.22
Total for Mortgage and Asset Backed Securities 2.22
Total Investment Securities 88,865,280 87.72
DERIVATIVES
OTC and exchange traded derivatives as at 31 December 2009, expressed in Euro.
Futures Contracts
DescriptionMaturity
dateNumber of contracts
Notional commitments
Net unrealisedgain/(loss) as at
31 December 2009
% of net assets
Euro BOBL Future 03/2010 40 4,626,400 (38,400) (0.04)Euro SCHATZ Future 03/2010 62 6,693,520 (5,840) (0.01)US 10yr T-note Future 03/2010 (24) 1,924,984 55,857 0.06
Total Futures Contracts 13,244,9041 11,617 0.01
1 Cash of EUR 1,952,550 held as collateral.
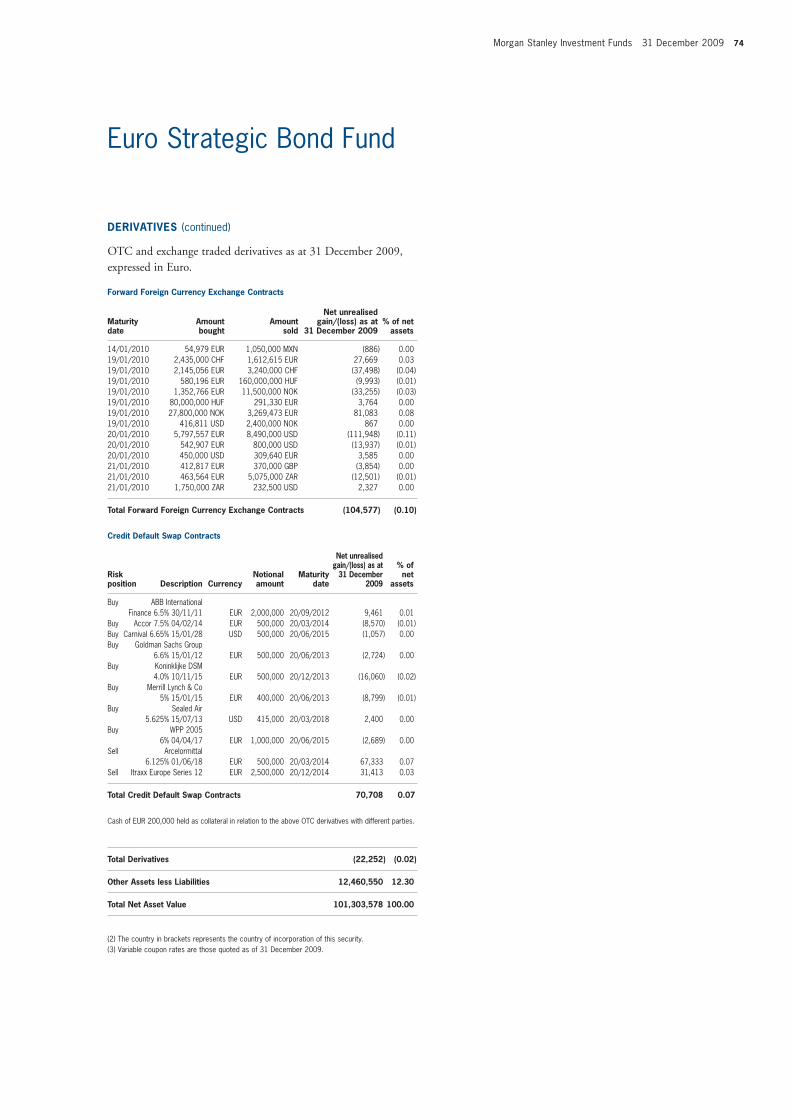
Morgan Stanley Investment Funds 31 December 2009 74
Euro Strategic Bond Fund
DERIVATIVES (continued)
OTC and exchange traded derivatives as at 31 December 2009, expressed in Euro.
Forward Foreign Currency Exchange Contracts
Maturity date
Amount bought
Amount sold
Net unrealisedgain/(loss) as at
31 December 2009 % of net
assets 14/01/2010 54,979 EUR 1,050,000 MXN (886) 0.0019/01/2010 2,435,000 CHF 1,612,615 EUR 27,669 0.0319/01/2010 2,145,056 EUR 3,240,000 CHF (37,498) (0.04)19/01/2010 580,196 EUR 160,000,000 HUF (9,993) (0.01)19/01/2010 1,352,766 EUR 11,500,000 NOK (33,255) (0.03)19/01/2010 80,000,000 HUF 291,330 EUR 3,764 0.0019/01/2010 27,800,000 NOK 3,269,473 EUR 81,083 0.0819/01/2010 416,811 USD 2,400,000 NOK 867 0.0020/01/2010 5,797,557 EUR 8,490,000 USD (111,948) (0.11)20/01/2010 542,907 EUR 800,000 USD (13,937) (0.01)20/01/2010 450,000 USD 309,640 EUR 3,585 0.0021/01/2010 412,817 EUR 370,000 GBP (3,854) 0.0021/01/2010 463,564 EUR 5,075,000 ZAR (12,501) (0.01)21/01/2010 1,750,000 ZAR 232,500 USD 2,327 0.00
Total Forward Foreign Currency Exchange Contracts (104,577) (0.10)
Credit Default Swap Contracts
Risk position Description Currency
Notional amount
Maturity date
Net unrealised gain/(loss) as at
31 December 2009
% of net
assets Buy ABB International Finance 6.5% 30/11/11 EUR 2,000,000 20/09/2012 9,461 0.01 Buy Accor 7.5% 04/02/14 EUR 500,000 20/03/2014 (8,570) (0.01)Buy Carnival 6.65% 15/01/28 USD 500,000 20/06/2015 (1,057) 0.00 Buy Goldman Sachs Group 6.6% 15/01/12 EUR 500,000 20/06/2013 (2,724) 0.00 Buy Koninklijke DSM 4.0% 10/11/15 EUR 500,000 20/12/2013 (16,060) (0.02)Buy Merrill Lynch & Co 5% 15/01/15 EUR 400,000 20/06/2013 (8,799) (0.01)Buy Sealed Air 5.625% 15/07/13 USD 415,000 20/03/2018 2,400 0.00 Buy WPP 2005 6% 04/04/17 EUR 1,000,000 20/06/2015 (2,689) 0.00 Sell Arcelormittal 6.125% 01/06/18 EUR 500,000 20/03/2014 67,333 0.07 Sell Itraxx Europe Series 12 EUR 2,500,000 20/12/2014 31,413 0.03
Total Credit Default Swap Contracts 70,708 0.07
Cash of EUR 200,000 held as collateral in relation to the above OTC derivatives with different parties.
Total Derivatives (22,252) (0.02)
Other Assets less Liabilities 12,460,550 12.30
Total Net Asset Value 101,303,578 100.00
(2) The country in brackets represents the country of incorporation of this security.(3) Variable coupon rates are those quoted as of 31 December 2009.
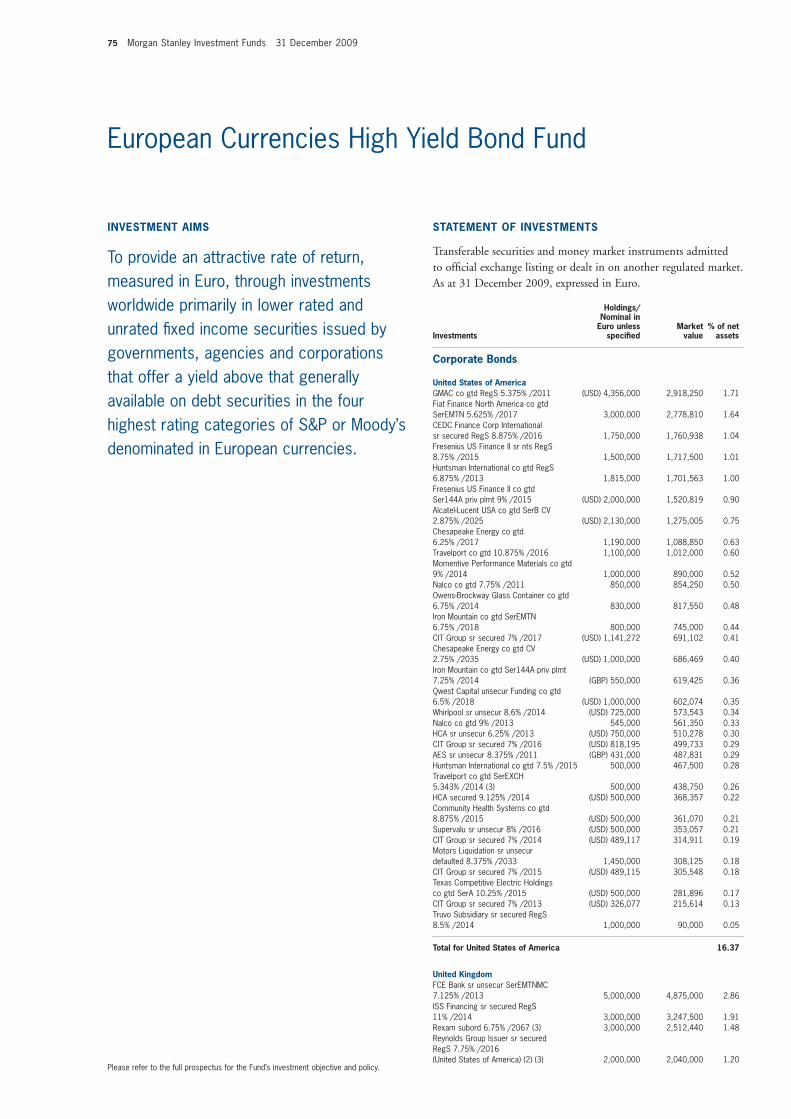
75 Morgan Stanley Investment Funds 31 December 2009
European Currencies High Yield Bond Fund
Corporate Bonds
United States of AmericaGMAC co gtd RegS 5.375% /2011 (USD) 4,356,000 2,918,250 1.71Fiat Finance North America co gtd SerEMTN 5.625% /2017 3,000,000 2,778,810 1.64CEDC Finance Corp International sr secured RegS 8.875% /2016 1,750,000 1,760,938 1.04Fresenius US Finance II sr nts RegS 8.75% /2015 1,500,000 1,717,500 1.01Huntsman International co gtd RegS 6.875% /2013 1,815,000 1,701,563 1.00Fresenius US Finance II co gtd Ser144A priv plmt 9% /2015 (USD) 2,000,000 1,520,819 0.90Alcatel-Lucent USA co gtd SerB CV 2.875% /2025 (USD) 2,130,000 1,275,005 0.75Chesapeake Energy co gtd 6.25% /2017 1,190,000 1,088,850 0.63Travelport co gtd 10.875% /2016 1,100,000 1,012,000 0.60Momentive Performance Materials co gtd 9% /2014 1,000,000 890,000 0.52Nalco co gtd 7.75% /2011 850,000 854,250 0.50Owens-Brockway Glass Container co gtd 6.75% /2014 830,000 817,550 0.48Iron Mountain co gtd SerEMTN 6.75% /2018 800,000 745,000 0.44CIT Group sr secured 7% /2017 (USD) 1,141,272 691,102 0.41Chesapeake Energy co gtd CV 2.75% /2035 (USD) 1,000,000 686,469 0.40Iron Mountain co gtd Ser144A priv plmt 7.25% /2014 (GBP) 550,000 619,425 0.36Qwest Capital unsecur Funding co gtd 6.5% /2018 (USD) 1,000,000 602,074 0.35Whirlpool sr unsecur 8.6% /2014 (USD) 725,000 573,543 0.34Nalco co gtd 9% /2013 545,000 561,350 0.33HCA sr unsecur 6.25% /2013 (USD) 750,000 510,278 0.30CIT Group sr secured 7% /2016 (USD) 818,195 499,733 0.29AES sr unsecur 8.375% /2011 (GBP) 431,000 487,831 0.29Huntsman International co gtd 7.5% /2015 500,000 467,500 0.28Travelport co gtd SerEXCH 5.343% /2014 (3) 500,000 438,750 0.26HCA secured 9.125% /2014 (USD) 500,000 368,357 0.22Community Health Systems co gtd 8.875% /2015 (USD) 500,000 361,070 0.21Supervalu sr unsecur 8% /2016 (USD) 500,000 353,057 0.21CIT Group sr secured 7% /2014 (USD) 489,117 314,911 0.19Motors Liquidation sr unsecur defaulted 8.375% /2033 1,450,000 308,125 0.18CIT Group sr secured 7% /2015 (USD) 489,115 305,548 0.18Texas Competitive Electric Holdings co gtd SerA 10.25% /2015 (USD) 500,000 281,896 0.17CIT Group sr secured 7% /2013 (USD) 326,077 215,614 0.13Truvo Subsidiary sr secured RegS 8.5% /2014 1,000,000 90,000 0.05
Total for United States of America 16.37
United KingdomFCE Bank sr unsecur SerEMTNMC 7.125% /2013 5,000,000 4,875,000 2.86ISS Financing sr secured RegS 11% /2014 3,000,000 3,247,500 1.91Rexam subord 6.75% /2067 (3) 3,000,000 2,512,440 1.48Reynolds Group Issuer sr secured RegS 7.75% /2016 (United States of America) (2) (3) 2,000,000 2,040,000 1.20
INVESTMENT AIMS
To provide an attractive rate of return, measured in Euro, through investments worldwide primarily in lower rated and unrated fi xed income securities issued by governments, agencies and corporations that offer a yield above that generally available on debt securities in the four highest rating categories of S&P or Moody’s denominated in European currencies.
STATEMENT OF INVESTMENTS
Transferable securities and money market instruments admitted to offi cial exchange listing or dealt in on another regulated market. As at 31 December 2009, expressed in Euro.
Investments
Holdings/Nominal in
Euro unless specifi ed
Market value
% of net assets
Please refer to the full prospectus for the Fund’s investment objective and policy.
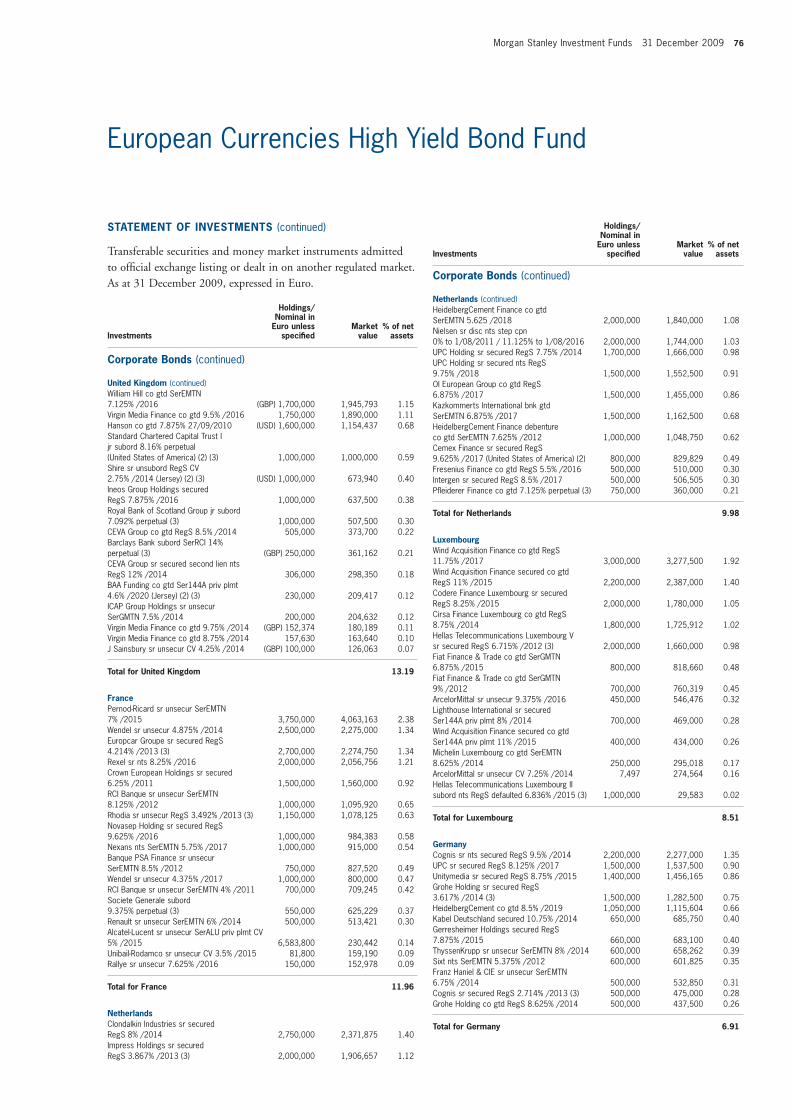
Morgan Stanley Investment Funds 31 December 2009 76
European Currencies High Yield Bond Fund
STATEMENT OF INVESTMENTS (continued)
Transferable securities and money market instruments admitted to offi cial exchange listing or dealt in on another regulated market. As at 31 December 2009, expressed in Euro.
Investments
Holdings/Nominal in
Euro unless specifi ed
Market value
% of net assets
Investments
Holdings/Nominal in
Euro unless specifi ed
Market value
% of net assets
Corporate Bonds (continued)
United Kingdom (continued)William Hill co gtd SerEMTN 7.125% /2016 (GBP) 1,700,000 1,945,793 1.15Virgin Media Finance co gtd 9.5% /2016 1,750,000 1,890,000 1.11Hanson co gtd 7.875% 27/09/2010 (USD) 1,600,000 1,154,437 0.68Standard Chartered Capital Trust I jr subord 8.16% perpetual (United States of America) (2) (3) 1,000,000 1,000,000 0.59Shire sr unsubord RegS CV 2.75% /2014 (Jersey) (2) (3) (USD) 1,000,000 673,940 0.40Ineos Group Holdings secured RegS 7.875% /2016 1,000,000 637,500 0.38Royal Bank of Scotland Group jr subord 7.092% perpetual (3) 1,000,000 507,500 0.30CEVA Group co gtd RegS 8.5% /2014 505,000 373,700 0.22Barclays Bank subord SerRCI 14% perpetual (3) (GBP) 250,000 361,162 0.21CEVA Group sr secured second lien nts RegS 12% /2014 306,000 298,350 0.18BAA Funding co gtd Ser144A priv plmt 4.6% /2020 (Jersey) (2) (3) 230,000 209,417 0.12ICAP Group Holdings sr unsecur SerGMTN 7.5% /2014 200,000 204,632 0.12Virgin Media Finance co gtd 9.75% /2014 (GBP) 152,374 180,189 0.11Virgin Media Finance co gtd 8.75% /2014 157,630 163,640 0.10J Sainsbury sr unsecur CV 4.25% /2014 (GBP) 100,000 126,063 0.07
Total for United Kingdom 13.19
FrancePernod-Ricard sr unsecur SerEMTN 7% /2015 3,750,000 4,063,163 2.38Wendel sr unsecur 4.875% /2014 2,500,000 2,275,000 1.34Europcar Groupe sr secured RegS 4.214% /2013 (3) 2,700,000 2,274,750 1.34Rexel sr nts 8.25% /2016 2,000,000 2,056,756 1.21Crown European Holdings sr secured 6.25% /2011 1,500,000 1,560,000 0.92RCI Banque sr unsecur SerEMTN 8.125% /2012 1,000,000 1,095,920 0.65Rhodia sr unsecur RegS 3.492% /2013 (3) 1,150,000 1,078,125 0.63Novasep Holding sr secured RegS 9.625% /2016 1,000,000 984,383 0.58Nexans nts SerEMTN 5.75% /2017 1,000,000 915,000 0.54Banque PSA Finance sr unsecur SerEMTN 8.5% /2012 750,000 827,520 0.49Wendel sr unsecur 4.375% /2017 1,000,000 800,000 0.47RCI Banque sr unsecur SerEMTN 4% /2011 700,000 709,245 0.42Societe Generale subord 9.375% perpetual (3) 550,000 625,229 0.37Renault sr unsecur SerEMTN 6% /2014 500,000 513,421 0.30Alcatel-Lucent sr unsecur SerALU priv plmt CV 5% /2015 6,583,800 230,442 0.14Unibail-Rodamco sr unsecur CV 3.5% /2015 81,800 159,190 0.09Rallye sr unsecur 7.625% /2016 150,000 152,978 0.09
Total for France 11.96
NetherlandsClondalkin Industries sr secured RegS 8% /2014 2,750,000 2,371,875 1.40Impress Holdings sr secured RegS 3.867% /2013 (3) 2,000,000 1,906,657 1.12
Corporate Bonds (continued)
Netherlands (continued)HeidelbergCement Finance co gtd SerEMTN 5.625 /2018 2,000,000 1,840,000 1.08Nielsen sr disc nts step cpn 0% to 1/08/2011 / 11.125% to 1/08/2016 2,000,000 1,744,000 1.03UPC Holding sr secured RegS 7.75% /2014 1,700,000 1,666,000 0.98UPC Holding sr secured nts RegS 9.75% /2018 1,500,000 1,552,500 0.91OI European Group co gtd RegS 6.875% /2017 1,500,000 1,455,000 0.86Kazkommerts International bnk gtd SerEMTN 6.875% /2017 1,500,000 1,162,500 0.68HeidelbergCement Finance debenture co gtd SerEMTN 7.625% /2012 1,000,000 1,048,750 0.62Cemex Finance sr secured RegS 9.625% /2017 (United States of America) (2) 800,000 829,829 0.49Fresenius Finance co gtd RegS 5.5% /2016 500,000 510,000 0.30Intergen sr secured RegS 8.5% /2017 500,000 506,505 0.30Pfl eiderer Finance co gtd 7.125% perpetual (3) 750,000 360,000 0.21
Total for Netherlands 9.98
LuxembourgWind Acquisition Finance co gtd RegS 11.75% /2017 3,000,000 3,277,500 1.92Wind Acquisition Finance secured co gtd RegS 11% /2015 2,200,000 2,387,000 1.40Codere Finance Luxembourg sr secured RegS 8.25% /2015 2,000,000 1,780,000 1.05Cirsa Finance Luxembourg co gtd RegS 8.75% /2014 1,800,000 1,725,912 1.02Hellas Telecommunications Luxembourg V sr secured RegS 6.715% /2012 (3) 2,000,000 1,660,000 0.98Fiat Finance & Trade co gtd SerGMTN 6.875% /2015 800,000 818,660 0.48Fiat Finance & Trade co gtd SerGMTN 9% /2012 700,000 760,319 0.45ArcelorMittal sr unsecur 9.375% /2016 450,000 546,476 0.32Lighthouse International sr secured Ser144A priv plmt 8% /2014 700,000 469,000 0.28Wind Acquisition Finance secured co gtd Ser144A priv plmt 11% /2015 400,000 434,000 0.26Michelin Luxembourg co gtd SerEMTN 8.625% /2014 250,000 295,018 0.17ArcelorMittal sr unsecur CV 7.25% /2014 7,497 274,564 0.16Hellas Telecommunications Luxembourg II subord nts RegS defaulted 6.836% /2015 (3) 1,000,000 29,583 0.02
Total for Luxembourg 8.51
GermanyCognis sr nts secured RegS 9.5% /2014 2,200,000 2,277,000 1.35UPC sr secured RegS 8.125% /2017 1,500,000 1,537,500 0.90Unitymedia sr secured RegS 8.75% /2015 1,400,000 1,456,165 0.86Grohe Holding sr secured RegS 3.617% /2014 (3) 1,500,000 1,282,500 0.75HeidelbergCement co gtd 8.5% /2019 1,050,000 1,115,604 0.66Kabel Deutschland secured 10.75% /2014 650,000 685,750 0.40Gerresheimer Holdings secured RegS 7.875% /2015 660,000 683,100 0.40ThyssenKrupp sr unsecur SerEMTN 8% /2014 600,000 658,262 0.39Sixt nts SerEMTN 5.375% /2012 600,000 601,825 0.35Franz Haniel & CIE sr unsecur SerEMTN 6.75% /2014 500,000 532,850 0.31Cognis sr secured RegS 2.714% /2013 (3) 500,000 475,000 0.28Grohe Holding co gtd RegS 8.625% /2014 500,000 437,500 0.26
Total for Germany 6.91

77 Morgan Stanley Investment Funds 31 December 2009
European Currencies High Yield Bond Fund
STATEMENT OF INVESTMENTS (continued)
Transferable securities and money market instruments admitted to offi cial exchange listing or dealt in on another regulated market. As at 31 December 2009, expressed in Euro.
Investments
Holdings/Nominal in
Euro unless specifi ed
Market value
% of net assets
Corporate Bonds (continued)
IrelandArdagh Glass Finance sr secured RegS 9.25% /2016 2,000,000 2,180,000 1.29Ardagh Glass Finance co gtd RegS 7.125% /2017 1,970,000 1,773,000 1.04Smurfi t Kappa Acquisitions sr secured RegS 7.25 /2017 1,800,000 1,773,000 1.04Smurfi t Kappa Funding sr subord 7.75% /2015 1,330,000 1,280,125 0.75Cloverie for Zurich Insurance secured SerEMTN 7.5% /2039 (3) 800,000 875,622 0.52Smurfi t Kappa Acquisitions sr secured RegS 7.75% /2019 550,000 547,250 0.32
Total for Ireland 4.96
DenmarkNordic Telephone Co Holdings sr secured RegS 8.25% /2016 3,500,000 3,780,000 2.22TDC sr unsecur 5.875% /2015 1,122,000 1,149,115 0.68ISS Holdings sr subord RegS 8.875% /2016 1,000,000 972,500 0.57
Total for Denmark 3.47
CanadaBombardier sr unsecur RegS 7.25% /2016 3,400,000 3,485,000 2.05Mecachrome International co gtd RegS defaulted 9% /2014 950,000 90,250 0.05
Total for Canada 2.10
British Virgin IslandsC10 - EUR Capital SPV co gtd 6.277% perpetual (3) 3,400,000 2,329,000 1.37
Total for British Virgin Islands 1.37
South AfricaConsol Glass co gtd RegS 7.625% /2014 1,805,000 1,678,650 0.98Edcon Proprietary sr secured RegS 3.964% /2014 (3) 750,000 486,000 0.29Edcon Holdings Proprietary co gtd RegS 6.214% /2015 (3) 51,000 26,520 0.02
Total for South Africa 1.29
AustriaPE Paper Escrow sr secured RegS 11.75% /2014 1,500,000 1,650,000 0.98
Total for Austria 0.98
ItalyPiaggio & C sr unsecur 7% /2016 1,000,000 1,012,500 0.60Telecom Italia Finance co gtd SerEMTN 7.75% /2033 (Luxembourg) (2) 350,000 406,288 0.24
Total for Italy 0.84
Corporate Bonds (continued)
CroatiaAgrokor sr unsecur RegS 10% /2016 1,250,000 1,267,823 0.75
Total for Croatia 0.75
LiberiaRoyal Caribbean Cruises sr unsecur RegS 5.625% /2014 1,400,000 1,222,667 0.72
Total for Liberia 0.72
SpainCampofrio Food sr nts RegS 8.25% /2016 1,200,000 1,192,645 0.70
Total for Spain 0.70
SwedenStena sr unsecur RegS 6.125% /2017 800,000 704,000 0.41
Total for Sweden 0.41
BermudaSeadrill sr unsecur CV 3.625% /2012 (USD) 1,000,000 699,757 0.41
Total for Bermuda 0.41
FinlandM-real sr unsecur 5.589% 15/12/2010 (3) 500,000 487,500 0.29
Total for Finland 0.29
BelgiumBarry Callebaut Services co gtd 6% /2017 350,000 343,000 0.20
Total for Belgium 0.20
SwitzerlandCredit Suisse Group Finance US bnk gtd 3.625% /2020 (United States of America) (2) (3) 250,000 237,769 0.14
Total for Switzerland 0.14
Total for Corporate Bonds 85.55
Equities
United States of AmericaCIT Group (USD) 28,068 541,159 0.32XO Holdings (USD) 1,023 420 0.00
Total for United States of America 0.32
Total for Equities 0.32
Total transferable securities and money market instruments admitted to offi cial exchange listing or dealt in on another regulated market 145,885,817 85.87
Investments
Holdings/Nominal in
Euro unless specifi ed
Market value
% of net assets
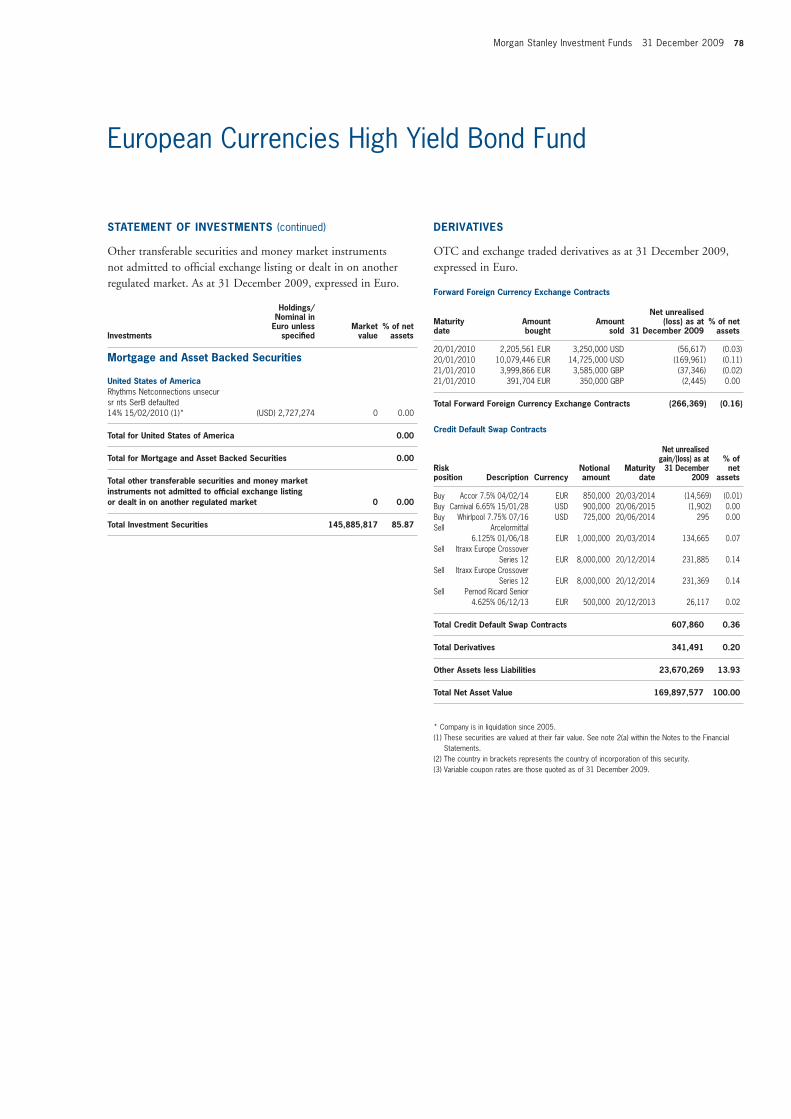
Morgan Stanley Investment Funds 31 December 2009 78
European Currencies High Yield Bond Fund
STATEMENT OF INVESTMENTS (continued)
Other transferable securities and money market instruments not admitted to offi cial exchange listing or dealt in on another regulated market. As at 31 December 2009, expressed in Euro.
Investments
Holdings/Nominal in
Euro unless specifi ed
Market value
% of net assets
Mortgage and Asset Backed Securities
United States of AmericaRhythms Netconnections unsecur sr nts SerB defaulted 14% 15/02/2010 (1)* (USD) 2,727,274 0 0.00
Total for United States of America 0.00
Total for Mortgage and Asset Backed Securities 0.00
Total other transferable securities and money market instruments not admitted to offi cial exchange listing or dealt in on another regulated market 0 0.00
Total Investment Securities 145,885,817 85.87
DERIVATIVES
OTC and exchange traded derivatives as at 31 December 2009, expressed in Euro.
Forward Foreign Currency Exchange Contracts
Maturity date
Amount bought
Amount sold
Net unrealised(loss) as at
31 December 2009 % of net
assets 20/01/2010 2,205,561 EUR 3,250,000 USD (56,617) (0.03)20/01/2010 10,079,446 EUR 14,725,000 USD (169,961) (0.11)21/01/2010 3,999,866 EUR 3,585,000 GBP (37,346) (0.02)21/01/2010 391,704 EUR 350,000 GBP (2,445) 0.00
Total Forward Foreign Currency Exchange Contracts (266,369) (0.16)
Credit Default Swap Contracts
Risk position Description Currency
Notional amount
Maturity date
Net unrealised gain/(loss) as at
31 December 2009
% of net
assets Buy Accor 7.5% 04/02/14 EUR 850,000 20/03/2014 (14,569) (0.01)Buy Carnival 6.65% 15/01/28 USD 900,000 20/06/2015 (1,902) 0.00 Buy Whirlpool 7.75% 07/16 USD 725,000 20/06/2014 295 0.00 Sell Arcelormittal 6.125% 01/06/18 EUR 1,000,000 20/03/2014 134,665 0.07 Sell Itraxx Europe Crossover Series 12 EUR 8,000,000 20/12/2014 231,885 0.14 Sell Itraxx Europe Crossover Series 12 EUR 8,000,000 20/12/2014 231,369 0.14 Sell Pernod Ricard Senior 4.625% 06/12/13 EUR 500,000 20/12/2013 26,117 0.02
Total Credit Default Swap Contracts 607,860 0.36
Total Derivatives 341,491 0.20
Other Assets less Liabilities 23,670,269 13.93
Total Net Asset Value 169,897,577 100.00
* Company is in liquidation since 2005.(1) These securities are valued at their fair value. See note 2(a) within the Notes to the Financial
Statements.(2) The country in brackets represents the country of incorporation of this security.(3) Variable coupon rates are those quoted as of 31 December 2009.
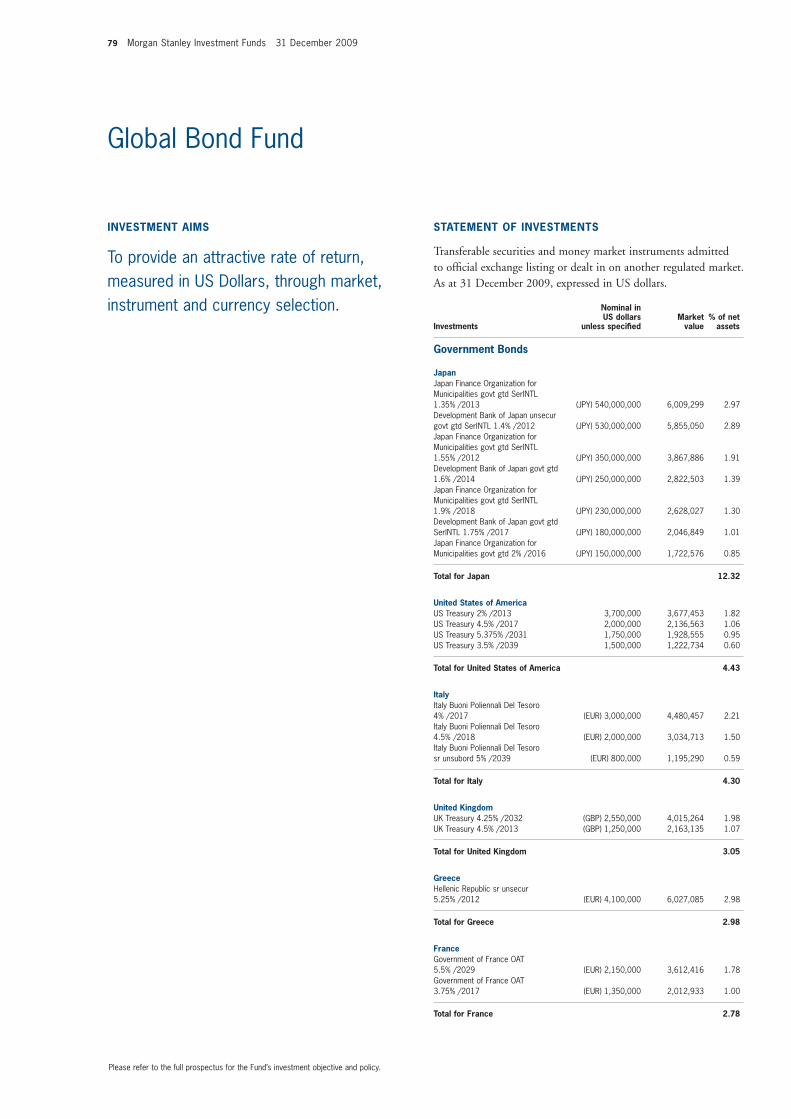
79 Morgan Stanley Investment Funds 31 December 2009
Global Bond Fund
INVESTMENT AIMS
To provide an attractive rate of return, measured in US Dollars, through market, instrument and currency selection.
STATEMENT OF INVESTMENTS
Transferable securities and money market instruments admitted to offi cial exchange listing or dealt in on another regulated market. As at 31 December 2009, expressed in US dollars.
Investments
Nominal in US dollars
unless specifi ed Market
value% of net
assets
Government Bonds
JapanJapan Finance Organization for Municipalities govt gtd SerINTL 1.35% /2013 (JPY) 540,000,000 6,009,299 2.97Development Bank of Japan unsecur govt gtd SerINTL 1.4% /2012 (JPY) 530,000,000 5,855,050 2.89Japan Finance Organization for Municipalities govt gtd SerINTL 1.55% /2012 (JPY) 350,000,000 3,867,886 1.91Development Bank of Japan govt gtd 1.6% /2014 (JPY) 250,000,000 2,822,503 1.39Japan Finance Organization for Municipalities govt gtd SerINTL 1.9% /2018 (JPY) 230,000,000 2,628,027 1.30Development Bank of Japan govt gtd SerINTL 1.75% /2017 (JPY) 180,000,000 2,046,849 1.01Japan Finance Organization for Municipalities govt gtd 2% /2016 (JPY) 150,000,000 1,722,576 0.85
Total for Japan 12.32
United States of AmericaUS Treasury 2% /2013 3,700,000 3,677,453 1.82US Treasury 4.5% /2017 2,000,000 2,136,563 1.06US Treasury 5.375% /2031 1,750,000 1,928,555 0.95US Treasury 3.5% /2039 1,500,000 1,222,734 0.60
Total for United States of America 4.43
ItalyItaly Buoni Poliennali Del Tesoro 4% /2017 (EUR) 3,000,000 4,480,457 2.21Italy Buoni Poliennali Del Tesoro 4.5% /2018 (EUR) 2,000,000 3,034,713 1.50Italy Buoni Poliennali Del Tesoro sr unsubord 5% /2039 (EUR) 800,000 1,195,290 0.59
Total for Italy 4.30
United KingdomUK Treasury 4.25% /2032 (GBP) 2,550,000 4,015,264 1.98UK Treasury 4.5% /2013 (GBP) 1,250,000 2,163,135 1.07
Total for United Kingdom 3.05
GreeceHellenic Republic sr unsecur 5.25% /2012 (EUR) 4,100,000 6,027,085 2.98
Total for Greece 2.98
FranceGovernment of France OAT 5.5% /2029 (EUR) 2,150,000 3,612,416 1.78Government of France OAT 3.75% /2017 (EUR) 1,350,000 2,012,933 1.00
Total for France 2.78
Please refer to the full prospectus for the Fund’s investment objective and policy.
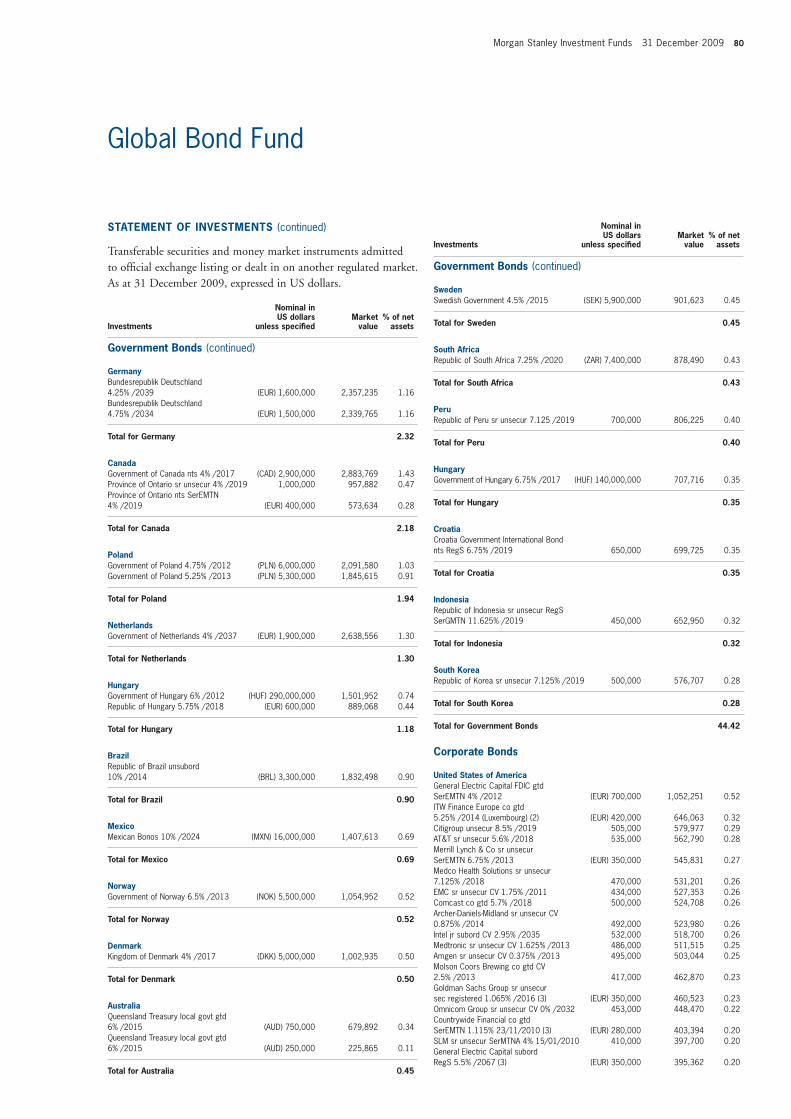
Morgan Stanley Investment Funds 31 December 2009 80
Global Bond Fund
Investments
Nominal in US dollars
unless specifi ed Market
value% of net
assets
Government Bonds (continued)
SwedenSwedish Government 4.5% /2015 (SEK) 5,900,000 901,623 0.45
Total for Sweden 0.45
South AfricaRepublic of South Africa 7.25% /2020 (ZAR) 7,400,000 878,490 0.43
Total for South Africa 0.43
PeruRepublic of Peru sr unsecur 7.125 /2019 700,000 806,225 0.40
Total for Peru 0.40
HungaryGovernment of Hungary 6.75% /2017 (HUF) 140,000,000 707,716 0.35
Total for Hungary 0.35
CroatiaCroatia Government International Bond nts RegS 6.75% /2019 650,000 699,725 0.35
Total for Croatia 0.35
IndonesiaRepublic of Indonesia sr unsecur RegS SerGMTN 11.625% /2019 450,000 652,950 0.32
Total for Indonesia 0.32
South KoreaRepublic of Korea sr unsecur 7.125% /2019 500,000 576,707 0.28
Total for South Korea 0.28
Total for Government Bonds 44.42
Corporate Bonds
United States of AmericaGeneral Electric Capital FDIC gtd SerEMTN 4% /2012 (EUR) 700,000 1,052,251 0.52ITW Finance Europe co gtd 5.25% /2014 (Luxembourg) (2) (EUR) 420,000 646,063 0.32Citigroup unsecur 8.5% /2019 505,000 579,977 0.29AT&T sr unsecur 5.6% /2018 535,000 562,790 0.28Merrill Lynch & Co sr unsecur SerEMTN 6.75% /2013 (EUR) 350,000 545,831 0.27Medco Health Solutions sr unsecur 7.125% /2018 470,000 531,201 0.26EMC sr unsecur CV 1.75% /2011 434,000 527,353 0.26Comcast co gtd 5.7% /2018 500,000 524,708 0.26Archer-Daniels-Midland sr unsecur CV 0.875% /2014 492,000 523,980 0.26Intel jr subord CV 2.95% /2035 532,000 518,700 0.26Medtronic sr unsecur CV 1.625% /2013 486,000 511,515 0.25Amgen sr unsecur CV 0.375% /2013 495,000 503,044 0.25Molson Coors Brewing co gtd CV 2.5% /2013 417,000 462,870 0.23Goldman Sachs Group sr unsecur sec registered 1.065% /2016 (3) (EUR) 350,000 460,523 0.23Omnicom Group sr unsecur CV 0% /2032 453,000 448,470 0.22Countrywide Financial co gtd SerEMTN 1.115% 23/11/2010 (3) (EUR) 280,000 403,394 0.20SLM sr unsecur SerMTNA 4% 15/01/2010 410,000 397,700 0.20General Electric Capital subord RegS 5.5% /2067 (3) (EUR) 350,000 395,362 0.20
STATEMENT OF INVESTMENTS (continued)
Transferable securities and money market instruments admitted to offi cial exchange listing or dealt in on another regulated market. As at 31 December 2009, expressed in US dollars.
Investments
Nominal in US dollars
unless specifi ed Market
value% of net
assets
Government Bonds (continued)
GermanyBundesrepublik Deutschland 4.25% /2039 (EUR) 1,600,000 2,357,235 1.16Bundesrepublik Deutschland 4.75% /2034 (EUR) 1,500,000 2,339,765 1.16
Total for Germany 2.32
CanadaGovernment of Canada nts 4% /2017 (CAD) 2,900,000 2,883,769 1.43Province of Ontario sr unsecur 4% /2019 1,000,000 957,882 0.47Province of Ontario nts SerEMTN 4% /2019 (EUR) 400,000 573,634 0.28
Total for Canada 2.18
PolandGovernment of Poland 4.75% /2012 (PLN) 6,000,000 2,091,580 1.03Government of Poland 5.25% /2013 (PLN) 5,300,000 1,845,615 0.91
Total for Poland 1.94
NetherlandsGovernment of Netherlands 4% /2037 (EUR) 1,900,000 2,638,556 1.30
Total for Netherlands 1.30
HungaryGovernment of Hungary 6% /2012 (HUF) 290,000,000 1,501,952 0.74Republic of Hungary 5.75% /2018 (EUR) 600,000 889,068 0.44
Total for Hungary 1.18
BrazilRepublic of Brazil unsubord 10% /2014 (BRL) 3,300,000 1,832,498 0.90
Total for Brazil 0.90
MexicoMexican Bonos 10% /2024 (MXN) 16,000,000 1,407,613 0.69
Total for Mexico 0.69
NorwayGovernment of Norway 6.5% /2013 (NOK) 5,500,000 1,054,952 0.52
Total for Norway 0.52
DenmarkKingdom of Denmark 4% /2017 (DKK) 5,000,000 1,002,935 0.50
Total for Denmark 0.50
AustraliaQueensland Treasury local govt gtd 6% /2015 (AUD) 750,000 679,892 0.34Queensland Treasury local govt gtd 6% /2015 (AUD) 250,000 225,865 0.11
Total for Australia 0.45

81 Morgan Stanley Investment Funds 31 December 2009
Global Bond Fund
Investments
Nominal in US dollars
unless specifi ed Market
value% of net
assets
STATEMENT OF INVESTMENTS (continued)
Transferable securities and money market instruments admitted to offi cial exchange listing or dealt in on another regulated market. As at 31 December 2009, expressed in US dollars.
Investments
Nominal in US dollars
unless specifi ed Market
value% of net
assets
Corporate Bonds (continued)
United States of America (continued)Harley-Davidson Funding co gtd Ser144A priv plmt 5.75% /2014 380,000 387,488 0.19Pfi zer sr unsecur 4.75% /2016 (EUR) 250,000 383,317 0.19Farmers Exchange Capital debentures Ser144A priv plmt 7.05% /2028 430,000 376,596 0.19Merck & Co co gtd 5.375% /2014 (EUR) 240,000 376,089 0.19Capital One Financial sr unsecur 6.750% /2017 350,000 372,481 0.18Alcatel-Lucent USA co gtd SerB CV 2.875% /2025 428,000 368,080 0.18CEDC Finance Corp International sr secured RegS 8.875% /2016 (EUR) 250,000 361,420 0.18Philip Morris International sr unsecur 5.65% /2018 340,000 357,611 0.18MetLife sr unsecur SerA 6.817% /2018 320,000 356,018 0.18Home Depot sr unsecur 5.875% /2036 360,000 346,083 0.17Goldman Sachs Group sr unsecur 6.15% /2018 305,000 324,424 0.16JPMorgan Chase & Co sr unsecured 6% /2018 300,000 323,111 0.16Bear Stearns sr unsecur 6.4% /2017 295,000 322,402 0.16CVS Pass-Through Trust pass through certs Ser144A priv plmt 8.353% /2031 283,110 312,293 0.15Omnicom Group sr unsecur 6.25% /2019 290,000 311,752 0.15Corning sr unsecur 6.625% /2019 280,000 304,912 0.15Chevron sr unsecur 4.95% /2019 290,000 304,740 0.15Goldman Sachs Group sr unsecur SerEMTN 5.375% /2013 (EUR) 200,000 304,426 0.15Boston Properties sr unsecur 5.875% /2019 275,000 277,048 0.14Republic Services co gtd Ser144A priv plmt 5.5% /2019 270,000 275,899 0.14CRH America co gtd 6% /2016 250,000 262,514 0.13Anheuser-Busch InBev Worldwide co gtd Ser144A priv plmt 5.375% /2020 255,000 257,804 0.13Time Warner Cable co gtd 6.75% /2018 235,000 255,951 0.13Archer-Daniels-Midland sr unsecur 5.45% /2018 240,000 254,670 0.13HCA sr unsecur 5.75% /2014 270,000 253,381 0.13Agilent Technologies sr unsecur 5.5% /2015 240,000 252,818 0.12General Electric sr unsecur 5.25% /2017 245,000 249,865 0.12Verizon Communications sr unsecur 5.5% /2018 215,000 226,041 0.11Bank of America sr unsecur SerMTNL 5.65% /2018 220,000 222,070 0.11Reinsurance Group of America sr unsecur 6.45% /2019 215,000 215,611 0.11World Financial Properties pass thru certs Ser144A priv plmt 6.95% /2013 211,716 213,154 0.11Boeing sr unsecur 6% /2019 195,000 211,902 0.10General Electric Capital sr unsecur 5.625% /2018 200,000 204,577 0.10SBA Telecommunications co gtd Ser144A priv plmt 8.25% /2019 190,000 202,350 0.10Simon Property Group sr unsecur 6.75% /2014 190,000 202,288 0.10CSC Holdings sr unsecur 7.625% /2018 195,000 199,536 0.10Merck & Co sr unsecur 5% /2019 185,000 190,859 0.09NRG Energy co gtd 8.5% /2019 185,000 188,026 0.09El Paso sr unsecur SerMTN 8.25% /2016 175,000 185,342 0.09Sealed Air sr nts Ser144A priv plmt 7.875% /2017 170,000 181,996 0.09Time Warner Cable co gtd 8.75% /2019 140,000 170,038 0.08
Corporate Bonds (continued)
United States of America (continued)Boston Scientifi c sr unsecur 6% /2020 165,000 169,673 0.08Time Warner Cable co gtd 8.25% /2019 135,000 159,879 0.08Quest Diagnostics co gtd 4.75% /2020 150,000 147,552 0.07Viacom sr unsecur 5.625% /2019 140,000 144,161 0.07World Financial Properties pass thru certs Ser144A priv plmt 6.91% /2013 133,164 142,093 0.07Xerox sr unsecur 4.25% /2015 140,000 138,838 0.07COX Communications sr unsecur Ser144A priv plmt 8.375% /2039 110,000 137,915 0.07CenterPoint Energy Resources sr unsecur 6.25% /2037 135,000 131,894 0.07Transcontinental Gas Pipe Line sr unsecur 6.05% /2018 120,000 128,512 0.06JPMorgan Chase & Co sr unsecur 6.3% /2019 115,000 126,781 0.06Verizon Communications sr unsecur 6.1% /2018 115,000 124,948 0.06Aetna sr unsecur 6.5% /2018 115,000 122,836 0.06Emerson Electric sr unsecur 5% /2019 105,000 108,861 0.05Pioneer Natural Resources sr unsecur 6.65% /2017 110,000 107,786 0.05Anheuser-Busch InBev Worldwide co gtd Ser144A priv plmt 4.125% /2015 105,000 106,506 0.05Goldman Sachs Group sr nts SerMTN 3.625% /2012 100,000 102,930 0.05Anheuser-Busch InBev Worldwide co gtd Ser144A priv plmt 7.2% /2014 80,000 90,510 0.05CVS Pass-Through Trust pass through certs 6.036% /2028 92,807 88,322 0.04Xerox sr unsecur 8.25% /2014 65,000 74,734 0.04Harley-Davidson Funding sr nts Ser144A priv plmt 6.8% /2018 70,000 70,179 0.03SLM sr unsecur SerMTNA 5% /2013 75,000 69,194 0.03KLA-Tencor sr unsecur 6.9% /2018 60,000 63,470 0.03Viacom sr unsecur 6.875% /2036 55,000 59,932 0.03CVS Caremark nts 6.6% /2019 50,000 54,580 0.03MetLife sr unsecur 6.75% /2016 45,000 50,240 0.02Daimler Finance North America co gtd 7.3% /2012 45,000 48,907 0.02Bunge Finance co gtd 8.5% /2019 40,000 45,343 0.02Wyeth unsecur co gtd 6.45% /2024 40,000 43,385 0.02Daimler Finance North America co gtd 8.5% /2031 35,000 43,033 0.02Emerson Electric sr unsecur 4.875% /2019 40,000 41,048 0.02Citigroup sr unsecur 6.125% /2018 40,000 39,642 0.02Qwest sr unsecur 6.5% /2017 35,000 34,152 0.02MetLife sr unsecur 7.717% /2019 20,000 23,639 0.01WellPoint sr unsecur 7% /2019 20,000 22,178 0.01Freeport-McMoRan Copper & Gold sr unsecur 8.375% /2017 15,000 16,383 0.01DirecTV Holdings / Direct TV Financing co gtd 7.625% /2016 15,000 16,379 0.01
Total for United States of America 11.87
NetherlandsFortis Bank Nederland govt liquid gtd SerEMTN 3.375% /2014 (EUR) 1,500,000 2,204,666 1.09LeasePlan govt liquid gtd SerEMTN 3.25% /2014 (EUR) 1,500,000 2,192,221 1.08ING Bank govt liquid gtd Ser144A priv plmt 3.9% /2014 1,600,000 1,654,679 0.82NIBC Bank govt liquid gtd SerEMTN 3.625% /2011 (EUR) 1,000,000 1,486,637 0.73NIBC Bank govt liquid gtd SerEMTN 3.5% /2014 (EUR) 1,000,000 1,476,934 0.73Bank Nederlandse Gemeenten nts SerEMTN 2% /2012 940,000 938,352 0.46ABN Amro Bank sr unsecur SerFORB CV 1.875% 27/10/2010 (EUR) 250,000 354,771 0.18OI European Group co gtd RegS 6.875% /2017 (EUR) 200,000 278,630 0.14
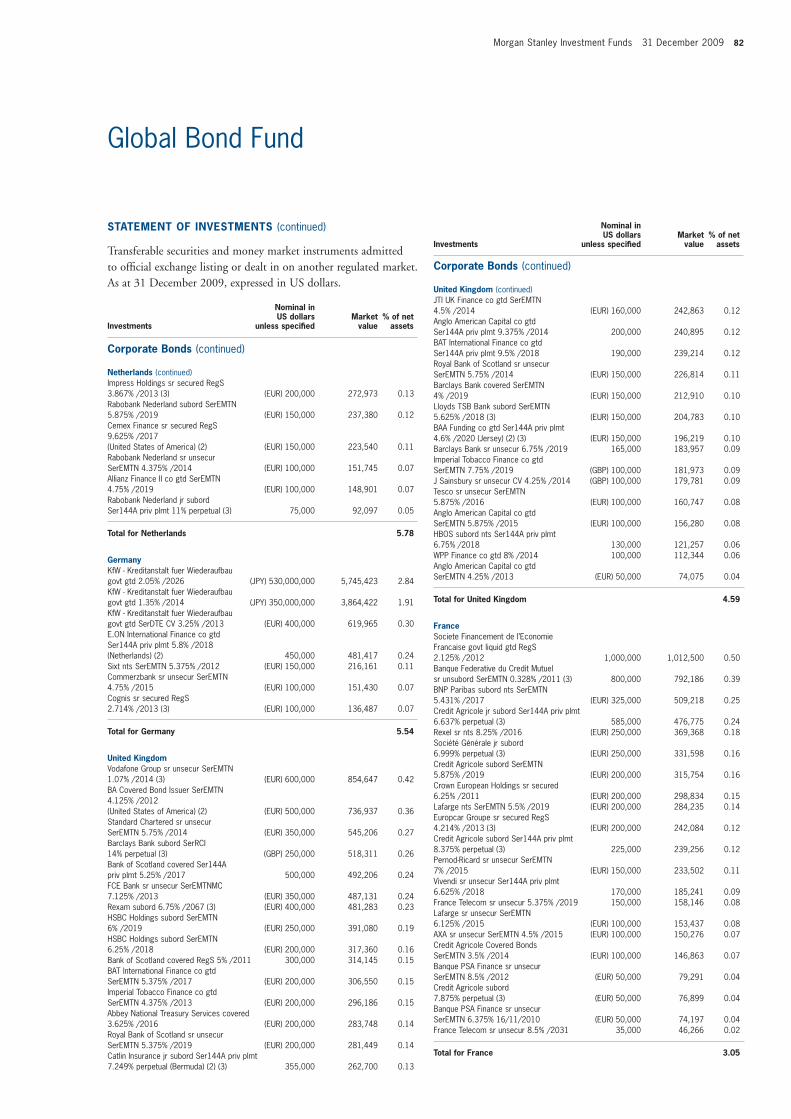
Morgan Stanley Investment Funds 31 December 2009 82
Investments
Nominal in US dollars
unless specifi ed Market
value% of net
assets
Corporate Bonds (continued)
United Kingdom (continued)JTI UK Finance co gtd SerEMTN 4.5% /2014 (EUR) 160,000 242,863 0.12Anglo American Capital co gtd Ser144A priv plmt 9.375% /2014 200,000 240,895 0.12BAT International Finance co gtd Ser144A priv plmt 9.5% /2018 190,000 239,214 0.12Royal Bank of Scotland sr unsecur SerEMTN 5.75% /2014 (EUR) 150,000 226,814 0.11Barclays Bank covered SerEMTN 4% /2019 (EUR) 150,000 212,910 0.10Lloyds TSB Bank subord SerEMTN 5.625% /2018 (3) (EUR) 150,000 204,783 0.10BAA Funding co gtd Ser144A priv plmt 4.6% /2020 (Jersey) (2) (3) (EUR) 150,000 196,219 0.10Barclays Bank sr unsecur 6.75% /2019 165,000 183,957 0.09Imperial Tobacco Finance co gtd SerEMTN 7.75% /2019 (GBP) 100,000 181,973 0.09J Sainsbury sr unsecur CV 4.25% /2014 (GBP) 100,000 179,781 0.09Tesco sr unsecur SerEMTN 5.875% /2016 (EUR) 100,000 160,747 0.08Anglo American Capital co gtd SerEMTN 5.875% /2015 (EUR) 100,000 156,280 0.08HBOS subord nts Ser144A priv plmt 6.75% /2018 130,000 121,257 0.06WPP Finance co gtd 8% /2014 100,000 112,344 0.06Anglo American Capital co gtd SerEMTN 4.25% /2013 (EUR) 50,000 74,075 0.04
Total for United Kingdom 4.59
FranceSociete Financement de l’Economie Francaise govt liquid gtd RegS 2.125% /2012 1,000,000 1,012,500 0.50Banque Federative du Credit Mutuel sr unsubord SerEMTN 0.328% /2011 (3) 800,000 792,186 0.39BNP Paribas subord nts SerEMTN 5.431% /2017 (EUR) 325,000 509,218 0.25Credit Agricole jr subord Ser144A priv plmt 6.637% perpetual (3) 585,000 476,775 0.24Rexel sr nts 8.25% /2016 (EUR) 250,000 369,368 0.18Société Générale jr subord 6.999% perpetual (3) (EUR) 250,000 331,598 0.16Credit Agricole subord SerEMTN 5.875% /2019 (EUR) 200,000 315,754 0.16Crown European Holdings sr secured 6.25% /2011 (EUR) 200,000 298,834 0.15Lafarge nts SerEMTN 5.5% /2019 (EUR) 200,000 284,235 0.14Europcar Groupe sr secured RegS 4.214% /2013 (3) (EUR) 200,000 242,084 0.12Credit Agricole subord Ser144A priv plmt 8.375% perpetual (3) 225,000 239,256 0.12Pernod-Ricard sr unsecur SerEMTN 7% /2015 (EUR) 150,000 233,502 0.11Vivendi sr unsecur Ser144A priv plmt 6.625% /2018 170,000 185,241 0.09France Telecom sr unsecur 5.375% /2019 150,000 158,146 0.08Lafarge sr unsecur SerEMTN 6.125% /2015 (EUR) 100,000 153,437 0.08AXA sr unsecur SerEMTN 4.5% /2015 (EUR) 100,000 150,276 0.07Credit Agricole Covered Bonds SerEMTN 3.5% /2014 (EUR) 100,000 146,863 0.07Banque PSA Finance sr unsecur SerEMTN 8.5% /2012 (EUR) 50,000 79,291 0.04Credit Agricole subord 7.875% perpetual (3) (EUR) 50,000 76,899 0.04Banque PSA Finance sr unsecur SerEMTN 6.375% 16/11/2010 (EUR) 50,000 74,197 0.04France Telecom sr unsecur 8.5% /2031 35,000 46,266 0.02
Total for France 3.05
Global Bond Fund
STATEMENT OF INVESTMENTS (continued)
Transferable securities and money market instruments admitted to offi cial exchange listing or dealt in on another regulated market. As at 31 December 2009, expressed in US dollars.
Investments
Nominal in US dollars
unless specifi ed Market
value% of net
assets
Corporate Bonds (continued)
Netherlands (continued)Impress Holdings sr secured RegS 3.867% /2013 (3) (EUR) 200,000 272,973 0.13Rabobank Nederland subord SerEMTN 5.875% /2019 (EUR) 150,000 237,380 0.12Cemex Finance sr secured RegS 9.625% /2017 (United States of America) (2) (EUR) 150,000 223,540 0.11Rabobank Nederland sr unsecur SerEMTN 4.375% /2014 (EUR) 100,000 151,745 0.07Allianz Finance II co gtd SerEMTN 4.75% /2019 (EUR) 100,000 148,901 0.07Rabobank Nederland jr subord Ser144A priv plmt 11% perpetual (3) 75,000 92,097 0.05
Total for Netherlands 5.78
GermanyKfW - Kreditanstalt fuer Wiederaufbau govt gtd 2.05% /2026 (JPY) 530,000,000 5,745,423 2.84KfW - Kreditanstalt fuer Wiederaufbau govt gtd 1.35% /2014 (JPY) 350,000,000 3,864,422 1.91KfW - Kreditanstalt fuer Wiederaufbau govt gtd SerDTE CV 3.25% /2013 (EUR) 400,000 619,965 0.30E.ON International Finance co gtd Ser144A priv plmt 5.8% /2018 (Netherlands) (2) 450,000 481,417 0.24Sixt nts SerEMTN 5.375% /2012 (EUR) 150,000 216,161 0.11Commerzbank sr unsecur SerEMTN 4.75% /2015 (EUR) 100,000 151,430 0.07Cognis sr secured RegS 2.714% /2013 (3) (EUR) 100,000 136,487 0.07
Total for Germany 5.54
United KingdomVodafone Group sr unsecur SerEMTN 1.07% /2014 (3) (EUR) 600,000 854,647 0.42BA Covered Bond Issuer SerEMTN 4.125% /2012 (United States of America) (2) (EUR) 500,000 736,937 0.36Standard Chartered sr unsecur SerEMTN 5.75% /2014 (EUR) 350,000 545,206 0.27Barclays Bank subord SerRCI 14% perpetual (3) (GBP) 250,000 518,311 0.26Bank of Scotland covered Ser144A priv plmt 5.25% /2017 500,000 492,206 0.24FCE Bank sr unsecur SerEMTNMC 7.125% /2013 (EUR) 350,000 487,131 0.24Rexam subord 6.75% /2067 (3) (EUR) 400,000 481,283 0.23HSBC Holdings subord SerEMTN 6% /2019 (EUR) 250,000 391,080 0.19HSBC Holdings subord SerEMTN 6.25% /2018 (EUR) 200,000 317,360 0.16Bank of Scotland covered RegS 5% /2011 300,000 314,145 0.15BAT International Finance co gtd SerEMTN 5.375% /2017 (EUR) 200,000 306,550 0.15Imperial Tobacco Finance co gtd SerEMTN 4.375% /2013 (EUR) 200,000 296,186 0.15Abbey National Treasury Services covered 3.625% /2016 (EUR) 200,000 283,748 0.14Royal Bank of Scotland sr unsecur SerEMTN 5.375% /2019 (EUR) 200,000 281,449 0.14Catlin Insurance jr subord Ser144A priv plmt 7.249% perpetual (Bermuda) (2) (3) 355,000 262,700 0.13
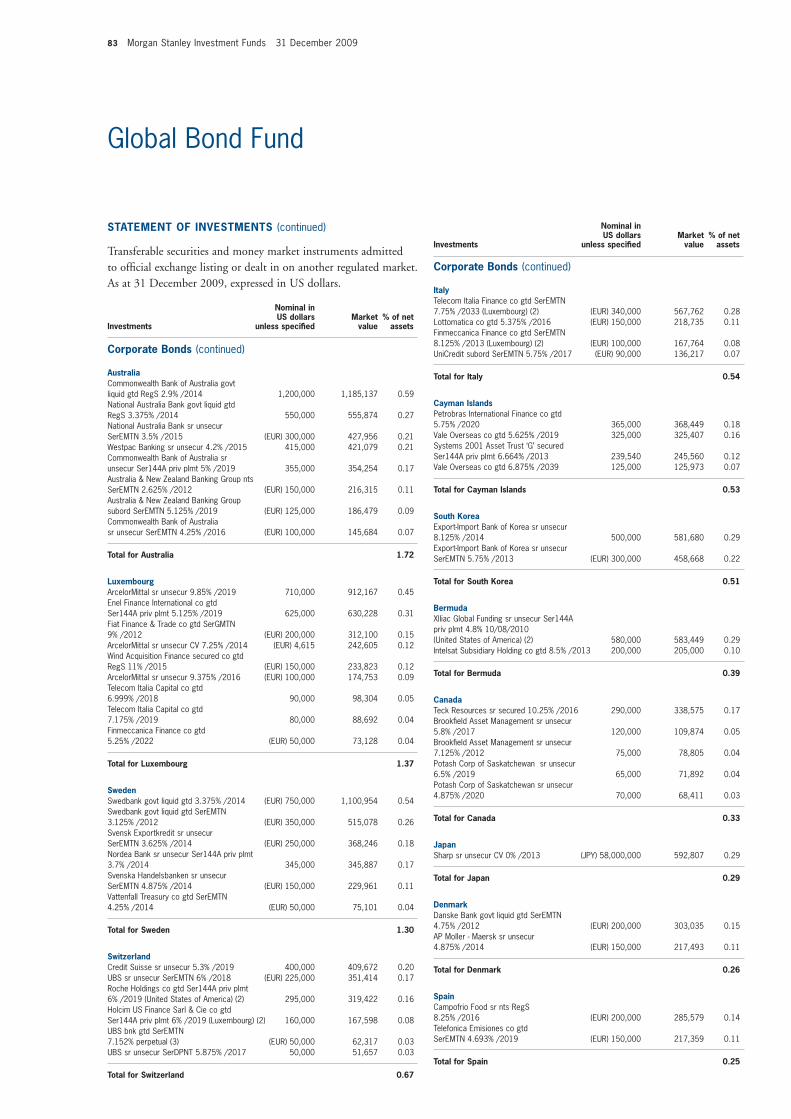
83 Morgan Stanley Investment Funds 31 December 2009
Global Bond Fund
Corporate Bonds (continued)
AustraliaCommonwealth Bank of Australia govt liquid gtd RegS 2.9% /2014 1,200,000 1,185,137 0.59National Australia Bank govt liquid gtd RegS 3.375% /2014 550,000 555,874 0.27National Australia Bank sr unsecur SerEMTN 3.5% /2015 (EUR) 300,000 427,956 0.21Westpac Banking sr unsecur 4.2% /2015 415,000 421,079 0.21Commonwealth Bank of Australia sr unsecur Ser144A priv plmt 5% /2019 355,000 354,254 0.17Australia & New Zealand Banking Group nts SerEMTN 2.625% /2012 (EUR) 150,000 216,315 0.11Australia & New Zealand Banking Group subord SerEMTN 5.125% /2019 (EUR) 125,000 186,479 0.09Commonwealth Bank of Australia sr unsecur SerEMTN 4.25% /2016 (EUR) 100,000 145,684 0.07
Total for Australia 1.72
LuxembourgArcelorMittal sr unsecur 9.85% /2019 710,000 912,167 0.45Enel Finance International co gtd Ser144A priv plmt 5.125% /2019 625,000 630,228 0.31Fiat Finance & Trade co gtd SerGMTN 9% /2012 (EUR) 200,000 312,100 0.15ArcelorMittal sr unsecur CV 7.25% /2014 (EUR) 4,615 242,605 0.12Wind Acquisition Finance secured co gtd RegS 11% /2015 (EUR) 150,000 233,823 0.12ArcelorMittal sr unsecur 9.375% /2016 (EUR) 100,000 174,753 0.09Telecom Italia Capital co gtd 6.999% /2018 90,000 98,304 0.05Telecom Italia Capital co gtd 7.175% /2019 80,000 88,692 0.04Finmeccanica Finance co gtd 5.25% /2022 (EUR) 50,000 73,128 0.04
Total for Luxembourg 1.37
SwedenSwedbank govt liquid gtd 3.375% /2014 (EUR) 750,000 1,100,954 0.54Swedbank govt liquid gtd SerEMTN 3.125% /2012 (EUR) 350,000 515,078 0.26Svensk Exportkredit sr unsecur SerEMTN 3.625% /2014 (EUR) 250,000 368,246 0.18Nordea Bank sr unsecur Ser144A priv plmt 3.7% /2014 345,000 345,887 0.17Svenska Handelsbanken sr unsecur SerEMTN 4.875% /2014 (EUR) 150,000 229,961 0.11Vattenfall Treasury co gtd SerEMTN 4.25% /2014 (EUR) 50,000 75,101 0.04
Total for Sweden 1.30
SwitzerlandCredit Suisse sr unsecur 5.3% /2019 400,000 409,672 0.20UBS sr unsecur SerEMTN 6% /2018 (EUR) 225,000 351,414 0.17Roche Holdings co gtd Ser144A priv plmt 6% /2019 (United States of America) (2) 295,000 319,422 0.16Holcim US Finance Sarl & Cie co gtd Ser144A priv plmt 6% /2019 (Luxembourg) (2) 160,000 167,598 0.08UBS bnk gtd SerEMTN 7.152% perpetual (3) (EUR) 50,000 62,317 0.03UBS sr unsecur SerDPNT 5.875% /2017 50,000 51,657 0.03
Total for Switzerland 0.67
STATEMENT OF INVESTMENTS (continued)
Transferable securities and money market instruments admitted to offi cial exchange listing or dealt in on another regulated market. As at 31 December 2009, expressed in US dollars.
Investments
Nominal in US dollars
unless specifi ed Market
value% of net
assets
Investments
Nominal in US dollars
unless specifi ed Market
value% of net
assets
Corporate Bonds (continued)
ItalyTelecom Italia Finance co gtd SerEMTN 7.75% /2033 (Luxembourg) (2) (EUR) 340,000 567,762 0.28Lottomatica co gtd 5.375% /2016 (EUR) 150,000 218,735 0.11Finmeccanica Finance co gtd SerEMTN 8.125% /2013 (Luxembourg) (2) (EUR) 100,000 167,764 0.08UniCredit subord SerEMTN 5.75% /2017 (EUR) 90,000 136,217 0.07
Total for Italy 0.54
Cayman IslandsPetrobras International Finance co gtd 5.75% /2020 365,000 368,449 0.18Vale Overseas co gtd 5.625% /2019 325,000 325,407 0.16Systems 2001 Asset Trust ‘G’ secured Ser144A priv plmt 6.664% /2013 239,540 245,560 0.12Vale Overseas co gtd 6.875% /2039 125,000 125,973 0.07
Total for Cayman Islands 0.53
South KoreaExport-Import Bank of Korea sr unsecur 8.125% /2014 500,000 581,680 0.29Export-Import Bank of Korea sr unsecur SerEMTN 5.75% /2013 (EUR) 300,000 458,668 0.22
Total for South Korea 0.51
BermudaXlliac Global Funding sr unsecur Ser144A priv plmt 4.8% 10/08/2010 (United States of America) (2) 580,000 583,449 0.29Intelsat Subsidiary Holding co gtd 8.5% /2013 200,000 205,000 0.10
Total for Bermuda 0.39
CanadaTeck Resources sr secured 10.25% /2016 290,000 338,575 0.17Brookfi eld Asset Management sr unsecur 5.8% /2017 120,000 109,874 0.05Brookfi eld Asset Management sr unsecur 7.125% /2012 75,000 78,805 0.04Potash Corp of Saskatchewan sr unsecur 6.5% /2019 65,000 71,892 0.04Potash Corp of Saskatchewan sr unsecur 4.875% /2020 70,000 68,411 0.03
Total for Canada 0.33
JapanSharp sr unsecur CV 0% /2013 (JPY) 58,000,000 592,807 0.29
Total for Japan 0.29
DenmarkDanske Bank govt liquid gtd SerEMTN 4.75% /2012 (EUR) 200,000 303,035 0.15AP Moller - Maersk sr unsecur 4.875% /2014 (EUR) 150,000 217,493 0.11
Total for Denmark 0.26
SpainCampofrio Food sr nts RegS 8.25% /2016 (EUR) 200,000 285,579 0.14Telefonica Emisiones co gtd SerEMTN 4.693% /2019 (EUR) 150,000 217,359 0.11
Total for Spain 0.25
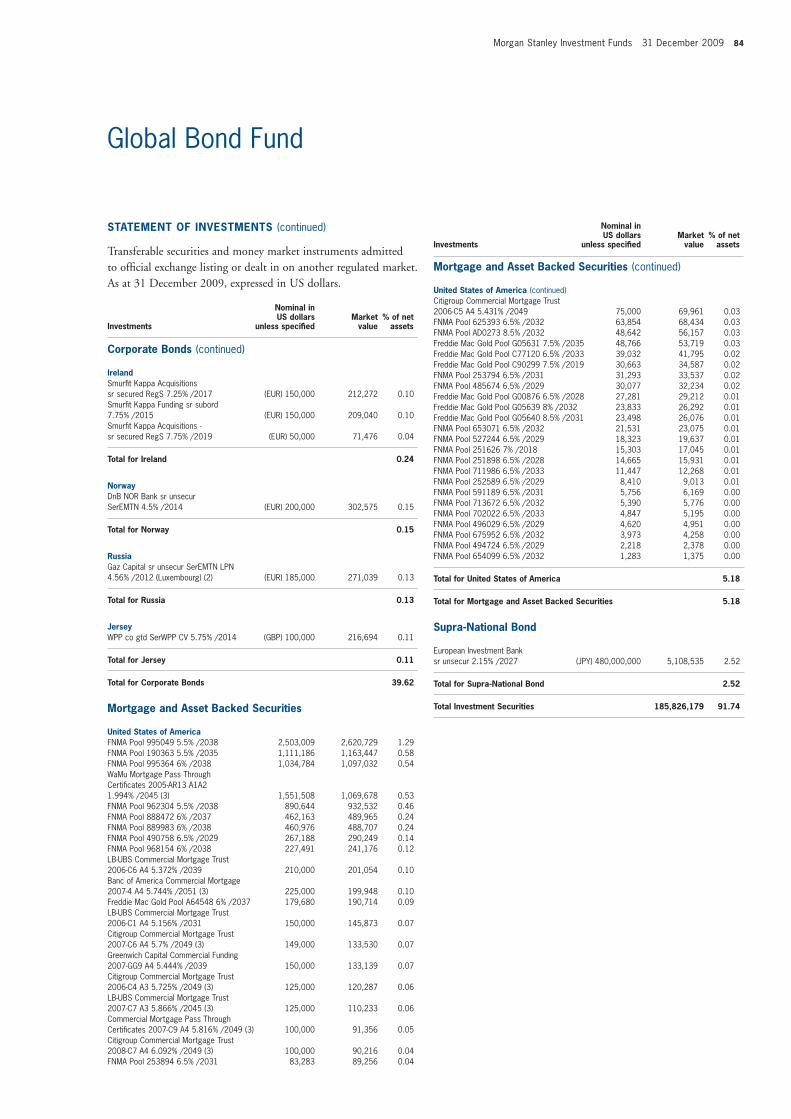
Morgan Stanley Investment Funds 31 December 2009 84
Global Bond Fund
Investments
Nominal in US dollars
unless specifi ed Market
value% of net
assets
Mortgage and Asset Backed Securities (continued)
United States of America (continued)Citigroup Commercial Mortgage Trust 2006-C5 A4 5.431% /2049 75,000 69,961 0.03FNMA Pool 625393 6.5% /2032 63,854 68,434 0.03FNMA Pool AD0273 8.5% /2032 48,642 56,157 0.03Freddie Mac Gold Pool G05631 7.5% /2035 48,766 53,719 0.03Freddie Mac Gold Pool C77120 6.5% /2033 39,032 41,795 0.02Freddie Mac Gold Pool C90299 7.5% /2019 30,663 34,587 0.02FNMA Pool 253794 6.5% /2031 31,293 33,537 0.02FNMA Pool 485674 6.5% /2029 30,077 32,234 0.02Freddie Mac Gold Pool G00876 6.5% /2028 27,281 29,212 0.01Freddie Mac Gold Pool G05639 8% /2032 23,833 26,292 0.01Freddie Mac Gold Pool G05640 8.5% /2031 23,498 26,076 0.01FNMA Pool 653071 6.5% /2032 21,531 23,075 0.01FNMA Pool 527244 6.5% /2029 18,323 19,637 0.01FNMA Pool 251626 7% /2018 15,303 17,045 0.01FNMA Pool 251898 6.5% /2028 14,665 15,931 0.01FNMA Pool 711986 6.5% /2033 11,447 12,268 0.01FNMA Pool 252589 6.5% /2029 8,410 9,013 0.01FNMA Pool 591189 6.5% /2031 5,756 6,169 0.00FNMA Pool 713672 6.5% /2032 5,390 5,776 0.00FNMA Pool 702022 6.5% /2033 4,847 5,195 0.00FNMA Pool 496029 6.5% /2029 4,620 4,951 0.00FNMA Pool 675952 6.5% /2032 3,973 4,258 0.00FNMA Pool 494724 6.5% /2029 2,218 2,378 0.00FNMA Pool 654099 6.5% /2032 1,283 1,375 0.00
Total for United States of America 5.18
Total for Mortgage and Asset Backed Securities 5.18
Supra-National Bond
European Investment Bank sr unsecur 2.15% /2027 (JPY) 480,000,000 5,108,535 2.52
Total for Supra-National Bond 2.52
Total Investment Securities 185,826,179 91.74
STATEMENT OF INVESTMENTS (continued)
Transferable securities and money market instruments admitted to offi cial exchange listing or dealt in on another regulated market. As at 31 December 2009, expressed in US dollars.
Investments
Nominal in US dollars
unless specifi ed Market
value% of net
assets
Corporate Bonds (continued)
IrelandSmurfi t Kappa Acquisitions sr secured RegS 7.25% /2017 (EUR) 150,000 212,272 0.10Smurfi t Kappa Funding sr subord 7.75% /2015 (EUR) 150,000 209,040 0.10Smurfi t Kappa Acquisitions - sr secured RegS 7.75% /2019 (EUR) 50,000 71,476 0.04
Total for Ireland 0.24
NorwayDnB NOR Bank sr unsecur SerEMTN 4.5% /2014 (EUR) 200,000 302,575 0.15
Total for Norway 0.15
RussiaGaz Capital sr unsecur SerEMTN LPN 4.56% /2012 (Luxembourg) (2) (EUR) 185,000 271,039 0.13
Total for Russia 0.13
JerseyWPP co gtd SerWPP CV 5.75% /2014 (GBP) 100,000 216,694 0.11
Total for Jersey 0.11
Total for Corporate Bonds 39.62
Mortgage and Asset Backed Securities
United States of AmericaFNMA Pool 995049 5.5% /2038 2,503,009 2,620,729 1.29FNMA Pool 190363 5.5% /2035 1,111,186 1,163,447 0.58FNMA Pool 995364 6% /2038 1,034,784 1,097,032 0.54WaMu Mortgage Pass Through Certifi cates 2005-AR13 A1A2 1.994% /2045 (3) 1,551,508 1,069,678 0.53FNMA Pool 962304 5.5% /2038 890,644 932,532 0.46FNMA Pool 888472 6% /2037 462,163 489,965 0.24FNMA Pool 889983 6% /2038 460,976 488,707 0.24FNMA Pool 490758 6.5% /2029 267,188 290,249 0.14FNMA Pool 968154 6% /2038 227,491 241,176 0.12LB-UBS Commercial Mortgage Trust 2006-C6 A4 5.372% /2039 210,000 201,054 0.10Banc of America Commercial Mortgage 2007-4 A4 5.744% /2051 (3) 225,000 199,948 0.10Freddie Mac Gold Pool A64548 6% /2037 179,680 190,714 0.09LB-UBS Commercial Mortgage Trust 2006-C1 A4 5.156% /2031 150,000 145,873 0.07Citigroup Commercial Mortgage Trust 2007-C6 A4 5.7% /2049 (3) 149,000 133,530 0.07Greenwich Capital Commercial Funding 2007-GG9 A4 5.444% /2039 150,000 133,139 0.07Citigroup Commercial Mortgage Trust 2006-C4 A3 5.725% /2049 (3) 125,000 120,287 0.06LB-UBS Commercial Mortgage Trust 2007-C7 A3 5.866% /2045 (3) 125,000 110,233 0.06Commercial Mortgage Pass Through Certifi cates 2007-C9 A4 5.816% /2049 (3) 100,000 91,356 0.05Citigroup Commercial Mortgage Trust 2008-C7 A4 6.092% /2049 (3) 100,000 90,216 0.04FNMA Pool 253894 6.5% /2031 83,283 89,256 0.04
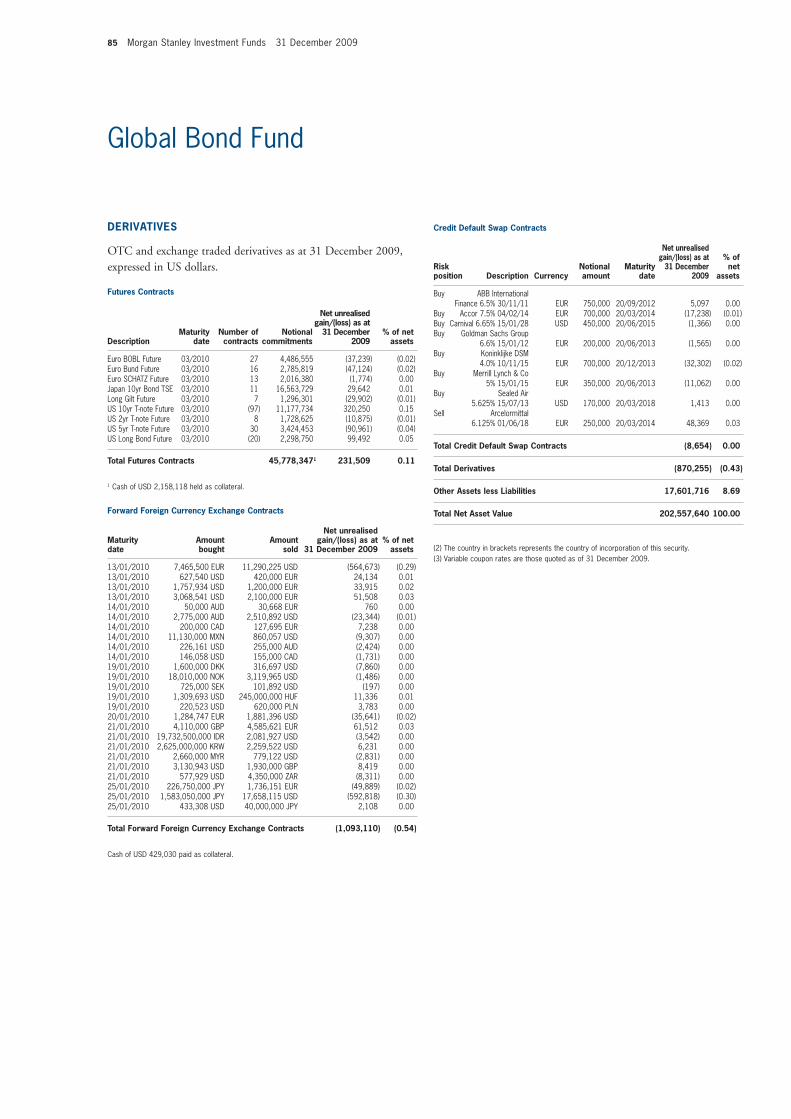
85 Morgan Stanley Investment Funds 31 December 2009
Global Bond Fund
DERIVATIVES
OTC and exchange traded derivatives as at 31 December 2009, expressed in US dollars.
Futures Contracts
DescriptionMaturity
dateNumber of contracts
Notional commitments
Net unrealisedgain/(loss) as at
31 December 2009
% of net assets
Euro BOBL Future 03/2010 27 4,486,555 (37,239) (0.02)Euro Bund Future 03/2010 16 2,785,819 (47,124) (0.02)Euro SCHATZ Future 03/2010 13 2,016,380 (1,774) 0.00Japan 10yr Bond TSE 03/2010 11 16,563,729 29,642 0.01Long Gilt Future 03/2010 7 1,296,301 (29,902) (0.01)US 10yr T-note Future 03/2010 (97) 11,177,734 320,250 0.15US 2yr T-note Future 03/2010 8 1,728,625 (10,875) (0.01)US 5yr T-note Future 03/2010 30 3,424,453 (90,961) (0.04)US Long Bond Future 03/2010 (20) 2,298,750 99,492 0.05
Total Futures Contracts 45,778,3471 231,509 0.11
1 Cash of USD 2,158,118 held as collateral.
Forward Foreign Currency Exchange Contracts
Maturity date
Amount bought
Amount sold
Net unrealisedgain/(loss) as at
31 December 2009 % of net
assets 13/01/2010 7,465,500 EUR 11,290,225 USD (564,673) (0.29)13/01/2010 627,540 USD 420,000 EUR 24,134 0.0113/01/2010 1,757,934 USD 1,200,000 EUR 33,915 0.0213/01/2010 3,068,541 USD 2,100,000 EUR 51,508 0.0314/01/2010 50,000 AUD 30,668 EUR 760 0.0014/01/2010 2,775,000 AUD 2,510,892 USD (23,344) (0.01)14/01/2010 200,000 CAD 127,695 EUR 7,238 0.0014/01/2010 11,130,000 MXN 860,057 USD (9,307) 0.0014/01/2010 226,161 USD 255,000 AUD (2,424) 0.0014/01/2010 146,058 USD 155,000 CAD (1,731) 0.0019/01/2010 1,600,000 DKK 316,697 USD (7,860) 0.0019/01/2010 18,010,000 NOK 3,119,965 USD (1,486) 0.0019/01/2010 725,000 SEK 101,892 USD (197) 0.0019/01/2010 1,309,693 USD 245,000,000 HUF 11,336 0.0119/01/2010 220,523 USD 620,000 PLN 3,783 0.0020/01/2010 1,284,747 EUR 1,881,396 USD (35,641) (0.02)21/01/2010 4,110,000 GBP 4,585,621 EUR 61,512 0.0321/01/2010 19,732,500,000 IDR 2,081,927 USD (3,542) 0.0021/01/2010 2,625,000,000 KRW 2,259,522 USD 6,231 0.0021/01/2010 2,660,000 MYR 779,122 USD (2,831) 0.0021/01/2010 3,130,943 USD 1,930,000 GBP 8,419 0.0021/01/2010 577,929 USD 4,350,000 ZAR (8,311) 0.0025/01/2010 226,750,000 JPY 1,736,151 EUR (49,889) (0.02)25/01/2010 1,583,050,000 JPY 17,658,115 USD (592,818) (0.30)25/01/2010 433,308 USD 40,000,000 JPY 2,108 0.00
Total Forward Foreign Currency Exchange Contracts (1,093,110) (0.54)
Cash of USD 429,030 paid as collateral.
Credit Default Swap Contracts
Risk position Description Currency
Notional amount
Maturity date
Net unrealised gain/(loss) as at
31 December 2009
% of net
assets Buy ABB International Finance 6.5% 30/11/11 EUR 750,000 20/09/2012 5,097 0.00 Buy Accor 7.5% 04/02/14 EUR 700,000 20/03/2014 (17,238) (0.01)Buy Carnival 6.65% 15/01/28 USD 450,000 20/06/2015 (1,366) 0.00 Buy Goldman Sachs Group 6.6% 15/01/12 EUR 200,000 20/06/2013 (1,565) 0.00 Buy Koninklijke DSM 4.0% 10/11/15 EUR 700,000 20/12/2013 (32,302) (0.02)Buy Merrill Lynch & Co 5% 15/01/15 EUR 350,000 20/06/2013 (11,062) 0.00 Buy Sealed Air 5.625% 15/07/13 USD 170,000 20/03/2018 1,413 0.00 Sell Arcelormittal 6.125% 01/06/18 EUR 250,000 20/03/2014 48,369 0.03
Total Credit Default Swap Contracts (8,654) 0.00
Total Derivatives (870,255) (0.43)
Other Assets less Liabilities 17,601,716 8.69
Total Net Asset Value 202,557,640 100.00
(2) The country in brackets represents the country of incorporation of this security.(3) Variable coupon rates are those quoted as of 31 December 2009.
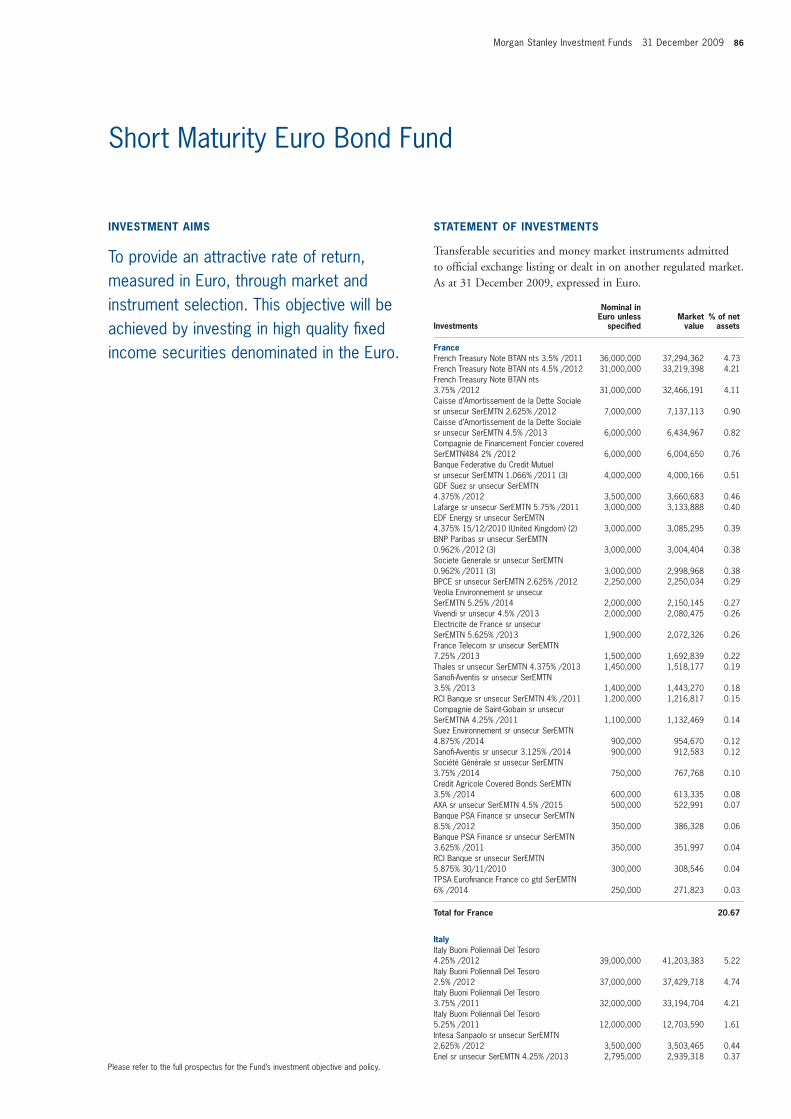
Morgan Stanley Investment Funds 31 December 2009 86
Short Maturity Euro Bond Fund
FranceFrench Treasury Note BTAN nts 3.5% /2011 36,000,000 37,294,362 4.73French Treasury Note BTAN nts 4.5% /2012 31,000,000 33,219,398 4.21French Treasury Note BTAN nts 3.75% /2012 31,000,000 32,466,191 4.11Caisse d’Amortissement de la Dette Sociale sr unsecur SerEMTN 2.625% /2012 7,000,000 7,137,113 0.90Caisse d’Amortissement de la Dette Sociale sr unsecur SerEMTN 4.5% /2013 6,000,000 6,434,967 0.82Compagnie de Financement Foncier covered SerEMTN484 2% /2012 6,000,000 6,004,650 0.76Banque Federative du Credit Mutuel sr unsecur SerEMTN 1.066% /2011 (3) 4,000,000 4,000,166 0.51GDF Suez sr unsecur SerEMTN 4.375% /2012 3,500,000 3,660,683 0.46Lafarge sr unsecur SerEMTN 5.75% /2011 3,000,000 3,133,888 0.40EDF Energy sr unsecur SerEMTN 4.375% 15/12/2010 (United Kingdom) (2) 3,000,000 3,085,295 0.39BNP Paribas sr unsecur SerEMTN 0.962% /2012 (3) 3,000,000 3,004,404 0.38Societe Generale sr unsecur SerEMTN 0.962% /2011 (3) 3,000,000 2,998,968 0.38BPCE sr unsecur SerEMTN 2.625% /2012 2,250,000 2,250,034 0.29Veolia Environnement sr unsecur SerEMTN 5.25% /2014 2,000,000 2,150,145 0.27Vivendi sr unsecur 4.5% /2013 2,000,000 2,080,475 0.26Electricite de France sr unsecur SerEMTN 5.625% /2013 1,900,000 2,072,326 0.26France Telecom sr unsecur SerEMTN 7.25% /2013 1,500,000 1,692,839 0.22Thales sr unsecur SerEMTN 4.375% /2013 1,450,000 1,518,177 0.19Sanofi -Aventis sr unsecur SerEMTN 3.5% /2013 1,400,000 1,443,270 0.18RCI Banque sr unsecur SerEMTN 4% /2011 1,200,000 1,216,817 0.15Compagnie de Saint-Gobain sr unsecur SerEMTNA 4.25% /2011 1,100,000 1,132,469 0.14Suez Environnement sr unsecur SerEMTN 4.875% /2014 900,000 954,670 0.12Sanofi -Aventis sr unsecur 3.125% /2014 900,000 912,583 0.12Société Générale sr unsecur SerEMTN 3.75% /2014 750,000 767,768 0.10Credit Agricole Covered Bonds SerEMTN 3.5% /2014 600,000 613,335 0.08AXA sr unsecur SerEMTN 4.5% /2015 500,000 522,991 0.07Banque PSA Finance sr unsecur SerEMTN 8.5% /2012 350,000 386,328 0.06Banque PSA Finance sr unsecur SerEMTN 3.625% /2011 350,000 351,997 0.04RCI Banque sr unsecur SerEMTN 5.875% 30/11/2010 300,000 308,546 0.04TPSA Eurofi nance France co gtd SerEMTN 6% /2014 250,000 271,823 0.03
Total for France 20.67
ItalyItaly Buoni Poliennali Del Tesoro 4.25% /2012 39,000,000 41,203,383 5.22Italy Buoni Poliennali Del Tesoro 2.5% /2012 37,000,000 37,429,718 4.74Italy Buoni Poliennali Del Tesoro 3.75% /2011 32,000,000 33,194,704 4.21Italy Buoni Poliennali Del Tesoro 5.25% /2011 12,000,000 12,703,590 1.61Intesa Sanpaolo sr unsecur SerEMTN 2.625% /2012 3,500,000 3,503,465 0.44Enel sr unsecur SerEMTN 4.25% /2013 2,795,000 2,939,318 0.37
INVESTMENT AIMS
To provide an attractive rate of return, measured in Euro, through market and instrument selection. This objective will be achieved by investing in high quality fi xed income securities denominated in the Euro.
STATEMENT OF INVESTMENTS
Transferable securities and money market instruments admitted to offi cial exchange listing or dealt in on another regulated market. As at 31 December 2009, expressed in Euro.
Investments
Nominal in Euro unless
specifi ed Market
value% of net
assets
Please refer to the full prospectus for the Fund’s investment objective and policy.
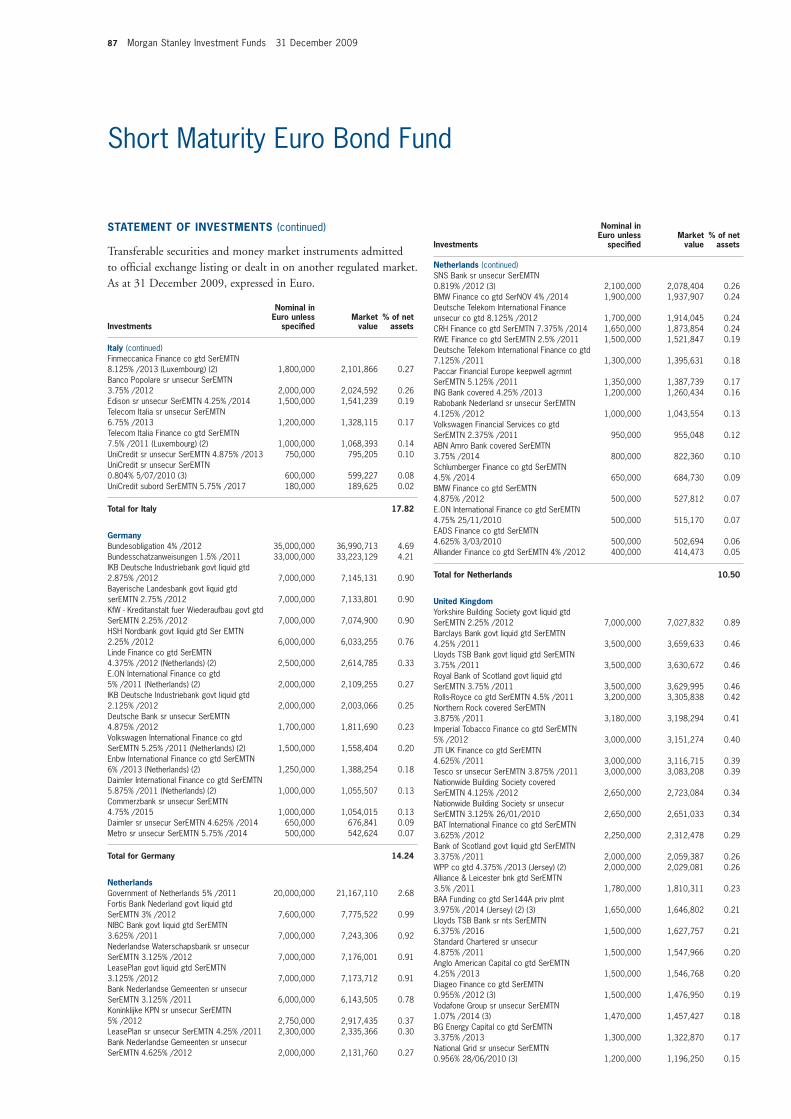
87 Morgan Stanley Investment Funds 31 December 2009
Short Maturity Euro Bond Fund
STATEMENT OF INVESTMENTS (continued)
Transferable securities and money market instruments admitted to offi cial exchange listing or dealt in on another regulated market. As at 31 December 2009, expressed in Euro.
Investments
Nominal in Euro unless
specifi ed Market
value% of net
assets
Investments
Nominal in Euro unless
specifi ed Market
value% of net
assets
Italy (continued)Finmeccanica Finance co gtd SerEMTN 8.125% /2013 (Luxembourg) (2) 1,800,000 2,101,866 0.27Banco Popolare sr unsecur SerEMTN 3.75% /2012 2,000,000 2,024,592 0.26Edison sr unsecur SerEMTN 4.25% /2014 1,500,000 1,541,239 0.19Telecom Italia sr unsecur SerEMTN 6.75% /2013 1,200,000 1,328,115 0.17Telecom Italia Finance co gtd SerEMTN 7.5% /2011 (Luxembourg) (2) 1,000,000 1,068,393 0.14UniCredit sr unsecur SerEMTN 4.875% /2013 750,000 795,205 0.10UniCredit sr unsecur SerEMTN 0.804% 5/07/2010 (3) 600,000 599,227 0.08UniCredit subord SerEMTN 5.75% /2017 180,000 189,625 0.02
Total for Italy 17.82
GermanyBundesobligation 4% /2012 35,000,000 36,990,713 4.69Bundesschatzanweisungen 1.5% /2011 33,000,000 33,223,129 4.21IKB Deutsche Industriebank govt liquid gtd 2.875% /2012 7,000,000 7,145,131 0.90Bayerische Landesbank govt liquid gtd serEMTN 2.75% /2012 7,000,000 7,133,801 0.90KfW - Kreditanstalt fuer Wiederaufbau govt gtdSerEMTN 2.25% /2012 7,000,000 7,074,900 0.90HSH Nordbank govt liquid gtd Ser EMTN 2.25% /2012 6,000,000 6,033,255 0.76Linde Finance co gtd SerEMTN 4.375% /2012 (Netherlands) (2) 2,500,000 2,614,785 0.33E.ON International Finance co gtd 5% /2011 (Netherlands) (2) 2,000,000 2,109,255 0.27IKB Deutsche Industriebank govt liquid gtd 2.125% /2012 2,000,000 2,003,066 0.25Deutsche Bank sr unsecur SerEMTN 4.875% /2012 1,700,000 1,811,690 0.23Volkswagen International Finance co gtd SerEMTN 5.25% /2011 (Netherlands) (2) 1,500,000 1,558,404 0.20Enbw International Finance co gtd SerEMTN 6% /2013 (Netherlands) (2) 1,250,000 1,388,254 0.18Daimler International Finance co gtd SerEMTN 5.875% /2011 (Netherlands) (2) 1,000,000 1,055,507 0.13Commerzbank sr unsecur SerEMTN 4.75% /2015 1,000,000 1,054,015 0.13Daimler sr unsecur SerEMTN 4.625% /2014 650,000 676,841 0.09Metro sr unsecur SerEMTN 5.75% /2014 500,000 542,624 0.07
Total for Germany 14.24
NetherlandsGovernment of Netherlands 5% /2011 20,000,000 21,167,110 2.68Fortis Bank Nederland govt liquid gtd SerEMTN 3% /2012 7,600,000 7,775,522 0.99NIBC Bank govt liquid gtd SerEMTN 3.625% /2011 7,000,000 7,243,306 0.92Nederlandse Waterschapsbank sr unsecur SerEMTN 3.125% /2012 7,000,000 7,176,001 0.91LeasePlan govt liquid gtd SerEMTN 3.125% /2012 7,000,000 7,173,712 0.91Bank Nederlandse Gemeenten sr unsecur SerEMTN 3.125% /2011 6,000,000 6,143,505 0.78Koninklijke KPN sr unsecur SerEMTN 5% /2012 2,750,000 2,917,435 0.37LeasePlan sr unsecur SerEMTN 4.25% /2011 2,300,000 2,335,366 0.30Bank Nederlandse Gemeenten sr unsecur SerEMTN 4.625% /2012 2,000,000 2,131,760 0.27
Netherlands (continued)SNS Bank sr unsecur SerEMTN 0.819% /2012 (3) 2,100,000 2,078,404 0.26BMW Finance co gtd SerNOV 4% /2014 1,900,000 1,937,907 0.24Deutsche Telekom International Finance unsecur co gtd 8.125% /2012 1,700,000 1,914,045 0.24CRH Finance co gtd SerEMTN 7.375% /2014 1,650,000 1,873,854 0.24RWE Finance co gtd SerEMTN 2.5% /2011 1,500,000 1,521,847 0.19Deutsche Telekom International Finance co gtd 7.125% /2011 1,300,000 1,395,631 0.18Paccar Financial Europe keepwell agrmnt SerEMTN 5.125% /2011 1,350,000 1,387,739 0.17ING Bank covered 4.25% /2013 1,200,000 1,260,434 0.16Rabobank Nederland sr unsecur SerEMTN 4.125% /2012 1,000,000 1,043,554 0.13Volkswagen Financial Services co gtd SerEMTN 2.375% /2011 950,000 955,048 0.12ABN Amro Bank covered SerEMTN 3.75% /2014 800,000 822,360 0.10Schlumberger Finance co gtd SerEMTN 4.5% /2014 650,000 684,730 0.09BMW Finance co gtd SerEMTN 4.875% /2012 500,000 527,812 0.07E.ON International Finance co gtd SerEMTN 4.75% 25/11/2010 500,000 515,170 0.07EADS Finance co gtd SerEMTN 4.625% 3/03/2010 500,000 502,694 0.06Alliander Finance co gtd SerEMTN 4% /2012 400,000 414,473 0.05
Total for Netherlands 10.50
United KingdomYorkshire Building Society govt liquid gtd SerEMTN 2.25% /2012 7,000,000 7,027,832 0.89Barclays Bank govt liquid gtd SerEMTN 4.25% /2011 3,500,000 3,659,633 0.46Lloyds TSB Bank govt liquid gtd SerEMTN 3.75% /2011 3,500,000 3,630,672 0.46Royal Bank of Scotland govt liquid gtd SerEMTN 3.75% /2011 3,500,000 3,629,995 0.46Rolls-Royce co gtd SerEMTN 4.5% /2011 3,200,000 3,305,838 0.42Northern Rock covered SerEMTN 3.875% /2011 3,180,000 3,198,294 0.41Imperial Tobacco Finance co gtd SerEMTN 5% /2012 3,000,000 3,151,274 0.40JTI UK Finance co gtd SerEMTN 4.625% /2011 3,000,000 3,116,715 0.39Tesco sr unsecur SerEMTN 3.875% /2011 3,000,000 3,083,208 0.39Nationwide Building Society covered SerEMTN 4.125% /2012 2,650,000 2,723,084 0.34Nationwide Building Society sr unsecur SerEMTN 3.125% 26/01/2010 2,650,000 2,651,033 0.34BAT International Finance co gtd SerEMTN 3.625% /2012 2,250,000 2,312,478 0.29Bank of Scotland govt liquid gtd SerEMTN 3.375% /2011 2,000,000 2,059,387 0.26WPP co gtd 4.375% /2013 (Jersey) (2) 2,000,000 2,029,081 0.26Alliance & Leicester bnk gtd SerEMTN 3.5% /2011 1,780,000 1,810,311 0.23BAA Funding co gtd Ser144A priv plmt 3.975% /2014 (Jersey) (2) (3) 1,650,000 1,646,802 0.21Lloyds TSB Bank sr nts SerEMTN 6.375% /2016 1,500,000 1,627,757 0.21Standard Chartered sr unsecur 4.875% /2011 1,500,000 1,547,966 0.20Anglo American Capital co gtd SerEMTN 4.25% /2013 1,500,000 1,546,768 0.20Diageo Finance co gtd SerEMTN 0.955% /2012 (3) 1,500,000 1,476,950 0.19Vodafone Group sr unsecur SerEMTN 1.07% /2014 (3) 1,470,000 1,457,427 0.18BG Energy Capital co gtd SerEMTN 3.375% /2013 1,300,000 1,322,870 0.17National Grid sr unsecur SerEMTN 0.956% 28/06/2010 (3) 1,200,000 1,196,250 0.15

Morgan Stanley Investment Funds 31 December 2009 88
Short Maturity Euro Bond Fund
STATEMENT OF INVESTMENTS (continued)
Transferable securities and money market instruments admitted to offi cial exchange listing or dealt in on another regulated market. As at 31 December 2009, expressed in Euro.
Investments
Nominal in Euro unless
specifi ed Market
value% of net
assets
United Kingdom (continued)Royal Bank of Scotland Group sr unsecur SerEMTN 5.25% /2013 1,000,000 1,033,893 0.13Granite Master Issuer 2006-4 A7 0.593% /2054 (3) 1,039,895 928,257 0.12Royal Bank of Scotland sr unsecur SerEMTN 5.75% /2014 700,000 736,735 0.09Lloyds TSB Bank nts SerEMTN 3.25% /2012 700,000 698,128 0.09SABMiller sr unsecur SerEMTN 4.5% /2015 650,000 668,844 0.08Lloyds TSB Bank subord SerEMTN 5.625% /2018 (3) 600,000 570,149 0.07National Grid Gas sr unsecur SerEMTN 5.125% /2013 400,000 427,889 0.05Royal Bank of Scotland sr unsecur SerEMTN 5.375% /2019 400,000 391,799 0.05Centrica sr unsecur SerEMTN 7.125% /2013 250,000 286,283 0.04Leek Finance 17 X A2C 0.852% /2037 (3) 284,442 263,101 0.03
Total for United Kingdom 8.26
United States of AmericaGeneral Electric Capital FDIC gtd SerEMTN 4% /2012 7,000,000 7,324,083 0.93Goldman Sachs Group FDIC gtd SerEMTN 3.5% /2011 4,000,000 4,132,400 0.52WM Covered Bond Program SerEMTN 3.875% /2011 3,800,000 3,872,058 0.49Toyota Motor Credit nts SerEMTN 5.25% /2012 3,500,000 3,703,306 0.47JPMorgan Chase & Co FDIC gtd 3.625% /2011 3,500,000 3,626,067 0.46Cellco Partnership / Verizon Wireless Capital sr unsecur 7.625% /2011 3,000,000 3,305,850 0.42AT&T sr unsecur 4.375% /2013 2,500,000 2,620,500 0.33Citigroup sr unsecur SerEMTN 3.625% /2011 2,490,000 2,525,469 0.32JPMorgan Chase & Co sr unsecur SerEMTN 6.125% /2014 1,800,000 2,002,089 0.25Roche Holdings co gtd SerEMTN 4.625% /2013 1,800,000 1,908,401 0.24Wells Fargo & Co sr unsecur SerEMTN 4% /2011 1,700,000 1,745,211 0.22Fortune Brands sr unsecur 4% /2013 1,690,000 1,673,824 0.21Merck & Co co gtd 5.375% /2014 1,500,000 1,636,079 0.21JPMorgan Chase & Co sr unsecur SerEMTN 5.25% /2013 1,500,000 1,610,743 0.20Goldman Sachs Group sr unsecur SerEMTN 5.375% /2013 1,500,000 1,589,192 0.20Merrill Lynch & Co sr unsecur SerEMTN 1.017% /2014 (3) 1,450,000 1,342,736 0.17Kraft Foods sr unsecur 5.75% /2012 1,250,000 1,323,245 0.17ITW Finance Europe co gtd 5.25% /2014 (Luxembourg) (2) 1,200,000 1,284,816 0.16Merck & Co co gtd 5% 1/10/2010 1,200,000 1,232,642 0.16Countrywide Financial co gtd SerEMTN 1.115% 23/11/2010 (3) 1,150,000 1,153,197 0.14Wachovia sr unsecur SerEMTN 0.865% /2014 (3) 1,000,000 949,061 0.12SES Global Americas Holdings co gtd SerEMTN 4.875% /2014 800,000 836,168 0.11Pfi zer sr unsecur 3.625% /2013 650,000 671,545 0.09Daimler Finance North America co gtd SerEMTN 5% /2012 500,000 525,810 0.07Zurich Finance USA co gtd SerEMTN 4.875% /2012 500,000 524,606 0.07
Total for United States of America 6.73
Investments
Nominal in Euro unless
specifi ed Market
value% of net
assets
GreeceHellenic Republic sr unsecur 5.25% /2012 30,000,000 30,695,775 3.89EFG Hellas bnk gtd SerEMTN 4.375% /2013 (United Kingdom) (2) 1,500,000 1,435,187 0.18
Total for Greece 4.07
SwedenSwedbank govt liquid gtd SerEMTN 3.125% /2012 8,000,000 8,194,620 1.04Swedish Governement nts SerEMTN 1.5% /2011 7,000,000 7,023,499 0.89Vattenfall sr unsecur SerEMTN 4.125% /2013 2,400,000 2,508,380 0.32Svenska Handelsbanken sr unsecur 3% /2012 2,200,000 2,224,905 0.28Nordea Bank nts SerEMTN 1.166% /2012 (3) 2,000,000 1,998,834 0.25Nordea Bank sr unsecur SerEMTN 3% /2012 1,500,000 1,521,506 0.19Rodamco Sverige co gtd SerEMTN 4.125% /2011 1,400,000 1,432,133 0.18Svenska Handelsbanken sr unsecur SerEMTN 4.875% /2014 1,000,000 1,067,079 0.14
Total for Sweden 3.29
SpainLa Caja de Ahorros y Pensiones de Barcelona govt liquid gtd 3.375% /2012 4,000,000 4,097,796 0.52BBVA Senior Finance bnk gtd SerGMTN 1.009% /2011 (3) 4,000,000 4,001,240 0.51Iberdrola Finanzas co gtd SerEMTN 6.375% /2011 3,000,000 3,238,856 0.41Santander International Debt bnk gtd SerEMTN 5.625% /2012 1,900,000 2,033,173 0.26Telefonica Emisiones co gtd SerEMTN 5.58% /2013 1,400,000 1,517,296 0.19Gas Natural Capital Markets co gtd SerEMTN 5.25% /2014 1,000,000 1,069,569 0.13Enagas unsecur 3.25% /2012 900,000 920,899 0.12Gas Natural Capital Markets co gtd SerEMTN 3.125% /2012 400,000 405,294 0.05
Total for Spain 2.19
AustraliaCommonwealth Bank of Australia sr unsecur SerEMTN 5.875% /2011 4,000,000 4,249,180 0.54BHP Billiton Finance co gtd SerEMTN 4.125% /2011 2,000,000 2,062,113 0.26Australia & New Zealand Banking Group sr unsecur SerEMTN 5.25% /2013 1,750,000 1,883,345 0.24Westpac Banking sr unsecur SerEMTN 0.782% /2011 (3) 1,750,000 1,744,258 0.22Australia & New Zealand Banking Group nts SerEMTN 2.625% /2012 1,300,000 1,304,885 0.17National Australia Bank sr unsecur SerEMTN 3.5% /2015 1,300,000 1,290,790 0.16National Australia Bank sr unsecur SerGMTN 4.75% /2016 900,000 936,461 0.12Resimac MBS Trust 2005-1E 1A 0.841% /2037 (3) 419,962 409,585 0.05Progress Trust 2004-E1 2A 0.922% /2035 (3) 369,142 363,581 0.05Medallion Trust 2004-1G A3 0.855% /2035 (3) 258,664 252,293 0.03
Total for Australia 1.84
SwitzerlandPhilip Morris International sr unsecur SerGMTN 5.625% /2011 (United States of America) (2) 2,750,000 2,914,182 0.37Credit Suisse sr unsecur SerEMTN 1.08% /2013 (3) 2,000,000 2,002,602 0.25
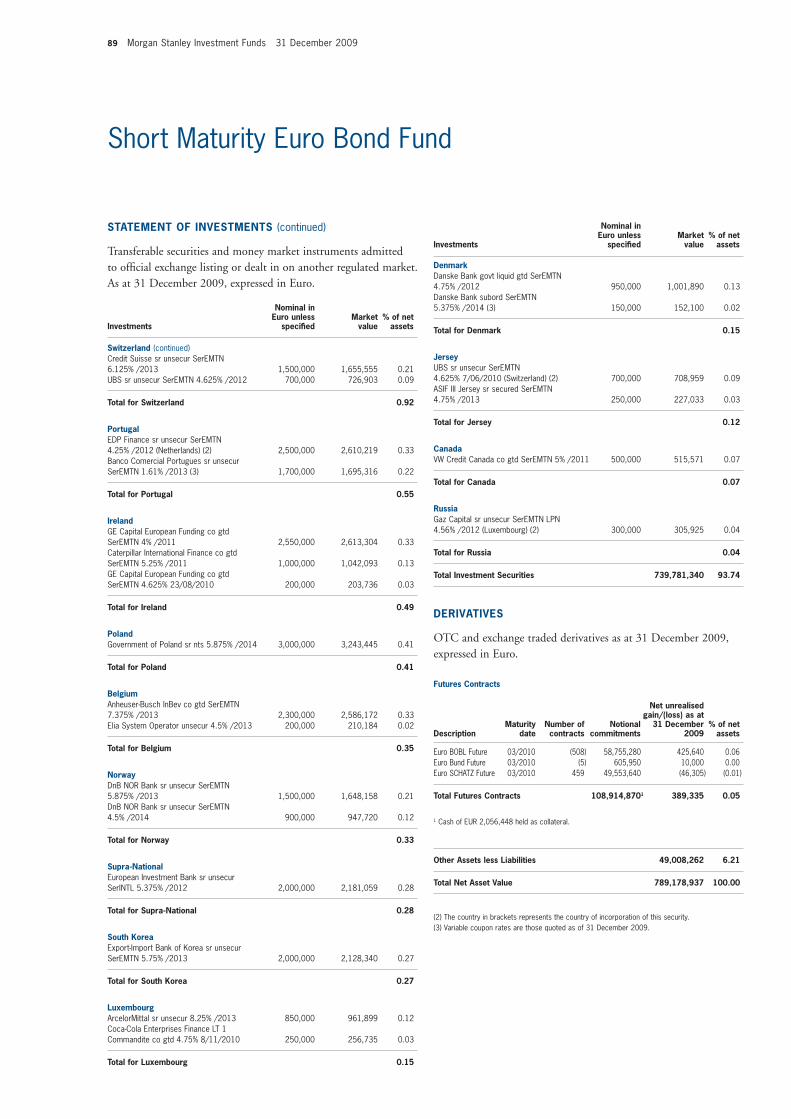
89 Morgan Stanley Investment Funds 31 December 2009
Short Maturity Euro Bond Fund
STATEMENT OF INVESTMENTS (continued)
Transferable securities and money market instruments admitted to offi cial exchange listing or dealt in on another regulated market. As at 31 December 2009, expressed in Euro.
Investments
Nominal in Euro unless
specifi ed Market
value% of net
assets
Investments
Nominal in Euro unless
specifi ed Market
value% of net
assets
Switzerland (continued)Credit Suisse sr unsecur SerEMTN 6.125% /2013 1,500,000 1,655,555 0.21UBS sr unsecur SerEMTN 4.625% /2012 700,000 726,903 0.09
Total for Switzerland 0.92
PortugalEDP Finance sr unsecur SerEMTN 4.25% /2012 (Netherlands) (2) 2,500,000 2,610,219 0.33Banco Comercial Portugues sr unsecur SerEMTN 1.61% /2013 (3) 1,700,000 1,695,316 0.22
Total for Portugal 0.55
IrelandGE Capital European Funding co gtd SerEMTN 4% /2011 2,550,000 2,613,304 0.33Caterpillar International Finance co gtd SerEMTN 5.25% /2011 1,000,000 1,042,093 0.13GE Capital European Funding co gtd SerEMTN 4.625% 23/08/2010 200,000 203,736 0.03
Total for Ireland 0.49
PolandGovernment of Poland sr nts 5.875% /2014 3,000,000 3,243,445 0.41
Total for Poland 0.41
BelgiumAnheuser-Busch InBev co gtd SerEMTN 7.375% /2013 2,300,000 2,586,172 0.33Elia System Operator unsecur 4.5% /2013 200,000 210,184 0.02
Total for Belgium 0.35
NorwayDnB NOR Bank sr unsecur SerEMTN 5.875% /2013 1,500,000 1,648,158 0.21DnB NOR Bank sr unsecur SerEMTN 4.5% /2014 900,000 947,720 0.12
Total for Norway 0.33
Supra-NationalEuropean Investment Bank sr unsecur SerINTL 5.375% /2012 2,000,000 2,181,059 0.28
Total for Supra-National 0.28
South KoreaExport-Import Bank of Korea sr unsecur SerEMTN 5.75% /2013 2,000,000 2,128,340 0.27
Total for South Korea 0.27
LuxembourgArcelorMittal sr unsecur 8.25% /2013 850,000 961,899 0.12Coca-Cola Enterprises Finance LT 1 Commandite co gtd 4.75% 8/11/2010 250,000 256,735 0.03
Total for Luxembourg 0.15
DenmarkDanske Bank govt liquid gtd SerEMTN 4.75% /2012 950,000 1,001,890 0.13Danske Bank subord SerEMTN 5.375% /2014 (3) 150,000 152,100 0.02
Total for Denmark 0.15
JerseyUBS sr unsecur SerEMTN 4.625% 7/06/2010 (Switzerland) (2) 700,000 708,959 0.09ASIF III Jersey sr secured SerEMTN 4.75% /2013 250,000 227,033 0.03
Total for Jersey 0.12
CanadaVW Credit Canada co gtd SerEMTN 5% /2011 500,000 515,571 0.07
Total for Canada 0.07
RussiaGaz Capital sr unsecur SerEMTN LPN 4.56% /2012 (Luxembourg) (2) 300,000 305,925 0.04
Total for Russia 0.04
Total Investment Securities 739,781,340 93.74
DERIVATIVES
OTC and exchange traded derivatives as at 31 December 2009, expressed in Euro.
Futures Contracts
DescriptionMaturity
dateNumber of contracts
Notional commitments
Net unrealisedgain/(loss) as at
31 December 2009
% of net assets
Euro BOBL Future 03/2010 (508) 58,755,280 425,640 0.06Euro Bund Future 03/2010 (5) 605,950 10,000 0.00Euro SCHATZ Future 03/2010 459 49,553,640 (46,305) (0.01)
Total Futures Contracts 108,914,8701 389,335 0.05
1 Cash of EUR 2,056,448 held as collateral.
Other Assets less Liabilities 49,008,262 6.21
Total Net Asset Value 789,178,937 100.00
(2) The country in brackets represents the country of incorporation of this security.(3) Variable coupon rates are those quoted as of 31 December 2009.
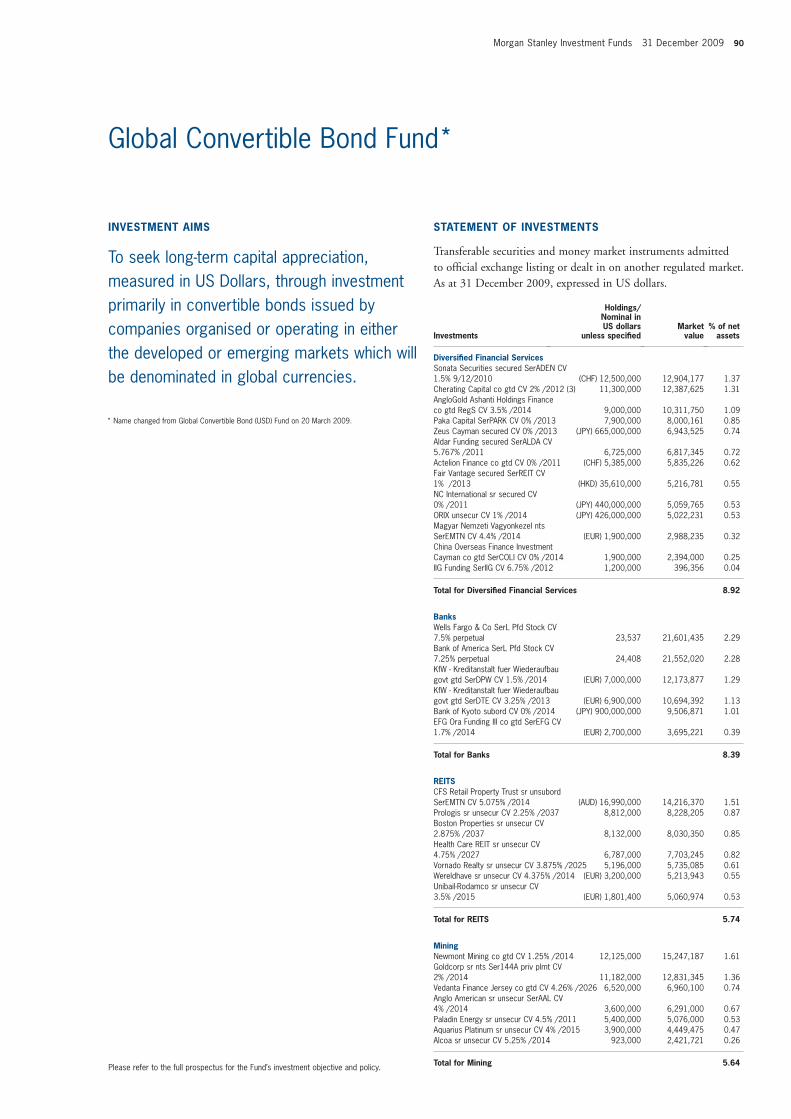
Morgan Stanley Investment Funds 31 December 2009 90
Global Convertible Bond Fund*
Diversifi ed Financial Services Sonata Securities secured SerADEN CV 1.5% 9/12/2010 (CHF) 12,500,000 12,904,177 1.37Cherating Capital co gtd CV 2% /2012 (3) 11,300,000 12,387,625 1.31AngloGold Ashanti Holdings Finance co gtd RegS CV 3.5% /2014 9,000,000 10,311,750 1.09Paka Capital SerPARK CV 0% /2013 7,900,000 8,000,161 0.85Zeus Cayman secured CV 0% /2013 (JPY) 665,000,000 6,943,525 0.74Aldar Funding secured SerALDA CV 5.767% /2011 6,725,000 6,817,345 0.72Actelion Finance co gtd CV 0% /2011 (CHF) 5,385,000 5,835,226 0.62Fair Vantage secured SerREIT CV 1% /2013 (HKD) 35,610,000 5,216,781 0.55NC International sr secured CV 0% /2011 (JPY) 440,000,000 5,059,765 0.53ORIX unsecur CV 1% /2014 (JPY) 426,000,000 5,022,231 0.53Magyar Nemzeti Vagyonkezel nts SerEMTN CV 4.4% /2014 (EUR) 1,900,000 2,988,235 0.32China Overseas Finance Investment Cayman co gtd SerCOLI CV 0% /2014 1,900,000 2,394,000 0.25IIG Funding SerIIG CV 6.75% /2012 1,200,000 396,356 0.04
Total for Diversifi ed Financial Services 8.92
BanksWells Fargo & Co SerL Pfd Stock CV 7.5% perpetual 23,537 21,601,435 2.29Bank of America SerL Pfd Stock CV 7.25% perpetual 24,408 21,552,020 2.28KfW - Kreditanstalt fuer Wiederaufbau govt gtd SerDPW CV 1.5% /2014 (EUR) 7,000,000 12,173,877 1.29KfW - Kreditanstalt fuer Wiederaufbau govt gtd SerDTE CV 3.25% /2013 (EUR) 6,900,000 10,694,392 1.13Bank of Kyoto subord CV 0% /2014 (JPY) 900,000,000 9,506,871 1.01EFG Ora Funding III co gtd SerEFG CV 1.7% /2014 (EUR) 2,700,000 3,695,221 0.39
Total for Banks 8.39
REITSCFS Retail Property Trust sr unsubord SerEMTN CV 5.075% /2014 (AUD) 16,990,000 14,216,370 1.51Prologis sr unsecur CV 2.25% /2037 8,812,000 8,228,205 0.87Boston Properties sr unsecur CV 2.875% /2037 8,132,000 8,030,350 0.85Health Care REIT sr unsecur CV 4.75% /2027 6,787,000 7,703,245 0.82Vornado Realty sr unsecur CV 3.875% /2025 5,196,000 5,735,085 0.61Wereldhave sr unsecur CV 4.375% /2014 (EUR) 3,200,000 5,213,943 0.55Unibail-Rodamco sr unsecur CV 3.5% /2015 (EUR) 1,801,400 5,060,974 0.53
Total for REITS 5.74
MiningNewmont Mining co gtd CV 1.25% /2014 12,125,000 15,247,187 1.61Goldcorp sr nts Ser144A priv plmt CV 2% /2014 11,182,000 12,831,345 1.36Vedanta Finance Jersey co gtd CV 4.26% /2026 6,520,000 6,960,100 0.74Anglo American sr unsecur SerAAL CV 4% /2014 3,600,000 6,291,000 0.67Paladin Energy sr unsecur CV 4.5% /2011 5,400,000 5,076,000 0.53Aquarius Platinum sr unsecur CV 4% /2015 3,900,000 4,449,475 0.47Alcoa sr unsecur CV 5.25% /2014 923,000 2,421,721 0.26
Total for Mining 5.64
INVESTMENT AIMS
To seek long-term capital appreciation, measured in US Dollars, through investment primarily in convertible bonds issued by companies organised or operating in either the developed or emerging markets which will be denominated in global currencies.
STATEMENT OF INVESTMENTS
Transferable securities and money market instruments admitted to offi cial exchange listing or dealt in on another regulated market.As at 31 December 2009, expressed in US dollars.
Investments
Holdings/Nominal in US dollars
unless specifi ed Market
value% of net
assets
Please refer to the full prospectus for the Fund’s investment objective and policy.
* Name changed from Global Convertible Bond (USD) Fund on 20 March 2009.
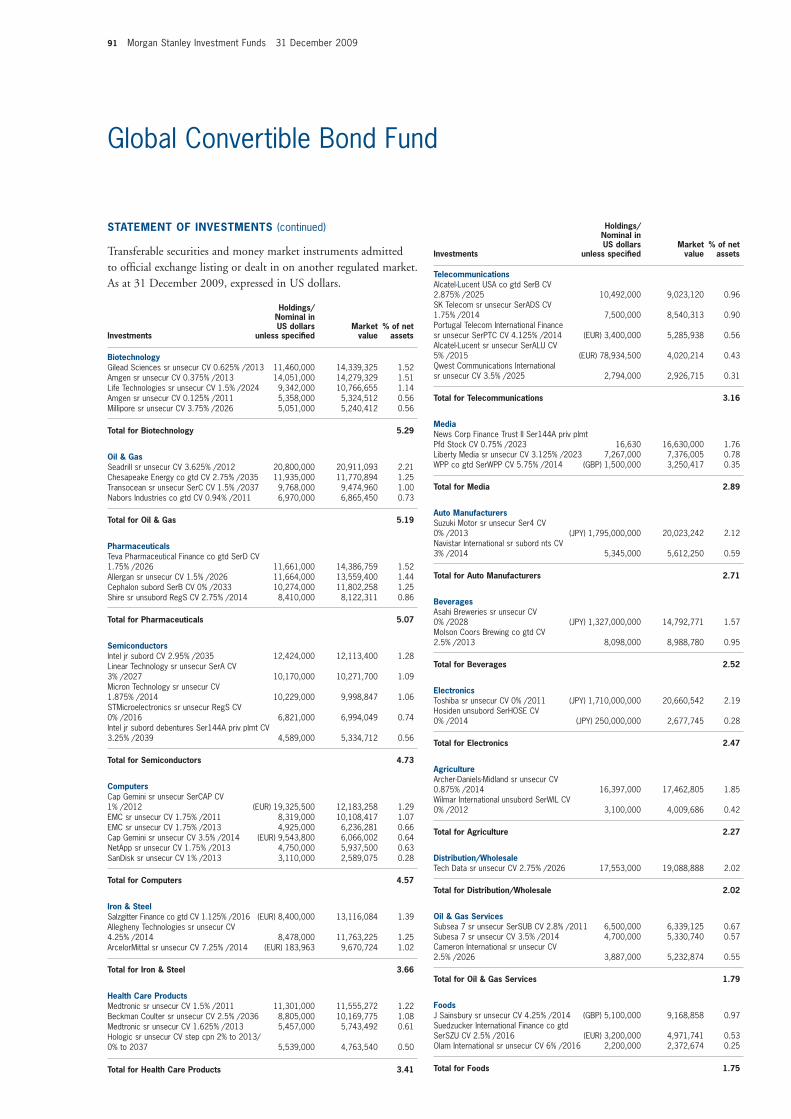
91 Morgan Stanley Investment Funds 31 December 2009
Global Convertible Bond Fund
STATEMENT OF INVESTMENTS (continued)
Transferable securities and money market instruments admitted to offi cial exchange listing or dealt in on another regulated market.As at 31 December 2009, expressed in US dollars.
Investments
Holdings/Nominal in US dollars
unless specifi ed Market
value% of net
assets
Investments
Holdings/Nominal in US dollars
unless specifi ed Market
value% of net
assets
BiotechnologyGilead Sciences sr unsecur CV 0.625% /2013 11,460,000 14,339,325 1.52Amgen sr unsecur CV 0.375% /2013 14,051,000 14,279,329 1.51Life Technologies sr unsecur CV 1.5% /2024 9,342,000 10,766,655 1.14Amgen sr unsecur CV 0.125% /2011 5,358,000 5,324,512 0.56Millipore sr unsecur CV 3.75% /2026 5,051,000 5,240,412 0.56
Total for Biotechnology 5.29
Oil & Gas Seadrill sr unsecur CV 3.625% /2012 20,800,000 20,911,093 2.21Chesapeake Energy co gtd CV 2.75% /2035 11,935,000 11,770,894 1.25Transocean sr unsecur SerC CV 1.5% /2037 9,768,000 9,474,960 1.00Nabors Industries co gtd CV 0.94% /2011 6,970,000 6,865,450 0.73
Total for Oil & Gas 5.19
PharmaceuticalsTeva Pharmaceutical Finance co gtd SerD CV 1.75% /2026 11,661,000 14,386,759 1.52Allergan sr unsecur CV 1.5% /2026 11,664,000 13,559,400 1.44Cephalon subord SerB CV 0% /2033 10,274,000 11,802,258 1.25Shire sr unsubord RegS CV 2.75% /2014 8,410,000 8,122,311 0.86
Total for Pharmaceuticals 5.07
SemiconductorsIntel jr subord CV 2.95% /2035 12,424,000 12,113,400 1.28Linear Technology sr unsecur SerA CV 3% /2027 10,170,000 10,271,700 1.09Micron Technology sr unsecur CV 1.875% /2014 10,229,000 9,998,847 1.06STMicroelectronics sr unsecur RegS CV 0% /2016 6,821,000 6,994,049 0.74Intel jr subord debentures Ser144A priv plmt CV 3.25% /2039 4,589,000 5,334,712 0.56
Total for Semiconductors 4.73
ComputersCap Gemini sr unsecur SerCAP CV 1% /2012 (EUR) 19,325,500 12,183,258 1.29EMC sr unsecur CV 1.75% /2011 8,319,000 10,108,417 1.07EMC sr unsecur CV 1.75% /2013 4,925,000 6,236,281 0.66Cap Gemini sr unsecur CV 3.5% /2014 (EUR) 9,543,800 6,066,002 0.64NetApp sr unsecur CV 1.75% /2013 4,750,000 5,937,500 0.63SanDisk sr unsecur CV 1% /2013 3,110,000 2,589,075 0.28
Total for Computers 4.57
Iron & Steel Salzgitter Finance co gtd CV 1.125% /2016 (EUR) 8,400,000 13,116,084 1.39Allegheny Technologies sr unsecur CV 4.25% /2014 8,478,000 11,763,225 1.25ArcelorMittal sr unsecur CV 7.25% /2014 (EUR) 183,963 9,670,724 1.02
Total for Iron & Steel 3.66
Health Care Products Medtronic sr unsecur CV 1.5% /2011 11,301,000 11,555,272 1.22Beckman Coulter sr unsecur CV 2.5% /2036 8,805,000 10,169,775 1.08Medtronic sr unsecur CV 1.625% /2013 5,457,000 5,743,492 0.61Hologic sr unsecur CV step cpn 2% to 2013/ 0% to 2037 5,539,000 4,763,540 0.50
Total for Health Care Products 3.41
TelecommunicationsAlcatel-Lucent USA co gtd SerB CV 2.875% /2025 10,492,000 9,023,120 0.96SK Telecom sr unsecur SerADS CV 1.75% /2014 7,500,000 8,540,313 0.90Portugal Telecom International Finance sr unsecur SerPTC CV 4.125% /2014 (EUR) 3,400,000 5,285,938 0.56Alcatel-Lucent sr unsecur SerALU CV 5% /2015 (EUR) 78,934,500 4,020,214 0.43Qwest Communications International sr unsecur CV 3.5% /2025 2,794,000 2,926,715 0.31
Total for Telecommunications 3.16
MediaNews Corp Finance Trust II Ser144A priv plmt Pfd Stock CV 0.75% /2023 16,630 16,630,000 1.76Liberty Media sr unsecur CV 3.125% /2023 7,267,000 7,376,005 0.78WPP co gtd SerWPP CV 5.75% /2014 (GBP) 1,500,000 3,250,417 0.35
Total for Media 2.89
Auto Manufacturers Suzuki Motor sr unsecur Ser4 CV 0% /2013 (JPY) 1,795,000,000 20,023,242 2.12Navistar International sr subord nts CV 3% /2014 5,345,000 5,612,250 0.59
Total for Auto Manufacturers 2.71
BeveragesAsahi Breweries sr unsecur CV 0% /2028 (JPY) 1,327,000,000 14,792,771 1.57Molson Coors Brewing co gtd CV 2.5% /2013 8,098,000 8,988,780 0.95
Total for Beverages 2.52
ElectronicsToshiba sr unsecur CV 0% /2011 (JPY) 1,710,000,000 20,660,542 2.19Hosiden unsubord SerHOSE CV 0% /2014 (JPY) 250,000,000 2,677,745 0.28
Total for Electronics 2.47
AgricultureArcher-Daniels-Midland sr unsecur CV 0.875% /2014 16,397,000 17,462,805 1.85Wilmar International unsubord SerWIL CV 0% /2012 3,100,000 4,009,686 0.42
Total for Agriculture 2.27
Distribution/Wholesale Tech Data sr unsecur CV 2.75% /2026 17,553,000 19,088,888 2.02
Total for Distribution/Wholesale 2.02
Oil & Gas Services Subsea 7 sr unsecur SerSUB CV 2.8% /2011 6,500,000 6,339,125 0.67Subesa 7 sr unsecur CV 3.5% /2014 4,700,000 5,330,740 0.57Cameron International sr unsecur CV 2.5% /2026 3,887,000 5,232,874 0.55
Total for Oil & Gas Services 1.79
FoodsJ Sainsbury sr unsecur CV 4.25% /2014 (GBP) 5,100,000 9,168,858 0.97Suedzucker International Finance co gtd SerSZU CV 2.5% /2016 (EUR) 3,200,000 4,971,741 0.53Olam International sr unsecur CV 6% /2016 2,200,000 2,372,674 0.25
Total for Foods 1.75

Morgan Stanley Investment Funds 31 December 2009 92
STATEMENT OF INVESTMENTS (continued)
Transferable securities and money market instruments admitted to offi cial exchange listing or dealt in on another regulated market.As at 31 December 2009, expressed in US dollars.
Investments
Holdings/Nominal in US dollars
unless specifi ed Market
value% of net
assets
Investments
Holdings/Nominal in US dollars
unless specifi ed Market
value% of net
assets
Global Convertible Bond Fund
Venture Capital 3i Group sr unsecur CV 3.625% /2011 (GBP) 9,600,000 15,419,887 1.63
Total for Venture Capital 1.63
Home Furnishings Sharp sr unsecur CV 0% /2013 (JPY) 1,399,000,000 14,298,903 1.51
Total for Home Furnishings 1.51
ElectricYTL Power Finance Cayman co gtd CV 0% 9/05/2010 6,500,000 8,211,781 0.87CMS Energy sr unsecur CV 2.875% /2024 4,257,000 5,337,214 0.56
Total for Electric 1.43
SovereignParpublica - Participacoes Publicas SGPS sr unsecur CV 2.69% 16/12/2010 (EUR) 6,500,000 9,869,446 1.05
Total for Sovereign 1.05
Commercial Services Alliance Data Systems sr nts CV 1.75% /2013 8,068,000 8,269,700 0.88
Total for Commercial Services 0.88
LodgingChampion Path Holdings co gtd CV 0% /2015 (HKD) 31,300,000 4,401,913 0.47Gaylord Entertainment co gtd Ser144A priv plmt CV 3.75% /2014 3,156,000 3,246,735 0.34
Total for Lodging 0.81
InternetSymantec sr unsecur CV 0.75% /2011 6,927,000 7,619,700 0.81
Total for Internet 0.81
Investment Companies Hongkong Land CB 2005 co gtd RegS CV 2.75% /2012 5,000,000 6,600,000 0.70
Total for Investment Companies 0.70
Offi ce Furniture & Business Equipment Neopost sr unsecur CV 3.75% /2015 (EUR) 4,545,800 5,690,091 0.60
Total for Offi ce Furniture & Business Equipment 0.60
Aerospace & Defense L-3 Communications Holdings co gtd CV 3% /2035 5,137,000 5,406,693 0.57
Total for Aerospace & Defense 0.57
Real Estate Genting Singapore sr unsubord CV 0% /2012 (SGD) 2,900,000 2,726,767 0.28CapitaLand sr unsecur RegS CV 2.875% /2016 (SGD) 3,250,000 2,467,108 0.26
Total for Real Estate 0.54
EntertainmentInternational Game Technology sr unsecur Ser144A priv plmt CV 3.25% /2014 3,794,000 4,657,135 0.49
Total for Entertainment 0.49
HomebuildingDR Horton co gtd SerDHI CV 2% /2014 3,681,000 4,118,119 0.44
Total for Homebuilding 0.44
Auto Parts & Equipment BorgWarner sr unsecur CV 3.5% /2012 2,789,000 3,552,489 0.38
Total for Auto Parts & Equipment 0.38
RetailTakashimaya CV 0% /2014 (JPY) 285,000,000 3,179,236 0.34
Total for Retail 0.34
Total Investment Securities 891,283,064 94.37
DERIVATIVES
OTC and exchange traded derivatives as at 31 December 2009, expressed in US dollars.
Forward Foreign Currency Exchange Contracts
Maturity date
Amount bought
Amount sold
Net unrealisedgain/(loss) as at
31 December 2009 % of net
assets 08/01/2010 263,788,442 EUR 378,853,198 USD 129,580 0.0113/01/2010 1,775,000 EUR 2,673,065 USD (122,954) (0.01)13/01/2010 30,166,495 USD 19,950,000 EUR 1,504,683 0.1613/01/2010 30,170,784 USD 19,950,000 EUR 1,508,973 0.1613/01/2010 30,172,779 USD 19,950,000 EUR 1,510,967 0.1613/01/2010 30,115,243 USD 19,925,000 EUR 1,489,348 0.1614/01/2010 14,752,840 USD 16,304,615 AUD 137,160 0.0114/01/2010 9,379,960 USD 72,680,000 HKD 6,098 0.0014/01/2010 4,918,148 USD 6,845,000 SGD 37,462 0.0019/01/2010 16,022,951 USD 16,420,000 CHF 131,981 0.0121/01/2010 26,394,008 USD 16,270,000 GBP 70,971 0.0125/01/2010 52,461,393 USD 4,705,000,000 JPY 1,741,441 0.1825/01/2010 52,481,874 USD 4,705,000,000 JPY 1,761,922 0.20
Total Forward Foreign Currency Exchange Contracts 9,907,632 1.05
Cash of USD 4,550,000 held as collateral with different parties.
Other Assets less Liabilities 43,216,124 4.58
Total Net Asset Value 944,406,820 100.00
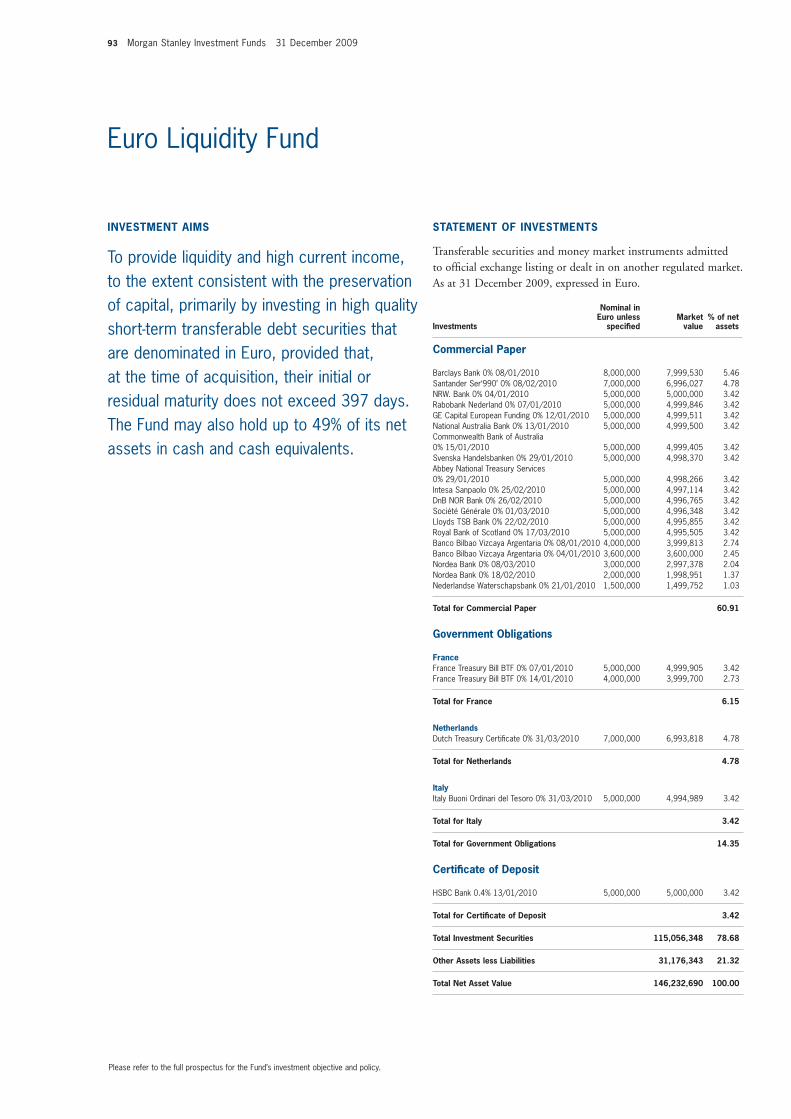
93 Morgan Stanley Investment Funds 31 December 2009
Euro Liquidity Fund
Commercial Paper
Barclays Bank 0% 08/01/2010 8,000,000 7,999,530 5.46Santander Ser‘990’ 0% 08/02/2010 7,000,000 6,996,027 4.78NRW. Bank 0% 04/01/2010 5,000,000 5,000,000 3.42Rabobank Nederland 0% 07/01/2010 5,000,000 4,999,846 3.42GE Capital European Funding 0% 12/01/2010 5,000,000 4,999,511 3.42National Australia Bank 0% 13/01/2010 5,000,000 4,999,500 3.42Commonwealth Bank of Australia 0% 15/01/2010 5,000,000 4,999,405 3.42Svenska Handelsbanken 0% 29/01/2010 5,000,000 4,998,370 3.42Abbey National Treasury Services 0% 29/01/2010 5,000,000 4,998,266 3.42Intesa Sanpaolo 0% 25/02/2010 5,000,000 4,997,114 3.42DnB NOR Bank 0% 26/02/2010 5,000,000 4,996,765 3.42Société Générale 0% 01/03/2010 5,000,000 4,996,348 3.42Lloyds TSB Bank 0% 22/02/2010 5,000,000 4,995,855 3.42Royal Bank of Scotland 0% 17/03/2010 5,000,000 4,995,505 3.42Banco Bilbao Vizcaya Argentaria 0% 08/01/2010 4,000,000 3,999,813 2.74Banco Bilbao Vizcaya Argentaria 0% 04/01/2010 3,600,000 3,600,000 2.45Nordea Bank 0% 08/03/2010 3,000,000 2,997,378 2.04Nordea Bank 0% 18/02/2010 2,000,000 1,998,951 1.37Nederlandse Waterschapsbank 0% 21/01/2010 1,500,000 1,499,752 1.03
Total for Commercial Paper 60.91
Government Obligations
France France Treasury Bill BTF 0% 07/01/2010 5,000,000 4,999,905 3.42France Treasury Bill BTF 0% 14/01/2010 4,000,000 3,999,700 2.73
Total for France 6.15
Netherlands Dutch Treasury Certifi cate 0% 31/03/2010 7,000,000 6,993,818 4.78
Total for Netherlands 4.78
Italy Italy Buoni Ordinari del Tesoro 0% 31/03/2010 5,000,000 4,994,989 3.42
Total for Italy 3.42
Total for Government Obligations 14.35
Certifi cate of Deposit
HSBC Bank 0.4% 13/01/2010 5,000,000 5,000,000 3.42
Total for Certifi cate of Deposit 3.42
Total Investment Securities 115,056,348 78.68
Other Assets less Liabilities 31,176,343 21.32
Total Net Asset Value 146,232,690 100.00
INVESTMENT AIMS
To provide liquidity and high current income, to the extent consistent with the preservation of capital, primarily by investing in high quality short-term transferable debt securities that are denominated in Euro, provided that, at the time of acquisition, their initial or residual maturity does not exceed 397 days. The Fund may also hold up to 49% of its net assets in cash and cash equivalents.
STATEMENT OF INVESTMENTS
Transferable securities and money market instruments admitted to offi cial exchange listing or dealt in on another regulated market. As at 31 December 2009, expressed in Euro.
Investments
Nominal in Euro unless
specifi ed Market
value% of net
assets
Please refer to the full prospectus for the Fund’s investment objective and policy.
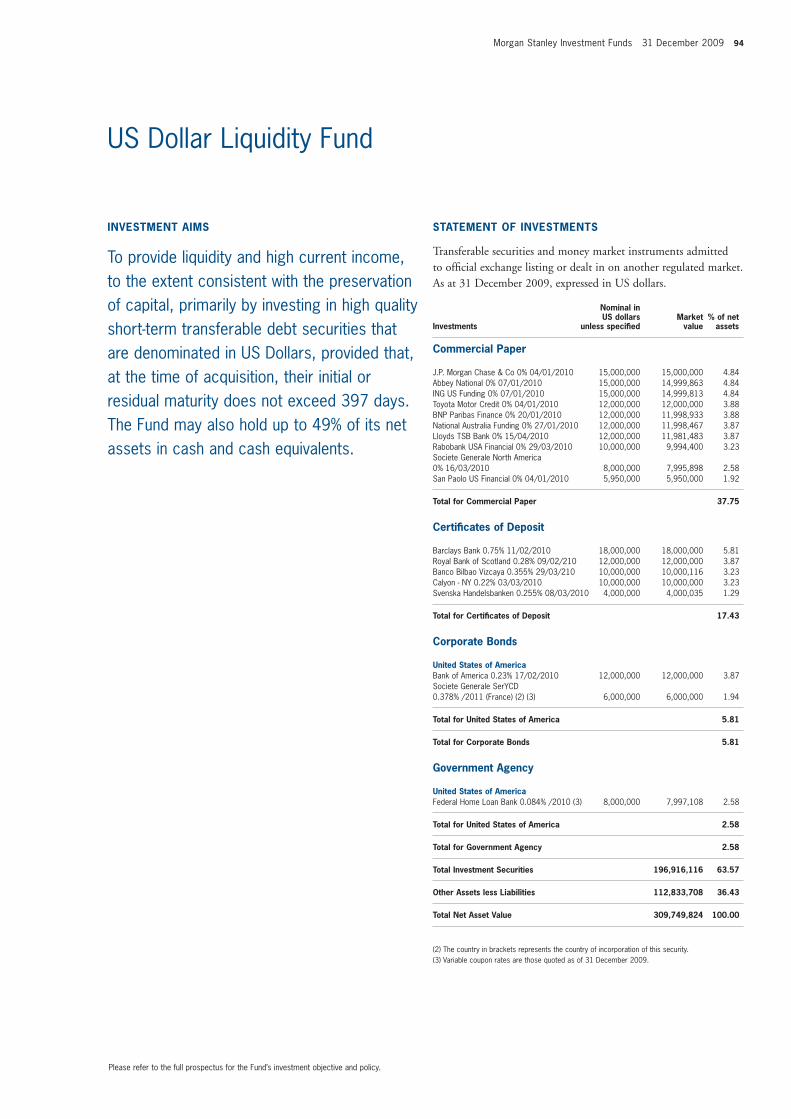
Morgan Stanley Investment Funds 31 December 2009 94
US Dollar Liquidity Fund
Commercial Paper
J.P. Morgan Chase & Co 0% 04/01/2010 15,000,000 15,000,000 4.84Abbey National 0% 07/01/2010 15,000,000 14,999,863 4.84ING US Funding 0% 07/01/2010 15,000,000 14,999,813 4.84Toyota Motor Credit 0% 04/01/2010 12,000,000 12,000,000 3.88BNP Paribas Finance 0% 20/01/2010 12,000,000 11,998,933 3.88National Australia Funding 0% 27/01/2010 12,000,000 11,998,467 3.87Lloyds TSB Bank 0% 15/04/2010 12,000,000 11,981,483 3.87Rabobank USA Financial 0% 29/03/2010 10,000,000 9,994,400 3.23Societe Generale North America 0% 16/03/2010 8,000,000 7,995,898 2.58San Paolo US Financial 0% 04/01/2010 5,950,000 5,950,000 1.92
Total for Commercial Paper 37.75
Certifi cates of Deposit
Barclays Bank 0.75% 11/02/2010 18,000,000 18,000,000 5.81Royal Bank of Scotland 0.28% 09/02/210 12,000,000 12,000,000 3.87Banco Bilbao Vizcaya 0.355% 29/03/210 10,000,000 10,000,116 3.23Calyon - NY 0.22% 03/03/2010 10,000,000 10,000,000 3.23Svenska Handelsbanken 0.255% 08/03/2010 4,000,000 4,000,035 1.29
Total for Certifi cates of Deposit 17.43
Corporate Bonds
United States of America Bank of America 0.23% 17/02/2010 12,000,000 12,000,000 3.87Societe Generale SerYCD 0.378% /2011 (France) (2) (3) 6,000,000 6,000,000 1.94
Total for United States of America 5.81
Total for Corporate Bonds 5.81
Government Agency
United States of America Federal Home Loan Bank 0.084% /2010 (3) 8,000,000 7,997,108 2.58
Total for United States of America 2.58
Total for Government Agency 2.58
Total Investment Securities 196,916,116 63.57
Other Assets less Liabilities 112,833,708 36.43
Total Net Asset Value 309,749,824 100.00
(2) The country in brackets represents the country of incorporation of this security.(3) Variable coupon rates are those quoted as of 31 December 2009.
INVESTMENT AIMS
To provide liquidity and high current income, to the extent consistent with the preservation of capital, primarily by investing in high quality short-term transferable debt securities that are denominated in US Dollars, provided that, at the time of acquisition, their initial or residual maturity does not exceed 397 days. The Fund may also hold up to 49% of its net assets in cash and cash equivalents.
STATEMENT OF INVESTMENTS
Transferable securities and money market instruments admitted to offi cial exchange listing or dealt in on another regulated market. As at 31 December 2009, expressed in US dollars.
Investments
Nominal in US dollars
unless specifi ed Market
value% of net
assets
Please refer to the full prospectus for the Fund’s investment objective and policy.
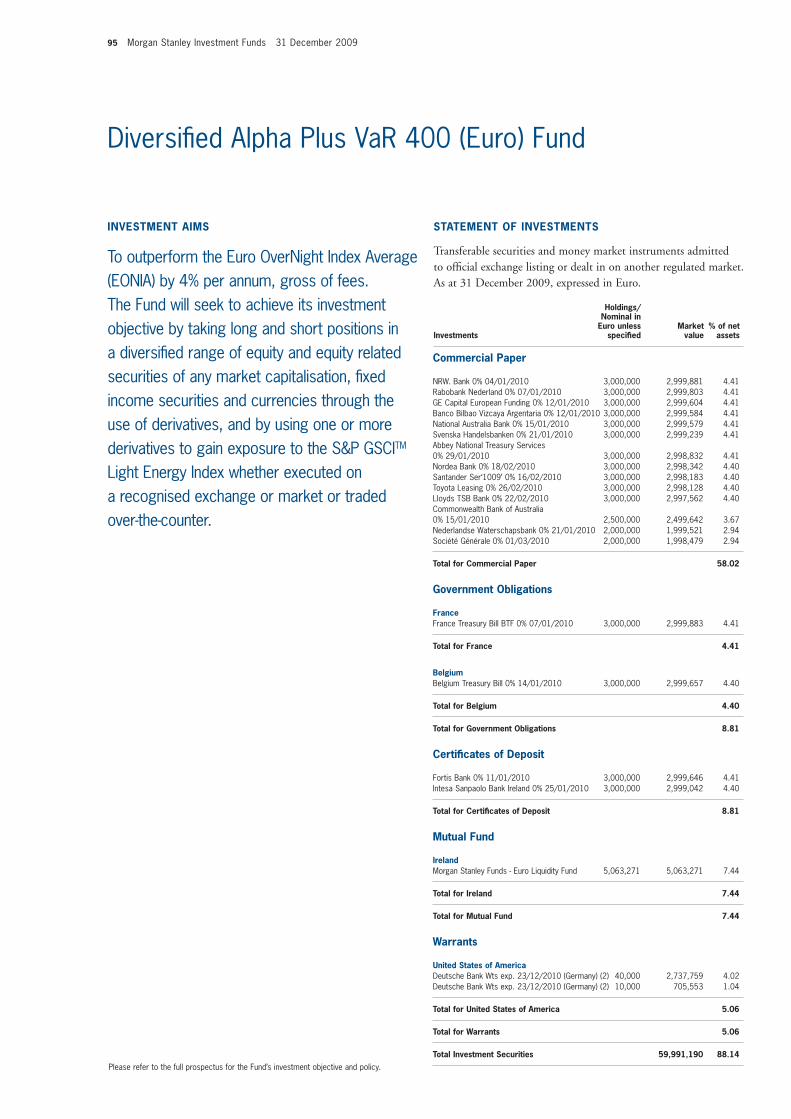
95 Morgan Stanley Investment Funds 31 December 2009
Diversifi ed Alpha Plus VaR 400 (Euro) Fund
Commercial Paper
NRW. Bank 0% 04/01/2010 3,000,000 2,999,881 4.41Rabobank Nederland 0% 07/01/2010 3,000,000 2,999,803 4.41GE Capital European Funding 0% 12/01/2010 3,000,000 2,999,604 4.41Banco Bilbao Vizcaya Argentaria 0% 12/01/2010 3,000,000 2,999,584 4.41National Australia Bank 0% 15/01/2010 3,000,000 2,999,579 4.41Svenska Handelsbanken 0% 21/01/2010 3,000,000 2,999,239 4.41Abbey National Treasury Services 0% 29/01/2010 3,000,000 2,998,832 4.41Nordea Bank 0% 18/02/2010 3,000,000 2,998,342 4.40Santander Ser‘1009’ 0% 16/02/2010 3,000,000 2,998,183 4.40Toyota Leasing 0% 26/02/2010 3,000,000 2,998,128 4.40Lloyds TSB Bank 0% 22/02/2010 3,000,000 2,997,562 4.40Commonwealth Bank of Australia 0% 15/01/2010 2,500,000 2,499,642 3.67Nederlandse Waterschapsbank 0% 21/01/2010 2,000,000 1,999,521 2.94Société Générale 0% 01/03/2010 2,000,000 1,998,479 2.94
Total for Commercial Paper 58.02
Government Obligations
France France Treasury Bill BTF 0% 07/01/2010 3,000,000 2,999,883 4.41
Total for France 4.41
Belgium Belgium Treasury Bill 0% 14/01/2010 3,000,000 2,999,657 4.40
Total for Belgium 4.40
Total for Government Obligations 8.81
Certifi cates of Deposit
Fortis Bank 0% 11/01/2010 3,000,000 2,999,646 4.41Intesa Sanpaolo Bank Ireland 0% 25/01/2010 3,000,000 2,999,042 4.40
Total for Certifi cates of Deposit 8.81
Mutual Fund
Ireland Morgan Stanley Funds - Euro Liquidity Fund 5,063,271 5,063,271 7.44
Total for Ireland 7.44
Total for Mutual Fund 7.44
Warrants
United States of America Deutsche Bank Wts exp. 23/12/2010 (Germany) (2) 40,000 2,737,759 4.02Deutsche Bank Wts exp. 23/12/2010 (Germany) (2) 10,000 705,553 1.04
Total for United States of America 5.06
Total for Warrants 5.06
Total Investment Securities 59,991,190 88.14
INVESTMENT AIMS
To outperform the Euro OverNight Index Average (EONIA) by 4% per annum, gross of fees. The Fund will seek to achieve its investment objective by taking long and short positions in a diversifi ed range of equity and equity related securities of any market capitalisation, fi xed income securities and currencies through the use of derivatives, and by using one or more derivatives to gain exposure to the S&P GSCITM Light Energy Index whether executed on a recognised exchange or market or traded over-the-counter.
STATEMENT OF INVESTMENTS
Transferable securities and money market instruments admitted to offi cial exchange listing or dealt in on another regulated market. As at 31 December 2009, expressed in Euro.
Investments
Holdings/Nominal in
Euro unless specifi ed
Market value
% of net assets
Please refer to the full prospectus for the Fund’s investment objective and policy.
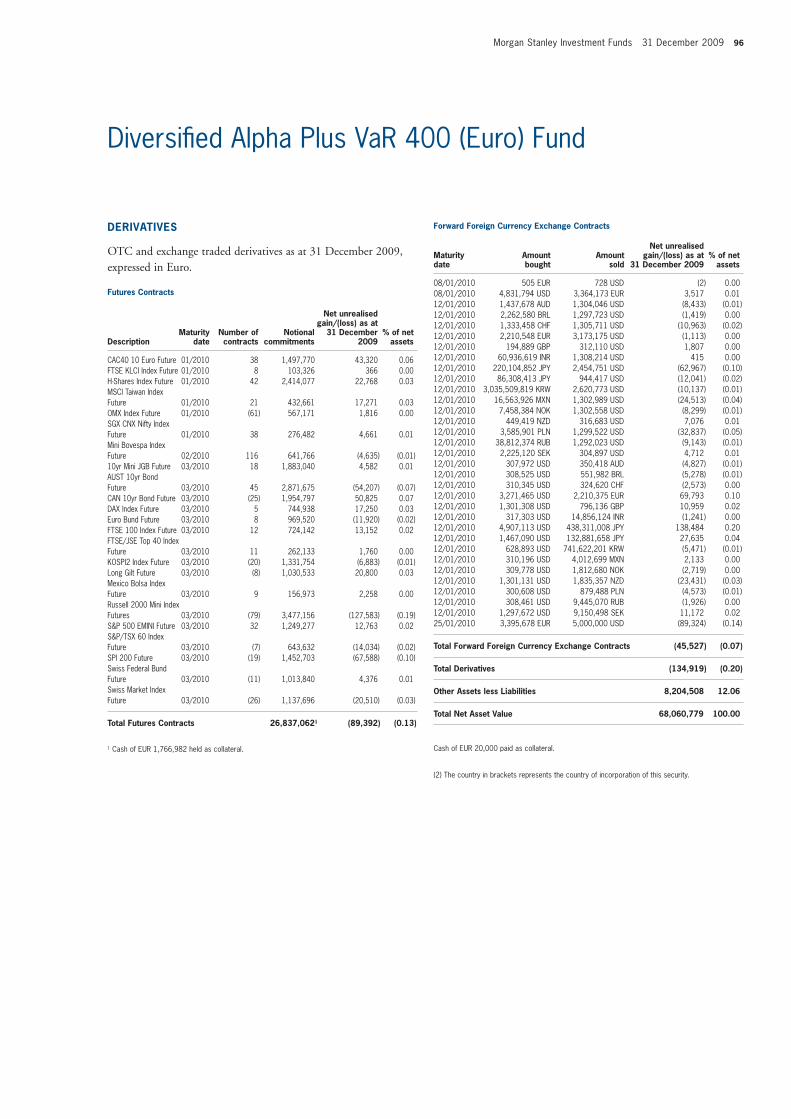
Morgan Stanley Investment Funds 31 December 2009 96
Diversifi ed Alpha Plus VaR 400 (Euro) Fund
DERIVATIVES
OTC and exchange traded derivatives as at 31 December 2009, expressed in Euro.
Futures Contracts
DescriptionMaturity
dateNumber of contracts
Notional commitments
Net unrealisedgain/(loss) as at
31 December 2009
% of net assets
CAC40 10 Euro Future 01/2010 38 1,497,770 43,320 0.06FTSE KLCI Index Future 01/2010 8 103,326 366 0.00H-Shares Index Future 01/2010 42 2,414,077 22,768 0.03MSCI Taiwan Index Future 01/2010 21 432,661 17,271 0.03OMX Index Future 01/2010 (61) 567,171 1,816 0.00SGX CNX Nifty Index Future 01/2010 38 276,482 4,661 0.01Mini Bovespa Index Future 02/2010 116 641,766 (4,635) (0.01)10yr Mini JGB Future 03/2010 18 1,883,040 4,582 0.01AUST 10yr Bond Future 03/2010 45 2,871,675 (54,207) (0.07)CAN 10yr Bond Future 03/2010 (25) 1,954,797 50,825 0.07DAX Index Future 03/2010 5 744,938 17,250 0.03Euro Bund Future 03/2010 8 969,520 (11,920) (0.02)FTSE 100 Index Future 03/2010 12 724,142 13,152 0.02FTSE/JSE Top 40 Index Future 03/2010 11 262,133 1,760 0.00KOSPI2 Index Future 03/2010 (20) 1,331,754 (6,883) (0.01)Long Gilt Future 03/2010 (8) 1,030,533 20,800 0.03Mexico Bolsa Index Future 03/2010 9 156,973 2,258 0.00Russell 2000 Mini Index Futures 03/2010 (79) 3,477,156 (127,583) (0.19)S&P 500 EMINI Future 03/2010 32 1,249,277 12,763 0.02S&P/TSX 60 Index Future 03/2010 (7) 643,632 (14,034) (0.02)SPI 200 Future 03/2010 (19) 1,452,703 (67,588) (0.10)Swiss Federal Bund Future 03/2010 (11) 1,013,840 4,376 0.01Swiss Market Index Future 03/2010 (26) 1,137,696 (20,510) (0.03)
Total Futures Contracts 26,837,0621 (89,392) (0.13)
1 Cash of EUR 1,766,982 held as collateral.
Forward Foreign Currency Exchange Contracts
Maturity date
Amount bought
Amount sold
Net unrealisedgain/(loss) as at
31 December 2009 % of net
assets 08/01/2010 505 EUR 728 USD (2) 0.0008/01/2010 4,831,794 USD 3,364,173 EUR 3,517 0.0112/01/2010 1,437,678 AUD 1,304,046 USD (8,433) (0.01)12/01/2010 2,262,580 BRL 1,297,723 USD (1,419) 0.0012/01/2010 1,333,458 CHF 1,305,711 USD (10,963) (0.02)12/01/2010 2,210,548 EUR 3,173,175 USD (1,113) 0.0012/01/2010 194,889 GBP 312,110 USD 1,807 0.0012/01/2010 60,936,619 INR 1,308,214 USD 415 0.0012/01/2010 220,104,852 JPY 2,454,751 USD (62,967) (0.10)12/01/2010 86,308,413 JPY 944,417 USD (12,041) (0.02)12/01/2010 3,035,509,819 KRW 2,620,773 USD (10,137) (0.01)12/01/2010 16,563,926 MXN 1,302,989 USD (24,513) (0.04)12/01/2010 7,458,384 NOK 1,302,558 USD (8,299) (0.01)12/01/2010 449,419 NZD 316,683 USD 7,076 0.0112/01/2010 3,585,901 PLN 1,299,522 USD (32,837) (0.05)12/01/2010 38,812,374 RUB 1,292,023 USD (9,143) (0.01)12/01/2010 2,225,120 SEK 304,897 USD 4,712 0.0112/01/2010 307,972 USD 350,418 AUD (4,827) (0.01)12/01/2010 308,525 USD 551,982 BRL (5,278) (0.01)12/01/2010 310,345 USD 324,620 CHF (2,573) 0.0012/01/2010 3,271,465 USD 2,210,375 EUR 69,793 0.1012/01/2010 1,301,308 USD 796,136 GBP 10,959 0.0212/01/2010 317,303 USD 14,856,124 INR (1,241) 0.0012/01/2010 4,907,113 USD 438,311,008 JPY 138,484 0.2012/01/2010 1,467,090 USD 132,881,658 JPY 27,635 0.0412/01/2010 628,893 USD 741,622,201 KRW (5,471) (0.01)12/01/2010 310,196 USD 4,012,699 MXN 2,133 0.0012/01/2010 309,778 USD 1,812,680 NOK (2,719) 0.0012/01/2010 1,301,131 USD 1,835,357 NZD (23,431) (0.03)12/01/2010 300,608 USD 879,488 PLN (4,573) (0.01)12/01/2010 308,461 USD 9,445,070 RUB (1,926) 0.0012/01/2010 1,297,672 USD 9,150,498 SEK 11,172 0.0225/01/2010 3,395,678 EUR 5,000,000 USD (89,324) (0.14)
Total Forward Foreign Currency Exchange Contracts (45,527) (0.07)
Total Derivatives (134,919) (0.20)
Other Assets less Liabilities 8,204,508 12.06
Total Net Asset Value 68,060,779 100.00
Cash of EUR 20,000 paid as collateral.
(2) The country in brackets represents the country of incorporation of this security.
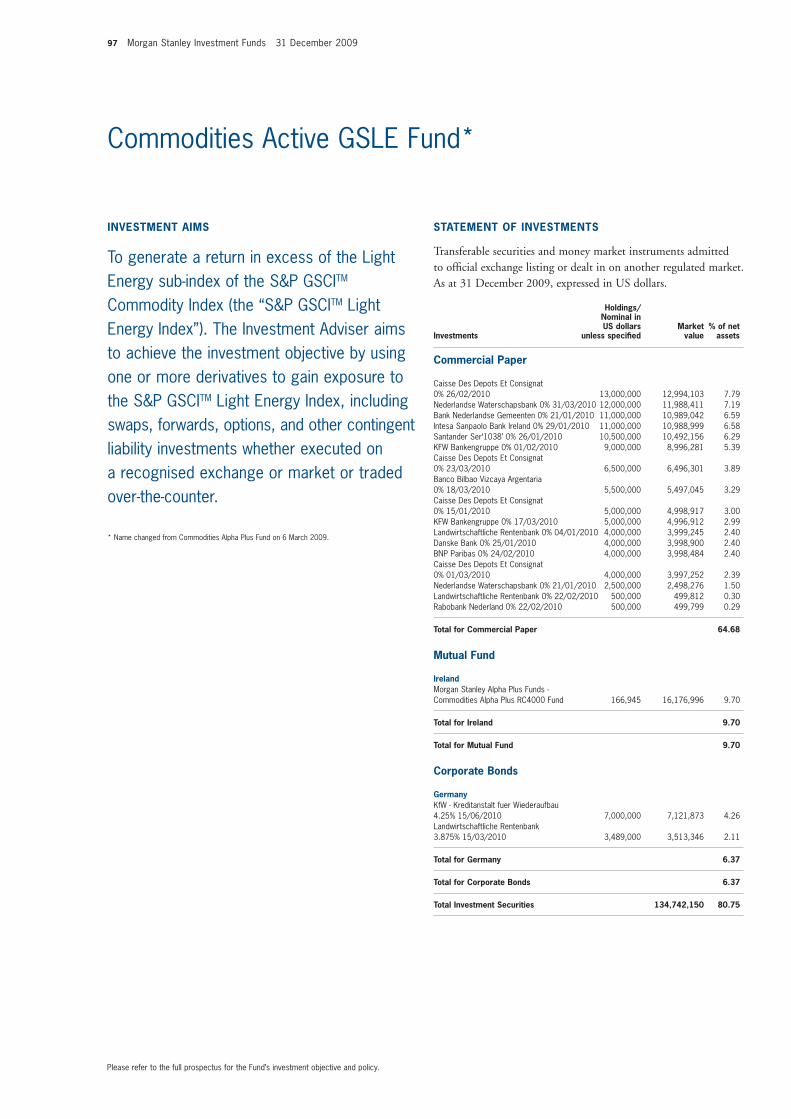
97 Morgan Stanley Investment Funds 31 December 2009
* Name changed from Commodities Alpha Plus Fund on 6 March 2009.
Commodities Active GSLE Fund*
INVESTMENT AIMS
To generate a return in excess of the Light Energy sub-index of the S&P GSCITM Commodity Index (the “S&P GSCITM Light Energy Index”). The Investment Adviser aims to achieve the investment objective by using one or more derivatives to gain exposure to the S&P GSCITM Light Energy Index, including swaps, forwards, options, and other contingent liability investments whether executed on a recognised exchange or market or traded over-the-counter.
Please refer to the full prospectus for the Fund’s investment objective and policy.
Commercial Paper
Caisse Des Depots Et Consignat 0% 26/02/2010 13,000,000 12,994,103 7.79Nederlandse Waterschapsbank 0% 31/03/2010 12,000,000 11,988,411 7.19Bank Nederlandse Gemeenten 0% 21/01/2010 11,000,000 10,989,042 6.59Intesa Sanpaolo Bank Ireland 0% 29/01/2010 11,000,000 10,988,999 6.58Santander Ser‘1038’ 0% 26/01/2010 10,500,000 10,492,156 6.29KFW Bankengruppe 0% 01/02/2010 9,000,000 8,996,281 5.39Caisse Des Depots Et Consignat 0% 23/03/2010 6,500,000 6,496,301 3.89Banco Bilbao Vizcaya Argentaria 0% 18/03/2010 5,500,000 5,497,045 3.29Caisse Des Depots Et Consignat 0% 15/01/2010 5,000,000 4,998,917 3.00KFW Bankengruppe 0% 17/03/2010 5,000,000 4,996,912 2.99Landwirtschaftliche Rentenbank 0% 04/01/2010 4,000,000 3,999,245 2.40Danske Bank 0% 25/01/2010 4,000,000 3,998,900 2.40BNP Paribas 0% 24/02/2010 4,000,000 3,998,484 2.40Caisse Des Depots Et Consignat 0% 01/03/2010 4,000,000 3,997,252 2.39Nederlandse Waterschapsbank 0% 21/01/2010 2,500,000 2,498,276 1.50Landwirtschaftliche Rentenbank 0% 22/02/2010 500,000 499,812 0.30Rabobank Nederland 0% 22/02/2010 500,000 499,799 0.29
Total for Commercial Paper 64.68
Mutual Fund
Ireland Morgan Stanley Alpha Plus Funds - Commodities Alpha Plus RC4000 Fund 166,945 16,176,996 9.70
Total for Ireland 9.70
Total for Mutual Fund 9.70
Corporate Bonds
Germany KfW - Kreditanstalt fuer Wiederaufbau 4.25% 15/06/2010 7,000,000 7,121,873 4.26Landwirtschaftliche Rentenbank 3.875% 15/03/2010 3,489,000 3,513,346 2.11
Total for Germany 6.37
Total for Corporate Bonds 6.37
Total Investment Securities 134,742,150 80.75
STATEMENT OF INVESTMENTS
Transferable securities and money market instruments admitted to offi cial exchange listing or dealt in on another regulated market. As at 31 December 2009, expressed in US dollars.
Investments
Holdings/Nominal in US dollars
unless specifi edMarket
value% of net
assets
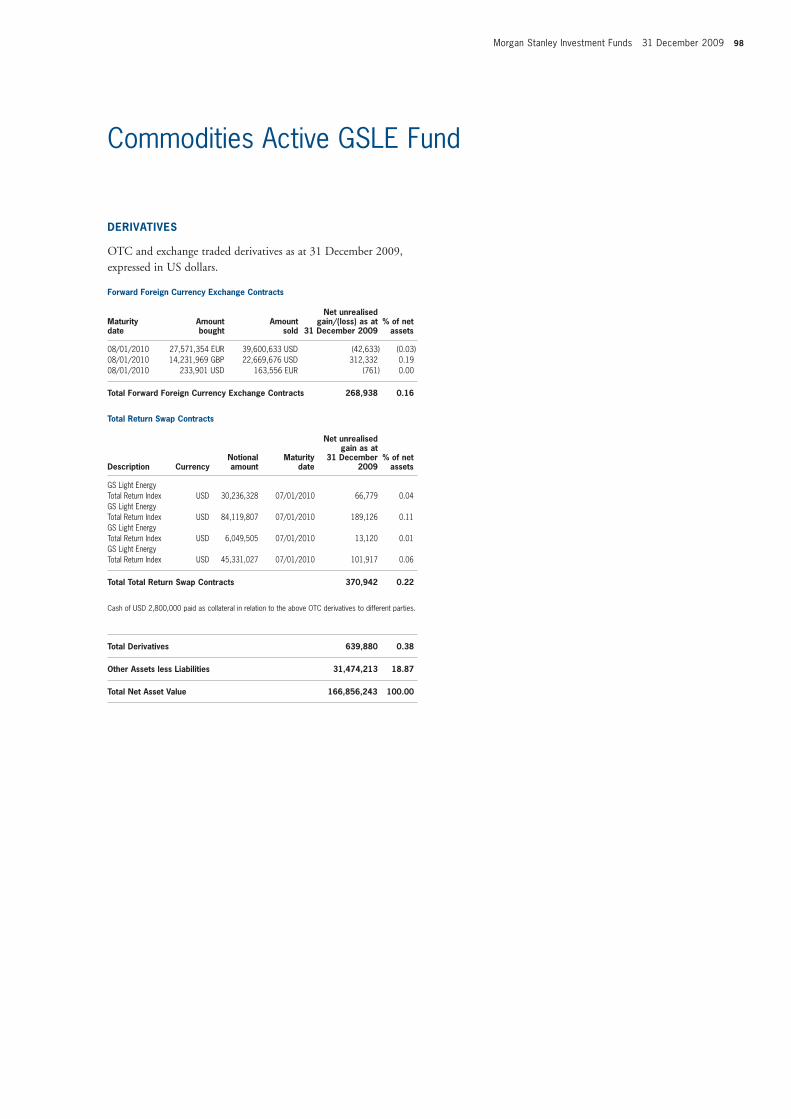
Morgan Stanley Investment Funds 31 December 2009 98
Commodities Active GSLE Fund
DERIVATIVES
OTC and exchange traded derivatives as at 31 December 2009, expressed in US dollars.
Forward Foreign Currency Exchange Contracts
Maturity date
Amount bought
Amount sold
Net unrealisedgain/(loss) as at
31 December 2009 % of net
assets 08/01/2010 27,571,354 EUR 39,600,633 USD (42,633) (0.03)08/01/2010 14,231,969 GBP 22,669,676 USD 312,332 0.1908/01/2010 233,901 USD 163,556 EUR (761) 0.00
Total Forward Foreign Currency Exchange Contracts 268,938 0.16
Total Return Swap Contracts
Description CurrencyNotional amount
Maturity date
Net unrealisedgain as at
31 December 2009
% of net assets
GS Light Energy Total Return Index USD 30,236,328 07/01/2010 66,779 0.04 GS Light Energy Total Return Index USD 84,119,807 07/01/2010 189,126 0.11 GS Light Energy Total Return Index USD 6,049,505 07/01/2010 13,120 0.01 GS Light Energy Total Return Index USD 45,331,027 07/01/2010 101,917 0.06
Total Total Return Swap Contracts 370,942 0.22
Cash of USD 2,800,000 paid as collateral in relation to the above OTC derivatives to different parties.
Total Derivatives 639,880 0.38
Other Assets less Liabilities 31,474,213 18.87
Total Net Asset Value 166,856,243 100.00
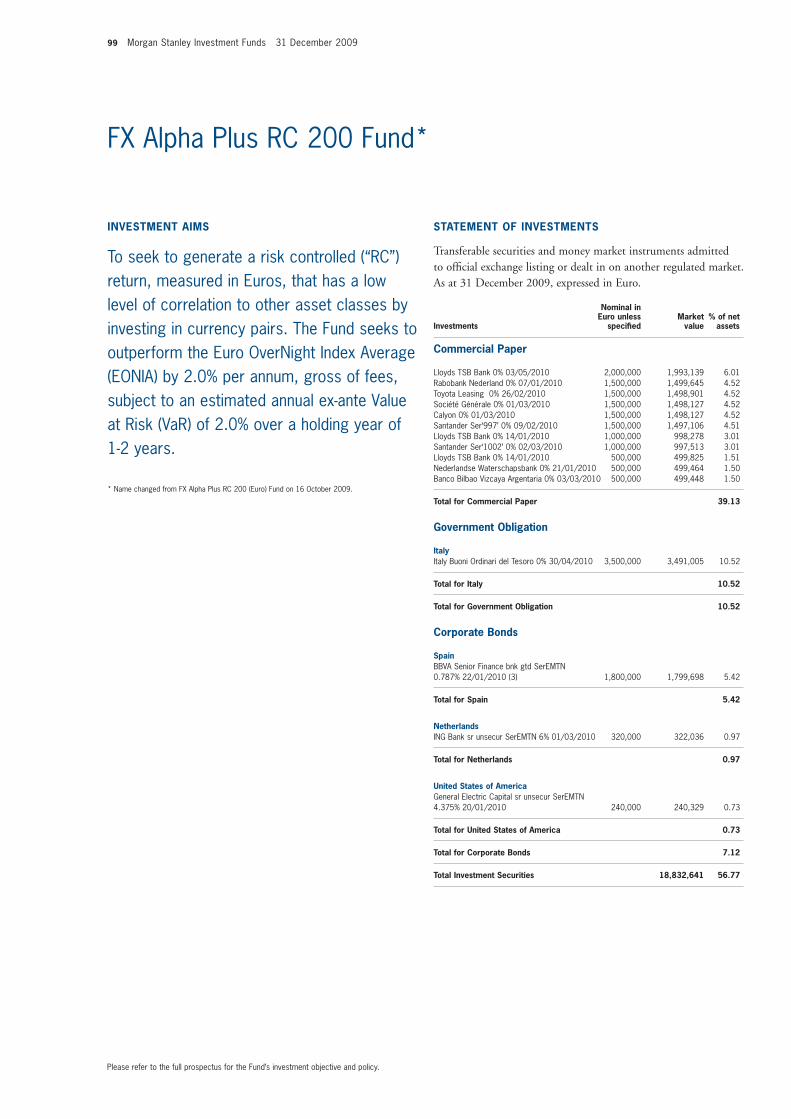
99 Morgan Stanley Investment Funds 31 December 2009
* Name changed from FX Alpha Plus RC 200 (Euro) Fund on 16 October 2009.
FX Alpha Plus RC 200 Fund*
INVESTMENT AIMS
To seek to generate a risk controlled (“RC”) return, measured in Euros, that has a low level of correlation to other asset classes by investing in currency pairs. The Fund seeks to outperform the Euro OverNight Index Average (EONIA) by 2.0% per annum, gross of fees, subject to an estimated annual ex-ante Value at Risk (VaR) of 2.0% over a holding year of 1-2 years.
Please refer to the full prospectus for the Fund’s investment objective and policy.
Commercial Paper
Lloyds TSB Bank 0% 03/05/2010 2,000,000 1,993,139 6.01Rabobank Nederland 0% 07/01/2010 1,500,000 1,499,645 4.52Toyota Leasing 0% 26/02/2010 1,500,000 1,498,901 4.52Société Générale 0% 01/03/2010 1,500,000 1,498,127 4.52Calyon 0% 01/03/2010 1,500,000 1,498,127 4.52Santander Ser‘997’ 0% 09/02/2010 1,500,000 1,497,106 4.51Lloyds TSB Bank 0% 14/01/2010 1,000,000 998,278 3.01Santander Ser‘1002’ 0% 02/03/2010 1,000,000 997,513 3.01Lloyds TSB Bank 0% 14/01/2010 500,000 499,825 1.51Nederlandse Waterschapsbank 0% 21/01/2010 500,000 499,464 1.50Banco Bilbao Vizcaya Argentaria 0% 03/03/2010 500,000 499,448 1.50
Total for Commercial Paper 39.13
Government Obligation
Italy Italy Buoni Ordinari del Tesoro 0% 30/04/2010 3,500,000 3,491,005 10.52
Total for Italy 10.52
Total for Government Obligation 10.52
Corporate Bonds
Spain BBVA Senior Finance bnk gtd SerEMTN 0.787% 22/01/2010 (3) 1,800,000 1,799,698 5.42
Total for Spain 5.42
Netherlands ING Bank sr unsecur SerEMTN 6% 01/03/2010 320,000 322,036 0.97
Total for Netherlands 0.97
United States of America General Electric Capital sr unsecur SerEMTN 4.375% 20/01/2010 240,000 240,329 0.73
Total for United States of America 0.73
Total for Corporate Bonds 7.12
Total Investment Securities 18,832,641 56.77
STATEMENT OF INVESTMENTS
Transferable securities and money market instruments admitted to offi cial exchange listing or dealt in on another regulated market. As at 31 December 2009, expressed in Euro.
Investments
Nominal in Euro unless
specifi ed Market
value% of net
assets
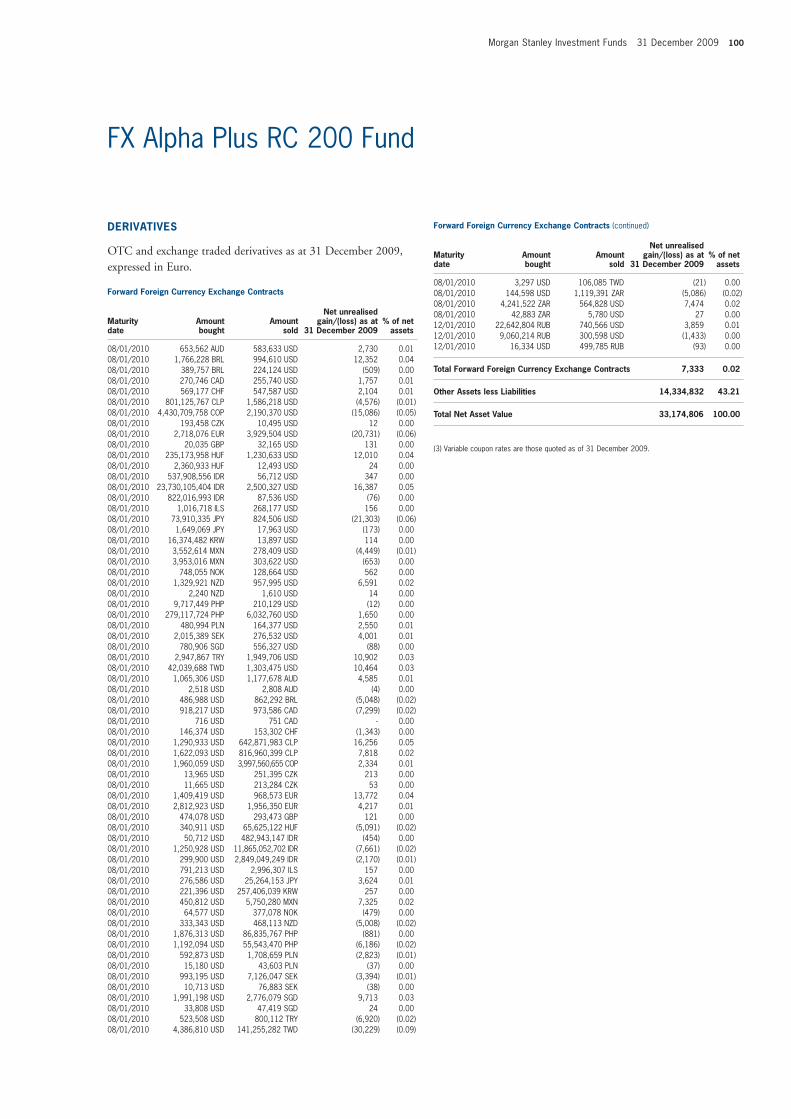
Morgan Stanley Investment Funds 31 December 2009 100
FX Alpha Plus RC 200 Fund
DERIVATIVES
OTC and exchange traded derivatives as at 31 December 2009, expressed in Euro.
Forward Foreign Currency Exchange Contracts
Maturity date
Amount bought
Amount sold
Net unrealisedgain/(loss) as at
31 December 2009 % of net
assets 08/01/2010 653,562 AUD 583,633 USD 2,730 0.0108/01/2010 1,766,228 BRL 994,610 USD 12,352 0.0408/01/2010 389,757 BRL 224,124 USD (509) 0.0008/01/2010 270,746 CAD 255,740 USD 1,757 0.0108/01/2010 569,177 CHF 547,587 USD 2,104 0.0108/01/2010 801,125,767 CLP 1,586,218 USD (4,576) (0.01)08/01/2010 4,430,709,758 COP 2,190,370 USD (15,086) (0.05)08/01/2010 193,458 CZK 10,495 USD 12 0.0008/01/2010 2,718,076 EUR 3,929,504 USD (20,731) (0.06)08/01/2010 20,035 GBP 32,165 USD 131 0.0008/01/2010 235,173,958 HUF 1,230,633 USD 12,010 0.0408/01/2010 2,360,933 HUF 12,493 USD 24 0.0008/01/2010 537,908,556 IDR 56,712 USD 347 0.0008/01/2010 23,730,105,404 IDR 2,500,327 USD 16,387 0.0508/01/2010 822,016,993 IDR 87,536 USD (76) 0.0008/01/2010 1,016,718 ILS 268,177 USD 156 0.0008/01/2010 73,910,335 JPY 824,506 USD (21,303) (0.06)08/01/2010 1,649,069 JPY 17,963 USD (173) 0.0008/01/2010 16,374,482 KRW 13,897 USD 114 0.0008/01/2010 3,552,614 MXN 278,409 USD (4,449) (0.01)08/01/2010 3,953,016 MXN 303,622 USD (653) 0.0008/01/2010 748,055 NOK 128,664 USD 562 0.0008/01/2010 1,329,921 NZD 957,995 USD 6,591 0.0208/01/2010 2,240 NZD 1,610 USD 14 0.0008/01/2010 9,717,449 PHP 210,129 USD (12) 0.0008/01/2010 279,117,724 PHP 6,032,760 USD 1,650 0.0008/01/2010 480,994 PLN 164,377 USD 2,550 0.0108/01/2010 2,015,389 SEK 276,532 USD 4,001 0.0108/01/2010 780,906 SGD 556,327 USD (88) 0.0008/01/2010 2,947,867 TRY 1,949,706 USD 10,902 0.0308/01/2010 42,039,688 TWD 1,303,475 USD 10,464 0.0308/01/2010 1,065,306 USD 1,177,678 AUD 4,585 0.0108/01/2010 2,518 USD 2,808 AUD (4) 0.0008/01/2010 486,988 USD 862,292 BRL (5,048) (0.02)08/01/2010 918,217 USD 973,586 CAD (7,299) (0.02)08/01/2010 716 USD 751 CAD - 0.0008/01/2010 146,374 USD 153,302 CHF (1,343) 0.0008/01/2010 1,290,933 USD 642,871,983 CLP 16,256 0.0508/01/2010 1,622,093 USD 816,960,399 CLP 7,818 0.0208/01/2010 1,960,059 USD 3,997,560,655 COP 2,334 0.0108/01/2010 13,965 USD 251,395 CZK 213 0.0008/01/2010 11,665 USD 213,284 CZK 53 0.0008/01/2010 1,409,419 USD 968,573 EUR 13,772 0.0408/01/2010 2,812,923 USD 1,956,350 EUR 4,217 0.0108/01/2010 474,078 USD 293,473 GBP 121 0.0008/01/2010 340,911 USD 65,625,122 HUF (5,091) (0.02)08/01/2010 50,712 USD 482,943,147 IDR (454) 0.0008/01/2010 1,250,928 USD 11,865,052,702 IDR (7,661) (0.02)08/01/2010 299,900 USD 2,849,049,249 IDR (2,170) (0.01)08/01/2010 791,213 USD 2,996,307 ILS 157 0.0008/01/2010 276,586 USD 25,264,153 JPY 3,624 0.0108/01/2010 221,396 USD 257,406,039 KRW 257 0.0008/01/2010 450,812 USD 5,750,280 MXN 7,325 0.0208/01/2010 64,577 USD 377,078 NOK (479) 0.0008/01/2010 333,343 USD 468,113 NZD (5,008) (0.02)08/01/2010 1,876,313 USD 86,835,767 PHP (881) 0.0008/01/2010 1,192,094 USD 55,543,470 PHP (6,186) (0.02)08/01/2010 592,873 USD 1,708,659 PLN (2,823) (0.01)08/01/2010 15,180 USD 43,603 PLN (37) 0.0008/01/2010 993,195 USD 7,126,047 SEK (3,394) (0.01)08/01/2010 10,713 USD 76,883 SEK (38) 0.0008/01/2010 1,991,198 USD 2,776,079 SGD 9,713 0.0308/01/2010 33,808 USD 47,419 SGD 24 0.0008/01/2010 523,508 USD 800,112 TRY (6,920) (0.02)08/01/2010 4,386,810 USD 141,255,282 TWD (30,229) (0.09)
Forward Foreign Currency Exchange Contracts (continued)
Maturity date
Amount bought
Amount sold
Net unrealisedgain/(loss) as at
31 December 2009 % of net
assets 08/01/2010 3,297 USD 106,085 TWD (21) 0.0008/01/2010 144,598 USD 1,119,391 ZAR (5,086) (0.02)08/01/2010 4,241,522 ZAR 564,828 USD 7,474 0.0208/01/2010 42,883 ZAR 5,780 USD 27 0.0012/01/2010 22,642,804 RUB 740,566 USD 3,859 0.0112/01/2010 9,060,214 RUB 300,598 USD (1,433) 0.0012/01/2010 16,334 USD 499,785 RUB (93) 0.00
Total Forward Foreign Currency Exchange Contracts 7,333 0.02
Other Assets less Liabilities 14,334,832 43.21
Total Net Asset Value 33,174,806 100.00
(3) Variable coupon rates are those quoted as of 31 December 2009.

101 Morgan Stanley Investment Funds 31 December 2009
* Name changed from FX Alpha Plus RC 400 (Euro) Fund on 16 October 2009.
FX Alpha Plus RC 400 Fund*
INVESTMENT AIMS
To seek to generate a risk controlled (“RC”) return, measured in Euro, that has a low level of correlation to other asset classes by investing in currency pairs. The Fund seeks to outperform the Euro OverNight Index Average (EONIA) by 4.0% per annum, gross of fees, subject to an estimated annual ex-ante Value at Risk (VaR) of 4.0% over a holding year of 1-2 years.
STATEMENT OF INVESTMENTS
Transferable securities and money market instruments admitted to offi cial exchange listing or dealt in on another regulated market. As at 31 December 2009, expressed in Euro.
Investments
Nominal in Euro unless
specifi ed Market
value% of net
assets
Please refer to the full prospectus for the Fund’s investment objective and policy.
Commercial Paper
Société Générale 0% 01/03/2010 9,000,000 8,988,764 5.56Calyon 0% 01/03/2010 9,000,000 8,988,764 5.56Toyota Leasing 0% 26/02/2010 8,000,000 7,994,138 4.95Santander Ser‘997’ 0% 09/02/2010 6,500,000 6,487,458 4.01Nederlandse Waterschapsbank 0% 21/01/2010 6,000,000 5,993,567 3.71Banco Bilbao Vizcaya Argentaria 0% 03/03/2010 6,000,000 5,993,377 3.71Santander Ser‘1002’ 0% 02/03/2010 5,500,000 5,486,321 3.39Lloyds TSB Bank 0% 03/05/2010 4,500,000 4,484,562 2.77Rabobank Nederland 0% 07/01/2010 2,000,000 1,999,363 1.24Lloyds TSB Bank 0% 14/01/2010 2,000,000 1,999,300 1.24Banco Bilbao Vizcaya Argentaria 0% 15/03/2010 1,500,000 1,498,169 0.93Lloyds TSB Bank 0% 14/01/2010 500,000 499,139 0.31
Total for Commercial Paper 37.38
Government Obligation
Italy Italy Buoni Ordinari del Tesoro 0% 30/04/2010 18,500,000 18,452,458 11.42
Total for Italy 11.42
Total for Government Obligation 11.42
Corporate Bonds
Spain BBVA Senior Finance bnk gtd SerEMTN 0.787% 22/01/2010 (3) 2,750,000 2,749,538 1.71
Total for Spain 1.71
Netherlands ING Bank sr unsecur SerEMTN 6% 01/03/2010 1,750,000 1,761,133 1.09
Total for Netherlands 1.09
United States of America General Electric Capital sr unsecur SerEMTN 4.375% 20/01/2010 1,360,000 1,361,862 0.84
Total for United States of America 0.84
Total for Corporate Bonds 3.64
Total Investment Securities 84,737,913 52.44
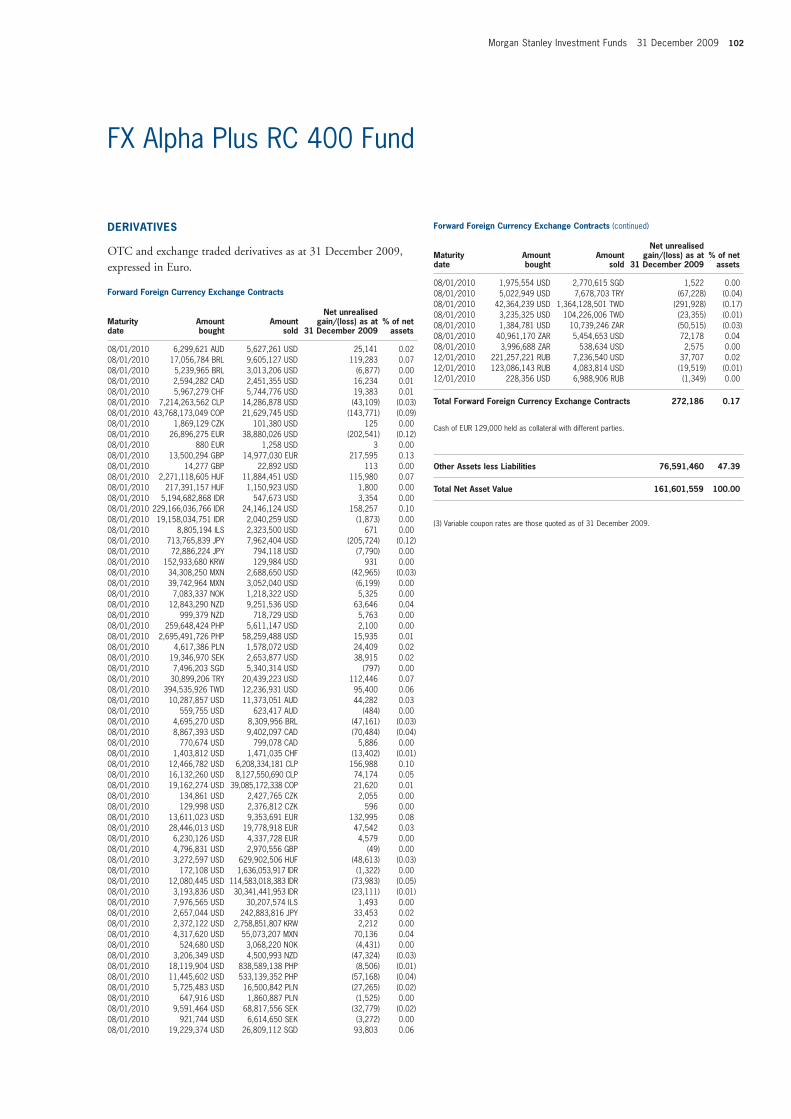
Morgan Stanley Investment Funds 31 December 2009 102
FX Alpha Plus RC 400 Fund
DERIVATIVES
OTC and exchange traded derivatives as at 31 December 2009, expressed in Euro.
Forward Foreign Currency Exchange Contracts
Maturity date
Amount bought
Amount sold
Net unrealisedgain/(loss) as at
31 December 2009 % of net
assets 08/01/2010 6,299,621 AUD 5,627,261 USD 25,141 0.0208/01/2010 17,056,784 BRL 9,605,127 USD 119,283 0.0708/01/2010 5,239,965 BRL 3,013,206 USD (6,877) 0.0008/01/2010 2,594,282 CAD 2,451,355 USD 16,234 0.0108/01/2010 5,967,279 CHF 5,744,776 USD 19,383 0.0108/01/2010 7,214,263,562 CLP 14,286,878 USD (43,109) (0.03)08/01/2010 43,768,173,049 COP 21,629,745 USD (143,771) (0.09)08/01/2010 1,869,129 CZK 101,380 USD 125 0.0008/01/2010 26,896,275 EUR 38,880,026 USD (202,541) (0.12)08/01/2010 880 EUR 1,258 USD 3 0.0008/01/2010 13,500,294 GBP 14,977,030 EUR 217,595 0.1308/01/2010 14,277 GBP 22,892 USD 113 0.0008/01/2010 2,271,118,605 HUF 11,884,451 USD 115,980 0.0708/01/2010 217,391,157 HUF 1,150,923 USD 1,800 0.0008/01/2010 5,194,682,868 IDR 547,673 USD 3,354 0.0008/01/2010 229,166,036,766 IDR 24,146,124 USD 158,257 0.1008/01/2010 19,158,034,751 IDR 2,040,259 USD (1,873) 0.0008/01/2010 8,805,194 ILS 2,323,500 USD 671 0.0008/01/2010 713,765,839 JPY 7,962,404 USD (205,724) (0.12)08/01/2010 72,886,224 JPY 794,118 USD (7,790) 0.0008/01/2010 152,933,680 KRW 129,984 USD 931 0.0008/01/2010 34,308,250 MXN 2,688,650 USD (42,965) (0.03)08/01/2010 39,742,964 MXN 3,052,040 USD (6,199) 0.0008/01/2010 7,083,337 NOK 1,218,322 USD 5,325 0.0008/01/2010 12,843,290 NZD 9,251,536 USD 63,646 0.0408/01/2010 999,379 NZD 718,729 USD 5,763 0.0008/01/2010 259,648,424 PHP 5,611,147 USD 2,100 0.0008/01/2010 2,695,491,726 PHP 58,259,488 USD 15,935 0.0108/01/2010 4,617,386 PLN 1,578,072 USD 24,409 0.0208/01/2010 19,346,970 SEK 2,653,877 USD 38,915 0.0208/01/2010 7,496,203 SGD 5,340,314 USD (797) 0.0008/01/2010 30,899,206 TRY 20,439,223 USD 112,446 0.0708/01/2010 394,535,926 TWD 12,236,931 USD 95,400 0.0608/01/2010 10,287,857 USD 11,373,051 AUD 44,282 0.0308/01/2010 559,755 USD 623,417 AUD (484) 0.0008/01/2010 4,695,270 USD 8,309,956 BRL (47,161) (0.03)08/01/2010 8,867,393 USD 9,402,097 CAD (70,484) (0.04)08/01/2010 770,674 USD 799,078 CAD 5,886 0.0008/01/2010 1,403,812 USD 1,471,035 CHF (13,402) (0.01)08/01/2010 12,466,782 USD 6,208,334,181 CLP 156,988 0.1008/01/2010 16,132,260 USD 8,127,550,690 CLP 74,174 0.0508/01/2010 19,162,274 USD 39,085,172,338 COP 21,620 0.0108/01/2010 134,861 USD 2,427,765 CZK 2,055 0.0008/01/2010 129,998 USD 2,376,812 CZK 596 0.0008/01/2010 13,611,023 USD 9,353,691 EUR 132,995 0.0808/01/2010 28,446,013 USD 19,778,918 EUR 47,542 0.0308/01/2010 6,230,126 USD 4,337,728 EUR 4,579 0.0008/01/2010 4,796,831 USD 2,970,556 GBP (49) 0.0008/01/2010 3,272,597 USD 629,902,506 HUF (48,613) (0.03)08/01/2010 172,108 USD 1,636,053,917 IDR (1,322) 0.0008/01/2010 12,080,445 USD 114,583,018,383 IDR (73,983) (0.05)08/01/2010 3,193,836 USD 30,341,441,953 IDR (23,111) (0.01)08/01/2010 7,976,565 USD 30,207,574 ILS 1,493 0.0008/01/2010 2,657,044 USD 242,883,816 JPY 33,453 0.0208/01/2010 2,372,122 USD 2,758,851,807 KRW 2,212 0.0008/01/2010 4,317,620 USD 55,073,207 MXN 70,136 0.0408/01/2010 524,680 USD 3,068,220 NOK (4,431) 0.0008/01/2010 3,206,349 USD 4,500,993 NZD (47,324) (0.03)08/01/2010 18,119,904 USD 838,589,138 PHP (8,506) (0.01)08/01/2010 11,445,602 USD 533,139,352 PHP (57,168) (0.04)08/01/2010 5,725,483 USD 16,500,842 PLN (27,265) (0.02)08/01/2010 647,916 USD 1,860,887 PLN (1,525) 0.0008/01/2010 9,591,464 USD 68,817,556 SEK (32,779) (0.02)08/01/2010 921,744 USD 6,614,650 SEK (3,272) 0.0008/01/2010 19,229,374 USD 26,809,112 SGD 93,803 0.06
Forward Foreign Currency Exchange Contracts (continued)
Maturity date
Amount bought
Amount sold
Net unrealisedgain/(loss) as at
31 December 2009 % of net
assets 08/01/2010 1,975,554 USD 2,770,615 SGD 1,522 0.0008/01/2010 5,022,949 USD 7,678,703 TRY (67,228) (0.04)08/01/2010 42,364,239 USD 1,364,128,501 TWD (291,928) (0.17)08/01/2010 3,235,325 USD 104,226,006 TWD (23,355) (0.01)08/01/2010 1,384,781 USD 10,739,246 ZAR (50,515) (0.03)08/01/2010 40,961,170 ZAR 5,454,653 USD 72,178 0.0408/01/2010 3,996,688 ZAR 538,634 USD 2,575 0.0012/01/2010 221,257,221 RUB 7,236,540 USD 37,707 0.0212/01/2010 123,086,143 RUB 4,083,814 USD (19,519) (0.01)12/01/2010 228,356 USD 6,988,906 RUB (1,349) 0.00
Total Forward Foreign Currency Exchange Contracts 272,186 0.17
Cash of EUR 129,000 held as collateral with different parties.
Other Assets less Liabilities 76,591,460 47.39
Total Net Asset Value 161,601,559 100.00
(3) Variable coupon rates are those quoted as of 31 December 2009.
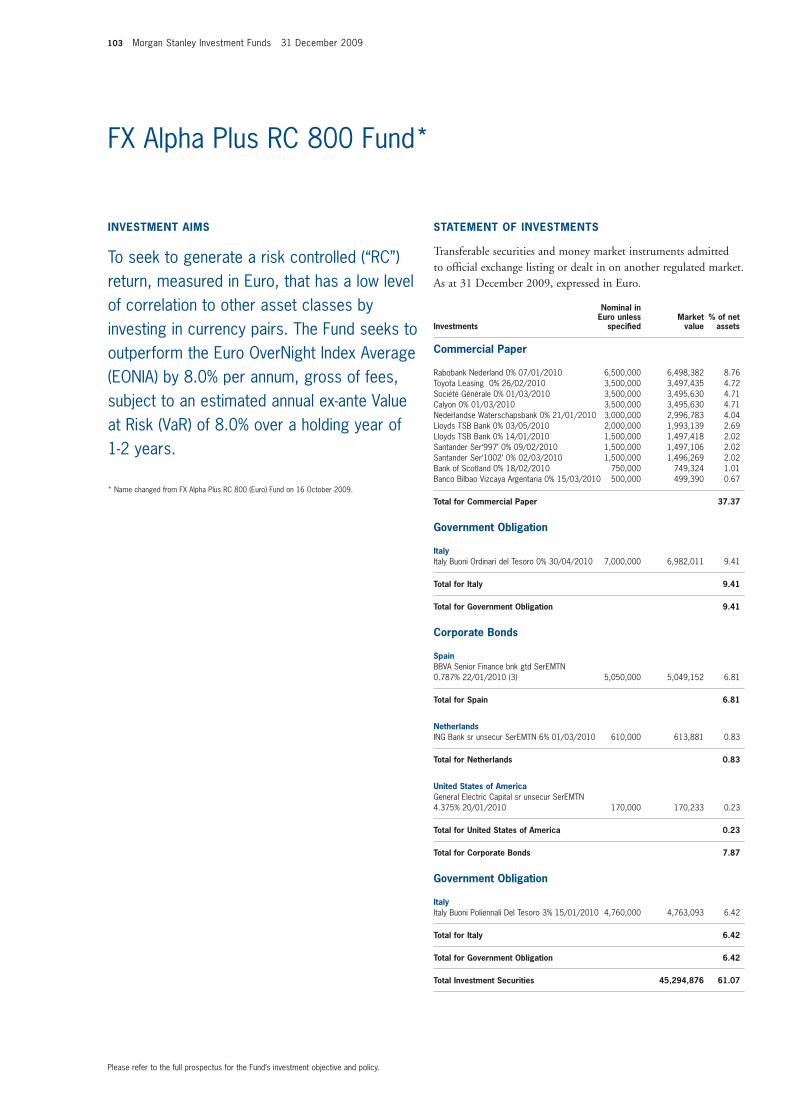
103 Morgan Stanley Investment Funds 31 December 2009
* Name changed from FX Alpha Plus RC 800 (Euro) Fund on 16 October 2009.
FX Alpha Plus RC 800 Fund *
Commercial Paper
Rabobank Nederland 0% 07/01/2010 6,500,000 6,498,382 8.76Toyota Leasing 0% 26/02/2010 3,500,000 3,497,435 4.72Société Générale 0% 01/03/2010 3,500,000 3,495,630 4.71Calyon 0% 01/03/2010 3,500,000 3,495,630 4.71Nederlandse Waterschapsbank 0% 21/01/2010 3,000,000 2,996,783 4.04Lloyds TSB Bank 0% 03/05/2010 2,000,000 1,993,139 2.69Lloyds TSB Bank 0% 14/01/2010 1,500,000 1,497,418 2.02Santander Ser‘997’ 0% 09/02/2010 1,500,000 1,497,106 2.02Santander Ser‘1002’ 0% 02/03/2010 1,500,000 1,496,269 2.02Bank of Scotland 0% 18/02/2010 750,000 749,324 1.01Banco Bilbao Vizcaya Argentaria 0% 15/03/2010 500,000 499,390 0.67
Total for Commercial Paper 37.37
Government Obligation
Italy Italy Buoni Ordinari del Tesoro 0% 30/04/2010 7,000,000 6,982,011 9.41
Total for Italy 9.41
Total for Government Obligation 9.41
Corporate Bonds
Spain BBVA Senior Finance bnk gtd SerEMTN 0.787% 22/01/2010 (3) 5,050,000 5,049,152 6.81
Total for Spain 6.81
Netherlands ING Bank sr unsecur SerEMTN 6% 01/03/2010 610,000 613,881 0.83
Total for Netherlands 0.83
United States of America General Electric Capital sr unsecur SerEMTN 4.375% 20/01/2010 170,000 170,233 0.23
Total for United States of America 0.23
Total for Corporate Bonds 7.87
Government Obligation
Italy Italy Buoni Poliennali Del Tesoro 3% 15/01/2010 4,760,000 4,763,093 6.42
Total for Italy 6.42
Total for Government Obligation 6.42
Total Investment Securities 45,294,876 61.07
INVESTMENT AIMS
To seek to generate a risk controlled (“RC”) return, measured in Euro, that has a low level of correlation to other asset classes by investing in currency pairs. The Fund seeks to outperform the Euro OverNight Index Average (EONIA) by 8.0% per annum, gross of fees, subject to an estimated annual ex-ante Value at Risk (VaR) of 8.0% over a holding year of 1-2 years.
STATEMENT OF INVESTMENTS
Transferable securities and money market instruments admitted to offi cial exchange listing or dealt in on another regulated market. As at 31 December 2009, expressed in Euro.
Investments
Nominal in Euro unless
specifi ed Market
value% of net
assets
Please refer to the full prospectus for the Fund’s investment objective and policy.
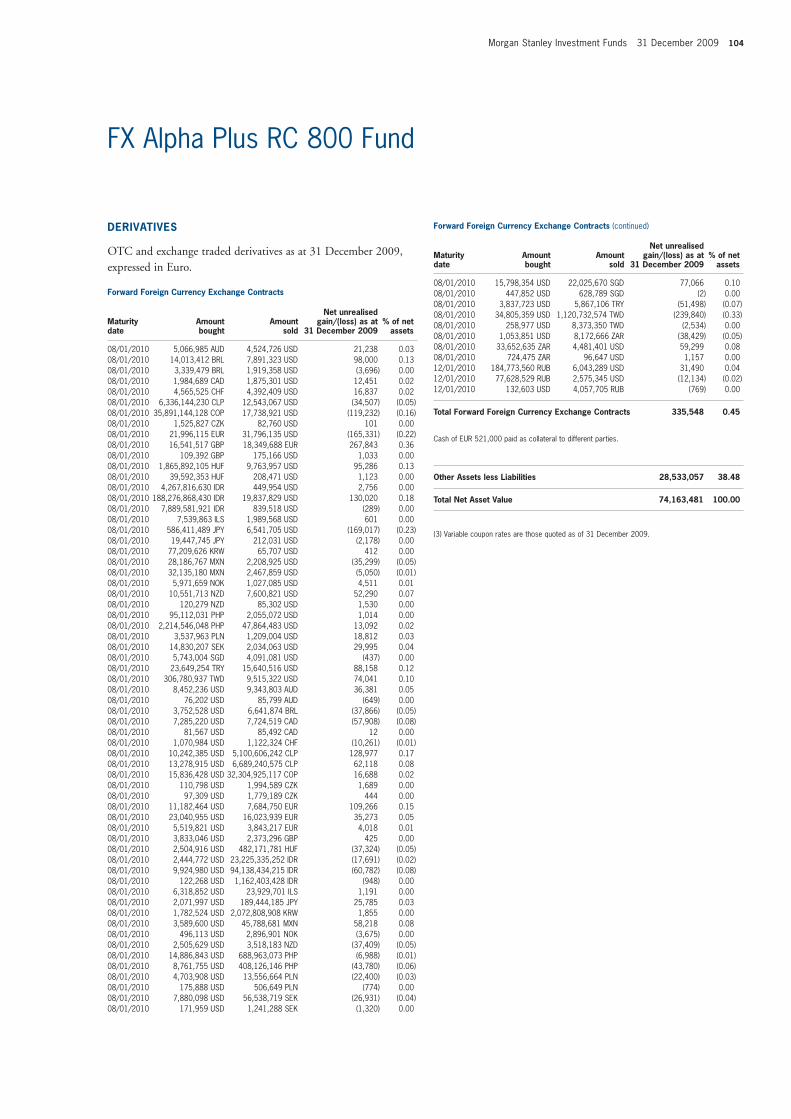
Morgan Stanley Investment Funds 31 December 2009 104
FX Alpha Plus RC 800 Fund
Forward Foreign Currency Exchange Contracts (continued)
Maturity date
Amount bought
Amount sold
Net unrealisedgain/(loss) as at
31 December 2009 % of net
assets 08/01/2010 15,798,354 USD 22,025,670 SGD 77,066 0.1008/01/2010 447,852 USD 628,789 SGD (2) 0.0008/01/2010 3,837,723 USD 5,867,106 TRY (51,498) (0.07)08/01/2010 34,805,359 USD 1,120,732,574 TWD (239,840) (0.33)08/01/2010 258,977 USD 8,373,350 TWD (2,534) 0.0008/01/2010 1,053,851 USD 8,172,666 ZAR (38,429) (0.05)08/01/2010 33,652,635 ZAR 4,481,401 USD 59,299 0.0808/01/2010 724,475 ZAR 96,647 USD 1,157 0.0012/01/2010 184,773,560 RUB 6,043,289 USD 31,490 0.0412/01/2010 77,628,529 RUB 2,575,345 USD (12,134) (0.02)12/01/2010 132,603 USD 4,057,705 RUB (769) 0.00
Total Forward Foreign Currency Exchange Contracts 335,548 0.45
Cash of EUR 521,000 paid as collateral to different parties.
Other Assets less Liabilities 28,533,057 38.48
Total Net Asset Value 74,163,481 100.00
(3) Variable coupon rates are those quoted as of 31 December 2009.
DERIVATIVES
OTC and exchange traded derivatives as at 31 December 2009, expressed in Euro.
Forward Foreign Currency Exchange Contracts
Maturity date
Amount bought
Amount sold
Net unrealisedgain/(loss) as at
31 December 2009 % of net
assets 08/01/2010 5,066,985 AUD 4,524,726 USD 21,238 0.0308/01/2010 14,013,412 BRL 7,891,323 USD 98,000 0.1308/01/2010 3,339,479 BRL 1,919,358 USD (3,696) 0.0008/01/2010 1,984,689 CAD 1,875,301 USD 12,451 0.0208/01/2010 4,565,525 CHF 4,392,409 USD 16,837 0.0208/01/2010 6,336,144,230 CLP 12,543,067 USD (34,507) (0.05)08/01/2010 35,891,144,128 COP 17,738,921 USD (119,232) (0.16)08/01/2010 1,525,827 CZK 82,760 USD 101 0.0008/01/2010 21,996,115 EUR 31,796,135 USD (165,331) (0.22)08/01/2010 16,541,517 GBP 18,349,688 EUR 267,843 0.3608/01/2010 109,392 GBP 175,166 USD 1,033 0.0008/01/2010 1,865,892,105 HUF 9,763,957 USD 95,286 0.1308/01/2010 39,592,353 HUF 208,471 USD 1,123 0.0008/01/2010 4,267,816,630 IDR 449,954 USD 2,756 0.0008/01/2010 188,276,868,430 IDR 19,837,829 USD 130,020 0.1808/01/2010 7,889,581,921 IDR 839,518 USD (289) 0.0008/01/2010 7,539,863 ILS 1,989,568 USD 601 0.0008/01/2010 586,411,489 JPY 6,541,705 USD (169,017) (0.23)08/01/2010 19,447,745 JPY 212,031 USD (2,178) 0.0008/01/2010 77,209,626 KRW 65,707 USD 412 0.0008/01/2010 28,186,767 MXN 2,208,925 USD (35,299) (0.05)08/01/2010 32,135,180 MXN 2,467,859 USD (5,050) (0.01)08/01/2010 5,971,659 NOK 1,027,085 USD 4,511 0.0108/01/2010 10,551,713 NZD 7,600,821 USD 52,290 0.0708/01/2010 120,279 NZD 85,302 USD 1,530 0.0008/01/2010 95,112,031 PHP 2,055,072 USD 1,014 0.0008/01/2010 2,214,546,048 PHP 47,864,483 USD 13,092 0.0208/01/2010 3,537,963 PLN 1,209,004 USD 18,812 0.0308/01/2010 14,830,207 SEK 2,034,063 USD 29,995 0.0408/01/2010 5,743,004 SGD 4,091,081 USD (437) 0.0008/01/2010 23,649,254 TRY 15,640,516 USD 88,158 0.1208/01/2010 306,780,937 TWD 9,515,322 USD 74,041 0.1008/01/2010 8,452,236 USD 9,343,803 AUD 36,381 0.0508/01/2010 76,202 USD 85,799 AUD (649) 0.0008/01/2010 3,752,528 USD 6,641,874 BRL (37,866) (0.05)08/01/2010 7,285,220 USD 7,724,519 CAD (57,908) (0.08)08/01/2010 81,567 USD 85,492 CAD 12 0.0008/01/2010 1,070,984 USD 1,122,324 CHF (10,261) (0.01)08/01/2010 10,242,385 USD 5,100,606,242 CLP 128,977 0.1708/01/2010 13,278,915 USD 6,689,240,575 CLP 62,118 0.0808/01/2010 15,836,428 USD 32,304,925,117 COP 16,688 0.0208/01/2010 110,798 USD 1,994,589 CZK 1,689 0.0008/01/2010 97,309 USD 1,779,189 CZK 444 0.0008/01/2010 11,182,464 USD 7,684,750 EUR 109,266 0.1508/01/2010 23,040,955 USD 16,023,939 EUR 35,273 0.0508/01/2010 5,519,821 USD 3,843,217 EUR 4,018 0.0108/01/2010 3,833,046 USD 2,373,296 GBP 425 0.0008/01/2010 2,504,916 USD 482,171,781 HUF (37,324) (0.05)08/01/2010 2,444,772 USD 23,225,335,252 IDR (17,691) (0.02)08/01/2010 9,924,980 USD 94,138,434,215 IDR (60,782) (0.08)08/01/2010 122,268 USD 1,162,403,428 IDR (948) 0.0008/01/2010 6,318,852 USD 23,929,701 ILS 1,191 0.0008/01/2010 2,071,997 USD 189,444,185 JPY 25,785 0.0308/01/2010 1,782,524 USD 2,072,808,908 KRW 1,855 0.0008/01/2010 3,589,600 USD 45,788,681 MXN 58,218 0.0808/01/2010 496,113 USD 2,896,901 NOK (3,675) 0.0008/01/2010 2,505,629 USD 3,518,183 NZD (37,409) (0.05)08/01/2010 14,886,843 USD 688,963,073 PHP (6,988) (0.01)08/01/2010 8,761,755 USD 408,126,146 PHP (43,780) (0.06)08/01/2010 4,703,908 USD 13,556,664 PLN (22,400) (0.03)08/01/2010 175,888 USD 506,649 PLN (774) 0.0008/01/2010 7,880,098 USD 56,538,719 SEK (26,931) (0.04)08/01/2010 171,959 USD 1,241,288 SEK (1,320) 0.00
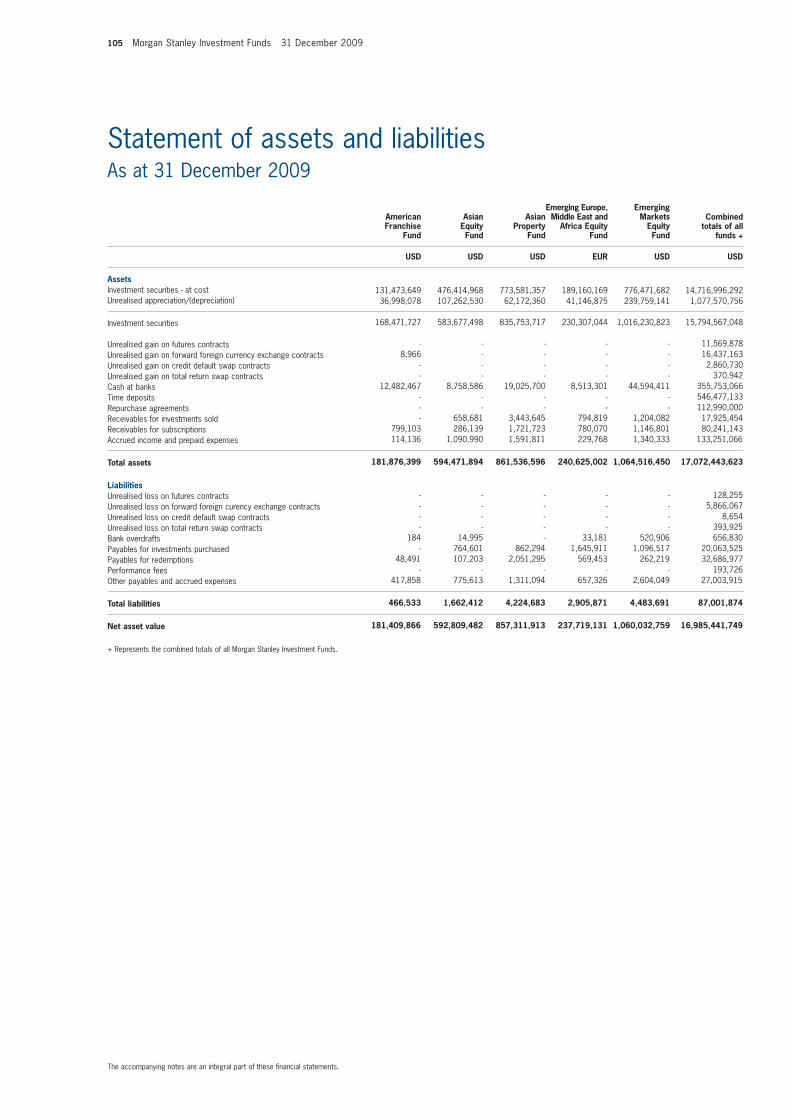
105 Morgan Stanley Investment Funds 31 December 2009
The accompanying notes are an integral part of these fi nancial statements.
Statement of assets and liabilitiesAs at 31 December 2009 Emerging Europe, Emerging American Asian Asian Middle East and Markets Franchise Equity Property Africa Equity Equity Fund Fund Fund Fund Fund
USD USD USD EUR USD USD
AssetsInvestment securities - at cost Unrealised appreciation/(depreciation)
Investment securities
Unrealised gain on futures contracts Unrealised gain on forward foreign currency exchange contracts Unrealised gain on credit default swap contracts Unrealised gain on total return swap contracts Cash at banks Time deposits Repurchase agreementsReceivables for investments sold Receivables for subscriptions Accrued income and prepaid expenses
Total assets
LiabilitiesUnrealised loss on futures contracts Unrealised loss on forward foreign curency exchange contracts Unrealised loss on credit default swap contracts Unrealised loss on total return swap contracts Bank overdrafts Payables for investments purchased Payables for redemptions Performance feesOther payables and accrued expenses
Total liabilities
Net asset value
+ Represents the combined totals of all Morgan Stanley Investment Funds.
Combinedtotals of all
funds +
131,473,649 476,414,968 773,581,357 189,160,169 776,471,682 14,716,996,292 36,998,078 107,262,530 62,172,360 41,146,875 239,759,141 1,077,570,756
168,471,727 583,677,498 835,753,717 230,307,044 1,016,230,823 15,794,567,048
- - - - - 11,569,878 8,966 - - - - 16,437,163 - - - - - 2,860,730 - - - - - 370,942 12,482,467 8,758,586 19,025,700 8,513,301 44,594,411 355,753,066 - - - - - 546,477,133 - - - - - 112,990,000 - 658,681 3,443,645 794,819 1,204,082 17,925,454 799,103 286,139 1,721,723 780,070 1,146,801 80,241,143 114,136 1,090,990 1,591,811 229,768 1,340,333 133,251,066
181,876,399 594,471,894 861,536,596 240,625,002 1,064,516,450 17,072,443,623
- - - - - 128,255 - - - - - 5,866,067 - - - - - 8,654 - - - - - 393,925 184 14,995 - 33,181 520,906 656,830 - 764,601 862,294 1,645,911 1,096,517 20,063,525 48,491 107,203 2,051,295 569,453 262,219 32,686,977 - - - - - 193,726 417,858 775,613 1,311,094 657,326 2,604,049 27,003,91 5
466,533 1,662,412 4,224,683 2,905,871 4,483,691 87,001,87 4
181,409,866 592,809,482 857,311,913 237,719,131 1,060,032,759 16,985,441,749
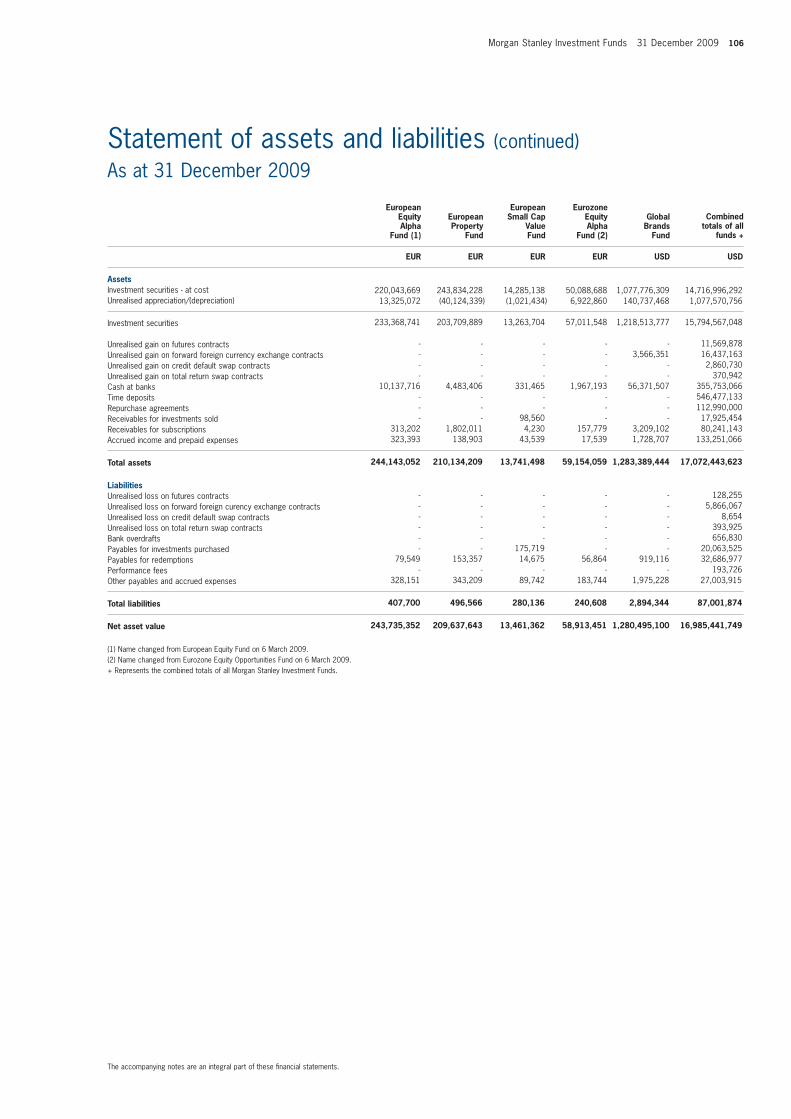
Morgan Stanley Investment Funds 31 December 2009 106
220,043,669 243,834,228 14,285,138 50,088,688 1,077,776,309 14,716,996,292 13,325,072 (40,124,339) (1,021,434) 6,922,860 140,737,468 1,077,570,756
233,368,741 203,709,889 13,263,704 57,011,548 1,218,513,777 15,794,567,048
- - - - - 11,569,878 - - - - 3,566,351 16,437,163 - - - - - 2,860,730 - - - - - 370,942 10,137,716 4,483,406 331,465 1,967,193 56,371,507 355,753,066 - - - - - 546,477,133 - - - - - 112,990,000 - - 98,560 - - 17,925,454 313,202 1,802,011 4,230 157,779 3,209,102 80,241,143 323,393 138,903 43,539 17,539 1,728,707 133,251,066
244,143,052 210,134,209 13,741,498 59,154,059 1,283,389,444 17,072,443,623
- - - - - 128,255 - - - - - 5,866,067 - - - - - 8,654 - - - - - 393,925 - - - - - 656,830 - - 175,719 - - 20,063,525 79,549 153,357 14,675 56,864 919,116 32,686,977 - - - - - 193,726 328,151 343,209 89,742 183,744 1,975,228 27,003,91 5
407,700 496,566 280,136 240,608 2,894,344 87,001,87 4
243,735,352 209,637,643 13,461,362 58,913,451 1,280,495,100 16,985,441,749
The accompanying notes are an integral part of these fi nancial statements.
Statement of assets and liabilities (continued) As at 31 December 2009 European European Eurozone Equity European Small Cap Equity Global Alpha Property Value Alpha Brands Fund (1) Fund Fund Fund (2) Fund
EUR EUR EUR EUR USD USD
AssetsInvestment securities - at cost Unrealised appreciation/(depreciation)
Investment securities
Unrealised gain on futures contracts Unrealised gain on forward foreign currency exchange contracts Unrealised gain on credit default swap contracts Unrealised gain on total return swap contracts Cash at banks Time deposits Repurchase agreementsReceivables for investments sold Receivables for subscriptions Accrued income and prepaid expenses
Total assets
LiabilitiesUnrealised loss on futures contracts Unrealised loss on forward foreign curency exchange contracts Unrealised loss on credit default swap contracts Unrealised loss on total return swap contracts Bank overdrafts Payables for investments purchased Payables for redemptions Performance feesOther payables and accrued expenses
Total liabilities
Net asset value
(1) Name changed from European Equity Fund on 6 March 2009.(2) Name changed from Eurozone Equity Opportunities Fund on 6 March 2009.+ Represents the combined totals of all Morgan Stanley Investment Funds.
Combinedtotals of all
funds +
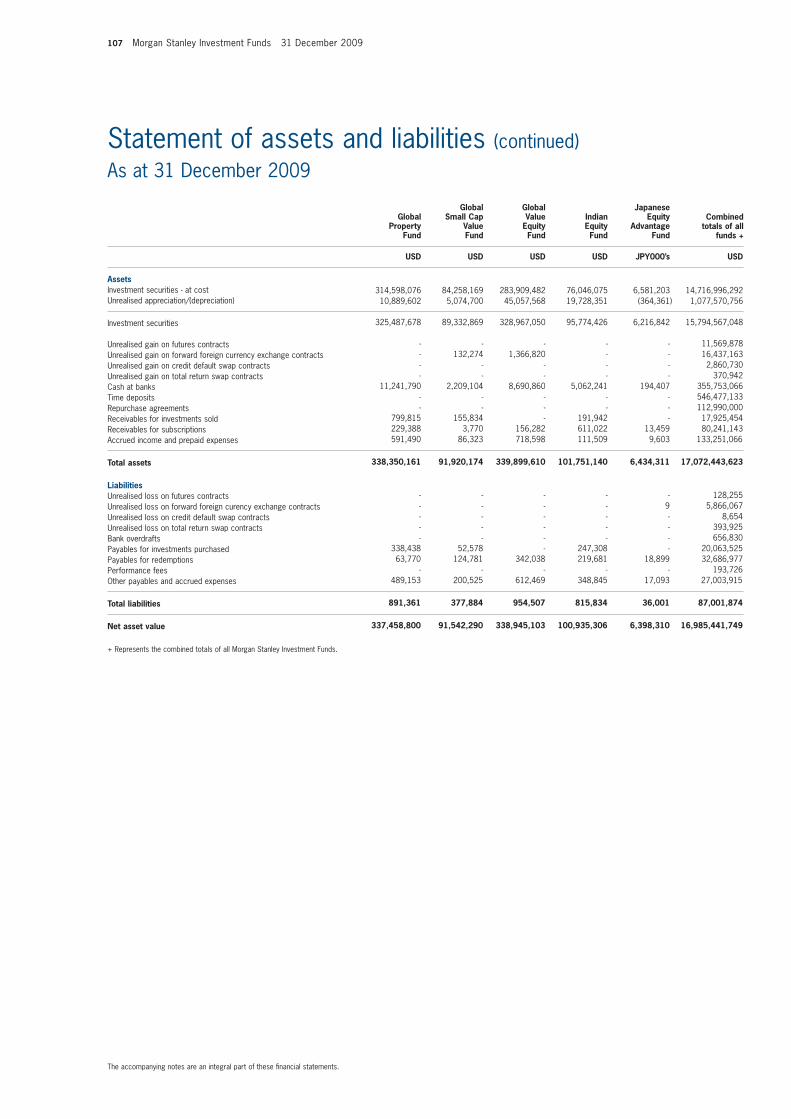
107 Morgan Stanley Investment Funds 31 December 2009
Statement of assets and liabilities (continued) As at 31 December 2009
The accompanying notes are an integral part of these fi nancial statements.
Global Global Japanese Global Small Cap Value Indian Equity Property Value Equity Equity Advantage Fund Fund Fund Fund Fund
USD USD USD USD JPY000’s USD
AssetsInvestment securities - at cost Unrealised appreciation/(depreciation)
Investment securities
Unrealised gain on futures contracts Unrealised gain on forward foreign currency exchange contracts Unrealised gain on credit default swap contracts Unrealised gain on total return swap contracts Cash at banks Time deposits Repurchase agreementsReceivables for investments sold Receivables for subscriptions Accrued income and prepaid expenses
Total assets
LiabilitiesUnrealised loss on futures contracts Unrealised loss on forward foreign curency exchange contracts Unrealised loss on credit default swap contracts Unrealised loss on total return swap contracts Bank overdrafts Payables for investments purchased Payables for redemptions Performance feesOther payables and accrued expenses
Total liabilities
Net asset value
+ Represents the combined totals of all Morgan Stanley Investment Funds.
Combinedtotals of all
funds +
314,598,076 84,258,169 283,909,482 76,046,075 6,581,203 14,716,996,292 10,889,602 5,074,700 45,057,568 19,728,351 (364,361) 1,077,570,756
325,487,678 89,332,869 328,967,050 95,774,426 6,216,842 15,794,567,048
- - - - - 11,569,878 - 132,274 1,366,820 - - 16,437,163 - - - - - 2,860,730 - - - - - 370,942 11,241,790 2,209,104 8,690,860 5,062,241 194,407 355,753,066 - - - - - 546,477,133 - - - - - 112,990,000 799,815 155,834 - 191,942 - 17,925,454 229,388 3,770 156,282 611,022 13,459 80,241,143 591,490 86,323 718,598 111,509 9,603 133,251,066
338,350,161 91,920,174 339,899,610 101,751,140 6,434,311 17,072,443,623
- - - - - 128,255 - - - - 9 5,866,067 - - - - - 8,654 - - - - - 393,925 - - - - - 656,830 338,438 52,578 - 247,308 - 20,063,525 63,770 124,781 342,038 219,681 18,899 32,686,977 - - - - - 193,726 489,153 200,525 612,469 348,845 17,093 27,003,91 5
891,361 377,884 954,507 815,834 36,001 87,001,87 4
337,458,800 91,542,290 338,945,103 100,935,306 6,398,310 16,985,441,749

Morgan Stanley Investment Funds 31 December 2009 108
Statement of assets and liabilities (continued) As at 31 December 2009
The accompanying notes are an integral part of these fi nancial statements.
Japanese Latin US US Value American Equity US Small Cap Equity Equity Growth Property Growth Fund Fund Fund Fund Fund
JPY000’s USD USD USD USD USD
AssetsInvestment securities - at cost Unrealised appreciation/(depreciation)
Investment securities
Unrealised gain on futures contracts Unrealised gain on forward foreign currency exchange contracts Unrealised gain on credit default swap contracts Unrealised gain on total return swap contracts Cash at banks Time deposits Repurchase agreementsReceivables for investments sold Receivables for subscriptions Accrued income and prepaid expenses
Total assets
LiabilitiesUnrealised loss on futures contracts Unrealised loss on forward foreign curency exchange contracts Unrealised loss on credit default swap contracts Unrealised loss on total return swap contracts Bank overdrafts Payables for investments purchased Payables for redemptions Performance feesOther payables and accrued expenses
Total liabilities
Net asset value
+ Represents the combined totals of all Morgan Stanley Investment Funds.
Combinedtotals of all
funds +
90,848,583 805,958,840 389,957,077 102,377,360 27,230,861 14,716,996,292 (17,900,132) 297,797,445 19,833,759 (3,139,400) 4,282,444 1,077,570,756
72,948,451 1,103,756,285 409,790,836 99,237,960 31,513,305 15,794,567,048
- - - - - 11,569,878 11,794 - 12,394 - - 16,437,163 - - - - - 2,860,730 - - - - - 370,942 1,461,388 3,906,238 14,845,569 4,725,881 1,074,252 355,753,066 - - - - - 546,477,133 - - - - - 112,990,000 - 9,771,305 - 241,284 175,348 17,925,454 63,938 2,062,925 830,533 259,857 89,875 80,241,143 36,638 2,014,871 45,650 432,687 26,901 133,251,066
74,522,209 1,121,511,624 425,524,982 104,897,669 32,879,681 17,072,443,623
- - - - - 128,255 - - - - - 5,866,067 - - - - - 8,654 - - - - - 393,925 - - - - - 656,830 - 1,242,911 - 161,468 201,640 20,063,525 168,857 906,887 311,283 1,036,301 62,199 32,686,977 - - - - - 193,726 110,646 2,127,616 618,126 785,376 104,696 27,003,91 5
279,503 4,277,414 929,409 1,983,145 368,535 87,001,87 4
74,242,706 1,117,234,210 424,595,573 102,914,524 32,511,146 16,985,441,749
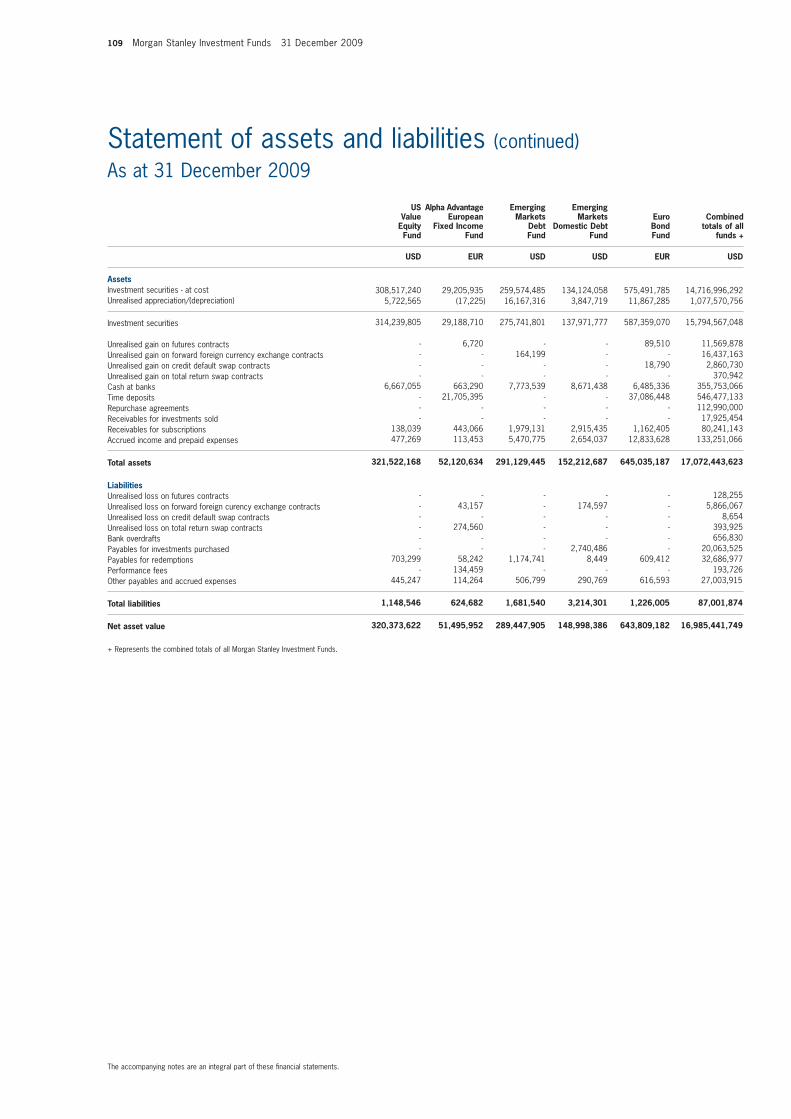
109 Morgan Stanley Investment Funds 31 December 2009
Statement of assets and liabilities (continued) As at 31 December 2009
The accompanying notes are an integral part of these fi nancial statements.
US Alpha Advantage Emerging Emerging Value European Markets Markets Euro Equity Fixed Income Debt Domestic Debt Bond Fund Fund Fund Fund Fund
USD EUR USD USD EUR USD
AssetsInvestment securities - at cost Unrealised appreciation/(depreciation)
Investment securities
Unrealised gain on futures contracts Unrealised gain on forward foreign currency exchange contracts Unrealised gain on credit default swap contracts Unrealised gain on total return swap contracts Cash at banks Time deposits Repurchase agreementsReceivables for investments sold Receivables for subscriptions Accrued income and prepaid expenses
Total assets
LiabilitiesUnrealised loss on futures contracts Unrealised loss on forward foreign curency exchange contracts Unrealised loss on credit default swap contracts Unrealised loss on total return swap contracts Bank overdrafts Payables for investments purchased Payables for redemptions Performance feesOther payables and accrued expenses
Total liabilities
Net asset value
+ Represents the combined totals of all Morgan Stanley Investment Funds.
Combinedtotals of all
funds +
308,517,240 29,205,935 259,574,485 134,124,058 575,491,785 14,716,996,292 5,722,565 (17,225) 16,167,316 3,847,719 11,867,285 1,077,570,756
314,239,805 29,188,710 275,741,801 137,971,777 587,359,070 15,794,567,048
- 6,720 - - 89,510 11,569,878 - - 164,199 - - 16,437,163 - - - - 18,790 2,860,730 - - - - - 370,942 6,667,055 663,290 7,773,539 8,671,438 6,485,336 355,753,066 - 21,705,395 - - 37,086,448 546,477,133 - - - - - 112,990,000 - - - - - 17,925,454 138,039 443,066 1,979,131 2,915,435 1,162,405 80,241,143 477,269 113,453 5,470,775 2,654,037 12,833,628 133,251,066
321,522,168 52,120,634 291,129,445 152,212,687 645,035,187 17,072,443,623
- - - - - 128,255 - 43,157 - 174,597 - 5,866,067 - - - - - 8,654 - 274,560 - - - 393,925 - - - - - 656,830 - - - 2,740,486 - 20,063,525 703,299 58,242 1,174,741 8,449 609,412 32,686,977 - 134,459 - - - 193,726 445,247 114,264 506,799 290,769 616,593 27,003,91 5
1,148,546 624,682 1,681,540 3,214,301 1,226,005 87,001,87 4
320,373,622 51,495,952 289,447,905 148,998,386 643,809,182 16,985,441,749
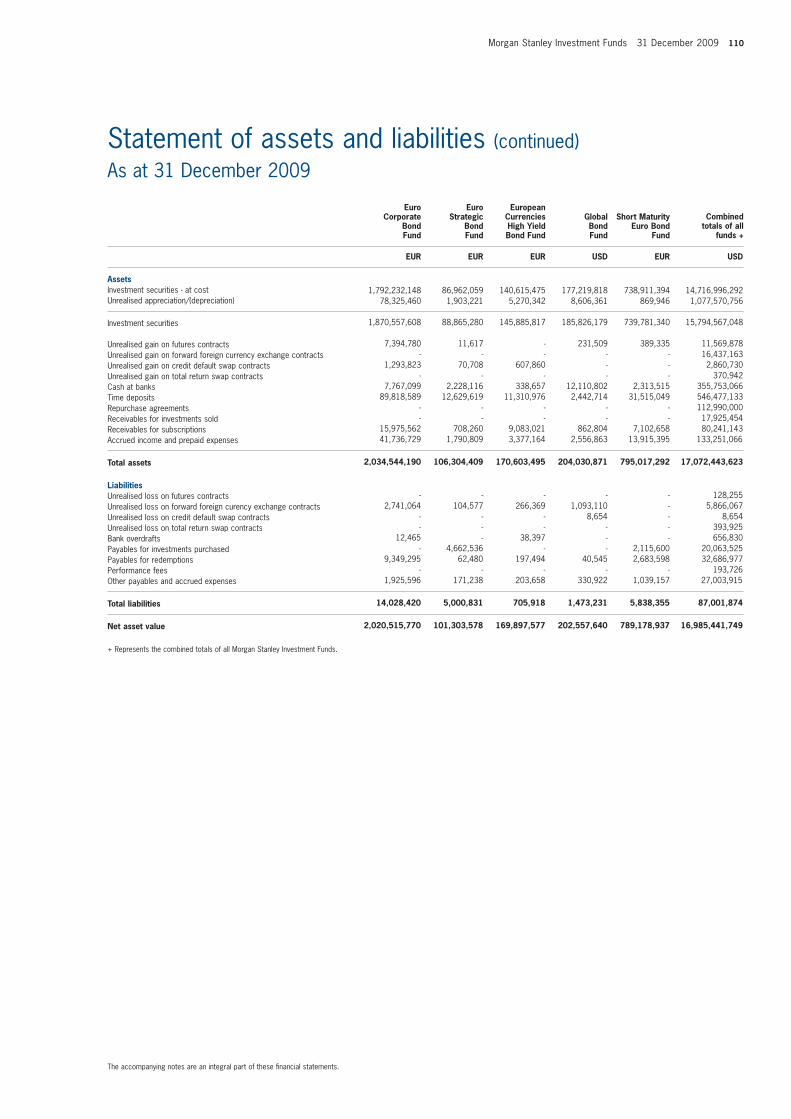
Morgan Stanley Investment Funds 31 December 2009 110
Statement of assets and liabilities (continued) As at 31 December 2009
The accompanying notes are an integral part of these fi nancial statements.
Euro Euro European Corporate Strategic Currencies Global Short Maturity Bond Bond High Yield Bond Euro Bond Fund Fund Bond Fund Fund Fund
EUR EUR EUR USD EUR USD
AssetsInvestment securities - at cost Unrealised appreciation/(depreciation)
Investment securities
Unrealised gain on futures contracts Unrealised gain on forward foreign currency exchange contracts Unrealised gain on credit default swap contracts Unrealised gain on total return swap contracts Cash at banks Time deposits Repurchase agreementsReceivables for investments sold Receivables for subscriptions Accrued income and prepaid expenses
Total assets
LiabilitiesUnrealised loss on futures contracts Unrealised loss on forward foreign curency exchange contracts Unrealised loss on credit default swap contracts Unrealised loss on total return swap contracts Bank overdrafts Payables for investments purchased Payables for redemptions Performance feesOther payables and accrued expenses
Total liabilities
Net asset value
+ Represents the combined totals of all Morgan Stanley Investment Funds.
Combinedtotals of all
funds +
1,792,232,148 86,962,059 140,615,475 177,219,818 738,911,394 14,716,996,292 78,325,460 1,903,221 5,270,342 8,606,361 869,946 1,077,570,756
1,870,557,608 88,865,280 145,885,817 185,826,179 739,781,340 15,794,567,048
7,394,780 11,617 - 231,509 389,335 11,569,878 - - - - - 16,437,163 1,293,823 70,708 607,860 - - 2,860,730 - - - - - 370,942 7,767,099 2,228,116 338,657 12,110,802 2,313,515 355,753,066 89,818,589 12,629,619 11,310,976 2,442,714 31,515,049 546,477,133 - - - - - 112,990,000 - - - - - 17,925,454 15,975,562 708,260 9,083,021 862,804 7,102,658 80,241,143 41,736,729 1,790,809 3,377,164 2,556,863 13,915,395 133,251,066
2,034,544,190 106,304,409 170,603,495 204,030,871 795,017,292 17,072,443,623
- - - - - 128,255 2,741,064 104,577 266,369 1,093,110 - 5,866,067 - - - 8,654 - 8,654 - - - - - 393,925 12,465 - 38,397 - - 656,830 - 4,662,536 - - 2,115,600 20,063,525 9,349,295 62,480 197,494 40,545 2,683,598 32,686,977 - - - - - 193,726 1,925,596 171,238 203,658 330,922 1,039,157 27,003,91 5
14,028,420 5,000,831 705,918 1,473,231 5,838,355 87,001,87 4
2,020,515,770 101,303,578 169,897,577 202,557,640 789,178,937 16,985,441,749
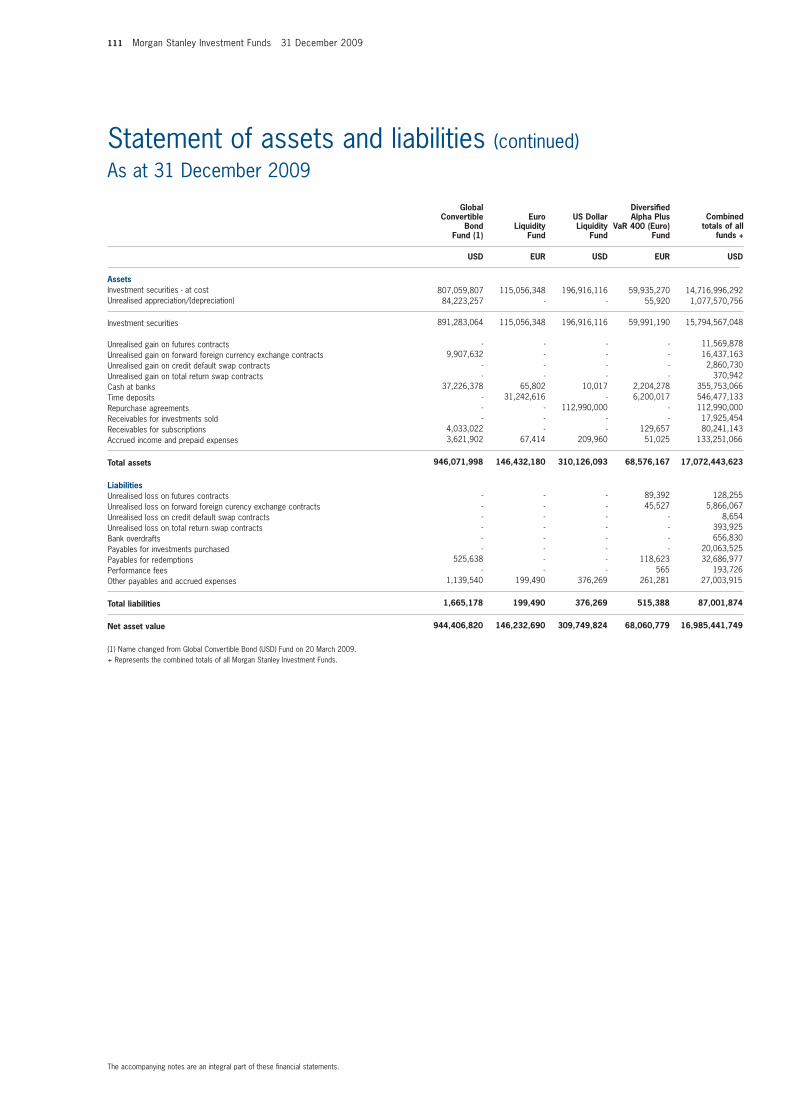
111 Morgan Stanley Investment Funds 31 December 2009
Statement of assets and liabilities (continued) As at 31 December 2009
The accompanying notes are an integral part of these fi nancial statements.
Global Diversifi ed Convertible Euro US Dollar Alpha Plus Bond Liquidity Liquidity VaR 400 (Euro) Fund (1) Fund Fund Fund
USD EUR USD EUR USD
AssetsInvestment securities - at cost Unrealised appreciation/(depreciation)
Investment securities
Unrealised gain on futures contracts Unrealised gain on forward foreign currency exchange contracts Unrealised gain on credit default swap contracts Unrealised gain on total return swap contracts Cash at banks Time deposits Repurchase agreementsReceivables for investments sold Receivables for subscriptions Accrued income and prepaid expenses
Total assets
LiabilitiesUnrealised loss on futures contracts Unrealised loss on forward foreign curency exchange contracts Unrealised loss on credit default swap contracts Unrealised loss on total return swap contracts Bank overdrafts Payables for investments purchased Payables for redemptions Performance feesOther payables and accrued expenses
Total liabilities
Net asset value
(1) Name changed from Global Convertible Bond (USD) Fund on 20 March 2009.+ Represents the combined totals of all Morgan Stanley Investment Funds.
Combinedtotals of all
funds +
807,059,807 115,056,348 196,916,116 59,935,270 14,716,996,292 84,223,257 - - 55,920 1,077,570,756 891,283,064 115,056,348 196,916,116 59,991,190 15,794,567,048 - - - - 11,569,878 9,907,632 - - - 16,437,163 - - - - 2,860,730 - - - - 370,942 37,226,378 65,802 10,017 2,204,278 355,753,066 - 31,242,616 - 6,200,017 546,477,133 - - 112,990,000 - 112,990,000 - - - - 17,925,454 4,033,022 - - 129,657 80,241,143 3,621,902 67,414 209,960 51,025 133,251,066
946,071,998 146,432,180 310,126,093 68,576,167 17,072,443,623
- - - 89,392 128,255 - - - 45,527 5,866,067 - - - - 8,654 - - - - 393,925 - - - - 656,830 - - - - 20,063,525 525,638 - - 118,623 32,686,977 - - - 565 193,726 1,139,540 199,490 376,269 261,281 27,003,91 5
1,665,178 199,490 376,269 515,388 87,001,87 4
944,406,820 146,232,690 309,749,824 68,060,779 16,985,441,749
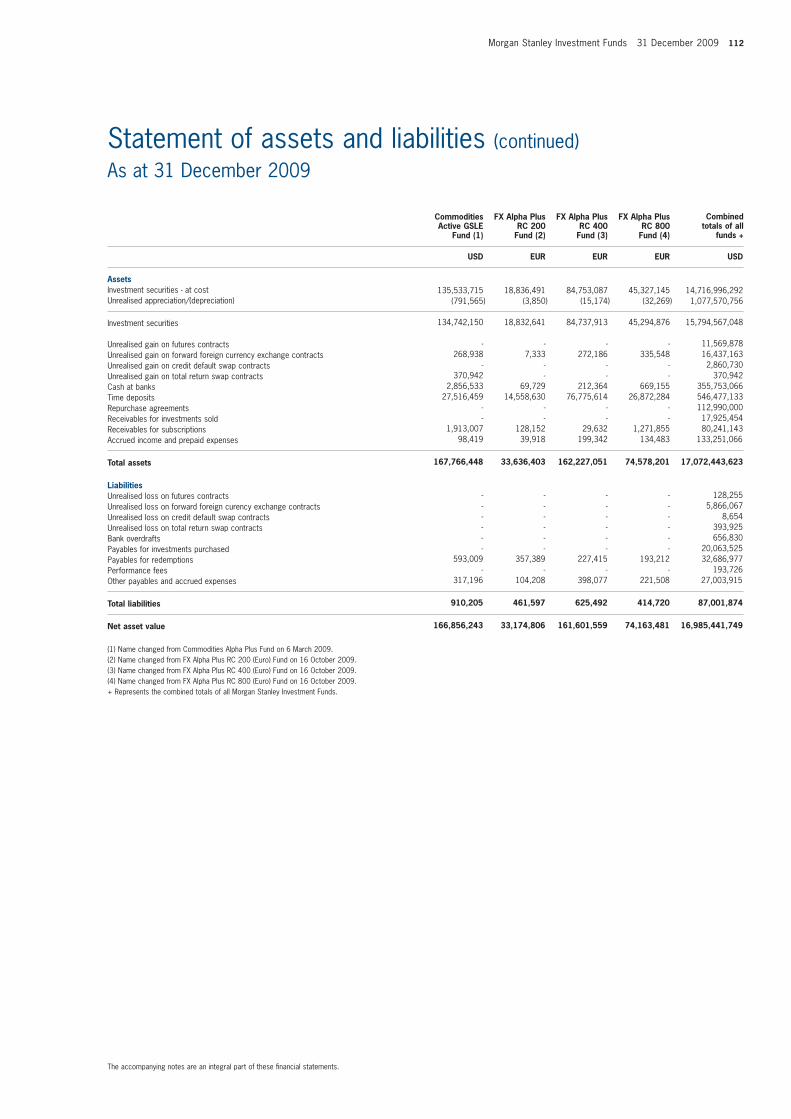
Morgan Stanley Investment Funds 31 December 2009 112
Statement of assets and liabilities (continued) As at 31 December 2009
The accompanying notes are an integral part of these fi nancial statements.
Commodities FX Alpha Plus FX Alpha Plus FX Alpha Plus Active GSLE RC 200 RC 400 RC 800 Fund (1) Fund (2) Fund (3) Fund (4)
USD EUR EUR EUR USD
AssetsInvestment securities - at cost Unrealised appreciation/(depreciation)
Investment securities
Unrealised gain on futures contracts Unrealised gain on forward foreign currency exchange contracts Unrealised gain on credit default swap contracts Unrealised gain on total return swap contracts Cash at banks Time deposits Repurchase agreementsReceivables for investments sold Receivables for subscriptions Accrued income and prepaid expenses
Total assets
LiabilitiesUnrealised loss on futures contracts Unrealised loss on forward foreign curency exchange contracts Unrealised loss on credit default swap contracts Unrealised loss on total return swap contracts Bank overdrafts Payables for investments purchased Payables for redemptions Performance feesOther payables and accrued expenses
Total liabilities
Net asset value
(1) Name changed from Commodities Alpha Plus Fund on 6 March 2009.(2) Name changed from FX Alpha Plus RC 200 (Euro) Fund on 16 October 2009.(3) Name changed from FX Alpha Plus RC 400 (Euro) Fund on 16 October 2009.(4) Name changed from FX Alpha Plus RC 800 (Euro) Fund on 16 October 2009.+ Represents the combined totals of all Morgan Stanley Investment Funds.
Combinedtotals of all
funds +
135,533,715 18,836,491 84,753,087 45,327,145 14,716,996,292 (791,565) (3,850) (15,174) (32,269) 1,077,570,756 134,742,150 18,832,641 84,737,913 45,294,876 15,794,567,048 - - - - 11,569,878 268,938 7,333 272,186 335,548 16,437,163 - - - - 2,860,730 370,942 - - - 370,942 2,856,533 69,729 212,364 669,155 355,753,066 27,516,459 14,558,630 76,775,614 26,872,284 546,477,133 - - - - 112,990,000 - - - - 17,925,454 1,913,007 128,152 29,632 1,271,855 80,241,143 98,419 39,918 199,342 134,483 133,251,066
167,766,448 33,636,403 162,227,051 74,578,201 17,072,443,623
- - - - 128,255 - - - - 5,866,067 - - - - 8,654 - - - - 393,925 - - - - 656,830 - - - - 20,063,525 593,009 357,389 227,415 193,212 32,686,977 - - - - 193,726 317,196 104,208 398,077 221,508 27,003,91 5
910,205 461,597 625,492 414,720 87,001,87 4
166,856,243 33,174,806 161,601,559 74,163,481 16,985,441,749
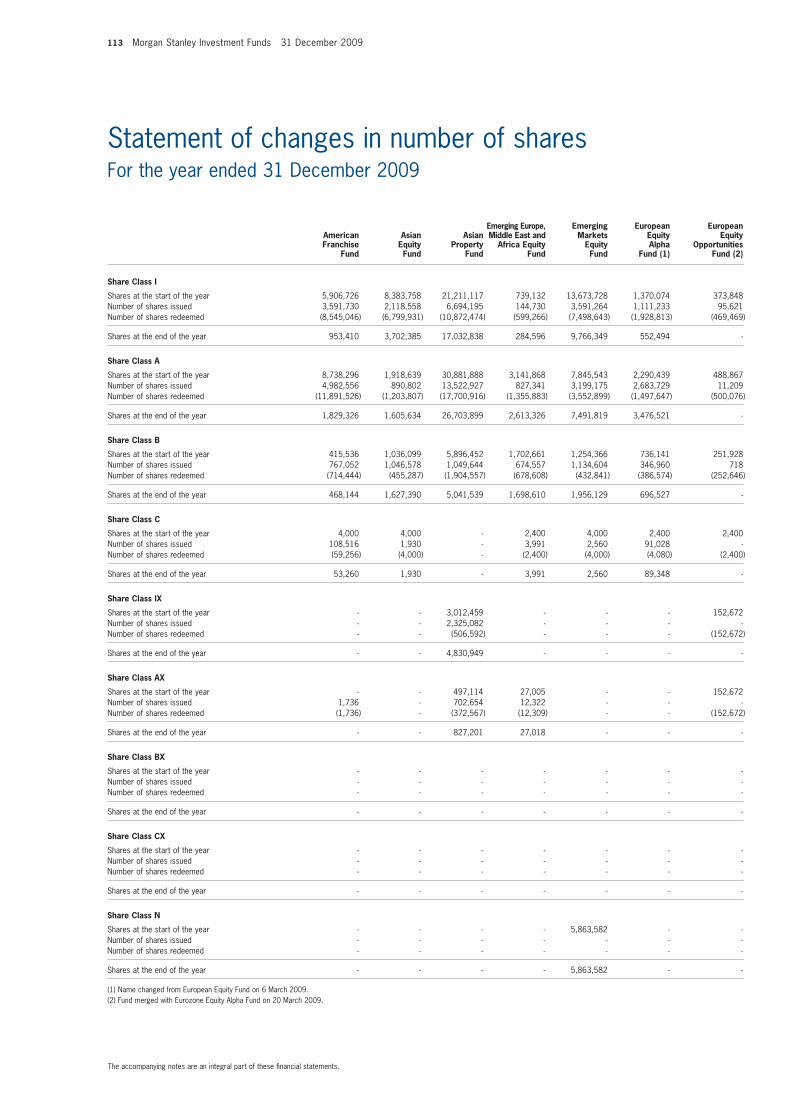
113 Morgan Stanley Investment Funds 31 December 2009
Statement of changes in number of shares For the year ended 31 December 2009
Emerging Europe, Emerging European European American Asian Asian Middle East and Markets Equity Equity Franchise Equity Property Africa Equity Equity Alpha Opportunities Fund Fund Fund Fund Fund Fund (1) Fund (2)
Share Class I
Shares at the start of the year 5,906,726 8,383,758 21,211,117 739,132 13,673,728 1,370,074 373,848 Number of shares issued 3,591,730 2,118,558 6,694,195 144,730 3,591,264 1,111,233 95,621 Number of shares redeemed (8,545,046) (6,799,931) (10,872,474) (599,266) (7,498,643) (1,928,813) (469,469)
Shares at the end of the year 953,410 3,702,385 17,032,838 284,596 9,766,349 552,494 -
Share Class A
Shares at the start of the year 8,738,296 1,918,639 30,881,888 3,141,868 7,845,543 2,290,439 488,867 Number of shares issued 4,982,556 890,802 13,522,927 827,341 3,199,175 2,683,729 11,209 Number of shares redeemed (11,891,526) (1,203,807) (17,700,916) (1,355,883) (3,552,899) (1,497,647) (500,076)
Shares at the end of the year 1,829,326 1,605,634 26,703,899 2,613,326 7,491,819 3,476,521 -
Share Class B
Shares at the start of the year 415,536 1,036,099 5,896,452 1,702,661 1,254,366 736,141 251,928 Number of shares issued 767,052 1,046,578 1,049,644 674,557 1,134,604 346,960 718 Number of shares redeemed (714,444) (455,287) (1,904,557) (678,608) (432,841) (386,574) (252,646)
Shares at the end of the year 468,144 1,627,390 5,041,539 1,698,610 1,956,129 696,527 -
Share Class C
Shares at the start of the year 4,000 4,000 - 2,400 4,000 2,400 2,400 Number of shares issued 108,516 1,930 - 3,991 2,560 91,028 - Number of shares redeemed (59,256) (4,000) - (2,400) (4,000) (4,080) (2,400)
Shares at the end of the year 53,260 1,930 - 3,991 2,560 89,348 -
Share Class IX
Shares at the start of the year - - 3,012,459 - - - 152,672 Number of shares issued - - 2,325,082 - - - - Number of shares redeemed - - (506,592) - - - (152,672)
Shares at the end of the year - - 4,830,949 - - - -
Share Class AX
Shares at the start of the year - - 497,114 27,005 - - 152,672 Number of shares issued 1,736 - 702,654 12,322 - - - Number of shares redeemed (1,736) - (372,567) (12,309) - - (152,672)
Shares at the end of the year - - 827,201 27,018 - - -
Share Class BX
Shares at the start of the year - - - - - - - Number of shares issued - - - - - - - Number of shares redeemed - - - - - - -
Shares at the end of the year - - - - - - -
Share Class CX
Shares at the start of the year - - - - - - - Number of shares issued - - - - - - - Number of shares redeemed - - - - - - -
Shares at the end of the year - - - - - - -
Share Class N
Shares at the start of the year - - - - 5,863,582 - - Number of shares issued - - - - - - - Number of shares redeemed - - - - - - -
Shares at the end of the year - - - - 5,863,582 - -
(1) Name changed from European Equity Fund on 6 March 2009.(2) Fund merged with Eurozone Equity Alpha Fund on 20 March 2009.
The accompanying notes are an integral part of these fi nancial statements.
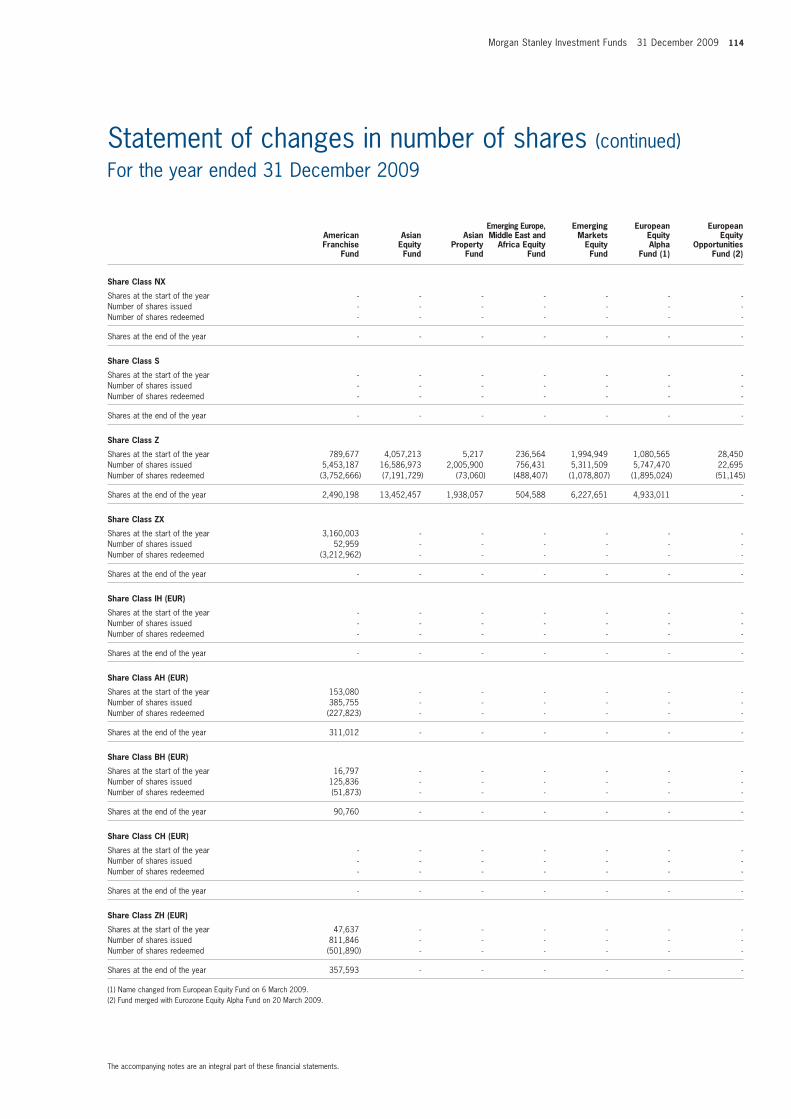
Morgan Stanley Investment Funds 31 December 2009 114
Statement of changes in number of shares (continued) For the year ended 31 December 2009
The accompanying notes are an integral part of these fi nancial statements.
Emerging Europe, Emerging European European American Asian Asian Middle East and Markets Equity Equity Franchise Equity Property Africa Equity Equity Alpha Opportunities Fund Fund Fund Fund Fund Fund (1) Fund (2)
Share Class NX
Shares at the start of the year - - - - - - - Number of shares issued - - - - - - - Number of shares redeemed - - - - - - -
Shares at the end of the year - - - - - - -
Share Class S
Shares at the start of the year - - - - - - - Number of shares issued - - - - - - - Number of shares redeemed - - - - - - -
Shares at the end of the year - - - - - - -
Share Class Z
Shares at the start of the year 789,677 4,057,213 5,217 236,564 1,994,949 1,080,565 28,450 Number of shares issued 5,453,187 16,586,973 2,005,900 756,431 5,311,509 5,747,470 22,695 Number of shares redeemed (3,752,666) (7,191,729) (73,060) (488,407) (1,078,807) (1,895,024) (51,145)
Shares at the end of the year 2,490,198 13,452,457 1,938,057 504,588 6,227,651 4,933,011 -
Share Class ZX
Shares at the start of the year 3,160,003 - - - - - - Number of shares issued 52,959 - - - - - - Number of shares redeemed (3,212,962) - - - - - -
Shares at the end of the year - - - - - - -
Share Class IH (EUR)
Shares at the start of the year - - - - - - - Number of shares issued - - - - - - - Number of shares redeemed - - - - - - -
Shares at the end of the year - - - - - - -
Share Class AH (EUR)
Shares at the start of the year 153,080 - - - - - - Number of shares issued 385,755 - - - - - - Number of shares redeemed (227,823) - - - - - -
Shares at the end of the year 311,012 - - - - - -
Share Class BH (EUR)
Shares at the start of the year 16,797 - - - - - - Number of shares issued 125,836 - - - - - - Number of shares redeemed (51,873) - - - - - -
Shares at the end of the year 90,760 - - - - - -
Share Class CH (EUR)
Shares at the start of the year - - - - - - - Number of shares issued - - - - - - - Number of shares redeemed - - - - - - -
Shares at the end of the year - - - - - - -
Share Class ZH (EUR)
Shares at the start of the year 47,637 - - - - - - Number of shares issued 811,846 - - - - - - Number of shares redeemed (501,890) - - - - - -
Shares at the end of the year 357,593 - - - - - -
(1) Name changed from European Equity Fund on 6 March 2009.(2) Fund merged with Eurozone Equity Alpha Fund on 20 March 2009.
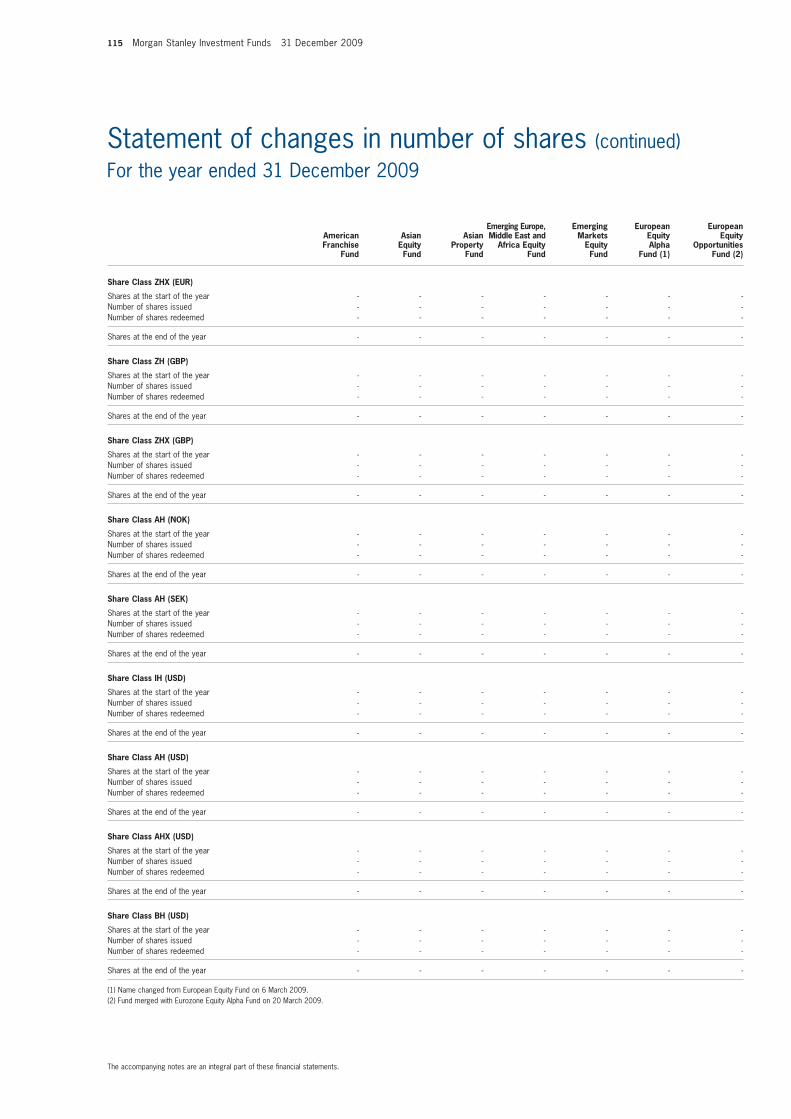
115 Morgan Stanley Investment Funds 31 December 2009
The accompanying notes are an integral part of these fi nancial statements.
Statement of changes in number of shares (continued) For the year ended 31 December 2009
Emerging Europe, Emerging European European American Asian Asian Middle East and Markets Equity Equity Franchise Equity Property Africa Equity Equity Alpha Opportunities Fund Fund Fund Fund Fund Fund (1) Fund (2)
Share Class ZHX (EUR)
Shares at the start of the year - - - - - - - Number of shares issued - - - - - - - Number of shares redeemed - - - - - - -
Shares at the end of the year - - - - - - -
Share Class ZH (GBP)
Shares at the start of the year - - - - - - - Number of shares issued - - - - - - - Number of shares redeemed - - - - - - -
Shares at the end of the year - - - - - - -
Share Class ZHX (GBP)
Shares at the start of the year - - - - - - - Number of shares issued - - - - - - - Number of shares redeemed - - - - - - -
Shares at the end of the year - - - - - - -
Share Class AH (NOK)
Shares at the start of the year - - - - - - - Number of shares issued - - - - - - - Number of shares redeemed - - - - - - -
Shares at the end of the year - - - - - - -
Share Class AH (SEK)
Shares at the start of the year - - - - - - - Number of shares issued - - - - - - - Number of shares redeemed - - - - - - -
Shares at the end of the year - - - - - - -
Share Class IH (USD)
Shares at the start of the year - - - - - - - Number of shares issued - - - - - - - Number of shares redeemed - - - - - - -
Shares at the end of the year - - - - - - -
Share Class AH (USD)
Shares at the start of the year - - - - - - - Number of shares issued - - - - - - - Number of shares redeemed - - - - - - -
Shares at the end of the year - - - - - - -
Share Class AHX (USD)
Shares at the start of the year - - - - - - - Number of shares issued - - - - - - - Number of shares redeemed - - - - - - -
Shares at the end of the year - - - - - - -
Share Class BH (USD)
Shares at the start of the year - - - - - - - Number of shares issued - - - - - - - Number of shares redeemed - - - - - - -
Shares at the end of the year - - - - - - -
(1) Name changed from European Equity Fund on 6 March 2009.(2) Fund merged with Eurozone Equity Alpha Fund on 20 March 2009.

Morgan Stanley Investment Funds 31 December 2009 116
The accompanying notes are an integral part of these fi nancial statements.
European Equity Optimised European Eurozone Global Research European Small Cap Equity Global Equity Global 130/30 Property Value Alpha Brands Growth Property Fund (1) (2) Fund Fund Fund (3) Fund Fund (4) Fund
Share Class I
Shares at the start of the year 46,610 4,062,405 94,913 287,741 9,033,160 2,063,534 9,436,933 Number of shares issued - 1,771,525 1,958 788,014 4,690,061 180,878 1,272,957 Number of shares redeemed (46,610) (3,058,873) (96,871) (948,854) (5,118,869) (2,244,412) (6,619,912)
Shares at the end of the year - 2,775,057 - 126,901 8,604,352 - 4,089,978
Share Class A
Shares at the start of the year 47,237 3,720,807 262,583 3,544,308 13,596,006 257,246 1,634,002 Number of shares issued - 4,857,906 90,343 2,539,844 2,699,243 7,732 8,053,807 Number of shares redeemed (47,237) (2,428,476) (135,118) (2,181,801) (6,182,934) (264,978) (4,337,531)
Shares at the end of the year - 6,150,237 217,808 3,902,351 10,112,315 - 5,350,278
Share Class B
Shares at the start of the year 50,618 550,207 194,958 1,329,507 3,099,867 83,763 187,208 Number of shares issued 263 476,014 89,911 1,005,502 597,279 17,083 613,169 Number of shares redeemed (50,881) (301,463) (92,788) (878,458) (939,857) (100,846) (151,903)
Shares at the end of the year - 724,758 192,081 1,456,551 2,757,289 - 648,474
Share Class C
Shares at the start of the year 2,400 - - - - 4,000 4,000 Number of shares issued - - - - 7,161 - 72,284 Number of shares redeemed (2,400) - - - (2,918) (4,000) (7,933)
Shares at the end of the year - - - - 4,243 - 68,351
Share Class IX
Shares at the start of the year - 79,445 - - - - 503,386 Number of shares issued - 246,252 - - - - 61,960 Number of shares redeemed - (149,352) - - - - (327,715)
Shares at the end of the year - 176,345 - - - - 237,631
Share Class AX
Shares at the start of the year - 32,169 5,380 - - 1,943 - Number of shares issued - 4,724 2,672 - - - - Number of shares redeemed - (1,349) (500) - - (1,943) -
Shares at the end of the year - 35,544 7,552 - - - -
Share Class BX
Shares at the start of the year - - - - - - - Number of shares issued - - - - - - - Number of shares redeemed - - - - - - -
Shares at the end of the year - - - - - - -
Share Class CX
Shares at the start of the year - - - - - - - Number of shares issued - - - - - - - Number of shares redeemed - - - - - - -
Shares at the end of the year - - - - - - -
Share Class N
Shares at the start of the year - - - - - - - Number of shares issued - - - - - - - Number of shares redeemed - - - - - - -
Shares at the end of the year - - - - - - -
(1) Name changed from European Optimised Research Extension Fund on 6 March 2009.(2) Shareholders of this Fund were compulsorily redeemed on 30 April 2009.(3) Name changed from Eurozone Equity Opportunities Fund on 6 March 2009.(4) Fund merged with Global Value Equity Fund on 3 April 2009.
Statement of changes in number of shares (continued) For the year ended 31 December 2009
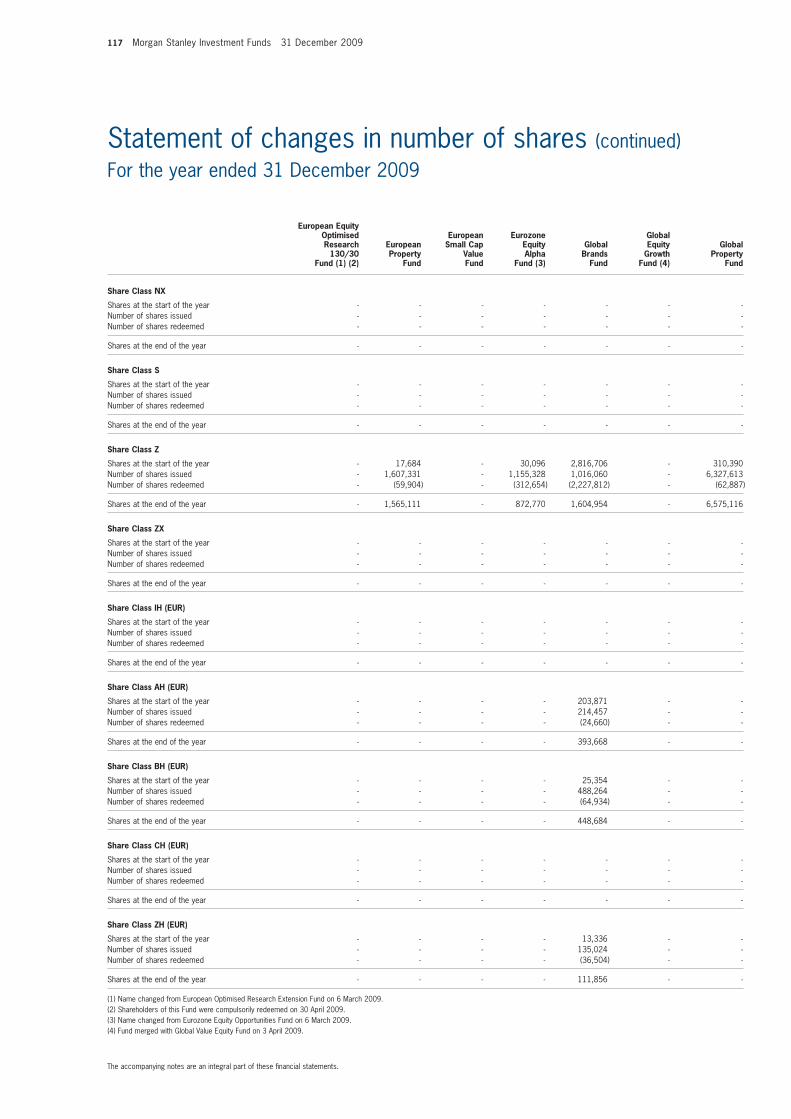
117 Morgan Stanley Investment Funds 31 December 2009
The accompanying notes are an integral part of these fi nancial statements.
Statement of changes in number of shares (continued) For the year ended 31 December 2009
European Equity Optimised European Eurozone Global Research European Small Cap Equity Global Equity Global 130/30 Property Value Alpha Brands Growth Property Fund (1) (2) Fund Fund Fund (3) Fund Fund (4) Fund
Share Class NX
Shares at the start of the year - - - - - - - Number of shares issued - - - - - - - Number of shares redeemed - - - - - - -
Shares at the end of the year - - - - - - -
Share Class S
Shares at the start of the year - - - - - - - Number of shares issued - - - - - - - Number of shares redeemed - - - - - - -
Shares at the end of the year - - - - - - -
Share Class Z
Shares at the start of the year - 17,684 - 30,096 2,816,706 - 310,390 Number of shares issued - 1,607,331 - 1,155,328 1,016,060 - 6,327,613 Number of shares redeemed - (59,904) - (312,654) (2,227,812) - (62,887)
Shares at the end of the year - 1,565,111 - 872,770 1,604,954 - 6,575,116
Share Class ZX
Shares at the start of the year - - - - - - - Number of shares issued - - - - - - - Number of shares redeemed - - - - - - -
Shares at the end of the year - - - - - - -
Share Class IH (EUR)
Shares at the start of the year - - - - - - - Number of shares issued - - - - - - - Number of shares redeemed - - - - - - -
Shares at the end of the year - - - - - - -
Share Class AH (EUR)
Shares at the start of the year - - - - 203,871 - - Number of shares issued - - - - 214,457 - - Number of shares redeemed - - - - (24,660) - -
Shares at the end of the year - - - - 393,668 - -
Share Class BH (EUR)
Shares at the start of the year - - - - 25,354 - - Number of shares issued - - - - 488,264 - - Number of shares redeemed - - - - (64,934) - -
Shares at the end of the year - - - - 448,684 - -
Share Class CH (EUR)
Shares at the start of the year - - - - - - - Number of shares issued - - - - - - - Number of shares redeemed - - - - - - -
Shares at the end of the year - - - - - - -
Share Class ZH (EUR)
Shares at the start of the year - - - - 13,336 - - Number of shares issued - - - - 135,024 - - Number of shares redeemed - - - - (36,504) - -
Shares at the end of the year - - - - 111,856 - -
(1) Name changed from European Optimised Research Extension Fund on 6 March 2009.(2) Shareholders of this Fund were compulsorily redeemed on 30 April 2009.(3) Name changed from Eurozone Equity Opportunities Fund on 6 March 2009.(4) Fund merged with Global Value Equity Fund on 3 April 2009.
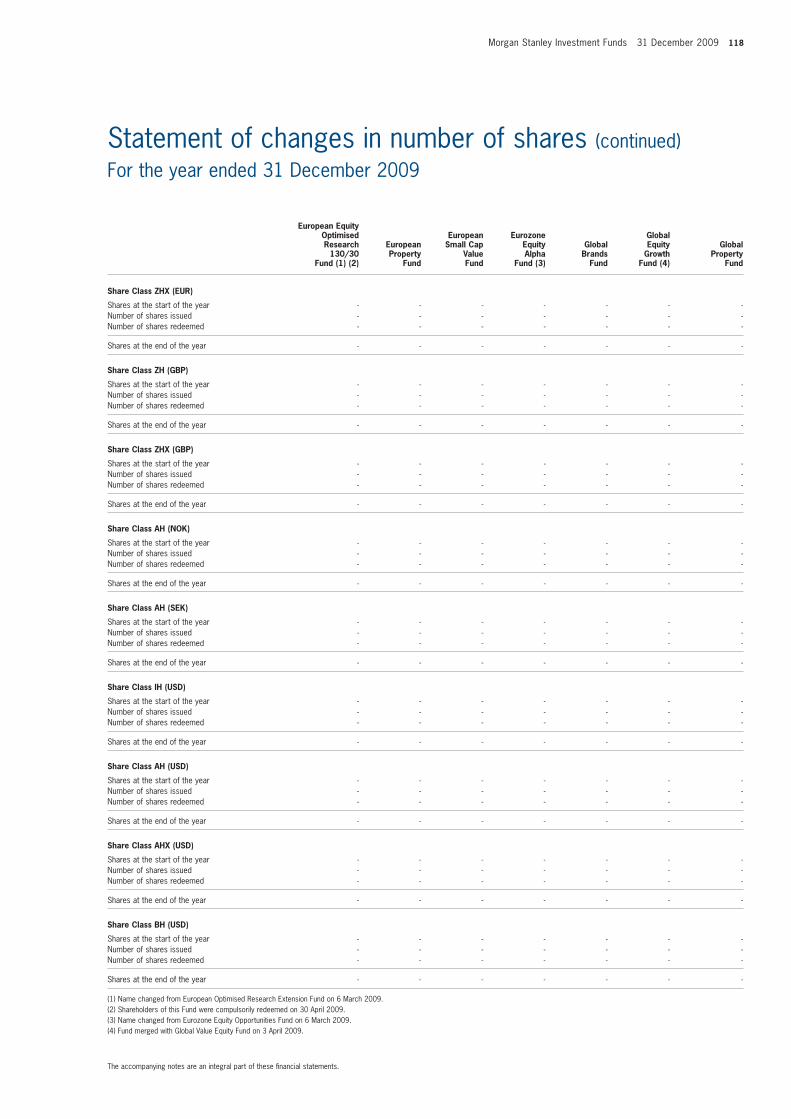
Morgan Stanley Investment Funds 31 December 2009 118
The accompanying notes are an integral part of these fi nancial statements.
Statement of changes in number of shares (continued) For the year ended 31 December 2009
European Equity Optimised European Eurozone Global Research European Small Cap Equity Global Equity Global 130/30 Property Value Alpha Brands Growth Property Fund (1) (2) Fund Fund Fund (3) Fund Fund (4) Fund
Share Class ZHX (EUR)
Shares at the start of the year - - - - - - - Number of shares issued - - - - - - - Number of shares redeemed - - - - - - -
Shares at the end of the year - - - - - - -
Share Class ZH (GBP)
Shares at the start of the year - - - - - - - Number of shares issued - - - - - - - Number of shares redeemed - - - - - - -
Shares at the end of the year - - - - - - -
Share Class ZHX (GBP)
Shares at the start of the year - - - - - - - Number of shares issued - - - - - - - Number of shares redeemed - - - - - - -
Shares at the end of the year - - - - - - -
Share Class AH (NOK)
Shares at the start of the year - - - - - - - Number of shares issued - - - - - - - Number of shares redeemed - - - - - - -
Shares at the end of the year - - - - - - -
Share Class AH (SEK)
Shares at the start of the year - - - - - - - Number of shares issued - - - - - - - Number of shares redeemed - - - - - - -
Shares at the end of the year - - - - - - -
Share Class IH (USD)
Shares at the start of the year - - - - - - - Number of shares issued - - - - - - - Number of shares redeemed - - - - - - -
Shares at the end of the year - - - - - - -
Share Class AH (USD)
Shares at the start of the year - - - - - - - Number of shares issued - - - - - - - Number of shares redeemed - - - - - - -
Shares at the end of the year - - - - - - -
Share Class AHX (USD)
Shares at the start of the year - - - - - - - Number of shares issued - - - - - - - Number of shares redeemed - - - - - - -
Shares at the end of the year - - - - - - -
Share Class BH (USD)
Shares at the start of the year - - - - - - - Number of shares issued - - - - - - - Number of shares redeemed - - - - - - -
Shares at the end of the year - - - - - - -
(1) Name changed from European Optimised Research Extension Fund on 6 March 2009.(2) Shareholders of this Fund were compulsorily redeemed on 30 April 2009.(3) Name changed from Eurozone Equity Opportunities Fund on 6 March 2009.(4) Fund merged with Global Value Equity Fund on 3 April 2009.
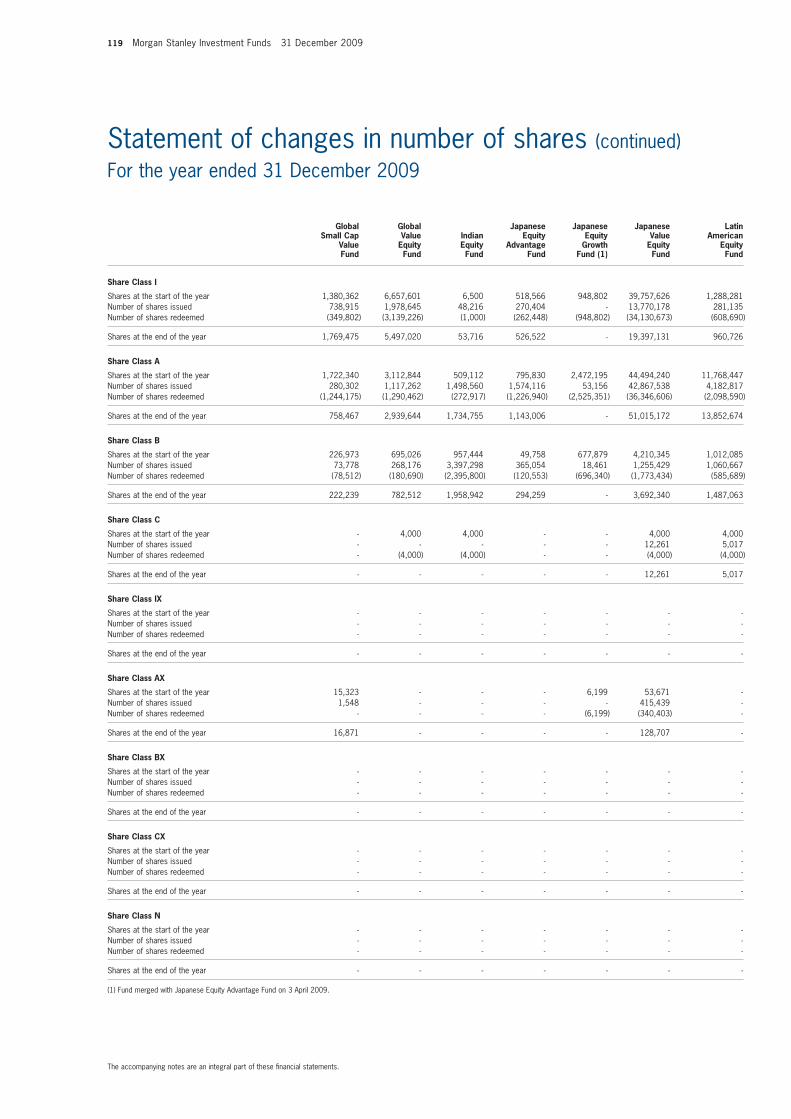
119 Morgan Stanley Investment Funds 31 December 2009
The accompanying notes are an integral part of these fi nancial statements.
Global Global Japanese Japanese Japanese Latin Small Cap Value Indian Equity Equity Value American Value Equity Equity Advantage Growth Equity Equity Fund Fund Fund Fund Fund (1) Fund Fund
Share Class I
Shares at the start of the year 1,380,362 6,657,601 6,500 518,566 948,802 39,757,626 1,288,281 Number of shares issued 738,915 1,978,645 48,216 270,404 - 13,770,178 281,135 Number of shares redeemed (349,802) (3,139,226) (1,000) (262,448) (948,802) (34,130,673) (608,690)
Shares at the end of the year 1,769,475 5,497,020 53,716 526,522 - 19,397,131 960,726
Share Class A
Shares at the start of the year 1,722,340 3,112,844 509,112 795,830 2,472,195 44,494,240 11,768,447 Number of shares issued 280,302 1,117,262 1,498,560 1,574,116 53,156 42,867,538 4,182,817 Number of shares redeemed (1,244,175) (1,290,462) (272,917) (1,226,940) (2,525,351) (36,346,606) (2,098,590)
Shares at the end of the year 758,467 2,939,644 1,734,755 1,143,006 - 51,015,172 13,852,674
Share Class B
Shares at the start of the year 226,973 695,026 957,444 49,758 677,879 4,210,345 1,012,085 Number of shares issued 73,778 268,176 3,397,298 365,054 18,461 1,255,429 1,060,667 Number of shares redeemed (78,512) (180,690) (2,395,800) (120,553) (696,340) (1,773,434) (585,689)
Shares at the end of the year 222,239 782,512 1,958,942 294,259 - 3,692,340 1,487,063
Share Class C
Shares at the start of the year - 4,000 4,000 - - 4,000 4,000 Number of shares issued - - - - - 12,261 5,017 Number of shares redeemed - (4,000) (4,000) - - (4,000) (4,000)
Shares at the end of the year - - - - - 12,261 5,017
Share Class IX
Shares at the start of the year - - - - - - - Number of shares issued - - - - - - - Number of shares redeemed - - - - - - -
Shares at the end of the year - - - - - - -
Share Class AX
Shares at the start of the year 15,323 - - - 6,199 53,671 - Number of shares issued 1,548 - - - - 415,439 - Number of shares redeemed - - - - (6,199) (340,403) -
Shares at the end of the year 16,871 - - - - 128,707 -
Share Class BX
Shares at the start of the year - - - - - - - Number of shares issued - - - - - - - Number of shares redeemed - - - - - - -
Shares at the end of the year - - - - - - -
Share Class CX
Shares at the start of the year - - - - - - - Number of shares issued - - - - - - - Number of shares redeemed - - - - - - -
Shares at the end of the year - - - - - - -
Share Class N
Shares at the start of the year - - - - - - - Number of shares issued - - - - - - - Number of shares redeemed - - - - - - -
Shares at the end of the year - - - - - - -
(1) Fund merged with Japanese Equity Advantage Fund on 3 April 2009.
Statement of changes in number of shares (continued) For the year ended 31 December 2009
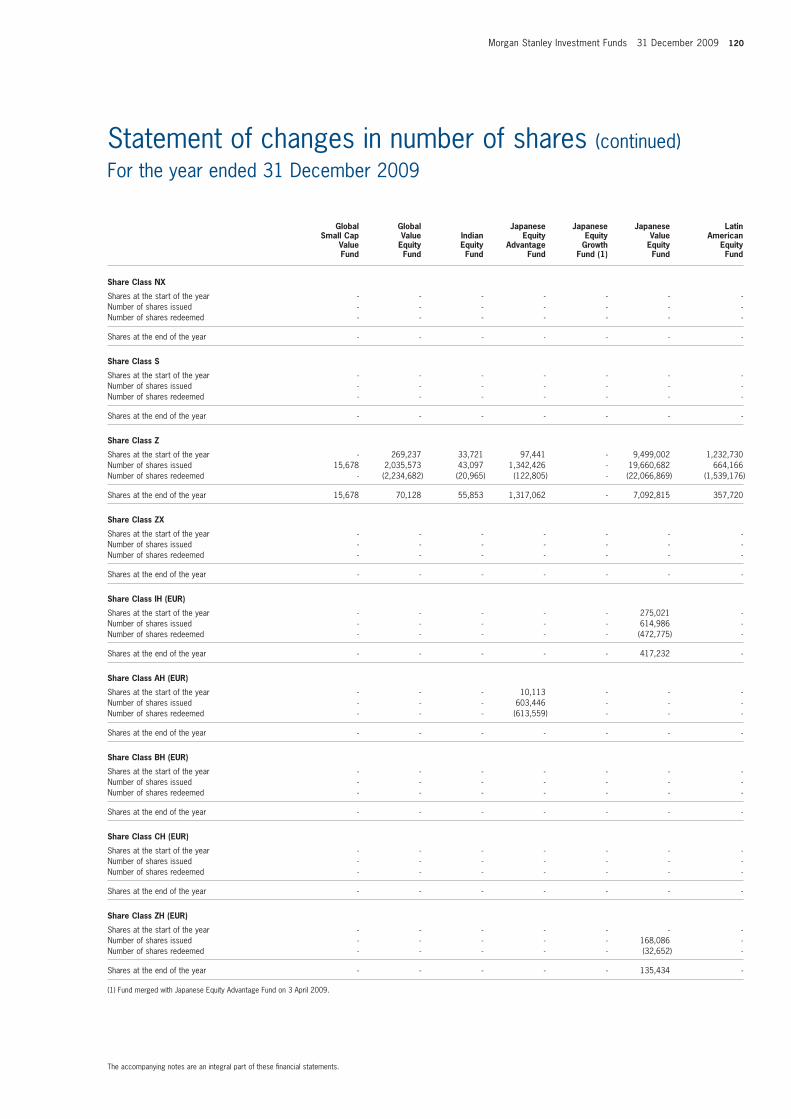
Morgan Stanley Investment Funds 31 December 2009 120
The accompanying notes are an integral part of these fi nancial statements.
Statement of changes in number of shares (continued) For the year ended 31 December 2009
Global Global Japanese Japanese Japanese Latin Small Cap Value Indian Equity Equity Value American Value Equity Equity Advantage Growth Equity Equity Fund Fund Fund Fund Fund (1) Fund Fund
Share Class NX
Shares at the start of the year - - - - - - - Number of shares issued - - - - - - - Number of shares redeemed - - - - - - -
Shares at the end of the year - - - - - - -
Share Class S
Shares at the start of the year - - - - - - - Number of shares issued - - - - - - - Number of shares redeemed - - - - - - -
Shares at the end of the year - - - - - - -
Share Class Z
Shares at the start of the year - 269,237 33,721 97,441 - 9,499,002 1,232,730 Number of shares issued 15,678 2,035,573 43,097 1,342,426 - 19,660,682 664,166 Number of shares redeemed - (2,234,682) (20,965) (122,805) - (22,066,869) (1,539,176)
Shares at the end of the year 15,678 70,128 55,853 1,317,062 - 7,092,815 357,720
Share Class ZX
Shares at the start of the year - - - - - - - Number of shares issued - - - - - - - Number of shares redeemed - - - - - - -
Shares at the end of the year - - - - - - -
Share Class IH (EUR)
Shares at the start of the year - - - - - 275,021 - Number of shares issued - - - - - 614,986 - Number of shares redeemed - - - - - (472,775) -
Shares at the end of the year - - - - - 417,232 -
Share Class AH (EUR)
Shares at the start of the year - - - 10,113 - - - Number of shares issued - - - 603,446 - - - Number of shares redeemed - - - (613,559) - - -
Shares at the end of the year - - - - - - -
Share Class BH (EUR)
Shares at the start of the year - - - - - - - Number of shares issued - - - - - - - Number of shares redeemed - - - - - - -
Shares at the end of the year - - - - - - -
Share Class CH (EUR)
Shares at the start of the year - - - - - - - Number of shares issued - - - - - - - Number of shares redeemed - - - - - - -
Shares at the end of the year - - - - - - -
Share Class ZH (EUR)
Shares at the start of the year - - - - - - - Number of shares issued - - - - - 168,086 - Number of shares redeemed - - - - - (32,652) -
Shares at the end of the year - - - - - 135,434 -
(1) Fund merged with Japanese Equity Advantage Fund on 3 April 2009.

121 Morgan Stanley Investment Funds 31 December 2009
The accompanying notes are an integral part of these fi nancial statements.
Statement of changes in number of shares (continued) For the year ended 31 December 2009
Global Global Japanese Japanese Japanese Latin Small Cap Value Indian Equity Equity Value American Value Equity Equity Advantage Growth Equity Equity Fund Fund Fund Fund Fund (1) Fund Fund
Share Class ZHX (EUR)
Shares at the start of the year - - - - - - - Number of shares issued - - - - - - - Number of shares redeemed - - - - - - -
Shares at the end of the year - - - - - - -
Share Class ZH (GBP)
Shares at the start of the year - - - - - - - Number of shares issued - - - - - - - Number of shares redeemed - - - - - - -
Shares at the end of the year - - - - - - -
Share Class ZHX (GBP)
Shares at the start of the year - - - - - - - Number of shares issued - - - - - - - Number of shares redeemed - - - - - - -
Shares at the end of the year - - - - - - -
Share Class AH (NOK)
Shares at the start of the year - - - - - - - Number of shares issued - - - - - - - Number of shares redeemed - - - - - - -
Shares at the end of the year - - - - - - -
Share Class AH (SEK)
Shares at the start of the year - - - - - - - Number of shares issued - - - - - - - Number of shares redeemed - - - - - - -
Shares at the end of the year - - - - - - -
Share Class IH (USD)
Shares at the start of the year - - - - - - - Number of shares issued - - - - - - - Number of shares redeemed - - - - - - -
Shares at the end of the year - - - - - - -
Share Class AH (USD)
Shares at the start of the year - - - - - - - Number of shares issued - - - - - - - Number of shares redeemed - - - - - - -
Shares at the end of the year - - - - - - -
Share Class AHX (USD)
Shares at the start of the year - - - - - - - Number of shares issued - - - - - - - Number of shares redeemed - - - - - - -
Shares at the end of the year - - - - - - -
Share Class BH (USD)
Shares at the start of the year - - - - - - - Number of shares issued - - - - - - - Number of shares redeemed - - - - - - -
Shares at the end of the year - - - - - - -
(1) Fund merged with Japanese Equity Advantage Fund on 3 April 2009.
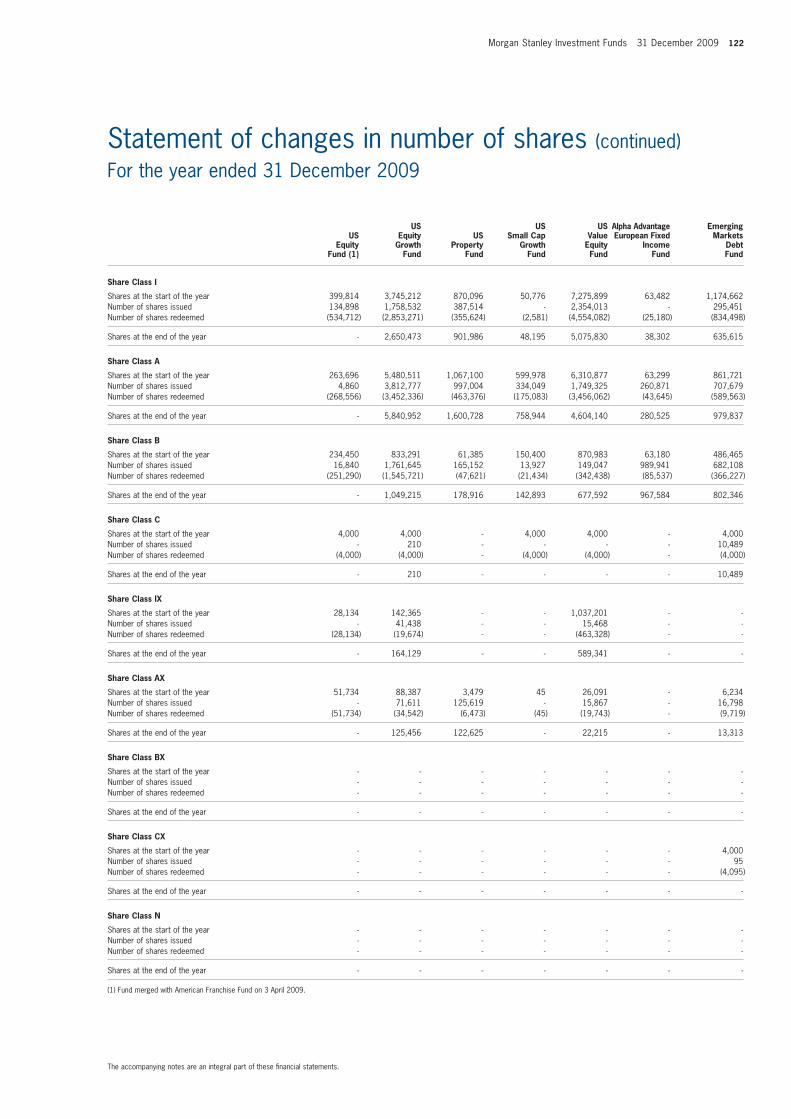
Morgan Stanley Investment Funds 31 December 2009 122
The accompanying notes are an integral part of these fi nancial statements.
Statement of changes in number of shares (continued) For the year ended 31 December 2009
US US US Alpha Advantage Emerging US Equity US Small Cap Value European Fixed Markets Equity Growth Property Growth Equity Income Debt Fund (1) Fund Fund Fund Fund Fund Fund
Share Class I
Shares at the start of the year 399,814 3,745,212 870,096 50,776 7,275,899 63,482 1,174,662 Number of shares issued 134,898 1,758,532 387,514 - 2,354,013 - 295,451 Number of shares redeemed (534,712) (2,853,271) (355,624) (2,581) (4,554,082) (25,180) (834,498)
Shares at the end of the year - 2,650,473 901,986 48,195 5,075,830 38,302 635,615
Share Class A
Shares at the start of the year 263,696 5,480,511 1,067,100 599,978 6,310,877 63,299 861,721 Number of shares issued 4,860 3,812,777 997,004 334,049 1,749,325 260,871 707,679 Number of shares redeemed (268,556) (3,452,336) (463,376) (175,083) (3,456,062) (43,645) (589,563)
Shares at the end of the year - 5,840,952 1,600,728 758,944 4,604,140 280,525 979,837
Share Class B
Shares at the start of the year 234,450 833,291 61,385 150,400 870,983 63,180 486,465 Number of shares issued 16,840 1,761,645 165,152 13,927 149,047 989,941 682,108 Number of shares redeemed (251,290) (1,545,721) (47,621) (21,434) (342,438) (85,537) (366,227)
Shares at the end of the year - 1,049,215 178,916 142,893 677,592 967,584 802,346
Share Class C
Shares at the start of the year 4,000 4,000 - 4,000 4,000 - 4,000 Number of shares issued - 210 - - - - 10,489 Number of shares redeemed (4,000) (4,000) - (4,000) (4,000) - (4,000)
Shares at the end of the year - 210 - - - - 10,489
Share Class IX
Shares at the start of the year 28,134 142,365 - - 1,037,201 - - Number of shares issued - 41,438 - - 15,468 - - Number of shares redeemed (28,134) (19,674) - - (463,328) - -
Shares at the end of the year - 164,129 - - 589,341 - -
Share Class AX
Shares at the start of the year 51,734 88,387 3,479 45 26,091 - 6,234 Number of shares issued - 71,611 125,619 - 15,867 - 16,798 Number of shares redeemed (51,734) (34,542) (6,473) (45) (19,743) - (9,719)
Shares at the end of the year - 125,456 122,625 - 22,215 - 13,313
Share Class BX
Shares at the start of the year - - - - - - - Number of shares issued - - - - - - - Number of shares redeemed - - - - - - -
Shares at the end of the year - - - - - - -
Share Class CX
Shares at the start of the year - - - - - - 4,000 Number of shares issued - - - - - - 95 Number of shares redeemed - - - - - - (4,095)
Shares at the end of the year - - - - - - -
Share Class N
Shares at the start of the year - - - - - - - Number of shares issued - - - - - - - Number of shares redeemed - - - - - - -
Shares at the end of the year - - - - - - -
(1) Fund merged with American Franchise Fund on 3 April 2009.
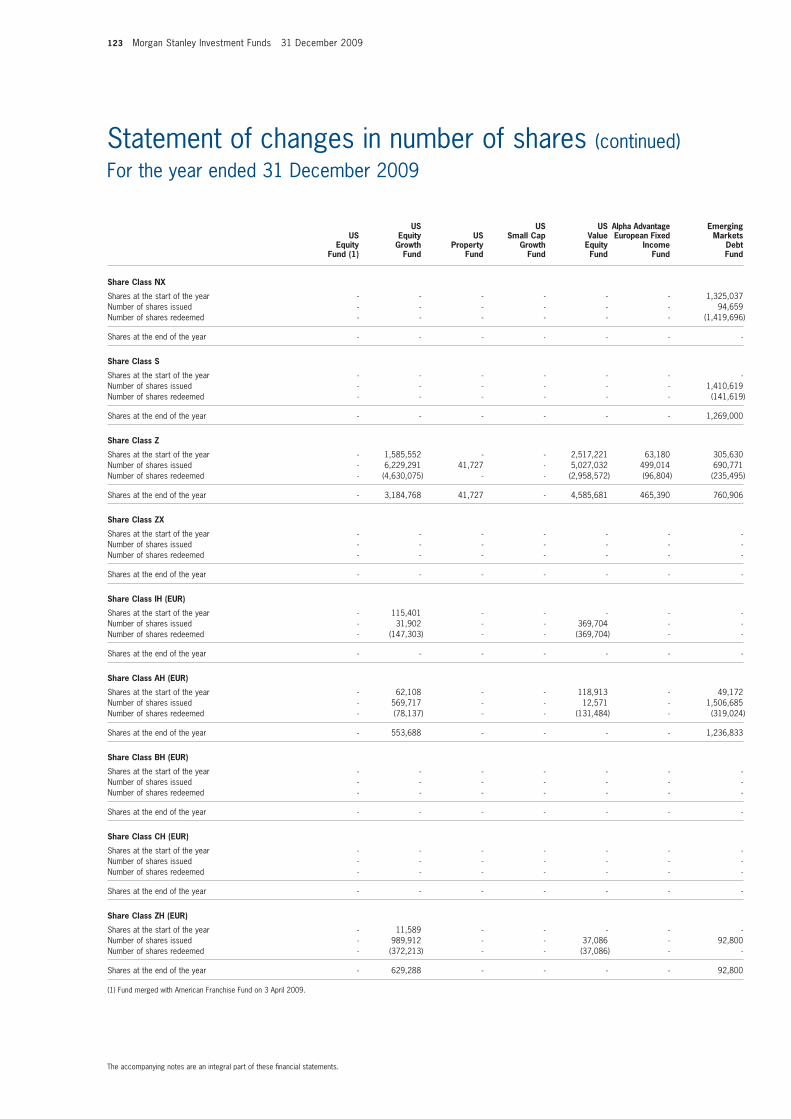
123 Morgan Stanley Investment Funds 31 December 2009
The accompanying notes are an integral part of these fi nancial statements.
Statement of changes in number of shares (continued) For the year ended 31 December 2009
US US US Alpha Advantage Emerging US Equity US Small Cap Value European Fixed Markets Equity Growth Property Growth Equity Income Debt Fund (1) Fund Fund Fund Fund Fund Fund
Share Class NX
Shares at the start of the year - - - - - - 1,325,037 Number of shares issued - - - - - - 94,659 Number of shares redeemed - - - - - - (1,419,696)
Shares at the end of the year - - - - - - -
Share Class S
Shares at the start of the year - - - - - - - Number of shares issued - - - - - - 1,410,619 Number of shares redeemed - - - - - - (141,619)
Shares at the end of the year - - - - - - 1,269,000
Share Class Z
Shares at the start of the year - 1,585,552 - - 2,517,221 63,180 305,630 Number of shares issued - 6,229,291 41,727 - 5,027,032 499,014 690,771 Number of shares redeemed - (4,630,075) - - (2,958,572) (96,804) (235,495)
Shares at the end of the year - 3,184,768 41,727 - 4,585,681 465,390 760,906
Share Class ZX
Shares at the start of the year - - - - - - - Number of shares issued - - - - - - - Number of shares redeemed - - - - - - -
Shares at the end of the year - - - - - - -
Share Class IH (EUR)
Shares at the start of the year - 115,401 - - - - - Number of shares issued - 31,902 - - 369,704 - - Number of shares redeemed - (147,303) - - (369,704) - -
Shares at the end of the year - - - - - - -
Share Class AH (EUR)
Shares at the start of the year - 62,108 - - 118,913 - 49,172 Number of shares issued - 569,717 - - 12,571 - 1,506,685 Number of shares redeemed - (78,137) - - (131,484) - (319,024)
Shares at the end of the year - 553,688 - - - - 1,236,833
Share Class BH (EUR)
Shares at the start of the year - - - - - - - Number of shares issued - - - - - - - Number of shares redeemed - - - - - - -
Shares at the end of the year - - - - - - -
Share Class CH (EUR)
Shares at the start of the year - - - - - - - Number of shares issued - - - - - - - Number of shares redeemed - - - - - - -
Shares at the end of the year - - - - - - -
Share Class ZH (EUR)
Shares at the start of the year - 11,589 - - - - - Number of shares issued - 989,912 - - 37,086 - 92,800 Number of shares redeemed - (372,213) - - (37,086) - -
Shares at the end of the year - 629,288 - - - - 92,800
(1) Fund merged with American Franchise Fund on 3 April 2009.
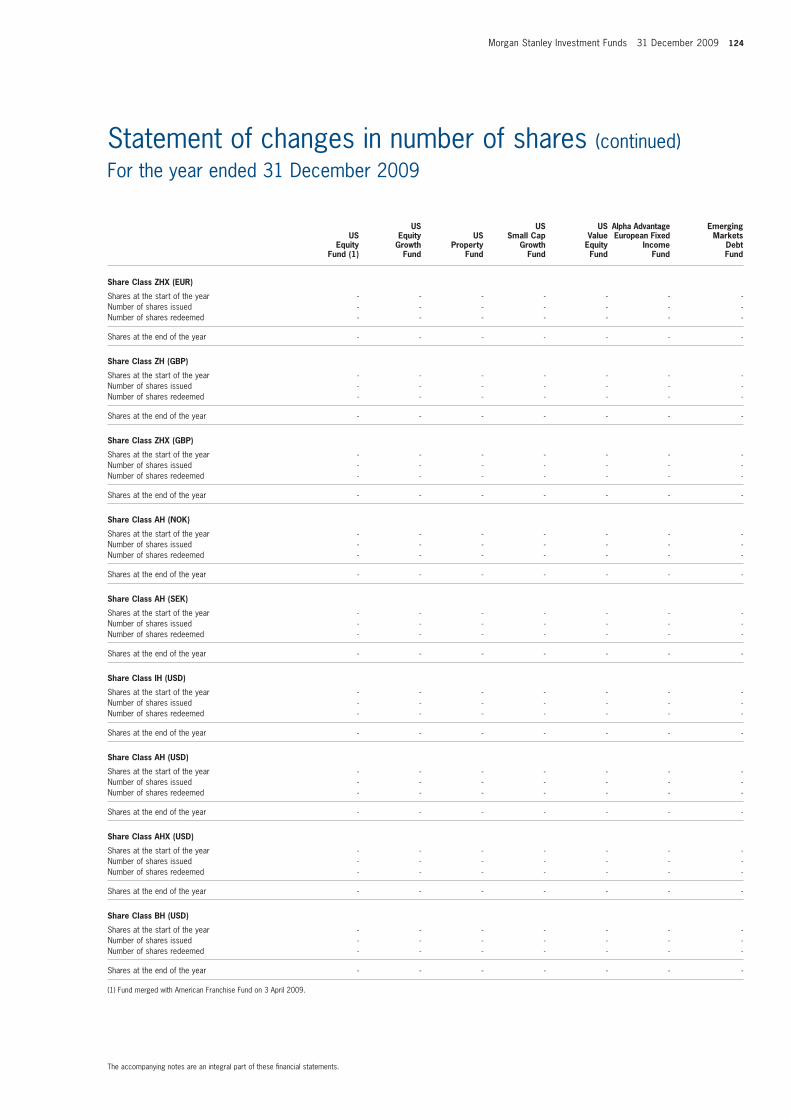
Morgan Stanley Investment Funds 31 December 2009 124
The accompanying notes are an integral part of these fi nancial statements.
Statement of changes in number of shares (continued) For the year ended 31 December 2009
US US US Alpha Advantage Emerging US Equity US Small Cap Value European Fixed Markets Equity Growth Property Growth Equity Income Debt Fund (1) Fund Fund Fund Fund Fund Fund
Share Class ZHX (EUR)
Shares at the start of the year - - - - - - - Number of shares issued - - - - - - - Number of shares redeemed - - - - - - -
Shares at the end of the year - - - - - - -
Share Class ZH (GBP)
Shares at the start of the year - - - - - - - Number of shares issued - - - - - - - Number of shares redeemed - - - - - - -
Shares at the end of the year - - - - - - -
Share Class ZHX (GBP)
Shares at the start of the year - - - - - - - Number of shares issued - - - - - - - Number of shares redeemed - - - - - - -
Shares at the end of the year - - - - - - -
Share Class AH (NOK)
Shares at the start of the year - - - - - - - Number of shares issued - - - - - - - Number of shares redeemed - - - - - - -
Shares at the end of the year - - - - - - -
Share Class AH (SEK)
Shares at the start of the year - - - - - - - Number of shares issued - - - - - - - Number of shares redeemed - - - - - - -
Shares at the end of the year - - - - - - -
Share Class IH (USD)
Shares at the start of the year - - - - - - - Number of shares issued - - - - - - - Number of shares redeemed - - - - - - -
Shares at the end of the year - - - - - - -
Share Class AH (USD)
Shares at the start of the year - - - - - - - Number of shares issued - - - - - - - Number of shares redeemed - - - - - - -
Shares at the end of the year - - - - - - -
Share Class AHX (USD)
Shares at the start of the year - - - - - - - Number of shares issued - - - - - - - Number of shares redeemed - - - - - - -
Shares at the end of the year - - - - - - -
Share Class BH (USD)
Shares at the start of the year - - - - - - - Number of shares issued - - - - - - - Number of shares redeemed - - - - - - -
Shares at the end of the year - - - - - - -
(1) Fund merged with American Franchise Fund on 3 April 2009.
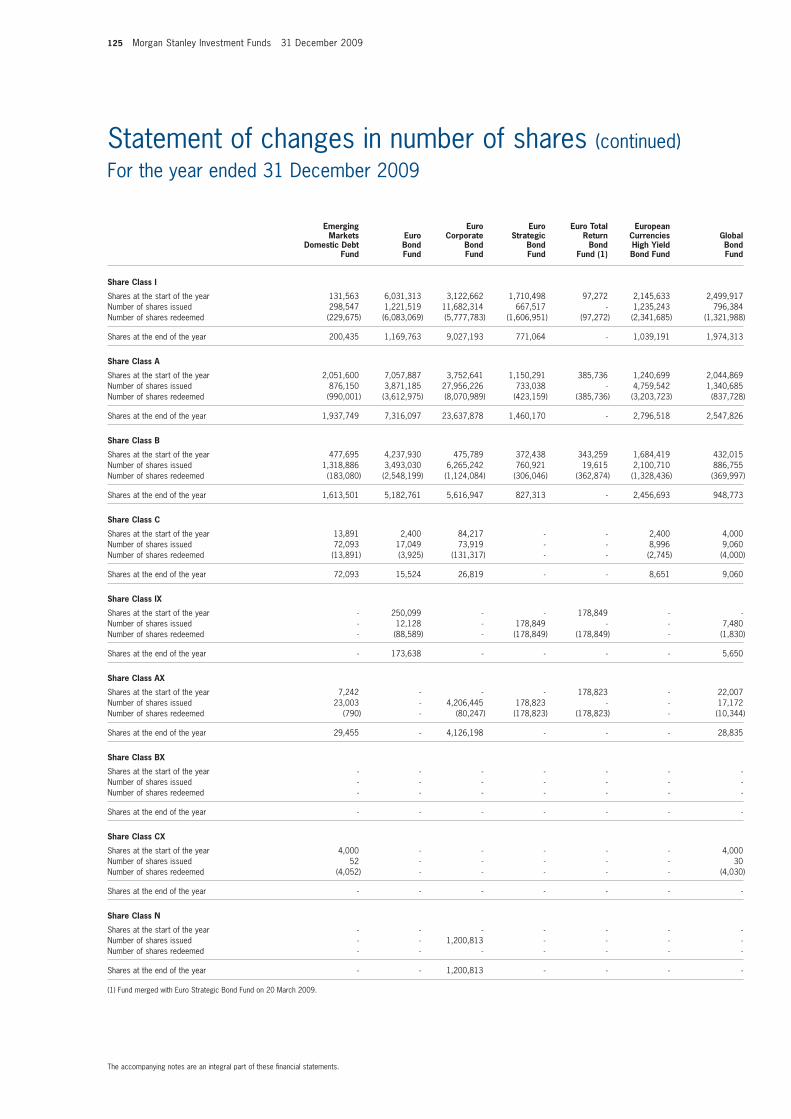
125 Morgan Stanley Investment Funds 31 December 2009
The accompanying notes are an integral part of these fi nancial statements.
Statement of changes in number of shares (continued) For the year ended 31 December 2009
Emerging Euro Euro Euro Total European Markets Euro Corporate Strategic Return Currencies Global Domestic Debt Bond Bond Bond Bond High Yield Bond Fund Fund Fund Fund Fund (1) Bond Fund Fund
Share Class I
Shares at the start of the year 131,563 6,031,313 3,122,662 1,710,498 97,272 2,145,633 2,499,917 Number of shares issued 298,547 1,221,519 11,682,314 667,517 - 1,235,243 796,384 Number of shares redeemed (229,675) (6,083,069) (5,777,783) (1,606,951) (97,272) (2,341,685) (1,321,988)
Shares at the end of the year 200,435 1,169,763 9,027,193 771,064 - 1,039,191 1,974,313
Share Class A
Shares at the start of the year 2,051,600 7,057,887 3,752,641 1,150,291 385,736 1,240,699 2,044,869 Number of shares issued 876,150 3,871,185 27,956,226 733,038 - 4,759,542 1,340,685 Number of shares redeemed (990,001) (3,612,975) (8,070,989) (423,159) (385,736) (3,203,723) (837,728)
Shares at the end of the year 1,937,749 7,316,097 23,637,878 1,460,170 - 2,796,518 2,547,826
Share Class B
Shares at the start of the year 477,695 4,237,930 475,789 372,438 343,259 1,684,419 432,015 Number of shares issued 1,318,886 3,493,030 6,265,242 760,921 19,615 2,100,710 886,755 Number of shares redeemed (183,080) (2,548,199) (1,124,084) (306,046) (362,874) (1,328,436) (369,997)
Shares at the end of the year 1,613,501 5,182,761 5,616,947 827,313 - 2,456,693 948,773
Share Class C
Shares at the start of the year 13,891 2,400 84,217 - - 2,400 4,000 Number of shares issued 72,093 17,049 73,919 - - 8,996 9,060 Number of shares redeemed (13,891) (3,925) (131,317) - - (2,745) (4,000)
Shares at the end of the year 72,093 15,524 26,819 - - 8,651 9,060
Share Class IX
Shares at the start of the year - 250,099 - - 178,849 - - Number of shares issued - 12,128 - 178,849 - - 7,480 Number of shares redeemed - (88,589) - (178,849) (178,849) - (1,830)
Shares at the end of the year - 173,638 - - - - 5,650
Share Class AX
Shares at the start of the year 7,242 - - - 178,823 - 22,007 Number of shares issued 23,003 - 4,206,445 178,823 - - 17,172 Number of shares redeemed (790) - (80,247) (178,823) (178,823) - (10,344)
Shares at the end of the year 29,455 - 4,126,198 - - - 28,835
Share Class BX
Shares at the start of the year - - - - - - - Number of shares issued - - - - - - - Number of shares redeemed - - - - - - -
Shares at the end of the year - - - - - - -
Share Class CX
Shares at the start of the year 4,000 - - - - - 4,000 Number of shares issued 52 - - - - - 30 Number of shares redeemed (4,052) - - - - - (4,030)
Shares at the end of the year - - - - - - -
Share Class N
Shares at the start of the year - - - - - - - Number of shares issued - - 1,200,813 - - - - Number of shares redeemed - - - - - - -
Shares at the end of the year - - 1,200,813 - - - -
(1) Fund merged with Euro Strategic Bond Fund on 20 March 2009.
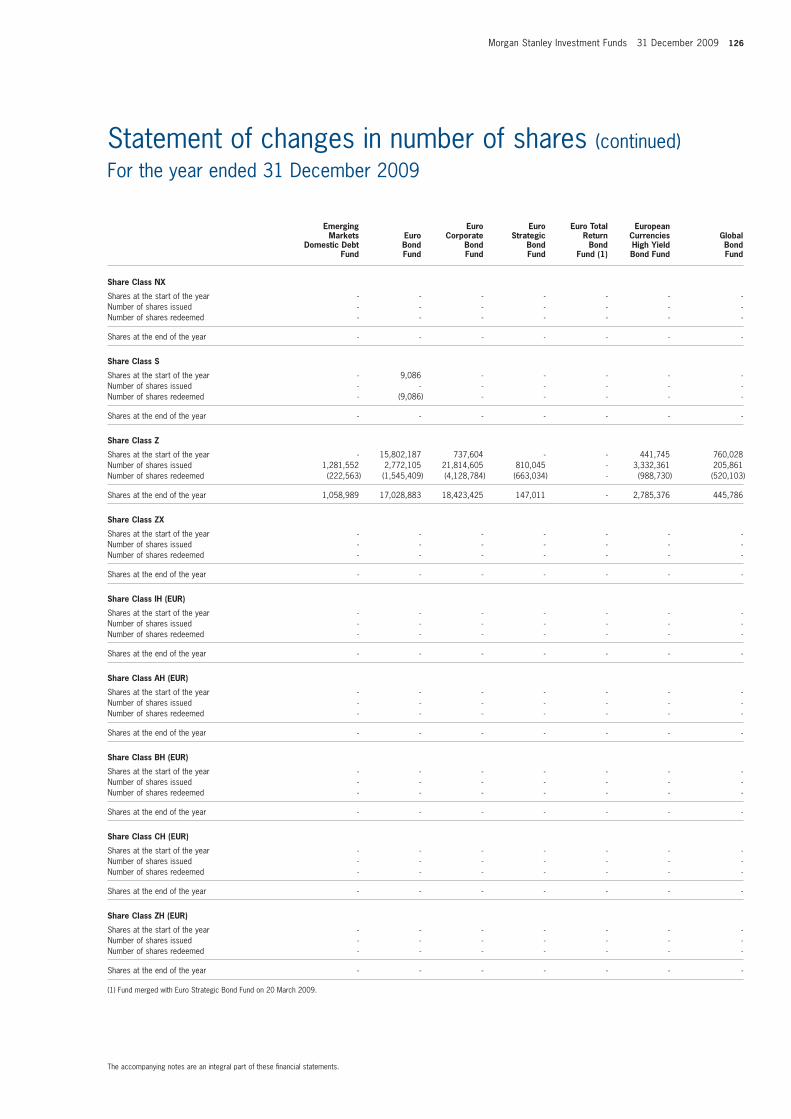
Morgan Stanley Investment Funds 31 December 2009 126
The accompanying notes are an integral part of these fi nancial statements.
Statement of changes in number of shares (continued) For the year ended 31 December 2009
Emerging Euro Euro Euro Total European Markets Euro Corporate Strategic Return Currencies Global Domestic Debt Bond Bond Bond Bond High Yield Bond Fund Fund Fund Fund Fund (1) Bond Fund Fund
Share Class NX
Shares at the start of the year - - - - - - - Number of shares issued - - - - - - - Number of shares redeemed - - - - - - -
Shares at the end of the year - - - - - - -
Share Class S
Shares at the start of the year - 9,086 - - - - - Number of shares issued - - - - - - - Number of shares redeemed - (9,086) - - - - -
Shares at the end of the year - - - - - - -
Share Class Z
Shares at the start of the year - 15,802,187 737,604 - - 441,745 760,028 Number of shares issued 1,281,552 2,772,105 21,814,605 810,045 - 3,332,361 205,861 Number of shares redeemed (222,563) (1,545,409) (4,128,784) (663,034) - (988,730) (520,103)
Shares at the end of the year 1,058,989 17,028,883 18,423,425 147,011 - 2,785,376 445,786
Share Class ZX
Shares at the start of the year - - - - - - - Number of shares issued - - - - - - - Number of shares redeemed - - - - - - -
Shares at the end of the year - - - - - - -
Share Class IH (EUR)
Shares at the start of the year - - - - - - - Number of shares issued - - - - - - - Number of shares redeemed - - - - - - -
Shares at the end of the year - - - - - - -
Share Class AH (EUR)
Shares at the start of the year - - - - - - - Number of shares issued - - - - - - - Number of shares redeemed - - - - - - -
Shares at the end of the year - - - - - - -
Share Class BH (EUR)
Shares at the start of the year - - - - - - - Number of shares issued - - - - - - - Number of shares redeemed - - - - - - -
Shares at the end of the year - - - - - - -
Share Class CH (EUR)
Shares at the start of the year - - - - - - - Number of shares issued - - - - - - - Number of shares redeemed - - - - - - -
Shares at the end of the year - - - - - - -
Share Class ZH (EUR)
Shares at the start of the year - - - - - - - Number of shares issued - - - - - - - Number of shares redeemed - - - - - - -
Shares at the end of the year - - - - - - -
(1) Fund merged with Euro Strategic Bond Fund on 20 March 2009.
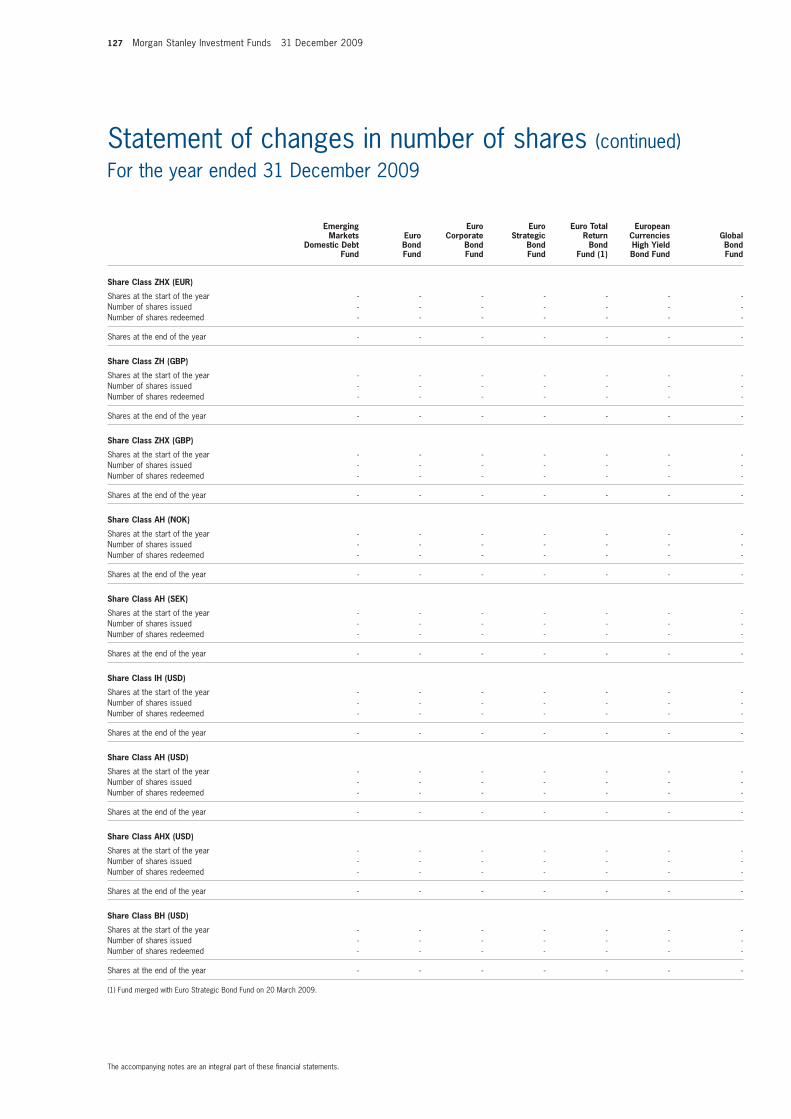
127 Morgan Stanley Investment Funds 31 December 2009
The accompanying notes are an integral part of these fi nancial statements.
Statement of changes in number of shares (continued) For the year ended 31 December 2009
Emerging Euro Euro Euro Total European Markets Euro Corporate Strategic Return Currencies Global Domestic Debt Bond Bond Bond Bond High Yield Bond Fund Fund Fund Fund Fund (1) Bond Fund Fund
Share Class ZHX (EUR)
Shares at the start of the year - - - - - - - Number of shares issued - - - - - - - Number of shares redeemed - - - - - - -
Shares at the end of the year - - - - - - -
Share Class ZH (GBP)
Shares at the start of the year - - - - - - - Number of shares issued - - - - - - - Number of shares redeemed - - - - - - -
Shares at the end of the year - - - - - - -
Share Class ZHX (GBP)
Shares at the start of the year - - - - - - - Number of shares issued - - - - - - - Number of shares redeemed - - - - - - -
Shares at the end of the year - - - - - - -
Share Class AH (NOK)
Shares at the start of the year - - - - - - - Number of shares issued - - - - - - - Number of shares redeemed - - - - - - -
Shares at the end of the year - - - - - - -
Share Class AH (SEK)
Shares at the start of the year - - - - - - - Number of shares issued - - - - - - - Number of shares redeemed - - - - - - -
Shares at the end of the year - - - - - - -
Share Class IH (USD)
Shares at the start of the year - - - - - - - Number of shares issued - - - - - - - Number of shares redeemed - - - - - - -
Shares at the end of the year - - - - - - -
Share Class AH (USD)
Shares at the start of the year - - - - - - - Number of shares issued - - - - - - - Number of shares redeemed - - - - - - -
Shares at the end of the year - - - - - - -
Share Class AHX (USD)
Shares at the start of the year - - - - - - - Number of shares issued - - - - - - - Number of shares redeemed - - - - - - -
Shares at the end of the year - - - - - - -
Share Class BH (USD)
Shares at the start of the year - - - - - - - Number of shares issued - - - - - - - Number of shares redeemed - - - - - - -
Shares at the end of the year - - - - - - -
(1) Fund merged with Euro Strategic Bond Fund on 20 March 2009.
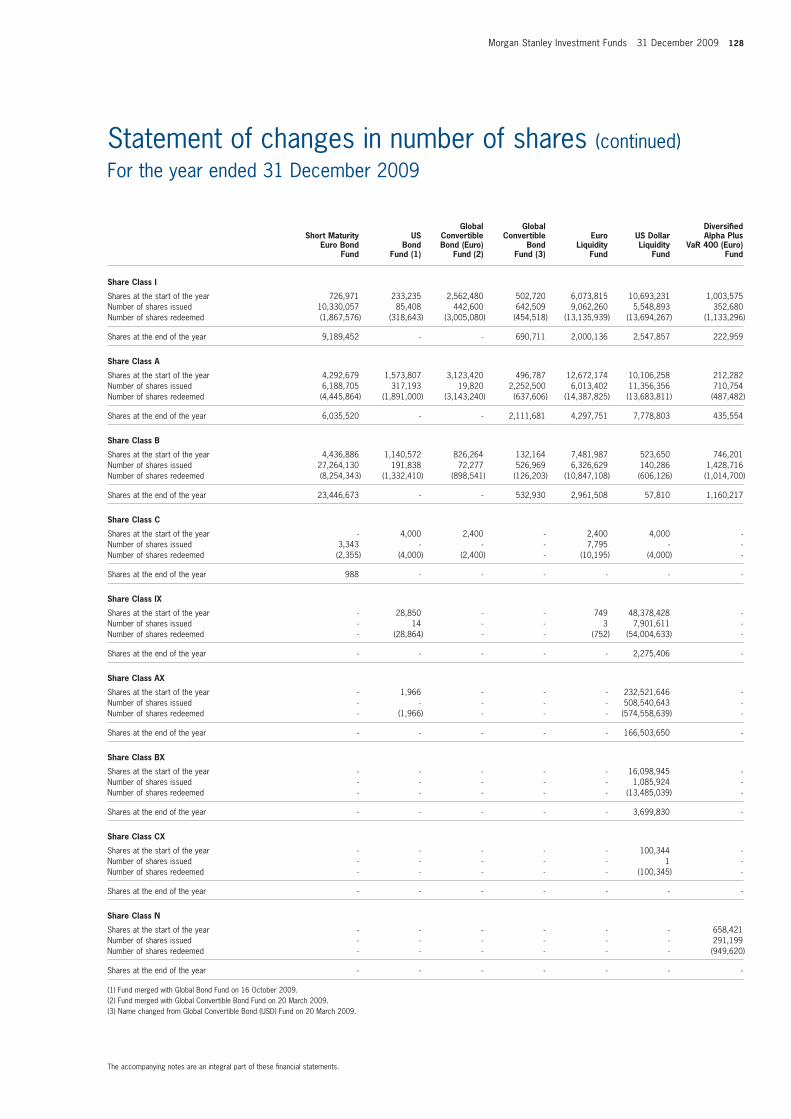
Morgan Stanley Investment Funds 31 December 2009 128
The accompanying notes are an integral part of these fi nancial statements.
Statement of changes in number of shares (continued) For the year ended 31 December 2009
Global Global Diversifi ed Short Maturity US Convertible Convertible Euro US Dollar Alpha Plus Euro Bond Bond Bond (Euro) Bond Liquidity Liquidity VaR 400 (Euro) Fund Fund (1) Fund (2) Fund (3) Fund Fund Fund
Share Class I
Shares at the start of the year 726,971 233,235 2,562,480 502,720 6,073,815 10,693,231 1,003,575 Number of shares issued 10,330,057 85,408 442,600 642,509 9,062,260 5,548,893 352,680 Number of shares redeemed (1,867,576) (318,643) (3,005,080) (454,518) (13,135,939) (13,694,267) (1,133,296)
Shares at the end of the year 9,189,452 - - 690,711 2,000,136 2,547,857 222,959
Share Class A
Shares at the start of the year 4,292,679 1,573,807 3,123,420 496,787 12,672,174 10,106,258 212,282 Number of shares issued 6,188,705 317,193 19,820 2,252,500 6,013,402 11,356,356 710,754 Number of shares redeemed (4,445,864) (1,891,000) (3,143,240) (637,606) (14,387,825) (13,683,811) (487,482)
Shares at the end of the year 6,035,520 - - 2,111,681 4,297,751 7,778,803 435,554
Share Class B
Shares at the start of the year 4,436,886 1,140,572 826,264 132,164 7,481,987 523,650 746,201 Number of shares issued 27,264,130 191,838 72,277 526,969 6,326,629 140,286 1,428,716 Number of shares redeemed (8,254,343) (1,332,410) (898,541) (126,203) (10,847,108) (606,126) (1,014,700)
Shares at the end of the year 23,446,673 - - 532,930 2,961,508 57,810 1,160,217
Share Class C
Shares at the start of the year - 4,000 2,400 - 2,400 4,000 - Number of shares issued 3,343 - - - 7,795 - - Number of shares redeemed (2,355) (4,000) (2,400) - (10,195) (4,000) -
Shares at the end of the year 988 - - - - - -
Share Class IX
Shares at the start of the year - 28,850 - - 749 48,378,428 - Number of shares issued - 14 - - 3 7,901,611 - Number of shares redeemed - (28,864) - - (752) (54,004,633) -
Shares at the end of the year - - - - - 2,275,406 -
Share Class AX
Shares at the start of the year - 1,966 - - - 232,521,646 - Number of shares issued - - - - - 508,540,643 - Number of shares redeemed - (1,966) - - - (574,558,639) -
Shares at the end of the year - - - - - 166,503,650 -
Share Class BX
Shares at the start of the year - - - - - 16,098,945 - Number of shares issued - - - - - 1,085,924 - Number of shares redeemed - - - - - (13,485,039) -
Shares at the end of the year - - - - - 3,699,830 -
Share Class CX
Shares at the start of the year - - - - - 100,344 - Number of shares issued - - - - - 1 - Number of shares redeemed - - - - - (100,345) -
Shares at the end of the year - - - - - - -
Share Class N
Shares at the start of the year - - - - - - 658,421 Number of shares issued - - - - - - 291,199 Number of shares redeemed - - - - - - (949,620)
Shares at the end of the year - - - - - - -
(1) Fund merged with Global Bond Fund on 16 October 2009.(2) Fund merged with Global Convertible Bond Fund on 20 March 2009.(3) Name changed from Global Convertible Bond (USD) Fund on 20 March 2009.
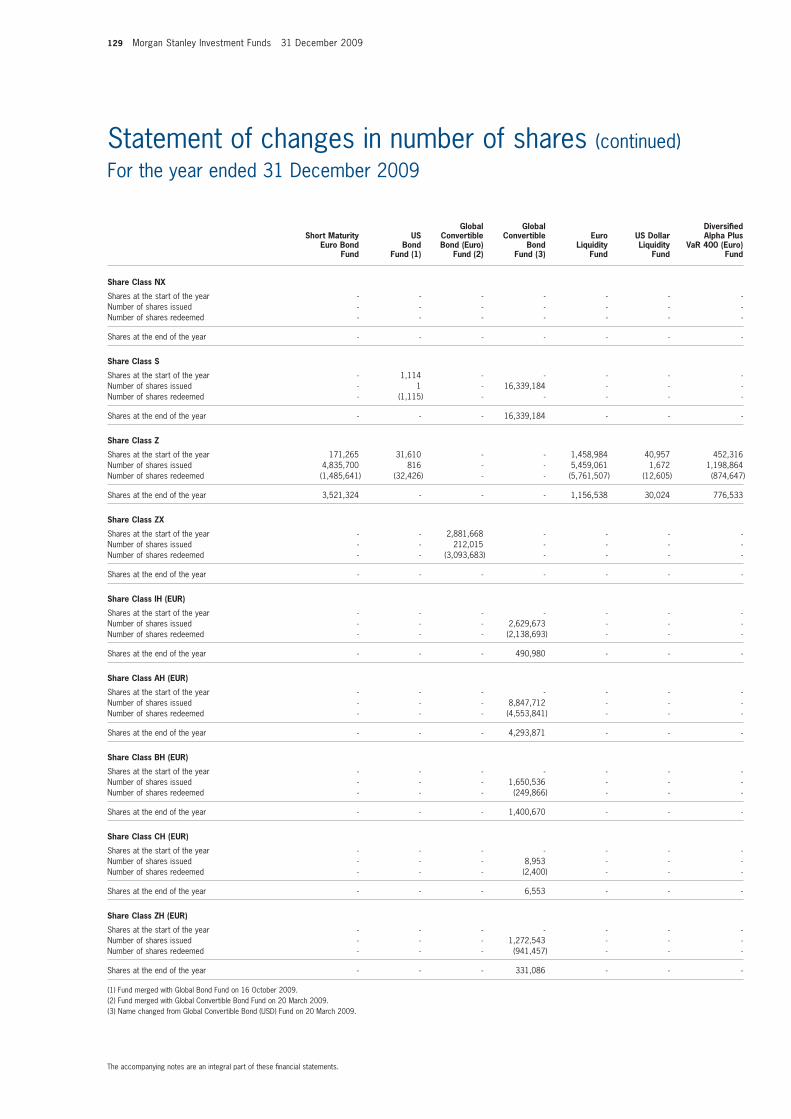
129 Morgan Stanley Investment Funds 31 December 2009
The accompanying notes are an integral part of these fi nancial statements.
Statement of changes in number of shares (continued) For the year ended 31 December 2009
Global Global Diversifi ed Short Maturity US Convertible Convertible Euro US Dollar Alpha Plus Euro Bond Bond Bond (Euro) Bond Liquidity Liquidity VaR 400 (Euro) Fund Fund (1) Fund (2) Fund (3) Fund Fund Fund
Share Class NX
Shares at the start of the year - - - - - - - Number of shares issued - - - - - - - Number of shares redeemed - - - - - - -
Shares at the end of the year - - - - - - -
Share Class S
Shares at the start of the year - 1,114 - - - - - Number of shares issued - 1 - 16,339,184 - - - Number of shares redeemed - (1,115) - - - - -
Shares at the end of the year - - - 16,339,184 - - -
Share Class Z
Shares at the start of the year 171,265 31,610 - - 1,458,984 40,957 452,316 Number of shares issued 4,835,700 816 - - 5,459,061 1,672 1,198,864 Number of shares redeemed (1,485,641) (32,426) - - (5,761,507) (12,605) (874,647)
Shares at the end of the year 3,521,324 - - - 1,156,538 30,024 776,533
Share Class ZX
Shares at the start of the year - - 2,881,668 - - - - Number of shares issued - - 212,015 - - - - Number of shares redeemed - - (3,093,683) - - - -
Shares at the end of the year - - - - - - -
Share Class IH (EUR)
Shares at the start of the year - - - - - - - Number of shares issued - - - 2,629,673 - - - Number of shares redeemed - - - (2,138,693) - - -
Shares at the end of the year - - - 490,980 - - -
Share Class AH (EUR)
Shares at the start of the year - - - - - - - Number of shares issued - - - 8,847,712 - - - Number of shares redeemed - - - (4,553,841) - - -
Shares at the end of the year - - - 4,293,871 - - -
Share Class BH (EUR)
Shares at the start of the year - - - - - - - Number of shares issued - - - 1,650,536 - - - Number of shares redeemed - - - (249,866) - - -
Shares at the end of the year - - - 1,400,670 - - -
Share Class CH (EUR)
Shares at the start of the year - - - - - - - Number of shares issued - - - 8,953 - - - Number of shares redeemed - - - (2,400) - - -
Shares at the end of the year - - - 6,553 - - -
Share Class ZH (EUR)
Shares at the start of the year - - - - - - - Number of shares issued - - - 1,272,543 - - - Number of shares redeemed - - - (941,457) - - -
Shares at the end of the year - - - 331,086 - - -
(1) Fund merged with Global Bond Fund on 16 October 2009.(2) Fund merged with Global Convertible Bond Fund on 20 March 2009.(3) Name changed from Global Convertible Bond (USD) Fund on 20 March 2009.
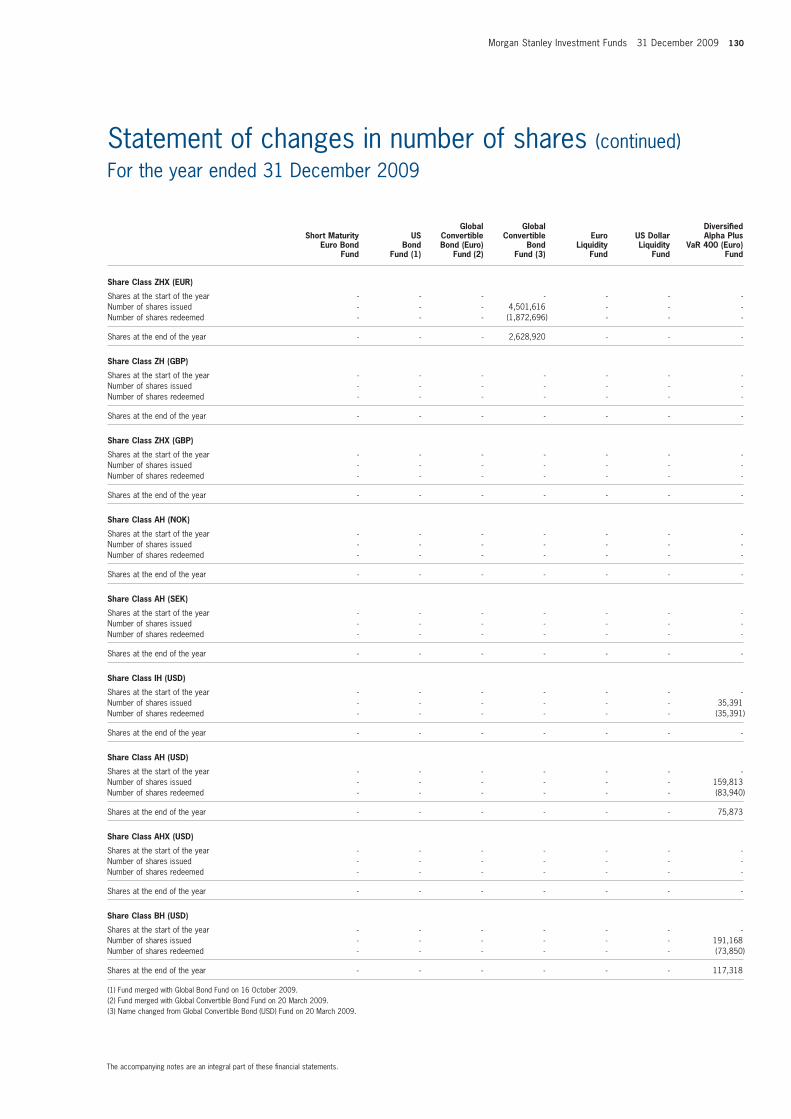
Morgan Stanley Investment Funds 31 December 2009 130
The accompanying notes are an integral part of these fi nancial statements.
Statement of changes in number of shares (continued) For the year ended 31 December 2009
Global Global Diversifi ed Short Maturity US Convertible Convertible Euro US Dollar Alpha Plus Euro Bond Bond Bond (Euro) Bond Liquidity Liquidity VaR 400 (Euro) Fund Fund (1) Fund (2) Fund (3) Fund Fund Fund
Share Class ZHX (EUR)
Shares at the start of the year - - - - - - - Number of shares issued - - - 4,501,616 - - - Number of shares redeemed - - - (1,872,696) - - -
Shares at the end of the year - - - 2,628,920 - - -
Share Class ZH (GBP)
Shares at the start of the year - - - - - - - Number of shares issued - - - - - - - Number of shares redeemed - - - - - - -
Shares at the end of the year - - - - - - -
Share Class ZHX (GBP)
Shares at the start of the year - - - - - - - Number of shares issued - - - - - - - Number of shares redeemed - - - - - - -
Shares at the end of the year - - - - - - -
Share Class AH (NOK)
Shares at the start of the year - - - - - - - Number of shares issued - - - - - - - Number of shares redeemed - - - - - - -
Shares at the end of the year - - - - - - -
Share Class AH (SEK)
Shares at the start of the year - - - - - - - Number of shares issued - - - - - - - Number of shares redeemed - - - - - - -
Shares at the end of the year - - - - - - -
Share Class IH (USD)
Shares at the start of the year - - - - - - - Number of shares issued - - - - - - 35,391 Number of shares redeemed - - - - - - (35,391)
Shares at the end of the year - - - - - - -
Share Class AH (USD)
Shares at the start of the year - - - - - - - Number of shares issued - - - - - - 159,813 Number of shares redeemed - - - - - - (83,940)
Shares at the end of the year - - - - - - 75,873
Share Class AHX (USD)
Shares at the start of the year - - - - - - - Number of shares issued - - - - - - - Number of shares redeemed - - - - - - -
Shares at the end of the year - - - - - - -
Share Class BH (USD)
Shares at the start of the year - - - - - - - Number of shares issued - - - - - - 191,168 Number of shares redeemed - - - - - - (73,850)
Shares at the end of the year - - - - - - 117,318
(1) Fund merged with Global Bond Fund on 16 October 2009. (2) Fund merged with Global Convertible Bond Fund on 20 March 2009.(3) Name changed from Global Convertible Bond (USD) Fund on 20 March 2009.
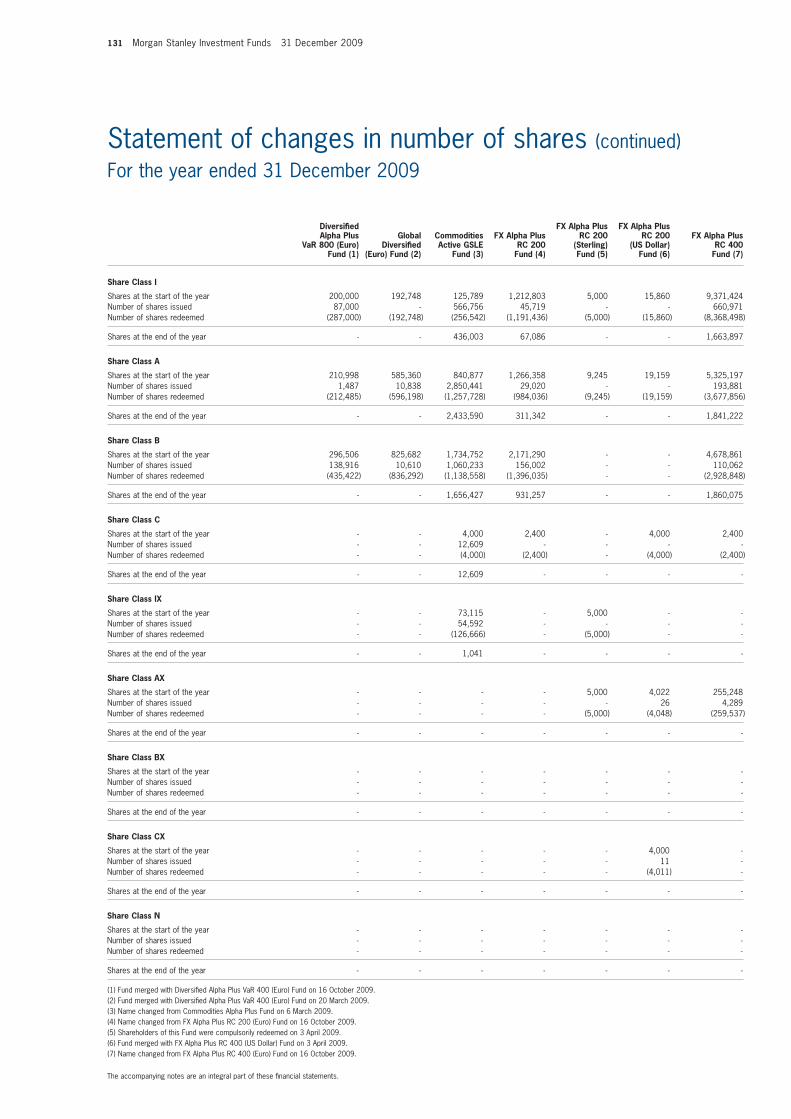
131 Morgan Stanley Investment Funds 31 December 2009
Statement of changes in number of shares (continued) For the year ended 31 December 2009
Diversifi ed FX Alpha Plus FX Alpha Plus Alpha Plus Global Commodities FX Alpha Plus RC 200 RC 200 FX Alpha Plus VaR 800 (Euro) Diversifi ed Active GSLE RC 200 (Sterling) (US Dollar) RC 400 Fund (1) (Euro) Fund (2) Fund (3) Fund (4) Fund (5) Fund (6) Fund (7)
Share Class I
Shares at the start of the year 200,000 192,748 125,789 1,212,803 5,000 15,860 9,371,424 Number of shares issued 87,000 - 566,756 45,719 - - 660,971 Number of shares redeemed (287,000) (192,748) (256,542) (1,191,436) (5,000) (15,860) (8,368,498)
Shares at the end of the year - - 436,003 67,086 - - 1,663,897
Share Class A
Shares at the start of the year 210,998 585,360 840,877 1,266,358 9,245 19,159 5,325,197 Number of shares issued 1,487 10,838 2,850,441 29,020 - - 193,881 Number of shares redeemed (212,485) (596,198) (1,257,728) (984,036) (9,245) (19,159) (3,677,856)
Shares at the end of the year - - 2,433,590 311,342 - - 1,841,222
Share Class B
Shares at the start of the year 296,506 825,682 1,734,752 2,171,290 - - 4,678,861 Number of shares issued 138,916 10,610 1,060,233 156,002 - - 110,062 Number of shares redeemed (435,422) (836,292) (1,138,558) (1,396,035) - - (2,928,848)
Shares at the end of the year - - 1,656,427 931,257 - - 1,860,075
Share Class C
Shares at the start of the year - - 4,000 2,400 - 4,000 2,400 Number of shares issued - - 12,609 - - - - Number of shares redeemed - - (4,000) (2,400) - (4,000) (2,400)
Shares at the end of the year - - 12,609 - - - -
Share Class IX
Shares at the start of the year - - 73,115 - 5,000 - - Number of shares issued - - 54,592 - - - - Number of shares redeemed - - (126,666) - (5,000) - -
Shares at the end of the year - - 1,041 - - - -
Share Class AX
Shares at the start of the year - - - - 5,000 4,022 255,248 Number of shares issued - - - - - 26 4,289 Number of shares redeemed - - - - (5,000) (4,048) (259,537)
Shares at the end of the year - - - - - - -
Share Class BX
Shares at the start of the year - - - - - - - Number of shares issued - - - - - - - Number of shares redeemed - - - - - - -
Shares at the end of the year - - - - - - -
Share Class CX
Shares at the start of the year - - - - - 4,000 - Number of shares issued - - - - - 11 - Number of shares redeemed - - - - - (4,011) -
Shares at the end of the year - - - - - - -
Share Class N
Shares at the start of the year - - - - - - - Number of shares issued - - - - - - - Number of shares redeemed - - - - - - -
Shares at the end of the year - - - - - - -
(1) Fund merged with Diversifi ed Alpha Plus VaR 400 (Euro) Fund on 16 October 2009.(2) Fund merged with Diversifi ed Alpha Plus VaR 400 (Euro) Fund on 20 March 2009.(3) Name changed from Commodities Alpha Plus Fund on 6 March 2009.(4) Name changed from FX Alpha Plus RC 200 (Euro) Fund on 16 October 2009.(5) Shareholders of this Fund were compulsorily redeemed on 3 April 2009.(6) Fund merged with FX Alpha Plus RC 400 (US Dollar) Fund on 3 April 2009. (7) Name changed from FX Alpha Plus RC 400 (Euro) Fund on 16 October 2009.
The accompanying notes are an integral part of these fi nancial statements.
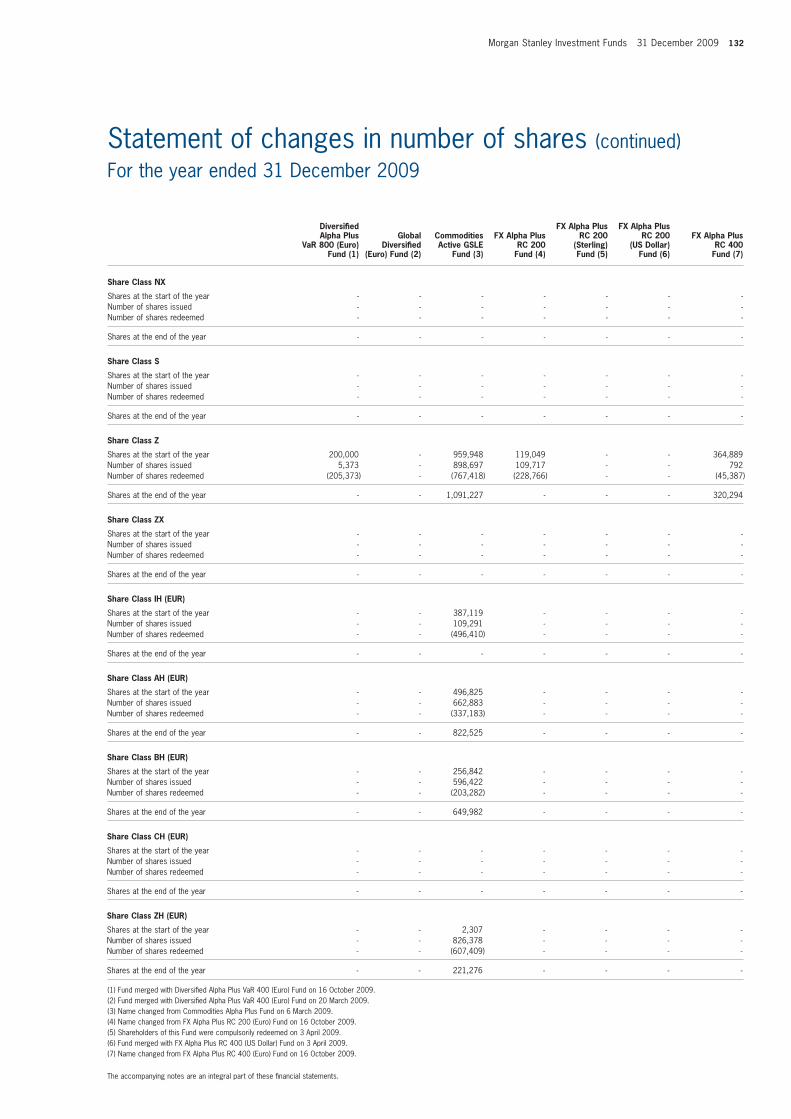
Morgan Stanley Investment Funds 31 December 2009 132
The accompanying notes are an integral part of these fi nancial statements.
Statement of changes in number of shares (continued) For the year ended 31 December 2009
Diversifi ed FX Alpha Plus FX Alpha Plus Alpha Plus Global Commodities FX Alpha Plus RC 200 RC 200 FX Alpha Plus VaR 800 (Euro) Diversifi ed Active GSLE RC 200 (Sterling) (US Dollar) RC 400 Fund (1) (Euro) Fund (2) Fund (3) Fund (4) Fund (5) Fund (6) Fund (7)
Share Class NX
Shares at the start of the year - - - - - - - Number of shares issued - - - - - - - Number of shares redeemed - - - - - - -
Shares at the end of the year - - - - - - -
Share Class S
Shares at the start of the year - - - - - - - Number of shares issued - - - - - - - Number of shares redeemed - - - - - - -
Shares at the end of the year - - - - - - -
Share Class Z
Shares at the start of the year 200,000 - 959,948 119,049 - - 364,889 Number of shares issued 5,373 - 898,697 109,717 - - 792 Number of shares redeemed (205,373) - (767,418) (228,766) - - (45,387)
Shares at the end of the year - - 1,091,227 - - - 320,294
Share Class ZX
Shares at the start of the year - - - - - - - Number of shares issued - - - - - - - Number of shares redeemed - - - - - - -
Shares at the end of the year - - - - - - -
Share Class IH (EUR)
Shares at the start of the year - - 387,119 - - - - Number of shares issued - - 109,291 - - - - Number of shares redeemed - - (496,410) - - - -
Shares at the end of the year - - - - - - -
Share Class AH (EUR)
Shares at the start of the year - - 496,825 - - - - Number of shares issued - - 662,883 - - - - Number of shares redeemed - - (337,183) - - - -
Shares at the end of the year - - 822,525 - - - -
Share Class BH (EUR)
Shares at the start of the year - - 256,842 - - - - Number of shares issued - - 596,422 - - - - Number of shares redeemed - - (203,282) - - - -
Shares at the end of the year - - 649,982 - - - -
Share Class CH (EUR)
Shares at the start of the year - - - - - - - Number of shares issued - - - - - - - Number of shares redeemed - - - - - - -
Shares at the end of the year - - - - - - -
Share Class ZH (EUR)
Shares at the start of the year - - 2,307 - - - - Number of shares issued - - 826,378 - - - - Number of shares redeemed - - (607,409) - - - -
Shares at the end of the year - - 221,276 - - - -
(1) Fund merged with Diversifi ed Alpha Plus VaR 400 (Euro) Fund on 16 October 2009.(2) Fund merged with Diversifi ed Alpha Plus VaR 400 (Euro) Fund on 20 March 2009.(3) Name changed from Commodities Alpha Plus Fund on 6 March 2009.(4) Name changed from FX Alpha Plus RC 200 (Euro) Fund on 16 October 2009.(5) Shareholders of this Fund were compulsorily redeemed on 3 April 2009.(6) Fund merged with FX Alpha Plus RC 400 (US Dollar) Fund on 3 April 2009.(7) Name changed from FX Alpha Plus RC 400 (Euro) Fund on 16 October 2009.
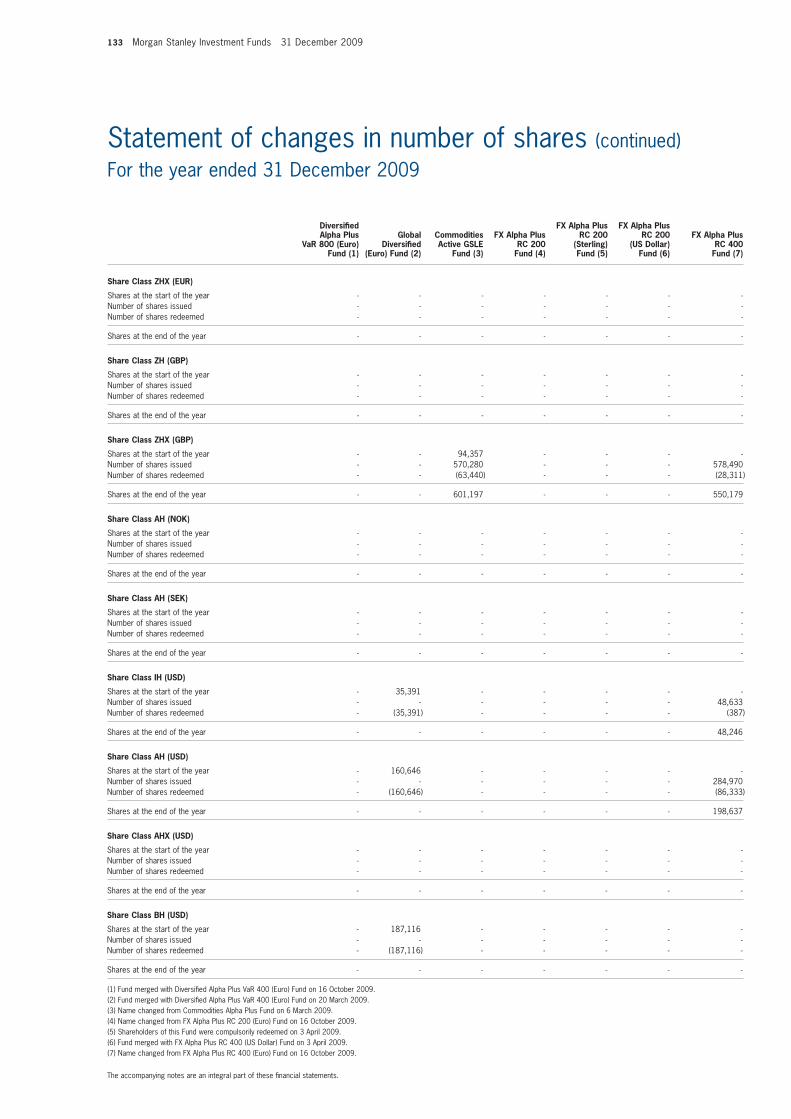
133 Morgan Stanley Investment Funds 31 December 2009
The accompanying notes are an integral part of these fi nancial statements.
Statement of changes in number of shares (continued) For the year ended 31 December 2009
Diversifi ed FX Alpha Plus FX Alpha Plus Alpha Plus Global Commodities FX Alpha Plus RC 200 RC 200 FX Alpha Plus VaR 800 (Euro) Diversifi ed Active GSLE RC 200 (Sterling) (US Dollar) RC 400 Fund (1) (Euro) Fund (2) Fund (3) Fund (4) Fund (5) Fund (6) Fund (7)
Share Class ZHX (EUR)
Shares at the start of the year - - - - - - - Number of shares issued - - - - - - - Number of shares redeemed - - - - - - -
Shares at the end of the year - - - - - - -
Share Class ZH (GBP)
Shares at the start of the year - - - - - - - Number of shares issued - - - - - - - Number of shares redeemed - - - - - - -
Shares at the end of the year - - - - - - -
Share Class ZHX (GBP)
Shares at the start of the year - - 94,357 - - - - Number of shares issued - - 570,280 - - - 578,490 Number of shares redeemed - - (63,440) - - - (28,311)
Shares at the end of the year - - 601,197 - - - 550,179
Share Class AH (NOK)
Shares at the start of the year - - - - - - - Number of shares issued - - - - - - - Number of shares redeemed - - - - - - -
Shares at the end of the year - - - - - - -
Share Class AH (SEK)
Shares at the start of the year - - - - - - - Number of shares issued - - - - - - - Number of shares redeemed - - - - - - -
Shares at the end of the year - - - - - - -
Share Class IH (USD)
Shares at the start of the year - 35,391 - - - - - Number of shares issued - - - - - - 48,633 Number of shares redeemed - (35,391) - - - - (387)
Shares at the end of the year - - - - - - 48,246
Share Class AH (USD)
Shares at the start of the year - 160,646 - - - - - Number of shares issued - - - - - - 284,970 Number of shares redeemed - (160,646) - - - - (86,333)
Shares at the end of the year - - - - - - 198,637
Share Class AHX (USD)
Shares at the start of the year - - - - - - - Number of shares issued - - - - - - - Number of shares redeemed - - - - - - -
Shares at the end of the year - - - - - - -
Share Class BH (USD)
Shares at the start of the year - 187,116 - - - - - Number of shares issued - - - - - - - Number of shares redeemed - (187,116) - - - - -
Shares at the end of the year - - - - - - -
(1) Fund merged with Diversifi ed Alpha Plus VaR 400 (Euro) Fund on 16 October 2009.(2) Fund merged with Diversifi ed Alpha Plus VaR 400 (Euro) Fund on 20 March 2009.(3) Name changed from Commodities Alpha Plus Fund on 6 March 2009.(4) Name changed from FX Alpha Plus RC 200 (Euro) Fund on 16 October 2009.(5) Shareholders of this Fund were compulsorily redeemed on 3 April 2009.(6) Fund merged with FX Alpha Plus RC 400 (US Dollar) Fund on 3 April 2009.(7) Name changed from FX Alpha Plus RC 400 (Euro) Fund on 16 October 2009.
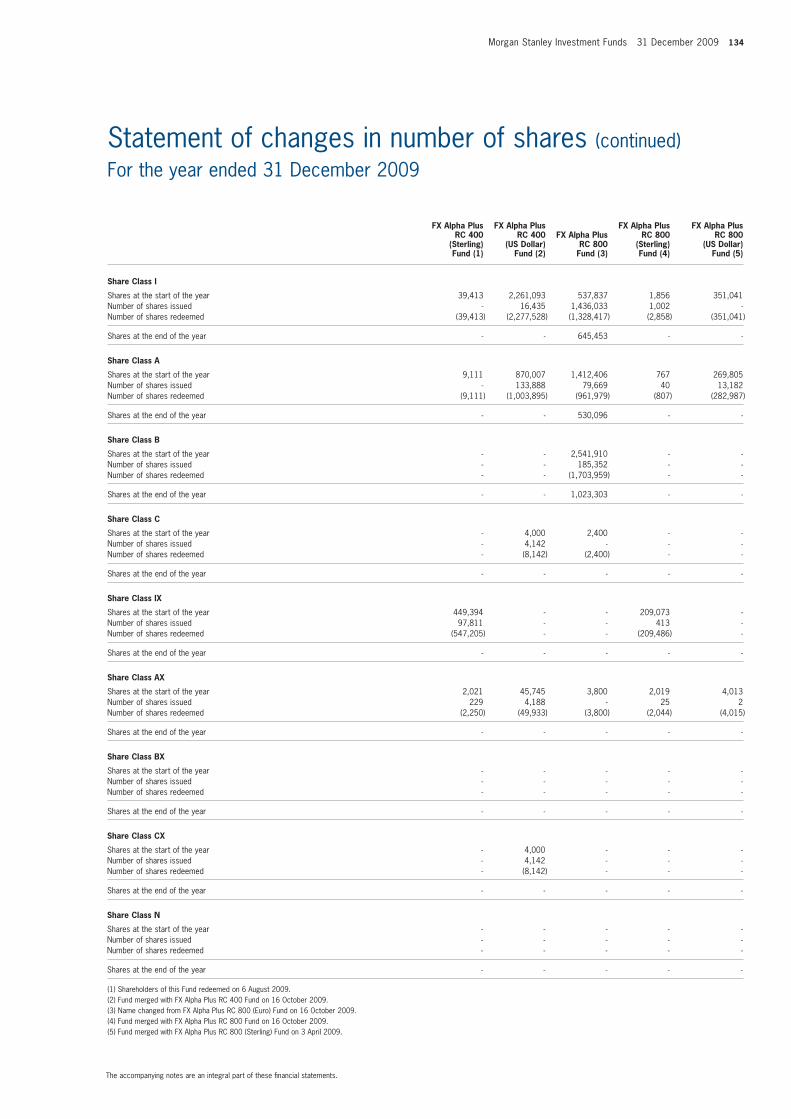
Morgan Stanley Investment Funds 31 December 2009 134
The accompanying notes are an integral part of these fi nancial statements.
FX Alpha Plus FX Alpha Plus FX Alpha Plus FX Alpha Plus RC 400 RC 400 FX Alpha Plus RC 800 RC 800 (Sterling) (US Dollar) RC 800 (Sterling) (US Dollar) Fund (1) Fund (2) Fund (3) Fund (4) Fund (5)
Share Class I
Shares at the start of the year 39,413 2,261,093 537,837 1,856 351,041 Number of shares issued - 16,435 1,436,033 1,002 - Number of shares redeemed (39,413) (2,277,528) (1,328,417) (2,858) (351,041)
Shares at the end of the year - - 645,453 - -
Share Class A
Shares at the start of the year 9,111 870,007 1,412,406 767 269,805 Number of shares issued - 133,888 79,669 40 13,182 Number of shares redeemed (9,111) (1,003,895) (961,979) (807) (282,987)
Shares at the end of the year - - 530,096 - -
Share Class B
Shares at the start of the year - - 2,541,910 - - Number of shares issued - - 185,352 - - Number of shares redeemed - - (1,703,959) - -
Shares at the end of the year - - 1,023,303 - -
Share Class C
Shares at the start of the year - 4,000 2,400 - - Number of shares issued - 4,142 - - - Number of shares redeemed - (8,142) (2,400) - -
Shares at the end of the year - - - - -
Share Class IX
Shares at the start of the year 449,394 - - 209,073 - Number of shares issued 97,811 - - 413 - Number of shares redeemed (547,205) - - (209,486) -
Shares at the end of the year - - - - -
Share Class AX
Shares at the start of the year 2,021 45,745 3,800 2,019 4,013 Number of shares issued 229 4,188 - 25 2 Number of shares redeemed (2,250) (49,933) (3,800) (2,044) (4,015)
Shares at the end of the year - - - - -
Share Class BX
Shares at the start of the year - - - - - Number of shares issued - - - - - Number of shares redeemed - - - - -
Shares at the end of the year - - - - -
Share Class CX
Shares at the start of the year - 4,000 - - - Number of shares issued - 4,142 - - - Number of shares redeemed - (8,142) - - -
Shares at the end of the year - - - - -
Share Class N
Shares at the start of the year - - - - - Number of shares issued - - - - - Number of shares redeemed - - - - -
Shares at the end of the year - - - - -
(1) Shareholders of this Fund redeemed on 6 August 2009.(2) Fund merged with FX Alpha Plus RC 400 Fund on 16 October 2009.(3) Name changed from FX Alpha Plus RC 800 (Euro) Fund on 16 October 2009.(4) Fund merged with FX Alpha Plus RC 800 Fund on 16 October 2009.(5) Fund merged with FX Alpha Plus RC 800 (Sterling) Fund on 3 April 2009.
Statement of changes in number of shares (continued) For the year ended 31 December 2009
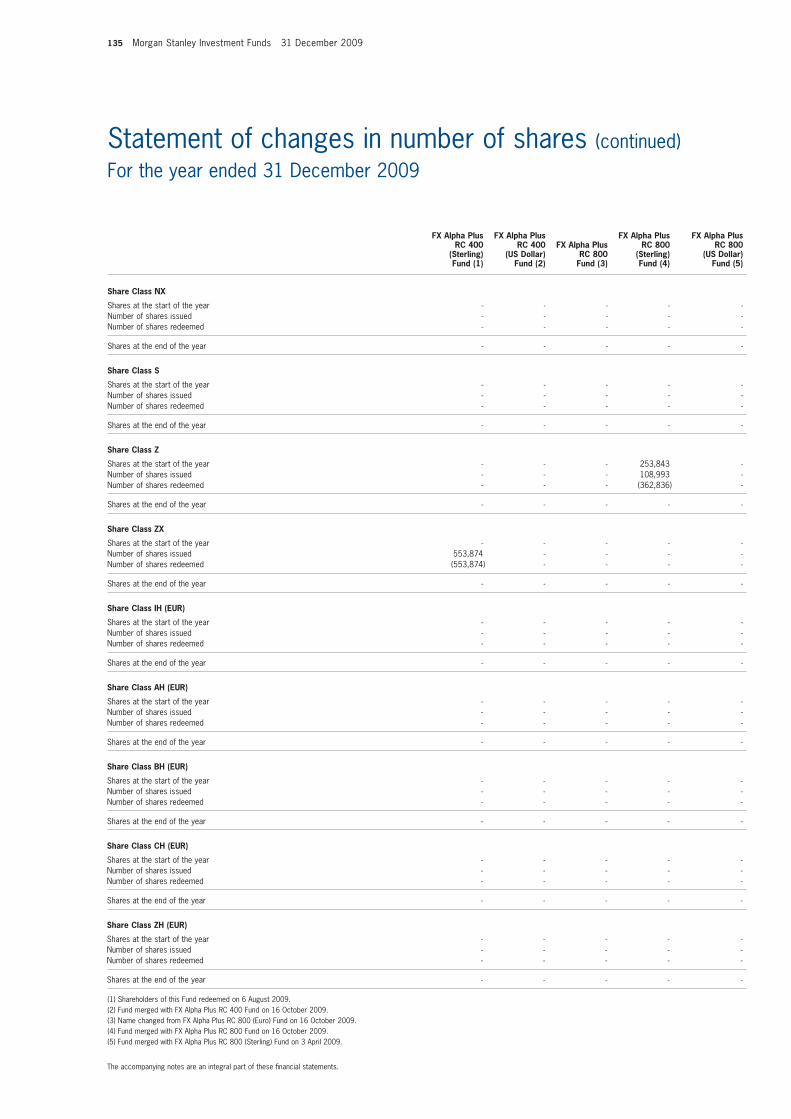
135 Morgan Stanley Investment Funds 31 December 2009
The accompanying notes are an integral part of these fi nancial statements.
Statement of changes in number of shares (continued) For the year ended 31 December 2009
FX Alpha Plus FX Alpha Plus FX Alpha Plus FX Alpha Plus RC 400 RC 400 FX Alpha Plus RC 800 RC 800 (Sterling) (US Dollar) RC 800 (Sterling) (US Dollar) Fund (1) Fund (2) Fund (3) Fund (4) Fund (5)
Share Class NX
Shares at the start of the year - - - - - Number of shares issued - - - - - Number of shares redeemed - - - - -
Shares at the end of the year - - - - -
Share Class S
Shares at the start of the year - - - - - Number of shares issued - - - - - Number of shares redeemed - - - - -
Shares at the end of the year - - - - -
Share Class Z
Shares at the start of the year - - - 253,843 - Number of shares issued - - - 108,993 - Number of shares redeemed - - - (362,836) -
Shares at the end of the year - - - - -
Share Class ZX
Shares at the start of the year - - - - - Number of shares issued 553,874 - - - - Number of shares redeemed (553,874) - - - -
Shares at the end of the year - - - - -
Share Class IH (EUR)
Shares at the start of the year - - - - - Number of shares issued - - - - - Number of shares redeemed - - - - -
Shares at the end of the year - - - - -
Share Class AH (EUR)
Shares at the start of the year - - - - - Number of shares issued - - - - - Number of shares redeemed - - - - -
Shares at the end of the year - - - - -
Share Class BH (EUR)
Shares at the start of the year - - - - - Number of shares issued - - - - - Number of shares redeemed - - - - -
Shares at the end of the year - - - - -
Share Class CH (EUR)
Shares at the start of the year - - - - - Number of shares issued - - - - - Number of shares redeemed - - - - -
Shares at the end of the year - - - - -
Share Class ZH (EUR)
Shares at the start of the year - - - - - Number of shares issued - - - - - Number of shares redeemed - - - - -
Shares at the end of the year - - - - -
(1) Shareholders of this Fund redeemed on 6 August 2009.(2) Fund merged with FX Alpha Plus RC 400 Fund on 16 October 2009.(3) Name changed from FX Alpha Plus RC 800 (Euro) Fund on 16 October 2009.(4) Fund merged with FX Alpha Plus RC 800 Fund on 16 October 2009.(5) Fund merged with FX Alpha Plus RC 800 (Sterling) Fund on 3 April 2009.
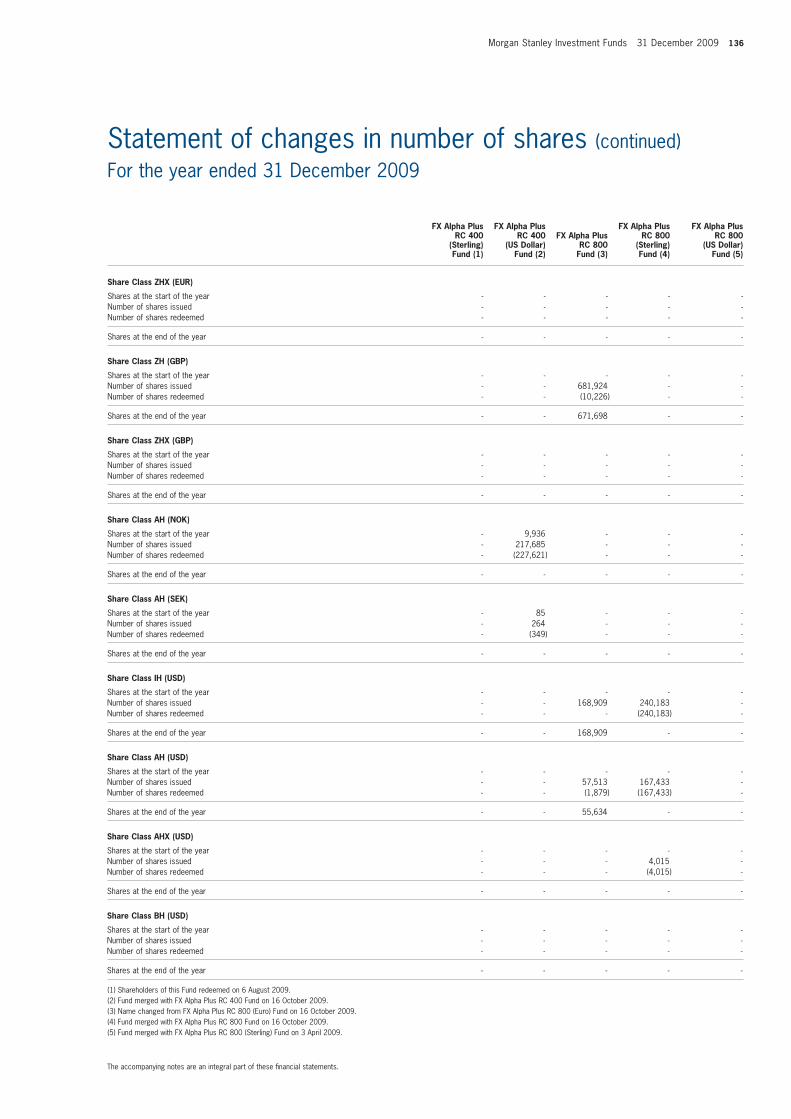
Morgan Stanley Investment Funds 31 December 2009 136
The accompanying notes are an integral part of these fi nancial statements.
FX Alpha Plus FX Alpha Plus FX Alpha Plus FX Alpha Plus RC 400 RC 400 FX Alpha Plus RC 800 RC 800 (Sterling) (US Dollar) RC 800 (Sterling) (US Dollar) Fund (1) Fund (2) Fund (3) Fund (4) Fund (5)
Share Class ZHX (EUR)
Shares at the start of the year - - - - - Number of shares issued - - - - - Number of shares redeemed - - - - -
Shares at the end of the year - - - - -
Share Class ZH (GBP)
Shares at the start of the year - - - - - Number of shares issued - - 681,924 - - Number of shares redeemed - - (10,226) - -
Shares at the end of the year - - 671,698 - -
Share Class ZHX (GBP)
Shares at the start of the year - - - - - Number of shares issued - - - - - Number of shares redeemed - - - - -
Shares at the end of the year - - - - -
Share Class AH (NOK)
Shares at the start of the year - 9,936 - - - Number of shares issued - 217,685 - - - Number of shares redeemed - (227,621) - - -
Shares at the end of the year - - - - -
Share Class AH (SEK)
Shares at the start of the year - 85 - - - Number of shares issued - 264 - - - Number of shares redeemed - (349) - - -
Shares at the end of the year - - - - -
Share Class IH (USD)
Shares at the start of the year - - - - - Number of shares issued - - 168,909 240,183 - Number of shares redeemed - - - (240,183) -
Shares at the end of the year - - 168,909 - -
Share Class AH (USD)
Shares at the start of the year - - - - - Number of shares issued - - 57,513 167,433 - Number of shares redeemed - - (1,879) (167,433) -
Shares at the end of the year - - 55,634 - -
Share Class AHX (USD)
Shares at the start of the year - - - - - Number of shares issued - - - 4,015 - Number of shares redeemed - - - (4,015) -
Shares at the end of the year - - - - -
Share Class BH (USD)
Shares at the start of the year - - - - - Number of shares issued - - - - - Number of shares redeemed - - - - -
Shares at the end of the year - - - - -
(1) Shareholders of this Fund redeemed on 6 August 2009.(2) Fund merged with FX Alpha Plus RC 400 Fund on 16 October 2009.(3) Name changed from FX Alpha Plus RC 800 (Euro) Fund on 16 October 2009.(4) Fund merged with FX Alpha Plus RC 800 Fund on 16 October 2009.(5) Fund merged with FX Alpha Plus RC 800 (Sterling) Fund on 3 April 2009.
Statement of changes in number of shares (continued) For the year ended 31 December 2009
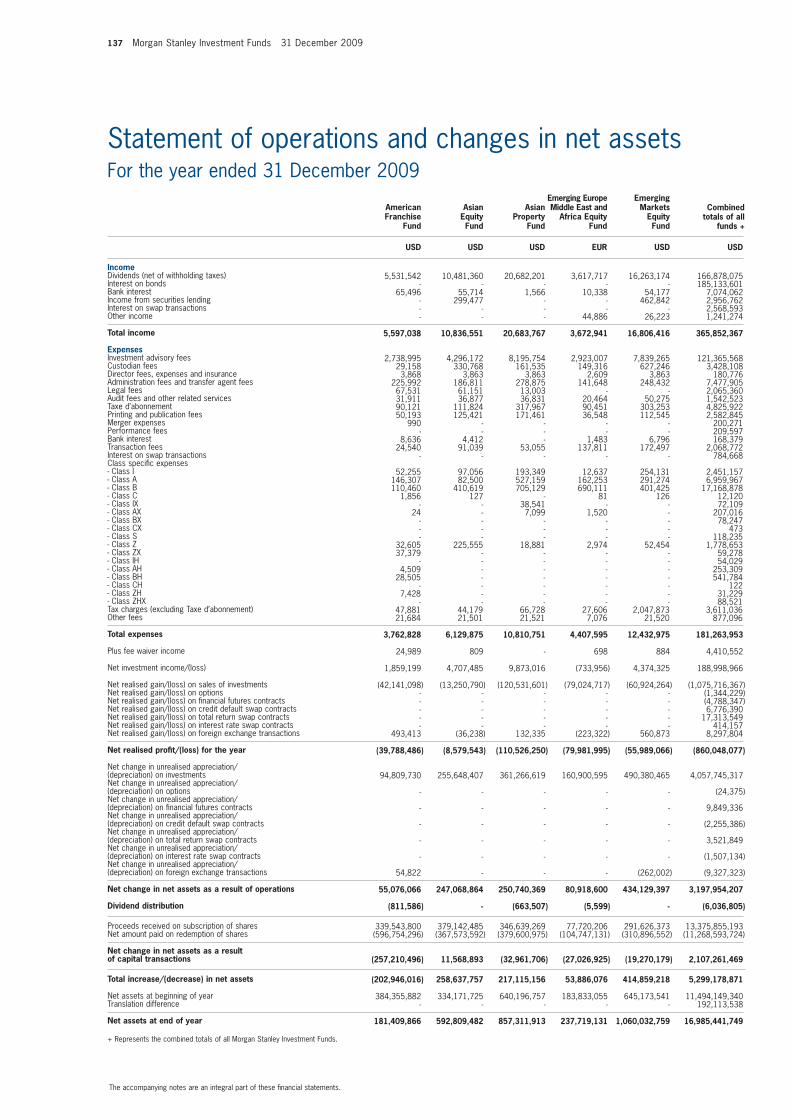
137 Morgan Stanley Investment Funds 31 December 2009
The accompanying notes are an integral part of these fi nancial statements.
Statement of operations and changes in net assetsFor the year ended 31 December 2009 Emerging Europe Emerging American Asian Asian Middle East and Markets Franchise Equity Property Africa Equity Equity Fund Fund Fund Fund Fund
USD USD USD EUR USD USD
Income Dividends (net of withholding taxes) Interest on bonds Bank interest Income from securities lending Interest on swap transactions Other income
Total income
ExpensesInvestment advisory fees Custodian fees Director fees, expenses and insuranceAdministration fees and transfer agent fees Legal feesAudit fees and other related servicesTaxe d’abonnement Printing and publication fees Merger expenses Performance fees Bank interest Transaction fees Interest on swap transactions Class specifi c expenses - Class I - Class A - Class B - Class C - Class IX - Class AX - Class BX - Class CX - Class S - Class Z - Class ZX - Class IH - Class AH - Class BH - Class CH - Class ZH - Class ZHX Tax charges (excluding Taxe d’abonnement) Other fees
Total expenses
Plus fee waiver income
Net investment income/(loss)
Net realised gain/(loss) on sales of investments Net realised gain/(loss) on optionsNet realised gain/(loss) on fi nancial futures contracts Net realised gain/(loss) on credit default swap contracts Net realised gain/(loss) on total return swap contracts Net realised gain/(loss) on interest rate swap contracts Net realised gain/(loss) on foreign exchange transactions
Net realised profi t/(loss) for the year
Net change in unrealised appreciation/(depreciation) on investments Net change in unrealised appreciation/(depreciation) on optionsNet change in unrealised appreciation/(depreciation) on fi nancial futures contracts Net change in unrealised appreciation/(depreciation) on credit default swap contracts Net change in unrealised appreciation/(depreciation) on total return swap contracts Net change in unrealised appreciation/(depreciation) on interest rate swap contracts Net change in unrealised appreciation/(depreciation) on foreign exchange transactions
Net change in net assets as a result of operations
Dividend distribution
Proceeds received on subscription of shares Net amount paid on redemption of shares
Net change in net assets as a result of capital transactions
Total increase/(decrease) in net assets
Net assets at beginning of yearTranslation difference
Net assets at end of year
+ Represents the combined totals of all Morgan Stanley Investment Funds.
5,531,542 10,481,360 20,682,201 3,617,717 16,263,174 166,878,075 - - - - - 185,133,601 65,496 55,714 1,566 10,338 54,177 7,074,062 - 299,477 - - 462,842 2,956,762 - - - - - 2,568,593 - - - 44,886 26,223 1,241,274
5,597,038 10,836,551 20,683,767 3,672,941 16,806,416 365,852,367
2,738,995 4,296,172 8,195,754 2,923,007 7,839,265 121,365,568 29,158 330,768 161,535 149,316 627,246 3,428,108 3,868 3,863 3,863 2,609 3,863 180,776 225,992 186,811 278,875 141,648 248,432 7,477,905 67,531 61,151 13,003 - - 2,065,360 31,911 36,877 36,831 20,464 50,275 1,542,523 90,121 111,824 317,967 90,451 303,253 4,825,922 50,193 125,421 171,461 36,548 112,545 2,582,845 990 - - - - 200,271 - - - - - 209,597 8,636 4,412 - 1,483 6,796 168,379 24,540 91,039 53,055 137,811 172,497 2,068,772 - - - - - 784,668 52,255 97,056 193,349 12,637 254,131 2,451,157 146,307 82,500 527,159 162,253 291,274 6,959,967 110,460 410,619 705,129 690,111 401,425 17,168,878 1,856 127 - 81 126 12,120 - - 38,541 - - 72,109 24 - 7,099 1,520 - 207,016 - - - - - 78,247 - - - - - 473 - - - - - 118,235 32,605 225,555 18,881 2,974 52,454 1,778,653 37,379 - - - - 59,278 - - - - - 54,029 4,509 - - - - 253,309 28,505 - - - - 541,784 - - - - - 122 7,428 - - - - 31,229 - - - - - 88,521 47,881 44,179 66,728 27,606 2,047,873 3,611,036 21,684 21,501 21,521 7,076 21,520 877,096
3,762,828 6,129,875 10,810,751 4,407,595 12,432,975 181,263,953
24,989 809 - 698 884 4,410,552
1,859,199 4,707,485 9,873,016 (733,956) 4,374,325 188,998,966
(42,141,098) (13,250,790) (120,531,601) (79,024,717) (60,924,264) (1,075,716,367) - - - - - (1,344,229) - - - - - (4,788,347) - - - - - 6,776,390 - - - - - 17,313,549 - - - - - 414,157 493,413 (36,238) 132,335 (223,322) 560,873 8,297,804
(39,788,486) (8,579,543) (110,526,250) (79,981,995) (55,989,066) (860,048,077)
94,809,730 255,648,407 361,266,619 160,900,595 490,380,465 4,057,745,317
- - - - - (24,375)
- - - - - 9,849,336
- - - - - (2,255,386)
- - - - - 3,521,849
- - - - - (1,507,134)
54,822 - - - (262,002) (9,327,323)
55,076,066 247,068,864 250,740,369 80,918,600 434,129,397 3,197,954,207
(811,586) - (663,507) (5,599) - (6,036,805)
339,543,800 379,142,485 346,639,269 77,720,206 291,626,373 13,375,855,193 (596,754,296) (367,573,592) (379,600,975) (104,747,131) (310,896,552) (11,268,593,724)
(257,210,496) 11,568,893 (32,961,706) (27,026,925) (19,270,179) 2,107,261,469
(202,946,016) 258,637,757 217,115,156 53,886,076 414,859,218 5,299,178,871
384,355,882 334,171,725 640,196,757 183,833,055 645,173,541 11,494,149,340 - - - - - 192,113,538
181,409,866 592,809,482 857,311,913 237,719,131 1,060,032,759 16,985,441,749
Combinedtotals of all
funds +
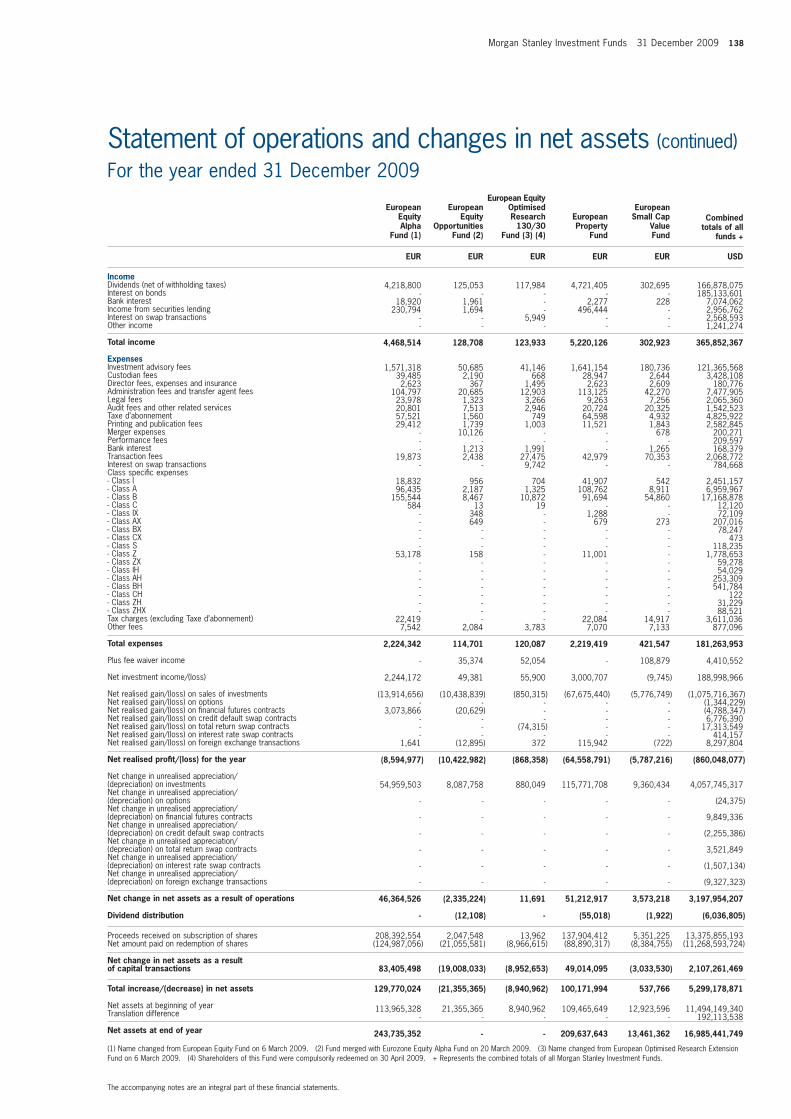
Morgan Stanley Investment Funds 31 December 2009 138
The accompanying notes are an integral part of these fi nancial statements.
Statement of operations and changes in net assets (continued)For the year ended 31 December 2009 European Equity European European Optimised European Equity Equity Research European Small Cap Alpha Opportunities 130/30 Property Value Fund (1) Fund (2) Fund (3) (4) Fund Fund
EUR EUR EUR EUR EUR USD
Income Dividends (net of withholding taxes) Interest on bonds Bank interest Income from securities lending Interest on swap transactions Other income
Total income
ExpensesInvestment advisory fees Custodian fees Director fees, expenses and insuranceAdministration fees and transfer agent fees Legal feesAudit fees and other related servicesTaxe d’abonnement Printing and publication fees Merger expenses Performance fees Bank interest Transaction fees Interest on swap transactions Class specifi c expenses - Class I - Class A - Class B - Class C - Class IX - Class AX - Class BX - Class CX - Class S - Class Z - Class ZX - Class IH - Class AH - Class BH - Class CH - Class ZH - Class ZHX Tax charges (excluding Taxe d’abonnement) Other fees
Total expenses
Plus fee waiver income
Net investment income/(loss)
Net realised gain/(loss) on sales of investments Net realised gain/(loss) on optionsNet realised gain/(loss) on fi nancial futures contracts Net realised gain/(loss) on credit default swap contracts Net realised gain/(loss) on total return swap contracts Net realised gain/(loss) on interest rate swap contracts Net realised gain/(loss) on foreign exchange transactions
Net realised profi t/(loss) for the year
Net change in unrealised appreciation/(depreciation) on investments Net change in unrealised appreciation/(depreciation) on optionsNet change in unrealised appreciation/(depreciation) on fi nancial futures contracts Net change in unrealised appreciation/(depreciation) on credit default swap contracts Net change in unrealised appreciation/(depreciation) on total return swap contracts Net change in unrealised appreciation/(depreciation) on interest rate swap contracts Net change in unrealised appreciation/(depreciation) on foreign exchange transactions
Net change in net assets as a result of operations
Dividend distribution
Proceeds received on subscription of shares Net amount paid on redemption of shares
Net change in net assets as a result of capital transactions
Total increase/(decrease) in net assets
Net assets at beginning of yearTranslation difference
Net assets at end of year
(1) Name changed from European Equity Fund on 6 March 2009. (2) Fund merged with Eurozone Equity Alpha Fund on 20 March 2009. (3) Name changed from European Optimised Research Extension Fund on 6 March 2009. (4) Shareholders of this Fund were compulsorily redeemed on 30 April 2009. + Represents the combined totals of all Morgan Stanley Investment Funds.
4,218,800 125,053 117,984 4,721,405 302,695 166,878,075 - - - - - 185,133,601 18,920 1,961 - 2,277 228 7,074,062 230,794 1,694 - 496,444 - 2,956,762 - - 5,949 - - 2,568,593 - - - - - 1,241,274
4,468,514 128,708 123,933 5,220,126 302,923 365,852,367
1,571,318 50,685 41,146 1,641,154 180,736 121,365,568 39,485 2,190 668 28,947 2,644 3,428,108 2,623 367 1,495 2,623 2,609 180,776 104,797 20,685 12,903 113,125 42,270 7,477,905 23,978 1,323 3,266 9,263 7,256 2,065,360 20,801 7,513 2,946 20,724 20,325 1,542,523 57,521 1,560 749 64,598 4,932 4,825,922 29,412 1,739 1,003 11,521 1,843 2,582,845 - 10,126 - - 678 200,271 - - - - - 209,597 - 1,213 1,991 - 1,265 168,379 19,873 2,438 27,475 42,979 70,353 2,068,772 - - 9,742 - - 784,668 18,832 956 704 41,907 542 2,451,157 96,435 2,187 1,325 108,762 8,911 6,959,967 155,544 8,467 10,872 91,694 54,860 17,168,878 584 13 19 - - 12,120 - 348 - 1,288 - 72,109 - 649 - 679 273 207,016 - - - - - 78,247 - - - - - 473 - - - - - 118,235 53,178 158 - 11,001 - 1,778,653 - - - - - 59,278 - - - - - 54,029 - - - - - 253,309 - - - - - 541,784 - - - - - 122 - - - - - 31,229 - - - - - 88,521 22,419 - - 22,084 14,917 3,611,036 7,542 2,084 3,783 7,070 7,133 877,096
2,224,342 114,701 120,087 2,219,419 421,547 181,263,953
- 35,374 52,054 - 108,879 4,410,552
2,244,172 49,381 55,900 3,000,707 (9,745) 188,998,966
(13,914,656) (10,438,839) (850,315) (67,675,440) (5,776,749) (1,075,716,367) - - - - - (1,344,229) 3,073,866 (20,629) - - - (4,788,347) - - - - - 6,776,390 - - (74,315) - - 17,313,549 - - - - - 414,157 1,641 (12,895) 372 115,942 (722) 8,297,804
(8,594,977) (10,422,982) (868,358) (64,558,791) (5,787,216) (860,048,077)
54,959,503 8,087,758 880,049 115,771,708 9,360,434 4,057,745,317
- - - - - (24,375)
- - - - - 9,849,336
- - - - - (2,255,386)
- - - - - 3,521,849
- - - - - (1,507,134)
- - - - - (9,327,323)
46,364,526 (2,335,224) 11,691 51,212,917 3,573,218 3,197,954,207
- (12,108) - (55,018) (1,922) (6,036,805)
208,392,554 2,047,548 13,962 137,904,412 5,351,225 13,375,855,193 (124,987,056) (21,055,581) (8,966,615) (88,890,317) (8,384,755) (11,268,593,724)
83,405,498 (19,008,033) (8,952,653) 49,014,095 (3,033,530) 2,107,261,469
129,770,024 (21,355,365) (8,940,962) 100,171,994 537,766 5,299,178,871
113,965,328 21,355,365 8,940,962 109,465,649 12,923,596 11,494,149,340 - - - - - 192,113,538
243,735,352 - - 209,637,643 13,461,362 16,985,441,749
Combinedtotals of all
funds +

139 Morgan Stanley Investment Funds 31 December 2009
The accompanying notes are an integral part of these fi nancial statements.
Statement of operations and changes in net assets (continued)For the year ended 31 December 2009 Eurozone Global Global Equity Global Equity Global Small Cap Alpha Brands Growth Property Value Fund (1) Fund Fund (2) Fund Fund
EUR USD USD USD USD USD
Income Dividends (net of withholding taxes) Interest on bonds Bank interest Income from securities lending Interest on swap transactions Other income
Total income
ExpensesInvestment advisory fees Custodian fees Director fees, expenses and insuranceAdministration fees and transfer agent fees Legal feesAudit fees and other related servicesTaxe d’abonnement Printing and publication fees Merger expenses Performance fees Bank interest Transaction fees Interest on swap transactions Class specifi c expenses - Class I - Class A - Class B - Class C - Class IX - Class AX - Class BX - Class CX - Class S - Class Z - Class ZX - Class IH - Class AH - Class BH - Class CH - Class ZH - Class ZHX Tax charges (excluding Taxe d’abonnement) Other fees
Total expenses
Plus fee waiver income
Net investment income/(loss)
Net realised gain/(loss) on sales of investments Net realised gain/(loss) on optionsNet realised gain/(loss) on fi nancial futures contracts Net realised gain/(loss) on credit default swap contracts Net realised gain/(loss) on total return swap contracts Net realised gain/(loss) on interest rate swap contracts Net realised gain/(loss) on foreign exchange transactions
Net realised profi t/(loss) for the year
Net change in unrealised appreciation/(depreciation) on investments Net change in unrealised appreciation/(depreciation) on optionsNet change in unrealised appreciation/(depreciation) on fi nancial futures contracts Net change in unrealised appreciation/(depreciation) on credit default swap contracts Net change in unrealised appreciation/(depreciation) on total return swap contracts Net change in unrealised appreciation/(depreciation) on interest rate swap contracts Net change in unrealised appreciation/(depreciation) on foreign exchange transactions
Net change in net assets as a result of operations
Dividend distribution
Proceeds received on subscription of shares Net amount paid on redemption of shares
Net change in net assets as a result of capital transactions
Total increase/(decrease) in net assets
Net assets at beginning of yearTranslation difference
Net assets at end of year
(1) Name changed from Eurozone Equity Opportunities Fund on 6 March 2009. (2) Fund merged with Global Value Equity Fund on 3 April 2009. + Represents the combined totals of all Morgan Stanley Investment Funds.
1,000,881 26,770,585 101,395 6,723,577 1,236,710 166,878,075 - - - - 16,571 185,133,601 8,356 114,349 1,714 10,535 10,209 7,074,062 69,581 - - 15,234 - 2,956,762 - - - - - 2,568,593 - 531,975 - - - 1,241,274
1,078,818 27,416,909 103,109 6,749,346 1,263,490 365,852,367
582,650 11,945,304 67,812 2,280,354 1,050,514 121,365,568 10,688 195,139 2,464 45,434 11,635 3,428,108 2,609 3,863 763 3,868 3,863 180,776 62,826 269,351 28,484 114,570 99,862 7,477,905 14,102 211,551 4,565 63,906 26,480 2,065,360 21,932 50,613 28,087 36,726 33,771 1,542,523 19,159 452,957 1,199 89,898 41,844 4,825,922 8,970 57,176 3,640 50,813 10,310 2,582,845 - - 14,829 - - 200,271 - - - - - 209,597 807 15,170 907 11 870 168,379 9,953 44,433 9,424 118,674 164,616 2,068,772 - - - - - 784,668 2,143 290,319 5,169 83,395 37,305 2,451,157 37,777 744,926 1,499 92,971 48,311 6,959,967 104,875 1,359,925 4,042 54,407 60,573 17,168,878 - 5 23 873 - 12,120 - - - 4,787 - 72,109 - - 11 - 644 207,016 - - - - - 78,247 - - - - - 473 - - - - - 118,235 8,779 36,645 - 30,991 89 1,778,653 - - - - - 59,278 - - - - - 54,029 - 17,901 - - - 253,309 - 76,724 - - - 541,784 - - - - - 122 - 1,162 - - - 31,229 - - - - - 88,521 16,122 105,207 - 31,038 25,684 3,611,036 7,035 24,918 4,930 18,552 21,462 877,096
910,427 15,903,289 177,848 3,121,268 1,637,833 181,263,953
14,666 67 74,145 23,830 1,502 4,410,552
183,057 11,513,687 (594) 3,651,908 (372,841) 188,998,966
(3,105,145) (137,123,515) (21,127,294) (34,827,431) (9,619,556) (1,075,716,367) - - - - - (1,344,229) 1,021,605 - - - - (4,788,347) - - - - - 6,776,390 - - - - - 17,313,549 - - - - - 414,157 1,747 (8,608,052) 29,780 (40,349) (19,548) 8,297,804
(1,898,736) (134,217,880) (21,098,108) (31,215,872) (10,011,945) (860,048,077)
17,324,668 381,474,482 17,731,376 120,894,631 32,024,896 4,057,745,317
- - - - - (24,375)
- - - - - 9,849,336
- - - - - (2,255,386)
- - - - - 3,521,849
- - - - - (1,507,134)
- 674,128 - - 132,274 (9,327,323)
15,425,932 247,930,730 (3,366,732) 89,678,759 22,145,225 3,197,954,207
- - - (182,875) - (6,036,805)
45,536,321 447,792,546 3,658,869 271,398,916 31,076,622 13,375,855,193 (31,233,810) (577,478,159) (46,179,322) (179,288,949) (44,910,057) (11,268,593,724)
14,302,511 (129,685,613) (42,520,453) 92,109,967 (13,833,435) 2,107,261,469
29,728,443 118,245,117 (45,887,185) 181,605,851 8,311,790 5,299,178,871
29,185,008 1,162,249,983 45,887,185 155,852,949 83,230,500 11,494,149,340 - - - - - 192,113,538
58,913,451 1,280,495,100 - 337,458,800 91,542,290 16,985,441,749
Combinedtotals of all
funds +
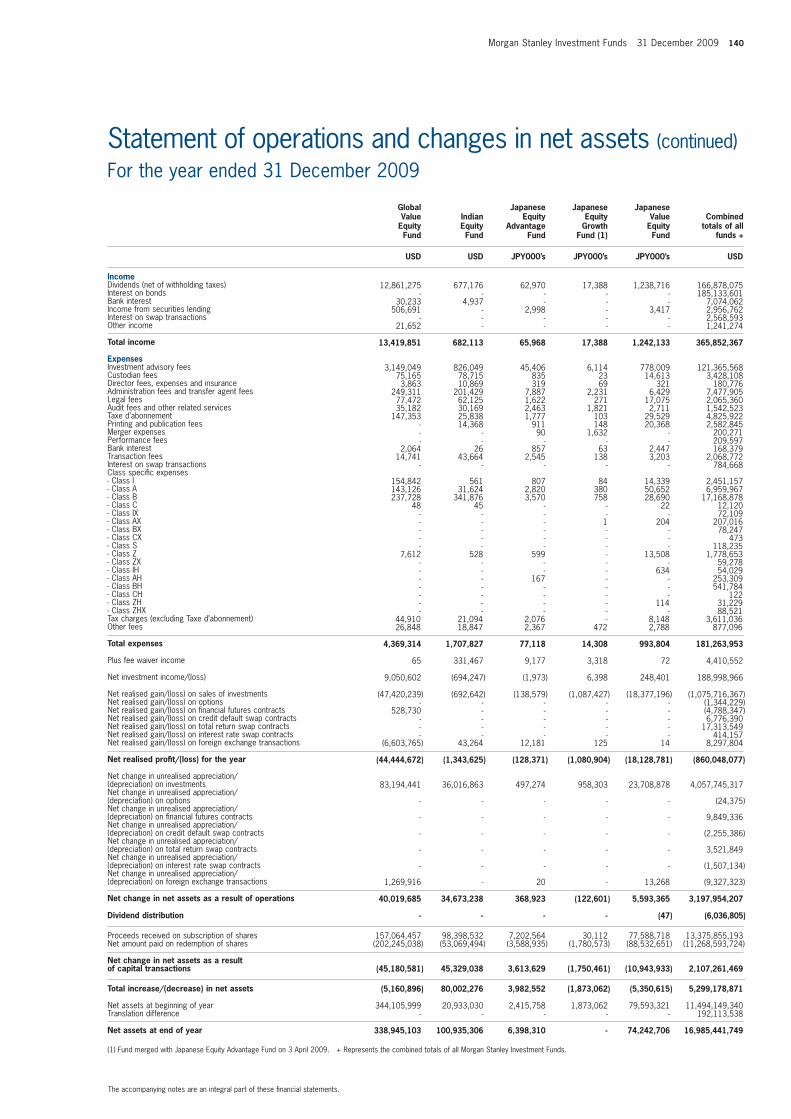
Morgan Stanley Investment Funds 31 December 2009 140
The accompanying notes are an integral part of these fi nancial statements.
Statement of operations and changes in net assets (continued)For the year ended 31 December 2009 Global Japanese Japanese Japanese Value Indian Equity Equity Value Equity Equity Advantage Growth Equity Fund Fund Fund Fund (1) Fund
USD USD JPY000’s JPY000’s JPY000’s USD
Income Dividends (net of withholding taxes) Interest on bonds Bank interest Income from securities lending Interest on swap transactions Other income
Total income
ExpensesInvestment advisory fees Custodian fees Director fees, expenses and insuranceAdministration fees and transfer agent fees Legal feesAudit fees and other related servicesTaxe d’abonnement Printing and publication fees Merger expenses Performance fees Bank interest Transaction fees Interest on swap transactions Class specifi c expenses - Class I - Class A - Class B - Class C - Class IX - Class AX - Class BX - Class CX - Class S - Class Z - Class ZX - Class IH - Class AH - Class BH - Class CH - Class ZH - Class ZHX Tax charges (excluding Taxe d’abonnement) Other fees
Total expenses
Plus fee waiver income
Net investment income/(loss)
Net realised gain/(loss) on sales of investments Net realised gain/(loss) on optionsNet realised gain/(loss) on fi nancial futures contracts Net realised gain/(loss) on credit default swap contracts Net realised gain/(loss) on total return swap contracts Net realised gain/(loss) on interest rate swap contracts Net realised gain/(loss) on foreign exchange transactions
Net realised profi t/(loss) for the year
Net change in unrealised appreciation/(depreciation) on investments Net change in unrealised appreciation/(depreciation) on optionsNet change in unrealised appreciation/(depreciation) on fi nancial futures contracts Net change in unrealised appreciation/(depreciation) on credit default swap contracts Net change in unrealised appreciation/(depreciation) on total return swap contracts Net change in unrealised appreciation/(depreciation) on interest rate swap contracts Net change in unrealised appreciation/(depreciation) on foreign exchange transactions
Net change in net assets as a result of operations
Dividend distribution
Proceeds received on subscription of shares Net amount paid on redemption of shares
Net change in net assets as a result of capital transactions
Total increase/(decrease) in net assets
Net assets at beginning of yearTranslation difference
Net assets at end of year
(1) Fund merged with Japanese Equity Advantage Fund on 3 April 2009. + Represents the combined totals of all Morgan Stanley Investment Funds.
12,861,275 677,176 62,970 17,388 1,238,716 166,878,075 - - - - - 185,133,601 30,233 4,937 - - - 7,074,062 506,691 - 2,998 - 3,417 2,956,762 - - - - - 2,568,593 21,652 - - - - 1,241,274
13,419,851 682,113 65,968 17,388 1,242,133 365,852,367
3,149,049 826,049 45,406 6,114 778,009 121,365,568 75,165 78,715 835 23 14,613 3,428,108 3,863 10,869 319 69 321 180,776 249,311 201,429 7,887 2,231 6,429 7,477,905 77,472 62,125 1,622 271 17,075 2,065,360 35,182 30,169 2,463 1,821 2,711 1,542,523 147,353 25,838 1,777 103 29,529 4,825,922 - 14,368 911 148 20,368 2,582,845 - - 90 1,632 - 200,271 - - - - - 209,597 2,064 26 857 63 2,447 168,379 14,741 43,664 2,545 138 3,203 2,068,772 - - - - - 784,668 154,842 561 807 84 14,339 2,451,157 143,126 31,624 2,820 380 50,652 6,959,967 237,728 341,876 3,570 758 28,690 17,168,878 48 45 - - 22 12,120 - - - - - 72,109 - - - 1 204 207,016 - - - - - 78,247 - - - - - 473 - - - - - 118,235 7,612 528 599 - 13,508 1,778,653 - - - - - 59,278 - - - - 634 54,029 - - 167 - - 253,309 - - - - - 541,784 - - - - - 122 - - - - 114 31,229 - - - - - 88,521 44,910 21,094 2,076 - 8,148 3,611,036 26,848 18,847 2,367 472 2,788 877,096
4,369,314 1,707,827 77,118 14,308 993,804 181,263,953
65 331,467 9,177 3,318 72 4,410,552
9,050,602 (694,247) (1,973) 6,398 248,401 188,998,966
(47,420,239) (692,642) (138,579) (1,087,427) (18,377,196) (1,075,716,367) - - - - - (1,344,229) 528,730 - - - - (4,788,347) - - - - - 6,776,390 - - - - - 17,313,549 - - - - - 414,157 (6,603,765) 43,264 12,181 125 14 8,297,804
(44,444,672) (1,343,625) (128,371) (1,080,904) (18,128,781) (860,048,077)
83,194,441 36,016,863 497,274 958,303 23,708,878 4,057,745,317
- - - - - (24,375)
- - - - - 9,849,336
- - - - - (2,255,386)
- - - - - 3,521,849
- - - - - (1,507,134)
1,269,916 - 20 - 13,268 (9,327,323)
40,019,685 34,673,238 368,923 (122,601) 5,593,365 3,197,954,207
- - - - (47) (6,036,805)
157,064,457 98,398,532 7,202,564 30,112 77,588,718 13,375,855,193 (202,245,038) (53,069,494) (3,588,935) (1,780,573) (88,532,651) (11,268,593,724)
(45,180,581) 45,329,038 3,613,629 (1,750,461) (10,943,933) 2,107,261,469
(5,160,896) 80,002,276 3,982,552 (1,873,062) (5,350,615) 5,299,178,871
344,105,999 20,933,030 2,415,758 1,873,062 79,593,321 11,494,149,340 - - - - - 192,113,538
338,945,103 100,935,306 6,398,310 - 74,242,706 16,985,441,749
Combinedtotals of all
funds +

141 Morgan Stanley Investment Funds 31 December 2009
The accompanying notes are an integral part of these fi nancial statements.
Statement of operations and changes in net assets (continued)For the year ended 31 December 2009 Latin US US American US Equity US Small Cap Equity Equity Growth Property Growth Fund Fund (1) Fund Fund Fund
USD USD USD USD USD USD
Income Dividends (net of withholding taxes) Interest on bonds Bank interest Income from securities lending Interest on swap transactions Other income
Total income
ExpensesInvestment advisory fees Custodian fees Director fees, expenses and insuranceAdministration fees and transfer agent fees Legal feesAudit fees and other related servicesTaxe d’abonnement Printing and publication fees Merger expenses Performance fees Bank interest Transaction fees Interest on swap transactions Class specifi c expenses - Class I - Class A - Class B - Class C - Class IX - Class AX - Class BX - Class CX - Class S - Class Z - Class ZX - Class IH - Class AH - Class BH - Class CH - Class ZH - Class ZHX Tax charges (excluding Taxe d’abonnement) Other fees
Total expenses
Plus fee waiver income
Net investment income/(loss)
Net realised gain/(loss) on sales of investments Net realised gain/(loss) on optionsNet realised gain/(loss) on fi nancial futures contracts Net realised gain/(loss) on credit default swap contracts Net realised gain/(loss) on total return swap contracts Net realised gain/(loss) on interest rate swap contracts Net realised gain/(loss) on foreign exchange transactions
Net realised profi t/(loss) for the year
Net change in unrealised appreciation/(depreciation) on investments Net change in unrealised appreciation/(depreciation) on optionsNet change in unrealised appreciation/(depreciation) on fi nancial futures contracts Net change in unrealised appreciation/(depreciation) on credit default swap contracts Net change in unrealised appreciation/(depreciation) on total return swap contracts Net change in unrealised appreciation/(depreciation) on interest rate swap contracts Net change in unrealised appreciation/(depreciation) on foreign exchange transactions
Net change in net assets as a result of operations
Dividend distribution
Proceeds received on subscription of shares Net amount paid on redemption of shares
Net change in net assets as a result of capital transactions
Total increase/(decrease) in net assets
Net assets at beginning of yearTranslation difference
Net assets at end of year
(1) Fund merged with American Franchise Fund on 3 April 2009. + Represents the combined totals of all Morgan Stanley Investment Funds.
18,974,259 83,073 2,506,650 2,220,050 60,728 166,878,075 - - - - - 185,133,601 24,285 838 47,394 4,232 4,736 7,074,062 - - - 46,157 - 2,956,762 - - - - - 2,568,593 - 21,883 - 203,631 - 1,241,274
18,998,544 105,794 2,554,044 2,474,070 65,464 365,852,367
12,047,981 38,010 3,330,892 685,222 402,761 121,365,568 380,152 - 41,548 4,576 2,439 3,428,108 3,863 763 3,863 3,863 3,863 180,776 307,584 26,338 198,114 67,038 79,672 7,477,905 93,758 3,127 6,605 5,182 12,356 2,065,360 29,966 27,643 32,338 36,033 27,723 1,542,523 376,569 1,054 128,684 30,147 11,189 4,825,922 167,347 - 48,930 - 5,517 2,582,845 - 13,666 990 - - 200,271 - - - - - 209,597 34,594 104 13,089 45 19 168,379 3,182 1,746 29,650 4,616 22,292 2,068,772 - - - - - 784,668 42,330 1,453 59,893 20,014 1,257 2,451,157 953,671 1,537 207,983 48,087 30,635 6,959,967 599,240 9,294 278,931 23,773 43,268 17,168,878 133 23 108 - 47 12,120 - 83 3,342 - - 72,109 - 285 3,747 2,046 - 207,016 - - - - - 78,247 - - - - - 473 - - - - - 118,235 40,836 - 40,590 75 - 1,778,653 - - - - - 59,278 - - 286 - - 54,029 - - 6,506 - - 253,309 - - - - - 541,784 - - - - - 122 - - 4,735 - - 31,229 - - - - - 88,521 56,238 - 36,469 29,886 21,269 3,611,036 10,063 3,340 18,386 10,001 10,002 877,096
15,147,507 128,466 4,495,679 970,604 674,309 181,263,953
931 30,198 1,825 - 84,235 4,410,552
3,851,968 7,526 (1,939,810) 1,503,466 (524,610) 188,998,966
(38,733,916) (9,176,887) (24,024,654) (18,731,888) (2,430,870) (1,075,716,367) - - - - - (1,344,229) - - - - - (4,788,347) - - - - - 6,776,390 - - - - - 17,313,549 - - - - - 414,157 (1,089,270) (13,873) (550,991) (3,565) 2,495 8,297,804
(35,971,218) (9,183,234) (26,515,455) (17,231,987) (2,952,985) (860,048,077)
598,801,011 7,935,218 179,139,661 41,123,972 7,876,683 4,057,745,317
- - - - - (24,375)
- - - - - 9,849,336
- - - - - (2,255,386)
- - - - - 3,521,849
- - - - - (1,507,134)
- - 41,328 - - (9,327,323)
562,829,793 (1,248,016) 152,665,534 23,891,985 4,923,698 3,197,954,207
- (1,785) - (2,819) - (6,036,805)
281,944,490 2,386,003 332,095,754 51,898,590 10,301,848 13,375,855,193 (225,362,740) (17,924,673) (289,676,396) (25,298,263) (5,985,520) (11,268,593,724)
56,581,750 (15,538,670) 42,419,358 26,600,327 4,316,328 2,107,261,469
619,411,543 (16,788,471) 195,084,892 50,489,493 9,240,026 5,299,178,871
497,822,667 16,788,471 229,510,681 52,425,031 23,271,120 11,494,149,340 - - - - - 192,113,538
1,117,234,210 - 424,595,573 102,914,524 32,511,146 16,985,441,749
Combinedtotals of all
funds +
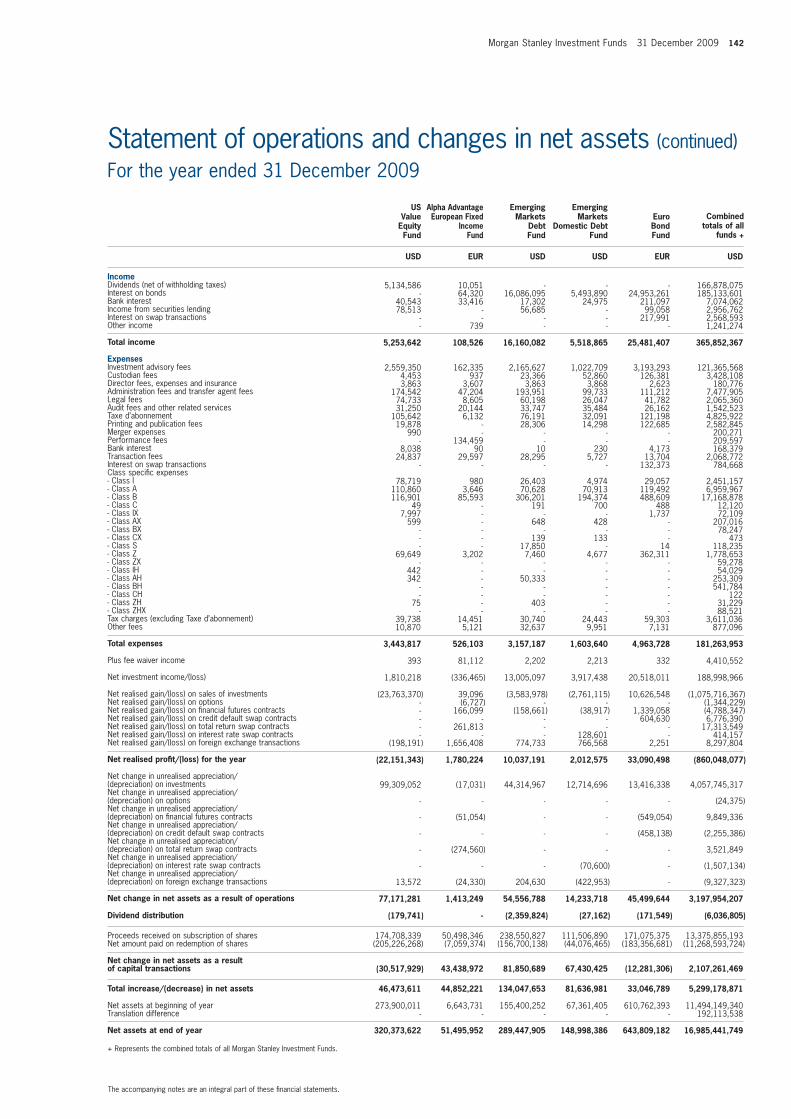
Morgan Stanley Investment Funds 31 December 2009 142
The accompanying notes are an integral part of these fi nancial statements.
Statement of operations and changes in net assets (continued)For the year ended 31 December 2009 US Alpha Advantage Emerging Emerging Value European Fixed Markets Markets Euro Equity Income Debt Domestic Debt Bond Fund Fund Fund Fund Fund
USD EUR USD USD EUR USD
Income Dividends (net of withholding taxes) Interest on bonds Bank interest Income from securities lending Interest on swap transactions Other income
Total income
ExpensesInvestment advisory fees Custodian fees Director fees, expenses and insuranceAdministration fees and transfer agent fees Legal feesAudit fees and other related servicesTaxe d’abonnement Printing and publication fees Merger expenses Performance fees Bank interest Transaction fees Interest on swap transactions Class specifi c expenses - Class I - Class A - Class B - Class C - Class IX - Class AX - Class BX - Class CX - Class S - Class Z - Class ZX - Class IH - Class AH - Class BH - Class CH - Class ZH - Class ZHX Tax charges (excluding Taxe d’abonnement) Other fees
Total expenses
Plus fee waiver income
Net investment income/(loss)
Net realised gain/(loss) on sales of investments Net realised gain/(loss) on optionsNet realised gain/(loss) on fi nancial futures contracts Net realised gain/(loss) on credit default swap contracts Net realised gain/(loss) on total return swap contracts Net realised gain/(loss) on interest rate swap contracts Net realised gain/(loss) on foreign exchange transactions
Net realised profi t/(loss) for the year
Net change in unrealised appreciation/(depreciation) on investments Net change in unrealised appreciation/(depreciation) on optionsNet change in unrealised appreciation/(depreciation) on fi nancial futures contracts Net change in unrealised appreciation/(depreciation) on credit default swap contracts Net change in unrealised appreciation/(depreciation) on total return swap contracts Net change in unrealised appreciation/(depreciation) on interest rate swap contracts Net change in unrealised appreciation/(depreciation) on foreign exchange transactions
Net change in net assets as a result of operations
Dividend distribution
Proceeds received on subscription of shares Net amount paid on redemption of shares
Net change in net assets as a result of capital transactions
Total increase/(decrease) in net assets
Net assets at beginning of yearTranslation difference
Net assets at end of year
+ Represents the combined totals of all Morgan Stanley Investment Funds.
5,134,586 10,051 - - - 166,878,075 - 64,320 16,086,095 5,493,890 24,953,261 185,133,601 40,543 33,416 17,302 24,975 211,097 7,074,062 78,513 - 56,685 - 99,058 2,956,762 - - - - 217,991 2,568,593 - 739 - - - 1,241,274
5,253,642 108,526 16,160,082 5,518,865 25,481,407 365,852,367
2,559,350 162,335 2,165,627 1,022,709 3,193,293 121,365,568 4,453 937 23,366 52,860 126,381 3,428,108 3,863 3,607 3,863 3,868 2,623 180,776 174,542 47,204 193,951 99,733 111,212 7,477,905 74,733 8,605 60,198 26,047 41,782 2,065,360 31,250 20,144 33,747 35,484 26,162 1,542,523 105,642 6,132 76,191 32,091 121,198 4,825,922 19,878 - 28,306 14,298 122,685 2,582,845 990 - - - - 200,271 - 134,459 - - - 209,597 8,038 90 10 230 4,173 168,379 24,837 29,597 28,295 5,727 13,704 2,068,772 - - - - 132,373 784,668 78,719 980 26,403 4,974 29,057 2,451,157 110,860 3,646 70,628 70,913 119,492 6,959,967 116,901 85,593 306,201 194,374 488,609 17,168,878 49 - 191 700 488 12,120 7,997 - - - 1,737 72,109 599 - 648 428 - 207,016 - - - - - 78,247 - - 139 133 - 473 - - 17,850 - 14 118,235 69,649 3,202 7,460 4,677 362,311 1,778,653 - - - - - 59,278 442 - - - - 54,029 342 - 50,333 - - 253,309 - - - - - 541,784 - - - - - 122 75 - 403 - - 31,229 - - - - - 88,521 39,738 14,451 30,740 24,443 59,303 3,611,036 10,870 5,121 32,637 9,951 7,131 877,096
3,443,817 526,103 3,157,187 1,603,640 4,963,728 181,263,953
393 81,112 2,202 2,213 332 4,410,552
1,810,218 (336,465) 13,005,097 3,917,438 20,518,011 188,998,966
(23,763,370) 39,096 (3,583,978) (2,761,115) 10,626,548 (1,075,716,367) - (6,727) - - - (1,344,229) - 166,099 (158,661) (38,917) 1,339,058 (4,788,347) - - - - 604,630 6,776,390 - 261,813 - - - 17,313,549 - - - 128,601 - 414,157 (198,191) 1,656,408 774,733 766,568 2,251 8,297,804
(22,151,343) 1,780,224 10,037,191 2,012,575 33,090,498 (860,048,077)
99,309,052 (17,031) 44,314,967 12,714,696 13,416,338 4,057,745,317
- - - - - (24,375)
- (51,054) - - (549,054) 9,849,336
- - - - (458,138) (2,255,386)
- (274,560) - - - 3,521,849
- - - (70,600) - (1,507,134)
13,572 (24,330) 204,630 (422,953) - (9,327,323)
77,171,281 1,413,249 54,556,788 14,233,718 45,499,644 3,197,954,207
(179,741) - (2,359,824) (27,162) (171,549) (6,036,805)
174,708,339 50,498,346 238,550,827 111,506,890 171,075,375 13,375,855,193 (205,226,268) (7,059,374) (156,700,138) (44,076,465) (183,356,681) (11,268,593,724)
(30,517,929) 43,438,972 81,850,689 67,430,425 (12,281,306) 2,107,261,469
46,473,611 44,852,221 134,047,653 81,636,981 33,046,789 5,299,178,871
273,900,011 6,643,731 155,400,252 67,361,405 610,762,393 11,494,149,340 - - - - - 192,113,538
320,373,622 51,495,952 289,447,905 148,998,386 643,809,182 16,985,441,749
Combinedtotals of all
funds +
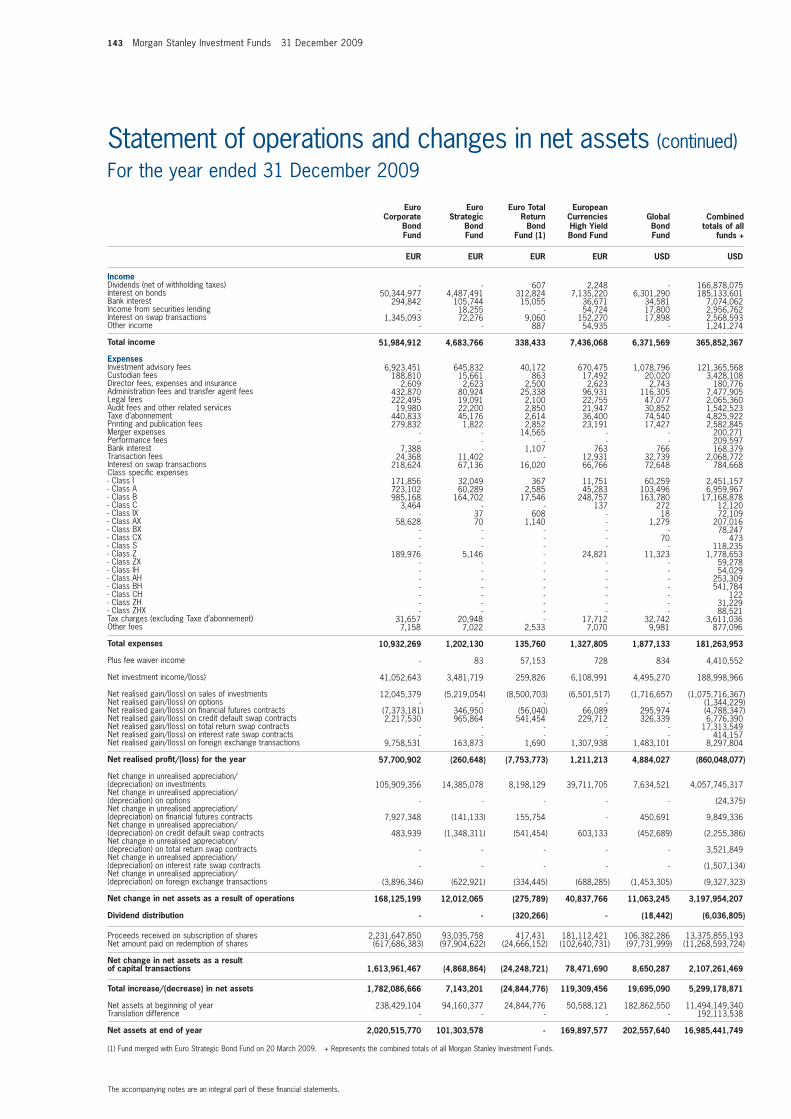
143 Morgan Stanley Investment Funds 31 December 2009
The accompanying notes are an integral part of these fi nancial statements.
Statement of operations and changes in net assets (continued)For the year ended 31 December 2009 Euro Euro Euro Total European Corporate Strategic Return Currencies Global Bond Bond Bond High Yield Bond Fund Fund Fund (1) Bond Fund Fund
EUR EUR EUR EUR USD USD
Income Dividends (net of withholding taxes) Interest on bonds Bank interest Income from securities lending Interest on swap transactions Other income
Total income
ExpensesInvestment advisory fees Custodian fees Director fees, expenses and insuranceAdministration fees and transfer agent fees Legal feesAudit fees and other related servicesTaxe d’abonnement Printing and publication fees Merger expenses Performance fees Bank interest Transaction fees Interest on swap transactions Class specifi c expenses - Class I - Class A - Class B - Class C - Class IX - Class AX - Class BX - Class CX - Class S - Class Z - Class ZX - Class IH - Class AH - Class BH - Class CH - Class ZH - Class ZHX Tax charges (excluding Taxe d’abonnement) Other fees
Total expenses
Plus fee waiver income
Net investment income/(loss)
Net realised gain/(loss) on sales of investments Net realised gain/(loss) on optionsNet realised gain/(loss) on fi nancial futures contracts Net realised gain/(loss) on credit default swap contracts Net realised gain/(loss) on total return swap contracts Net realised gain/(loss) on interest rate swap contracts Net realised gain/(loss) on foreign exchange transactions
Net realised profi t/(loss) for the year
Net change in unrealised appreciation/(depreciation) on investments Net change in unrealised appreciation/(depreciation) on optionsNet change in unrealised appreciation/(depreciation) on fi nancial futures contracts Net change in unrealised appreciation/(depreciation) on credit default swap contracts Net change in unrealised appreciation/(depreciation) on total return swap contracts Net change in unrealised appreciation/(depreciation) on interest rate swap contracts Net change in unrealised appreciation/(depreciation) on foreign exchange transactions
Net change in net assets as a result of operations
Dividend distribution
Proceeds received on subscription of shares Net amount paid on redemption of shares
Net change in net assets as a result of capital transactions
Total increase/(decrease) in net assets
Net assets at beginning of yearTranslation difference
Net assets at end of year
(1) Fund merged with Euro Strategic Bond Fund on 20 March 2009. + Represents the combined totals of all Morgan Stanley Investment Funds.
- - 607 2,248 - 166,878,075 50,344,977 4,487,491 312,824 7,135,220 6,301,290 185,133,601 294,842 105,744 15,055 36,671 34,581 7,074,062 - 18,255 - 54,724 17,800 2,956,762 1,345,093 72,276 9,060 152,270 17,898 2,568,593 - - 887 54,935 - 1,241,274
51,984,912 4,683,766 338,433 7,436,068 6,371,569 365,852,367
6,923,451 645,832 40,172 670,475 1,078,796 121,365,568 188,810 15,661 863 17,492 20,020 3,428,108 2,609 2,623 2,500 2,623 2,743 180,776 432,870 80,924 25,338 96,931 116,305 7,477,905 222,495 19,091 2,100 22,755 47,077 2,065,360 19,980 22,200 2,850 21,947 30,852 1,542,523 440,833 45,176 2,614 36,400 74,540 4,825,922 279,832 1,822 2,852 23,191 17,427 2,582,845 - - 14,565 - - 200,271 - - - - - 209,597 7,388 - 1,107 763 766 168,379 24,368 11,402 - 12,931 32,739 2,068,772 218,624 67,136 16,020 66,766 72,648 784,668 171,856 32,049 367 11,751 60,259 2,451,157 723,102 60,289 2,585 45,283 103,496 6,959,967 985,168 164,702 17,546 248,757 163,780 17,168,878 3,464 - - 137 272 12,120 - 37 608 - 18 72,109 58,628 70 1,140 - 1,279 207,016 - - - - - 78,247 - - - - 70 473 - - - - - 118,235 189,976 5,146 - 24,821 11,323 1,778,653 - - - - - 59,278 - - - - - 54,029 - - - - - 253,309 - - - - - 541,784 - - - - - 122 - - - - - 31,229 - - - - - 88,521 31,657 20,948 - 17,712 32,742 3,611,036 7,158 7,022 2,533 7,070 9,981 877,096
10,932,269 1,202,130 135,760 1,327,805 1,877,133 181,263,953
- 83 57,153 728 834 4,410,552
41,052,643 3,481,719 259,826 6,108,991 4,495,270 188,998,966
12,045,379 (5,219,054) (8,500,703) (6,501,517) (1,716,657) (1,075,716,367) - - - - - (1,344,229) (7,373,181) 346,950 (56,040) 66,089 295,974 (4,788,347) 2,217,530 965,864 541,454 229,712 326,339 6,776,390 - - - - - 17,313,549 - - - - - 414,157 9,758,531 163,873 1,690 1,307,938 1,483,101 8,297,804
57,700,902 (260,648) (7,753,773) 1,211,213 4,884,027 (860,048,077)
105,909,356 14,385,078 8,198,129 39,711,705 7,634,521 4,057,745,317
- - - - - (24,375)
7,927,348 (141,133) 155,754 - 450,691 9,849,336
483,939 (1,348,311) (541,454) 603,133 (452,689) (2,255,386)
- - - - - 3,521,849
- - - - - (1,507,134)
(3,896,346) (622,921) (334,445) (688,285) (1,453,305) (9,327,323)
168,125,199 12,012,065 (275,789) 40,837,766 11,063,245 3,197,954,207
- - (320,266) - (18,442) (6,036,805)
2,231,647,850 93,035,758 417,431 181,112,421 106,382,286 13,375,855,193 (617,686,383) (97,904,622) (24,666,152) (102,640,731) (97,731,999) (11,268,593,724)
1,613,961,467 (4,868,864) (24,248,721) 78,471,690 8,650,287 2,107,261,469
1,782,086,666 7,143,201 (24,844,776) 119,309,456 19,695,090 5,299,178,871
238,429,104 94,160,377 24,844,776 50,588,121 182,862,550 11,494,149,340 - - - - - 192,113,538
2,020,515,770 101,303,578 - 169,897,577 202,557,640 16,985,441,749
Combinedtotals of all
funds +
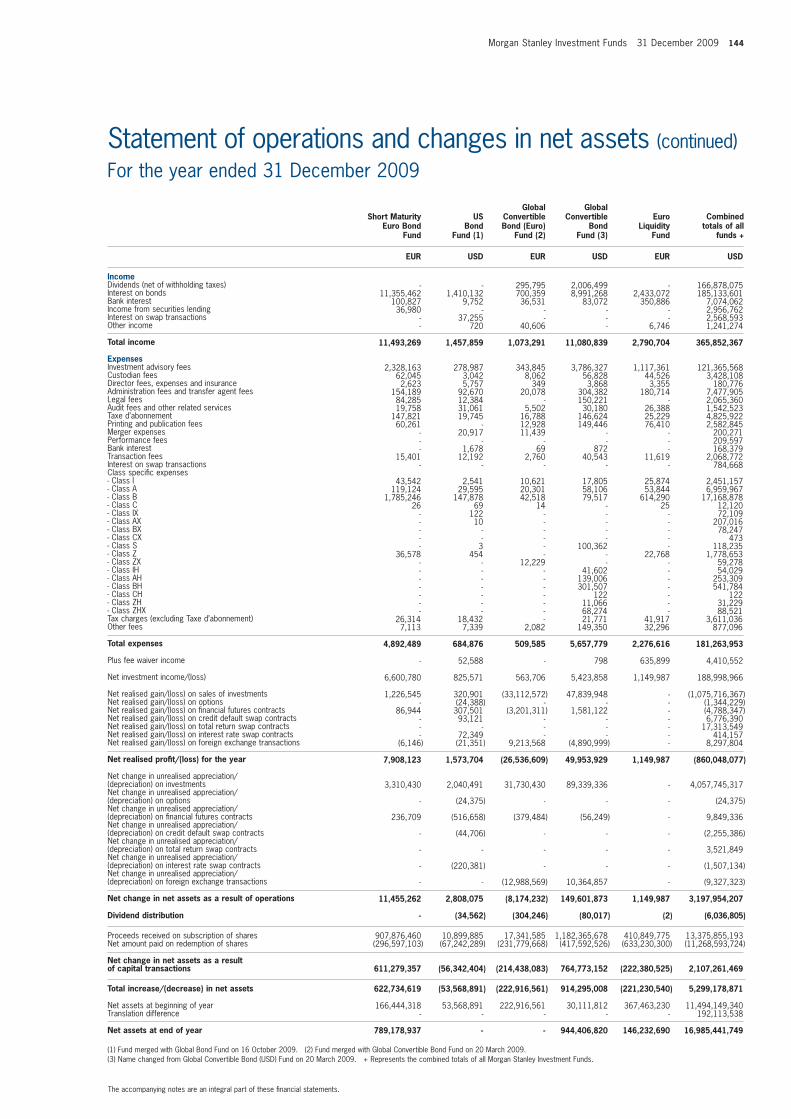
Morgan Stanley Investment Funds 31 December 2009 144
The accompanying notes are an integral part of these fi nancial statements.
Statement of operations and changes in net assets (continued)For the year ended 31 December 2009 Global Global Short Maturity US Convertible Convertible Euro Euro Bond Bond Bond (Euro) Bond Liquidity Fund Fund (1) Fund (2) Fund (3) Fund
EUR USD EUR USD EUR USD
Income Dividends (net of withholding taxes) Interest on bonds Bank interest Income from securities lending Interest on swap transactions Other income
Total income
ExpensesInvestment advisory fees Custodian fees Director fees, expenses and insuranceAdministration fees and transfer agent fees Legal feesAudit fees and other related servicesTaxe d’abonnement Printing and publication fees Merger expenses Performance fees Bank interest Transaction fees Interest on swap transactions Class specifi c expenses - Class I - Class A - Class B - Class C - Class IX - Class AX - Class BX - Class CX - Class S - Class Z - Class ZX - Class IH - Class AH - Class BH - Class CH - Class ZH - Class ZHX Tax charges (excluding Taxe d’abonnement) Other fees
Total expenses
Plus fee waiver income
Net investment income/(loss)
Net realised gain/(loss) on sales of investments Net realised gain/(loss) on optionsNet realised gain/(loss) on fi nancial futures contracts Net realised gain/(loss) on credit default swap contracts Net realised gain/(loss) on total return swap contracts Net realised gain/(loss) on interest rate swap contracts Net realised gain/(loss) on foreign exchange transactions
Net realised profi t/(loss) for the year
Net change in unrealised appreciation/(depreciation) on investments Net change in unrealised appreciation/(depreciation) on optionsNet change in unrealised appreciation/(depreciation) on fi nancial futures contracts Net change in unrealised appreciation/(depreciation) on credit default swap contracts Net change in unrealised appreciation/(depreciation) on total return swap contracts Net change in unrealised appreciation/(depreciation) on interest rate swap contracts Net change in unrealised appreciation/(depreciation) on foreign exchange transactions
Net change in net assets as a result of operations
Dividend distribution
Proceeds received on subscription of shares Net amount paid on redemption of shares
Net change in net assets as a result of capital transactions
Total increase/(decrease) in net assets
Net assets at beginning of yearTranslation difference
Net assets at end of year
(1) Fund merged with Global Bond Fund on 16 October 2009. (2) Fund merged with Global Convertible Bond Fund on 20 March 2009. (3) Name changed from Global Convertible Bond (USD) Fund on 20 March 2009. + Represents the combined totals of all Morgan Stanley Investment Funds.
- - 295,795 2,006,499 - 166,878,075 11,355,462 1,410,132 700,359 8,991,268 2,433,072 185,133,601 100,827 9,752 36,531 83,072 350,886 7,074,062 36,980 - - - - 2,956,762 - 37,255 - - - 2,568,593 - 720 40,606 - 6,746 1,241,274
11,493,269 1,457,859 1,073,291 11,080,839 2,790,704 365,852,367
2,328,163 278,987 343,845 3,786,327 1,117,361 121,365,568 62,045 3,042 8,062 56,828 44,526 3,428,108 2,623 5,757 349 3,868 3,355 180,776 154,189 92,670 20,078 304,382 180,714 7,477,905 84,285 12,384 - 150,221 - 2,065,360 19,758 31,061 5,502 30,180 26,388 1,542,523 147,821 19,745 16,788 146,624 25,229 4,825,922 60,261 - 12,928 149,446 76,410 2,582,845 - 20,917 11,439 - - 200,271 - - - - - 209,597 - 1,678 69 872 - 168,379 15,401 12,192 2,760 40,543 11,619 2,068,772 - - - - - 784,668 43,542 2,541 10,621 17,805 25,874 2,451,157 119,124 29,595 20,301 58,106 53,844 6,959,967 1,785,246 147,878 42,518 79,517 614,290 17,168,878 26 69 14 - 25 12,120 - 122 - - - 72,109 - 10 - - - 207,016 - - - - - 78,247 - - - - - 473 - 3 - 100,362 - 118,235 36,578 454 - - 22,768 1,778,653 - - 12,229 - - 59,278 - - - 41,602 - 54,029 - - - 139,006 - 253,309 - - - 301,507 - 541,784 - - - 122 - 122 - - - 11,066 - 31,229 - - - 68,274 - 88,521 26,314 18,432 - 21,771 41,917 3,611,036 7,113 7,339 2,082 149,350 32,296 877,096
4,892,489 684,876 509,585 5,657,779 2,276,616 181,263,953
- 52,588 - 798 635,899 4,410,552
6,600,780 825,571 563,706 5,423,858 1,149,987 188,998,966
1,226,545 320,901 (33,112,572) 47,839,948 - (1,075,716,367) - (24,388) - - - (1,344,229) 86,944 307,501 (3,201,311) 1,581,122 - (4,788,347) - 93,121 - - - 6,776,390 - - - - - 17,313,549 - 72,349 - - - 414,157 (6,146) (21,351) 9,213,568 (4,890,999) - 8,297,804
7,908,123 1,573,704 (26,536,609) 49,953,929 1,149,987 (860,048,077)
3,310,430 2,040,491 31,730,430 89,339,336 - 4,057,745,317
- (24,375) - - - (24,375)
236,709 (516,658) (379,484) (56,249) - 9,849,336
- (44,706) - - - (2,255,386)
- - - - - 3,521,849
- (220,381) - - - (1,507,134)
- - (12,988,569) 10,364,857 - (9,327,323)
11,455,262 2,808,075 (8,174,232) 149,601,873 1,149,987 3,197,954,207
- (34,562) (304,246) (80,017) (2) (6,036,805)
907,876,460 10,899,885 17,341,585 1,182,365,678 410,849,775 13,375,855,193 (296,597,103) (67,242,289) (231,779,668) (417,592,526) (633,230,300) (11,268,593,724)
611,279,357 (56,342,404) (214,438,083) 764,773,152 (222,380,525) 2,107,261,469
622,734,619 (53,568,891) (222,916,561) 914,295,008 (221,230,540) 5,299,178,871
166,444,318 53,568,891 222,916,561 30,111,812 367,463,230 11,494,149,340 - - - - - 192,113,538
789,178,937 - - 944,406,820 146,232,690 16,985,441,749
Combinedtotals of all
funds +
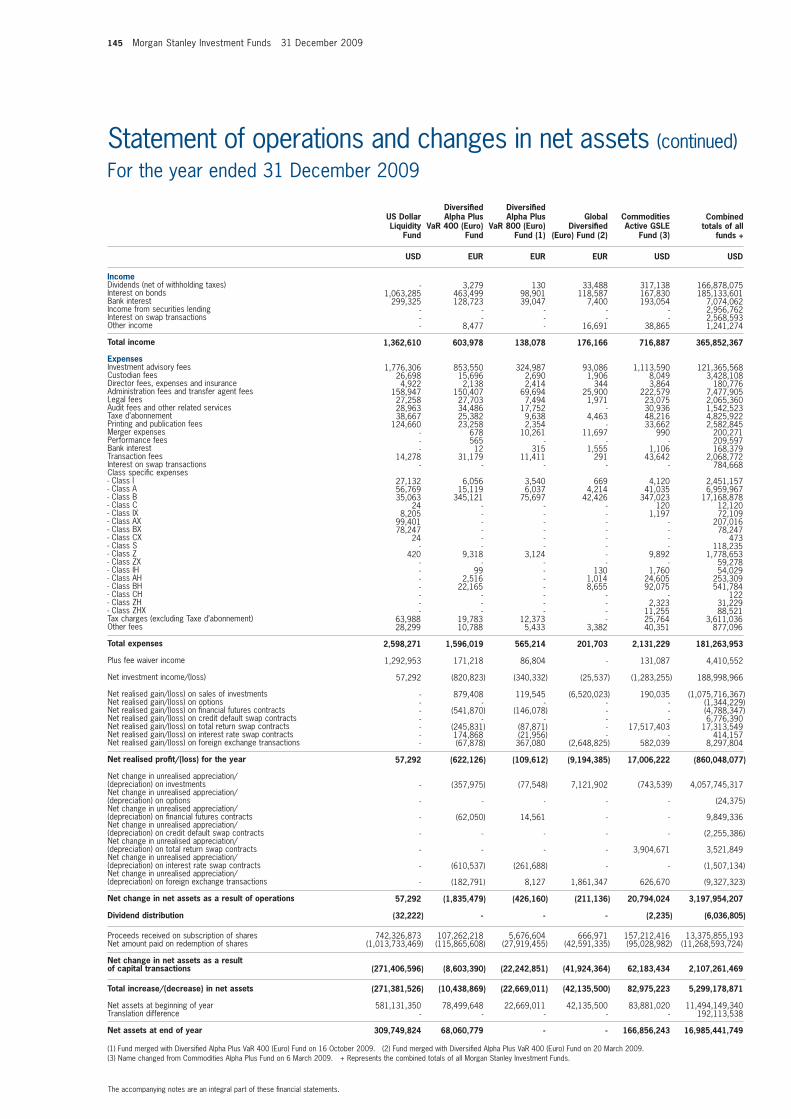
145 Morgan Stanley Investment Funds 31 December 2009
The accompanying notes are an integral part of these fi nancial statements.
Statement of operations and changes in net assets (continued)For the year ended 31 December 2009 Diversifi ed Diversifi ed US Dollar Alpha Plus Alpha Plus Global Commodities Liquidity VaR 400 (Euro) VaR 800 (Euro) Diversifi ed Active GSLE Fund Fund Fund (1) (Euro) Fund (2) Fund (3)
USD EUR EUR EUR USD USD
Income Dividends (net of withholding taxes) Interest on bonds Bank interest Income from securities lending Interest on swap transactions Other income
Total income
ExpensesInvestment advisory fees Custodian fees Director fees, expenses and insuranceAdministration fees and transfer agent fees Legal feesAudit fees and other related servicesTaxe d’abonnement Printing and publication fees Merger expenses Performance fees Bank interest Transaction fees Interest on swap transactions Class specifi c expenses - Class I - Class A - Class B - Class C - Class IX - Class AX - Class BX - Class CX - Class S - Class Z - Class ZX - Class IH - Class AH - Class BH - Class CH - Class ZH - Class ZHX Tax charges (excluding Taxe d’abonnement) Other fees
Total expenses
Plus fee waiver income
Net investment income/(loss)
Net realised gain/(loss) on sales of investments Net realised gain/(loss) on optionsNet realised gain/(loss) on fi nancial futures contracts Net realised gain/(loss) on credit default swap contracts Net realised gain/(loss) on total return swap contracts Net realised gain/(loss) on interest rate swap contracts Net realised gain/(loss) on foreign exchange transactions
Net realised profi t/(loss) for the year
Net change in unrealised appreciation/(depreciation) on investments Net change in unrealised appreciation/(depreciation) on optionsNet change in unrealised appreciation/(depreciation) on fi nancial futures contracts Net change in unrealised appreciation/(depreciation) on credit default swap contracts Net change in unrealised appreciation/(depreciation) on total return swap contracts Net change in unrealised appreciation/(depreciation) on interest rate swap contracts Net change in unrealised appreciation/(depreciation) on foreign exchange transactions
Net change in net assets as a result of operations
Dividend distribution
Proceeds received on subscription of shares Net amount paid on redemption of shares
Net change in net assets as a result of capital transactions
Total increase/(decrease) in net assets
Net assets at beginning of yearTranslation difference
Net assets at end of year
(1) Fund merged with Diversifi ed Alpha Plus VaR 400 (Euro) Fund on 16 October 2009. (2) Fund merged with Diversifi ed Alpha Plus VaR 400 (Euro) Fund on 20 March 2009.(3) Name changed from Commodities Alpha Plus Fund on 6 March 2009. + Represents the combined totals of all Morgan Stanley Investment Funds.
- 3,279 130 33,488 317,138 166,878,075 1,063,285 463,499 98,901 118,587 167,830 185,133,601 299,325 128,723 39,047 7,400 193,054 7,074,062 - - - - - 2,956,762 - - - - - 2,568,593 - 8,477 - 16,691 38,865 1,241,274
1,362,610 603,978 138,078 176,166 716,887 365,852,367
1,776,306 853,550 324,987 93,086 1,113,590 121,365,568 26,698 15,696 2,690 1,906 8,049 3,428,108 4,922 2,138 2,414 344 3,864 180,776 158,947 150,407 69,694 25,900 222,579 7,477,905 27,258 27,703 7,494 1,971 23,075 2,065,360 28,963 34,486 17,752 - 30,936 1,542,523 38,667 25,382 9,638 4,463 48,216 4,825,922 124,660 23,258 2,354 - 33,662 2,582,845 - 678 10,261 11,697 990 200,271 - 565 - - - 209,597 - 12 315 1,555 1,106 168,379 14,278 31,179 11,411 291 43,642 2,068,772 - - - - - 784,668 27,132 6,056 3,540 669 4,120 2,451,157 56,769 15,119 6,037 4,214 41,035 6,959,967 35,063 345,121 75,697 42,426 347,023 17,168,878 24 - - - 120 12,120 8,205 - - - 1,197 72,109 99,401 - - - - 207,016 78,247 - - - - 78,247 24 - - - - 473 - - - - - 118,235 420 9,318 3,124 - 9,892 1,778,653 - - - - - 59,278 - 99 - 130 1,760 54,029 - 2,516 - 1,014 24,605 253,309 - 22,165 - 8,655 92,075 541,784 - - - - - 122 - - - - 2,323 31,229 - - - - 11,255 88,521 63,988 19,783 12,373 - 25,764 3,611,036 28,299 10,788 5,433 3,382 40,351 877,096
2,598,271 1,596,019 565,214 201,703 2,131,229 181,263,953
1,292,953 171,218 86,804 - 131,087 4,410,552
57,292 (820,823) (340,332) (25,537) (1,283,255) 188,998,966
- 879,408 119,545 (6,520,023) 190,035 (1,075,716,367) - - - - - (1,344,229) - (541,870) (146,078) - - (4,788,347) - - - - - 6,776,390 - (245,831) (87,871) - 17,517,403 17,313,549 - 174,868 (21,956) - - 414,157 - (67,878) 367,080 (2,648,825) 582,039 8,297,804
57,292 (622,126) (109,612) (9,194,385) 17,006,222 (860,048,077)
- (357,975) (77,548) 7,121,902 (743,539) 4,057,745,317
- - - - - (24,375)
- (62,050) 14,561 - - 9,849,336
- - - - - (2,255,386)
- - - - 3,904,671 3,521,849
- (610,537) (261,688) - - (1,507,134)
- (182,791) 8,127 1,861,347 626,670 (9,327,323)
57,292 (1,835,479) (426,160) (211,136) 20,794,024 3,197,954,207
(32,222) - - - (2,235) (6,036,805)
742,326,873 107,262,218 5,676,604 666,971 157,212,416 13,375,855,193 (1,013,733,469) (115,865,608) (27,919,455) (42,591,335) (95,028,982) (11,268,593,724)
(271,406,596) (8,603,390) (22,242,851) (41,924,364) 62,183,434 2,107,261,469
(271,381,526) (10,438,869) (22,669,011) (42,135,500) 82,975,223 5,299,178,871
581,131,350 78,499,648 22,669,011 42,135,500 83,881,020 11,494,149,340 - - - - - 192,113,538
309,749,824 68,060,779 - - 166,856,243 16,985,441,749
Combinedtotals of all
funds +
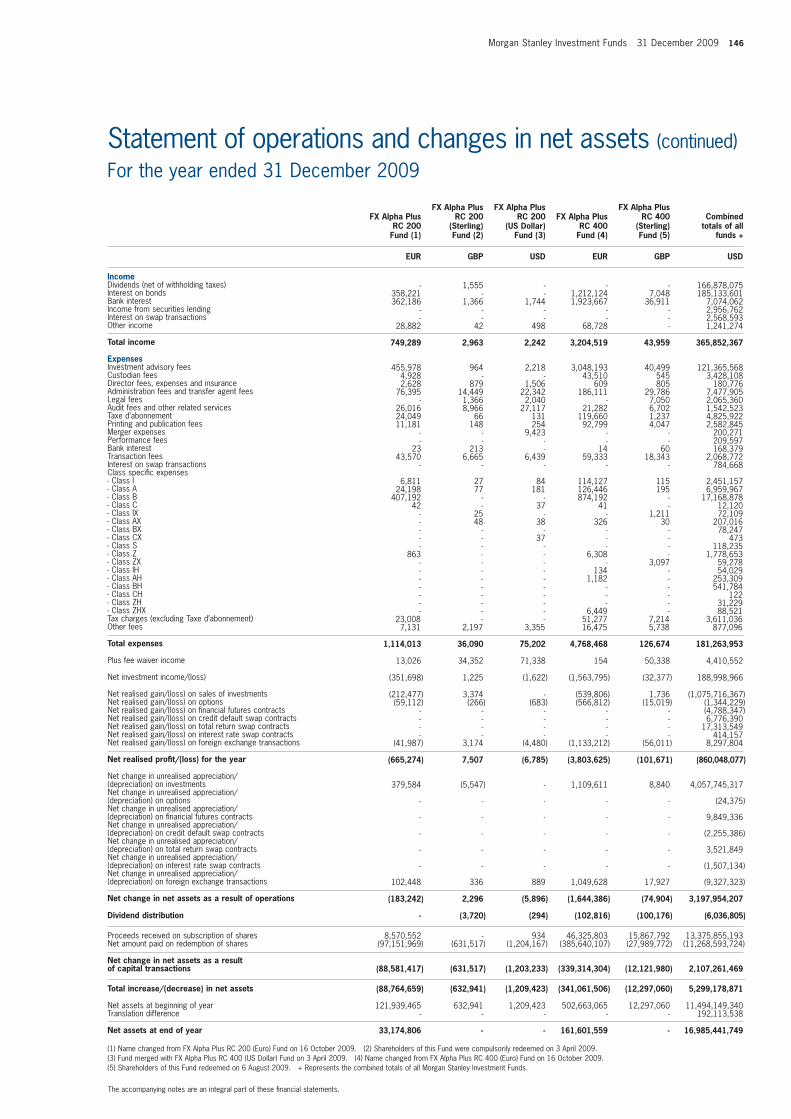
Morgan Stanley Investment Funds 31 December 2009 146
Statement of operations and changes in net assets (continued)For the year ended 31 December 2009
The accompanying notes are an integral part of these fi nancial statements.
FX Alpha Plus FX Alpha Plus FX Alpha Plus FX Alpha Plus RC 200 RC 200 FX Alpha Plus RC 400 RC 200 (Sterling) (US Dollar) RC 400 (Sterling) Fund (1) Fund (2) Fund (3) Fund (4) Fund (5)
EUR GBP USD EUR GBP USD
Income Dividends (net of withholding taxes) Interest on bonds Bank interest Income from securities lending Interest on swap transactions Other income
Total income
ExpensesInvestment advisory fees Custodian fees Director fees, expenses and insuranceAdministration fees and transfer agent fees Legal feesAudit fees and other related servicesTaxe d’abonnement Printing and publication fees Merger expenses Performance fees Bank interest Transaction fees Interest on swap transactions Class specifi c expenses - Class I - Class A - Class B - Class C - Class IX - Class AX - Class BX - Class CX - Class S - Class Z - Class ZX - Class IH - Class AH - Class BH - Class CH - Class ZH - Class ZHX Tax charges (excluding Taxe d’abonnement) Other fees
Total expenses
Plus fee waiver income
Net investment income/(loss)
Net realised gain/(loss) on sales of investments Net realised gain/(loss) on optionsNet realised gain/(loss) on fi nancial futures contracts Net realised gain/(loss) on credit default swap contracts Net realised gain/(loss) on total return swap contracts Net realised gain/(loss) on interest rate swap contracts Net realised gain/(loss) on foreign exchange transactions
Net realised profi t/(loss) for the year
Net change in unrealised appreciation/(depreciation) on investments Net change in unrealised appreciation/(depreciation) on optionsNet change in unrealised appreciation/(depreciation) on fi nancial futures contracts Net change in unrealised appreciation/(depreciation) on credit default swap contracts Net change in unrealised appreciation/(depreciation) on total return swap contracts Net change in unrealised appreciation/(depreciation) on interest rate swap contracts Net change in unrealised appreciation/(depreciation) on foreign exchange transactions
Net change in net assets as a result of operations
Dividend distribution
Proceeds received on subscription of shares Net amount paid on redemption of shares
Net change in net assets as a result of capital transactions
Total increase/(decrease) in net assets
Net assets at beginning of yearTranslation difference
Net assets at end of year
(1) Name changed from FX Alpha Plus RC 200 (Euro) Fund on 16 October 2009. (2) Shareholders of this Fund were compulsorily redeemed on 3 April 2009. (3) Fund merged with FX Alpha Plus RC 400 (US Dollar) Fund on 3 April 2009. (4) Name changed from FX Alpha Plus RC 400 (Euro) Fund on 16 October 2009.(5) Shareholders of this Fund redeemed on 6 August 2009. + Represents the combined totals of all Morgan Stanley Investment Funds.
- 1,555 - - - 166,878,075 358,221 - - 1,212,124 7,048 185,133,601 362,186 1,366 1,744 1,923,667 36,911 7,074,062 - - - - - 2,956,762 - - - - - 2,568,593 28,882 42 498 68,728 - 1,241,274
749,289 2,963 2,242 3,204,519 43,959 365,852,367
455,978 964 2,218 3,048,193 40,499 121,365,568 4,928 - - 43,510 545 3,428,108 2,628 879 1,506 609 805 180,776 76,395 14,449 22,342 186,111 29,786 7,477,905 - 1,366 2,040 - 7,050 2,065,360 26,016 8,966 27,117 21,282 6,702 1,542,523 24,049 66 131 119,660 1,237 4,825,922 11,181 148 254 92,799 4,047 2,582,845 - - 9,423 - - 200,271 - - - - - 209,597 23 213 - 14 60 168,379 43,570 6,665 6,439 59,333 18,343 2,068,772 - - - - - 784,668 6,811 27 84 114,127 115 2,451,157 24,198 77 181 126,446 195 6,959,967 407,192 - - 874,192 - 17,168,878 42 - 37 41 - 12,120 - 25 - - 1,211 72,109 - 48 38 326 30 207,016 - - - - - 78,247 - - 37 - - 473 - - - - - 118,235 863 - - 6,308 - 1,778,653 - - - - 3,097 59,278 - - - 134 - 54,029 - - - 1,182 - 253,309 - - - - - 541,784 - - - - - 122 - - - - - 31,229 - - - 6,449 - 88,521 23,008 - - 51,277 7,214 3,611,036 7,131 2,197 3,355 16,475 5,738 877,096
1,114,013 36,090 75,202 4,768,468 126,674 181,263,953
13,026 34,352 71,338 154 50,338 4,410,552
(351,698) 1,225 (1,622) (1,563,795) (32,377) 188,998,966
(212,477) 3,374 - (539,806) 1,736 (1,075,716,367) (59,112) (266) (683) (566,812) (15,019) (1,344,229) - - - - - (4,788,347) - - - - - 6,776,390 - - - - - 17,313,549 - - - - - 414,157 (41,987) 3,174 (4,480) (1,133,212) (56,011) 8,297,804
(665,274) 7,507 (6,785) (3,803,625) (101,671) (860,048,077)
379,584 (5,547) - 1,109,611 8,840 4,057,745,317
- - - - - (24,375)
- - - - - 9,849,336
- - - - - (2,255,386)
- - - - - 3,521,849
- - - - - (1,507,134)
102,448 336 889 1,049,628 17,927 (9,327,323)
(183,242) 2,296 (5,896) (1,644,386) (74,904) 3,197,954,207
- (3,720) (294) (102,816) (100,176) (6,036,805)
8,570,552 - 934 46,325,803 15,867,792 13,375,855,193 (97,151,969) (631,517) (1,204,167) (385,640,107) (27,989,772) (11,268,593,724)
(88,581,417) (631,517) (1,203,233) (339,314,304) (12,121,980) 2,107,261,469
(88,764,659) (632,941) (1,209,423) (341,061,506) (12,297,060) 5,299,178,871
121,939,465 632,941 1,209,423 502,663,065 12,297,060 11,494,149,340 - - - - - 192,113,538
33,174,806 - - 161,601,559 - 16,985,441,749
Combinedtotals of all
funds +
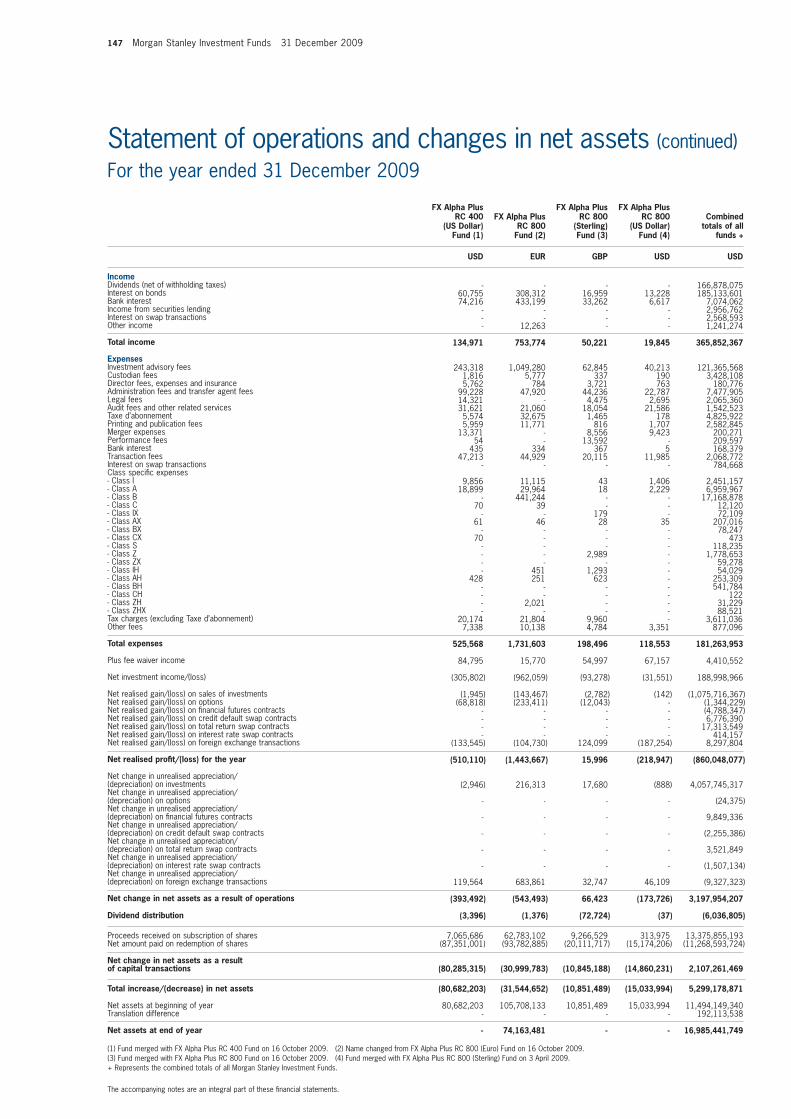
147 Morgan Stanley Investment Funds 31 December 2009
Statement of operations and changes in net assets (continued)For the year ended 31 December 2009
The accompanying notes are an integral part of these fi nancial statements.
FX Alpha Plus FX Alpha Plus FX Alpha Plus RC 400 FX Alpha Plus RC 800 RC 800 (US Dollar) RC 800 (Sterling) (US Dollar) Fund (1) Fund (2) Fund (3) Fund (4)
USD EUR GBP USD USD
Income Dividends (net of withholding taxes) Interest on bonds Bank interest Income from securities lending Interest on swap transactions Other income
Total income
ExpensesInvestment advisory fees Custodian fees Director fees, expenses and insuranceAdministration fees and transfer agent fees Legal feesAudit fees and other related servicesTaxe d’abonnement Printing and publication fees Merger expenses Performance fees Bank interest Transaction fees Interest on swap transactions Class specifi c expenses - Class I - Class A - Class B - Class C - Class IX - Class AX - Class BX - Class CX - Class S - Class Z - Class ZX - Class IH - Class AH - Class BH - Class CH - Class ZH - Class ZHX Tax charges (excluding Taxe d’abonnement) Other fees
Total expenses
Plus fee waiver income
Net investment income/(loss)
Net realised gain/(loss) on sales of investments Net realised gain/(loss) on optionsNet realised gain/(loss) on fi nancial futures contracts Net realised gain/(loss) on credit default swap contracts Net realised gain/(loss) on total return swap contracts Net realised gain/(loss) on interest rate swap contracts Net realised gain/(loss) on foreign exchange transactions
Net realised profi t/(loss) for the year
Net change in unrealised appreciation/(depreciation) on investments Net change in unrealised appreciation/(depreciation) on optionsNet change in unrealised appreciation/(depreciation) on fi nancial futures contracts Net change in unrealised appreciation/(depreciation) on credit default swap contracts Net change in unrealised appreciation/(depreciation) on total return swap contracts Net change in unrealised appreciation/(depreciation) on interest rate swap contracts Net change in unrealised appreciation/(depreciation) on foreign exchange transactions
Net change in net assets as a result of operations
Dividend distribution
Proceeds received on subscription of shares Net amount paid on redemption of shares
Net change in net assets as a result of capital transactions
Total increase/(decrease) in net assets
Net assets at beginning of yearTranslation difference
Net assets at end of year
(1) Fund merged with FX Alpha Plus RC 400 Fund on 16 October 2009. (2) Name changed from FX Alpha Plus RC 800 (Euro) Fund on 16 October 2009. (3) Fund merged with FX Alpha Plus RC 800 Fund on 16 October 2009. (4) Fund merged with FX Alpha Plus RC 800 (Sterling) Fund on 3 April 2009. + Represents the combined totals of all Morgan Stanley Investment Funds.
- - - - 166,878,075 60,755 308,312 16,959 13,228 185,133,601 74,216 433,199 33,262 6,617 7,074,062 - - - - 2,956,762 - - - - 2,568,593 - 12,263 - - 1,241,274
134,971 753,774 50,221 19,845 365,852,367
243,318 1,049,280 62,845 40,213 121,365,568 1,816 5,777 337 190 3,428,108 5,762 784 3,721 763 180,776 99,228 47,920 44,236 22,787 7,477,905 14,321 - 4,475 2,695 2,065,360 31,621 21,060 18,054 21,586 1,542,523 5,574 32,675 1,465 178 4,825,922 5,959 11,771 816 1,707 2,582,845 13,371 - 8,556 9,423 200,271 54 - 13,592 - 209,597 435 334 367 5 168,379 47,213 44,929 20,115 11,985 2,068,772 - - - - 784,668 9,856 11,115 43 1,406 2,451,157 18,899 29,964 18 2,229 6,959,967 - 441,244 - - 17,168,878 70 39 - - 12,120 - - 179 - 72,109 61 46 28 35 207,016 - - - - 78,247 70 - - - 473 - - - - 118,235 - - 2,989 - 1,778,653 - - - - 59,278 - 451 1,293 - 54,029 428 251 623 - 253,309 - - - - 541,784 - - - - 122 - 2,021 - - 31,229 - - - - 88,521 20,174 21,804 9,960 - 3,611,036 7,338 10,138 4,784 3,351 877,096
525,568 1,731,603 198,496 118,553 181,263,953
84,795 15,770 54,997 67,157 4,410,552
(305,802) (962,059) (93,278) (31,551) 188,998,966
(1,945) (143,467) (2,782) (142) (1,075,716,367) (68,818) (233,411) (12,043) - (1,344,229) - - - - (4,788,347) - - - - 6,776,390 - - - - 17,313,549 - - - - 414,157 (133,545) (104,730) 124,099 (187,254) 8,297,804
(510,110) (1,443,667) 15,996 (218,947) (860,048,077)
(2,946) 216,313 17,680 (888) 4,057,745,317
- - - - (24,375)
- - - - 9,849,336
- - - - (2,255,386)
- - - - 3,521,849
- - - - (1,507,134)
119,564 683,861 32,747 46,109 (9,327,323)
(393,492) (543,493) 66,423 (173,726) 3,197,954,207
(3,396) (1,376) (72,724) (37) (6,036,805)
7,065,686 62,783,102 9,266,529 313,975 13,375,855,193 (87,351,001) (93,782,885) (20,111,717) (15,174,206) (11,268,593,724)
(80,285,315) (30,999,783) (10,845,188) (14,860,231) 2,107,261,469
(80,682,203) (31,544,652) (10,851,489) (15,033,994) 5,299,178,871
80,682,203 105,708,133 10,851,489 15,033,994 11,494,149,340 - - - - 192,113,538
- 74,163,481 - - 16,985,441,749
Combinedtotals of all
funds +
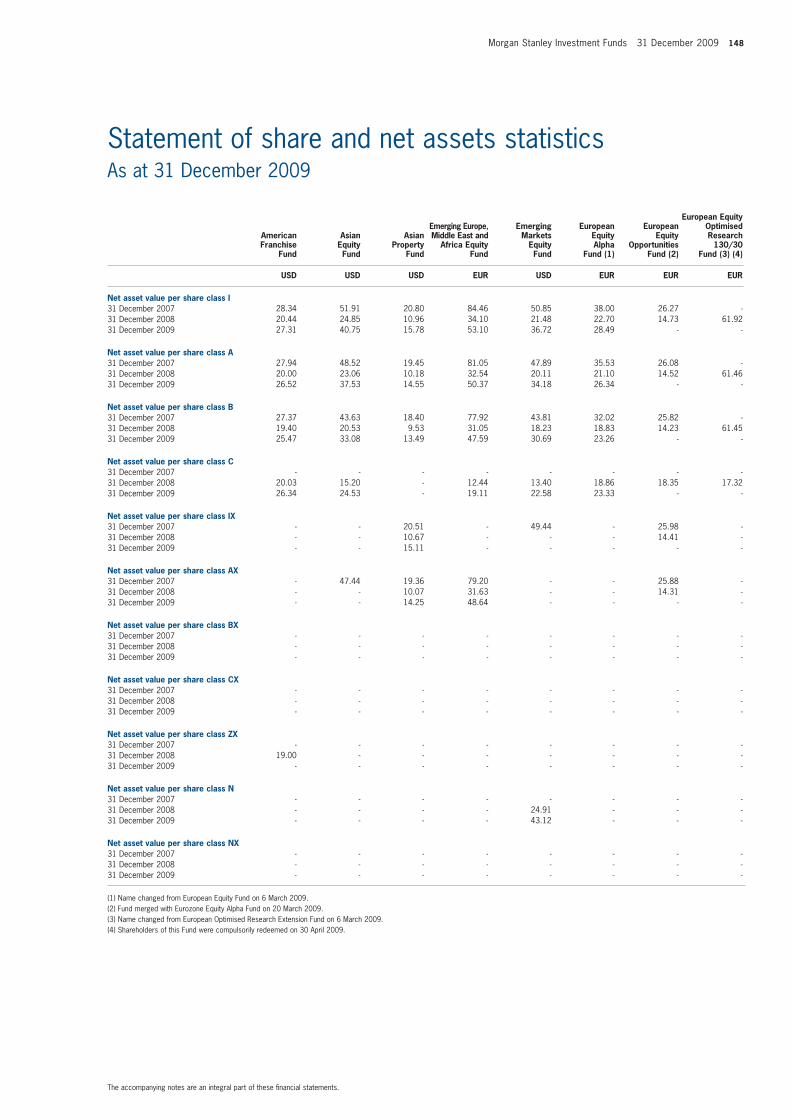
Morgan Stanley Investment Funds 31 December 2009 148
The accompanying notes are an integral part of these fi nancial statements.
Statement of share and net assets statisticsAs at 31 December 2009
European Equity Emerging Europe, Emerging European European Optimised American Asian Asian Middle East and Markets Equity Equity Research Franchise Equity Property Africa Equity Equity Alpha Opportunities 130/30 Fund Fund Fund Fund Fund Fund (1) Fund (2) Fund (3) (4)
USD USD USD EUR USD EUR EUR EUR
Net asset value per share class I 31 December 200731 December 200831 December 2009
Net asset value per share class A 31 December 200731 December 200831 December 2009
Net asset value per share class B 31 December 200731 December 200831 December 2009
Net asset value per share class C 31 December 200731 December 200831 December 2009
Net asset value per share class IX 31 December 200731 December 200831 December 2009
Net asset value per share class AX 31 December 200731 December 200831 December 2009
Net asset value per share class BX 31 December 200731 December 200831 December 2009
Net asset value per share class CX 31 December 200731 December 200831 December 2009
Net asset value per share class ZX 31 December 200731 December 200831 December 2009
Net asset value per share class N 31 December 2007 31 December 2008 31 December 2009
Net asset value per share class NX 31 December 200731 December 200831 December 2009
(1) Name changed from European Equity Fund on 6 March 2009.(2) Fund merged with Eurozone Equity Alpha Fund on 20 March 2009.(3) Name changed from European Optimised Research Extension Fund on 6 March 2009.(4) Shareholders of this Fund were compulsorily redeemed on 30 April 2009.
28.34 51.91 20.80 84.46 50.85 38.00 26.27 - 20.44 24.85 10.96 34.10 21.48 22.70 14.73 61.92 27.31 40.75 15.78 53.10 36.72 28.49 - -
27.94 48.52 19.45 81.05 47.89 35.53 26.08 - 20.00 23.06 10.18 32.54 20.11 21.10 14.52 61.46 26.52 37.53 14.55 50.37 34.18 26.34 - -
27.37 43.63 18.40 77.92 43.81 32.02 25.82 - 19.40 20.53 9.53 31.05 18.23 18.83 14.23 61.45 25.47 33.08 13.49 47.59 30.69 23.26 - -
- - - - - - - - 20.03 15.20 - 12.44 13.40 18.86 18.35 17.32 26.34 24.53 - 19.11 22.58 23.33 - -
- - 20.51 - 49.44 - 25.98 - - - 10.67 - - - 14.41 - - - 15.11 - - - - -
- 47.44 19.36 79.20 - - 25.88 - - - 10.07 31.63 - - 14.31 - - - 14.25 48.64 - - - -
- - - - - - - - - - - - - - - - - - - - - - - -
- - - - - - - - - - - - - - - - - - - - - - - -
- - - - - - - - 19.00 - - - - - - - - - - - - - - -
- - - - - - - - - - - - 24.91 - - - - - - - 43.12 - - -
- - - - - - - - - - - - - - - - - - - - - - - -

149 Morgan Stanley Investment Funds 31 December 2009
The accompanying notes are an integral part of these fi nancial statements.
Statement of share and net assets statistics (continued)As at 31 December 2009
European Equity Emerging Europe, Emerging European European Optimised American Asian Asian Middle East and Markets Equity Equity Research Franchise Equity Property Africa Equity Equity Alpha Opportunities 130/30 Fund Fund Fund Fund Fund Fund (1) Fund (2) Fund (3) (4)
USD USD USD EUR USD EUR EUR EUR
Net asset value per share class S 31 December 200731 December 200831 December 2009
Net asset value per share class Z31 December 200731 December 200831 December 2009
Net asset value per share class IH (EUR)31 December 200731 December 200831 December 2009
Net asset value per share class AH (EUR)31 December 200731 December 200831 December 2009
Net asset value per share class BH (EUR)31 December 200731 December 200831 December 2009
Net asset value per share class CH (EUR)31 December 200731 December 200831 December 2009
Net asset value per share class ZH (EUR)31 December 200731 December 200831 December 2009
Net asset value per share class ZHX (EUR)31 December 200731 December 200831 December 2009
Net asset value per share class ZH (GBP) 31 December 200731 December 200831 December 2009
Net asset value per share class ZHX (GBP)31 December 200731 December 200831 December 2009
Net asset value per share class AH (NOK)31 December 200731 December 200831 December 2009
(1) Name changed from European Equity Fund on 6 March 2009.(2) Fund merged with Eurozone Equity Alpha Fund on 20 March 2009.(3) Name changed from European Optimised Research Extension Fund on 6 March 2009.(4) Shareholders of this Fund were compulsorily redeemed on 30 April 2009.
- - - - - - - - - - - - - - - - - - - - - - - -
- - - - - - - - 19.35 14.86 16.91 11.12 12.42 19.07 25.86 - 25.86 24.37 24.36 17.32 21.26 23.95 - -
- - - - - - - - - - - - - - - - - - - - - - - -
21.43 - - - - - - - 15.04 - - - - - - - 19.65 - - - - - - -
- - - - - - - - 26.56 - - - - - - - 34.35 - - - - - - -
- - - - - - - - - - - - - - - - - - - - - - - -
- - - - - - - - 23.46 - - - - - - - 30.90 - - - - - - -
- - - - - - - - - - - - - - - - - - - - - - - -
- - - - - - - - - - - - - - - - - - - - - - - - - - -
- - - - - - - - - - - - - - - - - - - - - - - -
- - - - - - - - - - - - - - - - - - - - - - - -
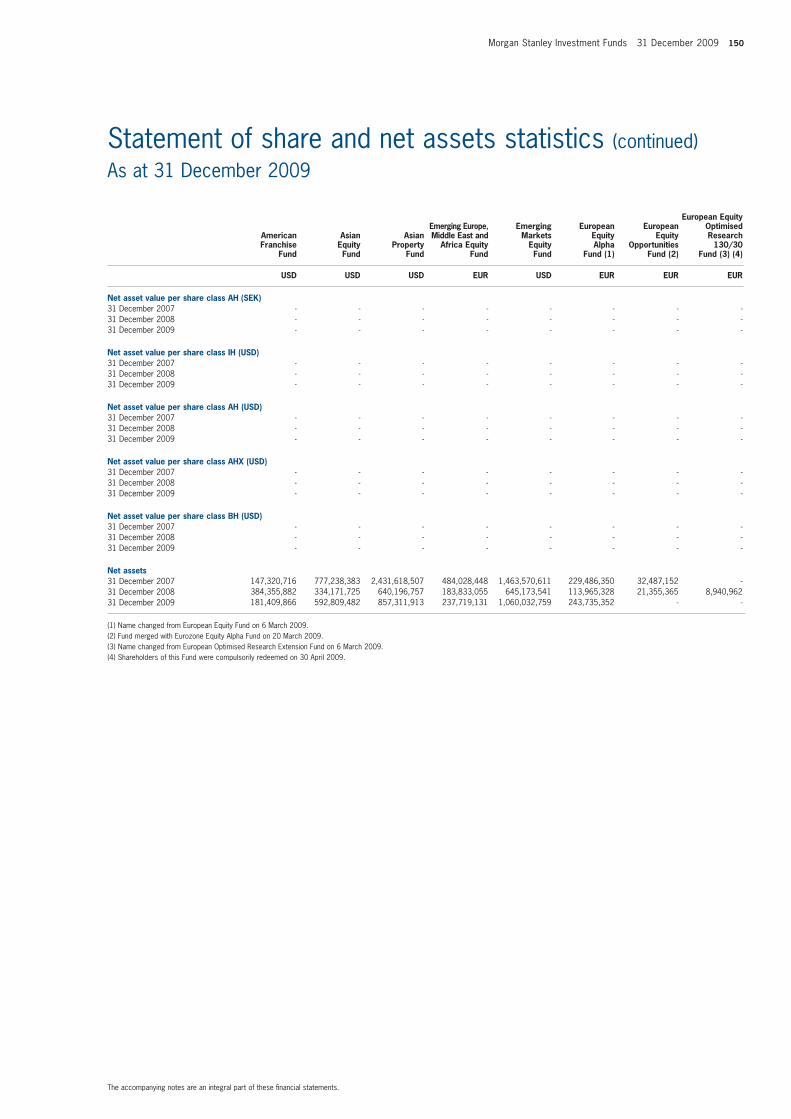
Morgan Stanley Investment Funds 31 December 2009 150
Statement of share and net assets statistics (continued)As at 31 December 2009
European Equity Emerging Europe, Emerging European European Optimised American Asian Asian Middle East and Markets Equity Equity Research Franchise Equity Property Africa Equity Equity Alpha Opportunities 130/30 Fund Fund Fund Fund Fund Fund (1) Fund (2) Fund (3) (4)
USD USD USD EUR USD EUR EUR EUR
Net asset value per share class AH (SEK)31 December 200731 December 200831 December 2009
Net asset value per share class IH (USD)31 December 200731 December 200831 December 2009
Net asset value per share class AH (USD)31 December 200731 December 200831 December 2009
Net asset value per share class AHX (USD)31 December 200731 December 200831 December 2009
Net asset value per share class BH (USD)31 December 200731 December 200831 December 2009
Net assets31 December 200731 December 200831 December 2009
(1) Name changed from European Equity Fund on 6 March 2009.(2) Fund merged with Eurozone Equity Alpha Fund on 20 March 2009.(3) Name changed from European Optimised Research Extension Fund on 6 March 2009.(4) Shareholders of this Fund were compulsorily redeemed on 30 April 2009.
- - - - - - - - - - - - - - - - - - - - - - - -
- - - - - - - - - - - - - - - - - - - - - - - -
- - - - - - - - - - - - - - - - - - - - - - - -
- - - - - - - - - - - - - - - - - - - - - - - -
- - - - - - - - - - - - - - - - - - - - - - - -
147,320,716 777,238,383 2,431,618,507 484,028,448 1,463,570,611 229,486,350 32,487,152 - 384,355,882 334,171,725 640,196,757 183,833,055 645,173,541 113,965,328 21,355,365 8,940,962 181,409,866 592,809,482 857,311,913 237,719,131 1,060,032,759 243,735,352 - -
The accompanying notes are an integral part of these fi nancial statements.
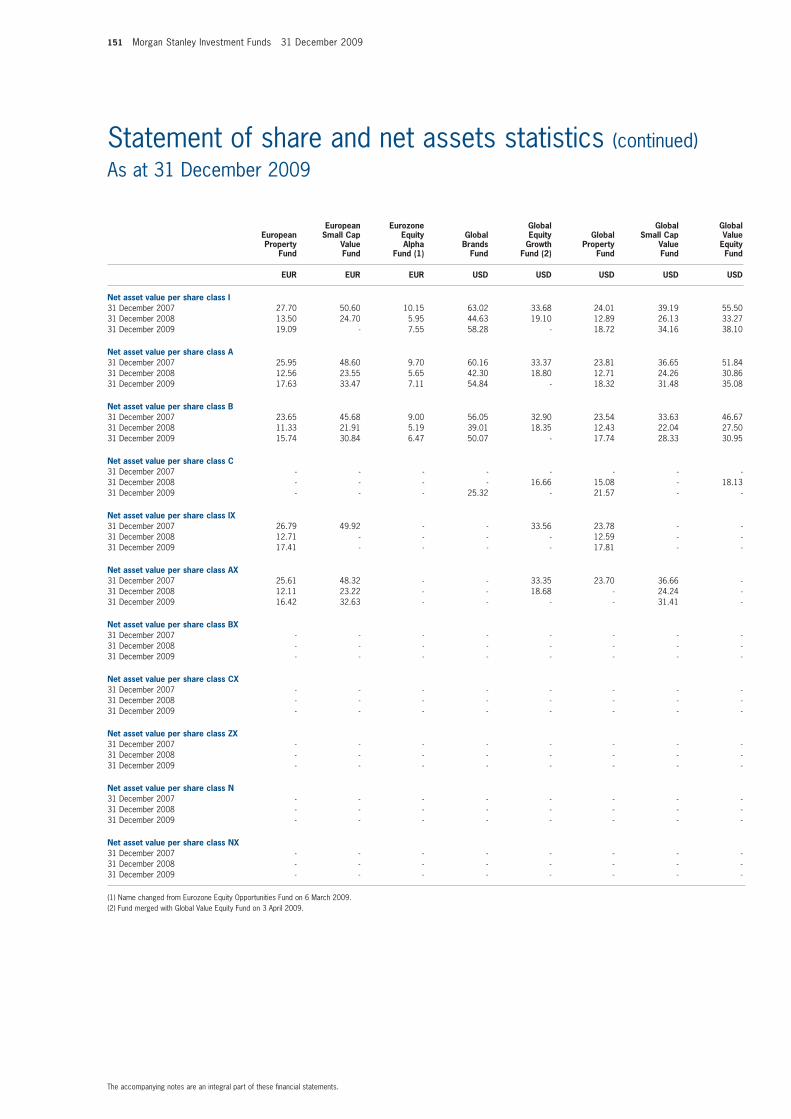
151 Morgan Stanley Investment Funds 31 December 2009
European Eurozone Global Global Global European Small Cap Equity Global Equity Global Small Cap Value Property Value Alpha Brands Growth Property Value Equity Fund Fund Fund (1) Fund Fund (2) Fund Fund Fund
EUR EUR EUR USD USD USD USD USD
Net asset value per share class I 31 December 200731 December 200831 December 2009
Net asset value per share class A 31 December 200731 December 200831 December 2009
Net asset value per share class B 31 December 200731 December 200831 December 2009
Net asset value per share class C 31 December 200731 December 200831 December 2009
Net asset value per share class IX 31 December 200731 December 200831 December 2009
Net asset value per share class AX 31 December 200731 December 200831 December 2009
Net asset value per share class BX 31 December 200731 December 200831 December 2009
Net asset value per share class CX 31 December 200731 December 200831 December 2009
Net asset value per share class ZX 31 December 200731 December 200831 December 2009
Net asset value per share class N 31 December 200731 December 200831 December 2009
Net asset value per share class NX 31 December 200731 December 200831 December 2009
(1) Name changed from Eurozone Equity Opportunities Fund on 6 March 2009.(2) Fund merged with Global Value Equity Fund on 3 April 2009.
27.70 50.60 10.15 63.02 33.68 24.01 39.19 55.50 13.50 24.70 5.95 44.63 19.10 12.89 26.13 33.27 19.09 - 7.55 58.28 - 18.72 34.16 38.10
25.95 48.60 9.70 60.16 33.37 23.81 36.65 51.84 12.56 23.55 5.65 42.30 18.80 12.71 24.26 30.86 17.63 33.47 7.11 54.84 - 18.32 31.48 35.08
23.65 45.68 9.00 56.05 32.90 23.54 33.63 46.67 11.33 21.91 5.19 39.01 18.35 12.43 22.04 27.50 15.74 30.84 6.47 50.07 - 17.74 28.33 30.95
- - - - - - - - - - - - 16.66 15.08 - 18.13 - - - 25.32 - 21.57 - -
26.79 49.92 - - 33.56 23.78 - - 12.71 - - - - 12.59 - - 17.41 - - - - 17.81 - -
25.61 48.32 - - 33.35 23.70 36.66 - 12.11 23.22 - - 18.68 - 24.24 - 16.42 32.63 - - - - 31.41 -
- - - - - - - - - - - - - - - - - - - - - - - -
- - - - - - - - - - - - - - - - - - - - - - - -
- - - - - - - - - - - - - - - - - - - - - - - -
- - - - - - - - - - - - - - - - - - - - - - - -
- - - - - - - - - - - - - - - - - - - - - - - -
Statement of share and net assets statistics (continued)As at 31 December 2009
The accompanying notes are an integral part of these fi nancial statements.
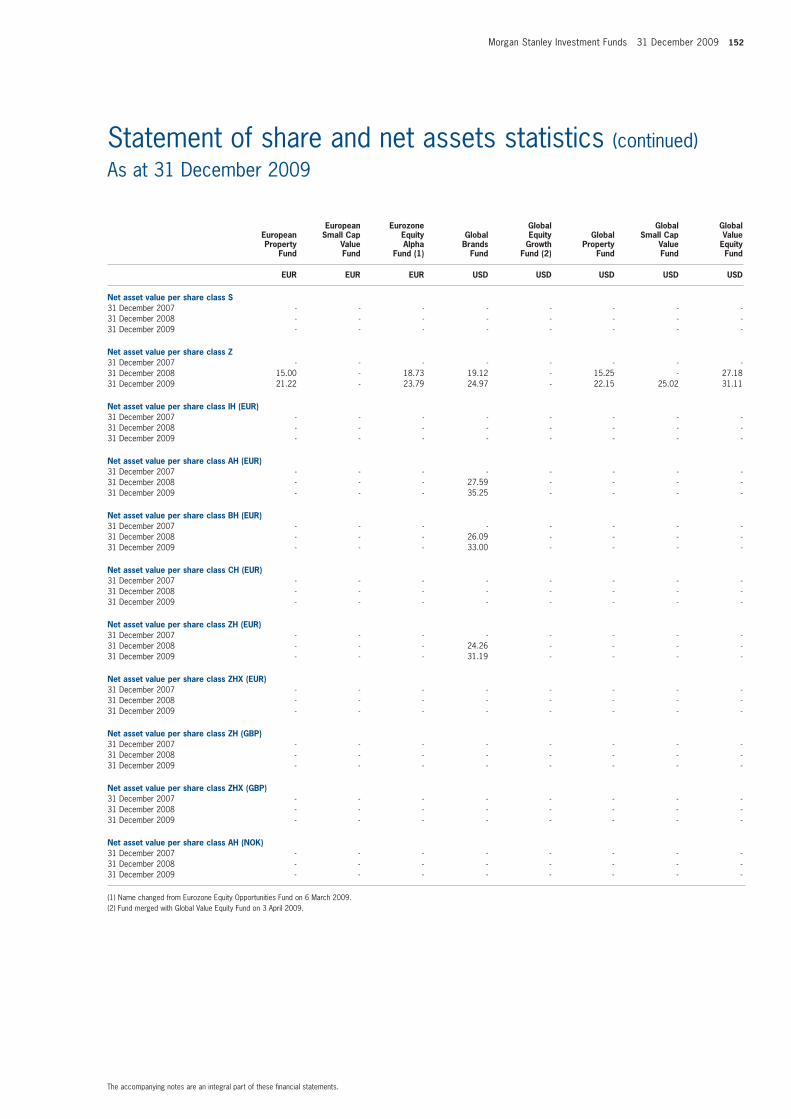
Morgan Stanley Investment Funds 31 December 2009 152
Statement of share and net assets statistics (continued)As at 31 December 2009
European Eurozone Global Global Global European Small Cap Equity Global Equity Global Small Cap Value Property Value Alpha Brands Growth Property Value Equity Fund Fund Fund (1) Fund Fund (2) Fund Fund Fund
EUR EUR EUR USD USD USD USD USD
Net asset value per share class S 31 December 200731 December 200831 December 2009
Net asset value per share class Z31 December 200731 December 200831 December 2009
Net asset value per share class IH (EUR)31 December 200731 December 200831 December 2009
Net asset value per share class AH (EUR)31 December 200731 December 200831 December 2009
Net asset value per share class BH (EUR) 31 December 200731 December 200831 December 2009
Net asset value per share class CH (EUR) 31 December 200731 December 200831 December 2009
Net asset value per share class ZH (EUR) 31 December 200731 December 200831 December 2009
Net asset value per share class ZHX (EUR)31 December 200731 December 200831 December 2009
Net asset value per share class ZH (GBP) 31 December 200731 December 200831 December 2009
Net asset value per share class ZHX (GBP) 31 December 200731 December 200831 December 2009
Net asset value per share class AH (NOK) 31 December 200731 December 200831 December 2009
(1) Name changed from Eurozone Equity Opportunities Fund on 6 March 2009.(2) Fund merged with Global Value Equity Fund on 3 April 2009.
- - - - - - - - - - - - - - - - - - - - - - - -
- - - - - - - - 15.00 - 18.73 19.12 - 15.25 - 27.18 21.22 - 23.79 24.97 - 22.15 25.02 31.11
- - - - - - - - - - - - - - - - - - - - - - - -
- - - - - - - - - - - 27.59 - - - - - - - 35.25 - - - -
- - - - - - - - - - - 26.09 - - - - - - - 33.00 - - - -
- - - - - - - - - - - - - - - - - - - - - - - -
- - - - - - - - - - - 24.26 - - - - - - - 31.19 - - - -
- - - - - - - - - - - - - - - - - - - - - - - -
- - - - - - - - - - - - - - - - - - - - - - - -
- - - - - - - - - - - - - - - - - - - - - - - -
- - - - - - - - - - - - - - - - - - - - - - - -
The accompanying notes are an integral part of these fi nancial statements.

153 Morgan Stanley Investment Funds 31 December 2009
The accompanying notes are an integral part of these fi nancial statements.
Statement of share and net assets statistics (continued)As at 31 December 2009
European Eurozone Global Global Global European Small Cap Equity Global Equity Global Small Cap Value Property Value Alpha Brands Growth Property Value Equity Fund Fund Fund (1) Fund Fund (2) Fund Fund Fund
EUR EUR EUR USD USD USD USD USD
Net asset value per share class AH (SEK) 31 December 200731 December 200831 December 2009
Net asset value per share class IH (USD) 31 December 200731 December 200831 December 2009
Net asset value per share class AH (USD) 31 December 200731 December 200831 December 2009
Net asset value per share class AHX (USD) 31 December 200731 December 200831 December 2009
Net asset value per share class BH (USD) 31 December 200731 December 200831 December 2009
Net assets 31 December 200731 December 200831 December 2009
(1) Name changed from Eurozone Equity Opportunities Fund on 6 March 2009.(2) Fund merged with Global Value Equity Fund on 3 April 2009.
- - - - - - - - - - - - - - - - - - - - - - - -
- - - - - - - - - - - - - - - - - - - - - - - -
- - - - - - - - - - - - - - - - - - - - - - - -
- - - - - - - - - - - - - - - - - - - - - - - -
- - - - - - - - - - - - - - - - - - - - - - - -
333,759,909 57,008,136 104,914,607 3,033,938,971 27,862,412 79,132,421 145,302,405 740,504,456 109,465,649 12,923,596 29,185,008 1,162,249,983 45,887,185 155,852,949 83,230,500 344,105,999 209,637,643 13,461,362 58,913,451 1,280,495,100 - 337,458,800 91,542,290 338,945,103
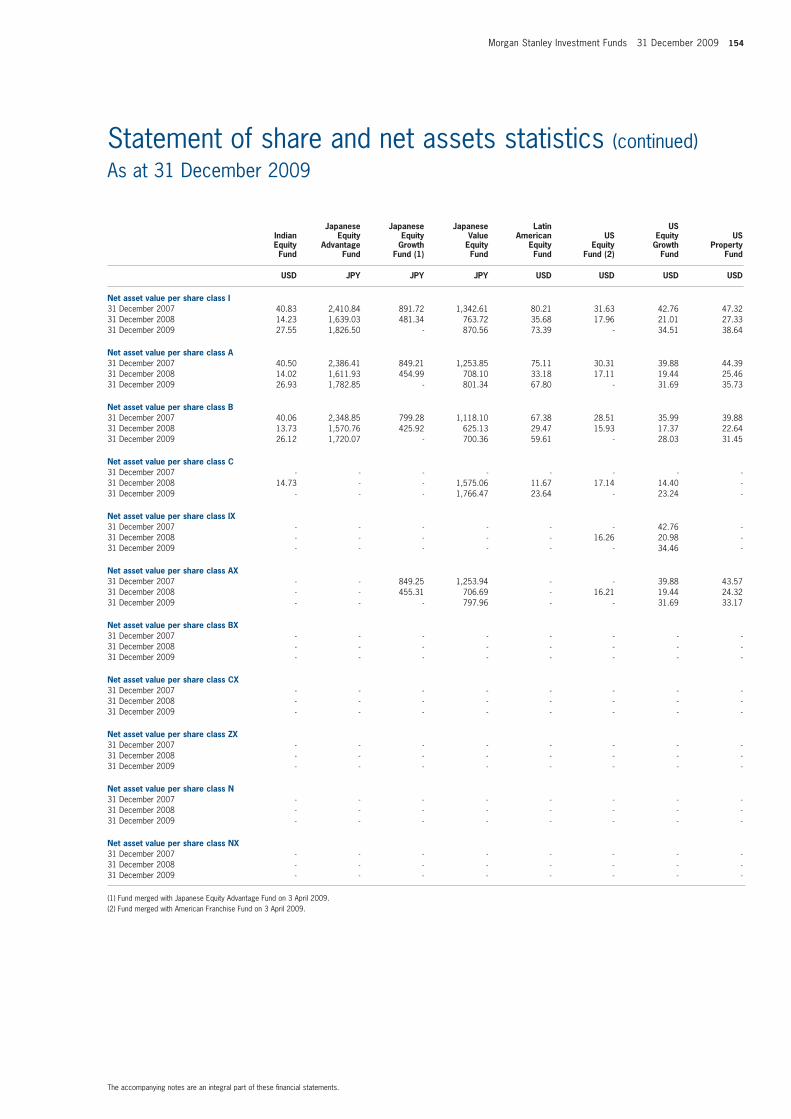
Morgan Stanley Investment Funds 31 December 2009 154
The accompanying notes are an integral part of these fi nancial statements.
Statement of share and net assets statistics (continued)As at 31 December 2009
Japanese Japanese Japanese Latin US Indian Equity Equity Value American US Equity US Equity Advantage Growth Equity Equity Equity Growth Property Fund Fund Fund (1) Fund Fund Fund (2) Fund Fund
USD JPY JPY JPY USD USD USD USD
Net asset value per share class I 31 December 200731 December 200831 December 2009
Net asset value per share class A 31 December 200731 December 200831 December 2009
Net asset value per share class B 31 December 200731 December 200831 December 2009
Net asset value per share class C 31 December 200731 December 200831 December 2009
Net asset value per share class IX 31 December 200731 December 200831 December 2009
Net asset value per share class AX 31 December 200731 December 200831 December 2009
Net asset value per share class BX 31 December 200731 December 200831 December 2009
Net asset value per share class CX 31 December 200731 December 200831 December 2009
Net asset value per share class ZX 31 December 200731 December 200831 December 2009
Net asset value per share class N 31 December 200731 December 200831 December 2009
Net asset value per share class NX 31 December 200731 December 200831 December 2009
(1) Fund merged with Japanese Equity Advantage Fund on 3 April 2009.(2) Fund merged with American Franchise Fund on 3 April 2009.
40.83 2,410.84 891.72 1,342.61 80.21 31.63 42.76 47.32 14.23 1,639.03 481.34 763.72 35.68 17.96 21.01 27.33 27.55 1,826.50 - 870.56 73.39 - 34.51 38.64
40.50 2,386.41 849.21 1,253.85 75.11 30.31 39.88 44.39 14.02 1,611.93 454.99 708.10 33.18 17.11 19.44 25.46 26.93 1,782.85 - 801.34 67.80 - 31.69 35.73
40.06 2,348.85 799.28 1,118.10 67.38 28.51 35.99 39.88 13.73 1,570.76 425.92 625.13 29.47 15.93 17.37 22.64 26.12 1,720.07 - 700.36 59.61 - 28.03 31.45
- - - - - - - - 14.73 - - 1,575.06 11.67 17.14 14.40 - - - - 1,766.47 23.64 - 23.24 -
- - - - - - 42.76 - - - - - - 16.26 20.98 - - - - - - - 34.46 -
- - 849.25 1,253.94 - - 39.88 43.57 - - 455.31 706.69 - 16.21 19.44 24.32 - - - 797.96 - - 31.69 33.17
- - - - - - - - - - - - - - - - - - - - - - - -
- - - - - - - - - - - - - - - - - - - - - - - -
- - - - - - - - - - - - - - - - - - - - - - - -
- - - - - - - - - - - - - - - - - - - - - - - -
- - - - - - - - - - - - - - - - - - - - - - - -
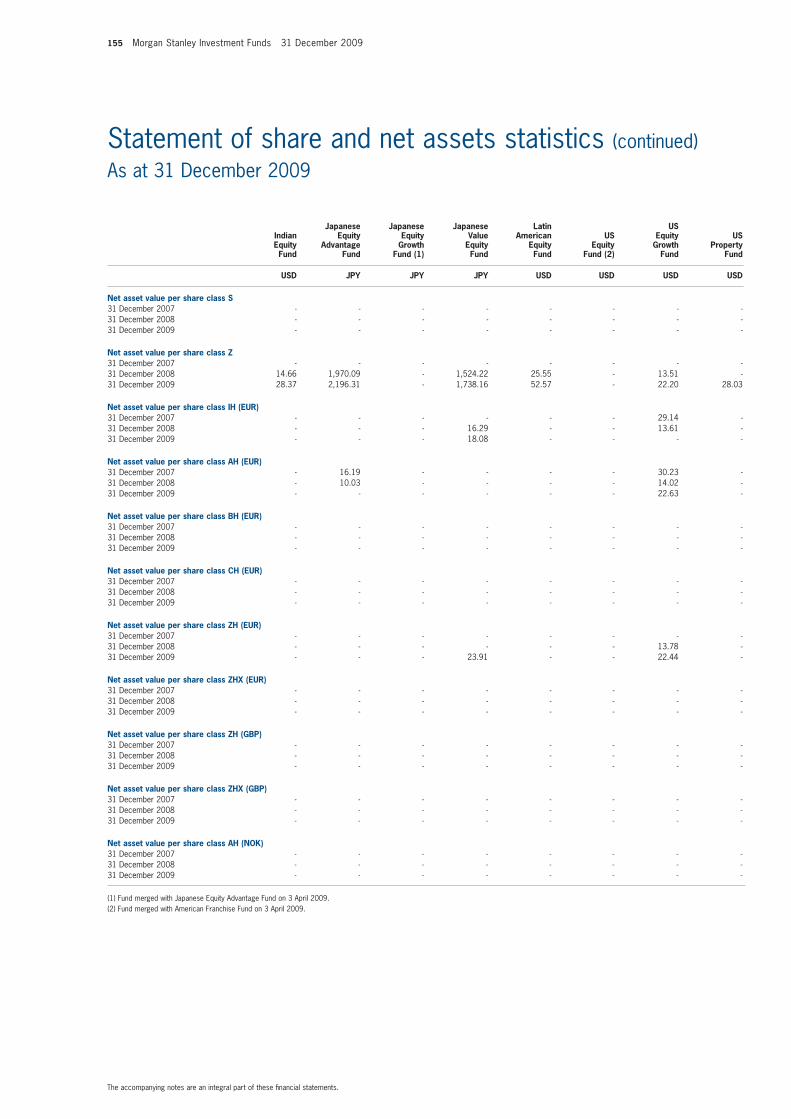
155 Morgan Stanley Investment Funds 31 December 2009
The accompanying notes are an integral part of these fi nancial statements.
Statement of share and net assets statistics (continued)As at 31 December 2009
Japanese Japanese Japanese Latin US Indian Equity Equity Value American US Equity US Equity Advantage Growth Equity Equity Equity Growth Property Fund Fund Fund (1) Fund Fund Fund (2) Fund Fund
USD JPY JPY JPY USD USD USD USD
Net asset value per share class S 31 December 200731 December 200831 December 2009
Net asset value per share class Z31 December 200731 December 200831 December 2009
Net asset value per share class IH (EUR)31 December 200731 December 200831 December 2009
Net asset value per share class AH (EUR)31 December 200731 December 200831 December 2009
Net asset value per share class BH (EUR) 31 December 200731 December 200831 December 2009
Net asset value per share class CH (EUR) 31 December 200731 December 200831 December 2009
Net asset value per share class ZH (EUR) 31 December 200731 December 200831 December 2009
Net asset value per share class ZHX (EUR)31 December 200731 December 200831 December 2009
Net asset value per share class ZH (GBP) 31 December 200731 December 200831 December 2009
Net asset value per share class ZHX (GBP) 31 December 200731 December 200831 December 2009
Net asset value per share class AH (NOK) 31 December 200731 December 200831 December 2009
(1) Fund merged with Japanese Equity Advantage Fund on 3 April 2009.(2) Fund merged with American Franchise Fund on 3 April 2009.
- - - - - - - - - - - - - - - - - - - - - - - -
- - - - - - - - 14.66 1,970.09 - 1,524.22 25.55 - 13.51 - 28.37 2,196.31 - 1,738.16 52.57 - 22.20 28.03
- - - - - - 29.14 - - - - 16.29 - - 13.61 - - - - 18.08 - - - -
- 16.19 - - - - 30.23 - - 10.03 - - - - 14.02 - - - - - - - 22.63 -
- - - - - - - - - - - - - - - - - - - - - - - -
- - - - - - - - - - - - - - - - - - - - - - - -
- - - - - - - - - - - - - - 13.78 - - - - 23.91 - - 22.44 -
- - - - - - - - - - - - - - - - - - - - - - - -
- - - - - - - - - - - - - - - - - - - - - - - -
- - - - - - - - - - - - - - - - - - - - - - - -
- - - - - - - - - - - - - - - - - - - - - - - -

Morgan Stanley Investment Funds 31 December 2009 156
Statement of share and net assets statistics (continued)As at 31 December 2009
Japanese Japanese Japanese Latin US Indian Equity Equity Value American US Equity US Equity Advantage Growth Equity Equity Equity Growth Property Fund Fund Fund (1) Fund Fund Fund (2) Fund Fund
USD JPY JPY JPY USD USD USD USD
Net asset value per share class AH (SEK) 31 December 200731 December 200831 December 2009
Net asset value per share class IH (USD) 31 December 200731 December 200831 December 2009
Net asset value per share class AH (USD) 31 December 200731 December 200831 December 2009
Net asset value per share class AHX (USD) 31 December 200731 December 200831 December 2009
Net asset value per share class BH (USD) 31 December 200731 December 200831 December 2009
Net assets 31 December 200731 December 200831 December 2009
(1) Fund merged with Japanese Equity Advantage Fund on 3 April 2009.(2) Fund merged with American Franchise Fund on 3 April 2009.* JPY000’s.
- - - - - - - - - - - - - - - - - - - - - - - -
- - - - - - - - - - - - - - - - - - - - - - - -
- - - - - - - - - - - - - - - - - - - - - - - -
- - - - - - - - - - - - - - - - - - - - - - - -
- - - - - - - - - - - - - - - - - - - - - - - -
86,889,462 2,289,421* 9,457,106* 130,806,819* 1,751,570,698 12,903,386 974,074,661 224,655,028 20,933,030 2,415,758* 1,873,062* 79,593,321* 497,822,667 16,788,471 229,510,681 52,425,031 100,935,306 6,398,310* - 74,242,706* 1,117,234,210 - 424,595,573 102,914,524
The accompanying notes are an integral part of these fi nancial statements.
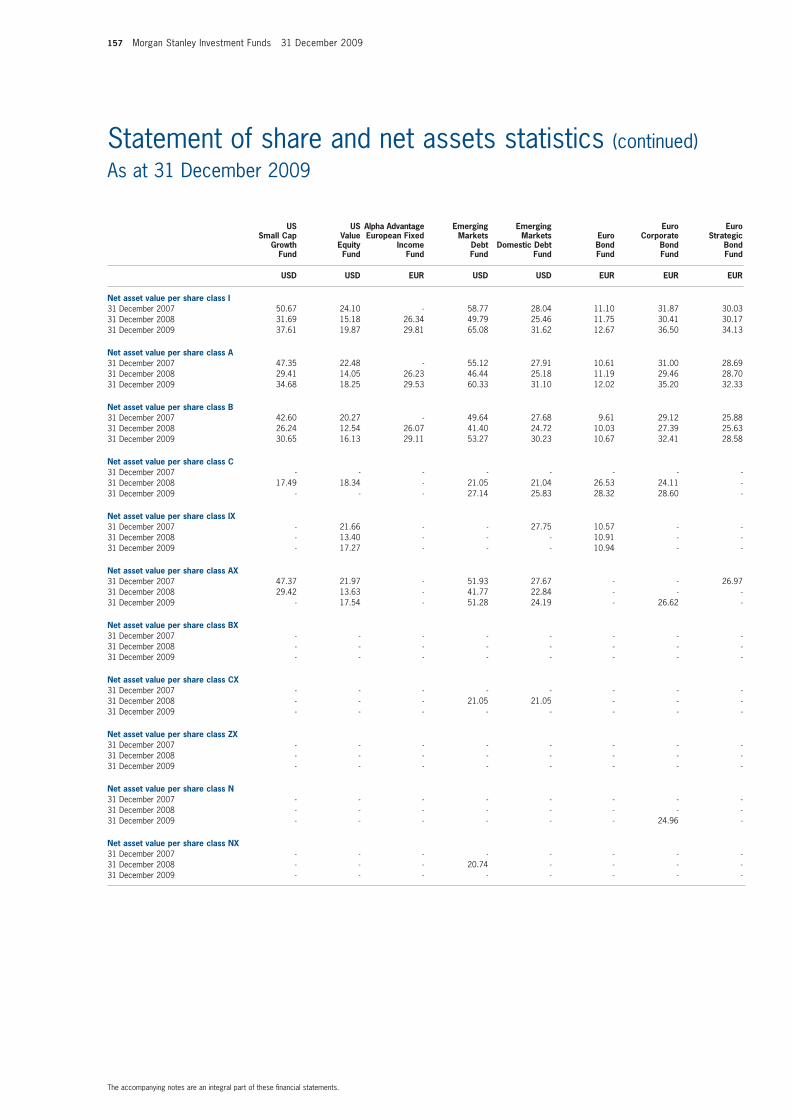
157 Morgan Stanley Investment Funds 31 December 2009
Statement of share and net assets statistics (continued)As at 31 December 2009
US US Alpha Advantage Emerging Emerging Euro Euro Small Cap Value European Fixed Markets Markets Euro Corporate Strategic Growth Equity Income Debt Domestic Debt Bond Bond Bond Fund Fund Fund Fund Fund Fund Fund Fund
USD USD EUR USD USD EUR EUR EUR
Net asset value per share class I 31 December 200731 December 200831 December 2009
Net asset value per share class A 31 December 200731 December 200831 December 2009
Net asset value per share class B 31 December 200731 December 200831 December 2009
Net asset value per share class C 31 December 200731 December 200831 December 2009
Net asset value per share class IX 31 December 200731 December 200831 December 2009
Net asset value per share class AX 31 December 200731 December 200831 December 2009
Net asset value per share class BX 31 December 200731 December 200831 December 2009
Net asset value per share class CX 31 December 200731 December 200831 December 2009
Net asset value per share class ZX 31 December 200731 December 200831 December 2009
Net asset value per share class N 31 December 200731 December 200831 December 2009
Net asset value per share class NX 31 December 200731 December 200831 December 2009
50.67 24.10 - 58.77 28.04 11.10 31.87 30.03 31.69 15.18 26.34 49.79 25.46 11.75 30.41 30.17 37.61 19.87 29.81 65.08 31.62 12.67 36.50 34.13
47.35 22.48 - 55.12 27.91 10.61 31.00 28.69 29.41 14.05 26.23 46.44 25.18 11.19 29.46 28.70 34.68 18.25 29.53 60.33 31.10 12.02 35.20 32.33
42.60 20.27 - 49.64 27.68 9.61 29.12 25.88 26.24 12.54 26.07 41.40 24.72 10.03 27.39 25.63 30.65 16.13 29.11 53.27 30.23 10.67 32.41 28.58
- - - - - - - - 17.49 18.34 - 21.05 21.04 26.53 24.11 - - - - 27.14 25.83 28.32 28.60 -
- 21.66 - - 27.75 10.57 - - - 13.40 - - - 10.91 - - - 17.27 - - - 10.94 - -
47.37 21.97 - 51.93 27.67 - - 26.97 29.42 13.63 - 41.77 22.84 - - - - 17.54 - 51.28 24.19 - 26.62 -
- - - - - - - - - - - - - - - - - - - - - - - -
- - - - - - - - - - - 21.05 21.05 - - - - - - - - - - -
- - - - - - - - - - - - - - - - - - - - - - - -
- - - - - - - - - - - - - - - - - - - - - - 24.96 -
- - - - - - - - - - - 20.74 - - - - - - - - - - - -
The accompanying notes are an integral part of these fi nancial statements.

Morgan Stanley Investment Funds 31 December 2009 158
Statement of share and net assets statistics (continued)As at 31 December 2009
US US Alpha Advantage Emerging Emerging Euro Euro Small Cap Value European Fixed Markets Markets Euro Corporate Strategic Growth Equity Income Debt Domestic Debt Bond Bond Bond Fund Fund Fund Fund Fund Fund Fund Fund
USD USD EUR USD USD EUR EUR EUR
Net asset value per share class S 31 December 200731 December 200831 December 2009
Net asset value per share class Z31 December 200731 December 200831 December 2009
Net asset value per share class IH (EUR)31 December 200731 December 200831 December 2009
Net asset value per share class AH (EUR)31 December 200731 December 200831 December 2009
Net asset value per share class BH (EUR) 31 December 200731 December 200831 December 2009
Net asset value per share class CH (EUR) 31 December 200731 December 200831 December 2009
Net asset value per share class ZH (EUR) 31 December 200731 December 200831 December 2009
Net asset value per share class ZHX (EUR)31 December 200731 December 200831 December 2009
Net asset value per share class ZH (GBP) 31 December 200731 December 200831 December 2009
Net asset value per share class ZHX (GBP) 31 December 200731 December 200831 December 2009
Net asset value per share class AH (NOK) 31 December 200731 December 200831 December 2009
- - - - - 10.71 - - - - - - - 11.29 - - - - - 32.73 - - - -
- - - - - - - - - 18.99 26.35 21.19 - 26.30 24.24 - - 24.86 29.88 27.70 29.31 28.39 29.11 28.14
- - - - - - - - - - - - - - - - - - - - - - - -
- 17.26 - 42.09 - - - - - 10.30 - 34.37 - - - - - - - 44.62 - - - -
- - - - - - - - - - - - - - - - - - - - - - - -
- - - - - - - - - - - - - - - - - - - - - - - -
- - - - - - - - - - - - - - - - - - - 25.19 - - - -
- - - - - - - - - - - - - - - - - - - - - - - -
- - - - - - - - - - - - - - - - - - - - - - - -
- - - - - - - - - - - - - - - - - - - - - - - -
- - - - - - - - - - - - - - - - - - - - - - - -
The accompanying notes are an integral part of these fi nancial statements.
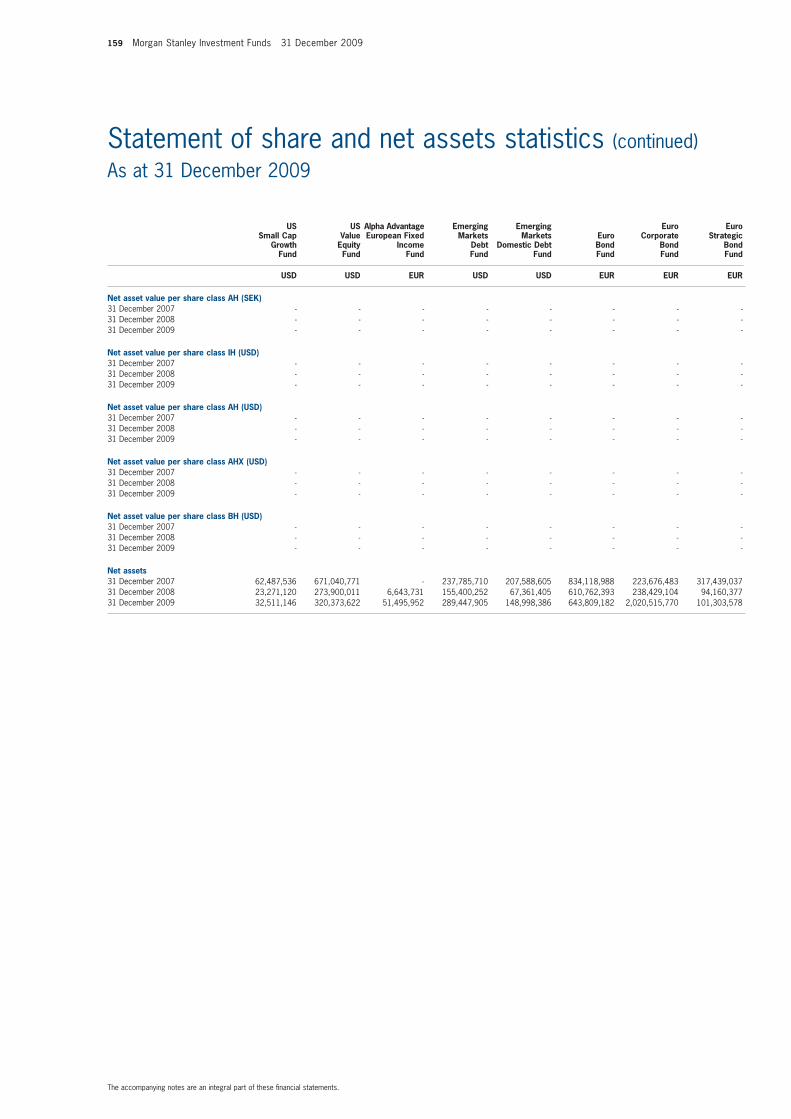
159 Morgan Stanley Investment Funds 31 December 2009
The accompanying notes are an integral part of these fi nancial statements.
Statement of share and net assets statistics (continued)As at 31 December 2009
US US Alpha Advantage Emerging Emerging Euro Euro Small Cap Value European Fixed Markets Markets Euro Corporate Strategic Growth Equity Income Debt Domestic Debt Bond Bond Bond Fund Fund Fund Fund Fund Fund Fund Fund
USD USD EUR USD USD EUR EUR EUR
Net asset value per share class AH (SEK) 31 December 200731 December 200831 December 2009
Net asset value per share class IH (USD) 31 December 200731 December 200831 December 2009
Net asset value per share class AH (USD) 31 December 200731 December 200831 December 2009
Net asset value per share class AHX (USD) 31 December 200731 December 200831 December 2009
Net asset value per share class BH (USD) 31 December 200731 December 200831 December 2009
Net assets 31 December 200731 December 200831 December 2009
- - - - - - - - - - - - - - - - - - - - - - - -
- - - - - - - - - - - - - - - - - - - - - - - -
- - - - - - - - - - - - - - - - - - - - - - - -
- - - - - - - - - - - - - - - - - - - - - - - -
- - - - - - - - - - - - - - - - - - - - - - - -
62,487,536 671,040,771 - 237,785,710 207,588,605 834,118,988 223,676,483 317,439,037 23,271,120 273,900,011 6,643,731 155,400,252 67,361,405 610,762,393 238,429,104 94,160,377 32,511,146 320,373,622 51,495,952 289,447,905 148,998,386 643,809,182 2,020,515,770 101,303,578
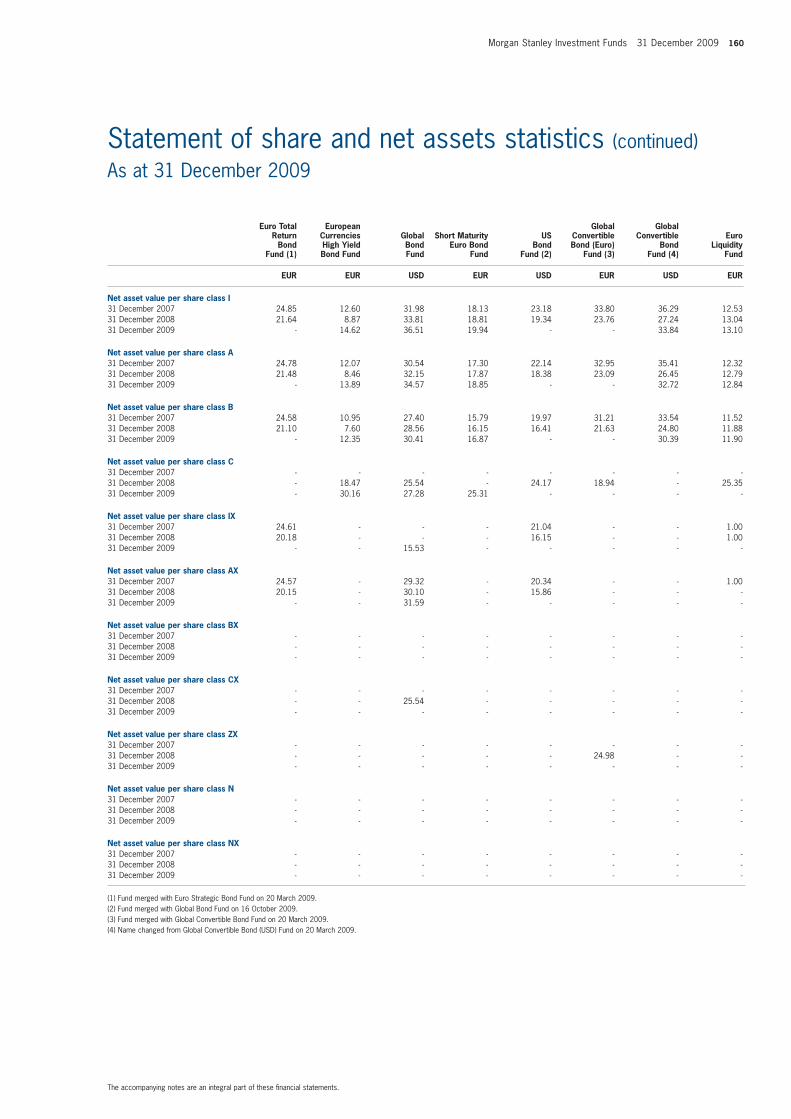
Morgan Stanley Investment Funds 31 December 2009 160
The accompanying notes are an integral part of these fi nancial statements.
Statement of share and net assets statistics (continued)As at 31 December 2009
Euro Total European Global Global Return Currencies Global Short Maturity US Convertible Convertible Euro Bond High Yield Bond Euro Bond Bond Bond (Euro) Bond Liquidity Fund (1) Bond Fund Fund Fund Fund (2) Fund (3) Fund (4) Fund
EUR EUR USD EUR USD EUR USD EUR
Net asset value per share class I 31 December 200731 December 200831 December 2009
Net asset value per share class A 31 December 200731 December 200831 December 2009
Net asset value per share class B 31 December 200731 December 200831 December 2009
Net asset value per share class C 31 December 200731 December 200831 December 2009
Net asset value per share class IX 31 December 200731 December 200831 December 2009
Net asset value per share class AX 31 December 200731 December 200831 December 2009
Net asset value per share class BX 31 December 200731 December 200831 December 2009
Net asset value per share class CX 31 December 200731 December 200831 December 2009
Net asset value per share class ZX 31 December 200731 December 200831 December 2009
Net asset value per share class N 31 December 200731 December 200831 December 2009
Net asset value per share class NX 31 December 200731 December 200831 December 2009
(1) Fund merged with Euro Strategic Bond Fund on 20 March 2009. (2) Fund merged with Global Bond Fund on 16 October 2009.(3) Fund merged with Global Convertible Bond Fund on 20 March 2009.(4) Name changed from Global Convertible Bond (USD) Fund on 20 March 2009.
24.85 12.60 31.98 18.13 23.18 33.80 36.29 12.53 21.64 8.87 33.81 18.81 19.34 23.76 27.24 13.04 - 14.62 36.51 19.94 - - 33.84 13.10
24.78 12.07 30.54 17.30 22.14 32.95 35.41 12.32 21.48 8.46 32.15 17.87 18.38 23.09 26.45 12.79 - 13.89 34.57 18.85 - - 32.72 12.84
24.58 10.95 27.40 15.79 19.97 31.21 33.54 11.52 21.10 7.60 28.56 16.15 16.41 21.63 24.80 11.88 - 12. 35 30.41 16.87 - - 30.39 11.90
- - - - - - - - - 18.47 25.54 - 24.17 18.94 - 25.35 - 30.16 27.28 25.31 - - - -
24.61 - - - 21.04 - - 1.00 20.18 - - - 16.15 - - 1.00 - - 15.53 - - - - -
24.57 - 29.32 - 20.34 - - 1.00 20.15 - 30.10 - 15.86 - - - - - 31.59 - - - - -
- - - - - - - - - - - - - - - - - - - - - - - -
- - - - - - - - - - 25.54 - - - - - - - - - - - - -
- - - - - - - - - - - - - 24.98 - - - - - - - - - -
- - - - - - - - - - - - - - - - - - - - - - - -
- - - - - - - - - - - - - - - - - - - - - - - -
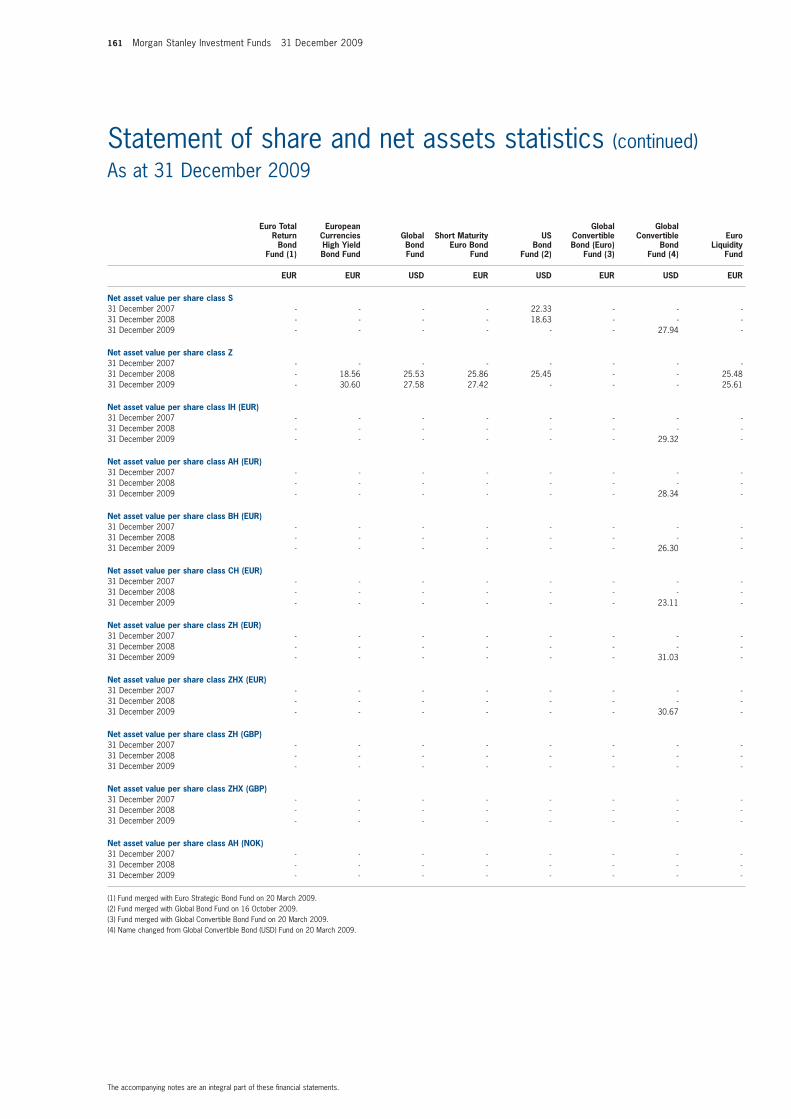
161 Morgan Stanley Investment Funds 31 December 2009
The accompanying notes are an integral part of these fi nancial statements.
Statement of share and net assets statistics (continued)As at 31 December 2009
Euro Total European Global Global Return Currencies Global Short Maturity US Convertible Convertible Euro Bond High Yield Bond Euro Bond Bond Bond (Euro) Bond Liquidity Fund (1) Bond Fund Fund Fund Fund (2) Fund (3) Fund (4) Fund
EUR EUR USD EUR USD EUR USD EUR
Net asset value per share class S31 December 200731 December 200831 December 2009
Net asset value per share class Z31 December 200731 December 200831 December 2009
Net asset value per share class IH (EUR)31 December 200731 December 200831 December 2009
Net asset value per share class AH (EUR)31 December 200731 December 200831 December 2009
Net asset value per share class BH (EUR) 31 December 200731 December 200831 December 2009
Net asset value per share class CH (EUR) 31 December 200731 December 200831 December 2009
Net asset value per share class ZH (EUR) 31 December 200731 December 200831 December 2009
Net asset value per share class ZHX (EUR)31 December 200731 December 200831 December 2009
Net asset value per share class ZH (GBP) 31 December 200731 December 200831 December 2009
Net asset value per share class ZHX (GBP) 31 December 200731 December 200831 December 2009
Net asset value per share class AH (NOK) 31 December 200731 December 200831 December 2009
(1) Fund merged with Euro Strategic Bond Fund on 20 March 2009. (2) Fund merged with Global Bond Fund on 16 October 2009.(3) Fund merged with Global Convertible Bond Fund on 20 March 2009.(4) Name changed from Global Convertible Bond (USD) Fund on 20 March 2009.
- - - - 22.33 - - - - - - - 18.63 - - - - - - - - - 27.94 -
- - - - - - - - - 18.56 25.53 25.86 25.45 - - 25.48 - 30.6 0 27.58 27.42 - - - 25.61
- - - - - - - - - - - - - - - - - - - - - - 29.32 -
- - - - - - - - - - - - - - - - - - - - - - 28.34 -
- - - - - - - - - - - - - - - - - - - - - - 26.30 -
- - - - - - - - - - - - - - - - - - - - - - 23.11 -
- - - - - - - - - - - - - - - - - - - - - - 31.03 -
- - - - - - - - - - - - - - - - - - - - - - 30.67 -
- - - - - - - - - - - - - - - - - - - - - - - -
- - - - - - - - - - - - - - - - - - - - - - - -
- - - - - - - - - - - - - - - - - - - - - - - -
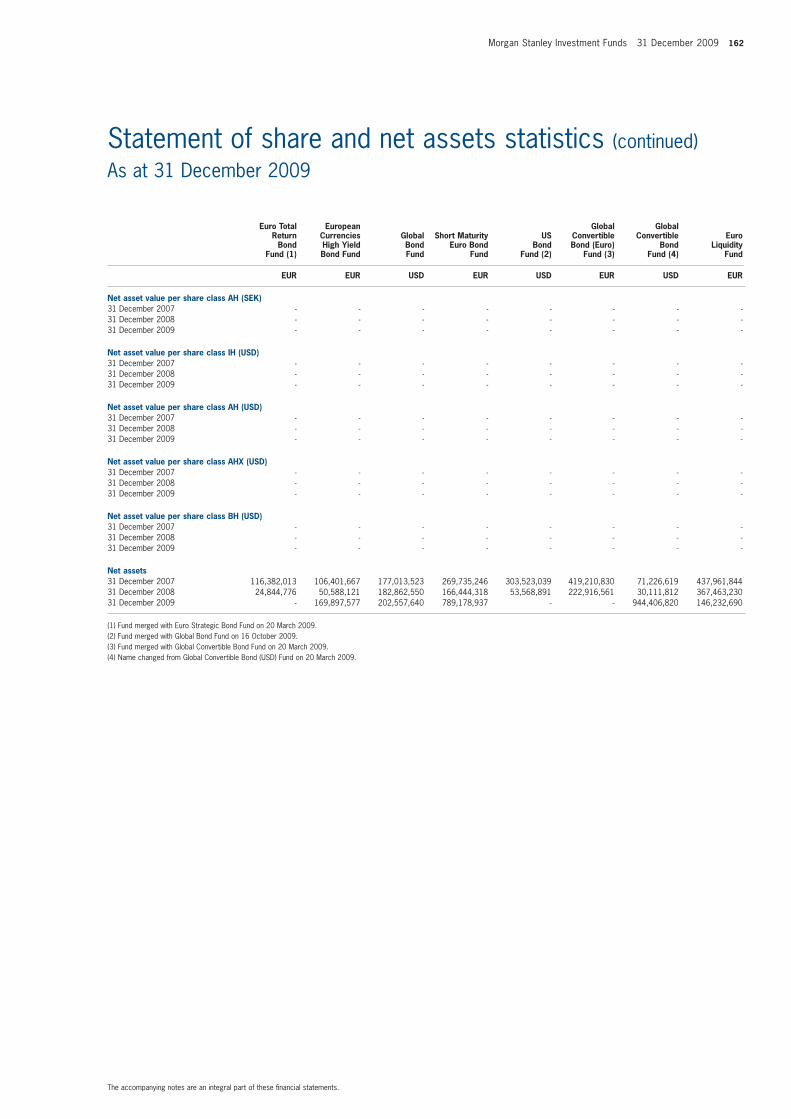
Morgan Stanley Investment Funds 31 December 2009 162
Statement of share and net assets statistics (continued)As at 31 December 2009
Euro Total European Global Global Return Currencies Global Short Maturity US Convertible Convertible Euro Bond High Yield Bond Euro Bond Bond Bond (Euro) Bond Liquidity Fund (1) Bond Fund Fund Fund Fund (2) Fund (3) Fund (4) Fund
EUR EUR USD EUR USD EUR USD EUR
Net asset value per share class AH (SEK) 31 December 200731 December 200831 December 2009
Net asset value per share class IH (USD) 31 December 200731 December 200831 December 2009
Net asset value per share class AH (USD) 31 December 200731 December 200831 December 2009
Net asset value per share class AHX (USD) 31 December 200731 December 200831 December 2009
Net asset value per share class BH (USD) 31 December 200731 December 200831 December 2009
Net assets 31 December 200731 December 200831 December 2009
(1) Fund merged with Euro Strategic Bond Fund on 20 March 2009. (2) Fund merged with Global Bond Fund on 16 October 2009.(3) Fund merged with Global Convertible Bond Fund on 20 March 2009.(4) Name changed from Global Convertible Bond (USD) Fund on 20 March 2009.
- - - - - - - - - - - - - - - - - - - - - - - -
- - - - - - - - - - - - - - - - - - - - - - - -
- - - - - - - - - - - - - - - - - - - - - - - -
- - - - - - - - - - - - - - - - - - - - - - - -
- - - - - - - - - - - - - - - - - - - - - - - -
116,382,013 106,401,667 177,013,523 269,735,246 303,523,039 419,210,830 71,226,619 437,961,844 24,844,776 50,588,121 182,862,550 166,444,318 53,568,891 222,916,561 30,111,812 367,463,230 - 169,897,577 202,557,640 789,178,937 - - 944,406,820 146,232,690
The accompanying notes are an integral part of these fi nancial statements.
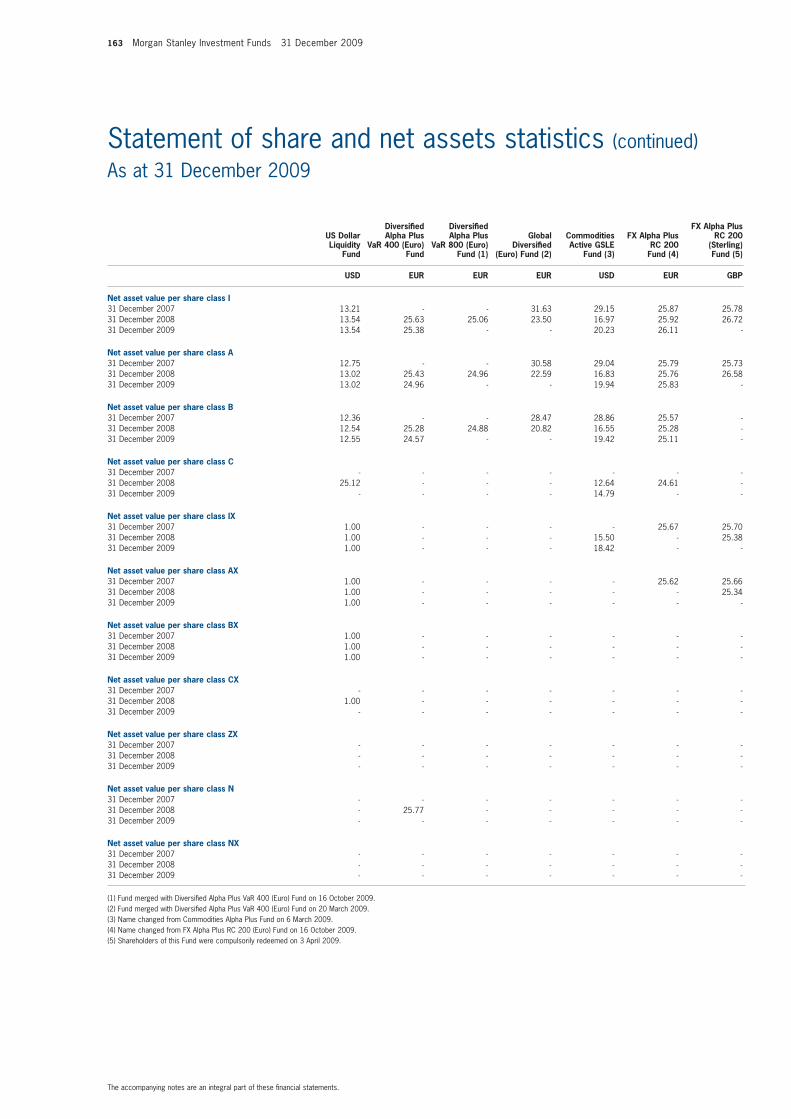
163 Morgan Stanley Investment Funds 31 December 2009
Statement of share and net assets statistics (continued)As at 31 December 2009
Diversifi ed Diversifi ed FX Alpha Plus US Dollar Alpha Plus Alpha Plus Global Commodities FX Alpha Plus RC 200 Liquidity VaR 400 (Euro) VaR 800 (Euro) Diversifi ed Active GSLE RC 200 (Sterling) Fund Fund Fund (1) (Euro) Fund (2) Fund (3) Fund (4) Fund (5)
USD EUR EUR EUR USD EUR GBP
Net asset value per share class I 31 December 200731 December 200831 December 2009
Net asset value per share class A 31 December 200731 December 200831 December 2009
Net asset value per share class B 31 December 200731 December 200831 December 2009
Net asset value per share class C 31 December 200731 December 200831 December 2009
Net asset value per share class IX 31 December 200731 December 200831 December 2009
Net asset value per share class AX 31 December 200731 December 200831 December 2009
Net asset value per share class BX 31 December 200731 December 200831 December 2009
Net asset value per share class CX 31 December 200731 December 200831 December 2009
Net asset value per share class ZX 31 December 200731 December 200831 December 2009
Net asset value per share class N 31 December 200731 December 200831 December 2009
Net asset value per share class NX 31 December 200731 December 200831 December 2009
(1) Fund merged with Diversifi ed Alpha Plus VaR 400 (Euro) Fund on 16 October 2009.(2) Fund merged with Diversifi ed Alpha Plus VaR 400 (Euro) Fund on 20 March 2009. (3) Name changed from Commodities Alpha Plus Fund on 6 March 2009.(4) Name changed from FX Alpha Plus RC 200 (Euro) Fund on 16 October 2009.(5) Shareholders of this Fund were compulsorily redeemed on 3 April 2009.
13.21 - - 31.63 29.15 25.87 25.78 13.54 25.63 25.06 23.50 16.97 25.92 26.72 13.54 25.38 - - 20.23 26.11 -
12.75 - - 30.58 29.04 25.79 25.73 13.02 25.43 24.96 22.59 16.83 25.76 26.58 13.02 24.96 - - 19.94 25.83 -
12.36 - - 28.47 28.86 25.57 - 12.54 25.28 24.88 20.82 16.55 25.28 - 12.55 24.57 - - 19.42 25.11 -
- - - - - - - 25.12 - - - 12.64 24.61 - - - - - 14.79 - -
1.00 - - - - 25.67 25.70 1.00 - - - 15.50 - 25.38 1.00 - - - 18.42 - -
1.00 - - - - 25.62 25.66 1.00 - - - - - 25.34 1.00 - - - - - -
1.00 - - - - - - 1.00 - - - - - - 1.00 - - - - - -
- - - - - - - 1.00 - - - - - - - - - - - - -
- - - - - - - - - - - - - - - - - - - - -
- - - - - - - - 25.77 - - - - - - - - - - - -
- - - - - - - - - - - - - - - - - - - - -
The accompanying notes are an integral part of these fi nancial statements.
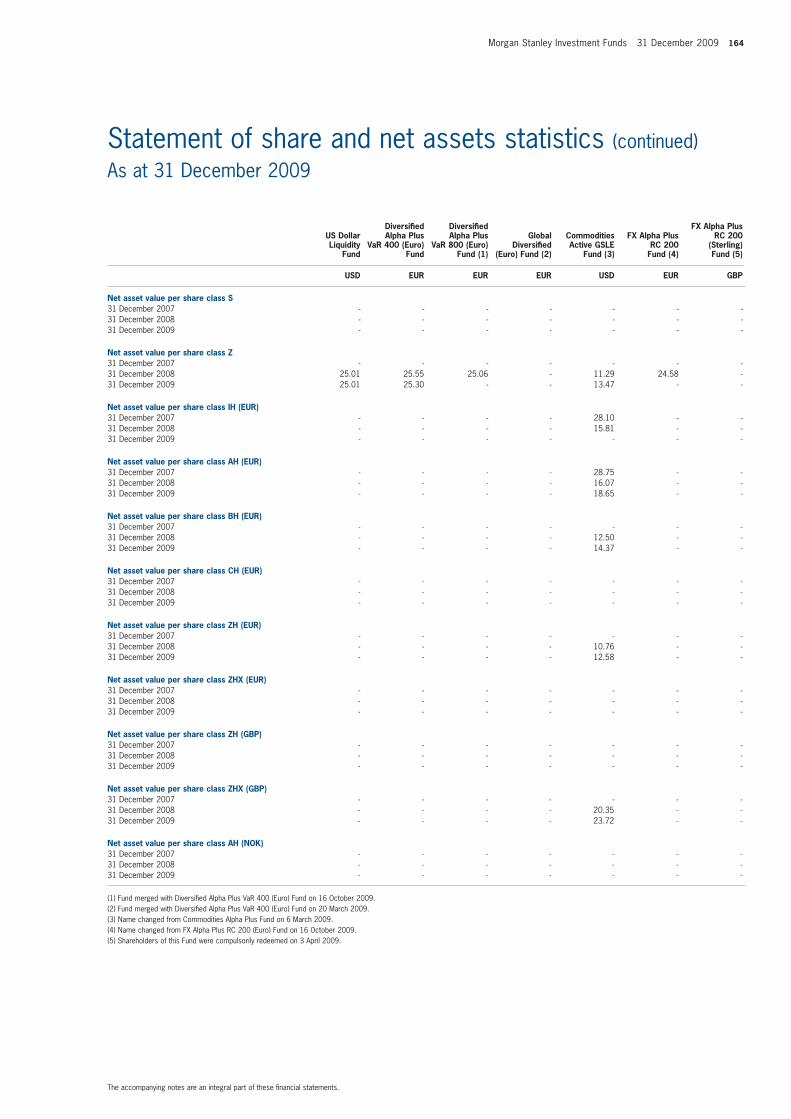
Morgan Stanley Investment Funds 31 December 2009 164
Statement of share and net assets statistics (continued)As at 31 December 2009
Diversifi ed Diversifi ed FX Alpha Plus US Dollar Alpha Plus Alpha Plus Global Commodities FX Alpha Plus RC 200 Liquidity VaR 400 (Euro) VaR 800 (Euro) Diversifi ed Active GSLE RC 200 (Sterling) Fund Fund Fund (1) (Euro) Fund (2) Fund (3) Fund (4) Fund (5)
USD EUR EUR EUR USD EUR GBP
Net asset value per share class S 31 December 200731 December 200831 December 2009
Net asset value per share class Z31 December 200731 December 200831 December 2009
Net asset value per share class IH (EUR)31 December 200731 December 200831 December 2009
Net asset value per share class AH (EUR)31 December 200731 December 200831 December 2009
Net asset value per share class BH (EUR) 31 December 200731 December 200831 December 2009
Net asset value per share class CH (EUR) 31 December 200731 December 200831 December 2009
Net asset value per share class ZH (EUR) 31 December 200731 December 200831 December 2009
Net asset value per share class ZHX (EUR)31 December 200731 December 200831 December 2009
Net asset value per share class ZH (GBP) 31 December 200731 December 200831 December 2009
Net asset value per share class ZHX (GBP) 31 December 200731 December 200831 December 2009
Net asset value per share class AH (NOK) 31 December 200731 December 200831 December 2009
(1) Fund merged with Diversifi ed Alpha Plus VaR 400 (Euro) Fund on 16 October 2009.(2) Fund merged with Diversifi ed Alpha Plus VaR 400 (Euro) Fund on 20 March 2009. (3) Name changed from Commodities Alpha Plus Fund on 6 March 2009. (4) Name changed from FX Alpha Plus RC 200 (Euro) Fund on 16 October 2009.(5) Shareholders of this Fund were compulsorily redeemed on 3 April 2009.
- - - - - - - - - - - - - - - - - - - - -
- - - - - - - 25.01 25.55 25.06 - 11.29 24.58 - 25.01 25.30 - - 13.47 - -
- - - - 28.10 - - - - - - 15.81 - - - - - - - - -
- - - - 28.75 - - - - - - 16.07 - - - - - - 18.65 - -
- - - - - - - - - - - 12.50 - - - - - - 14.37 - -
- - - - - - - - - - - - - - - - - - - - -
- - - - - - - - - - - 10.76 - - - - - - 12.58 - -
- - - - - - - - - - - - - - - - - - - - -
- - - - - - - - - - - - - - - - - - - - -
- - - - - - - - - - - 20.35 - - - - - - 23.72 - -
- - - - - - - - - - - - - - - - - - - - -
The accompanying notes are an integral part of these fi nancial statements.
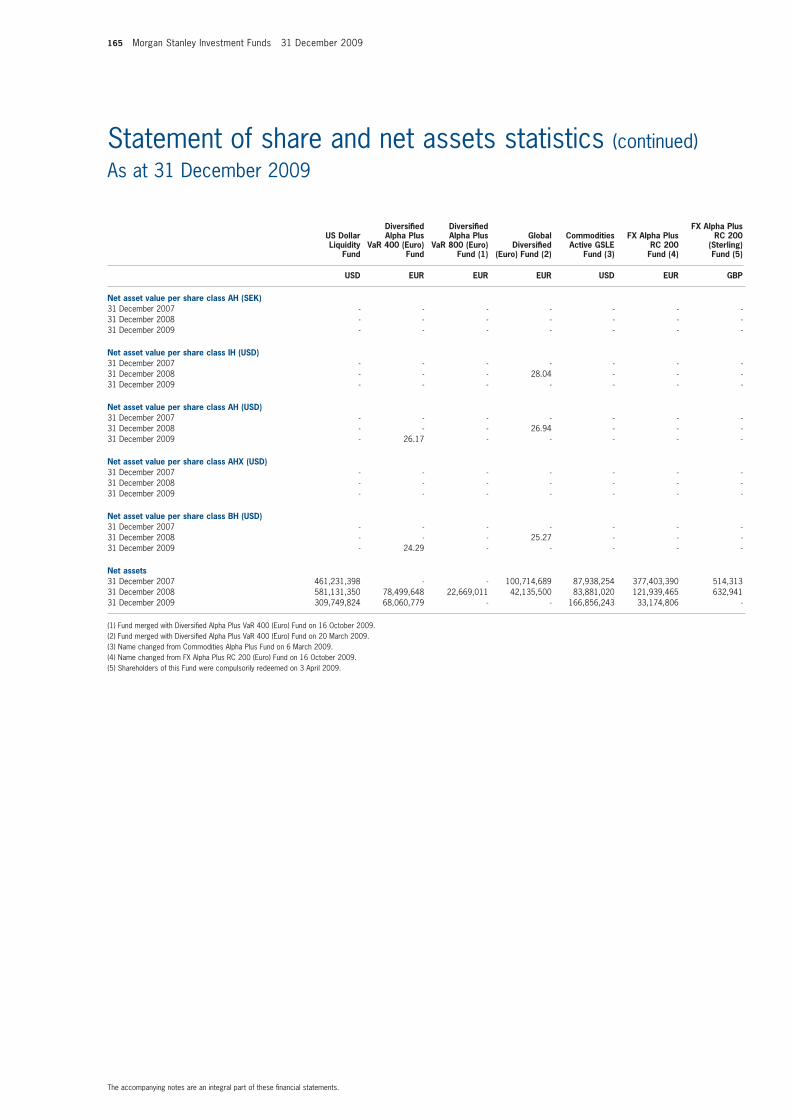
165 Morgan Stanley Investment Funds 31 December 2009
The accompanying notes are an integral part of these fi nancial statements.
Statement of share and net assets statistics (continued)As at 31 December 2009
Diversifi ed Diversifi ed FX Alpha Plus US Dollar Alpha Plus Alpha Plus Global Commodities FX Alpha Plus RC 200 Liquidity VaR 400 (Euro) VaR 800 (Euro) Diversifi ed Active GSLE RC 200 (Sterling) Fund Fund Fund (1) (Euro) Fund (2) Fund (3) Fund (4) Fund (5)
USD EUR EUR EUR USD EUR GBP
Net asset value per share class AH (SEK) 31 December 200731 December 200831 December 2009
Net asset value per share class IH (USD) 31 December 200731 December 200831 December 2009
Net asset value per share class AH (USD) 31 December 200731 December 200831 December 2009
Net asset value per share class AHX (USD) 31 December 200731 December 200831 December 2009
Net asset value per share class BH (USD) 31 December 200731 December 200831 December 2009
Net assets 31 December 200731 December 200831 December 2009
(1) Fund merged with Diversifi ed Alpha Plus VaR 400 (Euro) Fund on 16 October 2009.(2) Fund merged with Diversifi ed Alpha Plus VaR 400 (Euro) Fund on 20 March 2009. (3) Name changed from Commodities Alpha Plus Fund on 6 March 2009.(4) Name changed from FX Alpha Plus RC 200 (Euro) Fund on 16 October 2009.(5) Shareholders of this Fund were compulsorily redeemed on 3 April 2009.
- - - - - - - - - - - - - - - - - - - - -
- - - - - - - - - - 28.04 - - - - - - - - - -
- - - - - - - - - - 26.94 - - - - 26.17 - - - - -
- - - - - - - - - - - - - - - - - - - - -
- - - - - - - - - - 25.27 - - - - 24.29 - - - - -
461,231,398 - - 100,714,689 87,938,254 377,403,390 514,313 581,131,350 78,499,648 22,669,011 42,135,500 83,881,020 121,939,465 632,941 309,749,824 68,060,779 - - 166,856,243 33,174,806 -
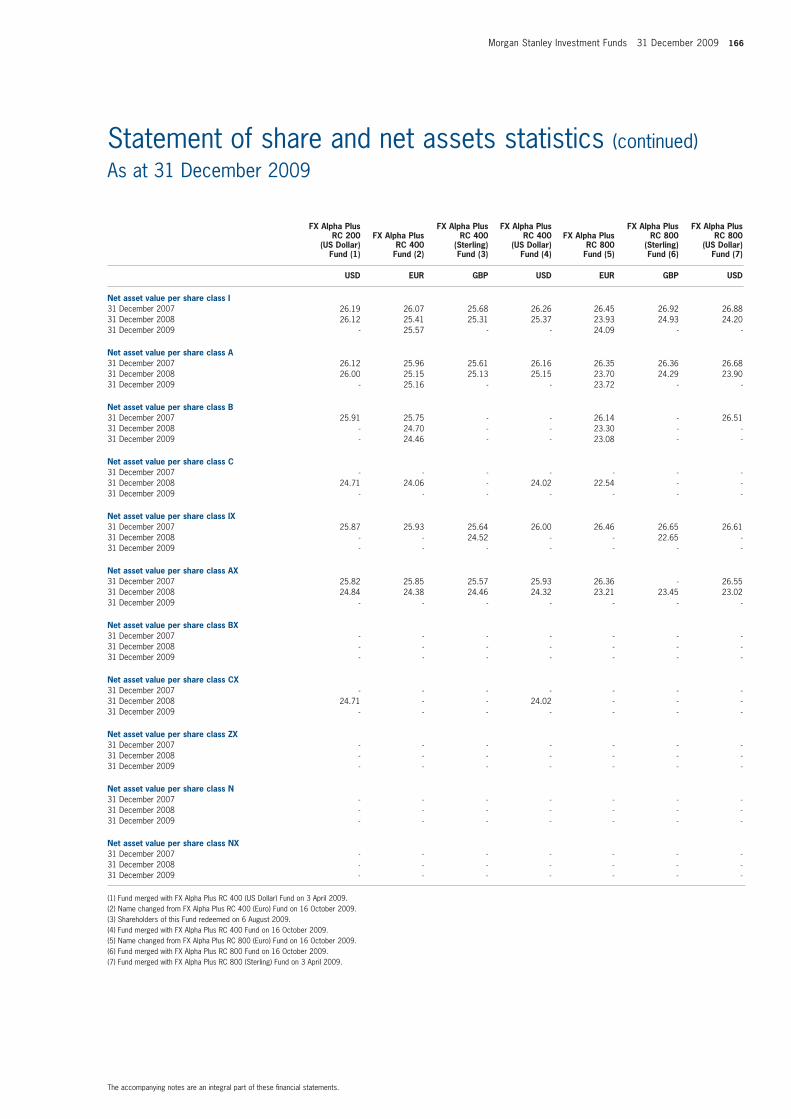
Morgan Stanley Investment Funds 31 December 2009 166
The accompanying notes are an integral part of these fi nancial statements.
Statement of share and net assets statistics (continued)As at 31 December 2009
FX Alpha Plus FX Alpha Plus FX Alpha Plus FX Alpha Plus FX Alpha Plus RC 200 FX Alpha Plus RC 400 RC 400 FX Alpha Plus RC 800 RC 800 (US Dollar) RC 400 (Sterling) (US Dollar) RC 800 (Sterling) (US Dollar) Fund (1) Fund (2) Fund (3) Fund (4) Fund (5) Fund (6) Fund (7)
USD EUR GBP USD EUR GBP USD
Net asset value per share class I 31 December 200731 December 200831 December 2009
Net asset value per share class A 31 December 200731 December 200831 December 2009
Net asset value per share class B 31 December 200731 December 200831 December 2009
Net asset value per share class C 31 December 200731 December 200831 December 2009
Net asset value per share class IX 31 December 200731 December 200831 December 2009
Net asset value per share class AX 31 December 200731 December 200831 December 2009
Net asset value per share class BX 31 December 200731 December 200831 December 2009
Net asset value per share class CX 31 December 200731 December 200831 December 2009
Net asset value per share class ZX 31 December 200731 December 200831 December 2009
Net asset value per share class N 31 December 200731 December 200831 December 2009
Net asset value per share class NX 31 December 200731 December 200831 December 2009
(1) Fund merged with FX Alpha Plus RC 400 (US Dollar) Fund on 3 April 2009.(2) Name changed from FX Alpha Plus RC 400 (Euro) Fund on 16 October 2009.(3) Shareholders of this Fund redeemed on 6 August 2009.(4) Fund merged with FX Alpha Plus RC 400 Fund on 16 October 2009.(5) Name changed from FX Alpha Plus RC 800 (Euro) Fund on 16 October 2009.(6) Fund merged with FX Alpha Plus RC 800 Fund on 16 October 2009.(7) Fund merged with FX Alpha Plus RC 800 (Sterling) Fund on 3 April 2009.
26.19 26.07 25.68 26.26 26.45 26.92 26.88 26.12 25.41 25.31 25.37 23.93 24.93 24.20 - 25.57 - - 24.09 - -
26.12 25.96 25.61 26.16 26.35 26.36 26.68 26.00 25.15 25.13 25.15 23.70 24.29 23.90 - 25.16 - - 23.72 - -
25.91 25.75 - - 26.14 - 26.51 - 24.70 - - 23.30 - - - 24.46 - - 23.08 - -
- - - - - - - 24.71 24.06 - 24.02 22.54 - - - - - - - - -
25.87 25.93 25.64 26.00 26.46 26.65 26.61 - - 24.52 - - 22.65 - - - - - - - -
25.82 25.85 25.57 25.93 26.36 - 26.55 24.84 24.38 24.46 24.32 23.21 23.45 23.02 - - - - - - -
- - - - - - - - - - - - - - - - - - - - -
- - - - - - - 24.71 - - 24.02 - - - - - - - - - -
- - - - - - - - - - - - - - - - - - - - -
- - - - - - - - - - - - - - - - - - - - -
- - - - - - - - - - - - - - - - - - - - -
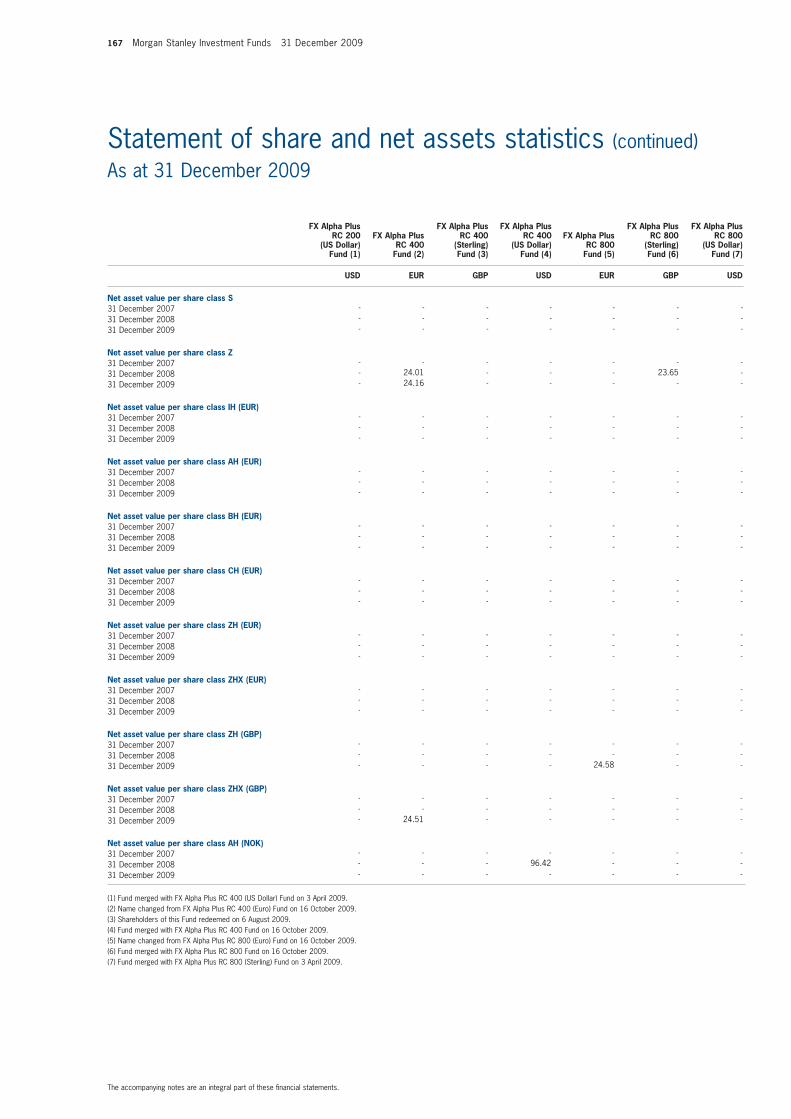
167 Morgan Stanley Investment Funds 31 December 2009
The accompanying notes are an integral part of these fi nancial statements.
Statement of share and net assets statistics (continued)As at 31 December 2009
FX Alpha Plus FX Alpha Plus FX Alpha Plus FX Alpha Plus FX Alpha Plus RC 200 FX Alpha Plus RC 400 RC 400 FX Alpha Plus RC 800 RC 800 (US Dollar) RC 400 (Sterling) (US Dollar) RC 800 (Sterling) (US Dollar) Fund (1) Fund (2) Fund (3) Fund (4) Fund (5) Fund (6) Fund (7)
USD EUR GBP USD EUR GBP USD
Net asset value per share class S 31 December 200731 December 200831 December 2009
Net asset value per share class Z31 December 200731 December 200831 December 2009
Net asset value per share class IH (EUR)31 December 200731 December 200831 December 2009
Net asset value per share class AH (EUR)31 December 200731 December 200831 December 2009
Net asset value per share class BH (EUR) 31 December 200731 December 200831 December 2009
Net asset value per share class CH (EUR) 31 December 200731 December 200831 December 2009
Net asset value per share class ZH (EUR) 31 December 200731 December 200831 December 2009
Net asset value per share class ZHX (EUR)31 December 200731 December 200831 December 2009
Net asset value per share class ZH (GBP) 31 December 200731 December 200831 December 2009
Net asset value per share class ZHX (GBP) 31 December 200731 December 200831 December 2009
Net asset value per share class AH (NOK) 31 December 200731 December 200831 December 2009
(1) Fund merged with FX Alpha Plus RC 400 (US Dollar) Fund on 3 April 2009.(2) Name changed from FX Alpha Plus RC 400 (Euro) Fund on 16 October 2009.(3) Shareholders of this Fund redeemed on 6 August 2009.(4) Fund merged with FX Alpha Plus RC 400 Fund on 16 October 2009.(5) Name changed from FX Alpha Plus RC 800 (Euro) Fund on 16 October 2009.(6) Fund merged with FX Alpha Plus RC 800 Fund on 16 October 2009.(7) Fund merged with FX Alpha Plus RC 800 (Sterling) Fund on 3 April 2009.
- - - - - - - - - - - - - - - - - - - - -
- - - - - - - - 24.01 - - - 23.65 - - 24.16 - - - - -
- - - - - - - - - - - - - - - - - - - - -
- - - - - - - - - - - - - - - - - - - - -
- - - - - - - - - - - - - - - - - - - - -
- - - - - - - - - - - - - - - - - - - - -
- - - - - - - - - - - - - - - - - - - - -
- - - - - - - - - - - - - - - - - - - - -
- - - - - - - - - - - - - - - - - - 24.58 - -
- - - - - - - - - - - - - - - 24.51 - - - - -
- - - - - - - - - - 96.42 - - - - - - - - - -
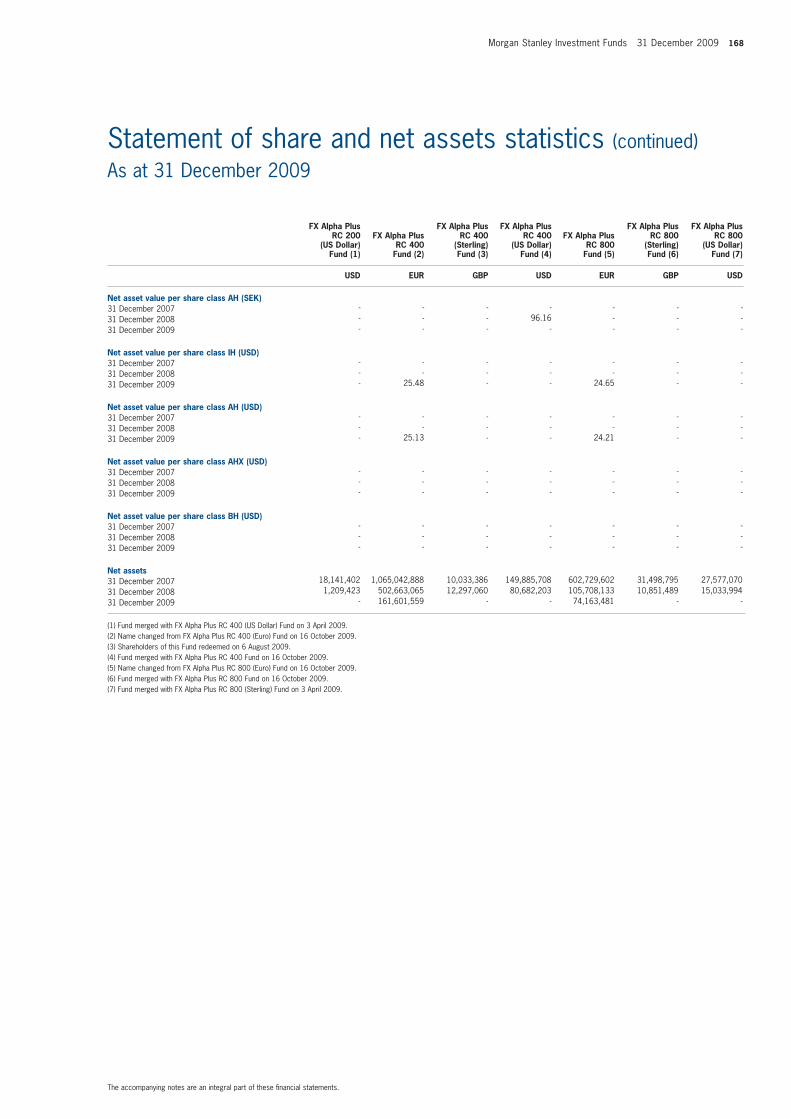
Morgan Stanley Investment Funds 31 December 2009 168
The accompanying notes are an integral part of these fi nancial statements.
Statement of share and net assets statistics (continued)As at 31 December 2009
FX Alpha Plus FX Alpha Plus FX Alpha Plus FX Alpha Plus FX Alpha Plus RC 200 FX Alpha Plus RC 400 RC 400 FX Alpha Plus RC 800 RC 800 (US Dollar) RC 400 (Sterling) (US Dollar) RC 800 (Sterling) (US Dollar) Fund (1) Fund (2) Fund (3) Fund (4) Fund (5) Fund (6) Fund (7)
USD EUR GBP USD EUR GBP USD
Net asset value per share class AH (SEK) 31 December 200731 December 200831 December 2009
Net asset value per share class IH (USD) 31 December 200731 December 200831 December 2009
Net asset value per share class AH (USD) 31 December 200731 December 200831 December 2009
Net asset value per share class AHX (USD) 31 December 200731 December 200831 December 2009
Net asset value per share class BH (USD) 31 December 200731 December 200831 December 2009
Net assets 31 December 200731 December 200831 December 2009
(1) Fund merged with FX Alpha Plus RC 400 (US Dollar) Fund on 3 April 2009.(2) Name changed from FX Alpha Plus RC 400 (Euro) Fund on 16 October 2009.(3) Shareholders of this Fund redeemed on 6 August 2009.(4) Fund merged with FX Alpha Plus RC 400 Fund on 16 October 2009.(5) Name changed from FX Alpha Plus RC 800 (Euro) Fund on 16 October 2009.(6) Fund merged with FX Alpha Plus RC 800 Fund on 16 October 2009.(7) Fund merged with FX Alpha Plus RC 800 (Sterling) Fund on 3 April 2009.
- - - - - - - - - - 96.16 - - - - - - - - - -
- - - - - - - - - - - - - - - 25.48 - - 24.65 - -
- - - - - - - - - - - - - - - 25.13 - - 24.21 - -
- - - - - - - - - - - - - - - - - - - - -
- - - - - - - - - - - - - - - - - - - - -
18,141,402 1,065,042,888 10,033,386 149,885,708 602,729,602 31,498,795 27,577,070 1,209,423 502,663,065 12,297,060 80,682,203 105,708,133 10,851,489 15,033,994 - 161,601,559 - - 74,163,481 - -
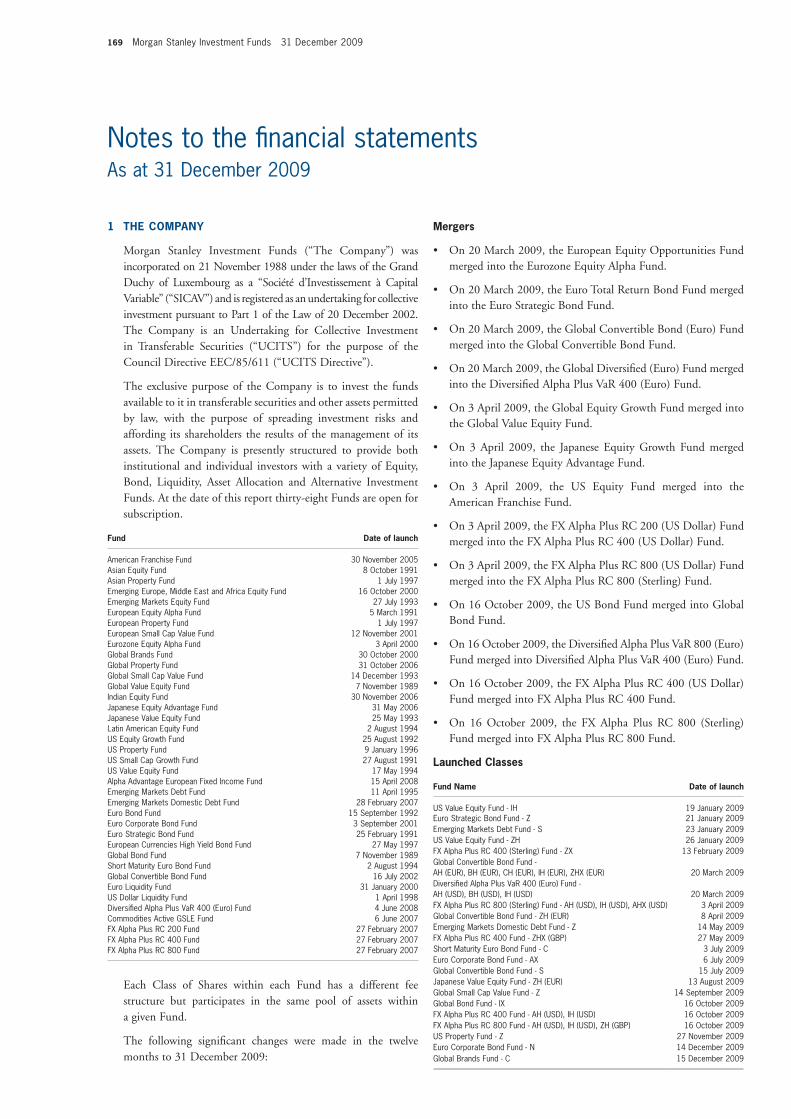
169 Morgan Stanley Investment Funds 31 December 2009
Notes to the fi nancial statementsAs at 31 December 2009
1 THE COMPANY
Morgan Stanley Investment Funds (“The Company”) was incorporated on 21 November 1988 under the laws of the Grand Duchy of Luxembourg as a “Société d’Investissement à Capital Variable” (“SICAV”) and is registered as an undertaking for collective investment pursuant to Part 1 of the Law of 20 December 2002. The Company is an Undertaking for Collective Investment in Transferable Securities (“UCITS”) for the purpose of the Council Directive EEC/85/611 (“UCITS Directive”).
The exclusive purpose of the Company is to invest the funds available to it in transferable securities and other assets permitted by law, with the purpose of spreading investment risks and affording its shareholders the results of the management of its assets. The Company is presently structured to provide both institutional and individual investors with a variety of Equity, Bond, Liquidity, Asset Allocation and Alternative Investment Funds. At the date of this report thirty-eight Funds are open for subscription.
Fund Date of launch
American Franchise Fund 30 November 2005Asian Equity Fund 8 October 1991Asian Property Fund 1 July 1997Emerging Europe, Middle East and Africa Equity Fund 16 October 2000Emerging Markets Equity Fund 27 July 1993European Equity Alpha Fund 5 March 1991European Property Fund 1 July 1997European Small Cap Value Fund 12 November 2001Eurozone Equity Alpha Fund 3 April 2000Global Brands Fund 30 October 2000Global Property Fund 31 October 2006Global Small Cap Value Fund 14 December 1993Global Value Equity Fund 7 November 1989Indian Equity Fund 30 November 2006Japanese Equity Advantage Fund 31 May 2006Japanese Value Equity Fund 25 May 1993Latin American Equity Fund 2 August 1994US Equity Growth Fund 25 August 1992US Property Fund 9 January 1996US Small Cap Growth Fund 27 August 1991US Value Equity Fund 17 May 1994Alpha Advantage European Fixed Income Fund 15 April 2008Emerging Markets Debt Fund 11 April 1995Emerging Markets Domestic Debt Fund 28 February 2007Euro Bond Fund 15 September 1992Euro Corporate Bond Fund 3 September 2001Euro Strategic Bond Fund 25 February 1991European Currencies High Yield Bond Fund 27 May 1997Global Bond Fund 7 November 1989Short Maturity Euro Bond Fund 2 August 1994Global Convertible Bond Fund 16 July 2002Euro Liquidity Fund 31 January 2000US Dollar Liquidity Fund 1 April 1998Diversifi ed Alpha Plus VaR 400 (Euro) Fund 4 June 2008Commodities Active GSLE Fund 6 June 2007FX Alpha Plus RC 200 Fund 27 February 2007FX Alpha Plus RC 400 Fund 27 February 2007FX Alpha Plus RC 800 Fund 27 February 2007
Each Class of Shares within each Fund has a different fee structure but participates in the same pool of assets within a given Fund.
The following signifi cant changes were made in the twelve months to 31 December 2009:
Mergers
• On 20 March 2009, the European Equity Opportunities Fund merged into the Eurozone Equity Alpha Fund.
• On 20 March 2009, the Euro Total Return Bond Fund merged into the Euro Strategic Bond Fund.
• On 20 March 2009, the Global Convertible Bond (Euro) Fund merged into the Global Convertible Bond Fund.
• On 20 March 2009, the Global Diversifi ed (Euro) Fund merged into the Diversifi ed Alpha Plus VaR 400 (Euro) Fund.
• On 3 April 2009, the Global Equity Growth Fund merged into the Global Value Equity Fund.
• On 3 April 2009, the Japanese Equity Growth Fund merged into the Japanese Equity Advantage Fund.
• On 3 April 2009, the US Equity Fund merged into the American Franchise Fund.
• On 3 April 2009, the FX Alpha Plus RC 200 (US Dollar) Fund merged into the FX Alpha Plus RC 400 (US Dollar) Fund.
• On 3 April 2009, the FX Alpha Plus RC 800 (US Dollar) Fund merged into the FX Alpha Plus RC 800 (Sterling) Fund.
• On 16 October 2009, the US Bond Fund merged into Global Bond Fund.
• On 16 October 2009, the Diversifi ed Alpha Plus VaR 800 (Euro) Fund merged into Diversifi ed Alpha Plus VaR 400 (Euro) Fund.
• On 16 October 2009, the FX Alpha Plus RC 400 (US Dollar) Fund merged into FX Alpha Plus RC 400 Fund.
• On 16 October 2009, the FX Alpha Plus RC 800 (Sterling) Fund merged into FX Alpha Plus RC 800 Fund.
Launched Classes
Fund Name Date of launch
US Value Equity Fund - IH 19 January 2009Euro Strategic Bond Fund - Z 21 January 2009Emerging Markets Debt Fund - S 23 January 2009US Value Equity Fund - ZH 26 January 2009FX Alpha Plus RC 400 (Sterling) Fund - ZX 13 February 2009Global Convertible Bond Fund - AH (EUR), BH (EUR), CH (EUR), IH (EUR), ZHX (EUR) 20 March 2009Diversifi ed Alpha Plus VaR 400 (Euro) Fund - AH (USD), BH (USD), IH (USD) 20 March 2009FX Alpha Plus RC 800 (Sterling) Fund - AH (USD), IH (USD), AHX (USD) 3 April 2009Global Convertible Bond Fund - ZH (EUR) 8 April 2009Emerging Markets Domestic Debt Fund - Z 14 May 2009FX Alpha Plus RC 400 Fund - ZHX (GBP) 27 May 2009Short Maturity Euro Bond Fund - C 3 July 2009Euro Corporate Bond Fund - AX 6 July 2009Global Convertible Bond Fund - S 15 July 2009Japanese Value Equity Fund - ZH (EUR) 13 August 2009Global Small Cap Value Fund - Z 14 September 2009Global Bond Fund - IX 16 October 2009FX Alpha Plus RC 400 Fund - AH (USD), IH (USD) 16 October 2009FX Alpha Plus RC 800 Fund - AH (USD), IH (USD), ZH (GBP) 16 October 2009US Property Fund - Z 27 November 2009Euro Corporate Bond Fund - N 14 December 2009Global Brands Fund - C 15 December 2009
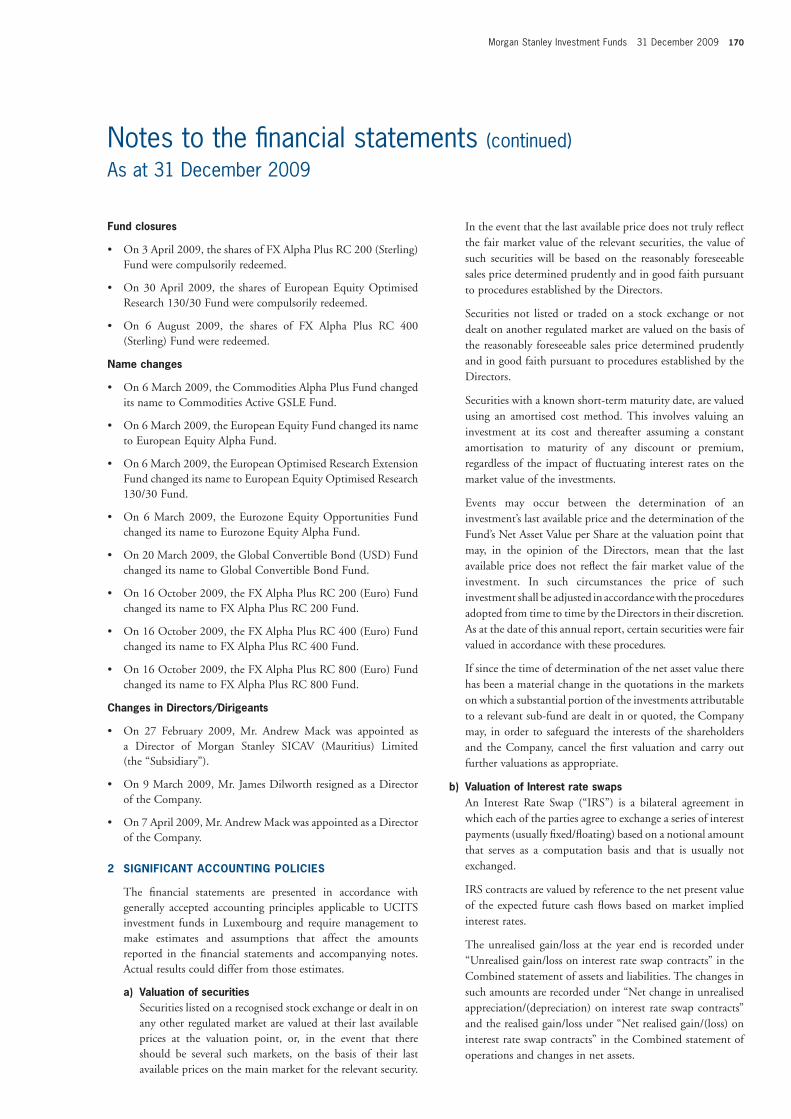
Morgan Stanley Investment Funds 31 December 2009 170
Notes to the fi nancial statements (continued)As at 31 December 2009
Fund closures
• On 3 April 2009, the shares of FX Alpha Plus RC 200 (Sterling) Fund were compulsorily redeemed.
• On 30 April 2009, the shares of European Equity Optimised Research 130/30 Fund were compulsorily redeemed.
• On 6 August 2009, the shares of FX Alpha Plus RC 400 (Sterling) Fund were redeemed.
Name changes
• On 6 March 2009, the Commodities Alpha Plus Fund changed its name to Commodities Active GSLE Fund.
• On 6 March 2009, the European Equity Fund changed its name to European Equity Alpha Fund.
• On 6 March 2009, the European Optimised Research Extension Fund changed its name to European Equity Optimised Research 130/30 Fund.
• On 6 March 2009, the Eurozone Equity Opportunities Fund changed its name to Eurozone Equity Alpha Fund.
• On 20 March 2009, the Global Convertible Bond (USD) Fund changed its name to Global Convertible Bond Fund.
• On 16 October 2009, the FX Alpha Plus RC 200 (Euro) Fund changed its name to FX Alpha Plus RC 200 Fund.
• On 16 October 2009, the FX Alpha Plus RC 400 (Euro) Fund changed its name to FX Alpha Plus RC 400 Fund.
• On 16 October 2009, the FX Alpha Plus RC 800 (Euro) Fund changed its name to FX Alpha Plus RC 800 Fund.
Changes in Directors/Dirigeants
• On 27 February 2009, Mr. Andrew Mack was appointed as a Director of Morgan Stanley SICAV (Mauritius) Limited (the “Subsidiary”).
• On 9 March 2009, Mr. James Dilworth resigned as a Director of the Company.
• On 7 April 2009, Mr. Andrew Mack was appointed as a Director of the Company.
2 SIGNIFICANT ACCOUNTING POLICIES
The fi nancial statements are presented in accordance with generally accepted accounting principles applicable to UCITS investment funds in Luxembourg and require management to make estimates and assumptions that affect the amounts reported in the fi nancial statements and accompanying notes. Actual results could differ from those estimates.
a) Valuation of securities Securities listed on a recognised stock exchange or dealt in on
any other regulated market are valued at their last available prices at the valuation point, or, in the event that there should be several such markets, on the basis of their last available prices on the main market for the relevant security.
In the event that the last available price does not truly refl ect the fair market value of the relevant securities, the value of such securities will be based on the reasonably foreseeable sales price determined prudently and in good faith pursuant to procedures established by the Directors.
Securities not listed or traded on a stock exchange or not dealt on another regulated market are valued on the basis of the reasonably foreseeable sales price determined prudently and in good faith pursuant to procedures established by the Directors.
Securities with a known short-term maturity date, are valued using an amortised cost method. This involves valuing an investment at its cost and thereafter assuming a constant amortisation to maturity of any discount or premium, regardless of the impact of fl uctuating interest rates on the market value of the investments.
Events may occur between the determination of an investment’s last available price and the determination of the Fund’s Net Asset Value per Share at the valuation point that may, in the opinion of the Directors, mean that the last available price does not refl ect the fair market value of the investment. In such circumstances the price of such investment shall be adjusted in accordance with the procedures adopted from time to time by the Directors in their discretion. As at the date of this annual report, certain securities were fair valued in accordance with these procedures.
If since the time of determination of the net asset value there has been a material change in the quotations in the markets on which a substantial portion of the investments attributable to a relevant sub-fund are dealt in or quoted, the Company may, in order to safeguard the interests of the shareholders and the Company, cancel the fi rst valuation and carry out further valuations as appropriate.
b) Valuation of Interest rate swaps An Interest Rate Swap (“IRS”) is a bilateral agreement in
which each of the parties agree to exchange a series of interest payments (usually fi xed/fl oating) based on a notional amount that serves as a computation basis and that is usually not exchanged.
IRS contracts are valued by reference to the net present value of the expected future cash fl ows based on market implied interest rates.
The unrealised gain/loss at the year end is recorded under “Unrealised gain/loss on interest rate swap contracts” in the Combined statement of assets and liabilities. The changes in such amounts are recorded under “Net change in unrealised appreciation/(depreciation) on interest rate swap contracts” and the realised gain/loss under “Net realised gain/(loss) on interest rate swap contracts” in the Combined statement of operations and changes in net assets.
171 Morgan Stanley Investment Funds 31 December 2009
c) Valuation of Credit default swaps A Credit Default Swap (“CDS”) is a transaction in which two
parties enter into an agreement, whereby the buyer pays the seller a periodic payment for the specifi ed life of the agreement. The seller makes no payments unless a credit event, relating to a predetermined reference asset, occurs. If such an event does occur, the seller will then make a payment to the buyer, and the swap contract will terminate.
CDS contracts are valued by reference to the net present value of the expected future cash fl ows based on the market interest rates and the markets expected default and recovery rate of the underlying asset.
The unrealised gain/loss of the year end is recorded under “Unrealised gain/loss on credit default swap contracts” in the Combined statement of assets and liabilities. The changes in such amounts are recorded under “Net change in unrealised appreciation/(depreciation) on credit default swap contracts” and the realised gain/loss under “Net realised gain/(loss) on credit default swap contracts” in the Combined statement of operations and changes in net assets.
d) Valuation of Total return swaps A Total Return Swap (“TRS”) is a transaction in which the
buyer receives the performance of an underlying asset and in return the buyer pays funding costs and generally, an arrangement fee. The underlying asset may be, but not limited to, a specifi c security, basket of securities, other instruments and index.
TRS contracts are valued by reference to the mark to market value based on the market value of the underlying asset.
The unrealised gain/loss of the year end is recorded under “Unrealised gain/loss on total return swap contracts” in the Combined statement of assets and liabilities. The changes in such amounts are recorded under “Net change in unrealised appreciation/(depreciation) on total return swap contracts” and the realised gain/loss under “Net realised gain/(loss) on total return swap contracts” in the Combined statement of operations and changes in net assets.
e) Valuation of Options Options are contractual agreements that convey the right, but
not the obligation, for the purchaser either to buy or sell a specifi c amount of a fi nancial instrument at a fi xed price, either at a fi xed future date or at any time within a specifi ed period.
Options are valued by reference to the expected future cash fl ow based on the market implied performance, spot level and the volatility of the underlying asset(s).
Options purchased are recorded as investments; Options written or sold are recorded as liabilities. When the exercise of an option results in a cash settlement, the difference between the premium paid and the settlement proceeds is accounted for as a realised gain or loss.
When securities are acquired or delivered upon exercise of an option, the acquisition cost or sale proceeds are adjusted by the amount of the premium paid. When an option is closed, the difference between the premium and the cost to close the position is accounted for as a realised gain or loss. When an option expires, the premium is accounted for as a realised gain for options written or as a realised loss for options purchased.
The market values of options are recorded under “Options purchased” or “Options premium received” in the Combined Statement of Net Assets.
f) Valuation of Forward foreign exchange contracts A forward foreign exchange contract is an agreement
between two parties to exchange one currency for another at a specifi c price and date in the future.
Open forward contracts are valued based by reference to the last available currency rates prevailing at the relevant valuation date.
The unrealised gain/loss of the year end is recorded under “Unrealised gain/loss on open forward foreign exchange contracts” in the Combined statement of assets and liabilities. The changes in such amounts are recorded under “Net change in unrealised appreciation/(depreciation) on forward foreign exchange contracts” and the realised gain/loss under “Net realised gain/(loss) on forward foreign exchange contracts” in the Combined statement of operations and changes in net assets.
g) Valuation of Futures contracts A futures contract is a contractual agreement, to buy or sell
a particular commodity or fi nancial instrument at a pre-determined price in the future. Futures contracts detail the quality and quantity of the underlying asset and they are standardised to facilitate trading on a futures exchange.
Futures contracts are valued at the last available prices on the exchanges for which the contracts are traded on.
The unrealised gain/loss of the year end is recorded under “Unrealised gain/loss on open futures contracts” in the Combined statement of assets and liabilities. The changes in such amounts are recorded under “Net change in unrealised appreciation/(depreciation) on fi nancial futures contracts” and the realised gain/loss under “Net realised gain/(loss) on fi nancial futures contracts” in the Combined statement of operations and changes in net assets.
h) Income and securities transactions Dividend income is recorded on the ex dividend date.
Interest income is accrued daily. Discounts and premiums are accreted as adjustments to interest income. Income from securities lending is recorded on a cash receipts basis.
Securities transactions are accounted for on the date the securities are purchased or sold. Realised gains or losses on
Notes to the fi nancial statements (continued)As at 31 December 2009
Morgan Stanley Investment Funds 31 December 2009 172
Notes to the fi nancial statements (continued)As at 31 December 2009
the sale of securities are determined on the basis of the average cost method.
i) Translation of foreign currencies Transactions in foreign currencies are translated into the
currency of each Fund at the last available rate of exchange prevailing in a recognised market at the date of the transactions. Assets and liabilities denominated in foreign currencies are translated into the currency of each Fund at the last available rate of exchange prevailing in a recognised market at the date of the Statement of Assets and Liabilities.
The combined Statement of Assets and Liabilities is presented in US dollars at the last available rate of exchange prevailing in a recognised market at the date of the Statement of Assets and Liabilities, while the combined Statement of Operations and Changes in Net Assets is presented in US dollars at the average exchange rates ruling during the year.
j) Valuation of repurchase agreements Under a repurchase agreement, the Company purchases
securities and agrees to re-sell them at a mutually agreed upon date and price. A repurchase agreement is collateralized by securities (see Note 11). Repurchase agreements are valued at cost with interest accrued from the date of purchase.
k) Mauritian subsidiary The Indian Equity Fund currently invests through the
Subsidiary where the Indian Equity Fund is the sole shareholder. All assets and liabilities, income and expenses of the Subsidiary are recorded in the Statement of Assets and Liabilities and the Statement of Operations and Changes in Net Assets of the Indian Equity Fund. All investments held by the Subsidiary are individually disclosed in the statement of investments of the Indian Equity Fund.
The Subsidiary incurs and pays certain fees and expenses relating to its investment activity in India. These fees and expenses may include brokerage costs and commissions, transaction costs associated with converting currency to and from Indian Rupee to US Dollars, fees incurred by its standing proxy, corporate and registration fees and taxes associated with the establishment and operation of the Subsidiary.
3 SECURITIES LENDING
Certain Funds may lend securities to qualifi ed fi nancial institutions, such as broker-dealers, to earn additional income. Any increase or decrease in the fair value of the securities loaned that might occur and any interest earned or dividends declared on those securities during the term of the loan would remain in the Fund. Funds that lend securities, receive debt securities and sometimes residual cash as collateral in an amount up to 105% of the current fair value of the loaned securities. The collateral is marked to market daily, by the securities lending agent, to ensure that up to 105% collateral
coverage is maintained throughout the term of the loan. Securities lending income is generated as a result of securities on loan less compensation to the administrative agent. Net securities lending income is included in the Statement of Operations.
The value of loaned securities and related collateral outstanding as at 31 December 2009 are as follows:
Value in USDCollateral MV
in USD
Asian Equity Fund 75,185,256 79,401,755 Emerging Markets Equity Fund 84,296,211 88,578,305 European Equity Alpha Fund 576,907 605,856 European Property Fund 38,373,178 40,874,310 Eurozone Equity Alpha Fund 1,465,876 1,544,898 Global Value Equity Fund 4,277,907 4,531,395 Global Property Fund 12,997,520 14,150,847 Japanese Equity Advantage Fund 3,795,083 4,277,843 Japanese Value Equity Fund 12,348,839 13,111,926 Emerging Markets Debt Fund 966,104 1,034,757 Euro Bond Fund 60,402,253 61,717,712 Euro Strategic Bond Fund 9,329,991 9,523,580 European Currencies High Yield Bond Fund 14,403,679 14,926,845 Global Bond Fund 4,823,068 4,926,236 Short Maturity Euro Bond Fund 150,735,919 154,544,662
Total 473,977,791 493,750,927
4 RELATED PARTY TRANSACTIONS AND AFFILIATIONS
Under the terms of an investment advisory agreement, Morgan Stanley Investment Management, Inc. has been appointed Investment Adviser with responsibility for advising the Company within the scope of the day-to-day management of the various Funds. The Investment Adviser may delegate any of its responsibilities to any other party subject to approval by the Directors and the CSSF but the Investment Adviser shall remain responsible for the proper performance by such party of those responsibilities. A full list of sub-advisers can be found on page 186. The Investment Adviser is entitled to receive from the Company a fee payable monthly in arrears, and calculated on the basis of the average daily net assets (before deduction of the fee) of each Fund attributable to each Class of Shares.
All expenses are paid directly by the Company and fees paid to the Investment Adviser are at the following annual rates:
Fund
Class I, IH, IX, Z, ZH
and ZHX
Class A, AH, AHX,
B, BH and BX
Class C, CH and CX Class S
American Franchise Fund 0.70% 1.40% 2.20% -Asian Equity Fund 0.75% 1.40% 2.20% -Asian Property Fund 0.75% 1.40% 2.20% -Emerging Europe, Middle East and Africa Equity Fund 1.10% 1.60% 2.40% -Emerging Markets Equity Fund 1.10% 1.60% 2.40% -European Equity Alpha Fund 0.70% 1.20% 1.90% -European Property Fund 0.75% 1.40% 2.20% -European Small Cap Value Fund 0.95% 1.60% 2.40% -Eurozone Equity Alpha Fund 0.75% 1.40% 2.20% -Global Brands Fund 0.75% 1.40% 2.20% -Global Property Fund 0.85% 1.50% 2.30% -Global Small Cap Value Fund 0.95% 1.60% 2.40% -Global Value Equity Fund 0.75% 1.40% 2.20% -

173 Morgan Stanley Investment Funds 31 December 2009
Notes to the fi nancial statements (continued)As at 31 December 2009
Fund
Class I, IH, IX, Z, ZH
and ZHX
Class A, AH, AHX,
B, BH and BX
Class C, CH and CX Class S
Indian Equity Fund 0.90% 1.60% 2.40% -Japanese Equity Advantage Fund 0.75% 1.40% 2.20% -Japanese Value Equity Fund 0.75% 1.40% 2.20% -Latin American Equity Fund 1.00% 1.60% 2.40% -US Equity Growth Fund 0.70% 1.40% 2.20% -US Property Fund 0.75% 1.40% 2.20% -US Small Cap Growth Fund 0.95% 1.60% 2.40% -US Value Equity Fund 0.70% 1.40% 2.20% -Alpha Advantage European Fixed Income Fund 0.65% 1.30% 2.10% -Emerging Markets Debt Fund 0.90% 1.40% 2.10% 0.75%Emerging Markets Domestic Debt Fund 0.90% 1.40% 2.10% 0.75%Euro Bond Fund 0.45% 0.80% 1.45% 0.45%Euro Corporate Bond Fund 0.45% 0.80% 1.45% 0.40%Euro Strategic Bond Fund 0.45% 0.80% 1.45% 0.35%European Currencies High Yield Bond Fund 0.50% 0.85% 1.50% 0.45%Global Bond Fund 0.45% 0.80% 1.45% 0.35%Short Maturity Euro Bond Fund 0.45% 0.80% 1.45% 0.30%Global Convertible Bond Fund 0.60% 1.00% 1.60% 0.55%Euro Liquidity Fund 0.20% 0.50% 0.85% -US Dollar Liquidity Fund 0.20% 0.50% 0.85% -Diversifi ed Alpha Plus VaR 400 (Euro) Fund 0.80% 1.60% 2.40% -Commodities Active GSLE Fund 0.55% 1.10% 1.70% -FX Alpha Plus RC 200 Fund 0.45% 0.80% 1.45% -FX Alpha Plus RC 400 Fund 0.70% 1.20% 1.90% -FX Alpha Plus RC 800 Fund 1.00% 1.50% 2.30% -
No investment advisory fee is payable in respect of Class “N”, “NH” and “NX” Shares.
In the case of any individual Fund or Class, the Investment Adviser may choose to waive or rebate all of its fee or any portion thereof at its absolute discretion for an indefi nite period, in order to reduce the impact such fee may have on the performance of the Fund or Class in instances where the net assets of the Fund or Class are of insuffi cient size.
The Funds will be subject to a monthly Shareholder Service Fee at a maximum annual rate of 0.25% of the Funds’ aggregate average daily Net Asset Value attributable to all Classes of Shares of the Funds. The current fees charged by the Company are as follows:
A, AH, AX, AHX, B, BX, BH, BHX, C, CH, CX, CHX 0.15%+I, IH, IX, IHX, Z, ZH, ZX, ZHX 0.08%+S, SX 0.05%N, NH, NX, NHX Nil
+ Except for the Liquidity Funds which charge 0.05%.
The Shareholder Service Fee will remain in force for an unlimited period and may be changed, subject to the maximum noted above, by the Company upon no less than one month’s prior written notice.
The shareholder service fee is paid to Morgan Stanley Investment Management Limited (the “Distributor”) as compensation for providing certain services to shareholders. The Distributor may choose to waive all of the shareholder service fees or any portion thereof at its absolute discretion and for an indefi nite period.
For each Share Class of Alpha Advantage European Fixed Income Fund, certain Asset Allocation and Alternative Investment Funds, the Investment Adviser may receive a performance fee (“the Performance Fee”) as defi ned by the prospectus. The Performance Fee will be calculated and accrued daily and will become payable at 31 December each year.
As at 31 December 2009, performance fees were payable in respect of the following sub-funds:
Fund Performance fee amount
Alpha Advantage European Fixed Income Fund - I 12,820 EURAlpha Advantage European Fixed Income Fund - A 22,692 EURAlpha Advantage European Fixed Income Fund - B 57,398 EURAlpha Advantage European Fixed Income Fund - Z 41,549 EURDiversifi ed Alpha Plus VaR 400 (Euro) Fund - AH 64 EURDiversifi ed Alpha Plus VaR 400 (Euro) Fund - IH 501 EUR
The Distributor is also paid a distribution fee for the Equity Funds, Bond Funds, Asset Allocation Funds and Alternative Investment Funds, accrued daily and paid monthly, at the annual rate of 1.00% of the average daily Net Asset Value of Classes B, BX, BH and BHX Shares as compensation for providing distribution-related services to the Funds with respect to such Shares.
The Liquidity Funds will pay the Distributor a distribution fee, accrued daily and paid monthly, at the annual rate of 0.75% of the average daily Net Asset Value for Classes B, BX, BH and BHX Shares.
a) Morgan Stanley Investment Management Inc. and the sub-advisers for the Company have entered into the following types of transactions in which a connected person had a material interest:
i) Transactions in relation to an investment in respect of which an affi liated fi rm benefi ted from a commission, fee, mark up or mark down; or
ii) Transactions in relation to a placing and/or a new issue in which the affi liated company was a member of the underwriting syndicate.
All the transactions executed on behalf of the Company were entered into in the ordinary course of business and on normal commercial terms.
The affi liations of the Directors are as follows:
Mr. James Dilworth was a Managing Director of Morgan Stanley Investment Management Limited. (Resigned as a Director of the Company on 9 March 2009).
Mrs. Laurence Magloire is an Executive Director of Morgan Stanley Investment Management Limited.
Morgan Stanley Investment Funds 31 December 2009 174
Notes to the fi nancial statements (continued)As at 31 December 2009 Mr. Andrew Mack is a Managing Director of Morgan
Stanley Investment Management Limited. (Appointed as a Director of the Company on 7 April 2009).
b) The total aggregate value of the transactions of the Company effected through affi liated fi rms is USD 1,250,433,488; such transactions represent 0.52% of total transactions. Total brokerage commission paid to affi liated fi rms is USD 1,301,527 at an average rate of commission of 0.10%.
Administration fees and transfer agent fees include operational costs of Morgan Stanley Investment Management Limited, Luxembourg branch, amounting to USD 1,517,332.
The Company has entered into a securities lending contract with Morgan Stanley & Co. International Limited, Morgan Stanley Securities Limited, Morgan Stanley & Co Incorporated and MSDW Equity Finance Service I (Cayman) Limited which is under normal commercial terms. The arrangement is exclusive in relation to certain securities.
The following Fund’s received securities lending income from the above named affi liates:
USD
Asian Equity Fund 266,202Emerging Markets Equity Fund 411,414 European Equity Alpha Fund 289,586European Equity Opportunities Fund 1,675European Property Fund 617,913Eurozone Equity Alpha Fund 91,169Global Property Fund 13,541Global Value Equity Fund 450,405Japanese Equity Advantage Fund 29,065Japanese Value Equity Fund 33,397US Property Fund 41,028US Value Equity Fund 69,789Emerging Markets Debt Fund 52,038Euro Bond Fund 127,622Euro Strategic Bond Fund 23,370European Currencies High Yield Bond Fund 70,325Global Bond Fund 16,821Short Maturity Euro Bond Fund 51,855
2,657,215
As at 31 December 2009, the Emerging Markets Equity Fund invested in the Morgan Stanley Growth Fund, advised by an affi liate of Morgan Stanley.
As at 31 December 2009, the Diversifi ed Alpha Plus VaR 400 (Euro) Fund invested in the Morgan Stanley Funds-Euro Liquidity Fund, advised by an affi liate of Morgan Stanley.
As at 31 December 2009, the Commodities Active GSLE Fund invested in the Morgan Stanley Alpha Plus Funds-Commodities Alpha Plus RC4000 Fund, advised by an affi liate of Morgan Stanley.
Directors’ remuneration:
The Directors of the Company who are not Directors, offi cers or employees of the Investment Manager or any affi liate thereof
will be entitled to remuneration from the Fund, at a current rate of EUR 35,000 per annum, for their services as Directors. Mr. Michael Griffi n and Mr. William Jones are the only Directors who receive remuneration. The Fund also bears reasonable out of pocket expenses and cost of Directors and Offi cers insurance. These expenses are disclosed under Directors fees, expenses and insurance in the Statement of Operations and Changes in Net Assets.
5 DIVIDEND POLICY
For the AX, AHX, BX, BHX, CX, CHX, IX, IHX, NX, NHX, SX, ZX and ZHX Classes of Shares of the Bond Funds, Equity Funds, Asset Allocation Funds and Alternative Investment Funds, the Company intends to declare dividends which will be equal to at least 85% of the net investment income attributable to such Classes. Such dividends, if any, will be accrued on the last Dealing Day of June and December and declared on the next Dealing Day. In the case of the NX Share Class of the Emerging Markets Debt Fund, such dividends, if any, will be accrued on the last Dealing Day of the month and declared on the next Dealing Day.
During the year to 31 December 2009, the Fund paid dividends as follows:
Fund Name Ccy Share Class Ex-Date Pay Date
Record Date
Dividend per Share
Equity FundsAmerican Franchise Fund USD ZX 02/01/09 07/01/09 31/12/08 0.124437
AX 01/07/09 06/07/09 30/06/09 0.035556ZX 01/07/09 06/07/09 30/06/09 0.137004AX 12/10/09 15/10/09 09/10/09 0.485437
Asian Property Fund USD AX 02/01/09 07/01/09 31/12/08 0.047066IX 02/01/09 07/01/09 31/12/08 0.088617
AX 01/07/09 06/07/09 30/06/09 0.075141IX 01/07/09 06/07/09 30/06/09 0.119859
Emerging Europe, EUR AX 01/07/09 06/07/09 30/06/09 0.217470Middle East and Africa Equity FundEuropean Equity EUR IX 02/01/09 07/01/09 31/12/08 0.029507Opportunities Fund AX 16/03/09 19/03/09 13/03/09 0.014696
IX 16/03/09 19/03/09 13/03/09 0.035102European Property Fund EUR AX 02/01/09 07/01/09 31/12/08 0.129321
IX 02/01/09 07/01/09 31/12/08 0.183621AX 01/07/09 06/07/09 30/06/09 0.279474IX 01/07/09 06/07/09 30/06/09 0.223085
European Small Cap EUR AX 01/07/09 06/07/09 30/06/09 0.307348Value FundGlobal Property Fund USD IX 02/01/09 07/01/09 31/12/08 0.154725
IX 01/07/09 06/07/09 30/06/09 0.187261Japanese Value Equity Fund JPY AX 02/01/09 07/01/09 31/12/08 0.867100US Equity Fund USD IX 02/01/09 07/01/09 31/12/08 0.025186
AX 30/03/09 02/04/09 27/03/09 0.006825IX 30/03/09 02/04/09 27/03/09 0.026629
US Property Fund USD AX 02/01/09 07/01/09 31/12/08 0.476530AX 01/07/09 06/07/09 30/06/09 0.203397
US Value Equity Fund USD AX 02/01/09 07/01/09 31/12/08 0.042470IX 02/01/09 07/01/09 31/12/08 0.109626
AX 01/07/09 06/07/09 30/06/09 0.036114IX 01/07/09 06/07/09 30/06/09 0.099114
Bond FundsEmerging Markets USD AX 02/01/09 07/01/09 31/12/08 1.534547Debt Fund CX 02/01/09 07/01/09 31/12/08 0.488332
175 Morgan Stanley Investment Funds 31 December 2009
Notes to the fi nancial statements (continued)As at 31 December 2009
Fund Name Ccy Share Class Ex-Date Pay Date
Record Date
Dividend per Share
Bond Funds (continued)Emerging Markets USD NX 02/01/09 07/01/09 31/12/08 0.146483Debt Fund (continued) NX 02/02/09 05/02/09 30/01/09 0.131445
NX 02/03/09 05/03/09 27/02/09 0.104901NX 01/04/09 06/04/09 31/03/09 0.190102NX 04/05/09 07/05/09 30/04/09 0.141706NX 02/06/09 05/06/09 29/05/09 0.130697AX 01/07/09 06/07/09 30/06/09 0.821940CX 01/07/09 06/07/09 30/06/09 0.603089NX 01/07/09 06/07/09 30/06/09 0.144930NX 03/08/09 06/08/09 31/07/09 0.146661NX 01/09/09 04/09/09 31/08/09 0.140469NX 01/10/09 06/10/09 30/09/09 0.143024NX 02/11/09 05/11/09 30/10/09 0.135580NX 01/12/09 04/12/09 30/11/09 0.146268
Emerging Markets USD AX 02/01/09 07/01/09 31/12/08 2.716301Domestic Debt Fund CX 02/01/09 07/01/09 31/12/08 0.271105
AX 01/07/09 06/07/09 30/06/09 0.538183CX 01/07/09 06/07/09 30/06/09 0.495660
Euro Bond Fund EUR IX 02/01/09 07/01/09 31/12/08 0.511110IX 01/07/09 06/07/09 30/06/09 0.264610
Euro Total Return EUR AX 02/01/09 07/01/09 31/12/08 0.664646Bond Fund IX 02/01/09 07/01/09 31/12/08 0.702913
AX 16/03/09 19/03/09 13/03/09 0.204852IX 16/03/09 19/03/09 13/03/09 0.218418
Global Bond Fund USD AX 02/01/09 07/01/09 31/12/08 0.423020CX 02/01/09 07/01/09 31/12/08 0.186967AX 01/07/09 06/07/09 30/06/09 0.272677
US Bond Fund USD AX 02/01/09 07/01/09 31/12/08 0.404571IX 02/01/09 07/01/09 31/12/08 1.017656IX 01/07/09 06/07/09 30/06/09 0.326348IX 13/10/09 16/10/09 12/10/09 0.167509
Global Convertible Bond EUR ZX 02/01/09 07/01/09 31/12/08 0.039886(Euro) Fund ZX 16/03/09 19/03/09 13/03/09 0.063767Global Convertible Bond USD ZHX 01/07/09 06/07/09 30/06/09 0.039369Fund
Alternative Investment FundsCommodities Active USD IX 02/01/09 07/01/09 31/12/08 0.028425GSLE Fund IX 01/07/09 06/07/09 30/06/09 0.001724FX Alpha Plus RC 200 GBP AX 02/01/09 07/01/09 31/12/08 0.349662(Sterling) Fund IX 02/01/09 07/01/09 31/12/08 0.394374FX Alpha Plus RC 200 USD AX 02/01/09 07/01/09 31/12/08 0.162359(US Dollar) Fund CX 02/01/09 07/01/09 31/12/08 0.070235FX Alpha Plus RC 400 Fund EUR AX 02/01/09 07/01/09 31/12/08 0.408573FX Alpha Plus RC 400 GBP AX 02/01/09 07/01/09 31/12/08 2.488235(Sterling) Fund IX 02/01/09 07/01/09 31/12/08 0.204610FX Alpha Plus RC 400 USD AX 02/01/09 07/01/09 31/12/08 0.074236(US Dollar) FundFX Alpha Plus RC 800 Fund EUR AX 02/01/09 07/01/09 31/12/08 0.362139FX Alpha Plus RC 800 GBP AX 02/01/09 07/01/09 31/12/08 0.283275(Sterling) Fund IX 02/01/09 07/01/09 31/12/08 0.337684
IX 01/07/09 06/07/09 30/06/09 0.634085IX 12/10/09 15/10/09 9/10/09 0.051633
FX Alpha Plus RC 800 USD AX 02/01/09 07/01/09 31/12/08 0.009181(US Dollar) Fund
For the AX, AHX, BX, BHX, CX, CHX, IX, IHX, NX, NHX, SX, ZX and ZHX Classes of Shares of the Liquidity Funds, the Company intends to declare dividends which will be equal to the net investment income attributable to such Classes and realized capital gains, reduced by realized losses, if any. In the case of the Liquidity Funds, such dividends, if any, will be declared on each Dealing Day.
6 TAXATION
Under current law and practice, the Company is not liable to any Luxembourg income tax, or any Luxembourg capital gains tax on
the realised capital appreciation of the assets of the Company nor are dividends paid by the Company liable to any Luxembourg withholding tax. The Company is, however, liable to annual subscription tax in Luxembourg (“taxe d’abonnement”) calculated at the rate of 0.05% of the Net Asset Value of all Funds (except the Liquidity Funds for which the rate is 0.01% of the Net Asset Value of the Liquidity Funds). Furthermore, the Company has sought the benefi t of a reduced annual tax rate of 0.01% for Class Z, ZH, ZX, ZHX, S, SX, N, NH, NX and NHX Shares. This tax is payable quarterly on the basis of the net assets of the relevant Funds, calculated at the end of the quarter to which the tax relates. No stamp or other tax will be payable in Luxembourg in connection with the issue of Shares of the Company, except a once and for all tax of EUR 1,239.47 which was paid upon incorporation.
Dividends, interest and capital gains on securities held by the Company may be subject to non-recoverable withholding tax or capital gains tax in the country of origin.
7 RATES OF EXCHANGE
The rates of exchange used for translation into U.S. dollars of assets and liabilities, including securities and foreign currency holdings, as of 31 December 2009 were:
Currency
AUD 1.114 = $1.00AUD* 1.112 = $1.00BRL 1.744 = $1.00BRL* 1.743 = $1.00CAD 1.049 = $1.00CAD* 1.048 = $1.00CHF 1.033 = $1.00CHF* 1.034 = $1.00CLP 507.25 = $1.00CLP* 507.25 = $1.00COP 2,042.5 = $1.00COP* 2,043 = $1.00CZK 18.4 = $1.00CZK* 18.404 = $1.00DKK 5.18 = $1.00EGP 5.485 = $1.00EUR 0.696 = $1.00EUR* 0.697 = $1.00GBP 0.618 = $1.00GBP* 0.619 = $1.00HKD 7.754 = $1.00 HUF 188.255 = $1.00HUF* 188.346 = $1.00IDR 9,460 = $1.00IDR* 9,395 = $1.00ILS 3.786 = $1.00ILS* 3.788 = $1.00INR 46.4 = $1.00 INR* 46.535 = $1.00 JPY 92.775 = $1.00 JPY* 93.095 = $1.00 KRW 1,158.3 = $1.00KRW* 1,164.475 = $1.00MXN 13.068 = $1.00MXN* 13.055 = $1.00MYR 3.424 = $1.00NOK 5.771 = $1.00NOK* 5.777 = $1.00NZD 1.375 = $1.00NZD* 1.374 = $1.00PEN 2.887 = $1.00
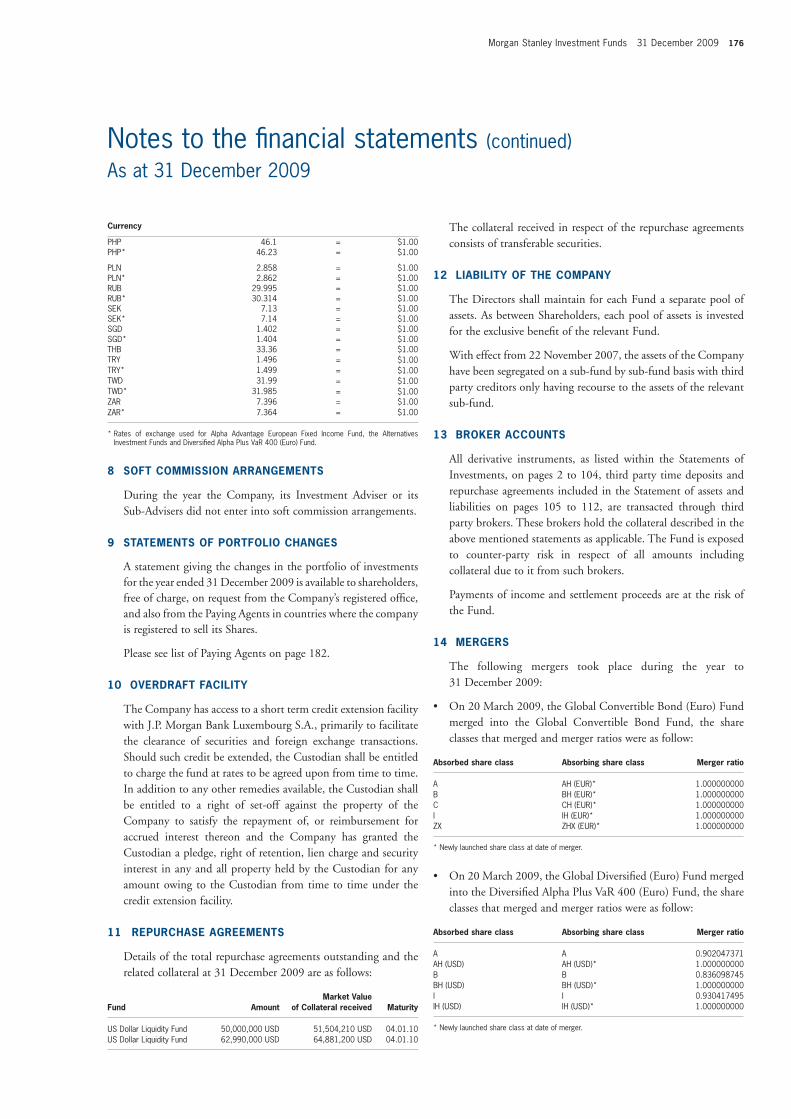
Morgan Stanley Investment Funds 31 December 2009 176
Notes to the fi nancial statements (continued)As at 31 December 2009
Currency
PHP 46.1 = $1.00PHP* 46.23 = $1.00
PLN 2.858 = $1.00PLN* 2.862 = $1.00RUB 29.995 = $1.00RUB* 30.314 = $1.00SEK 7.13 = $1.00SEK* 7.14 = $1.00SGD 1.402 = $1.00SGD* 1.404 = $1.00THB 33.36 = $1.00TRY 1.496 = $1.00TRY* 1.499 = $1.00TWD 31.99 = $1.00TWD* 31.985 = $1.00ZAR 7.396 = $1.00ZAR* 7.364 = $1.00
* Rates of exchange used for Alpha Advantage European Fixed Income Fund, the Alternatives Investment Funds and Diversifi ed Alpha Plus VaR 400 (Euro) Fund.
8 SOFT COMMISSION ARRANGEMENTS
During the year the Company, its Investment Adviser or its Sub-Advisers did not enter into soft commission arrangements.
9 STATEMENTS OF PORTFOLIO CHANGES
A statement giving the changes in the portfolio of investments for the year ended 31 December 2009 is available to shareholders, free of charge, on request from the Company’s registered offi ce, and also from the Paying Agents in countries where the company is registered to sell its Shares.
Please see list of Paying Agents on page 182.
10 OVERDRAFT FACILITY
The Company has access to a short term credit extension facility with J.P. Morgan Bank Luxembourg S.A., primarily to facilitate the clearance of securities and foreign exchange transactions. Should such credit be extended, the Custodian shall be entitled to charge the fund at rates to be agreed upon from time to time. In addition to any other remedies available, the Custodian shall be entitled to a right of set-off against the property of the Company to satisfy the repayment of, or reimbursement for accrued interest thereon and the Company has granted the Custodian a pledge, right of retention, lien charge and security interest in any and all property held by the Custodian for any amount owing to the Custodian from time to time under the credit extension facility.
11 REPURCHASE AGREEMENTS
Details of the total repurchase agreements outstanding and the related collateral at 31 December 2009 are as follows:
Fund AmountMarket Value
of Collateral received Maturity
US Dollar Liquidity Fund 50,000,000 USD 51,504,210 USD 04.01.10US Dollar Liquidity Fund 62,990,000 USD 64,881,200 USD 04.01.10
The collateral received in respect of the repurchase agreements consists of transferable securities.
12 LIABILITY OF THE COMPANY
The Directors shall maintain for each Fund a separate pool of assets. As between Shareholders, each pool of assets is invested for the exclusive benefi t of the relevant Fund.
With effect from 22 November 2007, the assets of the Company have been segregated on a sub-fund by sub-fund basis with third party creditors only having recourse to the assets of the relevant sub-fund.
13 BROKER ACCOUNTS
All derivative instruments, as listed within the Statements of Investments, on pages 2 to 104, third party time deposits and repurchase agreements included in the Statement of assets and liabilities on pages 105 to 112, are transacted through third party brokers. These brokers hold the collateral described in the above mentioned statements as applicable. The Fund is exposed to counter-party risk in respect of all amounts including collateral due to it from such brokers.
Payments of income and settlement proceeds are at the risk of the Fund.
14 MERGERS
The following mergers took place during the year to 31 December 2009:
• On 20 March 2009, the Global Convertible Bond (Euro) Fund merged into the Global Convertible Bond Fund, the share classes that merged and merger ratios were as follow:
Absorbed share class Absorbing share class Merger ratio
A AH (EUR)* 1.000000000B BH (EUR)* 1.000000000C CH (EUR)* 1.000000000I IH (EUR)* 1.000000000ZX ZHX (EUR)* 1.000000000
* Newly launched share class at date of merger.
• On 20 March 2009, the Global Diversifi ed (Euro) Fund merged into the Diversifi ed Alpha Plus VaR 400 (Euro) Fund, the share classes that merged and merger ratios were as follow:
Absorbed share class Absorbing share class Merger ratio
A A 0.902047371AH (USD) AH (USD)* 1.000000000B B 0.836098745BH (USD) BH (USD)* 1.000000000I I 0.930417495IH (USD) IH (USD)* 1.000000000
* Newly launched share class at date of merger.
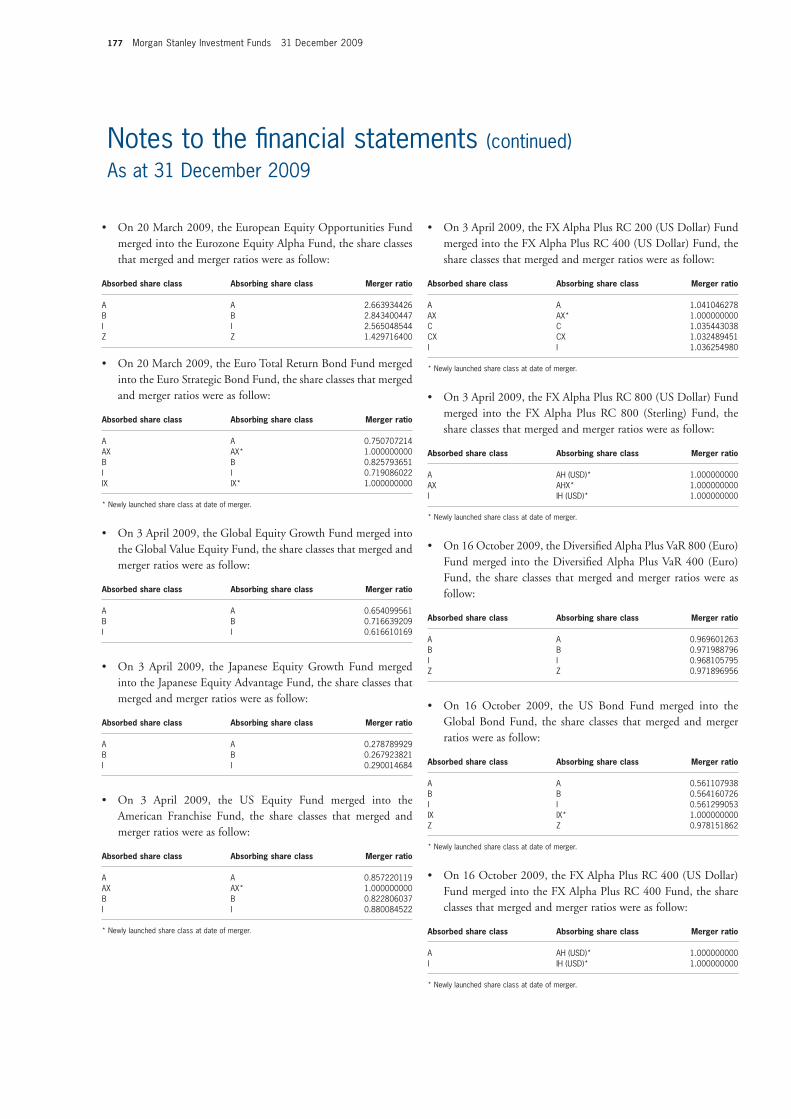
177 Morgan Stanley Investment Funds 31 December 2009
Notes to the fi nancial statements (continued)As at 31 December 2009
• On 20 March 2009, the European Equity Opportunities Fund merged into the Eurozone Equity Alpha Fund, the share classes that merged and merger ratios were as follow:
Absorbed share class Absorbing share class Merger ratio
A A 2.663934426B B 2.843400447I I 2.565048544Z Z 1.429716400
• On 20 March 2009, the Euro Total Return Bond Fund merged into the Euro Strategic Bond Fund, the share classes that merged and merger ratios were as follow:
Absorbed share class Absorbing share class Merger ratio
A A 0.750707214AX AX* 1.000000000B B 0.825793651I I 0.719086022IX IX* 1.000000000
* Newly launched share class at date of merger.
• On 3 April 2009, the Global Equity Growth Fund merged into the Global Value Equity Fund, the share classes that merged and merger ratios were as follow:
Absorbed share class Absorbing share class Merger ratio
A A 0.654099561B B 0.716639209I I 0.616610169
• On 3 April 2009, the Japanese Equity Growth Fund merged into the Japanese Equity Advantage Fund, the share classes that merged and merger ratios were as follow:
Absorbed share class Absorbing share class Merger ratio
A A 0.278789929B B 0.267923821I I 0.290014684
• On 3 April 2009, the US Equity Fund merged into the American Franchise Fund, the share classes that merged and merger ratios were as follow:
Absorbed share class Absorbing share class Merger ratio
A A 0.857220119AX AX* 1.000000000B B 0.822806037I I 0.880084522
* Newly launched share class at date of merger.
• On 3 April 2009, the FX Alpha Plus RC 200 (US Dollar) Fund merged into the FX Alpha Plus RC 400 (US Dollar) Fund, the share classes that merged and merger ratios were as follow:
Absorbed share class Absorbing share class Merger ratio
A A 1.041046278AX AX* 1.000000000C C 1.035443038CX CX 1.032489451I I 1.036254980
* Newly launched share class at date of merger.
• On 3 April 2009, the FX Alpha Plus RC 800 (US Dollar) Fund merged into the FX Alpha Plus RC 800 (Sterling) Fund, the share classes that merged and merger ratios were as follow:
Absorbed share class Absorbing share class Merger ratio
A AH (USD)* 1.000000000AX AHX* 1.000000000I IH (USD)* 1.000000000
* Newly launched share class at date of merger.
• On 16 October 2009, the Diversifi ed Alpha Plus VaR 800 (Euro) Fund merged into the Diversifi ed Alpha Plus VaR 400 (Euro) Fund, the share classes that merged and merger ratios were as follow:
Absorbed share class Absorbing share class Merger ratio
A A 0.969601263B B 0.971988796I I 0.968105795Z Z 0.971896956
• On 16 October 2009, the US Bond Fund merged into the Global Bond Fund, the share classes that merged and merger ratios were as follow:
Absorbed share class Absorbing share class Merger ratio
A A 0.561107938B B 0.564160726I I 0.561299053IX IX* 1.000000000Z Z 0.978151862
* Newly launched share class at date of merger.
• On 16 October 2009, the FX Alpha Plus RC 400 (US Dollar) Fund merged into the FX Alpha Plus RC 400 Fund, the share classes that merged and merger ratios were as follow:
Absorbed share class Absorbing share class Merger ratio
A AH (USD)* 1.000000000I IH (USD)* 1.000000000
* Newly launched share class at date of merger.
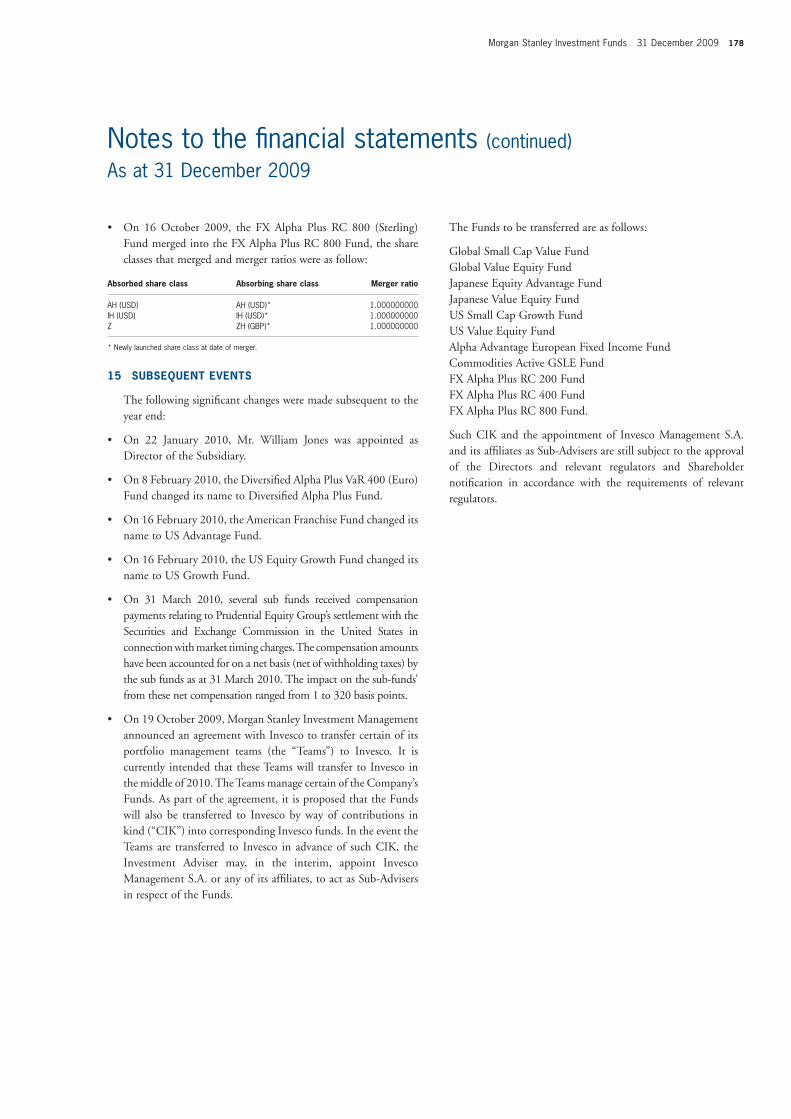
Morgan Stanley Investment Funds 31 December 2009 178
Notes to the fi nancial statements (continued)As at 31 December 2009
• On 16 October 2009, the FX Alpha Plus RC 800 (Sterling) Fund merged into the FX Alpha Plus RC 800 Fund, the share classes that merged and merger ratios were as follow:
Absorbed share class Absorbing share class Merger ratio
AH (USD) AH (USD)* 1.000000000IH (USD) IH (USD)* 1.000000000Z ZH (GBP)* 1.000000000
* Newly launched share class at date of merger.
15 SUBSEQUENT EVENTS
The following signifi cant changes were made subsequent to the year end:
• On 22 January 2010, Mr. William Jones was appointed as Director of the Subsidiary.
• On 8 February 2010, the Diversifi ed Alpha Plus VaR 400 (Euro) Fund changed its name to Diversifi ed Alpha Plus Fund.
• On 16 February 2010, the American Franchise Fund changed its name to US Advantage Fund.
• On 16 February 2010, the US Equity Growth Fund changed its name to US Growth Fund.
• On 31 March 2010, several sub funds received compensation payments relating to Prudential Equity Group’s settlement with the Securities and Exchange Commission in the United States in connection with market timing charges. The compensation amounts have been accounted for on a net basis (net of withholding taxes) by the sub funds as at 31 March 2010. The impact on the sub-funds’ from these net compensation ranged from 1 to 320 basis points.
• On 19 October 2009, Morgan Stanley Investment Management announced an agreement with Invesco to transfer certain of its portfolio management teams (the “Teams”) to Invesco. It is currently intended that these Teams will transfer to Invesco in the middle of 2010. The Teams manage certain of the Company’s Funds. As part of the agreement, it is proposed that the Funds will also be transferred to Invesco by way of contributions in kind (“CIK”) into corresponding Invesco funds. In the event the Teams are transferred to Invesco in advance of such CIK, the Investment Adviser may, in the interim, appoint Invesco Management S.A. or any of its affi liates, to act as Sub-Advisers in respect of the Funds.
The Funds to be transferred are as follows:
Global Small Cap Value FundGlobal Value Equity Fund Japanese Equity Advantage FundJapanese Value Equity FundUS Small Cap Growth FundUS Value Equity FundAlpha Advantage European Fixed Income FundCommodities Active GSLE FundFX Alpha Plus RC 200 FundFX Alpha Plus RC 400 FundFX Alpha Plus RC 800 Fund.
Such CIK and the appointment of Invesco Management S.A. and its affi liates as Sub-Advisers are still subject to the approval of the Directors and relevant regulators and Shareholder notifi cation in accordance with the requirements of relevant regulators.
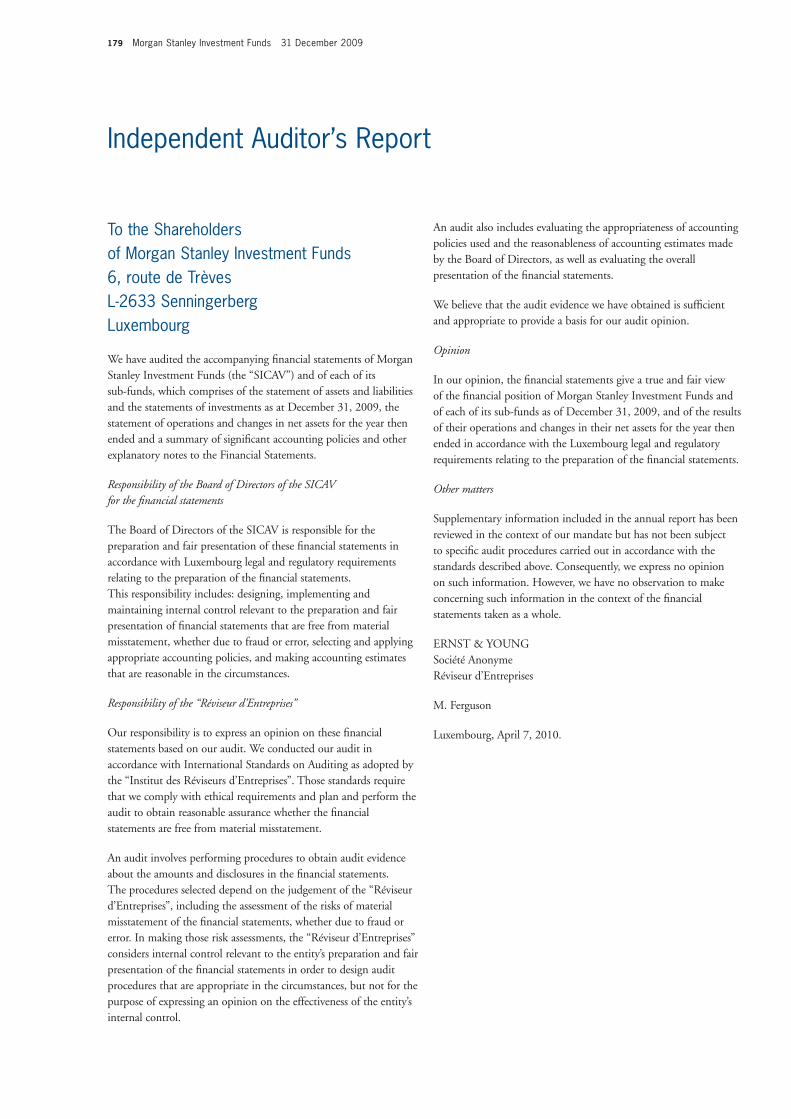
179 Morgan Stanley Investment Funds 31 December 2009
Independent Auditor’s Report
To the Shareholders of Morgan Stanley Investment Funds6, route de TrèvesL-2633 Senningerberg Luxembourg
We have audited the accompanying fi nancial statements of Morgan Stanley Investment Funds (the “SICAV”) and of each of its sub-funds, which comprises of the statement of assets and liabilities and the statements of investments as at December 31, 2009, the statement of operations and changes in net assets for the year then ended and a summary of signifi cant accounting policies and other explanatory notes to the Financial Statements.
Responsibility of the Board of Directors of the SICAV for the fi nancial statements
The Board of Directors of the SICAV is responsible for the preparation and fair presentation of these fi nancial statements in accordance with Luxembourg legal and regulatory requirements relating to the preparation of the fi nancial statements. This responsibility includes: designing, implementing and maintaining internal control relevant to the preparation and fair presentation of fi nancial statements that are free from material misstatement, whether due to fraud or error, selecting and applying appropriate accounting policies, and making accounting estimates that are reasonable in the circumstances.
Responsibility of the “Réviseur d’Entreprises”
Our responsibility is to express an opinion on these fi nancial statements based on our audit. We conducted our audit in accordance with International Standards on Auditing as adopted by the “Institut des Réviseurs d’Entreprises”. Those standards require that we comply with ethical requirements and plan and perform the audit to obtain reasonable assurance whether the fi nancial statements are free from material misstatement.
An audit involves performing procedures to obtain audit evidence about the amounts and disclosures in the fi nancial statements. The procedures selected depend on the judgement of the “Réviseur d’Entreprises”, including the assessment of the risks of material misstatement of the fi nancial statements, whether due to fraud or error. In making those risk assessments, the “Réviseur d’Entreprises” considers internal control relevant to the entity’s preparation and fair presentation of the fi nancial statements in order to design audit procedures that are appropriate in the circumstances, but not for the purpose of expressing an opinion on the effectiveness of the entity’s internal control.
An audit also includes evaluating the appropriateness of accounting policies used and the reasonableness of accounting estimates made by the Board of Directors, as well as evaluating the overall presentation of the fi nancial statements.
We believe that the audit evidence we have obtained is suffi cient and appropriate to provide a basis for our audit opinion.
Opinion
In our opinion, the fi nancial statements give a true and fair view of the fi nancial position of Morgan Stanley Investment Funds and of each of its sub-funds as of December 31, 2009, and of the results of their operations and changes in their net assets for the year then ended in accordance with the Luxembourg legal and regulatory requirements relating to the preparation of the fi nancial statements.
Other matters
Supplementary information included in the annual report has been reviewed in the context of our mandate but has not been subject to specifi c audit procedures carried out in accordance with the standards described above. Consequently, we express no opinion on such information. However, we have no observation to make concerning such information in the context of the fi nancial statements taken as a whole.
ERNST & YOUNGSociété AnonymeRéviseur d’Entreprises
M. Ferguson
Luxembourg, April 7, 2010.

Morgan Stanley Investment Funds 31 December 2009 180
Directors and service providers
DIRECTORS
James Dilworth(until 9 March 2009)Managing DirectorMorgan Stanley InvestmentManagement LimitedLondonUnited Kingdom
Michael Griffi nNon-executive DirectorDublinIreland
William JonesNon-executive DirectorLuxembourg
Andrew Mack(from 7 April 2009)Managing DirectorMorgan Stanley InvestmentManagement LimitedLondonUnited Kingdom
Laurence MagloireExecutive DirectorMorgan Stanley InvestmentManagement LimitedLuxembourg
DIRIGEANTS
Bryan GreenerExecutive DirectorMorgan Stanley InvestmentManagement LimitedLondonUnited Kingdom
Laurence MagloireExecutive DirectorMorgan Stanley InvestmentManagement LimitedLuxembourg
DIRECTORS OFMORGAN STANLEY SICAV (MAURITIUS) LIMITED (THE “SUBSIDIARY”)
Deven CoopoosamyDirectorFund AdministrationMultiConsult LimitedMauritius
Andrew Mack (from 27 February 2009) Managing Director Morgan Stanley Investment Management Limited LondonUnited Kingdom
Laurence MagloireExecutive DirectorMorgan Stanley InvestmentManagement LimitedLuxembourg
Abdool Azize OwasilDirectorFund AdministrationMultiConsult LimitedMauritius
INVESTMENT ADVISER
Morgan StanleyInvestment Management Inc.522 Fifth AvenueNew York, NY 10036USA
INVESTMENT SUB-ADVISERS
Morgan Stanley InvestmentManagement Limited25 Cabot SquareCanary WharfLondon E14 4QAUnited Kingdom
Morgan Stanley InvestmentManagement Company23 Church Street16-01 Capital SquareSingapore, 049481
Morgan Stanley Asset& Investment TrustManagement Co., LimitedYebisu Garden Place Tower20-3, Ebisu 4-ChomeShibuya-ku, Tokyo 150-6009Japan
Morgan Stanley Advisors Inc.522 Fifth AvenueNew York, NY 10036USA
REGISTERED OFFICE
6B, route de TrèvesL-2633 SenningerbergLuxembourg
DISTRIBUTOR
Morgan Stanley InvestmentManagement Limited25 Cabot SquareCanary WharfLondon E14 4QAUnited Kingdom
CUSTODIAN BANK
J.P. Morgan BankLuxembourg S.A.European Bankand Business Centre6C, route de TrèvesL-2633 SenningerbergLuxembourg
ADMINISTRATOR AND PAYING AGENT
J.P. Morgan BankLuxembourg S.A.European Bankand Business Centre6C, route de TrèvesL-2633 SenningerbergLuxembourg
DOMICILIARY AGENT
(UNTIL 31 MARCH 2009)
J.P. Morgan BankLuxembourg S.A.European Bankand Business Centre6C, route de TrèvesL-2633 SenningerbergLuxembourg
(FROM 1 APRIL 2009)
Morgan Stanley Investment Management Limited, Luxembourg BranchEuropean Bank and Business Centre6B, route de TrèvesL-2633 SenningerbergLuxembourg
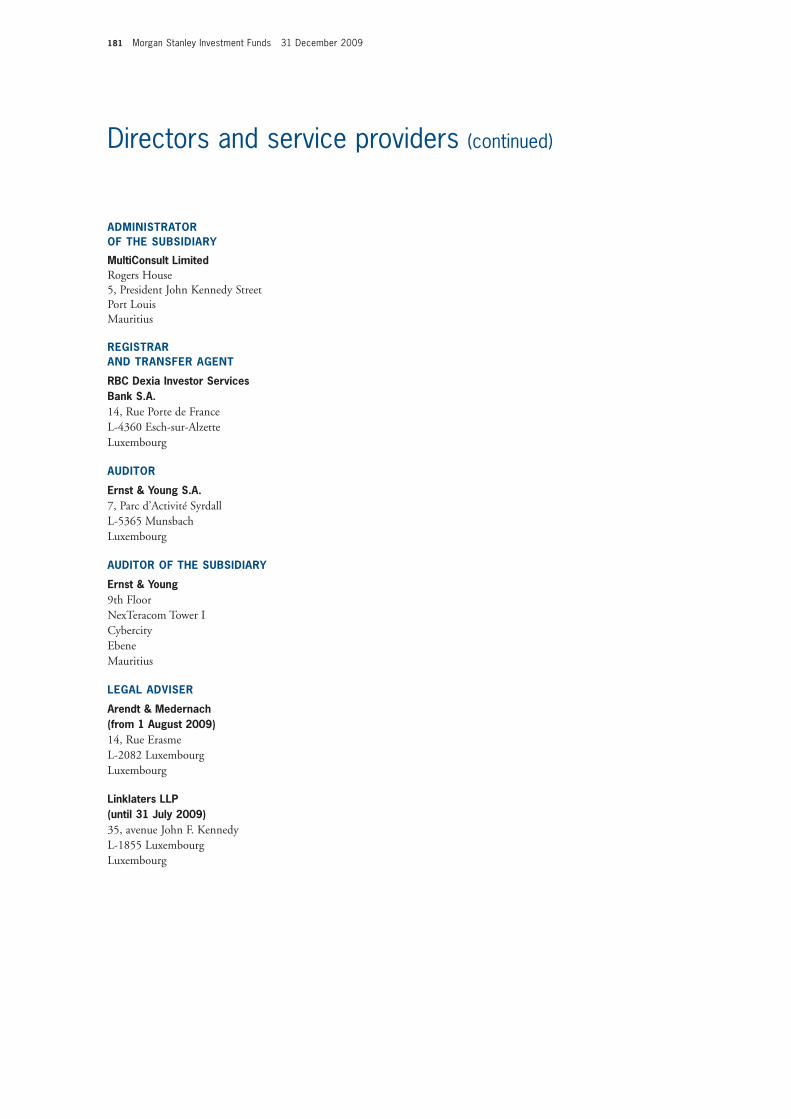
181 Morgan Stanley Investment Funds 31 December 2009
Directors and service providers (continued)
ADMINISTRATOROF THE SUBSIDIARY
MultiConsult LimitedRogers House5, President John Kennedy StreetPort LouisMauritius
REGISTRARAND TRANSFER AGENT
RBC Dexia Investor ServicesBank S.A.14, Rue Porte de FranceL-4360 Esch-sur-AlzetteLuxembourg
AUDITOR
Ernst & Young S.A.7, Parc d’Activité SyrdallL-5365 MunsbachLuxembourg
AUDITOR OF THE SUBSIDIARY
Ernst & Young9th Floor NexTeracom Tower ICybercityEbeneMauritius
LEGAL ADVISER
Arendt & Medernach(from 1 August 2009)14, Rue ErasmeL-2082 LuxembourgLuxembourg
Linklaters LLP(until 31 July 2009)35, avenue John F. KennedyL-1855 LuxembourgLuxembourg
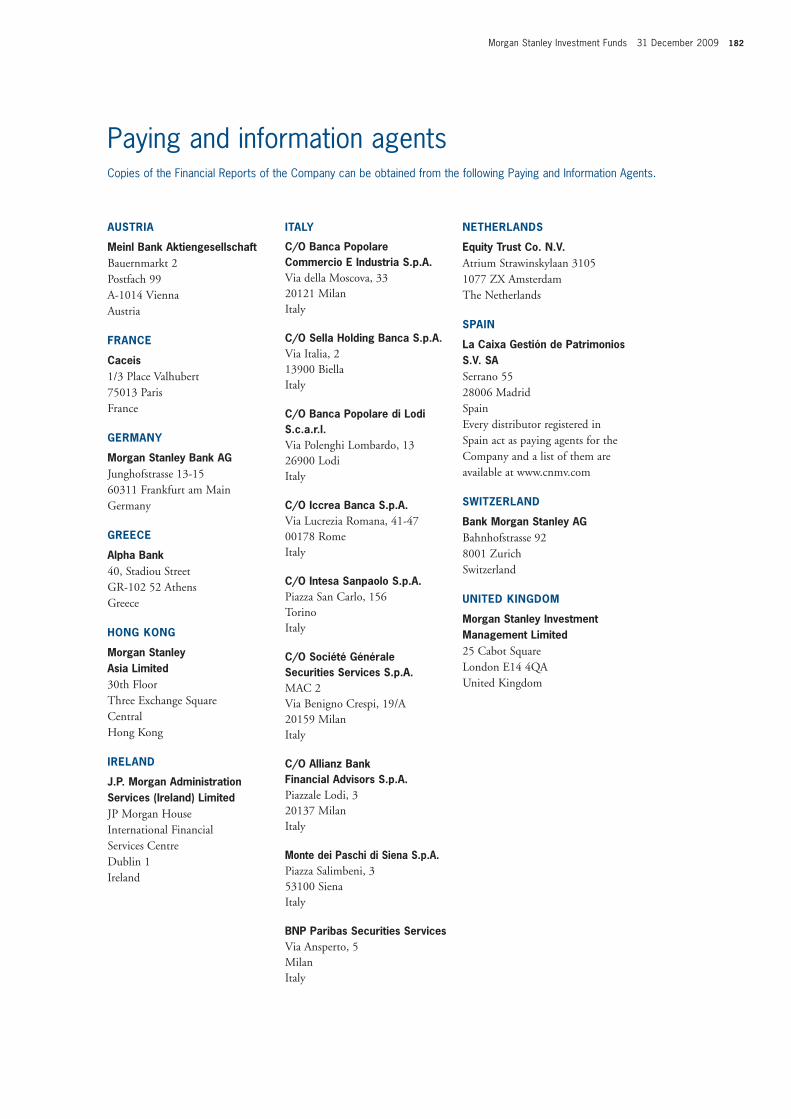
Morgan Stanley Investment Funds 31 December 2009 182
AUSTRIA
Meinl Bank AktiengesellschaftBauernmarkt 2Postfach 99A-1014 ViennaAustria
FRANCE
Caceis1/3 Place Valhubert75013 ParisFrance
GERMANY
Morgan Stanley Bank AGJunghofstrasse 13-1560311 Frankfurt am MainGermany
GREECE
Alpha Bank40, Stadiou StreetGR-102 52 AthensGreece
HONG KONG
Morgan StanleyAsia Limited30th FloorThree Exchange SquareCentralHong Kong
IRELAND
J.P. Morgan AdministrationServices (Ireland) LimitedJP Morgan HouseInternational Financial Services CentreDublin 1Ireland
ITALY
C/O Banca PopolareCommercio E Industria S.p.A.Via della Moscova, 3320121 MilanItaly
C/O Sella Holding Banca S.p.A.Via Italia, 213900 BiellaItaly
C/O Banca Popolare di LodiS.c.a.r.l.Via Polenghi Lombardo, 1326900 LodiItaly
C/O Iccrea Banca S.p.A.Via Lucrezia Romana, 41-4700178 RomeItaly
C/O Intesa Sanpaolo S.p.A.Piazza San Carlo, 156TorinoItaly
C/O Société GénéraleSecurities Services S.p.A.MAC 2Via Benigno Crespi, 19/A20159 MilanItaly
C/O Allianz BankFinancial Advisors S.p.A.Piazzale Lodi, 320137 MilanItaly
Monte dei Paschi di Siena S.p.A.Piazza Salimbeni, 353100 SienaItaly
BNP Paribas Securities ServicesVia Ansperto, 5MilanItaly
NETHERLANDS
Equity Trust Co. N.V.Atrium Strawinskylaan 31051077 ZX AmsterdamThe Netherlands
SPAIN
La Caixa Gestión de Patrimonios S.V. SASerrano 5528006 MadridSpainEvery distributor registered inSpain act as paying agents for theCompany and a list of them areavailable at www.cnmv.com
SWITZERLAND
Bank Morgan Stanley AGBahnhofstrasse 928001 ZurichSwitzerland
UNITED KINGDOM
Morgan Stanley InvestmentManagement Limited25 Cabot SquareLondon E14 4QAUnited Kingdom
Paying and information agentsCopies of the Financial Reports of the Company can be obtained from the following Paying and Information Agents.
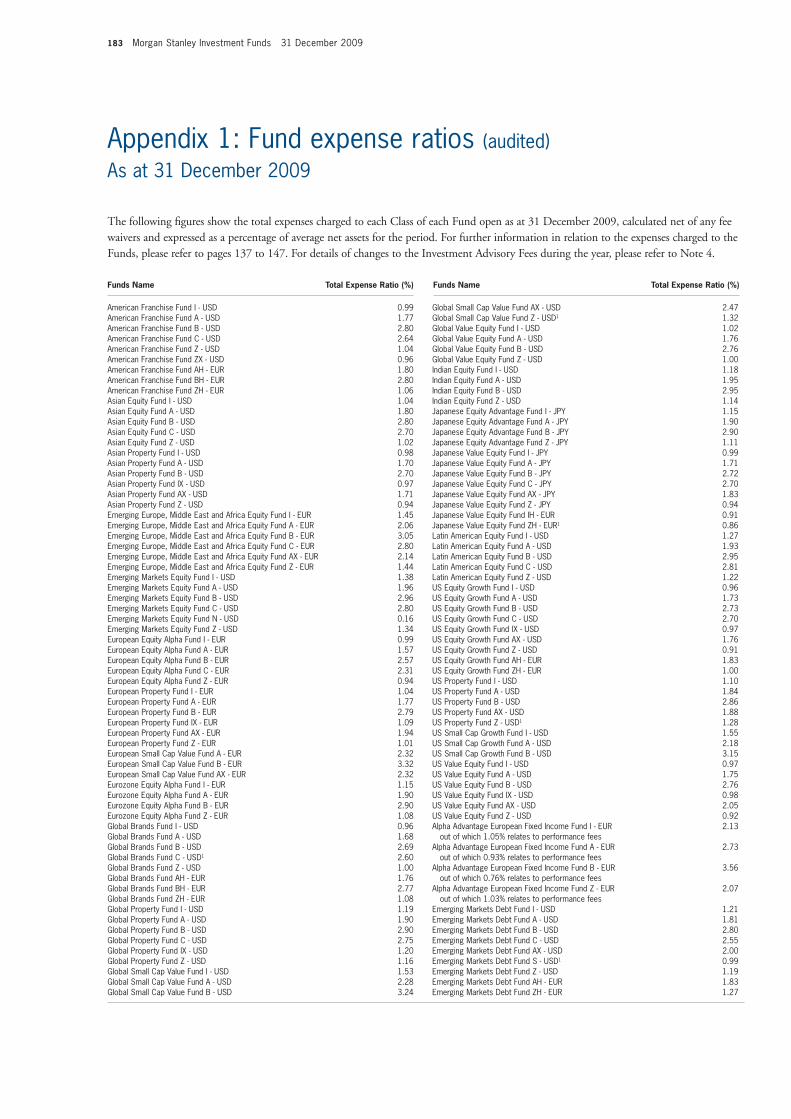
183 Morgan Stanley Investment Funds 31 December 2009
Funds Name Total Expense Ratio (%) Funds Name Total Expense Ratio (%)
American Franchise Fund I - USD 0.99American Franchise Fund A - USD 1.77American Franchise Fund B - USD 2.80American Franchise Fund C - USD 2.64American Franchise Fund Z - USD 1.04American Franchise Fund ZX - USD 0.96American Franchise Fund AH - EUR 1.80American Franchise Fund BH - EUR 2.80American Franchise Fund ZH - EUR 1.06Asian Equity Fund I - USD 1.04Asian Equity Fund A - USD 1.80Asian Equity Fund B - USD 2.80Asian Equity Fund C - USD 2.70Asian Equity Fund Z - USD 1.02Asian Property Fund I - USD 0.98Asian Property Fund A - USD 1.70Asian Property Fund B - USD 2.70Asian Property Fund IX - USD 0.97Asian Property Fund AX - USD 1.71Asian Property Fund Z - USD 0.94Emerging Europe, Middle East and Africa Equity Fund I - EUR 1.45Emerging Europe, Middle East and Africa Equity Fund A - EUR 2.06Emerging Europe, Middle East and Africa Equity Fund B - EUR 3.05Emerging Europe, Middle East and Africa Equity Fund C - EUR 2.80Emerging Europe, Middle East and Africa Equity Fund AX - EUR 2.14Emerging Europe, Middle East and Africa Equity Fund Z - EUR 1.44Emerging Markets Equity Fund I - USD 1.38Emerging Markets Equity Fund A - USD 1.96Emerging Markets Equity Fund B - USD 2.96Emerging Markets Equity Fund C - USD 2.80Emerging Markets Equity Fund N - USD 0.16Emerging Markets Equity Fund Z - USD 1.34European Equity Alpha Fund I - EUR 0.99European Equity Alpha Fund A - EUR 1.57European Equity Alpha Fund B - EUR 2.57European Equity Alpha Fund C - EUR 2.31European Equity Alpha Fund Z - EUR 0.94European Property Fund I - EUR 1.04European Property Fund A - EUR 1.77European Property Fund B - EUR 2.79European Property Fund IX - EUR 1.09European Property Fund AX - EUR 1.94European Property Fund Z - EUR 1.01European Small Cap Value Fund A - EUR 2.32European Small Cap Value Fund B - EUR 3.32European Small Cap Value Fund AX - EUR 2.32Eurozone Equity Alpha Fund I - EUR 1.15Eurozone Equity Alpha Fund A - EUR 1.90Eurozone Equity Alpha Fund B - EUR 2.90Eurozone Equity Alpha Fund Z - EUR 1.08Global Brands Fund I - USD 0.96Global Brands Fund A - USD 1.68Global Brands Fund B - USD 2.69Global Brands Fund C - USD1 2.60Global Brands Fund Z - USD 1.00Global Brands Fund AH - EUR 1.76Global Brands Fund BH - EUR 2.77Global Brands Fund ZH - EUR 1.08Global Property Fund I - USD 1.19Global Property Fund A - USD 1.90Global Property Fund B - USD 2.90Global Property Fund C - USD 2.75Global Property Fund IX - USD 1.20Global Property Fund Z - USD 1.16Global Small Cap Value Fund I - USD 1.53Global Small Cap Value Fund A - USD 2.28Global Small Cap Value Fund B - USD 3.24
Global Small Cap Value Fund AX - USD 2.47Global Small Cap Value Fund Z - USD1 1.32Global Value Equity Fund I - USD 1.02Global Value Equity Fund A - USD 1.76Global Value Equity Fund B - USD 2.76Global Value Equity Fund Z - USD 1.00Indian Equity Fund I - USD 1.18Indian Equity Fund A - USD 1.95Indian Equity Fund B - USD 2.95Indian Equity Fund Z - USD 1.14Japanese Equity Advantage Fund I - JPY 1.15Japanese Equity Advantage Fund A - JPY 1.90Japanese Equity Advantage Fund B - JPY 2.90Japanese Equity Advantage Fund Z - JPY 1.11Japanese Value Equity Fund I - JPY 0.99Japanese Value Equity Fund A - JPY 1.71Japanese Value Equity Fund B - JPY 2.72Japanese Value Equity Fund C - JPY 2.70Japanese Value Equity Fund AX - JPY 1.83Japanese Value Equity Fund Z - JPY 0.94Japanese Value Equity Fund IH - EUR 0.91Japanese Value Equity Fund ZH - EUR1 0.86Latin American Equity Fund I - USD 1.27Latin American Equity Fund A - USD 1.93Latin American Equity Fund B - USD 2.95Latin American Equity Fund C - USD 2.81Latin American Equity Fund Z - USD 1.22US Equity Growth Fund I - USD 0.96US Equity Growth Fund A - USD 1.73US Equity Growth Fund B - USD 2.73US Equity Growth Fund C - USD 2.70US Equity Growth Fund IX - USD 0.97US Equity Growth Fund AX - USD 1.76US Equity Growth Fund Z - USD 0.91US Equity Growth Fund AH - EUR 1.83US Equity Growth Fund ZH - EUR 1.00US Property Fund I - USD 1.10US Property Fund A - USD 1.84US Property Fund B - USD 2.86US Property Fund AX - USD 1.88US Property Fund Z - USD1 1.28US Small Cap Growth Fund I - USD 1.55US Small Cap Growth Fund A - USD 2.18US Small Cap Growth Fund B - USD 3.15US Value Equity Fund I - USD 0.97US Value Equity Fund A - USD 1.75US Value Equity Fund B - USD 2.76US Value Equity Fund IX - USD 0.98US Value Equity Fund AX - USD 2.05US Value Equity Fund Z - USD 0.92Alpha Advantage European Fixed Income Fund I - EUR 2. 13 out of which 1. 05% relates to performance fees Alpha Advantage European Fixed Income Fund A - EUR 2. 73 out of which 0. 93% relates to performance fees Alpha Advantage European Fixed Income Fund B - EUR 3. 56 out of which 0. 76% relates to performance fees Alpha Advantage European Fixed Income Fund Z - EUR 2.07 out of which 1.03% relates to performance fees Emerging Markets Debt Fund I - USD 1.21Emerging Markets Debt Fund A - USD 1.81Emerging Markets Debt Fund B - USD 2.80Emerging Markets Debt Fund C - USD 2.55Emerging Markets Debt Fund AX - USD 2.00Emerging Markets Debt Fund S - USD1 0.99Emerging Markets Debt Fund Z - USD 1.19Emerging Markets Debt Fund AH - EUR 1.83Emerging Markets Debt Fund ZH - EUR 1.27
Appendix 1: Fund expense ratios (audited) As at 31 December 2009
The following fi gures show the total expenses charged to each Class of each Fund open as at 31 December 2009, calculated net of any fee waivers and expressed as a percentage of average net assets for the period. For further information in relation to the expenses charged to the Funds, please refer to pages 137 to 147. For details of changes to the Investment Advisory Fees during the year, please refer to Note 4.
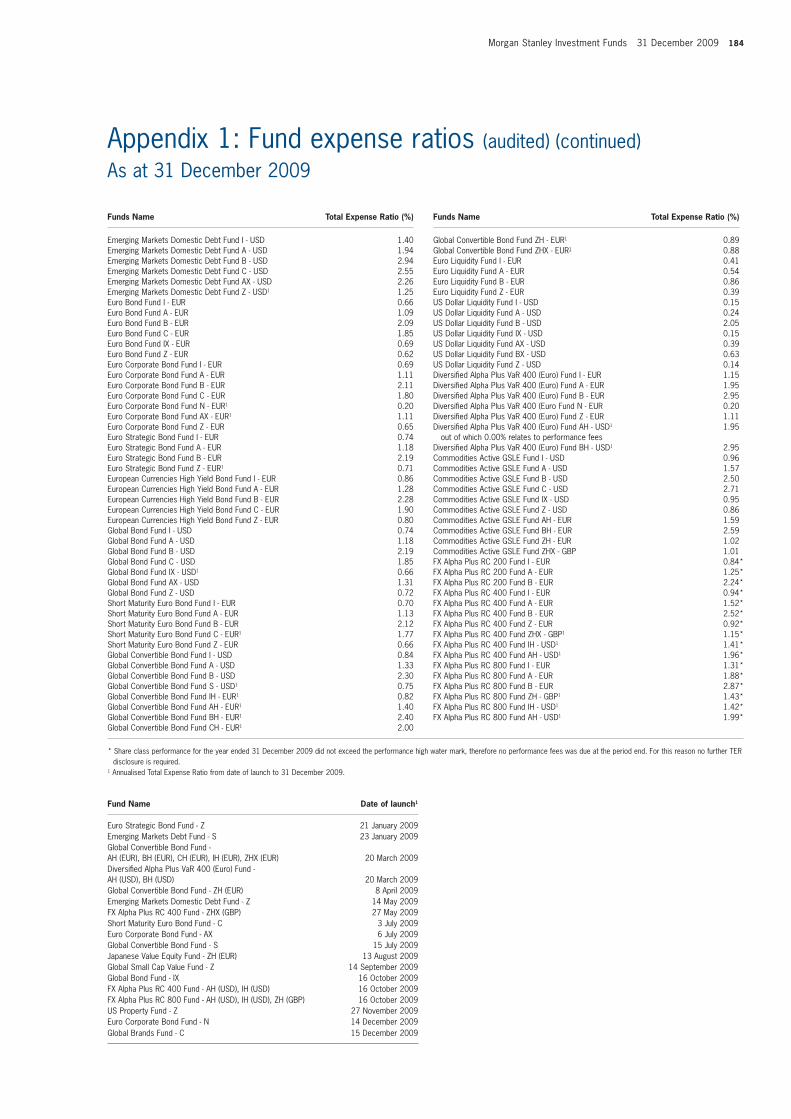
Morgan Stanley Investment Funds 31 December 2009 184
Funds Name Total Expense Ratio (%) Funds Name Total Expense Ratio (%)
Emerging Markets Domestic Debt Fund I - USD 1.40Emerging Markets Domestic Debt Fund A - USD 1.94Emerging Markets Domestic Debt Fund B - USD 2.94Emerging Markets Domestic Debt Fund C - USD 2.55Emerging Markets Domestic Debt Fund AX - USD 2.26Emerging Markets Domestic Debt Fund Z - USD1 1.25Euro Bond Fund I - EUR 0.66Euro Bond Fund A - EUR 1.09Euro Bond Fund B - EUR 2.09Euro Bond Fund C - EUR 1.85Euro Bond Fund IX - EUR 0.69Euro Bond Fund Z - EUR 0.62Euro Corporate Bond Fund I - EUR 0.69Euro Corporate Bond Fund A - EUR 1.11Euro Corporate Bond Fund B - EUR 2.11Euro Corporate Bond Fund C - EUR 1.80Euro Corporate Bond Fund N - EUR1 0.20Euro Corporate Bond Fund AX - EUR1 1.11Euro Corporate Bond Fund Z - EUR 0.65Euro Strategic Bond Fund I - EUR 0.74Euro Strategic Bond Fund A - EUR 1.18Euro Strategic Bond Fund B - EUR 2.19Euro Strategic Bond Fund Z - EUR1 0.71European Currencies High Yield Bond Fund I - EUR 0.86European Currencies High Yield Bond Fund A - EUR 1.28European Currencies High Yield Bond Fund B - EUR 2.28European Currencies High Yield Bond Fund C - EUR 1.90European Currencies High Yield Bond Fund Z - EUR 0.80Global Bond Fund I - USD 0.74Global Bond Fund A - USD 1.18Global Bond Fund B - USD 2.19Global Bond Fund C - USD 1.85Global Bond Fund IX - USD1 0.66Global Bond Fund AX - USD 1.31Global Bond Fund Z - USD 0.72Short Maturity Euro Bond Fund I - EUR 0.70Short Maturity Euro Bond Fund A - EUR 1.13Short Maturity Euro Bond Fund B - EUR 2.12Short Maturity Euro Bond Fund C - EUR1 1.77Short Maturity Euro Bond Fund Z - EUR 0.66Global Convertible Bond Fund I - USD 0.84Global Convertible Bond Fund A - USD 1.33Global Convertible Bond Fund B - USD 2.30Global Convertible Bond Fund S - USD1 0.75Global Convertible Bond Fund IH - EUR1 0.82Global Convertible Bond Fund AH - EUR1 1.40Global Convertible Bond Fund BH - EUR1 2.40Global Convertible Bond Fund CH - EUR1 2.00
Global Convertible Bond Fund ZH - EUR1 0.89Global Convertible Bond Fund ZHX - EUR1 0.88Euro Liquidity Fund I - EUR 0.41Euro Liquidity Fund A - EUR 0.54Euro Liquidity Fund B - EUR 0.86Euro Liquidity Fund Z - EUR 0.39US Dollar Liquidity Fund I - USD 0. 15US Dollar Liquidity Fund A - USD 0. 24US Dollar Liquidity Fund B - USD 2.05US Dollar Liquidity Fund IX - USD 0. 15US Dollar Liquidity Fund AX - USD 0.3 9US Dollar Liquidity Fund BX - USD 0. 63US Dollar Liquidity Fund Z - USD 0. 14Diversifi ed Alpha Plus VaR 400 (Euro) Fund I - EUR 1.15Diversifi ed Alpha Plus VaR 400 (Euro) Fund A - EUR 1.95Diversifi ed Alpha Plus VaR 400 (Euro) Fund B - EUR 2.95Diversifi ed Alpha Plus VaR 400 (Euro Fund N - EUR 0.20Diversifi ed Alpha Plus VaR 400 (Euro) Fund Z - EUR 1.11Diversifi ed Alpha Plus VaR 400 (Euro) Fund AH - USD1 1.95 out of which 0.00% relates to performance feesDiversifi ed Alpha Plus VaR 400 (Euro) Fund BH - USD1 2.95Commodities Active GSLE Fund I - USD 0.96Commodities Active GSLE Fund A - USD 1.57Commodities Active GSLE Fund B - USD 2.50Commodities Active GSLE Fund C - USD 2.71Commodities Active GSLE Fund IX - USD 0.95Commodities Active GSLE Fund Z - USD 0.86Commodities Active GSLE Fund AH - EUR 1.59Commodities Active GSLE Fund BH - EUR 2.59Commodities Active GSLE Fund ZH - EUR 1.02Commodities Active GSLE Fund ZHX - GBP 1.01FX Alpha Plus RC 200 Fund I - EUR 0.84*FX Alpha Plus RC 200 Fund A - EUR 1.25*FX Alpha Plus RC 200 Fund B - EUR 2.24*FX Alpha Plus RC 400 Fund I - EUR 0.94*FX Alpha Plus RC 400 Fund A - EUR 1.52*FX Alpha Plus RC 400 Fund B - EUR 2.52*FX Alpha Plus RC 400 Fund Z - EUR 0.92*FX Alpha Plus RC 400 Fund ZHX - GBP1 1.15*FX Alpha Plus RC 400 Fund IH - USD1 1.41*FX Alpha Plus RC 400 Fund AH - USD1 1.96*FX Alpha Plus RC 800 Fund I - EUR 1.31*FX Alpha Plus RC 800 Fund A - EUR 1.88*FX Alpha Plus RC 800 Fund B - EUR 2.87*FX Alpha Plus RC 800 Fund ZH - GBP1 1.43*FX Alpha Plus RC 800 Fund IH - USD1 1.42*FX Alpha Plus RC 800 Fund AH - USD1 1.99*
Appendix 1: Fund expense ratios (audited) (continued)As at 31 December 2009
* Share class performance for the year ended 31 December 2009 did not exceed the performance high water mark, therefore no performance fees was due at the period end. For this reason no further TER disclosure is required.
1 Annualised Total Expense Ratio from date of launch to 31 December 2009.
Fund Name Date of launch1
Euro Strategic Bond Fund - Z 21 January 2009Emerging Markets Debt Fund - S 23 January 2009Global Convertible Bond Fund - AH (EUR), BH (EUR), CH (EUR), IH (EUR), ZHX (EUR) 20 March 2009Diversifi ed Alpha Plus VaR 400 (Euro) Fund - AH (USD), BH (USD) 20 March 2009Global Convertible Bond Fund - ZH (EUR) 8 April 2009Emerging Markets Domestic Debt Fund - Z 14 May 2009FX Alpha Plus RC 400 Fund - ZHX (GBP) 27 May 2009Short Maturity Euro Bond Fund - C 3 July 2009Euro Corporate Bond Fund - AX 6 July 2009Global Convertible Bond Fund - S 15 July 2009Japanese Value Equity Fund - ZH (EUR) 13 August 2009Global Small Cap Value Fund - Z 14 September 2009Global Bond Fund - IX 16 October 2009FX Alpha Plus RC 400 Fund - AH (USD), IH (USD) 16 October 2009FX Alpha Plus RC 800 Fund - AH (USD), IH (USD), ZH (GBP) 16 October 2009US Property Fund - Z 27 November 2009Euro Corporate Bond Fund - N 14 December 2009Global Brands Fund - C 15 December 2009
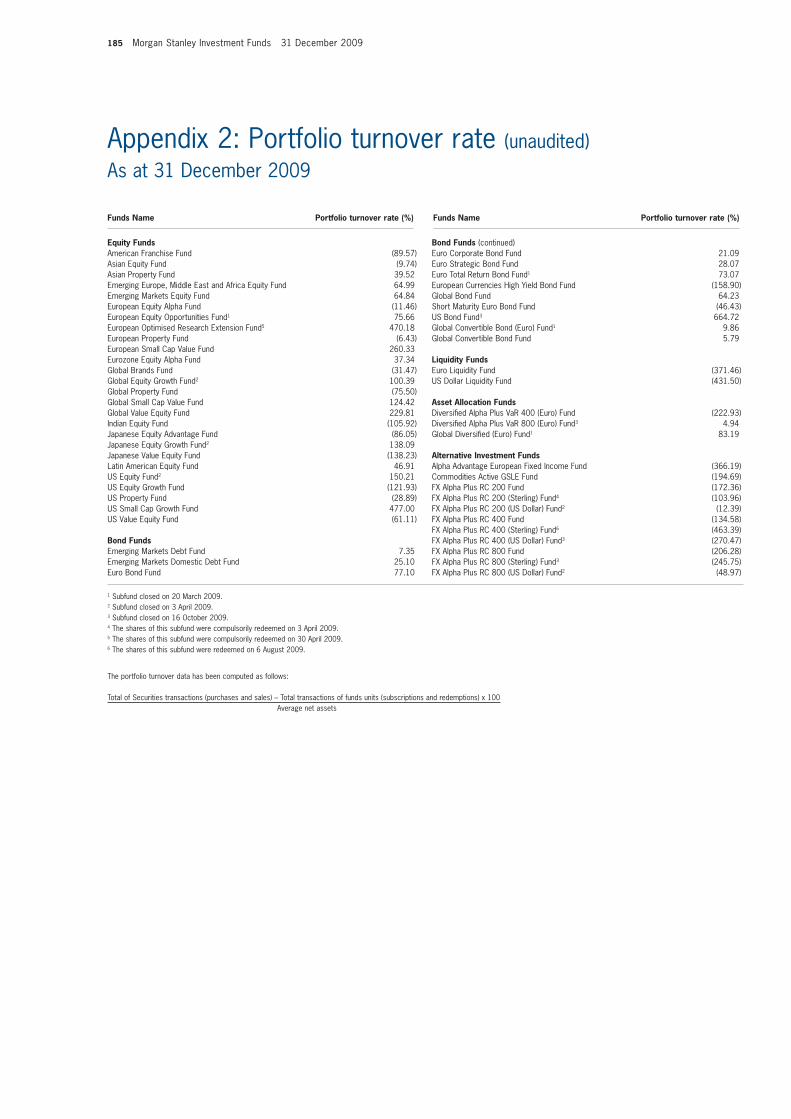
185 Morgan Stanley Investment Funds 31 December 2009
Equity FundsAmerican Franchise Fund (89.57)Asian Equity Fund (9.74)Asian Property Fund 39.52 Emerging Europe, Middle East and Africa Equity Fund 64.99 Emerging Markets Equity Fund 64.84 European Equity Alpha Fund (11.46)European Equity Opportunities Fund1 75.66 European Optimised Research Extension Fund5 470.18European Property Fund (6.43)European Small Cap Value Fund 260.33 Eurozone Equity Alpha Fund 37.34 Global Brands Fund (31.47)Global Equity Growth Fund2 100.39 Global Property Fund (75.50)Global Small Cap Value Fund 124.42 Global Value Equity Fund 229.81 Indian Equity Fund (105.92)Japanese Equity Advantage Fund (86.05)Japanese Equity Growth Fund2 138.09 Japanese Value Equity Fund (138.23)Latin American Equity Fund 46.91 US Equity Fund2 150.21 US Equity Growth Fund (121.93)US Property Fund (28.89)US Small Cap Growth Fund 477.00 US Value Equity Fund (61.11) Bond Funds Emerging Markets Debt Fund 7.35 Emerging Markets Domestic Debt Fund 25.10 Euro Bond Fund 77.10
Bond Funds (continued)Euro Corporate Bond Fund 21.09 Euro Strategic Bond Fund 28.07 Euro Total Return Bond Fund1 73.07 European Currencies High Yield Bond Fund (158.90)Global Bond Fund 64.23 Short Maturity Euro Bond Fund (46.43)US Bond Fund3 664.72 Global Convertible Bond (Euro) Fund1 9.86 Global Convertible Bond Fund 5.79 Liquidity Funds Euro Liquidity Fund (371.46)US Dollar Liquidity Fund (431.50) Asset Allocation Funds Diversifi ed Alpha Plus VaR 400 (Euro) Fund (222.93)Diversifi ed Alpha Plus VaR 800 (Euro) Fund3 4.94Global Diversifi ed (Euro) Fund1 83.19 Alternative Investment Funds Alpha Advantage European Fixed Income Fund (366.19)Commodities Active GSLE Fund (194.69)FX Alpha Plus RC 200 Fund (172.36)FX Alpha Plus RC 200 (Sterling) Fund4 (103.96)FX Alpha Plus RC 200 (US Dollar) Fund2 (12.39)FX Alpha Plus RC 400 Fund (134.58)FX Alpha Plus RC 400 (Sterling) Fund6 (463.39)FX Alpha Plus RC 400 (US Dollar) Fund3 (270.47)FX Alpha Plus RC 800 Fund (206.28)FX Alpha Plus RC 800 (Sterling) Fund3 (245.75)FX Alpha Plus RC 800 (US Dollar) Fund2 (48.97)
Appendix 2: Portfolio turnover rate (unaudited) As at 31 December 2009
1 Subfund closed on 20 March 2009.2 Subfund closed on 3 April 2009.3 Subfund closed on 16 October 2009.4 The shares of this subfund were compulsorily redeemed on 3 April 2009.5 The shares of this subfund were compulsorily redeemed on 30 April 2009.6 The shares of this subfund were redeemed on 6 August 2009.
The portfolio turnover data has been computed as follows:
Total of Securities transactions (purchases and sales) – Total transactions of funds units (subscriptions and redemptions) x 100Average net assets
Funds Name Portfolio turnover rate (%) Funds Name Portfolio turnover rate (%)
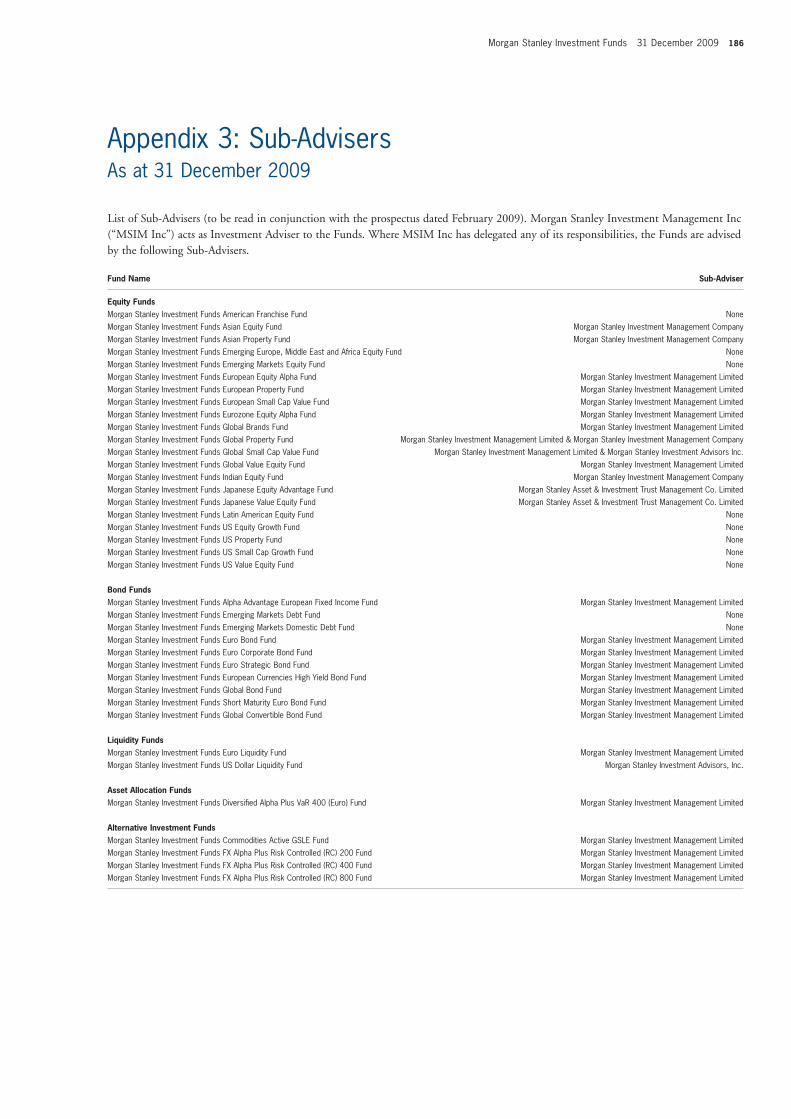
Morgan Stanley Investment Funds 31 December 2009 186
Equity FundsMorgan Stanley Investment Funds American Franchise Fund NoneMorgan Stanley Investment Funds Asian Equity Fund Morgan Stanley Investment Management CompanyMorgan Stanley Investment Funds Asian Property Fund Morgan Stanley Investment Management CompanyMorgan Stanley Investment Funds Emerging Europe, Middle East and Africa Equity Fund NoneMorgan Stanley Investment Funds Emerging Markets Equity Fund NoneMorgan Stanley Investment Funds European Equity Alpha Fund Morgan Stanley Investment Management LimitedMorgan Stanley Investment Funds European Property Fund Morgan Stanley Investment Management LimitedMorgan Stanley Investment Funds European Small Cap Value Fund Morgan Stanley Investment Management LimitedMorgan Stanley Investment Funds Eurozone Equity Alpha Fund Morgan Stanley Investment Management LimitedMorgan Stanley Investment Funds Global Brands Fund Morgan Stanley Investment Management LimitedMorgan Stanley Investment Funds Global Property Fund Morgan Stanley Investment Management Limited & Morgan Stanley Investment Management CompanyMorgan Stanley Investment Funds Global Small Cap Value Fund Morgan Stanley Investment Management Limited & Morgan Stanley Investment Advisors Inc.Morgan Stanley Investment Funds Global Value Equity Fund Morgan Stanley Investment Management LimitedMorgan Stanley Investment Funds Indian Equity Fund Morgan Stanley Investment Management CompanyMorgan Stanley Investment Funds Japanese Equity Advantage Fund Morgan Stanley Asset & Investment Trust Management Co. LimitedMorgan Stanley Investment Funds Japanese Value Equity Fund Morgan Stanley Asset & Investment Trust Management Co. LimitedMorgan Stanley Investment Funds Latin American Equity Fund NoneMorgan Stanley Investment Funds US Equity Growth Fund NoneMorgan Stanley Investment Funds US Property Fund NoneMorgan Stanley Investment Funds US Small Cap Growth Fund NoneMorgan Stanley Investment Funds US Value Equity Fund None
Bond Funds Morgan Stanley Investment Funds Alpha Advantage European Fixed Income Fund Morgan Stanley Investment Management LimitedMorgan Stanley Investment Funds Emerging Markets Debt Fund NoneMorgan Stanley Investment Funds Emerging Markets Domestic Debt Fund NoneMorgan Stanley Investment Funds Euro Bond Fund Morgan Stanley Investment Management LimitedMorgan Stanley Investment Funds Euro Corporate Bond Fund Morgan Stanley Investment Management LimitedMorgan Stanley Investment Funds Euro Strategic Bond Fund Morgan Stanley Investment Management LimitedMorgan Stanley Investment Funds European Currencies High Yield Bond Fund Morgan Stanley Investment Management LimitedMorgan Stanley Investment Funds Global Bond Fund Morgan Stanley Investment Management LimitedMorgan Stanley Investment Funds Short Maturity Euro Bond Fund Morgan Stanley Investment Management Limited Morgan Stanley Investment Funds Global Convertible Bond Fund Morgan Stanley Investment Management Limited
Liquidity Funds Morgan Stanley Investment Funds Euro Liquidity Fund Morgan Stanley Investment Management LimitedMorgan Stanley Investment Funds US Dollar Liquidity Fund Morgan Stanley Investment Advisors, Inc.
Asset Allocation Funds Morgan Stanley Investment Funds Diversifi ed Alpha Plus VaR 400 (Euro) Fund Morgan Stanley Investment Management Limited
Alternative Investment Funds Morgan Stanley Investment Funds Commodities Active GSLE Fund Morgan Stanley Investment Management LimitedMorgan Stanley Investment Funds FX Alpha Plus Risk Controlled (RC) 200 Fund Morgan Stanley Investment Management LimitedMorgan Stanley Investment Funds FX Alpha Plus Risk Controlled (RC) 400 Fund Morgan Stanley Investment Management LimitedMorgan Stanley Investment Funds FX Alpha Plus Risk Controlled (RC) 800 Fund Morgan Stanley Investment Management Limited
Fund Name Sub-Adviser
Appendix 3: Sub-AdvisersAs at 31 December 2009
List of Sub-Advisers (to be read in conjunction with the prospectus dated February 2009). Morgan Stanley Investment Management Inc (“MSIM Inc”) acts as Investment Adviser to the Funds. Where MSIM Inc has delegated any of its responsibilities, the Funds are advised by the following Sub-Advisers.
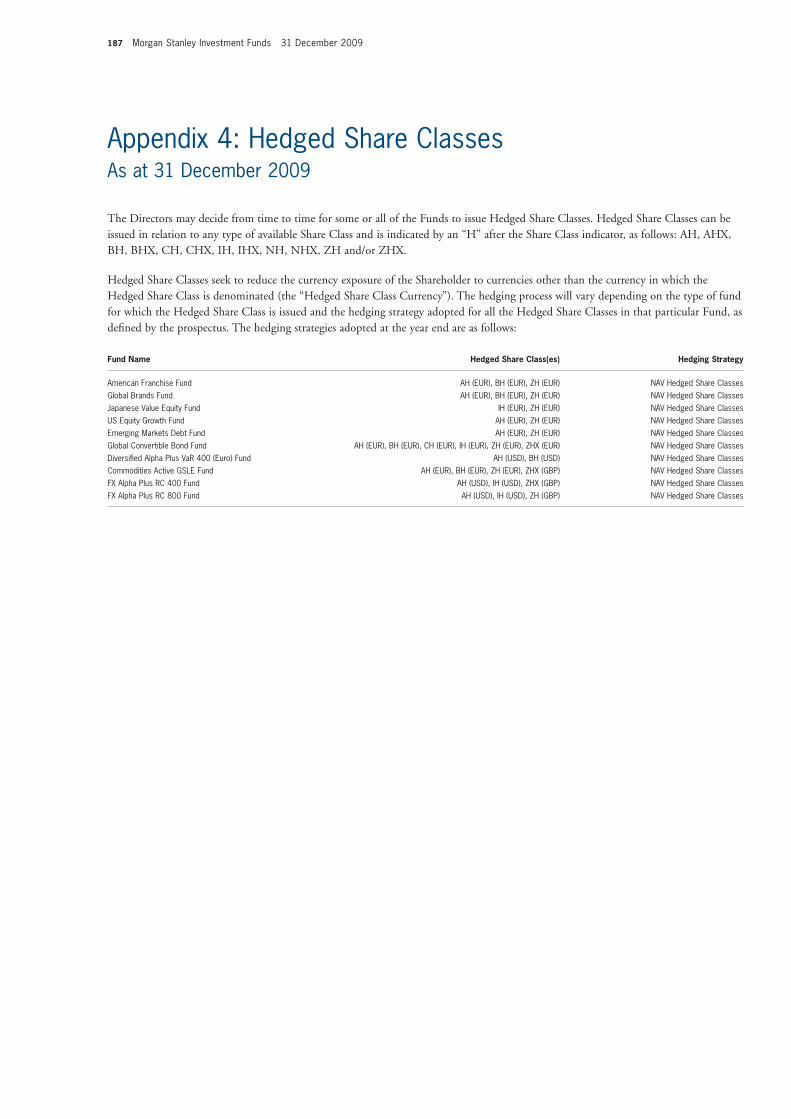
187 Morgan Stanley Investment Funds 31 December 2009
Fund Name Hedged Share Class(es) Hedging Strategy
Appendix 4: Hedged Share Classes As at 31 December 2009
The Directors may decide from time to time for some or all of the Funds to issue Hedged Share Classes. Hedged Share Classes can be issued in relation to any type of available Share Class and is indicated by an “H” after the Share Class indicator, as follows: AH, AHX, BH, BHX, CH, CHX, IH, IHX, NH, NHX, ZH and/or ZHX.
Hedged Share Classes seek to reduce the currency exposure of the Shareholder to currencies other than the currency in which the Hedged Share Class is denominated (the “Hedged Share Class Currency”). The hedging process will vary depending on the type of fund for which the Hedged Share Class is issued and the hedging strategy adopted for all the Hedged Share Classes in that particular Fund, as defi ned by the prospectus. The hedging strategies adopted at the year end are as follows:
American Franchise Fund AH (EUR), BH (EUR), ZH (EUR) NAV Hedged Share ClassesGlobal Brands Fund AH (EUR), BH (EUR), ZH (EUR) NAV Hedged Share ClassesJapanese Value Equity Fund IH (EUR), ZH (EUR) NAV Hedged Share ClassesUS Equity Growth Fund AH (EUR), ZH (EUR) NAV Hedged Share ClassesEmerging Markets Debt Fund AH (EUR), ZH (EUR) NAV Hedged Share ClassesGlobal Convertible Bond Fund AH (EUR), BH (EUR), CH (EUR), IH (EUR), ZH (EUR), ZHX (EUR) NAV Hedged Share ClassesDiversifi ed Alpha Plus VaR 400 (Euro) Fund AH (USD), BH (USD) NAV Hedged Share ClassesCommodities Active GSLE Fund AH (EUR), BH (EUR), ZH (EUR), ZHX (GBP) NAV Hedged Share ClassesFX Alpha Plus RC 400 Fund AH (USD), IH (USD), ZHX (GBP) NAV Hedged Share ClassesFX Alpha Plus RC 800 Fund AH (USD), IH (USD), ZH (GBP) NAV Hedged Share Classes
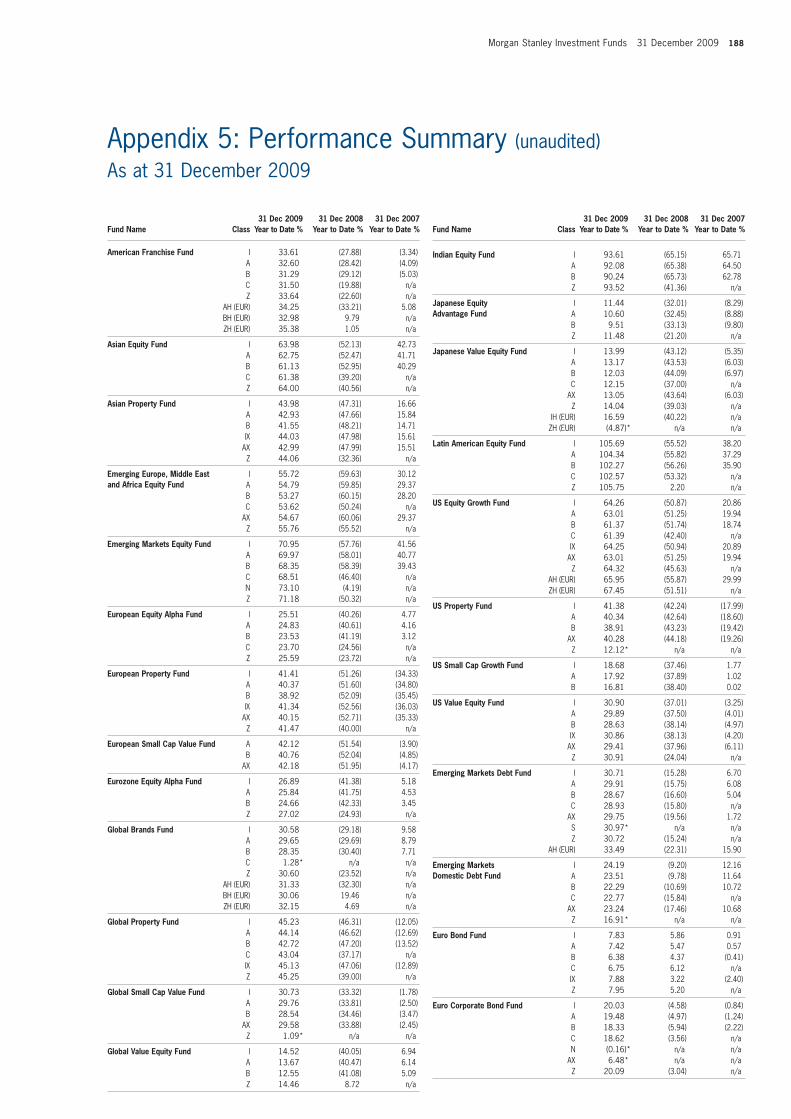
Morgan Stanley Investment Funds 31 December 2009 188
Appendix 5: Performance Summary (unaudited)As at 31 December 2009
Fund Name Class31 Dec 2009
Year to Date %31 Dec 2008
Year to Date %31 Dec 2007
Year to Date %
American Franchise Fund I 33.61 (27.88) (3.34)A 32.60 (28.42) (4.09)B 31.29 (29.12) (5.03)C 31.50 (19.88) n/aZ 33.64 (22.60) n/a
AH (EUR) 34.25 (33.21) 5.08BH (EUR) 32.98 9.79 n/aZH (EUR) 35.38 1.05 n/a
Asian Equity Fund I 63.98 (52.13) 42.73A 62.75 (52.47) 41.71B 61.13 (52.95) 40.29C 61.38 (39.20) n/aZ 64.00 (40.56) n/a
Asian Property Fund I 43.98 (47.31) 16.66A 42.93 (47.66) 15.84B 41.55 (48.21) 14.71IX 44.03 (47.98) 15.61
AX 42.99 (47.99) 15.51Z 44.06 (32.36) n/a
Emerging Europe, Middle East and Africa Equity Fund
I 55.72 (59.63) 30.12A 54.79 (59.85) 29.37B 53.27 (60.15) 28.20C 53.62 (50.24) n/a
AX 54.67 (60.06) 29.37Z 55.76 (55.52) n/a
Emerging Markets Equity Fund I 70.95 (57.76) 41.56A 69.97 (58.01) 40.77B 68.35 (58.39) 39.43C 68.51 (46.40) n/aN 73.10 (4.19) n/aZ 71.18 (50.32) n/a
European Equity Alpha Fund I 25.51 (40.26) 4.77A 24.83 (40.61) 4.16B 23.53 (41.19) 3.12C 23.70 (24.56) n/aZ 25.59 (23.72) n/a
European Property Fund I 41.41 (51.26) (34.33)A 40.37 (51.60) (34.80)B 38.92 (52.09) (35.45)IX 41.34 (52.56) (36.03)
AX 40.15 (52.71) (35.33)Z 41.47 (40.00) n/a
European Small Cap Value Fund A 42.12 (51.54) (3.90)B 40.76 (52.04) (4.85)
AX 42.18 (51.95) (4.17)
Eurozone Equity Alpha Fund I 26.89 (41.38) 5.18A 25.84 (41.75) 4.53B 24.66 (42.33) 3.45Z 27.02 (24.93) n/a
Global Brands Fund I 30.58 (29.18) 9.58A 29.65 (29.69) 8.79B 28.35 (30.40) 7.71C 1.28* n/a n/aZ 30.60 (23.52) n/a
AH (EUR) 31.33 (32.30) n/aBH (EUR) 30.06 19.46 n/aZH (EUR) 32.15 4.69 n/a
Global Property Fund I 45.23 (46.31) (12.05)A 44.14 (46.62) (12.69)B 42.72 (47.20) (13.52)C 43.04 (37.17) n/aIX 45.13 (47.06) (12.89)Z 45.25 (39.00) n/a
Global Small Cap Value Fund I 30.73 (33.32) (1.78)A 29.76 (33.81) (2.50)B 28.54 (34.46) (3.47)
AX 29.58 (33.88) (2.45)Z 1.09* n/a n/a
Global Value Equity Fund I 14.52 (40.05) 6.94A 13.67 (40.47) 6.14B 12.55 (41.08) 5.09Z 14.46 8.72 n/a
Fund Name Class31 Dec 2009
Year to Date %31 Dec 2008
Year to Date %31 Dec 2007
Year to Date %
Indian Equity Fund I 93.61 (65.15) 65.71A 92.08 (65.38) 64.50B 90.24 (65.73) 62.78Z 93.52 (41.36) n/a
Japanese Equity Advantage Fund
I 11.44 (32.01) (8.29)A 10.60 (32.45) (8.88)B 9.51 (33.13) (9.80)Z 11.48 (21.20) n/a
Japanese Value Equity Fund I 13.99 (43.12) (5.35)A 13.17 (43.53) (6.03)B 12.03 (44.09) (6.97)C 12.15 (37.00) n/a
AX 13.05 (43.64) (6.03)Z 14.04 (39.03) n/a
IH (EUR) 16.59 (40.22) n/aZH (EUR) (4.87)* n/a n/a
Latin American Equity Fund I 105.69 (55.52) 38.20A 104.34 (55.82) 37.29B 102.27 (56.26) 35.90C 102.57 (53.32) n/aZ 105.75 2.20 n/a
US Equity Growth Fund I 64.26 (50.87) 20.86A 63.01 (51.25) 19.94B 61.37 (51.74) 18.74C 61.39 (42.40) n/aIX 64.25 (50.94) 20.89
AX 63.01 (51.25) 19.94Z 64.32 (45.63) n/a
AH (EUR) 65.95 (55.87) 29.99ZH (EUR) 67.45 (51.51) n/a
US Property Fund I 41.38 (42.24) (17.99)A 40.34 (42.64) (18.60)B 38.91 (43.23) (19.42)
AX 40.28 (44.18) (19.26)Z 12.12* n/a n/a
US Small Cap Growth Fund I 18.68 (37.46) 1.77A 17.92 (37.89) 1.02B 16.81 (38.40) 0.02
US Value Equity Fund I 30.90 (37.01) (3.25)A 29.89 (37.50) (4.01)B 28.63 (38.14) (4.97)IX 30.86 (38.13) (4.20)
AX 29.41 (37.96) (6.11)Z 30.91 (24.04) n/a
Emerging Markets Debt Fund I 30.71 (15.28) 6.70A 29.91 (15.75) 6.08B 28.67 (16.60) 5.04C 28.93 (15.80) n/a
AX 29.75 (19.56) 1.72S 30. 97* n/a n/aZ 30. 72 (15.24) n/a
AH (EUR) 33.49 (22.31) 15.90
Emerging Markets Domestic Debt Fund
I 24.19 (9.20) 12.16A 23.51 (9.78) 11.64B 22.29 (10.69) 10.72C 22.77 (15.84) n/a
AX 23.24 (17.46) 10.68Z 16.91* n/a n/a
Euro Bond Fund I 7.83 5.86 0.91A 7.42 5.47 0.57B 6.38 4.37 (0.41)C 6.75 6.12 n/aIX 7.88 3.22 (2.40)Z 7.95 5.20 n/a
Euro Corporate Bond Fund I 20.03 (4.58) (0.84)A 19.48 (4.97) (1.24)B 18.33 (5.94) (2.22)C 18.62 (3.56) n/aN (0.16)* n/a n/a
AX 6.48* n/a n/aZ 20.09 (3.04) n/a
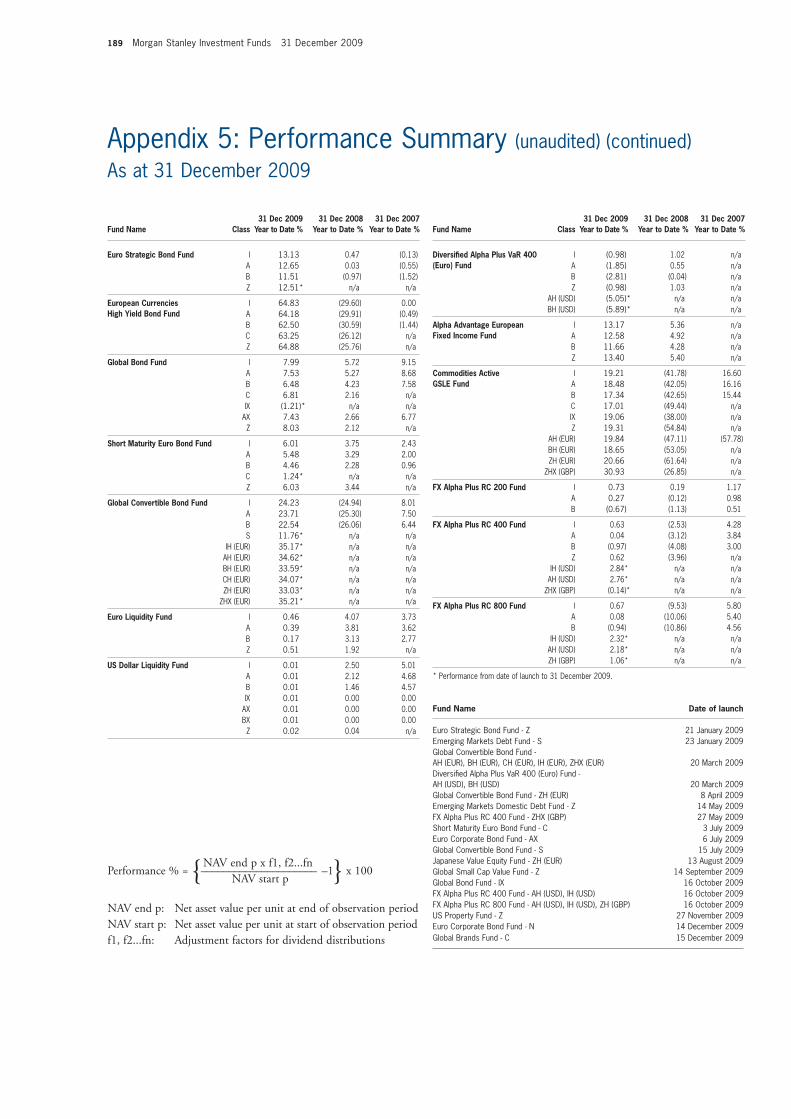
189 Morgan Stanley Investment Funds 31 December 2009
Appendix 5: Performance Summary (unaudited) (continued)As at 31 December 2009
NAV end p x f1, f2...fnPerformance % = {––––––––––––––––––––– –1} x 100 NAV start p
NAV end p: Net asset value per unit at end of observation periodNAV start p: Net asset value per unit at start of observation periodf1, f2...fn: Adjustment factors for dividend distributions
Fund Name Class31 Dec 2009
Year to Date %31 Dec 2008
Year to Date %31 Dec 2007
Year to Date %
Euro Strategic Bond Fund I 13.13 0.47 (0.13)A 12.65 0.03 (0.55)B 11.51 (0.97) (1.52)Z 12.51* n/a n/a
European Currencies High Yield Bond Fund
I 64.83 (29.60) 0.00A 64.18 (29.91) (0.49)B 62.50 (30.59) (1.44)C 63.25 (26.12) n/aZ 64.88 (25.76) n/a
Global Bond Fund I 7.99 5.72 9.15A 7.53 5.27 8.68B 6.48 4.23 7.58C 6.81 2.16 n/aIX (1.21)* n/a n/a
AX 7.43 2.66 6.77Z 8.03 2.12 n/a
Short Maturity Euro Bond Fund I 6.01 3.75 2.43A 5.48 3.29 2.00B 4.46 2.28 0.96C 1.24* n/a n/aZ 6.03 3.44 n/a
Global Convertible Bond Fund I 24.23 (24.94) 8.01A 23.71 (25.30) 7.50B 22.54 (26.06) 6.44S 11.76* n/a n/a
IH (EUR) 35.17* n/a n/aAH (EUR) 34.62* n/a n/aBH (EUR) 33.59* n/a n/aCH (EUR) 34.07* n/a n/aZH (EUR) 33.03* n/a n/a
ZHX (EUR) 35.21* n/a n/a
Euro Liquidity Fund I 0.46 4.07 3.73A 0.39 3.81 3.62B 0.17 3.13 2.77Z 0.51 1.92 n/a
US Dollar Liquidity Fund I 0.01 2.50 5.01A 0.01 2.12 4.68B 0.01 1.46 4.57IX 0.01 0.00 0.00
AX 0.01 0.00 0.00BX 0.01 0.00 0.00
Z 0.02 0.04 n/a
Fund Name Class31 Dec 2009
Year to Date %31 Dec 2008
Year to Date %31 Dec 2007
Year to Date %
Diversifi ed Alpha Plus VaR 400 (Euro) Fund
I (0.98) 1.02 n/aA (1.85) 0.55 n/aB (2.81) (0.04) n/aZ (0.98) 1.03 n/a
AH (USD) ( 5.05)* n/a n/aBH (USD) ( 5.89)* n/a n/a
Alpha Advantage European Fixed Income Fund
I 13.17 5.36 n/aA 12.58 4.92 n/aB 11.66 4.28 n/aZ 13.40 5.40 n/a
Commodities Active GSLE Fund
I 19.21 (41.78) 16.60A 18.48 (42.05) 16.16B 17.34 (42.65) 15.44C 17.01 (49.44) n/aIX 19.06 (38.00) n/aZ 19.31 (54.84) n/a
AH (EUR) 19.84 (47.11) (57.78)BH (EUR) 18.65 (53.05) n/aZH (EUR) 20.66 (61.64) n/a
ZHX (GBP) 30.93 (26.85) n/a
FX Alpha Plus RC 200 Fund I 0.73 0.19 1.17 A 0.27 (0.12) 0.98
B (0.67) (1.13) 0.51
FX Alpha Plus RC 400 Fund I 0.63 (2.53) 4.28A 0.04 (3.12) 3.84B (0.97) (4.08) 3.00Z 0.62 (3.96) n/a
IH (USD) 2.84* n/a n/aAH (USD) 2.76* n/a n/a
ZHX (GBP) ( 0.14)* n/a n/a
FX Alpha Plus RC 800 Fund I 0.67 (9.53) 5.80A 0.08 (10.06) 5.40B (0.94) (10.86) 4.56
IH (USD) 2.32* n/a n/aAH (USD) 2.18* n/a n/aZH (GBP) 1.06* n/a n/a
* Performance from date of launch to 31 December 2009.
Fund Name Date of launch
Euro Strategic Bond Fund - Z 21 January 2009Emerging Markets Debt Fund - S 23 January 2009Global Convertible Bond Fund - AH (EUR), BH (EUR), CH (EUR), IH (EUR), ZHX (EUR) 20 March 2009Diversifi ed Alpha Plus VaR 400 (Euro) Fund - AH (USD), BH (USD) 20 March 2009Global Convertible Bond Fund - ZH (EUR) 8 April 2009Emerging Markets Domestic Debt Fund - Z 14 May 2009FX Alpha Plus RC 400 Fund - ZHX (GBP) 27 May 2009Short Maturity Euro Bond Fund - C 3 July 2009Euro Corporate Bond Fund - AX 6 July 2009Global Convertible Bond Fund - S 15 July 2009Japanese Value Equity Fund - ZH (EUR) 13 August 2009Global Small Cap Value Fund - Z 14 September 2009Global Bond Fund - IX 16 October 2009FX Alpha Plus RC 400 Fund - AH (USD), IH (USD) 16 October 2009FX Alpha Plus RC 800 Fund - AH (USD), IH (USD), ZH (GBP) 16 October 2009US Property Fund - Z 27 November 2009Euro Corporate Bond Fund - N 14 December 2009Global Brands Fund - C 15 December 2009


www.morganstanleyinvestmentfunds.com
CN A
R SI
CAV
09