HSBC 4Xb - Fundsquare
222
HSBC Global Investment Funds Audited Report .for the year ended 31 March 2006 HSBC 4Xb
-
Upload
khangminh22 -
Category
Documents
-
view
5 -
download
0
Transcript of HSBC 4Xb - Fundsquare
HSBC Global Investment Funds
Audited Report .for the year ended 31 March 2006
HSBC 4Xb
i
Audited report for the year ended as at 31 March 2006
Societe d’lnvestissement a Capital Variable (SICAV), Luxembourg
HSBC Global Investment Funds
Information concerning the distribution of shares of HSBC Global Investment Funds in Switzerland or from Switzerland. HSBC Private Bank (Suisse) SA, Quai du General Guisan 2, case postale 3580 CH-1211 Geneva 3, is the legal representative of the Fund in Switzerland and the Fund's paying agent. The prospectus, simplified prospectuses, articles and annual and semi-annual reports of the Fund may be obtained free of charge upon request from the HSBC Private Bank (Suisse) SA. A breakdown of all the transactions carried out on behalf of each sub-fund of HSBC Global Investment Funds in the period under review can be obtained, free of charge, from the Fund's representative in Switzerland.
Information concerning the distribution of shares of HSBC Global Investment Funds in Germany or from Germany. HSBC Trinkaus & Burkhardt KGaA, 21-23 Konigsallee, D-40212 Dusseldorf, is the legal representative of the Fund in Germany and the Fund's paying agent. The prospectus, simplified prospectuses, articles and annual and semi-annual reports of the Fund may be obtained free of charge upon request from the HSBC Trinkaus & Burkhardt KGaA. A breakdown of all the transactions carried out on behalf of each sub-fund of HSBC Global Investment Funds in the period under review can be obtained, free of charge, from the Fund's representative in Germany.
No subscription can be received on the basis of financial reports. Subscriptions are only valid if made on the basis of the current Prospectus accompanied by the latest annual and the most recent semi-annual report, if published thereafter.
Audited report for the year ended as at 31 March 2006
I
A .- HSBC Global Investment Funds
. .
.
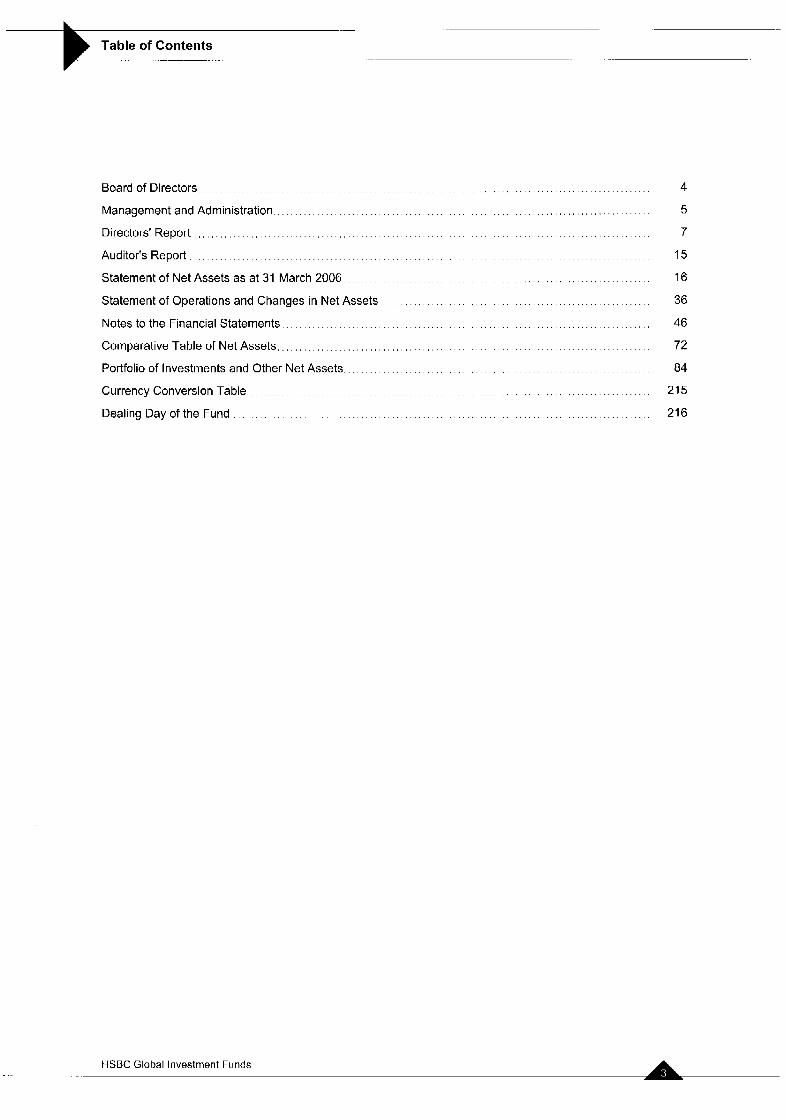
Table of Contents - .
Board of Directors
Management and Administration
Directors' Report
Auditor's Report
Statement of Net Assets as at 31 March 2006
Statement of Operations and Changes in Net Assets
Notes to the Financial Statements
Comparative Table of Net Assets
Portfolio of Investments and Other Net Assets
Currency Conversion Table
Dealing Day of the Fund
4
5
7
15
16
36
46
72
84
21 5
216
HSBC Global Investment Funds
.
Board of Directors - ._
Marc-Andre Bechet, Managing Director, RBC Dexia Investor Services Bank S.A., 5, rue Thomas Edison, L-1445 Strassen, Grand Duchy of Luxembourg.
Simeon Brown, Chief Operating Officer, HSBC Investments (Hong Kong) Limited, Level 22, HSBC Main Building, 1, Queens Road Central, Hong Kong.
Corinne Couteau, Head of HSBC Global Investment Funds Global Marketing & Business Development, HSBC Investments (France), 4, place de la Pyramide, lmmeuble Ile de France, La Defense 9, 92800 Paris Cedex 08, France (resigned on 14 June 2005).
Sylvie Vigneaux, Head of Regulatory and Savings, HSBC Investments (France), 4, place de la Pyramide, immeuble He de France, La Defense 9, 92800 Puteaux Cedex 08, France (since 29 July 2005).
Deshmukh-Rao Dhondee, Assistant Manager, HSBC Offshore Banking Unit, The Hong Kong and Shanghai Banking Corporation Limited Les Cascades, 5th Floor, Edith Cavell Street, Port Luis, Mauritius.
George Efthimiou, Global Chief Operating Officer, HSBC Group Investment Businesses Limited, 8 Canada Square, London E14 5HQ, United Kingdom.
Laurent Facque, Chief Operating Officer, HSBC Investments (France), 4, place de la Pyramide, lmmeuble He de France, La Defense 9, 92800 Puteaux Cedex 08, France
Bryan Greener, Head of Product Management - Global Products, HSBC Group Investment Businesses Limited, Level 21,8 Canada Square, London E14 5HQ, United Kingdom.
- ... _ _ .. _ _ .- - -~ HSBC Global investment Funds
Management and Administration b b Registered Office
b Management Company
69, route d'Esch, L-1470 Luxembourg, Grand Duchy of Luxembourg.
HSBC Investment Funds (Luxembourg) S.A., 69, route d'Esch, L-2953 Luxembourg, Grand Duchy of Luxembourg until 26 September 2005. 40, avenue Monterey, L-2163 Luxembourg, Grand Duchy of Luxembourg since 26 September 2005.
b Custodian and Administration Agent Dexia Banque Internationale a Luxembourg S.A., 69 Route d'Esch, L-1470 Luxembourg (until I June 2006). RBC Dexia Investor Services Bank S.A., 5, rue Thomas Edison. L-1445 Strassen, Grand Duchy of Luxembourg (since I June 2006).
b Transfer Agent First European Transfer Agent S A , 5, rue Thomas Edison, L-I445 Strassen, Grand Duchy of Luxembourg (until 2 January 2006). RBC Dexia Investor Services Bank S.A., 5, rue Thomas Edison, L-1445 Strassen, Grand Duchy of Luxembourg (since 2 January 2006).
b Investment Adviser HSBC Investments (UK) Limited, 8, Canada Square, London E14 5HQ, United Kingdom.
HSBC Halbis Partners (UK) Limited, 8, Canada Square, London E14 5HQ, United Kingdom.
HSBC Investments (France), lmmeuble Ile de France, 4, Place de la Pyramide, La Defense 9, 92800 Puteaux, France.
HSBC Halbis Partners (Hong Kong) Limited, HSBC Main Building,l, Queen's Road Central, Hong Kong.
HSBC Investments (USA) Inc.. 452, Fifth Avenue, 18th Floor, New York, NY 10018, United States of America.
HSBC Halbis Partners (USA) Inc., 452, Fifth Avenue, 18th Floor, New York, NY 10018, United States of America
HSBC Bank Brazil SA - Banco Multiplo, Travessa Oliviera Belo, 1 I-B, 80020-030 Curitiba, Brazil.
HSBC Trinkaus Capital Management GmbH, Konigsallee 21/23, D-40212 Dusseldorf, Germany (until 9 February 2006).
HSBC Investments Deutschland GmbH, Konigsallee 21/23, D-40212 Dusseldorf, Germany (since 9 February 2006).
Sinopia Asset Management, 66, rue de la Chaussee d'Antin, 75009 Paris, France
b Share Distributor HSBC Investments (UK) Limited, 8 Canada Square, London E14 5HQ, United Kingdom, Tel: (44) 20 7991 8888 Fax : (44) 20 7024 1999
Austria and Germanv Share Distributor HSBC Trinkaus & Burkhardt KGaA, Konigsallee 21 123, D-40212 Dusseldorf, Germany
Honq Konq Representative and Share Distributor HSBC Investment Funds (Hong Kong) Limited, HSBC Main Building, 1 Queen's Road Central, Hong Kong,
United Kinqdom Representative HSBC Investments (UK) Limited, 8, Canada Square, London E14 5HQ, United Kingdom, Tel: (44) 20 7991 8888 Fax : (44) 20 7024 I999
HSBC Global Investment Funds -
- Management and Administration (continued)
- __ .
b Share Distributor (continued)
Republic of Ireland Representative HSBC Securities Services (Ireland) Limited, HSBC House, Harcourt Centre, Harcourt Street, Dublin 2, Ireland.
Jersey Representative HSBC Funds Nominee (Jersey) Limited, HSBC House, Esplanade, St Helier, Jersey, JE1 1 HS Channel Islands.
Sinqapore Representative and Share Distributor HSBC Investments (Singapore) Limited, 21, Collyer Quay, # I 3-02 HSBC Building, Singapore 049320, Singapore.
Swiss Representative HSBC Private Bank (Suisse) S.A., Quai du General Guisan 2, Case postale 3580, CH-I211 Geneva 3, Switzerland.
Korea Representative and Share Distributor HSBC Korea Ltd, HSBC Building #25, I-Ka, Bongrae-Dong, Chung-Ku, Seoul, Korea.
Share Distributor for Continental Europe HSBC Investments (France) lmmeuble Ile de France, 4, Place de la Pyramide, La Defense 9, 92800 Puteaux, France.
b Central Paying Agent Dexia Banque Internationale a Luxembourg S.A., 69 Route d'Esch, L-1470 Luxembourg (until I June 2006). RBC Dexia Investor Services Bank S.A., 5, rue Thomas Edison, L-1445 Strassen, Grand Duchy of Luxembourg (since 1 June 2006).
Paying Agent in Hong Kong The Hongkong and Shanghai Banking Corporation Limited, HSBC Main Building, 1, Queen's Road Central, Hong Kong.
b
b Auditor KPMG Audit S.a r.1. Reviseurs d'Entreprises, 31, alee Scheffer, L-2520 Luxembourg, Grand Duchy of Luxembourg.
b Legal Advisers
Luxembourg: Elvinger, Hoss 8 Prussen, 2, Place Winston Churchill, B.P. 425, L-2014 Luxembourg, Grand Duchy of Luxembourg.
France: Latham 8 Watkins, 154, rue de I'Universite, F-75007, Paris, France.
United Kingdom: Linklaters and Paines, Barrington House, 59-67, Gresham Street, London EC2V 7JA, United Kingdom.
HSBC Global Investment Funds . . .- .
-_ -... b--- Directors’ Report ..
Asia ex Japan Equity For the 12 months ended March 2006, the fund returned 32.6% (gross of fees) in US dollar terms and outperformed the MSCl AC Far East exJapan index by 3.16%. Stock selection in the technology and consumer sectors contributed the most to performance during the period, with positive calls in both Taiwan and China. We remain positive on the outlook for the Asian markets given improving fundamentals and attractive valuations. Domestic consumption and asset reflation continue to be the two strongest themes for the region. We remain overweight in consumer-related companies and property.
Asia ex Japan Equity Smaller Companies For the 12 months ended March 2006, the fund returned 29.6% (gross of fees) in US dollar terms. Performance has largely tracked the market over the period. Positive stock selection in Taiwan and Singapore, particularly within the property sector and amongst cyclicals, added to performance, while our positive call on Hong Kong property has only recently started to come around. We remain positive on the outlook for the Asian markets given improving fundamentals and attractive valuations. Domestic consumption and asset reflation continue to be the two strongest themes for the region. We remain overweight in consumer-related companies and property.
Asia Pacific ex Japan Equity High Dividend For the 12 months ended March 2006, the fund returned 17.1% (gross of fees) in US dollar terms. The fund maintains its strategy of selecting high quality, high yielding stocks in Asia without adherence to a benchmark. This bias towards high-yielding stocks has been the major factor contributing to the fund‘s relative underperformance within the Asia Pacific ex-Japan universe, as high yield stocks fell from favour during the period under review. However, relative to its peer group, the fund has performed reasonably well. The long- term outlook for the Asian economies remains sound, with improving fundamentals and attractive valuations.
Brazil Equity For the 12-month period ending 31 March 2006, the fund returned 90.9% (gross of fees) in US dollar terms, outperforming the benchmark (MSCI 10140) by 13%. This performance was a consequence of careful stock selection, which in turn led to an overweight in consumption-related stocks, energy and mining and an underweight in the telecommunications sector. The fund will continue to differentiate itself by using a bottom-up approach and taking advantage of the close contact with companies on the ground. We remain positive on Brazil based on an improving macro-economic picture and attractive valuations.
BRlC Markets Since inception on 2 June 2005, to the year ended 31 March 2006, the fund returned 67.5% (share class ZC) in US Dollar terms. Within the BRlC markets, consumer discretionary and financial stocks have generally outperformed over the past twelve months, while materials and information technology have underperformed. More particularly, BRlC market performance has been led by Russia, which has seen particularly strong returns for investors over the past twelve months. While the market has re-rated from the low levels seen immediately following the Yukos crisis last Spring, it still remains cheaper than the emerging-markets average. Impressive earnings growth, ongoing reform of management and improving corporate governance were the key market catalysts.
Chinese Equity For the 12 months ended March 2006, the fund returned 41.6% (gross of fees) in US dollar terms but underperformed the MSCl China Index by 166bps. Relative underperformance was caused by the strong performance of China Mobile, which represents 16% of the index. Given our 10% single stock holding limit, the fund is naturally underweight China Mobile and thus, relative Performance suffered. Despite this situation, performance during the period was boosted by our overweight call on the Chinese property sector. We remain positive on the outlook for the Chinese economy, which continues to grow strongly. Our key overweight positions include the property sector and domestic consumption plays.
Emerging Europe Equity For the nine months ending 31 March 2006: the fund returned 30.7% (share class AD) in euro terms, performing in line with the peer group of European Convergence funds. The fund maintains its strategy of selecting attractively valued stocks in focussing on the main convergence sectors (banks, energy, healthcare, telecommunication, utilities) accounting for more than 90% of total market capitalisation. After the short correction of the converging markets we see attractive valuation levels, particularly compared to the “Old
HSBC Global Investment Funds - _. __ ._ Ih
Directors’ Report (continued) z- European Countries”. We therefore see further upside for the equity markets of the region.
Euroland Equity For the year ending 31 March 2006, the fund returned 38.31% (gross of fees) in euro terms, outperforming the MSCl EMU index by 6.29%. The fund maintains its strategy of seeking out companies with stabilising or improving fundamentals that are not yet reflected in valuations. Stock holdings Outperformed consistently and across the board. Underexposure to top performing sectors such as ut es, energy, pharmaceuticals, diversified financials and materials was compensated by excellent stock selection. Holdings in capital goods, banks and insurance have performed especially well. The long-term outlook for Euroland markets remains attractive, especially when viewed in the context of attractive valuations and in light of the media‘s focus on social agitation which has masked improving fundamental trends. This is especially true in Germany where the trade balance over the past 12 months exceeded that of China and Japan combined.
Euroland Value Creation For the year ending 31 March 2006, the fund returned 34.16% (gross of fees) in euro terms, outperforming the MSCl EMU index by 2.14%. The fund maintains its strategy of seeking out companies with stabilising or improving fundamentals that are not yet reflected in valuations. Stock holdings outperformed across the board. Underexposure to top performing sectors particularly to energy and diversified financials, as well as to utilities, pharmaceuticals and materials was compensated by excellent stock selection. Holdings in capital goods, banks and insurance have performed especially well. The long-term outlook for Euroland markets remains attractive, especially when viewed in the context of attractive valuations and in light of the media’s focus on social agitation which has masked improving fundamental trends. This is especially true in Germany where the trade balance over the past 12 months exceeded that of China and Japan combined.
Sustainability Leaders Since inception in December 2005, the fund has returned 8.47% (gross of fees) in euro terms. The strategy of the fund is to focus on the best SRI-ranked stocks in the Pan European universe. The fund has no benchmark. The portfolio holds a limited number of stocks, around 30 for the time being. The outlook for the European economy is improving, especially in Germany. The equity market should continue to rise, supported by attractive valuations and M&A activities.
Europe ex UK Equity For the year to 31 March 2006, the fund gained 31.7% (share class AC) in euro terms, underperforming the FT S&P Europe ex UK Index, which rose by 34.1%. European equity markets rallied during the period under review, as the eurozone recovery surprised on the upside. As a result, many equity markets in the region reached multi-year highs. An economic upturn in index heavyweights Germany and France prompted the European Central Bank to increase interest rates for the first time in more than two years. Fund performance suffered from exposure in the media sector, with German pay-TV operator Premiere a big detractor. Overall, stock selection was a negative for the fund, more than offsetting gains from the funds overweight to selected energy names.
The long term outlook for eurozone markets remains very attractive. The media’s focus on social angst masks improving fundamental trends, especially in Germany where the trade balance over the 12 months exceeded that of China and Japan combined.
Global Emerging Markets Equity For the year to 31 March 2006, the fund gained 49.0% (share class AC) in US dollar terms, outperforming the MSCl Emerging Markets Index, which rose by 48.0%.
Benchmark-relative performance has continued to improve since the change of manager in April 2005. Notably, overweight country positions in Russia and Brazil added value, as both countries were among the strongest emerging market performers. Within Russia, energy holdings - Gazprom in particular - contributed strongly to outperformance. Given that the main driver behind the rally in emerging markets has been strong global liquidity, the direction of major interest rates will be crucial. However, global growth remains strong, and GEM valuations in most markets remain accommodative.
Global Equity For the year to 31 March 2006, the fund gained 24.5% (share class AC) in US dollar terms, comfortably outperforming the MSCl World Index, which rose by 18.6%. This was a turnaround for the fund and coincided
HSBC Global Investment Funds .
with the appointment of a new fund manager in May 2005. A style shift favouring stock selection over country allocation contributed to this performance, as certain Japanese financials and global IT stocks rallied. The fund remains overweight in Japan, where there is increasing evidence of a domestic-led recovery, and also favours growth stocks. The IT sector in particular continues to benefit from the strong consumer product cycle in LCD TVs, PCs and personal music players.
Global Equity SRI For the year to 31 March 2006, the fund gained 16.7% (share class AC) in US dollar terms, underperforming the MSCl World Index, which rose by 18.6%. However, against its peer group of socially responsible global equity funds, the fund outperformed. Positive economic growth, strong liquidity and easing fears of inflation, despite persistently high commodity prices, have provided a supportive backdrop for global equities and we expect this positive environment to continue throughout 2006.
Global Equity Technology For the year to 31 March 2006, the fund gained 8.7% (share class AC) in US dollar terms, underperforming its customised benchmark, which rose 10.3%. Positive economic growth, strong liquidity and easing fears of inflation, despite persistently high commodity prices, have provided a supportive backdrop for global equities and we expect this positive environment to continue throughout 2006. Looking forward, the IT sector in particular continues to benefit from the strong consumer product cycle in LCD TVs, PCs and personal music players.
Global ex Euroland Equity Global ex-Euroland Equity posted a return of 22.2% (share class AD) over 12 months against 22.8% for its benchmark. Performance was even further behind the peer group. However, unlike the peer group, the fund is restricted from investing in countries outside the OECD and was therefore unable to participate in the explosive returns of the emerging markets.
Since the implementation of Halbis' investment philosophy in the fund (low number of holdings based on strong fundamental convictions) six months ago, it has significantly outperformed its benchmark. All positions are being held on the basis of long-term fundamentals.
Hong Kong Equity For the twelve months ending 31 March 2006. the fund returned 26.05% (gross of fees) in US dollar terms, outperforming the Hang Seng index, which gained 21.85%. Our overweight in the property sector has contributed positively to performance in both asset allocation and stock selection. Despite lingering concerns over the timing of the peak of the rate cycle, property investors such as Great Eagle, Hong Kong Land and Hysan performed well, as office and retail rentals continued to show robust growth. In addition, our weighting in the China-related shares also added value to the portfolio. Of note, Prime Success and China Yurun Food benefited from the domestic consumption demand in China while Petrochina and Angang New Steel were also in favour due to rising commodity prices. Our participation in IPOs, in particular Link RElT and China Construction Bank, also added value.
Indian Equity For the year ended 31 March 2006, the fund returned 73.79% (gross of fees) in US dollar terms, outperforming the benchmark, which gained 66.40%. Within this an average holding of 2.73% in cash hurt performance by 284bps implying that the invested portion of the fund outperformed by over 1000 basis points, notwithstanding the large fund size. Our underweight position in technology and overweight in consumer discretionary accounted for the bulk of the outperformance.
The economic and corporate outlook for India remains positive although market expectations are running significantly ahead of fundamentals. We expect India to disappoint these high expectations (both economic and corporate) and continue to position our portfolio with a defensivelvalue bias. The market valuation is well over 20x one-year forward price earnings multiples after stripping out commodities and financials with our portfolio multiples significantly below these valuations. Risk reward appears unfavourable in the near term as expectations are high and there are signs that some excesses are getting built in some sections of the market. However, domestic mutual fund and foreign institutional investor inflows remain strong coupled with positive sentiment. We will closely monitor politics in the second quarter given some key State elections along with the flood of new and 'recycled' paper hitting the markets and the results for the March quarterlfinancial year-end.
HSBC Global Investment Funds -. . . -. - . . -. . . . . . .. A
.
Directors' Report (continued) .- -.
Japanese Equity For the 12 months ending 31 March 2006, the fund returned 39% (share class AC) in yen terms, outperforming the peer group average, which gained 35.3%. The fund's management was transferred to Sinopia in May 2005 and the business's quants strategy was implemented, combining active sector allocation and stock-picking. Both returned positive alpha as the Japanese market surged was driven by the outperformance of banks and cyclicals emphasized by the fund's sector allocation. The mid-term outlook for the Japanese market remains sound as the market rise is compensated by an upward earnings revision. We expect annual earning results to be above expectations, which should underpin the pursuit of the market rise.
Korean Equity Since the fund's inception (late September) to the end of March 2006, the fund returned 37.8% (gross of fees) compared to 21.7% for the MSCl Korea. The strong relative performance of the fund was attributable to stock selection among cyclical and consumer stocks. There was also positive attribution from our stock picks within the technology space as well as the banking sector. We remain positive on the outlook for Korea given continued strong exports and the gradual recovery of the domestic economy. We remain overweight domestic consumption stocks as well as certain cyclicals.
Pan European Equity For the year to 31 March 2006, the fund gained 31.16% (share class PC) in euro terms, outperforming the FTSE World Europe, which rose by 30.92%. European equity markets rallied during the period under review, as the eurozone recovery surprised on the upside with its tenacity. As a result, many equity markets in the region reached multi-year highs. An economic upturn in index heavyweights Germany and France prompted the European Central Bank to increase interest rates for the first time in more than two years. Fund performance suffered from exposure with the media sector, with German pay-TV operator Premiere a big detractor. An overweight in oils and gas-related activities has proved beneficial for the fund as the price of oil has remained strong. Oil service companies such as Vallourec was one of the main beneficiaries of the oil theme. Restructuring in industrials particularly in Germany has also aided the outperformance with stocks such as MAN AG, a German truck manufacturer, benefiting. In the UK, a holding in BAE systems was positive for performance as order books remained strong and the company reached an agreement with the trustees of the company pension scheme that removed a negative influence on the share price.
Pan European Equity High Dividend For the year ending 31 March 2006, the fund returned 33.85% (gross of fees) in euro terms, outperforming the MSCl Europe index by 4.3%. The fund currently has a strong focus on companies with improving dividend prospects. Stock holdings outperformed across the board. Stock selection made up for low exposure in the high return sectors: energy, pharmaceuticals and commodities. Our holdings in banks performed particularly well. The outperformance in other sectors was pretty well balanced, the only exception being the telecoms sector which was a significant drag on Performance in the first quarter of 2006. The long-term outlook for Euroland markets remains attractive, especially when viewed in the context of attractive valuations and in light of the media's focus on social agitation which has masked improving fundamental trends. This is especially true in Germany where the trade balance over the past 12 months exceeded that of China and Japan combined.
Pan European Equity Smaller Companies The Pan European Equity Smaller companies fund posted a return of 47.40% (gross of fees) over the past 12 months against 44.83% for the benchmark. The fund is ranked 18/55 in its peer group. Our performance has accelerated over the period, particularly in the first quarter of 2006. Overall, an overweighting in oil services, capital goods and basic resources was positive. The pronounced underweight position in the UK has started to pay off, particularly in the last six months. Selected positions across industries and countries such as Vallourec, So'itech, Solarworld, Tandberg Television and Geophysique also made a real positive difference.
Singapore Equity For the 12 months ending 31 March 2006, the fund returned 29.4% (share class AC) in US dollar terms (NAV), outperforming the peer group average and benchmark. The fund's key strategy was a large overweight in several niche high-end condominium developers, which heavily outperformed the benchmark from July 2005
HSBC Global Investment Funds . . ...
Directors' Report (continued)
onwards, as the recovery in sales became increasingly evident to investors. The fund's corresponding underweight in banks helped performance. The fund's overweight in small cap stocks helped performance in the latter half, as investors switched from large caps into better value small caps. The Singapore economy should continue to perform well, though the Singapore equity market reflects the improved operating environment.
Thai Equity For the 12 months ended March 2006, the fund returned 11.5% (gross of fees) in US dollar terms, underperforming the Thailand SET index by 230bps. We had positioned the fund to benefit from an anticipated recovery in the economy, driven by a revival in tourism as well as government led infrastructure investment. However, the change in the political landscape meant that the timing of infrastructure investments would likely be pushed back, adversely impacting our portfolio position. Given the political overhang, we believe that the Thai market may trade in a range in the near term - albeit with a slight upward bias - and have positioned our portfolio accordingly.
UK Equity For the year to 31 March 2006, the fund gained 25.6% (share class AC) in sterling terms, underperforming the FTSE All Share Index, which rose by 28.0%. The fund performed strongly in the first half of the year before tailing off in the last few months. BAE Systems was a key contributor to performance over the period as order books remained strong and the company reached an agreement with the trustees of the company pension scheme that removed a negative influence on the share price. The underweight in mining detracted from performance as the continued strength in commodity prices was greater than expected. The team have remained sceptical on the long-term sustainability of commodity prices. Fixed line telecoms have been under pressure, with a holding in Vodafone a key detractor from performance over the period. In the media sector, Daily Mail & General Trust, a key holding in the fund over 2005, fell heavily towards the end of the period following the company's failure to secure the sale of Northcliffe, its regional news business.
US Equity For the year ending 31 March 2006, the fund returned 8.8% (share class PD) in US dollar terms, underperforming the peer group average, which gained 12.2%. The fund was reshuffled mid-May following the transfer of the fund's management to Sinopia Asset Management. We took this opportunity to implement a sectoral allocation based on our quantitative valuation of the market and to select, within those sectors, stocks with strong earning momentum. From that point, the sectoral allocation was positive for performance. However, the bias towards blue chips offset these gains. The outlook remains positive as the current price of the US market does not fully reflect the strong operational environment.
US Index For the year to 31 March 2006, the fund gained 11.1% (share class PD) in US dollar terms, compared with an increase in the S&P 500 Composite of 11.7%. Concerns over interest rates, inflation and the high oil price exerted downward pressure on global markets and this was exacerbated by the heavy toll of Hurricane Katrina. Nonetheless, the US market climbed as robust economic growth and corporate earnings pushed the market higher.
Asia Freestyle For the 12 months ended March 2006, the fund returned 19.3% (gross of fees) in US dollar terms. Performance lagged the market due to our high cash level during the first half of the period and our relative underweight position in Korea during the year. Going forward, we expect cash levels to be kept to a minimum as we look to be fully invested at all times. However, we will continue to manage the fund with a focus on bottom-up stock-picking, accepting differences in country weightings. We remain positive on the outlook for the Asian markets given improving fundamentals and attractive valuations. We remain overweight conglomerates and continue to like technology stocks on medium-term view, despite expected volatility in both the first and second quarters of 2006.
BRlC Freestyle For the year to 31 March 2006, BRlC Freestyle returned 72.8% (share class MIC) in US dollar terms, as the Brazilian, Russian, Indian and Chinese equity markets all rose strongly.
Russia was the strongest performing market, aided by improved market liquidity, as well as the persistently high energy prices, which boosted energy-related stocks. Brazil and India also experienced significant gains
7 HSBC Global Investment Funds .
.
Directors' Report (continued)
from the increased flows into emerging markets. The fund benefited from its high weighting in Brazil, as the appreciating currency, improved political stability and robust economic fundamentals supported the market. However, exposure to Brazil was trimmed towards the end of 2005, in favour of Chinese equities, which was the relative laggard during the period under review. Stock selection within all four markets was positive for the fund during the 12-month period.
Global Emerging Markets Equity Freestyle The Global Emerging Markets Equity Freestyle was launched on 22 March 2006.
UK Freestyle For the year to 31 March 2006, the fund gained 22.6% (share class MID) in sterling terms, as the UK stockmarket advanced strongly. The impressive performance of selected stocks within the focused portfolio added considerable value during the first six months of the period under review. BAE systems, which rose on increased orders, was a strong contributor. However, worse-than-expected trading in both the books and the entertainment market, forced HMV lower and acted as a drag on performance throughout the period. The position was subsequently sold.
Euro Corporate Bond For the twelve months ending 31 March 2006, the fund returned 0.77% (share class AC) in euro terms, placing it into the second quartile of its peer group over the 12-month period. After a relatively cautious investment approach during its inception phase (which largely explained its underperformance versus the benchmark) the fund's performance versus its peer group has been improving strongly during the past six months. Due to its ability to allocate approximately 30% high yield corporate bonds, the fund was able to partially counter the negative impact of increasing interest rates on the absolute performance since September 2005. While the current state of the economy, sound corporate fundamentals and market technicals are still supportive for European corporate bonds, the current stage of the credit cycle calls for a more cautious approach going forward. We are convinced that with our cautious investment approach, which results in a well-diversified portfolio, and the support of our experienced credit research team we will weather the upcoming "stormier" times of the credit cycle.
Euro Credit Bond The fund returned 1.23% net against benchmark returns of 1.58% (gross of fees), which was second quartile performance. A large curve flattening exposure has been the main driver but the last quarter's fund performance was mainly due to a short duration position. The fund intends to retain its focus on credit selection (avoiding GMlFord 2005 debacles) and benefits from an important credit barbell. We are long AAAIBBB and short ANA assets for a better risk-adjusted carry in a M&A and leveraged buyout environment. At the end of the period, we reduced our overweight credit position down to neutral in view of poor risklreward.
Euro Investment Grade Bond The fund returned 1.67% (share class AC) net against the benchmark 1.79% for a second quartile performance, The fund sources diversified excess returns from duration, curve, credit, sector and issuer selection in a disciplined process. Last year, large curve flattening exposure was the main driver, while staying away from the unfolding GM I Ford debacles and avoiding event risk were the building blocks of good performance in credit. Overall, low grade credit exposure was moderately long throughout until early March 2006: while we maintained a large short in swap-related products. Ten-year swap spreads widened by 16bps. Duration exposure was limited for most of the period until the first quarter of 2006, when we anticipated surprisingly strong economic growth in continental Europe. We are preparing for a cyclical bond buying opportunity in the second quarter as leading economic indicators are weakening now. Attractive valuations and reasonably bearish investor positioning certainly help building the case. In contrast, we remain cautious on credit at present.
Euro Investment Grade Corporate Bond For the twelve months ending 31 March 2006, the fund returned 0.10% (share class AC) in euro terms, placing it in the fourth quartile of its peer group over the 12-month period. After a relatively cautious investment approach during its inception phase, which led to the majority of its underperformance versus benchmark, the fund's performance versus its peer group has been improving steadily during the past six months. Absolute performance, however, was negatively influenced by the ongoing increase in interest rates since September 2005. While the current state of the economy, sound corporate fundamentals and market technicals are still
HSBC Global Investment Funds
supportive for European corporate bonds, the current stage of the credit cycle calls for a more cautious approach going forward. We are convinced that with our cautious investment approach, which results in a well- diversified portfolio, and the support of our experienced credit research team we will weather the upcoming "stormier" times of the credit cycle.
Euro High Yield Bond For the year ending 31 March 2006, the fund returned 7.1 % (gross of fees) versus 8.1% for its benchmark. The fund continued to focus on issuer selection and a defensive bias was maintained throughout the period. Consequently, the portfolio yield was slightly below the benchmark yield but this was more than compensated by the relatively poor performance of the issuers that were avoided. Credit quality remains strong across the Euro High Yield market and there was zero default over the past twelve months. Default rates should remain low going forward, especially given that Europe is beginning to experience an economic recovery. However, tighter monetary policies around the globe should lead to higher issuer differentiation going forward. As a result the focus will remain on issuer selection.
Global Emerging Markets Bond For the 12 months ended 31 March 2006, the fund returned 15.6% (share class AC) in US Dollar terms, outperforming its benchmark, the J P Morgan EMBl Global index, which returned 13.8% in the same period. While the US interest rate environment was choppy for most of 2005, emerging markets again proved resilient. Successful sovereign restructurings in Argentina and Dominican Republic, coupled with positive credit rating momentum in most emerging markets, helped fuel most emerging market debt indices by more than 10% - the third consecutive year of double digit performance. Record hard currency reserves in emerging markets spurred a combination of debt buybacks and less external issuance, all of which kept prices technically firm for most of 2005. With a new management team acquired mid-year, the fund was pushed into the first quartile of peer performance by year-end. For 2006, the new management team hopes to incorporate greater exposure to local bond markets in an effort to boost yields and reduce longer-term correlations.
Global Investment Grade Bond I Global Investment Grade Bond (US Dollar Hedged) For the year to 31 March 2006, the fund fell 3.7% (gross of fees) in US dollar terms, underperforming the Lehman Global Aggregate Index, which declined by 2.6%. A defensive position at the start of the reporting period was the key reason for our underperformance, with falling yields pushing bond prices higher against our expectations. However, an improving economic outlook in Japan, Europe and the US, combined with hawkish central bank rhetoric in those regions, helped firm yields and reduce the fund's benchmark-relative underperformance.
Looking forward, the picture for global bond markets is mixed. Although we see significant headwinds facing US growth, the Fed appears determined to push rates higher. And while higher energy prices and a levelling out in house prices could impact the US consumer, we are concerned that the bond bear market has not yet run out of steam.
Pan European Government Bond The fund returned 1.97% (gross of fees) net against the benchmark return of 2.44% for a first quartile performance, Primarily, the fund sources diversified excess returns from duration, curve currency management. It also seeks returns from investments in EUleuro applicant countries' debt.
The main drivers of the past year were a very large flattening exposure and growing investments in EUlEURO application countries in euro-denominated debt. Duration exposure was limited until the first quarter 2006 where we maintained a more bearish stance anticipating a strong growth recovery in continental Europe. However, performance in the first quarter was hit hard by a very strong UK yield curve inversion and strong underperformance from index-linked, Hungarian and Polish investments.
Sterling Investment Grade Bond For the year to 31 March 2006, the fund gained 6.75% (share class PC) in sterling terms underperforming the IBOXX GBP Overall Index, which rose by 7.6%. However, the fund outperformed its sector mean over the period.
A defensive position, which was adopted to protect against yield increases at the expensive-looking long end of the yield curve, detracted value as demand for long bonds from price insensitive buyers persisted, forcing
HSBC Global Investment Funds
- . . -. -
Directors' Report (continued)
yields even lower. Looking forward, the fund will retain its defensive stance and seek value in selected credits, with an emphasis on avoiding negative credit events.
US Dollar High Yield Bond The USD High Yield Bond fund was launched in January 2006, and for the three months ending 31 March 2006 the fund returned 3.78% (gross of fees), outperforming the benchmark's return of 2.81% by 96 basis points. During the course of the fund's truncated fiscal year, the Moody's US High Yield Default rate continued to run low, and issuance ran at a pace similar to the first quarter of 2005. Our strong performance in the quarter was largely due to our overweight relative to the fund's benchmark (the Merrill Lynch High Yield Master II Index) in B credits, which were the top performers during the quarter. Additional performance was gained through both our top-down and bottom-up focus, as we were underweight in the automotive sector, which suffered in the period under review, but had a select overweight to GMAC paper, which added significantly to performance.
US Dollar Investment Grade Bond For the 12 months ending 31 March 2006 the US Investment Grade Bond fund returned 2.69% (gross of fees), significantly outperforming the benchmark return of 2.13%. During the course of the fund's fiscal year, the US Federal Reserve maintained its gradualist approach to policy tightening, raising rates at each of the year's eight meetings. As a result, the short end of the yield curve climbed in a stepwise fashion, but yields on longer- dated maturities were unchanged. The latter were restrained by a number of factors including a global liquidity glut and increased demand for longer duration instruments from pension plans seeking to neutralise their long- dated liabilities. Inflation remained contained, although energy and other commodities prices, along with slowing productivity and rising wage growth threatened to push it higher. In the portfolio itself, security selection in the corporate bond and asset-backed sectors helped support performance, and we maintained our slightly defensive position on duration, with the portfolio slightly short of the benchmark.
Euro Reserve The fund returned 1.52% (share class AC) over the 12 months, against benchmark returns of 2.19%. The first part of the period was very quiet in the money market, but spreads continued to tighten on short-term paper because of liquidity issues in the market. The curve was flat, so the fund invested in fixed rate paper with more carry. In December, the European Central Bank announced a rate increase on the back of an improved economic outlook and inflation fears. The fund has invested in short-term maturity papers indexed on Eonia in order to profit from further ECB rate increases.
US Dollar Reserve For the US Dollar Reserve, the performance was slightly below benchmark for the year due to many economic activities. The Fund returned 3.4% (share class PD) in US dollar terms, against benchmark returns of 3.7%. However, this placed the fund in the first quartile of funds in its peer group over the same period. In 2005, the Federal Reserve continued to increase the Fed Fund's rate, energy prices rose sharply, even though the economy remained strong during this period. Throughout the year, the Fed kept to its stated policy of raising the Fed Fund's rate from 2.25% at the end of 2004 to 4.25% at the end of 2005. We continue to ladder maturities for the fund for 2006 as softer GDP growth and continued low inflation should allow the Fed to pause after increasing rates to 4.75% after its May Meeting. We continue to invest in commercial paper in the 30 - 90 day range. With this, yields should either remain stable or rise slightly and hopefully, with this shift, the yields for 2006 will increase.
Turkish Convergence For the year to 31 March 2006, the fund gained 47.7% (share class AC) in US dollar terms. Turkey has been a major beneficiary of liquidity flows into emerging markets and the domestic equity market rally that spanned 2005 has continued into 2006. Consequently, the fund's overweight in equities contributed to performance, as the market advanced strongly in expectation of the commencement of EU accession talks. In addition, progress of the IMF's review into its third stage also boosted sentiment. The fund has increased its overweight to long duration bonds during the period under review, a position which has benefited from improving monetary environment.
HSBC Global Investment Funds .-
=--- Auditor's Report
I
To the Shareholders of HSBC Global Investment Funds 69, route d'Esch L-1470 Luxembourg Grand Duchy of Luxembourg
We have audited the financial statements, which consist of the statement of net assets, the statement of operations and changes in net assets, the portfolio of investments and the notes of the financial statements of HSBC Global Investment Funds and of each of its sub-funds for the year ended 31 March 2006. These financial statements are the responsibility of the Board of Directors of the SICAV. Our responsibility is to express an opinion on these financial statements based on our audit.
We conducted our audit in accordance with International Standards on Auditing. Those Standards require that we plan and perform the audit to obtain reasonable assurance about whether the financial statements are free of material misstatement. An audit includes examining, on a test basis, evidence supporting the amounts and disclosures in the financial statements. An audit also includes assessing the accounting principles used and significant estimates made by the Board of Directors of the SICAV in preparing the financial statements, as well as evaluating the overall financial statements presentation. We believe that our audit provides a reasonable basis for our opinion.
In our opinion, the attached financial statements described above give, in conformity with Luxembourg legal and regulatory requirements, a true and fair view of the financial position of HSBC Global Investment Funds and of each of its sub-funds at 31 March 2006 and the results of their operations and changes in their net assets for the year then ended.
Supplementary information included in the annual report has been reviewed in the context of our mandate but has not been subject to specific audit procedures carried out in accordance with the standards described above. Consequently, we express no opinion on such information. We have no observation to make concerning such information in the context of the financial statements taken as a whole.
Luxembourg, 14 June 2006
KPMG Audit S.a r.1.
Reviseurs d'Entreprises
D.G. Robertson
HSBC Global Investment Funds . .
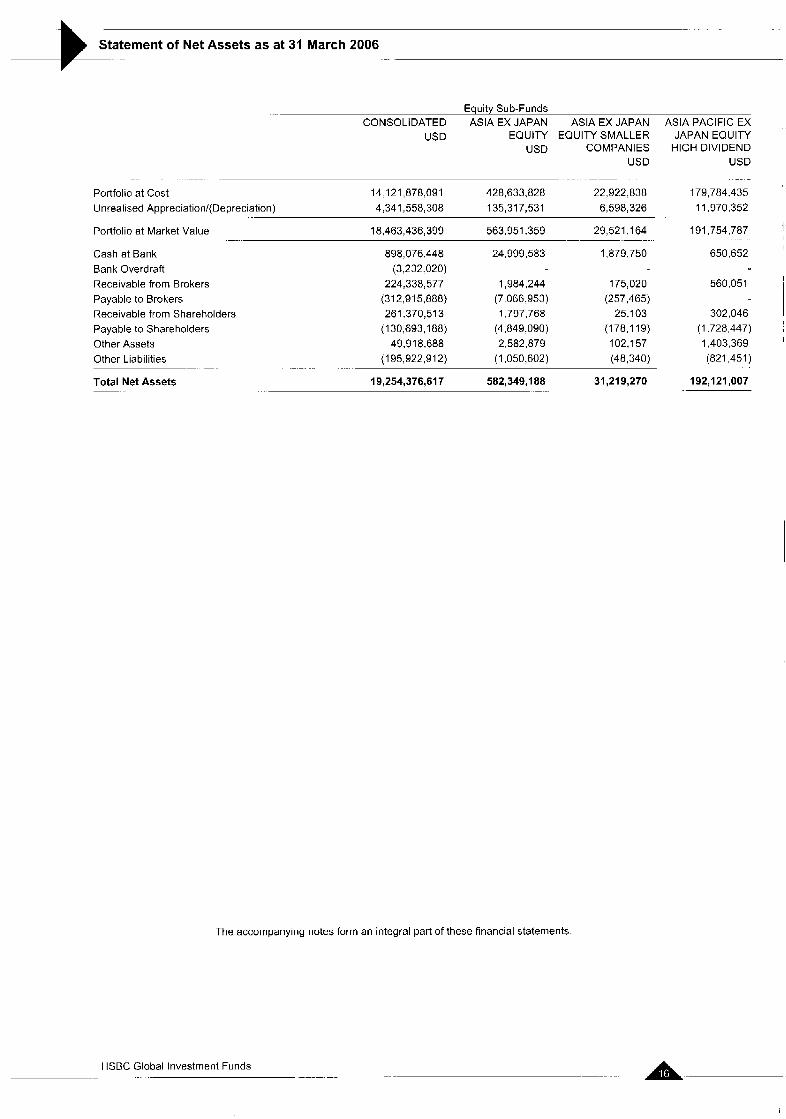
Statement of Net Assets as at 31 March 2006 & ... Equity Sub-Funds
CONSOLIDATED ASIA EX JAPAN ASIA EX JAPAN USD EQUITY EQUITY SMALLER
USD COMPANIES US0
. - . -.
Portfolio at Cost 14.121,878,091 428,633,828 22,922,838 Unrealised Appreciation/( Depreciation) 4:341,558,308 135,317,531 6,598,326
Portfolio at Market Value 18,463,436,399 563,951.359 29,521,164
. .-
Cash at Bank Bank Overdraft Receivable from Brokers Payable to Brokers Receivable from Shareholders Payable to Shareholders Other Assets Other Liabilities
Total Net Assets
898,076.448 (3,232.020)
224,338,577 (31 2,915,888) 261,370,513
(1 30,693,188) 49.918.688
(195,922,912)
19,254,376,617
24,999,583
1,984,244 (7.066.953)
(4,849.090) 2,582,879
(1,050,602)
I ,797,768
1,879,750
175,020 (257,465)
25.103 (1 78.1 19) 102,157 (48,340)
The accompanying notes form an integral part of these financial statements
31,219,270
- ASIA PACIFIC EX
JAPAN EQUITY HIGH DIVIDEND
USD . -
179,784.435 11,970,352
191,754,787
650,652
560,051
302,046 (1,728.447) 1,403,369 (821.451)
192,121,007
HSBC Global Investment Funds . _ _ _ -
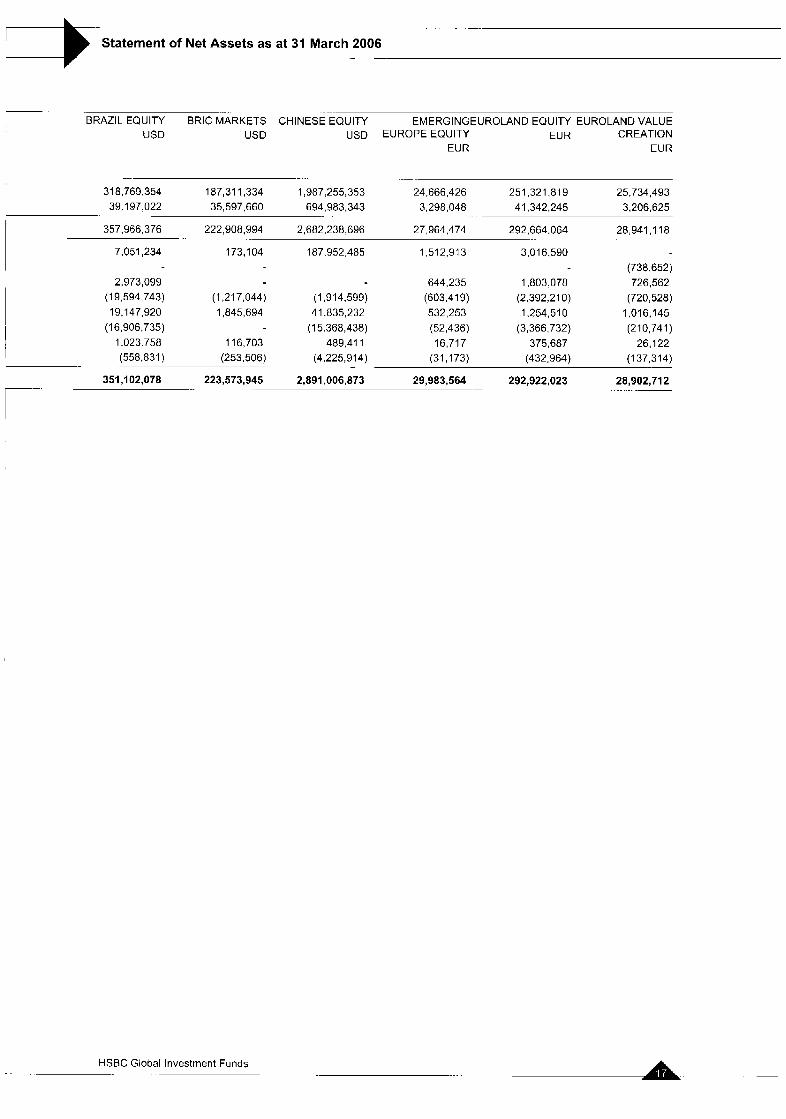
Statement of Net Assets as at 31 March 2006 .. .-
-BRAZIL EQUITY BRIC MARKETS CHINESE-EQUITY EMERGINGEUROLAND EQUITY EUROLAND VALUE USD USD USD EUROPE EQUITY EUR CREATION
EUR EUR I 318,769,354 187,311,334 1,987,255,353 24 666,426 251.321.819 25,734,493 39.1 97.022 35,597,660 694,983,343 3,298,048 41,342,245 3,206,625
357,966,376 222,908,994 2,682,238,696 27,964,474 292,664,064 28,941,118
. .
7,051,234 173,104 187,952,485 1,512,913 3,016.590 (738.652)
2,973,099 644,235 1,803.078 726,562 (19.594.743) (1,217,044) (1,914,599) (603,419) (2.392.210) (720,528) 19,147,920 1,845,694 41,835,232 532,253 1,254,510 1,016,145
(1 6,906,735) (1 5,368,438) (52,436) (3,366,732) (21 0,741 ) 1.023.758 116,703 489.41 1 16,717 375,687 26,122
(1 37.31 4)
28,902,712
.~ (558.831 ) (253,506) (4,225,914) (31,173) (432,964)
292,922,023 . ~- .-
351,102,078 223,573,945 2,891,006,873 29,983,564 7.-
HSBC Global Investment Funds
I -~
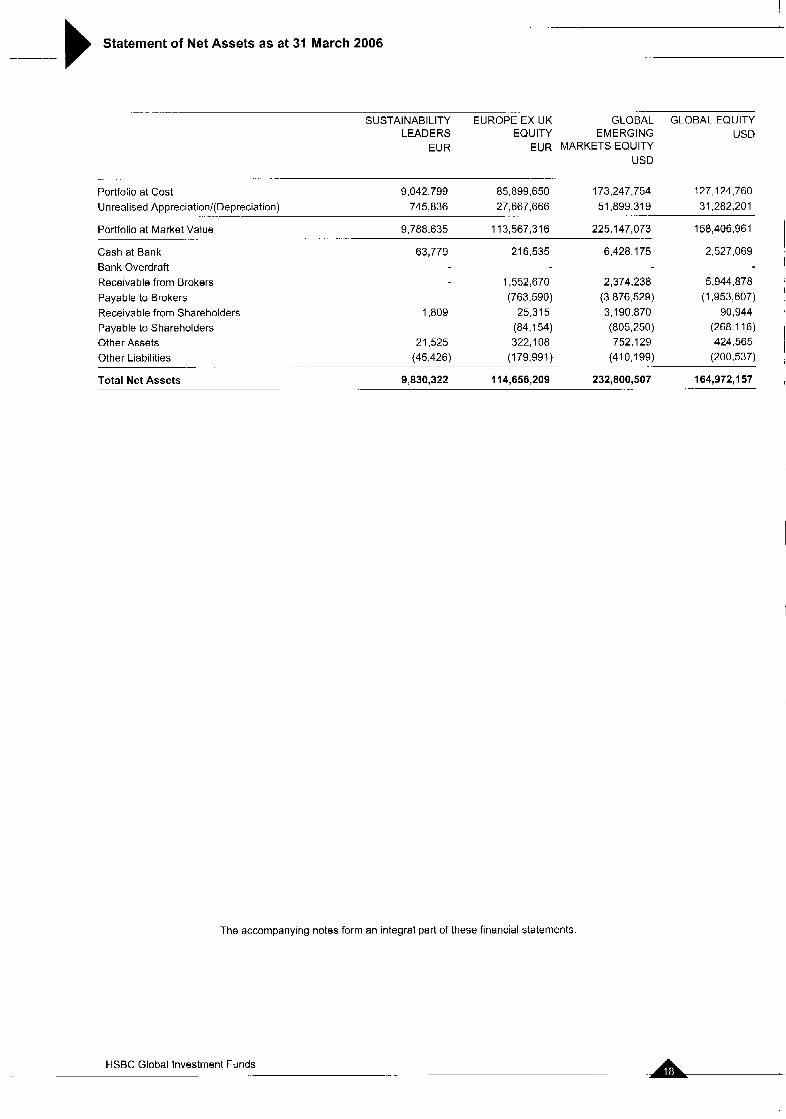
Statement of Net Assets as at 31 March 2006 . .. _. . .-
-_ - SUSTAINABILITY EUROPE EX UK GLOEZL GLOBAL EQUITY
LEADERS EQUITY EMERGING USD EUR MARKETS EQUITY
USD EUR
_-
Portfolio at Cost 9,042,799 85,899,650 173,247,754 127,124,760
Unrealised Appreciation/(Depreciation) 745,836 27,667,666 51,699,319 31,282,201
Portfolio at Market Value 9,788,635 113,567,316 225,147,073 158,406,961
Cash at Bank 63,779 216,535 6,428 175 2,527,069
- . .~
_ - ~
Bank Overdraft Receivable from Brokers Payable to Brokers Receivable from Shareholders Payable to Shareholders Other Assets Other Liabilities
Total Net Assets
. _.
1,552:670 (763,590)
1,809 25.31 5 (84,154)
21,525 322,108 (45,426) (179,991)
9,830,322 114,656,209
2,374.238 (3.876529) 3,190,870 (805,250) 752,129
(41 0,199)
232,800,507 ~
5,944,878 (1,953:607)
90,944 (268.1 16) 424,565
(200,537)
164,972,157
The accompanying notes form an integral part of these financial statements.
HSBC Global Investment Funds -. .- .
-~ .~
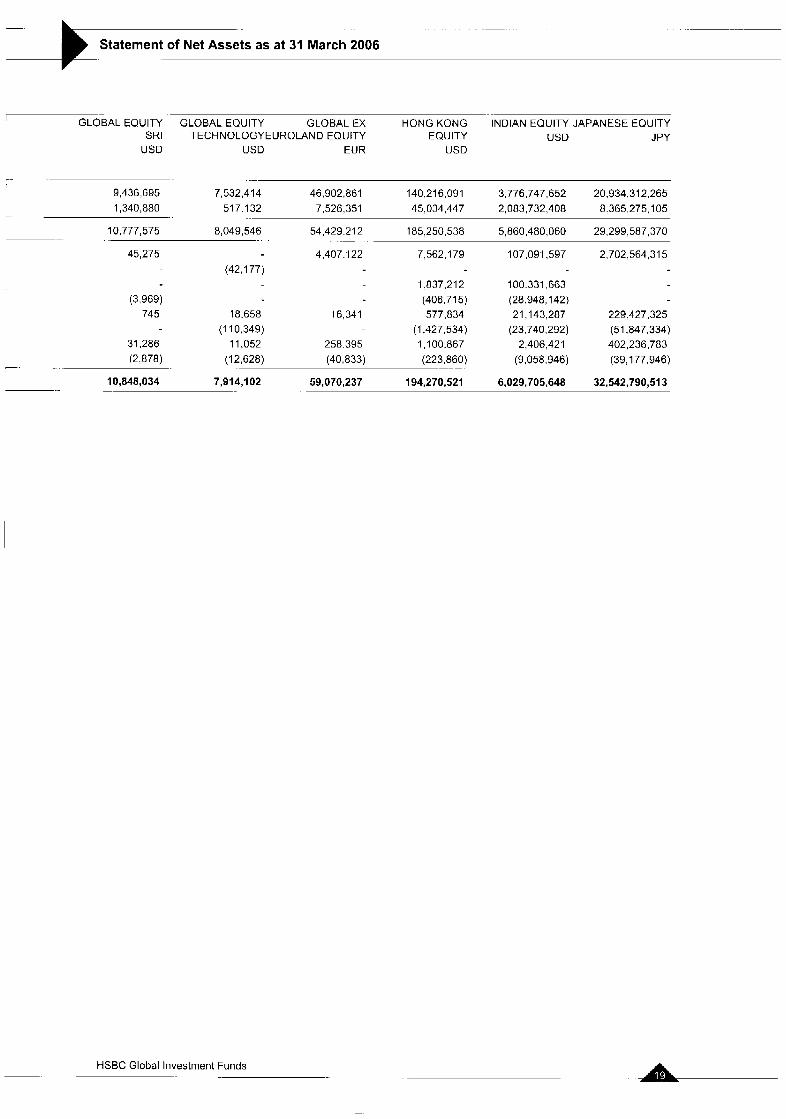
Statement of Net Assets as at 31 March 2006
I ..
GLOBAL EQUITY GLOBAL EQUITY GLOBAL EX HONG KONG INDIAN EQUITY JAPANESE EQUITY SRI TECHNOLOGYEUROLAND EQUITY EQUITY USD JPY
USD USD EUR USD
r- I
9,436,695 7,532,414 46,902,861 140,216,091 3,776,747,652 20,934,312,265 1,340.880 517.132 7,526,351 45,034,447 2,083,732,408 8,365,275,105
54.429.21 2 185,250,538 5,860,480,060 29,299,587,370
45,275 4,407.1 22 7,562,179 107,091,597 2,702,564,315 ._ -
8,049,546 -.
10,777,575
(42.177) 1 837,212 100,331,663
(3.969) (406.71 5) (28,948,142) 745 18,658 16,341 577,834 21,143,287 229,427,325
(110,349) (1,427,534) (23 740,292) (51,847,334) 31,286 11.052 258 395 1,100.867 2,406,421 402,236,783 (2.878) (12,628) (40,833) (223,860) (9,058,946) (39,177,946)
qo,a4a,o34 7,914,102 59,070,237 194,270,521 6,029,705,648 32,542,790,513
- .-
HSBC Global Investment Funds Ifh
Statement of Net Assets as at 31 March 2006 .- . . . . .
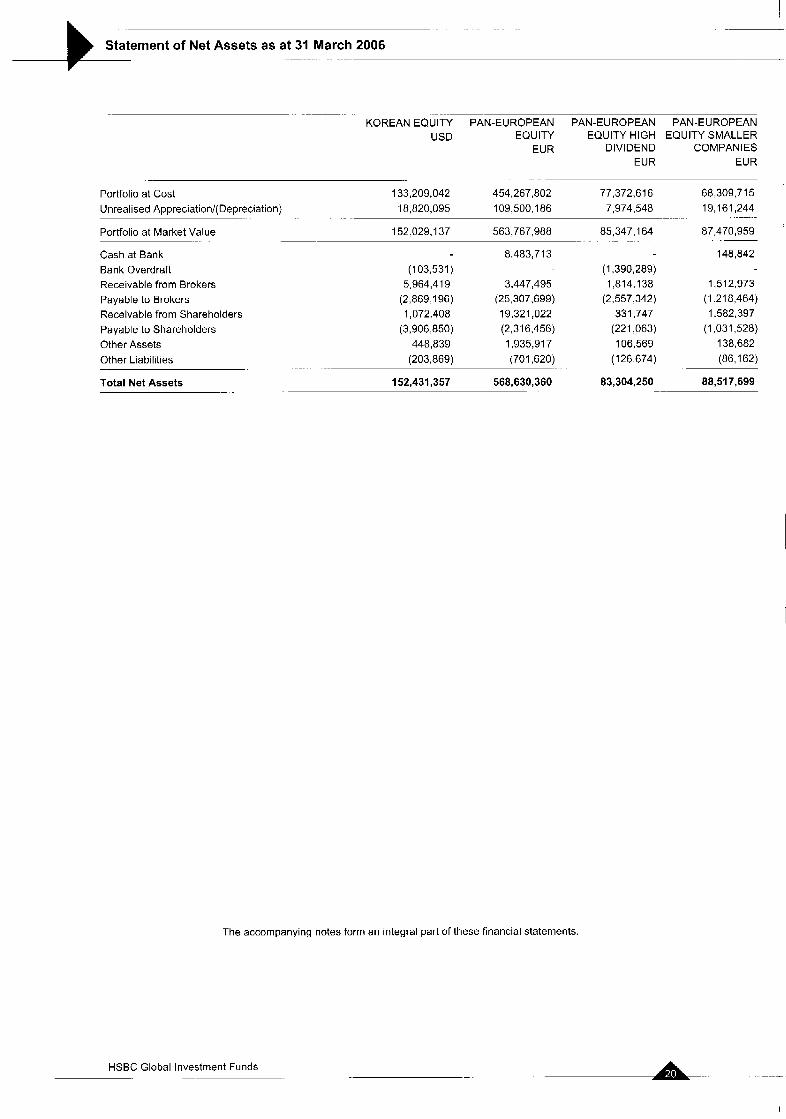
~ . . . . . . .
KOREAN EQUITY PAN-EUROPEAN PAN-EUROPEAN PAN-EUROPEAN USD EQUITY EQUITY HIGH EQUITY SMALLER
EUR DIVIDEND COMPANIES EUR EUR
Portfolio at Cost 133,209:042 454,267,802 77,372,616 60,309,715 19,161,244 Unrealised Appreciation/(Depreciation) 18,820,095 109,500.1 86
87,470,959 Portfolio at Market Value 152:029,137 563,767,988
Cash at Bank 8,483,713 148,842 Bank Overdraft (103,531) (1,390,289) Receivable from Brokers 5,964,419 3,447,495 1,814,138 1,512,973
. . . . . __
. ... ... .- 7,974,540
85,347,164
........
. .~ .- . . . . . . . . . ..
Payable to Brokers Receivable from Shareholders Payable to Shareholders Other Assets Other Liabilities
Total Net Assets -
(2,869.1 96) (25,307,699) (2,557,342) (1.2 1 8,464) 1,072.408 19,321,022 331,747 1,582,397
(3,906,850) (2,316,456) (221,063) (1 -031,528) 448,839 1,935,917 106.569 138,682
(203,869) (701,620) (126,674) (86,162)
88,517,699 . .
. -_ 152,431,357 568,630,360 83,304,250
The accompanying notes form an integral part of these financial statements.
HSBC Global Investment Funds ._ L-. ..
I
.-- - - -
Statement of Net Assets as at 31 March 2006
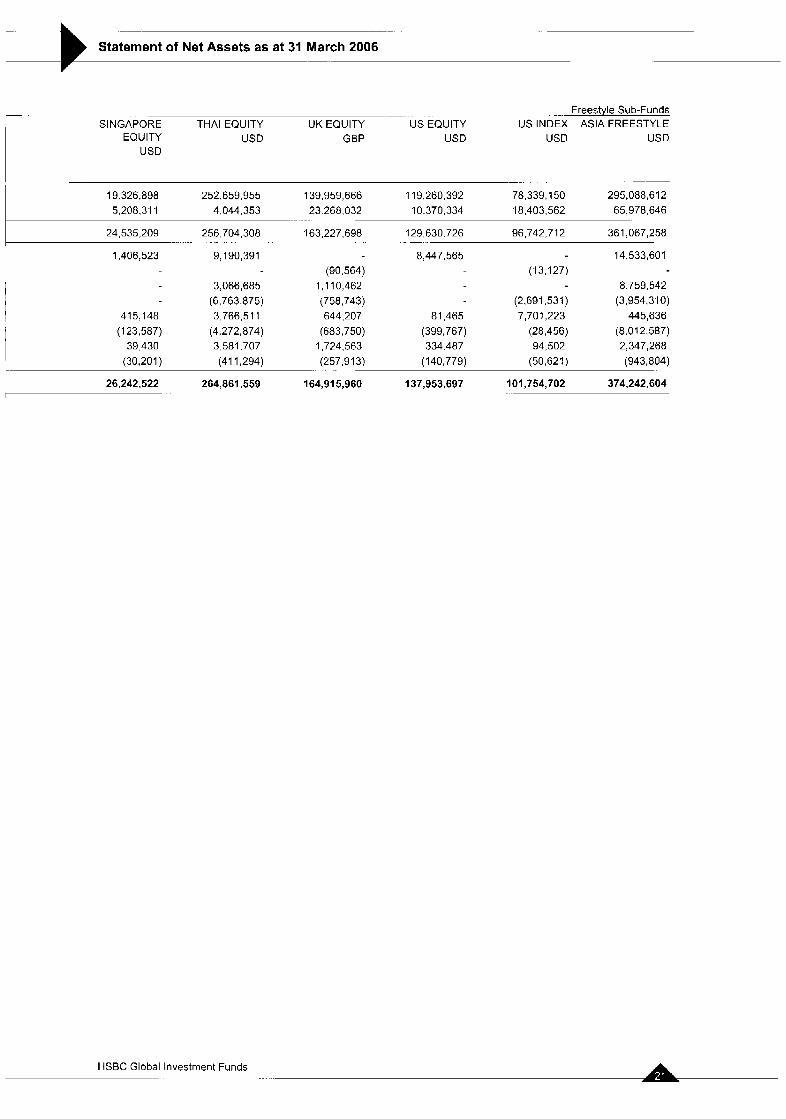
Freestyle Sub-Funds US INDEX ASIA FREESTYLE
EQUITY USD GBP USD USD USD
- . -. ... .
I SINGAPORE THAI EQUITY UK EQUITY US EQUITY
USD
19 326,898 252,659,955 139,959,666 119,260,392 78,339,150 295,088,612 5,208,311 4,044,353 23 268,032 10,370,334 18,403,562 65,978.646
24,535,209 256,704,308 163,227,698 129,630 726 96,742,7 1 2 361,067,258 . ..
.-
1,406,523 9,190,391
3,066,685 (6.763.875)
41 5.148 3,766,511 (123,587) (4,272,874) 39 430 3,581.707 (30.201 ) (41 1,294)
(90,564) 1 ,I 10,462
644,207 (683,750) 1,724,563 (257,913)
(758,743)
. .
8,447.565 (1 3,127)
(2,691,531) 81,465 7,701,223
(399,767) (28,456) 334.487 94,502 (140,779) (50,621)
14,533,601
8.759.542 (3,954,3 1 0) 445,636
(8,012,587) 2:347,268 (943,804)
26,242,522 264,861,559 164,915,960 137,953,697 101,754,702 374,242,604 .. .
HSBC Global Investment Funds . . . .. ..
Statement of Net Assets as at 31 March 2006 .- -
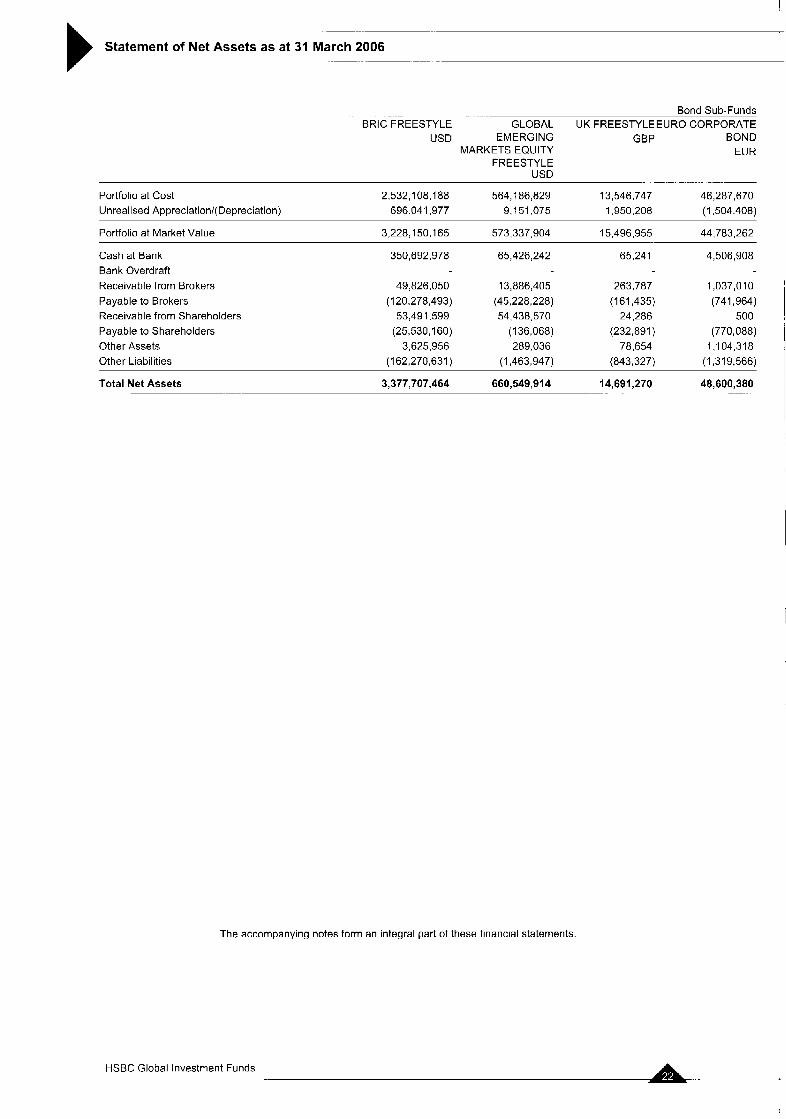
. . Bond Sub-Funds BRlC FREESTYLE GLOBAL UK FREESTYLEEURO CORPORATE
USD EMERGING GBP BOND MARKETS EQUITY EUR
FREESTYLE USD
- - .. . ...
Portfolio at Cost Unrealised Appreciationl(Depreciati0n)
2,532,108,188 564,l 86,829 13,546,747 46,287,670 696:041,977 9,151,075 1,950,208 (1.504.408)
Portfolio at Market Value 3,228,l 50.1 65 573,337,904 15,496,955 44.783.262
Cash at Bank Bank Overdraft Receivable from Brokers Payable to Brokers Receivable from Shareholders Payable to Shareholders Other Assets Other Liabilities
350,692,978
49:826,050 (1 20.278,493) 53,491,599 (25,530,160) 3,625,956
(162,270:631)
65,426,242
13,886,405 (45,228,228)
(1 36,068) 289,036
(1 :463,947)
54,43a,570
65,241
263,787 (161,435) 24.286
(232,891 ) 78,654
(843,327)
4,506,908
1,037,010 (741,964)
500 (770,088) 1,104,318 (1,319,566)
Total Net Assets 3,377,707,464 660,549,914 14,691,270 48,600,380 -. .
The accompanying notes form an integral part of these financial statements.
HSBC Global Investment Funds ...
__ ..
Statement of Net Assets as at 31 March 2006 . .-
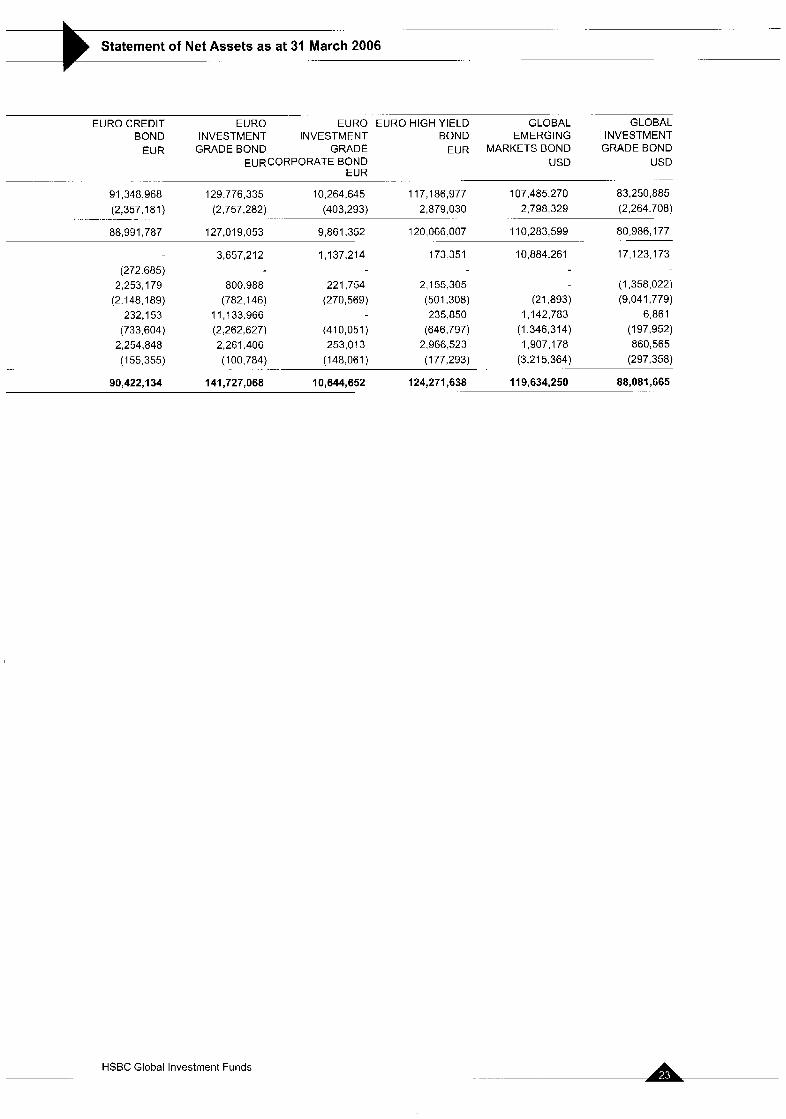
- EURO CREDIT EURO EURO EURO HIGH YIELD GLOBAL GLOBAL
BOND INVESTMENT INVESTMENT BOND EMERGING INVESTMENT EUR GRADE BOND GRADE EUR MARKETS BOND GRADE BOND
EURCORPORATE BOND USD USD
91,348,968 129,776,335 10,264,645 117,186,977 107.485.270 83,250,885 (2,357,181) (2,757,282) (403,293) 2,879,030 2,798,329 (2,264.708)
80,986,177 88,991,787 127,019.053 9,861.352 120.066.007 110,283,599
3,657.21 2 1 ,I 37.214 173.351 10,884:261 17,123.1 73
2.253:179 800.988 221,754 2,155,305 (1,358,022) (2.148.1 89) (782,146) (270,569) (501,308) (21,893) (9:041,779) 232.153 11,133,966 235,850 1,142,783 6,861 (733,604) (2,262,627) (41 0,051) (646,797) (1,346,314) (1 97,952) 2,254,848 2,261,406 253,013 2,966,523 1,907,178 860,565
(1 00,784) (148.061 ) (177,293) (3,215.364) (297,358) (155,355)
88,081,665
.- .- .. . . EUR
~ . . . . .. ..
. . . . -. . .- ..
.~
(272.685)
. . ..
. ... . 90,422,134 141,727,068 10,644,652 124,271,638 11 9,634,250
HSBC Global Investment Funds
I ._
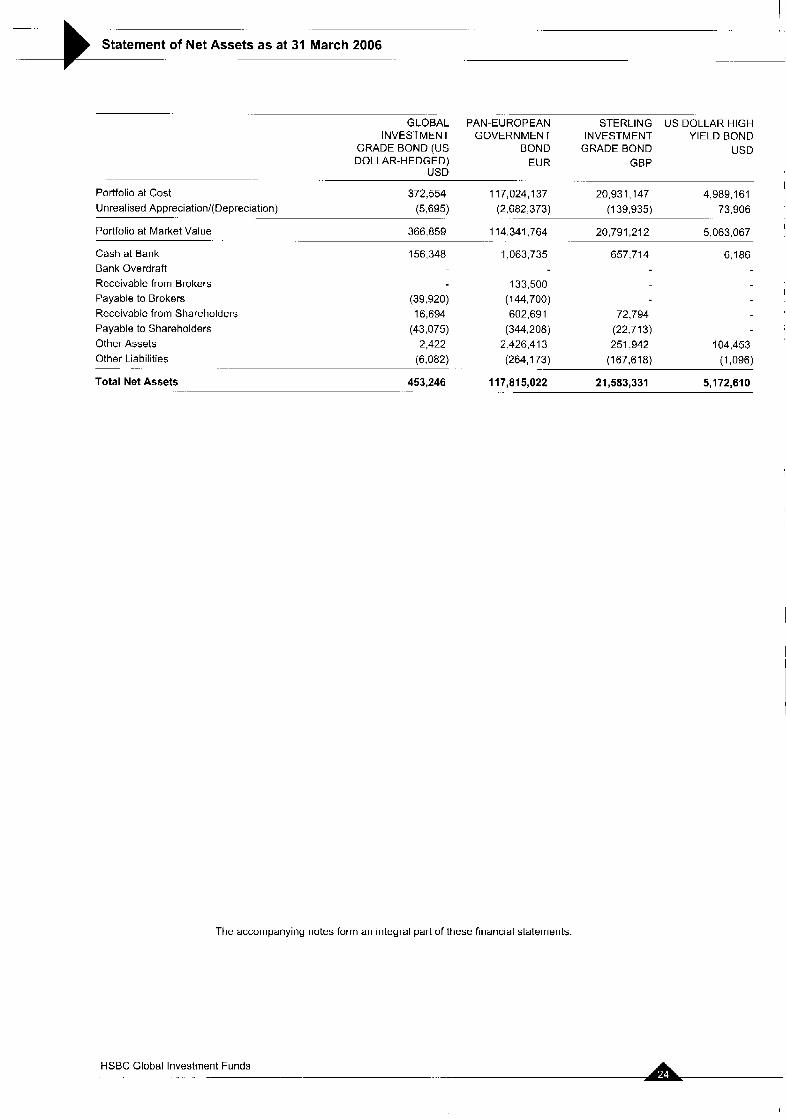
Statement of Net Assets as at 31 March 2006 - b -
GLOBAL INVESTMENT
GRADE BOND (US
USD
Portfolio at Cost 372,554 Unrealised Appreciation/(Depreciation) (5,695)
Portfolio at Market Value 366,859
Cash at Bank 156,348 Bank Overdraft Receivable from Brokers Payable to Brokers (39,920) Receivable from Shareholders 16,694 Payable to Shareholders (43,075) Other Assets 2,422 Other Liabilities (6,082)
Total Net Assets 453,246
DOLLAR-HEDGED) .-
__ ~ _ _
PAN-EUROPEAN GOVERNMENT
BOND EUR
STERLING US DOLLAR HIGH INVESTMENT YIELD BOND
GRADE BOND USD GBP
1 17,024,137 (2,682,373)
20,931,147 4,989,161 (1 39,935) 73,906
114,341,764
1,063,735
. 20:791,212 5,063,067
657,714 6,186
133,500 (144,700) 602,691 72,794
(344,208) (22.71 3)
(264,173) 2,426,413 251.942 104,453
(1 67,618) (1,096)
117,815,022 21,583,331 5.1 72,610 . _.
The accompanying notes form an integral part of these financial statements
HSBC Global Investment Funds .- .~ --
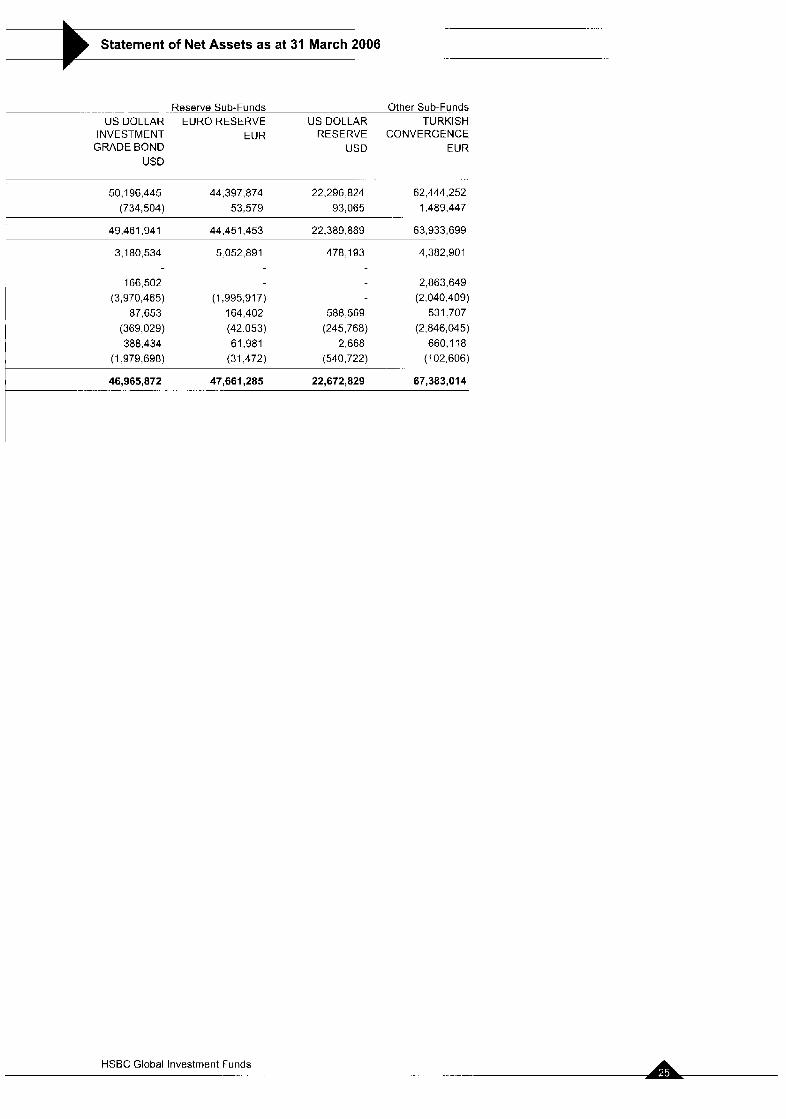
Statement of Net Assets as at 31 March 2006
. . ... .~ Reserve Sub-Funds Other Sub-Funds US DOLLAR EURO RESERVE US DOLLAR TURKISH
INVESTMENT EUR RESERVE CONVERGENCE GRADE BOND USD EUR
USD
50.1 96,445 44,397,674 22,296.824 62,444,252 (734,504) 53,579 93:065 1.489.447
I 49,461,941 44,451,453 22,389.889 63,933,699
3,180,534 5.052,89 1
166,502 (3,970,465) (1,995.917)
87.653 164,402 (369,029) (42.053) 388,434 61.981
(1 :979,698) (31,472)
478 193 4,382,901
2,863,649 (2,040,409)
588,569 531.707 (245,768) (2,846,045)
2,668 660.1 18 (540,722) (1 02,606)
HSBC Global Investment Funds .
- .
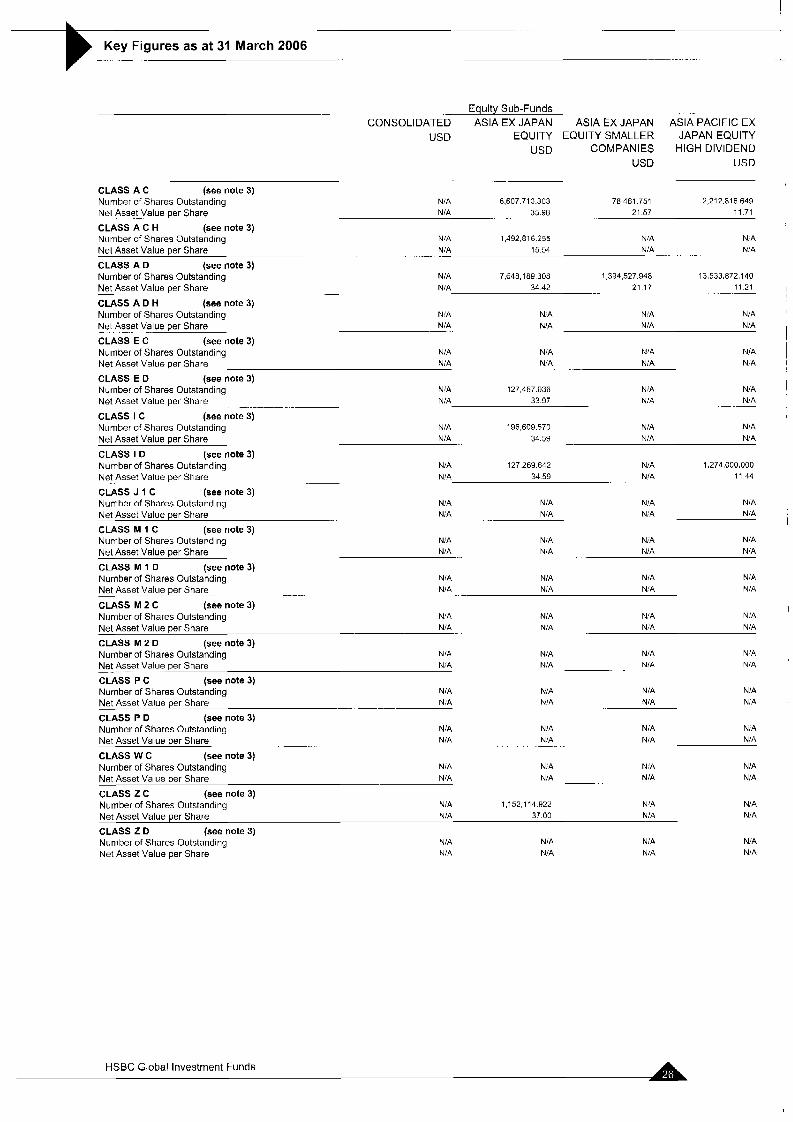
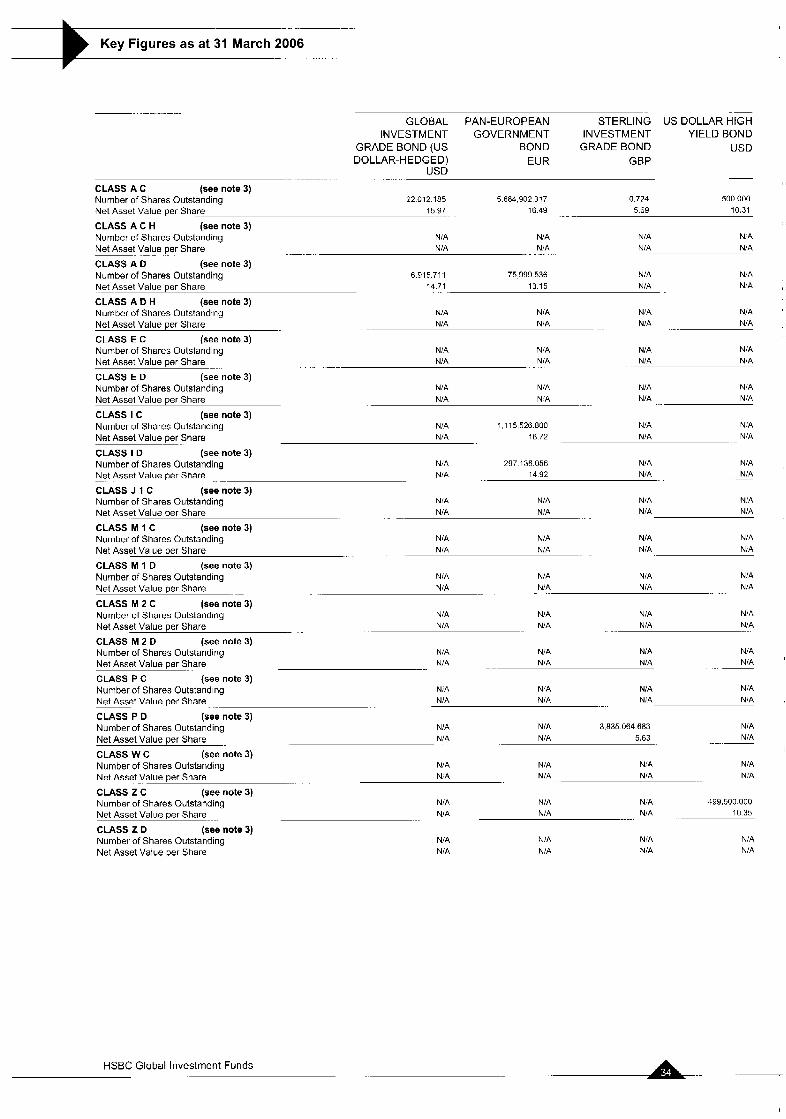
b Key Figures as at 31 March 2006
Equity Sub-Funds CONSOLIDATED ASIA EX JAPAN ASIA EX JAPAN-. ASIA PACIFIC EX
USD EQUITY EQUITY SMALLER JAPAN EQUITY USD COMPANIES HIGH DIVIDEND
USD USD
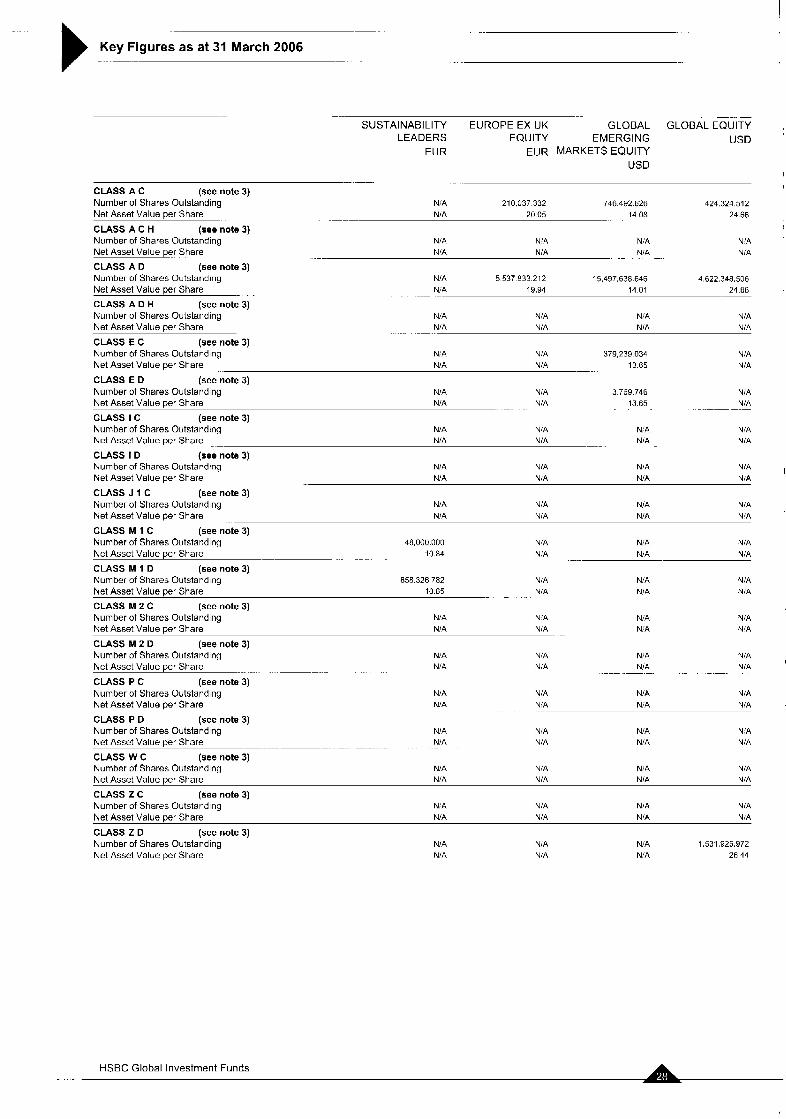
CLASS A C (see note 3) Number of Shares Outstanding N!A 6.607 710.303 78 461.751 2,212.816 649
NiA 35 98 21 57 11 71 Net A s s e t v a l u e per Share . . .
CLASS A C H
Net Asset Value per Share
CLASS A D Number of Shares Outstanding NiA 7.648,189 308 1 394,527.948 13,533.872.140
11.21
(see note 3) Number of Shares Outstanding NIA 1,492.816.255 NIA NiA
N:A 15 54 N:A N 'A - . . . . .
(see note 3)
. Net Asset Value per Share NIA 34 42 21 17
Net -. . Asset . . . . Value per Share -- .. .. .....
CLASS A D H (see note 3) Number of Shares Outstanding N 'A NIA NIA NiA
N 'A N!A N!A - N:A
CLASS E C (see note 3) Number of Shares Outstanding N:A N,A N 'A NIA Net Asset Value per Share NiA N:A NIA N:A
CLASS E D Number of Shares Outstanding NiA 127 467 036 NiA NiA
NIA Net Asset Value per Share
CLASS I C Number of Shares Outstanding N!A 196,609.570 N!A NIA
34.59 N:A N!A Net Asset Value per Share
CLASS I D
Net Asset Value per Share NIA 34.59 NIA 11 44
CLASS J 1 C Number of Shares Outstanding NIA N:A NIA NiA Net Asset Value per Share NiA N ,A N:A N:A
CLASS M 1 C
. . . .
(see note 3)
. - N:A 33.97 N:A - . ....
(see note 3)
... .- N:A
. . .
(see note 3) Number of Shares Outstanding NiA 127 269.642 NiA 1.274,OOO.OOO
...... - ...
(see note 3)
...
(see note 3) Number of Shares Outstanding N:A NIA N;A NiA Net Asset Value per Share NIA NiA NIA N 'A
CLASS M 1 D Number of Shares Outstanding NiA NIA NiA NiA Net Asset Value per Share - NIA NIA N!A N!A
CLASS M 2 C Number of Shares Outstanding N 'A NIA N!A N!A Net Asset Value per Share N!A NIA N:A N:A
Number of Shares Outstanding N !A NiA N!A N:A Net Asset Value-per Share NiA N:A NiA N,A
Number of Shares Outstanding NiA NiA NIA N!A Net Asset Value per Share N:A NIA NiA NiA
Number of Shares Outstanding N !A N 'A NIA NiA
N :A NiA NIA Net Asset Value per Share
(see note 3)
(see note 3)
. .
CLASS M 2 D (see note 3)
. . -. .... .
CLASS P C (see note 3)
CLASS P D (see note 3)
. -. ...... NiA
CLASS W C (see note 3) Number of Shares Outstanding NiA NIA N:A N!A Net Asset Value per Share N 'A NIA N!A N,'A
Number of Shares Outstanding NIA 1,152 114.922 N 'A N!A Net Asset Value per Share N!A 37.00 N!A N/A
Number of Shares Outstanding N!A NiA NiA N:A Net Asset Value per Share N:A N:A NiA NIA
CLASS 2 C (see note 3)
-.
CLASS Z D (see note 3)
HSBC Global Investment Funds
.- .. ......... _ -. ........ -. .
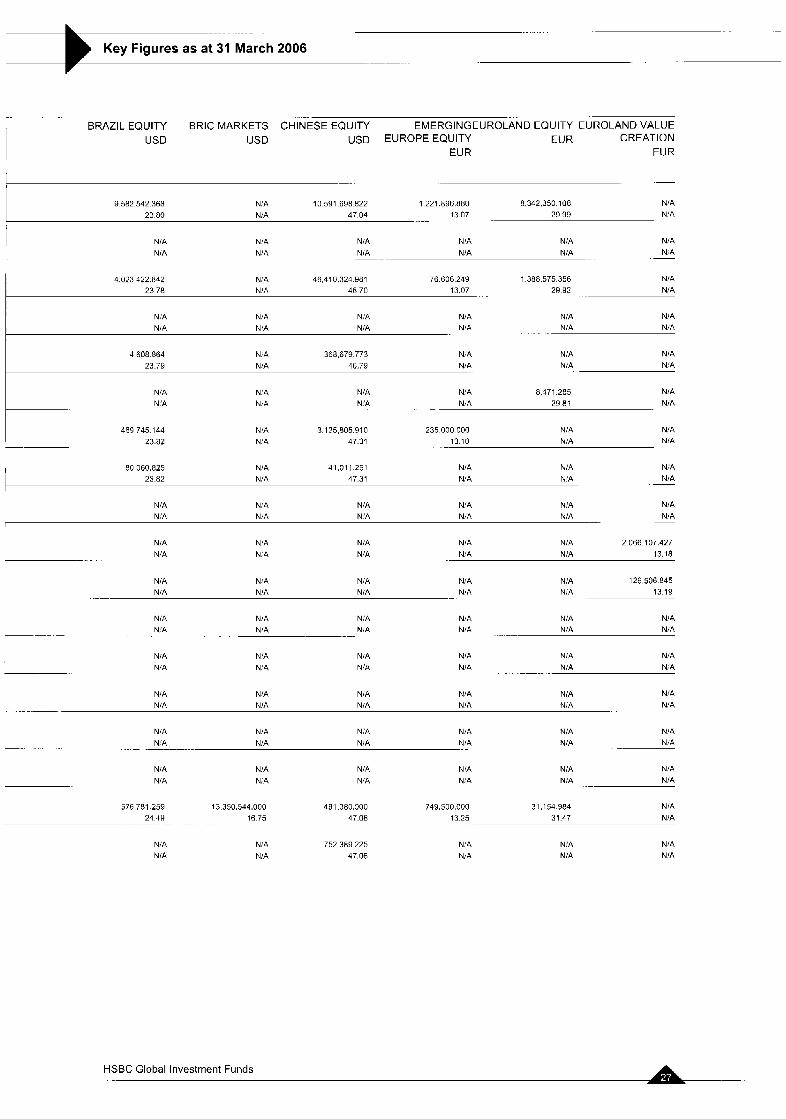
Key Figures as at 31 March 2006 . . .
.-
BRAZIL EQUITY BRlC MARKETS CHINESE EQUITY EMERGINGEUROLAND EQUITY EUROLAND VALUE USD USD USD EUROPE EQUITY EUR C RE AT1 ON
EUR EUR
.~ _. .
9 5a2.542 368 N:A IO 591.698 922 1 221.896.880 a.342,350 l o a N'A 23 a0 NiA 47.04 13.07 29.99 N 'A
I NiA N'A NiA N 'A NIA NiA NiA N 'A NiA N 'A NIA NIA ~- ~
4,023,422,842 N,'A 46,410.324 4H1 76.606 249 I 388,575 356 N'A 23 7a N 'A 46.70 13.07 29 92 NiA
...
N:A NIA N:A NIA NiA N'A N 'A NiA N'A NIA NiA NiA -. . . . . .
4 608.864 NIA 368,679 773 NIA N:A NIA 23.79 N 'A 46.79 NiA NiA N!A
....
N'A N 'A N 'A N 'A a . 4 7 1 . 2 ~ NiA N:A N.A N!A N:A 29 81 NiA
I 469 745 144 N 'A 3 135 805 910 235 000 000 N:A N!A 23 82 N 'A 47 31 13 10 N'A NIA -~
80,060.825 N 'A 41,011 251 N'A NiA NiA 23 a2 N.A 47 31 N!A N 'A NiA
~
N 'A N.A N 'A N 'A NIA NiA N,A N:A NIA N 'A N:A N!A
I - ~
NIA N 'A NIA N'A NIA 2066107427 N 'A N.A N 'A N 'A NIA 13 18 .- -.
NiA N,A N,A NiA N!A 126,506 a45 N'A N 'A NiA N,A NiA 13 19 _ _
NiA NiA N,A N,A NiA N'A N!A N 'A NIA N 'A N'A NiA -.
N'A N 'A N,A N'A NiA NiA N!A N 'A N'A N'A NIA NIA - ~~ ........
N'A N'A
N 'A N!A
NiA NiA
NiA N 'A
NiA NiA
N!A N!A
N,A N 'A N,A N,A NiA N'A N!A N 'A N'A N 'A NIA NiA _. ...
N'A N 'A N,A NiA NiA N:A NiA N,A N!A N:A N'A NIA
576,781 259 13 350.544.000 481 380.300 749.500.000 31,154 984 NiA 24 49 16.75 47.06 13.25 31.47 N IA . . ... - . _. ... . .
N:A NiA
NiA 752.389 225 NIA 47.06
N:A N,A
N 'A N:A
NiA N 'A
HSBC Global Investment Funds ..
-_
Key Figures as at 31 March 2006 . . -
..
- .... -_ ..... ._ .-
SUSTAINABILITY EUROPE EX UK GLOBAL GLOBAL EQUITY , LEADERS EQUITY EMERGING USD
EUR MARKETS EQUITY USD
EUR
.. . I CLASS A C (see note 3)
424.324.512 Number of Shares Outstanding NiA 210.037 332
Net Asset Value per Share . NiA 20 05 14 08 24.66
Number of Shares Outstanding NiA N 'A NiA N!A Net Asset Value per Share N 'A N iA NIA NiA
746.492 626
. . .-- __ CLASS A C H (see note 3)
CLASS A 0 (see note 3) Number of Shares Outstanding N!A 5 537 833.212 15,497,638 646 4,622.348.506 Net Asset Value per Share .. NiA 19.94 14 01 24.66
Number of Shares Outstanding NiA N!A NiA N:A NiA NiA N IA NiA
. - CLASS A D H
Net Asset Value per Share
CLASS E C
Net Asset Value per Share
CLASS E D
(see note 3)
. ..... . .
(see note 3) Number of Shares Outstanding N:A N 'A 379,239 034 N!A
NIA N:A 13.65 N:A . .
(see note 3) Number of Shares Outstanding NIA NiA 3 769 746 NIA
N!A Net Asset Value per Share N/A N!A 13.65 . . . - -. . .
CLASS I C Number of Shares Outstanding NIA NIA N:A N!A
N/A N/A NiA NiA Net Asset Value per Share
CLASS I D
(see note 3)
. .. - (see note 3)
Number of Shares Outstanding NIA N/A NiA NIA I Net Asset Value per Share N!A NiA N!A NIA
CLASS J 1 C Number of Shares Outstanding NiA N:A NIA NiA
NIA NiA N!A NIA Net Asset Value per Share
CLASS M 1 C
Net Asset Value per Share
CLASS M 1 0
(see note 3)
...
(see note 3) Number of Shares Outstanding 48,000 000 N 'A NiA NiA
10.84 N!A NiA NiA . .- .. . .- .. . .
(see note 3) Number of Shares Outstanding 058.326 782 NIA N;A N!A Net Asset Value per Share 10.85 N:A NIA NiA
CLASS M 2 C Number of Shares Outstanding N:A N!A NiA N:A Net Asset Value uer Share NIA NIA N:A NIA
_- .. ..
(see note 3)
CLASS M 2 0 Number of Shares Outstanding
CLASS P C Number of Shares Outstanding Net Asset Value per Share
CLASS P D Number of Shares Outstanding Net Asset Value per Share
CLASS W C Number of Shares Outstanding Net Asset Value aer Share
(see note 3)
Net Asset Value per Share .. ..
(see note 3)
(see note 3)
(see note 3)
N:A NiA
NiA N!A
NIA N 'A - _
N!A NiA
N!A NiA NiA , N,A NIA NiA
.- . -. -.
NiA N!A NIA N!A NiA NiA .-
NIA N!A
N!A N/A
N/A NiA
NiA N IA
N!A N:A
N:A NIA
CLASS 2 C Number of Shares Outstanding N:A N/A NiA NiA Net Asset Value per Share N/A N:A N 'A NIA
(see note 3)
CLASS 2 D (see note 3) Number of Shares Outstanding NIA NiA N:A 1,531,925 972 Net Asset Value per Share NIA NIA N,A 26 44
HSBC Global Investment funds . ..
.. ......... .... . .
Key Figures as at 31 March 2006 . . . ................
GLOBAL EQUITY GLOBAL EQUITY GLOBAL EX HONG KONG INDIAN EQUITY JAPANESE EQUITY SRI TECHNOLOGYEUROLAND EQUITY EQUITY USD JPY
USD US0 EUR USD
........... . . . -~ . . ............. ....
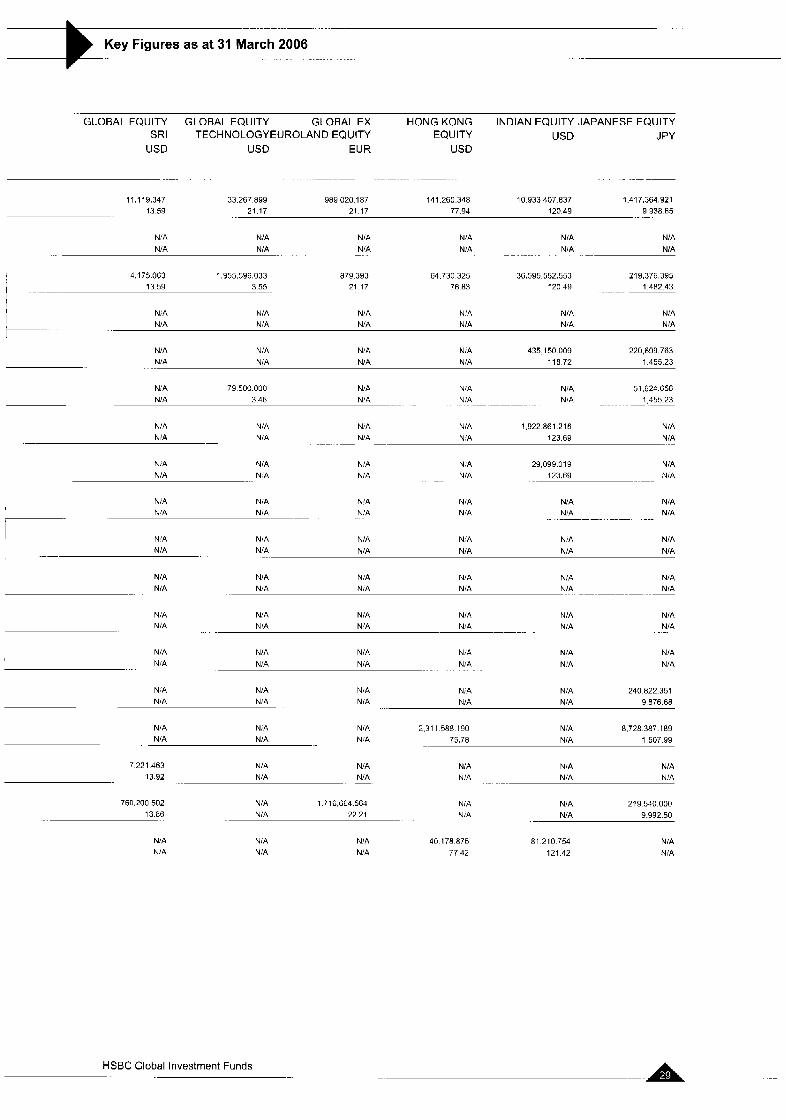
1.417,364.921 9,938.65
11 .I 19.347 33.267 899 989 020.187 141.260.348 10.933.407.837 21.17 21.17 77.94 120.49 .- .- 13.59 ..
N:A NIA NiA NIA NIA NIA N 'A NIA NIA NIA N/A NiA .. ...... ...
4 175 063 1,955.596.033 13 59 3 55 I - - - - -
879 393 64 730 325 36 595.552 553 21 17 76 a3 120 49 ...
219,376.395 1.482 43
I N:A NIA NIA N 'A NIA NIA NIA N/A N:A NIA NIA N /A
---
N!A N:A NiA NIA 435,150 009 220,699 763 NiA NiA NIA N 'A 11872 1,455 23 .-
51,624.656 1 455.23
NiA 79 500.000 NiA NIA NIA NIA 3.46 N 'A N!A NIA
~ -~ ....... . . . . . ......
N:A NiA NiA NiA 1.922861 216 NIA NIA N /A NiA N'A N!A 123 69 ._ -. .- _- .....
NiA NiA N!A N:A 29.099.01 9 NIA 123.69 NiA N/A N:A NiA .... NIA . . . . ...
NiA NiA NIA N'A NIA NIA N:A N 'A NIA NIA NIA
-. ... ........... -- .... NiA
NIA NIA NIA N:A NiA N/A N!A N!A NIA N/A N/A N/A ....
I NIA NIA N:A N!A N/A NIA
NIA NiA NiA NiA N/A NIA ~ . . .
N:A N!A NiA NIA NIA NIA N:A NiA NIA NiA NIA N!A . . . - . ....
NIA N/A NiA NiA NIA NIA N:A N:A NiA NiA NIA NIA ... . . . . . . . . . .
N:A N/A NiA NiA N 'A 240 822 351 NiA NIA NIA N/A 9 876 68 NiA -
NIA NiA NiA 2 311 588 190 N/A 8,728 387 189 N IA NIA N:A 75 70 N/A 1 507 99 ..
7 221 463 NIA N:A NiA NIA NIA 13 92 NiA N 'A N 'A NiA N 'A
.- . -
760 200 502 N:A 1 716 664 564 NiA N/A 219 540 000 13 86 NiA 22 21 NIA N/A 9 992 50 -
NiA NIA
NiA N 'A
HSEC Global Investment Funds
NIA 40 178 875 81 210 754 N!A 77.42 121 42
NIA NIA
.. -
Key Figures as at 31 March 2006 _. . -.
Bond Sub-F& BRlC FREESTYLE GLOBAL UK FREESTYLEEURO CORPORATE
USD EMERGING GBP BOND MARKETS EQUITY EUR
FREESTY LE USD
-
CLASS A C Number of Shares Outstandino
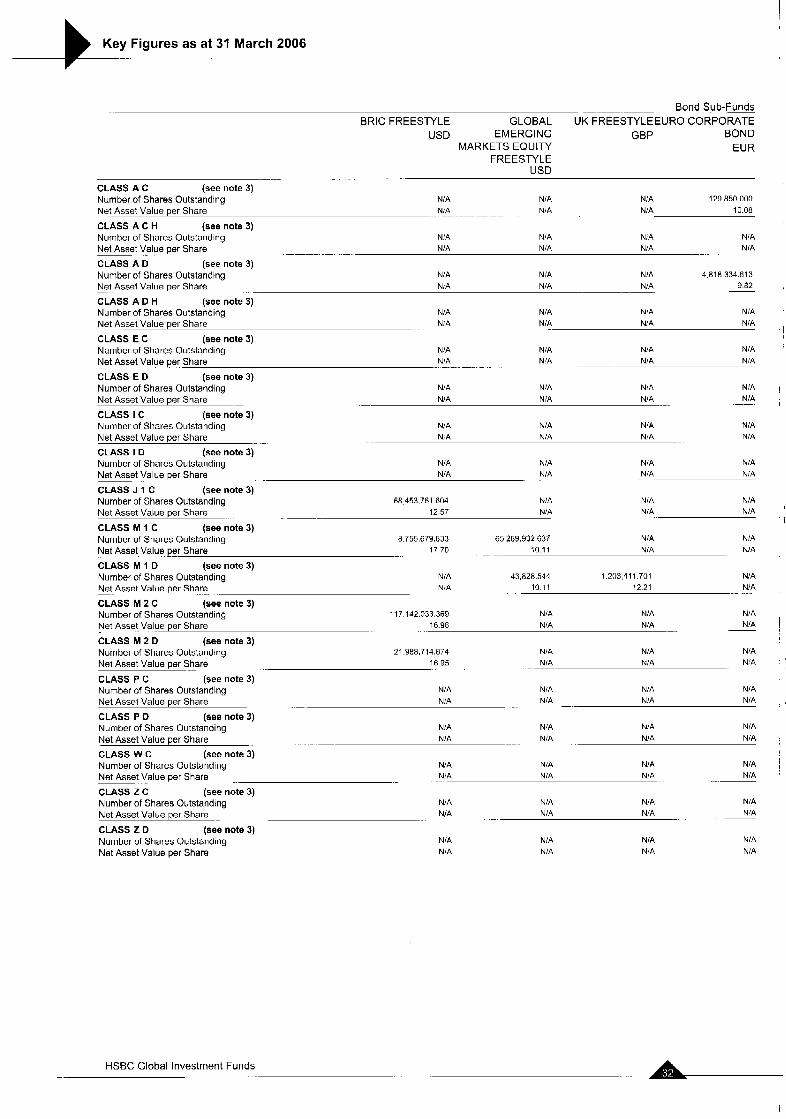
(see note 3) NIA NIA N:A 129.850 000
Net Asset Value per Share NiA NiA N/A 10 08 ............
CLASS A C H (see note 3) Number of Shares Outstanding N'A N'A NiA NIA
NIA NIA NiA NIA Net Asset Value per Share .. .- . .
CLASS A D (see note 3) Number of Shares Outstanding N:A N/A N IA 4.818 334.613
Net Asset Value per Share NiA N/A N/A 9.82 ~ . -
CLASS A D H (see note 3) Number of Shares Outstanding N/A N:A N'A N/A
Net Asset Value per Share NiA N iA N!A N/A ....
CLASS E C (see note 3) Number of Shares Outstanding N IA NIA NiA N/A
Net Asset Value perSJare N'A N'A NIA N!A
Number of Shares Outstandina NIA NIA NIA N!A
............. .....
CLASS E D (see note 3)
NIA NIA NIA N!A Net Asset Value per Share -- -
CLASS I C Number of Shares outstanding
(see note 3) N:A N/A N 'A NiA N:A N:A N/A NIA Net Asset Value per Share ... ..
CLASS I D (see note 3) Number of Shares Outstanding N/A N/A
N/A Net Asset Value per Share -_ N/A
CLASS J 1 C (see note 3) Number of Shares Outstandina 68 453.761 604 NIA
N 'A NIA
N:A NiA
NIA N/A Net Asset Value per Share 12 57 NIA NIA N/A
CLASS M 1 C Number of Shares Outstandina
(see note 3) 8.755,679.833 65,283,932 637 NiA N/A
Net Asset.Value-ppyShare 17 70 10 11 NiA NIA ........ ...
CLASS M 1 D Number of Shares Outstandina
(see note 3) NIA 43,828.544 1.203 41 1.701 N!A
Net Asset Value per Share. NIA 10.11 12.21 NIA .......
CLASS M 2 C (see note 3) Number of Shares Outstanding 117.lA2.033.369 N!A NIA NIA
N!A ~ ._ . 16.98 NiA NIA Net Asset-Value per Share . .
Net Asset Value per Share
CLASS M 2 D (see note 3) Number of Shares Outstanding 21.988,711.874 NIA NIA N IA
1695 NIA NIA N!A ....
CLASS P C (see note 3) Number of Shares Outstanding NiA NIA N/A NIA Net Asset Value per Share N'A N IA N/A NIA
Number of Shares Outstanding N/A N 'A NIA N/A NIA N'A NiA
CLASS P D (see note 3)
__ . NIA Net Asset Value per Share
Net Asset Value per Share
Net Asset Value per Share .- ... N'A ....
....
CLASS W C (see note 3) Number of Shares Outstanding NiA NIA NIA N:A
NiA ..... . . NiA NIA NIA
. .
CLASS Z C (see note 3) Number of Shares Outstanding NIA N/A N/A NIA
NIA ~ . . N/A N:A
CLASS 2 D (see note 3) Number of Shares Outstanding NIA N /A NIA N/A
Net Asset Value per Share NIA N IA NIA N/A
HSBC Global Investment Funds -. -. . .... L
I
-
Key Figures as at 31 March 2006 ..-. ~ - p i - - ..
-~ EURO CREDIT EURO EURO EURO HIGH YIELD GLOBAL GLOBAL
BOND INVESTMENT INVESTMENT BOND EMERGING INVESTMENT EUR GRADE BOND GRADE EUR MARKETS BOND GRADE BOND
EURCORPORATE BOND USD USD
7
EUR - -
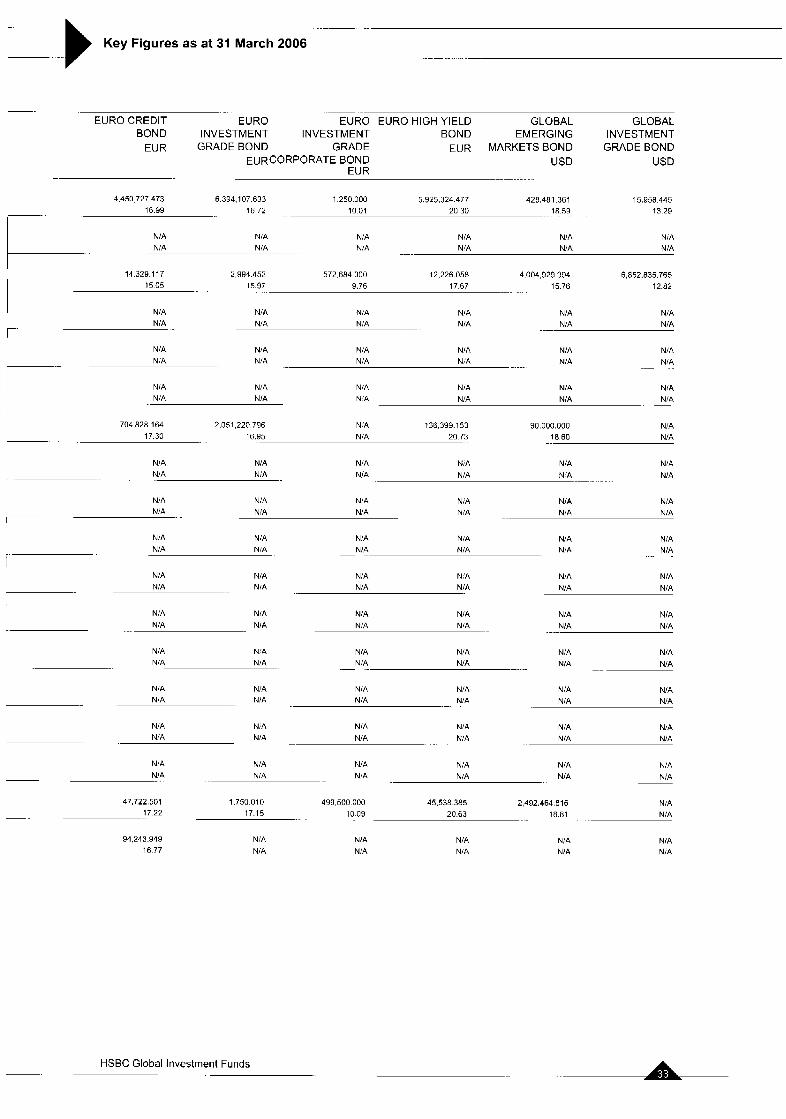
4.450 727 473 6 394.107 633 1 250 300 5.Y25.324 477 428,481 361 15 958 445 16 99 16 72 i o a i 20 30 18 59 13 29 . . r-
N/A NIA N:A NiA NIA NiA I- N/A NiA N'A NIA NIA NIA ..-. .... .
14 329.117 2,994.452 572,684 000 12,226.058 4,004,929 994 6,852.835.765 I... 15 05 15.97 9.76 17.67 15.76 12.82 . ..
NiA N;A NiA NIA N/A N!A NiA N!A N:A NIA NIA N/A
I
__ -- N/A NiA NiA NIA NIA NIA
NIA N;A N:A N:A NiA ..
NIA ._ . . . ..
NIA NiA NIA NiA NIA NIA NiA N/A N!A N:A NiA NIA .- -
70L.828 164 2.051,220.796 N!A 136.399.153 90,000.000 N/A 17.30 16.95 NiA 20 73 18.60 N/A
7- .. ~.
NIA NIA NiA NiA NiA NIA NIA NIA N iA NIA N/A N!A
I
.
NiA N:A NiA NiA N/A N iA N/A N/A N!A NiA N!A
... N!A ---
NiA N:A N /A NIA N!A NIA NIA N/A NIA N/A NIA NIA
. .. . - .. . .
1 . N/A N!A N:A N,'A NiA NiA NIA .. NiA NIA N/A N/A N/A
I NIA NIA N/A N/A NIA NIA
N/A NIA N'A NiA N/A NIA . . .. . ..
NiA N:A N/A NIA N/A NiA N/A NIA NiA N!A N/A
.. N/A ... _ .
NIA N/A NiA N/A N/A N/A N,A NIA NiA N:A N/A N/A _ _
N/A N,A NiA NiA NIA NiA N:A NIA N/A N:A NiA NIA
NiA N/A N:A N:A NiA N:A NIA NiA NiA NIA N/A N/A
47,722.501 1.750 010 499,500.000 45.538 385 2,492.464.816 NIA ~. 17.22 17.15 .. . 10 09 20.63 18.81 NiA
94,243.949 16 77
N/A NiA
NIA NIA
N:A NIA
N/A N/A
N/A NiA
HSBC Global Investment Funds
-.
Key Figures as at 31 March 2006 c-- . ....
~. .... .- . . ._ ....
GLOBAL PAN-EUROPEAN STERLING US DOLLAR HIGH INVESTMENT GOVERNMENT INVESTMENT YIELD BOND
GRADE BOND (US BOND GRADE BOND USD DOLLAR-H EDGED) EUR GBP
USD ~ ...... ..... ... -
CLASS A C (see note 3) Number of Shares Outstanding 22 012 185 5.684.902.317 0.724 500.000
15.97 lfi 49 5.69 10.31 - ... Net Asset Value per Sha[c-
~. Net Asset Value . . . per Share . -. . . . . . .
.
CLASS A C H (see note 3) Number of Shares Outstanding NIA NIA NIA NiA
NIA NIA N/A NIA
CLASS A D (see note 3) Number of Shares Outstanding 6.91 5.71 1 75 999.536 N:A NiA NKAsset Value per Share 14.71 13.15 N/A N:A ,
CLASS A 0 H Number of Shares Outstanding N'A NIA NiA N!A '
. . .
(see note 3)
NIA N 'A N'A N!A ..... Net Asset Value per Share ...
CLASS E C (see note 3) Number of Shares Outstanding NIA NiA NiA NiA
N!A NiA NIA NiA Net Asset Value per Share .. ....
CLASS E D (see note 3) Number of Shares Outstanding N/A NIA N!A N'A
N!A Net Asset Value per Share N/A N!A N/A . .- .....
CLASS I C (see note 3) Number of Shares Outstanding N/A 1,115 526.800 N!A N!A
Net Asset ValuepelShare NiA 16.72 N 'A N!A
Number of Shares Outstanding NiA 297.136.056 N'A NIA , CLASS I D (see note 3)
N:A .- . . 14 92 NIA -. Net Asset Value per Share - - - N'A ..
Net Asset Value per Share
CLASS J 1 C (see note 3) Number of Shares Outstanding NIA N/A N'A N'A
N/A NIA N/A N!A
CLASS M I C Number of Shares Outstanding N IA N:A N/A N/A
N IA N:A NiA NiA Net Asset Value per Share CLASS M 1 D Number of Shares Outstanding NIA NIA NIA NIA Net Asset Value per Share NIA NIA NIA NIA
CLASS M 2 C Number of Shares Outstanding N/A N'A NIA NIA Net Asset Value per Share N/A N!A N!A N!A
Number of Shares Outstanding NIA N/A NiA NiA Net Asset Value per Share NIA NIA NIA
Number of Shares Outstanding NiA N!A NiA NiA Net Asset Value per Share .- NIA NIA NiA NIA
Number of Shares Outstanding NIA N/A 3.835 064.683 NIA Net Asset Value per Share .- N/A N:A 5.63 NiA
Number of Shares Outstanding NIA N 'A N!A N:A Net Asset\lalue per Share NiA NIA NIA N 'A
Number of Shares Outstanding N/A N!A N:A 499,500.000 10 35
. . .....
(see note 3)
. . -.
(see note 3)
.....
(see note 3)
. . ....
CLASS M 2 D (see note 3)
NIA ' .. ~ .. -
CLASS P C (see note 3)
.. ...
CLASS P D (see note 3)
I CLASS W C (see note 3)
....
CLASS Z C (see note 3)
NIA .. NiA .... NIA Net Asset Value per Share-... ...
CLASS Z D (see note 3) Number of Shares Outstanding N/A N/A NIA N:A
Net Asset Value per Share NIA N!A NiA N:A
---- HSBC Global Investment Funds
..
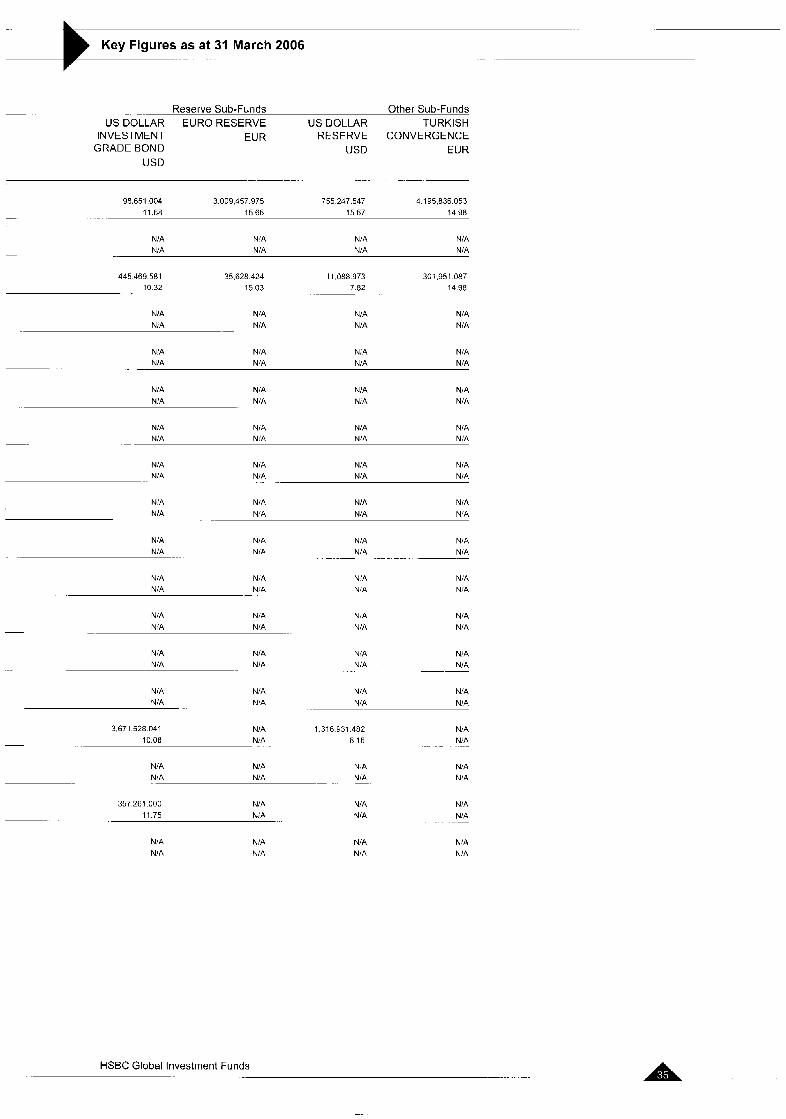
Key Figures as at 31 March 2006 . .
... -. Reserve Sub-Funds Other Sub-Funds US DOLLAR EURO RESERVE US DOLLAR TURKISH
INVESTMENT EUR RESERVE CONVERGENCE GRADE BOND USD EUR
USD
98.651 004 3 009.457 975 755 247 547 4 195.836 053 1 1 68 1566 1567 14 98
I N!A NIA NIA NiA NiA NiA u:A NiA -
445 469 581 35.628 424 I i ,088 973 301.951 087 10 32 15 03 7 82 14 98 I
N/A NiA
N 'A NiA
NIA N!A
N:A NIA
N 'A N 'A NiA N 'A NIA N 'A NIA N:A
. _.
NiA NIA N!A NiA N 'A NiA N,A N 'A
NIA NiA NIA N ,A N:A N!A NIA N:A
~ _
N'A NiA N!A NiA N:A NIA N:A NIA
N 'A N,A NIA NiA NIA N!A NiA N 'A
NiA NiA N 'A NiA N:A NiA N IA
.~ NiA -. .. ............
NiA NiA N 'A NiA NiA N:A NiA N IA -. .. ............
NIA N,A u 'A NiA NiA N:A UIA N:A
NIA N!A
NiA NiA
NIA N:A
N:A NIA
...
NIA NIA N!A N/A NiA N IA N;A NIA
NiA N:A NIA N:A NIA N 'A N:A NIA
3.671 528 041 NIA 1.316 931.482 NiA 10.08 NiA 8.16 NiA -. ... .... .............
N:A NIA N:A NiA NIA N!A NIA NIA __ . -
357 261 000 N:A NiA NIA N'A __ 1 1 75 NiA NiA ~_
NiA NIA
N!A NiA
N:A NIA
NiA N!A
HSBC Global Investment Funds .........
. ~ - -
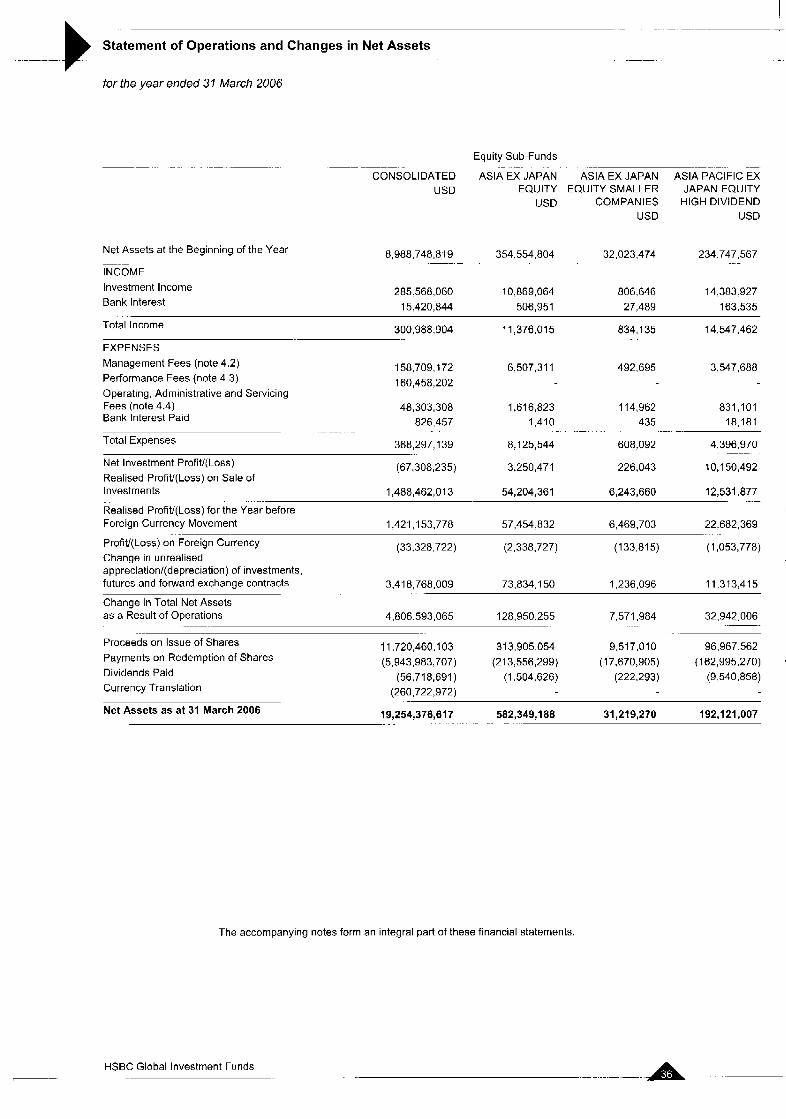
Statement of Operations and Changes in Net Assets
for the year ended 31 March 2006
__ -. .-- - -
~ . . . . . . . . ....
~ - - _
Net Assets at the Beginning of the Year
INCOME ._
Investment Income Bank Interest
Equity Sub-Funds
CONSOLIDATED ASIA EX JAPAN ASIA EX JAPAN USD EQUITY EQUITY SMALLER
USD COMPANIES USD
.... _ _
8,9a8,748,819 354 ~ 554,804 32,023.474
285,568,060 10,869,064 15,420,844 506,951
806,646 27,489
...
ASIA PACIFIC EX JAPAN EQUITY ' HIGH DIVIDEND
USD
I 234,747,567
.. -
14,383:927 '
163,535
300,986,904 11,376.015 834.135 14,547,462 Total Income
EXPENSES
Management Fees (note 4.2) 158,709,172 160,458,202 Performance Fees (note 4.3)
Operating, Administrative and Servicing Fees (note 4.4) 48,303,308
826.457 Bank Interest Paid
Total Expenses 368,297,139
(67,308,235) Net Investment Profit/(Loss) Realised Profit/(Loss) on Sale of Investments 1,488,462,013
Realised Profit/(Loss) for the Year before Foreign Currency Movement 1:421,153,778
.... .....
...
6,507,311
1,616,823 1,410
8,125,544
3,250,471
54,204,361
492,695
114,962 435
608,092
226.043
-. ...
6,243,660
57,454.832 6,469,703
3,547,688
831,101 18,181
4,396,970
10,150,492
12,531.877 .
22,682,369
Profit/(Loss) on Foreign Currency (33,328,722) (2,338,727) (1 33.81 5) (1,053,778) Change in unrealised appreciationl(depreciati0n) of investments. futures and forward exchange contracts 3.418,768.009 73,834,150 1,236,096 11,313:415
Change in Total Net Assets as a Result of Operations 4,806,593,065 128,950,255 7,571,984 32,942,006
Proceeds on Issue of Shares 11,720,460,103 31 3,905,054 9,517,010 96,967,562 Payments on Redemption of Shares (5,943,983,707) (213,556,299) (17,670,905) (162,995,270) Dividends Paid (56,718,691 ) (1 -504,626) (222,293) (9,540,858) Currency Translation (260,722,972)
Net Assets as at 31 March 2006 19,254,376,617 582,349,i aa 31,219,270 192,121,007
-. . .. _ .... ...
. . . . . . . . . . . . . . .
The accompanying notes form an integral part of these financial statements.
HSBC Global Investment Funds ........ -. -. A -
- -
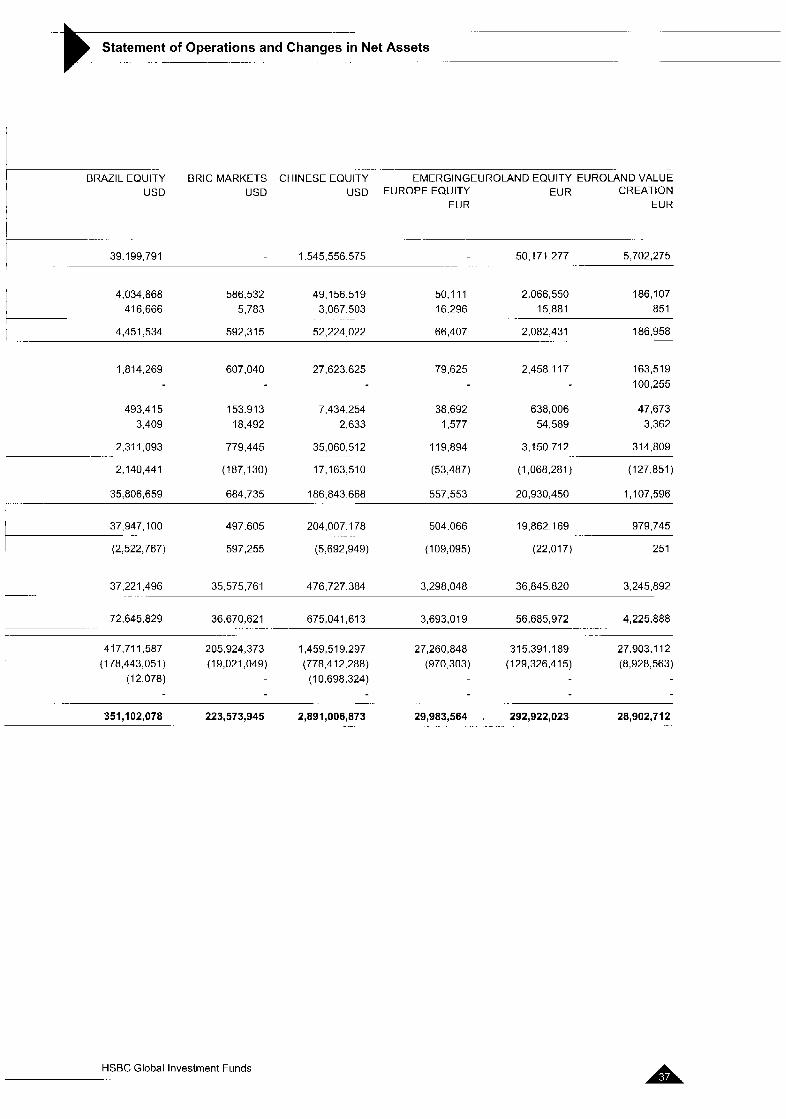
Statement of Operations and Changes in Net Assets .-
..... -
BRlC MARKETS CHINESE EQUITY EM ERG I NG EU ROLAN D EQU ITY E U ROLAN 0 VALU E USD USD EUROPE EQUITY EUR CREATION
EUR EUR
- 7 -----
I 39.1 99,791 1,545,556,575 50,171,277 5,702,275 . . ....
4,034 868 586,532 49,156.51 9 50.1 11 2,066,550 186,107 416,666 5.783 3,067,503 16.296 15,881 851
4,451.534 592,315 52,224,022 66,407 2,082,431 186,958 .- .-
. -. I _- ~
1,814,269 607,040 27,623,625 79,625 2,458,117 163,519 100,255
493.41 5 153 913 7,434,254 38,692 638,006 47,673 3,409 18,492 2,633 1,577 54,589 3,362
314,809 2.31 1,093 779.445 35,060,512 119.894 3,150.71 2
2,140,441 (187,130) 17,163,510 (53,487) (1,068,281) (127,851)
1,107,596
.. -.
- 35 806,659 684,735 186,643,668 557,553 20,930,450
979,745
597,255 (5,692,949) (1 09,095) (22,017 j 251 -
37 947,100 497.605 204,007,178 504.066 19,862,169 ....
37,221,496 35,575,761 476,727,384 3,298,048 36,845,820 3,245,892 .
36.670.621 675,041,613 3,693.019 56,685,972 4,225.888 -. ....... . ...
72,645,829 .....
-. ........ .....
417.71 1,587 205,924,373 1,459,519.297 27,260.848 315,391 .I89 27,903.1 12 (1 78,443,051 ) (19,021,049) (778,412,288) (970,303) (1 29,326,415) (8,928,563)
( 12,078) (10,698,324)
351,102,078 223,573,945 2,891,006,873 .....
29,983,564 292,922,023 28,902,712
HSBC Global Investment Funds
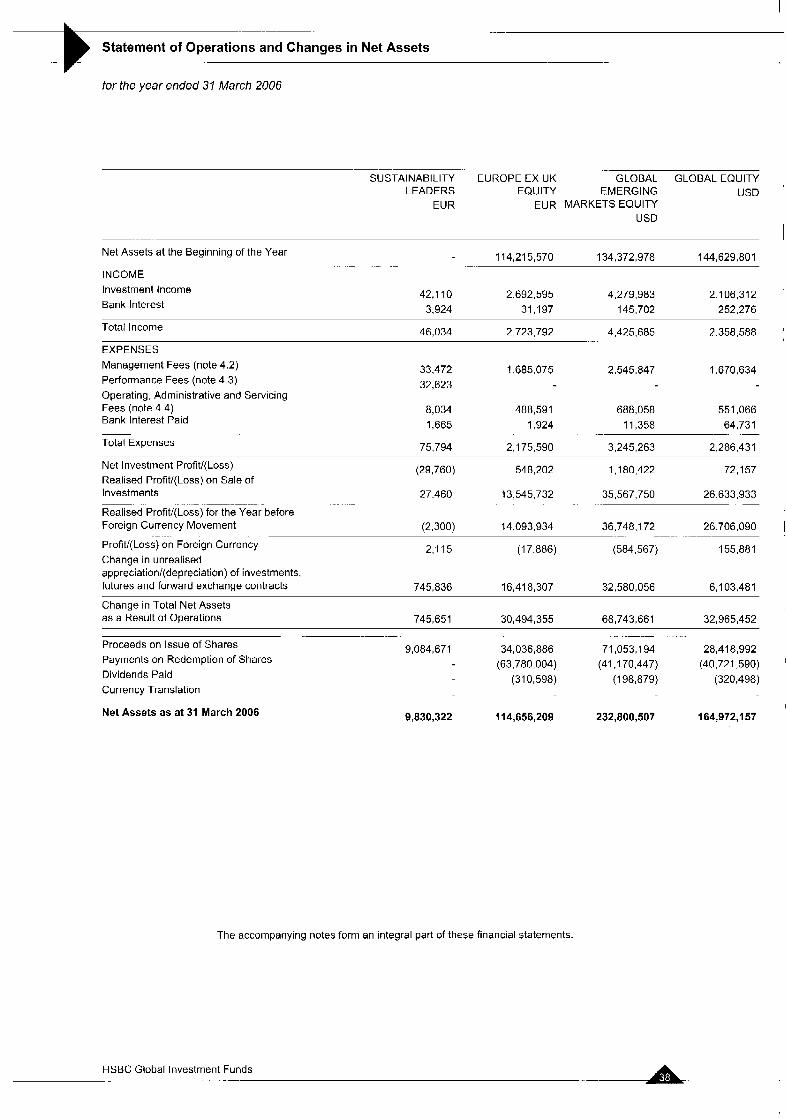
. ._ ~ .
Statement of Operations and Changes in Net Assets
for the year ended 31 March 2006
~- SUSTAINABILITY EUROPE EX UK GLOBAL GLOBAL EQUITY
LEADERS EQUITY EMERGING USD EUR EUR MARKETS EQUITY
USD
114,215,570 134,372,978 144,629,801 Net Assets at the Beginning of the Year
INCOME Investment Income Bank Interest
.-
42,110 2,692,595 4 . 2 7 9 . m 2.106,312 3,924 31,197 145,702 252,276
46,034 2,723,792 Total Income
EXPENSES Management Fees (note 4.2) Performance Fees (note 4 3) Operating, Administrative and Servicing Fees (note 4 4) 8,034 488,591
1,665 1.924 Bank Interest Paid
75.794 2,175,590 Total Expenses
33,472 1,685,075 32,623
~ .-.
2.545.847 1.670,634
688,058 551,066 64,731
3,245,263 2,286,431 -. .-
11,358
(29,760) 548,202 1,180,422 72,157
26.633,933
Net Investment Profit/(Loss) Realised Profit/(Loss) on Sale of Investments 27,460 13,545,732 35,567,750
Realised Profit/(Loss) for the Year before Foreign Currency Movement (2,300) 14,093,934
Profit/(Loss) on Foreign Currency Change in unrealised appreciation/(depreciation) of investments, futures and forward exchange contracts 745,836 16,418,307 32,580,056 6,103,481
_ _ ~. . ..... -. .~ .. . . . . . .
36,748,172 26,706,090 I ........ . . -. ~ .
2.1 15 (17,886) (584,567) 155,881
Change in Total Net Assets as a Result of Operations 745,651 30,494,355 68,743,661 32,965:452
_ __ _ 9,084,671 34,036,886 71,053,194 28,418.992 Proceeds on Issue of Shares
(63,780,004) (41,170,447) (40,721,590) Payments on Redemption of Shares
Dividends Paid (310,598) (1 98 879) (320,498) Currency Translation
Net Assets as at 31 March 2006
I
._. __ .- I
9,830,322 114,656,209 232,800,507 164,972,157
The accompanying notes form an integral part of these financial statements.
HSBC Global Investment Funds .-
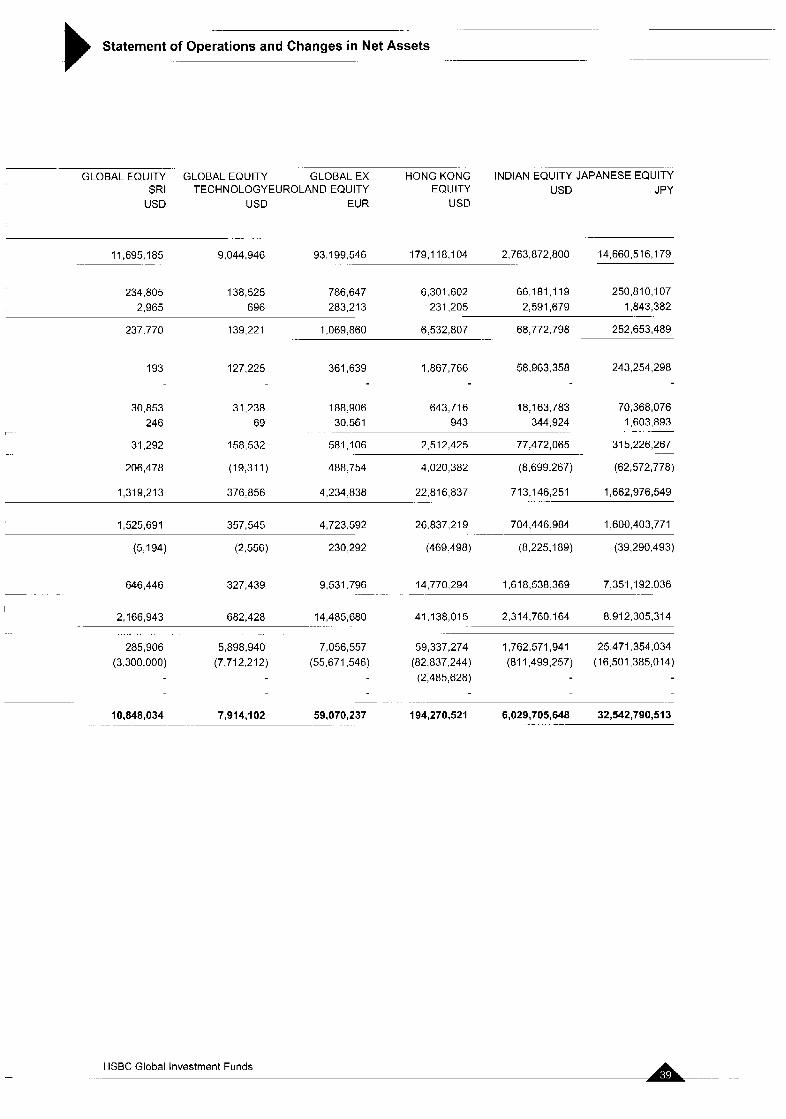
.. ..
Statement of Operations and Changes in Net Assets ._ . ._ -
_.
7- GLOBAL EQUITY GLOBAL EQUITY GLOBAL EX HONG KONG INDIAN E ~ U I T Y JAPANESE EQUITY SRI TECHNOLOGYEUROLAND EQUITY EQUITY USD JPY
USD US0 EUR USD
. -. . .
1 1,695,185 9,044.946 93,199,546 179,118,104 2,763,872,800 14,660,516,179 -
234,805 138,525 786,647 6,301 -602 66,181,119 250,810,107 1,843,382
237.770 139,221 1,069.860 6,532,807 68,772,798 252,653,489 .-
2,965 696 283,213 231,205 2,591,679
.-.
193 127,225 361,639 1,867,766 58,963,358 243,254,29a
r
..
30,853 31,238 188.906 643,716 18,163,783 70,368,076 I ,603,893 .. ~
344,924
31,292 158,532 581,106 2,512,425 77,472,065 .-.
246 69 30,561 943
31 5,226,267
206,478 (19,3i 1 ) 488.754 4.020,382 (8,699,267) (62,572,778)
--
1,319,213 376.856 4,234,838 22.81 6,837 71 3.1 46,251 1,662,976,549
1,525,691 357,545 4,723.592 26.837.219 704,446,984 1,600,403,771
(5,194) (2.556) 230,292 (469.498) (8,225,189) (39,290.493)
646,446 _ _ 9,531.796 .
327,439
2,166,943 682,428 14,485,680
285,906 5,898,940 7,056,557 (3,300.000) (7,712,212) (55,671,546)
~
59,070,237 _- ..
10,a4a,m4 7,914,102 .
14,770,294 1,618,538.369 7,351,192.036
41,138,015 2,314,760,164 8,912,30531 4
59,337,274 1,762,571,941 25,471,354,034 (82,837.244) (81 1,499.257) (16,501,385,014) (2,485,628)
6,029,705,648 32,542,790,513 -
194,270,521
HSBC Global Investment Funds .. ...
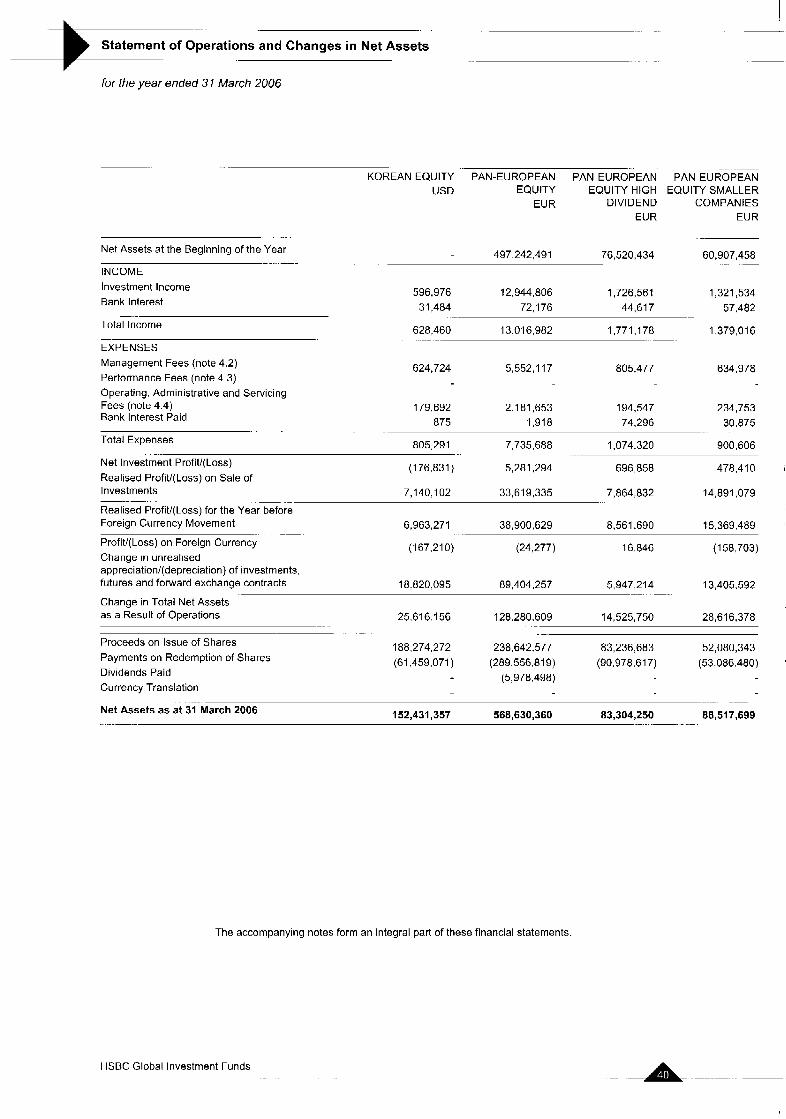
Statement of Operations and Changes in Net Assets
for the year ended 31 March 2006
-- . -
~
KOREAN EQUITY PAN-EUROPEAN PAN-EUROPEAN PAN-EUROPEAN USD EQUITY EQUITY HIGH EQUITY SMALLER '
EUR DIVIDEND COMPANIES
. . . . . . . . . . -
Net Assets at the Beginning of the Year
INCOME Investment Income Bank Interest
Total Income
EXPENSES Management Fees (note 4.2) Performance Fees (note 4.3) Operating, Administrative and Servicing Fees (note 4.4) Bank Interest Paid
..... . .
- ..
EUR
497,242,491 76,520,434 .-
596,976 12,944,806 1,726,561 31,484 72,176 44,617
628,460 13,016,982 1,771,178
624,724 5,552,117 805,477
179,692 2,181,653 194,547 875 1,918 74,296
EUR
I 60,907,458
.- -
1,321,534 '
57.482 ,
1,379,016
634.978
234,753 30.875
. . .
805,291 7,735.688 1,074:320 900,606 Total Expenses
(1 76,831 ) 5,281,294 696,858 478,410 Net Investment Profitl(Loss) Realised Profit/(Loss) on Sale of Investments 7,140,102 33,619,335 7,864,832 14,891,079
Realised Profit/(Loss) for the Year before Foreign Currency Movement 6,963,271 38,900,629 8,561.690 15.369,489
(1 67,210) (24,277) 16.846 (158.703) Profit/(Loss) on Foreign Currency Change in unrealised appreciationl(depreciati0n) of investments, futures and forward exchange contracts 18:820,095 89,404,257 5,947,214 13,405,592
Change in Total Net Assets as a Result of Operations 25,616.1 56 128.280.609 14,525,750 28,616,378
188,274,272 238.642.577 83,236,683 52,080,343 Proceeds on Issue of Shares
(61,459,071) (289,556,819) (90.978.61 7) (53.086.480) Payments on Redemption of Shares Dividends Paid Currency Translation
Net Assets as at 3 IMarch 2006
.-. .....
-. ~ ...
.. ....
-. .... .
.. - .. . ....
(5,978.498)
.
83,304,250 88,517,699 .- - ...... .... ..
152,431,357 568,630,360
The accompanying notes form an integral part of these financial statements.
HSBC Global Investment Funds
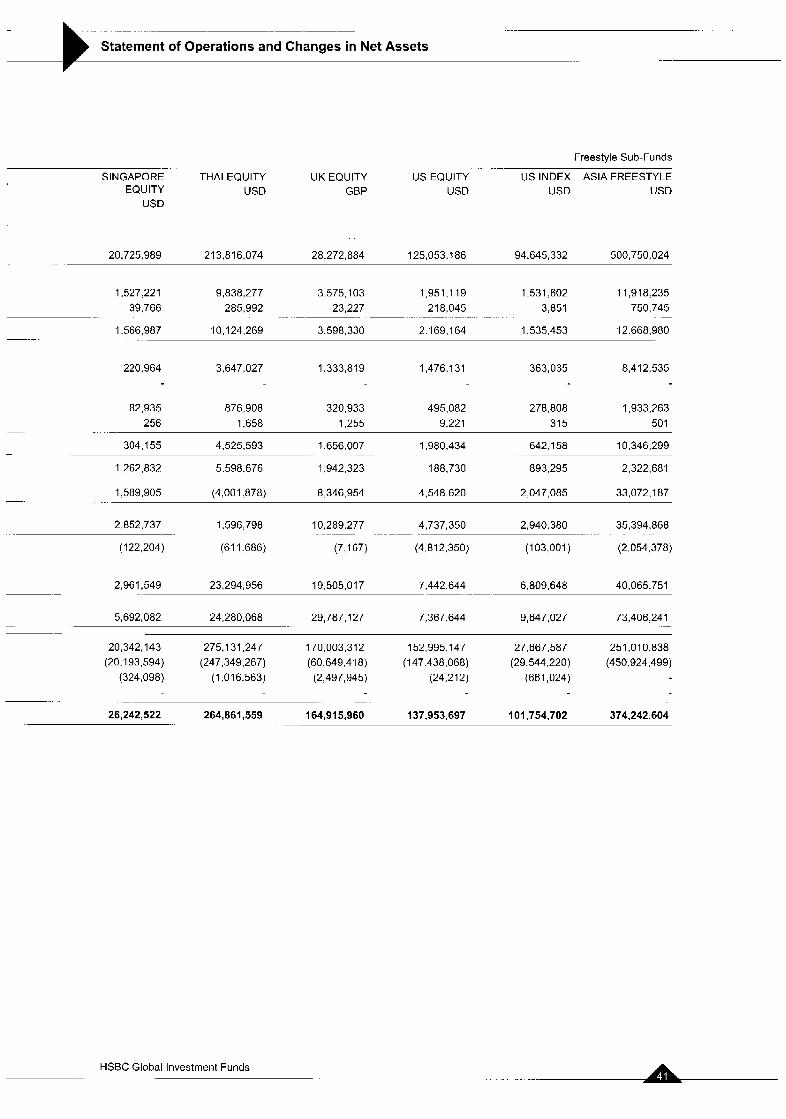
- ._ _ .-
Statement of Operations and Changes in Net Assets ._ .. .
Freestyle Sub-Funds
SINGAPORE THAI EQUITY UK EQUITY US EQUITY US INDEX ASIA FREESTYLE EQUITY USD GBP USD USD USD
.- .
USD
20,725,989 213,816,074 28,272,884 125,053,186 94,645,332 500,750,024
1,527.221 9,838,277 3 575,103 1,951 ,I 19 1531 602 11,91 8 235 750,745
1,566,987 10,124,269 3 598,330 2,169,164 1 535,453 12,668,980
- 39,766 285,992 23,227 218,045 3,851 __ . __ _.. _ - L-
I-
220,964 3,647,027 1,333,819 1,476,131 363,035 8,412,535
82,935 876.908 320,933 495,082 278,808 1,933,263 256 1,658 1,255 9,221 315 501
304,155 4,525,593 1,656,007 1,960,434 642,158 10,346,299
1,262,832 5.598.676 1,942,323 188,730 893,295 2,322,681
.
1,589,905 (4,001.878) 8,346,954 4.548 620 2,047,085 33,072,187 7
10,289.277 4,737,350 2,940.380 35,394.868 . . . -.
1,596,798 _ 2,852,737
(122,204) (611 686) (7,167) (4.81 2,350) (103,001) (2,054,378)
2,961.549 23,294,956 19,505.01 7 7,442.644 6,809.648 40,065 751 . .. ~-
73,406,241 ...
5,692,082 24,280,068 29,787,127 7,367.644 9,647,027 ... -
20,342,143 275,131,247 170,003,312 152,995,147 27.667.587 251,010,638 (20.1 93,594) (247,349,267) (60,649,418) (1 47,438,068) (29:544,220) (450,924,499)
(324:098) (1,016,563) (2,497,945) (24,212) (661,024)
- ._
26,242,522 264,861,559 164,915,960 137,953,697 101,754,702 374,242,604
HSBC Global Investment Funds
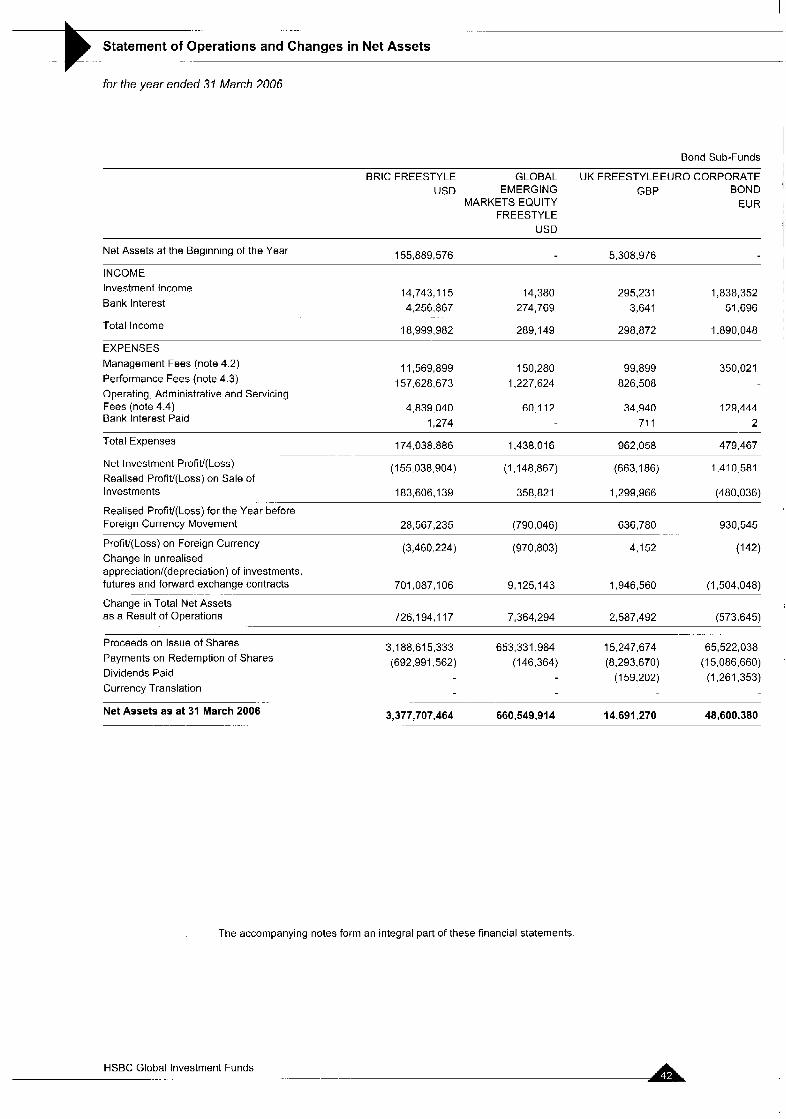
Statement of Operations and Changes in Net Assets
for the year ended 31 March 2006
._
Bond Sub-Funds
BRlC FREESTYLE GLOBAL UK FREESTYLEEURO CORPORATE USD EMERGING GBP BOND
MARKETS EQUITY EUR FREESTYLE
USD
Net Assets at the Beginning of the Year 155,889,576 INCOME Investment Income Bank Interest
Total Income
14,743,115 14,380 295,231 1,838,352 4,256,867 274,769 3.641 51,696
18,999,982 289,149 298,872 1,890,048 EXPENSES Management Fees (note 4.2) Performance Fees (note 4.3) Operating, Administrative and Servicing Fees (note 4.4) Bank Interest Paid
11,569,899 150,280 157,628,673 1,227,624
99,899 350,021 826.508
4,839.040 60.112 34,940 129,444 1,274 71 1 2
Total Expenses 174.03a.aa6 i.43a.016 962,058 479,467
(155,036,904) (1,148,667) (663,186) 1.41 0 581 Net Investment Profit/(Loss) Realised Profit/(Loss) on Sale of Investments 183,606,139 358,821 1,299,966 (480,036) Realised Profit/(Loss) for the Year before Foreign Currency Movement 28,567,235 (790,046) 636,780 930,545
~_
(3,460,224) (970,803) 4,152 (142) Profit/(Loss) on Foreign Currency Change in unrealised appreciationl(depreciati0n) of investments, futures and forward exchange contracts 701.087,106 9,1251 43 1,946,560 (1,504,048) Change in Total Net Assets as a Result of Operations 726,194,117 7,364,294 2,587.492 (573,645)
_. __ .~ ... .
-
3,188,615,333 653.331.9a4 15,247,674 65,522,038 Proceeds on Issue of Shares
Payments on Redemption of Shares (692,991,562) (146,364) (8,293,670) (1 5,086,660) Dividends Paid (1 59.202) (I ,261,353) Currency Translation
~. ...
3,377,707,464 660,549.91 4 14,691,270 48,600,380 Net Assets as at 31 March 2006 ..
The accompanying notes form an integral part of these financial statements.
HSBC Global Investment Funds .
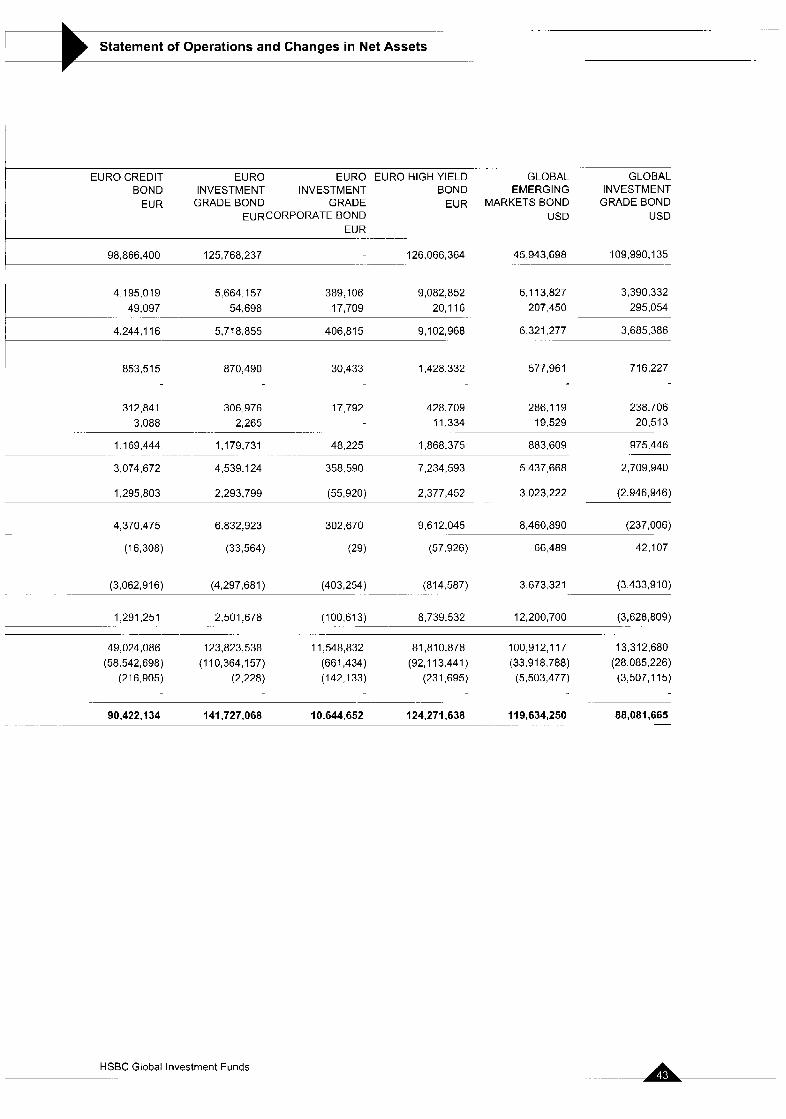
_.
Statement of Operations and Changes in Net Assets
EURO CREDIT EURO EURO EURO HIGH YIELD GLOBAL GLOBAL BOND INVESTMENT INVESTMENT BOND EMERGING INVESTMENT
EUR GRADE BOND GRADE EUR MARKETS BOND GRADE BOND EURCORPORATE BOND USD USD
EUR . ..
109,990,135 _ 45,943.698 ._
126.066,364 -
98,866,400 125,768,237
4,195,019 5 664,157 389 106 9,082,852 6.1 13,827 3,390,332 49,097 54,698 17,709 20,116 207,450 295,054
5.718 855 406.81 5 9,102,968 6,321,277 3,685,386 __
853,515 870,490 30,433 1,428,332 577,961 716,227
312,841 306,976 17,792 428.709 286.1 19 238,706 3,088 2,265 11,334 19,529 20,513
975,446 1,169,444 1,179,731 48,225 1,868.375
3,074,672 4,539.1 24 358.590 7,234,593 5,437,668 2,709,940
1295,803 2,293,799 (55,920) 2,377.452 3,023,222 (2,946,946)
- -~ 883,609 ~- - . _. ~.
4,370,475 6,832,923 302,670 9,612,045 8,460,890 (237,006)
(16,308) (33:564) (29) (57.926) 66,489 42,107
(3.062,9 1 6) (4,297.681 ) (403,254) (814.587) 3,673,321 (3 433,910) .
(3,628,809) ..
1,291,251 2,501,678 (100,613) 8,739,532 12,200,700 .~ _.
._
49,024,086 123,823.538 11,548,832 81,810.878 100,912,117 13,312,680 (58,542,698) (1 10,364,157) (661,434) (92,113,441 ) (33.91 8.788) (28,085,226)
(216,905) (2,228) (142,133) (231,695) (5,503,477) (3,507,115)
90,422,134 141,727,068 10,644,652 I 24,271,638 119,634,250 __ __ - 88,081,665
-
HSBC Global Investment Funds
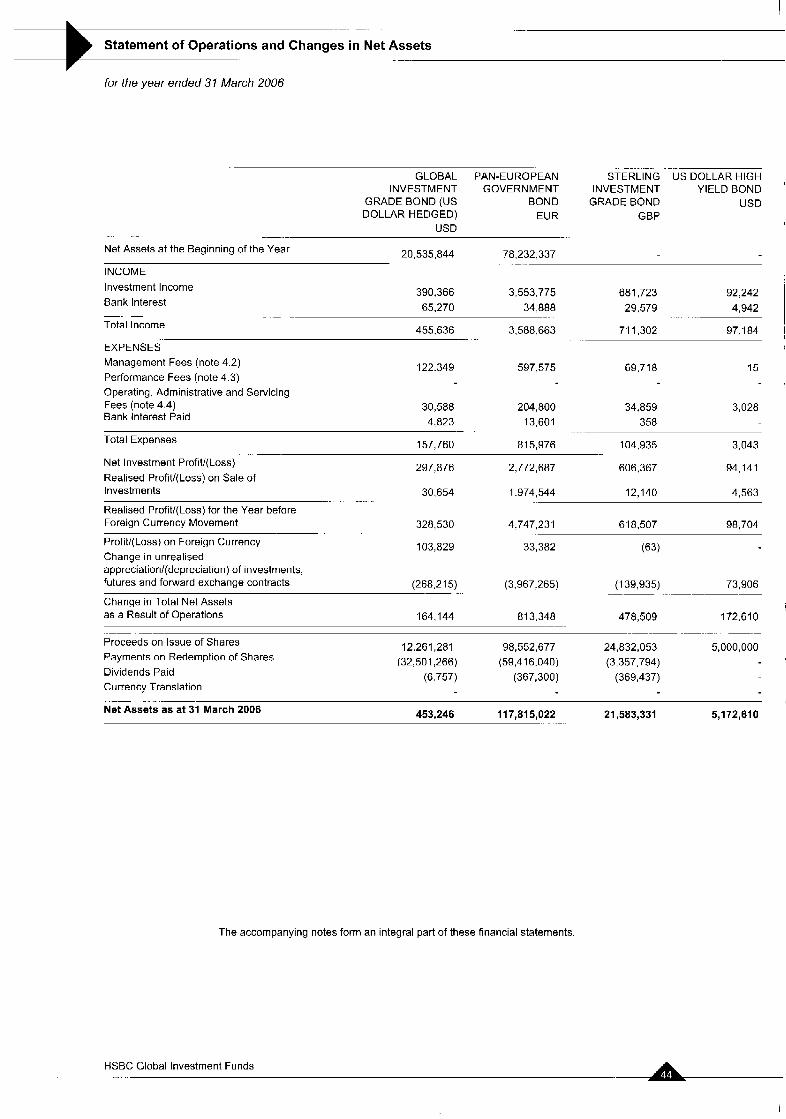
- ...
Statement of Operations and Changes in Net Assets
for the year ended 31 March 2006
-- -
.. .. ............
GLOBAL PAN-EUROPEAN STERLING US DOLLAR HIGH INVESTMENT GOVERNMENT INVESTMENT YIELD BOND
GRADE BOND (US BOND GRADE BOND USD DOLLAR-HEDGED) EUR GBP
. . . . . . . ..... - USD
. . . . . . . . - ___
20,535,044 78,232,337 Net Assets at the Beginning of the Year
INCOME Investment Income Bank Interest
Total Income
EXPENSES
. . . . .
390,366 3,553,775 681,723 92.242 4,942
3.588.663 71 1,302 97,184 .-
65,270 34,888 29,579 - . .... -. - ... . . .
-. .~ .. 455,636
...
Management Fees (note 4.2) Performance Fees (note 4.3)
122.349 597,575 69,718 15
Operating, Administrative and Servicing Fees (note 4.4) 30,588 204.800 34,859 3.028 Bank Interest Paid
157,760 815,976 104,935 3,043 Total Expenses
297,876 2,772,687 606,367 94,141 Net Investment Profitl(Loss) Realised Profit/(Loss) on Sale of Investments 30,654 1,974,544 12,140 4,563
Realised Profit/(Loss) for the Year before Foreign Currency Movement 328,530 4,747,231 618,507 98,704
Profit/(Loss) on Foreign Currency Change in unrealised appreciation/(depreciation) of investments, futures and forward exchange contracts (268.215) (3,967,265) (1 39,935) 73,906
Change in Total Net Assets as a Result of Operations 164,144 813,348 478,509 172.61 0
4.823 13,601 358 .....
.~
........
.
103,829 33,382 (63)
... ...
. - - ~.
12.261,281 98,552,677 24,832,053 5,000,000 Proceeds on Issue of Shares Payments on Redemption of Shares Dividends Paid Currency Translation
(32,501,266) (59,416,040) (3,357,794) (6,757) (367,300) (369,437)
. ~-
453,246 117,815,022 21,583,331 5,172,610 Necssets as at 31 March 2006
The accompanying notes form an integral part of these financial statements.
HSBC Global Investment Funds
i
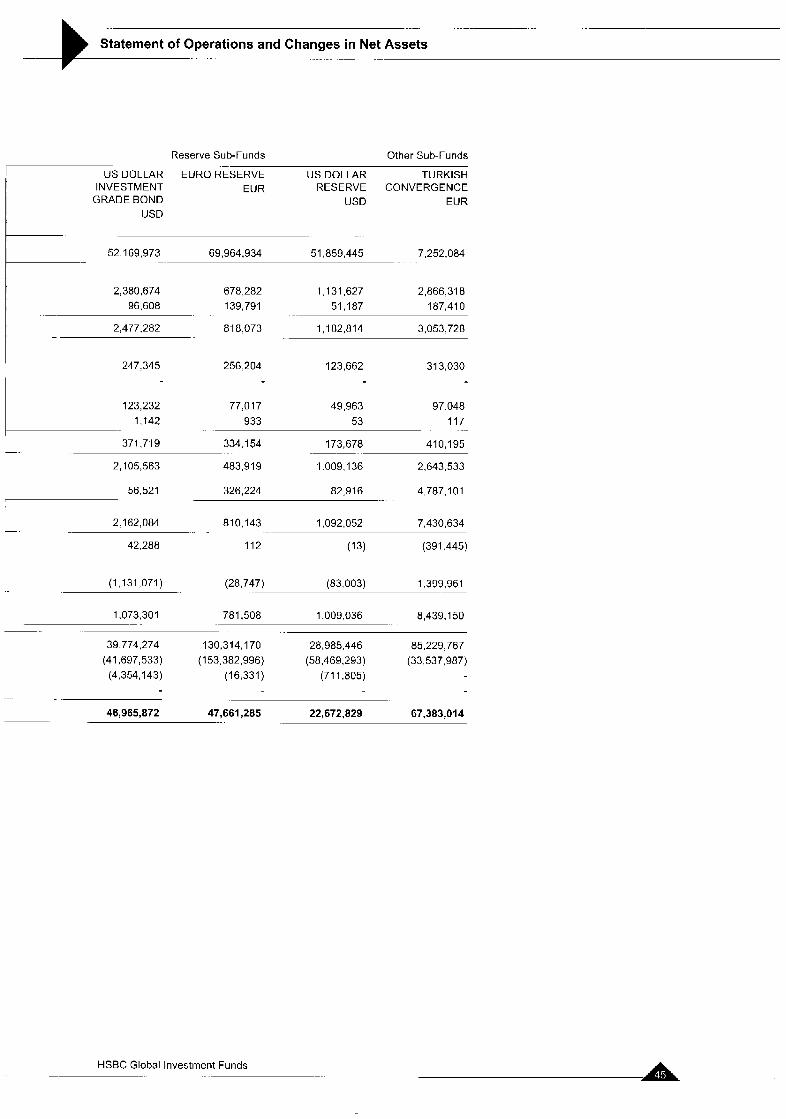
.. ...
Statement of Operations and Changes in Net Assets . . . . . . .- .- . ..
Reserve Sub-Funds Other Sub-Funds
US DOLLAR EURO RESERVE US DOLLAR TURKISH INVESTMENT EUR RESERVE CONVERGENCE
GRADE BOND USD EUR
.-
USD
52,169,973 69,964,934 51,859,445 7,252,084 -.
2,380,674 678,282 1,131,627 2,866,318 96,608 139,791 51.187 187,410
2,477,282 818,073 1,182,814 3,053,728 .. -
I 247.345 256,204 123,662 313,030
123,232 77,017 49,963 97.048 1,142 933 53 117
371,719 334,154 173,678 410,195
483,919 1,009,136 2,643,533
-
L- 2,105,563
56,521 326,224 82,916 4,787,101 ~. .
1,092,052 7,430,634
42,288 112 (13) (391 -445)
- . .. 81 0,143
. . 2,162,084
(1,131,071) (28,747) (83.003) 1,399,961
1,073,301 781,508 1,009,036 8,439.150
39,774,274 130,314,170 28,985,446 85,229,767 (41,697,533) (153,382,996) (58,469,293) (33,537,987) (4,354,143) (16.331) (71 1,805)
- ~.
46,965,872 47,661,285 22,672,829 67,383,014
HSBC Global Investment Funds -
-. ... .
Notes to the Financial Statements - --.
I - ... . .- . .
b I. Basis of presentation
The Company is incorporated under the laws of the Grand Duchy of Luxembourg as an investment company (Societb d’lnvestissement a Capital Variable or “SICAV”). The capital comprises various classes of shares each relating to a separate portfolio (a “sub-fund”) consisting of securities, cash and other sundry assets and liabilities. The accompanying financial statements present the assets and liabilities of the individual sub-funds and of the Company taken as a whole. The financial statements of each individual sub-fund are expressed in the currency designated in the prospectus for that particular sub-fund and the financial statements of the Company are expressed in United States dollars (USD). The financial statements have been prepared in accordance with the format prescribed by the Luxembourg authorities for Luxembourg investment companies.
The Company is an officially registered investment fund under part I of the law of 20 December 2002 and has been certified as a UCITS fund under the directive 85/61 I/CEE of the Council of Europe enabling it to be freely marketed within member states of the European Community from 1 October 1989, subject to member states enacting enabling legislation and complying with local marketing regulations.
The Company has been certified as a recognised collective investment scheme in the United Kingdom under the financial services and markets act 2000 (the “Act”).
Certain sub-funds of the Company are authorised by the Hong Kong Securities and Futures Commission under Section 104 of the “Securities and Futures Ordinance”.
Since 1 April 2005, the Company has proceeded to:
I ) on 1 April 2005, Euro Corporate Bond, on 1 April 2005, Euro Investment Grade Corporate Bond, on 2 June 2005, BRlC Markets, on 1 July 2005, Emerging Europe Equity, on 23 September 2005, Korean Equity, on 15 December 2005, Sustainability Leaders, on 30 December 2005, US Dollar High Yield Bond, on 22 March 2006, Global Emerging Markets Equity Freestyle.
The opening of new sub-funds:
2 ) On 10 June 2005, US Equity Opportunities class AC merged into US Equity class AC (exchange ratio 0.609301499) US Equity Opportunities class AD merged into US Equity class AD (exchange ratio 0.544458218) US Equity Opportunities class AD merged into US Equity class PD (exchange ratio 0.537749221) US Equity Opportunities class ED merged into US Equity class ED (exchange ratio 0.534453322) Euroland Equity Opportunities class AC merged into Euroland Equity class AC (echange ratio 0.7041 19793) Euroland Equity Opportunities class AD merged into Euroland Equity class AD (exchange ratio 0.692374571) Euroland Equity Opportunities class ED merged into Euroland Equity class ED (exchange ratio 0.616787252)
3) on 10 June 2005, Global Equity Opportunities changed its name to Global Equity. on 10 June 2005, Asia ex Japan Equity Opportunities changed its name to Asia ex Japan Equity Smaller Companies, on 20 June 2005, European Currencies Bond changed its name to Euro Credit Bond, on 20 June 2005, European Currencies High Yield Bond changed its name to European High Yield Bond, and on 30 December 2005, European High Yield Bond changed its name to Euro High Yield Bond. on 20 June 2005, Pan-European Currencies Government Bond changed its name to Pan-European Government Bond.
Change in name for the following sub-funds:
HSBC Global Investment Funds
Notes to the Financial Statements (continued) . . ~ -_ . -.
b I. Basis of presentation (continued)
4) On 28 October 2005, the following sub-funds of HSBC ASSET MANAGEMENT INVESTMENT FUNDS merged into HSBC Global Investment Funds: - Sterling Investment Grade Bond class A merged into Sterling Investment Grade Bond class PD (exchange ratio I) - UK Equity class A merged into UK Equity class AD (exchange ratio 0.718029736) - UK Equity class E merged into UK Equity class ED (exchange ratio 1) - UK Equity Opportunities class A merged into UK Freestyle class MD (exchange ratio 1.493797445)
b 2. Accounting Policies
The following accounting policies have been used consistently in dealing with items which are considered material in relation to the Company’s financial statements.
a) Accounting convention
The financial statements have been prepared under the historical cost convention modified by the revaluation of investments.
b) Assets and portfolio securities valuation
The assets of each Class within each sub-fund are valued as at 11 .OO a.m. (Luxembourg time) as at 31 March 2006.
In addition, portfolio securities and/or financial derivative instruments which are listed on an official stock exchange are valued at the last available price on the principal market on which such securities are traded. Securities traded on other organised markets are valued at the last available price or yield equivalents obtained from one or more dealers in such organised markets at the time of valuation. If such prices are not representative of their fair value, all such securities and all other permitted assets will be valued at their fair value at which it is expected they may be resold as determined in good faith by or under the direction of the Directors.
The financial derivative instruments which are not listed on any official stock exchange or traded on any other organised market will be valued in accordance with market practice. Shares or units in underlying open-ended investment sub-funds shall be valued at their last available net asset value reduced by any applicable charges.
c) Income and Expenses
Interest is accrued on a day-to-day basis. Dividends are accounted for on an ex-dividend basis.
d) Foreign Exchange
The cost of investments, income and expenses in currencies other than the fund relevant reporting currency have been recorded at the rate of exchange ruling at the time of the transaction. The market value of the investments and other assets and liabilities in currencies other than the relevant reporting currency have been converted at the rates of exchange ruling at 31 March 2006.
e) Realised Profitl(Loss) on Sale of Investments
Realised profit/(loss) on sale of investments is the difference between the historical average cost of the investment and the sale proceeds.
b 3. Share capital
The Company has issued either A, E, I, J, M, P, W, or Z Shares to investors in one or several sub-funds as detailed below.
Within each sub-fund, the Company is entitled to create different share classes and/or sub-classes, distinguished by their distribution policy (Capital-Accumulation (C) and Distribution shares (D)), their hedging activity (H) and/or by any other criterion to be stipulated by the Directors.
All share classes are available as both Capital-Accumulation and Distribution Shares.
HSBC Global Investment Funds
I ~ .. -
Notes to the Financial Statements (continued) .._. - - .. . - -.. . .
b 3. Share capital (continued)
Shares in existence before 2 October 2000 have been designated Class A Shares and are available to all investors. On 25 November 2002, all Shares in issue in Class A of the sub-funds Pan-European Equity, Hong Kong Equity, Japanese Equity, Singaporean Equity, North American Equity, US Index, US Dollar Bond and US Dollar Reserve were renamed Class P Shares. The rights and obligations relating to such Shares remain unchanged (except that the minimum initial investment amount was increased to USD 50,000).
Description Minimum Initial Minimum Investment Holding
A Shares are available to all investors. Class A
Class E
Class I
Class J
Class M
Class P
Class W
Class Z
E Shares will be available in certain countries, subject to the relevant regulatory approval, through specific distributors selected by the Share Distributor. E Shares will incur annual management fees equivalent to that of the Class A Shares plus 0.3% to 0.5% per annum of the Net Asset Value of Class E Shares, which may be payable to specific distributors in certain countries.
I Shares are available through specific distributors selected by the Share Distributor.
J Shares are available for investment by fund of fund ranges managed by the HSBC Group only.
M Shares are available to all investors.
P Shares are available for subscription in certain jurisdictions or through certain selected distributors.
W Shares are available through specific distributors that will also be members or affiliated entities of the HSBC Group as selected by the Share Distributor provided (in addition) the investors qualify as institutional investors within the meaning of article 129 of the 2002 Law. No Operating, Administrative and Services Expenses will be charged to Class W Shares. All the fees and charges allocated to this Class will be paid directly by members or affiliated entities of the HSBC Group.
Z Shares are available to investors having entered into a discretionary management agreement with an HSBC Group entity and to investors subscribing via distributors selected by the Share Distributor provided that such investors qualify as institutional investors within the meaning of article 129 of the 2002 law.
USD 5,000
USD 5,000
EUR 1,000,000
USD 100,000
USD 5,000
USD 50,000
USD 100,000
USD 1,000,000
USD 5,000
USD 5,000
EUR 1,000,000
USD 100,000
USD 5,000
USD 50,000
USD 100,000
USD 1,000,000
The Directors of the Company have authority to issue different Classes of Shares in one or several sub-funds. Details of the characteristics of such Share Classes offered by one or several sub-funds will be determined by the Directors. In case of the creation of additional Classes of Shares, this Prospectus will be updated.
The subscription proceeds of all Shares in a sub-fund are invested in one common underlying portfolio of investments. All Shares of the same class have equal rights and privileges. Each Share is, upon issue, entitled to participate equally in assets of the relevant class of the sub-fund to which it relates on liquidation and in dividends and other distributions as declared for such sub-fund. The Shares will carry no preferential or pre-emptive rights and each whole Share will be entitled to one vote at all meetings of Shareholders.
The minimum initial investment amount may be reduced at the discretion of the Company.
Share Class Denominations:
I
HSBC Global Investment Funds
~_ _ _
Notes to the Financial Statements (continued) ___ -
b 3. Share capital (continued)
The Share Classes issued in the different sub-funds are designated by their class name, followed by their distribution characteristics and, if applicable, their specific hedging policy. This means that for example Shares issued in Class A which are distributing income and applying a hedging policy, as defined above. would be identified as ADH whereas Class I Shares accumulating income would be identified as IC.
b 4. Charges and Expenses
1. Explanation of the Charging Structure
Investment in the Company is currently offered via eight charging structures, as represented by the A, E, I, J, M, P: W, and Z Classes of Shares.
The Management Company is entitled, in respect of each Class of Shares, to a management fee to cover all investment management, investment advisory and distribution services provided in relation to the relevant class (see 2. “Management Fee” below).
In addition, the Company pays to the Management Company a fee to cover operating administrative and servicing expenses. To preserve Shareholders from fluctuations in a sub-fund’s operating, administrative and servicing expenses, the Company has agreed with the Management Company that the fee charged to cover such operating, administrative and servicing expenses is fixed at an annual rate. The excess of such expenses above such annual rate will be borne directly by the Management Company (see 4. “Operating, Administrative and Servicing Expenses” below).
2. Management Fee
The Company pays to the Management Company an annual management fee calculated as a percentage of the Net Asset Value of each sub-fund or Share Class (“Management Fee”). The Management Fee is accrued daily and payable monthly in arrears at the rates specified in the table page 63. The maximum rate for Class E, I, J and M Shares is 3.5%.
The maximum rate for Class A, P and Z Shares is as stated in the table page 63.
No Management Fee is currently charged for Class W Shares.
The Management Fee covers management and distribution services provided in relation to the relevant sub-fund of the Company by the Management Company, the Investment Advisers and the Share Distributors. The Management Company is responsible for discharging, out of such fee, the fees of the Investment Advisers and the Share Distributors and may pay part of such fee to recognised intermediaries or such other person as the Management Company may determine, at its discretion.
The Management Company may instruct the Company to pay a portion of the Management Fee directly out of the assets of the Company to any of such service providers. In such case the Management Fee due to the Management Company is reduced accordingly.
3. Performance Fee
For sub-funds issuing Classes J Shares and M Shares, the Management Company is also entitled to a Performance Fee, payable annually in arrears after the end of each twelve month period (financial year for Class M I Shares) (for Class M I Series launched mid financial year, the first performance period was greater than a full year).
Each Dealing Day, the Performance Fee accrual will be calculated as 20% of the difference between the change in the Net Asset Value of the relevant Class of the sub-fund since the previous Dealing Day (net of all other fees and expenses and excluding the effect of subscriptions and redemptions) and the simple daily equivalent of the percentage defined below for the relevant sub-funds (hereafter the “Percentage“) provided that on such Dealing Day the Net Asset Value per Share of the relevant Class of the sub-fund is higher than the Low Tide Mark (as defined below). On the first issue of the relevant Class of Shares in a sub-fund, the Low Tide Mark will equal the initial offer price of the relevant Class of Shares of the sub-fund. The Low Tide Mark will not be set at a level below the initial offer price of the relevant Class of Shares of the sub-fund.
The cumulative Performance Fee accruals from the beginning of the twelve months period (financial year for Class M I Shares) will be included in the calculation of the Net Asset Value per Share. In the event of any change in the
HSBC Global Investment Funds
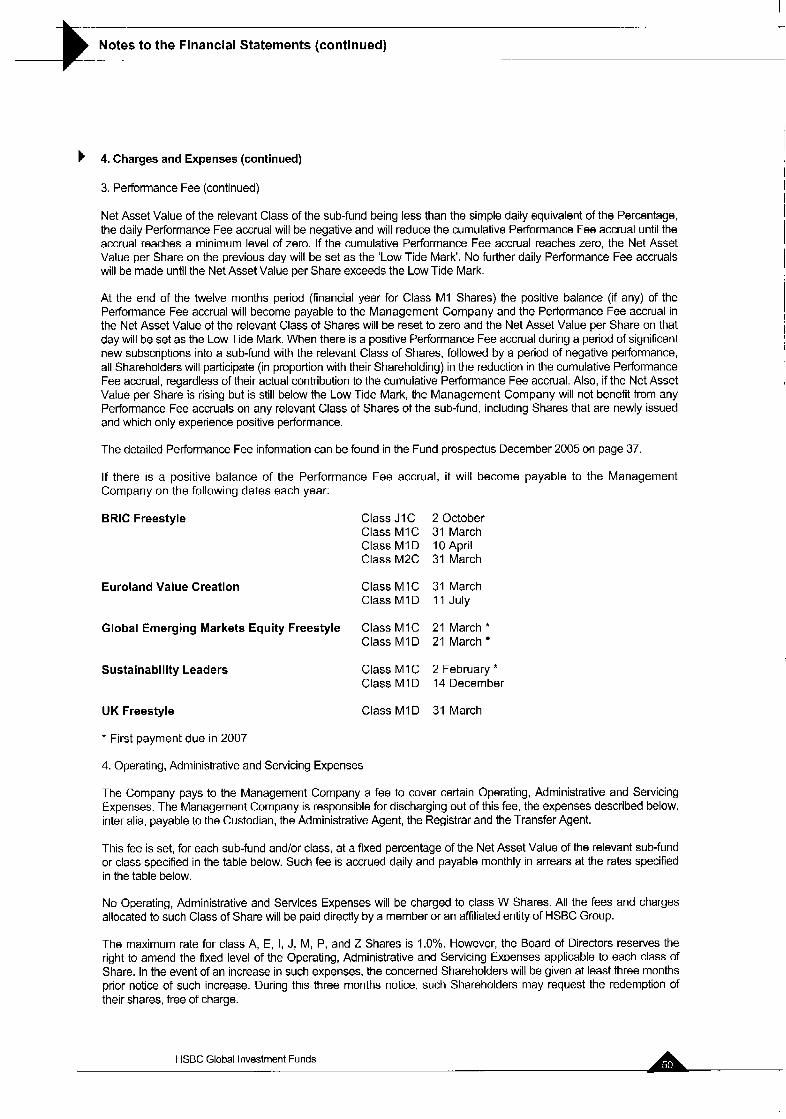
__ . _ -
Notes to the Financial Statements (continued) _ _
b 4. Charges and Expenses (continued)
3. Performance Fee (continued)
Net Asset Value of the relevant Class of the sub-fund being less than the simple daily equivalent of the Percentage, the daily Performance Fee accrual will be negative and will reduce the cumulative Performance Fee accrual until the accrual reaches a minimum level of zero. If the cumulative Performance Fee accrual reaches zero, the Net Asset Value per Share on the previous day will be set as the 'Low Tide Mark'. No further daily Performance Fee accruals will be made until the Net Asset Value per Share exceeds the Low Tide Mark.
At the end of the twelve months period (financial year for Class M I Shares) the positive balance (if any) of the Performance Fee accrual will become payable to the Management Company and the Performance Fee accrual in the Net Asset Value of the relevant Class of Shares will be reset to zero and the Net Asset Value per Share on that day will be set as the Low Tide Mark. When there is a positive Performance Fee accrual during a period of significant new subscriptions into a sub-fund with the relevant Class of Shares, followed by a period of negative performance, all Shareholders will participate (in proportion with their Shareholding) in the reduction in the cumulative Performance Fee accrual, regardless of their actual contribution to the cumulative Performance Fee accrual. Also, if the Net Asset Value per Share is rising but is still below the Low Tide Mark, the Management Company will not benefit from any Performance Fee accruals on any relevant Class of Shares of the sub-fund, including Shares that are newly issued and which only experience positive performance.
The detailed Performance Fee information can be found in the Fund prospectus December 2005 on page 37.
If there is a positive balance of the Performance Fee accrual, it will become payable to the Management Company on the following dates each year:
BRlC Freestyle
Euroland Value Creation
Class J I C 2 October Class MIC 31 March Class M I D I O April Class M2C 31 March
Class M I C 31 March Class M1D 11 July
Global Emerging Markets Equity Freestyle Class M1C 21 March * Class M I D 21 March
Sustainability Leaders Class M I C 2 February * Class M I D 14 December
UK Freestyle Class M I D 31 March
* First payment due in 2007
4. Operating, Administrative and Servicing Expenses
The Company pays to the Management Company a fee to cover certain Operating, Administrative and Servicing Expenses. The Management Company is responsible for discharging out of this fee, the expenses described below, inter alia, payable to the Custodian, the Administrative Agent, the Registrar and the Transfer Agent.
This fee is set, for each sub-fund andlor class, at a fixed percentage of the Net Asset Value of the relevant sub-fund or class specified in the table below. Such fee is accrued daily and payable monthly in arrears at the rates specified in the table below.
No Operating, Administrative and Services Expenses will be charged to class W Shares. All the fees and charges allocated to such Class of Share will be paid directly by a member or an affiliated entity of HSBC Group.
The maximum rate for class A, E, I, J, M, P, and Z Shares is 1.0%. However, the Board of Directors reserves the right to amend the fixed level of the Operating, Administrative and Servicing Expenses applicable to each class of Share. In the event of an increase in such expenses, the concerned Shareholders will be given at least three months prior notice of such increase. During this three months notice, such Shareholders may request the redemption of their shares, free of charge.
HSBC Global Investment Funds ~
Notes to the Financial Statements (continued) . .
b 4. Charges and Expenses (continued)
4. Operating, Administrative and Servicing Expenses (continued)
Operating, Administrative and Servicing Expenses cover the ongoing custody fees and safekeeping charges payable to the Custodian and its correspondent banks, fees for fund accounting and administration services (including domiciliary services) payable to the Administrative Agent and transfer agency fees for registrar and transfer agency services payable to the Registrar and Transfer Agent.
Operating, Administrative and Servicing Expenses also cover expenses relating to the creation of new sub-funds; the costs of the Subsidiary (see below); the Luxembourg asset-based taxe d’abonnement, at the rate referred to under “Taxation” below; attendance fees and reasonable out-of-pocket expenses incurred by the Company’s Directors; legal, auditing fees and other expenses; ongoing registration and listing fees, including translation expenses; the costs and expenses of preparing, printing, and distributing the Company’s prospectus, financial reports, statements and other documents made available directly or through intermediaries to its shareholders.
The Management Company may instruct the Company to pay a portion of the aforesaid fee directly out of the assets of the Company to any of the aforementioned service providers. In such case the fee due to the Management Company is reduced accordingly.
b 5. Transaction expenses and extraordinary expenses
The transaction expenses linked to security dealing are written off against the realised profiffloss from the sale of investments.
Each sub-fund bears the costs and expenses of buying and selling portfolio securities and financial instruments, brokerage fees and commissions, interest or taxes payable, and other transaction related expenses. These transaction fees are accounted for on a cash basis and are paid when incurred or invoiced from the net assets of the sub-fund to which they are attributable. Transaction fees are allocated across each sub-fund’s Share Classes.
The Company bears any extraordinary expenses including, without limitation, litigation expenses and the full amount of any tax, levy, duty or similar charge and any unforeseen charges imposed on the Company or its assets.
b 6. Indian Equity
The Company wholly owns a subsidiary in Mauritius namely HSBC Global Investment Funds Mauritius Limited, Manor House, lst floor Corner of St GeorgeKhazal Streets, Port Louis, Mauritius (“the Subsidiary”). The Subsidiary manages the Indian Equity sub-fund’s investments in India.
The Subsidiary is an open-ended investment company incorporated in Mauritius on 3 October 1995. The accounts of the Indian Equity sub-fund and the Subsidiary have been consolidated.
The Subsidiary has appointed Cross Border Financial Services Limited, Manor House, Corner of St GeorgelChazal Streets: Port Louis, Mauritius, to provide administrative services to the Subsidiary in Mauritius, including maintenance of its accounts, books and records. The Subsidiary has appointed KPMG Mauritius of KPMG Centre, 30 St George Street, Port Louis, Mauritius, as auditors of the Subsidiary in Mauritius to perform the auditor’s duties required by Mauritius law.
b 7. Taxation
Belgium
The Belgian government has enacted a law which charges an annual net asset value tax on foreign investment funds registered with the Belgian Banking and Finance Commission. An annual tax of 0.07% is charged on the net outstanding amounts of sub-funds placed in Belgium through Belgian financial intermediaries, or where that figure is not substantially documented, the tax authorities may calculate the tax on the total assets of those subfunds.
The tax will increase to 0.08% as from 1 January 2007 . HSBC Global Investment Funds _ -
- ~
Notes to the Financial Statements (continued)
7. Taxation (continued)
The Company understands that the validity of this tax charge is being questioned on the basis that it is contrary to European law and further developments are awaited. To date as the amounts are small, the Management Company has paid this tax cost on behalf of the Company out of the Operating, Administration and Servicing Expenses it receives. However, should the cost become substantial or long term the Management Company may require the subfunds concerned to bear that tax charge for future periods.
India
On the basis that it is a Mauritian tax resident, the Subsidiary will benefit from the tax advantages available to it under the India-Mauritius double taxation treaty, which became effective on 1 July 1983. The Subsidiary will file, through its Custodian, a declaration of Mauritian residency with the registrar of each Indian company in which it invests. Capital gains resulting from the purchase and sale by the Subsidiary of stocks on the Indian stock exchanges will be exempt from tax on the basis that the Subsidiary is able to benefit from the provisions of the India-Mauritius double taxation treaty.
Dividends from shares and income from units are exempt form tax.
The above-stated tax treatment under the India-Mauritius tax treaty will be available provided that the Subsidiary does not have a permanent establishment or its effective management and control in India. No guarantee or warranty can be given or should be assumed that the tax benefits of the treaty will continue to be available to the Indian Equity sub-fund in future periods due to, among others, changes in the regulatory environment in Mauritius, India or the European union.
The Indian Central Board of Direct Taxes has confirmed the availability of the treaty benefits to companies holding a certificate of Mauritian tax residence. The Supreme Court of India confirmed on 7 October 2003 the validity of this position.
Luxembourg
The Company is not liable to any Luxembourg tax on profits or income nor are dividends paid by the Company liable to any Luxembourg withholding tax. The Company is, however, liable in Luxembourg to a tax of 0.05% per annum of its Net Asset Value, such tax being payable quarterly on the basis of the value of the net assets of the Company at the end of the relevant calendar quarter. The tax rate is reduced to 0.01 % per annum for the US Dollar Reserve and Euro Reserve sub-funds and Classes J Share, W Share and Z Share in the relevant sub-funds. No stamp duty or other tax is payable in Luxembourg on the issue of Shares.
The Class or sub-funds may be exempted of this 0.01% tax if they comply with the requirements of the Luxembourg law of 19 December 2003.
No Luxembourg tax is payable on the realised or unrealised capital appreciation of the assets of the Company.
The Company paid a tax of EUR 1,239.46 on its incorporation.
Mauritius
The Subsidiary is registered with the Mauritius Offshore Business Activities Authority as an offshore company. As a result it is subject to a reduced rate of Mauritian income tax on its income. In addition, no Mauritian capital gains tax will be payable in respect of the Subsidiary’s investments in India and any dividends and redemption proceeds paid by the Subsidiary to the Indian Equity sub-fund will be exempt from Mauritian withholding tax. A certificate of Mauritian tax residence has been granted to the Subsidiary by the Commissioner of Income Tax in Mauritius. On the basis that it is Mauritian tax resident, the Subsidiary will qualify for certain reliefs from Indian tax as set out in the Indian tax section below. No guarantee or warranty can be given or should be assumed that the tax benefits of the treaty will continue to be available to the Indian Equity sub-fund in future periods due to, among others, changes in the regulatory environment in Mauritius, India or the European Union.
Turkey
A new tax system takes effect from 1 January 2006 which will charge a 10% withholding tax on dividends received by the Company and a 15% withholding tax on all other investment returns received by the Company from investments made in Turkey. The Company understands that this tax system has yet to be passed into law in Turkey but, should this be the case, the costs of this tax will be borne by shareholders in sub-funds investing in Turkey.
HSEC Global Investment Funds
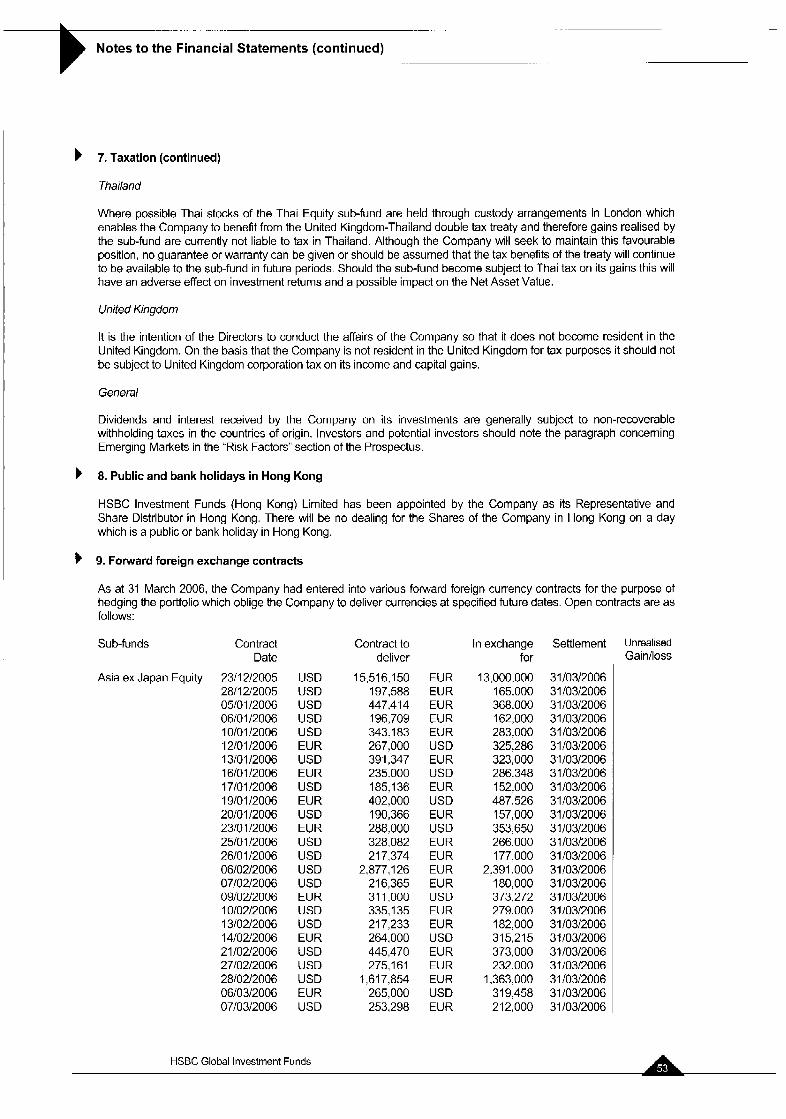
- ___ .. . -
Notes to the Financial Statements (continued) -. ..
7. Taxation (continued)
Thailand
Where possible Thai stocks of the Thai Equity sub-fund are held through custody arrangements in London which enables the Company to benefit from the United Kingdom-Thailand double tax treaty and therefore gains realised by the sub-fund are currently not liable to tax in Thailand. Although the Company will seek to maintain this favourable position. no guarantee or warranty can be given or should be assumed that the tax benefits of the treaty will continue to be available to the sub-fund in future periods. Should the sub-fund become subject to Thai tax on its gains this will have an adverse effect on investment returns and a possible impact on the Net Asset Value.
United Kingdom
It is the intention of the Directors to conduct the affairs of the Company so that it does not become resident in the United Kingdom. On the basis that the Company is not resident in the United Kingdom for tax purposes it should not be subject to United Kingdom corporation tax on its income and capital gains.
General
Dividends and interest received by the Company on its investments are generally subject to non-recoverable withholding taxes in the countries of origin. Investors and potential investors should note the paragraph concerning Emerging Markets in the "Risk Factors" section of the Prospectus.
8. Public and bank holidays in Hong Kong
HSBC Investment Funds (Hong Kong) Limited has been appointed by the Company as its Representative and Share Distributor in Hong Kong. There will be no dealing for the Shares of the Company in Hong Kong on a day which is a public or bank holiday in Hong Kong.
9. Forward foreign exchange contracts
As at 31 March 2006, the Company had entered into various forward foreign currency contracts for the purpose of hedging the portfolio which oblige the Company to deliver currencies at specified future dates. Open contracts are as follows:
Sub-funds Contract Date
Asia ex Japan Equity 23/12/2005 2811 212005 05101 12006 06/01/2006 10101 I2006 12101 12006 13/01 I2006 16/01 I2006 17/01 I2006 19/01 12006 20/01/2006 23101 12006 25/01/2006 26/01 12006 06/02/2006 07/02/2006 09/02/2006 10102l2006 13/02/2006 14/02/2006 21 10212006 2710212006 2810212006 06l03l2006 07/03/2006
USD USD USD USD USD EUR USD EUR USD EUR USD EUR USD USD USD USD EUR USD USD EUR USD USD USD EUR USD
Contract to deliver
15,516,150 EUR 197,588 EUR 447.414 EUR 196,709 EUR 343.183 EUR 267,000 USD 391,347 EUR 235.000 USD 185,136 EUR 402,000 USD 190,366 EUR 288,000 USD 328,082 EUR 217,374 EUR
2,877,126 EUR 216,365 EUR 311,000 USD 335,135 EUR 217,233 EUR 264,000 USD 445,470 EUR 275,161 EUR
1,617,854 EUR 265,000 USD 253,298 EUR
In exchange for
13,000,000 165,000 368,000 162,000 283,000 325,286 323,000 286,348 152,000 487,526 157,000 353,650 266,000 177,000
2,391,000 180,000 373,272 279,000 182,000 315,215 373,000 232,000
1,363,000 31 9,458 212,000
Settlement
31/03/2006 31/03/2006 31l0312006 31 10312006 31/03/2006 31 10312006 31/03/2006 31 10312006 31/03/2006 31l0312006 31/03/2006 31/03/2006 31/03/2006 31 10312006 3110312006 31 10312006 31 I0312006 31 I0312006 31 10312006 31 10312006 31 10312006 31 I0312006 31 10312006 31 10312006 31 10312006
Unrealised Gainlloss
HSBC Global Investment Funds
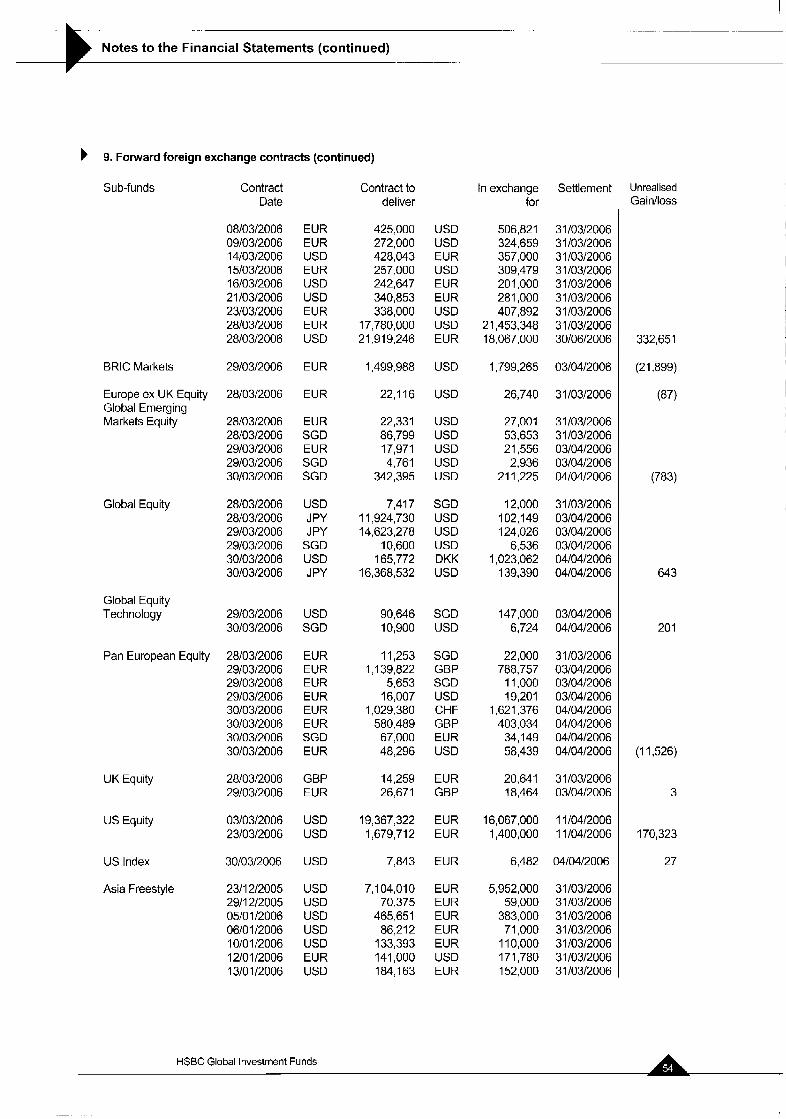
_ -
Notes to the Financial Statements (continued) -. -
b 9. Forward foreign exchange contracts (continued)
Sub-funds Contract Date
0810312006 0910312006 1410312006 1510312006 16l03l2006 21 10312006 2310312006 2810312006 2810312006
2910312006
2810312006
2810312006 2810312006 2910312006 2910312006 3010312006
2810312006 2810312006 2910312006 2910312006 3010312006 30l0312006
2910312006 3010312006
2810312006 2910312006 2910312006 2910312006 30l03l2006 3010312006 30/03/2006 3010312006
2810312006 2910312006
0310312006 2310312006
3010312006
2311 212005 2911 212005 05101 12006 06101 12006 IOIO1 I2006 12101 12006 13101 12006
Contract to deliver
In exchange Settlement for
Unrealised Gainlloss
332,651
(21,899)
(87)
(783)
643
201
(1 1,526)
3
170,323
27
EUR EUR USD EUR USD USD EUR EUR USD
EUR
EUR
EUR SGD EUR SGD SGD
USD J PY J PY
SGD USD J PY
USD SGD
EUR EUR EUR EUR EUR EUR SGD EUR
GBP EUR
USD USD
USD
USD USD USD USD USD EUR USD
425,000 USD 272,000 USD 428,043 EUR 257,000 USD 242,647 EUR 340,853 EUR 338,000 USD
17,780,000 USD 21,919,246 EUR
506,821 324,659 357,000 309,479 201,000 281,000 407,892
18,067,000 21,453,348
3110312006 31 10312006 31 10312006 31 I0312006 31 10312006 31 10312006 31 10312006 31 10312006 3010612006
BRlC Markets 1,499,988 USD I ,799,265 0310412006
Europe ex UK Equity Global Emerging Markets Equity
22,116 USD 26,740 3110312006
22,331 USD 86,799 USD 17,971 USD 4,761 USD
342,395 USD
27,001 31 l03l2006 53,653 3110312006 21,556 0310412006 2,936 0310412006
21 1.225 0410412006
Global Equity 7,417 SGD I 1,924,730 USD 14,623,278 USD
10,600 USD 165,772 DKK
16,368,532 USD
12,000 3110312006 102,149 0310412006 124,026 0310412006
6,536 03104l2006 1,023,062 0410412006
139,390 04l04l2006
Global Equity Technology 90,646 SGD
10,900 USD 147,000 0310412006
6,724 0410412006
Pan European Equity 11,253 SGD I ,I 39,822 GBP
5,653 SGD 16,007 USD
1,029,380 CHF 580,489 GBP
67,000 EUR 48,296 USD
22,000 788,757 I 1,000 19,201
1,621,376 403,034
34,149 58,439
3110312006 0310412006 03104l2006 0310412006 04l04l2006 0410412006 04l0412006 04104l2006
UK Equity
U S Equity
US Index
Asia Freestyle
14,259 EUR 26,671 GBP
20,641 31 I0312006 18,464 0310412006
19,367,322 EUR 1,679,712 EUR
16,067,000 1110412006 1,400,000 11104/2006
7,843 EUR 6,482 04l04l2006
7 ',104,010 EUR 70,375 EUR
465,651 EUR 86,212 EUR
133,393 EUR 141,000 USD 184,163 EUR
5,952,000 31 I0312006 59,000 3110312006
383,000 3110312006 71,000 31 10312006
11 0,000 31/0312006 171,780 3110312006 152,000 31 I0312006
HSBC Global Investment Funds
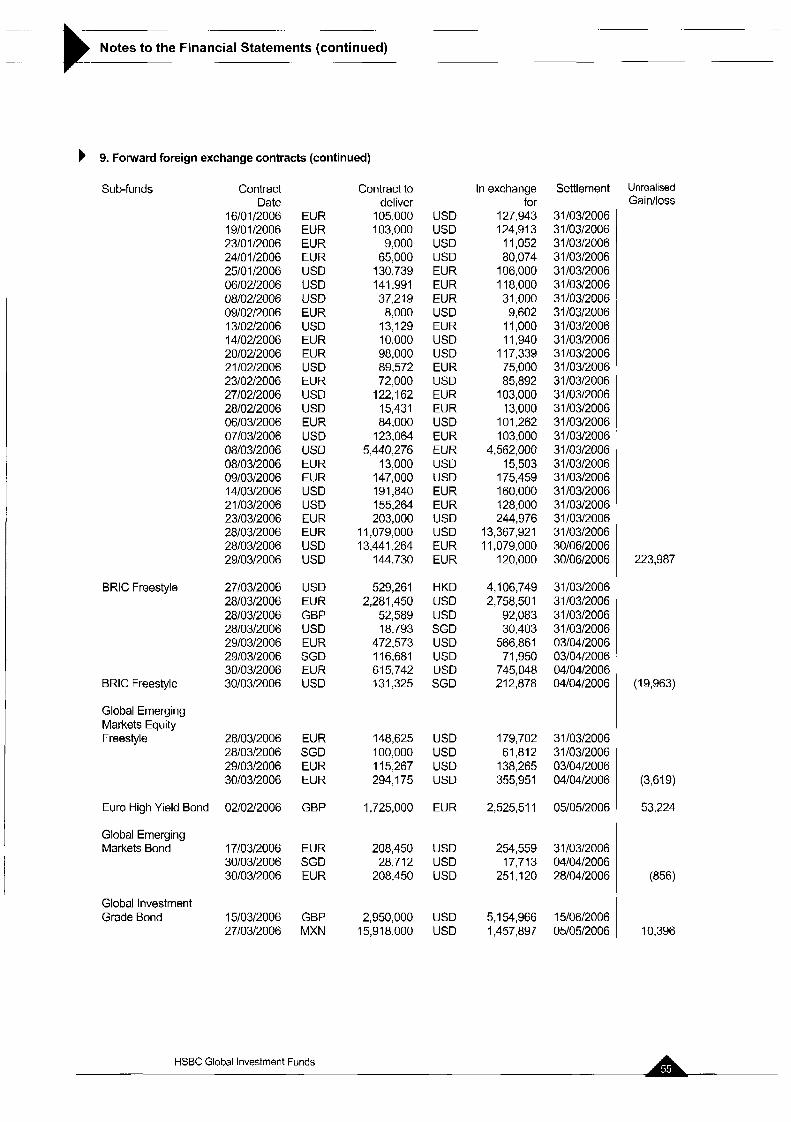
- - ..
Notes to the Financial Statements (continued) -
b 9. Foward foreign exchange contracts (continued)
Sub-funds
BRlC Freestyle
BRlC Freestyle
Global Emerging Markets Equity Freestyle
Euro High Yield Boni
Global Emerging Markets Bond
Global Investment Grade Bond
Contract Date
16101l2006 19101 12006 23101 I2006 2410112006 25101l2006 06l02l2006 08/02/2006 0910212006 13l02l2006 14l02l2006 20l0212006 21 10212006 2310212006 2710212006 2810212006 06103l2006 07l0312006 08/03/2006 0810312006 09103l2006 14l03l2006 21 IO312006 2310312006 2al0312006 28103l2006 2910312006
2710312006 2810312006 2810312006 2810312006 2910312006 2910312006 30103/2006 3010312006
2810312006 28103l2006 29103l2006 30103l2006
3 0210212006
17l03l2006 30103l2006 3010312006
15l03l2006 2710312006
EUR EUR EUR EUR USD USD USD EUR USD EUR EUR USD EUR USD USD EUR USD USD EUR EUR USD USD EUR EUR USD USD
USD EUR GBP USD EUR SGD EUR USD
EUR SGD EUR EUR
GBP
EUR SGD EUR
GBP MXN
Contract to deliver
105,000 USD 103,000 USD
9,000 USD 65,000 USD
130,739 EUR 141.991 EUR 37,219 EUR 8,000 USD
13,129 EUR 10,000 USD 98,000 USD 89,572 EUR 72,000 USD
122,162 EUR 15,431 EUR 84,000 USD
123,064 EUR 5,440,276 EUR
13,000 USD 147,000 USD 191,840 EUR 155,264 EUR 203,000 USD
1 1,079,000 USD 13,441,264 EUR
144,730 EUR
529,261 HKD 2,281,450 USD
52,589 USD 18,793 SGD
472,573 USD 116,681 USD 615,742 USD 131,325 SGD
148,625 USD 100,000 USD 115,267 USD 294,175 USD
1,725,000 EUR
208,450 USD 28,712 USD
208.450 USD
2,950,000 USD 15,918,000 USD
In exchange Settlement
127,943 31l0312006 124,913 3 1 IO312006
for
1 1,052 80,074 06,000 18,000 31,000 9,602
11,000 11,940 17,339 75,000 85,892 03,000 13,000 01,262 03,000
4,562,000 15,503
175,459 160,000 128,000 244,976
13,367,921 11,079,000
120,000
31l03l2006 31 IO312006 31 10312006 3110312006 31/03/2006 3110312006 31 10312006 31 10312006 31 IO312006 31l0312006 31 IO312006 31 10312006 31 10312006 31 10312006 31l0312006 3 1l03l2006 31 10312006 31 IO312006 31 10312006 31/03/2006 31/03/2006 31 IO312006 3010612006 3010612006
4,106,749 2,758,501
92,083 30,403
566,861 71,950
745,048 212,878
31l0312006 31 10312006 31 10312006 31 10312006 03lO412006 03104l2006 04/04/2006 04l0412006
179,702 31103l2006 61,812 31/03/2006
138,265 03104l2006 355,951 04l04l2006
2,525,511 0510512006
254,559 31l0312006 17,713 0410412006
251.120 2810412006
5,154,966 15l0612006 I ,457,897 05l0512006
Unrealised Gainlloss
223,987
(I 9,963)
(3,619)
53,224
(856)
10,396
HSBC Global Investment Funds
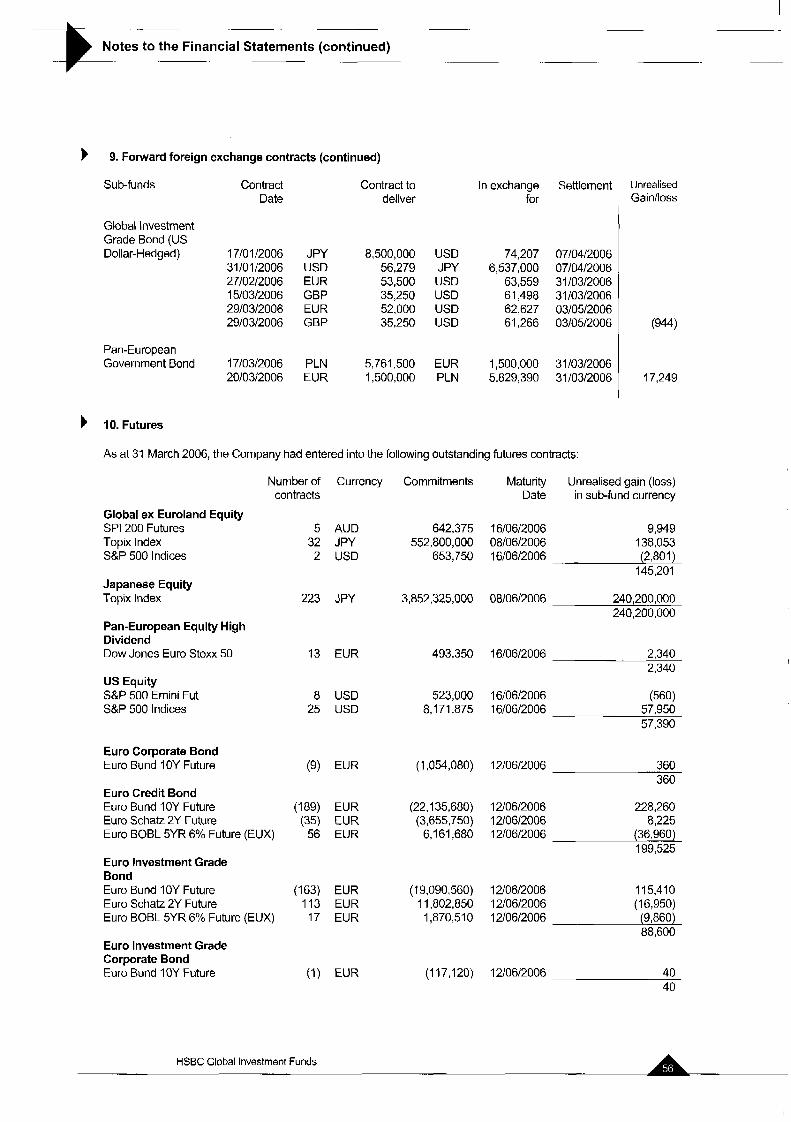
~-
Notes to the Financial Statements (continued) .~ .~
9. Forward foreign exchange contracts (continued)
Sub-funds Contract Contract to In exchange Settlement Unrealised Gainlloss Date deliver for
Global Investment Grade Bond (US Dollar-Hedged) 17/01/2006 JPY 8,500,000 USD 74,207 07/04/2006
31/01/2006 USD 56,279 JPY 6,537,000 07/04/2006 27/02/2006 EUR 53,500 USD 63,559 31/03/2006 15/03/2006 GBP 35,250 USD 61,498 31/03/2006 29/03/2006 EUR 52,000 USD 62,627 03/05/2006 29/03/2006 GBP 35,250 USD 61,266 03/05/2006
Pan-European Government Bond 17/03/2006 PLN 5,761,500 EUR 1,500,000 31/03/2006
2010312006 EUR 1,500,000 PLN 5,829,390 31/03/2006
10. Futures
As at 31 March 2006, the Company had entered into the following outstanding futures contracts:
Number of Currency contracts
Global ex Euroland Equity SPI 200 Futures 5 AUD Topix Index 32 JPY S&P 500 Indices 2 USD
Japanese Equity Topix Index 223 JPY
Pan-European Equity High Dividend Dow Jones Euro Stoxx 50 13 EUR
US Equity S8P 500 Emini Fut S&P 500 Indices
Euro Corporate Bond Euro Bund IOY Future
8 USD 25 USD
(9) EUR
Euro Credit Bond Euro Bund 1 OY Future (189) EUR Euro Schatz 2Y Future (35) EUR Euro BOBL 5YR 6% Future (EUX) 56 EUR
Euro investment Grade Bond Euro Bund 1OY Future (163) EUR Euro Schatz 2Y Future 113 EUR Euro BOBL 5YR 6% Future (EUX) 17 EUR
Euro Investment Grade Corporate Bond Euro Bund 1 OY Future (1) EUR
(944)
17.249
Commitments Maturity Unrealised gain (loss) Date in sub-fund currency
642,375 16/06/2006 9,949 552,800,000 08/06/2006 138,053
653,750 16/06/2006 (2,801) 145,201
3,852,325,000 08/06/2006
493.350 16/06/2006
240,200,000 240,200,000
2,340 2,340
523,000 16/06/2006 (560) 8,171,875 16/06/2006 57,950
57,390
(1,054,080) 12/06/2006 360 360
(22,135,680) 12/06/2006 228,260 (3,655,750) 12/06/2006 8,225
6,161,680 12/06/2006 (36,960) 199,525
(19,090,560) 12/06/2006 115,410 1 1,802,850 12/06/2006 (1 6,950) 1,870,510 12/06/2006 (9,860)
88,600
(1 1 7,120) 1 210612006 40 40
HSBC Global Investment Funds
I
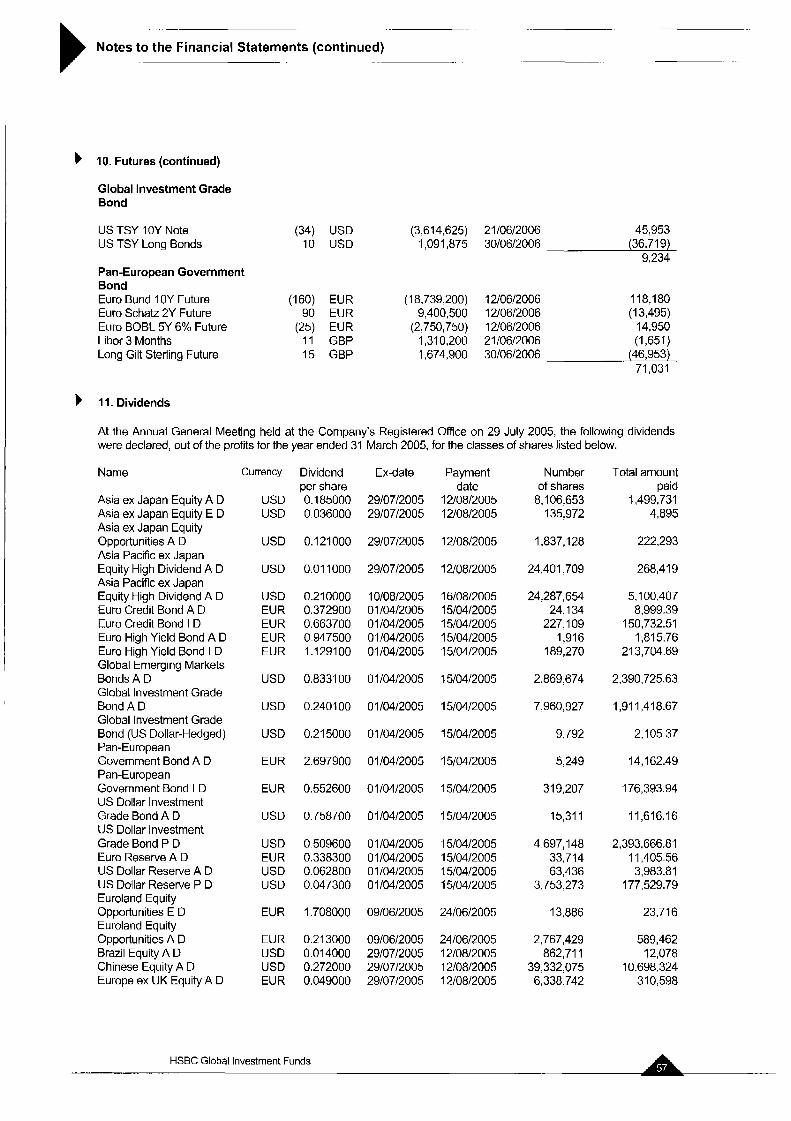
_. ..
Notes to the Financial Statements (continued)
b I O . Futures (continued)
Global Investment Grade Bond
US TSY 1 OY Note US TSY Long Bonds
Pan-European Government Bond Euro Bund I OY Future Euro Schatz 2Y Future Euro BOBL 5Y 6% Future Libor 3 Months Long Gilt Sterling Future
(34) USD (3,614,625) 21 10612006 45,953 10 USD 1,091,875 3010612006 (36,719)
9,234
(160) EUR (1 8,739,200) 12l06l2006 118,180 90 EUR 9,400,500 12/0612006 (1 3,495)
(25) EUR (2,750,750) 12l06l2006 14,950 11 GBP 1,310,200 21/06/2006 (1,651 1 15 GBP 1,674,900 30l0612006 (46,953)
71,031
b I I. Dividends
At the Annual General Meeting held at the Company’s Registered Office on 29 July 2005, the following dividends were declared, out of the profits for the year ended 31 March 2005, for the classes of shares listed below.
Name
Asia ex Japan Equity A D Asia ex Japan Equity E D Asia ex Japan Equity Opportunities A D Asia Pacific ex Japan Equity High Dividend A D Asia Pacific ex Japan Equity High Dividend A D Euro Credit Bond A D Euro Credit Bond I D Euro High Yield Bond A D Euro High Yield Bond I D Global Emerging Markets Bonds A D Global Investment Grade Bond A D Global Investment Grade Bond (US Dollar-Hedged) Pan-European Government Bond A D Pan-European Government Bond I D US Dollar Investment Grade Bond A D US Dollar Investment Grade Bond P D Euro Reserve A D US Dollar Reserve A D US Dollar Reserve P D Euroland Equity Opportunities E D Euroland Equity opportunities A D Brazil Equity A D Chinese Equity A D Europe ex UK Equity A D
CUI rrency
USD USD
USD
USD
USD EUR EUR EUR EUR
USD
USD
USD
EUR
EUR
USD
USD EUR USD USD
EUR
EUR USD USD EUR
Dividend per share 0.185000 0.036000
0.121 000
0.01 1000
0.21 0000 0.372900 0.663700 0.947500 1 . I 291 00
0.8331 00
0.240100
0.21 5000
2.697900
0.552600
0.758700
0.509600 0.338300 0.062800 0.047300
I .708000
0.21 3000 0.014000 0.272000 0.049000
Ex-date
2910712005 29/0712005
2910712005
2910712005
I oioa12005 01 I0412005 01 10412005 01/04/2005 01 10412005
01 10412005
01 IO412005
01 IO412005
01lO412005
01 10412005
01 10412005
01 IO412005 01 10412005 01 /04/2005 01 10412005
09106l2005
09l06l2005 2910712005 29/07/2005 2910712005
Payment date
12l08l2005 12l08l2005
12l08l2005
12l08l2005
16/08/2005 15l04l2005 15/04/2005 1510412005 15l04l2005
1510412005
15l04l2005
15l04l2005
15104/2005
15/04/2005
15104/2005
15l04l2005 15l04l2005 15l04l2005 15/04/2005
2410612005
2410612005 12l08l2005 12l08l2005 12/08/2005
Number of shares
8,106,653 135,972
1,837,128
24,401,709
24,287,654 24,134
227,109 1,916
189,270
2,869,674
7,960,927
9,792
5,249
319,207
15,311
4,697,148 33,714 63,436
3,753,273
13,886
2,767,429 862,711
39,332,075 6,338,742
Total amount paid
1,499,731 4,895
222,293
268,419
5,100,407 8,999.39
150,732.51 1,815.76
21 3,704.69
2,390,725.63
1,911,418.67
2,105.37
14,162.49
176,393.94
I 1,616.16
2,393,666.81 11,405.56 3,983.81
177,529.79
23,716
589,462 12,078
10,698,324 31 0,598
HSBC Global Investment Funds
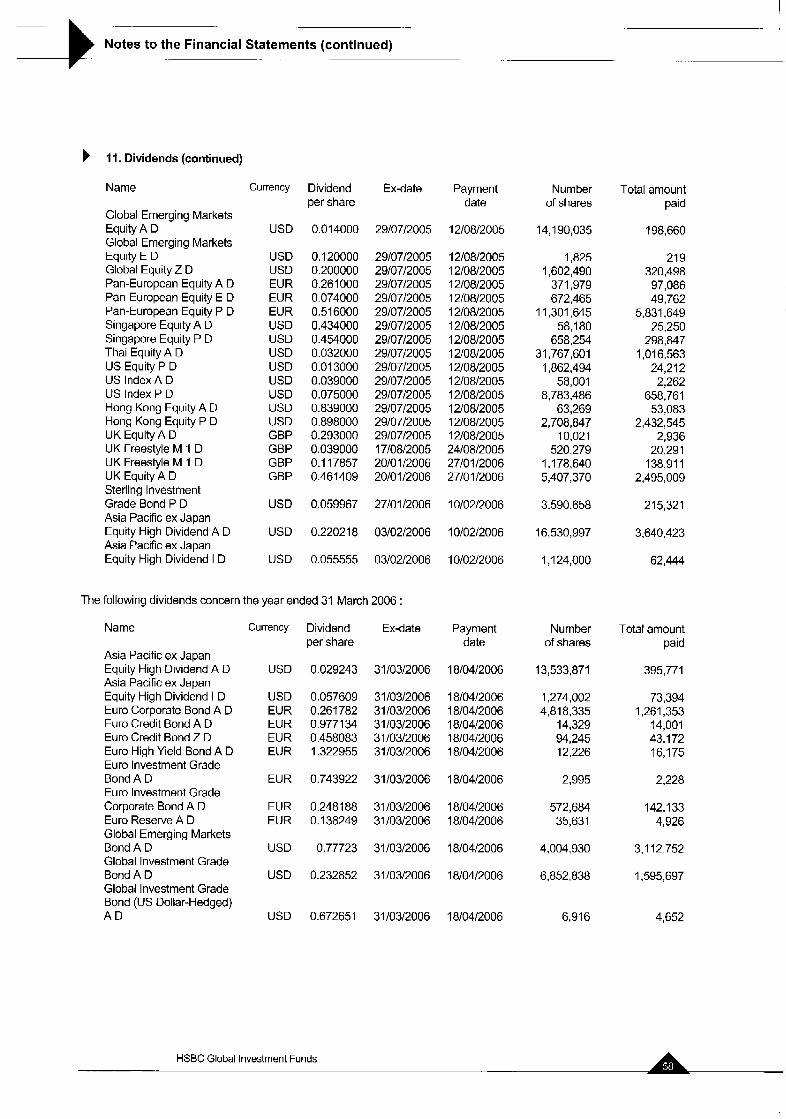
Notes to the Financial Statements (continued) -.
b I I. Dividends (continued)
The following dividends concern the year ended 31 March 2006 :
Name
Global Emerging Markets Equity A D Global Emerging Markets Equity E D Global Equity Z D Pan-European Equity A D Pan-European Equity E D Pan-European Equity P D Singapore Equity A D Singapore Equity P D Thai Equity A D US Equity P D US Index A D US Index P 0 Hong Kong Equity A D Hong Kong Equity P D UK Equity A 0 UK Freestyle M 1 D UK Freestyle M 1 D UK Equity A D Sterling Investment Grade Bond P D Asia Pacific ex Japan Equity High Dividend A D Asia Pacific ex Japan Equity High Dividend I D
Currency
USD
USD USD EUR EUR EUR USD USD USD USD USD USD USD USD GBP GBP GBP GBP
USD
USD
USD
Dividend per share
0.01 4000
0.120000 0.200000 0.261000 0.074000 0.516000 0.434000 0.454000 0.032000 0.013000 0.039000 0.075000 0.839000 0.898000 0.293000 0.039000 0.1 17857 0.461 409
0.059967
0.220218
0.055555
Ex-date
29/07/2005
29/07/2005 29/07/2005 29/07/2005 29/07/2005 29/07/2005 29/07/2005 29/07/2005 29/07/2005 29/07/2005 29/07/2005 2910712005 29/07/2005 29/07/2005 29/07/2005 17/08/2005 20101 12006 20/01/2006
27/01 12006
03/02/2006
03/02/2006
Name
Asia Pacific ex Japan Equity High Dividend A D Asia Pacific ex Japan Equity High Dividend I 0 Euro Corporate Bond A D Euro Credit Bond A D Euro Credit Bond Z D Euro High Yield Bond A D Euro Investment Grade Bond A D Euro Investment Grade Corporate Bond A 0 Euro Reserve A D Global Emerging Markets Bond A D Global Investment Grade Bond A D Global Investment Grade Bond (US Dollar-Hedged) A D
Payment date
12/08/2005
12/08/2005 12/08/2005 12/08/2005 12/08/2005 12/08/2005 12/08/2005 12/08/2005 12/08/2005 12/08/2005 12/08/2005 12/08/2005 12/08/2005 12/08/2005 12/08/2005 24/08/2005 27/01/2006 27/01 12006
10/02/2006
1010212006
10/02/2006
Currency Dividend Ex-date Payment per share date
USD 0.029243 31/03/2006 18/04/2006
USD 0.057609 31/03/2006 18/04/2006 EUR 0.261782 31/03/2006 18/04/2006 EUR 0.977134 31/03/2006 18/04/2006 EUR 0.458083 31/03/2006 18/04/2006 EUR 1.322955 31/03/2006 18/04/2006
EUR 0.743922 31/03/2006 18/04/2006
EUR 0.248188 31/03/2006 18/04/2006 EUR 0.138249 31/03/2006 18/04/2006
USD 0.77723 31/03/2006 18/04/2006
USD 0.232852 31/03/2006 18/04/2006
USD 0.672651 31/03/2006 18/04/2006
Number of shares
14,190,035
1,825 1,602,490 371,979 672,465
11,301,645 58,180 658,254
31,767,601 1,862,494 58,001
8,783,486 63,269
2,708,847 10,021 520,279
1 ,I 78,640 5,407,370
3,590,658
16,530,997
1,124,000
Number of shares
13,533,871
1,274,002 4,818,335 14,329 94,245 12,226
2,995
572,684 35,631
4,004,930
6,852,838
6,916
Total amount paid
198,660
219 320,498 97,086 49,762
5,831,649 25,250 298,847 1,016,563 24,212 2,262
658,761 53,083
2,432,545 2,936 20,291 138,91 I
2,495,009
215,321
3,640,423
62,444
Total amount paid
395,771
73,394 1,261,353 14,001 43,172 16,175
2,228
142,133 4,926
3,112,752
1,595,697
4,652
HSBC Global Investment Funds
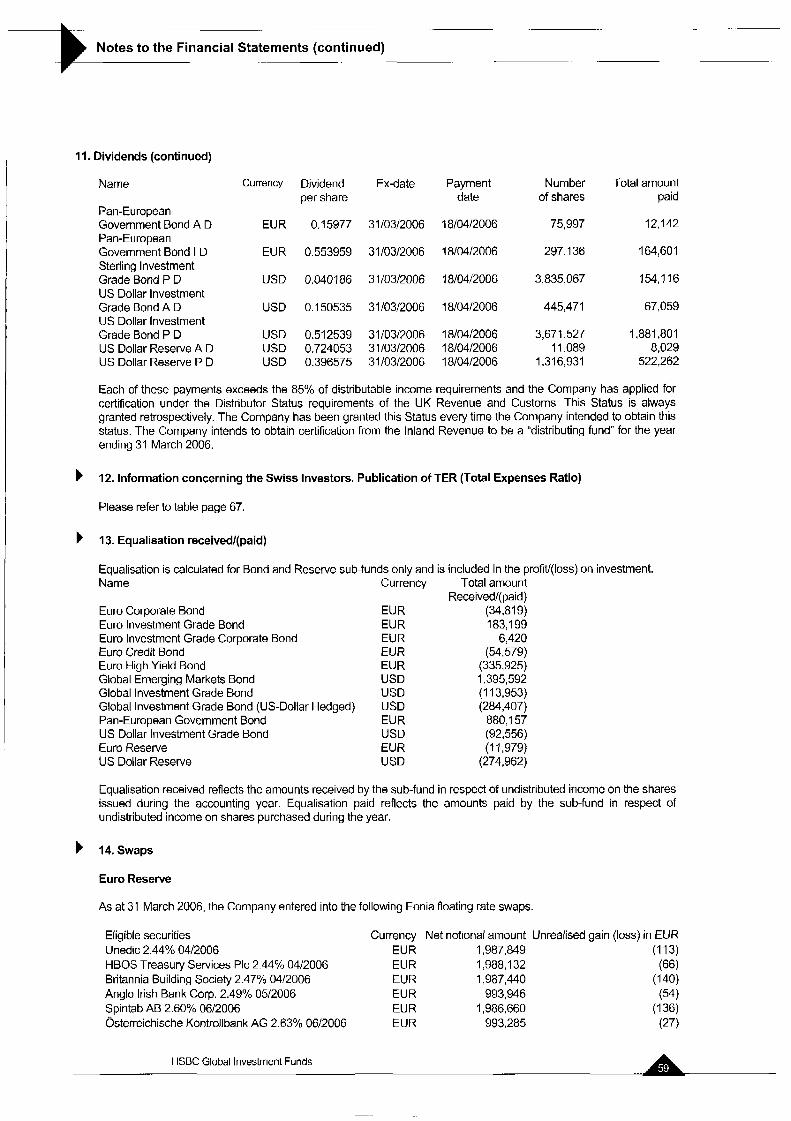
._
Notes to the Financial Statements (continued)
Name
Pan-European Government Bond A D Pan-European Government Bond I D Sterling Investment Grade Bond P D US Dollar Investment Grade Bond A D US Dollar Investment Grade Bond P D US Dollar Reserve A D US Dollar Reserve P D
Currency
EUR
EUR
USD
USD
US0 USD USD
Dividend per share
0.15977
0.553959
0.040186
0.1 50535
0.512539 0.724053 0.396575
Ex-date
31 I0312006
3110312006
3 1 I0312006
3110312006
31 10312006 31 I0312006 31 10312006
1 I. Dividends (continued)
_ _
Payment date
I810412006
1810412008
I 8/04/2006
1810412006
1810412006 1810412006 18lO412006
Number of shares
75,997
297,136
3,835,067
445,471
3,671,527
1,316,931 I I ,089
Total amount paid
12,142
164,601
154,116
67,059
1,881,801 8,029
522,262
Each of these payments exceeds the 85% of distributable income requirements and the Company has applied for certification under the Distributor Status requirements of the UK Revenue and Customs. This Status is always granted retrospectively. The Company has been granted this Status every time the Company intended to obtain this status. The Company intends to obtain certification from the Inland Revenue to be a “distributing fund” for the year ending 31 March 2006.
12. Information concerning the Swiss Investors. Publication of TER (Total Expenses Ratio)
Please refer to table page 67.
13. Equalisation received/(paid)
Equalisation is calculated for Bond and Reserve sub-funds only and is included in the profitl(l0ss) on investment. Name Currency Total amount
Receivedl( paid) Euro Corporate Bond EUR (34,819) Euro Investment Grade Bond EUR 183,199 Euro Investment Grade Corporate Bond EUR 6,420 Euro Credit Bond EUR (54,579) Euro High Yield Bond EUR (335,925) Global Emerging Markets Bond USD 1,395,592 Global Investment Grade Bond USD (1 13,953) Global Investment Grade Bond (US-Dollar Hedged) USD (284,407) Pan-European Government Bond EUR 880,157 US Dollar Investment Grade Bond USD (92,556)
US Dollar Reserve USD (274,962) Euro Reserve EUR (11,979)
Equalisation received reflects the amounts received by the sub-fund in respect of undistributed income on the shares issued during the accounting year. Equalisation paid reflects the amounts paid by the sub-fund in respect of undistributed income on shares purchased during the year.
14. Swaps
Euro Reserve
As at 31 March 2006, the Company entered into the following Eonia floating rate swaps
Eligible securities Currency Net notional amount Unrealised gain (loss) in EUR Unedic 2.44% 0412006 EUR 1,987,849 (113) HBOS Treasury Services PIC 2.44% 0412006 EUR 1,988,132 (66) Britannia Building Society 2.47% 0412006 EUR 1,987,440 (1 40) Anglo Irish Bank Corp. 2.49% 0512006 EUR 993,946 (54) Spintab AB 2.60% 0612006 EUR 1,986,660 (1 36) Osterreichische Kontrollbank AG 2.63% 0612006 EUR 993,285 (27)
HSBC Global Investment Funds
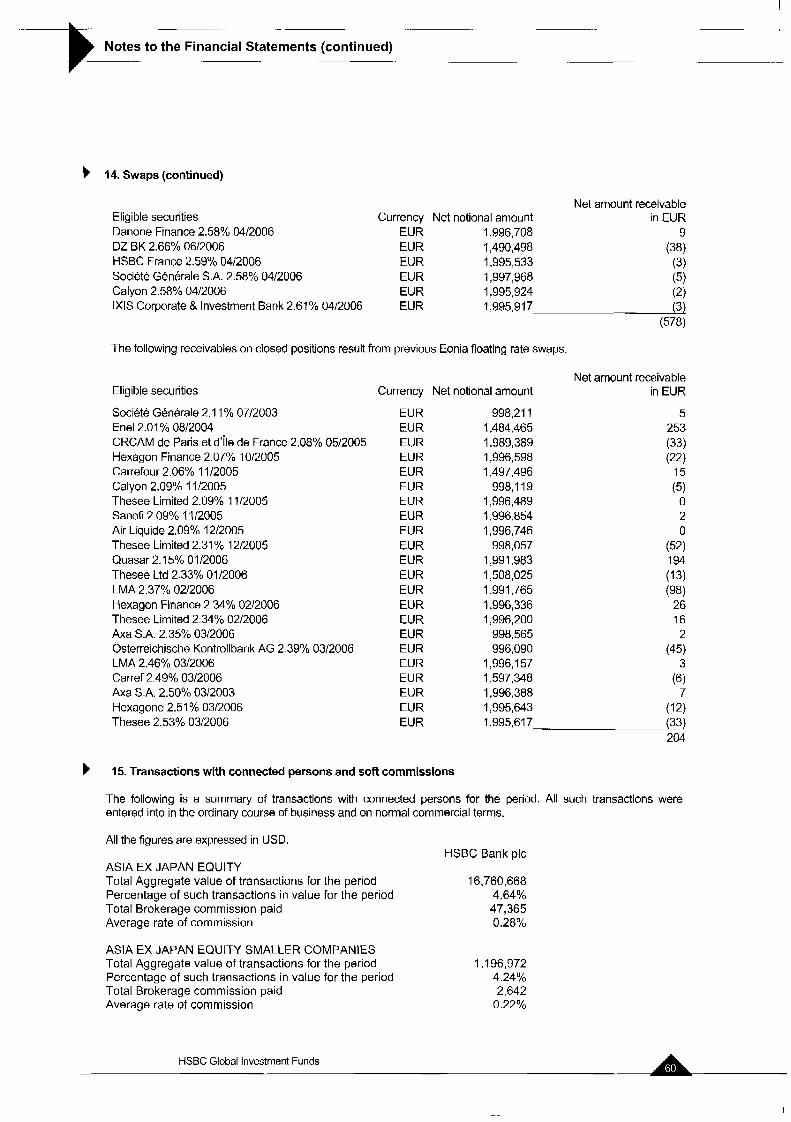
.. -.
Notes to the Financial Statements (continued)
b 14. Swaps (continued)
Net amount receivable Eligible securities Currency Net notional amount in EUR Danone Finance 2.58% 0412006 EUR 1,996,708 9 DZ BK 2.66% 0612006 EUR 1,490,498 (38) HSBC France 2.59% 0412006 EUR 1,995,533 (3) Societe Generale S.A. 2.58% 0412006 EUR 1,997,968 (5) Calyon 2.58% 0412006 EUR 1,995,924 (2) 1x1s Corporate & Investment Bank 2.61 % 0412006 EUR
. . 1,995,917 (3)
(578)
The following receivables on closed positions result from previous Eonia floating rate swaps.
Eligible securities
Societe Generale 2.1 1% 07/2003 Enel 2.01 Yo 0812004 CRCAM de Paris et d'ile de France 2.08% 0512005 Hexagon Finance 2.07% I012005 Carrefour 2.06% 1112005 Calyon 2.09% 1112005 Thesee Limited 2.09% 1112005 Sanofi 2.09% 1112005 Air Liquide 2.09% 1212005 Thesee Limited 2.31% 1212005 Quasar 2.15% 0112006 Thesee Ltd 2.33% 0112006 LMA 2.37% 0212006 Hexagon Finance 2.34% 0212006 Thesee Limited 2.34% 0212006 Axa S.A. 2.35% 0312006 Osterreichische Kontrollbank AG 2.39% 0312006 LMA 2.46% 0312006 Carref 2.49% 0312006 Axa SA. 2.50% 0312003 Hexagone 2.51 % 0312006 Thesee 2.53% 0312006
Currency Net notional amount
EUR EUR EUR EUR EUR EUR EUR EUR EUR EUR EUR EUR EUR EUR EUR EUR EUR EUR EUR EUR EUR EUR
998,211 1,484,465 1,989,389 1,996,598 1,497,496 998,119 1,996,489 1,996,854 1,996,746 998,057 1,991,983 1,508,025 1,991,765 1,996,336 1,996,200 998,565 996,090 1,996,157 1,597,348 1,996,388 1,995,643 1,995,617_
Net amount receivable in EUR
5 253 (33) (22)
(5) 15
0 2 0
(52) I 94 (13) (98) 26 16 2
3
7
(45)
(6)
(12) (33) 204
b 15. Transactions with connected persons and soft commissions
The following is a summary of transactions with connected persons for the period. All such transactions were entered into in the ordinary course of business and on normal commercial terms.
All the figures are expressed in USD. HSBC Bank plc
ASIA EX JAPAN EQUITY Total Aggregate value of transactions for the period 16,760,668 Percentage of such transactions in value for the period 4.64% Total Brokerage commission paid 47,365 Average rate of commission 0.28%
ASIA EX JAPAN EQUITY SMALLER COMPANIES Total Aggregate value of transactions for the period 1,196,972 Percentage of such transactions in value for the period 4.24% Total Brokerage commission paid 2,642 Average rate of commission 0.22%
HSBC Global Investment Funds
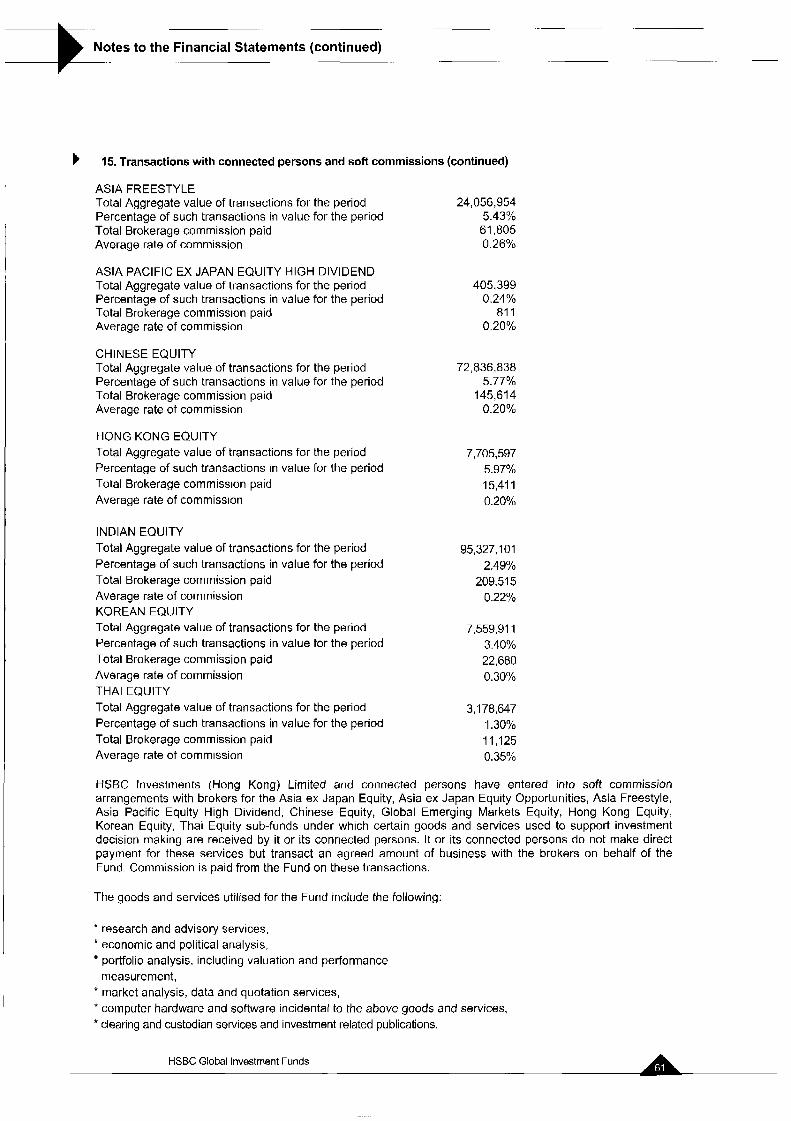
.~
Notes to the Financial Statements (continued) ~
b 15. Transactions with connected persons and soft commissions (continued)
ASIA FREESTYLE Total Aggregate value of transactions for the period 24,056,954
5.43% Total Brokerage commission paid 61,805 Average rate of commission 0.26%
Percentage of such transactions in value for the period
ASIA PACIFIC EX JAPAN EQUITY HIGH DIVIDEND Total Aggregate value of transactions for the period Percentage of such transactions in value for the period Total Brokerage commission paid Average rate of commission
405,399 0.24%
81 1 0.20%
CHINESE EQUITY Total Aggregate value of transactions for the period 72,836,838
5.77% Total Brokerage commission paid 145,614 Percentage of such transactions in value for the period
Average rate of commission 0.20%
HONG KONG EQUITY Total Aggregate value of transactions for the period Percentage of such transactions in value for the period Total Brokerage commission paid Average rate of commission
INDIAN EQUITY Total Aggregate value of transactions for the period Percentage of such transactions in value for the period Total Brokerage commission paid Average rate of commission KOREAN EQUITY Total Aggregate value of transactions for the period Percentage of such transactions in value for the period Total Brokerage commission paid Average rate of commission THAI EQUITY Total Aggregate value of transactions for the period Percentage of such transactions in value for the period Total Brokerage commission paid Average rate of commission
7,705,597 5.97% 15,411 0.20%
95,327,101 2.49%
209,515 0.22%
7,559,911 3.40% 22,680 0.30%
3,178,647 1.30% 11,125 0.35%
HSBC Investments (Hong Kong) Limited and connected persons have entered into soft commission arrangements with brokers for the Asia ex Japan Equity, Asia ex Japan Equity Opportunities, Asia Freestyle, Asia Pacific Equity High Dividend, Chinese Equity, Global Emerging Markets Equity, Hong Kong Equity, Korean Equity, Thai Equity sub-funds under which certain goods and services used to support investment decision making are received by it or its connected persons. It or its connected persons do not make direct payment for these services but transact an agreed amount of business with the brokers on behalf of the Fund. Commission is paid from the Fund on these transactions.
The goods and services utilised for the Fund include the following:
* research and advisory services, * economic and political analysis,
portfolio analysis. including valuation and performance
* market analysis, data and quotation services, * computer hardware and software incidental to the above goods and services, * clearing and custodian services and investment related publications.
measurement,
HSBC Global Investment Funds
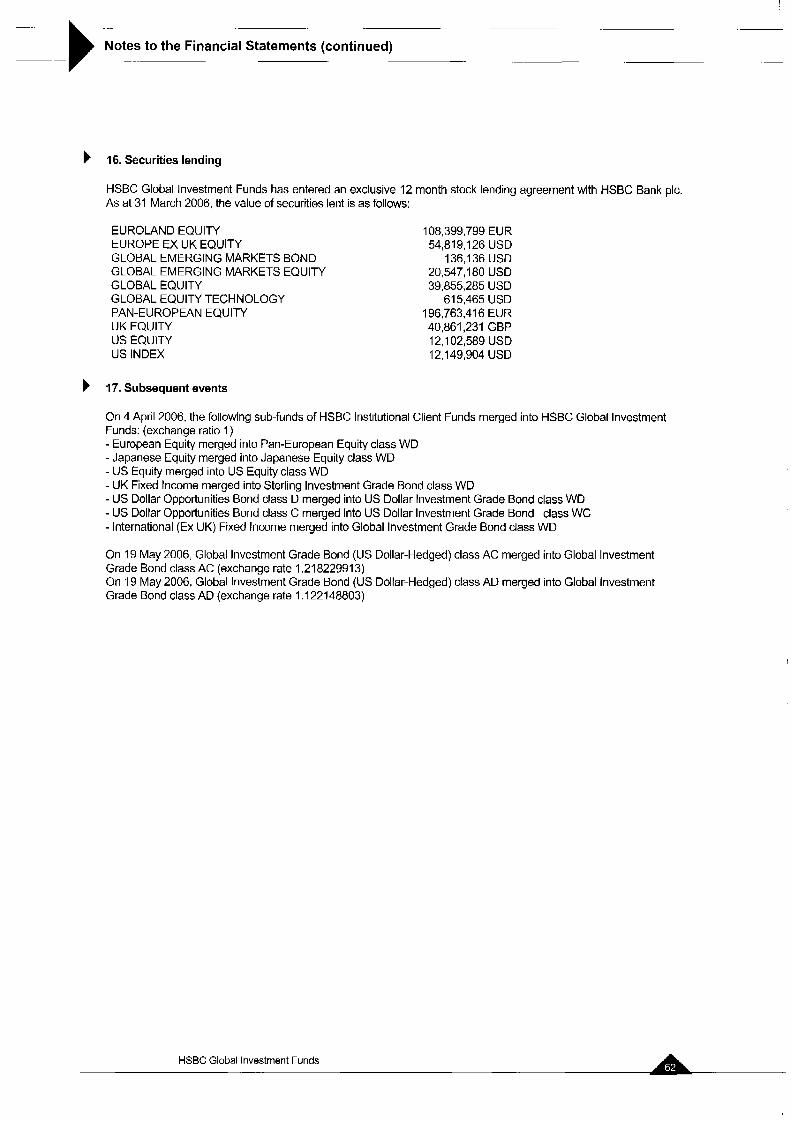
-~
Notes to the Financial Statements (continued) .- .- -
b 16. Securities lending
HSBC Global Investment Funds has entered an exclusive 12 month stock lending agreement with HSBC Bank plc. As at 31 March 2006, the value of securities lent is as follows:
EUROLAND EQUITY EUROPE EX UK EQUITY GLOBAL EMERGING MARKETS BOND GLOBAL EMERGING MARKETS EQUITY GLOBAL EQUITY GLOBAL EQUITY TECHNOLOGY
UK EQUITY US EQUITY US INDEX
PAN-EUROPEAN EQUITY
108,399,799 EUR 54,819,126 USD
136,136 USD 20,547,180 USD 39,855,285 USD
615,465 USD 196,763,416 EUR 40,861,231 GBP 12,102,589 USD 12,149,904 USD
b 17. Subsequent events
On 4 April 2006, the following sub-funds of HSBC Institutional Client Funds merged into HSBC Global Investment Funds: (exchange ratio 1) - European Equity merged into Pan-European Equity class WD - Japanese Equity merged into Japanese Equity class WD - US Equity merged into US Equity class WD - UK Fixed Income merged into Sterling Investment Grade Bond class WD - US Dollar Opportunities Bond class D merged into US Dollar Investment Grade Bond class WD - US Dollar Opportunities Bond class C merged into US Dollar Investment Grade Bond class WC - International (Ex UK) Fixed Income merged into Global Investment Grade Bond class WD
On 19 May 2006, Global Investment Grade Bond (US Dollar-Hedged) class AC merged into Global Investment Grade Bond class AC (exchange rate 1.218229913) On 19 May 2006, Global Investment Grade Bond (US Dollar-Hedged) class AD merged into Global Investment Grade Bond class AD (exchange rate 1,122148803)
HSBC Global Investment Funds
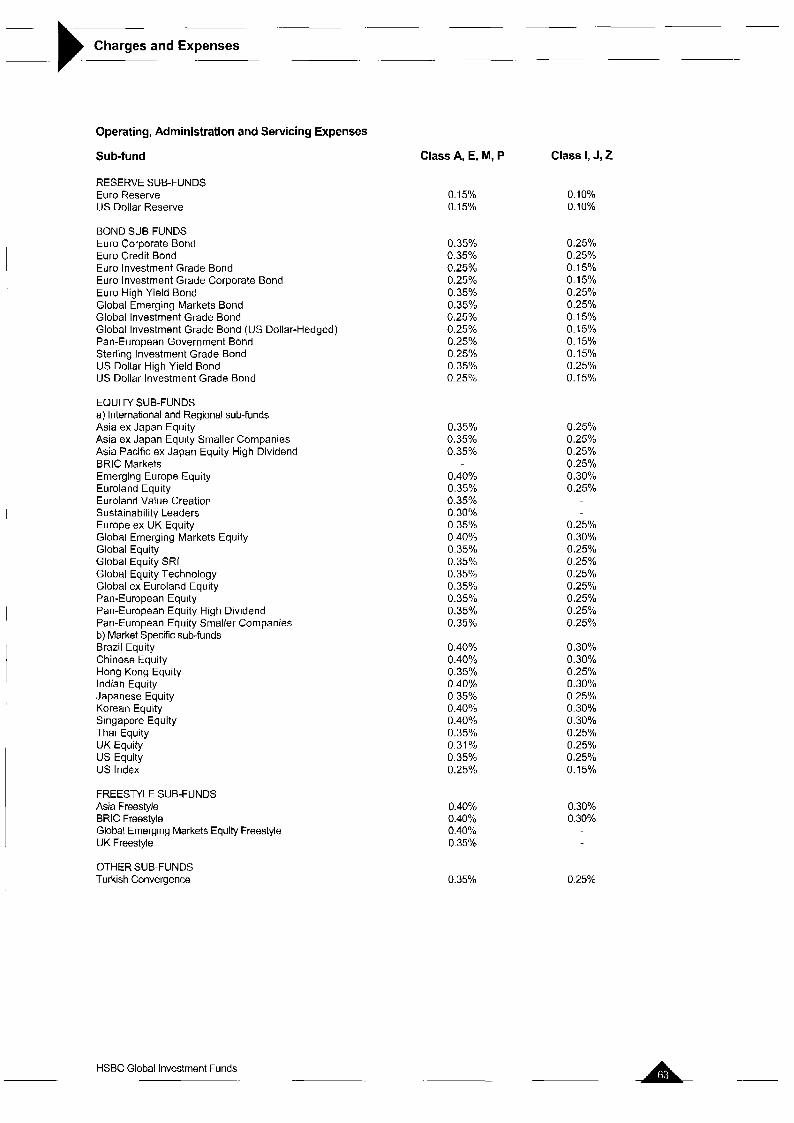
Charges and Expenses -~ ~.
Operating, Administration and Servicing Expenses
Sub-fund
RESERVE SUB-FUNDS Euro Reserve US Dollar Reserve
BOND SUB-FUNDS Euro Corporate Bond Euro Credit Bond Euro Investment Grade Bond Euro Investment Grade Corporate Bond Euro High Yield Bond Global Emerging Markets Bond Global Investment Grade Bond Global Investment Grade Bond (US Dollar-Hedged) Pan-European Government Bond Sterling Investment Grade Bond US Dollar High Yield Bond US Dollar Investment Grade Bond
EQUITY SUB-FUNDS a) International and Regional sub-funds Asia ex Japan Equity Asia ex Japan Equity Smaller Companies Asia Pacific ex Japan Equity High Dividend BRlC Markets Emerging Europe Equity Euroland Equity Euroland Value Creation Sustainability Leaders Europe ex UK Equity Global Emerging Markets Equity Global Equity Global Equity SRI Global Equity Technology Global ex Euroland Equity Pan-European Equity Pan-European Equity High Dividend Pan-European Equity Smaller Companies b) Market Specific sub-funds Brazil Equity Chinese Equity Hong Kong Equity Indian Equity Japanese Equity Korean Equity Singapore Equity Thai Equity UK Equity US Equity US Index
FREESTYLE SUB-FUNDS Asia Freestyle BRlC Freestyle Global Emerging Markets Equity Freestyle UK Freestyle
OTHER SUB-FUNDS Turkish Convergence
HSBC Global Investment Funds ~~ -
Class A, E, M, P
0.15% 0.15%
0.35% 0.35% 0.25% 0.25%
0.35% 0.25% 0.25%
0.25% 0.35%
0.35%
0.25%
0.25%
0.35%
0.35% 0.35%
0.40% 0.35% 0.35% 0.30% 0.35% 0.40% 0.35% 0.35% 0.35% 0.35% 0.35% 0.35% 0.35%
0.40% 0.40% 0.35% 0.40% 0.35% 0.40% 0.40% 0.35% 0.31 % 0.35% 0.25%
0.40% 0.40% 0.40% 0.35%
0.35%
Class I, J, 2
0.10% 0.10%
0.25% 0.25% 0.15% 0.15% 0.25% 0.25% 0.15% 0.15% 0.15% 0.15% 0.25% 0.15%
0.25% 0.25% 0.25%
0.30% 0.25%
0.25%
0.25%
0.25%
0.25%
0.25%
0.30%
0.25%
0.25%
0.25% 0.25%
0.30%
0.25% 0.30%
0.30% 0.25% 0.30% 0.30%
0.25%
0.15%
0.25%
0.25%
0.30% 0.30%
0.25%
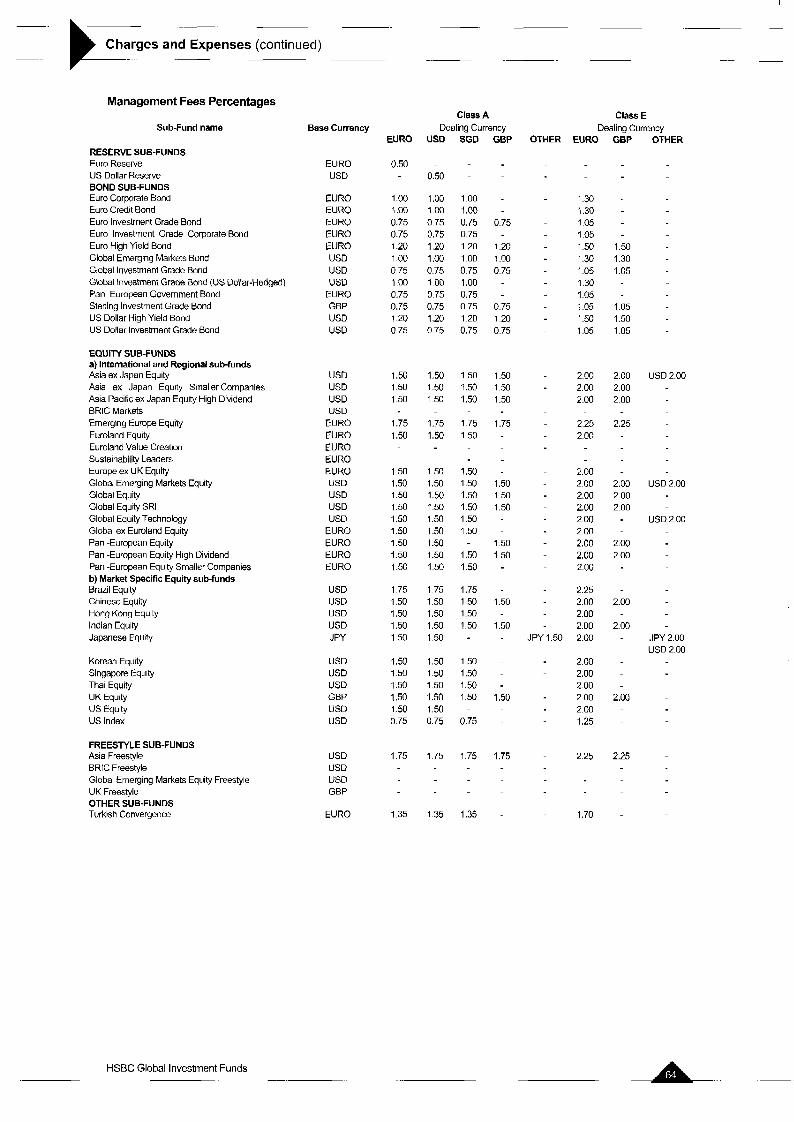
--
Charges and Expenses (continued) .- .~
Management Fees Percentages
Sub-Fund name
RESERVE SUB-FUNDS Euro Reserve US Dollar Reserve
Euro Corporate Bond Euro Credit Bond Euro Investment Grade Bond Euro Investment Grade Corporate Bond Euro High Yield Bond Global Emerging Markets Bond Global Investment Grade Bond Global Investment Grade Bond (US Dollar-Hedged) Pan -European Government Bond Sterling Investment Grade Bond US Dollar High Yield Bond US Dollar Investment Grade Bond
BOND SUB-FUNDS
EQUITY SUB-FUNDS a) International and Regional sub-funds Asia ex Japan Equity Asia ex Japan Equity Smaller Companies Asia Pacific ex Japan Equity High Dividend ERIC Markets Emerging Europe Equlty Euroland Equity Euroland Value Creation Sustainability Leaders Europe ex UK Equity Global Emerging Markets Equity Global Equity Global Equity SRI Global Equity Technology Global ex Euroland Equity Pan -European Equity Pan -European Equity High Divldend Pan -European Equity Smaller Companies b) Market Specific Equity sub-funds Brazil Equity Chinese Equity Hong Kong Equity Indian Equity Japanese Equity
Korean Equity Singapore Equity Thai Equity UK Equity
US Index us Equity
FREESTYLE SUB-FUNDS Asia Freestyle ERIC Freestyle Global Emerging Markets Equity Freestyle UK Freestyle
Turkish Convergence OTHER SUB-FUNDS
Base Currency
EURO USD
EURO EURO EURO EURO EURO USD USD USD
EURO GBP USD USD
USD USD USD USD
EURO EURO EURO EURO EURO us0 USD US0 USD
EURO EURO EURO EURO
USD USD USD USD JPY
USD USD US0 GBP USD USD
USD USD USD GBP
EURO
EURO
0.50
1 .oo 1 .oo 0.75 0.75 1.20 1 .oo 0.75 1 .oo 0.75 0.75 1.20 0.75
I
-
-- .~
Class A Dealing Currency
us0
0.50
1 .oo 1 .oo 0.75 0.75 1.20 1 .oo 0.75 1 .oo 0.75 0.75 1.20 0.75
SGD
1.00 1 .oo 0.75 0.75 1.20 1 .oo 0.75 1 .oo 0.75 0.75 1.20 0.75
GBP
0.75
1.20 1 .oo 0.75
0.75 1.20 0.75
OTHER EURO
Class E Dealing Currency
GBP OTHER
- 1.30 - 1.30 - 1.05 - 1.05 - 1.50 - 1.30
1.05 1.30 1.05 1.05
1.05 - 1.50
1.50 1.50 1.50 1.50 1.50 1.50 1.50 1.50 1.50 1.50 1.50 1.50
1.75 1.75 1.75 1.75 1.50 1.50 1.50 -
1.50 1.50 1.50 -
1.50 1.50 1.50 1.50 1.50 1.50 1.50 1.50 1.50 1.50 1.50 1.50 1.50 1.50 1.50 -
1.50 1.50 1.50 -
1.50 1.50 1.50 1.50 1.50 1.50 1.50 - 1.75 175 1.75 -
1.50 1.50 1.50 1.50 1.50 1.50 1.50 - 1.50 1.50 1.50 1.50 1.50 1.50 - - JPY 1.50
1.50 1.50 1.50 -
1.50 1.50 1.50 - 1.50 1.50 1.50 - 1.50 1.50 1.50 1.50 1.50 1.50 -
0.75 0.75 0.75 -
1.50 1.50 - 1.50
2.00 2.00 2.00
2.25 2.00
2.00 2.00 2.00 2.00 2.00 2.00 2.00 2.00 2.00
2.25 2.00 2.00 2.00 2.00
2.00 2.00 2.00 2.00 2.00 1.25
1.50 1.30 1.05
1.05 1.50 1.05
2.00 2.00 2.00
2.25
2.00 2.00 2.00
2.00 2.00
US0 2.00
USD 2.00
USD 2.00
2.00
2.00 - JPY 2.00
USD 2.00
2.00
1.75 1.75 1.75 1.75 - 2.25 2.25
1.35 1.35 1.35 - 1.70 -
HSBC Global Investment Funds .. ~
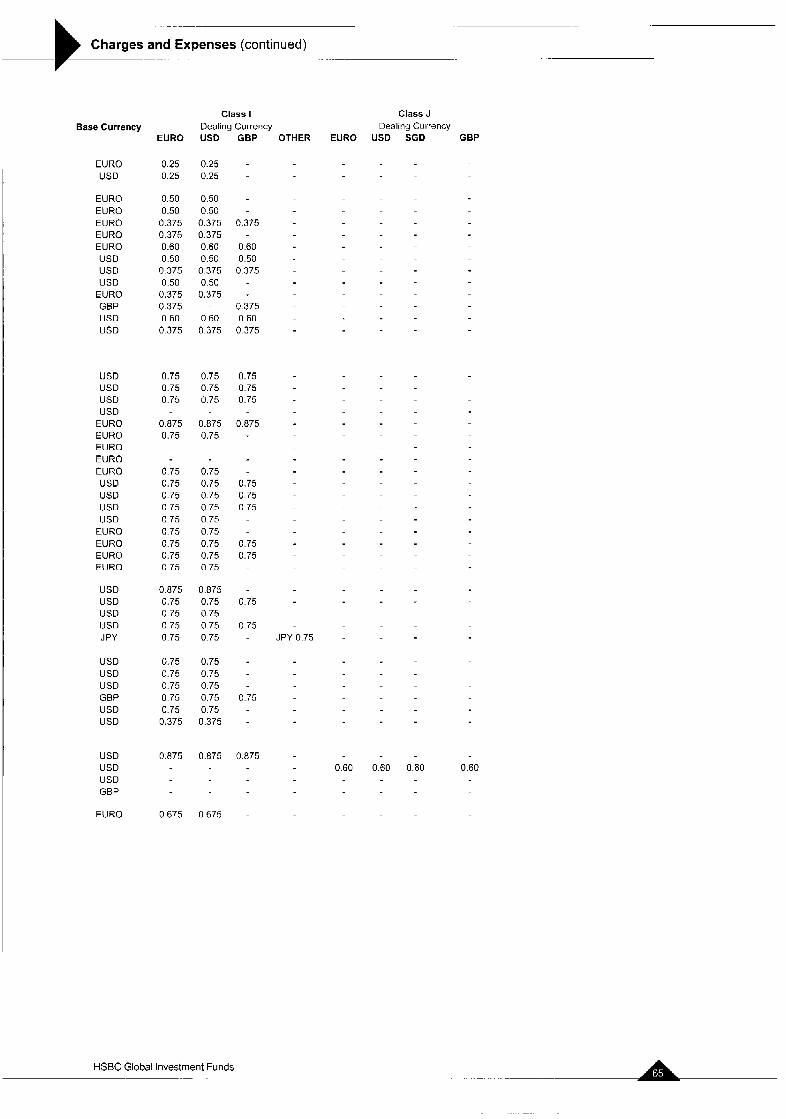
_. _.
Charges and Expenses (continued) .. _ _
Class I Dealing Currency
Class J Dealing Currency
USD SGD GBP Base Currency
EURO
0.25 0.25
0.50 0.50
0.375 0.375 0.60 0.50
0.375 0.50 0.375 0.375 0.60
0.375
USD
0.25 0.25
0.50 0.50
0.375 0.375 0.60 0.50 0.375 0.50 0.375
0.60 0.375
GBP OTHER EURO
EURO US0
EURO EURO EURO EURO EURO USD US0 USD
EURO GBP USD USD
0.375
0.60 0.50 0.375
0.375 0.60 0.375
USD USD USD USD
EURO EURO EURO EURO EURO USD USD USD USD
EURO EURO EURO EURO
0.75 0.75 0.75 0.75 0.75 0.75
0.875 0.875 0.75 0.75
0.75 0.75 0.75 0.75 0.75 0.75 0.75 0.75 0.75 0.75 0.75 0.75 0.75 0.75 0.75 0.75 0.75 0.75
0.75 0.75 0.75
0.875
0.75 0.75 0.75
0.75 0.75
USD USD USD US0 J PY
0.875 0.875 -
0.75 0.75 0.75
0.75 0.75 0.75 0.75 0.75 - JPY 0.75 -
0.75 0.75 -
USD USD USD GBP USD USD
0.75 0.75 - 0.75 0.75 - 0.75 0.75 - 0.75 0.75 0.75 0.75 0.75 -
0.375 0.375 -
USD USD USD GBP
0.875 0.875 0.875 0.60 0.60 0.60 0.60
EURO 0.675 0.675 -
_. . . .. 5 HSBC Global Investment Funds _ .-
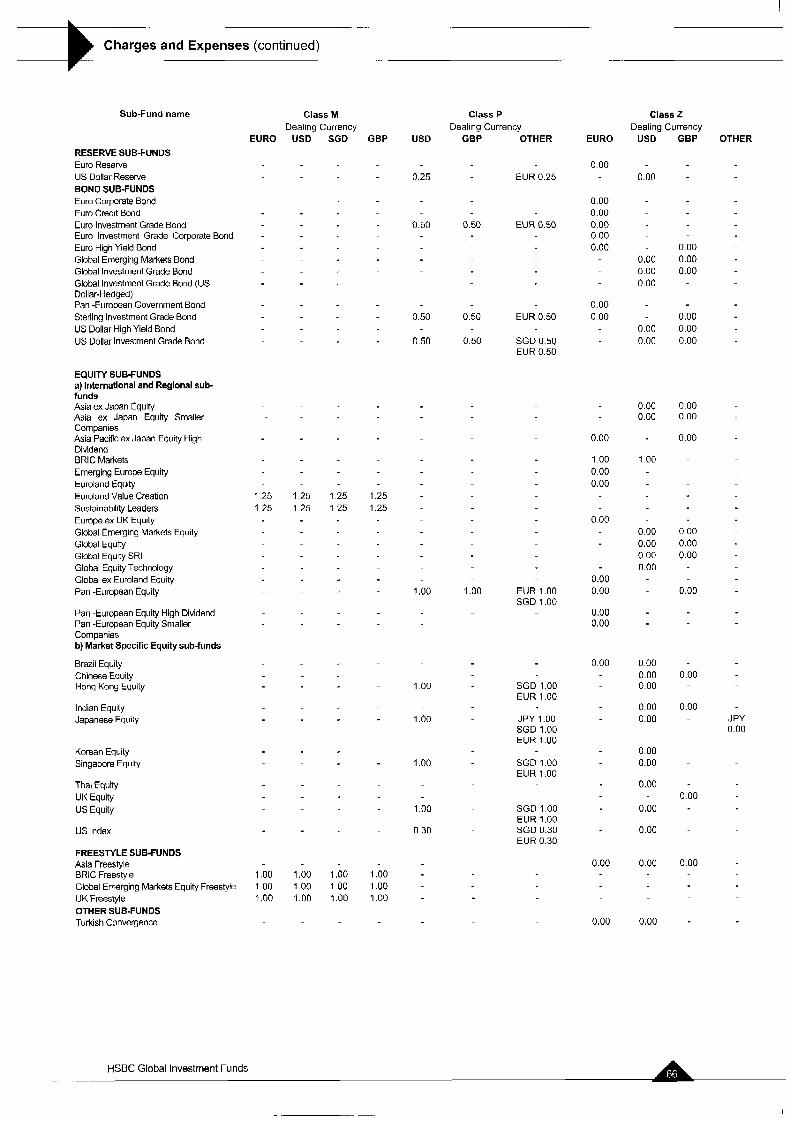
I . .. ... .
EURO
0.00
0.00 0.00 0.00 0.00 0.00
0.00 0.00
0.00
1 .oo 0.00 0.00
0.00
0.00 0.00
0.00 0.00
0.00
0.00
0.00
-
Charges and Expenses (continued)
GBP
1.25 1.25
1 .oo 1 .oo 1 .oo
Sub-Fund name Class M Dealing Currency
Class P Dealing Currency
Class Z Dealing Currency
EURO
1.25 1.25
1 .oo 1 .oo 1 .oo
USD
1.25 1.25
1 .oo 1 .oo 1 .oo
SGD
1.25 1.25
1 .oo 1 .oo 1 .oo
GBP
0.50
0.50
0.50
1 .oo
OTHER USD
0.00
0.00 0.00 0.00
0.00 0.00
0.00 0.00
1 .O@
0.00 0.00 0.00 0.00
0.00 0.00 0.00
0.00 0.00
0.00 0.00
0.00
0.00
0.00
0.00
0.00
GBP
0.00 0.00 0.00
0.00 0.00 0.00
0.00 0.00
0.00
0.00 0.00 0.00
0.00
0.00
0.00
0.00
0.00
OTHER
JPY 0.00
USD
0.25
0.50
0.50
0.50
1 .oo
1 .oo
1 .oo
1 .oo
1 .oo 0.30
RESERVE SUB-FUNDS Euro Reserve US Dollar Reserve
Euro Corporate Bond Euro Credit Bond Euro Investment Grade Bond Euro Investment Grade Corporate Bond Euro High Yield Bond Global Emerging Markets Bond Global Investment Grade Bond Global Investment Grade Bond (US Dollar-Hedged) Pan -European Government Bond Sterling Investment Grade Bond US Dollar High Yield Bond US Dollar Investment Grade Bond
BOND SUB-FUNDS EUR 0.25
EUR 0.50
EUR 0.50
SGD 0.50 EUR 0.50
EQUITY SUB-FUNDS a) International and Regional sub- funds Asia ex Japan Equity Asia ex Japan Equity Smaller Companies Asia Pacific ex Japan Equity High Dividend BRlC Markets Emerging Europe Equity Euroland Equity Euroland Value Creation Sustainability Leadem Europe ex UK Equity Global Emerging Markets Equity Global Equity Global Equity SRI Global Equity Technology Global ex Euroland Equity Pan -European Equity
Pan -European Equity High Dividend Pan -European Equity Smaller Companies b) Market Specific Equity sub-funds
Brazil Equity Chinese Equity Hong Kong Equity
Indian Equity Japanese Equity
EUR 1 .OO SGD 1 .OO
SGD 1 .OO EUR 1 .OO
JPY 1.00 SGD 1 .OO EUR 1 .OO
Korean Equity Singapore Equity
Thai Equity UK Equity US Equity
US Index
FREESTYLE SUB-FUNDS Asia Freestyle BRlC Freestyle Global Emerging Markets Equity Freestyle UK Freestyle OTHER SUB-FUNDS Turkish Convergence
SGD 1.00 EUR 1 .OO
SGD 1 .OO EUR 1 .OO SGD 0.30 EUR 0.30
HSBC Global Investment Funds -
I .. .. -.
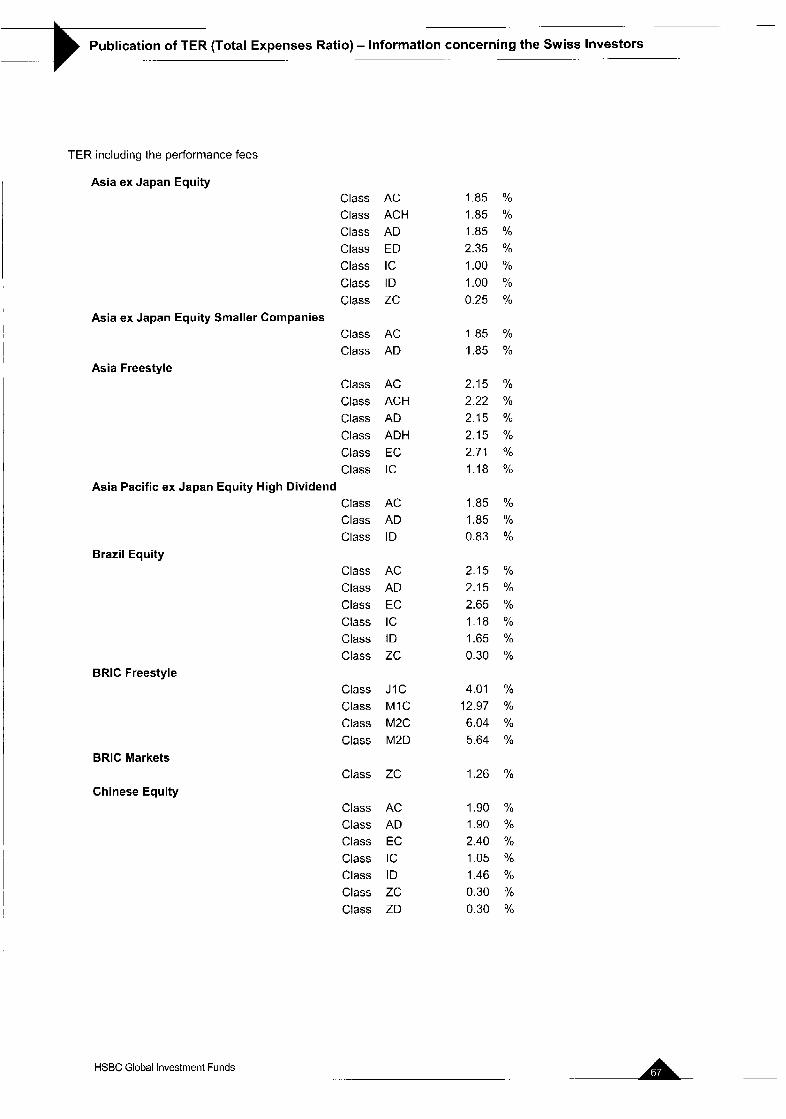
-
Publication of TER (Total Expenses Ratio) - Information concerning the Swiss Investors -
TER including the performance fees
Asia ex Japan Equity Class Class Class Class Class Class Class
Class Class
Class Class Class Class Class Class
Class Class Class
Class Class Class Class Class Class
Asia ex Japan Equity Smaller Companies
Asia Freestyle
Asia Pacific ex Japan Equity High Dividend
Brazil Equity
BRlC Freestyle
ERIC Markets
Chinese Equity
HSBC Global Investment Funds
AC ACH AD ED IC ID ZC
AC AD
AC ACH AD ADH EC IC
AC AD ID
AC AD EC IC ID zc
Class J IC Class MIC Class M2C Class M2D
Class ZC
Class AC Class AD Class EC Class IC Class ID Class ZC Class ZD
1.85 % 1.85 % 1.85 Yo 2.35 % 1.00 Yo
1.00 % 0.25 Yo
1.85 Yo 1.85 %
2.15 % 2.22 % 2.15 % 2.15 % 2.71 % 1.18 %
1.85 % 1.85 % 0.83 Yo
2-15 Yo
2.15 % 2.65 % 1-18 Yo
1.65 % 0.30 %
4.01 Yo 12.97 Yo 6.04 Yo
5.64 %
1.26 %
1.90 % 1.90 Yo 2.40 Yo
1.05 O h 1.46 Yo
0.30 % 0.30 %
-A.
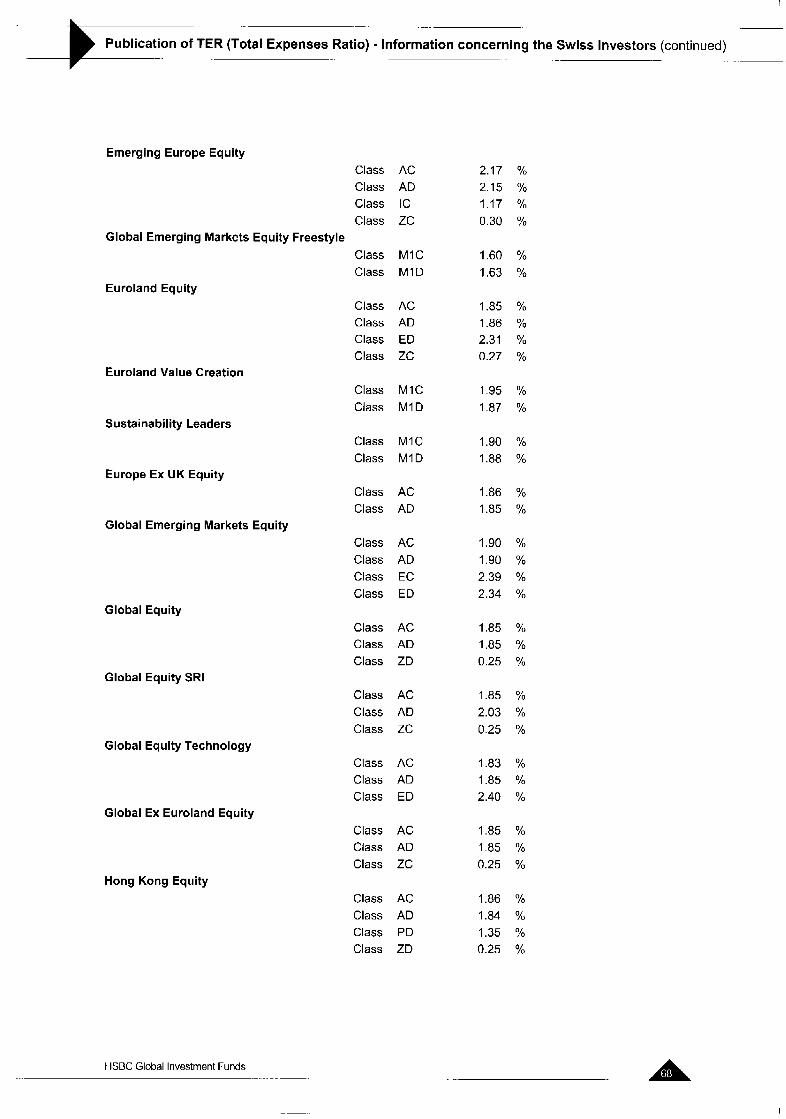
__ .. -
Publication of TER (Total Expenses Ratio) - Information concerning the Swiss Investors (continued) -
Emerging Europe Equity Class Class Class Class
Class Class
Class Class Class Class
Class Class
Class Class
Class Class
Class Class Class Class
Class Class Class
Class Class Class
Global Emerging Markets Equity Freestyle
Euroland Equity
Euroland Value Creation
Sustainability Leaders
Europe Ex UK Equity
Global Emerging Markets Equity
Global Equity
Global Equity SRI
Global Equity Technology
Global Ex Euroland Equity
Hong Kong Equity
AC AD IC zc
M I C M I D
AC AD ED zc
M I C M I D
M I C M I D
AC AD
AC AD EC ED
AC AD ZD
AC AD zc
Class AC Class AD Class ED
Class AC Class AD Class ZC
Class AC Class AD Class PD Class ZD
2.17 % 2.15 % 1.17 % 0.30 %
1.60 % 1.63 %
1.85 % 1.86 % 2.31 % 0.27 %
1.95 % 1.87 %
1.90 % 1.88 %
1.86 Yo
1.85 %
1.90 % 1.90 % 2.39 % 2.34 %
1.85 Yo
1.85 % 0.25 %
1.85 % 2.03 % 0.25 %
1.83 % 1.85 % 2.40 Yo
1.85 % 1.85 % 0.25 %
1.86 %
1.35 % 0.25 %
1.84 Yo
HSBC Global Investment Funds
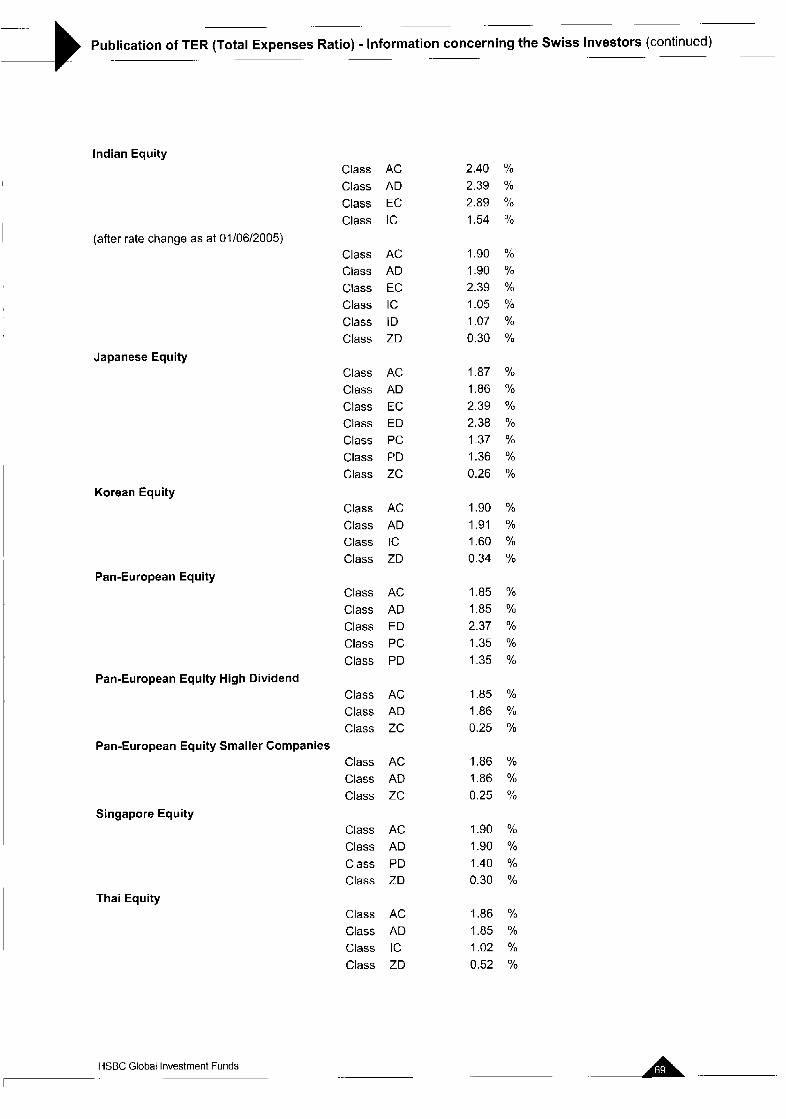
~. ~
Publication of TER (Total Expenses Ratio) - Information concerning the Swiss Investors (continued) .~ -~ .~ ..
Indian Equity
(after rate change as at 01/06/2005)
Japanese Equity
Korean Equity
Class AC Class AD Class EC Class IC
Class AC Class AD Class EC Class IC Class ID Class ZD
Class AC Class AD Class EC Class ED Class PC Class PD Class ZC
Class AC Class AD Class IC Class ZD
Pan-European Equity Class Class Class Class Class
Class Class Class
Class Class Class
Class Class Class Class
Class Class Class Class
Pan-European Equity High Dividend
Pan-European Equity Smaller Companies
Singapore Equity
Thai Equity
HSBC Global Investment Funds .-
AC AD ED PC PD
AC AD zc
AC AD zc
AC AD PD ZD
AC AD IC ZD
2.40 % 2.39 % 2.89 % 1.54 %
1.90 % 1-90 Yo 2.39 % 1.05 % 1.07 Yo
0.30 %
1.87 Yo
1.86 % 2.39 % 2.38 % 1.37 Yo 1.36 % 0.26 %
1.90 % 1.91 % 1.60 % 0.34 %
1.85 % 1.85 % 2.37 % 1.35 % 1.35 %
1.85 % 1.86 % 0.25 %
1.86 % 1.86 % 0.25 %
1.90 % 1-90 % 1.40 % 0.30 %
1.86 % 1.85 % 1.02 % 0.52 Yo
. A ..
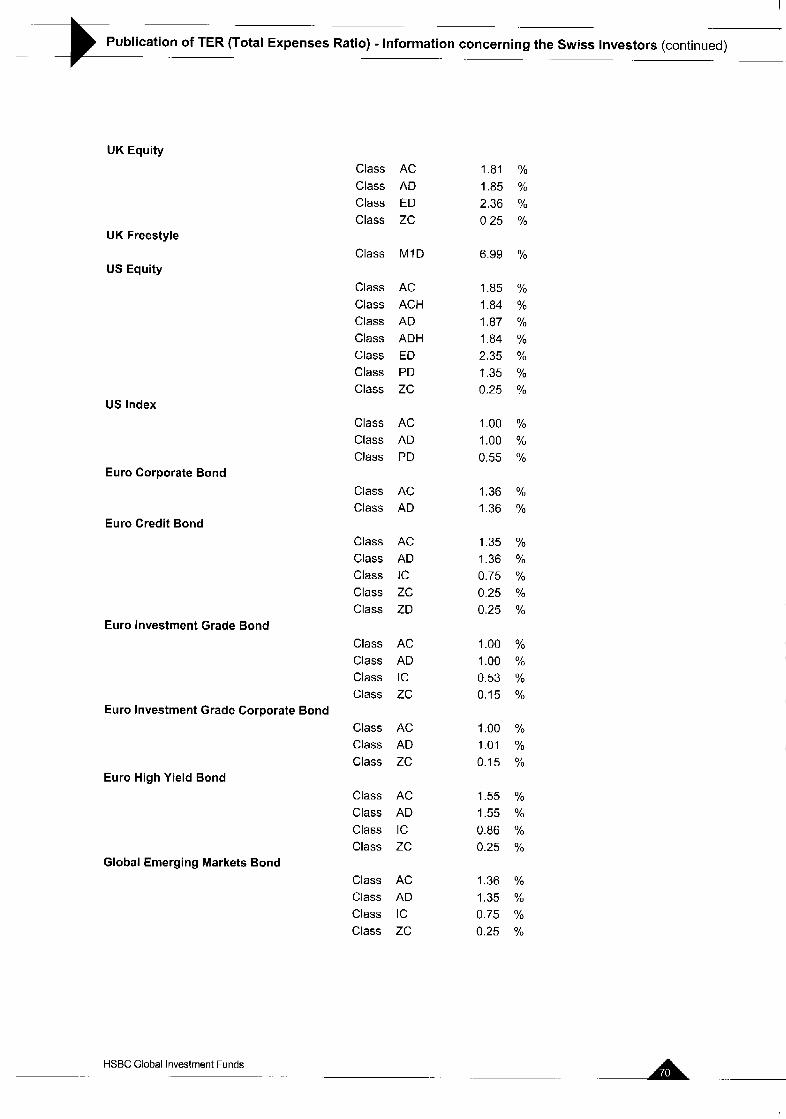
I
Publication of TER (Total Expenses Ratio) - Information concerning the Swiss Investors (continued) -
UK Equity
UK Freestyle
US Equity
US Index
Euro Corporate Bond
Euro Credit Bond
Euro Investment Grade Bond
Class AC Class AD Class ED Class ZC
Class M I D
Class AC Class ACH Class AD Class ADH Class ED Class PD Class ZC
Class AC Class AD Class PD
Class AC Class AD
Class AC Class AD Class IC Class ZC Class ZD
Class Class Class Class
Class Class Class
Class Class Class Class
Euro Investment Grade Corporate Bond
Euro High Yield Bond
AC AD IC zc
AC AD zc
AC AD IC zc
Global Emerging Markets Bond Class AC Class AD Class IC Class ZC
1.81 % 1.85 % 2.36 % 0.25 %
6.99 %
1.85 % 1.84 % 1.87 %
2.35 %
0.25 %
1.84 %
1.35 Yo
1.00 % 1.00 % 0.55 %
1.36 % 1.36 %
1.35 Yo
1.36 %
0.25 % 0.25 %
0.75 Yo
1.00 % 1.00 % 0.53 Yo 0.15 %
1.00 % 1.01 % 0.15 %
1.55 % 1.55 % 0.86 % 0.25 %
1.36 % 1.35 % 0.75 % 0.25 Yo
A . HSBC Global Investment Funds - .
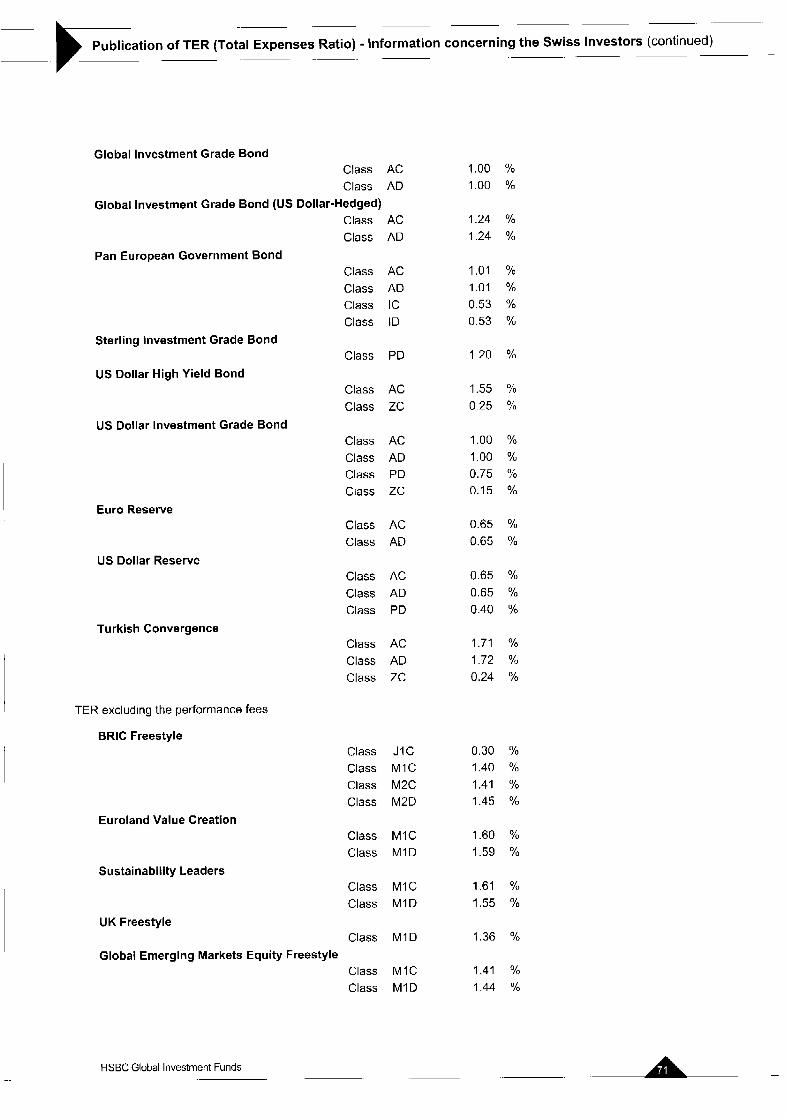
.~ ~. ~
Publication of TER (Total Expenses Ratio) - Information concerning the Swiss Investors (continued) .~ - .~ -~ ~~
Global Investment Grade Bond Class AC Class AD
Class AC Class AD
Class AC Class AD Class IC Class ID
Class PD
Class AC Class ZC
Class AC Class AD Class PD Class ZC
Global Investment Grade Bond (US Dollar-Hedged)
Pan European Government Bond
Sterling Investment Grade Bond
US Dollar High Yield Bond
US Dollar Investment Grade Bond
Euro Reserve
US Dollar Reserve
Turkish Convergence
I TER excluding the performance fees
Class AC Class AD
Class AC Class AD Class PD
Class AC Class AD Class ZC
BRlC Freestyle Class J I C Class MIC Class M2C Class M2D
Class M I C Class M1D
Class MIC Class M I D
Class M I D
Class MIC Class M I D
Euroland Value Creation
Sustainability Leaders
UK Freestyle
Global Emerging Markets Equity Freestyle
HSBC Global Investment Funds -.
1.00 % 1.00 %
1.24 % 1.24 Yo
1.01 % 1.01 % 0.53 % 0.53 %
1.20 %
1.55 % 0.25 %
1.00 % 1.00 Yo 0.75 % 0.15 %
0.65 % 0.65 %
0.65 % 0.65 % 0.40 Yo
1.71 % 1.72 Yo 0.24 %
0.30 % 1.40 % 1.41 Yo
1.45 %
1.60 % 1.59 %
1.61 % 1.55 %
1.36 '/a
1.41 % 1.44 %
. . A -
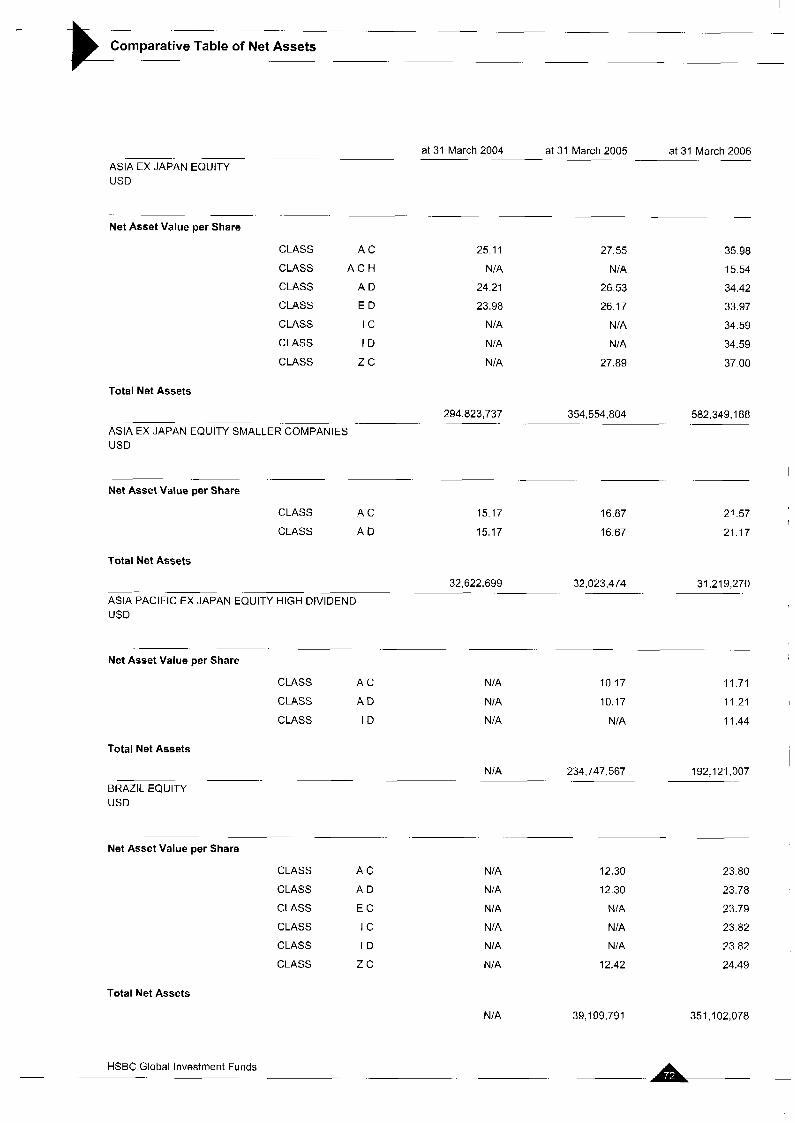
I
~- ~ ~. ~
Comparative Table of Net Assets ~~
p- .~ ~
at 31 March 2006 .~
at 31 March 2004 at 31 March 2005 ~-
-
ASIA EX JAPAN EQUITY USD
. ~.
Net Asset Value per Share
CLASS A C
CLASS A C H
CLASS A D
CLASS E D
CLASS I C
CLASS I D
CLASS z c
25.11
NIA
24.21
23.98
NIA
NIA
NIA
27.55
NIA
26.53
26.17
NIA
NIA
27.89
35.98 15.54
34.42
33.97
34.59
34.59
37.00
Total Net Assets
294,823,737 354,554,804 582.349.188 .-
ASIA EX JAPAN EQUITY SMALLER COMPANIES USD
Net Asset Value per Share
CLASS A C
CLASS A D
15.17
15.17
16.87
16.67
21.57
21.17
Total Net Assets
32,622,699 32,023,474 ~- ASIA PACIFIC EX JAPAN EQUITY HIGH DIVIDEND USD
31,219,270
Net Asset Value per Share
CLASS A C
CLASS A D
CLASS I D
Total Net Assets
NIA
NIA
N/A
10.17
10.17
N/A
11.71
11.21
11.44
NIA 234.7 92,121,007 -.
. , . ...
BRAZIL EQUITY USD
7.567
Net Asset Value per Share
CLASS A C
CLASS A D
CLASS E C
CLASS I C
CLASS I D
CLASS z c
N/A
NIA
NIA
NIA
NIA
NIA
12.30
12.30
NIA
N/A
N/A
12.42
23.80
23.78
23.79
23.82
23.82
24.49
Total Net Assets
N/A 39,199.791 351,102,078
~ A - HSBC Global Investment Funds
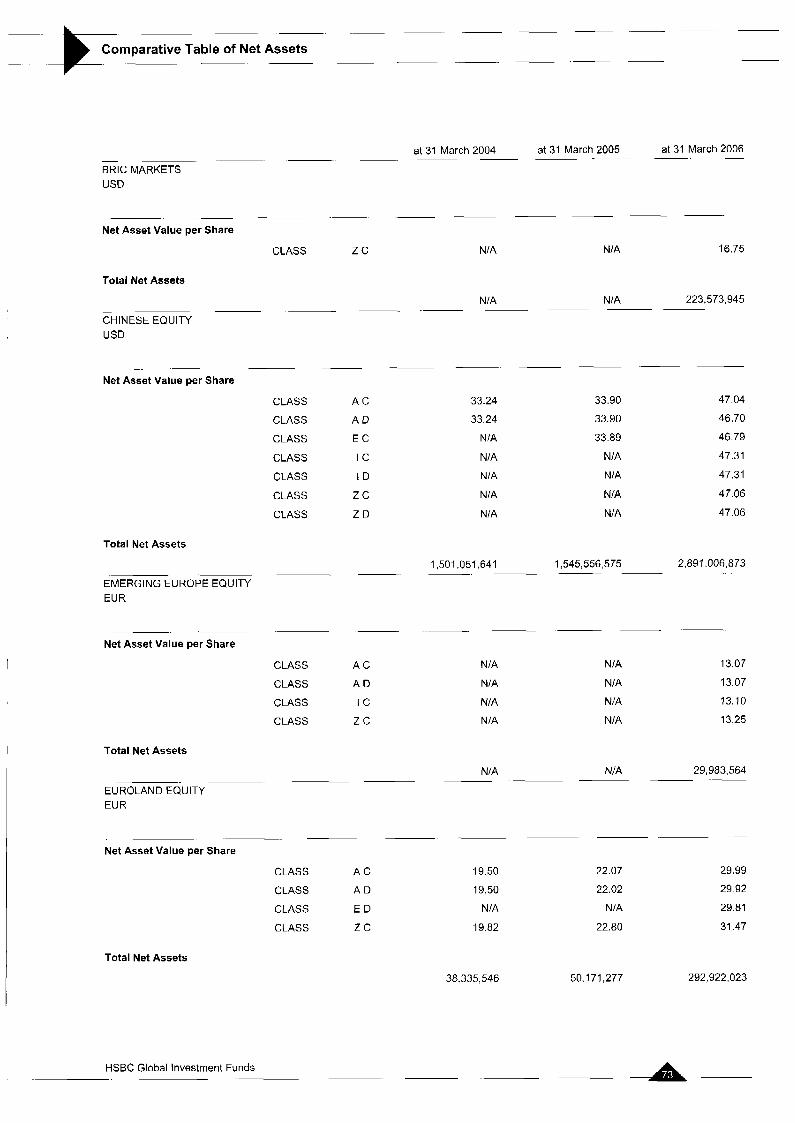
~~ ~p . ~ p
Comparative Table of Net Assets ~~
at 31 March 2005 at 31 March 2006 at 31 March 2004 p p p p - - - - ~~
BRlC MARKETS USD
~~
Net Asset Value per Share
CLASS z c NIA NIA 16.75
Total Net Assets
NIA NIA 223,573,945 ~. p. ~ -- -.
CHINESE EQUITY USD
~ .~ ~ .- ~ .- -. . ~.
Net Asset Value per Share
CLASS A C 33.24 33.90 47.04
CLASS A D
CLASS E C
CLASS I C
CLASS I D
33.24
N IA
NIA
NIA
33.90
33.89
NIA
NIA
46.70
46.79
47.31
47.31
CLASS z c NIA N/A 47.06
CLASS Z D NIA NIA 47.06
Total Net Assets
1,501,051.641 1,545,556,575 2,891.006.873 ~. p p p p p .
EMERGING EUROPE EQUITY EUR
~ ~ ~ ~ ~
Net Asset Value per Share
CLASS A C
CLASS A D
CLASS I C
CLASS z c
NIA
NIA
NIA
NIA
NIA
NIA
NIA
NIA
13.07
13.07
13.10
13.25
Total Net Assets
29,983,564 ~ --
NIA NIA
EUROLAND EQUITY EUR
. .~ -
Net Asset Value per Share
CLASS A C
CLASS A D
CLASS E D
CLASS z c
19.50
19.50
NIA
19.82
22.07
22.02
NIA
22.80
29.99
29.92
29.81
31.47
Total Net Assets
50,171,277 292,922,023 38,335,546
HSBC Global Investment Funds -
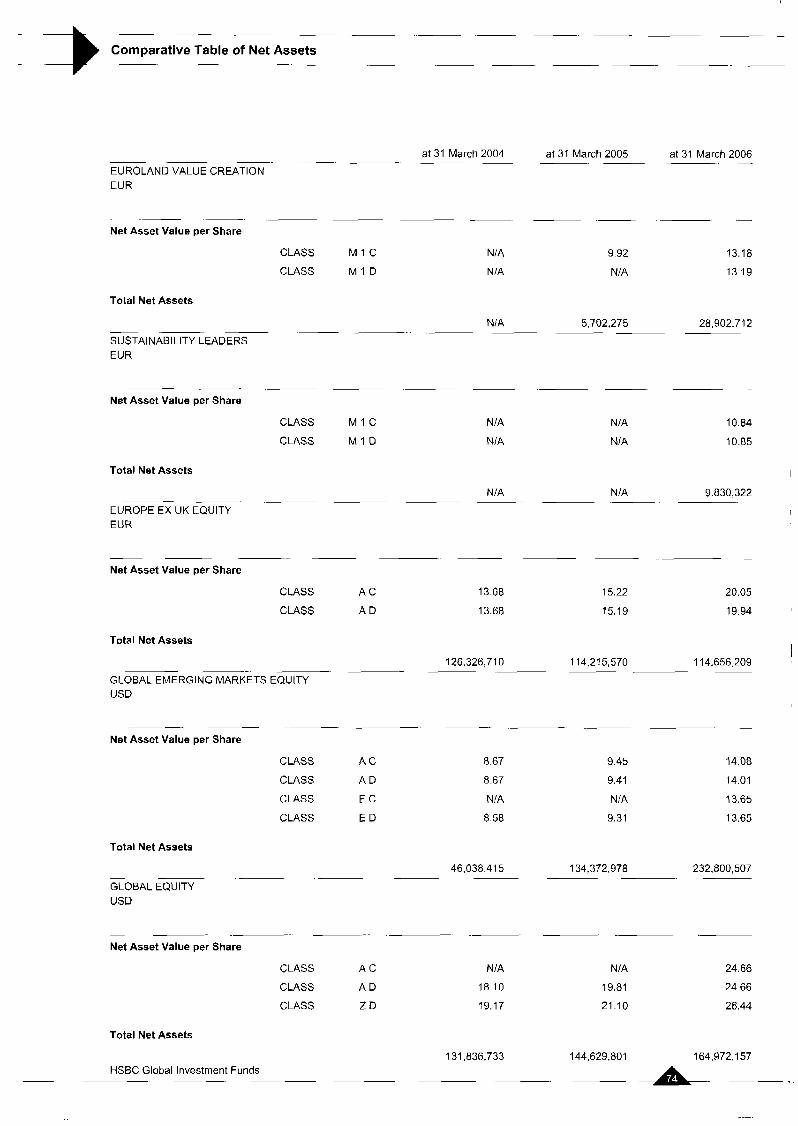
Comparative Table of Net Assets - -
at 31 March 2004 at 31 March 2005 - ~ ~~~~
EUROLAND VALUE CREATION EUR
- .~ ~~- Net Asset Value per Share
CLASS M I C
CLASS M I D
Total Net Assets
N/A
NIA
9.92
NIA
NIA 5,702,275
at 31 March 2006 -
13.18
13.19
28,902.71 2 -- ~ ~ -. -~ -- ~ ~
SUSTAINABILITY LEADERS EUR
.~ ~. -
Net Asset Value per Share
CLASS M I C NIA NIA 10 84
CLASS M I D NIA NIA 10.85
Total Net Assets I
NIA N /A 9.830,322 -- EUROPE EX UK EQUITY I
EUR I
~- ~ . ~. ~. .. - -. ~
Net Asset Value per Share
CLASS A C
CLASS A D
13.68
13.68
15.22
15.19
20.05
19.94
Total Net Assets
126.326.71 0 114,215,570 114,656,209
GLOBAL EMERGING MARKETS EQUITY USD
~. .~ -
Net Asset Value per Share
CLASS A C
CLASS A D
CLASS E C
CLASS E D
8.67
8.67
NIA
8.58
9.45
9.41
NIA
9.31
14.08
14.01
13.65
13.65
Total Net Assets
134,372,wa 232,800,507 46,038,415 - GLOBAL EQUITY USD
- -. ~- Net Asset Value per Share
CLASS A C NIA N/A 24.66
CLASS A D i a I O 19.81 24 66
CLASS Z D 19.17 21 I O 26.44
Total Net Assets
164,972.1 57 131.836.733 144,629,801
- A HSBC Global Investment Funds
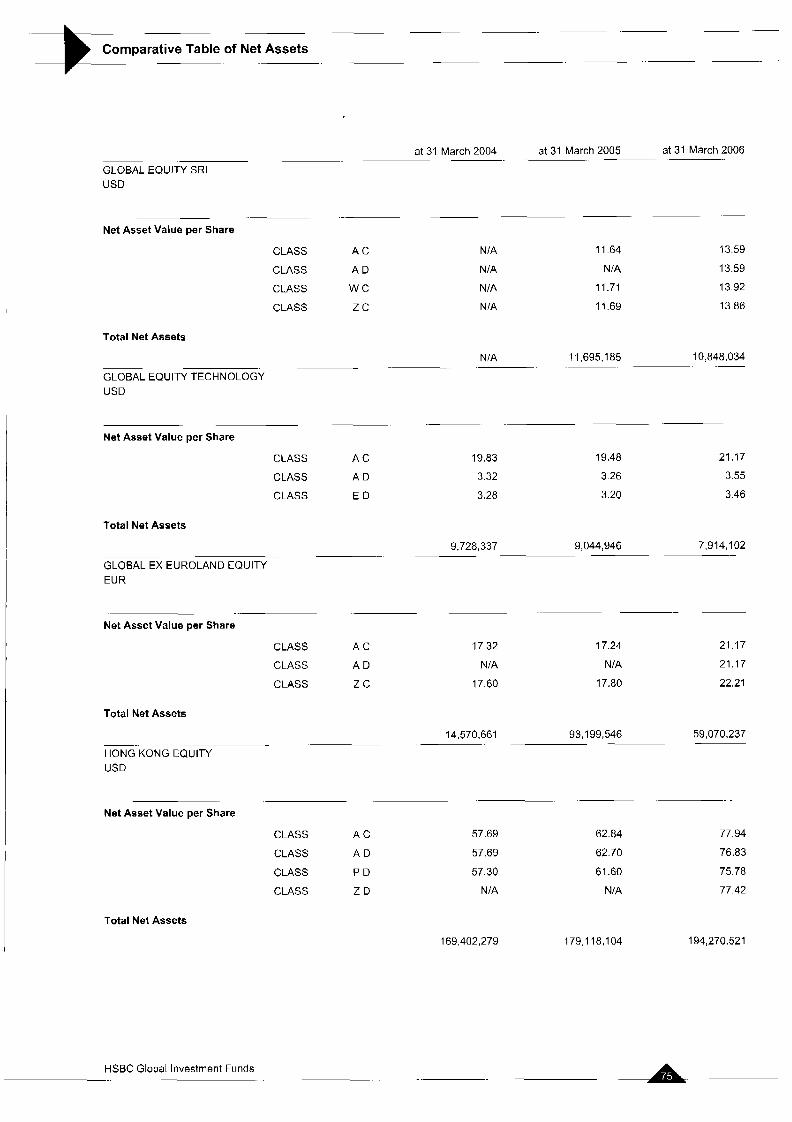
. ~~
Comparative Table of Net Assets
at 31 March 2004
GLOBAL EQUITY SRI USD
Net Asset Value per Share
Total Net Assets
CLASS A C
CLASS A D
CLASS W C
CLASS z c
NIA
NIA
NIA
N/A
N/A
at 31 March 2005 at 31 March 2006
11.64
NIA
11.71
11.69
13.59
13.59
13.92
13.86
11,695,185 10,848,034 ~
GLOBAL EQUITY TECHNOLOGY USD
Net Asset Value per Share
CLASS A C
CLASS A D
CLASS E D
19.83
3.32
3.28
19.48
3.26
3.20
21.17
3.55
3.46
Total Net Assets
9,728,337 9,044,946 7,914,102 -.
GLOBAL EX EUROLAND EQUITY EUR
. ...
Net Asset Value per Share
CLASS A C 17.32 17.24
CLASS A D NIA NIA
CLASS z c 17 60 17.80
Total Net Assets
HONG KONG EQUITY USD
14,570,661 93,199,546
21.17
21.17
22.21
59,070.237
Net Asset Value per Share
CLASS A C 57.69 62.84 77 94
CLASS A D 57.69 62 70 76.83
CLASS P D 57 30 61 60 75.78
CLASS ZD N/A NIA 77 42
Total Net Assets
169,402,279 179.1 18,104 194,270.521
A HSBC Global Investment Funds
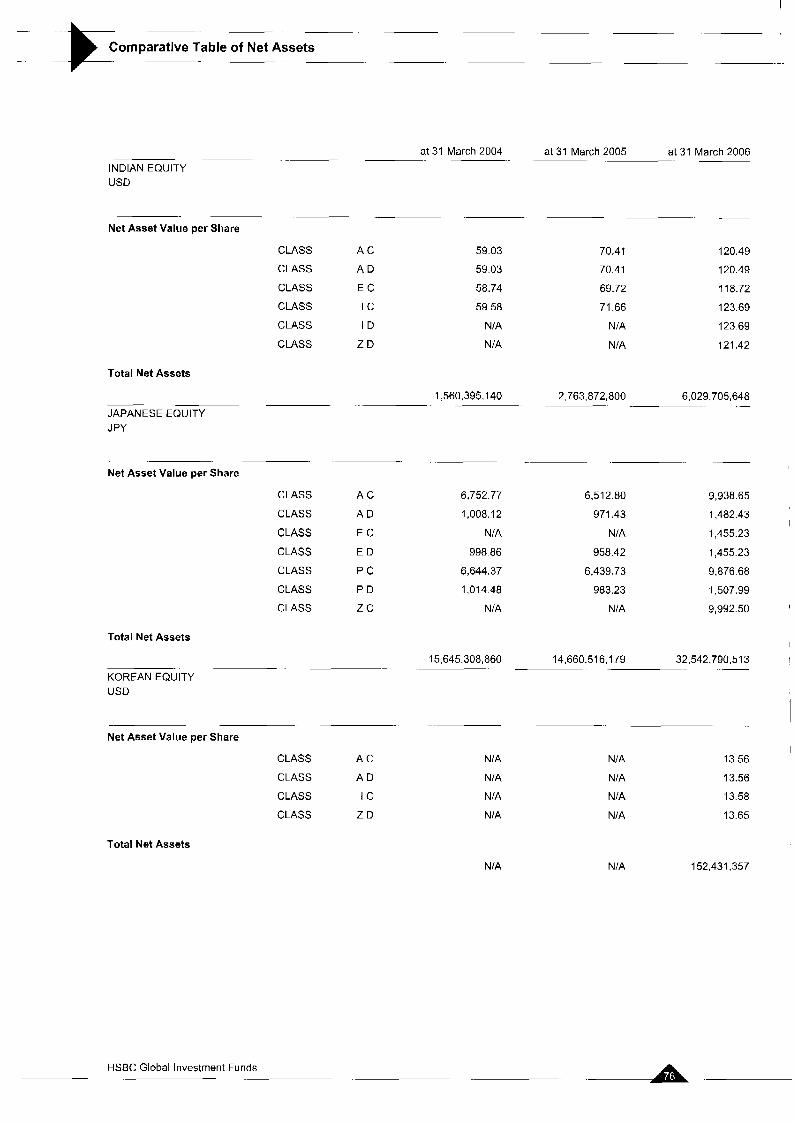
Comparative Table of Net Assets --+ .
INDIAN EQUITY USD
Net Asset Value per Share
CLASS
CLASS
CLASS
CLASS
CLASS
CLASS
Total Net Assets
JAPANESE EQUITY JPY
at 31 March 2004
A C
A D
E C
I C
I D
Z D
59.03
59.03
58.74
59.58
NIA
NIA
1.560,395.140
at 31 March 2005 at 31 March 2006
70.41
70.41
69.72
71.66
NIA
NIA
120.49
120.49
118.72
123.69
123.69
121.42
6,029,705,648 -
2,763,872,800
.-
Net Asset Value per Share
CLASS A C
CLASS A D
CLASS E C
CLASS E D
CLASS P C
CLASS P D
CLASS z c
6,752.77 6.512.80 9,938.65
1,008.12 971.43 1,482.43
NIA NIA 1,455.23
998.86 958.42 1,455.23
6,644.37 6:439.73 9,876.68
1,014.48 983.23 1,507.99
NIA NIA 9,992.50
Total Net Assets
15,645,308,860 14,660.51 6,179 32,542,790.51 3 -
KOREAN EQUITY USD
! _.
Net Asset Value per Share I
CLASS A C NIA NIA 13 56
CLASS A D NIA NIA 13.56
CLASS I C NIA NIA 13.58
CLASS Z D NIA NIA 13.65
Total Net Assets
NIA NIA 152,431,357
- A HSBC Global Investment Funds . .
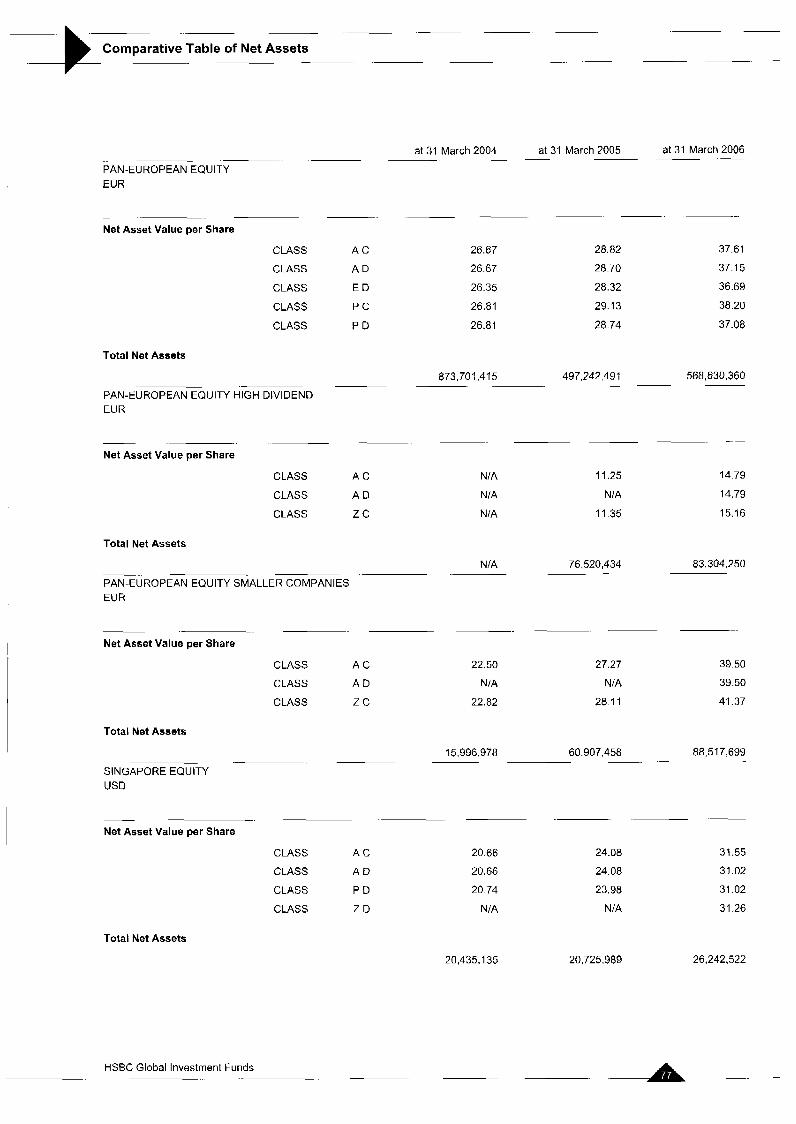
~. .~ ~ ~ ~. ~~
Comparative Table of Net Assets ~ ~. ~ ~ ~. -
at 31 March 2004 at 31 March 2005 at 31 March 2006
PAN-EU ROPEAN EQUITY EUR
~. ~ ~. ~ .-
Net Asset Value per Share
CLASS A C 26.67 28.82 37.61
CLASS A D 26.67 28.70 37.15
CLASS E D 26.35 28.32 36.69
CLASS P C 26.81 29.13 38.20
CLASS P D 26.81 28.74 37.08
Total Net Assets
568,630,360 ~~
873,701,415 497,242.491 . .
PAN-EUROPEAN EQUITY HIGH DIVIDEND EUR
. ~.
Net Asset Value per Share
CLASS A C
CLASS A D
CLASS z c
NIA
N/A
NIA
11.25 NIA
11.35
14.79 14.79 15.16
Total Net Assets
NIA 76,520,434 83,304,250 -.
PAN-EUROPEAN EQUITY SMALLER COMPANIES EUR
-. ~.
Net Asset Value per Share
CLASS A C
CLASS A D
CLASS Z C
22.50 NIA
22.82
27.27 N/A
28.1 1
39.50
39.50 41.37
Total Net Assets
88,517,699 .- ~. 60,907,458 . -
15,996,978
SINGAPORE EQUITY USD
- .-
Net Asset Value per Share
CLASS A C 20.66 24.08 31.55
CLASS A D 20.66 24.08 31.02
CLASS P D 20 74 23.98 31 -02
CLASS Z D NIA NIA 31.26
Total Net Assets
20,435,135 20,725,989 26,242,522
-A . - HSBC Global Investment Funds
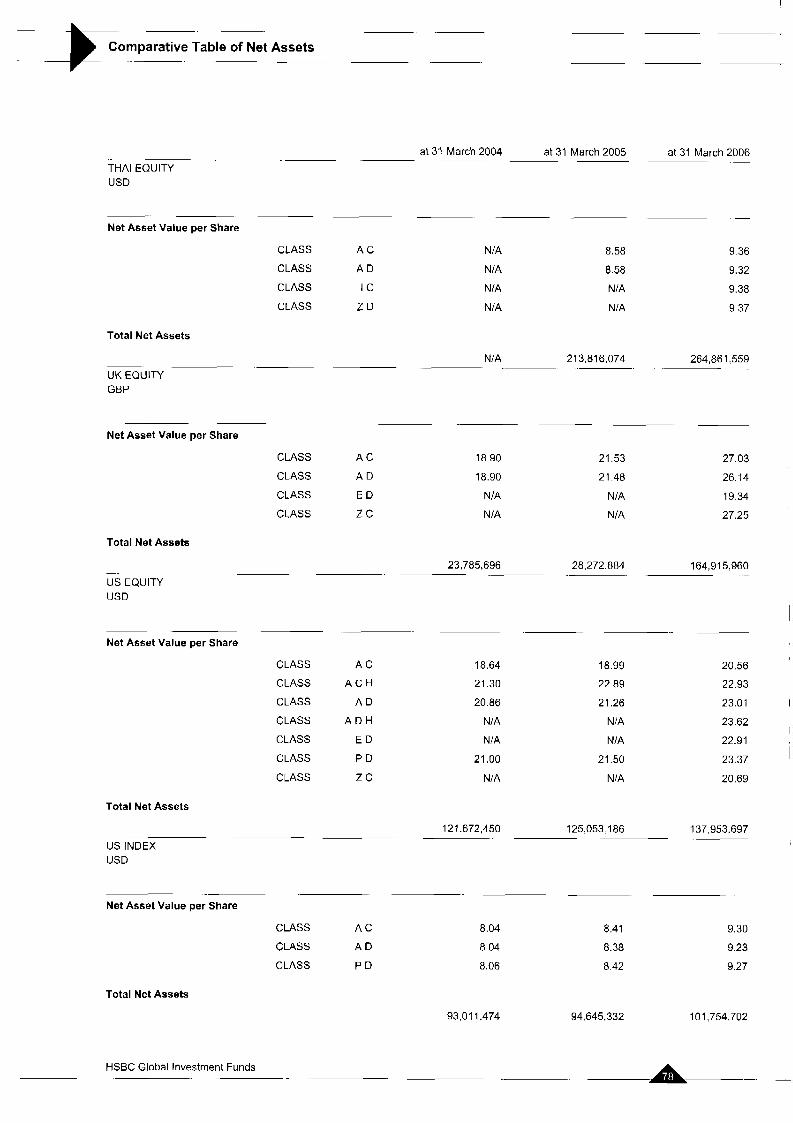
~~
Comparative Table of Net Assets . .~ ~- .~
at 31 March 2004 at 31 March 2005 THAI EQUITY USD
Net Asset Value per Share
CLASS A C
CLASS A D
CLASS I C
CLASS Z D
NIA
NIA
NIA
NIA
8.58
8.58
NIA
NIA
Total Net Assets
NIA 21 3,816,074 UK EQUITY GBP
at 31 March 2006 . .-
9.36
9.32
9.38
9.37
264,861.559
Net Asset Value per Share
CLASS A C
CLASS A D
CLASS E D
CLASS z c
Total Net Assets
8.90
8.90
NIA
NIA
23,785,696 -.
US EQUITY USD
Net Asset Value per Share
CLASS
CLASS
CLASS
CLASS
CLASS
CLASS
CLASS
Total Net Assets
A C
A C H
A D
A D H
E D
P D
z c
18.64
21.30
20.86
NIA
NIA
21 .oo N/A
121,672,450
21.53
21.48
NIA
NIA
27.03
26.14
19.34
27.25
164,915,960 28.272.884 .-
18.99
22.89
21.26
NIA
NIA
21 5 0
NIA
125,053.186
US INDEX USD
20.56
22.93
23.01 I
23.62
22.91
23.37
20.69
137.953.697
Net Asset Value per Share
CLASS A C
CLASS A D
CLASS P D
Total Net Assets
8.04
8.04
8.06
93.01 1.474
8.41
8.38
8.42
94:645,332
9.30
9.23
9.27
101,754.702
L- - HSBC Global Investment Funds
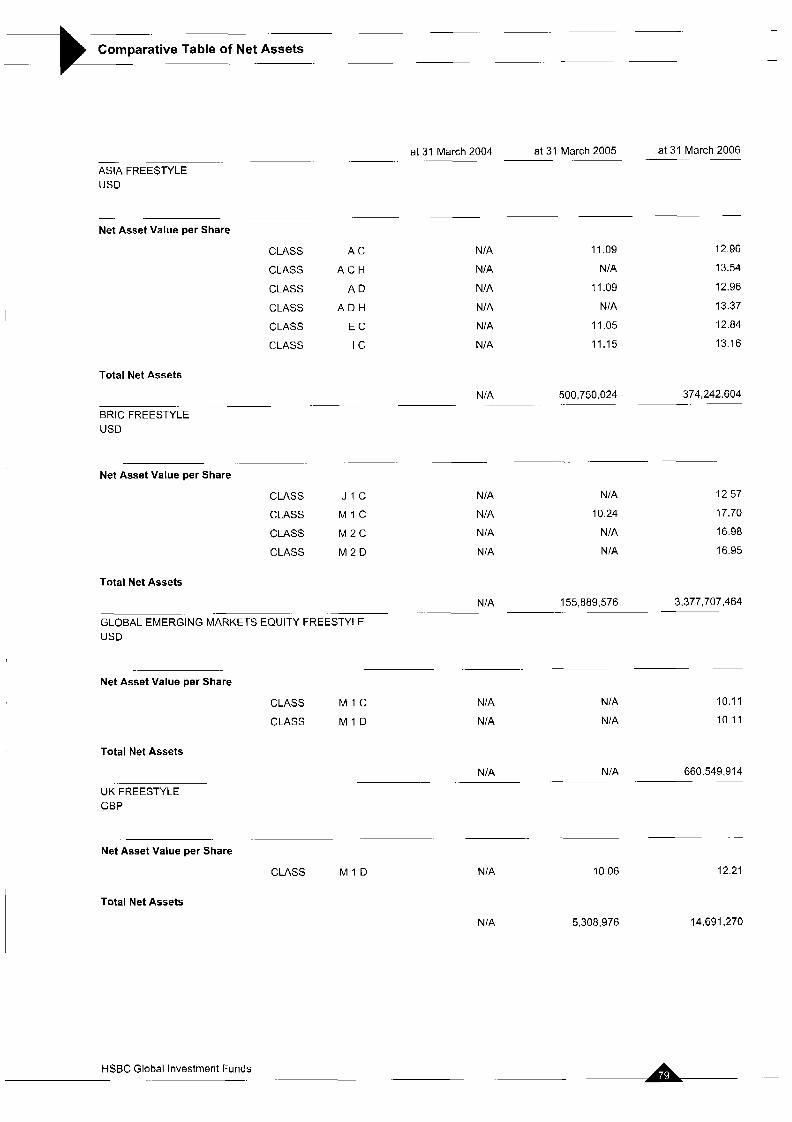
~. ~ ~ -
- Comparative Table of Net Assets
~.
at 31 March 2006 ~~
at 31 March 2005 ~ .~
at 31 March 2004 ~.
=A FREESTYLE USD
.~ -.
Net Asset Value per Share
CLASS A C
CLASS A C H
CLASS A D
CLASS A D H
CLASS E C
CLASS I C
NIA
NIA
NIA
NIA
NIA
NIA
11.09
NIA
1 1-09
NIA
11.05
11.15
12.96
13.54
12.96
13.37
12.84
13.16
Total Net Assets
500,750,024 374,242.604 ~. .~
NIA .~ ...
BRlC FREESTYLE USD
_.
Net Asset Value per Share
CLASS
CLASS
CLASS
CLASS
J 1 C
M I C
M 2 C
M 2 D
.
NIA
NIA
NIA
NIA
NIA
10.24
NIA
N IA
12.57
17.70
16.98
16.95
Total Net Assets
155,889,576 3,377,707,464 ~-
NIA
GLOBAL EMERGING MARKETS EQUITY FREESTYLE USD
.~
Net Asset Value per Share
CLASS M 1 C NIA NIA 10.11
CLASS M I D N IA NIA 10.11
Total Net Assets
UK FREESTYLE GBP
NIA NIA 660,549,914 -. -
-
Net Asset Value per Share
CLASS M I D NIA 10.06 12 21
Total Net Assets
NIA 5,308,976 14,691,270
A -- HSBC Global Investment Funds
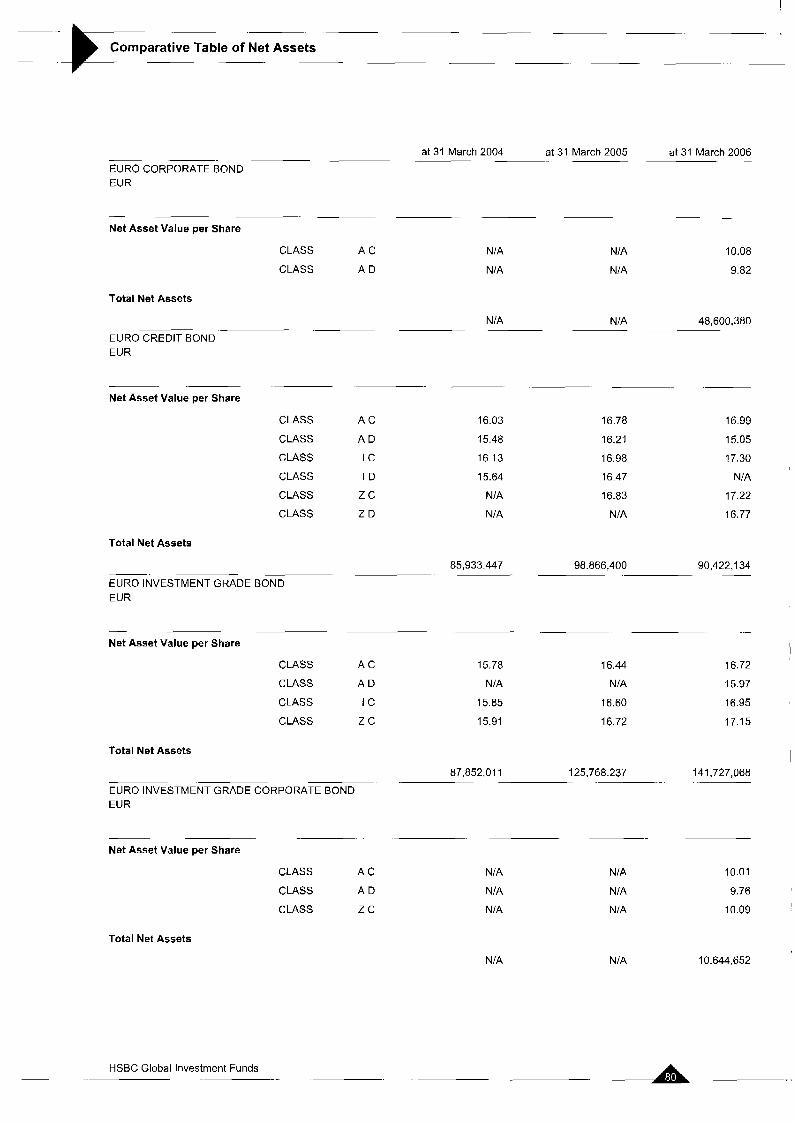
~.
Comparative Table of Net Assets
at 31 March 2006 - - at 31 March 2004 at 31 March 2005
EURO CORPORATE BOND EUR
-- -.
Net Asset Value per Share
CLASS A C
CLASS A D
NIA
NIA
NIA
NIA
10.08
9.82
Total Net Assets
NIA NIA 48,600,380
EURO CREDIT BOND EUR
.~ ~.
Net Asset Value per Share
CLASS A C
CLASS A D
CLASS I C
CLASS I D
CLASS Z C
CLASS Z D
16.03
15.48
16.13
15.64
NIA
NIA
16.78
16.21
16.98
16.47
16.83
NIA
16.99
15.05
17.30
NIA
17.22
16.77
Total Net Assets
EURO INVESSMENT GRADE BOND EUR
- Net Asset Value per Share
CLASS
CLASS
CLASS
CLASS
85,933.447 98,866,400 90,422,134 -
.-
I A C
A D
I C
z c
15.78
NIA
15.85
15.91
16.44
NIA
16.60
16.72
16.72
15.97
16.95
17.15
Total Net Assets
87,852,011 125,768 237 141,727,068
EURO INVESTMENT GRADE CORPORATE BOND EUR
- .
Net Asset Value per Share
CLASS A C
CLASS A D
CLASS z c
Total Net Assets
NIA
NIA
NIA
NIA
NIA
NIA
NIA
NIA
10.01
9.76
10.09
10,644,652
~ -. HSBC Global Investment Funds
- . ..
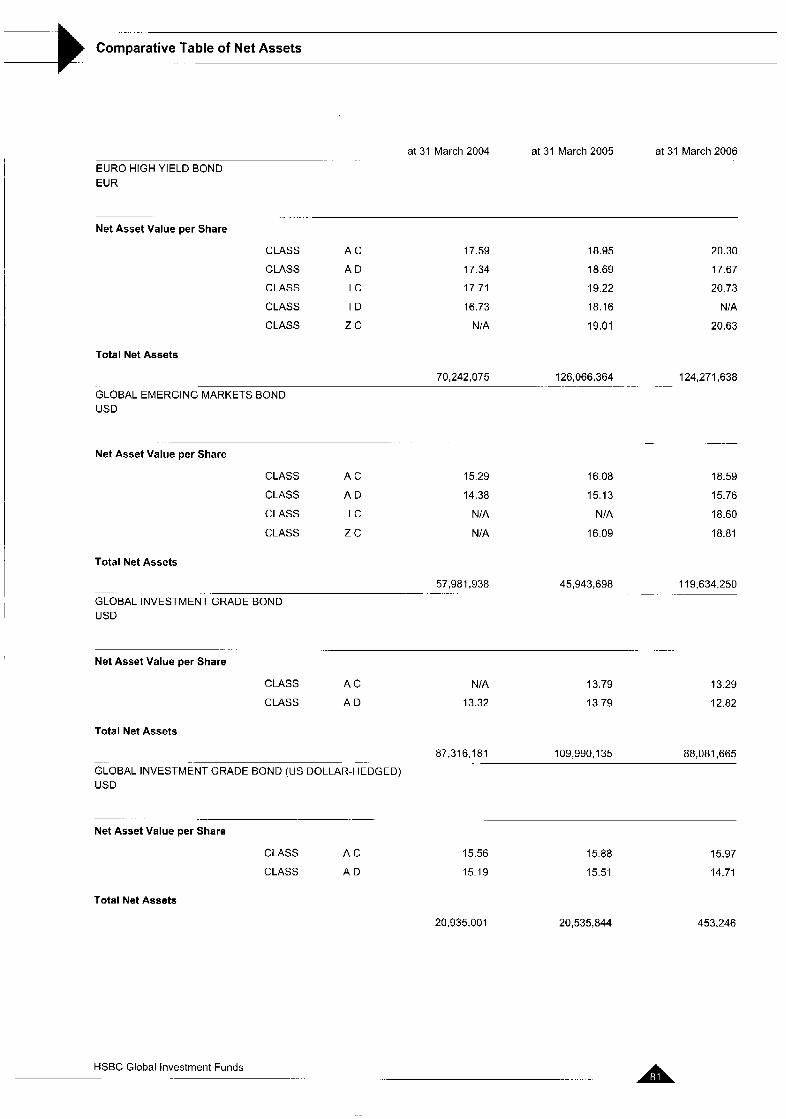
. .
Comparative Table of Net Assets
at 31 March 2004 at 31 March 2005 at 31 March 2006
EURO HIGH YIELD BOND EUR
Net Asset Value per Share
CLASS A C
CLASS A D
CLASS I C
CLASS I D
CLASS z c
17.59
17.34
17.71
16.73
N/A
18.95
18.69
19.22
18.16
19.01
20.30
17.67
20.73
NIA
20.63
Total Net Assets
126,066,364 124,271,638 . ~
70,242,075
GLOBAL EMERGING~ARKETS BOND USD
Net Asset Value per Share
CLASS A C
CLASS A D
CLASS I C
CLASS z c
15.29
14.38
NIA
NIA
16.08
15.13
NIA
16.09
18.59
15.76
18.60
18.81
Total Net Assets
57,981,938 _- -. -.
GLOBAL INVESTMENT GRADE BOND USD
45,943,698 _- 119,634.250
.. . . ....
Net Asset Value per Share
CLASS A C
CLASS A D
NIA
13.32
13.79
13.79
13.29
12.82
Total Net Assets
87.31 6,181 109,990,135 88,081,665 . - ..
GLOBAL INVESTMENT GRADE BOND ( u s DOLLAR-HEDGED) USD
.- . .- ~.
Net Asset Value per Share
CLASS A C
CLASS A D
Total Net Assets
HSBC Global Investment Funds
15.56
15.19
20,935,001
15.88
15.51
20,535,844
15.97
14.71
453,246
-.. . . A -
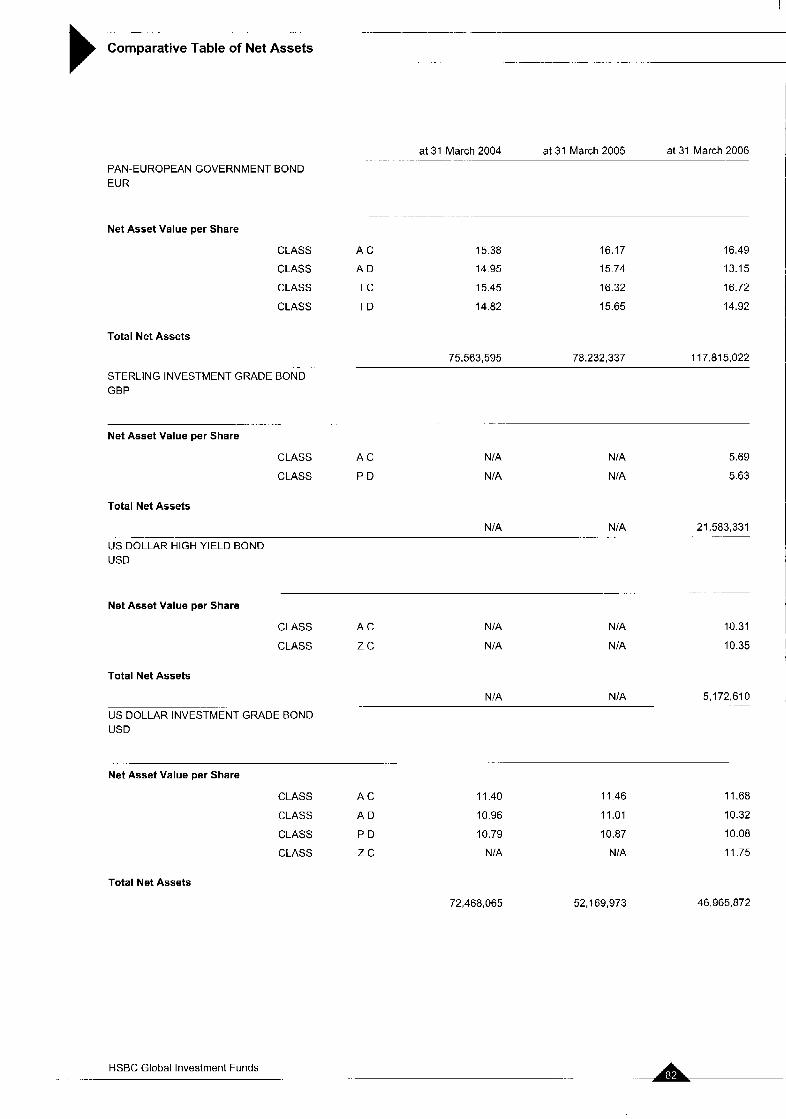
- ~~ -
Comparative Table of Net Assets - - . .
PAN-EUROPEAN GOVERNMENT BOND EUR
Net Asset Value per Share
at 31 March 2004 at 31 March 2005 at 31 March 2006
CLASS A C
CLASS A D
CLASS I C
CLASS I D
15.38
14.95
15.45
14.82
16.17
15.74
16.32
15.65
16.49
13.15
16.72
14.92
Total Net Assets
75.563,595 78.232,337 117,815,022
STERLING INVESTMENT GRADE BOND GBP
Net Asset Value per Share
CLASS A C
CLASS P D
.
NIA
NIA
NIA
NIA
Total Net Assets
NIA . . ._. . .
N /A __ ~~
US DOLLAR HIGH YIELD BOND USD
5.69
5.63
21,583,331
Net Asset Value per Share
CLASS A C
CLASS z c NIA
NIA
NIA
NIA
10.31
10.35
Total Net Assets
5,172:610 .
NIA NIA . .
US DOLLAR INVESTMENT GRADE BOND USD
-.
Net Asset Value per Share
CLASS A C
CLASS A D
CLASS P D
CLASS z c
Total Net Assets
11.40
10.96
10.79
NIA
72,468,065
1 I .46
11.01
10.87
NIA
52,169,973
11.68
10.32
10.08
11.75
46,965,872
HSBC Global Investment Funds
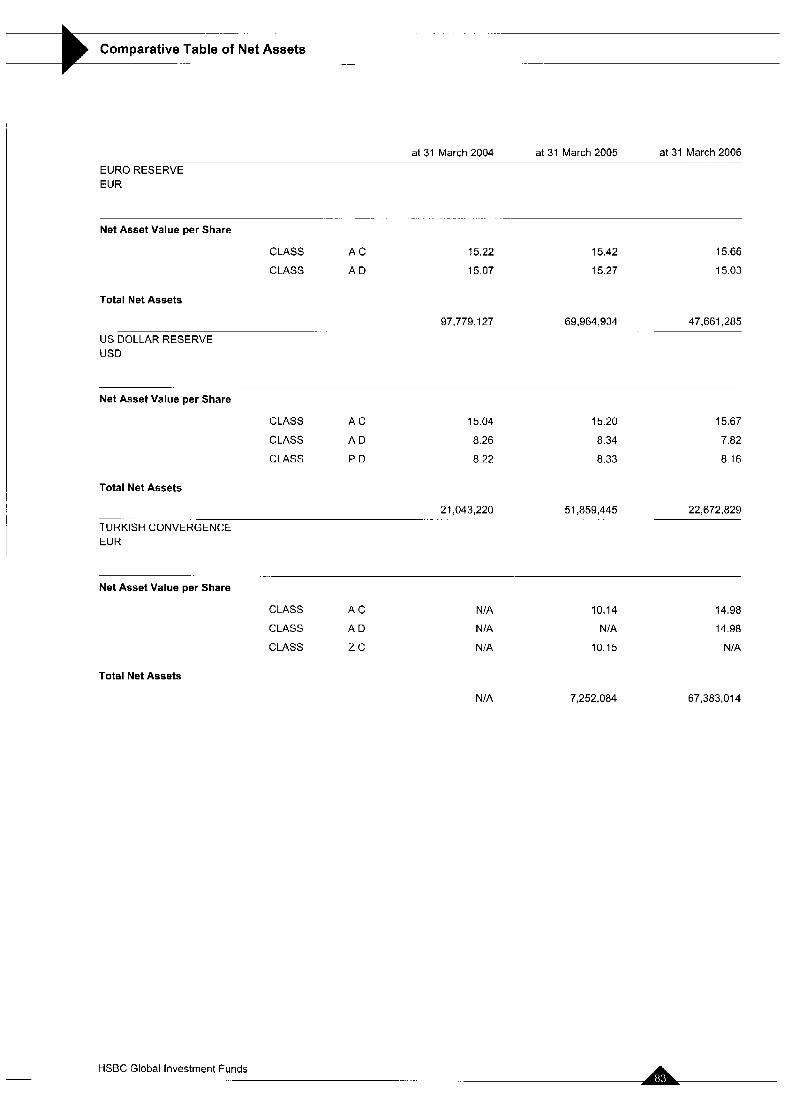
Comparative Table of Net Assets
at 31 March 2004 at 31 March 2005 at 31 March 2006
EURO RESERVE EUR
. .. - - . . . -
Net Asset Value per Share
CLASS A C
CLASS A D
Total Net Assets
US DOLLAR RESERVE USD
15.22
15.07
97,779,127
15.42
15.27
15.66
15.03
69,964,934 47,661,285
. ..
Net Asset Value per Share
CLASS A C
CLASS A D
CLASS P D
15.04
8.26
8.22
15.20
8.34
8.33
15.67
7.82
8.16
Total Net Assets
21,043,220 51,859,445 22,672,829
TURKISH CONVERGENCE EUR
. .....
Net Asset Value per Share
CLASS A C NIA 10.14 14.98
CLASS A D NIA NIA 14.98
CLASS Z C N/A 10.15 NIA
Total Net Assets
N/A 7,252,084 67,383,014
HSBC Global Investment Funds ~ .. .
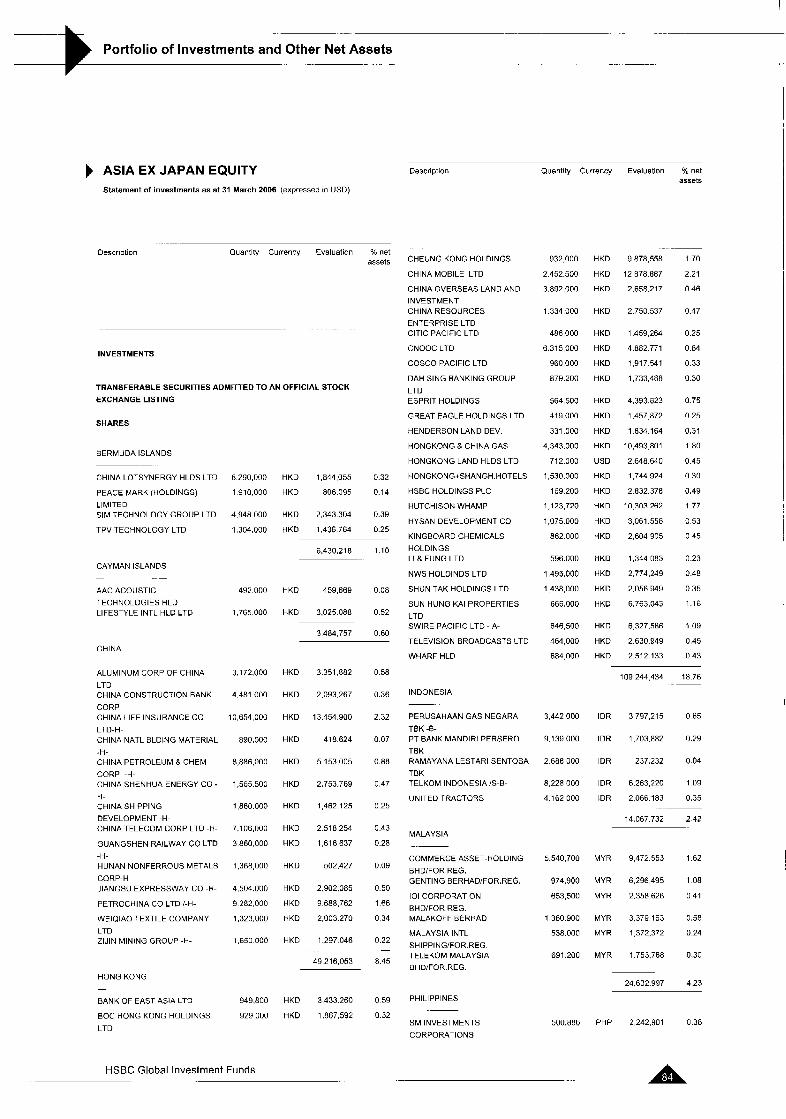
._ -. _.
Portfolio of Investments and Other Net Assets -.
Description Quantity Currency Evaluation % not assets
ASIA EX JAPAN EQUITY Statement of investments as at 31 March 2006 (expressed in USD)
. . .
Description Quantity Currency Evaluation % net assets
0.32
0.14
0.39
0.25
CHEUNG KONG HOLDINGS
CHINA MOBILE LTD
CHINA OVERSEAS LAND AND INVESTMENT CHINA RESOURCES
ENTERPRISE LTD ClTlC PACIFIC LTD
CNOOC LTD
COSCO PACIFIC LTD
DAH SING BANKING GROUP
LTD ESPRIT HOLDINGS
GREAT EAGLE HOLDINGS LTD
HENDERSON LAND DEV
HONGKONG 8 CHINA GAS
HONGKONG LAND HLDS LTD
HONGKONG+SHANGH.HOTELS
HSBC HOLDINGS PLC
HUTCHISON WHAMP
HYSAN DEVELOPMENT CO
KINGBOARD CHEMICALS
HOLDINGS LI 8 FUNG LTD
NWS HOLDINDS LTD
SHUN TAK HOLDINGS LTD
SUN HUNG KAI PROPERTIES
LTD SWIRE PACIFIC LTD - A-
TELEVISION BROADCASTS LTO
WHARF HLD
932,000
2 452.500
3.892,OOO
1,334 000
486 000
6.315 000
960 000
879.200
564,500
419 000
331 000
4,343.000
712.000
1,530.000
169,200
1,123,720
1,075.000
862 000
596.000
1,495,000
1 438,000
666,000
646,500
464.000
684 non
HKD
HKD
HKD
HKD
HKD
HKD
HKD
HKD
HKD
HKD
HKD
HKD
US0
HKD
HKD
HKD
HKD
HKD
HKD
HKD
HKD
HKD
HKD
HKD
HKD
9 878,558
12.878.887
2,658.217
2,750,537
1.459.264
4,882 771
1.917 541
1,733,488
4,393 823
1,457 872
1.834.164
10,493,RO 1
2 648.640
1,744.924
2 832.378
i n 303.262
3.061.558
2,604.905
1,344.083
2,774,249
2.056.949
6.763.043
6 327.586
2.630.949
2.512 133
1.70
2.21
0.46
0 47
0.25
0 84
0.33
0.30
0.75
0 25
0.31
1 .eo 0.45
0.30
0.49
1.77
0 53
0 45
0.23
0.48
0.35
1.16
1.09
0.45
0 43
INVESTMENTS
TRANSFERABLE SECURITIES ADMITTED TO AN OFFICIAL STOCK
EXCHANGE LISTING
SHARES
BERMUDA ISLANDS
CHINA LOTSYNERGY HLDS LTD
PEACE MARK (HOLDINGS)
LIMITED SIM TECHNOLOGY GROUP LTD
TPV TECHNOLOGY LTD
6,290,000 HKD 1,844,055
1910,000 HKD 806095
4.948 000 HKD 2.343.304
1,304,000 HKD 1.436 764
6,430,218 1.10
CAYMAN ISLANDS -
AAC ACOUSTIC
TECHNOLOGIES HLD LIFESTYLE INTL HLD LTD
492,000 HKD 459669 0 0 8
1.765000 HKD 3,025088 0 5 2
3 484.757 0.60
CHINA
ALUMINUM CORP OF CHINA
LTD CHINA CONSTRUCTION BANK
CORP CHINA LIFE INSURANCE CO
LTD-H- CHINA NATL BLDING MATERIAL
-H-
CORP -H- CHINA SHENHUA ENERGY CO - H- CHINA SHIPPING
DEVELOPMENT -H- CHINA TELECOM CORP LTD -H-
GUANGSHEN RAILWAY CO LTD
-H- HUNAN NONFERROUS METALS
CORP-H JIANGSU EXPRESSWAY CO -H-
PETROCHINA CO LTD I-H-
WElQlAO TEXTILE COMPANY
LTD ZlJlN MINING GROUP -H-
CHINA PETROLEUM a CHEM
3.172.000
4.481 000
10,654 000
890.000
8,886,000
1,565.500
1,860.000
7.106,non
3 860,000
1,368,000
4,504.000
9 282,000
1,323,000
1.650 000
949,800
929 000
HKD
HKD
HKD
HKD
HKD
HKD
HKD
HKD
HKD
HKD
HKD
HKD
HKD
HKD
-
HKD
HKD
3.351.882
2,093,267
13.454 900
418 E24
5 153.005
2.753.769
1,462,125
2 518.254
1,616 637
502,427
2,902,085
9 688.762
2,003 270
1,297 046
49,216,053
0 58
0.36
2.32
0.07
0.88
0.47
0.25
0.43
0.28
0.09
0.50
1.66
0 34
0.22
8.45
-
0 59
0 32
109,244 434 18.76
INDONESIA
PERUSAHAANGASNEGARA
TBK -6- PT BANK MANDlRl PERSERO
TBK RAMAYANALESTARISENTOSA
TBK TELKOM INDONESIA IS-8-
UNITED TRACTORS
3,442,000
9.139 000
IDR 3.797.215 0.65
IDR 1.703.682 0.29
2 688 000 IDR 237,232 0 0 4
IDR 6,263,220 1 09
IDR 2.066 183 0.35
8,228,000
4.162 000
14.067.732 2.42
MALAYSIA
COMMERCE ASSET-HOLDING
BHD/FOR.REG. GENTING BERHAD/FOR.REG.
101 CORPORATION
BHD/FOR.REG. MALAKOFF BERHAD
MALAYSIA INTL
SHIPPING/FOR.REG. TELEKOM MALAYSIA BHD!FOR.REG.
5.540 700 MYR 9,472.553 1.62
974,900
653,500
1,360.900
538.000
MYR 6,296495 1 0 8
MYR 2.358626 0 4 1
MYR 3.379163 0 5 8
MYR 1372,372 0 2 4
MYR 1 753.788 0.30 691.200
HONG KONG -
BANK OF EAST ASIA LTD
BOC HONG KONG HOLDINGS
LTD
24.632 997 4.23
PHILIPPINES 3,433.260
1,867,592 SM INVESTMENTS
CORPORATIONS
500.886 PHP 2,242,901 0.38
HSBC Global Investment Funds . ..
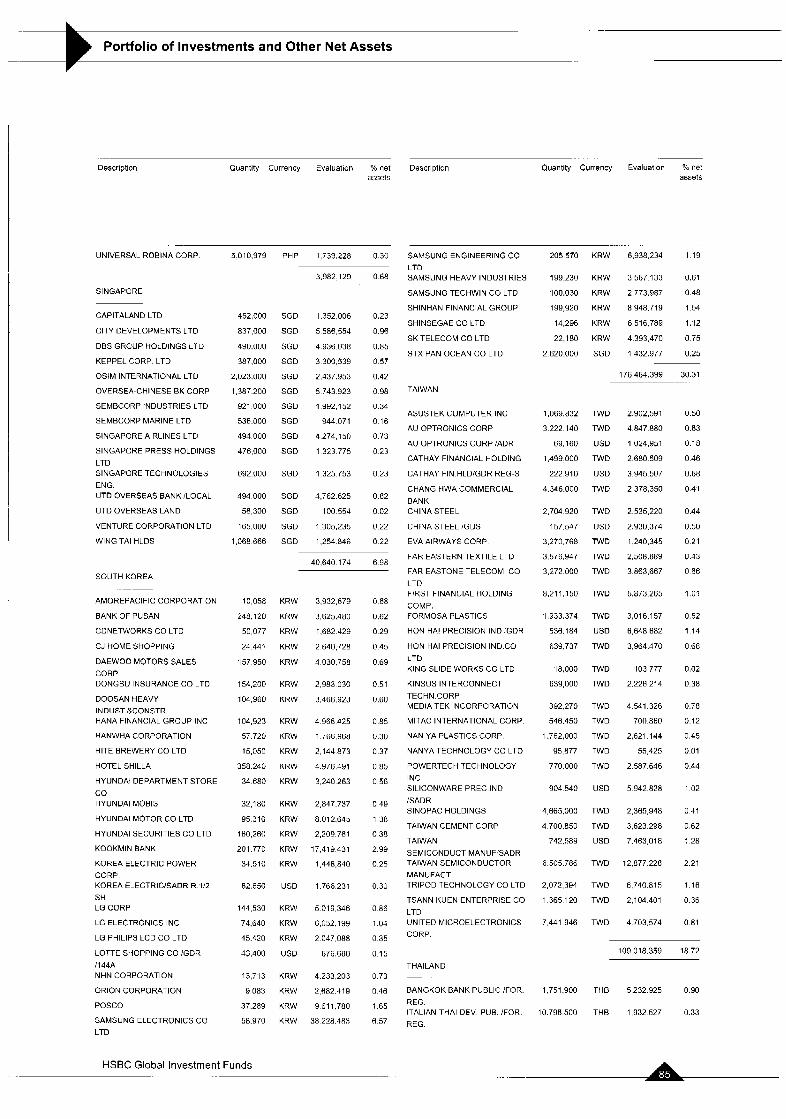
Portfolio of Investments and Other Net Assets -.
..-. .
Description Quantity Currency Evaluation % net Description Quantity Currency Evaluation % net assets assets
UNIVERSAL ROBINA CORP
SINGAPCRE
CAPITALAND LTD
CITY DEVELOPMENTS LTD
DES GRCUP HOLDINGS LTD
KEPPEL CORP LTD
OSlM INTERNATIONAL LTD
OVERSEA-CHINESE BK CORP
SEMBCORP INDUSTRIES LTD
SEMBCORP MARINE LTD
SINGAPORE AIRLINES LTD
SINGAPCRE PRESS HOLDINGS
LTD SINGAPORE TECHNOLOGIES
ENG. UTDOVERSEASBANKlLOCAL
UTD OVERSEAS LAND
VENTURE CORPORATION LTD
WING TAI HLDS
SOUTH K3REA
5 010.979 PHP 1,739.228 0 30
452,000
837,000
490.000
387.000
2,023.000
I ,387 200
921 000
536.000
454 000
476,000
SGD
SGD
SGD
SGD
SGD
SGD
SGD
SGD
SGD
SGD
1.352.006
5 586.554
4.936.038
3 300,539
2,137,953
5 743 923
1.992 152
944 071
4 274 150
1 323.775
0.23
0.96
0.85
0 57
0.42
0.98
0.34
0.16
0.73
0 23
692.000 SGD 1 325.753 0.23
494000 SGD 4,762625 082
56,300 SGD 100554 002
165,000 SGD 1305,235 022
1.068666 SGD 1,254846 022
40.640 174 6.98
AMOREPACIFIC CORPORATION
BANK OF PUSAN
CDNETWORKS CO LTD
CJ HOME SHOPPING
DAEWOO MOTORS SALES
CORP DONGBU INSURANCE CO LTD
DOOSAN HEAVY INDUST WONSTR. HANA FlhANClAL GROUP INC
HANWHA CORPORATION
HlTE BREWERY CO LTD
HOTEL SHILLA
HYUNDAI DEPARTMENT STORE
co HYUNDAl MOBIS
HYUNDAl MOTOR CO LTD
HYUNDAI SECURITIES CO LTD
KOOKMIN BANK
KOREA ELECTRIC POWER CORP KOREA E_ECTRIC/SADR R 1:2 SH LG CORP
LG ELECTRONICS INC
LG PHILIPS LCD CO LTD
LOTTE SHOPPING CO IGDR
1144A NHN CORPORATION
ORION CORPORATION
POSCO
SAMSUNG ELECTRONICS CO
LTD
10,058
248.120
50,077
24 441
157,950
154,200
104,960
104,923
57 720
15,050
358 240
34 600
32,180
55 310
160,260
201 770
34.510
82.650
144 530
74.640
45.420
43,400
13,713
9 083
37.289
58.970
KRW
KHW
KRW
KRW
KRW
KRW
KRW
KRW
KRW
KRW
KHW
KRW
KRW
KRW
KRW
KRW
KRW
USD
KRW
KRW
KRW
US0
KRW
KRW
KRW
KRW
3.932.879
3 625.480
1.682 429
2 640,728
4 030.758
2.983 030
3,466,923
4.966 425
1 766 968
2.144 a73
4 976.491
3.240 263
2 847.737
8 012.645
2,209.761
17.419431
1 448,840
1 766 231
5.019.346
6,052,199
2.047.080
876.680
4.233.203
2 682.419
9 61 1,780
38 228.483
0 60
0 62
0 29
0 45
0 69
0 51
0 60
0 85
0 30
0 37
0 85
0 56
0 49
1 18
0 38
2 99
0 25
0 30
0 86
1 04
0 35
0 15
0 73
0 46
1 65
6 57
SAMSUNG ENGINEERING CO LTD SAMSUNG HEAVY INDUSTRIES
SAMSUNG TECHWIN CO LTD
SHINHAN FINANCIAL GROUP
SHINSEGAE CO LTD
SK TELECOM CO LTD
STX PAN OCEAN CO LTD
205 570 KRW 6,938,234
199.230 KRW 3 567 133
100.030 KRW 2,773.987
199,920 KRW 8 948.715
14,296 KRW 6516.789
22,180 KRW 4353.470
2 620.000 SGD 1,432.977
119
0.61
o 48 1 54
1.12
0 75
0.25
TAIWAN
ASUSTEK COMPUTER INC
AU OPTRONICS CORP
AU OPTRONICS CORP :ADR
CATHAY FINANCIAL HOLDING
CATHAY FIN HLDlGDR REG-S
CHANG HWA COMMERCIAL
BANK CHINA STEEL
CHINA STEEL !GDS
EVA AIRWAYS CORP
FAR EASTERN TEXTILE LTD
FAR EASTONE TELECOM CO
LTD FIRST FINANCIAL HOLDING
COMP FORMOSA PLASTICS
HON HA1 PRECISION IND (GDR
HON HA1 PRECISION IND CO
LTD KING SLIDE WORKS CO LTD
KINSUS INTERCONNECT
TECHN CORP MEDIA TEK INCORPORATION
MITAC INTERNATIONAL CORP
NAN YA PLASTICS CORP
NANYA TECHNOLOGY CO LTD
POWERTECH TECHNOLOGY
INC SILICONWARE PREC IND
lSADR SINOPAC HOLDINGS
TAIWAN CEMENT CORP
TAIWAN
SEMICONDUCT MANUFXADR TAIWAN SEMICONDUCTOR MANUFACT TRIPOD TECHNOLOGY CO LTD
TSANN KUEN ENTERPRISE CO
LTD UNITED MICROELECTRONICS CORP
THAILAND -
BANGKOK BANK PUBLIC :FOR
REG ITALIAN-THAI DEV. PUB. !FOR.
REG
176,484.399
1,069.832 TWO
3222 140 TWD
69,160 US0
1.499 000 TWD
222910 USD
4 346.000 TWO
2,704920 TWD
157,547 USD
3,270,768 TWD
3,576,947 TWO
3.272 000 TWO
8,211,150 TWO
1.933.374 TWO
536.184 US0
639.737 TWO
18,000 TWD
639,000 TWD
392,270 TWD
546.450 TWD
1.762,OOO TWO
95877 TWD
770000 TWO
504540 US0
4665,000 TWO
4 700.850 TWD
742.589 USD
6505.786 TWD
2,072,394 TWD
1365120 TWO
7,441 546 TWO
2.902,SYl
4.847 880
1,024,951
2.680 509
3.945 507
2,378,350
2,535,220
2.930.374
1 240.345
2,508.889
3.863.667
5.873.265
3,016.157
6 648 682
3 964.470
103,777
2.226 214
4.541.326
700.860
2,621.144
55 425
2.587.646
5 942.828
2 365,948
3,623 298
7.463 o i a
12.877 228
6,740.815
2,104 401
4.703.574
30 31 -.
0 50
0.83
0.18
0.46
0.68
0.41
0.44
0.50
0.21
0.43
0 66
1.01
0.52
114
0 68
0.02
0.38
0.78
0.12
0.45
0.01
0.44
1 02
0 41
0.62
I 28
2.21
1.16
0.36
0.81
109 018.359 18.72
1.751.500 THE 5232925 090
10.798 500 THE 1.932 527 0.33
HSBC Global Investment Funds
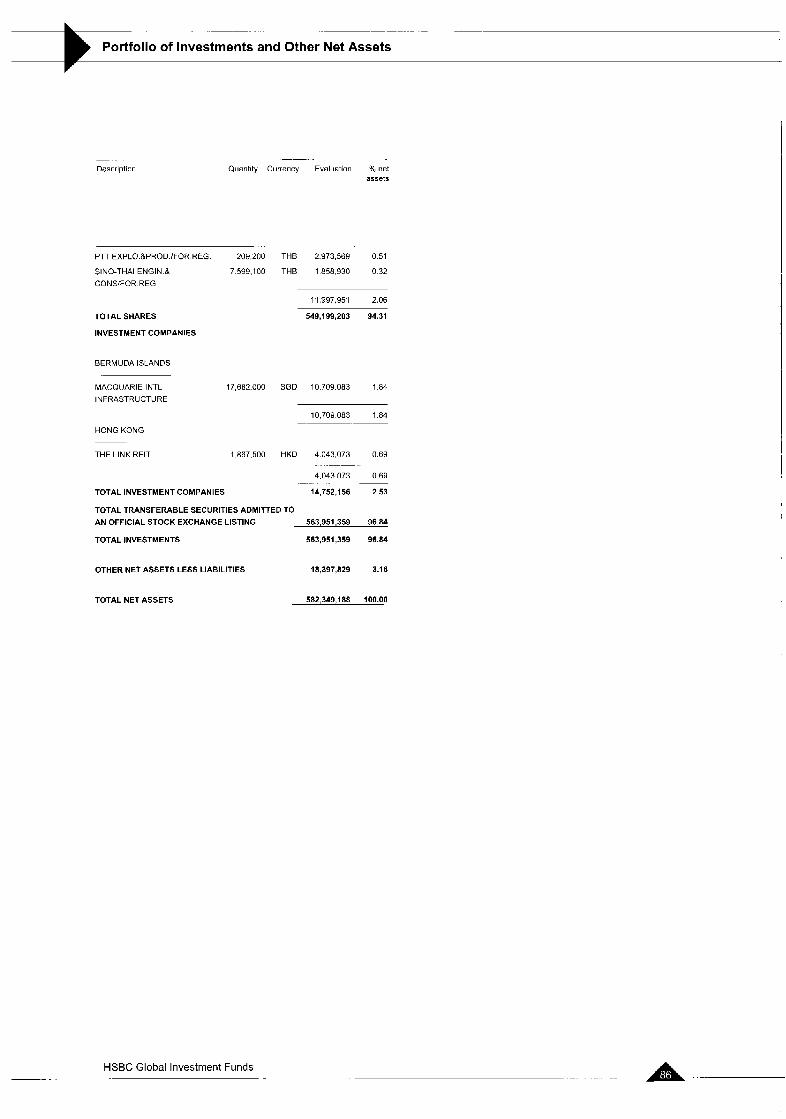
- .~
Portfolio of Investments and Other Net Assets
-.
Description .
Quantity Currency Evaluatian Yo net assets
PTT EXPLO &PROD /FOR REG 20Y 200 THB 2 973,569 0 51
SINO-THAI ENGIN & 7599,100 THB 1858930 0 3 2 CONSFOR REG
11 997,951 2 06
TOTAL SHARES
INVESTMENT COMPANIES
BERMUDA ISLANDS
549,199,203 94.31
MACQUARIE INTL INFRASTRUCTURE
17,682.000 SGD 10.709.083 1 84
10,709 083 1 .E4
HONG KONG
THE LINK RElT 1.867.500 HKD 4,043,073 0.69
4.043073 0 6 9
TOTAL INVESTMENT COMPANIES 14.752.156 2 53
TOTAL TRANSFERABLE SECURITIES ADMlnED TO AN OFFICIAL STOCK EXCHANGE LISTING 563,951,358 96 84
TOTAL INVESTMENTS 563,951,359 96.84
.
OTHER NET ASSETS LESS LIABILITIES 18,397,829 3.16
TOTALNETASSETS 582,349,188 100.00
HSBC Global Investment Funds . . . . .. . A . ..
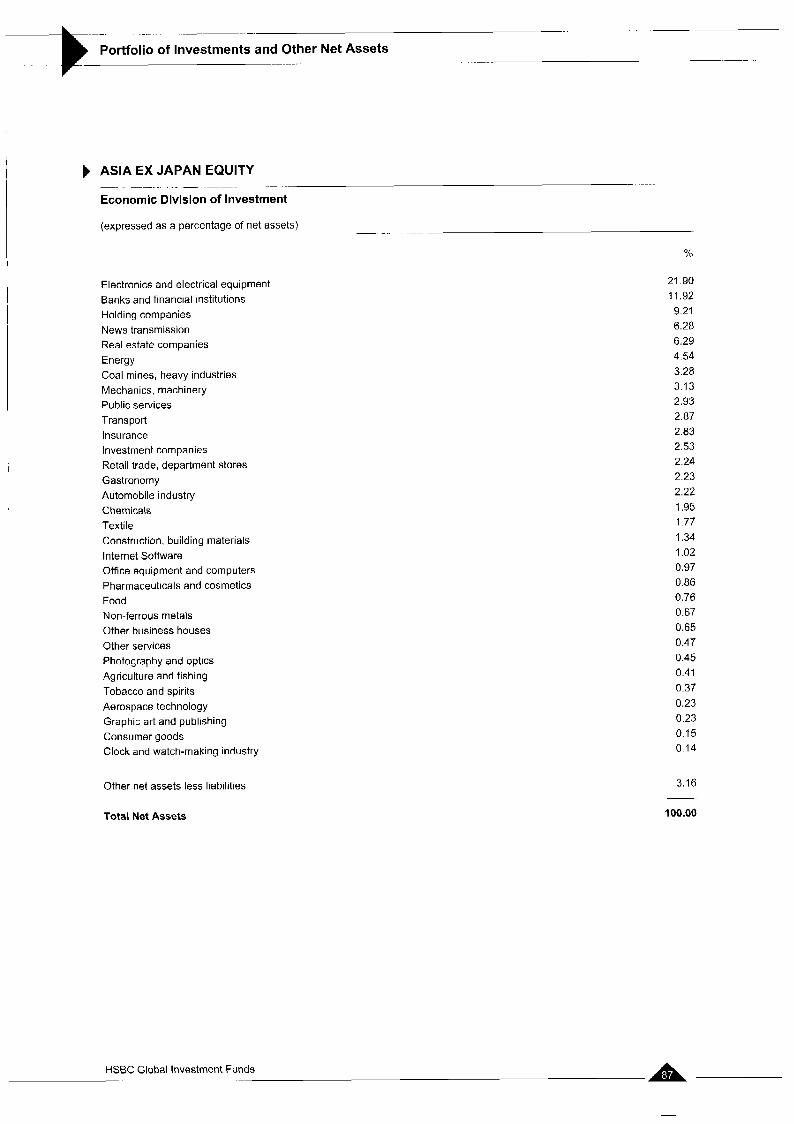
- _ _
Portfolio of Investments and Other Net Assets _- .
ASIA EX JAPAN EQUITY
Economic Division of Investment -_ .-. .- - __ . _-_
_- . . . -- (expressed as a percentage of net assets)
%
Electronics and electrical equipment Banks and financial institutions Holding companies News transmission Real estate companies Energy Coal mines, heavy industries Mechanics, machinery Public services Transport Insurance Investment companies Retail trade, department stores Gastronomy Automobile industry Chemicals Textile Construction, building materials Internet Software Office equipment and computers Pharmaceuticals and cosmetics Food Non-ferrous metals Other business houses Other services Photography and optics Agriculture and fishing Tobacco and spirits Aerospace technology Graphic art and publishing Consumer goods Clock and watch-making industry
Other net assets less liabilities
Total Net Assets
21.90 11.92 9.21 6.28 6.29 4.54 3.28 3.13 2.93
2.83 2.53 2.24 2.23 2.22 1.95 1.77 1.34 1.02 0.97 0.86 0.76 0.67 0.65 0.47 0.45 0.41 0.37 0.23 0.23 0.15 0.14
2.87
3.16
100.00
-
HSBC Global Investment Funds
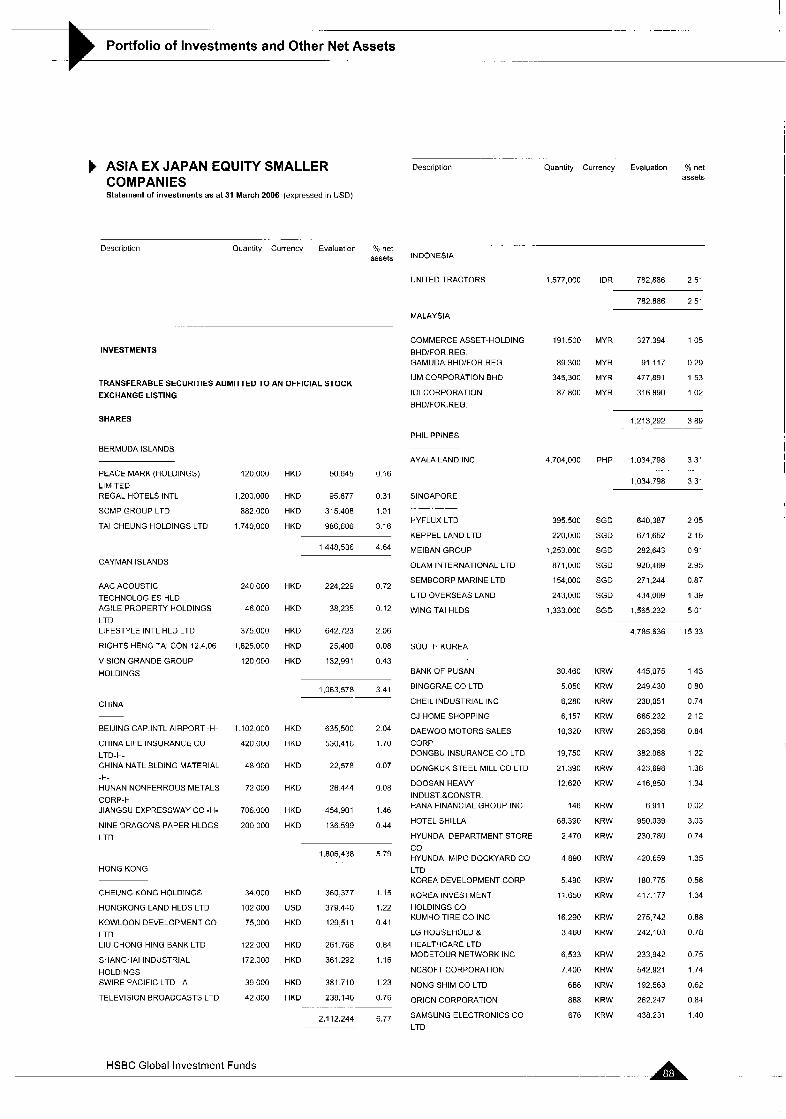
_- - --
Portfolio of Investments and Other Net Assets - - -.
ASIA EX JAPAN EQUITY SMALLER COMPANIES Statement of investments as at 31 March 2006 (expressed in USD)
. . -. . .
Description Quantity Currency Evaluation % net assets
. . - .
Description Quantity Currency Evaluation Yo net assets INDONESIA
UNITED TRACTORS
MALAYSIA
1,577,000
191 500
89 300
345 300
87 800
4.704,OOO
395 500
220,000
1,253 000
871,000
154,000
243,000
1,333 000
30.460
5 050
6 280
6 157
10,320
19,750
21 390
12.620
146
68 390
2,470
4 ago
5 490
1 1,650
16.290
3,460
6,533
7.400
688
888
E76
IDR 782,886 2.51
782.886 2.51
COMMERCE ASSET-HOLDING
BHD/FOR REG GAMUDA BHD!FOR.REG.
IJM CORPORATION BHD
101 CORPORATION
BHD/FOR.REG.
MYR 327394 105 INVESTMENTS
MYR 91 117 0 2 9
MYR 477,891 1 5 3
MYR 316890 1 0 2 TRANSFERABLE SECURITIES ADMITTED TO AN OFFICIAL STOCK EXCHANGE LISTING
SHARES
PHILIPPINES
BERMUDA ISLANDS AYALA LAND INC
SINGAPORE
PHP 1.034.798 3 31
1,034.798 3.31 PEACE MARK (HOLDINGS)
LIMITED REGAL HOTELS INTL
SCMP GROUP LTD
TAI CHEUNG HOLDINGS LTD
120.000
1,200,000
882.000
1 740,000
240 000
46.000
375.000
1,825.000
120,000
1 102.000
420,000
48 ooo
72 000
706.000
200 000
34.000
102 000
75,000
122 000
172 000
39 000
42,000
HKD 50.645 0 16
HKD 95877 0 3 1
HKD 315.408 1.01
HKD 986606 3 16 HYFLUX LTD
KEPPEL LAND LTD
MEIBAN GROUP
OLAM INTERNATIONAL LTD
SEMBCORP MARINE LTD
UTD OVERSEAS LAND
WING TAI HLDS
SGD 640.387 2 0 5
SGD 671,652 2.15
SGD 282.643 0 9 1
SGD 920.469 2 9 5
SGD 271.244 0 8 7
SGD 434,009 1 3 9
SGD 1,565232 5 0 1
1448.536 4 6 4
CAYMAN ISLANDS
AAC ACOUSTIC
TECHNOLOGIES HLD AGILE PROPERTY HOLDINGS
LTD LIFESTYLE INTL HLD LTD
HIGHTS HENG TAI CON.12.4.06
VISION GRANDE GROUP
HOLDINGS
HKD 224,229 0 7 2
HKD 38.235 0 12
4,785 636
445 075
249 430
230 051
665 232
263,358
382 068
423 698
416.850
6911
950.039
230.780
420.659
180 775
417 177
275 742
242,103
233.942
542.921
192.563
262.247
438 231
15 33
1 4 3
0 80
0.74
2.12
0.84
1.22
1.36
1.34
0.02
3.03
0.74
1.35
0.58
1 34
0.88
o 7a
0.75
1.74
0.62
o a4
1 40
HKD 642.723 2.06
HKD 25,400 0.08
HKD 132,991 0.43
SOUTH KOREA
BANK OF PUSAN
BINGGRAE CO LTD
CHEIL INDUSTRIAL INC
CJ HOME SHOPPING
DAEWOO MOTORS SALES
CORP DONGBU INSURANCE CO LTD
DONGKUK STEEL MILL CO LTD
DOOSAN HEAVY
INDUST.&CONSTR. HANA FINANCIAL GROUP INC
HOTEL SHILLA
HYUNDAI DEPARTMENT STORE
co HYUNDAI MlPO DOCKYARD CO
LTD KOREA DEVELOPMENT CORP
KOREA INVESTMENT
HOLDINGS CO KUMHO TIRE CO INC
LG HOUSEHOLD & HEALTHCARE LTD MODETOUR NETWORK INC
NCSOFT CORPORATION
NONG SHIM CO LTD
ORION CORPORATION
SAMSUNG ELECTRONICS CO
LTD
KRW
KRW
KRW
KRW
KRW
KRW
KRW
KRW
KRW
KRW
KRW
KRW
KRW
KRW
KRW
KRW
KRW
KRW
KRW
KRW
KRW
i ,063,578 3.41
CHINA
BElJlNG CAP.INTL AIRPORT -H-
CHINA LIFE INSURANCE CO
LTD-H- CHINA NATL ELDING MATERIAL
-H- HUNAN NONFERROUS METALS
CORP-H JIANGSU EXPRESSWAY CO -H-
NINE DRAGONS PAPER HLDGS
LTD
HKD 635,500 2 0 4
HKD 530,416 1 7 0
HKD 22,578 0.07
HKD 26444 0.08
HKD 454.901 1 4 6
HKD 136599 0.44
1,806,438 5.79
HONG KONG
CHEUNG KONG HOLDINGS
HONGKONG LAND HLDS LTD
KOWLOON DEVELOPMENT CO
LTD LIU CHONG HlNG BANK LTD
SHANGHAI INDUSTRIAL
HOLDINGS SWIRE PACIFIC LTD - A-
TELEVISION BROADCASTS LTO
HKD 360 377 1 15
US0 379,440 1.22
HKD 129,511 0 4 1
HKD 261 768 0 8 4
HKD 361.292 1.16
HKD 381 710 1.23
HKD 238,146 0.76
2,112.244 6.77
HSBC Global Investment Funds
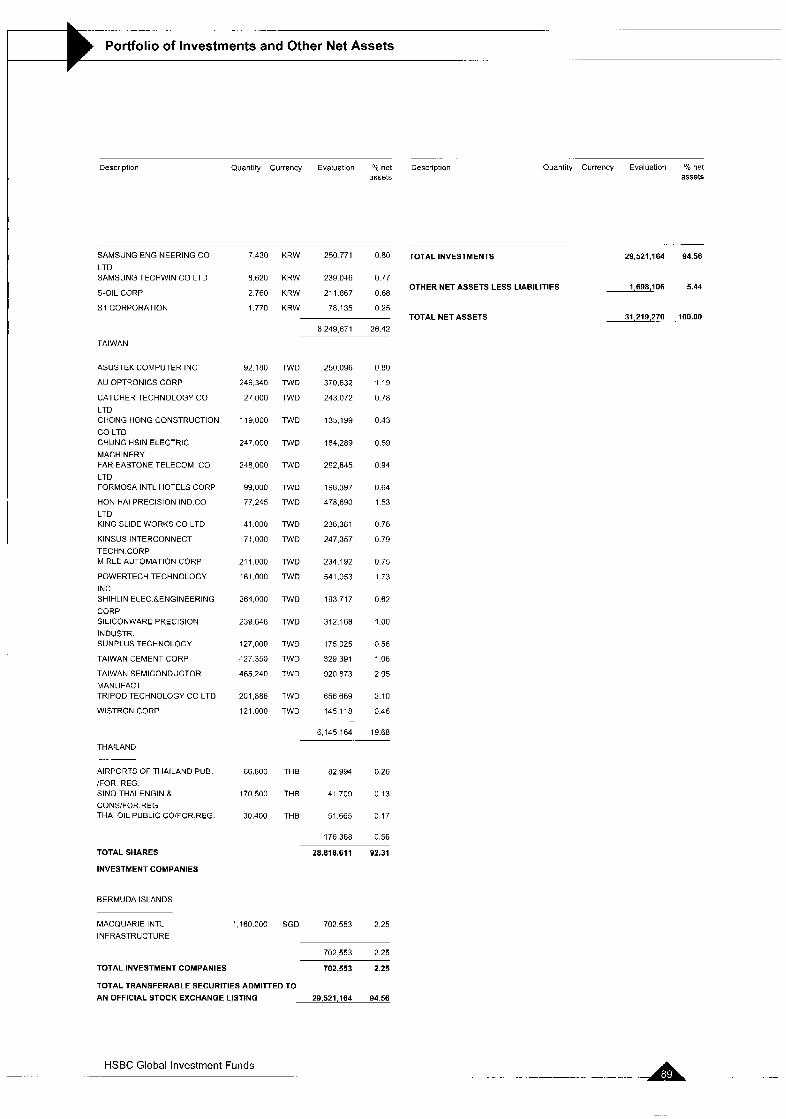
Portfolio of Investments and Other Net Assets
Description Quantity Currency Evaluation nct Description assets
SAMSUNG ENGINEERING CO
LTD SAMSUNG TECHWIN CO LTD
S-OIL CCRP
SI CORPORATION
TAIWAN
ASUSTEK COMPUTER INC
AU OPTRONICS CORP
CATCHE3 TECHNOLOGY CO
LTD CHONG HONG CONSTRUCTION
CO LTD CHUNG HSlN ELECTRIC
MACHINERY FAR EASTONE TELECOM CO
LTD FORMOSA INTL HOTELS CORP
HON HAIFRECISION INDCO
LTD KING SLIDE WORKS CO LTD
KINSUS INTERCONNECT
TECHN CORP MIRLE AUTOMATION CORP
POWERTECH TECHNOLOGY
INC SHlHLlN ELEC &ENGINEERING
CORP SILICONWARE PRECISION INDUSTR SUNPLUS TECHNOLOGY
TAIWAN CEMENT CORP
TAIWAN SEMICONDUCTOR
MANUFACT TRIPOD TECHNOLOGY CO LTD
WISTRON CORP
THAILAND
7.430 KRW 250.771 0.80 TOTAL INVESTMENTS
Quantity Currency Evaluation "h net assets
8.620 KRW 239046 0 7 7 760 KRW 21 a67 68 OTHER NET ASSETS LESS LIABILITIES 1,698,106 5.44
1.770 KHW 78.135 0.25
11.249 671 26.42 TOTAL NET ASSETS 31,219,270 . l O O . O O
92.180 TWO
24fi340 TWD
27000 TWD
119000 TWD
247UOO TWD
248000 TWD
99,0110 TWO
77,245 TWO
41 000 TWD
71,000 TWO
211 000 TWO
161 000 TWO
264,000 TWO
239648 TWD
127,000 TWD
427350 TWD
465.240 TWO
201 aa6 TWD
121 000 TWD
250,096
370.632
243 072
135 199
184,289
292,845
198.397
478,690
236,3ai
247,357
234.192
541.053
193.717
312.16a
175,025
329 391
920,873
656,669
145 i i a ..
0 00
1 1 9
0.78
0.43
0.59
0.94
I1 64
1.53
0 76
0.79
0 75
1 73
0.62
1 .oo
0.56
1.06
2.95
2.10
0.46
TOTAL SHARES
INVESTMENT COMPANIES
BERMUDA ISLANDS
29,521.164 94.58
AIRPORTS OF THAILAND PUB
/FOR REG SINO-THAI ENGIN R CONS/FOR.REG THAI OIL PUBLIC COlFOR REG
66800 THB 82,994 0.26
170500 THE 41.709 0 13
30,400 THE 51 665 0 17
176,368 0.56
MACQUARIE INTL
INFRASTRUCTURE
28.818.611 92.31
1,160.000 SGD 702 553 2.25
702,553 2.25
TOTAL INVESTMENT COMPANIES 702.553 2.25
TOTAL TRANSFERABLE SECURITIES ADMlTrED TO
AN OFFICIAL STOCK EXCHANGE LISTING 29,521.16A 9A.56
HSBC Global Investment Funds - -. . . .- . .. ..... . ... ._ -A
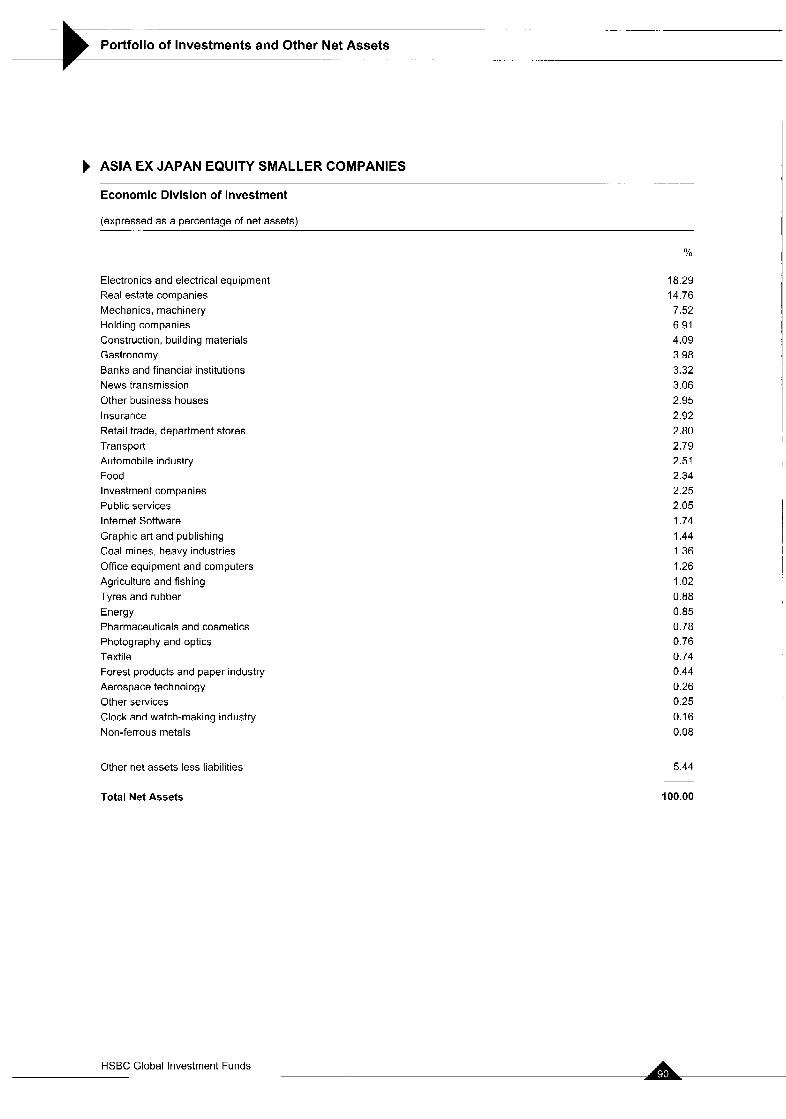
__ -~ ._
Portfolio of Investments and Other Net Assets -_
ASIA EX JAPAN EQUITY SMALLER COMPANIES - . _ _
Economic Division of Investment
(expressed as a percentage of net assets) ~ . -
Yo
Electronics and electrical equipment Real estate companies Mechanics, machinery Holding companies Construction, building materials Gastronomy Banks and financial institutions News transmission Other business houses Insurance Retail trade, department stores Transport Automobile industry Food Investment companies Public services Internet Software Graphic art and publishing Coal mines. heavy industries Office equipment and computers Agriculture and fishing Tyres and rubber Energy Pharmaceuticals and cosmetics Photography and optics Textile Forest products and paper industry Aerospace technology Other services Clock and watch-making industry Non-ferrous metals
Other net assets less liabilities
Total Net Assets
HSBC Global Investment Funds
18.29 14.76 7.52 6.91 4.09
3.32 3.06 2.95 2.92 2.80 2.79 2.51 2.34 2.25 2.05 1.74 1.44 1.36 1.26 1.02 0.88 0.85 0.78 0.76 0.74 0.44 0.26 0.25 0.16 0.08
3.98
5.44
100.00
I
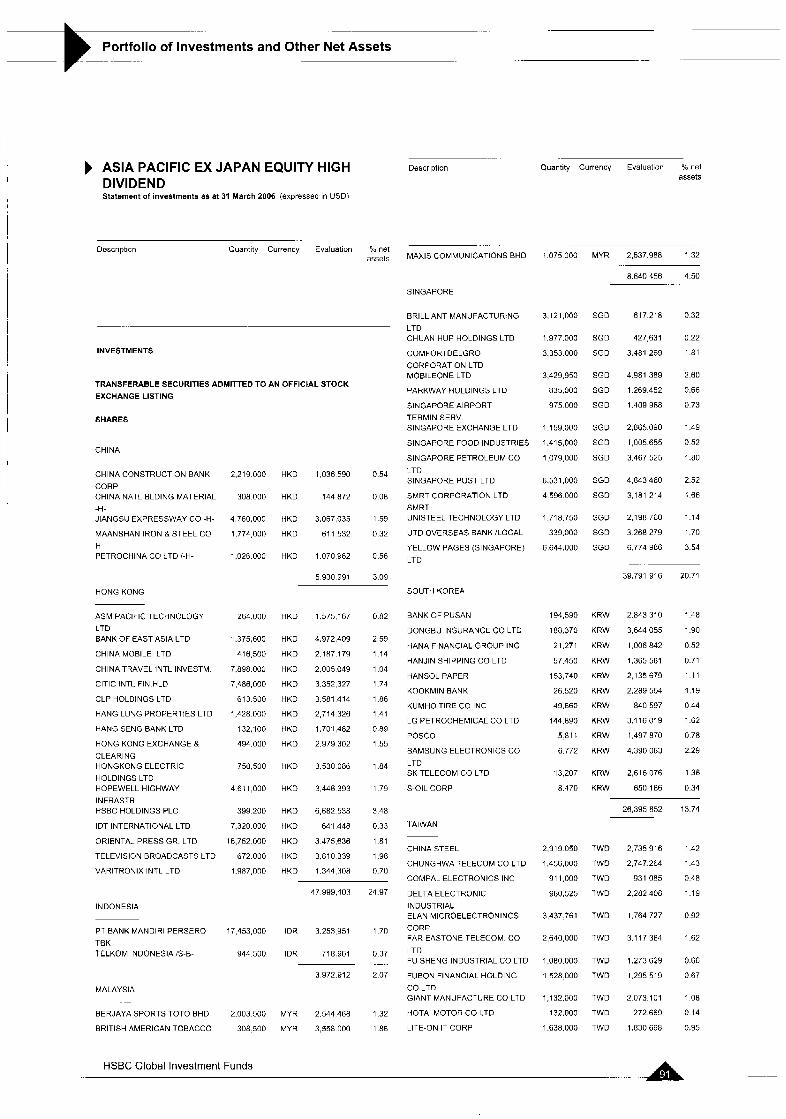
__
Portfolio of Investments and Other Net Assets
I
. ._
ASIA PACIFIC EX JAPAN EQUITY HIGH DIVIDEND Statement of investments as at 31 March 2006 (expressed in USDl
-. .
Quantity Currency Evaluation % net assets
Description
Descripticn Quantity Currency Evaluatiuri “io net assets MAXIS COMMUNICATIONS BHD
INVESTMENTS
TRANSFERABLE SECURITIES ADMITTED TO AN OFFICIAL STOCK
EXCHANGE LISTING
SHARES
CHINA
CHINA CONSTRUCTION BANK
CORP CHINA NATL BLDING MATERIAL
-H- JIANGSU EXPRESSWAY CO -H-
MAANSHAN IRON &STEEL CO
H PETROCHINA CO LTD I-H-
HONG KONG
ASM PACIFIC TECHNOLOGY
LTD BANK OF EAST ASIA LTD
CHINA MOBILE LTD
CHINA TRAVEL INTL INVESTM
ClTlC INTL FIN.HLD
CLP HOLDINGS LTD
HANG LUUG PROPERTIES LTD
HANG SENG BANK LTD
HONG KONG EXCHANGE & CLEARING HONGKONG ELECTRIC
HOLDINGS LTD HOPEWELL HIGHWAY
INFRASTR HSBC HOLDINGS PLC
IDT INTERNATIONAL LTD
ORIENTAL PRESS GR. LTD
TELEVISION BROADCASTS LTD
VARITHOUIX INTL LTD
INDONESIA
PT BANK MANDlRl PERSERO
TBK TELKOM NDONESIA ’S-B-
MALAYSIA .. .-
BERJAYA SPORTS TOTO BHD
BRITISH AMERICAN TOBACCO
2.219 000
308 000
4 760,000
1 774 000
1,026 000
264.000
1,375,600
416 500
7.898 000
7,486,000
613 500
1,428 000
132,100
494.000
750.500
4 61 1,000
399 200
7.320 000
16.752 000
672 000
1.987 no0
17 453,000
944 500
2.003 500
308 500
HKD 1,036 590 0 5 4
HKD 144872 0 0 8
HKD 3067,035 159
HKD 611 532 0 3 2
HKD 1070962 0 5 6
5 930 991 3 09
HKD
HKD
HKD
HKD
HKD
HKD
HKD
HKD
HKD
HKD
HKD
HKD
HKD
HKD
HKD
HKD
1.575 167
4,972,409
2.187 179
2.005 049
3,352,327
3.581 414
2,714 326
1,701,482
2.979 302
3.530 086
3.446 393
6,682 538
641 448
3 475,636
3.810 339
1.344 308
0.82
2.59
1.14
1.04
1.74
1.86
1.41
0.89
1.55
1.84
1.79
3.48
0.33
1 .81
1.98
0.7c
47 999.403 24.97
IDR 3.253 951 1.711
IDR 718.961 0.37
3 972.912 2.07
MYR 2.544468 1.32
hlYH 3,558 000 1.86
SINGAPORE
BRILLIANT MANUFACTURING
LTD CHUAN HUP HOLDINGS LTD
COMFORTDELGRO CORPORATION LTD MOBILEONE LTD
PARKWAY HOLDINGS LTD
SINGAPORE AIRPORT
1ERMIN.SERV. SINGAPORE EXCHANGE LTD
SINGAPORE FOOD INDUSTRIES
SINGAPORE PETROLEUM CO
LTD SINGAPORE POST LTD
SMRT CORPORATION LTD
SMRT UNISTEEL TECHNOLOGY LTD
UTDOVERSEASEANK/LOCAL
YELLOW PAGES (SINGAPORE)
LTD
SOUTH KOREA
BANK OF PUSAN
DONGBU INSURANCE CO LTD
HANA FINANCIAL GROUP INC
HANJIN SHIPPING CO LTD
HANSOL PAPER
KOOKMIN BANK
KUMHO TIRE CO INC
LG PETROCHEMICAL CO LTD
POSCO
SAMSUNG ELECTRONICS CO
LTD SK TELECOM CO LTD
S-OIL CORP
IAIWAN
1.075 000
3,121,000
1.977.000
3.353 000
3,429.950
835,000
975 000
1 159,000
1.415.000
1 079 000
6,531,000
4 596 000
1.718.750
339.000
6.644.000
194,590
188.370
21.271
57.450
153,740
26,520
49.660
144.890
5811
6.772
13,207
8.470
MYR 2,537.988 1 3 2
8,640,456 4.50
SGD
SGD
SGD
SGD
SGD
SGD
SGD
SGD
SGD
SGD
SGD
SGD
SGD
SGD
617.218
427,631
3,481,269
4,981,389
1 269.452
1,409,988
2,865090
1,005.655
3.467 525
4,843 460
3,181.214
2,198,760
3 268.279
fi.774 986
0.32
0.22
1.81
2.60
0.66
0.73
1.49
0.52
1.80
2.52
1.66
1.14
1.70
3.54
39,791.916 20.71
KRW
KRW
KRW
KRW
KRW
KRW
KRW
KRW
KRW
KRW
KRW
KRW
2.843 310
3,644 055
1,006 842
1,365.581
2,135 679
2,289.554
840 597
3.1 16,019
1,497 870
4,390.083
2,616,076
650 186
1.48
1.90
0.52
0.71
1.11
1.19
0 44
1.62
0.78
2.29
1 36
0.34
CHINA STEEL
CHUNGHWA TELECOM CO LTD
COMPAL ELECTRONICS INC
DELTA ELECTRONIC
INDUSTRIAL ELAN MICROELECTRONINCS
CORP. FAR EASTONE TELECOM. CO
LTD FU SHENG INDUSTRIAL CO LTD
FUBON FINANCIAL HOLDING
CO LTD GIANT MANUFACTURE CO LTD
HOTAI MOTOR CO LTD
LITE-ON IT CORP
2.919 050 TWD
1,456,000 TWD
911 000 TWD
980,525 TWD
3,437761 TWD
2640000 TWD
1,080000 TWD
I S 2 8 0 0 0 TWD
1132.000 TWD
132000 TWO
1,638000 TWO
26,395,852 13.74
2.735 916 1.42
2,747.264 1 43
931,085 0 4 8
2.282408 1 19
1.764 727 0 92
3.117384 1 6 2
1273,629 0 66
1.295 519 0 6 7
2073.101 1 0 8
272.669 0 14
1.830 668 0.95
HSBC Global Investment Funds ....
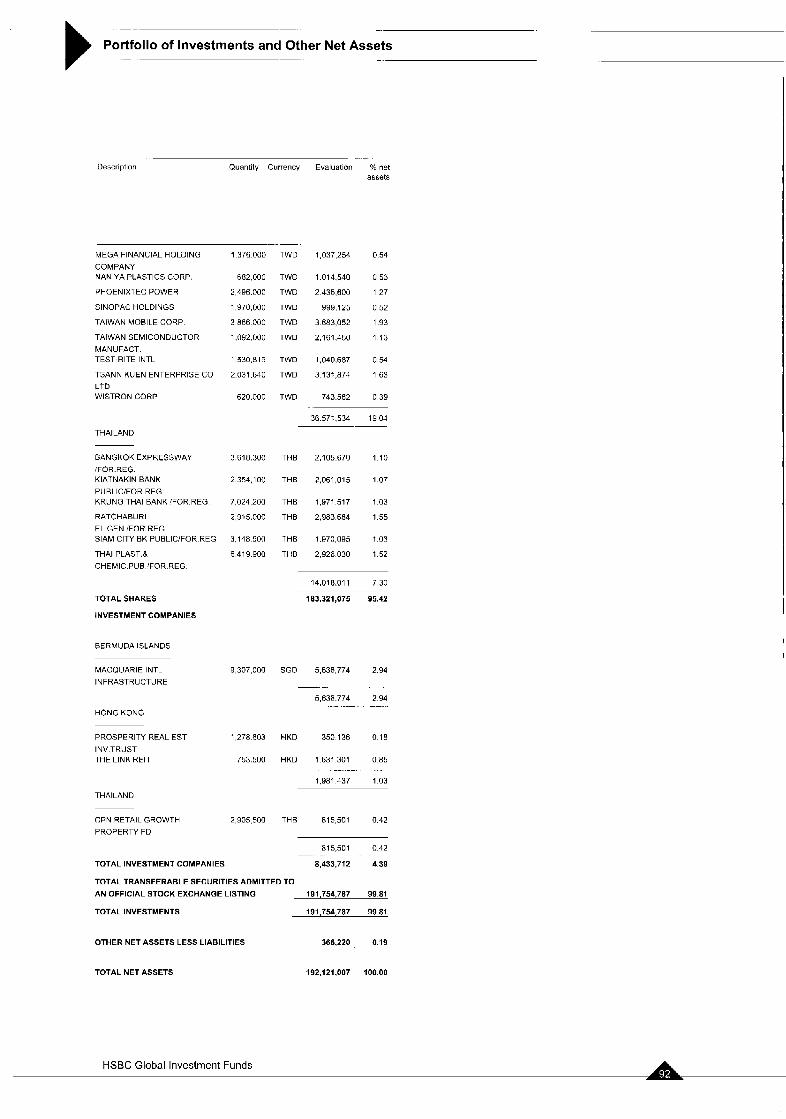
-.
Portfolio of Investments and Other Net Assets -..
. -....
Description Quantity Currency Evaluation % net assets
MEGA FINANCIAL HOLDING
COMPANY NAN YA PLASTICS CORP.
PHOENIXTEC POWER
SINOPAC HOLDINGS
TAIWAN MOBILE CORP.
TAIWAN SEMICONDUCTOR
MANUFACT. TEST-RITE INTL
TSANNKUENENTERPRISECO LTD WISTRON C O W
THAILAND
BANGKOK EXPRESSWAY IFOR REG KlATNAKlN BANK
PUBLlCiFOR REG KRUNG THAI BANK IFOR REG
RATCHABURI
EL GEN 'FOR REG SlAM CITY BK PUBLIC'FOR REG
THAI PLAST 8 CHEMIC PUB 'FOR REG
TOTAL SHARES
INVESTMENT COMPANIES
BERMUDA ISLANDS
MACQUARIE INTL
INFRASTRUCTURE
HONG KONG
PROSPERITY REAL EST.
INV.TRUST THE LINK RElT
THAILAND
CPN RETAIL GROWTH
PROPERTY FD
1 376 000
682.000
2,496.000
1 970.000
3 866.000
1.092.000
1930.819
2.031.640
620.000
3.618.300
2 354,100
7.024 200
2,915.000
3.148 500
6 419.900
9,307,000
1,278.603
753.500
2,905 500
1WD
1WD
TWO
r w D
TWO
r w D
rwo
W D
TWD
1,037,254
1 014.540
2 435.600
999,125
3 683,052
2,161,450
1,040.687
3 131,874
743 582
0 54
0 53
1 27
0.52
1 9 3
1.13
0.54
1 6 3
0 39
36 571.534 19 04
THE 2,105670 1 1 0
THE 2,061,015 1.07
THB 1,971 517 1 0 3
THE 2,983684 155
THB 1,970,095 1.03
THE 2.926030 1 5 2
14,018.011 7.30
183,321,075 95.42
SGD 5,636,774 2.94
5,636.774 2.94 . - --
HKD 350136 0 1 8
HKD 1631 301 0 8 5
1981 437 103
.. .-
THE 815,501 0.42
TOTAL INVESTMENT COMPANIES
815,501 0 4 2
6,433.712 4 39
TOTAL TRANSFERABLE SECURITIES ADMITTED TO
AN OFFICIAL STOCK EXCHANGE LISTING 191,754,787 99.81
TOTAL INVESTMENTS 191,754,787 99.81
OTHER NET ASSETS LESS LIABILITIES 366,220 . 0.19
TOTALNETASSETS 192,121,007 100.00
I
HSBC Global Investment Funds
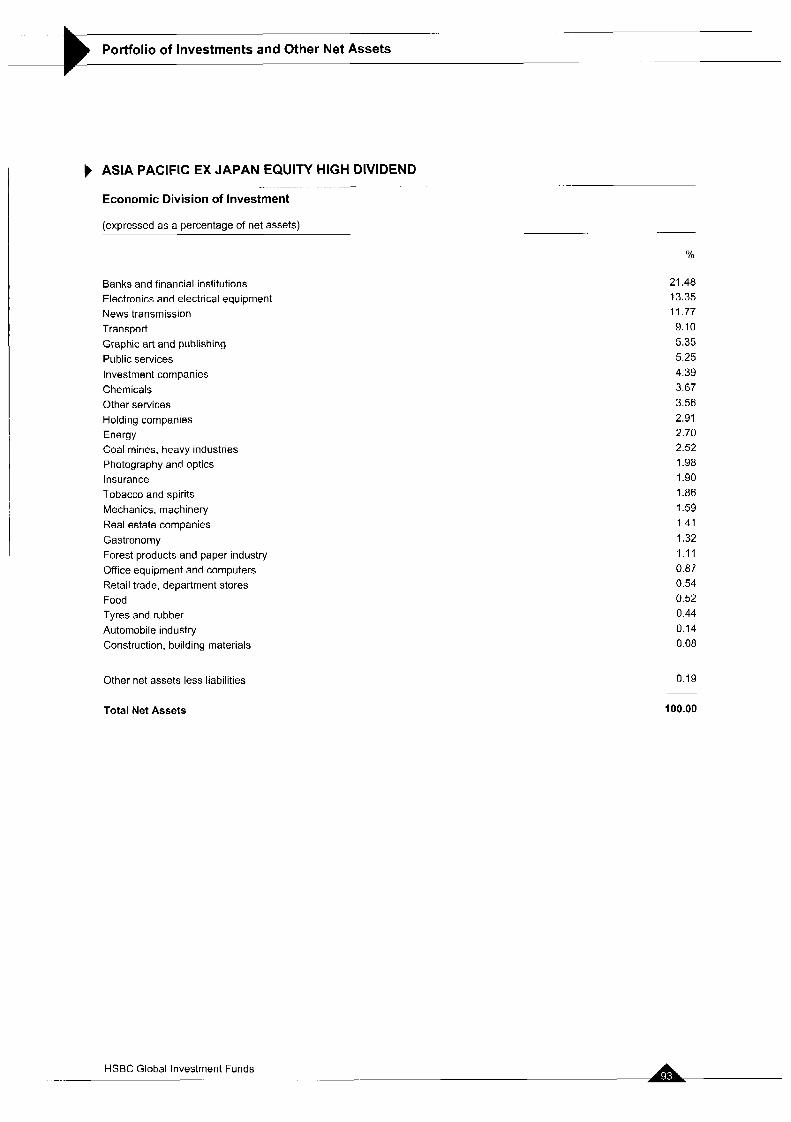
-
Portfolio of Investments and Other Net Assets
ASIA PACIFIC EX JAPAN EQUITY HIGH DIVIDEND
Economic Division of Investment . . ....... .
(expressed as a percentage of net assets)
%
Banks and financial institutions Electronics and electrical equipment News transmission Transport Graphic art and publishing Public services Investment companies Chemicals Other services Holding companies Energy Coal mines, heavy industries Photography and optics Insurance Tobacco and spirits Mechanics, machinery Real estate companies Gastronomy Forest products and paper industry Office equipment and computers Retail trade, department stores Food Tyres and rubber Automobile industry Construction, building materials
21.48 13.35 11.77 9.10 5.35 5.25 4.39 3.67 3.56 2.91 2.70 2.52 1.98 1.90 1.86 1.59 1.41 1.32 1.11 0.87 0.54 0.52 0.44 0.14 0.08
Other net assets less liabilities 0.19
Total Net Assets 100.00
HSBC Global Investment Funds -. . .-
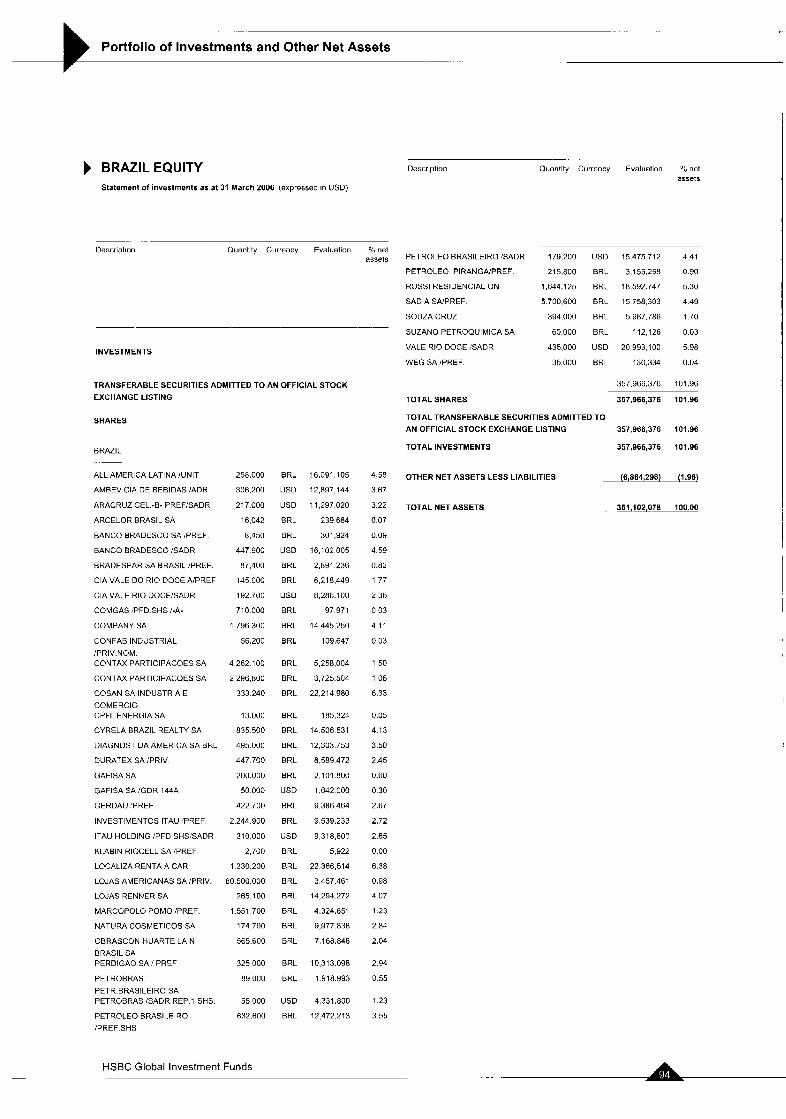
_ _
Portfolio of Investments and Other Net Assets _ _
I
BRAZIL EQUITY Statement of investments as at 31 March 2006 (expressed in USD)
...
Description Quantity Currency Evaluation net assets
INVESTMENTS
TRANSFERABLE SECURITIES ADMITTED TO AN OFFICIAL STOCK
EXCHANGE LISTING
SHARES
BRAZIL
ALL AMERICA LATINA !UNIT
AMBEV CIA DE BEBIDAS lADR
ARACRUZ CEL -E- PREF.SADR
ARCELOR BRASIL SA
BANCOBRAOESCOSA,PREF
BANCOBRADESCOjSADR
BRADESPAR SA BRASIL !PREF
CIA VALE DO RIO DOCE AiPREF
CIAVALE RIO DOCElSADR
COMGAS iPFD SHS ,-A-
COMPANY SA
CONFAB INDUSTRIAL
PR lV NOM CONTAX PARTICIPACOES SA
CONTAX PARTICIPACOES SA
COSAN SA INDUSTRIA E
COMERCIO CPFL ENERGIA SA
CYRELA BRAZIL REALTY SA
DIAGNOST DA AMERICA SA BRL
DURATEX SA iPRlV
GAFISA SA
GAFlSA SA /GDH 144A
GERDAU 'PREF
INVESTIMENTOS ITAU 'PREF
ITAU HOLDING (PFD SHS:SADR
KLABIN RIOCELL SA 'PREF
LOCALIZA RENTA A CAR
LOJAS AMERICANAS SA iPRlV
LOJAS RENNER SA
MARCOPOLO POMO PREF
NATURA COSMETICOS SA
OBRASCON HUARTE LAIN
BRASIL SA PERDIGAO SA ' PREF
PETROBRAS
PETR BRASlLElRO SA PETROBRAS GADR REP 1 SHS
PETROLEO BRASILEIRO PREF SHS
258,000
306,200
217 000
16,042
8,450
447 900
87,400
145 000
192.700
710 000
1 796.300
56,200
4 262.100
2 2 9 6 , ~ ~ ~
333 240
13.000
835 500
495.000
447 700
200.000
50 000
422 700
2 244 900
310.000
2 700
1 330.200
80 500.000
265,100
1551,700
174 700
565.600
325 000
89.000
55.000
632.600
BRL 16.091,105
USD 12,897 144
US0 11,297 020
BRL 239684
BRL 301,924
USD 16.102 005
BRL 2,891.236
BRL 6.218.449
US0 8,286.100
BRL 97971
BRL 14 445.250
BRL 109,647
BRL 5,258.004
BRL 3 725.504
BRL 22.214 980
BRL 185,324
BRL 14.506 531
BRL 12 303.753
BRL 8.589472
BRL 2,101.800
USD 1.042 000
BRL 9.386464
BRL 9,539.233
US0 9.318.600
BRL 5,922
BRL 22,366,514
BRL 3457,461
BRL 14,294 212
BRL 4,324,851
BRL 9,977838
BRL 7,168.848
BRL 10.313.098
BRL 1.918.993
US0 4,331.800
BRL 12472.213
4.58
3.67
3.22
0.07
0.09
4.59
0.82
1 77
2 36
0 03
4.11
0 03
1.50
1 06
6.33
0.05
4.13
3.50
2.45
0.60
0.30
2.67
2.72
2.65
0 00
6.38
0.98
4.07
1.23
2.84
2.04
2.94
0.55
1 23
3 55
Description Quantity Currency Evaluation O 6 net assets
PETROLEO BRASILEIRO 'SADR
PETROLEO 1PIRANGA:PREF
ROSS1 RESIDENCIAL ON
SADIA SNPREF
SOUZA CRUZ
SUZANO PETROQUIMICA SA
VALE RIO DOCE :SADR
WEG SA jPREF.
179,200
215,800
1,6A4.125
5 700.600
394.000
60.000
435.000
35.000
US0
BRL
BRL
BRL
BRL
BRL
US0
BRL
15,475 712
3 , i 5s.zsn
15 758,303
18,592.747
5 967.786
112.126
20 993.100
130,334
357,966,376
4.41
0.90
5.30
4.49
1.70
0 03
5.98
0.04
101.96
TOTAL SHARES 357,966,376 101.96
TOTAL TRANSFERABLE SECURITIES ADMITTED TO
357,966,376 101.96 AN OFFICIAL STOCK EXCHANGE LISTING
TOTAL INVESTMENTS 357,966376 101.96
-~
OTHER NET ASSETS LESS LIABILITIES (6,884,298) (1.96)
TOTAL NET ASSETS . 351,102,078 100.00
HSBC Global Investment Funds
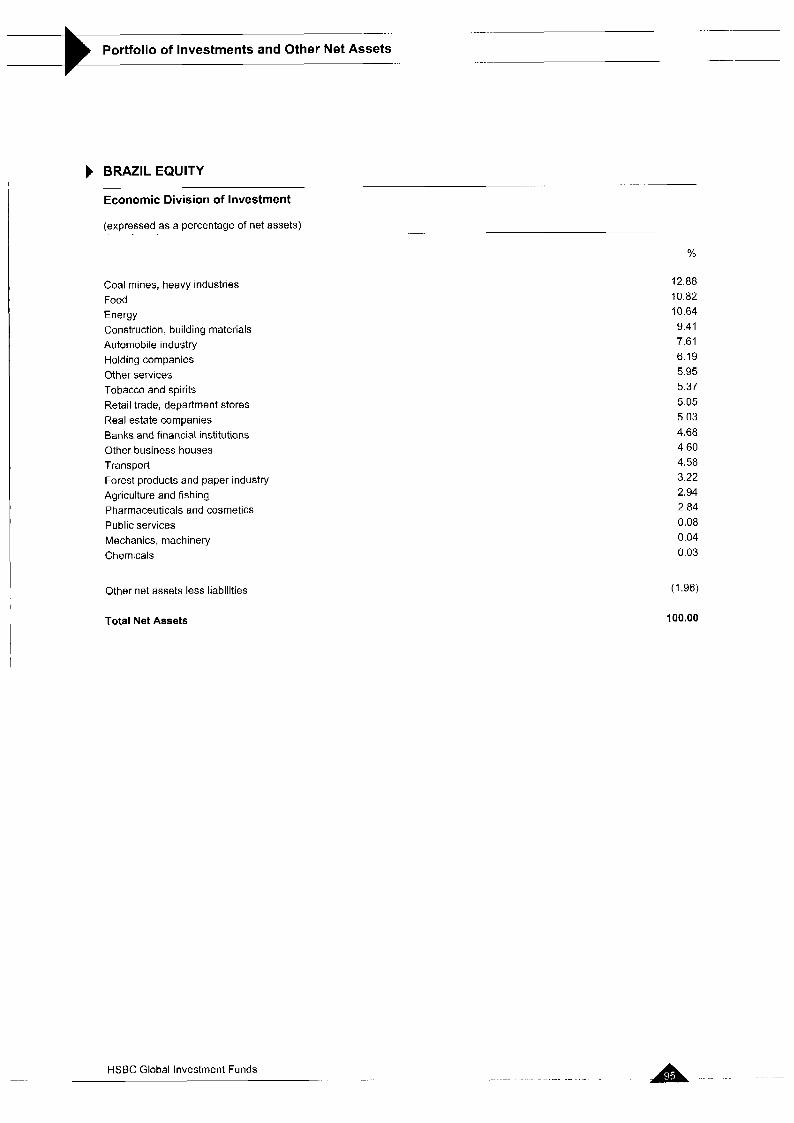
Portfolio of Investments and Other Net Assets ~.
.
.-.
..- BRAZIL EQUITY
Economic Division of Investment -...
.- (expressed as a percentage of net assets)
Coal mines, heavy industries Food Energy Construction, building materials Automobile industry Holding companies Other services Tobacco and spirits Retail trade, department stores Real estate companies Banks and financial institutions Other business houses Transport Forest products and paper industry Agriculture and fishing Pharmaceuticals and cosmetics Public services Mechanics, machinery Chemicals
Other net assets less liabilities
Total Net Assets
HSBC Global Investment Funds
12.88 10.82 10.64 9.41 7.61 6.19 5.95 5.37 5.05 5.03 4.68 4.60 4.58 3.22 2.94 2.84 0.08 0.04 0.03
(1.96)
100.00
. .... . . . . . . . ... . . . A ... .. .. .. - . .
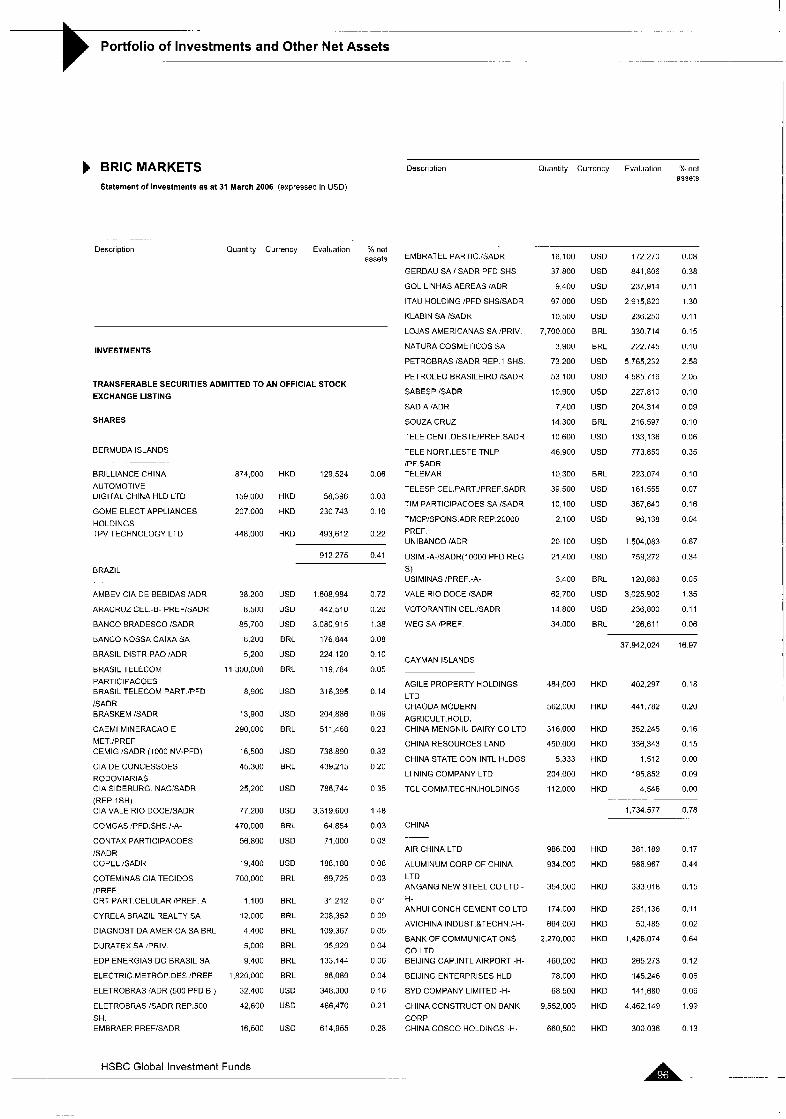
. . .. . . . .. . .
Portfolio of Investments and Other Net Assets . .. .- . . ... ... .. .. . . .. .
ERIC MARKETS Statement of investments as at 31 March 2006 (expressed in USD)
.. __ Description Quantity Currency Evaluation % net
assets
INVESTMENTS
TRANSFERABLE SECURITIES ADMITTED TO AN OFFICIAL STOCK EXCHANGE LISTING
SHARES
BERMUDA ISLANDS
BRILLIANCE CHINA AUTOMOTIVE DIGITAL CHINA HLO LTD
GOME ELECT APPLIANCES
HOLDINGS TPV TECHNOLOGY LTD
BRAZIL
AMBEV CIA DE BEBIDAS !ADR
ARACRUZ CEL -6- PREF/SADR
BANCO ERADESCO :SADR
BANCO NOSSA CAIXA SA
BRASIL DISTR PA0 lADR
BRASlL TELECOM PARTICIPACOES ERASIL TELECOM PART !PFD
/$ADA BRASKEM lSADR
CAEMI MINERACAO E
MET :PREF CEMIG lSADR (1000 NV-PFD)
CIA DE CONCESSOES
RODOVIARIAS CIA SIDERURG NAC'SADR
(REP 1SH) CIA VALE RIO DOCEISADR
COMGAS 'PFD SHS !-A-
CONTAX PARTICIPACOES
/SADR COPEL ISADK
COTEMINAS CIA TECIDOS
/PREF CRT PART CELULAR lPREF A
CYRELA BRAZIL REALTY SA
DIAGNOST DA AMERICA SA ERL
DURATEX SA IPRIV
EDP ENERGIAS DO BRASIL SA
ELECTRIC METHOP DES lPREF
874,000
159,UOO
207 000
448,000
38 200
8.500
85.700
8.200
5.200
I I ,300,000
8,900
13,900
290,000
16.500
45.300
25,200
77 200
470,000
56.800
19,400
700.000
1100
12.000
4 400
s,noo 9.400
1,820.000
ELETROERAS !ADR (500 PFD B ) 32.400
ELETROBRAS ISADR REPS00 42,600
SH EMBRAER PREFiSADR 16,500
HSBC Global Investment Funds
HKD 129,524 0.06
HKD 58,396 003
HKD 230743 0 10
HKD 493,612 0 2 2
US0
USD
US0
BRL
US0
BRL
US0
USD
BRL
USD
BRL
USD
USD
BRL
USD
USD
BRL
BRL
BRL
ERL
BRL
BRL
BRL
US0
USD
US0
912275 0.41
1 608.984
442,510
3 080.915
176 844
224 120
119,784
316,395
204,886
51 1,468
736 890
439,215
786.744
3,319 600
64,854
71,000
188,180
69.725
31 212
208,352
109.367
95,929
133,144
86.069
348,300
466,470
614,955
0.72
0 20
1.38
0.08
0.10
0.05
0.14
0.09
0.23
0.33
0 20
0 35
1.48
0.03
0 03
0 08
0 03
0 01
0 09
0.05
0 04
0.06
0.04
0.16
0.21
0.28
Oescri3tion Quantity Currency Evaluation YO net assets
EMBRATEL PARTIC !SADR
GERDAUSAISADRPFDSHS
GOL LINHAS AEREAS /AOR
ITAU HOLDING lPFD SHSiSADR
KLABIN SA ISADR
LOJAS AMERICANAS SA :PRIV
NATURA COSMETICOS SA
PETROBRAS iSADR REP 1 SHS
PETROLEO BRASlLElRO /SADR
SABESP ISADR
SADIA IADR
SOUZA CRUZ
TELE CENT OESTE/PREF SADR
TELE NORT LESTE TNLP IFF SADR TELEMAR
TELESP CEL PART IPREF SADR
TIM PARTICIPACOES SA /SADR
TMCPiSPONS ADR REP 20000 PREF UNIBANCO /ADR
USlM -A-/SADR(10000 PFD REG
USlMlNAS IPREF -A-
VALE RIO DOCE lSADR
VOTORANTIN CEL iSADR
WEG SA PREF
S)
16,100
37 800
9 400
97 000
10 500
7,700.000
3,900
73 200
53 100
10.900
7,400
14.300
10 600
46.900
10 300
39 500
10,100
2.100
20 100
21,400
3.400
62,700
14 800
34.000
US0
US0
US0
US0
US0
ERL
BRL
US0
US0
US0
USD
BRL
US0
USD
ERL
USD
US0
US0
US0
US0
BRL
US0
US0
BRL
172 270
841.806
237,914
2 915,820
236.250
330 714
222 745
5 765,232
4 585 716
227.810
204 314
216 597
133 136
773.850
223.074
161 555
367,640
96,138
1 504.083
759,272
120,863
3,025.902
236,800
126,611
0.08
0.38
0.11
1.30
0.1 1
0.15
0.10
2.58
2.05
0.10
0.09
0.10
0.06
0.35
0.10
0.07
0.16
0.04
0.67
0.34
0.05
1.35
0.11
0.06
37,942,024 16.97
CAYMAN ISLANDS
AGILE PROPERTY HOLDINGS
LTD CHAODA MODERN
AGRICULT.HOLD. CHINA MENGNIU DAIRY CO LTD
CHINA RESOURCES LAND
CHINA STATE CON INTL HLDGS
LI NlNG COMPANY LTD
TCL COMM.TECHN.HOLDINGS
484,000 HKD
562,000 HKD
316,000 HKD
450.000 HKD
5.333 HKD
204.000 HKD
112,000 HKD ...
402,297
441,782
352.2L5
336,3L3
1.512
195.852
4.516
1,734.577
~
CHINA
0.18
0.20
0.16
0.15
0 00
0 09
0.00
0.78
I
AIR CHINA LTD
ALUMINUM CORP OF CHINA
LTD ANGANG NEW STEEL CO LTD -
H- ANHUI CONCH CEMENT CO LTD
AVlCHlNA INDUST.&TECHN I-H-
BANK OF COMMUNICATIONS CO LTD BElJlNG CAP.INTL AIRPORT -H-
BElJlNG ENTERPRISES HLD
BY0 COMPANY LIMITED -H-
CHINA CONSTRUCTION BANK
CORP CHINA COSCO HOLDINGS -H-
986 000
934.000
354.000
174,000
664 000
2.270.000
460,000
78.000
68 500
9,552,000
660,500
HKD
HKD
HKD
HKD
HKD
HKD
HKD
HKD
HKD
HKD
HKD
381 189
986.967
333 018
251,136
50.485
1,426.074
265 2 i 3
145.2L6
141 680
4 462.1L9
300 036
0 17
0.44
0.15
0.11
0.02
0.64
0.12
0.06
0.06
1.99
0.13
A i . . .- . .-
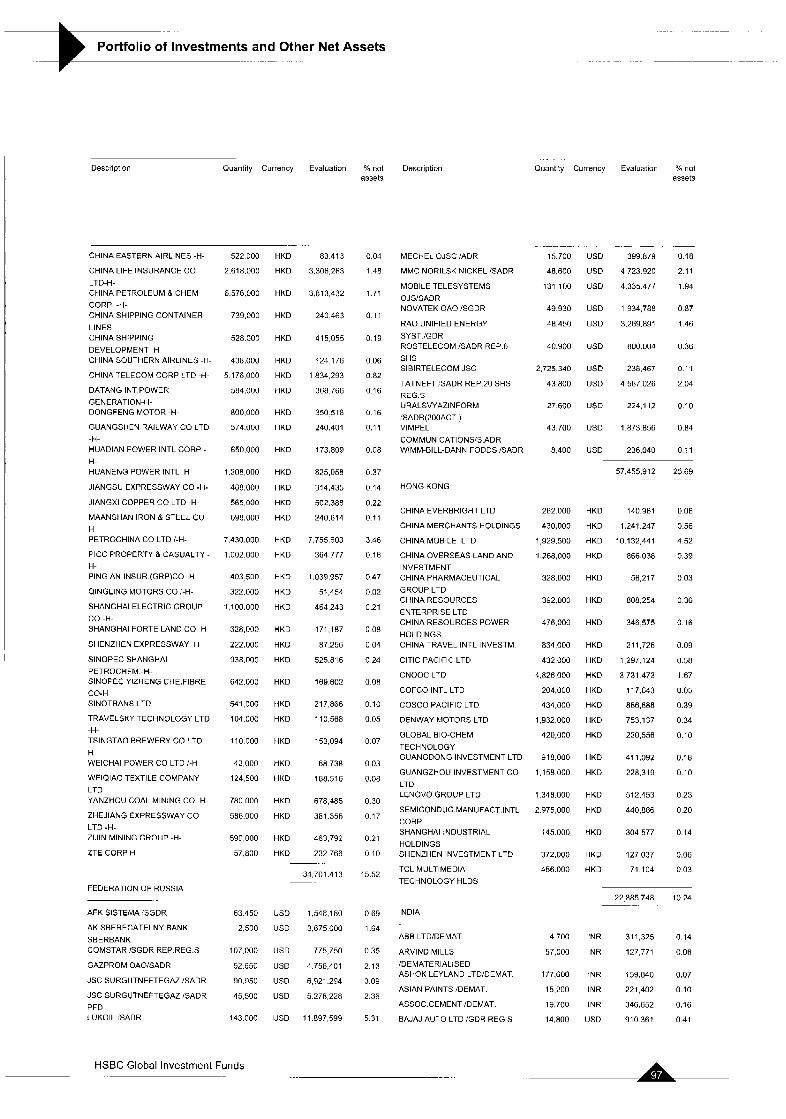
Portfolio of Investments and Other Net Assets ......
Description Quantity Currency Evaluation Yo nct Description assets
CHINA EASTERN AIRLINES -H-
CHINA LIFE INSURANCE CO
LTD-H-
CORP -H- CHINA SHIPPING CONTAINER
LINES CHINA SHIPPING
DEVELOPMENT -H- CHINA SOUTHERN AIRLINES -H-
CHINA TELECOM CORP LTD -H-
DATANG IhT POWER
GENERATION-H- DONGFENG MOTOR -H-
GUANGSHEN RAILWAY CO LTD
-H- HUADIAN FOWER INTL CORP - H- HUANENG POWER INTL H
JIANGSU EXPRESSWAY CO -H-
JlANGXl COPPER CO LTD -H-
MAANSHAN IRON & STEEL CO H PETROCHINA CO LTD /-H-
PlCC PROPERTY & CASUALTY -
H- PING AN INSUR.fGRP)CO -H-
QlNGLlNG MOTORS CO i-H-
SHANGHAI ELECTRIC GROUP
CO -H- SHANGHAI FORTE LAND CO -H-
SHENZHEN EXPRESSWAY H
SINOPEC SHANGHAI
PETROCHEM,-H- SINOPEC YIZHENG CHE.FIBRE
CO-H SINOTRANS LTD
TRAVELSKY TECHNOLOGY LTD
-H- TSINGTAO BREWERY CO LTD
H WElCHAl POWER CO LTD I-H-
WElQlAO TEXTILE COMPANY
LTD YANZHOU COAL MINING CO -H-
ZHEJIANG EXPRESSWAY CO
LTD -H- ZlJlN MINING GROUP -H-
ZTE CORP H
CHINA PETROLEUM a CHEM
FEDERATION OF RUSSIA
AFK SISTEMA !SGDR
AKSBEREGATELNYEANK
SBERBANK COMSTAR EGDR REP.REG.S
GAZPROM OAO/SADR
JSC SURGUTNEFTEGAZ !SADR
JSC SURGUTNEFTEGAZ 6 A D R
PFD LUKOIL XADR
522 000
2.6ia.000
6.576.000
739,000
528.000
438,000
5 176.000
584,000
800.000
574.000
~5o.non
1.208,000
4~8,000
565.000
698,000
7.430.000
1.002.000
403 500
322.000
1,100.000
328,000
222.000
938.000
642.000
541,000
104.000
110.000
42,000
124,500
780 000
586.000
590,000
57.800
63 450
2.500
107,000
52.650
90.950
45.500
143.000
HKD
HKD
HKD
HKD
HKD
HKD
HKD
HKD
HKD
HKD
HKD
HKD
HKD
HKD
HKD
HKD
HKD
HKD
HKD
HKD
HKD
HKD
HKD
HKD
HKD
HKD
HKD
HKD
HKD
HKD
HKD
HKD
HKO
83,413
3.306 263
3.813 432
240 463
415,055
124.1 76
1834,293
368.766
350 518
240.401
173.809
825,058
314,435
502.388
240.614
7,755,603
364 777
1,039,957
51,454
464,243
171.187
87.256
525.816
169 602
217,866
110,568
153,094
68 738
188.516
678,485
381 356
463.792
232.766
34 701.413
USD 1,548,180
USD 3.675000
US0 775,750
US0 4756,401
US0 6,921.294
USD 5278,228
USD 11 .897.599
0.04
1.48
1.71
0.1 1
0.19
0 06
0 82
0 16
0.16
0.11
0.08
0.37
0 14
0.22
0 11
3.46
0.16
0.47
0.02
0.21
o oa 0 04
0.24
0.08
0 10
0 05
0 07
0.03
0.08
0.30
0 17
0 21
0 10
15.52
0.69
1.64
0.35
2.13
3.09
2.36
5 31
MECHEL OJSC !ADR
MMC NORILSK NICKEL ISADR
MOBILE TELESYSTEMS
OJS!SADR NOVATEK OAO !SGDR
RAO UNIFIED ENERGY
SYST./GDR ROSTELECOM /SADR REP 6 SHS SIBIRTELECOM JSC
TATNEFT SADR REP 20 SHS REG.5 URALSVYAZINFORM
XADR(200ACT.) VIMPEL
COMMUNICATIONS/S.ADR WIMM-BILL-DANN FOODS /SADR
.............
.........
Quantity Currency Evaluation % net assets
15.700 USD
48.600 US0
131 100 US0
49,930 US0
48.450 US0
4n.900 USD
2.725 340 USD
43800 USD
27600 USD
43700 US0
8.400 US0
...... -
399.879
4.723.920
4335.477
1934,788
3,269.891
800.004
238.467
4 567 026
224,112
1.873 856
236,040
0 I 8
2 11
1 94
o a i 1 46
0 36
n 11
2 04
0 10
o a4
0 11
HONG KONG
CHINA EVERBRIGHT LTD
CHINA MERCHANTS HOLDINGS
CHINA MOBILE LTD
CHINA OVERSEAS LAND AND
INVESTMENT CHINA PHARMACEUTICAL
GROUP LTD CHINA RESOURCES
ENTERPRISE LTD CHINA RESOURCES POWER
HOLDINGS CHINA TRAVEL INTL INVESTM
ClTlC PACIFIC LTD
CNOOC LTD
COFCO INTL LTD
COSCO PACIFIC LTD
DENWAY hlOTORS LTD
GLOBAL BIO-CHEM
TECHNOLOGY GUANGDONG INVESTMENT LTD
GUANGZHOU INVESTMENT CO
LTD LENOVO GROUP LTD
SEMICONDUC.MANUFACT.lNTL CORP SHANGHAI INDUSTRIAL
HOLDINGS SHENZHEN INVESTMENT LTD
TCL MULTIMEDIA
TECHNOLOGY HLDS
262000 HKD
430,000 HKD
1,929.500 HKD
1.268,OOO HKD
328.000 HKD
392.000 HKD
476.000 HKD
834,000 HKD
432000 HKD
4,826,000 HKD
204,000 HKD
434,000 HKD
1.932 000 HKD
420,000 HKD
918.000 HKD
1.158000 HKD
i 348,000 HKD
2,975,000 HKD
145.000 HKD
372,000 HKD
456.000 HKD
57 455,912
140.961
1.241.247
10 132,441
866.038
56217
808,254
346 575
21 1,726
1,297.124
3.731.473
117 643
866,888
753.137
220,556
41 1.092
228.319
512,453
440.886
304 577
127,037
71.104
25 69 __
0 06
0 56
4 52
0 39
0 03
0 36
0 16
0.09
0 58
1 67
0 05
0.39
0 34
0.10
0.18
0 10
0 23
0 20
0 14
0.06
0 03
INDIA
ABB LTWDEMAT
ARVIND MILLS
!DEMATERIALISED ASHOK LEYLAND LTDOEMAT
ASIAN PAINTS iDEMAT
ASSOCCEMENTDEMAT
BAJAJ AUTO LTD :GDR REG.S
4700 INR 311,325 0.14
57,000 INR 127771 no6
i n . 6 0 0 INR 159.840 0 0 7
15.200 INR 221,402 0 10
19700 INR 346.652 0 16
14,800 USD 910361 0 4 1
HSBC Global Investment Funds
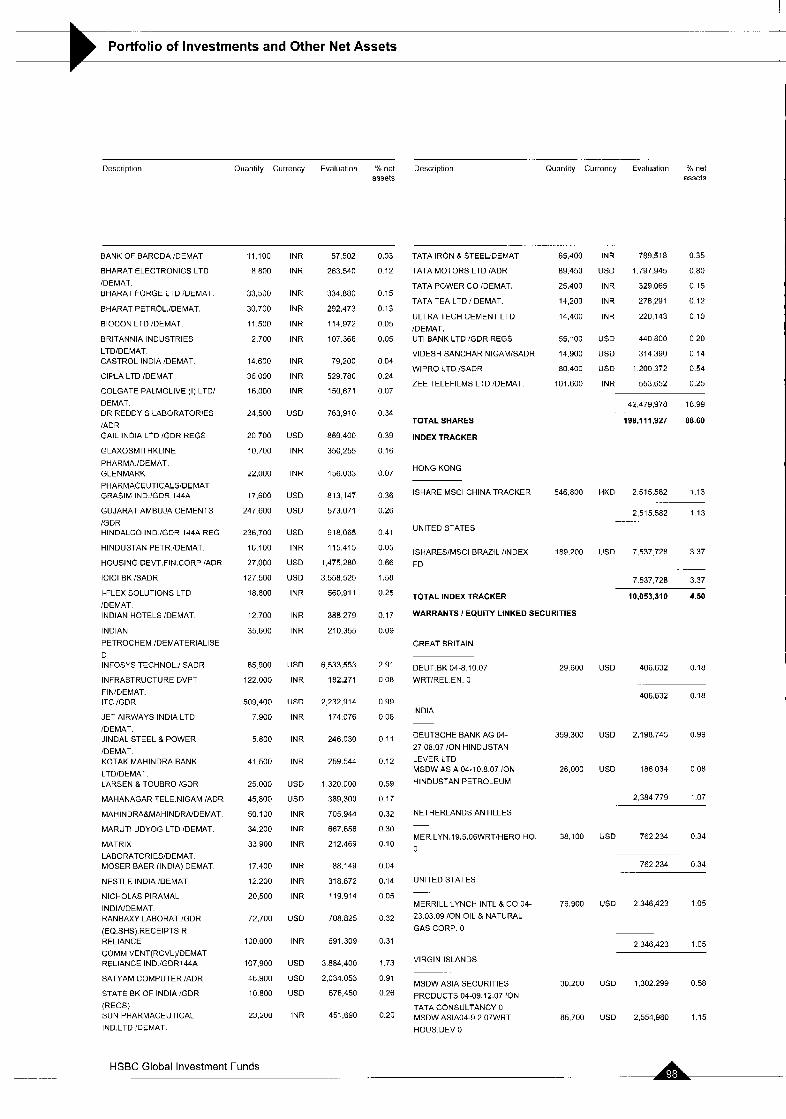
_~ -. . - Portfolio of Investments and Other Net Assets
~ .
Description Quantlty Currency Evaluation “h net Description Quantity Currency Evaluation ‘lo net assets assets
BANK OF BARODA IDEMAT
BHARAT ELECTRONICS LTD
DEMAT. BHARAT FOHGE LTD rDEMAT
BHARAT PETROL.iDEMAT.
BIOCON LTD iDEMAT.
BRITANNIA INDUSTRIES
LTDIDEMAT CASTROL INDlAiDEMAT
CIPLA LTD iDEMAT
COLGATE PALMOLIVE (I) LTD’ DEMAT. OR REDDY S LABORATORIES
iADR GAIL INDIA LTD IGDH KEGS
GLAXOSMITHKLINE
PHARMA.!DEMAT. GLENMARK
PHARMACEUTICALS’DEMAT GRASIM IND.’GDR 144A
GUJARAT AMBUJA CEMENTS
/GDR HINDALCO IND./GDR 144A REG
HINDUSTAN PETR.’DEMAT
HOUSING DEVT.FIN.CORP :ADR
IClCl BK ISADR
I-FLEX SOLUTIONS LTD
IDEMAT INDIAN HOTELS iDEMAT.
INDIAN
PETROCHEM :DEMATERIALISE
D INFOSYS TECHN0L.I SADR
INFRASTRUCTURE DVPT
FINIDEMAT. ITC iGDR
JET AIRWAYS INDIA LTD
IDEMAT.
IDEMAT. KOTAK MAHINDRA BANK
LTDIDEMAT LAHSEN & TOUBRO /GDR
MAHANAGAR TELE NIGAM iADR
MAHINDRA&MAHINDRA/DEMAT
JINDAL STEEL a POWER
MARUTI UDYOG LTD IDEMAT.
MATHIX
LABORATORI ESiDEMAT MOSER BAER (INDIA) DEMAT.
NESTLE INDIA ’DEMAT
NICHOLAS PIRAMAL
INDIAIDEMAT. RANBAXY LABORAT.IGDR
(EQ.SHS).RECEIPTS R RELIANCE COMM VENT(RCVL)IDEMAT RELIANCE IND iGDR144A
SATYAM COMPUTER iADR
STATE BK OF INDIA IGDR
(REGS) SUN PHARMACEUTICAL
IND.LTD IDEMAT
11,100 INR
8 80[1 INR
33,500 INR
30.700 INR
11.500 INR
2.700 INR
14.600 INR
36000 INR
16,1100 INK
24,500 USD
20700 USD
10.700 INR
22.000 INR
17,600 USD
247600 US0
236,700 US0
16.100 INR
27.000 USD
127500 US0
18.800 INR
12700 INR
35.600 INR
85900 US0
122000 INR
509,400 US0
7500 INR
5.800 INR
41.500 INR
25000 USD
45,800 US0
50.100 INR
34.200 INR
33500 INR
17.400 INR
12.200 INR
20.500 INR
72,700 USD
100000 INR
107.500 USD
46.900 US0
10600 US0
23.200 INR
57,502
263.540
334.880
292.473
114.972
107 368
79,200
529 780
150,671
763,910
a69 400
350,255
156.033
a i 3 , w
573,071
9ia.065
115,415
1,475.280
3.558.525
560.91 1
388 279
210.355
6 533,553
182,271
2,232.914
174 076
246.030
255.544
1,320 000
389,300
705,544
667.656
212.465
8 a . m
31 8 a72
119.914
708.825
651.309
3.884.400
2.034.053
576,450
451.650
0.03
0.12
0.15
0.13
0 05
0.05
0.04
0.24
0.07
0.34
0.35
0.16
0.07
0.36
0.26
0 41
0 05
0 66
1.58
0.25
0.17
0.09
2.91
0 08
0 99
0.08
0.1 1
0.12
0.59
0.17
0.32
0 30
0 10
0.04
0.14
0.05
0.32
0.31
1.73
0 91
0.26
0.20
TATA IRON 8 STEELiDEMAT
TATA MOTORS LTD IADR
TATA POWER CO iDEMAT.
TATA TEA LTD / DEMAT.
ULTRATECH CEMENT LTD
IDEMAT. UTI BANK LTD ’GDR REGS
VIDESH SANCHAR NIGAMISADR
WIPRO LTD iSADR
ZEE TELEFILMS LTD IDEMAT
TOTAL SHARES
INDEX TRACKER
HONG KONG
ISHARE MSCl CHINA TRACKER
UNITED STATES
ISHARESlMSCl BRAZIL ANDEX
FD
65,400
85.450
25.400
14,200
14,400
55,100
14.500
80 400
101,600
546.aoo
189.200
TOTAL INDEX TRACKER
WARRANTS I EQUITY LINKED SECURITIES
GREAT BRITAIN
DEUT.BK 04-8.10.07
WRTlREL EN. 0
INDIA
DEUTSCHE BANK AG 04-
27 08.07 ION HINDUSTAN
MSDW ASIA 04-10.8.07 ION LEVER LTD
HINDUSTAN PETROLEUM
NETHERLANDS ANTILLES
MER LYN.15.5.06WRTlHERO HO.
0
UNITED STATES
MERRILL LYNCH INTL R CO 04-
23.03.05 /ON OIL R NATURAL
GASCORP 0
VIRGIN ISLANDS
MSDW ASIA SECURITIES
PRODUCTS 04-09.12.07 ION TATA CONSULTANCY 0 MSDW ASIA04-5 2 07WRT
HOUS.DEV 0
25.600
355.300
26,000
38,100
79,900
30.200
85.700
INR m . 5 i a 0 3 5
US0 1,757,545 0 80
INR 329,065 0 15
INR 276,291 0 12
INR 220143 0 1 0
US0 440800 020
USD 314390 0 14
US0 1200372 0 5 4
INR 553,652 0.25
42 479,978 i a 95
198.111.927 88 60
HKD 2 515.582 1.13
2,515.582 1.13
USD 7,537 728 3.37
7.537.726 3.37
10,053,310 4.50
USD ~06.632 0 1 8
406.632 0.18
USD 2,198.745 0.99
US0 186034 008
USD 762234 0.34
762234 0 3 4
USD 2346.423 1 0 5
2 346,423 1.05
USD 1.302295 0.58
USD 2,554,980 1 15
HSBC Global Investment Funds - __
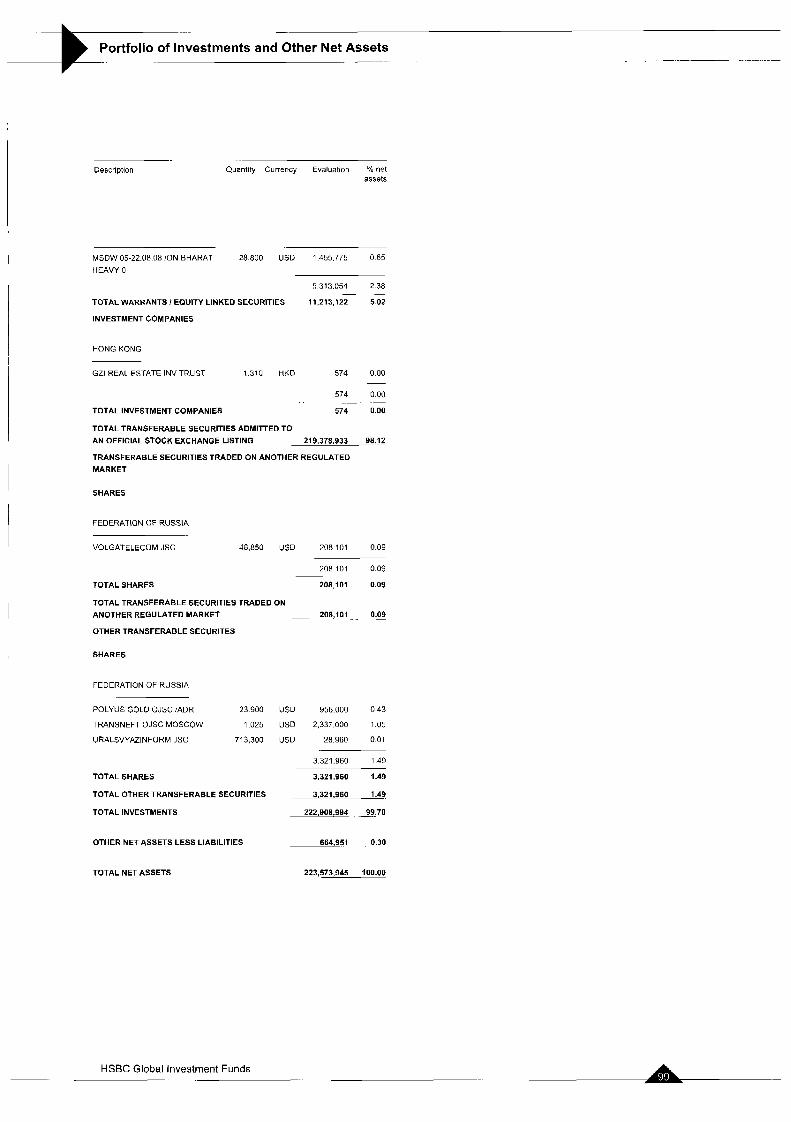
-
Portfolio of Investments and Other Net Assets - - - - .
I
Description Quantity Currency Evaluation ' lo net assets
MSDW 05-22 08 08 ION BHARAT 28.8UU USD 1 455.775 0 65
HEAVY 0
5313,054 238
TOTAL WARRANTS I EQUITY LINKED SECURITIES 11,213,122 5 02
INVESTMENT COMPANIES
- -
HONG KONG
GZl REAL ESTATE INV TRUST 1.310 HKD 574 000 - .-
574 no0
TOTAL INVESTMENT COMPANIES .-
574 0.00
TOTAL TRANSFERABLE SECURITIES ADMITTED TO
AN OFFICIAL STOCK EXCHANGE LISTING 219,378,833 98.12
TRANSFERABLE SECURITIES TRADED ON ANOTHER REGULATED
MARKET
SHARES
FEDERATION OF RUSSIA
VOLGATELECOM JSC 48,850 U S 0 208101 0.09
208 101 0.09
TOTAL SHARES 208,101 0.09
TOTAL TRANSFERABLE SECURITIES TRADED ON 208,101 0.g ANOTHER REGULATED MARKET -.
OTHER TRANSFERABLE SECURITES
SHARES
FEDERATION OF RUSSIA
POLYUS GOLD OJSC !ADR 23900 US0 956000 0 4 3
TRANSNEFT OJSC MOSCOW 1025 US0 2,337000 1 0 5
URALSVYAZINFORM JSC 713,300 US0 28.960 0 0 1
3321.960 149
TOTAL SHARES 3,321,960 1.49
TOTAL OTHER TRANSFERABLE SECURITIES 3.321.960 1.49
TOTAL INVESTMENTS 222,908,994 -99.70
OTHER NET ASSETS LESS LIABILITIES 664,951 0.30
TOTALNETASSETS 223,573,945 ioa.00
HSBC Global Investment Funds .-
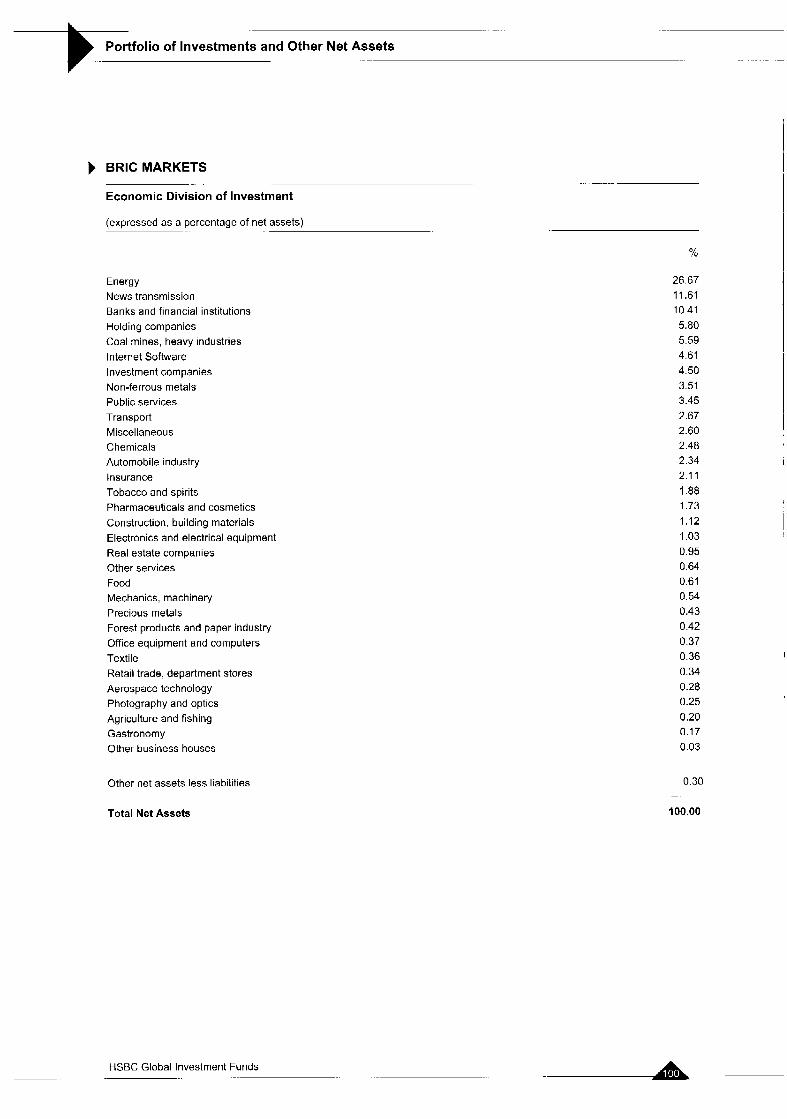
Portfolio of Investments and Other Net Assets . - - ._
BRlC MARKETS
Economic Division of Investment .~ __
(expressed as a percentage of net assets) ..
Energy News transmission Banks and financial institutions Holding companies Coal mines, heavy industries Internet Software Investment companies Non-ferrous metals Public services Transport Miscellaneous Chemicals Automobile industry Insurance Tobacco and spirits Pharmaceuticals and cosmetics Construction. building materials Electronics and electrical equipment Real estate companies Other services Food Mechanics, machinery Precious metals Forest products and paper industry Office equipment and computers Textile Retail trade, department stores Aerospace technology Photography and optics Agriculture and fishing Gastronomy Other business houses
Other net assets less liabilities
Total Net Assets
HSBC Global Investment Funds
%
26.67 11.61 10.41 5.80 5.59 4.61 4.50 3.51 3.45 2.67 2.60 2.48 2.34 2.1 1 1.88 1.73 1.12 1.03 0.95 0.64 0.61 0.54 0.43 0.42 0.37 0.36 0.34 0.28 0.25 0.20 0.17 0.03
0.30
100.00
_.
I
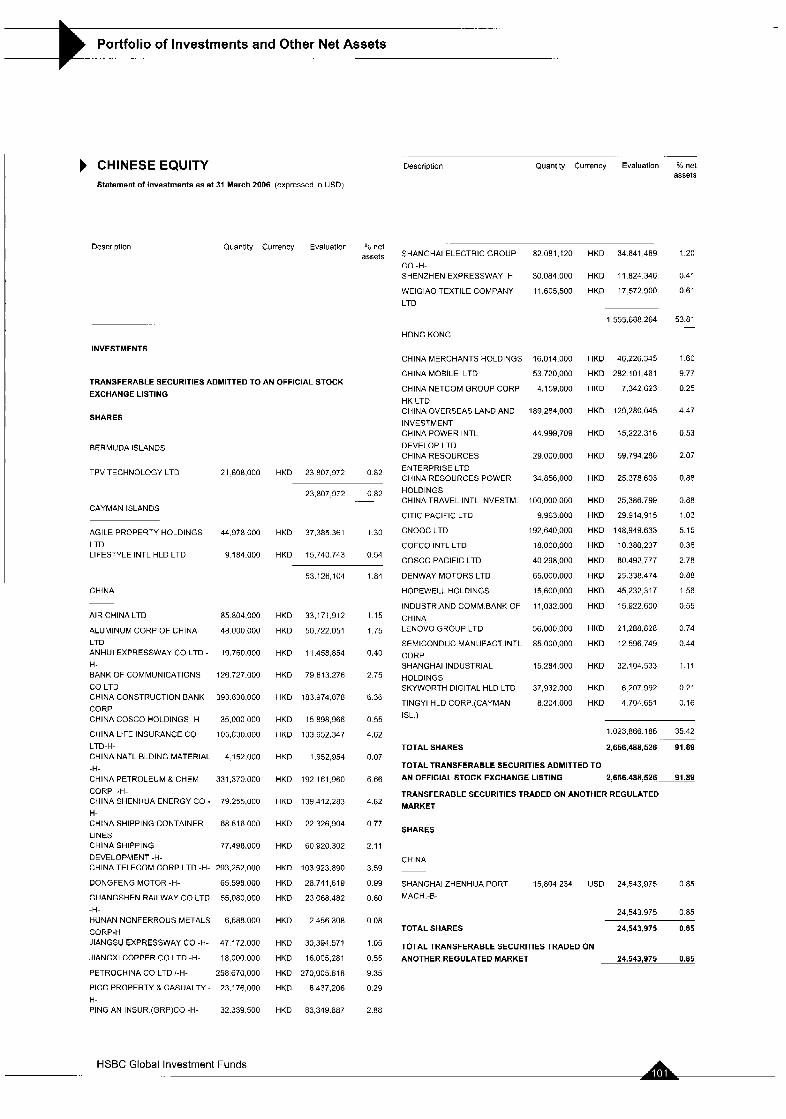
- ... -
Portfolio of Investments and Other Net Assets .. .. . .. .
CHINESE EQUITY Statement of investments as at 31 March 2006 (expressed in USD)
.. . ..
Description Quantity Currency Evaluation O'O net assets
INVESTMENTS
TRANSFERABLE SECURITIES ADMITTED TO AN OFFICIAL STOCK EXCHANGE LISTING
SHARES
BERMUDA ISLANDS
TPV TECHNOLOGY LTD
CAYMAN ISLANDS
AGILE PROPERTY HOLDINGS
LTD LIFESTYLE INTL HLD LTD
CHINA
AIR CHINA LTD
ALUMINUM CORP OF CHINA LTD ANHUI EXPRESSWAY CO LTD
H- BANK OF COMMUNICATIONS
CO LTD CHINA CONSTRUCTION BANK
CORP CHINA COSCO HOLDINGS -H-
CHINA LIFE INSURANCE CO LTD-H-
21 6o8.000
44.978 ooo
9 184.000
85 8o4.000
48 000 000
19 760.000
126 727.000
393 830.000
35 000 000
105,830.00U
CHINA NATL BLDING MATERIAL 4 1SZ.OUU -H- CHINA PETROLEUM 8 CHEM 331,370.000 CORP -H- CHINA SHENHUA ENERGY CO - 79 255,0[111
H- CHINA SHIPPING CONTAINER 68 616 000 LINES CHINA SHIPPING 77,498.000 DEVELOPMENT -H- CHINA TELECOM CORP LTD -H- 293,252,000
DONGFENG MOTOR -H- 65 598 000
GUANGSHEN RAILWAY CO LTD 55,080,000
-H- HUNAN NONFERROUS METALS 6,688 000 CORP-H JIANGSU EXPRESSWAY CO -H- 47 172.000
JlANGXl COPPER CO LTD -H- 18,000 000
PETROCHIUA CO LTD I-H- 258 670.000
PlCC PROPERTY 8 CASUALTY - 23,176,000 H- PING AN INSUR (GRP)CO -H- 32 339.500
HKD 23 R07.972 0.82
HKD 37.385 361 1.30
HKD 15,740 743 0.54
53.126 104
HKD 33,171.912
HKD 50,722,051
HKD 11,458,854
HKD 79 613.276
HKD 183.974.878
HKD 15 898,966
HKD 133,652,347
HKD 1.952.954
HKD 192 161.960
HKD 139,412283
HKD 22 326.904
HKD 60.920.302
HKD 103.923.890
HKD 28.741 619
HKD 23.068 482
HKD 2456308
HKD 30,394 571
HKD 16.005.281
HKD 270,005 618
HKD 8,437,206
HKD 83,349.887
1.R4
1.15
1.75
0.40
2.75
6.36
0 55
4.62
0.07
6 66
4 82
0 77
2 11
3.59
0.99
0 80
0.08
1.05
0.55
9.35
0.29
2.RH
.~
Description Quantity Currency Evaluation net assets
SHANGHAI ELECTRIC GROUP 82.081.120
CO -H- SHENZHEN EXPRESSWAY H 30.084.000
WElOlAO TEXTILE COMPANY 11.605,500
LTD
HKD 34,641,469
HKD 11 824 346
HKD 17 572.900
HONG KONG
CHINA MERCHANTS HOLDINGS
CHINA MOBILE LTD
CHINA NETCOM GROUP CORP
HK LTD CHINA OVERSEAS LAND AND
INVESTMENT CHINA POWER INTL
DEVELOP.LTD CHINA RESOURCES
ENTERPRISE LTD CHINA RESOURCES POWER
HOLDINGS CHINA TRAVEL INTL INVESTM.
ClTlC PACIFIC LTD
CNOOC LTD
COFCO INTL LTD
COSCO PACIFIC LTD
DENWAY MOTORS LTD
HOPEWELL HOLDINGS
1NDUSTR.AND COMM BANK OF
CHINA LENOVO GROUP LTD
SEMICONDUC MANUFACT.INTL
CORP SHANGHAI INDUSTRIAL
HOLDINGS SKYWORTH DIGITAL HLD LTD
TlNGYl HLD CORP.(CAYMAN
1%)
TOTAL SHARES
16,014.000
53 720.000
4.1 59,000
189,284,000
44,999,709
29.000 000
34.856.000
100 000 000
9,963 000
192 640.000
18 000.000
40 298.000
65.000,OOO
15 600.000
11 032.000
56,000,000
85 000.000
15 284.000
37,932.000
8 204.000
1,555688,264
HKD 46,226,345
HKD 282 101.461
HKD 7.342623
HKD 129,280.045
HKD 15,222316
HKD 59,794,288
HKD 25378603
HKD 25,386.799
HKD 29 914,915
HKD 148,949.633
HKD 10 380,237
HKD 80 492.777
HKD 25 338.474
HKD 45 232,317
HKD 15 922.600
HKD 21,288,828
HKD 12 596.749
WKD 32,104.533
HKD 6207.992
HKD 4704.651
1.20
0.41
0.61
53.81 .-
1 .EO
9.77
0.25
4.47
0.53
2.07
0.88
0.88
1.03
5.15
0.36
2.78
0.88
1.56
0.55
0.74
0.44
1.11
0.21
0.16
1.023 866,186 35.42
2,656,486,526 91-89 .~
TOTAL TRANSFERABLE SECURITIES ADMITTED TO AN OFFICIAL STOCK EXCHANGE LISTING 2,656,488,526.. 91.89
TRANSFERABLESECURITIESTRADEOONANOTHERREGULATED MARKET
SHARES
CHINA
SHANGHAI ZHENHUA PORT 15,604,234 USD 24343,975 0 85 MACH.-6-
24,543 975 0 85
TOTAL SHARES 24,543,975 0.85
TOTAL TRANSFERABLE SECURITIES TRADED ON
ANOTHERREGULATEDMARKET 24,543,975 0.85
HSBC Global Investment Funds
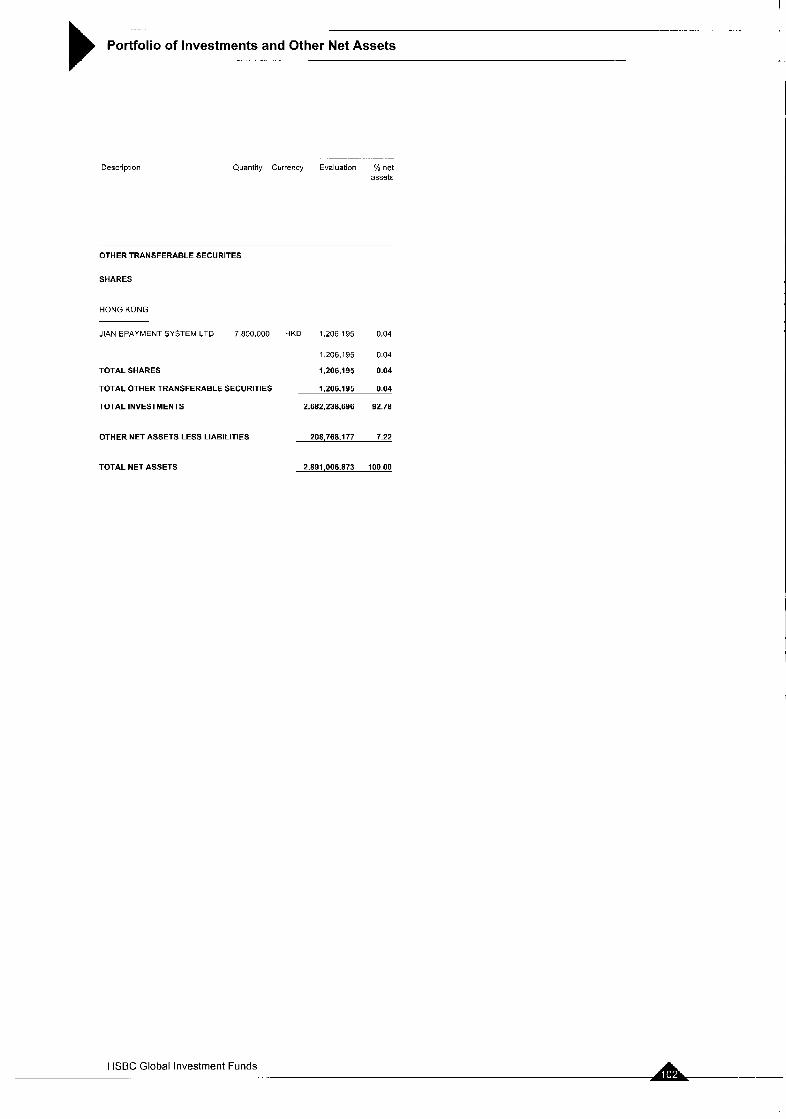
. ... - .
Portfolio of Investments and Other Net Assets . .. . -
Description Quantity Currency Evaluation % net assets
OTHER TRANSFERABLE SECURITES
SHARES
HONG KONG
JlAN EPAYMENT SYSTEM LTD 7,800,000 HKD 1,206,195 0.04
TOTAL SHARES
TOTAL OTHER TRANSFERABLE SECURITIES
TOTAL INVESTMENTS
OTHER NET ASSETS LESS LIABILITIES
TOTAL NET ASSETS
1 206.195 0.04
1,206,195 0.04
1,206,195 0.04
2.682.238.696 92.78
208,766.171 7.22
2,891,006,873 100.00
HSBC Global Investment Funds
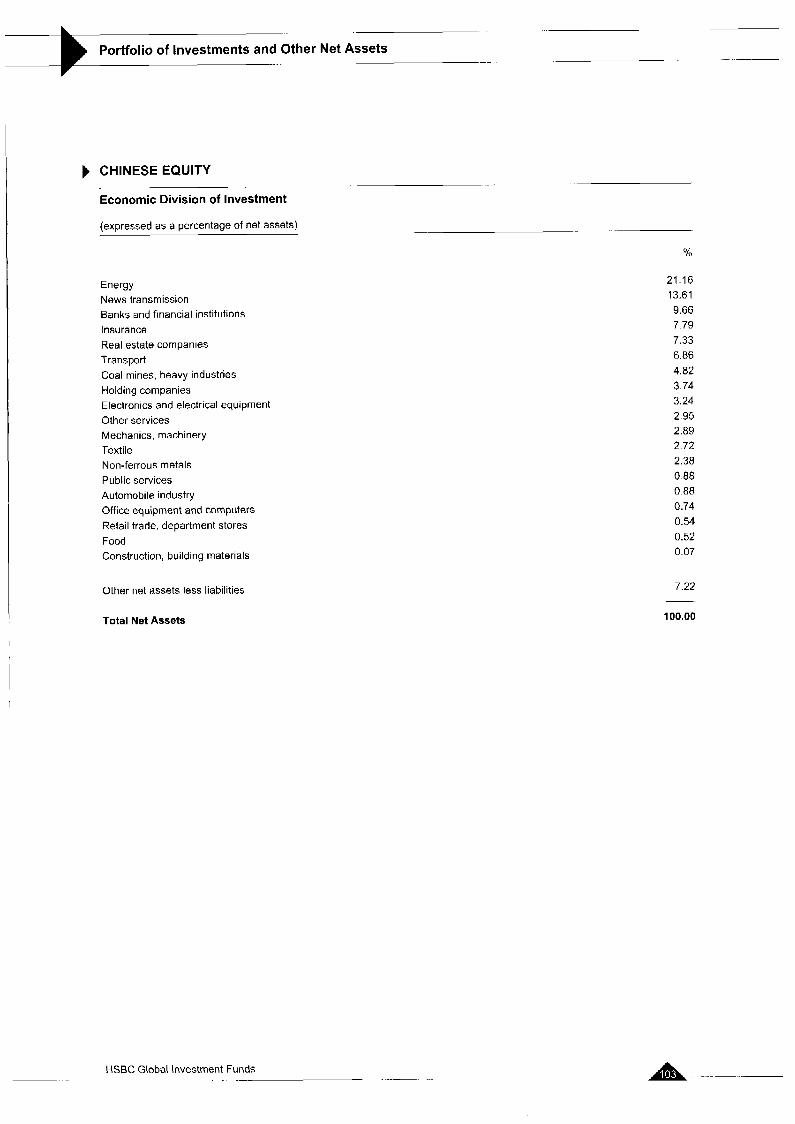
Portfolio of Investments and Other Net Assets - _ ..
b CHINESE EQUITY
Economic Division of Investment
(expressed as a percentage of net assets)
Energy News transmission Banks and financial institutions Insurance Real estate companies Transport Coal mines. heavy industries Holding companies Electronics and electrlcal equipment Other services Mechanics. machinery Textile Non-ferrous metals Public services Automobile industry Office equipment and computers Retail trade, department stores Food Construction, building materials
Other net assets less liabilities
Total Net Assets
21.16 13.61 9.66 7.79 7.33 6.86 4.82 3.74 3.24 2.95 2.89 2.72 2.38 0.88 0.88 0.74 0.54 0.52 0.07
7.22
100.00
-
HSBC Global Investment Funds . . -~ A . ...
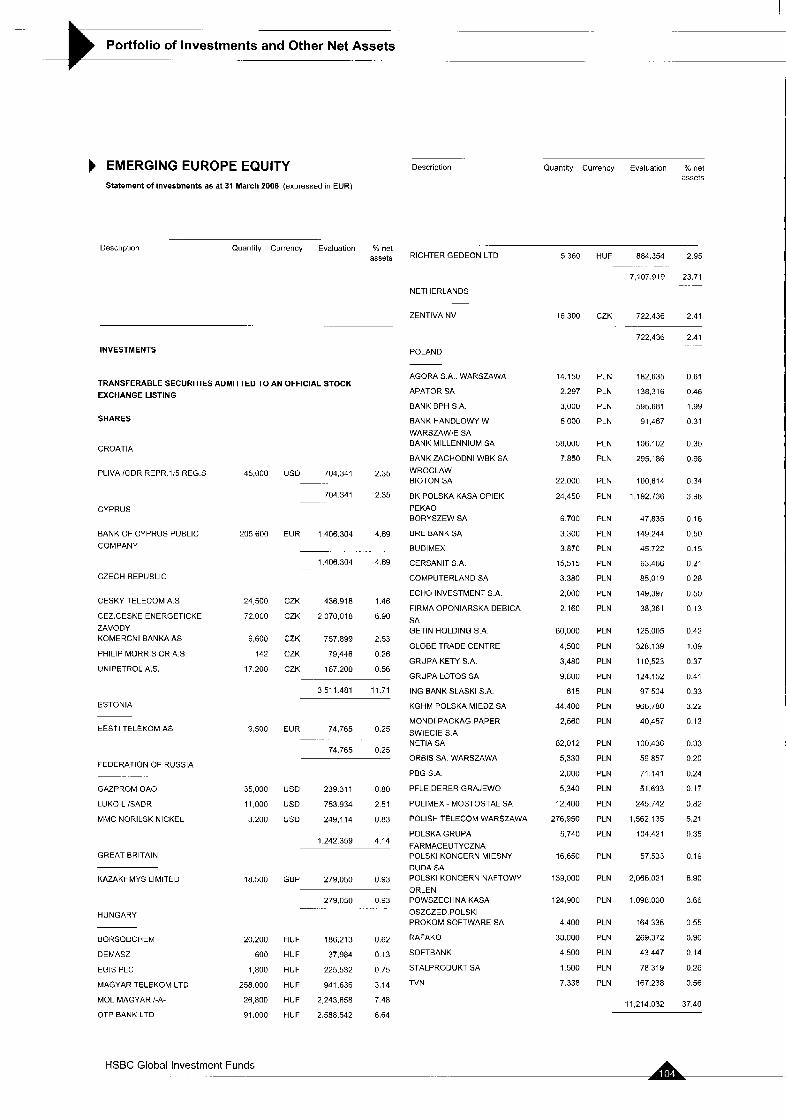
Portfolio of Investments and Other Net Assets _ _
EMERGING EUROPE EQUITY Statement of investments as at 31 March 2006 (expressed in EUR)
Descriotion Quantity Currency Evaluation % net assets
Description ._ Quantity Currency Evaluation % ne1
RICHTER GEDEON LTD
NETHERLANDS
5,360 HUF 884354 295
7,107.919 23.71
_ _
ZENTIVA NV .-
16,300 CZK 722.436 2 4 1
722436 241
. ._
. INVESTMENTS POLAND
TRANSFERABLE SECURITIES ADMITTED TO AN OFFICIAL STOCK EXCHANGE LISTING
AGORAS A WARSZAWA
APATOR SA
BANK BPH S A
BANK HANDLOWY W WARSZAWIE SA BANK MILLENNIUM SA
BANK ZACHODNI WBK SA
WROCLAW BIOTON SA
BK POLSKA KASA OPlEKl
PEKAO BORYSZEW SA
ERE BANK SA
BUDIMEX
CERSANIT S A
COMPUTERLAND SA
ECHO INVESTMENTS A
FIRMA OPONIARSKA DEBICA
SA GETIN HOLDINGS A
GLOBETRADECENTRE
GRUPA KETY S A
GRUPA LOTOS SA
ING BANK SLASKI S A
KGHk4 POLSKA MIEDZ SA
MONDI PACKAG PAPER
SWlEClE S A NETIA SA
ORBIS SA WARSZAWA
PEG S A
PFLEIDERER GRAJEWO
POLIMEX - MOSTOSTAL SA
POLISH TELECOM WARSZAW
POLSKA GRUPA
FARMACEUTYCZNA POLSKI KONCERN MIESNY DUDA SA POLSKI KONCERN NAFTOWY
ORLEN POWSZECHNA KASA
OSZCZED POLSKI PROKOM SOFTWARE SA
RAFAKO
SOFTBANK
STALPRODUKT SA
TVN
14.150 PLN 182.635 0.61
2.297 PLN 138.316 0.46
3,000 PLN 595.681 1.99
5,000 PLN 91.L67 0.31 SHARES
58,000 PLN 106.'02 0.35
7.850 PLN 295'86 0.98
22000 PLN 100614 0.34
24.450 PLN 1,192.736 3.98
6700 PLN 47,835 0.16
3300 PLN 149244 0.50
3.87C PLN 45722 U.15
15,515 PLN 63.466 0.21
3.380 PLN 85.019 0 2 8
2.000 PLN 149,397 0.50
2 160 PLN 38.361 0 13
CROATIA
PLlVA lGDR REPR.li5 REG.S 45,000 uso 704,341 2.35
704 341 2.35
CYPRUS
BANK OF CYPRUS PUBLIC
COMPANY
205 600 EUH I ,406.304 4.69
1,406.304 4 69
CZECH REPUBLIC
CESKY TELECOM A.S
CEZ.CESKE ENERGETICKE
ZAVODY KOMERCNI BANKAAS
PHILIP MORRIS CR A.S
UNIPETROL A.S
24500 CZK 436.918
72.000 CZK 2070,018
6,600 CZK 757.899
142 CZK 79,446
17200 CZK 167200
1.46
6.90
60,000 PLN 125.005 0.42
4,500 PLN 328.139 1.09
3.480 PLN 110,523 0.37
9.600 PLN 124.152 0.41
615 PLN 97504 0.33
44400 PLN Y66,780 3.22
2,560 PLN 40.157 0.13
82,012 PLN 100.436 0.33
5,330 PLN 59857 0.20
2,000 PLN 71.141 0.24
5.340 PLN 51.693 0.17
12400 PLN 245.742 0.82
276,950 PLN 1.562.135 5.21
5.740 PLN 104.421 0.35
16.650 PLN 57.533 0.19
2.53
0.26
0.56
3511.481 11.71
ESTONIA
tESTI TELEKOM AS 9,500 EUR 74,765 0.25
74.765 0.25
FEDERATION OF RUSSIA
GAZPROM OAO 35.000 US0 239 311 0 8 0
LUKOIL iSADR 11,000 USD 753934 2 51
MMC NORILSK NICKEL 3.200 USD 249,114 0.83
1.242359 4 14
'A
GREAT BRITAIN
KAZAKHMYS LlMlTEU 18.500 GBP 279,050 0 9 3 139,OUU PLN 2,066,021 6.90
124.900 PLN 1098.000 3.66 279050 0 9 3 . .
HUNGARY 4400 PLN 164336 0 5 5
38000 PLN 269.372 0.90
4500 PLN 43447 0 14
1500 PLN 78319 0 2 6
7.338 PLN 167.238 0 5 6
11,214.032 3740
BOHSODCHEM 20,200 HUF 186,213 0.62
DEMASZ 600 HUF 37.984 0 13
EGIS PLC 1,800 HUF 225.532 0 7 5
MAGYAR TELEKOM LTD 258.000 HUF 941.636 3.14
MOL MAGYAR :-A- 2fi,e00 HUF 2 243,658 7.48
OTP BANK LTD 91.ooo HUF 2.588.542 8.64
HSBC Global Investment Funds

Portfolio of Investments and Other Net Assets
Description Quantity Currency Evaluatlon % net assets
-. .
TUHKEY
AKBANK 7n.oon
CIMSA CIMENTO SANAYI VE 40 no0
FINANSBANK 53.000
TUKKCELL ILETlSlM HIZMET 55.0~0
TICAR
TURKIYE GARANTI BANKASI 67 000 /NOM. TURKIYE '/AKIFLAR BANKASI 50,000 TAO
TRY 227 896 0 76
TOTAL SHARES
1.701 787 5.68
27.964,A74 93.27
TOTAL TRANSFERABLE SECURITIES ADMITTED TO AN OFFICIAL STOCK EXCHANGE LISTING 27.964.474 93.27
TOTAL INVESTMENTS 27.964.474 93.27
OTHER NET ASSETS LESS LIABILITIES 2,019,090 6.73
TOTALNETASSETS 29.983364 100.00
HSBC Global Investment Funds
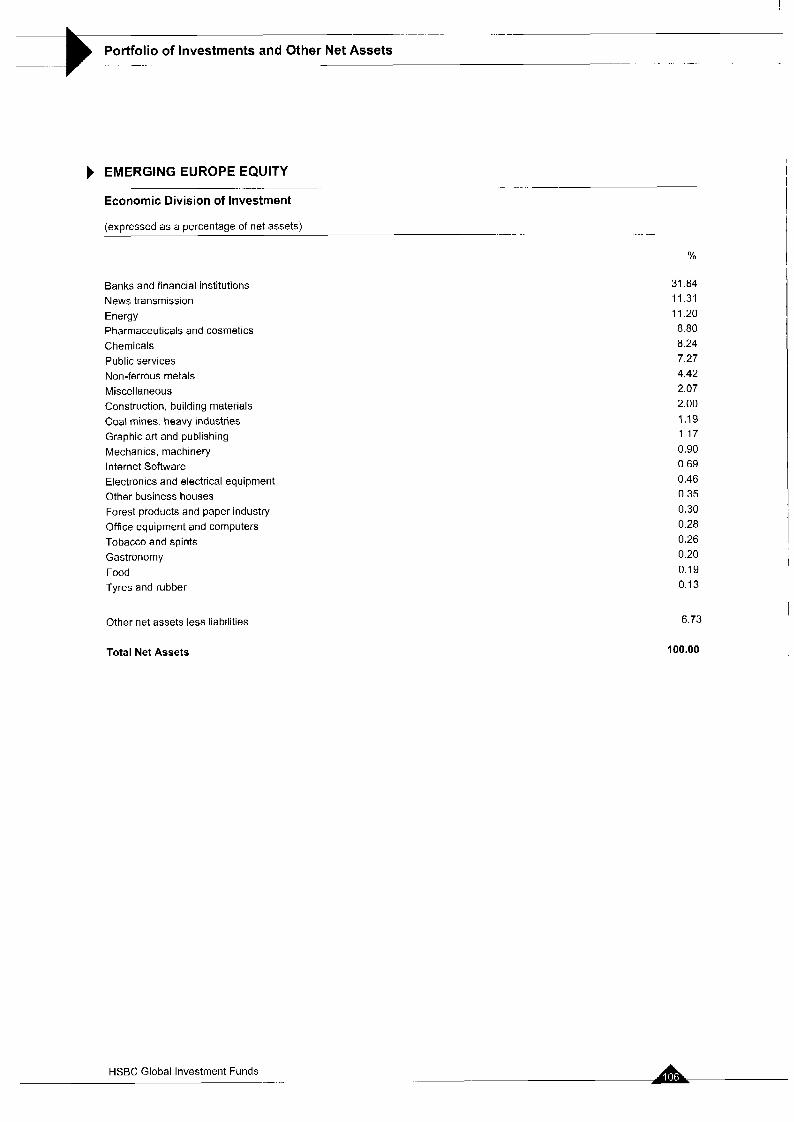
~- _. _- _. _ _
Portfolio of Investments and Other Net Assets - -.
EMERGING EUROPE EQUITY
Economic Division of Investment .. .. ~ . ~
._--. . ... .- (expressed as a percentage of net assets)
%
Banks and financial institutions News transmission Energy Pharmaceuticals and cosmetics Chemicals Public services Non-ferrous metals Miscellaneous Construction, building materials Coal mines. heavy industries Graphic art and publishing Mechanics, machinery Internet Software Electronics and electrical equipment Other business houses Forest products and paper industry Office equipment and computers Tobacco and spirits Gastronomy Food Tyres and rubber
Other net assets less liabilities
Total Net Assets
HSBC Global Investment Funds
31.84 11.31 11.20 8.80 8.24 7.27 4.42 2.07 2.00 1.19 1.17 0.90 0.69 0.46 0.35 0.30 0.28 0.26 0.20 0.19 0.13
6.73
100.00
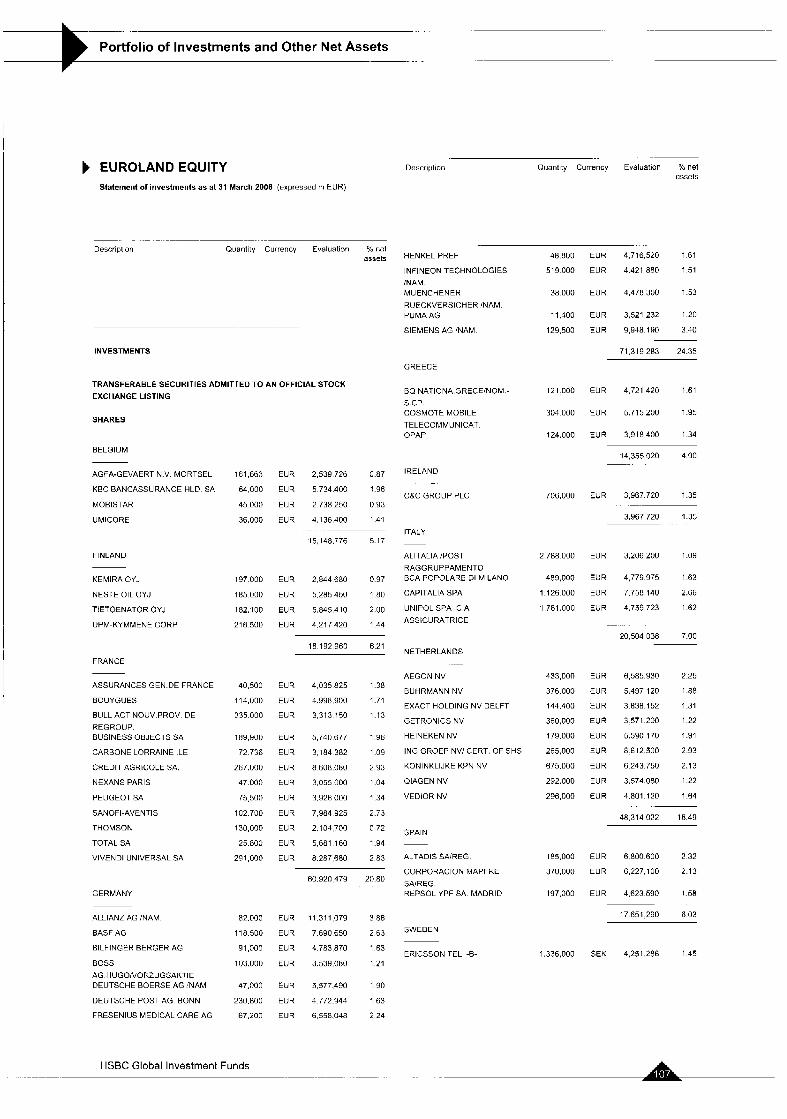
Portfolio of Investments and Other Net Assets .. .
EUROLAND EQUITY Statement of investments as at 31 March 2006 (expressed In EUR)
. -~
Description Quantity Currency Evaluation Yo net assets
Description Quantity Currency Evaluation Yo nat assets
0.87
1.96
0.93
1.41
HENKEL PREF
INFINEON TECHNOLOGIES INAM MUENCHENER RUECKVERSICHER INAM PUMA AG
SIEMENS AG 'NAM
48.800
519 000
38 000
11,400
129,500
121 000
304 000
124.000
706,000
2 788.000
489,000
1.126 000
1 781.000
433,000
376 000
144.400
360,000
179,000
265,000
675.000
292.000
296,000
185,000
370,000
197,000
1,336,000
EUR 4716,520 1 6 1
EUR 4,421,880 1 5 1
EUR 4,478,300 1 53
EUR 3,521,232 1 2 0
EUR 9,948.190 3 4 0
71.319.283 24.35 INVESTMENTS
TRANSFERABLE SECURITIES ADMITTED TO AN OFFICIAL STOCK
EXCHANGE LISTING
SHARES
GREECE
BO NATIONA.GRECEiNOM:
5 CP COSMOTE MOBILE
TELECOMMUNICAT. OPAP
EUR 4.721 420 1.61
EUR 5,715,200 1.95
EUR 3,918,400 1.34
BELGIUM 14,355,020 4.90
AGFA-GEVAERT N.V MORTSEL
KBCBANCASSURANCEHLD SA
MOBISTAR
UMICORE
IRELAND
CBC GROUP PLC
161 663
64,000
45 000
36 000
197 000
105 000
182 100
216 500
40.500
114,000
335 000
1 R 9 900
72 736
267 000
47 000
75 500
102 700
130,000
25 800
291,000
82 000
118500
91,000
103 000
47.0111)
230.800
67.200
EUR 2,539726
EUR 5734400
EUR 2738250
EUR 4,136.400
EUR 3,967,720 1 3 5
3,967720 1 3 5
ITALY .. . . -~
15,148,776 5.17
ALlTALlA !POST
RAGGRUPPAMENTO BCA POPOLARE DI MILANO
CAPITALIA SPA
UNIPOL SPA CIA
ASSKURATRICE
FINLAND EUR 3,206,200 1.09
EUR 4,779.975 1.63
EUR 7,758,140 2.66
EUR 4,759,723 1.62
KEMIRA OYJ
NESTE OIL OYJ
TIETOENATOR OYJ
UPM-KYMMENE CORP
EUR 2.844680 0 9 7
EUR 5.285450 1 8 0
EUR 5,845,410 2 00
EUR 4.217420 1 4 4 20.504 038 7.00
18 192 960 6.21 NETHERLANDS
AEGON NV
BUHRMANN NV
EXACT HOLDINti NV DELFT
GETRONICS NV
HEINEKEN NV
ING GROEP NV! CERT. OF SHS
KONINKLIJKE KPN NV
OIAGEN NV
VEDIOR NV
FRANCE
EUR 6,585.930 2.25
EUR 5,497,120 1.88
EUR 3838.152 1.31
EUR 3571.200 1.22
EUR 5,590,170 1.91
EUR R 612.500 2.93
EUR 6.243.750 2.13
EUR 3.574.080 1.22
EUR 4.801.120 1.64
48.314.022 16.49
. . .~
ASSURANCES GEN.DE FRANCE
BOUYGUES
BULL ACT NOUV.PROV. DE
REGROUP. BUSINESS OBJECTS SA
CARBONE LORRAINE .LE
CREDIT AGRICOLE SA.
NEXANS PARIS
PEUGEOT SA
SANOFI-AVENTIS
THOMSOh
TOTAL SA
VIVENDI UNIVERSAL SA
EUR 4.035 825 1.38
EUR 4,998,900 1.71
EUR 3.313 150 1.13
EUR 5,740,677 1 96
EUR 3.184382 1.09
EUR 8.608,080 2.93
kUH 3.055 000 1.04
EUR 3.926 000 1.34
EUR 7.984 925 2.73
EUR 2.104,700 0 72
EUR 5.681 160 1.94
EUR 8,207,680 2.83
SPAIN
ALTADIS SAIREG
CORPORACION MAPFRE
SAIREG HkPSOL YPF SA MADRID
EUR 6800.600 2 3 2
EUR 6,227,100 2 13
EUR 4,623590 1.58
60.920 479 20.80
GERMANY
17.651.290 6.03 ALLIANZ AG :NAM
BASF AG
BlLFlNGER BERGER AG
BOSS
AG HUGOiVORZUGSAKTlE DEUTSCHE BOERSE AG !NAM
DEUTSCHE POST AG BONN
FRESENIUS MEDICAL CARE AG
EUR 11.311,079 3 86
EUR 7,690,650 2 63
EUR 4 783,870 1.63
EUR 3,539,080 1.21
EUH 5,577.4911 1 90
EUR 4772.944 1 6 3
EUR 6,558.04R 2 24
SWEDEN
ERICSSON TEL. -8- SEK 4,251286 1 4 5
HSBC Global Investment Funds .. ...
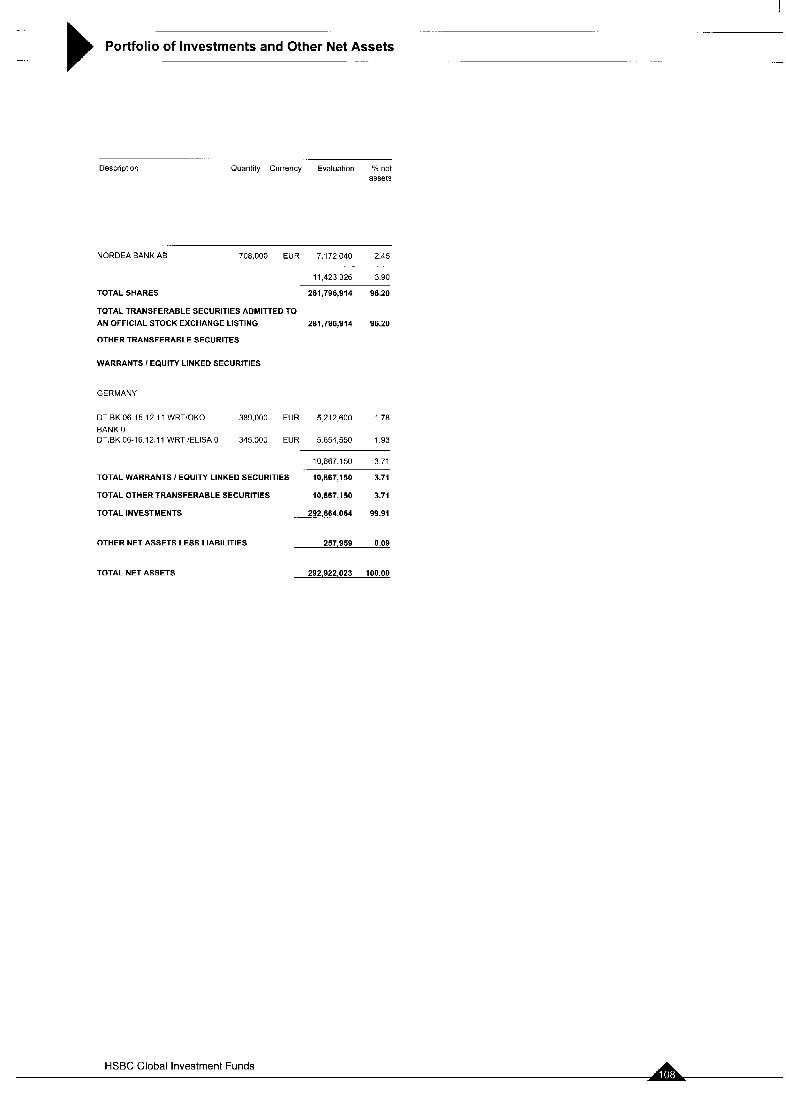
.
.-
Portfolio of Investments and Other Net Assets ..
Descrlptlon Quantity Currency Evaluation YO net assets
NORDEA BANK AB 708,000 EUR 7,172,040 2 4 5
11.423 326 3 90
TOTAL SHARES 281,796,914 96.20
TOTAL TRANSFERABLE SECURITIES ADMITTED TO AN OFFICIAL STOCK EXCHANGE LISTING 281,796,914 96.20
OTHER TRANSFERABLE SECURITES
WARRANTS I EQUITY LINKED SECURITIES
GERMANY
DT BK 06-15 12 11 WRT’OKO 389000 EUR 5212,600 1 7 8 BANK 0 DT BK 06-16 12 11 WRT jELISA 0 345.000 EUR 5 654,550 1 93
10 867.150 3 71
TOTAL WARRANTS / EQUITY LINKED SECURITIES 10,867,150 3.71
TOTAL OTHER TRANSFERABLE SECURITIES 10,667,150 3.71
TOTAL INVESTMENTS 292,664,064 99.91
OTHER NET ASSETS LESS LIABILITIES 257,959 0.09
TOTAL NET ASSETS 292.922.023 100.00
.
HSBC Global Investment Funds
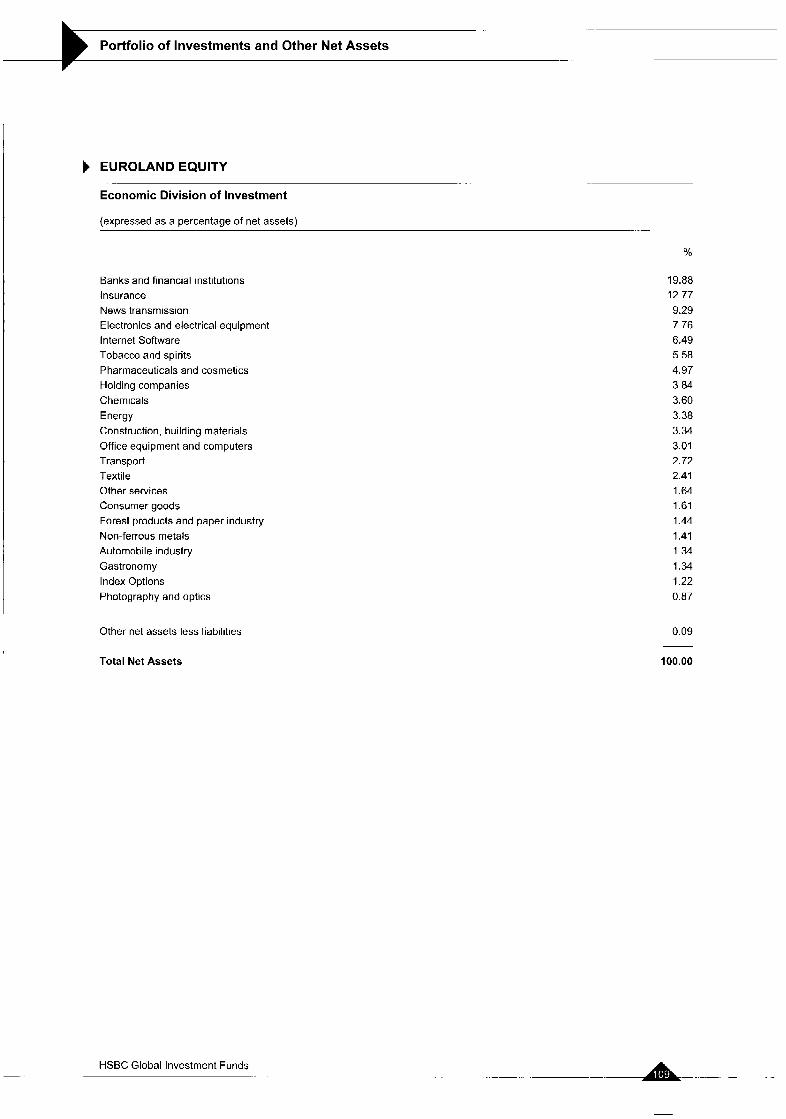
Portfolio of Investments and Other Net Assets __
EUROLAND EQUITY
Economic Division of Investment
(expressed as a percentage of net assets)
Banks and financial institutions Insurance News transmission Electronics and electrical equipment Internet Software Tobacco and spirits Pharmaceuticals and cosmetics Holding companies Chemicals Energy Construction, building materials Office equipment and computers Transport Textile Other services Consumer goods Forest products and paper industry Non-ferrous metals Automobile industry Gastronomy Index Options Photography and optics
Other net assets less liabilities
Total Net Assets
HSBC Global Investment Funds
%
19.88 12.77 9.29 7.76 6.49 5.58 4.97
3.60 3.38 3.34 3.01 2.72 2.41 1.64 1.61 1.44 1.41 1.34 1.34 1.22 0.87
3.84
0.09
100.00
.. . . . - . ..
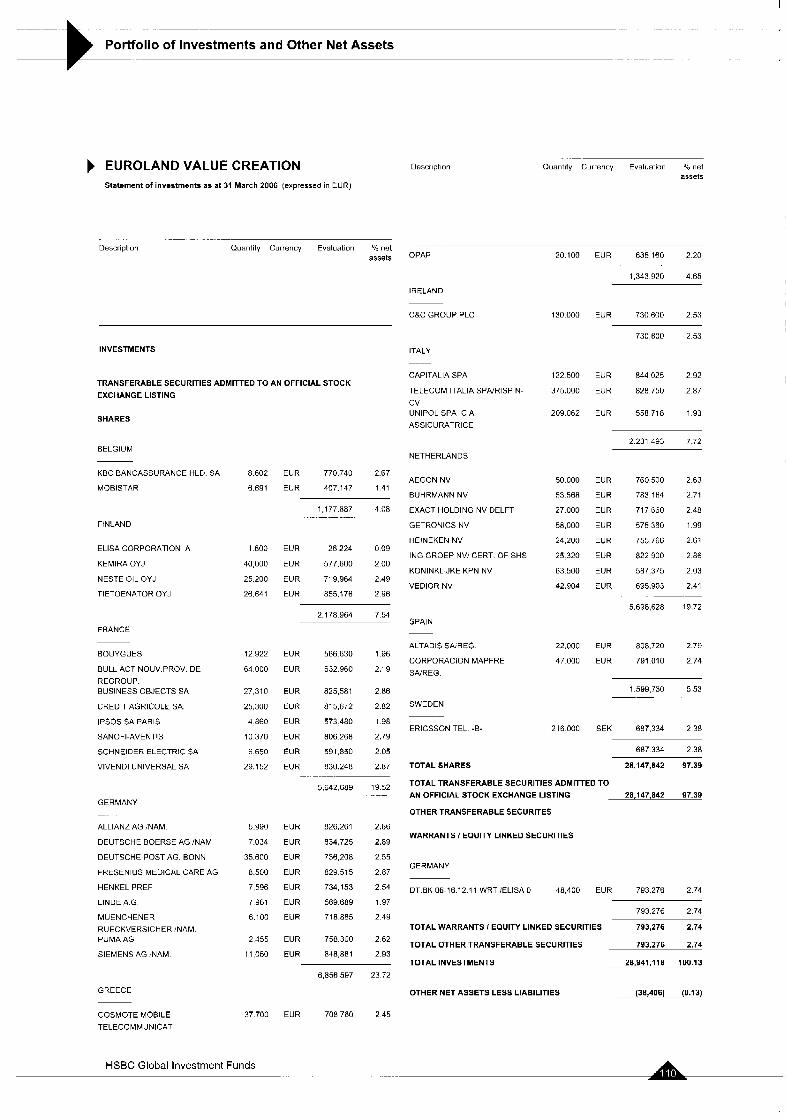
I
- . . -.
Portfolio of Investments and Other Net Assets &-- . . . - _ -_ ._
EUROLAND VALUE CREATION Statement of investments as at 31 March 2006 (expressed in EUR)
Descrlprlon Ouantity Currency Evaluamn Yo net assets
. .. --_ .- . . ...
Description Quantity Currency Evaluation 'lo not assets OPAP 20 100
130 000
122 500
375 000
209 062
50 000
53 S6H
27 000
58,000
24,200
25 320
63 500
42.90A
22.000
47 000
216 000
EUR 635,160 2.20
1,343.920 4.65
IRELAND
C&C GROUP PLC EUR 730,600 2 53
730 600 2 53
INVESTMENTS
TRANSFERABLE SECURITIES ADMITTED TO AN OFFICIAL STOCK
EXCHANGE LISTING
ITALY __ CAPlTALlA SPA
TELECOM ITALIA SPAiRlSP N-
cv UNIPOL SPA CIA
ASSKURATRICE
EUR 844025 2 9 2
EUR 828.750 2 8 7
EUR 558718 1 9 3 SHARES
2231 L93 7 7 2 BELGlUlvl
KBCBANCASSURANCEHLD SA
MOBISTAR
NETHERLANDS
8 602
6.691
1 600
40,000
25.200
26.641
12 922
64 000
27,310
25,300
4 860
10 370
6 650
29 152
5.990
7.034
35.600
8.500
7,596
7 961
6.100
2 455
11,050
37 700
EUR 770.740 2.67
EUR 407.147 1 4 1 AEGON NV
EUHRMANNNV
EXACT HOLDING NV DELFT
GETRONICS NV
HEINEKEN NV
ING GROEP NVI CERT. OF SHS
KONINKLIJKE KPN NV
VEDIOR NV
EUR 760500 2 6 3
EUR 783 164 2 7 1
EUR 717660 2 4 8
EUR 575560 1 9 9
EUR 755,766 2 6 1
EUR 822 goo 2 86
EUR 587 375 2 03
EUR 695.903 2.41
5 698,628 19 72
FINLAND
ELlSA CORPORATION A
KEMIRA OYJ
NESTE OIL OYJ
TIETOENATOH OYJ
EUR 26224 0 0 9
EUR 577.600 2 0 0
EUR 719,964 2.49
EUR 855.176 2 9 6
2.178 964 7.54 SPAIN
FKANCE
EOUYGUES
BULL ACT NOUV.PROV DE
REGROUP. BUSINESS OBJECTS SA
CREDIT AGRICOLE SA.
IPSO$ SA PARIS
SANOFCAVENTIS
SCHNEIDER ELECTRIC SA
VIVENDI UNIVERSAL SA
ALTADIS SAiREG
CORPORACION MAPFRE
SkREG.
EUR 808.720 2.79
EUR 791 010 2.74 EUR 566630 1.96
EUR 632.960 2.19
1,599 730 5 5 3 ~- EUR 825,581 2 8 6
EUH n15,fi72 2 8 2
EUR 573480 1 9 8
EUR 806268 2.79
EUR 591,850 2 0 5
EUR 830.248 2 8 7
SWEDEN
ERICSSON TEL. -E- SEK 687,334 2 3 8
687 334 2.38
TOTAL SHARES 28,147,842 97.39
5,642.689 19 52 .. .. ...
TOTAL TRANSFERABLE SECURITIES ADMITTED TO AN OFFICIAL STOCK EXCHANGE LISTING 28,147,842 97.39
OTHER TRANSFERABLE SECURITES GERMAhY -.
ALLIANZ AG (NAM
DEUTSCHE BOERSE AG 'NAM
DEUTSCHE POST AG BONN
FRESENIUS MEDICAL CARE AG
HENKEL PREF
LINDE A G
MUENCHENER
RUECKVERSICHER 'NAM PUMA AG
SIEMENS AG :NAM
EUR 826,261 2.86
EUR 834,725 2.89
EUR 736,208 2.55
EUR 829 515 2.87
EUR 734,153 2.54
EUR 569689 1.97
EUR 718.885 2.49
WARRANTS / EQUITY LINKED SECURITIES
GERM ANY
DT.BK 06-16.12.1 1 WRT lELlSA 0 48,400 EUR 793.276 2.74
793276 2 7 4
TOTAL WARRANTS I EQUITY LINKED SECURITIES 793,276 2.74
793.276 2.7h TOTAL OTHER TRANSFERABLE SECURITIES
TOTAL INVESTMENTS 28,941.118 100.13
EUR 758.300 2 6 2
EUR 848,861 2.93
6,856,597 23 72
GREECE
COSMOTE MOBILE
TELECOMMUNICAT
OTHER NET ASSETS LESS LIABILITIES (38,406) (0.13)
EUR 708760 2 4 5
HSBC Global Investment Funds
. ...._.
Portfolio of Investments and Other Net Assets .- . -~ -..
-~ Description Quantity Currency Evaluation YO net
assets
- TOTALNETASSETS
.
28,902,712 ino.00
HSEC Global Investment Funds
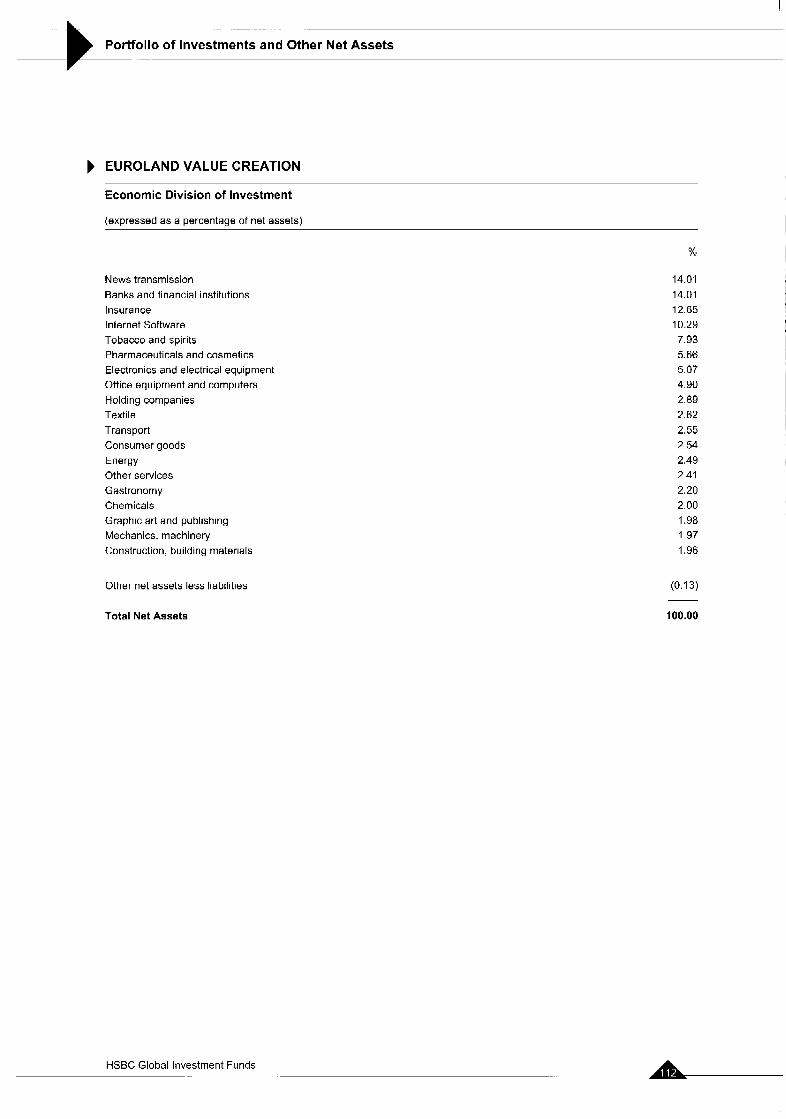
..
Portfolio of Investments and Other Net Assets __
EUROLAND VALUE CREATION
Economic Division of Investment
(expressed as a percentage of net assets)
News transmission Banks and financial institutions Insurance Internet Software Tobacco and spirits Pharmaceuticals and cosmetics Electronics and electrical equipment Office equipment and computers Holding companies Textile Transport Consumer goods Energy Other services Gastronomy Chemicals Graphic art and publishing Mechanics: machinery Construction, building materials
Other net assets less liabilities
Total Net Assets
HSBC Global Investment Funds
14.01 14.01 12.65 10.29 7.93 5.66
4.90 2.89 2.62 2.55 2.54 2.49 2.41 2.20 2.00 1.98 1.97 1.96
5-07
(0.13)
100.00
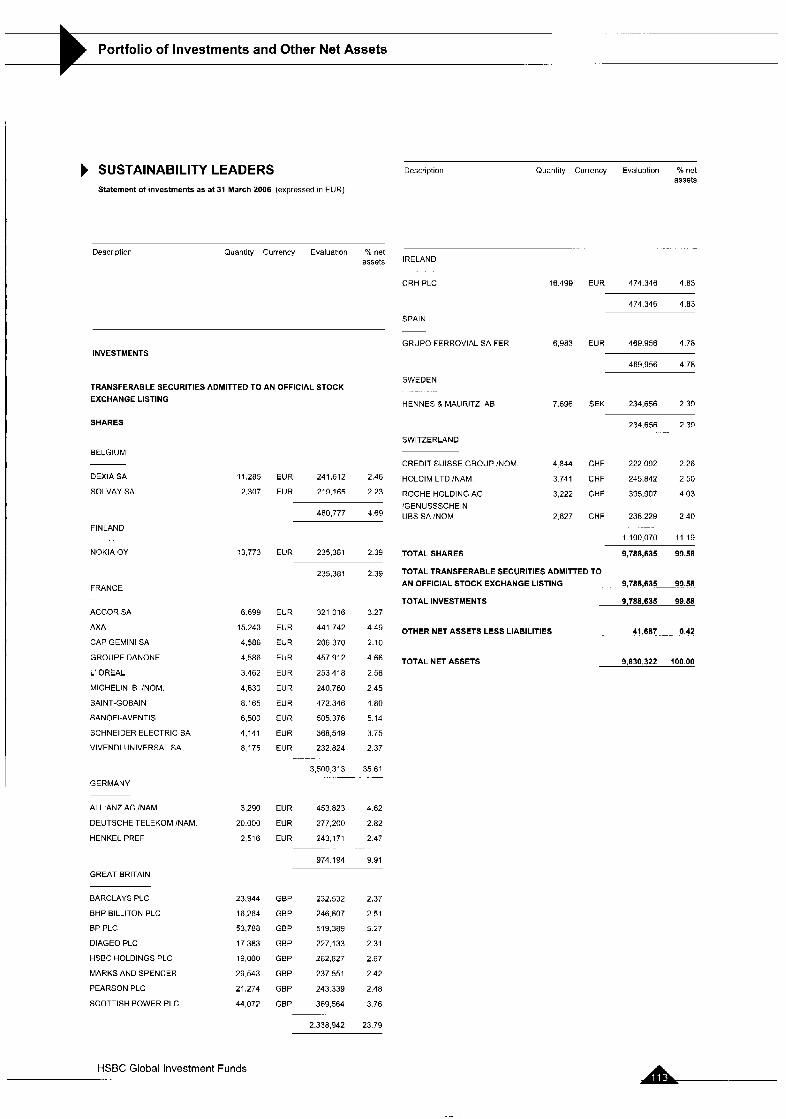
Portfolio of Investments and Other Net Assets ~.
SUSTAINABILITY LEADERS Statement of investments as at 31 March 2006 (expressed in EUR)
Description Quantity Currency Evaluation 'h net assets
Descriptior Quantity Currency Evaluation "h net assets
..
IRELAND
CRH PLC 16.499 EUR 474.346 4.83
474 346 4.83
SPAIN
GRUPO FERROVIAL SA FER 6.983 EUR 469.956 4.78 INVESTMENTS
TRANSFERABLE SECURITIES ADMITTED TO AN OFFICIAL STOCK EXCHANGE LISTING
SHARES
469,956 4.78
SWEDEN
HENNES & MAURITZ AB 7.696 SEK 234,656 239
234.656 2 39
SWITZERLAND
BELGIUM CREDIT SUISSE GROUP /NOM 4844 CHF 222092 226
HOLCIM LTD /NAM 3741 CHF 245842 250
ROCHE HOLDING AG 3,222 CHF 395.907 403 'GENUSSSCHEIN UBS SA 'NOM 2627 CHF 236229 240
1100,070 1 1 19 -
DEXIA SA
SOLVAY SA
FIN LAND
11,285
2.307
13,773
6 699
15.243
4,586
4.586
3,462
4.630
8.165
6.500
4 141
8,175
3,290
20,000
2,516
23,944
16.264
53,788
17 383
19,floo
29,543
21,274
44,072
EUR 241,612 2.46
EUR 219.165 223
460,777 4.69
NOKIA OY
FRANCE
EUR 235,381 2.39 TOTAL SHARES 9,788,835 99.58
TOTAL TRANSFERABLE SECURITIES ADMITTED TO AN OFFICIAL STOCK EXCHANGE LISTING 9,788,835--_99:58
235.381 2.39
TOTALINVESTMENTS 9,788,635 99.58 ACCOR SA
AXA
CAP GEMINI SA
GROUPE CANONE
L' OREAL
MlCHELlN B /NOM.
SAINT-GOBAIN
SANOFCAVENTIS
SCHNEIDER ELECTRIC SA
VIVENDI UNIVERSAL SA
EUR 321 016 327
EUR 441 742 449
EUR 206,370 2 10
EUR 457912 466
EUR 253418 258
EUR 240.760 245
EUR 472.346 480
EUR 505.376 5 14
EUR 368,549 375
EUR 232.824 2.37
OTHER NET ASSETS LESS LIABILITIES 41,687 0.42
TOTAL NET ASSETS 9,830,322 100.00
3,500,313 35 61 .- . -
GERMANY
ALLIANZ AG /NAM.
DEUTSCHE TELEKOM /NAM
HENKEL PREF
EUR 453823 462
EUR 277,200 282
EUR 243,171 247
974 194 991
GREAT BRITAIN
BARCLAYS PLC
BHP BILLITON PLC
BP PLC
DIAGEO PLC
HSBC HOLDINGS PLC
MARKS AND SPENCER
PEARSON PLC
SCOTTISH POWER PLC
GBP 232.532 2.37
GBP 246.607 2.51
GBP 519,389 5.27
GBP 227.133 2.31
GEP 262,827 2.67
GBP 237551 2.42
GBP 243339 2.48
GBP 369,564 3.76
2.338.942 23 79
HSBC Global Investment Funds ... . L-
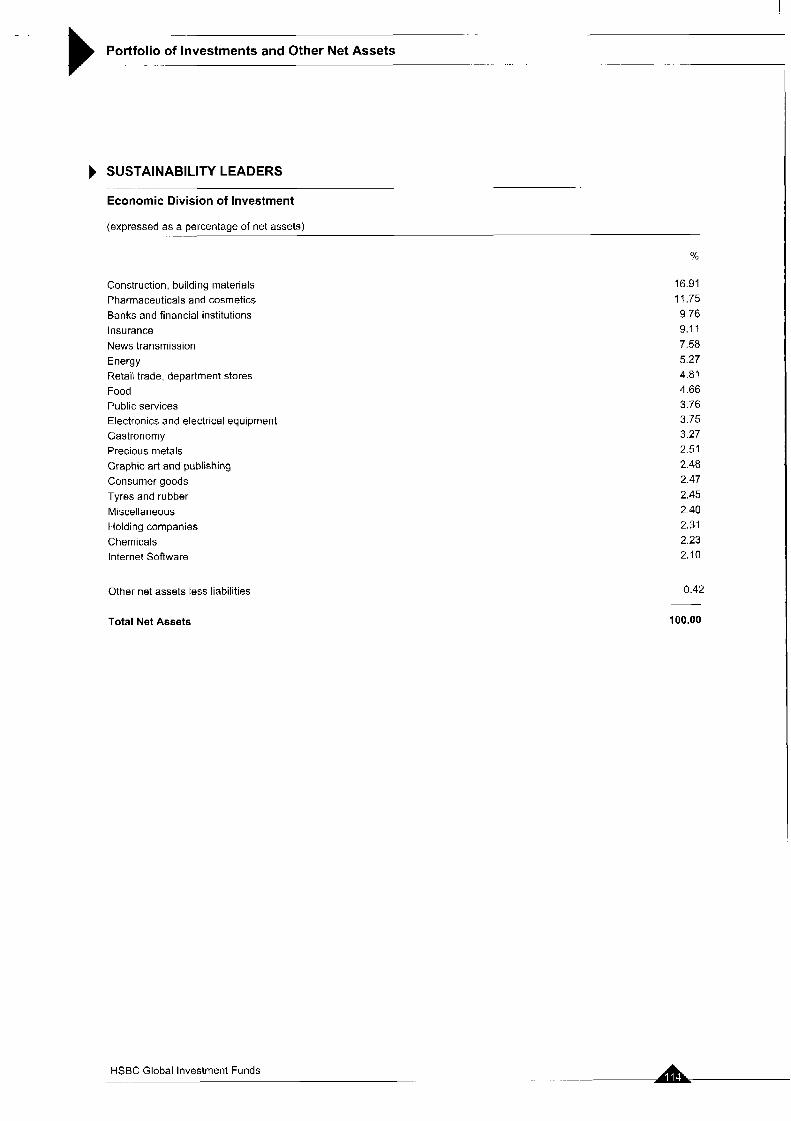
.-
Portfolio of Investments and Other Net Assets .
SUSTAINABILITY LEADERS
Economic Division of Investment . .-
...
(expressed as a percentage of net assets) ..
%
Construction, building materials Pharmaceuticals and cosmetics Banks and financial institutions Insurance News transmission Energy Retail trade, department stores Food Public services Electronics and electrical equipment Gastronomy Precious metals Graphic art and publishing Consumer goods Tyres and rubber Miscellaneous Holding companies Chemicals Internet Software
Other net assets less liabilities
16.91 11.75 9.76 9.1 1 7.58 5.27 4.81 4.66 3.76 3.75 3.27 2.51 2.48 2.47 2.45 2.40 2.31 2.23 2.10
0.42
Total Net Assets 100.00
HSBC Global Investment Funds - .. .. . . .
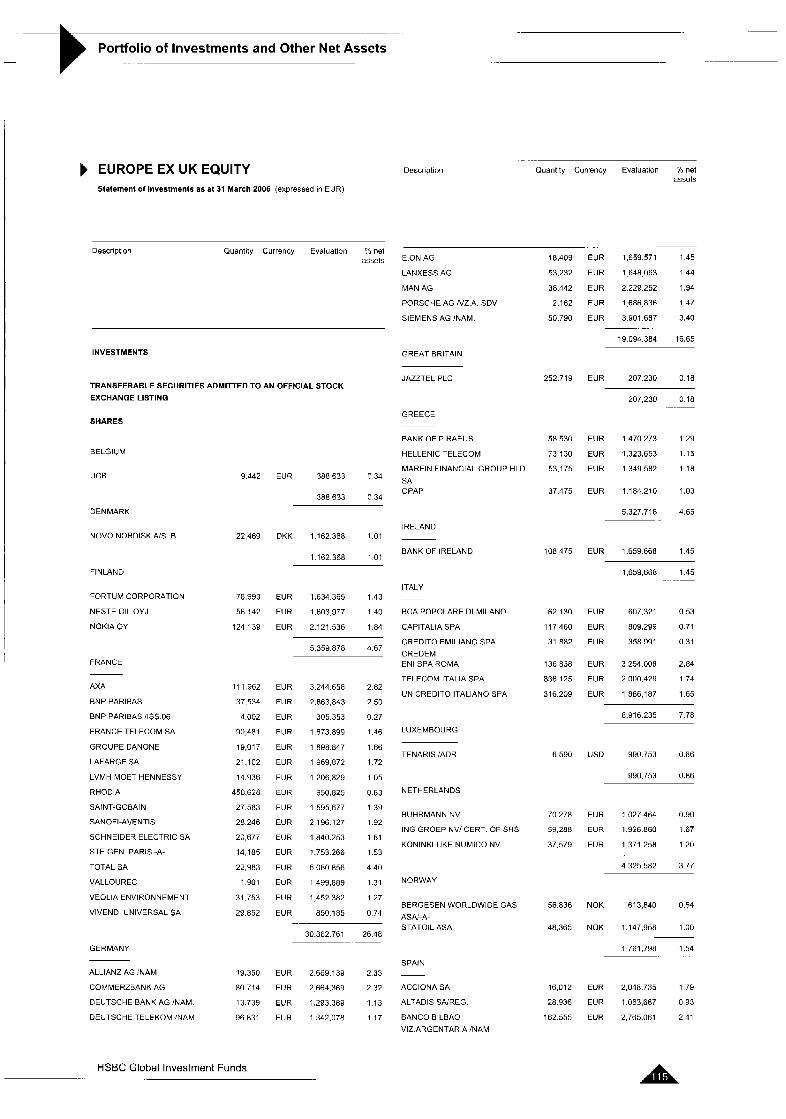
-- ....
Portfolio of Investments and Other Net Assets .- _.
EUROPE EX UK EQUITY Statement of investments as at 31 March 2006 (expressed in EUR)
Quanlily Currency Evaluation YO net assets
Description
Description Quantity Currency Evaluation “b net assets
. .
E.ON AG
LANXESS AG
MAN AG
PORSCHE AG /VZ.A. SDV
SIEMENS AG INAM.
18.409
53.232
38.442
2.162
50.790
252.719
58 530
73.130
53.175
37.475
l o a 475
62.130
117.460
31 882
136 838
836,125
316.209
6.590
70 278
59,288
37,579
56.836
48,365
16,012
28.936
162.555
EUR 1,659,571 1 45
EUR 1648,063 1 4 4
EUR 2229252 1 9 4
EUR 1686,836 1 4 7
EUR 3901 687 3 4 0 ~-
19094384 1665
INVESTMENTS
TRANSFERABLE SECURITIES ADMITTED TO AN OFFICIAL STOCK
EXCHANGE LISTING
tiREAT BRITAIN
JAZZTELPLC
GREECE
207.230 0 18
SHARES
BANK OF PIRAEUS
HELLENIC TELECOM
MARFIN FINANCIAL GROUP HLD
SA OPAP
EUR 1470273 1 2 9
EUR 1,323.653 1 15
EUR i 349582 1 18
BELGIUM
UCB 9 442
22,469
78,993
56 142
124 139
11 1.962
37,534
4,002
90,481
19,017
21.102
14.936
450.628
27.583
28 246
20,677
14.185
22,983
1901
31,753
29.852
19.350
80 714
13 739
96 831
EUR 1184.210 1.03
5,327.718 4.65 DENMARK
IRELAND NOVO NORDISK A S B DKK 1 162.368 1.01
BANK OF IRELAND
ITALY
1,659 668 1.45 FINLAND
FORTUM CORPORATION
NESTE OIL OYJ
NOKIA OY
EUR 1,634 365 1.43
EUR 1,603977 140
EUR 2.121 536 1 84
BCA POPOLARE DI MILANO
CAPlTALlA SPA
CREDIT0 EMILIANO SPA
CREDEM EN1 SPA ROMA
TELECOM ITALIA SPA
UNlCREDlTO ITALIAN0 SPA
EUR 607321 053
EUR 809,299 0 7 1
EUR 358991 0 3 1
EUR 3254.008 2 8 4
EUR 2 L100.429 1 74
EUR I 886,187 I 65
5,359.878 4.67
FRANCE
AXA
BNP PARIFAS
BNP PARIBAS ASS 06
FRANCE TELECOM SA
GROUPE CANONE
LAFARGE SA
LVMH MOET HENNESSY
RHODIA
SAINT-GOBAIN
SANOFI-AVENTIS
SCHNEIDE? ELECTRIC SA
STE GEN PARIS -A-
TOTAL SA
VALLOUREC
VEOLIA ENVIRONNEMENT
VIVENDI UNIVERSAL SA
EUR 3,244658 2.82
EUR 2,863,843 2.50
EUR 305353 0 2 7
EUR 1,673.899 1.46
EUR 1898,847 1 6 6
EUR 1969.872 1 7 2
EUR 1206.829 1 0 5
EUK 950.825 0 8 3
EUR 1595.677 1 3 9
EUR 2196127 1.92
EUR 1,840.253 1.61
EUR 1.753 266 1.53
EUR 5060856 4.40
EUR 1,499,889 1.31
EUR 1,452 382 1.27
EUR 850 185 0 7 4
8,916.235 7.78
LUXEMBOURG
TENARIS :ADR US0 990.753 0.86
990.753 0.86
NETHERLANDS
BUHRMANNNV
ING GHOEP NV! CERT OF SHS
KONINKLIJKE NUMICO NV
EUR 1,027464 0 9 0
EUR 1.926860 1 6 7
EUR 1.371 258 1 2 0
4 325582 3 7 7
NORWAY
BERGESEN WORLDWIDE GAS
ASAi-A- STATOIL ASA
NOK 613,840 0.54
NOK 1,147,958 1.00 30.362 761 26.48
GERMANY
ALLIANZ AG iNAM
COMMERZ3ANK AG
DEUTSCHE BANK AG INAM
DEUTSCHE TELEKOM INAM
1 761,798 1.54
SPAIN EUR 2669.139 2 3 3
EUR 2 664.369 2 32
EUR 1.293389 I 13
EUR 1342,078 1 17
ACCIONA SA
ALTADIS SAREG
BANCO BILBAO
VIZ ARGENTARIA !NAM
EUR 2048,735 1 7 9
EUR 1063.687 0 9 3
EUR 2.765.061 2 41
HSBC Global Investment Funds
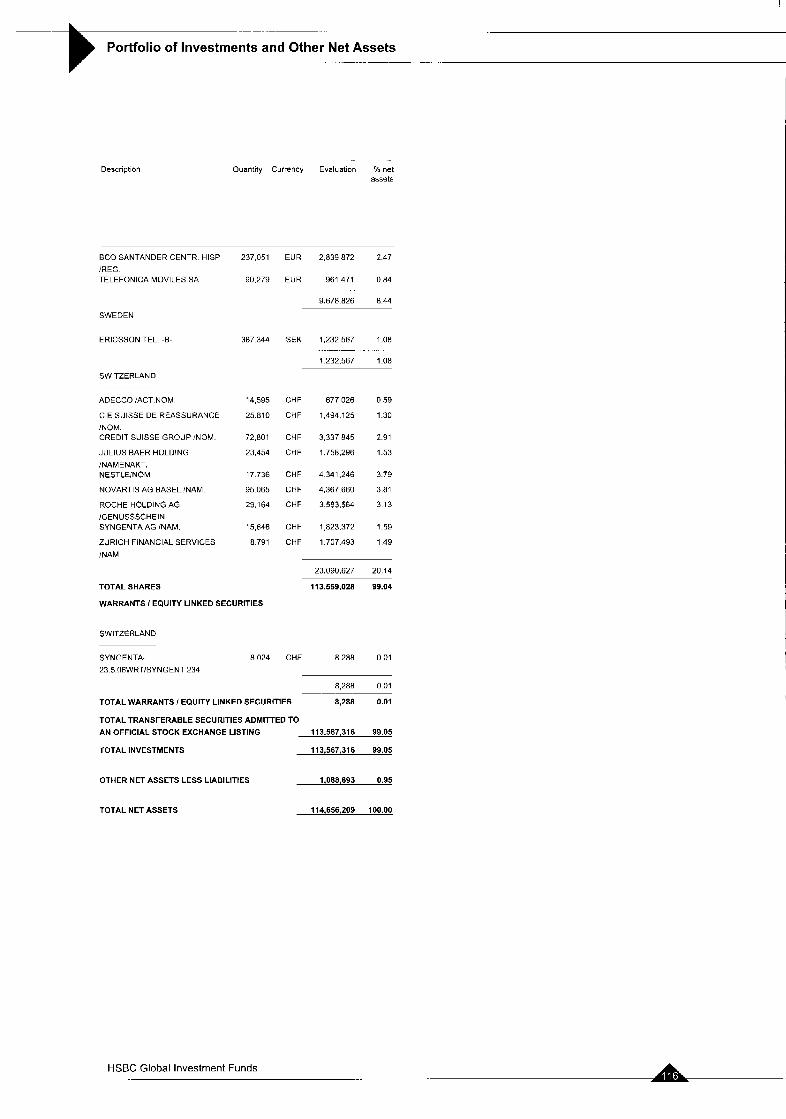
-.
Portfolio of Investments and Other Net Assets __ . -_
Description Ouantity Currency Evaluatian % net assets
BCO SANTANDER CENTR HlSP 237.051 EUR 2.839 872 2 47
/REG TELEFONICA MOVILES SA 90,279 EUR 961 471 0 8 4
9.678.826 8.44
SWEDEN
ERICSSON TEL. -E-
SWITZERLAND
ADECCO !ACT.NOM.
CIE SUISSE DE REASSURANCE /NOM CREDIT SUISSE GROUP INOM
JULIUS BAER HOLDING
INAMENAKT. NESTLEiNOM
NOVARTIS AG BASEL INAM
ROCHE HOLDING AG
IGENUSSSCHEIN SYNGENTA AG INAM.
ZURICH FINANCIAL SERVICES
INAM
387 344 SEK 1,232,567 108
1232567 1 0 8
.. - __
14,595
25.810
72,801
23,454
17 736
95 065
29,164
15,646
8 791
TOTAL SHARES
WARRANTS I EQUITY LINKED SECURITIES
SWITZERLAND
CHF
CHF
CHF
CHF
CHF
CHF
CHF
CHF
CHF
677,026
1494,125
3.337 845
1.758.296
4 341,246
4,367.660
3,583.564
1 823,372
1.707.493
0.59
1.30
2.91
1.53
3.79
3.81
3 13
1.59
1 49
23,090,627 20.14
113.559,028 99.04
SYNGENTA- 8.024 CHF 8.288 0.01
23.5.06WRT/SYNGENT 234
8,288 0.01
TOTAL WARRANTS / EQUITY LINKED SECURITIES 8,288 0.01
TOTAL TRANSFERABLE SECURITIES ADMITTED TO AN OFFICIAL STOCK EXCHANGE LISTING 113,567,316 99.05
TOTAL INVESTMENTS 113,567,316 99.05
OTHER NET ASSETS LESS LIABILITIES 1,088,893 0.95
TOTAL NET ASSETS 114,656.209 100.00
HSBC Global Investment Funds ... "
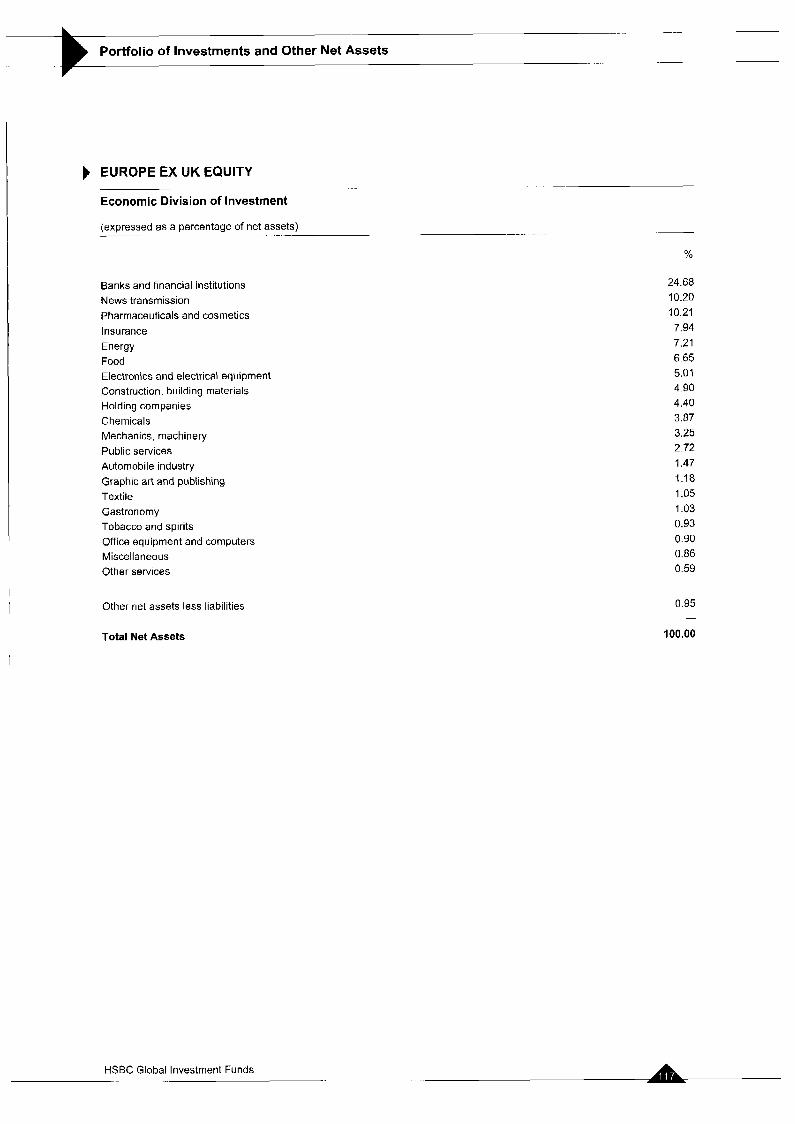
-. ..
Portfolio of Investments and Other Net Assets - .
EUROPE EX UK EQUITY
Economic Division of Investment .- .. _ _
(expressed as a percentage of net assets) - -- -
%
Banks and financial institutions News transmission Pharmaceuticals and cosmetics Insurance Energy Food Electronics and electrical equipment Construction, building materials Holding companies Chemicals Mechanics, machinery Public services Automobile industry Graphic art and publishing Textile Gastronomy Tobacco and spirits Office equipment and computers Miscellaneous Other services
Other net assets less liabilities
24.68 10.20 10.21 7.94 7.21 6.65 5.01 4.90 4.40 3.87 3.25 2.72 1.47 1.18 1.05 1.03 0.93 0.90 0.86 0.59
0.95
Total Net Assets 100.00
HSBC Global Investment Funds
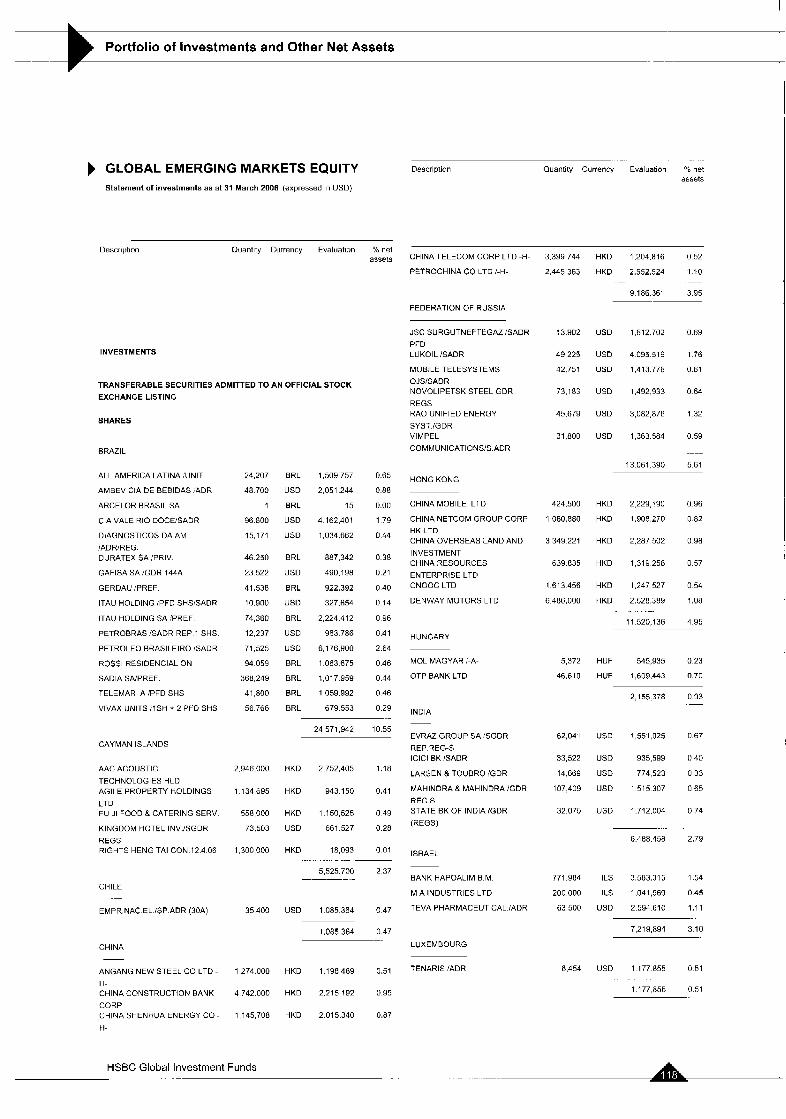
Portfolio of Investments and Other Net Assets - . ___
GLOBAL EMERGING MARKETS EQUITY Statement of investments as at 31 March 2006 (expressed in USD)
. .. ....
Description Quantity Currency Evaluation 96 net assets
Description Quantity Currency Evaluation YO net assets CHINA TELECOM CORP LTD -H-
PETROCHINA CO LTD I-H-
3,399,744
2,445,363
13.902
49 225
42.751
73.183
45.679
31.800
424.500
1,080,880
3 349 221
639 835
1613456
6,486,000
5,372
46.610
62,041
33,522
14.669
107,409
32.075
771.984
200,000
63 500
6.454
HKD 1.204.816 0 52
HKD 2,552,524 1 10
9 186.361 3 9 5
.- -
FEDERATION OF RUSSIA
JSC SURGUTNEFTEGAZ iSADR PFD LUKOIL !SADR
MOBILE TELESYSTEMS
OJSISADR NOVOLIPETSK STEEL GDR
REGS RAO UNIFIED ENERGY
SYST lGDR VIMPEL
COMMUNICATIONS!S.ADR
USD 1,612.702 0 69
USD 4095519 1 7 6
US0 1.413.776 0 61
USD 1,492,933 0 64
USD 3,082,876 1 32
USD 1,363.584 0 59
INVESTMENTS
TRANSFERABLE SECURITIES ADMITTED TO AN OFFICIAL STOCK
EXCHANGE LISTING
SHARES
BRAZIL
13.061.390 5.61 ALL AMERICA LATINA,UNIT
AMBEV CIA DE BEBIDAS rADR
ARCELOR BRASIL SA
CIA VALE HI0 DOCESADR
DIAGNOSTICOS DA AM
IADRIREG DURATEX SA F R I V
GAFISA SA rGDR 144A
GERDAE :PREF
ITAU HOLDING lPFD SHSISADR
ITAU HOLDING SA !PREF
PETROBRAS (SADR REP 1 SHS
PETROLEO BRASlLElRO GADR
ROSSI RkSlDENClAL ON
SADlA SAPREF
TELEMAR A !PFD SHS
VIVAX UNITS ( I S H + 2 PFO SHS
24,207
48 700
1
96 800
15,171
46 250
23 522
41.538
10.900
74,360
12.237
71.525
94 059
368 249
41,800
56 766
BRL
USD
BRL
USD
US0
BRL
USD
BRL
US0
BRL
US0
USD
BRL
BRL
BRL
BRL
1,509,757
2.051 244
15
4 162.401
1,034.662
887,342
490.198
922,392
327.654
2,224.412
963 786
6,176 900
1,063 675
1,017 959
1,059.992
679.553
0 65
0 88
0 00
1 79
n 44
0 38
0 21
0 40
0 14
0 96
0.41
2 64
0 46
0 44
0 46
0 29
HONG KONG
CHINA MOBILE LTD
CHINA NETCOM GROUP CORP HK LTD CHINA OVERSEAS LAND AND
INVESTMENT CHINA RESOURCES
ENTERPRISE LTD CNOOC LTD
DENLVAY MOTORS LTD
HKD 2229,'90 0 9 6
HKD 1,908,270 0 82
HKD 2.287 502 0 9 8
HKD 1.319258 0 5 7
HKD 1.247 527 0 54
HKD 2,528,389 1 08
11 520,136 4.95
HUNGARY
MOL MAGYAR I-A-
OTP BANK LTD
HUF 545,935 0.23
HUF 1,609,443 0.70
2,155 378 0.93
INDIA
24 571.942 10.55 EVRAZ GROUP SA SGDR
REP.SEG-S IClCl BK lSADR
LARSEN & TOUBRO !GDR
MAHINDRA & MAHINDRA lGDR
REGS STATE BK OF INDIA/GDR
(REGS)
USD 1,551,025 (1 67
USD 935,599 0 4 0
USD 774 523 0 33
USD 1515307 0 6 5
USD 1712.004 0 7 4
CAYMAN ISLANDS
AAC ACOUSTIC
TECHNOLOGIES HLD AGILE PROPERTY HOLDINGS
LTD FUJI FOOD & CATERING SERV.
KINGDOM HOTEL INV.!SGDR
REGS RIGHTS HENG TAI CON.12.4.06
2,946,000
1 134 695
558.000
73,503
1,300,000
35 400
1 274 000
4.742.000
1 145,708
HKD 2,752,405 1.18
HKD 943150 0.41
HKD 1,150,525 0.49
US0 661.527 0.28
HKD 18,093 0.01
5,525.700 2 37
...... ~
6.488.458 2.79
ISRAEL
BANK HAPOALIM B.M
M A INDUSTRIES LTD
TEVA PHARMACEUTICAL./ADR
ILS 3,583.315 1.54
ILS 1,041,969 0.45
US0 2,594610 1.11
CHILE .-
EMPR.NAC EL ISP ADR (30A) USD 1 085.364 0.47
7,219,894 3 10 1.085364 0 47
LUXEMBOURG CHINA
TENARIS /ADR ANGANG NEW STEEL CO LTD - H- CHINA CONSTRUCTION BANK
CORP CHINA SHENHUA ENERGY CO -
H-
USD 1177855 0 5 1
1177.855 0 5 1
HKD 1.198489 0.51
HKD 2,215192 0 9 5
HKD 2015340 0.87
HSBC Global Investment Funds . . . ... .
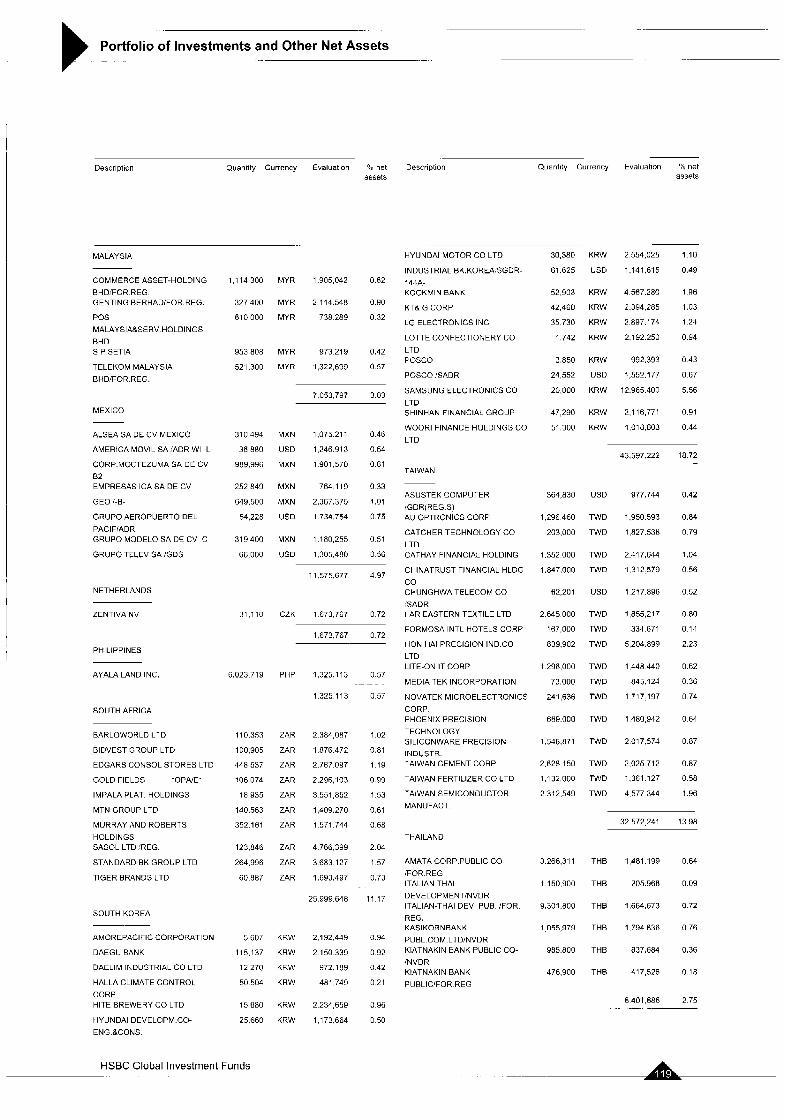
Portfolio of Investments and Other Net Assets .- -
.. .
.. .
.~
Description Quantity Currcncy Evaluation % net Description Quantity Currency Evaluation Yo net assets assets
MALAYSIA
COMMERCE ASSET-HOLDING
BHD:FOR REG GENTING BERHADiFOR.REG.
POS
MALAYSIA&SERV.HOLDINGS
BHD S P SETIA
TELEKOM MALAYSIA
BHD!FOR.REG.
MEXICO
ALSEA S A DE CV MEXICO
AMERICA MOVIL SA:ADR WI -L-
CORP.MOCTEZUMA SA DE CV 8 2 EMPRESAS ICA SA DE CV
GEO '-E-
GRUPOAEROPUERTODEL
PAClFlADR GRUPO M3DELO SA DE CV C
GRUPO TELEVISA 'GDS
NETHERLANDS
ZENTIVA NV
PHILIPPINES
AYALA LAND INC
SOUTH AFRICA
BARLOWORLD LTD
BIDVEST GROUP LTD
EDGARS CONSOL STORES LTD
GOLD FIELDS 'OPA'E-
IMPALA PLAT HOLDINGS
MTN GROUP LTD
MURRAY AND ROBERTS
HOLDINGS SASOL LTD 'REG
STANDARD BK GROUP LTD
TIGER BRANDS LTD
SOUTHKOREA
AMOREPACIFIC CORPORATION
DAEGU BANK
DAELIM IhDUSTHlAL CO LTD
HALLA CLIMATE CONTROL
CORP HlTE BREWERY CO LTD
HYUNDAI DEVELOPM.CO-
ENG.&CONS.
1114300
327,400
610 000
953 808
521.300
310,494
36 880
989.996
252 849
649.500
54,228
319400
66 000
31 .1 10
6 023 719
110.353
100.905
448 537
106 074
18 935
140 563
352 161
123.846
264.996
60 887
5 607
115.137
12 270
50 504
15 680
25 660
MYR 1 905,042 0.82
hlYR 2.114.548 0 90
MYR 738289 0 3 2
MYR 973219 0.42
hlYR 1,322,699 0.57
7 053,797 3.03
MXN 1.075 211 0.46
USD 1.246.913 0.54
MXN 1901 570 0.81
MXN 764 119 0.33
MXN 2,367.375 1.01
US0 1 734.754 0.75
MXN 1,180,255 0.51
USD 1305,480 0 5 6
11 575.677 4 97
CZK 1673,767 0 7 2
1673.767 0 72
PHP 1,325.113 0 5 7
1.325.113 0 5 7
.
ZAR 2 384,087 1.02
ZAR 1 876.472 0.81
ZAR 2.767 097 1.19
ZAR 2,296,103 0 99
ZAR 3 551,852 1.53
ZAR 1,409.270 0.61
ZAR 1571.744 0 6 8
ZAR 4 766399 2.04
ZAR 3683127 1.57
ZAR 1.693.497 0.73
25 999.648 11 17
KRW 2.192 449 0.94
KRW 2 150.339 0.92
KRW 972.189 0 4 2
KRW 481,749 021
KRW 2234,659 0 9 6
KRW 1.173.664 0 50
HYUNDAI MOTOR CO LTD
INDUSTRIAL BK.KOREA;SGDR-
144A- KOOKMIN BANK
KTB G CORP
LG ELECTRONICS INC
LOTTE CONFECTIONERY CO
LTD POSCO
POSCO 5 A D R
SAMSUNG ELECTRONICS CO
LTD SHINHAN FINANCIAL GKOJP
WOORI FINANCE HOLDINGS CO
LTD
30,380
61.625
52.903
42,460
35.730
1.742
3.850
24,552
20 000
47,290
51.300
KRW
US0
KRW
KRW
KRW
KRW
KRW
US0
KRW
KRW
KRW
2 554,025
1.141.615
4.567.280
2.394.285
2,897.1 74
2.192 250
992.393
1,552.177
12.965 400
2,116,771
1018 803
1 1 0
0.49
1 96
1.03
1 24
0 94
0 43
0 67
5.56
0.91
0 44
43.597 222 _.
TAIWAN
ASUSTEK COMPUTER
(GDR(REG S) AU OPTHONICS CORP
CATCHER TECHNOLOGY CO
LTD CAIHAY FINANCIAL HOLDING
CHINATRUST FINANCIAL HLDG
CO CHUNGHWA TELECOM CO 5 A D R I A R EASTERN TEXTILE LTD
FORMOSA INTL HOTELS CORP
HON HA1 PRECISION IND CO
LTD LITE-ON IT CORP
MEDIA TEK INCORPORATION
NOVATEK MICROELECTRONICS
CORP PHOENIX PRECISION
TECHNOLOGY SILICONWARE PRECISION INDUSTR IAIWAN CEMENT CORP
TAIWAN FERTILIZER CO LTD
TAIWAN SEMICONDUCTOR
MANUFACT
364,830 USD
1.296 460 TWD
203.000 TWD
1.352000 TWD
1847.000 TWO
62,201 USD
2645000 TWD
167 000 TWD
839.902 TWD
1296.000 TWD
73,000 TWD
241,636 TWD
669.000 TWD
1,548.871 TWD
2.628150 TWD
1 132 000 TWD
2312.549 TWD
977 744
1,950 593
I ,827 538
2,417,644
1 312 579
1217.896
1,855,217
334 671
5,204 899
1 448 440
845 124
1717 197
1 480 942
2 017 574
2.025 712
1.361 127
4 577 344
THAILAND
AMATA CORP PUBLIC CO
/FOR REG ITALIAN THAI
DEVELOPMENTiNVDR ITALIAN-THAI DEV PUB !FOR
REG KASIKORNBANK
PUBL COM LTDiNVDR KIATNAKIN BANK PUBLIC CO-
iNVDR KIATNAKIN BANK
PUBLIC'FOR REG
18.72
0.42
0.84
0.79
1.04
0.56
0 52
0 80
0.14
2.23
0.62
0.36
0 74
0 64
0 87
0.87
0.58
1.96
32 572 241 13 98
3 268.31 1 THE 1,481.199 0.64
1 150.900 THE 205.968 0.09
9,301,800 THE 1,664,673 0.72
1 [155,Y79 THE 1.794 636 0.76
985.800 THE 837.684 0.36
476.900 THE 417,526 0.18
._
6401,686 2 7 5 . . .
HSBC Global Investment Funds
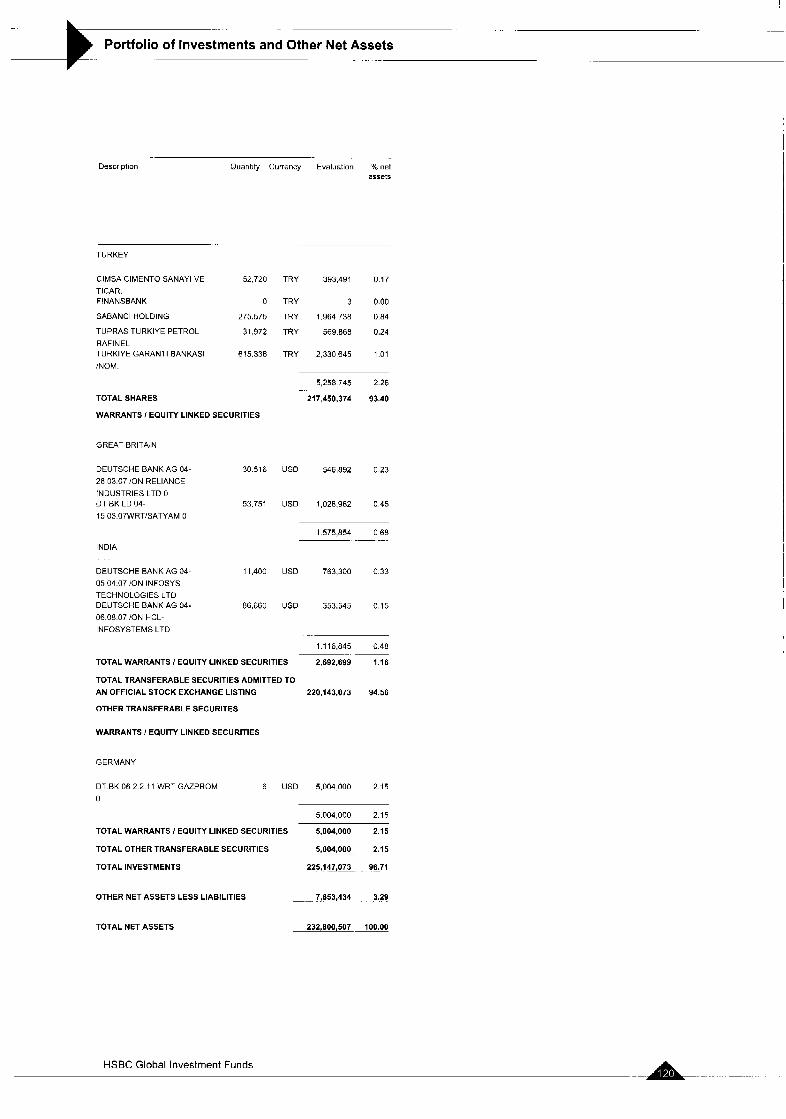
I
__ -. -
Portfolio of Investments and Other Net Assets
Description Quantity Currency Evaluation net assets
. .
TURKEY
CIMSA CIMENTO SANAYI VE 52.720 TRY 393,491 0.17
TICAR. FINANSBANK 0 TRY 3 0.00 SABANCI HOLDING 275.575 TRY 1.964 738 0.84
TUPRAS TURKIYE PETROL 31,972 TRY 569.868 0.24 RAFINEL TURKIYE GARANTI BANKASI 615.336 TRY 2.330645 1.01 INOM.
5,256 745 2.26
TOTAL SHARES 217,450,374 93.40
WARRANTS / EQUITY LINKED SECURITIES
GREAT BRITAIN
DEUTSCHE BANK AG 04- 30516 US0 546,892 0 2 3
26 03 07 /ON RELIANCE
INDUSTRIES LTD 0 DT BK LO 04- 53.751 US0 1,028,962 045 15 03 07WRTISATYAM 0
1575,854 0 6 8 .- ..
INDIA
DEUTSCHE BANK AG 04- 11.400 USD 763,300 0.33 05 04.07 /ON INFOSYS TECHNOLOGIES LTD DEUTSCHE BANK AG 04- 86,660 US0 353,545 0.15 06.08.07 /ON HCL-
INFOSYSTEMS LTD
1 116,845 0.48
TOTAL WARRANTS I EQUITY LINKED SECURITIES 2,692,699 1.16
TOTAL TRANSFERABLE SECURITIES ADMITTED TO
AN OFFICIAL STOCK EXCHANGE LISTING 220,143.073 94.56
OTHER TRANSFERABLE SECURITES
~
WARRANTS I EQUITY LINKED SECURITIES
GERMANY
DT BK 06-2 2 11 WRT GAZPROM 6 US0 5,004000 2 1 5
0
5.004,OOO 2.15
TOTAL WARRANTS / EQUITY LINKED SECURITIES 5.004,OOO 2.15
TOTAL OTHER TRANSFERABLE SECURITIES 5,004,000 2.15
TOTAL INVESTMENTS 225,147,073- 96.71
OTHER NET ASSETS LESS LIABILITIES - . 7,653,434 3.29
TOTALNETASSETS 232,800,507 100.00
I
HSBC Global Investment Funds - -. .. .
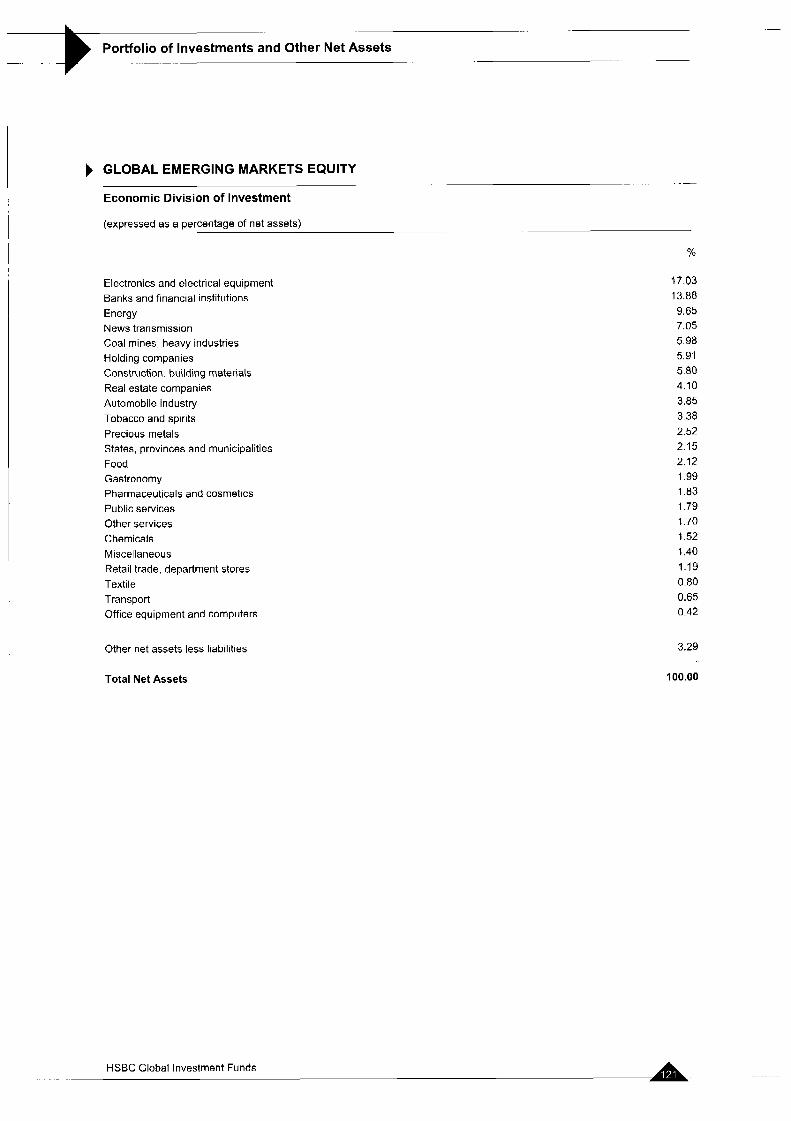
-
Portfolio of Investments and Other Net Assets - . __- - - -_
GLOBAL EMERGING MARKETS EQUITY
Economic Division of Investment - - -_
(expressed as a percentage of net assets) . - -
%
Electronics and electrical equipment Banks and financial institutions Energy News transmission Coal mines, heavy industries Holding companies Construction. building materials Real estate companies Automobile industry Tobacco and spirits Precious metals States, provinces and municipalities Food Gastronomy Pharmaceuticals and cosmetics Public services Other services Chemicals Miscellaneous Retail trade, department stores Textile Transport Office equipment and computers
Other net assets less liabilities
Total Net Assets
17.03 13.88 9.65 7.05 5.98 5.91 5.80 4.10 3.85 3.38 2.52 2.15 2.12 1.99 1.83 1.79 1.70 1.52 1.40 1.19 0.80 0.65 0.42
3.29
100.00
HSBC Global Investment Funds
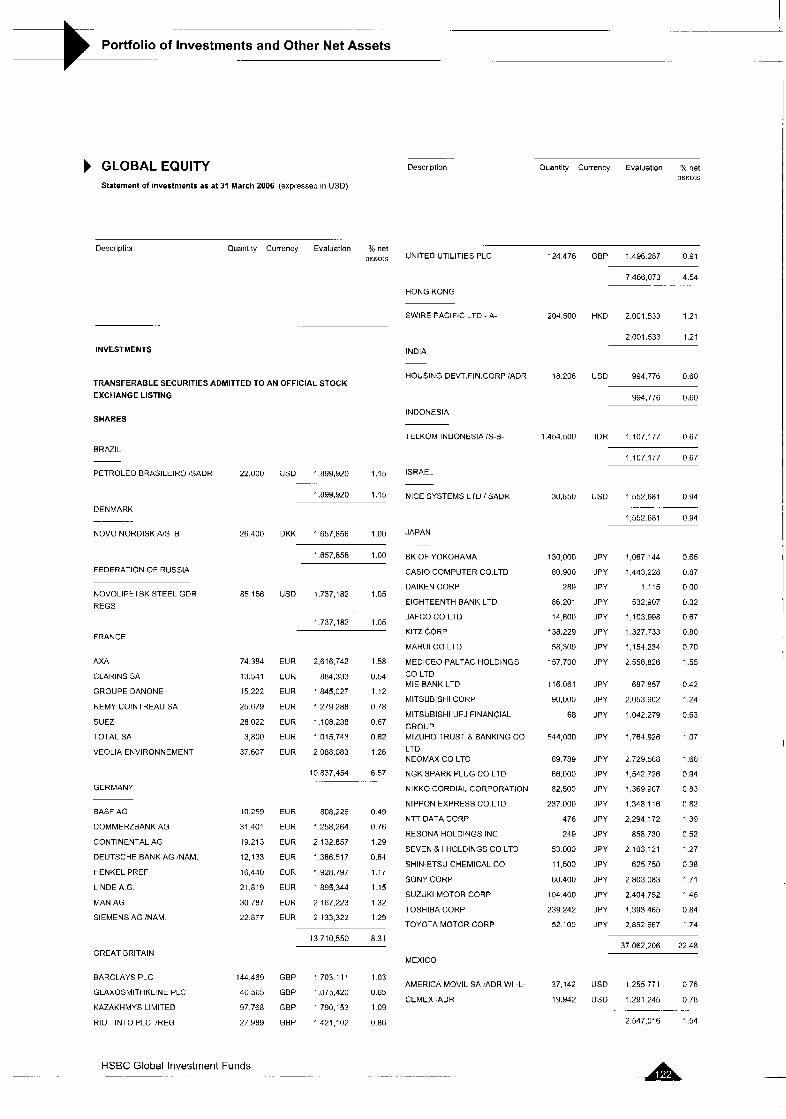
I - ._ _.
Portfolio of Investments and Other Net Assets - - _- __
GLOBAL EQUITY Statement of investments as at 31 March 2006 (expressed in USD]
Descriution Ouantity Currency Evaluation Yo net assets
Description Ouantity Currency Evaluation % net assets UNITE0 UTILITIES PLC 124476 GBP 1.496287 0 91
7486,073 4 5 4 ~. -
HONG KONG
SWIRE PACIFIC LTD - A- 204,500 HKD 2001,533 1 2 1
2,001.533 1.21
- .
INVESTMENTS INDIA
HOUSING DEVT.FIN.CORP iADR 18.206 US0 994,776 0.60 TRANSFERABLE SECURITIES ADMITTED TO AN OFFICIAL STOCK
EXCHANGE LISTING 994,776 0.60
INDOhESlA SHARES
TELKOM INDONESIA is-6-
ISRAEL
1,454,500
30,850
130 000
80 900
289
86 201
14.600
138.229
58 300
157,700
116061
90,000
68
544,000
89 789
66,000
82,500
237 000
476
249
53 000
11,500
60.400
104 400
239.242
52 100
37,142
19.942
IDR 1 107,177 0.67
BRAZIL 1.107177 0 6 7
PETROLEO BRASILEIRO ISADR 22.000
26 400
85,156
74.384
13.541
15 222
25 679
28.022
3,800
37 607
10 259
31 401
19 213
12,133
16440
21,819
30.787
22 877
144.469
40,565
97 768
27 989
i lSD 1,899,920 1.15
1,899,920 1.15 NICE SYSTEMS LTD I SADR US0 1 552.681 0.94
DENMARK 1.552 681 0.94
NOVO NORDISKAIS B JAPAN
BK OF YOKOHAMA
CAS10 COMPUTER CO LTD
DAIKEN CORP
EIGHTEENTH BANK LTD
JAFCO CO LTD
KlTZ CORP
MARUI CO LTD
MEDICEO PALTAC HOLDINGS
CO LTD MIE BANK LTD
MlTSUBlSHl CORP
MlTSUBlSHl UFJ FINANCIAL
GROUP MIZUHO TRUST & BANKING CO
LTD NEOMAX CO LTD
NGK SPARK PLUG CO LTD
NIKKO CORDIAL CORPORATION
NIPPON EXPRESS CO.LTD
NTT DATA CORP
RESONA HOLDINGS INC
SEVEN & I HOLDINGS CO LTD
SHIN-ETSU CHEMICAL CO
SONY CORP
SUZUKI MOTOR CORP
TOSHIBA CORP
TOYOTA MOTOR CORP
DKK 1657,856 100
1,657,856 1 .OO JPY
J PY
JPY
JPY
JPY
JPY
JPY
J PY
J PY
JPY
JPY
JPY
J PY
JPY
JPY
J PY
JPY
JPY
J PY
J PY
JPY
JPY
J PY
JPY
1,067,144
1 443,228
1,115
532,907
1 103.998
1 327.733
1,154.234
2 556,826
687 857
2,053.902
1,042.279
1,764.926
2 729.568
1,542 726
1,369 907
1.348 116
2,294 172
858,730
2 103 121
625 750
2 803.083
2,404,752
1,393 465
2,852 667
0.65
0.87
0.00
0.32
0.67
0.80
0.70
1.55
0.42
1.24
0.63
1.07
1.66
0.94
0 83
0 82
1 3 9
0.52
1.27
0.38
1.71
1 46
0.84
1.74
FEDERATION OF RUSSIA
NOVOLIPETSK STEEL GDR
REGS USD 1,737,182 1.05
1,737,182 1.05
FRANCE
M A
CLAHINS SA
GROUPE DANONE
REMY COINTREAU SA
SUEZ
TOTAL SA
VEOLIA ENVIRONNEMENT
EUR 2.616.742 1 58
EUR 884.333 0 5 4
EUR 1845,027 1 1 2
EUR 1279288 0 7 8
EUR 1.108.238 0 6 7
EUR 1 015.74:j n f i2
EUR 2088.083 1 2 6
10,837,454 6 57 ..
GERMANY
BASF AG
COMMERZBANK AG
CONTINENTAL AG
DEUTSCHE BANK AG 'NAM.
HENKEL PREF
LlNDE A G
MAN AG
SIEMENS AG !NAM
EUR 808.226 0 4 9
EUR 1258,264 0 7 6
EUR 2132.857 1 2 9
EUR 1,386.517 0 8 4
EUR 1,928,737 1 17
EUR 1895.344 1 1 5
EUR 2 167.223 1 3 2
EUR 2 133,322 1 2 9
13 710.550 8.31 37 062.206 22.48
GREAT BRITAIN MEXICO
BARCLAYS PLC
GLAXOSMITHKLINE PLC
KAZAKHMYS LIMITED
RIO TINTO PLC /REG
GBP 1703 111 1 0 3
GBP 1,075,420 0 65
GBP 1790,153 1 0 9
GBP 1421,102 0 8 6
AMERICA MOVIL SA IADR WI -L-
CEMEX :ADR
USD 1255771 0 7 6
USD 1.291 245 0 7 8
2 547,0'6 1.54
HSBC Global Investment Funds . . . . . . . -_ ...
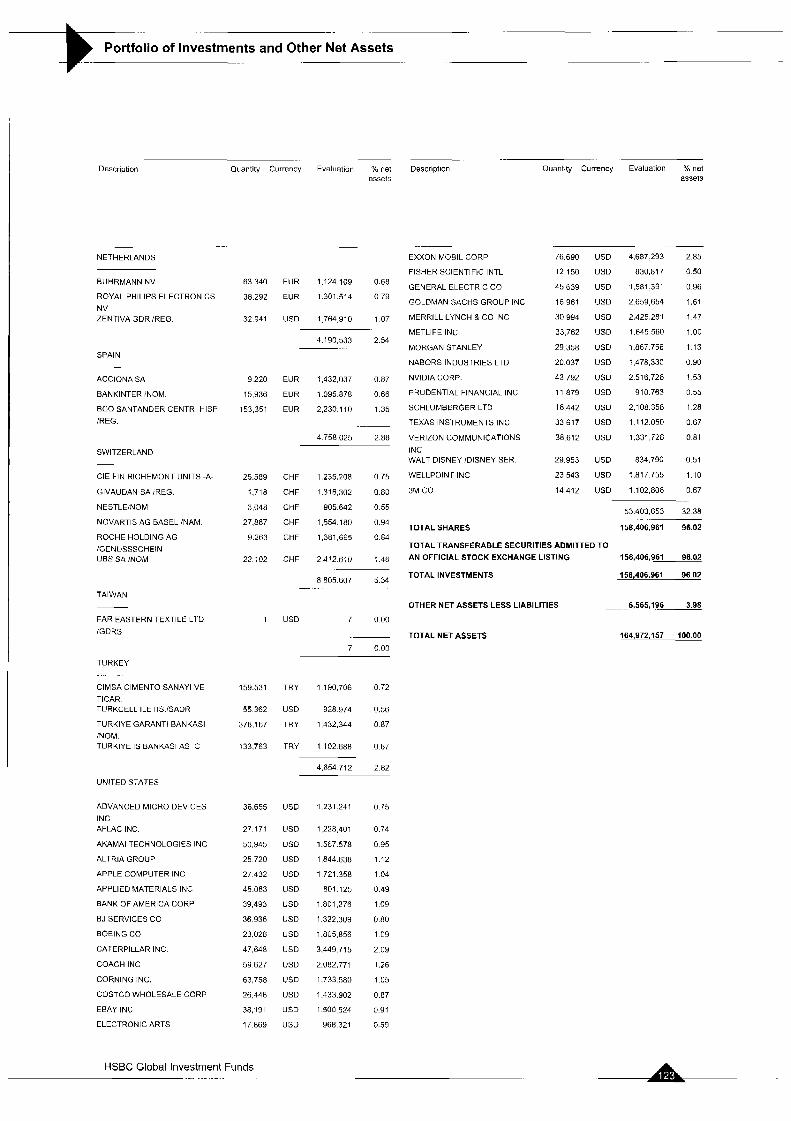
.. . . - _.
)olio of Investments ... . and Other Net Assets . ..
. .. ~ ~.
Description Quantity Currency Evaluation 'A net Description Quantity Currency Evaluation % net assets assets
NETHERLANDS
BUHRMANN NV
ROYAL PHILIPS ELECTRONICS NV ZENTIVA 3DR /REG
SPAIN - ACCIONA SA
BANKINTER INOM.
BCO SANTANDER CENTR HlSP !REG.
SWITZERLAND
CIE FIN RICHEMONT UNITS -A-
GIVAUDAN SA ,REG
NESTLEINOM
NOVARTIS AG EASEL lNAM
ROCHE HOLDING AG IGENUSSSCHEIN UBS SA INOM
TAIWAN - FAR EASTERN TEXTILE LTD
iGDRS
TURKEY
ClMSA CIMENTO SANAYI VE
TICAR TURKCELL ILETIS ISADR
TURKIYE GARANTI BANKASI :NOM TURKIYE I$ BANKASI AS C
UNITED STATES
ADVANCED MICRO DEVICES INC AFLAC INC.
AKAMAI TECHNOLOGIES INC
ALTRIA GROUP
APPLE COMPUTER INC
APPLIED MATERIALS INC
BANK OF AMERICA CORP
BJ SERVICES CO
BOEING CO
CATERPILLAR INC
COACH INC
CORNING INC.
COSTCO WHOLESALE CORP
EEAY INC
ELECTRONIC ARTS
63 340
30 292
32 941
9 220
15,936
153.351
25 509
1,718
3,048
27.867
9.263
22 102
1
159.531
55 362
378,167
133,763
36.655
27 171
50,Y45
25 720
27 432
45.083
39,493
36 936
23.028
47.648
59 627
63,758
26.446
38,191
17 869
EUR 1.124 109 068
EUR 1301.514 0 7 9
US0 1764,910 1 0 7
4,130,533 2.54
EUR 1,432,037 0.87
EUH 1.095878 0.66
EUR 2,230.110 1.35
4 758.025 2.80
CHF 1.235.208 0 75
CHF 1,316,302 0.80
CHF 905642 0.55
CHF 1.554.180 0.94
CHF 1 381,665 0.84
CHF 2.412.610 1 4 6
8805.607 5 3 4
U S 0 7 0.00
7 0.00
TRY 1 190 706 0 7 2
USD 928974 056
TRY 1432,344 0 8 7
TRY 1 102 688 0 6 7
USD
USD
USD
USD
USD
USD
USD
US0
USD
US0
US0
USD
US0
USD
USD
4.654 712 2.82
1,231 241
I ,228 401
1.567 578
1,844.638
1721 358
801.125
1 801.276
1,322,309
1,805,856
3.449 715
2.082.771
1.733 580
1.433 902
1 500 524
968.321
0.75
0.74
0.95
1 1 2
1 04
0 49
1.09
0 80
1 0 9
2.09
1.26
1.05
0.87
0.91
0.59
EXXON MOBlL GORP
FISHER SCIENTIFIC INTL
GENERAL ELECTRIC CO
GOLDMAN SACHS GROUP INC
MERRILL LYNCH a co INC
METLIFE INC
MORGAN STANLEY
NABORS INDUSTRIES LTD
NVlDlA CORP.
PRUDENTIAL FINANCIAL INC
SCHLUMBERGER LTD
TEXAS INSTRUMENTS INC
VERIZON COMMUNICATIONS
INC WALT DISNEY lDlSNEY SER.
WELLPOINT INC
3M CO
76.690
12 150
45 639
16 961
30 994
33.762
29.358
20.037
43 792
11 879
16 442
33 617
38 612
29 953
23,543
14 412
USD
USD
USD
US0
US0
usw USD USD
US0
USD
USD
US0
US0
USD
USD
USD
-
4.687 293
830,817
1,581 391
2 659,654
2 425,281
1.645 560
1.867 756
1 478,330
2 516 726
910 763
2,108.358
1 112.050
1331,728
834.790
1.817 755
1 102,806
2.85
0.50
0 96
1.61
1.47
1 .oo 1.13
0.90
1 53
0 55
1 28
0 67
0.81
0.51
1.10
0.67
53 403,653 32 38
158,406,981 96.02 . .
TOTAL SHARES
TOTAL TRANSFERABLE SECURITIES ADMITTED TO AN OFFICIAL STOCK EXCHANGE LISTING 158,406,961 96.02
TOTAL INVESTMENTS 158,405,961 96 02
OTHER NET ASSETS LESS LIABILITIES -. . 6,565.196 3.98
164.972.157 100.00 TOTAL NET ASSETS
HSBC Global Investment Funds - . .. ..
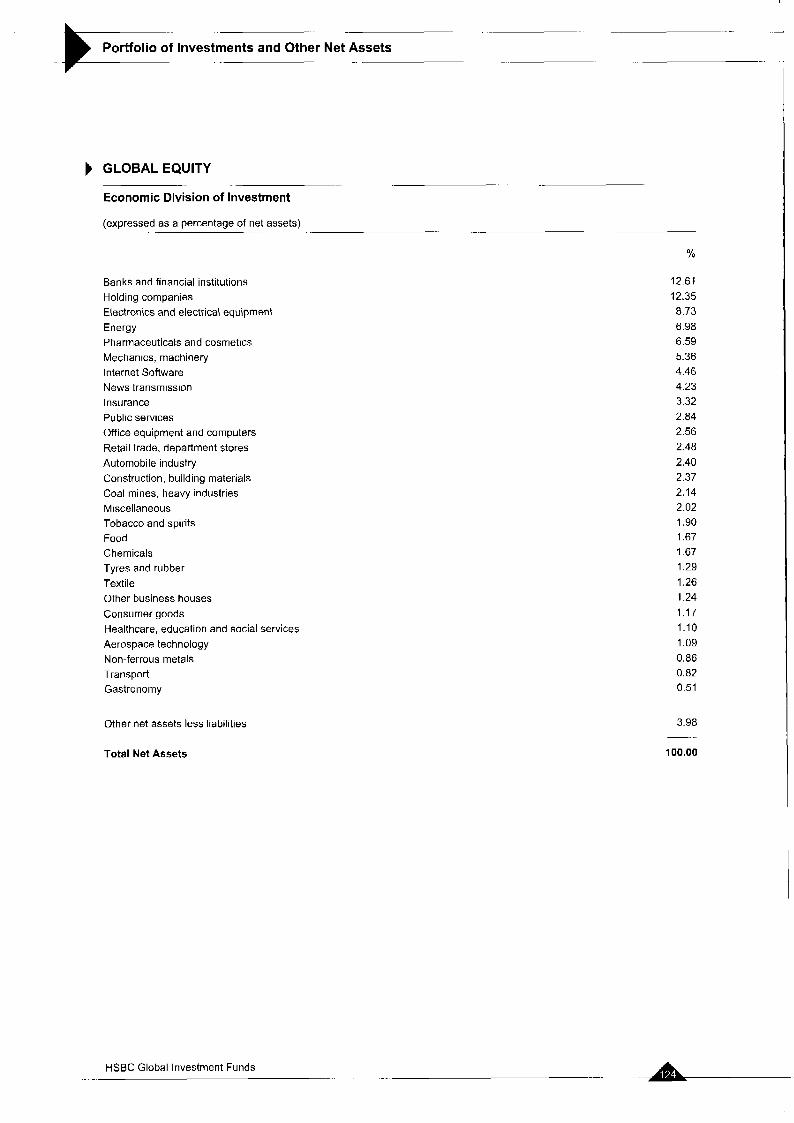
- - _- Investments and Other Net Assets
I
GLOBAL EQUITY
Economic Division of Investment --.
_. (expressed as a percentage of net assets)
%
Banks and financial institutions Holding companies Electronics and electrical equipment Energy Pharmaceuticals and cosmetics Mechanics, machinery Internet Software News transmission Insurance Public services Office equipment and computers Retail trade, department stores Automobile industry Construction, building materials Coal mines. heavy industries Miscellaneous Tobacco and spirits Food Chemicals Tyres and rubber Textile Other business houses Consumer goods Healthcare, education and social services Aerospace technology Non-ferrous metals Transport Gastronomy
Other net assets less liabilities
12.61 12.35 8.73 6.98 6.59 5.36 4.46 4.23 3.32
2.56 2.48 2.40 2.37 2.14 2.02 1.90 1.67 1.67 1.29 1.26 1.24 1.17 1.10 1.09 0.86 0.82 0.51
2.84
3.98
Total Net Assets 100.00
HSBC Global Investment Funds __ .. . ..
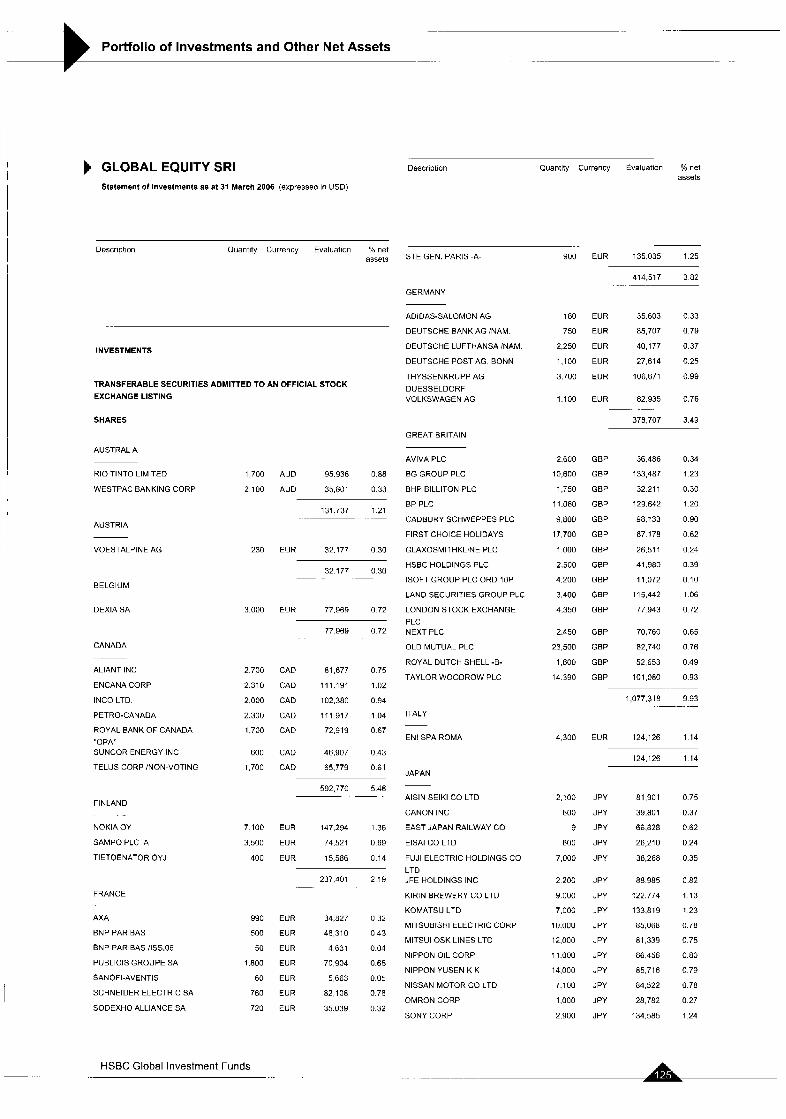
.. . ___
Portfolio of Investments and Other Net Assets . _. . . _
GLOBAL EQUITY SRI Statement of investments as at 31 March 2006 (expressed in USD)
Description Quantity Currency Evaluation % net assets
Description Quantity Currency Evaluation “h net assets STE GEN. PARIS -A-
GERMANY
900 EUR 135,035 1.25
ADIDAS-SALOMON AG
DEUTSCHE BANK AG INAM.
DEUTSCHE LUFTHANSA lNAM
DEUTSCHE POST AG BONN
THYSSENKRUPP AG
DUESSELDORF VOLKSWAGEN AG
i ao 750
2,250
1,100
3.700
EUR 35.603 0.33
EUR 85,707 0.79
EUR 40,177 0.37
EUR 27.614 0.25
EUR 106,671 0.99
INVESTMENTS
TRANSFERABLE SECURITIES ADMITTED TO AN OFFICIAL STOCK
EXCHANGE LISTING 1,100 EUR 82.935 0.76
378.707 3.49
~.
SHARES
GREAT BRITAIN
AUSTRAL A AVIVA PLC
BG GROUP PLC
BHP BILLITON PLC
BP PLC
CADBURY SCHWEPPES PLC
FIRST CHOICE HOLIDAYS
GLAXOSMITHKLINE PLC
HSBC HOLDINGS PLC
ISOFT GROUP PLC ORD 1OP
LAND SECURITIES GROUP PLC
LONDONSTOCKEXCHANGE
PLC NEXT PLC
OLD MUTUAL PLC
ROYAL DUTCH SHELL -E-
TAYLOR WOODROW PLC
2.600
10,600
1,750
11.060
9,800
17,700
1 000
2.500
4.200
3,400
4.350
2.450
23,500
1 600
14 390
GBP 36.486 0.34
GBP 133,487 1 2 3
GBP 32211 0.30
GBP 129.642 1 2 0
GBP 98.133 0 9 0
GBP 67 178 0 6 2
GBP 26.511 0 24
GBP 41,980 0 39
GBP 11.072 0 1 0
GBP 115,442 1 0 6
GBP 77943 0 7 2
GBP 70,760 0.65
GBP 82,740 0 7 6
GBP 52653 0 4 9
GBP 101,080 0 9 3
RIO TINTO LIMITED 1,700 AUD 95.936 0.88
WESTPAC BANKING CORP 2 100 AUD 35,801 0 3 3
131.737 1 2 1 . ~ ._
AUSTRIA
VOESTAL2INE AG 230 EUR 32,177 0.30
32 177 0 3 0 . -
BELGIUM
DEXlA SA 3.000 EUR 77.969 0.72
77969 0 7 2 . .
CANADA
ALIANT INC 2.700 CAD 81.677 0 7 5
ENCANA CORP 2.310 CAD 111.191 1 0 2
INCO LTD 2.000 CAD 102.3~0 0 9 4
PETRO-CANADA 2.300 CAD 111 917 1 0 4
ROYAL BANK OF CANADA 1.700 CAD 72,919 0 6 7 ‘OPA‘ SUNCOR ENERGY INC 600 CAD 46,907 0 4 3
TELUS CORP /NON-VOTING 1.700 CAD 65.779 0 6 1
1,077,318 9.93
ITALY
EN1 SPA ROMA
JAPAN
4,300 EUR 124,126 114
124.126 114
592,770 5 4 6 ~. AlSlN SElKl CO LTD
CANON INC
EAST JAPAN RAILWAY CO
ElSAl CO LTD
FUJI ELECTRIC HOLDINGS CO
LTD JFE HOLDINGS INC
KlRlN BREWERY CO LTD
KOMATSU LTD
MlTSUBlSHl ELECTRIC CORP
MlTSUl OSK LINES LTD
NIPPON OIL CORP
NIPPON YUSEN K K
NISSAN MOTOR CO LTD
OMRON CORP
SONY CORP
2,100
600
9
600
7 000
JPY 81,901 0.75
JPY 39.801 0.37
JPY 66,828 0.62
JPY 26,210 0.24
JPY 38,268 0.35
FINLAND
NOKIA OY
SAMPOPLC A
TIETOENATOR OYJ
7100 EUR 147,294 1.36
3.500 EUR 74.521 0.69
400 EUR 15,586 0.14
237,401 2 19 __ FRANCE
2 200
9,000
7,000
10.000
12,000
1 1,000
14.000
7.100
1,000
2,900
JPY 88985 0.82
JPY 122.774 1.13
JPY 133,819 1 2 3
JPY 85,068 0.78
JPY 81.339 0.75
JPY 86,456 0.80
JPY 84,522 0.78
JPY 28,782 0.27
JPY 85.716 0.79
JPY 134.585 1.24
AXA 990 EUR 34,827 0 3 2
BNP PARIBAS 500 EUR 46,310 0.43
BNP PARIBAS JSS.06 50 EUR 4 631 0.04
PUBLICIS GROUPE SA 1.800 EUR 70,904 0.65
SANOFI-AVENTIS 60 EUR 5,663 0.05
SCHNEIDER ELECTRIC SA 760 EUR 82.108 0.76
SODEXHO ALLIANCE SA 720 EUR 35.039 0.32
HSBC Global Investment Funds ~ . .
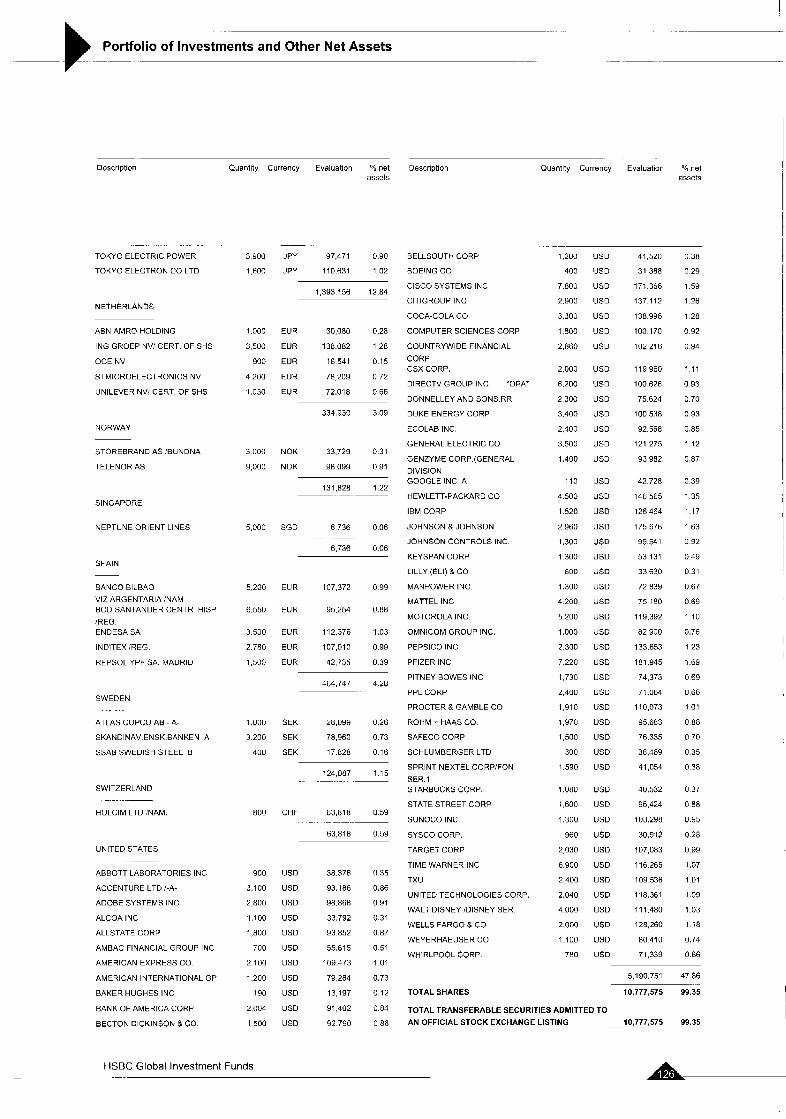
Portfolio of Investments and Other Net Assets .~ __
. .... _.
._ .
Doscripticn Quantity Currency Evaluation “10 net Description Quantity Currency Evaluation net assets assets
__ TOKYO ELECTRIC POWER
TOKYO ELECrKON CO LTD
NE1 HEHLANDS
ABN AMRO HOLDING
ING GROEP NV’CERT OF SHS
OCE NV
STMICROELECTRONICS NV
UNILEVER NV, CERT. OF SHS
NORWAY
STOREBRAND AS :EUNDNA
TELENOR AS
SINGAPORE
NEPTUNE ORIENT LINES
SPAIN
BANCO BILBAO
VI2 ARGENTARIA :NAM BCO SANTANDER CENTR HlSP
/REG ENDESA SA
INDITEX (REG.
REPSOL YPF SA MADRID
SWEDEN
ATLAS COPCO AB - A -
SKANDINAV ENSK BANKEN A
SSAB SWEDISH STEEL B
SWITZERLAND
HOLCIM LTD :NAM
UNITED STATES
ABBOTT LABORATORIES INC
ACCENTURE LTD !-A-
ADOEE SYSTEMS INC
ALCOA INC
ALLSTATI CORP
AMBAC FINANCIAL GROUP INC
AMERICAN EXPRESS CO
AMERICAN INTERNATIONAL GP
BAKER HUGHES INC
BANK OF AMERICA CORP
BECTON DICKINSON & CO.
3 900
1 6110
1.000
3 500
900
4 200
1,030
3 000
9,000
5.000
5.200
6.550
3.500
2.780
1,500
1.000
3.200
4u11
ROO
900
3.100
2.800
1.100
1,800
700
2 100
1,200
190
2.004
1 500
.
JPY 97,471 0.90
JPY 110,631 1 0 2
1.393 156 12.84
EUR 30,080 0.28
EUR 138.082 1 2 8
EUR 16541 0 15
EUR 78209 0 7 2
EUR 72.018 0 6 6
334,930 3.09
NOK 33,729 0.31
NOK 98099 0.91
131,828 1.22
SGD 6 736 006
6.736 0.06
__
EUR 107,372 0 9 9
EUR 95.254 0.88
EUR 112.376 1.03
EUR 107,010 0.99
EUR 42,735 0 3 9
464,747 4.28
SEK 28,099 0.26
SEK 78,960 0.73
SEK 17828 0.16
124,887 1 1 5 .. . .~
CHF 63,818 0 5 9
63.818 0 5 9
. . .. . .-. ~
USD 38.376 (135
US0 93.186 0 8 6
US0 98.868 0 9 1
USD 33,792 0 3 1
US0 93852 0 8 7
USD 55.615 0 5 1
USD 109473 1 0 1
USD 79284 0.73
US0 13,197 0 1 2
USD 91 402 0 8 4
USD 92790 0 8 6
BELLSOUTH CORP
BOEING CO
CISCO SYSTEMS INC
ClTlGROUP INC
COCA-COLA CO
COMPUTER SCIENCES CORP
COUNTRYWIDE FINANCIAL
CORP CSX CORP
DIRECTV GROUP INC ‘OPA’
DONNELLEY AND SONS RR
DUKE ENERGY CORP
ECOLAB INC
GENERAL ELECTRIC CO
GENZYME CORP (GENERAL
DIVISION GOOGLE INC A
HEWLETT-PACKARD CO
IBM CORP
JOHNSONgJOHNSON
JOHNSON CONTROLS INC
KEYSPAN CORP
LlLLY (ELI) & CO
MANPOWER INC
MATTEL INC
MOTOROLA INC
OMNICOM GROUP INC
PEPSICO INC
PFIZER INC
PITNEY BOWES INC
PPL CORP
PROCTER 8 GAMBLE CO
ROHM + HAAS CO
SAFECO CORP
SCHLUMBERGER LTD
SPRINT NEXTEL C0RP:FON
SER 1 STARBUCKSCORP
STATE STREET CORP
SUNOCO INC
SYSCO CORP
TARGET CORP
TIME WARNER INC
TXU
UNITED TECHNOLOGIES CORP
WALT DISNEY ,DISNEY SER
WELLS FARGO 4 CO
WEYERHAEUSER CO
WHIRLPOOL CORP
1,200 USD
400 US0
7.800 US0
2.900 USD
3.300 US0
1.800 US0
2,860 USD
2,000 US0
6,200 USD
2300 US0
3.400 USD
2,400 USD
3.500 USD
1.400 USD
110 USD
4500 USD
1520 USD
2960 USD
1.300 US0
1300 USD
600 USD
1.300 USD
4200 US0
5200 US0
1,000 USD
2.300 US0
7,220 USD
1.730 US0
2,4011 USD
1,910 US0
1,970 USD
1,500 USD
300 USD
1.590 US0
1.080 US0
1,600 USD
1.300 US0
960 US0
2,030 US0
6,900 US0
2400 USD
2.040 US0
4.000 US0
2.000 USD
1,100 USD
7HU US0
41,520
31,368
171,366
137,112
138.996
100,170
102,216
119960
100.626
75 624
100,53H
92.568
121 275
93 982
42.728
146,565
126 454
175 676
99.541
53 131
33 630
72 839
75 180
119,332
82 900
133.653
181.945
74.373
71,064
110,073
95,693
76.335
38,459
41,054
40.532
95.424
103.298
30,912
107,083
116.265
109 536
118.361
11 1.480
128,260
80410
71,339
0 38
0.29
1.59
1.26
1 28
0.92
u.94
1 1 1
0.93
0.70
0 93
0.85
1 1 2
0.87
0.39
1 3 5
1.17
1 6 3
0.92
0.49
0.31
0.67
0.69
1.10
0.76
1 2 3
1.69
0 69
0 66
1 0 1
0 88
0 70
0 35
0.38
0 37
0 88
0.95
0.28
0.99
1.07
1 0 1
1.09
1.03
1 1 8
0.74
0 66
5,190.751 47 86
TOTAL SHARES 10,777.575 99.35
TOTAL TRANSFERABLE SECURITIES ADMITTED TO
AN OFFICIAL STOCK EXCHANGE LISTING 10,777,575 99.35
A HSBC Global Investment Funds ..
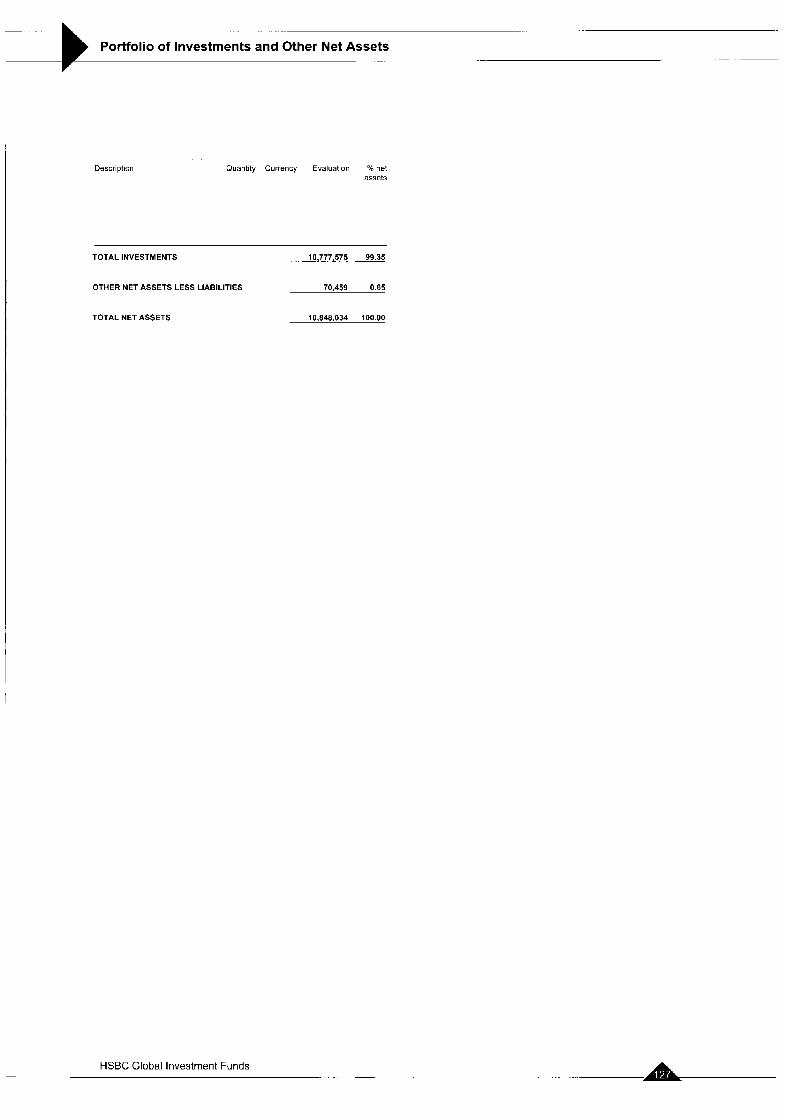
- _. .- ._
Portfolio of Investments and Other Net Assets -~ -
Description Quantity Currency Evaluation VQ net assets
TOTAL INVESTMENTS .. .10,!77,575 99.35
OTHER NET ASSETS LESS LIABILITIES 70,459 0.65
TOTALNETASSETS 10,848,034 100.00
HSBC Global Investment Funds . . -
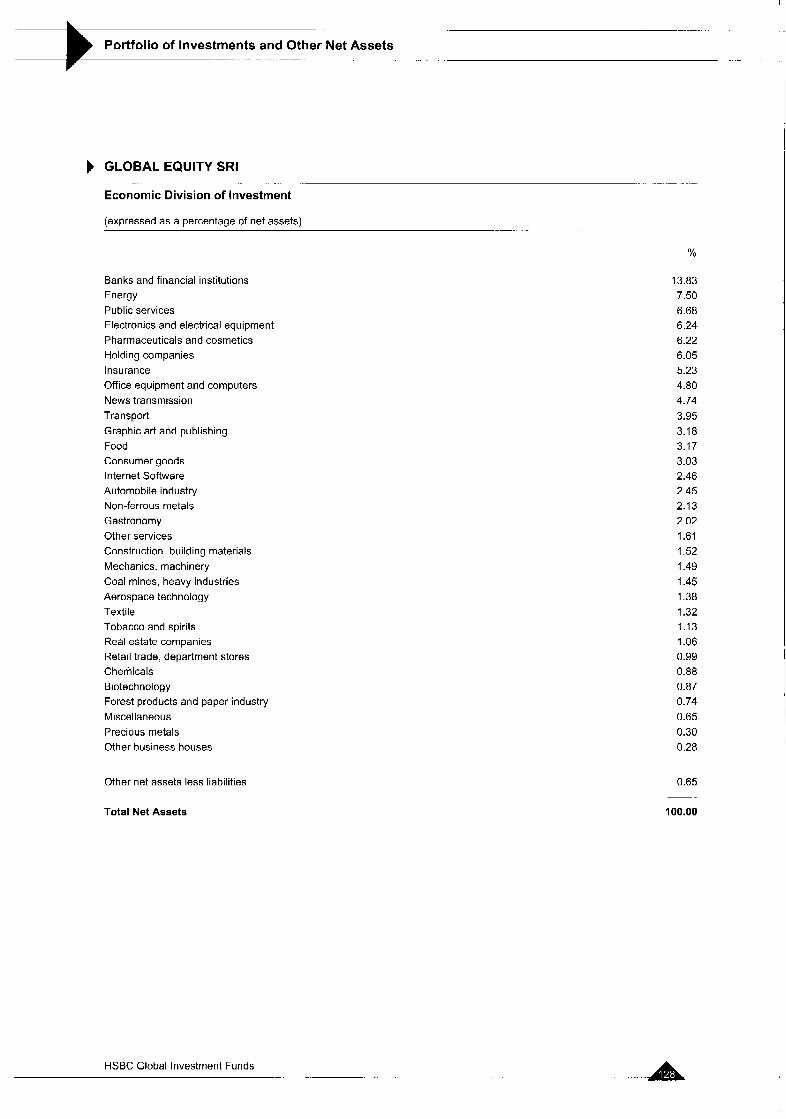
.-
Portfolio of Investments and Other Net Assets .-. . . _ _ .
GLOBAL EQUITY SRI
Economic Division of Investment -. . - ._ . -
(expressed as a percentage of net assets) - .- __
%
Banks and financial institutions Energy Public services Electronics and electrical equipment Pharmaceuticals and cosmetics Holding companies Insurance Office equipment and computers News transmission Transport Graphic art and publishing Food Consumer goods Internet Software Automobile industry Non-ferrous metals Gastronomy Other services Construction, building materials Mechanics, machinery Coal mines, heavy industries Aerospace technology Textile Tobacco and spirits Real estate companies Retail trade, department stores Chemicals Biotechnology Forest products and paper industry Miscellaneous Precious metals Other business houses
Other net assets less liabilities
Total Net Assets
13.83 7.50 6.68 6.24 6.22 6.05 5.23 4.80 4.74 3.95 3.18 3.17 3.03 2.46 2.45 2.13 2.02 1.61 1.52 I .49 1.45 1.38 1.32 1.13 1.06 0.99 0.88 0.87 0.74 0.65 0.30 0.28
0.65
100.00
HSBC Global Investment Funds - -.
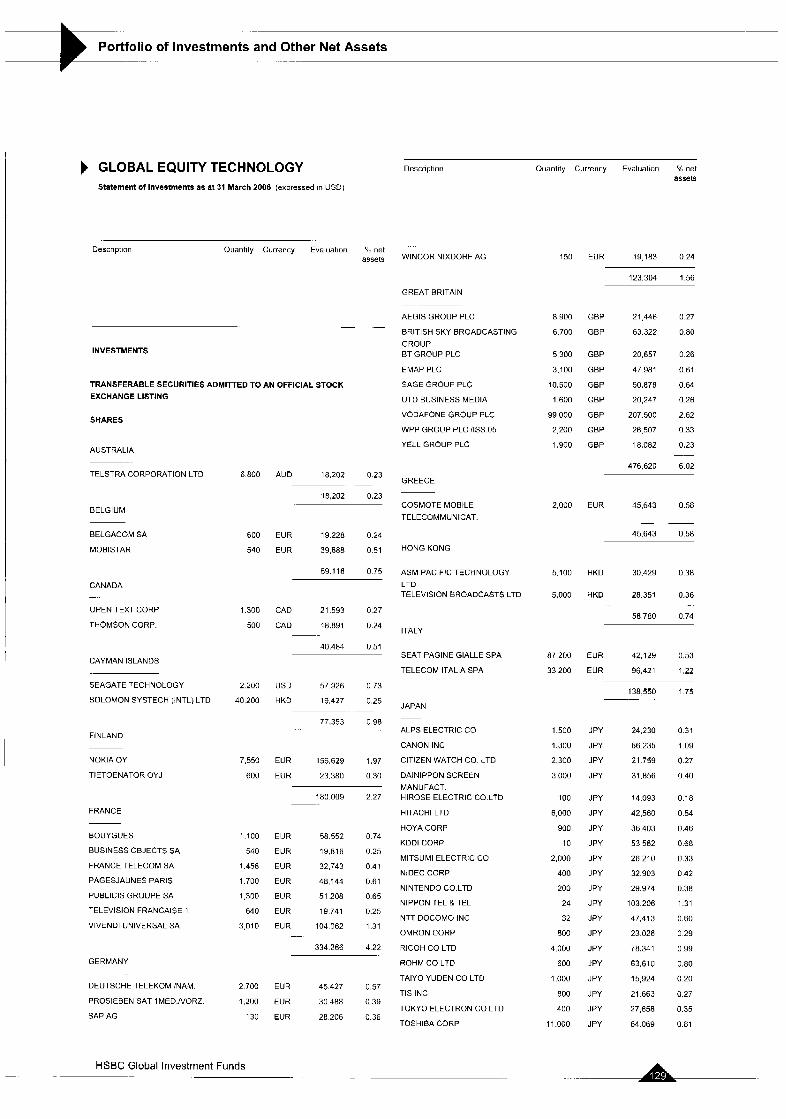
--
Portfolio of Investments and Other Net Assets =-..- ..
GLOBAL EQUITY TECHNOLOGY Statement of Investments as at 31 March 2006 (expressed in USD)
Description Quantity Currency Evaluation % net assets
.... Description Quantity Currency Evaluation "lo net
assets WINCOR NIXDORF AG 150 EUR 19183 0.24
123.304 1.56
GREAT BRITAIN
AEGIS GROUP PLC 8900 GBP 21 446 0 2 7
BRITISH SKY BROADCASTING 6,700 GBP 63.322 0 8 0 - -
GROUP ET GROUP PLC
EMAP PLC
SAGE GROUP PLC
UTD BUSINESS MEDIA
VODAFONE GROUP PLC
WPP GROUP PLC /ISS.O5
YELL GKOUP PLC
INVESTMENTS
TRANSFERABLE SECURITIES ADMITTED TO AN OFFICIAL STOCK
EXCHANGE LISTING
SHARES
5300 GBP 20.657
3.100 GBP 47981
10.500 GBP 50.878
1.600 GBP 20,247
99,000 GBP 207.500
2,200 GBP 26507
1.900 GBP 18.082
476.620
0.26
0.61
0.64
0.26
2.62
0 33
0.23 AUSTRALIA
6 02 TELSTRA CORPORATION LTD
BELGIUM
E 800
600
540
1.300
500
2.200
40 200
7.550
600
1,100
540
1.458
1700
1 300
640
3 u10
2 700
1,200
130
AUD 18,202 223 GREECE
0.23 ~
18,202 COSMOTE MOBILE
TELECOMMUNICAT.
2,000
5,100
5,000
87 200
33 200
1,500
1,300
2,300
3,000
100
6,000
900
10
2,000
400
200
24
32
800
4,000
600
1,000
800
400
11 000
EUR 45,643 0.58
-~
45.643 0.58 BELGACOM SA
MOBISTAR
EUR 19228 0.24
EUR 39.888 0.51 HONG KONG
59.116 0.75 ASM PACIFIC TECHNOLOGY LTD TELEVISION BROADCASTS LTD
HKD 30.429 0.38
CANADA -.
OPEN TEXT CORP
THOMSON CORP.
HKD 28.351 0.36
58.780 0 7 4 CAD 21.593 0 2 7
CAD 18.891 0.24 ITALY
40.484 0.51 SEAT PAGINE GIALLE SPA
TELECOM ITALIA SPA
EUR 42,129 0.53
EUR 96,421 1.22 CAYMAN ISLANDS
SEAGATE 'ECHNOLOGY
SOLOMON SYSTECH (INTL) LTD
US0 57926 0 73
HKD 19,427 0.25 138,550 175
JAPAN -
ALPS ELECTRIC CO
CANON INC
CITIZEN WATCH CO LTD
DAlNlPPON SCREEN
MANUFACT HIROSE ELECTRIC CO LTD
HlTACHl LTD
HOYA CORP
KDDl COHP
MlTSUMl ELECTRIC CO
NlDEC CORP
NINTENDO CO LTD
NIPPON TEL & TEL
NTT DOCOMO INC
OMRON CORP
RICOH CO LTD
ROHM CO LTD
TAIYO YUDEN CO LTD
TIS INC
TOKYO ELECTRON CO LTD
TOSHIEA COKP
77.353 0 9 8 JPY 24,230 0.31
JPY 86.235 1.09
JPY 21 759 0.27
JPY 31.856 0.40
JPY 14.093 0.18
JPY 42.560 0.54
JPY 36,403 0.46
JPY 53562 0.68
JPY 26,210 0.33
JPY 32.903 0 4 2
JPY 29.974 0.38
JPY 103.206 1.31
JPY 47413 0.60
JPY 23026 0 2 9
JPY 78.341 0 9 9
JPY 63,610 0.80
JPY 15,924 0.20
JPY 21.663 0.27
JPY 27,658 0.35
JPY 64069 0.81
FINLAND
NOKIA OY
TIETOENATOR OYJ
EUR 156,629 1.97
EUR 23.380 0.30
180009 2 2 7
FRANCE
BOUYGUES
BUSINESS OBJECTS SA
FRANCE TELECOM SA
PAGESJAUNES PARIS
PUBLICIS GROUPE SA
TELEVISION FRANCAISE 1
VIVENDI UNIVERSAL SA
EUR 58.552 0.74
EUR 19.816 0 2 5
EUR 32.743 0 4 1
EUR 48144 061
EUR 51 208 0.65
EUR 19,741 0.25
EUR 104.062 1.31
334.266 4.22
.-
GERMANY
DEUTSCHE TELEKOM INAM.
PROSIEBEN SAT 1 MED.NOR2.
SAP AG
EUR 45427 0.57
EUR 30488 0 3 9
EUR 28206 0 3 6
HSBC Global Investment Funds
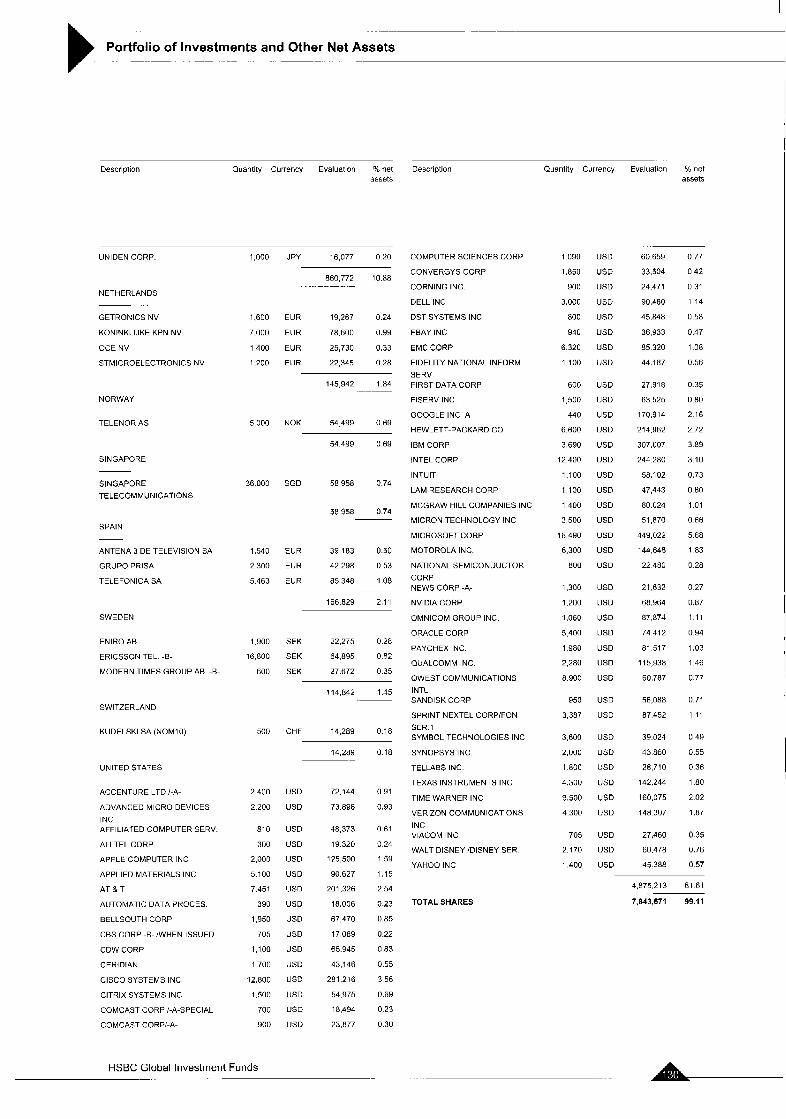
- -_ -
Portfolio of Investments and Other Net Assets - - -
Description Ouantity Currency Evaluation YO net Description Quantity Currency Evaluation YO net assets assets
UNIDEN CORP.
NETHERLANDS
GETROkICS NV
KONINKLIJKE KPN NV
OCE NV
STMICROELECTRONICS NV
NORWAY
TELENOR AS
SINGAPORE
SINGAPORE
TELECOMMUNICATIONS
SPAIN
ANTENA 3 DE TELEVISION SA
GRUPO PRlSA
TELEFONICA SA
SWEDEN
ENIRO AB
ERICSSON TEL -6-
MODERN TIMES GROUP AB -E-
SWITZERLAND
KUDELSKI SA (NOMIO)
UNITED STATES
ACCENTURE LTD I-A-
ADVANCED MICRO DEVICES
INC AFFILIATED COMPUTER SERV
ALLTEL CORP
APPLE COMPUTER INC
APPLIED MATERIALS INC
A T & T
AUTOMATIC DATA PHOCES
BELLSOUTH CORP
CBS CORP -B- !WHEN ISSUED
COW CORP
CEHlDlAN
CISCO SYSTEMS INC
ClTRlX SYSTEMS INC
COMCAST CORP i-A-SPECIAL
COMCAST CORPi-A-
1,000
1,600
7.000
1 400
1.200
5,000
36 000
1,540
2 300
5 463
1,900
16,800
600
500
2.400
2,200
a i 0
300
2.000
5,100
7.451
390
1,950
705
1,100
1 700
12,800
1,500
700
900
JPY 16,077 0 20
EUR 19.267 0.24
EUR 78.600 0.99
EUR 25,730 0.33
EUH 22,345 0.28
145,942 1.84
NOK 54499 0.69
54.499 0 6 9
SGD 58,958 0 7 4
58958 0.74
EUR 39,183 0.50
EUR 42298 0.53
EUR 85,348 I on . .. . ~
166,829 2.11
SEK 22,275 0.28
SEK 64.895 0.82
SEK 27.672 0.35
CHF 14289 0.18
USD
USD
USD
US0
US0
US0
USD
USD
US0
USD
USD
US0
US0
US0
USD
USD
14,289
72.144
73.898
48,373
19 320
125,500
90.627
201,326
18.006
67,470
17.089
65.945
43,146
281 216
I 8.494
54,975
23,877
HSBC Global Investment Funds -.
0.18
0.91
0.93
0.61
0 24
1 59
1.15
2.54
0.23
0.85
0.22
0.83
0.55
3 56
0.69
0.23
0.30
COMPUTER SCIENCES CORP
CONVERGYS CORP
CORNING INC.
DELL INC
DST SYSTEMS INC
EBAY INC
EMC CORP
FIDELITY NATIONAL INFORM
SERV FIRST DATA CORP
FISERV INC.
GOOGLE INC A
HEWLETT-PACKARD CO
IBM CORP
INTEL CORP
INTUIT
LAM RESEARCH CORP
MCGRAW HILL COMPANIES INC
MICRON TECHNOLOGY INC
MICROSOFT CORP
MOTOROLA INC.
NATIONAL SEMICONDUCTOR
CORP NEWS CORP -A-
NVlDlA CORP.
OMNICOM GROUP INC.
ORACLE CORP
PAYCHEX INC.
OUALCOMM INC.
QWEST COMMUNICATIONS
INTL SANDISK CORP
SPRINT NEXTEL CORPlFON
SER.l SYMBOL TECHNOLOGIES INC
SYNOPSYS INC.
TELLABS INC.
TEXAS INSTRUMENTS INC
TIME WARNER INC
VERIZON COMMUNICATIONS
INC VIACOM INC
WALT DISNEY 'DISNEY SER.
YAHOO INC
1090
1.850
900
3 000
no0 940
6 320
1100
600
1,500
440
6.600
3,690
12 400
1100
1,100
1 400
3 500
16,490
6.300
8oa
1,300
1,200
1.060
5 400
I 9ao
2,280
a goo
950
3,387
3.600
2,000
I aoo 4.300
9,500
4 300
705
2.170
1 400
u50
USD
USD
USD
u50
USD
u50
USD
u50
u50
USD
u50
USD
USD
USD
USD
USD
u50
u50
u50
USD
u50
USD
u50
USD
USD
u50
USD
USD
u50
USD
USD
USD
u50
u50
u50
USD
USD
USD
60 659
33.504
24.471
90,480
45.848
36 933
85 320
44.187
27,918
63 525
170.914
214.962
307,007
244 280
58 102
47,443
80 024
51,870
449,022
144.648
22 480
21,632
68.964
87,874
a i 517
115,938
74 412
60,787
56,088
87 452
39.024
43 860
28,710
142,244
160.075
148 307
27,460
60.47a
45 388
0.77
0 42
0 31
1 1 4
0.58
I .oa 0.47
0.56
0.35
0.80
2.16
2 72
3 89
3 10
0.73
0 60
1.01
0.66
5.68
1.83
0 28
0 27
0.87
1 1 1
0.94
1.03
1.46
u.77
0.71
1.11
0 49
0.55
0.36
I .ao 2.02
1.87
0 35
0.76
0.57
TOTAL SHARES 7,843,871 99.11
.
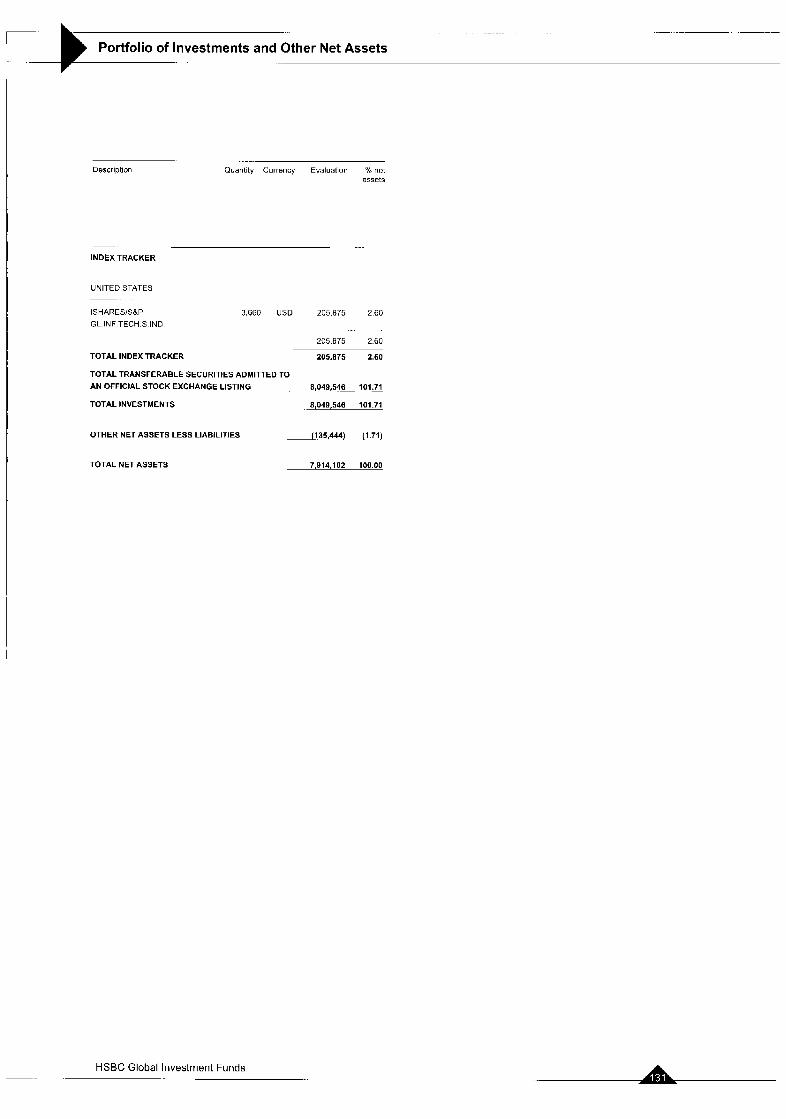
._
Portfolio of Investments and Other Net Assets -t Description Quantity Currency Evaluation "h net
assets
.
INDEX TRACKER
UNITED STATES
ISHARESISBP 3,660 US0 205875 2 6 0 GL INF TECH S IND
205875 2 6 0
TOTAL INDEX TRACKER 205,875 2.60
TOTAL TRANSFERABLE SECURITIES ADMITTED TO
AN OFFICIAL STOCK EXCHANGE LISTING 8 , 0 4 9 , 5 4 6 10171
TOTALINVESTMENTS 8,049,546 101 71
OTHER NET ASSETS LESS LIABILITIES (135,444) (1.71)
TOTALNETASSETS 7.914.102 100.00
HSBC Global Investment Funds -.
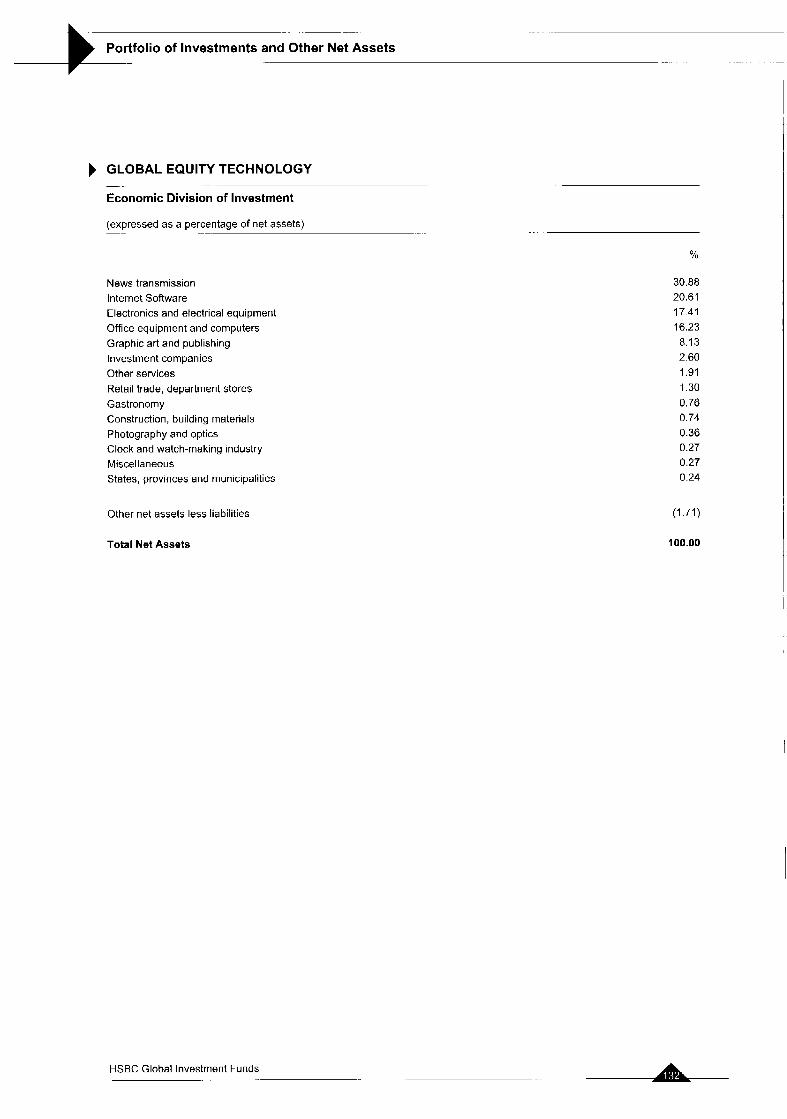
.. . -
Portfolio of Investments and Other Net Assets .- A- ..
b GLOBAL EQUITY TECHNOLOGY
Economic Division of Investment . .. -
.. . (expressed as a percentage of net assets)
.. -
News transmission Internet Software Electronics and electrical equipment Office equipment and computers Graphic art and publishing Investment companies Other services Retail trade, department stores Gastronomy Construction, building materials Photography and optics Clock and watch-making industry Miscellaneous States, provinces and municipalities
Other net assets less liabilities
Total Net Assets
HSBC Global Investment Funds -.
30.88 20.61 17.41 16.23 8.13 2.60 1.91 1.30 0.76 0.74 0.36 0.27 0.27 0.24
(1.71)
100.00
I
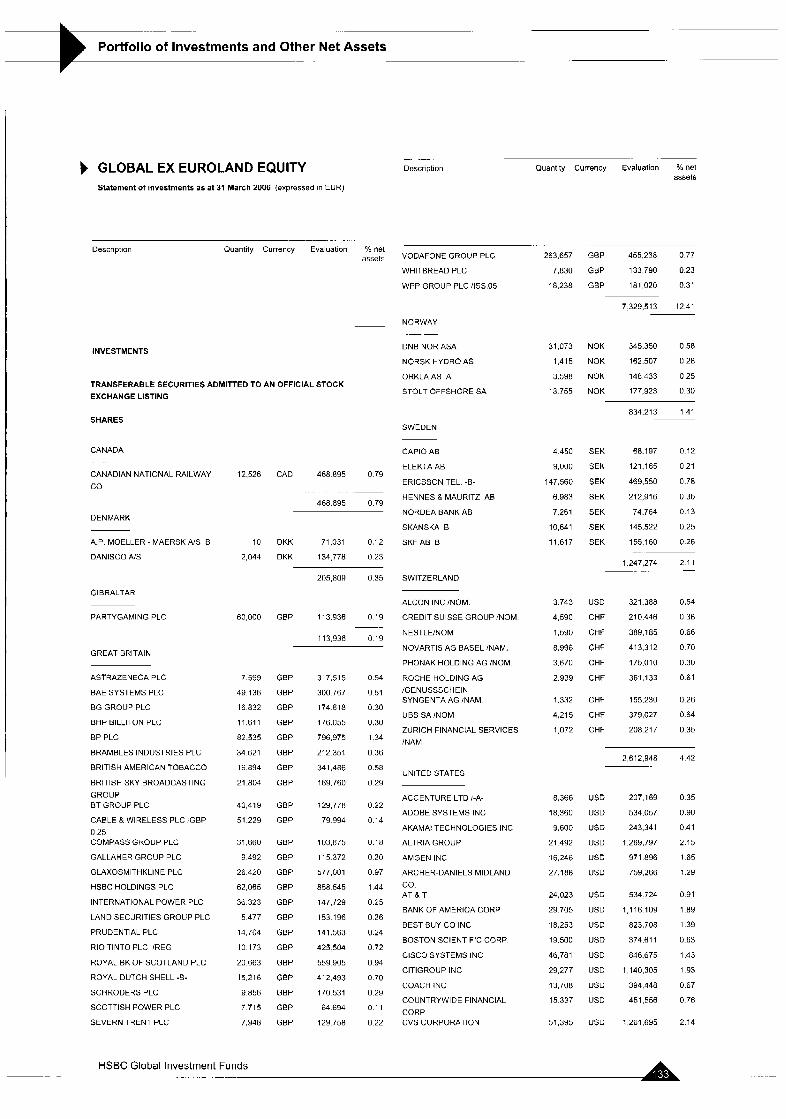
__ -
Portfolio of Investments and Other Net Assets _. . .
GLOBAL EX EUROLAND EQUITY Statement of investments as at 31 March 2006 (expressod in EUR)
_.
Description Quantity Currency Evaluation net assets
. . .
Description Quantity Currency Evaluation 263.657
7,830
18.238
31 073
1.415
3.598
13 755
4 450
9,000
147,560
C net VODAFONE GROUP PLC
WHITBREAD PLC
WPP GROUP PLC IlSS.05
GBP 455.238 0.77
GBP 133,790 0.23
GBP 181,020 0.31
7 329,513 12.41
~ NORWAY .- -
DNB NOR ASA
NORSK HYDHO AS
ORKLAAS A
STOLT OFFSHORE SA
NOK 345350 0.58
NOK 162.507 0 2 8
NOK 148433 0 2 5
NOK 177.923 030
INVESTMENTS
TRANSFERABLE SECURITIES ADMITTED TO AN OFFICIAL STOCK
EXCHANGE LISTING
SHARES 834.213 1 4 1
SWEDEN
CAP10 AB
ELEKTA AB
ERICSSON TEL -E- 0.79
CANADA SEK 68.197 0.12
SEK 121.165 0 2 1
SEK 469,550 0.78 CANADIAN NATIONAL RAILWAY
co 12.526 CAD 468.895
6.983 SEK 212,916 0.36
7.261 SEK 74.764 0.13
10,641 SEK 145.522 0.25
11.617 SEK 155,160 0.26
.~ 468 895 79 HENNES 8 MAURITZ AB
NOHDEA BANK AB
SKANSKA B
10 DKK 71.031 0 1 2 SKFAB B
2,1144 DKK 134778 0 2 3
205,809 0 35 SWITZERLAND
ALCON INC /NOM
60,000 GBP 113.936 0 1 Y CREDITSUISSE GROUP 'NOM ~-
19 NESTLEINOM 11 3.936
NOVARTIS AG EASEL jNAM.
DENMARK
A.P MOELLER - MAERSK AIS B
DANISCO AIS 1,247,274 2.1 1
~ . ...
GIBRALTAR 3743 USD 321.3e.e 0.54
4.590 CHF 210.446 0 3 6
1,590 CHF 389,185 0.66
8,996 CHF 413.312 0.70
PARTYGAMING PLC
GREAT BRITAIN PHONAK HOLDING AG INOM.
ROCHE HOLDING AG
iGENUSSSCHElN SYNGENTA AG jNAM.
UBS SA /NOM
ZURICH FINANCIAL SERVICES INAM
3.670
2 939
1.332
4,215
1,072
8,366
18.360
9,600
21 492
16,246
27.188
24,023
29 705
18,253
19.5UU
46.781
29,277
13,708
15 337
51,395
CHF
CHF
CHF
CHF
CHF
-
-
USD
USD
USD
u50
USD
u50
USD u50
USD
USD
u50
u50
USD
u50
USD
175.010
361,133
155,230
379,027
208 217
0.30
0.61
0.26
0.64
0.35
ASTRAZENECAPLC
BAE SYSTEMS PLC
BG GROUP PLC
BHP BILLITON PLC
BP PLC
BRAMBLES INDUSTRIES PLC
BRITISH AMERICAN 'TOBACCO
BRITISH SKY BROADCASTING
GROUP ET GROUP PLC
CABLE 8 WIRELESS PLC :GBP
u 25 COMPASS GHOUP PLC
GALLAHER GROUP PLC
GLAXOSMITHKLINE PLC
HSEC HOLDINGS PLC
INTERNATIONAL POWER PLC
LAND SECJRITIES GROUP PLC
PRUDENTIAL PLC
RIO TINTO PLC /REG
ROYAL BK OF SCOTLAND PLC
ROYAL DUTCH SHELL -B-
SCHRODEqS PLC
SCOTTISH POWER PLC
SEVERN T3ENT PLC
7599 GBP
49136 GBP
16832 GBP
11 611 GBP
82,535 GBP
34621 GBP
16 894 GBP
21.804 GBP
40419 GBP
51 229 GBP
:ji 660 GBP
9492 GBP
26420 GBP
62,065 GBP
36 323 GBP
5477 GBP
14,704 GBP
10173 GBP
20663 GBP
15216 GEP
9856 GBP
7715 GBP
7948 GBP
317,515
300 767
174.618
176.055
796.975
212 351
341,486
169,760
129,778
79.994
103,875
115.372
577.001
858 545
147 729
153.196
141.563
425.504
559 905
412,493
170 531
64 694
129 758
0.54
0 51
0.30
0.30
1.34
0.36
0.58
0 29
0.22
0.14
0.lR
0.20
0.97
1.44
0.25
0.26
0.24
0.72
0.94
0.7U
0.29
0.1 1
0.22
2,612,948 4.42
0.35
0.90
0.41
2.15
1.65
1.29
0.91
1.89
1.39
0.63
1.43
1.93
0.67
0.76
2.14
UNITED STATES
ACCENTURE LTD I-A-
ADOBE SYSTEMS INC
AKAMAI TECHNOLOGIES INC
ALTRIA GROUP
AMGEN INC
ARCHER-DANIELS MIDLAND
CO A T R T
BANK OF AMERICA CORP
BEST BUY CO INC
BOSTON SCIENTIFIC CORP.
CISCO SYSTEMS INC
ClTlGROUP INC
COACH INC
COUNTRYWIDE FINANCIAL
CORP CVS CORPORATION
207,169
534,057
243.341
1,269,797
971 896
759,266
534 724
1,116 109
823,708
374.61 1
846.675
1,140,305
394,448
451,556
1.261 695
HSBC Global Investment Funds .. - . ... -
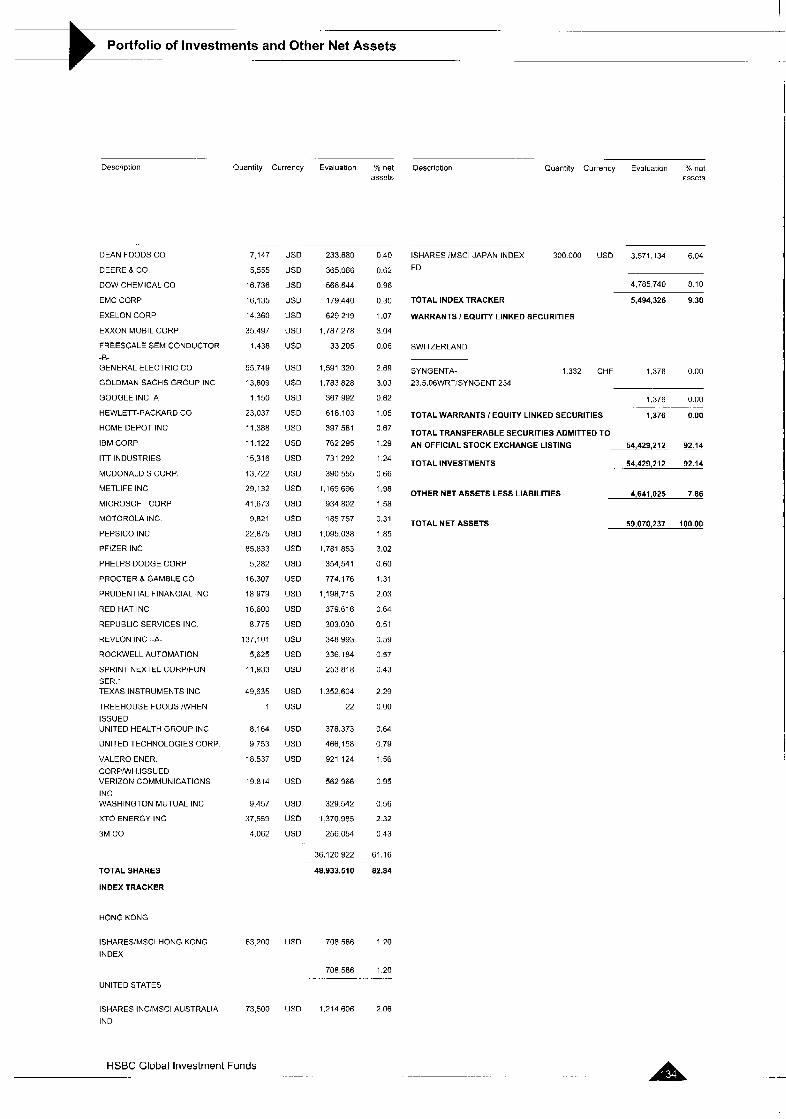
- ._
.. m e n t s , ~ Other Net Assets
.-
Description Quantity Currency Evaluation Yo net Description Quantity Currency Evaluation % net assots assets
DEAN FOODS CO
DEERE R CO
DOW CHEMICAL CO
EMC CORP
EXELON CORP
EXXON MOBlL CORP
FREESCALE SEMICONDUCTOR
-E- GENERAL ELECTRIC CO
GOLDMAN SACHS GROUP INC
GOOGLE INC A
HEWLETT-PACKARD CO
HOME DEPOT INC
IBM CORP
ITT INDUSTRIES
MCDONALD S CORP
METLIFE INC
MICROSOFT CORP
MOTOROLA INC
PEPSICO INC
PFIZER INC
PHELPS DODGE CORP
PROCTER & GAMBLE CO
PRUDENTIAL FINANCIAL INC
RED HAT INC
REPUBLIC SERVICES INC
REVLON INC '-A-
ROCKWELL AUTOMATION
SPRINT NEXTEL CORPlFON SER 1 TEXAS INSTRUMENTS INC
TREEHOUSE FOODS /WHEN
ISSUED UNITED HEALTH GROUP INC
UNITED TECHNOLOGIES CORP
VALERO ENER
CORPWH ISSUED VERIZON COMMUNICATIONS
INC WASHINGTON MUTUAL INC
XTO ENERGY INC
3M CO
TOTAL SHARES
INDEX TRACKER
HONG KONG
ISHARE5:MSCI HONG KONG
INDEX
7 147 USD
5,555 USD
16.736 USD
16,135 USD
14360 USD
35497 USD
1.438 USD
55749 USD
13,809 USD
1 150 US0
23,037 USD
11.388 US0
11 122 us0 15.316 USD
13.722 USD
29.132 US0
41.673 US0
9.821 US0
22.875 US0
85.833 US0
5,282 US0
16.307 US0
18979 US0
16,600 USD
8.775 USD
137,101 USD
5,625 US0
11,933 US0
49,635 USD
1 US0
0.164 US0
9753 USD
18537 USD
19814 USD
9.457 USD
37,559 US0
4,062 US0
233.680
365,086
566.644
179,440
629,219
1.787 278
33.205
1.591 320
1,703,028
367 992
618.103
397,581
762 295
731 292
390,555
1,169,696
934.802
185,757
1.095.038
1.701,853
354,541
774,176
1 198,715
379.61 6
303,030
348,993
336,184
253,818
1 352,604
22
370.373
466,158
921 124
562 966
329.542
1 370,985
256.054
0.40
0.62
0.96
0.30
1.07
3.04
0.06
2.69
3.03
0.62
1.05
0 67
1.29
1 24
0 66
1.98
1 58
0.31
1 .85
3.02
0.60
1.31
2.03
0 64
0.51
0.59
0 57
0.43
2 29
0 00
0.64
0.79
1 56
0 95
0.56
2.32
0 43
36,120,922 61.16
48,933,510 82.84
63200 US0 708,586 1 2 0
ISHARES lMSCl JAPAN INDEX 300 000 USD 3,571,134 6.04
FD -
4,785,740 8 10
TOTAL INDEX TRACKER 5,494,326 9.30
WARRANTS I EQUITY LINKED SECURITIES
SWITZERLAND
1.376 0.00 SYNGENTA- 1332 CHF
23.5.06WRTiSYNGENT 234
1.376 0.00
TOTAL WARRANTS / EQUITY LINKED SECURITIES 1.376 0.00
TOTAL TRANSFERABLE SECURITIES ADMITTED TO
. .- .
AN OFFICIAL STOCK EXCHANGE LISTING 5 4 , 4 2 9 9 2 1 2 . 92-14
TOTAL INVESTMENTS . . 54,429,212 92.14
OTHER NET ASSETS LESS LIABILITIES
TOTALNETASSETS
4,641,025 7.86
59,070,237 100.00
708,586 1.20
UNITED STATES
ISHARES INC/MSCI AUSTRALIA
IND 73,500 US0 1,214,606 2 0 6
HSBC Global Investment Funds .. . .
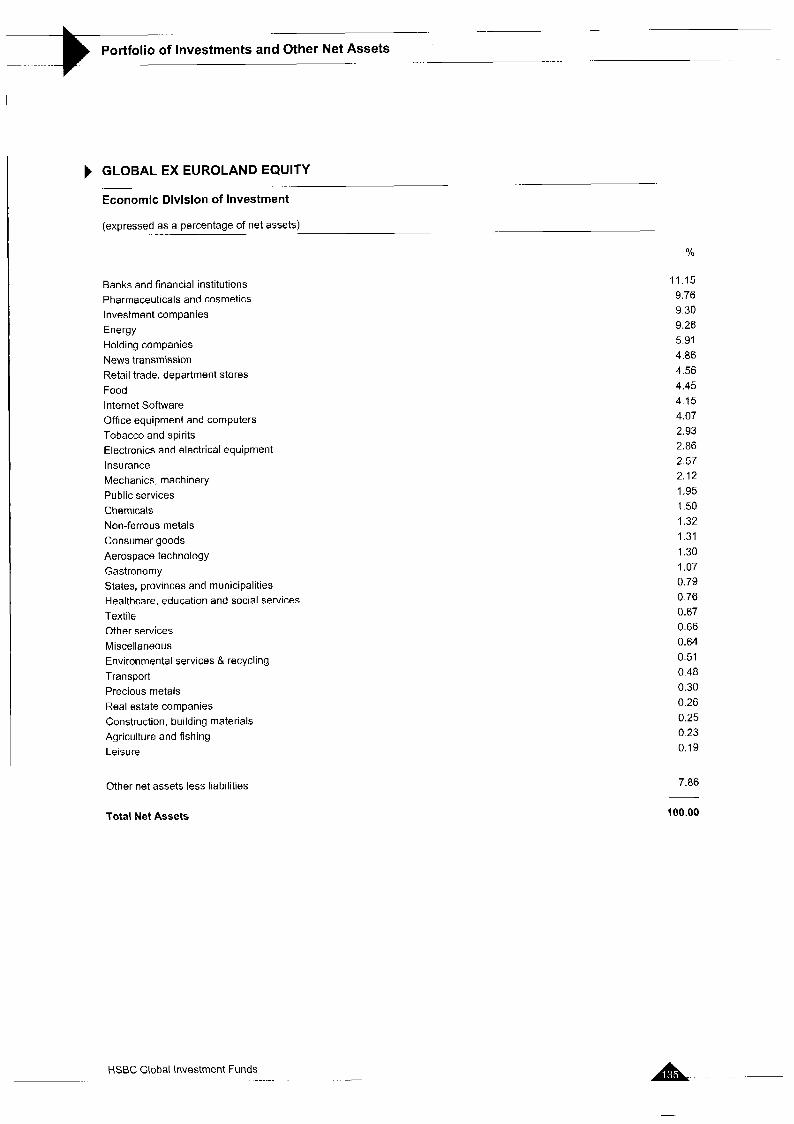
._ - - ._ ..
Portfolio of Investments and Other Net Assets -
GLOBAL EX EUROLAND EQUITY
Economic Division of Investment -. .~
(expressed as a percentage of net assets) .
Banks and financial institutions Pharmaceuticals and cosmetics Investment companies Energy Holding companies News transmission Retail trade. department stores Food Internet Software Office equipment and computers Tobacco and spirits Electronics and electrical equipment Insurance Mechanics, machinery Public services Chemicals Non-ferrous metals Consumer goods Aerospace technology Gastronomy States, provinces and municipalities Healthcare. education and social services Textile Other services Miscellaneous Environmental services & recycling Transport Precious metals Real estate companies Construction. building materials Agriculture and fishing Leisure
Other net assets less liabilities
Total Net Assets
HSBC Global Investment Funds . ..
11.15 9.76 9.30 9.26 5.91
4.56 4.45 4.15 4.07 2.93 2.86 2.57 2.12 1.95 1.50 1.32 1.31 1.30 1.07 0.79 0.76 0.67 0.66 0.64 0.51
0.30 0.26 0.25 0.23 0.19
4.86
0.48
7.86
100.00
A . .
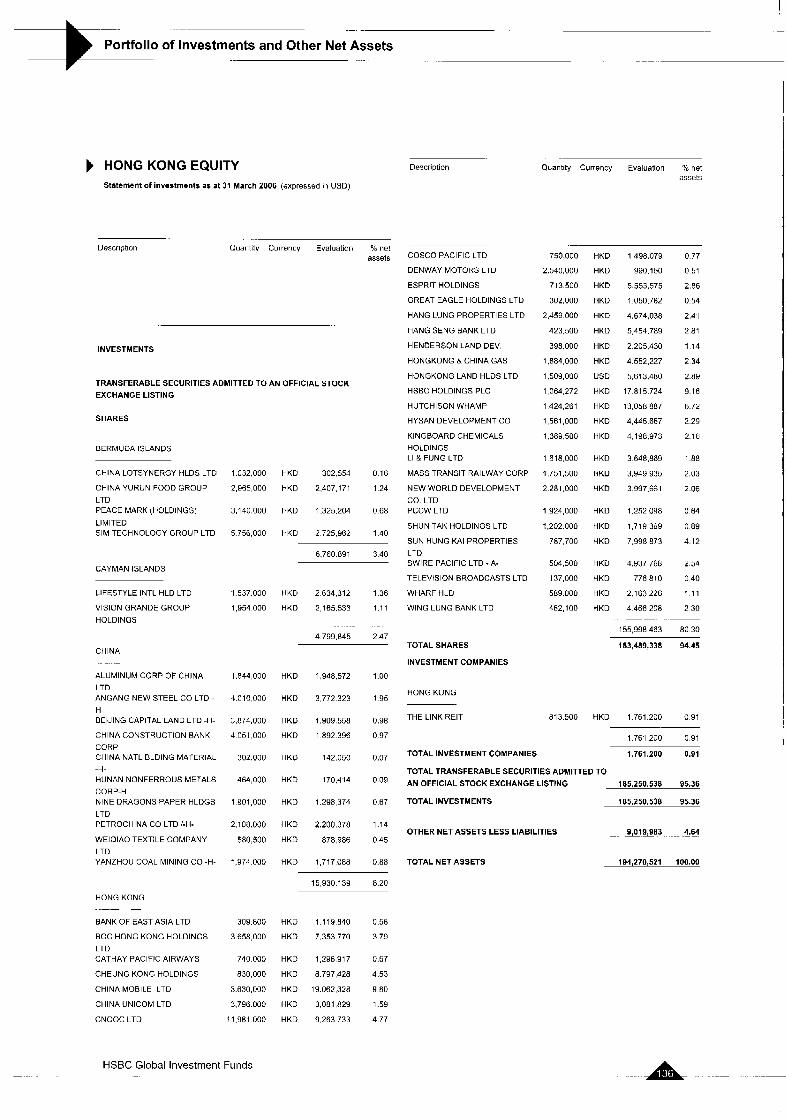
- .. ._ - ._
Portfolio of Investments and Other Net Assets . -_
HONG KONG EQUITY Statement of investments as at 31 March 2006 (expressed in USD)
Descriotion Quantity Currency Evaluation YO net assets
...
Description Quantity Currency Evaluation % net assets
0 16
1 24
0 68
1 40
COSCO PACIFIC LTD
DENWAY MOTORS LTD
ESPRIT HOLDINGS
GREAT EAGLE HOLDINGS LTO
HANG LUNG PROPERTIES LTD
HANG SENG BANK LTD
HENDERSON LAND DEV.
HONGKONG 8 CHINA GAS
HONGKONG LAND HLDS LTD
HSBC HOLDINGS PLC
HUTCHISON WHAMP
HYSAN DEVELOPMENT CO
KINGBOARD CHEMICALS
HOLDINGS LI 8 FUNG LTD
MASS TRANSIT RAILWAY CORP
NEW WORLD DEVELOPMENT
CO. LTD PCCn' LTD
SHUN TAK HOLDINGS LTD
SUN HUNG KAI PROPERTIES LTD SWIRE PACIFIC LTD ~ A-
TELEVISION BROADCASTS LTO
WHARF HLD
WING LUNG BANK LTD
750,000
2.540,OOO
713 500
302,000
2,459 000
423.500
398.000
1,884,000
1 509,000
1,06A,272
1424,261
1,561,000
1.389 500
1 618.000
1,751,500
2 281,000
1924,000
1,202 000
787.700
504 500
137,000
589 000
462,100
HKD
HKD
HKD
HKD
HKD
HKD
HKD
HKD
USD
HKD
HKD
HKD
HKD
HKD
HKD
HKD
HKD
HKD
HKD
HKD
HKD
HKD
HKD
1,498.079
990,150
5.553,575
1.050.782
4.674.038
5,454.789
2.205.430
4.552.227
5,613.480
17 815.724
13,058 887
4,445.667
4 198,973
3 648,859
3,949,935
3 997,fiBl
1,252,098
1,719 369
7.998 873
4,937,768
776,810
2.1 63,226
4.466.208
0 77
0 51
2 86
0 54
2 A I
2 81
1 1 4
2 34
2 89
9 16
6 72
2 29
2 16
1 88
2 03
2 U6
0 64
0 89
4 12
2 54
0 40
1 1 1
2 30
INVESTMENTS
TRANSFERABLE SECURITIES ADMITTED TO AN OFFICIAL STOCK EXCHANGE LISTING
SHARES
BERMUDA ISLANDS
CHINA LOTSYNERGY HLDS LTD 1.032.000
CHINA YURUN FOOD GROUP 2,965,000
LTD PEACE MARK (HOLDINGS) 3,140.000
LIMITED SIM TECHNOLOGY GROUP LTD 5 756,000
HKD 302.554
HKD 2,407,171
HKD 1,325,204
HKD 2725,962
6,760891 3 4 8
CAYMAN ISLANDS
LIFESTYLE INTL HLD LTD 1 537.000
VISION GRANDE GROUP 1,954 00[1
HOLDINGS
HKD 2634,312 1 3 6
HKD 2 165.533 Ill
. .-
4799.845 2 4 7
_ _ -~
155,998 463 80 30
TOTAL SHARES
INVESTMENT COMPANIES
183,489,338 94.45 CHINA .. ... . ...
ALUMINUM CORP OF CHINA
LTD ANGANG NEW STEEL CO LTD -
H- BElJlNG CAPITAL LAND LTD -H-
CHINA CONSTRUCTION BANK CORP CHINA NATL BLDING MATERIAL
-H- HUNAN NONFERROUS METALS
CORP-H NINE DRAGONS PAPER HLDGS
LTD PETROCHINA CO LTD /-H-
WElOlAO TEXTILE COMPANY
LTD YANZHOU COAL MINING CO -H-
1.844,OOO
4.010,OOO
3,874.000
4 051,000
302.000
464,000
1 901,000
2.108 000
580,500
1 974 000
HKD 1,948.572 1.00
HKD 3,772.323 1.95
HKD 1,909.558 0.98
HKD 1892.396 0.97
HKD 142.050 0.07
HKD 170,414 0.09
HKD 1.298374 0.67
HKD 2,200,378 1.14
HKD 878,986 0.45
HKD 1,717088 0.88
HONG KONG
THE LINK RElT 813.500 HKD 1.761.200 0 9 1
1.761.200 0 91
TOTAL INVESTMENT COMPANIES 1,761,200 0.91
TOTAL TRANSFERABLE SECURITIES ADMITTED TO AN OFFICIAL STOCK EXCHANGE LISTING 185,250,536 95.36
TOTAL INVESTMENTS 185.250.538 95.36
OTHER NET ASSETS LESS LIABILITIES . . . 9,019,983 . 4.64
TOTAL NET ASSETS 194,270,521 100.00
15,930.139 8.20
HONG KONG -
BANK OF EAST ASIA LTD 309,800
BOC HONG KONG HOLDINGS 3 658,000
LTD CATHAY PACIFIC AIRWAYS 740 000
CHEUNG KONG HOLDINGS 830.000
CHINA MOBILE LTD 3.630,OOO
CHINA UNICOM LTD 3.796 000
CNOOC LTD 11,981 000
HKD 1119840 0 5 8
HKD 7353770 3 7 9
HKD 1296917 0 6 7
HKD 8797428 4 5 3
HKD 19062,328 9 8 0
HKD 3,081 829 1 5 9
HKD 9263733 4 7 7
HSBC Global Investment Funds -
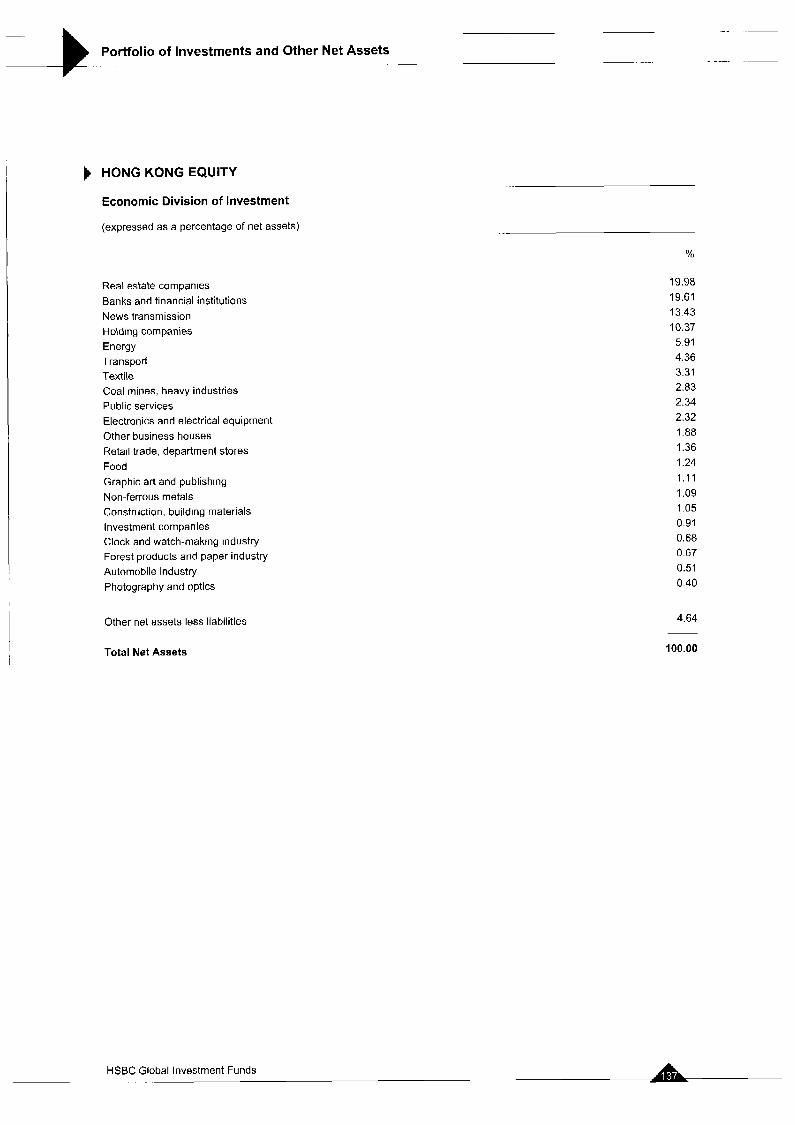
Portfolio of Investments and Other Net Assets . _._ . __
HONG KONG EQUITY
Economic Division of Investment
(expressed as a percentage of net assets)
Real estate companies Banks and financial institutions News transmission Holding companies Energy Transport Textile Coal mines, heavy industries Public services Electronics and electrical equipment Other business houses Retail trade. department stores Food Graphic art and publishing Non-ferrous metals Construction. building materials Investment companies Clock and watch-making industry Forest products and paper industry Automobile industry Photography and optics
Other net assets less liabilities
%
19.98 19.61 13.43 10.37 5.91 4.36 3.31 2.83 2.34 2.32 1.88 1.36 1.24 1.11 1.09 1-05 0.91 0.68 0.67 0.51 0.40
4.64
Total Net Assets 100.00
HSBC Global Investment Funds -
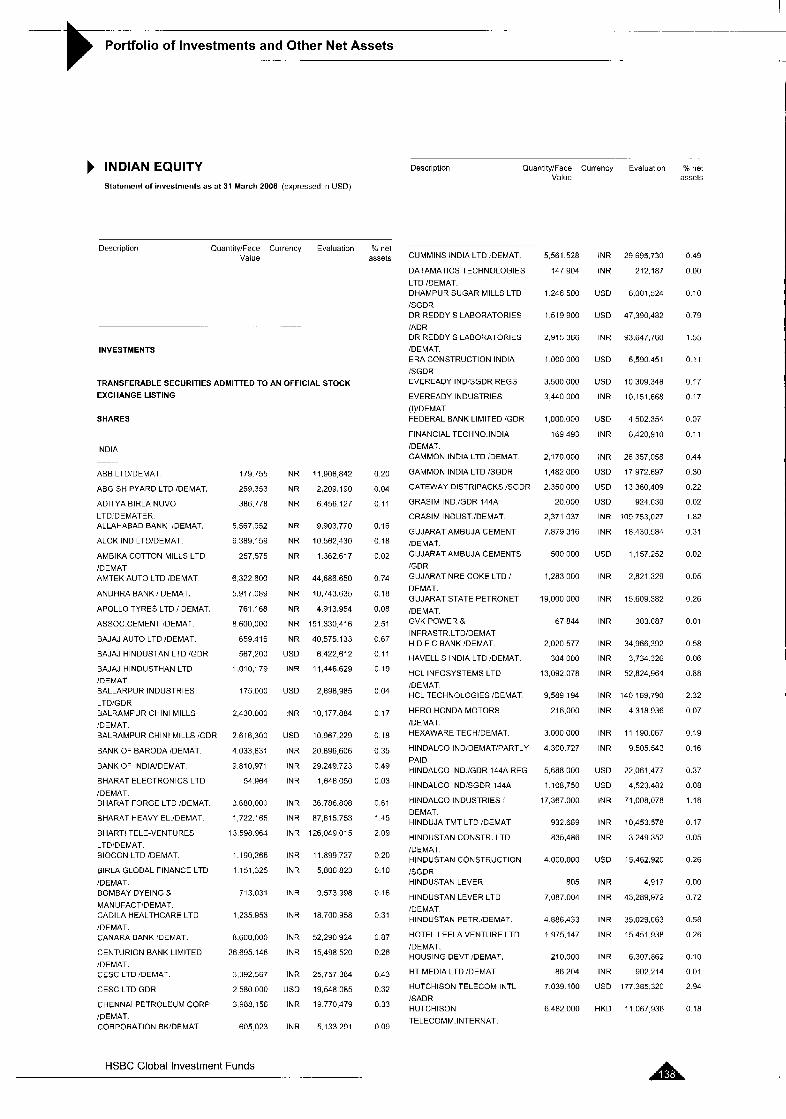
.~ -.
Portfolio of Investments and Other Net Assets ._ . -
- -
INDIAN EQUITY Statement of investments a s at 31 March 2006 (expressed in USD)
-. . .
Description OuantityIFace Currency Evaluamn % net Value assets
Description Ouantity'Face Currency Evaluation Value
C net assets 5,561.528
147 904
INR 29 695,730
INR 212,187
0.49
0 00
CUMMINS INDIA LTD iDEMAT
DATAMATICS TECHNOLOGIES
LTD /DEMAT DHAHPUR SUGAR MILLS LTD
/SGDR DR REDDY S LABORATORIES
/ADR DR REDDY S LABORATORIES
IDEMAT ERA CONSTRUCTION INDIA
iSGDR EVEREAOY INDISGDR REGS
EVEREADY INDUSTRIES
(1)IDEMAT FEDERAL BANK LIMITED iGDH
FINANCIAL TECHNO INDIA
IDEMAT GAMMON INDIA LTD IDEMAT
GAMMON INDIA LTD 'SGDR
GATEWAY DlSTRlPACKS ISGDI
GRASIM IND IGDR 144A
GRASIM INDUST iDEMAT
GUJARAT AMBUJA CEMENT iDEMAT GUJARAT AMBUJA CEMENTS
:GDR GUJARAT NRE COKE LTD I
DEMAT GUJARAT STATE PETRONET
IDEMAT GVK POWER 8 INFRASTR LTD/DEMAT H D F C BANK 'DEMAT
HAVELL S INDIA LTD IDEMAT
1 246 500
1 519 900
USD 6.001 924
US0 47.390.482
INR 93,647,760
0 10
0 79 .. . ...
INVESTMENTS
2,915 3fi6 1 55
1 000 000
3,500,000
3 440 000
1,000.000
169 493
USD 6.590451
USD I O 309.34a
INR 10.151.668
0 11
0 17
0.17
TRANSFERABLE SECURITIES ADMITTED TO AN OFFICIAL STOCK
EXCHANGE LISTING
SHARES USD 4,502.354
INR 6,420,810
0.07
0 11
INDIA 2,170,000
1,482,000
2.350,OOO
20,000
2,371 037
7.879.316
INR 26,357,058
US0 17 972.697
USD 13.3ao.409
INK in9 753,027
INR 18 4 3 0 . ~ a 4
USD 924C30
0.44
0 30
0.22
0 02
1 82
0 31
ABB LTD.DEMAT
ABG SHIPYARD LTD IDEMAT.
ADITYA BIRLA NUVO
LTD,DEMATER ALLAHABAD BANK IDEMAT
ALOK IND LTD'DEMAT
AMBIKA COTTON MILLS LTD
lDEMAT AMTEK AUTO LTD rDEMAT
ANDHRA BANK I DEMAT
APOLLO TYRES LTD I DEMAT
ASSOC CEMENT 'DEMAT
BAJAJ AUTO LTD IDEMAT
BAJAJ HINDUSTAN LTD 'GDR
BAJAJ HINDUSTHAN LTD IDEMAT BALLARPUR INDUSTRIES
LTDiGDR BALRAMPUR CHIN1 MILLS
/DEMAT BALRAMPUR CHIN1 MILLS rGDR
BANK OF BARODA IDEMAT
BANK OF INDIAIDEMAT
BHARAT ELECTRONICS LTD
iDEMAT BHARAT FORGE LTD 'DEMAT
BHARAT HEAVY EL IDEMAT
179.755
259.353
386.778
INR
INR
INR
11,906 842
2,209.1 90
6 456 127
0.20
0.04
0.1 1
?
5,567.952
6 389.159
257,575
6,322 600
5,917.089
761.168
8 600,000
659 416
567,200
1,010,179
175 000
INR
INR
INR
INR
INR
INR
INR
INR
USD
INR
USD
9,903,770
10.562 430
1 362.617
44.686 650
10.743.635
4.913.954
151 330416
40,575.133
6 422,612
11,446.629
2 696,985
10 177.884
0.16
0.18
0.02
0.74
0.18
0.08
2.51
0.67
0.1 1
0 19
0 04
500.000 USD 1.157252 0.02
1,283.000
19.000 000
INR 2,821 229
INR 15,609.C.82
INR 383C87
0.05
0 26
67 844 0 01
2.020 577
304 000
13,092,078
9,589 194
216.000
INR 34,966,592
INR 3,734 326
INR 52,824,564
INR 140 lfi9.790
INR 4318C36
0 58
0 06
0 88
2 32
0 07
HCL INFOSYSTEMS LTD
IDEMAT HCL TECHNOLOGIES :DEMAT
HEROHONDAMOTORS
IDEMAT. HEXAWARE TECHIDEMAl
HINDALCO INDIDEMATPARTLY
PAID HINDALCO IND./GDR 144A REG
HINDALCO INDISGDR 144A
HINDALCO INDUSTRIES /
DEMAT HINDUJA TMT LTD IDEMAT
2.430 000 INR 0 17
3.000 000
4.300.727
INR 11 190.C67
INR 9505543
0 19
0.16
2 616,300
4 033 831
9 810,971
54 964
3 680.000
1722,165
USD
INR
INR
INR
INR
INR
10 967,229
20 896,606
29.249 723
1.646 050
36 786.808
87 fil5.753
0.18
0 35
0.49
0.03
0.61
1 4 5
5,688.000
1 108,750
17,367.000
USD 22,061,477
US0 4,523482
INR 71,008,C.78
INR 10.453 578
INR 3249352
US0 15,462.920
INR 4,517
INR 43,289 572
INR 35,029,C63
INR 15451.038
0.37
0.08
1.18
932.689
835,486
0.17
0.05 BHARTI TELE-VENTURES 13 598 964 INR 126.049.015 2.09 HINDUSTAN CONSTR, LTD LTDiDENAT BIOCON LTD IDEMAT. 1,190,266 INR 11,899,727 0.20 IDEMAT' HINDUSTAN CONSTRUCTION 4.000.000
805
7.087.004
0.26
0.00
0.72
BIRLA GLOBAL FINANCE LTD 1 151 325 INR 5,806 823 0.10 !$GDR
IDEMAT HINDUSTAN LEVER BOMBAY DYEING 8 713.031 INR 9,573,998 0.16 LEVER LTD
MANUFACTIDEMAT. CADILA HEALTHCARE LTD 1,235 953 INK 18.700,958 0.31 HINDUSTAN PETR IDEMAT.
IDEMAT.
IDEMAT
CANARA BANK iDEMAT. ~I .WI 000 INR 52,290 924 o 87 HOTEL LEELA VENTURE LTD
CENTURION BANK LIMITED 26.695.148 INR 15,49a.520 0.26 'DEMAT.
HOUSING DEVT iDEMAT. IDEMAT. CLSC LTD IDEMAT. 3,392 5fi7 INR 25.757 384 0.43 HT LTD ;OEMAT
CESC LTD GDR 2 580.000 USD 19.548.085 0.32 TELECoM lNTL
4 886,433
1,975,147
0.58
0.26
210.000
86.204
7.039 100
INR 6,307.862
INR 902.214
US0 177 385,320
HKD 11 067,936
0.10
0.01
2.94 033 iSADR
HUTCHISON CHENNAI PETROLEUM CORP 3 988.156 INR 19 770,479 IDEMAT CORPOHATION EK'DEMAT 605023 INR 5.133291
o9 TELECOMM INTERNAT
6.482 000 0.18
HSBC Global Investment Funds
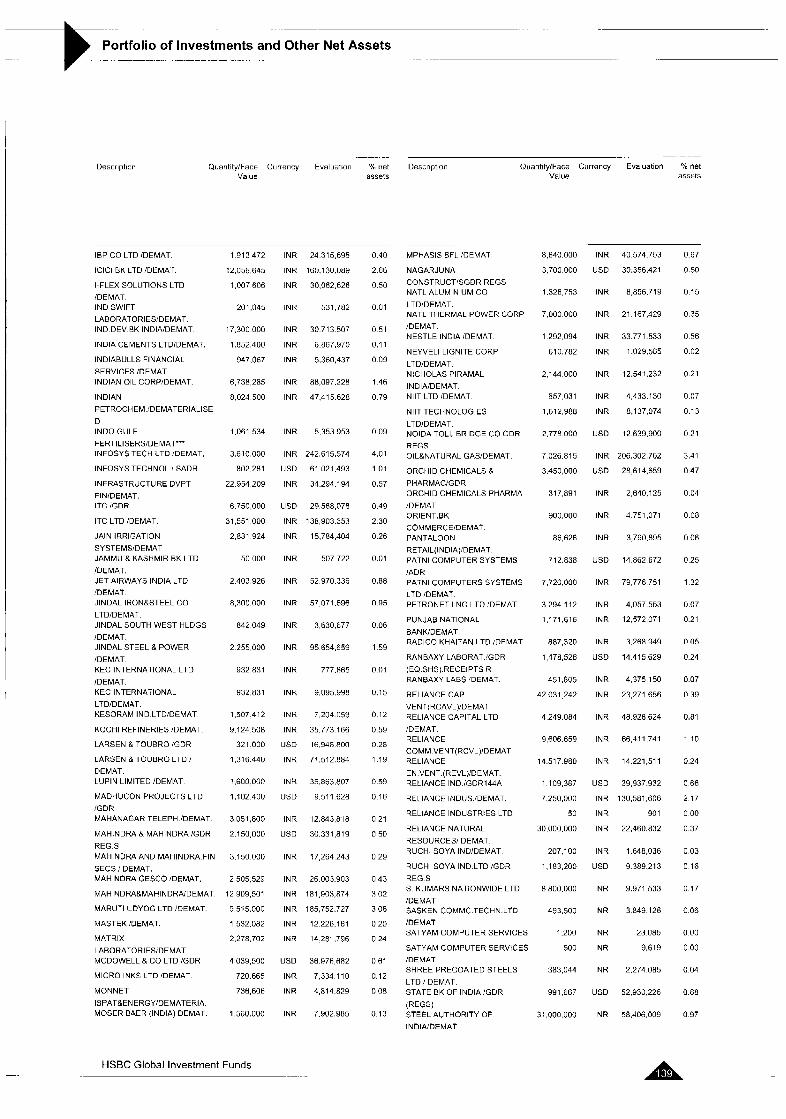
-. .. . .. ..
Portfolio of Investments and Other Net Assets ... . ... ... . . . . . . . ._ _. . . .. . . . .
Descriuticn
.- . . __ _. .
QuantitylFace Currency Evaluation % net Description Quantity/Face Currency Evaluation net Value assets Value assets
IBP CO LTD IDEMAT
IClCl BK LTD 'DEMAT
I FLEX SOLUTIONS LTD rDEMAT IND SWIFT
LABORATORIES'DEMAT IND DEV BK INDlAiDEMAT
INDIA CEMENTS LTDIDEMAT
INDIABULLS FINANCIAL
SERVICES IDEMAT INDIAN OIL CORPiDEMAT
INDIAN
PETROCHEM 'DEMATERIALISE
D INDO GULF
FERTILISERS/DEMAT"- INFOSYS TECH LTD rDEMAT
INFOSYS TECHNOL I SADR
INFRASTRUCTURE DVPT
FINIDEMAT ITC rGDR
ITC LTD DEMAT
JAlN IRRIGATION
SYSTEMS'DEMAT JAMMU 8. KASHMIR BK LTD
IDEMAT JET AIRWAYS INDIA LTD 'DEMAT JINDAL IRON&STEEL CO LTD'DEMAT JINDAL SOUTH WEST HLDGS
'DEMAT JINDAL STEEL & POWER
IDEMAT KEC INTERNATIONAL LTD
IDEMAT KEC INTERNATIONAL
LTD/DEMAT KESORAM IND LTD'DEMAT
KOCH1 REFINERIES 'DEMAT
LARSEN & TOUBRO 'GDR
LARSEN & TOUBRO LTD ' DEMAT LUPIN LIMITED lDEMAT
MADHUCON PROJECTS LTD lGDR MAHANAGAK TELEPH rDEMAT
MAHINDRA & MAHINDRA 'GDR
REG S MAHINDRA AND MAHINDRA FIN
SECS / DEMAT MAHINDRA GESCO lDEMAT
MAHINDRA&MAHINDRA!DEMAT
MARUTI LDYOG LTD lDEMAT
MASTEK 'DEMAT
MATRIX
LABORATORIES'DEMAT MCDOWELL 8. CO LTD :GDR
MICRO INKS LTD 'DEMAT
MONNET
ISPATgENERGY'DEMATERIA MOSER B4ER (INDIA) DEMAT
1.91 3 472
12,056,645
1,007 606
201,045
17,300 000
1,852,400
947.067
6,738,285
8,024 500
1.061 534
3,610,000
802.281
22.954 209
6.750,OOO
31,551,000
2.831 924
50 000
2.403.926
8,:300.000
842 049
2 255,000
932 831
932,831
1.507 412
9.124 508
321 000
1,316.440
1.600 000
1,102.400
3,051,800
2.150 000
3,150 000
2.505.529
12 909,501
9,515.000
1 532.082
2,278,702
4 039,500
720.665
736,606
1,560.000
INR 24.315.695
INR 1 6 o . i m o w
INR 30,062,626
INK 531 782
INR 30.713 507
INR 6.867,970
INK 5,360,437
INR 8n,097.228
INR 47.415 628
INR 5.353953
INR 242,615,574
US0 61 021.493
INR 34.294 194
US0 29.588.078
INR 138 903.353
INR 15,784,404
INR 507722
INR 52 970.336
INR 57 071.696
INR 3630,677
INR 95 654,659
INR 777.865
INR 9,095.998
INK 7.204059
INR 35.773 166
USD 16.948 800
INR 71.512.884
INH 35,863,607
USD 9.511 628
INR 12.043.818
USD 30,331,819
INR 17.264 243
INR 26003903
INK 181 903,874
INR 185,752.727
INR 12226.161
INR 14 281.796
LED 36976682
INR 7334 110
INR 4,814.829
INR 7.902.985
0.40
2.66
0.50
0.01
0.51
0.11
0.09
1 46
0.79
0 09
4.01
1 0 1
0.57
0.49
2 30
0 26
0.01
0.88
I1 9s
0 06
1.59
0.01
0.15
0.12
0.59
0.28
1.19
0.59
0.16
0 21
0 50
0 29
0 43
3 02
3.08
0 20
0 24
0 61
0.12
0.08
0.13
MPHASIS BFL 'DEMAT
NAGARJUNA
CONSTRUCT'SGDR REGS NATL ALUMINIUM CO LTD'DEMAT NATL THERMAL POWER CORP
lDEMAT NESTLE INDIA IDEMAT
NEYVELI LIGNITE CORP
LTD'DEMAT NICHOLAS PIRAMAL
INDlAiDEMAT NllT LTD 'DEMAT
NllT TECHNOLOGIES
LTD'DEMAT NOlDA TOLL BRIDGE CO GDR REGS OIL&NATURAL GASiDEMAT
ORCHID CHEMICALS 8 PHARMAC'GDR ORCHID CHEMICALS PHARMA
(DEMAT ORIENT BK COMMERCE'DEMAT PANTALOON
RETAIL(IND1A)'DEMAT PATNl COMPUTER SYSTEMS
'ADR PATNl COMPUTERS SYSTEMS
LTD 'DEMAT PETRONET LNG LTD 'DEMAT
PUNJAB NATIONAL
BANK:DEMAT RADICO KHAITAN LTD 'DEMAT
RANBAXY LABORAT 'GDR
(EO SHS) RECEIPTS R RANBAXY LABS 'DEMAT
RELIANCE CAP
VENT(RCAVL)rDEMAT RELIANCE CAPITAL LTD
'DEMAT RELIANCE COMM VENT(RCVL)'DEMAT RELIANCE
EN VENT (REVL)lDEMAT RELIANCE IND rGDR144A
RELIANCE INDUS 'DEMAT
RELIANCE INDUSTRIES LTD
RELIANCE NATURAL
RESOURCES DEMAT RUCHI SOYA INDIDEMAT
RUCHI SOYA IND LTD 'GDR
REG S S KUMARS NATIONWIDE LTD
/DEMAT SASKEN COMMC TECHN LTD
!DEMAT SATYAM COMPUTER SERVICES
SATYAM COMPUTER SERVICES /DEMAT SHREEPRECOATEDSTEELS
LTD I DEMAT STATE BK OF INDIA 'GDR
(REGS) STEEL AUTHORITY OF
INDIA,DEMAT
8,640.000
3,700 000
1,326 753
7.000 000
1.292.094
610.782
2,144 000
657,031
1,612,988
2.778 000
7 026.815
3,450,000
317,891
900,000
86,626
712.838
7,720.000
3294112
1,171.616
887,320
1 478,526
451,805
42 031 242
4 249.084
9,606.659
14.517 980
1 109.387
7,150,000
50
30,000,000
207,100
1,183,200
8.800.000
493.500
1,200
500
383,044
991,667
31,000,000
INR 40 574.753
US0 30.356.421
INR 8,856.719
INR 21 167.429
INR 33.771.533
INR 1.029.585
INR 12.541.232
INR 4433.130
INR 8,137.074
US0 12 639.900
INR 206,302.762
US0 28 614,659
INR 2,640,125
INR 4751,071
INR 3,790.895
USD 14862672
INR 79,776 751
INR 4,057.553
INR 12.572 071
INK 3.268949
USD 14.415 629
INR 4,375 150
INR 23,271 656
INR 48.928.624
INR 66,411.741
INR 14221,511
US0 39,937.932
INR 130,581 606
INR 901
INR 22,460.032
INR 1648.036
USD 9 389.213
INR 9.971.533
INR 3849 126
INR 23.085
INR 9,619
INR 2.274085
USD 52,930.226
INR 58.406.009
0.67
0.50
0.15
0.35
0.56
0.02
0.21
0.07
0.13
0 21
3.A1
0 47
0.04
0.08
0 06
0 25
1 32
0.07
0.21
0.05
0.24
0.07
0.39
0.81
1.10
0.24
0 66
2 17
0 00
0.37
0 03
0 16
0.17
0.06
0.00
0 00
0.04
0.88
0.97
HSBC Global Investment Funds
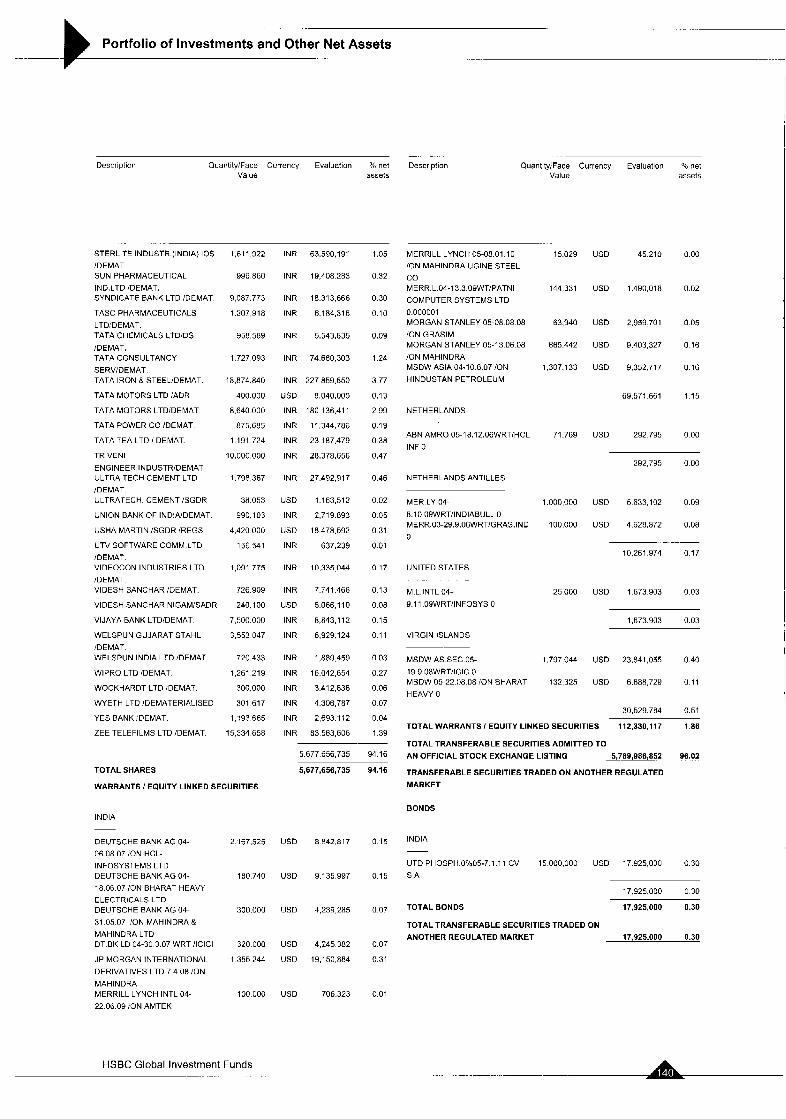
.
Portfolio of Investments and Other Net Assets __. ...
-. .
Description QuantityIFace Currency Evaluation Yo net Description Value assets
STERLITE INDUSTR (INDIA) IO$
/DEMAT SUN PHARMACEUTICAL
IND LTD IDEMAT SYNDICATE BANK LTD IDEMAT
TASC PHARMACEUTICALS
LTWDEMAT TATA CHEMICALS LTDIDS
IDEMAT TATA CONSULTANCY
SERVIDEMAT TATA IRON 8 STEEL!DEMAT
TATA MOTORS LTD :ADR
TATA MOTORS LTDIDEMAT
TATA POWER CO IDEMAT
TATA TEA LTD I DEMAT
TRlVENl
ENGINEER INDUSTRIDEMAT ULTRA TECH CEMENT LTD IDEMAT ULTRATECH CEMENT ISGDR
UNION BANK OF INDIAIDEMAT
USHA MA3TIN ISGDR /REGS
UTV SOFTWARE COMM LTD
iDEMAT VIDEOCON INDUSTRIES LTD
/DEMAT VIDESH SANCHAR DEMAT
VIDESH SANCHAR NlGAMiSADR
VIJAYA BANK LTDiDEMAT
WELSPUN GUJARAT STAHL
iDEMAT WELSPUN INDIA LTD IDEMAT
WIPRO LTD IDEMAT
WOCKHARDT LTD IDEMAT
WYETH LTD IDEMATERIALISED
YES BANK iDEMAT
ZEE TELEFILMS LTD /DEMAT
TOTAL SHARES
1,611,922
996 a60
9,087.773
1,207,918
958,589
1,727,093
18,874.840
400.000
8.640 000
875,685
1191.724
10.000,000
1,798,367
38.053
9 YO, 103
4,420.000
156 541
1,091 775
726.909
240,100
7 500.000
3.553 047
720.433
1,261 219
300,000
301 617
1,193.665
15.334 658
INR 63,590,191
INR 19,408 283
INR 18.313.666
INR 6,184,316
INR 5,543,835
INR 74.680.303
INR 227 859.650
US0 8,040,000
INR i a o 136.411
INR 23 187.479
INR 11,344.786
INR 28,378,656
INR 27,492,917
US0 1,163,512
INR 2,719 a93
US0 18.478.592
INR 637,239
INR 10.335 044
INR 7.741 466
US0 5,066,110
INR 8,843 112
INR 6.929124
INR 1,889459
INR 16.042 654
INR 3,412,836
INR 4,306787
INR a3 583,606
INR 2,693.112
1.05
0.32
0.30
0.10
0.09
1.24
3.77
0.13
2.99
0.19
0.38
0.47
0.46
0.02
0.05
0.31
0.01
0.17
0.13
0.08
0.15
0.1 1
0.03
0.27
0.06
0.07
0.04
1 39
WARRANTS I EQUITY LINKED SECURITIES
INDIA
DEUTSCHE BANK AG 04- 2 167 525 06 OR 07 ION HCL-
INFOSYSTEMS LTD DEUTSCHE BANK AG 04-
l a 06 07 /ON BHARAT HEAVY i a0 740
ELECTRICAL5 LTD DEUTSCHE BANK AG 04-
31 05 07 :ON MAHINDRA & MAHINDRA LTD DT BK LO 04-30 3 07 WRT !ICICI
JP MORGAN INTERNATIONAL
DERIVATIVES LTD 7 4 08 /ON
MAHINDRA MERRILL LYNCH INTL 04-
22 06 09 ION AMTEK
300 000
320 000
1 355 244
100 000
5.677 656.735 94 16
5,677:656,735
US0 8842.817
USD 9,135,997
USD 4,2392a5
USD 4,245382
US0 19,150,884
US0 706323
94.16
0.15
0.15
0.07
0.07
0.31
0.01
QuantityiFace Currency Evaluation “10 net Value assets
MERRILL LYNCH 05-oe.01.10 ION MAHINDRA UGINE STEEL
co MERR.L.04-13.3.09WTIPATNI COMPUTER SYSTEMS LTD
0.000001
/ON GRASIM
/ON MAHINDRA
HINDUSTAN PETROLEUM
MORGAN STANLEY 05-08 08.08
MORGAN STANLEY 05-73 06.08
MSDW ASIA 04-10.8.07 ;ON
NETHERLANDS
ABN AMRO 05-18.12.06WRT/HCL
INF 0
NETHERLANDS ANTILLES
MER LY 04-
8.1O.OBWRTIINDIABULL 0 MERR.03-29.9.06WRTIGRAS.lND 0
UNITED STATES
M.L.INTL 04-
9.1 1.OSWRTIINFOSYS 0
VIRGIN ISLANDS
MSDW AS.SEC 05- 19.9.08WRTiICIC 0 MSDW 05-22.08.[18 /ON BHARAT
HEAVY 0
15,029
144 331
63.940
665.442
I 307.133
71.769
I .ooo,ooo
100,000
25 000
1.797 044
132 325
US0 45210 000
USD 1,490,018 0 0 2
USD 2,959701 nos
US0 9,403,327 0 16
US0 9,352,717 0 16
69,571 661 1 15
US0 292795 000
292.795 0 0 0
US0 5,633,102 0.09
US0 4,628,872 0.08
10,261 974 0.17
US0 1673903 0.03
1,673.933 0.03
USD 23,841,055 0 40
USD 6.688 729 0 11
30,529,734 0.51
TOTAL WARRANTS I EQUITY LINKED SECURITIES 112,330,117 1 86
TOTAL TRANSFERABLE SECURITIES ADMITTED TO
AN OFFICIAL STOCK EXCHANGE LISTING 5,789,986,852 96.02
TRANSFERABLESECURITIESTRADEDONANOTHERREGULATED MARKET
BONDS
INDIA
UTD PHOSPH 0%05-7 1 11 CV 15 000,000 USD 17 925,030 0 30
S A
17 925.000 0 30
TOTAL BONDS 17,925,000 0.30
TOTAL TRANSFERABLE SECURITIES TRADED ON
ANOTHERREGULATEDMARKET 17.925.000 0.30
HSBC Global Investment Funds . . . . .
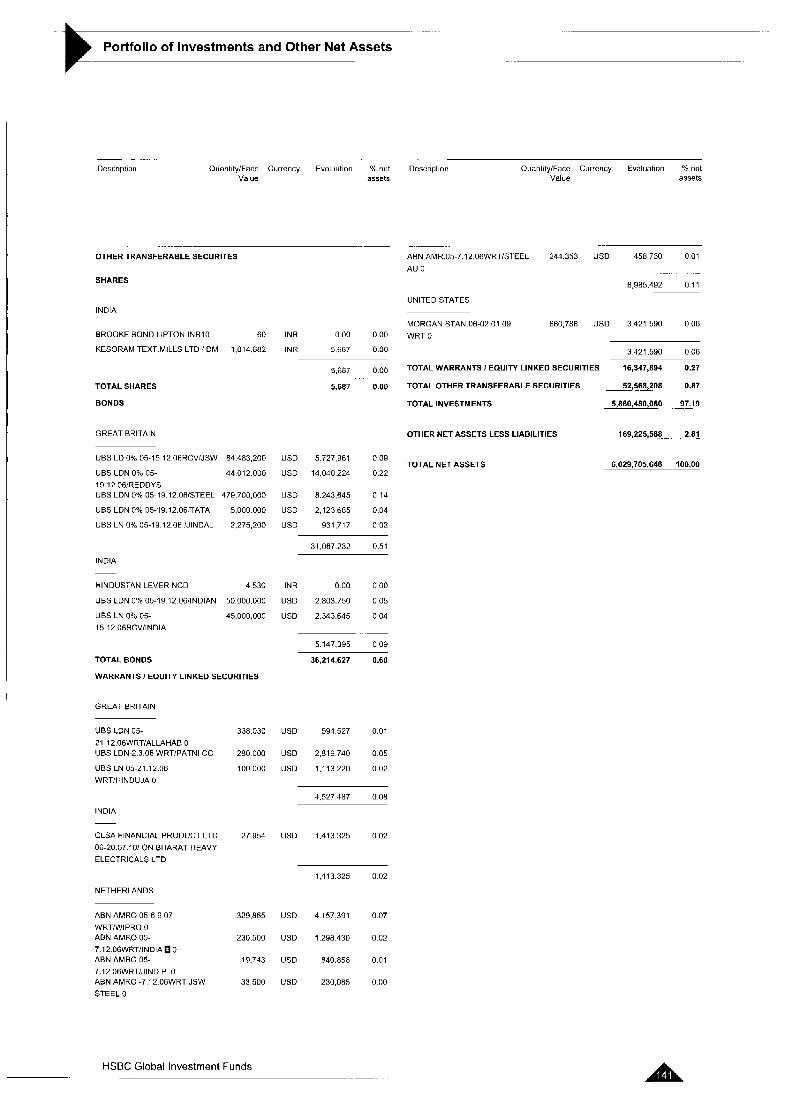
Portfolio of Investments and Other Net Assets
~ . ... . ...
Description Ouanlity/Face Currency Evaluation % riet Descriplion Ouantity/Face Currency Evaluation % not Value assets Value assets
OTHERTRANSFERABLESECURITES
SHARES
INDIA
BROOKE BOND LIPTON INRlO 60
KESORAM TEXT.MILLS LTD / OM 1.014 882
TOTAL SHARES
BONDS
GREAT B?ITAIN
INR 0.00 0.00
INK 5 687 0.00
5.687 0 00
5.687 0.00
UBS LO 0% 05-15 12 OGRCVIJSW
UBS LON 0% 05- 19 12 061REDDYS UBS LON 0% 05-19 12 OBISTEEL 479.700,OOO
UBS LDN 0% 05-19 12,06!TATA 5.000 000
UBS LN 0% 05-19 12 06 jJINDAL 2,275,200
84,483,200
44 012 000
USD 5,727,961 0.09
USD 14.040224 0 2 2
USD 8243,645 0.14
US0 2,123685 0 0 4
USD 931,717 0 0 2
31.067.232 0.51
INDIA ~
HINDUSTAN LEVER NCD 4 530
UBS LDN 0% 05-19 12 OGIINDIAN 50 000,000
UBS LN 0% OS- 45.000,OOO 15 12 OGRCV/INDIA
INR 0 0 0 0 0 0
US0 2803.750 0 0 5
US0 2343.645 0 0 4
~
5147.395 0 0 9
TOTAL BONDS
WARRANTS I EQUITY LINKED SECURITIES
GREAT BRITAIN
UBS LDN OS- 21 .1Z.O6WRT/ALLAHAB 0 UBS LON-2.3.06 WRT/PATNI CO
UBS LN 05-21.12.06
WRTlHlNDUJA 0
INDIA
CLSA FINANCIAL PRODUCT LTD 06-20.07."01 ON BHARAT HEAVY
ELECTRICAL$ LTD
NETHERLANDS
ABN AMRO 05-6 9 07
WRTIWIP3O 0 ABN AMRO 05- 7 12 OGWRTIINDIA 0 ABN AMRO 05- 7 12 OGWRTI'JIND P 0 ABN AMRO -7 12 O6WRT JSW
STEEL 0
338.030
280 000
100 000
27 954
329.865
230.500
19.743
33 500
36,214,627 0.60
USD 594527 0.01
USD 2.819 740 0.05
US0 1.113220 0.02
4.527 487 0.08
US0 1.413325 0 0 2
1,413325 0 02
USD 4 157391 007
USD 1298430 0 0 2
USD 840.856 0 0 1
USD 23008s 0110
.-- -~
ABN AMR OS-7 12 OGWRTISTEEL 244 353 US0 458 730 0 01
AU 0 -
6 985,492 0 11
UNITED STATES
MORGAN STAN 06-02 01 09 660,786 USD 3421 590 006 WRT 0
3421,590 006
TOTAL WARRANTS I EQUITY LINKED SECURITIES 16,347,894 0.27
TOTAL OTHER TRANSFERABLE SECURITIES ~ 52,568,208 0.87
TOTAL INVESTMENTS 5,860,480,060 -!?I9
OTHER NET ASSETS LESS LIABILITIES 169,225,588- 2.81
TOTAL NET ASSETS 6,029,705,648 100.00
HSBC Global Investment Funds .- . -
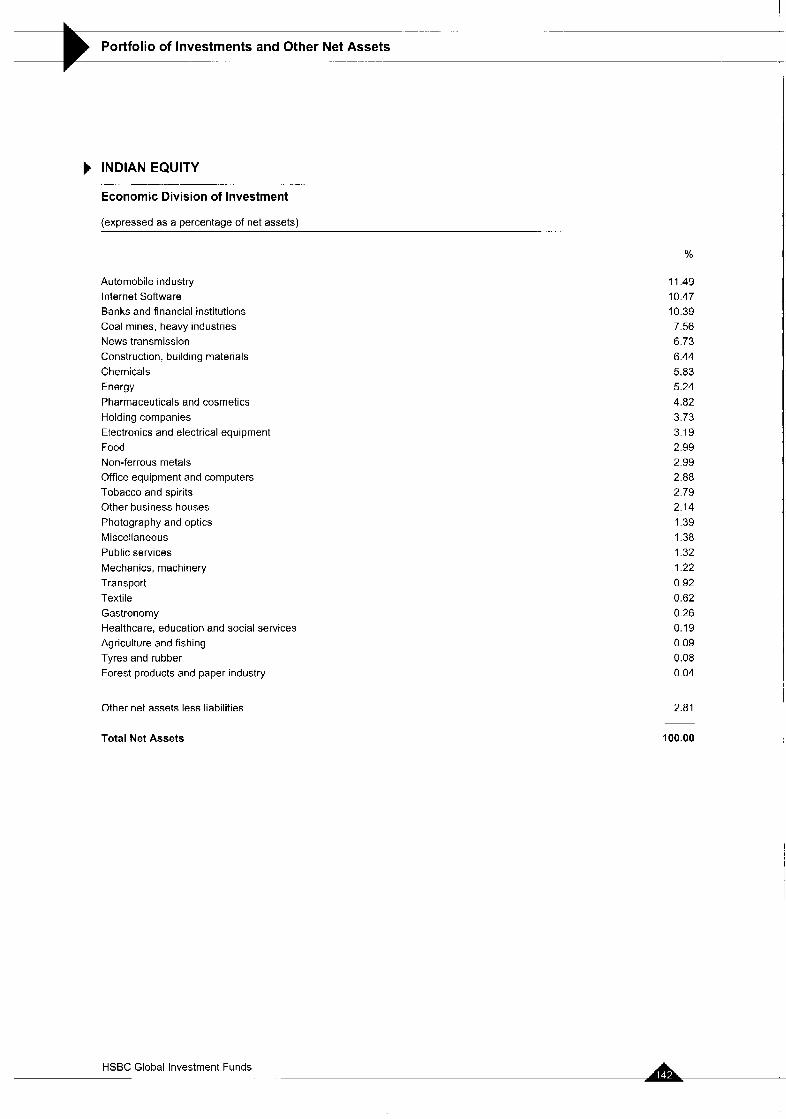
-. _
Portfolio of Investments and Other Net Assets . _ .- . __ _.
INDIAN EQUITY
Economic Division of Investment -
(expressed as a percentage of net assets)
Automobile industry Internet Software Banks and financial institutions Coal mines, heavy industries News transmission Construction. building materials Chemicals Energy Pharmaceuticals and cosmetics Holding companies Electronics and electrical equipment Food Non-ferrous metals Office equipment and computers Tobacco and spirits Other business houses Photography and optics Miscellaneous Public services Mechanics, machinery Transport Textile Gastronomy Healthcare, education and social services Agriculture and fishing Tyres and rubber Forest products and paper industry
Other net assets less liabilities
%
11.49 10.47 10.39 7.56 6.73 6.44 5.83 5.24 4.82 3.73 3.19 2.99 2.99 2.88 2.79 2.14 1.39 1.38 1.32 1.22 0.92 0.62 0.26 0.19 0.09 0.08 0.04
2.81
Total Net Assets 100.00
HSBC Global Investment Funds
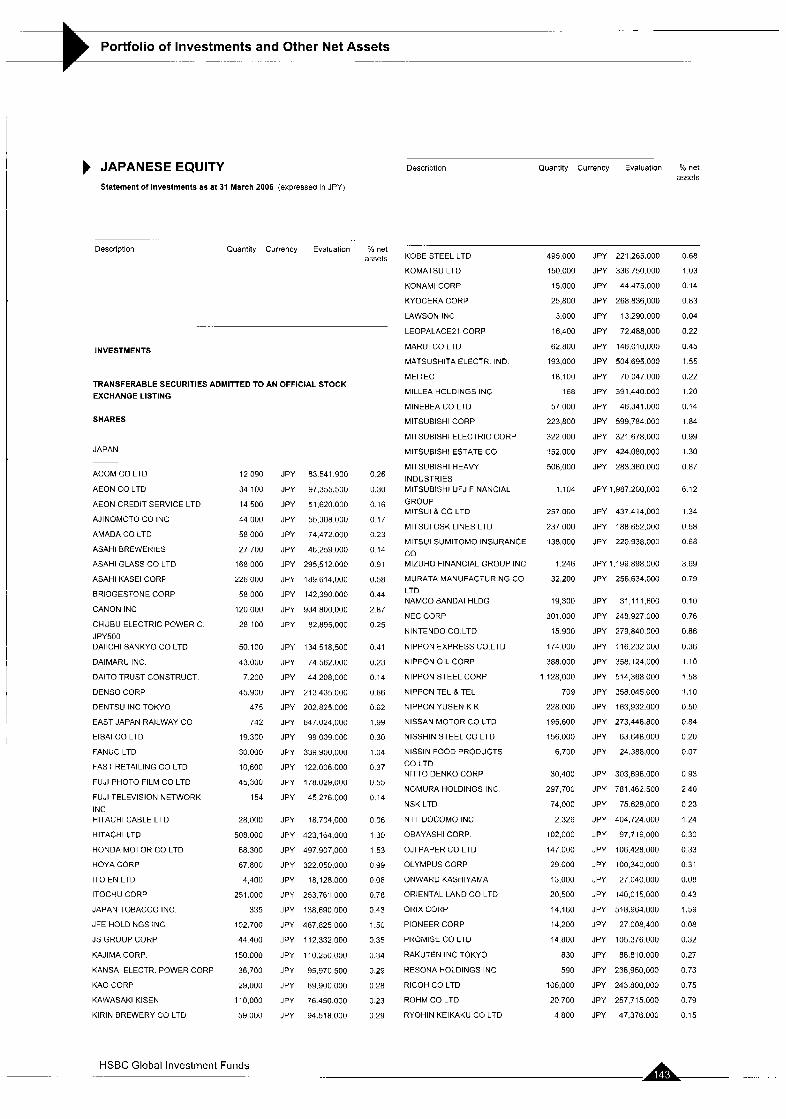
. . .. .. .
Portfolio of Investments and Other Net Assets -. . . -. . . .. . . . .. . . . .- . . ..
JAPANESE EQUITY Statement of investments as at 31 March 2006 (expressed in JPY)
Description Quantity Currency Evaluation Yo net assets
. .
Descriptio1 Quantlty Currency Evaluation >/. riel KOBE STEEL LTD 495,000
KOMATSU LTD 150,000
KONAMI CORP 15.000
KYOCERA CORP 25,800
LAWSON INC 3.000
LEOPALACE21 CORP 16,400
MARUI CO LTD 62.800
MA’ISUSHITA ELECTH IND. 193,000
.-
INVESTMENTS
TRANSFERABLE SECURITIES ADMITTED TO AN OFFICIAL STOCK EXCHANGE LISTING
SHARES
JAPAN ~
ACOM CO LTD
AEON CO LTD
AEON CREDIT SERVICE LTD
AJINOMOTO CO INC
AMADA CO LTD
ASAHI EREWEHIES
ASAHl GLASS CO LTD
ASAHI KASEl CORP
BRIDGESTONE CORP
CANON INC
CHUBU ELECTRIC POWER C
JPY500 DAllCHl SANKYO CO LTD
DAIMARU INC
DAITO TRUST CONSTRUCT
DENS0 CORP
DENTSU INC TOKYO
EAST JAPAN RAILWAY CO
ElSAl CO LTD
FANUC LTD
FAST RET41LING CO LTD
FUJI PHOTO FILM CO LTD
FUJI TELEVISION NETWORK
INC HlTACHl CABLE LTD
HlTACHl LTD
HONDA MOTOR CO LTD
HOYA CORP
IT0 EN LTD
ITOCHU CORP
JAPAN TOBACCO INC
JFE HOLD NGS INC
JS GROUP CORP
KAJIMA CORP
KANSAI ELECTR. POWER CORP
KAO CORP
KAWASAKI KlSEN
KlRlN BREWERY CO LTD
12.090
34 100
14 500
44,000
58 000
27,700
168 000
226,000
58 000
120,000
28 100
50.100
43.0UU
7 200
45.900
475
742
19.300
30 000
10,600
45,300
154
28.000
508 000
68.300
67.800
4,41111
251.000
335
102.700
44 400
150 000
36.700
29,000
110,000
59 000
HSBC Global Investment Funds - ~.
JPY
JPY
JPY
JPY
J PY
J PY
J PY
JPY
JPY
JPY
JPY
JPY
JPY
JPY
JPY
JPY
JPY
J PY
JPY
JPY
JPY
JPY
JPY
JPY
JPY
JPY
JPY
JPY
JPY
J PY
JPY
JPY
JPY
JPY
JPY
JPY
83 541.900
97,355,500
51,620 000
55,308 ooo 74.472 000
46,259 000
295,512 000
189,614,000
142,390 000
934 800,000
fl2.flY5,UOO
134 518.500
74,562.000
44 208,000
213 435.000
202.825 000
647.024,OOO
99 009 000
339,YUO 000
122.006 000
178.029,OOO
45.276 000
18,704,000
423 164.000
497 907.000
322 050.000
18,128.000
253.761 000
138.690,UOO
407,825 ooo 112.332,ooo
110.250,000
95,970,500
09,900,000
76 450.000
94.518.000
0 26
0.30
0.16
0.17
0.23
0.14
0 91
0.58
0 44
2 a7
0 25
0 41
0.23
0.14
0 66
0.62
1.99
0.30
1.04
0.37
0.55
0.14
0.06
1 30
1 5 3
0 99
0.06
0.78
0.43
1.50
0.35
0.34
0 29
0 28
0 23
0 29
MEITEC
MILLEA HOLDINGS INC
MINEBEA CO LTD
MlTSUBlSHl CORP
MlTSUBlSHl ELECTRIC CORP
MlTSUBlSHl ESTATE CO
MlTSUBlSHl HEAVY
INDUSTRIES MlTSUBlSHl UFJ FINANCIAL
GROUP MlTSUl& CO LTD
MlTSUl OSK LINES LTD
MITSUI SUMITOMO INSURANCE
CO MIZUHO FINANCIAL GROUP INC
MURATA MANUFACTURING CO
LTD NAMCO BANDAI HLDG
NEC CORP
NINTENDO CO.LTD
NIPPON EXPRESS CO.LTD
NIPPON OIL CORP
NIPPON STEEL CORP
NIPPON TEL 8 TEL
NIPPON YUSEN K K
NISSAN MOTOR CO LTD
NlSSHlN STEEL CO LTD
NlSSlN FOOD PRODUCTS
CO LTD NITTO DENKO COKP
NOMURA HOLDINGS INC
NSK LTD
NTT DOCOMO INC
OBAYASHI CORP.
OJI PAPER CO LTD
OLYMPUS CORP
ONWARD KASHIYAMA
ORIENTAL LAND CO LTD
OHlX CORP
PIONEER CORP
PHOMISE CO LTD
RAKUTEN INC TOKYO
HESONA HOLDINGS INC
RICOH CO LTD
ROHM CO LTD
RYOHIN KEIKAKU CO LTD
ia . i oo 168
57 000
223,800
322 000
152,000
506,000
1.104
257 000
237 000
138,000
1.246
32,200
19 300
301.000
15.900
174.000
388,000
1 128,000
709
228 000
195,600
156,000
6,700
30,40U
297,700
74.000
2.326
102,000
147.000
29 000
13,000
20.500
14,160
14.200
14 800
830
590
106,000
20.700
4 aoo
JPY
JPY
JPY
JPY
JPY
JPY
JPY
JPY
JPY
JPY
221,265.000
336 750.000
44 475.000
268 836,000
13 290 000
72 488.000
146,010,000
504 695 000
70 047 000
391.440 000
JPY 46,341.000
JPY 599.784 000
JPY 321.678.000
JPY 424.080,OOO
JPY 283.360 000
JPY 1,987.200,000
JPY 437.414.000
JPY 188 652.000
JPY 220 Y38.000
JPY 1.199 898.000
JPY 256,634.000
JPY 31 11 1,600
JPY 248,927 ooo JPY 279,840 000
JPY 116.232 000
JPY 358.124,OOO
JPY 514,368 000
JPY 35a.045.000
JPY 163,932.000
JPY 273,448.800
JPY 63 648.000
JPY 24.388.000
JPY 303 696.000
JPY 781 462 500
JPY 75 628.000
JPY 404,724.000
JPY 97,716,000
JPY 106.428.000
JPY 100,34ti,OUO
JPY 27.040.000
JPY 140,015.000
JPY 518.964,OOO
JPY 27 008,400
JPY 105.376.000
JPY 88,810 000
JPY 238,950,000
JPY 243.800 000
JPY 257,715 000
JPY 47,376 000
0 68
1 0 3
0 14
0 83
0.04
0.22
0 45
1 5 5
0.22
1.20
0.14
i .a4
0.99
1.30
0.87
6.12
1.34
o 58
0.68
3 69
11 79
0 10
0 76
0.86
0.36
1 1 0
1.58
1.10
0.50
0.84
0.20
0.07
0 93
2 40
0 23
1.24
0.30
0.33
0.31
0.08
0.43
1.59
0 08
0.32
0.27
0.73
0.75
0.79
0.15
...
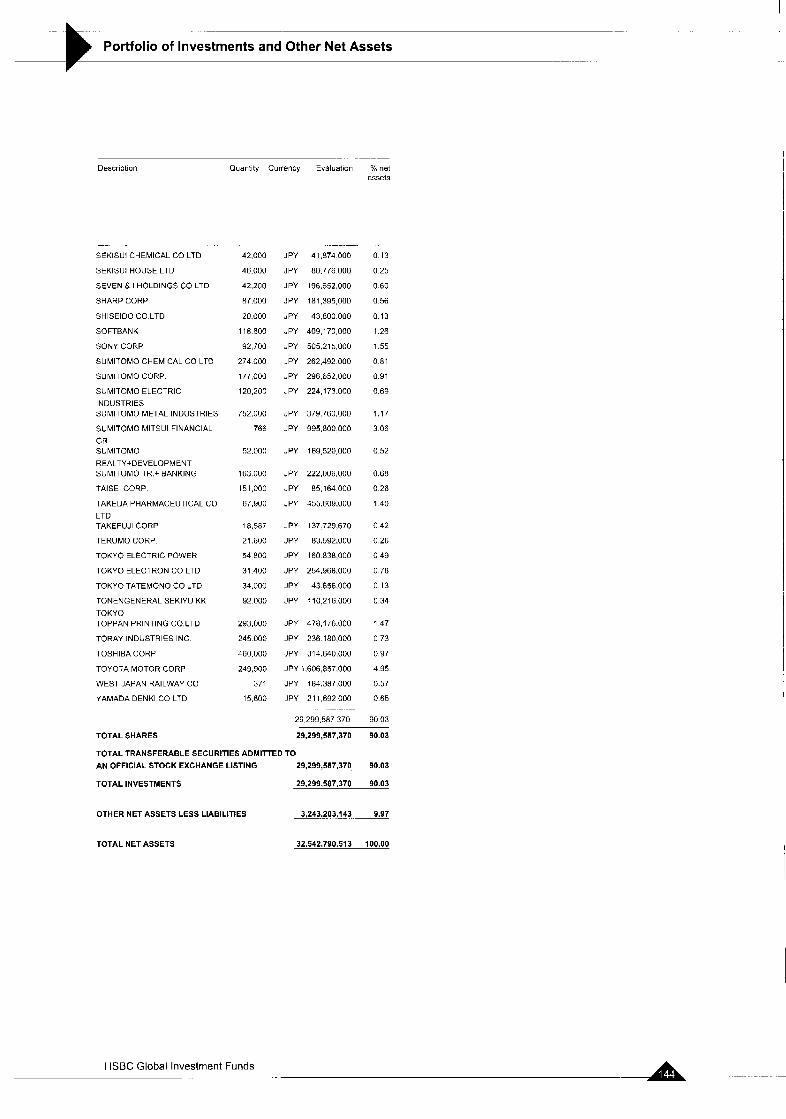
- - . __
Portfolio of Investments and Other Net Assets
. .
Descriptiun Quantity Currency Evaluation O% net assets
-
SEKlSUl CHEMICAL CO LTD
SEKlSUl HOUSE LTD
SEVEN & I HOLDINGS CO LTD
SHARP CORP
SHlSElDO CO LTD
SOFTBANK
SONY CORP
SUMITOMO CHEMICAL CO LTD
SUMITOMO CORP
SUMITOMO ELECTRIC
INDUSTRIES SUMITOMO METAL INDUSTRIES
SUMITOMO MlTSUl FINANCIAL
GR SUMITOMO
REALTY+DEVELOPMENT SUMITOMO TR + BANKING
TAlSEl CORP
TAKEDA PHARMACEUTICAL CO
LTD TAKEFUJI CORP
TERUMO CORP
TOKYO ELECTRIC POWER
TOKYO ELECTRON CO LTD
TOKYO TATEMONO CO LTD
TONENGENERAL SEKIYU KK
TOKYO TOPPAN PRINTING CO LTD
TOKAY INDUSTRIES INC
TOSHIBA CORP
TOYOTA MOTOR CORP
WEST JAPAN RAILWAY CO
YAMADA DENKI CO LTD
42.000
46.000
42.200
87 000
20,000
118600
92 700
274 000
177 000
120,200
752,000
766
52.000
163 000
151,000
67,900
16,587
21.600
54 800
31 400
34,000
92 000
293.000
245 000
460 000
249,900
371
15 600
JPY 41,874 000
JPY 80.776 000
JPY 196.652,OOO
JPY 181,395,000
JPY 43,800 000
JPY 409,170,000
JPY 505.215 no0
JPY 262.492 000
JPY 296,652 000
JPY 224,173.000
JPY 379.760,OOO
JPY 995,800 000
JPY 169 520,000
JPY 222,006,000
JPY 85.164 000
JPY 455.609.000
JPY 137 729,670
JPY 83.592.000
JPY 160 838,000
JPY 254,968.000
JPY 43 656.000
JPY 110.216.000
JPY 478,176.000
JPY 236 180.000
JPY 314.640,OOO
JPY 1.606,857.000
JPY 184,387,000
JPY 211.692 000
29,299587 370
. .. - ._ .
TOTAL SHARES 29,299,587,370
0.13
0.25
0 60
0.56
0.13
1.26
1.55
0.81
0.91
0.69
1.17
3.06
0.52
0.68
0.26
1.40
0 42
0.26
0 49
0.78
0 13
0 34
1 4 7
0 73
0.97
4.95
0.57
0.65
90.03
90.03 ~
TOTAL TRANSFERABLE SECURITIES ADMITTED TO
AN OFFICIAL STOCK EXCHANGE LISTING 29,299,587,370 90.03
TOTALINVESTMENTS 29,299,587,370 90.03
OTHER NET ASSETS LESS LIABILITIES 3,243303,143 9.97
TOTALNETASSETS 32,542,790,513 100.00
.A . . -. -. .- HSBC Global Investment Funds
-. .
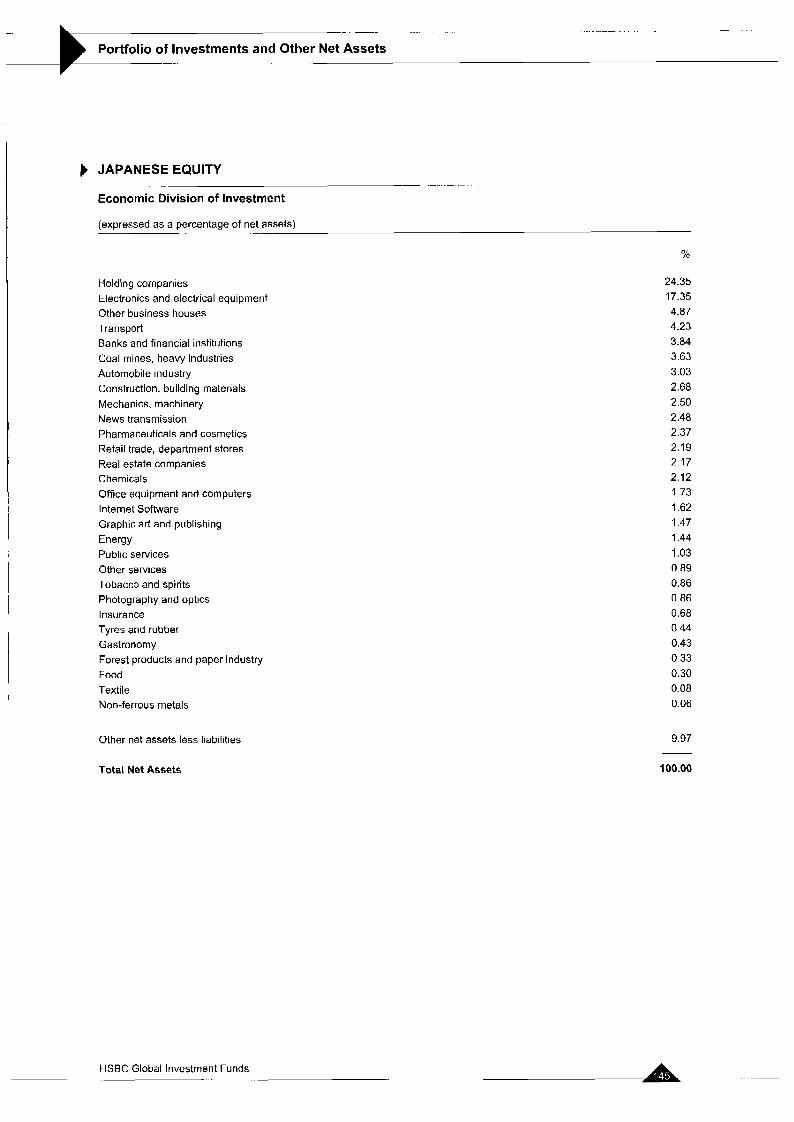
__ _.
Portfolio of Investments and Other Net Assets ._
JAPANESE EQUITY
Economic Division of investment ... .. . .- -
(expressed as a percentage of net assets) . ..
%
Holding companies Electronics and electrical equipment Other business houses Transport Banks and financial institutions Coal mines, heavy industries Automobile industry Construction, building materials Mechanics, machinery News transmission Pharmaceuticals and cosmetics Retail trade, department stores Real estate companies Chemicals Office equipment and computers Internet Software Graphic art and publishing Energy Public services Other services Tobacco and spirits Photography and optics Insurance Tyres and rubber Gastronomy Forest products and paper industry Food Text i I e Non-ferrous metals
24.35 17.35 4.87 4.23 3.84 3.63 3.03 2.68 2.50
2.37 2.19 2.17 2.12 I .73 1.62 1.47 1.44 1.03 0.89 0.86 0.86 0.68 0.44 0.43 0.33 0.30 0.08 0.06
2.48
Other net assets less liabilities 9.97
Total Net Assets 100.00
HSBC Global Investment Funds
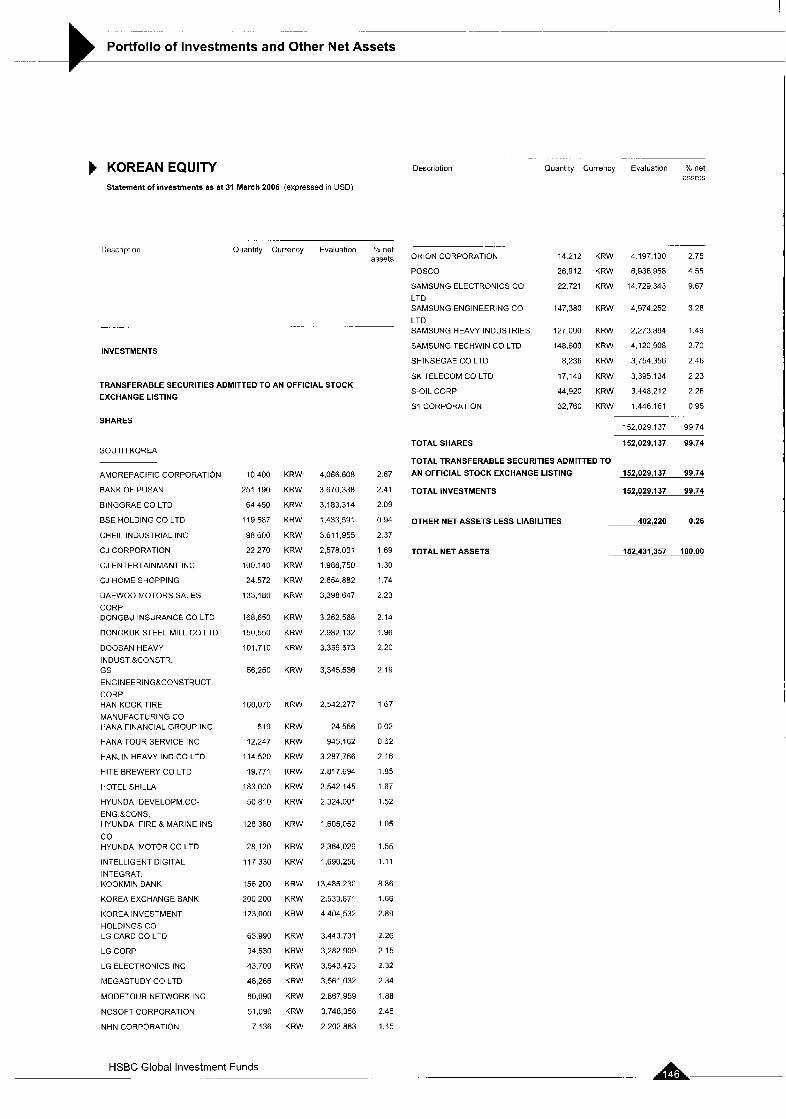
- . ..
Portfolio of Investments and Other Net Assets
KOREAN EQUITY Statement of investments as at 31 March 2006 (expressed In USD)
Descrlpt on ...
Quantity Currency Evaluation YO net assets
INVESTMENTS
TRANSFERABLE SECURITIES ADMITTED TO AN OFFICIAL STOCK
EXCHANGE LISTING
SHARES
SOUTHKOREA
AMOREPACIFIC CORPORATION
BANK OF PUSAN
BINGGRAE CO LTD
BSE HOLDING CO LTD
CHElL INDUSTRIAL INC
CJ CORPORATION
CJ ENTERTAINMANT INC
CJ HOME SHOPPING
DAEWOO MOTORS SALES
CORP DONGBU INSUHANCE CO LTD
DONGKUK STEEL MILL CO LTD
DOOSAN HEAVY
INDUST &CONSTR. GS
ENGlNEERlNG&CONSTRUCT.
CORP HAN KOOK TIRE
MANUFACTURING CO HANA FINANCIAL GROUP INC
HANA TOUR SERVICE INC
HANJIN HEAVY IND CO LTO
HlTE BREWERY CO LTD
HOTEL SHILLA
HYUNDAI DEVELOPM.CO-
ENG &CONS. HYUNDAI FIRE & MARINE INS
CO HYUNDAI MOTOR GO LTD
INTELLIGENT DIGITAL
INTEGRAT. KOOKMIN BANK
KOREA EXCHANGE BANK
KOREA INVESTMENT
HOLDINGS CO LG CARD CO LTD
LG CORP
LG ELECTHONICS INC
MEGASTUDY CO LTD
MODETOUR NETWORK INC
NCSOFT CORPORATION
NHN CORPORATION
10,400 KRW
251 190 KRW
64,450 KRW
119587 KRW
98600 KRW
22270 KRW
100.140 KRW
24572 KRW
133180 KRW
168.650 KRW
150,550 KRW
101.710 KRW
56.250 KRW
168,070 KRW
519 KRW
12,247 KRW
114520 KRW
19,771 KRW
183000 KRW
50.810 KRW
128,380 KRW
28,120 KRW
117330 KRW
156,200 KRW
200200 KRW
123.00U KRW
63.990 KRW
94.530 KRW
43.700 KRW
48,266 KRW
80,090 KRW
51,090 KRW
7 136 KRW
HSBC Global Investment Funds
4.066 608
3.670.338
3,183,314
1,433 591
3.61 1 955
2,578.031
i.g88,750
3,398,647
2 654.882
3 262.568
2,982,132
3.359 573
3,345.536
2 542,277
24 566
945,162
3.287.766
2.817 694
2.542 145
2.324.001
1.605.052
2.364.029
1,690,256
13,485 230
2,533,871
4 404,532
3,443,731
3,282.909
3,543,423
3.561 032
2.867 959
3 748,356
2 202.883
2.67
2.41
2.09
0.94
2.37
1.69
1.30
1.74
2 23
2.14
1.96
2.20
2.19
1 67
0 02
0 62
2.16
1.85
1.67
1.52
1 05
1.55
1.11
8.86
1 Si6
2.89
2 26
2 15
2 32
2.34
1 .88
2.46
1.45
Descriptian
ORION CORPORATION
POSCO
SAMSUNG ELECTRONICS CO
LTD SAMSUNG ENGINEERING CO LTD SAMSUNG HEAVY INDUSTRIES
SAMSUNG TECHWIN CO LTD
SHINSEGAE CO LTD
SK TELECOM CO LTD
S-OIL CORP
$1 CORPORATION
-. ..
Quantity Currency Evaluation C net assets
14 212
26,912
22.721
147.380
127 000
148,600
8,236
17,140
44,920
32,760
KRW 4197.130 275
KRW 6,936958 4.55
KRW 14729343 9.67
KRW 4,974.252 3.26
KRW 2 , 2 7 3 . a ~ 1.49
KRW 4,120,908 2.70
KRW 3.754.356 2.46
KRW 3,395 134 2 2 3
KRW 3,448,212 2 26
KRW 1.446 161 0 9 5
152.029 137 99.74
TOTAL SHARES 152,029.137 99.74
TOTAL TRANSFERABLE SECURITIES ADMITTED TO
AN OFFICIAL STOCK EXCHANGE LISTING - 152,029,137 99.74
TOTAL INVESTMENTS 152p29.137 99.74
OTHER NET ASSETS LESS LIABILITIES 402,220 0.26
TOTALNETASSETS 152.431.357 100.00
.
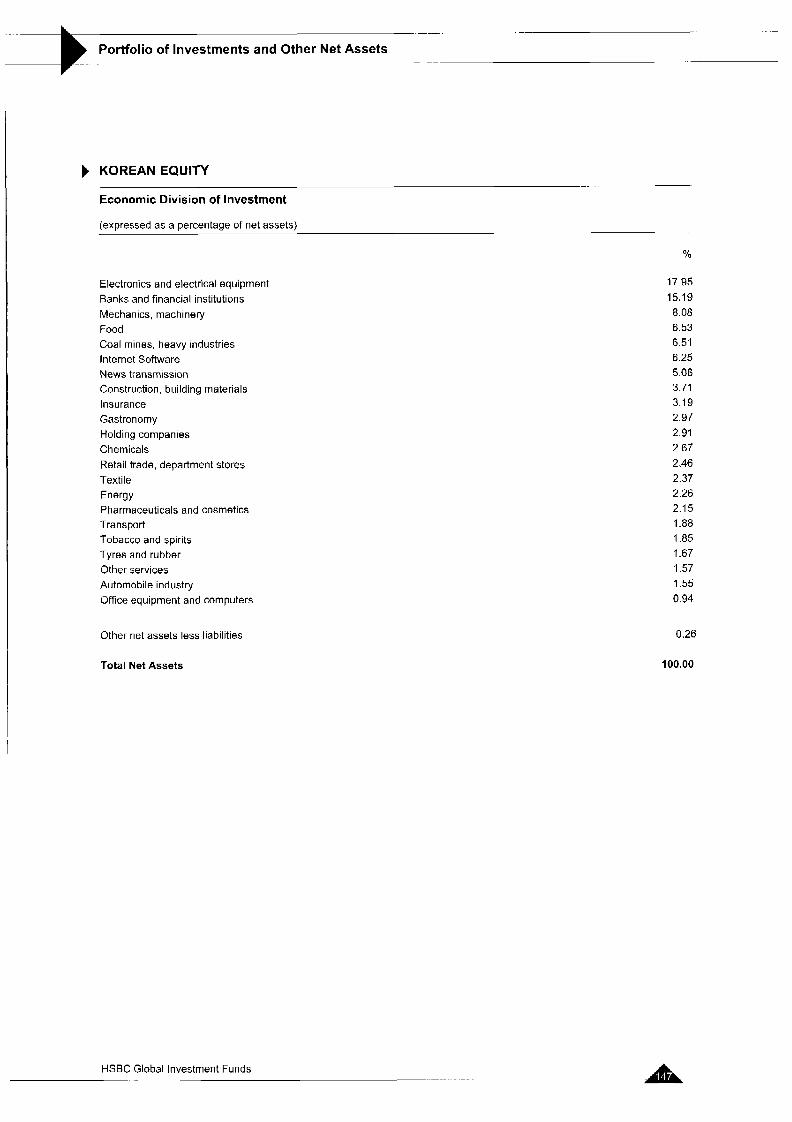
- _- .
Portfolio of Investments and Other Net Assets - .. _ _ _
KOREAN EQUITY
Economic Division of Investment ... ..
(expressed as a percentage of net assets)
Electronics and electrical equipment Banks and financial institutions Mechanics, machinery Food Coal mines. heavy industries Internet Software News transmission Construction, building materials Insurance Gastronomy Holding companies Chemicals Retail trade, department stores Textile Energy Pharmaceuticals and cosmetics Transport Tobacco and spirits Tyres and rubber Other services Automobile industry Office equipment and computers
Other net assets less liabilities
Total Net Assets
17.95 15.19 8.08 6.53 6.51 6.25 5.08 3.71 3.19 2.97 2.91 2.67 2.46 2.37 2.26 2.15 1.88 1.85 1.67 1.57 1.55 0.94
0.26
100.00
HSBC Global Investment Funds . . . . .
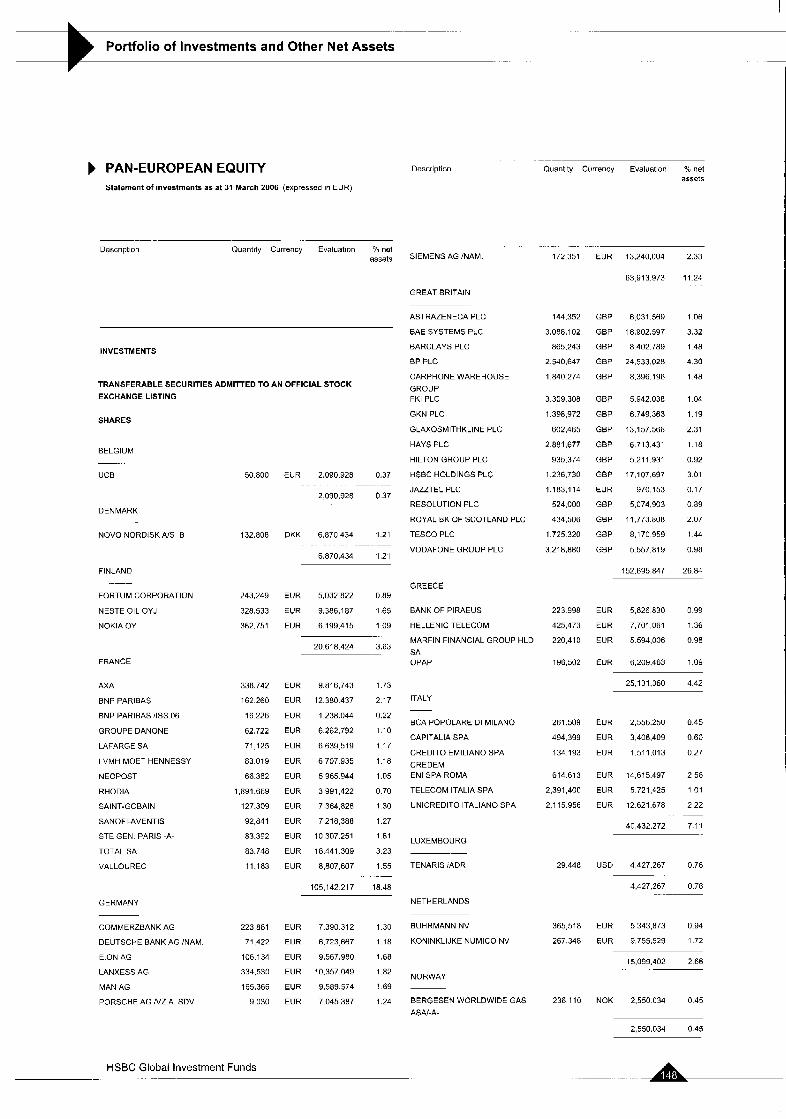
Portfolio of Investments and Other Net Assets _
PAN-EUROPEAN EQUITY Statement of investments as at 31 March 2006 (expressed in EUR)
Description Quantity Currency Evaluation “h net asscts
.
Description Quantity Currency Evaluation % net assets
. - . .. .. . .
172,351 EUR 13,240,004 2.33
63 9 13.973 11.24
SIEMENS AG /NAM.
GREAT BRITAIN
ASTRAZENECAPLC
BAE SYSTEMS PLC
BARCLAYSPLC
BP PLC
CARPHONEWAREHOUSE
GROUP FKI PLC
GKN PLC
GLAXOSMITHKLINE PLC
HAYS PLC
HILTON GROUP PLC
HSBC HOLDINGS PLC
JAZZTELPLC
RESOLUTION PLC
ROYAL BK OF SCOTLAND PLC
TESCO PLC
VODAFONE GROUP PLC
144,352 GBP 6031.569 1 0 6
3.088.102 GBP 18,902.597 3.32
865.243 GBP 8402,789 1 4 6
2,540,647 GBP 24,533,028 4 30
1.840 274 GBP 8.396.196 1 4 8
INVESTMENTS
TRANSFERABLE SECURITIES ADMITTED TO AN OFFICIAL STOCK EXCHANGE LISTING
SHARES
3.309.308
1,398,972
602,465
2.881.677
935.374
1,236.730
1,183,114
524,000
434,506
1.725 320
3,218,880
GBP
GBP
GBP
GBP
GEP
GBP
EUR
GEP
GBP
GBP
GBP
5 942.038
6.749.363
13,157.566
6 713.431
5 211.931
17,107,697
970,153
5,074.903
11,773.808
8,170 959
5 557.819
1.04
1.19
2.31
1.18
0.92
3.01
0.17
0 89
2.07
1 44
0.98
BELGIUhI
UCB 50.600
132.808
243,249
328,533
362 751
338.742
162 260
16 226
62,722
71 125
83 019
66 362
1891.665
127.309
92,841
63.392
83.748
11.163
223 881
71,422
106.1 34
334,530
165,366
9 030
EUR 2.090.928 0.37
2090,928 0 3 7
. -
DENMARK
NOVO NORDISK AIS B DKK 6,870,434 1 21
6.870.434 1 21
-
152.695 847 26 84 FINLAND
GREECE FORTUM CORPORATION
NESTE OIL OYJ
NOKIA OY
EUR 5,032.822 0.89
EUR 9,386.187 1 6 5
EUR 6199.415 1 0 9
BANK OF PIRAEUS
HELLENIC TELECOM
MARFIN FINANCIAL GROUP HLD
SA OPAP
223998 EUR 5.626830 0 9 9
425,473 EUR 7,701,061 1 3 6
220.410 EUR 5594.006 0.98
196,502 EUR 6,209.463 1 09
20,618,424 3.63
FRANCE
25.131.360 4.42 AXA
BNP PARIBAS
BNP PARIBAS ASS 06
GROUPE DANONE
LAFARGE SA
LVMH MOET HENNESSY
NEOPOST
RHODIA
SAINT-GOBAIN
SANOFCAVENTIS
STE GEN PARIS -A-
TOTAL SA
VALLOUREC
EUR 9,816,743 1.73
EUR 12,380 437 2.17
EUR 1.238.044 0.22
EUR 6,262,792 1.10
EUR 6,639 519 1.17
EUR 6.707.935 1.18
EUR 5.965.944 1.05
EUR 3991,422 070
EUR 7,364,826 1 3 0
EUR 7218,388 1 2 7
EUR 10,307.251 1 8 1
EUR 18,441.309 3.23
EUR 8807,607 1.55
105.142 217 18.48
. .
ITALY
BCA POPOLARE 01 MILANO
CAPlTALlA SPA
CREDIT0 EMILIANO SPA
CREDEM EN1 SPA ROMA
TELECOM ITALIA SPA
UNICREDITO ITALIAN0 SPA
261.509 EUR 2,556.250 0 4 5
494.399 EUR 3,406.409 0 60
134193 EUR 1.511 013 0 2 7
614613 EUR 14,615.497 2 5 6
2,391,400 EUR 5,721,425 1 01
2.1 15 956 EUR 12.621.678 2 22
40,432.272 7.11
LUXEMBOURG
TENARIS iADR
NETHERLANDS
29448 USD 4427.267 0.78
4,427.267 0.78
GERMANY
COMMERZBANK AG
DEUTSCHE BANK AG INAM.
E.ON AG
LANXESS AG
MAN AG
PORSCHE AG N Z A. SDV
BUHRMANNNV
KONINKLIJKE NUMICO NV
365,518 EUR 5 343,873 0.94
267,348 EUR 9,755.529 1.72
EUR 7.390312 1 3 0
EUR 6.723667 1 1 8
EUR 9,567980 1.68
EUR 10.357049 1 82
EUR 9,589.574 1 69
EUR 7045387 1.24
15,099.402 2.66
NORWAY
BERGESEN WORLDWIDE GAS
ASAI-A-
236 110 NOK 2.550034 0 4 5
2,550.034 0 45
HSBC Global Investment Funds -
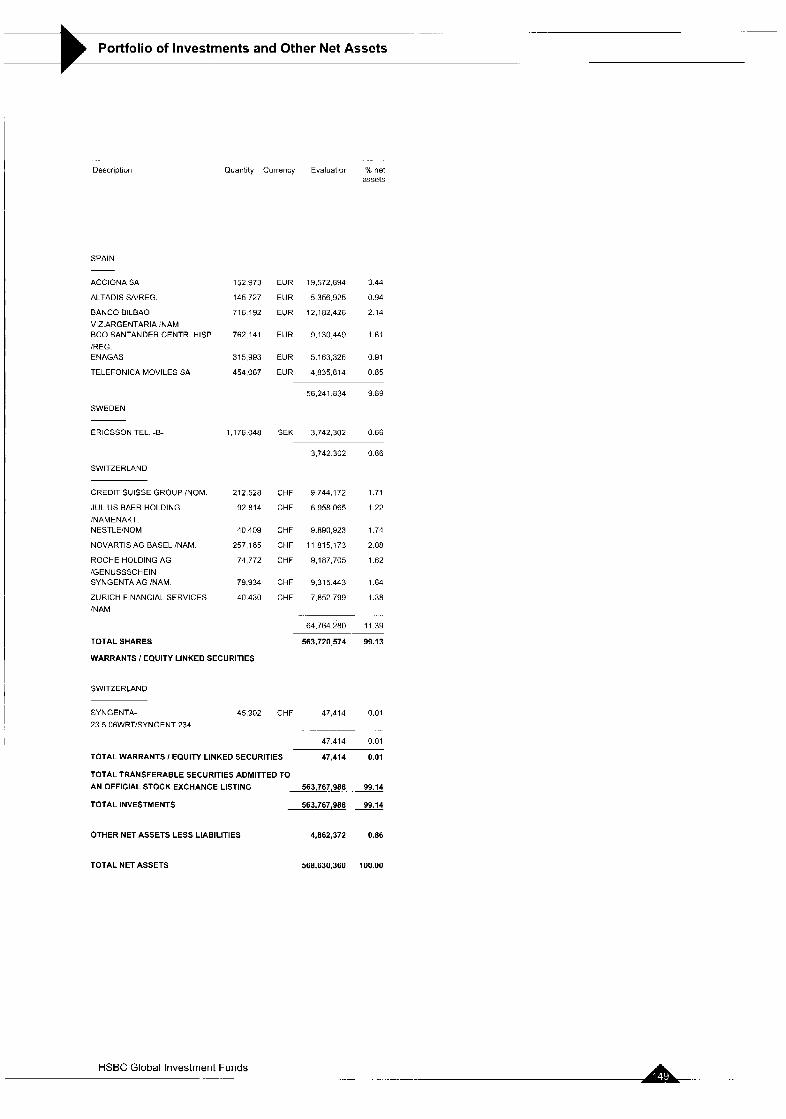
-
Portfolio of Investments and Other Net Assets
Descripliuri
SPAIN
. ...
Quantity Currency Evaluation net assets
ACCIONA SA 152 973 EUR 19572.894 3.44
ALTADIS SAIREG. 145 727 EUR 5.356.925 0.94
BANCO BILBAO 716 192 EUR 12,182,426 2.14
VIZARGENTARIA iNAM BCO SANTANDER CENTR. HISP 762 141 EUH 9.130 449 1.61
/REG. ENAGAS 315,Y93 EUR 5163,326 0 9 1
TELEFONICA MOVILES SA 454,067 EUR 4,835.814 0.85
5fi.241 834 9.89
SWEDEN
ERICSSON TEL -6-
SWITZERLAND
CREDIT SUISSE GROUP /NOM
JULIUS BAER HOLDING
!NAMENAKT NESTLEINOM
NOVARTIS AG EASEL :NAM
ROCHE HOLDING AG
!GENUSSSCHEIN SYNGENTA AG !NAM
ZURICH FINANCIAL SERVICES 'NAM
1,176 048 SEK 3,742,302 0 . M
212,528 CHF
92814 CHF
40.409 CHF
257,165 CHF
74,772 CHF
79.934 CHF
40.430 CHF
3,742 302 0.66
9,744,172 1 71
6958065 1.22
9.890 923 1.74
11 815.173 2 08
9,187,705 1.62
9,315 443 1.64
7.852 799 1.38
64.764 280 I I .39
TOTAL SHARES 563,720,574 99.13
WARRANTS / EQUITY LINKED SECURITIES
SW ITZER LAN 0
SYNGENTA- 45,902 CHF 47,414 0.01 23 5 OGWRTISYNGENT 234 . - . ..
47414 001
TOTAL WARRANTS I EQUITY LINKED SECURITIES 47,414 0.01
TOTAL TRANSFERABLE SECURITIES ADMITTED TO
AN OFFICIAL STOCK EXCHANGE LISTING 563,767,980. .99.14 TOTAL INVESTMENTS 563.767,988 99.14
OTHER NET ASSETS LESS LIABILITIES 4,862,372. 0.86
TOTALNETASSETS 568,630,360 100.00
HSBC Global Investment Funds . ._ . . d-
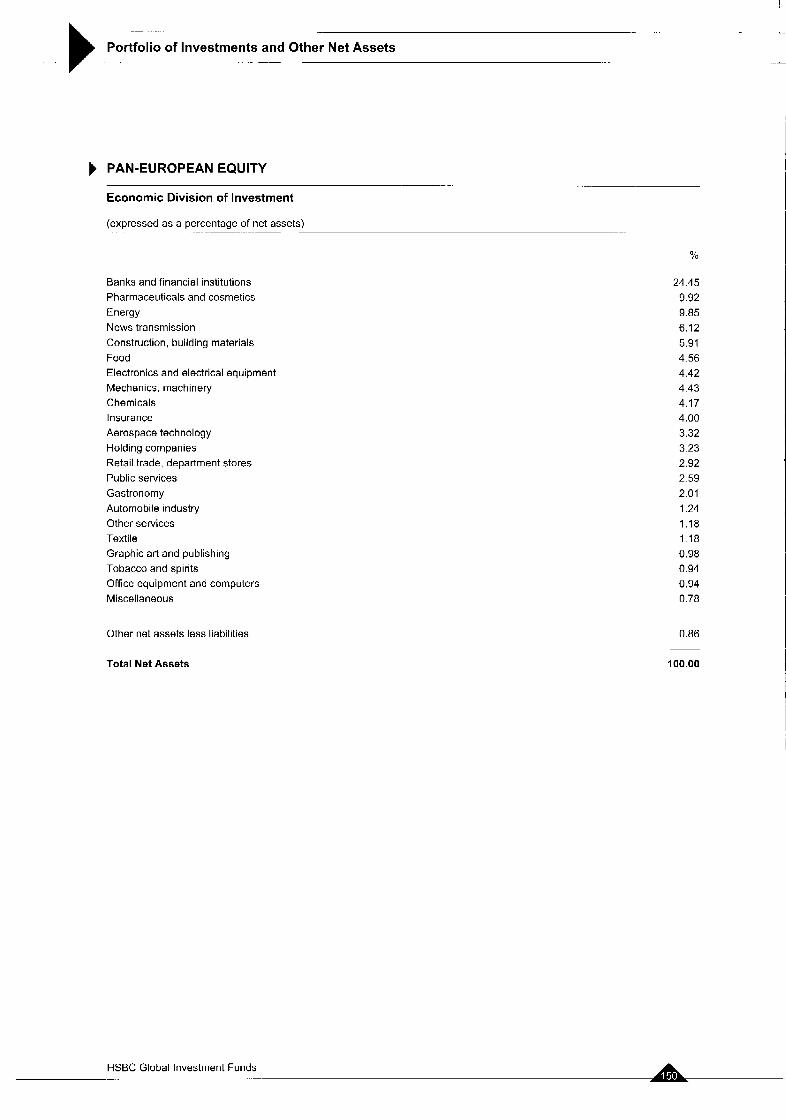
_- .
Portfolio of Investments and Other Net Assets -. -
I
PAN-EUROPEAN EQUITY ..
Economic Division of Investment
(expressed as a percentage of net assets) . ~ __
Banks and financial institutions Pharmaceuticals and cosmetics Energy News transmission Construction, building materials Food Electronics and electrical equipment Mechanics. machinery Chemicals Insurance Aerospace technology Holding companies Retail trade, department stores Public services Gastronomy Automobile industry Other services Textile Graphic art and publishing Tobacco and spirits Office equipment and computers Miscellaneous
Other net assets less liabilities
24.45 9.92 9.85 6.12 5.91 4.56 4.42 4.43 4.17 4.00 3.32 3.23 2.92 2.59 2.01 1.24 1.18 1.18 0.98 0.94 0.94 0.78
0.86
Total Net Assets 100.00
HSBC Global Investment Funds -. .
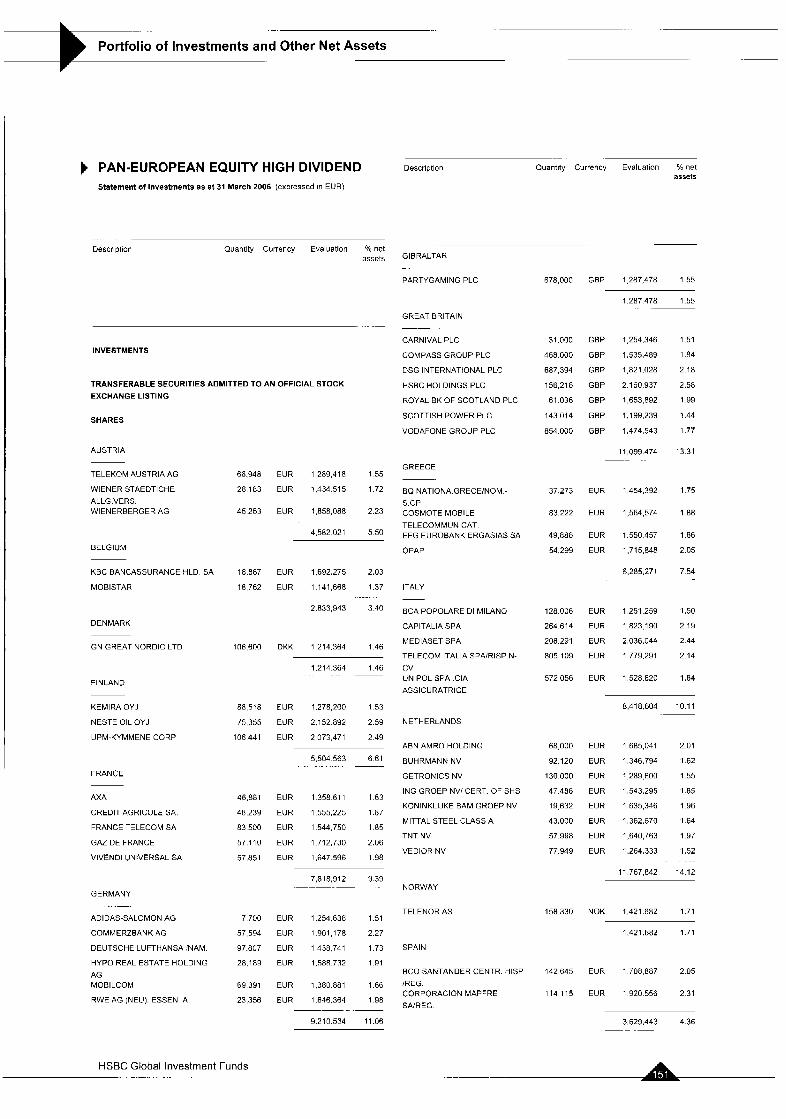
-_ .. -
Portfolio of Investments and Other Net Assets
PAN-EUROPEAN EQUITY HIGH DIVIDEND Statement of investments as at 31 March 2006 (axpressed in EUR)
__ Quantity Currency Evaluation YO net
assets Description
Descrlpllor Quantity Currency Evaluation '10 net assets GIBRALTAK
678,000 GEP I 287,478 I 55 PARTYGAMING PLC
1.287478 1 5 5
GREAT BRITAIN .
CARNIVAL PLC
COMPASS GROUP PLC
DSG INTERNATIONAL PLC
HSBC HOLDINGS PLC
ROYAL BK OF SCOTLAND PLC
SCOTTISH POWER PLC
VODAFONE GROUP PLC
. ..
31,000 GBP 1,254,346 1.51
468.000 GBP 1.535.489 1.84
687,394 GEP 1,821.028 2.18
156216 GBP 2,160,937 2.58
61 036 GBP 1,653,892 1.99
143 014 GBP 1,199,239 1.44
854,000 GBP 1,474,543 1.77
INVESTMENTS
TRANSFERABLE SECURITIES AOMITTED TO AN OFFICIAL STOCK EXCHANGE LISTING
SHARES
AUSTRIA 11,099474 1331 .
GREECE 1 5 5 ~.
1 72 B a NATIONA GRECE~NOM -
s CP 2.23 COSMOTE MOBILE
TELECOMMUNICAT 2 EFG EUROBANK ERGASIA$ SA
TELEKOM 4USTRIA AG
WIENER STAEDTICHE
ALLG.VERS. WIENERBERGER AG
66.940 EUR 1,289,418
28183 EUR 1.434515 37.273 EUR 1454,392 1 7 5
83.222 EUR 1,564,574 I 88
49,886 EUR 1550457 1 8 6
54.299 EUR 1.715.848 2 0 5
8,285271 7 54
. .
45253 EUR 1,858,088
4.582 021
BELGIUM OPAP
18.887 EUR 1.692.275 2.03 KBCBANCASSURANCEHLD SA
MOBlSTAFi 18.762 EUR 1,141,668 1.37
2,833,943 3 40
... ITALY
BCA POPOLARE Dl MILANO
CAPlTALlA SPA
MEDIASET SPA
TELECOM ITALIA SPA/RISP.N-
CV UNIPOL SPA .CIA
ASSICURATRICE
128006 EUR 1251 259 1 5 0
26.1.614 EUR 1823190 2 1 9
208,291 EUR 2,036.044 2 44
805109 EUR 1779.291 214
572056 EUR I 528,820 I 84
DENMARK
GN GHEAT NOHOIC LTD
FINLAND
1[16,600 DKK 1214.364 1 4 6
1.214364 1 4 6 ... ~
KEMIRA OIJ
NESTE OIL OYJ
UPM-KYMMENE CORP
8,418.604 10 11 88,518 EUR 1.278,200 153
75355 EUR 2.152892 2 5 9
106441 EUR 2073.471 2 4 9
NETHERLANDS
ABN AhlRO HOLDING
BUHRMANN NV
GETRONICS NV
ING GROEP NV/ CERT. OF SHS
KONINKLIJKE BAM GROEP NV
MITTAL STEEL CLASS A
TNT NV
VEDIOR NV
68 000
92 120
130.000
47 486
19632
43.000
57.998
77.949
EUR
EUR
EUR
EUR
EUR
EUR
EUR
EUR
1 685,041
1,346.794
1 289 600
1,543.295
1 635,346
1,362.670
1,640,763
1.264.333
I I 767.842
2 01
1 62
1 55
1 85
1 9 6
1 64
1 9 7
1 52
14 12
5.504563 6 6 1 . . ~-
FRANCE
AXA
CREDIT AGRICOLE SA.
FRANCE T!LECOM SA
GAZ DE FRANCE
VIVENDI UUIVEHSAL SA
46,881 EUR 1358611 1 6 3
48,239 EUR 1555,225 187
83500 EUR 1544.750 1 8 5
57,110 EUR 1712,730 2 0 6
57,851 EUH 1,647596 1 9 8
7,818,912 Y.39 NORWAY
GERMANY
TELENOR AS 158.330 NOK 1,*21.682 1.71 ADIDAS-SALOMON AG
COMMERZBANK AG
DEUTSCHE LUFTHANSA !NAM
HYPO REAL ESTATE HOLDING
AG MOBILCOM
RWE AG (NEU). ESSEN A
7,700 EUR 1254.638 1 5 1
57,594 EUR 1,901,178 2.27
97.807 EUR 1438,741 1 7 3
28,189 EUR 1.588 732 1 9 1
1.421.682 1 71
SPAIN
BCO SANTANDER CENTR HlSP /REG CORPOHACION MAPFRE SA,REG
142.645 EUR 1708,887 2 0 5
114,115 EUR 1920555 2 3 1 69391 EUR 1.380881 1 6 6
23,356 EUR 1.646.364 198
9.210.534 11.06
~
3,629.443 4 36 _ _ .-
HSBC Global Investment Funds .
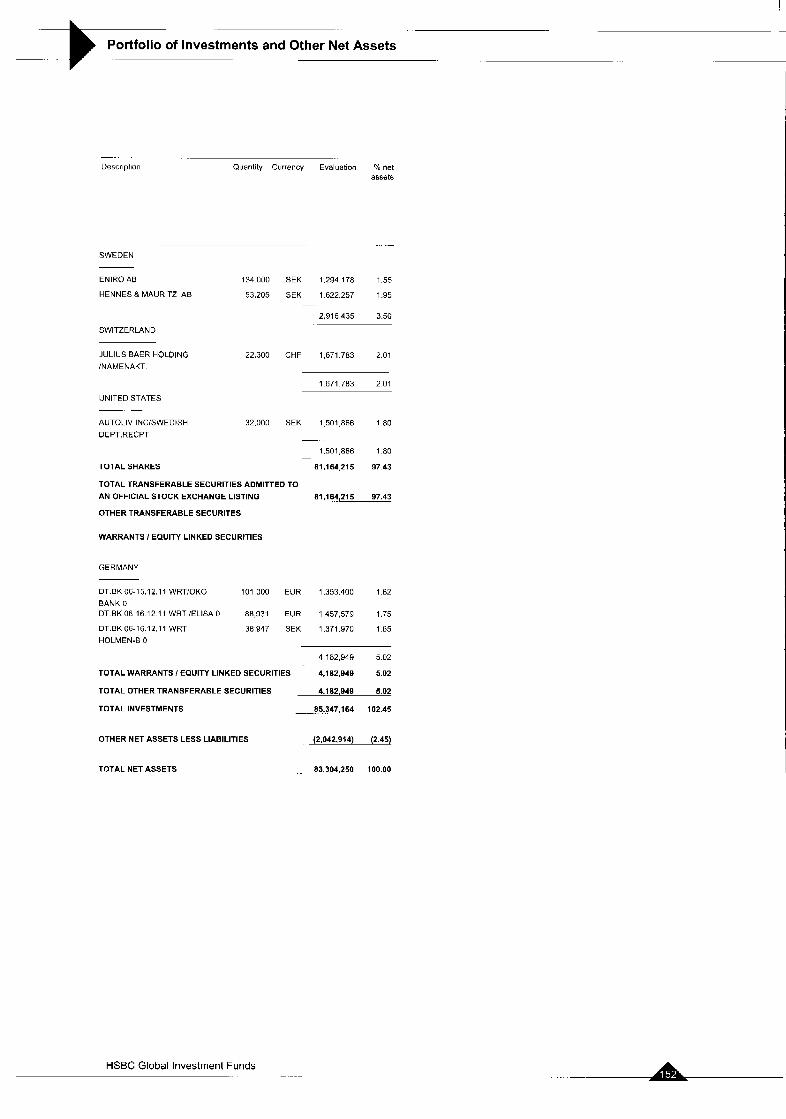
Portfolio of Investments and Other Net Assets
Quantity Currency Evaluatlon % net assets
. .-
SWEDEN
ENIRO AB 134.000 SEK 1,294,178 1.55
HENNES R MAURITZ AB 53,205 SEK 1.622.257 1.95
2,916,435 3.50
SWITZERLAND
JULIUS BAER HOLDING 22300 CHF 1,671 783 201 /NAMENAKT
I 671 783 201
UNITED STATES ~. -
AUTOLIV INC/SWEDISH 32000 SEK 1501,866 1 8 0
DEFT RECPT -.
1501,866 1 8 0
TOTAL SHARES 81,164,215 9743
TOTAL TRANSFERABLE SECURITIES ADMITTED TO
AN OFFICIAL STOCK EXCHANGE LISTING 81,164,215 97.43
OTHER TRANSFERABLE SECURITES
-
WARRANTS I EQUITY LINKED SECURITIES
GERMANY
DT.BK 06-15.12.1 1 WRT/OKO 101 000 EUR 1,353.400 1 6 2 BANK 0 DT.BK 06-16.12 11 WRT lELlSA 0 88,931 EUR 1,457,579 1.75
DT.BK 06-16.12.11 WRT 38.947 SEK 1.371.970 165 HOLMEN-B 0
4 182,949 5.02
TOTAL WARRANTS / EQUITY LINKED SECURITIES 4.182.948 5.02
TOTAL OTHER TRANSFERABLE SECURITIES 4.182.949 5.02
TOTAL INVESTMENTS 85,347,164 102.45
OTHER NET ASSETS LESS LIABILITIES (2,042,914) (2.45)
TOTAL NET ASSETS 83,304,250 100.00
HSBC Global Investment Funds ... ... .. .
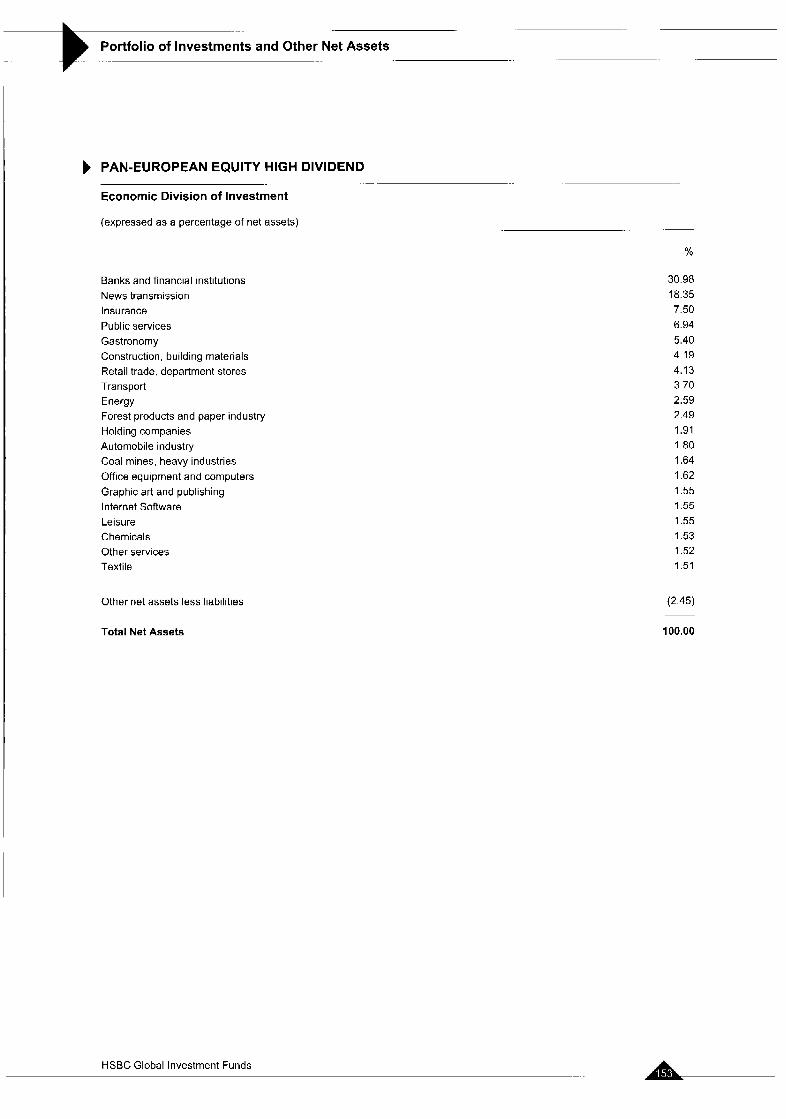
... .. .
)en& and .~
PAN-EUROPEAN EQUITY HIGH DIVIDEND
Economic Division of Investment __ ..
(expressed as a percentage of net assets) ~ . ..
%
Banks and financial institutions News transmission Insurance Public services Gastronomy Construction, building materials Retail trade. department stores Transport Energy Forest products and paper industry Holding companies Automobile industry Coal mines, heavy industries Office equipment and computers Graphic art and publishing Internet Software Le is u re Chemicals Other services Textile
Other net assets less liabilities
Total Net Assets
30.98 18.35 7.50 6.94 5.40 4.19 4.13 3.70 2.59 2.49 1.91 1.80 1.64 1.62 1.55 1.55 1.55 1.53 1.52 1.51
(2.45)
100.00
HSBC Global Investment Funds
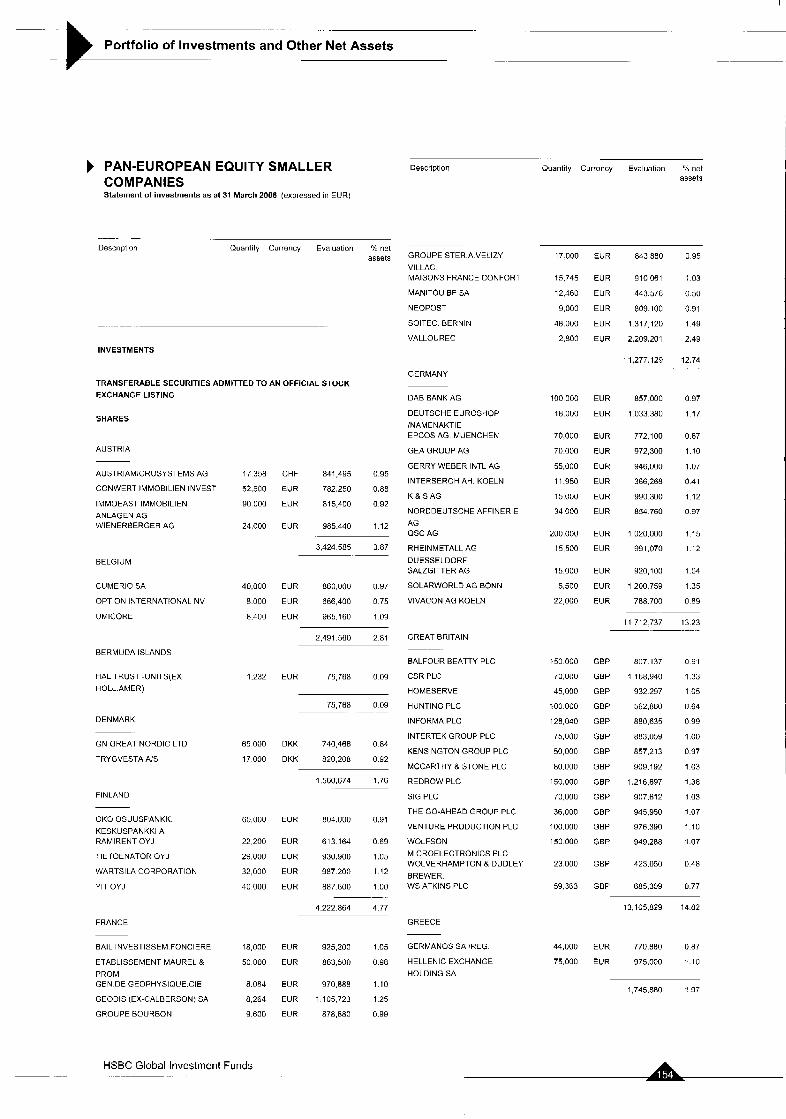
_ _
Portfolio of Investments and Other Net Assets
PAN-EUROPEAN EQUITY SMALLER COMPANIES Statement of investments as at 31 March 2006 (expressed in EUR)
Description Quantity Currcncy Evaluation "h net assets
Descrlpllon Quantity Currency Evaluation X net assets
0.95
0.88
0.92
1.12
GROUPE STERAVELIZY
VI LLAC . MAISONS FRANCE CONFORT
MANITOU BF SA
NEOPOST
SOITEC. BERNIN
VALLOUREC
17000 EUR
15,745 EUR
12,460 EUR
9,000 EUR
48.000 EUR
2,800 EUR
843 880
910,061
443.576
809.100
1317,120
2,209.201
11,277.129
857 000
1 033 380
772.100
972,300
946,000
366.268
990 300
a54 760
1 020.000
991.070
920,100
1 200 759
788 700
0 95
1.03
0 50
0.91
1.49
2.49
12.74 . .
0.97
1.17
0 87
1.10
1.07
0.41
1 1 2
0.97
1.15
1.12
1.04
1.35
0.89
INVESTMENTS
TRANSFERABLE SECURITIES ADMITTED TO AN OFFICIAL STOCK EXCHANGE LISTING
SHARES
GERMANY
DAB BANK AG
DEUTSCHE EUROSHOP
lNAMENAKTlE EPCOS AG MUENCHEN
GEA GROUP AG
GERRY WEBER INTL AG
INTERSEROH AH. KOELN
K B S A G
NORODEUTSCHE AFFlNERlE AG QSC AG
RHEINMETALL AG
DUESSELDORF SALZGITTER AG
SOLARWORLD AG BONN
VIVACON AG KOELN
100000 EUR
18.000 EUR
70,000 EUR
70.000 EUR
55,000 EUR
11,950 EUR
15,000 EUR
34000 EUR
200,000 EUR
15,500 EUR
15000 EUR
5,500 EUR
22000 EUR
AUSTRIA
AUSTRIAMICROSYSTEMS AG
CONWERT IMMOBILIEN INVEST
IMMOEAST IMMOBILIEN ANLAGEN AG WIENEHBERGER AG
17358 CHF 841,495
52.500 EUR 782.250
90000 EUR 815.400
24,000 EUR 985.440
3.424 585 3.87
BELGIUM
CUMERIO SA
OPTION INTERNATIONAL NV
UMICORE
40,000 EUR 860,000 0 9 7
8000 EUR 666,400 0 7 5
8.400 EUR 965.160 1 0 9 11 712.737 13.23
2,491.560 2 81 GREAT BRITAIN
BERMUDA ISLANDS BALFOUR BEATTY PLC
CSR PLC
HOMESERVE
HUNTING PLC
INFORMA PLC
INTERTEK GROUP PLC
KENSINGTON GROUP PLC
MCCAHTHY 8 STONE PLC
REDROW PLC
SIG PLC
THE GO-AHEAD GROUP PLC
VENTURE PRODUCTION PLC
WOLFSON
MICROELECTRONICS PLC WOLVERHAMPTON 8 DUDLEY
BREWER. WS ATKINS PLC
150 000
70 no0
45,000
100 000
128,040
75,000
50,000
80.000
150.000
70,000
36,000
100.000
150 000
GBP
GBP
GBP
GBP
GBP
GBP
GBP
GBP
GBP
GBP
GBP
GBP
GBP
n(17 137
1,168,940
932 297
562,sfin
880.635
883.059
857.213
909,192
1.216.897
907,612
945.950
976,330
949.288
423.050
0 91
1.33
1 0 5
0 64
0 99
1 .oo 0.97
1.03
1.38
1 03
1.07
1.10
1.07
HAL TRUST -UNITS(EX HOLL AMER)
1.232 EUR 75,768 009
75,768 009 ~.
DENMARK
GN GREAT NORDIC LTD
TRYGVESTA A:S
65000 DKK 740466 0 84
17000 DKK 820208 092
1 560.674 1.76
FINLANU
OK0 OSUUSPANKK.
KESKUSPANKKI A RAMIRENT OYJ
TIETOENATOH OYJ
WARTSILA CORPORATION
YIT OYJ
60000 EUR 804.000 0.91
22,200 EUR 613 164 069
29,000 EUR 930900 1.05
32,000 EUR 987200 1 12
40000 EUR 887600 100
23 000 GBP 0.48
59.363 GBP 685,339 0.77
4.222 864 4.77 13 105,829 14.82
FRANCE GREECE
BAIL INVESTISSEM FONCIERE
ETABLISSEMENT MAUREL B PROM GEN DE GEOPHYSIQUE.CIE
GEODIS (EX-CALBERSON) SA
GROUPE BOUHBON
GERMANOS SA !REG
HELLENIC EXCHANGE
HOLDING SA
18,000 EUR 925,200 1.05
50000 EUR 863500 098
8.084 EUR 970.888 1.10
8,264 EUR 1105,723 1 2 5
9.600 EUR 878,880 0.99
44,000 EUR 770.830 0.87
75.000 EUR 975.030 1.10
1,745.880 1.97
HSBC Global Investment Funds ~ .. .
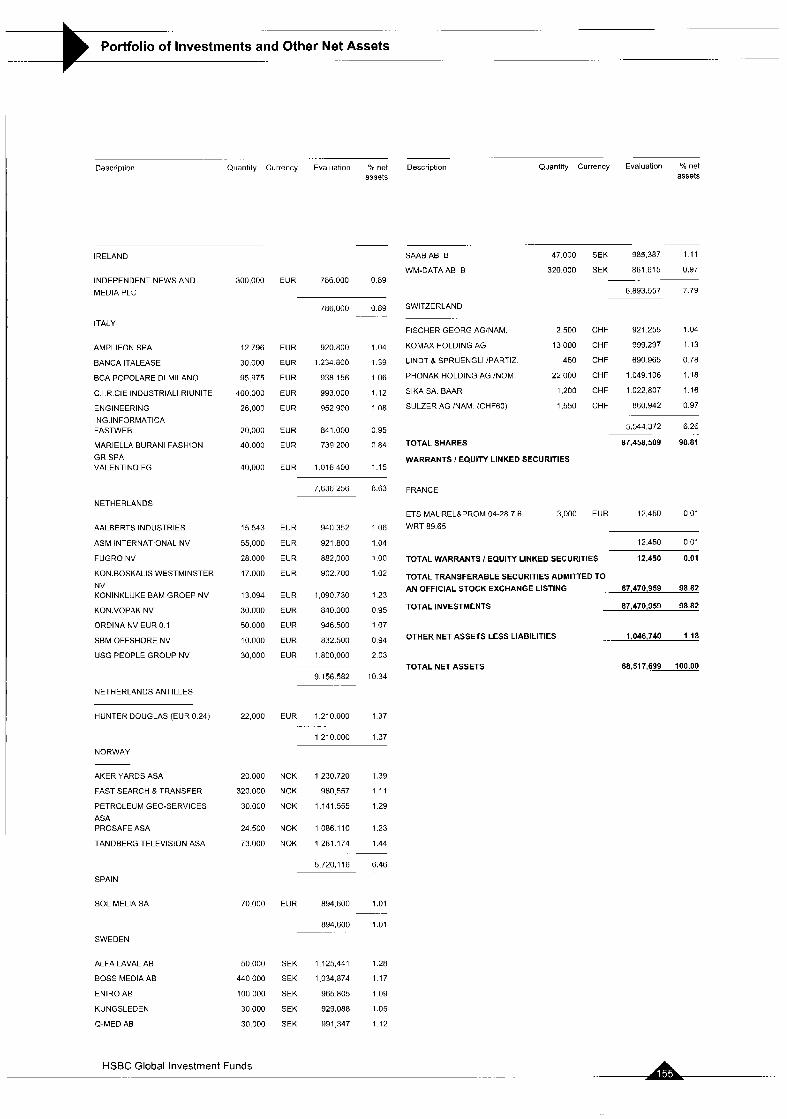
Portfolio of Investments and Other Net Assets -. .. _.
. . . .. -. .
Description Quantity Currency Evaluatlon "h net Description Quantity Currency Evaluation 'A net assets assets
IRELAND
INDEPENDENT NEWS AND
MEDIA PLC
SAABAB B
WM-DATAAB B 300,ooo EUR 78fi.000 0 8 9
-~
47.000 SEK 985.387 1 11
320.000 SEK 861.615 0.97
6.693.557 7.79
~. ~
ITALY
AMPLIFON SPA
BANCA ITALEASE
BCA POPOLARE 01 MILANO
C I R CIE INDUSTRIAL1 RlUNlTE
ENGINEERING
ING.INFORMATICA FASTWEB
MARIELLA BURANI FASHION
GR SPA VALENTlhO FG
12 796
30,000
95 975
400.000
26.000
20,000
40 000
40,000
EUR 920.800
EUR 1234800
EUR 938.156
EUR 993.000
EUR 952,900
EUR 841.000
EUR 739,200
EUR l .0 l f i 400
NETHERL4NDS
0.89 ..
1 04
1.39
1 06
1.12
I on
0 95
0 84
1.15
7,636,256 8.63 FRANCE
NETHERLANDS ANTILLES
HUNTER DOUGLAS (EUR 0 24)
NORWAY
SWITZERLAND
FISCHER GEORG AGjNAM.
KOMAX HOLDING AG
LINDT & SPRUENGLI lPARTlZ
PHONAK HOLDING AG !NOM.
SIKASA BAAR
SULZER AG !NAM. (CHFGO)
2500 CHF 921 255 1 0 4
13000 CHF 999.297 1 1 3
450 CHF 690965 0 7 6
22,000 CHF 1049106 1 1 8
1.200 CHF i 022.807 I 16
1,550 CHF 860.942 0 9 7
9.156 582 10.34
SPAIN
TOTAL SHARES
WARRANTS / EQUITY LINKED SECURITIES
AALBERTS INDUSTRIES
ASM INTERNATIONAL NV
FUGRO Nd
KON.BOSKALIS WESTMINSTER NV KONINKLIJKE BAM GROEP NV
KON.VOPAK NV
ORDINA hV EUR 0.1
SBM OFFSHORE NV
USG PEOPLE GROUP NV
15 543
55,000
28 000
17.000
13 094
30.000
50 000
10.000
30,000
EUR
EUR
EUR
EUR
EUR
EUR
EUR
EUR
EUR
940 352
921.800
862.000
902.700
1,090.730
840.000
946.500
832.500
1.800.000
106
1 04
1 .oo 1 02
1.23
0 95
1 07
0 94
2 03
22,000 EUR 1.210.000 137
1,210 000 1.37
.- . . . . .
AKERYARDSASA
FAST SEARCH 8 TRANSFER
PETROLEUM GEO-SERVICES
ASA PROSAFE ASA
TANDBERG TELEVISION ASA
20 000 NOK 1.230.720 1.39
320,000 NOK 980 557 1.11
30.000 NOK 1.141.555 1 29
24.500 NOK 1 066.110 1.23
73,000 NOK 1,281 174 1.44
5.720,116 6.46
~
SOL MELIA SA 70.000 EUR 894.600 1.01
SWEDEN
ALFALAVALAB
BOSS MEDIA AB
ENIRO AB
KUNGSLEDEN
Q-MED AB
894,600 1 0 1
50.000 SEK 1,125,441 128
440000 SEK 1034.874 117
100000 SEK 965605 109
30,000 SEK 929,088 1 05
30,000 SEK 991 347 1 1 2
5,544,372 6.26
87,456,509 98.81 ~.
3,000 EUR 12,*50 001 ET5 MAURELLPROM 04-28.7.6
WRT 89.65
12.450 001
TOTAL WARRANTS / EQUITY LINKED SECURITIES 12,450 0.01
TOTAL TRANSFERABLE SECURITIES ADMITTED TO AN OFFICIAL STOCK EXCHANGE LISTING 87.470.959 98.82
TOTAL INVESTMENTS 87,470,959 98.82
OTHER NET ASSETS LESS LIABILITIES .. 1.046.740 1.18
TOTALNETASSETS 88,517,699 100.00
HSBC Global Investment Funds
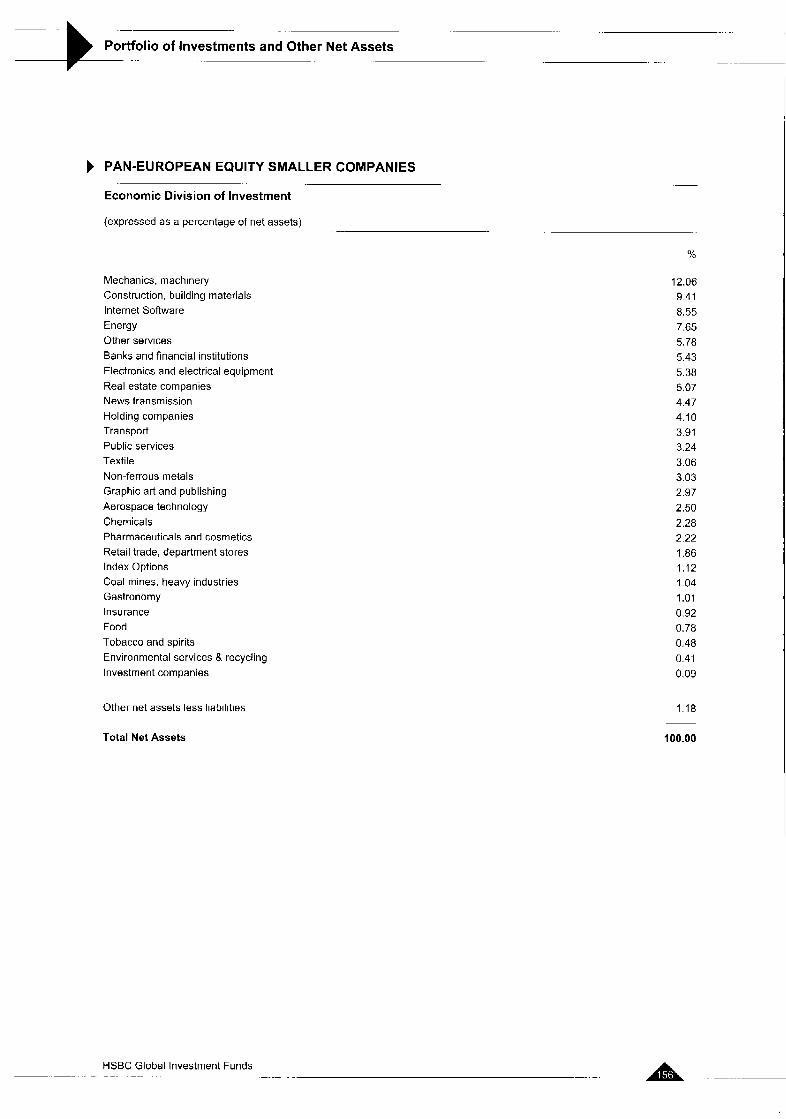
. . . .
of Investments and Other Net Assets - -~ - _ -
PAN-EUROPEAN EQUITY SMALLER COMPANIES
Economic Division of Investment
(expressed as a percentage of net assets) -_ .. -
Mechanics, machinery Construction, building materials Internet Software Energy Other services Banks and financial institutions Electronics and electrical equipment Real estate companies News transmission Holding companies Transport Public services Textile Non-ferrous metals Graphic art and publishing Aerospace technology Chemicals Pharmaceuticals and cosmetics Retail trade, department stores Index Options Coal mines. heavy industries Gastronomy Insurance Food Tobacco and spirits Environmental services & recycling Investment companies
Other net assets less liabilities
Total Net Assets
%
12.06 9.41 8.55 7.65 5.78 5.43 5.38 5.07 4.47 4.10 3.91 3.24 3.06 3.03 2.97 2.50 2.28 2.22 1.86 1.12 1.04 1.01 0.92
0.48 0.41 0.09
0.78
1.18
100.00
HSBC Global Investment Funds - .- -. . ~ . - -. -.
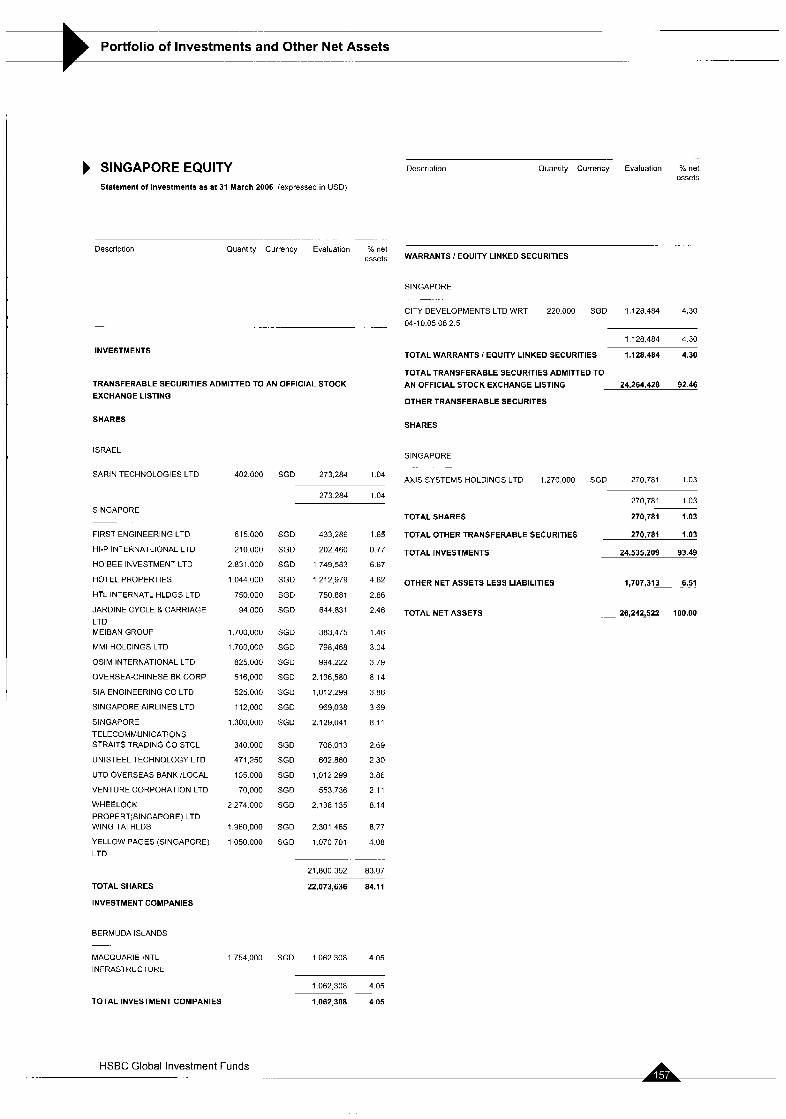
SINGAPORE EQUITY Statement of Investments a s at 31 March 2006 (expressed in USD)
-. . . . -. . .
Description Quantity Currency Evaluation 9t net %sets
.- ._ -.
INVESTMENTS
TRANSFERABLE SECURITIES ADMITTED TO AN OFFICIAL STOCK
EXCHANGE LISTING
SHARES
ISRAEL
SARIN TECHNOLOGIES LTD
SINGAPORE ~.
FIRST ENGINEERING LTD
HI-P INTERNATLIONAL LTD
HO BEE IhVESTMENT LTD
HOTEL PROPERTIES
HTL INTERNATL HLDGS LTD
JARDINE CYCLE &CARRIAGE
LTD MEIBAN GROUP
MMI HOLCINGS LTD
OSlM INTERNATIONAL LTD
OVERSEA-CHINESE BK CORP
SIA ENGINEERING CO LTD
SINGAPORE AIRLINES LTD
SINGAPORE
TELECOMMUNICATIONS STRAITS TRADING CO STCL
UNISTEEL TECHNOLOGY LTD
UTDOVERSEASBANKlLOCAL
VENTURE CORPORATION LTD
WHEELOCK
PROPERT(SINGAP0RE) LTD WING TAI HLDS
YELLOW PAGES (SINGAPORE) LTD
TOTAL SHARES
INVESTMENT COMPANIES
BERMUDA ISLANDS
MACQUARIE INTL
INFRASTRUCTURE
402.000
615.000
210.000
2 831,000
1044.000
750.000
94.000
1.700,000
1.700,OOO
825.000
516,000
525,000
112,000
1,300,000
340.000
471,250
105 000
70,000
2,274.000
1,960 000
1,050 000
1.754.000
SGD 273.284 104
SGD
SGD
SGD
SGD
SGD
SGD
SGD
SGD
SGD
SGD
SGD
SGD
SGD
SGD
SGD
SGD
SGD
SGD
SGD
SGD
433.286
202 460
1 749,583
1 212 979
750 881
644.831
383,475
798 468
994.222
2 136.580
1,012.299
969.038
2.129.041
706,013
602.860
1.012 299
553 736
2.136 135
2301,465
1.070 701
1 65
0.77
6.67
4.62
2.86
2.46
1.46
3.04
3 79
8 14
3.86
3 69
8.11
2.69
2.30
3.86
2.11
8.14
8.77
4.08
~.
21,800,352 83.07
22.073.636 84.11
SGD 1062 308 4.05
TOTAL INVESTMENT COMPANIES
1062,308 405
1,062,308 4 05 ~
..
Description Quantity Currency Evaluation % net assets
WARRANTS I EQUITY LINKED SECURITIES
SINGAPORE
CITY DEVELOPMENTS LTD WRT 220.000 SGD 1.128.484 4.30 04-10.05 06 2.5
1128.484 430
TOTAL WARRANTS I EQUITY LINKED SECURITIES 1.128.484 4.30
TOTAL TRANSFERABLE SECURITIES ADMITTED TO AN OFFICIAL STOCK EXCHANGE LISTING 24.264.428 92.46
OTHER TRANSFERABLE SECURITES
SHARES
SINGAPORE -
AXIS SYSTEMS HOLDINGS LTD 1.270,OOO SGD 270.781 1.03
270,781 1.03
TOTAL SHARES 270,781 1.03 ~-
270,781 1.03 TOTAL OTHER TRANSFERABLE SECURITIES
TOTAL INVESTMENTS 24,535,209 93.49
OTHER NET ASSETS LESS LIABILITIES 1,707,313- 6.51
TOTAL NET ASSETS 26,242,522 100.00
HSBC Global Investment Funds .. . . .. - .
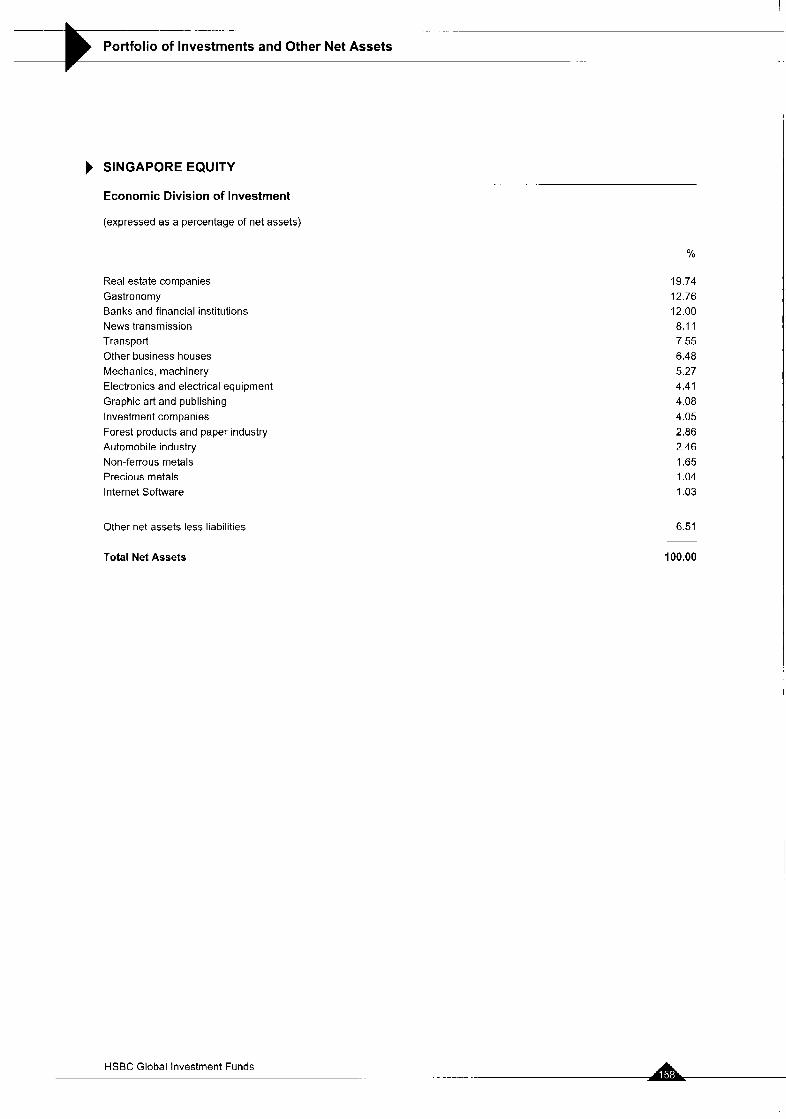
Portfolio of Investments and Other Net Assets _. .
SINGAPORE EQUITY
Economic Division of Investment
. _ . .. (expressed as a percentage of net assets)
- _.
Real estate companies Gastronomy Banks and financial institutions News transmission Transport Other business houses Mechanics, machinery Electronics and electrical equipment Graphic art and publishing Investment companies Forest products and paper industry Automobile industry Non-ferrous metals Precious metals Internet Software
Other net assets less liabilities
Total Net Assets
HSBC Global Investment Funds
%
19.74 12.76 12.00 8.1 1 7.55 6.48 5.27 4.41 4.08 4.05 2.86 2.46 1.65 1.04 1.03
6.51
100.00
. . __ .
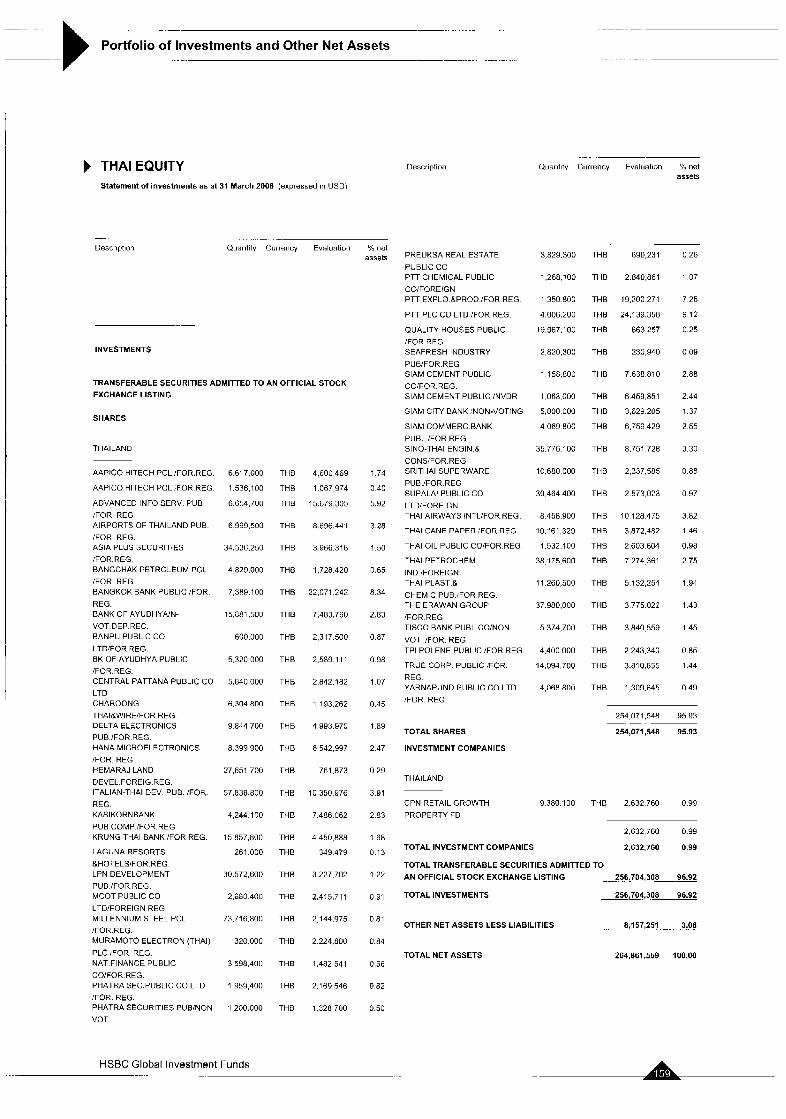
.. . -- . .. . . . . . . .
Portfolio of Investments and Other Net Assets . . .. . ..
-. .. .
THAI EQUITY Statement of investments as at 31 March 2006 (expressed in USD)
Descridion Quantity Currency Evaluation % net assets
. . . . -. . .- -.
Descrlptioi Quantity Currency Evaluation Yo nct assets PREUKSA REAL ESTATE 3,829,300 THE 690,231 0 26
PUBLIC CO PTT CHEMICAL PUBLIC 1,268.100 THE 2 840,861 1 0 7
COiFORElGN PTT EXPLO.RPROD.:FOR REG. 1 350.800 THB 19.200 271 7.25
PTT PLC CO LTD :FOR.REG. 4,006.200 THE 2A,139.358 9 12
QUALITY HOUSES PUBLIC 13,967,100 THE 663 257 0.25
:FOR.REG INVESTMENTS SEAFRESH INDUSTRY 2 820,300 THE 230 940 0 0 9
PUB/FOR.REG SlAM CEMENT PUBLIC 1158.800 THE 7638810 2.88
CO,FOR.REG.
--
TRANSFERABLE SECURITIES ADMITTED TO AN OFFICIAL STOCK EXCHANGE LISTING
SHARES
THAILAND
AAPICO HITECH PCL :FOR.REG 6 617,000
AAPICO HITECH PCL,FOH REG 1,536,100
ADVANCED INFO SERV PUB
:FOR REG AIRPORTS OF THAILAND PUB
:FOR REG ASIA PLUS SECURITIES ’FOR REG BANGCHAK PETROLEUM PCL
/FOR REG BANGKOK BANK PUBLIC (FOR
REG BANK OF AYUDHYA!N-
VOT DEP REC BANPU PUBLIC CO
LTD’FOR REG BK OF AYUDHYA PUBLIC ’FOR REG CENTRAL PATTANA PUBLIC CO LTD CHAROONG
THAILWIREIFOR REG DELTA ELECTRONICS PUB /FOR REG HANA MICROELECTRONICS
/FOR REG HEMARAJ LAND
DEVEL FOREIG REG ITALIAN-THAI DEV PUB ’FOR
REG KASIKORNBANK
PUB COMP :FOR REG KRUNG THAI BANK ’FOR REG
LAGUNA RESORTS
RHOTELSiFOR REG LPN DEVELOPMENT
PUB IFOR REG MCOT PUBLIC CO
LTD’FOREIGN REG MILLENNIUM STEEL PCL /FOR REG MURAMOTO ELECTRON (THAI)
PLC’FOR REG NAT FINANCE PUBLIC
CO!FOR REG PHATRA SEC.PUBLIC CO LTD
IFOR REG PHATRA SECURITIES PUB’NON
VOT
6,654,700
6,999,500
34.536.250
4 829.000
7 389.100
15 R81.5[10
600.000
5,320 000
5,840,000
6.304 800
9.844.700
8,399,900
27 651.700
57,838.800
4,244.1 00
15,857,800
261 000
30.572,600
2.680 400
73,716,800
320,000
3 59a.4m)
1 959,400
1,200.000
THE
THB
THB
THB
THB
THE
THE
THE
THE
THE
THE
THB
THE
THB
THE
THE
THE
THB
THB
THE
THB
THE
THE
THE
THB
THE
4,600,469
1.067.974
15,679,305
8 696.441
3 966.316
1,728.420
22,071.242
7,483.760
2,317 500
2.589 11 1
2.842.182
1 193.262
4 993.970
6 542.997
761.873
10 350 976
7.486 062
4 450.888
349 479
3.227.702
2.415.711
2 144.375
2 224,800
1,482.541
2.163 546
1.328 700
1.74
0 40
5.92
3 28
1 50
0.65
8.34
2.83
0.87
0.98
1 0 7
0.15
1 89
2 47
0 29
3.91
2.83
1 68
0.13
1 22
0.91
0.81
0.84
0.56
0.82
0.50
SlAM CEMENT PUBLIC ’NVDR
SlAM CITY BANK ’NON-VOTING
SlAM COMMERC BANK
PUBL :FOR REG SINO-THAI ENGIN 8 CONS,FOR REG SRlTHAl SUPERWARE
PUB ’FOR REG SUPALAI PUBLIC CO
LTD’FOREIGN THAI AIRWAYS INTL’FOR REG
THAI CANE PAPER :FOR REG
THAI OIL PUBLIC COiFOR REG
THAI PETROCHEM
IND (FOREIGN THAI PLAST R CHEMIC PUB ’FOR REG THE ERAWAN GROUP
’FOR REG TISCO BANK PUBL COiNON-
VOT /FOR REG TPI POLENE PUBLIC !FOR REG
TRUE COHP PUBLIC :FOR
REG YARNAPUND PUBLIC CO LTD
:FOR REG
1,063,000
5,800 ooo 4 069.800
35.776 100
10.680 000
30.464 400
8 458.900
10,161,329
1,532.100
XI 17s,600
11 260,500
37 980,000
5 374,700
4.400 000
14.094,700
4.068 800
THE
THE
THE
THE
THE
THE
THE
THB
THE
THE
THE
THE
THE
THE
THB
THE
6.459.851
3,629 205
6,759 429
8.751 728
2.337.585
2.573.023
10 128.475
3,872,482
2,603 804
7 274 361
5 132,254
3 775 022
3.840 559
2.243.340
3.810.855
1,309.645
2.44
1 37
2.55
3 30
0 88
0 97
3 82
1 46
0 98
2 75
1 94
1 4 3
1 45
0 85
1 44
0 49
TOTAL SHARES
INVESTMENT COMPANIES
THAILAND
254 071,548 95 93
254,071,548 95.93 _ _ .~
CPN RETAIL GROWTH 9380100 THE 2.632760 0 9 9
PROPERTY FD
2.632 760 0 9 9
TOTAL INVESTMENT COMPANIES 2,632,760 0.99
TOTAL TRANSFERABLE SECURITIES ADMITTED TO
256!704,308 96.92 AN OFFICIAL STOCK EXCHANGE LISTING
TOTAL INVESTMENTS 256,704,308 96.92
__..
OTHER NET ASSETS LESS LIABILITIES 8,157,251 .. 3.08
TOTAL NET ASSETS 264.861.559 100.00
HSBC Global Investment Funds -. -. ...
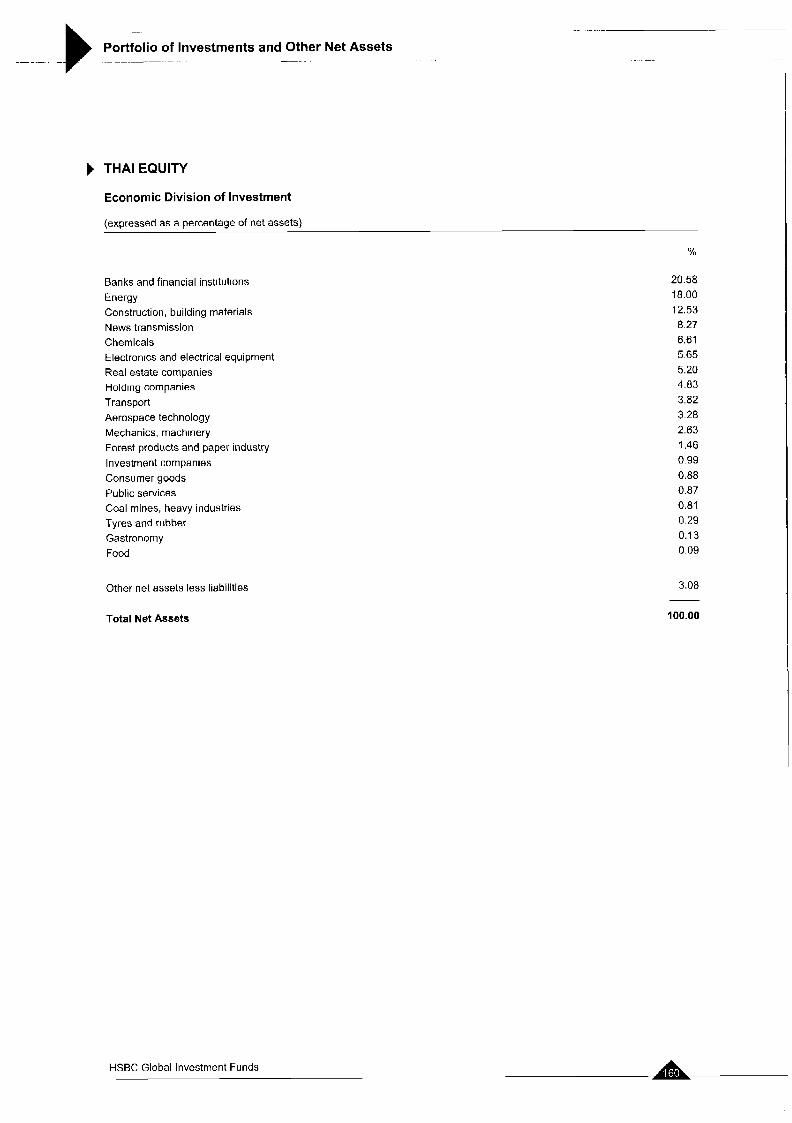
Portfolio of Investments and Other Net Assets __ . . - -_ _- --
THAI EQUITY
Economic Division of Investment
(expressed as a percentage of net assets)
%
Banks and financial institutions Energy Construction, building materials News transmission Chemicals Electronics and electrical equipment Real estate companies Holding companies Transport Aerospace technology Mechanics. machinery Forest products and paper industry Investment companies Consumer goods Public services Coal mines, heavy industries Tyres and rubber Gastronomy Food
Other net assets less liabilities
20.58 18.00 12.53
6.61 5.65 5.20 4.83 3.82 3.28 2.63 1.46 0.99 0.88 0.87 0.81 0.29 0.13 0.09
8.27
3.08
Total Net Assets 100.00
HSBC Global Investment Funds ... . . .... 7
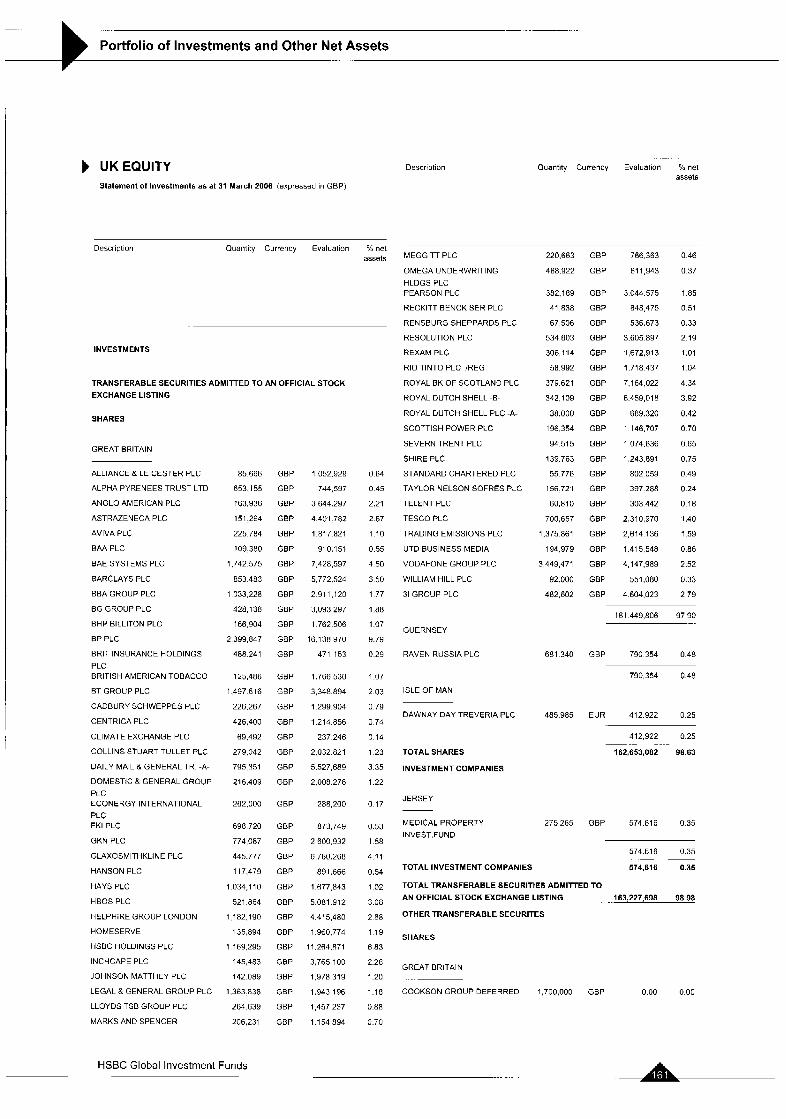
. -.
Portfolio of Investments and Other Net Assets
UKEQUITY Statement of Investments as at 31 March 2006 [expressed in GBP)
Descriptiun
.
Quantity Currency Evaluation Yo net assets
Description Quantity Currency Evaluation "A, net assets
INVESTMENTS
TRANSFERABLE SECURITIES ADMITTED TO AN OFFICIAL STOCK
EXCHANGE LISTING
SHARES
GREAT BRITAIN
ALLIANCE & LEICESTER PLC
ALPHAPYRENEESTRUSTLTD
ANGLO AMERICAN PLC
ASTRAZENECAPLC
AVIVA PLC
BAA PLC
BAE SYSTEMS PLC
EARCLAYS PLC
BBA GROUP PLC
EG GROUP PLC
BHP BILLITON PLC
BP PLC
BRIT INSURANCE HOLDINGS
PLC BRITISH AMERICAN TOBACCO
ET GROUP PLC
CADBURY SCHWEPPES PLC
CENTRICA PLC
CLIMATE EXCHANGE PLC
COLLINS STUART TULLET PLC
DAILY MAIL & GENERAL TR. -A-
DOMESTIC & GENERAL GROUP
PLC ECONERGY INTERNATIONAL
PLC FKI PLC
GKN PLC
GLAXOSMITHKLINE PLC
HANSON PLC
HAYS PLC
HBOS PLC
HELPHiRE GROUP LONDON
HOMESERVE
HSBC HOLDINGS PLC
INCHCAPE PLC
JOHNSON MATTHEY PLC
LEGAL 8. GENERAL GROUP PLC
LLOYDS TSB GHOUP PLC
MARKS AND SPENCER
85 666
653.155
163 936
151,264
225 784
109 380
1,742 575
853 483
1 033.228
428,138
166.904
2 399,847
488.241
125,486
1.497616
226 267
426,400
69,492
279.042
795 351
216.409
262,000
698 720
774,087
445.777
117.479
1034,110
521 864
1 182 190
135,894
1 169.295
145,483
142 089
1.363 838
264 639
206,231
GBP
GBP
GBP
GBP
GBP
GBP
GBP
GBP
GBP
GEP
GBP
GBP
GBP
GBP
GBP
GBP
GEP
GEP
GBP
GEP
GBP
GEP
GBP
GBP
GEP
GBP
GBP
GBP
GEP
GBP
GBP
GBP
GBP
GBP
GBP
GBP
1.052.929
744,597
3,644.297
4.401 782
1.817 821
910,151
7,428,597
5 772.524
2911.120
3,093.297
1 762.506
16,138 970
471 153
1,766,530
3,348.894
1 299.904
1214.856
237.246
2.032.821
5,527,689
2.008 276
288,200
873.749
2 600.932
6,780.268
891.666
1.677 843
5.081 912
4,415,480
1 960.774
11,264,871
3,765.1 00
1.978 319
1,943,196
1,457.237
1 154 894
0.64
0.45
2.21
2.67
1.10
0.55
4 50
3 50
1 77
1 .88
1.07
9.79
0.29
1.07
2 03
0 79
0 74
0.14
1 23
3.35
1.22
0.17
0 53
1 58
4 11
0.54
1.02
3.08
2 68
1 1 9
6 83
2.28
1.20
1.18
0.88
0.70
MEGGITT PLC
OMEGA UNDERWRITING
HLDGS PLC PEARSON PLC
RECKITT BENCKISER PLC
RENSBURGSHEPPARDSPLC
RESOLUTION PLC
HEXAM PLC
RIO TINTO PLC /REG
ROYAL BK OF SCOTLAND PLC
ROYAL DUTCH SHELL -E-
ROYAL DUTCH SHELL PLC -A-
SCOTTISH POWER PLC
SEVERN TRENT PLC
SHIRE PLC
STANDARDCHARTEREDPLC
TAYLORNELSONSOFRESPLC
TELENT PLC
TESCO PLC
TRADING EMISSIONS PLC
UTD BUSINESS MEDIA
VODAFONE GROUP PLC
WILLIAM HILL PLC
31 GROUP PLC
220.663
468,922
382.189
41 838
67,506
534 E03
306,114
58.992
379.621
342,109
38.000
196.354
94 515
139.763
55 776
156 721
60,810
700,657
1,375 861
194,979
3,449,471
92.000
482,602
GBP
GBP
GBP
GEP
GBP
GBP
GBP
GBP
GBP
GBP
GBP
GBP
GBP
GEP
GBP
GEP
GBP
GBP
GBP
GBP
GBP
GBP
GBP
766.363
611,943
3 044.575
848 475
536.673
3.605 897
1,672,913
1.718 437
7.164.022
6.459.01 8
689.320
1 146.707
1 074.636
1.243.891
802 059
397 28R
303 442
2,310,970
2,614 136
1.415.548
4,147.989
551.080
4 604,023
~
0.46
0.37
1 8 5
0.51
0.33
2 19
1.01
1.04
4.34
3.92
0.42
0.70
0.65
0.75
0.49
0 24
0.18
1.40
1.59
0.86
2.52
0.33
2 79
GUERNSEY
RAVEN RUSSIA PLC 681 340 GBP 790 354 0.48
790,354 0.48
ISLE OF MAN
DAWNAY DAY TREVERIA PLC 485.985 EUR 412.922 0 25
TOTAL SHARES
INVESTMENT COMPANIES
JERSEY
412,922 0 2 5
162,653,082 98.63 -. .. . -. ..
MEDICAL PROPERTY 275265 GBP 574.616 0.35
INVEST.FUND
574.616 0.35
TOTAL INVESTMENT COMPANIES 574.616 0.35 . - .~
TOTAL TRANSFERABLE SECURITIES ADMITTED TO
AN OFFICIAL STOCK EXCHANGE LISTING
OTHER TRANSFERABLE SECURITES
163,227,698 98 98
SHARES
GREAT BRITAIN
COOKSON GROUP DEFERRED 1,700,000 GBP 0.00 0.00
HSBC Global Investment Funds
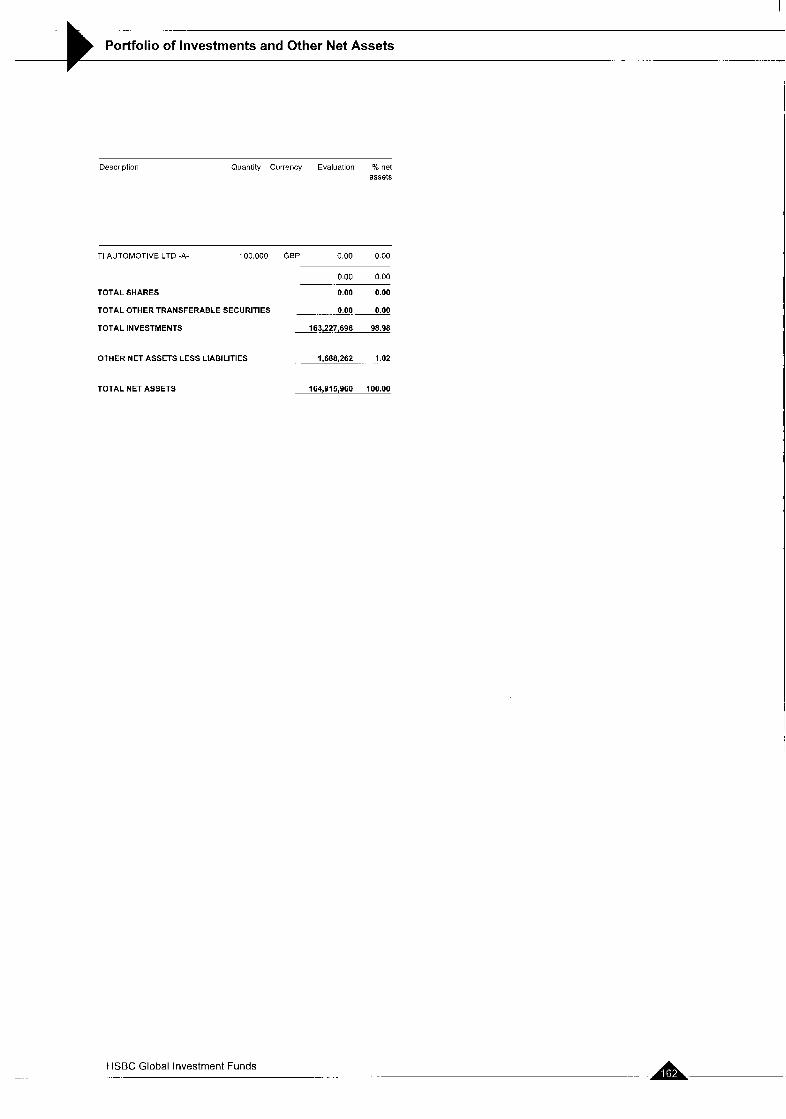
. _-
Portfolio of Investments and Other Net Assets . ~-
Description Quantity Currency Evaluation % net assets
TI AUTOMOTIVE LTD -A- 100,000 GBP 0.00 0.00
0.00 0 00
TOTAL SHARES 0.00 0.00
TOTAL OTHER TRANSFERABLE SECURITIES ~ 0.00 0.00
TOTAL INVESTMENTS 163,227,698 98.98
OTHER NET ASSETS LESS LIABILITIES 1,688,262 .. 1.02
TOTAL NET ASSETS 164,915,960 100.00
HSBC Global Investment Funds - -.
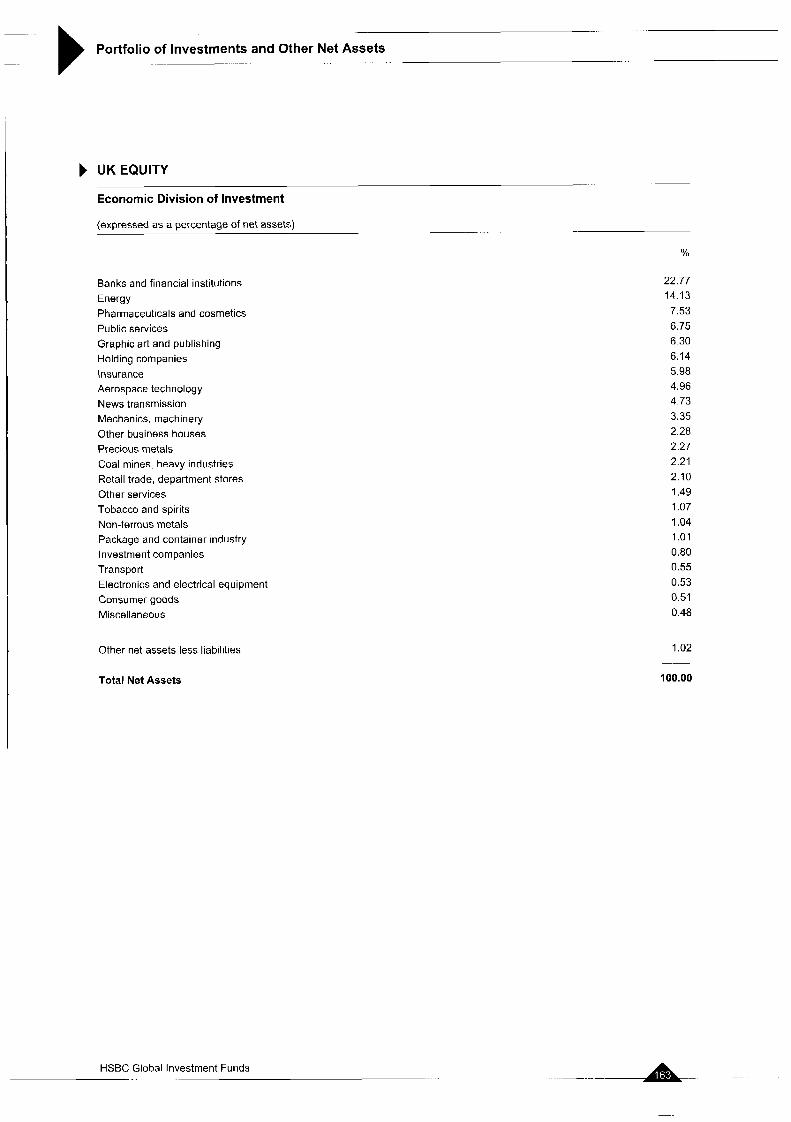
-
Portfolio of Investments and Other Net Assets ._ . _. ...
UKEQUITY
Economic Division of Investment - ..
-. -. . (expressed as a percentage of net assets) __
%
Banks and financial institutions Energy Pharmaceuticals and cosmetics Public services Graphic art and publishing Holding companies Insurance Aerospace technology News transmission Mechanics, machinery Other business houses Precious metals Coal mines. heavy industries Retail trade, department stores Other services Tobacco and spirits Non-ferrous metals Package and container industry Investment companies Transport Electronics and electrical equipment Consumer goods Miscellaneous
Other net assets less liabilities
Total Net Assets
22.77 14.13 7.53 6.75 6.30 6.14 5.98 4.96 4.73 3.35 2.28 2.27 2.21 2.10 1.49 1.07 1.04 1.01 0.80 0.55 0.53 0.51 0.48
1.02
100.00
HSBC Global Investment Funds . .
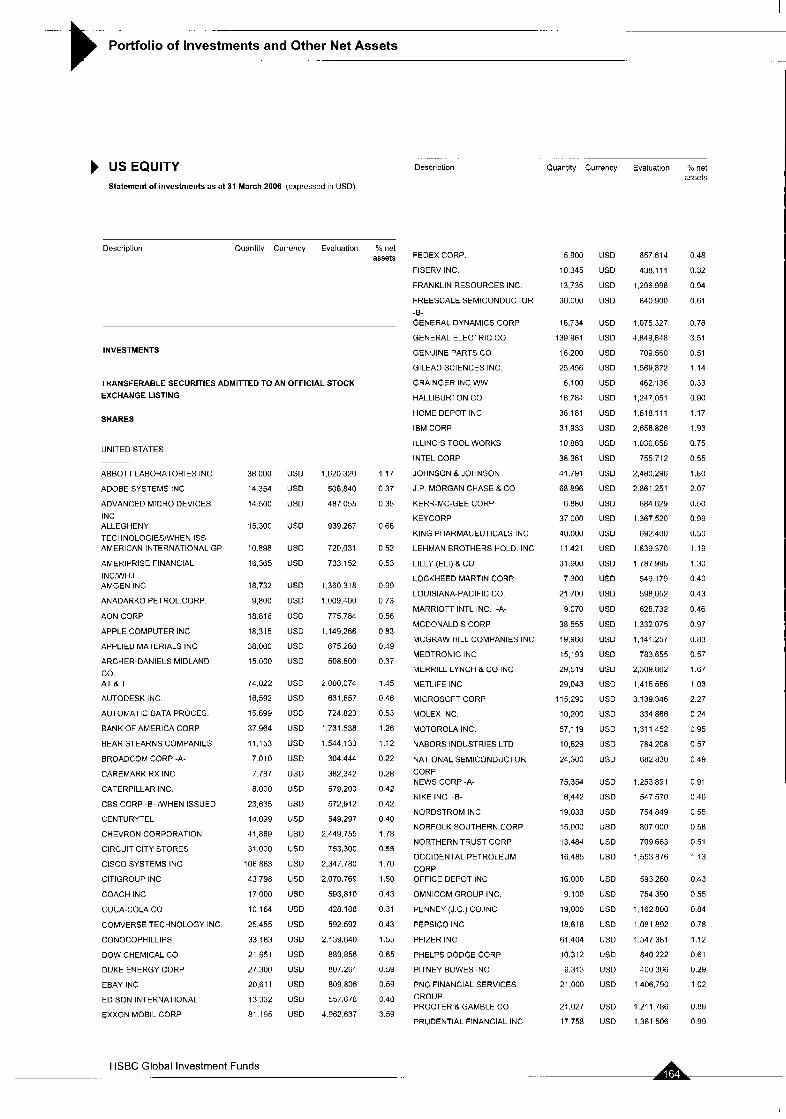
- ._
Portfolio of Investments and Other Net Assets ._ ._
USEQUITY Statement of investments as at 31 March 2006 (expressed in USD)
. . . . . . . .
Description . . . .. . . ..
Quantity Currency Evaluation ‘% net assets
Description Quantity Currency Evaluation YO net assets
INVESTMENTS
TRANSFERABLE SECURITIES ADMITTED TO AN OFFICIAL STOCK
EXCHANGE LISTING
SHARES
UNITED STATES __ ABBOTT LABORATORIES INC
ADOBE SYSTEMS INC
ADVANCED MICRO DEVICES
INC ALLEGHENY
TECHNOLOGlESlWHEN ISS AMERICAN INTERNATIONAL GP
AMERIPRISE FINANCIAL
INC!WH I AMGEN INC
ANADARKO PETROL CORP
AON CORP
APPLE COMPUTER INC
APPLIED MATERIALS INC
ARCHER-DANIELS MIDLAND
co A T L T
AUTODESK INC
AUTOMATIC DATA PROCES
BANK OF AMERICA CORP
BEAR STEARNS COMPANIES
BROADCOM CORP -A-
CAREMARK RX INC
CATERPILLAR INC
CBS CORP -6- /WHEN ISSUED
CENTURYTEL
CHEVRON CORPORATION
CIRCUIT CITY STORES
CISCO SYSTEMS INC
ClTlGROUP INC
COACH INC
COCA-COLA CO
COMVERSE TECHNOLOGY INC
CONOCOPHILLIPS
DOW CHEMICAL CO
DUKE ENERGY CORP
EBAY INC
EDISON INTERNATIONAL
EXXON MOBIL CORP
38000 USD
14354 US0
14500 USD
15,300 US0
10.898 US0
16365 US0
18.732 US0
9,800 US0
18816 US0
18.315 USD
38000 US0
15000 USD
74,022 USD
16,592 US0
15699 USD
37964 US0
11 153 USD
7010 USD
7787 USD
8.000 US0
23,635 US0
14.099 US0
41,869 US0
31,000 USD
106863 US0
43798 USD
17,000 USD
10164 USD
25.455 USD
33183 US0
21 651 USD
27300 US0 20,611 USD
13.332 US0
81 195 US0
1,620.320
506,840
487 055
939,267
720,031
733 152
1,360 318
1 009.400
775 784
1,149,266
675 260
508.500
2 000,074
631,657
724 823
1,731.538
1,544 133
304.444
382.342
579,200
572,912
549,297
2,449,155
753,300
2,347.780
2,070.769
593,810
428 108
592 592
2.139.640
889,856
807.26”
809.806
557.678
4.962.637
1 1 7
0 37
0 35
0.68
0 52
0.53
0.99
0 73
0.56
0.83
0.49
0.37
1.45
0.46
0.53
1.26
1.12
0.22
0.28
0 42
0 42
0 40
1 78
0.55
1.70
1 S O
0.43
0.31
0.43
1.55
0.65
0.59
0.59
0 40
3.59
FEDEX CORP
FISERV INC
FRANKLIN RESOURCES INC
FREESCALE SEMICONDUCTOR
-0- GENERAL DYNAMICS CORP
GENERAL ELECTRIC CO
GENUINE PARTS CO
GILEAD SCIENCES INC
GRAINGER INC WW
HALLIBURTON CO
HOME DEPOT INC
IBM CORP
ILLINOIS TOOL WORKS
INTEL CORP
JOHNSON&JOHNSON
J P MORGAN CHASER CO
KERR-MC-GEE CORP
KEYCORP
KING PHARMACEUTICALS INC
LEHMAN BROTHERS HOLD INC
LlLLY (ELI) 8 CO
LOCKHEED MARTIN CORP
LOUISIANA-PACIFIC CO
MARRIOTT INTL INC -A-
MCDONALD S CORP
MCGRAW HILL COMPANIES INC
MEDTRONIC INC
MERRILL LYNCH & CO INC
METLIFE INC
MICROSOFT CORP
MOLEX INC
MOTOROLA INC
NABORS INDUSTRIES LTD
NATIONAL SEMICONDUCTOR
CORP NEWS CORP -A-
NlKE INC -E-
NORDSTROM INC
NORFOLK SOUTHERN CORP
NORTHERN TRUST CORP
OCCIDENTAL PETROLEUM
CORP OFFICE DEPOT INC
OMNICOM GROUP INC
PENNEY (J C ) CO INC
PEPSICO INC
PFIZER INC
PHELPS DODGE CORP
PITNEY BOWES INC
PNC FINANCIAL SERVICES
GROUP PROCTER R GAMBLE CO
PRUDENTIAL FINANCIAL INC
5.900 USD
10 345 USD
13.735 USD
30.000 USD
16,734 USD
139961 USD
16,200 USD
25.456 USD
6,100 USD
16,784 USD
38.181 USD
31,933 USD
10,863 USD
38 361 USD
41,791 US0
68896 USD
6.880 USD
37000 USD
40.000 US0
11 421 US0
31.900 USD
7300 US0
21 700 USD
9.070 USD
38555 US0
19,966 US0
15.193 US0
29,519 USD
29,043 US0
115,290 US0
10,200 USD
57.119 US0
10,629 USD
24,300 USD
75,354 USD
6,442 USD
19,033 USD
15,000 US0
13,484 US0
16.485 US0
16.000 US0
9.100 US0
19,000 US0
18.618 US0
61.404 US0
10.312 USD
9,313 USD
21,000 USD
21,027 USD
17758 USD
657 614
438111
1 296 996
840 900
1 075 327
4,849,648
709 560
1 569 872
462,136
1,247 051
1618111
2,656 826
1 036 656
755 712
2,480,296
2 861 251
684 629
1 367 520
692 400
1 639 370
1 787 995
549 179
598 052
628 732
1 332 075
1,141 257
783 655
2,309 862
1 415 556
3 139 346
334 866
1,311 452
784 208
682 830
1 253 891
547 570
754 849
807 000
709 663
1,553 876
593 280
754 390
1 162800
1,081 892
1 547 381
840 222
400 366
1 406 790
1,211 786
1361 506
0 48
0 32
0.94
0.61
0 78
3 51
0 51
1 1 4
0.33
0.90
1 1 7
1.93
0 75
0 55
1.80
2.07
0.50
0.99
0.50
1.19
1.30
0.40
0.43
0.46
0.97
0.83
0.57
1.67
1.03
2.27
0 24
0 95
0.57
0 49
0.91
0.40
0.55
0.58
0.51
1.13
0.43
0.55
0.84
0.78
1.12
0 61
0.29
1 02
0.88
0 99
HSBC Global Investment Funds
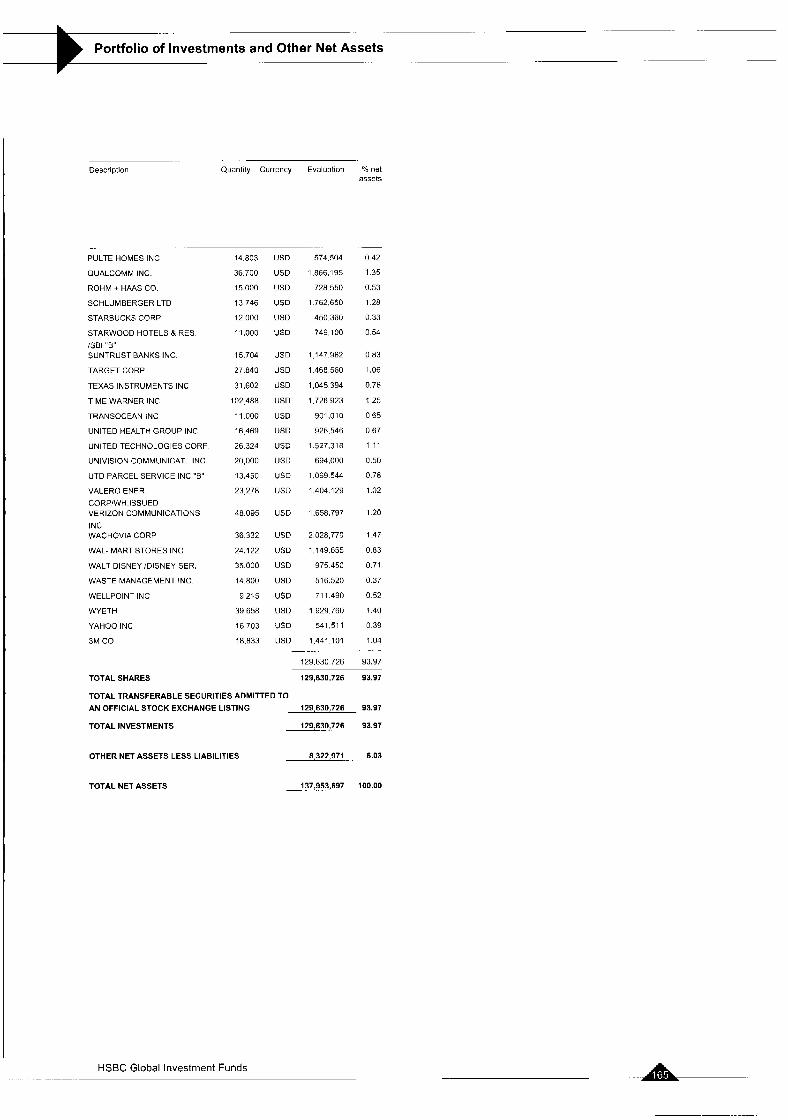
. -
Portfolio of Investments and Other Net Assets ~ -
Description Quaniity Currency Evaluatlon % net assets
PULTE HOMES INC
QUALCOMM INC
ROHM + HA4S CO
SCHLUMBERGER LTD
STARBUCKS CORP
STARWOOD HOTELS 8 RES
:SEI " 8 SUNTRUST BANKS INC
TARGET CORP
TEXAS INSTRUMENTS INC
TIME WARNER INC
TRANSOCEAN INC
UNITED HEALTH GROUP INC
UNITED TECHNOLOGIES CORP
UNlVlSlON COMMUNICAT INC
UTD PARCEL SERVICE INC "6"
VALERO ENER
CORP'WH ISSUED VERIZON CDMMUNICATIONS
INC WACHOVIA CORP
WAL- MART STORES INC
WALT DISNEY :DISNEY SER.
WASTE MANAGEMENT INC
WELLPOINT INC
WYETH
YAHOO INC
3M CO
14.803
36.700
15,000
13.746
12 000
11,000
15.704
27.840
102 488
31.602
11 000
16 469
26 324
20,000
13.450
23,278
48.095
36.332
24.122
35,000
14.800
9,215
39 658
16,703
18.833
US0 574.504 0 4 2
US0 1866.195 1 3 5
USD 728550 0.53
US0 1762,650 1 2 8
USD 450360 0 3 3
US0 749 100 0 5 4
USD 1 147.962 0.83
US0 1.468 560 1.06
USD 1.045 394 0.76
USD 1,726923 1 2 5
USD 901.011) 0 6 5
USD 926.546 0.67
US0 1527.:318 1 11
US0 694,000 0.51)
USD 1.069 544 0.78
USD 1.404.129 1.02
USD 1,658,797 1 20
USD 2,028,779 1 4 7
US0 1149.655 0 8 3
US0 975450 0.71
USD 516.520 0.37
US0 711 490 0.52
USD 1929.760 1 4 0
US0 541.511 0 39
US0 1,441,101 1 0 4
129.630 726 93.97
- ... .
TOTAL SHARES 129,630.726 93.97
TOTAL TRANSFERABLE SECURITIES ADMITTED TO AN OFFICIAL STOCK EXCHANGE LISTING 129,630,726 93.97
129,630,726 93.97 TOTAL INVESTMENTS ~-
OTHER NET ASSETS LESS LIABILITIES 8,322,971-. 6.03
TOTALNETASSETS 137,953,697 100.00
HSBC Global Investment Funds --L
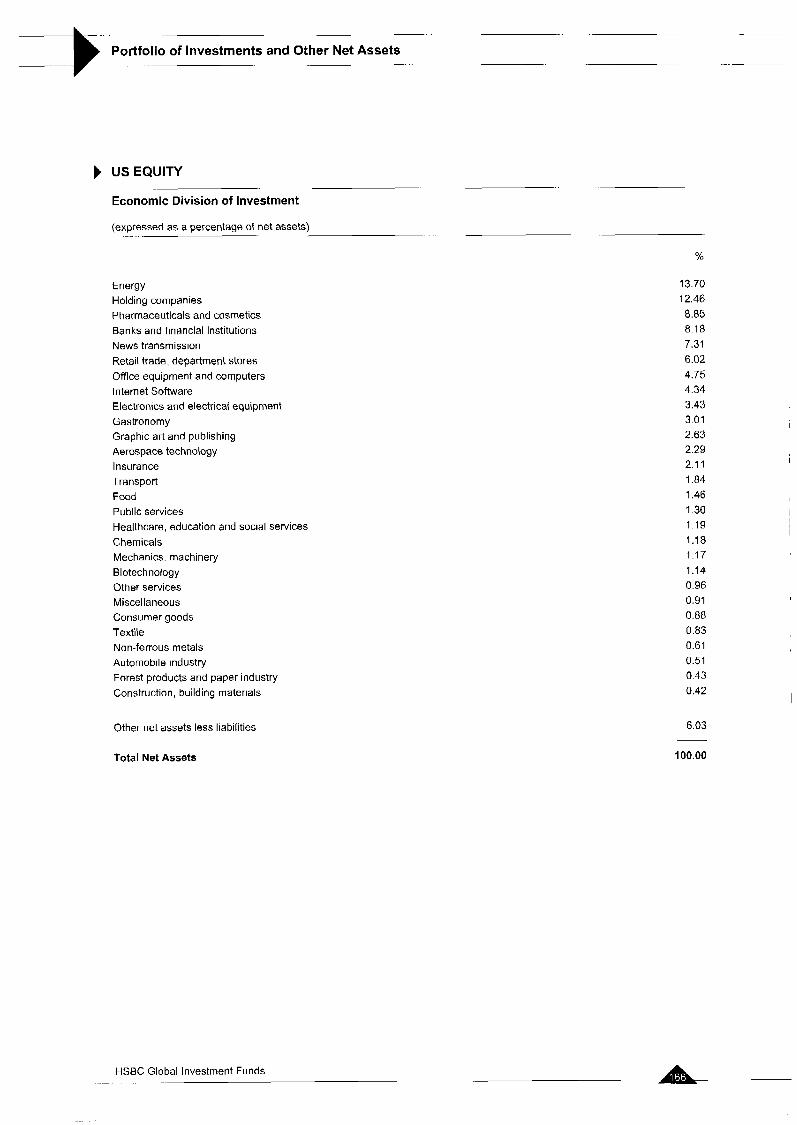
-
Portfolio of Investments and Other Net Assets -. -
USEQUITY
Economic Division of Investment
(expressed as a percentage of net assets)
%
Energy Holding companies Pharmaceuticals and cosmetics Banks and financial institutions News transmission Retail trade. department stores Office equipment and computers Internet Software Electronics and electrical equipment Gastronomy Graphic art and publishing Aerospace technology Insurance Transport Food Public services Healthcare, education and social services Chemicals Mechanics. machinery Biotechnology Other services Miscellaneous Consumer goods Textile Non-ferrous metals Automobile industry Forest products and paper industry Construction, building materials
Other net assets less liabilities
Total Net Assets
HSBC Global Investment Funds ...
13.70 12.46 8.85 8.18 7.31 6.02 4.75 4.34 3.43 3.01 2.63 2.29 2.1 1 1.84 1.46 I .36 1.19 1.18 1.17 1.14 0.96 0.91 0.88 0.83 0.61 0.51 0.43 0.42
6.03
100.00
I
I
.. .
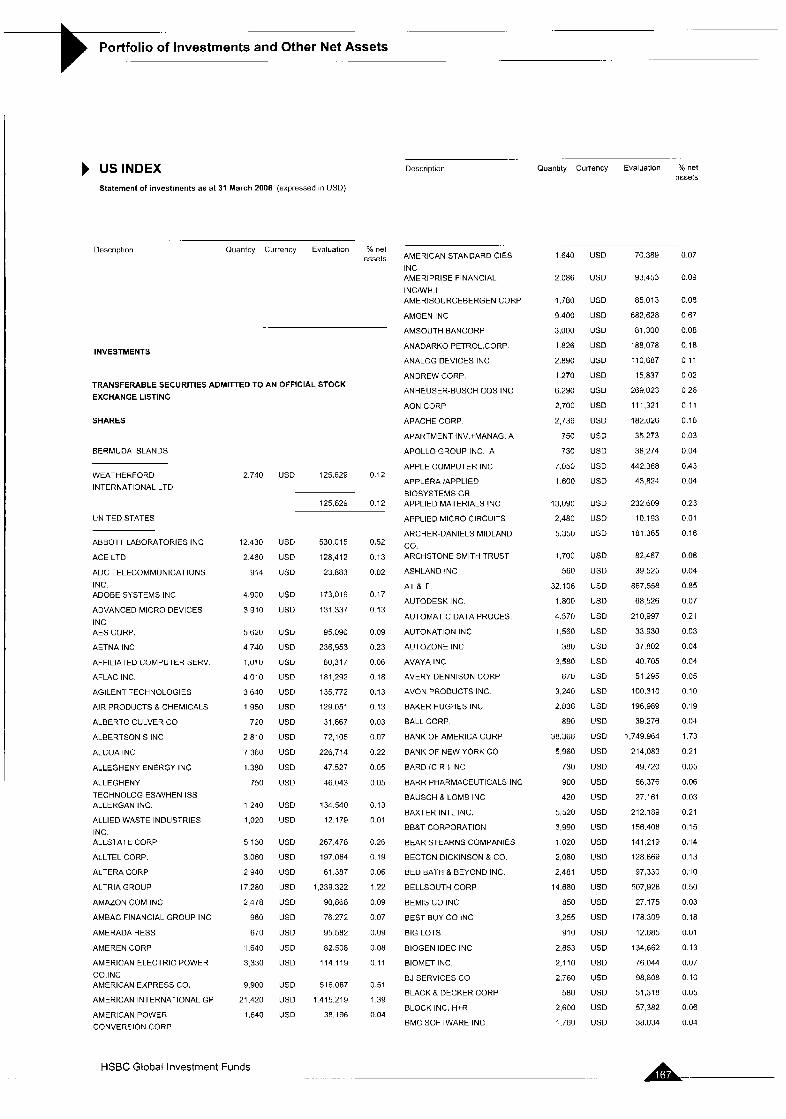
Portfolio of Investments and Other Net Assets 7 b US INDEX
Statement of investments as at 31 March 2006 (expressed in USD)
Description Quantity Currency Evaluation % net assek
.- .
INVESTMENTS
TRANSFERABLE SECURITIES ADMITTED TO AN OFFICIAL STOCK
EXCHANGE LISTING
SHARES
BERMUDA ISLANDS
WEATHEKFORD
INTERNATIONAL LTD
UNITED STATES
ABBOTT LABORATORIES INC
ACE LTD
ADC TELECOMMUNICATIONS
INC ADOBE SYSTEMS INC
ADVANCED MICRO DEVICES
INC AES CORP
AETNA INC
AFFILIATED COMPUTER SERV
AFLAC INC
AGILEN7 -ECHNOLOGIES
AIR PRODUCTS 8 CHEMICALS
ALBERT0 CULVER CO
ALBERTSON S INC
ALCOA INC
ALLEGHENY ENERGY INC
ALLEGHENY
TECHNOLOGIES'WHEN ISS ALLERGAN INC
ALLIED WASTE INDUSTRIES
INC ALLSTATE CORP
ALLTEL CORP
ALTERA CORP
ALTRIA GROUP
AMAZON COM INC
AMBAC FINANCIAL GROUP INC
AMERADAHESS
AMEREN CORP
AMERICAN ELECTRIC POWER
CO INC AMERICAN EXPRESS CO.
AMERICAN INTERNATIONAL GP
AMERICAN POWER
CONVERSION CORP
2.740
12 430
2.460
914
4.900
3 910
5,620
4 740
1010
4,010
3,640
1,950
720
2,810
7.380
1.380
750
1 240
1,020
5 130
3.060
2 940
17.280
2.478
9 60
670
1.640
3 330
9,900
21,420
1.640
USD 125.629 0.12
125.629 0.12
USD
USD
USD
USD
US0
USD
US0
USD
USD
US0
USD
USD
USD
USD
USD
USD
USD
USD
USD
US0
USD
US0
US0
US0
US0
US0
US0
US0
US0
USD
530 015
128.412
23.883
173,019
131 337
95,090
236,953
60,317
181 292
135 772
129 051
31.867
72,105
226 714
47 527
46.043
134,540
12.179
267.478
197.064
61 387
1,239322
90 868
76 272
95 582
82.508
114 119
516,087
1415.219
38 196
0.52
0.13
0 02
0 17
0 13
0 09
0.23
0 06
0.18
0.13
0 13
0.03
0.[17
0.22
0.05
0.05
0.13
0 01
0.26
0.19
0 06
1 22
0 09
0.07
0.09
0 UB
0 11
0 51
1 39
0.04
.. - -. .
Description Quantity Currency Evaluation Yo net assets
AMERICAN STANDARD ClES
INC AMERlPRlSE FINANCIAL
INCIWH I AMERISOURCEBERGEN CORP
AMGEN INC
AMSOUTH BANCORP
ANADARKO PETROL CORP
ANALOG DEVICES INC
ANDREW CORP
ANHEUSER-BUSCH COS INC
AON CORP
APACHE CORP
APAKTMENT INV +MANAG A
APOLLO GROUP INC A
APPLE COMPUTER INC
APPLERA !APPLIED
BIOSYSTEMS GR APPLIED MATERIALS INC
APPLIED MICRO CIRCUITS
ARCHER-DANIELS MIDLAND
co ARCHSTONE SMITH TRUST
ASHLAND INC
AT R T
AUTODESK INC
AUTOMATIC DATA PROCES
AUTONATION INC
AUTOZONE INC
AVAYA INC
AVERY DENNISON CORP
AVONPRODUCTSINC
BAKER HUGHES INC
BALL CORP
BANK OF AMERICA CORP
BANK OF NEW YORK CO
BARD (C R ) INC
BARR PHARMACEUTICALS INC
BAUSCH R LOME INC
BAXTER INTL INC
BB&T CORPORATION
BEAR STEARNS COMPANIES
BECTON DICKINSON 8 CO
BED BATH R BEYOND INC
BELLSOUTH CORP
BEMIS CO INC
BEST BUY CO INC
BIG LOTS
BIOGEN IDEC INC
BIOMET INC
BJ SERVICES CO
BLACK 8 DECKER CORP
BLOCKlNC H+R
BMC SOFTWARE INC
1 640
2 086
1,780
9 400
3,000
1 826
2.890
1270
6 290
2.700
2,736
750
730
7.050
I 600
13,090
2.480
5.350
1,700
560
32.108
1 800
4 570
1,560
380
3.580
870
3.240
2.836
890
38.368
5 960
730
900
420
5 520
3,990
1 020
2,080
2.481
14.680
850
3,255
910
2.853
2,110
2,760
580
2,600
1760
US0
US0
USD
USD
US0 USD
US0
USD
USD
US0
US0
USD
USD
USD
USD
USD
USD
USD
USD
USD
US0
US0
US0
US0
USD
US0
US0
US0
US0
USD
USD
USD
USD
USD
USD
USD
US0
USD
USD
USD
US0
USD
USD
US0
US0
USD
USD
US0
US0
US0
70.389
93,453
85.013
682,628
81.300
188,078
110 687
15.837
269 023
11 1,321
182.026
35 273
38 274
442.388
43,824
232 609
10.193
181 365
82,467
39 525
867.558
E8 526
210,997
33.930
37 802
40.705
51 295
100.310
196.989
39.276
1,749 964
214.083
49.720
56.376
27.161
212 189
15fi.408
141,219
128 669
97,330
507,928
27 175
178.309
12.685
134,662
76 044
98,808
51,318
57,382
38.034
0.07
0.09
0.08
0 67
0.08
0.18
0 11
0.02
0 26
0.11
0.18
0.03
0.04
0.43
0.04
0.23
0.01
0.18
0.08
0.04
0.85
0.07
0 21
0.03
0.04
0.04
0 05
0.10
0.19
0.04
1.73
0.21
0.05
0.06
0.03
0.21
0.15
0.14
0.13
0.10
0 50
0 03
0.18
0 01
0 13
0.07
0.10
0 05
0.06
0.U4
HSBC Global Investment Funds
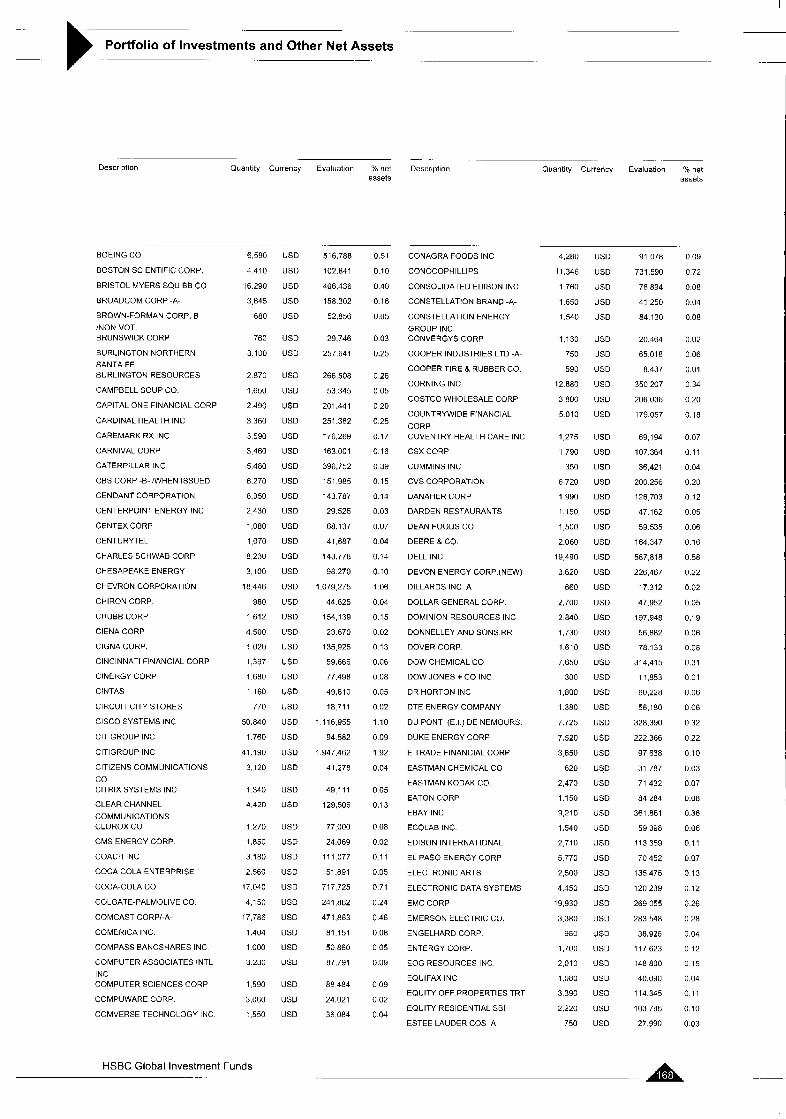
Portfolio of Investments and Other Net Assets .-
I
.~ . .... .
Description Quantity Currency Evaluation % net Descriplion Quantity Currency Evaluation net assets assets
BOEING CO
BOSTON SCIENTIFIC CORP.
BRISTOL MYERS SQUIBB CO
BROADCOM CORP -A-
BROWN-FORMAN CORP. B
/NON-VOT BRUNSWICK CORP
BURLINGTON NORTHERN SANTA FE BURLINGTON RESOURCES
CAMPBELL SOUP CO
CAPITAL ONE FINANCIAL CORP
CARDINAL HEALTH INC
CAHEMARK RX INC
CARNIVAL CORP
CATEKPILLAR INC
CBS CORP -B- :WHEN ISSUED
CENDANT CORPORATION
CENTERPOINT ENERGY INC
CENTEX CORP
CENTURYTEL
CHARLES SCHWAB CORP
CHESAPEAKEENERGY
CHEVRON CORPORATION
CHIRON CORP
CHUBB CORP
CIENA CORP
CIGNA CORP
CINCINNATI FINANCIAL CORP
CINEHGY CORP
CINTAS
CIRCUIT CITY STORES
CISCO SYSTEMS INC
CIT GROUP INC
ClTlGROUP INC
CITIZENS COMMUNICATIONS
CO ClTRlX SYSTEMS INC
CLEAR CHANNEL
COMMUNICATIONS CLOROX CO
CMS ENERGY CORP
COACH INC
COCA COLA ENTERPRISE
COCA-COLA CO
COLGATE-PALMOLIVE CO
COMCAST CORPj-A-
COMEHICA INC
COMPASS BANCSHARES INC
COMPUTER ASSOCIATES INTL
INC COMPUTER SCIENCES CORP
COMPUWARE COHP
COMVERSE TECHNOLOGY INC
6.590
4 410
16 290
3 645
680
760
3.100
2 870
1,650
2 490
3 360
3 590
3 460
5 480
6.270
8.350
2 430
i ,080
8 230
1 070
3.100
18 446
980
1612
4,500
1 020
1,397
i ,680
1160
770
50.840
1 760
41.190
3.120
1 340
4.420
1 270
1.850
3 180
2 560
17.040
4,150
17,786
1.404
1 000
3 230
1 590
3,060
1,550
US0
US0
USD
USD
USD
USD
USD
US0
USD
USD
USD
USD
USD
USD
USD
US0
USD
US0
USD
US0
USD
USD
USD
USD
USD
USD
USD
US0
US0
US0
USD
US0
US0
USD
USD
US0
USD
USD
USD
USD
USD
US0
US0
USD
US0
USD
US0
US0
USD
516,788
102.841
406,436
158.302
52,856
29.746
257.641
266.508
53 345
201.441
251.362
176 269
163.001
396,752
151 985
143 787
29.525
68.137
41.687
143.770
98 270
1,079 275
44 825
154,139
23 670
135 925
59,666
77.498
49,810
18711
1 116.955
94.582
1.947.462
41.278
49111
129,506
77 000
24,069
111 077
51.891
717,725
241,862
471.863
81.151
50 860
87,791
88 484
24.021
36 084
0.51
0.10
0 40
0.16
0.05
0.03
0.25
0.26
0 05
0 20
0.25
0.17
0.16
0 39
0.15
0.14
0.03
0.07
0.04
0.14
0.10
1.06
0.04
0.15
0.02
0.13
0.08
0.06
0.05
0 02
1 1 0
0 09
1 92
0.04
0 05
0.13
0.08
0.02
0.1 1
0.05
0.71
0.24
0.46
0.08
0 05
0.09
0 09
0.02
0.04
CONAGRA FOODS INC
CONOCOPHILLIPS
CONSOLIDATED EDISON INC
CONSTELLATION BRAND -A-
CONSTELLATION ENERGY
GROUP INC CONbERGYS CORP
COOPER INDUSTRIES LTD -A-
COOPER TIRE 8. RUBBER CO
CORNING INC
COSTCO WHOLESALE CORP
COUNTRYWIDE FINANCIAL
CORP COVENTRYHEALTHCAREINC
CSX CORP
CUMMINS INC
CVS CORPORATION
DANAHER GORP
DARDEN RESTAURANTS
DEAN FOODS CO
DEERE & CO
DELL INC
DEVONENERGYCORP(NEW)
DILLARDS INC A
DOLLAR GENERAL CORP
DOMINION RESOURCES INC
DONNELLEY AND SONS RR
DOVER CORP
DOW CHEMICAL CO
DOW JONES + CO INC
OR HORTON INC
DTE ENERGY COMPANY
DU PONT (E I ) D E NEMOURS
DUKE ENERGY CORP
E TRADE FINANCIAL CORP
EASTMAN CHEMICAL CO
EASTMAN KODAK CO
EATON CORP
EBAY INC
ECOLAE INC
EDISON INTERNATIONAL
EL PAS0 ENERGY CORP
ELECTRONIC ARTS
ELECTRONIC DATA SYSTEMS
EMC CORP
EMERSON ELECTRIC CO.
ENGELHARD CORP
ENTERGY CORP
EOG RESOURCES INC
EQUIFAX INC
EQUITY OFF PROPERTIES TRT
EQUITY RESIDENTIAL SBI
ESTEE LAUDER COS A
HSBC Global Investment Funds
4,280 US0
11.346 USD
1760 US0
1,650 USD
1.540 US0
1.130 USD
750 USD
590 USD
12.880 US0
3800 US0
5010 US0
1,275 US0
1.790 USD
350 US0
6,720 USD
1990 USD
1 150 USD
1,500 USD
2.060 US0
19,490 US0
3620 US0
660 USD
2,700 USD
2840 US0
1,730 USD
1.610 USD
7650 US0
300 USD
1,800 USD
1380 US0
7.725 US0
7.520 US0
3650 US0
620 US0
2,470 USD
1 150 US0
9,210 US0
1.540 USD
2710 US0
5,770 USD
2,500 US0
4.450 USD
19.930 USD
3.380 USD
980 USD
1,700 US0
2.010 US0
1,080 USD
3.390 US0
2,220 US0
750 US0
91 078
731 590
76,894
41 250
84.130
20.464
65.018
8.437
350,207
206.036
179,057
69,194
107 364
36,421
200 256
126 703
47.162
59.535
164.347
587.818
226,467
17 312
47,952
197,948
56.882
78 133
314,415
11,853
60.228
56,180
328.390
222.366
97.638
31 787
71 432
84 284
361 .861
59 338
113.359
70 452
135.475
120,239
269 055
283 548
38.926
117,623
148.800
40.090
114,345
103.7a5
27 990
0 09
0 72
0.08
0.08
0.04
0.02
0 06
0.01
0 34
0.20
0.18
0.07
0.1 1
0.04
0.20
0 12
0 05
0.06
0 16
0.58
0.22
0.02
0.05
0.19
0.06
0.08
0.31
0 01
0.06
0 06
0 32
0 22
0 10
0 03
0.07
0.08
0.36
0.06
0.1 1
0.07
0 13
0.12
0.26
0.28
0.04
0 12
0 15
0.04
0.1 1
0.10
0.03
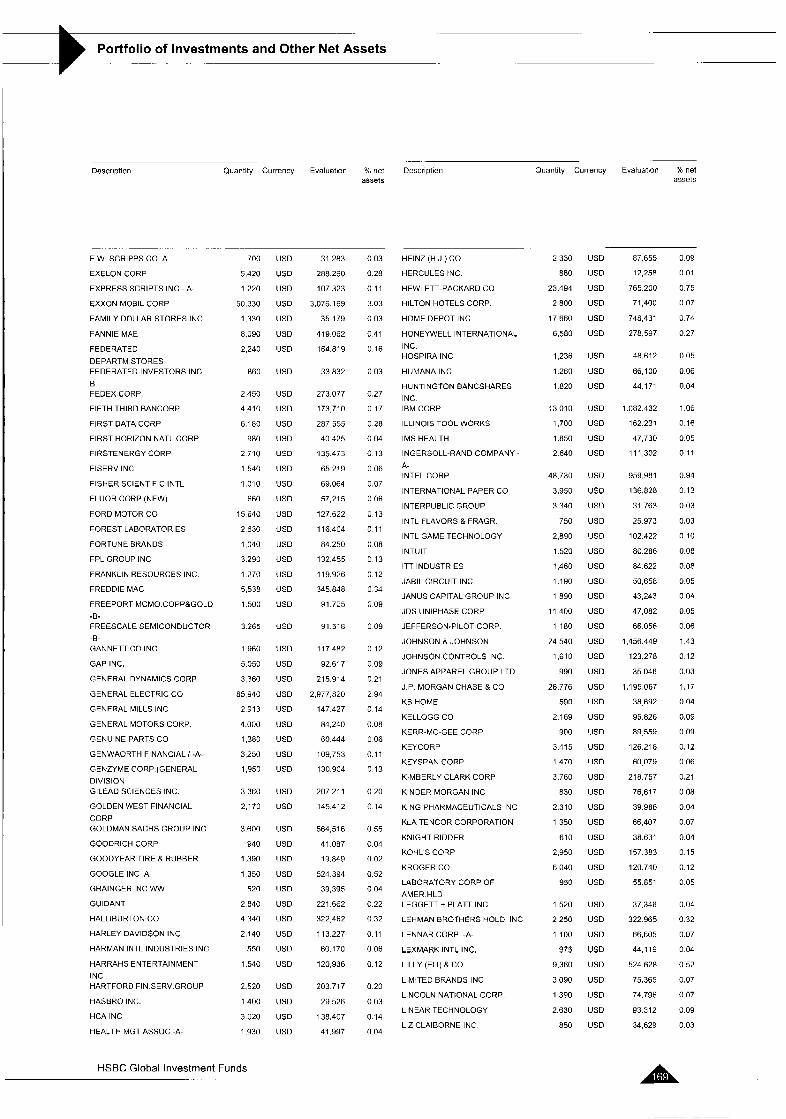
. -.
Portfolio of Investments and Other Net Assets .- -
.. .
Doscription Quantity Currency Evaluation % net Description Quantity Currency Evaluatton % net assets assets
-. . .. .. . .. ..
E W. SCRIPPS CO A
EXELONCORP
EXPRESS SCRIPTS INC - A-
EXXON MOBIL CORP
FAMILY DOLLAR STORES INC.
FANNIE MAE
FEDERATED
DEPARTM STORES FEDERATED INVESTORS INC.
B FEDEX CORP.
FIFTH THIRD BANCORP
FIRST DAT4 CORP
FIRST HORIZON NATL CORP
FIHSTENEKGY CORP
FISERV INC
FISHER SCIENTIFIC INTL
FLUOR CORP (NEW)
FORD MOTOR CO
FOREST LABORATORIES
FORTUNE BRANDS
FPL GROUP INC
FRANKLIN RESOURCES INC.
FREDDIE MAC
FREEPORT hlCMO COPP&GOLD
-E- FREESCALE SEMICONDUCTOR
-B- GANNETT CO INC
GAP INC.
GENERAL DYNAMICS CORP
GENERAL ELECTRIC CO
GENERAL MILLS INC
GENERAL MOTORS C O W
GENUINE PARTS CO
GENWAORTH FINANCIAL i -A-
GENZYME CORP.(GENERAL DIVISION GILEAD SCIENCES INC.
GOLDEN WEST FINANCIAL
CORP GOLDMAN SACHS GROUP INC
GOODRICH CORP
GOODYEAR TIRE & RUBBER
GOOGLE INC A
GRAINGER INC WW
GUIDANT
HALLIBURTON CO
HARLEY DAVIDSON INC.
HARMAN INTL INDUSTRIES INC
HARRAHS ENTERTAINMENT
INC HARTFORD FIN.SERV.GROUP
HASERO INC.
HCA INC
HEALTH MGT ASSOC.-A-
....
700
5,420
1 220
50,330
1,330
8.090
2,240
860
2 450
4 410
6.180
980
2 710
1 540
1,010
660
15 640
2 630
1,040
3.290
1.270
5.538
1 .5(1lI
3 265
1 960
5.050
3,360
85 940
2 913
4.000
1,380
3 250
1,950
3 360
2.170
3.600
940
1.390
1350
520
2 840
4 340
2,140
550
1,540
2.520
1 400
3 020
1,930
USD
US0
USD
US0
USD
USD
USD
USD
USD
USD
USD
USD
US0
USD
US0
US0
USD
USD
US0
USD
US0
USD
US0
USD
US0
USD
US0
US0
US0
US0
USD
US0
USD
USD
USD
USD
USD
USD
USD
US0
USD
USD
USD
USD
USD
USD
USD
USD
US0
31 283
2A8 290
107 323
3,076,169
35 179
419.062
164.81 9
33.832
273 077
173,710
287 555
40 425
135,473
65 219
69 064
57,215
127.622
116.404
84.250
132.455
11 9.926
345.848
91.725
91.518
117,482
92.617
215 914
2 977,820
147 427
84,240
60 444
109 753
130,904
207 21 1
145.412
564,516
41 087
19 849
524 394
39,395
221 662
322 462
113227
60.17U
120 936
203 717
29 526
138 407
41,997
0.03
0.28
0.1 1
3.03
0 03
0 41
0.16
0 03
0.27
0 17
0 28
0 04
0 13
0 06
0.07
0 06
0 13
0 11
0 OR
0 13
0 12
0 34
0 09
0 09
0 12
0 09
0.21
2 94
0 14
0.08
0 06
0.11
0 13
0.20
0 14
0.55
0.04
0.02
0.52
0.04
0.22
0.32
0.11
0.06
0.12
0.20
0.03
0.14
0.04
HEINZ (H J ) CO
HERCULES INC
HEWLETT-PACKARD CO
HILTON HOTELS CORP
HOME DEPOT INC
HONEYWELL INTERNATIONAL
INC HOSPIRA INC
HUMANA INC
HUNTINGTONBANCSHARES
INC IBM CORP
ILLINOIS TOOL WORKS
IMS HEALTH
INGERSOLL-RAND COMPAUY -
A- INTEL CORP
INTERNATIONAL PAPER CO
INTERPUBLIC GROUP
INTL FLAVORS & FRAGR
INTL GAME TECHNOLOGY
INTUIT
ITT INDUSTRIES
JABIL CIRCUIT INC
JANUS CAPITAL GROUP INC
JDS UNIPHASE CORP
JEFFERSON-PILOT CORP
JOHNSONBJOHNSON
JOHNSON CONTROLS INC
JONES APPAREL GROUP LTD
J P MORGAN CHASE & CO
KB HOME
KELLOGG CO
KERR-MC-GEE CORP
KEYCORP
KEYSPAN CORP
KIMBERLY CLARK CORP
KINDER MORGAN INC
KING PHARMACEUTICALS INC
KLA TENCOR CORPORATION
KNIGHT RIDDER
KOHL'S CORP
KROGER CO
LABORATORY CORP OF AMER HLD LEGGETT + PLATT INC
LEHMAN EHOTHEHS HOLD INC
LENNAR CORP -A-
LLXMAKK INTL INC
LlLLY (ELI) & CO
LIMITED BRANDS INC
LINCOLN NATIONAL CORP
LINEAH TECHNOLOGY
LIZ CLAIBORNE INC
2 330
880
23,494
2 800
17 660
6,580
1,236
1 260
1 820
13010
1,700
1.850
2 640
48.730
3.950
3 340
750
2.890
1 520
1,460
1.190
1 890
11 400
1180
24.540
1,610
990
28 776
590
2 169
900
3.415
1470
3 760
830
2.310
1350
610
2,950
6 040
950
1 520
2 250
1,100
975
9.360
3,090
1,390
2.630
850
USD
u50
u50
u50
u50
u50
u50
u50
u50
u50
u50
USD
USD
u50
u50
u50
u50
u50
u50
u50
u50
u50
u50
u50
u50
u50
u50
u50
u50
u50
USD
USD
u50
USD
u50
u50
USD
u50
USD
u50
USD
USD
USD
USD
USD
USD
USD
USD
USD
USD
87 655
12,258
7 6 5.2 0 0
71,400
748,431
278.597
48.612
66,100
44.171
1.082.432
162 231
47,730
11 1,302
959.981
136.828
31 763
25 973
102.422
80.286
84 622
50 658
43,243
47,082
66 056
1 456.449
123,278
35 046
1,195,067
38 692
95 826
89 559
126 218
60 079
218 757
76,617
39 986
66 407
38.631
157 383
120.740
55 851
37 346
322 965
66,605
44 119
524 628
75,365
74.796
93.312
34 629
0 09
0 01
0 75
[I 07
0 74
0 27
0.05
0.06
0.04
1.06
0.16
0.05
0.1 1
0.Y4
0.13
0.03
0.03
0 10
0.08
0.08
0.05
0 04
0.05
0.06
1 4 3
0 12
0.03
1.17
0.04
0.09
0 09
0.12
0 06
0.21
0 08
0.04
0.07
0.04
0 15
0 12
0 05
0.04
0.32
0.07
0 04
0 52
0.07
0.07
0.09
0.03
HSBC Global Investment Funds . ....

- -. -
Portfolio of Investments and Other Net Assets _ - . -... -_ _
Descriptian Quantity Currency Evaluatior Sb net Description Quantity Currency Evaluation ner assets assets
.
LOCKHEED MARTIN CORP
LOEWS CORP
LOUISIANA-PACIFIC CO.
LOWE S COMPANIES INC
LSI LOGIC CORP.
LUCENT TECHNOLOGIES INC
L-3 COMMUNICATIONS HLDS INC MANOR CARE INC
MARATHON OIL CORP.
MARRIOTT INTL INC. -A-
MARSH & MC-LENNAN COS INC
MARSHALL 8 ILSLEY CORP.
MASCO CORP.
MATTEL INC
MAXIM INTEGRATED
PRODUCTS MAYTAG CORP
MBlA INC.
MC-CORMICK&CO:N.VOTING
MCDONALD S CORP.
MCGRAW HILL COMPANIES INC
MCKESSON CORP
MEADWESTVACO CORP
MEDCOHEALTH SOLUTIONS
MEDIMMUNE INC
MEDTRONIC IN[:
MELLON FINANCIAL CO
MERCK 8 CO INC
MEREDITH CORP.
MERRILL LYNCH & CO INC
METLIFE INC
MGlC INVESTMENT CORP
MICRON TECHNOLOGY INC
MICROSOFT CORP
MILLIPORE CORP
MOLEX INC
MOLSON COORS BREW.-B-
INON-VOT MONSANTO CO
MONSTER WORLDWIDE INC
MOODY S CORP, WHEN
ISSUED MORGAN STANLEY
MOTOROLA INC
M8T BANK CORPORATION
MURPHY OIL CORP.
MYLAN LABORATORIES INC
NABORS INDUSTRIES LTD
NATIONAL CITY CORP.
NATIONAL OILWELL VARCO INC
NATIONAL SEMICONDUCTOR
CORP NAVISTAR INTL CORP.
2,870 US0
1.170 USD
860 US0
6,360 US0
3050 USD
37,400 USD
1,000 US0
690 USD
3122 USD
1310 USD
4 166 USD
1.730 USD
3,080 USD
3280 US0
2.670 USD
fi20 USD
9ao USD
1.280 USD
10490 USD
2,710 USD
2475 USD
1,100 USD
2602 USD
2.120 USD
9,720 USD
3 100 USD
17 990 USD
400 USD
7480 USD
6240 USD
780 USD
4.740 USD
73320 USD
390 USD
1,1100 USD
500 USD
2010 USD
940 USD
1.9411 USD
8690 USD
211 740 USD
680 USD
1300 USD
1.380 USD
1,280 US0
4,440 USD
1.400 USD
2.980 USD
550 US0
HSBC Global Investment Funds
21 5.91 0
119855
23.702
41 1.937
35,197
115 566
85.700
30,884
240.425
90 809
122 105
75 653
99 392
58,712
99,938
13,262
59 574
43,136
362 430
154 904
129 467
30 327
149 849
78.482
501.358
109,244
640,624
22,356
585 310
304.138
52 034
70,247
1 996 503
2a 369
32,830
34,345
169 724
46,549
137.449
552.a5a
476,190
77 343
65 533
32 485
94,438
154.645
92 232
83.738
15,301
0.21
0.12
0.02
0 40
0 03
0 11
0.08
0 03
0 24
0 09
0.12
0.07
0 IO
0.06
0 10
0.01
0.06
0.04
0.36
0.15
0.13
0.03
0.15
0 08
0.49
0.1 1
0.63
0.02
0.58
0.30
0.05
0.07
1.97
0.03
0 03
0.03
0.17
0.05
0 14
0.54
0 47
0.00
0.06
0.03
0.09
0.15
0.09
0 08
0.02
NCR CORP
NETWORK APPLIANCE CORP
NEW YORK TIMES -A-
NEWELL RUBBERMAID INC
NEWMONT MINING CORP
NEWS CORP -A-
NICOR INC
NlKE INC -6-
NISOURCE INC
NOBLE CORP
NORDSTROM INC
NORFOLK SOUTHERN CORP
NORTH FORK
BANCORPORATION INC NORTHERN TRUST CORP
NORTHROP GRUMMAN CORP
NOVELL INC
NOVELLUS SYSTEMS INC
NUCOR CORP
NVlDlA CORP
OCCIDENTAL PETROLEUM
CORP OFFICE DEPOT INC
OFFICEMAX INC
OMNICOM GROUP INC
ORACLE CORP
PACCAR INC.
PACTIV CORP
PALL CORP
PARAMETRIC TECHNOLOGY
CORP PARKER-HANNIFIN
PATTERSON COMPANIES INC
PAYCHEX INC
PENNEY (J C ) CO INC
PEOPLES ENERGY CORP
PEPS1 BOTTLING GROUP INC
PEPSICO INC
PERKINELMER INC
PFIZER INC
PGSE CORP (HOLDING CO)
PHELPS DODGE CORP
PINNACLE WEST CAP CORP
PITNEY BOWES INC
PLUhl CREEK TIMBER CO INC
PMC-SIERRA INC
PNC FINANCIAL SERVICES
GROUP PPG INDUSTRIES INC
PPL CORP
PRAXAIR
PRINCIPAL FINANCIAL GROUP
INC PROCTER &GAMBLE CO
1.480 USD
2.990 US0
1,160 USD
2330 US0
3.560 US0
19750 USD
350 US0
1.687 US0
2480 US0
1,060 US0
1870 US0
3220 US0
4 105 US0
1240 USD
2,804 US0
3.060 US0
1.130 USD
1260 USD
1,320 US0
3.480 USD
2,480 US0
700 USD
1,480 US0
31 430 USD
1 4 7 5 USD
1,190 USD
990 US0
852 USD
1040 USD
1,114 USD
2,540 US0
I a30 USD
300 USD
1.210 USD
13 360 USD
1,010 USD
60 760 USD
2,760 USD
1640 US0
720 USD
1730 USD
1,550 US0
1400 USD
2.530 USD
1,260 USD
3200 US0
2,670 US0
2.180 USD
27,154 US0
..
62.160
108,208
29.348
59,601
188.431
328.640
13.860
143.395
50 642
87.450
74 164
173.236
118.635
65 261
191 177
23.562
27.482
134 379
75,860
328,025
91,958
21,252
122.692
433 105
103 973
29,322
30,898
13 a02
84 053
39.335
104,572
111 996
10.674
36.808
776.350
23,503
1531,152
108 716
133,627
28.318
74 373
57,288
17 276
169.485
79,594
94,752
147 251
107.692
1,564.885
0 06
0 11
0 03
0 06
0 19
0.32
0 01
0.14
0.05
0.09
0.07
0.17
0.12
0.06
0 19
0.02
0.03
0.13
0.07
0.32
0.09
0.02
0.12
0.43
0.10
0.03
0.03
0.01
0.08
0.04
0.10
0.11
0.01
0.04
0.76
0.02
1.50
0.11
0 13
0.03
0.07
0.06
0.02
0.17
0.08
0.09
0.14
0.1 1
1.55
.. .. . .
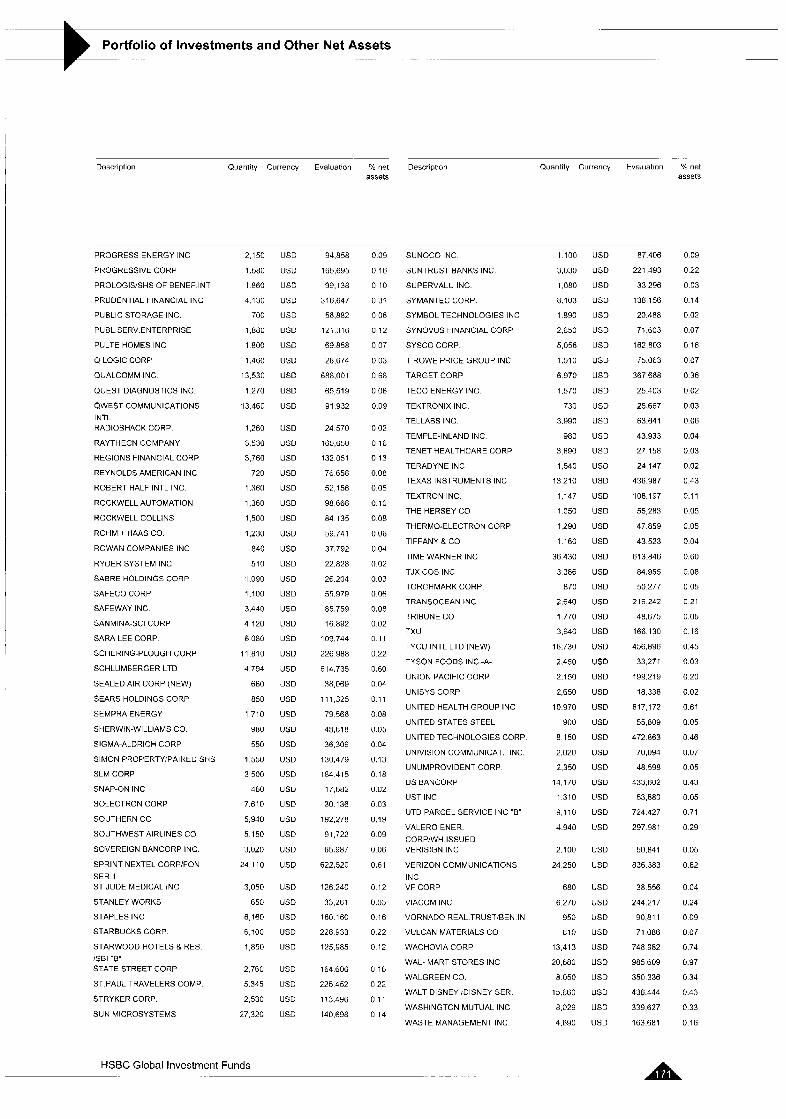
. _
Portfolio of Investments and Other Net Assets ~ -.- - ._
. .- .
Dnscription Quantity Currency Evaluation '/c net Description Quantity Currency Evaluation % net assets assets
PROGRESS ENERGY INC
PROGRESSIVE CORP
PR0LOGIS:SHS OF BENEF INT
PRUDENTIAL FINANCIAL INC
PUBLIC STORAGE INC
PUBL SERV ENTERPRISE
PULTE HOMES INC
Q LOGIC CORP
OUALCOMM INC
W E S T DIAGNOSTICS INC
QWEST COMMUNICATIONS INTL RADIOSHACK CORP
RAYTHECN COMPANY
REGIONS FINANCIAL COHP
REYNOLDS AMERICAN INC
ROBERT HALF INTL INC
ROCKWELL AUTOMATION
ROCKWELL COLLINS
ROHM + HAAS CO
ROWAN COMPANIES INC
RYDER SYSTEM INC
SABRE HOLDINGS CORP
SAFECO CORP
SAFEWAY INC
SANMINA SCI CORP
SARA LEE CORP
SCHERING-PLOUGH CORP
SCHLUMEERGER LTD
SEALED AIR CORP (NEW)
SEARS HOLDINGS CORP
SEMPHA ENERGY
SHERWIN-WILLIAMS CO
SIGMA-ALDRICH CORP
SIMON PROPERTYiPAlRED SHS
SLM CORP
SNAP-ON INC
SOLECTRON CORP
SOUTHEFNCO
SOUTHWEST AIRLINES CO
SOVEREIGN BANCORP INC
SPRINT NEXTEL CORP!FON
SER 1 ST JUDE MEDICAL INC
STANLEY WORKS
STAPLES INC
STARBUCKS CORP
STARWOOD HOTELS RES ISEl 6'' STATE STREET CORP
ST PAUL TRAVELERS COMP
STRYKER CORP
SUN MICROSYSTEMS
2.150 US0
1,580 US0
1860 US0
4.130 US0
700 US0
1,880 US0
1800 USD
1,460 US0
13,530 US0
1270 US0
13,460 USD
1,260 US0
3530 US0
3,760 US0
720 USD
1.360 USD
1.360 USD
1.500 USD
1,230 USD
840 US0
510 USD
1.090 US0
1,100 US0
3.440 US0
4 120 USD
6080 US0
11.810 US0
4,794 JSD
660 JSD
850 USD
1,710 USD
yno us0 550 USD
1,550 US0
3,500 US0
460 US0
7.610 US0
5,940 U S 0
5 150 US0
3,020 US0
24,110 US0
3,050 USD
650 USD
6 160 USD
6,100 USD
1850 US0
2.760 US0
5.345 US0
2,530 US0
27.320 US0
94.858
165,695
99,138
316,647
56.882
121.31fi
69.858
28,674
688.001
65 519
91,932
24.570
160,650
132.051
76 658
52,156
98.668
84 135
59,741
37.792
22.828
26.204
55.979
85.759
16 892
1119.744
226 988
614.735
:w 069
111 325
79 566
48,618
36.306
130,479
184415
17.fiR2
30.136
192,278
91,722
65.987
622,520
126.240
33,261
160.1 60
228 933
1 Z5,Y 85
164 606
225.452
113.496
140.698
0.09
0.16
0 10
0 31
0 06
0 12
0 07
0.03
0 68
0 06
0.09
0.02
0 16
0 13
0.08
0.05
0.10
0.08
0.06
U 04
0.02
0 03
0.06
0.08
0 02
11 11
0 22
0.60
0 04
0.1 1
0.08
0.05
0.04
0.13
0.18
0.02
0 03
0.19
0.09
0 06
0.61
0 12
0.03
0.16
0.22
0.12
0 16
0 22
0 11
0 14
SUNOCO INC
SUNTRUST BANKS INC
SUPERVALU INC
SYMANTEC CORP
SYMBOL TECHNOLOGIES INC
SYNOVUS FINANCIAL CORP
SYSCO CORP
T ROWE PRICE GROUP INC
TARGET CORP
TECO ENERGY INC
TEKTRONIX INC
TELLAES INC
TEMPLE-INLAND INC
TENET HEALTHCAKE COHP
TERADYNE INC
'TEXAS INSTRUMENTS INC
TEXTRON INC
THEHERSEYCO
THERMO-ELECTRON CORP
TIFFANY a co TIME WARNER INC
TJX COS INC
TORCHMARK CORP
TRANSOCEAN INC
TRIBUNE CO
TXU
TYCO INTL LTD (NEW)
TYSON FOODS INC -A-
UNION PACIFIC CORP
UNISYS CORP
UNITED HEALTH GROUP INC
UNITED STATES STEEL
UNITED TECHNOLOGIES CORP
UNlVlSlON COMMUNICAT INC
UNUMPROVIDENT CORP
US EANCORP
UST INC
UTD PARCEL SERVICE INC "E"
VALERO ENER
CORPlWH ISSUED VERlSlGN INC
VERIZON COMMUNICATIONS
INC VF CORP
VIACOM INC
VORNADO REAL TRUST'BEN IN
VULCAN MATERIALS CO
WACHOVIA CORP
WAL- MART STORES INC
WALGREEN CO
WALT DISNEY IDISNEY SER
WASHINGTON MUTUAL INC
WASTE MANAGEMENT INC
1.100
3,030
1,080
8.103
1 .E90
2,650
5,056
1.010
6 970
1,570
730
3.990
980
3 690
1,540
13 210
1.147
1,050
1 290
1.160
36 430
3 386
870
2,640
1 770
3,640
16.730
2.450
2.150
2,650
10.970
900
8 150
2,020
2.350
14,170
1.310
9,110
4.940
2.100
24 250
680
6.270
950
810
13,413
20.680
8 050
15.660
8.029
4.690
u50
USD
USD
USD
USD
USD
USD
u50
USD
USD
USD
USD
u50
u50
u50
u50
USD
u50
u50
USD
USD
USD
USD
u50
USD
USD
u50
USD
u50
u50
USD
u50
USD
u50
USD
u50
USD
USD
USD
u50
u50
u50
u50
USD
USD
USD
USD
USD
USD
u50
u50
87.406
221 493
33 296
138 156
20.488
71.603
162,803
75.063
367 668
25.403
25.667
63.641
43 933
27 158
2A,147
436.987
108.197
55 283
47 859
43 523
613.846
84,955
50 277
Z l f i 242
48,675
166 130
456,896
33.271
199.21 9
18.338
617,172
55 809
472 863
70,094
48 598
433 fi02
53,880
724 427
297 981
50.841
836 383
38 556
244.217
90.81 1
71 086
748 982
985 609
350 336
436.444
339,627
163.681
0.09
0 22
0.03
0.14
0.02
0.07
0 16
0 07
0.36
0.02
0 03
0.06
0.04
0.03
0.02
0.43
0.1 1
0.05
0.05
0.04
0.60
0.08
0 05
0 21
0.05
0.16
0.45
0.03
0.20
0.02
0.61
0 05
0 46
0.07
0 05
0 43
0.05
0.71
0.29
0.05
0.82
0.04
0.24
0 09
0 07
0.74
0.97
0.34
0.43
0.33
0.16
HSBC Global Investment Funds
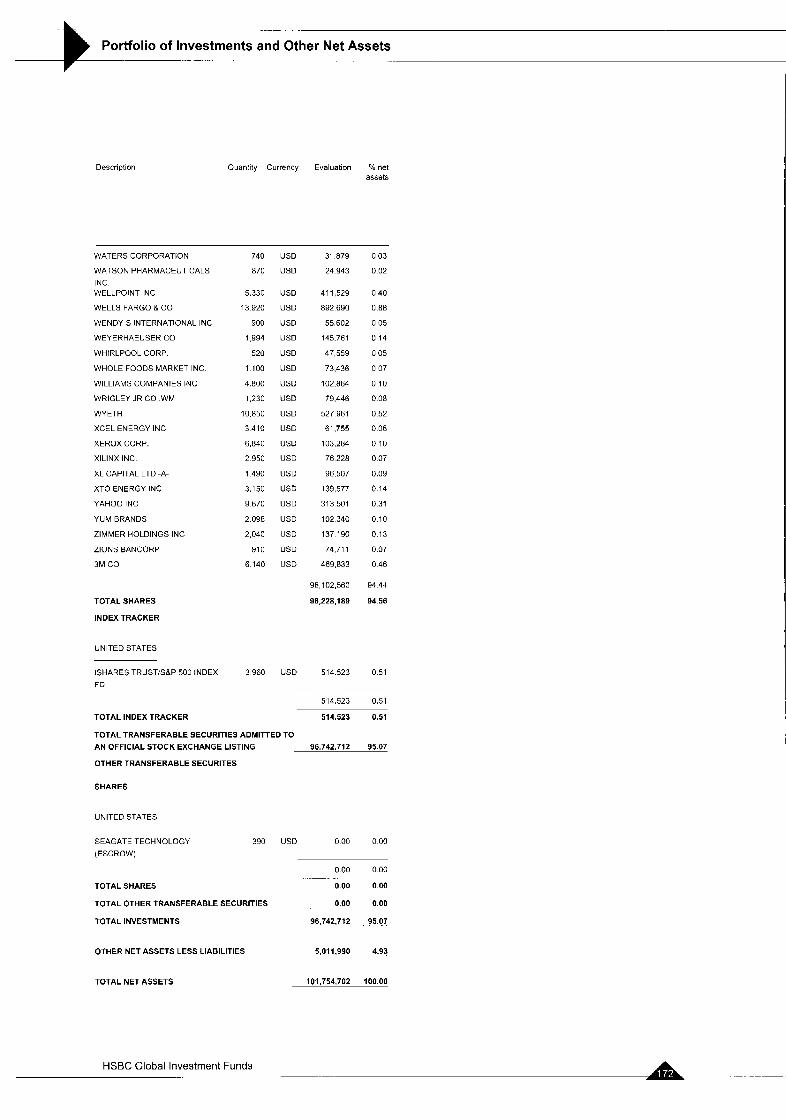
Portfolio of Investments and Other Net Assets _ -
Description QuanMy Currency Evaluation % net assets
WATERS CORPORATION
WATSON PHARMACEUTICALS
INC WELLPOINT INC
WELLS FARGO 8 CO
WENDY S INTERNATIONAL INC
WEYEHHAEUSER CO
WHIRLPOOL CORP
WHOLE FOODS MARKET INC
WILLIAMS COMPANIES INC
WRIGLEY JR CO WM
WYETH
XCEL ENERGY INC
XEROX CORP.
XlLlNX INC
XL CAPITAL LTD -A-
XTO ENERGY INC
YAHOO INC
YUM BRANDS
ZIMMER HOLDINGS INC
ZIONS BANCORP
3M CO
TOTAL SHARES
INDEX TRACKER
UNITED STATES
ISHARES TRUSTjSBP 500 INDEX
FD
740 US0
E70 USD
5.330 US0
13 920 USD
900 US0
1 Y94 US0
520 US0
1100 USD
4800 US0
1,230 US0
10.850 USD
3410 US0
6.840 US0
2950 US0
1490 US0
3.150 USD
9670 US0
2098 US0
2040 US0
Y10 US0
6140 US0
3960 US0
31 879
24 943
41 1,529
892 690
55 602
145.761
47 559
73,436
102.864
79.446
527 961
61,755
103,284
76 228
96 507
139,577
313 501
102 340
137 190
74711
469.833
96,102,560
96,228,189
514 523
0.03
0.02
0.40
0.88
0.05
0 14
0 05
0 07
0.10
0.08
0.52
0.06
0.10
0.07
0.09
0.14
0.31
0.10
0.13
0.07
0 46
94 44
94.56
0.51
... ~
514.523 0.51
TOTAL INDEX TRACKER 514.523 0.51
TOTAL TRANSFERABLE SECURITIES ADMITTED TO
AN OFFICIAL STOCK EXCHANGE LISTING 96,742,712 95.07
OTHER TRANSFERABLE SECURITES
SHARES
UNITED STATES
SEAGATE TECHNOLOGY
(ESCROW)
390 USD 0.00 0 00
TOTAL SHARES
TOTAL OTHER TRANSFERABLE SECURITIES
TOTAL INVESTMENTS
OTHER NET ASSETS LESS LIABILITIES
TOTALNETASSETS
HSBC Global Investment Funds
000 0 0 0
000 0 0 0
0.00 0.00
96,742,712 95.07
.
5,011,990 4.93
101,754,702 100.00
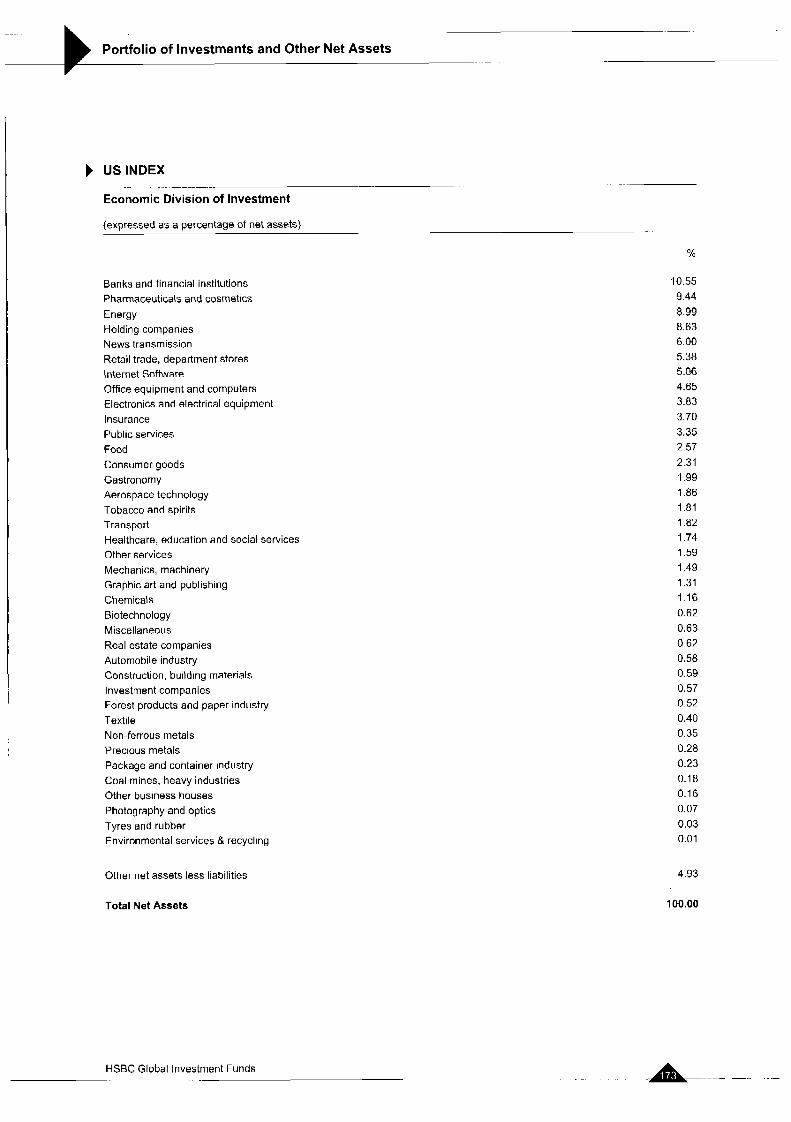
..
Portfolio of Investments and Other Net Assets _. ..
USINDEX
Economic Division of Investment - .- . ___ .. .- -
(expressed as a percentage of net assets)
%
Banks and financial institutions Pharmaceuticals and cosmetics Energy Holding companies News transmission Retail trade, department stores Internet Software Office equipment and computers Electronics and electrical equipment Insurance Public services Food Consumer goods Gastronomy Aerospace technology Tobacco and spirits Transport Healthcare, education and social services Other services Mechanics, machinery Graphic art and publishing Chemicals Biotechnology Miscellaneous Real estate companies Automobile industry Construction, building materials Investment companies Forest products and paper industry Textile Non-ferrous metals Precious metals Package and container industry Coal mines, heavy industries Other business houses Photography and optics Tyres and rubber Environmental services & recycling
Other net assets less liabilities
Total Net Assets
HSBC Global Investment Funds
10.55 9-44 8.99 8.63 6.00
5.06 4.65 3.83 3.70 3.35 2.57 2.31 1.99 1.86 1.81 1.82 1.74 1.59 1.49 1.31 1.16 0.62 0.63 0.62 0.58 0.59 0.57 0.52 0.40 0.35 0.28 0.23 0.18 0.16 0.07 0.03 0.01
5.38
4.93
100.00
.. A -. . .
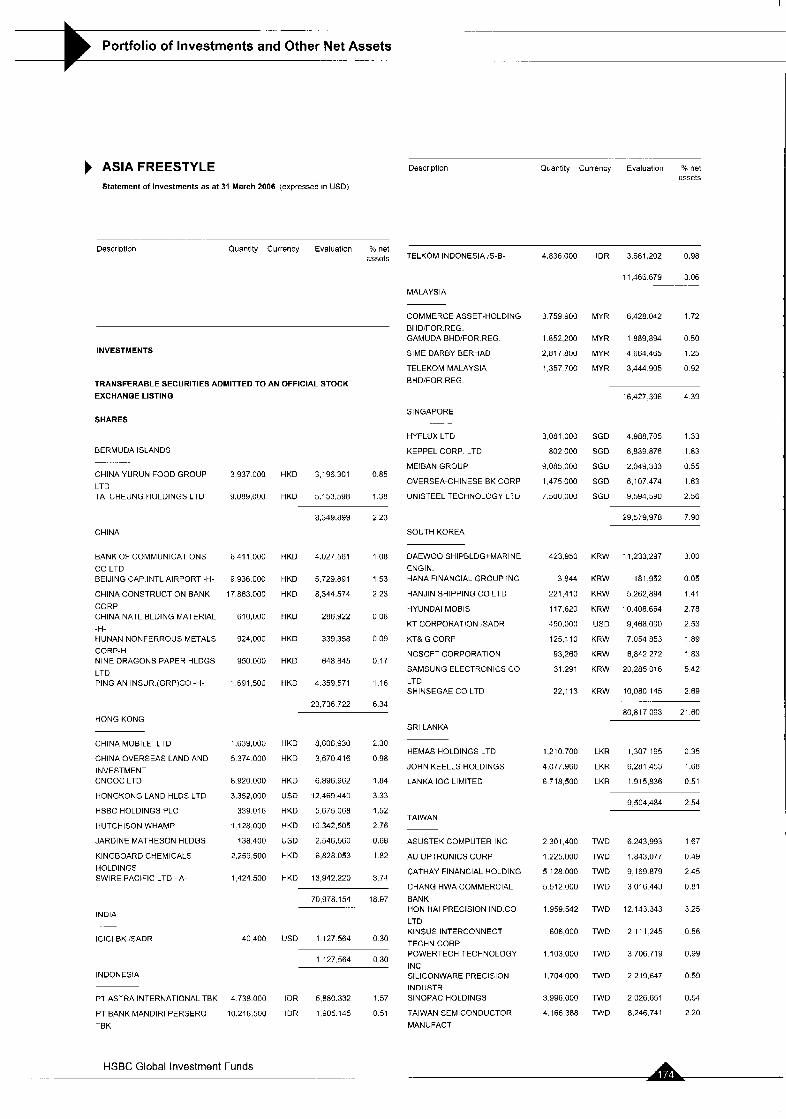
_ . ~.
Portfolio of Investments and Other Net Assets __ . . ___ .
Description Quantity Currency Evaluation Ob net assets
ASIA FREESTYLE Statement of investments as at 31 March 2006 ,expressed in USD)
Description Quantity Currency Evaluation 70 net assets
INVESTMENTS
TRANSFERABLE SECURITIES ADMITTED TO AN OFFICIAL STOCK
EXCHANGE LISTING
TELKOM INDONESIA E-B-
MALAYSIA
4,836,000
3 759 900
1.852.200
2 ~ 1 7 , a o u
1,357 700
3,081 000
802 000
9.085 000
1,475 000
7.500 [iuo
423.950
3 844
221,410
117.620
450.000
125.1 10
93,260
31 291
22,113
1.210 700
4,077.960
6 718,500
2 301,400
1.225,OOO
5 128 000
5 512.000
1 959.542
606,000
1.103.000
1.704.000
3 996.000
4.1 66,388
IDR 3,681,202 0.98
11,466 679 3 06
COMMERCE ASSET-HOLDING
BHD/FOR.REG. GAMUDA BHD/FOR REG.
SlME DARBY EERHAD
TELEKOM MALAYSIA
BHDiFOR.REG.
MYR 6.428042 1 7 2
MYR 1889.894 0 5 0
MYR 4664.455 1 2 5
MYR 3.444905 0 9 2
16,427 306 4.39
SINGAPORE SHARES
HYFLUX LTD
KEPPEL CORP. LTD
MEIBAN GROUP
OVERSEA-CHINESE BK CORP
UNISTEEL TECHNOLOGY LTD
SGD 4.988735 1 3 3
SGD 6.839 876 1 8 3
SGD 2.04Y 333 0 5 5
SGD 6,107474 1 6 3
SGD 9.594 59U 2 56
BERMUDA ISLANDS
CHINA YURUN FOOD GROUP
LTD TAI CHEUNG HOLDINGS LTD
3 937 000
9,089,000
6 41 1 000
9 936 000
17 863.000
610,000
924,000
950 000
1691.500
1.639,000
5 374 000
8 920 000
3 352,000
339 016
1 128 000
138 400
2,259,500
1 424 500
40 400
4 738 000
10.218 500
HKD 3.196 301 0.85
HKD 5,153,598 1.38
8,349.899 2 23 29 579,978 7.90
CHINA SOUTY KOREA
DAEWOO SHIPBLDG+MARINE
ENGIN. HANA FINANCIAL GROUP INC
HANJIN SHIPPING CO LTD
HYUNDAI MOBIS
KT CORPORATION SADR
KT& G CORP
NCSOFT CORPORATION
SAMSUNG ELECTRONICS CO
LTD SHINSEGAE CO LTD
BANK OF COMMUNICATIONS
CO LTD BElJlNG CAP INTL AIRPORT -H-
CHINA CONSTRUCTION BANK
CORP CHINA NATL BLDING MATERIAL
-H- HUNAN NONFERROUS METALS CORP-H NINE DRAGONS PAPER HLDGS
LTD PING AN INSUR.(GRP)CO -H-
HKD 4.027.561 1.08
HKD 5.729.891 1.53
HKD 8,344.574 2 23
HKD 286,922 0 0 8
HKD 339,358 0 0 9
HKD 648845 0.17
HKD 4 359,571 1.16
23.736 722 6.34
KRW
KRW
KRW
KRW
USD
KRW
KRW
KRW
KRW
11 233,237
181,932
5 262,834
10 408 664
9 468.000
7 054 853
6,842 272
20 285 016
10,080,115
3 00
0 05
1 4 1
2.78
2 53
1 89
1 83
5 42
2.69
80,817.0P3 21.60 HONG KONG
SRI LANKA
CHINA MOBILE LTD
CHINA OVERSEAS LAND AND
INVESTMENT CNOOC LTD
HONGKONG LAND HLDS LTD
HSBC HOLDINGS PLC
HUTCHISON WHAMP
JARDINE MATHESON HLDGS
KINGBOARD CHEMICALS
HOLDINGS SWlRE PACIFIC LTD - A -
HKD 8,606 930 2.30
HKD 3,670416 0.98
HKD 6,896.962 1.84
US0 12.469440 3 3 3
HKD 5,675 068 1.52
HKD 10342,505 2 7 6
US0 2,546,560 0.68
HKD 6,828 053 1.82
HKD 13942.220 3.74
HEMAS HOLDINGS LTD
JOHN KEELLS HOLDINGS
LANKA IOC LIMITED
LKR 1.307 195 0.35
LKR 6,281.453 1.68
LKR 1 915,836 0.51
9.504.484 2.54
TAIWAN
ASUSTEK COMPUTER INC
AU OPTRONICS CORP
CATHAY FINANCIAL HOLDING
CHANG HWA COMMERCIAL
BANK HON HA1 PRECISION IND.CO
LTD KINSUS INTERCONNECT
TECHN.CORP POWERTECH TECHNOLOGY
INC SILICONWARE PRECISION INDUSTR. SINOPAC HOLDINGS
TAIWAN SEMICONDUCTOR
MANUFACT.
TWO
TWD
TWD
TWD
TWD
TWD
TWD
TWD
TWO
TWD
6 243.993
1,843,077
9 169 879
3 016 443
12.143 343
2 111 245
3 706 719
2 219.647
2 026.651
8,246 741
1 67
0 49
2 45
0.81
3 25
0 56
0.99
0 59
0.54
2 20
70,978.154 18.97
INDIA -
IClCl BK SADR USD 1127564 0.30
1127.564 0 3 0
INDONESIA
P l ASY RA INTERNATIONAL TBK
PT BANK MANDlRl PERSERO
TBK
IDR 5,880.332 1.57
IDR 1 YO5145 0 5 1
HSBC Global Investment Funds
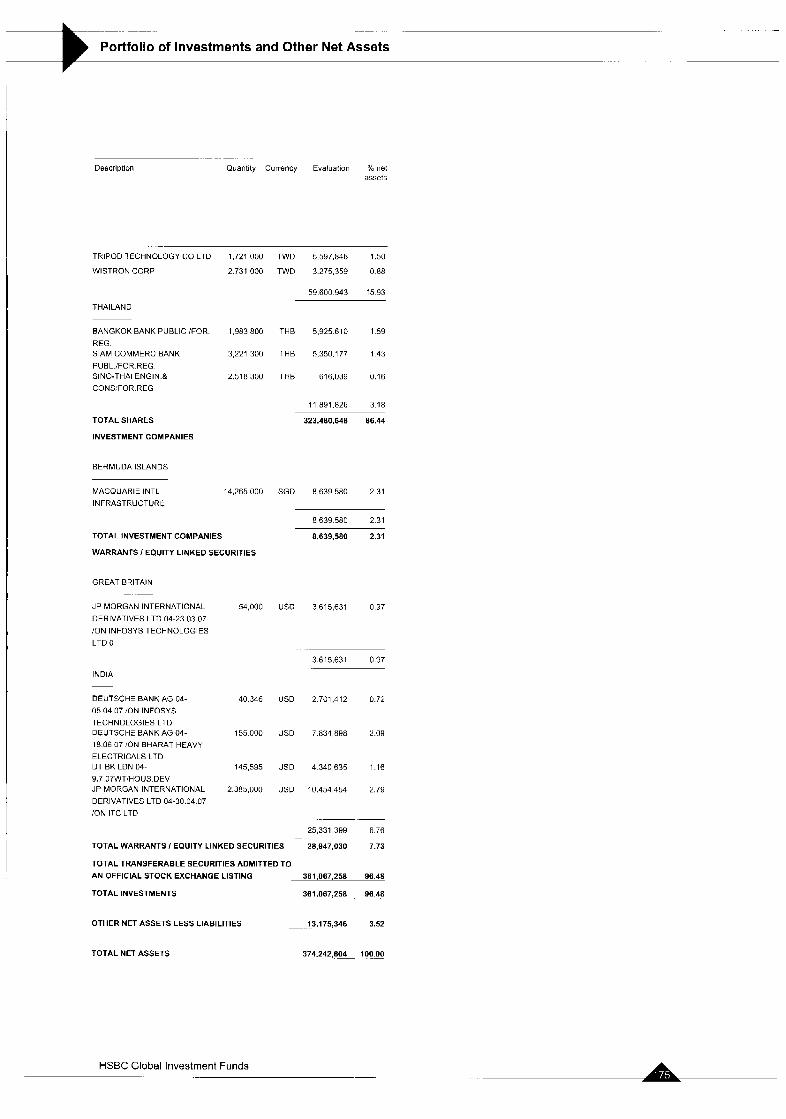
Portfolio of Investments and Other Net Assets
-. - . . .
Description Quantity Currency Evaluation >/. net assets
TRIPOD TECHNOLOGY CO LTD 1,721.000
WISTRON GORP 2,731,000
TWO 5597,846 1.50
TWO 3275,359 0 8 8
59 600 943 15 93
THAILAND
BANGKOK BANK PUBLIC /FOR 1.983 800
REG SlAM COMMERC BANK 3,221 300
PUBL :FOR REG SINO-THAI ENGIN & 2.518,300 CONS’FOR REG
TOTAL SHARES
INVESTMENT COMPANIES
BERMUDA ISLANDS
MACQUARIE INTL 14,265.000 INFRASTRUCTURE
TOTAL INVESTMENT COMPANIES
WARRANTS I EQUITY LINKED SECURITIES
GREAT BRITAIN
JP MORGAN INTERNATIONAL 54,000
DERIVATIVES LTD 04-23 03 07
!ON INFOSYS TECHNOLOGIES
LTD 0
INDIA
THE 5,925610 1 5 9
THE 5,350.177 1 43
THE 616.039 0.16
11 891.826 3 18
323.480.648 86.44
SGD 8639580 2.31
8639.580 2 3 1
8,639,580 2.31
USD 3,615,631 0.97
3.615.631 0 97
DEUTSCHF BANK AG 04-
05 04 07 :ON INFOSYS
TECHNOLOGIES LTD DEUTSCHE BANKAG 04- 155 000 18 06 07 :ON BHARAT HEAVY
ELECTRICALS LTD DT BK LDN 04- 145,595 9 7 07WT’HOUS DEV JP MORGAN INTERNATIONAL 2,385,000
DERIVATIVES LTD 04-30 04 07
:ON ITC LTD
40 346 USD 2 701,412 0.72
US0 7.834 898 2.09
US0 4.340.635 1.16
USD 10,454,454 2.79
25331 399 6 7 6
TOTAL WARRANTS / EQUITY LINKED SECURITIES 28.9A7.030 7.73
TOTAL TRANSFERABLE SECURITIES ADMITTED TO AN OFFICIAL STOCK EXCHANGE LISTING 361,067,258 96 48
TOTAL INVESTMENTS 361,067,258 96 48
.-
OTHER NET ASSETS LESS LIABILITIES 13,175,346 .. 3.52
TOTALNETASSETS 374,242,601 IOOe
HSBC Global Investment Funds .
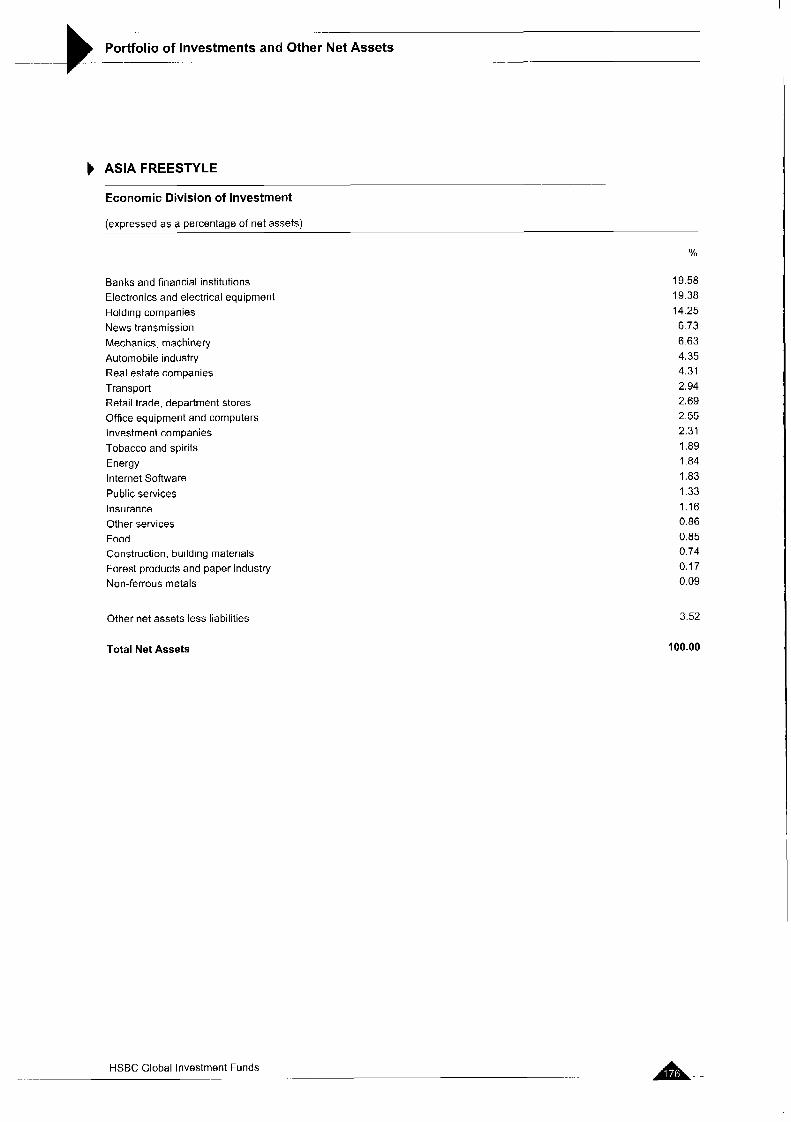
ASIA FREESTYLE
Economic Division of Investment
(expressed as a percentage of net assets)
%
Banks and financial institutions Electronics and electrical equipment Holding companies News transmission Mechanics, machinery Automobile industry Real estate companies Transport Retail trade, department stores Office equipment and computers Investment companies Tobacco and spirits Energy Internet Software Public services Insurance Other services Food Construction, building materials Forest products and paper industry Non-ferrous metals
Other net assets less liabilities
Total Net Assets
.-
Portfolio of Investments and Other Net Assets . -
19.58 19.38 14.25 6.73 6.63 4.35 4.31 2.94 2.69 2.55 2.31 1.89
1.83 1.33 1.16 0.86 0.85 0.74 0.17 0.09
I .a4
3.52
100.00
HSBC Global Investment Funds A.. ....
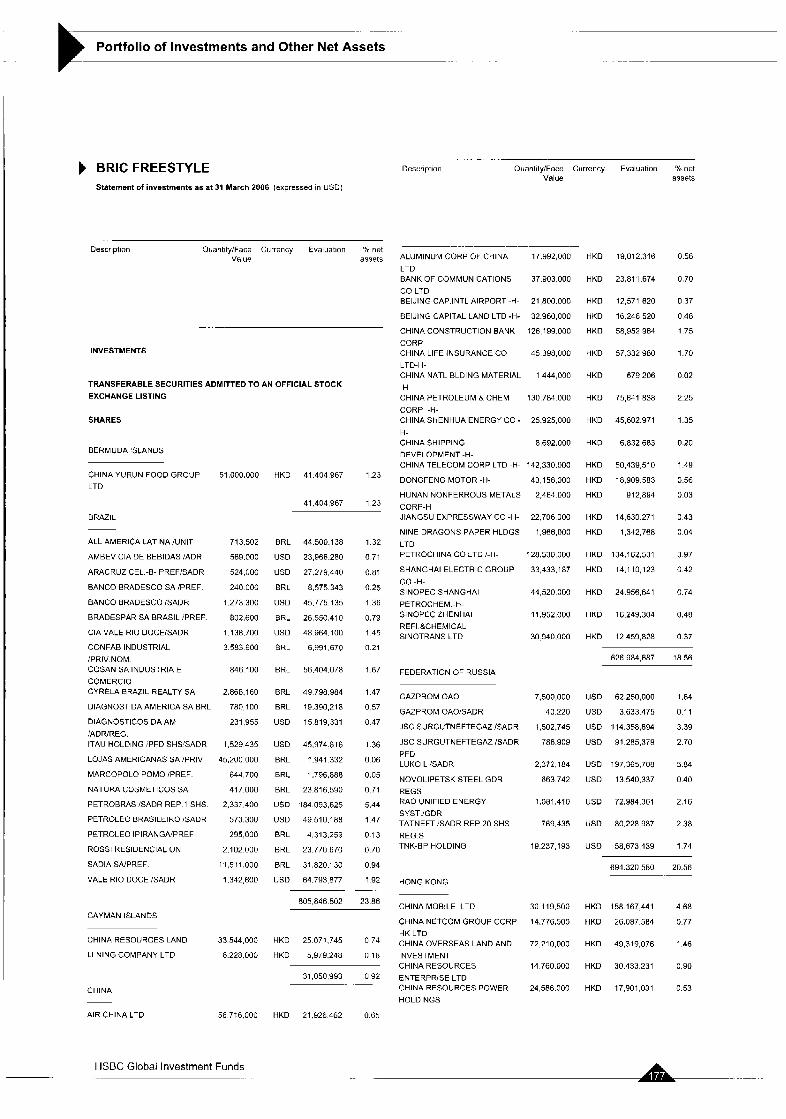
. .- ...
Portfolio of Investments and Other Net Assets
I
BRlC FREESTYLE Statement of investments as at 31 March 2006 (expressed in USD)
. . .. .. .
Description Ouanlily/Face Currency Evaluation % net Value assets
Description QuantitylFace Currency Evaluation YO net Value assets
INVESTMENTS
TRANSFERABLE SECURITIES ADMITTED TO AN OFFICIAL STOCK
EXCHANGE LISTING
SHARES
BERMUDA 'SLANDS
CHINA YURUN FOOD GROUP 51,000.000 LTD
HKD 41.404967 1.23
41,404,967 1 23
BRAZIL
ALL AMERICA LATINA /UNIT
AMBEV CIA DE BEBIDAS iADR
ARACRUZ CEL -8- PREF'SADR
BANCOBRADESCOSAPREF
BANCO BRADESCO ISADR
BRADESPAR SA BRASIL iPREF
CIA VALE RIO DOCEiSADR
CONFAB INDUSTRIAL
/PRIV NOM COSAN SA INDUSTRIA E
COMERCIO CYRELA BRAZIL REALTY SA
DIAGNOST DA AMERICA SA BRL
DIAGNOSTIC05 DA AM
!ADRIREG ITAU HOLDING IPFD SHSISADR
LOJAS AMERICANAS SA IPRIV
MARCOPOLO POMO IPREF
NATURA COSMETICOS SA
PETROBRAS lSADR REP 1 SHS
PETROLEO BRASILEIRO iSADR
PETROLEO IPIRANGAPREF
ROSS1 HESIDENCIAL ON
SADIA SAlPREF
VALE RIO DOCE /SADR
713.502
569.000
524,000
240 000
1,273 300
802,600
1.138.700
3.583 600
846 100
2.868.1 60
780 I [IO
231,955
1.529 435
45,200 000
644,700
417,000
2,337.400
573,300
295,000
2.102.000
11,511.000
1,342,600
BRL 44 500.138
US0 23,966.280
US0 27,279,440
BRL 8.575343
USD 45.775 135
BRL 26,550,410
USD 48.964.100
EHL 6,991,670
BRL 56.404.078
BRL 49 798.984
BRL 19,390,218
USD 15819,331
USD 45.974 816
BRL 1.941 332
BRL 1,796,888
BRL 23.816.590
USD 184 093,625
US0 49 510.188
BRL 4,313,259
BRL 23,770 670
BRL 31,820.130
USD 64.793 877
1.32
0.71
o.ni 0.25
1.36
0.79
1.45
(1.21
1 6 7
1.47
0.57
0.47
1.36
0.06
0.05
0.71
5.44
1 47
0 13
0.70
0.94
1.92
805,846.502 23.06
CAYMAN ISLANDS
CHINA RESOURCES LAND 33.544.000
LI NlNG COMPANY LTD 6.228.000
HKD 25071.745 0 7 4
HKD 5979.248 0 18
31,050,993 0 92 -. -
CHINA
AIR CHINA LTD 56 716.000
HSBC Global Investment Funds
HKD 21 926462 0.65
ALUMINUM CORP OF CHINA
LTD BANK OF COMMUNICATIONS
CO LTD BElJlNG CAP.INTL AIRPORT -H-
BElJlNG CAPITAL LAND LTD -H-
CHINA CONSTRUCTION BANK CORP CHINA LIFE INSURANCE CO
LTD-H- CHINA NATL BLDING MATERIAL
-H-
CORP -H- CHINA SHENHUA ENERGY CO - H- CHINA SHIPPING
DEVELOPMENT -H- CHINA TELECOM CORP LTD -H-
DONGFENG MOTOR -H-
HUNAN NONFERROUS METALS
CORP-H JIANGSU EXPRESSWAY CO -H-
NINE DRAGONS PAPER HLDGS
LTD PETHOCHINA CO LTD I -H-
SHANGHAI ELECTRIC GROUP
CO -H-
CHINA PETROLEUM a CHEM
SINOPEC SHANGHAI PETR0CHEM:H- SINOPEC ZHENHAI
REF1 &CHEMICAL SINOTRANS LTD
FEDERATION OF RUSSIA
GAZPROM OAO
GAZPROM OAOiSADR
JSC SURGUTNEFTEGAZ /SADR
JSC SURGUTNEFTEGAZ ISADR
PFD LUKOIL 'SADR
NOVOLIPETSK STEEL GDR
REGS RAO UNIFIED ENERGY
SYST IGDR TATNEFT iSADR REP 20 SHS
REG S TNK-BP HOLDING
HONG KONG
CHINA MOBILE LTD
CHINA NETCOM GROUP CORP HK LTD CHINA OVERSEAS LAND AND
INVESTMENT CHINA RESOURCES
ENTERPRISE LTD CHINA RESOURCES POWER HOLDINGS
17,992,000
37.903.000
21,800.000
32,960,000
126,199.000
45 398,000
1444,000
130,784.000
25,925,000
8,692.000
142,330.000
43.158.000
2,464 000
22.706 000
1,966,000
128.530,OOO
33,433,l 87
44,520.000
11,952,000
30 940.000
7,500,000
40,220
1,502,745
786.909
2,372 184
663 742
1.081,410
769.435
19.237 193
30 119,500
14,776,500
72 210,000
14 760.000
24,586.000
HKD
HKD
HKD
HKD
HKD
HKD
HKD
HKD
HKD
HKD
HKD
HKD
HKD
HKD
HKD
HKD
HKD
HKD
HKD
HKD
u50
USD
u50
USD
USD
u50
u50
USD
USD
HKD
HKD
HKD
HKD
HKD
19 012,316
23,811.674
12,571,620
16.246 520
58,952 964
57.332 980
679 206
75,841.838
45,602.971
6,832,683
50,439,510
18,909,583
912,894
14.630 271
1,342,768
134,162,531
14,110,123
24,956,641
16,249,304
12 459,828
0.56
0.70
0 37
0 48
1 75
1.70
0.02
2.25
1.35
0.20
1.49
0.56
0.03
0 43
0.04
3 97
0.42
0.74
0.48
0.37
626 984,687 18.56
62.250,OOO
3.633 475
114,358,894
91,285,379
197 365,708
13 540,337
72,984.361
80.228 987
58,673 439
1.84
0.1 1
3.39
2.70
5.84
0.40
2.16
2.38
1 74
694.320,580 20.56
158 167,441
26.087.584
49,319,076
30.433 231
17.901,031
4.68
0.77
1.46
0.90
0.53
.. . . .. .
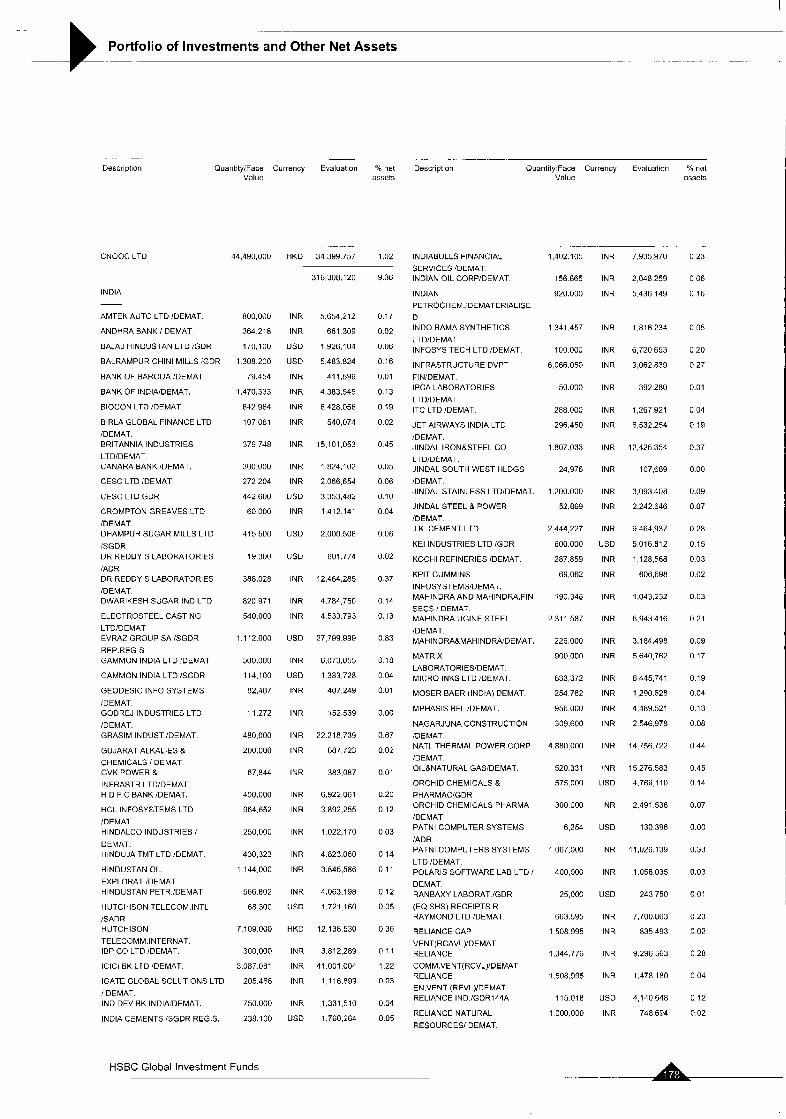
Portfolio of Investments and Other Net Assets -. .. . .. .- __
. -.
Descriplion
CNOOC LTD
INDIA
AMTEK AUTO LTD IDEMAT
ANDHRA BANK i DEMAT
BAJAJ HINDUSTAN LTD IGDR
BALRAMPUR CHIN1 MILLS IGDR
BANK OF BARODA 'DEMAT
BANK OF INDIAIDEMAT
BIOCON LTD IDEMAT
BIRLA GLOBAL FINANCE LTD
iDEMAT BRITANNIA INDUSTRIES
LTD/DEMAT CANARABANKiDEMAT
CESC LTD rDEMAT
CESC LTD GDR
CROMPTON GREAVES LTD
iDEMAT DHAMPUR SUGAR MILLS LTD
iSGDR OR REDDY S LABORATORIES
iADR OR REDDY S LABORATORIES
iDEMAT DWARIKESH SUGAR IND LTD
ELECTROSTEEL CASTING
LTD!DEMAT EVRAZ GROUP SAiSGDR
REP REG-S GAMMON INDIA LTD IDEMAT
GAMMON INDIA LTD /SGDR
GEODESIC INFO SYSTEMS
iDEMAT GODREJ INDUSTRIES LTD
/DEMAT GRASIM INDUSTiDEMAT
GUJARAT ALKALIES d CHEMICALS I DEMAT GVK POWER & INFRASTR LTDlDEMAT H D F C BANK IDEMAT
HCL INFOSYSTEMS LTD
/DEMAT HINDALCO INDUSTRIES I
DEMAT HINDUJA TMT LTD (DEMAT
HINDUSTAN OIL
EXPLORAT rDEMAT HINDUSTAN PETR :DEMAT
HUTCHISON TELECOM INTL
ISADR HUTCHISON
TELECOMM INTERNAT IBP CO LTD IDEMAT
lClCl BK L I D IDEMAT
IGATE GLOBAL SOLUTIONS LTD
i DEMAT IND DE\'BK INDIA'DEMAT.
INDIA CEMENTS iSGDR REG S
. . . .. . . .- .
0uaritity;Face Currency Evaluation ?b net Description Quantity:Face Currency Evaluation Yo nat Value assets Value assets
14,490,000
800 000
364 218
170,100
1 308 200
79 454
1,470.333
642.964
107 081
379 748
300,000
272 204
442,600
60 000
415 500
19.300
388.028
820 971
540.000
1.112.000
500.000
114,100
82,487
11 272
480 000
200 000
67.844
400,000
964.652
250.000
430,323
1 144.000
566.802
68 300
7 109 000
300,000
3,087 081
205.468
750 000
238 100
HKD 34,399.757 1.02
31 6,308.120
INR 5.654212
INR 661 309
US0 1,926,104
USD 5.483824
INR 411,599
INR 4,383.545
INR 6,428.056
INR 540.074
INR 15,101,053
INR 1.824.102
INR 2.066.654
USD 3.353.482
INR 1412 141
US0 2.000508
USD 601.774
INR 12,464,285
INR 4.78475G
INR 4533793
US0 27 799.999
INR 6,073,055
USD 1383.728
INR 407,249
INR 152.539
INR 22,218,739
INR 687723
INR 383.087
INR 6.922061
INR 3892,255
INR 1022,170
INR 4823060
INR 3.846.586
INR 4.063.198
US0 1.721 160
HKD 12.138 530
INR 3,812,289
INR 41.001.004
INR 1,116.899
INR 1331,510
USD 1,760,264
9 36
0.17
0.02
0.06
0.16
0.01
0 13
0 19
0 02
0 45
0.05
0 06
0 10
0.04
0.06
0.02
0.37
0.14
0.13
0.83
0 18
0 04
0 01
0.00
0.67
0.02
0.01
0.2u
0.12
0 03
0 14
0.11
0.12
0.05
0.36
0.1 1
1.22
0.03
0.04
0 05
INDIABULLS FINANCIAL SERVICES 'DEMAT INDIAN OIL CORPiDEMAT
INDIAN PETROCHEM rDEMATERlALlSE
D INDO RAMA SYNTHETICS
LTD!DEMAT INFOSYS TECH LTD iDEMAT
INFRASTRUCTURE DVPT
FlNiDEMAT IPCA LABORATORIES
LTDlDEMAT ITC LTD /DEMAT
JET AIRWAYS INDIA LTD
IDEMAT JINDAL IRONBSTEEL CO LTDDEMAT JINDAL SOUTH WEST HLDGS
IDEMAT JINDAL STAINLESS LTDiDEMAT
JINDAL STEEL & POWER
/DEMAT J K CEMENT LTD
KEI INDUSTRIES LTD /GDR
KOCH1 REFINERIES IDEMAT
KPlT CUMMINS
INFOSYSTEMSIDEMAT. MAHINDRA AND MAHlNDRA.FIN SECS / DEMAT MAHINDRA UGINE STEEL
IDEMAT MAHINDRABMAHINDRAiDEMAT
MATRIX
LABORATORlESlDEMAT MICRO INKS LTD IDEMAT
MOSER BAER (INDIA) DEMAT
MPHASIS BFL IDEMAT
NAGARJUNA CONSTRUCTION iDEMAT NATL THERMAL POWER CORP /DEMAT OlLgNATURAL GASlDEMAT
ORCHID CHEMICALS & PHARMACIGDR ORCHID CHEMICALS PHARMA
iDEhlAT PATNl COMPUTER SYSTEMS
iADR PATNI COMPUTERS SYSTEMS
LTD /DEMAT POLARIS SOFTWARE LAB LTD I
DEMAT RANBAXY LABORAT /GDR
(EQ SHS) RECEIPTS R RAYMOND LTD 'DEMAT
RELIANCE CAP
VENT(RCAVL)/DEMAT RELIANCE
COMM VENT(RCVL)IDEMAT RELIANCE EN VENT (REVL)/DEMAT RELIANCE IND iGDR144A
RELIANCE NATURAL
RESOURCES/ DEMAT
1,402 105
156 665
920.000
1 341.457
100 000
6,066.050
50.001)
288 000
296.450
1.807.033
24.976
1 200.000
52.869
2 444,227
600.000
287.859
69,062
190,346
2 31 1 587
226,000
900.000
633 372
254 762
956.000
309.600
4.880 ooo
520.331
575 00u
300 000
6.254
1 067.000
400,000
25.000
663.595
1 508 995
1,344 776
1,508,995
115018
1 000.000
INR
INR
INR
INR
INR
INR
INR
INR
INR
INR
INR
INR
INR
INR
u50
INR
INR
INR
INR
INR
INR
INR
INR
INR
INR
INR
INR
USD
INR
USD
INR
INR
u50
INR
INR
INR
INR
USD
INR
7,935,970
2,048 259
5.436 149
1.816 234
6,720 653
9,062.839
392.280
1.267 921
6,532.254
12,425.354
107,689
3,093.408
2.242 646
9 464,937
5 016.812
1 128.568
606,698
1,043,232
6,943416
3.1 84,498
5 640,762
6 445,741
1,290.628
4,489.521
2 546.978
14.756.722
15 276.583
4.769 110
2,491 538
130 396
11,026,139
1 058 035
243 750
7,700 863
835 493
9.296 563
1,478 180
4,140 648
748 694
0.23
0 06
0.16
0 05
0 20
0.27
0.01
0 04
0.19
0.37
0.00
0.09
0.07
0.28
0 15
0.03
0 02
11 u3
0 21
0.09
0.17
0.19
0.04
0.13
0.08
0.44
0 45
0 14
0.07
0.00
0.33
0.03
0.01
0 23
0.02
n 28
0 04
0 12
0.02
HSBC Global Investment Funds
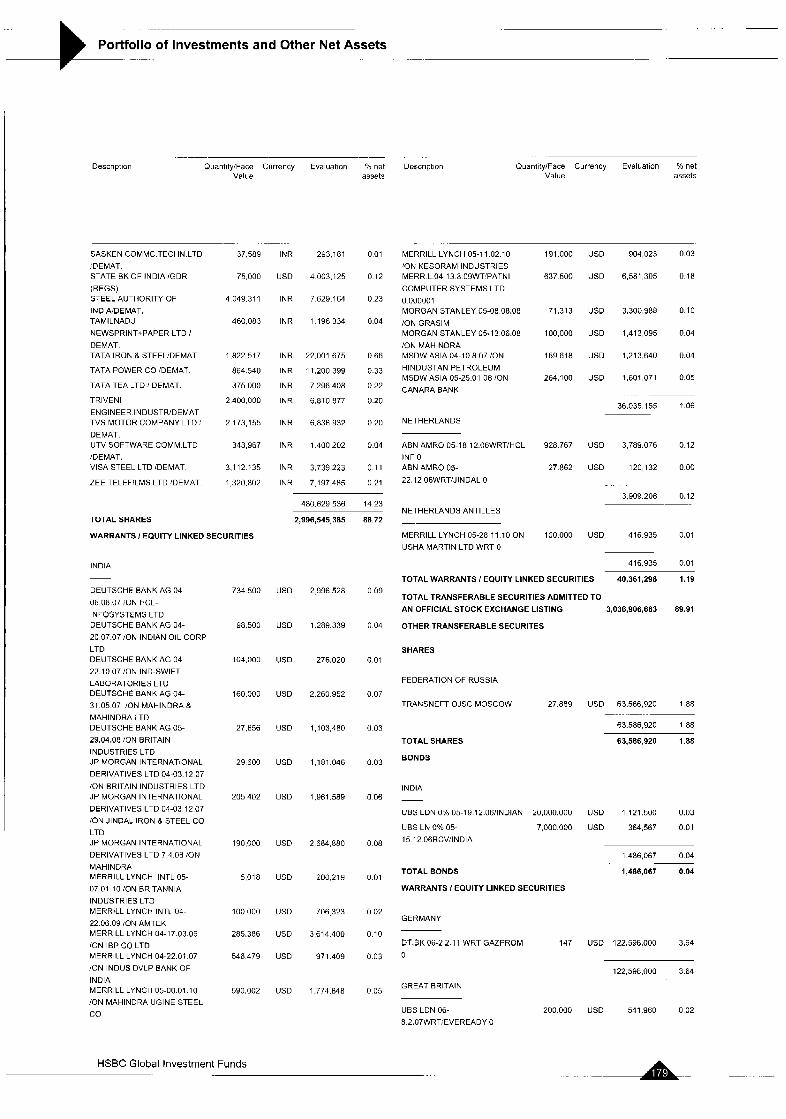
~
Portfolio of Investments and Other Net Assets _ _ - __ -
.
Description Quantity'Face Currency Evaluation YO net DQSCrlptiOn Value assets
-. . .- . .
SASKEN COMMC.TECHN.LTD 37.589
iDEMAT. STATE BK OF INDIA IGDR 75.000
(REGS) STEEL AU-HORITY OF 4 049.31 1
1NDIA:DEMAT. TAMILNADJ 460.083
NEWSPRINT+PAPER LTD ! DEMAT. TATA lROh 8 STEEL'DEMAT 1.822 517
TATA POWER CO DEMAT. 864 540
TATA TEA -TD 1 DEMAT. 375 000
TRlVENl 2 400,000
ENGINEER INDUSTROEMAT TVS MOTORCOMPANY LTD: 2 173,155
DEMAT. UTV SOFTWARE COMM LTD 343.967
:DEMAT. VISA STEEL LTD IDEMAT 3,112 135
ZEE TELEFILMS LTD IDEMAT. 1.320.802
INR 293.181
USD 4.003.125
INR 7629.164
INR 1196334
INR 22.001 675
INR 11,200,399
INR 7296408
INK 6,810,877
INR 6.836932
INR 1.400202
INR 3.739.223
INR 7 197.485
0 01
0 12
0 23
0 04
0 66
0 33
0 22
0 20
0 20
0 04
0 11
0 21
TOTAL SHARES
WARRANTS I EQUITY LINKED SECURITIES
INDIA
480.629 536 14 23
2,996,545,385
DEUTSCHE BANK AG 04-
06 OR 07 ION HCL- INFOSYSTEMS LTD DEUTSCHE BANK AG 04-
20 07 07 ION INDIAN OIL CORP
LTD DEUTSCHE BANK AG 04-
22 10 07 !ON IND-SWIFT LABORATORIES LTD DEUTSCHE BANK AG 04-
31 05 07 :ON MAHINDRA & MAHINDRA LTD DEUTSCHE BANK AG 05- 29.04 OR ION BRITAIN
INDUSTRIES LTD JP MORGAN INTERNATIONAL DERIVATIVES LTD 04-03 12 07
ION BRITAIN INDUSTRIES LTD JP MORGAN INTERNATIONAL
DERIVATIVES LTD 04-03 12 07 :ON JINDAL IRON 8 STEEL CO LTD JP MORGAN INTERNATIONAL
DERIVATIVES LTD 7 4 08 ION MAHINDRA MERRILL LYNCH INTL 05-
07 01 10 :ON BRITANNIA INDUSTRIES LTD MERRILL LYNCH INTL 04-
22 06 09 ION AMTEK MERRILL LYNCH 04-17 U3 09
/ON IBP CO LTD MERRILL LYNCH 04-22 01 07 /ON INDUS DVLP BANK OF
INDIA MERRILL LYNCH 115-U8 01 10
/ON MAHINDRA UGINE STEEL
co
734 500
98.500
104.OU11
160 000
27,656
29 600
205 402
190,000
5,018
100 000
285.386
546 479
590,002
US0
US0
US0
USD
USD
USD
USD
USD
USD
USD
USD
US0
US0
2 996.528
1.289.339
276.020
2,260 952
1,103,480
i . i a i 046
1,Y61.589
2 684.880
200.219
706 323
3,614 400
971 409
I .774.848
88.72
0 09
n 04
0.01
0.07
0.03
0.03
U 06
o oa
(1.01
0.02
0.10
0.03
0 05
. .
QuantitylFace Currency Evaluation "/o net Value assets
. ..
MERRILL LYNCH 05-11.02.10 191.000
'ON KESORAM INDUSTRIES MERR L.04-13.3 OYWT!PATNI 637.500
COMPUTER SYSTEMS LTD
0.000001 MORGAN STANLEY 05-08 08.08 71.313
:ON GRASIM MORGAN STANLEY 05-13 06.08 100,000
:ON MAHINDRA MSDW ASIA 04-10.8.07 !ON 169.618
HINDUSTAN PETROLEUM MSDW ASIA 05-25.01.08 ION 264,100
CANARA BANK
NETHERLANDS
USD 904,023 0.03
USD 6,581,305 0.18
USD 3,300,988 0.10
USD 1.413.095 0.04
US0 1,213,640 0.04
USD 1,601,071 0.05
.... .~
36,035,155 l.Ofi
ABN AMRO 05-18 12 OGWRTI'HCL 928 767 US0 3,789.076 0 12 INF 0 ABN AMRO 05- 27862 US0 120,132 000
22 12 OGWRT'JINDAL 0
3.909.208 0.12
NETHERLANDS ANTILLES
MERRILL LYNCH 05-28 11 10 ON 100,000 US0 416.935 0.01
USHA MARTIN LTD WRT 0
416.935 0.01
TOTAL WARRANTS / EQUITY LINKED SECURITIES 40,361,298 1.19
TOTAL TRANSFERABLE SECURITIES ADMITTED TO
AN OFFICIAL STOCK EXCHANGE LISTING 3,036,906,683 89.91
OTHER TRANSFERABLE SECURITES
SHARES
FEDERATION OF RUSSIA
TRANSNEFT OJSC MOSCOW 27.889 USD 63.586.920 1.88
TOTAL SHARES
BONDS
INDIA
63,586,920 1.88
63,586,920 1.88
UBS LON 0% 05-19.12.06I1NDIAN 20,000.000 US0 1,121.500 0.03
UBS LN 0% 05- 7,000.000 US0 364,567 0 0 1
15 12 06RCV;lNDIA
1486,067 0 0 4
TOTAL BONDS 1,486,067 0.04
WARRANTS I EQUITY LINKED SECURITIES
GERMANY
DT.BK 06-2.2.1 1 WRT GAZPROM 147 USD 122,598,000 3.64
0
122,598,000 3.64
GKEAT BRITAIN
UBS LON 06- 200000 US0 541,960 0 0 2
8 2.07WRTiEVEREADY 0
A- __ __ HSBC Global Investment Funds
-
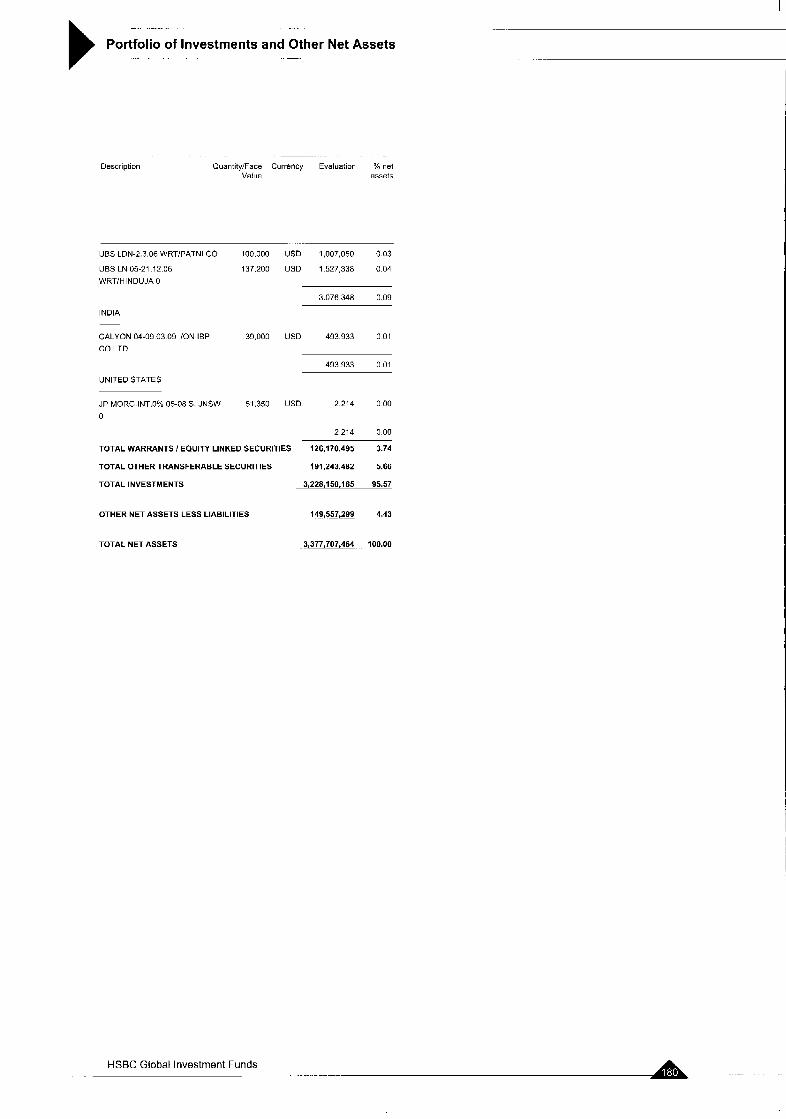
-. .. ..
Portfolio of Investments and Other Net Assets
Description . .. .. .
Quantity:Face Currency Evaluation % net Value assets
UBS LDN-2.3.06 WRTPATNI CO 100,000 USD 1,007,050 0.03
UBS LN 05-21.12.06 137.200 USD 1 527,338 0.04 WRTiHlNDUJA 0
3.076.348 0.09
INDIA
CALYON 04-09 03 09 /ON IBP 39.000 USD 493.933 001 CO LTD
493.933 001
UNITED STATES
JP MORG.INT.OSC OS-08 S. JNSW 51,350 US0 2.214 0 00
0
2,214 0.00
TOTAL WARRANTS / EQUITY LINKED SECURITIES 126,170,495 3.74
TOTAL OTHER TRANSFERABLE SECURITIES 181,243,482 5.66
TOTAL INVESTMENTS 3,228,l 50,165 95.57
OTHER NET ASSETS LESS LIABILITIES 149,557,299 4.43
TOTALNETASSETS 3,377,707,464 100.00
HSBC Global Investment Funds . .. . .. ..
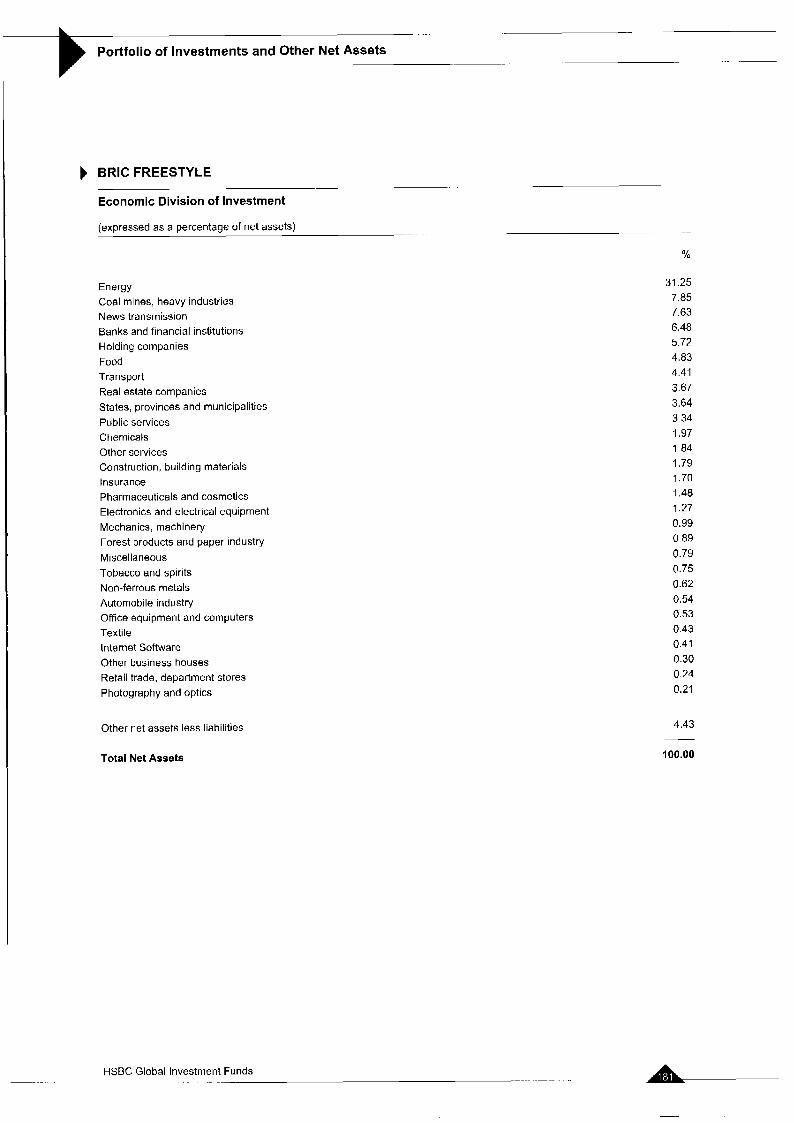
Portfolio of Investments and Other Net Assets . .~ ~-
ERIC FREESTYLE
Economic Division of Investment
(expressed as a percentage of net assets) ..
Energy Coal mines, heavy industries News transmission Banks and financial institutions Holding companies Food Transport Real estate companies States, provinces and municipalities Public services Chemicals Other services Construction, building materials Insurance Pharmaceuticals and cosmetics Electronics and electrical equipment Mechanics, machinery Forest products and paper industry Miscellaneous Tobacco and spirits Non-ferrous metals Automobile industry Office equipment and computers Textile Internet Software Other business houses Retail trade, department stores Photography and optics
Other net assets less liabilities
%
31.25
7.63 6.48 5.72
7.85
4.83 4.41 3.67 3.64 3.34 1.97 1.84 1.79 1.70 1.48 1.27 0.99 0.89 0.79 0.75 0.62 0.54 0.53 0.43 0.41 0.30 0.24 0.21
4.43
Total Net Assets 100.00
-. .. .. HSBC Global Investment Funds
. ... . A
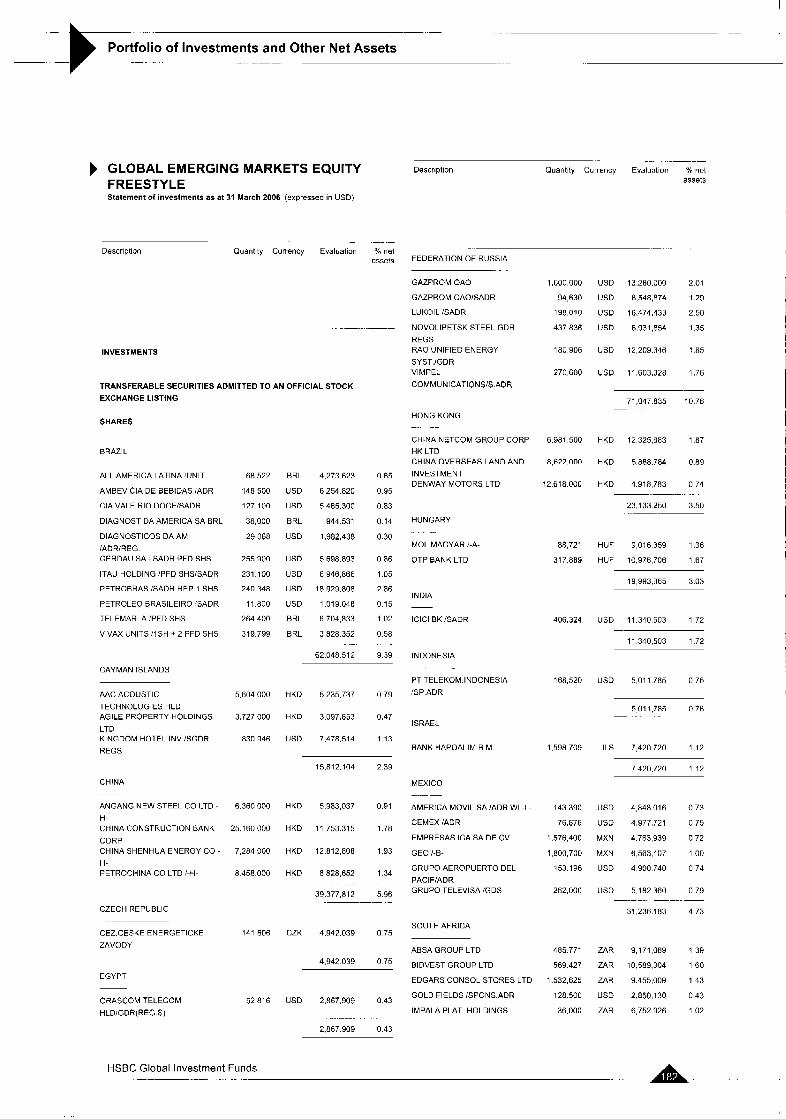
_ _ __ -_
Portfolio of Investments and Other Net Assets - - ~ __
GLOBAL EMERGING MARKETS EQUITY FREESTYLE Statement of investments as at 31 March 2006 (expressed in USD)
........ .-
Description Ouanrlty Currency Evaluation % net assets
.-
Yo net assets
0.65
0 95
0.83
0 14
0 30
0 86
1 05
2 86
0.15
1 02
0 58
9.39
.-
Description Ouanllty Currency Evaluation FEDERATION OF RUSSIA
GAZPROM OAO
GAZPROM OAOlSADR
LUKOIL /SADR
NOVOLIPETSK STEEL GDR
REGS RAO UNIFIED ENERGY
SYST./GDR VIMPEL
COMMUNICATIONSlS.ADR
1,600,000
94,630
198,010
437 836
180 906
270,600
6.981.500
8,622,000
12.618 000
88,721
317.889
406.324
168,520
1.598 709
143 390
76,876
1,576,400
1 800,700
153.196
262,000
485 771
569 427
1,532,625
128 500
36,000
USD 13280,000 2 0 1
US0 8,54H,574 1 29
US0 16.474.433 2 50
USD 8,931,854 1.35
US0 12209.346 1 8 5
US0 11.603.328 1.76
... . . -.
INVESTMENTS
TRANSFERABLE SECURITIES ADMITTED TO AN OFFICIAL STOCK EXCHANGE LISTING
SHARES
71,047.835 10 76 -
HONG KONG - . -.
CHINA NETCOM GROUP CORP HK LTD CHINA OVERSEAS LAND AND
INVESTMENT DENWAY MOTORS LTD
HKD 12 325,883 1 8 7
HKD 5.888.784 0.89
HKD 4.918783 0 7 4
BRAZIL
ALL AMERICA LATINA (UNIT
AMBEV CIA DE BEBIDAS lADR
CIA VALE RIO DOCElSADR
DIAGNOST DA AMERICA SA BRL
DIAGNOSTICOS DA AM
IADRiREG GERDAU SA / SADR PFD SHS
ITAU HOLDING lPFD SHSiSADR
PETKOBRAS XADR REP 1 SHS
PETROLEO BRASlLElRO !SADR
TELEMAR A !PFD SHS
VIVAX UNITS :ISH + 2 PFD SHS
68.522
148.500
127.100
38,000
29 068
255.90(1
231.100
240.348
11,800
264.400
319,799
5,604,000
3,727,000
830 946
6.360,OOO
25.160,OOO
7.284 000
8 458.000
141 606
52 816
BRL 4,273623
USD 6254.820
US0 5465,300
BRL 944.531
US0 1,982,438
23,133.250 3.50
HUNGARY . . . . .
MOL MAGYAR /-A-
OTP BANK LTO
HUF 9,016359 1 3 6
HUF 10.976706 1 6 7 US0 5,698.893
US0 6946,866
US0 18 929.808
US0 1019.048
BRL E 704,833
BRL 3828.352
62.048 512
-
19 993,065 3.03
INDIA
IClCl BK XADR
INDONESIA
USD 11.340 503 1 7 2
11 340,503 1.72
CAYMAN ISLANDS PT TELEKOM.INDONESIA
!SP ADR US0 5,011.785 0.76
AAC ACOUSTIC
TECHNOLOGIES HLD AGILE PROPERTY HOLDINGS
LTD KINGDOM HOTEL INV !SGDR
REGS
HKD 5.235.737 0 79
HKD 3,097,853 0.A7
US0 7,478,514 1 13
5011,785 076 -
ISRAEL
BANK HAPOALIM B M ILS 7,420720 1 1 2
15.H12.104 2.39 7 420.720 1 . I2
CHINA MEXICO
ANGANG NEW STEEL CO LTD -
H- CHINA CONSTRUCTION BANK
CORP CHINA SHENHUA ENERGY CO - H- PETROCHINA CO LTD I-H-
AMERICA MOVIL SA lADR WI -L-
CEMEX /ADR
EMPRESAS ICA SA DE CV
GEO !-B-
GRUPO AEROPUERTO DEL
PAClFiADR GRUPO TELEVISA !GDS
HKD 5,983,037 0.91
HKD 11.753.315 1.78
HKD 12.812,808 1 9 3
HKD 8.828.652 1 34
39,377,812 5.96
...........
USD 4,848016 0 7 3
USD 4,977.721 0.75
MXN 4,763,939 0.72
MXN 6,563,407 1.00
USD 4900 740 0 74
USD 5.182360 0 7 9
31,236.183 4 73
- .. - __. __ CZECH REPUBLIC
SOUTH AFRICA CEZ.CESKE ENERGETICKE ZAVODY
CZK 4,942.039 0 75
4.942 039 0.75 ABSA GROUP LTD
BIDVEST GROUP LTD
EDGARS CONSOL STORES LTD
GOLD FIELDS iSPONS.ADR
IMPALA PLAT. HOLDINGS
ZAR 9,171,069 1 3 9
ZAR 10.589.304 1 60
ZAR 9,455,009 1 43
USD 2,850,130 0 43
ZAR 6,752326 1 0 2
EGYPl
ORASCOM TELECOM
HLDIGDR(REG S) US0 2,867,909 0 43
.......
2.867909 0 4 3
HSBC Global Investment Funds
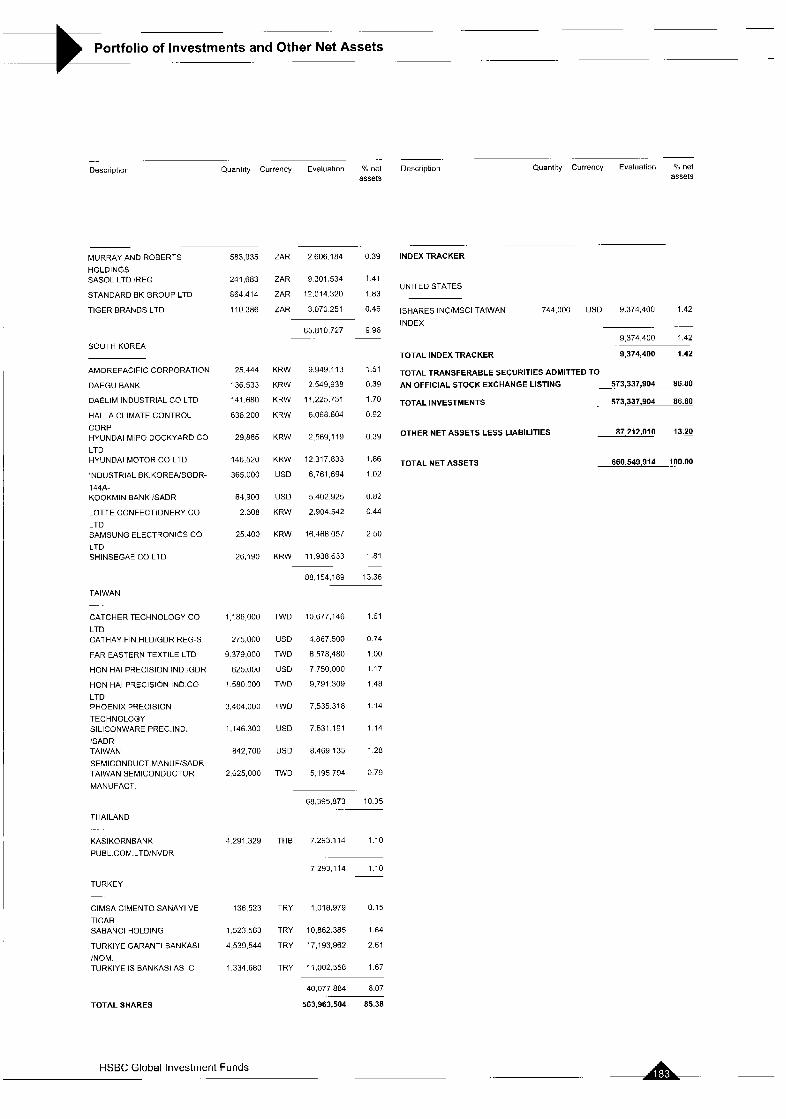
-. ~
Portfolio of Investments and Other Net Assets -
.~ . - .. ~. -. Description Quantity Currency Evaluation net Description Quantity Currency Evaluation '/. net
assets assets
MURRAY AND ROBERTS
HOLDINGS SASOL LTD !REG
STANDARD BK GROUP L
TIGER BRANDS LTD
583,935 ZAR 2606.184 0 3 9
241,683 ZAR 9 301,534 141
864414 ZAR I~.IJI~.:QO 1 a3
110386 ZAR 3.070251 0.46
INDEX TRACKER
UNITED STATES TO
ISHARES INClMSCl TAIWAN 744,000 US0 9,374,400 1 4 2
INDEX ._
9 374.400 1.AZ 65.n10.727 9 96
~
1.51
0.39
1 70
0.92
0.39
I .ne 1 02
0.82
0.44
2 50
i .ni -
SOUTHKOREA TOTAL INDEX TRACKER 9,374,400 1.42
TOTAL TRANSFERABLE SECURITIES ADMITTED TO AN OFFICIAL STOCK EXCHANGE LISTING 573,337,904 86.80
TOTAL INVESTMENTS 573,337.904 86.80
-
AMOREPACIFIC CORPORATION
DAEGU BANK
DAELIM INDUSTRIAL CO LTD
HALLA CLIMATE CONTROL
CORP HYUNDAI MlPO DOCKYARD CO
LTD HYUNDAI MOTOK CO LTD
INDUSTRIAL BK KOREAISGDR-
144A- KOOKMIN BANK lSADR
LOTTE CONFECTIONERY CO
LTD SAMSUNG ELECTRONICS CO
LTD SHlNSEGAf CO LTD
25.444
136.533
141.680
636 200
29.865
146.520
365,000
64,900
2 308
25 400
26,190
KRW 9.949.113
KRW 2549,938
KRW 11,225.731
KRW 6.068604
87,212,010 13.20 OTHER NET ASSETS LESS LIABILITIES KRW 2569,119
KRW 12 317.833
US0 6,761,694
USD 5402925
KRW 2.904.542
TOTALNETASSETS 660,549,914 ?OO.OO
KRW 16.466 057
KRW 11.938 633
TAIWAN -. .
CATCHER TECHNOLOGY CO LTD CATHAY FIN HLD!GDR REG-S
FAR EASTERN TEXTILE LTD
HON HA1 P?ECISION IND /GDR
HON HA1 P3ECISION IND CO
LTD PHOENIX PRECISION
TECHNOLOGY SILICONWARE PREC IND.
lSADR TAIWAN
SEMICONDUCT MANUFISADR TAIWAN SEMICONDUCTOR
MANUFACT
I la6 ooo
275 000
9 379.000
625,000
1 580 000
T'ND 10,677,146
4.867 500
6,s78,4ao
7 750.000
9,791 309
7 535 318
1.61
USD
TWO
U S 0
T'ND
T'ND
0.74
1 .oo 1 1 7
I 40
1.14 3,404.000
1,146 300 USD 7 531.191 1 1 4
842 700 US0 8,469,135 1 28
0.79 2 625,000 TWD 5.195.794
6n 395,873 10.35
THAILAND
KASIKORNBANK PUBL.CON.LTDINVDR
4291.329 THE 7.293 114 1.10
7 293.114 1.10 - ~
TURKEY -
CIMSA CIMENTO SANAYI VE TICAR SABANCI HOLDING
TURKIYE GARANTI BANKASI
;NOM TURKIYE IS BANKASI AS C
136523 TRY 1018,979 0 15
1.523 563 TRY 10.862.385 1 64
4.539544 TRY 17,193,Y62 2 61
I 334.680 TRY 11.002 558 1 67
40.077 a84 6.07
TOTAL SHARES 563,983,504 85.38
-A HSBC Global Investment Funds
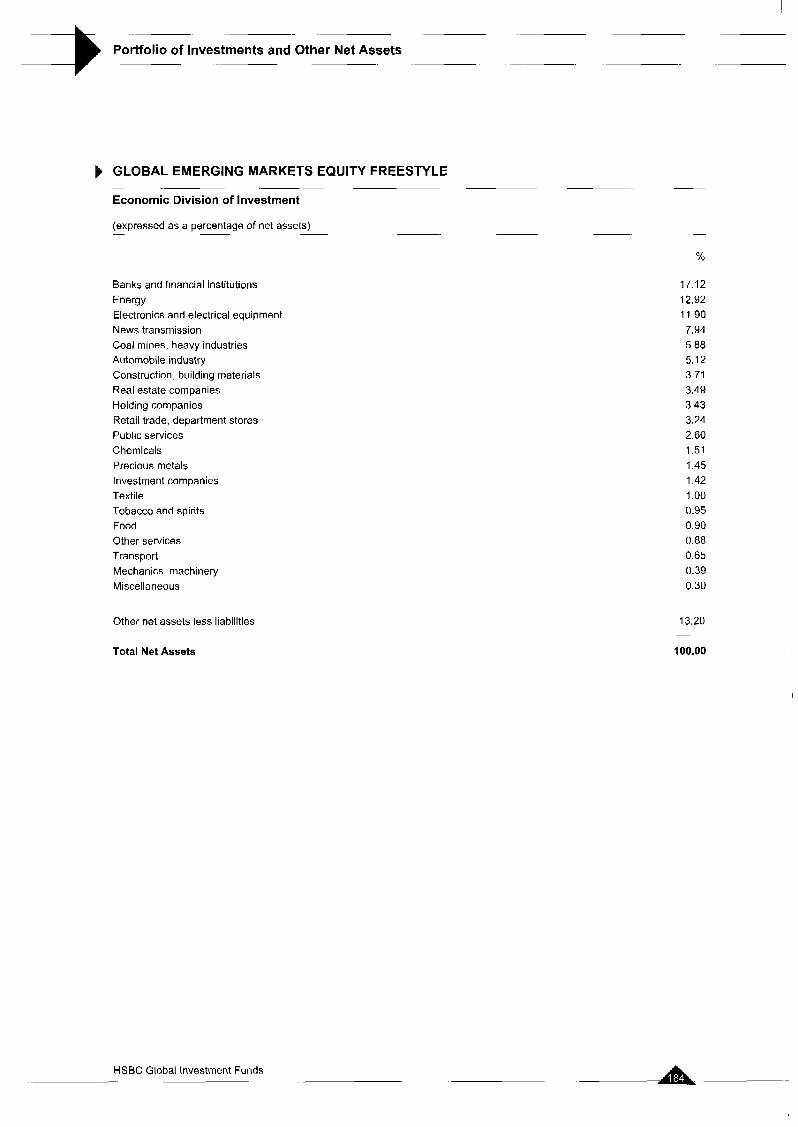
Portfolio of Investments and Other Net Assets --t GLOBAL EMERGING MARKETS EQUITY FREESTYLE
Economic Division of Investment - .- -
(expressed as a percentage of net assets) -
%
-. -
Banks and financial institutions Energy Electronics and electrical equipment News transmission Coal mines, heavy industries Automobile industry Construction. building materials Real estate companies Holding companies Retail trade, department stores Public services Chemicals Precious metals Investment companies Textile Tobacco and spirits Food Other services Transport Mechanics, machinery Miscellaneous
Other net assets less liabilities
Total Net Assets
17.12 12.92 11.90 7.94 5.88 5.12 3.71 3.49 3.43 3.24 2.60 1.51 1.45 1.42 1 .oo 0.95 0.90 0.88 0.65 0.39 0.30
13.20
100.00
-.
HSBC Global Investment Funds -.
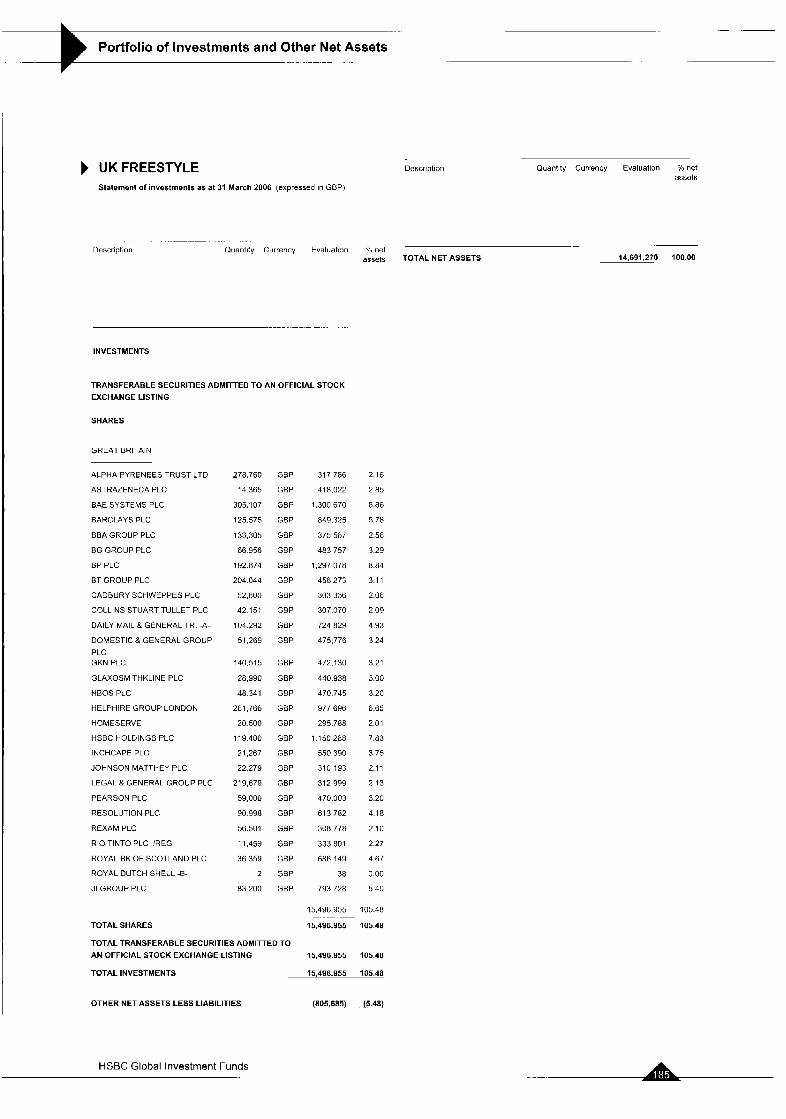
Portfolio of Investments and Other Net Assets -. . ... - . .-. . -. . .
UK FREESTYLE Statement of investments as at 31 March 2006 (expressed in GBP)
Dcscription Ouantity Currency Evaluation % nct assets
. . . .. .~ -
Description Quantity Currency Evaluation % net assets TOTAL NET ASSETS 14,691,270 100.00
- -. . - . -.
INVESTMENTS
TRANSFERABLE SECURITIES ADMITTED TO AN OFFICIAL STOCK EXCHANGE LISTING
SHARES
GREAT BRITAIN
ALPHA PYRENEES TRUST LTD
ASTRAZENECAPLC
BAE SYSTEMS PLC
BARCLAYS PLC
BBA GROUP PLC
BG GROUP PLC
BP PLC
ET GROUP PLC
CADBURY SCHWEPPES PLC
COLLINS STUART TULLET PLC
DAILY MAIL & GENERAL TR. -A-
DOMESTIC & GENERAL GROUP
PLC GKN PLC
GLAXOSM THKLINE PLC
HBOS PLC
HELPHIRE GROUP LONDON
HOMESERVE
HSBC HOLDINGS PLC
INCHCAPE PLC
JOHNSON MATTHEY PLC
LEGAL & GENERAL GROUP PLC
PEARSON PLC
RESOLUTION PLC
REXAM PLC
RIO TINTO PLC !REG
ROYAL BK OF SCOTLAND PLC
ROYAL DUTCH SHELL -6-
31 GROUP PLC
278.760 GBP
14365 GBP
305.107 GBP
125.575 GBP
133,305 GBP
66 956 GBP
192.874 GBP
204044 GBP
52,800 GBP
42151 GBP
104.292 GBP
51.269 GBP
140.515 GBP
28.990 GBP
48.341 GBP
261 766 GBP
20500 GBP
119400 GBP
21,267 GBP
22279 GBP
219,679 GBP
59000 GBP
90 998 GBP
56.501 GBP
11,45Y GBP
36359 GBP
2 GBP
83200 GBP
317,786
418,022
1,300 670
849 325
375 587
483 757
1,297 078
456 273
303 336
307 070
724 829
475.776
472,130
440.938
470 745
977 696
295 788
1.150288
550 390
310 193
312,999
470,003
61 3 782
308 778
333 801
686 149
38
793 728
2.16
2.85
8.86
5.78
2.56
3.29
8.84
3.1 1
2.06
2 09
4 Y3 3 24
3.21
3.00
3.20
6.65
2.01
7.83
3.75
2.11
2.13
3.20
4.10
2.10
2.27
4.67
0 00
5.40
15,496.955 105.48
TOTAL SHARES 15.496355 105.A8
TOTAL TRANSFERABLE SECURITIES ADMITTED TO AN OFFICIAL STOCK EXCHANGE LISTING 15,496,955 105.A8
TOTALINVESTMENTS 15,A96,955 105.48
OTHER NET ASSETS LESS LIABILITIES (805,685) (5.48)
HSBC Global Investment Funds
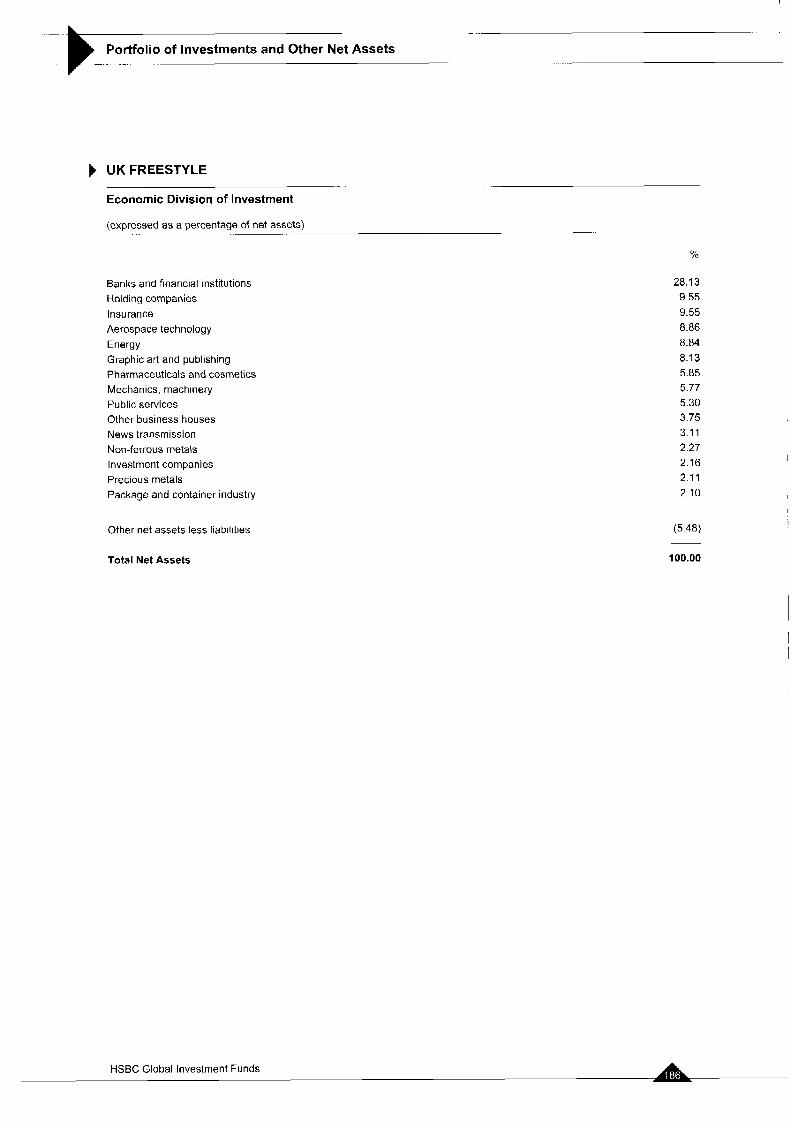
._
Portfolio of Investments and Other Net Assets -. .-
.. ...
UK FREESTYLE
Economic Division of Investment
(expressed as a percentage of net assets) ~ ..
%
Banks and financial institutions Holding companies Insurance Aerospace technology Energy Graphic art and publishing Pharmaceuticals and cosmetics Mechanics, machinery Public services Other business houses News transmission Non-ferrous metals Investment companies Precious metals Package and container industry
Other net assets less liabilities
Total Net Assets
28.13 9.55 9.55 8.86 8.84 8.13 5.85 5.77 5.30 3.75 3.11 2.27 2.16 2.11 2.10
(5.48)
100.00
~
HSBC Global Investment Funds
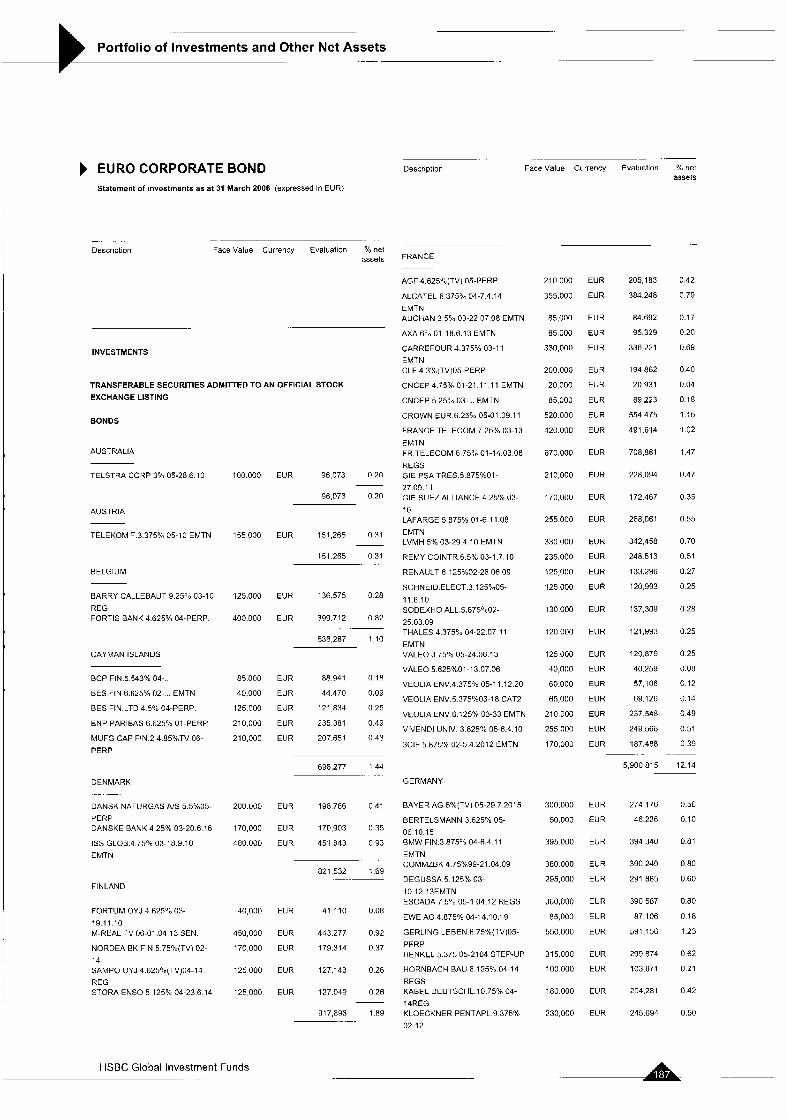
....
Portfolio of Investments and Other Net Assets -. .
EURO CORPORATE BOND Statement of investments as at 31 March 2006 (expressed in EURI
.. .. - .~
Face Value Currency Evaluation net assets
Description
-. . . . .
Description . . .
Face Value Currency Evaluation 'lo net assets
.-
0.42
0.79
0.17
0.20
0.69
0.40
0.04
0.18
1.15
1 02
1.47
0.47
0.35
0.55
0.70
0.51
n 27
0.25
0.28
0.25
0.25
0.08
0.12
0.14
0.49
0.51
0 39
FHANCE
AGF 4.62S10(TV) 05-PERP
ALCATEL 6 375% 04-7.4.14 EMTN AUCHAN 3 5% 03-22 07 08 EMTN
AXA6"a 01-18.6 13 EMTN
CARHEFOUR 4.375% 03-1 1
EMTN CLF 4.3"/dTV)OS-PERP
CNCEP4.75%01-21.11 11 EMTN
CNCEP 5.25% 03- ... EMTN
CROWN EUR 6 25% 05-01.09.11
FRANCE TELECOM 7 25% 03-13
EMTN FR TELECOM 6 759; 01-14.03 08
REGS GIE PSA TRES 5 875C01-
27 09.1 1 GIE SUEZ ALLIANCE 4.25% 03- 10 LAFARGE 5.875% 01-6 11.08
EMTN LVMH 5% 03-ZY.4 10 EMTN
REhlY COINTR 6 5 % 03-1.7 10
RENAULT 6 125"/002-26 06 09
SCHNEID ELECT.3 1259005-
11.8.10 SODEXHO ALL.5.87S0002-
25.03.09 THALES 4.375% 04-22.07 11
EMTN VALEO 3.75% 05-24.06 13
VALEO 5.625COI-13 07.06
VEOLIA ENV.4.375% 05-1 1 12.20
VEOLIA ENV.5.375'%03-18 CAT2
VEOLIA ENV 6 125% 03-33 EMTN
VIVENDI UNlV 3.625% 05-6.4.10
3CIF 5.875% 02.5 4 2012 EMTN
210000 EUR
355000 EUR
85,000 EUR
330,000 EUR
85000 EUR
200000 EUR
20,000 EUR
85,000 EUR
520000 EUR
420.000 EUR
670,000 EUR
210,000 EUR
i7oonn EUR
255000 EUR
330 000 EUR
235,000 EUR
125,000 EUR
125000 EUR
130000 EUR
120000 EUR
125000 EUR
40,000 EUR
60000 EUR
65,000 EUR
210000 EUR
2 s s n m EUR
170,000 EUR
205 183
384.248
84 692
95,329
336,221
194 862
20.931
89,223
554 475
491 614
708.881
228.094
172 467
268,061
342 458
248 513
133 296
120,993
137,309
121,993
120.879
40.259
57,106
69.126
237 548
249 566
187.488
INVESTMENTS
TRANSFERABLE SECURITIES ADMITTED TO AN OFFICIAL STOCK
EXCHANGE LISTING
BONDS
AUSTRALIA
TELSTRA COHP 3% 05-28 6.10
AUSTRIA
100 000 EUR 96,073 0.2(1
96,073 0 2 0
TELEKOM =.3.375% 05-10 EMTN
BELGIUM
155000 EUR 151,265 0 3 1
151.265 0 3 1
BARRY CALLEBAUT 9.25"; 03-10
REG FORTIS BANK 4.625% 04-PERP.
125,000 EUH 136.575 0.28
4oo.000 EUR 399.712 0.82 .
536,287 110
CAYMAN ISLANDS
BCP FIN 5 543% 04-
BES FIN 6 1725% 02- EMTN
BES FIN LTD 4 55: 04-PERP
BNP PARIBAS 6 625% 01-PEHP
MUFG CAP FIN 2 4 85%TV 06-
PERP
85.000 EUR 88.941 0.IH
40,000 EUR 44.470 0.09
125,000 EUR 121 H34 0.25
210000 EUR 235381 049
210.000 EUR 207.651 0.43
5,900.815 12 14 698,277 144 . ..
DENMARK GERMANY
DANSK NATURGAS A'S 5 S%O5- PERP DANSKE B4NK 4 25% 03-20 6 16
IS5 GLOB 4 75% 03-18 9 10 EMTN
BAYER AG 5"/o(TV) 05-29.7.2015
BERTELSMANN 3 625% 05- 06 10.15 BMW FIN.3.875"; 04-6.4.1 1
EMTN COMMZBK 4 75%99-21 04.09
DEGUSSA 5 125% 03-
10.12 13EMTN ESCADA 7.Y" 05-1 04.12 REGS
EWE AG 4.875% 04-14.10.19
GERLING LEBEN.6.75%(TV)05-
PERP HENKEL 5 375 05-2104 STEP-UP
HORNBACH BAU 6.125% 04-14
REGS KABFL DEUTSCHL.10.75% 04-
14REG KLOECKNER PENTAPL.9.375%
02-12
300.000
50,000
395 000
380 000
2gs,nno
360,000
85,000
550.000
315.000
100 000
1 80 000
230,000
EUR
EUR
EUR
EUR
EUR
EUR
EUR
EUR
EUR
EUR
EUR
EUR
274,176
46.226
394,340
390.249
291 885
390 587
e7 i o 6
591.156
299 874
103.871
204,281
245.094
0.56
0.10
0.81
0.80
0.60
0.80
0.18
123
0 62
0 21
0.42
0.50
20nooo EUR 198786 0 4 1
170.000 EUR 170,903 0 3 5
480000 EUR 451 843 0 9 3
. .
821 532 169
FIN LAND -
FORTUM OYJ 4 62500 03- 19 11 10 M-REAL TV 06-01 04 13 SEN
NORDEA BK FIN 5 75"/o(TV) 02-
14 SAMPO OYJ 4 62S0m(TV)[14-l4 REG STORA ENS0 5 125% 04-23 6 14
40,000 EUR 41.110 0.08
450,000 EUR 443.277 0.92
17oooo EUR 179.314 037
125000 EUR 127.143 0 2 6
125,000 EUR 127,049 (126
917,893 1.89
I HSBC Global Investment Funds -. .
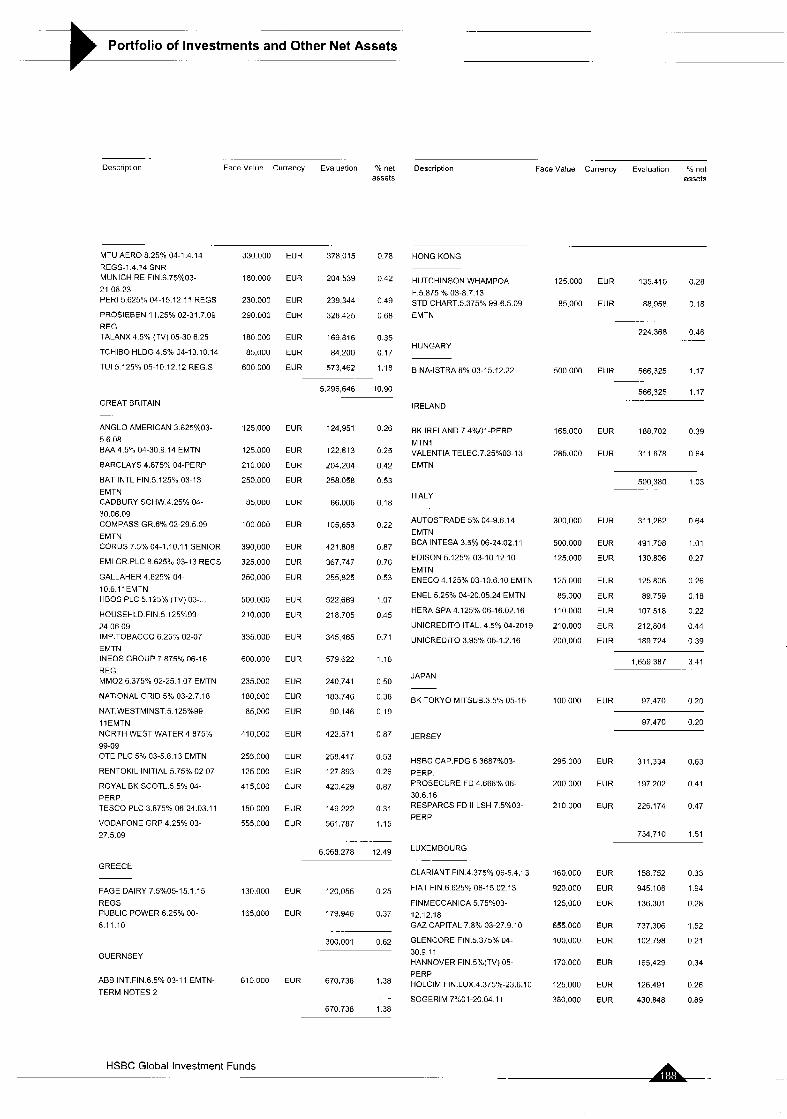
Portfolio of Investments and Other Net Assets -pli-- . -. ..
Face Value Currency Evaluation ne1 Description Face Value Currency Evaluation "lo net assets assets
Description
MTU AERO 8.25% 04-1.4 14
REGS-1 4.14 SNR MUNICH RE FIN.6.75%03-
21 06.23 PER1 5 625% 04-15.12 11 REGS
PROSIEBEN 11.25"/0 02-31.7.09 REG TALANX 4.5% (TV) 05-30 6 25
TCHIBO HLDG 4.5% 04-13.10 14
TU1 5 125% 05-10 12.12 REGS
330 000 EUR 378015 0.78
I80000 EUR 204539 0 4 2
230.000 EUR 239,344 0 4 9
290000 EUR 328,425 0 6 8
I80000 EUR 169 816 035
85,000 EUR 84200 0 17
600000 EUR 573,462 1.18
HONG KONG
HUTCHINSON WHAMPOA
F.5.875 O h 03-R.7.13 STD CHART.5.375% 99-6.5.09
EMTN
125000 EUR 135.110 0.28
85.000 EUR 88,958 0.18
224.368 0.46
HUNGARY
BINA-ISTRA 8% 03-15.12.22 500000 EUH 566,325 1.17
5,296,646 10.90 566,325 1.17 GREAT BRITAIN -
ANGLO AMERICAN 3 . m % n 3 -
5.6.08 BAA4.5% 04-30.9 14 EM'TN
BARCLAYS 4.875% 04-PERP
BAT INTL FIN 5.125'~ 03-13
EMTN CADBURY SCHW 4 25% 04-
30.06.09 COMPASS GR.6% 02-29.5.09
EMTN CORLJS 7 5% 04-1.10.11 SENIOR
EM1 GR.PLC 8 62590 03-13 REGS
GALLAHER 4.625% 04-
10.6.1 IEMTN HBOS PLC 5.125% (TV) 03-
HOUSEHLD.FIN 5 125%99-
24.06 09 IMP TOBACCO 6.25% 02-07 EMTN INEOS GROUP 7 875% 06-16
REG MMO2 6.375% 02-25 1 07 EMTN
NATIONAL GRID 5% 03-2.7.18
NAT.WESTMINST 5 125%99-
l l E M T N NORTH WEST WATER 4 8753:
99-09 OTE PLC 5% 03-5 8 13 EMTN
RENTOKIL INl l lAL 5.75% 02-07
ROYAL RK SCOTL 5 5% 04- PERP. TESCO PLC 3.875% 06-24.03.1 1
VODAFONE GRP 4 25% 03
27.5.09
IRELAND
125,000 EUR
125.000 EUR
210000 EUR
250.000 EUR
8500(1 EUR
100000 EUR
390,000 EUR
325000 EUR
250.000 EUR
500000 EUR
210.000 EUR
335000 EUR
600000 EUR
235.000 EUR
180,000 EUR
85.000 EUR
410.000 EUR
255000 EUR
125000 EUR
415,000 EUR
150000 EUR
555000 EUR
124,951
122 613
204 204
258 058
86 006
105,653
421.808
367 747
255,825
522 669
218 705
345,465
579 622
240.741
183.746
90.146
422.571
258 417
127 893
420 429
149 222
561,787
0 26
0.25
0.42
0.53
0.18
0.22
0.87
0.76
0.53
1.07
0.45
0.71
1.18
0 50
0.38
0 19
0.87
0.53
0.26
0.87
0.31
1.15
RK IRELAND 7.4'ioOl-PERP
MTN1 VALENTIA TELEC.7.25%03-13
EMTN
165.000 EUR 188702 0 3 9
285.000 EUR 311 678 0 64
500380 103 .
ITALY
AUTOSTRADE 5% 04-9.6 14
EMTN BCA INTESA 3.5% 06-24.02.11
EDISON 5.125% 03-10.12 10
EMTN ENECO 4.125% 03-10.6.10 EMTN
ENEL 5.25% 04-20.05.24 EMTN
HERA SPA 4.125% 06-16.02.16
UNICREDITO ITAL 4 5% 04-2019
UNICREDITO 3.95% 06-1.2.16
300,000 EUR
500.000 EUR
125.000 EUR
125000 EUR
85.000 EUR
110000 EUR
210,000 EUR
200.000 EUR
311.262 0 6 4
491,708 1 0 1
130806 0 2 7
125806 0 2 6
89.759 0 18
107,518 0 2 2
212,804 0 4 4
189.724 0 3 9
1.659 387 3 4 1
JAPAN
BK TOKYO MlTSUB 3.5% 05-15
JERSEY
I00000 EUR 97.470 0.20
97.470 0.20
HSEC CAP.FDG 5.3687%03- PERP PROSECURE FD 4 668% 06- 30 6 16 RESPARCS FD II LSH 7 5%03 PERF
295000 EUR 311,334 0.63
200000 EUR 197202 0 4 1
210000 EUR 226,174 0 4 7
734,710 1 5 1
LUXEMBOURG 6.068 278 12.49
GREECE CLARIANT FIN.4 375% 06-5.4.13
FIAT FIN.6.625% 06-15 02.13
FINMECCANICA 5 75%03-
12.12.18 GAZ CAPITAL 7.8% 03-27.9.10
GLENCORE FIN.5.375% 04-
30.9 11 HANNOVER FIN.S%(TV) 05- PERP HOLCIM FIN.LUX 4.375%-23.6.10
SOGERIM 7"t01-20.04.11
160 000
920.000
125,000
655 000
100 000
170 000
125,000
380.000
EUR
EUR
EUR
EUR
EUR
EUH
EUR
EUR
158 752
945 106
136.301
737,306
102 798
165,429
126.491
430.848
0.33
1 .94
0.28
1.52
0 21
0.34
0.26
0.89
FAGE DAIRY 7.5%05-15.1 15 REGS PUBLIC POWER 6.25% 00- 8.11.10
130.000 EUR 120,055 0 2 5
165.000 EUR 179.946 0.37
300.001 0 6 2
GUERNSEY
ABR INT.FIN.6.5°/o 03-1 1 EMTN-
TERM NOTES 2
610000 EUR 670,738 1.38
670 738 1 3 8
HSBC Global Investment Funds _. .... ...
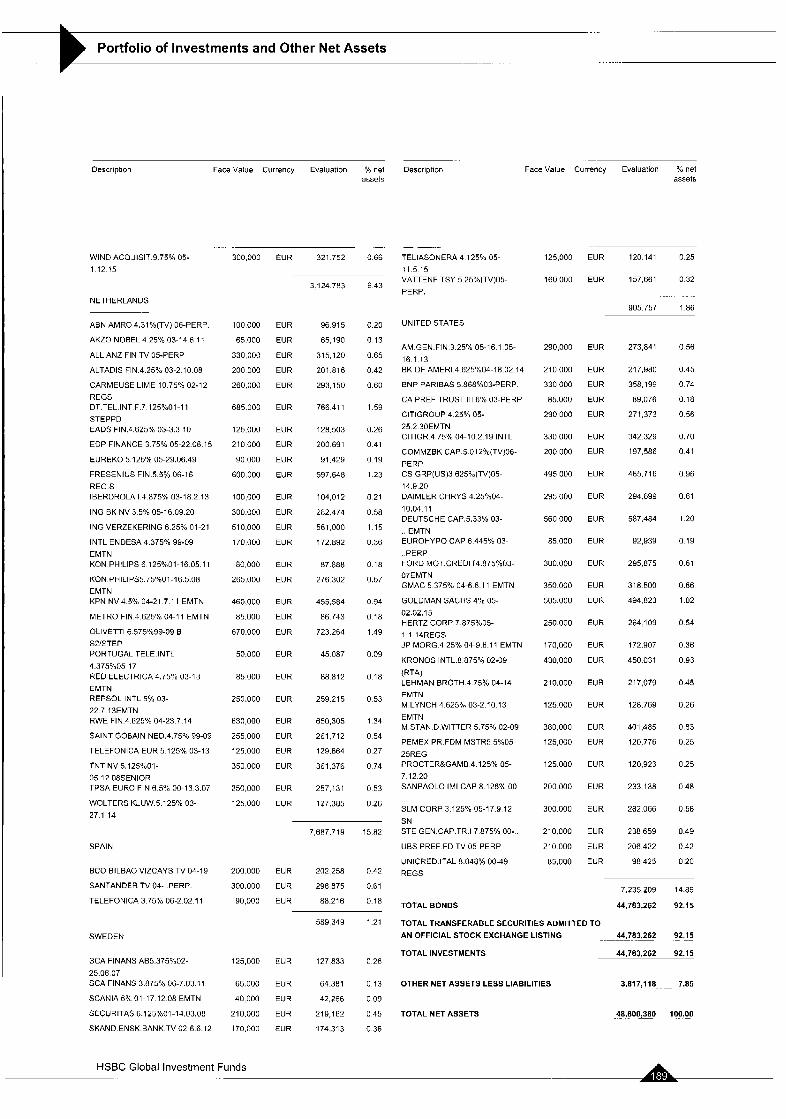
Portfolio of Investments and Other Net Assets .- - ._
Oescription Face Value Currency Evaluation % net Description assets
WIND ACOJISIT.9.75% 05- 1 12.15
NETHERLANDS
ABN AMRO 4,31'%(TV) 06-PERF.
AKZO NOBEL 4.25% 03-14 6 11
ALLIANZ FIN TV 05-PERP
ALTADIS FlN.4.25"/0 03-2.10.08
CARMEUSE LIME 10 75% 02-12
REGS DTTEL.INT F.7 125%01-11
STEPPD EADS FIN.4625% 03-3.3.10
EDP FINANCE 3.75% 05-22 06.15
EUREKO 5,125% 05-29.06.49
FRESENIUS FIN.5.5% 06-16
REG.S IBERDROLA I 4 875% 03-18 2.13
ING BK NV 3 5% 05-16.09 20
ING VERZEKERING 6.25% 01-21
INTL ENDESA 4.375% 99-09
EMTN KON PHILIPS 6 125%01-16.05.11
KON PHILIPS5.75"C01-16.5.08
EMTN KPN NV 4.5% 04-21 7.1 1 EMTN
METRO FIN.4.625% 04-1 1 EMTN
OLlVETTl 6 575%99-09 B S2/STEP PORTUGAL TELE.INTL
4.375%05- 17 RED ELECTRICA4.75:b 03-13 EMTN REPSOL INTL 5% 03-
22.7.13EMTN RWE FIN.4.625% 04-23.7.14
SAINT GOGAIN NED.4.75"Io 99-09
TELEFONICA EUR 5.125% 03-13
TNT NV 5.125%01- 05.12 08SENlOR TPSA EURO FIN 6.50b 00.13 3.07
WOLTERS KLUW.5.125% 03-
27 1 1 4
SPAIN
BCO BILBAO VIZCAYS TV 04-19
SANTANDEH TV 04- PERP
TELEFONICA 3 75% 06-2 02 11
SWEDEN
SCA FINANS AB5 375%02-
25 06 07 SCA FINANS 3 875% 06-7 03 11
SCANIA6°/L01-17 1208EMTN
SECURITAS 6 125%01-14.03 08
SKAND ENSK BANK TV 02-6 6 12
3o0.000
100,000
65.000
330 000
200 000
260,000
685.000
125,000
210 000
90 000
600,000
100,000
300.000
510.000
170,000
80,000
265,000
4fin,oo0
85.000
670.000
50.000
a5 ooo
250.000
6x1 no0
255,000
125.OOU
350 000
250,000
125,000
200 000
300.000
90,000
125,000
65.000
40 000
210.000
170,000
EUK 321,752 0.66
EUR
EUR
EUR
EUR
EUH
EUR
EUR
EUR
EUR
EUR
EUR
EUR
EUR
EUR
EUK
EUR
EUR
EUR
EUR
EUR
EUR
EUR
EUR
EUR
EUR
EUR
EUR
EUR
3 124.783
96,915
65,190
31 5,120
201 816
293 1 so
766 41 1
128,503
200 691
91,429
597,648
104,012
282.474
561.000
172.892
ti7 888
276.302
455,584
86 743
723.264
45 087
88 812
259 215
650,305
261,712
129.664
361,376
257.131
127.385
6 43
0.20
0.13
0.65
0.42
0.60
1.59
0.26
0.41
0 19
123
0 21
0 58
1 1 5
11 36
0 18
0.57
0.94
0.18
1.49
0.09
0.18
0 53
1 34
0 54
(1 27
0 74
0 53
0 26
7 687.719 15 82
EUR zn2258 042
EUR 88.216 018
EUR 298875 061
589349 1 2 1 _ _
EUR 127.833 0.26
EUR 64.381 0 13
EUR 42,266 009
EUR 219,162 0 4 5
EUR 174.313 0 3 6
-
TELIASONERA 4 125% 05- 11 5 1 5 VATTENF TSY 5 25?/a(TV)05
PERP.
UNITED STATES
AM GEN.FIN 3.25% 05-16 1 05- 16.1 13 BK OF AMER1.4 625%04-18.02.14
BNP PARIBAS 5.868%03-PERP.
CA PREF TRUST 1 1 1 6'X 03-PERP
CITIGAOUP 4.25% 05- 25 2 3OEMTN CITIGR.4 75% 04-10 2 19 INTL
COMMZBK CAP.S.O12%(TV!06-
PERP CS GRP(US)J 6259o(TV)05-
14.9 20 DAIMLER CHRYS 4 25%04-
10.04.11 DEUTSCHE CAP.5.33% 03-
... EMTN EUROHYPO CAP 6.445% 03-
PERP FORD MOT.CREDIT4.875%03-
07EMTN GMAC 5 375% 04-6.6.1 1 EMTN
GOLDMAN SACHS 4% 05- 02.02.1 5 HERTZ CORP 7.875%05-
1.1.14REGS JP MORG.4 25% 04-Y.6.11 EMTN
KRONOS INTL.8 875% 02-09
LEHMAN BROTH 4 75% 04-14 EMTN M LYNCH 4 625'm 03-2.10.13
EMTN M STAN D WITTER 5.75% 02-09
PEMEX PA FDM MSTR5 5%05-
25REG PROCTERAGAMB 4.125% 05-
7 12.20 SANPAOLO IMI CAP 8.126O/. 00-
F A )
SLM CORP 3 125"/. 05-17 9 12
SN STE GEN CAP TR I 7 875% 00-
UBS PREF FD TV 05-PERP
UNICRED ITAL 8 048% 00.49
REGS
Face Value Currency Evaluation YO net assets
125.000
160 000
290.000
210 000
330 000
85.000
290 000
330 000
ZOO 000
495 000
295,000
560,000
85.000
300.000
350 000
505.000
250.000
170,000
430,000
210.000
125 000
380.000
125 000
125 000
200 000
300.000
210 000
210 000
85 000
EUR 120141 0 2 5
EUR 157661 0 3 2
905757 1 8 6
EUR
EUR
EUR
EUR
EUR
EUR
EUR
EUR
EUR
EUR
EUR
EUR
EUR
EUR
EUR
EUR
EUR
EUR
EUR
EUR
EUR
EUR
EUR
EUR
EUR
EUR
EUR
273,841
217,880
358 199
89,076
271 373
342 329
197.586
465.716
294.699
587.484
92,939
295 875
31 8 500
494 823
264 I 0 9
172,907
450 031
217,079
128.769
401.485
120,776
120,923
233 138
282 066
238 659
206,422
98,425
0 56
0.45
0.74
0.18
0.56
0.70
0.41
0.96
0.61
1.20
0.19
0 61
0.66
1 02
0 54
0.36
0.93
0.45
0.26
0.83
0.25
0.25
0 48
0.58
0.49
0.42
0 20
TOTAL BONDS
7,235,209 14.89
44,783,262 92.15
TOTAL TRANSFERABLE SECURITIES ADMITTED TO AN OFFICIAL STOCK EXCHANGE LISTING . 44,783,262 - 92.1:
TOTAL INVESTMENTS 44,783,262 92.15
OTHER NET ASSETS LESS LlAQlLlTlES 3,a17,11a..- 7.85
TOTAL NET ASSETS 48 ,60030 100.00
HSBC Global Investment Funds
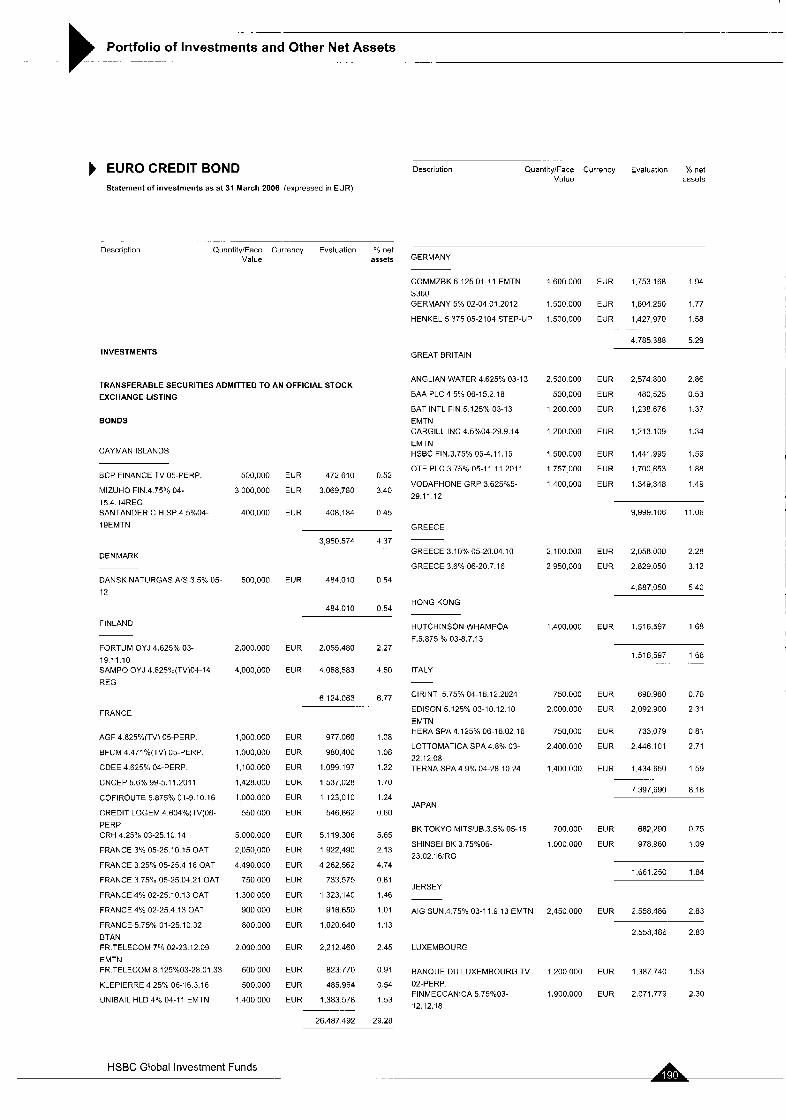
~. _ -
Portfolio of Investments and Other Net Assets - . - ... . - .. ...
EURO CREDIT BOND Statement of investments as at 31 March 2006 (expressed in EUR)
.. ...
Description Quantity'Face Currency Evaluation % net Value assets
.. .
Description Quantity:Facc Currency Evaluation ab net Value assets GERMANY
COMMZBK 6.125 01-11 EMTN
5360 GERMANY 5% 02-04 01.2012
HENKEL 5.375 05-2104 STEP-UP
1 600 000
1,500 000
1.500,OOO
2.500 000
500 000
1 200.000
1.200.000
1,500.000
1 757 000
1 400.000
2,100.000
2 950,000
1.400,OOO
750 000
2.000.000
750 000
2 400.000
1,400 000
700.000
1,000,000
2,450 000
1 200.000
1.900.000
EUR 1.753168 1 9 4
EUR 1,604250 1 7 7
EUR 1,427,970 1.58
4 785388 5.29
. . . .
INVESTMENTS
TRANSFERABLE SECURITIES ADMITTED TO AN OFFICIAL STOCK EXCHANGE LISTING
BONDS
CAYMAN ISLANDS
GREAT BRITAIN
ANGLIAN WATER 4 625% 03-13
BAA PLC 4 5 % 06-15.2 18
BAT INTL FIN.5 125% 03-13
EMTN CARGILL INC 4.5%04-29.9.14
EMTN HSBC FIN.3.75% 05-4.11.15
OTE PLC 3.75% 05-1 1.1 1 201 1
VODAPHONE GRP 3.625%5-
29.11 12
EUR 2.574800 2 8 6
EUR 4HO525 053
EUR 1,238 676 1 3 7
EUR 1.213.109 1.34
EUR 1,441.995 1.59
EUR 1.700653 188
EUR 1 349.348 1.49 BCP FINANCE TV 05-PEHP
MIZUHO FIN 4 75% 04-
1 5 4 14REG SANTANDER C HlSP 4 5%04
19EMTN
500 000
3 000,000
400.000
500,000
2,000,000
4,000,000
1,000 000
1.000 oon 1 100 000
1,428.000
1 000,000
550 000
5 000.000
2 OSO,000
4 490.000
750 000
1 300 000
900 000
eo0 ooo
2 000 000
600 000
500 000
1 400 000
EUR 472610 0 5 2
EUR 3069,780 3 4 0
9399.106 11.(16 EUR 408,184 0 4 5
GREECE
GREECE 3.10% 05-20.04 10
GREECE 3.6% 06-20.7.16
3,950.574 4 37 EUR 2,os8.000 2.28
EUR 2 829.050 3.12 DENMARK
DANSK NATURGAS A S 3 5% 05-
12
EUR 484.010 0 5 4
484010 0.54
4,887,950 5 40
HONG KONG
HUTCHINSON WHAMPOA
F.5.875 Yo 03-8.7.13
F I NLAN 0 EUR 1.516.597 1 6 8
FORTUM OYJ 4.625% 03- 19 11 10 SAMPO OYJ 4.625?a(TV)04-14
REG
EUR 2,055,480 2.27
EUR 4.068.583 4.50
1.516597 1 6 8 .. -
ITALY
ClRlNT 5.75% 04-16.12.2024
EDISON 5.125"k 03-10 12.10
EMTN HERA SPA 4.125% 06-16.02 16
LOTTOMATICA SPA 4.8% 03-
22.12.08 TERNA SPA 4 9% 04-28.10.24
EUR 690.960 0 7 6
EUR 2,092.900 2.31
EUR 733,079 0 8 1
EUR 2446 101 2 7 1
6,124.063 6.77
FRANCE
AGF 4.625WTV) 05-PERP.
BFCM 4 471Yb(TV) OS-PERF
CDEE 4.625% 04-PERP.
CNCEP 5.6% 99-5.11.2011
COFIROUTE 5.875% 01-9.10.16
CREDIT LOGEM.4.604%(TV)06-
PERP CRH 4.25Ob 03-25.10 14
FRANCE 3% 05-25.10 15 OAT
FRANCE 3 25% 05-25 4 16 OAT
FRANCE 3 7590 05-25 04.21 OAT
FRANCE 4% 02-25.10 13 OAT
FRANCE 4% 02-25.4.13 OAT
FRANCE 5.75% 01-25.10 32
BTAN FR TELECOM 7% 02-23 12.09
EMTN FR TELECOM 8.125°/003-28.01.33
KLEPIERRE 4 25% 06-16 3.16
UNlBAlL HLU 4% 04-1 1 EMTN
EUR 977.060 1.08
EUR 980400 1.08
EUR 1,099 197 1.22
EUR 1,537026 1 7 0
EUR 1123,010 1.24
EUR 546.662 0 6 0
EUR 5.119.306 5.65
EUR 1922,490 2 13
EUR 4.282.562 4.74
EUR 733.575 0 8 1
EUR 1,323,140 1.46
EUR 916650 1.01
EUR 1.020640 1.13
EUR 2.212 460 2.45
EUR 823770 0.91
EUR 485.96A 0.54
EUR 1.383.578 1.53
EUR 1.434650 1 5 9
7 397.690 8.18
JAPAN
BK TOKYO MITSUB.3.5% 05-15
SHlNSEl BK 3 75%06-
23 02.16iRG
EUR 682,290 0.75
EUR 978.960 1.09
1.661 250 1 84
JERSEY
AIG SUN 4 75% 03-1 1 9 13 EMTN EUR 2.558.486 2 83
2.558186 2 8 3
LUXEMBOURG
BANOUE DU LUXEMBOURG TV
02-PERP. FINMECCANICA 5 75%03-
12.12.18
EUR 1.387 740 1.53
EUR 2,071.779 2.30
26,487,492 29.28
HSBC Global Investment Funds
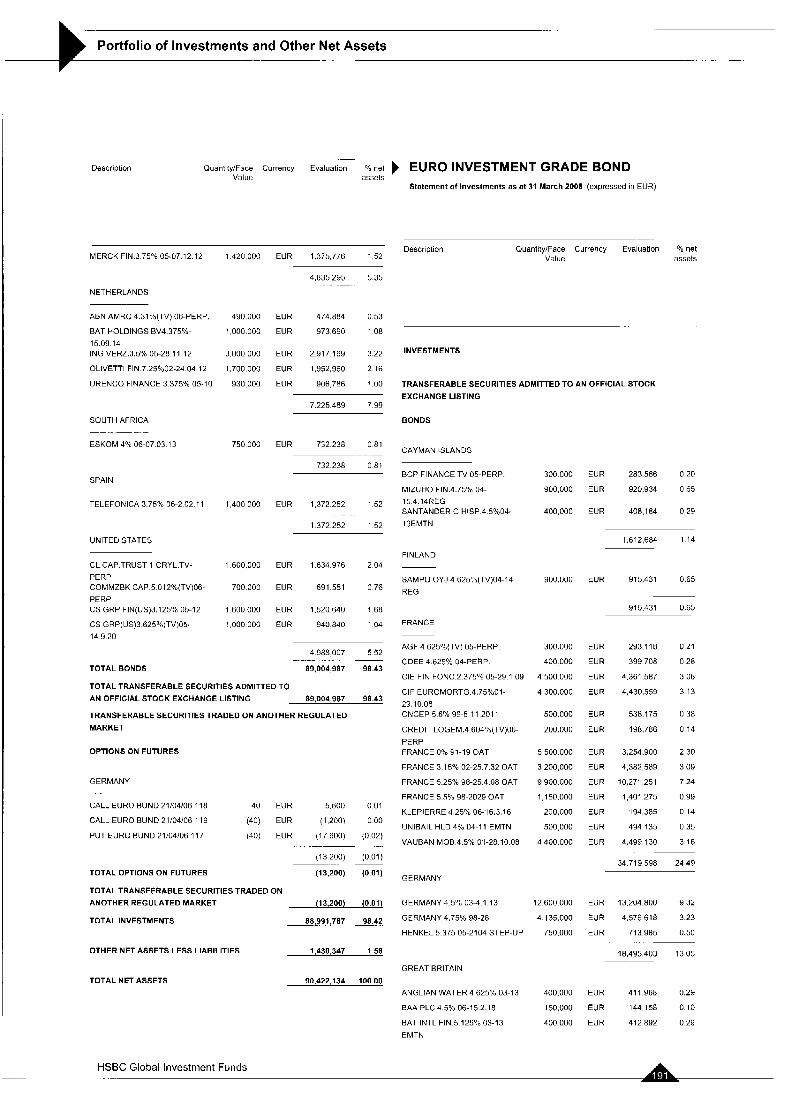
....
Portfolio of Investments and Other Net Assets .. -. . .-
Description (3uantity:Face Currency Evaluation 06 net EURO INVESTMENT GRADE BOND Value assets
Statement of investments as at 31 March 2006 (expressed in EUR)
Description PuantitylFace Currency Evaluation % net Value assets MERCK FIN.? 75% 05-07.12 12
NETHERLANDS
1.420 oon
490.000
1,000.000
3,000 000
1.700,OOO
930 000
750 000
1,400 000
1 600.000
700.000
1.600 000
1,000 000
EUR 1,375,776 1 52
4,835.295 5 35 . . . ._ . .
ABN AMRC 4 31"'o(TV) 06-PERP
BAT HOLDINGS BV4 375%
15 09 14 ING VERZ 3.5% 05-28 11 12
OLlVETTl FIN 7 25%02-24 04 12
URENCO FINANCE 3 375% 05-10
EUR 474.884 0 5 3
EUR 973.690 1 0 8
EUR 2917169 3.22
EUR I,YS2,Y60 2 16
EUR 906786 100
INVESTMENTS
TRANSFERABLE SECURITIES ADMITTED TO AN OFFICIAL STOCK
EXCHANGE LISTING 7.225.489 7.99
SOUTH AFRICA BONDS
ESKOM 4% 06-07.03.13 EUR 732,238 0 8 1 CAYMAN ISLANDS
732.238 0 8 1 BCP FINANCE TV 05-PERP 300000 EUR 283.566 0 2 0
MlZUHO FIN 4 75% 04- 900,000 EUR 920,934 0 6 5
15 4 14HEG SANTANDER C HlSP 4 5%04- 400.000 EUR 408.184 0 2 9
19EMTN
1,612,684 1 14
FINLAND
SPAIN
TELEFONICA 3.7570 06-2 02.11 EUR 1,372.252 1.52
1372.252 1 5 2
. .. ...
UNITED STATES
CL CAP TRUST 1 CRYL TV-
PERP COMMZBK CAP 5 012%(TV)06-
PERP CS GRP FlN(US)3.1259'0 05-12
CS GRP(US)3 625°btTV)05.
14 9 20
EUR 1834.976 2 0 4
SAMPO OYJ 4.625:b(TV)04-14 900,000 EUR 915.431 0.65
REG
915.431 0.65
EUR 691,551 0 7 6
EUR 1.520640 1 6 8
EUR 940,840 1 0 4 FRANCE
AGF 4 625Ob(TV) 05-PERP.
CDEE 4.625% 04-PERP
CIE FIN FONC.2.375°b 05-29.1 09
CIF EUROMORTG 4.75"/001-
29 10.08 CNCEP 5.6% 99-5 11 201 1
CREDIT LOGEM.4.604%(TV)06-
PERP FRANCE 0% 91-19 OAT
FRANCE 3.15% 02-25.7.32 OAT
FRANCE 5.25% 98-25 4 08 OAT
FRANCE 5.5% ynwu2y OAT
KLEPIERRE 4.25% 06-16.3.16
UNlBAlL HLD 4% 04-1 1 EMTN
VAUBAN MOB 4.501" 01-28 m o a
300.000
400 000
4,500 000
4,300.000
500.000
200.000
5,500 000
3,200,000
9,900 000
1,150,000
200,000
500 000
4,400 000
EUR
EUR
EUR
EUR
EUR
EUR
EUR
EUR
EUR
EUR
EUR
EUR
EUR
293.118
399 708
4,361 587
4,430.559
53n.175
1 9 8 . m
3,254.900
4,382 589
10,271,251
1,401 215
194,385
494 135
4,499.1 30
0 21
0 28
3 08
3 13
0 38
0 14
2 30
3 09
7 24
0 99
U 14
0 35
3 16
4 988,007 5 52
89,004,987 98.43 ~
TOTAL BONDS
TOTAL TRANSFERABLE SECURITIES ADMITTED TO
AN OFFICIAL STOCK EXCHANGE LISTING 89,00A,987 98.43
TRANSFERABLESECURITIESTRAOEDONANOTHERREGULATED MARKET
OPTIONS ON FUTURES
GERMANY
CALL EURO BUND 21/04/06 118 40 EUR 5,600
CALL EURO BUND 21:04/06 119 (40) EUR (1.200)
PUT EURO BUND 21,04106 117 (40) EUR (17 600)
(13 200)
.
0.01
0 00
(0.02)
(0.01)
.....
34 719 598 24.49 (0.01) TOTAL OPTIONS ON FUTURES (13,200)
TOTAL TRANSFERABLE SECURITIES TRADED ON
ANOTHER REGULATED MARKET (13.200)
TOTAL INVESTMENTS
GERMANY
GERMANY 4 5 % 03-4 1 13 12.600 000
GERMANY 4.75% 98-28 4,135,000
HENKEL 5 375 05-2104 STEP-UP 750,000
(0.01)
98.42 ~. ..
EUR 13.204.800 9.32
EUR 4.576618 3 2 3
EUR 713,985 0.50
18.495.403 13.05
.~
OTHER NET ASSETS LESS LIABILITIES 1 ,A30.3*7 1.58
GREAT BRITAIN
TOTAL NET ASSETS 90,A22,13A 100.00 ANGLIAN WATER 4 625"/. 03-13
BAA PLC 4 5 % 06-15 2 18
BAT INTL FIN 5 125O0 03-13 EMTN
400,000
150,000
400 000
EUR 411,968 0.29
EUR 144,158 0.10
EUR 412892 0.29
HSBC Global Investment Funds
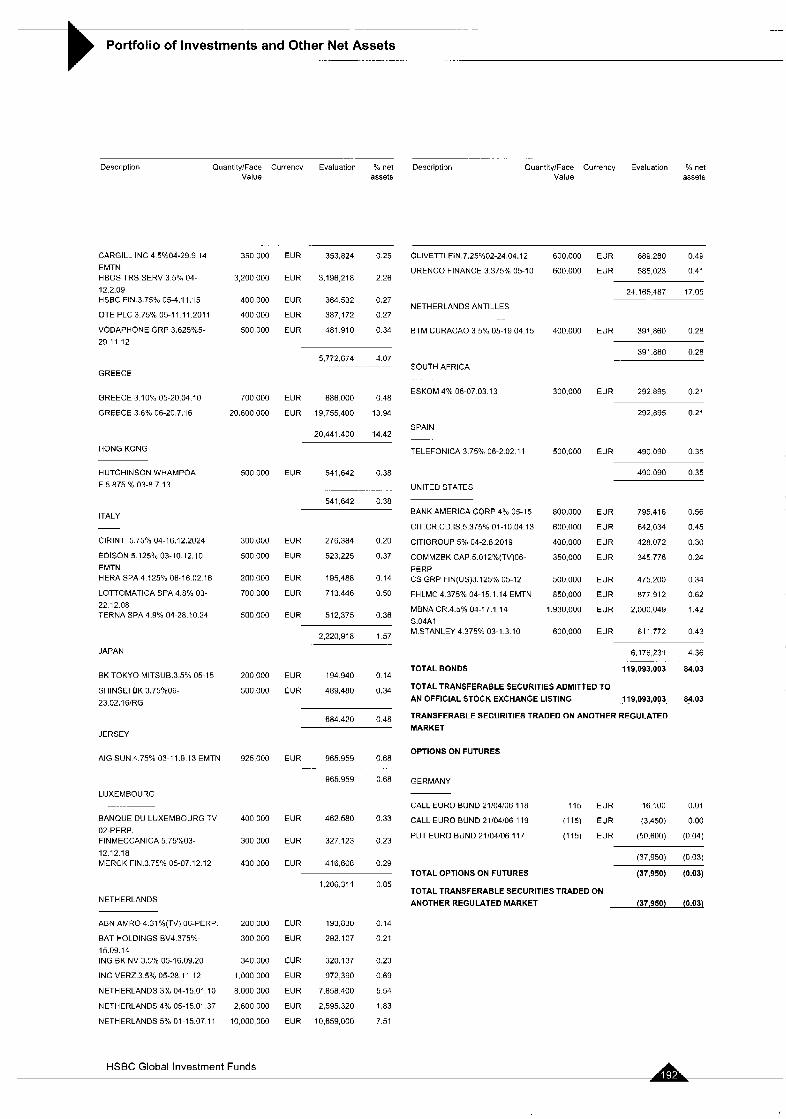
-. ___
Portfolio of Investments and Other Net Assets ... . .... ... . ...
-. ~ . .. . .
Description Quantity/Face Currency Evaluation % net Description QuantityIFace Currency Evaluatlon net Value assets Value assets
CARGILL INC 4 5%04-29 9 14
EMTN HBOS TRS SERV 3 5% 04-
12.2.09 HSBC FIN.3.75% 05-4.11.15
OTE PLC 3.75% 05-1 1 11.201 1
VODAPHONE GRP 3.625%5- 29.11 12
3x1 000
3,200 000
400.000
400 000
500.000
700,000
20.600,OOO
500 000
300,000
500,000
200.000
700 000
500,000
200.000
500,000
925,000
400.000
300 000
430 000
XI0 000
300.000
340.000
1.000 000
8,000 000
2.600 000
10,000,000
EUR 353,824 0 2 5
EUR 3.196218 2 2 6
EUR 384532 0.27
EUR 387 172 0 27
EUR 481 910 0 3 4
OLlVETTl FIN.7.25"~o02-24.04.12
URENCO FINANCE 3 375% 05-10
600,000
600.000
400.000
300.000
500.000
800.000
600.000
400,000
350.000
500.000
850.000
1.930,OOO
600,000
EUR 689280 0.49
EUR 585,023 0.41
24 165,487 17.05
NETHERLANDS ANTILLES ..
BTM CURACAO 3 5% 05-19 04 15 EUR 391 860 0.28
5.772 674 4.07 SOUTH AFRICA
GREECE
ESKOM 4% 06-07.03.13
SPAIN
EUR 292895 0.21 GREECE 3.10% 05-20.04.10
GREECE 3.6% 06-20.7.16
EUR 686000 0.48
EUR 19,755,400 13.94
20,441.400 14.42
292.395 0.21
TELEFONICA 3.75% 06-2 02.1 1
UNITED STATES
HONG KONG EUR 490090 0 3 5
HUTCHINSON WHAMPOA
F 5 875% 03-8 7 13
490 090 0.35 EUR 541,642 0.38
541 642 0.38 BANK AMERICA CORP 4% 05-15
CIT CR CD IS 5 375% 01-10 04 13
ClTlGROUP 5% 04-2 8 2019
COMMZBK CAP 5 012"/o(TV)06-
PERF CS GRP FIN(US)3 125% 05-12
FHLMC 4 375% 04-15 1 14 EMTN
MBNA CR 4 5% 04-17 1 14
S 04A1 M STANLEY 4 375% 03-1 3 10
EUR 795.416 0.56
EUR 642,034 0.45
EUR 428.072 0 3 0
EUR 345776 0 2 4
ITALY
ClRlNT 5 75% 04-16.12.2024
EDISON 5.12590 03-10.12.10
EMTN HERASPA4 125%06-1602.lfi
LOTTOMATICA SPA 4.8% 03-
22.12.08 TERNA SPA 4.9% 04-28 10.24
EUR 276,384 0.20
EUR 523,225 0.37
EUR 195,488 0.14
EUR 713446 0.50
EUR 512,375 0.36
EUR 475.200 0 3 4
EUR 877912 0 6 2
EUR 2,000,049 1.42
EUR 611 772 0 4 3 2,220,918 1 57
6,176,231 4.36 JAPAN
TOTAL BONDS 119,093,003 84.03 BK TOKYO MITSUB.3.5"h 05-15
SHlNSEl BK 3.75%06-
23.02.161RG
EUR 194940 0.14
EUR 489,480 0.3A TOTAL TRANSFERABLE SECURITIES ADMITTED TO
AN OFFICIAL STOCK EXCHANGE LISTING 119,093,003 84.03
TRANSFERABLESECURITIESTRADEOONANOTHERREGULATEO MARKET
684.420 0.48
JERSEY
OPTIONS ON FUTURES AIG SUN 4.75% 03-11.9.13 EMTN EUR 965.959 0.68
965.959 0.68
..
GERMANY
LUXEMBOURG CALL EURO BUND 21/04/06 118 115 EUR 16.100 0.01
CALL EURO BUND 21/04/06 119 (115) EUR (3.450) 0.00
PUT EURO BUND 21/04/06 117 (115) EUR (50.600) (0.04)
B A N W E DU LUXEMBOURG TV
02-PERF. FINMECCANICA 5.75"/.03-
12.12.18 MERCK FIN.3.75% 05-07.12.12
EUR 462580 0.33
EUR 327123 0 2 3
EUR 416608 0 2 9 (37,950) (0.03)
TOTAL OPTIONS ON FUTURES (37,950) (0.03)
TOTAL TRANSFERABLE SECURITIES TRADED ON
ANOTHERREGULATEDMARKET (37,950) (0.03)
1206,311 0 8 5
NETHERLANDS
ABN AMRO 4.31%(TV) 08-PERF
BAT HOLDINGS BV4.375"/0-
15.09.14 ING BK NV 3.5% 05-16.09.20
ING VERZ.3 5% 05-28.1 1 12
NETHERLANDS 3% 04-15.01 10
NETHERLANDS 4% 05-15.01 37
NETHERLANDS 5% 01-15.07.11
EUR 193830 0.14
EUR 292.107 0.21
EUR 320.137 0.23
EUR 972,390 0.69
EUR 7.858400 5 54
EUR 2,595.320 1.83
EUR 10,659,000 7.51
HSBC Global Investment Funds
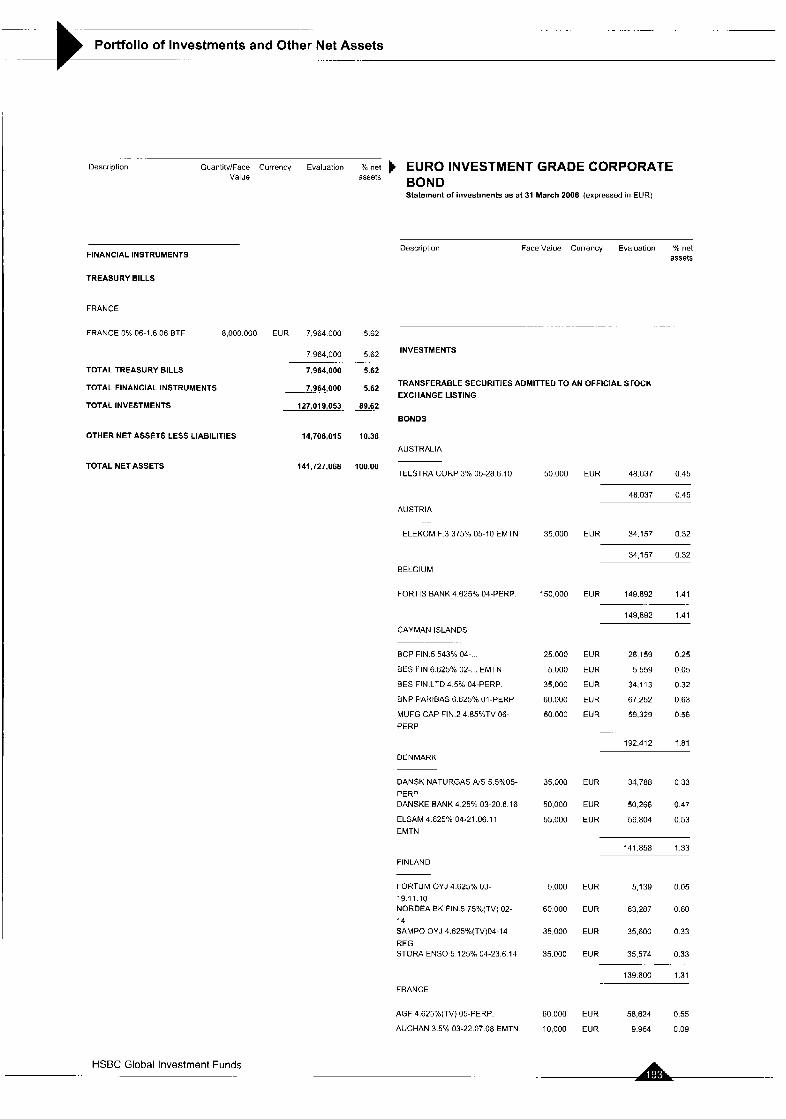
. .. -
Portfolio of Investments and Other Net Assets -
.. ..
Description QuantityjFace Currency Evaluation "/"net EURO INVESTMENT GRADE CORPORATE BOND Value assets
Statement of investments as at 31 March 2006 (expressed in EUR)
Description Face Value Currency Evaluation "h net assets FINANCIAL INSTRUMENTS
TREASURY BILLS
FRANCE
FRANCE 0% 06-1.6.06 BTF 8,000 000 EUR 7.964 000 5.62 . .. . . . . -. - .- .
INVESTMENTS 7964,000 562
7,964,000 5.62
~- 7.964,OOO 5.62
127,019,053. *,62
~. - TOTAL TREASURY BILLS
TOTAL FINANCIAL INSTRUMENTS
TOTAL INVESTMENTS
TRANSFERABLE SECURITIES ADMITTED TO AN OFFICIAL STOCK
EXCHANGE LISTING
BONDS
OTHER NET ASSETS LESS LIABILITIES 14,708,015 10.38
AUSTRALIA
TOTAL NET ASSETS 141,727.068 100.00 TELSTRA CORF 3% 05-28.6.10 50 000
35.000
150,000
25 000
5 000
35.000
60.000
60 000
35.000
50,000
55,000
5.000
60 000
35,000
35.000
60 000
10,000
EUR 48.037 0.45
48.037 0.45
AUSTRIA
TELEKOM F.3 375% 05-10 EMTN EUR 34,157 0 3 2
34157 0 3 2
BELGIUM
FORTIS BANK 4.625% 04-PERP. EUR 149.892 1.41
149,892 1.41
CAYMAN ISLANDS
BCF FIN.5.543"h 04-..
BE$ FIN 6 625% 02- ... EMTN
BES FIN.LTD 4.5% 04-PERP.
BNP PARIBAS 6.625% 01-PERF
MUFG CAP FIN.2 4.85"/uTV 06-
PERF
EUR 26159 0 2 5
EUR 5559 0 0 5
EUR 34.113 032
EUR 67.252 0 6 3
EUR 59.329 056
192.412 1.81
DENMARK
DANSK NATURGAS Ais 5 5%05-
PERP DANSKE BANK 4.25% 03-20.6.16
ELSAM 4.625% 04-21 06.1 1
EMTN
EUR 34788 0 3 3
EUR 50,266 0.47
EUR 56.804 0.53
141.858 1.33
FINLAND
FORTUM OYJ 4 625% 03- 1911 10 NORDEA BK FIN 5 75%(TV) 02-
14 SAMPO OYJ 4.625%(TV)04-14
REG STORA ENS0 5 125% 04-23 6 14
EUR 5.139 0 05
EUR 63.287 0.60
EUR 35,600 0.33
EUR 35,574 0.33
139.600 1.31
-.
FRANCE
AGF 4.625%(lV) 05-PERF.
AUCHAN 3.5% 03-22.07 08 EMTN
EUR 58,624 0.55
EUR 9.964 0.09
HSBC Global Investment Funds ~~
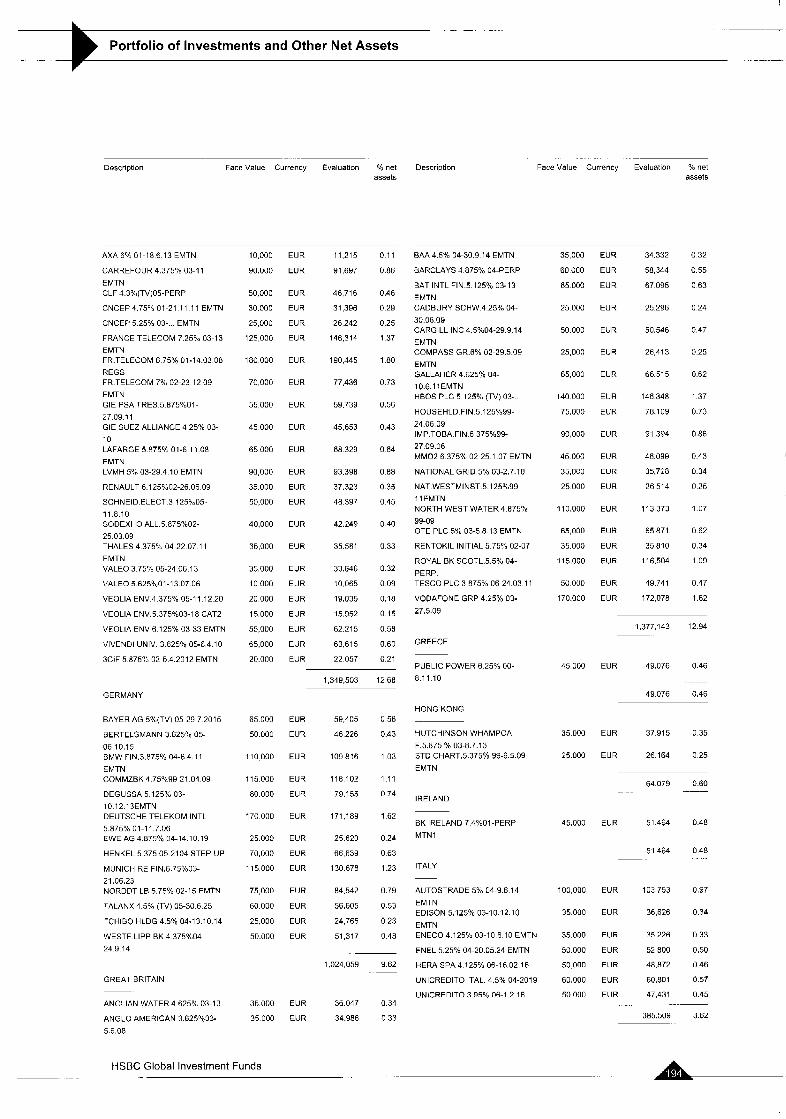
- . ~- - Portfolio of Investments and Other Net Assets
.
Dnscription Fact: Value Currency Evaluation Yo net Description assets
AXA 6 % 01-18 6.13 EMTN
CARREFOUR 4.375% 03-1 1
EMTN CLF 4.3%(TV)05-PERP
CNCEP4.75"b 01-21.11.11 EMTN
CNCEP 5 25% 03.. EMTN
FRANCE TELECOM 7.25% 03-13 EMTN FR.TELECOM 6 75% 01-14.03 08
REGS FR.TELECOM 7% 02-23 12 09
EMTN GIE PSA TRES 5 875C01-
27 09.1 1 GIE SUEZ ALLIANCE 4 25%; 03-
10 LAFARGE 5.875% 01-E 11.08
EMTN LVMH 5 !c 03-29.4 10 EMTN
RENAULT 6.125"102-26.06 09
SCHNEID.ELECT 3 125%05-
11.8.10 SODEXHO ALL.5.875°/u02-
25.03.09 THALES 4.375% 04-22 07.1 1
EMTN VALEO 3 75% 05-24 06.13
VALEO 5.625°,001-13 07.06
VEOLIA ENV.4 375% 05-1 1 12 20
VEOLIA ENV.5.375%03-18 CAT2
VEOLIA ENV 6.125% 03-33 EMTN
VIVENDI UNIV. 3.625% 05-6 4.10
3CIF 5.875:b 02-5.4.2012 EMTN
GERMANY
BAYER AG 5O/.(TV) 05-29 7 2015
BERTELSMANN 3 625% 05-
06.10.15 BMW FIN,3.875"/0 04-6.4.1 1
EMTN COMMZBK 4 75O'c99-21 04 09
DEGUSSA 5 1255; 03-
10.12.13EMTN DEUTSCHE TELEKOM INTL
5.875'X 01-11.7.06 EWE AG 4 87SY6 114-14.10 19
HENKEL 5.375 05-2104 STEP-UP
MUNICH RE FIN.6.75%03-
21.06.23 NORDDT LB 5.75% 02-15 EMTN
TALANX 4.5% (TV) 05-30.6.25
TCHIBO HLDG 4.5% 04-13 10 14
WESTF.LIPP BK 4 375C04-
24.9.14
GHEAl BRITAIN
ANGLIAN WATER 4 625% 03-13
ANGLO AMERICAN 3 625'633-
5 6.08
10.000
90.000
50.000
30.000
25.000
125,000
180,000
70.000
55,000
45 000
65 000
90,000
35.000
50,000
40.000
35,000
35,000
10 000
20 000
15.000
55,000
65,000
20.000
65.000
50 000
110000
115000
80.000
170.0OU
25 000
70,000
115000
75,000
60.000
25.000
50.000
35.000
35 000
EUR
EUR
EUR
EUR
EUR
EUR
EUR
EUR
EUR
EUR
EUR
EUR
EUR
EUR
EUR
EUR
EUR
EUR
EUR
EUR
EUR
EUR
EUR
11.215
91,697
48.716
31,396
26 242
146,314
190,445
77.436
59,739
45,653
68 329
93.398
37.323
48 397
42.249
35.581
33 846
10.065
19.035
15.Y52
62.215
63.615
22 057
0.1 1
0.86
0.46
0.29
0.25
1.37
1 80
0.73
0.56
0.43
0.64
0.88
0.35
0.45
0 40
0 33
0 32
0 09
0.18
0.15
0.58
0.60
0.21
1 349.503 12 68
EUR
EUR
EUR
EUR
EUR
EUR
EUR
EUR
EUR
EUR
EUR
EUR
EUR
EUR
EUR
59,405 0 56
46226 0.43
109816 103
118102 1 1 1
79.155 074
171,189 1 6 2
25620 024
66,639 0 6 3
130678 1.23
84.542 0.79
56,605 053
24,765 023
51,317 0 4 8
1,024,059 Y.62
36.047 0.34
34.986 0 33
. . . . . . .
Face Value Currency Evaluation "A net assets
BAA 4.5% 04-30.9.14 EMTN
BARCLAYS 4 875% 04-PERP
BAT INTL FIN.5.125% 03-13
EMTN CADBURY SCHW 4 25% 04-
30.06.09 CARGILL INC 4.5O/.04-29 9 14
EMTN COMPASS GR.69.b 02-29.5.09
EMTN GALLAHER 4.625% 04-
10.6 11EMTN HBOS PLC 5 125% (TV) 03-
HOUSEHLD.FIN.5.125%99-
24.06 09 IMP.TOBA FIN 6 375%99-
27 09.06 MM02 6 375% 02-25.1.07 EMTN
NATIONAL GRID 5% 03-2.7.1 8
NAT WESTMINST.5.125c/099-
11 EMTN NORTH WEST WATER 4.87570
99-09 OTE PLC 5Yb 03-5.8.13 EMTN
RENTOKIL INITIAL 5.754'. 02-07
ROYAL BK SCOTL.5.5% 04- PERP. TESCO PLC 3.875% 06-24.03 11
VODAFONE GRP 4.25% 03-
27.5.09
GREECE
PUBLIC POWER 6.25% 00- 8.11 10
HONG KONG
HUTCHINSON WHAMPOA
F.5.875 Yo 03-8.7.13 STD CHART.5.375% 99-6.5.09
EMTN
IRELAND
BK IRELAND 7 4CO1-PERP
MTNI
ITALY
AUTOSTRADE 5% 04-9.6 14
EMTN EDISON 5.125% 03-10 12.10
EMTN ENECO4.125C03-I06 10EMTN
ENEL 5.25% 04-20.05.24 EMTN
HERA SPA4.125"/0 06-16.02.16
UNICREDITO ITAL. 4.5% 04-2019
UNlCREDlTO 3 95% 06-1 2.16
35,000
EO OCO
65 000
25 000
50 000
25,000
65,000
140 000
75,000
90,000
45 000
35,000
25 000
11 0.000
65,000
35.000
115.000
50 ouo 170,000
45 000
35 000
25 000
45,000
100 000
35,000
35.000
50 000
50 000
60 000
50 000
EUR
EUR
EUR
EUR
EUR
EUR
EUR
EUR
EUR
EUR
EUR
EUR
EUR
EUR
EUH
EUR
EUR
EUR
EUR
34.332
58,344
67 095
25 296
50.546
26,413
66.515
146 348
78,109
91,394
46.099
35,728
26 514
113373
65 871
35,810
11 6.504
49,741
172,078
0 32
0.55
0 63
0 24
0.47
0.25
0.62
1.37
0.73
0.86
0.43
0.34
0.25
1 07
0.62
0.34
1.09
0.47
1.62
1,377,143 12 94
EUR 49.076 0.46
49.076 0.46
EUR 37915 0 3 5
EUR 2E 164 0 2 5
64 1179 0.60 - .. .
EUR 51.464 0 4 8
51,464 0 4 8 ~.
EUR 103.753 0.97
EUR 36.626 0.34
EUR 35226 0 3 3
EUR 52800 0.50
EUR 48872 046
EUR 60,801 057
EUR 47,431 0 4 5
385.509 3 6 2
-~
HSBC Global Investment Funds
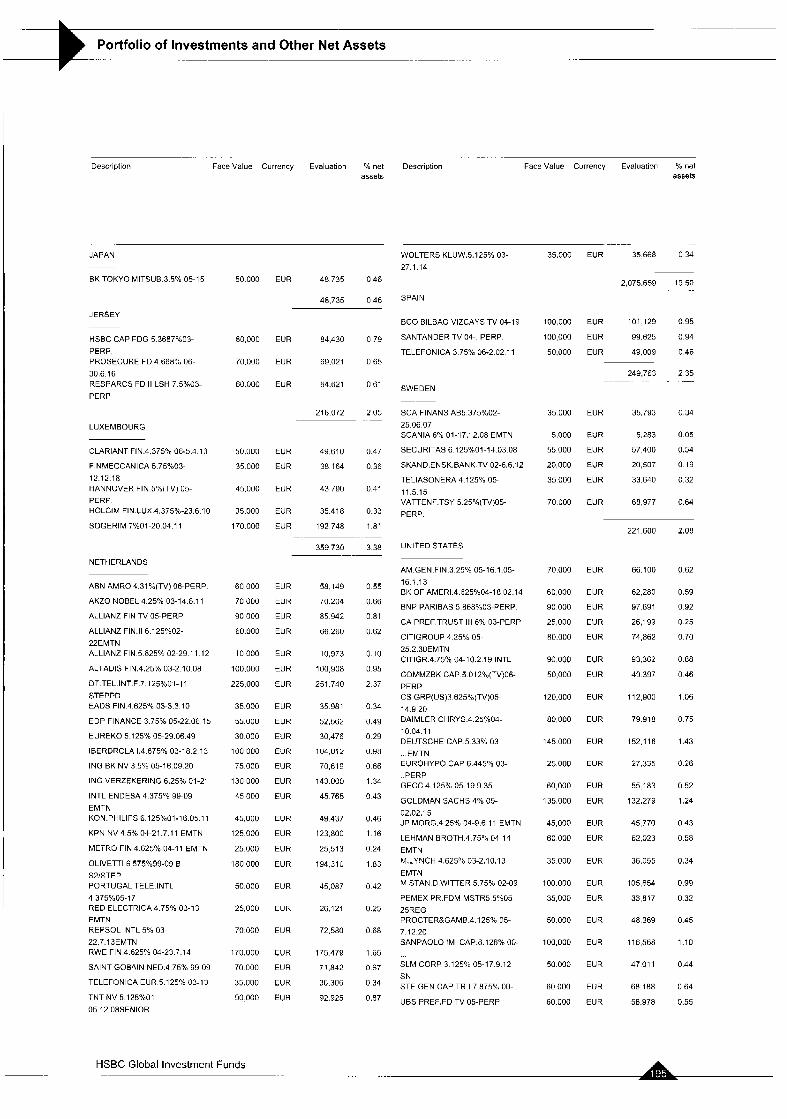
Portfolio of Investments and Other Net Assets - .-
. . . . . .
Description Face Value Currency Evaluation % riel Descriptiori Face Value Currency Evaluation YO net assets assets
JAPAN
BK TOKYO MITSUB 3.5% 05-15
JERSEY
50000 EUR 48735 0 4 6
48.735 0.46
HSBC CAP FOG 5.3687°/003-
PERP. PROSECURE FD 4.668:: 06-
30.6.16 RESPARCS FD II LSH 7 5%03-
PERP
80,000 EUR
70.000 EUR
60,000 EUR
84.430 o 79
69.021 0 6 5
64.621 061
218072 2.05
LUXEMBOURG
CLARIANT FlN.4.375Vc 06-5.4 13
FINMECCANICA 5.75"/003-
12.12.18 HANNOVER FIN.S%(TV) 05- PERP HOLCIM FIN.LUX.4.375%-23.6 10
SOGERIM i%01-20.04.11
50.000 EUR
35.000 EUR
45.000 ELJR
35.000 EUR
170.000 EUR
NETHERLANDS
AEN AMRO 4.31WTV) 06-PERP
AKZO NOBEL 4.25% 03-14.6.1 1
ALLIANZ FIN TV 05-PERP
ALLIANZ FIN.II 6.125?:02-
22EMTN ALLIANZ FIN 5.625% 02-29.1 1 12
ALTADIS FIN.4.25% 03-2 10.08
DT.TEL INT.F.7.125%UI-11
STEPPD EADS FIN.4 625O'O 03-3.3.10
EDP FINANCE 3.75% 05-22.06 15
EUREKO 5.125% 05-29.06.49
IBERDROLA 1.4 875% 03-18.2 13
ING BK NV 3 5% 05-16 09 20
ING VERZEKERING 6.25% 01-21
INTL ENDESA 4 375% 9Y-0Y
EMTN KON.PHILIPS 6 125%01-16 05.1 1
KPN NV 4.5% 04-21.7.11 EMTN
METRO FIN 4.625% 04-11 EMTN
OLlVETTl 6 575%99-09 E S2jSTEP PORTUGAL TELE.INTL
4 375CO5-17 RED ELECTRICA 4.75% 03-13 EMTN REPSOL INTL 5% 03-
22.7.13EMTN RWE FIN 4.625?/, 04-23.7.14
SAINT GOBAIN NED.4.7570 99-09
TELEFONICA EUR 5.125% 03-13
TNT NV 5.125"/001-
05.12 OBSENIOR
60000 EUR
70000 EUR
90,000 EUR
60000 EUR
10000 EUR
100,000 EUR
225,000 EUR
35.000 EUR
55.OUU EUR
30.000 EilR
100000 ELIH
75.000 EUR
130000 EUR
45,000 EUR
451100 EUR
125.000 EUR
25000 EUR
180,000 EUR
50.000 EUR
25,000 EUR
70.000 EUR
17UUOO EUR
70.000 EUR
35000 EUR
90000 EUH
HSBC Global Investment Funds
49,610 0.47
38 164 0.36
43790 0.41
35.418 0.33
192748 1.81
359730 3.38
58,149
70.204
85 942
66.260
10,Y73
100,908
251,740
35 981
52,562
30,476
104 1112
70,619
143 000
45 765
49 437
123,800
25.513
194,310
45.087
26.121
72.580
175 479
71.842
36.306
92.925
0 55
0 66
0 81
0 62
0 10
0 95
2 37
0 34
0 49
0 29
0 9R
0 66
1 34
0 43
0 46
116
0 24
1 83
0 42
0 25
0 68
1 65
0 67
0 34
0.87
WOLTERS KLUW.5.125% 03- 27.1.14
35.000 EUR 35668 034
2,075.659 19 50
SPAIN
BCO BILBAO VIZCAYS TV 04-19
SANTANDER TV 04- PERP
TELEFONICA 3 75% 06-2 02 11
100,000 EUR 101 129 095
100000 EUR 99.625 0 9 4
50.000 EUR 49.009 0.46
249,763 2 3 5 . . ..
SWEDEN
SCA FINANS AB5 375C02-
25 06 07 SCANIA 6% 01-17.12.08 EMTN
SECURITAS 6 125%01-14.03.08
5KAND.ENSK.BANK.TV 02-6.6.12
TELIASONERA 4.125% 05- 11 5 15 VATTENF.TSY 5 25%(TV)05-
PERF
35000 EUR 35,793 0.34
5.283 0 05
55000 EUR 57400 O S *
20,000 EUR 20,5117 0 19
35000 EUR 33,640 0 3 2
5.000 EUR
70000 EUR 68.977 0.64
221 600 2.08
UNITED STATES
AM.GEN.FIN.3 25% 05-16 1.05-
16.1.13 BK OF AMER1.4.625C04-I8 02.14
BNP PARIBAS 5 868%03-PERP.
CA PREF.TRUST 111 6% 03-PERP
ClTlGROUP 4 25% 05- 25.2.3UEMTN ClTlGR 4.75% 04-10.2 1Y INTL
COMMZBK CAP 5 012%(TV)06-
PERP CS GRP(US)3 625%(TV)05-
14.9 20 DAIMLER CHRYS.4.25%04-
100411 DEUTSCHE CAP.5.33% 03-
... EMTN EUROHYPO CAP 6 445% 03-
.PERP GECC 4.125% 05-19 9 35
GOLDMAN SACHS 4% 05-
02.02.15 JP MORG.4.25% 04-9.6.1 1 EMTN
LEHMAN BROTH 4 75% 04-14
EMTN M.LYNCH 4.625'b 03-2.10.13
EMTN M.5TAN.D.WITTER 5.75% 02-09
PEMEX PR.FDM MSTR5 5°/005-
25REG PROCTERBGAMB.4.125% 05- 7.12 20 SANPAOLO IMI CAP.@ 126% 00-
SLM CORP 3 125% 05-17 9 12
SN STE GEN CAP TR I 7 875% 00
UBS PREF FD TV 05-PERP
70,000 EUR
60,000 EUR
YO000 EUR
25,000 EUR
80.000 EUR
90,000 EUR
50,000 EUR
120,000 EUR
80000 EUR
145.000 EUR
2500U EUR
60,000 EUR
135.000 EUR
45,000 EUR
60,000 EUR
35.000 EUR
100.000 EUR
35,000 EUR
50.000 EUR
100,000 EUR
50000 EUR
60000 EUR
60.000 EUR
66.100
62 280
97 691
26,199
74,862
93.362
49 397
112 900
79 918
152 116
27 335
55 183
132,279
45,770
62,023
36.055
105,654
33 817
48 369
116,568
47 01 1
68 188
58 978
0.62
0.59
0 92
0.25
0 70
0.88
0 46
1.06
0.75
1.43
0.26
0.52
1.24
0 43
0.58
0.34
0.99
0 32
0.45
1.10
0.44
0 64
0.55
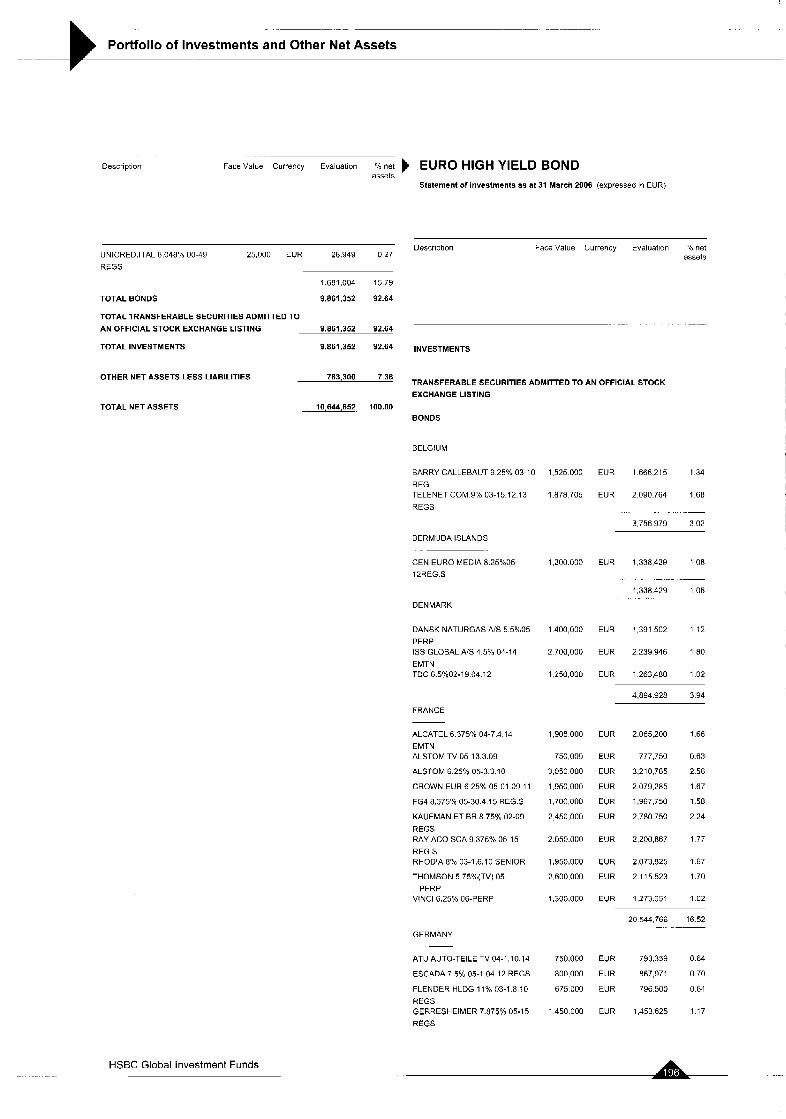
~- _ _ ~ - - ._ _
Portfolio of Investments and Other Net Assets _- -
Descriptiuri Facevalue Currency Evaluatlun %net EURO HIGH YIELD BOND assets
Statement of investments as at 31 March 2006 (expressed in EUR)
Description Face Value Currency Evaluation '10 net assets UNICRED.ITAL 8.048% 00-48 25,000 EUR 28.949 0 2 7
REGS
1,681,004 1579
TOTAL BONDS 9,861,352 92.64
TOTAL TRANSFERABLE SECURITIES ADMITTED TO
AN OFFICIAL STOCK EXCHANGE LISTING 9,861,352 92.64
TOTAL INVESTMENTS 9861,352 92,64
. .-
INVESTMENTS
OTHER NET ASSETS LESS LIABILITIES 783,300 7.36 TRANSFERABLE SECURITIES ADMITTED TO AN OFFICIAL STOCK
EXCHANGE LISTING
TOTAL NET ASSETS 10,644,652 100.00 BONDS
BELGIUM
1.525000 EUR 1.666.215 1.34 BARRY CALLEBAUT 9 25% 03-10
REG TELENET COM.9"h 03-15.12.13
REGS
1.878 706 EUR 2.090.764 1.68
. . . . . .
3.756 979 3.02
BERMUDA ISLANDS
CEN.EURO MEDIA 8.25%05 12REG.S
1,200.000 EUR 1,338,429 1 OR
.~
1,338.429 1 OR
DENMARK
DANSK NATURGAS AIS 5.5%05- PERP ISS GLOBAL AIS 4.5% 04-14
EMTN TDC 6.5%02-19 04.12
1400,000 EUR 1,391 502 1 1 2
2 700.000 EUR 2239946 1 8 0
1250,000 EUR 1263,480 1 0 2
4.894.928 3.94
FRANCE
ALCATEL 6 375% 04-7 4 14
EMTN ALSTOM TV 05-13.3 09
ALSTOM fi 25% 05-3 3 10
CROWN EUR 6 25% 05-01 09 11
FG4 8 375% 05-30 4 15 REG S
KAUFMAN ET BR 8 75% 02-09
REGS RAY ACQ SCA 9 375% 05-1 5
REG S RHODIA 8 % 03-1 6.10 SENIOR
THOMSON 5 75O/,(TV) 05-
VlNCl 6 25% 06-PERF PERP
1,908 000 EUR 2.065.200 1.66
750,000 EUR 777,750 0.63
3,050 000 EUR 3,210,765 2.58
1,950,000 EUR 2.079.285 1.67
1.700.000 EUR 1,967.750 1.58
2450,000 EUR 2.780750 2 2 4
2.050.000 EUR 2,200,867 1 77
1,950.000 EUR 2,073,825 1 fi7
2.600.000 EUR 2 11 5.523 1.70
1,300,000 EUR 1,273 051 1 02
20 544.766 16 52 .
GERMANY
ATU AUTO-TEILE TV 04-1.10.14
ESCADA 7 5% 05-1 04 12 REGS
FLENDER HLDG 11% 03-1 8 10 REGS GERRESHEIMER 7 875% 05-15
REGS
750.000 EUR 793.359 0.64
800.000 EUR 867,971 0.70
675000 EUR 796.500 0.64
1450000 EUR 1.453625 1 1 7
HSBC Global Investment Funds ... .
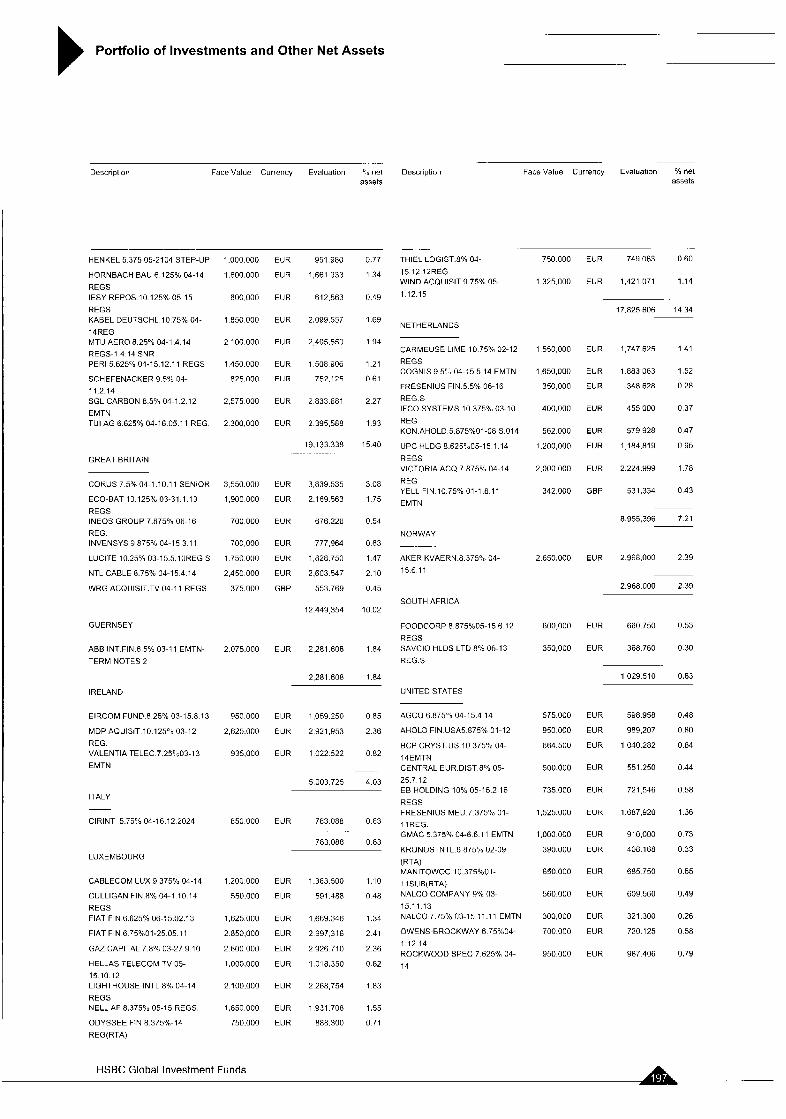
. . -
Portfolio of Investments and Other Net Assets ..
.- ..
Face Value Currency Evaluation ‘In net aSSBtS assets
Descrlpllon Face Value Currency Evaluation “ 0 net Description
-
THIEL LOGIST.8% 04-
15 12 12REG WIND ACQUISIT.9.75% 05
1.12.15
750.000 EUR 749,063 0.60
1325.000 EUR 1,421,071 1.14
HENKEL 5 375 05-2104 STEP-UP
HORNBACH BAU 6 125% 04-14
REGS IESY REPOS 10 125% 05-15
REGS KABEL DEUTSCHL 10 75% 04-
14REG MTU AERO 0 25% 04-1 4 14 REGS-I 4 14 SNR PER1 5 625% 04-15 12 11 REGS
SCHEFENACKER 9 5% 04- 11 2 14 SGL CARBON 8 5% 04-1 2 12
EMTN TU1 AG 6 625% 04-16 05 11 REG
1.000 000
1.600.000
600.000
1850.000
2 100.000
1 450 000
825.000
2,575.000
2 300.000
EdR 951 980 0.77
EUR 1,661933 1.34
EUR 612.563 0.49
EUR 2,099.557 1 69
EUR 2405,550 1 9 4
EUR 1508906 1.21
EUR 752.125 0 6 1
EUR 2833.681 2 2 7
EUR 2395.588 1 9 3
17.825 606 14 34
NETHERLANDS
CARMEUSE LIME 10 75% 02-12
REGS COGNIS 9 5‘, 04-15 5 14 EhlTN
FHESENIUS FIN 5 5% 06-16
REG S IFCO SYSTEMS 10 375% 03-10
REG KON AHOLD 5 875%01-08 S 014
UPC HLDG e 6 2 ~ ~ 0 5 - 1 5 I 14
REGS VICTORIA ACQ 7 875% 04-14
REG YELL FIN 10 75% 01-1 8 11
EMTN
1,747625 1 4 1
1.883 063 1.52
348628 0 2 8
1550,000 EUR
1,650,(1110 EUR
350,000 EUR
400,000 EUR
562000 EUR
1.200,OOO EUR
2.000000 EUR
342000 GBP
455,000 0 37
579928 0 4 7
i ie4,819 0 9 5
2224.999 1 78
19.133 33H 1540
3 08
1.75
0.54
0.63
1 4 7
2.10
0.45
10.02
1.84
GREAT BRITAIN
COHUS 7 5’/004-1.10 11 SENIOK
ECO-BAT 1 3 125CO3-31.1.13
REGS
REG INVENSYS 3 875% 04-15 3.1 1
LUCITE 10.25% 03-15.5.10HEG S
NTL CABLE 8.75% 04-15 4 14
WRG ACQUISIT.TV 04-1 1 REGS
INEOS GROUP 7.875% (16-16
3 550.0011 EUR 3 839.535
1900000 EUR 2 169563 531.334 0 4 3
8,955,396 7.21 70U U00 kUH 676226
NOHWAY 700,000 EUR 777,964
1.750.000 EUH 1 828.7511
2.450 000 EUR 2.603 547
375.000 GBP 553.769
AKER KVAERN 8 3759.04
1 5 6 1 1
2.650.000 EUR
2.968 000 239
SOUTH AFRICA 12 449 354
FOODCORP 8.875%05-15 6.12
REGS SAVCIO HLDS LTD H% 06-13 REG.S
GUERNSEY . .
ABB INT FIN 6.5% 03-11 EMTN-
TERM NOTES 2
600,000 EUR 660750 0.53
350.000 EUR 368.760 0.30 2 075.000 EJR 2.281 608
2,281.608 1 .84 1029 510 0.83
IRELAND UNITED STATES
AGCO 6 875% 04-15 4 14
AHOLD FIN USA5.875% 01-12
BCP CRYST.US 10 375% 04-
14EMTN CENTRAL EUR.DIST 8% 05- 25.7 12 EB HOLDING I O ’ % 05-15 2.15
REGS FRESENIUS MED.7.37593 01- 11 REG. GMAC 5.375% 04-6.6.1 1 EMTN
KRONOS INTL.8 875’ia 02-09
W A ) MANITOWOC 10 375%01-
11SUQRTA) NALCO COMPANY 9% 03- 15.11 13 NALCO 7 75% 02-15 11.11 EMTN
OWENS-BROCKWAY 6.75%04-
1.12 14 ROCKWOOD SPEC 7.625% 04-
14
EIRCOM FUND.8.25”h 03-15.8 13
MDP AQUISIT 10 125Oc 03-12
REG VALENTIA TELEC 7 25?~03-13
EMTN
950 000
2 fi25.om
935,000
850 000
1,200 000
550.000
1,625 OUO
2 850,000
2 600 000
1 000.000
2 100.000
1,850 000
750.000
EUR 1,059.250 0.85
EUK 2921 953 2.36
EUR 1022522 0.82
575 000
950 000
864,500
500.000
735.000
1,525.000
1.000 000
390.000
650.000
560.000
300 000
700.000
950 000
EUR
EUR
EUR
EUR
EUH
EUH
EUR
EUR
EUR
EUR
EUR
EUR
EUR
598 958
989,207
1 040 282
551 250
721 546
1.687 920
910,000
408 168
685 750
609 560
321 300
720 125
987 406
0.48
0.HO
0.84
0.44
0.58
1.36
0.73
0.33
0.55
0.49
0.26
0 58
0.79
5003.725 4 0 3
ITALY
ClRlNT 5.75% 04-16.12 2024 EdR 783088 0.63
LUXEMBOURG
CABLECOM LUX 9 375% 04-14
CULLIGAN FIN 8% 04-1 10.14
REGS FIAT FIN 6.625% 06-15 02.13
FIAT FIN 6.75%01-25 05.1 1
GAZ CAPIT4L 7.8% 03-27 9.10
HELLAS TELECOM TV 05- 15.10.12 LIGHTHOUSE INTL 8% 04-14
REGS NELL AF 8.37593 05-15 REGS.
ODYSSEE FIN 8.375%-14
REG(RTA)
EUR 1.363500 1.10
EUR 591.488 0 4 8
EUR 1,669.346 134
EUR 2997,316 2 4 1
EUR 2926710 2.36
EUR 1,018.350 0 82
EUR 2268,754 1 8 3
EUR 1,931 708 1.55
EUR 888.300 0.71
HSBC Global Investment Funds
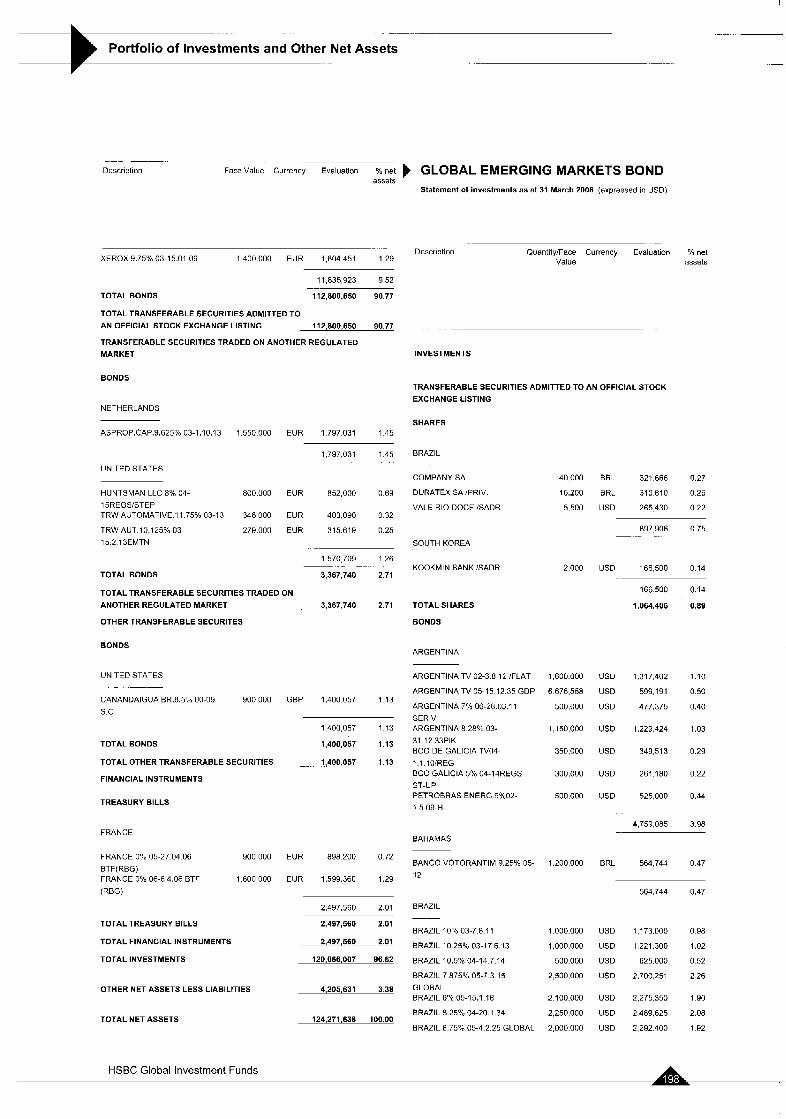
-_
Portfolio of Investments and Other Net Assets
- -. . Description Face Value Currency Evaluation YO net GLOBAL EMERGING MARKETS BOND
assets Statement of investments as at 31 March 2006 (expressed in USD)
Quantity/Face Currency Evaluarlon % net Value assets
Description XEROX 9.75% 03-15.01 09 1,400000 EUR 1,604451 1 2 9
11,835,923 9.52
TOTAL BONDS 112.800.650 90.77
TOTAL TRANSFERABLE SECURITIES ADMITTED TO
AN OFFICIAL STOCK EXCHANGE LISTING 112.800.650 90.77 ..
TRANSFERABLE SECURITIES TRADED ON ANOTHER REGULATED
MARKEl
BONDS
INVESTMENTS
TRANSFERABLE SECURITIES ADMITTED TO AN OFFICIAL STOCK EXCHANGE LISTING
NETHERLANDS
SHARES 1,550.000 EUR 1 797.031 1 45
1,797,031 1.45 BRAZIL
ASPROP.CAP.9.625% 03-1.10.13
UNITED STATES 40000 BRL 321.666 0.27
16.200 BRL 310810 0 2 6
5.500 USD 265430 0 2 2
COMPANY SA
800.000 EUR 852,000 0 69 DURATEX SA PRIV
346000 EUR 403.090 0 3 2
27Y.000 EUR 315.619 0.25
VALE RIO DOCE iSADR
SOUTH KOREA
HUNTSMAN LLC 8% 04-
15REGS/STEP TRW AUTOMATIVE.11.75"h 03-13
TRW AUT.l0.125% 03- 1 5 2 l3EMTN
897906 0 7 5 - ... -.
1570,709 1 2 6
3,367,740 2.71 KOOKMIN BANK 'SADR . . .. . 2.000 USD 166,500 0 14
TOTAL BONDS
166500 0.14 TOTAL TRANSFERABLE SECURITIES TRADED ON
ANOTHER REGULATED MARKET 3,367,740 2.71 TOTAL SHARES
OTHER TRANSFERABLE SECURITES BONDS
1,064,406 0.89
BONDS ARGENTINA
UNITED STATES -
CANANDAIGUA BR.8.5'0 00-09 900,000
s c
ARGENTINA TV 02-3 8 12 'FLAT
ARGENTINA TV 05-15 12 35 GDP
ARGENTINA 7% 06-28 OJ 11
SER V ARGENTINA 8 28'm 03- 31 12 33PIK BCO DE GALlClA TV04-
1 1 lOlREG BCO GALlClA 5% 04-14REGS
ST-UP PETROBRAS ENERG 90/,02- 1 5 09-H-
1,600.000
6.676.558
500,000
1 ,I 50,000
350,000
300,000
soo.oon
1,200,000
1 .ooo.ooo 1,000,000
500.000
2,500.000
2.100.000
2,250,000
2 000.000
USD 1,317,402 1 1 0
US0 599.191 0 5 0
USD 477,375 0.40
US0 1,229,424 1.03
US0 349,513 0.29
US0 261.180 0 2 2
US0 525,000 0.44
GBP 1,400 057 1 13
1400057 1 1 3
1.400.057 1.13
-. 1.,400,057 1.13
TOTAL BONDS
TOTAL OTHER TRANSFERABLE SECURITIES
FINANCIAL INSTRUMENTS
TREASURY BILLS
4,759,085 3.98 FRANCE
BAHAMAS
FRANCE 0% 05-27 04 06 900 000 BTF(RBG) FRANCE 0% 06-6.4.06 BTF 1,600.000
(REG)
EUR 8982OC 0.72
EUR 1,599.360 1.29
BANCO VOTORANTIM 9.25% 05-
12
BRL 564.744 0 4 7
564,744 0.47
2,497,560 2 01 BRAZIL
TOTAL TREASURY BILLS
TOTAL FINANCIAL INSTRUMENTS
TOTAL INVESTMENTS
2,497,560 2.01
2,497,560 2.01
120.066.007 96.62
4,205,631 3.38
124.271.638 100.00
BRAZIL 10% 03-7 8.1 1
BRAZIL 10.25% 03-17.6 13
BRAZIL 10.5"/0 04-14.7.14
BRAZIL 7.875% 05-7.3 15
GLOBAL BRAZIL 8% 05-15.1 18
BRAZIL 8.25% 04-20.1.34
BRAZIL 8.759; 05-4.2.25 GLOBAL
US0 1173.000 0 9 8
US0 1.221.300 1.02
US0 625.000 0 52
USD 2.700.251 2 26
OTHER NET ASSETS LESS LIABILITIES USD 2,275.350 1.90
US0 2.489.625 2.08
US0 2,292.400 1.92 TOTAL NET ASSETS
HSBC Global Investment Funds
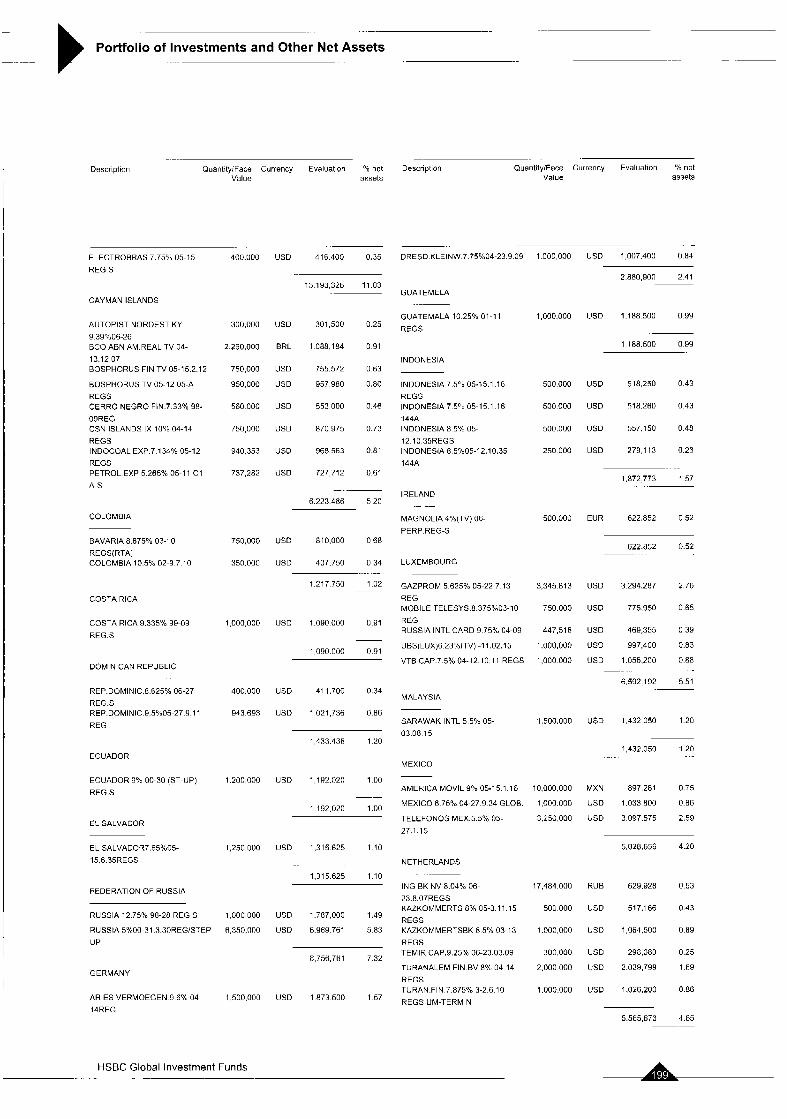
.-. ..
Portfolio of Investments and Other Net Assets ..
- . .
Description OuantityiFace Currency Evaluation '10 nct Description QuantitylFace Currency Evaluation "/o net Value assets Value assets
1 .ooo,ooo
1,000.000
500,000
500 000
500.000
250 000
500.000
3,345 813
750 000
447,516
1 .000,000
1,000 000
1,500.000
10.000.000
1,000.000
3.250.000
17,484,000
500 000
1 .000,000
mo.000
2.000 000
1,000.000
US0 1 007.400 0.84 ELECTROBRAS 7.75% 05-15
REG S
400,(100
300,000
2.290,OOO
750,000
950 000
560 000
750,000
940.353
737,282
750,000
3511.000
1 000,000
400.000
943.693
1.200,000
1 ,z5o,u00
1.000 000
6 3sn,ono
1.500.000
US0 416400 0.35 DRESD KLEINW 7.75%04-23.9.09
GUATEMELA
2,880,900 2.41 13 193.326 11.03
CAYMAN ISLANDS
GUATEMALA 10.25% 01-11
REGS
USD 1.188 500 0.99 AUTOPIST UORDEST KY
9 39°/u06-26 BCO ABN AM REAL TV 04-
13 12 07 BOSPHORUS FIN TV 05-15 2.12
BOSPHORUS TV 05-12 05-A
REGS CERRO NE3RO FIN 7 33% 98-
OYREG CSN ISLANJS IX 10% 04-14 REGS INDOCOAL EXP 7 134% 05-12
REGS PETROL EXP 5 265% 05-1 1 C1
A-S
US0 301,500 0 2 5
ERL 1088,184 091
US0 755.572 0 6 3
US0 957980 0 80
US0 553000 0 4 6
USD 870975 0 7 3
USD 968563 0 8 1
USD 727712 0 6 1
1188.500 0 9 9
INDONESIA
INDONESIA 7 5'0 05-15 1 I 6 REGS INDONESIA 7 5'0 05-15 1 16
144A INDONESIA 8 5% 05- 12 10 35REGS INDONESIA 8 57005-12 10 35
144A
US0 518,250 0 4 3
US0 518.260 0.43
USD 557.150 0.48
US0 279,113 0.23
1.872773 157 -~
IRELAND
MAGNOLIA 4%(TV) 06-
PERP.REG-S
6.223.486 5 20
COLOMBIA EUR 622.852 OS2
BAVARIA a 8750~ 03-10
REGS(RTA! COLOMBIA 10 5% 02-9 7 10
US0 810.000 0 6 8
US0 407.750 0 3 4
622.852 0.52
LUXEMBOURG
1.217 750 1.02 GAZPROM 5.625% 05-22 7 13 REG MOBILE TELESYS.8.3759.kO3-10
REG RUSSIA INTL CARD 9.75% C4-09
UBS(LUX)6 23"MTV) -1 1.02.15
VTB CAP.7 5% 04-12.10 11 REGS
USD 3294.287 2 7 6
COSTA RlCA USD 775.950 0.65
COSTA RlCA 8.335% 99-09
REG.S
us0 1.090000 0.91 US0 469,355 0 3 9
US0 997,400 0 8 3
US0 1055,200 0 8 8
6.592 192 551
-
1,090.000 0.91
DOMINICAN REPUBLIC
REP.DOMINIC.8.625°h 06-27
REG.S REP.DOMINIC.Y.54o05-27.9.11 REG
USD 411.700 0.34
USU 1 021,736 0.86
MALAYSIA
SARAWAK INTL 5 5% 05- 03.08 15
USD 1.432 050 1.20
1433,436 1 2 0
USD 1 192.020 1 0 0
1,432.050 1 20 .. ECUADOR
MEXICO
ECUADOR 9% 00-30 (ST-UP)
REG.S AMERICA MOVIL 9'0 05-15 1 16
MEXICO 6 7570 04-27 9 34 GLOB
TELEFONOS MEX 5 5% 05
2 7 1 15
MXN 897.281 0 7 5
USD 1.033 800 0 8 6
USD 3097575 2.59 1.192.020 1.00
EL SALVACOR
EL SALVAGOR7.65%05-
15.6.35REGS
5,028.656 4.20 USD 1,315625 110
1.315625 1.10
NETHERLANDS ~
ING BK NV 8 04% 06-
23 8 07REGS KAZKOMMERTS 8% 05-3 11 15
REGS KAZKOMMERTSBK 8 5% 03-13
REGS TEMlR CAP 9 25% 06-23 03 09
TUHANALEhl FIN BV 8% 04-14
REGS TURAN FIN 7 875% 3-2 6 10
REGSIUM-TERM N
RUB 629.928 0 5 3 FEDERATION OF RUSSIA
US0 517.166 0 4 3
US0 1064,500 0 8 9
US0 298.080 0 2 5
US0 2,029,795 169
USD 1,026,200 0 86
RUSSIA 12 75% 98-28 REG S
RUSSIA 5%00-31 .J.:KJREG/STEP UP
US0 1.787.000 1.49
USU 6.969 761 5.83
8,756 761 7.32
USD 1 873.500 1.57
GERMANY
ARIES VERMOEGEN.9 6% 04
14REG. 5.565 673 4.65
HSBC Global Investment Funds .
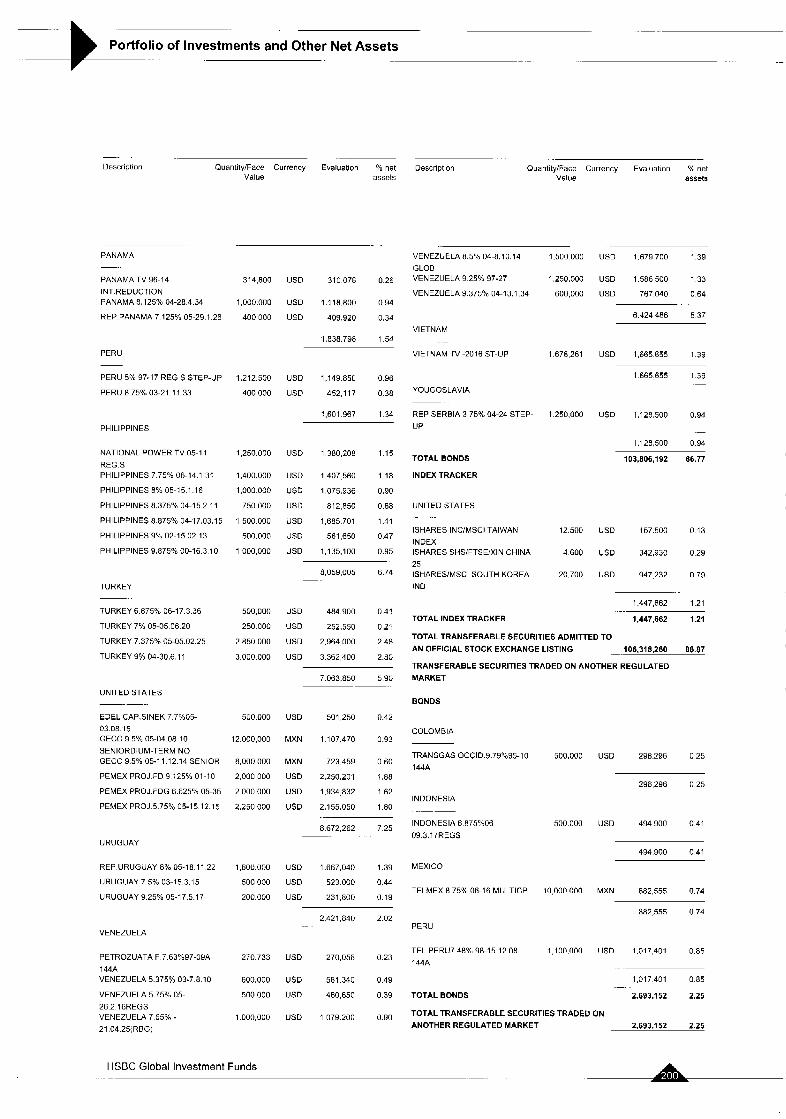
.- ..
Portfolio of Investments and Other Net Assets -
-. -. .
Description QuantityIFace Currency Evaluation YO net Description Quantity/Face Currency Evaluatlon % net Value assets Value assets
PANAMA VENEZUELA 8.5% 04-8.10.14
GLOB VENEZUELA 9.25% 97-27
VENEZUELA 9 375% OA-13.1.34
1.500000 US0 1.67Y 700 1.39
1,250.000 US0 1586500 1 3 3
600,000 US0 767040 0.64
PANAMA TV 96-14 314,800 INT REDUCTION PANAMA 8 125% 04-28 4 34 1 000,000
REP PANAMA 7 125% 05-29 1 26 400 000
US0 310078 0.26
US0 1.118.800 0 94
USD 409.920 0.34 6.424 486 5.37
VIETNAM .. .-
VIETNAM TV -2016 ST-UP
1.838.798 1 54
PERU 1.678.261 USD 1.665 655 1.39
PERU 5% 97-17 REG S STEP-UP
PERU 8.75% 03-21.1 1 33
1.212.500
400,000
1665655 1 3 9 - US0 1,149 850 0.96
US0 452,117 0.38 YOUGOSLAVIA ~
REP SERBIA 3 75% 04-24 STEP- UP
1.601 967 1.34 1.250.000 USD 1.128,500 0.94
1.128,500 0 94
PHILIPPINES -.
NATIONAL POWER TV 05-1 1 1,250.000 REG S PHILIPPINES 7 75% 06-14.1 31 1,400.000
PHILIPPINES 8% 05-15.1.16 1,000 000
PHILIPPINES 8.375% 04-15 2.11 750 000
PHILIPPINES 8.875% 04-17.03.15 1 500.000
PHILIPPINES 9% 02-15.02 13 500.000
PHILIPPINES 9.875% 00-16.3 10 1 000,000
USD 1380,208 1 1 5
USD 1407560 1 1 8
USD 1,075936 0 9 0
USD 812,850 0.68
US0 1,685 701 1 4 1
US0 561 650 0 4 7
US0 1,135,100 0.95
TOTAL BONDS
INDEX TRACKER
103,806,192 86.77
UNITED STATES
ISHARES INCiMSCl TAIWAN
INDEX ISHARES SHSlFTSElXlN CHINA
25 ISHARESIMSCI SOUTH KOREA IND
12.500 US0 157.500 0 1 3
4600 US0 342,930 0 2 9
20.700 US0 947232 1179 8,059,005 6.74
TURKEY
1,447,662 1.21 TURKEY 6.875% 06-17.3.36 500.000
TURKEY 7% 05-05.06 20 250 000
TURKEY 7.375% 05-05.02.25 2.850 000
TURKEY 9% 04-30.6.11 3.000 000
US0 484.900 0.41
USD 252,550 0.21
USD 2.964000 2 4 8
US0 3.362400 2 8 0
TOTAL INDEX TRACKER 1,447,662 1.21
TOTAL TRANSFERABLE SECURITIES ADMITTED TO
AN OFFICIAL STOCK EXCHANGE LISTING IOE,~I~.,~EO 86.87
TRANSFERABLESECURITIESTRADEDONANOTHERREGULATED MARKET
BONDS
COLOMBIA
7063,850 5 9 0
UNITED STATES
EDEL CAPSINEK 7.7"/005- 500 000 03.08 15 GECC 9.5% 05-04 08.10 12.000.000 SENIORDIUM-TERM NO GECC 9 5% 05-1 1.12 14 SENIOR 8,000.000
PEMEX PROJ FD 9 125% 01-10 2,000 000
PEMEX PROJ FDG 6.625% 05-35 2.000 000
PEMEX PROJ 5.75% 05-15 12.15 2.250,OOO
US0 501 2.50 0 4 2
MXN 1107.470 0 9 3
MXN 723.459 060
USD 2,250.201 1 88
USD 1.934832 1 6 2
USD 2,155050 1 8 0
TRANSGAS OCCID Y.7Y0:o95-l0
144A 500,000
500.000
10,000 000
1.100.000
USD 298.296 0 2 5
298,296 0 2 5
USD 494.900 0.41
INDONESIA
INDONESIA 6 875%06-
09.3.17REGS 8672,262 7 2 5
URUGUAY 494.900 0.41
REP URUGUAY 8% 05-18 11 22
URUGUAY 7 5% 03-15 3.15
URUGUAY 9 25% 05-17 5 17
1 fiOO.IlO0
500,000
200.000
USD 1,667,040 1.39
US0 523000 0 4 4
US0 231 800 0 19
MEXICO
TELMEX 8 75% 06-16 MULTICP MXN 882,555 0.74
882,555 0.74 2.421 840 2.02
.- . PERU VENEZUELA
TEL PERU7 48% 98-15 12 08
144A USD 1.017,401 0.85
... .
1.017401 0 8 5
2,683,152 2.25 -.
PETROZUATA F 7 63%97-O9A 270.733 144A VENEZUELA 5 375% 03-7 8 10 600.000
VENEZUELA 5 75% 05- 500.000 26 2 16REGS
21 04 25:RBG)
VENEZUELA 7 65%. 1 O~O,LIUII
US0 270,056 0.23
US0 581.340 0 4 9
USD 460,650 0.39
USD 1.079.200 0.90
TOTAL BONDS
TOTAL TRANSFERABLE SECURITIES TRADED ON
ANOTHER REGULATED MARKET 2,693,152 2.25
HSBC Global Investment Funds
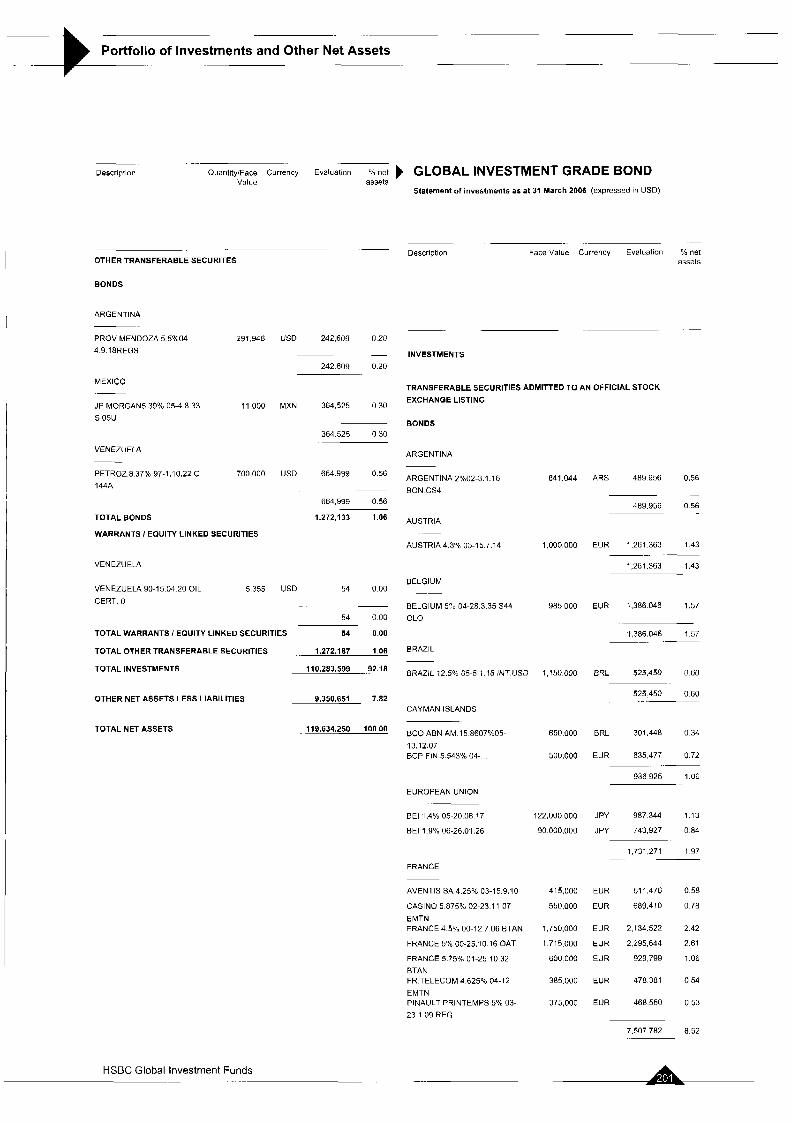
~
Portfolio of Investments and Other Net Assets . .
Descriptior Ouantity/Face Currency Evaluation "0 net GLOBAL INVESTMENT GRADE BOND Value assets
Statement of investments as at 31 March 2006 (expressed in US01
~
OTHER TRANSFERABLE SECURITES
BONDS
ARGENTINA ~-
PROV MENDOZA 5 5Oh.04- 291.948 USD 242.609 020
4 9 IBREGS ~. .-
242609 0 2 0
MEXICO
JP MORGAN5 39% 05-4 8 33 11,000 MXN 364.525 0 30
S.05U .~
364 525 030
VENEZUELA
PETROZ 8 37% 97-1.10.22 C 700.000 USD 664.999 0 5 6
144A ~
664,999 0 56
TOTAL BONDS 1,272,133 1.06
WARRANTS I EQUITY LINKED SECURITIES
VENEZUELA
VENEZUELA 90-15 04 20 OIL 5355 USD 54 000
CERT. 0 ~
54 0 0 0
TOTAL WARRANTS / EQUITY LINKED SECURITIES 54 0 0 0
TOTAL OTHER TRANSFERABLE SECURITIES 1,272.187 1 0 6
TOTAL INVESTMENTS 110,283,539 . 92.18
- .-. - Description Face Value Currency Evaluation Yo riel
assets
. . - ~.
INVESTMENTS
TRANSFERABLE SECURITIES ADMITTED TO AN OFFICIAL STOCK EXCHANGE LISTING
BONDS
ARGENTINA
ARGENTINA 2%02-3 1.16
BON CS4
AUSTRIA
AUSTRIA 4.3% 03-15 7.14
BELGIUM
841.044 ARS 489956 0.56
.-
489.956 0.56
1.000.000 EUR 1.261 363 1 4 3
1.261.363 1.43
-
BELGIUM 5:a 04-28.3.35 S44
OLO
985000 EUR 1.386046 1.57
1,386.046 1 57 - BRAZIL
BRAZIL 12.504 05-5 1.16 INT USD 1,150,000 BRL 525,450 0 60
OTHER NET ASSETS LESS LIABILITIES 9,350,651 7.82 525450 0 6 0
CAYMAN ISLANDS
TOTAL NET ASSETS 119,634,250 100.00 BCO ABN A M 15 8607%05-
13.12 07 BCP FIN 5 543% 04-
650.000 BRL 301.448 0 34
500,000 EUR 635.477 0 7 2
936 925 106
~- -
HSBC Global Investment Funds .
EUROPEAN UNION
BE1 1.4% 05-20.06 17
BE1 1.9% 06-26.01.26
122,000,000 JPY 987344 1 1 3
90000,000 JPY 743,927 0 8 4
1.731 271 197 -.
FRANCE
AVENTIS SA4.25O4 03-15.9.10
CASINO 5 875%. 02-23.1 1.07
EMTN FRANCE 4.5% 00-12 7 06 BTAN
FRANCE 5% 00-25.10 16 OAT
FRANCE 5.75% 01-25 10 32
BTAN FR TELECOM 4.625% 04-12
EMTN PINAULT PRINTEMPS 5% 03-
23 1.09 REG
415,000 EUR 511,476 0.58
550.000 EUR 689.410 0 7 8
1750.000 EUR 2,134.522 2 4 2
1715000 EUR 2295,644 2 6 1
600000 EUR 929,799 106
385.000 EUR 478381 0 5 4
375,000 EUR 468550 0 5 3
7.507 782 8.52
8
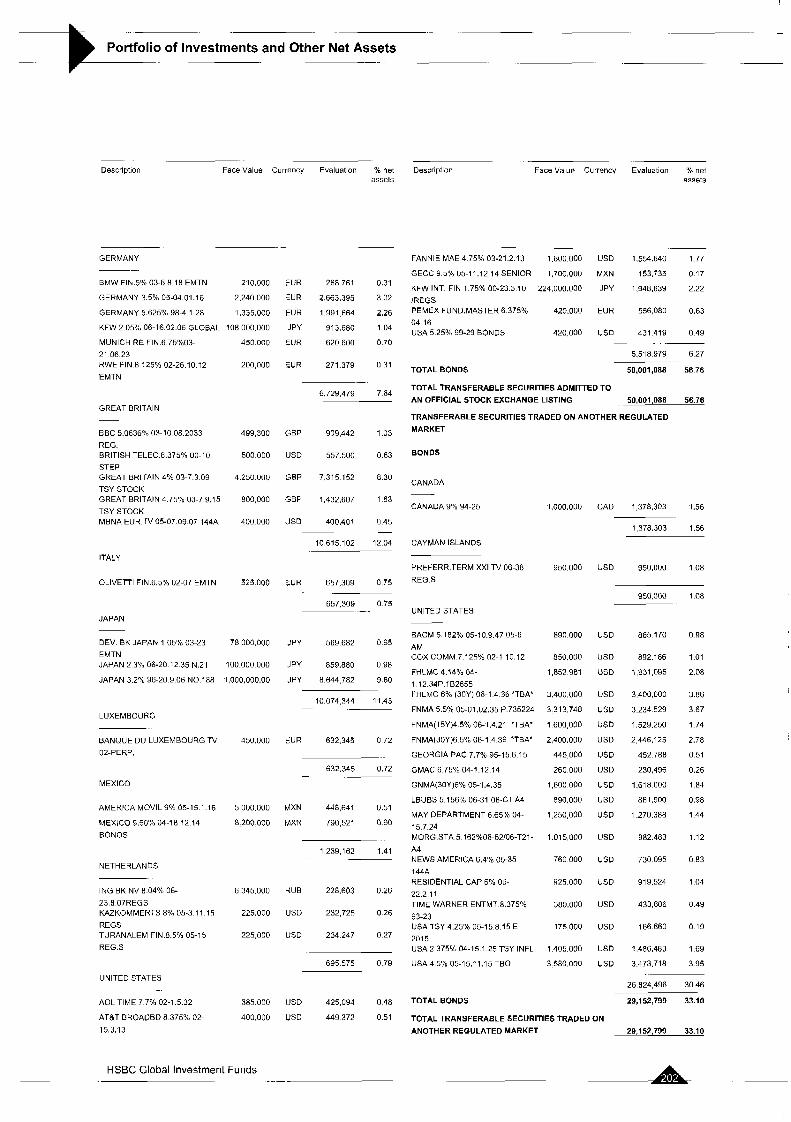
-
Portfolio of Investments and Other Net Assets -
~.
Descriptlon Face Value Currency Evaluation % net Description Face Value Currency Evaluation Yo net assets assets
. -
GERMANY FANNIE MAE4.75% 03-21.2 13 1,600,000 US0 1.554.640 1.77
GECC 9 5% 05-11.12.14 SENIOR 1,700.000 MXN 153.735 0 17
KFW INT. FIN 1.75% 00-23 3 10 224,000.000 JPY 1,948,639 2.22 :REGS PEMEX FUND.MASTER 6.375% 420.000 EUR 556,080 0.63 04-16 USA 5.25% 99-29 BONDS 420.000 US0 431 419 0.49
5.518 979 6 2 7
TOTAL BONDS 50,001,088 56.76
TOTAL TRANSFERABLE SECURITIES ADMITTED TO
AN OFFICIAL STOCK EXCHANGE LISTING 50,001,088 56.76
TRANSFERABLE SECURITIES TRADED ON ANOTHER REGULATED
MARKET
- . . .~
BhlW Flh 5% 03-6.8.18 EMTN 210.000 EUR 268761 0.31
GERMANY 3.5% 05-04 01.16 2,240.000 EUR 2,663.395 3 02
GERMANY 5.625% 98-4.1 28 1,335,000 EUR 1.991 fi64 2.26
KFW 2.05% 06-16.02.06 GLOBAL 108 000,000 JPY 913,680 1.04
MUNICH RE FIN.6.75%03- 450000 EUR 620600 0.70 21 06.23 RWE FIN 6 125% 02-26.10.12 200,0110 EUR 271.379 0 31 EMTN
6.729.479 7.64
GREAT BRITAIN -.
BBC 5 0636% 03-10 08.2033
REG BRITISH TELEC 8 375% 00-10
STEP GREAT BRITAIN 4% 03-7 3 09
TSY STOCK GREAT BRITAIN 4 75% 03-7 9.15
TSY STOCK MBNA EUR TV 05-07 09 07 144A
499,300 GBP 909.442 1 0 3
500 000 USD 557.500 0 6 3
4250000 GBP 7.315152 8 3 0
800,000 GBP 1,432,607 1 63
400000 USD 400.401 0 4 5
10 615 102 12 04
-
BONDS
CANADA _ _ CANADA 9% 94-25 1,000 000
950.000
890 000
850.000
1,852 981
X400,OOO
3 313.748
1 600,000
2,400 000
445 000
260 000
1,600 000
890.000
1 250,000
1 015 000
760 000
925.000
380.000
175 000
1 405.000
3 580.000
CAD 1 378,303 1.56
1,378.303 1.56
CAYMAN ISLANDS
PREFERR.TERM XXI TV 06-38
REG.S
ITALY US0 950,000 1 0 8
OLlVETTl FIN.6.5% 02-07 EMTN 525000 EUR 657,309 0 7 5
657.309 0 7 5 950.000 1 OB
0 98
1 0 1
2.08
3 86
3 67
1 74
2.78
0 51
0.26
1 84
0 98
1 44
1 1 2
0 83
1 04
0 49
0 19
1 69
3 95
UNITED STATES JAPAN
BACM 5 182% 05-10.9.47 05-E AM COX COMM 7.125% 02-1.10.12
FHLMC 4.14% 04- 1.12.34P.lB2655 FHLMC 6 % (30Y) 06-1.4.36 *TEA*
FNMA 5.5% 05-UI ,0235 P.735224
FNMA(15Y)4.5% 06-1.4.21 'TBA'
FNMA(30Y)6 546 06-1.4.36 *TEA*
GEORGIA PAC 7.7% 95-15 6.15
GMAC 6 75% 04-1.12.14
GNMA(30Y)6% 05-1.4.35
LBUBS 5.156% 06-31 06-C1 A4
MAY DEPARTMENT 6.65% 04-
15 7.24 MORG.STA 5.162%06-52/06-T21-
A4 NEWS AMERICA 6.4% 05-35
144A RESIDENTIAL CAP 6 % OB- 22.2.11 TIME WARNER ENTMT.8.37596
93-23 USA TSY 4.25% 05-15 8 15 E- 2015 USA 2 375% 04-15.1 25 TSY INFL
USA 4 5% 05-15.1 1 . I 5 TBO
US0
US0
USD
US0
US0
US0
USD
US0
USD
USD
US0
US0
USD
USD
USD
USD
USD
USD
US0
865 170
892.186
1 831,t'95
3,400 COO
3.234 529
1.529.250
2 446,125
452.788
230,496
1.618 COO
8fi1.900
1.270.388
982.483
730 095
919.524
433,606
166 660
1,486,483
3.473.718
DEV. BK JAPAN 1.05% 03-23 78 000,000 JPY 569 682 0.65 EMTN JAPAN 2 3% 06-20 12 35 N.21 100,000 000 JPY 859.880 0 98
JAPAN 3 2% 96-20 9.06 N0.lHH 1,000,000.00 JPY 8.644 782 9 80
10.074 344 11.43 -
LUXEMBOURG
BANQUE DU LUXEMBOURG TV 02-PERP.
450.000 EUR 632.345 0 7 2
632.345 0.72 .~ -
MEXICO
AMERICA MOVIL 9% 05-15.1.16
MEXICO 9.50% 04-18 12 14
BONOS
5.000.000 MXN 448,641 0.51
8200,000 MXN 790,521 0 9 0
1,239,162 1.41 .~ -
NETHERLANDS
ING BK NV 8.04% 06- 23 8 07REGS KAZKOMMERTS 8% 05-3.11.1s
REGS TURANALEM FIN.8.5% 05-15 REG.$
6,345.000 RUB 228.603 0.26
225.000 USD 232,725 0 2 6
225000 USD 234247 0 2 7
695575 0.79
UNITED STATES
AOL TIME 7.7% 02-1.5.32
AT&T BROADBD 8.375% 02-
15.3.1 3
26 824,496 30.46
29,152,799 33.10 -.
TOTAL BONDS 385.000 USD 425,094 0 4 8
400000 US0 449372 0 5 1 TOTAL TRANSFERABLE SECURITIES TRADED ON
ANOTHERREGULATEDMARKET 29,152,799 33.10
-2- HSBC Global Investment Funds . .. .-
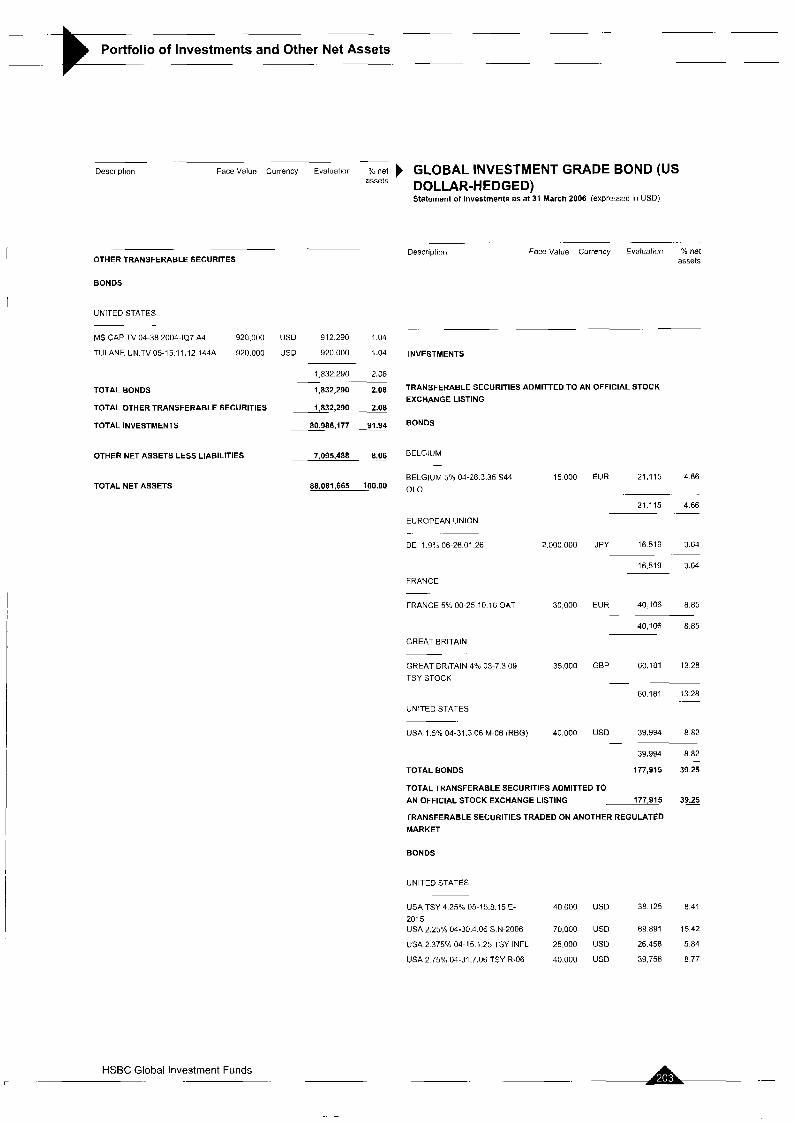
Portfolio of Investments and Other Net Assets ~ ~. -- E-
- Description FaceValuo Currency Evaluation >/,net GLOBAL INVESTMENT GRADE BOND (US
DOLLAR-HEDGED) Statement of Investments as at 31 March 2006 (expressed in USDl
assets
OTHER TRANSFERABLE SECURITES
BONDS
UNITED STATES
MS CAP TL 04-38 2004-187 A4 920,000 US0 912.290 1.04
TULANEUNTV05-15.11.12 144A 920000 USD 920000 1.04
1832.290 2.08
TOTAL BONDS 1,832,290 2.08
. .-
__
TOTAL OTHER TRANSFERABLE SECURITIES 1,832,290 2.08
TOTAL INVESTMENTS 80,986,177
OTHER NET ASSETS LESS LIABILITIES 7,095,488 E,@
TOTALNETASSETS 88.081.665 100.00
HSBC Global Investment Funds
.~ .~ - Description Face Value Currency Evaluation % net
assets
INVESTMENTS
TRANSFERABLE SECURITIES ADMITTED TO AN OFFICIAL STOCK EXCHANGE LISTING
BONDS
BELGIUM -
BELGIUM svo 04-28.3.35 544 15000 EUR 21,115 4 6 6
OLO -
21.115 4.66
EUROPEAN UNION .~
BE1 1.9:3 06-26.01.26 2.000 000 JPY 16 519 3.64
16.519 364
~ .~
FRANCE
FRANCE 5 % 00-25 10 16 OAT 30,000 EUR 40 i o 6 8 8 5
40,106 885 -
~~
GREAT BRITAIN
GREAT BRITAIN 4% 03-7 3 09 35,000 GBP 60.181 1328
TSY STOCK ~
60181 1328 ~ .-
UNITED STATES
USA 1 5% 04-31.3 06 M-06 IRBG) 40,000 USD 39.994 8 82
39.994 8 8 2
177,915 3925
- -
- TOTAL BONDS
TOTAL TRANSFERABLE SECURITIES ADMITTED TO AN OFFICIAL STOCK EXCHANGE LISTING 177,915 39.25
TRANSFERABLESECURITIESTRADEOONANOTHERREGULATED
MARKET
BONDS
UNITED STATES
USATSY 425%05-15.8.15E- 40000 USD 38 125 8 . ~ 1
201 5 USA 2.25% 04-30.4.06 S.N-2006 70,000 USD 69 891 15.42
USA 2 375% 04-15.1.25 TSY INFL 25,000 USD 26.458 5.84
USA 2.75% 04-31.7.06 TSY R-06 40.000 USD 39,756 8 77
A --
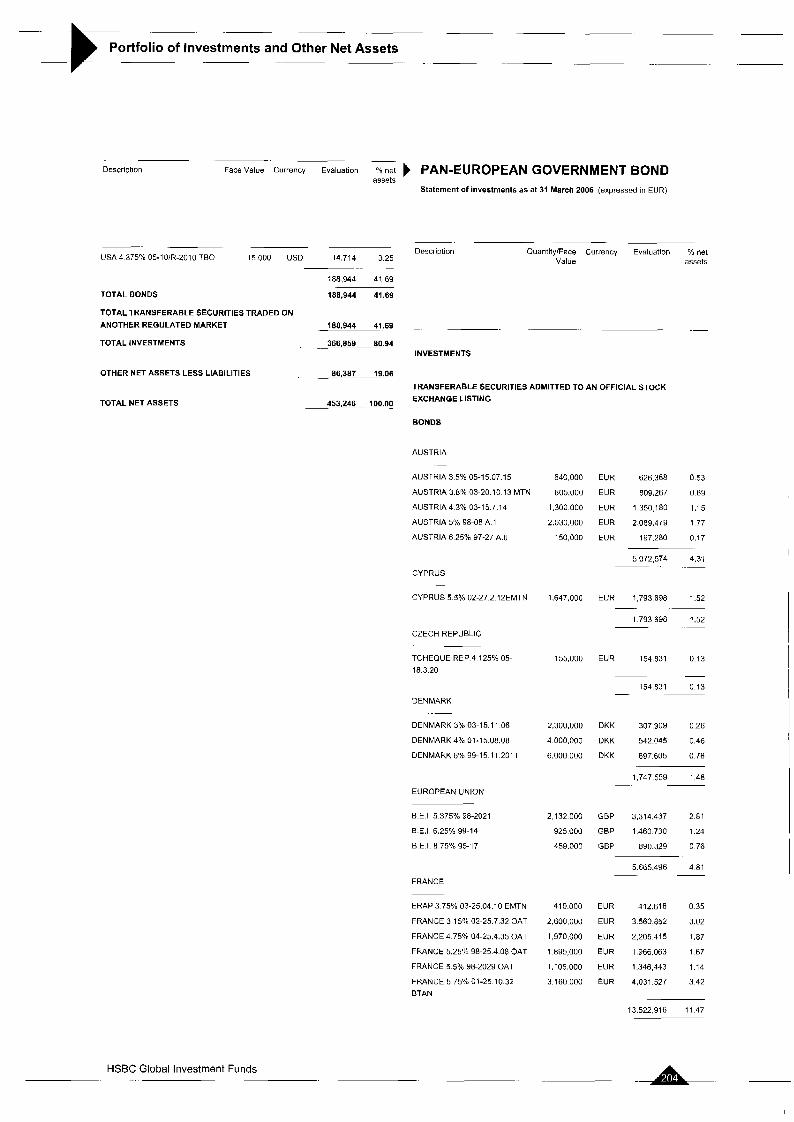
~. ~~ .~ ~-
Portfolio of Investments and Other Net Assets .~ -~ .~ ~
.-
Description Face Value Currency Evaluation $6 net PAN-EUROPEAN GOVERNMENT BOND assets
USA 4 375% 05-10jR-2010 TBO 15000 USD 14.714 3 2 5
188.944 41 69
TOTAL BONDS 188,944 41.69
TOTAL TRANSFERABLE SECURITIES TRADED ON ANOTHERREGULATEDMARKET 188,944 41.69
-- -
-
TOTAL INVESTMENTS . . 366.859 80.94
OTHER NET ASSETS LESS LIABILITIES 86.387 19,OS
TOTAL NET ASSETS 453.246 100.00
Statement of investments as at 31 March 2006 (expressed in EUR)
QuantityIFace Currency Evaluation % net Value assets
Description
.- .~ -
INVESTMENTS
TRANSFERABLE SECURITIES ADMITTED TO AN OFFICIAL STOCK
EXCHANGE LISTING
BONDS
AUSTRIA -
AUSTRIA 3.5% 05-15.07 15
AUSTRIA 3 8% 03-20.10.13 MTN
AUSTRIA 4.3% 03-15.7.14
AUSTRIA 5% 98-08 A.l
AUSTRIA 6 25% 97-27 A.6
CYPRUS -
CYPRUS 5.5% 02-27.2.12EMTN
CZECH REPUBLIC
TCHEQUE REP 4 125% 05-
18.3.20
DENMARK
DENMARK 3% 03-15.11 06
DENMARK 4% 01-15 08.08
DENMARK 6% 99-15.11.2011
EUROPEAN UNION
B.E I 5.375% 98-2021
B.E.I. 6.25% 99-14
B E.I. 8 759’0 95-17
FRANCE
ERAP 3.759.0 03-25 04.10 EMTN
FRANCE 3 1590 02-25.7.32 OAT
FRANCE 4.75% 04-25.4.35 OAT
FRANCE 5.25Y: 98-25.4.08 OAT
FRANCE 5 5% 98-2029 OAT
FRANCE 5 75% 01-25 10.32 BTAN
640.000
805.000
1 300 000
2.030,OOO
150,001)
1.647,OOC
155 000
2,300,000
4 000.000
6,000 000
2,132 000
925 000
459 000
410.000
2.600,000
1,970 000
1 895,000
1,105,000
3 160 000
EUR 626,368 0 5 3
EUR 809.267 0.69
EUR 1350.180 1.15
EUR 2.089.479 1 77
EUR 197.280 0.17
5 072,574 4.31 ~. .-
EUR 1,793698 1 5 2
1 793 698 1.52
~
.-
EUR 154.831 0.13
~
154,831 0 1 3 -. .~
DKK 307,909 0.26
DKK 542,045 0.46
DKK 897605 0.76
- 1,747 559 1.48
GBP 3,314.437 2 8 1
GBP 1460 730 1 2 4
GBP 890.329 0 7 6
5 665.496 A.81 ~. .~
EUR 412.616 0 3 5
EUR 3560852 3.02
EUR 2,205415 1 8 7
EUR 1966.063 1 6 7
EUR 1,346,443 1 14
EUR 4,031 527 3 4 2
13.522 916 11 47
HSBC Global Investment Funds - .. A -
1
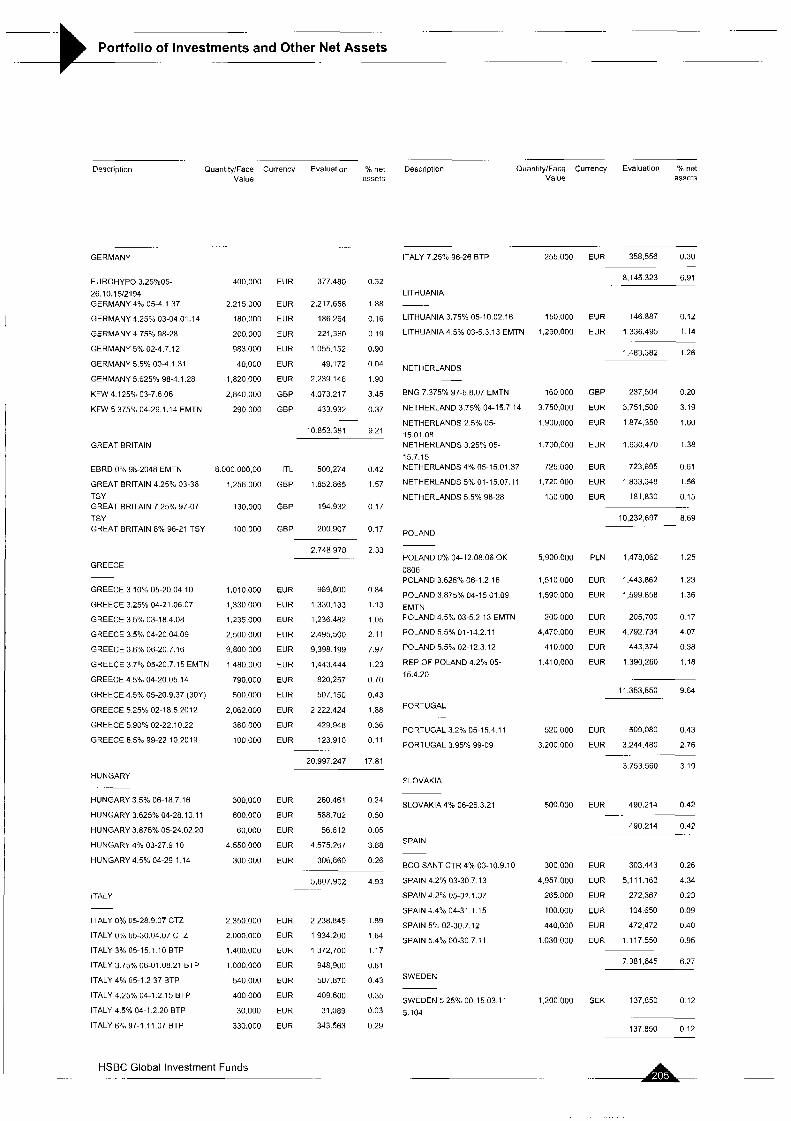
Portfolio of Investments and Other Net Assets ..
Description Ouantity!Face Currency Evaluation o/n net Description OuantitylFace Currency Evaluation 9.b net Value assets Value assets
GERMANY ITALY 7 25:; 96-26 BTP
LITHUANIA
255,000 EUR 358,556 0.30
8.145 323 6.91
-
EUROHYPO 3.25%05- 26.10.15121.34 GERMANY 4% 05-4 1 37
GERMANY 4.25:; 03-04.01 . I4
GERMANY 4.75% 98-28
GERMANY 5% 02-4.7.12
GERMANY 5.5% 00-4.1 31
GEHMANY 5 625% 98-4.1 28
KFW 4.125c4, 03-7 6 06
400,000 EUR 377.480 0.32
2.215 000
1 80,(100
200.000
Y83.000
40,000
1.820.000
2,840,000
290 on0
EUR
EUR
EUR
EUR
EUR
EUR
GBP
GBP
2,217,658
186 264
221 ,361)
1055.152
49,172
2,239 146
4.073 217
433 932
1.88
0.16
0 19
0.90
0.04
1.90
3.45
0.37
LITHUANIA 3.75% 05-10 02 16
LITHUANIA 4 5% 03-5 3 13 EMTN
150.000 EUR 146887 0.12
1,290,000 EUR 1 336.495 1.14
1,483,382 1.26
NETHERLANDS
BNG 7 375% 97-6.8.07 EMTN
NETHERLAND 3.75% 04-15.7 14
NETHERLANDS 2 5% 05- 1501.OH NETHERLANDS 3.25Oi 05- 15 7.15 NETHERLANDS 4% 05-15.01.37
NETHERLANDS 5% 01-15 07.11
NETHERLANDS 5 5% 98-28
160000 GBP 237504 0 2 0
3 750.000 EUR 3.751 500 3.19
1,900,000 EUR 1 874,350 1.60
i ,700,ooo EUR I ,630,470 1.38
725,000 EUR 723.695 0.61
1.720 000 EUR 1 833,348 1.56
150000 EUR 181.830 0.15
KFW 5 375% 04-29.1.14 EMTN
10 853.381 9 21
GREAT BRITAIN
EBRD 0% 98-2048 EMTN
GREAT BRITAIN 4.25% 03-36 TSY GREAT BRITAIN 7 25% 97-07 TSY GREAT BRITAIN 8% 96-21 TSY
8000000.00 ITL 500,274 0 4 2
1,256.000 GBP 1.852 865 1 57
130.000 GEP 194932 0 17 ~~
10,232,697 8 69 ~
100,000 GBP 200907 0.17 POLAND
POLAND U% 04-12 08.06 OK
0806 POLAND 3.625"'~ 06-1.2.16
POLAND 3.875% 04-15 01.09 EMTN POLAND 4 5O/, 03-5.2.13 EMTN
POLAND 5 5% 01-14.2.11
POLAND 5.570 02-12.3.12
REP.OF POLAND 4.2% 05-
15.4.20
2.748.978 2 33 5,900 000 PLN 1 478,062 1.25
GREECE
1,510000 EUR 1.443.862 1 2 3
1,590,000 EUR 1,599 858 1 36
200000 EUR 205,700 0 17
4,470.000 EUR 4.792 734 4 0 7
410.000 EUR 443374 0 3 8
1410,000 EUR 1390,260 1 1 8
GREECE 3 I O ? & 05-20.04 10
GREECE 3.25% 04-21.06 07
GREECE 3.5% 03-18.4.08
GREECE 3.5% 04-20 04.09
GREECE 3.6% 06-20.7.16
GREECE 3 7% 05-20.7 15 EMTN
GREECE 4 5'm 04-20.05 14
GREECE 4.5% 05-20.9.37 (30Y)
GREECE 5.25% 02-18.5 2012
GREECE 5 90% 02-22.10.22
GREECE 6.5% 99-22 10.2019
1010,000
1,330 000
1.235,OOO
2.500 000
9,800 000
1 480 000
790.000
500.000
2 062.000
360 000
100 000
EUR
EUR
EUH
EUR
EUR
EUR
EUR
EUR
EUR
EUR
EUR
989.800
1330,133
1,236 482
2,495,500
9.398 199
1,443,444
820,257
507.150
2 222.424
429,948
123.910
0 84
113
1 0 5
2 11
7.97
1 2 3
0 70
0.43
1.88
0 36
0.11
11,353,850 9.64
PORTUGAL .-
PORTUGAL 3.2% 05-15.4.1 1
PORTUGAL 3.95%, 99-09
520000 EUR 509.080 0 4 3
3.200,OOO EUR 3.244.480 2 76
3 753560 3 19 20 997.247 17.81
HUNGARY SLOVAKIA
HUNGARY 3 5% 06-18.7.16
HUNGARY 3.625% 04-28.10 11
HUNGARY 3.875% 05-24.02.20
HUNGARY 4% 03-27.9 10
HUNGARY 4.5% 04-29 1 14
300,000 EUR 280.461 0 2 4
600.000 EUR 588.702 0 5 0
60000 EUR 56.612 0.05
4.550.000 EUR 4.575.267 3 88
3oo.000 EUR 3nfi860 0.26
SLOVAKIA 4% 06-26 3.21
SPAIN
500.000 EUR 490.214 0 4 2
490,214 0.42
BCO SANT.CTR 4% 03-10.9 10
SPAIN 4.2% 03-30 7.13
SPAIN 4.2% 05-31.1.37
SPAlN44% 04-31 1.15
SPAIN 5% 02-30.7.12
SPAIN 5 490 00-30 7 11
300.000 EUR 303.443 0.26
4.957.000 EUR 5,111 163 4.34
265000 EUR 272,367 0.23
100,000 EUR 104650 0.09
440,000 EUR 472,472 0.40
1.030000 EUR 1117 550 0.95
5,807 902 . ...
2,238 845
1 934 200
1372,7110
948.900
5117 H70
409 600
31,089
343 563
4.93
1.84
1 64
1.17
0.81
0 43
0.35
0.03
0.29
-
EUR
EUR
CUR
EUR
EUR
EUR
EUR
EUR
ITALY ~
ITALY 11% 05-28.9.07 CTZ
ITALY 0:; 05-30.04.07 CTZ
ITALY 3% 05-15 1.10 BTP
ITALY 3.75% 06-01.(1H 21 B l P
ITALY 4% 05-1.2 37 BTP
ITALY 4.25% 04-1 2 15 BTP
ITALY 4.5% 04-1 2.20 BTP
ITALY 6% 97-1.11.07 BTP
2 350.000
2 000,~1110
1.400.000
1 000.000
540,000
400 000
30.000
330.000
7 381.645 6.27
SWEDEN
SWEDEN 5 25% 00-15 03 11
S 104
1.200.000 SEK 137.850 0.12
137850 0.12
HSBC Global Investment Funds ._ . .. .
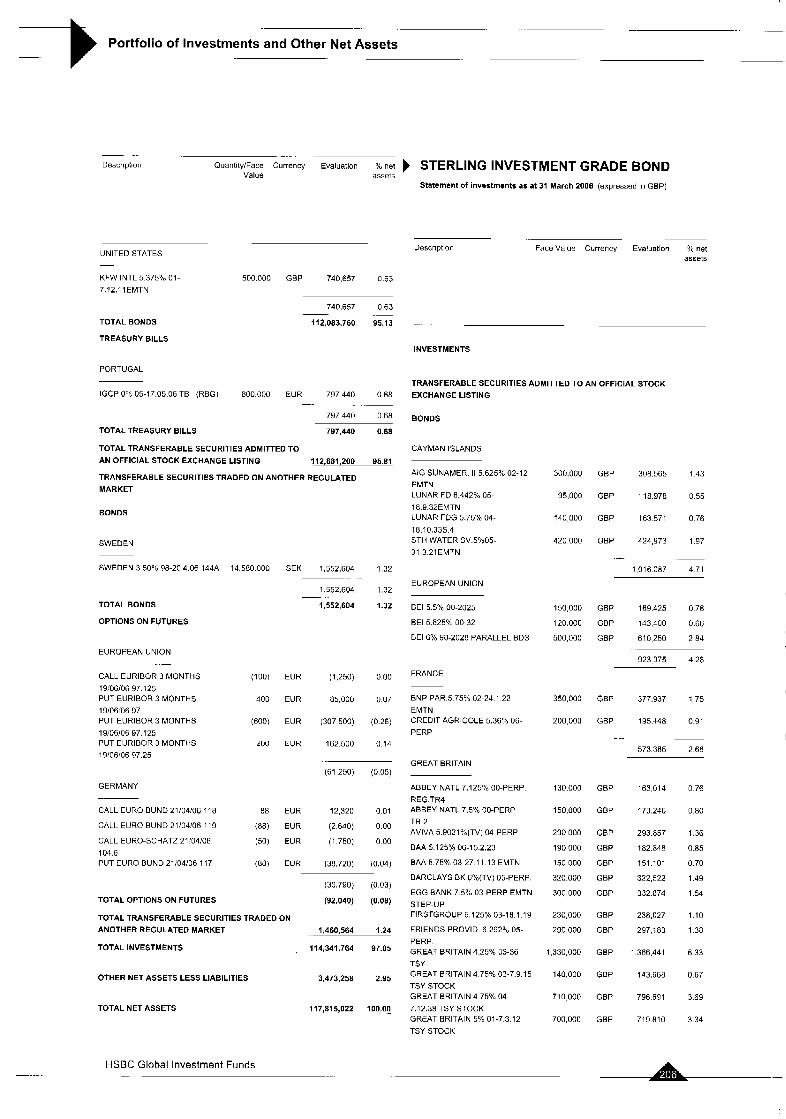
- -
Portfolio of Investments and Other Net Assets
. . ~ ..
Description QuantityiFdce Currency Evaluatlon 01" net STERLING INVESTMENT GRADE BOND
Statement of investments as at 31 March 2006 (expressed in GBP) Value assets
-~ Description Face Value Currency Evaluation 9b net
assets UNITED STATES -
KFW INTL 5 375% 01- 500.000 GBP 740.657 0 63 7 12.11EMTN
740.657 0.63
TOTAL BONDS 112.083.760 95.13
TREASURY BILLS
-.. .
INVESTMENTS
PORTUGAL
TRANSFERABLE SECURITIES ADMITTED TO AN OFFICIAL STOCK
EXCHANGE LISTING IGCP 0% 05-17 05 06 TB (RBG) 800.000 EUR 797 440 0 68
797440 0 6 8
. .~ -.
BONDS
TOTAL TREASURY BILLS 797.440 0.68
TOTAL TRANSFERABLE SECURITIES ADMITTED TO
AN OFFICIAL STOCK EXCHANGE LISTING 112,881,200 95.81
TRANSFERABLE SECURITIES TRADED ON ANOTHER REGULATED MARKET
CAYMAN ISLANDS
AIG SUNAMER II 5 625O0 02-12 EMTN LUNAR FD 6.442% 05-
18 9 32EMTN LUNAR FDG 5.75% 04-
18.10 335 4 STH WATER SV 5%05- 31 3 21EMTN
300.000
95,000
140 000
420 000
150 000
120 000
500,000
350,000
200 000
130,000
150,000
290 000
190 000
150 000
320.000
300,000
230,000
290,000
1 330,000
140,000
710 000
700,000
GBP 308.565 1.43
GBP 118.978 0.55
GBP 163571 0.76
GBP 424,973 1.97
.~
1.016 387 4.71
BONDS
SWEDEN
SWEDEN 3 50% 98-20.4.06 144A 14.580 000 SEK 1,552.604 1.32
1 552.604 1.32
TOTAL BONDS 1,552,604 1.32
OPTIONS ON FUTURES
..
-. .
EUROPEAN UNION
BE1 5.5% 00-2025
BE1 5.625% 00-32
BE1 6% 98-2028 PARALLEL BDS
GBP 169.125 0 7 8
GBP 143400 066
GBP 610,250 2 8 4
EUROPEAN UNION -
CALL EURIBOR 3 MONTHS
19!06/06 97 125 PUT EURIBOR 3 MONTHS
19I06/OB 97 PUT EURIBOR 3 MONTHS
19'06106 97 125 PUT EURIBOR 3 MONTHS
19'06106 97 25
923375 4.28 FRANCE EUR (1,250) 000
EUR 85,000 0 0 7
EUR (307500) (026)
EUR 162500 0 1 4
BNP PAR.5.7596 02-24,' 22
EMTN CREDIT AGRICOLE 5.36% 06- PERP
GBP 377,937 1 7 5
GBP 195.448 0.91
-~ .. ..
573.385 2.66
GREAT BRITAIN (61.250) (0.05)
ABBEY NATL 7.125% 00-PERP.
REG.TR4 ABBEY NATI 7.5% 00-PERP
TR.2 AVIVA 5.90219b(TV) 04-PERP
BAA 5.125% 06-15.2.23
BAA 5.75% 03-27.1 1 13 EMTN
BARCLAYS BK 6YdTV) 05-PERP.
EGG BANK 7 5% 03-PERP EMTN
STEP-UP FIRSTGROUP 6.125% 03-18.1.19
FRIENDS PROVID. 6.292% 05-
PERP. GREAT BRITAIN 4.25% 03-36
TSY GREAT BRITAIN 4.75% 03-7.9.15
TSY STOCK GREAT BRITAIN 4 75% 04-
7.12.38 TSY STOCK GREAT BRITAIN 5% 01-7.3 12 TSY STOCK
GERMANY -~
CALL EURO BUND 21:04:06 118
CALL EURO BUND 21104!06 119
CALL EURO-SCHATZ 21104:OE
104 6 PUT EURO BUND 21i04!06 117
GBP
GBP
GBP
GBP
GBP
GBP
GBP
GBP
GBP
GBP
GBP
GBP
GBP
163,014
173,246
293 057
1 82.848
151 101
322,522
332 874
238,027
297.183
1.366.441
143.668
796 691
719 810
0 76
0 80
1.36
0.85
0.70
1.49
1.54
1.10
1 38
6 33
0.67
3.69
3.34
EUR 12,320 0 0 1
EUR (2640) 000
EUR (1 750) 000
EUR (38,720) (0.04)
(30.790) (0.03)
TOTAL OPTIONS ON FUTURES (92,040) (0.08)
TOTAL TRANSFERABLE SECURITIES TRADED ON
ANOTHER REGULATED MARKET 1,460,564 1 24
TOTAL INVESTMENTS 114,341,764 97.05
OTHER NET ASSETS LESS LIABILITIES 3,473,258 2.95
TOTALNETASSETS 117,815,022 100.00
HSBC Global Investment Funds -_
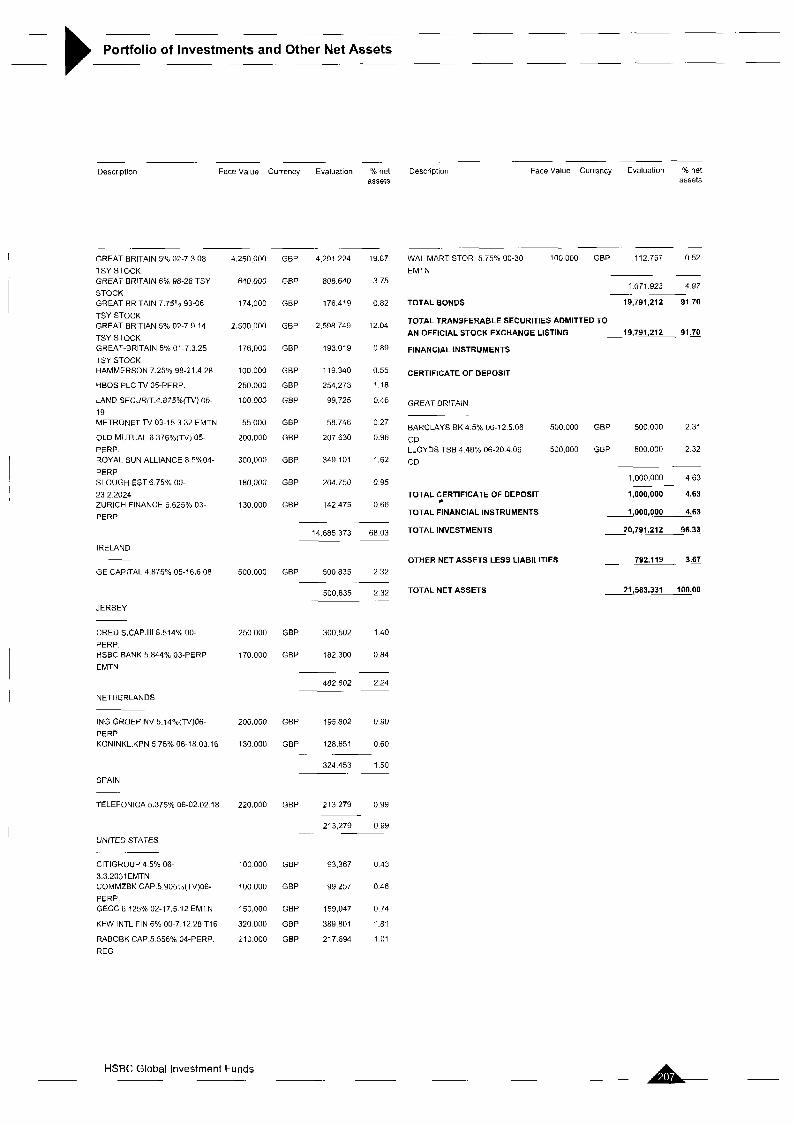
~ -- - ~ - ~ -----
Portfolio of Investments and Other Net Assets ~ ~ _ p - . ~ ~ ~ ~ - -
~ .- .- - ~. ~ ~. .~
Description Face Value Currency Evaluation 'X net Description Face Value Currency Evaluation % net assets assets
GREAT BRITAIN 5% 02-7 3 08 TSY STOCK GREAT BRITAIN 6% 98-28 TSY STOCK GREAT BR TAlN 7 75O0 93-06 TSY STOCK GREAT BR TlAN 5% 02-7 9 14 TSY STOCK GREAT-BRITAIN 5% 01-7 3 25 TSY STOCK HAMMERS3N 7 25% 98-21 4 28
HBOS PLC TV 05-PERP
LAND SECJRIT 4 875%(TV) 05- 19 METRONET TV 03-15 3 32 EMTN
OLD MUTLAL 6 376YdTV) 05- PERP ROYAL SUN ALLIANCE 8 5%04-
PERP SLOUGH EST 6 75% 00- 23 2 2024 ZURICH FINANCE 6 625% 03-
PERP
IRELAND
4 250 ooo
640 000
174,000
2 500 000
176,000
1 ou 000
250.000
100 000
55 000
200.000
300,ono
180 000
130 000
GBP
GBP
GBP
GBP
GBP
GBP
GBP
GBP
GRP
GBP
GBP
GBP
GBP
4,291 224
808.mo
176 419
2.598 749
193.019
119340
254,273
99,725
58.746
207 630
349 101
204,750
142,475
1Y 87
3 75
0 82
12 04
0 89
0 55
1 1 8
0 46
0 27
0.96
1 6 2
0 95
0 66
-.
14,685,373 68.03 ~p
GE CAPITAL 4.875% 05-16.6.08
JERSEY
500000 GEP 500.835 232
500.835 2 32
-
.~ __
CRED.S.CAP.III 8.514°/u 00- PERP. HSBC BANK 5 844% 03-PERP
EMTN
NETHERLANDS
ING GROEP NV 5 14"o(TV)06- PERP KONINKL KPN 5 75% 06-18 03 16
SPAIN
250000 GBP 300.502 1 4 0
170000 GEP 182.300 084
-~ 482,802 224
~~
200000 GBP 195,802 090
130.000 GBP 128.651 0 6 0
324453 150
-
~~
TELEFONICA 5.375% Ofi-02 02.18 220.000 GBP 213 279 0.99
UNITED STATES ~
ClTlGROUP 4 5% 06- 3.3.2031 EMTN COMMZBK CAP 5 9059o(TV)06-
PERP GECC 6 125% 02-17 5 12 EMTN
KFW INTL FIN 6% 00-7 12 28 T16
RABOBK CAP 5 556% 04-PERP.
REG
213,279 099 -.
100000 GEP 93.367 (143
100000 GBP 99257 046
150,00(1 GBP 159,047 0 74
320000 GBP 389801 181
210000 GBP 217694 101
WAL MART STOR 5 75% 00-30 100 000 GBP 112 757 0 52
EMTN ~- 1.071 923 4 9 7
19,791,212 91 70 ~. -.
TOTAL BONDS
TOTAL TRANSFERABLE SECURITIES ADMITTED TO AN OFFICIAL STOCK EXCHANGE LISTING 19,791.212 91.70
FINANCIAL INSTRUMENTS
CERTIFICATE OF DEPOSIT
GREAT BRITAIN - -
BARCLAYS BK 4 5% 06-12 5 06 500 000 GBP 500,000 2 31
CD LLOYDS TSB 4 48% 06-20 4 06 500 000 GEP 500.000 2 32
CD ~- 1,000,000 4 63
TOTAL CERTIFICATE OF DEPOSIT 1,000,000 4.63
TOTAL FINANCIAL INSTRUMENTS 1,000,000 4.63
TOTAL INVESTMENTS 20,791,212 96.33
~- 0
~
792,119 3.57 OTHER NET ASSETS LESS LIABILITIES - ~.
TOTAL NET ASSETS 21,583.331 100.00
A- - HSBC Global Investment Funds .~
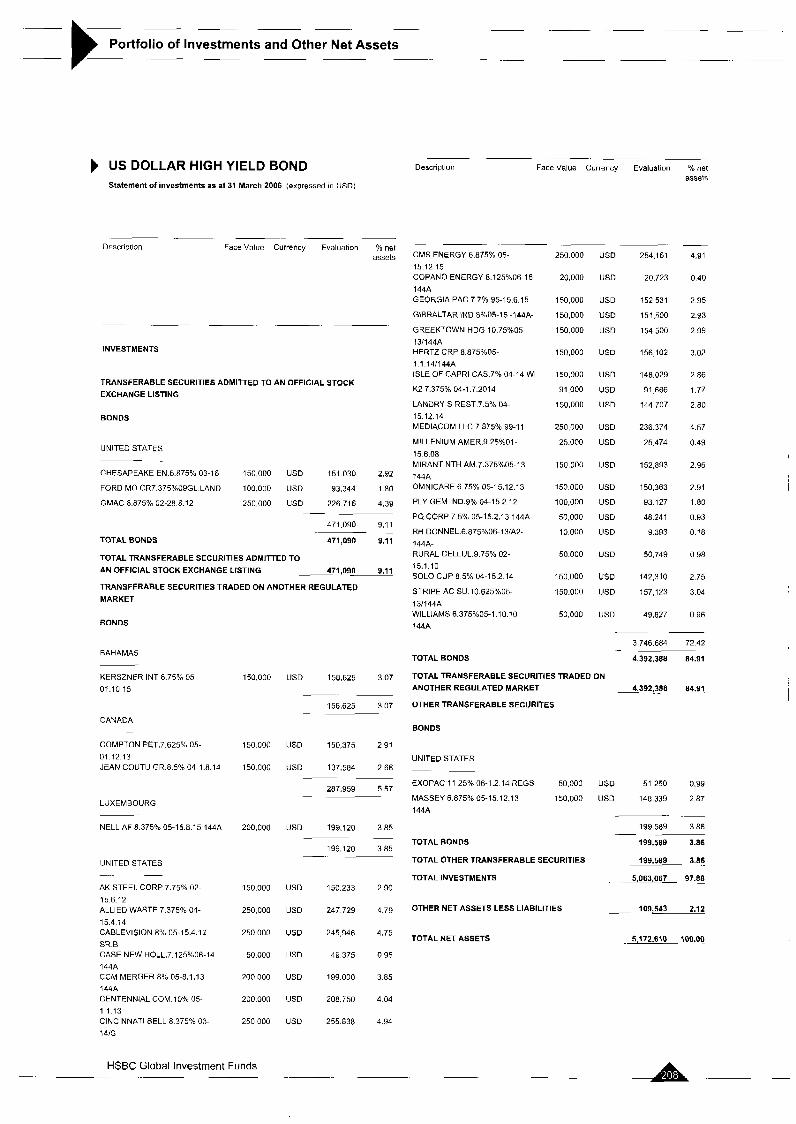
- -- ~- ~ .-
Portfolio of Investments and Other Net Assets - -
US DOLLAR HIGH YIELD BOND Statement of investments as at 31 March 2006 (oxpressed in USD)
~ .- ~- ~ - Description Face Value Currency Evaluation % net
assets
INVESTMENTS
TRANSFERABLE SECURITIES ADMITTED TO AN OFFICIAL STOCK
EXCHANGE LISTING
BONDS
UNITED STATES ~.
CHESAPEAKE EN 6 875'Yo 03-16 150,000 US0 151 030
FORD MO CR7 375%09GL LAND 100 000 USD 93.344
GMAC 6 875% 02-28 8 12 250,000 USD 226716
471 090
- -
TOTAL BONDS 471,090
TOTAL TRANSFERABLE SECURITIES ADMITTED TO
AN OFFICIAL STOCK EXCHANGE LISTING
TRANSFERABLESECURITIESTRAOEDONANOTHERREGULATED MARKET
4 7 1 , 0 9 L
BONDS
BAHAMAS
KERSZNER INT 6.75% 05- 01.10 15
CANADA
COMPTON PET.7.625% 05- 01.12.13 JEAN COUTU GR 8 5% 04-1.8.14
LUXEMBOURG
NELL AF 8.375% 05-15.8.15 144A
~. .
UNITED STATES
AK STEEL CORP 7 75% 02-
15.6.12 ALLIED WASTE 7.375C 04- 1 5 4 14 CABLEVISION 8% 05-15.4 12
SR.B CASE NEW HOLL.7.125%06-14
144A CCM MERGER 896 05-8.1.13 144A CENTENNIAL COM.lO% 05-
1 1.13 CINCINNATI BELL 8 375% 03-
14;s
150 000
150 000
I 50 o w
200,000
150.000
250,000
250 000
50.000
200,000
200,000
250 000
2.92
1 .80
4.39
9.1 1
9.11
-
-
9.11
USD 158.625 3 0 7
-. ~
158,625 3.07 -
Description Face Valile Currency Evaluation Yo net assets
CMS ENERGY 6.875% 05- 15.12 15 COPANO ENERGY 8.125%06-I6 144A GEORGIA PAC.7.7% 95-15.6.15
GIBRALTAR IND 8%05-15 -144A-
GREEKTOWN HOG 10.75%05-
13/144A HERTZ CRP 8.8757005- 1 .I .14/144A ISLE OF CAPRI CAS.7% 04-14 WI
K2 7.375% 04-1 7.2014
LANDRY S REST 7.5% 04- 15 12.14 MEDIACOM LLC 7 875% 99-11
MlLLENlUM AMER.9.25%01-
15 6.08 MIRANT NTH AM 7.375%05-13
144A OMNICARE 6.75% 05-15.12.13
PLY GEM IND.9"h 04-15 2 12
PQ CORP 7.5% 05-15.2.13 144A
RH 00NNEL.6.875%06-13/A2-
144A- RURAL CELLUL.9.75"/e 02-
15.1.10 SOLO CUP 8 5% 04-15.2 14
STRIPE AC su.10 m ~ ~ o 5 - 13/144A WILLIAMS 6.375"%05-1.10 10 144A
250.000 USD
20.000 US0
150,000 USD
150,000 US0
150000 USD
150,000 US0
150,000 US0
91,000 US0
150,000 USD
250,000 USD
25.000 US0
150000 USD
150,000 US0
100,000 USD
50,000 US0
10000 US0
50000 US0
150.000 USD
150.000 US0
50.000 US0
254,161
20.723
152 531
151.500
154.500
156,102
148.029
91 686
144 707
236 374
25,474
152 893
150,363
93.127
48 241
9.393
50.i49
142,310
157,123
49,827
A.91
0.40
2.95
2.93
2.99
3.02
2 a6
1.77
2.80
4.57
0.49
2.96
2.91
1.80
0 93
0.18
0 98
2 75
3.04
0.96
TOTAL BONDS
TOTAL TRANSFERABLE SECURITIES TRADED ON
ANOTHERREGULATEDMARKET
OTHER TRANSFERABLE SECURITES
BONDS
US0 150,375 2 9 1
USD 137.584 2 66
287.959 5 5 7
-~
-. ..
USD 199.120 3.85
199,120 3.85
~~
-.
USD 150.233 2 9 0
US0 247729 4.79
USD 245,946 4.75
US0 49375 0 9 5
USD 199,000 3.85
US0 208.750 4.04
US0 255838 4.94
UNITED STATES -. ~
EXOPAC 11 25% 06-1.2 14 REGS 50.000
MASSEY 6.875% 05-15.12.13 15n.ooo 144A
TOTAL BONDS
TOTAL OTHER TRANSFERABLE SECURITIES
TOTAL INVESTMENTS
OTHER NET ASSETS LESS LIABILITIES
TOTAL NET ASSETS
USD 51 290 0.99
USD 148,339 2 8 7
.~
- 199,589 386
199,589 3.86
199.589 . 3.88
5,063,067 97.88
- 109,543 2.12
5,172.610 . 100.00
- - 3,746.684 72.42
4,392.388 84.91 -
4,392,388 64.91
HSBC Global Investment Funds - - A . - .-
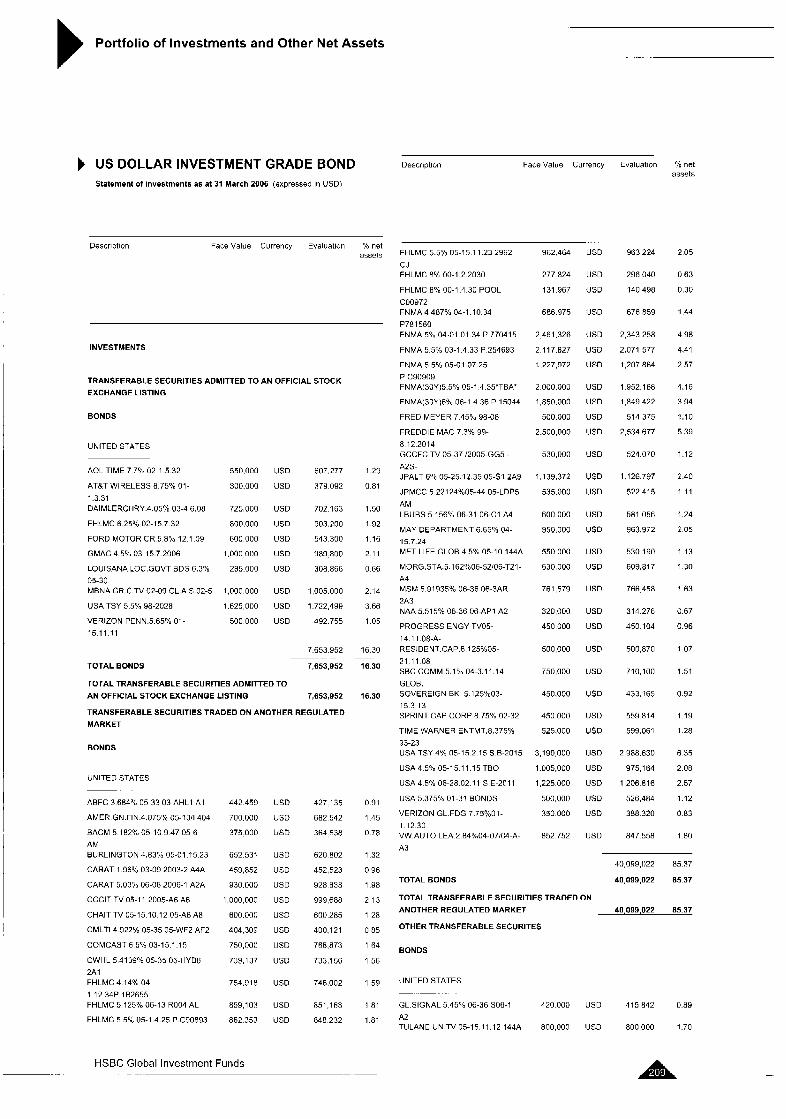
-. -
Portfolio of Investments and Other Net Assets . _... ..
US DOLLAR INVESTMENT GRADE BOND Statement of investments as at 31 March 2006 (expressed in USD)
Description Face Value Currency Evaluation 'YO net assets
INVESTMENTS
TRANSFERABLE SECURITIES ADMITTED TO AN OFFICIAL STOCK EXCHANGE LISTING
BONDS
UNITED STATES
AOL TIME 7 7% 02-1.5 32
ATBT WIRELESS 8.75% 01-
1.3 31 DAIMLERCHRY.4.U5% 03-4.6.08
FHLMC 6 25% 02-15.7.32
FORD MOTOR CR 5 8% 12.1.09
GMAC 4.5% 03-15.7 2006
LOUISANA LOC.GOVT BDS 6.3% 05-30 MBNA CR.C.TV 02-09 CL.A 5.02-5
USA TSY 5.5% 98-2028
VERIZON PENN.5.65"h 01-
15 11 11
55n.ooo
300.000
725.000
noo.ooo 600 000
1,000 000
285 000
1,000.000
1.625 000
500 000
US0
US0
US0
US0
USD
US0
USD
USD
USD
USD
607.277
379.092
702 163
903.200
543 300
989 800
308.866
1,005.000
1.722 499
492 755
7.653 952
1 29
0 81
1.50
1 92
1 1 6
2.1 1
0 66
2.14
3.66
1.05
16.30
TOTAL BONDS 7,653,952
TOTAL TRANSFERABLE SECURITIES ADMITTED TO AN OFFICIAL STOCK EXCHANGE LISTING 7,653.952
TRANSFERABLE SECURITIES TRADED ON ANOTHER REGULATED MARKEl
BONDS
UNITED STATES
ABFC 3.684% 05-33 03-AHLI A I
AMER GN.FIN.4.875% 05-1311 404
BACM 5 182% 05-10 9.47 05-6
AM BURLINGTON 4.83% 05-01.15.23
CARAT 1.96% 03-09 20(13-2 A4A
CARAT 5.03'k 06-08 2006-1 A2A
CCCIT TV 05-1 1 2005-A6 A6
CHAlTTV05-15 10.12 05-A8A8
CMLTI 4.922% 05-35 05-WF2 AF2
COMCAST 6 5% 03-15.1.15
CWHL 5 4139Ob 05-35 05-HYB8
2A1 FHLMC 4.14% 04-
I .I 2.34P.182655 FHLMC 5 125% 06-13 ROO4 AL
FHLMC 5 S t 05-1.4.25 P.C90893
442 459
700,000
375 000
652 531
4 5 9 , ~ s ~
930.000
1,000,000
600.000
404.309
750,000
739,137
7s4.yin
859,1113
862.353
USD
USD
USD
US0
US0
US0
US0
us0 USD
U S 0
US0
US0
US0
USD
427 135
682 542
364 538
620 802
452,523
928 838
600.285
999.688
400.121
768.073
733,156
746.002
mi ,i f in
848 232
16.30
16.30
0.91
1.45
0.78
1.32
0.96
1.98
2 13
I 28
0 85
1.64
1.56
1.59
1 n i 1.81
Description Face Value Currency Evaluation % net assets
FHLMC 5.5% 115-15 11 23 2962
CJ FHLMC 8% 00-1.2.2030
FHLMC 8% 00-1.4.30 POOL
COO972 FNMA4 487% 04-1.10.34
P781560 FNMA 5 % 04-01 01.34 P 770415
FNMA 5.5% 03-1 4.33 P 254693
FNMA 5 5% 05-01.07.25 P c90909 FNMAl30YJ5.5% 05-1 4.35'TE.A'
FNMA(30Y)6% 06-1 4 36 P 15044
FRED MEYER 7 45% 98-08
FREDDIE MAC 7.3% 99- 8.12.2014 GCCFC TV 05-37 !2005-GG5 - A2S- JPALT 6% 05-25 12 35 05-SI 2A9
JPMCC 5 22124%05-44 05-LOP5
AM LBUBS 5.156% 06-31 06-C1 A4
MAY DEPARTMENT 6.65% 04-
1s 7.24 MET LIFE GLOB 4.5% 05-10 144A
MORG.STA.5.162Yo06-52~06-T21- A4 MSM 5.91935% 06-36 06-3AR 2A3 NAA 5.515% 06-36 06-AP1 A2
PROGRESS ENGY TV05-
14.11 08-A- RESIDENT.CAP.G.lZS'hO5-
21 11 08 SBCCOMM.5 1% 04-3.11.14
GLOB. SOVEREIGN BK 5.125"/03- 15 3 13 SPRINT CAP.CORP 8.75% 02-32
TIME WARNER ENTMT.8.375%
93-23 USA TSY 4% 115-15 2.15 S 6-2015
USA45°~n05-15.11.15TB0
USA 4 5% 06-28.02 11 S E-201 1
USA 5.375% 01-31 BONDS
VERIZON GL.FDG 7.75%01-
1.12.30 VW.AUT0 LEA 2.84%04-071C4-A-
A3
962464 USD
277824 USD
131 967 USD
686975 USD
2461 326 US0
2 117.827 US0
1,227,972 US0
2000.000 US0
I ,850.000 USD
500.000 US0
2.500,OOO l lS0
530,000 US0
1,139,372 US0
535.000 US0
600000 USD
950000 USD
550000 USD
630000 USD
761,579 USD
320000 USD
450000 US0
500,000 US0
750,000 US0
450.000 US0
450000 USD
525.000 US0
3,190000 US0
1,005,000 USD
1.225000 USD
500,000 USD
350000 USD
852752 US0
963 224
296 040
140,498
676,859
2,343 258
2,071,577
1,207 864
1 952.188
1,849.422
514,375
2,534,677
524.070
1 126.797
522.415
581 056
963,972
530 190
609,817
766 458
314 276
450 104
500,870
710,100
433.165
559 814
599.061
2,988.630
975,164
1,206 816
526,484
388 320
847 558
2 05
0.63
0.30
1.44
4.98
4.41
2.57
4.16
3.94
1.10
5.39
1.12
2.40
1.11
1.24
2 05
1 1 3
I 30
1 63
0.67
0.96
1.07
1.51
0.92
1 1 9
I .2n
6 35
2 08
2.57
1.12
0.83
1.80
TOTAL BONDS
40,099,022 85.37
40,099,022 85.37
TOTAL TRANSFERABLE SECURITIES TRADED ON
ANOTHER REGULATED MARKET 40,099,022 85.37
OTHER TRANSFERABLE SECURITES
BONDS
UNITED STATES - .
GL SIGNAL 5 45% 06-36 SO6-1 420000 US0 415842 0 8 9
A2 TULANE UN TV 05-15 11 12 144A 800,000 US0 800,000 1 70
HSBC Global Investment Funds
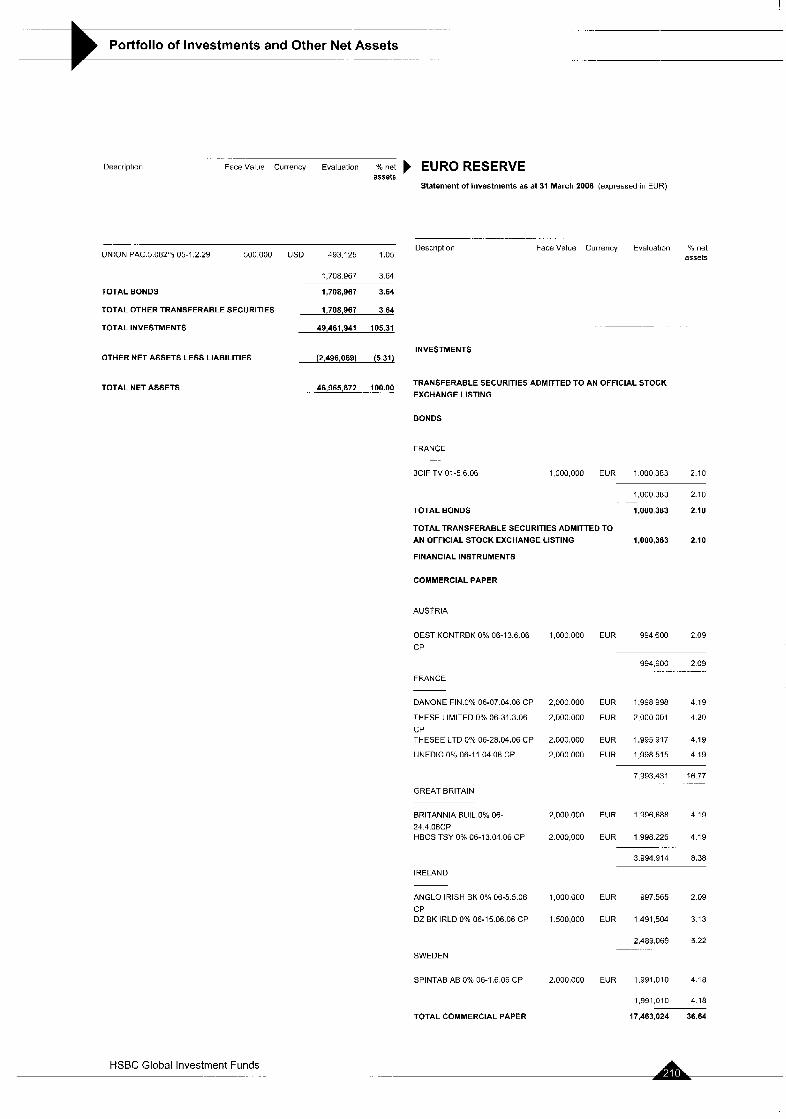
-_ .__ ..
Portfolio of Investments and Other Net Assets .-
Descrietian .......
Face value Currency Evaluation % net EURO RESERVE a s s m
Statement of Investments a5 at 31 March 2006 [expressed in EUR)
....... ._ . .
Description Face Value Currency Evaluation % net assets UNION PAC 5 082"'o 05-1.2 29 500,000 US0 493,125 1.05
1,708 967 3.64
TOTAL BONDS
TOTAL OTHER TRANSFERABLE SECURITIES
TOTAL INVESTMENTS
1,708,967 3.64
1.708.967 3.64
49,461.941 105.31
(2.A96.069) (5.31)
. 46,965,872 100.00 .~
INVESTMENTS OTHER NET ASSETS LESS LIABILITIES
TRANSFERABLE SECURITIES ADMITTED TO AN OFFICIAL STOCK EXCHANGE LISTING
TOTAL NET ASSETS
BONDS
FRANCE -.
3CIF TV 01-5 6.06 1000,000 EUR 1000383 2 10
1,000 383 2 10
1,000,383 2 I O -. ..
TOTAL BONDS
TOTAL TRANSFERABLE SECURITIES ADMITTED TO
AN OFFICIAL STOCK EXCHANGE LISTING
FINANCIAL INSTRUMENTS
1,000,383 2.10
EUR 994600 2.09
COMMERCIAL PAPER
AUSTRIA
OEST KONTRBK 0% 06-13.6.06
CP
1,000 000
2,000 000
2,000.000
2,000,000
2.000 000
2,000.000
2 000,000
1,000 000
1 500,000
2.000,000
994,600 2 0 9
FRANCE
DANONE FIN 0% 06-07 04 06 CP
THESE LIMITED O'X 06-31.3.06
CP THESEE LTD 0% 06-28.04.06 CP
UNEDIC 0% 08-11 04 06 CP
EUR 1.998998 4 19
EUR 2,000001 4.20
EUR 1.995917 4.19
EUR 1,998515 4 19
7,993,431 16 77
GREAT BRITAIN
BRITANNIA BUIL.O% 06- 24.4.0fiCP HBOS TSY 0% 06-13.04 06 CP
EUR 1996.688 4 19
EUR 1998.226 4 19
3.994 914 8.38
IRELAND
ANGLO IRISH BK 0% 06-5.5.06
CP DZ BK IRLD 0% 06-15 06 06 CP
EUR 997565 2.09
EUR 1491,504 3.13
2,489,069 5 22
SWEDEN
SPINTAB AB 0% 06-1.6.06 CP EUR 1,991,010 4 18
i , w i , o i o 4.18
TOTAL COMMERCIAL PAPER 17,463,024 36.64
HSBC Global Investment Funds . -
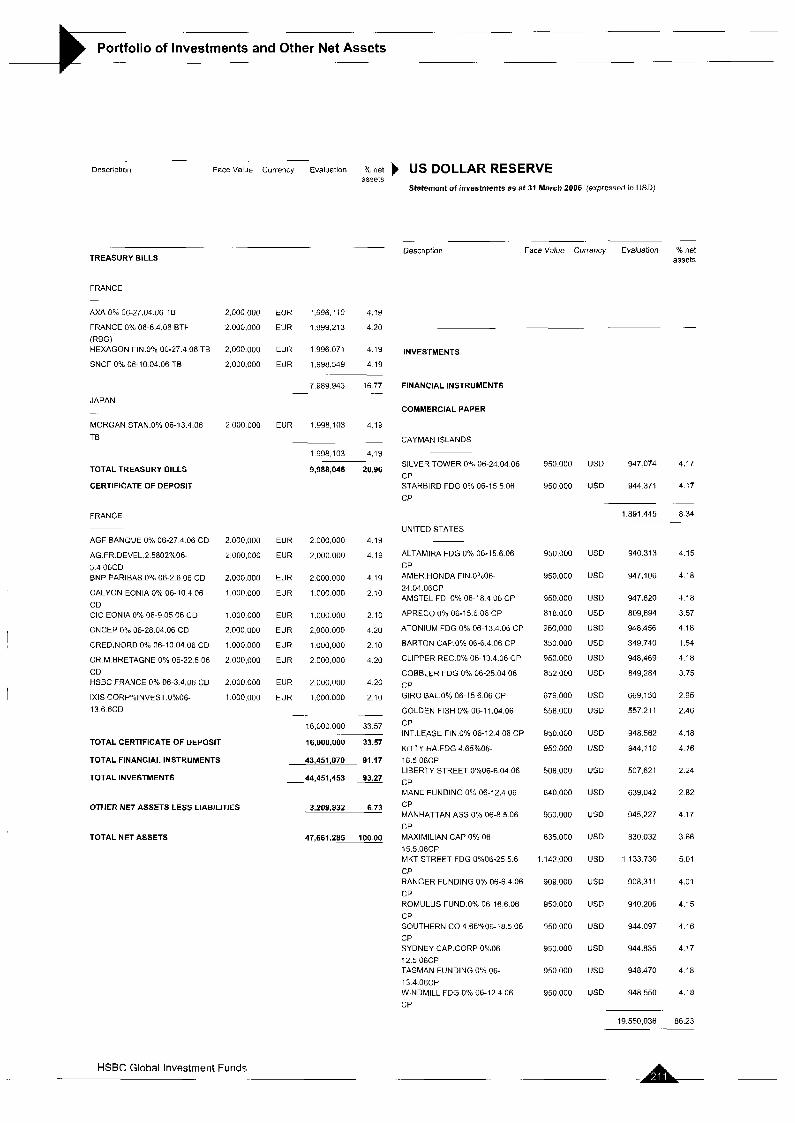
~
Portfolio of Investments and Other Net Assets -~
Dcscriptian Face Value Currency Evaluation 31, net US DOLLAR RESERVE
TREASURY BILLS
FRANCE -
AXA 0% 06-27.04 06 TB
FRANCE 0% 06-6 4.06 BTF
(RBG) HEXAGON FIN 0% 06-27 4 06 TB
SNCF 0% 06-10 04.06 TB
JAPAN -
MORGAN STAN.O"h 06-13.4.06
TE
TOTAL TREASURY BILLS
CERTIFICATE OF DEPOSIT
FRANCE
AGF BANQUE 0% 06-27 4 06 CD
AG FR DEVEL 2 5802O/uO6- 3 4 06CD ENP PARIBAS 0% 06-2 6 06 CD
CALYON EONIA 0% 06-10 4 06 CD CIC EONIA 0% 06-9 05 06 CD
CNCEP On, 06-28 04 06 CD
CRED NORD 0'0 06-10 U4 06 CD
CR M BRETAGNE 0% 06-22 5 06 CD HSBC FRANCE 0% 06-3 4 06 CD
1x1s C0RP"blNVEST 0%06- 13 6 6CD
assets
2.000 000
2 000.000
2,000 000
2,000.000
2 000 000
2.000,000
2 000,000
2,000.000
1.000 000
1,000 000
2 oou [loo
1 000 000
2.000,ooo
2.000 000
1 000.000
EUR 1,996.110 4.19
EUR 1.999213 4.20
EUK 1996071 4.19
EUR 1,998.549 4 19
7 989.943 16.77 . .-
EUR l.YY8,103 419
- 1998.103 4.19
9,988,046 20.96
EUH 2 000,000 4.19
EUR 2.000.000 4.19
EUR 2000.000 4 19
EUR 1.000.000 2 10
EUR 1.OOO.l)0U 2 10
EUR 2.000000 4.2U
EUR lUUO000 210
EUR 2000,000 420
EUR 2.000.000 4.20
EUR 1,000 000 2.10
-_ __ 16,000 000 33.57
TOTAL CERTIFICATE OF DEPOSIT
TOTAL FINANCIAL INSTRUMENTS
TOTAL INVESTMENTS
OTHER NET ASSETS LESS LIABILITIES
TOTAL NET ASSETS
16,000,000 33.57
43,451,070 91.17
-. 44,451,453 93.27
3.209.832 6.73
47,661.285 100.00
HSBC Global Investment Funds
Statement of investments as at 31 March 2006 (expressed in USD)
. . - -.
Description Face Value Currency Evaluation % net assets
INVESTMENTS
FINANCIAL INSTRUMENTS
COMMERCIAL PAPER
CAYMAN ISLANDS
SILVER TOWEH 0'" 06-24 04 06 CP STARBIRD FOG 0% 06-15 5 I16 CP
UNITED STATES
ALTAMIRA FOG 0% 06-15 6 06 CP AMER.HONDA FIN.U0006-
24.04.06CP AMSTEL FD. 0% 06-18.4 06 CP
APRECO 0% 06-15 6 06 CP
ATONIUM FDG 0% 06-13.4 OB CP
BARTON CAP.O% 06-6.4 06 CP
CLIPPER REC.O% 06-13.4.06 CP
COBBLER FOG 0% 06-25.04 06 CP GIRO EAL.O% 06-15 6.06 CP
GOLDEN FISH 0% 06-11.04.06 CP INT.LEASE FIN Oo/r 06-12.4 OB CP
KITTY HA.FDG 4.65%06- 18.5 06CP LIBERTY STREET 0%06-6.04 06 CP MANE FUNDING On; 06-12.4 06 CP MANHATTAN ASS.O% 06-8 5.06 CP MAXlMlLlAN CAP 0% 06- 15.5.06CP MKT STREET FOG 0%06-25 5.6 CP RANGER FUNDING 0% 06-6.4.06 CP ROMULUS FUND 0% 06-16 6.06 CP SOUTHERN CO 4.66"/006-18 5 06 CP SYDNEY CAP.CORP 0°/006- 12 5 06CP TASMAN FUNDING 0% 06- 13.4.06CP WINDMILL FOG 0% 06-12 4.06 CP
950.000
950,000
950 000
950.000
950.000
818,000
950,000
350 000
950.000
852 ooo
676 000
558.000
950.000
950 000
508.000
640.000
950.000
835.000
1.142,OOU
909 000
950.000
950,000
950 000
950.000
950,000
USD 947074 4.17
US0 944371 4 17
-
1.891 445 834
USD
US0
USD
USD
US0
US0
USD
USD
U S 0
USD
USD
USD
USD
USD
US0
USD
USD
US0
USD
US0
US0
USD
USD
940.313
947,106
947 820
809,694
948.456
349 740
948,469
849,284
669.150
557 21 1
948.562
944.110
507 621
639 U42
945.227
830 032
1 133 730
908.31 1
940 206
944 097
944.835
948 470
948 550
4 15
4.18
4.18
3 57
4 18
1.54
4.18
3 75
2.95
2.46
4 18
4.16
2.24
2.82
4 17
3.66
5.01
4.01
4.15
4.16
4 17
4.18
4.18
19,550,036 86.23 ~ .-
-A
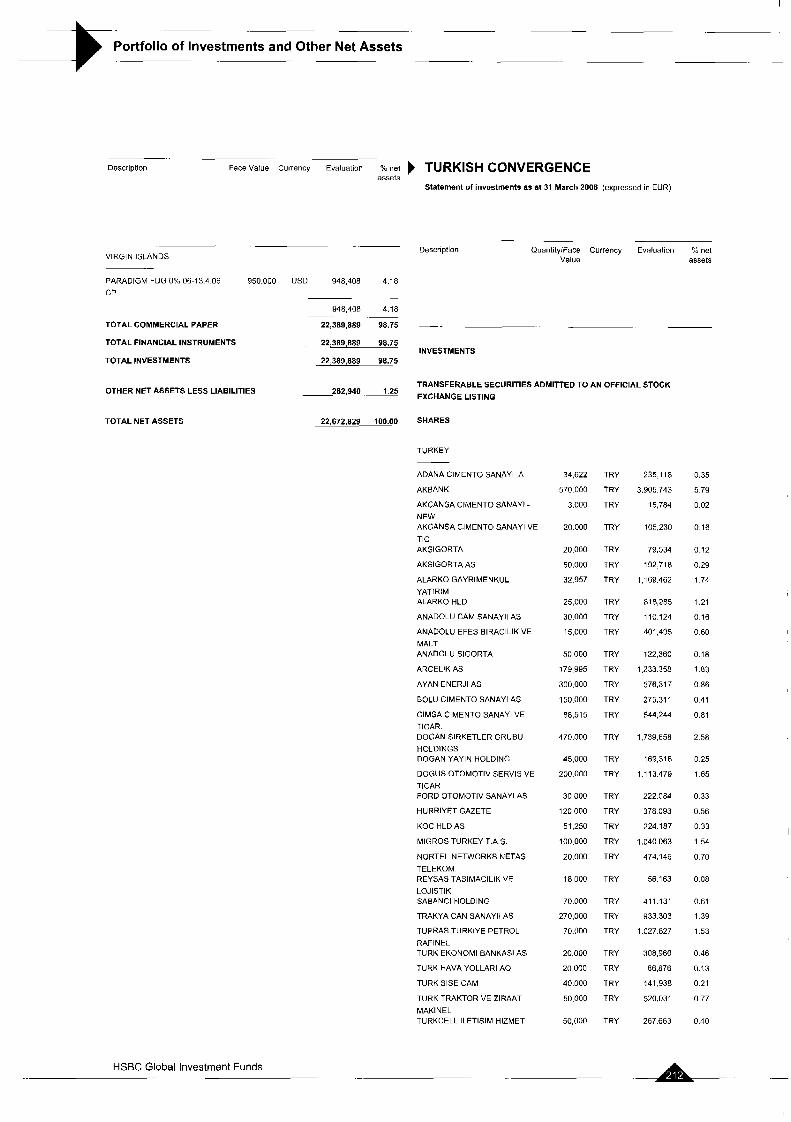
~-
Portfolio of Investments and Other Net Assets -
- Doscriptlop Face Value currency Evaluation 01" net TURKISH CONVERGENCE
assets Statement of investments as at 31 March 2006 (expressed in EUR)
Description QuantityiFace Currency Evaluation "Ib net .
VIRGIN ISLANDS
PARADIGM FDG 0% 06-13.4 06 CP
950.000
TOTAL COMMERCIAL PAPER
TOTAL FINANCIAL INSTRUMENTS
TOTAL INVESTMENTS
OTHER NET ASSETS LESS LIABILITIES
TOTAL NET ASSETS
US0 948,408 418
-
948,408 4.18
22,389,889 96.75
22,389,889 98.75
. 22,389.889 98.75
~. .~
-282,940 . I .25
22,672.829 100.00
Value
INVESTMENTS
TRANSFERABLE SECURITIES ADMITTED TO AN OFFICIAL STOCK EXCHANGE LISTING
SHARES
TURKEY
ADANA CIMENTO SANAYI A
AKBANK
AKCANSA CIMENTO SANAYI - NEW AKCANSA CIMENTO SANAYI VE
TIC AKSIGORTA
AKSIGORTA AS
ALARKO GAYRIMENKUL
YATlRlM ALARKO HLD
ANADOLU CAM SANAYII AS
ANADOLU EFES BlRAClLlK VE MALT ANADOLU SIGORTA
ARCELIK AS
AYAN ENERJI AS
BOLU CIMENTO SANAYI AS
CIMSA CIMENTO SANAYI VE TICAR. DOGAN SIRKETLER GRUBU HOLDINGS DOGAN YAYIN HOLDING
DOGUS OTOMOTIV SERVIS VE
TICAR FORD OTOMOTIV SANAYI AS
HURRIYET GAZETE
KOC HLD AS
MIGROS TURKEY T.A S.
NORTEL NETWORKS NETAS
TELEKOM REYSAS TASlMAClLlK VE
LOJlSTlK SABANCI HOLDING
TRAKYA CAN SANAYII AS
TUPRAS TURKIYE PETROL
RAF I N EL TURK EKONOMI BANKASI AS
TURK HAVA YOLLARI A 0
TURK SlSE CAM
TURK TRAKTOR VE ZIRAAT
MAKINEL TURKCELL ILETISIM HIZMET
34,622
570 000
3,000
20.000
20,000
50.000
32.957
25,000
30,000
15,000
50,000
179 995
300.000
150,000
88.515
470,000
A5.000
200.000
30,000
120,000
51.250
100,000
20,000
18 000
70.000
270.000
70,000
20,000
20,000
40 000
50,000
50,000
TRY
TRY
TRY
TRY
TRY
TRY
TRY
TRY
TRY
TRY
TRY
TRY
TRY
TRY
TRY
TRY
TRY
TRY
TRY
TRY
TRY
TRY
TRY
TRY
TRY
TRY
TRY
TRY
TRY
TRY
TRY
TRY
235.118
3.905 743
15,784
105.230
79,534
192718
1,169,462
8 18,285
110 124
401,495
122,360
1.233.358
576,317
275.31 1
544,244
1,739,658
169,316
1.113.479
222 ORA
378 093
224 187
1,040 063
474.146
56 163
411 131
933.303
1.027 827
308,960
86,876
141.938
520,031
267.663
assets
0.35
5 79
0.02
0.16
0 12
0.29
1.74
1.21
0 16
0 60
0.18
183
0.86
0.41
0.81
2 58
0 25
1.65
0 33
0.56
0 33
1.54
0.70
0 08
0.61
1.39
1.53
0 46
0.13
0.21
0.77
0.40
A- HSBC Global Investment Funds -
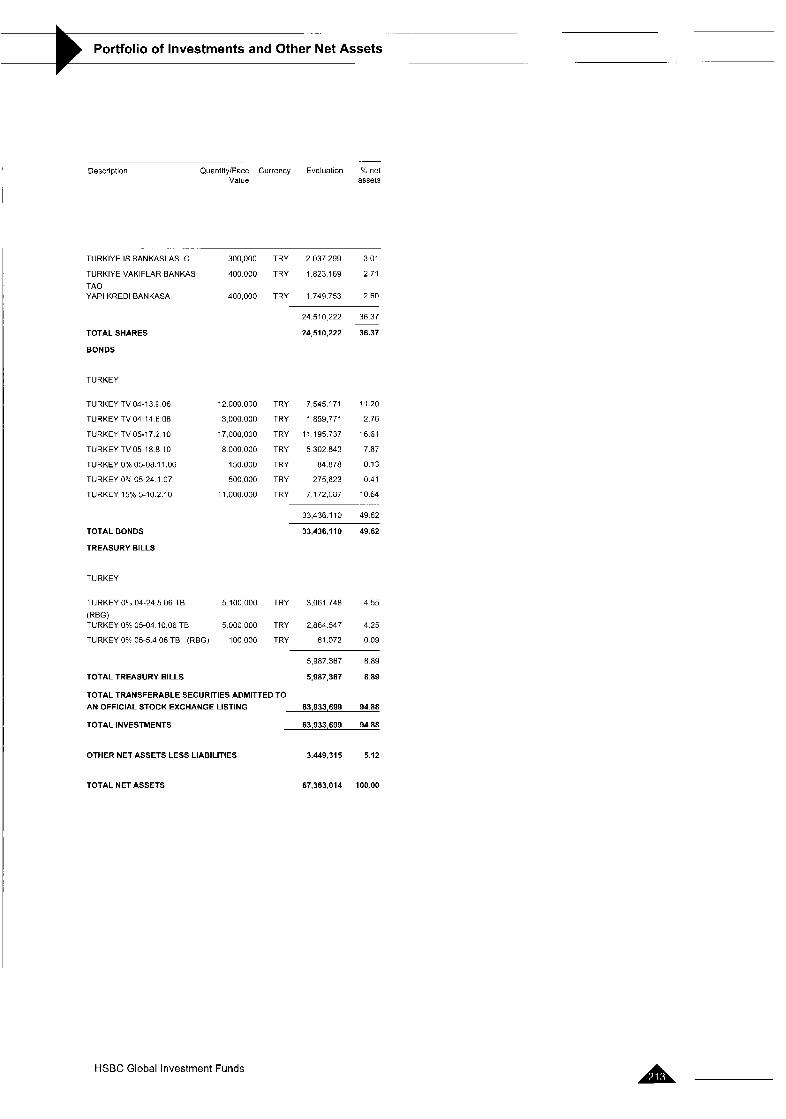
.-
Portfolio of Investments and Other Net Assets
.- -__ Description QuantitylFace Currency Evaluation C net
Value assets
. . . . .... - .
TURKIYE IS BANKASI AS C 300,000 TRY 2 037.299 3.01
TURKIYE VAKIFLAR BANKASI 400000 TRY 1.823.169 2 7 1
TAO YAW KREDI BANKASA 400,000 TRY 1.749.753 2 fiO
TOTAL SHARES
BONDS
TURKEY
TURKEY TV 04-13 9 06
TURKEY TV 04-14 6 06
TURKEY TV 05-17 2 10
TURKEY TV05-18 8 10
TURKEY 0% 05-08 11 06
TURKEY O Y 05-24 1 07
TURKEY 15% 5-10 2 10
TOTAL BONDS
TREASURY BILLS
12 000000 TRY
3 OOO.OOf1 TRY
17 000,000 TRY
8000,000 TRY
150.000 TRY
500.000 TRY
1 1 ono.ooo TRY -
24.510 222 36.37
24,510,222 36.37
7,545 171
1 859,771
11 195 737
5 302 843
84 878
275.623
7 172,087
33.436 110
33,438,l I O
11 20
2 76
16 61
7.87
0 13
0.41
10 64
49 62
49.62
.. ..
~
TURKEY
TURKEY 09? 04-24.5.06 TB 5 100000 TRY 3.061 748 4.55
(REG) TURKEY 0% 05-04 10.06 TB 5.000000 TRY 2,864 547 4.25
TURKEY O"4 05-5.4.06 TB (RBG) 100,000 TRY 61.072 0.09
TOTAL TREASURY BILLS
5,987.367 8.89
5,987,367 8.89
TOTAL TRANSFERABLE SECURITIES ADMITTED TO
AN OFFICIAL STOCK EXCHANGE LISTING 63,933,699 94.88
TOTAL INVESTMENTS 63,933,699 94.88
OTHER NET ASSETS LESS LIABILITIES 3,449,315 5.12
TOTAL NET ASSETS 67,383,014 100.00
Ah HSBC Global Investment Funds
-
)vestments and Other Net Assets __
The detailed list of movements in the investment portfolio can be obtained free of charge upon request at the registered office of the Company. The current prospectus, the articles of association as well as the interim report and the audited annual report are available free of charge upon request from the German payment and information office.
HSBC Global Investment Funds - .._ . -_-_ -. A . .. .
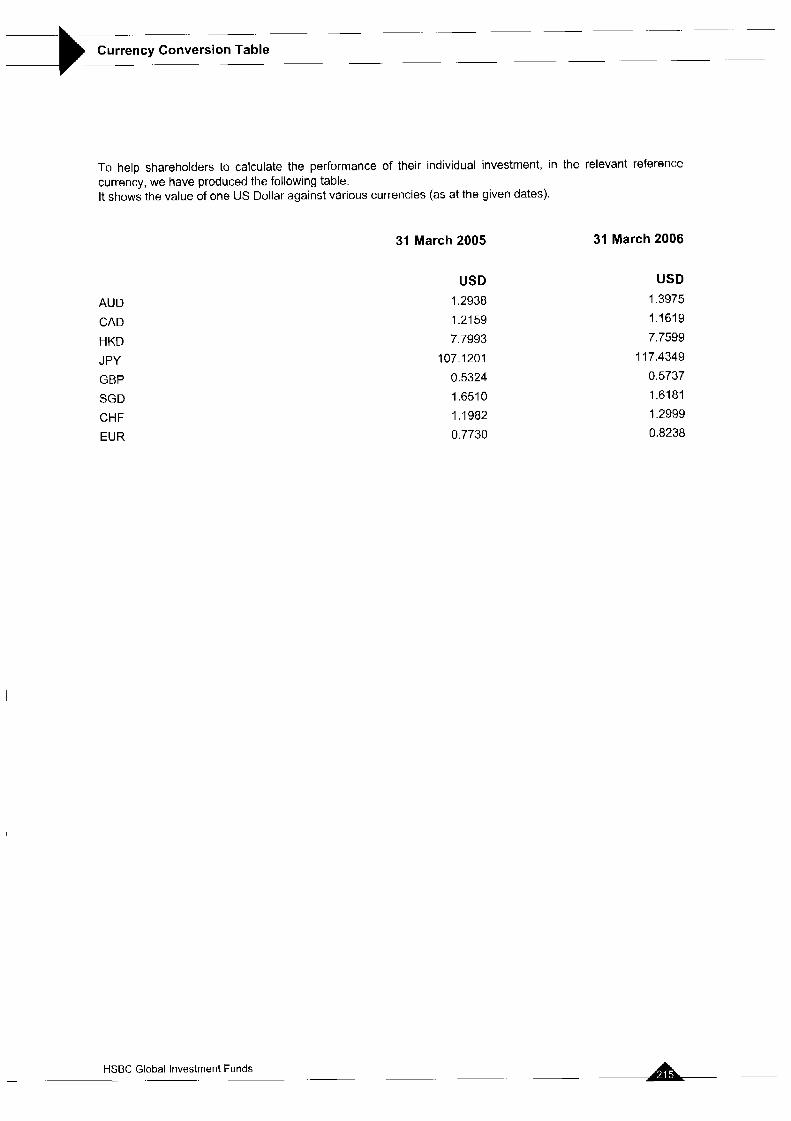
To help shareholders to calculate the performance of their individual investment, in the relevant reference currency, we have produced the following table. It shows the value of one US Dollar against various currencies (as at the given dates).
AUD
CAD
HKD J PY GBP
SGD
CHF EUR
31 March 2005
USD 1.2938 1.21 59 7.7993
107.1201 0.5324 1.651 0 1.1982 0.7730
31 March 2006
USD 1.3975 1.1619 7.7599
I 17.4349 0.5737 1.6181 1.2999 0.8238
A- HSBC Global Investment Funds .~ -
Dealing for Shares of the Company will take place on any Business Day (a day on which banks are open for normal banking business in Luxembourg) other than days during a period of suspension of dealing in Shares provided that, for sub-funds materially invested in markets other than North or South American markets, such Business Day is a day where stock exchanges and regulated markets in countries where the sub-fund is materially invested are open for normal trading. For sub-funds materially invested in North or South American markets, dealing for Shares of the sub-fund will take place on any Business Day (other than days during a period of suspension of dealing in Shares ) except a Business Day following the day where stock exchanges and regulated markets in such countries were closed for normal trading.
Shareholders who deal through the Company's local distributor or representative should note that there will be no dealing for the Shares of the Company in the jurisdiction in which such distributor or representative operates on a day which is not a business day in such jurisdiction.
The Company will determine the dealinglnon-dealing calendar according to the latest market information obtained by the Company from time to time. Shareholders can obtain the latest dealinglnon-dealing calendar of the Company from the registered office of the Company or from the Company's local distributor or representative.
A HSBC Global Investment Funds . .~ ~
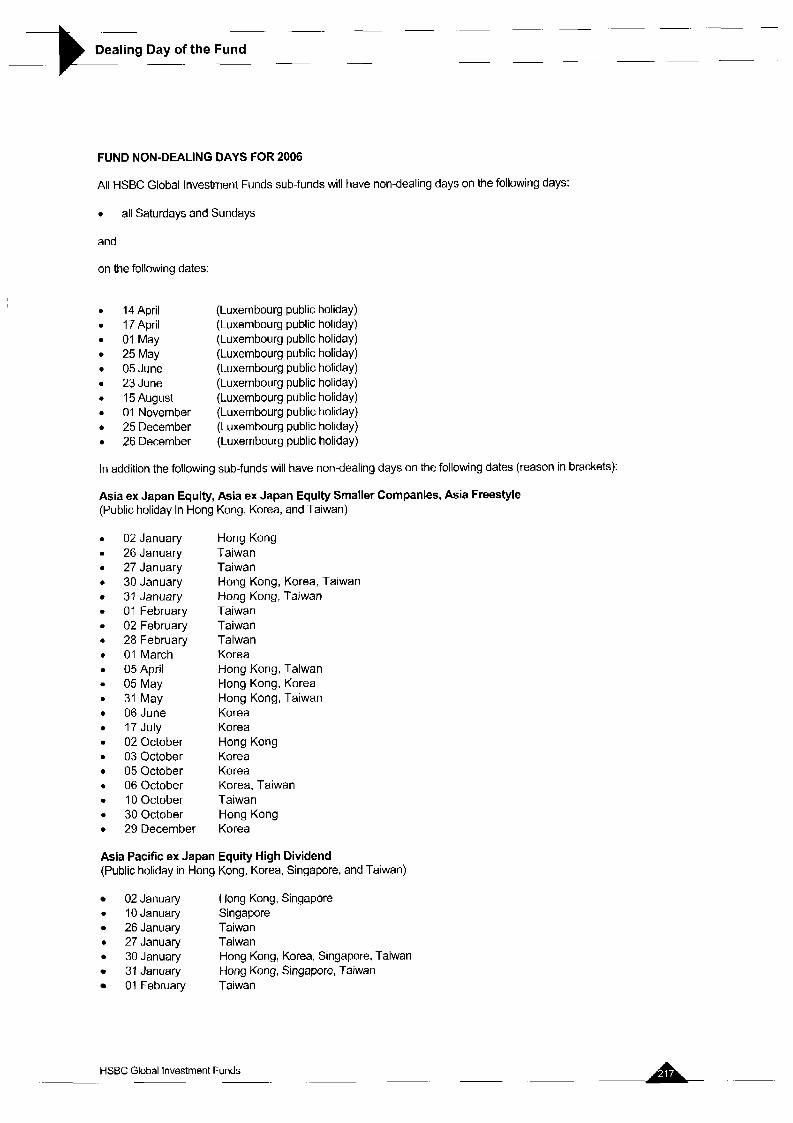
FUND NON-DEALING DAYS FOR 2006
All HSBC Global Investment Funds sub-funds will have non-dealing days on the following days:
e all Saturdays and Sundays
and
on the following dates:
14 April 17 April 01 May 25 May 05 June 23 June 15 August 01 November 25 December 26 December
(Luxembourg public holiday) (Luxembourg public holiday) (Luxembourg public holiday) (Luxembourg public holiday) (Luxembourg public holiday) (Luxembourg public holiday) (Luxembourg public holiday) (Luxembourg public holiday) (Luxembourg public holiday) (Luxembourg public holiday)
In addition the following sub-funds will have non-dealing days on the .Jlowing dates (reason in brac..:ts):
Asia ex Japan Equity, Asia ex Japan Equity Smaller Companies, Asia Freestyle (Public holiday in Hong Kong, Korea, and Taiwan)
02 January 26 January 27 January 30 January 31 January 01 February 02 February 28 February 01 March 05 April 05 May 31 May 06 June I 7 July 02 October 03 October 05 October 06 October 10 October 30 October 29 December
Hong Kong Taiwan Taiwan Hong Kong, Korea, Taiwan Hong Kong, Taiwan Taiwan Taiwan Taiwan Korea Hong Kong, Taiwan Hong Kong, Korea Hong Kong, Taiwan Korea Korea Hong Kong Korea Korea Korea, Taiwan Taiwan Hong Kong Korea
Asia Pacific ex Japan Equity High Dividend (Public holiday in Hong Kong, Korea, Singapore, and Taiwan)
02January Hong Kong, Singapore 0 I O January Singapore
26January Taiwan e 27January Taiwan
30January Hong Kong, Korea, Singapore, Taiwan 31 January Hong Kong, Singapore, Taiwan 01 February Taiwan
HSBC Global Investment Funds ~. ~. .~
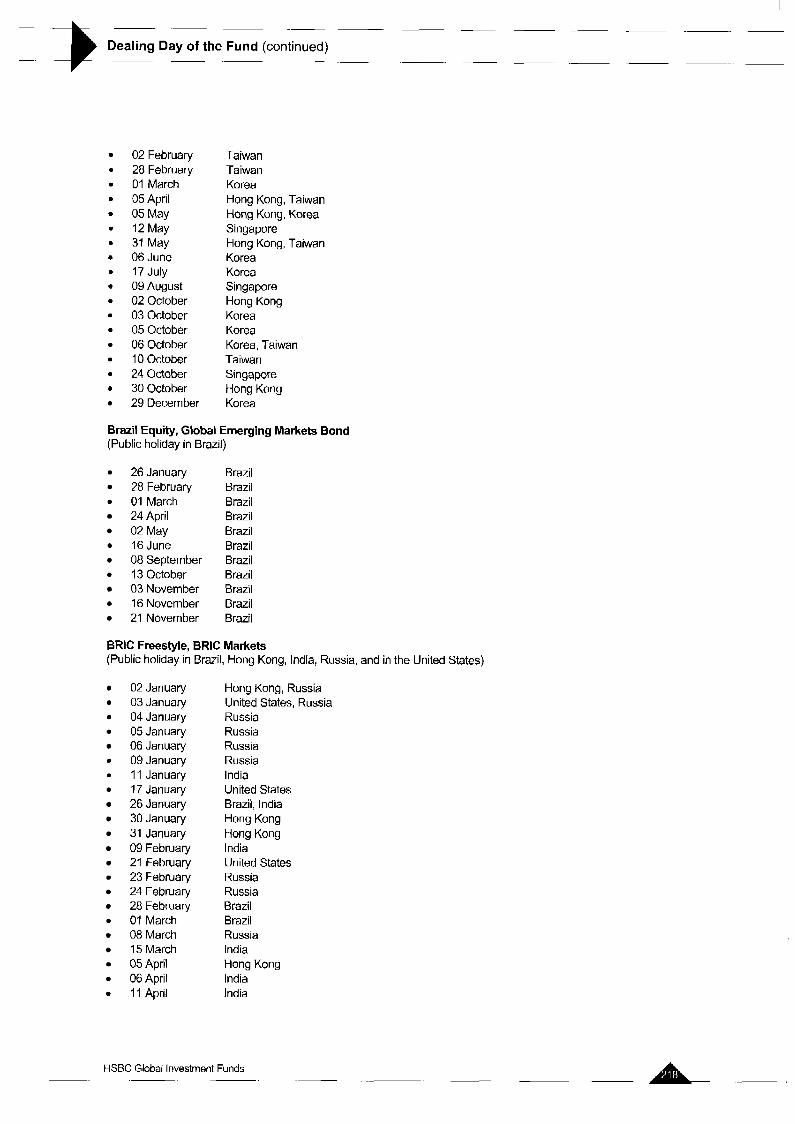
02 February 28 February 01 March 05 April 05 May 12 May 31 May 06 June 17 July 09 August 02 October 03 October 05 October 06 October 10 October 24 October 30 October 29 December
Taiwan Taiwan Korea Hong Kong, Taiwan Hong Kong, Korea Singapore Hong Kong, Taiwan Korea Korea Singapore Hong Kong Korea Korea Korea, Taiwan Taiwan Singapore Hong Kong Korea
Brazil Equity, Global Emerging Markets Bond (Public holiday in Brazil)
26January 28February 01 March 24 April 02May 16 June 08 September 13 October 03November 16November 21 November
Brazil Brazil Brazil Brazil Brazil Brazil Brazil Brazil Brazil Brazil Brazil
BRlC Freestyle, BRlC Markets (Public holiday in Brazil, Hong Kong, India, Russia, and in the United States)
02 January 03January 04January 05January 06January
c OSJanuary 0 11 January
17 January 26January 30January 31 January 09February 21 February 23February 24 February 28February 01 March 08 March 15 March 05April 06 April 1 1 April
Hong Kong, Russia United States, Russia Russia Russia Russia Russia India United States Brazil, India Hong Kong Hong Kong India United States Russia Russia Brazil Brazil Russia India Hong Kong India India
HSBC Global Investment Funds .~
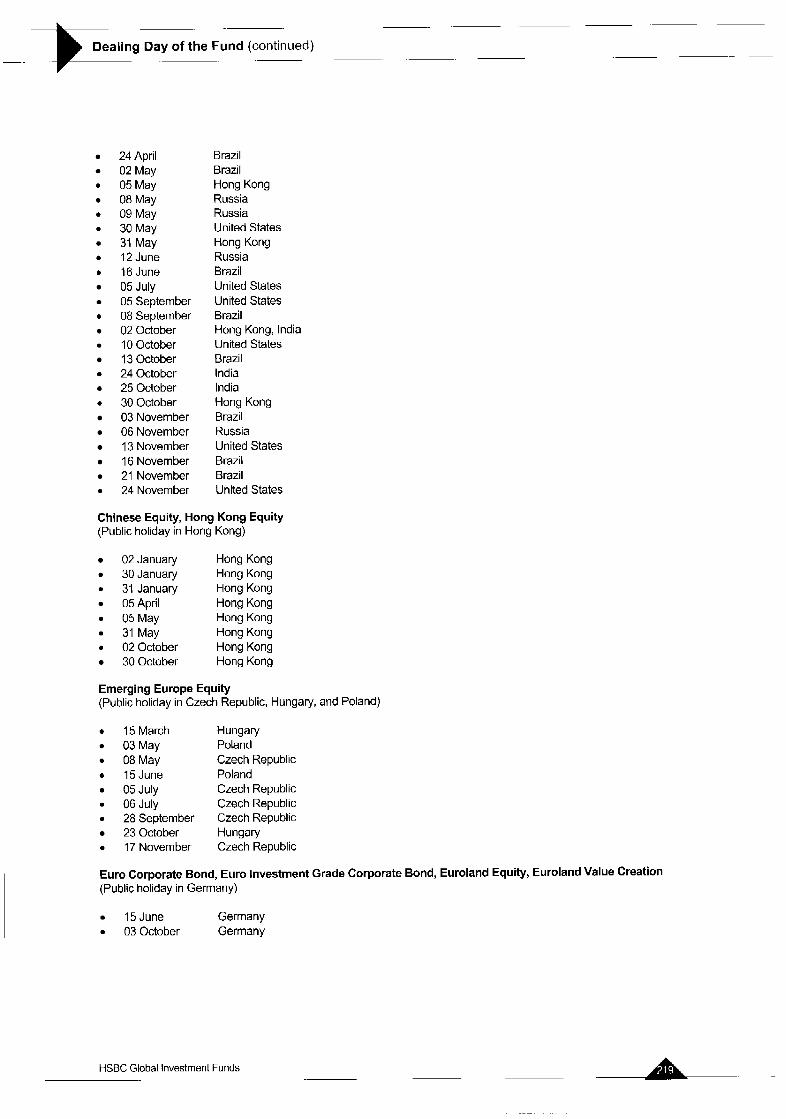
--- ~. -
-~ Dealing Day of the Fund (continued)
-~ ~ ~. -.
24 April 02May
0 05May 08May
0 09May 0 30May
31 May 0 12June 0 16June
05 July 05 September
0 08 September 02October 10 October 13 October 24October 25 October
0 30October 03November 06November 13 November 16 November 21 November 24November
Brazil Brazil Hong Kong Russia Russia United States Hong Kong Russia Brazil United States United States Brazil Hong Kong, India United States Brazil India India Hong Kong Brazil Russia United States Brazil Brazil United States
Chinese Equity, Hong Kong Equity (Public holiday in Hong Kong)
02January 30January
0 31 January 05 April 05May 31 May
0 02 October 30October
Hong Kong Hong Kong Hong Kong Hong Kong Hong Kong Hong Kong Hong Kong Hong Kong
Emerging Europe Equity (Public holiday in Czech Republic, Hungary, and Poland)
0 15 March 0 03May 0 08May 0 15 June
05 July 0 06 July 0 28 September
23October 17 November
Hungary Poland Czech Republic Poland Czech Republic Czech Republic Czech Republic Hungary Czech Republic
Euro Corporate Bond, Euro Investment Grade Corporate Bond, Euroland Equity, Euroland Value Creation (Public holiday in Germany)
15June Germany 03October Germany
HSBC Global Investment Funds .- -
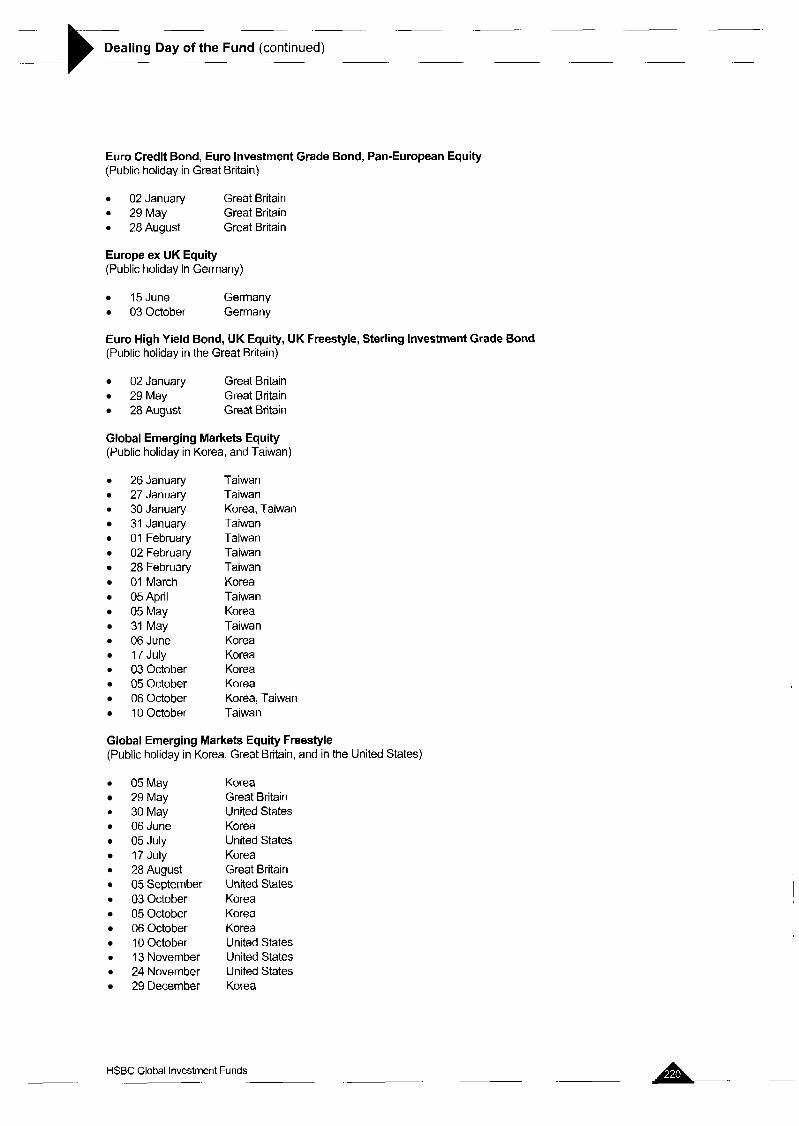
-
~- ) x a l i n g Day of the Fund (continued)
.~
Euro Credit Bond, Euro Investment Grade Bond, Pan-European Equity (Public holiday in Great Britain)
02 January Great Britain 29May Great Britain 28August Great Britain
Europe ex UK Equity (Public holiday in Germany)
15 June Germany 03October Germany
Euro High Yield Bond, UK Equity, UK Freestyle, Sterling Investment Grade Bond (Public holiday in the Great Britain)
02 January Great Britain 29May Great Britain 28August Great Britain
Global Emerging Markets Equity (Public holiday in Korea, and Taiwan)
26January 27Janualy 30January 31 January 01 February 02February 28February 01 March 05 April 05May 31 May 06 June 17 July 03October 05October 06October 10 October
Taiwan Taiwan Korea, Taiwan Taiwan Taiwan Taiwan Taiwan Korea Taiwan Korea Taiwan Korea Korea Korea Korea Korea, Taiwan Taiwan
Global Emerging Markets Equity Freestyle (Public holiday in Korea, Great Britain, and in the United States)
05May 29May
0 30May O6June 05 July 17 July 28August 05 September 03October 05October 06 October 10 October 13November 24November 29December
Korea Great Britain United States Korea United States Korea Great Britain United States Korea Korea Korea United States United States United States Korea
HSBC Global Investment Funds
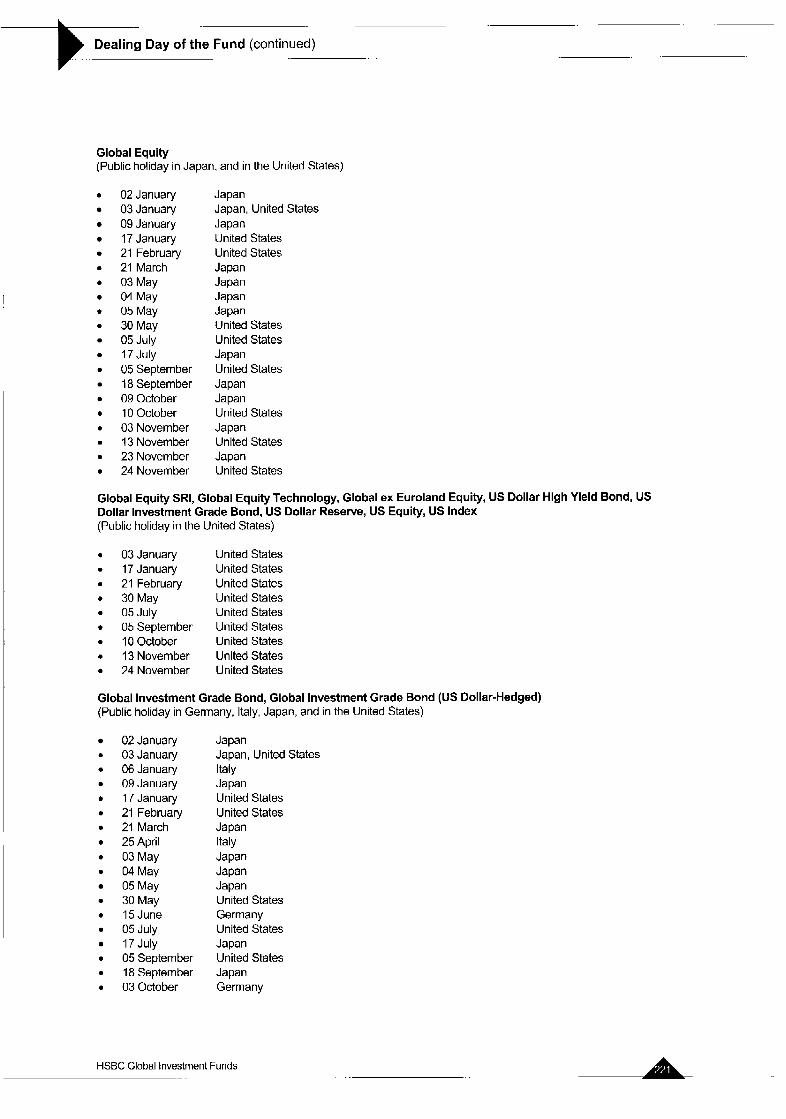
Dealing Day of the Fund (continued) - _
Global Equity (Public holiday in Japan, and in the United States)
e 02January 03January OSJanuary 17 January 21 February
0 21 March 0 03May
04May 0 05May e 30May
05 July 17 July 05 September 18 September 09October
0 10 October 0 03November e 13 November 0 23November e 24November
Japan Japan, United States Japan United States United States Japan Japan Japan Japan United States United States Japan United States Japan Japan United States Japan United States Japan United States
Global Equity SRI, Global Equity Technology, Global ex Euroland Equity, US Dollar High Yield Bond, US Dollar Investment Grade Bond, US Dollar Reserve, US Equity, US Index (Public holiday in the United States)
03 January 17 January 21 February 30 May 05 July 05 September 10 October 13 November 24 November
United States United States United States United States United States United States United States United States United States
Global Investment Grade Bond, Global Investment Grade Bond (US Dollar-Hedged) (Public holiday in Germany, Italy, Japan, and in the United States)
02January 0 O3January e OGJanuary
OSJanuary 0 17 January 0 21 February e 21 March e 25 April e 03May e 04May
05May 30May
e 15 June 05 July 17 July
e 05 September 18 September
0 03October
Japan Japan, United States Italy Japan United States United States Japan Italy Japan Japan Japan United States Germany United States Japan United States Japan Germany
HSBC Global Investment Funds
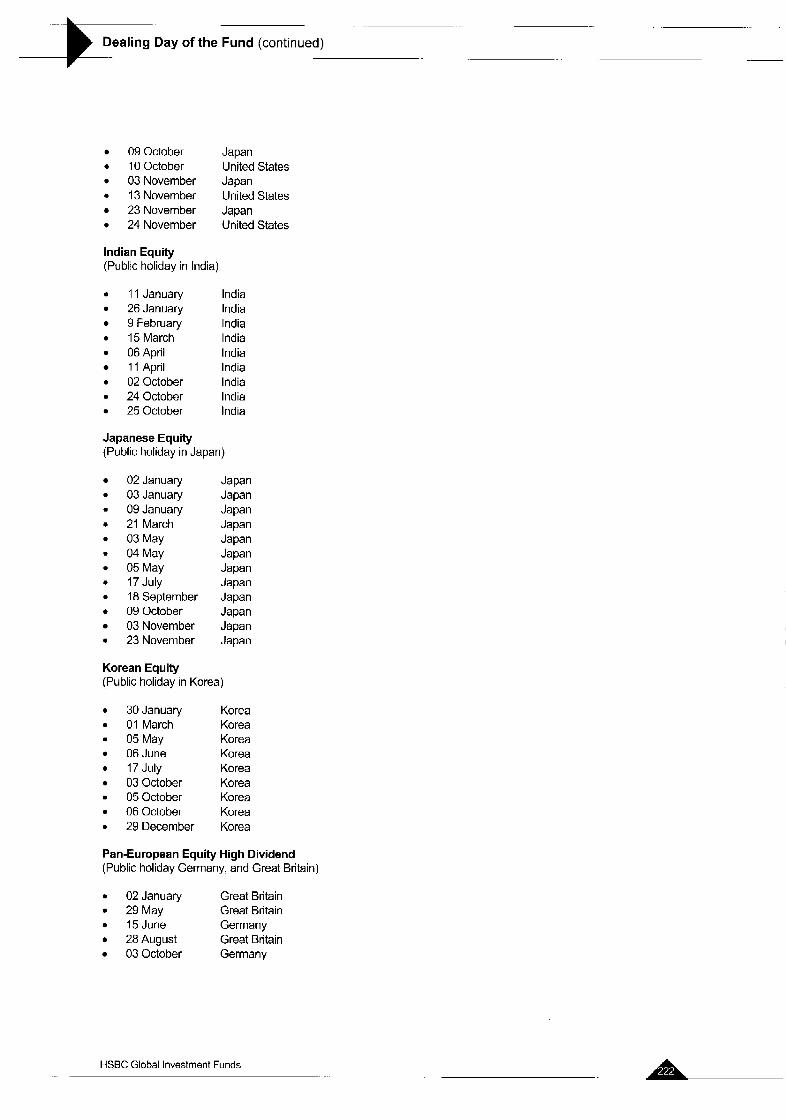
.-
Dealing Day of the Fund (continued) --b .~
09October Japan 0 10October United States 0 03 November Japan 0 13 November United States
23 November Japan 0 24 November United States
Indian Equity (Public holiday in India)
0 11 January 0 26 January
9February 0 15 March 0 06 April
11 April 0 02October 0 24October
25October
India India India India India India India India India
Japanese Equity (Public holiday in Japan)
0
0
0
0
0
0
0
0
0
0
02 January 03 January 09 January 21 March 03 May 04 May 05 May 17 July 18 September 09 October 03 November 23 November
Japan Japan Japan Japan Japan Japan Japan Japan Japan Japan Japan Japan
Korean Equity (Public holiday in Korea)
30 January 01 March 05 May 06 June 17 July 03 October 05 October 06 October 29 December
Korea Korea Korea Korea Korea Korea Korea Korea Korea
Pan-European Equity High Dividend (Public holiday Germany, and Great Britain)
0 02January Great Britain 0 29May Great Britain
15 June Germany 28August Great Britain 03 October Germany
HSBC Global Investment Funds . - A
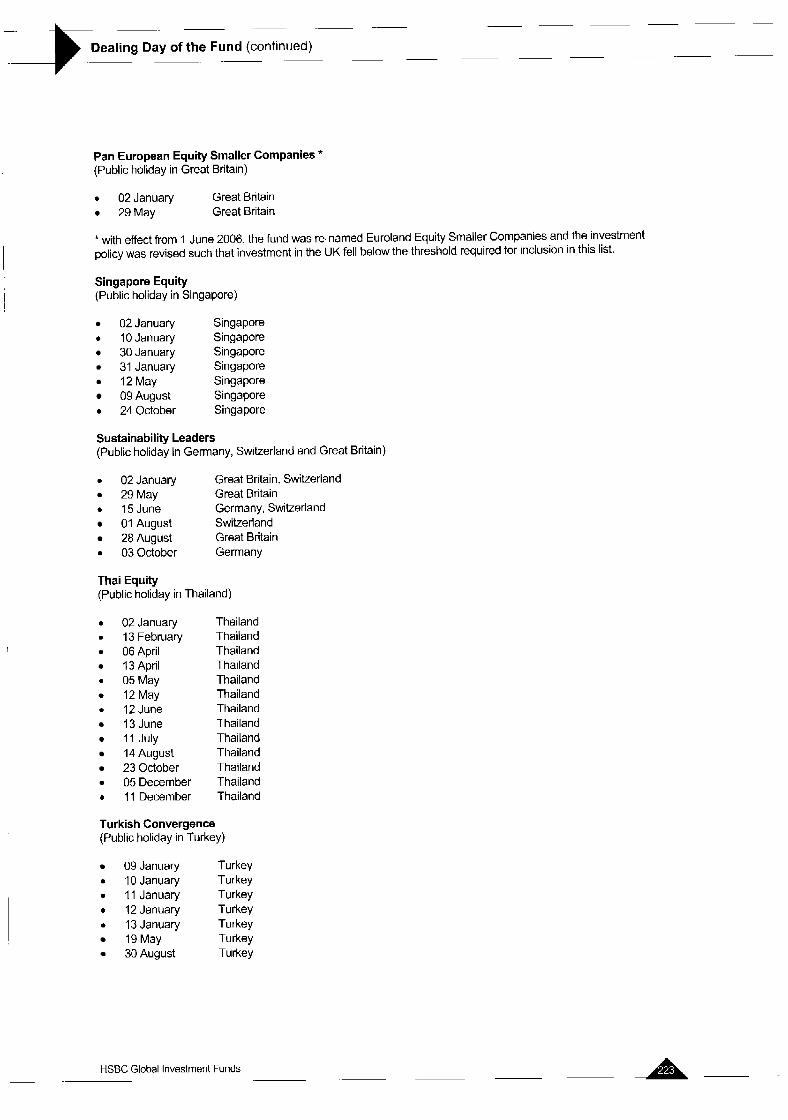
Pan European Equity Smaller Companies * (Public holiday in Great Britain)
0 02January Great Britain 29May Great Britain
’ with effect from 1 June 2006, the fund was re-named Euroland Equity Smaller Companies and the investment policy was revised such that investment in the UK fell below the threshold required for inclusion in this list.
Singapore Equity (Public holiday in Singapore)
02January Singapore 0 10 January Singapore
30January Singapore 31 January Singapore 12May Singapore 09August Singapore
0 24October Singapore
Sustainability Leaders (Public holiday in Germany, Switzerland and Great Britain)
0 02January Great Britain, Switzerland 29May Great Britain
0 15 June Germany, Switzerland 01 August Switzerland 28August Great Britain 03October Germany
Thai Equity (Public holiday in Thailand)
1
0
0
0
0
0
0
02 January 13 February 06 April 13 April 05 May 12 May 12 June 13 June I 1 July 14 August 23 October 05 December 11 December
Thailand Thailand Thailand Thailand Thailand Thailand Thailand Thailand Thailand Thailand Thailand Thailand Thailand
Turkish Convergence (Public holiday in Turkey)
OSJanuary Turkey 0 10 January Turkey 0 11 January Turkey 0 12 January Turkey 0 13 January Turkey
19May Turkey 30August Turkey
~ -- A - HSBC Global Investment Funds .-
~