3 0 AVR. 2007 - Fundsquare
167
Morgan Stanley Investment Management 3 0 AVR. 2007 d'lnvestissement a Capital Variable rated under the laws of Luxembourg Table of contents 1 2 74 108 112 118 123 157 Shareholders' Information Equity Funds Bond Funds Liquidity Funds Asset Allocation Funds Open Forward Foreign Currency Exchange Contracts and Futures Contracts Statements and Notes Other Information
-
Upload
khangminh22 -
Category
Documents
-
view
2 -
download
0
Transcript of 3 0 AVR. 2007 - Fundsquare
Morgan Stanley Investment Management
3 0 AVR. 2007
d'lnvestissement a Capital Variable rated under the laws of Luxembourg
Table of contents
1
2
74
108
112
118
123
157
Shareholders' Information
Equity Funds
Bond Funds
Liquidity Funds
Asset Allocation Funds
Open Forward Foreign Currency Exchange Contracts and Futures Contracts
Statements and Notes
Other Information
Morgan Stanley SICAV 31 December 2006
Table of contents
/I
1 Shareholders’ information
STATEMENT OF INVESTMENTS
Equity Funds
2 American Franchise Fund
4 Asian Equity Fund
6 Asian Property Fund
8 Emerging Europe, Middle East and North Africa Equity Fund
10 Emerging Markets Equity Fund
13 European Equity Fund
15 European Equity Euro Hedged Fund
17 European Equity Opportunities Fund
19 European Property Fund
21
23 European Systematic Equity Fund
27 Global Brands Fund
28 Global Equity Growth Fund
31 Global Property Fund
33
36 Global Systematic Equity Fund
38 Global Value Equity Fund
40 Indian Equity Fund
42 Japanese Equity Advantage Fund
44 Japanese Equity Growth Fund
48 Japanese Systematic Equity Fund
52 Japanese Value Equity Fund
54 Latin American Equity Fund
56 US Equity Fund
59 US Equity Growth Fund
61 US Property Fund
63 US Small Cap Growth Fund
66 US Systematic Equity Fund
71 US Value Equity Fund
European Small Cap Value Fund
Global Small Cap Value Fund
Bond Funds
74 Emerging Markets Debt Fund
77 Euro Bond Fund
80 Euro Corporate Bond Fund
82 Euro Strategic Bond Fund
85
88 Global Bond Fund
92
95
98
European Currencies High Yield Bond Fund
Global Convertible Bond (Euro) Fund
Global Convertible Bond (USD) Fund
Short Maturity Euro Bond Fund
100 US Bond Fund
106
Liquidity Funds
io8 Euro Liquidity Fund
110 US Dollar Liquidity Fund
Asset Allocation Funds
112 Global Diversified (Euro) Fund
115 Global Diversified (USD) Fund
US Dollar Short Duration Fund
CURRENCY EXCHANGE CONTRACTS AND FUTURES CONTRACTS
118
121 Open futures contracts
Open forward foreign currency exchange contracts
STATEMENTS AND NOTES
123
130
137
146
152
Statement of assets and liabilities
Statement of changes in number of shares
Statement of operations and changes in net assets
Statement of share and net assets statistics
Notes to the financial statements
OTHER INFORMATION
157 Independent Auditor’s Report
158 Directors and service providers
160 Paying and information agents
161
163 Appendix 2: Sub-advisors
164
Appendix 1: Fund expense ratios
Appendix 3: Portlolia turnover rate
1 Morgan Stanley SICAV 31 December 2006
Share holders’ information
The annual general meeting of shareholders of the Company is held at the registered office of the Company and will be held on the second Tuesday of the month of May at 10.30 am, or if such day is not a bank business day on the following bank business day.
Notices of all general tneetings ate sent by mail to all registered hareholders at thcir registered address at least 8 days prior rn the meeting. Such notices will indicate the time and place of the mceting as well as the conditions of admission thereto. Said notices will also conrain the agenda and requirements of 1.uxembourg law with regard to the riccessary quorum and majorities at the meeting. To the extent required by law, furthcr notices will be published in [he Mtinorial C, Recueil des SociPtPs er Associations du Journal Officiel du Grand-Ducht: de Luxernhourg and in one I.uxembourg newspaper.
Audited financial starcments ro the shareholders i n respect of the preceding financial year arc made available at the registered office of the Company and are sent to holdcts of registered Shares at rheir regisrered address. In addition, unaudited semi-annual reports arc also madc availalde at rhe rcgistered office.
The Company’s financial ycar end is 31 December.
An!- other noticcs relevant to the Company are also published in a
Luxembourg newspaper or mailed ro affected sharcholders.
The net assei value per share of cach Class of Share is available on each dcaling day during I.uxembourg business hours at the registered office of thc. Company, and is published daily in several leading financial newspapers world-wide.
No subscriptions can be received on the basis of financial rcports. Subscriptions arc only valid if made o n the baqis of the currenr prospectus supplemented by rhe latest annual report and the niwt recenr semi-annual report, if published thereafrer.
In Switzerland, Bank Morgan Sranley A.G. carries out the functions of Swiss representative of the Cotnpany as wcll as those of paying agenr. I’he proqicctus, rhe articles of-ssociatinn, the annual arid semi-annual reports of the Cotnpany may be obrained, upon rcquesr and free of charge, ar ths Swiss represenrarivc’s registcred office, Rank Morgan Sranlcy A.G., Bahnhofsrrasse 92, 8023 Zurich, Switzerland.
In Switzerland, the list of the purchases and sales of investments which the Company has undertaken during rhe financial ycar can he obtained, upon request and free of charge, from the Swiss representative, Hank Morgan Stanley A.G., Bahnhofsrrasse 92, 8023 Zurich, Switzerland.
The investment aims ser out in this annual report arc sumrn;ities only. ‘I’he complere investment objecrives and policies for each Fund arc set out in the Company’s current prospectus.
FUNDS LAUNCHED IN THE TWELVE MONTHS TO 31 DECEMBER 2006
The Japanese Equiry Advanragc Fund and the US Sysrematic Equity Fund opened for subscription on 31 May 2006.
The Global Equiry Growth Fund and the Japanese Systemaric Equiry Fund opened for subscription on 31 July 2006.
The Global Property Fund opened for subscription on 3 1 October 2006.
The Indian Equity Fund opened for subscription on 30 Novern her 2006.
‘1-he European Equity Opportuniries Fund opened for subscription on 21 December 2006.
FUND NAME CHANGES IN THE TWELVE MONTHS TO 31 DECEMBER 2006
O n 31 October 2001; the following Funds changed their names:
* The European Equity Fund to rhe European Equiry Euro Hedged Fund.
* The Eui-opean Value Equity Fund to the European Equiry Fund.
= ‘I’he ‘X70rld Equity Fund co the Global Systematic Equity Fund.
TO 31 DECEMBER 2006 1 Classes AX and 1X of the Asian Equity Fund, Asian Propcrty Fund, European Systematic Equiry Fund, Global Value Equity Fund, Larin American Equity Fund, US Equity Growth Fund, Emerging Markers 13ebr Fund, and Euro Bond Fund were opened for subscription on 31 January 2006.
SHARE CLASSES LAUNCHED IN THE TWELVE MONTHS
Clasg AX of rhc US Small Cap Growth Fund opened for subscription on 31 May 2006.
Class AX of the Global Small Cap l7alue Fund opetied for suhscriprion on 2 Junc 2006.
Classes AH and IH of the American Franchise Fund Japanese Equity Advantage Fund, US Equity Growrh Fund, US Value Equity Fund and Emerging Markets Debr Fund were opened for subscription on 31 October 2006.

Morgan Stanley SlCAV 31 December 2006 2
American Franchise Fund
INVESTMENT AIMS
To seek long-term capital appreciation, measured in US Dollars, through investment primarily in equity securities of companies domiciled or exercising the predominant part of their economic activity in the US by investing in a concentrated portfolio of companies whose success the Company believes depends on intangible assets (for example, but not limited to, brand names, copyrights or method of distribution) underpinning a strong business franchise.
STATEMENT OF INVESTMENTS Transferable securities and money marker insrruments admitred to official cxcharigc listing or dealt in 011 another regulated market. A\ at 31 1)cccrribcr 2006, expressed in US dollars.
Investment Market
Holding value ..... .
Packaged Foods & Meats Kellogg 545,496 27,547,548 Cadbury Schweppes 2,066.933 22,135,792 Nestle Reed 43,283 15,344,807
Total for Packaged Foods & Meats
. . . . . . .
% of net assets
6.22 5.00 3.47
14.69
._
Tobacco
Reynolds American 370,860 24,447,091 5.52
Total for Tobacco 13.51
Hltria Group 410 808 35,329.488 7.99
. -.
Publishlng Thomson New York flmes 'A' McGravr-Hill Companies
Total for Publishing 11.27
Household Products 7 31 Kimberly-Clark
Total for Household Products 7.31
473.197 32,352,479
Broadcasting & Cable TV Clear Channel Communications 480,117 17.072.961 3 86 Westwood One 1,937,902 14,127,305 3.19
Total for Broadcasting & Cable TV 7.05
Personal Products Colgate-Palmolwe Estee Lauder Companies 'A'
Total for Personal Products
Pharmaceuticals Pfizer
270,048 17,739,453 4.01 321,150 13,285,916 3.00
7.01
1 .I 75,058 30,622,011 6.92
Total for Pharmaceuticals 6.92
IT Consulting & Other Services Accenture ' A 595,748 22,209,485 5.02
Total for If Consulting & Other Servlces 5.02
Motorcycle Manufacturers Harley-Davidson 280,995 19.804.528 4.47
Total for Motorcycle Manufacturers 4.47 . . .
Housewares & Specialties Fortune Brands 184,886 15,805,904 3.57
Total for Housewares & Specialties 3.57
Fertilizers & Agricultural Chemicals Scotts Miracle-Gro 'K 256,945 13,427.946 3.03
Total for Fertilizers & Agricultural Chemicals 3.03
Please refer to the full prospectus for the Funds Investment objective and policy

3 Morgan Stanley SICAV 31 December 2006
American Franchise Fund
STATEMENT OF INVESTMENTS (continued) Transfcrable securities and money market i n s t rumen t s admir tcd to official cxchangc listing o r dcalt in on ano the r regulated market .
As a t 31 D e c e m b e r 2006, expressed in US dollars.
Investment Market % of net
Holding value assets
Diversfied Commercial & Professional Services Weight Watchers International 214.413 11,305,997 2.56
Total for Diversified Commercial & Professional Services 2.56
Restaurants Donmo'$ Pi iza 393,116 11,168.426 2.52
Total for Restaurants 2.52
Distillers & Vintners BrovoForrnan '6 non-vig 167,878 11,131,990 2.52
Total for Distillers & Vlntners 2.52
Health Care Services IMS Health 399,542 11.031.355 2.49
Total for Health Care Services 2.49
Soft Drinks PepsiCo
Total for Soft Drinks
- ... . 173,766 10.961.159 2.48
2.40
. . . .. ._ . __
Total Investment Securities 426,744.933 96.42
Total NAV 442,585,114 100.00
_ _
_ ._ __ .
Morgan Stanley SICAV 31 December 2006 4
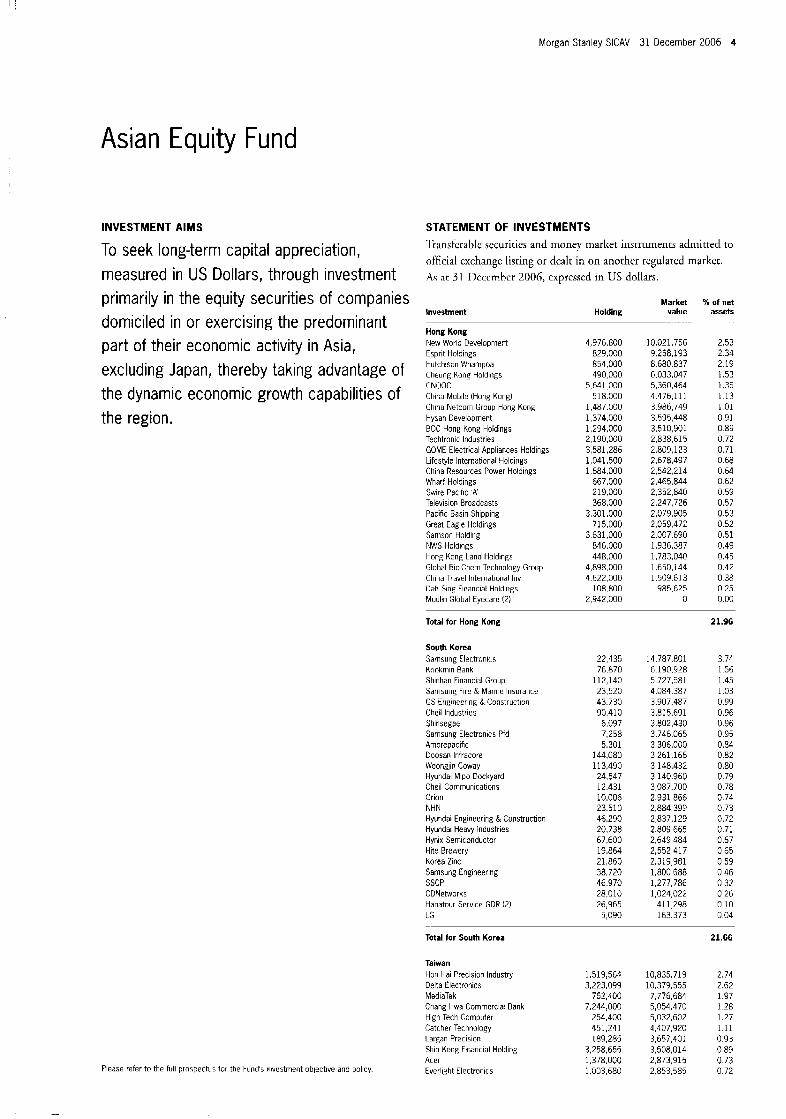
Asian Equity Fund
INVESTMENT AIMS
To seek long-term capital appreciation, measured in US Dollars, through investment primarily in the equity securities of companies domiciled in or exercising the predominant part of their economic activity in Asia, excluding Japan, thereby taking advantage of the dynamic economic growth capabilities of the region.
Please refer to the full prospectus for the Fund's investment objective and policy.
STATEMENT OF INVESTMENTS ~li;insfcrablc sccuriries and money market iiisrruments admitted to official exchange listing 01- dealt in on another regulated market. A s a t 31 Ikccmhcr 2006, cxprcssed in US dollars.
Investment
Hong Kong New World Developmert Esprit Holdings Hutchison Whampoa Cheung Kong Holdings CNOOC China Mobile (Hong Kong) China Netcom Group Hong Kong Hysan Development BOC Hong Kong Holdings Techtronir Industries GOME Electrical Appliances Holdings Lifcstylc Interr.ationa1 Holdirigs Cliina Resources Power Holdings Wharf Holdings Swire Pacihc ' A Television Broadcasts Pacific Basin Shipping tireat Eagle Holdings Samson Holding NWS Holdings Hong Kong Land Holdings Global Bio-Chem Technology Group China Travel International liiv Uah Sing Financial Holdings Moulin Global Eyecare (2)
H o I d i n g
4,976,800 829,000 854,000 490 000
5.641 000 518.000
1,487.000 1,374,000 1,294,000 2,190.000 3,581,286 1.041.500 1 684 000
667,000 219,000 368,000
3,301,000 715,000
3,631,000 846,000 448,000
4,898,000 4,622,000
108,800 2,942,000
Market value
10,021,756 9.258.193 11,680,837 6,033,047 5,360,464 4.476.11 1 3.986.749 5,595,448 3.510.901 2,838,615 2,809,123 2,678.497 2,542,214
2,352,840 2247,726 2,079,905 2,059.472 2,007.690 1.936.387 1,783,04(! 1,650,144 1,509.613
985,625 0
2,465,844
96 of net assets
2.53 2.34 2.19 1.53 1.35 1.13 1.01 0.91 0.89 0.72 0.71 0.68 0.64 0.62 0.59 0.57 0.53 0.52 0.51 0.49 0.45 0.42 0 38 0 25 0.00
Total for Hong Kong
South Korea Samsung Electronics Kookmin Bank Shinhan Financial Group Samsung Firc & Marine Insurance GS Engincering & Construction Cheil Industries Shinsegae Samsung Electronics Pfd Amorepacific Doosan lnfracore Woonglin Coway Hyundai Mipo Dockyard Chcil Communications Ortoii NHN Hyundai Engineering 8, Construction tlyundai Heavy lndustrles Hynix Semiconductor Hite Brewery Korea Zinc Samsung Engineering SSCP CDNetworks Hanatour Service GDR (2) ILG
22,435 76,870
112,140 23,520 43.730 90,410 6.097 7,258 5.301
144,080 113.490 24,547 12.431 10,006 23.510 46,290 20,738 67.600 19,864 21,860 38,720 46.970 28.010 26,965
5,090
21.96
14,7a7,80i 3 74 6,190,928 136 5,727,581 1.45 4.084.387 1.03 3,907,487 0.99 3.815.691 0.96 3,802,430 0.96 3,746,065 0.95 3,306,000 0.84 3,261,166 0.82 3,148,432 0.80 3,140,960 0.79 3,087,700 0.78 2,931,866 0.74 2,884,399 0.73 2.837.129 0.72 2,809.665 0.71 2,649,484 0.67 2,552,417 0.65 2,319,981 0.59 1.800.688 0.46 1,277,786 0 32 1,024,022 0 26
411,298 0.10 163.373 0.04
Total for South Korea
Taiwan Hurl Hai Precision Industry Delta Electronics MediaTek Chang Hwa Commcrcia, Bank High Tech Computer Catcher Technology Largan Precision Shtn Kong Financial Holding Acer Everlight Electronics
1,519.564 3,223,099
752,400 7,244.000
254,400 451,241 189,285
3,258,655 1,378.000 1,003,680
10,835,719 10,379,555
5,054,470 5,032,602 4,407,920 3,657,401 3,508,014 2,873,915 2,853,585
7,776,684
21.66
2.74 2.62 1.97 1.28 1.27 1.11 0.93 0.89 0.73 0 72

5 Morgan Stanley SICAV 31 December 2006
Asian Equity Fund
STATEMENT OF INVESTMENTS (continued) Transferable securities and nionev market instruments adiiiitted to official exchange listing or dealt in on another regulared market. As at 31 December 2006, expressed in US dollars.
Investment Market X of net
Holding value assets
Taiwan (continued) Tripoc Technology Wistron Far Eastern Textile Cathay Financial Holding Powerchip Semiconductor Transcend Information TXC Realtek Semicoriductor Holteh Semiconductor
751,470 1,798,440 2,580,300
9 2 3,4 5 5 2,847,817
710,743 1,019,000
709.000 601,299
2,696,579 0.68 2.669.667 0.68 2.255.438 0.57 2.095.865 0.53 1,921.544 0.49 1,874.679 0.47 1,628,275 0.41 1.219.901 0.31 1.165.530 0.29 . . ._ -.
Total far Taiwan 18.69
China PetroChina 8,:46,000 11,543,244 2.92 China Cortstruction Bank 'H' (5) 12,374,000 7,876,208 1.99 lrldustrial &Commercial Bank of China ' H (5) 9.975.000 6.195.294 1.57 Ping An Insurance Group Co of China 'ti (5) 939,000 5,198.052 1.31 China Life Insurance 'H' (5) Air China 'H' ( 5 ) Huaneng Power International 'H' (5) PlCC Property & Casualty ' H (5) C O X 0 Holdings ' H 15) Maanshar. Iron & Steel 'H' 5) China Commtinications Construction ' t i ' (5) China Coal Energy .H (5) Angang Steel 'H (5)
1,455,000 8,396,000 4,702,000 8.004.000 4,840,000 4,834,000 2,639.000 1,895,000
39,000
4.967.403 4,545,235 4,202.1 28 4,106,595 3,155,406 2,654,217 2.609.562 1,230,559
57,170
1.26 1.15 1.06 1.04 0.80 0.67 0.66 0.31 0 01
Total for China 14.75
Slngapore CapitaLand DBS Group Holdings United Overseas Bank Surttec RElT Oversea-Chinese Ranking United lrtdustrial SembCOrp Industries Unisteel Technology Wheeloch Properties S CDL Hospitality Trusts Singapore Press Holdings C ~ t y Oevelopments CapitaCommercial Trust CapitaRetail China Trust
1.973.000 512.000 426,000
4,219,000 844.800
2,929,000 1,208,920 1,459,000 1,607,000 1,312,800
601,000 :82.000 558,000 130,100
7.977.436 2.02 7.546.107 191 5,389,592 1 36 5,007,552 1.27 4242,180 1.07 3,992,161 1.01 3,027,425 0.77 2.426.275 0.61 2,357,995 0.60 2.083.198 0.53 1,677,501 0.42 1,507,369 0.38
953,411 0.24 178,173 0.04
Total for Singapore
Indonesia PT Telekomunikasi Indonesia PT Astra International PT United Tractors Bank Rakyat Indonesia PT Rank Central Asia PT Kawasan lndustri Jababeka PT Perusahaan Perkebunan London PT lridocement Tunggal Prakarsa PT Bank Mandiri Persero PT Mitra Adiperkasa Astra Agro L.estdri
6.814.500 2.359.000 4,720,200 5.656.500 3,972,000
94,403,500 2.048.500 1,958,500 3,329,500 7,879,700
180.500
12.23
7,652,910 1.94 4,118,119 1.04 3,437,739 0.87 3.239.114 0.82 2,296,592 0.58 1,627,013 0.41 1.503.319 0.38 1,252,168 0.32 1,082,870 0.27
797.301 0.20 252,883 0.06
Investment
Thai I and PTr (F) 14) Slam Commercial Bank (F) Regd (4) Kasikornbank (F) (4) Bangkok Bank (F) Regd 14) Land & Houses (F) (4) Kasikornbank 'NVDR' Modernform Group Wts exp. 30/11/2007
Holding
248,100 863,600 752,900 383.100
1,797,400 45,800 64.859
Market value
1,441,245
1,301,694 1,218,714
343,072 77.917 4,127
1,385,582
% of net assets
0.36 0.35 0.33 0.31 0.09 0.02 0 00
Total far Thallancl
Malaysia SP Setia PPB Oil Palms Bumiputra-Commerce Holdings Road Builder (M) Holdings Kuala Lumpur Kepong IJM IJM Wts exp. 7/07/2010
1.46
740.500 1,069,844 0.27 321,000 1.036.657 0.26 430.000 944,051 0 24 932.000 897,677 0.23 219,000 837.535 0 21 369 000 768,314 0 19 110,600 76,762 0 02
Total for Malaysia 1.42
Philippines Ayala 146,720 1,766.268 0 44
0 33 Philippine Long Distance Telephone 24,895 1,295.292
Total for Philippines 0.77
394,878,567 99.83 Total Investment Securities
Total NAV 395.536.191 100.00 . - -.
12) This security is valued at its fair market value. See note 2(a) Nithin the Notes to the
(4) (F1, Foreign. (5) 'H': Hong Kong registered shares.
Financial Statements.
Total for Indonesia 6.89
Morgan Stanley SICAV 31 December 2006 6
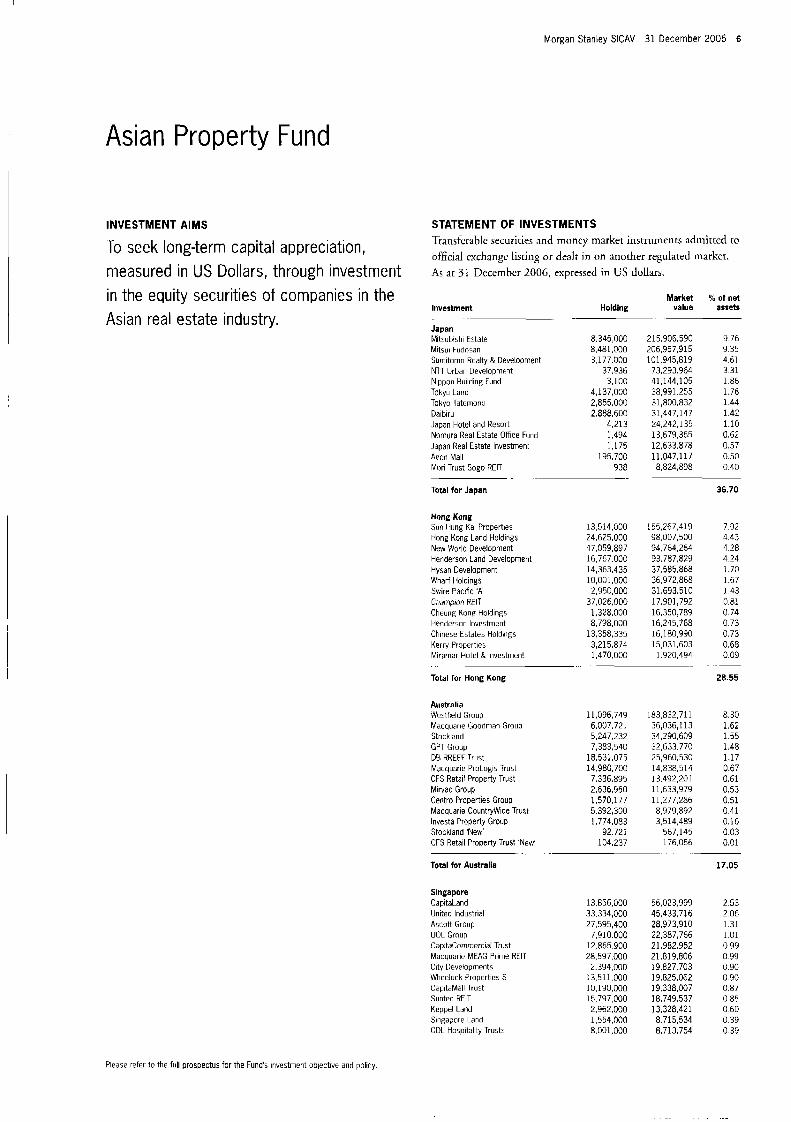
Asian Property Fund
INVESTMENT AIMS STATEMENT OF INVESTMENTS Transferablc securicies and moncy rnarket instrumcnts admiteed to official exchangc lisririg or dealt in on mother regulated rnarket. To seek long-term capital appreciation,
measured in US Dollars, through investment ac 31 Dccernhcr 2006, expressed in us dollars.
Market % of net value assets
in the equity securities of companies in the Asian real estate industry.
Investment
Japan Mitsubistii Estate 8,345,000 215,906,590 9.76 Mitsui Fudosan 8,481,000 206,957,915 9.35 Sumitomo Realty & Development 3,177.000 101.945.819 4.61 NTT Urban Developmeit 37.936 73293.964 3 31 Nippon BuildinE Fund 3.100 41,144,105 1.86 Tokyu Land 4,137,000 38,991.255 1.76 Tokyo Tatcmono 2,555,000 31,800,832 1.44 Daibiru 2.888.600 31,447.147 1.42
Nomura Real Estate Office Fund 1,494 13,679,365 0.62 Japan Real Estate Investment 1,175 12.633.878 0.57 Aeon Mall 195,700 11.047.117 0.50
0.40 Mori Trust Sogo RElT
Total for Japan 36.70
H o I d i n g . .. .. -- . -
Japan Hotel aiid Resort 4,213 24,242,135 1.10
938 8,824,898 . .. ..
Hong Kong Sun Hung Kai Properties Hong Kong Land Holdings New World Development Henderson Land Development Hysan Oevelopment Wharf Holdings Swire Pacific 'A' Champion REIT Ctieung Kong Holdings Henderson Investment Chinese Estates Holdings Kerry Properties Miramar Hotel & Investment
Total for Hong Kong
Australia Wesffield Group Nlacquarie Goodman Group Stockland GPT Group DE RREFF Triist Macquarie ProLogis Trust CFS Retail Property Trust Mirvac Group Centro Properties Group Macquarie Countrywide Trust lnvesta Property Grow Stockland 'New' CFS Retail Property Trust 'Nevi
Total for Australia
Singapore CapitaLand United Industrial Ascotf Group UOL Grnup CapitaCommercial Trust Macquarie MEAG Prime RElT City Develovments Wheelock Properties S CapitdMall Trust Suntec RElT Keppel Land Singapore Land CDL Hospitality Trusts
13,514,000 24,625,000 47,059,897 16,767.000 14,363,435 10,001.000 2.950.000
37,026,000 1,328.000 8,798,000
13.358.335 3,215.874 1,470,000
155,267,419 98,007,500 94,764,264 93,787,829 37.585.868 36,972.868 31,693,510 17,901.792 16.350.789 16,245,768 16,180,990 15,031,603
1,920,494
7.02 4 43 4.28 4.24 1.70 1.67 1.43 0.81 0 74 0 73 0.73 0.68 0.09
11,096,749 6.007.721 5,247.232 7,383.540
15,531,075 14.980.700 7.336.895 2.636.950 1,570,177 5392,300
92.721 104,237
1.774,om
13,856,000 33,334,000 27,595,400
7.910.000 12.865.900 28,597.000 2.394.000
1351 1.000 10,190.000 15,797,000 2.962.000 1,554,000 8,001,000
183 832,711 36,036,113 34,290,609 32,633.770 25,960,530 14,535,514 13,492,201 11,633,979 11,277,286 8,379,892 3,514,489
567,145 176,056
-. -
56,023,999 45,433,716 28,973,910 22,387,766 21,952,952 21,819,806 19,827,703 19,525,062 19.338.007 18,749,537 13,328,421 8,715,534 8,713,754
28.55
5.30 1.62 1.55 1.45 1.17 0.67 0.61 0.53 0.51 0 41 0.16 0.03 0.01
17.05
2 53 2 06 1 3 1 1.01 0 99 0 99 0.90 0 90 0.87 0 55 0 60 0 39 0 39
Please refer to the full prospectus for the Fund's investment objective and policy.

7 Morgan Stanley SlCAV 31 December 2006
Asian Property Fund
STATEMENT OF INVESTMENTS (continued) Transferable sccurities and money market instruments adinitced to
official exchange listing or dealt in on ariuthcr regulaced market. As at 31 13ecember 2006, exprcsscd in LJS dollars.
Investment
Singapore (continued) Ascott Residence Trust Hotel Properties K-REIT Asia CapitaRetail China Trust Overscas Union Enterprise
Total for Singapore
Market % of net H o I d i n g value assets
. .-
7,543,000 7,870.614 0.36 2.527.000 4,449,524 0.20 2,677,000 4.364.484 0.20
783,600 1,073,145 0.05 14,000 93,126 0.00
14.60
.. . .
.-
total Investment Securities 2,143,830,069 96.90
Total NAV 2,212,410.239 100.00 -
--

Morgan Stanley SlCAV 31 December 2006 8
Emerging Europe, Middle East and North Africa Equity Fund
INVESTMENT AIMS
To seek long-term capital appreciation, measured in Euro, by investing primarily in equity securities of issuers in Central, Eastern and Southern Europe (including the Russian Federation), the Middle East and North Africa.
STATEMENT OF INVESTMENTS Transferable securities and money market irlstrunlenrs adniitted to official cxchange listing or dealt in on another regulated market. A h at 31 December 2006, expresscd in Euro.
Market ?4 of net value assets Investment
Russian Federation Sberbank GDR Regs 121,358 33,390,867 9.43 NovaTek OAO GDR Regs 608,200 29,300,281 8.27 OAO Gazprom ADR 831,750 29,027,008 8.19
7.57 Wimm-Bill.Dann Foods ADR 548.000 26.828343 Unlfied Energy System GDR Regs ADR 298.625 24,830,665 7.01 LUKOIL ADR 188,220 12,480,409 3.52 CTC Media 599,300 11,193,966 3.16 SurgutnefteEaz ADR 139,503 8.149.405 2.30 ThlK OAO GDR Ser144a 300,161 7,970,287 2.25 MMC Norilsk Niche1 ADR 64,400 7,719,596 2.18
Efes Breweries International GDR Regs 187,962 4.798.514 1.36 Efes Breweries International GDR 120,832 3.084.741 0.87
57.180 2,239,525 0.63 Kalina ADR
Total for Russian Federation 58.64
H o I d i n g - . -_ ..
Magntt 248,000 6,716,941 1.90
~ .
Poland Bank Pekao TVN Bank Millenium Powszechna Kasa Oszczednosci Bank Polski Multimedia Polska AmRest Holdings Eurocash Rank Zachodni WBK
Total for Poland
...
190,744 1.690.850 4,330.837
653,202 1,180,142
161,421 1,446,057
45.364
Turkey BIM Birlesik Maeazalar Turkiye Garanti Bankasi Dogan Yayin Turkiye Is Bankasi 'C' Coca-Cola lcecek Uretim Yapi vc Kredi Bankasi Anadolu Efes Biracilih Ve Malt Sanayii Aksigorta Anadolu Hayat Einehlilik
176,367 2,385,100 1,956,593 1,070.599
623,400 2,400,000
118,500 855,500 652,000
Total for Turkey
11.245.858 10,719,759 8,971,296 8,016.240 3,782,588 3,101,365 2,946,390 2,666,269
.. .. .~
7,084,573 5,978,435 5,218.731 3,727,136 3,572,610 3,162,142 2,776,716 2.451.370 1.697.145
3 17 3.03 2.53 2.26 1.07 0.88 0.83 0.75
14.52
2 00 1 69 1.47 1 0 5 1.01 0 89 0.79 0.69 0 48
10.07
Morocco Credit lmmobilier et Hotelier 102,970 5,306.112 1.50 Banque Marocaine du Commerce Exterieur 46,559 5,178.796 1 4 6
0.90 UNA
Total for Morocco 3.86
23,138 3.173.971 . ..
Austria Raiffeisen International Bank Holding 89,968 10,392,204 2.93
Total for Austria 2.93
..
Czech Republic Ceske Energettcke Zavody 294,000 10,251,082 2 89
Total for Czech Republic 2.89
-
Slovak Republic Central European Media Enterprises ' A 132,600 7.031.894 1.99
Total for Slovak Republic 1.99
. . -. . . .
Please refer to the full prospectus for the fund's investment objective and policy
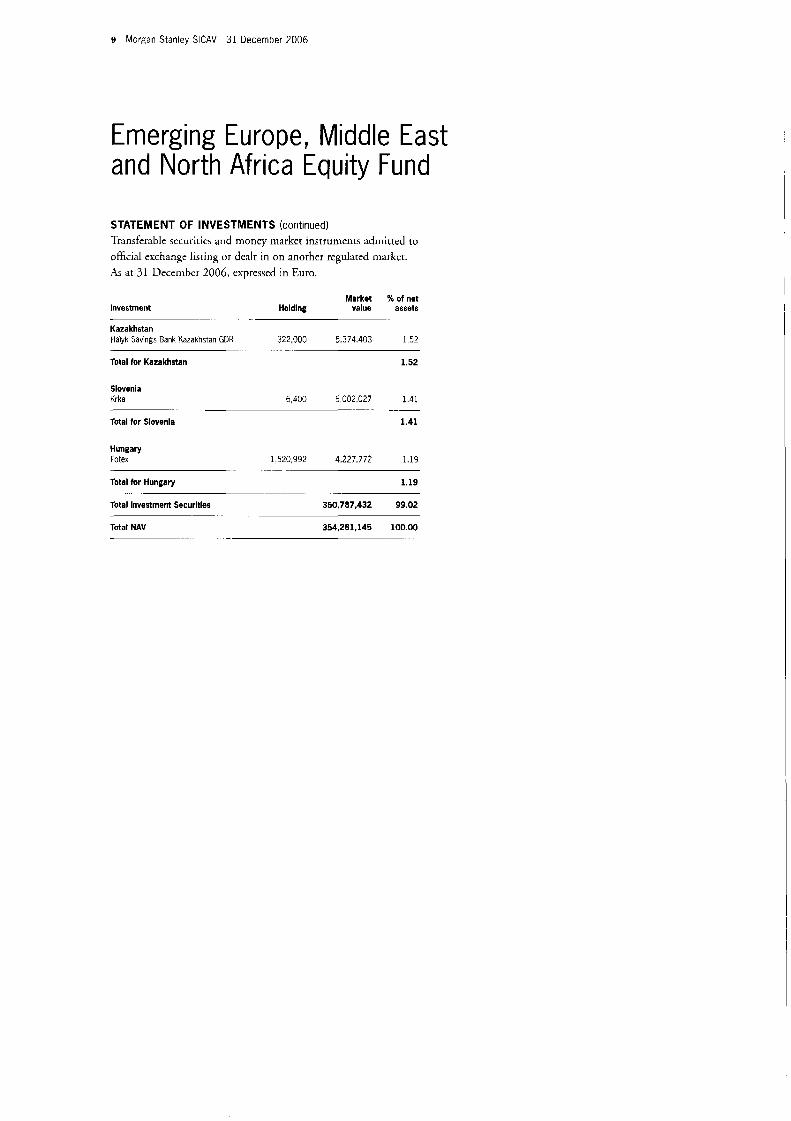
9 Morgan Stanley SICAV 31 December 2006
Emerging Europe, Middle East and North Africa Equity Fund
STATEMENT OF INVESTMENTS (continued) Transferable sccuritics and money market instruments admitted to official exchange listing o r dealt in on anorher regulaced rrarkct. As at 31 Decernhcr 2006, expressed in Euro.
Market 96 of net Investment H o I d i n g value assets
Kazakhstan Halyk Savings Bank Kazakhstan GDR 322,000 5.374.403 1 5 2
Total for Kazakhstan 1.52
-
..
Slovenia Krka 6,400 5.002.027 1 4 1
Total tor Slovenia 1.41
Hungary Fotex 1520,992 4.227.772 119
Total for Hungaty 1.19
-.
- -~
Total Investment Securities 350,787,432 99.02
Total NAV 354,261,145 100.00 -
-. . -

I '
Morgan Stanley SlCAV 31 December 2006 10
Emerging Markets Equity Fund
INVESTMENT AIMS
To seek to maximise total return, measured in US Dollars, through investment primarily in emerging country equity securities. The Fund will invest in those emerging market countries in which the Company believes that economies are developing strongly and in which the markets are becoming more sophisticated.
Please refer to the full prospectus for the Fund's investment objective and policy.
STATEMENT OF INVESTMENTS Transfer.rablc sccuriries and money marker instruments adrnittcd to
official exchange lisring or dealt in on annrher regulated rnarkct
As at 31 Deccmber 2006, expressed in US dollars.
Market % of net Investment Holding value assets
Russian Federation Sberbank GDR Regs 85,050 30,844,800 3.10 OAO Gazprom ADR 491,450 22,606,701 2.28 Unified Energy System GDR Regs ADR 171,051 18,747,190 1 .88 NovaTek OAO GOA Regs 248,737 15,794,800 1.58 Wimm-Bill-Dann Foods ADR 176,800 11,408.904 1.14 LUKOIL ADR 129,283 11,299,334 1.13 TMK OAO GDR Ser144a 221,105 7,138,675 0.78 CTC Media 279,000 6,868,980 0.69 Surgutneftegaz ADR 49,635 3,821,895 0.38 TMK GDR 87,629 3,067,015 0.31 Efes Brewerles International GOR Regs 71,329 2,400,221 0.24 Efes Breweries International GDR 48,218 1.622286 0.16 MSCl5% /ZOO7 1,037,582 1,037,582 -0.10 TMK GDR 4,000 140.000 0.01 Peter Hambro Mining 4.400 87,173 0.01
Total for Russian Federation 13.79
- .. -- .. --
.- _ .. __
Brazil Petroleo Brasileiro ADR Pfd 158,315 Companhia Vale do Rio Doce ADR Pfd .A' 577,342 Unibanco ADR 135,470 Petroleo Brasileiro ADR 101,415 Banco lfau Holding Financeira ADR Pfd 244.276 Companhia Energetica de Minas Gerais ADR Pfd 143,700 Tam ADR Pfd 200,600 Banco ltau Holding Financeira Pfd 144,794 Lojas Arnericanas Pfd 85,784,900 Petroleo Brasileiro Pfd 199,628 All America Latina Logistica Pfd 437,000
Natura Cosrneticos 261,100 Gerdau ADA Pfd 208,536 Cyrela Brazil Realty 293,400 Go1 Linhas Aereas lnteligentes ADR 95,500 Gerdau Pfd 123,176 NET Servicos de Comunicacao Pfd 168,000 Unlbanco - UnlBo de Bancos Brasileiros 129.1 48 Companhia Vale do Rio Doce pfd ' A 11,066
Total for Brazil
ltausa - lnvestimentos ltau Pfd 883.988
.-
Mexico America Movil ADR 'L' Grupo Televisa ADR 'CPO' Wal-Mart de Mexico 'v' Fornento Economico Mexican0 ADR Grupo Financier0 Banorte ' 0 Corp GEO ' B Wal-Mart de Mexico ADR 'v'
617,831 1,025,740 5,832,343
71,200 1,823,800 1,327,500
79,166
Total for Mexico
South Korea Samsung Electronics Shinhan Financial Group Kookrnin Bank GS Engineering K Constructlon Samsung Fire & Marine Insurance Sarnsung Electronics Pfd Shinsegae NHN Orion Woonglin Coway Aniore pacific Hyundai Engineering & Construction
25,135 153,590
73,990 64.300 30,780
9,067 6,696
33,840 13,275
135,780 5.699
51,990 71,380 Cheil Industries
14,645,721 14,635,620 12.732.825 10,208,434 8,867,219 7,047,048 6,116.294 5,247,486 4,799,970 4,654,902 4,536,353 4,519,899 3,665,988 3,399,137 2,801,155 2,770,455 2,013,426 1,909,145 1,221,515
280,316
1.47 1.47 1 2 8 1.02 0.89 0.71 0.61 0.53 0.48 0.47 0.46 0.45 0.37 0.34 0.28 0.28 0.20 0.19 0.12 0.03
11.65
27,876.535 2.80 27,869,356 2.80 25,308,772 2.54
8,302,632 0.83 7.099.869 0.71 6,641,021 0 67 3,423,930 0.34
10.69
16.567.478 I .66 7,844.651 0.79 5,958,980 0.60 5,745.516 0.58 5.345.129 0.54 4,679,742 0.47 4,176,000 0.42 4,151,768 0.42 3,889,718 0.39 3,766,800 0.38 3,554,215 0.36 3,186,484 0.32 3,012,543 0 30

11 Morgan Stanley SICAV 31 December 2006
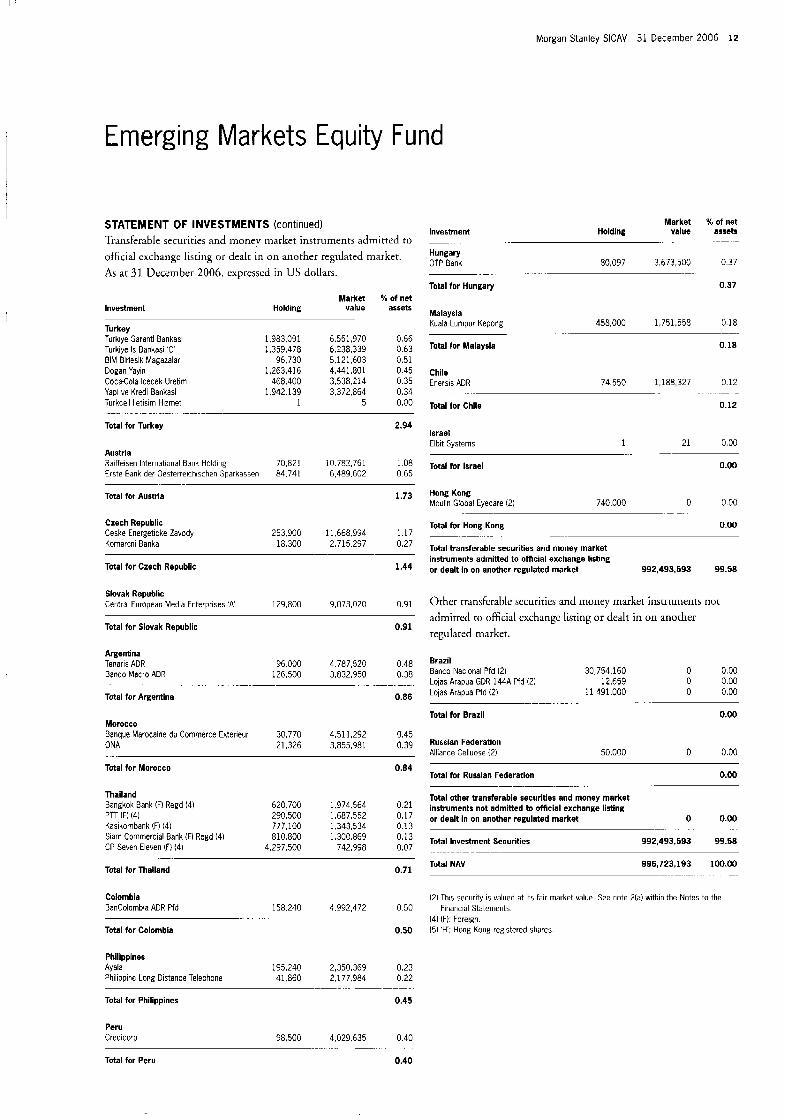
Emerging Markets Equity Fund
STATEMENT OF INVESTMENTS (continued) Transferable sccuritics and money marker instruments admitted to official exchange listing o r dealt in on anorher regulated market. As at 31 December 2006, cxprcssed in US dollars.
Market % of net Investment Holding value assets
- ~.
775,660 218.800 593,772 734,220 94,070
677,980 678,000 102,505 67,304 33,576
100
4,453,922 4,159,190 3,868,637 3,532,583
3.1 50,347 2,931,997 1,632,213 1.055.327
628.207 1,407
3,485,985
0.45 0.42 0.39 0.35 0.35 0.32 0 29 0.16 0.11 0.06 0.00
7.62
1.10 1.06 0.73 0.43 0.42 0.37 0.34 0.33 0.30 0.28 0.28 0.28 0.27 0 27 0.24 0.19 0.15 0.12 0.03 G.00
South Africa (continued1 Murray & Roberts Holdings Gold Fields Group Five Aveng Sasol Aspen Pharmacare Holdlngs African Oxygen Harmony Gold Minirig Harmony Gold Mining ADR Gold Fields ADR Mittal Steel South Africa
Total for South Africa . ..
Market 46 of net Investment H o I d i n g value assets
..
South Korea (continued] Hite Brewery Hyundai Mipo Dockyard Korea Zinc Doosan lnfracore Cheil Communications Hynix Semiconductor LG Hyundai lvlotx Pfd SSCP CDNetworks LG Telecom Hariatour Service GDR (21 Iiyundai Heavy Industries
23,388 22,374 24,320
111,930 9,781
56,920 37,670 28,070 37,550 26,220 84,334 46,702 4,827
3.005.232 2,862,910 2,581,058 2,533,469 2,429,474 2,230,897 1,209,085 1,143,928 1,021,522
958,581 872,358 712,348 653,981
0.30 0.29 0.26 0.25 0 24 0.22 0.12 0.11 0.10 0.10 0.09 0.07 0.07
Taiwan Hon Hai Precision Industry Delta Electronics MediaTek High Tech Computer Catcher Technology Chang Hwa Commercial Bank Everlight Electronics Acer Shin Kong Financial Holding Largan Precision Wistron Powerchip Semiconductor Tripod Technology Transcend Information Far Eastern Textile Cathay Financial Holding Realtek Semiconductor TXC King Slide Works Delta Electronics GDR
1.529.231 3,246,960
703,000 214,200 433,141
5,287,000 1,201,260 1,590,000 2.795.641
146,933 1,882,228 4.075.644
762,520 1,013,420 2.793.360
835.512 888,000 733,000 63.800
1,201
10,904,653 10,456.396 7.266,094 4237.356 4,231,112 3.688,982 3,415,329 3,316,056 3,009,569 2.839.057 2,794,045 2,750,013 2,736.232 2,673,029 2,441.673 1,896,270
1,171,271 324,821
19,768
1,527,888
10,774,430 10,422,278 9,566.414 5,935,205 3.1 12.101 2.708,069 1,743,732
864,484
Total for South Korea 9.45
1.15 1.02 0.75 0.58 0.53 0.53 0.52 0.39 0.32 0 31 0.31 0.30 0.27 0.27 0.27 0.26 0.24 0.18 0.14 0.08 0.06
India Bharat Heavy Electricals lrlfusys Technologies Bharti Airtel (21 ABB Matiiridra & Mahindra Morgan Stanley Growth Furid Gularat Ambula Cements HDFC Sank Cipla UTI Bank Glenmark Pharmaceuticals HCL Technologies Hindustan Lever Container Corporation Of India Piinjab National Bank (2) IClCl Bank ADR lnfosys Technologies ADR ITC Siemens India IClCl Bank ITC GOR
221.328 231,632 513.900 68,300
258,600 5,372,744 1,637,050
160.600 558,700 289,000 224.000 237.600 549,900
55,883 211,235 62,000 43,000
439,200 33.955 40,000
174,OGO . . .. ...
11,534,690 10.245.209 7.555.198 5.759.755 5.324.687 5,242.444 5,137,679 3,887,415 3.182.893 3,076,029 3,059,946 3,018,481 2,697.152 2,631,998 2,666 076 2.590.980 2,352,960 1,753.017 1.389.598
808.533 565,500
Total for Taiwan 7.19
1 0 8 1.05 0 96 0.60 0.31 0.27 0.17 0.09
Poland Bank Pekao TVN Powstechna Kasa Oszczednosci Bank Polski Bank Millenium Bank Zachodni WBK Multimedia Polsha Bank Handlowy w Warszawie Polski Koncern Naftowy Orlen
138,645 1,247,195
591,395 2,173,722
40,171 640,998
59,756 52,913 Total for lndla
China China Construction Bank 'H' ( 5 ) Industrial &Commercial Bank of China ' H (5) PetroChina Cliina Petroleum &Chemical 'H' (5) China Shipping Development 'W (5) Ping An Insurance Group Co of China ' H (51 Air Chma 'H' (51 China Life Insurance 'H' (51 PlCC Property & Casualty 'H' (5) Maanshan Iron & Steel 'H (51 China Corrimunications Construction 'H' (51 China Coal Energy 'H' (51 Huadian Power International 'T (51 TPV Technology Angang Steel ' H (5)
8.48
Total for Poland 4.53 24,616,000 15,655,000 5,700,000 8,068,000 3,828,000 1,007.000 9.018,OOO 1,408,000 9.294.000 7.056.000 3 687,000 2.805.000 3,210,000
854.000 55,000
15,706,587 9,723,040 8,077,153 7,469,650
5,574,482 4 881,960 4,806,944 4,768,452 3,8 7 4,2 5 6 3,645,871 1,821.487 1,263,073
540,287 80,625
5,857,614
1.57 0.97 0.81 0.75 0.59 0.56 0.49 0.48 0.48 0.39 0.37 0.18 0.13 0.05 0.01
In d o n e I i a PT Telekomunikasi Indonesia PT Astra International PT Bank Central Asia Bank Rakyat Indonesia PT Bank Mandiri Persero PT United Tractors PT Perusahaan Gas Negara
12,222.500 13,726,275 3.269.600 5.707.758 6,889,500 3,983.477 6,089,500 3.487.066
10,508,500 3,417,731 3,656,500 2,663,043 1,452,500 1,873.464
1.38 c.57 G.40 0.35 c.34 C.27 0 19
Total for Indonesia 3.50
Hong Kong China Mobile (Hong Kong) China Netcom Group (Hong Kong) China Resources Power Holdings GOME Electrical Appliances Holdings China Power International Development Shenzhen Investment 'New' Global B i d h e m Technology Group
Total for Hong Kong
.
1.244.COO 10,749,580 1.07 1.939.000 5.198.592 0.52 3.247.000 4,901,762 0.49 5,176,000 4,059,999 0.41 6,662.000 3.657,921 0.37 7,574,000 3,155,529 0.32 6,371,000 2,146,400 0.22
Total for China 7.83
South Africa MTN Group Naspers 'N' Sappi Tiger Brands Massniart Holdings Reunert
1,195,900 14.607.327 1.47 415,680 9,880,845 0.99 384,900 6,476,086 0.65 224,703 5,502,143 0.55 532.100 5,348,811 0.54 444,370 5,201.869 0.52
3.40
Morgan Stanley SICAV 31 December 2006 1 2
Emerging Markets Equity Fund
STATEMENT OF INVESTMENTS (continued) Market X of net Investment H o I d I n g value assets
Hungary OTP Bank 80,097 3673 500 0 3 7
Total for Hungary 0.37
__ . -.
._ ~_
Transferable securities and money niarket instruments admitted to official cxchangc listing or dealt in on another regulated market. As at 31 Lkcernber 2006, cxprcsscd in I!S dollars.
Market % of net Holdlng value assets Investment Malaysia
Kuala Lunipur Kepong 458,000 1,751,558 0 18 __ _. _
Total for Malaysia 0.18 6,551,970 6,238,339 5.12 1,603 4.441.801 3538.214 3.372.864
5
0.66 0.63
Turkey Turkiye Saranti Bankasi 1.983,091 Turkiye 1s Bankasi 'c' 1,359,478 BIM Birlesik Magazalar 96,730 Dogan "ayin 1.263.416 Coca-Cola lcecek Uretim 468.400 Yapi ve Kredi Bankasi 1,942,139 Turkcell lletisim Hizmet 1
Total for Turkey
.......................
0.51 0.45 0.35 0.34 0.00
Chile Enersis ADR 74.550 1,188,327 0.12
._ - -
Total for Chile 0.12
2.94 Israel Elbit Systems 1 21 0.30
Total for Israel 0.00 Austria Raiffeisen International Bank Holding 70,821 Erste Bank der Oesterreichischen Sparkassen 84.741
10,782,761 6,489502
1 .OR 0.65
Total for Austria 1.73 Hong Kong Moulin Global Eyecare (2) 740,000 0 0 0 0
Total for Hong Kong 0.00
. .. _
.
Total transferable securities and money market instruments admitted to otnclal exchange lisnng or dealt In on another regulated market 992,493,593 99.58
Czech Republic Ceske Energeticke Zavody Komercni Banka
253.900 11.668.994 1 1 7 18,300 2,715.297 0.27
Total lor Czech Republlc 1.44
Slovak Republic Central European Media Enterprises 'A' 129,800 9,073,020 0.91 Other transfcrablc securities and money market instruments not
admitted to official cxchangc listing or dealt in on another regulated market.
Total for Slovak Republic 0.91
Argentina Tenaris ADR 96.000 4 787,520 0 48 Banco Macro ADR 126,500 3,832,950 0 38
Total for Argentina 0.86
. . . _ _._
Brazil Banco Nacional Pfd 12) 30,754,160 0 0.00 Lolas Arapua GDR 144A Pfd 12) 12,659 0 0.00 Lqas Arapua Pfd (2) 11,491,000 0 0.00
. . . . .._.. . . - . .
Total for Brazil 0.00 Morocco Banque Marocaine du Commerce Exterieur 30,770 4,511,292 0.45 ONA 21,326 3,855,981 0.39 Russlan Federation
Alliance Celluose (2) 50,000 0 0.00 Total for Morocco 0.84
Total for Russian Federation 0.00
Total other transferable securities and money market instruments not admitted to official exchange listing
-
or dealt in on another regulated market 0 0.00 ..
Total Investment Securities 992,493.593 99.58
Thai I and Bangkok Bank (F) Regd (4) 620.700 1.974.564 0 21 PTT IF) 14) 290,500 1,687,552 0.17 Kasikornbank (F) (4) 777.100 1,343,534 0 13 Slam Commercial Bank (F) Regd 14) 810,800 1,300,869 0.13 CP Seven Eleven (F) (4) 4,297,500 742,998 0.07
o,71 Total NAV 996,723,193 100.00 . ._ .. - _ Total for Thailand
Colombia BanColombia ADR Pfd 158.240 4,992,472 0 50 Financial Statements.
Total for Colombia 0.50 15) 'H'; Hong Kong registered shares.
(2) This security is valued at its fair market value. See note 2(a) within the Notes to the
(4) (F): Foreign. . . .
Philippines Ayala 195.240 2,350,369 0.23 Philippine Long Distance Telephone 41,860 2,177.984 0.22
Total for Philippines 0.45
~
Peru Credico'p 98,500 4,029535 0.40
......
Total for Peru 0.40
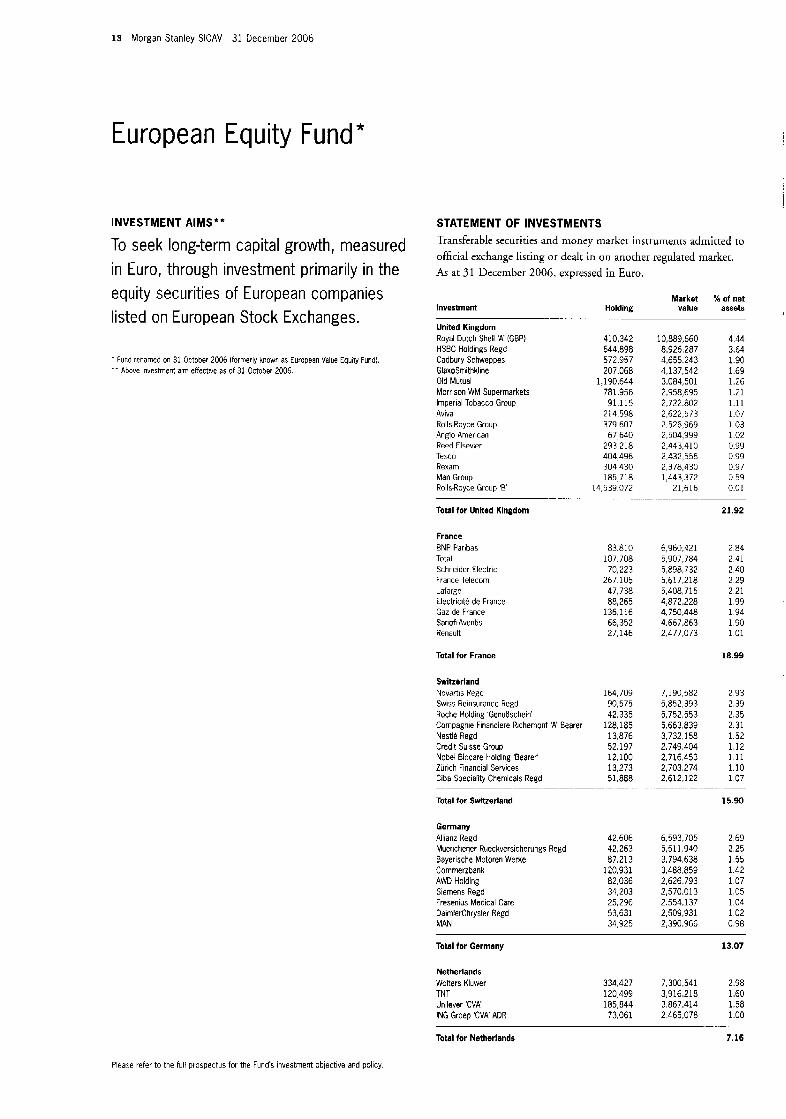
13 Morgan Stanley SICAV 31 December 2006
European Equity Fund*
INVESTMENT AIMS"
To seek long-term capital growth, measured in Euro, through investment primarily in the equity securities of European companies listed on European Stock Exchanges.
~ Fund renamed on 31 October 2006 (formerly known as European Value Equity Fund) _ _ Ahave investment aim effectivc a5 of 31 October 2006.
STATEMENT OF INVESTMENTS Transferable securities and nioney tnarkct instruments admitted to official exchange lisring or dcalt in on another regulated marker. As at 31 Deccmbcr 2006, expressed in Euro.
Inveslment Market % of net
H o I d I n g value assets
United Kingdom Royal Dutch Shell 'A' IGBPI HSBC Holdings Regd Cadbury Schweppes GlaxoSrnithkline Old Mutual Morrison WM Supermarkets Imperial Tobacco Group Aviva Rolls-Royce Group Anglo American Reed Elsevier Tesco Rexam Man Group Rolls-Royce Group ' E
410,342 644,898 572,957 207,068
1,190,644 781.956 91,115
2 14,598 379 607
67,640 293,218 404,496 304,430 185,718
14,533,072 . -
10,889,660 4 44 8,926,287 3.64 4,655.243 1.90 4,137,542 1.69 3,084,501 1.26 2,958,695 1.21 2.722.802 1.11 2,622,573 1.07 2,526,969 1.03 2,504,999 1.02 2,443,410 0.99 2,432,556 0.99 2,378,430 0.97 1,443,372 3.59
21,616 0.01
Total tor Unlted Klngdom 21.92
France BNP Paribas Total Schneider Electric France Telecom Lafarge Electricite de France Gaz de France Sanofi-Aventis Renault
83.810 107.708
70,223 267,105
47.738 88,265
136,116 66,352 27,146
6,960,421 5,307,784 5,898,732 5,617.218 5,408,715 4,872.228 4,750.448 4.667.863 2,477.073
2.84 2,41 2.40 2 29 2.21 1.99 1 94 1.90 1 0 1
Total for France
Switzerland Novartis Regd Swiss Reinsurance Regd Roche Holding 'GenuOschein' Compagnie Financiere Richemont 'A' Bearer Nestle Regd Credit Suisse Group Nobel Biocare Holding 'Bearer' Zurich Financial Services Ciba Speciality Chemicals Regd
Total for Swltzerland
Germany Allianz Regd Muenchener Rueckversicherungs Regd Bayerische Motoren Werke Commerzbank AWD Holding Siemens Regd Fresenius Medical Care DaimlerChrysler Regd MAN
164,709 90,575 42,335
128,185 13,876 52,197 12,100 13,273 5i.aa8
- .- .
42.606 42,263 87,213
120,931 82,036 34,203 25,296 53,631 34,925
18.99
7,190,582 2.93 5,852,393 2.39 5,152,553 2.35 5,663.839 2 31 3,732.1 58 1 5 2 2,749,404 1.12 2,716.453 1 1 1 2,703,274 1.10 2,612.122 1 0 7
15.90
6,593,705 2.69 5.511.940 2.25 3,794,638 1 5 5 3,488,859 1 4 2 2,626.793 1 0 7 2,570,013 1.05 2.554.137 1.04 2,509,931 1 02 2,390,966 0.98
Total for Germany
Netherlands Walter5 Kluwer TNT Unilever 'CVA' ING Groep 'CVA ADR
13.07
334,427 7,300.541 2.98 120,499 3,916,218 1.60 185.844 3,867,414 1.58
73,061 2.465078 1 .oo
Total for Netherlands 7.16
Please refer to the full prospectus for the Fund's investment objective and policy
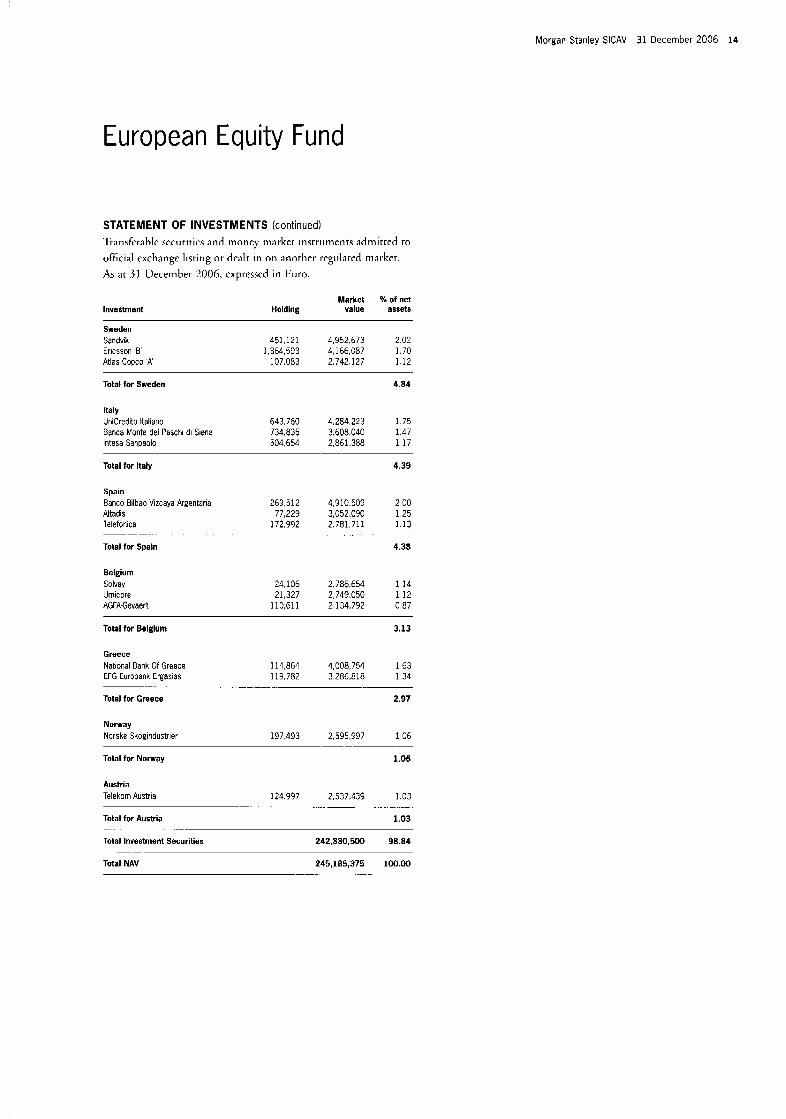
Morgan Stanley SICAV 31 December 2006 14
European Equity Fund
STATEMENT OF INVESTMENTS (continued) Transfcrahlc sccuritics and rrioriey rriarkec inscruriierits admirted to official cxchangc listing or dcali in mi anocher regulated market. As at 31 December 2006, cxprcsscd in Euro.
Investment Market 96 of net
H o I d I n g value asset5
Sweden Sandvik Ericssop '8' Atlas Copco 'A'
451,121 4,952,673 2.02 1.364,593 4,166,087 1.70
107.083 2.742.127 1.12
Total for Sweden 4.84
Italy UniCredito ltaliano 643.760 4.284.223 1.75 Banca Nonte dei Paschi di Siena 734.835 3,608.040 1.47 Mesa Smpaolo 504,654 2,861.388 1.17
Total for Italy
Spain Banco Bilbao Vizcaya Argentaria Altadis lelefonlca
Total for Spaln
- - .. . .
Belgium Solvay Umicore AGFA-Gevaert
4.39
269 512 4,910.509 2 00 77,229 3,052,090 1 2 5
172,992 2,781,711 1 1 3
4.38
24,106 2,786,654 1 1 4 21,327 2,749,050 1.12
110,611 2,134,792 0.87
Total for Belglum 3.13
Greece National Bank Of Greece 114.864 4,008,754 I 6 3 EFG Eurobank Ergasia$ 119,782 3,286,818 1.34
Total for Greece 2.97
.
Norway Norske Skogindustrier 197.493 2,595,997 1 06
Total for Noway 1.06
Austria Telekom Austria 124.997 2,537,439 1.03
Total for Austria 1.03
. .... ... .. . . .
. .
Total Investment Securities 242,330,500 98.84
Total NAV 245,185,375 100.00
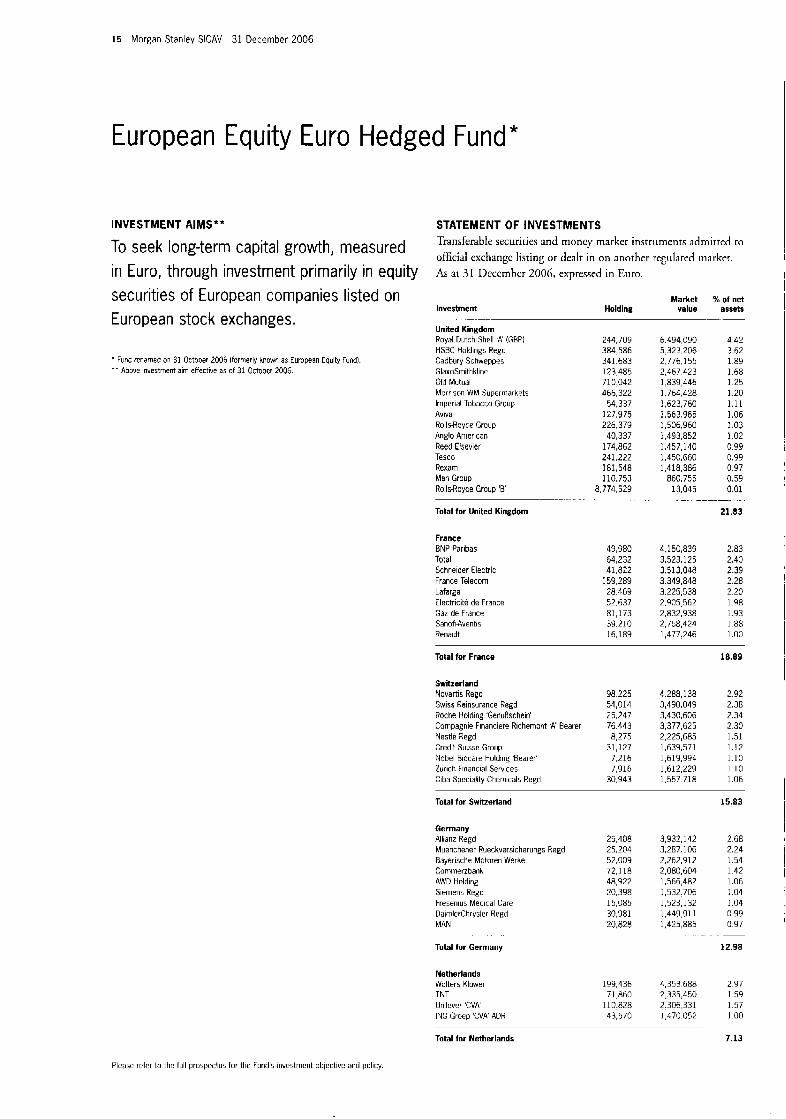
15 Morgan Stanley SlCAV 31 December 2006
European Equity Euro Hedged Fund*
INVESTMENT AIMS*'
To seek long-term capital growth, measured in Euro, through investment primarily in equity securities of European companies listed on European stock exchanges.
. Func renamed on 31 Octooer 2006 lforrnerly hno:vn as European Equity Fund) * - Abuve investment aim effective as of 31 October 2006.
STATEMENT OF INVESTMENTS Transferable securiries and money market instruments adinirted co official excharigc listing o r dealt in on another regulated marker. As a~ 31 llcccmhcr 2006, expressed in Euro.
Investment Market % of net
Holding value assets
United Kingdom Royal Dutch Shell 'A (GBP) HSBC Holdings Regd Cadbury Schweppes GlaxoSmithkline Old Mutual Morrison WM Supermarkets Imperial Tobacco Group Aviva RollsRoyce Group Anglo American Reed Elsevier Tesco Rexam Man Group Rolls-Royce Group ' 6
Total for United Kingdom
France BNP Paribas Total Schneider Electric France Telecom Lafarge Electricite de France Gaz de France Sanofi-Aventis Renault
244,709 384,586 341.683 123,485 710,042 466,322
54,337 127,975 226.379
40,337 174,862 241,222 181,548 110,753
8,774,529
49,980 64,232 41,822
159,289 28.469 52.637 81,173 39.210 16,189
6,494,090 5,323 206 2,776,155 2.467.423 1,839,446 1,764,428 1.623.760 1,563,965 1,506,960 1493,852 1,457,140 1,450,660 1,418,386
860,755 13,045
. ..
4.150.839 3,523,125 3.513.048 3.349.848 3.225.538 2.905 562 2,832,938 2.758.424 1,477.246
4.42 3.62 1.89 1.68 1.25 1.20 1.11 1.06 1.03 1.02 0.99 0.99 0.97 0.59 0.01
21.83
2.83 2.40 2.39 2 28 2.20 1.98 1.93 1.88 1 .oo
Total for France
Switzerland Novartis Regd Swiss Reinsurance Regd Roche Holding 'GenuRschein' Compagnie Financiere Richemont 'A Bearer Nestle Regd Credit Suisse Group Nobel Biocare Holding 'Bearer' Zurich Financial Services Ciba Speciality Chemicals Regd
98,225 54,014 25,247 76.443 8,275
31,127 7,216 7,916
30.943
4,288,138 3,490,049 3,430,606 3.377.625 2,225,685 1,639,571 1,619,994 1,612,229 1.557.718
18.89
2.92 2.38 2.34 2.30 1.51 1.12 1.10 1.10 1.06
Total for Switzerland
Germany Allianz Regd Muenchener Rueckversicherungs Regd Bayerische Motoren Werke Commerzbank AWD Holding Siemens Regd Fresenius Medical Care DaimlerChrysler Regd MAN
Total for Germany
Nether I and s Wolters Kluwer TNT Unilever 'CVA ING Groep 'CVA ADR
25.408 25,204 52,009 72.118 48,922 20,398 15,085 30,981 20,828
199,436 71,860
110,828 43,570
3,932,142 3.287.106 2,262,912 2,080,604 1,566,482 1.532.706 1,523,132 1,449,911 1,425,885
4.353.688 2,335,450 2,306,331 1,470,052
Total for Netherlands
15.83
2.68 2.24 1.54 1.42 I .06 1.04 1.04 0.99 0.97
12.98
.~
2.97 1.59 1.57 1 .oo
7.13
Please refer to the full prospectus for the Fund's investment objective and policy.
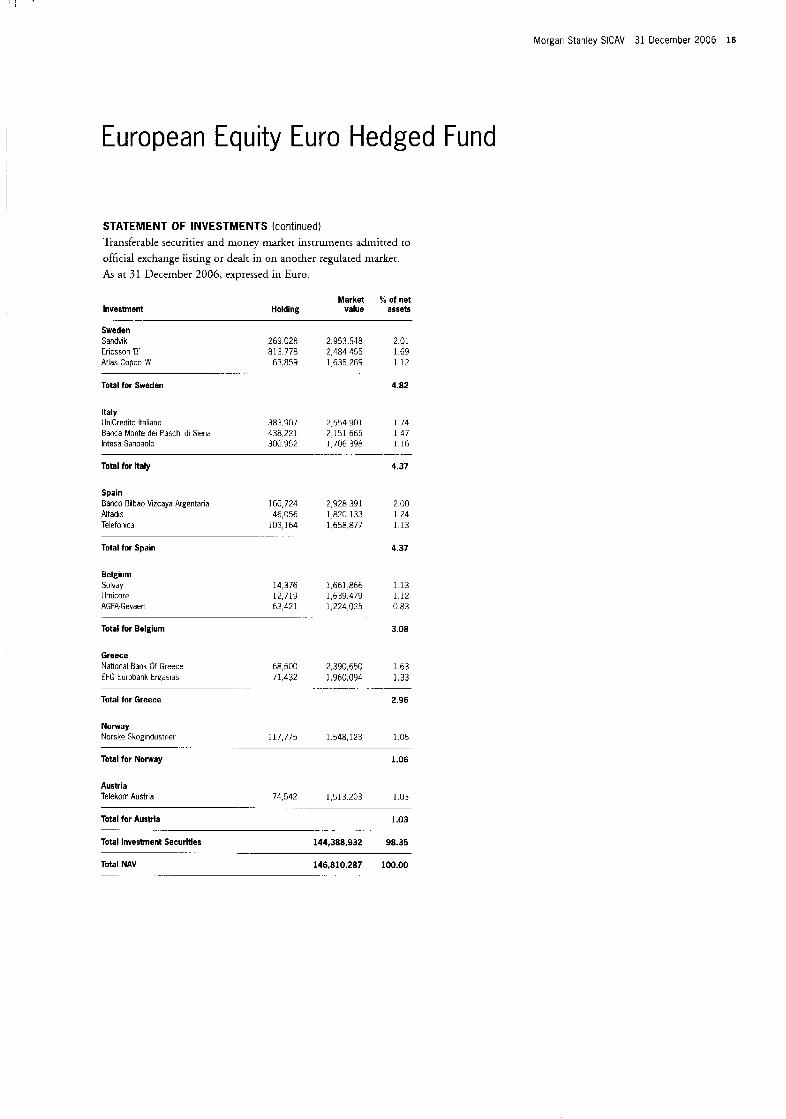
Morgan Stanley SICAV 31 December 2006 16
European Equity Euro Hedged Fund
STATEMENT OF INVESTMENTS (continued) Transferable securities and money marker insrrumencs adinitred ro official exchange lisring or dealr in on anorher regulared marker. As at 31 December 2006, expressed in Euro.
Investment Market % of net
Holding value assets
Sweden Sandvik 269.028 Ericsson 'B' 813,778 Atlas Copco 'A' 63,859
Total for Sweden
Italy UniCredito ltaliano 383.907 Banca Mmte del Paschi di Siena 438,221 lntesa Sanpaolo 300.952
Total for Italy
Spain Banco Bilbao Vizcaya Argentaria 160,724 Altadis 46,056 Telefonica 103,164
Total for Spain
.. . .
Be I g i u m Solvay Umicore AGFA.Gevaert
14,376 12,719 63,421
Total for Belgium
Greece National Bank Of Greece EFG Embank Ergasias
Total for Greece
Norway Norske Skogindustrier
68,500 71,432
...
117,775
2,953,548 2.01 2,484,455 1.69 1,635,269 1.12
4.02
2,554.901 1.74 2,151,665 1.47 1,706.398 1.16
4.37
.~
2,928,391 2.00 1,820,133 1.24 1.658,877 1.13
4.37
1,661,866 1.13 1.639.479 1.12 1,224,025 0.83
3.08
2,390,650 1 6 3 1,960,094 1.33
2.96
_. __ .
1,548,123 1.06 .. . .. . .
Total for Norway 1.06
Austria Telekom Austria 74,542 1,513 203 103
Total for Austria 1.03
Total Investment Securities 144,388,932 98.35
Total NAV 146,810,287 100.00
-_
-
- _.
- .-
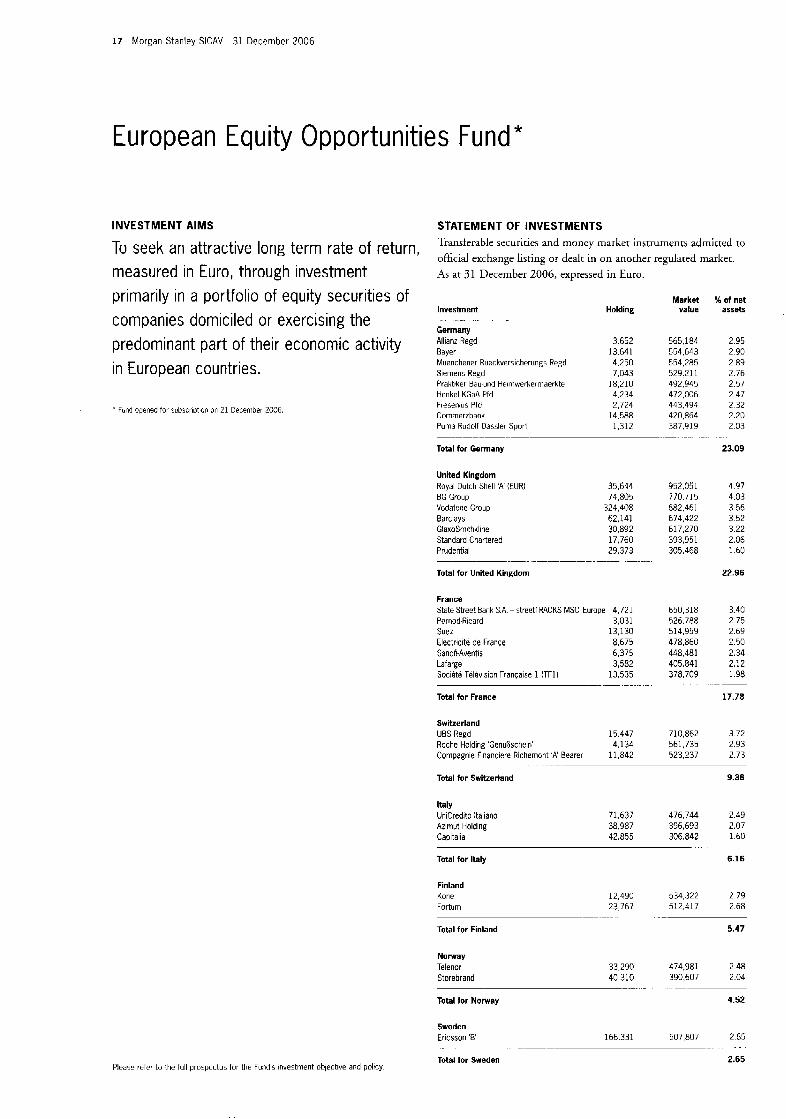
17 Morgan Stanley SICAV 31 December 2006
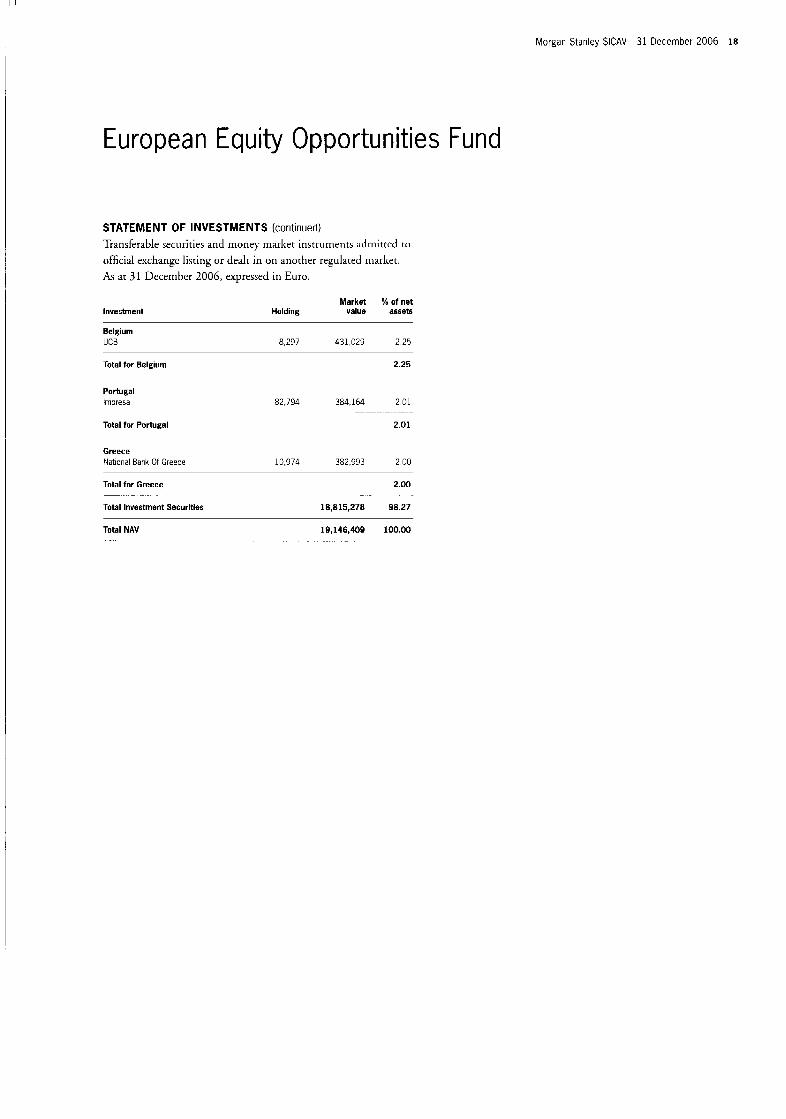
European Equity Opportunities Fund *
INVESTMENT AIMS
To seek an attractive long term rate of return, measured in Euro, through investment primarily in a portfolio of equity securities of companies domiciled or exercising the predominant part of their economic activity in European countries.
. Fmd opened for rubscriut 011 on 21 December 2G06.
Please refer to the full prospcctus for the Fund's investment objective and poltcy
STATEMENT OF INVESTMENTS Transferable securities and moncy market instrument5 admitted to official exchange listing or dealt in on another regulared marker. As at 3 1 December 2006, expressed in Euro.
Invesiment
Germany Allianz Rpgd Bayer Muenchener Rueckversicherungs Regd Siemens Regd Praktiker Bau-und Heimwerkermaerkte Henkel KGaA Pfd Fresenius Pfd Commerzbank Puma Rudolf Oassler Sport
H o I d i n g
3.652 13.641 4.250 7,043
18,210 4,234 2,724
14.588 1,312
Total for Germany
United Kingdom Royal Dutch Shell 'A (EUR) BG Group Vodafone Group Barclays GlaxoSmithkline Standard Chartered Prudential
35,644 74,805
324,408 62,141 30.892 17,760 29,373
-... - .- .. .
Total for United Kingdom
France State Street Bank S.A. - streetTRACKS MSCl Europe 4,721 Pcrnod-Ricard 3,031 Suez 13,130 Electricite de France 8,675 Sanoh-Aventis 6,375 Lafarge 3,582 Societe Television Francaise 1 (TF1) 13,535
Total for France
Switzerland UBS Regd 15.447 Roche Holding 'GenuOschein' 4.134 Compagnie FinanciPre Richemont 'A Bearer 11,842
Market value
565,184 554,643 554,285 529.211 492,945 472,006 443,494 420,864 387,919
. ..
952,051 770.715 682,461 674,422 617,270 393,951 305.468
650,318 526.788 514,959 478,860 448,481 405,841 378,709
710,862 561,735 523,237
56 of net assets
2.95 2.90 2.89 2.76 2.57 2.47 2.32 2.20 2.03
23.09
4.97 4.03 3.56 3.52 3.22 2.06 1.60
22.96
3.40 2 75 2.69 2.50 2.34 2.12 1 98
....
17.78
3.72 2.93 2.73
. _.
Total for Switzerland 9.38
Italy UniCredito ltaliano 71 637 476,744 2.49 Azimut Holding 38 987 396.693 2.07 Capitalia 42,855 306,842 1 6 0
Total for Italy 6.16
Fin I and Kone 12,490 534,322 2 79 Fortum 23,767 512,417 2.68
Total for Finland 5.47 .- _- - .
Norway Telenor 33,290 474,981 2 48 Storebrand 40 310 390,607 2.04
Total lor Norway 4.52 _- - -. .
Sweden 166 331 507 807 2 65 Ericsson 'E
Total tor Sweden 2.65
i
I
I
i I I
!
I I
!
I
I I
Morgan Stanley SlCAV 31 December 2006 18
European Equity Opportunities Fund
STATEMENT OF INVESTMENTS (continued) Transferable securities and money market instruments :Idrrrittcd to
official exchangc liscing or dealc in on anorher regdared market. As at 31 Decemhcr 2006, expressed in Euro.
Investment Market % of net
H o I d i n g value assets
Belgium UCB 8,297 431,029 2.25
Total for Belgium
Portugal lmpresa
2.25
82.794 384.164 2 01
Total for Portugal
Greece National Bank Of Greece
2.01
10.974 382.993 2.00
Total for Greece
Total Investment Securltles
. . - . . 2.00
18,815,278 98.27
Total NAV . ...
19,146,409 100.00 .. . .
19 Morgan Stanley SICAV 31 December 2006
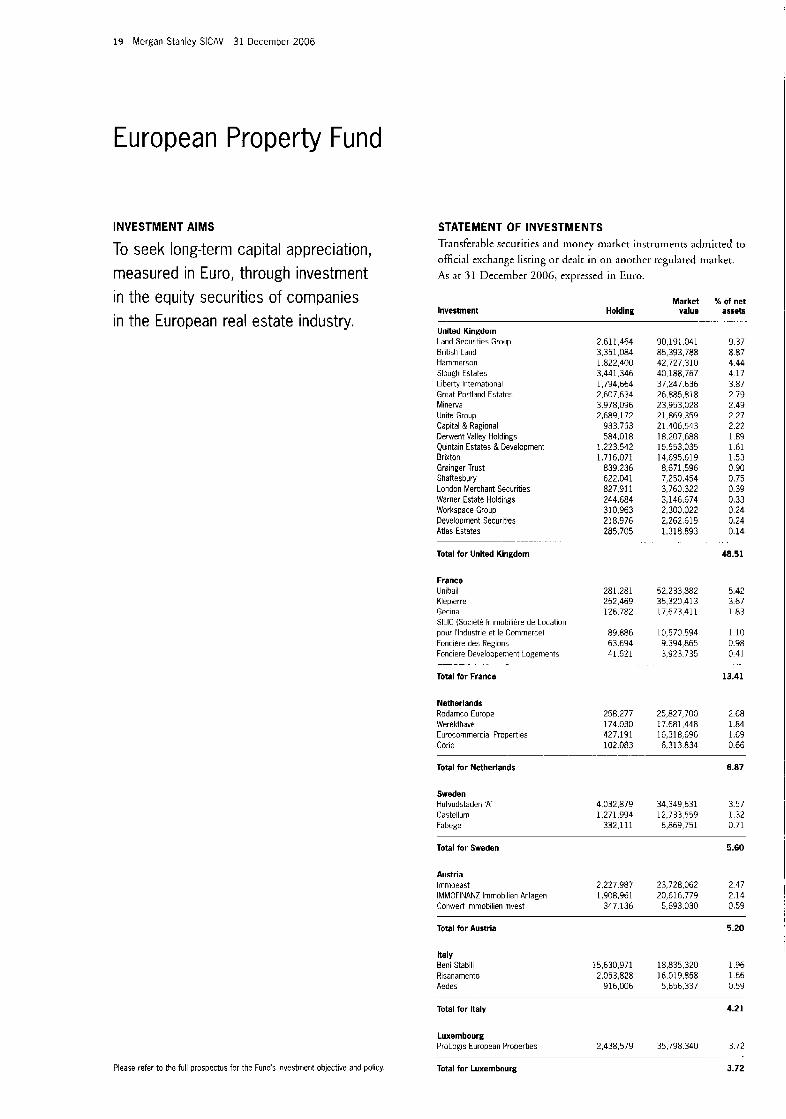
European Property Fund
INVESTMENT AIMS
To seek long-term capital appreciation, measured in Euro, through investment in the equity securities of companies in the European real estate industry.
Please refer to the full prospectus for the Fund's investment objective and policy
STATEMENT OF INVESTMENTS Transferable securiries and money marker insrumenrs admirted to official exchange listing or dealr in on anothcr rcgulatcd market. As a t 3 1 December 2006, expressed in Euro.
Market % of net Investment Holding value assets
United Kingdom Land Securities Group British Land Hammerson Slough Estates Liberty International Great Portland Estates Minerva Unite Group Capital & Regional Derwent Valley Holdings Quintain Estates & Development Brixton Grainger Trust Shaftesbury London Merchant Securities Warner Estate Holdings Workspace Group Development Securities Atlas Estates
Total for United Kingdom
. . .
France Unibail Klepierre Gecina SILK (Societe lmmobiliere de Location pour I'lndustrie et le Commerce) Fonciere des Regions Fonciere Developpement Logements
Total lor France .. ... . . . .
Netherlands Rodamco Europe Wereldhave Eurocommercial Properties Corio
2.611.464 3,351,084 1.822,400 3,441.346 1,794,664 2,607.634 3,978,096 2,689,172
933.753 584,018
1,223.542 1,716,071
839,236 622.041 827,911 244,684 310,963 218.976 285,705
281.281 252,469 126,782
89,886 63.694 41,521
258,277 174.030 427,191 102,083
90.191.041 85,393,788 42,727.310 40,188,767 37.247.636 26.885.818 23,953,028 21,869359 21.406.543 18,207,688 15.553.035 14,695,619 8,671,596 7,250,454 3,760.322 3,146,674 2,300.022 2,262,619 1,318.893
52,233,882 35,320,413 17,673,411
10,570.594 9,394,865 3,923.735
25,827,700 17,681,448 16,318,696 6,313.834
9.37
4.44 4.17 3.87 2.79 2.49 2.27 2.22 1 .E9 1.61 1.53 0 90 0.75 0.39 0.33 0 24 0.24 0.14
48.51
8.87
5.42 3.67 1.83
1.10 0.98 0.41
13.41
2.68 1.84 1.69 0.66
Total for Netherlands
Sweden Hufvudstaden 'A' Castellurn Fabege
6.87
4,032,879 34,349,631 3.57 1,271,994 12,733,559 1.32
332,111 6,869,751 0.71
Total for Sweden 5.60
Austria lmmoeast 2,227.987 23,728,062 2 47 IMMOFINANZ lmmobilien Anlagen 1,908,961 20,616,779 2,14 Conwert lmmobilien Invest 347,136 5,693.030 0.59
Total for Austria
Italy Beni Stabili Risanamento Aedes
5.20
15,630,971 18,835,320 1.96 2,053,828 16.019.858 1.66
916,006 5,656,337 0.59
Total for Italy 4.21
Luxembourg ProLogis European Properties 2,438,579 35.798.340 3.72
Total for Luxembourg 3.72
.- -.
Morgan Stanley SICAV 31 December 2006 20
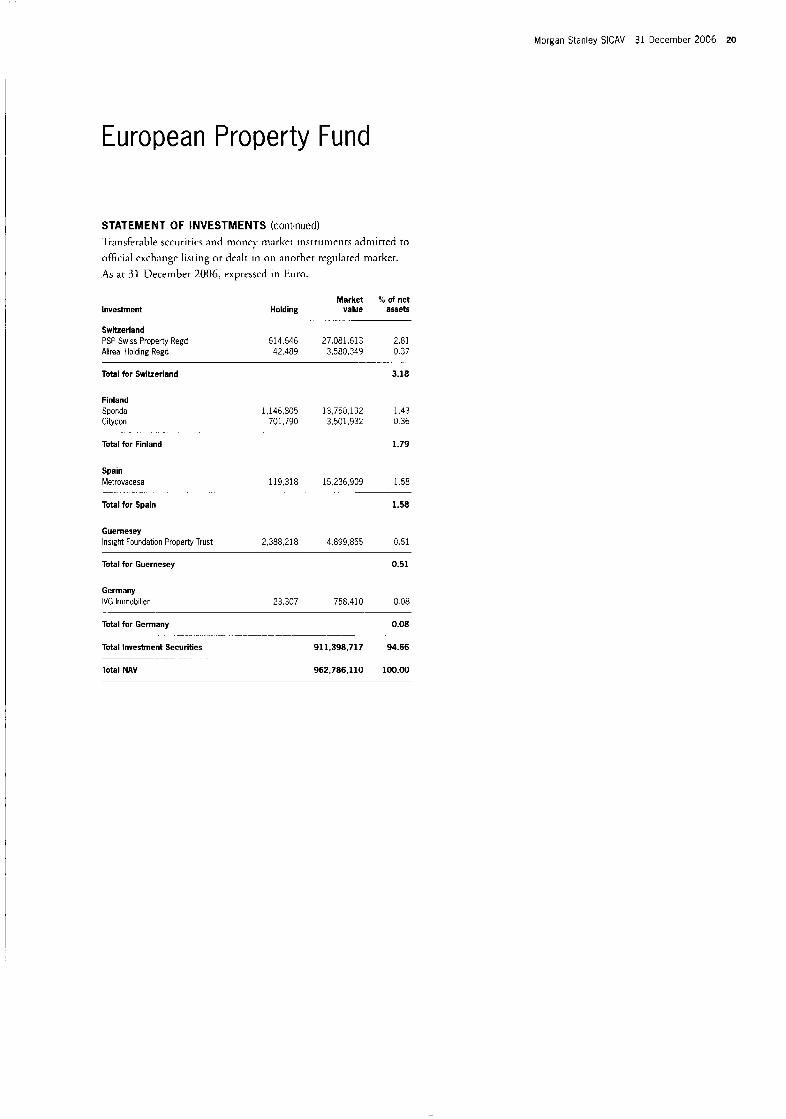
European Property Fund
STATEMENT OF INVESTMENTS (continued) Tr;insfcr;ible sccuritics arid rnoncy rnarkrt instrumenrs adinitced to official cxcharigc listing or dealt in on another regulared marker. As at 31 December 2006, exprcsscd in Euro.
Market % of net Investment Holding value assets
Switzerland PSP Swiss Property Regd 614.646 27,081,613 2.81
. . . .. . . . . . -. -. . . . .
Allreal Holding Regd 42.~189 3,580,344 0 37 ....... .. . .
Total for Switzerland 3.18
Finland Sponda Citycon
Total for Finland
Spain Metrovacesa
Total for Spain
...
1,146,805 13,753.192 1.43 701,190 3,501,932 0.36
1.79
119,318 15,236,909 1 58
1.58
Guernesey Insight Foundation Property Trust 2,388,218 4,899,855 G.51
Total for Guernesey 0.51
Germany IVG lmmoblllen 23.307 758.410 0.08
Total for Germany 0.08 .. . . ~ _ _
Total Investment Securities 911,398,717 94.66
Total NAV 962,786,110 100.00
_ _ . .
21 Morgan Stanley SICAV 31 December 2006
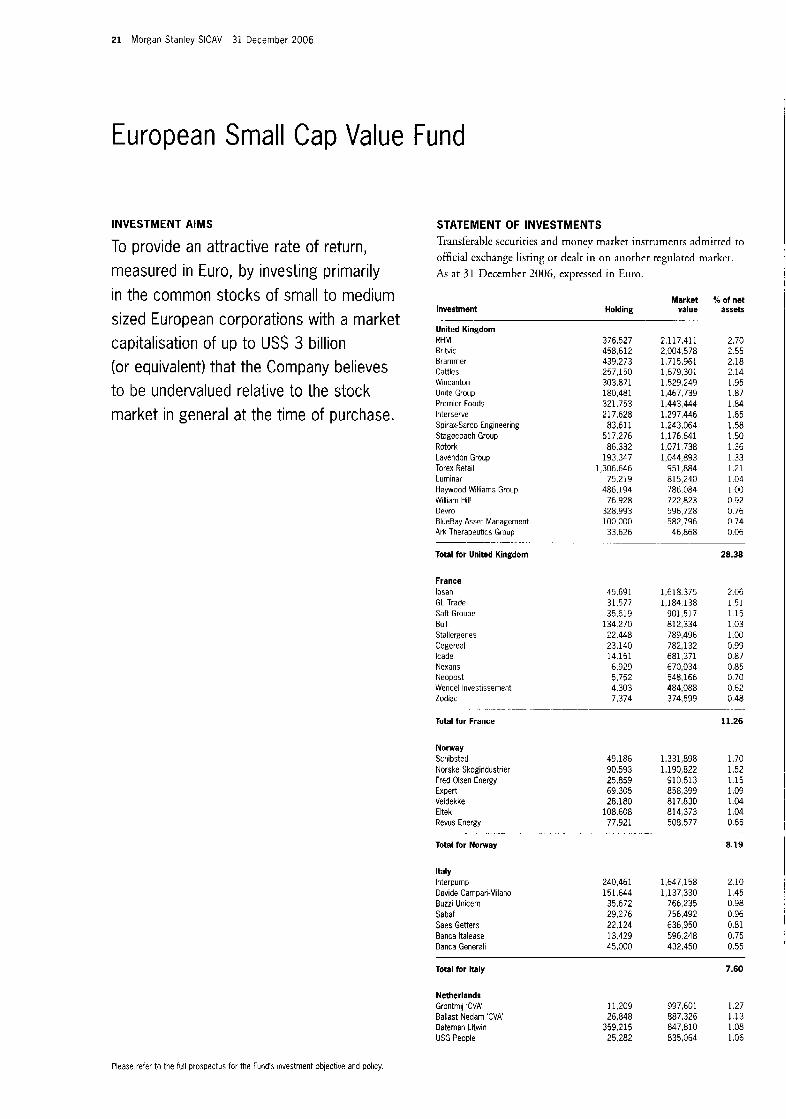
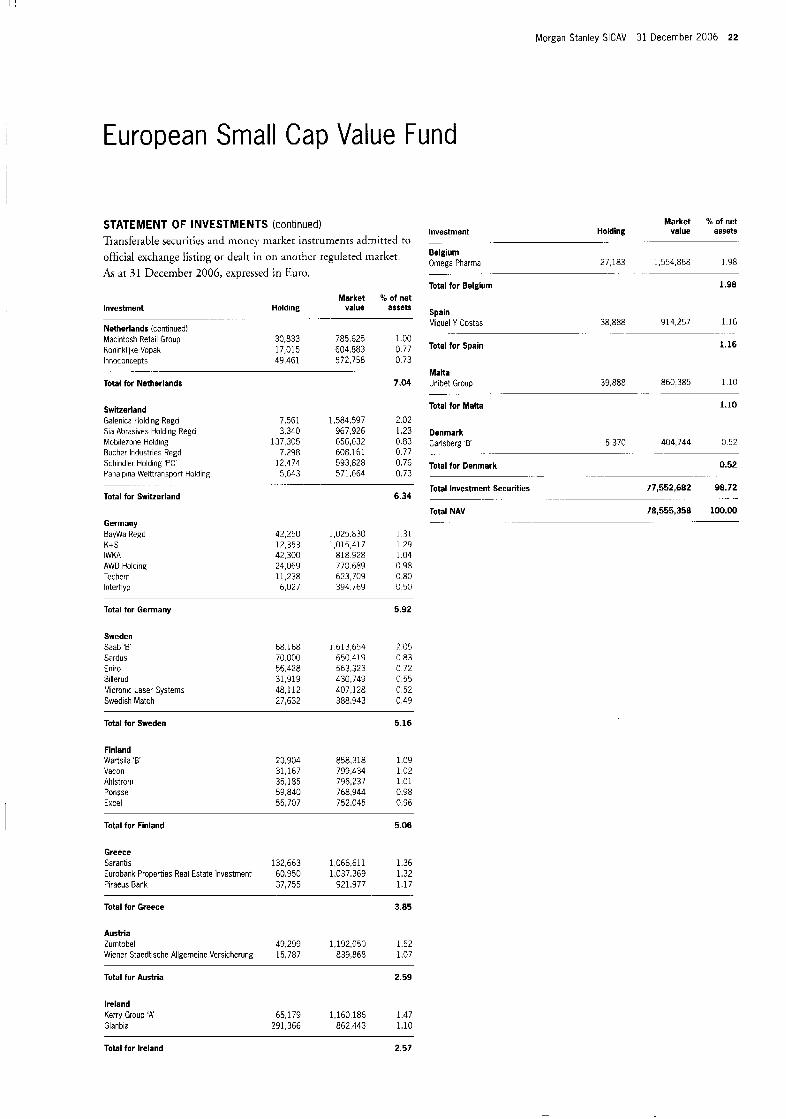
European Small Cap Value Fund
INVESTMENT AIMS STATEMENT OF INVESTMENTS Transferahlc sccuriries and money market instruments admitred to official cxchange listing or dealt in on anorher regulated tnarkci. As a t 31 December 2006, expressed in Euro.
To provide an attractive rate of return, measured in Euro, by investing primarily in the common stocks of small to medium Market % of net
Investment Holding value assets
United Kingdom . .. sized European corporations with a market
RHM Britvic Brammer Cat tles Wincanton Unite Group
capitalisation of up to US$ 3 billion (or equivalent) that the Company believes to be undervalued relative to the stock
Premier Foods lnterserve Spirax-Sarco Engineering
market in general at the time of purchase. Stagecoach Group Rotork Lavendon Group Torex Retail Luminar Heywood Williams Group William Hill Oevro BlueBay Asset Management Ark Therapeutics Group
Total for United Kingdom
France lpsen GL Trade Saft Groupe Bull Stallergenes Cegereal lcade Nexaris Neopost Wendel lnvestissement Zodiac
Total for France
. . . . . .
Nomay Schibsted Norske Skogindustrier Fred Olsen Energy Expert Veidekke Eltek Revus Energy
Total for Norway
Italy lnterpump Davide Campari-Milano Buzz1 Uiiicem Sabaf Saes Getters Banca ltalease Banca Generali
376.527 458,612 439,273 257,150 303.871 180,481 321,753 21 7,628
83,611 517,276
86,332 193,347
1,306,646 75,219
486,194 76 928
328,993 100.000
33,626
45,691 31,577 35,619
134,270 22,448 23,140 14,151 6,929 5,752 4,303 7,374
2,117,411 2.70 2,004.578 2.55 1.715.961 2.18 1,679.301 2.14 1.529249 1.95 1,467.739 1.87 1,443,444 1.84 1,297,446 1.65 1.243.064 1.58 1,176,641 1 50 1,071.738 1 36 1,044,893 1.33
951,884 1.21 815,240 1.04 786.084 100 722,823 0 92 596,728 0.76 582,796 0.74 46,868 0.06
28.38
1.618.375 2.06 1.184.1 38 1.51
901,517 1.15 812,334 1.03 789,496 1.00 782,132 0.99 681,371 0.87 670,034 0.85 548,166 0.70 484,088 0.62 374.599 0.48
49,186 90,593 25,859 69.305 28,180
108 608 77,921
. -
240,461 151.644 35,672 29,276 22,124 13,429 45,000
11.26
1,331,898 1.70 1,190,822 1.52
910.613 1 1 5 858,399 1.09 817.830 1 0 4 814,373 1.04 508,577 0 65
8.19
1,647,158 2.10 1,137,330 1.45
766.235 0.98 756.492 0.96 636,950 0.81 596.248 0.75 432,450 0.55
Total for Italy
Netherlands Grontmij 'CVA' Ballast Nedam 'CVA' Bateman I.itwln USG People
7.60
11,209 997,601 1.27 26,848 887,326 1.13
359.215 847,810 1.08 25,282 835.064 1.06
Please refer to the full pto=,pectw for the Fimd's investment objective and policy.
Morgan Stanley SICAV 31 December 2006 22
European Small Cap Value Fund
STATEMENT OF INVESTMENTS (continued) Transferable securities and rnoncy marker iiistrumeiirs admitted to
official exchange listing or dealt in on :irmhcr regdated market. As at 31 December 2006, expressed in F.uro.
Market 56 of net Holding value assets Investment
Belgium Omega Pharma 27,183 1,554,868 1.98
_. -.
Total for Belglum 1.98
Investment Market W of net
Holding value assets Spain Miquel Y Costas 38,888 914,257 1.16
Total for Spain 1.16
. . . . .. .
. - . . . ..
Netherlands (continued) Macintosh Retail Group 30,833 785,625 1.30 Koninklije Vopak 17,015 604,883 0 77 Innoconcepts 49,461 572.758 0 73
Malta Uriibet Group 39.888 860.385 1.10 Total for Netherlands 7.04 - _- Total for Malta 1.10 Switzerland
Galenice Holding Regd Sia Abrzsives Holding Regd mobile ion^ Holding Bucher Industries Regd Schindler Holding 'PC Panalpina Welttransport Holding
7,561 1.584.597 2.02 3,340 967.a26 1.23
137.305 656,632 0.83 7.238 608.161 0.77
12,474 593.628 0.76 5,643 571,E64 0.73
Denmark Larlsbwg E 5 370 404,744 0 52
Total for Denmark 0.52
Total Investment Securities 77,552,682 98.12
Total NAV 78,555,358 100.00
- ..
. -- .- .-
.. -. .. -.
-~ -
6.34 Total for Switzerland
Germany BayWa Reed KcS IWKA AWD Holding Techeni lnterhyp
42,250 1,025.630 1.31 17.353 1,015,417 1.29 42,300 818.928 1.04 24,069 773.689 C.98 11,238 623,709 C.80 6,027 394.T69 3.5G
Total for Germany 5.92
Sweden Saab '6' Sardus Eniro Biller ud Micronic Laser Systems Swedish Match
68.168 1,613,654 1 0 5 70.000 650.419 0 83 55.428 563.323 0 72 31.919 430.749 0.55 48,112 407.128 0.52 27,632 388.943 0.49
Total for Sweden 5.16
Fin I and Wartsila ' B Vacon Ahlstrom Ponsse Excel
23.904 858,318 1.09 31,167 799J34 1,02 35,185 796,237 1.01 59.840 768,944 0.98 55,707 752.045 C.96
Total for Finland 5.06
Greece Sarantis 132.663 1,066 611 1 36 Eurobank Properties Real Estate Investment 60,950 1.037.369 1.32 Piraeus Bank 37,755 921.977 1 1 7
Total for Greece 3.85
Austria Zurntobel 49 299 1,192,050 1.52 Wiener Staedtische Allgemeine VersiLherung 15,787 839.868 1.07
Total far Austria 2.59
Ireland Kerry Group 'A' Glanbia
65,179 1,160,186 1.47 291.366 862,443 1.10
Total for Ireland 2.57
23 Morgan Stanley SICAV 31 December 2006
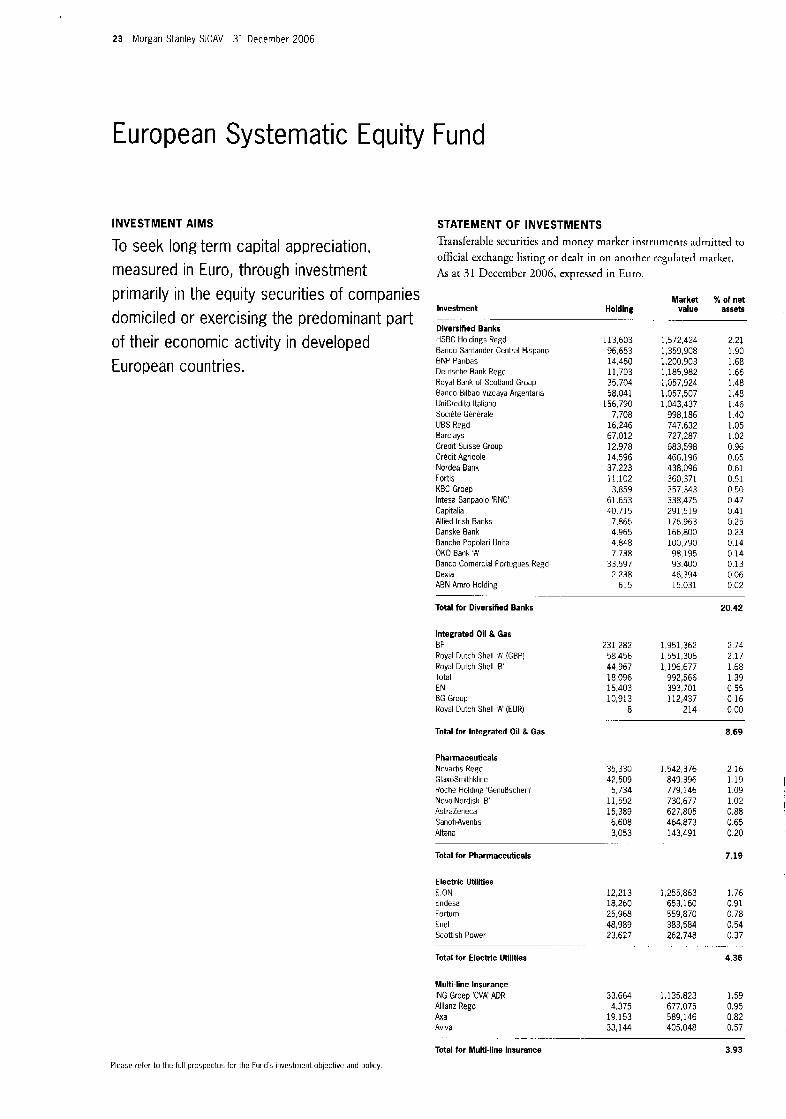
European Systematic Equity Fund
INVESTMENT IMS
To seek long-term capital appreciation, measured in Euro, through investment primarily in the equity securities of companies domiciled or exercising the predominant part of their economic activity in developed European countries.
I STATEMENT OF INVESTMENTS Transferablc securities and money market insrrurncnts admitted to official exchangc listing or dealr in on another regulated market. As ar 31 Deccmher 2006, expressed in Euro.
Investment
Dlversllied Banks HSBC Holdings Regd Banco Santander Central Hispano BNP Paribas Deutsche Bank Regd Royal Bank of Scotland Group Banco Bilbao Vizcaya Argentaria UniCredito ltaliano Societe Generale UBS Regd Barclays Credit Suisse Group Credit Agricole Nordea Bank Fortis KBC Groep lntesa Sanpaolo 'RNC Capitalia Allied Irish Banks Danske Bank Banche Popolari Unite OK0 Bank 'A' Banco Cornercial Portugues Regd Dexia ABN Arnro Holding
. H o I d i n g
Market value
% of net assets
113,603 96,653 14,460 11,703 35,704 58.041.
156,790 7,708
16,246 67,012 12,978 14.596 37,223 11,102 3,859
61.653 40,715
7,865 4.965 4,848 7.738
33,597 2,238
615
1,572.424 1,359,908 1.200,903 1,185,982 1,057,924 1.057.507 1,043,437
998,186 747.632 727,287 683,598 466,196 438,096 360,371 357.343 338,475 291,519 176.963 166,800 100,790 98,195 93.400 46,394 15.031
2.21 1 90 1.68 1.66 1.48 1.48 1.46 1.40 1.05 1.02 0.96 0.65 0.61 0.51 0 50 0.47 0.41 0.25 0.23 0.14 0.14 0.13 0.06 0.02
Total tor Diversihed Banks 20.42
Integrated Oil & Gas BP Royal Dutch Shell ' A IGBP! Royal Dutch Shell ' E Total EN1 BG Group Royal Dutch Shell ' A IEUR)
Total for Integrated Oil & Gas
~ .. .
Pharmaceuticals Novartls Regd GlaxoSmithkline Roche Holding 'GenuRschein' Novo-Nordisk ' B AstraZeneca Sanofi-Aventis
231,282 1,951,362 2.74 58,456 1,551,306 2.17 44,967 1,196,677 1.68 18.096 992.566 1.39 15,403 10,913
8
3931701 112,437
214
0 55 0.16 0.00
35,330 42,509
5,734 11,592 15,389 6,608
1,542,376 849.396 779,146 730,677 627,805 464,873
8.69
2.16 1.19 1.09 1.02 0.88 0.65
Altana 3,053 143,491 0.20
Total for Pharmaceuticals 7.19
Electrlc Utllltles €.ON 12,213 1,255,863 1.76 Endesa 18,260 653,160 0.91 Forturn 25.968 559,870 0.78 Enel 48,989 383,584 0.54 Scottish Power 23,627 262.748 0.37
Total for Elecwlc UtlllUes 4.36
. . . . . .. . . .- ... .. . . . . .
Multi-line Insurance ING Groep 'CVA' ADR Allianz Regd Axa Avlva
33,664 1,135,823 1.59 4,375 677,075 0.95
19.153 589,146 0.82 33,144 405,048 0.57
.. .
Total tor Multi-line Insurance 3.93
Please refer to the full prospectus for the Fund's investment objective and policy
! '
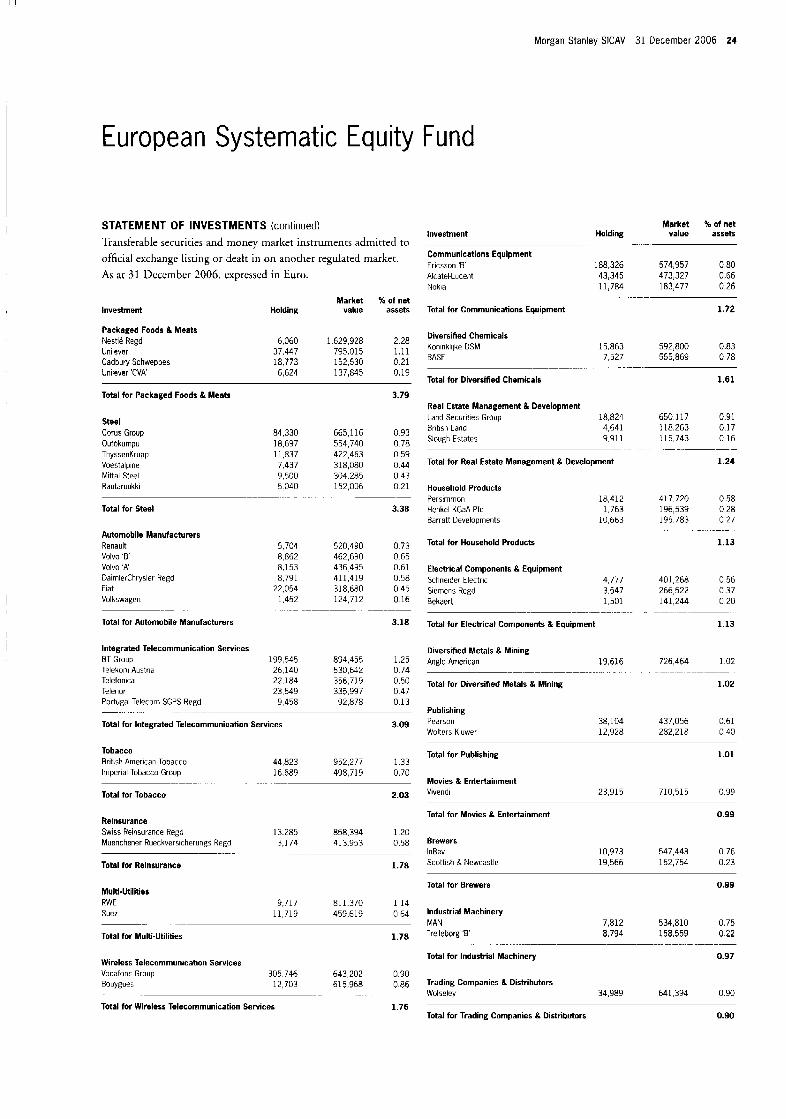
Morgan Stanley SICAV 31 December 2006 2 4
European Systematic Equity Fund
STATEMENT OF INVESTMENTS (continued) Transferable securiries and money market instruments admitted to official exchange lisring or dealt in on anorher regulated market. As at 3 1 llecernber 2006, expressed in Euro.
Investment Market 36 of net
H o I d i n g value assets
Packaged Foods & Meats Nestle Regd Unilever Cadbury Schweppes Unilever 'CVA
6,060 1,629,928 2.28 37,447 795.015 1.11 18.773 152,530 c.21 6,624 137,815 0.19
Total for Packaged Foods & Meats 3.79
Steel Corus Group Outokumpu ThyssenKrupp Voestalpine Mittal Steel Rautaruukki
Total for Steel
Automobile Manufacturers Renault VOlVO '6 VOIVO 'A' DaimlerChrysler Regd Fiat Volkswagen
Total for Automobile Manufacturers
..
84,330 665,116 0 93 18,697 554,740 0 78 11,837 422,463 0 59 7,437 318,080 0 44 9,500 304.285 0 43 5 040 152,006 0 21
3.38 _ __
5,704 520,490 0 7 3 8,862 462,690 0 65 8,153 436 495 0 61 8,791 411,419 0 58
22,054 318,680 0 4 5 1.452 124,712 0 16
3.18
._ .
Integrated Telecommunication Services BT Group 199,545 894.455 1.25 Telekom Austria 26.140 530.642 0.74 Telefonica 22.184 356,719 0.50 Telenor 23,549 335.997 0.47 Portugal Telecom SGPS Regd 9,458 92,878 0.13
Total for Integrated Telecommunication Services 3.09
- ...... ......
Tobacco British American Tobacco Imperial Tobacco Group
44,823 952.277 1.33 16.689 498,719 0.70
. . __ ..
Total for Tobacco 2.03
Investment
Communications Equipment Ericsson '6' Alcatel-Lucent Nokia
Total for Communications Equipment
Market % of net Holding value assets
.....
188,326 574,957 0.80 43,345 473,327 0.66 11,784 183,477 0.26
1.72
Diversified Chemicals Koninklijke DSM 15.863 592,800 0.83 BASF 7,527 555,869 0 78
Total for Diversified Chemicals 1.61
.
Real Estate Management & Development
British Land 4,641 118,263 0.17 Slough Estates 9.91 1 115,743 0.16
Total for Real Estate Management & Development 1.24
Land Securities Group 18,824 650,117 0.91
.- ..
Household Products 417 720 058 Persimmon 18,412
Henhel KGaA Fid 1763 196,539 0 28 Barratt Developments 10,663 195783 027
Total for Household Products 1.13
_ . _
Electrical Components & Equipment Schneider Electric 4.777 401,268 0 5 6 Siemens Regd 3.547 266,522 0.37 Bekaert 1.501 141,244 0.20
Total for Electrical Components & Equipment 1.13
__ . . .
Diversified Metals & Mining Anglo American 19,616 726,464 1.02
Total for Diversified Metals & Mlnlng 1.02
~ . . . . . . . . . . . . ... .
Publishing Pearson Woltcrs Kluwer
38,104 437,056 0.61 12,928 282.218 0.40
Total for Publishing
Movies & Entertainment Vivendi
1.01
23,915 710,515 0.99
Reinsurance
Muenchener Rueckversicherungs Regd 3,174 413,953 0.58
Total for Reinsurance 1.78
Swiss Reinsurance Regd 13.285 858,394 1 20
-_ ... .
Total for Movies & Entertainment 0.99
Brewers InBev Scottish & Newcastle
10,973 547,443 0.76 19,566 162,754 0.23
Multl-Utilities RWE 9,717 81 1,370 1.14 Suez 11,719 459,619 0.64
Total for Multi-Utilities 1.78
._
Wireless Telecommunication Servlces
Bouygue: 12,703 615,968 0.86 Vodafonf Group 305.746 643,202 0.90
Total for Wlreless Telecommunication Services 1.76
Total for Brewers 0.99
Industrial Machinery MAN 7,812 534,810 0.75 Trelleborg ' E 8,794 158,559 0.22
........ ~ .................
Total for Industrial Machinery 0.97
Trading Companies & Distributors Wolseley 34,989 641,394 0.90
Total for Trading Companies & Distributors 0.90

25 Morgan Stanley SICAV 31 December 2006
European Systematic Equity Fund
STATEMENT OF INVESTMENTS (continued) 'lransfcrablc sccuritics and money market instruments admitted to official exchange listing or dealt in on another regulated markec. As at 31 December 2006, exprcsscd in Euro.
Market 96 of net Investment Holding value assets
Casinos & Gaming Ladbrokes 98,213 610.710 0.85 Sportingbet 20,101 12.850 0.02
-. .... _. .....
Market 96 of net Investment Holdlng value assets
Tires & Rubber Continental 4,777 420,854 0.59
Total for Tires & Rubber 0.59
... .
!
IT Consulting & Other Services Atos Origin 8.896 398,897 0.56
Total for IT Consulting & Other Services 0.56
Total for Casinos & Gaming 0.87 Asset Management & Custody Banks Man Group 47,604 369.971 0.52
Airlines British Airways Deutsche Lufthansa
Total for Asset Management 8 Custody Banks 0.52 49,802 390.570 0.55 10,952 228,349 0.32
Alternative Carriers TeliaSonera 49,572 311,185 0.44 Total for Airlines 0.87 . . . .... -
Total for Alternative Carriers 0.44 I
Industrial Conglomerates Tomklns 71,069 259659 036 Orkla 4,272 183,118 0 26 DCL 5,514 141 986 020
Total for Industrial Conglomerates 0.82
. _. _ _
Thrifts & Mortgage Finance HBOS 18,316 308,253 0.43
Total for Thrifts & Mortgage Finance 0.43
Building Products Compagnie de Saint-Gobdin 8,738 557,921 0.78
Department Stores Marks & Spencer Group PPR
19,800 211.064 0.30 693 78.240 0.11
Total for Building Products 0.78 Total for Deparbnent Stores 0.41 1 Oil & Gas Equipment & Services Technip 2,766 144.109 0.20 ProSafe 12,615 134,342 0 19
Specialty Chemicals Imperial Chemical Industries 75,302 506,028 0.71
Total for Speclalty Chemlcals 0.71
.............
Total l o r Oil & Gas Equlpment & Servlces 0.39 Gas Utilities Gaz de France 14,151 493,870 0.69
Advertising WPP Group 26,697 274,066 0.38 Total for Gas Utilities 0.69
Total for Advertising 0.38 Construction & Engineering Arnec 45,941 287,891 0.40 Vinci 2,119 205,013 0 2 9
Total for Construction & Engineering 0.69
. -. . -. - -_ Distributors lnchcape 33.303 250,532 0.35
Total for Distributors 0.35
Food Retall Oelhaize 3,772 238.768 0.34 Kesko 'B' 3,420 136,492 0 19 Axfood 3,288 102,746 0 14
Total for Food Retail 0.67
. . . . . . . ~ . . . . .
Oil & Gas Exploration & Production DET Norske Oljeselskap 175,815 245 302 0.34
Total for Oil & Gas Exploration & Production 0.34
. .-
Construction Materlals Lafarge 2,163 245,068 0.34 Property & Casualty Insurance
Royal & Sun Alliance Insurance Group 200.094 453,664 0 64
Total for Propem & Casually Insurance 0.64
..... - _. . Total for Constructlon Materlals 0.34
Apparel Accessories B Luxury Goods Benetton Group 16,480 238,301 0 33
Total for Apparel Accessories & Luxury Goods 0.33 __
Diversified Commercial & Professional Services Group 4 Securicor 153,730 429,681 0.60
Total for Diversified Commercial & Professional Services 0.60
Computer Storage & Peripherals Logitech International Regd 9 958 2 17,365 0.30
Total for Computer Storage & Peripherals 0.30 .-
Aerospace & Defense Finrneccariica 12.265 252,046 0 3 5 BAE Systems 27,575 174,542 0.25
Total for Aerospace B Defense 0.60
~~~ ...

Morgan Stanley SlCAV 31 December 2006 26
European Systematic Equity Fund
STATEMENT OF INVESTMENTS (continued) Tratisferable securities and moticy rriarkct instruments admitted to
official exchange lisring or dzalr in on another rcgulatcd markct. As at 31 December 2006, exprcsscd in Euro.
Investment Market X of net
Holding value assets
Agriculrral Products Kerry Group 'A 12,201 217,178 0 30
Total for Agricultural Products 0.30
. -
Commodity Chemicals Solvay 1 868 215,941 0 30
Total for Commodity Chemicals 0.30 .- . ..
Restaurants Sodexho Alliance 4,140 196.407 0.28
...-
Total for Restaurants 0.28
Leisure Products First Chcice Holidays 45 576 193,113 0 27
Total for Leisure Products 0.27
-
Life .% Health Insurance Aegon 11,358 164 350 0 23 Friends Provident 3,262 10524 0 0 2
Total for Life & Health Insurance 0.25
__ -. . .-
Fertilizers & Agricultural Chemicals Yara International 8,961 155,603 0.22
Total for Fertilizers & Agricultural Chemicals
Paper Products Norske Skogindustrier 11,058 145.355
Total for Paper Products
~ - -.
Oil & Gas Drilling Ocean 23,117 129,407
Total for 011 & Gas Drilling
_ .. -- .
Retail REIT's Rodarnco Europe 1,251
Total for Retail REIT'S
Apparel Retail Next 4,039
.... 125,100
108.088
0.22
0 20
0.20
0 18
0.18
0 18
0.18
.-
0.15 - _ . -
Total for Apparel Retail 0.15
Market 56 of net value assets Investment Holding
Systems Software Business Objects 1 30 0.00
. . - -. - .
Total for Systems Software 0.00
Total Investment Securities 67,063,819 93.87
Total NAV 71,439,733 100.00
Paper Packaging Rexam 11,653 91.041 0 13
Total for Paper Packaging 0.13
. .. ~ ..
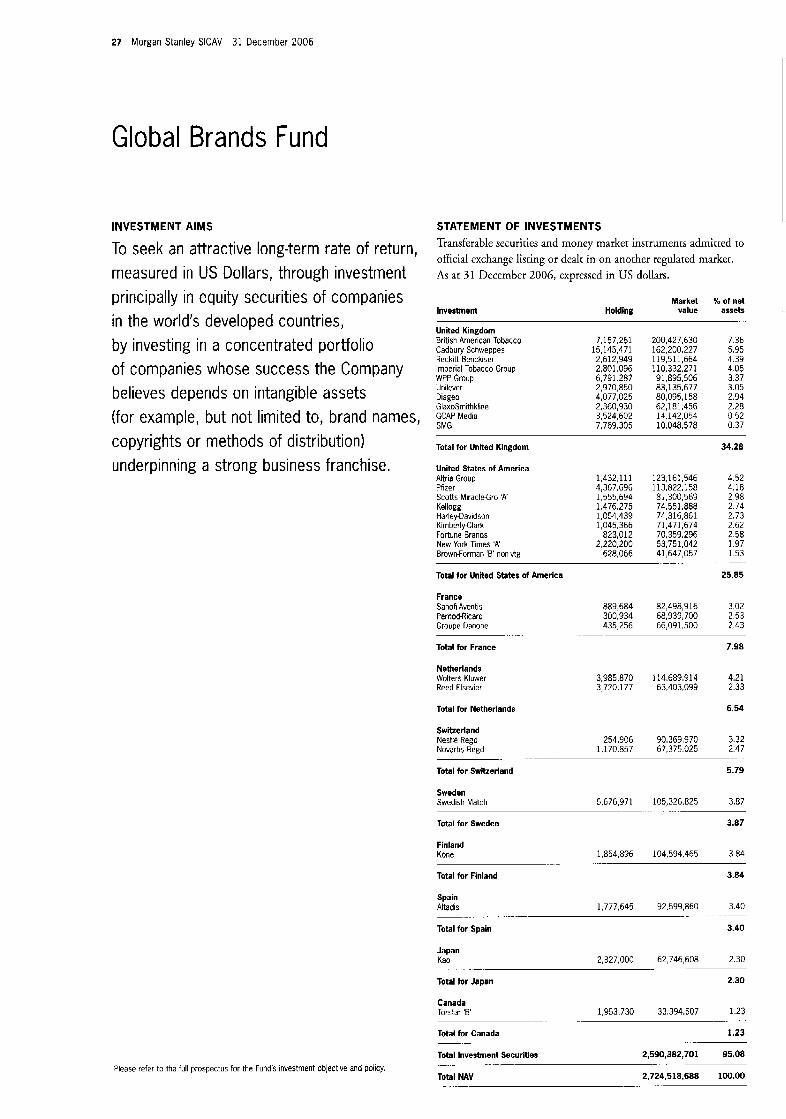
27 Morgan Stanley SICAV 31 December 2006
Global Brands Fund
INVESTMENT AIMS
To seek an attractive long-term rate of return, measured in US Dollars, through investment principally in equity securities of companies in the world's developed countries, by investing in a concentrated portfolio of companies whose success the Company believes depends on intangible assets (for example, but not limited to, brand names, copyrights or methods of distribution) underpinning a strong business franchise.
Please refer to the full prospectus for the Funds investment objective and policy.
STATEMENT OF INVESTMENTS Transferable securities and money market instruments adinitred to official exchange listing or dealr in on another regulated marker. As at 31 December 2006, expressed in US dollars.
Investment Market 96 of net
Holdlng value assets
United Kingdom British American Tobacco 7,157,261 200,427,630 7.36 Cadbury Schweppes 15,145,471 162,200,227 5.95 Reckitt Benckiser 2,612,943 119,511,664 4.39 Imperial Tobacco Group 2.801.096 110.332.271 4 05 WPP Group Unilever Diageo GlaxoSmithkline GCAP Media SMG
6.791.287 91,895.506 3 37 2,970,850 83,135,677 3.05 4.077.025 80.095.158 2.94 2:360;930 62; 181 :456 2.28 3,524,602 14,142,054 0.52 7,769,305 10.048.578 0.37
Total for Unlted Klngdom 34.28
1,432,111 :23.161.546 4.52 4,367,636 i 13,822,158 4.18 1,555,694 81,300,569 2.98 1,476,275 74.55i.am 2.74 1,054,439 74,316,861 2.73 1,045,366 71,471,674 2.62 823.012 70.359.296 2.58
United States of America Altria Group Pfizer Scotts MiracleGro 'A' Kellogg Harley-Davidson KimberlyClark Fortune Brands New York Times ' A 2.220:200 53,751,042 1.97
1.53 Brownforman 'B' non-vtg 628,066 41,647,057
Total for United States of America 25.85
France 3.02 Sanofi-Aventis
Pernod-Ricard 300,934 68,939,700 2.53 Groupe Danone 435,256 66,031,500 2.43
-. ._ .. . .
889,684 82,498,916
- . . ... .
Total for France 7.98
3.985.870 i 14.689.914 4.21 Netherlands Wolters Kluwei Reed Elsevier 3,720,177 63,403,039 2 33
_ .
Total for Netherlands 6.54
Switzerland Nestle Regd Novartis Regd
254,906 90,363,970 3.32 1.170.857 67.375.025 2.47
.. - -.
Total for Switzerland 5.79
Sweden Swedish Match 5,676,971 105,326,825 3 87
Total for Sweden 3.87
-.
Finland Kone 1,854,896 104.594.465 3.84
-.
Total for Finland 3.84
Spain Altadis 1,777 645 92 599,860 3 40
Total for Spain 3.40
. - ~ -.
Japan Kao 2,327,000 62,746,608 2.30
-
Total for Japan 2.30
Canada Torstar 'B 1,953 730 33 394,507 123
Total for Canada 1.23
Total Inveslment Securles 2,590,382,701 95.08
Total NAV 2,724,518,688 100.00
__ __
__ - . . -._
-
._ - - -
I /
Morgan Stanley SlCAV 31 December 2006 28
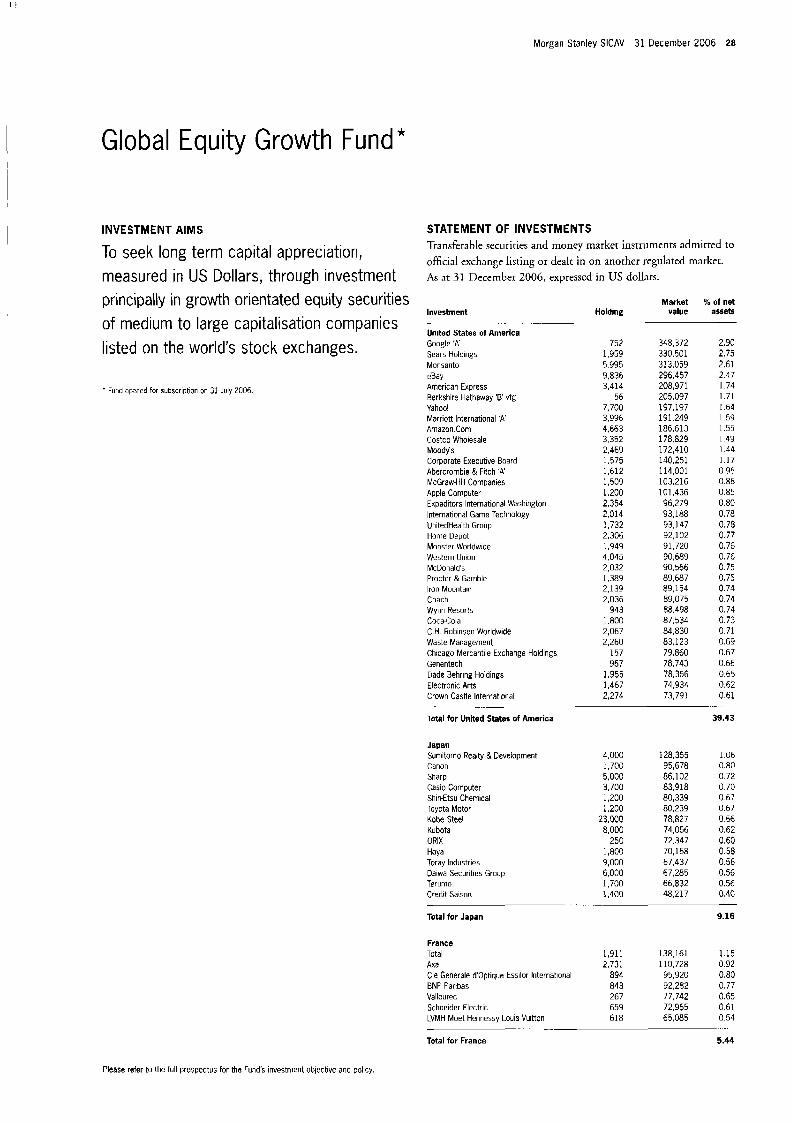
Global Equity Growth Fund*
INVESTMENT AIMS STATEMENT OF INVESTMENTS Transferable securities and money market instruments admitted to official exchange listing or dealt in on another regulated marker.
To seek long term capital appreciation, measured in US Dollars, through investment AS at 31 December 2006, expressed in us dollars.
Market 96 of net value assets
principally in growth orientated equity securities Investment
United States of Amerlca Google ' A Sears Holdings Monsanto eBay American Express Berkshire Hathaway '6 utg Yahoo! Marriott International 'A' Amazon.Com Costco Wholesale Moodys Corporate Executive Board Abercrombie & Fitch ' A McGraw-Hill Companies Apple Computer Expeditors International Washington International Game Technology UnitedHealth Group Home Depot Monster Worldwide Western Union McDonald's Procter & Gamble Iron Mountain Coach Wynn Resorts Coca-Cola C.H. Robinson Worldwide Waste Management Chicago Mercantile Exchange Holdings Genentech Dade Behring Holdings Electronic Arts Crown Castle International
Total tor Unlted States of America
H o I d i n g of medium to large capitalisation companies - .
listed on the world's stock exchanges.
* Fund opcned for subscription on 31 July 2006.
... ...
752 1,959 5.995 9,836 3,414
56 7,700 3.996 4,663 3.352 2,469 1.575 1,612 1,509 1,200 2,354 2,014 1,732 2,306 1,949 4.045 2,032 1,389 2,139 2,036
943 1,800 2,067 2,260
157 967
1,955 1,467 2,274
348,372 330.501 313,059 296,457 208,971 205,097 197,197 191.249 186,613 178,829 172,410 140,251 114,001 103,216 101,436 96,279 93,188 93,147 92,102 91,720 90,689 90,566 89,687 89,154 89,075
87,534 84,830 83,123 79,860 78,743 78.356 74,934 73,791
88.498
Japan Sumitomo Realty 8, Development Canon Sharp Casio Computer Shin-Etsu Chemical Toyota Motor Kobe Steel Kubota ORlX Hoya Toray Industries Daiwa Securities Group Terumo Credit Saison
4,000 1,700 5,000 3,700 1,200 1,200
23,000 8,000
250 1,800 9,000 6,000 1,700 1,400
128,355 95,678 86,102 83,918 80,339 80,239 78,827 74,056 72.347 70,158 67,437 67,285 66,832 48,217
Total for Japan
2.90 2.75 2.61 2.47 1.74 1.71 1.64 1.59 1.55 1.49 1.44 1.17 0.95 0.86 0.85 0.80 0.78 0.78 0.77 0.76 0.76 0.75 0.75 0.74 0 74 0.74 0.73 0.71 0.69 0.67 0.66 0.65 0.62 0 61
39.43
.... .
1.06 0.80 0.72 0.70 0.67 0.67 0.66 0.62 0.60 0.58 0.56 0.56 0.56 0.40
France Total 1,911 Axa 2,731 Cie Generale d'0ptique Essilor International 894 BNP Paribas 843 Vallourec 267 Schneider Electric 659 LVMH Moet Hennessy Louis Vuitton 618
Total for France
9.16
138,161 1 1 5 110,728 0 92
95,920 0 8 0 92,282 0 77 77,742 0.65 72,965 061 65,085 0 54
5.44
Please refer to the full prospectus for the Fund's investment objective and policy.
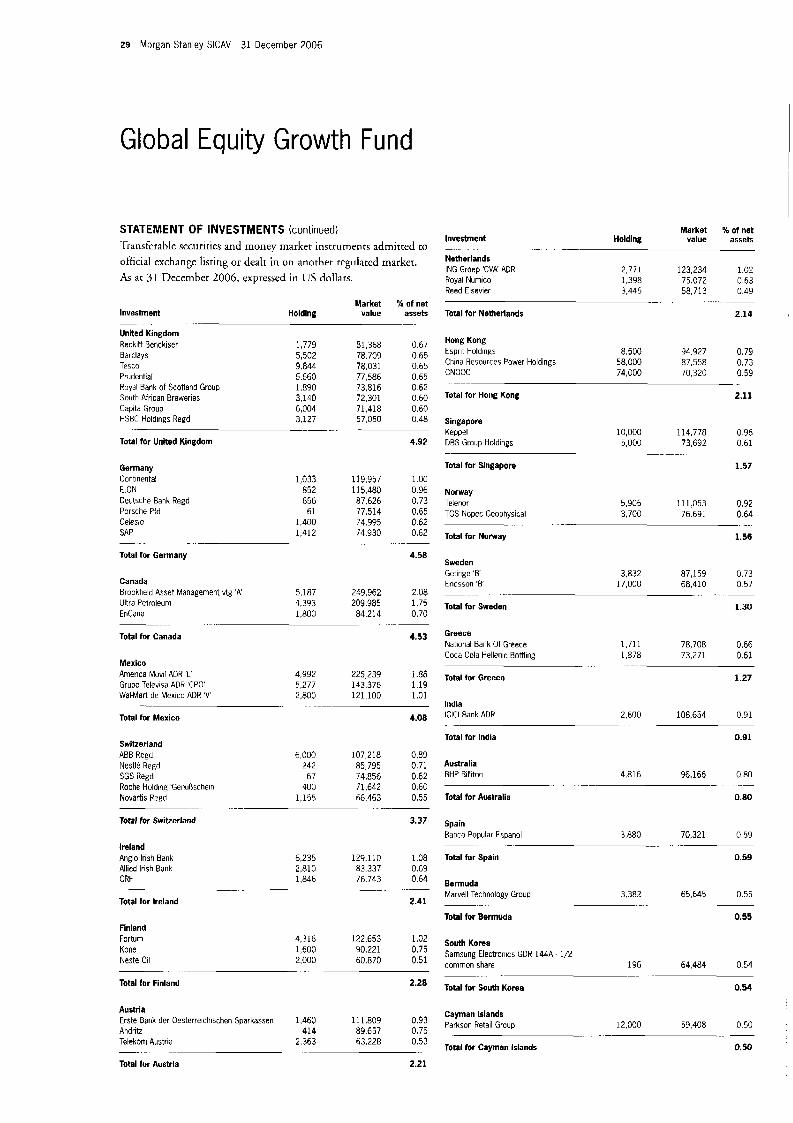
29 Morgan Stanley SICAV 31 December 2006
Global Equity Growth Fund
STATEMENT OF INVESTMENTS (continued) Ti-atisfcrable securicies and money market instruments admitted to official exchange listing or dealt in o n another rcgulated marker. As ar 31 December 2006, expressed in US dollars.
lnvesiment
United Kingdom Reckitt Benchiser Barclays Tesco Prudential Royal Bank of Scotland Group South African Breweries Capita Group HSBC Holdings Regd
-. . . .... H o I d I n g
Market % of net value assets
1,779 5,502 9.844 5.660 1,890 3,140 6,004 3,127
81,368 0.67 78.709 0.65 78,031 0.65 77,586 0.65 73,816 0.62 72.301 0.60 71,418 0.60 57,050 0.48
Total tor Unlted Kingdom 4.92
Germany Continental 1,033 119,957 €.ON 852 115,480 Deutsche Bank Regd 656 87.626 Porsche Pfd 61 77,514 Celesio 1,400 74,995 SAP 1,412 74,930
Total for Germany
- .. ......
1 .oo 0.96 0.73 0.65 0 62 0.62
4.58
.~
Canada
Ultra Petroleum 4,393 209.985 1.75 EnCana 1,800 84,214 0.70
Total for Canada 4.53
Brookfield Asset Management vtg ' A 5,187 249,962 2.08
...... . . ~
Mexico
Grupo Televisa ADR CPO 5,277 143.376 1 1 9 Wal-Mart de Mexico ADR 'v' 2,800 121,100 1.01
Total for Mexico 4.08
America Movil AOR 'L' 4.992 225,239 1.88
-_ . ... ._-..
Switzerland ABB Regd 6,000 107,218 0.89 Nestle Regd 242 85,795 0.71 SGS Regd 67 74,856 0.62 Roche Holding 'GenuOschein' 400 71,642 0.60 Novartis Regd 1,155 66,463 0.55
Total for Switzerland 3.37 - .. .
Ireland Anglo Irish Bank 6 235 129.1 10 1 08 Allied Irish Bank 2,810 83 337 0.69 CRk 1,846 76,743 0 64
Total far Ireland 2.41 __ ~
Fin I and Forturn 4,316 122,653 1.02 Kone 1,600 90.221 0.75 Neste Oil 2,000 60,870 0 51
Total for Finland 2.28
-. -
Austria Erste Bank der Oesterreichischen Sparkassen 1,460 11 1,809 0.93 Andritz 414 89,657 0.75 Telekom Austria 2.363 63,228 0.53
Total for Austrla 2.21
-. . . . . . .
Market % of net Holding value assets Investment
Netherlands ING Groep 'CVA' ADR 2,771 123,234 1 0 2 Royal Numico 1,398 75,072 0 63 Reed Elsevier 3,445 58,713 0 49
Total tor Netherlands 2.14
__ -
- .~
Hong Kong Esprit Holdings 8,500 94.927 0.79 China Resources Power Holdings 58,000 87,558 0.73
74,000 70,320 0 5 9 CNOOC
Total tor Hong Kong 2.11
._ .-
Singapore Keppel 10,000 114,778 0 9 6 DES Group Holdings 5,000 73,692 0 61
Total tor Slngapore 1.57
Norway Telenor 5.905 111.053 0.92 TGS Nopec Geophysical 3,700 76.691 0 64
Total for Nomay 1.56
. -. -._
Sweden Getinge '6 3,832 87,159 0 73 Ericsson 'E 17 000 68,410 0 5 7
1.30 Total for Sweden
- -_ . _ _ ~
Greece National Bank Of Greece 1,711 78,708 0.66 Coca Cola Hellenic Bottling 1,878 73,271 0 61
Total for Greece 1.27
. -. . .
India 2,600 108,654 0.91 IClCl Bank ADA
Total for India 0.91
...
Australia BHP Billiton 4,816 96,166 0 8 0
Total for Australia 0.80
_ .-
Spain Banco Popular Espanol 3.880 70,321 0.59
Total for Spain 0.59
~.
Bermuda Marvel1 Technology Group 3,382 65.645 0 55
Total for Bermuda 0.55
~. . .- ..
South Korea Samsung Electronics GDR 144A - 1/2 common share 196 64,484 0.54
Total for South Korea 0.54
~. . -.
Cayman Islands Parkson Retail Group 12,000 59,408 0 50
Total for Cayman Islands 0.50 - .
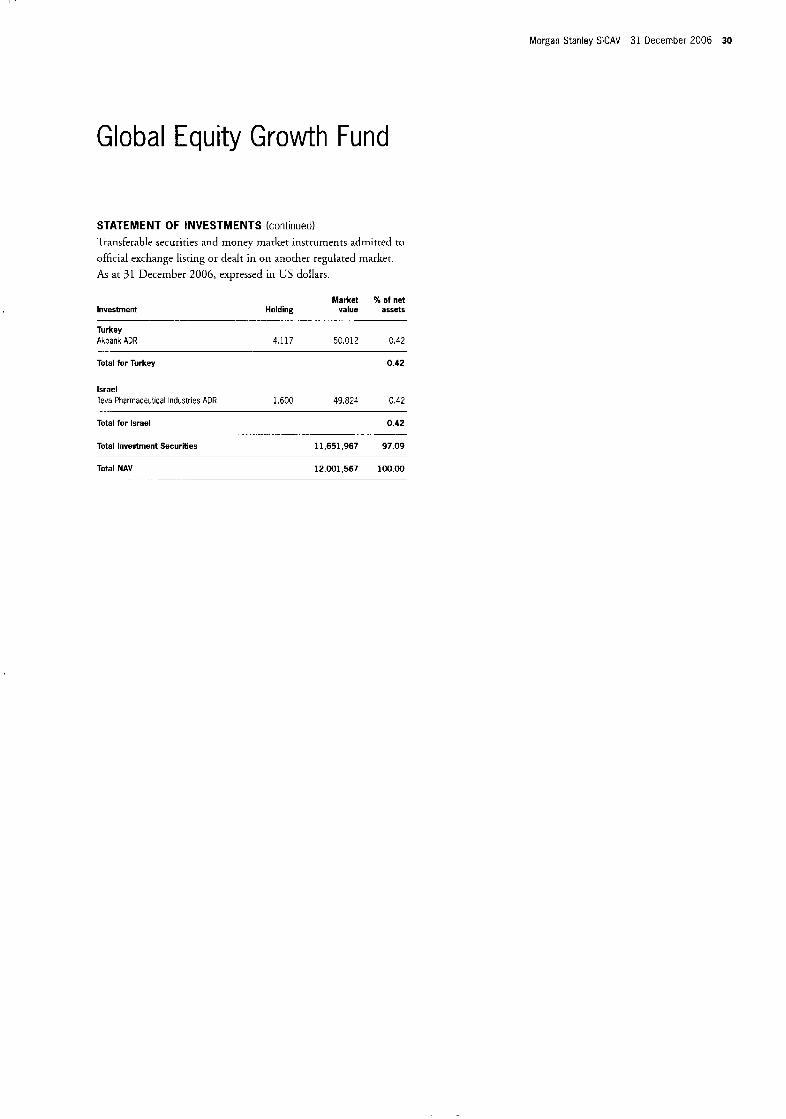
Morgan Stanley SlCAV 31 December 2006 30
Global Equity Growth Fund
STATEMENT OF INVESTMENTS (continued) Transferable securities and money marker instruments admitted to official exchange listing or dealt in on another regulated market. As at 3 1 December 2006, expressed in US dollars.
Market % of net Investment Holding value assets
Turkey Akbank ADR 4.117 50.012 0.42
.. .....
Total for Turkey 0.42
Israel Teva Pharmaceutical Industries ADR 1.600 49.823 0.42
Total for Israel 0.42
Total Investment Securities 11,651,967 97.09
-. __ .......
Total NAV 12,001.567 100.00 . -~
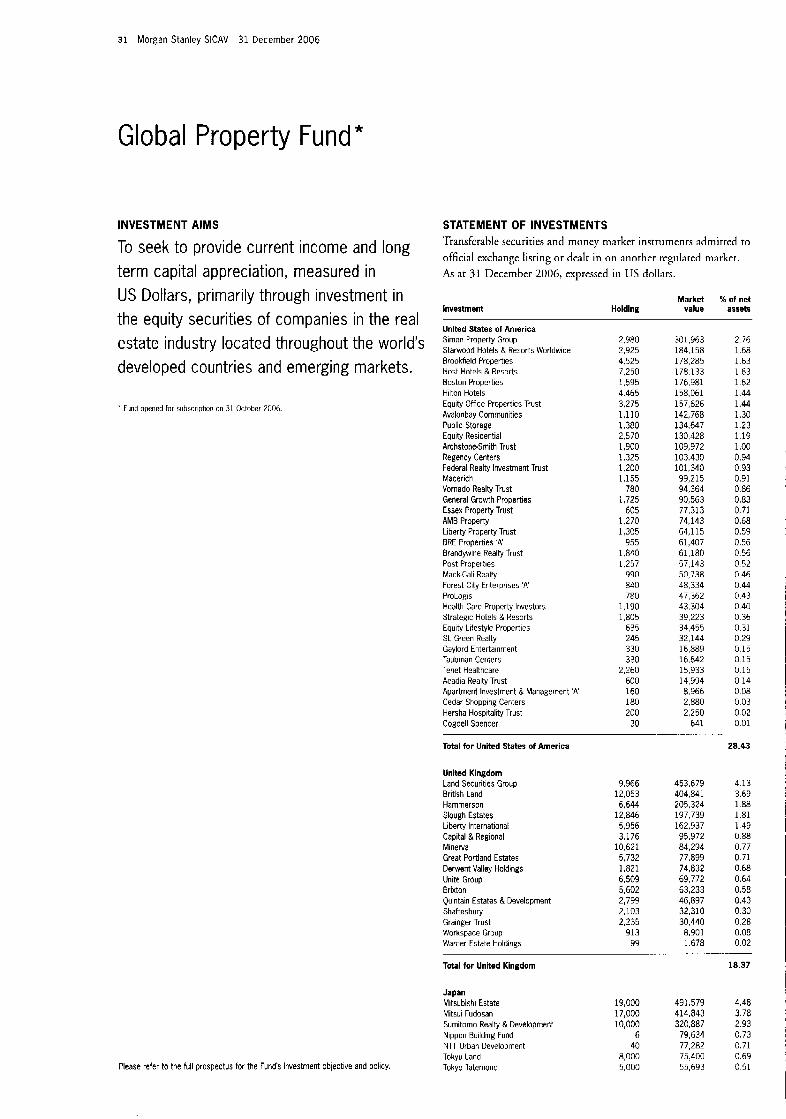
31 Morgan Stanley SICAV 31 December 2006
Global Property Fund *
INVESTMENT AIMS
To seek to provide current income and long term capital appreciation, measured in US Dollars, primarily through investment in the equity securities of companies in the real estate industry located throughout the world's developed countries and emerging markets.
. Fund opened for subscription on 31 October 2006
Please refer to the full prospectus for the Fund's investment objective and policy.
STATEMENT OF INVESTMENTS 'hnsfcrable securities and money market instruments admitred to official exchange lisring or dealt in on another regulared market. As at 31 December 2006, expressed in US dollars.
Investment Market 56 of net
Holding value assets
Unlted States of America Simon Property Group Starwood Hotels & Resorts Worldwide Brookfield Properties Host Hotels & Resorts Boston Properties Hilton Hotels Equity Office Properties Trust Avalonbay Communities Public Storage Equity Residential Archstone6mith Trust Regency Centers Federal Realty Investment Trust Macerich Vornado Realty Trust General Growth Properties Essex Property Trust AMB Property Liberty Property Trust ERE Properties 'A' Brandywine Realty Trust Post Properties MackCali Realty Forest City Enterprises 'A' ProLogis Health Care Property Investors Strategic Hotels & Resorts Equity Lifestyle Properties SL Green Realty Gaylord Entertainment Taubman Centers Tenet Healthcare Acadia Realty Trust Apartment Investment & Management 'A' Cedar Shopping Centers Hersha Hospitality Trust Cogdell Spencer
2,980 2,925 4,525 7,250 1,595 4.465 3,275 1,110 1,380 2,570 1.900 1,325 1,200 1,155
780 1.725
605 1,270 1.305
955 1,840 1.257
990 840 780
1,190 1,805
635 245 330 330
2,260 600 160 180 200
30
Total for United States of America
United Kingdom Land Securities Group British Land Hammerson Slough Estates Liberty International Capital & Regional Minerva Great Portland Estates Derwent Valley Holdings Unite Group B r i x t o n Quintain Estates & Development Shaftesbury Grainger Trust Workspace Group Warner Estate Holdings
9.966 12,053 6,644
12.846 5,956 3,176
10.621 5,732 1,821 6,509 5,602 2,799 2,103 2,235
913 99
301,963 184. I58 178,285 178.133 176.981 158,061 157,626 142,768 134.647 130,428 109,972 103.430 101,340 99,215 94,364 90,563 77,313 74,143 64,115 61,407 61,180 57,143 50,738 48,334 47,362 43.304 39,223 34,455 32.144 16,889 16.642 15,933 14,994 8.966 2,880 2,250
641 - ... .
453,679 404,841 205,324 197,739 162,937 95,972 84,294 77,899 14,832 69,772 63,233 46,897 32,310 30,440 8,901 1.678
2.76 1.68 1.63 1.63 1.62 1.44 1.44 1.30 1.23 1.19 1 .oo 0.94 0.93 0.91 0.86 0.83 0.71 0.68 0.59 0.56 0.56 0.52 0.46 0.44 0.43 0.40 0.36 0.31 0.29 0.15 0.15 0.15 0 14 0.08 0.03 0.02 0.01
28.43
4.13 3.69 1.88 1.81 1.49 0.88 0.77 0.71 0.68 0.64 0.58 0.43 0.30 0.28 0.08 0 02
Total for United Kingdom 18.37
Japan Mitsubishi Estate 19,000 Mitsui Fudosan 17,000 Sumitomo Realty & Development 10,000 Nippon Building Fund 6 NTr Urban Development 40 Tokyu Land 8,000 Tokyo Tatemono 5,000
491,579 4.48 414,843 3.78 320.887 2.93
79,634 0.73 77,282 0.71 75.400 0.69 55,693 0.51
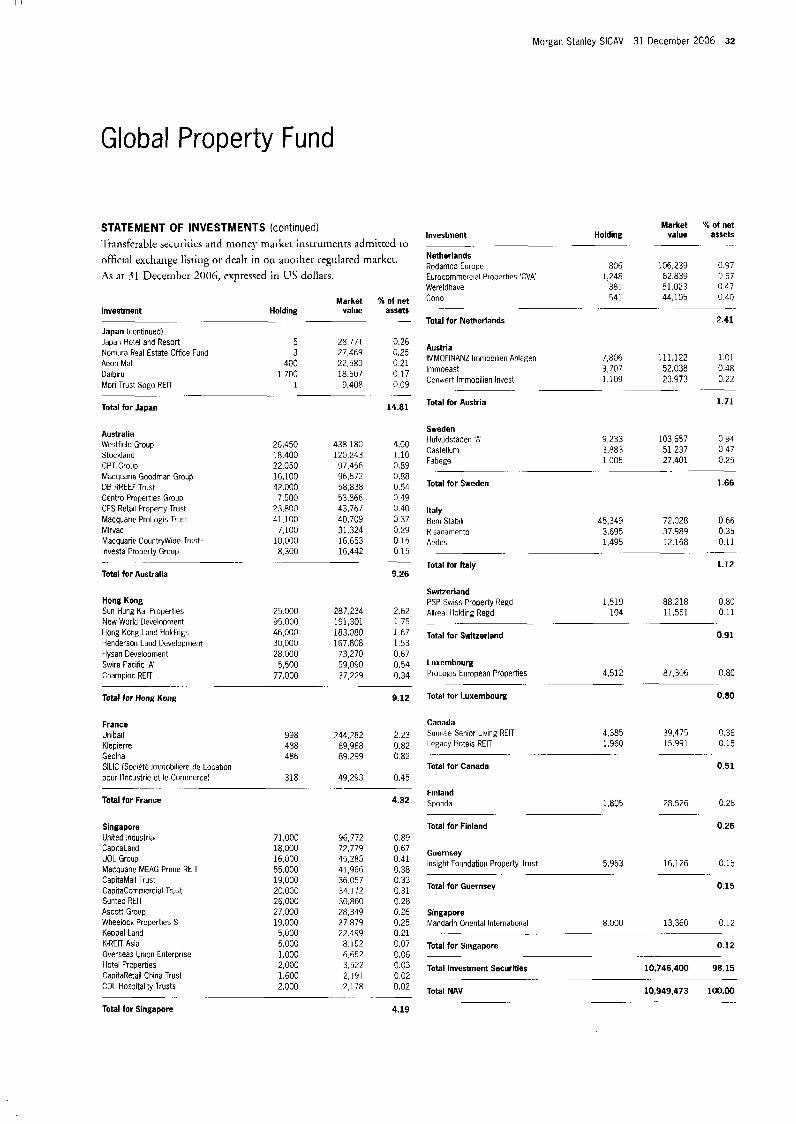
I f
Morgan Stanley SlCAV 31 December 2006 32
Global Property Fund
STATEMENT OF INVESTMENTS (continued) Transferable seciiritica and money rnarkct instruments adrnittcd to
official exchange listing or dealt in on another regulated marker. As ar 31 Decernhcr 2006, expressed in US dollars.
Investment Market
value H o I d i n g
Japan (continued) Japan Hotel and Resort 5 28.771 Nomura Real Estate Office Fund 3 27.469 Aeon Mall 400 22.580 Daibiru 1,700 18.507 Mori Trust Sogo REIT 1 9.408
Total for Japan
-.
Australia Wesffield Group Stockland GPT Group Macquarie Goodman Group DB RREEF Trust Centro Properties Group CFS Retail Property Trust Macquarle ProLogis Trust Mirvac Macquarie CountryWlde Trust, lnvesta Property Group
Total for Australla
26,450 18,400 22,050 16,100 42,000
7,500 23,800 41.100
7.100 10,000 8,300
438,180 120,243 97.456 96,572 58,838 53,866 43,767 40,709 31.324 16,653 16,442
Hong Kong Sun Hung Kai Properties New World Development Hong Kong Land Holdings Henderson Land Development Hysan Development Swire Pacific 'A Champior RElT
Total for Hong Kong
.
25.000 287.234 95.000 191.301 46,000 183.080 3C,OOO 167.808 28.000 73,270
5.500 59,090 77.000 37,229
_- -
France Unibail 998 244.2E2 Klepierre 488 89,988 Gecina 486 89.299 SILK (Soriete lrnmobiliere de Locatlon oour I'lndJstrle et le Commerce) 318 49,293
- - Total for France
Singapore United Industrial CapitaLand UOL Group Macguarle MEAG Prime RElT CapitaMall Trust CapitaConmercial Trust Suntec RElT Ascott Group Wheeloch Properties S Keppel Land K.REIT Asia Overseas Unlon Enterprise Hotel Prcperties CapitaRe:ail Chlna Trust CDL Hos3itality Trusts
Total for Singapore
71,000 96,772 18,000 72,779 16.000 45.285 55,000 41,966 19,000 36.057 20,000 34,112 26,000 30,860 27,000 28,349 19,000 27.879 5,000 22.499 5,000 8.152 1,000 6.652 2,000 3,522 1.600 2,191 2.000 2,178
% of net assets
.-
0.26 0.25 0.21 0 17 0.09
14.81
.-
4.00 1.10 0.89 0.88 0.54 0.49 0.40 0.37 0.29 0.15 0.15
9.26
2.62 1.75 1.67 1.53 0.67 0.54 0.34
9.12
2 23 0.82 0.82
0.45
4.32
0.89 0 67 0 41 0.38 0.33 0.31 0.28 0 26 0.25 0.21 0.C7 0.06 0.03 0 02 0.02
.._.
4.19
Investment
Netherlands Rodamco Europe Eurocommcrcia Properties 'CVK Wereldhave Corlo
Total for Netherlands
.- --
-
Market % of net H o I d I n g value assets
~. .-
106,239 0.97 806 1.248 62 839 0 57
381 51.023 0 47 541 44,105 0 40
2.41
Austria IMMOFINANZ lmmobilien Anlagen 7,806 11 1,122 1 0 1
3,707 52.038 0 4 8 linmoeast Conwprt lmmobilien Invest 1.109 23.973 0.22
. . --
Total for Austria 1.71
Sweden Hufvudstadeii 'A' 9,233 103,657 0 94 Castellum 3,883 51,237 0 47 Fabege 1005 27,401 0.25
._
Total for Sweden 1.66
Italy Bcni Stabill 45,349 72,028 066 RljanamPnto 3,695 37.989 0 35 Aedes 1495 12168 0 I1
-- . .
Total for Italy 1.12
Switzerland PSP Swiss Property ReEd 1,519 88218 080 Allreal Holding Regd I04 11,551 0 11
Total for Switzerland 0.91 - - . -
Luxembourg ProLoRis European Properties 4,512 87,306 0.80
-
Total for Luxembourg 0.80
Canada Sunrise Smor Living RElT 4 385 39.475 0.36 Legacy Hotels RElT 1,960 15.991 0 15
Total for Canada 0.51
-. -_ - ..
Finland Sponda 1,805 28.526 0.26
Total for Finland 0.26
Guernsey Insight Founddtion Property Trust 5,963 16,126 0 1 5
Total for Guernsey 0.15
Singapore Mandarin Oriental International
Total for Singapore
Total Investment SecurlUes
-
--
Total NAV
8.000 13,360 0.12
0.12
10,746,400 98.15
10,949,473 100.00
_. --
-
. -
.- -.
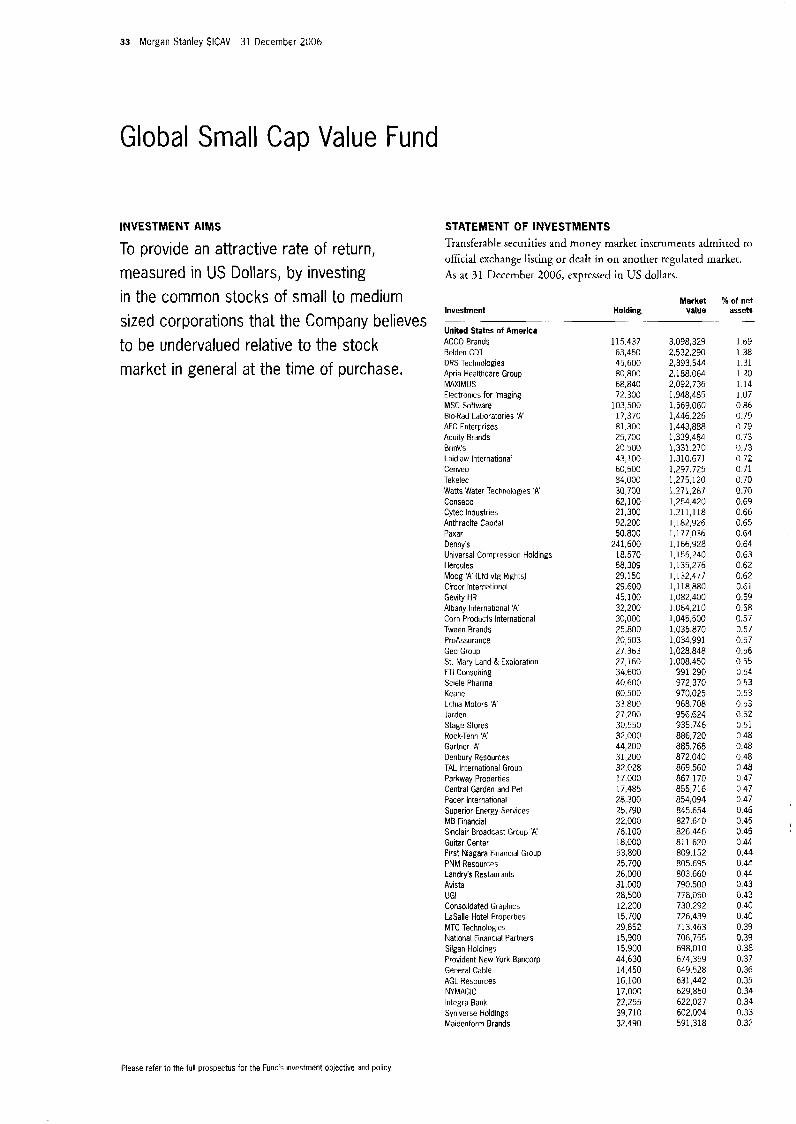
33 Morgan Stanley SlCAV 31 December 2006
Global Small Cap Value Fund
INVESTMENT AIMS
To provide an attractive rate of return, measured in US Dollars, by investing in the common stocks of small to medium sized corporations that the Company believes to be undervalued relative to the stock market in general at the time of purchase.
STATEMENT OF INVESTMENTS Transferakle securities and money marker instruments adtnirtcd to
official exchange listing or dealt in on another regulated market. As a t 31 December 2006, exprcssed in US dollars.
Market % of net Invesiment
United States of Amerlca ACCO Brands Belden COT DRS Technologies Apria Healthcare Group MAXIMUS Electronics for Imaging MSC.Sohare Bio-Rad Laboratories 'A' AFC Enterprises Acuity Brands Brinks Laidlaw International Cenveo Tekelec Watts Water Technologies 'A' Conseco Cytec Industries Anthracite Capital Paxar Denny's Universal Compression Holdings Hercules Moog ' A (Ltd vtg Rights) Circor International Gevity HR Albany International 'A' Corn Products International Tween Brands ProAssurance Geo Group St. Mary Land & Exploration FTI Consulting Sciele Pharma Keane Lithia Motors 'A' Jarden Stage Stores Rock-Tenn 'A' Gartner ' A Denbury Resources TAL International Group Parkway Properties Central Garden and Pet Pacer International Superior Energy Services ME Financial Stnclair Broadcast Group 'A' Guitar Center First Niagara Financial Group PNM Resources Landry's Restaurants Avista UGI Consolidated Graphics LaSalle Hotel Properties MTC Technologies National Financial Partners Silgan Holdings Provident New York Bancorp General Cable AGL Resources NYMAGIC Integra Bank Syniverse Holdings Maidenform Brands
-- . Holding value
115.437 63,450 45,600 80,800 68,840 72.300
103,500 17,370 81.300 25,700 20.500 43,100 60.500 84,000 30,700 62,100 21,300 92,200 50.800
241,600 18.570 58,309 29,150 29,600 45,100 32,200 30,000 25,800 20,503 27.363 27,160 34,600 40,600 80,500 33.800 27,200 30,550 32,000 44,200 31,200 32,028 17.000 17,485 28,300 25,790 22,000 76,100 18,000 53,800 25.700 26,000 31.000 28,500 12,200 15,700 29,852 15,900 15.900 44,630 14,450 16.100 17,000 22,255 39,710 32,490
3.098.329 2,532,290 2,393.544 2,188,064 2,092,736 1.948.485 1,569,060 1,446,226 1,443.888 1,339,484 1,331.270 1.310.671 1,297.725 1,275,120 1.271.287 1,254.420 1.211,118 1 182,926 1,177,036 1,166,928 1,155,240 1,135,276 1,132,477 1,118,880 1,082,400 1.064.210 1,045,500
1,034,991 1,028,848 1.008.450
991,290 972.370 970,025 968 708 956.624 935.746 886,720
872,040 869,560 867,170 855,716 854,094
827,640 826,446 811,620 809,152 805.695 803,660 790,500 778,050 730,292 726,439 713,463 706,755 698,010 674,359 649.528 631,442 629,850 622,027 602,004 591.318
i.o35,a70
a a m a
845,654
assets .-
1.69 1.38 1.31 1 20 1.14 1.07 0.86 0.79 0.79 0.73 0.73 0 72 0 71 0.70 0.70 0.69 0.66 0.65 0.64 0.64 0.63 0 62 0.62 0.61 0.59 0 58 0.57 0.57 0.57 0.56 0.55 0.54 0.53 0.53 0.53 0.52 0.51 0.48 0.48 0.48 0 48 0.47 0.47 0.47 0.46 0.45 0.45 0.44 0.44 0.44 0.44 0.43 0.43 0.40 0.40 0.39 0.39 0.38 0.37 0.36 0.35 0.34 0.34 0.33 0.32
Please refer to the full prospectus for the Funds investment objective and policy.
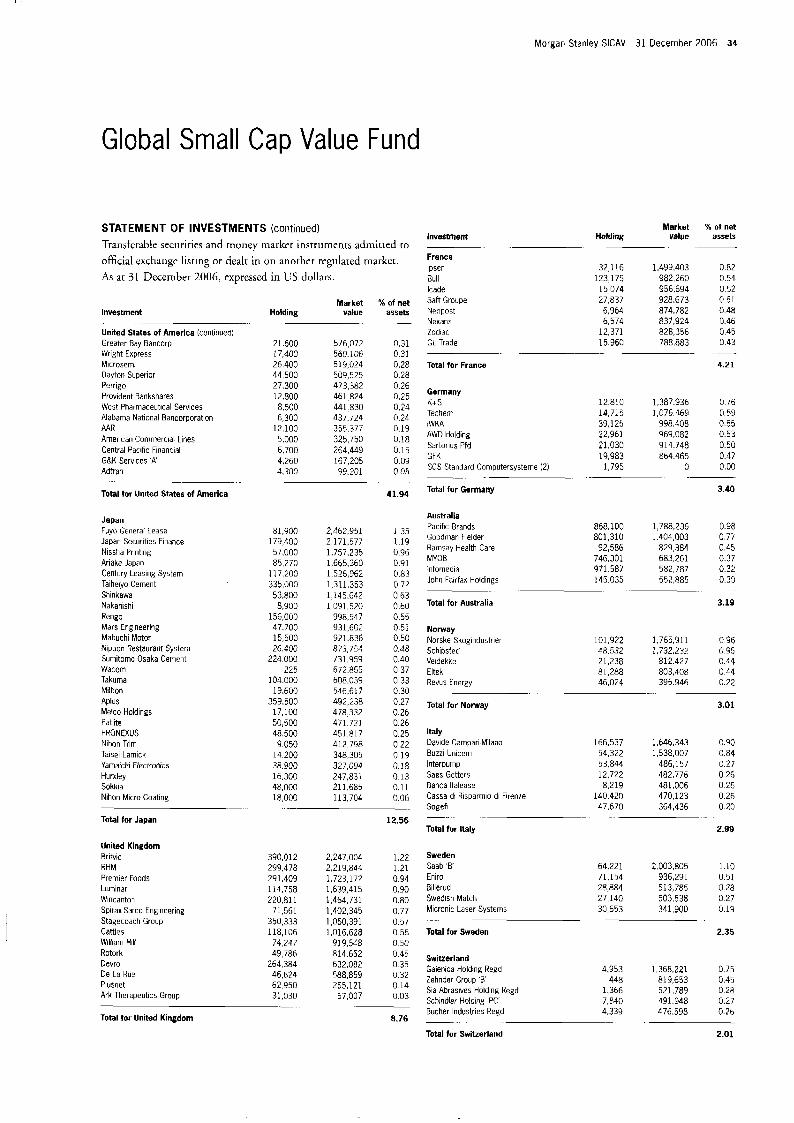
I '
Morgan Stanley SICAV 31 December 2006 34
Global Small Cap Value Fund
STATEMENT OF INVESTMENTS (continued) Transferable securiries and money marker instruments admitted ro official exchangc liscing or dealt in o n :itroilier regulared markct. As at 31 December 2006, expressed in US dollars.
Investment Market
Holding value
United States of America (continued) Greater Bay Banmi) Wright Express Microscm Dayton Superior Perrigo Provident Bankshares West Pharmaceutical Services Alabama National Bancorporation AAR American Commercial Lines Central Pacific Financial G&K Servces 'A' Adtrari
21.600 576,072 17,400 560.106 26.400 519,024 44.500 509,525 27.300 473.382 12.800 461 824 8,500 441 830 6,300 437.724
12,100 355.377 5.000 325,750 6.700 264.449 4.260 167.205 4,300 99.201
Total for United States of America
Japan Fuyo General Lease Japan Securities Finance Nissha Pr nting Ariake Japan Centiiry Leasing System Taiheiyo Cement Shinkawa Nakanishi Rengo Mars Eng neering Mabuchi Motor Nippon Restaurant System Sumitomo Osaka Cement Wacom Takuma Milbon Aplus Melco Holdings Patlite PRONEXVS Nihon Trim Taisei Lamick Yamaichi Electronics Hurxley Sokkia Nihon Micro Coating
Total for Japan
United Kingdom Britvic RHM Premier Foods Luminar Wincantoi Spirax-Sarco Engineering Stagecoach Group Cattles William Hill Rotork Devro De La Rue Plusnet Ark Therapeutics Group
81.Y00 179,400 57,000 85,270
117,200 335,000
8.900 156.000 47.700 15,500 26.400
224.000 225
104.000 19.600
359.500 17,100 50,500 48.500 9.050
14.200 38.900 16.300 48,000 18,000
53,800
2,462.951 2,171,577 1.757.235 1,665,360 1526,962 1,311,353 1,145,642 1,091,520
998.547 931,6C2 921.836 873,754 731,959
608.039 546,617 492,238 478.332 471.721
412.798 348.305 327,094 247.831 211,685 113 704
672.855
4~1.817
X of net assets -
0.31 0.31 0.28 0.28 0 26 0.25 0.24 0.24 0.19 0.18 0.15 0.09 0.05
41.94
1.35 1.19 0.96 0.91 0.83 0.72 0.63 0.60 0.55 0.51 0.50 0.48 0.40 0.37 0 33 0.30 0.27 0.26 0.26 0.25 0.22 0.19 0 18 0.13 0.11 0.06
390,012 299.478 291,409 114.758 220,811
71,561 350,333 118,106 74,247 49.786
264,384 46.624 62.950 31,030
Total for United Kingdom
12.56
2,247.004 1.22 2,219,844 1.21 1,723.172 0.94 1,639,415 0.90 1,464,731 0.80 1,402,345 0.77 1,050,391 0.57 1,016,628 0.56
919.5L8 0 5 0 814.652 C.45 632,082 0.35 588,859 0.32 255,121 0.14
57,007 0.03
8.76
Investment
France lpscn Bull lcade Saft Groupe Neopost Nexans Zodiac GL Trade
Total for France
Germany K+S Techem IWKA AMID Holding Sartorius Pfd GFK SCS Staridard Computersysteme (2)
-
Market Holding value
-.
32,116 1,499,403
15,074 956.694 27.837 928.673 6,964 874.782 6,574 837,924
12,371 828,356 15.960 788,883
123,175 9a2.260
-- -. .
?4 of net assets
0.82 0.54 0.52 0.51 0.48 0.46 0.45 0.43
4.21
-
12,810 1.387.936 0.76 14,715 1,076.469 0.59 39,125 998,408 0.55 22,961 969.082 0.53 21,030 914.748 0.50 19,983 864.465 0.47 1,795 0 0.00
. .~
Total for Germany 3.40
Australia Pacific Brands Goodman Fielder Ramsay Health Care MYOB lnfornedia John Fairfax Holdings
Total for Australia
-.
Norway Norske Skogindustriei Schibsted Veidekke Eltck Revus Energy
868,100 1,788.236 0 98 801,310 1404,003 0 77 92,586 829,384 0 4 5
746,301 683,261 0 37 971 587 582,787 0 32 145.035 552,885 0 3 3
3.19
101,922 1765,911 0 96 48532 1,732,231 0 9 5 21.238 812427 0.44 81,288 803.408 0 44 46,024 395 946 0.22
. --
Total for Norway 3.01
Italy Davide Campari-Milano 166,537 1,646,343 C.90 Buzzi Unicem 54,322 1,538,007 0.84 lnterpump 53,844 486,157 0.27 Saes Getters 12,722 482.776 026 Banca ltalease 8,219 481.006 0.26 Cassa di Risparmio di Firenre 140.420 470,123 0.26 Sogefi 47,670 364,436 0.20
Total for Italy 2.99
- .. . . .. - - ..
Sweden Saab '8' 64.221 2,003,805 1.10 Eniro 71,154 936.291 0.51 Billerud 28,884 513,785 0.28 Swedish Match 27,140 503,538 0.27
30,653 341,900 0.19 Micronic Laser Systems
Total for Sweden 2.35
.- .. - -
Switzerland Galenica Holding Regd 4,953 1,368,221 0 75 Zehndcr Group '8' 448 819,653 0.45
1,366 521,789 0 2 8 Sia Abrasives Holding Regd Schindlcr Holding 'Pc' 7.840 491.948 0.27 Bucher Industries Regd 4.339 476.598 0.?6
Total for Switzerland 2.01
- .. .
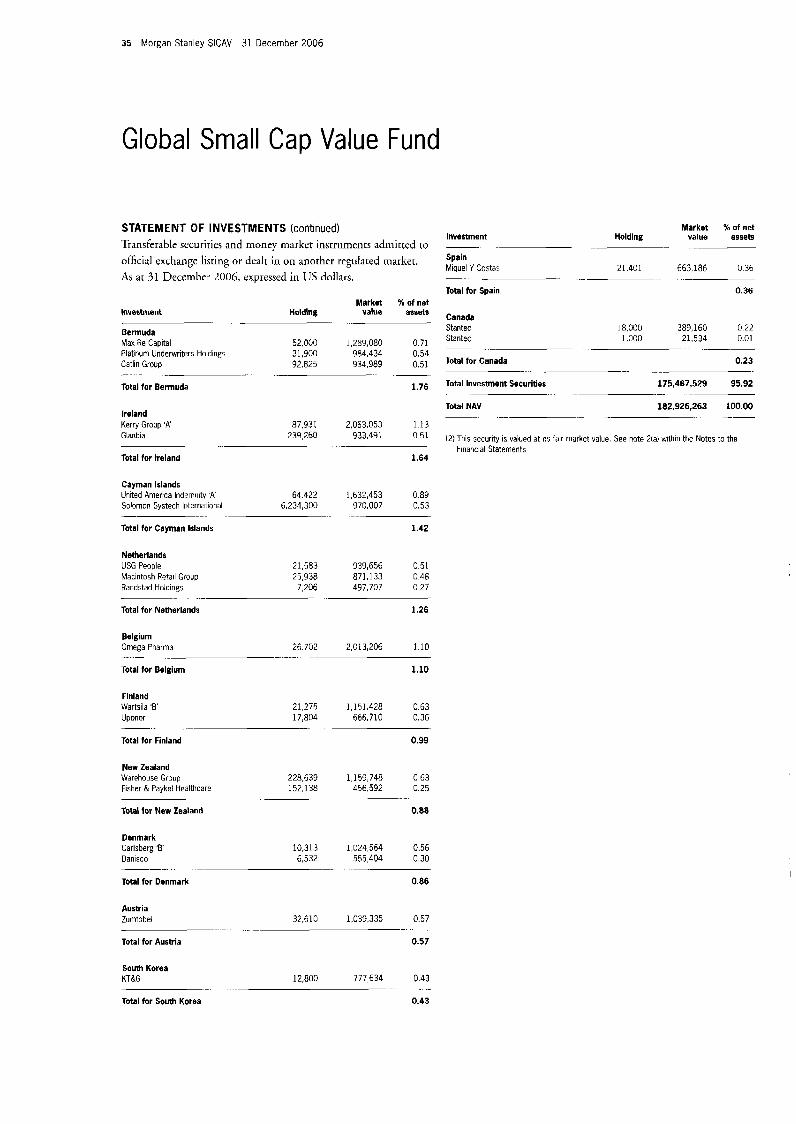
35 Morgan Stanley SlCAV 31 December 2006
Global Small Cap Value Fund
Market % of net Investment H o I d I n g value assets
STATEMENT OF INVESTMENTS (continued) Transferable sccurities and monev markct instruments admictcd to . - .
official exchange lisring or dcalt in on another regulated market. 'pain Miquel Y Costas
As a t 31 December 2006, expressed in US dollars. ... . . . . 21.401 663,186 0.36
.-
Total for Spain 0.36
Investment Holding
Bermuda Max Re Capital 52 000 Platinum Underwriters Holdings 31,900 Catlin Group 92 825
Total for Bermuda .
Ireland Kerry Group 'A' Glanbia
87,931 239,260
-- ..
Total for Ireland
Market X of net value assets
1,289,080 0 71 984,434 0.54 934,989 0.51
1.76 -- -
2.063.053 1.13 933.491 0.51
1.64
Cayman Islands
Solomon Systech International 6,234,300 970.007 0.53
Total for Cayman Islands 1.42
United America lndemriity A' 64.422 1,632.453 0 89
- -- . .-
Nether I and s USG People 21,583 939,656 0.51 Macintosh Retail Group 25,938 871.133 0.48 Randstad Holdings 7,206 497,707 0.27
Total for Netherlands 1.26 . . . . .
Belgium Omega Pharma 26.702 2,013,206 1.10
Total for Belgium 1.10 .......... . ... -
F I n I a n d Wartsila '8' 21,275 1,151.428 0.63 Uponor 17,804 666,710 0.36
Total for Finland 0.99 -..
New Zealand Warehouse Group 228,639 1,159,748 0 63 Fisher & Paykel Healthcare 152,138 456,592 0 25
Total for New Zealand 0.88
.. -. ..
Denmark Carlsberg ' E 10,313 1,024,564 0 56 Danisco 6,532 555,404 0 3 0
Total for Denmark 0.86 - -- .....
Austria Zumtobel 32,610 1,039,335 0 57
Total for Auseia 0 57 .. _ -
South Korea KT&G 12,800 777634 0 4 3
Total for South Korea 0.43
Canada Stantec Stantec
18,000 389,160 0.22 1,000 21,534 0.01
... - . ..
Total for Canada 0.23
Total Investment Securities 175,467,529 95.92
Total NAV 182,926,263 100.00
.- ..
- . ........
~ ......... . . . . . .
(2) This security is valued at its falr market value. See note 2(a) withln the Notes to the Financial Statements
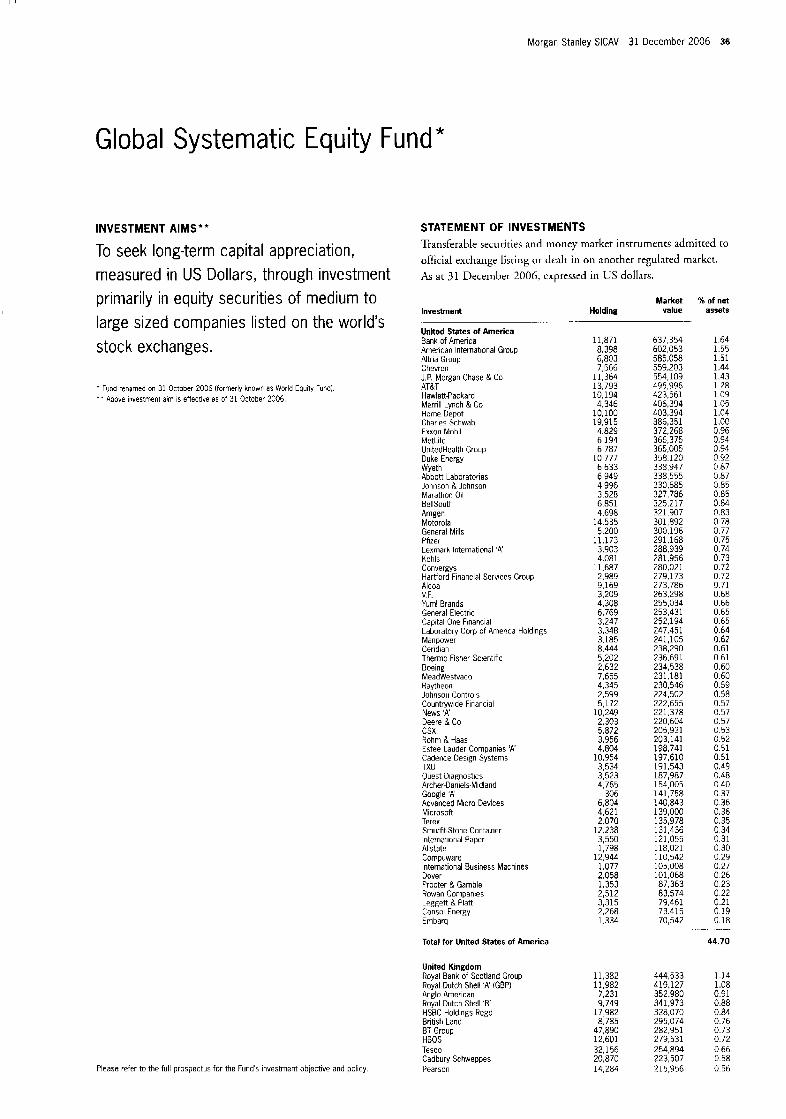
Morgan Stanley SlCAV 31 December 2006 36
Global Systematic Equity Fund *
INVESTMENT AIMS'* STATEMENT OF INVESTMENTS Transferable securities and money market instruments admitred to official exchange listing or dcalt in on anorher regulated markct. To seek long-term capital appreciation,
measured in us Dollars, through investment at 31 December 2006, cxpressed in us dollars.
primarily in equitv securities of medium to . < Investment
United States of America large sized companies listed on the world's .
stock exchanges.
. Fund renamed on 31 October 2006 (formerly knorli a5 horld Eouity TunU). * * AOove i:#ves:ment a'm is effective as of 31 October 2i.05.
Bank of America American International Group Altria Group Chevron J.P. Morgan Chase & Co AT&T Hewlett-Packard Merrill Lynch & Co Home Depot Charles Schwab Exxon Mobil IdetLite UnttedHealth Group Duke Energy Wyeth Abbott Laboratories Johnson R Johnson Marathon Oil BellSouth Amgen Motorola General Mills Pfizer Lexmarh International ' A Kohls Convergys Hartford Financial Services Group Alcoa V F. Yum! Brands General Electric Capital One Financial Laboratory Corp of America Holdings Manpower Ceridian Thermo Fisher Scientific Boeing MeadWestvaco Raytheon Johnsori Controls Countrywde Financial News 'A' Deere & Co CSX Rohm R Haas Estee Lauder Companies 'A Cadence Oesign Systems TXU Quest Diagnostics Archer-Daniels-Midland Google 'A' Advanced Micro Devices Microsoft Terex Smurfit-Stone Container International Paper Allstate Compuware International Business Machines Dover Procter R Gamble Rowan Companies Leggetl & Platt Consol Energy Embarq
Please refer to the full prospectus for the Fund's investment oblective and policy.
H o I d i n g value
11,871 8,398 6,803 7,566
11,364 13,793 10,194 4,346
10,100 19,915 4.829 6.194 6.787
10,777 6,633 6,949 4,996 3.528 6,851 4,698
14,535 5,200
11,173 3,903 4.081
11,687 2,989 9,169 3,209 4,308 6,769 3,247 3,348 3,185
5,202 2,632 7,655 4,345 2,599 5,172
10,249 2,303
3,956 4.804
10,954 3,534 3,523 4,765
306 6,804 4,621 2.070
12.238 3,550 1,798
12,944 1,077 2.058 1,353 2,512 3,315 2,268 1,334
8.444
5,872
637,354 602,053 585.058 559.203 554,109 495,996 423,561 406,394 403,394 386.351 372,268 366,375 365,005 358.120 338,947 338,555 330.685
325,217 321.907 301,892 300,196 291.168 288,939 281,956 280,021 279,173 273.786 263,298 255,034 253,431 252,194 247.451 241,105 238,290 236.691 234,538 231.181 230,546 224,502 222,655 221.378 220.604 205,931 203,141 198,741 197,610 191,543 187,987 154,005 141,758 140,843 139,000 135,978 131,436 121,055 118,021 110,542 105,008 101,068 87,363 83,574 79,461 73.415 70,542
327,786
Total for United States of America
United Klngdom Royal Bank of Scotland Group Royal Dutch Shell 'A' (GEP) Anglo American Royal Dutch Shell ' E HSRC Holdings Regd British Land BT Group HBOS Tesco Cadbury Schweppes Pearson
Market X of net
11,382 444,533 11,982 419,127 7.231 352.980 9,749 341,973
17.982 328,070 8.785 295,074
47,890 282.951 12,601 279,531 32,156 254,894 20.870 223,507 14.284 215,956
assets ....
1.64 1.55 1.51 1.44 1.43 1.28 1.09 1.05 1.04 1 .oc 0.96 0.94 0.94 0.92 0 87 0.87 0.85 0.85 0.84 0.83 0.78 0.77 0.75 0.74 0.73 0.72 0.72 0.71 0.68 0.66 0.65 0.65 0.64 0.62 0.61 0 61 0.60 0.6G 0 59 0.58 0.57 0.57 0.57 G.53 0.52 0.51 0.51 0.49 0.48 0.40 0.37 0.36 0.36 0.35 0 34 0.31 0.30 0.29 0.27 0.26 0 23 0 22 0.21 0 19 0.18
44.70
.
1.14 1.08 0.91 0.88 0.84 0.76 0.73 0.72 0.66 0.58 0.56
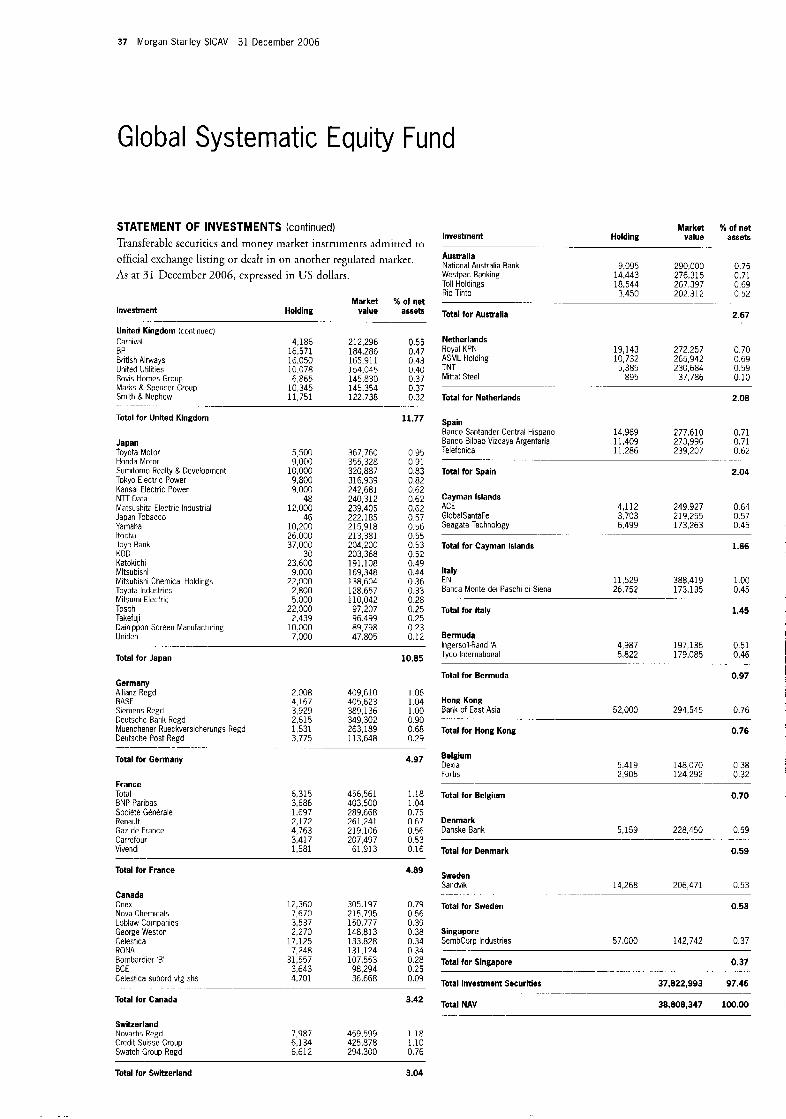
37 Morgan Stanley SICAV 31 December 2006
Global Systematic Equity Fund
STATEMENT OF INVESTMENTS (continued) Transferable securiticr and money market instruments adrnittcd to official exchangc listing o r dcalr in o n another regulated market. As at 31 December 2006, cxprwed in L'S dollars.
Market K of net value assets Holding Investment
Australia National Australia Bank Westpac Banking Toll Holdings Rio Tinto
9.095 290,000 0 7 5 14,443 276,315 0.71 18,544 267,397 0 69 3.450 202.312 0.52
2.67
. Market % of net Investment H o I d i n g value assets
United Kingdom (continuedl Carnival BP
Total for Australla
Netherlands Royal KPN ASML Holding TNT Mittal Steel
4,186 16,571 16,050 10.078 6.865
212,296 184,286 165.911 154,045 145.830
0.55 0.47 0.43 0.40 0.37
19,143 272.257 0.70 10,732 265,942 0.69 5,385 230,684 0.59
895 37.786 0.10
British Airways United Utilities Bovis Homes Group Marks R Spencer Group 10,345 145.354 0.37 Smith & Nephew 11,751 122,738 0.32
Total for Unlted Klngdom 11.77
.........
.
Total for Netherlands
SDain
2.08
Banco Santander Central Hispano 14.969 277.610 0.71 Banco Bilbao Vizcaya Argentaria 11,409 273,996 0.71 Telefonica 11,286 239,207 0.62
Japan Toyota Motor 5.500 367,760 0.95 Honda Motor 9,000 355,328 0.91 Sumitomo Realty & Develoomerit 10,000 320,887 0.83 Tokyo Electric Power 9,800 316,939 0.82 Kansai Electric Power 9,000 242,681 0.62 NTT Data 48 240.312 0.62 Matsushita Electric Industrial 12.000 239,405 0.62 Japan Tobacco 46 222,185 0.57 Yarriaha 10,200 215.918 0.56 It0ct.u 26.000 213,381 0.55 Joy0 Bank 37,000 204,200 0.53 KOD 30 203.368 0.52 Katokichi 23.600 191,108 0.49 Mitsubishi 9.000 169,348 0.44 Mitsubish Chemical Holdirigs 22,000 138,604 0.36 Toyota Industries 2,800 128,657 0.33 Mitsumi Electric 5.000 110,042 0 28 Tosoh 22,000 97,207 0.25 Takefuji ?.439 96.499 0.25 Dain ppon Screeri Manufacturing 10.000 89,798 0.23 Uniden 7,000 47.805 0.12
.... ~.
Total for Spain 2.04
Cayman Islands ACE 4,112 249.927 0 6 4 GlobalSantaFe 3,703 219,255 0.57 Seagate Technology 6,499 173,263 0.45
Total for Cayman Islands 1.66
. .
Italy EN1 11,529 388,419 1 00 Banca Monte del Paschi di Siena 26.752 173 135 0 45
Total for Italy 1.45
-~ -.
Bermuda lngersoll Rand 'A 4,987 197,136 051 Tyco International 5 822 179,085 0.46
Total for Bermuda 0.97
- Total for Japan 10.85
Germany Allianz Rcgd BASF Siemens Regd Deutsche Barik Regd Muenchener Rueckversicherungs Regd Deutsche Post Regd
2.008 409,610 1.06 4,167 405,623 1.04 3,929 389,136 1 .oo 2,615 349.302 0.90 1,531 263,189 0.68 3,775 113,648 0.29
Hong Kong 294,545 0 7 6 Bank of East Asia 52,000
Total for Hong Kong 0.76
. .
Total for Germany 4.97 Belgium Dexia Fortis
5.419 148,070 0 38 2,905 124,292 0.32
France
BNP Paribas Societe Generale Renault Gaz de France Carrefour Vivendi
Tutdl Total for Belgium 0.70 6.315 456,561 1.18 3,686 403,500 1.04 1.697 289,668 0.75 2,172 261,241 0.67 4,763 219.106 0.56 3.417 207,497 0.53 1,581 61,913 0.16
Denmark Danske Bank 228,450 059
0.59
5,159 .........
Total for Denmark
Total for France 4.89 Sweden Sandvik 14,268 206,471 0.53
12,360 7,670 3.537
305.197 215,795 150.777
0.79 0.56 0.39
Canada Onex Nova Chemicals Loblaw Companies George Weston Celejtica RONA Bombardier 'B' BCE Celeslica subord vtg shs 4,701 361668 0.09
. . . . . . . . .
Total for Canada 3.42
0.53 Total for Sweden
Singapore SembCorp Industries
2 270 i48:813 o 38 17,125 133,828 0.34 7.248 131.124 034
57,000 142,742 0.37
Total for Singapore 0.37 31,557 107,553 0.28 3 643 98 294 0 25
Total Investment Securltles 37,822,993 97.46
Total NAV 30,000,347 100.00
Switzerland Novartis Regd Credit Suisse Group Swatch Group Regd
7,987 459,599 1.18 6,134 425,878 1.10 6,612 294,300 0.76
Total for Switzerland 3.04
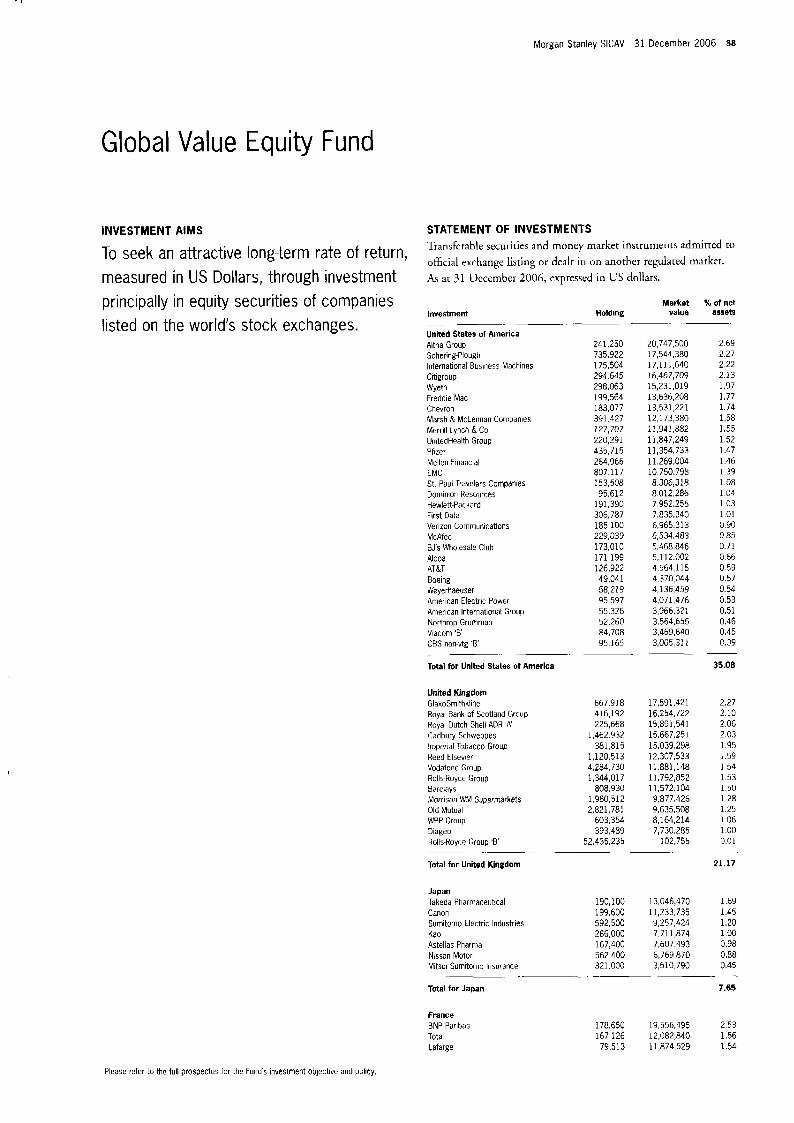
Morgan Stanley SICAV 31 December 2006 38
Global Value Equity Fund
INVESTMENT AIMS STATEMENT OF INVESTMENTS Transfcrable securities and money market insrruments admitted to
official exchange listing or dealt in on another regulated marker. To seek an attractive long-term rate of return, measured in US Dollars, through investment 31 n&&,- 2006, expressed in LS doII;ii-s.
principally in equity securities of companies Investment
United States of America A h a Group Schering-Plough International Business Machines Citigroup Wyeth Freddie Mac Chevron Marsh & McLennan Companies Mcrrill Lynch & Co UmtedHealth Group Pfizer Mellon Financial EMC St. Paul Travelers Companies Dominion Resources HewlettFackard First Data Verizon Communications McAfee BJ's Wholesale Club Alcoa AT&T Boeing Weyerhaeuser American Electric Power American International Group Northrop Grumman Viacom ' E CBS non-vtg ' E
Total for United States of America
-. .~ listed on the world's stock exchanges.
. -
Market Holding value
241,250 735,922 175,504 294,645 298,063 199,564 183,077 391.427 127,707 220,291 435,715 264,966 807,117 153,508 95,612
191,390 306,787 185.100 229,039 173,010 171,199 126,922 49,041 58,219 95,597 55,326 52,260 84,708 95,165
20,747,500 17,544,380 17,111,640 16,467,709 15,231,019 13,636,208 13,531,221 12,173,380 11,941,882 11,847,249 11.354.733 11,269,004 10.750.798 8.306,318 8,012,286 7,952,255 7,835,340 6.965.313 6,534,483 5,468.846 5.112.002 4,564,115 4.370.044 4,136,459 4,071,476 3,966,321 3,564,655 3,469,640 3,005.31 1
96 of net assets
~
2 69 2.27 2.22 2.13 1.97 1.77 1.74 1.58 1.55 1.52 1.47 1.46 1.39 1.08 1.04 1.03 1.01 0.90 0.83 0.71 0.66 0.59 0.57 0.54 0.53 0.51 0.46 0.45 0.39
United Kingdom GlaxoSmithkline Royal Bank of Scotland Grow Royal Dutch Shell ADR 'A' Cadbury Schweppes Imperial Tobacco GrouF Reed Elsevier Vodafone Group Rolls-Royce Group Barclays Morrison WM Supermarkets Old Mutual WPP Group Diageo Rolls-Royce Group 'B
Total for United Kingdom
~. .~
667.918 416,192 225,668
1.462.932 381,815
1,120.51 3 4,284,730 1,344,017
808.930 1,980,512 2,821,781
603,354 393,489
52,435,235
Japan Takeda Pharmaceutical Canon Sumitomo Electric Industries Kao Astellas Pharma Nissan Motor Mitsul Sumitomo Insurance
Total for Japan
-
35.08
17,591,421 16,254.722 15,891,541 15,667,251 15,039.298 12,307,533 11,881,148 11,792,852 11.572.104 9,877.426 9,635,508
7,730,285 102,755
a, 1642 14
~. .~
2.27 2.10 2.06 2.C3 1.95 1.59 1.54 1.53 1.50 1.28 1.25 1.06 1 .oo 0.01
21.17 -
190,100 13,046,470 199,600 11,233,735 592,500 9,257,424 286,000 7,711,874 167,400 7.607.493 562,400 6,769,870 321.000 3,510.790 - . -
1.69 1.45 1.20 1 0 0 0.98 0.88 0.45
7.65
France BNP Paribas Total 1 afarge
178,650 19,556.495 2.53 167,126 12,082,840 1.56
79.513 11,874,529 1.54
Please refer to the full prospectus for the Funds investment objective and pulicy.
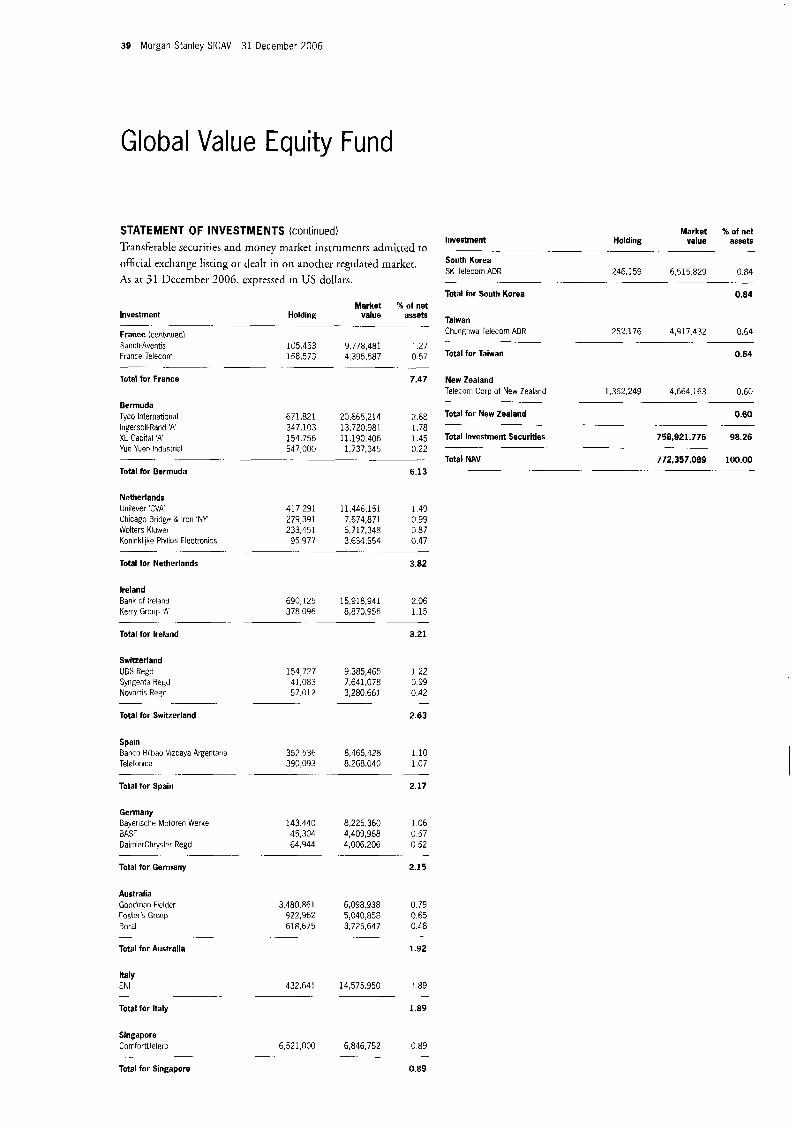
39 Morgan Stanley SICAV 31 December 2006
Global Value Equity Fund
STATEMENT OF INVESTMENTS (continued) lrarrsferable securities and money market instrurnenrs admitted to official exchange listing or dealt in on another regulated markec. As ar 31 [kcember 2006. expressed in US dollars.
Market Sb of net Invest m e n t Holdlng value assets - ~. .-
France (continuedl Sanofi-Aventis France Telecom
Total for France
- .. ..
Bermuda Tyco lnterriational Inge?ioll-Rand ' A XL Capital ' A Yue Yuen !qdustrial
Total for Bermuda
-.
Netherlands Unilever 'CVA Chicago Bridge & Iron 'NY' Welters Kluvrer Kuninklilke Philips Electronics
Total for Netherlands
-. . .- ..
Ireland Bank of Ireland Kerry Group 'A
Total for Ireland
Switzerland URS Regd Syngenta Regd Novartis Regd
Total for Switzerland
-.
Spain Barico Bilbao Vizcaya Argentaris Telefonica
105,453 9,778,481 1.27 158.573 4,395,587 0 57
7.47
- .~
671,821 20,665,214 2.68 347,103 13,720,981 1.78 154,756 11.190,406 1 4 5 547,000 1,737,345 0 22
6.13
~.
Market 96 of net Holding value assets Investment
South Korea SK Telecom ADR 246.159 6,515.829 0 84
Total for South Korea 0.84
- -
Taiwan Chunghwa Telecom AOR 252,176 4,917 432 0 64
Total for Taiwan 0.64
.~
New Zealand Telecorn Corp of New 7ealand 1,362 249 4,664 163 0 60
Total for New Zealand 0.60
Total Investment Securities 758,921.775 98.26
Total NAV 772,357,089 100.00
.~ - ~-
- ~ ~ .~ -
-- ~ ~. ~.
- --
417,291 11,4~6.151 1.49 279,391 7,674.871 0.99 233,451 6,717,348 0 87
95.977 3.634.554 0.47
3.82
~. -
690,125 15,918,941 2.06 378 096 8,870.956 1.15
3.21
.-
154,727 9 385.465 1 2 2 41.083 7,641,078 0 99 57.012 3,280.661 0.42
2.63 -
352.536 8,466,428 1.10 1.07 390,093 8.268.040
- . - ~- - Total for Spain 2.17
Germany Bayerische Motoren Werke 143.440 8.226.360 1.06 BASF 45,304 4,409,968 0.57 DaimlerChrysler Regd 64.944 4,006,206 0.52
Total for Germany 2.15
. . . . .-
Australia Goodman Fielder 3.480 861 6,098.938 0.79 Foster's Groilp 922,962 5.040 858 0 65 Bora1 618,675 3.725.647 0 48
Total for Australla 1.92
-~ -
Italy EN1 432,641 14,575,950 1 89
Total for Italy 1.89
- - . - -
Singapore ComfortDelgro 6,521,000 6,846,752 0.89
Total for Singapore 0.89
._ -

Morgan Stanley SICAV 31 December 2006 40
Indian Equity Fund"
INVESTMENT AIMS
To seek long term capital appreciation, measured in US Dollars, by investment, through a Subsidiary, primarily in the equity securities of companies domiciled or exercising the predominant part of their economic activity in India.
' Fund opened for subscription on 30 Nuverriber 2006
STATEMENT OF INVESTMENTS Transfcrable securiries and rnoncy marker insrrurnents admiired to
official cxchange lisring or dealt in on anorher regulated rnarkct. As at 31 December 2006, expresscd in US dollars.
Investment Market 96 of net
Holding value assets . . ~ -. --
Heavy Electrlcal Equipment Bharat Heavy Electrical$ 8,300 432,561 8.69 ABB 3,400 286,723 5.76
Total for Heavy Electrical Equipment 14.45
. ..... --
IT Consulting & Other Services lnfosys Technologies 9,300 472,546 9.50 HCL Technologies 8,500 123,589 2.48 Wipro 7,200 98,878 1.99
.... -~ --
Total for If Consulting & Other Service8 13.97
Diversified Banks
IClCl Bank 6,900 139,472 2 80 Punlab National Bank 10,900 137,573 2 76 UTI Bdnk 9,200 97,922 1 9 7
HDFC Bank 9,100 220.271. 4 43
State Bank of India 2,600 88,329 1.78 .
Total for Diversified Banks 13.74
Communications Equlpment Bharti Airtel 24,300 357,251 7.18
.. .. -
Total for Communications Equlpment 7.18
Construction Materials ACC Gularat Ambula Cements Shree Cement
6,100 150,263 3.02 25,100 80,244 1.61
2,400 79,137 1.59
Total for Construction Materials 6.22
Pharmaceuticals Cipla 21,300 12 1,345 2.44 Glenmark Pharmaceuticals 7,100 96,989 1.95 Aventis Pharma 1,900 58,365 1 1 7
Total for Pharmaceuticals 5.56
. ..
Tobacco ITC 49,400 197,175 3 96
Total for Tobacco 3.96
. .- ...
Construction & Engineering Hindustan Construction tiammon India Unitech
31,100 103,655 2.09 8,600 81,799 1.64 1.000 10,431 0.21
. -. .
Total for Construction & Engineering 3.94
Automobile Manufacturers Mahindra & Mahindra 7.400 152.369 3 06
Total for Automobile Manufacturers 3.06
. -
Oil & Gas Drilling Aban Gffshore 3 600 112,854 2.27
Total for Oil L Gas Drilling 2.27 ~~ ..
Please rc'er to the full prospectus for the Funds investment objective and policy.
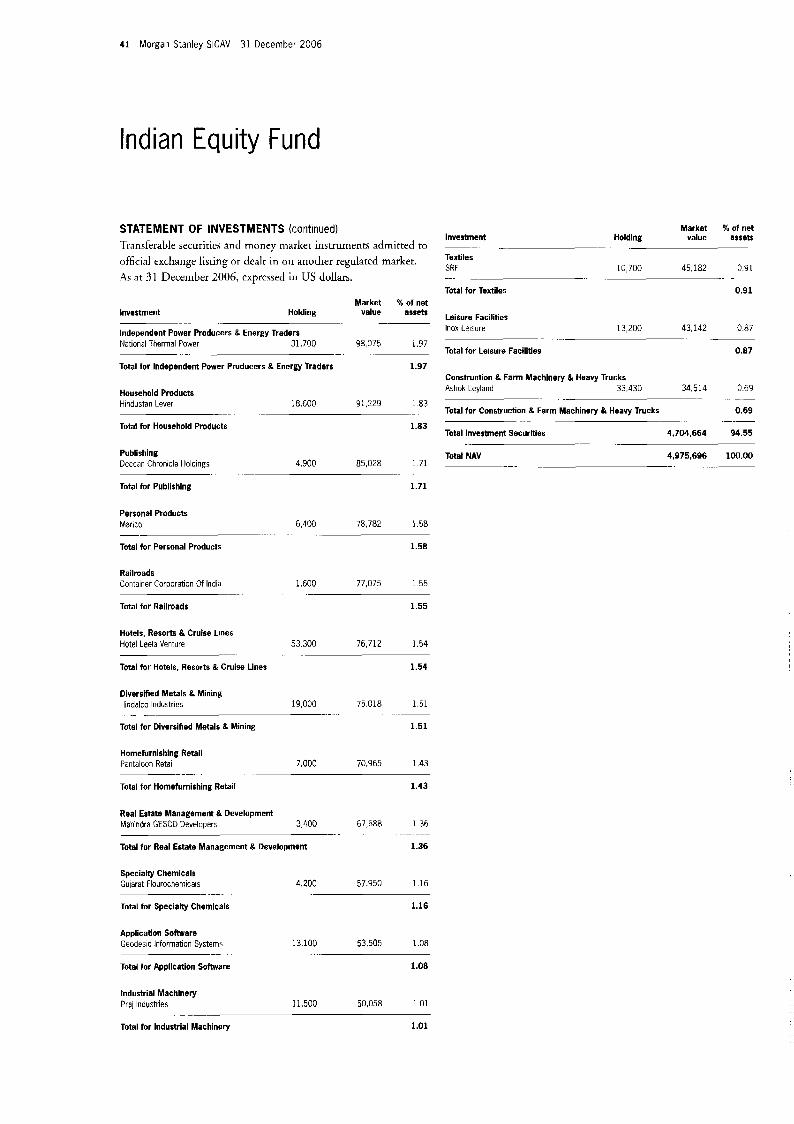
41 Morgan Stanley SICAV 31 December 2006
Indian Equity Fund
STATEMENT OF INVESTMENTS (continued) Transferable securitics and money marker instruments admitted to official exchange liscirig o r dcalt in on another regulared market. As a t 31 December 2006, cxprcssed in US dollars.
Market I of net Investment H 0 Id i n g value assets
Independent Power Producers & Energy Traders National Thermal Power 31,700 98,075 1.97
Total for Independent Power Producers & Energy Traders 1.97
.. . . .. -~
.. -. . .
Household Products Hindustan Lever 18.600 91,229 183
Total for Household Products 1.83
Publishing Deccan Chronicle HoldinRs 4.900 85,028 1.71
Total for Publishlng 1.71
Personal Products Marm 6,400 78,782 1.58
Total for Personal Products 1.58 ~.
Railroads Container Corporation Of India 1.600 77,075 1 5 5
Total for Railroads 1.55
-.
Hotels, Resorts & Cruise Lines Hotel Leela Venture 53.300 76,712 1.54
Total for Hotels. Resorts & Cruise Lines 1.54
Diversified Metals & Mining Hindalco Industries 19,000 75.018 1 5 1
Total for Diversified Metals 8. Mining 1.51
. .- . .~ .-
Homefurnishing Retail Pantaloon Retail 7.000 70,965 1.43
Total for Homefurnishing Retail 1.43
Real Estate Management & Development Mahlndra GESCO Developers 3,400 67,688 1 3 6
Total for Real Estate Management & Development 1.36
.. .
Specialty Chemlcals Gularat Flourochemicals 4,200 57.950 1.16
Total for Specialty Chemlcals 1.16 .-
Application Software Geodesic Information Systems 13,100 53.505 1 .os
_- Total tor Application Software 1.08
Industrial Machinely Praj Industries 11,500 50,058 101
Total for Industrial Machinery 1.01
..
Market 96 of net Investment Holdlng value assets
Textiles SRF 10,700 45 182 0 9 1
~- -
. . - -
Total for Textiles 0.91
Leisure Facilities lnox Leisure 13,200 43,142 0.87
.-
Total for Leisure Facilities 0.87
Construction 8. Farm Machlnery & Heavy Trucks Ashok Leyland 33,430 34,514 0.69
Total for Construction & Farm Machinery & Heavy Trucks 0.69
Total Investment Securltles 4,704,664 94.55
Total NAV 4,975,696 100.00
.- ..
- . .. .. .. -. .
-. . ..

Morgan Stanley SICAV 31 December 2006 42
Japanese Equity Advantage Fund *
INVESTMENT AIMS STATEMENT OF INVESTMENTS Transferable sccuriries and money market instruments admitced to official exchanE:c listing or dealt in on anocher regulated markec. To seek long-term capital appreciation,
measured in Japanese Yen, through investment primarily in the equity securities of companies domiciled in or exercising the predominant
which are listed on any exchanges or over-the-counter markets . Total for Electronic Equlpment Manufacturers 9.73
- - ;it 31 Decemhcr 2006, expressed in Jap;incqeYen.
Market % of net Holding value assets Investment
Electronic Equipment Manufacturers ~-
33,200 154 048.000 3 22 part of their economic activity in Japan and ;;;zncc 4,400 129,756,000 2 71
Oytex 37,650 94,313,250 1 9 7 1.83 Hamarnatsu Photonics 24 600 87,822,000
-~ - -
' Fund oprned for su!iscription on 31 May 2006.
Office Electronics Canon 28,500 190,950.000 3 99 Ricoh 67,000 162 810,000 3 40
Total for Office Electronics 7.39
- .. -- -
Diversified Banks Mizuho Financial Group 3 57 201 170,850,000 Sumitomu Mitsui Financial Group 137 167,140,000 3 49
.- ~-
Total for DiversMed Banks 7.06
Pharmaceuticals Tsumura & Co 57,000 158 460 000 3.31 Hisarnitsu Pharrnawutical 39,100 147 407,000 3 08
Total for Pharmaceuticals 6.39
- -
Steel Nippon Steel JFE Holdings
221,000 151,164,000 3.16 22.300 136,639,000 2.85
Total for Steel 6.01
Computer Storage & Perlpherals Roland DG 49,500 178,200,000 3.72
1 8 2 Wacorn
5.54
245 87,220.000 - . -- -
Total for Computer Storage & Perlpherals
IT Consulting & Other Services Hitachi Systems & Services 67,600 167,986,000 3.51
75,500 87,202,500 1.82 Zuken
5.33 -
Total for IT Consulting & Other Services
Industrial Machinery
1 1 0 Tsubaki Nakashima
Total for Industrial Machinery 4.63
SMC 10,000 168,800,000 3 53 28.600 52,910,000
._ --
Apparel Accessories & Luxury Goods 1.61 Descente
Daidoh 39,300 51,404,400 1.07 Levi Strauss Japan 26,000 41,574,000 0.87
3.55
129,000 77.142.000
. .-
Total for Apparel Accessories & Luxury Goods
Construction & Farm Machinery & Heavy Trucks Hitachi Construction Machinery 51,400 164,480,000 3 43
Total for Construction & Farm Machinery & Heavy Trucks
.. --
3.43
Please refer to the full prospectus for the Fund's investment oblective and policy.
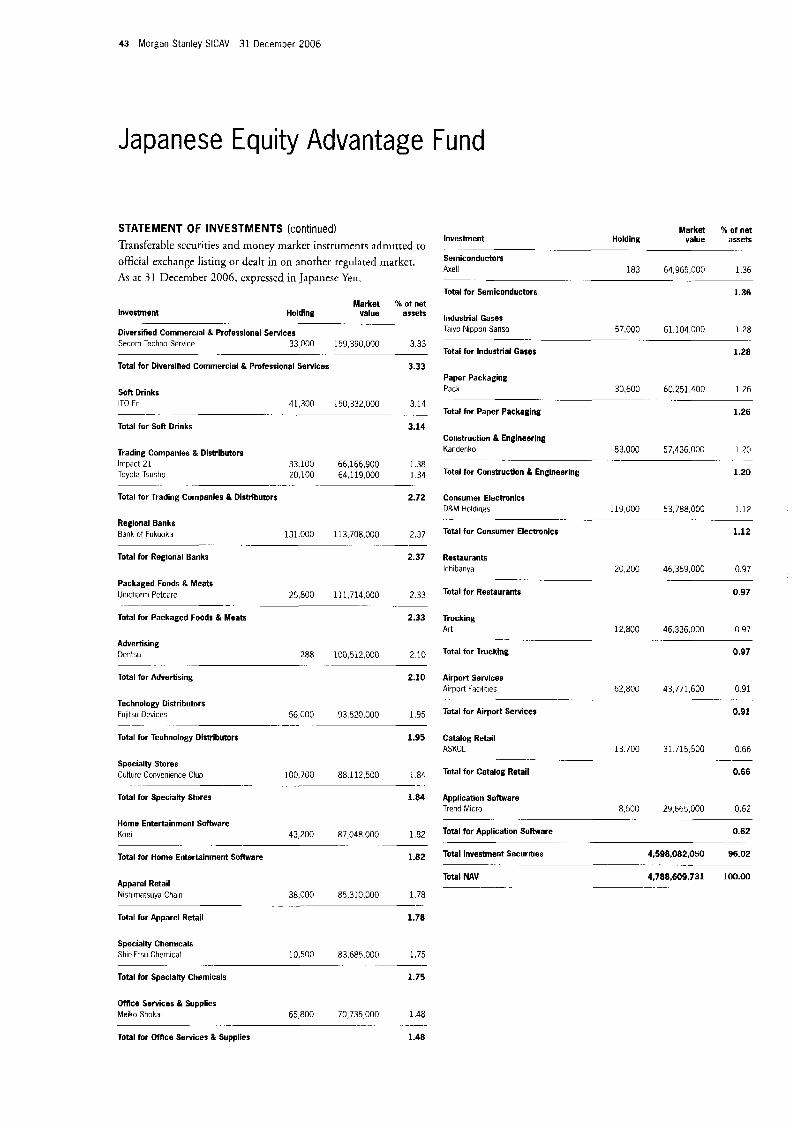
43 Morgan Stanley SlCAV 31 December 2006
Japanese Equity Advantage Fund
STATEMENT OF INVESTMENTS (continued) Transferable sccurities and money market instruments admitted to official exchange listing or dealt in on another regulated market. As a t 31 December 2006, expressed in Japanesc Yen.
Market % of net Investment Holding value assets
Diversified Commercial & Professional Services Secom Techno Service 33.000 153,390,000 3.33
Total for Diverslfied Commercial & Professional Sewlces 3.33
-. . . -.
- . .. -.. ..
Son Drinks IT0 En
Total for Soft Drinks
. -.
Trading Companles & Distributors Impact 21 Toyota Tsusho
Total for Trading Companies & Distributors
41,300 150,332,000 3 14
3.14
-
33.100 66,166,900 1.38 20,100 64,119 000 1 34
2.72
. . -.
Regional Banks Bank of Fukuoka 131.000 113,708,000 2.37
Total for Regional Banks 2.37
Packaged Foods & Meats Unicharm Petcare 25,800 111,714,000 2 33
Total for Packaged Foods & Meats 2.33
.~ . _. -- .- . ..
Advertising Dentsu 288 100,512.000 2 10
Total for Advertising 2.10
.-
Technology Distributors Fulitsu Devices 56,000 93,520,000 1.95 - . .- -. . .
Total for Technology Distributors 1.95
Specialty Stores Culture Convenience Club 100,700 88,112,500 1 84
Total for Specialty Stores 1.84
- .. -.
Home Entertainment Software Koei 43,200 87,048.000 1.82
Total for Home Entertainment Software 1.82
Apparel Retail Nishimatsuya Chain 38,000 85,310,000 1 78
Total for Apparel Retail 1.78
- .-.
Specialty Chemicals Shin-Etsu Chemical 10,500 83,685,000 1.75
Total for Speclalty Chemicals 1.75
Market % o f net Invesbnent Holding value assets
Semiconductors Axell 183 64,965,000 1 36
Total for Semiconductors 1.36
Industrial Gases Taiyo Nippon Sanso 57,000 61.104,OOO 1 28
Total for Industrial Gases 1.28
- - -
Paper Packaging Pack 30,600 60,251,400 1 26
Total for Paper Packaging 1.26
Construction & Engineering Kandenko 83,000 57 436 000 1 2 0
Total for Construction & Engineerlng 1 20
- - -
Consumer Electronics D&M Holdmas 119,000 53,788 000 1 1 2
Total for Consumer Electronlcs 1.12
- .~
Restaurants lchibanya 20,20G 46,359,000 0.97
Total for Restaurants 0.97
- ..
Trucking Art 12,800 46,336,000 0 97
Total for Trucking 0.97
- .. - ..
Airport Sewlces Airport Facilities 62,800 43,771,600 0.91
.--
Total for Airport Services 0.91
Catalog Retail ASKUL 13.700 31 715 500 0.66
Total for Catalog Retail 0.66 -~
Application S o h a r e Trend Micro 8 5 0 0 29665,000 0 6 2
Total lor Application Software 0.62
Total Investment Securlties 4,598,082,050 96.02
Total NAV 4,788,609,731 100.00
__
.- -
_ - _ _ --
Otnce Services & Supplies Meiko Shokai 65,800 70,735,000 1 4 8
-. -.
Total for OfAce Services & Supplies 1.48
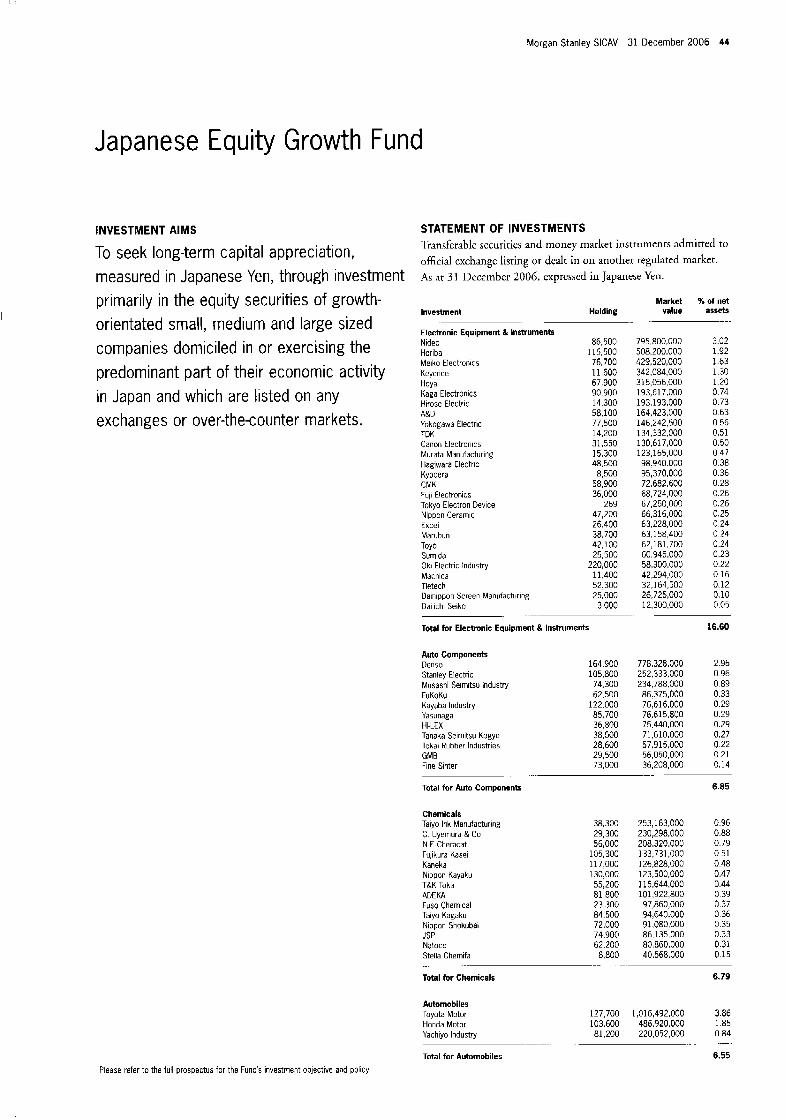
Morgan Stanley SICAV 31 December 2006 44
Japanese Equity Growth Fund
INVESTMENT AIMS
To seek long-term capital appreciation, measured in Japanese Yen, through investment primarily in the equity securities of growth- orientated small, medium and large sized companies domiciled in or exercising the predominant part of their economic activity in Japan and which are listed on any exchanges or over-the-counter markets.
STATEMENT OF INVESTMENTS 1 ransfirable securities and money market instruments admitted to offickil cxchange listing or dcalc in on another regulated market. As at 31 Ikcember 2006, exprcsscd in Japanese Yen.
- .
Investment
Electronic Equipment & Instruments Nidec Horiba Meiko Electronics Keyence Hoya Kaga Electronics Hirose Electric A&D Yokogawa Electric TDK Canon Electronics Murata Manufacturing Hagiwara Electric Kyocera CMK Fuji Electronics Tokyo Electron Device Nippon Ceramic Excel Marubun Toyo Sumida Oki Electric Industry Macnica Tietech Dainippon Screen Manufacturing Dai-ichi Seiko
. -~
H o I d I n g Market
value 96 of net
assets
86,500 115,500
76,700 11,600 67,900 90,900 14,300 58,100 77,500 14,200 31,550 15,300 48.500
8,500 58,900 36,000
269 47,200 26.400 38,700 42,100 25,500
220,000 11,400 52,300 25,000
3.000
795,800,000 508,200,000 429,520,000 342,084,000 315,056,000 193,617,000 193,193,000 164,423,000 146,242,500 134,332,000 130,617,000 123,165,000 98.940.000 95,370,000 72,682,600 68,724,000 67,250,000 66,316,000 63,228,000 63,158,400 62,181,700 60,945,000 58,300,000 42,294,000 32,164,500 26,725,000 12,300,000
3.02 1.92 1.63 1.30 1.20 0 74 0.73 0.63 0.56 0.51 0.50 0.47 0 38 0.36 0.28 0.26 0.26 0.25 0.24 0 24 0.24 0.23 0.22 0.16 0.12 0.10 0.05
Total for Electronic Equipment & Instruments 16.60
Auto Components Denso Stanley Electric Musashi Seimitsu Industry FuKoKu Kayaba Industry Yasunaga HI-LEX Tanaka Seiniitsu Kogyo Tokal Rubber Industries GMB Fine Sinter
Total for Auto Components
Chemicals Taiyo Ink Manufacturing C Uyemura & Co N E Chemcat Fujikura Kasei Kaneka Nippon Kayaku T&K Toka ADEKA Fuso Chemical Taiyo Kagaku Nippon Shokubai JSP Natoco Stella Chemifa
164,900 778,328,000 105,800 252,333,000
74,300 234,788,000 62,500 86.375.000
122,000 76.616.000 85,700 76,615,800 36,800 75.440.000 38,500 71,610.000 28,600 57,915,000 29,500 56,050,000 73,000 36,208,000
-. -~
38,300 253,163,000 29,300 230,298,000 56,000 208,320,000
105,300 133,731,000 117,000 126.828.000 130,000 123,500,000 55,200 115,644,000 81,800 101,922,800 23,300 97,860,000 84,500 94,640.000 72,000 91.080.000 74,900 86.135.000 62,200 80,860,000
8,800 40,568,000
2.96 0.96 0.89 0.33 0 29 0.29 0.29 0.27 0.22 0.21 0.14
6.85
0.96 0.88 0.79 0.51 0.48 0.47 0.44 0.39 0 37 0 36 0.35 0.33 0.31 0.15
.__ --- .. .
Total tor Chemicals 6.79
Automobiles Toyota Motor 127,700 1,016,492,000 3 86 Honda Motor 103,600 486,920,000 1 85 Yachiyo Industry 81,200 220,052,000 0 84
Total for Automobiles 6.55
Please refer to the full prospectus for the Funds investment objective and policy
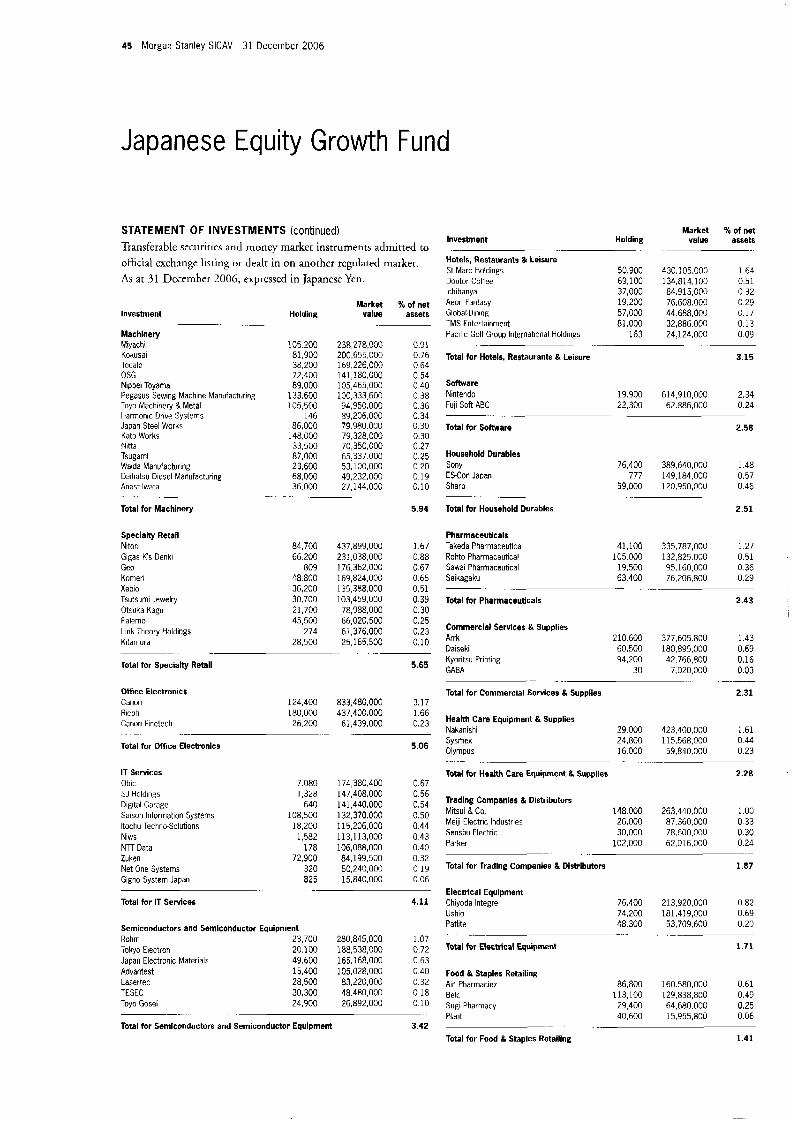
45 Morgan Stanley SICAV 31 December 2006
Japanese Equity Growth Fund
Market % of net Investment H o I d i n g value assets
STATEMENT OF INVESTMENTS (continued) Transferable securirics and money market iristrumcnts admitted to -.. .- . ..
50,900 430,105,000 69.100 134,814,100 37,000 84,915,009 19.200 76.608.000 57,000 44,688,000 81,000 32,886.000
163 24.124.000 .....
official exchange listing o r dealt in on anorher regulated marker. As a t 31 December 2006, expressed in Japanese Ycn.
Hotels, Remurants & Leisure St Marc Holdings Doutor Coffee lchibanya Aeon Fantasy Global-Dining TMS Entertainment Pacific Golf Group International Holdings
Total for Hotels, Restaurants & Leisure
- ~~
1.64 0.51 0 32 0.29 0.17 0.13 0.09
Market %of net H o I d i n g value assets Investment
Machinery Miyachi Kokusai Tocalo OSG Nipsei Toyama Pegasus Sewing Machine Manufacturing Toyo Machmery & Metal Harmonic Drive Systems Japan Steel Works Kat0 Works Nitta Tsugami Waida Manufacturing Daihatsu Diesel Manufacturing Anest lwata
Total for Machinery
---
-. . .. -..
105,200 81,900 38,200 72,400 89,000
133,600 105,500
146 86,000
148.000 33,500 87,000 23,600 68,000 36.000
- -_
238.278.000 200,655,000 169,226,000 141,180,000 105.465,OOO 100 333 600 94,950,000 89,206,000 79.980.000 79,328,000 70,350,000 65.337 000 53,100,000 49,232,000 27,144,000
0.91 0.76 0.64 0.54 0 40 0.38 0.36 0.34 0.30 0.30 0.27 0.25 0.20 0.19 0.10
3.15
Software Nintendo Fuji Soft ABC
19.900 614,910,000 2.34 22,300 62,886,000 0.24
- . -
Total for Sottware 2.58
Household Durables 1.48 Sony
ES-Con JaDan 777 149,184,000 0 5 7 Sharp 59,000 120,950,000 0 46
Total for Household Durables 2.51
76,400 389,640,000
~. . -
5.94
437,899,000 231.038.000 176.362.000 169,824,000 135,388,000 103,459,000
78,988,000 66,020,500 61,376,000 25.165.500
1.67 0.88 0.67 0.65 0.51 0.39 0.30 0.25 0.23 0.10
41,100 105.000
19,500 63.400
.
335,757,000 132.825.000 95,160,000 76,206,500
1.27 0.51 0.36 0.29
Specially Retail Nitori Gigas K's Denki Gco Komeri Xebio Tsutsumi Jewelry Otsuka Kagu Palemo Link Theory Holdings Kitamura
Total for Specialty Retail
.
Pharmaceuticals Takeda Pharmaceutical Rohto Pharmaceutical Sawai Pharmaceutical Seikagaku
Total for Pharmaceuticals
.- ~-
84,700 66.200
809 48.800 36,200 30,700 21,700 45,500
274 28,500
2.43 i
Commercial Services & Supplies Arrk Daiseki Kyoritsu Printing GABA
210.600 60,500 94,200
30
377.605.800 180.895.000 42.766.800
7,020,000
1.43 0.69 0.16 0.03 5.65
Ofhce Electronics Canon
_ - .. -. .
Total for Commercial Servlces & Supplies 2.31 124,400 833,480,000 3.17
437,400,000 1.66 o,23 Health Care Equipment & Supplies
1.61 Nakanishi 5,06 Sumex 24,800 115,568,000 0.44
Olympus 16,000 59,840,000 0.23
29.000 423,400,000 61,439,000 -...-
Ricoh 180,000 Canon Finetech 26.200
Total for Office Electronics
. . . . ... .. .
7.080 1.328
640 108,500
18,200 1,582
178 72,900
320
IT Services Obic SJ Holdings Digital Garage Saison Information System5 ltochu Techno-Solutions Niws
Zuken Net One Systems Gigno System Japan 825 15.840.000
Total for IT Services
NTT Datd
--
Total for Health Care Equipment & Supplles 2.28 174,380.400 0.67 147,408,000 0.56 141 ,440,000 o,54 Trading Companies & Dlstributors
132.370.000 0.50 & 148.000 263,440,000 1.00 26.000 87,360,000 0.33
Senshu Electric 30,000 78,600,000 0.30 :::: Parker 102,000 62,016,000 0.24
84,199,500 0.32 50,240,000 0 19 Total for Tradlng Companies & Distributors 1.87
0.06
15,206,000 Meiii Electric Industries
113,113,000 106,088,000 .. .
Elecaical Equlpment Chiyoda lntegre Ushio Patlite
Total for Electrical Equipment
4.11 0 82 0.69 0.20
76,400 213,920,000 74,200 181,419,000 48.300 53,709,600
.. - Semiconductors and Semiconductor Equipment Rohm 23,700 280,845,000 Tokyo Electron 20.100 188,538,000 Japan Electronic Materials 49,600 165.168.000 Advantest 15,400 105.028.000 Lasertec 28,500 83,220,000 TESEC 30,300 48,480,000 Toyo Gosei 24,900 26.892.000
Total for Semiconductors and Semiconductor Equipment
_.
1.07 0.72 0.63 0.40 0.32 0.18 0.10
3.42
___ .
1.11
Food & Staples Retailing Ain Pharrnaciez Eelc Sugi Pharmacy Plant
86,800 160.580,OOO 113,100 129,538,800 29,400 64,680.000 40,600 15,955,800
0.61 0.49 0.25 0 06
Total for Food & Staples Retalllng 1.41
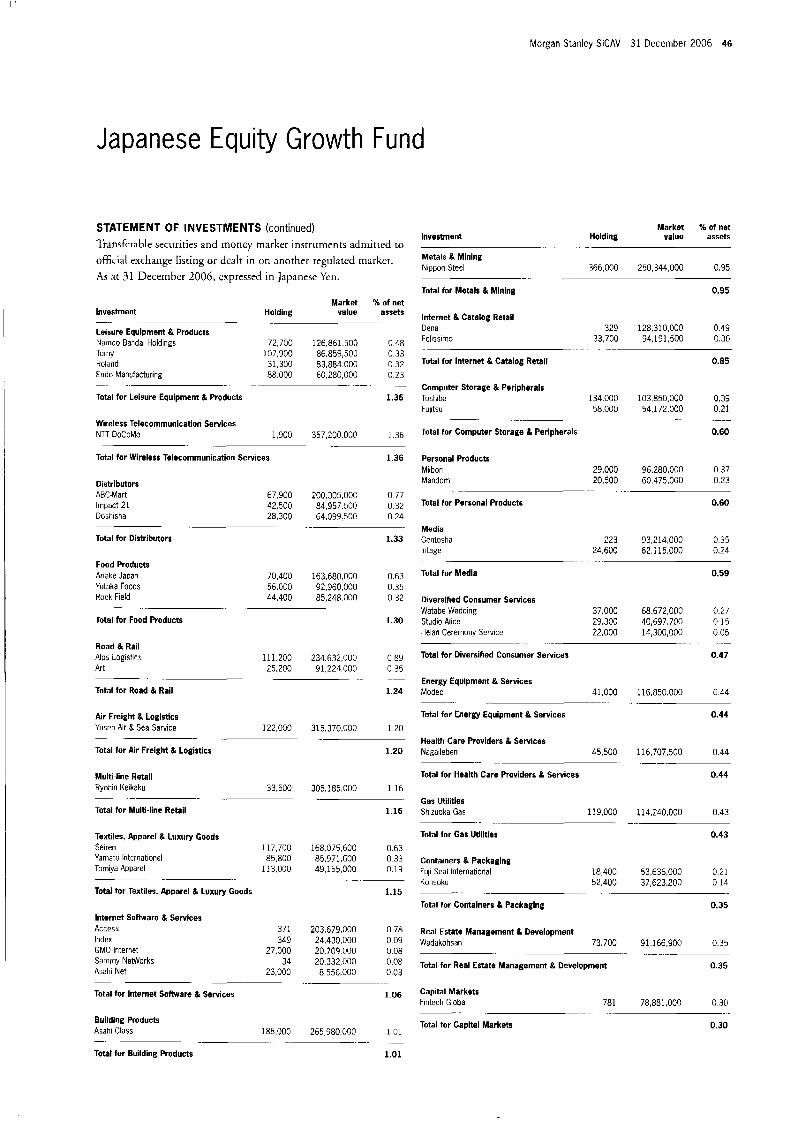
Morgan Stanley SICAV 31 December 2006 4 6
Japanese Equity Growth Fund
STATEMENT OF INVESTMENTS (continued) 'lkmsfcrable securities and moricy marker instruments admitted LO
official exchange lisring or dcalt in on another regulatcd markcr. As at 31 Decernbcr 2006, expressed in Japanesc Ycn.
Investment
Leisure Equipment & Products Namco Baidai Holdings Tomy Roland Endo Manbfacturing
..
-. ....
Total for Leisure Equipment & Products
Market 96 of net Holding value assets
72.700 126,861.500 0.48 107,YOO 86,859,500 0.33 31,300 83.884.000 0.32 88.000 60,280,000 0.23
1.36
.
Wireless Telecommunication Services NTT DoCoMo 1,900 357,200.000 1.36
Total for Wireless Telecommunication Services 1.36 . -- -_
Distributors ABC.Mart 67.900 200.305,OOC 0 77 Impact 21 42,500 84,957.500 0.32 Doshisha 28,300 64.099.500 0 24
Total for Distributors 1.33
Food Products Artake Japan 70,400 163,680,000 0.63 Yutaka Foods 56 000 92.960.000 0.35 Rock Field 44,400 85,248.000 0 32
Total for Food Products 1.30
- . .~
Road & Rail Alps Logistics 111,200 234632,000 0 89 Art 25,200 91,224 000 0 35
Total for Road & Rail 1.24
~. -
Air Freight & Logistics Yusen Air & Sea Service 122.000 315,370,000 1.20
Total for Air Freight & Logistics - . - ..
1.20
Multi-line Retail Ryohin Kelkaku 33.500 305,185,000 1.16
Total for Multi-line Retail 1.16
- ..
Textiles, Apparel & Luxury Goods Seiren 117,700 168 075,600 0.63 Yarnato International 85,800 85.971.600 0 33 Torniya Apparel 113,000 49,155,000 0.19
Total for Textiles, Apparel & Luxury Goods 1.15
- .~ .
Internet Software & Services Access 371 203,679.000 0 7 8 Index 349 24.430.000 0 09 GMO Internet 27.000 20,709 000 0.08 Sammy NetWorks 34 20,332,000 0.08 Asaht Net 23,000 8,556.000 0 03
Total for Internet Software & Services 1 06
-
Building Products Asahi Glass 186,000 265,980.000 1 0 1
Total for Building Products 1.01 - - - - .- -
Investment Market X 01 net
H o I d i n g value assets . ._
Metals & Mlning Nippon Steel 366,000 250,344,000 0.95
Total for Metals & Mlnlng 0.95
.. ..
Internet & Catalog Retail Dena 329 128,310,000 0 4 9 Felissimo 33,700 94,191,500 0.36
Total for Internet & Catalog Retail 0.85 - - - .-
Computer Storage & Peripherals Toshiba 134 000 103,850,000 0 39 Fujitsu 58,000 54 172 000 0 21
Total for Computer Storage & Peripherals 0.60
..-
Personal Products Milbon 29,000 96,280,000 0 37 Mandom 20,500 60,475,000 0.23
Total for Personal Products 0.60
-_ -
Media Gentosha lntage
223 93,214,000 0.35 24.600 62.115.000 0.24
.- -
Total for Media 0.59
Diverstfled Consumer Services Watabe Wedding 37,000 68 672,000 0.27 Studio Alice 29,300 40,697,700 0 15 Heian Ceremony Service 22,000 14,300,000 0 05
Total for Diversified Consumer Services 0.47
-
Energy Equipment & Services Modec 41,000 116,850 000 0 44
Total for Energy Equipment & Services 0.44
~- -_
Health Care Providers & Services Nagaileben 45,500 116,707,500 0.44
Total for Health Care Providers & Services 0.44
- -
Gas Utilities Shizuoka Gas 119,000 114,240,000 0.43
Total for Gas Utllltles 0.43 - - ..
Containers & Packaging
Kohsoku 52,400 37,623,200 0 14
Total for Containers & Packaging 0.35
Fuji Seal lnterndtional 18,400 53,636,000 0 21
-
Real Estate Management & Development Wadakohsdn 73.700 91.166.900 0.35
Total for Real Estate Management & Development 0.35 --
Capital Markets Fintech Global 781 78,881,000 0.30
- .. -.
Total for Capital Markets 0.30
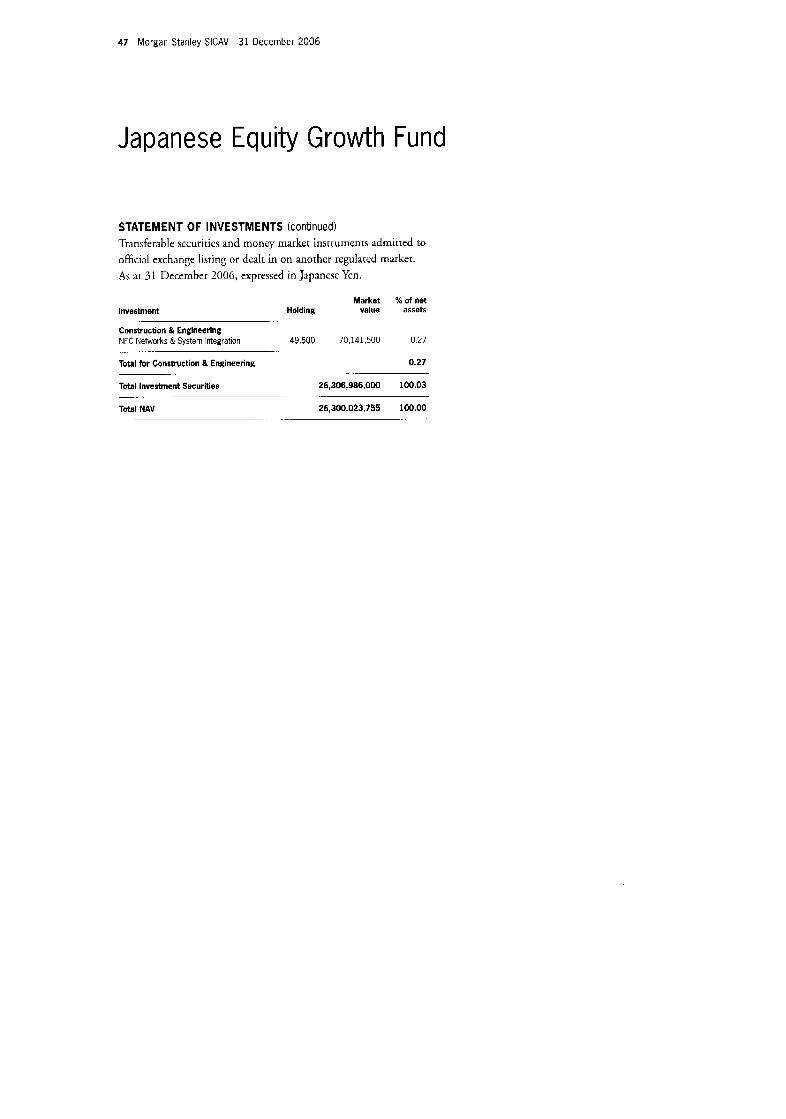
47 Morgan Stanley SICAV 31 December 2006
Japanese Equity Growth Fund
STATEMENT OF INVESTMENTS (continued) Transferable sccuritics and money market instruments admirred to official exchange lihring or dealt in on another regulated market. As at 3 1 December 2006, expressed in Japanese Yen.
Investment Market % of net
H o I d i n g value assets .
Construction & Engineering NEC Networks & System Integration 49,500 70,141,500 0.27
Total tor Construction & Engineering 0.27
Total Investment Securities 26,306,986.000 100.03
Total NAV 25,300,023,755 100.00
. . .. . . - . .-
- - - . --
-. -.
.- .... . ---
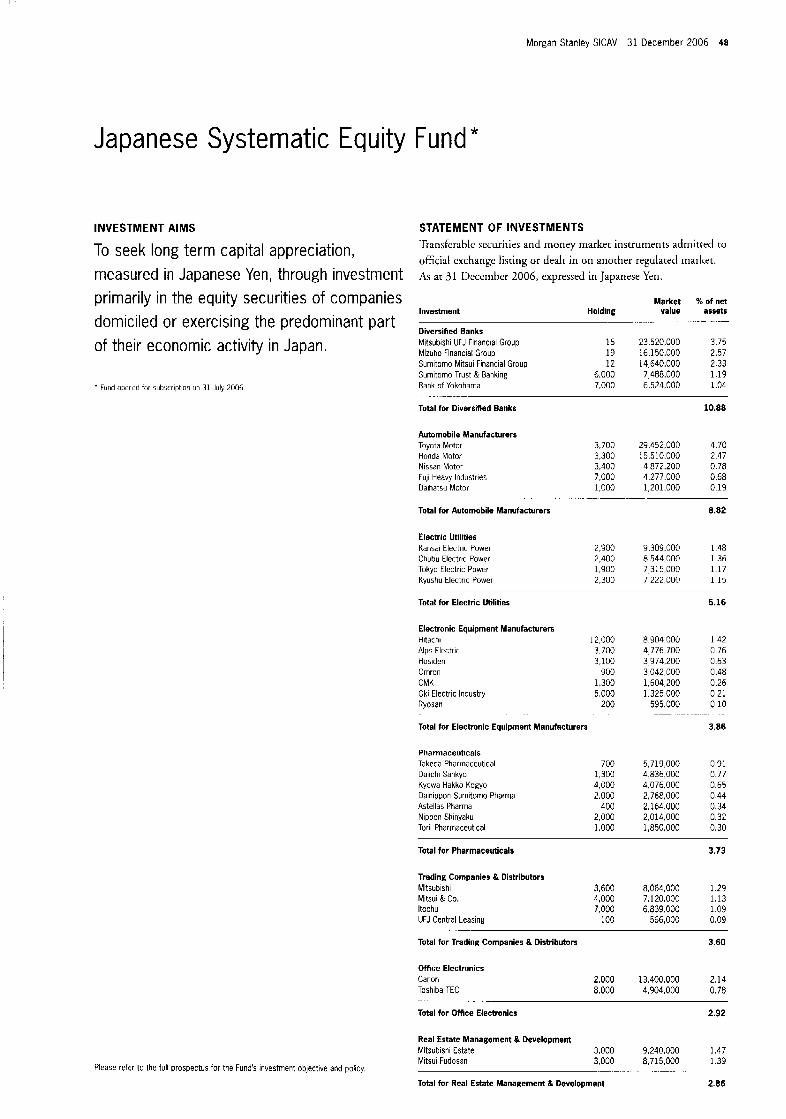
Morgan Stanley SICAV 31 December 2006 48
Japanese Systematic Equity Fund *
INVESTMENT AIMS
To seek long term capital appreciation, measured in Japanese Yen, through investment primarily in the equity securities of companies domiciled or exercising the predominant part of their economic activity in Japan.
* Fund ope:ed for subscription un 31 July 2006
Please refer to the full prospectus for the Fund's investment objective and policy.
STATEMENT OF INVESTMENTS Transfcrablc sccuritits and money marker instrunients admitted to official cxcharigc listing or dealr in on anorher regulated market. A s at 31 Ilcccrribcr 2006, expressed in Japanese Yen.
Market Investment H o I d i n g value
Diversified Banks Mitsubishi UFJ Financial Group 16 23,520,000 Mizuho Financial Group 19 16,150,000 Sumitorno Mitsui Financial Group 12 14,640,000 Sumitorno Trust & Banking 6,000 7,488,000 Bank of Yokohama 7,000 6,524,000
~ ...
% of net assets
.-
3.75 2.57 2.33 1.19 1.04
Total for Diversifted Banks
Automobile Manufacturers Toyota Motor Honda Motor Nissan Motor Fuji Heavy Industries Daihatsu Motor
Total for Automobile Manufacturers
Electric Utilities Kansai Electric Power Chubu Electric Power Tokyo Electric Power Kyushu Electric Power
10.88
3,700 29.452.000 4.70 3,300 15,510,000 2.47 3,400 4,872.200 0.78 7,000 4.277.000 0.68 1,000 1,201.000 0.19
8.82
2,900 9,309,000 1.48 2,400 8.544.000 1.36 1,900 7,315,000 1.17 2,300 7,222,000 1.15
Total for Electric Utilities
Electronic Equipment Manufacturers Hitachi 12.000 Alps Electric 3.700 Hosiden 3.100 Ornron 900 CMK 1,300 Oki Electric Industry 5,000 Ayosan 200
Total for Eiecmnlc Equipment Manulacturers
Pharmaceuticals Takeda Pharmaceutical Daiichi Sankyo Kyowa Hakko Kogyo Dainipoon Sumitorno Pharma Astellas Pharma Nippon Shinyaku Torii Pharmaceutical
8.904.000 4,776.700 3,974,200 3,042,000 1,604,200 1.325.000
595.000
700 1,300 4,000 2.000
400 2,000 1.000
5,713,000 4,836,000 4.076.000 2,768,000 2,164,000 2.014.000 1,850,000
5.16
1 4 2 0 76 0.63 0.48 0.26 0 21 0 10
3.86
.. .
0.91 0 77 0.65 0.44 0 34 0 32 0.30
Total for Pharmaceuticals 3.73
Trading Companies & Distributors Mitsubishi 3,600 8,064,000 1.29 Mitsui 8 Co. 4,000 7,120,000 1.13 ltochu 7.000 6 839.000 1 09 UFJ Central Leasing 100 566,000 0 09
Total for Trading Companies & Distributors 3.60
.-
Office Electronics Canon 2.000 13.400.000 2 14 Toshiba TEC 8.000 4,904,000 0.78
Total for Office Electronics 2.92
Real Estate Management & Development Mitsubishi Estate 3,000 9,240,000 1.47 Mitsui Fudosan 3,000 8,715,000 1 39
- . .
Total for Real Estate Management Development 2.86
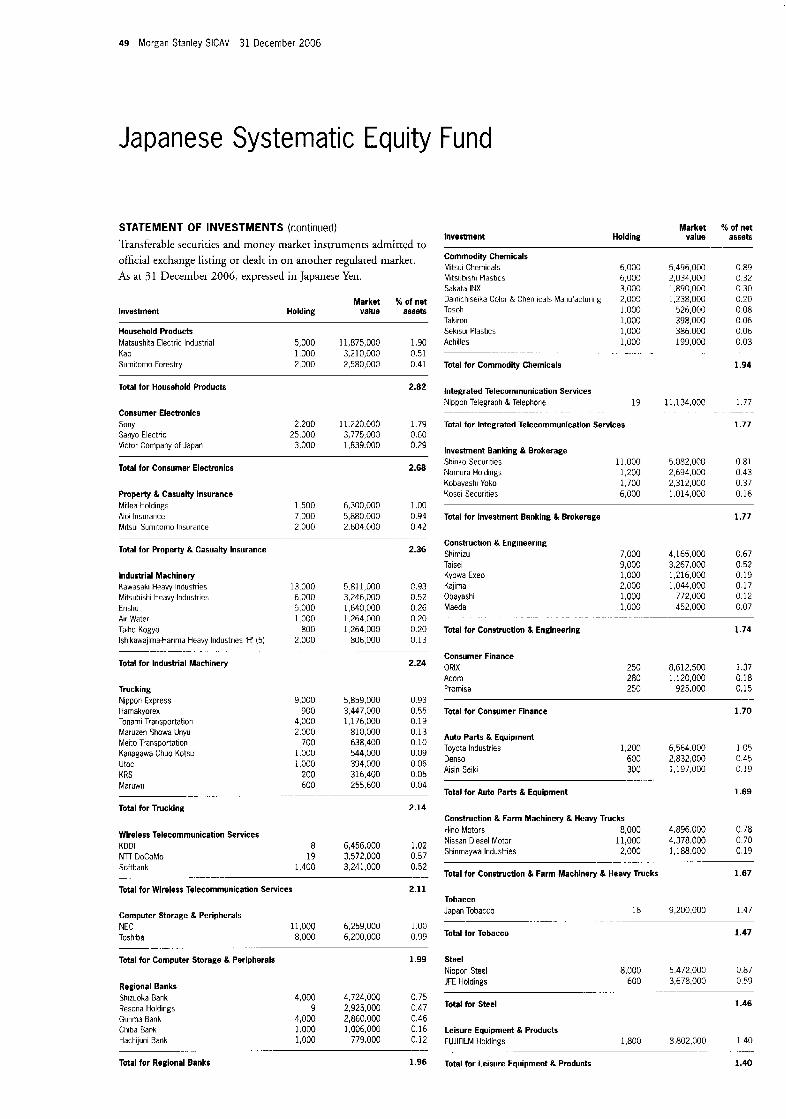
49 Morgan Stanley SlCAV 31 December 2006
Japanese Systematic Equity Fund
STATEMENT OF INVESTMENTS (continued) 'I'ransfcrahle securities arid nioncy rriarkct instrumcnts admitted to
official exchange listing or dealt in on anorher regulared marker. As ;It 31 December 2006, expressed in Japanese Yen.
Market % of net Holding value assets Investment
Commodity Chemicals Mitsui Chemicals Mitsubishi Pla$tlc$ Sakata INX Dainichiseika Color & Cheniicals Manufacturing Tosoh Takiron Sekisui Plastics Achilles
Total tor Commodity Chemicals
~ .......... - . . .
6.000 6,000 3.000 2,003 1.000 1,000 1,000 1,000
5,496,000 2,034,000 1890,000 1,238,000
526,000 398,000 386 000 199,000
11.1 34,OOC
5.082.000 2,694.000 2,312,000 1014,000
0.89 0.32 0.30 0.20 0.08 0.06 0.06 0.03
1.94
1.77
Investment Market 96 of net
Holding value assets
Household Products Matsushita Electric Industrial Kao Sumitomo Forestry
5,000 11,875,000 1.90 1,000 3,210,000 0.51 2,000 2,580,000 0.41
Total for Household Products 2.82 Integrated Telecommunication Services Nippon Telegraph R Telephone 19
Consumer Electronics Sony Sanyo Electric Victur Company of Japan
1.77
0.81 0 43 0.37 0.16
2.200 11.220.000 1 7 9 25,000 3,775,000 0.60
3,000 1,839.000 0.29
Total for Integrated Telecommunlcatlon Servlces
Investment Banking & Brokerage Shinko Securities 11.000 Nomiira Holdings 1,200 Kobayashi Yoko 1,700 Kosci Securities 6,000
Total for Consumer Electronics 2.68
Property & Casualty Insurance Millea Holdings 1,500 6,300,000 1 00 Aioi Insurance 7,000 5,880 000 0 94 Mitsui Sumitomo Inburdim 2,000 2.604.000 042
Total for Investment Banking & Brokerage 1.77
Construction & Engineering Shtmizu Taisei Kyowa Exeo Kajima Obayashi Maeda
Total for Construction & Engineering
. . _.
Total for Property & Casualty Insurance 2.36
c.93 0.52 0.26 0.20 0.20 0.13
7.000 4,165.000 0.67 9,000 3,267,000 0.52 1,000 1,216.000 0.19 2,000 1,044,000 0.17 1.000 772,000 0.12 1,000 452,000 0.07
Industrial Machinery Kawasaki Heavy Industries Mitsubishi Heavy Industries Enshu Air Water Taiho Kogyo Ishikawajima-Harima Heavy Industries 'H' (5)
Total for Industrial Machinery
~ _. . . . . . .
13.000 6,000 5,000 1,000
800 2,000
9,000 900
4,000 2.000
700 1.000 1,000
200 600
5,811,000 3,246,000 1,640,000 1,264,000 1,264,000
806,000 .
5,859,000 3,447,000 1.176.000
810,000 638,400 544,000 394.000 316,400 255.600
1.74
Consumer Finance ORlX Acorn Promise
2.24
0.93 0.55 0.19 0.13 0.10 0.09 0.06 0.05 0.04
250 8,612,500 1.37 280 1,120,000 0.18 250 925,000 0.15 Trucking
Nippon Express Hamakyorex Tonanii Transportation Maruzen Showa Unyu Meco Transportation Kanagawa Chuo Kotsu utoc KRS Maruwri
Total for Trucking
~~ .......
Total for Consumer Finance 1.70
Auto Parts & Equipment Toyota Industries 1,200 6.564.000 1 0 5 Denso 600 2,832,003 045 Aisin Seiki 300 1197,000 0 19
_ -
Total for Auto Parts & Equipment 1.69
2.14 Construction & Farm Machinery & Heavy Trucks Hino Motors 8,000 4,896,000 0 78 Nissan Diesel Motor 11.000 4.378.000 0 70 Shinmapva Industries 2,000 1,188.000 0.19
Total for Construction & Farm Machinery & Heavy Trucks 1.67
. ... . .
Wireless Telecommunication Services KDDl NTI DoCoMo Softbank
8 6,456,000 1 .oz 19 3,572,000 0.57
1,400 3,241,000 0.52 . _ __ ..___ _.
Total for Wlreless Telecommunication Services 2.11 Tobacco Japan Tobacco 16 9,200,000 1.47 Computer Storage & Peripherals
NEC 11,000 6,259,000 1 .oo Toshiba 8,000 6,200,000 0.99
Total for Computer Storage & Perlpherals 1.99
....... ~ _ .......
.... . .___
Total for Tobacco 1.47
Steel 0.87 Ntppon Steel
JFE Holdings 600 3,678,000 0.59
Total for Steel 1.46
8,000 5.472,OOO
........ Regional Banks Shizuoka Bank 4,000 4.724.000 0.75 Resona Holdings 9 2,925,000 0.47 Gunma Bank 4,000 2,860,000 0.46 Chiba Bank 1.000 1,006,000 0.16 Hactiiluni Bank 1,000 779,000 0.12
...... .
Total for Regional Banks 1.96
Leisure Equipment & Products FUJFILM Holdings 1,800 8.802.000 1 40
Total l o r Leisure Equipment & Products 1.40 ... ...
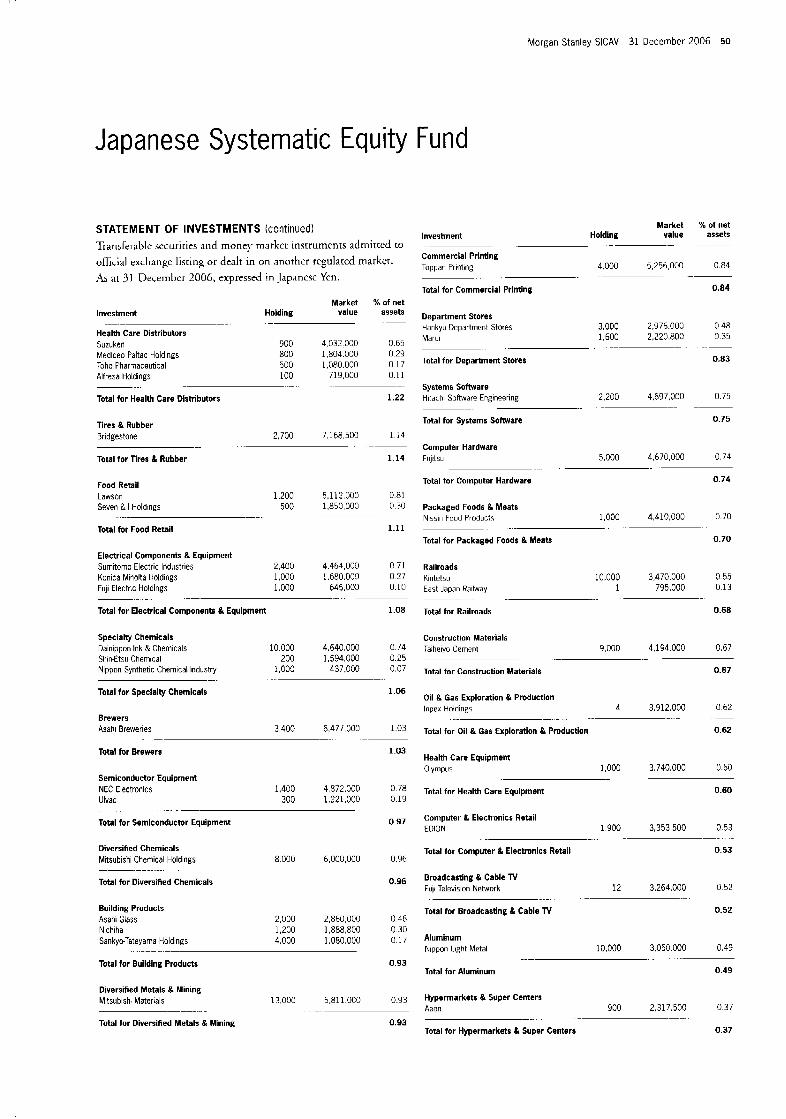
Morgan Stanley SICAV 31 December 2006 50
Japanese Systematic Equity Fund
STATEMENT OF INVESTMENTS (continued) Transferablc sccuriries and money rn:irkct insrrurnents admitted [O official exchange lisring or dealt in on another regulared market. As at 31 Dccemhcr 2006, expressed in Japancsc Yen.
Investment
Health Care Distributors Suzuken Medicpo Faltac Holdings Toho Pharnaceutical Alfresa Holdings
Total for Health Care Distributors
.-
Market % of net Holding value assets
.~
900 4.032.000 0.65 800 1.804.000 0.29 500 1.080.000 0.17 100 719,000 0.11
1.22
. .- -.
Tires & Rubber Bridgestone 2,700 1.168 500 1 1 4
Total for Tires & Rubber 1.14
-~ -.
Food Retail Lawsori 1,200 5,112.000 0.81 Seven & I Holdings 500 1,850,000 0.30
Total for Food Retail 1.11 . .
Electrical Components & Equipment Sumitomo Electric Industries 2.400 4,464,003 0.71 Konica Miqolta Holdings 1,000 1.680.000 0.27 FUJI Electrc Holdings 1,000 645.003 0.10
. -_ . .. . -- . .
Total for Electrical Components & Equipment 1.08
Specialty Chemicals Dainippon Ink & Cheniicals 10,000 4,640,000 0.74 Shin-Etsu Chemical 200 1.594.000 0.25 Nippon Synthetic Chemical Industry 1,000 437.000 0.07
Total for Specialty Chemicals 1.06
. .... .
Brewers Asahi Breweries 3,400 6,471,000 1.03
Total for Brewers 1.03 - -~ .
Semiconductor Equipment NEC Electronics 1,400 4,872,000 0 78 Ulvac 300 1,221,000 3 19
0 97
. .. - . .-
Total for Semlconductor Equipment
Diversified Chemicals Mitsubishi Chemical Holdings 8.000 6,000,000 0.96
.. .. _- .
Total for Diversified Chemicals 0.96
Building Products Asahi Glass Nichiha Sankyo-Thteyama HoldinRs
2,000 2,860,000 0.46 1,200 1,888,800 0.30 4,000 1.080.000 0.17
Total for Building Products 0.93
Diversified Metals & Mining Mitsubish. Materials 13,000 5.811,OCO 0.93
Total for Diversified Metals & Mining 0.93
. ... . .... ..
Market Investment Holding value
Commercial Printing Toppan Printing 4 000 5,256,000
Total for Commercial Printing
Department Stores Hankyu Department Stores 3,000 2.976.000 Marui 1,600 2.220.800
Total for Deparbnent Stores
.. . ..
Systems Software Hitachi Software Engineering 2,200 4,697,000
Total for Systems Soflware
.. . .. -
Computer Hardware Fujitsu 5,000 4.670,OOO
% of net assets
0.84
0.84
0 48 0.35
0.83
0.75
0.75
0.74 . .... -
Total for Computer Hardware 0.74
Packaged Foods & Meats Nissin Food Products 1,000 4,410,000 0 70
Total for Packaged Foods & Meats 0.70
Railroads 10,000 3,470,000 0 55 Kintetsu
East Japan Railway 1 795,000 0 13
Total for Railroads 0.68
Construction Materials 9,000 4,194,000 0.67 Taiheiyo Cement
Total for Construction Materials 0.67 .....
Oil & Gas Exploration & Production lnpex Holdings 4 3,912000 0 6 2
Total for Oil & Gas Exploration & Production 0.62
- ._ - .
Health Care Equipment Olympus 1,000 3,740.000 0 60
Total for Health Care Equlpment 0.60 ~ -.
Computer & Electronics Retail EDION 1,900 3,353,500 0.53
Total for Computer & Electronics Retail 0.53
. .. . .. . . -
Broadcasting & Cable Tv Fiili Television Network
Total for Broadcasting & Cable TV
12 3,264000 0 52
0.52 - _ ..
Aluminum Nippon Light Metal 10,000 3,050 000 0.49
Total for Aluminum 0.49
.~ -_
Hypermarkets & Super Centers Aeon 900 2,317 500 0 3 7
Total for Hypermarkets & Super Centers 0.37 __
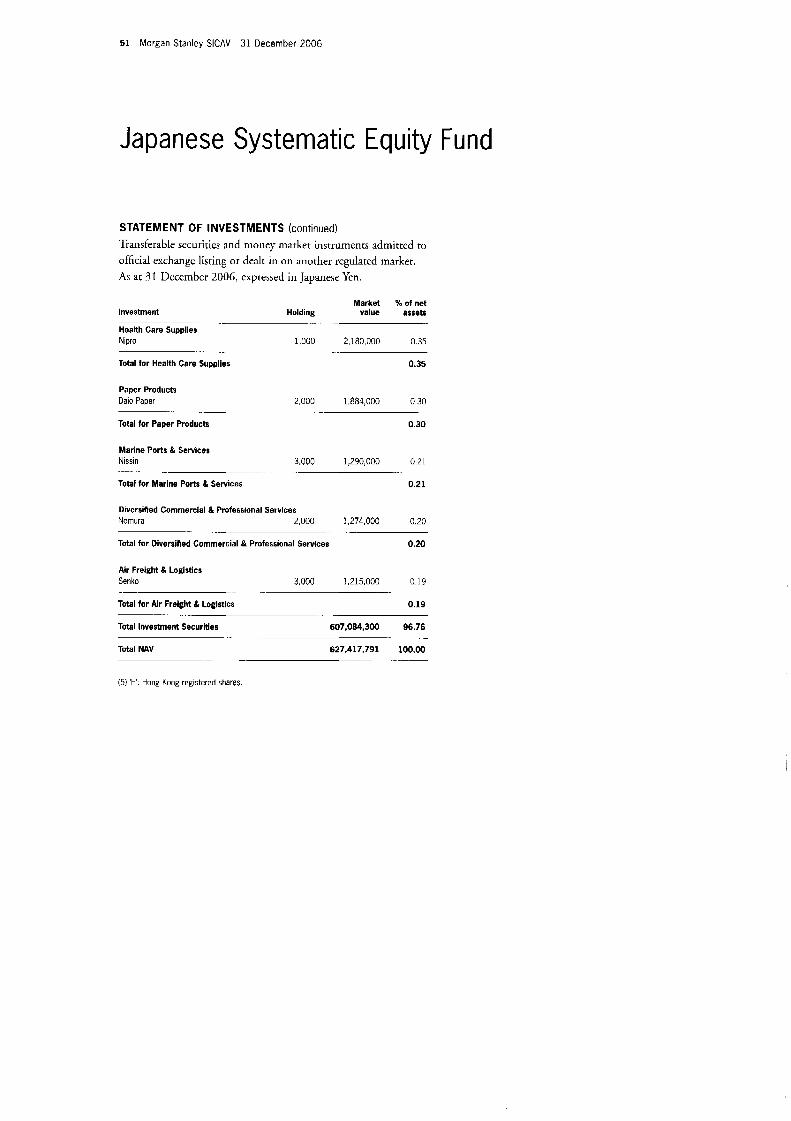
5 1 Morgan Stanley SICAV 31 December 2006
Japanese Systematic Equity Fund
STATEMENT OF INVESTMENTS (continued) Transferable sccurities and nionzy marker instrumenrs admitrcd to official exchange listing or dealr in on another regulated market. As at 31 13ecember 2006, cxptessecl in Japanese Ycn.
Market 96 of net investment Holding value assets
Health Care Supplies Nipro 1,000 2 180000 035
Total for Health Care Supplies 0.35
-. - -
Paper Products Dam Paper 2.000 1,884,000 030
Total tor Paper Products 0.30
- - -
Marine Ports IL Services Nissin 3,000 1,290,000 0 21
Total tor Marine Ports 8 Services
_ _ 0.21
Diversined Commercial .% Professional Services Nomura 2,000 1,274,000 0.20
Total for Diversified Commercial & Professional Servlces 0.20 -- .. ... __
Air Freight & Logistics Senko 3,000 1.215.000 0 19
Total for Air Freight & Logistics 0.19
Total investment Securities 607,084,300 96.76
Total NAV 627,417,791 100.00
.- __ __
- . .
-.
_ -
(5) 'W: Hong Kong registered shares
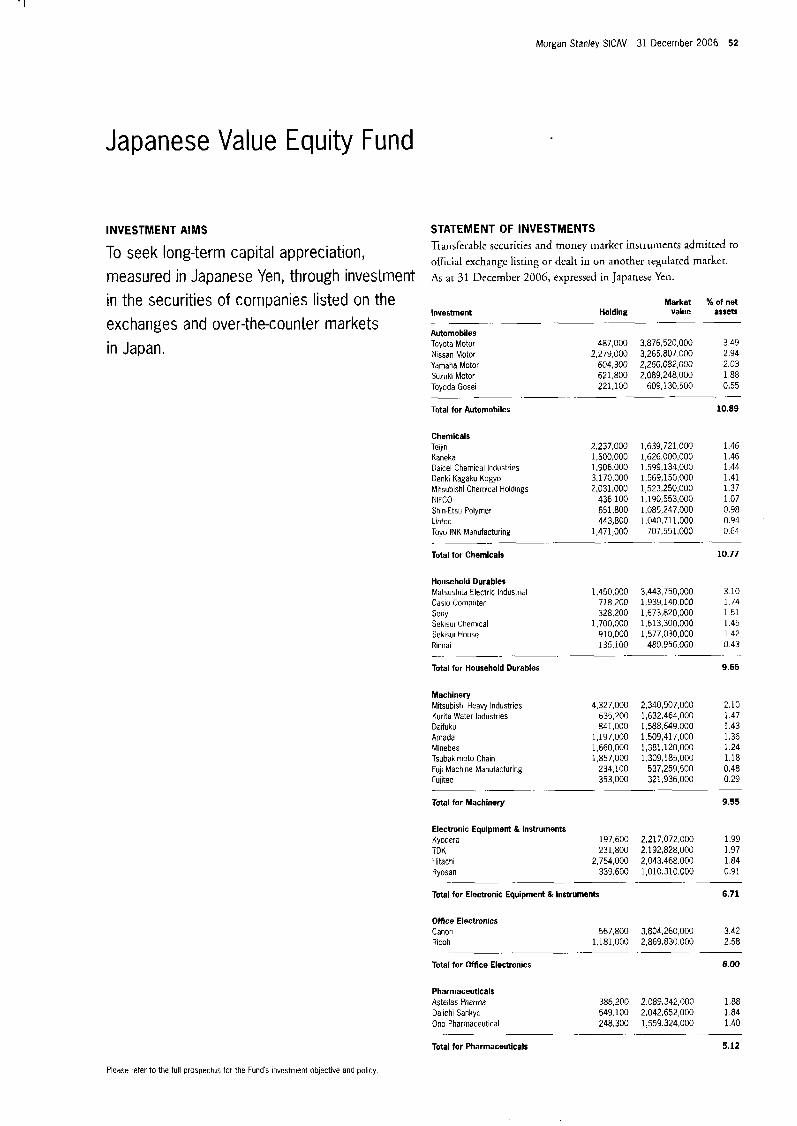
Morgan Stanley SlCAV 31 December 2006 52
Japanese Value Equity Fund
INVESTMENT AIMS STATEMENT OF INVESTMENTS Transferable securiries and money market instruments admitred to official exchange lisring or dcalt in on another regulated marker. To seek long-term capital appreciation,
measured in Japanese Yen, through investment A at 31 December 2006, expressed in Japanese Yen.
Market Investment Holding value
in the securities of companies listed on the . ~ -- -- --
exchanges and over-the-counter markets Automobiles
in Japan. Toyota Motor 487,000 3 876,520,000 Nissan Motor 2,279,000 3 265,807 000
604,300 2,260,082,000 Yamaha Motor Suruki Motor 621 800 2,089,248,000 Toyoda Gosei 221,100 609,130,500
Total for Automobiles
Chemlcals Teijin Kaneka Daicel Chemical Industries Denki Kagaku Kogyo hlitsubishi Chemical Holdings NIFCO Shin-Etsu Polymer Lintec Toyo INK Manufacturing
Total tor Chemicals
.
Household Durables Matsushita Electric Industrial Casiu Computer Sony Sekisui Chemical Sekisui House Rinnai
2.237.000 1,500,000 1,906,000 3,170,000 2,031,000
436.100 651,800 443,800
1,471,000
X of net assets
3.49 2.94 2.03 1.88 0.55
10.89
-
1,639,721,000 1,626,000,000 1,599,134,000 1,569,150,000 1,523,250,000
1,190,553,000 1,085,247,000 1.040,711,000
707.551.000 - ~. .
1,450,000 3,443,750,000 718,200 1.939.140.000 328,200 1,673,820,000
1,700,000 1.613.300.000 910,000 1.577.030,OOO 135,100 480,956.000
1.46 1.46 1.44 1.41 1.37 1 0 7 0.98 0.94 0.64
10.77
Total for Household Durables
Machinery Mitsubishi Heavy Industries Kurita Water Industries Daifuku Amada Minebea Tsubakimoto Chain Fuji Machine Manufacturing Fujitec
Total for Machinery
4,327,000 635,200 841,000
1,197,000 1,660,000 1,857,000
234,100 353,000
~-
2,340,907,000 1,632,464,000 1,588,649.000 1,509,417,000 1.381,120,000 1,309,185.000
537,259,500 321,936.000
3.10 1.74 1.51 1.45 1 4 2 0.43
9.65
-. -
2.10 1.47 1.43 1.36 1.24 1.18 0.48 0.29
9.55
Electronic Equipment & Instruments
TDK 23 1,800 2,192,828,000 1.97 Hitachi 2,754,000 2,043.468.000 1.84 Ryosan 339,600 1.010.310.000 0.91
Total for Electronic Equipment & Instruments 6.71
Kyocera 197.600 2,217,072,000 1 99
- ~- .~ ~
Office Electronics Canon 567,800 3,804,260,000 3 42 Ricoh 1.181,OOO 2.869.830.000 2.58
Total for M f c e Electronics 6.00
. .~ --
Pharmaceutlcals Astellas Pharma 386,200 2.089.342.000 1.88 Daiichi Sanhyo 549,100 2,042,652,000 1.84 Ono Pharmaceutical 248,300 1.559.324.000 1.40
Total for Pharmaceuticals 5.12 . -. .~
Please ,der to the full prospectus tor the Funds Investment objective and policy

53 Morgan Stanley SICAV 31 December 2006
Japanese Value Equity Fund
STATEMENT OF INVESTMENTS (continued) ‘liansferablc securities and money nurker instruments admitted to official exchange listing or dealt in o n another regulated rnarket. As at 31 Dcccmher 2006, expressed in Japanese Yen.
Market % of net Invest m e n t Holding value assets
Computers & Peripherals FuIitSu 2,954,000 2,759,036.000 2.49 NEC 4,016,000 2,285,104.000 2.05
4.54
-. -. --
.-
Total for Computers & Peripherals
Computer Storage & Peripherals Toshiba 4017 000 3,113,175,000 2 80 Mitcurni Electric 632,600 1,657,412,000 1 4 9 -- - -. Total for Computer Storage & Peripherals
Trading Companies B Otstributors Mitwbishi 1,130 700 Hitachi High-lechnologies 248,100 N a g m & Company 570.000
Total for Trading Companies & Dlstributors
- - .~
Building Products Daikin Industries 487,000 Sanna Shutter 1,463,000 Nippoti Sheet Glass 1,513.000
Total for Building Products
-- ~
Home Entertainment Software Ninteiido 120.400
4.29
2,532,768,000 2.27 878,274,000 0.79 808.260,OOO 0.73
3.79
2,016,180.000 1.81 1,029,952.000 0 93
844,254.000 0.76
3.50
-- .-
3,720.360,OOO 3.35 - - - -~
Total for Home Entertainment Software 3.35
Leisure Equipment & Products FUAFILM Holdings 390,400 1,909,056,000 1 7 1 Yamaha 563,400 1 419,768,000 1.28
Total for Leisure Equipment & Products 2.99
Construction & Engineering Obayashi 2.069.000 1,591,268,000 1 4 3 Kyuderiko 636.000 445.200.000 0.40 Maeda Road Construction 501.000 432,363,000 0.39 Sanki Engineering 382,000 320,116,000 0.29
Total far Constructlon & Engineering 2.51
.~ . . -
Commercial Services & Supplies Dai Nippori Printing 900,000 1 654.200 000 1 4 9 Nissha Frinting 121,500 445 905,000 0 40
Total for Commercial Services & Supplies 1.89
- .~ ~
Electrical Equipment Furukawa Electric 2.448.000 1,831,104,000 1 6 5
Total for Electrical Equipment 1.65
.~ -
Market 96 of net Holding value assets Investment
Road & Rail - - - - ~
East Japan Railway 1785 1,419,075,000 1 2 8 - - ~~~ ~ - Total for Road B Rall 1.28
Food & Staples Retailing FamilyMart 436.800 1,415.232.000 1 2 7
Total for Food & Staples Aetalllng 1.27
-~
Consumer Finance 601,900 1,366.313.000 1.23 Hitachi Capital
Total for Consumer Finance 1.23
.~ - -~ -
Diversified Telecommunication Services Nippon Telegraph & Telephone 2,133 1.249.938.000 1 1 2
Total for Diversified Telecommunicatlon Services 1.12
Metals & Mining Mitsui Mining &Smelting 1,938 000 1 155,048.000 1 04
Total for Metals & Mining 1.04
-_ ~ ~ ~-
Electric Utilities Tokyo Electric Power 281.600 1084,160,000 0.97
Total for Electric Utilities 0.97 .- . -.
Food Products Nippon Meat Packers 830,000 1,079,000,000 0.97
Total for Food Products 0.97
- ~.
Textiles, Apparel & Luxury Goods Nisshiribo Industries 824 000 1,015.992.000 0 91
0.91
.~ -- ~
Total for Textiles, Apparel & Luxury Goods
Steel 1 477 000 1 310 268,000 0 91 Nippon Steel
Total for Steel 0.91
-. ~. --
Media Toho 298,300 641,345,000 0 58
Total for Media 0.58
-. ~ -- ~-
Agricultural Products House Foods 222 000 435 564,000 0 39
Total for Agrlcultural Pmducts 0.39
Total Investment Securities 110,493,184.000 99.36
Total NAV 11 1.200.9O4,825 100.00
- ~- .~ .~
-~~
-. ~ .~ . -~
.~ ~. - ~
Semiconductors & Semiconductor Equipment Rohm 140 200 1,661,370,000 1 49
.~ . ...
Total for Semiconductors & Semiconductor Equipment 1.49
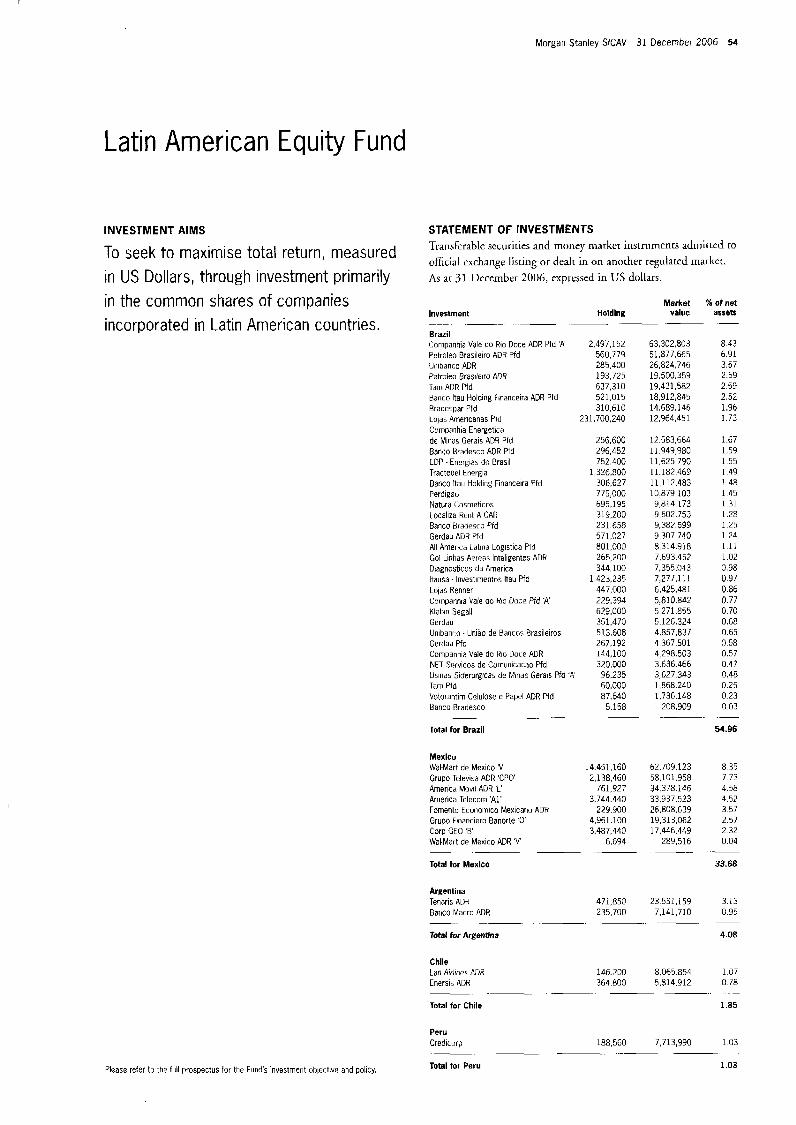
Morgan Stanley SlCAV 31 December 2006 54
Latin American Equity Fund
INVESTMENT AIMS
To seek to maximise total return, measured in US Dollars, through investment primarily in the common shares of companies incorporated in Latin American countries.
Please refer to the full prospectus lor the Funds investmerit objective and policy.
STATEMENT OF INVESTMENTS Transfcrable securities and money rnarkcr instrumcnrs admitted to official cxchangc listing 01- dealt in on another regulated markci. As ar 31 Ikcember 2006, expressed in US dollars.
~. Investment Holding value -__ -- - ~
Brazil Companhia Vale do Rio Doce ADR Pfd 'A' Pctroleo Brasileiro ADR Pid Unibanco ADR Petroleo Brasdeiro ADR Tam ADR Pfd Banco ltau Holdlng Flnanceira ADR Pfd Bradespar Pfd Lolas Ainericanas Pfd Conipanhla Energetica dc Minas Gerais ADR Pfd Banco Bradesco ADR Pfd tDP - Energias do Brasil Tractebel Energia Banco ltau Holding Flnanceira Pfd Perdigao Natura (:osmeticos Localiza Rent A CAR Banco flradesco f f d Gerdau ADR Pfd All America Latiila Logistica Pfd Go1 Linhas Aereas lnteligentes ADA Diagnosticas da America ltausa - lnvestimentos ltau Pfd Lolas Henner Coillpatlhld Vale do Rio Doce R d 'A Klablii Seeall Gerdau Unibanr;o - Uniao de Bancos Erasileiros Gerdau Pfd Companhia Vale do Rio Doce AUH NET Servicos dc Cumunicacao Pfd Usinas Siderurgicas de Minas Gera~s Pfd 'A' Tarn Ptd Votorantim Celulose e Papel ADR Pfd Banco Bradesco
2.497.152 560,779 285.400 193,725 637,310 521,015 310,610
!31.700.240
256,600 296,452 752,400
1,326,800 306,627 175,000 695,195 319,200 231.658 571,027 801,000 265,200 344,100
1,423,235 447.000 229,394 629.000 351,470 513,608 267.192 144,100 320.000
96.235 60,000 87.640
5.158
63,302303 51,877,665 26,824,746 19,500,359 19,431,582 18.912,845 14,689,146 12,964,451
12.583.664 11,949,980 11,625,790 1 1.182.469 11,112,483 10.879,103 9,814.173 9.602.753 9.381.599 9.307.740 8.314.918 7.693.452 7.355.043 7,277,111 6.425.481 5,810,842 5,271,855 5.126.324
4.367.501 4.298.503 3536.466 3,627.343 1,868,240 1.736.148
208.909
4,857,837
Market % of net assets .~
8.43 6.91 3.57 2.59 2 59 2.52 1.96 1.73
1.67 1.59 1.55 1.49 1.48 1.45 1.31 1.28 1.25 1.24 1.11 1.02 0.98 0.97 0.86 0.77 0.70 0.68 0.65 0.58 0.57 0.47 0.48 0.25 0 23 0.03
~ ~~- Total for Brazil
Mexico Wal-Mart de Mexico 'V Grupo Televiba ADR 'CPO AmeriCd Movil ADR 'I' America Telecom A l ' Foment0 Economico MexicanL Grupo Flnanciero Banorte '0' Corp GEO 'B' Wal Mart de Mexico ADR 'V
Total for Mexlco
~
14,451,160 2,138,460
761,927 3,744.440
i ADR 229.900 4.961.100
6,694 3,487,440
62.709.123 58,101.958 34.378.146 33.937.523 26,808.639 19,313,062 17,446,449
289,516
Argentina Tenaris ADR 471,850 23 531,159 Bdrico Macro ADR 235,700 7,141,710
Total for Argentma
- --
Chile
Cnersis ADR Ldn Airlines ADR 146.200 8,065,854
364,800 5.814.912
54.96
8.35 7.73 4.58 4.52 3.57 2.57 2 32 0.04
33.68 -~
3.13 0.95
4.08
1.07 0.78
-- -. ~. - -
Total for Chile 1.85
Peru Crediwrp 188,560 7,713,990 1 03
Total for Peru 1.03
- ~ -- -- ~
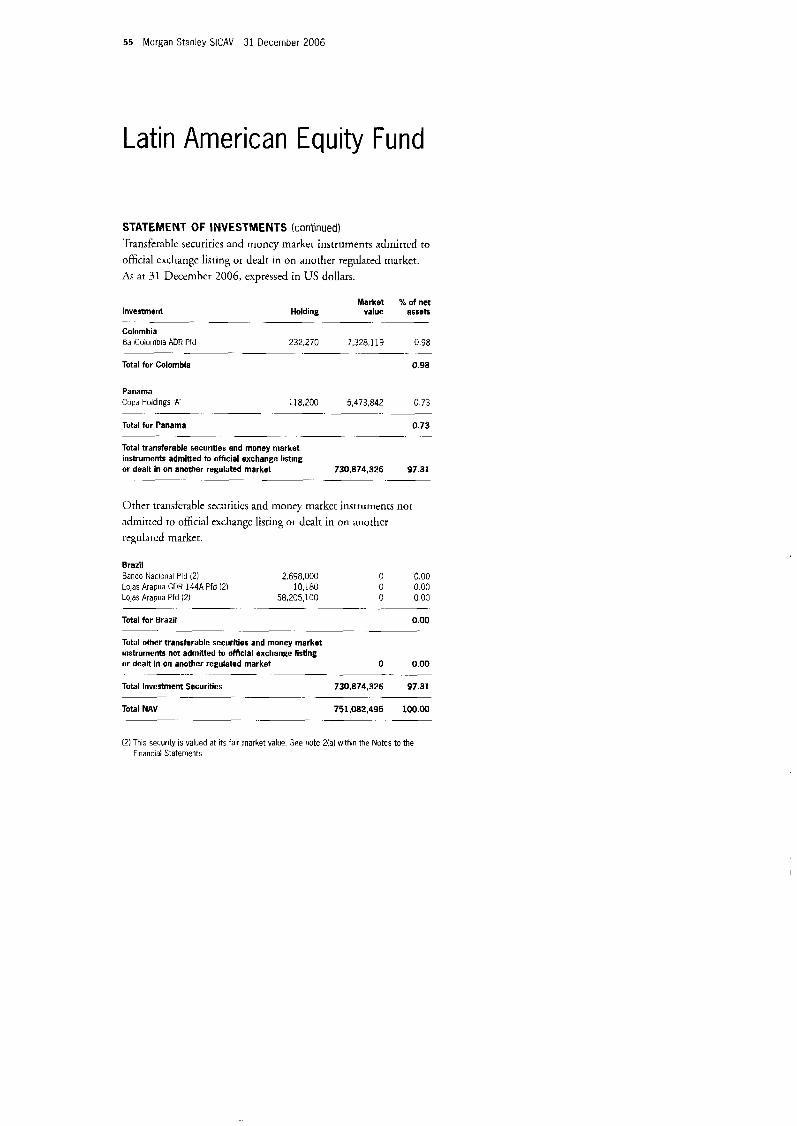
55 Morgan Stanley SICAV 31 December 2006
Latin American Equity Fund
STATEMENT OF INVESTMENTS (continued) 'liansferahlc securities and money market instruments adinirtcd to official cxchange listing or deal[ in on another regulated tnarket. As at 31 Decemhcr 2006, expressed in US dollars.
Market % of net Investment Holding value assets
Colombia BarColombia ADR Pfd 232,270 7,328,113 0.98
Total for Colombia 0.98
.~ -.
. -
Panama Copd Holdings A 118,200 5,473,842 0 73
Total for Panama 0.73
Total transferable securities and money market insiruments admitted to official exchange listing
- -. ~ .~ --
or dealt in on anorher regulated market 73o,a74,326 97.31 -- - ~ ~
Other transfcrable securitics and nioney market instruments no[ adniitrcd to official exchange listing or dealt in on another regulatcd market.
Brazil Banco Nariorial Pfd (2) 2 698,000 0 0.00 Lolas Arapua GDR 144A Pfd ( 2 ) 10,180 0 0 0 0 Lola5 Arapiia Pfd (2) 58,205,100 0 0 0 0
Total for Brazll 0.00
Total other transferable securlties and money market instruments not admitted to official exchange listing
~. . .~
~- . -~
or dealt In on another regulated market 0 0.00
Total Investment Securities 730,874,326 97.31 . -- --
~
Total NAV 751,082,495 100.00 ~. -~ ~
(2) This security is valued at its fair market value. See note 2(a) within the Notes to the Fnancial Statements
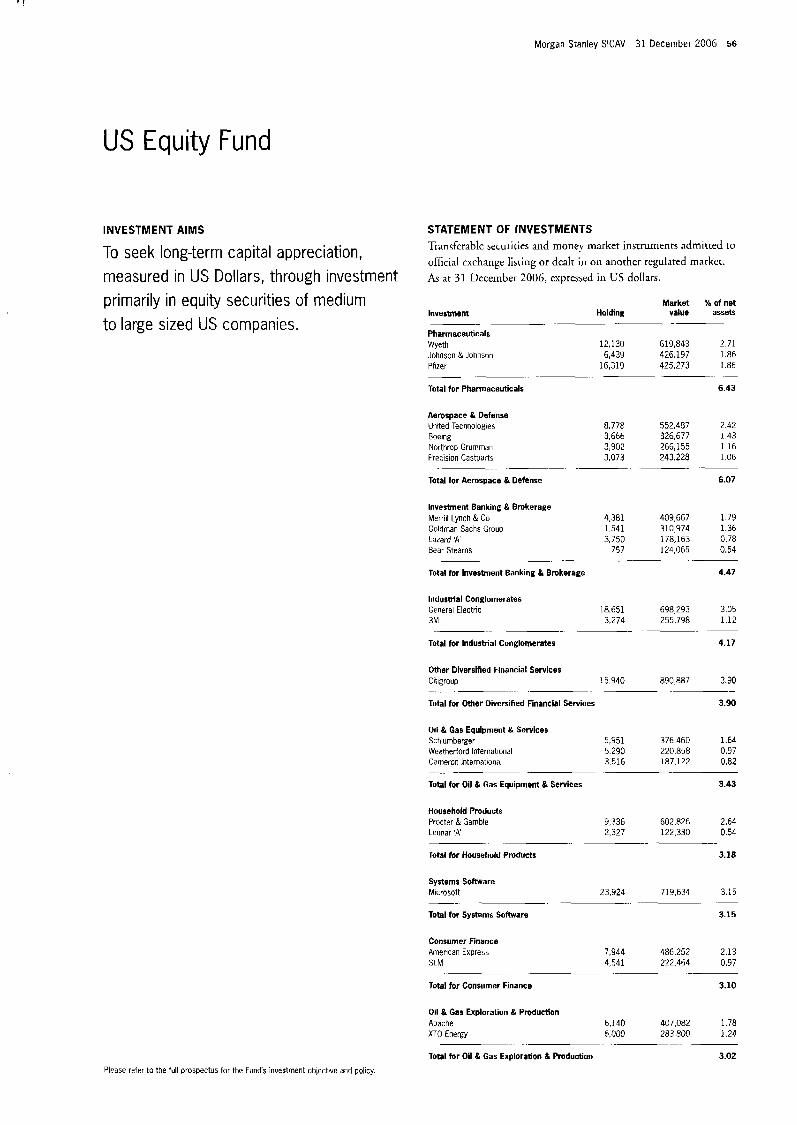
1' !
Morgan Stanley SICAV 31 December 2006 56
US Equity Fund
INVESTMENT AIMS STATEMENT OF INVESTMENTS Trandcrable securities and money market instruments acimirred to official cxchange listing or dealt in on another regulated markcr. To seek long-term capital appreciation,
measured in us Dollars, through investment ,4s at 31 December 2006, expressed in US dollars.
Market % of net Holding value assets
primarily in equity securities of medium Investment
Pharmaceuticals Wyeth 12,130 619,843 2 71 Johnson &Johnson 6,439 426,197 1 86 Pfizer 16,319 425,273 1.86
Total for Pharmaceuticals 6.43
~- ~. to large sized US companies.
- _ _ ~
Aerospace & Defense United Technologies 8.778 552.487 2.42
Northrop Grurnrnan 3,902 266,155 1 1 6 Precision Castparts 3.073 243 228 1 06
Total for Aerospace & Defense 6.07
Boeing 3,666 326,677 1. 43
. . .~ -
Investment Banking & Brokerage
Goldman Sachs Group 1.541 310,974 1 36 Lazard 'A 3.750 178,163 0.78 Bear Stearns 757 124,065 0.54
Total for Investment Banking & Brokerage 4.47
Merrill Lynch & Co 4,381 409,667 1 7 9
- ~
Industrial Conglomerates General Electric 18.651 698,293 3.05 3M 3.274 255.798 1.12
Total for Indusirial Conglomerates 4.17
. .- .. . - .
Other Diversified Flnancial Services Citigroup 15.940 890,887 3.90
Total for Other Diversified Financial Services 3.90
.. -. . -
Oil & Gas Equipment & Services Schlurnberger 5,951 376,460 1 64 Weatherford International 5.290 220,858 0.97 Cameron International 3.516 187,122 0 82
Total for Oil & Gas Equipment & Services 3.43 - .. . . -
Household Products Procter & Gamble 9,336 602,826 2.64 Lennar 'A' 2,327 122,330 0.54
Total for Household Products 3.18
-. - ... . -_
Systems Software Microsott 23.924 719,634 3.15
Total for Systems Software 3.15
. .~ -_
Consumer Finance Ameriran Express 7,944 486,252 2.13 SLM 4,541 222,464 0.97
Total for Consumer Finance 3.10
.. . .- .
Oil & Gas Exploration & Production Apache 6.140 407,082 1 7 8 XTO Energy 6.000 283.800 1.24
Total for Oil & Gas Exploration & Production 3.02 . . - .~
Please refer to the tull prospectus for the Fund's irwestment objective and pol~cy.
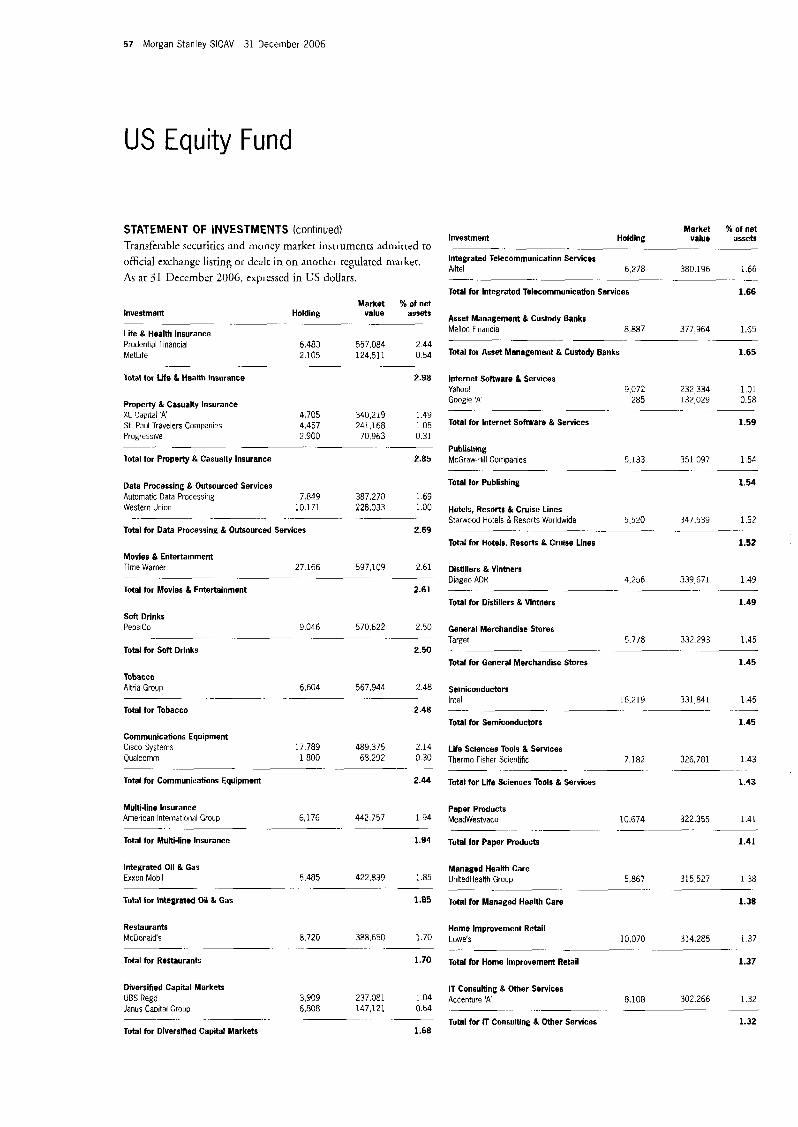
57 Morgan Stanley SICAV 31 December 2006
US Equity Fund
Market % of net Investment Holding value assets
Transferable wcurities and monev market instrumencs admitted to .~ ~- ~- - STATEMENT OF INVESTMENTS (continued)
official exchangc listing or dcalt in on aiiochcr regulated market. Integrated Telecommunication Ailtel 6,278 380,196 1.66
As at 31 Deccrnber 2006, expressd in US dollars. . . ~
1.66 Total for Integrated Telecommunicatlon Services
Asset Management & Custody Banks Mellon Financial 8 887 377 964 1.65
Market % o f net Investment H o I d I n g value assets
Life & Health Insurance Prudential Financial 6 483 557084 244 MetLife 2,105 124 511 0 54 Total for Asset Management & Custody Banks
~ ~. .~ ~ -~
- 1.65
Total tor Life & Health Insurance
Pmperry & Casualty Insurance XC Cdpital 'A' 4,705 340,219 1.49 St Paul Travelers Companies 4,457 241,168 105 Progressive 2,900 70,963 0.31
Total for Property & Casualty Insurance 2.85
~. .
Data Processing & Outsourced Services Automatic Data Processing 7.849 387.270 1 69 Western Union 10,171 228,033 1 .00
Total for Data Processing & Outsourced Services 2.69
. ~ . . . . . . .
2.98 internet Software & Services Yahoo' Google A 285 132,029 0 58
Total for Internet Software & Services 1.59
- -~ ~. ~
Movies & Entertainment Time Warner 27 166 597109 261
Total for Movies 8 Entertainment 2.61
- - --
Soft Drinks PepsiCo 9,046 570 622 2.50
Total for Soft Drinks 2.50 - -- ~
Tobacco A h a Group 6.604 567.944 2 4 8
Total for Tobacco 2.48 -~ ..
Communications Equipment Cisco Systems 17,789 489.375 2.14 Qualcomm 1,800 68,292 0 3 0
Total for Communications Equipment 2.44
~. . - . - -
9.072 232,334 1.01
Publishing McGraw-HIII Companies 5,133 351,097 1.54
Total for Publishing 1.54 .~
Hotels. Resorts & Cruise Lines Starwood Hotels & Resorts Worldwide 5,520 347.539 1 5 2
Total for Hotels. Resorts & Crulse Lines 1.52
~
Distillers & Vintners Diageo ADR 4,256 339,671 1.49
Total tor Distillers & Vintners 1.49
. ..
General Merchandise Stores Target 5.778 332,293 1.45
Total for General Merchandise Stores 1.45
. . . . . . - -
Semiconductors Intel 16,219 331,841 1.45
Total for Semiconductors 1.45 .. - - ...... -
Life Sciences Tools & Services Therrno Fisher Scientific 7,182 326,781 1 43
Total for Llfe Sciences Tools & Services 1.43
- . - .
Paper Products Multl-line Insurance American lnternatlondl Group 6.176 442.757 1 94 MeadWestvaco 10.674 322.355 1.41
Total for Multi-line Insurance 1.94 Total for Paper Products 1.41 . . - . - .-
Integrated Oil & Gas Managed Health Care Exxon Mobil 5,485 422,839 1 85 UnitedHealth Group 5,867 315,527 1 38
- - .. _-. - - -. - Total for Integrated Oil & Gas 1.85 Total for Managed Health Care 1.38
Restaurants Home Improvement Retail McDonald's 8.720 388.650 1.70 Lowe's 10,070 314.285 1.37
Total for Restaurants 1.70 Total for Home Improvement Retail 1.37
. . - ...... -- .- -. .
Diversified Capital Markets UBS Regd 3,909 237.081 1.04 Accenture 'A' 8.108 302,266 1.32
1.32
IT Consulting & Other Services
Janus Capital Croup 6,808 147,121 0.64 . . . . . . . . . . . -. .. ... . . . Total for IT Consultlng & Other Services .-
Total for Diverslfied Capital Markets 1.68
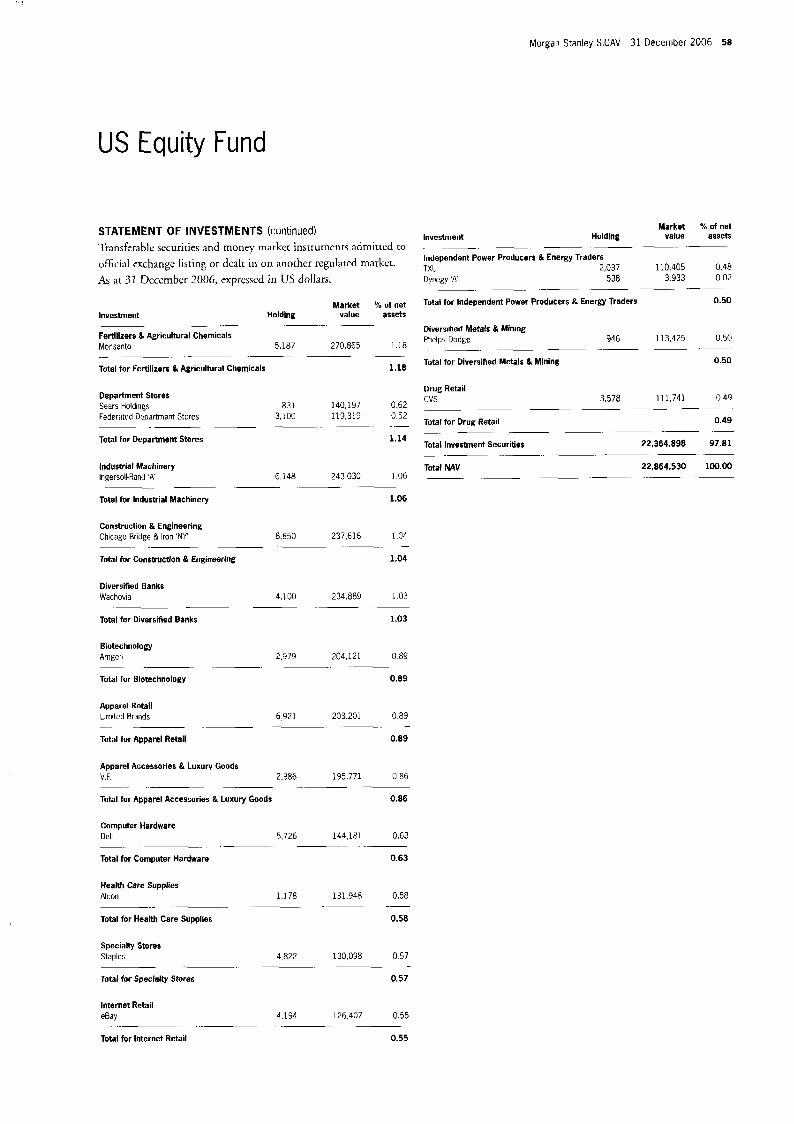
Morgan Stanley SICAV 31 December 2006 58
US Equity Fund
STATEMENT OF INVESTMENTS (continued) ‘Itansferable sccuriries and tnoney m:irker insrrumcnrs admitted co official exchangc listing or dcalr in on another regulated markct. As a t 31 December 2006, expressed in US dollars.
Investment Market % of net
H o I d i n g value assets ~ ~. -
Fertilizers & Agricultural Chemicals Monsanto 5.187 270,865 1 1 8
1.18 .. .~ ~ -. ~~
Total for Fertilizers & Agricultural Chemicals
Department Stores Sears Holdings 831 140,197 0 62 Federdted ilepartment Stures 3,100 119,315 0 52
Total for Department Stores 1.14
~ -- -
Industrial Machinery lngersoll Rand A 6 148 243 030 106
Total for Industrial Machinery 1.06 .~ ~ ~ -- -
Construction & Engineering Chlcago Bridge & Iron ‘NY’ 8.650 237,616 1 04
Total for Construction & Engineering 1.04 ~- .~ ~. ~ -
Diversified Banks Wachovia 4 100 234.889 1 0 3
~ .~ ~ ~
Total for Oiversified Banks 1.03
Biotechnology Arngeri 2,979 704,12 1 0 89
Total for Biotechnology 0.89 ~ ~ ~ -
Apparel Retail LlrnltPd Brands 6 921 203 201 0 89
Total for Apparel Retail 0.89
__ .~ -. -
Apparel Accessories & Luxury Goods V.F. 2,386 195,771 0.86
Total for Apparel Accessories & Luxury Goods 0.86
Computer Hardware Dell 5,726 144.181 0.63
Total for Computer Hardware 0.63 .~ ~. .~
Health Care Supplies Alcon 1.178 131.948 0.58
Total for Health Care Supplies 0.58
Specialty Stores Staples 4 822 130.098 0 57
Total for Specialty Stores 0.57
~ -
Internet Retail ?Bay 4.194 126,407 0 55
. . ~
Total for Internet Retail 0.55
Market % of net Investment Holdlng value assets
Independent Power Producers & Energy Traders TXU 2,037 110405 0 4 8 Dynegy A 538 3933 0 0 2 - -
Total for Independent Power Producers & Energy Traders 0.50
Diversified Metals & Mining Phelps Dodge 946 113,425 0.50
Total for Diversified Metals & Mlning 0.50
Drug Retail cvs 3.578 111,741 0 49
Total for Drug Retail 0.49
Total Investment Securities 22,364.898 97.81
Total NAV 22,864,530 100.00 ~ - --
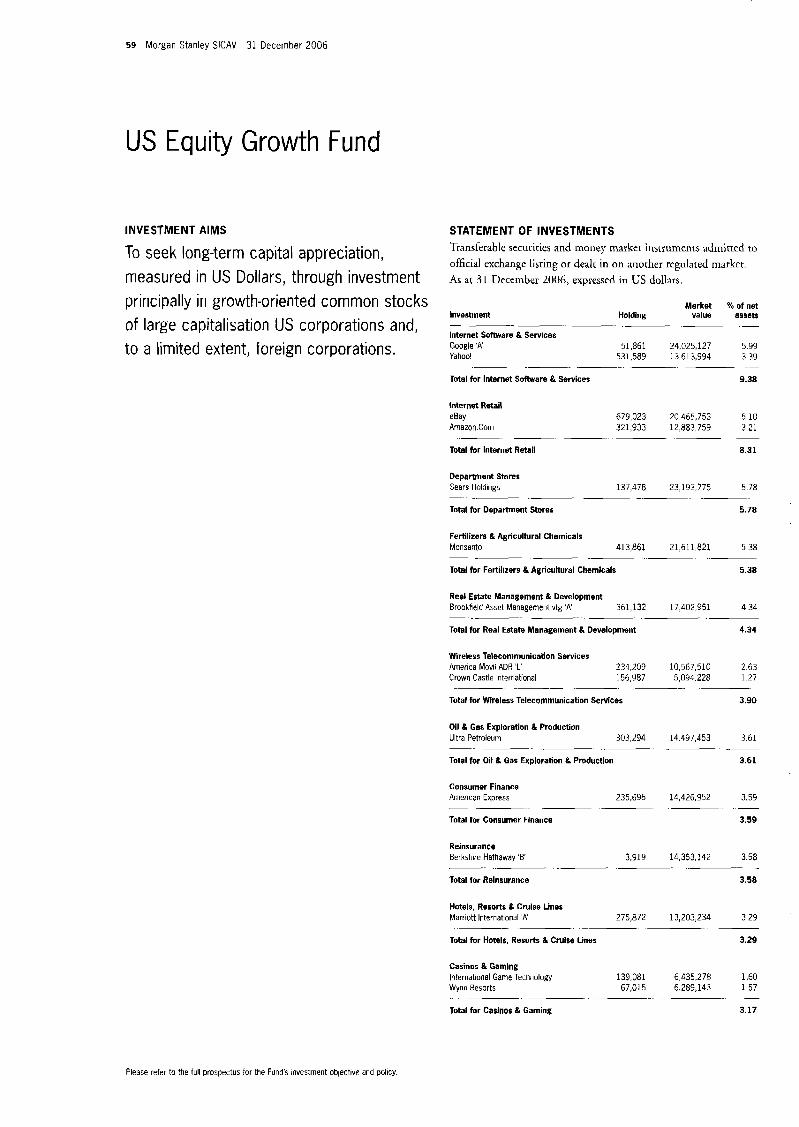
59 Morgan Stanley SlCAV 31 December 2006
US Equity Growth Fund
INVESTMENT AIMS
To seek long-term capital appreciation, measured in US Dollars, through investment principally in growth-oriented common stocks of to
large capitalisation US corporations and, a limited extent, foreign corporations.
STATEMENT OF INVESTMENTS 'Transferable securicics and money market instrunienrs admitted to officisl exchange lihting or dealt in on another regulated marltct. As at 31 Decrrnher 2006, expressed in C'S dollars.
Market % of net Investment Holdlng value assets
Internet Software R Services Google 'A' 51,861 24,025,127 5 99 Yahoo' 531.589 13 613,994 3 39
Total for Internet Software & Services 9.38
-
- ~ ~. ~ -
Internet Retail eBay 679,023 20,465,753 5.10 Amazon.Com 321,933 12,883,759 3 21
Total for Internet Retail 8.31
-- -- .- ~. ~ ~
Department Stores Sears Holdings 137,478 23,193.775 5 78 -- .~ ~. ~.
Total for Department Stores 5.78
Fertilizers & Agricultural Chemicals Monsanto 413,861 21,611 821 5 38
Total for Fertilizers & Agricultural Chemicals 5.38
~ --
Real Estate Management & Development Brookheld Asset Management vtg 'A 361,132 17,402.951 4 34
Total for Real Estate Management & Development
~ ~ -
4.34
Wireless Telecommunication Services America Movil ADR 'L' 234,209 10,567,510 2 63 Crown Castle Intemational 156,987 5,094 228 1 2 7
Total for Wireless Telecommunication Services 3.90
-~
Oil & Gas Exploration & Production Ultra Petroleum 303,294 14 497,453 3 61
Total for Oil & Gas Exploration & Production 3.61
-- ~- ~
Consumer Finance American Express 235,696 14,426,952 3.55
Total for Consumer Finance 3.59
- . . ~. ~
Reinsurance Berkshire Hathaway ' B 3,919 14,353,142 3 58
Total for Reinsurance 3.58
-
Hotels. Resorts R Crulse Lines Marriott International 'A 275,872 13,203,234 3 29
Total for Hotels. Resorts & Crulse Lines 3.29
~- -~ -~
Casinos & Gaming International Game Technology 139,081 6,435,278 1.60 Wynn Resorts 67,015 6 289,143 1 5 7
____-. ~. .-
Total for Casinos & Gaming 3.17
Please refer to the full prospectus for the Fund's investment objectwe and policy.
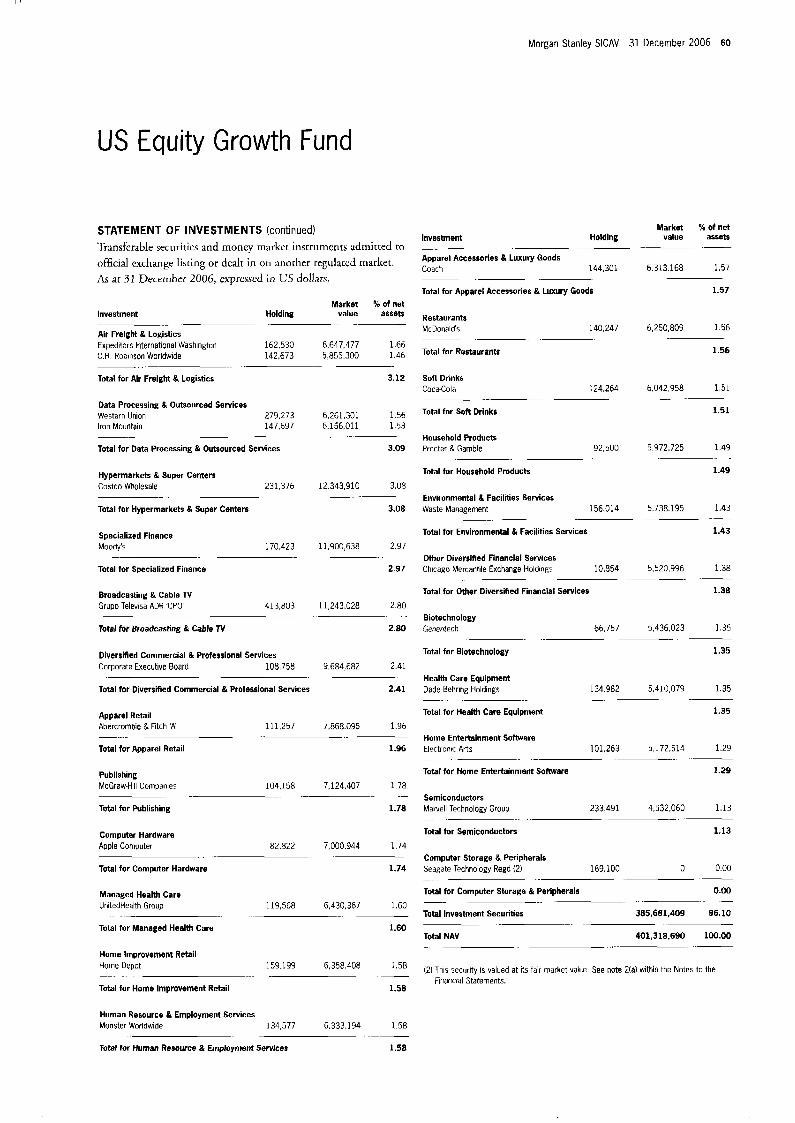
I '
Morgan Stanley SlCAV 31 December 2006 60
US Equity Growth Fund
Inveslment - .
STATEMENT OF INVESTMENTS (continued) 'liansferable securitics and monev msrkct inscrumenn admirted to
Market % o f net Holding value assets
. -
official exchange listing or dealt in o n anorher regulated market. Apparel Coach Accessories ' Goods 144,301 6.313.168 1.57
1.57 at 31 Decerntier 2006, exprrsscd in US dollars. ~
Total for Apparel Accessories & Luxury Goods Market % of net
value assets Restaurants Investment Holding
Alr Freight & Logistics Expeditors International Washington 162,530 6,647,477 1.66 C.H. Robinson Worldwide 142,673 5,855.300
140,247 6,250,809 1.56
1.56
.. . .. - McDonald's
~
.46 Total for Restaurants - .__ . . -- -
Total for Air Frelght & Logistics 3.12 Soft Drlnks CocaCola 124,264 6,042,958 1.51
Data Processing & Outsourced Services Western Union 279.273 6.261.301 1 56 Iron Mountain 147,697 6,156,011 1 5 3
Total for Data Processing & Outsourced Services 3.09
. . ..
Hypermarkets & Super Centers Costco Wholesale 231,376 12.343.91C 3.08
. . . .. . -
Total for Hypermarkets & Super Centers 3.08
Specialized Finance Moody's 170,423 11,900,638 2 97
.. . .-
Total for Specialized Finance 2 97
Broadcasting & Cable TV Grupo Televisa ADR 'CPO 413,803 11,243,028 2 80
Total for Broadcasting & Cable TV 2.80
Diversified Commercial & Professional Services Corporate Executive Board 108,758 9.684.682 2 41
Total for Diversified Commercial & Professional Services 2.41
Apparel Retail Abercrombie & Fltch 'A' 111.257 7,868.095 1.96 - .... . .. . .~
Total tor Apparel Retail 1.96
Publlshing McGraw-H II Companies 104,158 7,124,407 1 7 8
Total for Publishing 1.78
. - -. - . .-
Computer Hardware Apple Computer 82.822 7,000.944 1 74
Total for Computer Hardware 1.74
Managed Health Care UnitedHealth Group 119,568 6,430,367 1.60
Total for Managed Health Care 1.60 _.
Home Improvement Retail
. ~. ~ ~-
Total for Soft Drinks 1.51
Household Products Procter & Gamble 92,500 5.972.725 1 49
Total for Household Products 1.49
- -.
Environmental & Facilities Services Waste Management 156,014 5.738.195 1.43
Total for Environmental & Facilities Services 1.43
. . - . -
Other Diversified Financial Services Chicago Mercantile Exchange Holdings 10,854 5,520,996 1 38
Total for Other Diversified Financlal Services 1.38 - - - . --
Biotechnology Genentech 66,757 5,436,023 1.35
Total for Biotechnology 1.35 ~
Health Care Equipment Dade Behring Holdings 134 982 5,410,079 1.35
Total for Health Care Equipment 1.35 .. ~ - .
Home Entertainment Software Electronic Arts 101,263 5,172.514 1.29
Total for Home Entertainment Software 1.29 .. - .. -- -
Semiconductors Marvel1 Technology Group 233,491 4,532,060 1.13
Total for Semiconductors 1.13
. . .~ --
Computer Storage & Peripherals Seagate Technology Regd (2) 169,100 0 000
0.00
Total Investment Securities 385,661,409 96.10
Total NAV 401,318.690 100.00
- - -.
Total for Computer Storage & Peripherals -.
-
-
159.199 6.358.408 1.58
1.58
(2) This security is valued at its fair market value. See note Z(a) within the Notes to the Home Depot - .. . ... __
Flnanclal Statements. Total for Home Improvement Retail
Human Resource & Employment Services Monster Worldwide 134,577 6,333,194 1 58
Total for Human Resource €2 Employment Services 1.58
... --
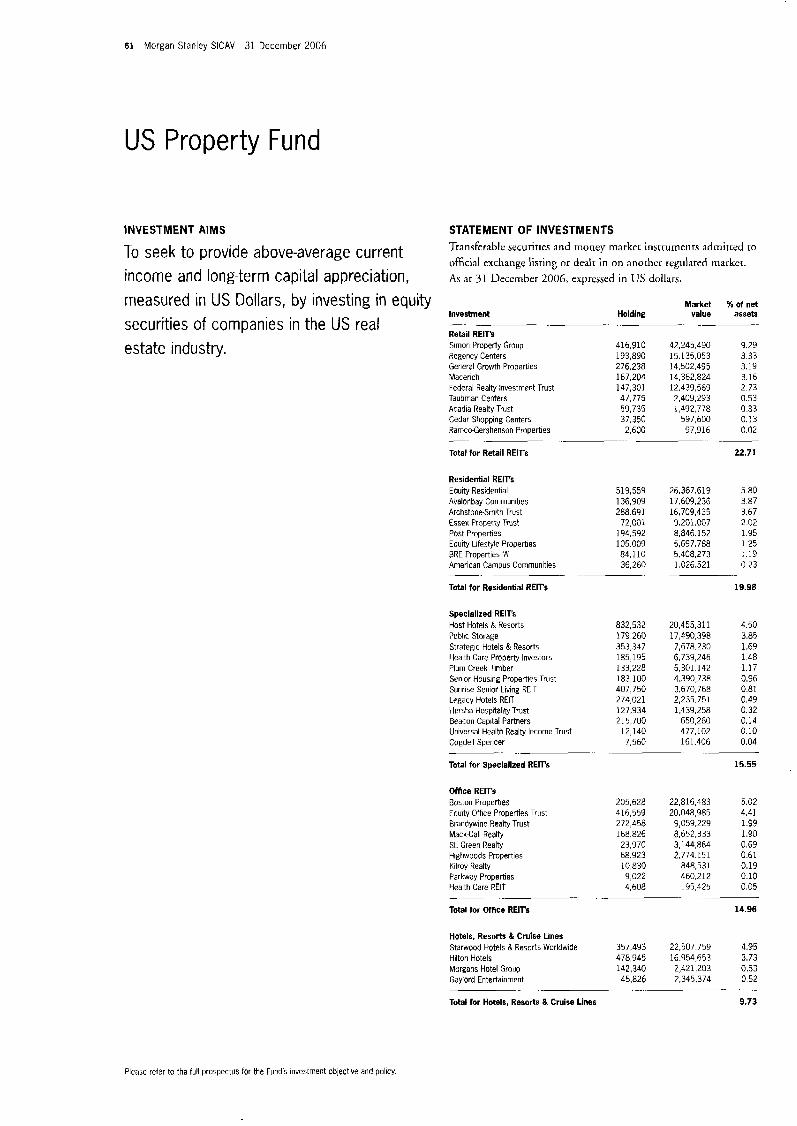
61 Morgan Stanley SlCAV 31 December 2006
US Property Fund
INVESTMENT AIMS
To seek to provide above-average current income and long-term capital appreciation, measured in US Dollars, by investing in equity securities of companies in the US real estate industry.
STATEMENT OF INVESTMENTS Transferahlc securities and money market instruments admitted to official exchange listing or dealt in on anorhcr regulated markct. As at 31 Deccmber 2006, exprwed in US dollars.
Investment
Retail REIT's Simon Property Group Regency Centers General Growth Properties Mac e r i c h Federal Realty Investment Trust Taubman Centers Acadia Realty Trust Cedar Shopping Centers RarnceGershenson Properties
Holding . .~
416,910 193,890 276,238 167.204 147,301 47,775 59,735 37,350 2,600
Market value
--
42,245,490 15.135.053 14,502.495 14,362,824 12,433,569 2,409,293 1,492,778
597,600 97,916
96 ot net assets
9.29 3.33 3.19 3.16 2.73 0.53 0.33 0.13 0.02
Total for Retail RElT's
Residential REIT's Equity Residential Avalonbay Communities ArchstoneSmith Trust Essex Property Trust Post Properties Equity Lifestyle Properties ERE Properties 'A' American Campus Communities
Total for Residential RElfs
.. ..
Specialized REITs Host Hotels & Resorts Public Storage Strategic Hotels & Resorts Health Care Property Investors Plum Creek Timber Senior Housing Properties Trust Sunrise Senior Living RElT legacy Hotels RElT Hersha Hospitality Trust Beacon Capital Partners Universal Health Realty Income Trust Cogdell Spencer
Total for Specialized RElTs
~. .
Ofhce REIT'S Boston Properties Equity Office Properties Trust Brandpine Realty Trust MackCali Realty SL Green Realty Highwoods Properties Kilroy Realty Parkway Properties Health Care RElT
Total for Office RElTs
-
Hotels. Resorts L Cruise Lines Starwood Hotels & Resorts Worldwide Hilton Hotels Morgans Hotel GrQUR Gaylord Entertainment
519,559 136,909 288.691 72,001
194,592 105.009 84,110 36,260
22.71
26.367.619 5.80 17,609,236 3.87 16,709.435 3.67 9,201,007 2.02 8,846.152 1.95 5,697,788 1.25 5.408.273 1.19 1.026.521 0.23
19.98
832,532 179.260 353,347 185.195 133,228 183,100 407,750 274,021 127,934 2 15,700
12,140 7,560
4.50 20,455,311 17,490,398 3.85
7,678.230 1.69 6,739,246 1 4 8 5.301.142 1.17 4,390,738 0.96 3.670.768 0.81 2,235,751 0.49 1,439,258 0.32
650,260 0.14 477,102 0.10 161.406 0.04 - ..
15.55
205,628 416,559 272,458 168,826 23,970 68,923 10,830 9,022 4,608
22,816,483 20,048,985
9,059,229 8,652,333 3,144,864 2.774.151
848,531 460,212 195,425
-. . .. . -
5.02 4.41 1.99 1.90 0.69 0.61 0.19 0.10 0.05
14.96
357,493 22.507.759 4.95
142,340 2,421.203 0.53 45,826 2,345,374 0 52
478,945 16,954,653 3.73
. . -- . ... - Total for Hotels, Resorts & Cruise Lines 9.73
Please refer to the full prospectus for the Fund's investment objectlve and policy.
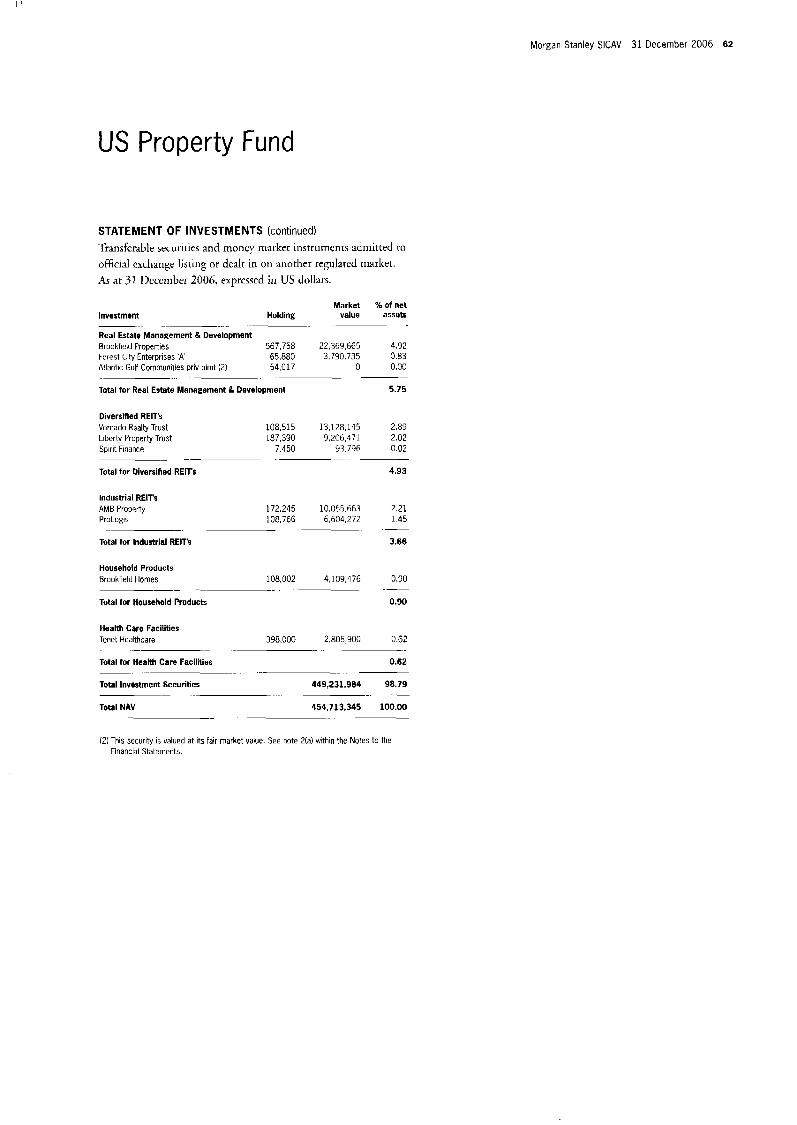
I '
Morgan Stanley SICAV 31 December 2006 62
US Property Fund
STATEMENT OF INVESTMENTS (continued) Iransferable securities and money marker instruments admitted to official exchange listing or dealt in or1 another regulated market. As at 31 I k c m b e r 2006, expressed in US dollars.
Investment Holding
Real Estate Management & Development Brookfield Properties 567,758 Forest City tnterprises A 65 880 Atlantic Gulf Communities priv plrnt (2) 54.C17
Total for Real Estate Management & Development
-.
Market Z of net value assets
22,369,665 4.92 3.790.735 0.83
0 0.00
5.75 ~
Diversified REIT's Vornado Realty Trust 108.515 13,128,145 2.89
Spirit Finance 7.450 93.796 0.02
Total for Diversified REITs 4.93
Liberty Property Trust 187,390 9,206,471 2.02
- --
Industrial REIT's AMB Property 172,245 10.055.663 2 21 ProLogis 108,766 6,604,272 1 4 5
Total for Industrial REIT's 3.66
__
Household Products Brookfield Homes 108,002 4,103,476 0.90
Total for Household Products 0.90
-. . - __
Health Care Facilities Tenet Healthcare 398,000 2,805,900 0 62
Total tor Health Care Facilities 0.62
Total Investment Securities 449,231.984 98.79
Total NAV 454,713,345 100.M1
-
~. -
- _ _
_.
(2) This security is valued at its fair market value. See note 2(a) within the Notes to the Financial Statements.
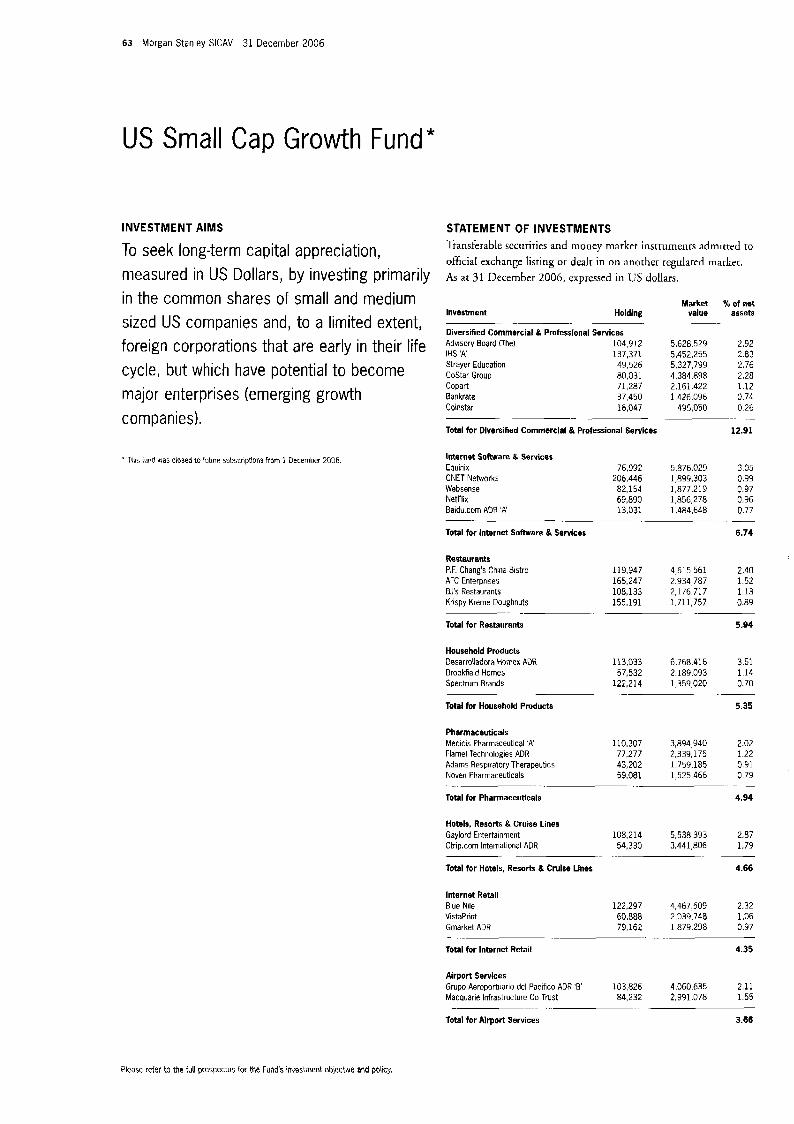
63 Morgan Stanley SICAV 31 December 2006
US Small Cap Growth Fund"
INVESTMENT AIMS
To seek long-term capital appreciation, measured in US Dollars, by investing primarily in the common shares of small and medium sized US companies and, to a limited extent, foreign corporations that are early in their life cycle, but which have potential to become major enterprises (emerging growth companies).
~ Thhr fund via5 closed to future subscrlotions from 1 December 2006.
STATEMENT OF INVESTMENTS Transferable wcurities and money market insrtiimencs admitted to
official exchange listing or dealt in on another regulared market. As at 31 IJccernber 2006, expressed in US dollars.
Investment Holding
Diversified Commercial & Pmfesslonal Services Advisory Board (The) 104,912 IHS 'A' 137,371 Strayer Education 49,526 Costar Group 80,031 Copart 71 287 Bankrate 37,450 Coinstar 16,047
Total for Dlversfied Cornmerclal & Professional Servlces
Market value
5,628,529 5.452.255 5,327,799 4,384,898 2.161.422 1.426.096
495,050
% of net assets
2.92 2.83 2.76 2.28 1.12 0.74 0.26
12.91
-. ...
Internet Software & Services Equinix 76,992 5,876,029 3 05 CNET Networks 206.446 1,899,303 0.99 Websense 82,154 1,877,219 0 97 NetFlix 69,890 1,856,278 0.96 Baidu corn ADR 'A' 13,031 1,484,648 0.77
Total far Internet Software & Services 6.74
~. -_
Restaurants P.F Chang's China Bistro 119,947 4,615.561 2.40 AFC Enterprlses 165,247 2,934,787 1 52 BJ's Restaurants 108,133 2.1 76.71 7 1 1 3 Krispy Kreme Doughnuts 155,191 1.711.757 0.89
Total for Restaurants 5.94
. .
Household Products Desarrolladora Homex ADR 113,033 6,768,416 3 51 Brookfield Homes 57,532 2.189.093 1 1 4 Spectrum Brands 122,214 1,359,020 0.70
Total for Household Products 5.35
- .-
Pharmaceuticals Medicis Pharmaceutical ' A 110,307 3,894,940 2.02 Flame1 Technologies ADR 77.277 2,339,175 1.22 Adam Respiratory Therapeutics 43,202 1.759.185 0.91 Noven Pharmaceuticals 59,081 1,525,466 0 79
Total for Pharmaceutlcals 4.94
.... .... ... - -. .
Hotels, Resorts & Cruise Lines Gaylord Entertainment 108,214 5,538,393 2.87
1.79 Ctrip.com International ADR
Total for Hotels, Resorts B Cruise Lines 4.66
54,330 3,441,806 -- .. - -
Internet Retail Blue Nile 122,297 4.467.509 2.32 Vistaprint 60,888 2,039,748 1.06 Gmarket ADR 79,162 1,879,298 0.97
Total for Internet Retail 4.35 - .. .... . . . . .
Airport Services Grupo Aeroportuario del Pacific0 ADR ' 0 103,826 4.060.635 2.11 Macquarie Infrastructure Co Trust 84,232 2,391,078 1.55
Total for Airport Services 3.66
.. - . . . -
Please refer to the full prospectus for the Funds investment objective and policy.
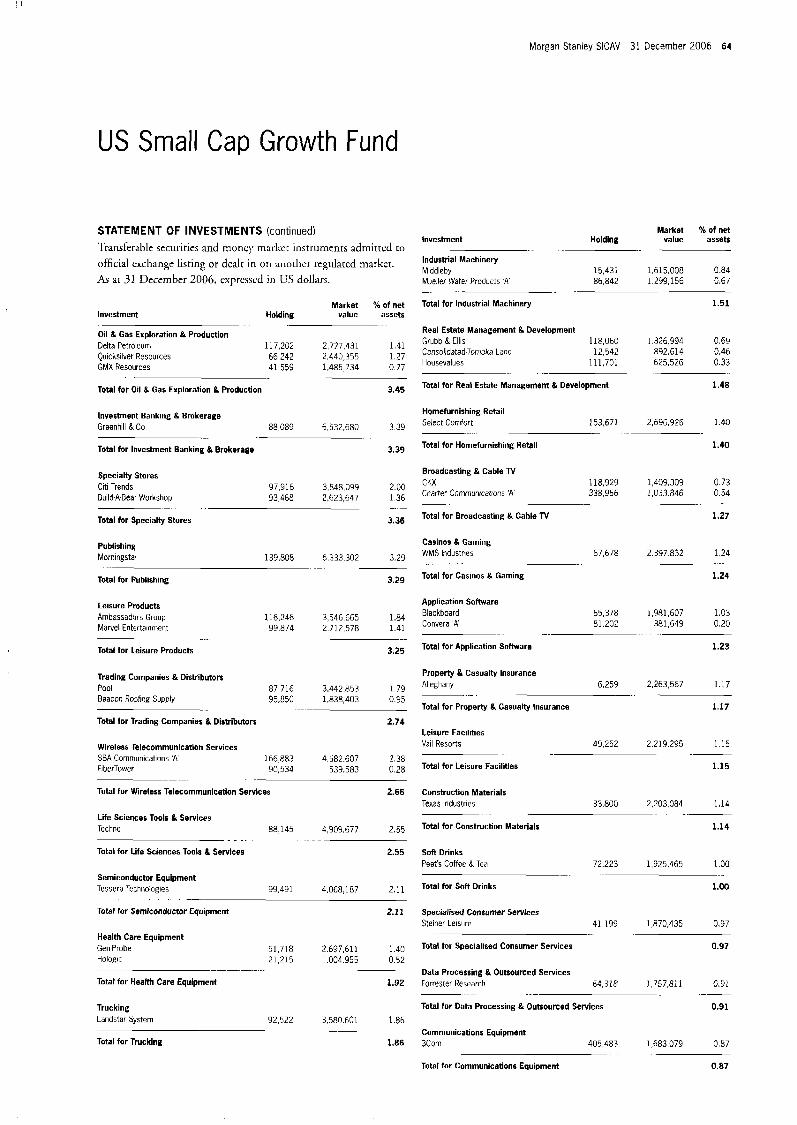
Morgan Stanley SICAV 31 December 2006 64
US Small Cap Growth Fund
STATEMENT OF INVESTMENTS (continued) 'Iiansf'erable securities and rnoncy markct instruments adrnittctl to official otchange listing or dealr in o n anothcr regtilaced market. As ar 31 December 2006, exprcsscd in US dollars.
Investment Market 96 of net
Holding value assets - . -. . .
Oil .% Gas Exploration & Production Delta Petroleum 117,202 2,777,431 1.41 Quicksilver Resources 66,242 2,440,355 1.27 GMX Resources 41.559 1.485.734 0.77
3.45 Total for 011 & Gas Exploration & Production
Investment Banking 8 Brokerage Greenhill & Co 88,089 6,532,680 3 39
Total for Investment Banking & Brokerage 3.39
Specially Stores Citi Trends 97,916 3,848,099 2 00 Build-A-Bear Workshop 93,468 2.623.647 1 36
Total for Specialty Stores 3.36
. .-
Publishing Morningstar 139.808 6 333.302 3.29
Total for Publishing 3.29
- .. . .
Leisure Products Ambassadors Group 116,246 3,546.665 1.84 Marvel Entertainment 99.874 2,712,578 1.41
Total for leisure Products 3.25
.
Trading Companies & Distributors Pool 87,716 3.442.853 1 79 Beacon Ro3fing Supply 95.850 1838,403 G.95
Total for Trading Companies & Distributors 2.74
. ... -.
Wlreless Telecommunication Services SBA Communications 'A 166,883 4.582.607 2.38 FlberTower 90,534 539.583 0.28
Total for Wireless Telecommunication Servlces 2.66
..... . ..
Life Sciences Tools & Services Techne 88 145 4,909,677 2.55
Total for Life Sciences Tools & Services 2.55 . .. . ..
Semiconductor Equipment Tessera Technologies 99 491 4.068.187 2.11
Total for Semiconductor Equipment 2.11
Health Care Equipment Gen-Probe 51,718 2.697.611 1 4 0 Hologic 21,215 1004.955 0 5 2
1.92
.
Total for Health Care Equipment
Trucking Landstar System 92,522 3.580.601 I .8h
Total for Trucking 1.86
Market % of net Investment Holcllng value assets
Industrial Machinery 15,431 1,615,008 0.84 Middleby 86,842 1,299,156 G.67 Mueller Water Products .A
Total tor lntlustrial Machinery 1.51
..
-. - .. .. -.
Real Estate Management & Development Grubb &El l is 118,060 1.326.994 0.69 Consolidated-Tomoka Land 12,542 892,614 0.46 Housevalues 111,701 625,526 0.33
Total for Real Estate Management & Development 1.48 .-
Homefurnishing Retail Select Currifort 153.671 2,696,926 1 40
Total for Homefurnishing Retail 1.40
.-. .. .
Broadcasting & Cable TV CKX 118,929 1,439,309 0 73 Charter Communications 'A 338.966 1,033 846 0 54 ~ ._ .- -
Total for Broadcasting & Cable TV 1.27
Casinos & Gaming WMS lndustrles 67 678 2.397 832 1 2 4
Total for Casinos & Gaming 1.24 . . . .-
Application Software Blackboard Convera 'X
65,378 1,981,607 1.03 81.202 381,649 0.20
.-.
Total for Application Software 1.23
Property & Casualty Insurance Allcghany 6,259 2,263,567 1.17
Total for Property & Casualty Insurance 1.17 ~ .-
Leisure Facilities VaiI Resorts 49,252 2.219.295 1 1 5
.-
Total for Leisure Facilitles 1.15
Construction Materials Texas Industries 33 800 2,203 084 1.14
Total for Construction Materials 1.14
...
Soft Drinks Pee:'s Coffee & Ted 72.223 1,925,465 1 00
Total for Soft Drinks 1.00
. ..
Specialised Consumer Services StPiner Leisure 41.199 1,870,435
Total tor Specialised Consumer Services
0.97
0.97 .-
Data Processing & Outsourced Services Forrester Resrarch 64.318 1,757811 G 91
Total for Data Processing & Outsourced Services 0.31 ~ ... . - .-
Communications Equipment 3Com 405,483 1,683.379 0.87
-. .
Total for Communications Equipment 0.87
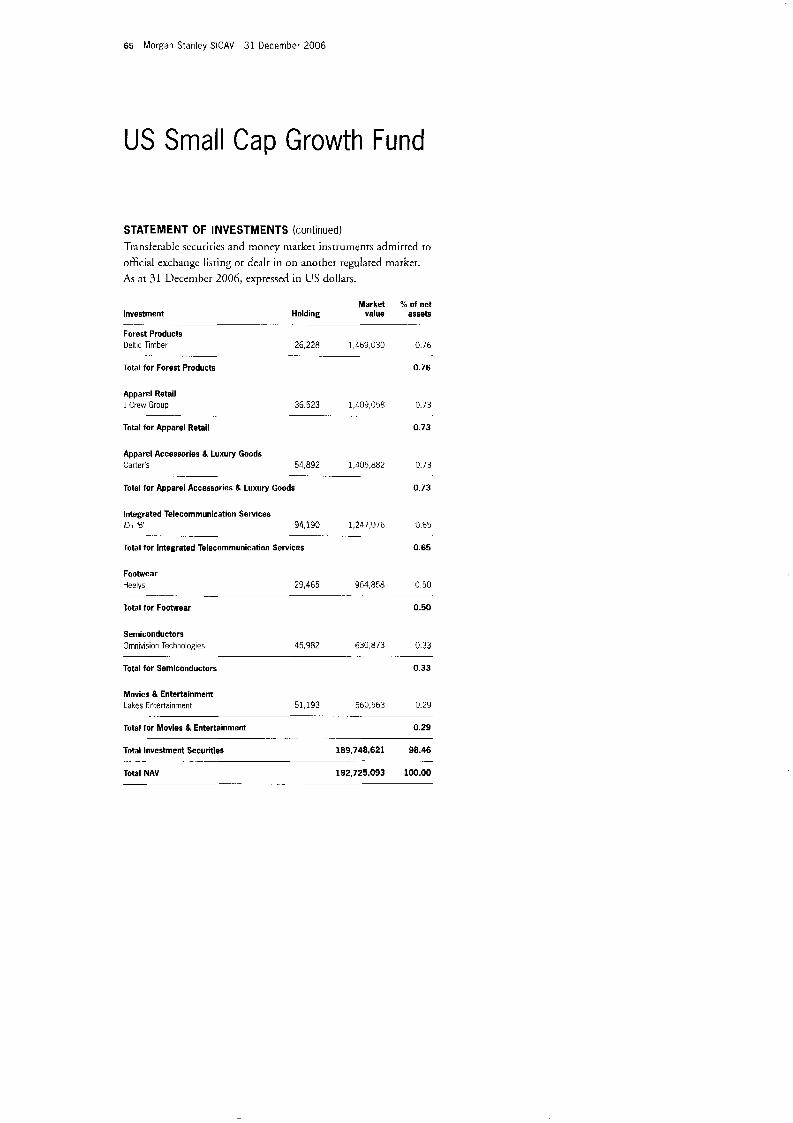
65 Morgan Stanley SlCAV 31 December 2006
US Small Cap Growth Fund
STATEMENT OF INVESTMENTS (continued) Transferablc sccurities and money market ins t ruments adiiiirted to official exchatigc listing o r dealr in on anothcr regulated marker. As at 31 Deczrnbcr 2006, expressed in US dollars.
Investment Market % of net
Holding value assets _ _ - Forest Products Deltic Timbpr 26 228 1,469,030 0 76
Total for Forest Products 0.76 - .-
Apparel Retail J Crew Group 36 523 1,409,058 0.73
Total for Apparel Retail 0.73
Apparel Accessories & Luxury Goods Carter's 54 892 1.r06.882 0.73
Total for Apparel Accessories & Luxury Goods 0.73 -_ - .
Integrated Telecommunication Services IDT 'B' 94,190 1,247,076 0 65
Total for Integrated Telecommunication Services 0.65
- -
Footwear Heelys 29,465 964,858 0 50
Total for Footwear 0.50
- --
Semiconductors Omnivision Technologies 45,982 630.873 0.33
- .- .
Total for Semlconductors 0.33
Movies 8 Entertainment takes Fntertainment 51,193 560.563 0.29
Total for Movies & Entertainment 0.29
Total Investment Securities 189,748,621 98.46
Total NAV 192.725.093 100.00
... .... .
........... ... -
...... ........
.... . . . . .
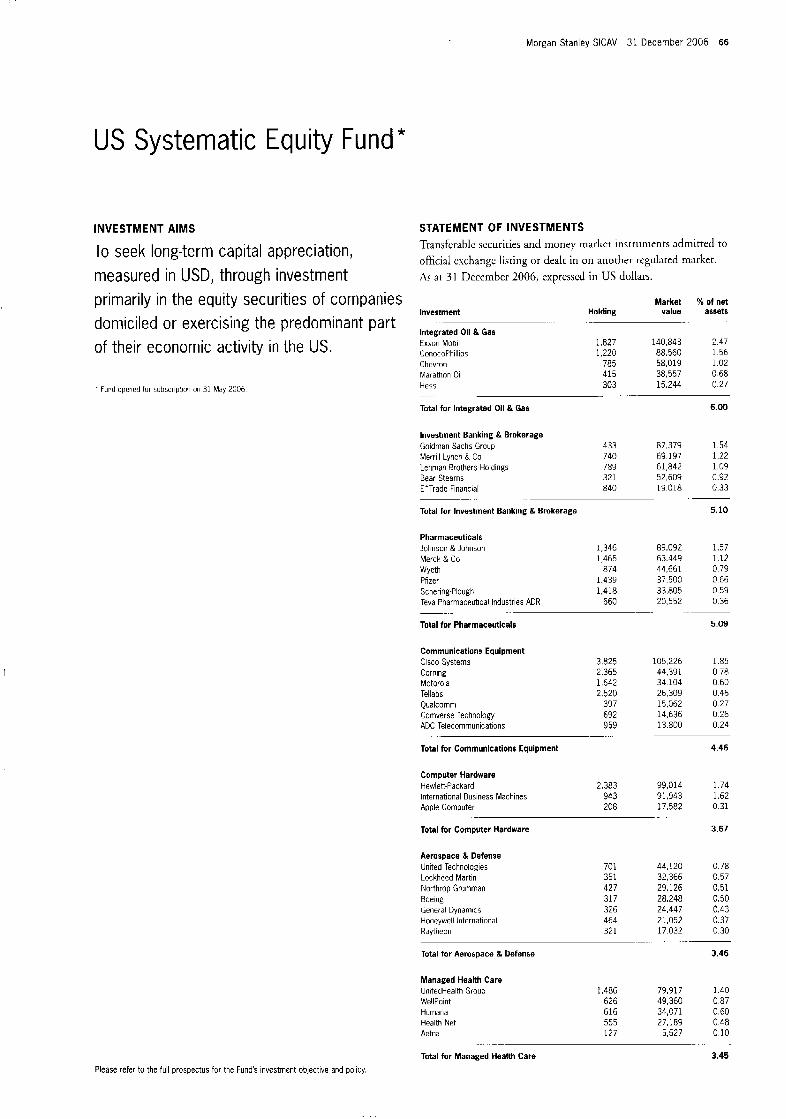
Morgan Stanley SICAV 31 December 2006 66
US Systematic Equity Fund"
INVESTMENT AIMS STATEMENT OF INVESTMENTS Transfcr:ikIc sccuriries and money market insrruments admitted to
official cxchanvc listing or dealr in on another rcwlared market. To seek long-term capital appreciation,
Y
measured in USD, through investment primarily in the equity securities of companies domiciled or exercising the predominant part
A s P I 31 December 2006, expresscd in US dollars
Market 96 of net value assets Investment
Inteerated Oil & Gas
H o I d i n g
of their economic activity in the US.
. FJrd opened for subscriu:io1 on 31 May 2C%
Exxun Mobil 1.827 140,843 2.47 ConocoPhillips 1,220 88.560 1.56 Chevron 785 58,019 1.02 Marathon Oil 415 38,557 0.68 Hess 303 15,244 0.27
Total for Integrated Oil & Gas 6.00 . .-
Investment Banking & Brokerage Goidman Sachs Group 433 87,379 I 5 4 Merrill Lynch & Co 740 69,197 1.22 Lehman Brothers Holdings 789 61,842 1.09 Bear Stearns 321 52,609 0.92 E'Tradc Financial 840 19.018 0.33
Total for Investment Banking & Brokerage 5.10
. -~ .. ..
Pharmaceuticals Johnson &Johnson 1,346 89,092 1.57 Merck & Co 1,465 63.449 1 1 7
Pfizer 1,439 37.500 0 66
Teva Pharmaceutical Industries ADR 660 20,552 0.36
Total for Pharmaceuticals 5.09
Wycth a74 44,661 0 79
Schering-Plough 1,418 33.805 0 59
.
Communications Equipment Cisco Systems Corning Motorola Tellabs Qualcomrri Cornverse leclinology ADC Telecommunications
Total for Communlcations Equipment
3.825 105.226 1.85 2.365 44,391 0 78 1,642 34 104 0 60 2,520 26.309 0.46
397 15,062 0 27 692 14.636 0 26 959 13.800 0 24
4.46 -.
Computer Hardware Hewlett-Packard 2.383 99,014 1 74 International Business Machines 943 91.943 1.62 Apvle (hrnputer 208 17.582 0 31
. . ..
Total for Computer Hardware 3.67
Aerospace & Defense United Technologies Lockhccd Martin Northrop Gruinman Boeirig tieneral Dynamics Howywell International Raytheon
701 351 427 317 326 464 321
44,120 0.78 32,366 0.57 29,126 3.51 28,248 0.50 24.447 0.43 21.052 0.37 17.032 0.30
Total for Aerospace & Defense 3.46
Managed Health Care UnitedHPalth Group 1,486 79,917 1 40 WellPoint 626 49 360 0 87 Huniarid 616 34,C71 0 60 Health Net 555 27,189 0 48 Aetna 127 5,527 0 10
Total for Managed Health Care 3.45
- __ _.
Please refer tu the full prospectus for the Fund's investment objective and policy.
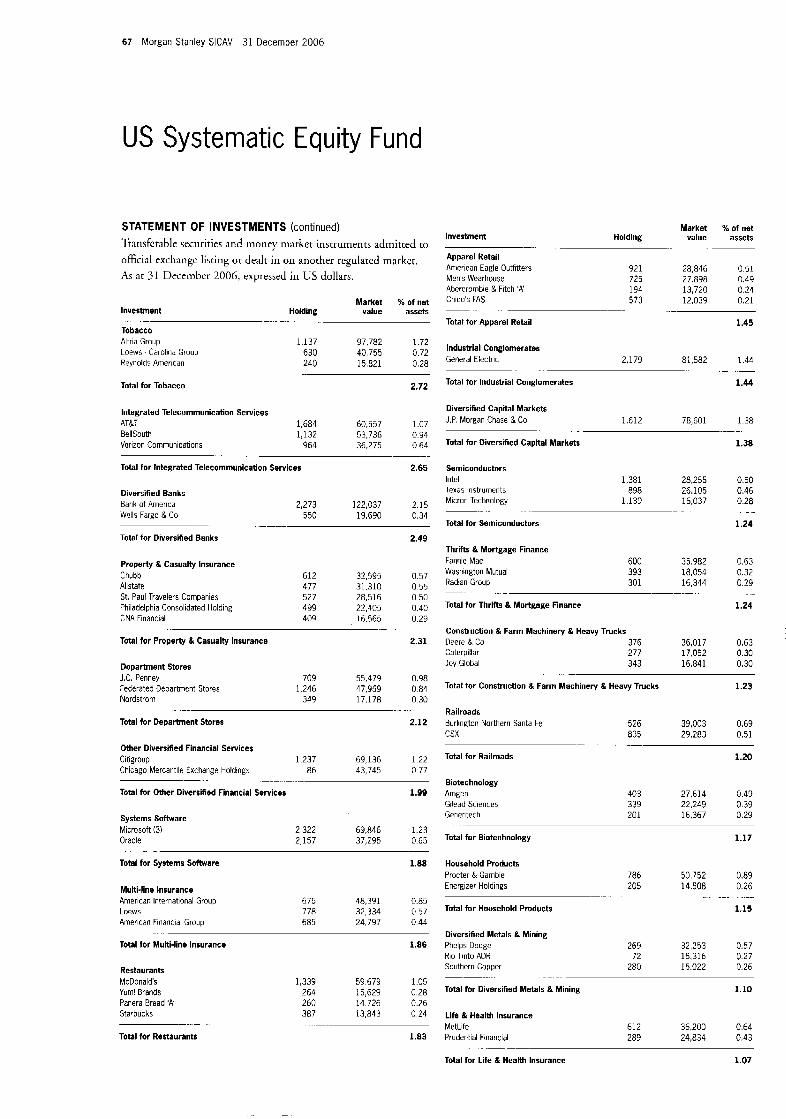
67 Morgan Stanley SICAV 31 December 2006
US Systematic Equity Fund
STATEMENT OF INVESTMENTS (continued) 'liarisfcrable secuiities and money market instruments adinitred [o
offici21 excharrgc li\ting or dealt in on anorher rcgulatcd market. As at 31 Decembcr 2006, expressed in US dollars.
Market % of net lnve$tment Holding value assets
Tobacco . . -. . . . .
Altria Group 1,137 97,782 1.72 Loews - Carolina Group 630 40,755 0.72 Reynolds American 240 15,821 0.28
Total for Tobacco 2.72
...
Integrated Telecommunication Services AT&T 1,684 60.557 1.07 BellSouth 1.132 53,736 0 9 4 Verizon Communications 964 36,275 0 64
Total for Integrated Telecommunication Services 2.65
Diversified Banks Bank of America 2,273 122,037 2 15 Wells Fargo & Co 550 19,690 0.34
Total for Diversified Banks 2.49
__ ..
Property & Casualty Insurance Chubb Allstate St. Paul Travelers Companies Philadelphia Consolidated Holding CNA Financial
612 32,595 0.57 477 31.310 0.55 527 28,516 0.50 499 22,405 0.40 409 16.565 0.29
Total for Property & Casualty Insurance 2.31
Department Stores J.C. Penney 709 55,479 0.98 Fecerated Departmcnt Stores 1,246 47,959 0.84 Nordstrom 349 17,178 0.30
Total for Department Stores 2.12
. ......
Other Diversified Financial Services Citigroup 1,237 69,136 1 2 2 Chicago Mercantile Exchange Holdmgs 86 43,745 0 77
Total for Omer Diversified Financial Services
.. _ ........ -. . ._
1.99
Systems Software Microsoft (3) 2 322 69,846 1 2 3 Oracle 2,157 37,295 0 65
Total for Systems Software 1.88
. .
Multi-line Insurance American International Group 675 48,391 0.85 Locws 778 32,334 0 5 7 American Financial Group 685 24,797 0 44
Total tor Multi-line Insurance 1.86
. _-
Restaurants McDonald's Yum! Brands Parera Bread 'A' Starbucks
1,339 59,679 1.05 264 15,629 0.28 260 14.726 0.26 387 13,843 0 24
Total for Restaurants 1.83
Investment
Apparel Retail American Eagle Ouffitters Men's Wearhouse Abercrombie & Fitch 'A' Chico's FAS
Total for Apparel Retail
..
Market % of net Holding value assets
.~
921 28,846 0.51 725 27.898 0.49 194 13,720 0.24 573 12,039 0.21
1.45
.....
Industrial Conglomerates General Electric 2,179 81,582 1 44
.-
Total for Industrial Conglomerates 1.44
Diversified Capital Markets J.P. Morgan Chase & Co 1.612 78,601 1 38
Total for Diversified Capltal Markets 1.38
. _. .
Semiconductors Intel 1,381 28,255 0.50 Texas Instruments 898 26,105 0.46 Micron Technology 1,139 16,037 0.28
Total for Semiconductors 1.24
. ... .... ....
Thrifts & Mortgage Finance F a m e Mae 600 35 982 0.63 Washington Mutual 393 18,054 0.32
301 16,344 0 2 9 Radian Group
Total for Thrlfts & Mortgage Finance 1.24
... .- ~_ _ -.
Construction & Farm Machinery & Heavy Trucks Deere & Co 376 36,017 0.63 Caterpillar 277 17,052 0 30 Joy Global 343 16,841 0.30
Total for Constructlon & Farm Machinery & Heavy Trucks 1.23 -
Railroads Burlineton Northern Santa Fe 526 39.003 0.69 csx 835 29.283 0.51
Total for Railroads 1.20
._ ._._
Biotechnology Amgen Gilead Sciences Genentech
403 27,614 0.49 339 22,249 0.39 201 16.367 0.29
Total for Biotechnology 1.17
Household Products Procter & Gamble 786 50 752 0 89 Energizer Holdings 205 14508 0 2 6
Total for Household Products 1.15
._ . ___
Diversified Metals & Mining Phelps Dodge 269 32,253 0.57 Rio Tinto ADR 72 15,316 0 27 Southern Copper 280 15.022 0.26
Total for Diversified Metals & Mining 1.10
._
Llfe & Health Insurance MetLife Prudential Financial
612 36.200 0.64 289 24,834 0.43
Total for Life & Health Insurance 1.07
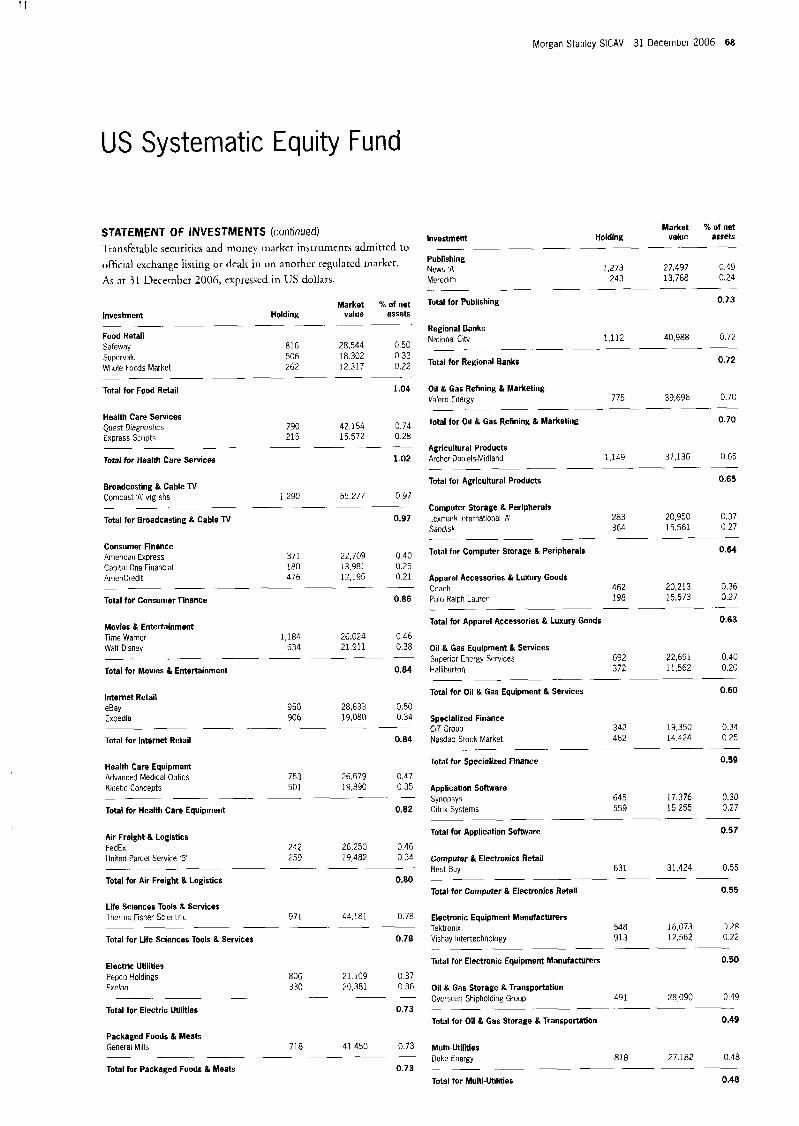
Morgan Stanley SlCAV 31 December 2006 68
US Systematic Equity Fund
STATEMENT OF INVESTMENTS (continued) Transferablc securirics and money market instruments admirtcd to official exchange lisling or dealr in on anorhcr regul:itcd markec. As at 31 December 2006, expresscd in LJS dollars.
Investment
Food Retail Safeway Supervalu Whole Foo3s Market
Total for Food Retail
-. ~
---
Market % of net H o I d i n g value assets
-----
816 28,544 050 506 18.302 032 262 12317 0.27
1.04 - _ _ - - -
Health Care Services Quest Diagnostics 790 42,154 3.74 Express S-ripts 215 15.572 0.28
Total for Health Care Services 1.02 - - - .- - .-
Broadcasting & Cable TV Comcast A' flg shs 1,230 55.277 0.97
Total for Broadcasting & Cable TV 0.97
Consumer Finance 371 22.709 040 her i ca r i Express
Capital One Financial 180 13.981 0.25 AmeriCredit 476 12.195 0 21
.- ~- -. - .- - Total for Consumer Finance 0.86
Movies & Entertainment Time Warner 1184 26,024 046 Walt Disney 634 21 311 0 38
Total for Movies & Entertainment 0.84 - - - - ~ -- - -
Internet Retail eBay 950 28,633 0.50 Expedia 906 19.080 0 34
- ~- Total for Internet Retail 0.84
Health Care Equipment Advancej Medlcal Optics 753 26,679 0 47 Kinetic Concepts 501 19,830 0 3 5 - - -
Total for Health Care Equipment 0.82
Air Freight & Logistics FedEx 242 26.250 0.46 United Parcel Service ' E 259 19.482 0.34
~
Total for Air Freight & Logistics 0.80
Life Sciences Tools & Services Thermo Fisher Scientific 971 44.181 0.78
Total for Llfe Sciences Tools & Services 0.78 -
Electric Utilities Pepco Yoldings 806 21 IC3 037 Exelon 330 70,381 0 36
Total for Electric Uulities 0.73
_ _ _ - _ _ _
Packaged Foods & Meats General Mills 718 41,450 0.73
Total for Packaged Foods & Meats 0.73 -. - -- -. .-
Market % of net Investment Holding value assets
Publishing
Meredith 243 13,768 0.24
Total for Publishing 0.73
~ ~ - - - - - -- -
NWS 'A' 1,273 27,497 0 43
.
Regional Banks National City 1,112 40,988 0.72 - ~ ~
Total for Regional Banks 0.72
Oil & Gas Refining & Marketing Valero Energy 775 39,696 07C
Total for Oil & Gas Refining & Marketing 0.70 - - .~ --- - - -
Agricultural Products Archer-Daniels-Midland 1,149 37,136 0 6 5
Total for Agricultural Products 0.65 _ _ _ _ _ . - ~ -
Computer Storage & Perlpherals Lcxmark International A 283 20,950 0.37 Sandisk 364 15,561 0 27
Total for Computer Storage & Peripherals 0.64 -~
Apparel Accessories & Luxury Goods Coach 462 20,213 0.36 Palo Ralph Laurel1 198 15,573 027
Total for Apparel Accessories & Luxury Goods 0.63 - - - - --
Oil & Gas Equipment & Services Superior Energy Services 692 22.691 0.40 Palliburtorl 372 11,562 0.20 - - -- - -- -
Total for Oil & Gas Equipment & Services 0.60
Speclalized Finance CIT Group 342 13,350 0.34
14424 025 Nasdaq Stock Market 462
Total for Specialized Finance 0.59
Applicatlon Software Synopsys 645 17.376 0 30 Citrix Systems 559 15 255 0.27
__ .- .~ ~ - -- Total for Application Sotlware 0.57
Computer & Electronics Retail Best Buy 631 31,424 0.55
Total for Computer & Electronics Retall 0.55
Electronic Equipment Manufacturers Tektronix 548 16,073 0 2 8
12,562 022 Vishay Intertechnology 913
Total for Electronic Equipment Manufacturers 0.50 -. __ - - __ - -
Oil & Gas Storage & Transportation Overseas Shipholding Grow 431 28090 049
Total for Oil & Gas Storage & Transportation 0.49
Multi-Utilities Duke Energy 818 27.182 0 48
Total for Multi-Utilities 0.48 ~
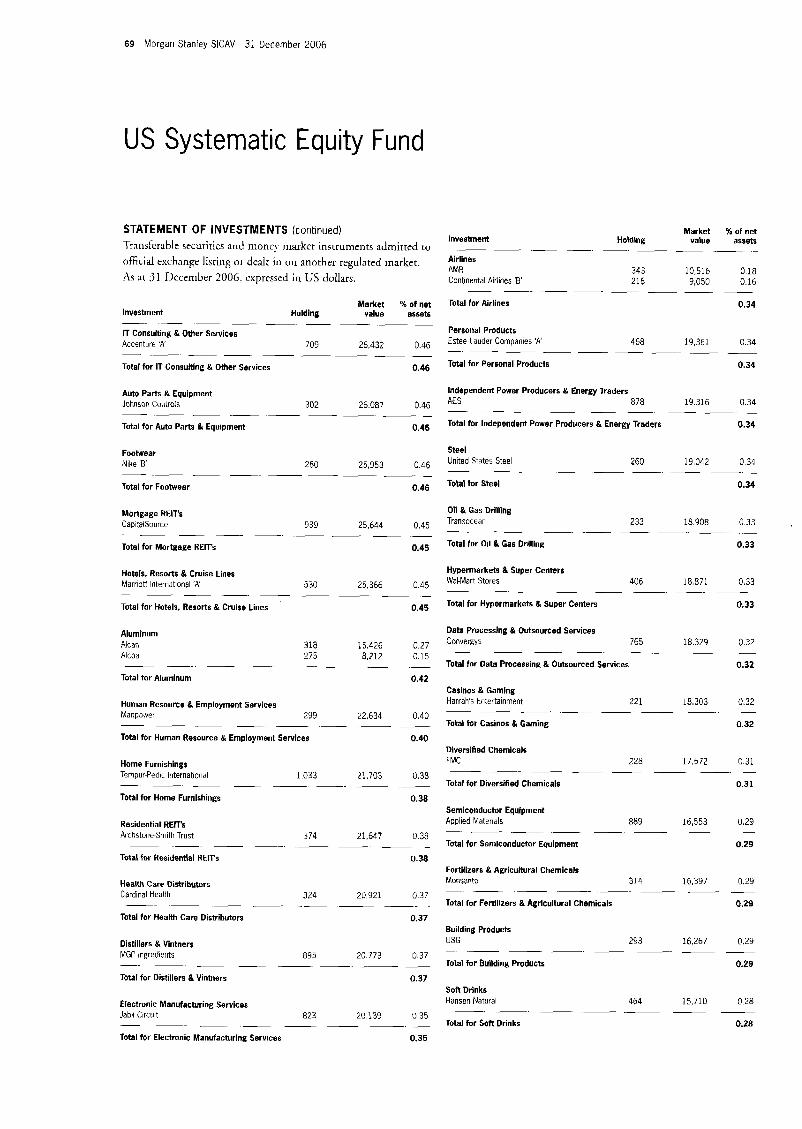
69 Morgan Stanley SlCAV 31 December 2006
US Systematic Equity Fund
STATEMENT OF INVESTMENTS (continued) Transferable securities and moncy rnarkct insrrumeiits admirted to
official exchange listing or dealt in o n another regulated market. As at 31 Dccclnbzr 2006. cxpressed in US dollars.
Market 96 of net In v e s t m e n t Holding value assets
IT Consulting & Other Services Acc?ntilre A' 709 26 432 0 46
Total for IT Consulting & Other Services 0.46
- - ~ - - ~ - - -
- - - - -
Auto Parts & Equipment Johnson Controls 302 26 087 0 46
Total for Auto Parts & Equipment 0.46
- - - - - - - - -
Footwear Nike ' B 260 25,953 0 46
Total for Footwear 0.46
-- - - - - - -. .-
Mortgage REIT's Cap1:alSuurce 939 25,644 0.45
Total for Mortgage REIT's 0.45
- - -. - - - - -
Hotels. Resorts & Cruise Lines Marrioti International 'A' 530 25.366 0 45
Total for Hotels, Resorts & Cruise Lines 0.45
- - -- - .- -
Aluminum Alcan 318 15.426 0.27 A l ~ o d 275 8.212 0.15
Total for Aluminum 0.42
-- -- - .- -. .- .-
Human Resource & Employment Services Manp3,ver 299 22,634 0.40
Total for Human Resource & Employment Services 0.40
~
Home Furnishings Tcmpur-PedlL Internatlorid 1033 21,703 0.38
Total for Home Furnishings 0.38 - - - -- - -- - .-
Residential REIT's Archstone-Smith Trust 374 21,647 0 38
~ - -- ~- - - - - Total for Residential REIT's 0.38
Health Care Distributors Cardinal Health 324 20,921 0.37
Total for Health Care Distributors 0.37
-- .~ .- -- .
Distillers & Vintners MGP l rpdients 895 20.773 0.37
Total for Distillers 6i Vinrners 0.37 ~ -
Electronic Manufacturing Services Jabil Clrcriit 823 20139 0 3 5
Total for Electronic Manufacturing Services 0.35
~
Market 96 of net value assets investment Holdlng
Air I in e s 343 10.516 018 AMR
Continental Airlines 'B' 216 9,050 0 16
Total for Airlines 0.34
- - - - - - - .- -
- - -- - .- - -. - -
Personal Products Estee lauder Companies 'A' 468 19,361 0.34 -- - Total for Personal Products 0.34
Independent Power Producers & Energy Traders AES 878 19.316 0.34
Total for Independent Power Producers & Energy Traders 0.34
-----
Steel Uriited States Steel 260 19,042 0 34 -- Total for Steel 0.34
Oil & Gas Drilling Transocean
Total for Oil & Gas Drllllng
233 18.908 0 3 3
0.33
- -- -- -. - -. .-
Hypermarkets & Super Centers Wal-Mart Stores 406 18,871 0.33 ~ - -. -. - - - - Total for Hypermarkets & Super Centers 0.33
Data Processing & Outsourced Services Convergys 765 18.329 0.32
Total for Data Processing & Oursourced Services 0.32
- - .- - .- -. -
Casinos & Gamlng Harrah's EntertainmPnt 22 1 18,303 0.32
Total for Casinos & Gaming 0.32
~ - - - - - -
Diversified Chemicals FMC 228 17,572 0.31
Total for Diversified Chemicals 0.31
- - -. -. - -. -
Semiconductor Equlpment Applied Materials 889 16,553 0 29
Total for Semlconductor Equipment 0.29
- ~. - - - - - .-
Fertilizers & Agricultural Chemicals Monsanto 31 4 16.397 0.29 - - - -. - -. - Total for Fertillzers & Agricultural Chemicals 0.29
Building Products USG 293 16,267 0.29
Total for Bullding Products 0.29
-. .- - - - -- -. -
Soft Drinks Hanscn Natural 464 15,710 0 28
Total for Soft Drinks 0.28 -------
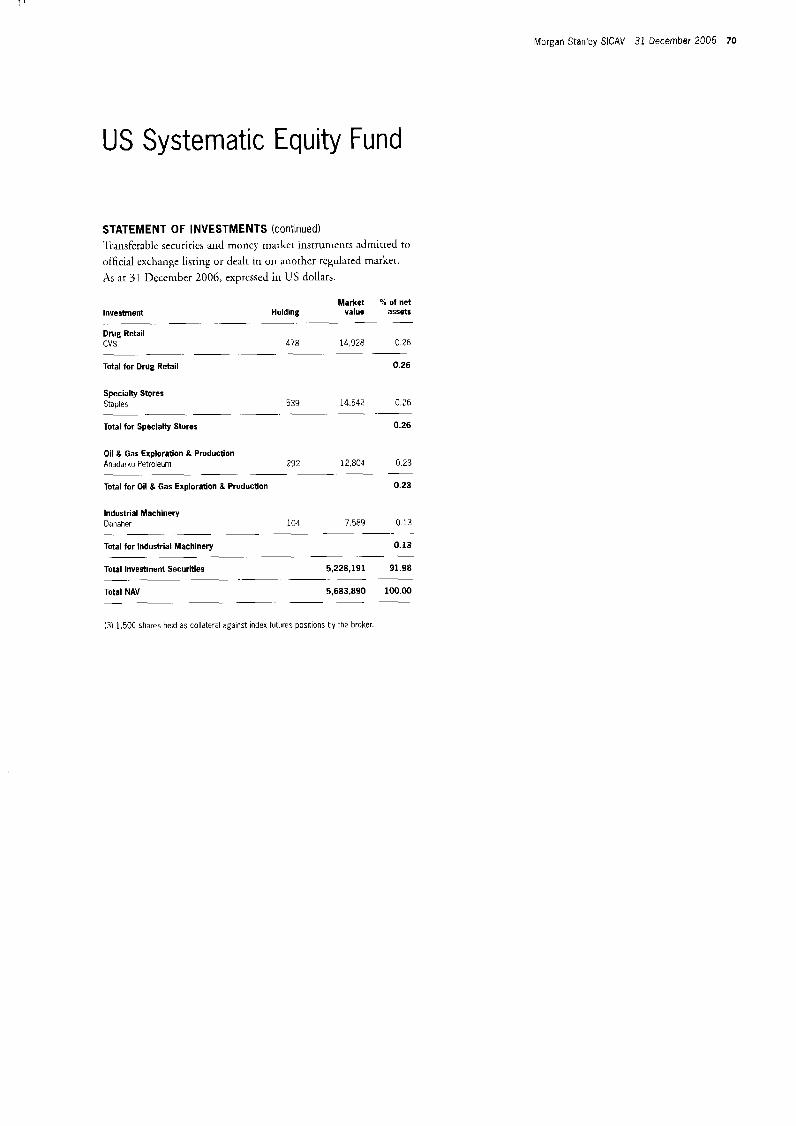
Morgan Stanley SICAV 31 December 2006 70
US Systematic Equity Fund
STATEMENT OF INVESTMENTS (continued) ‘liansferablc securitics and money markct insrrumcnrs arlrnirred to
olficial exchange listirlg 01- dealt in on arrorher regulated rriarker. As at 31 Dcccnlber 2006, exprcssed in U S dollars.
Market % of net Investment Holdlng value assets
Drug Retail cvs 478 14,928 C 7 h
Total for Drug Retail 0.26 - -. - __ - ~ -
Specialty Stores Staples 539 14.542 0.26
Total for Speclalty Stores 0.26 - - -. - --
Oil & Gas Exploration 8 Production Anadarko Petroleum 292 12.804 0 2 3
Total for Oil & Gas Exploration 8 Production 0.23
Industrial Machinery Danaher 104 7.589 0 13
Total for Industrial Machinery 0.13
Total Investment Securities 5,228,191 91.98
Total NAV 5,683.890 10Cl.00
- -. .- - - -
- - - - - -
-
13) 1.5OC shares held as collateral against index futures positions by the broker

71 Morgan Stanley SICAV 31 December 2006
US Value Equity Fund
INVESTMENT AIMS STATEMENT OF INVESTMENTS Thnsferakle securities and money market instruments adrnirted to official cxchangc listing or deal[ in on another regulated markcr.
To provide reasonable long-term capital growth, measured in Us Dollars. Investments will be A~ at 31 necemI>cr 2006, expressed in c's dollars.
sought in equity securities that the Company Investment
Pharmaceuticals Bristol-Myers Squibb Schering-Plough
believes to be undervalued relative to the stock - -- --
market in general at the time of purchase. Wyeth Pfizer GlaxoSmithKline AOR Eli Lilly & Co Abbotl Laboratories Sanofi-Aventis ADR
Total for Pharmaceutlcals
-- .- -
H 0 Id i n g --
1,268,300 1,167,200
453,800 838,600 411.400 332.400 303,800 205,500 --
Market 56 of net value assets
. -. .-
33,204,094 3.23 27,826,048 2.70 23.189.180 2 25 21.853.916 2.12 21,660,210 2.11 17,241,588 1 68 14,801,136 1 44 9,533,145 0 93
16.46
- --
Dlversified Banks Bank of America 591,900 31,779,111 3.09 Wachovia 430.871 24,684,600 2.40 Wells Fargo & Co 430,000 15,394,900 1.50 U.S. Bancorp 106,600 3,870646 0 37 Barclays ADR 21,100 1,228,653 0.12
Total for Diversified Banks 7.48
-. -. -- .- -. -. .- -
Integrated Telecommunicatlon Services Verizori CornmunlLations 869,200 32,707,996 3 18 AT&T 829.900 29 843,204 2 90 Sprint Nextel 267,300 5,118 795 0 50 Ernbarq 19,920 1,053370 0 1 0
Total for Integrated Telecomrnunicaaon Services 6.68
- - - -- - -- - -
Movies & Entertainment Time Warner 1,223.000 26,881 540 2 61 Viacom B' 536 600 21,979,136 7 14 Walt Disney 167.400 5,785,344 0 56
Total for Movies & Entertalnment 5.31
- - .- -. - -- --
Packaged Foods & Meats Unilever 'NY' 833,500 22,837,900 2 22 Kraft Foods 'A' 476,500 16,987 225 1 6 5 Cadbury Schweppes ADR 291,500 12.537.415 1.22 -. -. - .- - -
Total for Packaged Foods & Meats 5.09
Other Diversified Financial Services Citigroup 812,900 45,432,981 4 42
Total for Other Diversified Financial Services 4.42
-- - .- - --
Broadcasting & Cable TV Conicast 'A' vtp. shs 451,600 19,351.060 1.88 Liberty bdiledia Holding 'Serie A' 122,815 11,981,831 1.16 Clear Channel Communications 238.999 8,498,804 0.83
Total for Broadcasting & Cable TV 3.87
-- ~
Thrifts & Mortgage Finance Freddie Mac 395.300 27,010,849 2.63 Fame Mae 129,600 7 772,112 0 75
Total for Thrifts B Mortgage Finance 3.38
- .- - ~ - -
Please refer to the full prospectus for the Fund's investment objective and policy.
-
Paper Products International Paper 950,556 32,413.960 3.15
Total for Paper Products 3.15
-- -- -- -. -. --
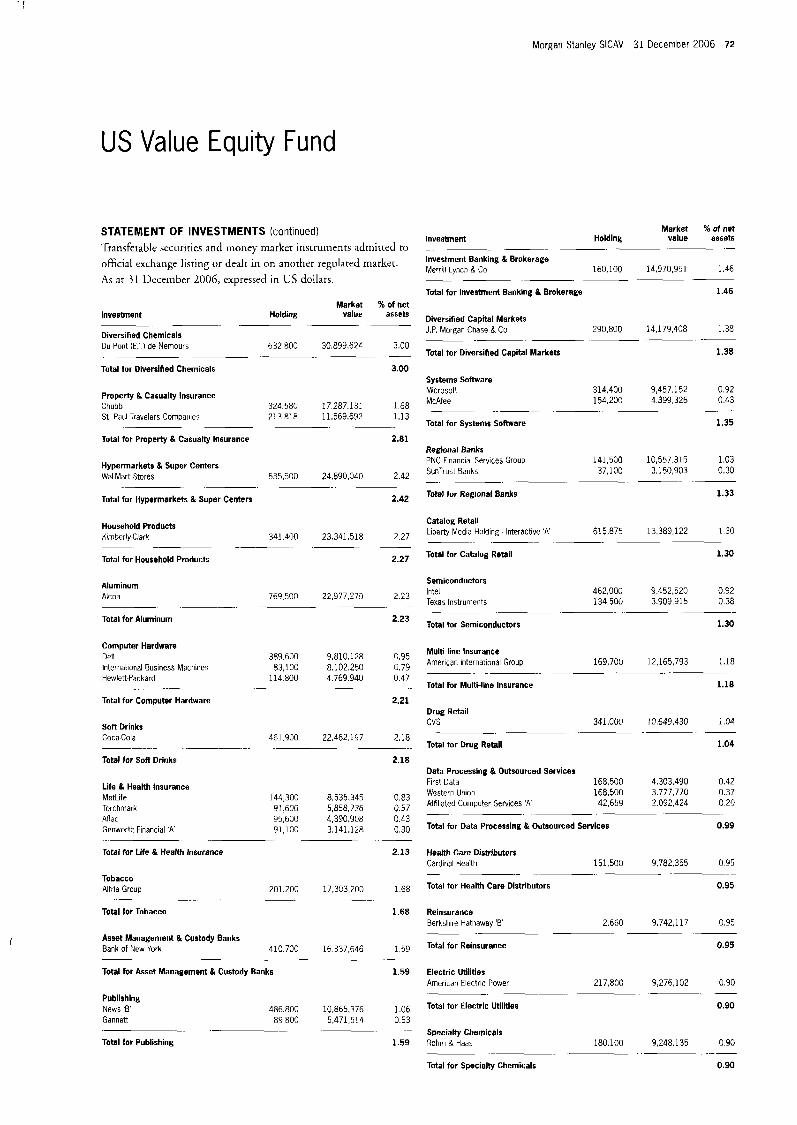
Morgan Stanley SICAV 31 December 2006 72
US Value Equity Fund
STATEMENT OF INVESTMENTS (continued) 'Transferable sccuriries and money market insrruments ;idmirted to official rxchatige listing o r dealr in on another regulated marker. As at 31 l k e m b e r 2006, cxpressed in US dollars.
Market % of net Investment Holding value assets
Diversified Chemicals Du Pont (ELI de Nemours 632.800 30,899.62L 3.00
Total for Diversified Chemicals 3.00
~ ~. .
. . - . -
Pmperty & Casualty Insurance Chubb 324.580 17 287 13: 1 68 St. Paul Travelers Cornparlies 713 818 11,569,632 1.13
Total for Property & Casualty Insurance 2.81
. . -~
Hypermarkets & Super Centers Wal-Mart Stores 535,500 74,890,040 2 42
Total for Hypermarkets & Super Centers 2.42
. ~. .~
Household Products Kimberly-Clark 341.400 23.341.518 2 27
Total for Household Products 2.27 ... -
Aluminum Alcoa 769.500 72,977 273 2 23
Total for Aluminum 2.23
. -
Computer Hardware Dell 389.600 9.810.128 0.95 International Business Machines 83,100 8.102.250 0.79 Hewlett-Packard 114.800 4.769.940 0 47
Total for Computer Hardware 2.21
-. -- ..
Son Drinks Coca-Cola 461.900 22,462,197 2.18
- .~ . - ~ ..
Total for Soft Drinks 2.18
Life & Health Insurance MetLife 144.300 8,535,345 0.83 Torchmark 91.600 5,858,736 0.57 Aflac 95,600 4,390.9C8 0.43 Genwortk Financial ' A 91,100 3,141,128 0.30 . . .~ -. .-
Total for Life & Health Insurance
Tobacco Altria Group 201.200 17,303,200
Total for Tobacco
Asset Management & Custody Banks Bank of New York 41C.700 16.337.646
Total for Asset Management & Custody Banks
-
Publishing News ' E 486.800 19,865,376 Gannett 80 800 5 471,5!4
Total for Publishing
.-. -
2.13
1.68
1.68
1.59
1.59
__
1.06 0.53
1.59
...
Market % of net Invesiment Holding value assets
Investment Banking & Brokerage Mewll lynch & Co 160,100 14,970,351 1 46
Total for Investment Banklng & Brokerage 1.46
- -
~ -- ~ _ _ _ _
Diversified Capital Markets J P. Morgan Chase & Co 290,800 14,179,408 1 38
Total for Diversified Capital Markets 1.38
~ ~ -- - ~.
Systems Software Micrusafl 314,400 9,457 152 0 92 McAfee 154,200 4399326 0 4 3
Total for Systems Software 1.35
Regional Banks 1.03 PNC Financial Servlces Group
SunTrust Banks 37,100 3,150,903 0.30
Total for Regional Banks 1.33
141,500 10,557.315
~. -~ ~-
Catalog Retall Liberty Medla Holding - Interactive 'A' 615,875 13.389.122 1 30
Total for Catalog Retail 1.30
~ .~
Semiconductors lritel 462.000 9.452.520 0.92 Texas Instrument? 134500 3.909915 038
Total for Semiconductors 1.30
.~ ~-
Multi-line Insurance A m m a n International Group 169,700 12,165,793 1.18
Total for Multi-llne Insurance 1.18 ~
Drug Retail cvs 341,000 10,649,430 1.04
Total for Drug Retail 1.04
. .~
Data Processlng & Outsourced Services First Data 168,500 4.303 490 0 42 Western Union 168,500 3777770 037 Afhllated Computer Services 'A' 42,659 2092424 0 2 0
0.99 Total for Data Processing & Outsourced Services
Health Care Distributors Cardlnal Health 151.500 9.782.355 0 95
Total for Health Care Distributors 0.95
... ... . - . .. -
Reinsurance Berkshire Hathaway '6 2.660 9,742,117 0.95
Total for Reinsurance 0.95 -. . .
Electric Utilities Americari Electric Power 217,800 9,276,102 0.90
Total for Electric Utilities 0.90
.. . - .~
Specialty Chemicals Rohm & Hads 180.100 9.248.135 0 90
Total for Specialty Chemicals 0.90
.~ -- ..
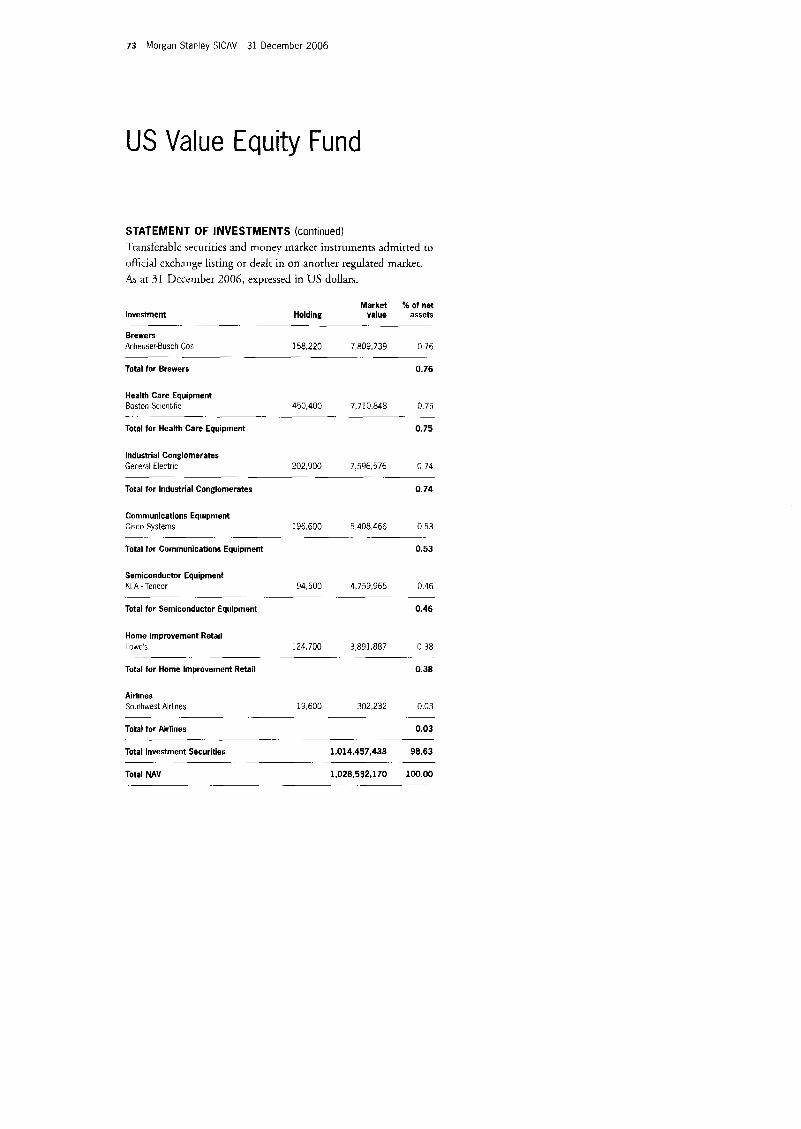
73 Morgan Stanley SICAV 31 December 2006
US Value Equity Fund
STATEMENT OF INVESTMENTS (continued) Transferable securities and money market instruments admirted to
oficial exchange listing o r dealt in on another regulated marker. As at 31 rlccember 2006, expressed in US dollars.
Market % of net Invesbnent H o I d i n g value assets
. ~
Brewers Anheuser-Busch Cos 158,220 7,809,739 0.76 ~ ~. -
Total for Brewers 0.76
Health Care Equlpment Boston Scientific 450,400 7.710.848 0 75
Total for Health Care Equipment 0.75 - ~. -
Industrial Conglomerates Gereral Electric 202,900 7,596,576 0.74
- -
Total for Industrial Conglomerates 0.74
Communications Equipment CISCO Systems 196600 5408466 0 5 3
Total for Communicabons Equipment 0.53
~ ~. ~.
Semiconductor Equipment KLA - Tencor 94,500 4,759.965 0.46
Total for Semiconductor Equipment 0.46
~- .. . . .
Home Improvement Retail Lowe's 124.700 3,891.887 o 38
-- .
Total for Home Improvement Retail 0.38
Airlines Southwest Airllneb 19,600 302.232 0.03 -. ~.
Total for Alrlines 0.03
Total Investment Securities 1,014,457,433 98.63
Total NAV 1,028,532,170 100.00
.~
-
~-
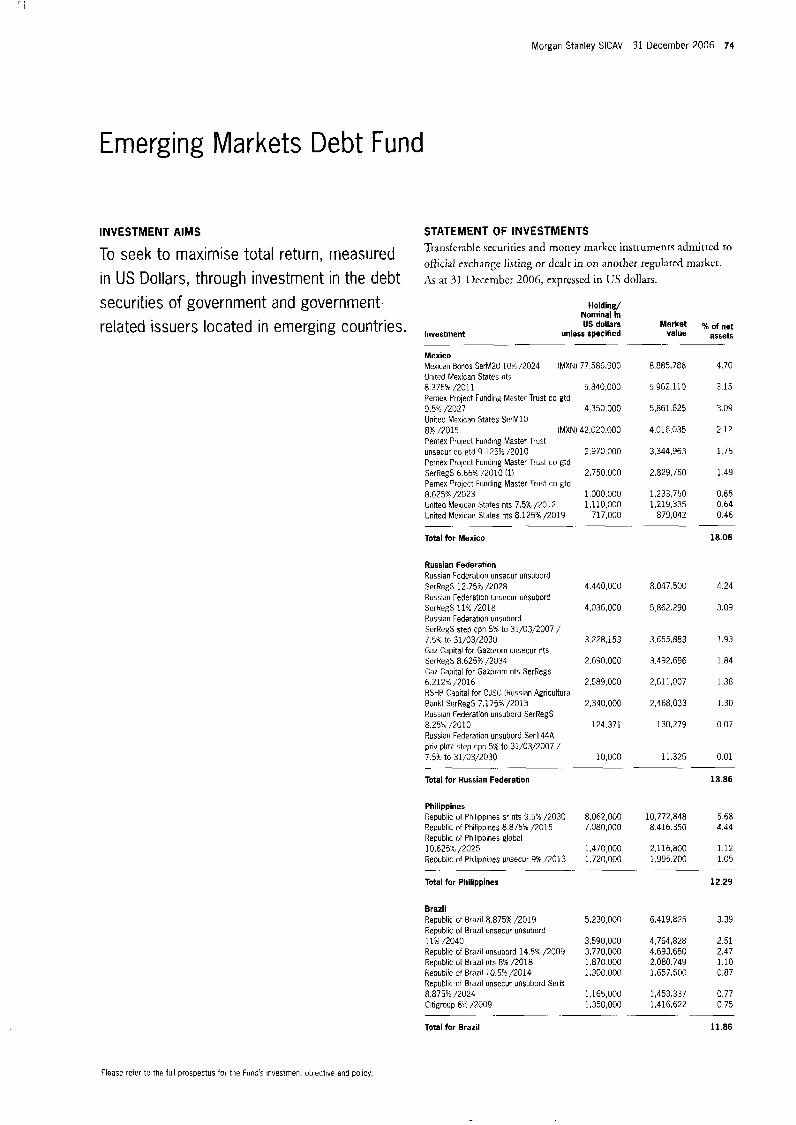
Morgan Stanley SICAV 31 December 2006 74
Emerging Markets Debt Fund
INVESTMENT AIMS
To seek to maximise total return, measured in US Dollars, through investment in the debt securities of government and government- related issuers located in emerging countries.
STATEMENT OF INVESTMENTS Transfcrable sccuriries and money markct irlstrurnerlcs adniittcd co oficial exchangc listing or rlcalr in on another regulated markct.
AS at 3 1 Ilccember 2006, exprcsscd in US dollars.
Hold[ng/ Nominal in US dollars Market 96 of net
unless specihed value assets Investment
Mexico Mexican Bonos SerM20 I@& /2024 (MXNI 77.586.900 United Mexican States nts 8.375% /2011 5,340,000 Pemex Project Funding Master Trust co Ktd 9.5% /2027 4,350,000 United Mexican States SerMlO 8% /2015 (MXN) 42.020.000 Pemex Prolect Funding Master Trust unsecur co gld 9.125% /2010 2.970.000 Pcrriex Project Fundirig Master Trust co gtd SerRegS 6.613 /2010 (1) 2.750.000 Pernex Project Funding Master Trust co gtd 8,625% /2023 1,000,000 United Mexican States nts 7.5% /2012 United Mexican States nts 8.125'4 /2019
Total for Mexico
1,110,000 717,000
~ ~ ~ _ _
Russian Federation Russian Federation unsecur unsubord SerRegS 12.751 /2028 Russian Federation unsecur unsubord SerRegS 11% /2018 Russian Federation unsubord SerRegS step cpn 5% to 31/03/2007 / 7.5% to 31/03/2030 Caz Capital for Gazprom unsecur nts ScrRegS 8 625% /2034 Gaz Capital for Gazprom nts SerRegs 6.212S,'XJl6 RSHB Capital for OJSC (Russian Agricultural Rank) SerRegS 7,1753 /2013 Russian Federation unsubord SerRegS
Russlan Federation unsubord Ser144A priv plmt step cpn 5 2 to 31/03/2007 /
8.25% /XI10
7.5F to 31/03/2030
4.440.000
4,036,000
3.228.153
2.690.000
2,589,000
2.340.000
124.371
10,000
8,885,786 4.70
5.962.110 3 15
5,861.625 3.09
4,016,035 2 12
3344.963 1 7 6
1 49 2,829,750
1.233.750 0.65 1,219,335 0 64
879,042 0.46
18.06
.- .-
8.047.500 4.24
5.862.290 3.09
m 5 . m 1.93
3,492,696 1.84
2,611,007 1 38
2,468,033 1.30
130,279 0.07
11.325 0.01 -.
Total for Russian Federation 13.86
Philippines Republic of Philippines s' nts 9.5% /2030 8,062,000 10,772,848 5.68 Republic of Philippines 8.875% /2015 7.080,OOO 8.416.350 4.44 Republic of Philippines global 10.6251: /2025 1.470.000 2.116.800 1.12 Republic of Philippines unsecur 9% /2013 1,720,000 1.995.200 1.05
Total for Phllippines 12.29
-
Brazil Republic of Brazil 8.8754: /2019 Republic of Brazil unsecur unsubord 1 I % /2040 Republic of Braril unsubord 14.5% /2009 Republic of Brazil nts 82 /2018 Republic of Brad 10.5% /2014 Republic of Brazil unsecur unsubord SerB 8.875% /2024 Citigroup 6 5 /2009
Total for Brazil
. -
5,230,000
3,590,000 3,770,000 1,870.000 1.300.000
1,165,000 1,350,000 -. .
6.419.825
4.764,828 4.693.650 2.080.749 1,657,500
1,453.337 1,416,622
3.39
2.51 2.47 1.10 0.87
0.77 0.75
11.86
Please refer to the full prospectus for the Funds investment objective and ~olicy.

75 Morgan Stanley SICAV 31 December 2006
Emerging Markets Debt Fund
STATEMENT OF INVESTMENTS (continued) Transfcrable securities and money marker instrumencs admitted ro ufficial exchange lisring o r dealr in on another regulated markct. As a t 31 Ikcember 2006, exprzsscd in US dollars
H o I d i n e/ Nominal in US dollars
Investment unless specified
Venezuela Republic of Venezuela nts 10.75’4 /2013 4,210,000 RPpubliL of Venezuela 9.375% /2034 2.022.000 Republic of Venezuela nts 8.5% /2014 1,380,000 Republic of Venezuela 5.75% /2016 1,380,000 Republic of Venezuela Wt5 exp. 15/04/2020 14,345
Total for Venezuela
.- ~. -
- .. . . .~
Market value
-- -
5243,555 2,674,095 1,566.300 1,314,450
480,558
% of net assets
2.77 1.41 0.83 0.69
0.25
5.95
Argentina Republic of ArRentina i t s 5.83% 1’2033 (1) IARS) 10.250.000 4,996.875 2.64 Republic of Argentina sr nts defaulted 11% /2049 3.670,OOO 1,633,150 0.86 Republic of Argentina nts 0%/2035 (11 (ARS) 37,626,112 1,461,774 0.77 Republic of Argentina nts 8.28% /2033 352.628 380,688 0.20 Recuhlic of Argentina {its 3% /2035 (11 940,569 127,465 0.07
Total for Argentina 4.54
. .-
Turkey Republic of Turkey unsecur sr unsubord 11 375% /2030 2,240,000 3,449,981 1.82
Republic of Turkey nts 11% /2013 1,660,090 2,048,025 1.08 Republlc of Turkey nts 11 5% /2012 200.000 246,500 0.13
Total for Turkey 4.24
Republlc at Turkey 7% /2016 2,260,000 2,333,776 1.21
.- -. ...
United States of America Citigroup Funding SerEMTN E 0 0 8 (1) 4 110,000 4,256,685 2 24 JP Morgan 8, Chase Co Note Regs 09; /ZOO8 12) 4.860.000 3,592,026 1 89
Total for United States of America 4.13
~- - _ _
C o I o m b i a Republic of Colombia 7,3755 /2037 1.630.000 1,753,880 0.93 Republx of Colombia 11.75% /2020 890,000 1,294,950 0.68 Republic of Colombia unsecur 8 1251/2024 980,000 1.131.900 0.60 Republlc of Colombia nts 8.25% /2014 760,000 862,220 0.45 Repcblic of Colombia bnk gtd 9.75% /2011 695.157 757.721 0.40
Total for Colombla 3.06
- .- ~- .
Peru Fiepublic of Peril unsecur 8.75% /2033 2.680.000 3,537,600 1.87 Republic of Peru unsubord 9.8756 /2015 705,000 891.825 0.47 Republic of Peru 8.3759: /2016 690,000 821,100 0.43
Total for Peru 2.77
.- . . ...
Panama Republic of Panama global 9.375% /2029 1090,000 1.460,600 0.77 RepLblic of Pdnarna global 9 625% /2011 1 159,000 1,327,055 0 70 RepLblic of Panama 7.125% /2026 870 000 943,950 0.50 Republic of Panama unsecur 7.258 /2015 540,000 587,250 0 3 1
Total for Panama 2.28
-
H o I d i n g/ Nominal in US dollars Market % of net
Investment unless specmed value assets
Nigeria Citigroup Funding 0% 30/01/2009 2,236,300 2 530,933 1 34 Central Bank of Nigeria Wts exp 15/11/2020 4 000 760000 040
Total for Nigerla 1.74
~ - ~ -
Cayman Islands Banco ABN AMRO Real SerRegS 15.861% /2007 IBRL) 6,200,000 2,993 023 1.58
Total for Cayman Islands 1.58
Chile Empresa Nacional de Petroleo nts SerRegS
2,460,000 2,597,831 1.37 6.75%/2012 Ernpresa Nacional de Petroleo nts Ser144A priv plnit 6.75% /2012 90.000 95.043 0.05
Total for Chile 1.42
-- ~ -_
Bulgaria Republic of Bulgaria SerRegS 8.25% /2015 1.639.000 1,954,507 1.03
Total for Bulgaria 1.03
- .-
Ukralne Ukralne Government International Bond sr unsubord SerRegS 6.58% /2016 1,900.000 1,901,995 1 00
Total for Ukraine 1 .oo - ~ -~
Ecuador Republic of Ecuador SerRegS step cpn 9% to 15/08/2006/ 10% to 15/08/2030 1,860,000 1,408.950 0.74 Reoublic of Ecuador nts SerRegS 9.375% /2015 450,000 357,750 0.19
Total for Ecuador 0.93 .-
Trinidad & Tobago National Gas nts SerRegs 6 05% /2036 1 472,000 1 443,180 0 76
Total for Trinidad & Tobago 0.76 -. -~
Tunisia Banque Centrale de Tunisie unsubord 7 375% /2012 780 000 848,640 0 4 5
Total for Tunisia 0.45
Qatar State of Qatar sr unsecur SerRegS 9.75% /2030 500,000 75055G 0 4 0
Total for Qatar 0.40 ~-
Ivory Coast Ivory Coast Ser20YR FLlRB 2% /2018 2,240,000 526,400 0 2 8
Total for Ivory Coast 0.28
Total transferable securities and money market Instruments admltted to official exchange listing or dealt in on another regulated market 175.613.874 92.63
- .
_.
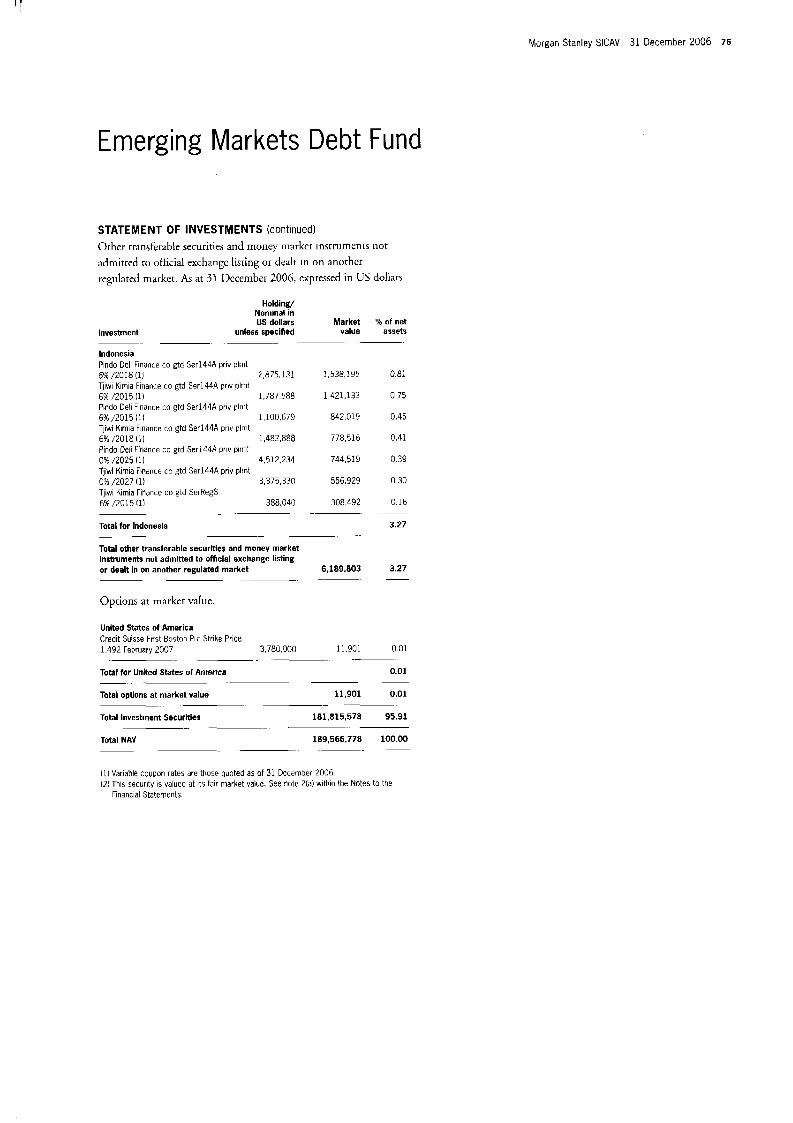
‘ I
Morgan Stanley SlCAV 31 December 2006 76
Emerging Markets Debt Fund
STATEMENT OF INVESTMENTS (continued) Ocher cmnsferahle securities arid money markec inscrurnenis not admitted to official exchangc liscing or dealt in on anothcr regulated market. As at 31 Ilccember 2006, expressed in US dollan.
H o I d i n g/ Nominal in US dollars Market ?4 of net
Investment unless specified value assets
Indonesia Pindo Deli Finance co gtd Ser144A priv plmt 6% /2018 (1) 2,875,131 1,538,195 0.81 Tjiwi Kimia Finance co gtd Ser144A priv plmt 6% /2015 I11 1.787.588 1,421,132 0.75 Pmdo Deli ‘inance co gtd Ser144A priv plmt 6% /2015 (1 I 1,100,679 842.019 0.45 TJIWI Kimia Finance co gtd Serl44A priv plrnt 6% /2018 11) 1,482,888 778,516 0.41 Pindu Deli Finance co gtd Ser144A puv plmt 0% /2025 (11 4,512,234 744,519 0 3 9 Tjiwi Kimia Finance co gtd Ser144A priv plmt 0% /2027 (1) 3,375,330 556,929 0.30 Tjiwi Kimia Finance co gtd SerRegS 6%/2015111 388,040 308.492 0.16
Total for Indonesia 3.27
Total other transferable securities and money market instruments not admltted to official exchange listing or dealt in on another regulated market 6,189.803 3.27
.
. .~ ~- .
. .
. . .~ ~.
Options at market value.
United States of America Credit Suisse First Boston Put Strike Price 1.492 February 2007 3.780.000 11,901 0.01
. ..
Total for United States of America 0.01 .~ ~ ~. -
Total options at market value 11,901 0.01 - . -
Total Investment Securities 181,815,578 95.91
Total NAV 189,566,778 100.00
-.
. ~. .. .
(1) Variable coupon rates are those Quoted as of 31 December 2006. (2) This security is valued at its fair market value. See note 2(a) within the Notes to the
Financial Statements.
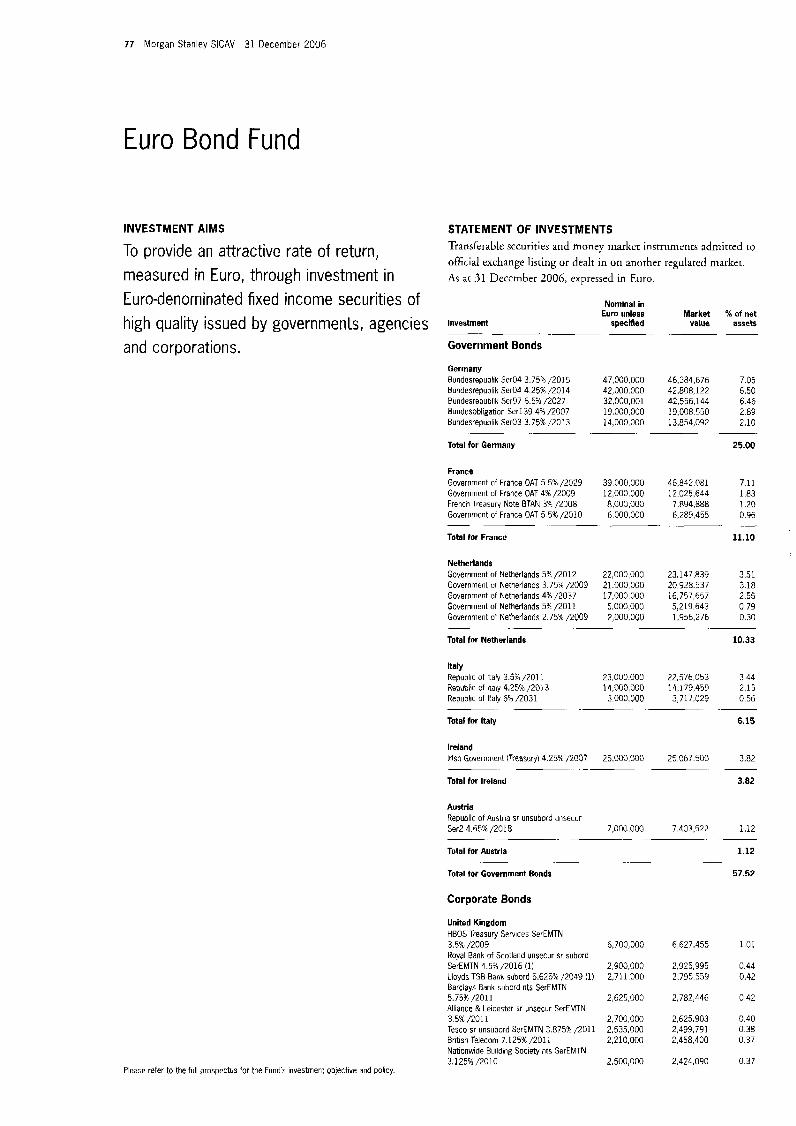
77 Morgan Stanley SlCAV 31 December 2006
Euro Bond Fund
INVESTMENT AIMS STATEMENT OF INVESTMENTS Transferable securities and money markct instrunicrits adniicted to official exchange listing or dealt in on another regulated market. As ;it 31 Deccrnber 2006, expressed in Fmo.
To provide an attractive rate of return, measured in Euro, through investment in Euro-denominated fixed income securities of Nominal in
Euro unless Market % of net specified value assets high quality issued by governments, agencies investment -- ~ ~
and corporations.
Please refer to the full prospectus for the Fund's investment objective and policy.
Government Bonds
Germany Bundesrepublik Ser04 3.754 /2015 47,000,000 46,384,676 7.05 Bundesrepublik Ser04 4 25% /2014 42,000,000 42,808,122 6.50 Bundesrepublik Ser97 6.5% /2027 32,000,001 42,556,144 6.46 Bundesobligation Ser139 477 /2007 19,000,000 19,008.550 2 89 Bundesrepublik Ser03 3.759: /2013 14,000,000 13,854,092 2.10
Total for Germany 25.00
-. ~. ~
France Government of France OAT 5.5% /2029 39,000,000 46.842.081 7.11 Government of France OAT 4% /2009 12,000.000 12,025,644 1.83
Government of France OAT 5.5% /2010 6,000,000 6,289,455 0.36
Total for France 11.10
French Treasury Note ETAN 3% /2008 8,000,000 7.894.888 1.20
-
Netherlands Government of Netherlands 5% /2012 22,000,000 23.147.839 3.51 Government of Netherlands 3.75% /2009 21.000,OOO 20,928.537 3.18 Government of Netherlands 4% /2037 17,000.000 16,757,657 2.55 Government of Netherlands 5% /2011 5,000,000 5.219.643 0.79 Government of Netherlands 2.75% /2009 2,000.000 1,956,276 0.30
Total for Netherlands 10.33
~. .~ ~. - - .~
Italy
Republic of Italy 4.25% /2013 14,000,000 14,179,459 2.15 Republic of Italy 6% /2031 3.000,OOO 3,717,029 0.56
Total for Italy 6.15
Republic of Italy 3.5% /2011 23,000.000 22,576,053 3.44
~ . . -.
Ireland Irish Government (Treasury1 4.25% /200? 25,000,000 25,067 500 3.82
Total for Ireland 3.82
. .~ . .~
Austria Republic of Austria sr unsubord unsecur Ser2 4.65% /2018 7,000.000 7,403,522 1.12
Total for Austria 1.12
Total for Government Bonds 57.52
- . .. - -- . . .~
.. - . ... . . -. .
Corporate Bonds
United Kingdom HBOS Treasury Services SerEMTN 3.5% /zoo9 Royal Bank of Scotland unsecur sr subord SerEMTN 4 5% /2016 (1 ) Lloyds TSB Bank subord 5.625% /2049 I1 Barclays Bank subord nts SerEMTN 5.75% /2011 Alliance & Leicester sr unsecur SerEMTN 3.5% /2011 Tesco sr unsubord SerEMTN 3.875% /201 British Telecom 7.125% /2011 Nationwide Euildmg Society nts SerEMTN 3.125%/2010
6,700,000
2,900,000 2.711.000
2,625,000
2.700.000 2.535.000 2,210.000
2,500,000
6,627.455
2,925,995 2,795.559
2,782,446
2,625.903 2,499,791 2,458,400
2.424.090
1.01
0.44 0.42
0.42
0.40 0 38 0.37
0.37
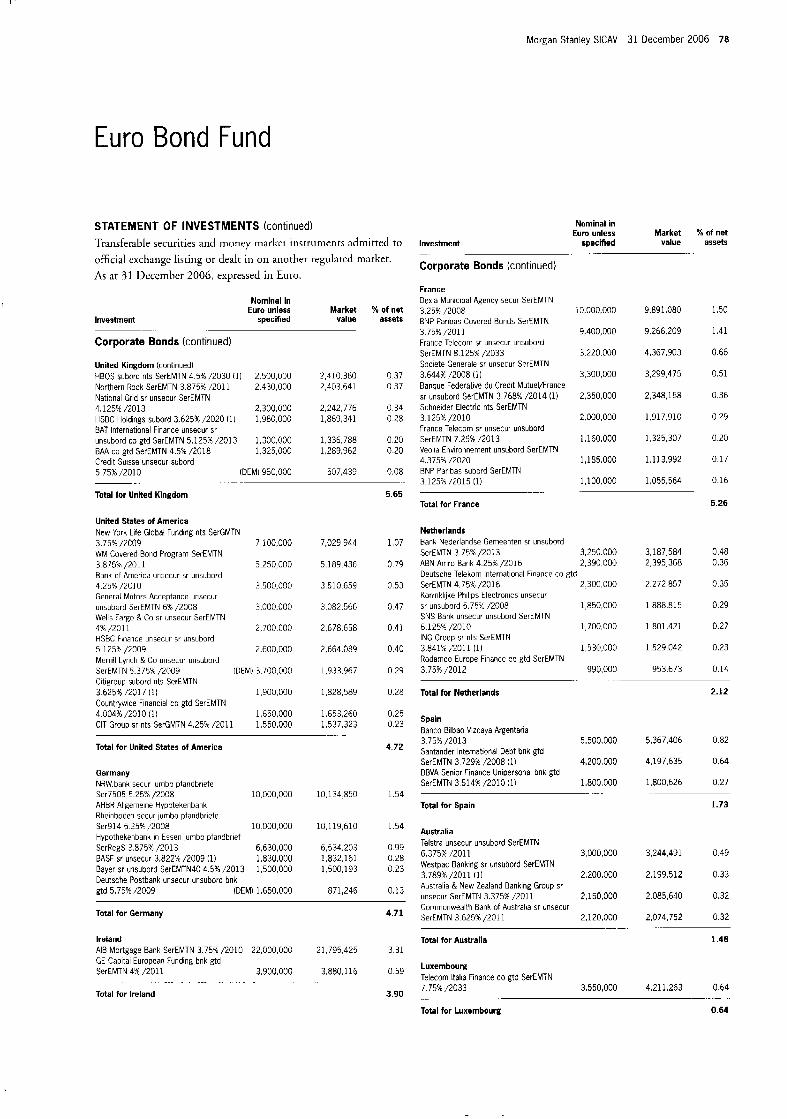
Morgan Stanley SlCAV 31 December 2006 78
Euro Bond Fund
STATEMENT OF INVESTMENTS (continued) Transferable securities and money rnarkct iriscruments adiiiitted to offici;il cxcharrgc listing or dealt in on another regul:itcd market. As at 31 13ccc.rnhcr 2006, expressed in Euro.
Nominal in Euro unless Market % of net
Investment specified value assets
Corporate Bonds (continued)
United Kingdom (continued) HEOS subord nts SerEMTN 4.5% /2030 (1) 2.500,OOO 2.410.360 0.37 Northern Rock SerEMTN 3.875% /2011 2,430,000 2,403.641 0.37 National Grid 5r unsecur SerEMTN 4.125% /2013 2.300.00C 2,242.77E 0.34 HSBC Holdings subord 3.625% /2023 (1) 1.980.000 1,869,301 0 28 EAT International Finance unsecur sr unsubord LO gtd SerEMTN 5,125% /2013 1,300,000 1.336.788 0.20
Credit Suisse unsecur subord 5.75?0/2010 (DEM) 950,000 507.439 0.08
BAA co gtd SerEMTN 4.5% /2018 1,325,000 1,289,962 0.20
. . -. . .
Total for United Kingdom
United States of America New Yurk Life Global Funding nts SerGMTN 3.75"4 /2C09 7,lOC.OOO WM Covered Bond Program SerEMTN 3.875'70 /2011 5.250.000 Bank of America unsecur 5r unsubord 4,25Y~ /2C10 3,500,090 General Motors Acceptance unsecur unsubord SerEMTN 6% /2008 3,000.000 Wells Fargo & Co sr unsecur SerEMTN 41:/2011 2,700.COO HSBC Flnaice unsecur 51 unsubord 5.125% /ZOO9 2.600,OOO Merrill Lynch & Co unsecur unsubord SerEMTN 5.375Y0 /2009 (OEM) 3.70C.00C Citigroup subord nts SerEMTN 3.625%/2017 (1) 1,900.000 Countrywice Financial co gtd SerEMTN 4.004a4 /2010 (1) 1,650,000 CIT Group sr nts SerGMTN 4,259~ /2011 1,550,000
Total for United States of America
Germany NRW.bank secur jumbo pfandbriefe Ser7505 E..25% /2008 10,000,000 AHBR Allgemeine Hypotekenbank Rheinbodei secur jumbo pfandbriefe Ser914 5.254: /2008 10.000.000 Hypothekenbank in Essen jumbo pfandbrief SerRegS 2.875% /2013 6,630,000 BASF sr unsecur 3.822% /2009 (1) 1,830.000 Bayer sr uisubord SerEMTN40 4.5% /2013 1,500,000 Deutsche Postbank unsecur unsubord bnk gtd 5.75% /2009 (DEM) 1.650.000
7,029,944
5,189,436
3,510.659
3,082,566
2,678,658
2.664.089
1,933.967
1,828,589
1,653,260 1.537.323
..
10.134.850
10,119,610
6334.203 1.832.161 1.500,193
871,246
5.65
1.07
0.79
0.53
0.47
0.41
0.40
0.29
0.28
0.25 0 23
4.72
1.54
1.54
0.99 0.28 0.23
0.13
Total for Germany 4.71
Ireland AIB Mortgage Bank SerEMTN 3.7536 /201G 22,000.000 21,795.425 3.31 GE Capital European Funding bnk gtd SerEMTN 4% /2011 3.900.000 3,880.116 0 59
Total for Ireland 3.90
.. . . . . . . . . . .
Nominal in Euro unless Market % of net
Investment specified . .~ -.
Corporate Bonds (continued)
France Oexia Municipal Agency secur SerEMTN 3.25% /2008 ENP Paribas Covered Bonds SerEMTN 3 759; /2011 Frarice Telecom sr unsecur unsubord SerEMlN 8.125% /2033 Societe Generale sr unsecur SerEMTN 3.644% /2008 (1) Banque Federative du Credit Mutuelflrance sr unsubord SerEMTN 3 768%, 1'2014 (1) Schneider Electric nts SerEMTN 3.125% /2010 France Telecom sr urisecur unsubord SerEMTN 7 75% 1'2013 Veolia Environnement unsubord SerEMTN 4.375% /2020 BNP Paribas subord SerEMTN 3.125% /2015 (1)
13,000,000
9.400,OOO
3,220.000
3,300,000
2,350,000
2.000,000
1.160,OOO
1,185,000
1,100.000
Total for France
Netherlands Bank Nederlandse Gemeenten sr unsubord SerEMTN 3 75'4 /2013 3.250.000 ABN Amro Bank 4.25% /2016 2.390.000 Deutsche Telekom International Finance co gtd SerEMTN 4.75% /2016 2.300,OOO Koninklijke Philips Electronics unsecur sr unsubord 5.75% /ZOO8 1,850,000 SNS Bank unsecur unsubord SerEMTN 6.125%/2010 1,700,000 ING Groep sr nts SerEMTN 3.841%;2011 (1) 1,530,000 Rodamco Europe Finance co gtd SerEMTN 3.75% /2012 990,000
value
9,891,080
9.266.209
4,367,903
3,299 415
2,348,158
1.917.910
1,325,307
1.1 13.992
1,055,564
3,187,584 2,395,368
2 . 2 7 2 m
1,888,815
1,801,421
1,529,042
953.673
assets .-
1.50
1.41
0.66
0.51
0.36
0 29
0.20
0.17
0.16
5.26
0.48 0.36
0.35
0.29
0.27
0.23
0.14
Total for Netherlands 2.12
Spain Banco Bilbao Vizcaya Argentaria 3 75% /2013 5.500.000 5,367,406 0.82 Santander lriternational Debt bnk gtd
0.64 SerEMTN 3 72977 /2008 (1) BBVA Senior Finance Unipersonal bnk gtd SerEMTN 3 514% /2010 (1) 1.800,OOO 1.800.626 0.27
Total for Spain 1.73
4.200.000 4,197,635
- ... .
Australia Telstra unsecur unsubord SerEMTN 6.375% /2011 3,000,000 3,244,491 0.49 Westpac Banking sr unsubord SerEMTN 3.789%/2011 (1) 2,200,000 2,199,512 0.33 Ailstralia & New Zealand Banking Group sr unsecur SerEMTN 3.375% /2011 2,150,000 2,085,640 0.32 Commonwealth Bank of Australia sr unsecur SerEMTN 3.6259 /2011 2,120,000 2,074,752 0.32
Total for Australia 1.46
Luxembourg Telecom ltalia Finance co gtd SerEMTN 7 75% /2033 3,550,000 4.211.263 0 64
Total for Luxembourg 0.64
- . ..
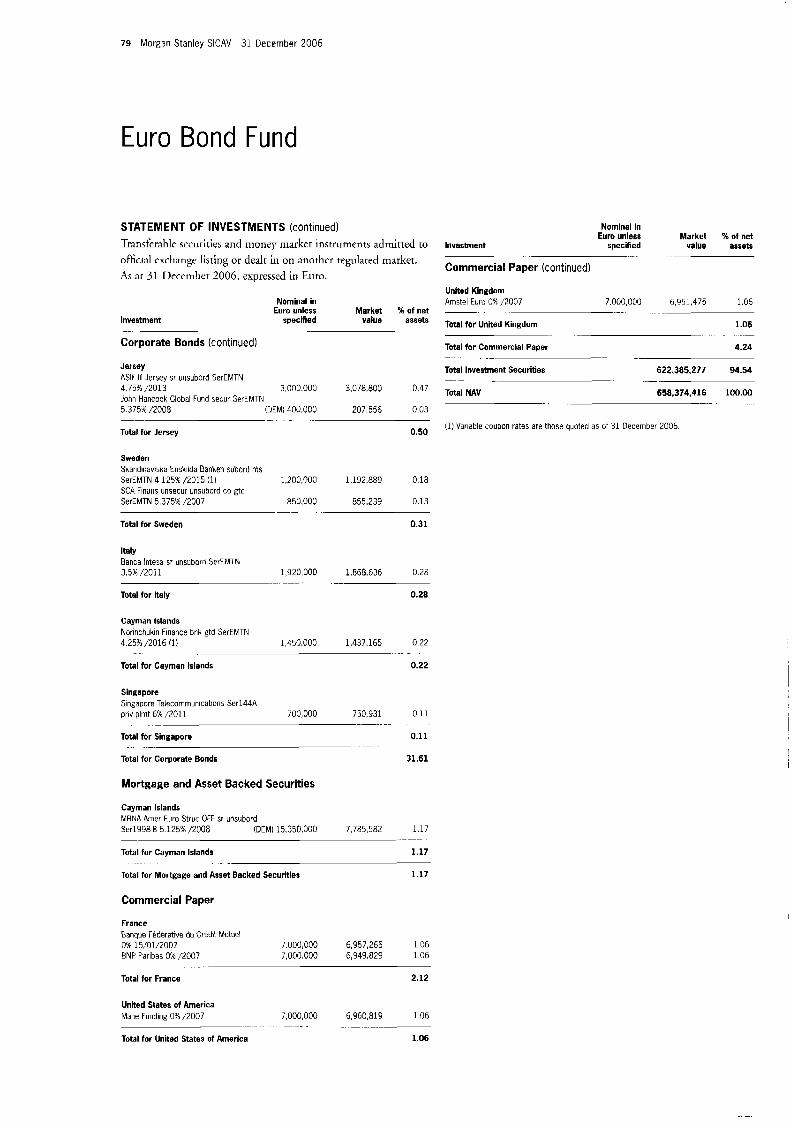
7 9 Morgan Stanley SlCAV 31 December 2006
Euro Bond Fund
STATEMENT OF INVESTMENTS (continued) Transferable sccurities and money iiiarket instrumcnts admitted to official cxchangc listing or dealt in on anothcr regulated market. As ar 3 1 Deccrnlicr 2006, expressed in Euro.
Nominal in Euro unless Market 96 of net
Investment specified value assets ... . .
Corporate Bonds (continued)
Jersey ASlF Ill Iersey sr unsubord ScrEMTN 4.736 /2013 3,000.000 3,078,800 0.47 John Hancock Global Fund secur SerEMTN 5.375% /ZOO8 (OEM) 400,OCO 207,556 0.03
Nomlnal in Euro unless Market 56 of net
Investment Specified value assets
Commercial Paper (continued)
United Kingdom 1 06 Amstel Euro 0% /2007
Total tor United Kingdom 1.06
Total for Commerclal Paper 4.24
7 000,000 6,951 475 ~ .- _.
-
- .- -
Total Investment Securities ~22,3a5.277 94.54 -. _ _
Total NAV 658,374,416 100.00
_- . . . . . . . . .
o,50 (1) Variable coupon rates are those quoted as of 31 December 2006.
Total for Jersey
Sweden Skandinavlska Enskilda Banken subord nts SerEMTN 4.125%/2015 3 ) : ,200,000 1.192.889 0.18 SCA Finaris unsecur unsubord co gtd SerEMTN 5.375% /2007 850,000 855,239 0.13
Total for Sweden 0.31
- . ..
Italy Banca lntesa 5r unsubord SerEMTN 3,5% /20 1 1 1,920.000 1,868,636 0.28
Total for Italy 0.28
...... .. .
Cayman Islands Norinchukin Finance bnk gtd SerEMTN 4 25%/2016 (1) 1,450,000 1,437,165 0 22
Total tor Cayman Islands 0.22
....
Singapore Singapore Telecommunications Ser144A priv plnit 6% /2011 700,000 750,931 0 11
Total tor Singapore 0.11
Total for Corporate Bonds 31.61
.. . ._
. __
Mortgage and Asset Backed Securities
Cayman Islands MENA Amer Euro Struc OFF sr unsubord Ser1998B 5.125% /2008 (OEM) 15,350,000 7,785,582 1.17
Total for Cayman Islands 1.17
Total tor Mortgage and Asset Backed Securities 1.17
..
Commercial Paper
France Banque Federative du Credit Mutuel 0% 15,’01/2007 7,000,000 6,957,265 1 06 BNP Paribas 0% /2007 7,000 000 6.949.829 1 0 6
Total for France 2.12
United States of America Mane Funding 0% /2007 i.OO0,OOO 6,960,819 1.06
Total for United States of Amerlea 1.06
........... . . -. ........... ~
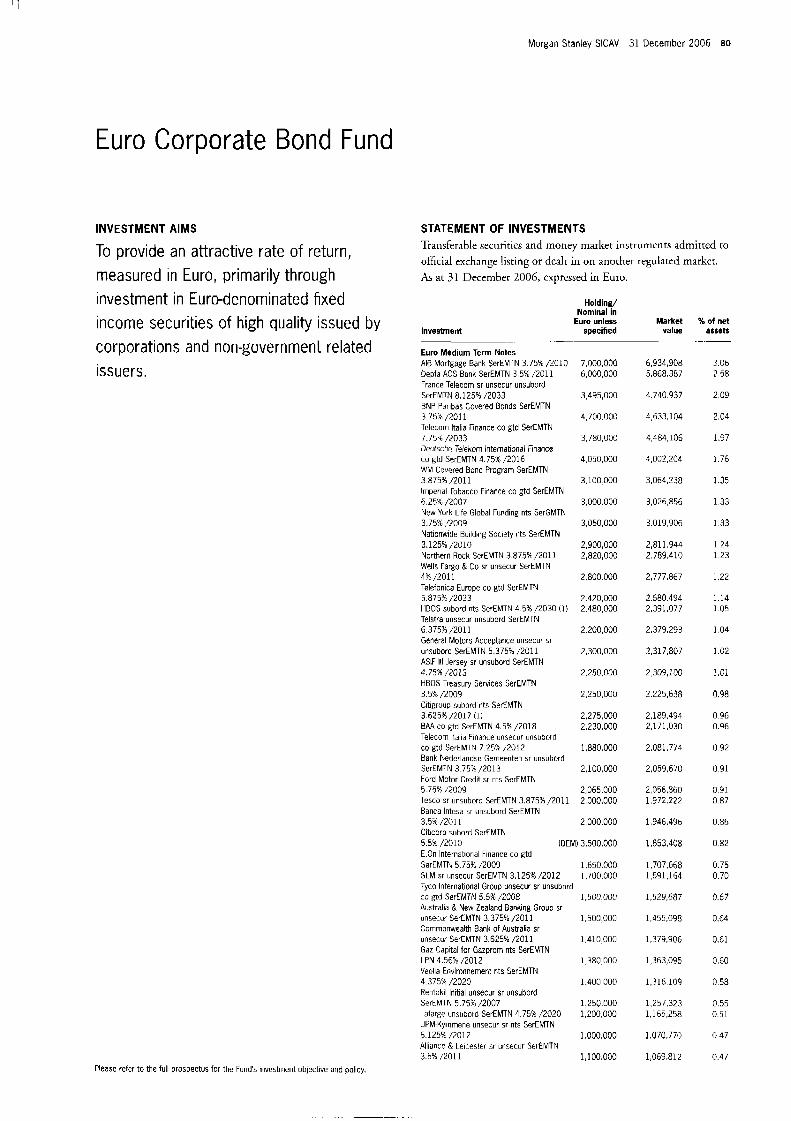
Morgan Stanley SICAV 31 December 2006 80
Euro Corporate Bond Fund
INVESTMENT AIMS STATEMENT OF INVESTMENTS Transferable securitics and money market inStrUmctltS admitted to official exchange listing or dealc in on another regulated marker. As at 31 December 2006, cxprcssed in Euro.
To provide an attractive rate of return, measured in Euro, primarily through investment in Euro-denominated fixed income securities of high quality issued by corporations and non-government related issuers.
Please refer to the full prospectus for the Fund's investment objective and policy.
. . .. . .
Holding/ Nominal in
Euro unless Market specified value
.
Euro Medium Term Notes AIB Mortgage Bank SerEMTN 3.754: /2010 Depfa ACS Bank SerEMTN 3.5% /2011 France Telecom sr unsecur unsubord SerEMTN 8.125% /2033 BNP Paribds Covered Bonds SerEMTN 3.755 /2011 Telecom ltalia Finance co gtd SerEMTN 7.75'4 /2033 Deutsche Telekom International Finance co ptd SerEMTN 4.75% /2016 WM Covered Bond Program SerEMTN 3 875% /2011 Imperial Tobacco Finance co gtd SerEMTN 6.25% LO07 New York Life Global Funding nts SerGMTN 3.759: /2009 Nationwide Building Society nts SerEMTN 3.125%/2010 Northern Rock SerEMTN 3.875% /2011 Wells Fargo & Co sr unsecur SerEMTN 4%/2011 Telefonica Europe co gtd SerEMTN 5.875% /2033 HBOS subord nts SerEMTN 4.5% /2030 (1) Telstra unsecur imsubord SerEMTN 6 375%/2011 General Motors Acceptance unsecur sr unsubord SerEMTN 5.375% /2011 ASlF Ill Jersey sr unsubord SerEMTN 4.75% /2013 HBOS Treasury Services SerEMTN 3.59; /2009 Citigroup subord nts SerEMTN 3.625% /2017 (1) BAA co gtd SerEMTN 4.5% /2018 Telecom ltalia Finance unsecur unsubord co gtd SerEMTN 7.2531;2012 Bank Nederlandsc Gemeenten sr unsubord SerEMlN 3.753 /2013 Ford Motor Credit sr nts ScrEMTN 5.75% /2009 Tesco sr unsubord SerEMTN 3.875% /2011
7,000,000 6,000,000
3,495,000
4,700.000
3,780,000
4,050,000
3.100.000
3.000.000
3,050,000
2,900,000 2,820,000
2,800.000
2.420.000 2,480,000
2.200.000
2,300,000
2,250,000
2,250,000
2,275,000 2.230.000
1,880,000
2,100.000
2,065,000 2,000.000
Banca lntesa sr unsubord SerEMTN 3.5% /2011 2.000.000 Citlcorp subord SerEMTN 5 5% /2010 (DEM) 3,500,000 E.On International Finance co gtd SerEMTN 5.75% /2009 1,650,000 SLM sr unsccur SerEMTN 3.1259: /2012 1,700,000 Tyco International Group Jnsecur sr unsubord ca gtd SerEMTN 5.5% /2008 1.500.000 Australia & New Zealand Banking Group sr unsecur SerEMTN 3.375% /2011 1,500,000 Commonwealth Bank of Australia sr unsecur SerEMTN 3.625% /2011 1,410,000 Gaz Capital for Gazprom nts SerEMTN LPN 4,567~ 1'2012 1,380,000 Veolia Environnement nts SerEMTN 4.375% /2020 1.400,OOO Rentokil Initial unsecur sr unsubord SerEMTN 5.75% /2007 1,250,000 Lafarge unsilbord SerEMTN 4.75% /2020 1,200.000 UPM-Kymmene unsecur sr nts SerEMTN 6.125% /2012 1.000,000 Alliance & Leicester sr unsecur SerEMTN 3.5% /2011 1,100,000
6.934.908 5.868.387
4.740.937
4,633,104
4,484,106
4,002,204
3,064.238
3,026,856
3,019,906
2.81 1,944 2.789.410
2,777,867
2.580.494 2,391,077
2,379,293
2,317,807
2 309,100
2,225,638
2.189.494 2,171,030
2,081,774
2,059,670
2,056.860 1,972,222
1,946.496
1,853,408
1,707,668 1,591,164
1,523,687
1,455,098
1.379.906
1,363,095
1.316.109
1,257.323 1,165,258
1.070.770
1,069.812
% of net assets
3.06 2.58
2 09
2.04
1.97
1.76
1.35
1 33
I 3 3
1 2 4 1.23
1.22
1.14 1.05
1.04
1.02
1.01
0.98
0 96 0.96
0.92
0.91
0.91 0.87
0.86
0.82
0.75 0.70
0.67
0.64
0.61
0.60
0 58
0.55 0.51
0.47
0.47
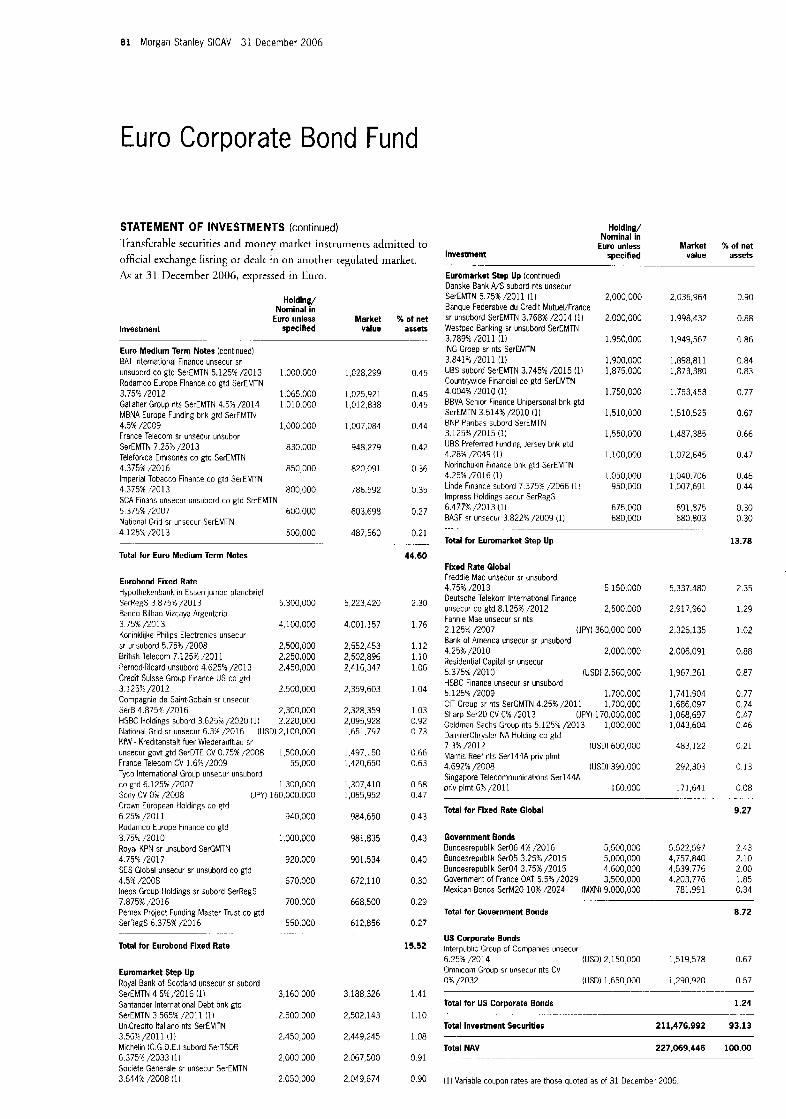
8 1 Morgan Stanley SICAV 31 December 2006
Euro Corporate Bond Fund
STATEMENT OF INVESTMENTS (continued) 'l 'r: insfcrahle sec i i r i t i es and money marltct i n s t r u m e n t s a d m i t t e d to
ofticia1 e x c h a n g e l i s r i n g or dealt in on a n o t h e r r e g u l a t e d m a r k e t .
As at 31 necernher 2006, expressed in Euro.
H o I d i n e/ Nominal in
Euro unless Market 56 of net Investment specified value assets
.....
Euro Medium Term Notes (continued) BAl International Finance unsecur sr unsubord co gtd SerEMTN 5.1259: /2013 1,000,000 Rodamco Europe Finance co gtd SerEhlTN 3.75F /2012 1.065,000 Galaher Group nts SerEMTN 4.5% /2014 1,010.000 MBNA Europe Funding bnk gtd SerEMTN 4.5% 1'2009 1,000.000 France Telecom sr unsecur unsubor SerEMTN 7.2573 /2013 830,000 Teleforiica Errrisones co gtd SerEMTN 4.3751 2 0 1 6 850,000 Imperial Tobacco Finance co gtd SerEMTN 4.375% ./2013 800,000 SCA Finans unsecur unsubord co gtd SerEMTN 5.375% /2007 600.000 National Grid sr unsecur SerEMTN 4.125X/7013 500.000
Total for Euro Medium Term Notes
Eurobond Fixed Rate Hypothekenbank in Essen jumbo pfandbrief SerRegS 3.8757; /2013 5.300,OOO Banco Bilbao Vizcaya Argentaria 3.759;/2013 5,100.000 Korinklijke Philips Electronics unsecur sr unsubord 5.75% /2008 2,500,000 British Telecom 7 125% /2011 2,250,000 Period-Ricard unsubord 4.625% /2013 2,450.000 Credit Suisse Group Finance US co gtd 3.1 2 5% /20 1 2 2.500.000 Conpagnie de Saint-Gobain sr unsecur Sera 4.875"I /2016 2,300,000 HSBC Iioldings subord 3.6251 /2020 (11 2.220.000 National Grid sr unsccur 6.3% 1'2016 (USD) 2,100,000 KflZ: - Kreditanstalt fuer Wiederarifbau sr unsccur govt gtd SerDTE CV 0.759: /2008 1,500,000 France Telecom CV 1.6% /2009 55,000 Tyco International Group unsecur unsiihord co gtd 6.125% /2007 1.300,OOO SOW CV 0% /2008 (JPYI 160.000.000 Crom European Holdings co gtd 6 25% /2011 Rodamco Europe Finance co gtd 3 759ci2010 Royal KPN sr unsubord SerGMTN 4 75% /2017 SES Global unsecur sr iinsubord co gtd 4.5% /2008 lneos Group Holdings sr subord SerRegS 7,875% 12016 Peniex Project Funding Master Trust co gtd SerqegS 6.37596 ;2016
Total for Eurobond Fixed Rate
. ..
Euromarket Step Up Royal Bank of Scotland ursecur sr subord SerEMTN 4 5% /2016 (1) Santander International Debt bnk gtd SerEMTN 3.565% /2011 :1) UniCredito ltaliano nts SerEMrN 3.569;/2011 (1) Micheliii (C G 0 E.) subord SerTSDR 6.3758 /2333 (1) Societe Generale sr unsecur SerEMTN 3.654% /2008 (11
940,000
:.000,000
920.000
670.000
700 000
550.000 ..
3,160 000
2.500,OOO
2,450,000
2 000 000
2 050,000
1,C,28,299
1.025.921 1,012,838
1,007,084
948,279
820,091
786.592
603,698
487,560
5,223,420
4.001.157
2,552,453 2.502.896 2,416.347
2.359.603
2.328.359 2,095,928 1.651.797
1,497,150 1,420,650
1,307,410 1,065,952
984,650
981,835
901,534
672,110
668.500
612,856
3,188,326
2,502,143
2,449,245
2,067,500
2,049,674
0.45
0.45 0.45
0.44
0.42
0.36
0.35
0.27
0.21
44.60
2.30
1.76
1.12 1.10 1.06
1.04
1.03 0.92 0.73
0.66 0.63
0.58 0.47
0 43
0.43
0.40
0.30
0.29
0.27
15.52
1.41
1.10
1.08
9.91
0.90
Holding/ Nominal in
Euro unless Market % of net Investment specified value assets
_. . ..
Euromarket Step Up (continued) Danske Bank A/S subord nts unsecur Ser€MTN 5 75%/2011 (1) Banque Federative du Credit Mutuel/France sr unsubord SerEMTN 3.768%/2014 (11 Westpac Banking sr unsubord SerEMTN 3.789% /2011 (11 ING Groep sr nts SerEMTN 3.841% /2011 (1) UBS subord SerEMTN 3.745% /2015 (1) Countrpvide Financial co gtd SerEMTN 4.004%/2010 (1) BBVA Senior Finance Unipersonal bnk gtd SerEMTN 3.514% /2010 11) BNP Paribas subord SerEMTN 3.1259:/2015 (11 UBS Preferred Funding Jersey bnk gtd 4.28% /2049 (1) Norinchukin Finance bnk gtd SerEMTN 4.25%,'2016 (1) Linde Finance subord 7.375% /2066 (l! Impress Holdings secur SerRegS 6.4779: /2013 (1) BASF sr unsecur 3.822% /2009 (1)
Total for Euromarket Step Up
. -. ... .
2,000,000
2.000,000
1.950.000
1,900,000 1,875,000
1.750,OOO
1,510,000
1,550,000
1.100.000
1,050,000 950,000
675,000 680,000
2,036,964
1.998.432
1,949,567
1,898,811 1,873,380
1.753.458
1.510.525
1,487,385
1,072,645
1,040.706 1.007.691
691,875 680.803
Fixed Rate Global Freddie Mac unsecur sr unsubord 4.75% /2013 5.1 50,000 Deutsche Telekom International Finance unsecur co gtd 8.125% E 0 1 2 2,500.000 Fannie Mae unsecur sr nts 2.1256 /2007 (JPYI 360,000,000 Bank of America unsecur sr unsubord 4.25%/2010 2,000,000 Residential Capital sr unsecur 6.375% /2010 (USD) 2,560,000 HSBC Finance unsecur sr unsubord 5.125% /2009 1,700.000 CIT Group sr nts SerGMTN 4.25% /2011 1,700,000 Sharp Ser20 CV 0% /2013 (JPY) 170,000,000 Goldman Sachs Group nts 5.125% /2013 1,000.000 DaimlerChrysler NA Holding co gtd 7.3% /2012 (USDI 600,000 Mantis Reef nts Ser144A priv plmt 4.692% /2008 (USD) 390.000 Singapore Telecommunications Ser144A priv plmt 6% /2011 160.000
5.337.480
2,917,960
2,326,135
2.006.091
1,967.261
1.741.904 1,686,097 1,068,697 1,043,604
483,122
292,303
171,641
Total for Fixed Rate Global
Government Bonds Bundesrepublik Ser06 4K /2016 5 500,000 Bundesrepublik Ser05 3.25% /2015 5,000,000 Bundesrepublik Ser04 3.75% /2015 4,600,000 Government of France OAT 5 5% /2029 3,500,000 Mexican Bonos SerM2O 10% /2024 (MXN) 9,000,000
5522,597 4,757,840 4,539.776 4.203.776
781,991
0.90
0.88
0 86
0.84 0.83
0.77
0.67
0 66
0.47
0.46 0.44
0.30 0.30
13.78
2.35
1.29
1.02
0.88
0.87
0.77 0.74 0.47 0 46
0.21
0.13
0.08
9.27
2.43 2.10 2.00 1.85 0.34
. .-
Total for Government Bonds 8.72
US Corporate Bonds Interpublic Group of Companies unsecur 6.25% /2014 (USD) 2.150 000 1,519.578 0.67 Omnicom Group sr unsecur nts CV 0% /2032 (USD) 1,650 000 1,290,920 0 57
Total for US Corporate Bonds 1.24
Total Investment Securities 211,476,992 93.13
Total NAV 227,069.446 100.00 . . . - -_
11) Variable coupon rates are those quoted as of 31 Decembe, 2006
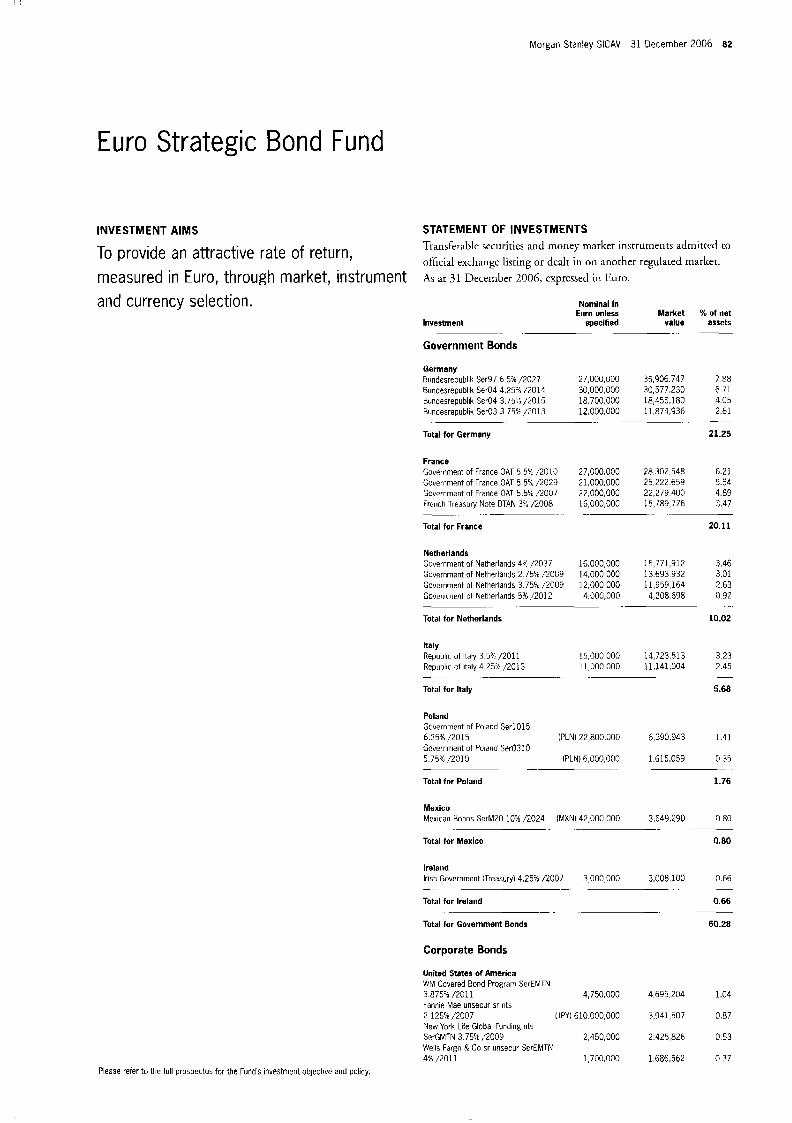
I !
Morgan Stanley SICAV 31 December 2006 82
Euro Strategic Bond Fund
INVESTMENT AIMS STATEMENT O f INVESTMENTS Ti-ansfer;iblc securities and money market instrutnents admitted to
official exchangc listing or dealt in on anocher regulaied marker. To provide an attractive rate of return, measured in Euro, through market, instrument A$ 31 Deceinber 2006, expressed in Euro.
and currency selection. Nominal in Euro unless Market X of net
value assets Invesiment specified
Government Bonds .- - -
Germany Bundcsrepublik Ser97 6 YA /2027 27,000,000 35,906 747 7 88 Bundesrepublik Ser04 4 25% /2014 30,000,000 30,577,230 6 71 Bundpsrepublik Suo4 3 75% /2015 18 700,000 18,455,180 4 05 Bundesrepublik Ser03 3 75% /2013 12 000,000 11,874,936 2 6 1
Total for Germany 21.25
. - __
France Government of France OAT 5.5"4 /2010 27,000,000 28.302.548 6.21 tiovernment of France OAT 5.51/2029 21,000,000 25.222.659 5.54 Government of France OAT 5.5% /2007 22,000,000 22273.400 4.89 French Treasury Note BTAN 3% /ZOO8 16.000,OOO 15,789,776 3.47
Total for France 20.11
-- . - - . .. - --
Netherlands Government of Netherlands W /2037 16.000.000 15,771,912 3.46 Government of Netherlands 2.75% /20C9 14.000.000 13.693.932 3.01 Government 01 Netherlands 3 75% /2009 12,000.000 11,959,164 2.63 Government 01 Netherlands 5p6 /2012 4.000.000 4,208,698 0.92
Total for Netherlands 10.02
. ... .. ..
Italy Republic of Italy 3.5% /2011 15.000.000 14,723,513 3.23 Republic of Italy 4.25% /2013 11,000,000 11,141,004 2.45
Total for Italy 5.68
- .~ .
Poland Guvernment of Poland SerlOl5 6.25% /2015 (PLN) 22,800,000 6.390.943 1.41 Gwernment of Poland Ser0310 5.75% /2010 (PLN) 6,000,000 1.615.059 0.35
.- - .. - .
Total for Poland
Mexico Mexican Bonos SerM20 10% /2024 (MXN) 42,000.000 3,649,290
Total for Mexico
-. -.
Ireland Irish Government (TreasLry) 4.25% /2007 3.000,OOO 3.008.100
Total for Ireland
Total for Government Bonds
- -. . . .
-_
Corporate Bonds
United States of America WM Covered Bond Program SerEMTN 3.875'4 /2011 4,750,000 4.695.204 Fannie Mae unsecur sr nts 2.1255; 12007 (JPY) 610.000.000 3,941,507 New York Life Global Funding nts SerGMfN 3.759f ;2009 2,450,000 2,425,826 Wells Fargo R Co sr unsecur ScrEMTN 4% /2011 1,700.000 1,686562
Please refer to the full prospectus for the Fund's investment objective and policy.
1.76
0.80
0.80
0.66
0.66
60.28
1.04
0.87
0 53
0.37

83 Morgan Stanley SICAV 31 December 2006
Euro Strategic Bond Fund
STATEMENT OF INVESTMENTS (continued) Transferable securicics a n d money marker instruments admirrcd to
official eXChdllge listing or dealc in on another regulated market. As at 31 Decerrrlwr 2006, expressed in Euro.
Nominal In Euro unless Market 96 of net
Investment specMed value assets
Corporate Bonds (continued) - ._ - ~.
United States of America Icontiwed) Citigroup subord nts SerEMTN 3.625%/2017 (1) 1.520,OOO CIT Group sr nts SerGMTN 4.25% /2011 1,420.000 General Motors Acceptance unsecur sr unsubord SerEMTN 5.375% /2011 1,350,000 Residential Capital LO gtd 5.125Ya /2012 1,200,000 Comtrywide Financial co gtd SerEMTN 4.004X/2010 (1) 1,200,000 Ford Motor Credit sr nts SerEMTN 5.75% /2009 1,195.000 General Motors Acceptance unsecur unsubord SerEMTN 6% /2008 1,110,000 Interpublic Group of Companies unsecur 6.25% /2014 (USD) 1,425,000 Bank of America unsecur sr unsubord 4.2550 /2010 1,000,000 Merrill Lynch & Co unsecur unsubord SerEMTN 5.375% /2009 (OEM) 1,810,000 Omnicom Group sr unsecur nts CV O W /2032 (USDi 1.200,OOO Owens Brockway Glass Container co gtd 6.75% /2014 700.000 Huntsman International sr subord nts SerEXCH 10.125% /2009 592,800 Echostar DES co gtd 6.62% 12014 (US01 800,000 HSBC Finance unsecur sr unsubord 5.125% /2009 300,000 Interpublic Group of Companies 5.4% /2009 (USD) 350,000 Bank of America sr unsecur unsubord 3.625% ,‘2008 250,000
Total for United States of America
..
United Kingdom HBOS Treasury Services SerEMTN 3.57% /2009 4,750,000 Northern Rock SerEMTN 3.875% /2011 2.160,OOO Alliance IL Leicester sr unsecur SerEMTN 3.5% /2011 1,650,000 HSBC Holdings subord 3.625% /2020 (1) 1,570,000 Royal Bank of Scotland unsecur sr subord SerEMTN 4.5% /2016 (1) 1,450,000 National Grid sr unsecur SerEMTN 4 1255/2013 1,500,000 Tesio sr unsubord SerEMTN 3.875% /2011 i.480.000 HBOS siibord nts SerEMTN 4.5% /2030 (1) :.490,000 British Telecom 7.125% /2011 1.100,000 Experian Finance sr unsecur nts SerEMTN 4.125% /2007 1,210.000 BAT International Finance unsecur sr unsiibord co gtd SerEMTN 5 125% /2013 1,140.000 BAA co gtd SerEMTN 4.5% /2018 1,100.000 MBNA Europe Funding bnk gtd SerEMTN 4.5% /2009 300.000 Nationwide Biiilding Society nts SerEMTN 3.125% /2010 900,000 lneos Group Holdings sr subord SerRegS 7.875% /2016 745,000 Gall3her Group nts SerEMTN 4.5% /2014 670,000 Rentirkil Initial unsecur sr unsubord SerEMTN 5.7577 /2007 600,000
1 462 871 1,408,387
1,360,452 1,206,704
1,202,371
1,190,289
1,140,549
1,007,161
1,003 046
946,076
938,851
705.250
604.656 591,497
307,395
261,806
248,813 .. -
4,698,569 2.136.569
1,604,718 1,482.255
1,462,998
1,462,680 1,459,444 1,436,575 1.223.638
1.210.019
1 , I 72,260 1,070,912
936.375
872.672
711.475 671,883
603.515
0.32 0.31
0.30 0.26
0.26
0.26
0.25
0.22
0.22
0.21
0.21
0.15
0.13 0.13
0.07
0.06
0.05
6.22
1.02 0.46
0.35 0.33
0.32
0.32 0.32 0.32 0.27
0.27
0.26 0.24
0.20
0.19
0.16 0.15
0.13
Nominal in Euro unless
Investment specified ~- .
Corporate Bonds (continued)
United Kingdom Irontinued) Imperial Tobacco Finanre co gtd SerEMTN 4 375% /2013 550 000 MBNA Europe Funding bnk gtd SerEMTN 6 5% /2007 450,000 Pearson 6 125% 12007 425,000
Total for Unlted Kingdom
~ .-
France BNP Paribas Covered Bonds SerEMTN 3.759: /2011 Societe Generale sr unsecur SerEMTN 3.644% /2008 (1) France Telecorn sr unsecur unsubord SerEMTN 8.125% 12033 Lalarge unsubord SerEMTN 4.75% /2020 France Telecom CV 1.6K /2009 Banque Federative du Credit MutuelFrance sr unsubord SerEMTN 3.768% /2014 11) Compagnie de Saint-Gobain sr unsecur SerE 4.875% /2016 Pernod-Ricard unsubord 4.625% j2013 Michelin (C.G.D.E.) subord SerTSDR 6.375% /2033 11) France Telecom !insecu‘ sr unsubord SerEMTN 7.25% /2013 Crown European Holdings co gtd 6.25%/2011 Schneider Electric nts SerEMTN 3.125% /2010 Veolia Environnement unsubord SerEMTN 4.375% /2020 BNP Paribas subord SerEMTN 3 12536/2015 I11
Total for France
.... .
6.650.000
2,450.000
1,400.000 1,510,000
56,200
1,450,000
1,400,000 1,400,000
1,150.000
1,030,000
1.105.000
1,200.000
1.100,000
1,000.000
Market % of net value assets
540,782 0.12
452,671 0.10 425.725 0.09
... .
5.62
6,555,350
2,449,610
1,899.088 1.466.282 1,451,646
1.448.863
1,417,262 1,380,770
1,188.813
1,176,781
1,157,488
1,150,746
1,034,085
959,604
1.44
0.54
0.42 0.32 0.32
0 32
0.31 0.30
0.26
0 26
0.25
0.25
0.23
0.21
Netherlands Bank Nederlandse Gemeenten unsecur sr unsubord 0.8% /2008 iJPY) 810.000.000 Bank Nederlandse Gerneenten sr unsubord SerEMTN 3.75% /2013 2,900,000 Deutsche Telekorn International Finance co gtd SerEMTN 4.75‘5 /2016 1,450,000 ABN Amro Bank 4 25% /2016 1,410,000 ING Groep sr nts SerEMTN 3.841%/2011 11) 1.410.000 Telefonica Europe co gtd SerEMTN 5.8752/2033 1,100.000 Royal KPN sr unsubord SerGMTN 4.75’4 /2017 900,000 Rodamco Europe Finance co gtd SerEMTN 3.75% /2012 700,000 Impress Holdings secur SerRegS 6.4771 1’2013 (1) 600,000 Koninklilke Philips Electronics unsecur sr unsubord 5.75% /2008 600,000 Linde Finance subord 7.375% /2066 (1) 560,000 Altadis Finance co gtd 4.25% /2008 500,000
Total for Netherlands
.... - -.
Ireland AIE Mortgage Bank SerEMTN 3 75% /2C10 10,500,000 GE Capital European Funding bnk gtd SerEMTN 4% /2011 2,200,000
Total for Ireland
.
5.43
5.169.569 1.15
2,844.306 0.62
1,432.888 0.31 1,413,167 0 31
1,409.1 17 0.31
1,172.952 0.26
881,936 0.19
674,314 0.15
615.000 0.13
612,589 0.13 594.007 0 13 500.099 0.11
3.80 . ..... .
10,402,362 2.28
2,188.783 0.48
2.76
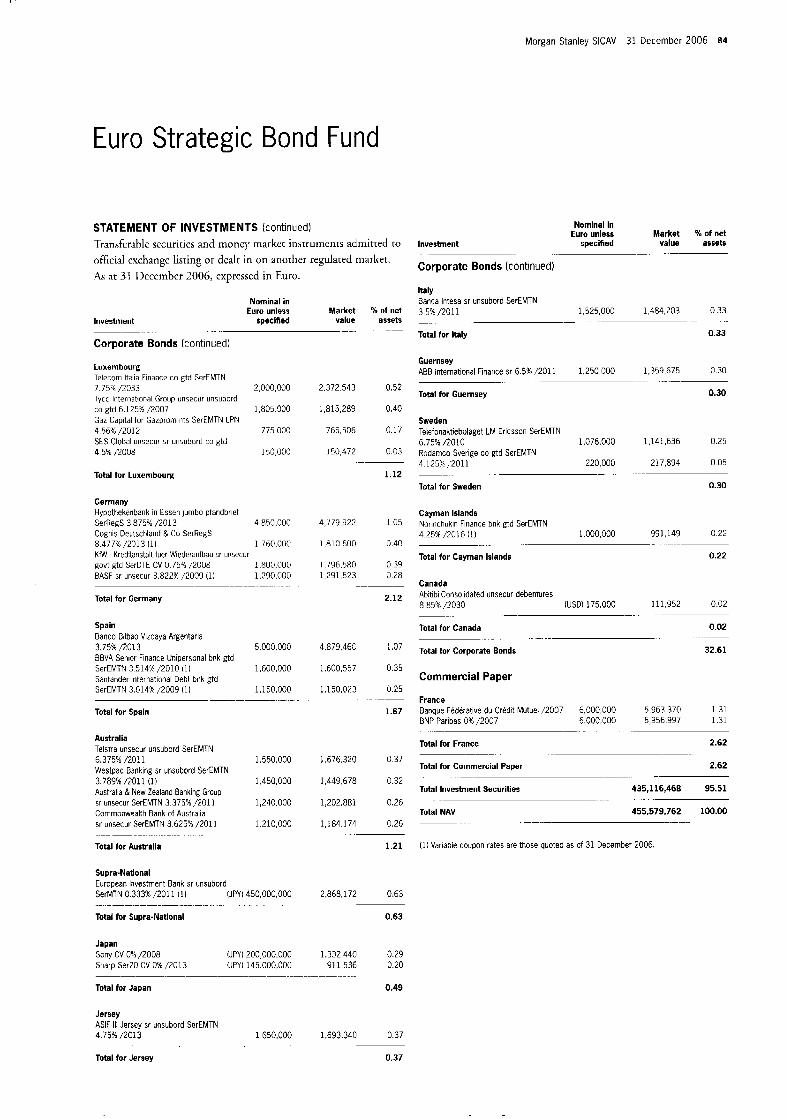
Morgan Stanley SICAV 31 December 2006 84
Euro Strategic Bond Fund
STATEMENT OF INVESTMENTS (continued) Tiansfcrablc securiries and money market instrurricrirs admitted to official exchange listing or dealt in on another regulaced market h s at 31 1)cccrnber 2006, expressed in h r o .
Nominal in Euro unless Market 56 of net
Investment speclned value assets .... -. ... ~- ....
Corporate Bonds (continued)
Luxembourg Telecom ltalia Finance co gtd SerEMTN 7.753 /2333 2.0011,OOO 2.372.543 0.52 Tyco lnternstronal Group unsecur unsubord co gtd 6.125% /2007 1,805.OOO 1.815,289 0.40 Gaz Capital for Gazprom nts SerEMTN LPN 4 , 5 w /2012 S t S Global unsecur sr unsubord co gtd 4 5% /2003 150,000 150.472 0.03
775.000 765,506 o . i i
_~ .. . .- ....
Total for Luxembourg
Germany Hypothekenbank in Essen jumbo pfandbrief SerRegS 3 875% /2013 4.850.000 Cognis Drulschland & Co SerRegS 8.477% /2013 (11 1.760.06C KV/ - Kreditanstall twr Wiederailfbau sr umecur god gtd SerDTE CV 0.75% /2008 ~.800.@00 BASF sr unsccur 3.822% /2003 (1) 1,290,000
Total for Germany
Spain Banco Bilbao Viccaya Argentarid 3.751/?013 5.000.000 BBVA Senior Finance Unipersonal bnk gtd SerEMTN 3.5148 /2010 ill 1,600,000 Saritarider International Deb1 bilk gtd SerEMTN 3.614% /2009 (:I 1,150,000
Total for Spain
Australia Telstra unsecur unsubord SerEMTN 6.375% /20! 1 1.550,OOO Westpac Bsnking sr unsubord SerEMTN 3.789%/2011 (1) 1,450,000 Australia &New Zealand Banking Group sr unsecur SerEMTN 3.375%/2011 1,240.000 Commonwealth Bank of Australia sr unsecur SerEMTN 3.625% /2011 1.210.000
Total tor Australla
Supra-National European lavestment Bank sr unsubord SerMTN 0.3331s /2011 (1)
Total for Supra-National
(JPYI 450,000,000 ... ___ .- - -. . . . . . . . . . .
Japan Sony CV 0% /2008 Sharp SerZO CV 0% /2013
(JPYI 200,G00.000 (JPY) 145.000.000
1.12
4,779.922 1.05
1.810.600 0.40
1.796.580 0 39 1.291.523 0.28
2.12
4,879.46: 1.07
1.600.557 0.35
1.150.0?? 0 25
1.67
1,676;.320 0.37
1,449,678 0.32
1,202,881 0.26;
1,184.1 74 0.26
1.21
2,868,172 0.63
0.63
1,332,440 0.29 91 1.536 0.20
Total for Japan 0.49
Jersey ASlF 111 Jersey sr unsubord SerEMTN 4 75% /2C13 1 650,000 1,693,340 0 37
Total for Jersey 0.37
_~
Nominal in Euro unless Market ?4 of net
Investment specified value assets _- - - -
Corporate Bonds (continued)
Italy Banca lntesa sr unsubord SerEMTN 3 5?/2011 1 525,000 1,484,203 0 33
Total for Italy 0.33
_- __ -.
Guernsey ABB International Finance sr 6.5% /2011 1,250,000 1.359.675 0.30
Total for Guernsey 0.30
~ .- -.
Sweden Telefonaktiebolaget LM Erirsson SerEMTN 6.75% /2010 1,076 000 1,141,636 0 25 Rodamco Sverige co gtd ScrEMTN
220 000 217,894 0 0 5 4125% 2011
Total for Sweden 0.30
. _- _-
Cayman Islands Norinchukin Finance bnk gtd SerEMTN 4 25% /2@16 (1) 1,000,000 991,149 0 2 2
_. ._ ...
Total for Cayman Islands 0.22
Canada Abitibi Consolidated unsecur debentures 8 85% 12030 iUSD1 175,000 111 952 0 02
Total for Canada 0.02
Total for Corporate Bonds 32.61
._ .- - ~.
...
Commercial Paper
France Banque Federative du Lredrt Mutuel/2007 6,000 000 5 963 370 1 3 1
1 3 1 BNP Paribas OK /2007
Total for France 2.62
Total for Commercial Paper 2.62
Total Investment Securities 435,116,468 95.51
Total NAV 455.579.762 100.00
5 000 000 5 956,997 _. _ _
__ __ -
__ _ .
._
__- - - _ .. ~.
(1) Variable couoon rates are those quoted as of 31 December 2006.
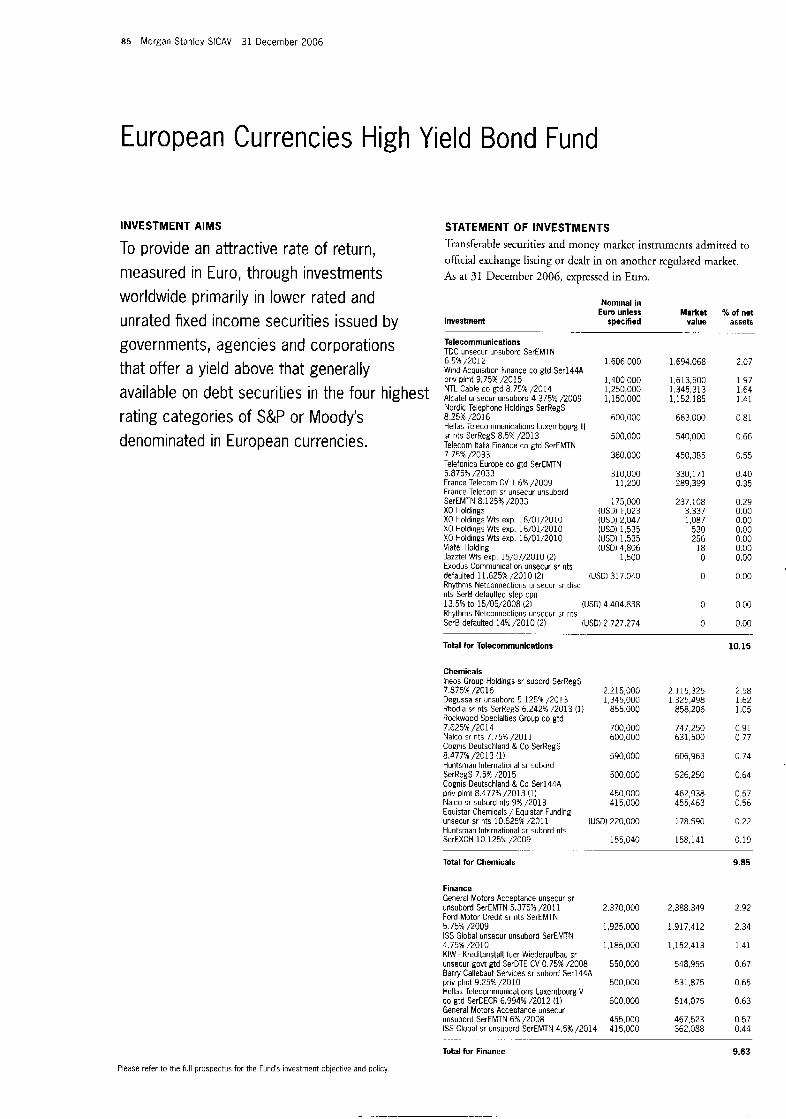
85 Morgan Stanley SICAV 31 December 2006
European Currencies High Yield Bond Fund
INVESTMENT AIMS
To provide an attractive rate of return, measured in Euro, through investments worldwide primarily in lower rated and unrated fixed income securities issued by govern men t s , agencies and corporations that offer a yield above that generally available on debt securities in the four highest rating categories of S&P or Moody's denominated in European currencies.
STATEMENT OF INVESTMENTS Transferable securities and money market instruments admitted to official exchange liscing or dealt in on anorher regularcd market. As at 31 Decemhcr 2006, expressed in Euro.
Investment .
Telecommunications TDC unsecur unsubord SerEMTN 6 591 /2012 Wind Acquisition Finance co gtd Ser144A priv plint 9.75% /2015 NTL Cable co a d 8 75% /2014 Alcatel unsecu;ursubord 4 375% /200Y Nordic Telephone Holdings SerRegS 8 2536 /2016 Hellas Telecommunications Ltixembourg 111 sr nts SerRegS 8.5% /2013 Telecom ltalia Finance co gtd SerEMTN 7 75% e 0 3 3 Telefonica Europe co gtd SerEMTN 5.875% /2033 France Telecom CV 1.6% /2009 France Telecom sr unsecur unsubord SerEMTN 8.125% /2033
Nominal in Euro unless
specified Market
value % of net
assets
1,606,000
1,400.000 1,250,000 1,150,000
600,000
500,000
380.000
310,000 11,200
175.000 XO Holdings IUSD) 1,023 XO Holdings Wts exp 16/01/2010 (USD) 2.047 XO Holdings Wts exp. 16/01/2010 (USD) 1,535 XO Holdings Wts exp 16/01/2010 (USD) 1,535 Viatel Holding IUSDI 4 RO6 . . . , . . .
1.500 Jazztel Wts exp. 15/07/2010 (2) Exodus Communication unsecur sr nts defaulted 11.625% /2010 (2) Rhythms Netconnections unsecur sr disc nts SerB defaulted step cpn 13.5% to 15/05/2008 (2) Rhvthms Netconnections unsecur sr nts
(USD) 317.040
(USD) 4,404.838
S&B defaulted 14% /2010 12) IUSD) 2.727.274
1,694,068
1,613,500 1,345,313 1,152.185
663.000
540.000
450,385
330,171 289.399
237.108 3.337 1,087
530 256
18 0
0
0
0
2.07
1.97 1.64 1.41
0.81
0.66
0.55
0.40 0.35
0.29 0.00 0 00 0.00 0.00 0.00 0.00
0.00
0 00
0.00 . .
Total for Telecommunications
Chemicals lneos Group Holdings sr subord SerRegS 7.875% DO16 2,215,000 Degussa sr unsubord 5.125% /2013 1,345,000 Rhodia sr nts SerRegS 6.242% /2013 (1) 855,000 Rockwood Specialties Group co atd ,~ 7.625% /2014 Nalco sr nts 7.75% /2011 Cognis Deutschland & Co SerRegS 8.477% /2013 (1) Huntsman International sr subord SerReaS 7.591 /2015 Cogni;Deutschland & Co Ser144A priv plmt 8.477% /2013 11) Nalco sr subord nts 9%/2013 Equistar Chemicals / Equistar Funding unsecur sr nts 10.625% /2011 Huntsman International sr subord nts SerEXCH 10.1251 /2009
Total for Chemicals
.. . ...
700,000 600.000
590,000
500.000
450.000 415,000
(USD) 220,000
155,040
2.115.325 1.325.498
858,206
747,250 631.500
606,963
526,250
462,938 455.463
178.590
158,141
10.15
2.58 1.62 1.05
0.91 0 77
0.74
0.64
0.57 0.56
0.22
0.19
9.85
Fin an c e General Motors Acceptance unsecur sr unsubord SerEMTN 5.375% /2011 Ford Motor Credit sr nts SerEMTN 5.75% /2009 ISS Global unsecur uiisubord SerEMTN 4.75% /2010 KtW - Kreditanstalt fuer Wiederaufbau sr unsecur govt a d SerDTE CV 0 75% /2008 550,000 548,955 0 67 Barry Callebaut Services sr subord Ser144A priv plmt 9.25% /2010 500.000 531,875 0 65
2,370,000 2,388.349 2.92
1,925,000 1.917,412 2.34
1,185,000 1,152,413 1 4 1
Hellas Telecommunications Luxembourg V co gtd SerDECR 6.994% 12012 (1) ~00.000 514,075 0.63 General Motors Acceptance unsecur unsubord SerEMTN 6% /2008 455,000 467,523 0.57 ISS Global sr unsubord SerEMTN 4.5% /2014 415,000 362,088 0.44
Total for Finance 9.63 .. . . .... .
Please refer tu the full prospectus for the Funds investment objective and policy
- . ._ ~

I '
Morgan Stanley SlCAV 31 December 2006 86
European Currencies High Yield Bond Fund
STATEMENT OF INVESTMENTS (continued) Transfer;ible sccurirics and money market instrummts adnlitrcd to official txchangc listing or dcalt in on another regulated markcr. As at 31 Decc-rntm 2006, expressed in Euro.
Investment
Forest Products Crown European Holdings co gtd 6.25%/2011 Clondalkin Industries sr nts Ser144A priv plmt 8% 2 0 1 4 Owens Brocksay Glass Container co gtd 6.75%/2014 Gerresheimer Holdings co gtd Ser144A priv plmt 7.875% /2015 Smurfit Kappa Funding iinsecur sr nts SerEUR 10 125%/2012 Smurht Kappa Funding sr subord 7.75% /2015 Graham Packaging subord rits 9.8751 2 0 1 4 Gerresheimer Holdings co gtd SerRegS
. . .
7.875~4 12015
Total for Forest Product
Nominal in Euro unless Market % of net
specified value assets
1.200.300
700,308
725,000
550 000
485,000
450.000
(USD) 315.300
185.300
i.751.300
141.125
730,438
566.500
528,650
455.625
242,555
190.550
1.53
0 91
0 89
0.69
0.65
0.56
0.30
0.23
5.76
Diversified Medla Lighthouse International co gtd Ser144A priv plmt 8% /ZOlP 1.800,000 1.977.753 2 42 Unity Meda sr nts SerRegS 8.75% /2015 980.000 955.505 1.17 WDAC Subsidiary sr nts Ser144A priv plmt 8.5% 1'2014 495,000 524.703 0.64 LMI Group unsecur sr unsubord Ser144A priv plmt 8.625% /2013 350.000 387.625 0.47 Interpublic Group of Companies unsecur 6.759 /2014 (USD) 525.000 372,411 0.45 EM1 Grow unsecur unsubord co gtd 9.7591 /2008 (GBP) 140,000 218,319 0.27
Total for Diversified Media 5.42
.......... - . . . . . . . . . . . . . . . -
Energy El Paso nts 7.125% /ZOO9 Gaz Capital for Gazprom nts Ser144A priv plmt 5.875% /2015 Chesapeae Energy co gtd 6.25% /7317 Linde finance subord 7 3753: 12066 (1) Kinder Morgan unsecur sr nts 6.5% /2012 Hilcorp Erergy I / Hilcorp Finance sr nts Ser144A priv plmt 10 5% /2010
Total for Energy
~ . .........
900,000 942.759 1.15
825,000 866,522 1 .G6 800.000 822.003 1 00 680.300 721,294 0 8 8
(USD) 390,000 297,913 0 36
(USD) 183.000 149.596 0.18
4.63
.......... .- ....
Automobile Manufacturers Fiat Finance R Trade sr nts co gtd SerGMrN 5.625% /201 I 1,700.000 1,757,375 2.15
General Motors unsecur 8.375'4 ,'2033 450.000 438.203 0.54 Fiat Finance R Trade co gtd 6 6257; ,'2013 760,000 822.703 1 00
Total for Automobile Manufacturers 3.69
Nomlnal in Euro unless Market % of net
Investment specified value assets
Health Care Fresenius Medical Care Capital Trust 111
Fresenius Finance co gtd SerHegS 57., /2013 625,000 631,250 0.77 Fresenius Finance co gtd SerRegS 5.5% 1'2016 600.000 619,200 0.76 Fisher Scientific International sr subord nts 6.125%/2015 (USD) 395,000 297.082 0 36
Total for Health Care 3.18
-. . - ...
co gtd 7.375% .'2008 (OEM) 2,000.000 1,358,374 1.29
_- ......
Aerospace Bombardier sr uiisecur SerRegS
769,688 0.94 7,25% 1'2016 750,000 Mecachrome International sr subord SerRegS 9% /2014 700.000 687.750 0.84 MTU Aero Engines Investment GmbH & Co sr nts Ser144A priv plmt 8,25% /2014 390.000 430,950 0.53 MTU Aero Engines Investment Gmbli & Co sr nts SerHegs 8 25% :/2014 270.000 298,350 0.36
Total for Aerospace 2.67 - .- ._ -
Cable Telenet Communications sr nts Ser144A priv plmt 94- /2013 672,300 741,211 0.91 Cablecom Luxembourg co gtd Ser144A priv plmt 9.375% /2014 525,000 583,406 0.71 TVN Firlarlce unsecur sr co gtd Ser144A priv plint 9.5% /2013 500,000 563.750 0.69 lntelsat co gtd 9% /2014 (USD) 81,000 65,216 0.08
Total for Cable 2.39
.- . . . . .
Automobile Europcar Groupe sr subord Ser144A priv plmt 7,087% E 0 1 3 (1) 750,000 771.563 0.94 Mlcheliri (C.G.O.E.) subord SerTSDR 6.375"4 12033 (1) 700.000 724,329 0 88 ArvinMeritor sr unsecur nts 8 75% ,'2012 !US01 480,000 375.995 0.46
. . _.._. -.
Total for Automobile 2.28
Industrial lrrpress Holdings sr suburd SerRegs 9,25% /2014 1,000,000 1,030,000 1.25 Ba$ell co gtd SerRegs 8 375% /2015 750,000 808,125 0.99
. - - -. .. .
Total for Industrial 2.24
Hotels, Restaurants & Leisure Ladbrokes Group Finance unsecur sr unsubord L o gtd SerEMTN 6.51 /2009 1,700,000 1,766,917 2.16
Total for Hotels, Restaurants & Leisure 2.16
. . . .
Manufacturing ABB International Finance sr 6.5% /2011 885,000 962.471 1.17 Johnsondiversey sr subord nts SerEURO 9.6259; /2012 740,000 777,000 0 95
Information Technology lnvensys sr nts SerRegS 9.875:;) /2011 955,500 1,060.605 1.30 Xerox unsecur sr [its 9 .751 :2C09 750,000 830,625 1.01 Iron Mountain sr subord Ser144A priv plmt 7.25% /2014 (GBP) 5>0,00G 813.609 0.99
Total for Information Technology 3.30
.... ... ......... .- ........
Total for Manufacturing 2.12
Utility British Energy Holdings co gtd SerRegS 7% /2c22 (GBP) 608,216 929,115 1 1 4 AES sr nts 8.375Ut /2011 (GBP) 431,000 673.618 0.82 Northviest Pipeline sr unsecur co gtd 8.1254 /2010 (USD) 50,000 39,687 0 05
. .... -.
Total for Utility 2.01
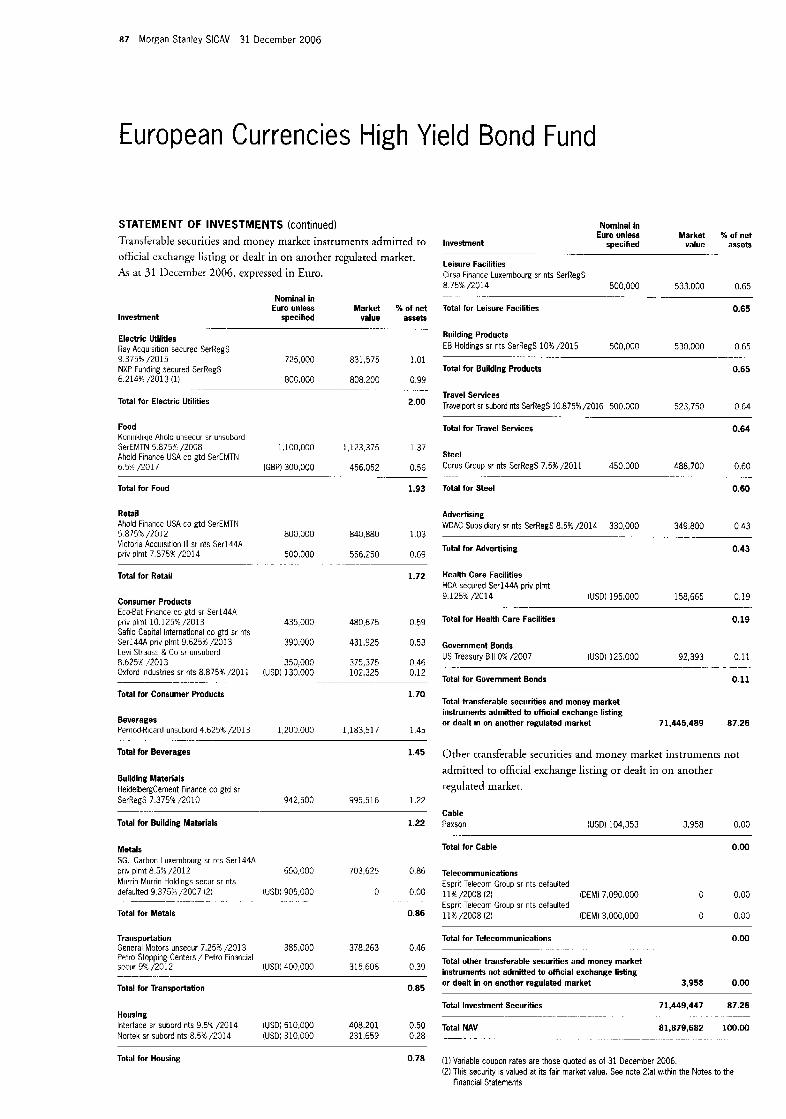
87 Morgan Stanley SICAV 31 December 2006
European Currencies High Yield Bond Fund
STATEMENT OF INVESTMENTS (continued)
Transferable securities and money niarkct instruments admitred to official cxchange listing or dealt in on anorhcr regulated market. As at 31 Ikccmhcr 2006, expressed in Euro.
Investment
Nominal in Euro unless Market % of net
specified value assets . . . _- .... ...
Electric Utilities Ray Acquisition secured SerRegS 9.375% /2015 725,000 831.575 1.01 NXP Funding secured SerRegS 6.214%/2013 (1) 80G.000 808.200 0.99
Total for Electric Utilities 2.00
.. . -. .. -.
Food Koniriklikjc Ahold unsecur sr unsubord
Ahold Finance USA co gtd SerEMTN 6.5". /2017 IGBP) 300,000 456,052 0.56
Total for Food 1.93
SprEMTN 5 8 7 5 t /ZOO8 1,100,000 1,123,375 1 3 7
Retail Ahold FirianLe USA co gtd SerEMTN 5 8/5X/?912 800.000 840,880 103 Virtoria Acqiiisition 111 sr nts Serl44A priv plmt 7 875% /2014 500,000 556.250 0.69
Total for Retail 1.72
.
Consumer Products EceBat Finance co gtd sr Ser144A
Safilo Capital International co gtd sr [its Ser:44A priv plmt 9 625% /2013 390,000 431.925 0.53 Levi Strauss & Co sr unsubord 8.625&!2013 350.000 375,375 0.46 Oxford Industries sr nts 8.875% /201i (USD) 130,000 102.325 0.12
Total for Consumer Products 1.70
priv plint 10,1255 1'2013 435,000 480,675 0 59
. ~
Beverages Pernod-Ricard unsubord 4.6254: /2013 1,200.000 1,183,517 1 45
Total for Beverages 1 4 5
Bulldlng Materials HeidelbergCement Finance co gtd sr SerRegS 7 375% /2010 942,500 995,516 1.22
Total for Building Materials 1.22
Nominal in Euro unless Market % of net
specified value assets Investment
Leisure Facilities Cirsa Finance Luxembourg sr nts SerRegS 8.75%/2014 500,000 533.000 0.65
Total for Leisure Facilities 0.65
...
--- ..- .. . . . .
Building Products EB Holdings sr nts SerRegS 10% /2015 500,000 530,000 0 65
Total for Bulldlng Products 0.65
. - .......
Travel Services Travelport sr subord nts SerRegS 10 875% /2016 500.000 523,750 0 64
Total for Travel Services 0.64
........
Steel Corus Group sr nts SerRegS 7.5% /2011 450 000 488,700 0.60
Total for Steel 0.60
.- ._
Advertising WDAC Subsidiary sr nts SerRegS 8.5%/2014 330,000 349.800 0 4 3
Total for Advertising 0.43
- .
Health Care Facilities HCA secured Ser144A priv plmt 9 125%/2014 (USD) 195,000 158,665 0.19
. - -.
Total for Health Care Facilities 0.19
Government Bonds US Treasury Bill OW /ZOO7 IUSD) 125,000 92,393 0 11
-
Total for Government Bonds 0 11
Total transferable securities and money market instruments admitted to official exchange listing or dealt in on another regulated market 71,445,489 87.26
Other transferable securiries and money market instruniencs not admitted to official exchange listing or dealt in on another regulated market.
Cable Paxson (USD) 104,353 3.958 0.00
Metals SGL Carbon Luxembourg sr nts Serl44A priv plmt 8.5% /2012 650,000 703,625 0.86 Murrin Murrin Holdings sccur sr nts defaulted 9 375% /2007 (2) (USDi 905.000 0 0.oc
Total for Metals 0.86
. . . . . ........
Total for Cable 0.00
Telecommunications Esprit Telecom Group sr nts defaulted 11% /2008 (2) (DEM) 7.090.000 0 0.00 Esprit Telecom Group sr nts defaulted 11 % /ZOO8 12) (DEM) 3,000,000 0 0.00
Transportation Gcrieral Motors unsecur 7.25% /2013 385.000 378,263 0.46 Petro Stopping Centers! Petro Financial secur 9% /2012 (USD: 400,000 315,606 0.39
Total for Transportation 0.85
Housing Interface sr subord nts 9 5% /2014 (USD: 510,000 408,201 0 50 Nortek sr subord nts 8.5% /2014 (USD: 310,000 231,659 0.28
Total for Telecommunications 0.00
Total other transferable securities and money market instruments not admitted to official exchange listing or dealt In on another regulated market 3,958 0.00
Total Invesbnent Securities 71,449,447 87.26
Total NAV 81,879,682 100.00
_. .- -. . .....
. - .
Total for Housing 0.78 11) Variable coupon rates are those quoted as of 31 December 2006 (2) This security is valued at its fair market value. See note 2la) within the Notes to the
Financial Statements

' I
Morgan Stanley SICAV 31 December 2006 88
Global Bond Fund
INVESTMENT AIMS
To provide an attractive rate of return, measured in US Dollars, through market, instrument and currency selection.
Please refer to the full prospectus for the Fund's investment objective and policy.
STATEMENT OF INVESTMENTS Transferable securities and moncy rriarkec insrruments admitted to official exchange listing or dealt i n on anothcr regulated market.
at 31 1.lecenibcr 2006, expressed in US dollars.
Nominal in US dollars Market % of net
Investment unless specfied value a88ets
Government Bonds ...
France Government of France OAT 5.5% /2029 (EUR) 13.600.000 21530.734 7 94 Freilch Treasury Note BTAN 3% /2008 (EUR) 8,600,000 11,186,721 4.13 Government of France OAT 5.5% /2010 (EUR) 7,000,000 9,671,819 3.57
Total for France 15.64 .. . .
Germany
Bundesobllgatlon Ser139 4% /2007 (EUR) 5,000.000 6,593,466 2.43
Bundesrcpublik Ser03 3.75% /2013 (EUR) 1.900.000 2.478.289 0.91
Total for Germany 8.58
Bundesrepublik Ser97 6.5% /2027 (EUR) 5,800,000 10,166,902 3.75
Bundesrepublik Ser04 4.25% /2014 (EURI 3.000.000 4.030.385 1.49
. .. . .
United Kingdom UK Treasury 5% /2014 (GBP) 7,400,000 14,647,722 5.40
.
Total for United Kingdom 5.40
United States of America US Treasury 5.54: /2028 US Treasury 3 125% /2007 US Treasury 4 1 /2014
7,600,000 8,196,125 3.02 3,500,000 3,475,390 1.28 1,800,000 1.722.656 0.64
_. -~ ....
Total for United States of America 4.94
Japan Dedelopment Bank of Japan govt gtd SerlNTL 1 7% /2022 (JPY) 860.000.000 6,814,657 2 52 Japan Bank for lnternatlonal Cooperation govt gtd 0 35% /2008 (JPY) 600,000,000 5 024.003 1.85
Total for Japan 4.37
Supra-National European Investment Bank nts SerEMTN 2.125% /2007 (JPY) 700.000.000 5,944,717 2.19
Total lor Supra-Natlonal 2.19
Canada Government of Canada 5% /2014 (CAD) 6.200.000 5,645,954 2 08
Total for Canada 2.08
~ .. - ..
Netherlands Government of Netherlands 5% /2011 (EUR) 3,500,000 4.816,008 1.78
Total for Netherlands 1.78
Poland Governrrient uf Poland Ser0310 5.75%/2010 (PLN) 7,700,000 2,731,972 1.01
Total for Poland 1.01
Sweden Swedish Government Ser1045 5 2 5 1 /2011 (SEK) 17,000,000 2,615,300 0 96
Total for Sweden 0.96
.. - . . .
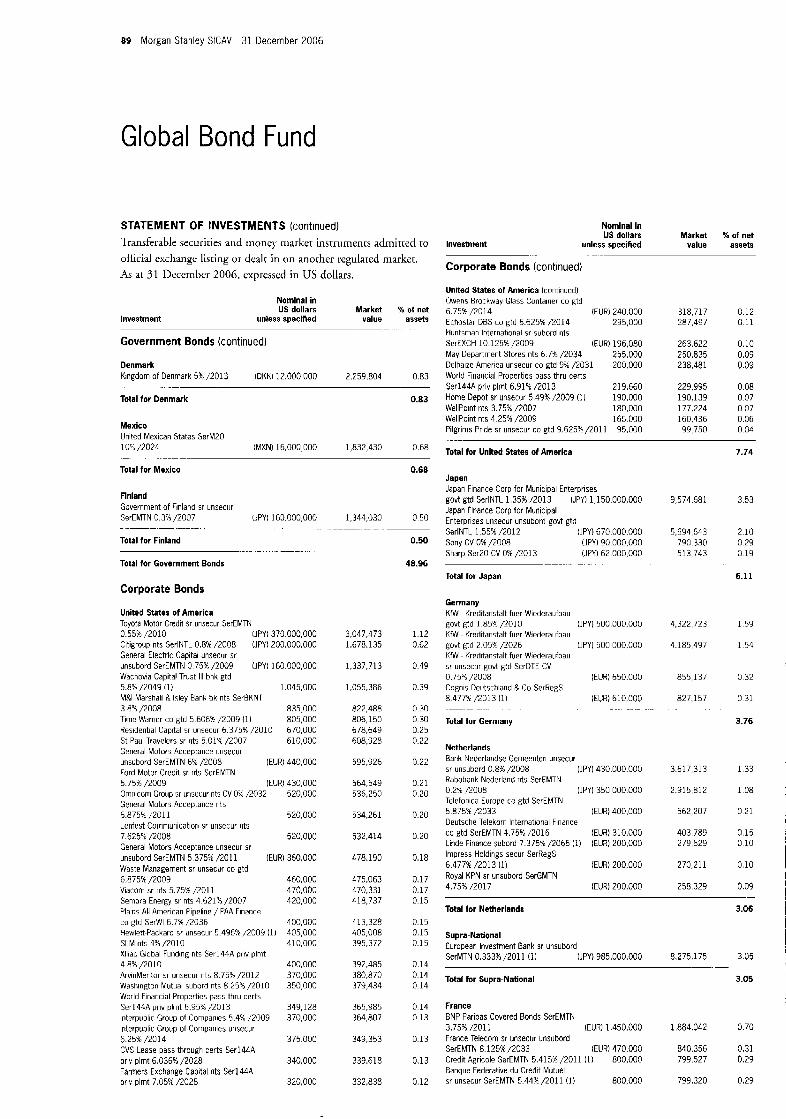
89 Morgan Stanley SICAV 31 December 2006
Global Bond Fund
STATEMENT OF INVESTMENTS (continued) Transferable securities and trioticy rnarkct instruments admitted to olficial cxchangc lihting o r clealt in o n another regulared market. As at 31 Dcccmhcr 2006, expressed in US dollars.
Nomlnal in US dollars Market 56 of net
Investment unless speclfied value assets ..
Government Bonds (continued)
Denmark Kingdom of Denmark 5X /2013 (DKK) 12.000,OOO 2,259.804 0.83
Total for Denmark 0.83
Mexico United Mexican States SerM20 lWd /2024 (MXN) 16,000,000 1,832,430 0.68
- .- __ Total for Mexico
Finland Government of Finland 51 unseciir SerEMTN 0.3:/: /2007 (JPY) 163,000,000
Total for Finland
Total for Government Bonds
. .. ....
..............
Corporate Bonds
United States of America Toyota Motor Credit sr unsecur SerEMTN 0.55% /2010 (JPY) 370.000.000 Citigroup rits SerlNTL 0.84; /ZOO8 (JPYI 200,000.000 General Electric Capital unsecur sr unsubord SerEMTN 0 75%. /2009 (JPY) 160.000.000 Wachovia Capital Trust 111 bnk gtd 52% DO49 (1) 1.045.000 MRI Marshall R lsley Bank bk nts SerBKNl 3.Ph /2008 835.000 Time Warner co gtd 5.606% /2009 (11 805.000 Residential Capital sr unsecur 6.375% /2010 670,000 St Paul Travelers sr nts 5.018 /2007 610,000 General Motors Acceptance iuiisecur unsubord SerEMTN 6% /2008 (EUR) 440,000 Ford Motor Credit sr nts SerEMTN 5.75% /2009 (EUR) 430.000 Orririicurrl Group sr unseur nts CV 0% 1'2032 520,000 General Motors Acceptance nts 6.875% 12011 520,000 Lerifest Comniunication sr uriseur nts 7.625'1 /2008 520,000 General Motors Acceptance unsecur 5r unsubord SerEMTN 5 375% /2011 (EUR) 360,000 Waste Management sr unsecur co gtd 6.8754: /2009 460,000 Viacofri sr rits 5.75% /2011 470,000 Sempra Energy sr nts 4 621% /2007 420,000 Pla n5 All American Pipeline / PAA Finance co gtd SerWl 6.7% i2036 400,000 Hev:lett-Packard 5r unsecur 5.496% /2009 (1) 405,000 SLM nts 4% /2010 410,000 Xlliac Global Funding nts Ser144A prlv plnit 4.8%/2010 400,000 ArviriMeritor sr unsecur nts 8,7% i2012 370,000 Washington Mutual subord nts 8 25% /2010 350,000 World Financial Properties pass thru certs Ser144A priv plmt G.955x :2013 349,128 Interpublic Group of Companies 5.49: /2009 Interpublic Group of Companies unsecur 6.25sh /2014 375.000 CVS Lease pass through zerts Ser144A priv plmt 6.036% /2028 340,000 Farmers Exchange Capital nts Ser144A priv plmt 7.05% /2028 320,000
370,000
0.68
1,344,030 0 50
3,041,473 1,678,135
1,337,713
1,055,386
822,488 806,150 678,649 608,928
595,926
564.549 536,250
534,261
532,414
478,190
e75.063 670.331 L18.737
413.328 405,008 395,372
392,485 380,870 379,434
365,985 364,807
349,353
339,618
332,838
0.50
48.96
1.12 0.62
0.49
0.39
0.30 0.30 0.25 0.22
0.22
0.21 0.20
0.20
0.20
0.18
0.17 0.17 0.15
0.15 0.15 0.15
0.14 0.14 0.14
0.14 0.13
0.13
0.13
0.12
Nominal in US dollars
Investment unless specified
Corporate Bonds (continued) ......
United States ot America (continued) Owens Brockway Glass Container co gtd 6.75% /2014 (EUR) 240.000 Echostar DBS LO gtd 6.625% /2014 295,000 Huntsman International sr subord nts SerEXCH 10.125% /2009 (EUR) 196,080 May Department Stores nts 6.7% /2034 255.000 Delhaize America unsecur co gtd 9% /2031 200.000 World Financial Properties pass thru certs Ser144A priv plmt 6.91% /2013 219,660 Home Depot sr unsecur 5,499: 12009 (1) WellPoint nts 3.75% /2007 180,000 WellPoint nts 4.25% /2009 165.000 Pilgrims Pride sr unsecur co gtd 9.625K /2011 95,000
190,000
Market value
% of net assets
318,717 287.49i
263.622 2 5 0.8 3 5 238,481
229,995 190.139 177,224 160,436 99.750
Total for United States of America
Japan Japan Finance Corp for Municipal Enterprises god gtd SerlNTL 1.35% /2013 Japan Finance Corp for Municipal Enterprises uiisecur unsubord govt gtd SerlNTL 1 55% /2012 Sony CV 0% i2008 Sharp Ser20 CV 0% /2013
(JPYI 1,150,000,000
(JPY) 670,000,000 (JPY) 90,000,000 (JPY) 62,000,000
. .... ..
Total for Japan
Germany KfW - Kreditanstalt fuer Wiederaufbau govt gtd L85! /2010 KfW - Kreditaiistalt fuer Wiederaufbau govt gtd 2.05% /2026 KtW - Kreditanstalt fuer Wiederaufbau sr unsecur govt gtd SerDTE CV 0.753 /ZOO8 (EUR) 650.000 Cognis Deutschland & Co SerRegS
(EUR) 610,000
(JPY) 500.000.000
IJPY) 500,000,000
8.477% /2013 (1) . . . . . . . . . . .......
Total for Germany
Netherlands Bank Nederlandse Gerneenten unsecur sr unsubord 0.8Y /2008 (JPYI 430.000.000 Rabobank Nederland nts SerEMTN 0.2?4,/2008 (JPYI 350,000.000 Telefonica Europe co gtd SerEMTN 5.8754: /2033 (EUR) 400,000 Deutsche Telekom International Finance co gtd SerEMTN 4.75% /2016 (EUR) 310,000 Linde Finance subord 7.375% /2066 ( 1 ) (EUH) 200,000 Impress Holdings secur SerRegS 6.477% /2013 (1) (EUR) 200.000 Royal KPN sr unsubord SerGMTN 4.75% /2017 (EUR) 200.000
....
9,574.681
5,694,643 790.330 51 3,743
4,322,723
4,185,497
855,137
827,157
3,617,313
2,915,812
562,207
403.789 279,629
270,211
258,329
7.74
3 53
2 10 0 29 0 19
6.11
1.59
1.54
0.32
0 31
3.76
1.33
1.08
0 21
0.15 0 10
0.10
0.09
0.12 0.11
0.10 0.09 0 09
0 08 0.07 0.07 0.06 0.04
Total for Netherlands 3.06
Supra-National European Investment Bank sr unsubord SerMTN 0.333% /2011 (1) (JPY) 985.000.000 8.275.175 3.05
Total for Supra-National 3.05
France BNP Paribas Covered Bonds SerEMTN 3.755x /2011 (EURI 1.450.000 1884.042 0 70 France Teleconi sr unsecur unsubord SerEMTN 8 125% /2033 (EURI 470,000 840,356 0.31 Credit Agricole SerEMTN 5.4153 /2011 (1) 800,000 799,527 0.29 Banque Federative du Credit Mutuel sr unsecur SerEMTN 5 44% /2011 (1) 800,000 799,320 0.29
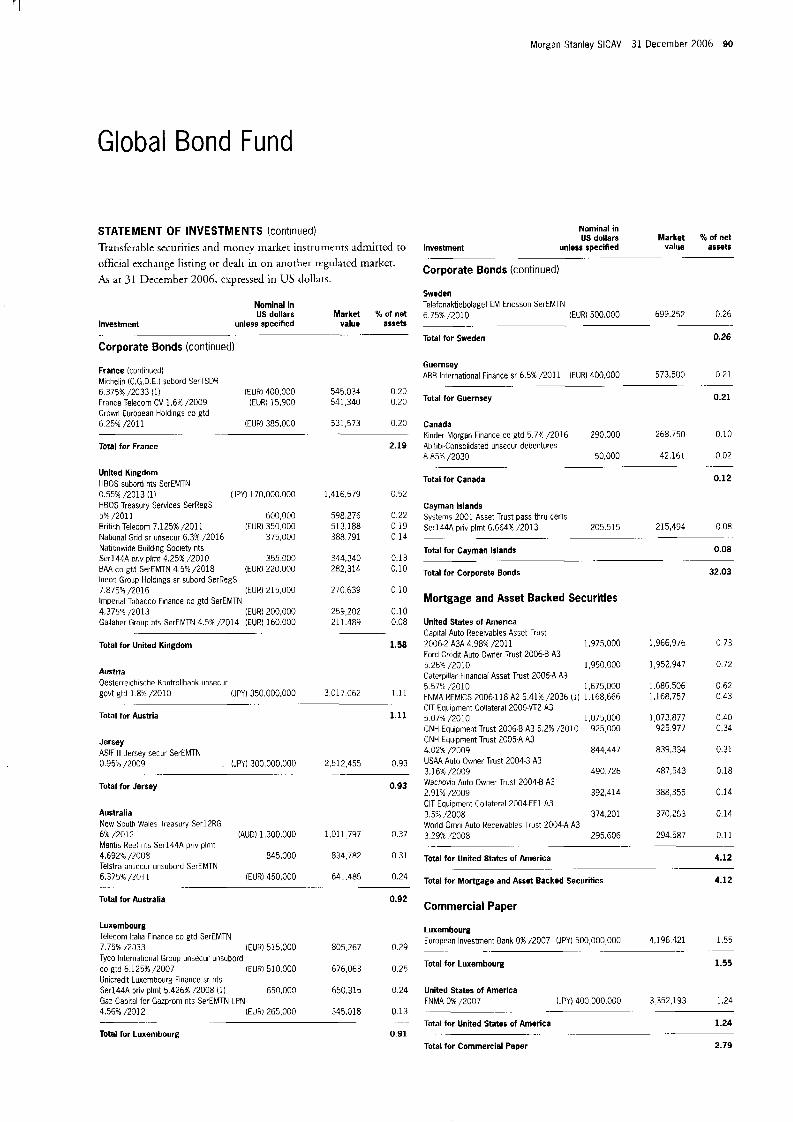
Morgan Stanley SlCAV 31 December 2006 90
Global Bond Fund
STATEMENT OF INVESTMENTS (continued) Transfcrable securiries and rnoncy marker insrrumcnts adrnirted to official exchange listing o r dcalt in on another regulated market. As at 31 December 2006, cspressed in US dollars.
Investment
Nominal in US dollars Market % of net
unless specified value assets
Corporate Bonds (continued)
France (continued) Michelin 1C.G.D.E ) subord SerTSDR
France Telecom CV 1,VL 12009 (EUR) 15,900 541,340 0.20 Crown Euripean Holdings co gtd
6.375% /2033 11) (EUR) 400,030 545.034 0.20
6 25:4 /2011 (EUR) 385,000 531,513 0.20 .- ._ ...
Total for France 2.19
Unlted Kingdom HBOS subord nts SerEMTN 0.55% /2013 (1) (JPY) 170,000.000 HBOS Treasury Services SerRegS 5% /2011 600,000 British Telecom 7.125% /2011 IEUR) 350,000 National Grid sr unsecur 6.3% /2016 375,000 Nationwide Buildlng Society nts Ser144A priv plmt 4.25% /201 C 355.000 BAA co gtd SerEMTN 4 5% /2018 (EUR) 220.000 lneos Group Holdings sr subord SerRegS 7.875'4 /2016 IEUR) 215,000 Imperial Tobacco Finance co gtd SerEMTN 4.375"L /2013 (EUR) 200,000 Gallaher Group nts SerEMTN 4.58 /2014 (EUR) 160.000
1,416,579
598,276 51 3.1 88 388.791
344,340 282,314
270.639
259.202 211.489
0.52
0.22 0.19 0.14
0.13 0.10
0.10
0.10 0.08
-
Total for United Kingdom 1.58
Austria Oesterreichische Kontrollbank unsecur govt gtd 1.8% /2010 IJPY) 350.00G.000 3.017.062 1.11
.-
Total for Austria
Jersey ASlF 111 Jersey secur SerEMTN 0 95% /2009 . (JPY) 300,000,000
Total for Jersey
.. . - . .
Australia New South Wales Treasury Serl2RG 6% /201> (AUD) 1.300.000 Mantis Rezf nts Ser144A priv plnit 4.632% /,'008 845.000 Telstra unjecur unsubord SerEMTN 6.375% /2011 (EUR) 450,000
Total for Australia
... .
Luxembourg Telecom lialia Finance co gtd SerEMTN 7.75% i2333 IEUH) 515.000 Tyco International Group unsecur unsubord co gtd 6.125% /2007 (EUR) 510.000 Unicredit Luxembourg Finance sr nts Ser144A 3riv plmt 5.426%, /2008 11) 650,000 Gaz Capital for Gazprom nts SerEMTN LPN 4.56% /2312 IEUR) 265,000
1-11
2,512,455 0.93
0.93
1.011.797 0.37
834,782 0.31
641,485 0.24
0.92
805,267 0.29
676,063 0.25
650,315 0.24
345.018 0.13 ._
Total for Luxembourg 0.91
Investment
Nominal in US dollars Market K of net
unless specified value assets . -
Corporate Bonds (continued)
Sweden Telefonaktiebolaget LM Ericsson SerEMTN
IEUR) 500,000 699 252 0 26 6 75% /2010
Total for Sweden 0.26
. - ~.
Guernsey ABE International Finance sr h 5% /2011 (EUR) 400,000 573,500 0 2 1
. .~ ...
Total for Guernsey 0.21
Canada
Ahilibi-Consolidated unsccur debentures Kinder Morgan Finance co gtd 5.7"L /2016 290,000 268.750 0.10
8 . 8 3 /2030 50,000 42.161 0.02
Total for Canada 0.12
. . ..
Cayman Islands Systems 20C1 Asset Trust pass thru certs Ser144A priv plmt 6.664% /2013 205 515 215,494 0 0 8
Total for Cayman Islands 0.08
Total for Corporate Bonds 32.03
__ __
-~
Mortgage and Asset Backed Securities
United States of America Capital Auto Receivables Asset Trust 2006-2 A3A 4.98%. /2011 1,975,000 Ford Credit Auto Owner ;rust 2006-8 A3 5.264 /2010 1,950.000 Caterpillar Financial Asset Trust 2006-A A3 5 57% ,'2010 1,675,000 FNMA REMICS 2006-1 18 A2 5.41% /2036 (1) 1.168.666 CIT Equipment Collateral 2006-Vr2 A3 5.07% /2010 1,075,000 CNH Equipment Trust 2006-8 A3 5,2% /2010 925,000 CNH Equipment Trust 2CO5-A A3 4.02% /2009 844,447 USAA Auto Owner Trust 2004-3 A3 3.16% 1'2009 490.726 Wachovia Auto Owner Trust 2004-E A3 2.91% /ZOO9 392,414 CIT Equipment Collateral 2004-EF1 A3 3.5% ,/2008 374,201 World Ornni Auto Receivables Trust 2004-A A3 3.29% /2008 295,606
... _
1 966.976
1,952,947
1.686.506 1,168,757
1073.877 925.977
839.334
487,543
388,355
370.253
294 587
0 73
0.72
0.62 0 43
0.40 0.34
0.31
0.18
0.14
0.14
0.1 1
Total for United States of America
Total for Mortgage and Asset Backed Securities
4.12
4.12 ... .
Commercial Paper
Luxembourg European Investment Bank 0% /2007 (JPY) 500,000,000 4,196 421 1 5 5
- _ ~ ~. -.
Total for Luxembourg 1.55
United States of America FNMA 091 /2007 (JPY) 400,000.000 3 352,193 1 2 4
Total for United States of America 1.24
Total for Commercial Paper 2.79
-_ . -
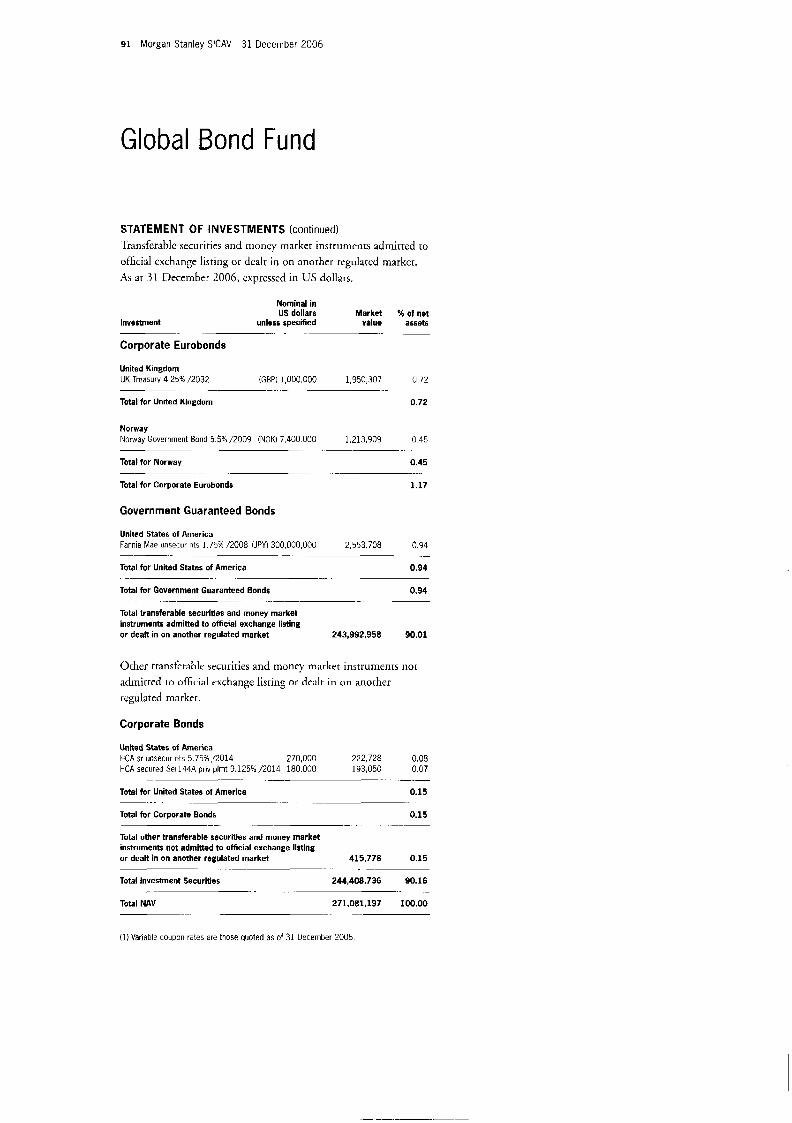
9 1 Morgan Stanley SlCAV 31 December 2006
Global Bond Fund
STATEMENT OF INVESTMENTS (continued) Transferaklc secui-ities and rnoncy market instrurncrits admitted ro official cxchange listing or dcalr in on anorher regulated marker. As a t 31 December 2006, expressed in US dollars.
Nominal in US dollars Market % of net
investment unless speciiied value assets __ _
Corporate Eurobonds
UK Treasury 4 25% /203? (GOPI 1,000 000 1,950,307 0 72 United Kingdom
. - _ _ Total for United Klngdom 0.72
Norway Nor:vay Government Bond 5 5% /ZOO9 (NOK) 7,400 000 1213,909 0 45
- -
Total for Norway 0.45
Total for Corporate Eurobonds 1.17
._ ....
Government Guaranteed Bonds
United States of America Fame Mae u n w u r rits 1.75% /2008 (JPY) 300,000.000
Total for United States of America
Total for Government Guaranteed Bonds
Total transferable securities and money market instruments admitted to official exchange listing or dealt in on another regulated market 243,992,958 90.01
2,553 708 0 94
0.94
0.94
- . . . -
__ . . - - .
. -. -~ - _.
Other transferable securities and money market instrumenrs no[ adinitred to official cxchange lisring or dealt in o n anorher regulated marker.
Corporate Bonds
United States of America HCA sr unsecur nts 5.75%/2014 270,000 222.728 0.08 HCA secured Ser144A priv plrnt 9.125%/2014 180,000 193,050 C.07
Total for United States of America 0.15
Total for Corporate Bonds 0.15
Total other transferable securities and money market instruments not admitted to official exchange llstlng or dealt in on another regulated market 415.778 0.15
Total Investment Securises 244.408,736 90.16
Total NAV 271,081,197 100.00
.... -- . .
~. ... .........
_ _ ._ .
. .- . . . .
... -. . .... . . . . .
.....
(1) Variable coupon rates are those quoted as of 31 December 2006
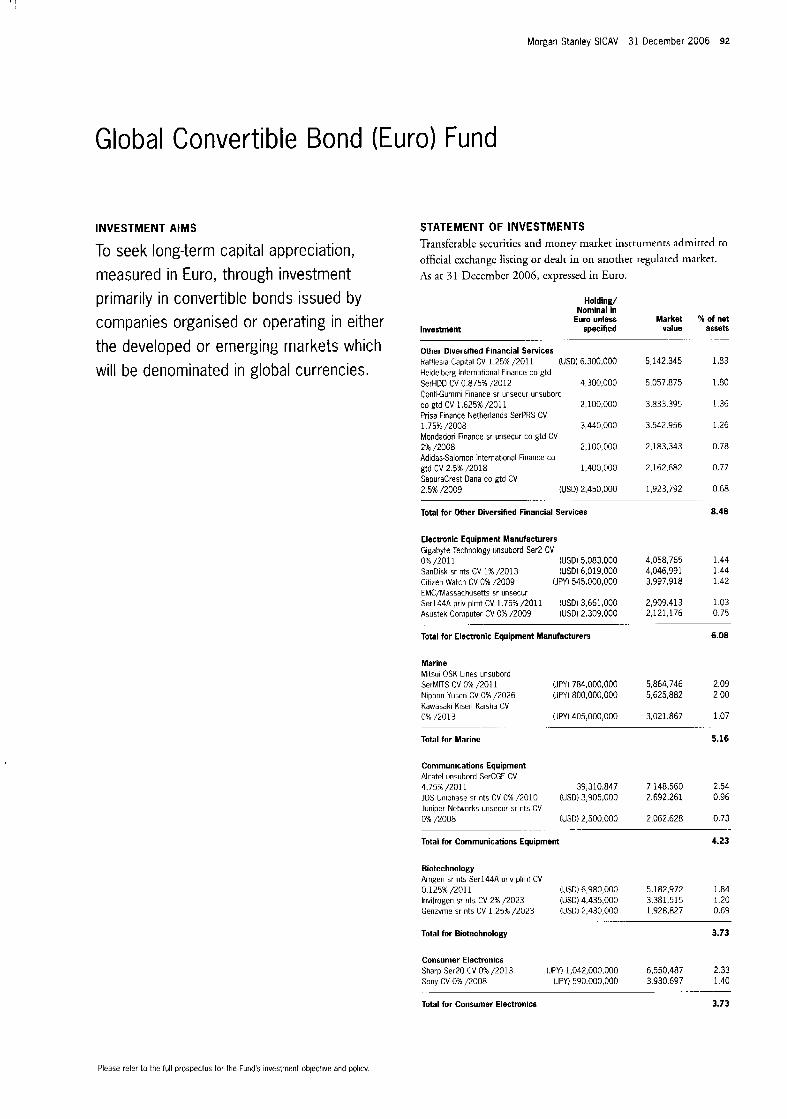
Morgan Stanley SICAV 31 December 2006 92
Global Convertible Bond (Euro) Fund
INVESTMENT AIMS STATEMENT OF INVESTMENTS Transferable securitics and money niarket instruments admirted to official exchange listing or dealr in on another regulated market. As ar 3 1 December 2006, cxpressed in Euro.
To seek long-term capital appreciation,
primarily in convertible bonds issued by measured in Euro, through investment
Holding/ Nominal in
Euro unless Market % of net companies organised or operating in either specified value assets -. .. . . the developed or emerging markets which
will be denominated in global currencies. Other Diversified Financial Services Rafflesia Capital CV 1 25% /2011 (USD) 6.300.000 5,142.345 Heidelberg International Finance co gtd SerHDD 6V 0.8751: /2012 4,300,000 5,057,875 ContiGummi Finance sr unsecur unsubord co gtd CV 1.625%/2011 2,100,000 3,833,395 Prisa Fmance Netherlands SerPRS CV 1.75% /2008 3,440,000 3,542,956 Mondadori Finance sr unsecur co gtd CV 2% /2008 2,100,000 2,183,343 Adidas-Salomon International Finance co
1,400,000 2,162.682 gtd CV 2.5%/2018 SapuraCrest Dana co gtd CV 2.5% /2009 (USDI 2,450,000 1,923,792
Total for Other Diversified Financial Services
.... . . --
Electronic Equipment Manufacturers Gigdbyte Technology unsubord Ser2 CV 0% /2011 (USD) 5.083.000 4,058,765 SanDisk sr nts CV 1% /2013 (USD) 6,019,000 4.046.991 Citizen Watch CV 0% /2009 (JPY) 545,000,000 3,997,918 EMCpdassachusetts sr unsecur Ser144A priv plmt CV 1.75%/2011 (USD) 3,661,000 2,909,413 Asustek Computer CV 055 /2009 (USD) 2.309.000 2,121.176
1.83
1.80
1.36
1.26
0.78
0.77
0.68
8.48
1.44 1.44 142
1.03 0.75
-. .
Total for Electronic Equipment Manufacturers 6.08
Marine Mitsui OSK Lmes unsubord SerMITS CV osh /2011 (JPY) 784,000,000 5,864,746 2.09
Kawasaki Kisen Kaisha CV 0% /2013 (JPY) 405,000,000 3.021.867 1.07
Total for Marine 5.16
Nippon Yusen CV 0% /2026 (JPY) 800,000,000 5,625,882 2.00
. . ... . .
Communications Equipment Alcatel unsubord SerCGE CV 4.75% /201 1 39,310,847 7,148,560 2.54 JDS Uniphase sr nts CV 0% /2010 (USD) 3,905,000 2.692.261 0.96 Juniper Networks unsecur sr nts CV 0% /2008 (USD) 2,500.000 2,062,628 0.73
Total for Communications Equipment 4.23
.. .- . .
Biotechnology Amgen sr nts Ser144A priv plmt CV 0 125X/2011 (USD) 6,980,000 5,182,972 1.84
Genzyme sr nts CV 1.25% /2023 (USD) 2,430,000 1,928,827 0 69 lnvitrogen gr nts CV 2% /2023 (USD) 4,435,000 3,381,515 120
Total for Biotechnology 3.73
.. . ...
Consumer Electronics
Sony CV Ox /2008 (JPY) 590.000.000 3.930.697 1 40
Total for Consumer Electronics 3.73
Sharp Ser20 CV 0% /2013 (JPY) 1,042,000.000 6,550,487 2 33
- - __
Please refer to the full prospectus for the hnd 's investment oblective and policy
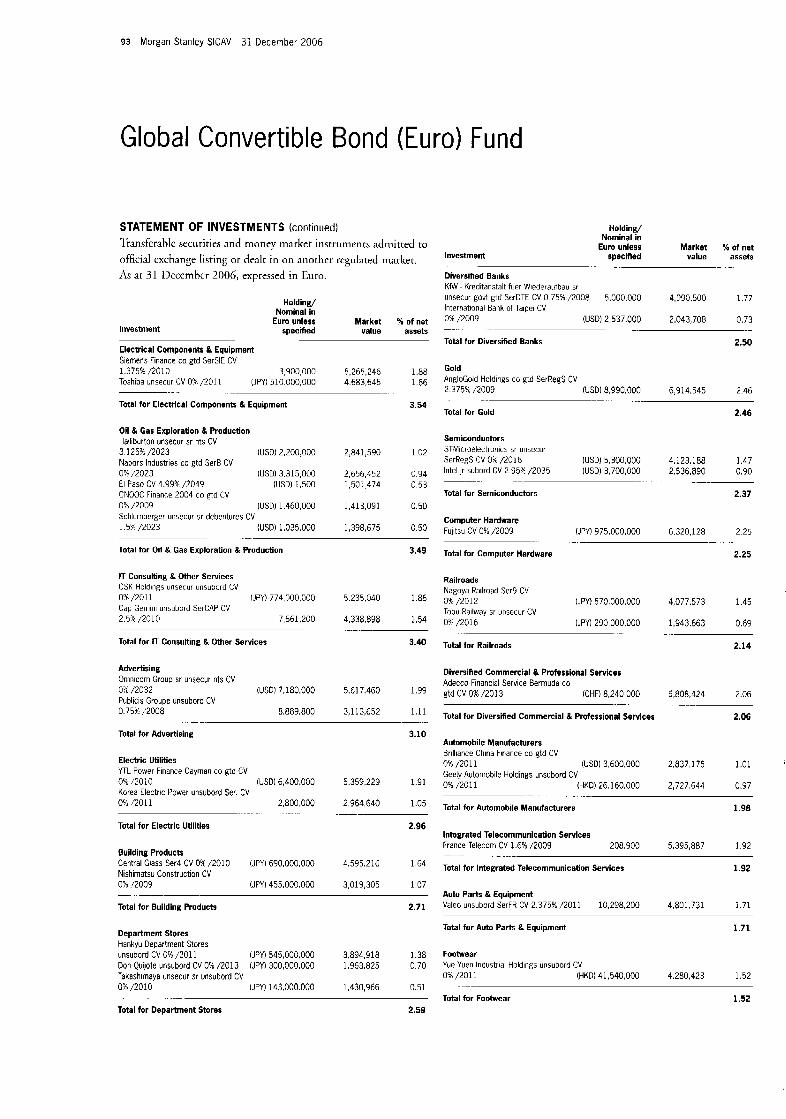
93 Morgan Stanley SICAV 31 December 2006
Global Convertible Bond (Euro) Fund
STATEMENT OF INVESTMENTS (continued) liansfcrahlc securities and nionev market instruments admitted to official cxchange listing or dealr in on another regulated market. As ar 31 hCclTlhCr 2006, expressed in Euro.
Holding/ Nomlnal in
Euro unless Market X of net Investment specihed value assets
Electrical Components & Equipment Siemens Finance co gtd SerSlE CV 1.3750'. /2010 3,900,000 5,265,246 1.88 Toshiba unsecur CV O"4, e 0 1 1 (JPY) 510.000.000 4.683.645 1.66
Total for Electrical Components & Equipment 3.54
~-
. .. .
Oil & Gas Exploration & Production Halliburton unsecur sr nts CV
Nabors Industries co gtd SerB CV 0 8 /2023 IUSD) 3.315.000 2,656,452 0.94 El Faso CV 4.99% /2049 (USD) 1,500 1.501.474 0.53 CNOOC Finance 2004 co gtd CV OR 1'2009 (USDI 1.460.000 1.413.091 0.50 Schlumberger unsecur sr debentures CV 1.5% /2023 IUSD) 1.035.000 1,398,675 0.50
3.49
3 125% /2023 (USD) 2,200.000 2,841,590 1.02
. ....
Total for Oil & Gas Exploration & Production
IT Consulting & Other Services CSK Holdings unsecur unsubord CV 0%/2011 (JPY) 774,000,000 5.235.040 1.86 C ~ F Gemini unsubord SerCAP CV 2.5% /2010 7,661.200 4 3 8 . 8 9 8 1.54
Total for IT Consulting & Other Services 3.40
.
Advertising Oninicom Group sr iinsecur nts CV 0% /2032 (USD) 7,180,000 5.617.460 1.99 Publicis Groupe unsubord CV 0.75% /2008 8,889,800 3.113.652 1.11
-
Total for Advertising 3.10
Electric Utilities YTL Power Finance Cayman co gtd CV out 12010 (USDI 6.400.000 5.359.229 1.91 Korea Electric Power uiisubord Ser CV o x i2011 2,800.000 2.964.640 1.05
Total for Electrlc Utllltles 2.96
. _ -. . . . . . . .
Building Products Central Glass S ~ r 4 CV 0% /2010 (JPY) 690,000,000 4.595.216 1.64 Nishimatsu Construction CV 0% /ZOO9 (JPYI 455.000.000 3,019,305 1 0 7
Total for Building Products 2.71
Department Stores Hankyu Department Stores unsubord CV 0% /2011 (JPY) 545,000,000 3,894,918 1.38 Don Quijote unsubord CV 0% /2013 (JPYI 300.000.000 1,963,825 0.70
Uh /2010 IJPYI 143.000.000 1,430,966 0.51
Total for Department Stores 2.59
lakashimaya unsecur sr unsubord CV
..
Holding/ Nominal in
Euro unless Market X of net speclfied value assets Investment
Diversified Banks KfW - Kreditanstalt fuer Wipderaufbau sr unsecur govt gtd SerDTE CV 0 7556 /2008 5.000.000 4,990.500 1 7 7 International Bank of Taipei CV 0% /2009 (USD) 2,537,000 2,043,708 0.73
Total for Diversified Banks 2.50
- . _ .
.. ._ .~ - -_
Gold AngloGold Holdings co gtd SerRegS CV 2 375% /2009 (LED) 8,990,000 6 914,545 2 46
Total for Gold 2.46
.. __
Semiconductors STMicroelectronics sr unsecur SerRegS CV 0% /2016 (USD) 5,300,000 4,123,188 1 4 7 Intel jr subord CV 2 95% /2035 (USD) 3,700,000 2 536,890 0.90
Total for Semiconductors 2.37
Computer Hardware Fulitsu CV 0% /2009 (JPY) 975.000.000 6,320,128 2 25
Total for Computer Hardware 2.25
._ - -.
Railroads Nagoya Railroad Ser9 CV ox /2012 (JPY) 570,000,000 4.077.573 1.45 Tobu Railway sr unsecur CV OX /2016 IJPY) 290.000.000 1,943.663 0.69
Total for Railroads 2.14
.. . . .- . .-
Diversified Commercial & Professional Services Adecco Financial Service Bermuda co gtd CV 0% /2013 (CHF) 8,240 000 5,808,424 2 06
Total for Diversified Commercial & Professional Servlces 2.06
-. _
Automobile Manufacturers Brilliance China Finance co gtd CV OM /2011 (USD) 3,600,000 2,837,175 1.01 Geely Automobile Holdings unsubord CV 0%/2011 (HKD) 26.160.000 2,727,644 0.97
Total for Automobile Manufacturers 1.98
. . - .
Integrated Telecommunication Services France Telecom CV 1 6% /2009 208,900 5.395.887 1 92
Total for Integrated Telecommunication Services 1.92
...-
Auto Parts & Equipment Vale0 unsubord SerFR CV 2.3754: /2011 10,298,200 4,801,731 1.71
Total for Auto Parts & Equipment 1.71
Foolwear Yue Yuen Industrial Holdings unsubord CV osh /2011 (HKE 41,540,000 4,280,423 1.52
Total for Footwear 1.52
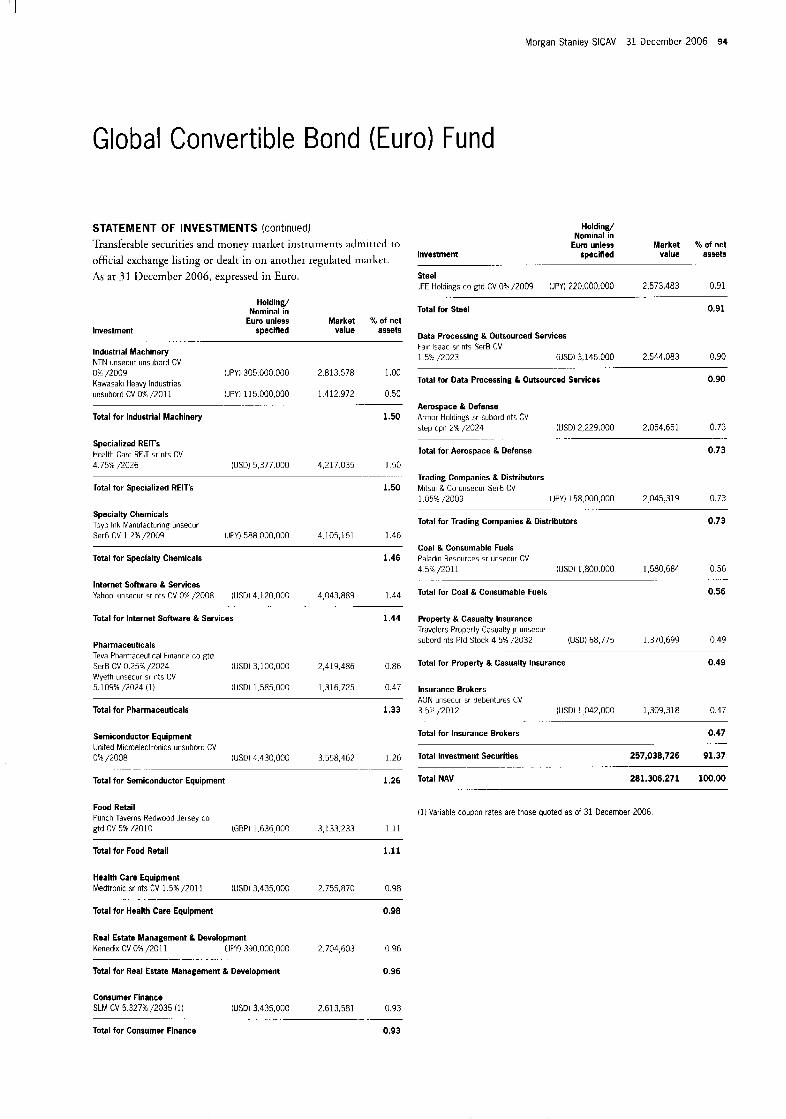
Morgan Stanley SICAV 31 December 2006 94
Global Convertible Bond (Euro) Fund
STATEMENT OF INVESTMENTS (continued) 'Transferable securities and money market instruments :idrnittcd LO
official cxchatige listing or dealt in on another regulated rnarkct. As ;it 3 1 13cccrnbcr 2006, expressed in Euro.
Investment
Holding/ Nominal in
Euro unless Market % of net specified value assets
Industrial Machinery NTN unsecur unsubord CV OX /2009 (JPY) 305.000.000 2,813.578 1.00 Kawasaki Heavy Industries unsubord CV OW /2011 (JPY) 115.000,03@ 1,412.972 0 52
Total for Industrial Machinery 1.50
. .. ... .
Specialized REIT's Health Care RElT sr nts CV 4.7536 12026 (USD) 5.377.000 4.217.035 1.50
Total for Specialized REIT's 1.50
Specialty Chemicals Toyo Ink Manufacturing unsecur Ser6 CV 1.2% /2009 (JPY) 588.000,OOO 4,105,161 1.46
Total for Specialty Chemicals 1.46
Internet Software & Services Yahoo1 unsecur sr nts CV O K /2008 (USD) 4 120.00G 4,043,889 1 4 4
Total for Internet Software & Services 1.44
Pharmaceuticals leva Phariraceutical Finance co gtd SerB CV 0.25% /2024 (US01 3,100,000 2,419,486 0.86 Wyeth unsecur sr nts CV 5.109%/2024 (1) (US01 1,585,000 1,316,725 0.47
Total for Pharmaceuticals 1.33
Semiconductor Equipment United Microelectronics unsubord CV 0% /2008 (USD) 4,430,000 3.558.462 1 2 6
Total for Semiconductor Equipment 1.26
Food Retail Punch Taverns Redwood Jersey co gtd CV 5% 12010 (GBP) 1,636.000 3,133,233 1 1 1
Total for Food Retail 1.11
Health Care Equipment Medtronic sr nts CV 1 5%/2011 (USD) 3,435,000 2.755.870 0.98
0.98
.. . -
Total for Health Care Equipment
Real Estate Management & Development Kenedix CV OX /2011 (JPYI 390,000 000 2,704,603 0 96
. .
Total for Real Estate Management & Development 0.96
Investment
Holding/ Nominal in
Euro unless Market I of net specMed value assets
..
Steel JFE Holdings co gtd CV OX /2009 (JPY) 220,000,000 2,573,483 0 91
Total for Steel 0.91
. -
Data Processing & Outsourced Services Fair Isaac gr nts SerB CV 1 54: /2023 (USD) 3,145 000 2,544.083 0.90
Total for Data Processing & Outsourced Services 0.90
Aerospace & Defense Armor Holdings sr suhord nt9 CV step cpn 2 X /2024 (USDI 2,229,000 2.054.651 0 73
.- - - ....
Total for Aerospace & Defense 0.73
Trading Companies & Distributors Mitsui & Co unsecur Ser6 CV 1.05% /2009 (JPY) 158,000,000 2 045.319 0 73
Total for Trading Companies & Distrlbutors 0.73 _.
Coal & Consumable Fuels Paladin Resources sr unsecur CV 4 5% /2011 (U5D) 1,800 000 1,580,684 0 56
Total for Coal & Consumable Fuels 0.56
___
Property & Casualty Insurance Travelers Property Casually ]r unsecur subord nts Pfd Stock 4 5% /2032 (USD) 68,775 1,370,699 0.49
Total for Property & Casualty Insurance 0.49
Insurance Brokers AON unsecur 5r debentures CV 3 5> 12012 (USDI 1042,000 1,309,318 0 47
Total for Insurance Brokers 0.47
Total Investment Securities 257,038,726 91.37
Total NAV 281306.271 100.00
.-
. .
-
(1) Variable coupon rates are those quoted as of 31 December 2006
Consumer Finance SLM CV 5 327% /2035 (1) (USD) 3 435,OOC 2 613,581 0 93
Total for Consumer Finance 0.93 ~~ .. .~
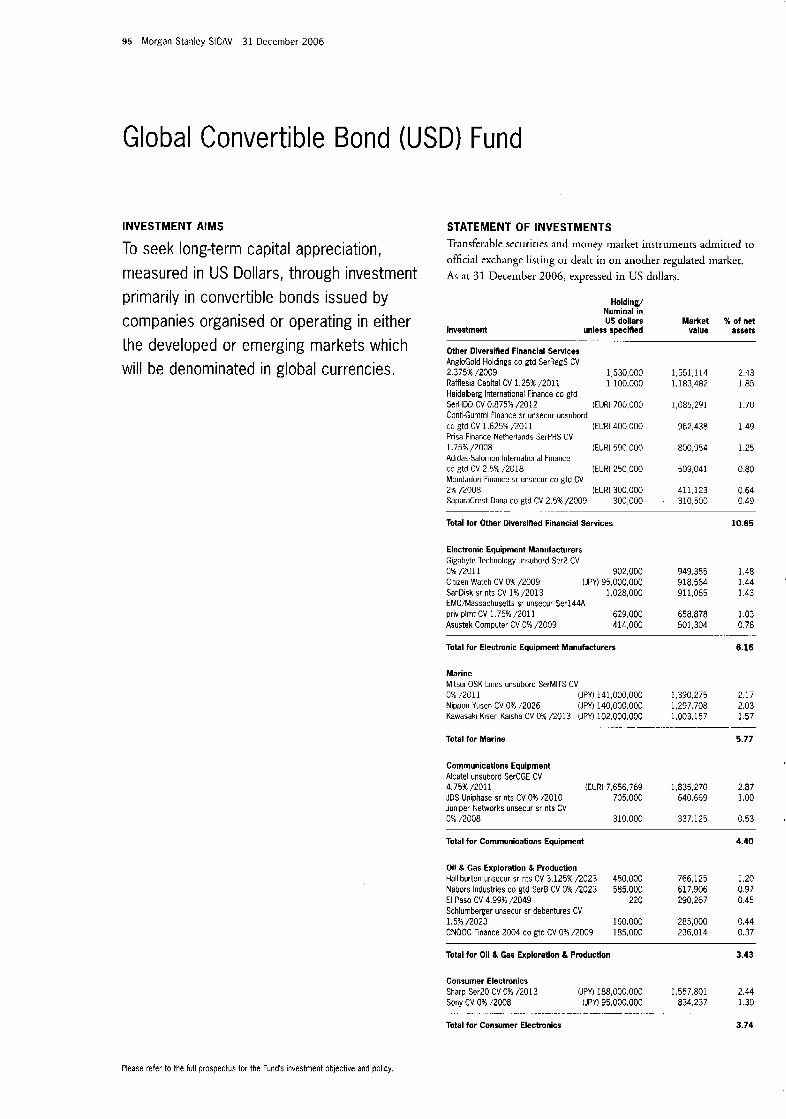
95 Morgan Stanley SICAV 31 December 2006
Global Convertible Bond (USD) Fund
INVESTMENT AIMS STATEMENT OF INVESTMENTS Transferable securiries and money market instruments adniicred co official exchangc listing or dealt in on another regulated rnarkct.
To seek long-term capital appreciation, measured in us Dollars, through investment AS :it 31 December 2006, expressed in us dollars.
primarily in convertible bonds issued by H o I d i n e/ Nominalk US dollars Market % of net
value assets unless specified companies organised or operating in either
- . . .. .
the developed Or emerging markets which Other Diversified Financial Services AngloGold Holdings co gtd SerRegS CV
will be denominated in global currencies. 2.375% /2009 1,530,000 Rafflesia Capital CV 1.25% /2011 1,100,000 Heidelberg International Finance co gtd SerHDD CV 0.875% /2012 (EUR) 700,000 Conti-Gurnrni Finance sr unsecur unsubord co gtd CV 1.625%/2011 (EUR) 400,000 Prisa Finance Netherlands SerPRS CV 1.75% /2008 (EUR) 590,000 AdidasWomon International Finance co gtd CV 2.5% /2018 IEUR) 250,000 Mondadori Finance sr unsecur co gtd CV 2% /ZOO8 (EUR) 300,000 SapuraCrest Dana co gtd CV 2.5% /ZOO9 300,000
. .. .- _ _ -.
1,551,114 2.43 1,183,482 1.85
1,085,291 1.70
962,438 1.49
800,954 1.25
509,041 0.80
411,123 0.64 310,500 0.49
Total for Other Diversified Financial Services 10.65
Electronic Equipment Manufacturers Gigabyte Technology unsubord Ser2 CV 0% /2011 902,000 949.355 1.48 Citizen Watch CV 0% /2009 (JPY) 95.000.000 918.564 1.44 SanDisk sr nts CV 1% /2013 1,028,000 911,065 1.43 EMCAassachusetts sr unsecur Ser144A priv plmt CV 1.75%/2011 629,000 658,878 1.03 Asustek Computer CV 0% /2009 414,000 501,304 0.78
Total for Electronic Equipment Manufacturers
Marine Mitsui OSK Lines unsubord SerMlTS CV 0% /2011 (JPY) 141,000.000 NipDon Yusen CV 0% /2026 (JPY) 140,000.000 Kawasaki Kisen Kaisha CV OX /2013 IJPY) 102 000,000
Total tor Marine
. -.
Comrnunicatlons Equipment Alcatel unsubord SerCGE CV 4.75% /2011 (EUR) 7,656,769 JDS Uniphase sr nts CV 0% /2010 705,000 Juniper Networks unsecur sr nts CV 0% /2008 310,000
6.16
1,390,275 2.17 1.297.708 2.03 1,003,157 1.57
5.77
1,835,270 2.87 640,669 1 .oo
337.125 0.53
Total for Communications Equipment 4.40
011 & Gas Exploration & Production Halliburton unsecur sr nts CV 3.125% /2023 450,000 766,125 1.20 Nabors Industries co gtd SerB CV 0% /2023 585,000 617,906 0.97 El Paso CV 4.996 /2049 220 290,267 0.45 Schlumberger unsecur sr debentures CV 1.5% /2023 160,000 285,000 0.44 CNOOC Finance 2004 co gtd CV 0% /2009 185,000 236,014 0.37
Total for Oil & Gas Exploration & Production 3.43
Consumer Electronics Sharp Ser20 CV 0% /2013 (JPY) 188,000,000 1,557,801 2 44 Sony CV 0% /2008 (JPY) 95,000,000 834,237 1 30
Total for Consumer Electronics 3.74
. - _ . .- . ... . . . - - .. - -
Please refer to the full prospectus for the Funds Investment objective and policy.
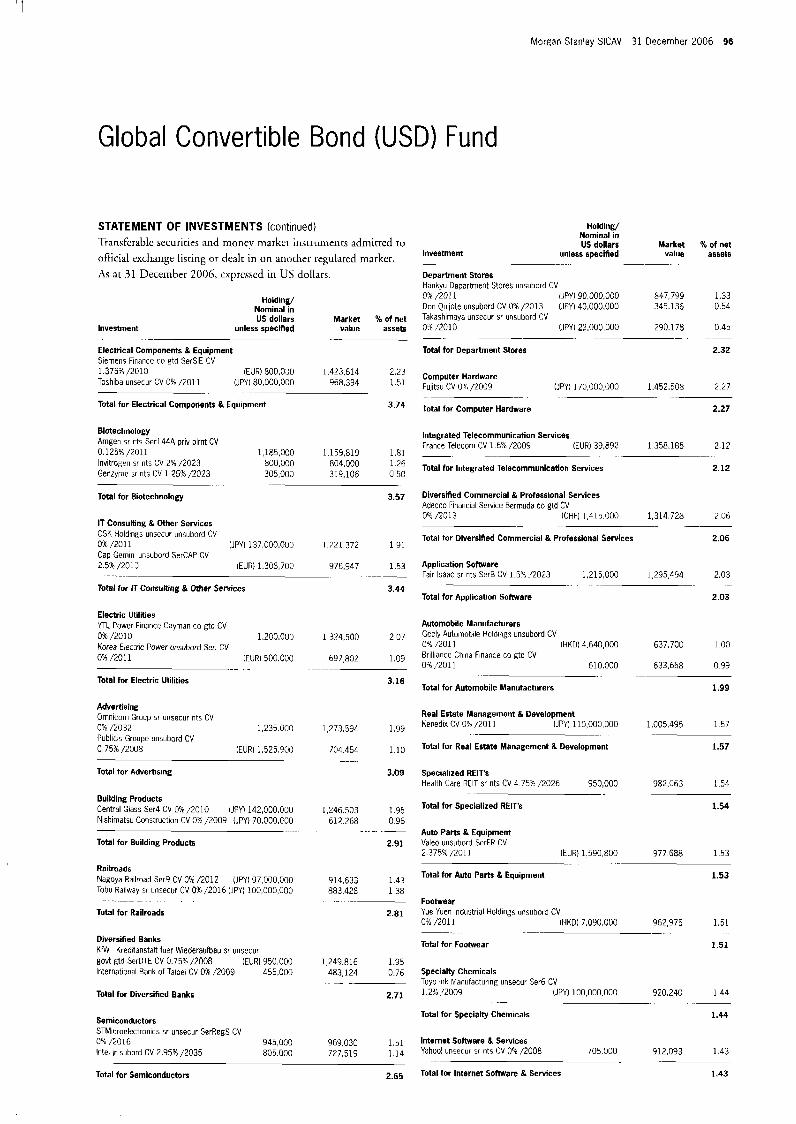
Morgan Stanley SlCAV 31 December 2006 96
Global Convertible Bond (USD) Fund
STATEMENT OF INVESTMENTS (continued) Transfcrablc securiries and moncy niarkcr instrLtineiits admirred to
official cxchange lisriiig or dealt in o n another regulated marker. As at 31 December 2006, cxprcsscd in US dollars.
Holding/ Nominal in US dollars Market % of net
Investment unless speclned value assets
Electrical Components & Equipment Siemens Finance co gtd SerSIE CV 1 375% /2010 (EUR) 800,030 1,423.614 2.23 Toshiba unsecur CV 0% /2011 IJPY) 80,000,000 968,394 1 5 1
Total for Electrical Components & Equipment 3.74
. .- ... . -
... .
Biotechnology Amgen sr rts Ser144A priv plrnt CV 0 125%/2011 1,185,000 1159.819 181 lnvitrogeri br nts CV 2% /2023 800,000 804,000 1 2 6 Genzyme sr nts CV 1 25% e 0 2 3 335,000 319.106 C5C
.-
Total for Biotechnology 3.57
IT Consulting & Other Services CSK Holdings unsecur unsuhord CV O%, /2011 IJPY) 137,000.000 1.721 372 1 9 1 Cap Gcmin unsubord SerCAP CV 2 5% /2011 IEUR) 1308,70@ 976,947 1 5 3
Total for IT Consultlng & Other Services
...... . _- -
3.44
Electric Utilities YTL Power Fmance Cayman co gtd CV 0% /2010 1.2C0.000 1.324.500 2 07 Korea Elecrric Power unsubord Ser. CV 0% /2011 FUR) 500.C00 697.802 1.09
Total for Electric Utilities 3.16
.__ . ..
Advertising Omnicom Group sr unsecur nts CV OW 1'2032 1.235 GOO 1,273,594 1.99 Publicis Groupe unsubord CV 0.75% /2008 IEUR) 1,5i15,000 104.454 1 1 0
Total for Advertising 3.09
Bulldlng Products Central Glass Ser4 CV OX /2010 (JPY) 142,000,000 1.246.503 1.95 Nishimatsu Construction CV 0% /2009 (JPY) 70.000,GOO 61?.768 0.96
..... .. -. __ Total for Building Products 2.91
Railroads Nagoya Railroad Ser9 CV 0% /2012 (JPY) 97,000,000 914,633 1 4 3 Tohu Railway sr unsecur CV 0% /2016 IJPY) 109,000,000 883 428 1 38
Total for Railroads 2.81
...... _ . ~ _ _
Diversfied Banks KfW - Kreditanstalt fuer Wlederaufbau sr unsecur gob? gtd SerDTE CV 0.759: /2008 IEURI 950,000 1,249.816 1.95 International Bank of 'Taipel CV 0% /20G9 455.000 483,124 0.76
Total for Diversified Banks 2.71
.......
Semiconductors STMicroelectronics sr unsecur SerRegS CV 0"k /2016 945,000 963.03C 1.51 Intel jr subord CV 2.95% /2035 805.000 727.515. 1 1 4
Total for Semiconductors 2.65
H o I d I n g/ Nominal in US dollars
Investment unless specified
Department Stores Hankyu Departrrient Stores iinsubord CV 0% /2011 IJPY) 90 000,000 Don Quijote unsubord CV 0% /2013 (JPY) 40,000,000 Takashimaya unsccur sr unsubord CV 0": :2010 IJPY) 22,000 000
Total for Department Stores
.- .- ...
-. . -
Market % of net value assets
-. . . .~
847,799 1.33 345.136 0 54
290.178 0 4 5
2.32
~-
Computer Hardware 2.21 Fujitsu CV 0% /2009 IJPY) 170,000,000 1.452.508
Total for ComDuter Hardware 2.27
... ...... ~ __
Integrated Telecommunication Services France Telecom CV 1 6% /2009 IEUR) 39,892 1 358.185 2.12
Total for Integrated Telecommunication Services 2.12 ~. .-.
Diversified Commercial & Professional Services Adecco Financial Service Bermuda co gtd CV 0% /?a13 ICHF) 1,415.000 1,314,728 7.06
Total for Diversified Commercial & Professlonal Services 2.06
_.
Application Software Fair Isaac sr nts SerB CV 1.5% ./2023 1,215,000 1.295.494 2.03
Total for Appllcation Sofrware 2.03
. . . . . ....
Automobile Manufacturers Gccly Autornoblle Hclding$ unsubord CV 0% /2011 IHKD) 4 640,000 637.700 1 00 Brilliance Clma Flnance co Rtd CV 0% /20 1 1 610.000 633,668 0 9 9
Total for Automobile Manufacturers 1.99
.-
Real Estate Management & Development Kenedix CV 0% 1201 1 (JPY) 110,000,000 1.005.495 1 5 7
Total for Real Estate Management B Development 1.57
-_
Specialized REIT's Health Care RElT sr nts CV 4 75% /2026 950.000 982,063 1 5 4
Total for Specialized REIT's 1.54
...
Auto Parts & Equipment
2 375% /2011 IEUR) 1.590,800 977 688 1 5 3
Total for Auto Parts & Equipment 1.53
vdleo urisubord SerFH Cv
_.
Footwear Yue Yueri Industrial Holdings unsuhord CV 0% /21)11 IHKD) 7,090,000 962,975 1.51
Total for Footwear 1.51
. -_._ -. .
Specially Chemicals Toyo Ink Manufacturing unsecur Ser6 CV 1.2':; 12009 IJPY) 100,000.000 920,240 1 44
Total for Specialty Chemicals 1.44
Internet Software & Setvices Ydhou! unsecur sr nts CV 0"4 /2008 705 000 912,093 1 43
Total for Internet Software & Services 1.43
-. ._
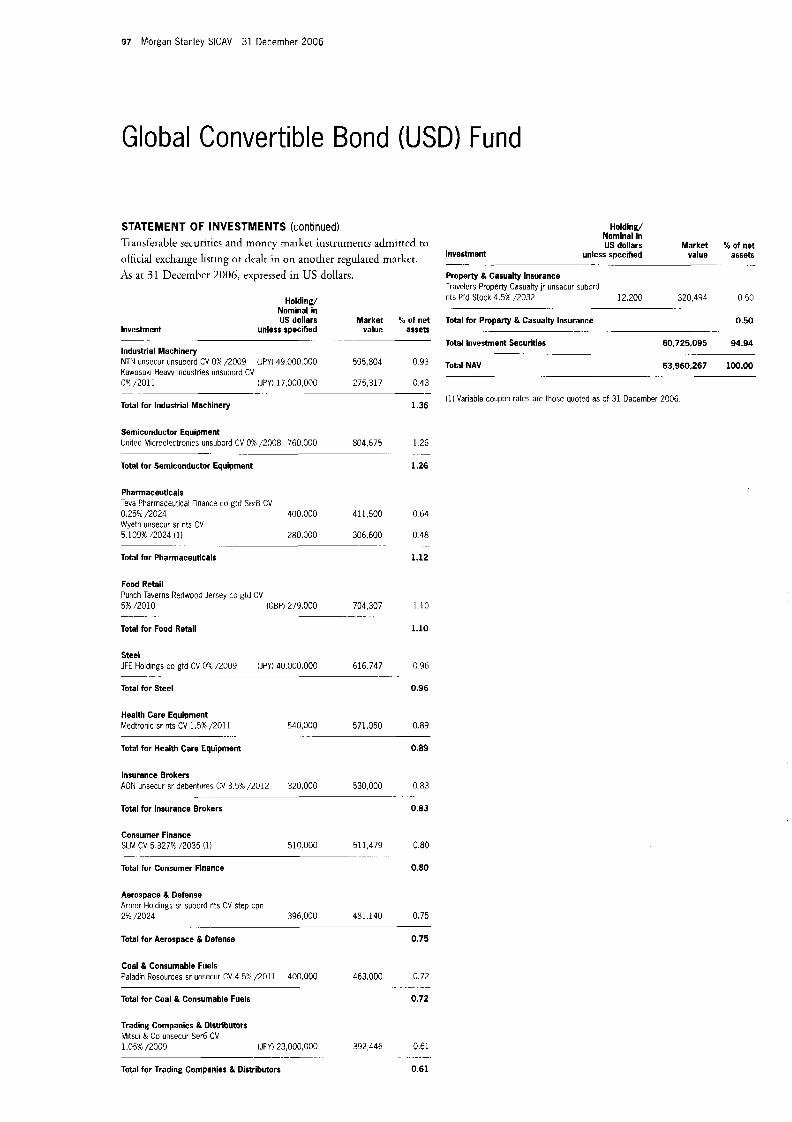
97 Morgan Stanley SICAV 31 December 2006
Global Convertible Bond (USD) Fund
STATEMENT OF INVESTMENTS (continued) Transferable securities arid rnoncy market instrumenrs admirtcd to
official exchange lisring or dcalt in on another regulaced niarkcr. at 31 Deceinkcr 2006, expressed in US dollars.
Holding/ Nominal in US dollars Market % of net
Investment unless specified value asset8
Industrial Machinery NTN unsewr unsubord CV 0% 12009 (JPY) 49 000,000 595,804 0 93 Kawasaki Heavy InduEtries unsuburd CV 0". /2011 (JPY) 17,000,000 275,317 0 43
_- _-
._ -
Total for Industrial Machinety
Semiconductor Equipment United Microelcctronics unsubord CV 0% /2008 760,000 804,675
Total for Semiconductor Equipment
- .- ....
Pharmaceutlcals Teva Pharmacwtical Finance co gtd SerB CV 0.25% /2024 400.000 411.500 Wyeth urlsecur sr nts CV 5.109% 12024 (1) 280,000 306.600
Total for Pharmaceutlcals
Food Retail Punch Taverns Redwood Jersey co gtd CV 5% /2010 (GBP) 279.000 734 307
Total for Food Retail
.- .- .
Steel JFE Holdings co gtd CV 0% /2009 (JPY) 40.000.000 616,747
Total for Steel
- . .-
Health Care Equipment Medtronic sr nts CV 1.5% /2011 540,000 571,050
1.36
126
I .26
.-
0 64
o 48
1.12
110
1.10 .
0 96
0.96
0.89 ..... ...
Total for Health Care Equipment 0.89
Insurance Brokers AON unsecur $r debentures CV 3 5% /2012 320,000 530,000 0 83
Total for Insurance Brokers 0.83
-. . . .
Consumer Finance 51 M CV 5 327% /7035 (1) 510.000 511,479 0 80
Total for Consumer Finance 0.80
...... - ..
Aerospace & Defense Armor Holdings sr subord nts CV step cpn 241 /2024 396,000 481.140 0.75
Total for Aerospace & Defense 0.75
Coal & Consumable Fuels Paladin Resources sr unsecur CV 4 5% /2011 400,000 463,000 0 72
Total for Coal & Consumable Fuels 0.72 - .. _-
Holding/ Nominal in US dollars Market % of net
Investment unless specified value assets
Property & Casuatty Insurance Travelers Property Casualty ]r unsecur subord nts Pfd Stock 4.56 /2032 12,200 320,494 0 5 0
Total for Property & Casualty Insurance 0.50
60,725,095 94.94 Total Investment Securities
Total NAV 63.960.267 100.00
.. ... . . -
. . . . .
. . . . . . . ....... - .....
... .-
-- . . . . . . . .
(1) Variable coupon rates are those Quoted as of 31 December 2006
Trading Companies & Distributors Mitsui & Co unsecur Ser6 CV 1.05% /ZOO9 (JPY) 23.000,OOO 392,446 0.61
Total for Trading Companies & Distributors 0.61
... . . . . . .
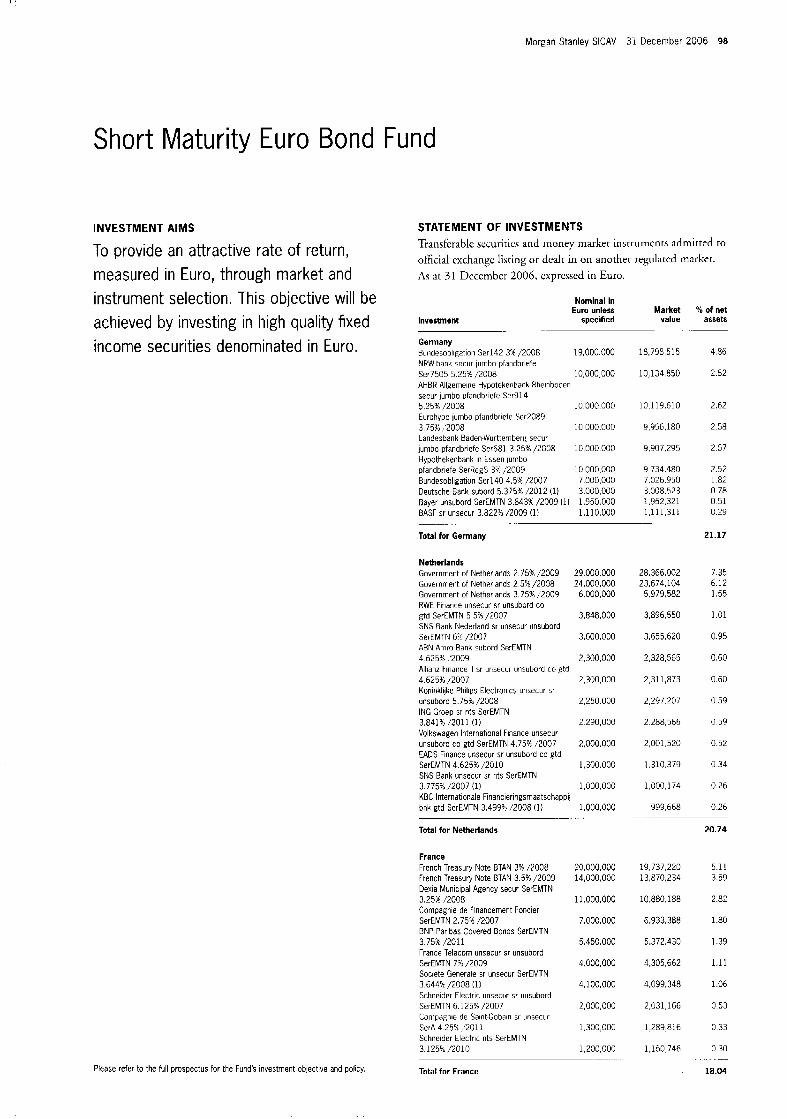
Morgan Stanley SICAV 31 December 2006 98
Short Maturity Euro Bond Fund
INVESTMENT AIMS STATEMENT OF INVESTMENTS Transferable securirics and money market insrrumcnts admirted to official exchange listing or dcalr in on another regulatcd marker. As at 3 I December 2006, exprcsscd in Euro.
To provide an attractive rate of return, measured in Euro, through market and
Nominal in Euro unless Market % of net
Investment specified value assets
instrument selection. This objective will be achieved by investing in high quality fixed ...
income securities denominated in Euro. Germany Bundesobliaation Ser142 3% /2008 4.86 19,000.000 18,798,515 NHNbank iecur jumbo pfandbriefe Ser7505 5.25X /ZOO8 10,000,000 AHBR Allgemeine Hyputekenbank Hheinboden sccur jumbo vfandbriefe Ser914 5.25%, /2008 10.000.000 Eurohypo jumbo pfandbriefe Ser2089 3.759; ,72008 10,000,000 Landesbank Baden-Wurttemberg secur jumbo pfandbricfe Ser681 3.25'% /2C08 Hypothekenhank in Essen iurnbo
Bundesobligation Serl40 4.5% /2007 7,000,000 Deutsche Bank subord 5 375% /2012 (1) 3,000,000 Bayer unsubord SerCMTN 3.8434, /2009 (1) 1.950.000 BASr sr unsecur 3.822% /ZOO9 (1)
Total for Germany
10.000.000
pfandbriefe SerRcgS 31,7009 10,000,000
1.1 10.000
Netherlands Gownment of Netherlands 7 15% /2009 29,000.000 Government of Netherlands 2 5% /2008 24,000,000 Government of Netherlands 3.75% 2 0 0 9 6.000.000 RWE Firlance unsecur sr unsubord co gtd SerCMTN 5 5% /2007 3,848,000 SNS Bank Nederland sr unseciir unsiibord SerEMTN 6: 12007 3,600,000 AEN Amro Bank subord SerEMTN 4.6259; .'2009 2,300,000 Allianz Finance II sr unsecur unsubord co gtd 4.6256 12007 2,300,000 Koninklijke Philigs Electronics unsecur sr msubord 5.75% /2008 2.250.000 ING Groep sr nts ScrEMTN 3.841X/2011 (1) 2.290,OOO Volkswagen International Finance unsecur uiisubord co gtd SerEMTN 4.75% /ZOO7 2,000.000 EADS Finance unsecur sr iinsubord co gtd SerEMTN 4.625% /2010 1.300.000 SNS Bank unsecur sr rits SerEMTN 3 775% /2007 (1) 1,000,000 KBC Internationale Financieringsmaatschappij bnk gtd ScrEMTN 3.499% /ZOO8 (1) 1,000.000
.. .
Total for Netherlands
France French Treasury Note BTAN 3% /7008 French Treasury Note BTAN 3.5% /2009 Dexia Municipal AEency s x u r SerEMTN 3.25% /ZOO8 Compagnie de Financement Foncier SerEMTN 2.75Y /2007 RNP Paribas Covered Bonds SerEMTN 3.75% /2011 France Telecom unsecur sr unsubord SerEMTN 7": 12009 Societe Generale sr unsecur SerEMTN
Schneider Electric unseclrr sr urisubord SerEMTN 6.125% /ZOO7 Campdgnie de Saint-Gobain sr unsecur SerA 4.25% /2011 Schneider Electric nts SerEMTN 3.1254, /2010
3.6444: /2008 (1)
20.000.000 14,000,000
1 I .000.000
7,000,000
3,450,000
4.000.000
4,100,000
2,000,000
1,300,000
1,200,000
Please refer to the full prospectus for the Fund's investment objective and policy. Total for France
10,134,850
10.119.610
9,956,180
9,907,295
9.734.480 7,026,959 3.008.573 1,952,321 1,111.31 I
2 62
2.62
2 58
2 57
7.57 1 82 0 78 0 51 c.29
21.17
28,366,002 7.35 6.12 23,674,104
5,979,582 1.55
3.896.550 1.01
3,655,620 0.95
2.328,565 0.60
2,311,873 0.60
2,297.201 0.59
2288,566 0.59
2,001,520 0.52
1,310,379 0.34
1,000,174 0.26
999,668 0.26
19.737.220 13,870,234
10,880 188
6,933,388
5,372,430
4,305 662
4,099,348
2,031,166
1,289,816
1,150,746
20.74
5.11 3.59
2.82
1.80
1.39
1.11
1.06
CI 53
0.33
0 30 . . __ 18-04
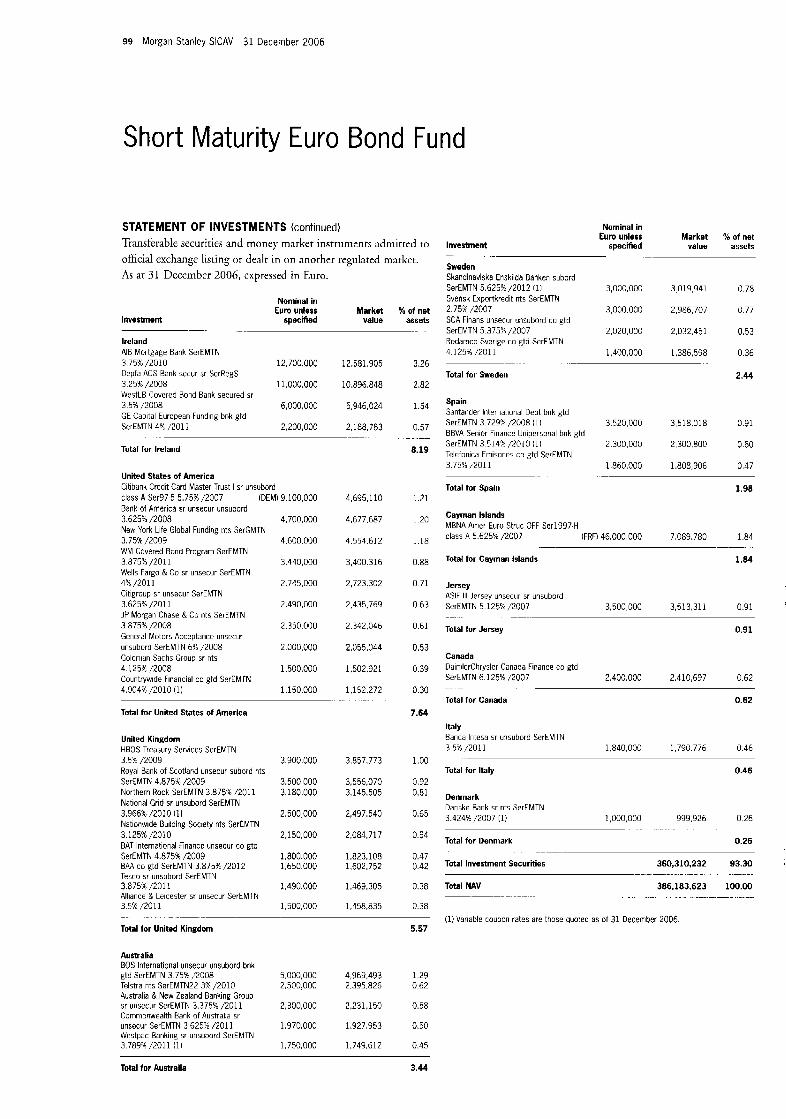
99 Morgan Stanley SICAV 31 December 2006
Short Maturity Euro Bond Fund
STATEMENT OF INVESTMENTS (continued) Transferable securities arid muney market instrunients admitred to
official exchange listing o r clealt in o n another regulated markct. As ar 31 December 2006, cxpressed in Euro.
Investment
Ireland A16 Mortgage Bank SerEMTN 3.75% /2010 Depfa ACS Bank secur sr SerRegS 3.25% 12008 WestLB Covered Bond Bank secured sr 3 5% /2008 GE Capital European Funding bnk gtd SerEMTN 4 9 /2011
Total for Ireland
_ .~
Nominal in Euro unless Market K of net
specihed value assets
12,700,000 12,581,905 3.26
11.000.000 10396,848 2.82
6.000.000 5,946,024 1.54
2,200,000 2,188,783 0.57
8.19
.. . . .
United States of America Citibank Credit Card Master Trust I sr unsubord class A Ser97 5 5.75% /ZOO7 (DEM) 9,100,000 Bank of America sr unsecur unsubord 3.625% i2008 4,700,000 New York Life Global Funding nts SerGMTN 3.75% /zoo9 4,600.000 WM Covered Bond Program SerEMTN 3.875% /2011 3.440.000 Wells Fargo & Co sr unsecur SerEMTN 4% /2011 2,745,000 Citigroup sr unsecur SerEMTN 3.6251 /2011 2.490,OOO JP Morgan Chase & Co nls SerEMTN 3 675% /2008 2.350.000 General Motors Acceptance unsecur unsubord SerEMTN 69: /2008 2,000,000 Goldnian Sachs Group sr nts 4.12591 /2008 1,500,000 Countrpwde Financial co gtd SerEMrN 4.904% /2010 (1) 1,150.000
Total for United States of Amerlca
United Kingdom HR3S Treasury Services SerEMTN
Royal Bank of Scotland unsecur subord nts SerEMTN 4.875'1; /ZOO9 Northern Rock SerEMTN 3.875% /2011 National Grid sr unsubord SerEMTN 3.966% /2010 11) Nation.vide Building Society nts SerEMTN 3 12506/2010 BAT lriterriational Finance unsecur co gtd SerEMTN 4.875% ROO9 B M co gtd SerEMTN 3.875% /2012 Tesco sr unsubord SerEMTN 3 P75% /2011 Alliance & Leicester sr unsecur SerEMTN 3 5% /2011
Total for United Kingdom
3.58 /2009
-. . . _
3,900,000
3.500,OOO 3,180.000
2,500,000
2,150,000
1,800.000 1,650,000
1,490.000
1,500,000
4,695,110
4,677 687
4.554.612
3,400.316
2,723.302
2,435,769
2.342.046
2,055,044
1,502,921
1.152.272 .. -
3,857,773
3,556,070 3,145,505
2.497.540
2,084,717
1.823.108 1,602,752
1,463,305
1.458.835
1.21
1 20
1.18
0.88
0.71
0.63
0.61
0.53
0.39
0.30
7.64
1.00
0.92 0.81
0.65
0.54
0.47 0.42
0.38
0.38
5.57
Investment
Sweden Skandinaviska Enskilda Banken subord SerEMTN 5.625% /2012 11) Svensk Exportkredit nts SerEMTN 2 15;; /2007 SCA Finans unsecur unsubord co gtd SerEMTN 5 375% /2007 Rodamco Sverige co gtd SerEMTN 4 125%/2011
Total for Sweden
_.
_. .
Nominal in Euro unless Market % of net
specified value assets _-
3,000.0CO 3.019,941 0.78
3,000.000 2,986,707 0.77
2,020,000 2.032.451 0.53
1,400,000 1,386,598 0 36
2.44
Spain Santander International Debt bnk gtd SerEMTN 3.72991 /2008 (1) 3,520,000 3.518.018 0.91 BBVA Seriior Finance Unipersonal bnk Rtd SerEMTN 3.5144 /2010 (1) 2,300,000 2,300.800 0.60 Telefonica Emisones co gtd SerEMTN 3.759Li2011 1,860,000 1,808,906 0.47
Total for Spaln 1.98
__
Cayman Islands MBNA Amer Euro Struc OFF Ser1997-H class A 5 625% /2007 IFRF) 46.000,OOO 7,089,780 1 84
Total for Cayman Islands 1.84
__ ..
Jersey ASlF 111 Jersey unsecur sr unsubord SerEMTN 5 125% /2007 3,500 000 3,513,311 0 91
Total for Jersey 0.91
.. ...... _ _
Canada DaimlerChrysler Cdnada Finance co gtd SerEMrN 6 125% /2007 2,400,000 2,410 697 0 62
Total for Canada 0.62
... ..
Italy Banca lntesa sr uisubord SerEhlTN 3.5%/2011 1.840,OOO 1,790.776 0.46
Total for Italy 0.46
Denmark Danske Bank sr nts SerEMTN 3 424% /ZOO7 (1) 1,000,000 999 926 0 26
Total for Denmark 0.26
Total Investment Securities 360,310,232 93.30
Total NAV 386,183,623 100.00
-
- . -. . . . .-
. ._. - -. .. -
11) Variable coupon rates are those quo'ed as of 31 December 2006.
Australia BOS International unsecur unsubord bnk gtd SerEMTN 3.75% /2008 5,000,000 4.969.493 1.29 Telstra nts SerEMTN22 3% /2010 2,500.000 2.395.826 0.62 Australia & New Zcaland Banking Group sr unsecur SerEMTN 3.375% /2011 2,300,000 2,231,150 0.58 Commonwealth Bank of Australia sr unsecur SerEMTN 3.625?6 /2011 1,970,000 1,927,953 0.50 Westpac Banking sr unsuoord SerEMTN 3.7894 L O 1 1 (1) 1,750,000 1,749,612 0.45
Total for Australia 3.44

Morgan Stanley SICAV 31 December 2006 100
US Bond Fund
INVESTMENT AIMS
To provide an attractive rate of return, measured in US Dollars, through investment primarily in US Dollar denominated fixed income securities issued by governments, agencies and corporations either in the US domestic markets or in the Euromarkets.
Please refer to the full prospectus for the Fund's investment objective and policy.
STATEMENT OF INVESTMENTS Transferable securiries and money market instruments ;idmittcd t o
offi;ci;il cxchangc liciing or dealt in on another regulated market. As at 31 December 2006, expressed in US dollars
Investment
Nominal in US dollars
unless specified
Mortgage and Asset Backed Securities
United States of America FNMA Pool 7 1/07 7% ,/2049 10.400.000 FNMA Pool 256317 79; /2036 G t Dealer Floorplan Master Note Trust 2004-2 A 5.433 /2009 (1) MBNA Credit Card Master Note Trust 2003-A3 A3 5.47%/2010 (1) Structured Assct Mortgage Investmerits 2006-AR3 l l A 2 5.62'4 /2036 (1) CNH Equipment Trust 2OC5-B A3 4.27% /2010 USAP Allto Owner Trust 20042 A4 3 589; /2011 Greeripoint Mortgage Funding Trust 2006-AR2 3A2 5.67% /2036 (1) FNMA Pool 709458 7% /2033 Harley-Davidson Motorcyce Trust 2005-1 A2 3.768 /2012 GF Equipment Small Ticket 2005-2A A3 4 88% ;2009 Merrill Aiito Trust Securitization 2005.1 A3 4.1% /2009 Capital Auto Receivables Asset Trust 2006-SN1A A3 5.310': ;2009 Volkswagen Auto Loan Enhanced Trust 20G5 1 A3 4.8% ,'2009 Washington Mutual 2006-AR7 2A 5.807% /2046 (1) Capital Ailto Receivables Asset Trust 2005-1 A4 4.053 /2009 Downey Savings & Loan Association Mortgage Loan Trust 2005-AR1 2A1A 5.767% /2047 11) Bear Stearns Mortgage Funding Trust 2006-AR4 A1 5.53% /2036 (1) Greenpoint Mortgage Funding Trust 2006-OH1 A I 5.51X ./2037 (1) Luminent Mortgage Trust 2006-1 A I 5.59% /2036 (1) Capital Auto Receivables Asset Trust 2006.2 A3A 4.98% /2011 Resideritid Accredit Loans 2006.QG10 A1 5 51'%/2037 11) Nissari Auto Receivables Owner Trust 2005-E A3 3.991 12009 Harborview Mortgage Loan Trust 2006-7 2A1B 5.57%/2037 (1) Banc of America Securities Auto Trust 2005-WF1 A3 3.99% /2009 Caterpillar Financial Asset Trust 2006-A A3 5.57% /2010 Harborview Mortgage Loan Trust 2OC6-10 2A1A 5.5% 1'2036 (1) GS Auto Loan Trust 2006-1 A3
7.739.253
3,025,000
2,675,000
2,514,629
2.525.000
2,500,000
2,307,956 2,216,623
2.300.000
2,250,000
2,225,000
2,200.000
2,200,000
2.1 79,486
2.200,000
2,179,382
2,175,000
2,175,000
2.142,158
2,125,000
2.100,000
2,108,907
2,058.969
2,050,000
2,000.000
1,963,080 . .
5.37% /2010 1,950,000 American Home Mortgage Assets 2006.1 1A3 5.584 /2046 (1) 1,952,954 Countrywide Alternative Loan Trust 2OG5-76 2A2 6.527% /2036 (1) 1,930,593 Countryride Home Loan Mortgage Pass Through Trust 2005-1 1 4A1 5 62% /2035 (1) 1.812.463 Honda Auto Receivables Gwner Trust 2OC5-3 A3 3.874s /ZOO9 1,802,801 GE Eqiiipinent Small Ticket 2005 1A A3 4.38% 12009 1,775,000
Market value
10,669,750 7,939,990
3,028,618
2,681,163
2,525,058
2.499.270
2,469,332
2,3 10,724 2,274,117
2.264.768
2,242,092
2,209,132
2,201.893
2.193.308
2.186.723
2.185,953
7,181,766
2,175,389
2.174.320
2.148.318
2.1 16.367
2.100.000
2,092,838
2,063,213
2.033.593
2,013,739
1.963.386
1,956,155
1,952,421
1,949,918
1,817,304
1,788,136
1,762,719
% of net assets
3.47 2.59
0.99
0.88
0.83
0 81
0.80
0.75 0.74
0 73
0 73
0.72
0 71
0 71
0.71
0.71
0.71
0.71
0.71
0.70
0.69
0.68
0.68
0 67
0 66
0 65
0.64
0.63
0.63
0.63
0.59
0.58
0.57
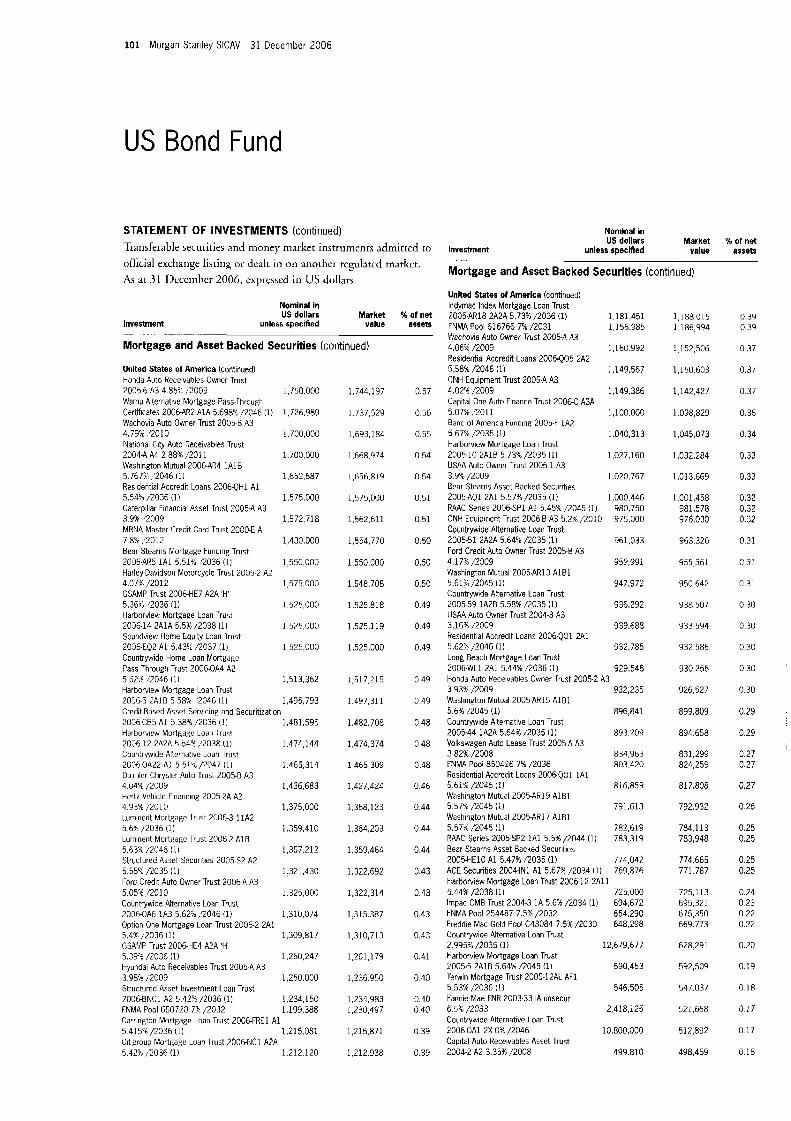
101 Morgan Stanley SICAV 31 December 2006
US Bond Fund
STATEMENT OF INVESTMENTS (continued) li-ansferable securities and money market instruments adinirted [o
official exchange lisiitig or dcalt in on another regulated markcr. As at 31 Occcrnhcr 2006, cxprcsscd in LIS do1l;irs.
Nominal in US dollars Market % of net
Investment unless specified value assets ... . . . . . . . .. .-
Mortgage and Asset Backed Securities (continued)
Unlted State8 of Amerlca (continued) Hu-Ida Auto Receivables Owricr Trust 7005-6 A3 4.85: :2009 1,750.000 Wamu Alternative Mortgage Pass-Through Certifirates 2006-AR2 A1A 5 6 W / X 4 6 (1: 1,726,989 Wachovia Auto Owner Trust 2005.8 A3 4.796 ,/2010 1.700,OOO Natiorial City Auto Receivables Trust 2004-A A4 2 88% /2011 1.700.000 Washingtun Mutual 200G-AR4 l A l B 5.161i:,'204h (1) 1,652,687 Residential Accredit Loans 2C06-QHI A I 5.54% 2 0 3 6 (1) 1,575,000 Cawi l lar Financial Asset .Trust 2005-A A3 3.9% '2009 1,572.718 MENA Master Credit Card Trust 2000-C A 7.8% ;2012 1.430,OOO bear Stearns PvlortRage Funding Trust 20g6-AR5 1 A l 551X !2036 (11 1.550,OOO Harley Davidsoii MotorcyLle Trust 2005-2 A2 4.07'2, /2012 1,575,000 GSAMP Trust 2006-HE7 A2A 'H' 5 . 3 G ~ ) '2036 11) 1.525.000 Harborviev. Mortgage Loan Trust 2036.14 2A1A 5.5% 12038 (1) 1.575.000 Soundviev. Home kquity Loan lrilst 2036-EQ2 A1 5.439: ,7037 (1) 1.525.000 Countrywide Home Loan Mortpagc Pass Throug!i Trust 2006-OA4 A2 5.62;': 12046 (1) 1.513.362 Harborviea Mortgage Loan Trust 2036-5 2AIb 5 58% '2046 ( I ) 1,495,793 Crpdit-based Asset Servicing and Securitization 2036-CB5 A I 5.3816 /2C36 (1) 1,481,595 Harborview Mortgagc Loan Trust 7026.12 2A2A 5.54X ,'203R (1) 1,474.144 Countrywide Alternative Loan Trust 2036-OA22 A I 5 51 X PO47 (1) 1,465,314 Da mler Chrysler Auto Trust 2005.8 A3 4.04% /zoo9 1.436,683 tle'tz Vehicle Financing 2005-2A A2 4.93R/2010 1,375,000 I uniinent Mortgage lrust 2006-3 l l A 2 5.6% /2036 (1) 1,359,410 Luminent Mortgagc Trust 2006 2 A1B 5.63% /2046 (1) 1,357,212 Structiired Asset Securities 2005.S2 A2 5.55". /2035 (1) 1,321,430 Ford Credit Auto Owner Trust 2006-A A3 5.05Y ,/2510 1,325,000 Countrywide Alternative Loari Trust 2036-(1A6 1A3 5.621 ,'XI46 (1) 1,310,074 Option One Mortgage Loan Trust 2006-2 2Al 5.49;. /2036 (1 1 1.309.817 GSAMP Trust 2006-HE4 A2A ' H 5.394 DO36 (1) 1,260,247 Hyimdai Auto Heceivables Trust 2005-A A3 3 98~1,2009 1,250.000 Structured Asset Irivestment Loan Trust 2006-BNC1 A! 5.42% /2036 (1) 1,234,150 fNMA Pool 650720 7% /2032 1,199,388 Camg-ton Mortgage Loan Trust 20G6-FREl A I 5 415Y/2036 (1) 1.215.081 Cit group Mortgage Luan Trust 2006-NC1 A2A 5.42% n o 3 6 (1) 1,212,120
1,744,197
1.737529
1,693,184
1568.974
1.656.819
1,575,000
1.562.611
1,554,770
1.550.000
1.548.708
1,525,818
1.525.1 19
1,525,000
1,517,215
1.497.311
1,482,708
,474.374
,465,309
,427,424
,368,123
,364,203
,359,464
1,322,692
1,322,314
1.315.387
1,310,713
1,261,179
1,236.950
1,234,983 1,230,497
1.215.871
1.212.938
0.57
0.56
0.55
0.54
0.54
0.51
0.51
0.50
0.50
0.50
0.49
0.49
0.49
0 49
0.49
0.48
0.48
0.48
0.46
0.44
0.44
0.44
0.43
0.43
0.43
0.43
0.41
0.40
0.40 0.40
0.39
0.39
Nomlnal in US dollars Market X of net
Investment unless specified value assets
Mortgage and Asset Backed Securities (continued)
United States of America (continued) lndymac Index Mortgage Loan Trust 2005-AR18 2A2A 5.73% /2036 (1) 1,181,451 FNMA Pool 616766 7% /2031 1,156.985 Wachovia Auto Owner Trust 2005-A A3 4.06% ./2009 1,160.992 Residential Accredit Luans 2006.QO5 ZA2 5.58% /2046 (1) 1,149,567 CNH Equipment Trust 2005-A A3 4.0P4 /2009 1,149.386 Capital One Auto Finance Trust 2006-C A3A 5.07% /2011 1,100.000 Eanc 01 America Funding 2005-F 1AZ 5.67% /2035 (1) Harborview Mortgage Loan Trust 2005 10 2A1B 5.73%/2035 (1) USAA Auto Owner Trust 2005-1 A3 3.9% /zoo9 Bear Stearns Asset Backed Securities 2005-AQ1 2A1 5.57%/2035 (1) RAAC Series 2006-SP1 A I 5.45% ,7045 (1) CNH Equipment Trust 2006-8 A3 5.2% /2010 Countrpide Alternative Loan Trust 2005-51 2A2A 5.64% /2035 (1) Ford Credit Auto Owner Trust 2005-8 A3 4.173 /zoo9 Washington Mutual 2005-AR13 A l B l 5.61%/2045 (11 Countrywide Alternative Loan Trust 2005-59 1A2B 5.58% /2035 (1) USAA Auto Owner Trust 2004-3 A3 3.163 /2009 Residential Accredit Loans 2006-QOl 2A1 5.62% /2046 (1) Lone Beach Mortirare Loan Trust
,040.31 3
,027,160
,020,767
,000,446 980,750 975,000
961,033
959.991
947,972
936,292
939.688
932.785
929,548 2O&-WL1 2A1 5.4& /2036 (1) Honda Auto Receivables Owner Trust 2005-2 A3 3 93% /2009 932,235 Washington Mutual 2005-AH15 A I 61 5.69 /2045 (1) 896,841 Countrywide Alternative Loan Trust 2005-44 1A2A 5.64% /7035 11) 893.209 Volkswagen Auto Lease Trust 2005-A A3 3 82% /2008 834,963 FNMA Pool 850426 7% /2036 803.420 Residential Accredit Loaris 2006,QOl 1 A l 5 61'X. /2046 (1) 816.859 Washington Mutual 2005.AR19 A l B l 5 57% /2045 (1) 791,613 Washington Mutual 2095-AR17 A l B l 5.5736 /2045 (1) 782,619 RAAC Series 2005-SP2 1 A l 5 5%/2044 (1) 783.319 bear Stearns Asset backed Securities 2005-HE10 A I 5.47% /2035 (1) 774.042 ACE Securities 2004-IN1 A1 5.67% /2034 11) 769,876 Harborview Mortgage Loan Trust 2006-12 2 A l l 5.44% /2038 11) 725,000 lmpac CMB Trust 2004-3 1A 5.6% /2034 (1) 694,672 FNMA Pool 254487 7.5% /2032 654.290 Freddie Mac Gold Pool C43084 7.5% /2030 648,298 Countrywide Alternative Loan Trust 2.9953 /2035 (1) 12,679577 Harborview Mortgage Loan Trust 2005.5 ZAlB 5.64% 1'2045 (1) 590,453 Teriin Mortgage Trust 2005-l2AL AFl 5.53% /2036 (1) 546,505 Fannie Mae FNR 2003-33 IA unsecur 6.5% /2033 2,418,125 Countrywide Alternative Loan Trust 2006-OA1 2X OX /2046 10,800.000 Capital Auto Receivables Asset Trust 2004-2 A2 3.354: /2008 499.810
1,188.015 1,186,994
1 152,506
1.150.603
1,142,427
1098,829
1.045.073
1.032.284
1.01 3.669
1,001,458 981,578 976.030
963,326
955,361
950.642
938,507
933.594
932,586
930,256
926,527
899,809
894.658
831,299 824.259
81 7.808
792.932
784,113 783,948
774,665 771.787
725,113 695,321 675,350 669.773
628.291
592,509
547.037
521,668
512,892
498,469
0.39 0.39
0 37
0.37
0 37
0.36
0 34
0.33
0.33
0.32 0.32 0 32
0 31
0.31
0 31
0.30
0.30
0.30
0.30
0.30
0.29
0.29
0.27 0.27
0.27
0 26
0.25 0.25
0 25 0.25
0.24 0.23 0.22 0.22
0.20
0.19
0 18
0.1 7
0.17
0.16
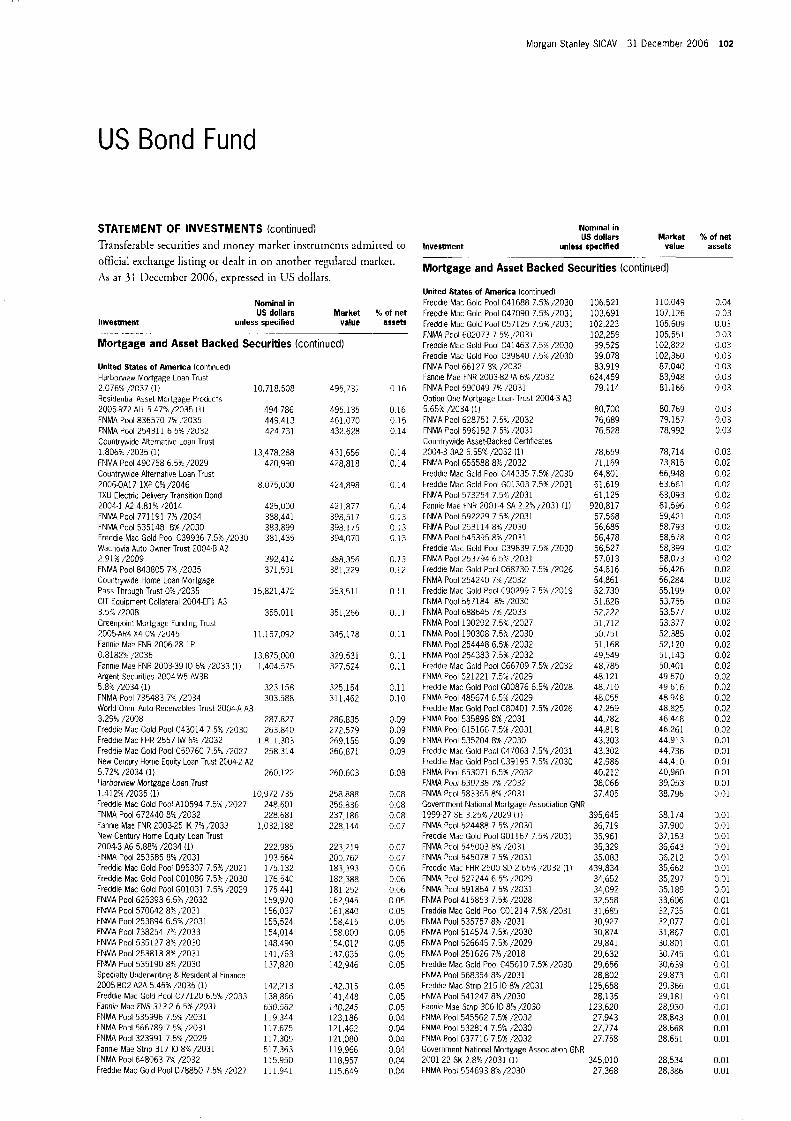
Morgan Stanley SICAV 31 December 2006 102
US Bond Fund
STATEMENT OF INVESTMENTS (continued) Trmsferable securities and inoney marker instrurncnts adtiiirred to
ofiicial exchange listing or dealt in on another regulated ~narltct. A s i n 3: 1)cccrnhcr 2006, expressed in US dollars.
Investment
Nominal in US dollars Market X of net
unless specified value assets
Mortgage and Asset Backed Securities (continued)
United States of America (continued) Harborview Mortgage Loan Trust 2.076% /2C37 (1) 10,718,508 Resideritia Asset Mortgage Products 2005-R22 All 5.47% /2035 ( 1 ) 494,786 FNMA Pool 836570 7% /2035 449.413 FNMA Pool 254311 6.5% /2032 424.731 Countrywide Alternative Loan Trust 1 806~: 12035 (1) 13.478.288 FNMA Pool 490758 6.54: /2029 420,990 Countrywide Alternative Loan Trust 2006-OA17 1XP 0% /2046 8.075,OOO TXU Electric Delivery Transition Rond 2004-1 A2 4.818 12014 425,000 FNMA Pool 771191 7% /2034 388,441 FNMA Pool 535148 8%. /7030 383.899 Freddie Mac Gold Pool C39936 7.57: /2030 381.435 Wachuvia Auto Owner Trust 2004-8 A3 2.9 1 ?+ 12009 192.414 FNMA Pool 843805 7% /2035 371,591 Countrywide Home Loan Mortgage Pass Through Trust CG /2035 15,821,472 CIT Equipnent Collateral 2004-EFl A3 3.52; 12008 355,011 Greenpoin: Mortgage Funding Trust 2005-AR4 X4 OYc 1'2045 11.157.092 Fannie Mae FNR 2006-28 1P 0.81824: ,'2036 13,875.000 F a m e Mae FNR 2003-39 IO 6%/2033 (1) 1,404.575 Argent Securities 2004-W5 AV3B 5.8A /2034 (1) 323.158 FNMA Pool 735483 7% /2034 303.588 World Omni Auto Receivables lri lst 2004-A A3 3.29% /2008 287.827 Freddie Mac Gold Pool C43014 7.5% /2030 263.840 Freddie Mac FHR 2557 IW 6% /2032 1.81 1,303 Freddie Mac Gold Pool C59760 7.59~ 12027 258.314 New Century Home Equity Loan Trus! 2004-2 A2 5.72"h /2034 (11 260.122 Harborview Mortgage Loan Trust 1.412%/2035 (1) 10.972.735 Freddie Mac Gold Pool A10594 7.57; ,2027 FNMA Pool 672440 8% /2032 Fame Mat FNR 2003-25 IK 7% 1'2033 New Century Home Equity Loan Trust 2004-3 A6 5.88% /2034 (1) FNMA Pool 253585 82 /2031 Freddie Mac Gold Pool 1395307 7.5% 12021 Freddie MdC Gold Pool COlO86 7.5% 12030 Freddie Mac Gold Pool GO1031 7.5~4 :2029
FNMA Pool 570642 8% /2031 FNMA Pool 253894 6.51 /2031 FNMA Pool 738254 7% /2033 FNMA Pool 535127 8% /2030 FNMA Pool 253813 8% /2031 FNMA Pool 535190 8% /2030 Specialty Uriderwriting & Residential Finance 2005-BC2 A2A 5.45% /2035 (1) Freddie Mac Gold Pool C77120 6.59~ 12033 Fannte Mae FNS 3132 6.5% /2031 FNMA Pool 535996 7.53 12031 FNMA Pool 566789 7.5% /3031 FNMA Pool 323991 7.536 /2029 Fannie Mae Strip 317 IO 8% /2031 FNMA Pool 648063 7% /2032 Freddie Mac Gold Pool 078850 7% /2027
FNMA Pool 625393 6.5% /2032
248,601 228,681
1.032.188
222,985 193.564 175,132 176,340 175.441 159,9?0 156,037 155,524 154.014 148.490 141, /63 137,820
147,713 138.866 630.567 119.344 11 7.675 11 7,305 517,363 115.950 111.941
495.73:
495.135 461.070 439.678
431,656 428,818
424,898
421,877 398,517 398.1 15 394,070
388,356 381,229
353,511
351,266
345.178
329.531 327.524
325.154 311.462
286.835 272.579 269,155 266.871
260.603
258.888 256.536 237.186 228.144
223,219 200.767 183,393 182,388 181,252 162,945 161,840 158,415 158.009 154.012 147.035 142,946
142.315 141,448 140.745 123,186 121.462 121,080 119,966 118.957 115.649
0.16
0.16 0.15 0.14
0.14 0.14
0 14
0.14 0 13 0.13 0,13
0.13 0 12
0 11
0.11
0 11
5.11 c.11
c.11 0.10
0.09 0.09 0.09 0.09
0.08
0.08 0.08 3.08 0.07
0.07 0.07 0.06 3.06 0.06 0.05 0.05 0.05 0.05 0.05 0.05 0.c5
0.05 0.C5 0.05 3.04 0.04 0.04 3.04 0.C4 0.c4
Nominal in US dollars Market
Investment unless specMed value . --
Mortgage and Asset Backed Securities (continued)
United States of America (continued) treddie Mac Gold Pool C41688 7.5% /2030 Freddie Mac Gold Pool C47090 7.56 /2031 Freddie Mac Gold Pool C57125 7.5% /2031 FNMA Pool 602073 7.5%/2031 Ffeddie Mac Gold Pool C41463 7.5% /2030 Freddie Mac Gold Pool C39840 7.5% /2030 FNMA Pool 66177 89; /2032 t annie Mae FNR 2003-82 IA 6% 12032 FNMA Pool 590049 7% /2031 Optiori One Mortgage Loan Trust 2004-3 A3 5.65% /2034 (1)
FNMA Pool 596192 7.52 /2031 Countrywide Asset-Backed Certificates 2004-3 3A2 5 55"4, /2032 (1) FNMA Pool 655588 8% ,'2032 Freddie Mac Gold Pool C44335 7.5% 12030 Freddie Mac Gold Pool GO1303 7.5% /2031 FNMA Pool 573254 7 5% /2031 F a m e Mae FNH 2001-4 SA 2.2%/2031 ( I ) FNMA Pool 592229 7 5% /2031
FNMA Pool 545395 8% /2031 Freddie hlac Gold Pool C39839 7.5% /2030 FNhlA Pool 253794 6.5% ,'2031 rreddie Mac Gold Pool C68730 7.5% /2026 FNMA Pool 254240 7% ,'2032 Freddie Mac Gold Pool C90299 7.5% /2019
FNMA Pool 688645 7% /2033
FNMA Pool 628751 7.51 12032
FNMA Pool 253114 85,; /7030
FNMA Pool 351184 8% /2030
FNMA Pool 190292 7.5% ./2027 FNMA Pool 190308 7.5:~ /2030 FNMA Pool 254448 6.5% /2032 FNMA Pool 254383 7.53 /2032 Freddie Mac Gold Pool C66709 7 5 9 ~ /2032 FNMA Pool 521221 7.5% 12029 Freddie Mac Gold Pool GO0876 6.5% /2028 FNMA Pool 485674 6.5% /2029 Freddie Mac Gold Pool C80401 7.5% /2026 tNMA Pool 535898 8% :2031 FNMA Pool 615166 7 . 5 i /2031 FNMA Pool 535204 8% /2030 Freddie Mac Gold Pool C47063 7.5"h/2031 Freddie Mac Gold Pool C39195 7.591 /2030 FNMA Pool 653071 6.5% /2032 FNMA Pool 630738 7% /7032 FNMA POOI 583355 8 ~ 4 :2031
106,521 103,691 102,223 102.259 99.525 99,078 83,919
624,459 79.114
80,700
76.528
78,659 71,169 64,801 61,619 61,125
920.817 57.568 56,685 56.478 56,527 57.013 54.616 54,861 52.730 51,828 52,222 51,712 50.751
49,549 48,785 48,121 48,710 48,055 47,259 44,782 44,818 43,303 43.302 42,986 40,212 38,066 37 405
76,689
51,168
Government National Mortgage Association GNR 1999-27 SE 3.25% /2029 (11 FNMH POOI 524488 7 5% 12030 Freddie Mac Gold Pool GO1167 7.5% /2031 FNMA Pool 545003 8% /2031 FNMA POOI 545078 7 5% 12031 Freddie Mac FHR 2500 SO 2.65-h 12032 ( I ) FNMA Pool 527744 6.5% .'2029 FNMA Pool 591854 7 5% /2031 FNMA Pool 415853 7.5% /2028 Freddie Mac Gold Pool C01214 7.5%/2031 FNMA PUOI 535757 8% 1'2031 FNMA Pool 514574 7.5% /203C FNMA Pool 526645 7.5% /2029 FNMA Pool 251626 7a4 /2018 Freddie Mac Gold Pool C45610 7.5% /2030
Freddie Mac Strip 215 IO 8% /2031 FNMA Pool 541247 8% /2030 tannlp Mae Strip 306 IO 84: /2030 FNMA Pool 545562 7.5% /2032 FNMA Pnol 532814 7 5% /2030 FNMA Pool 637716 7 5% /2032 Government National Mortgage Association GNR 2001-22 SK 2.891 1'2031 (1) FNMA Pool 554693 8% /2030
395,645 36,719 35,961 35,329 35.083
439,834 34,652 34,092 32.558 31,685 30,927 30,874 29,841 29,632 29,656
125,658 28,135
123,620 27.943 27,774 27.758
345.010 27,368
FNMA Pool 568354 8% DO31 28,802
110.049 107.126 105.609 105.551 102,822 102,360 87.040 83,948 81,166
80,769 79,157 78.992
78.714 73.815
63.661 63.093 61,596 59,421 58.793
58,399 58.073 56,426 56,284 55.199 53.755 53,577 53.377 52.385 52,120 51,143 50.401 49.670 49,616
48.825 46,448 46.261 44.913 44.736 44,410 40,960 39.053 38.796
38.174 37.900 31,153 36.643 36.212 35.662 35.297 35.189 33,606 32,735 32,077 31,867 30.801 30.745 30,639 29.873 29.366
28.930
28.668 28.651
28,534 28,386
66,948
58,518
48,948
29,181
28,843
X of net assets
0.04 0.03 0.03 0 03 0.03 0.03 0.03 0.03 0.03
0.03 0.03 0.03
0.03 0.02 0.02 0.02 0.02 0.02 0.02 0.02 0 02 0.02 0 02 0.02 0.02 0.02 0.02 0.02 0.02 0.02 0.02 0.02 0.02 0.02 0.02 0.02 0.02 0.02 0.02 0.01 0.01 0.01 0.01 0.01 0.01
0.01 0.01 0.01 0.01 0.01 0.01 0.01 0.01 0 0 1 0 01 0 01 0.01 0.01 0.01 0 01 0.01 0.01 0.01 0.01 0 01 0.01 0.01
0.01 0.01
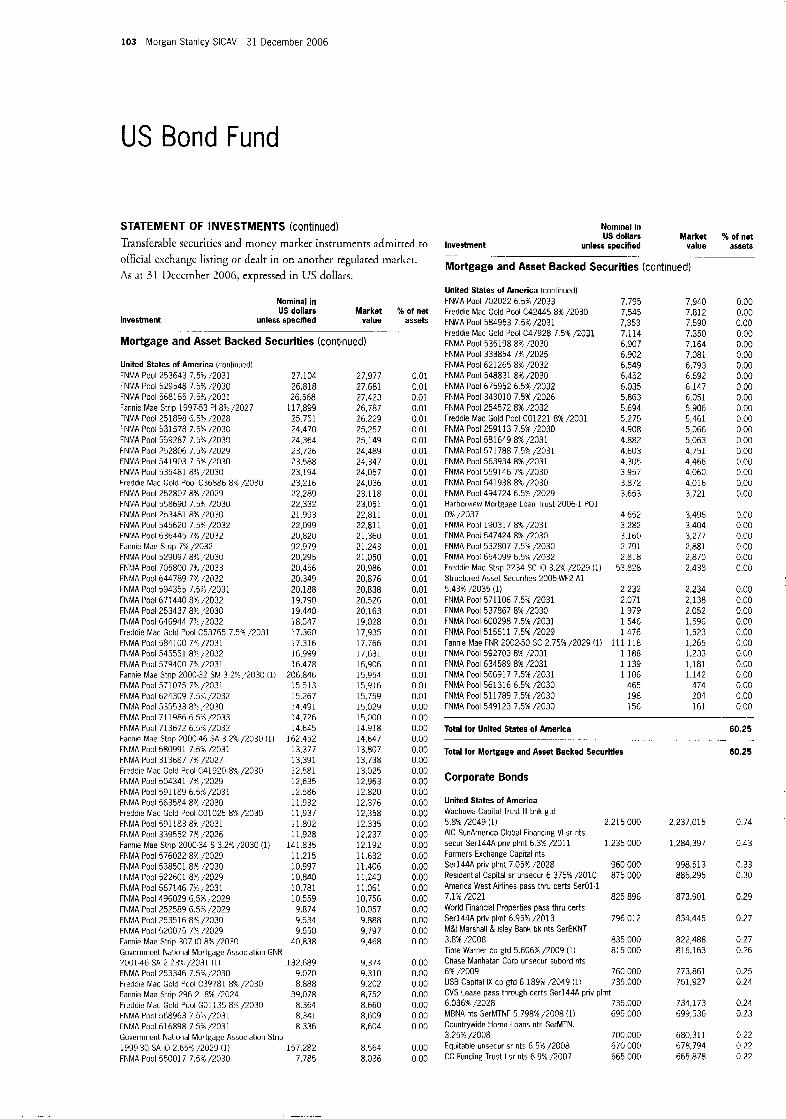
103 Morgan Stanley SlCAV 31 December 2006
US Bond Fund
As a[ 31 1)cccmber 2006, expressed in US dollars.
Investment
Nominal In US dollars Market
unless specified value
STATEMENT OF INVESTMENTS (continued) Transferable securirics and rnoncy market instruments adniitced to ollicial cxchangc lkting o r dealt in on another regdared markcc.
Mortgage and Asset Backed Securities (continued)
United States of America (continued)
TNMA Pool 529548 7.5% /7030 FNMA Pool 568165 7.5%/2031 Fame Mae Strip 1997-53 PI 8% /2027
FNLIA Pool 253643 7.5h 1'2031
FNMA Pool 251898 6.5% 1'2028 FNMA Pool 531578 7 5%. /2030 FNMA Pool 559287 7.5% /2033 [NMA Pool 752806 7,5% QOZY FNMA Pool 541903 7 5% /2030 FNMA Pool 535481 8% 1'2030 Freddie Mac Gold Pool C36586 8% 12030 FNMA Pool 252837 8% /2029
rNMA Pool 253481 89: /2030
FNMA Pool 636445 7% /2032 Fannie Mae Strip 7Y, /2032 FNMA Pool 529097 8% ,/2030
FNtilA Pool 644789 7X /2032 FNMA Pool 594355 7.3% /2031 FNMA Pool 671440 8x2 /2032 FNUA Pool 253437 89: ,'203C FNMA Pool 646944 79; 12032 Freddie Mac tiuld Pool C53765 7.5% /2031 FNtilA Pool 5841 90 7Y /2031
FNMA Pool 558690 7.54: /2030
FNMA Pool 545620 7 5% /2032
FNUA Pool 705800 7% /2033
FNMA Pool 545551 89; ,2032 FNMA PUUI 579400 7R 1'2031 Fannie Mae Strip 2000-32 SM 3 2C ,'2030 (1) FNMA Pool 571075 7% /2G31 FNMA Pool 624309 7.3:; /2032 TNMA Pool 535533 8% ,,2030 FNMA Pool 711986 6.5% 12033 FNMA Pool 713672 G.5% ,12032 Fannie Mae Strip 2000-46 SA 3.2%, /XI30 (1) FNMA Pool 580991 7.5% 12031 FNMA Pool 313687 78 /2027 Freddie Mac Gold Pool C41920 8% /2030 FNMA Pool 504341 7% /'2029 FNMA Pool 591189 6.5'4;2031 FNMA Puul 563584 85 2 0 3 0 Freddie Mac Gold Pool C01025 806,12030 FNMA Pool 591 183 8% /2031 FNMA Poo 339552 7? /2026 Fame Mae Strip 2000-34 S 3.2Y /2030 (1) FNMA Pool 576022 8X /2029 FNMA Pool 538501 83 12C30
FNMA Pool 496029 6.5% ,'2029 FNMA Pool 252589 6.5;: /2029 FNMA Pool 253516 8% /2030 FNMA Pool 520075 I"+ /2029
27.104 26,818 26.568
117,899 25.751 24,470 24.364 23,726 23.588 23,194 23,216 22,289 22,332 21.993 22,099 20,820 92.979 20.295 20,456 20.349 20.188 19.790 19,440 18,547 17.360 17.316 16,999 16.478
206,846 15.513 15,267 14,491 14,726 14.645
162.452 13,377 13,391 12.581 12,635 12.586 11,932 11,937 11.892 11,928
141.835 11.215 10,997 10,840 10,781 10.559 9.874 9.534
. . . . 9.550 40,838
132,689 9.020 8.888
39,078 8.364 8,341 8.336
157.282 7.785
Fannie Mae Strip 307 IO 8%, e 0 3 0 Gcvcrnnicnt Natiorial Mortgagc Association GNR %0014S SA 2 23% /2031 (1) FNMA Pool 253346 7.5% /2030 Freddie Mac Gold Pool C39781 8% /7030 Fannie Mae Strip 296 2 8% 12024 Freddie Mac Gold Pool GO1 135 8% /2030 FNMA Ponl 568963 7.33? /2031 iNlAA Pool 616898 7.5? ./2031 Government National Mortgage Association Strip 1999 30 SA IO 2.65% /2029 (1) FNMA Pool 55001 7 7.576 /%030
27.977 27.681 27,423 76,787 26.229 25,257 25,149 24,489 24,347 24,057 24,036 23.118 23.051 22,811 22.81 1 21,360 21.243 21.050 20,986 20,876 20,838 20.526 20,163 19,028 17,935 17.766 17,631 15,906 15,954 15,916 15,759 15,029 15,000 14.918 14,647 13,807 13,738 13,025 12,963 12.820 12,376 12,358 12.335 12,237 12.192 11.632 11,406 11,243 11,061 10.756 10.057 9.888 9,797 9,468
9,374 9.310 9.202 8,752 8.660 8,609 8,604
8.564 8.036
% of net assets
0.01 0.01 0.01 0.01 0.01 0.01 0.01 0.01 0.01 0.01 0.01 0.01 9.01 0.01 0.01 0 01 0.01 0.01 0 01 0 3 1 0.01 0.01 0.01 0 01 0.01 0.01 0.01 0.01 0.01 0.01 0.01 0.00 0.00 0.00 0.00 0.00 0 00 0.00 0.00 0.00 0.00 0.00 0.00 0.00 0.00 0.00 0.00 0.00 0.00 0.00 0.00 0.00 0 00 0 00
0 00 0.00 0 00 0.00 0.00 0 00 0.00
0.00 0 00
Nominal In US dollars Market X of net
Investment unless specified value assets - -.
Mortgage and Asset Backed Securities (continued)
Unlted States of America (continued) FNMA Pool 702022 6.5% /2033 Freddie Mac Gold Pool C42445 8% /2030 FNMA Pool 584953 7.5% /2031 Freddie Mac Gold Pool C47928 7 5% /2031 FNMA Pool 535198 8% /2030 FNMA Pool 333854 7% /2025 FNMA Pool 621265 8 X /2032 FNMA Pool 548831 86 /2030 FNMA Pool 675952 6.5% /2032 FNMA Pool 343010 7 5% /2026 FNMA Pool 254572 8% /2032 Freddie Mac Gold Pool CO1221 8% /2031 FNMA Pool 2591 13 7 5% /2030 FNMA Pool 581649 8% R031 FNMA Pool 571788 7 5% /2031 FNMA Pool 563934 8% /2031 FNMA Pool 559146 7% /2030 FNMA Pool 541938 8% /2030 FNMA Pool 494724 6.5% /2029 Harborview Mortgage Loan Trust 2006-1 PO1 0% 12037 FNMA Pool 190317 8% /2031 FNMA Pool 547424 8% /2030 FNMA Pool 532807 7.5Y /2030 FNMA Pool 654099 6.5% /2032 Freddie Mac Strip 2234 SC IO 3.2% /2029 (1) Structured Asset Securities 2005-WF2 A I 5.43% /2035 (1) FNMA Pool 571106 7.5% /2031 FNMA Pool 537867 8 A /2030 FNMA Pool 600298 7.5% /XI31 FNMA Pool 515611 7.5% /2029 Fame Mae FNR 2002-50 SC 2.75% 12029 (1) FNMA Pool 592703 801 /2031 FNMA Pool 634589 8% /2031 FNMA Pool 566517 7.5% /2031 FNMA Pool 561316 6.5% /2030 FNMA Pool 511789 7.5% /2030 FNMA Pool 549123 7.5% /2030
Total for United States of America
7,795 7,940
7,353 7 590 7,114 7,350 6,907 7,164 6,902 7,081 6.549 6,793 6,452 6.692 6,035 6,147 5.863 6,051 5,694 5.906 5,275 5,461 4.908 5,066 4.882 5,063 4,603 4,751 4,305 4,466 3,957 4,060 3,872 4,016 3,653 3,721
4,652 3,496 3.282 3 404 3,160 3,277 2,791 2,881 2,818 2.870
7,545 7,812
53,828
2.232 2.071 1,979 1,546 1.476
111,118 1,188 1.139 1,106
465 198 156
Total for Mortgage and Asset Backed Securities
Corporate Bonds
United States of America Wachovia Capital Trust 111 bnk gtd 5.8% /2049 (1) 2,215,000 AI[: SunAmerica Global Financing VI sr nts secur Ser144A priv plmt 6 3% /2011 1.235.000 Farmers Exchange Capital nts Ser144A priv plmi 7.05% /2028 960,000 Residential Capital sr unsecur 6 375% /2010 875.000 America West Airlines pass thru certs SerOl-l 7.1%/2021 825,896 World Financial Properties pass thru certs Ser144A priv plmt 6.9591 /2013 796,012 M&l Marshall & lsley Bank bk nts SerBKNT 3.8% /2008 835.000 Time Warner co gtd 5.606% /2009 (1) 815,000 Chase Manhatan Corp unsecur subord nts 6% /2009 760,000 USE Capital IX co gtd 6 189% /2049 (1) 735,000 CVS Lease pass through certs Ser144A priv plmt 6.036% D O 2 8 735,000 MBNA nts SerMTNF 5.798% /2008 (1) 695.000 Countrywide Home Loans nts SerMTNL 3.75% /ZOO8 700,000 Equitable unsecur sr nts 6.5% /2008 670,000 CC Funding Trust I sr nts 6.9% 1'2007 665.000
2,438
2,234 2,138 2.052 1,596 1,523 1,265 1,233 1.181 1.142
474 204 161
2 237.015
1,284.397
998.513 886,295
873,901
834,445
822 488 81 6,163
773,861 751,927
734,173 699 536
680.311 678,794 665,878
0.00 0.00 0.00 0.00 0.00 0.00 0.00 0.00 0 00 0.00 0.00 0.00 0 00 0.00 0.00 0.00 0.00 0.00 0.00
0.00 0.00 0.00 0.00 0.00 c.00
0.00 0.00 0.00 0.00 0.00 0.00 0.00 0.00 0.00 0.00 0.00 0 00
60.25
60.25
0 74
0 43
0.33 0 30
0.29
0 27
0 27 0.26
0.25 0 24
0 24 0.23
9 22 0 22 0 22

Morgan Stanley SICAV 31 December 2006 104
US Bond Fund
STATEMENT OF INVESTMENTS (continued) 'liansferable securities and money market instrurnents admitted to
official exchange listing o r dcalc in on another rcgdarzd market. As at 31 December 2006, expressed in US dollars.
Nominal in US dollars
Investment unless specified
Corporate Bonds (continued)
Unlted States of America (continued) Caterpillar Financial Services nts SerMTNF 5.445% KO07 (1) 665.000 Washington Mutual subord nts 8.25% /2010 600.000 St Paul Travelers sr nts 5.01% 12007 630.000 Xlliac Global Fundmg nts Ser144A priv plmt 4.8% /2010 635.000 Ameren 4.2639: /2007 610.000 Hyatl Equities nt5 Ser144A priv plmt 6.875% /ZOO7 595,GOO Clorox sr nts 5.485% /2007 (1) 560.000 Miller Brewing nts Ser144A priv plmt 4 25% e 0 0 8 570,000 Arizona Ptblic Service nts 5.8% /2014 545.000 HSBC Finance nts 6.75% / 2 0 l l 475.000 TCI Communications unsecur sr debentures 7.875% /2026 440.000 lnternatioral Lease Finance unsccur nts 3.75% /2007 490.300 Plains All American Pipeline / PAA Finance co gtd SeW 6.796 12036 465.300 Cuouer Industries unsecur co gtd 5.25% /2007 475.000 Ohio Power 51 unsecur ScrK 6 1 17016 455.000 Viacorri sr rits 6,875% /2036 470.000 Carolina Power & Light 1st mortgage 5.1258 /2013 445.300 EOP Openting LP unsecur sr nts 6.763% /ZOO7 435.000 Cooper Industries LO gtd 5.25% /2012 440.000 Hewlett-Packard sr unsecur 5.496% ;2009 (1) 435,000 SLM rits 4% /2010 445.000 May Department Stores nt5 6.7% /2034 435.000 Wisconsin Electric Power urisubord 3 5% /2007 435.000 Platinum Underwriters Finance co gtd ScrB 7.5% /2017 40G.OOG News' America Holdings co gtd sr debentures 7.75% /2024 World Financial Properties pass thru certs Ser144A 3riv plmt 6.91% /2013 American General Finance nts SerMTNH 4.625% /2010 Federatec Department Stores unsecur sr rits 6.625% /ZOO8 Textron Fiiancial unsecur nts SerMTN 5.125%/2011 Sempra Energy sr nt5 4.6219: i2007 Fred Meyer unsecur co gtd 7.45% /2008 Mohawk Industries unsecur nts SerD 7.276 :2012 Textron Financial sr unsccur 4 175% i20OR FedEx nts 2.65% /2007 ConAgra Foods unsccur nts 8.25% /2030 AT&T nis 6 15% /2034 Norfolk Southern nts 7.353 /2007 Yum! Brands unsecur sr nts 8.875% /2011 COmicast Cable Communications unsecur 51 n t i 6.75% /2011 Detroit Edison sr 6.125% /2010 Citicorp subord nts SerMTNF 6.3751 /?008 Nisource Finance nts 5.94%/2005 (1) Popular horth America co gtd SerMTNF 5.65% /2009 Washington Mutual Preferred Funding II 6.665Y~ /2049 (1)
~~~
390.000
398.317
425.000
405,000
410,000 405,000 3m5.000
365,000 365,000 355.000 285,000 350,000 325,000 285,000
300.000 305.000 305.000 3 10,000
300.000
300 000 ~~~
Texas Eastern Transmission unsecur sr rits 7% /2032 260 000
Market YO of net value assets
-.
665,690 650.458 628.893
623,070 606,863
597.567 560.756
560.527 541.481 501.713
498.295
485,286
480.493 473.595 467.711 465,323
437,653
437.169 436,529 435,003 429,123 427,895 427.816
423.215
419,601
417,058
415,824
414.022
406.360 403.782 393.264
381.377 360. I 9 0 352.584 347,436 344.877 327.180 319.409
313,928 313.010 311,556 310,334
301.708
301,699
231,976
0.22 0.21 0.20
0.20 0.20
0.19 0.18
0.18 G.18 0.16
0.16
0.16
0.16 0 15 0.15 0.15
0.14
0 14 0.14 0.14 0.14 0.14 0 14
0.14
0.14
17.14
0.13
0.13
0.13 0.13 0.13
0.12 0.12 0.11 0.11 0.11 0.11 0 10
0.10 0.10 0.10 0.10
0 10
0.10
0.09
Nomlnal in US dollars
Investment unless specified - .. .
Corporate Bonds (continued)
United States of America (continued) Consumers Energy SerH 4.891 /2009 Burlingtori Norlhern Santa Fe unsccur nts 6.125b /2C09 Public Service Electric & Gas SerMTNB 5% /2013 Huntingtnii National Bank sr nts SerBKNT 4.375% I2010 General Electric Capital nts SerMTNA 5.875PI /2012 IC1 WilniinEton co gtd 4.375% /2008 EnterRy Gulf States 5 769%/2009 (1) Union Pacifir nts 6 625% /2008 Bank of New York nts SerBKNT 3 8% /2008 HSRC Finance unsecur sr unsubord 5.87511 .'2009 Sara Lee unsecur 6.125% /2032 HSRC Finance wisecur sr unsubord 6.4". /2008 Home Depot 5r unsecur 5.49% /2009 (1) tiitergy Gulf States 3,6% /2008 Bank of New York unsecur sr nts 5 2% /2007 Consolidated Natural Gas Company sr nts unsecur unsubord SerC 6.25% /2011 Househ6ld Finance nts 4.125% /ZOO8 DaimlerChryslcr NA Holding co gtd
Sprmt Capital unsecur co gtd 8 75% /2032 HSBC Finarice nts 6.3753; /2011 CIT Group sr nt5 SerMTN 4.752 /2008 Washington Mutual Bank subord nts 5.54: /2013 CVS sr unsecur 5.75% /2011 DaimlerChrysler NA Holding co gtd
CIT Group unsecur sr nts 7.375% /2007 ConAgra Foods unsecur sr nts 7% /2028 Panhandle Eastern Pipe Line sr nts SerB 2.75% /2007 Caterpillar Financial Services nts SerMTNF 3 625% /2007
7.2% 1'2009
m 3y? 12031
295,000
285,000
295.000
295,000
275,000 280.000 270,000 250,000 250.000
235,000 255,000
220,000 210,000 2 10,000 200.000
190,000 190,000
175,000 145,000 160,000 160,000
135,000 130,000
110.000 130,000 120,000
110,000
95,000
Market %of net value assets
291.459
290,038
289,364
287,863
282.960 274.031 269.382 253,086 246.164
237,989 230,008
223,638 210,153 204,464 199.577
196.084 186,221
181,581 174.484 167,001 158,426
135,014 131,755
130.918 130,616 130,401
109,340
93,446
Total for United States of America
Australia Mantis Reef nts Ser144A pitv plmt 4.69216 :'2008 785,000 775.508 FRG Finance nts Ser144A priv plmt 5 125%/2015 495,000 471,245
0.09
0.09
0.09
0.09
0.09 0.09 0.09 0.08 0 08
0.08 0.07
0.07 0 07 0.07 0.06
0.06 0.06
0.06 0.06 0.05 0.05
0.04 0.04
0.04 0.04 0.04
0.04
0.03
12.70
. -.
0.26
0.15 - -~
Total for Australia 0.41
United Kingdom Nationwide Building Society nt5 Ser144A
Vodafofle Group 5.454%, /2007 (1) 565,000 565,431 0.18
Total for United Kingdom 0.40
priv plmt 4.25%/2010 690,000 669.281 0.22
-_ .. .. -.. -- - .
Luxembourg Unicredit Luxembourg Finance sr nts Ser144A priv plmt 5.426% /2008 (11 930,000 930.450 0.30
Total for Luxembourg 0.30 - -. . -~
Cayman Islands Systems 2001 Asset Trust pass thru certs Ser144A priv plmt 6.664% /2013 725.347 760.566 0.25
Total for Cayman Islands 0.25 ~. .- .-
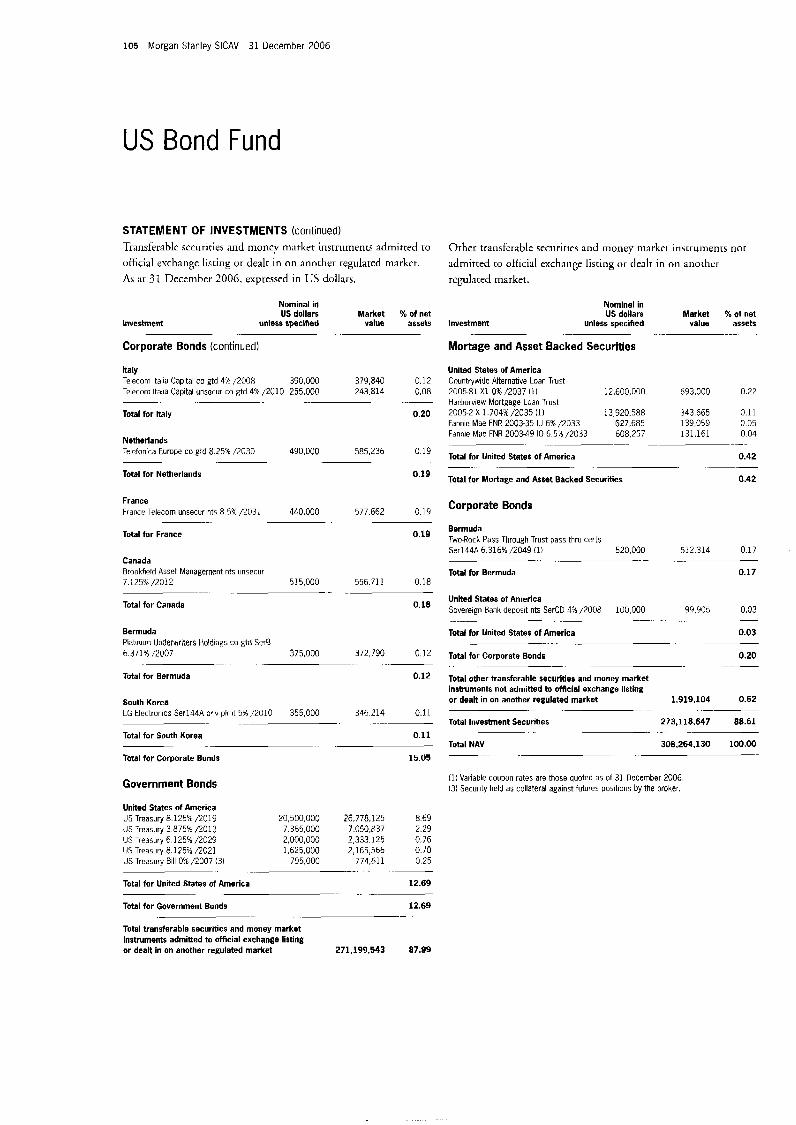
105 Morgan Stanley SlCAV 31 December 2006
US Bond Fund
STATEMENT OF INVESTMENTS (continued) Transferable securities and money triarket instriunienrs admitted to official exchange listing or dealt in on another regulated market. As :it 31 Deceniber 2006, expressed in US dollars.
Nominal in US dollars Market % of net
Investment unless speclned value assets
Corporate Bonds (continued) . .
Italy Telecom ltalia Capital co gtd 4% /2008 390,000 379,840 0.12 Telecom ltalia Capital uiisccur co gtd 4X /2010 255,000 243.814 0.08 ~- ... .. . .
Total for Italy 0.20
Netherlands Telcfonica Europe co gtd 8 25% /2030 490,000 585,236 0 1 9
Total for Netherlands 0.19
France France Telecom unsecur ntc 8 5% /2031 440,000 577.662 0 19
Total for France 0.14 -. .-
Canada Brookfield Asset Management nts unsecur 7.125% /2012 515,000 556.711 0.18
Total for Canada 0.18
- ..
Bermuda Platinum Underwriters HoldinEs co gtd SerB h 371% /7007 375,000 372,790 0 12
Total for Bermuda 0.12 -
South Korea LG Electronics Ser144A p'iv plrrit 5% /2010 355,000 346214 0.11
Total for South Korea 0.11
Total for Corporate Bonds 15.05
.- . .- .~
~.
Government Bonds
United States of America US Treasury 8 125% /2019 US -reasury 3 875% /2013 US -reawry 6 125% /2029 US Treasury 8 175% /2021 US Treasury Bill 0% /2007 (3)
20,500 000 7,365,000 i.ooo,ooo 1,625,000
795 000
Total for United States of America
Total for Government Bonds
Total transferable securities and money market Instruments admitted to official exchange llstlng or dealt in on another regulated market
-. .-
2 6 . 7 7 a . m 8.69 7.050.837 2.29 2,333.125 0.76 2,165,566 0.70
774,611 0.25
12.69
12.69
. . . . .-
. . . . . . . .
....
271,199,543 87.99
Orher trarlsfcrable securiries and money markel instrumenrs nor
admitted ro official exchange lisring o r dealr in on anothcr rcgulated market.
Nomlnal in US dollars Market % of net
Investment unless specified value assets . . . .- .. .-
Mortage and Asset Backed Securities
United States of America Countrywide Alternative Loan Trust 2005-81 XI 0% /2037 (1) Harborview Mortgage Loan Trust 2005-2 X 1.704% /2035 (1) Fannie Mae FNR 2003-35 IU 6% /2033 Fannie Mae FNR 2003-49 IO 6.5% /2033
Total for United States of America
Total for Mortage and Asset Backed Securities
12,600,000
13,920.588 627.685 608.257
. .- ..... __
. . . . . . .
693,000 0.22
343 665 0.11 139,059 0 05 131.161 0 04
0.42
0.42
~- .__.
Corporate Bonds
Bermuda Twd?ock Pass Through Trust pass thru cprts Serl44A 6.316%/2049 (1) 520.000 512.314 0 I /
Total for Bermuda 0.17 . . . . - ...
United States of America Sovereign Bank deposit nts SerCD 4is /2008 100,000 99,905 0.03
Total for United States of America 0.03
Total for Corporate Bonds 0.20
- . .- .- . .
.....
. . . . . . . -.
Total other transferable securltles and money market instruments not admitted to official exchange listing or dealt in on another regulated market 1.919.104 0.62
Total Investment Securities 273,118.647 88.61
308,264,130 100.00 Total NAV
. . . . . .... .
...
...
(1) Variable coupon rates are those quoted as of 31 December 2006 (3) Security held as collateral against futures positions by the broker.

Morgan Stanley SICAV 31 December 2006 106
US Dollar Short Duration Fund
INVESTMENT AIMS
To maximise yield and total return primarily by investing in high quality US Dollar denominated fixed income securities issued by governments, agencies and corporations. The Fund will be managed to maintain a duration of up to 12 months at all times. The Fund may also hold up to 49% of its net assets in cash and cash equivalents.
STATEMENT OF INVESTMENTS Transfer:ihlc sccuriries and money marker insrruments adrnittcd co
official exchange listing or dealt in on anothcr regulated market. As ar 31 December 2006, cxpressed in US dollars.
Nominal in US dollars
Investment unless specified
Mortgage and Asset Backed Securities -
United States of America FNMA Pool 849101 6.7743 /2036 (1)
FNMA Pool 826146 6.82% /2035 (1) FNMA Pool 758614 4.533% /2033 (1) FNMA Pool 868851 7.246%/2036 11) FNMA Pool 872466 7.216% /2036 I11 FNMA Pool 865913 6 731%, /2036 (1) FNMA Pool 885947 7.246% /2036 (1) Freddle Mac Gold Pool C01441 7.5% /2032 Freddie Mac Nan tiold Pool 160953 5 76% 12036 (1) FNMA Pool 865918 6.786% /2036 (11 FNMA Pool 657323 7.55 /2032 FNMA Pool 628075 7.5% ,'2032 CNH Equipment Trust 2005-8 A3 4.27% /2010 FNMA Pool 632894 7 5% /2030 Volkswagen Auto Loan Enhanced Trust 2005-1 A3 4.8? /2009 FhMA Pool 252717 7.58 DO29 GE Equipment Small Ticket 2005-2A A3 4.88% /2009 t iE EquiDment Small Ticket 2005-lA A3 4.38% /2009 FNMA REMICS 2 W - 1 1 8 A2 5.41% /2036 (1) I reddie Mac Non Gold Pool 1G0820 4.373%. /2035 (1) F a m e Mae FNR 2005-27 NA 5.5% /2024 FNMA Pool 735540 4.468% /2035 (1)
Freddie Mac Non Gold P3o1 780926 4 349% /2033 11) Freddie Mac FHR 2182 ZC 7.5% /2029 Capital Auto Receivables Asset Trust 200G-SN1A A3 5 3 1 1 /2009 Dalmler Chrysler Auto Trust 2006-A A3 5% /2010 Honda Auto Receivables Owner Trust 20056 A3 4.85% /2009 FNMA Pool 725695 3.612% DO34 11) Freddie Mac Gold Pool CO1380 7.5%/2032 Countrywide Asset-Backed Certificates 2005-7 AF2 4.367% /2035 Ill FNMA Pool 82621 1 4 75'4 /2035 11) New Century Home Equity Loan Trust 2005-A A2 4.461% /2035 FNMA Pool 607636 7.5% /2031 Banc uf America Securities Auto Trust 2006-G1 A3 5 18% e 0 1 0 Freddie Mac Non Gold Pool 781757 3,53F4 /2034 (11 FNMA Pool 735559 4.19% /2035 (1) Iionda Auto Receivables Owner Trust 2005-1 A3 3.53% /ZOO8 Harley-Davldson Motorcycle Trust 2002-2 A2 3.095X /2010 .
FNMA Pool 779346 3.747"4 /2034 (1) FNMA Pool 773300 4 296% /2035 (1) FNMA Pool 254250 7.5% /2032 Freddie Mac Gold Pool C46909 7.5% /2030 FNMA Pool 555629 5 96% /2033 (1) FNMA Pool 768006 4.5% /2013 Capital @ne Auto Finance Trust 2006.C A3A 5,07% /2011
FNMA Pool 849025 6.778% /2036 (11
FNMA Pool 794386 4.164% 1'2034 11)
409,649 399,362 391.645 340.828 300.603 276.173 262.827 247,942 242,397
222,288 203,750 197,539 192.680
200.000 178,832
175,000 156,348
150.000
150,000 146,083
144,351 141,978 140,836 134,386
132.029 120,534
125,000
125.000
125.000 114,291 105,210
108,870 105,513
104,696 98,083
100,000
96.264 94,862
85.144
82.273 73,467 74,184 64,098 63,077 63.737 52.180
50.000
Market value
418,252 407,747 405,010 337,367 307.346
268 379 253.521 250,426
224,695 208.058 203,897 198.882
197 962 184.588
174.468 161,381
149,473
148.962 146,095
142.960 141,795 139.394 134.013
130,948 126,279
125.108
124,769
124.585 114.652 108,695
107.905 104,422
103.864 101,240
100.1 30
96,175 95.167
84.608
81.789 74.016 73,670 66.161 65.167 64,680 51,171
49,946
282,358
W of net assets
3.16 3.08 3.06 2.55 2.32 2.13 2.03 1 92 1.85
1.70 1.57 1.54 1.5C
1.50 1.39
1 32 1 2 2
1.13
1.13 1.10
1.08 1.07 1.05 1.01
0.99 0.95
0.94
0.94
0.94 0.87 0.82
0 81 0 79
0.78 0 76
0.76
0.73 0.72
0.64
0.62 0.56 0.56 0.50 0.49 0 49 0.39
0.38
Please reier to the full prospectus for the Fund's lrlvestrllerlt oblectlve and uol~cy.
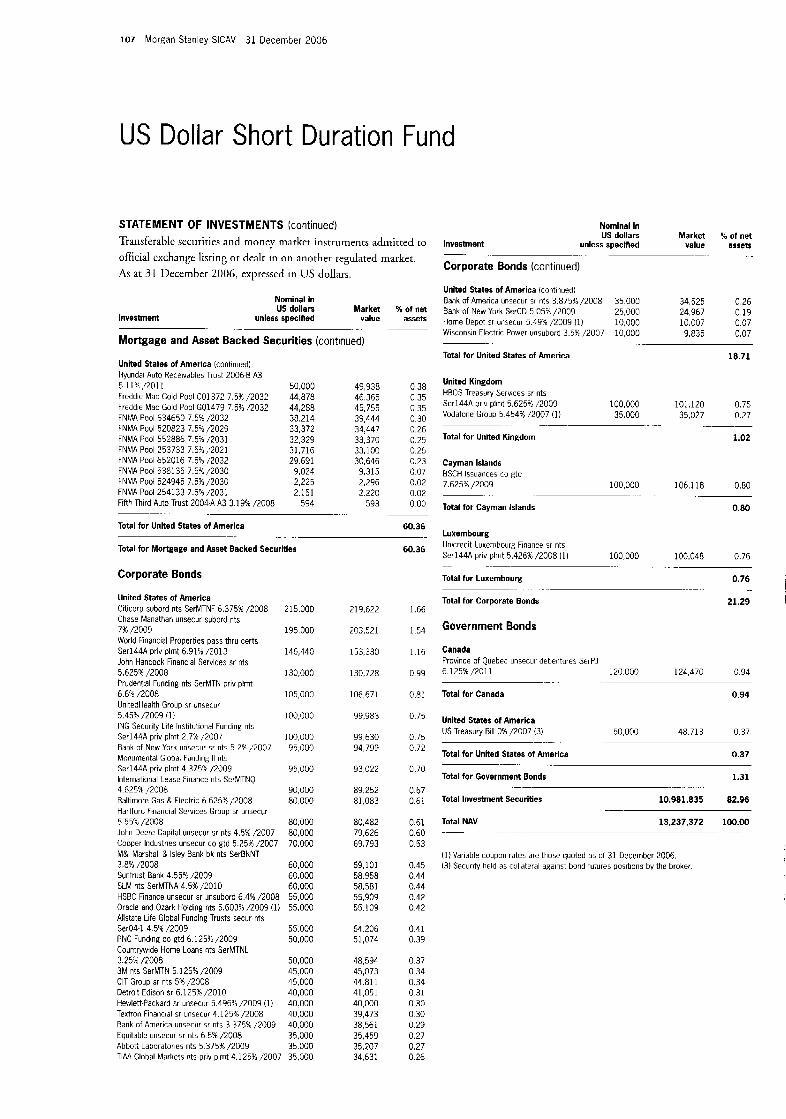
107 Morgan Stanley SICAV 31 December 2006
US Dollar Short Duration Fund
STATEMENT OF INVESTMENTS (continued) Transfirahlc securities and money inarktt instruments adiiiicted [o
official cxchangr listing or deal[ in on another regulated market. As at 31 Decernbrr 2006, expresscd in LIS dollars.
Investment
Nominal In US dollars Market ?4 ot net
unless specified value assets _.
Mortgage and Asset Backed Securities (con t inued)
United States of America (continued) liyundai Auto Receivables Trust 2006.8 A3 5 11%,12011 Freddie Mac Gold Pool CO1372 7.54; /2032 Freddie Mac Gold Pool GO1479 7.5% /2032
FNMA Pool 520823 7.5% /2029 FNMA Pool 552886 7.5% /2031 FNMA Pool 253733 7.5#,'2021 FNMA Pool 652016 7.5% /2032 FNMA Pool 538135 7.5%/2030 FNFvlA Pool 524945 7.52/2030 FNMA Pool 254133 7.5%/2031 Fiftb Third Auto Trust 2004-A A3 3.1991 /2008
Total tor United States of America
FNMA Pool 634650 7.5% /2032
.
_.
50.000 44,878 44,288 38.214 33,372 32.329 31,716 29.691
9,024 2,225 2,151
594
49,938 46.365 45,355 39,444 34.447 33,370 33,100 30,646 9,315 2,296 2.220
593
0 38 0.35 0.35 0.30 0.26 0.25 0.25 0.23 0.07 0.02 0.02 0 00
60.36
Total for Mortgage and Asset Backed Securities
Corporate Bonds
United States of America Citicorp subord nts SerMTNF 6.375% /2008 215.000 Chase Manathan unsecur subord nts 7% /2009 195.000 World Financial Properties pass thru certs Ser144A priv plmt 6.917; /2013 146,440 John Hancock Financial Services sr nts 5.6255 /2008 130,000 Prudential Funding nts SerMTN priv plmt 6.W /2008 105,000 UnitedHealth Group sr unsecur 5.45% 1'2009 (1) 100,000 ING Securily Lite lristitutiorial Funding nts Ser144A priv plmt 2.7% /2007 100,000 Bank of New York unsecur sr nts 5 2% /2007 95,000 Monumental tilobal Furiding II nts Ser144A priv plmt 4.375% /2009 95,000 lriterriational Lease Finance nts SerMTNQ
Baltimore Gas & Electric 6 625% ,'2008 80.000 Hartford Financial Services Group sr unsecur 5.55% /ZOO8 80,000 John Deere Capital unsecur sr nts 4.5% /2007 80,000 Cooper Industries unsecur co gtd 5.25% /ZOO7 70,000 M&l Marshall & lsley Bank bk nts SerBKNT 3.8% /2008 60,000 Suntriist Bank 4.550'. /2C09 60,000 SLV nts SerMTNA 4.5% /2010 60,000 HSBC Finance unsecur sr msubord 6.4% e 0 0 8 55,000 Oracle and Ozark Holding rits 5.603% /2009 (1) 55,000 Allstate Life Global Funding Trusts s e w nts SerO4-l 4 5"4 /2009 55.000 PNC Funding co gtd 6.12591 /200Y 50,000 Countrywide Home Loans nts SerMTNL 3.25;; /?008 50,000 3M nts SerMTN 5 125% /2009 45.000 CIT Group sr nts 5% /2008 45,000 Detroit Edison sr 6.125% /2010 40,000 Hewlett-Packard sr unsecur 5.4961: /2009 (1) 40.000 Textron Financial sr unsecur 4.125% /2008 40,000 Bank of America unsecur sr nts 3.375%, /7009 40,000 Equitable unsecur sr nts 6 5% /2008 35,000 Abboti Laboratories nts 5.375% /2009 35.000 TlAA Global Markets nts priv plmt 4.125% ,12007 35,000
4.625% /2008 90,000
219,622
203,521
153,330
130,728
106,671
99,983
99,630 94,799
93,022
89,252 81.083
80,482 79.626 69,793
59,101 58.958 58,581 55,909 55,109
54,206 51,074
48,594 45,073 44.81 1 41,051 40,000 39,473 38,561 35,459 35,707 34.631
60.36
I .66
1 5 4
1.16
0.99
0.81
0.75
0.75 0.72
0.70
0.67 0.61
0.61 0.60 0.53
0.45 0.44 0.44 0.42 0.42
0.41 0.39
0 37 0 34 0.34 0.31 0.30 0.30 0.29 0.27 0.27 0.26
Nominal in US dollars Market % of net
unless specMed value assets Investment ~ _ _ Corporate Bonds (continued)
Unlted States of America (continued) Bank of America unsecur sr rits 3.875% /2008 35,000 34 525 0 26
Home Depot sr unsecur 5.49% /2009 (1) 10,000 10.007 0 07 Wisconsin Electric Power unsubord 3.5% /2007 10 000 9,835 0.G7
Total for United States of America 18.71
Bank of New Yurk SerCD 5 05% /2009 25,000 24 967 0 19
.- ~.
United Kingdom HBOS Treasury Services sr nts Ser144A priv plmt 5,625% /2009 100,000 101.120 0.75 Vodafone Group 5 454% /2007 !1) 35,000 35,027 0.27
..
Total for United Kingdom 1.02
Cayman Islands BSCH Issuances LO gtd 7 625% /2009 100,000 106118 080
Total for Cayman Islands 0.80
-~
Luxembourg Unicredit Luxembourg Finance sr nts Ser144A priv plnit 5.426%/2008 (1) 100,000 100,048 0.76
Total for Luxembourg 0.76
. . -_ - .. .
1 Total for Corporate Bonds 21.29 !
Government Bonds
Canada Province of Quebec unsecur debentures SerPJ 6.125% /2011 120.000 124,470 0.94
Total for Canada 0.94
. . . . .
. .. ...
United States ot America US Treasury Bill 0% /2007 (3) 50,000 48 713 0 37
Total for United States of America 0.37
Total for Government Bonds 1.31
Total Investment Securities 10.981.835 82.96
Total NAV 13,237,372 100.00
~-
_ _ .. - _ _
-.
__ -~ ._
(1) Variable coupon rates are those quoted as of 31 December 2006. (3) Security held as collateral against bond futures positions by the broker.
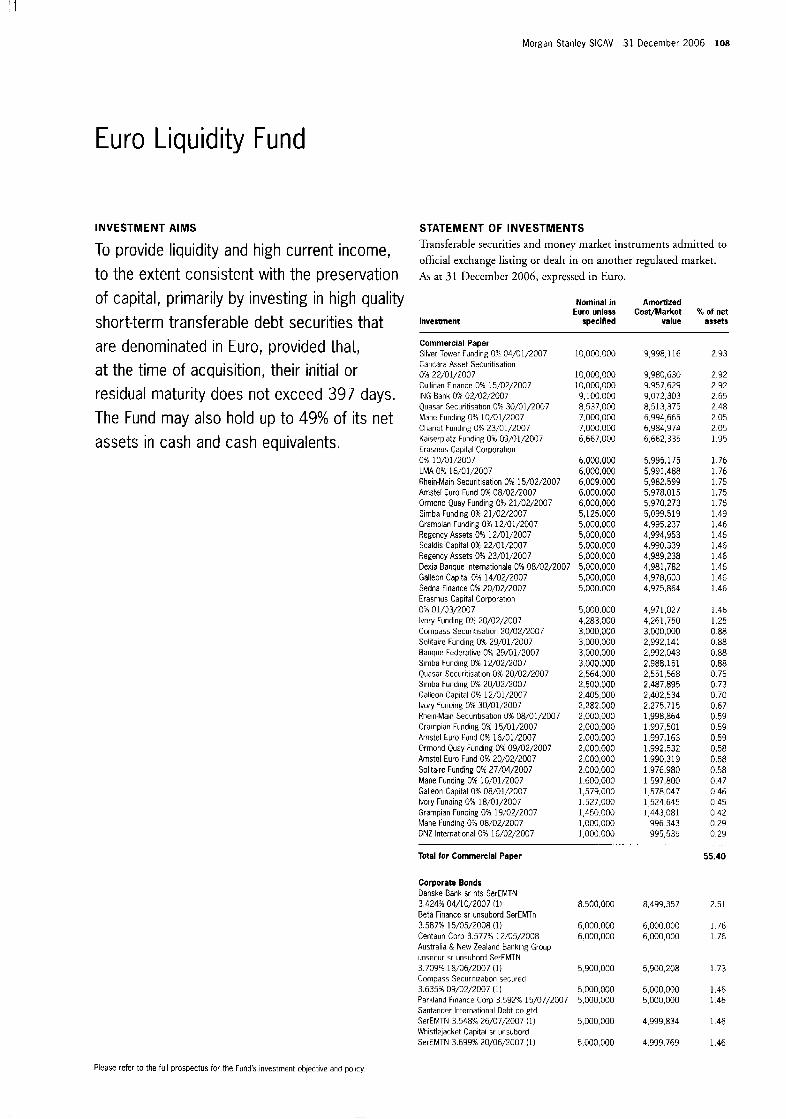
Morgan Stanley SlCAV 31 December 2006 108
Euro Liquidity Fund
INVESTMENT AIMS
To provide liquidity and high current income, to the extent consistent with the preservation of capital, primarily by investing in high quality short-term transferable debt securities that are denominated in Euro, provided that, at the time of acquisition, their initial or residual maturity does not exceed 397 days. The Fund may also hold up to 49% of its net assets in cash and cash equivalents.
STATEMENT OF INVESTMENTS Transferable securities and money market instruments admitted to official exchange lisring or dealt in on another regulaced market. A< at 31 I)cccrnl)cr 2006, cxpresscd in Euro.
Investment
Nominal in Amonlzed Euro unless Costmarket 96 of net
specified value assets
Commercial Paper Silver Tower Funding 09; 04/01/2007 10,000,000 Caricara Asset Securitisation V% 22/01/2007 10,000,000 Cullinan Finance 0% 15/02/2007 10,000,000 ING Bank 0% 02/02/2007 9,100.000 Quasar Securitisation OX 30/01/2007 8.537,OOO Mane Funding 0% 10/01/2007 7,000,000 Chariut Funding 0% 23/01/2007 7.000.000 Kaiserplatz Funding Oh 09/01!2007 6,667,000 Erasmus Capital Corporation 0% 10;01/2007 6,000,000 LMA 0% 16/01/2007 6,000,000 Rhein-Main Securitisation O X 15/02/2007 6,009.000 Arnstel Euro Fund 0% 08/02/2007 6,000,000 Ormond Quay Funding 093 21/02/2007 6,000,000 Simba Funding 0% 21/02/2007 5,125,000 Grampian Funding OS 12/01/2007 5,000,000 Regency Assets 0% 12/01/2007 5,000,000 Scaldis Capital 0% 22/01/2007 5,000.000 Regency Assets Vh 23/01/2007 5,000.000 Dexia Banque Internationale 0% 08/02/2007 5.000,OOO Galleon Capital 0 4 14/02/2007 Sedna Finance 0% 20/02/2007 Erasrnus Capital Corporation 077 01/03/2007 Ivory Funding 0% 20/02/2007 Compass Securitisation 20/02/2007 Sulitaire Funding 0% 29/01/2007 Banqw Federative 0% 29/01/2007 Simba Funding 0% 12/02/2007 Qudsar Securitisation OX 20/02/2007 Simba Funding 0% 20/02/2007 Galleon Capital 0% 12/01/2007 Ivory Funding 0% 30/01/2007 Rhein Main Securitisation 3% 08/01/2007 Grampian Fundirig 0% 15/01/2007 Amstel Euro Fund 0% 16/01/2007 Ormond Quay Funding 0% 09/02/2007 Amstel Euro Fund FA 20/02/2007 Solitaire Funding 0% 27/04/2007 Mane Funding 0% 16/01/2007 Galleon Capital 0% 08/01/2007 Ivory Funding 0% 18/01;2007 Grampian Funding 0% 19,’02/2007 Mane I unding 0% 08/02/2007 BNZ International 0% 16/02/2007
5,000,000 5.000.000
5.000.000 4,283,000 3.000,OOO 3,000,000 3,000,000 3.000.000 2,564,000 2,500.000 2.405,OOO 2.282.000 2,000,000 2,000,000 2.000.000 2,000,000 2.000,000 2.000,000 1,600,000 1,579,000 1.527.000 1,450,000 1,000,000 1,000,000
Total for Commercial Parrer
Corporate Bonds Danske Bank sr nts SerEMTN 3.424% 04/10/2007 (1) 8.500.000 Beta Finance sr unsubord SerEMTn 3.587% 15/05/2008 (1) 6,000.000 Centauri Corp 3.577% 12/05/2008 6.000,OOO Australia & New Zealand Banking Group unsecur sr unsubord SerEMTN 3.7394 18/06/2007 (1) 5,900,000 Compass Securitization secured 3,63531 09/02/2007 (1) 5.000,OOO Parkland Finance Corp 3 592% 15/07/2007 5,000,000 Santander International Debt co gtd SerEMTN 3.54801; 26/07/2007 (1) 5,000.000 Whistlejacket Capital sr unsubord SerEMTN 3.699% 20/06/2007 (1) 5,000,000
9,998,116
9,980,630 9.957.629 9,072,303
6,994,665 6,984,974 6,662,335
5,995,175
5,982,599 5,978,015 5.970.273 5,099,519 4,935,237 4,994,953 4.990.339
4,981,782 4,978,603 4,975,864
4,971,027 4,261,750 3.000.000 2,992,141 2,992,043 2.988.151 2,551,568
2,402,534 2,275,715 1,998,864 1997,501 1.997.163 1,992,532 1,990,319 1,976,980 1.597.800 1,578,047 1,524,645 1,443,081
996.343 995,535
a.513,375
5.991.4a8
4,989,238
2,487,895
8,499,357
6,000.000 6,000,000
5,900,208
5,000,000 5,000,000
4.999.834
4.999.769
2.93
2.92 2.92 2.65 2.48 2.05 2.05 1.95
1.76 1.76 1.75 1.75 1.75 1 49 1.46 1.46 1.46 1.46 1.46 1.46 1.46
1.46 1.25 0.88 0.88 0.88 0.88 0 75 0.73 0.70 0.67 0.59 0.59 0.59 0.58 0.58
0.47 0.46 0.45 0 42 0.29 0.29
55.40
0.58
2.51
1.76 176
.73
.46
.46
.46
.46
Please refer to the full prospectus for the Funds investment objective and policy.
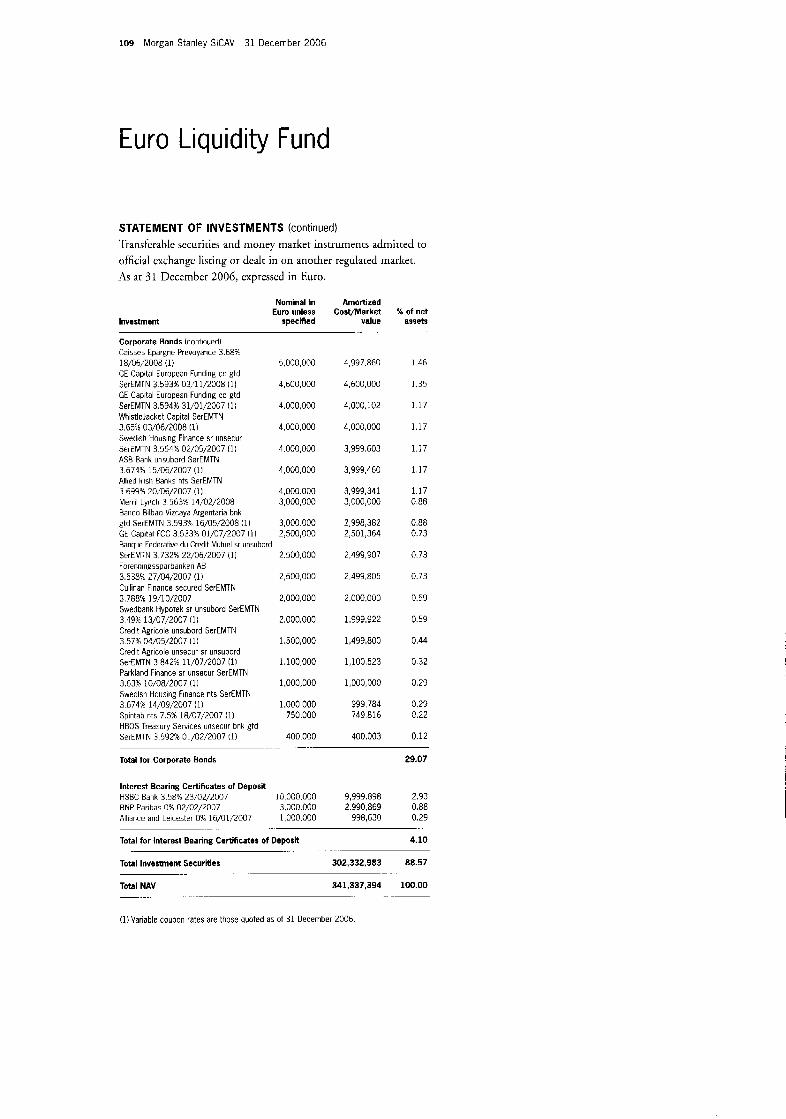
109 Morgan Stanley SlCAV 31 December 2006
Euro Liquidity Fund
STATEMENT OF INVESTMENTS (continued) ‘liansfcrahlc securiries and money market instruments admitted to official cxchangc listing or dcalt in on another replaced market. As at 31 December 2006, expressed in Euro.
Investment
Nominal In Amortized Euro unless Costplarket
specified value
Corporate Bonds lcontlnued) Caisses Epargne Prevoyance 3.68% 18/06/2008 (1) 5,000,000 GE Capital European Funding co gtd SerEMTN 3.593% 03,‘11/2008 (1) 4,600,000 GE Capital European Funding co gtd SerEMTN 3.594% 31/01/2007 (1; 4.000.000 WhistleJacket Capital SerEMTN 3.65% 03/06/2008 11) 4,000,000 Swedish Housing Finance sr unsecur SerNTN 3.554% 02/05;2007 (1) 4,000,000 ASB Bank unsubord SerEMTN 3.674% 15/06/2007 (1) 4,000,000 Allled Irish Banks nts SerEMTN 3.639?4 20/06/2007 (1) 4.000.000 Merril ILynch 3 563% 14/02/2008 3,000,000 Banco Bilbao Vlzcaya Argentaria bnk gtd SerEMTN 3.593% 16/05/2008 (11 3,000.000 GE Capltal FCC 3.533% 01/07/2007 (1) 2.500,OOO Banaue Federatrve du Credit Mutuel sr unsubord SerEMTN 3.732% 22/06/2007 (1) Forenningssparbankcn AB 3.538% 27/04/2007 (1) Cullinan Finance secured SerEMTN 3.738% 19/10/2007 Swedbank Hypotek sr unsubord SerEMTN 3 49% 13/07/2007 (1) Credit Agricole unsubord SerEMTN 3.57% 04/05/2007 (1) Credit Agricole unsecur sr unsubord SerEMTN 3 842% 11/07/2007 (1) Parkland Finance sr unsecur SerEMTN 3.63% 10/08/2007 11) Swedish Housing Finance nts SerEMTN 3.674F 14/09/2007 (1) Spintab nts 7.5% 18/07/2007 (1) HBOS Treasury Services unsecur bnk gtd SerEMTN 3.592% 01/02/2007 11)
2.500,OOO
2,500,000
2,000.000
2,000,000
1,500,000
I .100,000
1,000,000
1.000,000 750.000
400,000
4.997.860
4,600,000
4,000,102
4,000,000
3,999.603
3,999,460
3,999,341 3,000,000
2,998,382 2,501,364
2,499,907
2,499,805
2.000.000
1,999,922
1,499,800
1,100.523
1,000,000
999.784 749,816
400,003
% of net assets
1.46
1.35
.17
.17
.17
.I7
1.17 0.88
0.88 0.73
0.73
0.73
0.59
0.59
0.44
0.32
0.29
0.29 c.22
0.12 -
Total for Corporate Bonds 29.07
Interest Bearing Certificates of Deposit HSBC Bank 3.58% 23/02/2007 10.000,OOO 9,999.898 2.93 BNP Paribas 0% 02/02/2007 3.000.000 2,990,869 0.88 Alliance and Leicester O X 16/01/2007 1.000.000 998,630 0.29
Total for Interest Bearing Certiticates of Deposit 4.10
Total Investment Securities 302.332.983 88.57
Total NAV 341,337,394 100.00
.
. . . . ....
.. ... . .
.. . . ....
(1) Variable coupon fates are those quoted as of 31 December 2006.
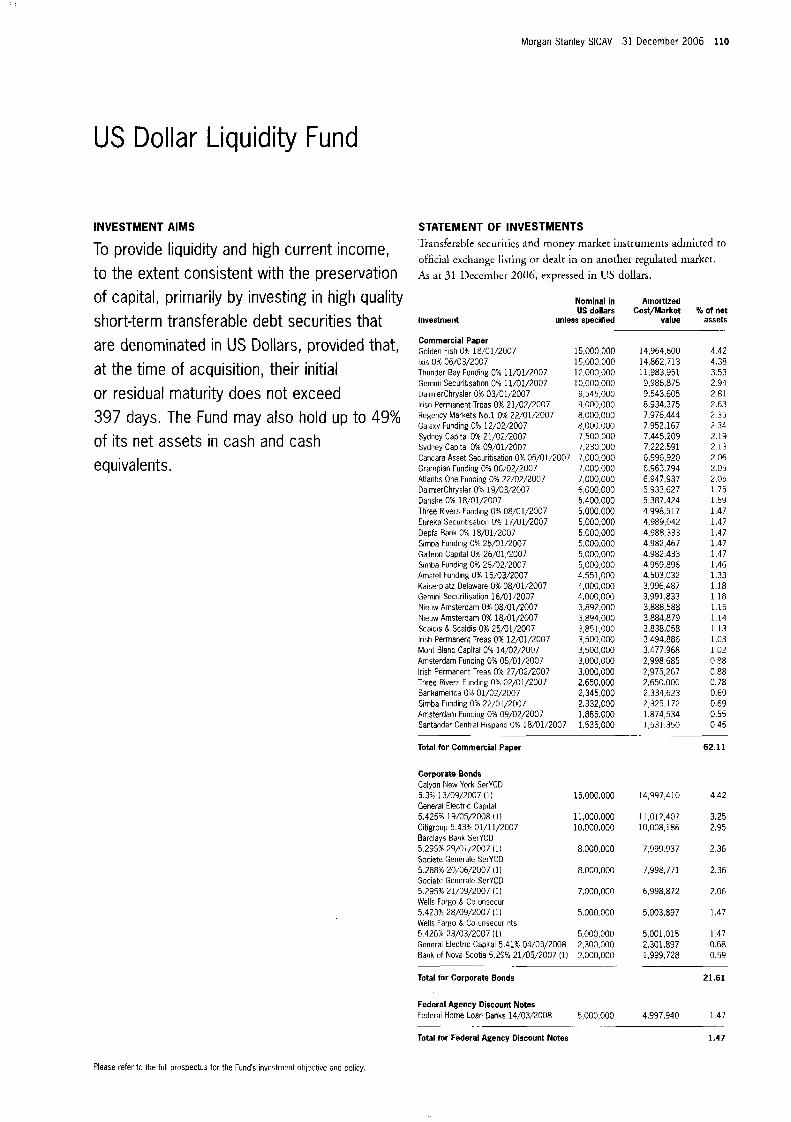
I .
Morgan Stanley SlCAV 31 December 2006 110
US Dollar Liquidity Fund
INVESTMENT AIMS
To provide liquidity and high current income, to the extent consistent with the preservation of capital, primarily by investing in high quality short-term transferable debt securities that are denominated in US Dollars, provided that, at the time of acquisition, their initial or residual maturity does not exceed 397 days. The Fund may also hold up to 49% of its net assets in cash and cash equivalents.
STATEMENT OF INVESTMENTS Transferable sccuritics a n d money market instruments admirted [o
official cxcliarigc listing or dealt in on another regulated marltet. As at 31 IIcccrntwr 2006, expressed in US dollars.
- Investment
Nominal in US dollars
unless specllied
Commercial Paper Golden Fish 0% 18/01/2007 15,000,000 1x1s 06 06/03/2007 15,000.000 Thunder Bay Fundlng 0% 11/01/2007 12,000,000 Gemini Securitisation 0% i 1/01/2007 10,000.000 DaimlerChrysler 0% 03/01/2007 9,545,000 Irish Permanent Trcas 0% 21/02/2007 9.000.000 Regency Markets No.1. 0% 22,’01/2007 8.000.000 Galaxy Funding 0% 12/02/2007 8,000.000 Sydney Capital 0% 21/02:2007 7,500,000 Sydqey Capital 0% 09/C1/2007 7,230,000 Cancara Asset Securitisation O%, 05/01/2007 7,000,000 Grampian Funding 0% 06/02/2007 7.000,OOO Atlantis One Fundlng OK 22/02/2007 7,000,000 DaimlerChrysler 0% 19/03/2007 6,000,000 Danske 0% 18/01/2007 5.400.000 Three Rivers Funding 0% 08/01/2007 5,000.000 Eureks Securilisation 0% 17/01/2007 5,000,000 Depfa Bank 0% 18/01/2007 5,000,000 Simoa Funding 0% 26/01/2007 5,000,000 Galleon Capital 08 26/01:2007 5,000,000 Slinba Funding 0% 26/02/2007 5,000,000 Amstel Funding 0% 15/93/2007 L.551,OOO Kaiserplatz Delaware OX 08/01/2007 4,000,000 Gemini Securltlsallon 16/01/2007 4,000,000 Nieuw Amsterdam 0% 08/01/2007 3.892.000 Nieuw Amsterdam 0% 18/01/2007 3,894,000 Scaldis & Scaldis 0% 25/01/2007 3,851,000 Irish Permanent Treas 0% 12/01/2007 3,500.000 Mont Blanc Capital 0% 14,’02/2007 3,500,000 Amsterdam Funding 0% 05/01/2007 3,000,000 Irish Permanent Treas osb 27/02/2007 3,000,000 Three Rivers Funding OX 02/01/2007 2,650,000 Bankamerica 06 01/02/2007 2,345.000 Simba Fundinz osb 22/01/2007 2,332,000 Amsterdani Funding O X 09/02/2007 1,885.000 Santander Central Hlspano 0% 18/01/2007 1,535,000
Amortlzed Cosrnarket
value
14,364,600 14,862,713 11,983,951 9,986,875 9.543.605 8,934,375 7,976,444 7,352,167 7.445209 7,222,591 6,996,320 6.963.794 6,947,937 5,933 627 5,387,424 4,398,517 4,989,042 4,988,333 4,982,467 4.982.433 4,359,896 4,503.032 3,936,487 3,991,833 3,888,588 3.884.879 3,838,058 3.494.886 3.477.968 2,998.685 2,975,267 2.650.000 2,334,623 2,325,112 1,874,534 1,531,350
96 of net assets
4.42 4.38 3.53 2.94 2 81 2.63 2.35 2.34 2.19 2.13 2.06 2.05 2.05 1.75 1.59 1.47 1.47 1.47 1 4 7 1.47 I .46 1.33 1.18 1.18 1 1 5 1.14 1.13 1.03 1.02 0.88 0.88 0.78 0.69 0.69 0.55 0.45
-. .-
Total for Commercial Paper 62.11
Corporate Bonds Calyon New York SerYCD 5.37. 13/09/2007 (1) 15,000,000 General Electric Capltal 5.4251 19/05/2008 (1) 11,000,000 Citigroup 5.43% 01/11/2007 10,000,000 Barclays Bank SerYCD 5.295% 29/01/2007 (1) 8.000,OOO Societe Generale SerYCD 5 28% 20/06/2007 (1) 8.000,OOO Societe Generale SerYCD 5.2951 21/09/2007 (1) 7,000,000 Wells Fargo & Co unsecur 5.4239: 28/09/2007 (1) 5,000.000 Wells Fargo & Co unsecur nts 5 426ib 23/03/2007 (1) 5,000,000 General Electric Capital 5.41% 04/03/2008 2,300.000 Bank of Nova Scotia 5.29% 21/05/2007 (1) 2,000,000
Total for Corporate Bonds
-.
14,997,410
11,012,407 10,008,186
7,993,937
7,998,771
6,998,872
5,003,897
5,001,015 2.30 1,897 1,999,728
4 42
3.25 2.95
2.36
2.36
2.06
1.47
1.41 0.68 0.59
21.61
Federal Agency Discount Notes Federal Home Loan Banks 14/03/2008 5,000,000 4,997,340 1 4 7
.. . - ~.
Total for Federal Agency Discount Notes 1.47
Please refer to the full prospectus for the Fund‘s Investment ogectlve and policy.
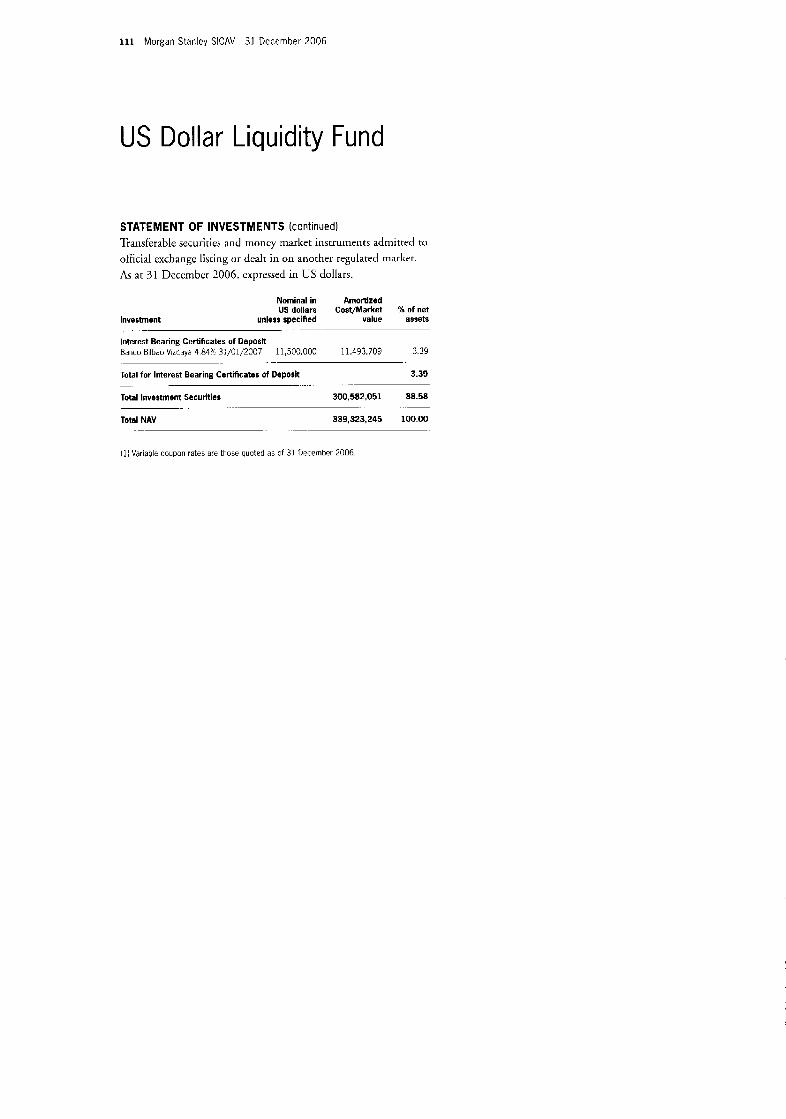
111 Morgan Stanley SICAV 31 December 2006
US Dollar Liquidity Fund
STATEMENT OF INVESTMENTS (continued) Transferable securities and moncy market insrruiiieiits admitted to
official exchange lkting o r dcalt in on anorher regulated market. As at 31 December 2006, cxprcssed in US dollars.
Nominal in Amortlzecl US dollars Cost/Market % of net
Investment unless specified value asset8
Interest Bearing Certificates of Deposit
. .-
Banco Bilbao Vizcaya 4 8404 31/01/2007 11,500,000 11,493,709 3.39
Total for Interest Bearing Certificates of Deposit
. ....
3.39
Total Investment Securities 300,582,051 88.58
Total NAV 339,323,245 100.00
- - -
.~ .. ..
-. .-
( I ) Variable coupon rates are those quoted as of 31 December 2006
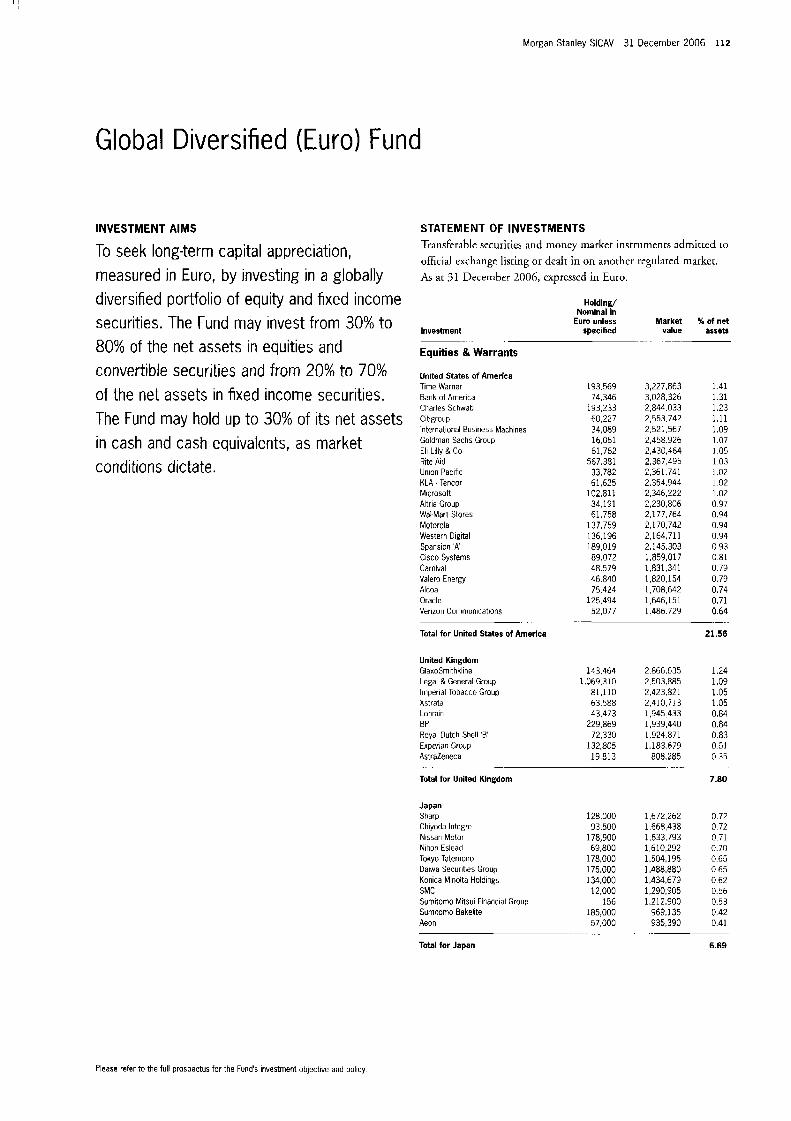
I !
Morgan Stanley SICAV 31 December 2006 112
Global Diversified (Euro) Fund
INVESTMENT AIMS
To seek long-term capital appreciation, measured in Euro, by investing in a globally diversified portfolio of equity and fixed income securities. The Fund may invest from 30% to 80% of the net assets in equities and convertible securities and from 20% to 70% of the net assets in fixed income securities. The Fund may hold up to 30% of its net assets in cash and cash equivalents, as market conditions dictate.
STATEMENT OF INVESTMENTS Transferable securities and rrioncy market instruments admittcd LO
official cxchangc listing or dealt in on anothcr regulaced market. As at 31 December 2006, expressed in Euro.
Investment
Holding/ Nominal in
Eum unless Market X of net specified value assets
Equities &Warrants
United States of America Time Warner Bank of America Charles Schwab Citigroup International Business Machines Goldman Sachs Group Eli Lilly & Co Rite Aid Union Pacific KLA - Tencor Mlcrosotl Altria Group Wal-Mart Stores Motorola Western Digital Spansion .A' Cisco Systems Carnival Valero Energy Alcoa Oracle Verizon Communications
Total for United States of America
United Kingdom GlaxoSmithkline Legal & General Group Imperial Tobacco Group Xstrata Lonmin BP Royal Dutch Shell '6 Experian Group AstraZeneca
193.569 74,346
193,233 60,227 34,089 16,061 61,762
567.381 33,782 61,625
102,811 34.191 61,758
137,759 136.196 189,019 89.072 48.579 46.840 75.424
125,494 52,077
3,227,863 3,028,326 2.844.033 2.553.742 2.521.567 2.458.926 2,430,464 2,367,495 2,361.741 2.354.944 2,346,222 2,230,806 2,177,764 2.170.742 2,164,711 2,145,303 1,859,017 1,831,341 1,820,154 1,708,642 1,646,151 1.486.729
143,464 2,866,635 1,069,310 2,503,885
81,110 2,423,821 63.588 2,410,713 43,473 1.945.433
229,869 1,933,440 72,330 1.924.871
132,805 1.183.679 19,813 808.285
. .. .. . . - .. .
Total for United Klngdom
Japan Sharp Chiyoda lntegre Nissan Motor Nihon Eslead Tokyo Tatemono Daiwa Securities Group Konica Minolta Holdings SMC Sumitorno Mitsui Financial Group Sumitomo Bakelite Aeon
128.000 93,500
178,900 69,800
178,000 175,000 134,000 12,000
156 185.000 57,000
~ ....
1,672,262 1,668,438 1,633,793 1,610,292 1,504,195 1.488.880 1,434,679 1,290,905 1,212,900
969,135 935,390
1.41 1.31 1.23 1.11 1.09 1.07 1.05 1.03 1.02 1 9 2 1,02 0.97 0.94 0.94 0.94 0.93 0.81 0.79 0.79 0.74 0.71 0.64
21.56
1.24 1.09 1.05 1.05 0.84 0.84 0.83 0.51 0.35
7.80
0.72 0 72 0.71 9.70 0.65 0.65 0.62 0.56 0.53 0.42 0.41
.
Total for Japan 6.69
Please refer to the full prospectus for the Funds investment objective and policy.
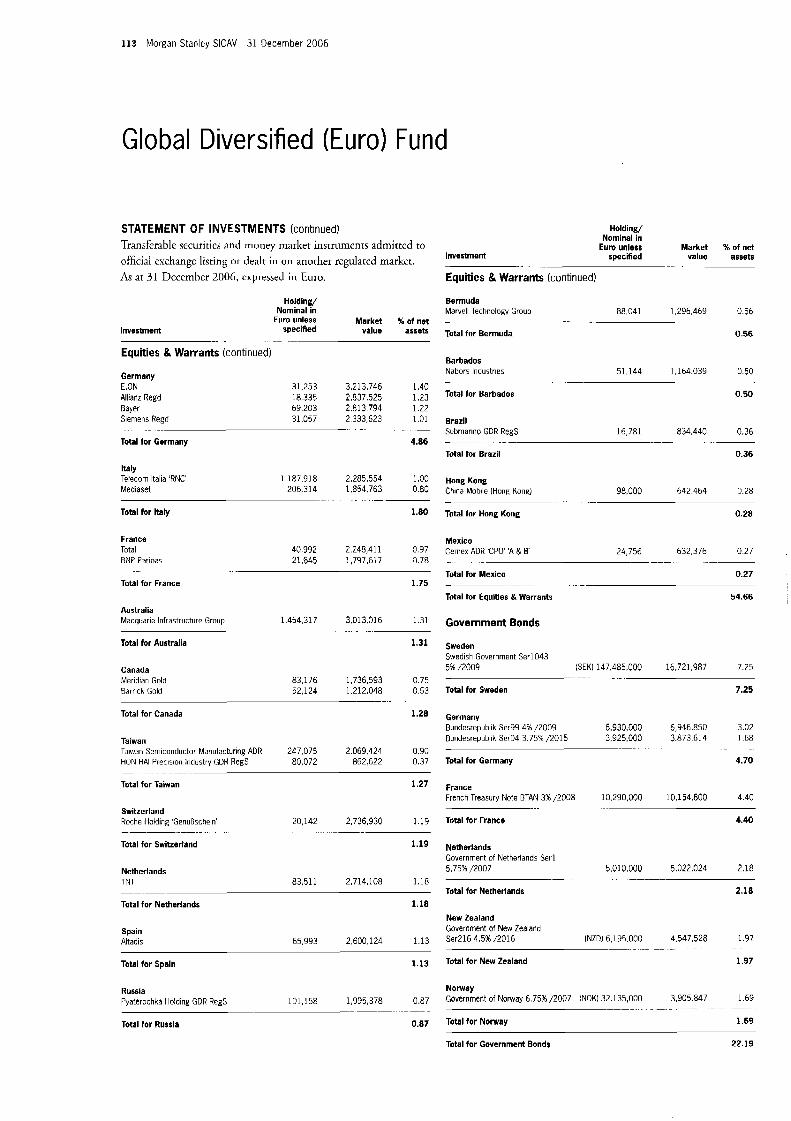
113 Morgan Stanley SICAV 31 December 2006
Global Diversified (Euro) Fund
STATEMENT OF INVESTMENTS (cont inued)
Transferable securitics and money market insrrurnenrs adrnirtcd to official exchange listing o r dealt in on another regulared markct. As at 31 Decertiher 2006, expressed in Euro.
H o I d i n g/ Nominal in
Euro unless Market % of net Investment specified value assets
-. . . . - ....
Equities & Warrants (continued)
H o I d i n 9/ Nominal in
Euro unless Market % of net specfied value assets Investment
- . _. .~
Equities & Warrants (continued)
Bermuda Marvel1 Technology Group 88,041 1,296469 9 5 6
Total for Bermuda 0.56
- .
Barbados Nabors Industries 51,144 1,164,039 0 50
1,23 Total for Barbados 0.50 31,253 3213.746 1.40
69.203 2.813 794 1.22 18.335 2,837,525
Germany E.ON Allianz Regd Baler Siemens Regd 31,057 2233,623 1.01 Brazil
. . . . . . . . . . . Submarino GDR Regs 16,781 834,440 0.36
Total for Brazil 0.36
.. -
Total for Germany 4.86 . . . . .- .
Italy Telecom ltalia 'RNC' 1,187,918 2,285,554 1.00 Hong Kong Mediaset 206,314 1,854,763 0.80 China Mobile (Hong Kong) 98,000 642.464 0.28
Total for Italy 1.80 Total for Hong Kong 0.28
.- . . . . . . . . . . . . .
France Total 40,992 2,248,411 0.97 BNP Paribas 21,645 1,797,617 0.78
Total for France 1.75
.- ... _
Australia Macquarie Infrastructure Group 1454,317 3,013,016 1.31
Total for Australia 1.31
- - .
Canada Meridian Gold Barrick tiold
83,176 1,736,593 0.75 52,124 1,212,048 0.53
. . . . .
Total for Canada 1.28
Taiwan Taivian Semiconductor Manufacturing ADR 247.075 2,069,424 0.30 HON HA1 Precision Industry GDR Regs 80,072 862.622 0.37
Total for Taiwan 1.27 ........
Switzerland Roche Holding 'GenuRschein'
Total for Switzerland
.. . -_ ...
Netherlands TNT
20,142 2,736,930 119
1.19
.
83,511 2.714.108 1.18
Total for Netherlands 1.18
Spain Altadis 65.993 2,600,124 1.13
Total for Spain 1.13
Mexico Cemex ADR 'CPO 'A & E 24,756 632 376 0 27
Total for Mexico 0.27
Total for Equltles &Warrants 54.66
__ .
Government Bonds
Sweden Swedish Government Ser1043 5h /2009 (SEK) 147,485 000 16,721,987 7 25
Total for Sweden 7.25
-. -
Germ any Bundesrepublik Ser99 4% /2009 6.930.000 6,946350 3.02 Bundesrepublik SerO4 3.75?4 /2015 3,925,000 3.873.614 1 6 8
Total for Germany 4.70
. .
France French Treasury Note BTAN 3% /2008 10.290.000 10,154.800 4 40
Total for France 4.40
....
Netherlands Government of Netherlands Ser l 5.75% /2007 5,010,000 5,022,024 2.18
Total for Netherlands 2.18
. . ._
New tealand Government of New Zealand Ser216 4 5% /2016 (NZD) 6,195 000 4 547,528 1 9 7
Total for New tealand 1.97
- . - __
Russia Pyaterochka Holding GDR Regs
Total for Russla
-_ _ _ . - - .__ - .. _ 0.87 Total for Norway 1.69
NOW8y 101,158 1,995,378 0.87 Government of Norway 6.75% /2007 (NOK) 32,135,000 3,905.847 1.69
Total for Government Bonds 22.19

Morgan Stanley SlCAV 31 December 2006 114
Global Diversified (Euro) Fund
STATEMENT OF INVESTMENTS (continued) Transferable securitics arid rnoncy rnarkct iristrmiciiti admirted ro
official exchange liscing or dealt in on another regulated market. /\a at 31 1)cccrnhcr 2006, cxprcsscd in Euro.
Investment
Corporate Bonds
Ho ld inu Nominal in
Euro unless Market % of net specified value assets
Unlted States of America Residential Capital co gtd 6.375% /2013 (GBP) 1.300.000 1.944.631 0.84 General Electric Capital unsecur sr unsubord SerEMTN 5.125% /2007 1.710.000 1.718.34C 0.75 DaimlerChrysler Holding co gtd SerEMTN 4.125%/2009 1,560.000 1,547.188 0 67
Total for United States of America 2.26
Supra-National European Investment Bank unsecur sr unsubord 6.25% /2014 (GBP) 3.150.000 4.979.108 7.16
Total for Supra-National 2.16
Spain Telefonica fmisiones co gtd SerEMTN 3.8764 /2010 (1) 2,200,000 2,200,266 0.95
Total for Spain 0.95
~~ . . .. . . ... . ..
United Kingdom Carnival cc gtd 4.25% /2013 1,700,000 1,671.984 0.72
Total for United Kingdom 0.72
Mexico Pemex Project Funding Master Trust co gtd SerRegS 6.62595 /2010 1,560.000 1,663.396 0.72
Total for Mexico 0.72
Luxembourg Telecom ltalia Finance co gtd SerEMTN 7 75% /2033 545.000 646.i 16 0.28
Total for Luxembourg 0.28
Germany HT1 Fundirg subord 6.352% /2049 (1) 600.000 636.659 0.28
Total for Germany 0.28
Total for Corporate Bonds 1.31
.. .- .. -.
. . ~.
H o I d i n g/ Nominal In
Euro unless Market % of net Invesbnent specified value assets
-.
Mutual Fund
Luxembourg JPMorgan Investmerit Funds - Global Convertible Bond Fund (USD) 'A' 130,066 12,482,626 5.41
Total for Luxembourg 5.41
. - -. ... ..
Ireland ishares S&P 500 Index Fund (USD) 906,910 9.790.858 4.25
Total for Ireland 4.25
Total for Mutual Fund 9.66
216,513,602 93.88 Total Investment Securities
Total NAV 230,632,507 100.00
. . .
. . .. .. .~ . -. - .. .
. ... ...-..
.. .
~ ....
(1) Vanable coupon rates are those quoted as of 31 December 2006
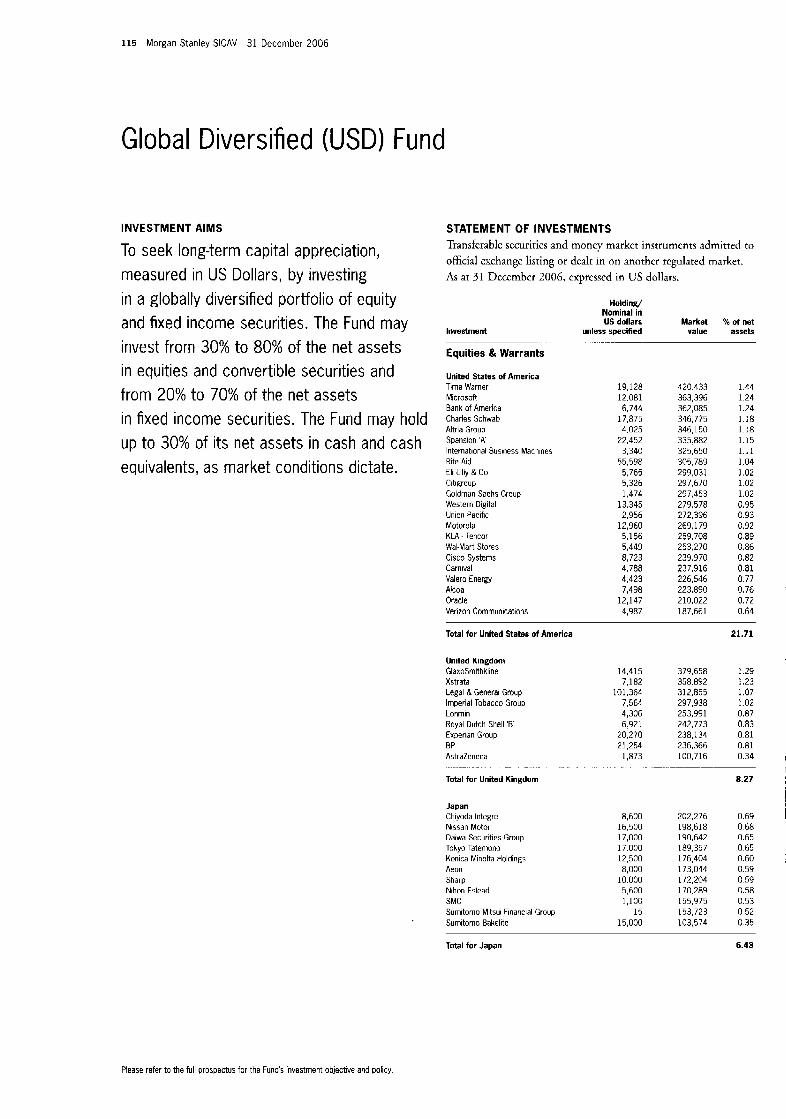
115 Morgan Stanley SICAV 31 December 2006
Global Diversified (USD) Fund
INVESTMENT AIMS
To seek long-term capital appreciation, measured in US Dollars, by investing in a globally diversified portfolio of equity and fixed income securities. The Fund may invest from 30% to 80% of the net assets in equities and convertible securities and from 20% to 70% of the net assets in fixed income securities. The Fund may hold up to 30% of its net assets in cash and cash equivalents, as market conditions dictate.
STATEMENT OF INVESTMENTS Transferable securities and money market instruments ;Idmitred tu official exchange liscing or dealc in on anothcr rcgulated market.
As at 31 December 2006, exprcsscd in US dollars.
Investment
Holding/ Nominal in US dollars
unless speciiied Market
value % of net
assets
Equities &Warrants
United States of America Time Warner Microsoft Bank of America Charles Schwab Altria Group Spansion ' A International Business Machines Rite Aid Eli Lilly & Co Citigroup Goldman Sachs Group Western Digital Union Pacific Motorola KLA - Tencor Wal.Mart Stores Cisco Systems Carnival Valero Energy Alcoa Oracle Verizon Communications
19,128 12.081 6,744
17.875 4.025
22,452 3,340
55,598 5,765 5,326 1,474
13,345 2,956
12,960 5,156 5,449 8,723 4.788 4,423 7,498
12,147 4,987
420.433 363,396 362,085 346,775 346,150 335.882 325,650 305,789 299,031 297,670 297.453 279,578 272,396 269,179 259.708 2 5 3,2 7 0 239,970 237,916 226,546 223,890 210,022 187,661
1.44 1.24 1.24 1.18 1.18 1.15 1.11 1.04 1.02 1.02 1.02 0.95 0.93 0.92 0.89 0.86 0.82 0.81 0.77 0.76 0.72 0.64
Total for United States of America
United Kingdom GlaxoSrnithkline Xstrata Legal & General Group Imperial Tobacco Group Lonmin Royal Dutch Shell 'B' Experian Group BP AstraZeneca
14,415 7,182
101,364 7,564 4,306 6.921
20,270 21,254
1,873
379,658 358.892 312.855 297.938 253,991 242,773 238,134 236,366 100,716
21.71
1.29 1.23 1.07 1.02 0.87 0.83 0.81 0.81 0.34
. - -. ~
Total for United Kingdom 8.27
Japan Chiyoda lntegre Nissan Motor Daiwa Securities Group Tokyo Tatemono Konica Minolta Holdings Aeon Sharp Nihon Eslead SMC Sumitorno Mitsui Financial Group Sumitomo Bakelite
8,600 202,276 0.69 16,500 198.618 0.68 17,000 190,642 0.65 17.000 189,357 0.65 12,500 176,404 0.60 ,
8,000 173,044 0.59 10.000 172,204 0.59
5,600 170.289 0.58 1,100 155,975 0.53
15 153,723 0.52 15,000 103,574 0.35
Total far Japan
Please refer to the full prospectus for the Fund's investment objective and policy.
6.43
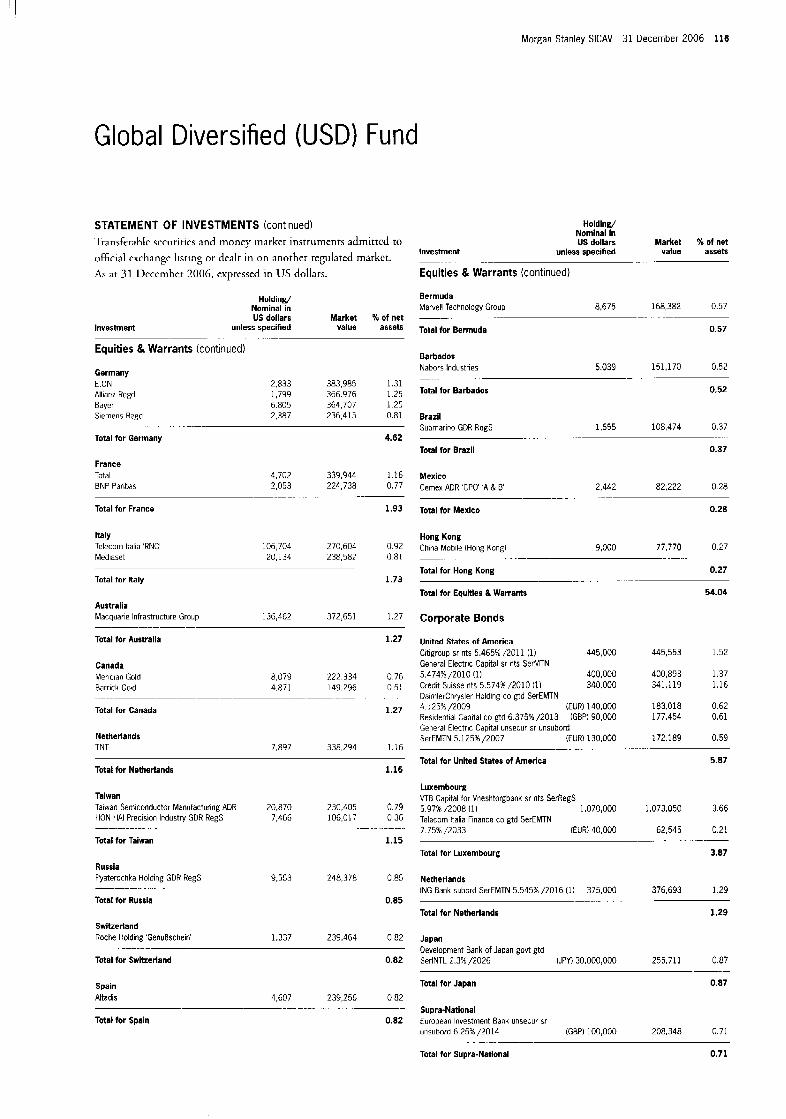
Morgan Stanley SICAV 31 December 2006 116
Global Diversified (USD) Fund
H o I d I n &I Nominal in
STATEMENT OF INVESTMENTS (continued) Transferable securities and money market instruments admitted to US dollars Market % of net
Investment unless specified value assets official cxchange liscing or dealt in on another regulated market. . . . .
As at 31 Ilcccmber 2006, expressed in US dollars. Equities & Warrants (continued)
Bermuda H o I d i n 9/ Nominal in Marvel1 Technology Group 8,675 168,382 0.57 US dollars Market %of net ..... --
Investment unless specihed value assets Total for Bermuda .- -
Equities & Warrants (conttnued)
Germany E.ON 2,833 383,985 1.31 Allianz Regd 1,799 366.976 1 2 5 Bayer 6 805 364,707 1 2 5 Siemens Regd 2,387 236,413 0.81
Total for Germany 4.62 . __
France Total 4,702 339,944 1 1 6 BNP Paribas 2,053 224,738 0 77
Total for France 1.93
-. -
0.57
Barbados Nabors Industries 5.039 151,170 0.52
Total for Barbados 0.52
-- -.
Brazil Submarino GDR Regs 1,655 108,474 0.37
Total for Brazil 0.37
.- _. .
Mexico Ccmex ADR 'CPO 'A & B' 2,442 82,222 0.28
Total for Mexico 0.28 . . . . .
Italy Hong Kong Telecom ltalia 'RNC' 106,704 270,604 0.92 China Mobile (Hang Kongl 9,000 77,770 0.27 Mediaset 20,134 238.582 0 8 1 . . .. .- ...
Total for Hong Kong 0.27 Total for Italy 1.73 .
Total for Equities &Warrants 54.04 ...... _-
Australia Macquarie Infrastructure Group 136,462 372.651 1.27 Corporate Bonds
Total for Australia
Canada Meridian Gold Earrick God
1.27
8,079 222.334 0.76 4.871 149.296 0.51
Total for Canada
Netherlands TNT
1.27
7,897 338,294 1.16
Total for Netherlands 1.16
Taiwan Taiwan Semiconductor Manufacturing ADR ZG.870 230,405 0.79 HON HA1 Precision Industry GDR Regs 7,466 106,017 0 36
Total for Taiwan 1.15
........ . ._ ............
Russia Pyaterochla Holding GDR Regs 9,553 248.378 0 8 5
Total for Russia 0.85
......
Switzerland Roche Holding 'GenuOschein' 1,337 239.464 0.82
Total for Swiherland 0.82
United States of America Citieroup sr nts 5.465% /2011 (1) 445,000 445,553 1.52 General Electric Capital sr nts SerMTN 5.474%/2010 (1) 400,000 400,893 1.37
DaimlerChrysler Holding co gtd SerEMTN 4.125%/2009 (EUR) 140,000 183.018 0.62 Residential Capital co gtd 6.375% /2013 (GBPI 90,000 177,454 0.61 General Electric Capital unsecur sr unsubord SerEMTN 5.125%/2007 (EURI 130,000 172.189 0.59
Total for United States of America 5.87
Credit Suisse nts 5,574s /2010 (11 340.000 341,119 1.16
........ ...
Luxembourg VTB Capital for Vneshtorgbank sr nts SerRegS 5.97%/2008 (11 1,070,000 1,073,050 3.66 Telecom ltalia Finance co gtd SerEMTN 7.75%/2033 (EUR) 40,000 62,545 0.21
.
Total for Luxembourg 3.87
Netherlands ING Bank subord SerEMTN 5.545% /2016 (1) 375,000 376,693 1 2 9
Total for Netherlands 1.29
.....
Japan Development Bank of Japan gob? gtd SerlNTL 2.3% /2026 (JPY) 30.000.000 255,711 0.87
Spain Total for Japan 0.87
Altadis 4,607 239,256 0 82 .. - . ~- Supra-National
unsubord 6 25% /2014 (GBP) 100,000 208,348 0 71 Total for Spain 0.82 European Investment Bank unsecur sr
Total for Supra-Natlonal 0.71
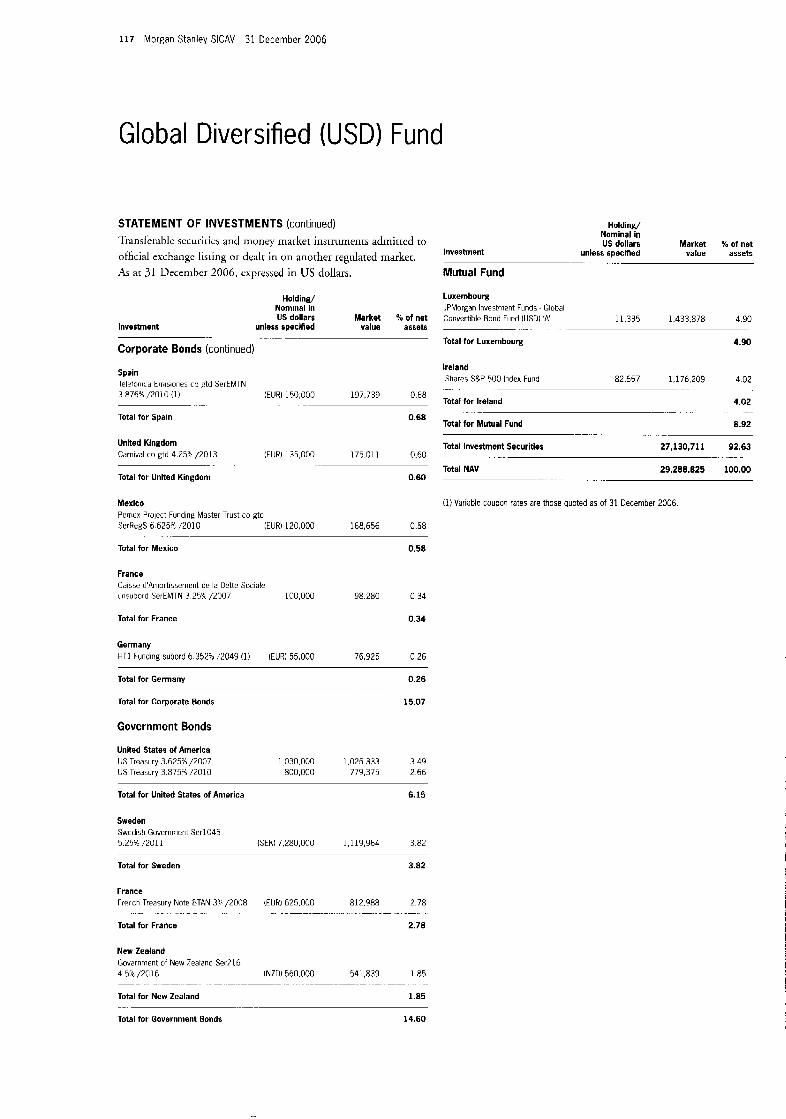
117 Morgan Stanley SICAV 31 December 2006
Global Diversified (USD) Fund
STATEMENT OF INVESTMENTS (continued) ?i.ansf>rahlc sccurirics and money market inscrurneiits admirrcd to official ercl~angc listing o r dc:ilt in o n another regulated marker.
ar 31 Decerribcr 2006, cxpressetl in LJS dollars.
Holding/ Nominal In US dollars Market % of net
Investment unless spechied value assets
Corporate Bonds (continued) ... ._
Spain TelefoniLa Erriisiones co gtd SerEMTN 3 876%/2010 (1) (EUR) 150,000 197.739 0.68
Total for Spain 0.68
..... . . . .
United Kingdom Carnival co gtd 4.254 12013 (EUR) 135,000 175.011 0.60
Total for Unlted Kingdom 0.60
... ....
Mexico Pcrrtex Prulect Funding Master Trust co gtd SerRegS 6 625? EO10 (EUR) 120,000 168.656 0.58
Total for Mexico 0.58
France Caisse d'Amortissement de la Dette Sociale unsubord SerEhlTN 3.25% /ZOO7 100,000 98.280 0 34
Total for France 0.34
Germany HT1 Funding subord 6 3571;2049 (1) (EUR) 55,000 76,925 0.26
Total for Germany 0.26
Total for Corporate Bonds 15.07
_
Government Bonds
United States of America US Treasury 3.6253 /2007 US Tredsury 3.875% /2010
1.030.000 1.025.333 3.49 800,000 779,375 2.66
Total for United States of America 6.15
Sweden Swedish Government Serl045 5.25% /2011 (SEK) 7,280,000 1,119,964 3.82
Total for Sweden 3.82
France I-rerch Treasury Note BTAN 35: /2008 (EURI 625,000 812.988 2.78
Total for France 2.78
. . . . . . . . . . . . . . . .... -. ................... -. .. _ ... .
New Zealand Government of New Zealand Ser?lb 4.59/2C16 (NZO) 560.000 541,839 1.85
Total for New Zealand 1.85
__ ....... ........ __ . ~ . . . . . .- .-. ...
Holding/ Nominal in US dollars Market 96 of net
lnve$tment unless speclned value assets _.
Mutual Fund
Luxembourg JPMorgan Investment Funds - Global Convertible Bond Fund (USD) 'A' 11,335 1.433.878 4 90
Total for Luxembourg 4.90
Ireland ishares S&P 500 Index Fund 82657 1,176209 4 0 2
Total for Ireland 4.02
Total for Mutual Fund 8.92
Total Investment Securities 27,130,711 92.63
Total NAV 29.288.825 100.00
-. __ ~ _ _
_ _ . _ -- _
__
. _ ..- __
_ _
(1) Variable coupol rates are those quoted as of 31 December 2006
Total for Government Bonds 14.60
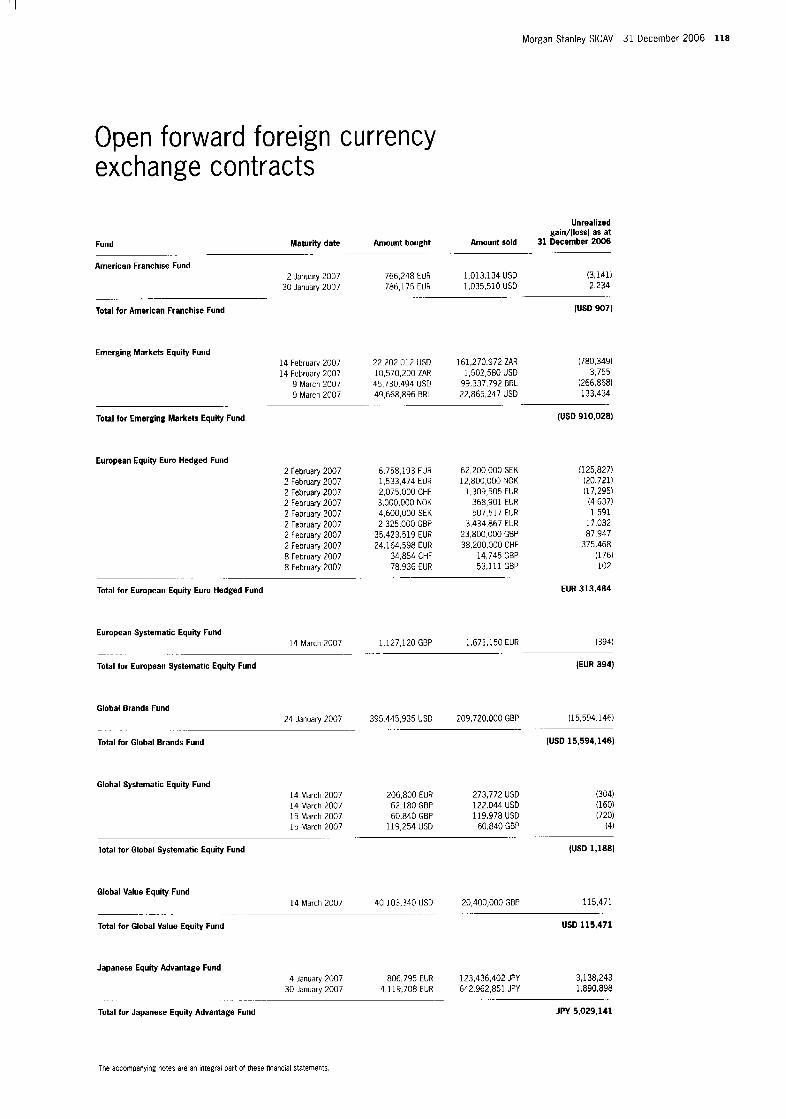
' I
Morgan Stanley SICAV 31 December 2006 118
Open forward foreign currency exchange contracts
Unrealized gain/(loss) as at
Amount sold 3 1 December 2006 Fund Maturity date Amount bought
American Franchise Fund
- -
2 January 2007 766,248 tUR 1,013,134 US0 (3.141) 30 January 2007 186.175 EUR 1,035,510 US0 2 234
(USD 907) . - __. - -.
Total for American Franchise Fund
Emerging Markets Equity Fund 14 February 2007 22.202 012 US0 161,270.972 ZAR 1780 349) 14 February 2007 10,570,200 ZAR 1,502,580 USD 3.755
9 March 2007 45.730.494 USD 99,337,792 BRL :266.868) 9 March 2007 49,668,896 BRL 22365,247 USD 133,434
- -
Total lor Emerging Markets Equity Fund (USD 910,028)
European Equity Euro Hedged Fund 2 February 2007 2 February 2007 2 February 2007 2 February 2007 2 February 2007 2 February 2007 2 February 2007 2 February 2007 8 February 2007 8 February 2007
.- .
Total for European Equity Euro Hedged Fund
European Systematic Equity Fund 14 MarLh 2007
- -..
Total for European Systematic Equity Fund
6,758,193 FUR 1,533,474 EUR 2.075.000 CHF 3.000.000 NOK 4,600,000 SEK 2,325 000 GBP
35,423,519 EUR 24.164.598 EUH
34,854 CHF 78.936 EUR
62.200.000 SEK 12,800,000 NOK
1,309,505 EUR 368,901 EUR 507,517 EUR
3.434.867 EUR 23,800,000 SBP 38.200.000 CHF
14,745 GBP 53,111 GBP
325,827) 120.721) (17,295) (4,637) 1,591
17,032 87 947
375.468 1176) 102
1,127,120 GBP 1.671.150 EUR .. .
EUR 313,484
1394)
(EUR 394)
Global Brands Fund 24 January 2007 395.445,935 USD 209.720,000 GBP (15,594,146)
(USD 15,594.146)
.. . .- . . ... ... .. . . .
Total for Global Brands Fund
Global Systematic Equity Fund 14 March 2007 206,800 EUR 273,772 USD (304) 14 March 2007 62.180 GBP 122.044 USD (160) 15 March 2007 60,840 GBP 119,978 USD (720) 15 March 2007 119,254 USD 60,840 GBP (4)
(US0 1,188)
. . . . ..... __ .
Total for Global Systematic Equity Fund
Global Value Equity Fund 14 March 2007 40 103,340 USD 20,400,000 GBP 115,471
US0 115,471 .. .. - _. _
Total for Global Value Equity Fund
Japanese Equity Advantage Fund 4 January 2007 806,795 EUR 123,436,402 JPY 3 138,243
30 January 2007 4,119,708 FUR 642 962,851 JPY 1890,898
JPY 5,029,141 . _.
Total for Japanese Equity Advantage Fund
The accompanylng notes are an Integral part of these flnanclal statements.
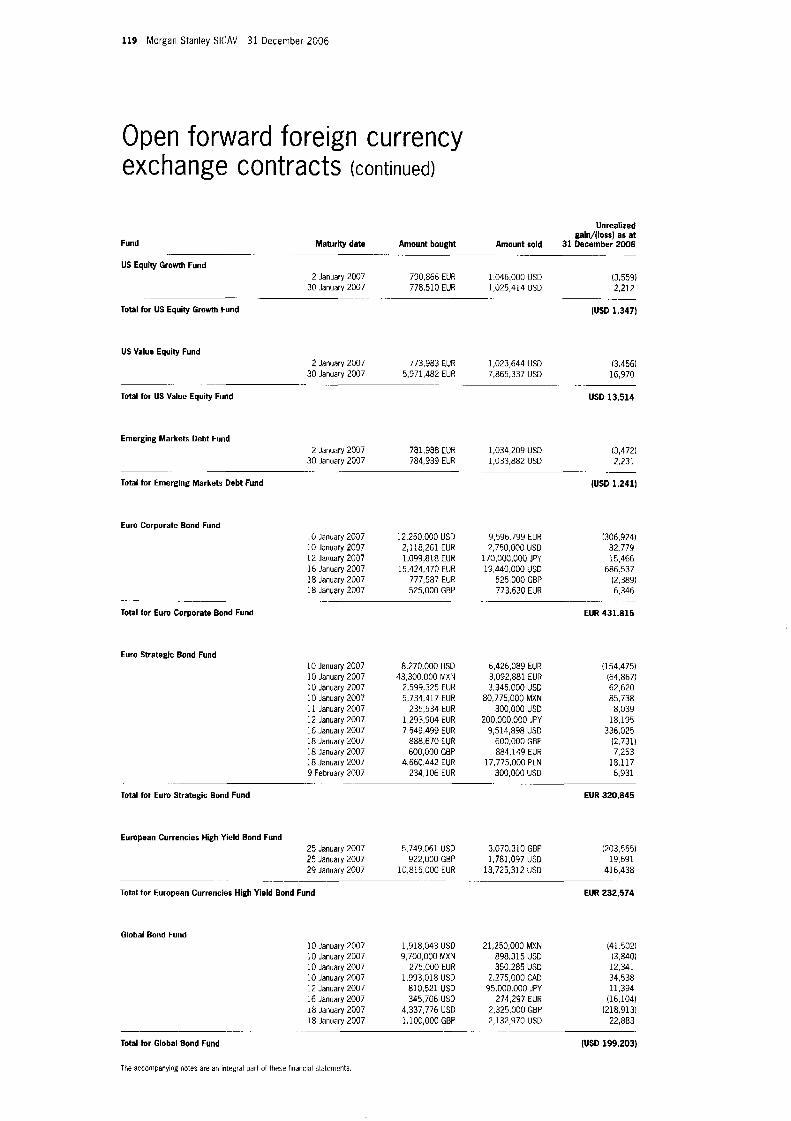
119 Morgan Stanley SlCAV 31 December 2006
Open forward foreign currency exchange contracts (continued)
Unrealized galn/(loss) as at
Fund Maturlty date Amount bought Amount sold 31 December 2006
US Equity Growth Fund -- ._ -- ..
2 January 2007 790,866 EUR 1 046,000 USD 13.559) 30 January 2007 778,510 EUR 1,025,414 USD 2,212
- -_ - -.-. .
Total for US Equity Gmwh Fund (USD 1.347)
US Value Equity Fund 2 January 2007 773 983 EUR 1,023 644 USD (3,456)
30 January 2007 5,971,482 EUR 7,865,337 USD 16 970
USD 13,514
_ .- - ~.
Total for US Value Equity Fund
Emerging Markets Debt Fund 2 January 2007 781 988 EUR 1,034,209 USD (3,472)
30 January 2007 784,939 EUR 1,033,882 USD 2,231 .. -~ ~
Total for Emerglng Markets Debt Fund (USD 1,241)
Euro Corporate Bond Fund 10 January 2037 12.250,OOO USD 10 January 20117 2,118,261 EUR 12 January 2007 1.099.818 EUR 16 January 2007 15,424,470 EUR 18 January 2007 777,587 EUR 18 January 2007 525,000 GBP
-. .- .. .-
Total for Euro Corporate Bond Fund
Euro Strategic Bond Fund 10 January 2007 10 January 2007 10 January 2007 10 January 2007 11 January 2007 12 January 2007 16 January 2007 18 January 2007 18 January 2007 18 January 2007 9 Februafy 2007
8,270,000 USD 43,300.000 MXN
2.599.325 EUR 5,734,417 EUR
235,534 EUR 1,293,904 EUR 7.549.499 EUR
888.670 EUR 600,000 GBP
4,660.442 EUR 234,106 EUR
Total for Euro Strategic Bond Fund
Eumpean Currencies High Yield Bond Fund 25 January 2007 5,749 061 USD 25 January 2007 922,000 GBP 29 January 2007 10,815,000 EUR
.. . -..
Total for European Currencies High Yield Bond Fund
9,596.799 EUR (306,924) 2,750,000 USD 32,779
170.000.000 JPY 15,466 19.440.000 US0 686.537
525,000 GBP (2.389) 773,630 EUR 6,346
EUR 431.815
.. . .
6,426,089 EUR 3,092,881 EUR 3.345,COO US0
80,775,000 MXN 300,000 USD
200,000,000 JPY 9,514,898 USD
600,000 GBP 884,149 EUR
17,775,000 PLN 300,000 USD
(154,475) (64.867) 62,620 85,738
8,039 18,195
336,025 (2,731) 7,253
18,117 6,931
. . ..-
...
Global Bond Fund 10 January 2007 10 January 2007 10 January 2007 10 Januafy 2007 12 January 2007 16 January 2007 18 January 2007 18 January 2007
1,918,043 USD 9,700,000 MXN
275,000 EUR 1,993,018 USD
810.521 US0 345.7G6 USD
4.337,776 USD 1.100.000 GBP
EUR 320,845
3.070.310 GBP (203.555) 1,781,097 USD 19,691
13,725,312 USD 416,438
21,250,000 MXN 898,315 USD 350.285 US0
2.275.000 CAD 95,000,000 JPY
274.297 EUR 2,325,000 GBP 2,132,970 USD
EUR 232,574
(41.502) (3,840) 12,341 34,538 11,394
(16.104) 1218.913)
22,883 ..
Total for Global Bond Fund (US0 199,203)
The accompanying notes are an integral part of the$? hnancial statements.
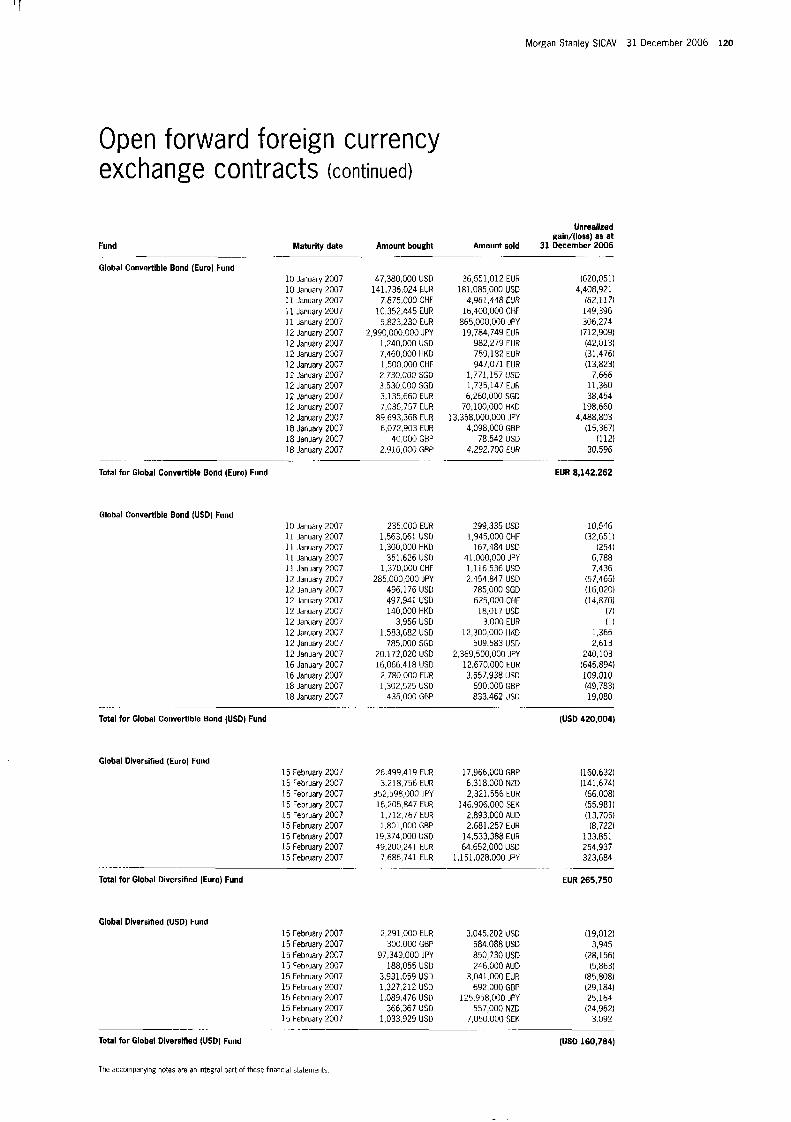
' I
Morgan Stanley SICAV 31 December 2006 120
Open forward foreign currency exchange contracts (continued)
Fund Maturity date Amount bought
Global Convertible Bond (Euro) Fund .- --
10 January 2007 47,380,000 USD 10 January 2007 141.736.024 EUR 11 January 2007 7.875.000 CHF 11 January 2007 10,352,445 EUR 11 January 2007 5,823,230 EUR 12 January 2007 2,990,000.000 JPY 12 January 2007 1,240,000 USD 12 January 2007 7,460,000 HKD 12 January 2007 1,500.000 CHF 12 January 2007 2,730,000 SGD 12 January 2007 3.530.000 SGD 12 January 2007 3,135,660 EUR 12 January 2007 7,036,757 EUR 12 January 2007 89.693,368 EUR 18 January 2007 6,072,903 EUR 18 January 2007 40,000 GEP 18 January 2007 2.910.000 GBP
. - - .
Total for Global Convertible Bond (Euro) Fund
Global Convertible Bond (USD) Fund 10 January 2007 11 January 2007 11 Janudry 2007 11 January 2007 11 January 2007
12 January 2007 12 January 2007 12 January 2007 12 January 2007 12 January 2007 12 January 2007 12 January 2007 16 January 2007 16 January 7007 18 January 2007 18 January 20G7
12 Jdrluary 2007
-. .. ... .- -
Total for Global Convertible Bond (USD) Fund
Global Diversified (Euro) Fund 15 February 2007 15 February 2007 15 February 2007 15 February 2007 15 February 2007 15 February 2007 15 February 2307 15 February 2007 15 February 2007
._ . . -. . . . --
Total for Global Diversified (Euro) Fund
235.000 EUR 1,563,061 US0 1,300,000 HKD
351.626 USD 1.370.000 CHF
285.000.000 JPY 496,176 US0 497.941 US0 140,000 HKD
3,956 US0 1,583,682 USD
785,000 SGD 20,172,020 USD 16,066.418 USD
2.780.000 EUR 1,302,575 USD
435,000 GBP
Unrealized gain/(loss) as at
Amount sold 31 December 2006 ~. - -
1
36.551,012 EUR 181.085,GOO USD
4,961,448 EUR 16,400,000 CHF
865,000,000 JPY 19,784,749 EUR
982,279 EUR 759,182 EUR 947.071 EUR
1,771,157 USD 1,735,147 EUR 6,260,000 SGD
70,100,000 HKO 3.358.000,OOO JPY
4,098,000 GBP 78.542 USD
4.292.700 EUR
(620,051) 4,408,921
162,117) 149,396 306,274 (712.909)
(42,0131 (31,476) (13.8231
7,666 11,360 38,454
198,660 4,488,803
(15.3671 (112)
30,596
299.335 US0 1,945,000 CHF
167,484 US0 41.000.000 JPY 1,116,536 USD 2.454.847 USD
785,000 SGD 625,000 L'HF
18,017 US0 3.000 EUR
12,300,000 HKD 509.583 USD
2,369,500,000 JPY 12.670.000 EUR 3,557.938 US0
690.001) GBP 833,462 JSD
EUR 8,142.262
10,546 (32,651)
(254) 6,788 7,436
(57.465) (16.0201 (14,8701
(7) (1)
1,365 2.613
240,103 S45.894) 109,010 (49,783) 19,080
. .. .
(USD 420,004)
Global Diversified (USD) Fund 15 February 7007 1 5 February 2007 15 February 2CG7 15 February 2007 15 February 2007 15 February 2007 15 February 2007 15 February 2007 15 February 2001
- - ~ .. . . . . . .
Total for Global Diversiiied (USD) Fund
26,499,419 EUR 3218,756 EUH
352,598,000 JPY 16,205,847 EUR
1,712,767 EUR 1.801.000 GBP
19,374.000 USD 49,200,241 EUR
7,686,741 EUR
17,966,000 GBP 6.318.000 NZD 2,321,556 EUR
146,906,000 SEK 2,893.000 AUD 2,681,257 EUR
14,533,388 EUR 64,652,000 US0
1,151,028,000 JPY
(160.632) (141.6741
(66.0081 (55,9811 (13.705)
(8.722) 133,851 254,937 323,684
2,291,000 EUR 300.000 GBP
97.349.000 JPY 188,055 USD
3.931.059 USD 1,327.212 USD 1,089,476 USD
366,367 US0 1,033.929 USD
3,045,202 USD 584.088 US0 850,730 USD 246,000 AUD
3,041.000 EUR 692,000 GBP
1 ;15.958.000 JPY 557,000 NZD
7.050.000 SEK -__ .. ~
EUR 265,750
(19,0121 3,945
(28,1561 (5,8631
(85,8081 (29.184) 25,164
(24.962) 3.092
(USD 160,784)
The accompanying notes are an integral part of these financial statements.
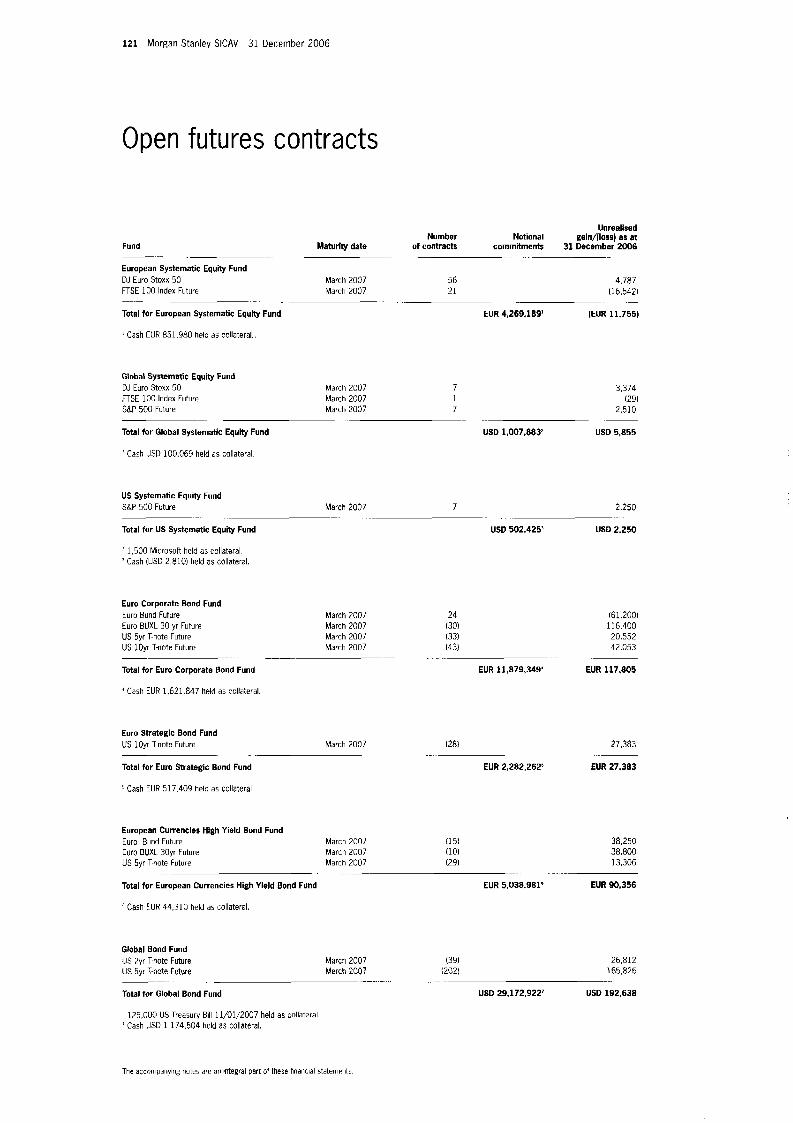
121 Morgan Stanley SICAV 31 December 2006
Open futures contracts
Unrealised Number Notional gain/(loss) as at
Fund Maturity date of contracts commitments 31 December 2006
European Systematic Equity Fund DJ Euro Stoxx 50 March 2007 56 4,787 FTSE 100 Index Future March 2007 21 I1 6.542)
Total tor European Systematic Equity Fund EUR 4,259,189' (EUR 11.755)
I Cash EUR 851,980 held as collateral..
- .- - . . . . .
. . . . ... .. .- .
Global Systematic Equity Fund DJ Euro Stoxx 50 March 2007 7 3,374 FTSE 100 Index Future March 2007 1 (29) S&P 500 Future March 2037 7 2,510
Total for Global Systematic Equity Fund USD 1,007,8832 USD 5,855
' Cash USD 100,069 held as collateral
. . - ...
US Systematic Equity Fund S&P 500 Future March 2007 7
Total for US Systematlc Equity Fund
' 1,500 Microsoft held as collateral ' Cash IUSD 2 8101 held as collateral
.. . _ -. . .- .~
USD 502.42F
Euro Corporate Bond Fund Euro Bund Future March 2007 24 Euro BUXL 30 yr Future March 2007 130) US 5yr T-note Future March 2007 133) US lOyr T-note Future March 2007 143)
Total for Euro Corporate Bond Fund
' Cash EUR 1.621 847 held as collateral.
._ -. . .
EUR 11,879,349' ...
Euro Strategic Bond Fund US lOyr Tnotc Future March 2007 (281
Total for Euro Strategic Bond Fund
Cash EUR 517.409 held as collateral
. - _.
EUR 2,282.262'
European Currencies Hlgh Yield Bond Fund Euro Bund Future March 2007 Euro BUXL 30yr Future March 2007 US 5yr T-note Future March 2007
(15) 110) 129)
2,250
US0 2,250
(61,2001 116,400 20,552 42,053
EUR 117,805
27.383
EUR 27,383
38,250 38,800 13,306
._ -
Total for European Currencies High Yleld Bond Fund
' Cash EUR 44,310 held ds collateral
EUR 5.038.9816 EUR 90,356
Global Bond Fund US 2yr T-note Future March 2007 (39) 26,812 US 5yr T-note future March 2007 (202) 165.826
Total for Global Bond Fund USD 29,172,922' USD 192,638 . . . ......
125,000 US Treasury Bill 11/01/2007 held as collateral 'Cash US0 1,174,504 held as collateral.
The accompanying notes are an fntegral part of these financial statemmts.
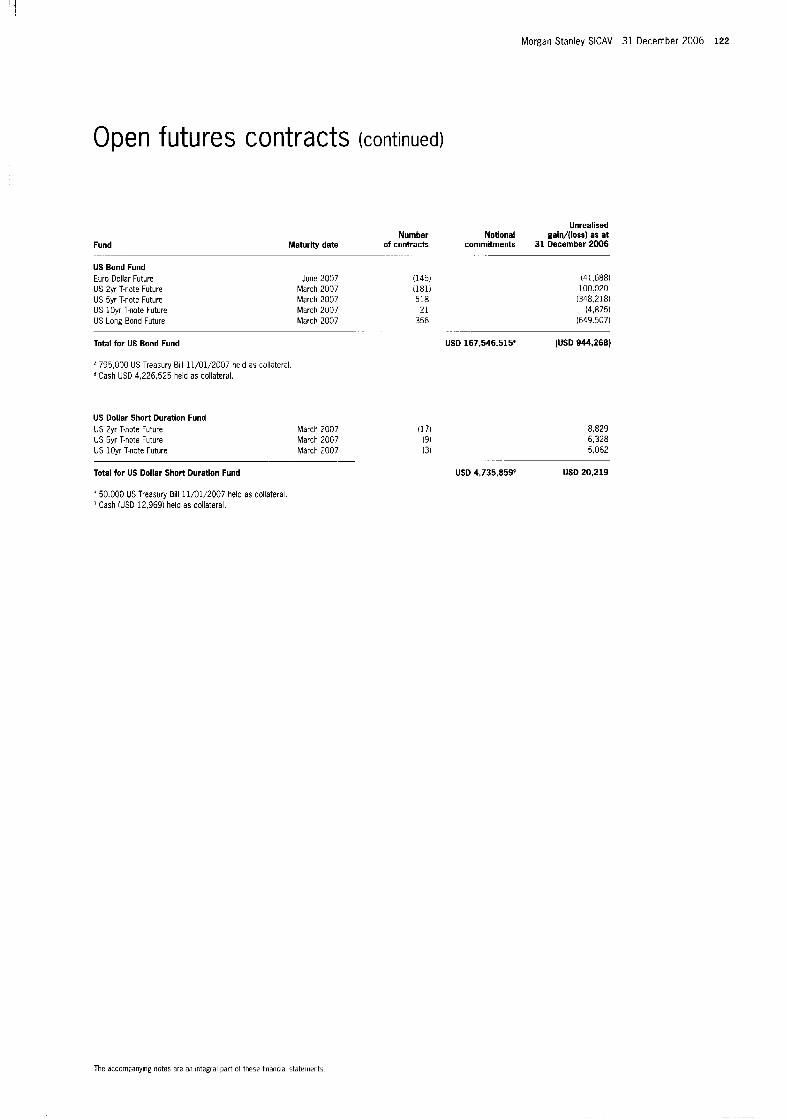
Morgan Stanley SlCAV 31 December 2006 122
Open futures contracts (continued)
Fund Maturlty date
Unrealired Number Notion a I gain/(loss) as at
of conbacts commitments 31 December 2006 __ .- .. . .
US Bond Fund Euro Dollar Future US 2yr T-note Future US 5yr T-note Future US lOyr T-note Future US Long Bond Future
June 2007 March 2007 March 2007 March 2007 March 2007
1 145! 1181) 518
21 356
141,688) 100.020
1348.218) (4,875)
1649.507)
Total for US Bond Fund
795,000 US Treasury Bill 11/01/2007 held as collateral. a Cash USD 4,226,525 held as collateral.
US Dollar Short Duratlon Fund US 2yr Tmte Future US 5yr T-note Future US lOyr T-note Future
March ?007 March 2007 March 2007
11 7) 19) (3)
USD 167.546.515' (USD 944,268)
8,829 6,328 5,062
Total for US Dollar Short Duration Fund
50.000 US Treasury Bill 11/01/2007 held as collateral ' Cash 1USD 12.969) held as collateral.
USD 20,219 USD 4.735.859'
The accornranying notes are m Integral part of these financial statmcnts
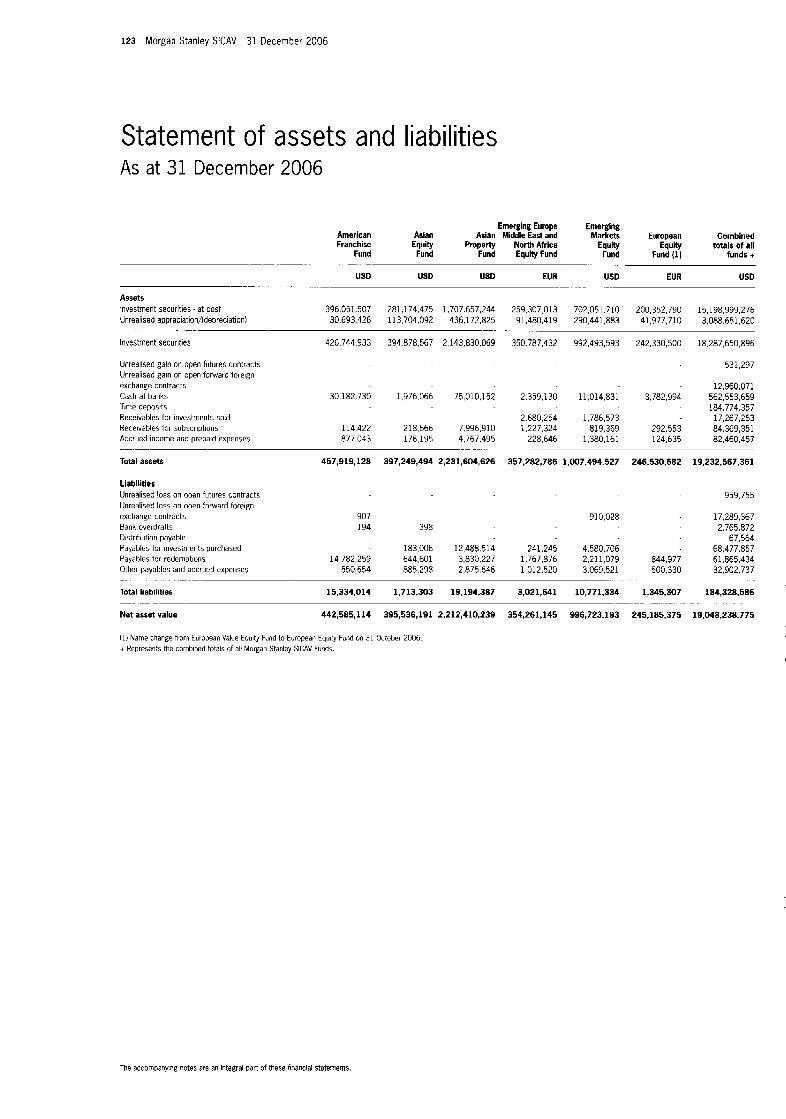
123 Morgan Stanley SICAV 31 December 2006
Statement of assets and liabilities As at 31 December 2006
Emerging Europe Emerglng Combined American Asian Asian Middle East and
Equity totals of all Fund Fund (1) funds +
Franchise Equity Properly North Africa Fund Fund Fund Equity Fund
USD USD USD EUR USD EUR USD
Markets European
. -. .... .
...... ......... ......... -
A$$et$ Investment securities - at cost 396,051.507 281.174.475 1,707,657,244 259,307.013 702,051.710 200,352,790 15,195,999,276 Unrealised appreciation/(depreciation) 30,693.426 113,704.092 436,172,825 91,480.419 290,441,883 41,977,710 3,088,651,620
Investment securities 426,744.933 394,878,567 2,143,830,069 350,787,432 992,493,593 242,330,500 18,287,650,896
. - .- . . . . . . .- . .
Unrealised gain on open futures contracts Unrealised gain on open forward foreign exchange contracts Cash at banks Titre deposits Receivables for investments sold Receivables for subscriptions Accrued income and prepaid expenses
Total assets
Liabllitles Unrealised loss on open futures contracts Unrealised loss on open forward foreign exchange contracts Bank overdrafts Distribution payable Payables for investments purchased Payables for redemptioris Other payables and accrued expenses
Total liabilities
Net asset value
...................
__ ~
30,182,730 1,976.066 75,010,152
114,422 218,666 7,996,910 877,043 176,195 4,767,495
457,919,128 397,249,494 2,231,604,626
.........
907 194 398
183,006 12,488.514 14,782,259 644,601 3,830,227
550,654 885,298 2,875,646
15,334,014 1.713.303 19.194.387
2,359,130 11.014.831
2,680,254 1,786,573 1,227,324 819.369
228,646 1,380,161
357,282,786 1.007.494.527
910,028
241,245 4,580,706 1,767,876 2,211,079 1,012,520 3.069.521
3,021,641 10,771,334
-. .
442,585,114 395,536,191 2,212,410,239 354,261,145 996,723.193
531,297
12,960,071 3,782,994 562,553,659
17,267,263 292,553 84,369,351 124,635 82,460,467
- 184,774,357
246,530,682 19,232,567,361
959,755
17,289,367 2,765,872
67,564 68,477,857
844,977 61.865.434 500,330 32,902,737
1,345.307 184,328,586
245.185.375 19,048.238.775
.. - .. -. .- .
(1) Name change from EuroAean Value Equity Fund 10 European Equity Fund on 31 October 2006 + Kepresenx the combined totals of all Mofgan Stanley SlCAV Funds.
The acconDany.ng notes are an integral Dart of these hnancial statements
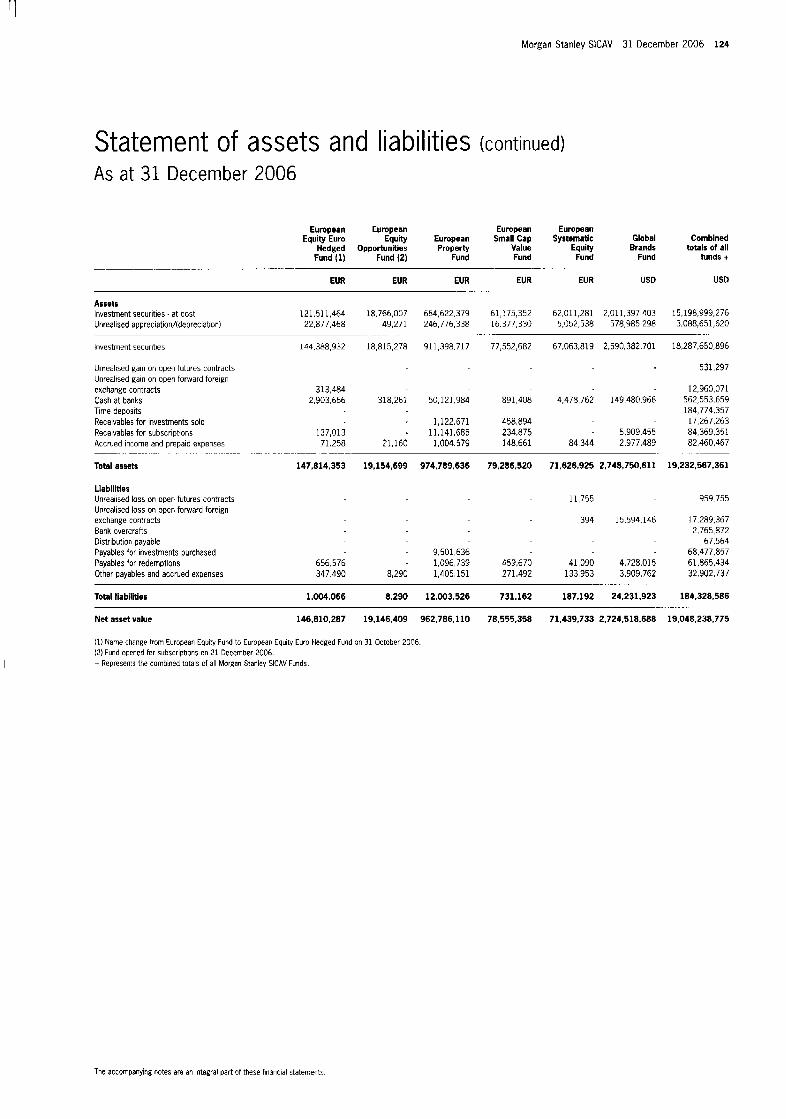
Morgan Stanley SICAV 31 December 2006 124
Statement of assets and liabilities (continued) As at 31 December 2006
Eumpean European European European Equity Euro Equity European Small Cap Systematic Global Combined
Hedged Opportunities Property Value Equity Brands totals of all Fund (1) Fund (2) Fund Fund Fund Fund funds t
EUR EUR EUR EUR EUR USD USD ........ - ._ . ..
.. _ ...... Assets Investment securities - at cost 121,511,464 18,766,007 664,622.379 61,175,352 62,011,281 2,011,397,403 15,198,999,276 Unrealised appreciation/(depreciationl 22,877.468 49,271 246,776,338 16,377,330 5,052,538 578,985.298 3,088,651,620
Investment securities 144,388,932 18,815,278 911,398.717 77,552,682 67,063,819 2,590,382,701 18,287,650,896
.. - . . . . _._ . . .
Unrealised gain on open futures contracts Unrealised gain on open forward foreign exchange contracts Cash at banks Time deposits Receivables for investments sold Receivables for subscriptions Accrued income and prepaid expenses
Total assets
.. .- . . . . . . . . . . . . . . . . . . . . . . . . . . . . . . -. ......
313,484 2,903,666 318,261 50,121,984 891,408 4,478,762 149,480,966
. 1,122.671 458,894 137,013 . 11,141,685 234,875 - 5,909,455
71.258 21,160 1.004.579 148.661 84,344 2,977,489
147,814,353 19,154.699 974,789.636 79.286.520 71,626,925 2,748,750,611
........
Liabilities Unrealised loss on open futures contracts Unrealised loss on open forward foreign exchange contracts Bank overcrafts Distribution payable Payables for investments purchased Payables for redemptions 656.576 Other payables and accrued expenses 347.490
Total liabilities 1,004.066
11,755
394 15,594,146
531,297
12,960,071 562,553,659 184,774,357
17,267,263 84,369,351 82,460.467
19,232,567.361
959.755
- 9,501,636 - 1,096,739 459,670 41,090 4.728.015
8,290 1,405,151 271,492 133,953 3,909,762
187,192 24,231,923 8.290 12.003.526 731.162
.......
17,289,367 2,765,872
67,564
61,865,434 32,902,737
68,477,857
184,328,586
Net asset value 146,810,287 19,146,409 962,786,110 78,555,358 71,439,733 2,724,518,688 19.048.238.775
(1) Name Change trom European Epuity Fund to European Equity Euro Hedged Fund 3n 31 October 2006 (21 Fund opened for subscriptions on 21 December 2006 + Represen!s the comblned totals of all Morgan Stanley SlCAV Funds
The accompanying notes are an integral part of these financial statement?

125 Morgan Stanley SICAV 31 December 2006
Statement of assets and liabilities (continued) As at 31 December 2006
Global Global Global Global Equity Global Small Cap Systematic Value lndlan Combined
Growth Property Value Equity Equity Equlty totals of all Fund (1) Fund (2) Fund Fund (3) Fund Fund (4) funds +
. .. - -. . .. . ....
USD USD USD USD USD USD u50 . ... . . __ . . . . . .. - . . . . . . . . . .
Assets Investment securities - at cost Unrealised appreciation/(depreciation)
Investment securities
Unrealised gain on open futures contracts Unrealised gain on open torward foreign exchange contracts Cash at banks Tinie deposits Receivables for investments sold Receivables for subscriptions Accrued income and prepaid expenses
10294868 9876196 1,357,099 870 204
11,651,967 10 746,400
.
388,847 210,229
11.043
33,222 47.830
135,901,168 34.514.487 573,120.123 4,773,896 15,198,999,276 39,566,361 3,308,506 185,801,652 (69.232) 3,088,651,620
175,467,529
11,174,279
195,787 20,278
280.806
37.822.993 758,921,775 4,704,664 18,287,650,896
5,855 531.297
115.471 12,960,071 615.415 14,071.966 246,409 562,553,659
- 184,774,357 97,430 17.267.263
10.51 1,286 257.654 50,041 84,369,351 55,721 1,111,505 22,816 82,460,467
Total assets
Liabilities Unrealised loss on open futures contracts Unrealised loss on open forward foreign exchange contracts Bank overdrafts Distribution payable Parables for investments purchased Parables for redemptions Othpr payables and accrued expenses
12,074,036 11,015.502 187,138,679
1.002
14,092 19,727 2,838,156 928,306
58.377 45.300 445,954
959,755
1,188 17,289,367 9,438 2,765,872
67,564
230,605 797,620 61.865.434 138,130 1.323.662 33,886 32,902,737
9,930.430 4,910 6a.477.857
i Total liabilities 72,469 66,029 4,212,416 10,300,353 2,121,282 48,234 184,328,586 I
--. . .. ... ... . . .. . . .
. . .. . . . .. . . . . . . .- . . ... . ..
Net asset value 12,001,567 10,949,473 182,926,263 38,808,347 77237.089 4.975.696 19,048,238.775
(1; Fund opened tor subscri3tions or 31 July 2006. 121 Fund opened ‘or subscri3tions OP 31 October 2006. (31 Name change frorri World Equity Fund to Global Systematic Equity Fund on 31 October 2006. (4) Func opened for subscriitiuns ofi 30 Nuverriber 2006. + Represents the combined totals of all Morgaii Stanley SlCAV Funds.
The acLorripanyirig iiotes arc an irtegal pari of these financial statements.
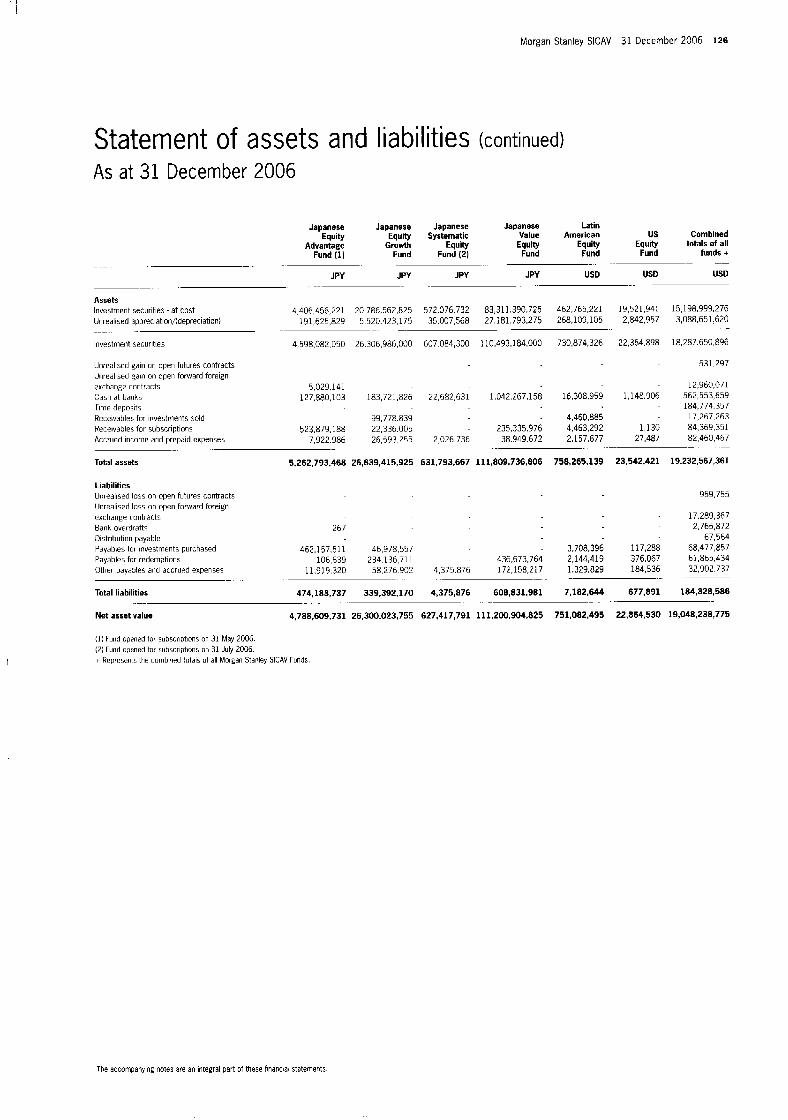
I 1 I
Morgan Stanley SlCAV 31 December 2006 126
Statement of assets and liabilities (continued) As at 31 December 2006
Japanese Japanese Japanese Japanese Latin
Advantage Growth Equity Equity Equity Equity Equity Systematic Value American us Combined
Equity totals of all Fund Fund (2) Fund Fund Fund funds +
- Fund (1)
.. . .- . . - . .. .- . JPY JPY JPY JPY US0 USD US0
.. - .. - .
Assets Investment securities - at cost 4,406,456,221 20,786,562,825 572.076.732 83,311,330,725 462,765,221 19,521,941 15,198,999.276
191,625,829 5,520,423,175 35.007.568 27,181,793,275 268,109,105 2,842,957 3,088.651.620 Unrealised appreciation/(depreciation)
Investment securities 4,598,082.05C 26,306,986,000 607.084,300 110,493,184,000 730,874.326 22,364.898 18.287.650,896
. - -. - ... .-
Unrealised pain on operi futures contracts Unrealised gain on open forward foreign exchange contracts Cash at banks Time deposits Receivables for investments sold Receivables for subscriptions Accrued income and prepaid expenses
Total assets
Liabilities Unrealised loss on open futures contracts Unrealised loss on open forward foreign exchange contracts Bank overdrafts Distribution payable Payables for Investments purchased Payables for redemptions Other payales and accrued expenses
Total liabilities
Net asset value
5.029.141 127,880,103 183,721,826 22,682,631 1,042,267,158 16,308,959
- 99,778.839 - 4,460,885 - 235.335.976 4,463,292
38.949.672 2,157,677
5,262,793.468 26,639,415,925 631.793.667 111,809,736,806 758,265,139
523.879.188 22.336.005
. .. -. . 7.922.986 26.593.255 2,026.736
-
531.297
- 12,360,071 1.148.906 562,553,659
- 184.774.357 - 17,267,263
1,130 84,369.351 27,487 82,460,467
.- . -.
23,542,421 19,232,567,361
(I! Fund opened for subscriptions or 31 May 2006. (2) Fund opened to< subscripttons on 31 July 20C6 + Represen-5 the combiied :otais uf all Morgan Stanley SlCAV Funds
267
462,157,511 46,978,557 106,639 234.136.711 - 436,673,764
11,919,320 58,276.902 4.375.876 172,158,217
474,183,737 339.392.170 4,375,876 608,831,481
4,788,609,731 26,300,023,755 627,417,791 111.200.904,825
.- . . .. -. .
. .. -. . . . -
959.755
- 17.289.367 2,765,872
67,564
2,144,419 376.067 61,865,434 1,329,829 184,536 32.902.737
7,182,644 677,891 184,328,586
751,082,495 22.864.530 19,048,238,775
3,708,396 117,288 68,477,857
-_ ..
.. . - -
The accompanying noies are an integral part of these financlam statements
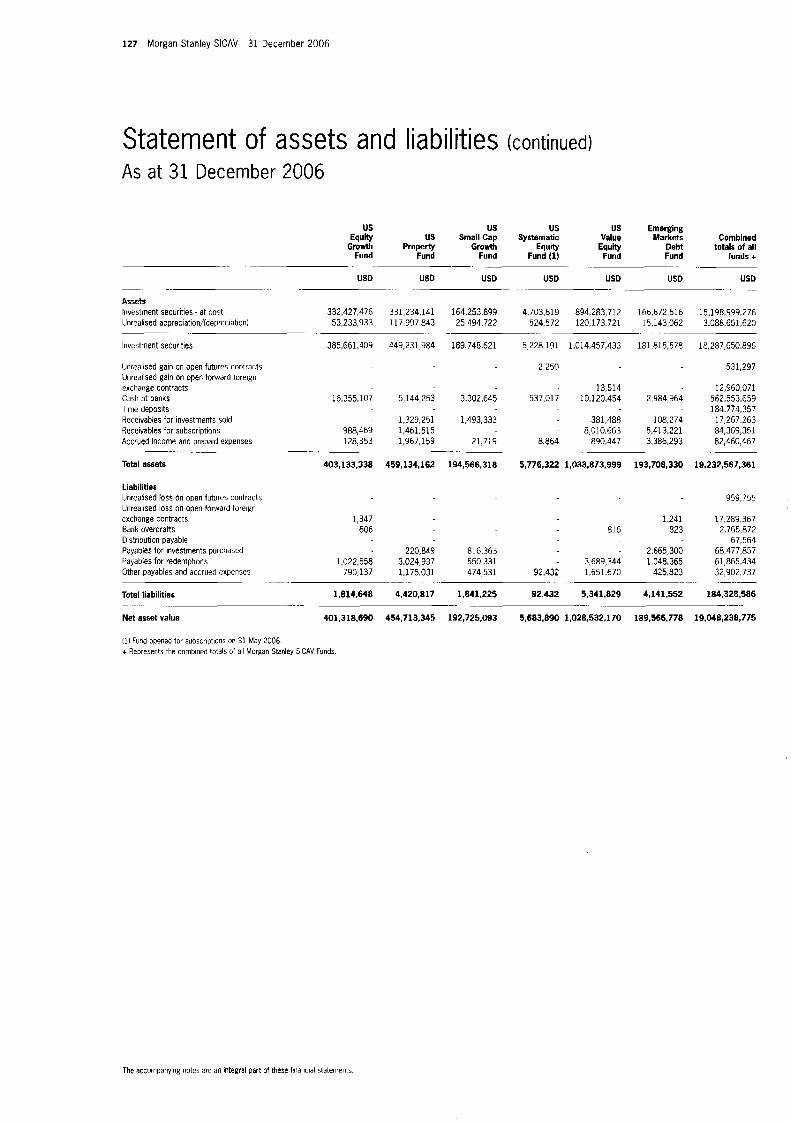
127 Morgan Stanley SICAV 31 December 2006
Statement of assets and liabilities (continued) As at 31 December 2006
us us us US Emerging Equity US Small Cap Sy8tematiC Value Markets Combined
Gmwth Property Growth Equity Equity Debt totals of all Fund Fund Fund Fund (1) Fund Fund funds +
USD USD USD US0 USD USD US0
. .- . . . . -. - ..
.. .. .- . . . . . . . ...... - - -.
Assets Investment securities - at cost 332.427.476 331,234.141 164.253.899 4,703,619 894,283,712 166,672,516 15,198,999,276 Unrealised appreciation/(depreciatiotil 53,233,933 117,997,843 25,494,722 524,572 120,173.721 15.:43,062 3,088,651,620
Investment securities 385,661,409 449,231,984 189.748.621 5,228,191 1.014.457.433 181,815,578 18,287,650,896
. . . -. _- ~- .- -_ .- ....
Unrealised gain on open futures contracts Unrealised gain on open forward foreign exchange contracts Cash at banks 16,355,107 5,144,253 3.302.645 Time deposits
Receivables for subscriptions 988,469 1,461.51 5 Accrued income and prepaid expenses 128.353 1.967.159 21.719
Total assets 403.133.338 459,134,162 194,566.318
Receivables for investments sold - 1,329,251 1,493,333
. . -.
Liabilities Unrealised loss on open futures contracts Unrealised loss on open forward foreign exchange contracts Bank overdratts Distribution payable Payables for investments purchased Parables for redemptions Other payables and accrued expenses
Total liabilities
Net asset value
........ -
........... .......
1,347 606
220,849 1,022,558 3,024,937
790.137 1,175,031
1,814.648 4.420,817
401.318.690 454,713,345
2.250 531,297
13,514 12,960,071 537,017 10,120,454 2,984,964 562,553,659
- 184.774.357 17,267.263 84,369,351
8,864 890,447 3,386.293 82,460,467
5,776,322 1,033,873,999 193,708,330 19,232,567,361
381,488 108,274 - 8,010,663 5,413,221
. . .~
815
816,363 550,331 - 3,689,344 474,531 92,432 1.651.670
1,841,225 92.432 5,341,829
._
192,725,093 5,683,890 1,028,532,170
1,241 823
2,665,300 1,048,365
425,823
4,141,552
959,755
17,289.367 2,765,872
67,564 68,477,857 61,865,434 32,902,737
184,328,586
. . .
189,566,778 19,048,238,775
(1) Fund opened tor subscriptlons on 31 May 2006. + Represents the combined totals of all Morgan Stanley SlCAV Funds
The accompanying notes are an mtegral parr of these financial statements
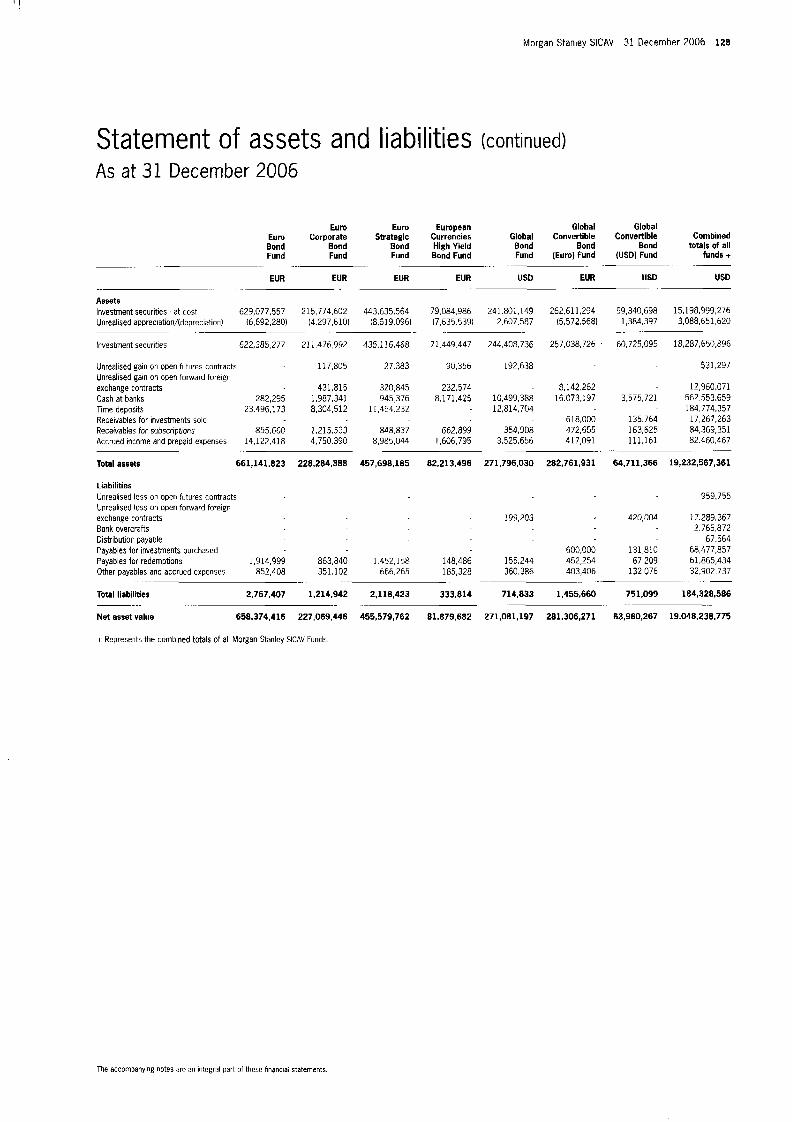
Morgan Stanley SlCAV 31 December 2006 128
Statement of assets and liabilities (continued) As at 31 December 2006
Euro Eum Corporate Bond Bond Fund Fund
EUR EUR . ..
... ...
Assets Investment securities - at cost 629,077,557 215,774,602 Unrealised sppreciation/(depreciationl (6,692,280) 14.297,6101
Investment securities 622,385,277 21 1.476.992
-. -
Unrealised gam on open futures contracts Unrealised gain on open forward foreign exchange contracts Cash at banks 282,295 Time deposits 23,496,173 Receivables for investments sold Receivables for subscriptions 855,660 Accrued income and prepaid expenses 14,122,418
Total assets 661,141.823
Liabilities Unrealised loss on open futures contracts Unreallsed loss on open forward foreign exchange contracts Bank overcrafts Distributior payable Payables for investments purchased Payables for redemptions 1,914,999 Other payables and accrued expenses 852,408
Total liabilities 2,767.407
Net asset value 658.374.416
.~
.. .
~. . . . ...
Euro Strategic
Bond Fund
EUR
-. ~
443.635.564 (8,519,0961
435.1 16.468
117,805 27.383
431,815 320,845 1,987,341 945.376 8,304,512 11.454.232
1.215.533 848,837 4,750.390 8,985,044
228,284,388 457,698,185
.~
863,840 1.452.158 351,102 666.265
1,214,942 2,118,423
227.069.446 455,579,762
..
~. .
European Currencies Global High Yield Bond Bond Fund Fund
EUR USD
..
-.
79.084.986 241.801,149 (7.635.5391 2.607.587
Global Convertible
Bond (Euro) Fund
EUR -
262,611,294 15.572.568)
71,449.447 244,408,736
90,356 192,638
257,038.726
Global Convertible Combined
Bond totals of all (USD) Fund funds +
USD USD .
232,574 - 8.142.262 8,171,425 10.499.388 16.073.197
618,000 662,899 354,908 472,655
1,606,795 3,525,656 417,091
82,213,496 271,796,030 282,761,931
- 12,814,704
59,340,698 15,198,999,276 1,384,397 3,088,651,620
60,725,095 18,287,650,896
531,297
-. -..
199,203
600,000 148,486 155,244 452,254 185,328 360.386 403,406
333.814 714,833 1,455,660
81.879.682 271,081,197 281,306,271
__ .. .-
~-
12,960,071 3,575,721 562.553.659
135,764 17,267,263 84,369,351 163,625
111,161 82,460,467
64,711,365 19,232,567,361
- 1 ~ 7 7 4 . 3 5 7
.. . -
959,755
420,004
131,810 67,209
132.076
751,099
17,289,367 2.765.872
67.564 68,477,857 61,865,434 32.902.737
184,328,586
.~
63,960,267 19,048,238,775
+ Represents the combined totals of all Morgan Stanley SlCAV Funds
The accomanying notes are an Integral part of thcse financlai statements.
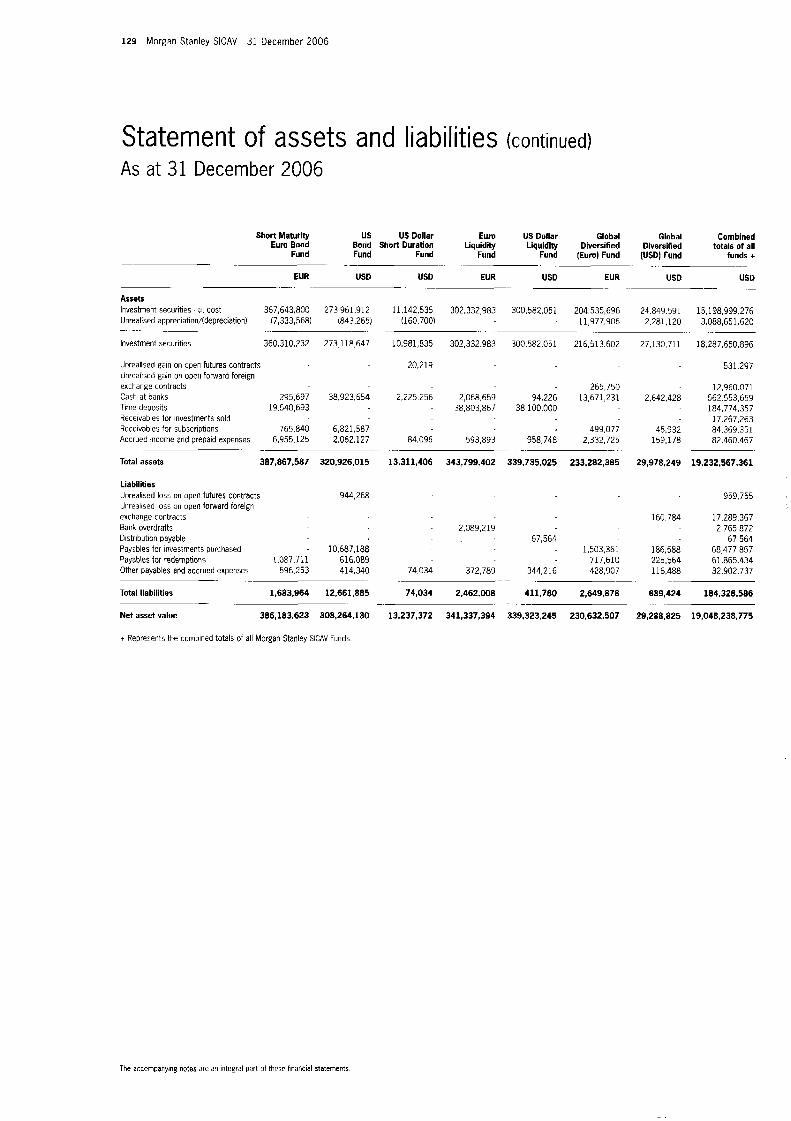
129 Morgan Stanley SICAV 31 December 2006
Statement of assets and liabilities (continued) As at 31 December 2006
Short Maturlty US US Dollar Euro US Dollar Global Global Combined Bond Short Duration Liquidity Liquidity Diversified Dlversihed totals of all
Fund Fund Fund Fund Fund (Euml Fund (USD) Fund funds + Eum Bond
. .. -. - .. .- .. .
EUR USD USD EUR USD EUR USD us0 .. .- . ..
Assets Investment securities - at cost 367,643800 273,961,912 11.142.535 302.332.983 300,582,051 204,535,696 24.849.591 15.198,999.276 Unrealised appreciation/(depreciation) (7,333,568) (843.265) (160.700) - 11,377,906 2,281,120 3,088,651,620
Investment securities 360,310,232 273.118,647 10,981,835 302,332.983 300.582.051 216.513.602 27,130,711 18,287,650,836
Unreafised gain on open futures contracts 20,219 531.297 Unrealised gain on operi forward foreign exchange contracts 265,750 12,960.071 Cash at banks 295,697 38.923,654 2.225.256 2,068.659 94,226 13,671,231 2.E42.428 562,553,653 Time deposits 19,540,693 - 38,803,867 38,100,000 - 184,774,357 Receivables for investmerts sold 17,267,263 Receivables for subscriptions 765.840 6,821,587 499.077 45,932 84,369,351 Accrued income and prepaid expenses 6,955,125 2.062.127 84,096 593.893 958,748 2,332,725 159,178 82.460.467
... . - .... . . - -. ... -
-- ... . _- .. ... . . .. .
Total assets 387,867,587 320,926,015
Liabilities Unrealised loss on open futures contracts Unrealised loss on open forward foreign exchange contracts Bank overdrafts Distribution payable
Payables for redemptions 1.087.71 1 616,089 Other payable$ and accrued expenses 596,253 414,340
Total liabilities 1,683.964 12,661,885
Net asset value 386,183.623 308,264,130
+ Represents the combined totals of all Morgan Stanley SlCAV Funds
944,268
Payables for investments purchased - 10.687.188
13,311,406 343,799.402
- 2,089,219
74.034 372,789
74,034 2.462.008
13,237,372 341,337,394
.- .
339,735,025 233,282,385 29,978,249 19,232,567,361
67,564 - 1,503,361
717,610 344,216 428.907
411,780 2,649,878
339,323.245 230,632,507
.-
959,755
160.784
186,588 225,564 116,488
689,424
29,288.825
._
.~
17,283,367
67,564 68,477,857 61.865.434 32,902,737
2,765,872
184.328.586
19,048,238,775
The acccmpanying notes are a i integral Part crf these financial statements
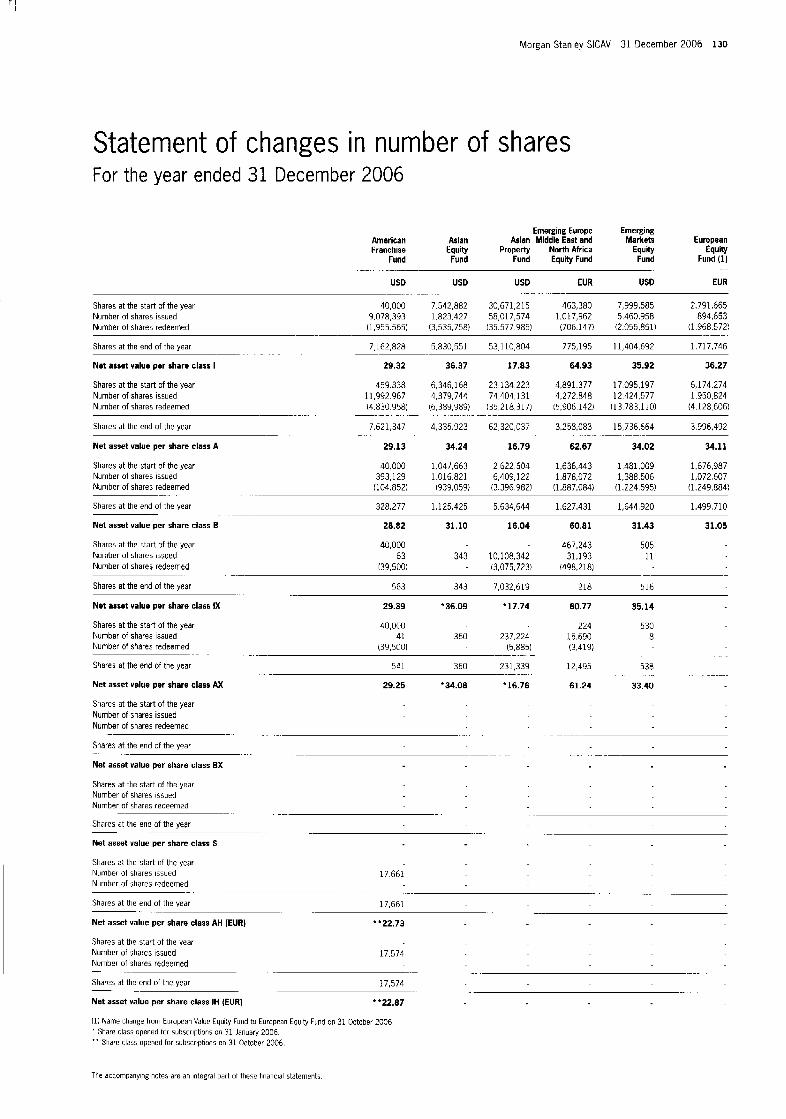
Morgan Stanley SICAV 31 December 2006 130
Statement of changes in number of shares For the year ended 31 December 2006
American Asian Franchise mi*.
Fund Fund ..........
USD US0
Shares at the start of the year 40,000 7.542.882 Number of shares issued 9,078,393 1.823.427 Number of shares redeemed 11.955565) !3,535.758)
........
Emetging Europe Asian Middle East and
Properly North Africa Fund Equity Fund
USD EUR
30,67 1,2 15 463,380 58,017,574 1.01 7,962
(35.577.985) (706.147)
..... ~
Emerging Markets
Fund Equity
USD
European Equity
Fund (1) ..
EUR
7,999,585 5.460.958
(2,055,851)
2.791.665 894,653
(1,968,572;
7.162,828 5,830,551 53.1 10,804 775,195 11,404,692 1.717.746 Shares at the end of the year
Net asset value per share class I 29.32 36.37 17.83 64.93 35.92 36.27
Shares at the start of the year 459.338 6,346,168 23.134.223 4.891377 17,095,197 6,174.274 1,950,824 Number of shares issued 11,992.967 4.379.744 74,404,131 4.272.848 12.424.577
Number of shares redeemed (4.830.958) (6,389,989) (35,218,317) (5.906.142) (13.783.1101 14.128.606)
Shares at the end of the year 7,621,347 4,335.923 62,320,037 3,258,083 15,736,664 3.996.492
Net asset value per share class A 29.13 34.24 16.79 62.67 34.02 34.11
Shares at the start of the year 40.000 1,041,663 2.622.504 1,636,443 1,481,009 1,676,987 Number of shares issued 393,129 1.016.821 6,409,122 1,878,072 1,388.506 1,072,607 Number of shares redeemed (104.852) (939.059) (3.396.982) 11,887,084) (1,224,595) (1,249,884;
Shares at the end of the year 328,277 1,125,425 5.634.644 1.627.431 1,644,920 1,499,710
Net asset value per share class B 28.82 31.10 16.04 60.81 31.43 31.05
Shares at the start of the year 40,000 467,243 505 Number of shares issued 63 343 10,108,342 31,193 11 Number of shares redeemed 139.500) - (3,075,723) (498.218)
. . . . . .
~ ........ -. .- -. .. .- .......... ..
... ....... .... .
. . .
.
... . .-
Shares at the end of the year 563 343 7,032,619 218 516
Net asset value per share class IX
Shares at the start of the year Number of shares issued Number of shares redeemed
Shares at the end of the year
Net asset value per share class AX
Shares at the start of the year Number of shares issued Number of shares redeemed
Shares at the end of the year
Net asset value per share class EX
Shares at the start of the year Number of shares issued Number of shares redeemed
...
29.39 *36.09 '17.74 60.77 35.14
40,000 224 530 41 360 237,224 15.690 8
139,500)
541
(5.885) (3,419) -- - ...... . . .
-.. 231,339 12,495 538
29.25 '34.08 *16.76 61.24 33.40
... ..... 360
....
... ........
.- - ...... ......
Shares at the end of the year
Net asset value per share class S
~ ...- ... .-
Shares at the start of the year Number of shares issued 17.661 Number of shares redeemed
Shares at the end of the year
Net asset value per share class AH (EUR)
... .... .- . .- -.
-.- . . 17,661
"22.73
~
Shares at the start of the year Number of shares issued 17.574 Number of shares redeemed
Shares at the end of the year
Net asset value per share class IH (EUR)
(1) Name change from European Value Equi:y Fund tu Eurtipean Equity Fund on 31 October 20C6 ' Share class opened for subscriptions on 31 January 2006. * * Share class opened for subscriptiuns on 31 October 2006.
... ... -..-
17,574
* '22.87 .- --
... .
.. ._ ...
The accompanying notes are an integral part of these financial statements
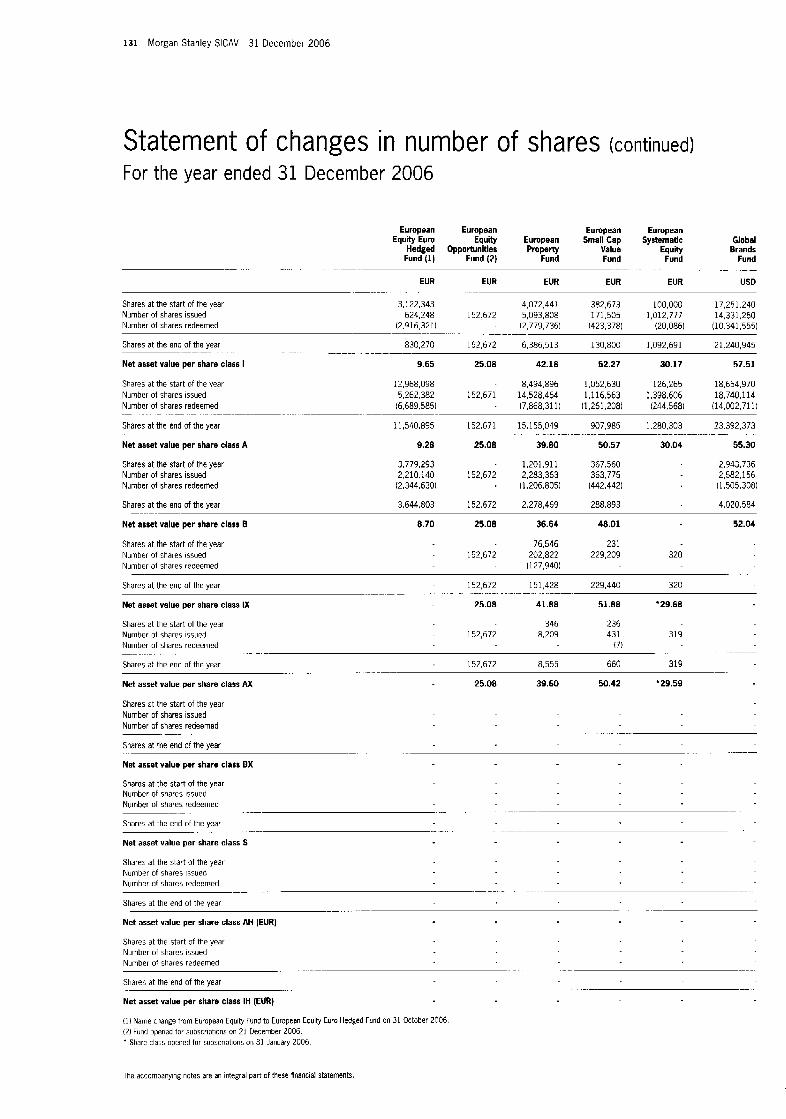
131 Morgan Stanley SICAV 31 December 2006
Statement of changes in number of shares (continued) For the year ended 31 December 2006
European European European European Equity Euro E q u i European Small Cap Systematic Global
Hedged Opportunities Property Value Equity Brands Fund (1) Fund (2) Fund Fund Fund Fund
EUR EUR EUR EUR EUR USD
Shares at the start of the year 3,122,343 - 4,072,441 382,673 100,000 17,251.240 Number of shares issued 624,248 152.672 5,093,808 171.505 1.012.777 14,331,260
(2,916,321) - 12,779,736) 1423.378) (20.086) (10,341,555) Number of shares redeemed
830,270 152,672 6,356,513 130.800 1,092,691 21,240,945 Shares at the end of the year
Net asset value per share class I 9.65 25.08 42.18 52.27 30.17 57.51
Shares at the start of the year 12,968,098 - 8,494,896 1,052,630 126,265 18,654,970 Number of shares issued 5,262.382 152,671 14,528,464 1,116.563 1.398.606 18,740,114 Number of shares redeemed (6,689,585) - (7,868,3111 11,261,208) (244.5681 (14,002,711)
11,540,895 152,671 15,155,049 907,985 1,280,303 23,392,373 Shares at the end of the year
Net asset value per share class A 9.28 25.08 39.80 50.57 30.04 55.30
... .... .... . . . . - .. _ . .-
- - _. . .
~ .....
. . . . .... . ___ ... ._ ._ _
.................. ~- ...... ~. .
... .... ...... ~ .
Shares at the start of the year Number of shares issued Number of shares redeemed
3,779,293 - 1,201,911 367.560 2,943,736 2,210.140 152,672 2,283,363 363,775 2,582.156 (2,344,6301 . 11,206,8051 (442,442) I1,505,3081
Shares at the end of the year 3,644,503 152,672 2,278,469 288,893 4.020.584
Net asset value per share class B
Shares at the start of the year Number of shares issued Number of shares redeemed
8.70 25.08 36.64 48.01 52.04
76,546 231 152,672 202,822 229,209 320
- (127,940)
152,672 151,428 229,440 320 Shares at the end of the year
Net asset value per share class IX 25.08 41.88 51.88 *29.68
Shares at the start of the year 346 236 Number of shares issued 152,672 8,209 431 319
I71 Number of shares redeemed
Shares at the end of the year 152,672 8,555 660 319
Net asset value per share class AX 25.08 39.60 50.42 '29.59
Shares at the start of the year Number of shares issued Number of shares redeemed
Shares at the end of the year
Net asset value per share class BX
Shares at the start of the ycar Number of shares issued Number of shares redeemed
Shares at the end of the year
Net asset value per share class S
Shares at the start of the year Number of shares issued Number of shares redeemed
Shares at the end of the year
Net asset value per share class AH (EUR)
Shares at the start of the year Number of shares issued Number of shares redeemed
Shares at the end of the year
Net asset value per share class IH (EUR)
( I ) Name change from European Equity Fund to turopean Equity Euro Hedged Fund on 31 October 2006 (21 Fund opened for subscriptions on 21 December 2006. * Share class opened for subscriptions on 31 January 2006
__ ..................... .... _ ._
. ....... . . . . . . .
. ......... . . . .
. .... . . . ~.
. .... . . . ... _.
. _. ... _ . ... .
. _. ...... ..... -. .
_. .. . . . . . . . .
.. .- .-
. . ._ ...... _. .......... ...
.. __ __ . ...... .... ....
The accompanying notes are an integral part of these financial statements
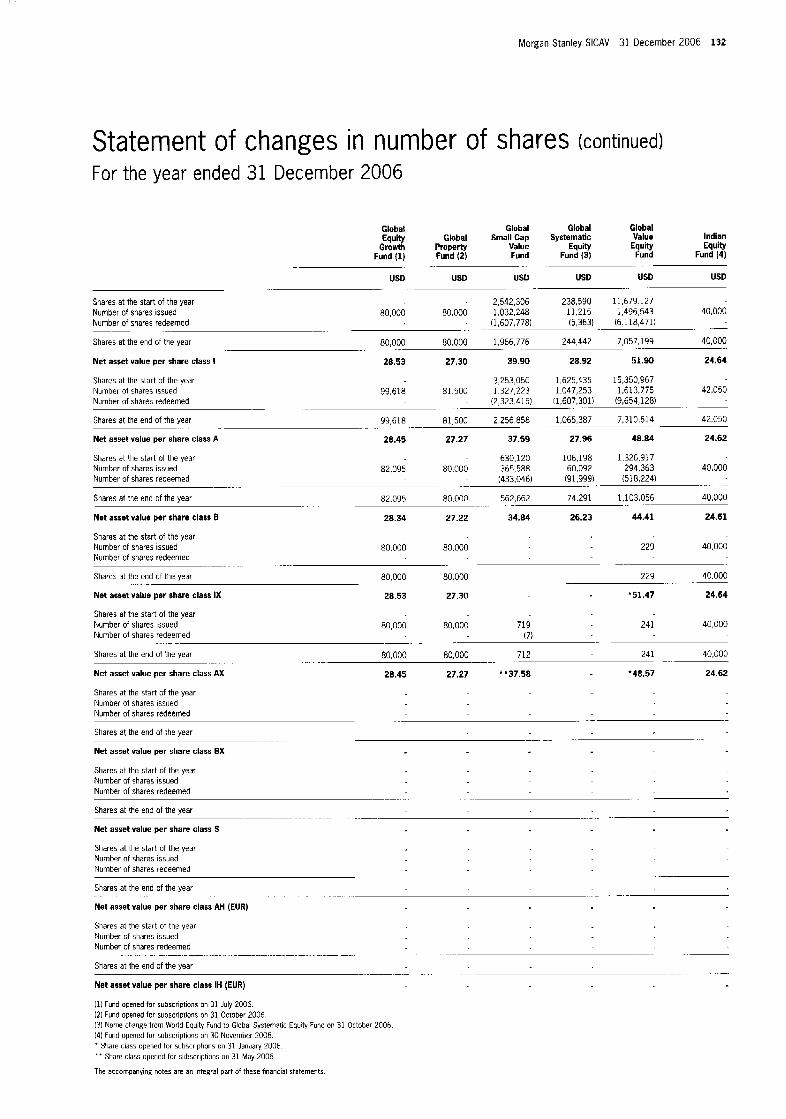
Morgan Stanley SICAV 31 December 2006 132
Statement of changes in number of shares (continued) For the year ended 31 December 2006
Global Global Global Global Equity Global Small Cap SyStMIIatiC Value Indian
Growth Property Value Equity Equity Equity Fund (1) Fund (2) Fund Fund (3) Fund Fund (4)
.. - -. ... ...
USD USD US0 US0 USD USD . . . . -.
238,590 11.679.127
15,363) (6.118,4711 - (1,607,778) .
244,442 7,057,199
Shares at the start of the year - 2,542,306 Number of shares issued 80,000 80,000 1,032,246 11.215 1,496,543 40,000 Number of shares redeemed
40,000 Shares at the end of the year
Net asset value per share class I 28.53 27.30 39.90 28.92 51.90 24.64
Shares at the start of the year - 3,253,050 1,625,435 15,350,967 Number of shares issued 99.618 81.500 1,327,223 1,047,253 1,613,775 42,050
- (2,323,415) (1,607,301) (9,654,128) Number of shares redeemed
81,500 2,256.858 1,065,387 7.310.614 42.050 Shares at the end of the year
Net asset value per share class A 28.45 27.27 37.59 27.96 48.84 24.62
Shares at the start of the year Number of shares issued 82.095 80,000 365,588 60,092 294,363 40,000 Number of shares redeemed
Shares at tie end of the year
. - . . --. --
. . 80.000 1.966.776 .. - . 80.000 ..
. . -- -
.... . . . 99.618
. -.
630,120 106,198 1,326,917
- 1433,046) (91,999) (518.224) - ... . -. ---
82,095 80.000 562,662 74.291 1,103.056 40,000
Net asset value per share class E 28.34 27.22 34.84 26.23 44.41 24.61
Shares at t l e start of the year Number of shares issued 80.000 83,000 229 40.000 Number of shares redeemed
40.000 Shares at the end of the year 80,000 80.000
Net asset value per share class IX 28.53 27.30 '51.47 24.64
Shares at t i e start of the year Number of shares issued 80,000 80,000 719 241 40,000 Number of shares redeemed
80,000 80.000 712 241 40,000 Shares at the end of the year
Net asset value per share class AX 28.45 27.27 **37.58 -48.57 24.62
Shares at the start of the year Number of shares issued Number of shares redeemed
Shares at the end of the year
Net asset value per share class BX
Shares at the start of the year Number of shares issued Number of shares redeemed
Shares at me end of the year
Net asset value per share class S
Shares at the start of the year Number of shares issued Number of shares redeemed
Shares at the end of the year
Net asset value per share class AH (EUR)
Shares at the start of the year Number of shares issued Number of shares redeemed
Shares at the end of the year
Net asset value per share class IH (EUR)
(11 Fund opened for subscriptions on 31 July 2006 121 Fund opened for subscriptions on 31 October 2006. 131 Name ctange from World Equity Fund to Global Systematic E ~ t y Fund on 31 October 2006. 141 Fund opened for subscriptions on 3G November 2006. * Share class opened for subscriptions on 31 January 2006. ' * Share class opened for subscriptions on 31 May 2006.
The accompanying notes are an integral part of these financial statements
. . . . . . . . . . . . . . . .
. ..... .. . . .
- . 229
- ...... ..... -.
. .- (7) - .... .- . -
...... ....... ...... -
.- .. .-
... .. -. -. ......
.... - . ...
....... ............
_- . .- . . . -
. . . . . . . . . .
.. . ....... .- ......... . - .. . - ....
.... .. . . . ..... - ......

133 Morgan Stanley SICAV 31 December 2006
Statement of changes in number of shares (continued) For the year ended 31 December 2006
Japanese Japanese Japanese Japanese Latin Equity Equity Systematlc Value Amerlcan us
Advantage Growth Equity Equity Equity Equity Fund (1) Fund Fund (2) Fund Fund Fund
JPY JPY JPY JPY USD USD
Shares at the start of the year - 10.168.022 . 18.019.072 7.409.458 11,897 Number uf shares issued 805,524 2,901,163 58,140 16,642,993 1,748,327 15,763 Number of shares redeemed (323,223) (6,471,638) - (9,482,293) (3,954,631) (25,640)
2,020 Shares at the end of the year
Net asset value per share class I 2,628.68 1,067.80 2,665.65 1,418.44 58.04 29.65
Shares at the start of the year - 23,502,487 - 35,376,628 3,592,731 9,153,219 Number of shares issued 1,046.357 13.471.546 61.729 43,736,929 8,786,411 2,415.614 Number of shares redeemed (157,333) (21,345,877) (556) (31,615,727) (5.048.300) (11.052.098)
Shares at the end of the year 889.024 15,628.156 61.173 47,497,830 7,330,842 516,735
Net asset value per share class A 2,619.08 1,024.33 2,660.71 1,334.27 54.71 28.94
Shares at the start of the year . 2,907,804 - 7216,745 966.484 190,479 Number of shares issued 116,446 2.154.370 - 7,066.342 1.:10,576 403.389 Number of shares redeemed (1,669) (2,969271) - (4,215,478) (1,108,955) (308,379)
Shares at the erid of the year 114,777 2,092,903 - 10,067,609 968.105 285.489
Net asset value per share class B 2,603.97 973.07 - 1.201.90 49.58 27.50
Shares at the start of the year 578.917 1,157
Number of shares redeemed
.... . . . . . . - . .-
.. . . . . . . . . - - . . . -
.... -- . . . . . . . -. -
-. 482,301 6,597,547 58,140 25,179,772 5.203.154
. . . . . . .. . . . .
. . . . - _- .. .
.... .... .- . . . . . . . .
. .... . .... .- --
.- . -
Number of shares issued 44,744 553.130 58,140 1 222
Shares at the end of the year 44,744 1,132.047 58.140 1.158 222
Net asset value per share class IX 2,628.92 1.067.78 2.665.65 1,415.61 -57.75
... . . . . . . . .- . .
... ... ..... - ..
Shares at the start of the year 1,380 1,215 Number of shares issued 44,744 58,140 4,738 234 Number of shares redeemed (65)
Shzres at the end of the year 44,744 1,380 58,140 5,888
.... . . . . . . . . . -
. . . . .. . - . ..... 234
Net asset value per share class AX 2,619.04 1.024.36 2,660.71 1,334.37 '54.59 . . .
Shares at the start of the year Number of shares Issued Number of shares redeemed
Shares at the end of the year
Net asset value per share class EX
Shares at the start of the year Nurriber of shares issued Number ol shares redeemed
Shares at the end of the year
Net asset value per share class S
Shares at the start of the year Number of shares issued 215,462 Number of shares redeemed
Shares at the end of the year
Net asset value per share class AH (EUR)
Shares at the start of the year Number of shares issued 23,363 Nunber of shares redeemed
Shares at the end of the year
Net asset value per share class IH (EUR)
(1) Furw uperied for subscriptiom on 31 May 7006. Pi Fund opened tor subscriptions o:i 31 July 2005. . Share class opened for sdhscriptions on 31 January 2006.
.. . .
.. .
. . .- ~ ..... ....
. . . .. . .- .
..... ... ~- . - .
2 15,462
* * 23.16 ..... ..... . . .
. . - . . . . . .
23,363
* * 23.24 ....... ........ .-
Share class opened for rubscriptioris UII 31 Octuber 2006
The scco-ipanyirg notes are an i:i:egral oart uf fhese financial statements
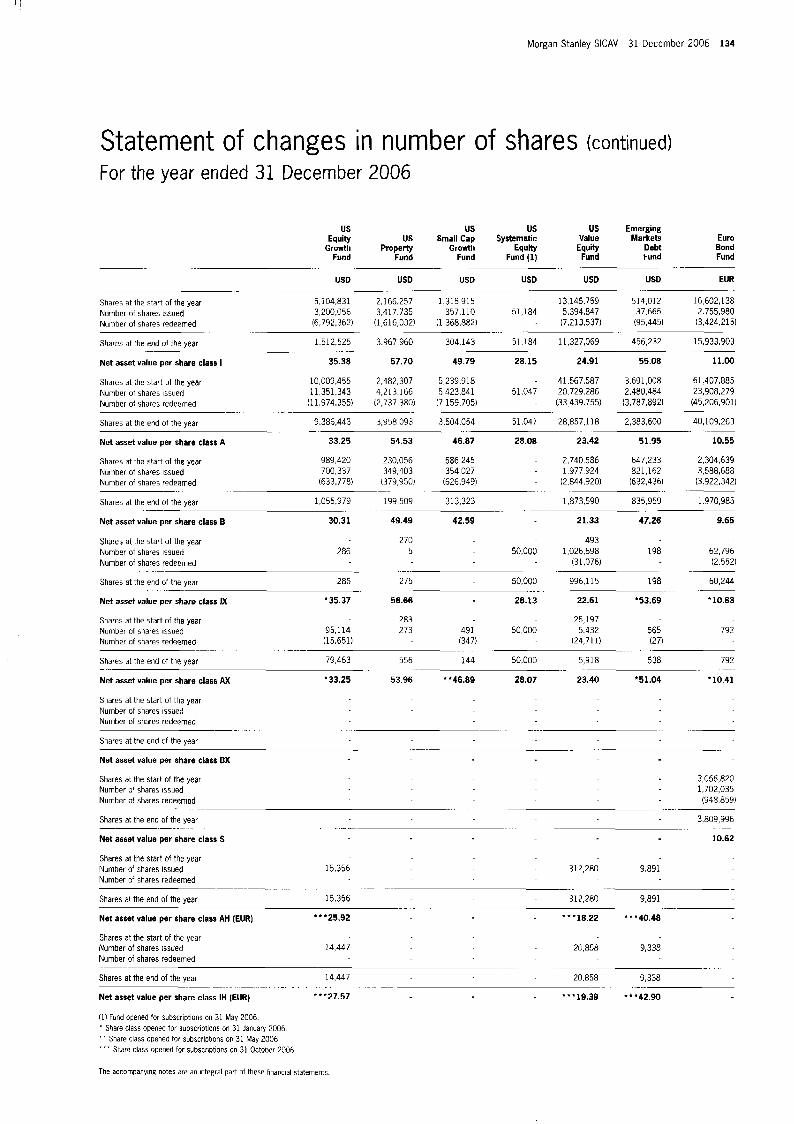
Morgan Stanley SICAV 31 December 2006 134
Statement of changes in number of shares (continued) For the year ended 31 December 2006
us us us US Emerging Equity US Small Cap Systematic Value Markets
Growth Property Growth Equity Equity Debt Fund Fund Fund Fund (1) Fund Fund
USD USD USD USD USD USD
Shares at the start of the year 5,104,831 2,166.257 1,315,915 13.145.759 514,012 Number of shares issued 3,200,056 3.417.735 357,110 51,184 5.394.847 37.665
(6,792,362) (1.616,032) (1,368,882) - (7,213,537) (95.445) Number of shares redeemed
1.512.525 3.967.960 304.143 51,184 11.327,069 456,232 Shares at :he end of the year
Net asset value per share class I 35.38 57.70 49.79 28.15 24.91 55.08
~ .... -. .. --
.. - . . - .
~- -. ... ~ .-
... ... .- .-.
Euro Bond Fund
. -
EUR
16 602,138 2.755.980 13,424,215)
- .
15,933,903
11.00
Shares at The start of the year 10,009.455 2,482,307 5,239.918 - 41.567.587 3,691,008 61,407,885 Number of shares issued 11,351,343 4,213.1 66 5.423.84 1 51,047 20.729.286 2.480.484 23,908,279
(11,974.355) (2,737,380) (7,159.705) - (33.439.755) (3,787,8921 (45,206,901) Number of shares redeemed
40,109,263 Shares at the end of the year
Net asset valuu per share class A 33.25 54.53 46.87 28.08 23.42 51.95 10.55
Shares at :he start of the year 989,420 230,056 586,245 - 2,740.586 647,233 2,304,639 Number of shares issued 700,337 349,403 354,027 - 1,977,924 821,162 3,588,688 Number of shares redeemed (633.778) (379,950) (626.949) - (2,844,920) (632.436) (3,922,342)
- 1,873,590 835,959 1.970.985 Shares at the end of the year 1,055.979 199,509 313,323
Net asset value per share class B 30.31 49.49 42.59 21.33 47.26 9.65
.. - -~ -- 9.386.443 3.958.093 3.504.054 51,047 28,857,118 2,383,600
...... . - .... - .-
-~ . -. . ...
. ...... ... .- -.
Shares at the start of the year 270 493 Number of shares issued 286 5 50,000 1,026,698 198 62,796 Number of shares redeemed (31.076) (2.552)
60,244 Shares at the end of the year 286 275 50,000 996,115 198
Net asset value per share class IX '35.37 56.66 28.13 22.61 '53.69 *10.83
Shares at the start of the year 283 25,197 Number of shares issued 95,114 273 491 50.000 5.432 565 792 Number of shares redeemed (15.651) (347) (24,711) 127)
Shares at the end of the year 79,463 556 144 50.000 5,918 538 792
Net asset value per share class AX '33.25 53.96 * *46.89 28.07 23.40 *51.04 '10.41
Shares at the start of the year Number of shares issued Number of shares redeemed
Shares at the end of the year
Nut asset value per share class BX
Shares at the start of the year 3,056,820 Number 0' shares issued 1,702,035 Number 0; shares redeemed (948.859)
Shares at the end of the year 3,809,996
Net asset value per share class S 10.62
Shares at the start of the year Number 0: shares issued 15.356 312,280 9,891 Number 0' shares redeemed
Shares at the end of the year 15.356 312,280 9,891
Net asset value per share class AH (EUR) *"25.92 "'18.22 ***40.48
Shares at the start of the year Number of shares issued 14,447 2 w a 9,338 Number o i shares redeemed
Shares at the end of the year 14,447 20.858 9,338
Net asset value per share class IH (EUR) ***27.57 *'*19.39 ***42.90
(1) Fmd ocened for Subscriptions on 31 May 2006. Share class opened for subscriptions on 31 Januar) 2006
' * Share class opened tor SubSCriDbOnS on 31 May 2U06. ... Share class opened for sdbscriptions on 31 Octobcr 7006
The accornpanymg notes are an integral part of these financial statements
. ....... .- -~
.- ... ...
-. . . . . .
- .. -.
.. ..... -. . . . . . .
. . ~-
.. ~ .- .....
. . .... . . . .... -~ - .
..... ...... .... .
. ... -.
....... - . . .
~ -. ..... . . . . . . . . . . .... - . . .
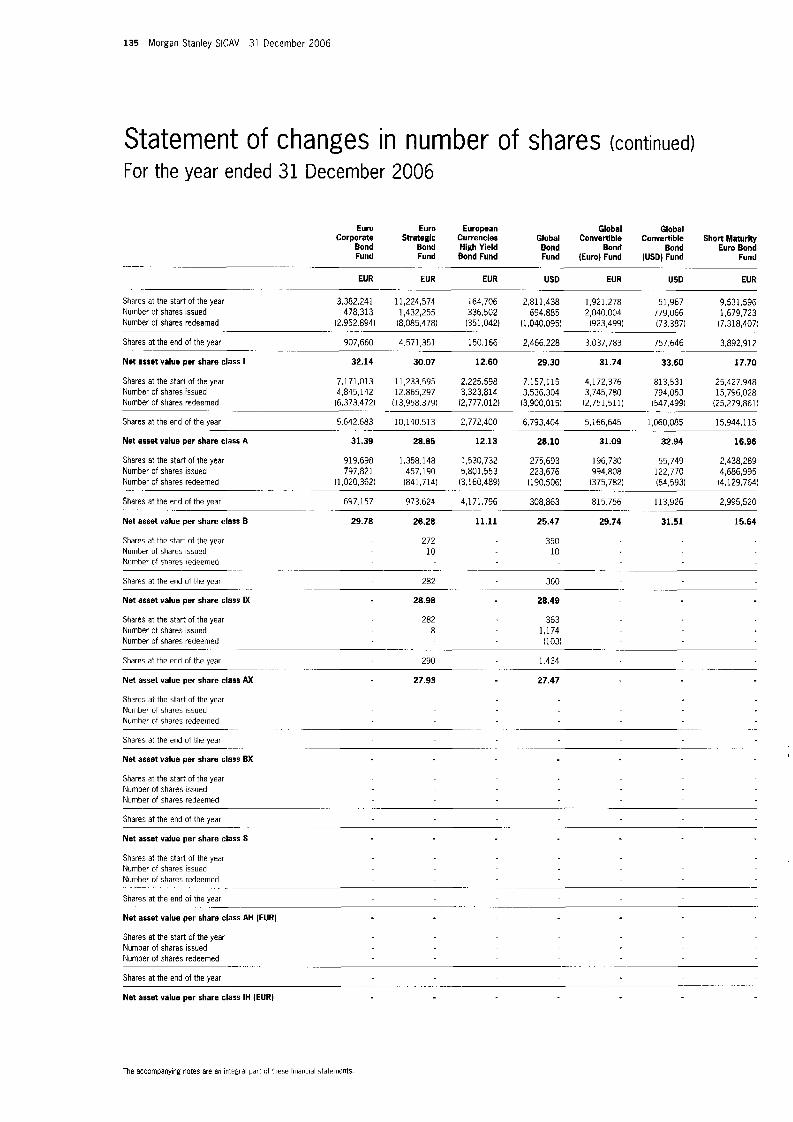
135 Morgan Stanley SICAV 31 December 2006
Statement of changes in number of shares (continued) For the year ended 31 December 2006
Euro Euro European Global Global Corporate Strategic Currencies Global Convertlble Convertible Short Maturlry
Bond Bond High Yield Bond Bond Bond Euro Bond Fund Fund Bond Fund Fund (Euro) Fund (USD) Fund Fund
EUR EUR EUR USD EUR USD EUR
Shares at the start of the year 3,382,241 11,224,574 164,706 2,811.438 1.921.278 51,967 9,531,596 Number ot shares issued 478.313 1,432,255 336,502 694.885 2,040.004 779,066 1,679,723 Number of shares redeemed (2.952.894) (8,085,478) (351.042) l1.040.095) (923,499) (73.387) (7,318,407)
Shares at the end of the year 907,660 4,571,351 150.166 2,466,228 3.037.783 757,646 3,892,912
Net asset value per share class I 32.14 30.07 12.60 29.30 31.74 33.60 17.70
Shares at the star! of the year 7.171.013 11,233.593 2,225.598 7,157,115 4,172,376 813.531 25.427.948 Number of shares issued 4,845,142 12,865,297 3,323,814 3,536,304 3,745,780 794,053 15.796,028
(6.373.472) (13.958.3791 (2,777.012) (3,900,015) (2,751,5111 (547,4991 (25,279,861) Number of shares redeemed
Shares at the end of the year 5,642.683 10.140.513 2,772,400 6.793.404 5,166,645 1,060,085 1 5,944,115
Net asset value per share class A 31.39 28.85 12.13 28.10 31.09 32.94 16.96
Shares at the start of the year 919,698 1,358.148 1,530,732 275,693 196,730 55,749 2,438,289 Number of shares issued 797,821 457,190 5,801,553 223.676 994.808 122,770 4,686,995 Number of shares redeemed (1.020362) (841,714) (3.160.489) (190.506) (375,782) (64,593) (4,129,764)
Shares at the end of the year 697.157 973.624 4,171,796 308,863 815.756 113,926 2,995,520
Net asset value per share class B 29.78 26.28 11.11 25.47 29.74 31.51 15.64
... .. .. .. . _. . . . .- -.
- . .- . . ._ . . . .
.- -. ... .- . . . . . . . .
. ........ ... -- ..
. . . . . . . -- . - ... -. -.
.- . . . . . . . -.
... .. .. -. . . . . . . .- .. -.
.. . . . . ... . .
Shares at the start of the year Number of shares issued Number of shares redeemed
Shares at the erid of the ycar
Net asset value per share class IX . . . .
272 350 10 10
.... - .- . . . . .
- .. 360
28.98 28.49 . . . .
282
Shares at the start of the year 282 363 Number of shares issued 8 1,174 Number of shares redeemed (103)
1.434 Shares at the end of the year
Net asset value per share class AX 27.93 27.47
-. -.. .-
~ -- 290
- . . . . . . . . . . . ...... .......
Shzres at the start of the year Number of shares issued Number ot shares redeemed
Shares at the erid of the year
Net asset value per share class BX
. . . . . . . . . . . ....... .-
...... ~. ......
Shares at the start of the year Number 01 shares issued Number of shares redeemed
Shares at the end of the year
Net asset value per share class 5
Shares at the start of the year Number of shares issued Number of shares redeemed
Shzres at the end of the year
Net asset value per share class AH (EUR)
Shares at the start of the year Number of shares issued Number of shares redeemed
Shares at the end of the year
Net asset value per share class IH (EUR)
.. .
- . ..... -. .
... . . ._ . . . . . -
. ~.
... ... . . . . .
. . . . . . . . . . . . . . - _-_ . . . . . . . . . -
The accompanying notes are ari irltegral part :)f these financial statements.
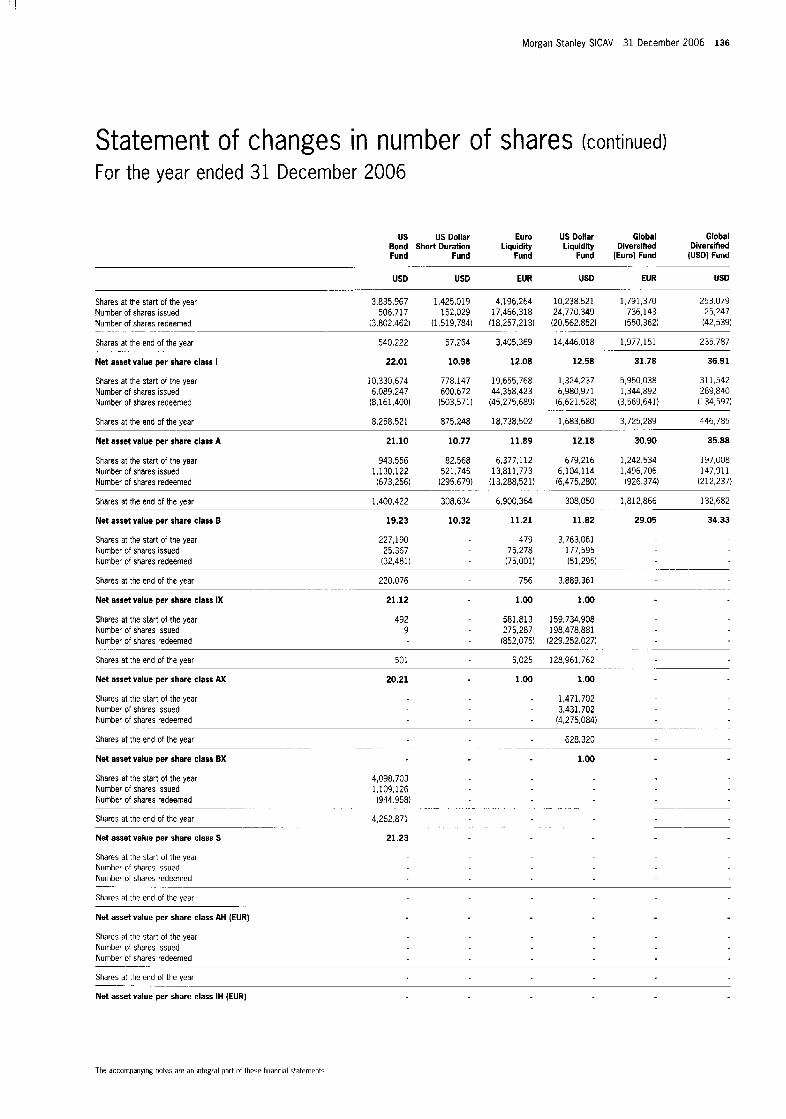
Morgan Stanley SlCAV 31 December 2006 136
Statement of changes in number of shares (continued) For the year ended 31 December 2006
US US Dollar Euro US Dollar Global Global Bond Short Duration Liquidity Liquldlty Dlversmed Diversfied Fund Fund Fund Fund (Euro) Fund (USD) Fund
USD USD EUR USD EUR US0
Shares at the start of the year 3.835.967 1,425,013 4,196,264 10,238.521 1,791,370 253.079 Number of shares issued 506.717 152,029 17,466,318 24,770.349 736,143 25,247
13,802,462) (1,519,784) (18,257,213) (20.562.852) (550,362) (42,539) Number of shares redeemed
57,264 3,405,369 14,446.018 1,977,151 235.787 Shares at the end of the year
Net asset value per share class I 22.01 10.98 12.08 12.58 31.78 36.91
Shares at the start of the year 10,330,674 778.147 19,655,768 1.324.237 5,950.038 311,542 Number of shares issued 6,089,247 600,672 44.358.423 6,980,971 1,344,892 269,840
(8,161,400) (503,571) (45,275,689) (6,621,5281 (3,569,641) (134.597) Number of shares redeemed
Shares at the end of the year 5,258,521 875.248 18,738,502 1,683,680 3,725,289 446,785
......... . . . . --
.. - .......
. ._ .................. . . .
..- .... ... _ . .- 540.222
...
.......
- - ~. . . . . .
Net asset value per share class A 21.10 10.77 11.89 12.18 30.90 35.88
Shares at the start of the year 943.556 82,568 6,377,112 679.216 1,242,534 197.008 Number of shares issued 1,130,122 521,745 13,811,773 6,104,114 1,496,706 147,911 Number of shares redeemed (673.256) (295.679) (13,288,5211 (6,475,280) (926,374) 1212.237)
Shares at the end of the year 1,400,422 308,634 6,900364 308,050 1,812,866 132.682 . . . . . ........
.
Net asset value per share class B 19.23 10.32 11.21 11.82 29.05 34.33
Shares at :he start of the year 227,190 479 3,763,061 Number of shares issued 25.367 75,278 177,595 Number of shares redeemed 132,481) (75,001) (51.295)
Shares at :he end of the year 220.076 756 3,889,361
~ ......
Net asset value per share class IX 21.12 1.00 1.00
Shares at :he start of the year 492 581,813 159.734.908 Number of shares issued 9 275,287 198.478.881 Number of shares redeemed - (852,075) (229,252,0271
Shares at :he end of the year 501 5,025 128.961.762 .. ~- ....
. -. ......
Net asset value per share class AX 20.21 1.00 1.00
Number of shares issued - 3,431,702 Shares at :he start of the year - 1,471,702
Number of shares redeemed - (4,275,084)
628.320
1.00
. . . . - ........
. . . . . . . . . . . ~
Shares at :he end of the year
Net asset value per share class EX
Shares at :he start of the year Number of shares issued Number of shares redeemed
Shares at :he end of the year
Net asset value per share class S
4 098,703 1,109.1 26 (944 958)
. -
4,262 871
21.23
Shares at :he start of the year Number of shares issued Number of shares redeemed
Shares at :he end of the year
Net asset value per share class AH (EUR)
Shares at :he start of the year Number of shares issued Number of shares redeemed
Shares at :he end of the year
Net asset value per share class IH (EUR)
. ...
- . .....
. . -.
. . . . . _ _
The accompanying notes are an mtegral part of these financial statements
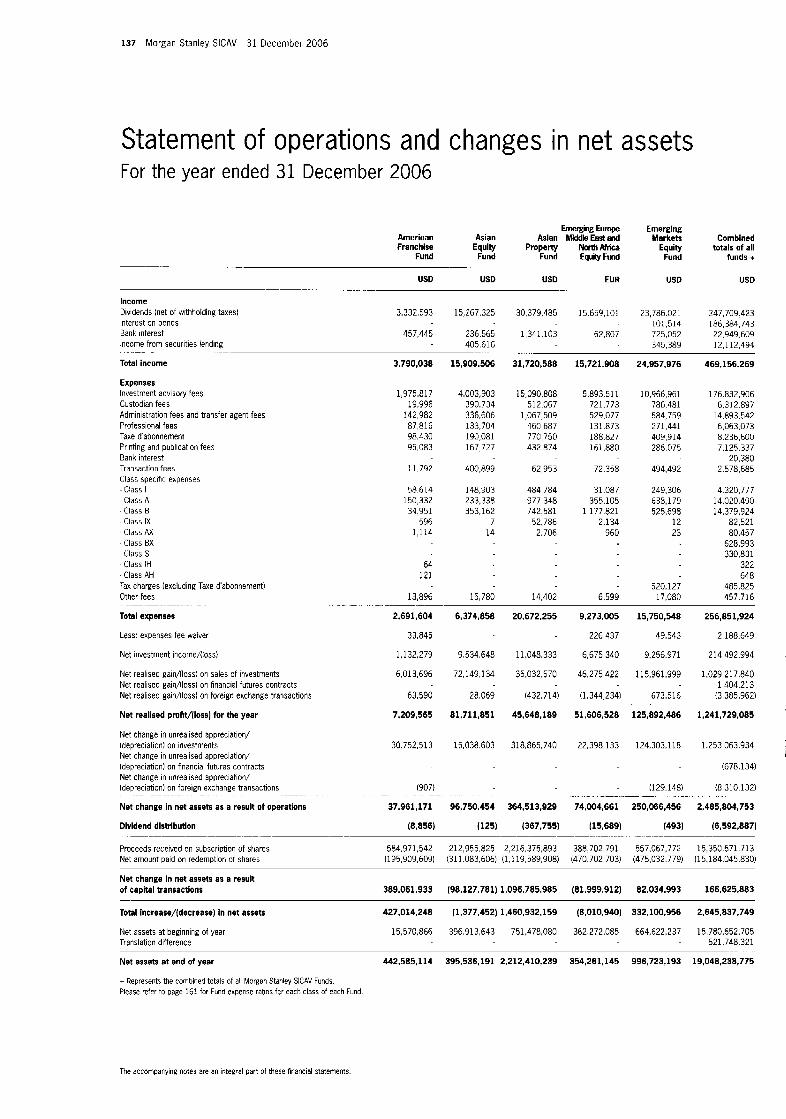
137 Morgan Stanley SICAV 31 December 2006
Statement of operations and changes in net assets For the year ended 31 December 2006
Emetghg Europe Emerglng American Asian Aslan Middle East and Markets Combined Franchise Equity Property NorthAlr(ca Equity totals of all
Fund Fund Fund EquilyFund Fund tunds + ... - - ~- -.
USD USD USD EUR USD USD -. -
Income Dividends (net of withholding taxes) 3.332.593 15,267,325 Interest on bonds Bank interest 457.445 236.565 Income from securities lending 405,616
Total income 3,790,038 15,909.506
. . . ....... .
Expenses Investment advisory fees Custodian fees Administration fees and transfer agent fees Professional fees Taxe dabonnement Printing and publication fees Bank interest Traisaction fees Class specific expenses - Class I - Class A - Class B - Class IX - Class AX - Class BX - Class S -Class IH -Class AH Tax charges (excluding Taxe dabonnement) Other fees
1,975,817 19,996
142,982 87,816 98,430 95,083
11,792
58.614 150,332 34.951
596 1,114
64 121
13.896
4,003,903 390.734 336,606 133,704 190,081 167.727
400,899
148,903 233.338 353,162
7 14
15,780
30.379,485 15.659.101 23,786.021 247.709.423 101,514 186,384,743
1,341,103 62,807 725.052 22.949.609 345,389 12,112,494
31,720,588
15,090,808 512,067
1,067,509 460,687 770,750 432,874
62.953
484,784 9 77,348 742,581 52,786 2.706
14,402
15,721,908 24.957.976
5,893,511 10,966,361 721,773 786.481 5 2 9,O 7 7 584,759 131.873 271,441 i8a.827 409,9 14 161,880 286.075
I
72,358 494,492
31.087 249,306 355,105 638,179
..177.821 525,698 2.134 12
960 23
520.127 6,599 17,080
469.156.269
176.832.906 6,312.897
14,893.542 6,063,073 8,236,600 7.125.337
20.380 2.578,685
4.320,7i7 14.020.490 14,379,924
82,521 80.457
628,993 330,831
322 648
485,825 457,716
. ....... ........
Total expenses 2,691,604 6,374,858 20.672.255 9.273.005 15,750,548 256,851,924
Less: expenses fee waiver 33,845 226,437 49,543 2,188,649
Net investment income/(loss) 1,132,279 9,534,648 11.048.333 6,675,340 9,256.971 214,492,994
Net realised gain/(loss) on sales of investments 6.013.696 72,149.134 35,032,570 46,275.422 115,961,999 1,029.217.840 Net realised gain/(loss) on financial futures contracts 1,404,213 Net realised gain/(loss) on foreign exchange traisactions 63,590 28.069 (432.714) (1,344,2341 673,516 (3,385,962)
Net realised pmfit/(loss) for the year
Net charige in unrealised appreciation/ (depreciation) on investnients Net change in unrealised appreciation/ (depreciation) on financial futures contracts Net change in unrealised apareciation/ (depreciation) on foreign exchange transactions
Net change in net assets as a result of operations
Dividend distribution
. . ._ .............
7,209,565
30.752.513
(907)
37,961,171 . . .
(8,856)
81,711,851 45,648,189
15,038.603 318,865,740
96,750.454 364,513,929
(125) (367,755)
Proceeds received 011 subscription of shares Net amount paid on redemption of shares
584,971,542 (195.909.609)
212,955.825 2,216375,893 (31 1.083,606) (1,119,589,908)
51,606,528
22,338,133
. . . . . . . __ .... 74,004,661
(15,689) ....
388,702.791 (470,702,703)
125,892,486
124,303,118
(129.148)
250,066,456
(493)
557,067,772 (475,032.779)
....
.........
1,241,729,085
1,253,063,934
(678.134)
(8,310,132)
2,485,804,753
(6,592,887)
15,350.671.713 (1 5,184,045,830)
Net change in net assets as a result of capital transactions 389.061.933 (48,127,781) 1,096,785,985 (81,999,912) 82,034,993 166,625,883
Total Increase/(decrease) In net assets 427,014,248 (1,377,452) 1,460,932,159 (8,010,940) 332,100,956 2,645,837,749
Net assets at beginning of year 15,570,866 396,913,643 751,478,080 362272,085 664.622.237 15.780.652.705 Translation difference - 621,748,321
Net assets at end of year 442,585,114 395,536,191 2,212,410,239 354,261,145 996,723,193 19,048,238,775
+ Represents the combined totals of all Morgan Stanley SlCAV Funds. Please :efw to page 161 for Fund expense ratios fcr each class of each Fund.
. . . .
The accompdnying notes are an integral par! of these financial statements
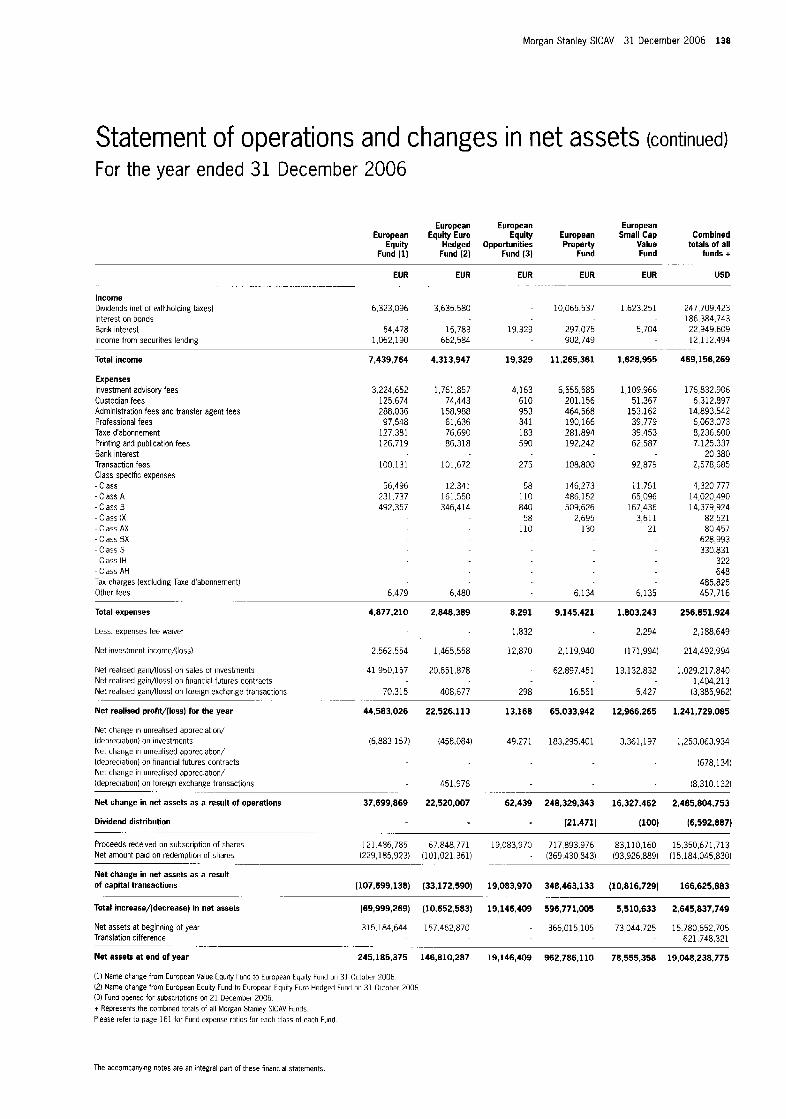
Morgan Stanley SICAV 31 December 2006 138
Statement of operations and changes in net assets (continued) For the year ended 31 December 2006
European Equity Euro
Hedged Fund (2)
European European Equity European Small Cap Combined
Opportunities Property Value totals of all Fund (3) Fund Fund funds +
EUR EUR EUR USD -. -
..... _. .
Europe an Equity
Fund (1)
EUR ............ -
6,323,096
54,478 1,062,190
EUR
3,635.580 Income Dividends lnet of withholding taxes) Interest on bonds Bank interest Income from securities lending
- 10.065.537 1,623,251 247,709,423
19.329 297,075 5,704 22,949.609 902,749 12,112,494
- 186,384,743 15.783
662,584
Total income 7.439.764 4.313.947 19.329 11.265.361 1,628,955 469,156,269
3.224.652 125.674 288.036
97,548 127.381 126,719
100.13 1
56,496 231.737 492,357
1,761.857 74,443
158,988 61,636 76.690 86,318
4,163 610 953 34 1 183 590
6,555.585 201,156 464,568 190,166 281,894 192,242
108,800
146,273 486.152 509,626
2,695 130
1,109,966 51,367
153,162 39,779 39,453 62,587
176,832,906 6,312,897
14,893.542 6,063.073 8,236,600 7.125.337
20,380 2,578,685
4,320,777 14.020.490 14,379,924
82,521 80.457
628,993 330,831
322 648
457,716 485,825
Expenses Investment advisory fees Custodian fees Administra:ion fees and transier agent fees Professional fees Taxe d'abonnement Printing anl publication fees Bank interest Transaction fees Class specific expenses - Class I - Class A - Class B - Class IX - Class AX - Class BX - Class S - Class IH - Class AH Tax charges (excluding Taxe d'abonnement) Other fees
Total expenses
Less: expenses fee waiver
Net investment income/(loss)
Net realisecl gainflloss) on sales of investments Net realisel gain/(lossl on hnancial futures contracts Net realise3 gain/(loss) on foreign exchange transactions
. .-
101,672
12.341 161,550 346,414
275
58 110 840
58 110
92,879
11.751 65,096
167,436 3,611
21
6,479 6,480 6.134 6,135
4,877,210 2.848.389 8.291 9.145.421 1.803.243 256,851.924
1,832 2,294 2,188,649
1,465.558 12,870
20,651,878
408,677 298
2.119.940 (171.994) 214,492.994
62.897.451 13.132.832 1.029.217,840 1,404.213
16.551 5,427 (3,385,962)
2.562.554
41,950,157
70,315
44,583,026 . ....
22,526,113 13.168
(458,084) 49,271
65,033,942 12,966.265 1,241,729,085 Net realised proht/(loss) for the year
Net change in unrealised appreciation/ (depreciation) on investments Net change in unrealised appreciation/ (depreciation) on financial futures contracts Net change in unrealised appreciation/ (depreciation) on foreign exchange transactms
Net change in net assets as a result of operations ..
(6.883.157) 183.295.401 3.361.197 1,253,063,934
(678 134)
(8,310.132) 451,978
37,699,869 22,520,007 62,439 248,329,343 16,327,462 2,485,804.753
Dividend distribution (21.471) (100) (6,592,887)
Proceeds received on subscription of shares 121.486.785 67,848,771 19,083,970 717,893.976 83,110,160 15,350,671,713 Net amount paid on redemption of shares (229,185,923) (101.021.361) - (369,430 843) (93,926,889) (15,184.045.830)
Net change in net assets as a result of capital transactions (107.699.138) (33,172,590) 19,083,970 348,463,133 (10,816,729) 166,625,883
Total increase/(decrease) in net assets (69,999,269) (10.652.583) 19.146.409 596,771,005 5,510,633 2,645,837,749
Net assets at beginning ot year 315,184,644 157,462,870 - 366,015,105 73,044,725 15.780.652.705
__ -. ..... ~.
-- .......
- . . ..
Translation difference - 621,748,321 ... ... ...
Net assets at end of year 245,185,375 146,810,287 19,146,409 962.786.110 78.555.358 19.048.238.775
(1) Name chnge from European Value h t y Fund to European Equity Furid on 31 October 2006 121 Name ctange from European Equity Fund to Furopean Equity Euro Hedged Fund on 31 October 2006 (3) Fund opened for subscriptions on 21 December 2006 + Represents the combined totals 0' all Morgan Stanley SICAV Fiinds. Please refer to page 161 for Fund expense ratlos !or each c!ass of each Fund
The accornCanying notes are an Integral pdrt of these finanr al statements
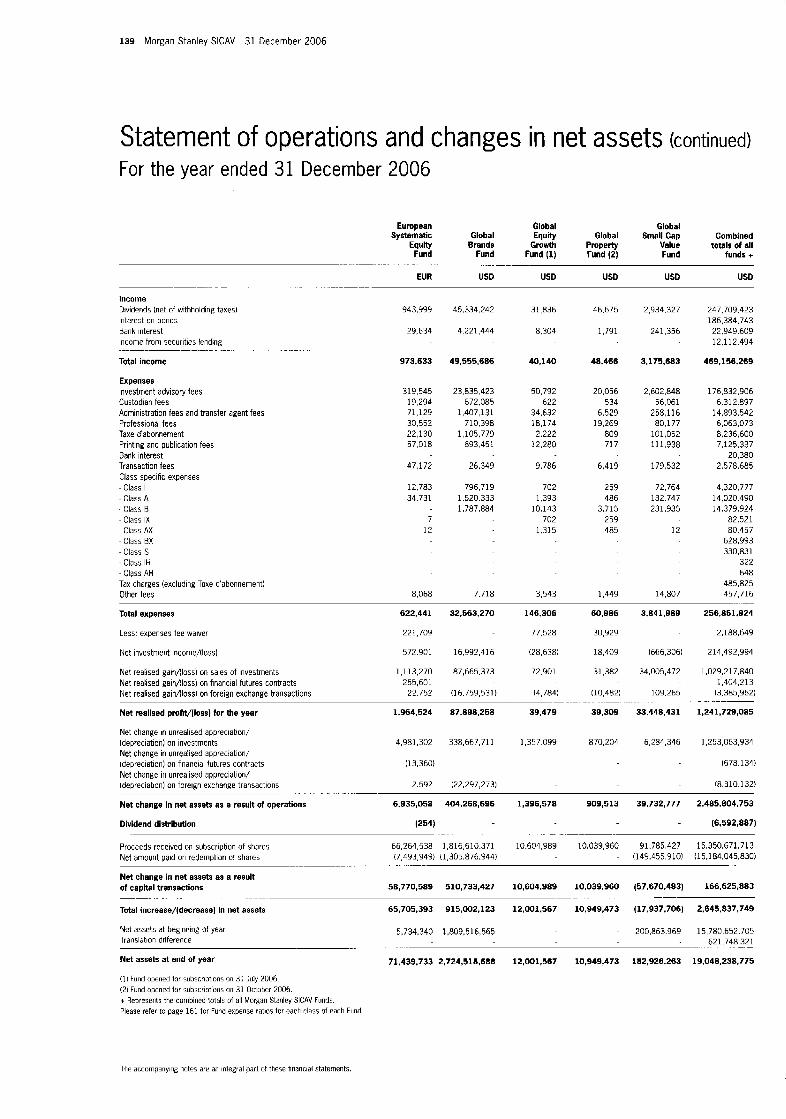
139 Morgan Stanley SICAV 31 December 2006
Statement of operations and changes in net assets (continued) For the year ended 31 December 2006
Income Dividends (net of withholding taxes) Interest on bonds Bank interest Income from securities lending
Total income
Expenses Investment advisory fees Custodian fees Adninistration fees and transfer agent fees Professional fees Taxe d'abonnement Printing and publication fees Bank interest Transaction fees Class specific expenses - Class I - Class A
Class B - Class IX - Class AX - Class BX - Class S - Class IH - Class AH Tax charges (excluding Taxe d'abonnement) Other fees
European Global Global Systematic Global Equity Global Small Cap Combined
E N t y Brands Growth Property Value totals of all Fund Fund Fund (1) Fund (2) Fund funds +
EUR USD USD USD USD USD
......... ...
. . .
943,999 45,334,242 31,836 46,675 2.934.327 247,709,423
29,634 4.221.444 8,304 1,791 241,356 22.949.609 12.1 12,494
973.633 49.555.686 40,140 48,466 3,175,683 469,156,269
- 186,384,743
. . . . _ ..... . . _._._
319,545 23,835.423 19,294 672,085 71,129 1,407,131 30,552 710.398 22,130 1,105,779 57.018 693.451
47,172 26,349
50,792 20,056 2.602.848 622 534 56,061
34,632 6.529 258,116 18,174 19.269 80.177 2.222 809 101,052
12,280 717 111.938
9.786 6,419 179,532
12.783 796,719 702 34.731 1.520.333 1,393
- 1,787,884 10.143 7 702
12 1,315
8,068 7.718 3,543
259 72,764 486 132.747
3,715 231,935 259 485 12
1,449 14,807
176,832,906 6.312.897
14,893,542 6,063,073 8,236,600 7,125,337
2.578.685 20,380
4,320,777 14,020,490 14.379.924
82.521 80,457
628,993 330,831
322 648
485,825 457,716
Total expenses 622.441 32.563.270 146.306 60.986 3.841.989 256,851,924
Less, expenses fee waiver
Net investment incomeAoss)
221,709 77.528 30,929 2,188,649
572.901 16,992.416 (28.638) 18,409 (666,306) 214,492,994
Net realised gain/(loss) on sales of investments 1,113,270 87,665.373 72.901 31,382 34,005,472 1,029,217,840 Net realised gain/(loss) on financial futures contracts 255,601 1,404,213
22.752 (16.759.531) (4.784) (10,482) 109,265 (3,385,9621 Net realised gainAloss) on foreign exchange transactions
1.964.524 87,898.258 39.479 39.309 33.448.431 1,241,729,085 Net realised proht/(loss) for the year
~ __ _ _ .... .. ......... . . . . . .
Net change in unrealised appreciation/ (depreciation) on investments 4,981,302 338,667,711 1.357.099 870,204 6,284,346 1,253,063,934 Net change in unrealised appreciation/ (depreciation) on financial futures contracts (13.360) (678.134) Net change in unrealised appreciation/ (depreciation) on foreign exchange transactions 2.592 122,297,2731 18.310.132)
Net change in net a88et8 as a result of operations 6,935,058 404,268,696 1,396,578 909,513 39.732,777 2.485.804.753
- (6,592,887)
Proceeds received on subscri~tion of shares 66,264,538 1,816,610.371 10,604,989 10,039,960 91,785,427 15,350,671,713 (7,493,949) (1,305,876,944) - (149,455,9101 (15,184,045,830) Net amount paid on redemption of shares
Net change in net assets as a result of capital transactions 58,770,589 510,733,427 10,604.989 10.039.960 (57.670.483) 166,625,883
Total increase/(decrease) In net asset8 65,705,393 915,002,123 12,001.567 10,949,473 (17.937.706) 2,845,837,749
. . . . . . . .
~. ................. Dividend distribution (254)
. . . .
. . . . ....
..... .-. .. . . .
Net assets at beginning of year 5,734,340 1,803,516,565 - 200,863.969 15,780,652,705 .. . .- . 621,748.322 Translation difference
Net assets at end of year 71,439,733 2,724,518,688 12,001,567 10,949,473 182,926.263 19.048.238.775
(1) Fund opened for subscristions on 31 July 2006. (2) Fund opened for subscri3tions on 31 October 2006. + Represents the combined totals of all Morgan Stanley SICAV Funds. Please refer to page 161 fcr Fund expense ratios fcr each class of each Fund.
._ ...
The accompanying notes are an integral part o! these hnancial statements

Morgan Stanley SlCAV 31 December 2006 140
Statement of operations and changes in net assets (continued) For the year ended 31 December 2006
Global Global Japanese Japanese
Equity Equity Equity Advantage Growth Systematic Value Indian Equity Equity Combined
totals of all Fund (1) Fund Fund (2) Fund (3) Fund funds t
USD US0 USD JPY JPY US0
.... .- - ...
.
Income Dividends (net of withholding taxes) Interest on bonds Bank interest Income from securities lending
Total income ..
Expenses Investment advisory fees Custodian fees Administration fees and transfer agent fees Professional fees Taxe d'abonnement Printing and publication fees Bank interest Transaction fees Class specific expenses - Class I - Class A . Class B -Class IX -Class AX - Class BX - Class S -Class 1H - Class AH Tax charges (excluding Taxe d'abonnement) Other fees
Total expenses
Less expenses fee waiver
Net investment income/(loss)
Net realised gain/(loss) on sales of investments Net realised gain/iloss) on financial futures contracts Net realised gainAloss) on foreign exchange transactions
..
688.752 18,487,191
27,192 1,033,254 256,112 2.610.442
972,056 22,130,887
412.071 9,280.583 10,599 218,370 90,250 656.916 28,853 281,213 18.411 421,451 60.893 342,819
78,160 127.112
5,046 336,318 43,555 588,363 24,549 522,486
7 14
14,903 14.808
764
801
15,660,920 347,633.124
1.565
4.938 625
3,890 20.675
187 295
2,071
60 112 860
60 112
15,660,920 347,633,124
16,361,477 483,012,376 379,284 9,512,765
6,844,456 36.178.102 2,586,993 12,912.767
770.181. 17,989,923 4,862,302 17,190.336
31,079 1,109,342 3,358,963 6,398,978
441,102 7,343,150 995.713 32.313.357
1,093,338 30,479.168
96,538 2,132 51,588 733,494
7,494 15.940
1,080,785 1,741,971
787,290 12,790,460
104,173
288,939 9,340,427
6,523,196 131,215,332 59,607 20,053 391,503
33,885
22.246
(10,074)
(38)
4.999
38,977,233 656.917.861
18,655,362
(4,660,951) (309.284.737)
20,815.082 3,547,035,591 5,230,777 5.885.957 (7,522,484)
247,709,423 186,384,743 22,949,609 12,112.494
469,156,269
176,832,906 6,312,897
14,893,542 6,063.073 8,236,600 7,125,337
20,380 2,578,685
4,320,777 14,020,490 14,379,924
82,521 80,457
628,993 330,831
322 648
485,825 457,716
256,851,924
2,188,649
214,492,994
1,029,217,840 1,404,213
(3,385,962) ...... - - -. . . . . . . .
Net realised profit/(loss) for the year 6.891.795 140,947,262 (5,113) 27,270,865 3,230,228,370 1,241,729,085
Net change in unrealised appreciation/ (depreciation) on investments 11,505,234) 20,480,995 (69,232) 191,625,829 (7,443,111,059) 1,253,063,934 Net change in unrealised appreciation/ (depreciation) on financial futures contracts 5,855 (678,134) Net change in unrealised appreciation/ (depreciation) on foreign exchange transactions 31,936 115,471 - 5,029,141 (8,310,132)
Net change in net assets as a result of operations 5,424,352 161.543.728 (74,345) 223,925,835 (4.212.882.689) 2,485,804,753
Dividend distribution (1451 (6592.887)
. . ~. .- - . . .
~- .. . . . . . -- . . . . . . . . . . . . .
Proceeds received on subscription of shares Net amount paid on redemption of shares
29.272.827 148,738,517 5,050,041 5,760,726,371 20,434,879,770 15,350,671,713 (42,242,705) (709,274,515) ' (1,196,042,4751 (31,794,581,7671 (15,184,045,830)
Net change in net assets as a result of capital transactions (12,969,878) (560,535,998) 5,0$0,041 4.554,683,8% (11,359,701,997) 166,625,883
Total increase/(decrease) in net assets (7.545526) (398,992,415) 4.975.696 4,788,609,731 115,572,584,685) 2,645,837,749
Net assets at beginning of year 46,353,873 1,171,349.504 . 41,872,608,441 15,780652,705 Translation difference 621,748,321
Net assets at end of year 38.808.347 772,357,089 4,975,696 4,788,609,731 26.300.023.755 19,048,238,775
. . . . . .... .- . - .- -. ~. .
- . . . - . - ... _-
111 Name change from World Eauity Fund to Global Systematic iautb Fund on 31 Octobri (2) Fund opened for subscriptions on 30 November 2006 13) Fund opened for subscriptions on 31 May 2006. + Represents the combined totals of all Morgan Stanley SlCAV Funds Please refer to Page 161 tor Fund expense ratios for each class of each Fund.
' 2006
The accompanying notes are an integral part of these financial statements.
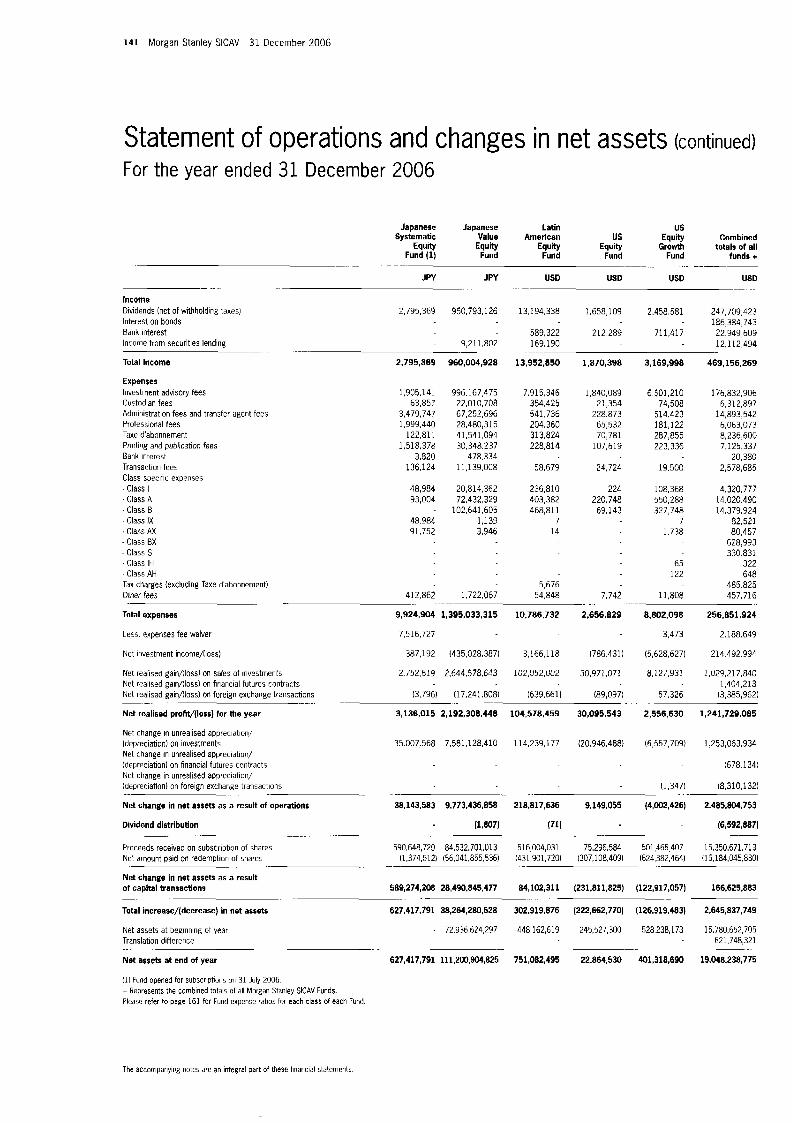
141 Morgan Stanley SICAV 31 December 2006
Statement of operations and changes in net assets (continued) For the year ended 31 December 2006
Japanese Japanese Latin us Systematic Value Amerlcan us Equity Combined
Equity Equity Equity Equity Growth totals of all Fund (1) Fund Fund Fund Fund funds +
.... ...... -. ............ .. ~
JPY JPY - ....
Income Dividends (net of withholding taxes) 2,795,369 950,793,126 Interest on bonds Bank interest Income trom securities lending - 9,211,802
Total Income 2,795,369 960,004.928 .. ...... -
Expenses Investment advisory fees Custodian fees Administration fees and transfer agent fees Professional tees Taxe d'abonnement Prmting and publication fees Bank interest Transaction fees Class specific expenses - Class I - Class A - Class B - Class IX . Class AX - Class EX - Class S - Class IH - Class AH Tax charges (excluding Taxe d'abonnement) Other fees
Total expenses
1,905.141 996.167.475 63.857 22,010,708
3,479.74? 67,252,696 1.999.440 28,480,315
122.81: 41,541,094 1.518.378 30,348.237
3.820 478.334 136,124 11,139.008
48,984 20,814.362 93,004 72,432,329
- 102,641,605 48.984 1,139 91,752 3,946
412,862 1,722,067
9,924,904 1,395,033,315 ~.
Less. expenses fee waiver 7,516,727
Net investment income/lloss) 387,192 1435,028,387)
Net realised gain/(loss) on sales of investments Net realised gain/lloss) on financial futurcs contracts
USD USD USD USD . ..
13,194.338 1,658,109 2,458,581 247,739,423 - 166,384,743
589,322 212.289 711,417 22,949,609 169,190 12,112,494
13,952,850
7,915,346 354.425 541.736 204,360 313,824 228,814
58.679
236,810 403,382 468,811
7 14
5,676 54.848
10,786,732
3,166,118
102,052,002
1,870,398
1,840,089 21,354
228.873 65,532 70,781
107,619
24,724
224 220.748
69,143
7,742
2,656,829 ... .....
(786.431)
30,971.071
3,169.998
6,501,210 74.508
514.423 181,122 287,855 223,336
19.500
108.368 550.288 327,748
7 1.738
65 122
11,808
8,802,098
3,473
(5,628,627)
8,127,931
.-
469,156.269
176,832,906 6,312,897
14,893,542 6,063,073 8,236,600 7,125,337
20,380 2,578,685
4.320.777 14.020.490 14,379,924
82,521 80,457
628.993 330.831
322 648
485.825 457,716
256,851,924
2.188.649
214.492.994
1,029,217,840 1,404,213
.
13.796) (17,241.808) (639.661) 189,097) 57.326 13,385,962) Net realised gain/lloss) on foreign exchange transactions
Net realised pmht/(loss) for the year 3,136,015 2,192,308.448 104,578,459 30,095,543 2.556.630 1,241,729,085
Net change in unrealised appreciation! (depreciation) on investments 35.007.568 7.581.128.410 114,239,177 (20,946,4881 (6,557,709) 1,253,063,334 Net change in unrealised appreciation/ (depreciation) on financial futures contracts 678.134) Net change in unrealised appreciation/
11,347) (8,310,132) (depreciation) on foreign exchange transactions
Net change in net assets as a result of operations 38.143.583 9,773,436,858 218,817,636 9,149,055 (4,002,426) 2,485,804,753
(6,592,887) Dividend distribution 11,807) (711
Proceeds received on subscription of shares 590,648,720 84.532.701.013 516,004,031 75,296,584 501,465.407 15.350.671.713 (1,374,512) (56,041,855.536) (431,901,720) (307.108.409) 1624,382,464) (15,184,045.830) Ne: amount paid on redemption of shares
Net change in net assets as a result of capital transactions 589,274,208 28.490.845.477 84,102,311 (231,811,825) (122,917,057) 166,625.883
Total increase/(decrease) in net assets 627,417,791 38,264,280,528 302,419,876 (222,662,770) (126,319,483) 2,645,837,749
_._ . - - ..
... . . . . . .
... . . . . . . -- .. -. . . .-
... -. _ . . . . . .
-. . .. - - . . . . . .
Net assets at beginning of year . 72,336,624,297 448,162,619 245,527,300 528.238.173 15.780.652.705 621,748,321 Translation difference
Net assets at end of year 627,417,791 111,200.904,825 751,082,495 22,864.530 401,318,690 19,048,238,775
(1) Fund opened for subscriptions on 31 July 2006. + Represents the combined to:als of all Morgan Stanley SlCAV Funds. Please refer to page 161 for Fund expense ratios for each class of each Fund.
. . - . -
The accompdnyivg notes are an integral part of these hnancial statements
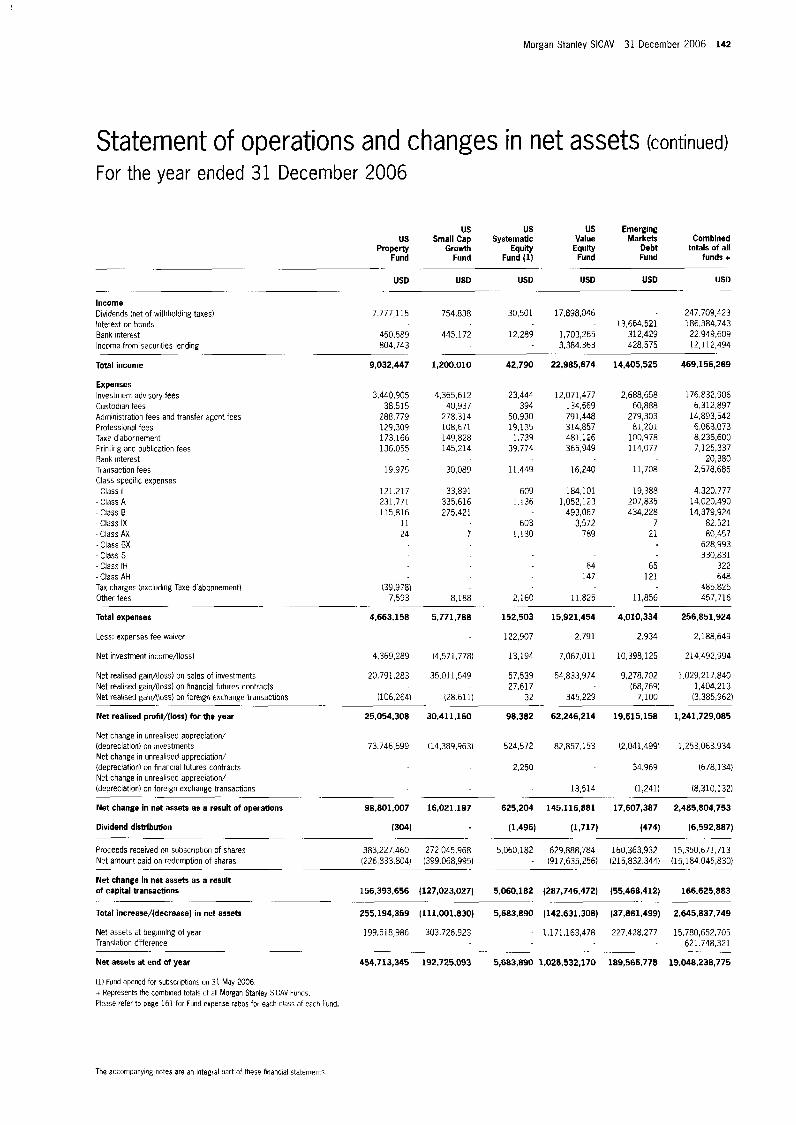
Morgan Stanley SlCAV 31 December 2006 142
Statement of operations and changes in net assets (continued) For the year ended 31 December 2006
. .
Income Dividends (net of withholding taxes) Interest on bonds Bank interest Income from securities lending
. .
us Fund
Property
~
US0 -. . -~
7.777.1 15
450.589 804,743
Total income
Expenses Investment advisory fees Custodian fees Administration fees and transfer agent fees Professional tees Taxe dabornement Printing anc publication fees Bank interest Transaction fees Class specihc expenses - Class I
- Class B -Class IX - Class AX - Class BX - Class s - Class IH -Class AH Tax charge: (excluding Taw dabomementl Other fees
Total expenses
Less: experses fee waiver
Net investment income/(loss)
Net realised gain/(loss) on sales of investments Net realised gain/(loss) on hnancial futures contracts Net realised gainflloss) on forelgn exchange transactions
- Class A
9,032,447
3,440,905 38.515
288.779 129,309 173,166 136.055
19.975
121.217 231,771 115,816
11 24
(39.9781
us us Small Cap Systemarlc
Growth Equity Fund Fund (1)
USD USD .-
754,838 30,501
445.172 12.289
1,200.010 42,790
4,365,612 40,937
278.314 108,671 149,828 145.2 14
30,089
33,891 335,616 275,421
7
23,444 394
50,930 19,135
1,739 39.774
11,449
609 1.136
603 1,130
US Emerging Value Markets Comblned EUUltY Debt totals of all Fund Fund funds +
USD USD US0
. . .-.
17,898346 - 247,709,423 - 13,664,521 186,384,743
1,703,265 312,429 22.949.609 3,384.363 428,575 12,112,494
22,985,674 14,405,525 469,156,269 .. .
12,071,477 134,569 791,448 314,857 481,126 365,949
16,240
184,101 1,052,123
493,067 3,572
789
64 147
7,593 8.188 2,160 11 825 -- -
2,688,658 176.832.906 60,888 6,312.897
279,303 14,893,542 81,201 6.063.073
100,978 8.236.600 114,077 7,125,337
20,380 11,708 2,578,685
19,388 4,320,777 207,835 14,020,490 434,228 14,379,924
7 82.521 21 80,457
628.993 330,831
65 322 121 648
485.825 11,856 457,716
4,663,158 5.771.788 152,503 15.921.454 4,010,334 256.851.924
122,907 2.791 2.934 2,188,649
4,369,289 (4,571,778) 13,194 7,067,011 10,398,125 214,492,994
20.791.283 35,011,549 57.539 54,833,974 9,278,702 1.029,217.840 27,617 (68,769) 1.404.21 3
(106.2641 128.611) 32 345,229 7,100 (3.385.962) . .. .- . --
Net realised pmfit/(loss) for the year 25,054,308 30,411,160 98.382 62,246,214 19,615,158 1,241,729,085
Net change in unrealised appreciation/ (depreciation) on investments 73,746,699 (14,389,963) 524,572 82,857,153 (2,041,4991 1,253,063.934 Net change in unrealised appreciation/ (depreciation) on financial futures contracts 2,250 34.969 (678.134) Net change in unrealised appreciation,' (depreciation) on foreign exchange transactions 13,514 (1.241) (830 .132)
Net change in net assets as a result of operatlons 98,801,007 16,021,197 625,204 145,116.881 17,507,387 2,465,804,753
(474) (6,592,887)
Proceeds remved on subscription of shares 383,227,460 272,045,968 5,060,182 629,888,784 160,363,932 15,350,671.713 Net amount paid on redemotion of shares (226,833.804) (399,068,9951
Net change in net assets as a result of capital transactions 156,393,656 (127,023,027) 5.050.182 1287,746,472) (55,468,412) 166.625.883
Total increase/(decrease) in net assets 255,194,359 [111,001.830) 5,683,890 (142.631.308) (37,861,499) 2,645,837,749
-. . .- .. .. ._ - ..
.~ Dividend distribution (304) (1,496) 11,717)
. . - ... - .
- (917,635,256) (215,832,3441 115.184.045.830) - .- - .. . . .. -. ..
- . . . - . .. - .. . ..
Net assets zt beginning of year 199,518,986 303,726,923 - 1,171,163,478 227.428.277 15.780,652.705 Translation lifference - 621,748,321
Net assets at end of year 454713,345 192,725.093 5,683,890 1,028,532,170 189,566,778 19,048,238,775
(1) Fund opened for subscriptions on 31 May 2C06 + Represents the combined totals uf all Morgan Stanley SlCAV Funds. Please refer t3 page 161 for Fund expense rates for each Cbss of each Fund.
- .- .. .. -- ...
The accompanyilp notes are an integral part a! these financial statements

143 Morgan Stanley SICAV 31 December 2006
Statement of operations and changes in net assets (continued) For the year ended 31 December 2006
Euro Euro European Euro Corporate Strategic Currencies Global Combined Bond Bond Bond High Yield Bond totals of all Fund Fund Fund BondFund Fund funds +
EUR EUR EUR EUR US0 USD
. . -. _._
... .- - - .
Income Dividends (net of withholding taxes) Interest on bonds Bank interest Income from securities lending
Total income
Expenses Investment advisory fees Custodian fees Administration fees and transfer agent fees Professional fees Taxe dabonnement Printing and publication fees Bank interest Transaction fees Class specific expenses - Class I - Class A . Class E - Class IX -Class AX - Class BX - Class S - Class IH - Class AH Tax charges (excluding Taxe dabonnement) Other fees
-.
31,131,718 1,125,904
79,132
32,336,754 . -- -
5,305,865 201,169 515,642 245,971 375,263 290,337
11,576,243 27.232.761 239.012 987,576
88,612
4,533 3.877.835
100,857 20,190
8.785.692 482.882
20,489
11,815.255 28,308,949
1,823.095 4,651,101 66,745 177,448
91.826 223,384 121,086 338,085 127,069 260,128
247,146 437,azo
8,380 10,628 11,658
143,585 47,837 163,953 780,859 263,069 656,979 235,126 217.039 323,281
254 7 13 11
93,656
6.483 6.161 6.455
4,003,415
500,201 14,392
120,685 34,692 30,210 55,389
3,745
2,191 40,510
34 7,64 1
6,160
9,289,063
1,842,889 72,263
246,886 100,004 132,471 :3o,a47
6.970
59,387 272.918
76.332 7
25
8,004
247,709,423 186,384,743 22,949,609 12,112,494
469,156,269 -. --
176,832,906
14.893.542 6.063.073 8.236.600 7,125,337
20,380 2.578.685
4,320,777 14,020,490 14,379,924
82,521 80,457
628,993 330,831
322
485,825 457,716
6 , 3 1 2 . a ~
648
- ...... . - . . . . ~~
~-
Total expenses 8,203,200 3,021,701 7,310,310 1,155,816 2,949.003 256,851,924
Less: expenses fee waiver 8,460 2,188,649
Net investment income/(loss) 24.133.554 8.793.554 20,998,633 2,856,059 6,340.060 214,492,934
(10.137.910) (3,193.688) (10,946,878) 923,341 445.817 1,029,217,840 Net realised gain/(loss) cn sales of investments Net realised gain/(loss) on financial futures contracts 29a.202 80,321 (26.418) 207.134 1,404,213
(3,385,962) (42,592) 1402,233) (345.381) 559,154 Net realised gain/(loss) on foreign exchange transactions
Net realised profrv(loss) for the year 13,995.407 5,855,476 9.729.849 3,413,601 7.552.165 1,241,729,085
Net change in unrealised appreciation/
Net change in unrealised appreciation/ (depreciation1 on financial futures contracts 293,344 a9.038 109,482 255.044 (678.134) Net change in unrealised appreciation/
933.771 528,469 346,493 (316.220) (8,310,132) (depreciation) on foreign exchange transactions
Net change in net assets as a result of operatlons (11.012,666) (270.991) (8,201,3451 3.630.959 13,074,219 2,485,804,753
(477) (6,592,887) Dividend dlstrlbution (229) (513)
Proceeds received on subscription of shares 334,862,422 183,762,052 424,878,958 105.754.881 122,408,001 15,350,671,713 (559,226,042) (321,218,773) (664.088.183) (70842,889) (140,777,1211 (15,184,045,830) Net amount paid on redemption of shares
Net change in net assets as a result of capital transactions (224,363.620) (131,456,721) (239.209.225) 34,911,992 (18,369,120) 166.625.883
Total increase/(decrease) in net assets (235,376,515) (131,727,712) (247,411,083) 38,542,951 (5.295.378) 2,645,837,749
Net assets at beginning of year 893.750.931 358,797,158 702,990,845 43.336.731 276.376.575 15,780,652,705 Translation difference
Net assets at end of year 658,374.416 227,069.446 455.579,762 81,879.682 271,081,197 19.048,238,775
+ Represents the combined totals of all Morgan Stanley SlCAV Funds. Please refer to page 161 for Fund expense ratnos for each class of each Fund
- - . -. -- -. .. 263
. .
(depreciation) on investments (25,008,573) (7.353.5a2) (18,548,701) (23a.617) 5,583,230 1.~53.063.934
..... - . - . - - - - . . . . .
. . . . . - . -- -. -.
...
~. -- - . --- - . .- -. - -. -- - -
- 621,748,321 -. - - - -- .. - __ .- - -
Ibe accompanying notes are an integral part of these financial statements
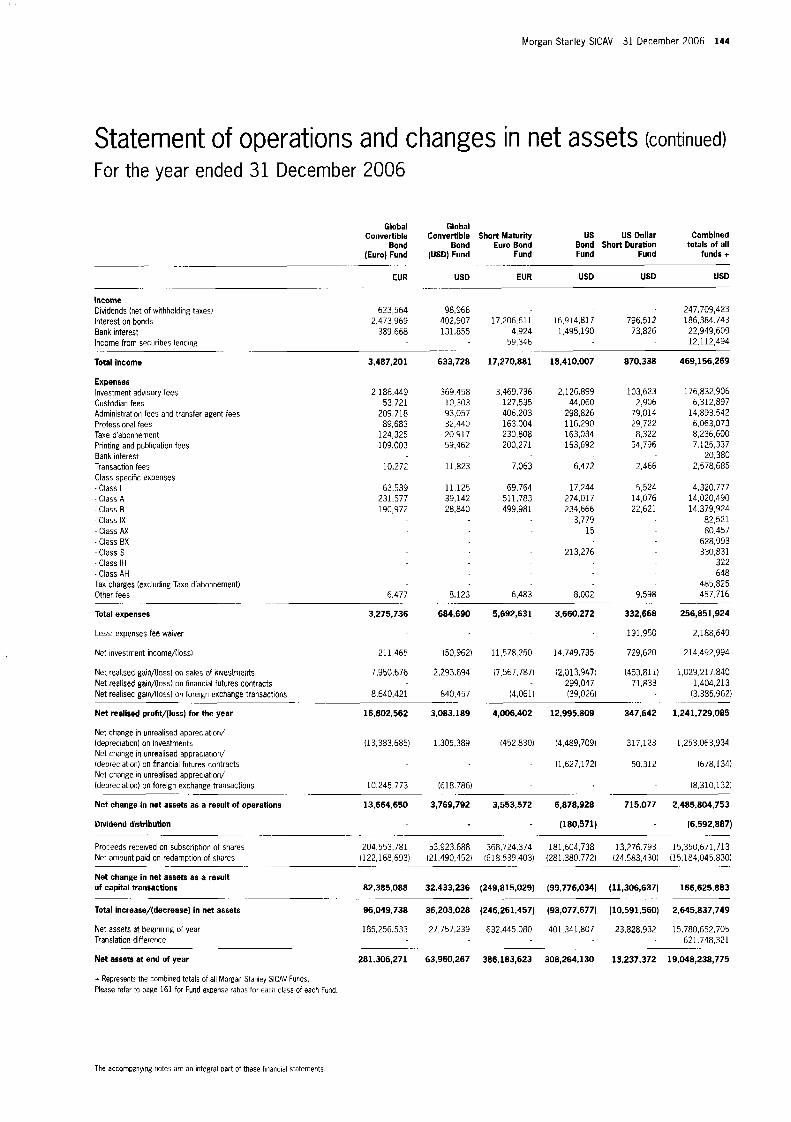
Morgan Stanley SICAV 31 December 2006 144
Statement of operations and changes in net assets (continued) For the year ended 31 December 2006
Global Global Combined Convertible Convertible Short Maturity US US Dollar
totals of all Bond Bond Euro Bond Bond Short Duration (Euro) Fund (USD) Fund Fund Fund Fund funds +
EUR USD EUR USD USD USD ... . . ....... ~ -. .....
~. .
Income Dividends (net of withholding taxes1 623,564 98,966 Interest on bonds 2,473,969 402,907 Bank interest 389 668 131.855 Income from securities lendlng - .... . _- ..
Total Income 3,487,201
Expenses Investment advisory fees Custodian fees Administrat on fees and transfer agent fees Professions1 fees Taxe d'abonnernent Printing and publicatlon fees Bank interest Transaction fees Class specihc expenses - Class I - Class A - Class B - Class IX - Class Ax . Class BX -Class S - Class IH . Class AH Tax charges (excluding Taxe d'abonnementl Other fees
Total expenses
Less: expenses fee waiver
Net investment income/(lossl
Net realised gam/(lossl on sales of investments Net realised gain/(loss) on financial futures contracts Net realisec gatn/(loss) on foreign exchange transactlons
Net reallsed proht/(loss) for the year
Net change in unrealised appreciation/ (depreciation) on investments Net change in unrealised appreciation/ (depreciation1 on financial futures contracts Net change in unrealised appreciation/ (depreciation) on foreign exchange transactions
Net change in net assets as a result of operations
Divldend distribhon
. - ..
- . .-
-. .- -.
2,186,449 53,721
209,718 89,683
124,325 109,003
10,272
63.539 231.577 190,972
6.477
633,728
369.458 10,303 93,057 32,440 20.917 59,462
11,823
11.125 39,142 28,840
8,123
247,709,423 17,206,611 16,914.817 796,512 186.384.743
4,924 1,495,190 73,826 22,949,609 59,346 12.1 12,494
...
17,270,881 18.410.007
3,469,736 2,126399 127,535 44,060 406.203 298.826 163,004 116,290 230,808 163,334 200,271 153,692
7,063 6,472
69,764 17.244 511,783 274.017 499,981 234.666
15 3,779
213.276
6,483 8,002
3,275,736
211,465
7.950.676
8,640,421
684,690 5,692,631 3.660.272
(50,962) 11,578,250 14,749,735
2.293.694 (7,567,787) (2,013,947) 299,047
840.457 (4,061) (39,026)
870.338
103,623 2.906
79,014 29 722 8,322
54,796
2,466
5,524 14,076 22,621
9,598
332,668
191.950
729,620
(453.811) 71,833
.... .- -
16,802,562 3.083.189 4,006.402 12,995.809 347.642
(13,383,685) 1.305.389 (452.830) (4,489,7091 317.123
- (1,627,1721 50.312
10,245,773 (618.786)
469,156,269
176,832.906 6,312,897
14.893.542 6.063.073 8,236,600 7.125.337
20.380 2,578,685
4.320.777 14,020,490 14,379,924
82,521 80.457
628,993 330,831
322 648
485.825 457.716
256,851,924
2,188,649
214,492,994
1,029,217,840 1,404.213
(3.385.962)
1,241,729,085
1.253.063.934
(678,134)
(8.310.1321 ..
13.664.650 3,769,792 3,553.572 6,878,928 715,077 2.485.804.753
- (180,571) - (6,592,887) .. .... - -. . - .
Proceeds received on subscrlptlon of shares 204,553,781 53,923.688 368,724,374 181,604,738 13.276.793 15,350,671,713 Net amount paid on redemption of shares (122,168,693) (21,490,4521 (618,539,403) (281.380.772) 124,583,4301 115.184.045.830)
-- ... . . . ......
Net change in net assets as a result of capital transactions 82,385.088 32,433,236 (249,815,029) (99.776,034) (11,306,637) 166,625,883
.. . . - . . .-
Total increase/(decrease) in net assets 96,049,738 36,203,028 (246,261,457) (93,077,677) (10,541,560) 2.645.837,749
Net assets at beginning of year 185.256.533 27.757.239 632.445.080 401,341,807 23,828,932 15,780,652,705 Translation difference - 621,748,321
Net assets at end of year 281.306.271 63,960,267 386,183,523 308,264,130 13,237,372 19,048,238,775
+ Represent! the combined totals of all Morgan Stanley SlCAV Funds. Please refer to page 161 for Fund expense ratlos for earh class of each Fund
-- . -- . - . -. .
The accompznymg notes are an integral part ot these financial statements
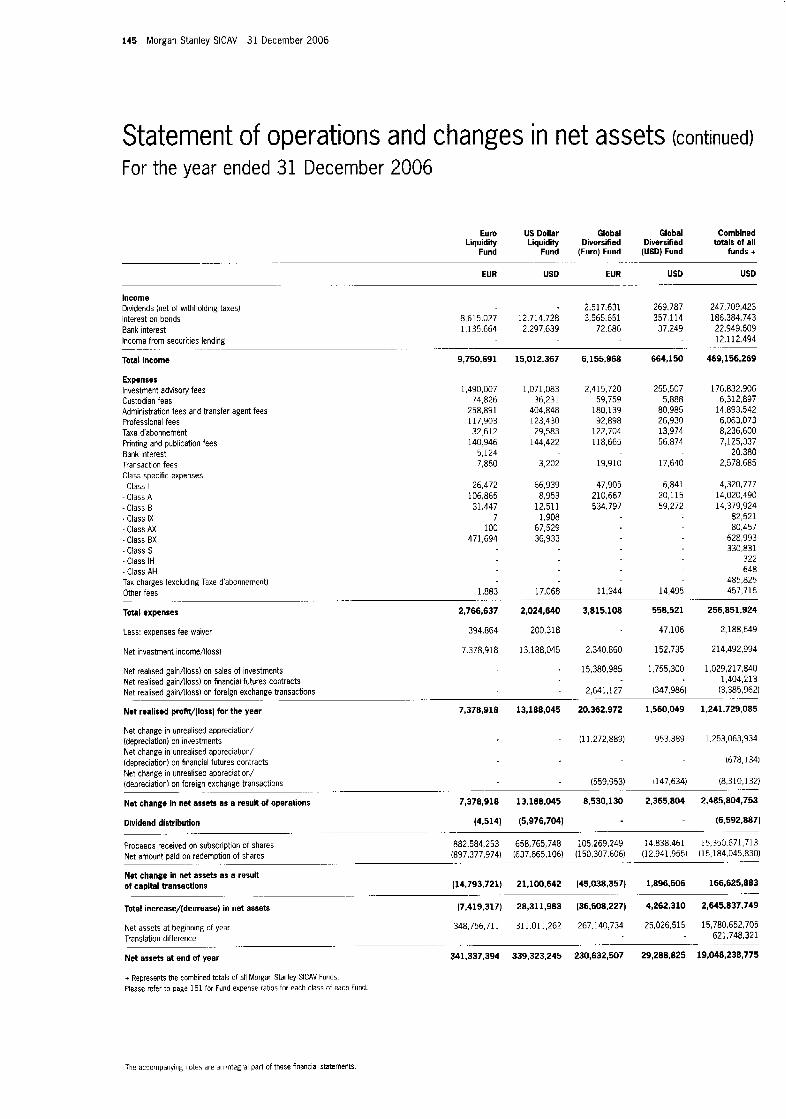
145 Morgan Stanley SICAV 31 December 2006
Statement of operations and changes in net assets (continued) For the year ended 31 December 2006
Euro US Dollar Global Global Combined Liquidity Liquidity Diversihed Diversfied totals of all
Fund Fund (Euro) Fund (USD) Fund funds +
EUR US0 EUR USD USD
..... .... .....
- ..........
Income Dividends (net of withholding taxes) . 2.517.631 269.787 247.709.423 Interest on bonds 8,615,027 12,714,728 3,565.651 357,114 186.384.743 Bank interest 1,135,664 2,297,639 72.686 37,249 22.949.609
12.112.494 Income from securities lending .. ...... .... . . . . - -...
Total income 9,750,691
Expenses Investment advisory fees Custodian fees Administration fees and transfer agent fees Professional fees Taxe d'abonnement Printing and publication fees Bank interest Transaction fees Class specific expenses - Class I -Class A -Class 8 . Class IX - Class AX - Class BX - Class 5 - Class IH - Class AH Tax charges (excluding Taxe d'abonnemerit) Other fees
Total expenses
... .... .... -
1,490,007 74,826
258,891 117,903 32.612
140.946 5,124 7,860
26,472 106,865 31,447
7 100
471,694
1,883
2,766,637
Less: expenses fee waiver 394.864
Net investment income/(loss) 7,378,918
Net realised gain/(loss) on sales of investments Net realised gainflloss) on financial futures contracts
15,012,357
1,071,083 36,231
404,848 123,430 29,583
144,422
3,202
66,939 8,953
12,511 1,908
67,529 36,933
17,068
6.155.968
2,415,720 59,759
180,139 92,898
122,704 118,665
19,910
47,905 210,667 534,797
11,944
2,024,640
200.318
13,188,045
3,815.108
2.340.860
15,380,985
2,641,127
664,150
255,507 5,888
80,985 26,930 13,974 56.874
17,640
6.841 20,115 59,272
14,495
558.521
47,106
152,735
1,755,300
(347.986)
..
469,156,269
176,832,906 6,312,897
14.893.542 6,063,073 8,236,600 7,125,337
20.380 2,578,685
4,320,777 14,020,490 14,379,924
82,521 80,457
628,993 330.831
322 648
485,825 457,716
256,851,424
2,188,649
214,492,994
1,029.21 7,840 1,404,213
(3,385,962) .~ Net realised gain/(loss) on foreign exchange transactions
Net realised pmflt/(loss) for the year 7,378,918 13,188,045 20.362.972 1,560,049 1,241.729.085 -
Net change in unrealised appreciation/ (depreciation) on investments Net change in unrealised appreciation/ (depreciation) on hnancial futures contracts
(11.272,889) 953.389 1,253,063,934
(678,134) Net change in unrealiseo appreciation/ (depreciation) on foreign exchange transactions (8.310.132)
- - (559.953) 1147.634)
.- .... - . - . . . .
Net change in net assets as a result of OpBraUOnS 7,378,918 13.188.045 8,530,130 2,365.804 2,485,804,753
Dividend dishibution (4.514) (5,976,704) - (6,592.887)
Proceeds received on subscription of shares 882,584,253 658,765,748 :05,269.249 14 838,461 15,350 671,713 (897,377,974) (637 665.106) (150.307.606) (12 941.955) (15,184.045.830) Net amount paid on redemption of shares
.~ -_ - _- .. --
- - - -
Net change in net assets as a result of capital transactions (14,793,721) 21,100,642 (45,038,357) 1,896.506 166,625,883
..... -. . - __ Total increase/ldecrease) in net assets (7.419.317) 28,311,983 (36.508.227) 4,262,310 2,545,837,749
348,756,711 311,011,262 267.140.734 25,026,515 15,780.652.705 - 621,748,321
Net assets at beginning of year Translation difference
Net assets at end ot year 341,337,394 339,323.245 230,632,507 29,288.825 19,048,238,775
+ Represents the combined totals 01 all Morgan Stanley SlCAV Funds. Please refer to page 161 for Fund expense ratios for each class of each Fund.
..... . -- __ . . -. .
Tlie accompanying notes are an integral part of these financial statements
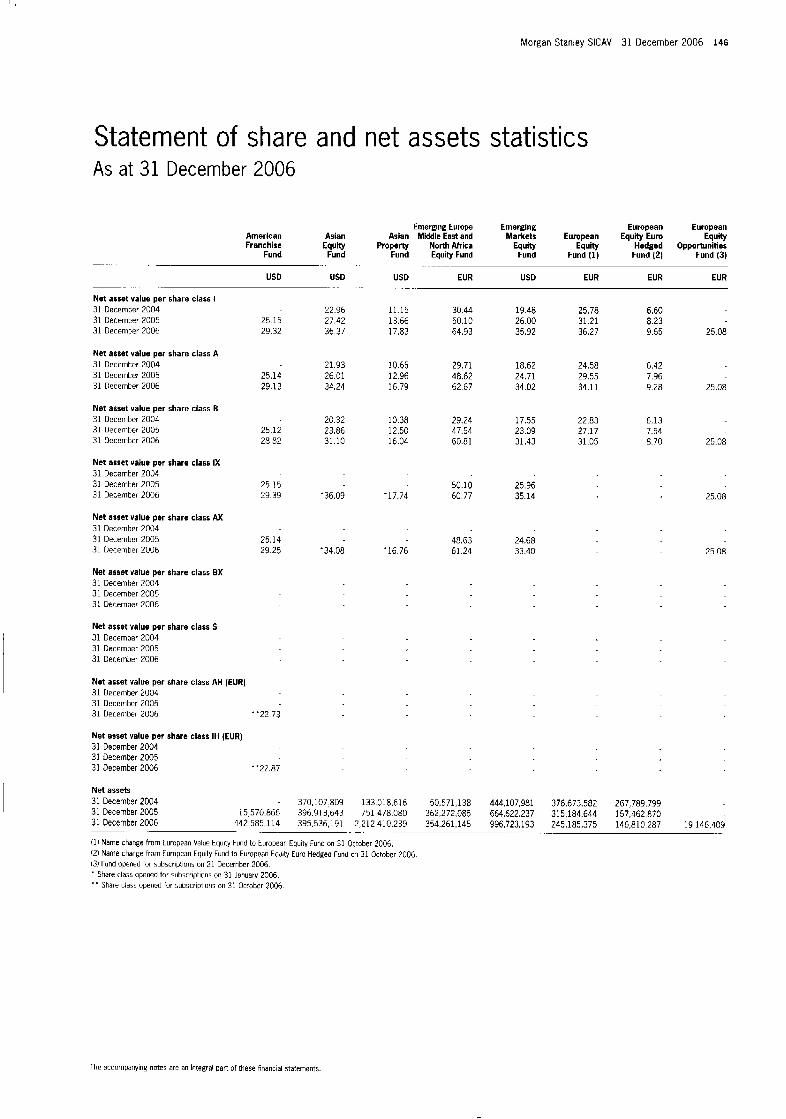
Morgan Stanley SICAV 31 December 2006 146
Statement of share and net assets statistics As at 31 December 2006
American Asian
Fund Fund
USD USD
Franchise Equity
- .._. _.
~ _. .
Nut asset value per share class I 31 December 2004 31 December 2005 25 15 31 December 2006 29.32
Net asset valuu pur share class A 31 December 2004 31 December 2005 25.14 31 December 2006 29.13
Net assut value per share class B 31 December 2004 31 December 2005 25.12 31 December 2006 28.82
Net asset value pur share class IX 31 December 2004 31 December 2005 25.15 31 December 2006 29.39
Net asset value per share class AX 31 December 2004 31 December 2005 25.14 31 Oecember 2006 29.25
Net asset value per share class EX 31 December 2004 31 December 2005 31 December 2006
Net asset valuu per share class S 31 December 2004 31 December 2005 31 December 2006
Net asset value per share class AH (EUR) 31 December 2004 31 December 2005 31 December 2006 "222 73
Net asset value per share class IH (EUR) 31 December 2004 31 December 2005 31 December 2006 -'22.87
Nut assets 31 Decemb?r 2004 31 December 2005 31 December 2006
15,570,866 442.585.1 14
22.96 27.42 36 37
21.93 26.01 34.24
20.32 23.86 31.10
'36.09
'34.08
Emerging Europe Emerglng European European Asian Middle East and Markets European Equity Euro Equity
Hedged Opportunities Fund (2) Fund (3) Fund Equity Fund Fund Fund (1)
Propem North Africa Equity
USD EUR USD EUR EUR EUR
11.15 13.66 17.83
10 65 12.96 16.79
10.38 12.5C 16.04
-17.74
'16 76
370,107.809 133.018.616 396.913.643 751.478 080
30.44 50.1C 64.93
29.71 48.62 62 67
29.24 47.54 60.81
50.10 60 77
48.63 61.24
19.48 26.00 35.92
18.62 24.71 34.02
17.55 23.09 31.43
25.96 35.14
24.68 33.40
25.78 31.21 36.27
24.58 29.55 34.11
22.83 27.17 31.05
6.60 8.23 9.65 25 08
6.42 7.96 9.28 25.08
6.13 7.54 8.70 25.08
25.08
25 08
50,571,138 444107.981 376,673,582 267,789,799 362,272,085 664,622,237 315.184.644 157,462.870
395.536.191 2,212:410.239 354261,145 996,723,193 245.185.375 146,810.287 19.146.409 . .... -. - ~ . ...
(1) Name change from European Value Equity Fund to Europear Equlty Fund on 31 Octuher 2006. (2) Name change from European Equlty Fund to European Fa,ity Euro Hedged Fuid 0.1 31 Octuhcr 7006 131 Fund opened fur subscriptions on 21 December 2006. * Share class opened for subscrlptlons on 31 January 2906. * * Share class opened for subscrlptlons UII 31 Oc!obcr 2006.
Thc accornpanylng notes are an integral Dart of these financial statcments
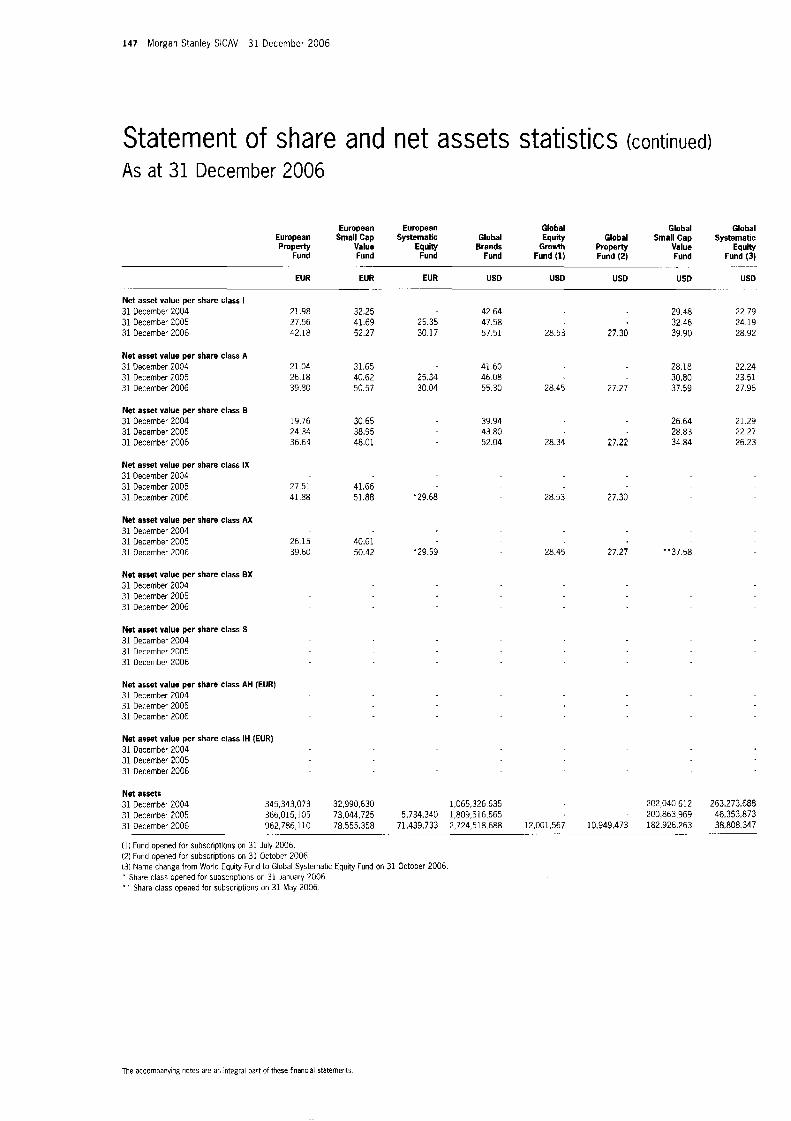
147 Morgan Stanley SICAV 31 December 2006
Statement of share and net assets statistics (continued) As at 31 December 2006
European European Global Global Global European Small Cap Systematic Global Equity Global Small Cap Systematic Property Value Equity Brands Growth Property Value Equity
Fund Fund Fund Fund Fund (1) Fund (2) Fund Fund (3) . - . . -
EUR EUR
Net asset value per share class I 31 13ecember 2004 31 December 2005 31 December 2006
Net asset value per share class A 31 December 2004 31 December 2005 31 December 2006
Net asset value per share class B 31 Oecember 2004 31 December 2005 31 December 2006
Net asset value per share class IX 31 December 2004 31 December 2005 31 DeLcmber 2006
Net asset value per share class Ax 31 December 2004 31 December 2005 31 December 2006
Net asset value per share class EX 31 DeLernber 2004 31 December 2005 31 Deceniber 2006
Net asset value per share class S 31 December 2004 31 December 2005 31 December 2006
Net asset value per share class AH (EUR) 31 December 2004
31 December 2006 31 DQrQmber 2005
21.98 27.56 42.18
21.04 26.18 39.80
19.76 24.34 36.64
27.51 41.88
26.15 39.60
32.25 41.69 52.27
31.65 40.62 50.57
30 65 38.95 48.01
41.66 51.88
40.61 50.42
Net asset value per share class IH (EUR) 31 Decernber 2004 31 December 2005 31 December 2006
Net assets 31 December 2004 345,343,073 31 December 2005 366,015,105 31 December 2006 962,786,110
(11 Fund opened for subscriptions on 31 July 2006. (2) Fund opened for subscriptions on 31 October 2006.
- ..
32,990,630 73,044,725 78,555,358
EUR USD USD USD USD u50 . . __
25.35 30 17
25.34 30.04
'29.68
'29.59
5,734,340
42.64 47.58 57.51 28.53
41.60 46.08 55.30 28.45
39.94 43.80 52.04 28.34
28.53
28.45
29.48 32.46
27.30 39.90
28.18 30.80
27.27 37.59
26.64 28.83
27.22 34.84
27.30
27.27 "37.58
1.065.326.635 1,809,516.565
202,040.612 200,863,969
71.439.733 2,724,518.688 12,001,567 10,949.473 162,926,263 -.
(31 Name change from World Eauity Fund to Global Systematic Equity Fund on 31 October 2006 - Share clast opened for subscriptions on 31 January 2006 * * Share class opened for subscriotions on 31 May 2006.
22.79 24.19 28.92
22.24 23.51 27.96
21.29 22.27 26.23
263,273,688 46,353,873 38,808.347
The accornpxying rlctes are arm ntegral part of these hnaricial statements
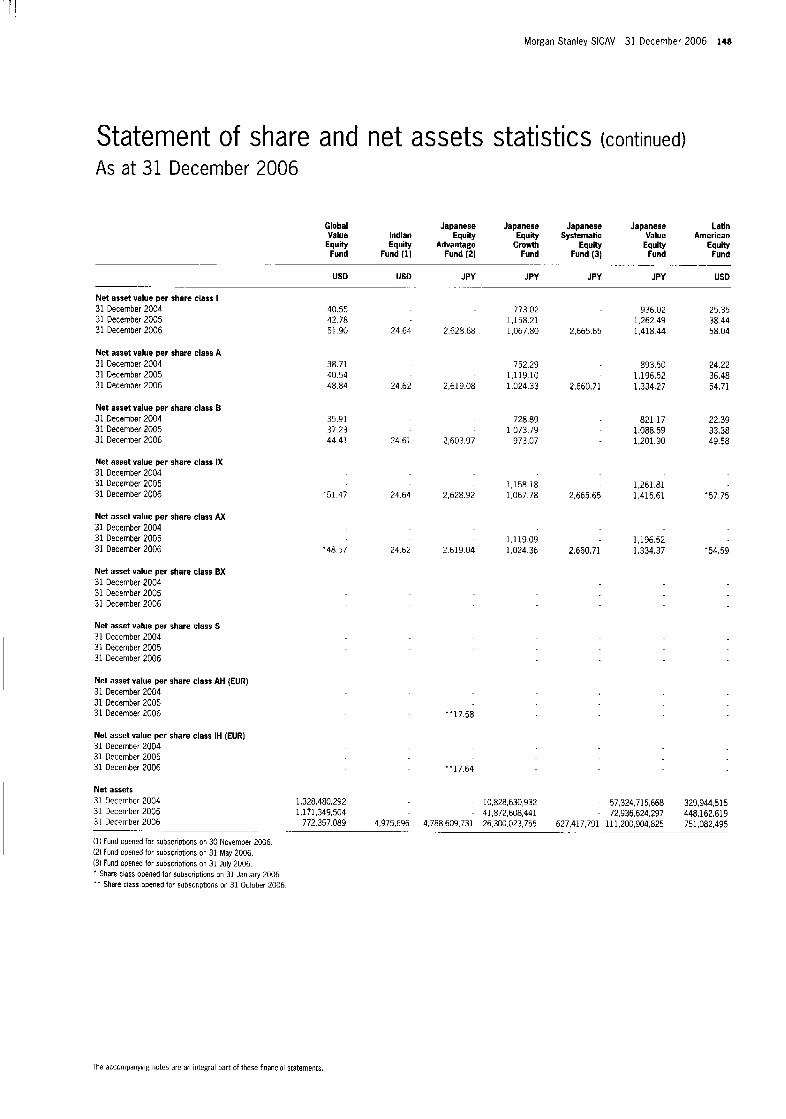
Morgan Stanley SICAV 31 December 2006 148
Statement of share and net assets statistics (continued) As at 31 December 2006
Global Japanese Japanese Japanese Japanese Latin Value Indian Equity Equity Systematic Value American
Equity Equity Advantage GroWm Equity Equity Equity Fund Fund (1) Fund (2) Fund Fund (3) Fund Fund
_.__ ~ __ _- US0 USD
. -.
Net asset value per share class I 31 December 2004 31 December 2005 31 December 2006
Net asset value per share class A 31 Decemxr 2004 31 Decemoer 2005 31 Decemoer 2006
Net asset value per share class B 31 Decemoer 2004 31 December 2005 31 December 2006
Net asset value per share class IX 31 December 2004 31 December 2005 31 December 2006
Net asset value per share class AX 31 December 2004 31 December 2005 31 December 2006
Net asset value per share class BX 31 December 2004 31 December 2005 31 December 2006
Net asset value per share class S 31 December 2004 31 December 2005 31 December 2006
Net asset value per share class AH (EUR) 31 December 2004 31 December 2005 31 December 2006
40.55
51.90 24.64 42.78
38.71 40.54 48.84 24.62
35.91 37.23 44.41 24.61
'51.47 24.64
'48.57 24.62
Net asset value per share class IH (EUA) 31 December 2004 31 December 2005 31 December 2006
Net assets 31 December 2004 1,328,480,292 31 December 2005 1.1 71,349,504 31 December 2006 772.357.089 4,975,696
11) Fund opened for subscriptms or, 30 November 2006 (21 Fund opened for subscriptions or 31 May 2006. (3) Fund opened for subscriptions on 31 July 2006. * Share cla65 opened for subscriptions on 31 January 2006 * - Share ~ I ISS opened for subscrlptlons on 31 October 2006
.. -
JPY JPY JPY JPY USD
2.628.68
2.619.08
2,603.97
2,628.92
2.619 04
* * 17.58
"17.64
773.02 1,158.21 1,067.80
752.29 1,119.10 1.024 33
728.89 1,073.79
973.07
1,158.18 1,067.78
1.1 19.09 1,024.36
- 10,828,630,932
4,788,609,731 26,300.023.755 - 41,872,608,441
2.665.65
2,660.71
2,665.65
2,660.71
936.02 1,262.49 1,418.44
893.50 1.196.52 1.334.27
821.17 1,088.59 1,201.90
1,261.81 1.415.61
1.196.52 1.334.37
57,324,715,668 72.936.624.297
25.35 38.44 58.04
24.22 36.48 54.71
22.39 33.38 49.58
'57.75
'54.59
329.944.515 , ,
, . .,. ,. . 448,162,619 627.41 7,791 11 1,200,904,825 751,082,495
The accompanying notes are an integral part of these financial statements
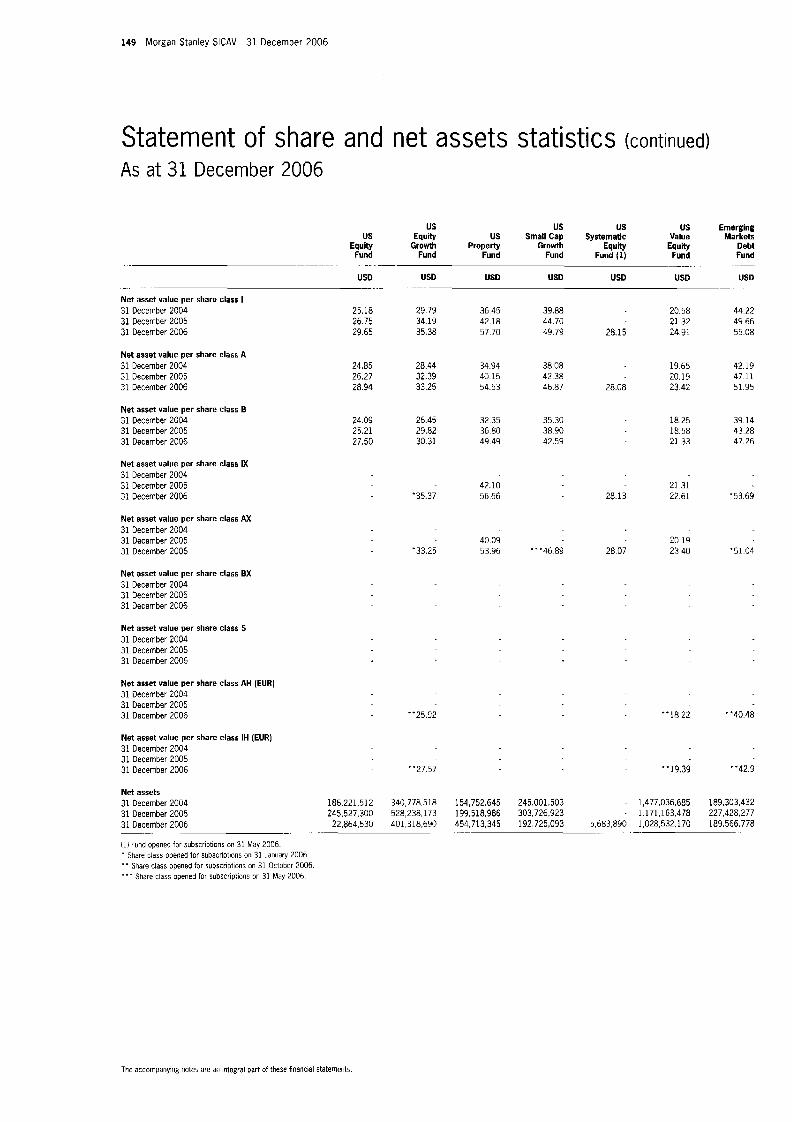
149 Morgan Stanley SlCAV 31 December 2006
Statement of share and net assets statistics (continued) As at 31 December 2006
us us us US Emerglng us Equity US Small Cap Systematlc Value Markets
Equity Growth Property Growth Equity Equity Debt Fund Fund Fund Fund Fund (1) Fund Fund
USD USD u50 USD USD USD USD
- _ _ --
_. . .. .- . - -.-
Net asset value per share class I 31 December 2004 31 December 2005 31 December 2006
Nut asset value per share class A 31 December 2004 31 December 2005 31 December 2006
Net asset value per share class B 31 December 2004 31 December 2005 31 December 2006
Nut asset value per share class IX 31 December 2004 31 December 2005 31 December 2006
Nut asset value per share class AX 31 3ecember 2004 31 December 2005 31 December 2006
Net asset value per share class BX 31 December 2004 31 3ecember 2005 31 3ecember 2006
25.18 26.75 29.65
24.85 26.27 28.94
24.09 25.21 27.50
Net asset value pur share class 5 31 December 2004 31 December 2005 31 December 2006
Net asset value per share class AH (EUR) 31 December 2004 31 December 2005 31 December 2006
Nut asset value per share class IH (EUR) 31 December 2004 31 December 2005 31 December 2006
Net assets 31 December 2004 186,221,512 31 December 2005 245,527,300
22,864,530 31 December 2006
(1) Fund opened for subscriptions on 31 May 2006. . Share class opened for SubscrlDtions on 31 January 2006 * - Share class opened for rubscriptions uri 31 October 2006. ' * ' Share class operied for subscriptions on 31 May 2006.
- . .
29.79 34.19 35.38
28.44 32.39 33.25
26.45 29.82 30 31
'35.37
'33.25
"25.92
"27.57
340,778,516 528,238,173 401,318,690
36 45 39.88 20.58 44.22 42.18 44.70 21.32 49.66 57.70 49.79 28.15 24.91 55.08
34.94 38.08 19.65 42.19 40.15 42.38 20.19 47.11 54.53 46.87 28.08 23.42 51.95
32.35 35.30 18.25 39.14 36.80 38.90 18.58 43.28 49.49 42.59 21.33 47.26
42.10 21.31 56.66 28.13 22.61 '53.69
40.09 20 19 53.96 "'46.89 28 07 23.40 '51.04
"18.22 "40.48
* * 19.39 "42.9
154,752,645 245.001.503 - 1,477.036.685 189 303.432 199,518,986 303,726.923 . 1171.163478 227,428,277 454,713,345 192,725,093 5,683,890 1,028,532 170 189.566.778 . --. -.
The accornpaiiying notes are an Integral part of these financial statements.
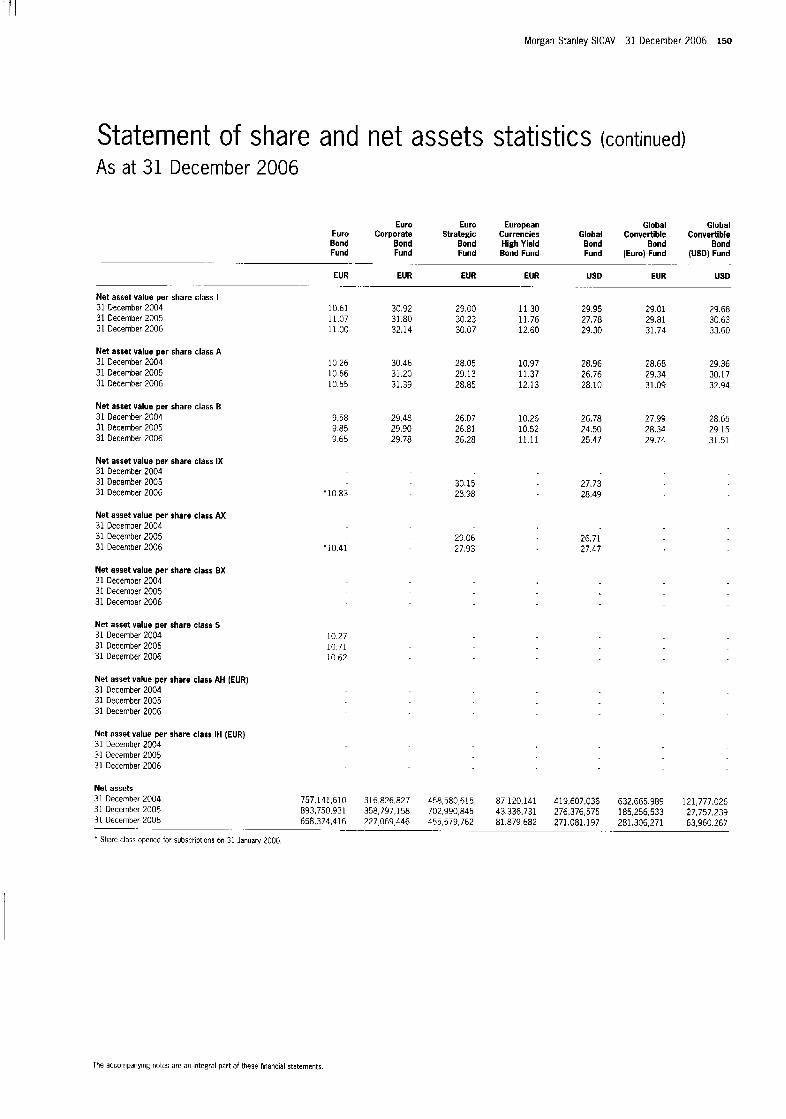
Morgan Stanley SlCAV 31 December 2006 150
Statement of share and net assets statistics (continued) As at 31 December 2006
Euro Bond Fund
EUR - -.
Net asset value pur share class I 31 December 2004 31 December 2005 31 December 2006
Net asset value pur share class A 31 December 2004 31 December 2005 31 December 2006
Net asset value per share class B 31 December 2004 31 December 2005 31 December 2006
Net asset value per share class IX 31 December 2004 31 December 2005 31 December 2006
Nut asset value per share class AX 31 Decemxr 2004 31 December 2005 31 December 2006
Net asset value per share class BX 31 Decemm 2004 31 Decemxr 2005 31 Decemer 2006
Net asset value per share class S 31 December 2004 31 December 2005 31 December 2006
Net asset value per share class AH (EUR) 31 December 2004 31 December 2005 31 December 2006
Net assut value per share class IH (EUR) 31 December 2004 31 December 2005 31 December 2006
10.61 11.07 11 .oo
Euro Euro European Corporate Stratugic Currencies
Bond Bond High Yield Fund Fund Bond Fund
EUR EUR EUR
.. .
Global Global Convertible
Bond Bond Fund (Euro) Fund
USD EUR
Global Convertible
Bond (USD) Fund
USD
30.92 29.00 11 30 31.80 30.23 11.76 32.14 30.07 12.60
29.95 29.01 27.78 29.81 29.30 31.74
29.68 30.63 33.60
10.26 30.46 28.05 10.97 28.96 28.68 29 36 10.66 31.20 29.13 11.37 26.76 29.34 30.17 10.55 31.39 28.85 12.13 28.10 31.09 32.94
9.58 29.48 26.07 10.26 26.78 27.99 28.65 9.85 29.90 26.81 10.52 24.50 28.34 29.15 9.65 29.78 26.28 11.11 25.47 29.74 31.51
30.15 '10.83 28.98
-10.41
10.27 10.71 10 62
29.06 27.93
27.73 28.49
26.71 27.47
Net assets 31 December 2004 757,141,610 316,826.827 458,580,615 87.120.141 419.607.036 632.665.989 121,777.026 31 December 2005 893,750.931 358,797.158 702,990,845 43.336.731 276,376,575 185,256,533 27,757,239 31 December 2006 658,374,416 227,069,446 455,579,762 81,879.682 271.081.197 281,306,271 63,960.267
' Share class opened for subscrlptlons on 31 January 2006. . -. . -.- .. ~ ..
The accompanying notes are an integral part of these financial statements
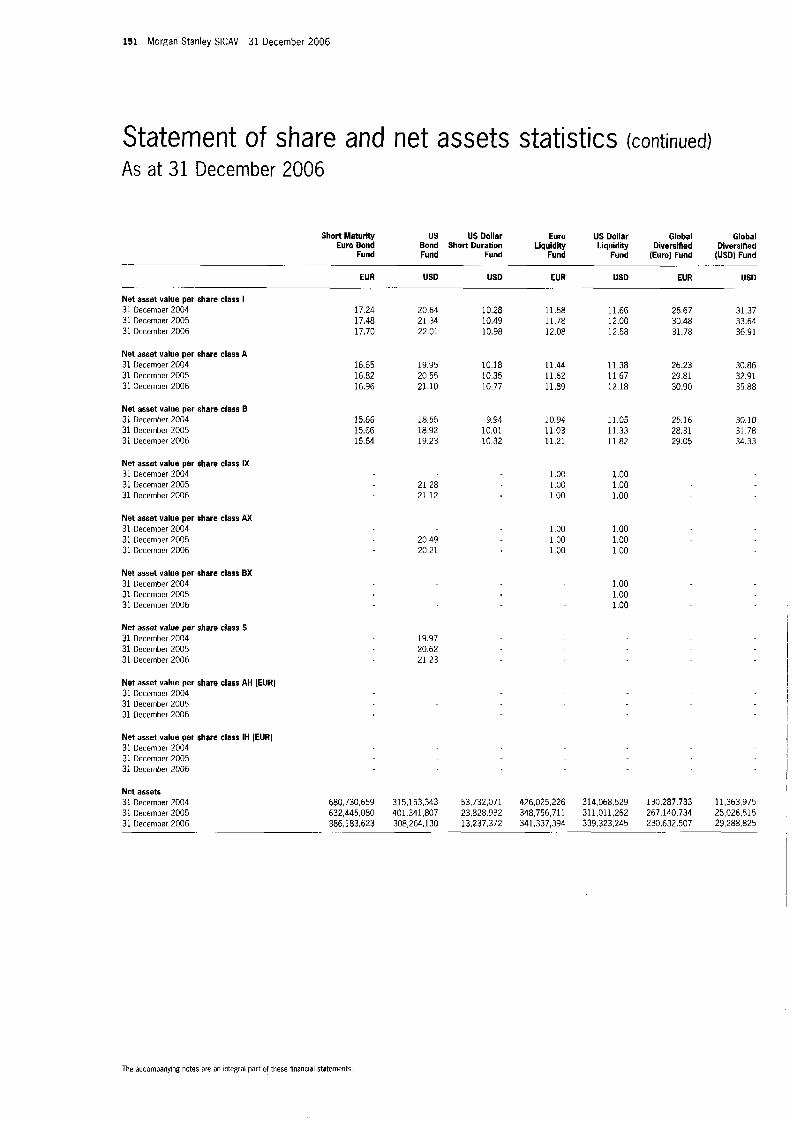
151 Morgan Stanley SICAV 31 December 2006
Statement of share and net assets statistics (continued) As at 31 December 2006
Short Maturity US US Dollar Euro US Dollar Global Global Euro Bond Bond Short Duration Liquidity Liquidity Diversfied Diverslfied
Fund Fund Fund Fund Fund (Euro) Fund (USD) Fund - - -~ . .-
- - Net asset value per share class I 31 December 2004 31 December 2005 31 December 2006
Net asset value per share class A 31 December 2004 31 December 2005 31 Ilecember 2006
Net asset value per share class B 31 December 2004 31 December 2005 31 December 2006
Net asset value per share class IX 31 December 2004 31 December 2005 31 December 2006
Net asset value per share class AX 31 December 2004 31 December 2005 31 December 2006
Net asset value per share class EX 31 December 2004 31 December 2005 31 December 2006
Net asset value per share class 5 31 December 2004 31 December 2005 31 December 2006
Net asset value per share class AH (EUR) 31 December 2004 31 December 2005 31 December 2006
Net asset value per share class IH (EUR) 31 December 2004 31 December 2005 31 December 2006
Net assets 31 December 2004 31 December 2005 31 December 2006
EUR - .
17.24 17.48 17.70
16.65 16.82 16.96
15.66 15.66 15.64
680,730,659 632,445.080 386,183,623
USD USD EUR
20.64 21.34 22.01
19.95 20.55 21.10
18.55 18.92 19.23
21.28 21.12
20.49 20.21
19.97 20.62 21.23
31 5,153,343 401,341,807 308,264,130
10.28 11.58 10.49 11.78 10.98 12.08
10.18 11.44 10.35 11.62 10.77 11.89
9.94 10.94 10.01 11.03 10 32 11.21
1 .oo 1 .oo 1 .oo
1 .oo 1 .oo 1 .oo
53,732,071 426,025,226 23.828.932 348,756,711 13,237,372 341,337,394
USD EUR
11.66 26.67 12.00 30.48 12.58 31.78
11.38 26.23 11.67 29.81 12.18 30.90
11.05 25.16 11.33 28.31 11.82 29.05
1 .oo 1 .oo 1 .oo
1 .oo 1.00 1.00
1 .oo 1.00 1 .oo
u50
31.37 33.64 36.91
30.86 32.91 35.88
30.10 31.78 34.33
314,068.529 130,287,733 11,363,975 31 1.01 1,262 267,140,734 25,G26.515 339,323,245 230,632,507 29.288.825
The accompanying notes arc an integral part of these financial statements
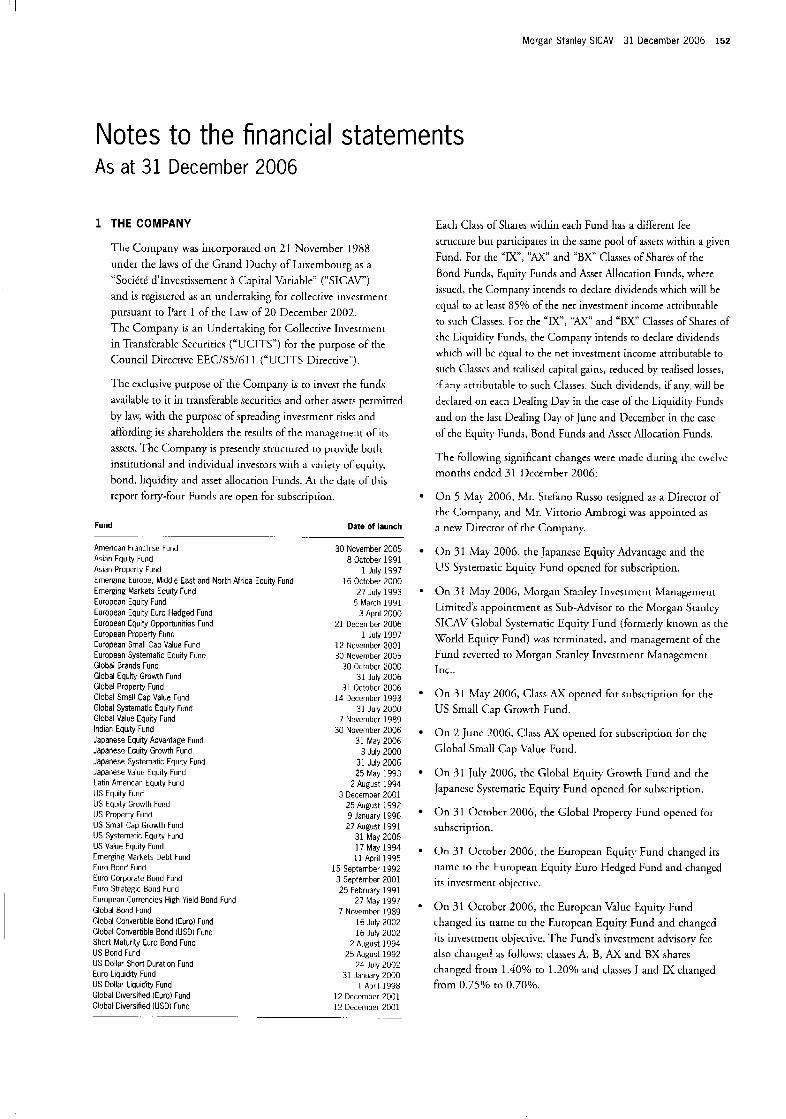
‘ I
Morgan Stanley SICAV 31 December 2006 152
Notes to the financial statements As at 31 December 2006
1 THE COMPANY
The Company was incorporated on 21 November 1988 under the laws of the Grand Iluchy of Luxembourg as a “Sociict dlnvcstissemenr Capital Variable” (“SICAV”) and is registered a an undertaking for collective invesririent pursuanr to Part 1 of the I.aw of 20 December 2002. The Cornpany is an llndertaking for Collective Invesrrnent in Transferable Securities (“UCITS”) for the purpose of the Council Directive EECIRSI611 (“LJCITS Directive”).
The exclusive purpose of the Company is to invest the funds available to it in transferable securities and other assets permitted by law, with [he purpose of spreading investment rish and affording its shareholders the results of the managmerit of its assets. ‘I’hc Company is presenrly strucrurcd tu provide both institutional and individual invesrors with a variety of equiry, bond, liquidity and asset allocation Funds. At thc date of this reporr forty-four Funds are open for subscription.
Fund
American Franchise Fund Asian Equity Fund Asian Property Fund Emerging Europe. Middle East and North Africa Equity Fund Emerging Markets Equity Fund Furopean Equity Fund European Equity Euro Hedged Fund European Equity Opportunities Fund European Property Fund European Small Cap Value Fund European Systematic Equity Fund Global Brands Fund Global Equity Growth Fund Global Property Fund Global Smell Cap Value Fund Global Systmatic Equity Fund Global Value Equity Fund Indian Equity Fund Jdpanese Equity Advantage Furid Japanesc Equity Growth Fund Japanese Systematic Equity Fund Japanese Value Equity Fund Latin American Equity Fund US Equity Fund US Equity Growth Fund US Propert] Fund US Small Cap Growth Fund US Systematic Eauity Fund US Value Equity Fund Emerging Markets Debt Fund Euro Bond Fund Euro Corporate Bond Fund Euro Strategic Bond Fund European Currencies High Yield Bond Fund Global Bond Fund Global Convertible Bond (Euro) Fund Global Convertible Bond (USD) Fund Short Maturity Euro Bond Fund US Bond FLnd US Dollar Short Duration Fund Euro Liquid0 Fund US Dollar Liquidity Fund Global Diversified (Euro) Fund Global Diversified (USD) Fund
~-
~-
Date of launch
30 Ncvember 2005 8 October 1991
1 July 1997 16 October 2000
27 July 1993 5 March 1991
3 April2000 21 December 2006
1 July 1997 12 November ZOO1 30 November 2005
30 October 2000 31 July 2006
31 October 2006 14 December 1993
31 July 2000 7 November 1989
30 November 2006 31 May 2006
3 July 2000 31 July 2006 25 May 1993
2 August 1994 3 December 2001
25 August 1992 9 January 1996 27 August 1991
31 May 2006 17 May 1994 11 April 1995
15 September 1992 3 September 2001 25 February 1991
27 May 1997 7 November 1989
16 July 2002 16 July 2002
2 August 1994 25 August 1992
24 July 2002 31 January 2000
1 April 1998 12 December 2001 12 December 2001
. -
Each Class of Shares within each Fund has a diKerent fee srrucrure bur parricipares in [he same pool of assets within a given Fund. For [he “ I X , “AX” and “HX” Classes of Shares of the Hord Funds, F.quity Funds and Asset Allocation Funds, where issucci, the Company intends to declare dividends which will be cqud to at least 85% of the net investnient income attriburable to such Classes. For the “IX”, “AX” and “BX” Classes of Shares of the Liquidity Funds, the Company intends to declare dividends which will I)c equal tu the net investment income attributable to such Classes and rcaliscd capital gains, reduced by realised losses, if any attributable to such Classes. Such dividends, if any, will be declared on each Dealing Day in the c a e of rhc Liquidity Funds and on the lasc Dealing Day of June and 13ecember in the case ofthc Equity Iknds , Bond Funds and h e r Allocation Funds.
The following significant changes were made during the twclvc
monrhs ended 31 Ilccember 2006:
On 5 May 2006, Mr. Stefmo Russo resigned as a Direcror of the Company, and Mr. Virtorio Ambrogi was appointed as
a new Direcror of the Cornpany.
On 3 1 May 2006, the Japanese Equity Advanrage and the US Systemaric Equity Fund opened for subscription.
O n 31. May 2006, Morgan Stanley Investment 1Man;igernent Limited’s appointment as Sub-Advisor to rhe Morgan Stanley SICAV Global Systematic Equity Fund (formerly known as the World Equiy Fund) was terminated, and management of rhe bund rcvcrtcd to Morgan Stanley Invesmienr Management Inc..
O n 31 May 2006, Class AX opened for subscription for the US Small Cap Growth Fund.
O n 2 June 2006, Class AX opened for subscriprion for the Global Small Cap W u e Fnnd.
O n 31 July 2006, the Global Equity Growth Fund and rhe )apancse Systematic Equity Fund opened for suhscription.
O n 31 October 2006, the Global Property Fund opened f n r subscription.
O n 31 October 2006, [he Luropcan Equity Fund changed its name to thc European Equity Euro Hedged Fund and changed its investinenr objecrivc.
On 31 October 2006, the European Valuc kquity l - ind changed irs t i a m to the European Equity Fund and changed its investinenr objecrivc. ‘I’hc Fund’s investmenr advisory fee also changed as follows: classes A, B, AX and RX shares changed from 1.40% ro 1.20Yn and classes J and IX changed from 0.75% to 0.70%.
9
.
153 Morgan Stanley SICAV 31 December 2006
Notes to the financial statements (continued) As at 31 December 2006
O n 31 October 2006, the World Equity Fund changed its name to the (~lohal Syscetnacic Equity Fund and changed its investment objective. The Funds investment advisory fee also changed as follows: classes A, R, AX and BX shares changed from 1 .,IO% to 1 .OO"/o and classes I and IX changed from 0.75?40 ro 0.5.5Yo.
O n 31 October 2006. Classes AH a n d IH opcncd for subscriptions for the American Franchise Fund, the Japanese Equity Advantage Fund, [he US Equiry Growth Fund, the L'S Valuc Equity Fund and rhe Emerging Markets 13cht Fund.
On 30 November 2006, the Indian Equiry Fund opened for subscription.
(3n 21 Ilcceniber 2006, rhe European Fqiity C>pportunitics Fund opetied for subscriprion.
SIGNIFICANT ACCOUNTING POLICIES
'I'he financial starements are prcscntcd in accordance with gcrrcrally accepted accounting principles applicahle co UCITS investment furlcis in Luxembourg and require managcmcrlt to
make estimates and ;issumpriotis that affecr the amounts reported in [he financial statements : i d accompanying notes. Actual results could differ from those estimates.
a) Valuation of securities Securities listed o n a rccognised stock exchange or dealt in
on any other rcgulatcd marker are valued at their last available prices ;it the valuation poinr, or, in the event that there should be se\,cral such markers, on rhe basis of their last available prices on [he main market for the relevant securiry.
In the even[ [hac the last available price docs not rruly reflect the fair rriarkct value of the relevant secutitics, the value of such securities will he based on rhe reasonably hresezable sales price determined prudently and in good faith pursuant to procedures esrablished by rhe Directors.
Securities nor listed or trndcd on a srock exchange or not dcalr on another regulated rnarkct are valued on the basis of
the reasonably foreseeable salcs price decerniined prudently arid in good birh pursuant to procedures esrablished bv the Llrcctors.
Securities with a known short-term tnaruricy date, are valueti using an arnorrised cost methoti. 'I'his involves valuing an irivcstnienr at its cost and thcrcafter assuming a consrant amortisation to maturiry of any discount or premium, regardless of the impact of fluctuating intcrest races on the market value of the investments.
F,xents may occur benveen the determination of an irwestment's last :available price and the detcrminarion of tlie Fund's k t Asset Valuc per Share at the valuation p i n [ that may, in tlie opinion of the Directors, mean that the la\t available price does nor reflect the Fair market value of
the investment. In such circumstances rlie price of such investment shall be adjusted in accordance with the procedures adopced from time to time by the Direcrois in theii- discretion. As ac tlie date of this annual report, certain securities were
fair valued in accordance with these procedures.
If since the time of dererrninarion of [he net asser value thcrc has hccn a rnarerial change in the quotations in the tnarltecs on which a substantial portion of the investments attributahlc to the relevant class ofshares are dealt in or quoted, the Company may, in order 10 safeguard rhe inceresrs of the shareholders and the Company, cancel [he first vduation and carry out further valuations as appropriate.
b) Valuation of forward foreign currency exchange and futures contracts Forward and fiitures contracts as disclosed on pages I18 to
1'12, which arc traded on exchanges or on orher organised markets are valued ar tlie lasr available prices of these contracts on exchanges and organised markets o n which the particular fiiturcs o r fnrwards conrracts are traded by the Company.
The liquidating value of futures conrracrs not traded on exchanges or on other orgnnised markets shall mean their net liquidaring value determined, pursuant to the policies established by the Board of Directors, on a lmis consisrently applied for each different varicty of concraccs.
c) Income and securities transactions Ilividend income is recorded on the ex dividend dare. Interest inconie is accrued daily. niscounrs and premiums are accreted as adjustments to interest income. Income from sccuricies lending is recorded on :I c:sh receipts basis.
Securities transacrions are accounted for o n the dare rhe securities arc purchased or sold. Realised gains or losses on the sale of securities are determined o n the hasis of [he average cos[ merhod.
d) Translation of foreign currencies Trans:ictiorls in foreign currencies are translated inro the currency of each Fund ar rhe last available rate of exchange prevailing in a rccognised market at the d:itc of the transactions. Assets and liah currencies are rranslated into the currency of each Fund a t the last available rate of exchange prevailing in a recognisrd marker at rhe date of rhe Statement ofAssets and Lhbili
The combined Sratenient of As prcsenred in US dollars a t the last available rate of exch:irlgc prevailing in a recognised market at [he date of the Sratenient of Assets and L.iah Statement of Operations and Changes in Net Assets is presented in US dollars at rhe average exchange rares ruling during the year.
es denominated in foreign
cs, while rhe combined
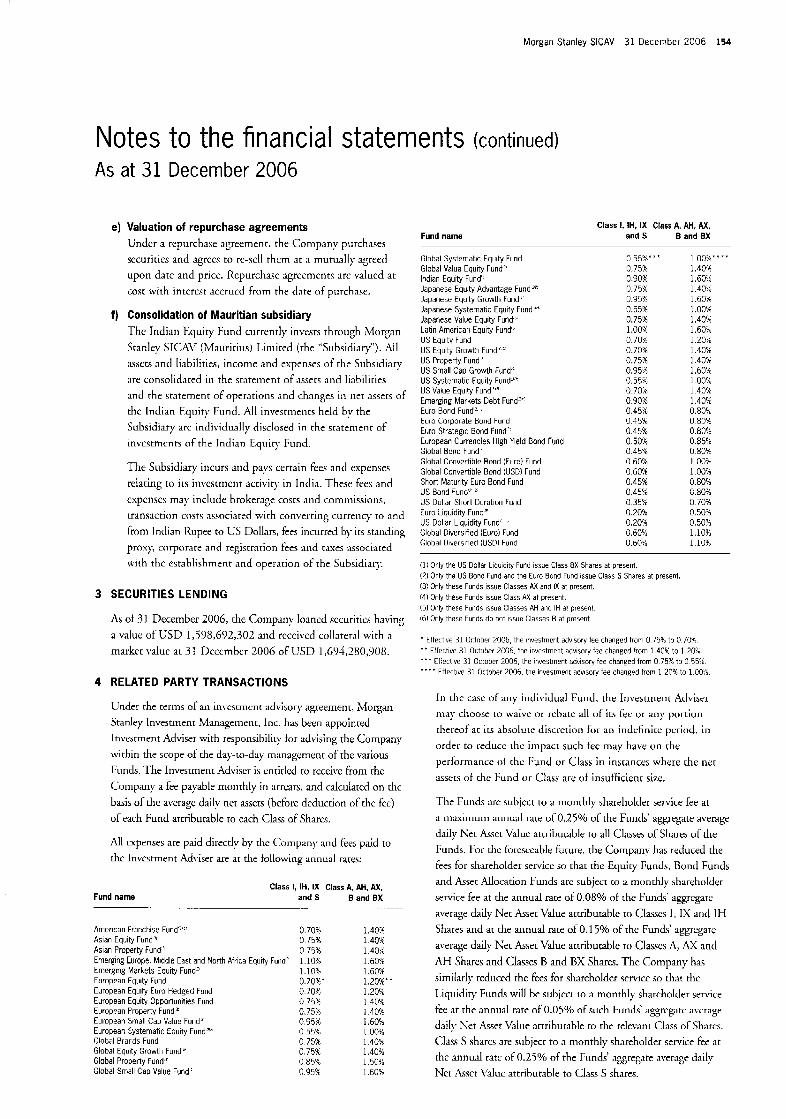
Morgan Stanley SICAV 31 December 2006 154
Notes to the financial statements (continued) As at 31 December 2006
Valuation of repurchase agreements tinder a repurchase agreement. the Company piirchases securirics arid agrccs to re-sell them at :I mutually agtced upon date and price. Repurchase agrccrncnts arc valued at cos[ with intcrcst accrued from the date of purchase.
Consolidation of Mauritian subsidiary The Indian t;.quity Fund currently invests through lMorgan Stanley SICAl' (IMauririus) Limited (the "Subsidiary"). =VI
es, income and expenses of the Subsidiary ;ire consolidated in the statement of assecs and liabilicies and the statement of operations and changes in ner assers of the Indim Equity Fund. All investnienrs held by the Subsidiary arc individually disclosed in the sratement of invcstmcnts of the Indian Equity Fund.
The Subsidiary incurs arid pays certain fees and expenses relating to its iri\,cstmcnt :ictivity in India. Thesr fees and cxpcnscs may include brokerage cosrs and commissions, transaction costs associated wirh converting currency ro and from Indian Kupee to C'S Dollars, fees incurred by its standing proxj; corporate and registrarion fees and raxes associated with the establishment and operarion of rhe Subsidiary.
SECURITIES LENDING
As of 31 December 2006, the Cornpatiy loaned securities h;iving ;I value of LSD 1,598,632,302 atid rcccivcd collateral with a marker value at 31 I ) c c c r n b c r 2006 of USD 1,694,280,908.
RELATED PARTY TRANSACTIONS
Under the rerms of' ai invcstmcnt advisory agreemenr, Morgan Stanley Investtiienr Maiqetnctit, Itrc. has been appointcd In\wtment Adviser with responsibility for advising the Company within the scope of [he day-io-day m:in;igement of the various Funds. The Invesrrnenc Adviser is cntitled to receive from the Company a fee payable tnotrthly in ;irre;irs, and calculated on rhe basis of the average d;iily net assets (before deducriotr of chc fee) of each Fund attributable to each Class of Shares.
All cxpenses are paid directly hy the Company and fees paid to the Investment Adviser ai-e ar the following annual rates:
Class I. IH. IX Class A. AH. AX. Fund name and S
.. - ._
American Franchise Furid I.:' 0 70% Asian Equity Fund '' 0 75% Asian Property Fund' 0 75% Emerging Europe. Middle East and North Africa Equity Fund' 1.10% Emerging Market5 Equity Fund' 1.10% European Equity Fund 0.70%' European Equity Euro Hedged Fund 0.709'. European Equity Opportunities Fund 0.75% European Froperty Fund' 0.75% European Small Cap Value Fund" 0.95% European Systematic Equity Fund!" 0 55% Global Brards Fund 0 75% Global Equity Growth Fund" 0.75% Global Property Fund' 0.85% Global Small Cap Value Fund' 0.9504
, . . B and EX
1.40% 1.40% 1.407: 1,60% 1.60% 1.20% * + 1.208 I .40% 1.40% 1.60% 1 .oox 1.40Yc 1.40% 1.50% 1.60%
Fund name Class I , IH, IX Class A, AH, AX.
and5 Band EX
Global Systematic Equity Fund Global Value Equity Fund" Indian Equity Fund! Japanese Equity Advantage Fund -" Japanese Equity Growth Fund' Japanese Systematic Equity Fund ''I Japanese Value Equity Fund' Latin American Equity Fund', US Equity Fund US Equib Growth Fund! I US Pruperty Fund? US Small Cap Growth Fund' US Systematic Fquity Fund"' US Value Equity Fund"' Emerging Markets Debt Fund ''' Euro Bond Fund' ! Euro Coroorate Burid Fund Eilro Strategic Bond Fund' European Currencies High Yield Bond Fund Global Bond Fund' Global Convertible Bond (Euro) Fund Global Convertible Bond W D ) Fund Short Maturity Euro Bond Fund US Bond Fund' US Dollar Short Duration Fund Euro Liquidity Fund' US Dollar Liquidity Fund- ' Global Diversified (Euro) Fund Global Diversified (USD) Fund
0.5596"' l.ouY,---' 0.75% 1 .do% 0.90% 1.60% 0.758 1.40-A 0.95% 1,60% 0.55% 1 .OO% 0.75% 1,40% 1.008 1.6059 0.70/: 1.20% 0.70% 1.40% 0.75% 1 40% 0.956 1.60% 0.55% 1 00% 0.705 1.40%, 0.90% 1.409; 0.45% 0.80% 0.45% 0.80% 0 459: 0.80% 0 501; 0.85? 0.45% 0.80% 0.60% 1 .00Y" 0.60% 1.00% 0.45% 0.80h 0.45% C.80% 0.3551 0.7077 0.20% 0.504 0.204 0.50% 0.6G:X 1.109; 0.60% 1.10%
(1; Only the US Dollar Liquidity Fund issue Class BX Shares at present (71 Only the US Bond Fund and the Euro Bond Fund Issue Class S Shares at present (3: Orily these Fiinds irrue Classes AX and IX at present. (4) Orily these Funds issue Class AX at present. (51 Only these Funds issue Classes AH and IH ai present. 161 Only these Funds do not issue Classes B at present.
* Effecti,,e 31 Octnher 2006, the investment advisory fee changed from 0.75% to 0.70% * + Effective 31 Octuber 2X6. the investment advisory fee changed +om 1.40% to 1.7090. ". tt:ective 31 Octcber 2006. the mvestment auvisory fee changed frurri 0 75% tu 0 55 * - - * Effective 31 Ortober 7006. the investment advtsoty fee changed trom 1.2P6 to 1.0
In the case of :my individual Fund, the Investment Acivisrr may choose LO waive o r rcbatc all of its fec or any portion rhereof ar its absoluic discrctioti for an indefinite period, in
order to reduce the impact such Fec may have o n the perhrmancc of-the I-'untl or Class in instances where the net assets of the Fund o r (.:lass are of insufficient size.
The Funds arc subjcct to ;I monthly shareholder service fee at a trmimum annual rate of 0.25% ofthe Funds' aggregate average daily Ket Aqsct Value attrihutahle to a11 Classes o f Shares of the Funds. For the fimsccahle future, the Company has reduced the fees for shareholder service so that the Equity Funds, Bond Funds and &set Allocation Funds arc subject to a monthly shareholder seivice fee at the annual rare of0.08Yo of the Funds' aggregate average daily Ner Asser Value arrriburaldc to C l ~ c s I , IX :itid IH Shai-es and ar rhe annual rare of 0.1 5% of the Funds' aggregate average daily Ker Assec Value atirihutahlc to Cl;isscs A, AX and AH Shares and Classes B and BX Shares. The Company has similarly reduced rhe fees for sliareholder senice so that the Liquidity Funds will he sul>jcct to a monthly sharcholtler senrice fee at rhe annual rate of0.05Yo of such Funds' :iggrcgatc average
d;iily Ket &set Value arrribucable ro [lie relevant Class of Shares. Class S shares are subject to a monthly shareholder service fee at [he annual rate of 0.25% of the Funds' aggregate average daily Net AWL \'aluc attrihutable to Class S shares.
155 Morgan Stanley SICAV 31 December 2006
Notes to the financial statements (continued) As at 31 December 2006
The shareholder service fee is paid tu Morgan Stanley Investment Managemcnr Limitcd (rhc “Ilistrihutor”) as compensation for providing certain serviccs to shareholdcrs. ‘I’hc I)istrihutor may choose to waive all of the Shareholder service fees or any portion [hereof ar its absolute discretion and for an indefinite period.
The Distriburor is also paid a distribution fee for the Equity Funds, Bond Funds and Asset Allocarion Funds, accrued daily and paid monthly, at the annual rate of 1.OOYn of rhe average daily Net Asset Value of Classes B and BX Shares as cornpensacion for providing distribution-related services to the Funds with respecr ro such Shares.
The Liquidity Funds will pay thc Ilistributor a distribution fee, accrued daily and paid monthly, at the annual rate of 0.750/0 of
the average daily Ket Asset Value for Classes R and RX Shlrcs.
a) Morgan Stanley Investment Management Inc. and thc sub-advisers for the Morgan Stanley SICAV have cntcrcd into the following types of transactions in which a connected person had a material interest:
i) Transactions in relation to an invesrrnent in respect of which a n affiliated firm beliefired froin a commission, fee, mark up or mark down; or
i i ) ‘liansactions in relation ro a placing and/or a new issue in which the affiliated company \vu a member of [he undeiwriting syndicate.
All the transaccions executed on behalf of the Morgan Stanley SICAV were entered into in the ordinary course of business and on normal commercial terms.
b) The total aggregarc value of the transactions of the Morgan Stanley SJCAV effected through affiliated firms is USD 2,229,043,594; such transactions represent 1.47Yo of rota1 rransactions. Total brokerage commission paid to ;iffli:itcd firms is L‘Sn 1,375,904 at an average rate o f
cornmishn of 0.0C;Yo.
Payments of USD 1,252,015 were made to Linklaters Loesch (of which Mr. Freddy Rrausch, a direcror of the Company, i s
a partner) for the work performed in 2006. An amount of US11 1,760,951 was paid to Morgan Stanley Investment Managccrncnr Limired u reimbursement for legal fees incurred. Those amounts arc disclosed under [he professional fees expensc line a p p r i n g in the Sratemenr of Operations and Changes in Net Assets.
Administration fees and transfer agent fees include operational cosrs of Morgan Stanley Investment Managcmenr Limited, Luxembourg branch, amounting to USL) 569,343.
‘l‘he Company has enrered into a securities lending conrract with Morgan Stanley & Co. International Limited, Morgan Stanley Trading GmbH & Co KG, Morgan Sranley Securities Limited, JMorgan Stanley & C o Incorporated and
MSI3W Equity Finance Service T (Cayman) 1,imited which is under norrnal commercial terms. The arrangement is cxclusivc in relation to certain securities.
5 TAXATION
Under current law and practice, the Company is not liable to any Luxembourg income tax, or any Luxembourg capital gains tax on rhe realised capital appreciation of the assets of the Company nor are dividends paid by rhe Company liable to any hxernbourg withholding tax. The Company is, however, liable to annual tax in I..uxembourg calculated a t the rate of 0.05% of the Net Asset Value of all Funds (except the Liquidity Funds for which the rate is 0.01 % of the Net Asset Value of the Liquidiry Funds). This tax is payable quarterly un
the basis of the net assets of rhe relevant Funds, calculated at the end of the quarter to which [he [ax dares . No stamp or other tax will be payable in Luxembourg in connection wirh the issue of Shares of the Company, except a once and for all tax of Euro 1,239.47 which was paid upon incorporation.
Dividends, interest and capital gains on securities held by the Company may be subject to nun-recoverable withholding [ax or capital gains tax in the countly of origin.
6 RATES OF EXCHANGE
The races of exchange used for translation into U S . dollars of assets and liabilities, including securities and foreign currency holdings, as of 31 December 2006 were:
Currency
ARS 3 072 - $1 00 AUD 1267 - 51.00 BRL 2 136 - $1 00
.- .. .
- - -
CAD CHF DKK EUR GBP HKD UUF IDR ILS INR JOD JPY KRW MAD MXN MY R NOK NZO OMR PEN PLN SEK SGD THE TND TRY W D 2AR
1.162 1.22
5.657 0.759
0.51 7.777
- -
-
190.785 - 8993.5
4.216 - 44.12 0.709 -
119.045 930
8.451 10.84
-
-
-
-
3.53 -
1.419 - 0.385 3.195 2.904 6.859 1.533 - 36.15 $1.00
$1.00 $1 00
1.301 1.417
- $1.00 - $1.00
32.605 6.984
6 248 -
- - - - - - -
- -
$1.00 $1.00 51.00 $1.00 51.00 51.00 $1.00 51.00 $1.00 $1.00 $1.00 51.00 $1.00 51.00 51.00 $1.00 51.00 $1.00 $1.00 $1.00 $1.00 51.00 $1.00
. . . ... ... .. .
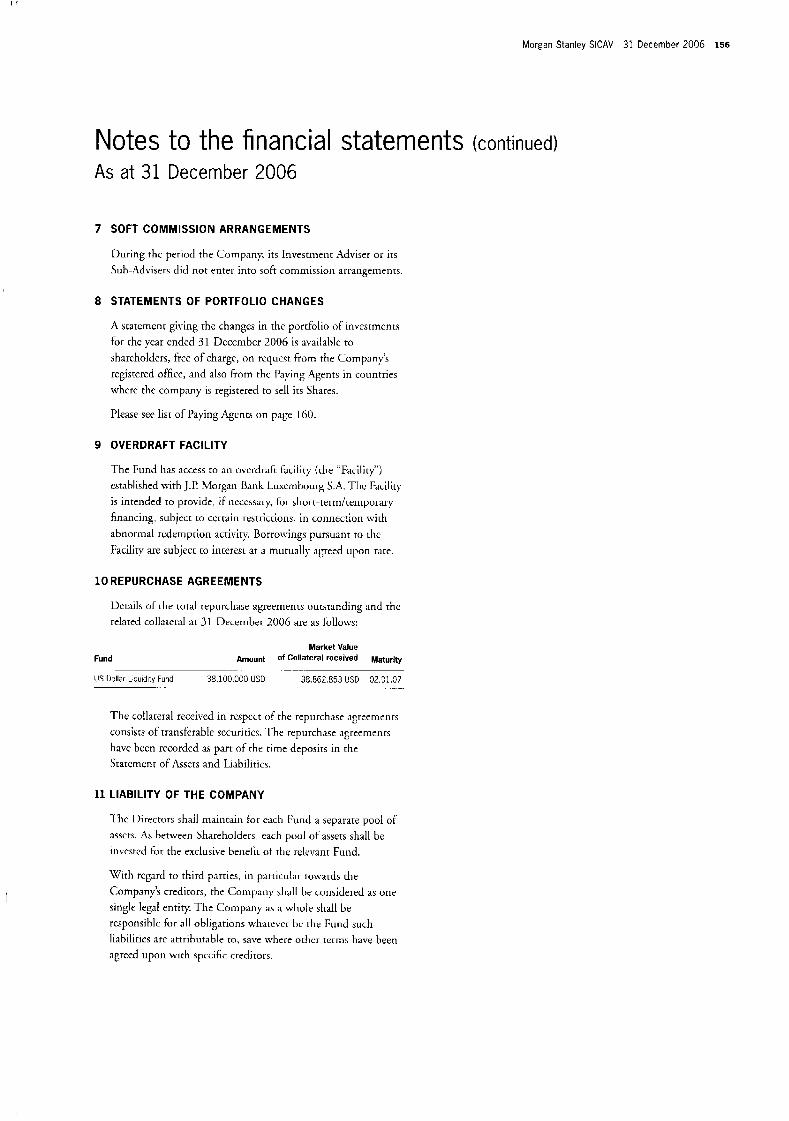
Morgan Stanley SICAV 31 December 2006 156
Notes to the financial statements (continued) As at 31 December 2006
7 SOFT COMMISSION ARRANGEMENTS
During thc period the Cornpan); its Investmenr Adviser or irs Sul)-Adviser\ did not enter into soft commission arrangemenrs.
8 STATEMENTS OF PORTFOLIO CHANGES
A statement giving the changes in the porrfolio of- inves[mcrits for the year ended 31 December 2006 is available to shareholders, free of charge, on request from the Compny’s registered office, atid also from thc Paying Agrnts in countries whcrc thc company is registered to sell irs Shares.
Please see lisr of Paying Agents o n p3ge 160.
9 OVERDRAFT FACILITY
The Fund has access IO an overdraft b c i l i t y (rhe “Facility”) established with J.P Morgan Bank Luxcrnl)ourg S.A. Thc Facility is intended ro provide, if necessary, for short-term/reinporaiy financing, suhjcct to ccrrain restrictions, in connection wirh abnormal rcdernprion activity. Borrowings pursuatii to thc
aciliry ” are subjecr ro inrerest at :I mutually agreed tipon rare.
10 REPURCHASE AGREEMENTS
Details of the total repurchase agreements outstanding :ind the
relarzd collateral at 31 Ihcemher 2006 are as follo~vs:
Fund Market Value
Amount of Collateral recelved Maturity . __
US Dollar L,quidity Fund 38.100.000 USD 38,862,853 USD 02.31.07 . .. -. - . . . - -
The collateral received in respect of the repurchase agreemenrs consists of transferable securitics. ‘l’he repurchase agreenietirs have bren recorded as part of thc time deposirs in rhe Statement of Assers and Liabilities.
11 LIABILITY OF THE COMPANY
- , L tic 1)irecrors shall maintain for cach Fund a separate pool of assets. As hetween Shareholders, each pool of assets shall be itivcstcd for the exclusive benefit of the relevant Fund.
W’ih regard to third parries, in particular towards the Company’s creditors, the Company sh;ill he considered as one single legal entity. The Company ;as :I whole shall be resporisiblc for all obligations wlyatevcr be the Fund such liabiliries arc attributable ro, save where other terms have been agreed upon with specific credirors.
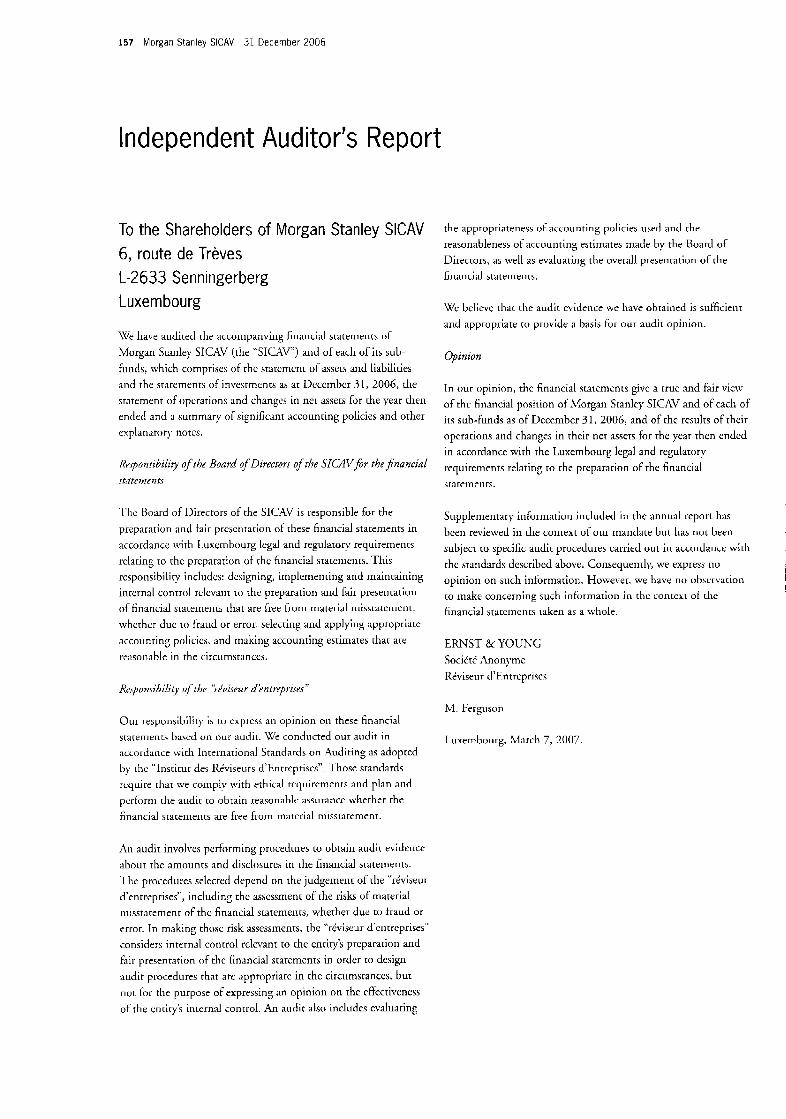
157 Morgan Stanley SICAV 31 December 2006
Independent Auditor’s Report
To the Shareholders of Morgan Stanley SICAV 6, route de Treves L-2633 Se nn ing e r be rg Luxembourg
KJr have audited the acconipanying financial statements of
Morgan Scanley SICAV (the “SIC14V’) and of each of its sub- funds, which comprises of rhc statcrricn1 of assets and liabiliries and the statements of investmrnra as at llcccmkcr 31, 2006, the statement of opcrarions and ctrarigcs in net assets for rhe year then ended and a surnrnary or significant accounting policies and other explanatory notcs.
khprkbility of’the Board of Directors of the SIUl’fur thr,finnwial stflKmt‘nts
‘I’hc Roard ofnirectors of the SICAV is responsible for the prrpararion and kiir presentation of these financial starenients in accordance w i t h I .uxemhourg lcgal arid regulatory requiremenrs relaring ro rhr pi-eparation of the financial sratctiicnrs. This responsibility include\: designing, irnplementing and mainraining internal control rclcvairt LO the preparation and fair presentation of financial sLareiiients rhat are free from material misstatcmcrrt, whether duc LO Uraud or error, selecting and applying ;ippropriatc accounting policies. and rnaking accounting estimates that are rcasonable in the circumst;inccs.
Our responsibility is to express an opinion on these financial statements hascd on our audit. We conducted our audit in
accordance wirh Inrernarional Standards o n .4uditing as adopred liy the “lnstitur des R.iviseurs d’Enrrcpriscs”. ‘I’hose srandards require rhat we comply with cthical rcquircmenu and plan and perform the audir ro obtain reasonahlc assurance wherher rhe financial srarements are free from matcrial rnissratement.
An audit involves perforrning procedures to obtain audit evidence about the amounts and disclosures in [he financial sraternrnts. ‘Hie procedures selected depend o n the judgetnenr of rhe “rCviseur d’entrzprises”, including rhc asscssnienr of rhe risks o f material misstatement of rhc financial sratenlents, whether due to fraud or error. T i l making those risk assessments, the “rkviseur d‘cntrcprises” considers internal control relevant to the entity’s preparation and fair presentation of the Linancial statements in order to design audit procedui-es that ;ire ;ippropriare in the circumstances, hut not. for the purpose of exprrssing ;in opinion on the effectiveness o f the cnrity’s iriternal conrrol. An audit also includrs evaluating
the appropriateness of accounting policies used and the reasonableness of accounting estimates made by the Hoard of
Direcrors, as well as evaluating the overall presentation of the financial statements.
K’c bclicvc that the audit evidence we have obtained is sufficient and appropriate to provide a basis for our audit opinion.
Opinion
I n oiir opinion, ttrc financial sratcirients give a [rue and fair view of the financial position of Morgan Sranley SICAV and of each of its sub-llnds as of December 31, 2006, and of the results of their operations and changes in rheir net assets for the year then ended in accordance with the Luxembourg legal and rcgulatory requirements relating to the preparation o f the financial scaternenrs.
Supplementary information included in thc annual report has heen reviewed in the conrext of our mandate but has not been subject to specific audit procedures carried out in accordance with the standards dcscrihed above. Consequenrly, we express no
to make concerning such information in the context ol- the financial srarcfricnts taken as a whole.
opinion on such informarion. However, we have n o ohscrvation I !
ERNST & YCWNiC; Socittt Anonyme RCviseur d’ F-ntrcpriscs
M. Ferguson
T.uxembourg, hlarch 7 , 2007.

I
Morgan Stanley SlCAV 31 December 2006 158
Directors and service providers
DIRECTORS
Freddy Brausch Partner (Laye r ) Linklarcrs Locsch Grand h c h y of Iuxcrribourg
Michael Green Managing Director hlorgnn Stanley Jnvestmenr Matiagcrncnr I .imited Londot1
Ronald Robison Marlaging IXrcctor hlorgan Stanley Investnienr Managenienr Inc. New York
Stefan0 Russo (until 5 May 2006) Managing Director Morgan Stanley Bank Inrernational Limited Rank Limired Milan
Vittorio Ambrogi (from 5 Ma:, 2006) hianaging Director Morgan Sranlcy Bank Internarional Lirnitcd Milan
DIRIGEANTS
Laurence Maglorie Vice President Morgan Stanley Invesrnient hlanagcrncn t I .i ni i red Luxernbourg
John Sun Executive Director Morgan St;iriIcy Investment M ;in age rnent Inc. New York
DIRECTORS OF THE SUBSIDIARY
Michael Green Managing Director Morgxn Stanlev Invesrrrictit Managenient Limited London
Ronald Robison Managing Director Morgan Stanley Invesrinent hlatiagernciit Itic. New Yorlc
Vittorio Ambrogi Managing Director Morgan Sranley Bank International I .imited l l i l an
Uday Kumar Gujadhur Director hIulciConsulr Limited hlauricius
Pamela Balasoupramanien Director klulriCoiisult 1.iriiitcti hlauritius
INVESTMENT ADVISER
Morgan Stanley Investment Management Inc 1 221 Avenue of [he Aniericas New York, NY 10020 USA
INVESTMENT SUB-ADVISERS
Morgan Stanley Investment Management Limited 25 C a h Squarc Canary 1Y/h:irf Loridon F.14 4QA Uni tcd Ki ngtlom
Morgan Stanley Investment Management Company 23 Church Strcct 16-0 I Capital Squarc Singapore, 049481
Morgan Stanley Asset & Investment Trust Management Co., Limited Yebisu Gardcri Placc ‘lijwcr 20-:3? Ebisu 4-Chorrie Shibuya-ku, Tokyo 150-6009 japan
Morgan Stanley Investment Advisors Inc. 1221 Avenue of the Americas New York, XI’ 10020 USA
Morgan Stanley & co . International Limited 25 Cabor Square Canary Wharf 1.ondon E 1 4 4QA h i terl Kingdom
REGISTERED OFFICE
6 , ruiitr d e ‘ l i tves I -2633 Senningerberg Grand Duchy of Luxembourg
DISTRIBUTOR
Morgan Stanley Investment Management Limited 25 Cabot Square Canary Wharf. Lorldori E l 4 4QA Unitcrl Kingdom
CUSTODIAN BANK
J.P. Morgan Bank Luxembourg S.A. h o p e a n Rank and Business Center 6, route de Treves L-2633 Senningerberg Grand Duchy of Luxcrnhourg
ADMINISTRATOR, PAYING AND DOMICILIARY AGENT
J.P. Morgan Bank Luxembourg S.A. European Bank atid Husincss Ccntcr 6 , rourc tlc ‘I ibes 1,-2633 Seniiingerberg Grand Duchy of Luxcrnhourg
ADMINISTRATOR OF THE SUBSIDIARY
.%dtiConsult Limited 10, Frrrc Felix de Valois Strcct
Port Louis Mauriiius
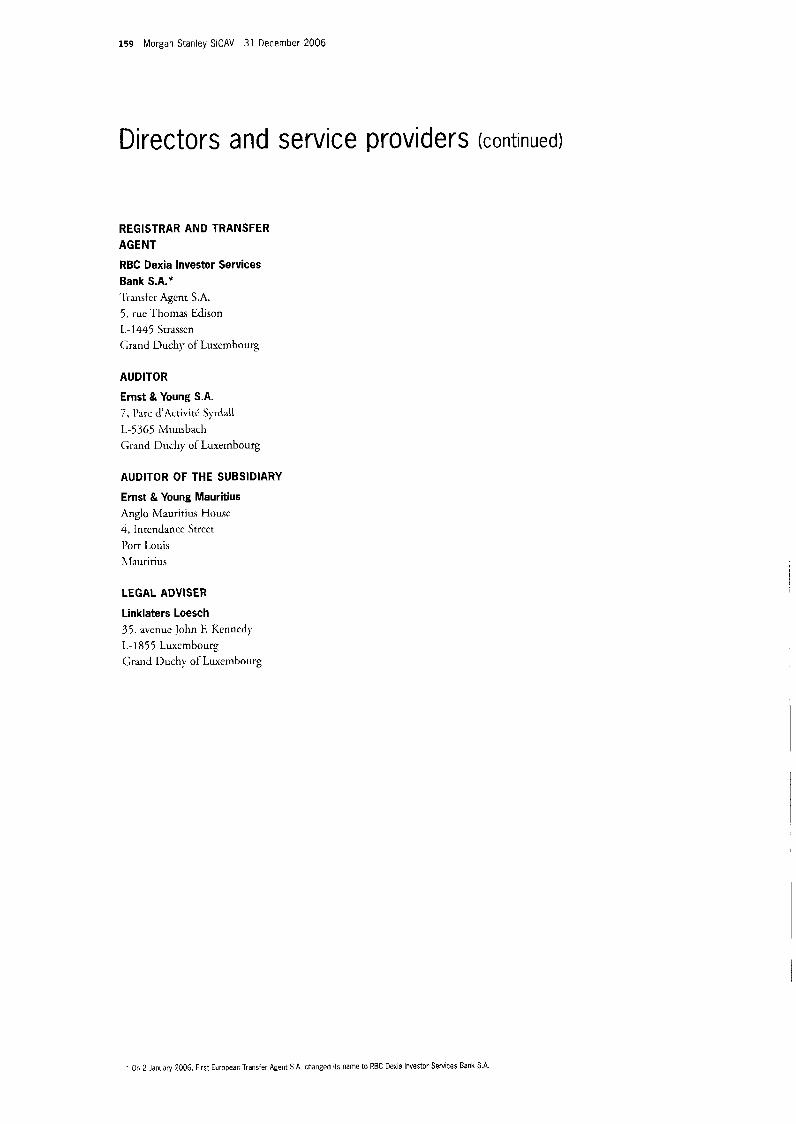
159 Morgan Stanley SlCAV 31 December 2006
Directors and service providers (continued)
REGISTRAR AND TRANSFER AGENT
RBC Dexia Investor Services Bank S.A.* ‘liansfcr Agent S.A. 5, rue ‘Ihotnas Edison L l 4 4 5 Strasscrr <;rand Duchy of‘ Luxembourg
AUDITOR
Ernst & Young S.A. 7 , Parc cj’:\ctivitC Syrdall L- j365 h.iunsbach Grand Duchy of Luxeinbourg
AUDITOR OF THE SUBSIDIARY
Ernst & Young Mauritius Anglo Mauri t ius Housc 4, Intcndancc Street Port I .ouis
hiaui-irius
LEGAL ADVISER
Linklaters Loesch 37. avcnuc john F. Kcntiedp 1 ,- 1 855 1,uxcrnbourg (;rad l h c h y o&- Luxembourg
. ilr, 2 January 2006. First Europear; Transfer Agent S.A. cnanged its name to RBC Dexia Investor Servlces Bank S.A.
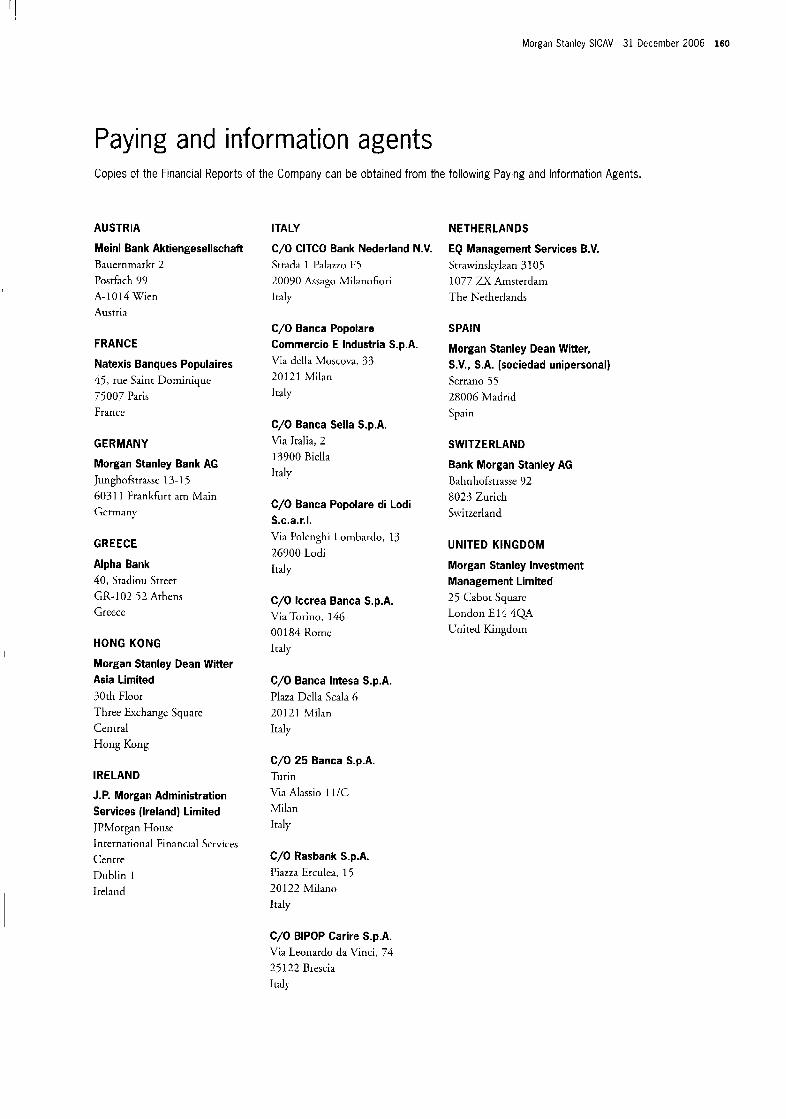
Morgan Stanley SICAV 31 December 2006 160
Paying and information agents Copies of the Financial Reports of the Company can be obtained from the followmg Paytng and lnformatlon Agents.
AUSTRIA
Meinl Bank Aktiengesellschaft Rauernrnarkt 2 Postfach 99 A-1014 Wien Austria
FRANCE
Natexis Banques Populaires 45. rue Sainr Dominique 7.5007 Paris Francc
GERMANY
Morgan Stanley Bank AG Junghofstraw 13-1 5 603 1 1 Frat) kfiirt am Main C h n a n y
GREECE
Alpha Bank 40, Stadiou Street GR-102 52 Athens Greecc
HONG KONG
Morgan Stanley Dean Witter Asia Limited 30th Floor Three Exchange Square Central Hong Kong
IRELAND
J.P. Morgan Administration Services (Ireland) Limited JPMorgan House International Financial Services
Centre Dublin I Ireland
ITALY
C/O ClTCO Bank Nederland N.V. Strada 1 I'alazzo F5 20090 Assago Xlilanofiori Italy
C/O Banca Popolare Comrnercio E Industria S.p.A. Via dclla Moscova, 3.3 20121 Milan Italy
C/O Banca Sella S.p.A. Via Jtalia, 2 13'300 Riella It;1ly
C/O Banca Popolare di Lodi S.c.a.r.1. Via I'nlcnghi I.orrtbartlo, 1.3 26900 Lodi Italy
C/O lccrea Banca S.p.A. Via h r i n o , 146 00 184 Komc Icaly
C/O Banca lntesa S.p.A. Plaza Della Scala 6 20121 Milan Iraly
C/O 25 Banca S.p.A. Turin Via Alassio 11/C Milan Italy
C/O Rasbank S.p.A. Piazza Erculea, 1 i 20 122 Milano Italy
NETHERLANDS
EQ Management Services B.V. Strawinskylaan 3 105 1077 ZX Arnsterdani The Ketherlands
SPAIN
Morgan Stanley Dean Witter, S.V., S.A. (sociedad unipersonal) Serrano 55 28006 Madrid Spain
SWITZERLAND
Bank Morgan Stanley AG Rahnhofstrasse 92 8023 Zurich Switzerland
UNITED KINGDOM
Morgan Stanley Investment Management Limited 25 Cabot Squarc London E14 4QA United Kingdoni
C/O BIPOP Carire S.p.A. V i a Leonardo da Vinci, 74 25 122 Rrescia Italy
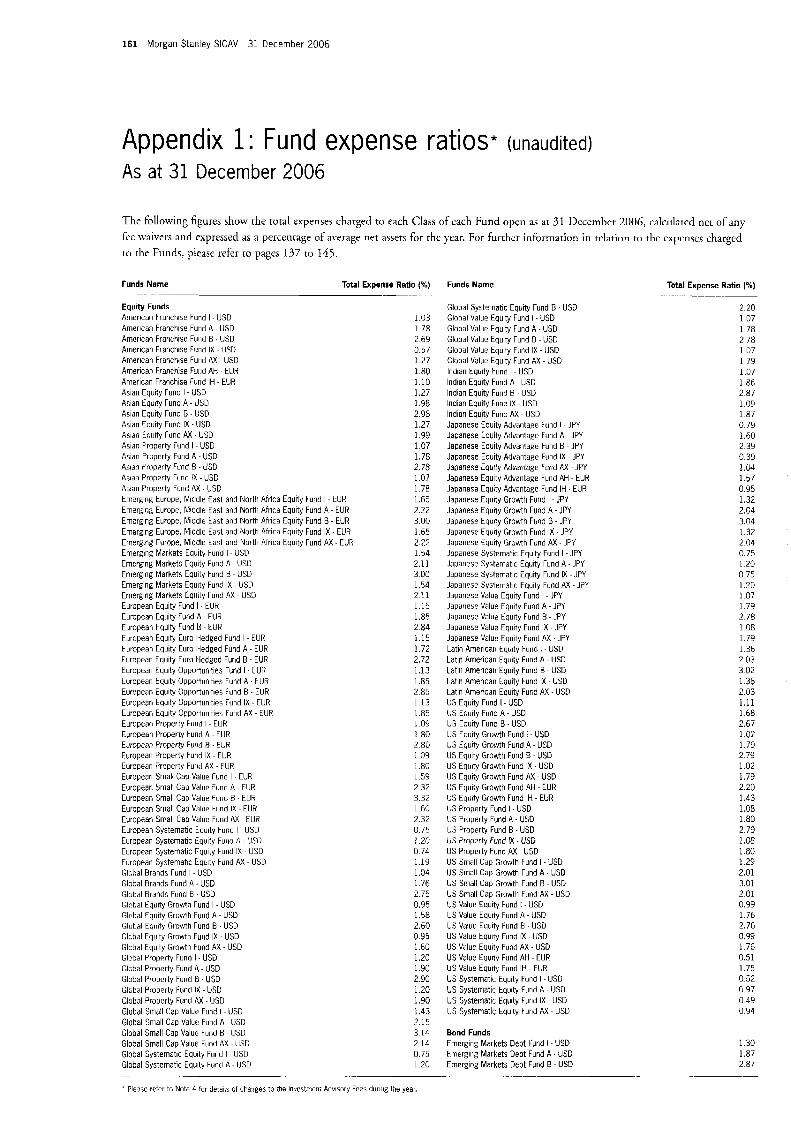
161 Morgan Stanley SlCAV 31 December 2006
Appendix 1 : Fund expense ratios* (unaudited) As at 31 December 2006
The following figures show the total expenses charged to each Class of tach Fund opcn as a t 31 Occcrnhcr 2006, calculatcd ~ C L of any Lcc waivers and expressed as a percentage of average net assets for thc )-ear. For f u r r h c r i n f o r m a r i o n in relation to t h e c x p r c s chargcd to [he Funds, please refer ro pages 137 to 145.
Funds Name Total Expense Ratlo (96) .. . .- -
Equity Funds American Franchise Fund I - USD American Franchise Fund A - USD Amcrican Frarichibe Fund B - USD Arriericdn Frarichise Fcnd IX - USD American Franchise Fund AX - US0 American Franchise Fund AH - EUR American Franchise Fund IH - EUR Asian Equity Furld I - USD Asian Equity rund A - US0 Asian Equity Fund B - USD Asiari Eqiiity Fund IX - USD Asian tqiiity Fund AX - USD Asian Property Fund I - USD Asian Property Fund A - USD Asran Property lund B - USD Agian Property Fund IX - USD Asian Property Fund AX - USD EmZrginE Europe, Middle East and North Africa Equity Fund I - EUR Emaging Europe, Middle East and North Africa Eqiiity Fund A - EUR EmcrginL: Europe, h4iddle East and North Africa Equity Fund B - EUR Emerging Europe. hliddle East and North Africa Equity Fund IX - EUR Errifrging Furope. hiddle Last and North Africa Equity Fund AX - EUR EnierRiiiR Markets Equity Fund I USD Emcrgirig Markets Fquity Fund A - USU Erriergiiig Markets Equity Fund B - USD Emerging Markets Equity Fund IX US0 Errierging fddrkets Equity ruiid AX - US9 European Equity Fund I - EUR European Eqiiit), Fund A - FUR Europeaii tquity Fund 0 -CUR European Eqiiity Euro Hedged Fund I - EUR turopean Cquity Euro Hedged Fund A - EUR Curopean Equity Euro Hcdgcd Furid B - EUR European Equity Opportunities h i i d I - t U t i Curopean Equity Opportunities Fund A - FUR European Equity Opportunities hind B - EUR European tqiiity Opportunities Fund IX - EUR European Equity Opporturiities Fund AX - FUR Eurupedn Property hind I - CUR European Property Fund A - EUR European Property Fund B - EUR Furopean Property Fund IX - EUR European Property Furid AX - FUR European Small Cap Value Fund I - EUR Europear. Small Cap Value Fund A - EUR European Small Cap Value Furid B - EUR European Srriall Cap Value tiind IX - EUR European Small Cap Value Fund AX - EUR European Systematic Equity Fund I USD European Systematic Equity Fund A - USU European Systematic Fquity trml IX - USD European Systematic CqLity Fund AX - USD (:lcbal Brands Fund I - USD Global Brands Furid A I US0 Global Brands Fund B . USU Global Lquity Growth Fund I - USD Global Equity Growth Fund A - USU Glcbal Eqiiity Growth Fund B - USD Clcbal Equity Growth Fund IX - USD Glcbal Equity tirowth Fund AX - US0 tilcbal Property Fund I - US0 Global Property Fund A - US0 Global Property Furid B - US0 Global Property Fund IX - USD Global Propefty Fund AX - US0 Global Small Cap Value Fund I - US0 Global Small Cap Value Fund A . US0 Global Small Cap Value Fund B US0 Global Small Cap Value Fund AX - US0 tilobal Systeinatic Equity Fund I . USD Global Systcrnatic Equily Fund A - USD - .
1.03 1.78 2.69 0.57 I 2 7 1.80 1.10 1.27 1.98 2.98 1.27 1 9 9 1 0 7 1.78 2 78 1 0 7 1.78 1.65 2.22 3.00 1.65 2.27 1.54 2.11 3 00 !.54 2 11 1.15 1.85 2.84 1.15 1.72 2.72 1.13 1.85 2 85 I 1 3 1.85 1.09 I .80 2.80 1.09 1.80 1.59 2 32 3.32 1.60 2.32 0.75 1.20 0.74 1.19 1.04 176 2.75 0.95 1.58 2.60 0.95 1.60 1.20 1 90 2 90 1.20 1.90 1.43 2.15 3.14 2.14 0.75 120
~
Funds Name
Global Systernatic Equity Fund B I US0 Global Value Eqiiity Fund I - USD Global Value Equity Fund A - USD Global Value Equity Fund B - US0 Global Value Equity Fund IX - US0 Global Value Equity Fund AX - US0 Indian Equity Fund I - USD Indian Equity Fund A - USD Indian Equity Fund B . USD Indian Eqiiity Func IX - USD Indian Equity FunG AX - USD Japanese Equity Advantage Fund I - JPY Japanese Equity Advantage Fund A - JPY Japanese Equity Advantage Fund B - JPY Japanese Equity Advantage Fund IX - JPY Japanese Eqiiity Advantage Fund Ax - JPY Japanese Equity Advantage Fund AH - EUR Japanese Equity Advantage Fund IH EUR Japanese Equity Growth Fund I - JPY Japanese Equity Growth Fund A - JPY Japanese Equity Growth Fund B - JPY Japanese Fquity Growth Fund IX - JPY Japanese Equity Grobvth Fund AX - JPV Japanese Systematic Equity Fund I - JPY Japanese Systematic Eqiiity Fund A - JPI' Japanese Systematic Equity Fund IX - JPY Japariese Systernatic Fuiiily Fund AX - J?Y Japanese Value Equity Fund I - JPY Japanese Value Equity Fund A - JPY Japanese Value Equity Fund B - JPY Japanese Value Eqiiity Fund IX - JPY Japanese Value Equity Furid AX. JPY Latin American Equity Fund I - US0 Latin American Equity Fund A - US0 Latin American Eqiiity Fund B - US0 Latin American Equity Fund IX - US0 Latin American Equity Fund AX - US0 US Equity Fund I - US0 US Equity Fund A - USD US Equity Fund B - USD US Equity Growth Fund I - USU US Equity Grovjth Fund A - USD US Equity Growth Fund B - USU US Equity Grobvth Fund IX - US0 US Equity Growth Fund AX - US0 US Equity Growth Fund AH - EUR US Eauity Growth Fund IH - EUR US Property Fund I - USD US Property Fund A - USD US Property Fund B - USD US Property Fund IX - USD US Property Fund AX US0 US Srriall Cap Growth Fund I - USD US Small Cap Growth Fund A - USD US Small Cap Growth Fund B - USD US Small Cap Growth Fund AX - USD US Value Equity Fund I - US0 US Value Equity Furid A - USD US Vdlue Eqwty Fund B - US0 US Value Equity Fund IX - US0 US Value Equity Fund AX - USD US Value Equity Fund AH - EUR US Value Equity Fund IH - EUR US Systematic Equity Fund I - US0 US Systematic Equity Fund A - US0 US Systematic Equity Fund IX - US0 US Sygtematic Equity Fund AX - USD
Bond Funds Emerging Markets Debt Fund I - USD €.merging Markets Debt Fund A - USD EmeEing Markets Debt Fund B - USD
.. -
Total Expense Ratio ( O h )
2.20 1.07 1.78 2.78 1 0 7 1.79 1.07 1.86
1.09
0.79
. ~
2.87
1.87
1.60 2.39 0.39 1.04 1.57 0 95 1.32 2.04 3.04 132 2.04 0.75 1.20 0.75 1.20 1.07 1.79
1 08 1.79 1.36 2.03 3.02 1.36 2.03 1.11 1 68 2.67 1 07 1.79 2.79 1.02 1.79 2.20 1.43 1.08 1 80 2 79 1.08
1.21) 2.01 3.C1 2 01 0.99 1.76 2.76 0.99 1.76 0.51 1.75 0.32 G 97 0.49 0.54
2 78
1 .mu
1.30 1.87 2.87
' F l e 3 x rcfcr to Note 4 fur detai,z UI L I x E e s to i l i ~ Invcrtmcn; Advisory Fees dilririg the yea:.
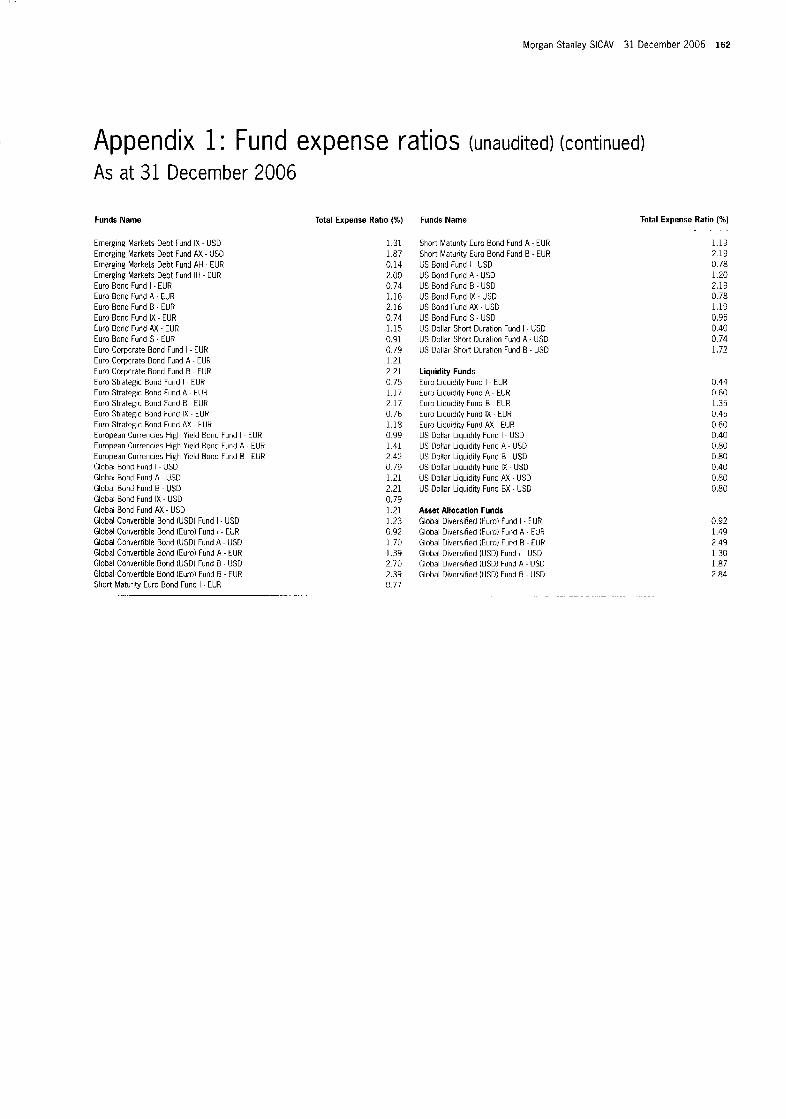
Morgan Stanley SICAV 31 December 2006 162
Appendix 1 : Fund expense ratios (unaudited) (continued) As at 31 December 2006
Funds Name Total Expense Ratio (96) Funds Name
Emerging Markets Debt Fund IX - USD Errierging Markets Debt Fund AX - US0 Emerging Markets Debt Fund AH - EUR Emerging Markets Debt Fund IH - EUR Euro Bond Fund I - EUR Euro Bond Fund A - EUR Euro Bond Fund 0 - EUR Euro Borid Fund IX - EUR €uro Bond Fund AX - EUR Euro Bond Fund S - EUR Euro Corpcrate Bond Fund I - EUH Euro Corpcrate Bond Fund A - EUR Euro Corpcrate Bond Fund B - EUR Euro Strategic Burid Fund I - EUR Euro Strategic Bond Fund A - tUH Euro Strategic Bond Fund B - EUR Euro Strategic Bond Fund IX - EUR Euro Strategic Bond Fund AX - tUH Europearl Currericies High Yield Bond Fund I - EUR European Currencies High Yield Bond Fund A - EUR European Currencies High Yield Bond Fund B - EUH Global Bond Fund I - US0 Global Bond Fund A - US0 Global Bond Fund B - US0 Global Bond Fund IX - US0 Global Bond Fund AX - USD Global Coniertible Bond (USD) Fund I - USD Global Curriertible Bond (Euro) Fund I - EilR Global Kowertible Burid (USD) Furid A US0 Global Coniertible Bond (Euro) Fund A - tUR Global Corwrtible Burid (USD) Fund B - USD Global Con,/ertible Bond (Euro) Fund B - EUR Short Matu-ity Euro Bond Fund I - EUH
1.31 1.87 0.14 7.00 0.74 1.16 2.16 0.74 1.15 0.91 C.19 121 2.21 s 75 1.17 2 17 0.76 1 . I 8 0 99 1.41 2 42 0 79 1.21 2.21 0.79 1 2 1 1 .%3 0.92 1.70 1.39 2.70 2.39 ::.77
Short Maturity Euro Bond Fund A - EUR Short Maturity Eilro Bond Fund B - EUR lis Borid Fund I USD US Bond Fund A - USU US Bond Fund B - USD US Burid Fund IX - US0 US Bond I und AX - USD US Bond Fund S - USD US Dollar Short Duration Fund I - US0 US Dollar Short Duration Fund A - US0 US Uollar Short Uuration Fund B - US0
Liquidity Funds Euro Liquidity Fund I - EUR Euru Liquidity Furid A - ELR Euro Liquidity Fund B - EUR Euro Liquidity Fund IX - EUR Euro Liquidity Furilf AX EUR US Dollar Liquidity Fund I - USD US Dollar Liquidity Fund A - USD US Dollar Liquidity Fund B - USU US Dollar Liquidity Fund IX - US0 US Dollar Liquidity Fund AX - USD CIS Dollar Liquidity Fund BX - USD
Asset Allocation Funds Global Uiversihed (Euro) Fund I - EUR Global Dlversfied (Fur01 Fund A - EUR Global Diversified iEuro) Fund B - EUH Global Diversified (USD) Fund I . USD Global Uivmlfied (USU: hind A - USU Global Diversified IUSD) Fund B - US0
Total Expense Ratio (%)
1.19 2.19 0.78 1.20 2,19 0 78 1.19 9.95 0 40 0 74 1.72
. . .
0.44 0.60 1.35 0.45 0.60 0.40 0.80 0.80 0.40 0.80 0.80
0.92 1.49 2.49 1.30 1.87 2 84
. -. . .. . . . -
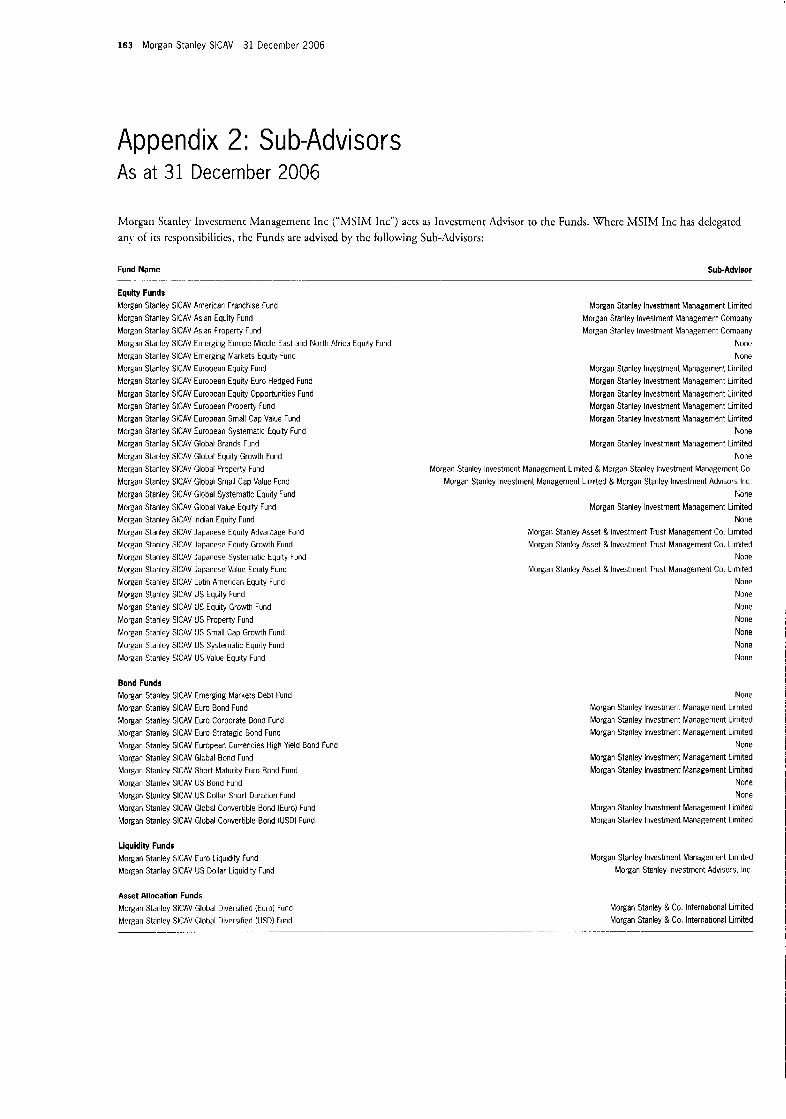
163 Morgan Stanley SICAV 31 December 2006
Appendix 2: Sub-Advisors As at 31 December 2006
Morgan Sratilcy Invcstrncnt Mariagcmcnt Inc ( “ M S I M Inc”) acts as Invcsrmenr Advisor to the Funds. Where hfSI5f Inc has delegated mi! of its rcsI”ir’sil)ilities, rhc Funds arc advised by thc following Sub-Advisors:
Fund Name Sub-Advisor .- . .. - . . - .. . -
Equity Funds Morgan Stanley SICAV American Franchise Fund Morgan Stanley SICAV Asian Equity Fund Morzan Stanley SICAV Asian Property Fund Morgan Stanley SICAV Emerging Europe Middle East and North Africa Equity Fund Morgan Stanley SICAV Emerging Markets Equity 5md Morgan Stanley SICAV European Euuity Fund Morgan Stanley SICAV European Equity Euro Hedged Fund MorEan Stanley SICAV Eurclpeari Equity Opporturiities Fund Morgan Stanley SlCAV European Property Fund Morgan Stanley SlCAV European Small Cap Value Fund Morgar. Stanley SlCAV Eurapean Systematic Lquity Fund Morzan Stanley SlCAV Global Brands Fund Morgan Stanley SlCAV Global Equity Growth Fund Morgan Stanley SICAV Global Property Fund Muraan Stanley SlCAV Global Small Cap Value FLnd Morzan Stanley SlCAV Global Systematic Eqrrity ‘und Mofzan Stanley SlCAV Global Value Equity Fund Morgan Stanley SICAV Indian Equity Fund Morgan Stanley SICAV Japanese Equity Advantage Fund Morgan Stanley SICAV Japanese Equity Growth Fund Morgan Stanley SlCAV Japanese Systematic Equity Fund Morgan Stanley SICAV Japanese Value Equity Fund Morgan Stanley SlCAV Ldtin American Equity Fund Morgan Stanley SlCAV US tquity Fund Morgan Stanley SICAV US Equity Growth Fund Morgan Stanley SlCAV US Property Fund Morgan Stanley SlCAV US Small Cap Growth Fund Morgan Stanley SICAV US Systematic Equity Fund Morgan Stanley SlCAV US Value Equity Fund
Bond Funds Morgan Stanley SlCAV Fmerging Markets Debt tund Morzan Stanley SICAV Euro Bond Fund Morgari Stanley SICAV Euro Corporate Bond Fund Morgan Stanley SICAV Euro Strategic Bond Fund Morgan Stanley SICAV Europearl Currencies Higb Yield Bond Fund Morgan Stanley SICAV Global Bond Fund Morgan Stanley SICAV Short Maturity Euro Bond Fund Morgan Stanley SICAV US Bond Fund Murgan Stanley SICAV US Dollar Short Duration Fund Mopan Stanley SlCAV Global Convertible Bond (Euro) Fund Morgan Stanley SICAV Global Convertible Bond (US01 Fund
Liquidity Funds Morgan Stanley SICAV Furo Liquidity Fund Morgan Stanley SICAV US Dollar Liquidity Fund
Asset Allocation Funds Morgan Stanley SICAV Global Diversified (Euro) Fund Morgan Stanley SlCAV Global Diversified (USD) Fund
Moman Stanley Investment Management Limited Morgan Stanley Investment Management Company Morgan Stanley Investment Management Company
None None
Morgan Stanley Investment Management Limited Morgan Stanley Investment Management Limited Morgan Stanley Investment Management Liriiited Morgan Stanley Investment Management Limited Morgan Stanley Investment Management Limited
None Morgan Stanley Investment Management Limited
None Morgan Stanley Investment Management Limited & Morgan Stanley Investment Management Co.
Morgan Stanley Investment Management Limited & Morgan Stanley Investment Advisors Inc None
Morgan Stanley Investment Management Limited None
Morgan Stanley Asset & Investment Tast Management Co. Limited Morgan Stanley Asset & Investment Tvst Management Co. Limited
None Morgan Stanley Asset & Investment Pust Management Co. Limited
None None None None None None None
None Morgan Stanley Investment Management Limited Morgan Stanley lnvcstment Management Limited Morgan Stanley Investment Management Limited
None Morgan Stanley Investment Management Limited Morgan Stanley Investment Management Limited
None None
Morgan Stanley Investment Management Limited Morgan Stanley Investment Management Limited
Morgan Stanley Investment Management Limited Morgan Stailcy Investment Advisors. Inc
Morgan Stanley & Co International Limited Morgan Stanley & Co. International Limited
. . . .. . .. _ .~ .. . - . ~ .. . .
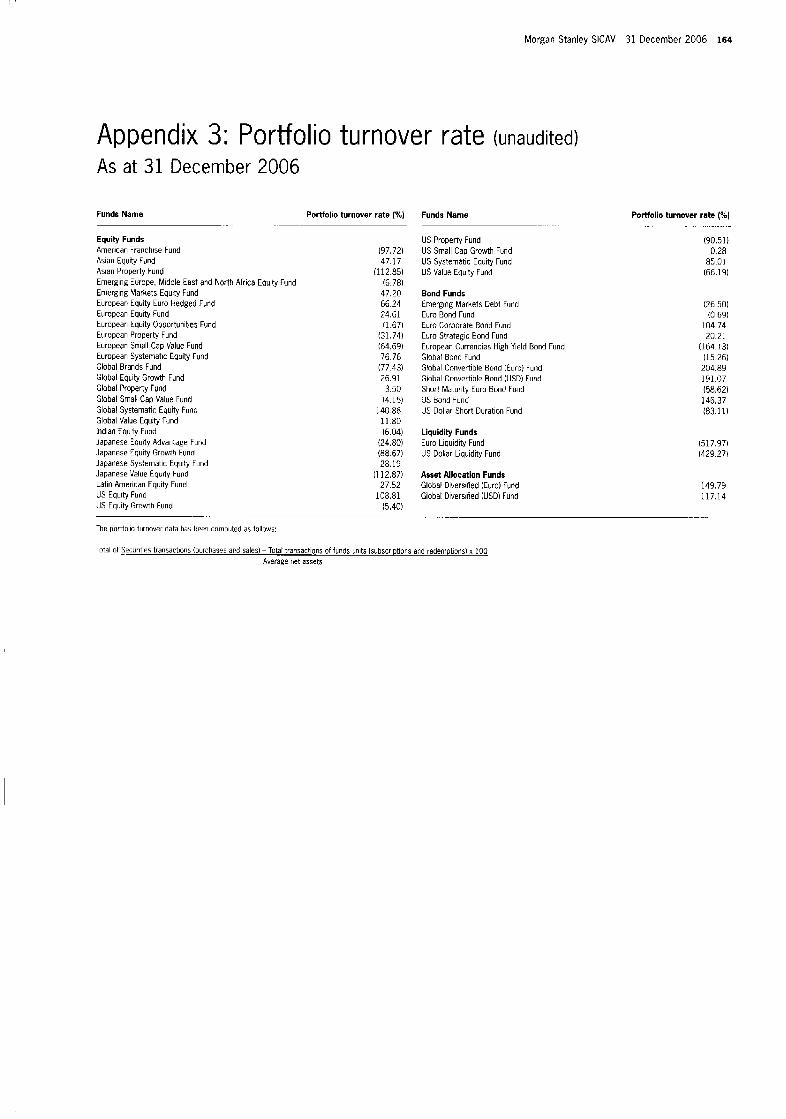
Morgan Stanley SlCAV 31 December 2006 164
Appendix 3: portfolio turnover rate (unaudited) As at 31 December 2006
Fund8 Name Portfolio turnover rate ( O h )
. .-
Equity Funds American -ranchise Fund Asian Equity Fund Asian Property fund Emerging Grope, Middle East and North Africa Equity Fund Emerging Markets Equity Fund European Equity Euro Hedged Fund European Equity Fund European Equity Opportunities Fund European Property Fund European Small Cap Value Fund European Systematic Equity Fund Global Brands Fund Global EqLity Growth Fund Global Property Fund Global Small Cap Value Fund Global Systematic Equity Fund Global Value Equity Fund Indian Equ ty Fund Japanese Iquity Advantage Fund Japanese Equity Growth Fund Japanese Systematic Equity Fund Japanese ‘Value Eaulty Fund Latin American Equity Fund US Eauity Fund US Equity Growth Fund
The portfolio turnover data has beel computed as follows:
-.
Funds Name
(97.72) 47.17
(112.85) (6.78)
47.20 66.24 24.61 (1.67)
(31.74) (64.69) 76.76
(77.43) 26.91
3.50 (4.15)
140.86 11.80 (6.04)
(24.80) (88.67) 28.19
( I 12.87) 27 52
108.81 (5.40)
US Property Fund US Small Cap Growth Fund US Systematic Equity Fund US Valiie Equity Fund
Bond Funds Emerging Markets Debt Fund Euro Bond Fund Euro Corporate Bond Fund Euro Strategic Bond Fund European Currencies High Yield Bond Fund Global Bond Fund Global Convertible Bond (Euro) Fund Global Convertible Bond (USD) Fund Short Maturity Euro Bond Fund US Bond Fund US Dollar Short Duration Fund
Liquidity Funds Euro Liquidity Fund US Dollar Liquidity Fund
Asset Allocation Funds Global Divershed (Euro) Fund Global Diversified (USD) Fund
Portfolio turnover rate (%)
(90.51) 0.28
85.01 (66.19)
(26.50) (0 69)
104.74 20.21
(164.13) (15.26)
204.89 191.07 (58.62) 146.37 (83.11)
(517.97) (429.27)
149.79 117.14
Total of Securities transactions (purchases ard sales) -Total transactions of funds mt j (subscriptions and redemptions) x 100 Average net assets

www.morganstanley.com/sicav The Morgan Stanley SlCAV website IS directed only to persons located in Austria, Germany, Italy. Luxembourg. Spain, Sweden. Switzerland and the United Kingdom