AVlVA - Fundsquare
103
AVlVA
-
Upload
khangminh22 -
Category
Documents
-
view
6 -
download
0
Transcript of AVlVA - Fundsquare
AVlVA

Board of Directors
Manaqcrncnt and Administrdtion
Schedule of Investments and Other Net Asscts
Aviva Investors - Absolute Bond tund Avivd Investors - Absolute 1 AA Fiind Aviva Investors Amciican Equity furid Aviva Investors - Asia-Pacific Equity Fund Aviva Invpstnr5 - Australian Kesources Fund Aviva lnvestnrs - tmerging Markets Bond Fund Aviva lrivestors - 1:mrrging Markets Equity Fund Aviva Investors Emcrqing Markets Fquity Small Cap Fund Aviva Investors - Emerging Markcts Local CurretiLy Hotid tund Aviva Investors - EUK Reserve Fund Aviva Invpstors - European Aggregate Bond Fund Aviva lnvpstnrs - turopean Convergence Equity Fund Avivd Investors - tiirnpean Corporate Bond Fund Aviva Irivestors - Furopean tquity Fund Aviva Investors - r utopean RH1 Fund Aviva lrivestors - ruiopean Sorially Responsible Equity Fund Aviva Investors - Europcan Value Equity Fund Aviva Invpstnrs - Frpnrh Equity Fund AVIVJ Investors - GHP Reserve Fund Aviva Investors - Globijl Convertibles Fund Aviva Investors. Global Equity Focus rutid Aviva Investors - Global RElT Fund Aviva Investors - Japanese Equity Fund Aviva Investors - Long Term Europcan Bond rurid Aviva Investors - Pan-European Equity Fund Aviva Investors Short Tcrm Curopean Rond runt1 Aviva Investors - UK Equity Focus Fund
Staternetit of Net Assets
Statistics
Statement of Changes in Shares Outstanding
Statement of Operations and Changes in Net Assets
Notes to the Findncidl Statements
2
3
4 5 6 9
11 I ? 14 16 17 18 19 21 I ? ? A 26 27 29 31 32 33 37 39 40 42 43 45 46
47
55
67
81
89
I h i5 tepntt d 0 ~ 5 not conMule an olfet of shares. Subsctipttotls ate otily vdlid if rridde uti thr hiw of thr riittetit ptospectus supplcmctitcd by thc last available diiriual repoil and Ihc latest semi-aririudl icputt if publi!kd .iftrt wrtl ;it1 lltltillA tppott Pa-4 performanre is not ncccssaiily iridtcatlve of futule letUIti5.
C r q i i r \ of Itir ptnqx=rtii<, aititial teport, wmi-annual icpott and details 01 charigcs i r i irivvjtnietitj fur tht. wh-fundr aie available ltom the registetcd OIIICC. ltcc 01 chatgc
Board of Directors
!
Chairman
James Tanner (until February 29, 2008) Morley Fund Management Limited 1, Poultry London ECZR 8EJ. United Kingdom
Adam Lessing (since February 29, 2008) Head of European Business Development Morley Fund Management Limited
London ECZR 8EJ, United Kingdom 1, Poultry
Directors
JosP Caturla Aviva Gesti6n de lnversiones A.1.E 45, Calk Zurbano E-2801 0 Madrid, Spain
Jacques Elvinger Elvinger, Hoss & Prussen 2, place Winston Churchill L-1340 Luxembourg, Grand Duchy of Luxembourg
Marcel Ernzer FAS S.A. 54, rue de Cessange L-1320 Luxembourg, Grand Duchy of Luxembourg
Adam Lessing (until April 1, 2008) Head of European Business Development Morley Fund Management Limited
London ECZR 8EJ. United Kingdom 1, Poultry
William Gilson (since April 1, ZOOS) 34, avenue de la Liberte, 4th Floor L-1930 Luxembourg, Grand Duchy of Luxembourg
Secretary
Aviva Fund Services SociCtC Anonyme 34, avenue de la LibertC 4th Floor L-1930 Luxembourg, Grand Duchy of Luxembourg
Unaudited Semi-Annual Report
The accompanying notes form an integral part of these financial statements
2
Management and Administration
Distribution in Luxembourg and Registered Office
Aviva Investors (formerly Aviva Morley) 34, avenue de la Libertk 4th Floor L-1930 Luxembourg, Grand Duchy of Luxembourg
Investment Adviser
Morley Fund Management Limited
London ECZR 8EJ, United Kingdom 1, Poultry
Manager, Administrator, Domiciliary and Registrar Agent
Unaudited Semi-Annual Report 1
1
Aviva Fund Services Societe Anonyme 34, avenue de la Liberte 4th Floor L-1930 Luxembourg, Grand Duchy of Luxembourg
Paying Agent and Custodian
JP Morgan Bank Luxembourg S.A. European Bank and Business Centre 6, route de Treves L-2633 Senningerberg, Grand Duchy of Luxembourg
I
I
Independent Auditor
Ernst &I Young S.A. 7, Parc d'Activite Syrdall L-5365 Munsbach, Grand Duchy of Luxembourg
Legal Adviser
Elvinger, Hoss & Prussen 2 , place Winston Churchill L-1340 Luxembourg, Grand Duchy of Luxembourg
Marketing and Distribution Agent
Aviva Fund Services Societe Anonyme 34, avenue de la Liberte 4th Floor L-1930 Luxembourg, Grand Duchy of Luxembourg
The accompanying notes form an integral part of these financial statements.
3
Aviva Investors - Absolute Bond Fund
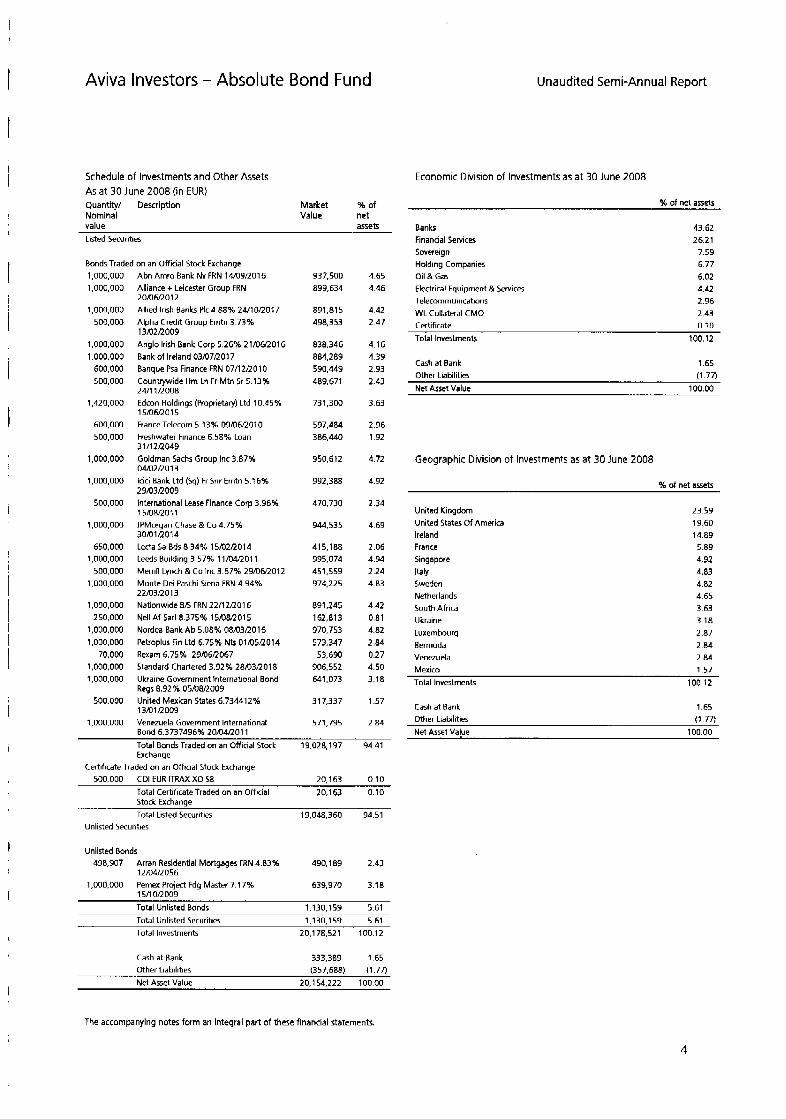
Schedule of Investments and Other Assets As at 30 June 2008 (in EUR) Quantity/ Description Market %of Nominal Value net value assets Listed Securities
Bonds Traded on an Official Stock Exchange 1,000,000 1,000,000
1,000,000 500,000
1,000,000 1,000,000
600,000 500,000
1,420,000
600,000
500,000
1,000,000
1,000,000
500,000
1,000,000
650,000 1,000,000
500.000 1 .ooo.ooo
1,000,000 250,000
1,000,000 1,000,000
70,000 1,000,000 1.000.000
500.000
1.000.000
Abn Amro Bank Nv FRN 14/09/2016 Alliance + Leicester Group FRN 20/06/2012 Allied Irish Banks PIC 4.88% 24/10/2017 Alpha Credit Group Erntn 3.73%
Anglo Irish Bank Corp 5.26% 21106/2016 Bank of Ireland 03/07/2017 Banque Psa Finance FRN 07/12/2010 Countrywide Hm Ln Fr Mtn Sr 5.13% 24/11/2008 Edcon Holdings (Proprietaly) Ltd 10.45% 15/06/2015 FranceTelecom 5.13% 09106R010 Freshwater Finance 6.58% Loan 3 1 11 2R049 Goldman Sachs Group Inc 3 87% 04/02/2013 lcici Bank Ltd (59) Fr Snr Emtn 5.16% 29103/2009 International Lease Finance Corp 3.96% 15/08R011 JPMorgan Chase & Co 4.75% 30101 no14 tecta Sa Bds 8.34% 15102/2014 Leeds Building 3.57% 11/04ROll Merrill Lynch & Co Inc 3.67% 29/06/2012 Monte Dei Paschi Siena FRN 4.94% 22/03/2013 Nationwide 8/5 FRN 22/12/2016 Nell Af Sarl 8.375% 15BW2015 Nordea Bank Ab 5.08% 08m3/2016 Petroplus Fin Ltd 6.75% Nts 01/05/2014 Rexarn 6.75% 294612067 Standard Chartered 3.92% 28/03/2018 Ukraine Government International Bond Regs 8.92% 05/038/2009 United Mexican States 6.734412%
Venezuela Government International
i3102n009
i 3 m 1 ~ 0 0 9
Bond 6.3737496% 20/04/2011 Total BondsTraded on an Official Stock 19,028,197 94.41 Exchange
Certificate Traded on an Official Stock Exchange 500,000 CDI EUR ITRAX XO 58 20,163 010
Total Certificate Traded on an Official 20.163 0.10
937,500 899,634
891,815 498,353
838,346 884.289 590,449 489.671
731.300
597.484 386,440
950,612
992.388
470,730
944.535
41 5,188 995,074 451,559 974.225
891.245 162,813 970,753 573,347 53,690
906,552 641,073
317,337
571.795
4 65 4 46
4 42 2 47
4 16 4 39 2 93 2 43
3 63
2 96 1 92
4 72
4 92
2 34
4 69
2 06 4 9 4 2 24 4 83
4 42 0 81 4 82 2 84 0 27 4 50 3 18
157
2 8 4
Stock Exchange Total Listed Securities 19.048.360 94.51
Unlisted Securities
Unlisted Bonds 498,907 Arran Residential Mortgages FRN 4.83% 490.189 2.43
12/04/2056 1,000,000 Pemex Project Fdg Master 7.17% 639.970 3.18
15/1 OR009 TOW Unlisted Bonds 1,130,159 5.61 Total Unlisted Securities 1.130.159 5.61 Total Investments 20.1 78.52 1 100.12
Cash a t Bank 333.389 1.65 Other Liabilities (357.688) (1.77) Net Asset Value 20,154,222 10000
Unaudited Semi-Annual Report
Economic Division of Investments as at 30 June 2008
% of net assets
Banks Financial Services Sovereign Holding Companies Oil & Gas Electrical Equipment & Sewices Telecommunications WL Collateral CMO Certificate Total Investments
43.62 26.21
7.59 6.77 6.02 4.42 2.96 2.43 0.10
100.12
Cash at Bank 1.65 Other Liabilities (1 77) Net Asset Value 100.00
Geographic Division of Investments as at 30 June 2008
% of net assets
United Kingdom United States Of America Ireland France Singapore
Sweden Netherlands South Africa Ukraine Luxembourg Bermuda Venezuela Mexico Total lnvestmenb
Italy
23.59 19.60 14.89 5.89 4.92 4.83
4.65 3.63 3.18 2.87 2.84 2.84 1.57
100.12
4.82
Cash at Bank 1.65 Other Liabilities (1.77) Net Arret Value 100.00
The accompanying notes form an integral part of these financial statements.
4
Aviva Investors - Absolute TAA Fund
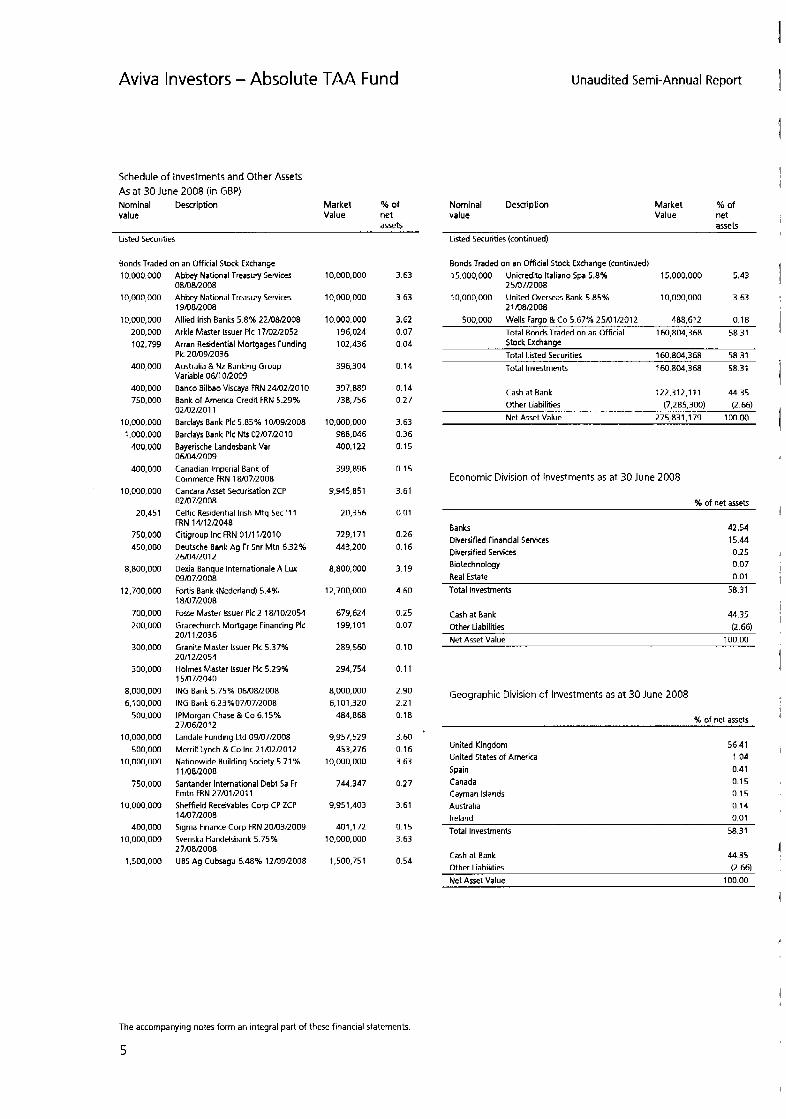
Schedule of Investments and Other Assets A5 at 30 June 2008 (in GBP) Nominal Description Market %o f value Value net
assets listed Securities
Bonds Traded on an Official Stock Exchange 10.000.000
10,000,000
10,000,000 200,000 102,799
400,000
400,000 750,000
10,000,000 1,000,000
400,000
400,000
10,000,000
20.451
750,000 450,000
8,800.000
12,700.000
700,000 200,000
300,000
300,000
8,000,000 6,100,000
500,000
10,000,000 500,000
10,000,000
750,000
10.000.000
400,000 10,000,000
1,500,000
Abbey National Treasury Services 08/08/2008 Abbey National Treasury Services 19/08/2008 Allied Irish Banks 5.8% 22/08/2008 Arkle Master Issuer PIC 17/02/2052 Arran Residential Mortgages funding PIC 20/09/2036 Australia & Nz Banking Group Variable OW1 OR009 Banco 8ilbao Viscaya FRN 24/02/2010 Bank of America Credit FRN 5.29% 02/02/2011 Barclays Bank Pic 5.85% 10/09/2008 Barclays Bank PIC Nts 02107/2010 Bayerische Landerbank Var 06/04/2009
Canadian imperial Bank of Commerce FRN 18/07/2008 Cancara Asset Securisation ZCP 02107R008 Celtic Residential Irish Mtg Sec '1 1 FRN 14/12/2048 Citigroup Inc FRN Ol l l lR010 Deutsche Bank Ag Fr Snr Mtn 6.32% ZM14R012 Dexia Banque Internationale A Lux
Fortis Bank (Nederland) 5.4% 18/07/2008 Fosse Master Issuer PIC 2 18/1 On054 Gracechurch Mortgage Financing PIC 20/11/2036 Granite Master Issuer PIC 5.37% 20/12/2054 Holmes Master Issuer PIC 5.29% 15/07R040 ING Bank 5.75% 06108/2008 ING Bank 6.23%07/07/2008 JPMorgan Chase & Co 6.1 5% 27/06/2012 Landale Funding Ltd 09/07/2008 Merrill Lynch & Co Inc 21/02/2012 Nationwide Building Society 5.71 % 11/08/2008 Santander International Debt Sa Fr Emtn FRN 27101/2011 Sheffield Receivables Corp CP ZCP 14/07/2008 Sigma Finance Corp FRN 20/t33R009 Svenska Handelsbank 5.75% 27/08/2008 UBS Ag Cubsagu 6.48% 12/03/2008
09/07/2008
10,000,000
10,000,000
10.000.000 196,024 102,436
396,304
397.889 738.756
10,000,000 988,046 400,122
399.896
9,945.851
20,356
729,171 443,200
8,800,000
12,700,000
679,624 199,101
289,560
294.754
8,000,000 6,101,320
484.868
3,957,529 453,276
10,000,000
744,347
9,951,403
401,172 10,000,000
1.500.751
3.63
3 63
3.62 0.07 0 04
0.14
0.14 0.27
3.63 0.36 0.15
0.15
3.61
0.01
0.26 0.16
3.19
4.60
0.25 0.07
0.10
0.11
2.90 2.21 0.18
3.60 0.16 3.63
0.27
3.61
0.15 3.63
0.54
Nominal Description value
Unaudited Semi-Annual Report
Market % of Value net
assets Listed Securities (continued)
Bonds Traded on an Official Stock Exchange (continued) 15,000,000 Unicredito Italiano Spa 5.8% 15,000,000 5.43
25/07/2008
2 1/08/2008 10,000,000 United Overseas Bank 5.85% 10,000,000 3 63
500,000 Wells Fargo & Co 5 67% 25/01/2012 488.612 0.18 Total Bonds Traded on an Official 160.804.368 58.31 Stock Exchange Total Listed Securities 160.804.368 58 31 Total Investments 160.8M.368 58.31
Cash a t Bank 122,312,111 4435 Other Liabilities (7,285,300) (2.66) Net Asset Value 275.831.179 100.00
Economic Division of Investments as at 30 June 2008
% of net assets
Banks 42.54 Diversified financial Services 15.44 Diversified Services 0.25 Biotechnology 0.07 Real Estate 0.01
Total Investments 58.31
Cash at Bank 44.35 Other Liabilities (2.66) Net Asset Value 100.00
Geographic Division of Investments as at 30 June 2008
% of net assets
United Kingdom 56.41 United States of America 1 04 Spain 0.41 Canada 0.15 Cayman Islands 0.15 Australia 0.14 Ireland 0.01 Total Investments 58.31
Cash a t Bank 44.35 Other Liabilities (2 66) Net Asset Value 100.00
I 1
1 I I
I
,
1
i i I
I
I
I
I I
I I
I
1
1
f
I
The accompanying notes form an integral part of these financial statements.
5
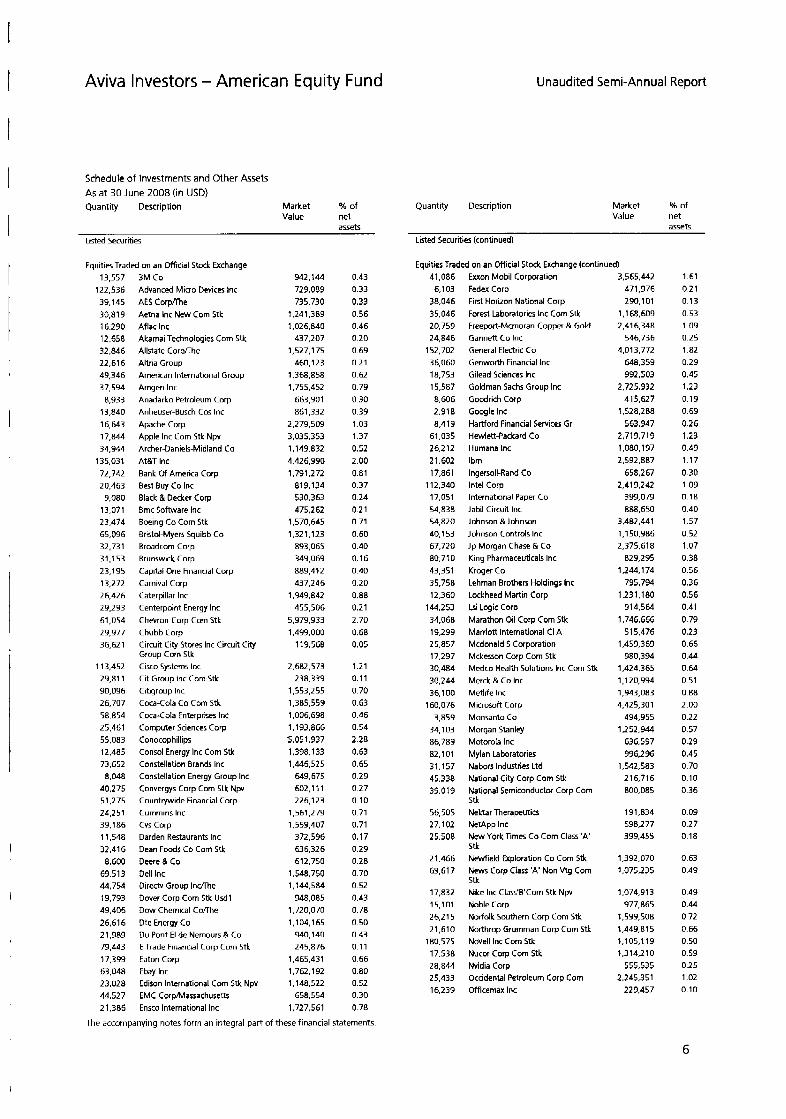
Aviva Investors - American Equity Fund Unaudited Semi-Annual Report
Schedule of Investments and Other Assets As a t 30 June 2008 (in USD) Quantify Description Market % of
assets Value net
Listed Securities
EquitiesTraded on an Official Stock Exchange 13,557
122,536 39,145 30,819 16.290 12.658 32.846 22,616 49,346 37,594
8,933 13,840 16,643 17,844 34,944
135,031 72,742 20,463
9,080 13,071 23,474 65,096 32,731 31,153 23,195 13,272 26,426 29.293 61,054 29.977 36,621
113,452 29.81 1 90.096 26,707 58.854 25,461 55,083 12.485 73.652 8,048
40,275 51,275 24,251 39,186 1 1,548 32,416 8,600
69.513 44,754 19,793 49,406 26,616 21,989 79.443 17,399 63,048 23,028 44,527 21,386
3M Co Advanced Micro Devices Inc AES Corvhe Aetna Inc New Corn Stk Aflac Inc Akamai Technologies Corn Stk Allstate Corpflhe Altria Group American International Group Arngen Inc Anadarko Petroleum Corp Anheuser-Busch Cos Inc Apache Corp Apple Inc Corn Stk Npv Archer-Daniels-Midland Co At&T Inc Bank Of America Corp Best Buy Co Inc Black 5 Decker Corp Brnc Software Inc Bwing t o Corn Stk Bristol-Myers Squibb Co Broadcom Corp Brunswick Corp Capital One Financial Corp Carnival Corp Caterpillar Inc Centerpoint Energy Inc Chevron Corp Corn Stk Chubb Corp Circuit City Stores Inc Circuit City Group Corn Stk Cisco Systems Inc Cit Group Inc Corn Stk Citigroup Inc Coca-Cola Co Corn Stk
Coca-Cola Enterprises Inc Computer Sciences Corp Conocophillips Consol Energy Inc Corn Stk Constellation Brands Inc Constellation Energy Group Inc Convergys Corp Corn Stk Npv Countqwide Financial Corp Curnrnins Inc Cvs Corp Darden Restaurants Inc Dean Foods Co Corn Stk
Deere & Co Dell Inc Directv Group Indhe Dover Corp Corn Stk U d l Dow Chemical C d h e Dte Energy Co Du Pont El de Nernours & Co E Trade Financial Corp Corn Stk
Eaton Corp Ebay Inc Edimn International Corn Stk Npv EMC CorpNassachusetts Ensco International Inc
942,144 729.089 735,730
1,241,389 1,026,840
437,207 1,527,175
460,123 1,368.858 1,755,452
663,901 861,332
2,279,503 3,035,353 1,149.832 4,426,990 1,731,272
81 9.134 530,363 475,262
1,570,645 1.32 1,123
893.065 349,069 883,412 437,246
1.949.842 455,506
5,979,333 1,499,000
119,568
2,682,573 238.339
1,553,255 1,385,559
1,133,866 5,051,337 1.398.133 1,446,525
649,675 602,111 226,123
1,561,279 1,559,407
372,596 636,326 612,750
1,548,750 1,144,584
948,085 1,720,070 1,104.1 65
940.140
1,006.6ga
245,876 1.~65.431 1,762,192 1,148,522
1,727,561 658.554
0.43 0.33 0.33 0.56 0.46 0.20 0.69 0.2 1 0.62 0.79 0.30 0.39 1.03 137 0.52 2.00 0.81 a 37 0.24 0.2 1 0.71 0.60 0.40 0.16 0.40 0.20 0.88 0.21 2 70 0.68 0.05
1.21 0.11 0.70 0 63 0.46 0.54 2.28 0.63 0.65 0.29 0.27 0.10 0.71 0.71 0.17 0.29 0.28 0.70 0.52 0.43 0.78 0.50 0.43 0 11 0.66 0.80 0.52 0.30 0.78
Market % of Value net
assets
Quantity Description
Listed Securities (continued)
Equities Traded on an Official Stock Exchange (continued) 41,086
6,103 38,046 35.046 20,759 24,846
152,702 36,060 18.753 15,587 8,606 2.918 8,419
61,035 26,212 21,602 17,861
112,340 17,051 54,838 54,820 40.1 53 67,720 80,710 43.351 35,758 12,360
144,253 34,068 19.299 25,857 17.297 30,484
36,100 160,076
3,859 34,103
30 .2~4
86,789 82,101 31,157 45.338 39,019
56,505 27,102 25,508
2 1,466 69.617
17.832 15,101 26,215 21,610
180.575 17.538
25,433 16,239
28.844
Euon Mobil Corporation Fedex Corp First Woriizon National Corp Forest Laboratories Inc Corn Stk Freeport-Mcmoran Copper & Gold Gannen Co Inc General Electric Co Genworth Financial Inc Gilead Sciences Inc Goldrnan Sachs Group Inc Goodrich Corp Google Inc Hartford Financial Services Gr Hewlett-Packard Co Humana Inc Ibrn Ingersoll-Rand Co Intel Corp International Paper Co Jabil Circuit Inc Johnson &Johnson Johnson Controls Inc Jp Morgan Chase & Co King Pharmaceuticals Inc Kroger Co Lehrnan Brothers Holdings Inc Lockheed Martin Corp ki Logic Corp Marathon Oil Corp Corn Stk Marriotl International C l A Mcdonald'S Corporation Mckesson Corp Corn Stk Medco Health Solutions Inc Corn Stk Merck & Co Inc Metlife Inc Microsoft Corp Monsanto Co Morgan Stanley Motorola Inc Mylan Laboratories Nabors Industries Ltd National City Corp Com Stk National Semiconductor Corp Corn
Nektar Therapeutics NetApp Inc New Vork Tim- Co Corn Class 'A'
Newfield Exploration Co Corn Stk News Corp Class 'A' Non Vtg Corn Stk Nike Inc Class'B'Corn Stk Npv Noble Corp Norfolk Southern Corp Corn Stk Northrop Grurnrnan Corp Corn Stk Novel1 Inc Corn Stk Nucor Corp Corn Stk Nvidia Corp Occidental Petroleum Corp Corn Officernax Inc
Stk
stk
3,565,442 471.976 290,101
1,168.609 2,416,348
546,736 4,013,772
648.359 992.503
2,725,932 415,627
1,528,288 563.947
2,719,719 1,080,197
658,267 2,413,242
399.079 888,650
3.482.441 1,150,986
829,295 1,244,174
795.794 1,231,180
914.564 1,746,666
51 5.476 1,459,369
980.394 1,424,365 1,120,994 i,w3,0a3 4,425,301
494.955 1,252,944
636,597 996,296
2 1 6.71 6
2,592,887
2,375,618
1,542,583
800.085
191,834 598,277 399,455
1.392.070 1,075,235
1,074,913 977.865
1,599,508 1.449.81 5 1,105.1 19 1,314.21 0
555,535 2,245,351
229.457
1.61 0.21 0.13 0.53 1.09 0.25 1.82 0.29
1.23 0.19 0.69 0.26 1.23 0.49 1.17 0.30 1.09 0.18 0.40 1.57 0.52 1.07 0.38 0.56 0.36 0.56 0.41 0 79 0.23 0.66 0.44 0.64 0 51
0.45
0.88 2.00 0.22 0.57 0.29 0.45 0.70 0.10 0.36
0.09 0.27 0.18
0.63 0.49
0.49 0.44 0 72 0.66 0.50 0.59 0.25 1.02 0.10
The accompanying notes form an integral part of these financial statements
I
6
I

Aviva Investors - American Equity Fund (continued)
Schedule of Investments and Other Assets As at 30 June 2008 (in USD) (continued) Quantity Description Market % of
assets Value net
Listed Securities (continued)
Equities Traded on an Official Stock Exchange (continued) 1 1 9.375 14.332 16.191
27.728 18,187
36,737 12,154 171,664 22,202 27,317 53,690 15,230 62,365 24,468 20.288 24,171 16,520 41,014 12,066 23,072 17,169
278,615 13.199 23,218 30,953
1 1 6.92 1 13,571 9,838
22,744 73,574 63,572 55,681 110,771 6,546 26,999 39,260 7.993 12,769 52,005 38.977 34,301 78,995 35.887 56,566 4.803
8.01 1
13,225 95,709 47,707 27,109
Oracle Corp Corn Paccar Inc Patterson Uti Energy Inc Corn Stk Penneyg.C.)Co Inc Corn Stk Pepro Holdings Inc Pep4 Bottling Group Int Pepsico Inc Pfizer Inc Corn Pg & E Corp(Hldgs) Corn Stk Npv Philip Morris International In Pmc Sierra Inc Com Stk Ppg Industries Inc Corn Stk Procler &Gamble Co Qualcomm Inc Corn Stk Quest Diagnostics Inc Corn Stk Reynolds American Inc Rowan Cos Inc Corn Rr Donnellq & Sons Co Ryder System Inc Corn Stk Safeway Inc Corn Stk Sandisk Corp Corn Stk Sanmina-Sci Corp Corn Stk
Schlurnberger Ltd Sernpra Energy Sepracor Inc Corn Stk Slm Corp Sprint Nextel Corp Corn Stanley Works Corn Stk Starwood Hotels And Resorts Worldwide Sunoco Inc Symantec Corp Com Stk
Texas Instruments Inc Corn Stk The Walt Disney Co. Time Warner Inc Corn Stk Transocean Inc Travelers Cos IncAhe Tyco International Ltd Com Stk United States Steel Corp Corn Stk United Technologies Corp Unitedhealth Group Inc Corn Stk Unurnprovident Corp Valero Energy Corp Veruon Communications Inc
Wachovia Corp Wal-Marl Stores Inc Corn Stk Washington Mutual Inc Corn Stk
Wellpoint Inc Wells Fargo & Co Corn Stk Wyeth Xilinx Inc Corn Stk
Npv
2,536,719 606,602 578.181 669,645 690,843
1,026,432 776.641
2,972,362 852,113
1,360,660 415.561 871,461
3.782.749 1 ,I 17.821 968,853
1,127.2 15 766.941
1,206,427 M3.353 678.548 330,761 349,662
1.398.7M 1,281,518 612,560 156.41 5
1,041,766 608,388 395.488
851.422 1,434,325 1,813,709 1.757.571 1.596.210 997,774
1,196,056 1,572,559 1,490,655
1,352,390 819.686
1,371.525 2.71 0.3 18 583.164
3,185,231 2 15,502
636.982 2,302,280 2,196,307 685,180
780,441
115 0 27 0 26 0 30 0 31 0 46 0 35 1 34 0 39 0 63 0 19 0 39 171 0 51 OM 0 51 0 35 0 55 0 38 0 31 0 15 0 16 0 63 0 58 0 28 0 07 0 47 0 28 0 18
0 39 0 65 0 02 0 79 0 72 0 45 0 54 0 71 0 67 0 35 0 61 0 37 0 62 123 0 26 1 44 0 10
0 29 104 0 99 0 31
Quantity Description
Unaudited Semi-Annual Report
Market % of Value net
as<&
Listed Securities (continued)
Equities Traded on an Official Stock Exchange (continued) 13,514 XI Capital Ltd 321.160 015
555,716 0.25 Total Equities Traded on an Official 214,657,859 97.07 Stock Exchange Total Listed Securities 214,657,853 97.07 Total Investments 214,657,853 97.07
26.381 Yahoo Inc
Cash at Bank Other Assets
6,596,791 2.98 340,235 0 16
Other Liabilities (458,448) (0.2 1 ) Net Asset Value 221,136,437 100.00
1
I
1
I
The accompanying notes form an integral part of these financial staternenfs
7
I
I
I
Aviva Investors - American Equity Fund (con t i n ued)
Unaudited Semi-Annual Report
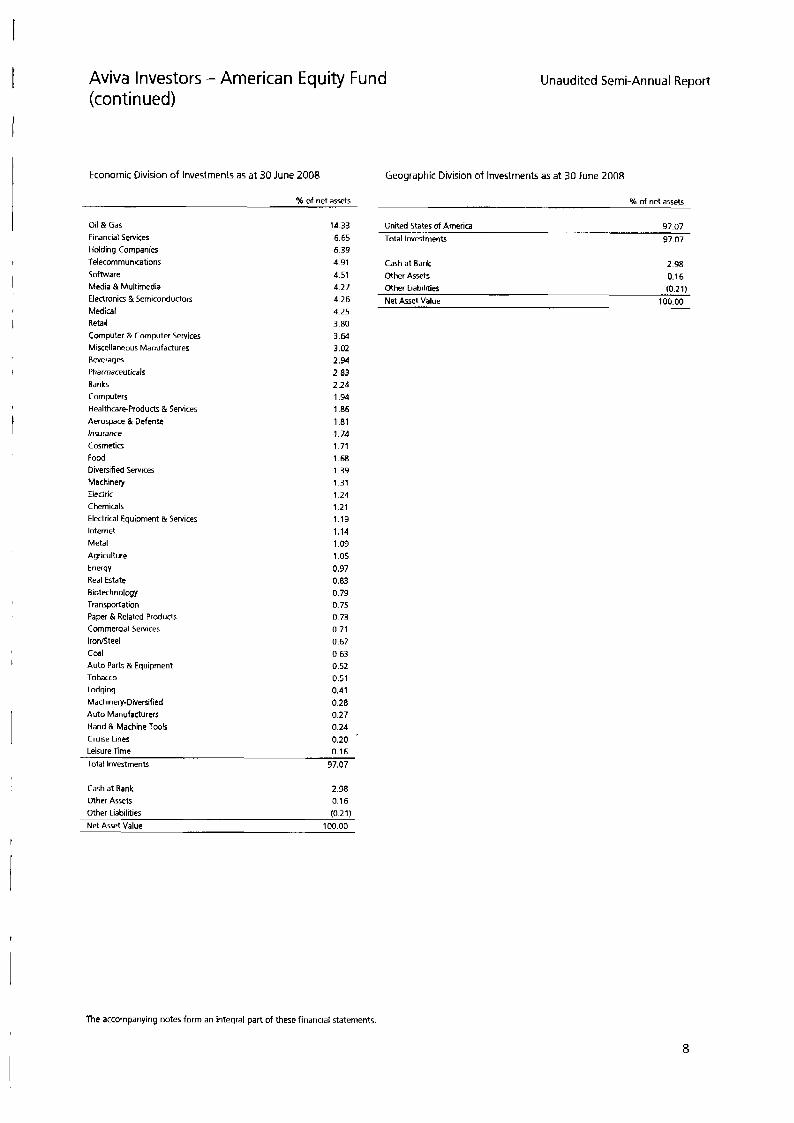
Economic Division of Investments as at 30 June 2008 Geographic Division of Investments as a t 30 June 2008
% of net assets 56 of net asset5
Oil & Gas Financial Services Holding Companies Telecommunications Software Media & Multimedia Electronic; & Semiconductors Medical Retail Computer & Computer Services Miscellaneous Manufactures Beverages Pharmaceuticals Banks Computers Healthcare-Products & Services Aerospace & Defense Insurance Cosmetics Food Diversified Services Machinery Electric Chemimls Electrid Equipment & Services Internet Metal Agriculture Energy Real Estate Biotechnology Transportation Paper & Related ProduN Commercial Services lronrjleel Coal Auto Park & Equipment Tobacco Lodging Machinery-Diversified Auto Manufacturers Hand & Machine Tools Cruise Lines
14.33 United States of America 97.07 6.65 Total Investments 97.07 6.39 4.91 Cash at Bank 2.98
4.27 Other Liabilities (0.21) 4.26 Net Asset Value 100.00
4.51 Other Assets 0.16
4.25 3.80 3.64 3.02 2.94 2 83 2.24 1.94 1.86 1.81 1.74 1.71 1.68 1.39 1.31 1.24 1.21 1.19 1.14 1.09 1.05 0.97 0.83 0.79 0.75 0.73 0 71 0.67 0 63 0.52 0.51 0.41 0.28 0.27 0.24 0.20
Leisure Time 0.16 Total Investments 97.07
Cash at Bank 2.98 Other Assets 0.16
Net Asset Value 100 00
Other Liabilities (0.21)
I
The accompanying notes form an integral part of these fihanciai statements.
8
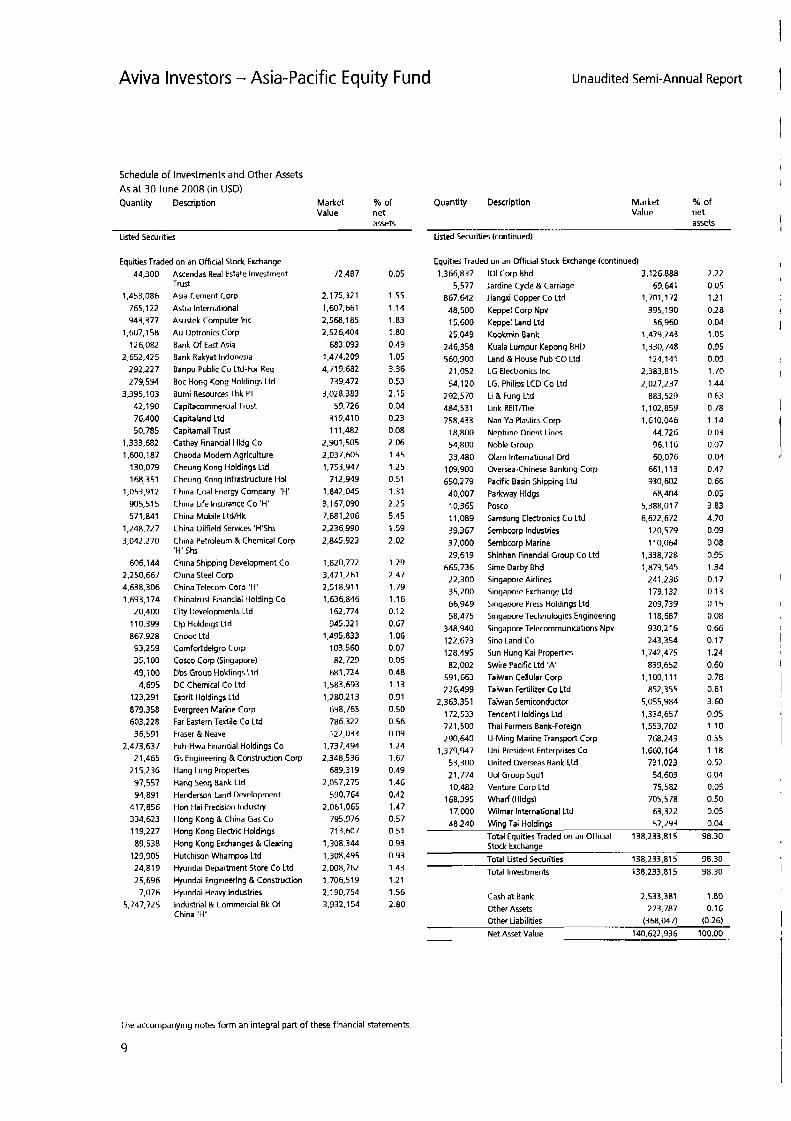
Aviva Investors - Asia-Pacific Equity Fund
Schedule of Investments and Other Assets As at 30 June 2008 (in USD) Quantity Description Market % o f
assell Value net
listed Securities
Equities Traded on an Official Stock Exchange 44,300
1,453,086 765.122 943,377
1,607.1 5a 126,082
2,652,425 292,227 279,594
3.395.1 03 42.190 76,400 50.785
1,333,682
130,079 168,351
1,053,912 905.515 571,841
3,042,270
606,144 2,250.667 4,638.306 1,693.1 74 20,400 110,399 867.928 93.259 35,100 49,100 4,695
123.291 879.358 603,228 36.591
2,473,637 2 1,465 215.236 97.557 94.891 417,856 334,623 1 1 9,227 89.538 129,905 24.819 25,696 7,076
5,747,725
1.600.ia7
i.24a.727
Ascendas Real Estate investment Trust Asia Cement Corp Astra International Asustek Computer inc Au Optronics Corp Bank Of East Asia Bank Rakyat Indonesia Banpu Public Co Ltd-For Reg Boc Hong Kong Holdings Ltd Bumi Resources Tbk PT Capitacommercial Trust Capitaland Ltd Capitamall Trust Cathay Financial Hldg Co Chaoda Modern Agriculture Cheung Kong Holdings Ltd Cheung Kong infrastructure Hol China Coal Energy Company 'H' China Life insurance Co 'H' China Mobile LtdMk China Oilfield Services 'H'Shs China Petroleum & Chemical Corp 'H' Shs China Shipping Development Co China Steel Corp China Telecorn Corp 'H' Chinatrust financial Holding Co City Oevelopmentr Ltd Clp Holdings Ltd Cnooc Ltd Comfortdelgro Corp Cosco Corp (Singapore) Dbs Group Holdings Ltd DC Chemical Co Ltd Esprit Holdings Ltd Evergreen Marine Corp Far Eastern Textile Co Ltd Fraser & Neave Fuh-Hwa Financial Holdings Co Gs Engineering & Construction Corp Hang Lung Properties Hang Seng Bank Ltd Henderson Land Development Hon Hai Precision Industry Hnng Knng & China Gas Co Hong Kong Electric Holdings Hong Kong Exchanges & Clearing Hutchimn Whampoa Ltd Hyundai Department Store Co Ltd Hyundai Engineering & Construction Hyundai Heavy industries Industrial & Commercial Bk Of China 'H'
72.487
2.175.321 1,607,661 2,568,185 2,526,404 683.093
1.474.209 4.71 9.682 739.472
3.028.383 59,726 319,410 111.482
2,901,505 2,037,605 1,753,947 712,949
1,842,045 3,167,090 7,681,206 2.2 36,990 2,845,323
1.a20.772 3,471,261 2,518.91 1 1,636,846 162,774 945.321
1.495.833 103.560 82,729 681.724
1,280.21 3 698.765 786.322 122,033
2,348,536 689,319
2,057,275 590.764
2.061.065 795.976 713,607
1,308.344 1,308,495 2.008.762 1.706.5 19 2,190,754 3,932.1 54
i.sa3.6g3
1.737.494
0 05
155 114 1 83
0 49 1 05 3 36 0 53 2 15 0 04 0 23 0 08 2 06 145 125 0 51 131 2 25 5 45 159 2 02
129 2 47 1 79 116 0 12 0 67 106 0 07 0 06 0 48 113 0 91 0 50 0 56 0 09 124 1 67 0 49 146 0 42 1 47 0 57 0 51 0 93 0 93 1 43 121 156 2 80
1 a0
Unaudited Semi-Annual Report 1
Quantity Description Market % of Value net
assets Listed Securities (continued)
Equities Traded on an Official Stock Exchange (continued) 1,366.837
5,577 867,642 48,500 15,600 25,049 246.358 560,900 21.052 54,120
2 92,570 484.53 1 758,433
1 8.800 54.800 33.480 109,900 650.279 40,007 10,365 1 1.089 39.367 37,000 29,619 665.736 22,300 35,200 66.949 58,475
348.940 122,673 128,495 82,002 591,663 22 6.499
2.363.351 172,533 721,500 290.640
1,379,947 53,300 2 1,774 10.482 168.395 17,000 48.240
101 Corp Bhd Jardine Cycle & Carriage liangxi Copper Co Ltd Keppel Corp Npv Keppel Land Ltd Kwkmin Bank Kuala Lumpur Kepong BHD Land & House Pub CO Ltd LG Electronics Inc LG. Philips LCD Co Ltd Li & Fung Ltd Link REITme Nan Ya Plastics Corp Neptune Orient Lines Noble Group Olam International Ord Oversea-Chinese Banking Corp Pacific Basin Shipping Ltd Parkway Hldgs Posco Samsung Electronics Co Ltd Sembcorp Industries Sembcorp Marine Shinhan Financial Group Co Ltd Sime Darby Bhd Singapore Airlines Singapore Exchange ttd Singapore Press Holdings Ltd Singapore Technologies Engineering Singapore Telecommunications Npv Sino Land t o Sun Hung Kai Properties Swire Pacific Ltd 'A' Taiwan Cellular Corp Taiwan Fertilizer Co Ltd Taiwan Semiconductor Tencent Holdings Ltd Thai Farmers Bank-Foreign U-Ming Marine Transport Corp Uni-President Enterprises Co United Overseas Bank Ltd Uol Group Sgdl Venture Corp Ltd Wharf (Hldgs) Wilmar International Ltd Wino Tai Holdinos
3,126,888 69.641
1,701,172 395.1 90 56,960
1.479.243 1,330,748 124,14 1
2.383.81 5 2,027,237 883,529
1,102,859 1,610,046 44,726 96,116 60,076 661,113 930,602 68.404
5.388.017 6.622.672 120.579 1 10.064
1,338.728 1,879.545 241,236 179,132 209,739 118,687 930.216 243,354
1,742,475 839.652
1.1 00.1 1 1 852,355
5,055,984 1,334,657 1,553,702 768.243
1,660,lU 731,023 54.603 75.582 705.578 63,322 57.293
2 22 0 05 121 0 28 0 04 105 0 95 0 09 1 70 144 0 63 0 78 114 0 03 0 07 0 04 0 47 0 66 0 05 3 83 4 70 0 09 0 08 0 95 1 34 0 17 0 13 0 15 0 08 0 66 0 17 124 0 60 0 78 0 61 3 60 0 95 110 0 55 118 0 52 0 04 0 05 0 50 0 05 0 04
Total Equities Traded on an Official 138,233.81 5 98.30 Stock Exchange Total Listed Securities 136,233,815 98.30 Total Investment 138,233,815 98.30
Cash at Bank 2,533,381 1 .ao Other Assets 223.787 0.16 Other Liabilities (368,047) (0.26) Net Asset Value 140.622.936 100.00
1
1
I
I
I
The accompanying notes form an integral part of these financial statements.
9

I
i
Aviva Investors - Asia-Pacific Equity Fund (con tin ued)
Unaudited Semi-Annual Report
Economic Division of Investments as at 30 June 2008
% of net assets
Banks Telecommunications Electronics & Semiconductors Electrical Equipment & Services Ironfiteel Agriculture Insurance Real Estate Oil & Gas Engineering & Construction Coal Mining Financial Services Transportation Chemicals Retail
Holding Companies Energy-Alternate Sources Miscellaneous Manufactures Building Materials Distribution &Wholesale
11.03 8.69 7.28 7.08 6.30 4.67 4.31 4.00 3.65 3.56 3.46 3.36 3.25 3.16 2.88 2.62 2.38 1.59 1.56 1.55 1.54
Computer & Computer Services 1.47 Electronics 1.44 Diversified Services 1.34 Food 1.22 Metal FabricateMardware 1.21 Internet 0.95 REKS 0.95 Textiles 0.56 Electric 0.51 Airlines 0.17 Media & Multimedia 0.15 Home Builders 0.03 Beverages 0.09 Shipbuilding 0.08 Healthcare-Products & Services 0.05 Lodging 0.04 Total Investments 98.30
Cash at Bank 1 .a0 Other Assets 0.16 Other Liabilities (0.26) Net Asxt Value ioo.00
Geographic Division of Investments as at 30 June 2008
% of net assets
Taiwan Hong Kong South Korea China Thai I and Malaysia Indonesia
22.49 22.20 20.68 15.21 4.55 4.51 4.34
Sinoaowe 4.24
Total Investments 98.30
Cash at Bank 1 80 Other Asxts 0.16 Other Liabilities (0.26) Net Asset Value 100.00
The accompanying notes form an integral part of these financial statements.
10

Aviva Investors - Australian Resources Fund
Schedule of Investments and Other Assets As at 30 June 2008 (in EUR) Quantity Description Market %of
assets Value net
Listed Securities
EquitiesTraded on an Official Stock Exchange
480,000
250,000 323,275
76,956 175,901
88,097 218,949
1,470,588
152.129 189.274
66,322 204,081
710,573 1,190,476
2 17,391 320,699
123,199 79,898
375,000 308,483 198.1 70
559,701
343.053 990,099
284.090
23,312 106.382 36,204
72347
Alumina Npr Australian Worldwide Exploration Npv
Avoca Resources Npv
Bhp Billiton Limited Ord Npv
Bluescope Steel Ord Npv Caltex Australia Npv
Centennial Coal Co Ord Npv Citadel Resource Group Ltd Npv
Equinox Minerals Npv(Cdi) Fortescue Metals Group Npv Gloucester Coal Ord Npv
Kagara Ltd Npv Lihir Gold Com Nov
Metals X Ltd Npv
Minara Resources Ord Npv Mount Gibson Iron Npv
Newcrest Mining Npv Northern Iron Ltd Npv Oil Search Npv
Onesteel Npv Origin Energy Ltd Npv (Post Reconstruction)
Oxiana Resources NI Npv
Paladin Energy Ltd Npv Panaust Ltd Npv
Queensland Gas Co Ltd Npv Rio Tinto Limited Npv
Whitehaven Coal Limited Npv Wmdside Petroleum Npv Worlevoarsons Nnv
1,391.371
63 1.609 439,932
2,047,797
1.207.61 6 701,315 746,233 31 6.343
436,797 1.377.969
520,686 570,396
1,426,635
296,044 430,491
610,605 2,204,720
201,370
1,552,706 1.403.4ia
1,353,678
896,589 1,342,969
617,803
930,976
1,927,431 286,296
i.49o.a7i
1 689.733
4.58
2.08 1.45
6.75 3.98
2.31 2.46 1.04
1.44 4.54
1.72 1-88
4.70 0.98
1.42
2 01 7.27 0.66
5.12 4 63 6.44
2.95
4.43 2 .M
3.07
6.35 0.94 4.91
5.57
Total Equities Traded on an Gfficiai Stock 29.650.399 97 72 Exchange
Total Llsted Securibes 29,650,399 97 72
Total Investments 29,650,399 97 72
Cash at Bank Other Assets
Other Liabilities
535,753 1.77 163,437 0.54
(8.008) (0.03)
Unaudited Semi-Annual Report
Economic Division of Investments as at 30 June 2008
X of net assets
Mining Oil & Gas
Iron/Steel Engineering & Construction
Coal Media
50.78 23.93
11.28 5.57
5.12 1.04
Total Investments
Cash at Bank Other Assets Other Liabilities
97.72
1 77 0.54
(0.03)
Net Asset Value 1 OD.00
Geographic Division of Investments a5 at 30 June 2008
% of net assets
Australia 97.72
Total Investments 97.72
Cash at Bank 1.77
Other Assets 0.54
Other Liabilities (0 03) Net Asset Value 100.00
Net Asset Value 30,341.581 100.00
The accompanying notes form an integral part of these financial statements.
11
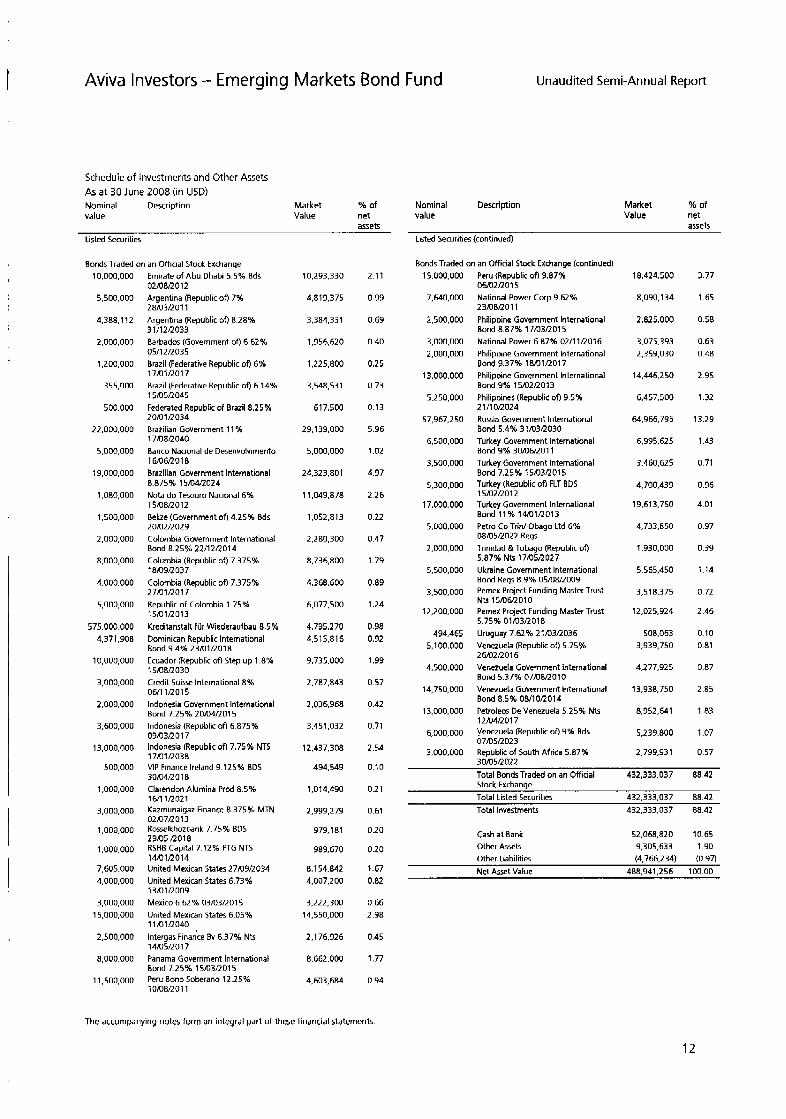
Aviva Investors - Emerging Markets Bond Fund Unaudited Semi-Annual Report
Schedule of Investments and Other Assets As at 30 June 2008 (in USD) Nominal Description Market 56 of value Value net
assets
Nominal Description value
Listed Securities
Bonds Traded on an Official Stock Exchange 10,000,000
5,500.000
4,388.1 12
2.000.000
1,200,000
355,000
500.000
22.000.000
5,000,000
19,000,000
1,080,000
1,500,000
2,000,000
8,000,000
4,000,000
5,000,000
575.000.000 4,371,908
10,000,000
3,000,000
2,000.000
3,600,000
13,000,000
500,000
1,000,000
3,000,000
1,000,000
1,000.000
7.605.000 4,000,000
3,000,000 15,000,000
2,500,000
8,000.000
11,500,000
Emirate of Abu Dhabi 5.5% Bds 02/08/2012 Argentina (Republic of) 7% 28/03/2011 Argentina (Republic of) 8.28% 31/12/2033 Barbados (Government of) 6.62% 05/12/2035 Brazil (Federative Republic of) 6% 17/01/2017 Brazil (Federative Republic of) 6.14% 15/05/2045 Federated Republic of Brazil 8.25% 20/D1/2034 Brazilian Government 11% 17/08RO40 Banco Nacional de Desenvolvimento 16/06/2018 Brazilian Government International
Nota do Tesouro Nacional6% 15/08/2012 Belize (Government of) 4.25% Bds 20/02/2029 Colombia Government International Bond 8.25% 22/12/2014 Columbia (Republic of) 7.375%
Colombia (Republic of) 7.375%
Republic of Colombia 1.75%
Kreditanstalt fur Wiederaufbau 8.5% Dominican Republic International Bond 9.4% 23/01/2018 Ecuador (Republic of) Step up 1 .8% 15/08/2030 Credit Suisse International 8% 06/11/2015 Indonesia Government International Bond 7.25% 20m4/2015 Indonesia (Republic of) 6.875% 09/03/2017 Indonesia (Republic of)7.75% NTS
VIP Finance Ireland 9.125% BDS
Clarendon Alumina Prod 8.5% 16/11 I202 1 Kazmunaiqaz Finance 8.375% MTN
8.875% i5mmo24
18/09/2037
27/01/2017
15/01/2013
i7mino38
30/04/2018
o 2 m m o l Rosselkhozbank 7.75% BDS 29/05 I2018 RSHB Capital 7.12% PTG NTS 1 M l R 0 1 4 United Mexican States 27,Q9/2034 United Mexican States 6.73%
Mexico 6.62% 03/03/2015 United Mexican States 6.05% 11/01/2040 lntergas Finark Bv 6.37% Nts 14/05/2017 Panama Government International Bond 7.25% 15m3/2015 Peru Bono Soberano 12.25% i o m n o i i
i 3 / 0 1 ~ 0 0 9
10,293,330
4,819,375
3,384,331
1,356,620
1,225,800
3,548.531
617,500
29.1 39.000
5,000,000
24,323,801
11,049,878
1,052,813
2,280,300
8,736,800
4,368,600
6,077,500
4,735,270 4.51 5.81 6
9.735.000
2.787.843
2.036.968
3,451,032
12,437,308
494,549
1,014,490
2,999,279
979.181
383.670
8.1 54.842 4,007,200
3,222,300 14,550,000
2.1 76.926
8.662.000
4,603,684
2.11
0.99
0.69
0.40
0.25
0.73
0.13
5.96
1.02
4.97
2.26
0.22
0.47
179
0 89
1.24
0.98 0.92
1.39
0.57
0.42
0.71
2.54
0.10
0.2 1
0.61
0.20
0.20
1.67 0.82
0.66 2.98
0.45
1.77
0.94
Market % of Value net
assets Listed Securities (continued)
Bonds Traded on an Official Stock Exchange (continued) 15,000,000
7,640,000
2,500,000
3,000,000 2.000.000
13,000,000
5,250.000
57,967,250
6,500,000
3,500,000
5,300,000
17,000,000
5,000,000
2,000.000
5,500,000
3,500,000
12,200.000
494,465 5,100,000
4,500,000
14,750,000
13,000,000
6,000,000
3,000,000
Peru (Republic ofi3.87% 06D2/2015 National Power Corp 9.62% 23/08/2011 Philippine Government International Bond 8.87% 17/03/2015 National Power 6.87% 02/11/2016 Philippine Government International Bond 9.37% 181DlR017 Philippine Government International Bond 3% 15,Q2/2013 Philippines (Republic 009.5% 21/10/2024 Russia Government International Bond 5.4% 31/03/2030 Turkey Government International Bond 9% 30/06/2011 Turkey Government International Bond 7.25% 15/03/2015 Turkey (Republic of) FLT BDS 15/02/2012 Turkey Government International Bond 11 % 1 M l R 0 1 3 Petro Co Trid Obago Ltd 6% 08105D022 Regs Trinidad &Tobago (Republic ofi 5.87% Nts 17/05/2027 Ukraine Government International Bond Regs 8.9% 05/08/2009 Pemex Project Funding Master Trust
Pemex Project Funding Master Trust 5.75% 01/03/2018 Uruguay 7.62% 21/03/2036 Venezuela (Republic of) 5.75% 2M12R016 Venezuela Government International Bond 5.37% 07,QSROlO Venezuela Government International Bond 8.5% 08/10R014 Petroleos De Venezuela 5.25% Nts 12/04/2017 Venezuela (Republic of) 9% Bds 07/05/2023 Republic of South Africa 5.87% 30/05/2022
~ t s i 5 m m o i o
18,424,500
8,090,134
2,825,000
3.075.393 2,359,030
14,446,250
6,457,500
64966,795
6,995.625
3,460,625
4.700.439
19,613,750
4,733,850
1,930,000
5,565,450
3.51 8,375
12,025,924
508.063 3,939.750
4,277.925
13,938,750
8,952,641
5,239,800
2.799.931
3.77
1.65
0.58
0.63 0.48
2.95
1.32
13.29
1.43
0.71
0.96
4.01
0.97
0.39
114
0 72
2.46
0.10 0.81
0.87
2.85
1.83
1.07
0.57
Total Bonds Traded on an Official 432,333,037 88.42 Stock Exchange Total Listed Securities 432,333,037 88.42 Total Investments 432.333.037 88.42
Cash a t Bank 52,068,820 10.65 Other Assets 9,305,633 1.90 Other liabilities (4,766,234) (0.97) Net Asset Value 488,941,256 100.00
The accompanying notes form an integral part of these financial statements.
12

Aviva Investors - Emerging Markets Bond Fund (continued)
Economic Division of Investments as at 30 June 2008
% of net assets
Sovereign Oil & Gas Electrical Equipment & Services Food Financial Services Banks Metal
76.44 4.34 2.28 1.65 1.42 1.38 0.2 1
Telecommunications 0.10 Told Investments 88.42
Cash at Bank Other Assets
10.65 1.30
Other Liabilities (0.97) Net Asset Value 100.00
Geographic Division of Investments as at 30 June 2008
% of net assets
Brazil Russia Venezuela Philippines Turkey Mexico Peru Colombia Indonesia United Arab Emirates Ecuador Panama Argentina Trinidad And Tobago Ukraine Dominican Republic South Africa Barbados Belize Jamaica
18.50 14.81 8.41 8.22 7.1 1 6.13 4.71 4.39 3 67 2 11 1.99 1.77 1.68 1.36 1.14 0.92 0.57 0.40 0.22 0.21
Uruguay 0.10 Total Investments 88.42
Cash at Bank 10.65 Other Asset!, 1.90 Other Liabilities (0.97) Net Asset Value 100.00
! I Unaudited Semi-Annual Report ,
1
I
The accompanying notes form an integral part of these financial statements.
13

Aviva Investors - Emerging Markets Equity Fund
Schedule of Investments and Other Assets As at 30 June 2008 (in USD) Quantity Description Market % of
Value net assets
Quantity Description
Unaudited Semi-Annual Report
2,999,243 1.662.474
608.826 16.1 54,233 10,774,827 11,261,334 18,876,157
1,438,492 35,738,874 4,220,000
604,130 43,481,463 16,579,076 19,241,985 12.41 8,260 10,680,673 6,732,882
14,751,584 35.808.033
7,160,026 26.964.442 54,710,487 2 1.1 19.961
1.474.M6
3,445,535 11,477,251 7,851,174
52,731 3.1 60,821
15,660,325 90
3.709.&15 4,257,567
1 1.51 0,114 75,134
8,044,886 38
32,599,957 12.298.708
256,247 432.939
5,182,555 5,340,577
34,245 288,336 306,104
87,656 3.844.236 1.010.01 5
67,669,893
767.31 1 16,649,452 13.968.000 10,885,420
308.382 2.977.288
All America Lafina Logistica S America Movil Sa De Cv Arcelormittal South Africa Ltd Asia Cement Corp Astra International Asustek Computer Inc Au Optronics Corp Aveng Ltd Bank Rakyat Indonesia Banpu Public Co Ltd-For Reg Bell Equipment Npv Burni Resources Tbk PT Cathay Financial Hldg Co Chaoda Modern Agriculture China Coal Energy Company 'H' China Life Insurance Co 'H' China Mobile LtdMk China Oilfield Services 'H' Shs China Petroleum & Chemical Corp 'H' Shs China Shipping Development Co China Steel Corp China Telecorn Corp 'H' Chinatrust Financial Holding Co Cia Saneamento Basico De Sao Paolo Corn Npv Cia Vale Do Rio Owe Cnooc Ltd Controladora Coml Mexic-Ubc DC Chemical Co Ltd Desarrolladora Homex SAB de CV Dp World Ltd Ernbratel Participacoes Sa Corn Npv Enka lnsaat Ve Sanayi As Esor Evergreen Marine Corp Evrat Group Sa Gdr Each Repr 1R Ord 'Regs' Far Eastern Textile Co Ltd Ford Otomotive Sanayii AS Fuh-Hwa Financial Holdings Co
Grupo Financier0 Banorte Gs Engineering & Construction Corp HDFC Bank Ltd Hindalco Industries Ltd Hon Hai Precision Industry Housing Devel Fin Hyundai Depaflment Store Co Ltd Hyundai Engineering & Construction Hyundai Heavy Industries Icl-Israel Chemicals Ord Impala Platinum Hldgs Industrial & Commercial Bk of China 'H' lnfosys Technologies Ltd 101 Corp Bhd Jiangru Expressway Co H Shs Jiangxi Copper Co Ltd Kookmin Bank Kuala Lumpur Kepong BHD
30,487,354 87,462,757 17,751,716 24,183,461 22,633,873 30,657,090 29,672,747 10,684,400 19,863,543 68,156,124 2,663.1 90
38.784.848 35,068,774 24,501,867 21,704,844 37,356,264 90,438,864 2 6.42 6.22 5 33.496.993
21,507,714 4 1,587,345 29.71 1.464 20,417,354 37,009,472
122.1 61,443 19,780,497 23,686.585 17,786,950 31,552,305 13,702,784
1 42,556,042
2,828,131 9.146.294 8,771,895
10,486,705 286
22,838,356 57,010,335 28.036.581 11,547.1 86 17,148,647 2 6,342.2 73
1.564.615 23,336.894 20,328.933 27.1 38.599 85.678.91 1 41,148,020 46.294.562
30,988,623 38,088,647 1 1,454,466 21,342.866 18,211.187 16,082,367
124 2 80 0 57 0 78 0 73 0 98 0 95 0 34 064 2 18 0 09 125 1 1 6 0 79 0 70 120 2 90 0 85 1 08
0 69
1 34 0 95 0 66 119
3 91 064 0 76 0 57 101 044 0 00 137 0 09 0 29 0 28
0 34 0 00 0 74 1 83 0 90 0 37 0 55 0 85 0 05 0 75 0 65 0 87 2 74 1 32 1 48
0 93 1 22 0 37 0 69 0 58 0 52
Market Value % of net assets
Listed Securities
Equities Traded on an Official Stock Exchange
Listed Securities (continued)
Equities Traded on an Ufficial Stock Exchange (continued) 82 8. 8 12
7,348,000 26.459
232,619 727,120
1,257,525 61,412
426.246 281.999
238.305 1,483,806 1,352,656 1,389,175 9.269.608 3.219.407
471,326 188.780
2,789,812 130,671 839.575
1.663.975 137,873 427.492
10,596,058 361,788
7,763,400 332.357
7,193,446 2,809.134
28.590.774 1,161,468
824,377 10.928.351 2.871.378 3.51 8.548
2 33,748 15,730,623
641,197
320,004 63,322
299.637
Kumha Iron Ore Ltd Land & House Pub CO Ltd Larsen & Toubro LG Electronics Inc LG. Philips LCD t o Ltd Lojas Renner Sa Com Npv Lukoil-Spon Adr Lukoil-Spon Adr Magnitogorsk Iron & Steel Works Gdr Each Mechel A m Adr Level 3 Spons Mrnc Norilsk Nickel -Adr- Mtn Group Ltd Murray Pi Roberts Hldgs Ord Nan Ya Plastics Corp Oao Gazprom-Spon Adr Oao Severstal Gdr Each Repr 'Regs' Oraxom Construclion Industry Gdr Each Petroleo Brasileiro S.A. Adr Posm Pretoria Portland Cement Co Raspadskaya Oao Samsung Electronics Co Ltd Sasol Ltd Sberbank Rf Shinhan financial Group Co Ltd Sirne Darby Bhd Sun Pharmaceuticals Industries Taiwan Cellular Corp Taiwan Fertilizer Co Ltd Taiwan Semiconductor Tele Norte Leste Participacoes Teva Pharmaceutical Industries Thai Farmers Bank-Foreign Turtcell lletisim Hizmet U-Ming Marine Transport Corp Unibanco Gdr Uni-President Enterpriser Co Usinas Sid Minas Gerais Usiminas Corn Npv Usinas Siderurgicas De Minas G Wimm Bill Dann Foods Ojsc Adr X5 Retail Grow N.V Gdr Each Shs Reo ' 5 '
33,543,706 1,626.296 1.344146
26,340,517 27.236.602 24,463,703
6.073.W,7 42.1 55.729 4,901,143
1 1,631,667 37.258.369 31.670.61 3 15,259,733 i9.67a.071
187.369.487 1 2,202,630 25674080
158,182,340 67.92 6,444 3,087,731
15,558,166 82,341,734 25,933,274 33,589,504 16,352,135 2 1.91 8.092 1 0,82 7.009 13,375,166 10,571,263 61.1 65,045 29.001.856 37,548,134 23,533,461 16,821,504 9,300.51 0
29.618.209 18,324,942 30,385,292
15,352,043 6,884,368
10,082,785
1.08 0.05 0 0 4 0.85 0.87 0.79 0.20 1.35 0.16
0.37 1.20 1.02 0.49 0.63 6.02 0.39 0.83
5.08 2.18 0.10 0.50 2.64 0.83 1.08 0.53 0.70 0.35 0.43 0.34 1.96 0.93 121 0.76 0.54 0.30 0.95 0.61 0.98
0.51 0.22 0.32
Total Equities Traded on an Ufficial 2.915.654.195 93.62 Stock Exchange
Warrant Traded on an Official Stock Exchange 301.180 Citigroup lnc24/10R012 15.807.131 0.51 28.586 Goldman Sachs International 28,271,554 0.90
2 2/04/2 009 229.281 HSBC Bank PLC 25/0112010 10.475.591 0.34
Total Warrant Traded on an Official Stock Exchange 54,554,276 1.75 Total Listed Securities 2.970.208.471 95.37 Total Investments 2,970,208,471 95.37
Cash a t Bank 152.781.192 4.91 Other Assets 5,055,519 0.16 Other Liabilities (13,552,395) (0.44) Net Asset Value 3.114492.187 100.00 . . . - . . - - . -
The accompanying notes form an integral part of these financial statements
14

Aviva Investors - Emerging Markets Equity Fund (con t i n ued)
Unaudited Semi-Annual Report
Economic Division of Investments as a t 30 June 2008
56 of net assets
Oil & Gas Mining Telecommunications Banks IronlSteel Electronics & Semiconductors Chemicals Diversified Financial Services Electrical Equipment & Services Engineering & Construction Retail Transportation Agricukure Coal Insurance Pharmaceuticals Building Societies Water Food Home Builders Software Building Materials Diversified Services Miscellaneous Manufactures Computer & Computer Services Energy-Allernate Sources Metal Fabricatewardware Commercial Services Textiles Holding Companies
15 19 10 15 9 57 7 37 6 87 4 75 4 29 4 06 3 49 3 21 3 03 2 96 2 53 2 45 2 36 1 56 137 119 115 1 06 0 99 0 88 0 88 0 87 0 85 o a5 0 69 0 37 0 34 0 04
Auto Manufacturers 0.00 Total Investments 95.37
Cash a t Bank 4.91 Other Assets 0.16
Other Liabilities (0.4) Net Asset Value 100.00
Geographic Division of Investments as at 30 June 2008
% of net assets
Brazil 15.5B Taiwan 12.35 Russia 11.92 South Korea 11.38 China 8.01 Mexico 6.40
South Africa 5.93 Hong Kong 4.33 Israel 3.96 Thailand 3.00 Indonesia 262
India 2.35 Malaysia 2.44
Turkey 1.91 United Kingdom 1.25
Egypt 0.83 United States of America 0.67 United Arab Emirates 0.44 Total Investments 95.37
Cash at Bank 4.91 Other Assets 0.16 Other Liabilities (0.44) Net Asset Value 100.00
The accompanying notes form an integral part of these financial statements.
15
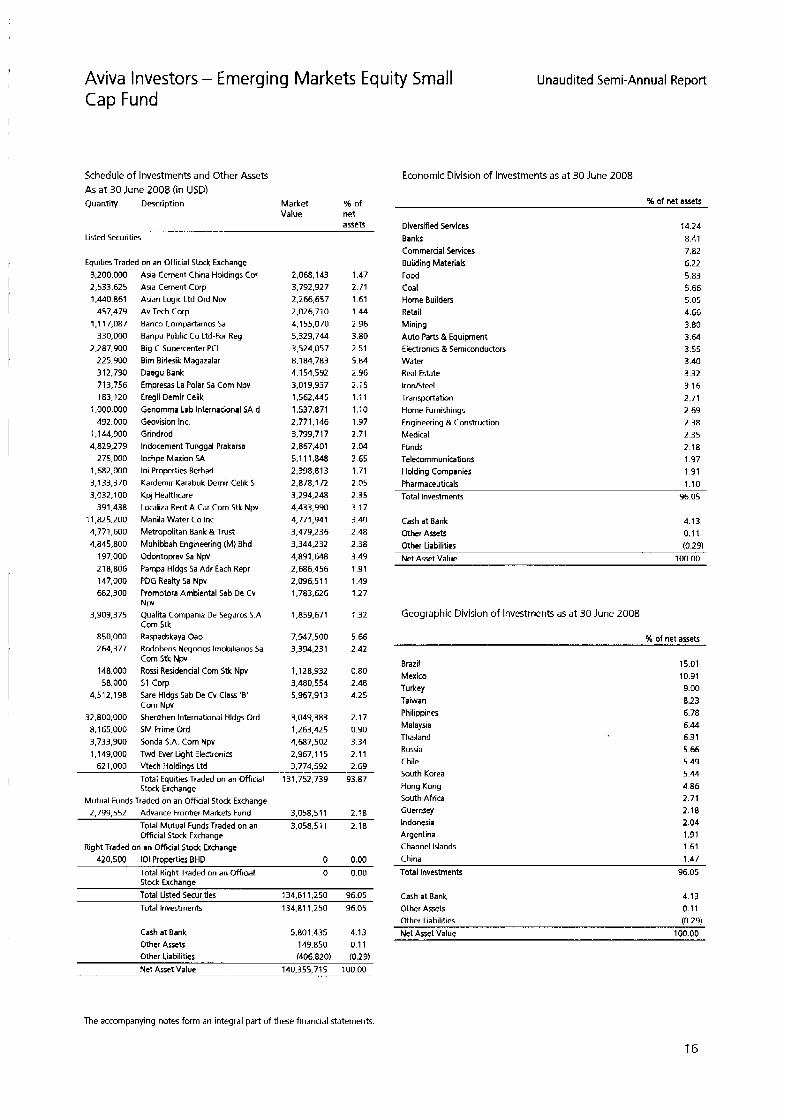
Aviva Investors - Emerging Markets Equity Small Cap Fund
Unaudited Semi-Annual Report
Schedule of Investments and Other Assets As a t 30 June 2008 (in USD) Quantity Description Market % of
Value net assets
Listed Securities
EquitiesTraded on an Official Stock Exchange 3,200.000 2,533.625 1.440.861
457,479 1,117.087
330,000 2.287.900
225,900 3 12.790 713,756 183,120
1,000,000 492.000
1,144,900 4.829.279
275,000 1,682,000 3,133,370 3.032.1 00
391.438 11,825.200 4,771,600 4,845,800
197,000 218,806 147,000 682,300
3,909,375
850.000 264.377
148,000 58,000
4.51 2,198
32.800.000 8.165.000 3,733,900 1,149,000
Asia Cement China Holdings Cor Asia Cement Corp Asian Logic Ltd Ord Npv Av Tech Corp Banco Cornpartarnos Sa Banpu Public Co Ltd-For Reg Big C Supercenter PCL Bim Birlesik Magazalar Daegu Bank Empresas La Polar Sa Corn Npv Eregli Demir Celik Genomrna tab Internacional SA d Geovision Inc. Grindrod lndocement Tunggal Prakarsa lochpe Maxion SA loi Properties Berhad Kardemir Karabuk Dernir Celik S Kpj Healthcare Localiza Rent A Car Com Stk Npv Manila Water Co Inc Metropolitan Bank &Trust Muhibbah Engineering (M) Bhd Odontoprev Sa Npv Pampa Hldgs Sa Adr Each Repr PDG Realty Sa Npv Promotora Ambiental Sab De Cv Npv Qualita Compania De Seguros S.A Corn Stk Raspadskaya Oao Rodobens Negocios Imobiliarios Sa Corn Stk Npv Rossi Residencial Corn Stk Npv 51 Corp Sare Hldgs Sab De Cv Class '8' Corn Npv Shenzhen International Hldgs Ord SM Prime Ord Sonda S.A. Corn Npv Twd Ever Light Electronics
2.068.1 43 3,792,927 2.266.657 2.026.71 0
4,155,070 5,323,744 3,524,057 8.1 84,783 4.1 54.592 3,019.937 1,562,445 1.537.871 2,771,146 3,799,717 2,867,401 5.1 1 1,848 2.338.81 3 2.878.1 72 3.294.248 4,433,990 4,771,941 3.479.236 3,344,232 4,8¶1.648 2,686,456 2,096.51 1 1,783,626
1,853,671
7.947.500 3,394,231
1,128,932 3,480,554 5.967.913
3,049.383 1,263,425 4,687,502 2,967.1 15
1 47 2 71 161 144 2 96 3 80 2 51 5 84 2 96 2 15 111 110 197 2 71 204 3 65 171 2 05 2 35 3 17 3 40 2 48 2 38 3 49 191 1 49 127
132
5 66 2 42
0 80 2 48 4 25
2 17 0 90 3 34 2 11
621,000 Vtech Holdings Ltd 3.774.592 2 69
Total EpuitiesTraded on an Gfficial 131,752,733 93.87 Stock Exchange
Mutual Funds Traded on an Official Stock Exchange 2,799,552 Advance Frontier Markets Fund 3,058,511 2.18
Total Mutual Funds Traded on an 3,058,511 2.18 Official Stock Exchange
Right Traded on an Official Stock Exchange 420,500 101 Properties BHD 0 0.00
Total Right Traded on an Official 0 0.00 Stock Exchange Total Listed Securities 134,811.250 96.05 Total Investments 134.81 1.250 96.05
Cash at Bank Other Assetr
5,801.435 4.13 149.850 0.11
Economic Division of Investments as at 30 June 2008
% of net assets
Diversified Services 14.24 Banks 8.41 Commercial Services 7.82 Building Materials 6.22 Food 5.83 Coal 5 66 Home Builders 5.05 Retail 4.66 Mining 3.80 Auto Parts & Equipment 3 .M Electronics & Semiconductors 3.55 Water 3.40 Real Estate 3.32 Iron/5teel 3 16 Transportation 2.71 Home Furnishings 2.69 Engineering & Construction 2.38 Medical 2.35 Funds 2.18 Telecommunications 1.97
Pharmaceuticals 1.10 Total Investments 96.05
Holding Companies 191
Cash at Bank 4.13 Other Assets 0.1 1 Other Liabilities (0.29) Net Asset Value 100.00
Geographic Division of Investments as at 30 June 2008
% of net assets
Brazil 15.01 Mexico 10.91
Taiwan 8.23 Philippines 6.78 Malaysia 6.44 Thailand 6.3 1 Russia 5.66 Chile 5.49 South Korea 5.44 Hong Kong 4.86
2.71 South Africa Guernsey 2.18 Indonesia 2.04 Argentina 1.91 Channel Islands 1.61 China 1.47 Total Investments 96.05
Turkey 9.00
Cash a t Bank 4.13 Other Assets 0.1 1 Other Liabilities (0.29) Net Asset Value 100.00
Other Liabilities (406.82 0) (0.2 9) Net Asset Value 140,355,715 100.00
The accompanying notes form an integral part of these financial statements.
16
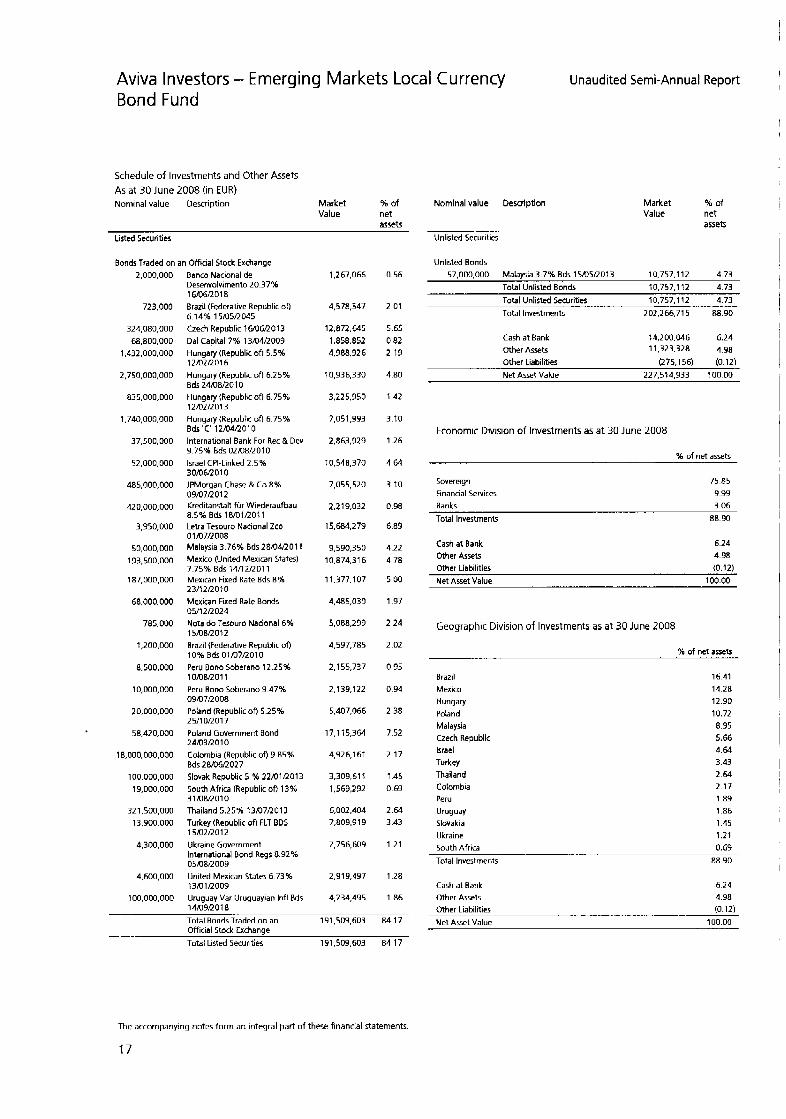
Aviva Investors - Emerging Markets Local Currency Bond Fund
Schedule of Investments and Other Assets As at 30 June 2008 (in EUR) Nominal value Description Market % of
Value net assets
Listed Securities
Bonds Traded on an Official Stock Exchange 2,000,000
723.000
324.0ao.000 68.800.000
1,432,000,000
2,750,000,000
835,000,000
1.740.000.000
37,500,000
52.000.000
485,000.000
420,000,000
3,950,000
50,000,000 193,500,000
187,000,000
68.000.000
785.000
1,200,000
8,500,000
10,000,000
2 0,000,000
58.42 0,000
18,000,000,000
100,000,000 19,000,000
32 1,500,000 13,900,000
4,300,000
4,600,000
100,000,000
Banco Nacional de Desenvolvimento 20.37%
Brazil (Federative Republic of)
Czech Republic 16/06/2013 Dal Capital 7% 13/04/2009 Hungary (Republic of) 5.5% 12M212016 Hungary (Republic ofl 6.25%
Hungary (Republic of) 6.75% 12/02/2013 Hungary (Republic 00 6.75% Bds'C' 12104R010
i6106/2018
6.14% 15m5~045
Bds 2ma/20io
International Bank For Rec & Dev 9.75% Bds 02/08/2010 Israel CPI-Linked 2.5%
JPMorgan Chase & Co 8%
Kredttanstalt fur Wtederaufbau 8.5% Bds 18/01/2011 Letra Tesouro Nacional Zcp 01B7ROO8 Malaysia 3.76% Bds 28/04/2011 Mexico (United Mexican States) 7.75% Bds 14/12/2011 Mexican Fixed Rate Bds 8% 23/12/2010 Mexican Fixed Rate Bonds 05/12R024 Nota do Tesouro Nacional 6%
Brazil (Federative Republic ofl 10% 8ds01/07/2010 Peru Bono Soberano 12.25% 10m&2011 Peru Bono Soberano 9.47% 09M7/2008 Poland (Republic of) 5.25% 2 5/1 OR01 7 Poland Government Bond 24iU3R010
30mmoio
09m7~012
1 srn8~012
Colombia (Republic 00 9.85% Bds 28/06/2027 Slovak Republic 5 % 22/01/2013 South Africa (Republic of) 13% 31/08/2010 Thailand 5.25% 13/07/2013 Turkey (Republic of) FLT BDS 1 5/02/2012 Ukraine Government International Bond Regs 8.92% 05/08RO09 United Mexican States 6.73% 13/01/2009 Uruguay Var Uruguayian lnfl Bds 14/09/2018
1,267,066
4,578,547
12,872,645 1.858.852 4.988.926
10,936,330
3,225,350
7,051,993
2,863,929
io.54a.370
7,055,520
2,219,032
15,684,279
9,530,350 10.874.31 6
11.377.107
4,485,030
5.oaa.299
4,537,785
2.1 55,737
2,133,122
5.407.066
17.1 15.3M
4926.1 61
3,309.61 1 1,569,232
6,002,404 7,aog.gig
2,756,609
2.91 3.497
4,234,495
0 56
2 01
5 65 0 82 2 19
4 80
1 42
3 10
126
4 6 4
3 10
o 98
6 89
4 22 4 78
5 00
1 97
2 24
2 02
0 95
0 94
2 38
7 52
2 17
145 0 69
2 6 4 3 43
121
128
1 86
Total Bonds Traded on an i9i.so9.603 a4 17
Total Listed Securities i9i.509.603 a4 17 Official Stock Exchange
Nominal value Description
Unaudited Semi-Annual Report
Market 56 of Value net
assets Unlisted Securities
Unlisted Bonds 57,000,000 Malaysia 3 7% Bds 15/05/2013 10.757.112 4.73
Total Unlisted Bonds 10.757.1 12 4.73 Total Unlisted Securities 10,757.1 12 4.73 Total Investments 202,266,715 88.90
Cash at Bank 14.200.046 6.24 Other Assets 11,323.328 4.98 Other Liabilities (275,156) (0.12) Net Asset Value 227,514,333 10000
Economic Division of Investments as at 30 June 2008
56 of net assets
Sovereign Financial Services
75.85 9.99
Banks 3.06 Total Investments 88.90
Cash at Bank 6.24 Other Assets 4.98 Other Liabilities (0.12) Net Asset Value 100.00
Geographic Division of Investments as at 30 June 2008
% of net assets
Brazil Mexico Hungary Poland Malaysia Czech Republic Israel Turkey Thailand Colombia Peru Uruguay Slovakia Ukraine
16.41 14.28 12.90 10.72 8.95 5.66 4 . a 3.43 2.64 2.17 1 .a9 1.86 1.45 1.21
South Africa 0.69 Total Investments 88.90
Cash at Bank Other Assets
6.24 4.98
Other Liabilities (0.12) Net Asset Value 100.00
I i I
I
I
i
I ! I
i
I i
! I I I I
1
The accompanying notes form an integral part of these financial statements.
17

Aviva Investors - EUR Reserve Fund Unaudited Semi-Annual Report
Schedule of Investments and Other Assets As a t 30 June 2008 (in EUR) Nominal Description value
Market % of Value net
assets Listed Securities
Bonds Traded on an Official Stock Exchange 1,000,000
2.000.000
2,000,000
1,500,000
2.000.000
2,000.000
2,000.000
1,500,000
2.000.000
5,000,000 3,000,000
5,000.000
2.000.000
2,000,000
2,000,000
2,000,000
1,000,000
3,000,000
2,000,000 5,000,000 2,000,000
3,000,000
1.500.000
2.000.000
2,000.000 2,000.000
2,000,000
2,000,000
2.000.000
2,000.000
5,000,000
3.000.000
3.000.000
2.000.000 2.000.000
2,000.000
Abn Amro Bank Nv FRN 4.72% 21/01/2010 Alliance & Leicester Emtn FRN 5.05% 14m9/2009 Alliance + Leicester Frn FRN 12/08/2008 Allied Irish Banks Fr Snr Emtn 4.68% 11/04/2012 Allied Irish Banks FRN 4.83% 04/11/2010 Anglo Irish Bank FRN 4.71 %
Anz Natl Bank FRN 4.93%
Bank of America Corp 4.7% 15/02/2012 Bank of America Corp 3.36% 20/11 DO08 Barclays Bank PLC 4.63% 09/07/2008 Britannia Building Society Fllg Rate Nts 14/12/2009 Cancara Asset Securisation (CP) ZCP
Citigroup Inc Emtn 3.67% 30/07/2009 Citigroup Inc Fltg Rate Nts 4.85%
Commonwealth Bank of Australia 3.61% 02/11/2011 Coventry Building Society 4.97% 26/03/2008 Coventry Building Society Emtn 3.4% 11m5/2010 Credit Agricole Frn Mtn 4.69%
Danske Bank FRN 5.0% lWO3R010 Dexia Bil4.6% CD 09/07/2008 DNB NorBank Asa FRN 4 75% 2 7/09/2 01 o GE Capital Euro Funding 4.72% 04/05/201 1 Goldman Sachs Group Inc 5.05% 1 1/05/201i Hbos Treasury Services 3.78% 23/0moog KBC lfima Nv FRN 4 71% 28/t)1/2009 Landesbank Baden Wuer FRN
Merrill Lynch Sa Luxembourg Emtn
National Australia Bank FRN 4.65% 05/08/2008 National Australia Bank FRN 5.02%
Nationwide Building Society Emtn 3.69% 03/11/2008 Nordea Bank Finland PIC 4.70% 08/08/2008 Northern Rock Fr Snr Emtn 5.03% 13/03/2012 Portman Building Society 5.07%
Raiffeiren FRN 4.70% 04/02/2010 Royal Bank Canada FRN 4.85% 23mQ011 Santander Intl Debt Sa FRN 4 89%
31/01/201i
21/09/2009
o immoo8
12/01/2012
i g m i n o i o
ogm3/200g
FRN 4.96% 29109/20io
18/03/2011
i 7/09/2009
23/03/2011
995.828
1.91 2,494
1,394,000
1,430.796
1,936,866
1.8M.780
1.988.748
1,458,809
2,000.928
5,000,000 2,929,488
4,973,731
1.978.018
1.31 2.686
1.961.722
1,994,588
974.637
2,980,218
1.993.362 5.000.000 1,988,318
2,963,157
1.452.083
1,994,294
1,995,800 1,999,680
1.890.086
1.998.614
1.967.31 6
1,992,740
5,000,000
2,730,876
2,959,824
1,989,350 1,985,414
1,978,042
0.85
1.64
1.71
1.23
1 66
1.58
1.71
1.25
1.72
4.29 2.51
4.28
1 70
1 .a 1.68
1.71
0.M
2.56
1.71 4.29 1.71
2.55
1.25
1.71
1.71 1.72
1.62
1.72
1.69
1.71
4.29
2.40
2.54
1.71 1.70
1.70
Nominal Description value
Market % of Value net
assets Listed Securities (continued)
Bonds Traded on an Official Stock Exchange (continued) 5,000,000 Sheffield Receivables Corp/ZCP
07r07R008 4,983,803 4.28
1,000,000 Societe Generale FRN 5.01 % 12/06L!009 997,122 0.86 5,000,000 Unicredito ltaliano SPA, 4.77% 5,000,000 4.29
24/07/200a 2,000,000 Westpac Banking FRN 4.87% 1,388,580 1.71
08/07/2009 Total BondsTraded on an Official Stock 97,189,398 83.43 Exchange Total Listed Securities 97,189,338 83 43 Total Investments 97,189,338 83.43
Cash at Bank 18.933.003 16.25 Other Asets 1,221,764 105 Other Liabilities (847,049) (0.73) Net Asset Value 11 6.497.116 100.00
Economic Division of Investments as at 30 June 2008
% of net assets
Banks 52.70 Financial Services 21.57 Building Societies 4.25 Real estate 2.51 Transportation 2.40 Total Investments 83.43
Cash at Bank 1625 Other Assets 1.05 Other Liabilities (0.73) Net Asxt Value 100.00
Geographic Division of Investments as a t 30 June 2008
% of net assets
United Kingdom United States of America Ireland Australia Sweden France Netherlands Germany Denmark Norway Austria Spain Luxembouro
31.33 17.84 7.02 6.80 4.29 3.42 2.56 1.72 1.71 1.71 1.71 1.70 1 67
Total Investmentr, 83.43
Cash a t Bank 16.25 Other Assets 1.05 Other Liabilities (0.73) Net Asset Value 100.00
The accompanying notes form an integral part of these financial statements.
18
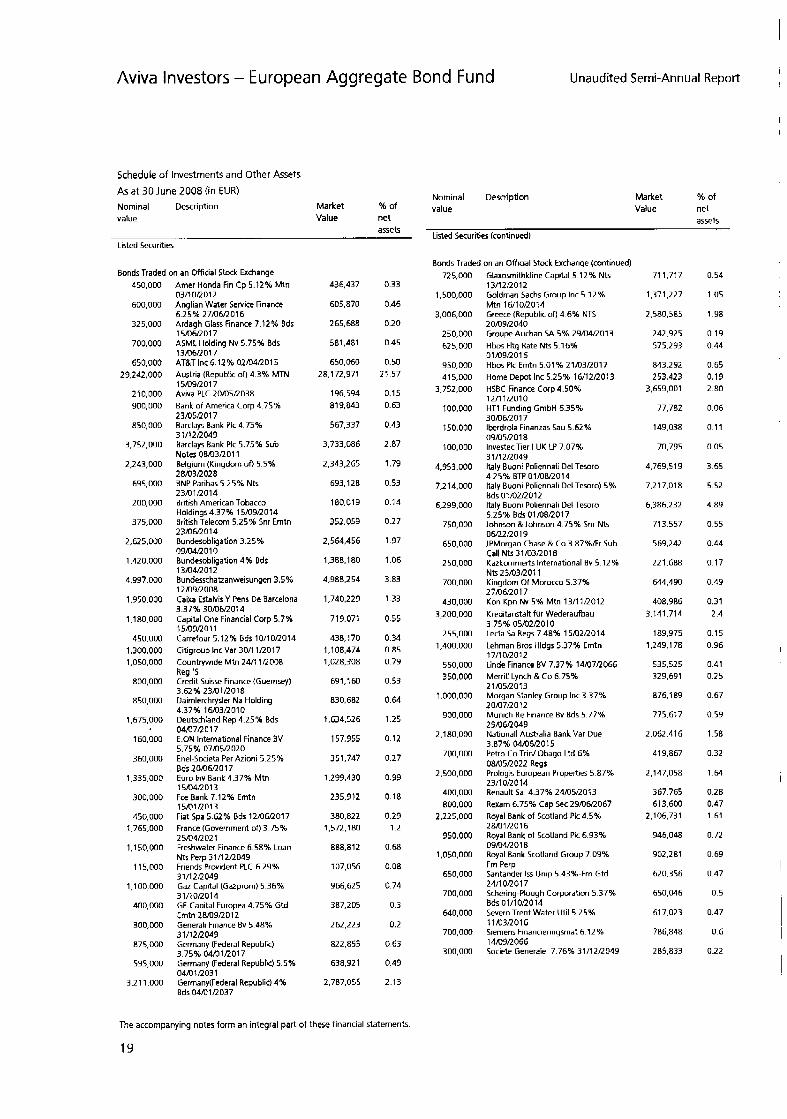
Aviva Investors - European Aggregate Bond Fund
Schedule of Investments and Other Assets As at 30 June 2008 (in EUR) Nominal Description Market % of value Value net
Listed Securities
assets
Bonds Traded on an Official Stock Exchange 450,000
600,000
325,000
700,000
650,000 29,242,000
210.000 900,000
aso,ooo
3,752,000
2,243,000
695,000
200.000
375,000
2,625,000
1,420,000
4,997,000
1,950,000
1,180.000
450,000 1,300,000 1,050,000
800,000
aso,ooo
1,675,000
160,000
360,000
1,335,000
300,000
450,000 1,765,000
1,150,000
115,000
1,100,000
400,000
300,000
875,000
595,000
3.2 1 1,000
Amer Honda Fin Cp 5.12% Mtn 0311 OR01 2 Anglian Water Sewice Finance
Ardagh Glass Finance 7.12% Bds
ASML Holding Nv 5 75% Bds 13B6R017 ATgirInc6 12% 02/04/2015 Austria (Republic 00 4.3% MTN 15/09/1017 Aviva PLC 2 0 ~ 5 n 0 3 8 Bank of America Corp 4 75% 2 3/05R 0 1 7 Barclays Bank PIC 4.75% 31/12/2049 Barclays Bank PIC 5.75% Sub Notes 08103/2011 Belgium (Kingdom 00 5.5%
8NP Paribas 5.25% Nls
British American Tobacco Holdings 4.37% 15/09/2014 British Telecom 5.25% Snr Emtn 23M6R014 Bundesobligation 3.25% 09/04/2010 Bundesobligation 4% Bds 13/04/2012 Bundesschabanweisungen 3.5% 12/09/2008 Caixa Estalvis Y Pens De Barcelona 3.37% 30106R014 Capital One Financial Corp 5.7% 15/1)9R011 Carrefour 5.12% Bds 10/10/2014 Citigroup Inc Var 30/11/2017 Countrywide Mtn 24/1 lROO8 Reg ‘S Credit Suisse Finance (Guernsey) 3.62% 23/01/2018 Daimlerchrysler Na Holding 4.37% 16M3/2010 Deutschland Rep 4.25% Bds M/07R017 E.ON International Finance BV 5.75% 07/05/2020 Enel-Societa Per Azioni 5 25% Bds 20M6/2017 Euro Inv Bank 4.37% Mtn 1 5/04/2013 Fce Bank 7.12% Emtn 151010013 Fiat Spa 5.62% Bds 12/06/2017 France (Government of) 3.75% 25M412021 Freshwater Finance 6.58% Loan Nts Perp 31/12/2049 Friends Provident PLC 6.29% 31/12/2049 Gaz Capital (Gatprom) 5.36% 3 1 /I OD01 4 GE Capital Europea 4.75% Gtd Emtn 28/09/2012 Generali Finance Bv 5.48% 31/12/2043 Germany (Federal Republic) 3 75% 04101R017 Germany (Federal Republic) 5.5% 04/01/203 1 Germany(Federa1 Republic) 4% Bds 04/01/2037
6.25% 27/06/2016
15/06/2017
2 a m 2 02 8
23/01/2014
436,437
605,870
2 65. 688
581,481
650,060 28,172,371
196.594 819.8d3
567,337
3,733,086
2,343,265
693,128
180.01 9
352,059
2,564,456
1.3aa.iao
4,988,254
1,740,223
719.071
438,170 1,108,474 1,028,308
691,160
830,682
1,634,526
157.955
35 1,747
1,299,430
235.912
380.822 1,572,180
888,812
107,056
966,625
387,205
262,223
822,855
638,921
2,787,055
0 33
0 46
0 20
0 45
0 50 21 57
0 15 0 63
0 43
2 a7
1 79
0 53
0 14
0 27
197
1 06
3 83
133
0 55
0 34 0 85 0 79
0 53
064
125
0 12
0 27
0 99
0 18
0 29 1 2
0 68
0 08
0 74
0 3
0 2
0 63
0 49
2 13
I i
Unaudited Semi-Annual Report
I
Nominal Description Market % of value Value net
Listed Securities (continued)
assets
Bonds Traded on an Official Stock Exchange (continued) 725,000
1,500,000
3,006,000
250,000 625,000
950,000 415,000
3,752,000
100,000
150,000
100,000
4.953.000
7,214,000
6,299.000
750,000
650,000
250.000
700,000
430,000 3,200,000
255,000 1,400,000
550,000 350,000
1,000,000
900.000
2.1 a0.000
700,000
2,500,000
400,000 800,000
2,225,000
950.000
1,050,000
650,000
700,000
640,000
700,000
300,000
Glaxosmithkline Capital 5 12% Nts 13/12/2012 Goldman Sachs Group Inc 5.12% Mtn 16/10/2014 Greece (Republic o f l4 6% NTS 20/09/2040 Groupe Auchan SA 5% 29/04/2013 Hbos Fltg Rate Nts 5.16% 01/09/2016 Hbos PIC Erntn 5.01% 21/03/2017 Home Depot Inc 5.25% 16/12/2013 HSBC Finance Corp 4.50% 12/11/2010 HT1 Funding GmbH 6.35% 30/06/2017 lberdrola Finanzas 5au 5.62% 09B5R 0 1 8 InvestecTier I UK LP 7.07% 3 111 2R049 Italy Buoni Poliennali Del Tesoro 4.25% BTP 01/08R014 Italy Buoni Poliennali Del Tesoto) 5% Bds 01/02/2012 Italy Buoni Poliennali Del Tesoro 5.25% Bds 01/08/2017 Johnson &Johnson 4.75% Snr Nts 06/22/2019 JPMorgan Chase & Co 3.87%/Fr Sub Call Nts31/03/2018 Kazkornrnerts International Bv 5.12% Nts 23/03/2011 Kingdom Of Morocco 5.37% 27/06/2017 Kon Kpn Nv 5% Mtn 13/11/2012 Kredilanstalt fur Wederaufbau 3 75% 05/02/2010 Lecta Sa Regs 7.48% 15102R014 Lehrnan Bros Hldgs 5.37% Erntn 17/10/2012 Linde Finance BV 7.37% 14iO7/1066 Merrill Lynch & t o 6.75% 2 1 B5R013 Morgan Stanley Group Inc 3.37%
Munich Re Finance Bv Bds 5.77% 29106~2049 Nationall Australia Bank Var Due
Petro t o Trin/ Obago Ltd 6% 08105/2022 Regs Prologis European Properties 5 87% 23/10/2014 Renaull Sa. 4.37% 24/05/2013 Rexarn 6.75% Cap Sec 29/06/2067 Royal Bank of Scotland PIC 4.5% 28/01/2016 Royal Bank of Scotland PIC 6.93% 09/04/2 0 1 8 Royal Bank Scotland Group 7.09%- Frn Perp Santander Iss Unip 5.43%-Frn Gtd 24/1 OR01 7 Schering-Plough Corporation 5.37% Bds01/10/2014 Severn Trent Water Uti1 5.25% 1 1 B3R016 Siemens Financierinqsrnat 6.12%
20/07/2012
3.87% 04/06/2015
14/09/2066 Societe Generale 7.76% 31/12/2049
711,717
1,371,227
2.580.585
242,925 575.293
843,292 253,423
3,659,001
77,782
149,038
70.795
4,769,519
7.217.0ia
6,386,232
713,557
569.242
221.688
644.490
408.986 3,141,714
189.975 1.149.17a
535,525 329.691
876.189
775,617
2,062,416
419.867
2,147,058
367,765 613.600
2.1 06,731
946,048
902.281
620.356
650,046
617.023
786,848
285.833
0 54
1 05
198
0 19 0 44
0 65 0 19 2 80
0 06
0 11
0 05
3 65
5 52
4 89
0 55
0 44
0 17
0 49
0 31 2 4
0 15 0 96
0 41 0 25
0 67
0 59
158
0 32
164
0 28 0 47 1 61
0 72
0 69
0 47
0 5
0 47
0 6
0 22
I
The accompanying notes form an integral part of these financial statemenb.
19

Aviva Investors - European Aggregate Bond Fund (con t in ued)
Unaudited Semi-Annual Report
Schedule of Investments and Other Assets
As at 30 June 2008 (in EUR) (continued) Quantity/ Description Nominal value
Market % of Value net
assets
Economic Division of Investments as at 30 June 2008
% of net assets
Sovereign 52.43
Listed Securities (continued)
Bonds Traded on an Official Stock Exchange (continued) 1,350,000 Standard Chartered Bank 3.62% 1,198,631 0.92
1,250,000 Telefonaktiebolaqet Lm Ericsson 1,097,051 0.84 03B2/2017
Banks
Financial Services
Telecommunications
Diversified Services
16.78
12.89
2.19 2.17
Commercial Services 1.64
5.37% Nts27X16R017 350,000 Telefonica Emisiones SAU 5.58% 343,157 0.26
12mmoi3 1,265.000 Time Warner Inc 5.5% 795,794 0.61
300,000 UBS Capital Securities LTD 298,883 0.23
275,000 Unicredito Italian 5.75% Sub Emtn 266,437 0.2
300,000 Unilever NV 4.87% NTS 291,803 0.22
500.000 Volkswagen Leasing Gmbh 4.87% 481.790 0.37
1,500,000 Wachovia Corp 5.3% 15/10R011 939.387 0.72 1,650,000 Westlb Ag 4.25% Bds 1511 1R010 1.612.238 1.24
Total BondsTraded on an Official 126,002,888 96.45 Stock Exchange
Cerhficate Traded on an Official Stock Exchange
1,500,000 CDI EUR ITRX SRF#S09 44,908 0.03
1,500,000 CDI EUR ITRX SRFISO9 M.908 0.03 570.000 CDI EUR ITRX X01S08 25,118 0.02
570,000 CDI EUR lTRXXOXSO8 (25.118) (002)
15/11/2011
31/12/2049
2M19RO17
2 1 B5R013
Bds 18/10/2012
Total Certificate Traded on an 89,816 0.06 Official Stock ExchanQe
Total listed Securities 126,092.704 96.51
Total lnveslments 126,092,704 96.51
Cash at Bank
Other Assets
1,578,414 1.21
3,192.093 2.44 Other Liabilities (207,688) (0.16)
Net Asset Value 130.655.523 100 00
Holding Companies
Oil & Gas
1.19
1.06 Pharmaceuticals 1.04
Auto Parts & Equipment Leisure Time
Auto Manufacturers
Healthcare-Products .4 Services
Retail Engineering & Construction
Food
Energy-Alternate Sources Electric
Investment Companies Insurance
0.64 0 61
0.57 0.55
0.53 0.41
0.41 0.30 0.23
0.23 0.23
Packaging & Containers 0.20 Forest Products & Paper 0.15
Certificate 0.06
Total Investments 96.51
Cash at Bank 1.21 Other Assets 2.44
Mher Liabilities (0.16)
Net Asset Value 100.00
Geographic Division of Investments a5 at 30 June 2008
% of net assets
Austria 21.59 Germany 15.99 Italy 14 54 United States of America 13.33 United Kingdom 11.05 France 2.76 Netherlands 2.62 Luxembourg 2.53 Spain 2.17 Greece 1.98 Belgium 1.79 Australia 1.58 Ireland 118 Euro Member Countries 0.99 Sweden 0.84 Channel Islands 0.53 Morocco 0.49 Trinidad And Tobago 0.32 Jersey 0.23 Told Investmentr, 96.51
Cash at Bank 1.21
Other Assets 2.44 Other Liabilities (0.16)
Net Asset Value 100.00
The accompanying notes form an integral part of these financial statements
20
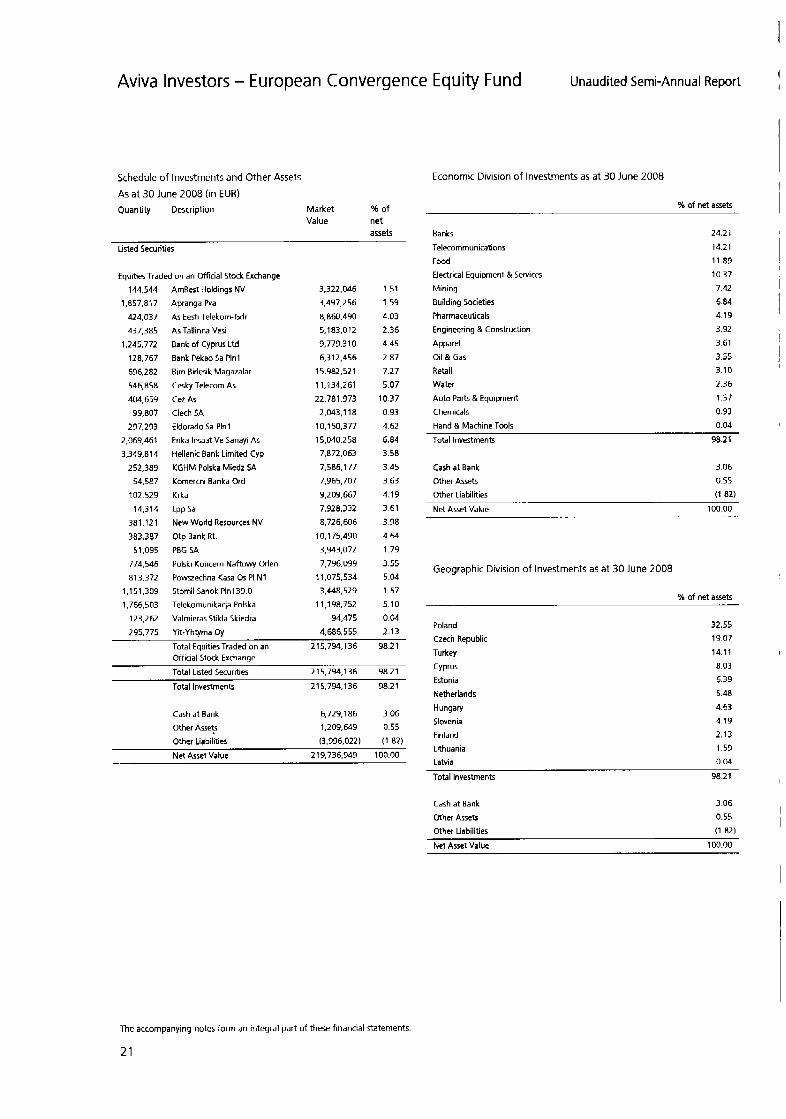
Aviva Investors - European Convergence Equity Fund Unaudited Semi-Annual Report
Schedule of Investments and Other Assets
As at 30 June 2008 (in EUR) Quantity Description Market % of
Value net assets
Listed Securities
Equities Traded on an Official Stock Exchange 144.544
1,857.817
424.037 437,385
1,245,772 128,767
696.282 546.858
404.659 99.807
297,293 2,069,461 3,349,814
252.389 54,587
102.529
14,314
381,12 1
383.387 51,095
774,546 813,372
1,151,309
1,766,503 123,262
295,775
AmRest Holdings NV Apranga h a
As Eesti Telekom-Gdr As Tallinna Vesi Bank of Cyprus Ltd
Bank Pekao Sa Plnl
Bim Birlesik Magazalar
testy Telecom As
Ce2 As Ciech SA
Eldorado Sa Plnl
Enka lnsaat Ve Sanayi As
Hellenic Bank Limited Cyp
KGHM Polska Miedz SA Komercni Banka Ord
Krka
LPP Sa New World Resources NV
Otp Bank Rt.
PBG SA
Polski Koncern Naftnwy Orlen
Powgechna Kasa Os PI N1 Stomil Sanok Pln139.0
Telekomunikacja Polska
Valmieras Stikla Skiedra Yit-Yhtvma Ov
3,322,046 3,497,256
8,860.490 5,183,012
9.779.3 10 6,312,456
15,982.521 1 1,134,261
22,761,973 2,043.118
10,150,377 15,040,258 7,872,063
7,586.177
7,365,707 9,209,667
7,928,332 8.72 6,606
10,175,430 3,943,072
7.796.099 11,075,534 3,448,529
11,198,752 94.475
4.686.555
151 159
4 03 2 36 4 45
2 87 7 27
5 07
10 37 0 93
4 62 6 84 3 58
3 45 3 63
4 19 3 61
3 98 4 6 4
1 79
3 55 504 157
5 10 0 04
2 13 , , . . Total EquttiesTraded on an 215,794,136 98.21 Official Stock Exchange Total Listed Securities 215,794,136 98.21
Total Investments
Cash at Bank Other Assets Other Liabilities
215,734,136 98.21
6,729,186 3.06 1,209,649 0.55
(3.996.022) (1.82)
Net Asset Value 219,736,949 100.00
Economic Division of Investments as at 30 June ZOOS
% of net assets
Banks
Telecommunications Food
Electrical Equipment & Services Mining
Building Societies
Pharmaceuticals
Engineering & Construction
Apparel
Oil & Gas Retail
water Auto Parts & Equipment
C hemicals
24.21
14.21
11.89 10.37 7.42
6 84 4.19
3.92 3.61
3 55 3.10
2.36 1.57
0.93 Hand A Marhinp T m k 0.04
Total Investments 98.2 1
Cash at Bank 3.06 Mher Assets 0.55
Other Liabilities (1 82) Net Asset Value 100 00
Geographic Division of Investments as at 30 June 2008
% of net assets
Poland Czech Republic
Turkey Cyprus
Estonia Netherlands
Hungary Slovenia
32.55 19.07
14.11 8.03 6.39
5.48
4.63 4 19
Finland 2.13 Lithuania 1.59 Latvia 0.04
Total Investments 98.21
Cash at Bank
Other Assets Other Liabilities
3.06
0.55 (1 32)
I
Net Asset Value 100.00
The accompanying notes form an integral part of these financial statements
21
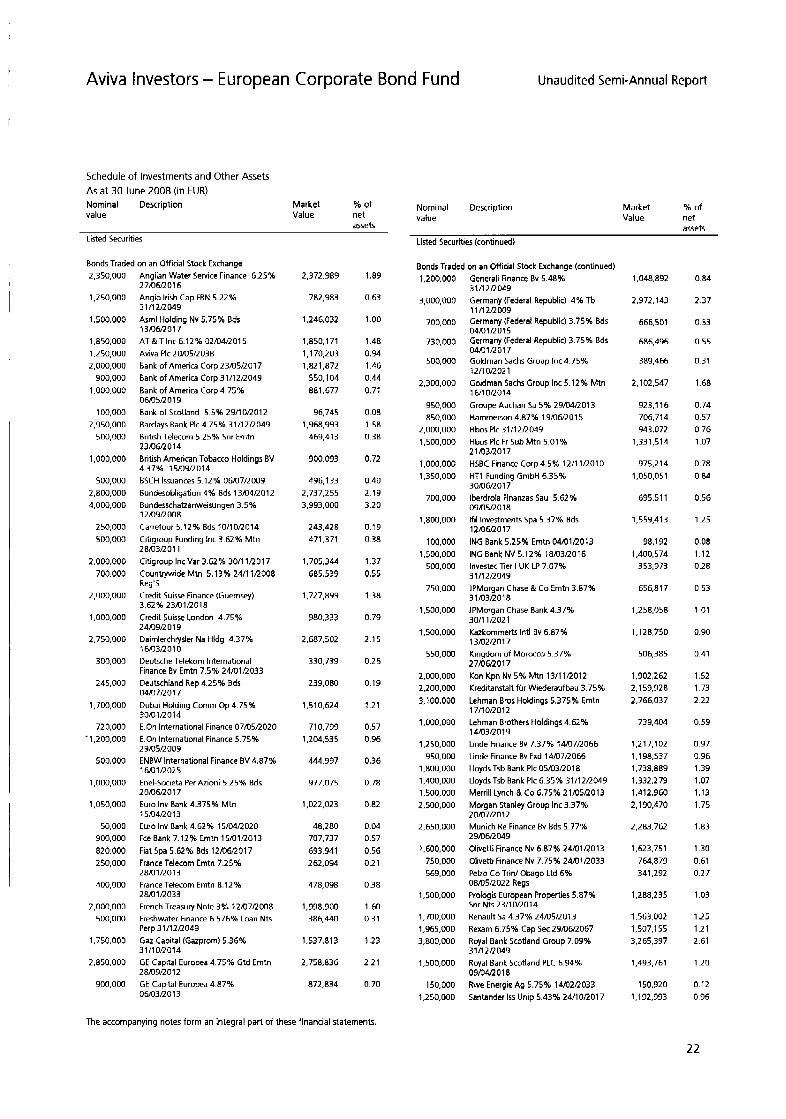
Aviva investors - European Corporate Bond Fund
I
Schedule of Investments and Other Assets As at 30 June 2008 (in EUR) Nominal Description Market % of value Value net
assets
Nominal Description value
Listed Securities
Bonds Traded on an Official Stock Exchange 2,350,000
1,250,000
1,500,000
1,850,000 1,250,000 2,000,000
900,000 1 .ooo.ooo
100,000 2,950,000
500,000
1,000,000
500,000 2,800,000 4,000,000
250,000 500,000
2,000,000 700.000
2.000.000
1,000,000
2,750,000
300.000
245,000
1,700,000
720,000 - 1,200,000
500,000
1,000,000
1,050,000
50,000 900,000
820.000 250,000
400,000
2,000.000 500,000
1,750,000
2,850,000
900 000
Anglian Water Service Finance 6.25% 27/06/2016 Anglo Irish Cap FRN 5.22% 3 1 /12/2049 Asrnl Holding Nv 5.75% Bds 13/06R017 AT&Tlnc 6.12% 02104Q015 Aviva PIC 2O!U5/2038 Bank of America Corp 23/05/2017 Bank of America Corp 31/12/2049 Bank of America Corp 4.75% 06/05/2019 Bank of Scotland 5.5% 29/10/2012 Barclays Bank PIC 4.75% 31/12/2049 British Telecorn 5 25% Snr Emtn 23/0136/2014 British American Tobacco Holdings BV
BSCH Issuances 5.12% 06B7/2009 Bundesobligation 4% Bds 13/04/2012 Bundesscha~anweisungen 3.5% 12/09/2008 Carrefour 5.12% 8ds 10/10/2014 Citigroup Funding Inc 3.62% Mtn
Citigroup IncVar 3 62% 30/11R017 Countrywide Mtn 5.13% 24/11/2008 Reg5 Credit Suisse Finance (Guernsey) 3 62% 23/01/2018 Credit Suisse London 4.75% 24/09/2013 Dairnlerchrysler Na Hldg 4 37% 16/03/2010 Deutsche Telekom International Finance Bv Emtn 7 5% 24iU1/2033 Deutschland Rep 4.25% Bds
Dubai Holding Comm Op 4.75% 30/01/2014 E.On International Finance 07/05/2020 E.On International Finance 5.75%
ENBW International Finance BV 4.87% 16/01/2025 Enel-Societa Per Azioni 5.25% Bds
Euro Inv Bank 4.375% Mtn 1 5/04/2013 Euro Inv Bank 4.62% 15/04/2020 Fce8ank 7.12% Emtn 15/01/2013 Fiat Spa 5.62% Bdr 12/06/2017 France Telecom Emtn 7.25% 28/01/2013 France Telecom Emtn 8.12% 28/01/2033 French Treasury Note 3% 12/137/2008 Freshwater Finance 6.576% Loan Nts Perp 31/12/2049 Gaz Capital (Gatprom) 5.36% 31/10R014 GE Capital Europea 4.75% Gtd Emtn 28109/2012 GE Capital Europea 4 87% 06/03/2013
4.37% i~/09/2014
28/03/2011
04mmoi7
29/05/2009
20/06/2017
2.372.989
782,983
1,246,032
1.850.1 71 1,170,203 1,821,872
550,104 881.677
96,745 1,968,993
469.413
900.093
496,133 2,737,255 3.993.000
243,428 471,371
1,705.3M 685,539
1,727,899
980.333
2,687,502
330,739
239,080
1,510,624
710.799 1,204,535
444.997
977,075
1,022,023
48,280 707,737 693,941 262,094
478,098
1,998,900 386,440
1.537.81 3
2.758.836
872.834
1 89
0 63
1 00
1 48 094 1 46 0 4 4 0 71
0 08 158 0 38
0 72
0 40 2 19 3 20
0 19 0 38
137 0 55
1 38
0 79
2 15
0 26
0 19
121
0 57 0 96
0 36
0 78
0 82
0 04 0 57 0 56 0 21
0 38
160 0 31
123
2 21
0 70
Unaudited Semi-Annual Report
Market % of Value net
assets Listed Securities (continued)
Bonds Traded on an Official Stock Exchange (continued) 1.200.000
3,000,000
700,000
730,000
500,000
2.300.000
950,000 850,000
2,000,000 1,500,000
1.000.000 1,350,000
700,000
1,800,000
100,000 1,500,000
500,000
750.000
1,500,000
1,500,000
550.000
2,000,000 2,200.000 3,100,000
1,000,000
1,250,000 950,000
1,800,000 1,400,000 1,500,000 2,500,000
2,650,000
1,600,000 750,000 569.000
1,500,000
1,700,000 1,365,000 3,800,000
1.500.000
150.000 1,250,000
Generali Finance Bv 5.48% 31/12/2049 Germany (Federal Republic) 4% Tb 11/12/2009 Germany (Federal Republic) 3.75% Bds
Germany (Federal Republic) 3.75% Bds 04MlR017 Goldman Sachs Group Inc 4.75% 12/10/2021 Goldman Sachs Group Inc 5.12% Mtn 16/10/2014 Group Auchan Sa 5% 29/04/2013 Hammerson 4.87% 19/06/2015 Hbos PIC 31/12/2049 Hbos PIC Fr Sub Mtn 5.01 % 2 1 /03/2017 HSBC Finance Corp 4.5% 12/11/2010 HT1 Funding GmbH 6.35%
lberdrola Flnanzas Sau 5.62% 09/05/20 18 lfil Investments Spa 5.37% 8ds 12/136/2017 ING Bank 5.25% Emtn 04BlR013 ING Bank NV 5.12% 18/03/2016 lnvestec Tier I UK LP 7.07% 3 1/12/2049 JPMorgan Chase & Co Erntn 3.87% 31/03/2018 JPMorgan Chase Bank 4.37% 3011 1/2021 Kazkornrnerk lntl Bv 6.87% 13/02/2017 Kingdom of Morocco 5.37% 27/06/201 7 Kon Kpn Nv 5% Mtn 13/11/2012 Kreditanstalt fur Wiederaufbau 3.75% Lehman Bros Holdings 5.375% Emtn 17/1 OR01 2 Lehrnan Brothers Holdings 4.62% 14,4J3/2019 Linde Finance Bv 7.37% 14107/2066 Linde Finance Bv Fxd 14/07/2066 Lloyds Tsb Bank PIC 05/03/2018 Lloyds Tsb Bank PIC 6.35% 31/12/2049 Merrill Lynch & Co 6.75% 21/05/2013 Morgan Stanley Group Inc 3.37% 2 0/137/20 12 Munich Re Finance Bv Bds 5.77% 29/06/2049 Olivetti Finance Nv 6.87% 24/01/2013 Olivetti Finance Nv 7.75% 24/01/2033 Petro Co Trin/ Obago Ltd 6% 08/05/2022 Regs Prologis European Properties 5.87% Snr Nts23/10/2014 Renault Sa 4.37% 24/05/2013 Rexam 6.75% Cap Sec 29/06/2067 Royal Bank Scotland Group 7.09% 31/12/2049 Royal Bank Scotland PLC 6.94% 09/04/2018 Rwe Energie Ag 5.75% 14/02/2033 Santander 15s Unip 5.43% 24/10/2017
0 4 m i ~ o i s
3ommoi7
1,048,892
2,372,143
666,501
686,496
389,466
2.1 02,547
923.1 16 706,714 943,072
1,331,514
975.2 14 1,050,051
695.511
1,559,413
98.192 1,400,574
353.973
656,817
1,258,058
1,128,750
506,385
1,902,262 2,159,328 2,766,037
739.404
1.2 17.1 02 1,138,537 1,738,883 1,332,279 1,412,360 2,190,470
2.283.762
1,623,751 764.879 341.292
1,288,235
1.563.002 1,507,155 3,265,397
1,493,761
150.320 1,192,993
0.84
2.37
0.53
0.55
0.31
1.68
0.74 0.57 0.76 1.07
0.78 0 84
0.56
1.25
0.08 1.12 0.28
0 53
1.01
0.90
0.41
1.52 1.73 2.22
0.59
0.97 0.36 1.39 1.07 1.13 1.75
1.83
1.30 0.61 0.27
1.03
1.25 1.21 2.61
1.20
0.12 0.96
The accompanying notes form an integral part of these financial statemenfs
22

Aviva investors - European Corporate Bond Fund (con t i n ued)
Schedule of Investments and Other Assets As at 30 June 2008 (in EUR) (continued) Quantity/ Description Market % of Nominal Value net value assets
Listed Securities (continued)
Bonds Traded on an Official Stock Exchange 700,000
270,000
1,700,000
1,350,000
1,650,000
1.500.000
500,000 2,000,000
2.000.000
1,725,000
1,450,000 400,000
500,000
1,100,000
750,000 900,000
Schering-Plough Corporation 5.37% Bds 01/102014 Severn Trent Water Uti1 5.25% 11/03/2016 Siemens Financieringsmat 6.12%
Societe Generale 7.76% 31/12/2049 Standard Chartered Bank 3.62% 03/02R017 Telefonica Emisiones 5.58%1247/2013 Tesco Plc5.12% 10/04/2047 furanalem Finance Bv 6.25% 27/0g/2011 UBS Capital Securities ttd 3 1 /12/2O49
14/09/2066
Unicredito Italian 5.75% Sub Emtn 2M)9/2017 Unilever Nv4.87% 21/05/2013 Veda Environnement 5.12% Mtn 2 4/1)5R 022 Veolia Environnement 6.12% 25/11/2033 Voltswagen Leasing Gmbh 4.875% Bds 18/10R012 Wood Street Clo 29106R023 Wt Finance Aust ,by LtdMleMield Europe Finance M e a Finance Llc 3.62% 27/06/2012
650,046
260,307
1.910.916
1,286,250
1.464.994
1,470,672
417.287 1.683.1 76
1,932,555
1,671,289
1.41 0,379 354.254
463.947
1,059,937
546,000 788.448
0.52
021
1.53
1.03
1.17
1.18
0.33 1.35
1 60
1.34
1.13 0.28
0.37
0.85
0.M 0.63
Total BondsTraded on an Official 117,040,735 93.73 Stock Exchange
Certificate Traded on an Official Stock Exchange 1,400,000 CDI EUR ITRX XO#SO8 61,694 005 1,400,000 CDI EUR ITRX XOdS08 (61,694) (0.05)
Total Certificate Traded on an 0 0.00 Official Stock Exchange Total Listed Securities 117,040.795 93 73 Total Investments 117,040,795 93.73
Cash at Bank 5,330,717 4.26 Other Assets 2,731,916 2.19 Other Liabilities (226.624) (0.18) Net Asset Value 124,876,801 100.00
i Unaudited Semi-Annual Report
Economic Division of Investments as a t 30 June 2008
% of net assets
Banks Diversified Financial Swvices Sovereign Telecommunications Holding Companies Energy-Alternate Sources Food Auto Parts & Equipment Auto Manufadurers Investment Companies Diversified Services Oil & Gas Electric Special Purpose Entity Real Estate Electrical Equipment & Services Commercial Services Engineering & Construction Insurance Pharmaceuticals Water Energy Retail Certificate
2 5.48 22.92 11.05 7.32 4.68 2.21 2.20 2.15 1.81 1.60 1.53 1.50 1.49 1.21 1.20 1 .08 1 03 0.97 0.94 0.52 0.37 0.28 0.19 0.00
Total lnvestmenfs 93.73
Cash a t Bank 4.26 Other Assets 2 19 Other Liabilities (0.1 8) Net Asset Value 100.00
Geographic Division of Investments as at 30 June 2008
% of net assets
United States of America 19 61 United Kingdom 17.94 Netherlands 16.62 Germany 14.41 France 6.05 Italy 3.37 Ireland 3.22 Spain 3.10 Luxembourg 2.26 Jersey 1.60 Channel Islands 1.38 Cayman Islands 1.21 Euro Member Countries 0.86 Swiizerland 0 79 Australia 0.63 Morocco 0.41 Trinidad And Tobago 0.27 Total investments 93.73
Cash at Bank 4.26 Other Assets 2.19 Other Liabilities (0 18) Net Asset Value 100.00
The accompanying notes form an integral part of these financial statements.
23

Aviva Investors - European Equity Fund
Schedule of Investments and Other Assets As at 30 June 2008 (in EUR) Quantity Description Market % of
Value net assets
Listed Securities
Equities Traded on an Official Stock Exchange
59.020 42,046
46,671
190,757 63,778 95.481
773.1 50 136,554
84,318 50.809 90.337
93,423 671,467
275,563 72.324
161,029
102.774 187,451
155.126 146,269
259.348 113,333 53,434
234.456 1.41 6,385
172.979 104,571 134,144
138.788
260,321 91,399
115.896 261,690
142,873 62.a80
131,527
43.823 228.910 443,186
127.981 260,463
223.457 92.715
198.764
240.489 10,859
111,220
680.931 88,645 22.491
403,530
22,225
Acciona S.A. Advanced Metallurgical Group N
Air Liquide Aker Kvaerner ASA
Allianz Ag-Reg Alpha BankA.E.
Banca Popolare Di Milano Bayer Ag Beiersdorf Ag Npv Bilfinger Berger Ag Npv Cap Gemini SA
Carrefour Sa
Cyprus Popular Bank Ltd
Deutche Post AG E.On Ag EFG Eurobank Ergasias Sa
EFG International Elan Carp PIC
Fresenius Ag-Pfd Ftesenius Medical Care
Galp Energia SGPS SA Gamesa Corp Tecnologica Sa
Gerresheimer AG
Grifols Sa Eur0.50 Group 4 Securicor PLC
Groupe Eurotunnel SA Groupe Eurotunnel SA Heineken Nv
Hellenic Telecommunications Or lntralot SA
Kone Oyj
National Bank Of Greece Sa
Nestle SA
Nobel Biocare Holding AG Omv Ag Outokurnpu Technology
Pernod-Ricard Premiere AG ProSafe SE
Red Electrica De Espana Sa
Reed Elsevier NV Repro1 Ypf Sa Eurl Roche Holding Ag-Genusxhein Royal Dutch Shell Sarnpo Oyj-A Shares
SMA Solar Technology AG Societe Generale-A Storebrand
Subsea 7 Inc Swatch Group AG
Swedish Match AB
Syngenta AG
8,873,656 2,277,422
3,864,826 2,842,217
7,103,913 1,769,263
4,580,314 7.169.085 3,886,638
2,783,668 3,379,959
3,309.043 3,082,034
4.533.01 1 9.1 90.2 10 2,407,384
1.773.71 1 4.1 51,723
8519.51 9 5,106,982
3.619.201 3.512.756 1,733,933
4.659.813 3.561.1 59
1,720,276 1.040.481 4.348.948
2,205,341
2.746.387 2.04 1,854 3,285,652 7.498.185
2,953,563 3.1 65,065 5.2 17,676
2,801,824 3,193,295 2.761.769
5.281.776 2,757,001
5,590,894 10,362,474 5,134,074
3.81 6,560 598.982
6.1 15,432
3,245,757 1.413.541 3,547,322
5,174,682
4,513,572
3.66 0.94
1.59 1.17
2.93 0.73 1 .89
2.96 1.60 1.15
1.39 1.36
1.27 1 .a7
3.79 0.99
0.73 1.71
3.51 2.11 1.49
1.45 0.71
1.92 1.47 0.71
0.43 1.79
0.91 1.13
0.84 1.35 3.09
1.22 1.30 2.15 1.15
1.32 1.14
2.18 1.14
2.30 4.27 2 12 1.57
0.25 2.52 1.34
0.58 1.46
2.13 1 .&6
Quantiv Description
Unaudited Semi-Annual Report
Market 56 of Value net
assets
Listed Securities (continued)
Equities Traded on an Gfficial Stock Exchange (continued) 339,097 Tele2 Ab Ser 'B' Npv 4,151,378 1.71
425,568 Teliasonera Ab
166,006 Tnt Nv 144,789 Tognum Ag Npv
67,056 ThyssenKrupp AG
1,470,232 Unicredito ltaliano Spa
1.935.623 0.80
2,664,470 1.10
3,663,752 1.51 2,502,678 1.03 5,673.489 2.35
61,734 Vestas Wind Systems AIS 5.103.478 2.10
112,627 Vinci S.A. 4,340,645 1.79
224,406 Vivendi Universal Sa 5.387.988 2.23
Total Equities Traded on an Official 245,653,930 101.26 Stock Exchange
Total Listed Securities 245.653.930 101.26
Total Investments 245,653,930 101.26
Other Assets 174.887 0.07
Bank Overdraft (2,088,746) (0.86)
Other Liabilities (1.148.856) (0.47)
Net Asset Value 242,531,215 100.00
The accompanying notes form an integral part of these financial statements.
24

Aviva Investors - European Equity Fund (continued)
I
Unaudited Semi-Annual Report
Economic Division of Investments as at 30 June 2008
% of net assets
Geographic Division of Investments as at 30 June 2008
% of net assets
Banks
Pharmaceuticals Engineering & Constructlon
Chemicals Electrical Equipment & Services
Oil & Gas
Transportation
Food
11 .E3
1 1.42 7.77
6.41 6.14
5.72 4.52
4 45 Insurance 4.27
Telecommunications Oil & Gas Services Machinery
Beverages Media
Commercial Services Media & Mukimedia
Electric Agricukure
3 42 3.21 3.18
2.94 2.46
2.31 2.22
2.18 2.13
Healthcare-Products & Services 2.11
Cosrneticflersonal Care
Financial Services Retail
Energy Compulers
1.60 1.57 1.46
1.45 1.39
Healthcare-Products 1.22 Entertainment Irodteel
1.13 1.10
Metal FabricateMardware 0.94 Packaging & Containers 0.71
Total Investments 101.26
Other Assets 0.07 Bank Overdraft Other Liabilities
Net Asset Value 100.00
Germany France SwiQerland Spain Netherlands Greece Sweden Finland Italy United Kingdom Norway Cyprus Denmark Ireland Portugal
24.34 13.17 12.63 11.51 5.38 5.1 1 4.64 4.56 4.23 3.59 3.09 2.41 2.10 1.71 1.49
Austria 1.30 Total Investments 101.26
Other Assets 0.07 Bank Overdraft
Other Liabilities (0.86) (0.47)
Net Asset Value 100 00
I
The accompanying notes form an integral part of these financial statements.
25
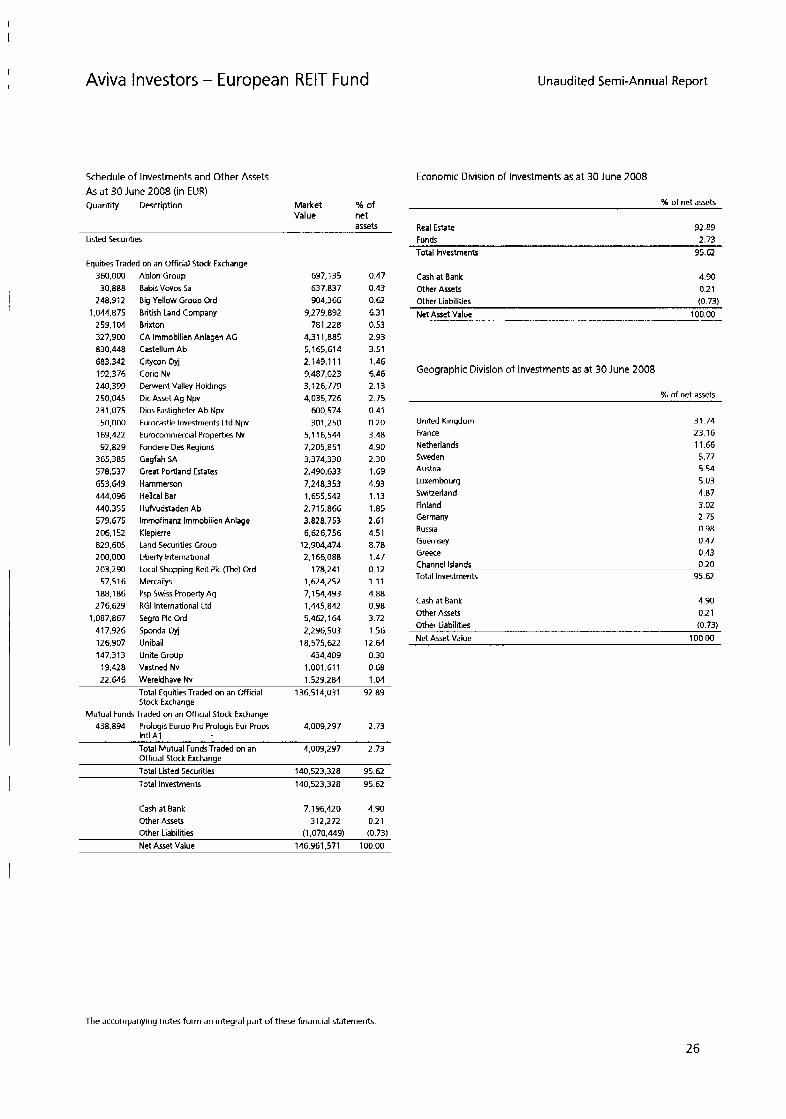
Aviva Investors - European RElT Fund Unaudited Semi-Annual Report
Schedule of Investments and Other Assets As at 30 June 2008 (in EUR) Quantity Description Market % of
Value net assets
Listed Securities
Eauities Traded on an Official Stock Exchange 360,000 30.888 248.912
1,044,875 259,104 327,900 830,448 683,342 192.376 240.399 250,045 231,075 50,000 169,422 32.S29 365,385 578,537 653.649 444,096 440,355 579.675 206,152 829.605 200,000 203,290 57,516 188.186 276,629
1,087,867 417.926 126,907 147,313 19,428 22.6A6
Ablon Group Babis Vovos Sa Big Yellow Group Ord British Land Company Brixton CA lrnmobilien Anlagen AG Castellum Ab Cilycon Oyj Corio Nv Derwent Valley Holdings Dic Asset Ag Npv Dios Fastigheter Ab Npv Eurocastle Investments Ltd Npv Eurocommercial Properties Nv Fonciere Des Regions Gagfah SA Great Portland Estates Hammerson Helical Bar Hufvudstaden Ab lmmofinant lmmobilien Anlage Klepierre Land Securities Group Liberty International Local Shopping Ret PIC (the) Ord Mercailys Psp Swiss Property Ag RGl International Ltd Segro PIC Ord Sponda Gyj Unibail Unite Group Vastned Nv Wereldhave Nu
697,135 637.837 904.366
9,279,892
4.31 1.885 5,165,614 2,149,111 9.487.023 3,126,779 4,035,72 6 600,574 301,250
5,116,544 7,205,851 3,374,330 2,490,633 7,248,353 1,655,542 2.71 5,866 3,828,753 6,626,756 12,904,474 2.166.088
1,624,252
781.228
178,241
7,154,493 1,445,842 5,462,164 2,296,503 18.575.622 434.409
1,001,611 1.529.284
0.47 0.43 0.62 6.31 0.53 2.93 3.51 1.46 6.46 2.13 2.75 0.41 0.20 3.48 4.30 2.30 1.69 4.93 1.13 1.85 2.61 4.51 8.78 1.47 0.12 1.11 4.88 0.98 3.72 1.56 12.64 0.30 0 68 1.04
Total Equities Traded on an Official 136,514,031 92 89 Stock Exchange
Mutual Funds Traded on an Official Stock Exchange 438.834 Prologis Europ Pro Prologis Eur Props 4,009,237 2.73
lntl A 1
Total Mutual FundsTraded on an 4,009,297 2.73 Official Stock Exchange Total Listed Securities 140.523.328 95.62 Total Investments 140,523.328 95.62
Cash at Bank 7,196,420 4.90 Other Assets 312.272 0.21 Other Liabilities (1,070,449) (0.73) Net Asset Value 146.961.571 100.00
Economic Division of Investments as at 30 June 2008
% of net assets
Real Estate 32.89
Total Investments 95.62
Cash at Bank Other Assets
4.90 0.2 1
Other Liabilities (0.73) Net Asset Value 100.00
Geographic Division of Investments as at 30 June 2008
% of net assets
United Kingdom France Netherlands Sweden Austria Luxembourg Swleerland Finland Germany Russia Guernsey Greece
31 74 23 16 1 1 66 5.77 5 54 5 03 4 87 3 02 2 75 0 98 0 47 0 43
Channel Islands 0.20 Total Investments 95.62
Cash at Bank 4.90 Other Assets 0.2 1 Other liabilities (0.73) Net Asset Value 100 00
The accompanying notes form an integral part of these financial statements.
26
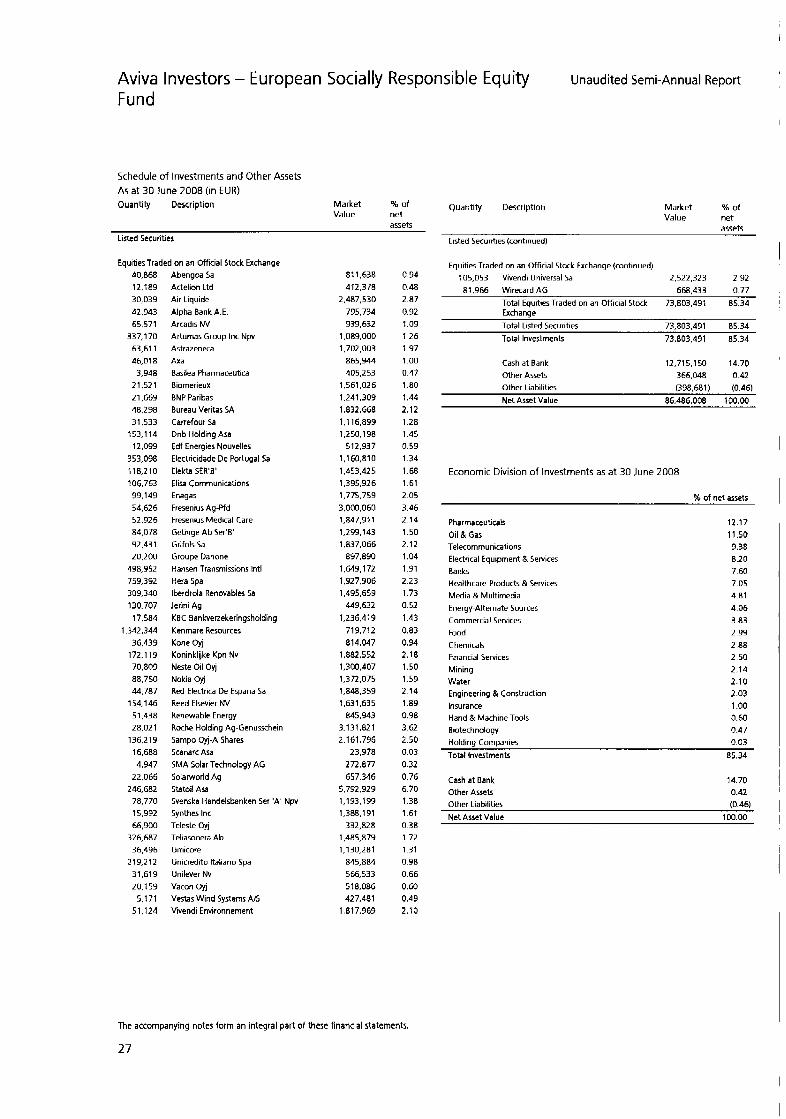
Aviva Investors - European Socially Responsible Equity Unaudited Semi-Annual Report
Fund
Schedule of Investments and Other Assets A5 at 30 June 2008 (in EUR) Quantity Description Market % of
assets Value net
Listed Securities
Equities Traded on an Official Stock Exchange 40,868 12,189 30,039 42,943 65,571
337,170 63.61 1 46.01 8 3,948
21,521 21,669 48.298 31,533
153,114 12.099
353,098 118,210 106,763 99,149 54,626 52,926 84.078 92,431
498,952 759,392 309,340 130.707 17,584
1,342,344 36,439
172,119 70.809 88,750 44.787
1 54,146 51,438 28.021
136.2 19 16.68B 4,947
22,066 246.682 78,770 15,992 66,900
32 6.687 36,496
2 19.2 12 31.619 20,159
5,171 51,124
20,200
Abengoa Sa Actelion Ltd Air Liquide Alpha Bank A.E. Arcadis NV Artumas Group Inc Npv Astrazeneca Ara Basilea Pharrnaceutica Biomerieux BNP Paribas Bureau Veritas SA Carrefour Sa Dnb Holding Asa Edf Energies Nouvelles Electricidade De Portugal Sa Elekta SER'B' Eli- Communications Enagas Fresenius Ag-Pfd Fresenius Medical Care tetinge Ab Ser'B' Grifols Sa troupe Danone Hansen Transmissions lntl Hera Spa lberdtola Renovabls Sa Jerini Ag KBC Bankverzekeringsholding Kenmare Resources Kone Oyj Koninklhke Kpn Nu Neste Oil Oyj Nokia Oyj Red Eledrica De Espana Sa Reed Elsevier NV Renewable Energy Roche Holding Ag-Genusxhein Sampo Oyj-A Shares Scanarc Asa SMA Solar Technology AG Solarworld Ag Statoil Asa Svenska Handelsbanken Ser 'A' Npv Synthes Inc Teleste Ovj Teliasonera Ab Umicore Unicredito ltaliano Spa Unilever Nv Vacon Oyj Vestas Wind Systems A1s Vivendi Environnement
81 1,638 412.378
2,487.530 795,734 939,632
1.089.000 1.702.003 865,944 405,253
1.561.026 1,241,309 1.832.668 1,116,899 1,250,198
512,937 1.1 60.81 0 1,453,425 1,395,926 1,775,759 3.000.060 1,847.91 1 1.299.143 1,837,066
897.890 1,643,172 1,927,906 1,495.659
449,632 1,236,419
719.712 814,047
1.882.552 1,300,407 1.372.075 1,848,359 1,631,635
845.943 3.1 31.82 1 2.1 61,796
23,978 272,877 657.346
5,792,929 1.1 93.199 1,388.1 91
332.828
1.1 30,281 845.884 566.533 518.086 427,481
1,817,969
1.485.879
0.94 0.48 2.87 0.92 1.09 126 1.97 1 .oo 0.47 1 .a0 1.44 2.12 1.28 1.45 0.59 1.34 1.68 1.61 2 05 3.46 2 14 1.50 2.12 1.04 1.91 2.23 1.73 0.52 1.43 0.83 0.94 2.18 1.50 1.59 2.14 1.89 0.98 3.62 2 50 0.03 0 32 0.76 6.70 1.38 1.61 0.38 1.72 1.31 0.98 0.66 0.63 0.49 2.10
Quantity Description Market % of
assets Value net
Listed Securities (continued)
Equities Traded on an Official Stock Exchange (continued) 105,053 Vivendi Universal Sa 2,522,323 2 92 R1 966 Wirecard AG 6 ~ 4 3 3 n77
Total Equities Traded on an Official Stock 73,803,491 85.34 Exchange Total Listed Securities 73.803.491 85.34 Total Investment 73,603,491 85.34
Cash a t Bank 12,715,150 14.70
Other Liabilities (398.681) (0.46) Net Asset Value 86.486.008 100.00
Other Assets 366,048 0.42
Economic Division of Investments as at 30 June 2008
56 of net assets
Pharmaceuticals 12.17 Oil &Gas 11.50 Telecommunications 9.38 Electrical Equipment & Services 8.20 Banks 7.60 Healthcare-Products & Services 7.05 Media &Multimedia 4.81 Energy-Alternate Sources 4.06 Commercial Services 3.83 Food 2.99 Chemicals 2.88 Financial Services 2.50 Mining 2.14 Water 2.10 Engineering & Construction 2.03 Insurance 1 .oo Hand & Machine Tools 0.60 Biotechnology 0.47 Holding Companies 0.03 Total Investments 85.34
Cash a t Bank 14.70 Other Assets 0.42 Other Liabilities (0.46) Net Asset Value 100.00
The accompanying notes form an integral part of these financial statements.
27
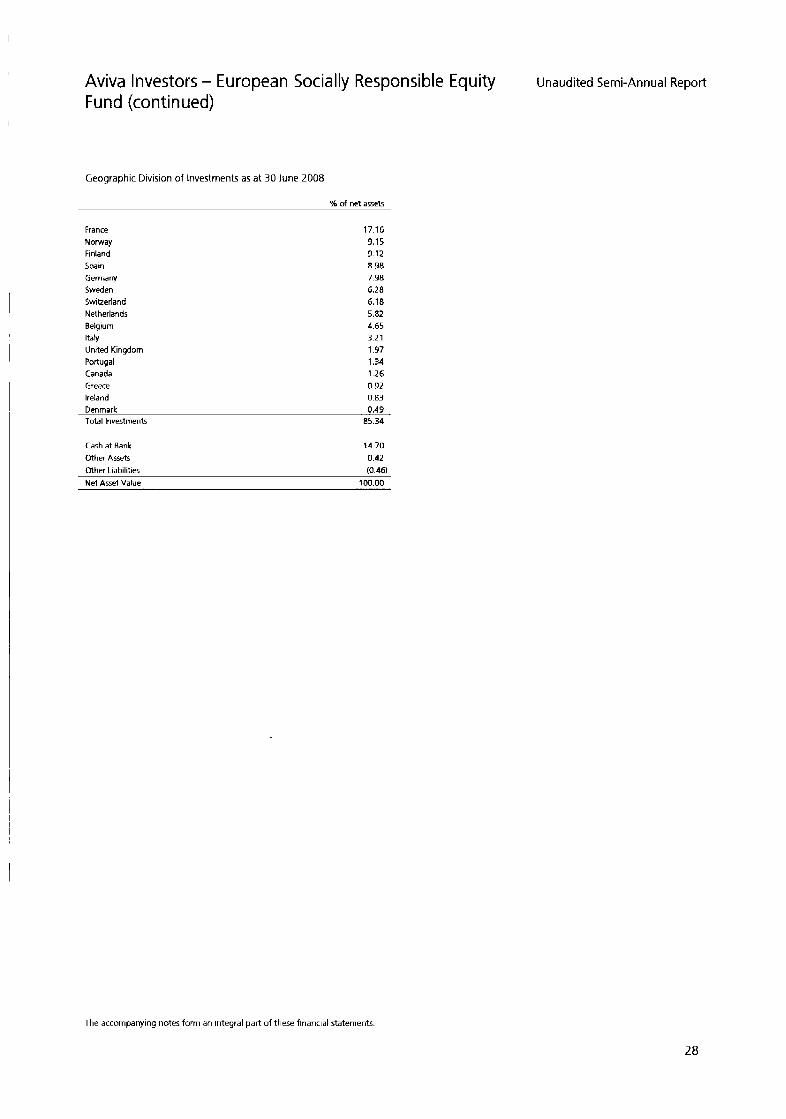
Aviva Investors - European Socially Responsible Equity Fund (continued)
Unaudited Semi-Annual Report
Geographic Division of Investments as at 30 June 2008
% of net assets
France 17.16 Norway 9.15 Finland 9.12 Spain 8.98 Germany 7.98 Sweden 6.28 Swiberland 6.18 Netherlands 5.82 Belgium 4.65 Italy 3.21 United Kingdom 1.97 Portugal 1.34 Canada 1.26 Greece 0.92 Ireland 0.83 Denmark 0.49 Total Investments 85.34
Cash at Bank 14.70
Other Assets 0.42 Other Liabilities (0.46) Net Asset Value 100.00
The accompanying notes form an integral part of these financial sfatemenfs.
28

Aviva Investors - European Value Equity Fund
Schedule of Investments and Other Assets As at 30 June 2008 (in EUR) Quantity Description Market % o f
assets Value net
Listed Securities
Equities Traded on an Official Strxk Exchange 152,039 219,163
8.319 1 53,028 162,160
7,890 64,343
32.852
11 6,378
12 1,797
16,560
12,270 6,597
35,698 15,293
165,904 18.239
523.397 10,217
7 1,704 253,055 25.061
124,970
87.582
22.980 46.437
142,646 86.023 40.187 39,201
363,873 276.742 114,012 23,505
216.218 53,748 15,415
485,025
42.160 43,129
110.017 261,535
81,387 30,671
176.01 6 122.783 184,694
8,730
15.518
14,809
48,560 95.282 4,652
36,993 154.768 46.2 1 a
120.974 206,554
ADVA AG Optical Networking Alcatel SA Allianz Ag-Reg Arnoldo Mondadori Ed~tore SPA
Astrazeneca Bacou Dalloz Banca Popolare Di Milano Belgacom Sa BIC BNP Paribas Carrefour Sa Casino Guichard Perrachon CNP Assurances Cornmenbank Ag Cornpagnie De Saint-Gobain Davide Campari-Milano SPA Delhaite Group Deutsche Telekom Ag E. On Ag Eni Spa Fortis France Telecorn Sa Gas Natural Sdg Sa GN Store Nord Gpc Biotech Ag H Lundbeck A15 Heineken Nv Hellenic Telecommunications Or Hoganas Ab IDS Scheer A t lntesabci Spa Koninkldke Ahold Nv Koninklijke Kpn Nv Lagardere S.C.A. Mediaset SpA Medigene Ag Mobistar Sa Morphosys AG M-Real Oy] 'E' Muenchener Rueckver Ag Nestle SA Nokia Cyj Nordea Ab Novartis Ag Orion Oyj Paion Ag Pharrnexa AIS Portugal Telecorn SGPS SA Reed Elsevier NV Repol Ypf Sa
Roche Holding Ag-Genusxhein Royal Dutch Shell Rwe Ag (Neu) Npv 'A' Sarnpo Gy-A Shares Sanofi-Aventis SA5 AB Stmicroelectronics Nv Stora Enso Oyj Ser 'R' Npv
259.227 836,107 926,612 565.438
4,338,820 594,354 381.232
3.345.1 55 1,079,024
948.640 4.1 22.1 09
883,992 472,906 670,944 609,579 876,388 776.069
5.426.31 8 1,298,274 2,070.876
746,797 4.747.3 12
920,365 382,07 6
55.612 667,837
1,366,905 416,093 300.280
1,310,398
1,247,006 M8.766 900,007
776,299 639,497
1.639.1 34
666.774 981,608
9,072.103 1.01 9,372
34,505 39.180
877,285
4,624,583
2.3~8.534
338,881
62a.107
i.208.00a
1,954,986 2 18.425
5,427,404 2,461,134
369.787 587.079
6.51 7,280 146,735 ao6.110
1,222,800
0 2 1 0 68 0 75 0 46 3 53 o 48 0 31 2 73 0 88 0 77 3 35 0 72
0 55 0 50 0 71 0 63 4 42 1 06 1 68 0 61
0 75 0 31 0 05 0 54 3 76 111 0 34 0 24 107 1 92 101 0 69 0 73 0 28 0 63 0 52 0 51 133
0 54 0 80
o 38
3 87
o 98
7 38 0 83 0 03 0 03 0 71 1 59 o 18 4 41 2 00 0 30 0 40 5 30 0 12 0 66 0 99
Unaudited Semi-Annual Report ,
Quantity Description Market % of Value net
assets Listed Securities (continued)
Equities Traded on an Official Stock Exchange (continued) 250,446 Super De Boer
50,870 5,526 Swiss Life Holding
18,665 Swiss Reinsurance 16.852 Swisscorn Ag
1,366,556 Telecorn ltalia Spa 75,485 Telefonica Sa
177,369 Teliasonera Ab 191,689 Thornsonlex-TMM 72.2 15 fietoenator Oyj 49.893 Total Fina Elf Sa
61,252 Upm-Kyrnrnene Oyj 38,102 Valeo 90.330 Vivendi Universal Sa
31 5,175 Wolters Kluwer Cva
Svenska Handelsbanken Ser 'A' Npv
269,824 Unilever Nv
7.494 Zurich Financial Services
767,617 770.573 930.908 779.903
3.571.878 1,400,037 1,268,525
642,158 924.352
2,689.981 4.834.572
636,715 764.898
2,168,823 4,707.139 1.204.709
806,732
0.62 0.63 0.76 0.63 2.91 1.14 1.03 0 66 0.52 0.75 2.19 3.92 0.52 0.62 1 7 6 3.83 0.98 . .
Total Equities Traded on an Official 117,876,648 95.87 Stock Exchange Total Listed Securities 117376.648 95.87 Total Investments 1 1 7 . 8 7 6 . ~ 95.87
Cash at Bank Other Assets
5,767.654 4 69 1,137.311 093
Other Liabilities (1,833,428) (1.491 Net Asset Value 122,948,185 10000
The accompanying notes form an integral part of these financial statements
29

Aviva Investors - European Value Equity Fund (con t i n u ed)
Unaudited Semi-Annual Report
Economic Division of Investments as at 30 June 2008
% of net assets
Geographic Division of Investments as at 30 June 2008
% of net assets
Pharmaceuticals Telecommunications Food Oil & Gas Media & Multimedia Insurance Banks Beverages Media Forest Products & Paper Electrical Equipment & Services Biotechnology Household ProducWWares Computers Electronics & Semiconductors Auto Parts & Equipment Home Furnishings Building Societies Miscellaneous Manufactures Financial %Nice5 Metal Commercial Services
22.00 21.94 12.15 6.80 5.59 4.83 4.74 4.47 3.47 2.02 1.36 0.91 0.88 0.75 0.66 0.62 0.52 0.50 0.48 0.48 0.34 0.24
Airlines 0.12 Total Investments 95.87
Cash at Bank 4 69 other Assets 0.93 Other Liabilities (1.49) Net Asset Value 100.00
France SwiQerland Netherlands Germany Italy United Kingdom Finland Belgium Sweden Spain Greece Denmark Portugal Total Investments
Cash at Bank Other Assets
22.71 18.06 17.32 9.73 6 10 5.53 4.62 4.59 2.55 1.96 1.11 0.88 0.71
95.87
4.69 0.93
Other Liabilities (1.49) Net Asset Value 100 00
The accompanying notes form an integral part of these financial statements
30
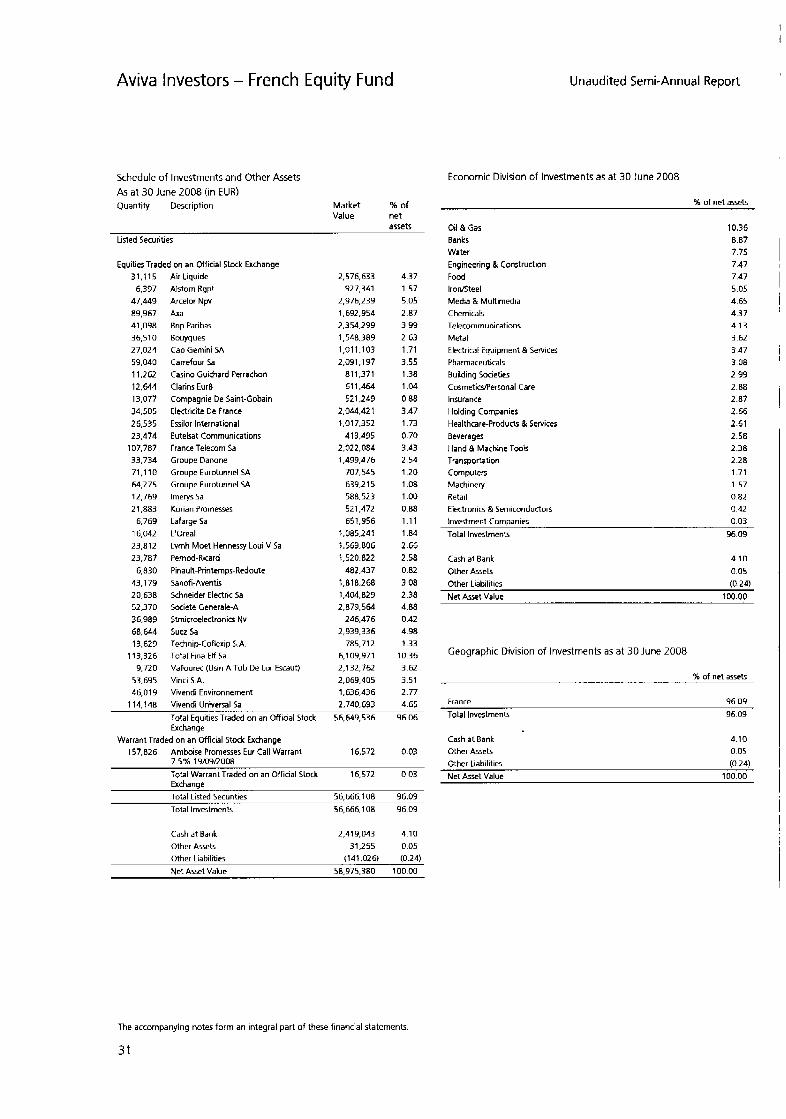
Aviva Investors - French Equity Fund Unaudited Semi-Annual Report
Schedule of Investments and Other Assets As at 30 June 2008 (in EUR) Quantity Description Market % of
ass& Value net
Listed Securities
EquitiesTraded on an Official Stock Exchange 31.115
6,397 47,449 89,967 41,098 36,510 27,024 59.040 11,262 12.644 13,077 34,505 26,535 23,474
107,787 33,734 71,110 64.275 12,769 2 1,883
6.769 16,042 23,812 23,787
6.830 43.179 20,638 52,370 36.989 68.644 13.629
113,326 9,720
53.695 46,019
Air Liquide Alstom Rgpt Arcelor Npv Axa Bnp Paribas Bouygues Cap Gemini SA
Carrefour Sa
Casino Guichard Perrachon Clarins Eur8 Compagnie De Saint-Gobain Electricite De France Essilor International Eutelsat Communications France Telecom Sa Groupe Danone Groupe Eurotunnel SA Groupe Eurotunnel SA lmerys Sa Korian Promesses Lafarge Sa L'Oreal Lvmh Moet Hennessy Loui V Sa Pernod-Ricard Pinault-Printemps-Redoute Sanofi-Aventis Schneider Electric Sa Societe Generale-A Stmicroelectronics Nv Suez Sa TechnipCoflexip S A Total Fina Elf Sa
Vallourec (Usin A Tub De Lor Escaut) Vinci S.A. Vivendi Environnement
2,576,633 927,341
2,976,239 1,692,354 2,354,299 1,548.389 1.01 1,103 2,091,197
811.371 611,464 521,249
2,044,421 1.01 7,352
413,495 2.022.084 1,493,476
707.545 639.21 5 588.523 521,472 651,956
1,085,211 1,563,806 1,520.822
482,437 1,818.268 1,404,829
246,476 2,939,336
785,712 6.1 09,971 2.1 32.762 2,069,405 1,636,436
2,879,564
4.37 1.57 5.05 2.87 3.99 2.63 1.71 3.55 1.38 1.04 0 88 3.47 1.73 0.70 3.43 2.54 1.20 1.08 1 .oo
1.11 1.84 2.66 2.58 0.82 3 08 2.38 4.88 0.42 4.98 1.33
10.36 3.62 3.51 2.77
0.88
1 14.148 Vivendi Universal Sa 2,740,633 4 65
Total Eauities Traded on an Official Stock 56,649,536 96.06 Exchange
Warrant Traded on an Official Stock Exchange 157,826 Amboise Promesses Eur Call Warrant 16,572 0.03
7.5% 19/09R008 Total Warrant Traded on an Official Stock 16.572 003 Frrhanne
3- _^_..I.. Total Listed Securities 56.666.108 96.09 Total Investments 56,666,108 96 09
Cash a t Bank 2,419,043 4.10 Other Assets 31,255 0.05 Other Liabilities (141.026) (0.24) Net Asset Value 58.975.380 100 00
Economic Division of Investments a5 at 30 June 2008
% of net assets
Oil & Gas 10.36 Banks 8.87 Water 7.75
Food 7.47 lrodteel 5.05 Media & Multimedia 4.65 Chemicals 4.37 Telecommunications 4.13 Metal 3.62
Pharmaceuticals 3.08
Engineering & Construction 7.47
Electrical Equipment & Services 3.47
Building Societies 2 99 CosmeticvPersonal Care 2.88 Insurance 2.87 Holding Companies 2.66 Healthcare-Products & Services 2.61 Beverages 2.58 Hand & Machine Tools 2.38 Transportation 2.28
Machinery 1.57 Computers 1.71
Retail 0.82 Electronics & Semiconductors 0 42 Investment Companies 0.03 Total Investments 96.09
Cash at Bank 4.10 Other Assets 0.05 Other Liabilities (0 .28 Net Asset Value 100.00
Geographic Division of Investments as at 30 June 2008
% of net assets
France 96.09 Total Investments 96.09
Cash a t Bank Other Assets
4.10 0.05
The accompanying notes form an integral part of these financial statemenfs.
31
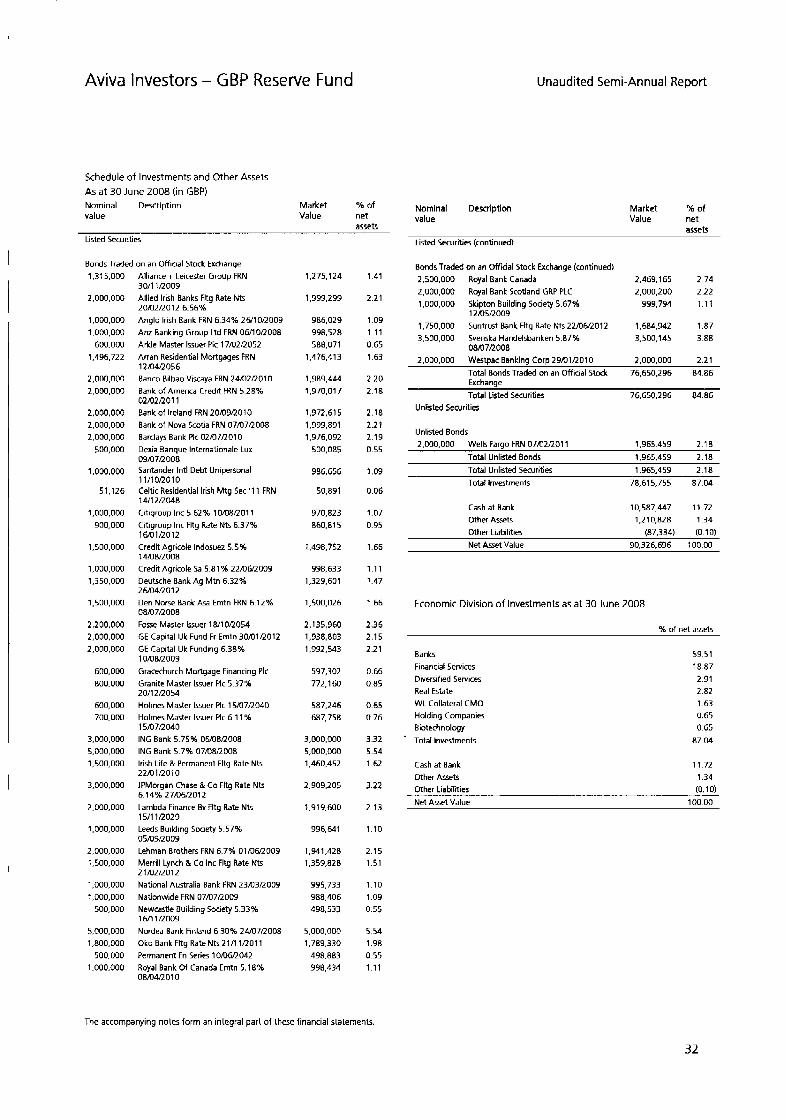
Aviva Investors - GBP Reserve Fund Unaudited Semi-Annual Report
Schedule of Investments and Other Assets As a t 30 June 2008 (in GBP) Nominal Description Market % of value Value net
assets Listed Securities
Bonds Traded on an Official Stock Exchange 1.31 5,000
2,000,000
1,000,000 1,000,000
600.000 1.496.722
2.000.000 2.000.000
2.000.000 2,000.000 2.000.000
500,000
1,000,000
51,126
1,000,000 900,000
1,500,000
1,000,000 1,350,000
1,500,000
2,200.000 2,000,000 2,000.000
600,000 800.000
600,000 700.000
3,000,000 5,000,000 1,500,000
3,000,000
2.000.000
1,000,000
2,000,000 1,500,000
1,000,000 1,000,000
500,000
5,000,000 1,800,000
500.000 1,000,000
Alliance + Leicester Group FRN 30/11/2009 Allied Irish Banks Fltg Rate Nts
Anglo Irish Bank FRN 6.34% 26/10Q009 Anz Banking Group Ltd FRN 06/10/2008 Arkle Master Issuer Pic 17/U2/2052 Arran Residential Mortgages FRN 12M4R056 Banco Bilbao Viscaya FRN 24/02/2010 Bank of America Credit FRN 5.28% 02102RO11 Bank of Ireland FRN 20/090010 Bank of Nova Scotia FRN 07/07/2008 Barclays Bank PIC 02/07/2010 Dexia Banque Internationale Lux 09/07/2008 Santander lntl Debt Unipersonal 1 1 /1 OR01 0 Celtic Residential Irish Mtg Sec '1 1 FRN 14/12/2O48 Citigroup Inc 5.62% 10108R011 Citigroup Inc Fltg Rate NE 6.37% 1m1/2012 Credit Agricole lndosuez 5.5%
Credit Agricole Sa 5.81 % 22/06/2009 Deutsche Bank Ag Mtn 6.32% ZM14R012 Den Norse Bank Asa Emtn FRN 6.12%
Fosse Master Issuer lW1 OR054 GE Capital Uk Fund Fr Emtn 30mlR012 GE Capital Uk Funding 6.38% 1 0/08/2009 Gracechurch Mortgage Financing PIC Granite Master Issuer PIC 5.37% 20/12/2054 Holmes Master Issuer PIC 15/07/2040 Holmes Master Issuer PIC 6.1 1 %
ING Bank 5.75% 06iUW008 ING Bank 5 7% 07/08/2008 Irish Life & Permanent Fltg Rate Nts 22/01/2010 JPMorgan Chase & Co Fltg Rate Nts
Lambda Finance Bv Fltg Rate Ntr 15/11/2029 Leeds Building Society 5.57% 05m9/2009 Lehman Brothers FRN 6.7% 01/06R009 Merrill Lynch & t o Inc Fltg Rate Nts
National Australia Bank FRN 23/03/2009 Nationwide FRN 07/07/2009 Newcastk Building Society 5.33% 16/11/2009 Nordea Bank Finland 6.30% 24/07/2008 Oko Bank Fltg Rate Nts 21/1lROll Permanent Fn Series 1010612042 Royal Bank of Canada Emtn 5.18% 08104nO10
20/02/2012 6.56%
i 4 m a ~ o o 8
08/07/2008
1 5 n 7 ~ 0 4 0
6.14% 27mmoi2
2 1 m2/2012
1,275,124
1,999,299
986.029 998,528 588,071
1.476.41 3
1,389,444 1,370,017
1.972.61 5 1,999,831 1,976,032
500,085
986.656
50,891
970.823 860,815
1.498.752
998,633 1,329,601
1,500,026
2,135,360 1,338,803 1,992,543
597,302 772,160
587,246 687.758
3,000,000 5,000,000 1,460,452
2,909,205
1.919.600
996.641
1,541,428 1,359,828
995.733 988.406 498.533
5,000,000 1,783,330
498.883 998,434
1.41
2.21
1.09 1.11 0 65 1.63
2.20 2.18
2.18 2.21 2.19 0.55
1.09
0.06
1.07 0.95
1.66
1.11 1.47
1.66
2.36 2.15 2.21
0.66 0.85
0.65 0.76
3.32 5.54 1.62
3.22
2.13
1.10
2.15 151
1.10 1.03 0.55
5.54 1.98 0.55 1.11
Nominal Description value
Market %of Value net
assets Listed Securities (continued)
BondsTraded on an Official Stock Exchange (continued) 2,500,000 Royal Bank Canada 2,463,165 2.74 2,000,000 Royal Bank Scotland GRP PLC 2,000.200 2.22 1,000,000 Skipton Building Society 5.67% 999,794 1.11
12/05/2009 1,750,000 Suntrust Bank Fltg Rate NtS22/06/2012 1,684,342 1.87 3,500,000 Svenska Handelsbanken 5.87% 3,500,145 3.88
06/07/2008 2,000,000 WesSpac Banking Corp 29/01/2010 2,000,000 2.21
Total Bonds Traded on an Official Stock 76,650,296 84.86
Total Listed Securities Unlisted Securities
76,650,236 84.86
Unlisted Bonds 2,000,000 Wells Fargo FRN 07/t)2/2011 1,965,459 2.18
Total Unlisted Bonds 1,965,459 2 18 1,965,453 2 18 Total Unlisted Securities
Total investment 78.61 5,755 87 04
Cash a t Bank 10,587,447 11.72 1,210,828 1.34 Other Asets
Net Asset Value 90.326.696 100.00 Other Liabilities (87,334) (0.10)
Economic Division of Investments as at 30 June 2008
% of net assets
Banks 59.51 Financial Services 18.87 Diversified Sewices 2.91 Real Estate 2.82 WL Collateral CMO 1.63 Holding Companies 0.65 Biotechnology 0 65 Total Investments 87.04
Cash at Bank Other Assets
11.72 1.34
Other Liabilities (0.10) Net Asset Value 100 00
The accompanying notes form an integral part of these financial statements
32
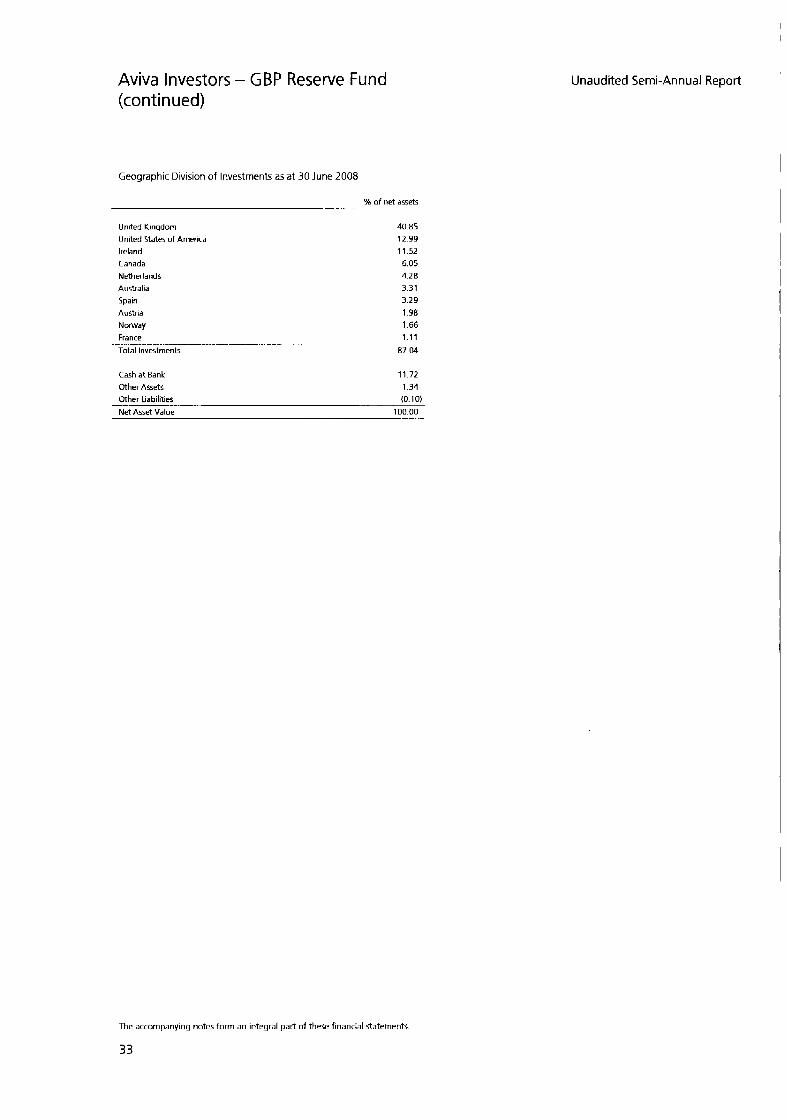
Aviva Investors - GBP Reserve Fund (con t i n u ed)
Geographic Division of Investments as at 30 June 2008
% of net assets
United Kingdom 40 85
United States of America 12 99
Ireland 11 52 Canada 6 05 Netherlands 4 28 Australia 3 31 Spain 3 29 Austrla 1 98 Norway 1 66 France 111 Total Investments 87 04
I
Unaudited Semi-Annual Report
Cash at Bank 11.72 Other Assets 1.34 Other Liabilities (0.10) Net Asset Value 100.00
The accompanying notes form an integral part of these financial statements
33

Aviva Investors - Global Convertibles Fund
Schedule of Investments and Other Assets As at 30 June 2008 (in USD) Quantity/ Dexription Market % of Nominal value Value net
Listed Securitres
Equities Traded on an Official Stock Exchange
assets
24,500 6,000
70,000 23 5.000
4,040,000 3,500
395.700 6,500,000
7,000 100,000
4,750
Bank of America Corp Bunge Ltd Chesapeake Energy Corp Prd Conv Citigroup Inc Energy Photovoltaics Inc 144A Fuelcell Energy Inc Ser '6' General Motors Corp JPMorgan Australia Funding Tsl Lehrnan Brothers Holdings Vale Capital Ltd (Companhia) Wachovia Corp
2 1.g03.000 5,320,182
11.027.800 10,370,550
2.739.625 8,523,378 4.539.31 6 5.902.M5 6,712,500 4,287,843
4. 120.800
2.27 0.62 1.15 1.08 0.43 0.28 0.89 0.47 0 61 0.70 0 45
6.300 Washington Mutual Mtg P/r Ser 'R' 3,676,050 0.38 Total Equities Traded on an Gfficial Stock Exchange
Bonds Traded on an Official Stock Exchange 7,800,000
5,600,000
6,400,000
4,000,000 5,000,000 5,900,000
20,500,000 8,000,000
9,000,000
5.300.000 1,100,000,000
425,000,000 7,000,000
20.000.000
4,500,000
7,000,000
4,700,000
11,000,000 7,000,000 8,000,000
8,500,000 3,000,000
55,000,000
3,000,000
4,000,000
2 5,000,000
19,400,000 12,500,000
5,000,000 6,000,000
Abn Amro Bank Nv 0.5% 23/03/2011 Addax Petroleum Corp 3.75% 31/05/2012 Allami Privatizacios Es Vagyonkezelo Rt 1% 28/O9/2009 Allergan Inc 1.5% 01/04/2026 Amdocs Ltd 0.5% 15/03/2024 KAHN Entreprises 15/08/2013 Amgen Inc 0.37% OlB2R013 Amylin Pharmaceuticals 3% 15/06ROl4 Archer-Daniels-Midland t o 0.87% 15/O2/2014 Artemis Conseil2% 31/07/2011 Asahi Breweries Ltd 0% 26/05/2023 Bank of Kyoto 0% 31/O3/2014 Beckman Coulter Inc 2.5% 15/12/2036 Berjaya Land Berhad 8% 15108/2011 BES Finance Ltd 1.25% 2m2/2011 BioTreat Technology 0%
CAIXA ESTALVIS Y PENS DE BARCELONA 3.5% 19B6/2011 Cap Gemini 2.5% 01/01/2010 Capitaland Ltd2.1% 15/11/2016 Central European Distribution Carp 3% 15/03/2013 Chattem Inc 1.62% 01/05/2014 China Medical Technologies Inc 3.5% 15/11R011 China Petroleum & Chemical Corp 0% 24/04/2014 Coeur d'Alene Mines Corp 3.25% 15/03/2028 Compal Electronics Inc 0% 19rn8/2010 Deutsche Bank Ag London 13.05% 1 ox16R009 Emc Corp 1.75% 01/12/2011 Financial Federal Corp 2% 15/04/2034 First Gen Corporation 11/02/2013 Fonis Bank SaNv Var 6.65% 19/12/2049
18/01 no 13
89,723,695
12,862,252
6.43 1.973
11,253,964
4,220,000 4,325,000 4,948,566
17,660,625 6.650.000
9.1 57,500
10,504,536 1 1.259.1 18
4,543,784 7,735,000
6.304.5 14
4,611,296
3,217,385
7,075,370
9,006,607 5,081,229
10,160,000
3,222,500 4,897,500
7.5 73,423
2,587,500
4,561,932
ia.335.000
22,237,250 12,437,500
4.412.500 7,109,654
9.33
1.34
0.67
1.17
0.4 0 51 0 51 1.86 0.69
0.95
1.09 1.17
0.47 0.80
0.66
0.48
0.33
0.74
0.93 0.53 1.05
0.96 0.51
0.79
0.27
0.47
1.91
2.31 1.29
0.46 0.74
The accompanying notes form an integral part of these financial statements.
Unaudited Semi-Annual Report
Nominal value Description Market % of Value net
assets Listed Securities (continued)
Bonds Traded on an Official Stock Exchange (continued) 15,000,000
5,000,000
2,200,000,000 4,550,000
7,675,000
10,000,000
12,000,000 6,000,000
3,000,000
7,500,000 6,000,000
6,000,000 a.ooo,ooo
2,500,000
2,500,000
7,000,000
1,200.000.000
2,500,000
8,000,000
6,000,000
s.000.000
6,500,000 4,500.000
4.000,OM
18,000,000 12.000.000
4,500,000 7,000,000
17,000,000
6,000,000 26,500,000
9,000,000
5,000,000
2,000.000
2.22 7.72 9
5,000,000
Ford Motor Co 4.25% 15/12/2036 Fortfinlux SaAegs Perpetual FRN 5.95% 31/12/2049 Fujitsu Limited 0% 27/05/2009 Global Crossing Ltd 5% 15/0SR011 HCC Insurance Holdings 1.3% 01/1)4/2023 Health Care Reit Inc 4.75% 0111 2R026 Hologic Inc Var 15/12/2037 lmmofinanz Ag 1.25% 19/11/2017 lndowind Energy 2.5% Mtn 22/12/2012 Intel Corp2.95% 15/12/2035 INTL POWER FIN 111 LTD 4.75% 05/06/2015 101 RESOURCES (L) BHD lsis Pharmaceutical 2.625% 15/02/2027 IVG Finance Bv 1.75% 2 9B3R 0 1 7 JA Solar Holdings Co Ltd 4.5% 15/05/2013 Jaiprakash Associates 0%
Keystone Capital Corp 0.1 % 04tD4/2013 Klockner & Co Finance lntl 1.5% 27/07/20 12 L-3 Communications Corp 3%
LG.PHILIP5 LCD CO LTD 0% 18rt34/2012 Linear Technology Corp 3.12% 01 /05/2027 Macerich t o 3.25% 15/03/2012 Magnolia Finance Cnv Perpetual FixTo Float 4% 31/12/2049 Mannkind Corp 3.75% 1 5/12/2013 Medtronic Inc 1.62% 15/04/2013 Merrill Lynch & Co Inc 0.47% 13103/2032 Michelin France 0% 01/01/2017 Nabors Industries Inc 0.94%
National Bank of Abu Dhab
Netapp Inc 1.75% Ol/O6/2013 Network Healthcare Holdings 6% Gtd 3011 1/2011 Newmont Mining Corp Sr Nt Cv1.62% 15/O7/2014 Nobel Biocare Investments Nv 1 % Cb 08/11/2011 Nokian Renkaa (Nokian Tyres) 0% 27B612014 North Star Natural Gas 5% 15/05/2013 Novagold Resources Inc 5.5%
12/09/2012
oimano35
i m 5 ~ 0 i i
28/02/2018
oim5/2ois
11,250,000
5.1 32,172
20,736.192 4,641,000
8,193,063
10,737,500
10,305.000 8,203,994
2,550,000
7,350,000 9,233,332
5,535,000
9,280,000
2.1 75,499
2,265,625
7,297.500
12.1 54,277
3,12 7,304
a,goo,ooo
6.237.288
4,931,250
5.395.000 7.277.759
2,160,000
19,237,500 12,376,800
6.286.887 a.645.000
4,483,672
5,887,500 2,525,612
11,790,000
4.304.839
3.243.21 0
2,127,481
4,950,200
117
0 53
2 16 0 48
0 85
112
107 0 85
0 27
0 76 0 96
o 58 0 96
0 23
0 24
0 76
125
0 33
0 93
0 65
0 51
0 56 0 76
0 22
2 00 129
0 65 0 90
0 47
0 61 0 26
123
0 45
0 34
0 22
0 51
34
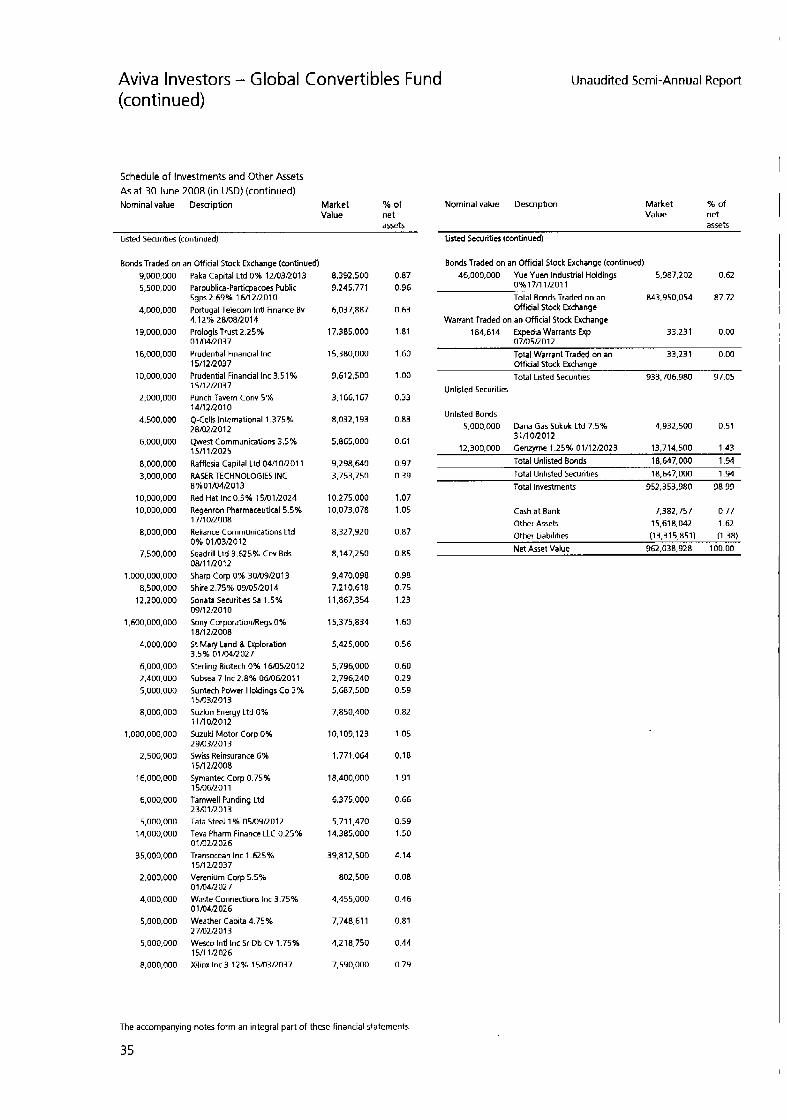
Aviva Investors - Global Convertibles fund (con tin ued)
Schedule of Investments and Other Assets As a t 30 June 2008 (in USD) (continued) Nominal value Description Market 96 of
Value net assets
Listed Securities (continued)
Bonds Traded on an Official Stock Exchange (continued) 9,000,000 5,500,000
4,000,000
19,000,000
16,000,000
10,000,000
2.000.000
4,500,000
6,000,000
8,000,000 3,000,000
10,000,000 10,000,000
8,000.000
7,500,000
1,000,000,000 8,500,000
12.200.000
1,600.000.000
4,000,000
6.000.000 2,400.000 5,000,000
8,000,000
1,000,000,000
2,500,000
16,000,000
6,000,000
5,000,000 14,000,000
35,000,000
2.000.000
4.000.000
5,000,000
5,000,000
8,000,000
Paka Capital Ltd 0% 12/03/2013 ParpublicaParticpacoes Public Sgps2.692 16/12/2010 Portugal Telecom lnU Finance Bv 4.12% 28x18/2014 Prologis Trust2.25% 01 /04/2037 Prudential Financial Inc 15/12/2037 Prudential Financial Inc 3.51 % 1 511 212037 Punch Tavern Conv 5% 11/12/2010 Q-Cells International 1.375% 28/02/2012 Qwest Communications 3.5% 191 1/1025 Rafflesia Capital Ltd 04/10/2011 RASER TECHNOLOGIES INC 8%01/04/2013 Red Hat Inc 0.5% 15/01/1024 Regenron Pharmaceutical 5.5% 17/10/2008 Reliance Communications Ltd 0% 01/03/2012 Seadrill Ltd 3.625% Cnv Bds ow1 1 n o 1 2 Sharp Corp 0% 30/09/2013 Shire2.75% 09/05/2014 Sonata Securities Sa 1.5% 09/12/2010 Sony CorporationAegs 0%
S t Mary Land & Explorabon 3.5% 011WR027 Sterling Biotech 0% 16105/2012 Subsea 7 Inc 2.8% ObO6RO11 Sunlech Power Holdings Co 3% 151U3R013 Suzlon Energy Ltd 0% 11/10/2012 Suzuki Motor Corp 0%
Swiss Reinsurance 6% 15/12/2008 Syrnantec Corp 0 75%
Tamwell Funding Ltd
Tab Steel 1% OSx19R012 Teva Pharm Finance LLC 0.25%
Transocean Inc 1.625% 15/12/2037 Verenium Corp 5.5% 01 /Om027 Waste Connections Inc 3.75% 01 /04R026 Weather Capita 4.75% 2 71021201 3 Wesco lnU Inc Sr Db Cv 1.75% 15/11R026 Xilinx Inc3.12% 15/03/2037
is/ i2nooa
29/03/2013
immoi 1
23/01/2013
oim2/2026
8,392.500 9,245,771
6,037,887
17,385,000
15,380,000
9,612,500
3.1 66.1 67
8.032.1 93
5.865.000
9,298,640 3,753,750
10.275.000 10,073,078
8,327,920
8,147.2 50
9,470,038 7,210,618
11,867,354
15,375,834
5,425,000
5,736,000 2,796,240 5.687.500
7,850,400
10.1 09,123
1,771,064
18,400,000
6,375,000
5.71 1,470 14,385,000
39,812,500
802,500
4,455,000
7,748,611
4,218,750
7,590,000
0 87 0 96
0 63
181
1 60
1 00
0 33
0 83
0 61
0 97 0 39
1 07 1 05
0 87
o a5
0 98 0 75 123
1 60
0 56
0 60 0 29 0 59
0 82
105
0 18
191
0 66
0 59 1 50
4 14
0 08
0 46
0 81
044
0 79
Unaudited Semi-Annual Report
Nominal value Description Market % of Value net
assets Listed Securities (continued)
Bonds Traded on an Official Stock Exchange (continued) 46,000,000 Yue Yuen Industrial Holdings 5,987,202 0.62
0%17/11/2011
Official Stock Exchange Total Bonds Traded on an a0.9so.0~4 87.72
Warrant Traded on an Official Stock Exchange 184,614 Expedia Warrants Exp 33.231 000
mmsnoi 7 Total Warrant Traded on an 33,231 0.00 Official Stock Exchange Total Listed Securities 933,706,980 97.05
Unlisted Securities
Unlisted Bonds 5.000.000 Dana Gas Sukuk Ltd 7.5% 4.932.500 0.51
12,300,000 Genzyme 1.25% 01/12/2023 13,714,500 143 Total Unlisted Bonds 18,647,000 1.94 Total Unlisted Securities 18,647,000 1.94 Total Investments 952,353,380 98 99
3 1/1 OR01 2
Cash at Bank 7,382,757 0.77 Other Assets 15,618.042 1.62 Other Liabilities (13,315,851) (1.38) Net Asset Value 362,038,928 100.00
The accompanying notes form an integral part of these financial statements
35

Aviva Investors - Global Convertibles Fund (con t i n ued)
Economic Division of Investments as at 30 June 2008
% of net assets
Diversified Financial Services Banks Diversified Services Software Pharmaceuticals Biotechnology Holding Companies Computer & Computer Services Transportation Insurance Auto Manufacturers REKS Electrical Equipment & Services Mining Energy Beverages Special Purpose Entity Real Estate Telecommunications Healthcare-Products & Services Oil & Gas
Energy-Alternate Sources Home Furnishings Electronics & Semiconductors Agriculture Investment Companies Media & Multimedia Medical Engineering & Construction Rubber Apparel Iron/Steel Electric Machinery-Diversified Auto Parts & Equipment Retail Total lnvestmenls
10.08
8.71 9.78
5-18 5.15 4.34 4.34 4.18 4.14 3.63 3.11 2.93 2.63 2.57 2.41 2.23 2.20 2.12 2.1 1 2.00 1.98 1 .85
1.60 1.41 1.20 1.17 0.93 0.77 0.76 0.65 0.62 0.59 0.46 0.39 0.34 0.33
98 99
Cash at Bank 0.77 Other Assets 1.62 Other Liabilities (1.38) Net Asset Value 100.00
Unaudited Semi-Annual Report
Geographic Division of Investments as at 30 June 2008
% of net assets
United States of America 52.39 Japan 7.42 India 3.90 Cayman Islands 3.56 Malaysia 3 08 Luxembourg 2 90 Germany 2.74 France 2.68 Netherlands 2.20 United Kingdom 1.59 Bermuda 1.57 Jersey 1.47 China 1.30 Canada 1.18 Hungary 1.17 United ArabErnirates 1.13 Portugal 0.96 Norway 0.85 Austria 0 85 Channel Islands 0.76 Spain 0.74 Belgium 0.74 South Korea 0.65 Swiberland 0.63 Singapore 0.53 Australia 0.47 Taiwan 0.47 Philippines 0.46 Finland 0.34 South Africa 0.26 Total Investments 98.99
Cash a t Bank 0 77 Other Assetr, 1.62 Other Liabilities (1 38) Net Asset Value 100 00
I
The accompanying notes form an integral part of these financial statements
36
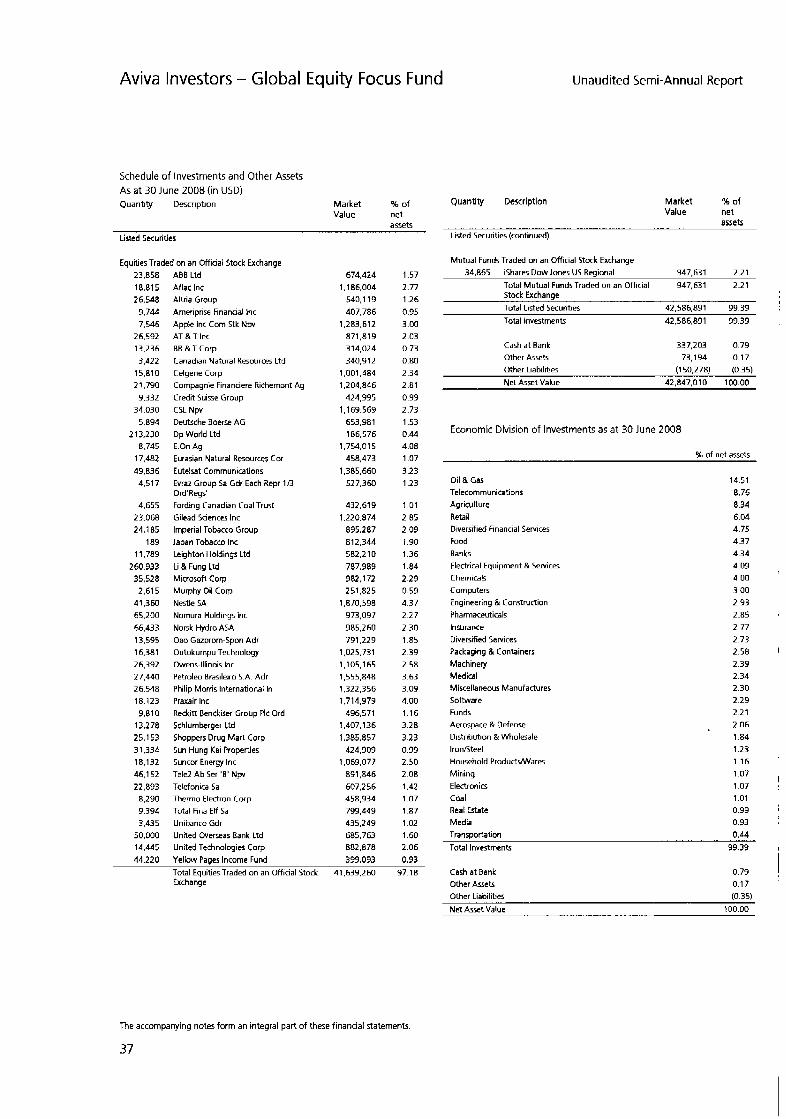
Aviva Investors - Global Equity Focus Fund
Schedule of Investments and Other Assets As a t 30 June 2008 (in USD) Quantiv Description Market %of
assets Value net
Listed Securities
Equities Traded on an Official Stock Exchange 23.858 18,815 26.548
9,744 7,546
26,592 13,236 3,422
15.810 21,790
9,332 34,030
5,894 213,230
8,745 17,482 49,836
4,517
4,655 23.068 24,185
189 11,789
260.933 35,528 2,615
41,360 65,200 66,433 13,595 16,381 26,392 27,440 26,548 18,123 9,810
13,278 25,153 31,334 18,132 46.152 22,893
8,290 9,394 3,435
50,000 14,445
ABB Ltd Aflac Inc Altria Group Ameriprise Financial Inc Apple Inc torn Stk Npv AT & T Inc BE & t Corp Canadian Natural Resources Ltd Celgene Corp Cornpagnie Financiere Richemont Ag Credit Suisse Group CSL Npv Deutsche Boerse AG Dp World Ltd E.On Ag Eurasian Natural Resources Cor Eutelsat Communications Evraz Group Sa Gdr Each Repr 1/3 Ord'Regs' Fording Canadian Coal Trust Gilead Sciences Inc Imperial Tobacco Group Japan Tobacco Inc Leighton Holdings Ltd Li & Fung L t d Microsofl Corp Murphy Oil Corp Nestle SA Nomura Holdings Inc Norsk Hydro ASA Oao Gazprom-Spon Adr Outokurnpu Technology mens-Illinois Inc Petroleo Brasilelro S.A. Adr Philip Morris International In Praxair Inc Reckitt Benckiser Group PIC Ord Schlurnberger Ltd Shoppers Drug Mart Corp Sun Hung Kai Properties Suncor Energy Inc Tele2 Ab Ser 'E' Npv Telefonica Sa Therrno Electron Corp Total Fina Elf Sa Unibanco Gdr United Overseas Bank Ltd United Technologies Corp
674,424 1,186,004
540.119 407.786
1,283,612 871.819 314,024 340,912
1,001,484 1,204,846
424,995 1,169.569
653,981 186,576
1,754.01 5 458,473
1,385,660 527,360
432,619 1.220.874
895.287 812,344 582,210 787.989 982,172 251,825
1,870,598 973.097 985,260 791,229
1,025,731 1,105,165 1,555.848 1,322,356 1,714,979
496,571 1,407,136 1,385,857
424,909 1.069.077
891,846 607,256 458.934 799.4d9 435,249 685.763 882,878
1.57 2.77 1.26 0.95 3.00 2.03 0.73 0.80
2.34 2.81 0.99 2.73 1.53 0.44 4.08 1.07 3.23 1.23
1.01 2 85 2.09 1.90 1.36 1.84 2.29 0.59 4.37 2.27 2.30
2.39 2.58 3.63 3.09 4.00 1.16 3.28 3.23 0.99 2.50 2.08 1.42 1.07 1.87 1.02 1 60 2.06
1 .a5
44.220 Yellow Pages Income Fund 399.093 0.93 Total EquitiesTraded on an Offlcial Stock 41,639,260 97.18 Exchange
Quantity Description
Unaudited Semi-Annual Report
Market % o f Value net
assets Listed Securities (continued)
Mutual Funds Traded on an Official Stock Exchange 34.865 ishares DOW Jones US Regional 947,631 2.21
Total Mutual FundsTraded on an Wfficial 947,631 2.21 Stock Exchange Total Listed Securities 42,586,891 99.39 Total lnvestmenfs 42.586.891 99.39
Cash a t Bank 337,203 079 Other Asset 73,194 017 Other Liabilibes (150.278) (0 35) Net Asset Value 42,847.010 100 00
Economic Division of Investments as at 30 June 2008
% of net assets
Oil & Gas 14 51 Telecommunications 8.76 Agricutture 8 34 Retail 6.04 Diversified Financial Services 4.75 Food 4.37 Banks 4.34 Electrical Equipment & Senices 4.09 Chemicals 4 00 Computers 3.00 Engineering & Construction 2 93 Pharmaceuticals 2.85 Insurance 2.77 Diversified Services 2.73 Packaging & Containers 2.58 Machinery 2.39 Medical 2.34 Miscellaneous Manufactures 2.30 Software 2.29 Funds 2.21 Aerospace & Defense 2 06 Distribution & Wholesale 1.84 Ironfiteel 1.23 Household Produckwares 1.16 Mining 1.07 Electronics 1.07 Coal 1.01 Real Estate 0.99 Media 0.93 Transportation 0.44 Total Investments 99.39
Cash at Bank Other Assets
0.79 0.17
Other Liabilities (0.35) Net Asset Value 100.00
The accompanying notes form an integral part of these financial staternenfr,
37

I
Aviva Investors - Global Equity Focus Fund (con t i n ued)
Geographic Division of Investments as a t 30 June 2008
% of net assets
United States of America SwiDerland Canada Germany France Brazil Japan Australia Netherlands Antilles United Kingdom Russia Hong Kong Finland Norway Sweden Singapore Spain Kazakhstan
33.81 9.74 8.47 5.62 5.10 4.65 4.17 4.09 3.28 3.25 3.08 2.83 2.39 2.30 2.08 1.60 1 42 1.07
United Arab Emirates 044 Total Investrnenk 99.39
Cash at Bank 0.79 Other Assets 0.17 Other Liabilities (0.35) Net Asset Value 100.00
Unaudited Semi-Annual Report
The accompanying notes form an integral part of these financial statements
38
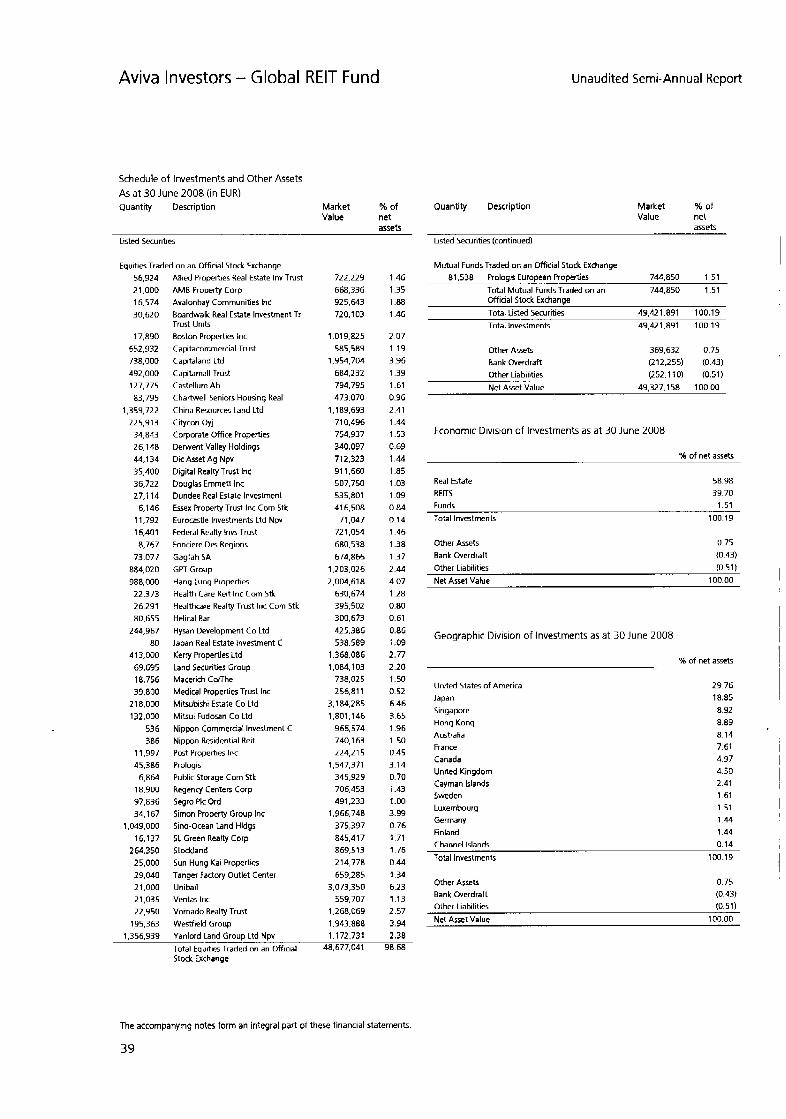
Aviva Investors - Global RElT Fund Unaudited Semi-Annual Report
Schedule of Investments and Other Assets As at 30 June 2008 (in EUR) Quantity Description Market %of
assets Value net
Listed Securities
EquitiesTraded on an Official Stock Exchanqe 56.924 21.000 16.574 30,620
17.890 652.932 738,000 492.000 127,775 83.795
1,359,722 22 5.91 3
34.843 26.148 44,134 35.400 36,722 27,114
6,146 1 1,792 16,401 8.767
73,077 864.020 988,000 22,373 26.291 80.655
24d.967 80
413,000 69,695 18.756 39,800
2 18,000 132,000
536 386
11,997 45,386
6.864
97,836 34.1 67
1,049,000 16,137
2U.350 25,000 29,040 2 1,000 21,035 22,950
195.363 1.356.939
i a . 9 ~ 0
Allied Properties Real Estate Inv Trust AMB PropeQ Corp Avalonbay Communities Inc Boardwalk Real Estate Investment Tr Trust Units Boston Properties Inc Capitacommercial Trust Capitaland L td Capitamall Trust Castellum Ab Chartwell Seniors Housing Real China Resources Land Ltd Citycon Oyj Corporate Office Propertes Derwent Valley Holdings Dic Asset Ag Npv Digital Realty Trust Inc Douglas Ernmen Inc Dundee Real Estate Investment Essex ProDeRy Trust Inc Corn Stk Eurocastle Investments Ltd Npv Federal Realty lnvs Trust Fonciere Des Regions Gagfah SA GPT Group Hang Lung Properties Health Care Reit Inc Corn Stk Healthcare Realty Trust Inc Corn Stk Helical Bar Hysan Development t o Ltd Japan Real Estate Investment C Kerry Properties Ltd Land Securities Group Macerich C d h e Medical Properties Trust Inc Mitsubishi Estate Co Ltd Mitsui Fudosan t o Ltd Nippon Commercial Investment C Nippon Residential Reit
Post Properties Inc Prologis Public Storage Corn Stk Regency Centers Corp Segro PIC Ord Simon Property Group Inc Sino-Ocean Land Hldgs 5L Green Realty Corp Stockland Sun Hung Kai Properties Tanger Factory Outlet Center Unibail Ventas Inc Vornado Realty Trust Westfield Group Yanlord Land Grouo Ltd NDV
722,229 668.336 925,643 720,103
1.019.825 585,589
1,954,704 684,232 794.795 473.070
1,189,693 710,496 754.937 3A0.097 712,323 911.660 507,750 535,801 416,508
71,047 72 1,054 680.538 674,866
1.203.026 2,004,618
630,674 395,502 300,673 425,386 538.589
1.368.086 1,084,103
738.025
3,184,285 256.81 1
1,801,146 966,574 740,163 224.21 5
1,547,371 345.929 706,453 491,233
i.g6~.74a 375,397 845.417 869,513
659,285 3,073,350
559.707 1,268,069 1.943.888 1.172.731
214,778
1 46 1.3s 1.88 1.46
2 07 119 3.96 1.39 1.61 0.96 2.41 1 .A4 1.53 0.69 1 .A4 1.85 1.03 1.09 0.84 0.14 1.46 1.38 1.37 2.44 4.07 1.28 0.80 0.61 0.86 1.09 2.77 2.20 1.50 0.52 6.46 3.65 1.96 1.50 0.45 3.14 0.70 1.43 1.00 3.99 0.76 1.71 1.76 0.44 1.34 6.23 1.13 2.57 3.94 2.38 , , - . .
Total Equities Traded on an Offtcial 48,677,041 98 68 Slock Exchange
Quantity Description Market % of Value net
assets Ltsted Securities (continued)
Mutual Funds Traded on an Official Stock Exchange 81,538 Prologis European Properties 744,850 151
Total Mutual Funds Traded on an 744850 1.51 Official Stock Exchange Total Listed Securities 49,421.891 100.1 9 Total Investments 49.42 1.831 100.1 9
Other Assets 369.632 0.75 (2 12.2 55) (0.43) Bank Overdraft
Other Liabilities (252.110) (0.51) Net Asset Value 49.327.158 100.00
Economic Division of Investments as at 30 June 2008
% of net assets
Real Estate REITS
58.98 39.70
Funds 1.51 Total Investments 100.13
Other Assets 0 75 Bank Overdraft (0 43) Other Liabilities (0 51) Net Asset Value 10000 I
I Geographic Division of Investments as at 30 June 2008 I
% of net assets
Umted States of America 29 76 Japan 18 85 Singapore 8 92
Australia 8 14
1 Hong Kong 889 . France 7 61 i Canada 4 97 I Uniled Kingdom 4.50 Cayman Islands 2.41 Sweden 1.61 Luxembourg 1.51 Germany 1.44 Finland 1.44 Channel Islands 0.14 Total Investments 100.19
Other Assets Bank Overdraft
0.75 (0.43)
Other Liabilities (0.51) Net Asset Value 100.00
The accompanying notes form an integral part of these financial statements
39
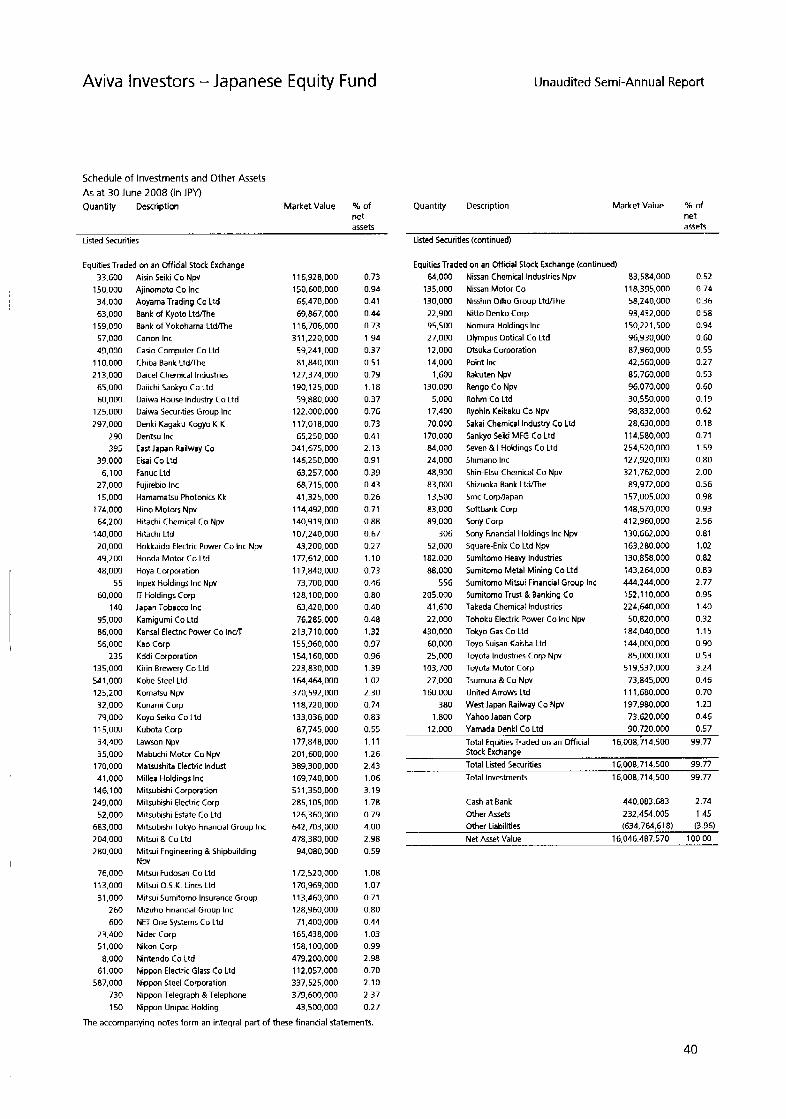
Aviva investors -Japanese Equity Fund Unaudited Semi-Annual Report
Schedule of Investments and Other Assets As at 30 June 2008 (in JPY) Quantity Description Market Value % of
net assets
Listed Securities
Equities Traded on an Official Stock Exchange 33.600 150,000 34,000 63,000 159,000 57,000 49.000 110,000 213.000 65.000 60,000 125,000 297.000
2 90 395
39.000 6,100 27,000 15,000 174,000 b4.200 140,000 20,000 49,200 48,000
55 60,000
140 95.000 86,000 56,000
235 135,000 541,000 125,200 32.000 79,000
1 1 5,000 34,400 35,000 170,000 41,000 146,100 249.000 52,000 683.000 204.000 280.000
76,000 113,000 31.000
2 60 600
23.400 51,000 8.000 61.000 587,000
730 150
Aisin Seiki Co Npv Ajinomoto Co Inc Aoyama Trading Co Ltd Bank of Kyoto Ltdllhe Bank of Yokohama Ltdllhe Canon Int Casio Computer Co Ltd Chiba Bank Ltdme Daicel Chemical Industries Daiichi Sankyo Co Lld Daiwa House Industry Co Ltd Daiwa Securities Group Inc Denki Kagaku Kogyo K K Dentsu Inc East Japan Railway Co Eisai Co Ltd Fanuc Ltd Fujirebio Inc Hamamatsu Photonics Kk Hino Motors Npv Hitachi Chemical Ca Npv Hitachi Lld Hokkaido Electric Power Co Inc Npv Honda Motor Co Ltd Hoya Corporation lnpex Holdings Inc Npv l T Holdings Corp Japan Tobacco Inc Kamigumi Co Ltd Kansai Electric Power Co InuT Kao Corp Kddi Corporation Kirin Brewery Co Ltd Kobe Steel Ltd Komatsu Npv Konami Corp Koyo Seiko Co Ltd Kubota Corp Lawson Npv Mabuchi Motor Co Npv Matsushita Electrlc lndust Millea Holdings Inc Mitsubishi Corporation Mitubishi Electric Cerp Mitsubishi Estate Co Ltd Mitsubishi Tokyo Financial Group Inc Mitsui & Co L t d Mitsui Engineering & Shipbuilding Npv Mitsui Fudosan Co Ltd Mitsui O.S.K. Lines Ltd Mitsui Sumitomo Insurance Group MiZuho Financial Group Inc NET One Systems Co Ltd Nidec Corp Nikon Cerp Nintendo Co Ltd Nippon Electric tlars Co Ltd Nippon Steel Corporation Nippon Telegraph &Telephone Nippon Unipac Holding
116,928,000 150,600,000 66,470,000 63,867,000
1 1 6,706,000 31 1,220,000 59,241.000 81,840,000 127,374,000 190,125,000 59,880.000 122,000,000 117,018,000 65,250,000 341,675,000 146,250,000 63,2 57,000 68.71 5,000 41,325,000 114,492,000 140.91 9,000 107,240,000 43,200,000 177,612,000 1 1 7,840,000 73,700,000 128,100,000 63,420,000 76,285,000 21 3.71 0,000 155,960,000 154.1 60,000 223,830,000 164,464,000 370,592,000 118,720,000 133,036,000 87,745.000 177,848,000 201,600.000 389,300,000 169.740.000 51 1,350,000 285,105,000 126.360.000 €42,703,000 478,380,000 94.080.000
172.520.000 170,969,000 1 1 3,460,000 128,960,000 71,400,000 165,438,000 158,100,000 479.200.000 112,057,000 337.52 5,000 379,600,000 43,500,000
0.73 0.94 0.41 0.44 0.73 1.94 0.37 0.51 0.79 1.18 0.37 0.76 0.73 0.41 2.13 0.91
0.39 0.43 0.26 0.71 0.88 0.67 0.27 1.10 0.73 0.46 0.80 0 40 0.48 1.32 0.97 0 96 1.39 1.02 2.30 0.74 0.83 0.55 1.11 1.26 2.43 1.06 3.19 1.78 0.79 4.00 2.98 0.59
1.08 1.07 0.71 0.80 0.44 1.03 0.99 2.98 0.70 2.10 2.37 0.27
Quantity Description Market Value % of net assets
Listed Securities (continued)
Equities Traded on an Official Stock Exchange (continued) 64,000 135,000 130,000 22,900 95,500 27,000 12,000 14,000 1,600
130,000 5,000 17,400 70.000 170,000 84.000 24,000 48,900 83,000 13,500 83.000 89.000
306 52,000 182,000 88,000
556 205.000 41,600 22,000 430,000 60,000 25,000 103,700 27,000 160,000
380 1,800 12.000
Nissan Chemical Industries Npv Nissan Motor Co Nisshin Oillio Group Ltdme Nitto Denko Corp Nomura Holdings Inc Olympus Optical t o Ltd Otsuka Corporation Point lnc Rakuten Npv Rengo t o Npv Rohm Co Ltd Ryohin Keikaku Co Npv Sakai Chemical Industry Co Ltd Sankyo Seiki MFG Co Ltd Seven & I Holdings Co Ltd Shimano Inc Shin-Etsu Chemical t o Npv Shizuoka Bank Ltdllhe Smc CorpAapan Softbank Corp Sony Corp Sony Financial Holdings Inc Npv Square-Enix Co Ltd Npv Sumitomo Heavy Industries Sumitorno Metal Mining Co Ltd Sumitomo Mifsui Financial Group Inc Sumitomo Trust &Banking Co Takeda Chemical Industries Tohoku Electric Power Co Inc Npv Tokyo Gas Co Ltd Toyo Suisan Kaisha Ltd Toyota Industries Corp Npv Toyota Motor Corp Tsumura & Co Npv United Arrows Ltd West Japan Railway Co Npv Yahoo Japan Corp Yamada Denki Co Ltd
83,584,000 1 1 8,395.000 58,240,000 93,432,000 150,221,500 96,930,000 87,960,000 42,560,000 85,760,000 96,070,000 30.550.000 98,832,000 28,630,000 114,580,000 254,520,000 127.920.000 321,762.000 89,972.000 157.005.000 148,570,000 412,960,000 130,662,000 163,280,000 130,858,000 143,264,000 444,244,000 152.1 10,000 224.M0.000 50,820,000 184.040.000 144,000,000 85.000.000 51 9.537.000 73,845,000
1 1 1,680,000 197.980.000 73,620,000 90.720.000
0 52 0 74 0 36 0 58 0 94 0 60 0 55 0 27 0 53 0 60 0 19 0 62 0 18 0 71 159 0 80 2 00 0 56 0 98 0 93 2 56 0 81 1 02 0 82 0 89 2 77 0 95 1 40 0 32 115 0 90 0 53 3 24 0 46 0 70 123 0 46 0 57
Total Equities Traded on an Official 16,008,714,500 99 77 Stock Exchange Total Listed Securities 16,008,714,500 99 77 Total Investments 16,008,714,500 99 77
Cash at Bank 440,083,683 2 74 Other Assets 232.454.005 1.45 Other Llabllities Net Asset Value 16 046 487.570 100 00
(634,764,6183 (3 96)
The accompanying notes form an integral part of these financial statements.
40

Aviva Investors -Japanese Equity Fund (con t i n u ed)
Economic Division of Investments as a t 30 June Z O O 8
% of net assets
Banks Distribution & Wholesale Auto Manufadurers Chemicals Retail Machinery Transportation Pharmaceuticals Electrical Equipment & Services Telecommunications Home Furnishings Ironfiteel Media & Multimedia leisure Tlme Software Financial Services Miscellaneous Manufactures Food Office I Business Equipment Electric Real Estate Insurance Electronics & Semiconductors Oil & Gas Auto Parts & Equipment Internet Brewery Hand & Machine T w l s Computer & Computer Services Cosmeticflersonal Care Mining Forest Products & Paper Healthcare-Products & Services Shipbuilding Machinery-Diversified Commercial Services Medical Advertising Agriculture Home Builders Instruments-Scientific
.Semiconductors Total Investments
Cash at Bank Other Assets Other Liabilities Net Asset Value
10 76 6 16 5 79 5 68 5 26 4 63 4 42 3 95 3 52 3 33 3 14 3 12 3 03 2 99 2 56 2 51 2 39 2 20 1 94 1 92 167 1 77 165 161 1 5 6 1 46 1 39 1 03 0 99 0 97 0 89 0 87 0 73 0 59 0 55 0 48 0 43 0 41 0 40 0 37 0 26 0.19
99.77
2.14 1.45 (3.96)
100.00
Unaudited Semi-Annual Report
Geographic Division of Investments as at 30 June 2008
% of net assets
Japan 99.77 Total Investments 99.77
Cash at Bank 2.74 Gther Assets 1.45 Other Liabilities (3.96) Net Asset Value 100.00
The accompanying notes form an integral part of these financial statements
41
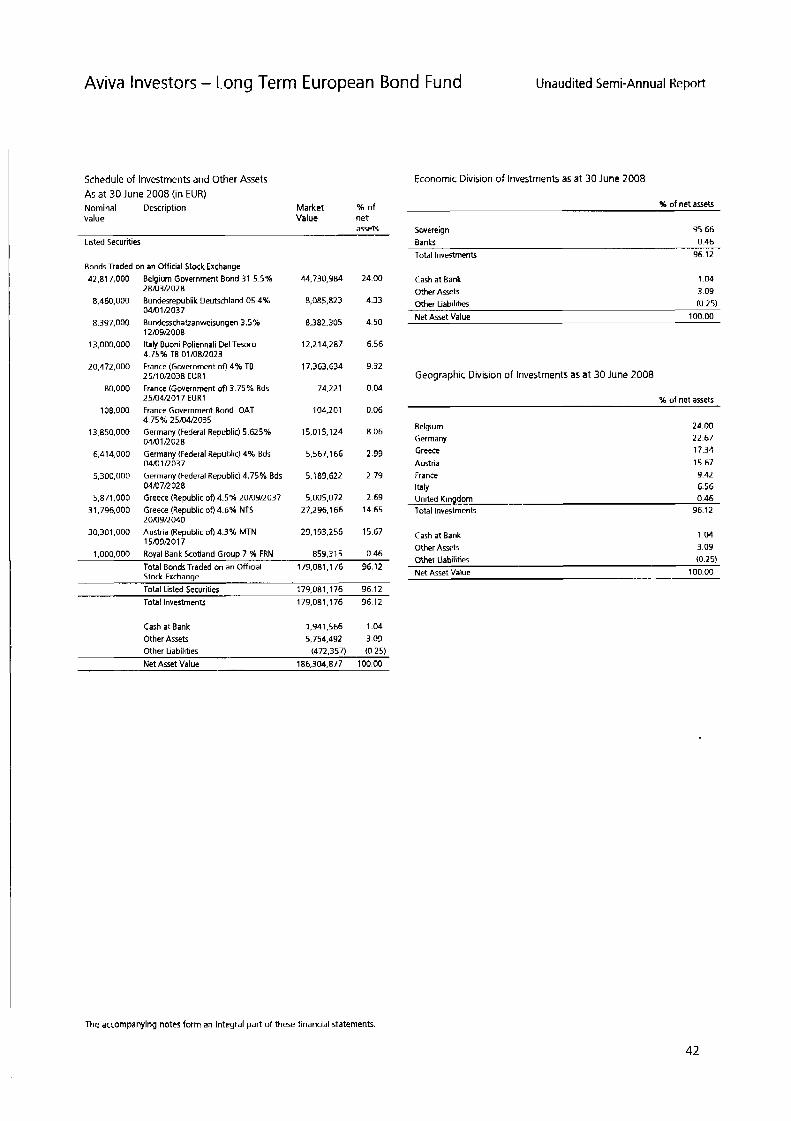
Aviva Investors - Long Term European Bond Fund
Schedule of Investments and Other Assets As at 30 June 2008 (in EUR) Nominal Description Market % of value Value net
assets
Listed Securities
Bonds Traded on an Official Stock Exchange 42.817.000
8,460,000
8,397,000
13,000,000
20,472,000
80,000
108.000
13.850.000
6,414,000
5,300,000
5.871.000 31,796,000
30,301,000
Belgium Government Bond 31 5.5% 2 e m 2 02 8 Bundesrepublik Deutschland 05 4% ~ m i n 0 3 7 BundesschaQanweisungen 3.5%
Italy Buoni Poliennali Del Temro
France (Government of) 4% TB 25/10/2038 EURl France (Government of) 3.75% Bds 25/04/2017 EURl France Government Bond OAT 4.75% 25/04/2035 Germany (Federal Republic) 5.625% 04/01/2028
1 2 1 ~ 9 ~ 0 0 8
4.75% TB o i m ~ o 2 3
Germany (Federal Republic) 4% Bds 04/01 DO37 Germany (Federal Republic) 4.75% Bds 04B712028 Greece (Republic of) 4.5% 20/09/2037 Greece (Republic of) 4.6% NTS 20x19/2040 Austria (Republic of) 4.3% MTN 15/03/2017
44,730,984
8,085,823
8.382.305
12.2 14,287
17,363,634
74.221
104,201
15,015,124
5.567.1 66
5,189,622
5,005,072 27.296.1 66
29.193.256
24.00
4.33
4.50
6.56
9.32
0.04
0.06
8.06
2.99
2 79
2 69 14.65
15.67
1.000.000 Royal Bank Scotland Group 7 56 FRN 859.315 0.46 Total Bonds Traded on an Official 179.081.1 76 96.12 Stock Exchange Total Listed Securities 179,081,176 96 12 Total Investments 179.081.176 96 12
Cash a t Bank 1.941.566 1.04 Other Assets 5,751,492 3.09 Other Liabilities (472.357) (0.25) Net Asset Value 186.304.877 100.00
Unaudited Semi-Annual Report
Economic Division of Investments as at 30 June 2008
% of net assets
Sovereign 95.66 Banks 0.46 Total Investments 96.12
Cash at Bank Other Assets
1.04 3.09
Other Liabilities (0.25) Net Asset Value 100.00
Geographic Division of Investments as at 30 June 2008
% of net assets
Belgium Germany Greece Austria France Italy
24.00 22.67 17.34 15.67 9.42 6.56
United Kingdom 0.46 Total Investmenk 96.12
Cash at Bank Other Assets
104 3.09
Other Liabilities (0.25) Net Asset Value 100.00
The accompanying notes form an integral part of these financial statements.
42
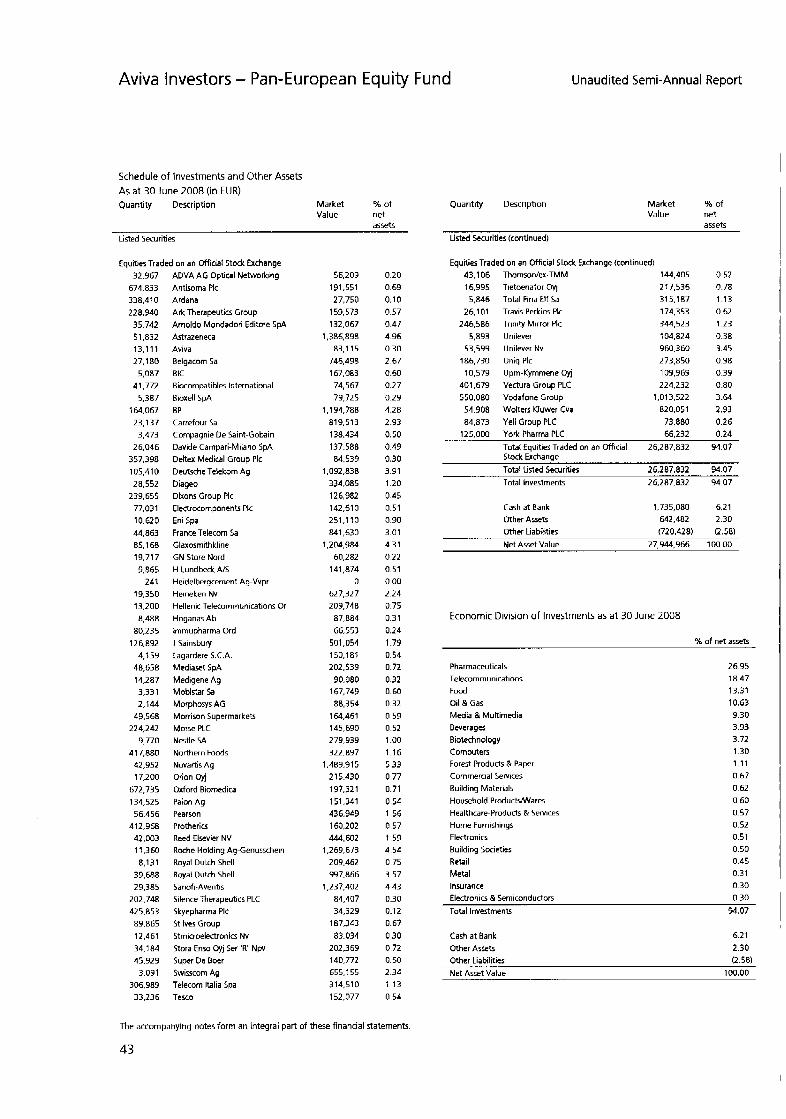
Aviva Investors - Pan-European Equity Fund Unaudited Semi-Annual Report
Schedule of Investments and Other Assets As at 30 June 2008 (in EUR) Quantity Description Market % of
assets Value net
Listed Securities
Eauities Traded on an Official Stock Exchange 32,967
338,410 22 8,940
35.742
13,111 27,180
674,833
51.832
5,087 41,772
5.387 164.067 23,137
3,473 26,046
357.398 105,410
239,655 77,031 10,620 44,863 85.168
28.552
19,717 9.865
241 19.350 13,200
80,235 126.892
4.159 48,658
3,331
8,488
14,287
2,144 49.568
224,242 9,770
417,880 42.952 17,200
672.735 134,525 56,456
412,968 42,003 11,360 8,131
39,688 29.385
2 02,748 425.853 89.865 12,461 34,184 45,929
3,091 306,989 33.236
ADVA AG Optical Networkmg Antisoma PIC Ardana Ark Therapeutics Group Arnoldo Mondadori Editore SpA Astrazeneca Aviva Belgacom Sa BIC Biocompatibles International Bioxell SpA BP Carrefour Sa Compagnie De Saint-Gobain Davide Campari-Milano SpA Defter Medical Group PIC Deutsche Telekom Ag Diageo Dixons Group PIC Electrncomponents PIC Eni Spa France Telecom Sa Glaxosmithkline GN Store Nord H Lundbeck AA Heidelbergcement Ag-Vvpr Heineken Nv Hellenic Telecommunications Or
Hoganas Ab lmmupharma Ord J Sainsbury Lagardere S.C.A. Mediaxt SpA Medigene Ag Mobistar Sa Morphosys AG Morrison Supermarkets Morse PLC Nestle SA Northern Foods Novartis Ag Orion Oyj Oxford Biomedica Paion Ag Pearson Protherics Reed Elsevier NV Roche Holding Ag-Genusschein Royal Dutch Shell Royal Dutch Shell Sanofi-Aventis Silence Therapeutics PLC Skyepharma PIC St lves Group Stmicroelectronics Nv Stora Enso Oyj Ser 'R' Npv Super De Boer Swisscom Ag Telecom ltalia Spa Tesco
56,209 191,551 27,750
159.573 132,067
1,386,898 83,115
746.498 167.083 74,567 79.725
1,194.78a 81 9.51 3 138.434 137.588 84.539
i.o92,a3a 334.085 126,982 142,610 251,110 841,630
1,204,384 60,282
141.874 0
627,327 209.748
87,884 66,553
501,054 150.1 81 202,539
90,080 167.749 88,354
164,461 145.690 279,939
1,483,915 21 5.430 197.321 151,341 436,949 160,202 444.602
1,263,673 209.462
1,237,402 84,407 34,329
187,343 83.034
202.3 69 140,772 655.155 314,510 152.077
322.897
997.866
0.20 0.69 0.10 0.57 0.47 4.96 0.30 2.67 0.60 0.27 0.29 4.28 2.93 0.50 0.49 0.30 3.91 1.20 0.45 0.51 0.90 3.01 4.31 0.22 0.51 0.00 2.24 0.75 0.31 0.24 1.79 0.54 0.72 0.32 0.60 0.32 0 59 0.52 1 .oo 1.16 5.33 0.77 0.71 0.54 1.56 0.57 1.59 4,5A 0.75 3.57 4 43 0.30 0.12 0.67 0.30 0 72 0.50 2.34 113 0.54
Quantiv Description Market %of
assets Value net
Listed Securities (continued)
Equities Traded on an Mfcial Stock Exchange (contin 43.106 Thomsonlex-TMM 16,995 Tietoenator Oyj 5.846 Total Fina Elf Sa
26,101 Travis Perkins PIC 246,586 Trinity Mirror PIC
5,893 Unilever 53,599 Unilever Nv
186,730 Uniq PIC 10,579 Upm-Kymmene Oyj
401,679 Vectura Group PLC 550.080 Vodafone Group 54.908 Wolters Kluwer Cva 84,873 Yell Group PLC
ued) 144,405 217,536 315.187 174.353 344.523 104,824 960.360 273.850 109,969 224,232
1,013,522 820,051
73.880
0.52 0.78 1.13 0.62 1.23 0.38 3.45 0.98
0.80 0.39
3.64 2.93 0.26
125,000 York Pharma PLC 66,232 0.24 Total EquitiesTraded on an Official 25,287,832 94.07 Stock Exchange Total Listed Securities 26,287,832 94.07 Total Investments 26.287.832 94.07
Cash a t Bank 1.735.080 621 Other Assets 642.482 230 Other Liabilities (720.428) 0.58) Net Asset Value 27.944.966 100 00
Economic Division of Investments as at 30 June 2008
% of net assets
Pharmaceuticals 26 95
Food 13.31 Oil & Gas 10.63 Media & Multimedia 9.30
Telecommunications 18.47
Beverages 3.93 Biotechnology 3.72 Computers 1.30 Forest Products & Paper 1.11 Commercial Services 0.67 Building Materials 0.62 Household ProduMares 0.60 Healthcare-Products & Services 0.57 Home Furnishings 0.52 Electronics 0.51 Building Societies 0.50 Retail 0.45 Metal 0.3 1 Insurance 0.30 Electronics & Semiconductors 0.30 Total Investments 94.07
Cash a t Bank Other Assets
6.2 1 2.30
Other Liabilities (2 58) Net Asset Value 100.00
The accompanying notes form an integral part of these financial staternentr,
43
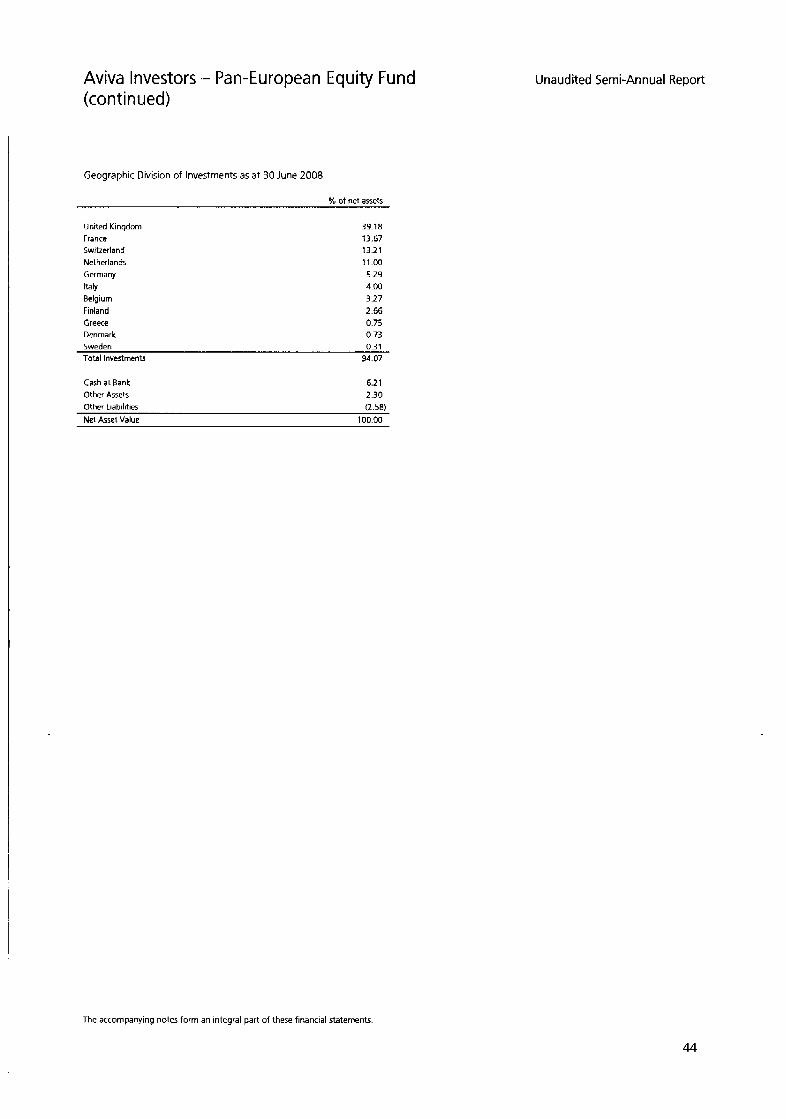
Aviva Investors - Pan-European Equity Fund (con t i n ued)
Geographic Division of Investments as at 30 June 2008
96 of net assets
United Kingdom 39.18 France 13.67 Swiberland 13.21 Netherlands 11 .oo Germany 5.29 Italy 4.00 Belgium 3.27 Finland 2.66 Greece 0.75 Denmark 0.73 Sweden 0.31 Total Investments 94.07
Cash at Bank 6.2 1 Other Assets 2.30 Other Liabilities (2.58) Net Asset Value 100.00
Unaudited Semi-Annual Report
The accompanying notes form an integral pan of these financial statemenfs.
44
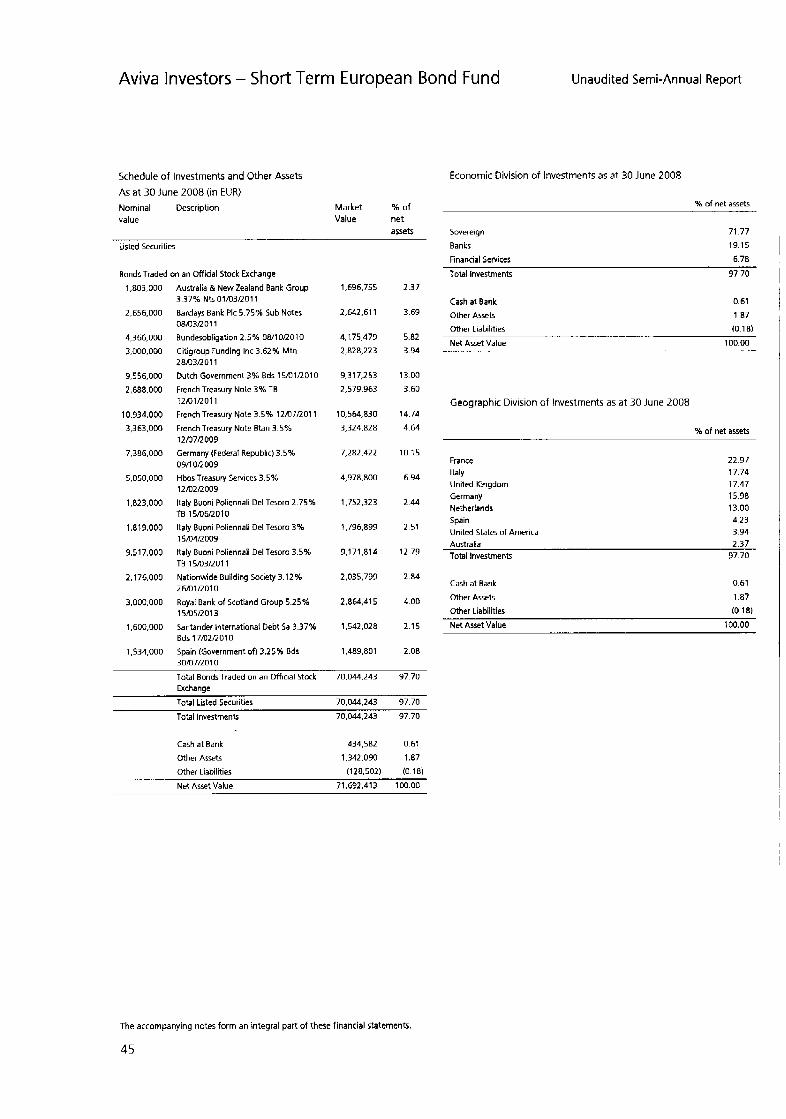
Aviva Investors - Short Term European Bond Fund
Schedule of Investments and Other Assets
As a t 30 June ZOO8 ( in EUR) Nominal Description Market % o f value Value net
assets
Listed Securities
Bonds Traded on an Official Stock Exchange 1,803,000
2,656,000
4,366,000 3,000,000
9,556,000
2.688.000
10,934,000 3,363,000
7,386,000
5,050,000
1,823,000
1,813,000
9,517,000
2,176,000
3,000,000
1,600,000
1,534,000
Australia & New Zealand Bank Group
Barclays Bank PIC 5.75% Sub Notes 08B3R011 Bundesobligation 2 . 5 % 08/10/2010 Citigroup Funding Inc 3.62% MIn 28/03/2011 Dutch Government 3% Bds 15BlRO10 French Treasury Note 3% TB
French Treasury Note 3.5% 12/07/2011
French Treasury Note Btan 3.5% 12107R003 Germany (Federal Republic) 3 5% 0911 ol2009 Hbos Treasury Services 3.5% 12/02/2009
Italy Buoni Poliennali Del Tesoro 2.75%
Italy Buoni Poliennali Del Tesoro 3% 15/04/2009 Italy Buoni Poliennali Del Tesoro 3.5%
Nationwide Building Society 3.12% 26m1/2010
Royal Bank of Scotland Group 5.25% 15/05/2013 Santander International Debt Sa 3.37% Bdr 17B2R010 Spain (Government of) 3.25% Bds
3.37% ~ t s o i m 3 ~ o i 1
12/01/2011
TB i 5 m m o i o
TB 1 ~ ~ 3 ~ 0 1 1
30/07~01 o
1,696,755
2,642.61 1
4,175,473 2,828,223
9.31 7,253
2,573,963
10.564.830 3,324,828
7.282.422
4.g78,aoo
1,752,323
1,796,893
3,171,814
2,035,739
2,864,415
1,542,028
1,489,801
2.37
3.69
5.82 3.94
13.00
3.60
14.74 4.64
10.15
6.94
2.44
2.51
12 79
2.84
4.00
2 15
2.08
Total Bonds Traded on an Official Stock 70,044,243 97.70 Exchange
Total Listed Securities 70.044.243 97.70
Total Investments 70,044,243 97.70
Cash a t Bank 434.582 061
Other Assets 1,342.090 1.87
Other Liabilities (128.502) (0 18)
Net Asset Value 71.692.413 100 00
Unaudited Semi-Annual Report
Economic Division of Investments as at 30 June 2008
% of net assets
Sovereign 71.77 Banks 19.15
Financial Services 6.78
Total Investments 97 70
Cash at Bank Other Assets
0.61
107 Other Liabilities (0.18)
Net Asset Value 100.00
Geographic Division of Investments as a t 30 June 2008
% of net assets
France
United Kingdom Germany Netherlands Spain United States of America
Italy 22.97 17.74 17.47 15.98 13 00 4.23 3.94
Australia 2.37 Total Investments 97.70
Cash at Bank 0.61
Other Assets Other Liabilities
1.87
(0 18) Net Asset Value 100.00
The accompanying notes form an integral part of these financial statements.
45
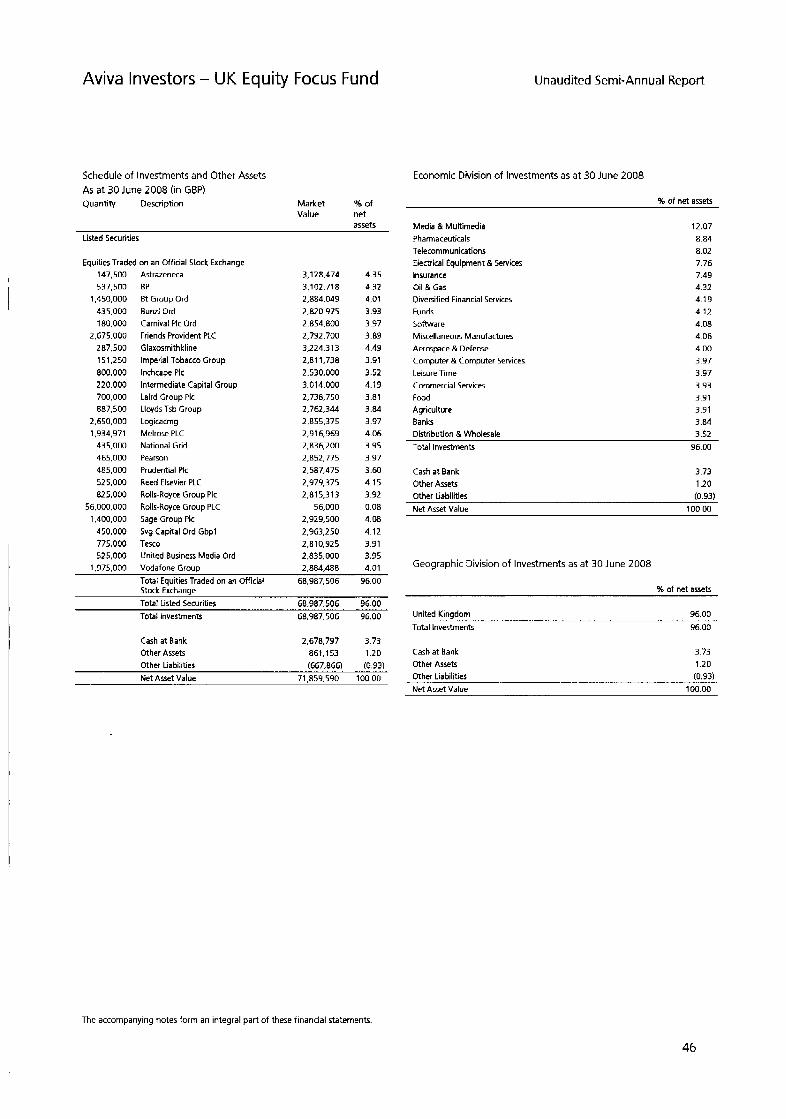
Aviva Investors - UK Equity Focus Fund
Schedule of Investments and Other Assets As at 30 June 2008 (in GBP) Quantity Description Market % of
assets Value net
Listed Securities
EquitiesTraded on an Official Stock Exchange 147,500 537,500
1,450,000 435.000 180.000
2.675.000 287,500 151,250 800,000 220.000 700,000 887.500
2.650.000 1,934,971
435,000 465,000 485,000 525,000 825,000
56,000,000 1,400,000
450,000 775,000 525,000
1.975.000
Astrazeneca BP Et Group Ord Bunzl Ord Carnival PIC Ord Friends Provident PLC tlaxosmithkline Imperial Tobacco Group Inchcape PIC Intermediate Capital Group Laird Group PIC Lloyds Tsb Group Logicacmg Melrose PLC National Grid Pearson Prudential PIC Reed Elsevier PLC Rolls-Royce Group PIC Rolls-Royce Group PLC Sage Group PIC Svg Capital Ord Gbpl Tesco United Business Media Ord Vodafone GrOUD
3,128,474 3,102,718 2.8W.049 2.820.975 2.854.800 2,792,700 3,224,313 2.81 1,738 2,530,000 3.014.000 2,738,750 2,762,344 2,855,375 2.91 6,969
2352.775 2,587,475 2,979,375 2.81 5.3 13
56,000 2.929.500 2.963.250 2.81 0,925 2.835.000
2.a36.200
2.884.488
4.35 4.32 4.01 3.93 3.97 3.89 4.49 3.91 3.52 4.19
3.84 3.97 4.06 3.95 3 97 3.60 4.15 3.92
3.81
0.08 4.08 4.12 3.91 3.95 4.01 . .
Total Equities Traded on an Official 6a.987.506 96.00 Stock Exchange Total Listed Securities 68,387,506 96.00 Total Investment5 68.987.506 96.00
Cash a t Bank Other Assets
2,678,797 3.73 861,153 1.20
Other Liabilltres f667 8661 10 931 Net Asset Value 71.859.590 100.00
Unaudited Semi-Annual Report
Economic Division of Investments as at 30 June 2008
% of net assets
Media & Multimedia Pharmaceuticals Telecommunications Electrical Equipment & Services Insurance Oil & Gas Diversified Financial Services Funds Software Miscellaneous Manufactures Aerospace & Defense Computer & Computer Services leisure i h e Commercial Services Food Agriculture Banks
12.07 8.84 8.02 7.76 7.49 4.32 4.19 4.12 4.08 4.06 4.00 3.97 3.97 3.93 3.91 3.91 3.84
Distribution & Wholesale 3.52 Total Investments 96.00
Cash at Bank 3.73 Other Assets 1.20 Other Liabilities (0.93) Net Asset Value 100 00
Geographic Division of Investments as at 30 June 2008
% of net assets
United Kinodom 96.00 Total Investments 96.00
Cash at Bank 3.73 Other Assets 1.20 Other Liabilities (0.93) Net Asset Value 100.00
The accompanying notes form an integral part of these financial statements
46
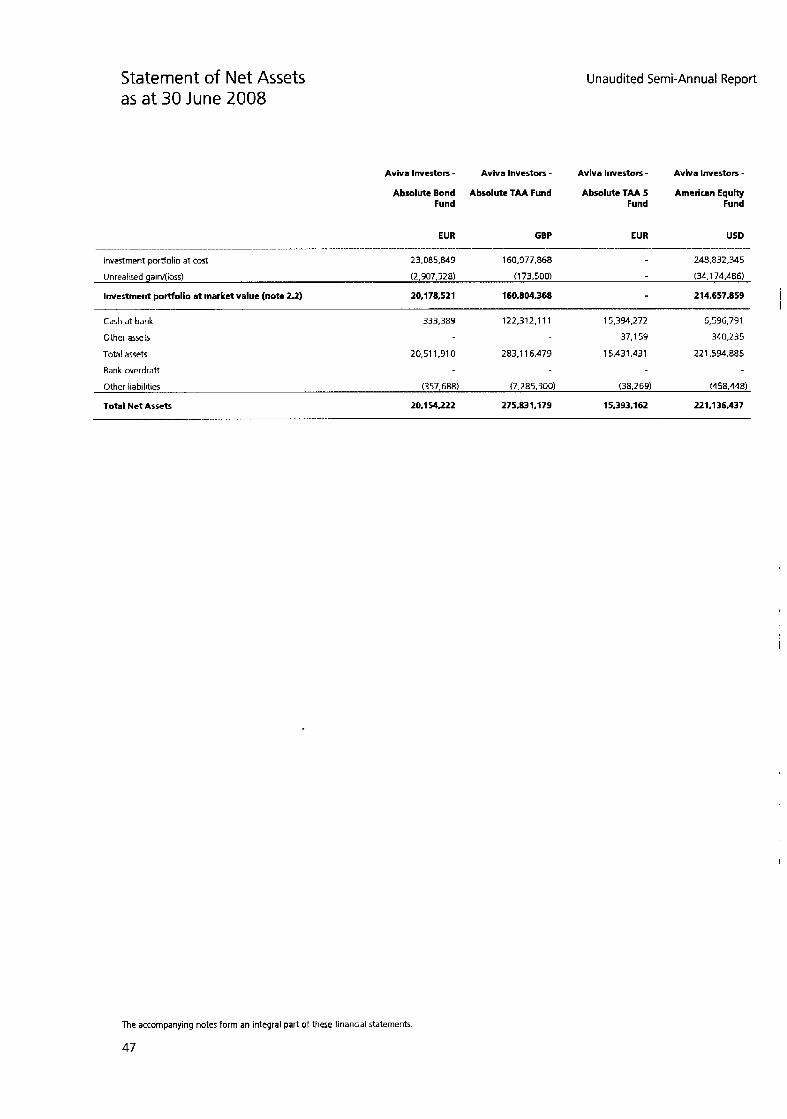
Statement of Net Assets as at 30 June 2008
Unaudited Semi-Annual Report
AvNa Investors - Avhra Investors - Avlva Investors - Avhra Inverton - Absolute Bond Absolute TAA Fund Absolute TAA 5 American Equity
Fund Fund Fund
EUR GBP EUR USD
Investment portfolio at cost 23,085,849 160.977.868 248,832,345
Unrealised gain/(loss) (2,907,328) (1 73.500) (34.174.486)
Investment portfolio a t market value (noto 2.2) 20,178,521 160.804.368 214,557,859
........... ~ ... . , , , . , . ..., ~ ~ .... ~
Cash at bank 333.389 122,312.11 1 15,394,272 6.596.791
Other assets 37.1 59 340,235
Total assets 20.51 1.91 0 283,116,473 15.431.431 221,534,885
Bank overdraft
Other liabilities (357,688) (7.285.300) (38.263) (458.448)
Total Net Ass& 20.1 54.222 275.831.179 15,393.162 221,136,437
The accompanying notes form an integral part of these financial statements
47
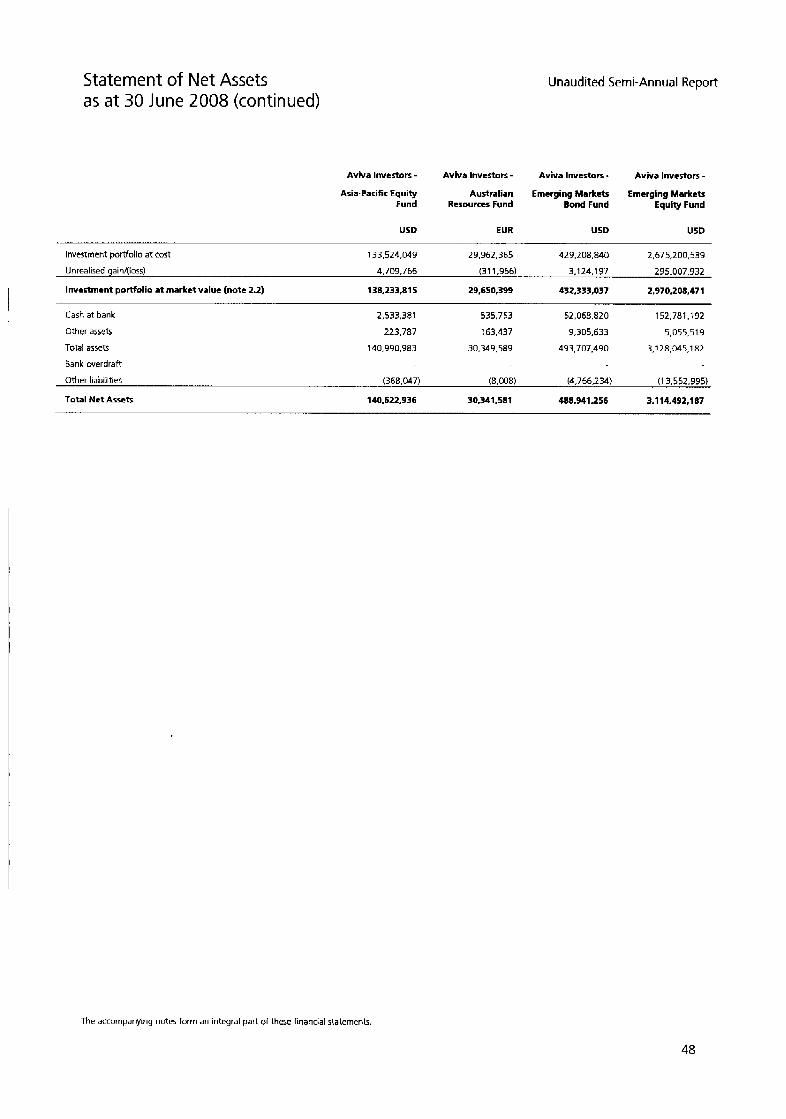
Statement of Net Assets as a t 30 June 2008 (continued)
Unaudited Semi-Annual Report
Aviva Investors - Aviva Investors - Aviva Investors + Aviva Investors - Asia-Pacific Equity Australian Emerging Markets Emerging Markets
Fund Resources Fund Bond Fund Equity Fund
USD EUR USD USD
Investment portfolio at cost 133,524,049 23,962,365 429,208.840 2,675,200,539
Unrealised gain/(loss) 4,709,766 (31 1,966) 3.124.1 97 235,007,932
Investment portfolio at market value (note 2.2) 138.233.81 5 29,650,399 432,333,037 2.970.208.471
Cash a t bank 2,533.381 535.753 52.068.820 152.781.192
Other assets 223.787 163,437 9.305.633 5.055.51 9
Total assets 140,990,983 30,349,589 493.707.490 3,128,045,182
Bank overdraft
Other liabilities (368.047) (8,008) (4,766,234) (1 3,552,395)
Total Net Assets 140,622,936 30,341,581 488,341,256 3.114.492.187
The accompanying notes form an integral part of these financial statements
48
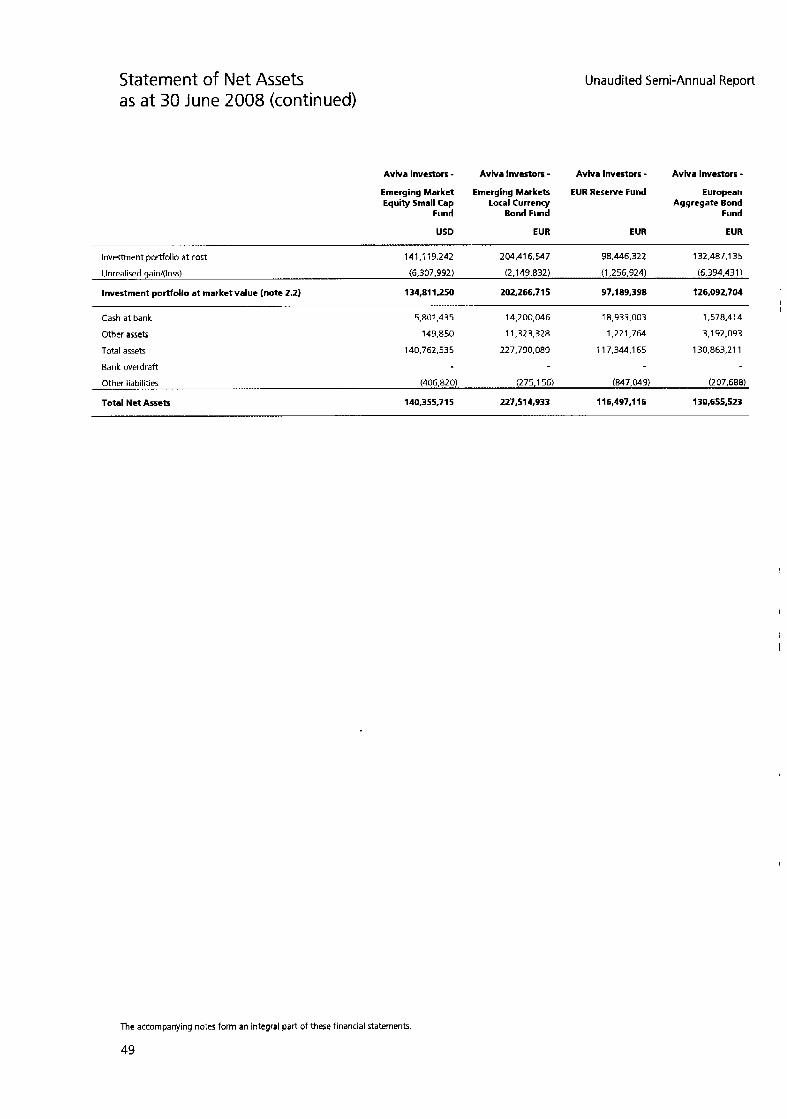
Statement of Net Assets as a t 30 June 2008 (continued)
Unaudited Semi-Annual Report
Aviva Investors - AvNa Investors - Aviva Investors - Aviva Investors - Emerging Market Emerging Markets EUR Reserve Fund European Equity Small Cap Local Currency Aggregate Bond
Fund Bond Fund Fund
USD EUR EUR EUR
Investment portfolio at cost 141,119,242 204.41 6.547 9 a . a 6 . m 132,487.135
Unrealised gain/(loss) (6,307.992) (2.149.832) (1,256.924) (6,394,431)
Investment portfolio at market value (note 2.2) 134.811.250 202,266,715 97.189.398 126.092.704
Cash at bank 5,801.435 14,200,046 18.933.003 1,578.414
Other assets 149.850 11,323,328 1,221,764 3.1 92.093
Total assets 140,762,535 227.790.089 117,344,165 130,863.21 1
Bank overdraft
Other liabilities (406,820) (275.1 56) (847.049) (207.688)
Total Net Assets 140.355.71 5 227,514,333 116.497.1 16 130,655,523
The accompanying notes form an integral part of these financial statements
49
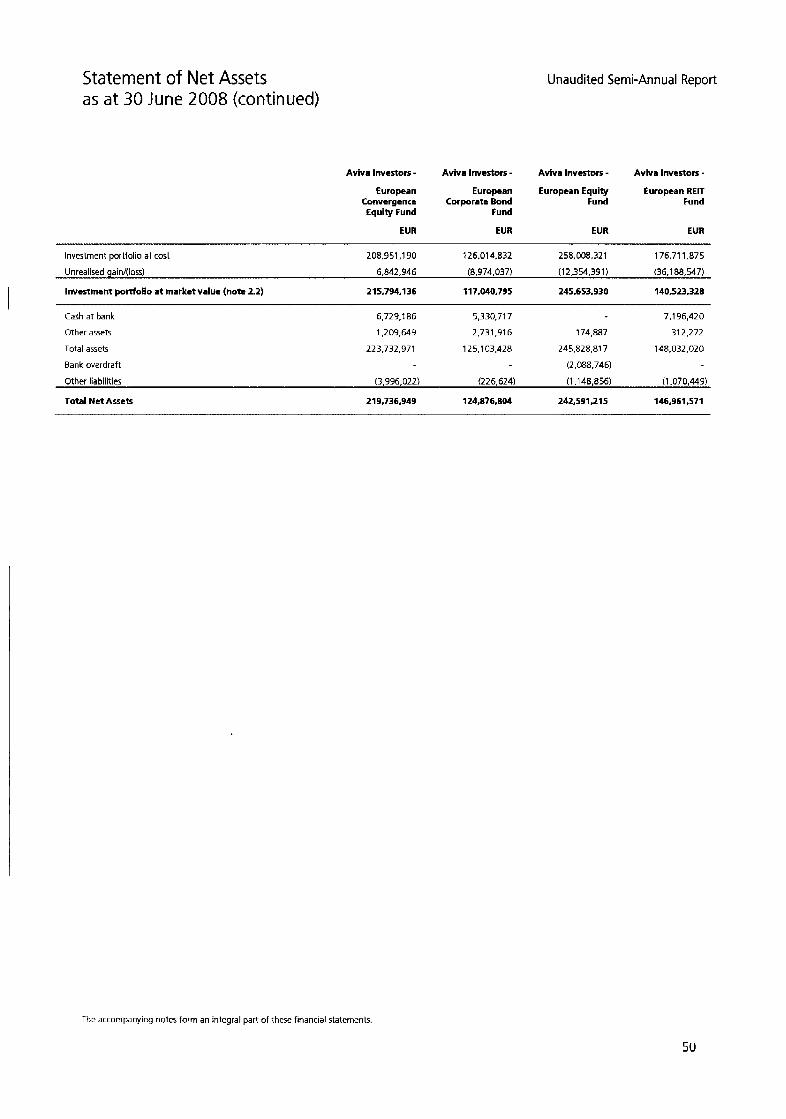
Statement of Net Assets as a t 30 June 2008 (continued)
Unaudited Semi-Annual Report
Avhra Investors - Avhra Investors - Avlva Investors - Aviva Investors - European European European Equity European RElT
Convergence Corporate Bond Fund Fund Equity Fund Fund
EUR EUR EUR EUR
Investment portfolio at cost 208,951,130 126,014,832 258,008,321 176.71 1.875
Unrealised gain/(loss) 6.842.946 (8,974,037) (1 2,354.391 ) (35.1 88,547)
Investment portfolio a t market value (note 2.2) 21 5,794.1 36 117,040,795 245,653,330 140,523.328
Cash at bank 6.729.1 86 5,330.717 7.1 96,420
Other a5sets 1,209,643 2,731.91 6 174.887 31 2,272
Total assets 223,732.971 125,103,428 245.828.81 7 148,032,020
Bank overdraft (2,088,746)
Other liabilities (3.996.022) (226,624) (1.148,856) (1,070,443)
Total Net Assets 219,736,949 124,876,804 242.591.21 5 146,961.571
111 -
The accompanying notes form an integral part of these financial statements.
50
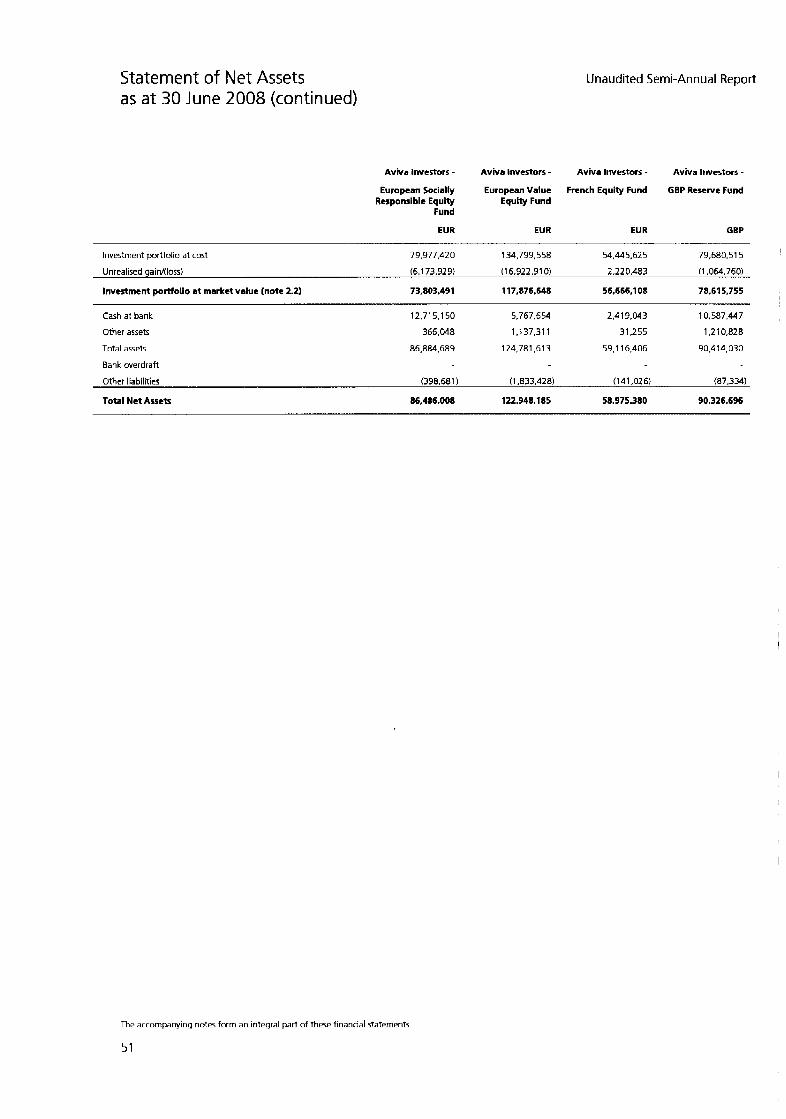
Statement of Net Assets as a t 30 June 2008 (continued)
Unaudited Semi-Annual Report
Avhra Investors - Aviva Investors - Aviva Investors - Aviva Investors - European Socially European Value French Equity Fund GBP Reserve Fund
Responsible Equity Equfty Fund Fund
EUR EUA EUR GBP
Investment portfolio at cost 73,977,420 134,799,558 54.445.62 5 79.680.51 5
Unreaitsed gain/(loss) (6,173,923) (1 6.922.91 0) 1,220,483 (1.064.760)
Investment portFolio at market value (note 2.2) 73,803,431 117,876,548 56,666.108 78.615.755
Cash at bank 12.71 5.1 50 5.767.654 2.4 19,043 10.587.447
Other assets 366.048 1,137,311 31,255 1.2 10.828
Total assets 86,884.689 124,781,613 59.1 16,406 90,414,030
Bank overdrafr
Other llablllties (398.681) (1,833,428) (141,026) (87.334)
Total Net Assets 86,486.008 122,348,185 58.975.380 90.326.696
I
I
I
The accompanying notes form an integral part of these financial statements.
51

Statement of Net Assets as a t 30 June 2008 (continued)
Unaudited Semi-Annual Report
Avhra Investors - Avhra Investors - Aviva Investors - Aviva Investors - Global Global Equity Global RElT Fund Japantst Equity
Convtrtibles Fund Focus Fund Fund
us0 USD EUR JPY
Investment portfolio at cost 989,123,688 39,438,364 68,251.781 17,495,534,536
Unrealised gain/(loss) (36.769.708) 3,148,527 (1 8,829,890) (1,489,820,036)
Investment portfolio at market value (note 2.2) 952,353,980 42,586,891 49,421,891 16.008.714.500
Cash at bank 7.382.757 337,203 440,083,683
Other assets 15.61 8,042 73.194 369.632 232.454.005
Total assets 975,354,779 42,997,288 49.791.523 16.581.252.1 88
Bank overdraft (212,255)
Other liabilities
Total Net A r r e t 962,038,928 42.847.010 49,327,158 16,046,487,570
(13,315,851) (1 50.278) (252.110) (634,764.61 8)
The accompanying notes form an integral part of these financial statements.
52
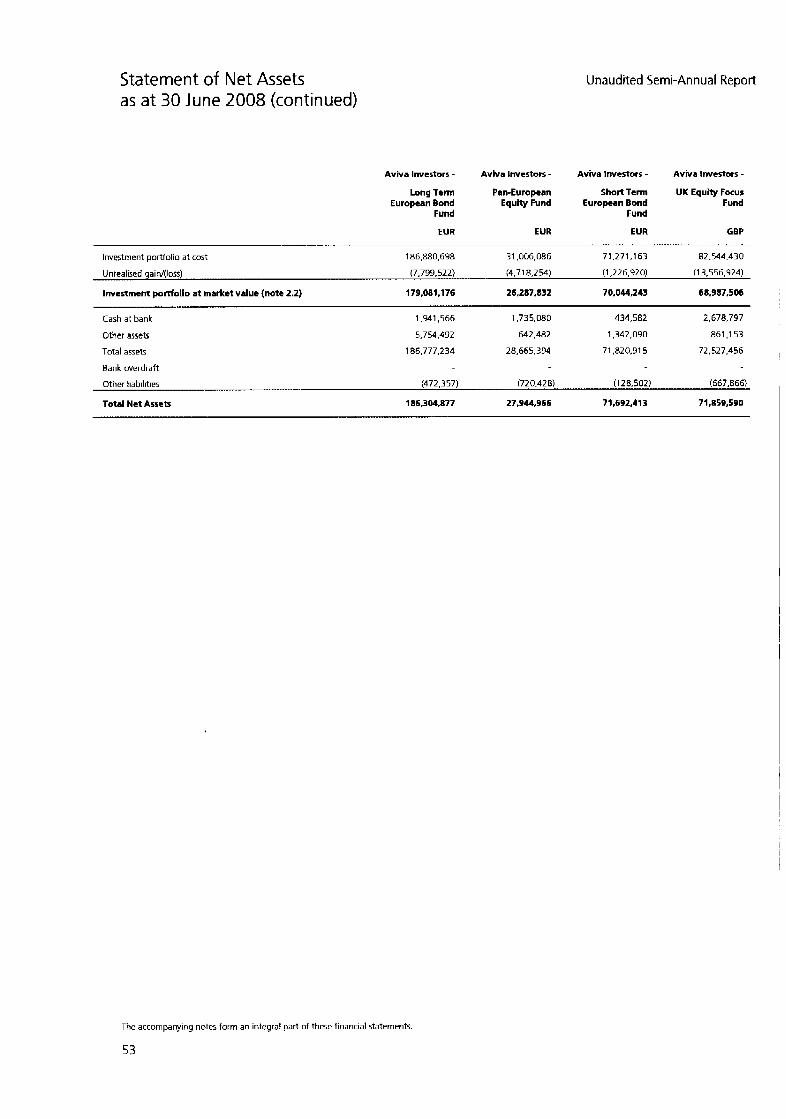
Statement of Net Assets as a t 30 June 2008 (continued)
Unaudited Semi-Annual Report
AvNa Investors - Avhra Investors - Aviva lnvtstors - Aviva Invtstots - Long Ttrm Pan-European Short Term UK Equity Focus
European Bond Equity Fund European Bond Fund Fund Fund
EUR EUR EUR GBP
Investment portfolio at cost 186,880.698 31.006.086 71,271.1 63 82,544,430
Unrealised gain/(loss) (7,799,522) (4.71 8,254) (1.226.920) (13,556,924)
Investment portfolio at market value (note 2.2) 179,081,176 26.287.832 70.044.243 68,987,506
Cash at bank
Other assets
ToIal assets
Bank overdraft
1,941,566 1,735,080 434.5a2 2.67a.797 I
5.754.492 642.482 1,342,090 861.1 53
186.777.234 28.665.394 71.820.91 5 72,527,456 I
Other liabilities (472,357) (720.428) (1 28.502) (667.866)
Total Net AsseB 185.304.877 2 7,944,966 7 1,632,413 71,859,590
The accompanying notes form an integral part of these financial statements.
53

Statement of Net Assets as a t 30 June 2008 (continued)
Unaudited Semi-Annual Report
Combined Combined*
EUR GBP
Investment portfolio at cost 5,347,651,287 4,238,939,426
Unrealised gain4loss) 147,463 1 16.890
Investment portfolio at market value (note 2.2) 5.347.798.750 4,239,056,316
Cash a t bank 41 3.058.794 327.42 0.602
Other assets 53.51 2.458 42.417.887
Total assets 5,814,370,002 4.608.894.805
Bank overdraft (2.301.001) (1,823,342)
Other liabilities (46,993,875) (37,255,536)
Total Net Assets 5,765,069,126 4.569.81 5.327
'For Information purposes only The accompanying notes form an integral part of these financial statements
54
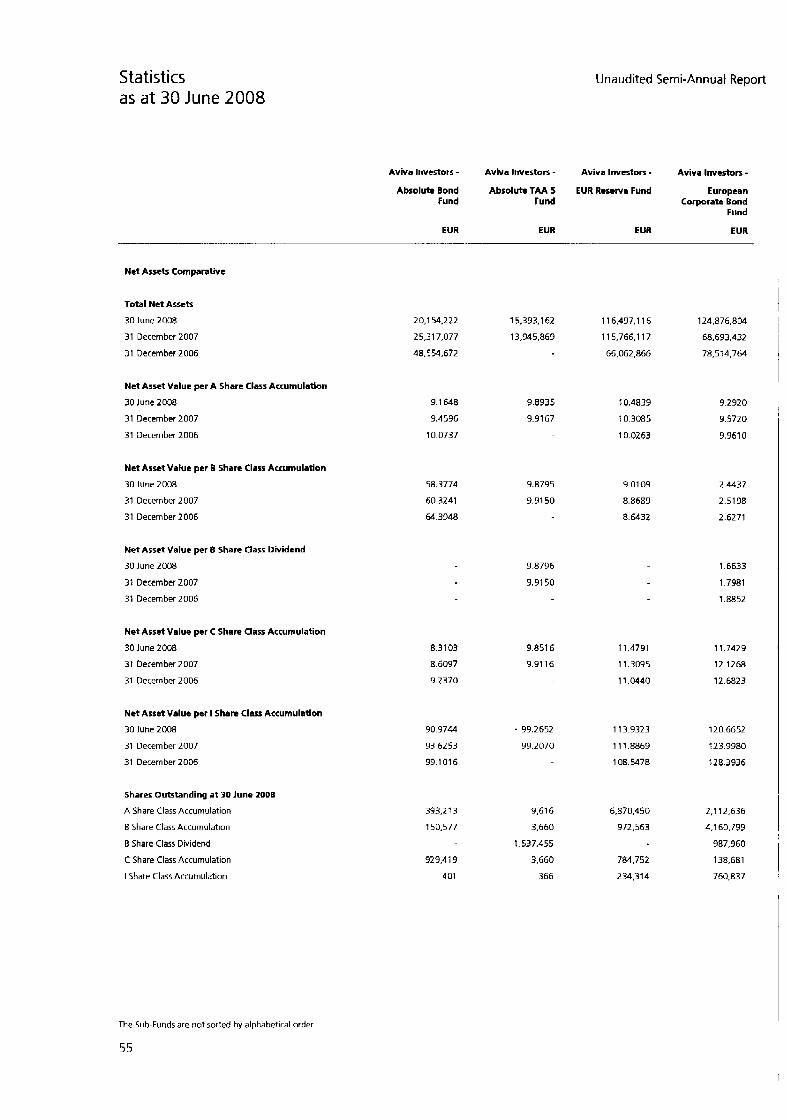
Statistics as at 30 June 2008
Unaudited Semi-Annual Report
Aviva Investors - A v b a lnvestors - Avhra Investors - Aviva Investors - Absolute Bond Absolute TAA 5 EUA Reserve Fund European
Fund Fund Corporate Bond Fund
EUA EUR EUR EUR
Net Assets Comparative
Total Net Assets
30 June 2008
31 December 2007
31 December 2006
20.154.222
25,317,077
48.554.672
124,876,804 ' 78.514.764 , i 68.693.432
i 1 5.393.1 62 11 6,497.1 16
13,945.869 11 5,766.1 17
66.062.866
Net Asset Value per A Share Class Accumulatlon
30 June 2008
31 December 2007
31 December 2006
9.1 648
9.4596
10.0737
9.8935
9.9167
10.4839
10.3085
10.0163
9.2920
9.5720
9.961 0
I
2.4437
2.5198
Net Asset Value per B Share Class Accumulation
30 June 2008
31 December 2007
31 December 2006
58.3774
60.3241
M.3948
9.8795
9.91 50
9.01 09
8.8689
8.6432 2.6271
1.6633
Net Asset Value per B Share Class Dividend
30 June 2008
31 December 2007
31 December 2006
9.8796
9.91 50 1.7981
1.8852 I Net Asset Value per C Share Class Accumulation
30 June 2008
31 December 2007
31 December 2006
8.31 03
8.6097
9.2370
9.851 6
9.91 16
11.4791
11.3095
11.0440
11.7429
12.1268
12.6823
120.6652
123.9980
128.3936
Net Asset Value per I Share Class Accumulation
30 June 2008
31 December 2007
31 December 2006
90.9744
93.6253
99.1016
. 99.2652
99.2070
113.9323
1 11.8869
108.5478
I I I 2.1 12,636
Shares Outstanding a t 30 June 2008
A Share Class Accumulation
B Share Class Accumulation
B Share Class Dividend
C Share Class Accumulation
I Share Class Accumulation
393.213
150.577
9.616 6.870.450
3.660 972,563
1.537.455
3.660 784.752
366 234,314
4,160,793 I 987,960
138,681
760.837
929.41 9
401
The Sub-Funds are not sorted by alphabetical order
55

Statistics as a t 30 June 2008 (continued)
Unaudited Semi-Annual Report
Aviva Investors - Aviva lnvrstors - Aviva Investors - Aviva Investors - European REIT European Socially European Value French Equlty Fund
Fund Responsible Equity Equity Fund Fund
EUR EUR EUR EUR I-
Net Assets Comparative
Total Net Assets
30 June 2008
31 December 2007
31 December 2006
146,961,571
146,306,772
24 1.8 7 7.242
86.486.008
94.396.230
68.272.783
i 2 2 . w . i a5 58,375,380
126.877.055 64.406.033
138332.337 71.057.895
Net Asset Value per A Share Class Accumulation
30 June 2008
31 December 2007
31 December 2006
6.2956
7.6512
10.7921
9.0503
10.3275
10.3780
8.7783
10.5906
10.0946
8.5367
10.3232
10.1966
Net Asset Value per B Share Class Accumulation
30 June 2008
31 December 2007
31 December 2006
8.1226
9.8849
13.9753
5.4476
6.5858
6.2699
7.4060
8.9461
8.5479
3.6699
4.4435
4.3398
Net Asset Value per B Share Class Dividend
30 June 2008
31 December 2007
31 December 2006
7.8736
9.681 1
13.6887
7.2818
8 . a ~
8.4327
3.6096
4.3761
4.3344
Net Arstt Value per C Share Class Accumulation
30 June 2008
31 December 2007
31 December 2006
16.2916
19.8736
2a.2424
13.9165
16.8660
16.1 379
17.3809
21.0477
20.2124
12.4470
15.1050
15.0328
Net Asset Value per I Share Class Accumulation
30 June 2008
31 December 2007
31 December 2006
168.5687
204.0293
2 8 5.3442
173.6635
208.8073
196.6271
167.5445
201.3383
190.3773
Shares Outstanding at 30 June 200s
A Share Class Accumulation
6 Share Class Accumulation
B Share Class Dividend
C Share Class Accumulation
I Share Class Accumulation
2,376.866
2.51 5,526
7.1 14,995
198,592
310.31 1
904,369
4,316,207
2,325.013
230,903
12.892.944
54,681
4,338
161,524
247.140
15,680,526
7.123 292,906
292.012
The Sub-funds are not sorted by alphabetical order
56
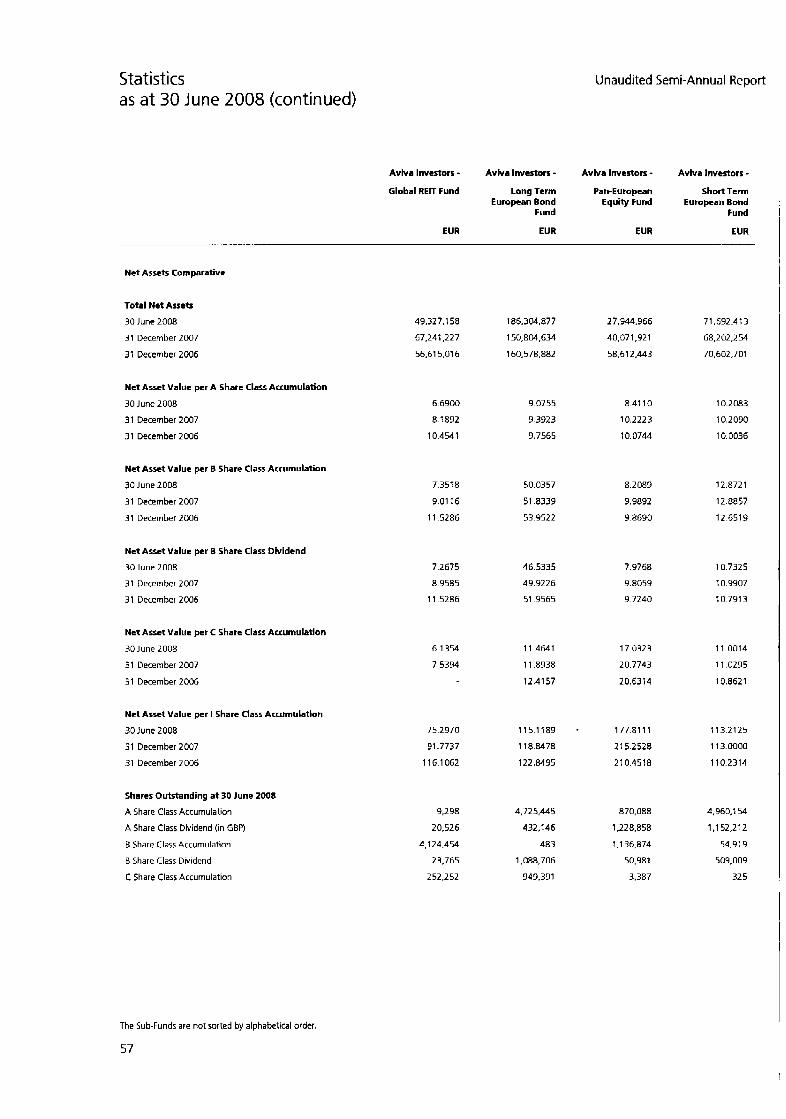
Statistics as a t 30 June 2008 (continued)
Unaudited Semi-Annual Report
Aviva Investors - AvNa investors - Global REIT Fund Long Term
European Bond Fund
EUR EUR
AvNa Investors - Aviva Investors - Parr European Short Term
Equity Fund European Bond Fund
EUR EUR
Net Assets Comparative
Total Net Assets
30 June 2008
31 December 2007
31 December 2006
49.327.1 58
67.241.227
56.61 5.01 6
186,304,877
150,804,634
160,578.882
27,944,366 71,632,413
40,071,921 68,202,254
58,612.443 70,602,701
Net Asset Value per A Share Class Accumulation
30 June 2008
31 December 2007
31 December 2006
6.6900
8.1892
10.4541
9.0755
9.3923
9.7565
8.41 10
10,2223
10.0744
10.2083
10.2030
10.0036
Net Asset Value per B Share Class Accumulation
30 June 2008
31 December 2007
31 December 2006
50.0357
51.8339
53.9522
7.3518
9.01 16
11.5286
8.2089
9.9892
9.8690
12.8721
12 8857
12 6519
Net Asset Value per B Share Class Dividend
30 June 2008
31 December 2007
31 December 2006
7.2675
8.9585
11.5286
46.5335
49.9226
51.9565
7.9768
9.8059
9.7240
10.7325
10,9907
10.791 3
Net Asset Value per C Share Class Accumulation
30 June 2008
31 December 2007
31 December 2006
6.1354
7.5394
11.4641
11.8938
12.41 57
17.0323
20.7743
20.6314
11.0014
11.0235
10.8621
Net Asset Value per I Share Class Accumulation
30 June 2008
31 December 2007
31 December 2006
75.2970
91.7737
116.1062
115.1189 . 118.8478
122.8495
177.81 11
21 5 2528
210.4518
113.2125
1 13.0000
110.2314
Shares Outstanding a t 30 June 2008
A Share Class Accumulation
A Share Class Dividend (in GBP)
B Share Class Accumulation
8 Share Class Dividend
C Share Class Accumulation
4.725.445
432,146
483
1,088,706
949.391
870,088
1.228.858
1,136,874
50.981
3,387
4.960.1 54
1,152,212
54.91 9
509.009
32 5
9,298
20,526
4.124.454
23.765
252.252
The Sub-Funds are not sorted by alphabetlcal order.
57

Statistics as a t 30 June 2008 (continued)
Unaudited Semi-Annual Report
A v k a lnvertors - Aviva lnvertors - Aviva Investors - Aviva Investors - American Equity Asia-Pacific Equity Emerging Markets Emerging Marke t
Fund Fund Bond Fund Equity Small Cap Fund
USD USD US0 USD
Net Assets Comparative
Total Net Assets
30 June 2008
31 December 2007
31 December 2006
221,136.437
309,843,824
312,959,072
140.622.936
166,744,868
110,122,688
488,941,256
51 2,802,107
501,236,139
140,355.71 5
161.658.344
Net Asset Value per A Share Class Accumulation
30 June 2008
31 December 2007
31 December 2006
8.5355
9.8618
10.1 575
11.7600
14.3906
10.7970
10.5556
10.6274
10.1378
3.2277
10.7783
Net Asset Value per B Share Class Accumulation
30 June 2008
31 December 2007
31 December 2006
4.9298
5.7030
5.8884
5.2408
6.421 2
4.8294
6.6213
6.6747
6.421 3
8.3859
3.8077
Net Asset Value per B Sham Class Dinridend
30 June 2008
31 December 2007
31 December 2006
9.2079
10.7691
4.9238
5.7030
5.88M
5.1 350
6.351 5
4.7771
Net Asset Value per C Share Class Accumulation
30 June 2008
31 December 2007
31 December 2006
12.4184
14.4018
14.3456
25.1182
30.8520
23.321 0
13.2172
13.3570
12.9139
8.3629
9.8051
Net Asset Value per I Share Class Accumulation
30 June 2008
31 December 2007
31 December 2006
129.9842
149.5930
152.8432
263.1204
320.71 34
238.7079
136.41 34
136.8050
130.2349
Net Asset Value per I Share Class Accumulation Hedged
30 June 2008 13.5270
Shares Outstanding a t 30 June 2008
A Share Class Accumulation
B Share Class Accumulation
B Share Class Dividend
C Share Class Accumulation
I Share Class Accumulation
I Share Class Accumulation Hedged
4,513,763
9,644,046
22,809,838
590.431
117.588
3,270,785
7,538.639
10.527.143
217.131
11.929
3.650
90,641
4,349
26,868
15.203.438
3,660 51,206
3.574.61 7
5.000
The Sub-Funds are not sorted by alphabetical order
58
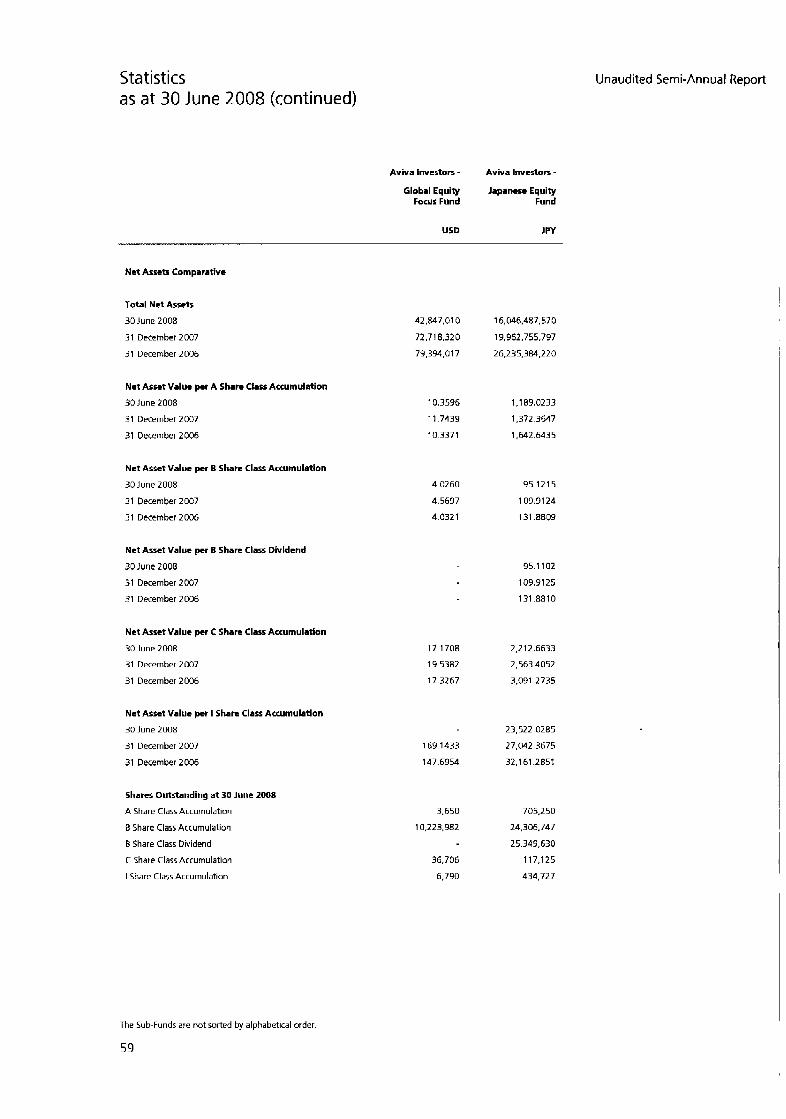
Statistics as a t 30 June 2008 (continued)
Aviva Investors - Aviva Investors - Global Equity Japanese Equity
Focus Fund Fund
USD JPY I
Net Assets Comparative
Total Net Assets
30 lune 2008
31 December 2007
31 December 2006
Net Asset Value per A Share Class Accumulation
30 lune 2008
31 December 2007
31 December 2006
Net Asset Value per B Share Class Accumulation
30 June 2008
31 December 2007
31 December 2006
Net Asset Value per B Share Class Dhridend
30 June 2008
31 December 2007
31 December 2006
Net Asset Value per C Share Class Accumulation
30 June 2008
31 December 2007
31 December 2006
Net Asset Value pet I Share Class Accumulation
30 June 2008
31 December 2007
31 December 2006
Shares Outstanding at 30 June 2008
A Share Class Accumulation
B Share Class Accumulation
B Share Class Dividend
C Share Class Accumulation
I Share Class Accumulation
42,847.01 0 72.71 8,320 79,394.01 7
10.3596
11.7439
10 3371
4.0260
4.5697
4.0321
17.1 708
19.5382
17.3267
169.1433
147.6954
3.650
10,223,982
36,706
6,790
16,046,487,570
19,962.755.797
26,235,384,220
1.1 89.0233
1,372.3647
1.642.6435
95.1215
109.91 24
131.8809
95.1102
109.9125
131 -8810
2.212.6633
2.563.4052
3.091 2735
23,522,0285
27.042.3675
32.161.2851
705.250
24.306.747
25,349,630
117.125
434,727
Unaudited Semi-Annual Report
The Sub-Funds are not sorted by alphabetical order.
59
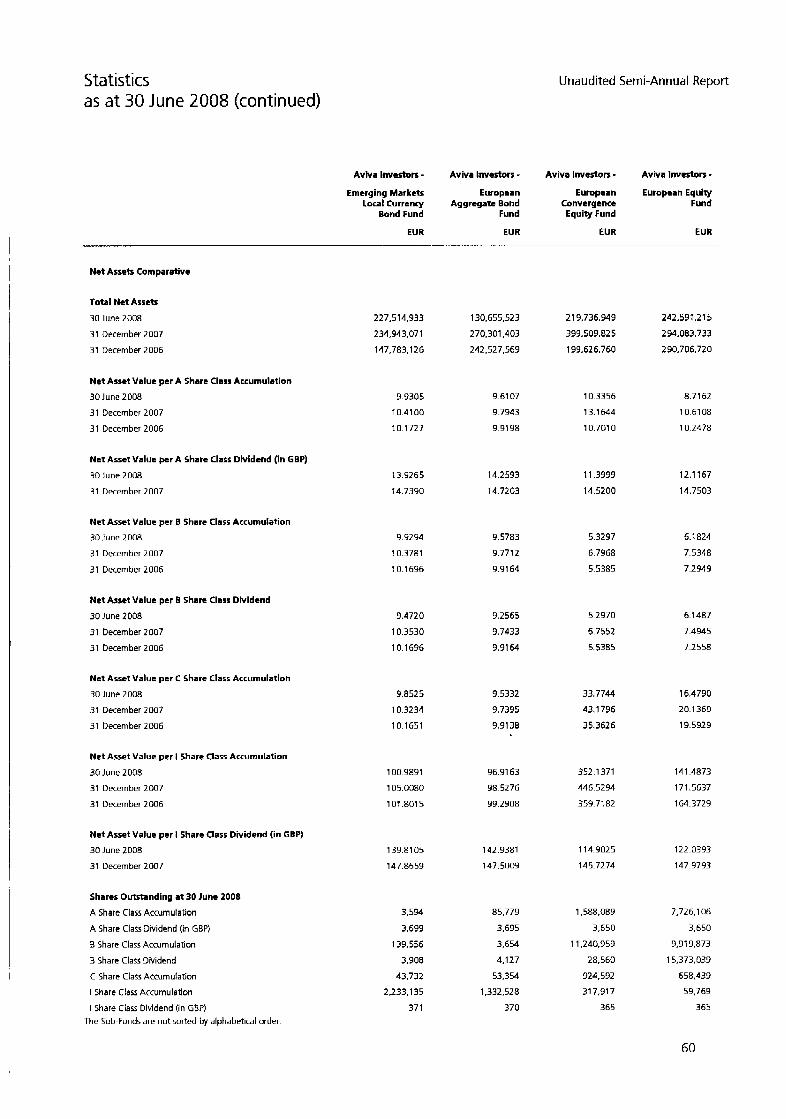
Statistics as a t 30 June 2008 (continued)
Unaudited Semi-Annual Report
Avhra Investors - Aviva lnvertors - Aviva Investors - Aviva Investors +
Emerging Markets European European European Equity Local Currency Aggregate Bond Convergence Fund
EUR EUR EUR EUR
Bond Fund Fund Equity Fund
Net Assets Comparative
Total Net Assets
30 June 2008
31 December 2007
31 December 2006
227,514,933
234,943,071
147,783.1 26
130,655,523
270,301,403
242,527,569
21 9,736.949
399.509325
193,626,760
242.591.215
294.083.733
290,706,720
Net Asset Value per A Share Class Accumulation
30 June 2008
31 December 2007
31 December 2006
9.9305
10.41 00
10.1727
9.61 07
9.7943
9.91 98
10.3356
13.1644
10.701 0
8.71 62
10.61 08
10.2478
Net Asset Value per A Share Class Dhrldend (in GBP)
30 June 2008
31 December 2007
13.9265
14.7390
14.2593
14.7203
11.3999
14.5200
12.1167
14.7503
Net Asset Value per B Share Class Accumulation
30 June 2008
31 December 2007
31 December 2006
9.9294
10.3781
10.1696
9.5783
9.7712
9.91 64
5.3297
6.7968
5.5385
6.1 824
7.5348
7.2949
Net Asset Value per B share Class Dividend
30 June 2008
31 December 2007
31 December 2006
9.4720
10.3530
10.1696
9.2565
9.7433
9.91 E4
5 2970
6.7552
5.5385
6.1487
7.4945
7.2558
Net Asset Value per C Share Class Accumulation
30 June 2008
31 December 2007
31 December 2006
9.8525
10.3234
10.1651
9.5332
9.7395
9.9138
33.7744
43.1796
35.3626
16.4790
20.1360
19.5929
Net Asset Value per I Share Class Accumulation
30 June 2008
31 December 2007
31 December 2006
100.9891
105,0080
101.801 5
96.9163
98.5276
99.2308
352.1 371
446.5294
359.7182
141.4873
171.5637
164.3729
Net Asset Value per I Share Class Dividend (in GBP)
30 June 2008
31 December 2007
114.9025
145.7274
122.0393
147.9793
139.8105
147.8659
142.9381
147,5009
Shares Outstanding a t 30 June 2008
A Share Class Accumulation
A Share Class Dividend (in GBP)
B Share Class Accumulation
B Share Class Dividend
C Share Class Accumulation
I Share Class Accumulation
I Share Class Dividend (in GEP) The Sub-Funds are not sorted by alphabetical order.
3.594
3.699
139.556
3,908
43,732
2.233.135
371
85,779
3,695
3,654
4,127
53,354
1.332.528
370
1.588.089
3,650
11,240,959
28,560
924,592
317,917
365
7.726.1 06
3,650
9,919.873
15,373,033
658.439
59.769
365
60
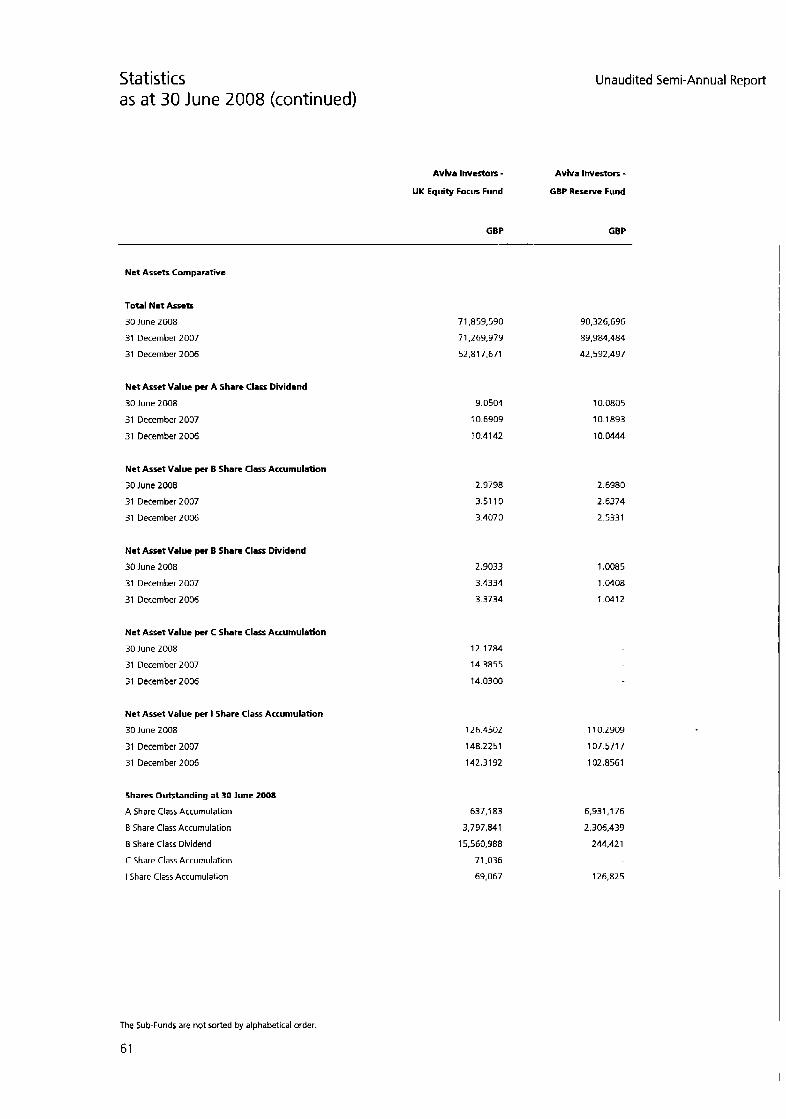
Statistics as a t 30 June 2008 (continued)
Unaudited Semi-Annual Report
Aviva Investors - UK Equity Focus Fund
Avhra Investors - GBP Reserve Fund
GBP GBP
Net Assets Comparative
Total Net Assets
30 June 2008
31 December 2007
31 December 2006
Net Asset Value per A Share Class Dividend
30 June 2008
31 December 2007
31 December 2006
Net Asset Value per B Share Class Accumulation
30 June 2008
31 December 2007
31 December 2006
Net Asset Value per B Share Class Dividend
30 June 2008
31 December 2007
31 December 2006
Net Asset Value per C Share Class Accumulation
30 June 2008
31 December 2007
31 December 2006
Net Asse t Value per I Share Class Accumulation
30 June 2008
31 December 2007
31 December 2006
Shares Outstanding at 30 lune 2008
A Share Class Accumulation
B Share Class Accumdation
B Share Class Dividend
C Share Class Accumulation
I Share Class Accumulation
71,859,590
71,269,973
52.81 7.671
9.0504
10.6909
10.4142
2.9798
3.51 10
3.4070
2.9033
3.4334
3.3734
12.1784
14.3855
14.0300
126.4502
148.2251
142.31 92
637.1 83
3,737,841
15,560,988
71.036
69,067
90,326,696
89,384,484
42,592,497
10.0805
10.1 a93
10.0444
2.6980
2.6374
2.5331
1.0085
1.0408
10412
11 0.2909
107.5717
102.8561
6,931,176
2,306,433
244,421
126,825
The Sub-Funds are not sorted by alphabetical order.
61
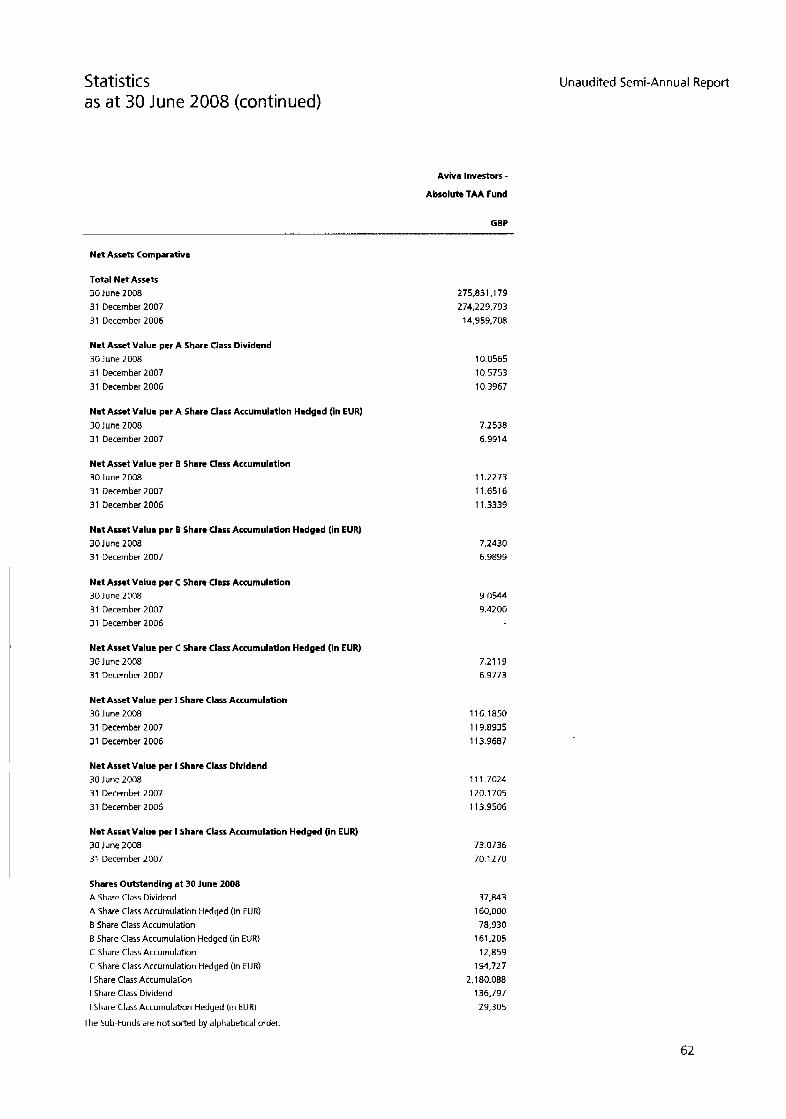
Statistics as a t 30 June 2008 (continued)
A v k a Investors - Absolute TAA Fund
GBP
N t t AssetE Comparative
Total Net Asstts 30 June 2008 31 December 2007
31 December 2006
N c t Asset Value per A Share Class Dividend
30 June 2008
31 December 2007 31 December 2006
Net Asset Value per A Share Class Accumulation Hedged (in EUR)
30 June 2008 31 December 2007
Net Asset Value per B Share Class Accumulation 30 June 2008
31 December 2007 31 December 2006
Net Asset Value per B Share Class Accumulation Hedged (in EUR)
30 June 2008 31 December 2007
Net Asset Value per C Share Class Accumulation
30 June 2008 31 December 2007
31 December 2006
Net Asset Value per C Share Class Accumulation Hedged (in EUR) 30 June 2008 31 December 2007
Net Asset Value per I Share Class Accumulation 30 June 2008
31 December 2007
31 December 2006
Net Asset Value per I Share Class Dividend
30 June 2008 31 December 2007
31 December 2006
Net Asset Value per I Share Class Accumulation Hedged (in EUR) 30 June 2008
31 December 2007
Shares Outstanding a t 30 June 2008 A Share Class Dividend
A Share Class Accumulation Hedged (in EUR) B Share Class Accumulation
B Share Class Accumulation Hedged (in EUR) C Share Class Accumulation
C Share Clarr Accumulation Hedged (in EUR) I Share Class Accumulation I Share Class Dividend
I Share Class Accumulation Hedged (in EUR)
The Sub-Funds are not sorted by alphabetical order.
275,831.1 79
274,229.793
i4.959.7oa
10.0565 10 5753
10.3967
7.2538 6.9914
1 1.2273
11.6516 11 3339
7.2430 6.9899
9.0544 9.4200
7.21 19 6.9773
116.1 850
11 9.8935
113.9687
11 1.7024
120.1 705 113.9506
73.0736
70.1270
37.843
160.000 78,930
161,205 12,859
194.727 2.180.088
136.797
29.305
Unaudited Semi-Annual Report
62

Statistics as a t 30 June 2008 (continued)
Aviva Investors - Emerglng Markets Equity
Fund
USD
Unaudited Semi-Annual Report
Net Assets Comparative
Total Net Assets
30 June 2008
31 December 2007
31 December 2006
Net Asset Value per A Share Class Accumulation
30 June 2008
31 December 2007
31 December 2006
Net Asset Value per A Share Class Accumulation (in EUR)
30 June 2008
31 December 2007
Net Asset Value per B Share Class Accumulation
30 June 2008
31 December 2007
31 December 2006
Net Asset Value per B Share Class Accumulatlon (In EUR)
30 June 2008
31 December 2007
Net Asset Value per B Share Class Dividend
30 June 2008
31 December 2007
31 December 2006
Net Asset Value per C Share Class Accumulation
30 June 2008
31 December 2007
31 December 2006
Net Asset Value per I Share Class Accumulation
30 June 2008
31 December 2007
31 December 2006
Net Asset Value per I Share Class Accumulation (in EUR)
30 June 2008
31 December 2007
3.1 14.492.1 87
3,347,924502
1,641,050,798
12.8855
14.8120
10.8484
14.3634
16.51 07
4.4847
5.1617
3.7899
14.331 1
16.4941
4.3938
5.0668
3.71 73
39.1823
45.2090
33.3630
412.1004
471.6165
342.2664
144.7952
165.7068
Shares Outstanding a t 30 June 2008
A Share Class Accumulation
A Share Class Accumulation (in EUR)
B Share Class Accumulation
B Share Class Accumulation (in EUR)
B Share Class Dividend
C Share Class Accumulation
I Share Class Accumulation
I Share Class (in EUR)
The Sub-Funds are not sorted by alphabetical order.
63
1,188,443
3,650
9,337,256
3,650
41 7,603,525
11 1.924
2,955,360
365
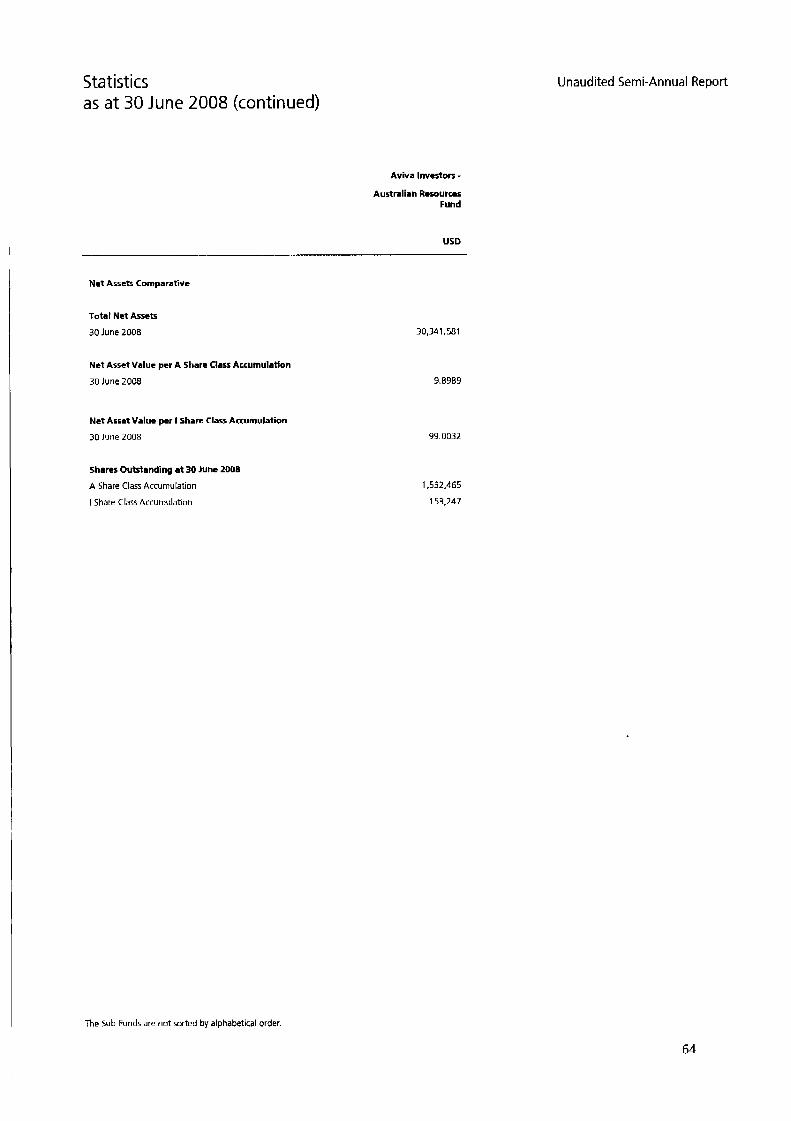
Statistics as a t 30 June 2008 (continued)
Aviva Investors - Australian Resources
Fund
USD
Unaudited Semi-Annual Report
Net Assets Comparative
Total Net Assets
30 June 2008
Net Asset Value per A Share Class Accumulatlon
30 June 2008
Net Asset Value per I Share Class Accumulation
30 June 2008
Shares Outstanding at 30 lune 2008
A Share Class Accumulation
I Share Class Accumulation
30,34 1,581
3.8389
93.0032
1,532.465
153.247
The Sub-Funds are not sorted by alphabetical order.
64

Statistics as a t 30 June 2008 (continued)
A h a Investors - Global Convertibles Fund
USD
Unaudited Semi-Annual Report
Net Assets Comparative
Total Net Assets
30 June 2008
31 December 2007
31 December 2006
Net Asset Value per A Share Class Accumulation
30 June 2008
31 December 2007
31 December 2006
Net Asset Value per A Share Class Dividend (in GBP)
30 June ZOO8
31 December 2007
Net Asset Value per B Share Class Accumulation
30 June 2008
31 December 2007
31 December 2006
Net Asset Value per C Share Class Accumulation
30 June 2008
31 December 2007
31 December 2006
Net Asset Value per I Share Class Accumulation
30 June 2008
. 31 December 2007
31 December 2006
Net Asset Value per I Share Class Dlvidend (in GBP)
30 June 2008
31 December 2007
Net Asset Value per I Share Class ACCUmUl8tiOn Hedged
30 June 2008
Net Asset Value per I Share Class Accumulation Hedged (in GBP)
30 June 2008
The Sub-Funds are not sorted by alphabetical order.
65
962,038,928
1.045.893.782
321,027,333
10.8749
11.6521
10.2492
20.2332
21.7954
7.6727
8.2313
7.2580
15.7275
16.9144
14.9896
162.4454
173.501 3
151.6243
203.1 109
21 8.5255
139.2910
98.4651
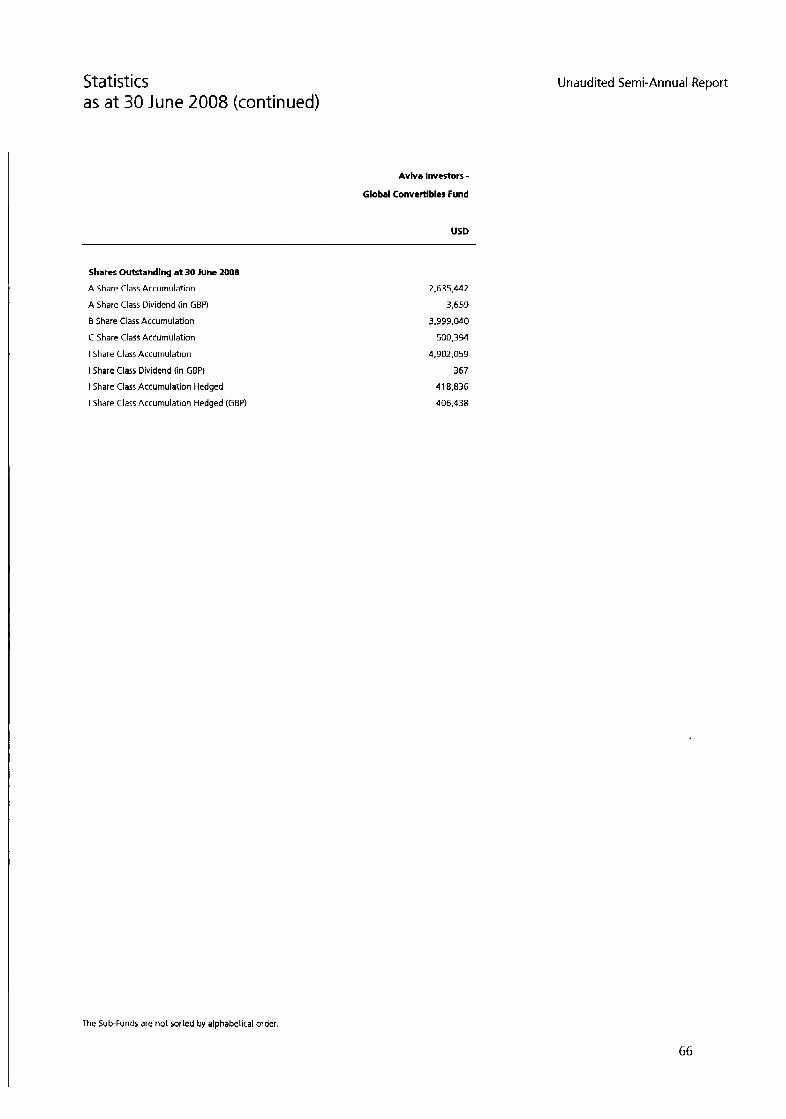
Statistics as a t 30 June 2008 (continued)
Aviva Investors - Global Convertibles Fund
U5D
Unaudited Semi-Annual Report
Shares Outstanding at 30 June 2008
A Share Class Accumulation
A Share Class Dividend (in GBP)
B Share Class Accumulation
C Share Class Accumulation
I Share Class Accumulation
I Share Class Dividend (in GBP)
I Share Class Accumulation Hedged
I Share Class Accumulation Hedged (GBP)
2.635.442
3.659
3,399,040 500.394
4,902.059
367
41 8,836
406,438
The Sub-Funds are not sorted by alphabetical order.
66
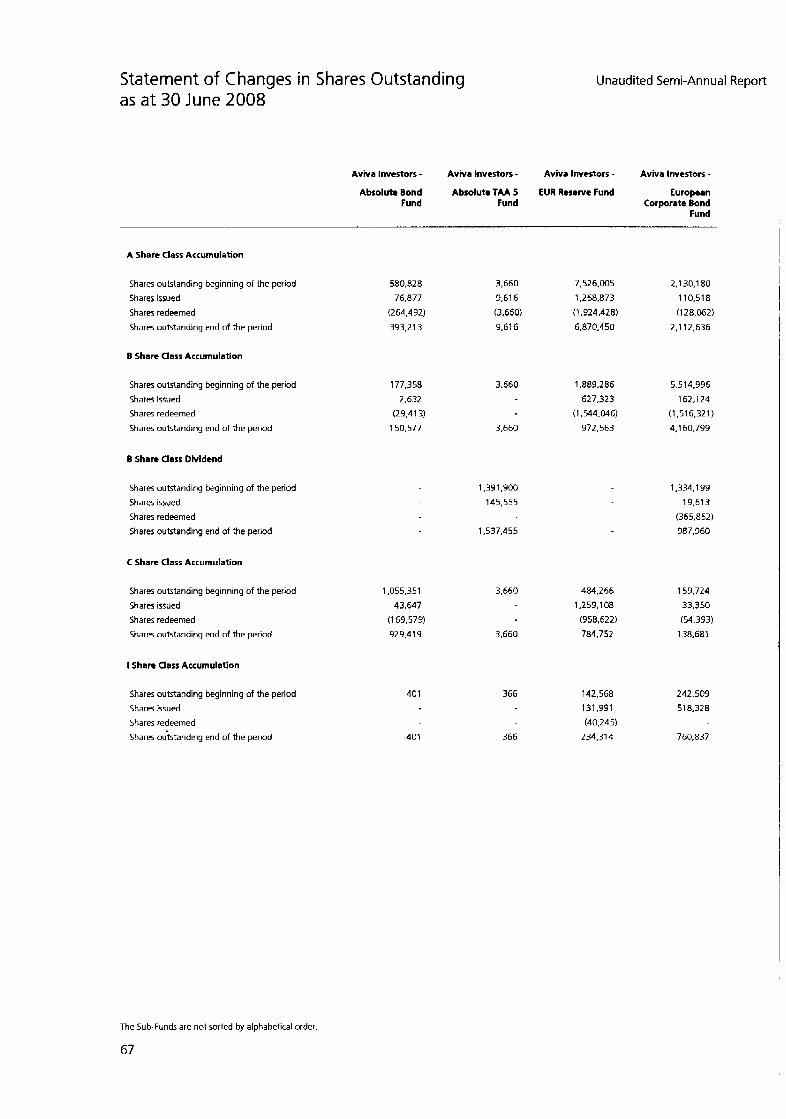
Statement of Changes in Shares Outstanding as at 30 June 2008
Unaudited Semi-Annual Report
Aviva Investors - Aviva Investors - Aviva Investors - Aviva Investors - Absolute Bond Absolute TA4 5 EUR Rescrvr Fund European
Fund Fund Corporate Bond Fund
A Share Class Accumulation
Shares outstanding beginning of the period
Shares issued
Shares redeemed
Shares outstanding end of the period
B Share Class Accumulation
Shares outstanding beginning of the period
Shares issued
Shares redeemed
Shares outstanding end of the period
B Share Class Dividend
Shares outstanding beginning of the period
Shares issued
Shares redeemed
Shares outstanding end of the period
C Share Class Accumulation
Shares outstanding beginning of the period
Shares issued
Shares redeemed
Shares outstanding end of the period
I Share Class Accumulation
Shares outstanding beginning of the period
Shares issued
Shares redeemed
Shares oukanding end of the period
580,828
76.877
(264.4 92)
393.21 3
177,358
2,632
(29.413)
150,577
3,660 7,525,005 2,130,180
9.616 1,268,873 110,518
(3.660) (1,324,428) (1 28,062)
9.61 6 6,870,450 2,112,636
3,660
3,660
1,391,900
145,555
1.537.455
1,055,351
43,647
(1 69,579)
929.41 9
401
401
3,660
3,660
366
366
1.889.286 5,514,996
627.323 162.124
(1.544.046) (1.51 6,321)
972,563 4.1 60,799
1,334.1 99
19,613
(365.852)
987,960
484.266
1,259,108
(958,622)
784.752
142,568
131.991
(40.245)
234,314
159,724
33.350
(54,393)
138,681
242,509
518,328
760.837
The Sub-Funds are not sorted by alphabetical order.
b/
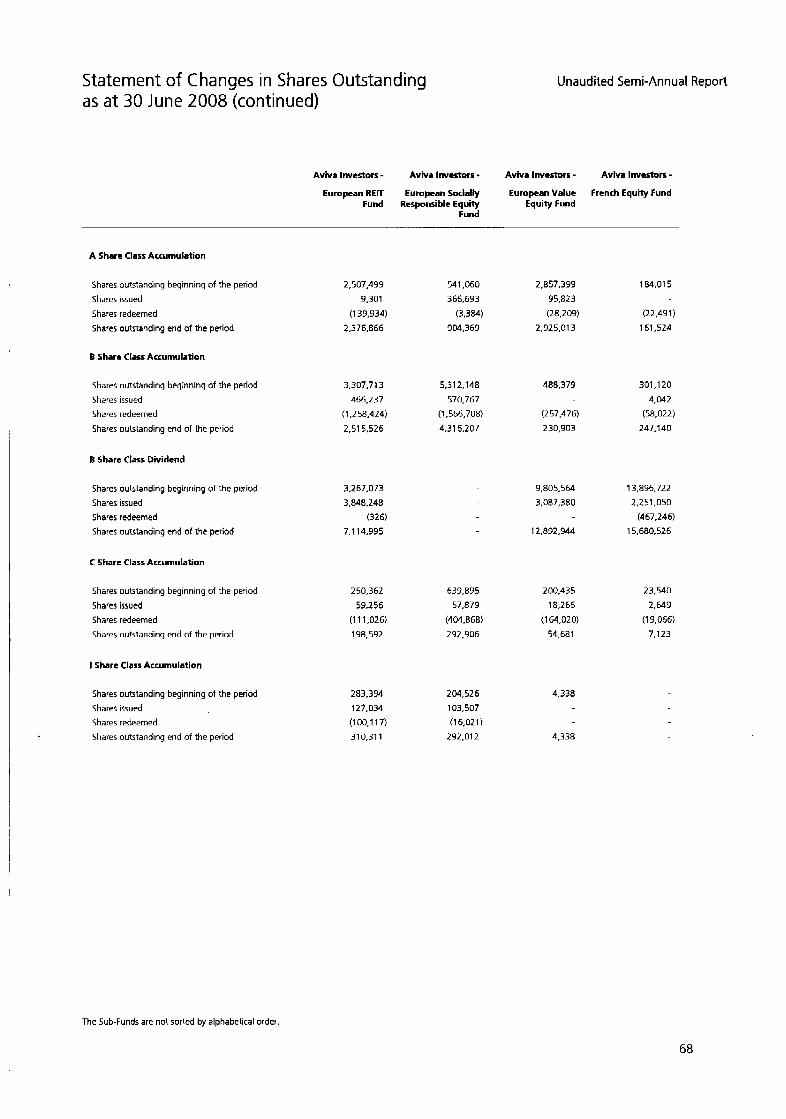
Statement of Changes in Shares Outstanding as a t 30 June 2008 (continued)
Unaudited Semi-Annual Report
Avka Investors - Aviva lnvrrtors - Aviva Investors - Avlva lmrestolr - European REK European Socially European Value French Equity Fund
Fund Responsible Equity Equity Fund Fund
A Share Class Accumulation
Shares outstanding beginning of the period
Shares issued
Shares redeemed
Shares outstanding end of the period
B Share Class Accumulation
Shares outstanding beginning of the period
Shares issued
Shares redeemed
Shares outstanding end of the period
I Share Class Dividend
Shares outstanding beginning of the period
Shares issued
Shares redeemed
Shares outstanding end of the period
C Share Class Accumulation
Shares outstanding beginning of the period
Shares issued
Shares redeemed
Shares outstanding end of the period
I Share Class Accumulation
Shares outstanding beginning of the period
Shares issued
Shares redeemed
Shares outstanding end of the period
2,507,499
9.301
(1 39.934)
2.376.866
3.307.713
466.237
(1,258,424)
2.51 5.526
3.267.073
3,848,248
(326)
7.1 14.995
250,362
59,256 (1 11,026)
198.592
283.394
127.034
(1 00.1 17)
310.31 1
541.060
366.693
(3.384) 904.369
5.31 2.148
570,767
(1,566,708)
4.31 6.207
639.895
57.879
(404.868)
292,906
204,526
103.507
(1 6,021)
292.012
2,857,399
95.823 (28,209)
2.925.013
488.379
(257,476)
230,903
9.805.564
3,087,380
12.892.944
200.435
18,266
(1 64.020)
54,681
4,338
4,338
184.01 5
(22,491)
161,524
301.120
4,042
(58.022)
247.140
13,836,722
2,251,050
(467,246)
15,680,526
23,540
2.649
(1 9.066)
7,123
The Sub-Funds are not sorted by alphabetical order.
68
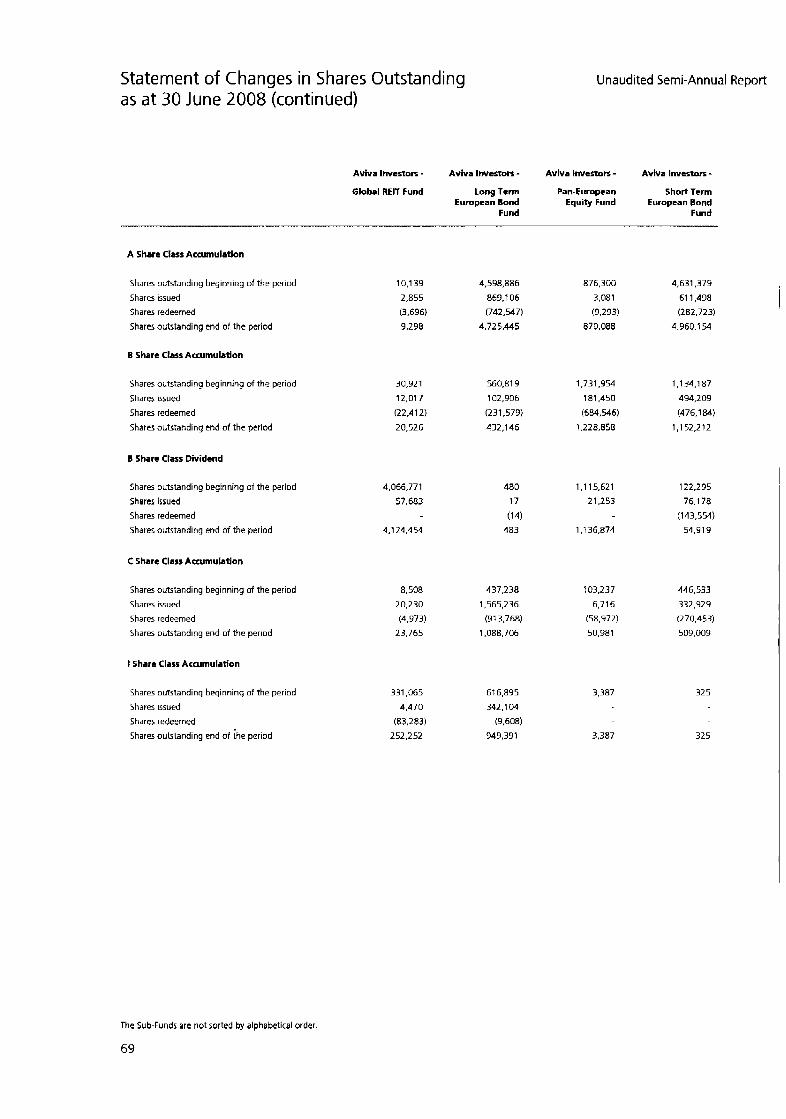
Statement of Changes in Shares Outstanding as a t 30 June 2008 (continued)
Unaudited Semi-Annual Report
Avhra Investors - Avlva hVCStOK - Avlva lnvertorr - Avhta Investors - Global RElf Fund Long Term Pan-European Short Term
European Bond Equity Fund European Bond Fund Fund
-- --_I-
A Share Class Accumulation
Shares outstanding beginning of the period
Shares issued
Shares redeemed
Shares outstanding end of the period
B Share Class Accumulation
Shares outstanding beginning of the period
Shares issued
Shares redeemed
Shares outstanding end of the period
B Share Class Dividend
Shares outstanding beginning of the period
Shares issued
Shares redeemed
Shares outstanding end of the period
C Share Class Accumulation
Shares outstanding beginning of the period
Shares issued
Shares redeemed
Shares outstanding end of the period
I Share Class Accumulation
Shares outstanding beginning of the period
Shares issued
Shares redeemed
Shares outstanding end of ;he period
10.1 39
2,855
(3.696) 9,298
30.92 1 12.017
(22.412)
20.526
4,066,771
57,683
4.1 24.454
8.508
20,230
(4.973) 23,765
331,065
4,470
(83.283)
252.252
4,598,886
869,106
(742.547)
4.725.445
560.81 9
102,906
(231.579)
432,146
480
17
(14) 483
437,238
1,565,236
(913,768)
1,088.706
616,895
342,104
(9.608) 949,391
876,300 4,631,379
3,081 61 1.498
(9,293) (282,723)
870.088 4.960.1 54
1,731.954 1,134,187
181,450 494,209
(684.96) (476,184)
1,228,858 1,152,212
1,115.621 122,295
21.253 76.178
1 ,136,874 54.91 9
(143,554)
103,237
6,716
(58,972)
50.981
3,387
3.387
446,533
332.929
(270.453)
509,009
32 5
325
The Sub-Funds are not sorted by alphabetical order
69
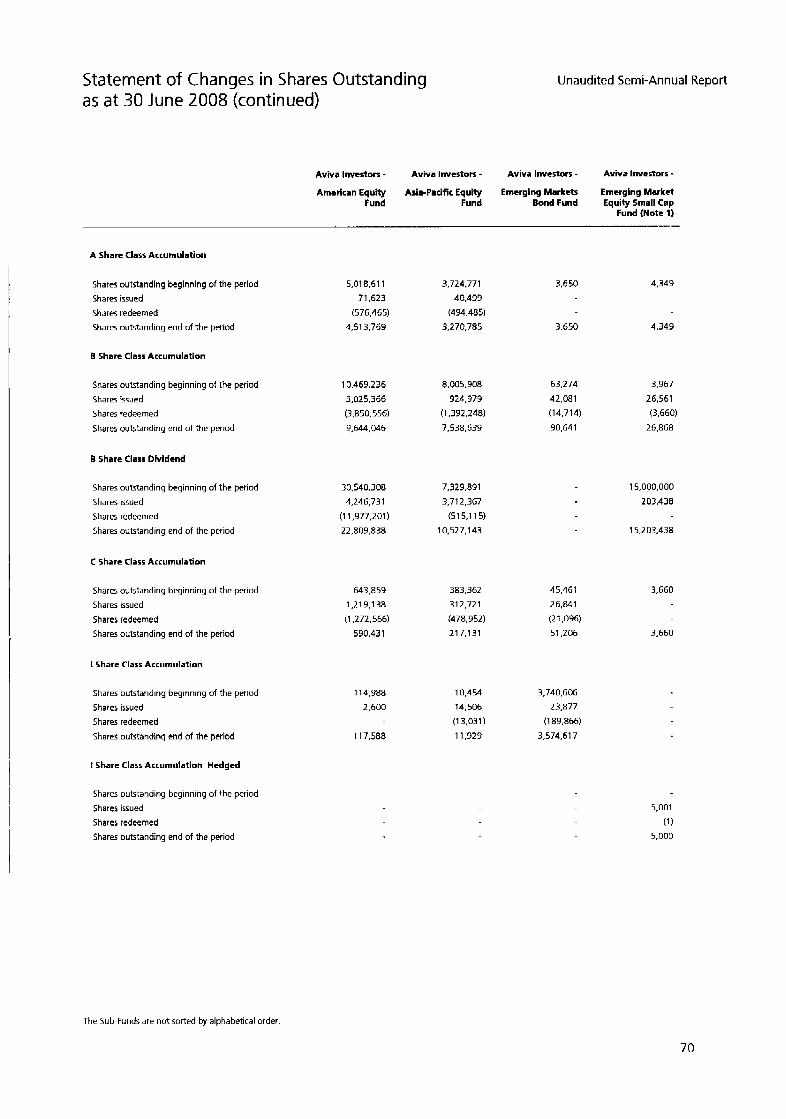
Statement of Changes in Shares Outstanding as a t 30 June 2008 (continued)
Unaudited Semi-Annual Report
Aviva Investors - Aviva h C S t O K - Aviva lnvtrtors - Aviva Investors - Ametlcan Equity Asia-Pacific Equity Emerglng Markets Emerglng Market
Fund Fund Bond Fund Equity Small Cap Fund (Notc 1)
A Share Class Accumulatlon
5.018.61 1 71,623
(576.465)
4,513,763
3,724,771 40.499
(494,485) 3.270.785
3,650 4.349 Shares outstanding beginning of the period
Shares issued
Shares redeemed
Shares outstanding end of the period 3.650 4.349
B Share Class Accumulation
10,463,236
3,025,366 (3.850.556)
9,644,046
8.005.908 924,979
(1,332,248)
7,538,633
63.274
42,081 (14.714)
90.641
3,967
26,561
(3,660) 26.868
Shares outstanding beginning of the period
Shares issued
Shares redeemed
Shares outstanding end of the period
B Share Class Dividend
Shares outstanding beginning of the period
Shares issued
Shares redeemed
Shares outstanding end of the period
30,540,308 4.246.731
(1 1,977,201)
22,803,838
7.329.891 3.712.367
(51 5.1 15) 10.527.143
15,000,000
203.438
15,203,438
C Share Class Accumulation
643.859
1,219,138 (1,272.566)
590.431
383,362 312,721
(478.952) 217.131
45,461
26,Ml
(2 1.096) 51,206
3.660 Shares outstanding beginning of the period
Shares issued
Shares redeemed
Shares outstanding end of the period 3,660
I Share Class Accumulation
Shares outstanding beginning of the period
Shares issued
Shares redeemed
Shsres outstanding end of the period
114.988 2,600
10.454
14,506 (13,031)
1 1.929
3,740,606
23.877 (1 89,866)
3,574.617 1 17.588
I Share Class Accumulatlon Hedged
Shares outstanding beginning of the period
Shares issued
Shares redeemed
Shares outstanding end of the period
5.001
(1 1 5.000
The Sub-Funds are not sorted by alphabetical order.
70
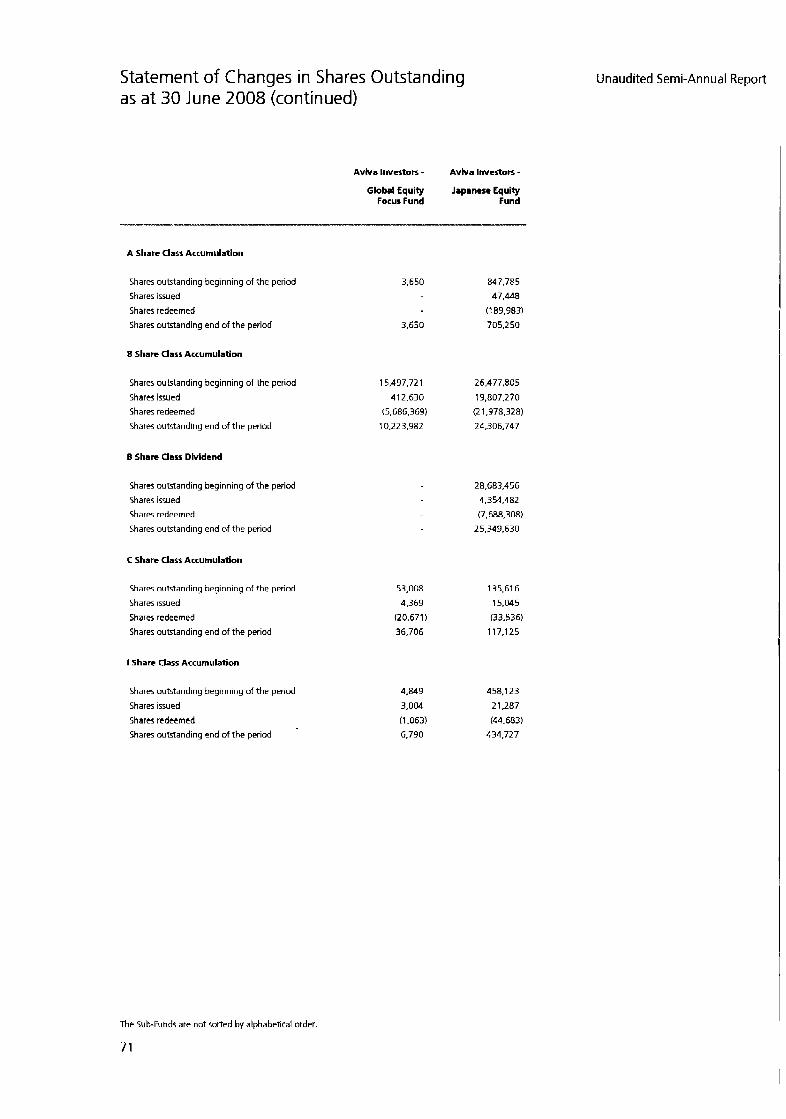
Statement of Changes in Shares Outstanding as a t 30 June 2008 (continued)
Avhra Investors - Avhra Investors - Global Equity Japanese Equity
Focus Fund Fund
A Share Class Accumulation
Shares outstanding beginning of the period
Shares issued
Shares redeemed
Shares outstanding end of the period
B Share Class Accumulation
Shares outstanding beginning of the period
Shares issued
Shares redeemed
Shares outstanding end of the period
E Share Class Dividend
Shares outstanding beginning of the period
Shares issued
Shares redeemed
Shares outstanding end of the period
C Share Class Accumulation
Shares outstanding beginning of the period
Shares issued
Shares redeemed
Shares outstanding end of the period
I Share Class Accumulation
Shares outstanding beginning of the period
Shares issued
Shares redeemed
Shares outstanding end of the period
3,650
3.650
15,437,721
412,630
(5,686,369)
10,223,982
53,008
4,369
(20,671) 36,706
4.849
3.004
(1.063) 6.790
847,785 47.448
(189.983)
705.250
26,477,805
19,807,270
(21.978328)
24,306,747
28,683.456
4.354.482
(7.688.308)
25.349.630
135.61 6
15,045
(33.536)
117,125
458.123
21,287
(44.683)
434.727
Unaudited Semi-Annual Report
The Sub-Funds are not sorted by alphabetical order.
71
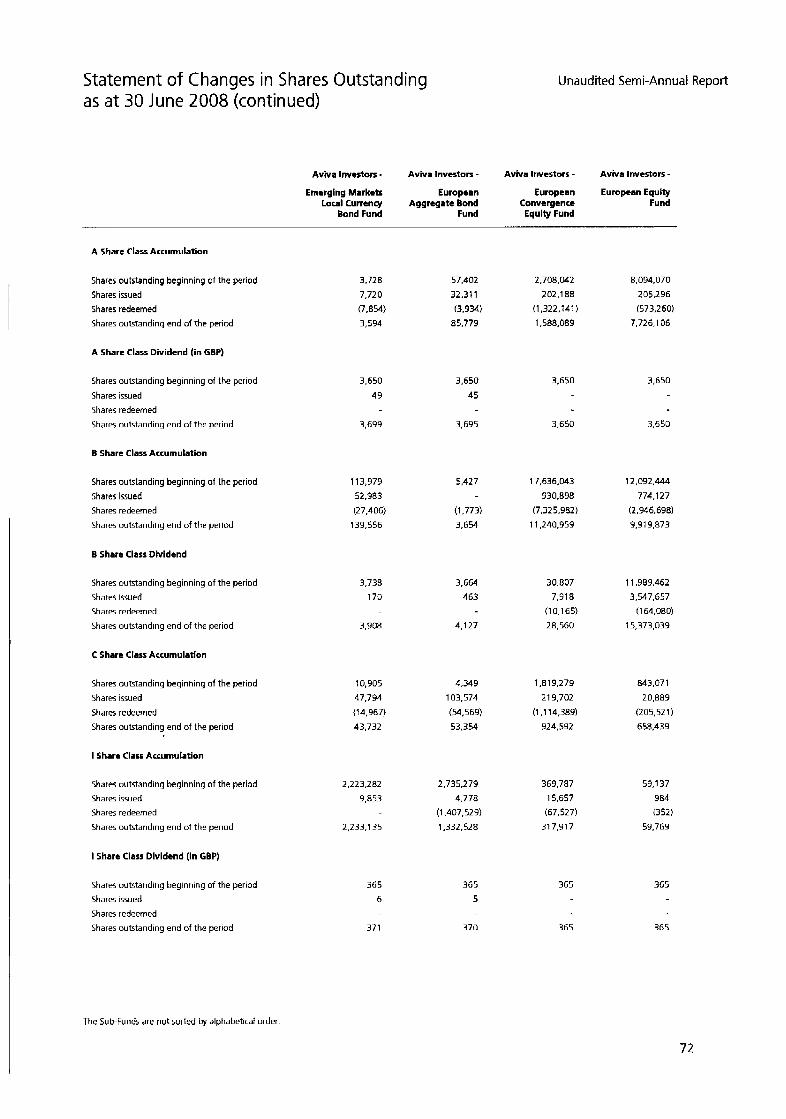
Statement of Changes in Shares Outstanding as a t 30 June 2008 (continued)
Unaudited Semi-Annual Report
Aviva Investors - Aviva Investors - Avhra Investors - Aviva lnvtstors - Emerglng Mark& European European European Equity
Locd Currtncy Aggregate Bond Convergence Fund Bond Fund Fund Equlty Fund
A Share Class Accumulation
Shares outstanding beginning of the period
Shares issued
Shares redeemed
Shares outstanding end of the period
3,728
7,720
(7.854) 3,594
57.402
32.311
(3.934)
85.779
2,708,042
202,188
(1,322,141)
1,588,089
8.094.070
205,296
(573.260)
7.726.1 06
A Share Class Dividend (in GBP)
3,650
49
3,650
45
3,650 3,650 Shares outstanding beginning of the period
Shares issued
Shares redeemed
Shares outstanding end of the period 3,650 3,650 3.699 3,695
5.427
B Share Class Accumulation
Shares outstanding beginning of the period
Shares issued
Shares redeemed
Shares outstanding end of the period
1 13,979
52.983
(27.406)
139.556
17,636.043
930.898
(7,325,382)
1 1.240.959
12,092,444
774.1 27
(2,946,638)
9.91 9.873 (1.773)
3.654
B Shart Class Dividend
Shares outstanding beginning of the period
Shares issued
Shares redeemed
Shares outstanding end of the period
3.738
170
3,664
463
4,127
30.807
7.918
(10.165)
28,560
11,983,462
3.547.657
(1 64,080) 15,373.039 3.908
C Share Class Accumulation
10,905
47.794
(14,967)
43,732
4,349
103,574
(54,569)
53.354
1.81 9.279
21 9,702
(1,114.389)
924,592
843,071
20.889
(205.521)
658.439
Shares outstanding beginning of the period
Shares issued
Shares redeemed
Shares outstanding end of the period
I Share Class Accumulation
Shares outstanding beginning of the period
Shares issued
Shares redeemed
Shares outstanding end of the period
2.223.282
9.853
2.735.279
4,778
(1.407.529)
1,332,528
369.787
15.657
(67.527)
317.917
59.1 37
984 (352)
59.769 2,233.1 35
I Share Class Dividend (in GBP)
Shares outstanding beginning of the period
Shares issued
Shares redeemed
Shares outstanding end of the period
365 6
365
5 365 365
371 370 365 365
The Sub-Funds are not sorted by alphabetical order
72
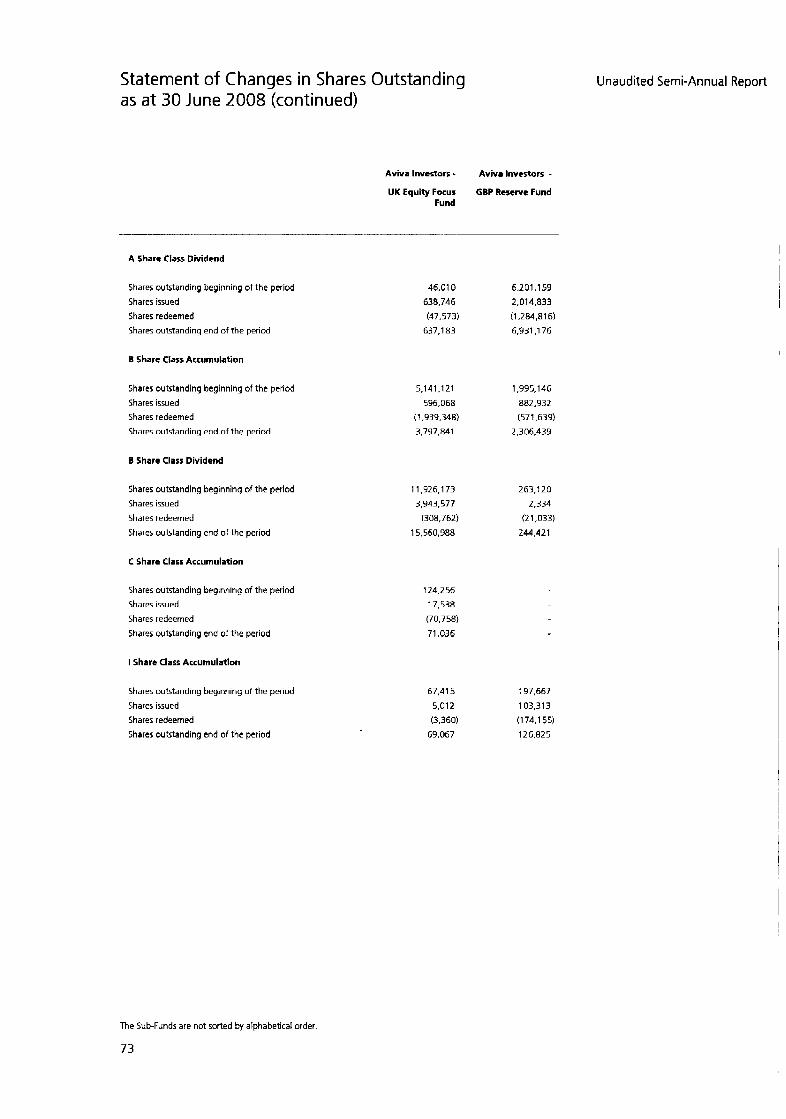
Statement of Changes in Shares Outstanding as a t 30 June 2008 (continued)
Aviva Investors - UK Equity Focus
Fund
AvN4 Investors - GBP Rercrvc Fund
A Share Class Dividend
Shares outstanding beginning of the period
Shares issued
Shares redeemed
Shares outstanding end of the period
B Share Class Accumulation
Shares outstanding beginning of the period
Shares issued
Shares redeemed
Shares outstanding end of the period
B Share Class Dividend
Shares outstanding beginning of the period
Shares issued
Shares redeemed
Shares outstanding end of the period
C Share Class Accumulation
Shares outstanding beginning of the period
Shares issued
Shares redeemed
Shares outstanding end of the period
I Share Class Accumulation
Shares outstanding beginning of the period
Shares issued
Shares redeemed
Shares outstanding end of the period
46.01 0
630,746
(47.573)
637.1 83
5,141,121
596,068
(1.939.348)
3,737,841
11,926,173
3,343,577
(308.762)
15,560,988
124.256
17.538
(70,758)
71,036
67.41 5
5,012
(3.360) 69,067
6,201,159
2,014,833
(1.2&4,816)
6.931.1 76
1,995.146
882,932
(571.639)
2.306.439
263,120
2,334
(21,033)
244.421
197,667
103,313
(174.155)
126,825
Unaudited Semi-Annual Report
The Sub-Funds are not sorted by alphabetical order.
73
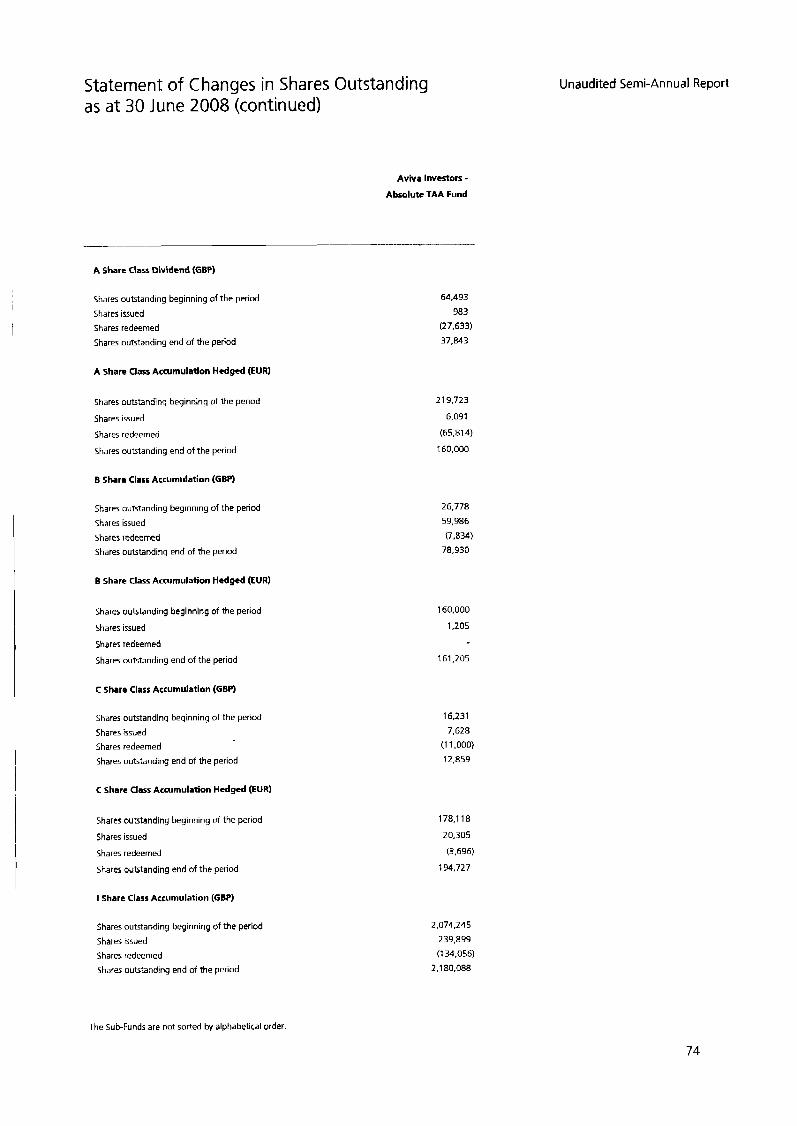
Statement of Changes in Shares Outstanding as a t 30 June 2008 (continued)
Aviva Investors - Absolute TAA Fund
A Share Class Dividend (GBP)
Shares outstanding beginning of the period
Shares issued
Shares redeemed
Shares outstanding end of the period
A Share Class Accumulation Htdgcd (EUA)
Shares outstanding beginning of the period
Shares issued
Shares redeemed
Shares outstanding end of the period
B Share Class Accumulation (GBP)
Shares outstanding beginning of the period
Shares issued
Shares redeemed
Shares outstanding end of the period
B share Class Accumulation Hedged (EUR)
Shares outstanding beginning of the period
Shares issued
Shares redeemed Shares outstanding end of the period
C Share Class Accumulation (GBP)
Shares outstanding beginning of the period
Shares issued
Shares redeemed
Shares outstanding end of the period
C Share Class Accumulation Hedged (EUR)
Shares outstanding beginning of the period
Shares issued
Shares redeemed
Shares outstanding end of the period
I Share Class Accumulation (GBP)
Shares outstanding beginning of the period
Shares issued
Shares redeemed
Shares outstanding end of the period
64.493
983 (27.633)
37.843
21 9,723
6,091
(65,814)
160,000
26.778
59,986
(7,834) 78.930
160.000
1,205
161,205
16,231 7.628
(1 1.000) 12,859
178,118
20,305
(3,696)
194.727
2,074,245 239.899
(1 34.056) 2.1ao.oaa
Unaudited Semi-Annual Report
The Sub-Funds are not sorted by alphabetical order
74
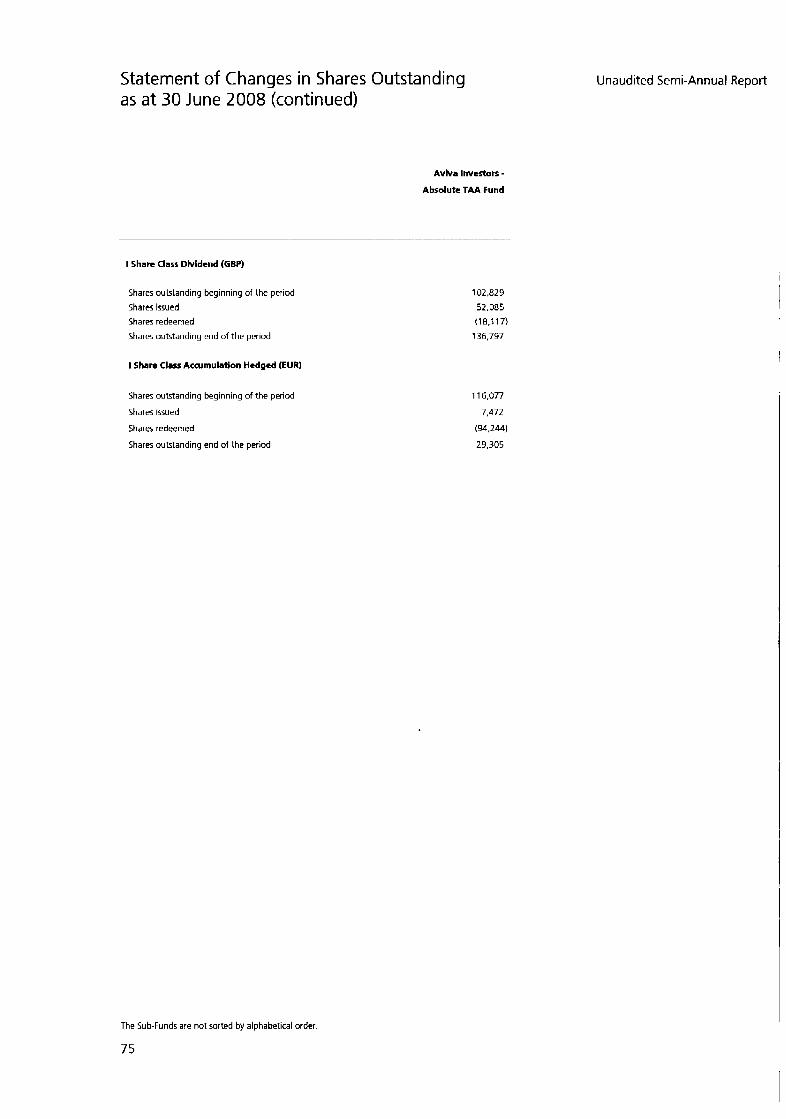
Statement of Changes in Shares Outstanding as a t 30 June 2008 (continued)
Avhra Investors - Absolute TAA Fund
I Sharc Class Dhrldend (GBP)
Shares outstanding beginning of the period
Shares issued Shares redeemed
Shares outstanding end of the period
I Share Class Accumulation Hedged (EUR)
Shares outstanding beginning of the period
Shares issued
Shares redeemed
Shares outstanding end of the period
102,829
52,085 ( 1 8.1 17)
136,797
11 6,077
7.472
(94.244) 29.305
Unaudited Semi-Annual Report
The Sub-Funds are not sorted by alphabetical order
75
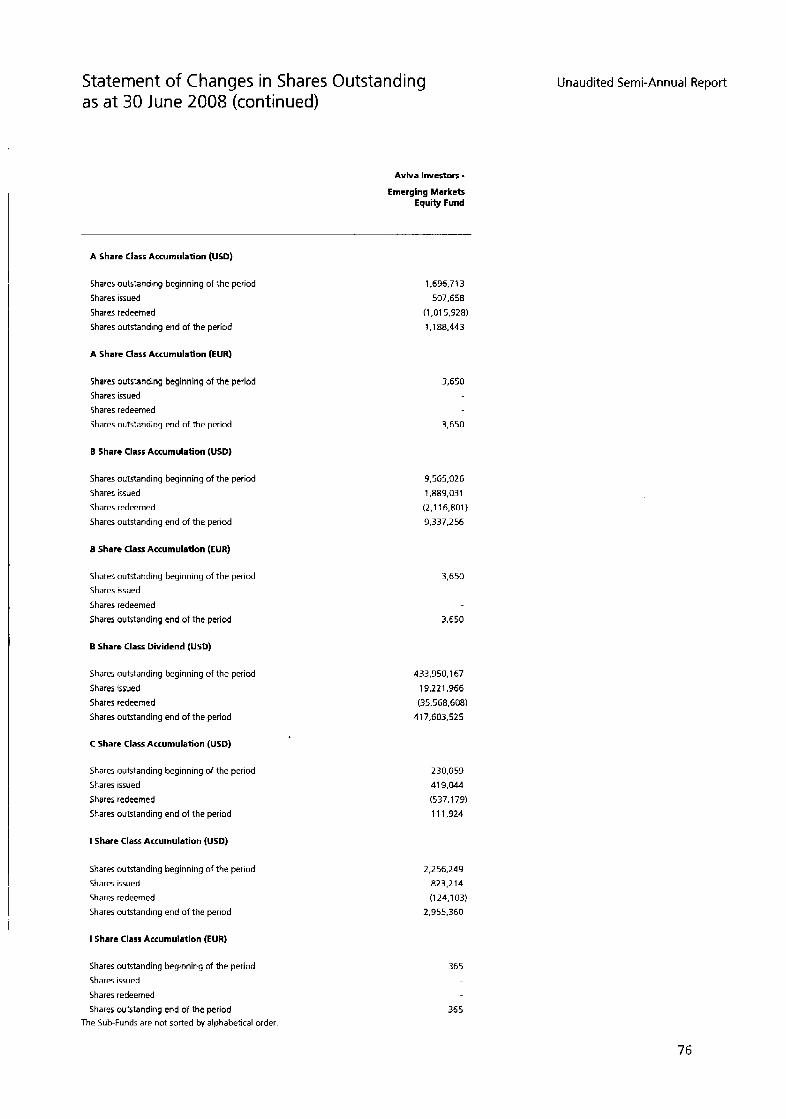
Statement of Changes in Shares Outstanding as a t 30 June 2008 (continued)
Avhra Investors - Emcrglng Markets
Equity Fund
A Share Class Accumulation (USD)
Shares outstanding beginning of the period
Shares issued
Shares redeemed
Shares outstanding end of the period
A Share Class Accumulation (EUR)
Shares outstanding beginning of the period
Shares issued
Shares redeemed
Shares outstanding end of the period
B Share Class Accumulation (USD)
Shares outstanding beginning of the period
Shares issued
Shares redeemed
Shares outstanding end of the period
B Share Class Accumulation (EUR)
Shares outstanding beginning of the period
Shares issued
Shares redeemed
Shares outstanding end of the period
B Share Class Dividend (USD)
Shares outstanding beginning of the period
Shares issued
Shares redeemed
Shares outstanding end of the period
C Share Class Accumulation (USD)
Shares outstanding beginning of the period
Shares issued
Shares redeemed
Shares oubtanding end of the period
I Share Class Accumulation (USD)
Shares outstanding beginning of the period
Shares issued
Shares redeemed
Shares outstanding end of the period
I Share Class Accumulation (EUR)
Shares outstanding beginning of the period
Shares issued
Shares redeemed
Shares outstanding end of the period The Sub-Funds are not sorted by alphabetical order.
1.696.71 3 507.658
(1.01 5,928) 1.1 88.443
3,650
3.650
9.565.026
1,883,031 (2,116.801) 9,337,256
3,650
3,650
433,350,167
19,221,366 (35,568,608)
417.603525
230,059 41 9.044
(537.179) 1 1 1,924
2,256,243 823.2 14 (1 24.1 03)
2,955,360
365
365
Unaudited Semi-Annual Report
76
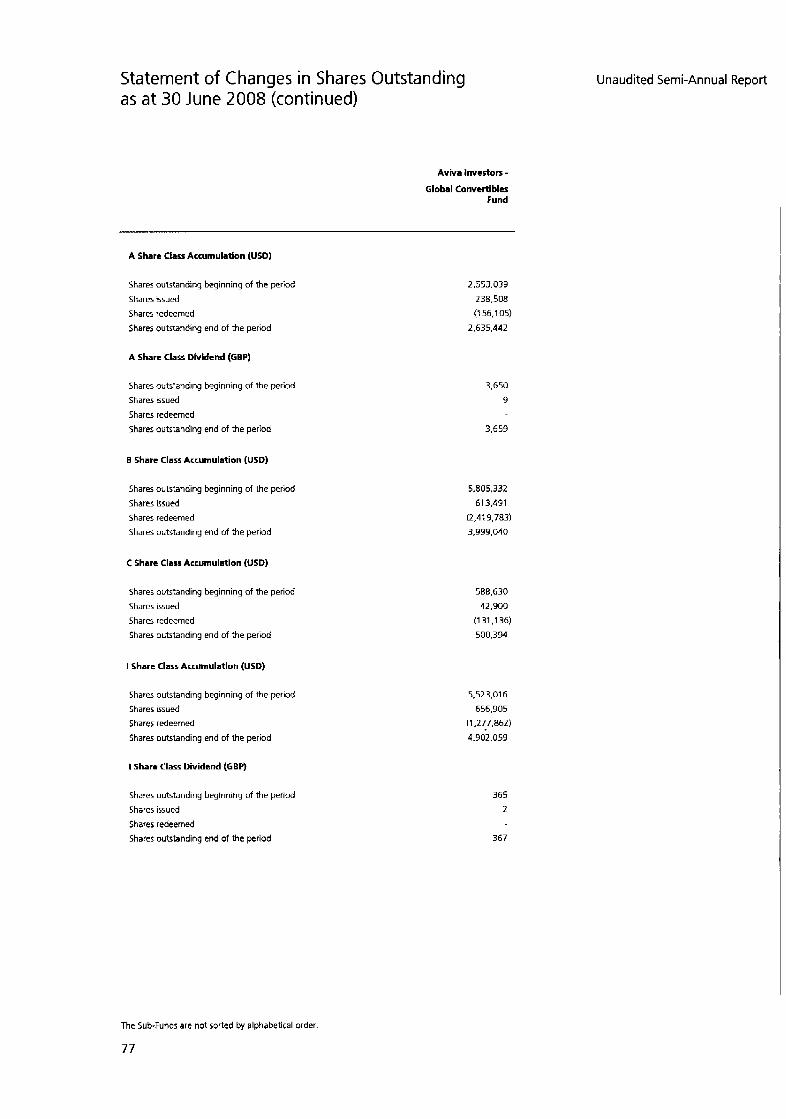
Statement of Changes in Shares Outstanding as a t 30 June 2008 (continued)
Aviva Investors - Global Convertibles
Fund
A Share Class Accumulation (USD)
Shares outstanding beginning of the period
Shares issued
Shares redeemed
Shares outstanding end of the period
A Share Class Dfvidend (GBP)
Shares outstanding beginning of the period
Shares issued
Shares redeemed
Shares outstanding end of the period
B Share Class Accumulation (USD)
Shares outstanding beginning of the period
Shares issued
Shares redeemed
Shares outstanding end of the period
C Share Class Accumulation (USD)
Shares outstanding beginning of the period
Shares issued
Sharer redeemed
Shares outstanding end of the period
I Share Class Accumulatfon (USD)
Shares outstanding beginning of the period
Shares issued
Shares redeemed
Shares outstanding end of the period
I Sham Class Oiidcnd (GBP)
Shares outstanding beginning of the period
Shares issued
Shares redeemed
Shares outstanding end of the period
2,553,033
238.508
(1 56.1 05)
2.635.442
3.650
9
3.659
5805.332
613,491
(2.41 9.783)
3,999,040
588,630
42,900
(1 3 1 ,136)
500.394
5,523,016
656,905
(1,277,862)
4.902.059
365
2
367
Unaudited Semi-Annual Report
The Sub-Funds are not sorted by alphabetical order
77
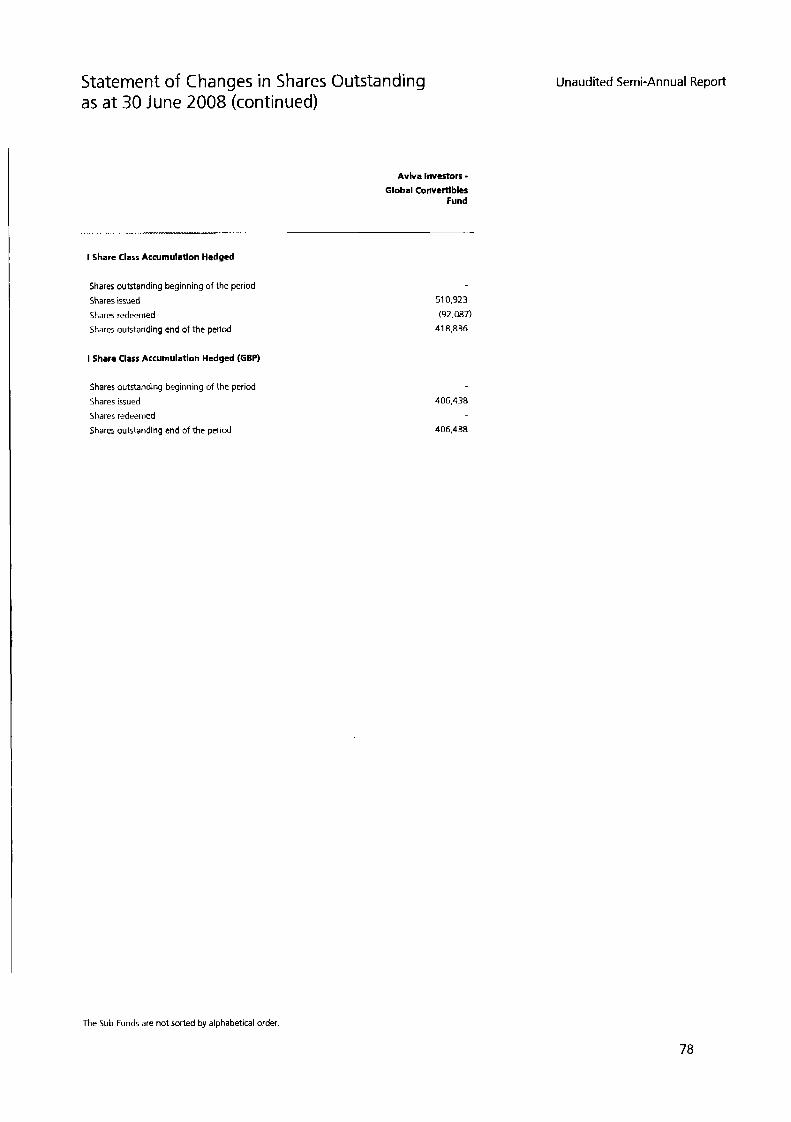
Statement of Changes in Shares Outstanding as a t 30 June 2008 (continued)
Avhra Investors
Global Convertibles Fund
I Share Class Accumulation Hedged
Shares outstanding beginning of the period
Shares issued
Shares redeemed
Shares outstanding end of the period
I Share Class Accumulation Hedged (GBP)
Shares outstanding beginning of the period
Shares issued
Shares redeemed
Shares outstanding end of the period
51 0,923 (92.087)
41 8.836
406,438
406.438
Unaudited Semi-Annual Report
The Sub-Funds are not sorted by alphabetical order.
78
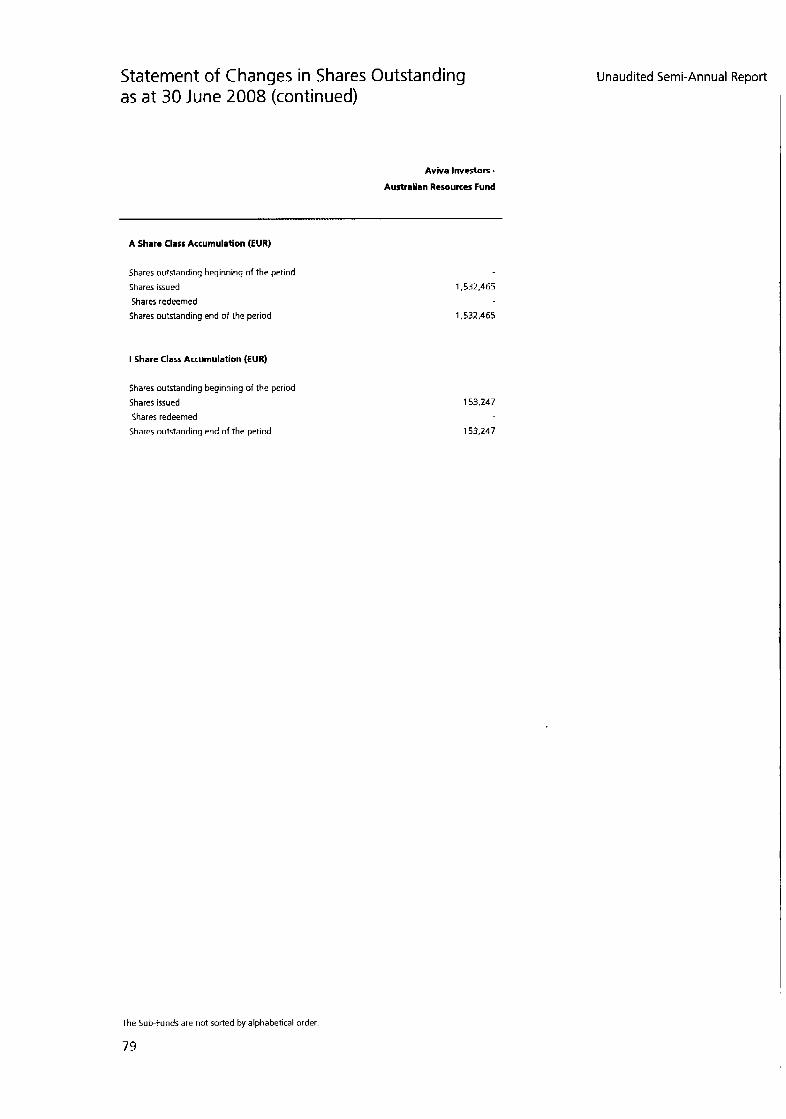
Statement of Changes in Shares Outstanding as a t 30 June 2008 (continued)
Aviva Investors +
Australian Resources Fund
A Share Class Accumulation (EUR)
Shares outstanding beginning of the period
Shares issued
Shares redeemed
Shares outstanding end of the period
I Share Class Accumulation (EUR)
Shares outstanding beginning of the period
Shares issued
Shares redeemed
Shares outstanding end of the period
1,532,465
1.532.465
153,247
153.247
The Sub-Funds are not sorted by alphabetical order
79
Unaudited Semi-Annual Report
Unaudited Semi-Annual Report
The accompanying notes form an integral part of these financial statements
80
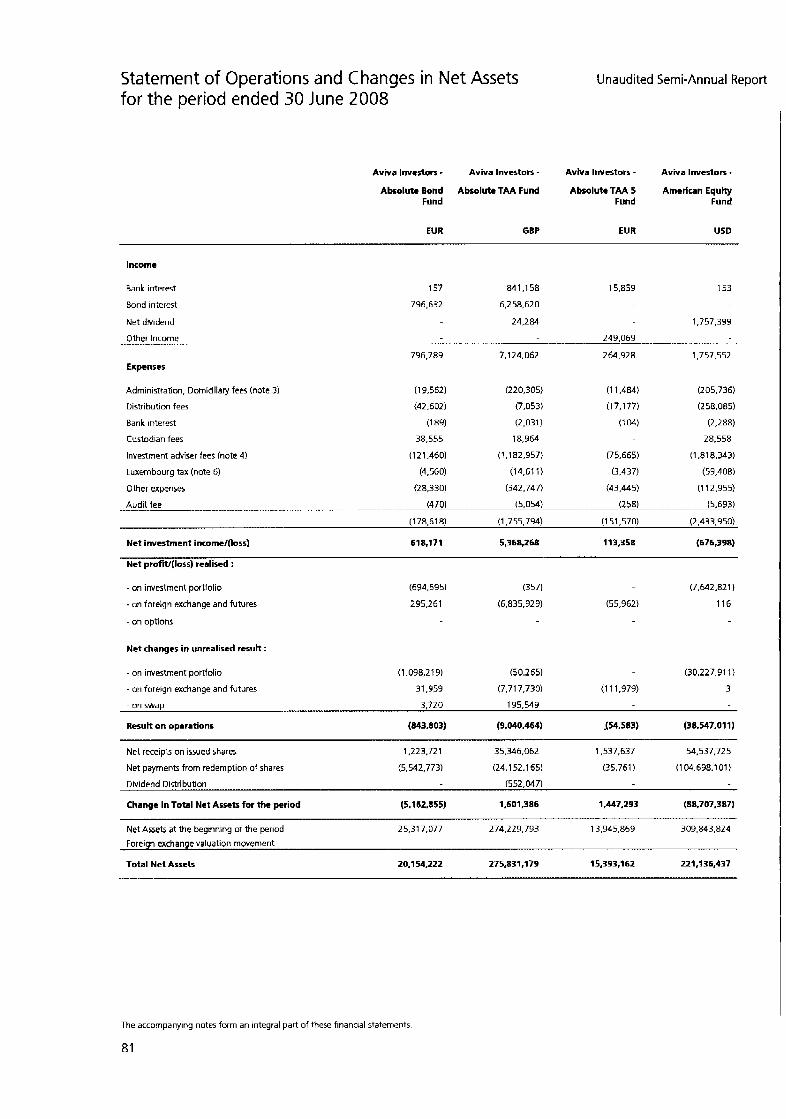
Statement of Operations and Changes in Net Assets for the period ended 30 June 2008
Unaudited Semi-Annual Report
Aviva lnvtstors - Avhra hVI!ltOK - Avhrs Investors - AvNa Investors +
Absolute Bond Absolutt TAA Fund Absolute TAA 5 American Equity Fund Fund Fund
EUR GBP EUR USD
Income
Bank interest
Bond interest
157 841.1 58 15.859
796.632 6,258,620
153
Net dividend 24.284 1,757,339
Other Income
Expenses
249.069 _--_-------_________I__
796.789 7,124,062 264.928 1,757,552
Administration, Domiciliary fees (note 3) (1 9,562) (220,305) (1 1.484) (205,736)
Distribution fees (42.502) (7.053) (17.177) (258.085)
Bank interest (1 89) (2,031) (1 04) (2.288)
Custodian fees 38,555 18,964 28,558
Investment adviser fees (note 4) (121.460) (1,182,957) (75,665) (1.81 8,343)
Luxembourg tax (note 6) (4,560) (14.61 1) (3.437) (59.408)
Other expenses (28,330) (342,747) (43.44 5) (1 12.955)
Audit ~ fee (470) (5.054) (258) (5.693) .. ...... . .. ... . . .. , . . .......... ~
(1 78.61 8) (1,755,794) (1 51,570) (2,433,950)
Net investment income/(loss) 618.171 5,368,268 113,358 (676,398)
Net proflt/(loss) realised :
- on investment portfolio
- on foreign exchange and futures
~ on options
Net changes in unrealised result :
- on investment portfolio
- on foreign exchange and futures
(694.695) (357) (7.642.821)
295,261 (6.835.929) (55,962) 116
(1,098,219) (50.265) (30.227.91 1)
31,959 (7.71 7.730) (1 11,979) 3
- on swap 3,720 195,549
Result on oprrations (843.803) (3,040,464) 154.583) (38.547.01 1)
Net receipts on issued shares 1.223.721 35,346,062 1,537,637 54.537.725
Net payments from redemption of shares (5.542.773) (24.1 52.165) (35.761) (1 04.698.1 01)
Dividend Distribution (552,047)
Change in Total Net Assets for the period (5,162,855) 1,601,386 1,447,293 (88,707,387)
Net Assets at the beginning of the period 25,317.077 274.229.793 13,945.869 309,843,824
Foreign exchange valuation movement
Total Net Assets 20.154.222 275,831,179 15.393.162 221,336,437
The accompanying notes form an integral part of these financial statements.
81
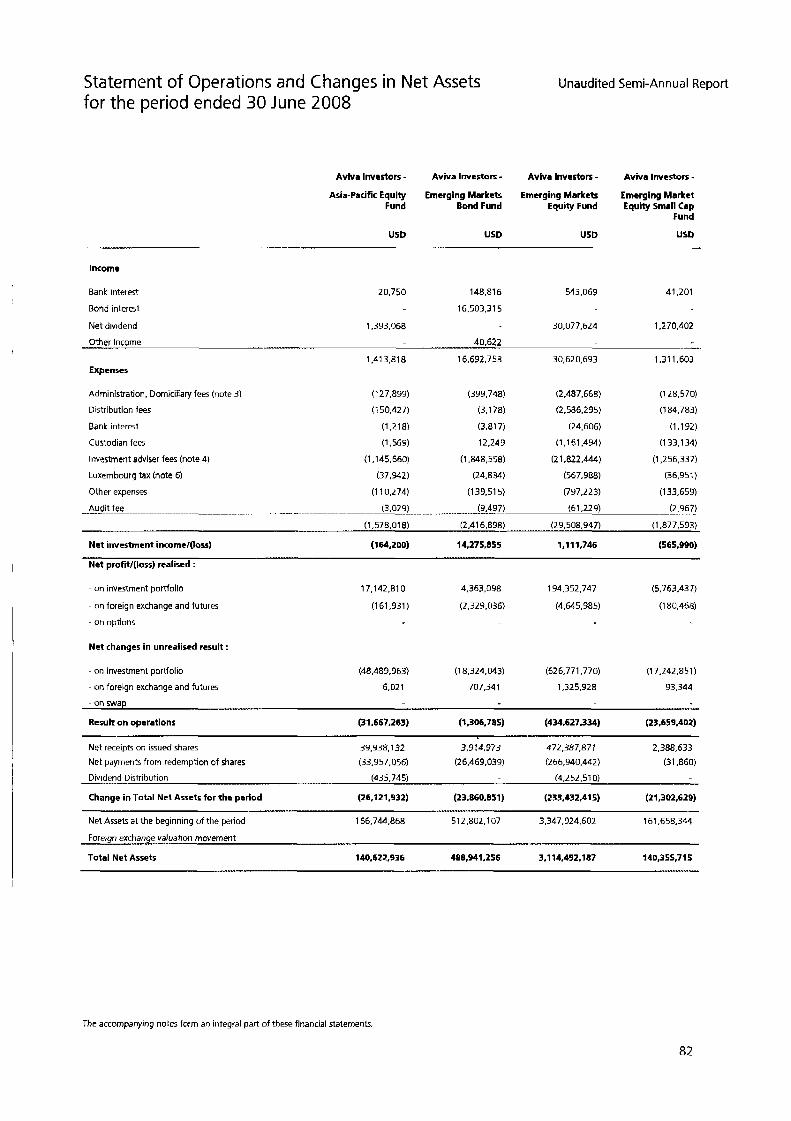
Statement of Operations and Changes in Net Assets for the period ended 30 June 2008
Unaudited Semi-Annual Report
Avhra Investors - Aviva Investors - Avlva Investors - Aviva Investors - Asia-Pacific Equity Emerging Markets Emerging Markets Emerging Market
Fund Bond Fund Equity Fund Equity Small Cap Fund
USD USD USD USD
Income
Bank interert 20.750 148,816 543.069 41,201
Bond interest 16.503.31 5
Net dividend 1,393,068 30.077.624 1,270,402
Other Income I 40.622
Expenses
-I_
1,413,818 16,692.753 30,620,693 1,311,603
Administration, Domiciliary fees (note 3)
Distribution fees
Bank interest
Custodian fees
(127,899) (399.748) (2,487,668) (1 28.570)
(1 50,427) (3.1 78) (2,586,295) (184.783)
(3.81 7) (24,606) (1,192)
(1.161.494) (133.134) 12,249
Investment adviser fees (note 4) (1,145,660) (1.848.558) (21,822,444) (1,256.337)
Luxembourg tax (note 6) (37,942) (24,834) (567.988) (36.951)
Other expenses (1 10.274) (139.51 5) (797.223) (133.659)
Audit fee ..... ... . . . . ........ (3.02 9) ... . .... , ........................................ (9.497) (61,229) (2.967) .
(1,578,018) (2,416,898) (29,508,347) (1,877,593)
Net investment income/(loss) (164.200) 14,275.855 1,111,746 (565.990)
Net profit/(loss) rcalised :
- on investment portfolio
- on foreign exchange and futures
- on options
Net changes in unrealircd result :
- on investment portfolio
- on foreign exchange and futures
17.142.81 0 4,363,098 194,352,747 (5763.437)
(1 80.468) (1 61.931) (2.329.036) (4.645.985)
(48,489,963) (1 8.324.043) (626,771,770) (1 7.242.851)
6.021 707.341 1,325.928 93,344
- on swap
Result on operations (31,657,263) (1,306,785) (434,627,334) (23,659,402)
Net receiptr, on issued shares
Net payments from redemption of shares
39,938,132 3.914.973 472,387,871 2,388,633 (33,957,056) (26,469,039) (266,940,442) (31.860)
(435.745) (4,252.51 0) Dividend Distribution
Change in Total Net Assets for the period (26,121,932) (23.850.851) (233.432.41 5) (21,302,629)
Net Assets at the beginning of the period 166,744.868 5 1 2,802,107 3,347,924,602 161,658,344
The accompanying notes form an integral part of these financial statements.
82
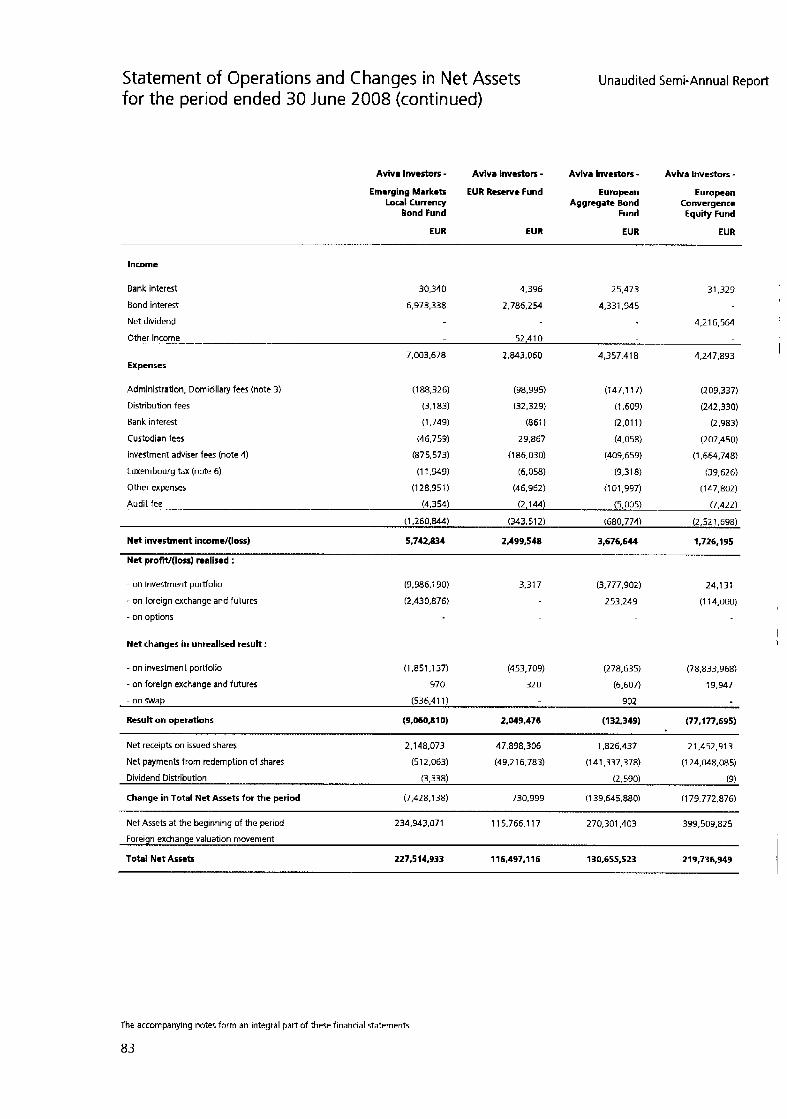
Statement of Operations and Changes in Net Assets for the period ended 30 June 2008 (continued)
Unaudited Semi-Annual Report
Aviv4 Investors - Aviva Investors - Avlva Investors - Aviva Investors - Emerging Markets EUR Rcservt Fund European European
Local Currency Aggregate Bond Convergence Bond Fund Fund Equity Fund
EUR EUR EUR EUR
I lnwme
Bank interest 30,340 4,396 25,473 31,329
Bond interest
Net dividend
6,973,338 2,786,241 4,331,945
4.21 6,564
I Other Income 52.41 0 --
7.003.678 2,843,060 4,357.41 8 4,247,833 Expenses
Adminibration, Domiciliary fees (note 3)
Distribution fees
Bank interest
Custodian fees
Investment adviser fees (note 4)
Luxembourg tax (note 6)
Other expenses
(188,326) (98.995) (147.1 17) (2 09.337)
(3.183) (32,329) (1.609) (242.330)
(1.749) (861) (2.01 1) (2.983)
(46.759) 29.867 (4.058) (207,450)
(875.573) (186,030) (409,659) (1,664,748)
(1 1.949) (6.058) (9.31 8 ) (39.626)
(1 28,951) (46.962) (1 01,997) (1 47,802)
~- Audit fee (4.354) (2.144) (5,005) (7.422)
(1,260,844) (343.51 2) (680.774) (2,521,638)
Net investment income/(loss) 5.742334 ZA99.548 3,676,644 1.726.195
Net profit/(loss) realised :
- on investment portfolio
~ on foreign exchange and futures
- on options
Net changes in unrealised result :
(9.986.1 90)
(2,430,876)
3.31 7 (3,777,902) 24,131
253,249 (1 14,000) I
I
- on investment portfolio (1,851,137) (453.709) (278.635) (78.833.968)
- on foreign exchange and futures 970 32 0 (6.607) 19,947
- on swap (536,411) 902
Result on operations ( 9 . ~ 0 S 1 0 ) 2,049,476 (132.349) (77,177,695)
Net receipts on issued shares 2.1 48,073 47.898.306 1326.437 21,452.91 3
Net payments from redemption of shares (51 2.063) (49.21 6.783) (141,337,378) (1 24.048.085)
Dividend Distribution (3.338) (2.590) (9)
Change in Total Net Assets for the period (7,428.1 38) 730.999 (1 39,645,880) (1 73,772,876)
Net Assets at the beginning of the period 234.943.071 11 5.766.1 17 270,301,403 399,503,825
Foreign exchange valuation movement
Total Net Assets 227,514,933 116,497,116 130,655,523 219.736.949
The accompanying notes form an integral part of these financial statements.
83

Statement of Operations and Changes in Net Assets for the period ended 30 June 2008 (continued)
Unaudited Semi-Annual Report
AvNa Investors - Avhra Investors - Aviva Investors - Avhra lnvcstors - European European Equity European RElT European Socially
Corporate Bond Fund Fund Responsible Equity Fund Fund
EUR EUR EUR EUR
Income
Bank interest 38,522 18,293 115.126 134,313
Bond interest
Net dividend
2,782,010 1,093
4,505,841 3,834,626 1.683.232
Other Income 126,140 70.112 , 45.988-
2,820,532 4,650,274 4,020,957 1,863,533 Expenses
Adminisfration. Domiciliary fees (note 3)
Distribution fees
Bank interest
Custodian fees
Investment adviser fees (note 4)
Luxembourg tax (note 6)
Other expenses
(86,722) (211.141) (129.839) (72.570)
(1 8.1 96) (254.406) (1 14,275) (54.1 00)
(51 0) (2,188) (1.088) (704)
32.958 (65.000) 15.468 16.401
(31 8,808) (1,929,318) (1,044.61 6) (51 1.772)
(1 2.366) (55.058) (26.01 5) (12,363)
(42.31 5) (125,230) (75.41 4) (52.076)
Audit fee (1.270). (5,444) (2.710) (1.751)
(447.229) (2.647.785) (1,378,489) (688.935)
Net investment incomcl(lors) 2.373.303 2,002,483 2.642.468 1.171.59a
Net profiV(loss) reallsed :
- on investment portfolio
- on foreign exchange and futures
- on options
Net changes in unrealiscd result :
- on investment portfolio
- on foreign exchange and futures
(1,499,031) (4.609.21 6) (1 6,146,388) (2,344.869)
11 5,020 70.344 (47.474) (1 3.994)
(4.055.490) (50.380.091) (19,718,048) (1 6.59631 9)
(239.474) 15,752 6.01 9 (1 07)
~ on swap 1,805
Result on operations (3.303367) (52,900,722) (33,263,423) (17,781,191)
Net receipts on issued shares 65,683,466 31.345.478 68,321,551 27.9’31 ,958
Net paymenE from redemption of shares (6.285.469) (29,937.274) (34,081,083) (1 8,120.989)
Dividend Distribution (1 10.758) (322,246)
Change In Total Net Assets for the period 56,183.372 (51,492,518) 654,793 (7.910.222)
Net Assets at the beginning of the period 68.693.432 2’34.083.733 146,306,772 94,396.230
Foreign exchange valuation movement
Total Net Assets 124,876,804 242,591,215 146,961,571 86,486,008
The accompanying notes form an integral part of these financial statements.
84
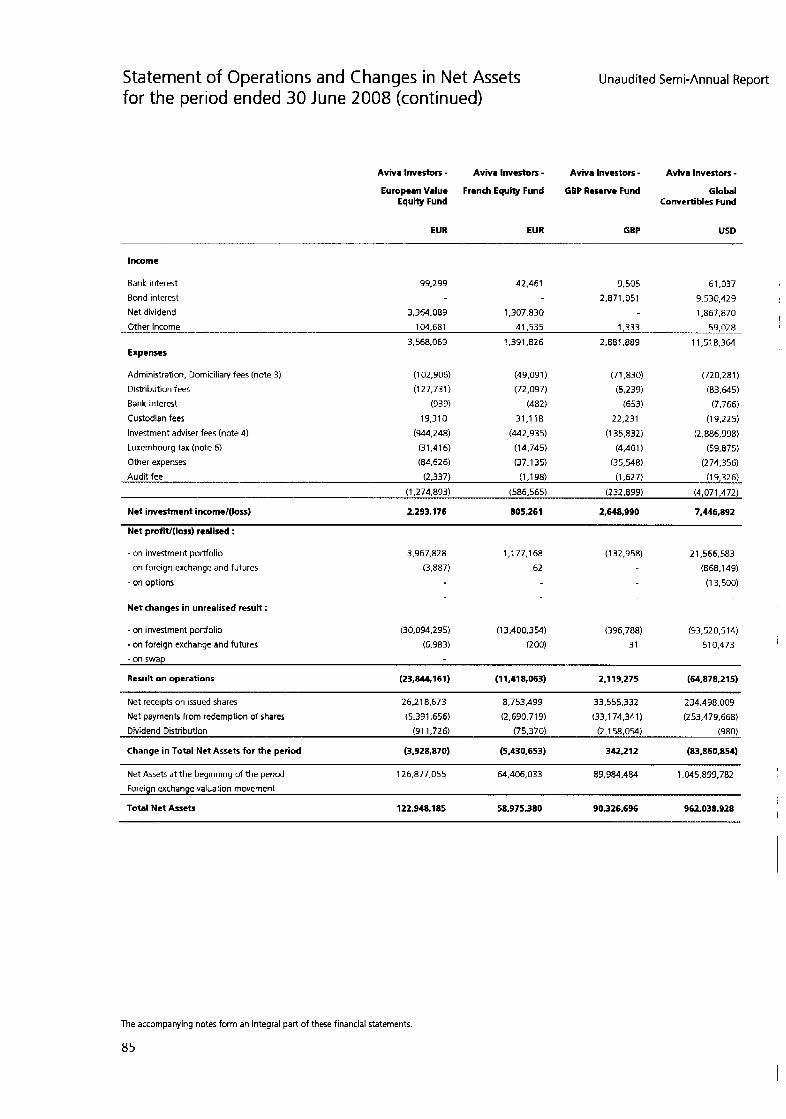
Statement of Operations and Changes in Net Assets for the period ended 30 lune 2008 (continued)
Unaudited Semi-Annual Report
Aviva Investors - Aviva Investors - AvNa Investors - AvNa Investors - European Value French Equity Fund GBP Reserve Fund Global
Equity Fund Convertibles Fund
EUR EUR GBP USD
lncomt
Bank interest 99.299 42.461 9,505
Bond interest 2 . m ,051
Other Income ~ 104,681 41,535 1.333
Net dividend 3,364,089 1,307,830
3,568,069 1,391,826 2,881,883 Expenses
Administration, Domiciliary fees (note 3)
Distribution fees
Bank interest
Custodian fees
Investment adviser fees (note 4)
Luxembourg tax (note 6)
Other expenses
(1 02.906) (49.091) (71.830)
(127.731) (72,097) (5.239)
(939) (482) (653) 19.31 0 31.118 22,231
(944.248) (442.935) (1 35,832) (31.41 6) (14,745) (4,401 1 (84,626) (37.135) (35.548)
61,037
9.530.429
1,867,870
59.02a I ,,.... ̂ ^ ..................
11,518.364
(720,281)
(83.645)
(7.766)
(19.225)
(2,886,938)
(59.875) (274.356)
(1 9,326)
(1,274,833) (586.565) (232,899) (4,071,472) --l--__l_
Audit fee .....I..._.-.._.-._-.-II (2.337) (1.198) (1.627)
Net investment income/(loss) 2.293.176 805,261 2.648.990 7 .~6 .a92
Net profit/(lors) rcaliscd :
on investment portfolio
on foreign exchange and futures
on options
3.967.828 1.1 77.1 68 (1 32,958) 21.566.583
(3.887) 62 (868.149)
(1 3.500)
Net changes in unrealised result :
- on investment portfolio (30,094,295) (1 3.400.354) (396.788) (93,520,514) 31 510,473 ~ - on foreign exchange and futures (6,983) (200)
- on swap
Result on operations (23,844,161) (1 1.41 8,063) 2.119.275 (64.878.21 5)
Net receipts on issued shares 26.218.673 8.753.499 33.555332 234.498.009
Net payments from redemption of shares (5,331,656) (2.690.71 9) (33.1 74.34 1 ) (253.479.668)
Dividend Distribution (91 1.726) (75.370) (2.1 58,054) (980)
Change in Total Net Assets for the period (3.928.870) (5.430.653) 342.212 (83,860,854)
Net Assets at the beginning of the period 126,877,055 M.406.033 a9.984.484 1.045.899.782
foreign exchange valuation movement I
I Total Net Assets 122.348.1 85 58,915,380 90.326.696 962.038.928
The accompanying notes form an integral part of these financial statements
85

Statement of Operations and Changes in Net Assets for the period ended 30 June 2008 (continued)
Unaudited Semi-Annual Report
Avhra Investors - Avka Investors - Aviva investors - Aviva Investors - Global Equity Global REIT Fund Japanese Equity Long Term
Focus Fund Fund European Bond Fund
USD USD JPY EUR
Income
Bank interest 7,090 346.640
Bond interest 4.1 14,443
Net dividend 540,593 1.1 11,240 138,323,123
10.61 7 1,250,643 24.432
551.21 0 1 ,118,330 140.520.406 4,138,875 Other Income ---
Expenses
Administration. Domiciliary fees (note 31
Distribution fees
Bank interest
Custodian fees
Investment adviser fees (note 4)
Luxembourg tax (note 6)
(45.472) (49.000) (13,714,048) (1 48.543)
(66.562) (42,997) (6,832,073) (63,538)
(3.497) (497) (1 48,331) (43,801)
45.232 38,526 2,139,432 6,179
(392,034) (395.81 7) (84,983,924) (601,034)
(1 3,007) (9.796) (1,784,359) (25.909) Other expenses (60.5a4) (52,305) (1 0,563,254) (60.933)
Audit fee (1.338) (1.234) (369.099) (2.784)
(537.1 82) (513.120) (1 16,322,136) (940,363)
Net investment income/(loss) 14,028 605,210 24,198,210 3.198.512
Net profW(loss) realised :
- on investment portfolio
- on foreign exchange and futures
- on options
Net changes in unreelised result :
- on investment portfolio
- on foreign exchange and futures
761,009 (4.486.907) (2.081.912.063) (2.M0.081)
35.834 (47.055) 59.097 (374.1 60)
(9.1 12,412) (7.561.266) (41 5,241,203) (7,042,363)
13,742 (1.036) 135,709 (333,321)
- on swap
Result on operations (8,287,793) (1 1,491,054) (2.472.760.250) (7,491,413)
Net receipts on issued shares 2.293.689 1.1 36,794 2,867.46.67 1 74.236.269
Net payments from redemption of shares (23.877.200) (7,354,807) (4.31 0,954,648) (31,243,790)
Dividend Distribution (205,002) (823)
Change in Total Net Assets for the period (29,871,310) (17.914.063) (3,916,268,227) 35,500,243
Net Assets a t the beginning of the period 72.718.320 67,241,227 19,362,755,797 150.804.634
Foreign exchange valuation movement
Total Net Ass& 42.847.010 43,327,158 16,046,487,570 186.304.877
The accompanying notes form an integral part of these financial statements
86
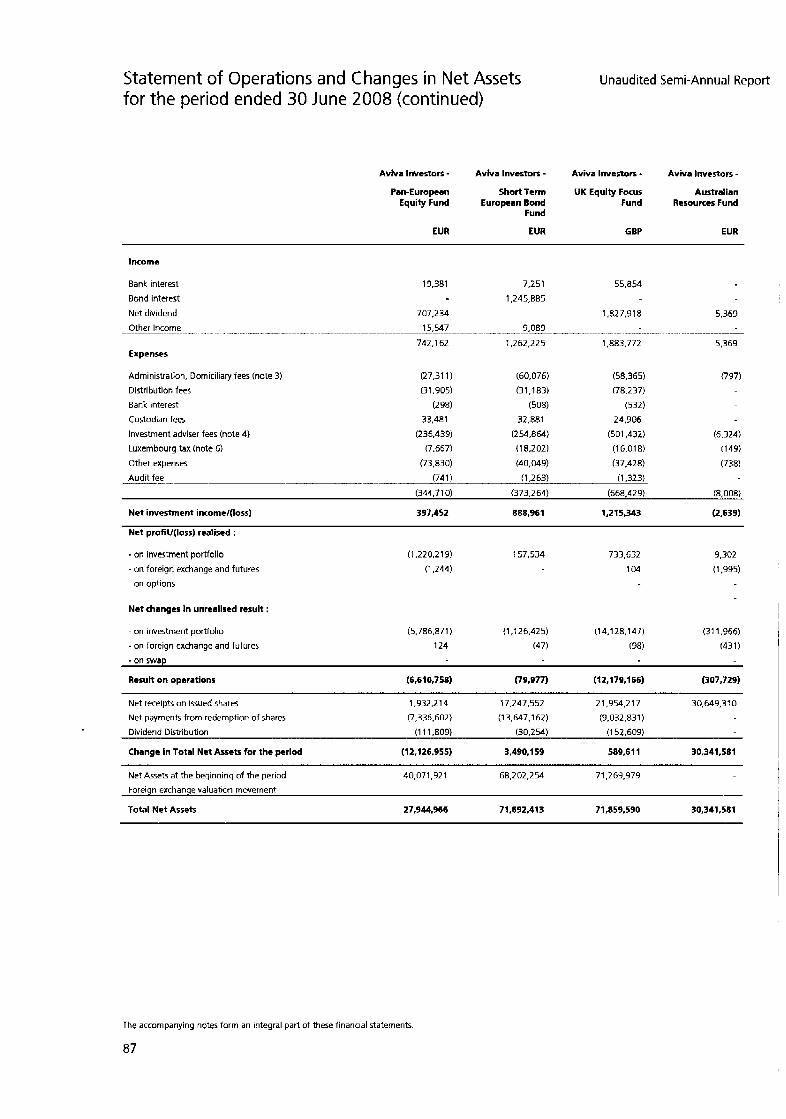
Statement of Operations and Changes in Net Assets for the period ended 30 June 2008 (continued)
Unaudited Semi-Annual Report
Avhra Investors - Avhra ~nvestorr - Aviva Investors - AvNa Investors - Pan-European Short Term UK Eqully Focus Australian
Equity Fund European Bond Fund Resources Fund Fund
EUR EUR GBP EUR
Income
Sank interest 19,381 7,251 55,854
Bond interest 1,245,885
Net dividend 707.234 1,827.91 8 5,369
Other Income __x .. 15.547 9,089 __" " ._..ll_l_.....__-_l___......~..~..- .,x_.x ". ...
742.1 62 1,262,225 1,883,772 5,369 Expenses
Administration, Domiciliary fees (note 3) (27.31 1) (60,076) (58,365) (797) Distribution fees (31.905) (31.1 83) (78,237)
Bank interest (298) (508) (532)
Custodian fees 33,481 32,881 24.906
Investment adviser fees (note 4) (236.439) (254,854) (501.432) (6.324)
Luxembourg tax (note 6) (7.667) (18,202) (1 6.01 8) (149)
Other expenses (73.830) (40.049 (37.428) (738)
_ l l l l . - . ~ . _ Audit fee (74 1 ).. (1,263) (1.323)
(344.710) (373.264) (668.429) (8,008)
Net investment income/(loss) 397.452 888,961 1 ,2 15.343 (2.639)
Net profit/(loss) realiscd :
- on investment portfolio (1.220.21 9) 157,534 733,632 9.302
- on foreign exchange and futures (1.244) 104 (1.995) - on options
Net changes in unrealired result :
- on investment portfolio
- on foreign exchange and futures
- on swan
(5,786,871) (1,126.425) (14,128,147) (31 1,966)
124 (47) (98) (43 1 )
Rcsutt on operations (6,610,758) (79.977) (12,179,166) (307.729)
Net receipts on issued shares 1,932,214 17,247,552 21.954.217 30.649.31 0
Net payments from redemption of shares (7,336,602) (1 3.647.1 62) (3,032,831)
Dividend Distribution (1 1 1,809) (30,254) (1 52,609)
Change in Total Net Assets for the period (12,126.955) 3,490,159 589,611 30.341.581
Net Assets at the beginning of the period 40,071.92 1 68,202,254 71.269.979
Foreign exchange valuation movement
Total Net Assets 27.944.966 71.692.413 71,859,590 30,341,581
The accompanying notes form an integral part of these financial statemenb
87
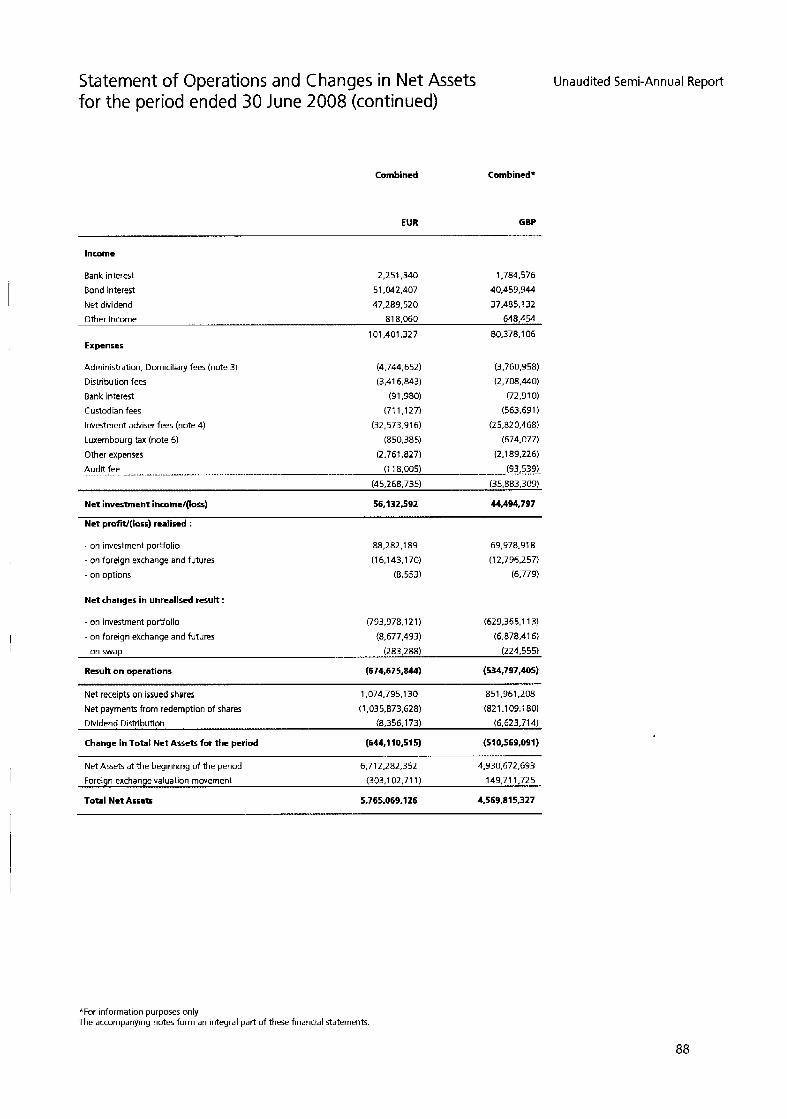
Statement of Operations and Changes in Net Assets for the period ended 30 June 2008 (continued)
Combined
Unaudited Semi-Annual Report
Combined'
EUR GBP -
Income
Bank interest 2,251,340 1.784.576
Band interest 51,042,407 40,453,944
Net dividend 47.289.520 37,485.1 32
818.060 648.454
101,401.327 80.378.1 06 I
Other Income
Expenses
Administration, Domiciliary fees (note 3)
Distribution fees
Bank interest
Custodian fees
Investment adviser fees (note 4)
Luxembourg tax (note 6)
(4,744,652)
(3.41 6.843)
(91,980)
(71 1,127)
(32.573.91 6)
(850,385)
(3.760.958)
(2,708,440)
(72.910)
(563,631
(2 5.82 0.468)
(674.077)
Other expenses (2.761.827) (2,189,226)
Aud't.!:@ ~ , . ..., .. . (1 18.005, (92.5391. (45,268.735) (35,883,309)
Net investment income/(loss) 56,132,592 44.494.797
Net profit/(losr) rcalircd :
on investment portfolio
on foreign exchange and futures
on options
Net changes in unrealised result :
- on investment p o f h l i o
- on foreign exchange and futures
88,282.189
(1 6.143.1 70)
(8.553)
69.978.91 8
(1 2,796,257)
(6.779)
(793.978.1 2 1) (629.3651 13)
(8,677,493) (6,878.41 6 ) - on swap (283,288) (224,555)
Result on operations (674,675,844) (534,797,405)
Net receipts on issued shares 1,074.795.1 30 851,961,208
Net payments from redemption of shares (1,035,873,628) (821.1 09.1 80) Dividend Distribution (8.356.1 73) (6,623,714)
Change in Total Net Assets for the period (644,110,515) (510,569,091)
Net Assets at the beginning of the period 6.71 2,282,352 4,330,672,693
Foreign exchange valuation movement (303,102.71 1 ) 149.711.725
Total Net Assets 5.765.069.126 4.569.ai 5,327
*For information purposes only The accompanying notes form an integral part of these financial statements
88
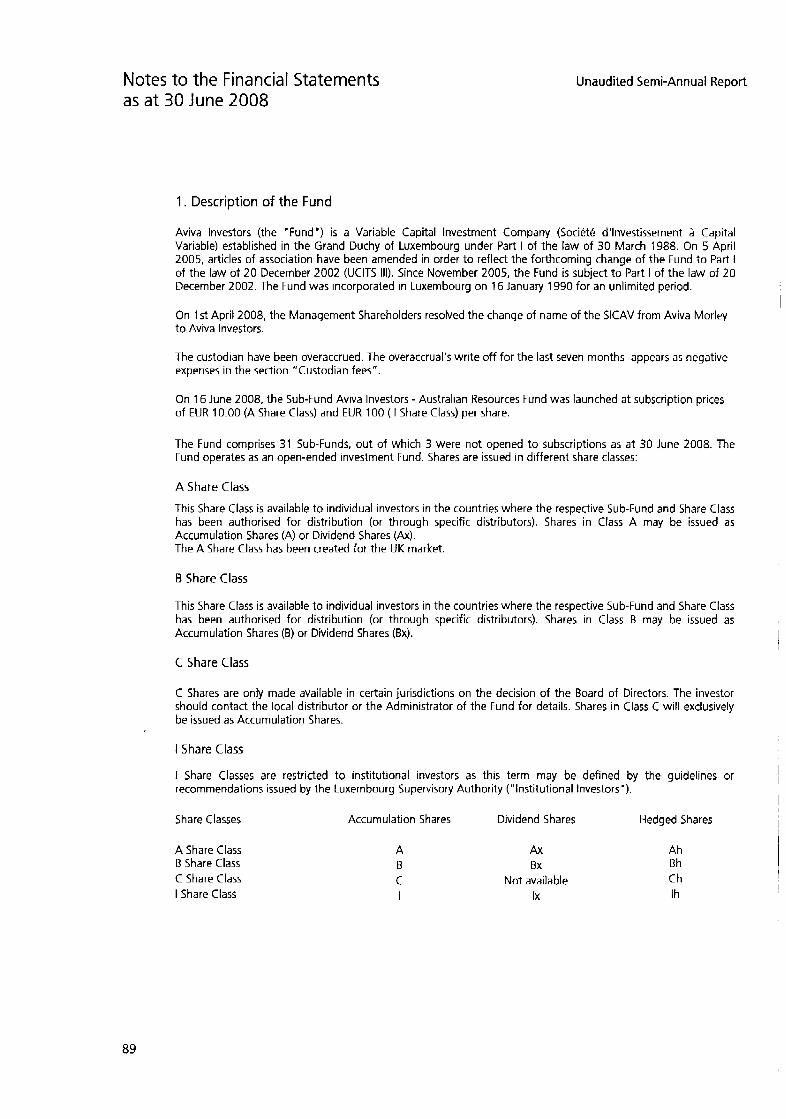
Notes to the Financial Statements as a t 30 June 2008
Unaudited Semi-Annual Report
1. Description of the Fund
Aviva Investors (the 'Fund ") is a Variable Capital Investment Company (Sociktb d'lnvestissement a Capital Variable) established in the Grand Duchy of Luxembourg under Part I of the law of 30 March 1988. On 5 April 2005, articles of association have been amended in order to reflect the forthcoming change of the Fund to Part I of the law of 20 December 2002 (UCITS Ill). Since November 2005, the Fund is subject to Part I of the law of 20 December 2002. The Fund was incorporated in Luxembourg on 16 January 1990 for an unlimited period.
On 1 st April 2008, the Management Shareholders resolved the change of name of the SICAV from Aviva Morley to Aviva Investors.
The custodian have been overaccrued. The overaccrual's write off for the last seven months appears as negative expenses in the section "Custodian fees".
On 16 June 2008, the Sub-Fund Aviva Investors - Australian Resources Fund was launched at subscription prices of EUR 10.00 (A Share Class) and EUR 100 ( I Share Class) per share.
The Fund comprises 31 Sub-Funds, out of which 3 were not opened to subscriptions as a t 30 June 2008. The Fund operates as an open-ended investment Fund. Shares are issued in different share classes:
A Share Class
This Share Class is available to individual investors in the countries where the respective Sub-Fund and Share Class has been authorised for distribution (or through specific distributors). Shares in Class A may be issued as Accumulation Shares (A) or Dividend Shares (Ax). The A Share Class has been created for the UK market.
B Share Class
This Share Class is available to individual investors in the countries where the respective Sub-Fund and Share Class has been authorised for distribution (or through specific distributors). Shares in Class B may be issued as Accumulation Shares (B) or Dividend Shares (Bx).
C Share Class
C Shares are only made available in certain jurisdictions on the decision of the Board of Directors. The investor should contact the local distributor or the Administrator of the Fund for details. Shares in Class C will exclusively be issued as Accumulation Shares.
I Share Class
I Share Classes are restricted to institutional investors as this term may be defined by the guidelines or recommendations issued by the Luxembourg Supervisory Authority ("Institutional Investors').
Share Classes Accumulation Shares Dividend Shares Hedged Shares
A Share Class B Share Class C Share Class I Share Class
A B C I
Ax Bx
Not available Ix
Ah Bh Ch Ih
89
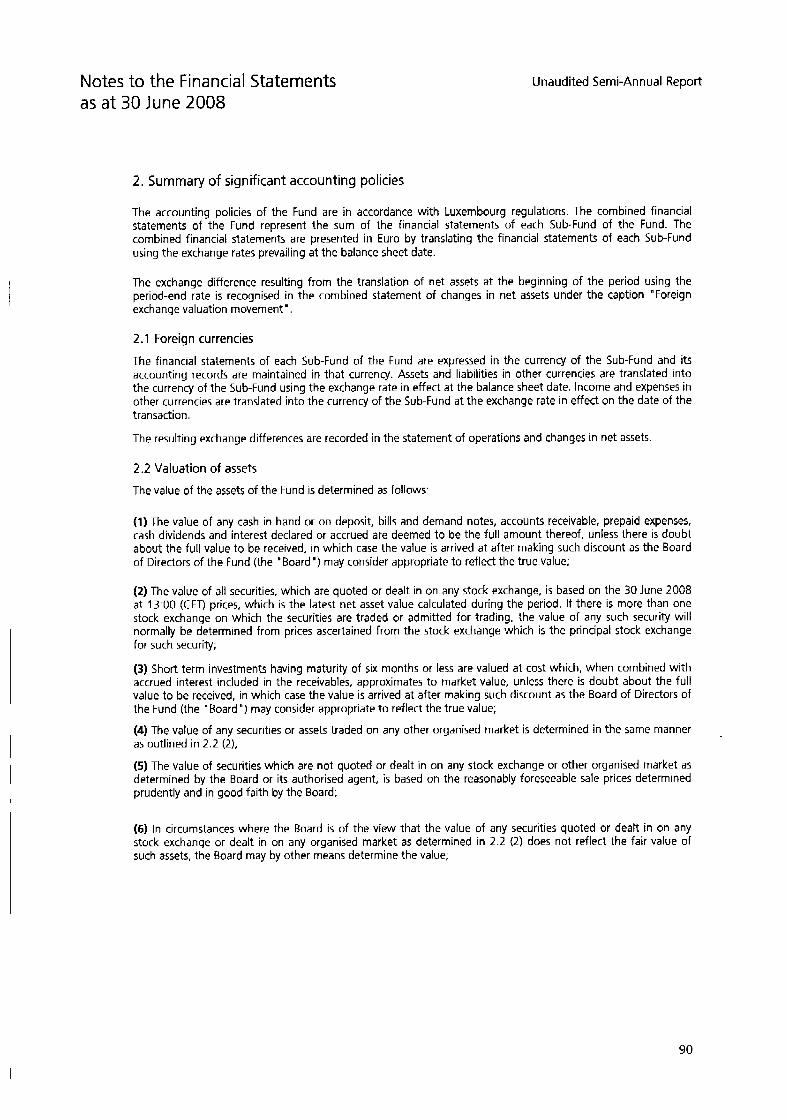
I
Notes to the Financial Statements as a t 30 June 2008
Unaudited Semi-Annual Report
2. Summary of significant accounting policies
The accounting policies of the Fund are in accordance with Luxembourg regulations. The combined financial statements of the Fund represent the sum of the financial statements of each Sub-Fund of the Fund. The combined financial statements are presented in Euro by translating the financial statements of each Sub-Fund using the exchange rates prevailing at the balance sheet date.
The exchange difference resulting from the translation of net assets at the beginning of the period using the period-end rate is recognised in the combined statement of changes in net assets under the caption "Foreign exchange valuation movement'.
2.1 Foreign currencies
The financial statements of each Sub-Fund of the Fund are expressed in the currency of the Sub-Fund and its accounting records are maintained in that currency. Assets and liabilities in other currencies are translated into the currency of the Sub-Fund using the exchange rate in effect at the balance sheet date. Income and expenses in other currencies are translated into the currency of the Sub-Fund at the exchange rate in effect on the date of the transaction.
The resulting exchange differences are recorded in the statement of operations and changes in net assets.
2.2 Valuation of assets
The value of the assets of the Fund is determined as follows:
(1) The value of any cash in hand or on deposit, bills and demand notes, accounts receivable, prepaid expenses, cash dividends and interest declared or accrued are deemed to be the full amount thereof, unless there is doubt about the full value to be received, in which case the value is arrived at after making such discount as the Board of Directors of the Fund (the "Board ") may consider appropriate to reflect the true value;
(2) The value of all securities, which are quoted or dealt in on any stock exchange, is based on the 30 June 2008 a t 13:OO (CET) prices, which is the latest net asset value calculated during the period. If there is more than one stock exchange on which the securities are traded or admitted for trading, the value of any such security will normally be determined from prices ascertained from the stock exchange which is the principal stock exchange for such security;
(3) Short term investments having maturity of six months or less are valued at cost which, when combined with accrued interest included in the receivables, approximates to market value, unless there is doubt about the full value to be received, in which case the value is arrived a t after making such discount as the Board of Directors of the Fund (the 'Board") may consider appropriate to reflect the true value;
(4) The value of any securities or assets traded on any other organised market is determined in the same manner as outlined in 2.2 (2);
(5) The value of securities which are not quoted or dealt in on any stock exchange or other organised market as determined by the Board or its authorised agent, is based on the reasonably foreseeable sale prices determined prudently and in good faith by the Board;
,
(6) In circumstances where the Board is of the view that the value of any securities quoted or dealt in on any stock exchange or dealt in on any organised market as determined in 2.2 (2) does not reflect the fair value of such assets, the Board may by other means determine the value;
90

Notes to the Financial Statements as a t 30 June 2008 (continued)
2.2 Valuation of assets (continued)
Unaudited Semi-Annual Report
(7) Futures contracts. The Fund on behalf of a Sub-Fund may enter into financial futures contracts as part of its investment strategy. Upon entering into a futures contract, the Fund is required to deposit with a broker an amount ("initial margin") equal to a certain percentage of the purchase price indicated in the futures contract. Subsequent payments ('variation margin") are made or received by the Fund each day, depending on the daily fluctuations in the value of the underlying futures contracts. These subsequent payments are recorded for financial reporting purposes as unrealised result by the Fund. When entering into a closing transaction, the Fund will realise, for book purposes, a gain or loss equal to the difference between the values of the futures contract to sell and the futures contract to buy. Futures contracts are valued at the last sale price or, in the absence of a sale, the mean between the closing bid and asked quotation or if no bid or asked prices are available, at the last bid price. Certain risks may arise upon entering into futures contracts from the contingency of imperfect market conditions;
(8) Forward foreign currency exchange contracts. All Sub-Funds in connection with the portfolio purchases and sales of securities denominated in a foreign currency, may enter into forward foreign currency exchange contracts for the purposes of hedging foreign currency exchange risks. Contracts are recorded at market value based on the exchange rate of the underlying currency on the valuation day. Certain risks may arise upon entering into these contracts from the potential inability of counterparties to meet the terms of their contracts. Realised gains or losses arising from such transactions are included in net profiV(1oss) realised on foreign exchange;
(9) Swaps contracts. A swap is an agreement that obliges two parties to exchange a series of cashflows a t specified intervals based upon or calculated by reference to changes in specified prices or rates for a specified amount of an underlying asset. The payment flows are usually netted against each other, with the difference being paid by one party to the other. Risks may arise as a result of the failure of another party to the swap contract to comply with the terms of the swap contract. The loss incurred by the failure of a counterparty is generally limited to the net payment to be received by the Fund, and/or the termination value at the end of the contract. Therefore, the Fund considers the creditworthiness of each counterparty to a swap contract in evaluating potential credit risk. Additionally, risks may arise from unanticipated movements in interest rates or in the value of the underlying securities or indices.
The cashflows received and paid by the Sub-Fund in connection with swap contracts are converted to present value on the valuation date at the zero-coupon swap rate corresponding to the maturity of these cashflows. The value of the swap contracts is the difference between these two present value conversions.
2.3 Treatment of interest income and dividends
The assets of each Sub-Fund include:
(1) All stock, stock dividends, cash dividends and cash distributions receivable by the Sub-Fund to the extent information thereon is reasonably available to the Fund;
(2 ) Ali interest accrued on any interest bearing securities owned by the Fund except to the extent that it is included or reflected in the principal amount of such security.
3. Administration and domiciliary fees
The Fund pays to the Administrative Agent a fee based on the aggregate net asset value of each Sub-Fund for the administrative services provided. Each Sub-Fund pays to Aviva Fund Services Societe Anonyme, a fixed fee of EUR 3,000 per annum for domiciliary services. The fees are calculated and accrued each dealing day and are payable monthly in arrears.
91
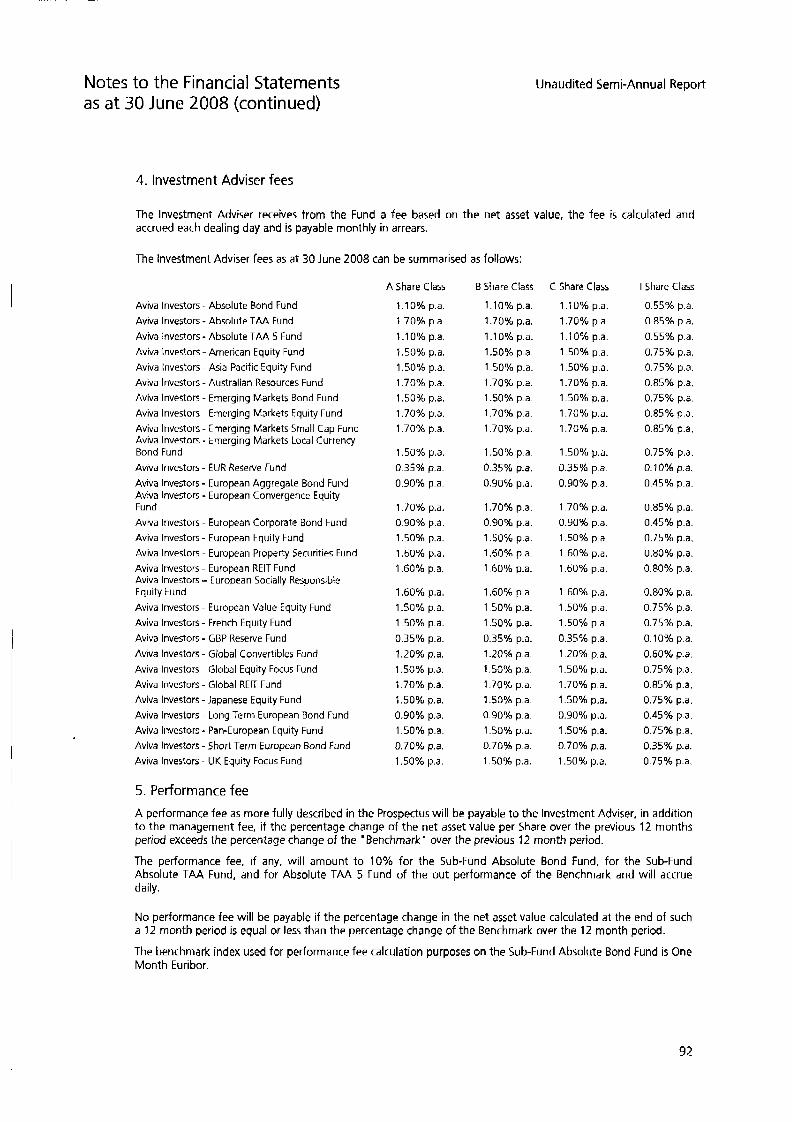
Notes to the Financial Statements as a t 30 June 2008 (continued)
Unaudited Semi-Annual Report
4. Investment Adviser fees
The Investment Adviser receives from the Fund a fee based on the net asset value, the fee is calculated and accrued each dealing day and is payable monthly in arrears.
The Investment Adviser fees as a t 30 June 2008 can be summarised as follows:
Aviva Investors - Absolute Bond Fund Aviva Investors - Absolute TAA Fund
Aviva Investors - Absolute TAA 5 Fund Aviva Investors - American Equity Fund Aviva Investors - Asia-Pacific Equity Fund Aviva Investors - Australian Resources Fund Aviva Investors - Emerging Markets Bond Fund Aviva Investors - Emerging Markets Equity Fund Aviva Investors - Emerging Markets Small Cap Fund Aviva Investors - Emerging Markets Local Currency Bond Fund Aviva Investors - EUR Reserve Fund
Aviva Investors - European Aggregate Bond Fund Aviva Investors - European Convergence Equity Fund Aviva Investors - European Corporate Bond Fund Aviva investors - European Equity Fund Aviva Investors - European Property Securities Fund Aviva Investors - European RElT Fund Aviva Investors - European Socially Responsible Equity Fund Aviva Investors - European Value Equity Fund Aviva Investors - French Equity Fund
Aviva Investors - GBP Reserve Fund Aviva Investors - Global Convertibles Fund Aviva Investors - Global Equity Focus Fund Aviva investors - Global RElT Fund Aviva Investors - Japanese Equity Fund Aviva Investors - Long Term European Bond Fund Aviva Investors - Pan-European Equity Fund Aviva Investors - Short Term European Bond Fund Aviva Investors - UK Equity Focus Fund
A Share Class
1.1 0% p.a. 1.70% p-a.
1.1 0% p.a. 1.50% p.a. 1.50% p.a. 1.70% p.a. 1.50% p.a. 1.70% p.a. 1.70% p.a.
1 .SO% p.a. 0.35% p.a.
0.90% p-a.
1.70% p.a. 0.90% p.a. 1.50% p.a. 1.60% p.a. 1.60% p.a.
1.60% p.a. 1.50% p.a. 1.50% p.a.
0.35% p-a- 1.20% p.a. 1.50% p.a. 1.70% p.a. 1 .SO% p.a. 0.90% p.a. 1.50% p-a- 0.70% p.a. 1.50% p.a.
B Share Class
1.10% p.a. 1 .?O% p.a. 1.1 0% p.a.
1.50% p-a. 1.50% p.a. 1.70% p-a. 1.50% p.a.
1.70% p.a. 1 .70% p.a.
1.50% p-a- 0.35% p.a. 0.90% p.a.
1.70% p.a. 0.90% p-a. 1.50% p-a- 1.60% p-a. 1.60% p-a.
1.60% p-a- 1.50% p-a- 1.50% p-a. 0.35% p.a. 1.20% p.a. 1.50% p-a. 1.70% p-a. 1 .SO% p-a. 0.90% p.a. 1.50% p.a. 0.70% p.a. 1.50% p.a.
C Share Class
1.10% p-a. 1.70% p.a. 1.1 0% p.a. 1.50% p.a. 1.50% p.a. 1.70% p.a. 1.50% p.a. 1.70% p.a. 1.70% p.a.
1.50% p.a.
0.35% p-a. 0.90% p-a.
1.70% p.a. 0.90% p.a. 1.50% p.a. 1.60% p.a. 1.60% p.a.
1.60% p.a. 1.50% p.a. 1.50% p.a.
0.35% p.a.
1.50% p.a. 1.70% p.a. 1.50% p.a. 0.90% p.a. 1.50% p.a. 0.70% p.a. 1 .SO% 13.a.
1.20% p.a.
I Share Class
0.55% p.a. 0.85% p.a.
0.55% p-a. 0.75% p.a. 0.75% p.a. 0.85% p.a. 0.75% p.a. 0.85% p.a. 0.85% p.a.
0.75% p.a. 0.10% pa. 0.45% p.a.
0.85% p.a. 0.45% p.a. 0.75% p.a. 0.80% p.a. 0.80% p.a.
0.80% p.a. 0.75% p.a. 0.75% p.a. 0.1 0% p-a.
0.60% p-a. 0.75% p.a. 0.85% p.a. 0.75% p.a. 0.45% p-a. 0.75% p-a. 0.35% p-a. 0.75% p-a.
5. Performance fee A performance fee as more fully described in the Prospectus will be payable to the Investment Adviser, in addition to the management fee, if the percentage change of the net asset value per Share over the previous 12 months period exceeds the percentage change of the 'Benchmark" over the previous 12 month period.
The performance fee, if any, will amount to 10% for the Sub-Fund Absolute Bond Fund, for the Sub-Fund Absolute TAA Fund, and for Absolute TAA 5 Fund of the out performance of the Benchmark and will accrue daily.
No performance fee will be payable if the percentage change in the net asset value calculated a t the end of such a 12 month period is equal or less than the percentage change of the Benchmark over the 12 month period.
The benchmark index used for performance fee calculation purposes on the Sub-Fund Absolute Bond Fund is One Month Euribor.
92
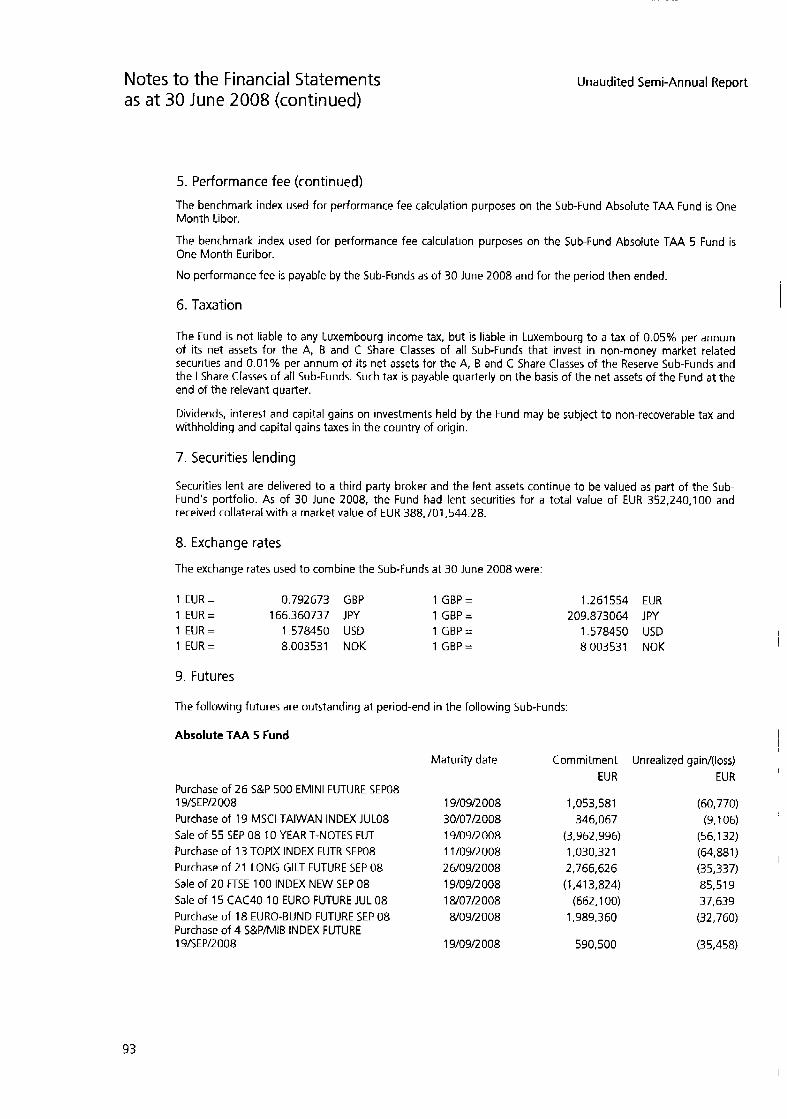
Notes to the Financial Statements as a t 30 June 2008 (continued)
Unaudited Semi-Annual Report
5. Performance fee (continued) The benchmark index used for performance fee calculation purposes on the Sub-Fund Absolute TAA Fund is One Month Libor.
The benchmark index used for performance fee calculation purposes on the Sub-Fund Absolute TAA 5 Fund is One Month Euribor.
No performance fee is payable by the Sub-Funds as of 30 June 2008 and for the period then ended.
6. Taxation
The Fund is not liable to any Luxembourg income tax, but is liable in Luxembourg to a tax of 0.05% per annum of its net assets for the A, B and C Share Classes of all Sub-Funds that invest in non-money market related securities and 0.01 % per annum of i ts net assets for the A, B and C Share Classes of the Reserve Sub-Funds and the I Share Classes of all Sub-Funds. Such tax is payable quarterly on the basis of the net assets of the Fund a t the end of the relevant quarter.
Dividends, interest and capital gains on investments held by the Fund may be subject to non-recoverable tax and withholding and capital gains taxes in the country of origin.
7. Securities lending
Securities lent are delivered to a third party broker and the lent assets continue to be valued as part of the Sub- Fund’s portfolio. As of 30 June 2008, the Fund had lent securities for a total value of EUR 352,240,100 and received collateral with a market value of EUR 388,701,544.28.
8. Exchange rates
The exchange rates used to combine the Sub-Funds a t 30 June 2008 were:
1 EUR= 0.792673 GBP 1 GBP= 1 EUR= 166.360737 JPY 1 G B P = 1 EUR= 1.578450 USD 1 GBP= 1 EUR= 8.003531 NOK 1 GBP=
1.261554 EUR 209.873064 JPY
1.578450 USD 8.003531 NOK
9. Futures
The following futures are outstanding at period-end in the following Sub-Funds:
Absolute TAA 5 Fund I
Purchase of 26 S&P 500 EMlNl FUTURE SEP08 19/SEP/2008 Purchase of 19 MSCl TAIWAN INDEX JULO8 Sale of 55 SEP 08 10 YEAR T-NOTES FUT Purchase of 13 TOPIX INDEX FUTR SEP08 Purchase of 21 LONG GILT FUTURE SEP 08 Sale of 20 FTSE 100 INDEX NEW SEP 08 Sale of 15 CAC40 10 EURO FUTURE JUL 08 Purchase of 18 EURO-BUND FUTURE SEP 08 Purchase of 4 S&P/MIB INDEX FUTURE 19lSEPl2008
Maturity date
19l09l2008 30/07/2008 19l09l2008 11l09/2008 2 610912 008 19/09/2008 18/07/2008 8/09f2008
1 910912 008
Commitment Unrealized gain/(loss) EUR
I EUR
1,053,581 346,067
(3,962,996) 1,030,32 1 2,766,626 (1,413,824)
(662,100) 1,989,360
(60.770) (9,106)
(56,132) (64,881 ) (3 5,337) 85.51 9 37,639 (32,760)
I
590,500 (35,458)
93

Notes to the Financial Statements as a t 30 June 2008 (continued)
Unaudited Semi-Annual Report
9. Futures (continued) Absolute TAA 5 Fund (continued)
Maturity date Commitment Unrealized gain/(loss) EUR EUR
Sale of 74 DJ EURO STOXX 50 SEP 08 19/09/2008 (2,488,62 0) 133,041 Purchase of 9 AUST 1 OY BOND FUTURE SEP 08 15/09/2008 531,217 3.554
TOTAL (34,691)
The net unrealised loss attributed to these transactions is included in the 'Other liabilities" in the Statement of Net Assets.
Absolute TAA Fund
Purchase of 2474 S&P 500 EMlNl FUTURE SEP 08 19lSEPl2008 Purchase of 1552 MSCl TAIWAN INDEX JUL 08 Sale of 571 7 SEP 08 10 YEAR T-NOTES FUTURE Purchase of 1246 TOPIX INDEX FUTURE SEP 08 Purchase of 21 57 LONG GILT FUTURE SEP 08 Sale of 1980 FTSE 100 INDEX NEW SEP 08 Sale of 1428 CAC40 10 EURO FUTURE JUL 08 Purchase of 1801 EURO-BUND FUTURE SEP 08 Purchase of 41 3 S&P/MIB INDEX FUTURE 19lSEPl2008 Sale of 6349 DJ EURO STOXX 50 SEP 08 Purchase of 961 AUST 1 OY BOND FUTURE SEP08
Maturity date
19/09/2008 30/07/2008 19lQ9l2008 1 1 /09/2 008 26/09/2008 19/09/2008 18/07/2008 8/09/2 008
19/09/2008 1 910912 008 15/09/2008
Commitment Unrealized gainl(loss) GBP GBP
79,467,295 22,407,472
(326.530.1 15) 78,278,316
225.255.51 0 (1 10,949,300)
(49,963,709) 157.778.826
(4,905,925) (613,684)
(4,557,49 1 ) (4.92 9,302) (2,656,107) 6,734.2 35 3,380,658 (2,598,240)
48.32a.586 (2.902.01 7) (1 69,249,083) 9,802,245
44,962,159 300,837 TOTAL (2.944.79 1 )
The net unrealised loss attributed to these transactions is included in the 'Other liabilities' in the Statement of Net Assets.
European Aggregate Bond Fund
Maturity date Commitment Unrealized gain/(loss) EUR EUR
Sale of 30 5 YEAR T-NOTE SEP 08 30/09/2008 (2.099.27 1) (4.306) Sale of 7 SEP 08 10 YEAR T-NOTES FUTURE 19/09/2008 (504,381) (4,504) Sale of 2 3 MO EURO EURIBOR SEP 08 15IQ9l2008 (474,650) 72 5 Purchase of 20 EURO-BUND FUTURE SEP 08 8/09/2008 2,2 1 0,400 (30,960)
TOTAL (39,045)
The net unrealised loss attributed to these transactions is included in the 'Other liabilities' in the Statement of Net Assets.
Long Term European Bond Fund
Maturity date Commitment Unrealized gainl(loss) EUR EUR
Sale of 20 3M0 EURO EURIBOR SEP 08 15/09/2008 (4,746,500) 7,250 Purchase of 21 7 EURO-BUND FUTURE SEP 08 8/09/2008 2 3,982,840 (335,660)
TOTAL (328.41 0)
The net unrealised loss attributed to these transactions is included in the "Other liabilities" in the Statement of Net Assets.
94
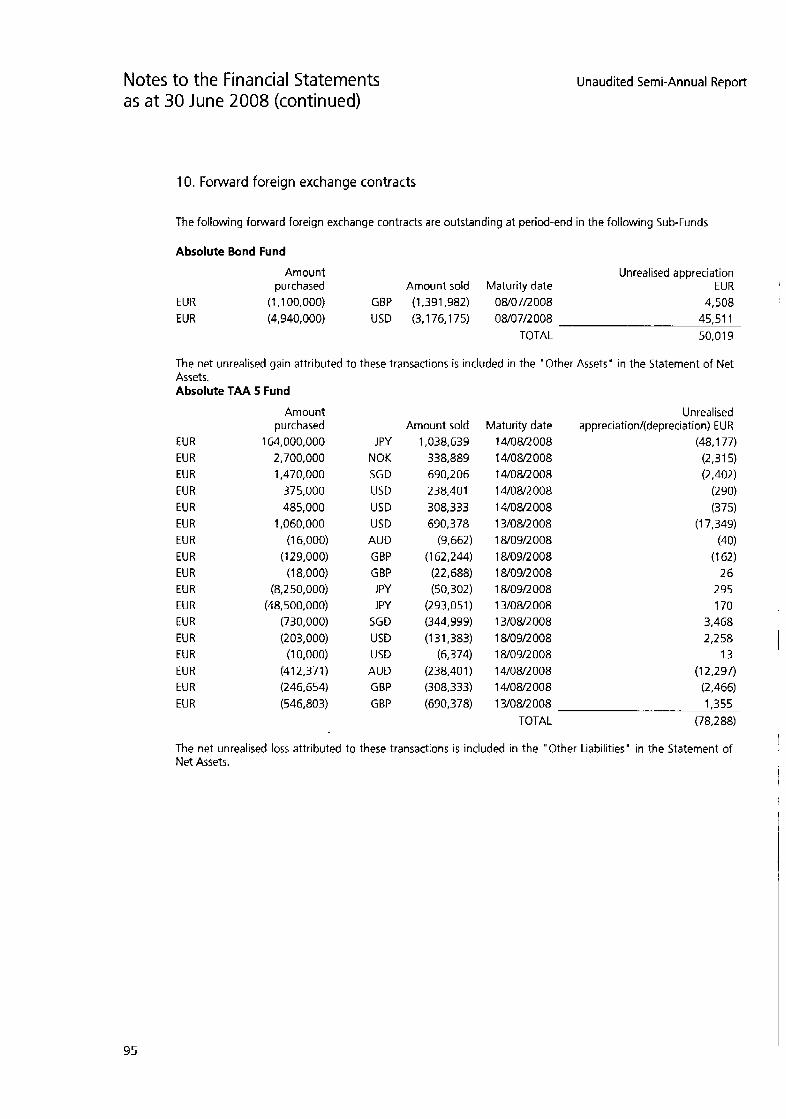
Notes to the Financial Statements as a t 30 June 2008 (continued)
Unaudited Semi-Annual Report
10. Forward foreign exchange contracts
The following forward foreign exchange contracts are outstanding at period-end in the following Sub-Funds
Absolute Bond Fund
Amount Unrealised appreciation purchased Amount sold Maturity date EUR
EUR (1,100,000) GBP (1,391,982) 08/07/2008 4,508 EUR (4,940,000) USD (3,176,175) 08/07/2008 45,511
TOTAL 50.01 9
The net unrealised gain attributed to these transactions is included in the "Other Assets" in the Statement of Net Assets. Absolute TAA 5 Fund
Amount Unrealised purchased Amount sold Maturity date appreciation/(depreciation) EUR
EUR 164,000,000 JPY 1,038,639 14/08/2008 (48,177) EUR 2,700,000 NOK 338.889 14/08/2008 ( 2 3 5) EUR 1,470,000 SGD 690,206 14/08/2008 (2.402) EUR 375,000 USD 238,401 14/08/2008 (290) EUR 485,000 USD 308,333 14/08/2008 (375) EUR 1,060,000 USD 690,378 13/08/2008 (1 7,349)
EUR (129,000) GBP (1 62,244) 18/09/2008 (1 62) EUR (18,000) GBP (22,688) 18/09/2008 26 EUR (8,250,000) J PY (50,302) 18/09/2008 295 EUR (48,500,000) JPY (293,051) 13/08/2008 170 EUR (730,000) SGD (344,999) 13/08/2008 3,468 EUR (203,000) USD (131,383) 18/09/2008 2,258 EUR (1 0.000) USD (6,374) 18/09/2008 13 EUR (412,371) AUD (238,401) 14/08/2008 (1 2,2 97) EUR (246,654) GBP (308,333) 14/08/2008 (2.466) EUR (546,803) GBP (690,378) 13/08/2008 1,355
TOTAL (78,288)
The net unrealised loss attributed to these transactions is included in the "Other Liabilities" in the Statement of Net Assets.
EUR (1 6,000) AUD (9,662) 1 8/09/2008 (40)
I
I
95
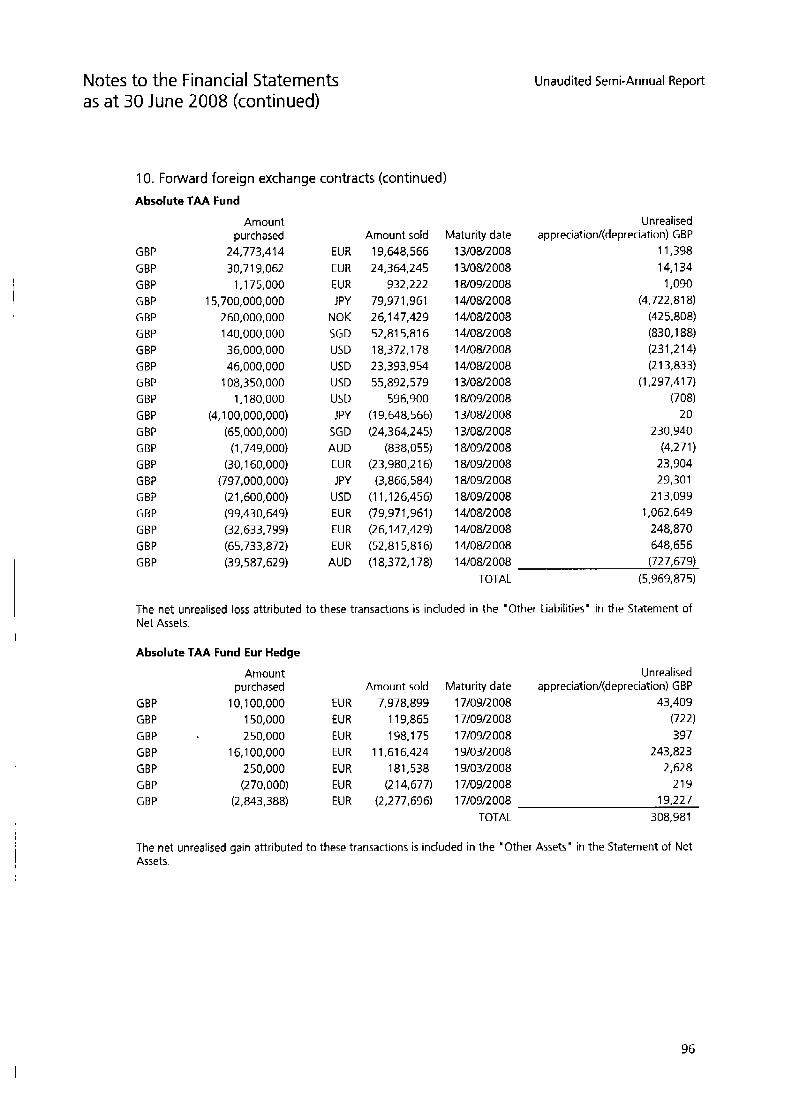
Notes to the Financial Statements as a t 30 June 2008 (continued)
10. Fonrvard foreign exchange contracts (continued) Absolute TAA Fund
Amount purchased
GBP 24,773,414 GBP 30,719,062 GBP 1,175,000 GBP 15,700,000,000 GBP 2 60,000,000 GBP 140,000,000 GBP 36,000,000 GBP 46,000,000 GBP 108,350,000 GBP 1,180,000 GBP (4.1 00,000,000) GBP (65,000,000) GBP (1,749,000) GBP (30.1 60,000) GBP (797,000,000) GBP (21,600,000) GBP (99,430,649) GBP (32,633,799) GBP (65,733,872) GBP (39,587,629)
Amount sold EUR 19,648,566 EUR 24,364,245 EUR 932,222 JPY 79,971,961
NOK 26,147,429 SGD 52.81 5.81 6 USD 18.372.1 78 USD 23,393,954 USD 55,892,579 USD 596,900 JPY (1 9,648,566)
SGD (24,364,245) AUD (838,055) EUR (23,980.2 16) JPY (3,866,584)
USD (1 1,126,456) EUR (79,971,961) EUR (26,147,429) EUR (52.81 5.81 6)
AUD (18,372,178)
Maturity date 13/08/2008 13/08/2008 18/09/2008 14/08/2008 14/08/2008 1 4/08/2 008 14/0&/2008 14/08/2008 13/08/2008 18/09/2008 13/08/2008 1 3/08/2 008 1 8/09/2 008 1 8/09L? 008 18/09/2008 18/09/2008 14/08/2008 14/08/2 008 14/08/;! 008 14/08/2 008
Unaudited Semi-Annual Report
Unrealised appreciation/(depreciation) GBP
1 1,398 14,134
1,090 (4.722.81 8)
(425,808) (830.1 88) (231,2 14) (21 3,833)
(1.297.41 7) (708)
20 2 30,940
(4.271) 23,904 29,301
2 1 3,099 1,062,649
248,870 648,656 (72 7.679)
TOTAL (5,969,875)
The net unrealised loss attributed to these transactions is included in the 'Other Liabilities' in the Statement of Net Assets.
Absolute TAA Fund Eur Hedge
GBP GBP GBP GBP GBP GBP GBP
Amount purchased
10,100,000 150,000 250,000
16.1 00,000 250,000 (270,000)
(2,843,388)
Amount sold EUR 7,978,899 EUR 1 19,865 EUR 198,175 EUR 11.61 6,424 EUR 181,538 EUR (214,677) EUR (2,277,696)
Maturity date 17/09/2008 1 710912 008 1 710912 008 19/03/2008 1 910312 008 1 7/09/2 008 17/09/2008
TOTAL
Unrealised appreciation/(depreciation) GBP
43,409 (722) 397
243,823 2,628
219 19,227
308.981
The net unrealised gain attributed to these transactions is included in the "Other Assets' in the Statement of Net Assets.
96
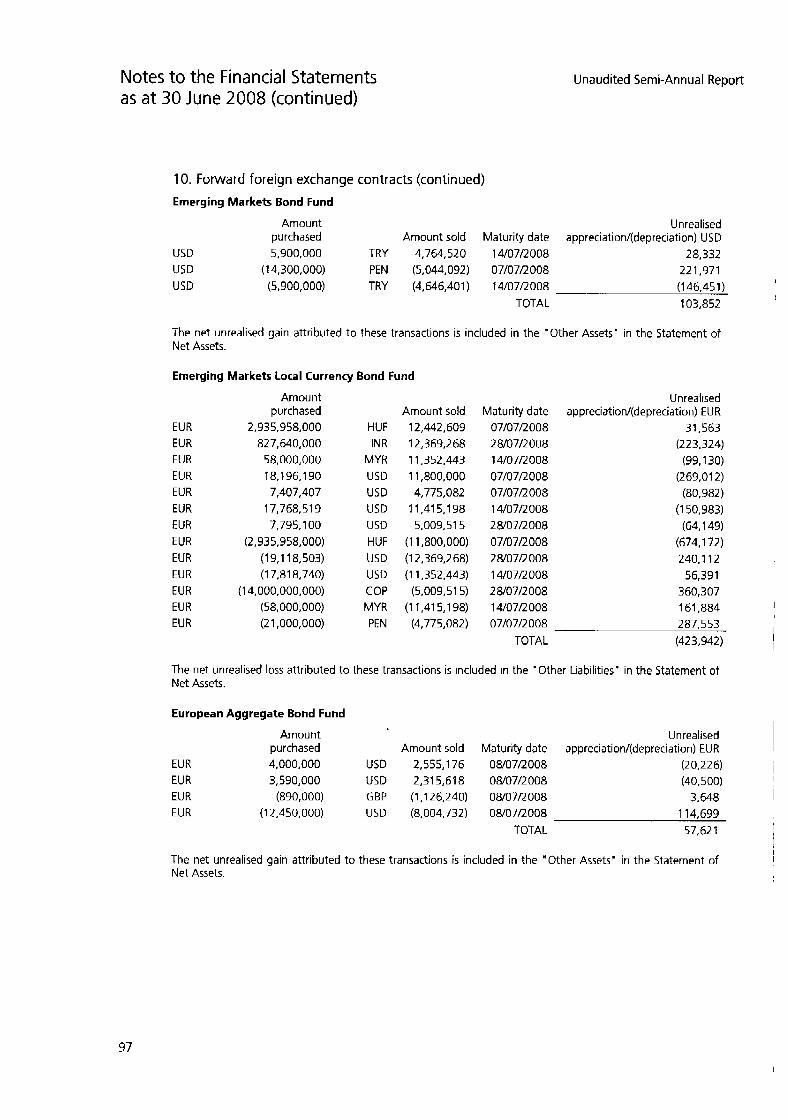
Notes to the Financial Statements as a t 30 June 2008 (continued)
Unaudited Semi-Annual Report
10. Forward foreign exchange contracts (continued) Emerging Markets Bond Fund
Unrealised purchased Amount sold Maturity date appreciation/(depreciation) USD
USD 5,900,000 TRY 4,764,520 14/07/2008 28,332 USD (1 4,300,000) PEN (5,044,092) 07/07/2008 22 1,971 USD (5,900,000) TRY (4,646,401) 14/07/2008 (1 46.45 1)
TOTAL 103,852
Amount
I
,
The net unrealised gain attributed to these transactions is included in the "Other Assets" in the Statement of Net Assets.
Emerging Markets Local Currency Bond Fund
EUR EUR EUR EUR EUR EUR EUR EUR EUR EUR EUR EUR
Amount purchased
2,935,958,000 827,640,000
58,000,000 18.1 96.1 90 7,407,407 17.768.51 9 7,795,100
(2,935,958,000) (1 9.1 18,503) (17,818,740)
(1 4,000,000,000) (58,000,000)
HUF INR
MYR USD USD USD USD HUF USD USD COP MYR
Amount sold 12,442,609 12,369,268 11,352,443 1 1,800,000 4,775,082
1 1.41 5.1 98 5,009.51 5
(1 1,800,000) (1 2,369,268) (1 1,352,443) (5,009,515) (1 1,415,198)
Maturity date 07/07/2 008 28/07/2008 14/07/2008 07/07/2008 07/07/2008 14/07/2008 28/07/2008 07/07/2008 28/07/2008 14/07/2008 2W07/2008 14/07/2008
Unrealised appreciation/(depreciation) EUR
31,563 (223,324) (99,130) (269.01 2) (80,982)
(1 50,983) (64,149) (674,172) 240.1 12 56,391 360,307 161,884 I
EUR (2 1,000,000) PEN (4,775,082) 07/07/2008 287,553 TOTAL (423,942)
The net unrealised loss attributed to these transactions is included in the 'Other Liabilities" in the Statement of Net Assets.
European Aggregate Bond Fund
Amount Unrealised purchased Amount sold Maturity date appreciation/(depreciation) EUR
EUR 4,000,000 USD 2,555,176 08/07/2008 (20,226) EUR 3,590,000 USD 2.31 5.61 8 08/07/2008 (40,500) EUR (890,000) GBP (1,126,240) 08/07/2008 3,648 EUR (1 2,450,000) USD (8,004,732) OW07R008 1 14,699
TOTAL 57.62 1
The net unrealised gain attributed to these transactions is included in the "Other Assets" in the Statement of Net Assets.
97
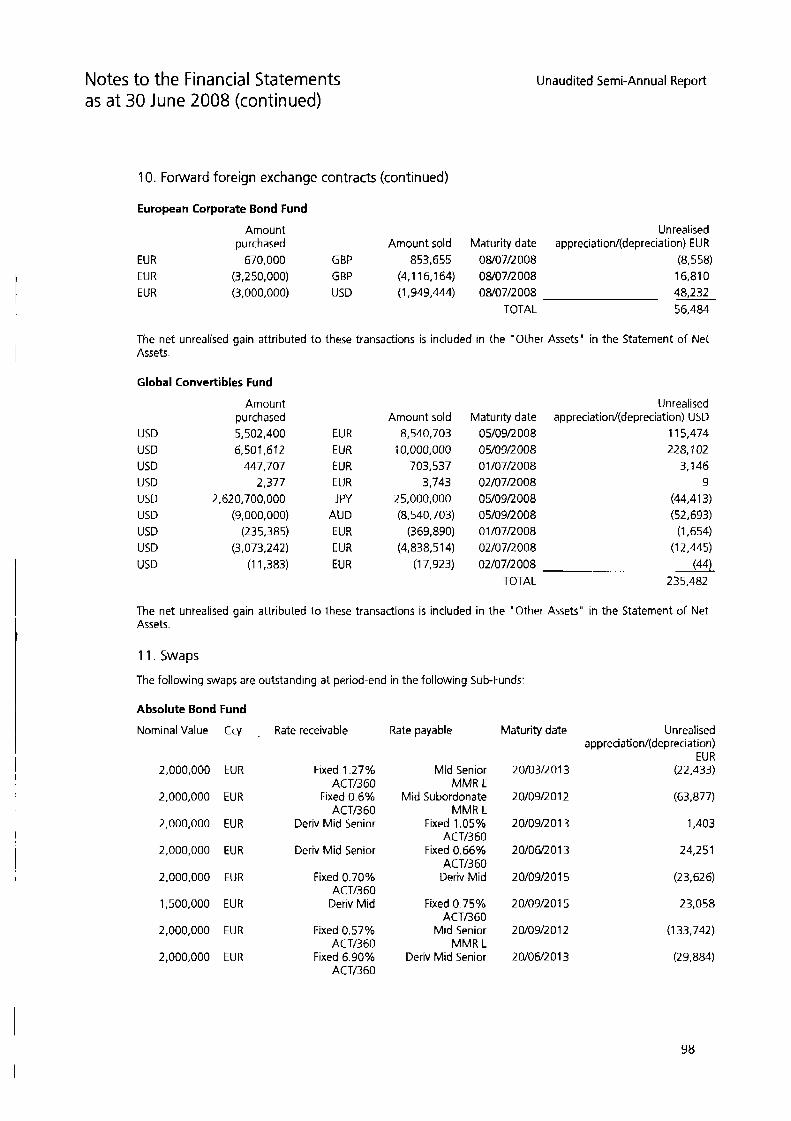
Notes to the Financial Statements as a t 30 June 2008 (continued)
10. Forward foreign exchange contracts (continued)
Unaudited Semi-Annual Report
European Corporate Bond Fund
Amount Unrealised purchased Amount sold Maturity date appreciationl(depreciati0n) EUR
EUR 670,000 GBP 853.655 08/07/L008 (8.558) EU R (3,250,000) GBP (4.1 16.1 64) 08/07/2008 16.81 0 EUR (3,000,000) USD (1,949,444) 08/07/2008 48,232
TOTAL 56,484
The net unrealised gain attributed to these transactions is included in the "Other Assets" in the Statement of Net Assets.
Global Convertibles Fund
USD USD USD USD USD USD USD USD USD
Amount purchased 5,502,400 6.50 1.61 2
447,707 2,377
2,620,700,000 (9,000,000)
(235,385) (3,073,242)
(1 1,383)
EUR EUR EUR EUR JPY
AUD EUR EUR EUR
Amount sold 8,540,703
10,000,000 703,537
3,743 25,000,000 (8,540,703)
(369,890) (4,838.51 4)
(1 7,923)
Unrealised Maturity date appreciationl(depreciation) USD
05l09l2008 1 15,474 05/09/2008 228.102 01/07/2008 3,146 02/07/2008 9 0510912 008 (44.41 3) 05/0912 008 (52.693) 0 1 I0712008 (1.654) 02/0712008 (1 2,445) 02/07/2008 (44)
235.482 TOTAL
The net unrealised gain attributed to these transactions is included in the "Other Assets" in the Statement of Net Assets.
11. Swaps
The following swaps are outstanding at period-end in the following Sub-Funds:
Absolute Bond Fund
Nominal Value Ccy
2,000,000 EUR
2,000,000 EUR
2,000,000 EUR
2,000,000 EUR
2,000,000 EUR
1,500,000 EUR
2,000,000 EUR
2,000,000 EUR
Rate receivable
Fixed 1.27% ACT1360
Fixed 0.6% ACT1360
Deriv Mid Senior
Deriv Mid Senior
Fixed 0.70% ACT1360
Deriv Mid
Fixed 0.57% ACT1360
Fixed 6.90% ACT1360
Rate payable
Mid Senior MMR L
Mid Subordonate MMR L
Fixed 1.05% ACT1360
Fixed 0.66% ACT1360
Deriv Mid
Fixed 0.75% ACT/360
Mid Senior MMR L
Deriv Mid Senior
Maturity date
20/03/2013
20/09/2012
20/09/2013
20l06l2013
20/09/2015
2 Ol09l2 0 1 5
2 010912 0 1 2
20/06/2013
Unrealised appreciation/(depreciation)
EUR (22,433)
(63,877)
1,403
24.2 5 1
(2 3,62 6)
23.058
(1 33,742)
(29,884)
98

Notes to the Financial Statements as a t 30 June 2008 (continued)
1 1. Swaps (continued) Absolute Bond Fund (continued)
Nominal Value
2,000,000
2,000,000
2,000,000
1,500,000
1,000,000
1,000,000
2,000,000
2,000,000
2,000,000
2,000,000
2,000,000
2,000,000
2,500,000
2,000.000
2,000,000
2,000.000
3,000,000
Ccy
EUR
EUR
EUR
EUR
EUR
EUR
EUR
EUR
EUR
EUR
EUR
EUR
EUR
EUR
EUR
EUR
USD
Rate receivable Rate payable
Fixed 2.25% ACT1360
Deriv Mid Senior
Fixed 0.78% ACT1360
Deriv Mid Senior
Fixed 0.77% ACT13 60
Deriv Mid Senior
Fixed 0.78% ACT13 60
Deriv Mid Senior
Fixed 2.10% ACT1360
Fixed 0.45% ACT/360
Fixed 0.96% ACT1360
Fixed 1 . I 8% ACT1360
Mid Senior MMR L
Deriv Mid Senior
Fixed 0.67% ACT1360
Mid Senior MMR L
Fixed 4.0% ACT1360
Deriv Mid Senior
Fixed 0.33% ACT1360
Deriv Mid Senior
Fixed 0.93% ACT/360
Deriv Mid Senior ModRe
Fixed 1.45% ACT1360
Deriv Mid Senior ModRe
Fixed 2.05% ACT1360
Deriv Mid Senior
Mid Senior MMR L
Mid Senior MMR L
Deriv Mid Senior
Fixed 0.27% ACT13 60
Fixed 0.6% ACT1360
Deriv Mid Senior
Fixed 0.88% ACT1360
Mid Bond
Unaudited Semi-Annual Report
Maturity date
20/0912013
20106/2013
20106/2013
20/06/2015
20l09R 01 2
2 0/03/2 0 1 3
2 0109R 0 1 2
2OlO612013
20106/2013
20/09L? 01 2
2 0/03/2 0 1 3
20/06/2013
2 010912 0 1 2
20106/2013
2 0106/2 0 1 3
20l03R013
2 OlOW2 00 8
TOTAL
Unrealised appreciationl(depreciation)
EUR 10,349
9,955
(1 5,427)
10,384
(67,134)
15.874
(99,251)
66,146
(35,536)
(9 5,845)
(61,822)
(49,409)
19,726
9,367
@,I 04)
43,601
17.284
(455,692)
The net unrealised loss attributed to these transactions is included in the "Other Liabilities" in the Statement of Net Assets.
Emerging Markets local Currency Bond Fund
Nominal Value Ccy Rate receivable Rate payable Maturity date Unrealised appreciationl(depreciati0n)
EUR 2,750,000.000 HUF Fixed 8.43% 6M HUF-BUBOR 24/08/2010 168,449
ACT/360
The net unrealised loss attributed to these transactions is included in the "Other Assets" in the Statement of Net Assets.
99
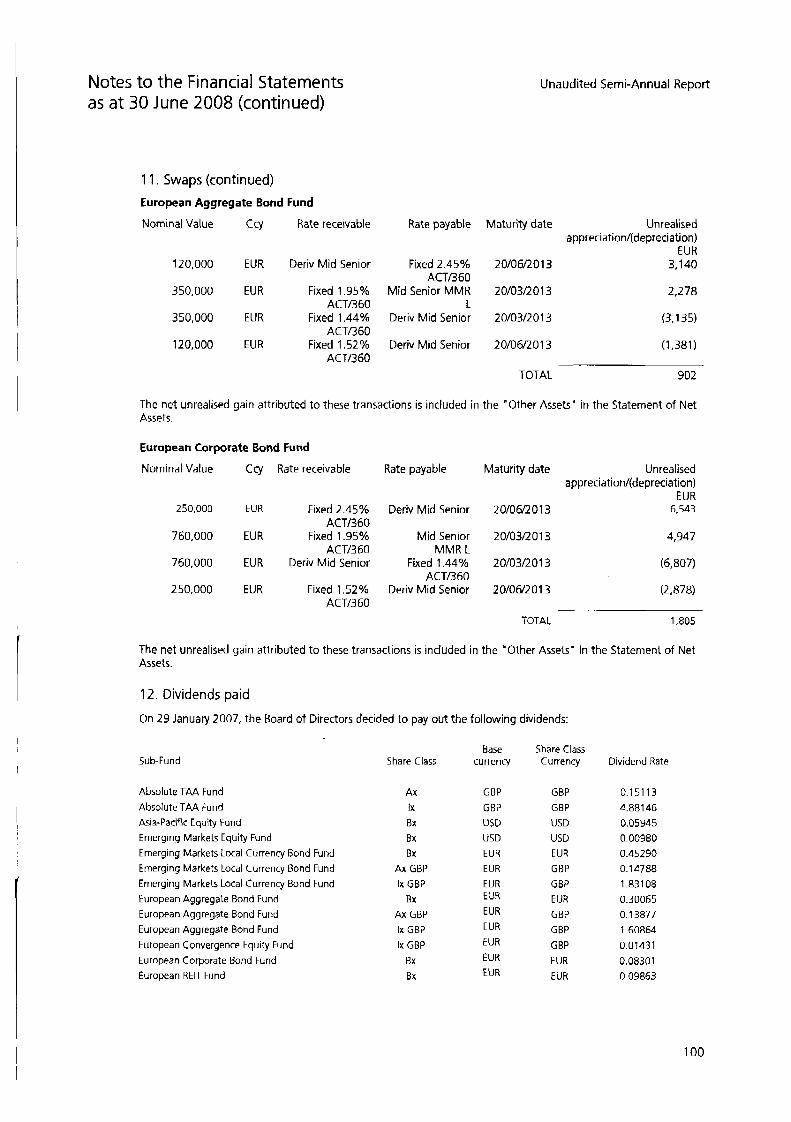
Notes to the Financial Statements as a t 30 June 2008 (continued)
11. Swaps (continued) European Aggregate Bond Fund
Nominal Value Ccy Rate receivable
120,000 EUR Deriv Mid Senior
350,000 EUR Fixed 1.95% ACT1360
350,000 EUR Fixed 1.44% ACT1360
120,000 EUR Fixed 1.52% ACT1360
Unaudited Semi-Annual Report
Rate payable Maturity date Unrealised appreciation/(depreciation)
EUR Fixed 2.45% 20/06/2013 3,140
Mid Senior MMR 20103R013 2,278
Deriv Mid Senior 20I03R013 (3.1 35)
ACT/360
L
Deriv Mid Senior 20/06/2013 (1.381)
TOTAL 902
The net unrealised gain attributed to these transactions is included in the "Other Assets" in the Statement of Net Assets.
European Corporate Bond Fund
Nominal Value Ccy Rate receivable
250,000 EUR Fixed 2.45% ACT1360
760,000 EUR Fixed 1.95% ACT1360
760,000 EUR Deriv Mid Senior
250,000 EUR Fixed 1.52% ACT1360
Rate payable Maturity date Unrealised appreciation/(depreciation)
EUR Deriv Mid Senior 20/06/2013 6.543
Mid Senior 20/03R013
Fixed 1.44% 20/03/2013
Deriv Mid Senior 20/06/2013
MMR L
ACT1360
TOTAL 1,805
The net unrealised gain attributed to these transactions is included in the "Other Assets' in the Statement of Net Assets.
12. Dividends paid
On 29 January 2007, the Board of Directors decided to pay out the following dividends:
Sub-Fund
Absolute TAA Fund Absolute TAA Fund Asia-Pacific Equity Fund Emerging Markets Equity Fund Emerging Markets Local Currency Bond Fund Emerging Markets Local Currency Bond Fund Emerging Markets Local Currency Bond Fund European Aggregate Bond Fund European Aggregate Bond Fund European Aggregate Bond Fund European Convergence Equity Fund European Corporate Bond Fund European REK Fund
Share Class
Ax IX
BX
Bx Bx
Ax GBP Ix GBP
Bx Ax GBP
Ix GBP
Ix GBP Bx Bx
Base currency
GBP
GBP USD USD
EUR
EUR
EUR EUR EUR EUR EUR EUR EUR
Share Class Currency
GBP GBP
USD USD EUR GBP GBP EUR GBP
GBP GBP EUR EUR
Dividend Rate
0.15113
0.05945 0.00980 0.45290 0.14788 1.83108 0.30065 0.1 3877 1.60864
0.01 43 1 0.08301 0.09863
4.88146
100
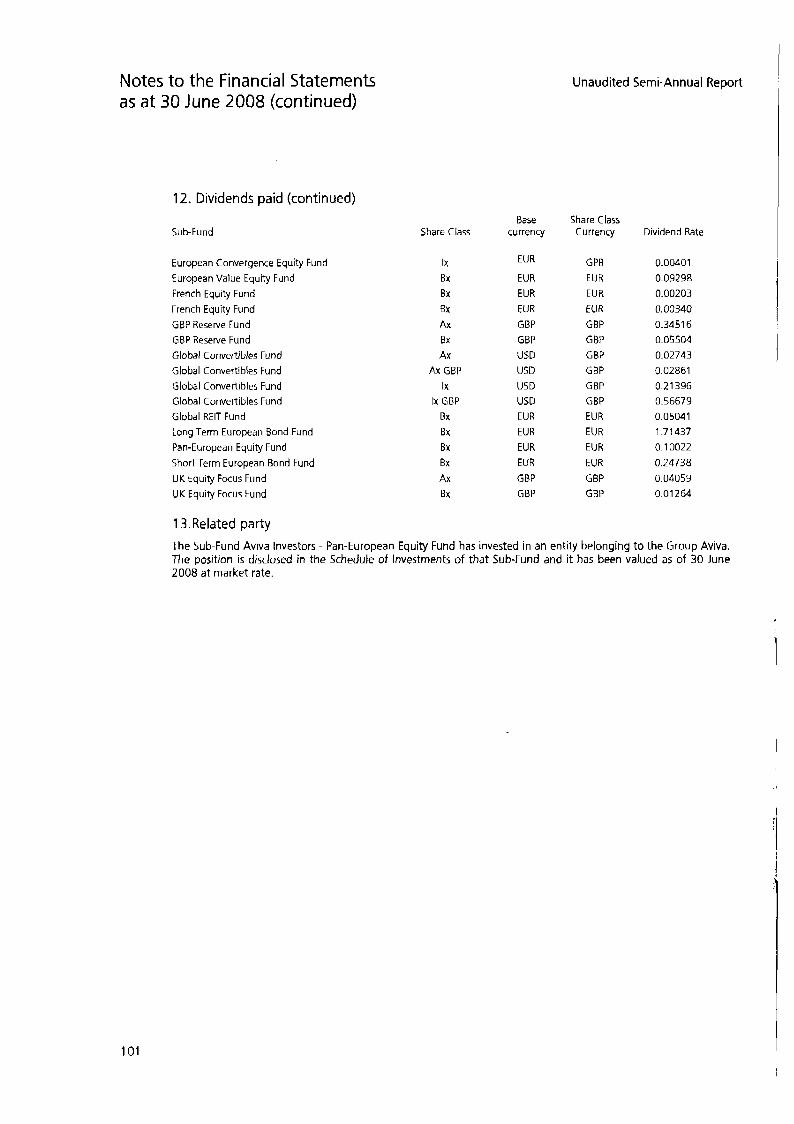
Notes to the Financial Statements as at 30 June 2008 (continued)
12. Dividends paid (continued)
Sub-fund
European Convergence Equity Fund
European Value Equity Fund French Equity Fund French Equity Fund
GBP Reserve Fund GBP Reserve Fund Global Convertibles Fund
Global Convertibles Fund Global Convertibles Fund Global Convertibles Fund Global RElT Fund Long Term European Bond Fund
Pan-European Equity Fund
Short Term European Bond Fund UK Equity Focus Fund UK Equity Focus Fund
13.Related party
Share Class
Ix BX Bx Ex
Ax Bx Ax
Ax GBP Ix
Ix GBP
Bx Bx Bx Bx Ax Bx
Base currency
EUR
EUR EUR
EUR GBP GBP USD USD USD USD EUR EUR EUR EUR
GBP GBP
Share Class Currency
GPB EUR EUR
EUR GBP GBP GBP GBP GBP GBP EUR EUR EUR
EUR GBP GBP
Dividend Rate
0.00401
0.09298 0.00203 0.00340 0.3451 6 0.05504 0.02743 0.02861 0.21396 0.56679 0.05041 1.71 437 0.1 0022
0.24738 0.04059 0.01264
The Sub-Fund Aviva Investors - Pan-European Equity Fund has invested in an entity belonging to the Group Aviva. The position is disclosed in the Schedule of Investments of that Sub-Fund and it has been valued as of 30 June 2008 at market rate.
101
Aviva Fund Services SociCtC Anonyme, PO Box 1586, L-1 01 5 Luxembourg Registered Address: 34 avenue de la LibertP. 4th floor, L-1930 Luxembourg, Grand Duchy of Luxembourg Registered in Luxembourg under R.C.S. number 825708 www.rnorleyfrn.com E-mail: helpdeskOavivafundr.lu Telephone: + (352) 40 28 20 261