JPMorgan Funds - Fundsquare
495
JPMorgan Funds Société d’Investissement à Capital Variable, Luxembourg Audited Annual Report (R.C.S. No B 8 478) 30 June 2011
-
Upload
khangminh22 -
Category
Documents
-
view
0 -
download
0
Transcript of JPMorgan Funds - Fundsquare
JPMorgan FundsSociété d’Investissement à Capital Variable, Luxembourg
Audited Annual Report
(R.C.S. No B 8 478)
30 June 2011
GB
JPMorgan FundsAudited Annual ReportAs at 30 June 2011
Contents (continued)
Board of Directors 1Management and Administration 2Board of Directors’ Report 3Investment Managers’ Report 4Audit Report 5Financial Statements and Statistical Information
Combined Statement of Net Assets 8Combined Statement of Operations and Changes in Net Assets 28Statement of Changes in the Number of Shares 47Statistical Information 61
Notes to the Financial Statements 75
Schedules of InvestmentJPMorgan Funds - Africa Equity Fund 85JPMorgan Funds - Aggregate Bond Fund 87JPMorgan Funds - America Equity Fund 92JPMorgan Funds - America Large Cap Fund 94JPMorgan Funds - Asia Pacific Bond Fund 95JPMorgan Funds - Asia Pacific ex-Japan Behavioural Finance Equity Fund 98JPMorgan Funds - Brazil Alpha Plus Fund 100JPMorgan Funds - Corporate Bond Portfolio Fund I 102JPMorgan Funds - Corporate Bond Portfolio Fund II 105JPMorgan Funds - Eastern Europe Equity Fund 108JPMorgan Funds - Emerging Europe, Middle East and Africa Equity Fund 110JPMorgan Funds - Emerging Markets Alpha Plus Fund 112JPMorgan Funds - Emerging Markets Bond Fund 114JPMorgan Funds - Emerging Markets Corporate Bond Fund 118JPMorgan Funds - Emerging Markets Corporate Bond Portfolio Fund II 121JPMorgan Funds - Emerging Markets Currency Alpha Fund 124JPMorgan Funds - Emerging Markets Debt Fund 127JPMorgan Funds - Emerging Markets Diversified Equity Fund 132JPMorgan Funds - Emerging Markets Equity Fund 134JPMorgan Funds - Emerging Markets Infrastructure Equity Fund 136JPMorgan Funds - Emerging Markets Investment Grade Bond Fund 138JPMorgan Funds - Emerging Markets Local Currency Debt Fund 141JPMorgan Funds - Emerging Markets Small Cap Fund 145JPMorgan Funds - Emerging Markets Strategic Bond Fund 147JPMorgan Funds - Emerging Markets Value Fund 150JPMorgan Funds - Emerging Middle East Equity Fund 152JPMorgan Funds - EU Government Bond Fund 153JPMorgan Funds - Euro Aggregate Bond Fund 156JPMorgan Funds - Euro Corporate Bond Fund 159JPMorgan Funds - Euro Government Short Duration Bond Fund 162JPMorgan Funds - Euro Money Market Fund 165JPMorgan Funds - Euro Short Duration Bond Fund 167JPMorgan Funds - Euroland Equity Fund 170JPMorgan Funds - Euroland Select Equity Fund 174JPMorgan Funds - Europe 130/30 Fund 177JPMorgan Funds - Europe Aggregate Plus Bond Fund 181JPMorgan Funds - Europe Balanced Fund (EUR) 185JPMorgan Funds - Europe Convergence Equity Fund 189JPMorgan Funds - Europe Dynamic Fund 190JPMorgan Funds - Europe Dynamic Mega Cap Fund 193JPMorgan Funds - Europe Dynamic Small Cap Fund 194JPMorgan Funds - Europe Equity Fund 196JPMorgan Funds - Europe Focus Fund 200JPMorgan Funds - Europe High Yield Bond Fund 203JPMorgan Funds - Europe Micro Cap Fund 207JPMorgan Funds - Europe Select 130/30 Fund 209JPMorgan Funds - Europe Small Cap Fund 212JPMorgan Funds - Europe Strategic Growth Fund 215JPMorgan Funds - Europe Strategic Growth Small Cap Fund 220JPMorgan Funds - Europe Strategic Value Fund 222JPMorgan Funds - Europe Strategic Value Small Cap Fund 226JPMorgan Funds - Europe Technology Fund 228JPMorgan Funds - Germany Equity Fund 230JPMorgan Funds - Global Absolute Return Bond Fund 231JPMorgan Funds - Global Aggregate Bond Fund 236JPMorgan Funds - Global Catholic Ethical Balanced Fund 241JPMorgan Funds - Global Consumer Trends Fund 244JPMorgan Funds - Global Convertibles Fund (EUR) 246JPMorgan Funds - Global Corporate Bond Fund 250JPMorgan Funds - Global Credit Bond Fund 254JPMorgan Funds - Global Duration-Hedged Corporate Bond Fund 257JPMorgan Funds - Global Dynamic Fund 261JPMorgan Funds - Global Equity Fund (USD) 265
JPMorgan FundsAudited Annual ReportAs at 30 June 2011
Contents (continued)
JPMorgan Funds - Global Focus Fund 268JPMorgan Funds - Global Government Bond Fund 271JPMorgan Funds - Global Government Short Duration Bond Fund 274JPMorgan Funds - Global Healthcare Fund 277JPMorgan Funds - Global Infrastructure Trends Fund 280JPMorgan Funds - Global Merger Arbitrage Fund 283JPMorgan Funds - Global Mining Fund 285JPMorgan Funds - Global Natural Resources Fund 286JPMorgan Funds - Global Real Estate Securities Fund (USD) 289JPMorgan Funds - Global Research Enhanced Index Equity Fund 292JPMorgan Funds - Global Short Duration Bond Fund 299JPMorgan Funds - Global Socially Responsible Fund 304JPMorgan Funds - Global Strategic Bond Fund 306JPMorgan Funds - Highbridge Asia Pacific STEEP Fund 311JPMorgan Funds - Highbridge Diversified Commodities Fund 313JPMorgan Funds - Highbridge Europe STEEP Fund 316JPMorgan Funds - Highbridge US STEEP Fund 319JPMorgan Funds - Japan Dynamic Fund 322JPMorgan Funds - Japan Market Neutral Fund 323JPMorgan Funds - JF ASEAN Equity Fund 325JPMorgan Funds - JF Asia Alpha Plus Fund 326JPMorgan Funds - JF Asia Pacific ex-Japan Equity Fund 328JPMorgan Funds - JF China Fund 331JPMorgan Funds - JF Greater China Fund 332JPMorgan Funds - JF Hong Kong Fund 333JPMorgan Funds - JF India Fund 334JPMorgan Funds - JF Japan Alpha Plus Fund 335JPMorgan Funds - JF Japan Equity Fund 337JPMorgan Funds - JF Japan Small Cap Fund 338JPMorgan Funds - JF Korea Equity Fund 339JPMorgan Funds - JF Pacific Balanced Fund 341JPMorgan Funds - JF Pacific Equity Fund 345JPMorgan Funds - JF Pacific Technology Fund 348JPMorgan Funds - JF Singapore Fund 349JPMorgan Funds - JF Taiwan Fund 350JPMorgan Funds - Latin America Equity Fund 351JPMorgan Funds - Managed Reserves Fund 352JPMorgan Funds - Russia Fund 357JPMorgan Funds - Sterling Bond Fund 358JPMorgan Funds - Systematic Alpha Fund 361JPMorgan Funds - UK Equity Fund 365JPMorgan Funds - US 130/30 Fund 368JPMorgan Funds - US Aggregate Bond Fund 371JPMorgan Funds - US Dynamic Fund 387JPMorgan Funds - US Growth Fund 389JPMorgan Funds - US Growth Alpha Plus Fund 391JPMorgan Funds - US Research Enhanced Index Equity Fund 392JPMorgan Funds - US Select 130/30 Fund 394JPMorgan Funds - US Select Long-Short Equity Fund 397JPMorgan Funds - US Short Duration Bond Fund 400JPMorgan Funds - US Small and Micro Cap Fund 405JPMorgan Funds - US Small Cap Growth Fund 407JPMorgan Funds - US Technology Fund 409JPMorgan Funds - US Value Fund 410
Appendix: Unaudited Additional DisclosuresFund Total Expense Ratios 413Summary of Investment Objectives of the Sub-Funds 429Performance and Volatility 436Interest Rate Received/(Charged) on Bank Accounts 452Sub-Fund Share Classes Subject to Taxe d’abonnement Rate of 0.01% 452Portfolio Turnover Ratio 453Historical Statements of Changes in the Number of Shares 454
For additional information, please consult www.jpmorganassetmanagement.com
No subscriptions can be received solely on the basis of this report. Subscriptions are only valid if made on the basis of the current prospectus, the current simplified prospectus, supplemented by thelatest audited annual report and, if published thereafter, the latest unaudited semi-annual report.
The current prospectus, the current simplified prospectus, the unaudited semi-annual reports, as well as the audited annual report can be obtained free of charge from the registered office of the SICAVand from local paying agent.
Following a review of the disclosure of Investment Manager(s) within the Prospectus and Simplified Prospectus, the details of the Investment Manager(s) for the individual Sub-Funds will now beavailable from the Management Company at its registered office, or from www.jpmorganassetmanagement.com.
JPMorgan FundsBoard of Directors
As at 30 June 2011
Chairman
Iain O.S. SaundersBankerDuine, ArdfernArgyll PA31 8QNUnited Kingdom
Directors
Jacques ElvingerPartnerElvinger, Hoss & Prussen2, place Winston ChurchillL-2014 LuxembourgGrand Duchy of Luxembourg
Jean FrijnsProfessor, Finance and InvestmentsAntigonelaan 2NL-5631 LR EindhovenThe Netherlands
Berndt MayManaging DirectorJPMorgan Asset Management (Europe) S.à r.l.Austrian BranchFührichgasse 8A-1010 ViennaAustria
Registered Office
European Bank & Business Centre6, route de TrèvesL-2633 SenningerbergGrand Duchy of Luxembourg
Deputy Chairman
Pierre JaansEconomist3, rue de KahlerL-8356 GarnichGrand Duchy of Luxembourg
James B. BroderickManaging DirectorJPMorgan Asset Management (UK) Limited20 Finsbury StreetLondon EC2Y 9AQUnited Kingdom
Robert Van der MeerProfessor of Finance12 Lange VijverbergNL-2513 AC The HagueThe Netherlands
1
JPMorgan FundsManagement and Administration
As at 30 June 2011
Management Company, Registrar and Transfer Agent,Global Distributor and Domiciliary Agent
JPMorgan Asset Management (Europe) S.à r.l.European Bank & Business Centre6, route de TrèvesL-2633 SenningerbergGrand Duchy of Luxembourg
Investment Managers
J.P. Morgan Investment Management Inc.245 Park AvenueNew York, NY 10167United States of America
JPMorgan Asset Management (Japan) LimitedTokyo Building7 - 3, Marunouchi 2 - Chome Chiyoda-kuTokyo 100 - 6432Japan
JPMorgan Asset Management (UK) Limited20 Finsbury StreetLondon EC2Y 9AQUnited Kingdom
JPMorgan Asset Management (Taiwan) Limited17th Floor, 65 Tun Hwa South RoadSection 2, TaipeiTaiwan
JF Asset Management Limited21st Floor, Chater House8 Connaught Road, CentralHong Kong
JPMorgan Asset Management (Singapore) Limited168 Robinson Road17th Floor, Capital TowerSingapore 068912
Highbridge Capital Management LLC9 West 57th StreetNew York, NY 10019United States of America
Custodian, Corporate, Administrative Agent & Paying Agent
J.P. Morgan Bank Luxembourg S.A.European Bank & Business Centre6, route de TrèvesL-2633 SenningerbergGrand Duchy of Luxembourg
Auditor
PricewaterhouseCoopers S.à r.l.400, Route d’EschB.P. 1443L-1014 LuxembourgGrand Duchy of Luxembourg
Legal Adviser
Elvinger, Hoss & Prussen2, place Winston ChurchillL-2014 LuxembourgGrand Duchy of Luxembourg
2
JPMorgan FundsBoard of Directors’ Report
As at 30 June 2011
The Board of Directors is pleased to present the Audited Annual Report for the year ended 30 June 2011.
The Fund
The Fund is a variable capital investment company, organised as a “Société Anonyme”, under the laws of the Grand Duchy of Luxembourg. The Board ofDirectors has appointed JPMorgan Asset Management (Europe) S.à r.l. as Management Company of the Fund.
The Fund is organized as an “umbrella” with a number of Sub-Funds, each of which has its own investment policy and restrictions.
At present, the Fund has issued shares in 117 Sub-Funds.
During the year, the following Sub-Funds were launched:
- JPMorgan Funds - Corporate Bond Portfolio Fund I on 1 July 2010;- JPMorgan Funds - Emerging Markets Corporate Bond Fund on 14 July 2010;- JPMorgan Funds - Global Duration-Hedged Corporate Bond Fund on 16 September 2010;- JPMorgan Funds - Global Absolute Return Bond Fund on 7 October 2010;- JPMorgan Funds - Emerging Markets Corporate Bond Portfolio Fund II on 24 November 2010;- JPMorgan Funds - Emerging Markets Investment Grade Bond Fund on 29 November 2010;- JPMorgan Funds - Emerging Markets Diversified Equity Fund on 10 December 2010;- JPMorgan Funds - Highbridge Asia Pacific STEEP Fund on 13 December 2010;- JPMorgan Funds - US Short Duration Bond Fund on 15 December 2010;- JPMorgan Funds - US Select Long-Short Equity Fund on 31 January 2011;- JPMorgan Funds - Global Mining Fund on 8 February 2011;- JPMorgan Funds - US Research Enhanced Index Equity Fund on 18 February 2011;- JPMorgan Funds - Corporate Bond Portfolio Fund II on 22 February 2011;- JPMorgan Funds - Highbridge Diversified Commodities Fund on 4 March 2011;- JPMorgan Funds - Global Merger Arbitrage Fund on 8 March 2011;- JPMorgan Funds - Emerging Markets Strategic Bond Fund on 12 April 2011;- JPMorgan Funds - Global Catholic Ethical Balanced Fund on 19 May 2011;- JPMorgan Funds - Japan Market Neutral Fund on 3 June 2011.
During the year, the total net assets of the Fund increased from USD 44.1 billion to USD 61.6 billion at year end.
The Fund qualifies as an Undertaking for Collective Investment in Transferable Securities under the amended EC Directive 85/611 of 20 December 1985 andfrom 1 July 2011 the Fund is subject to the law of 17 December 2010. The Fund may therefore be offered for sale in European Union Member States, subject toregistration in countries other than the Grand Duchy of Luxembourg. In addition, applications to register the Fund and its Sub-Funds may be made in othercountries.
The Fund and the Sub-Funds are currently registered for offer and distribution in the Grand Duchy of Luxembourg and in the following jurisdictions:
Austria, Bahrain, Belgium, Chile, Cyprus, Denmark, Estonia, Finland, France, Germany, Greece, Hong Kong, Ireland, Italy, Jersey, Korea, Macau, TheNetherlands, Norway, Peru, Poland, Portugal, Singapore, Spain, Sweden, Switzerland, Taiwan and the United Kingdom.
Responsibility of the Directors
The responsibility of the Directors of the Fund is governed exclusively by Luxembourg law. With respect to the annual accounts of the Fund, the duties of theDirectors are governed by general corporate law and the law of 19 December 2002 on, inter alia, the accounting and annual accounts of undertakings and bythe law of 17 December 2010 relating to undertakings for collective investment.
Change in the Board of Directors
Earlier this year Ms Andrea L. Hazen informed the Board of her intention to retire from the Board of Directors and it was agreed that this would be effectivefrom 31 March 2011. Ms Hazen had been a Director of the Company since September 2005 and the Board would like to take this opportunity to record theirthanks for her services.
In addition, the Board would like to advise that with effect from 31 March 2011 Mr James B. Broderick was co-opted as a Director and his appointment will beapproved by Shareholders at the forthcoming Annual General Meeting.
ALFI Code of Conduct
Following its introduction the Board of Directors has adopted the ALFI Code of Conduct (the “Code”) which sets out principles of good governance. The Boardof Directors considers that the Fund has been in compliance with the Code in all material aspects throughout the financial year ended 30 June 2011.
Annual General Meeting
The next Annual General Meeting of the Company will be held on 16 November 2011.
Board of Directors
Luxembourg, 4 October 2011
3
JPMorgan FundsInvestment Managers’ Report
For the Year Ended 30 June 2011
Market Review
Global stock markets made strong gains over the 12 months to the end of June 2011, with the MSCI World Index rising 10.8% in euro terms against a backdropof strong corporate profits growth (source: FactSet).
In contrast, government bond investors experienced losses in euro terms, with the JPMorgan Global Bond Index down 6.9% in euro terms. Returns werenegative in the period as the environment was poor for bonds, with developed markets experiencing a disappointingly weak recovery, rising inflationarypressures and expectations for rising interest rates.
Bond markets were also impacted by ongoing eurozone sovereign debt concerns. In peripheral Europe, the JPMorgan Ireland Index fell 22.9% and theJPMorgan Portugal Index was down 21.5% as both countries required bailouts in the period from the European Union (EU) and the International MonetaryFund (IMF). Core European markets were also hurt, with the JPMorgan Germany Index losing 1.0% and the JPMorgan France Index down 0.4% (source forgovernment bond indices: J.P. Morgan).
The review period began well for equities with a strong second-quarter 2010 corporate earnings season. However, the positive market sentiment quicklyfaded over the summer as the macroeconomic outlook became increasingly uncertain and investors waited to see if central banks would introduce morestimulus measures.
With the US economic recovery looking fragile, Ben Bernanke, chairman of the US Federal Reserve (“Fed”), talked of the need for a second round ofquantitative easing (QE2). In September and October markets rallied as investors changed allocation priorities towards equities in anticipation of QE2. On 3November, the Fed announced a larger-than-expected USD 600 billion asset purchase package, which was well received by the market.
The global stock market rally faltered in late November, when eurozone sovereign debt and Chinese inflation concerns undermined investor confidence. Abailout for Ireland from the EU and IMF calmed nerves, helping global markets to regain their upward momentum towards the end of 2010. Sentiment wasfurther supported in early 2011 by strong leading economic indicators from the developed world and generally good fourth-quarter 2010 corporate earningsresults.
Geopolitical instability in North Africa and the Middle East came to the fore in February, with political protests breaking out in Tunisia and Egypt. In March,violence escalated and civil unrest spread to Bahrain and Libya, resulting in disruption to oil production, which triggered a sharp rise in oil prices. Developedcountry bond investors feared that high oil prices would add to existing inflationary pressures, resulting in earlier-than-expected interest rate rises.
In the eurozone, the European Central Bank raised interest rates by 0.25% to 1.25% in April in an attempt to bring inflation back below its 2% target – makingit the first major developed market central bank to tighten policy. In emerging markets, central banks in China, Brazil, Korea, India and Thailand also raisedtheir key lending rates over the review period in an effort to combat rising prices. However, despite inflation rising sharply, the Bank of England and US Fedkept policy unchanged as economic growth remained weak.
Markets succumbed to further uncertainty when a massive earthquake, measuring 9.0 in magnitude, hit Japan on 11 March. Concerns about therepercussions of the earthquake, particularly on production lines and manufacturing supply chains, resulted in losses for markets globally.
Market volatility continued as the eurozone sovereign debt crisis re-emerged towards the end of the review period. A swift rescue package from the EU andIMF for Portugal reassured investors, but in May investor concerns turned to Greece, where a debt default became increasingly likely.
The Greek parliament eased investor concerns in late June by approving a new five-year package of additional spending cuts, tax increases and state assetsales, paving the way for the EU and IMF to release the next tranche of bailout funds. However, markets remain volatile as European politicians search for acomprehensive solution to the crisis.
Meanwhile, the impact of higher oil prices, the Japanese earthquake and tighter monetary policy started to come through in economic data. In China,investors began to worry about a hard landing for the economy as industrial data softened. Meanwhile, US economic data pointed towards a slowdown, withmanufacturing activity weakening in April and May, unemployment rising and the housing market continuing to struggle. The period drew to a close withreassurance from Fed officials that the exit from QE2, starting on the 30 June, should be gradual and flexible.
Outlook
The recent weakness in global economic data has led investors to question whether we are experiencing a soft patch or if this is the beginning of reneweddownturn. It seems most likely we are seeing a mid-cycle soft patch and that growth will pick up again later in the year and into 2012 as Greece receivesanother tranche of bailout money from the EU and IMF, oil prices stabilise and Japanese supply constraints ease.
In the US, the Fed is expected to keep interest rate policy unchanged through 2011 and probably 2012 in order to support economic growth. Monetaryconditions also remain broadly accommodative in the eurozone and Japan, and interest rates in the UK look to stay lower for longer as it is likely the Bank ofEngland will want to delay a rate increase given the economy is just beginning to feel the full force of the government’s fiscal austerity measures.
On global stock markets sentiment is likely to remain subdued while uncertainty remains over the course of the global economy – in particular the outlook forthe US and China. Middle East and eurozone debt concerns will also continue to weigh on confidence. However, globally, valuations do not look stretchedgiven expectations for firm corporate earnings growth in 2011.
Investment Managers
4 October 2011
The information contained in this report is historical and not necessarily indicative of future performance.
4
Following our appointment by the General Meeting of the Shareholders dated 17 November 2010, we have audited the accompanying financial statements of JPMorgan Fundsand of each of its Sub-Funds, which comprise the Combined Statement of Net Assets and the Schedule of Investments as at 30 June 2011 and the Combined Statement ofOperations and Changes in Net Assets for the year then ended, and a summary of significant accounting policies and other explanatory notes to the financial statements.
Responsibility of the Board of Directors of the SICAV for the financial statementsThe Board of Directors of the SICAV is responsible for the preparation and fair presentation of these financial statements in accordance with Luxembourg legal and regulatoryrequirements relating to the preparation of the financial statements and for such internal control as the Board of Directors of the SICAV determines is necessary to enable thepreparation of financial statements that are free from material misstatement, whether due to fraud or error.
Responsibility of the “Réviseur d’entreprises agréé”Our responsibility is to express an opinion on these financial statements based on our audit. We conducted our audit in accordance with International Standards on Auditing asadopted for Luxembourg by the “Commission de Surveillance du Secteur Financier”. Those standards require that we comply with ethical requirements and plan and performthe audit to obtain reasonable assurance whether the financial statements are free from material misstatement.
An audit involves performing procedures to obtain audit evidence about the amounts and disclosures in the financial statements. The procedures selected depend on thejudgment of the “Réviseur d’entreprises agréé”, including the assessment of the risks of material misstatement of the financial statements, whether due to fraud or error. Inmaking those risk assessments, the “Réviseur d’entreprises agréé” considers internal control relevant to the entity’s preparation and fair presentation of the financialstatements in order to design audit procedures that are appropriate in the circumstances, but not for the purpose of expressing an opinion on the effectiveness of the entity’sinternal control. An audit also includes evaluating the appropriateness of accounting policies used and the reasonableness of accounting estimates made by the Board ofDirectors of the SICAV, as well as evaluating the overall presentation of the financial statements.
We believe that the audit evidence we have obtained is sufficient and appropriate to provide a basis for our audit opinion.
OpinionIn our opinion, the financial statements give a true and fair view of the financial position of JPMorgan Funds and of each of its Sub-Funds as of 30 June 2011, and of the results oftheir operations and changes in their net assets for the year then ended in accordance with Luxembourg legal and regulatory requirements relating to the preparation of thefinancial statements.
Other mattersSupplementary information included in the annual report has been reviewed in the context of our mandate but has not been subject to specific audit procedures carried out inaccordance with the standards described above. Consequently, we express no opinion on such information. However, we have no observation to make concerning suchinformation in the context of the financial statements taken as a whole.
PricewaterhouseCoopers S.à r.l. Luxembourg, 4 October 2011Represented by
Régis Malcourant
PricewaterhouseCoopers S.à r.l., 400 Route d’Esch, B.P. 1443, L-1014 LuxembourgT: +352 494848 1, F: +352 494848 2900, www.pwc.lu
Cabinet de révision agréé. Expert-comptable (autorisation gouvernementale n° 00123693)R.C.S. Luxembourg B 65 477 - Capital social EUR 516 950 - TVA LU17564447
5
Audit Report
To the Shareholders ofJPMorgan Funds

This page has been left blank intentionally
6

This page has been left blank intentionally
7
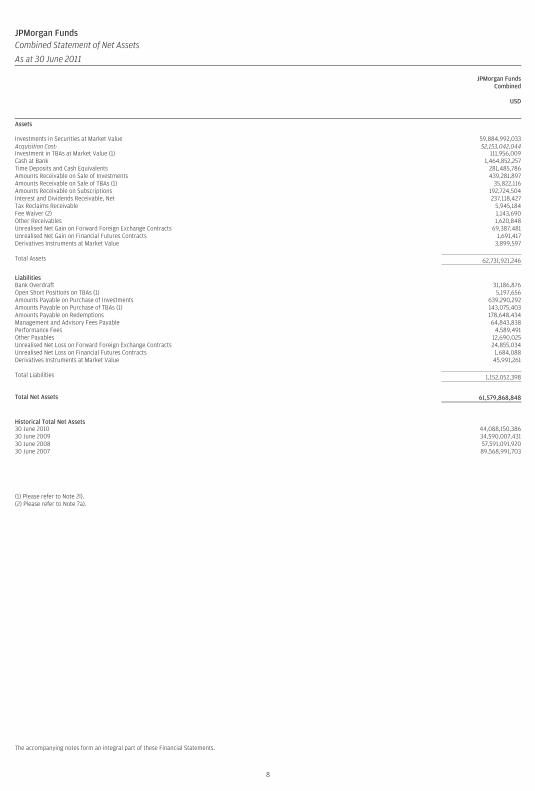
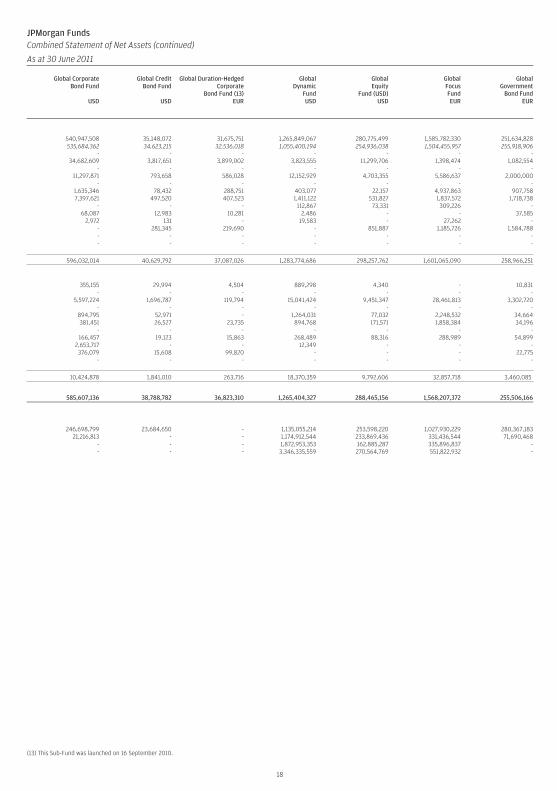
JPMorgan FundsCombined Statement of Net Assets
As at 30 June 2011
JPMorgan FundsCombined
USD
Assets
Investments in Securities at Market Value 59,884,992,033Acquisition Cost: 52,153,042,044Investment in TBAs at Market Value (1) 111,956,009Cash at Bank 1,464,852,257Time Deposits and Cash Equivalents 281,485,786Amounts Receivable on Sale of Investments 439,281,897Amounts Receivable on Sale of TBAs (1) 35,822,116Amounts Receivable on Subscriptions 192,724,504Interest and Dividends Receivable, Net 237,118,427Tax Reclaims Receivable 5,945,184Fee Waiver (2) 1,143,690Other Receivables 1,620,848Unrealised Net Gain on Forward Foreign Exchange Contracts 69,387,481Unrealised Net Gain on Financial Futures Contracts 1,691,417Derivatives Instruments at Market Value 3,899,597
Total Assets 62,731,921,246
LiabilitiesBank Overdraft 31,186,876Open Short Positions on TBAs (1) 5,197,656Amounts Payable on Purchase of Investments 639,290,292Amounts Payable on Purchase of TBAs (1) 143,075,403Amounts Payable on Redemptions 178,648,434Management and Advisory Fees Payable 64,843,838Performance Fees 4,589,491Other Payables 12,690,025Unrealised Net Loss on Forward Foreign Exchange Contracts 24,855,034Unrealised Net Loss on Financial Futures Contracts 1,684,088Derivatives Instruments at Market Value 45,991,261
Total Liabilities 1,152,052,398
Total Net Assets 61,579,868,848
Historical Total Net Assets30 June 2010 44,088,150,38630 June 2009 34,590,007,43130 June 2008 57,591,091,92030 June 2007 89,568,991,703
(1) Please refer to Note 2l).(2) Please refer to Note 7a).
The accompanying notes form an integral part of these Financial Statements.
8
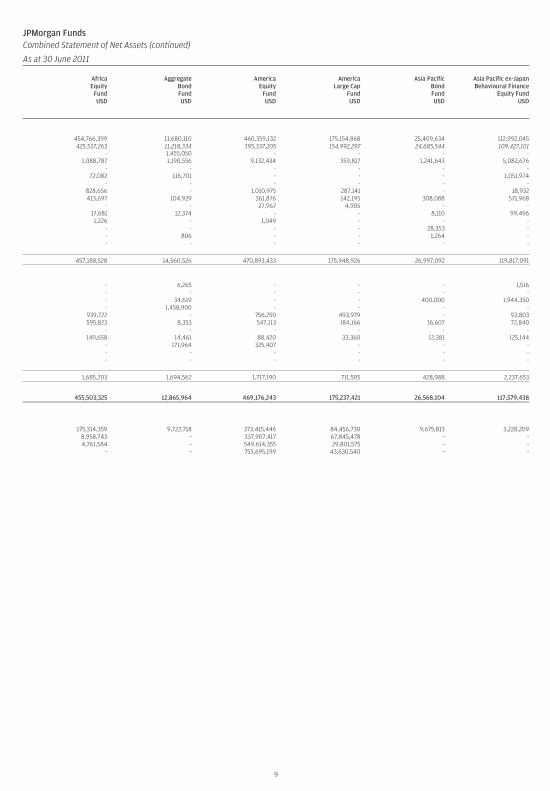
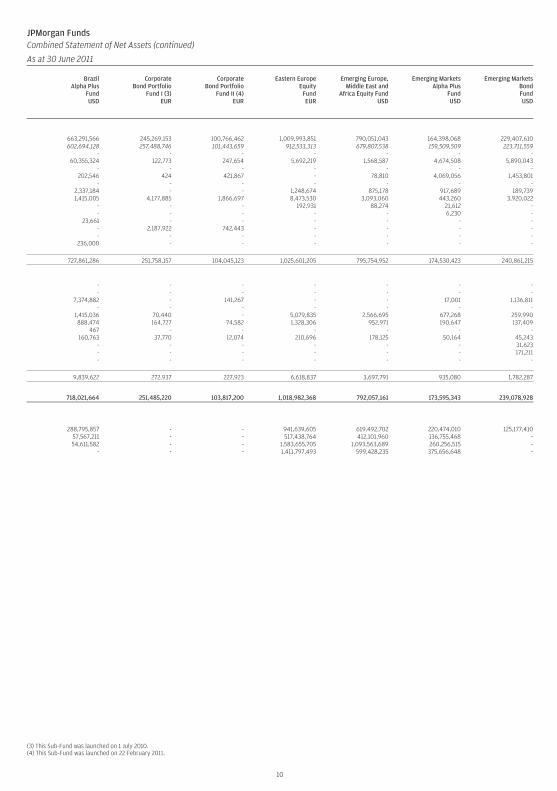
JPMorgan FundsCombined Statement of Net Assets (continued)
As at 30 June 2011
AfricaEquity
FundUSD
AggregateBondFundUSD
AmericaEquity
FundUSD
AmericaLarge Cap
FundUSD
Asia PacificBondFundUSD
Asia Pacific ex-JapanBehavioural Finance
Equity FundUSD
454,766,399 11,680,110 460,359,132 175,154,868 25,409,634 112,992,045425,537,263 11,218,334 395,337,205 154,992,297 24,685,544 109,427,101
- 1,455,050 - - - -1,088,787 1,190,556 9,132,434 359,817 1,241,643 5,082,676
- - - - - -72,082 116,701 - - - 1,051,974
- - - - - -828,656 - 1,010,975 287,141 - 18,932413,697 104,929 361,876 142,195 308,088 571,968
- - 27,967 4,905 - -17,681 12,374 - - 8,110 99,4961,226 - 1,049 - - -
- - - - 28,353 -- 806 - - 1,264 -- - - - - -
457,188,528 14,560,526 470,893,433 175,948,926 26,997,092 119,817,091
- 6,265 - - - 1,516- - - - - -- 34,619 - - 400,000 1,944,350- 1,458,900 - - - -
939,722 - 756,250 493,979 - 93,803595,823 8,353 547,113 184,166 16,607 72,840
- - - - - -149,658 14,461 88,420 33,360 12,381 125,144
- 171,964 325,407 - - -- - - - - -- - - - - -
1,685,203 1,694,562 1,717,190 711,505 428,988 2,237,653
455,503,325 12,865,964 469,176,243 175,237,421 26,568,104 117,579,438
175,314,359 9,722,718 373,415,446 84,456,730 9,675,813 3,228,2098,958,743 - 337,907,417 67,845,478 - -4,761,584 - 549,614,355 29,801,575 - -
- - 753,695,199 43,630,540 - -
9
JPMorgan FundsCombined Statement of Net Assets (continued)
As at 30 June 2011
BrazilAlpha Plus
FundUSD
CorporateBond Portfolio
Fund I (3)EUR
CorporateBond Portfolio
Fund II (4)EUR
Eastern EuropeEquity
FundEUR
Emerging Europe,Middle East and
Africa Equity FundUSD
Emerging MarketsAlpha Plus
FundUSD
Emerging MarketsBondFundUSD
663,291,566 245,269,153 100,766,462 1,009,993,851 790,051,043 164,398,068 229,407,610602,694,128 257,488,746 101,443,659 912,533,313 679,807,538 159,509,509 223,711,559
- - - - - - -60,355,324 122,773 247,654 5,692,219 1,568,587 4,674,508 5,890,043
- - - - - - -202,546 424 421,867 - 78,810 4,069,056 1,453,801
- - - - - - -2,337,184 - - 1,248,674 875,178 917,689 189,7391,415,005 4,177,885 1,866,697 8,473,530 3,093,060 443,260 3,920,022
- - - 192,931 88,274 21,612 -- - - - - 6,230 -
23,661 - - - - - -- 2,187,922 742,443 - - - -- - - - - - -
236,000 - - - - - -
727,861,286 251,758,157 104,045,123 1,025,601,205 795,754,952 174,530,423 240,861,215
- - - - - - -- - - - - - -
7,374,882 - 141,267 - - 17,001 1,136,811- - - - - - -
1,415,036 70,440 - 5,079,835 2,566,695 677,268 259,990888,474 164,727 74,582 1,328,306 952,971 190,647 137,409
467 - - - - - -160,763 37,770 12,074 210,696 178,125 50,164 45,243
- - - - - - 31,623- - - - - - 171,211- - - - - - -
9,839,622 272,937 227,923 6,618,837 3,697,791 935,080 1,782,287
718,021,664 251,485,220 103,817,200 1,018,982,368 792,057,161 173,595,343 239,078,928
288,795,857 - - 941,639,605 619,492,702 220,474,010 125,177,41057,567,211 - - 517,438,764 412,101,960 136,755,468 -54,611,582 - - 1,583,655,705 1,093,563,689 260,256,515 -
- - - 1,411,797,493 599,428,235 375,656,648 -
(3) This Sub-Fund was launched on 1 July 2010.(4) This Sub-Fund was launched on 22 February 2011.
10
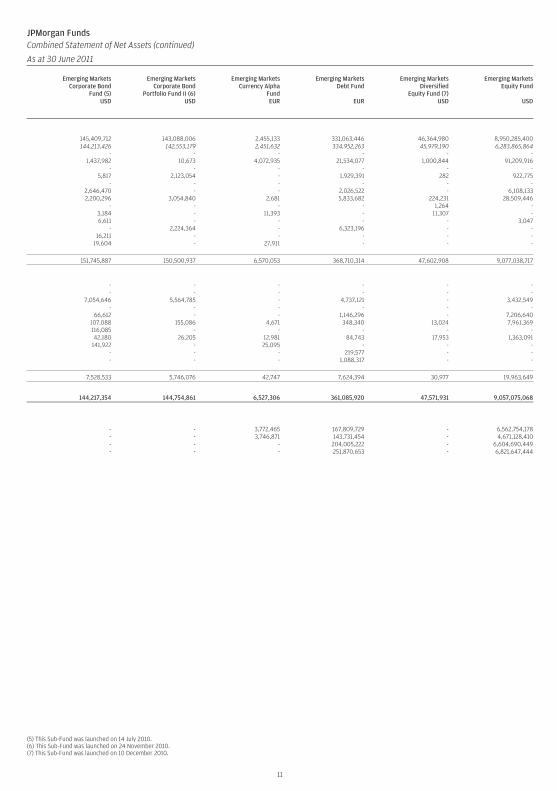
JPMorgan FundsCombined Statement of Net Assets (continued)
As at 30 June 2011
Emerging MarketsCorporate Bond
Fund (5)USD
Emerging MarketsCorporate Bond
Portfolio Fund II (6)USD
Emerging MarketsCurrency Alpha
FundEUR
Emerging MarketsDebt Fund
EUR
Emerging MarketsDiversified
Equity Fund (7)USD
Emerging MarketsEquity Fund
USD
145,409,712 143,088,006 2,455,133 331,063,446 46,364,980 8,950,285,400144,213,426 142,553,179 2,451,632 334,952,263 45,979,190 6,283,865,864
- - - - - -1,437,982 10,673 4,072,935 21,534,077 1,000,844 91,209,916
- - - - - -5,817 2,123,054 - 1,929,391 282 922,775
- - - - - -2,646,470 - - 2,026,522 - 6,108,1332,200,296 3,054,840 2,681 5,833,682 224,231 28,509,446
- - - - 1,264 -3,184 - 11,393 - 11,307 -6,611 - - - - 3,047
- 2,224,364 - 6,323,196 - -16,211 - - - - -
19,604 - 27,911 - - -
151,745,887 150,500,937 6,570,053 368,710,314 47,602,908 9,077,038,717
- - - - - -- - - - - -
7,054,646 5,564,785 - 4,737,121 - 3,432,549- - - - - -
66,612 - - 1,146,296 - 7,206,640107,088 155,086 4,671 348,340 13,024 7,961,369116,085 - - - - -42,180 26,205 12,981 84,743 17,953 1,363,091
141,922 - 25,095 - - -- - - 219,577 - -- - - 1,088,317 - -
7,528,533 5,746,076 42,747 7,624,394 30,977 19,963,649
144,217,354 144,754,861 6,527,306 361,085,920 47,571,931 9,057,075,068
- - 3,772,465 167,809,729 - 6,562,754,178- - 3,746,871 143,731,454 - 4,671,128,410- - - 204,005,222 - 6,604,690,449- - - 251,870,653 - 6,821,647,444
(5) This Sub-Fund was launched on 14 July 2010.(6) This Sub-Fund was launched on 24 November 2010.(7) This Sub-Fund was launched on 10 December 2010.
11
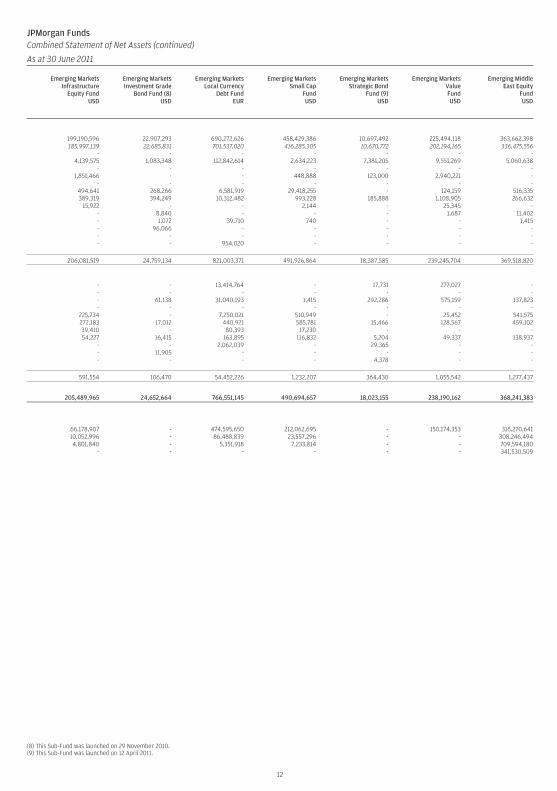
JPMorgan FundsCombined Statement of Net Assets (continued)
As at 30 June 2011
Emerging MarketsInfrastructure
Equity FundUSD
Emerging MarketsInvestment Grade
Bond Fund (8)USD
Emerging MarketsLocal Currency
Debt FundEUR
Emerging MarketsSmall Cap
FundUSD
Emerging MarketsStrategic Bond
Fund (9)USD
Emerging MarketsValueFundUSD
Emerging MiddleEast Equity
FundUSD
199,190,596 22,907,293 690,272,626 458,429,386 10,697,492 225,494,118 363,662,398185,997,139 22,685,831 701,537,020 416,285,305 10,670,772 202,194,165 336,475,556
- - - - - - -4,139,575 1,083,348 112,842,614 2,634,223 7,381,205 9,551,269 5,060,638
- - - - - - -1,851,466 - - 448,888 123,000 2,940,221 -
- - - - - - -494,641 268,266 6,581,919 29,418,255 - 124,159 516,335389,319 394,249 10,312,482 993,228 185,888 1,108,905 266,632
15,922 - - 2,144 - 25,345 -- 8,840 - - - 1,687 11,402- 1,072 39,710 740 - - 1,415- 96,066 - - - - -- - - - - - -- - 954,020 - - - -
206,081,519 24,759,134 821,003,371 491,926,864 18,387,585 239,245,704 369,518,820
- - 13,414,764 - 17,731 277,027 -- - - - - - -- 61,138 31,040,193 1,415 292,286 575,159 137,823- - - - - - -
225,734 - 7,250,021 510,949 - 25,452 541,575272,183 17,012 440,921 585,781 15,466 128,567 459,10239,410 - 80,393 17,230 - - -54,227 16,415 163,895 116,832 5,204 49,337 138,937
- - 2,062,039 - 29,365 - -- 11,905 - - - - -- - - - 4,378 - -
591,554 106,470 54,452,226 1,232,207 364,430 1,055,542 1,277,437
205,489,965 24,652,664 766,551,145 490,694,657 18,023,155 238,190,162 368,241,383
66,178,907 - 474,595,650 212,062,695 - 150,174,353 316,270,64110,052,996 - 86,488,839 23,557,296 - - 308,246,4944,801,840 - 5,351,918 7,233,814 - - 709,594,180
- - - - - - 341,530,509
(8) This Sub-Fund was launched on 29 November 2010.(9) This Sub-Fund was launched on 12 April 2011.
12
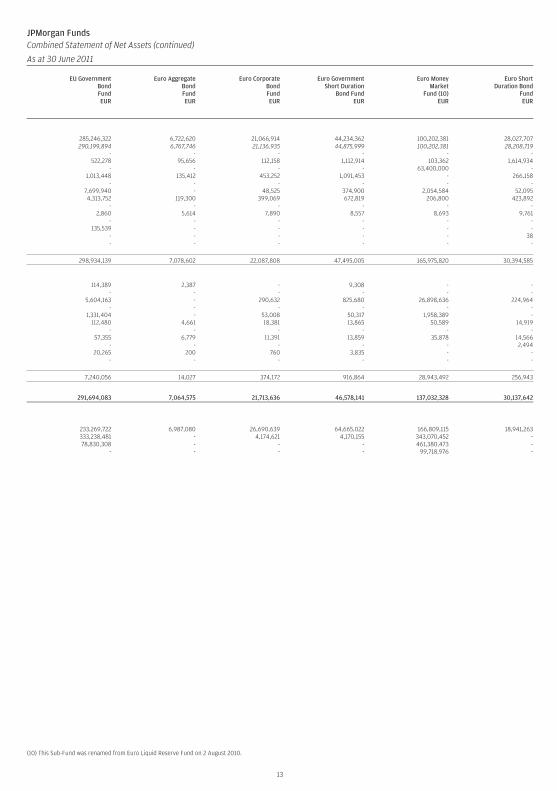
JPMorgan FundsCombined Statement of Net Assets (continued)
As at 30 June 2011
EU GovernmentBondFundEUR
Euro AggregateBondFundEUR
Euro CorporateBondFundEUR
Euro GovernmentShort Duration
Bond FundEUR
Euro MoneyMarket
Fund (10)EUR
Euro ShortDuration Bond
FundEUR
285,246,322 6,722,620 21,066,914 44,234,362 100,202,381 28,027,707290,199,894 6,767,746 21,136,935 44,875,999 100,202,381 28,208,719
- - - - - -522,278 95,656 112,158 1,112,914 103,362 1,614,934
- - - - 63,400,000 -1,013,448 135,412 453,252 1,091,453 - 266,158
- - - - - -7,699,940 - 48,525 374,900 2,054,584 52,0954,313,752 119,300 399,069 672,819 206,800 423,892
- - - - - -2,860 5,614 7,890 8,557 8,693 9,761
- - - - - -135,539 - - - - -
- - - - - 38- - - - - -
298,934,139 7,078,602 22,087,808 47,495,005 165,975,820 30,394,585
114,389 2,387 - 9,308 - -- - - - - -
5,604,163 - 290,632 825,680 26,898,636 224,964- - - - - -
1,331,404 - 53,008 50,317 1,958,389 -112,480 4,661 18,381 13,865 50,589 14,919
- - - - - -57,355 6,779 11,391 13,859 35,878 14,566
- - - - - 2,49420,265 200 760 3,835 - -
- - - - - -
7,240,056 14,027 374,172 916,864 28,943,492 256,943
291,694,083 7,064,575 21,713,636 46,578,141 137,032,328 30,137,642
233,269,722 6,987,080 26,690,639 64,665,022 166,809,115 18,941,263333,238,481 - 4,174,621 4,170,155 343,070,452 -78,830,308 - - - 461,380,473 -
- - - - 99,718,976 -
(10) This Sub-Fund was renamed from Euro Liquid Reserve Fund on 2 August 2010.
13
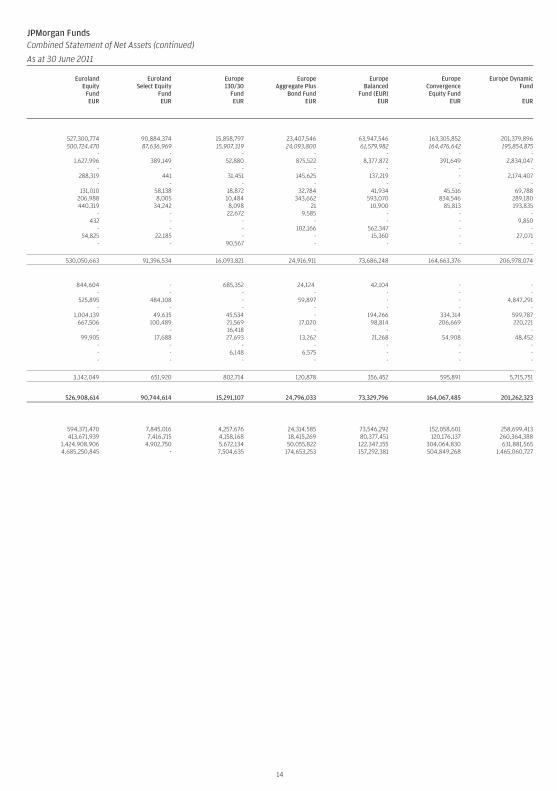
JPMorgan FundsCombined Statement of Net Assets (continued)
As at 30 June 2011
EurolandEquity
FundEUR
EurolandSelect Equity
FundEUR
Europe130/30
FundEUR
EuropeAggregate Plus
Bond FundEUR
EuropeBalanced
Fund (EUR)EUR
EuropeConvergenceEquity Fund
EUR
Europe DynamicFund
EUR
527,300,774 90,884,374 15,858,797 23,407,546 63,947,546 163,305,852 201,379,896500,724,470 87,636,969 15,907,319 24,093,800 61,579,982 164,476,642 195,854,875
- - - - - - -1,627,996 389,149 52,880 875,522 8,377,872 391,649 2,834,047
- - - - - - -288,319 441 31,451 145,625 137,219 - 2,174,407
- - - - - - -131,010 58,138 18,872 32,784 41,934 45,516 69,788
206,988 8,005 10,484 343,662 593,070 834,546 289,180440,319 34,242 8,098 21 10,900 85,813 193,835
- - 22,672 9,585 - - -432 - - - - - 9,850
- - - 102,166 562,347 - -54,825 22,185 - - 15,360 - 27,071
- - 90,567 - - - -
530,050,663 91,396,534 16,093,821 24,916,911 73,686,248 164,663,376 206,978,074
844,604 - 685,352 24,124 42,104 - -- - - - - - -
525,895 484,108 - 59,897 - - 4,847,291- - - - - - -
1,004,139 49,635 45,534 - 194,266 334,314 599,787667,506 100,489 21,569 17,020 98,814 206,669 220,221
- - 16,418 - - - -99,905 17,688 27,693 13,262 21,268 54,908 48,452
- - - - - - -- - 6,148 6,575 - - -- - - - - - -
3,142,049 651,920 802,714 120,878 356,452 595,891 5,715,751
526,908,614 90,744,614 15,291,107 24,796,033 73,329,796 164,067,485 201,262,323
594,371,470 7,845,016 4,257,676 24,314,585 73,546,292 152,058,601 258,699,413413,671,939 7,416,715 4,158,168 18,415,269 80,377,451 120,176,137 260,364,388
1,424,908,906 4,902,750 5,672,134 50,055,822 122,347,155 304,064,830 631,881,5654,685,250,845 - 7,504,635 174,653,253 157,292,381 504,849,268 1,465,060,727
14
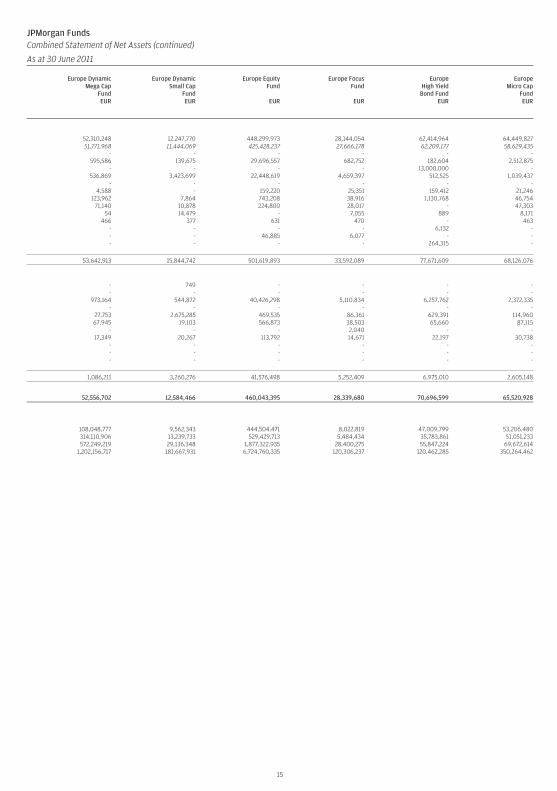
JPMorgan FundsCombined Statement of Net Assets (continued)
As at 30 June 2011
Europe DynamicMega Cap
FundEUR
Europe DynamicSmall Cap
FundEUR
Europe EquityFund
EUR
Europe FocusFund
EUR
EuropeHigh Yield
Bond FundEUR
EuropeMicro Cap
FundEUR
52,310,248 12,247,770 448,299,973 28,144,054 62,414,964 64,449,82751,771,968 11,444,069 425,428,237 27,666,178 62,209,177 58,629,435
- - - - - -595,586 139,675 29,696,557 682,752 182,604 2,512,875
- - - - 13,000,000 -536,869 3,423,699 22,448,619 4,659,397 512,525 1,039,437
- - - - - -4,588 - 159,220 25,351 159,412 21,246
123,962 7,864 743,208 38,916 1,130,768 46,75471,140 10,878 224,800 28,017 - 47,303
54 14,479 - 7,055 889 8,171466 377 631 470 - 463
- - - - 6,132 -- - 46,885 6,077 - -- - - - 264,315 -
53,642,913 15,844,742 501,619,893 33,592,089 77,671,609 68,126,076
- 749 - - - -- - - - - -
973,164 544,872 40,426,298 5,110,834 6,257,762 2,372,335- - - - - -
27,753 2,675,285 469,535 86,361 629,391 114,96067,945 19,103 566,873 38,503 65,660 87,115
- - - 2,040 - -17,349 20,267 113,792 14,671 22,197 30,738
- - - - - -- - - - - -- - - - - -
1,086,211 3,260,276 41,576,498 5,252,409 6,975,010 2,605,148
52,556,702 12,584,466 460,043,395 28,339,680 70,696,599 65,520,928
108,048,777 9,562,343 444,504,471 8,022,819 47,009,799 53,206,480314,110,906 13,239,733 529,429,713 5,484,434 35,783,861 51,051,233572,249,219 29,136,348 1,877,322,935 28,400,275 55,847,224 69,672,614
1,202,156,717 181,667,931 6,724,760,335 120,306,237 120,462,285 350,264,462
15
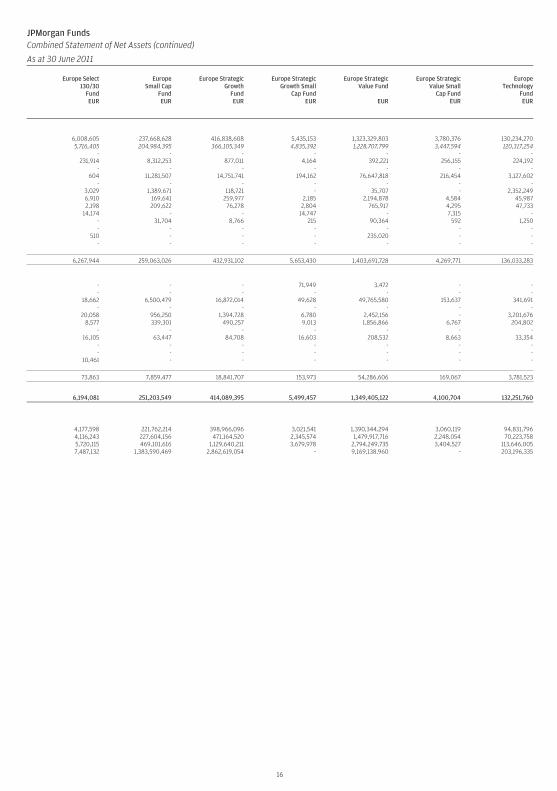
JPMorgan FundsCombined Statement of Net Assets (continued)
As at 30 June 2011
Europe Select130/30
FundEUR
EuropeSmall Cap
FundEUR
Europe StrategicGrowth
FundEUR
Europe StrategicGrowth Small
Cap FundEUR
Europe StrategicValue Fund
EUR
Europe StrategicValue Small
Cap FundEUR
EuropeTechnology
FundEUR
6,008,605 237,668,628 416,838,608 5,435,153 1,323,329,803 3,780,376 130,234,2705,716,405 204,984,395 366,105,349 4,835,392 1,228,707,799 3,447,594 120,317,254
- - - - - - -231,914 8,312,253 877,011 4,164 392,221 256,155 224,192
- - - - - - -604 11,281,507 14,751,741 194,162 76,647,818 216,454 3,127,602
- - - - - - -3,029 1,389,671 118,721 - 35,707 - 2,352,2496,910 169,641 259,977 2,185 2,194,878 4,584 45,9872,198 209,622 76,278 2,804 765,917 4,295 47,733
14,174 - - 14,747 - 7,315 -- 31,704 8,766 215 90,364 592 1,250- - - - - - -
510 - - - 235,020 - -- - - - - - -
6,267,944 259,063,026 432,931,102 5,653,430 1,403,691,728 4,269,771 136,033,283
- - - 71,949 3,472 - -- - - - - - -
18,662 6,500,479 16,872,014 49,628 49,765,580 153,637 341,691- - - - - - -
20,058 956,250 1,394,728 6,780 2,452,156 - 3,201,6768,577 339,301 490,257 9,013 1,856,866 6,767 204,802
- - - - - - -16,105 63,447 84,708 16,603 208,532 8,663 33,354
- - - - - - -- - - - - - -
10,461 - - - - - -
73,863 7,859,477 18,841,707 153,973 54,286,606 169,067 3,781,523
6,194,081 251,203,549 414,089,395 5,499,457 1,349,405,122 4,100,704 132,251,760
4,177,598 221,762,214 398,966,096 3,021,541 1,390,344,294 3,060,119 94,831,7964,116,243 227,604,156 471,164,520 2,345,574 1,479,917,716 2,248,054 70,223,7585,720,115 469,101,616 1,129,640,211 3,679,978 2,794,249,735 3,404,527 113,646,0057,487,132 1,383,590,469 2,862,619,054 - 9,169,138,960 - 203,196,335
16
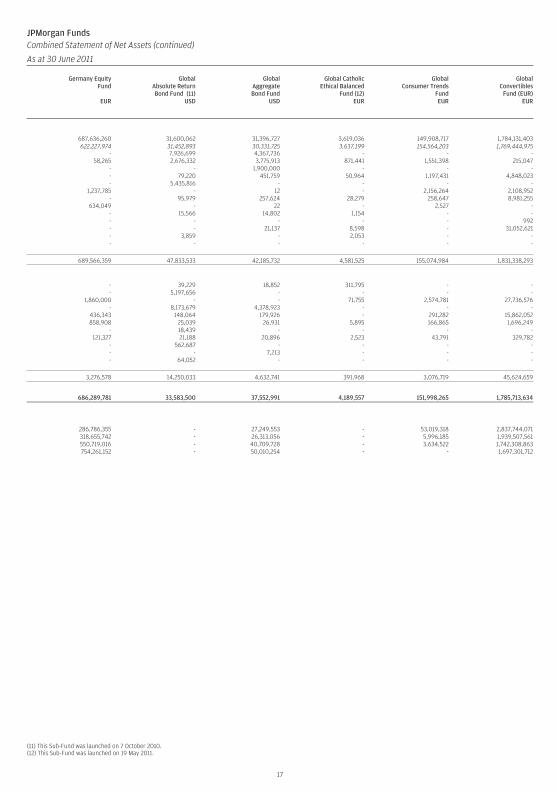
JPMorgan FundsCombined Statement of Net Assets (continued)
As at 30 June 2011
Germany EquityFund
EUR
GlobalAbsolute ReturnBond Fund (11)
USD
GlobalAggregateBond Fund
USD
Global CatholicEthical Balanced
Fund (12)EUR
GlobalConsumer Trends
FundEUR
GlobalConvertibles
Fund (EUR)EUR
687,636,260 31,600,062 31,396,727 3,619,036 149,908,717 1,784,131,403622,227,974 31,452,893 30,331,725 3,637,199 154,564,203 1,769,444,975
- 7,926,699 4,367,736 - - -58,265 2,676,332 3,775,913 871,441 1,551,398 215,047
- - 1,900,000 - - -- 79,220 451,759 50,964 1,197,431 4,848,023- 5,435,816 - - - -
1,237,785 - 12 - 2,156,264 2,108,952- 95,979 257,624 28,279 258,647 8,981,255
634,049 - 22 - 2,527 -- 15,566 14,802 1,154 - -- - - - - 992- - 21,137 8,598 - 31,052,621- 3,859 - 2,053 - -- - - - - -
689,566,359 47,833,533 42,185,732 4,581,525 155,074,984 1,831,338,293
- 39,229 18,852 311,795 - -- 5,197,656 - - - -
1,860,000 - - 71,755 2,574,781 27,736,576- 8,173,679 4,378,923 - - -
436,343 148,064 179,926 - 291,282 15,862,052858,908 25,039 26,931 5,895 166,865 1,696,249
- 18,439 - - - -121,327 21,188 20,896 2,523 43,791 329,782
- 562,687 - - - -- - 7,213 - - -- 64,052 - - - -
3,276,578 14,250,033 4,632,741 391,968 3,076,719 45,624,659
686,289,781 33,583,500 37,552,991 4,189,557 151,998,265 1,785,713,634
286,786,355 - 27,249,553 - 53,019,318 2,837,744,071318,655,742 - 26,313,056 - 5,996,185 1,939,507,561550,719,016 - 40,709,728 - 3,634,522 1,742,308,863754,261,152 - 50,010,254 - - 1,697,301,712
(11) This Sub-Fund was launched on 7 October 2010.(12) This Sub-Fund was launched on 19 May 2011.
17
JPMorgan FundsCombined Statement of Net Assets (continued)
As at 30 June 2011
Global CorporateBond Fund
USD
Global CreditBond Fund
USD
Global Duration-HedgedCorporate
Bond Fund (13)EUR
GlobalDynamic
FundUSD
GlobalEquity
Fund (USD)USD
GlobalFocusFundEUR
GlobalGovernment
Bond FundEUR
540,947,508 35,148,072 31,675,751 1,265,849,067 280,775,499 1,585,782,330 251,634,828535,684,362 34,623,215 32,536,018 1,055,400,194 254,936,038 1,504,455,957 255,918,906
- - - - - - -34,682,609 3,817,651 3,899,002 3,823,555 11,299,706 1,398,474 1,082,554
- - - - - - -11,297,871 793,658 586,028 12,152,929 4,703,355 5,586,637 2,000,000
- - - - - - -1,635,346 78,432 288,751 403,077 22,157 4,937,863 907,7587,397,621 497,520 407,523 1,411,122 531,827 1,837,572 1,718,738
- - - 112,867 73,331 309,226 -68,087 12,983 10,281 2,486 - - 37,585
2,972 131 - 19,583 - 27,262 -- 281,345 219,690 - 851,887 1,185,726 1,584,788- - - - - - -- - - - - - -
596,032,014 40,629,792 37,087,026 1,283,774,686 298,257,762 1,601,065,090 258,966,251
355,155 29,994 4,504 889,298 4,340 - 10,831- - - - - - -
5,597,224 1,696,787 119,794 15,041,424 9,451,347 28,461,813 3,302,720- - - - - - -
894,795 52,971 - 1,264,031 77,032 2,248,532 34,664381,451 26,527 23,735 894,768 171,571 1,858,384 34,196
- - - - - - -166,457 19,123 15,863 268,489 88,316 288,989 54,899
2,653,717 - - 12,349 - - -376,079 15,608 99,820 - - - 22,775
- - - - - - -
10,424,878 1,841,010 263,716 18,370,359 9,792,606 32,857,718 3,460,085
585,607,136 38,788,782 36,823,310 1,265,404,327 288,465,156 1,568,207,372 255,506,166
246,698,799 23,684,650 - 1,135,055,214 253,598,220 1,027,930,229 280,367,18321,216,813 - - 1,174,912,544 233,869,436 331,436,544 71,690,468
- - - 1,872,953,353 162,885,287 335,896,837 -- - - 3,346,335,559 270,564,769 551,822,932 -
(13) This Sub-Fund was launched on 16 September 2010.
18
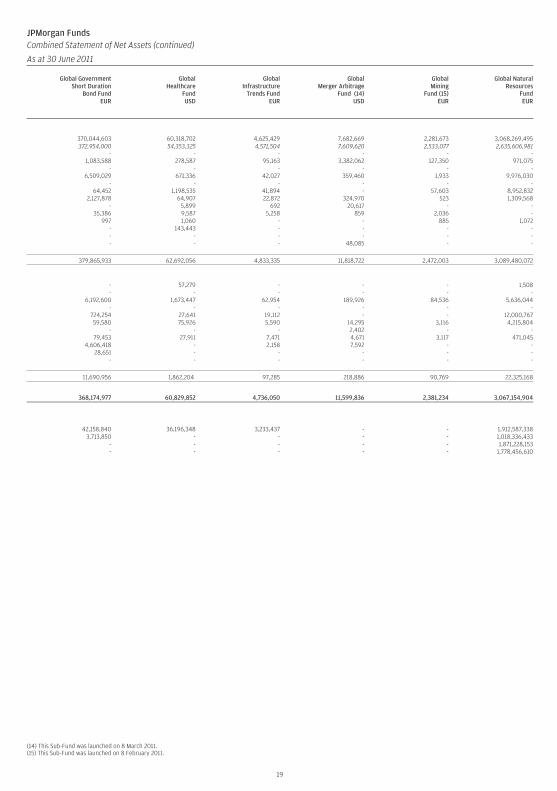
JPMorgan FundsCombined Statement of Net Assets (continued)
As at 30 June 2011
Global GovernmentShort Duration
Bond FundEUR
GlobalHealthcare
FundUSD
GlobalInfrastructure
Trends FundEUR
GlobalMerger Arbitrage
Fund (14)USD
GlobalMining
Fund (15)EUR
Global NaturalResources
FundEUR
370,044,603 60,318,702 4,625,429 7,682,669 2,281,673 3,068,269,495372,954,000 54,353,325 4,571,504 7,609,620 2,533,077 2,635,606,981
- - - - - -1,083,588 278,587 95,163 3,382,062 127,350 971,075
- - - - - -6,509,029 671,336 42,027 359,460 1,933 9,976,030
- - - - - -64,452 1,198,535 41,894 - 57,603 8,952,832
2,127,878 64,907 22,872 324,970 523 1,309,568- 5,899 692 20,617 - -
35,386 9,587 5,258 859 2,036 -997 1,060 - - 885 1,072
- 143,443 - - - -- - - - - -- - - 48,085 - -
379,865,933 62,692,056 4,833,335 11,818,722 2,472,003 3,089,480,072
- 57,279 - - - 1,508- - - - - -
6,192,600 1,673,447 62,954 189,926 84,536 5,636,044- - - - - -
724,254 27,641 19,112 - - 12,000,76759,580 75,926 5,590 14,295 3,116 4,215,804
- - - 2,402 - -79,453 27,911 7,471 4,671 3,117 471,045
4,606,418 - 2,158 7,592 - -28,651 - - - - -
- - - - - -
11,690,956 1,862,204 97,285 218,886 90,769 22,325,168
368,174,977 60,829,852 4,736,050 11,599,836 2,381,234 3,067,154,904
42,158,840 36,196,348 3,233,437 - - 1,912,587,3383,713,850 - - - - 1,018,336,433
- - - - - 1,871,228,153- - - - - 1,778,456,610
(14) This Sub-Fund was launched on 8 March 2011.(15) This Sub-Fund was launched on 8 February 2011.
19
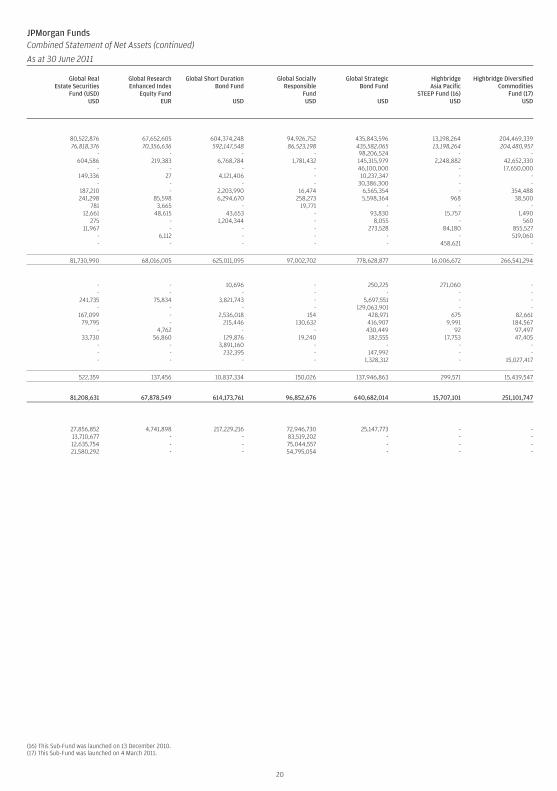
JPMorgan FundsCombined Statement of Net Assets (continued)
As at 30 June 2011
Global RealEstate Securities
Fund (USD)USD
Global ResearchEnhanced Index
Equity FundEUR
Global Short DurationBond Fund
USD
Global SociallyResponsible
FundUSD
Global StrategicBond Fund
USD
HighbridgeAsia Pacific
STEEP Fund (16)USD
Highbridge DiversifiedCommodities
Fund (17)USD
80,522,876 67,652,605 604,374,248 94,926,752 435,843,596 13,198,264 204,469,33976,818,376 70,356,636 592,147,548 86,523,198 435,582,065 13,198,264 204,480,957
- - - - 98,206,524 - -604,586 219,383 6,768,784 1,781,432 145,315,979 2,248,882 42,652,330
- - - - 46,100,000 - 17,650,000149,336 27 4,121,406 - 10,237,347 - -
- - - - 30,386,300 - -187,210 - 2,203,990 16,474 6,565,354 - 354,488241,298 85,598 6,294,670 258,273 5,598,364 968 38,500
781 3,665 - 19,771 - - -12,661 48,615 43,653 - 93,830 15,757 1,490
275 - 1,204,344 - 8,055 - 56011,967 - - - 273,528 84,180 855,527
- 6,112 - - - - 519,060- - - - - 458,621 -
81,730,990 68,016,005 625,011,095 97,002,702 778,628,877 16,006,672 266,541,294
- - 10,696 - 250,225 271,060 -- - - - - - -
241,735 75,834 3,821,743 - 5,697,551 - -- - - - 129,063,901 - -
167,099 - 2,536,018 154 428,971 675 82,66179,795 - 215,446 130,632 416,907 9,991 184,567
- 4,762 - - 430,449 92 97,49733,730 56,860 129,876 19,240 182,555 17,753 47,405
- - 3,891,160 - - - -- - 232,395 - 147,992 - -- - - - 1,328,312 - 15,027,417
522,359 137,456 10,837,334 150,026 137,946,863 299,571 15,439,547
81,208,631 67,878,549 614,173,761 96,852,676 640,682,014 15,707,101 251,101,747
27,856,852 4,741,898 217,229,216 72,946,730 25,147,773 - -13,710,677 - - 83,519,202 - - -12,635,754 - - 75,044,557 - - -21,580,292 - - 54,795,054 - - -
(16) This Sub-Fund was launched on 13 December 2010.(17) This Sub-Fund was launched on 4 March 2011.
20
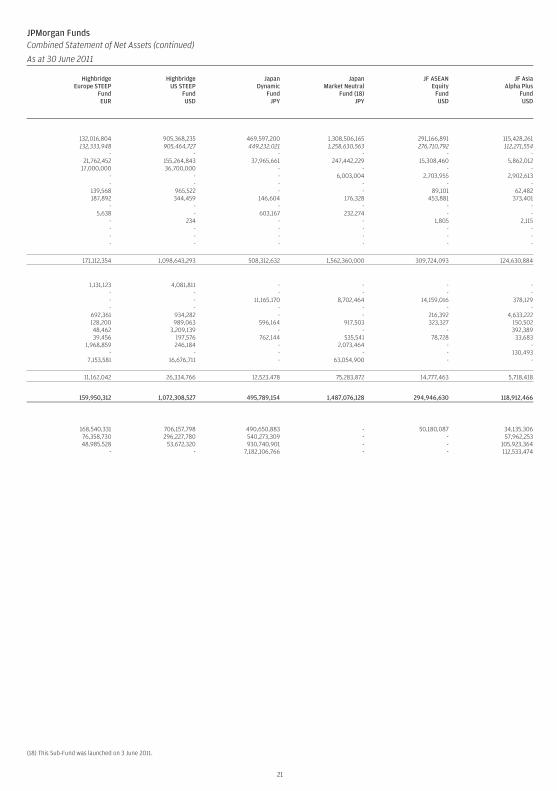
JPMorgan FundsCombined Statement of Net Assets (continued)
As at 30 June 2011
HighbridgeEurope STEEP
FundEUR
HighbridgeUS STEEP
FundUSD
JapanDynamic
FundJPY
JapanMarket Neutral
Fund (18)JPY
JF ASEANEquity
FundUSD
JF AsiaAlpha Plus
FundUSD
132,016,804 905,368,235 469,597,200 1,308,506,165 291,166,891 115,428,261132,333,948 905,464,727 449,232,021 1,258,630,563 276,710,792 112,271,554
- - - - - -21,762,452 155,264,843 37,965,661 247,442,229 15,308,460 5,862,012
17,000,000 36,700,000 - - - -- - - 6,003,004 2,703,955 2,902,613- - - - - -
139,568 965,522 - - 89,101 62,482187,892 344,459 146,604 176,328 453,881 373,401
- - - - - -5,638 - 603,167 232,274 - -
- 234 - - 1,805 2,115- - - - - -- - - - - -- - - - - -
171,112,354 1,098,643,293 508,312,632 1,562,360,000 309,724,093 124,630,884
1,131,123 4,081,811 - - - -- - - - - -- - 11,165,170 8,702,464 14,159,016 378,129- - - - - -
692,361 934,282 - - 216,392 4,633,222128,200 989,063 596,164 917,503 323,327 150,50248,462 3,209,139 - - - 392,38939,456 197,576 762,144 535,541 78,728 33,683
1,968,859 246,184 - 2,073,464 - -- - - - - 130,493
7,153,581 16,676,711 - 63,054,900 - -
11,162,042 26,334,766 12,523,478 75,283,872 14,777,463 5,718,418
159,950,312 1,072,308,527 495,789,154 1,487,076,128 294,946,630 118,912,466
168,540,331 706,157,798 490,650,883 - 50,180,087 34,135,30676,358,730 296,227,780 540,273,309 - - 57,962,25348,985,528 53,672,320 930,740,901 - - 105,923,364
- - 7,182,106,766 - - 112,533,474
(18) This Sub-Fund was launched on 3 June 2011.
21
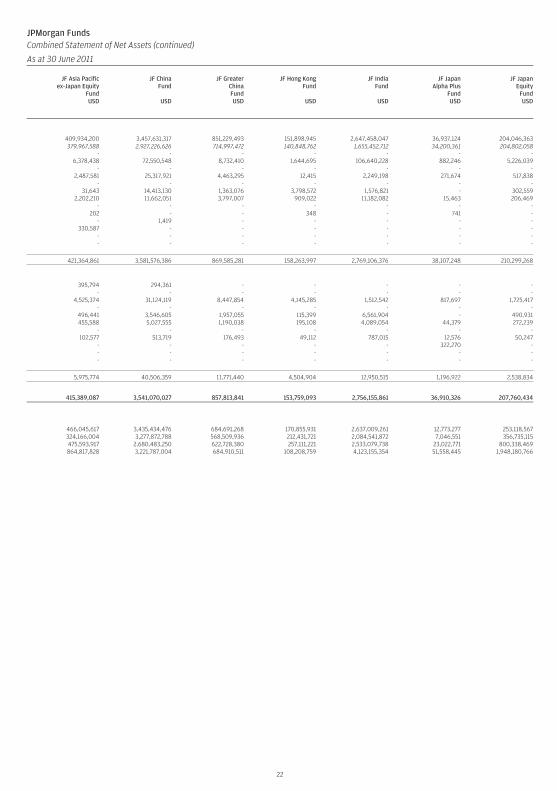
JPMorgan FundsCombined Statement of Net Assets (continued)
As at 30 June 2011
JF Asia Pacificex-Japan Equity
FundUSD
JF ChinaFund
USD
JF GreaterChinaFundUSD
JF Hong KongFund
USD
JF IndiaFund
USD
JF JapanAlpha Plus
FundUSD
JF JapanEquity
FundUSD
409,934,200 3,457,631,317 851,229,493 151,898,945 2,647,458,047 36,937,124 204,046,363379,967,588 2,927,226,626 714,997,472 140,848,762 1,655,452,712 34,200,361 204,802,058
- - - - - - -6,378,438 72,550,548 8,732,410 1,644,695 106,640,228 882,246 5,226,039
- - - - - - -2,487,581 25,317,921 4,463,295 12,415 2,249,198 271,674 517,838
- - - - - - -31,643 14,413,130 1,363,076 3,798,572 1,576,821 - 302,559
2,202,210 11,662,051 3,797,007 909,022 11,182,082 15,463 206,469- - - - - - -
202 - - 348 - 741 -- 1,419 - - - - -
330,587 - - - - - -- - - - - - -- - - - - - -
421,364,861 3,581,576,386 869,585,281 158,263,997 2,769,106,376 38,107,248 210,299,268
395,794 294,361 - - - - -- - - - - - -
4,525,374 31,124,119 8,447,854 4,145,285 1,512,542 817,697 1,725,417- - - - - - -
496,441 3,546,605 1,957,055 115,399 6,561,904 - 490,931455,588 5,027,555 1,190,038 195,108 4,089,054 44,379 272,239
- - - - - - -102,577 513,719 176,493 49,112 787,015 12,576 50,247
- - - - - 322,270 -- - - - - - -- - - - - - -
5,975,774 40,506,359 11,771,440 4,504,904 12,950,515 1,196,922 2,538,834
415,389,087 3,541,070,027 857,813,841 153,759,093 2,756,155,861 36,910,326 207,760,434
466,045,617 3,435,434,476 684,691,268 170,855,931 2,637,009,261 12,773,277 253,118,567324,166,004 3,277,872,788 568,509,936 212,431,721 2,084,541,872 7,046,551 356,735,115475,593,917 2,680,483,250 622,728,380 257,111,221 2,533,079,738 23,022,771 800,338,469864,817,828 3,221,787,004 684,910,511 108,208,759 4,123,155,354 51,558,445 1,948,180,766
22
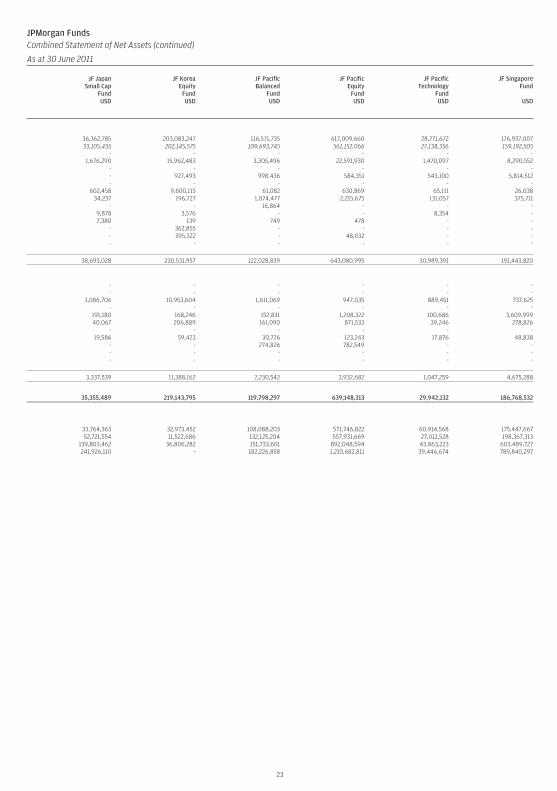
JPMorgan FundsCombined Statement of Net Assets (continued)
As at 30 June 2011
JF JapanSmall Cap
FundUSD
JF KoreaEquity
FundUSD
JF PacificBalanced
FundUSD
JF PacificEquity
FundUSD
JF PacificTechnology
FundUSD
JF SingaporeFund
USD
36,362,785 203,083,247 116,571,735 617,009,660 28,771,672 176,937,00733,105,435 202,145,575 109,693,745 561,152,066 27,138,356 159,192,505
- - - - - -1,676,290 15,962,483 3,305,496 22,591,930 1,470,097 8,290,552
- - - - - -- 927,493 998,436 584,351 543,100 5,814,512- - - - - -
602,458 9,600,115 61,082 630,869 65,111 26,03834,237 196,727 1,074,477 2,215,675 131,057 375,711
- - 16,864 - - -9,878 3,576 - - 8,354 -7,380 139 749 478 - -
- 362,855 - - - -- 395,322 - 48,032 - -- - - - - -
38,693,028 230,531,957 122,028,839 643,080,995 30,989,391 191,443,820
- - - - - -- - - - - -
3,086,706 10,953,604 1,611,069 947,035 889,451 737,625- - - - - -
191,180 168,246 152,831 1,208,322 100,686 3,609,99940,067 206,889 161,090 871,533 39,246 278,826
- - - - - -19,586 59,423 30,726 123,243 17,876 48,838
- - 274,826 782,549 - -- - - - - -- - - - - -
3,337,539 11,388,162 2,230,542 3,932,682 1,047,259 4,675,288
35,355,489 219,143,795 119,798,297 639,148,313 29,942,132 186,768,532
33,764,363 32,973,452 108,088,203 571,746,822 60,914,568 175,447,66752,721,554 11,522,686 132,125,204 557,931,669 27,012,528 198,367,313
139,803,462 36,806,282 151,733,601 892,048,594 43,863,223 603,489,727241,926,110 - 182,226,858 1,210,682,811 39,446,674 789,840,297
23
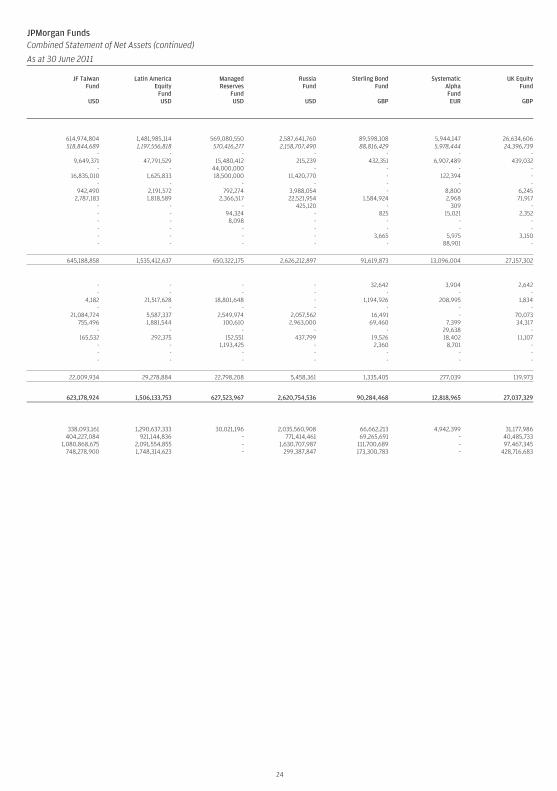
JPMorgan FundsCombined Statement of Net Assets (continued)
As at 30 June 2011
JF TaiwanFund
USD
Latin AmericaEquity
FundUSD
ManagedReserves
FundUSD
RussiaFund
USD
Sterling BondFund
GBP
SystematicAlphaFundEUR
UK EquityFund
GBP
614,974,804 1,481,985,114 569,080,550 2,587,641,760 89,598,108 5,944,147 26,634,606518,844,689 1,197,556,818 570,416,277 2,158,707,490 88,816,429 5,978,444 24,396,739
- - - - - - -9,649,371 47,791,529 15,480,412 215,239 432,351 6,907,489 439,032
- - 44,000,000 - - - -16,835,010 1,625,833 18,500,000 11,420,770 - 122,394 -
- - - - - - -942,490 2,191,572 792,274 3,988,054 - 8,800 6,245
2,787,183 1,818,589 2,366,517 22,521,954 1,584,924 2,968 71,917- - - 425,120 - 309 -- - 94,324 - 825 15,021 2,352- - 8,098 - - - -- - - - - - -- - - - 3,665 5,975 3,150- - - - - 88,901 -
645,188,858 1,535,412,637 650,322,175 2,626,212,897 91,619,873 13,096,004 27,157,302
- - - - 32,642 3,904 2,642- - - - - - -
4,182 21,517,628 18,801,648 - 1,194,926 208,995 1,834- - - - - - -
21,084,724 5,587,337 2,549,974 2,057,562 16,491 - 70,073755,496 1,881,544 100,610 2,963,000 69,460 7,399 34,317
- - - - - 29,638 -165,532 292,375 152,551 437,799 19,526 18,402 11,107
- - 1,193,425 - 2,360 8,701 -- - - - - - -- - - - - - -
22,009,934 29,278,884 22,798,208 5,458,361 1,335,405 277,039 119,973
623,178,924 1,506,133,753 627,523,967 2,620,754,536 90,284,468 12,818,965 27,037,329
338,093,161 1,290,637,333 30,021,196 2,035,560,908 66,662,213 4,942,399 31,177,986404,227,084 921,144,836 - 771,414,461 69,265,691 - 40,485,733
1,080,868,675 2,091,554,855 - 1,630,707,987 111,700,689 - 97,467,345748,278,900 1,748,314,623 - 299,387,847 173,300,783 - 428,716,683
24
JPMorgan FundsCombined Statement of Net Assets (continued)
As at 30 June 2011
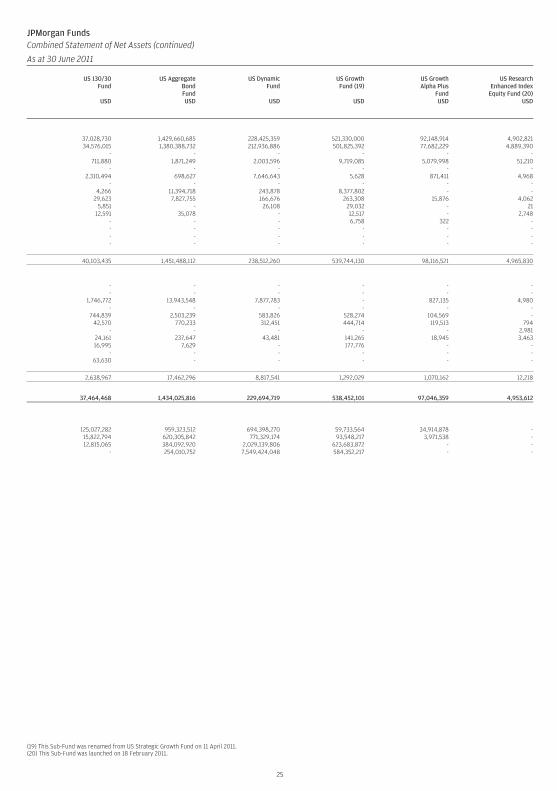
US 130/30Fund
USD
US AggregateBondFundUSD
US DynamicFund
USD
US GrowthFund (19)
USD
US GrowthAlpha Plus
FundUSD
US ResearchEnhanced Index
Equity Fund (20)USD
37,028,730 1,429,660,685 228,425,359 521,330,000 92,148,914 4,902,82134,576,015 1,380,388,732 212,936,886 501,825,392 77,682,229 4,889,390
- - - - - -711,880 1,871,249 2,003,596 9,719,085 5,079,998 51,210
- - - - - -2,310,494 698,627 7,646,643 5,628 871,411 4,968
- - - - - -4,266 11,394,718 243,878 8,377,802 - -
29,623 7,827,755 166,676 263,308 15,876 4,0625,851 - 26,108 29,032 - 21
12,591 35,078 - 12,517 - 2,748- - - 6,758 322 -- - - - - -- - - - - -- - - - - -
40,103,435 1,451,488,112 238,512,260 539,744,130 98,116,521 4,965,830
- - - - - -- - - - - -
1,746,772 13,943,548 7,877,783 - 827,135 4,980- - - - - -
744,839 2,503,239 583,826 528,274 104,569 -42,570 770,233 312,451 444,714 119,513 794
- - - - - 2,98124,161 237,647 43,481 141,265 18,945 3,46316,995 7,629 - 177,776 - -
- - - - - -63,630 - - - - -
2,638,967 17,462,296 8,817,541 1,292,029 1,070,162 12,218
37,464,468 1,434,025,816 229,694,719 538,452,101 97,046,359 4,953,612
125,027,282 959,323,512 694,398,270 59,733,564 34,914,878 -15,822,794 620,305,842 771,329,174 93,548,217 3,971,538 -12,815,065 384,092,920 2,029,139,806 623,683,872 - -
- 254,010,752 7,549,424,048 584,352,217 - -
(19) This Sub-Fund was renamed from US Strategic Growth Fund on 11 April 2011.(20) This Sub-Fund was launched on 18 February 2011.
25
JPMorgan FundsCombined Statement of Net Assets (continued)
As at 30 June 2011
US Select130/30
FundUSD
US SelectLong-Short
Equity Fund (21)USD
US ShortDuration
Bond Fund (22)USD
US Small andMicro Cap
FundUSD
US Small CapGrowth
FundUSD
US TechnologyFund
USD
US ValueFund
USD
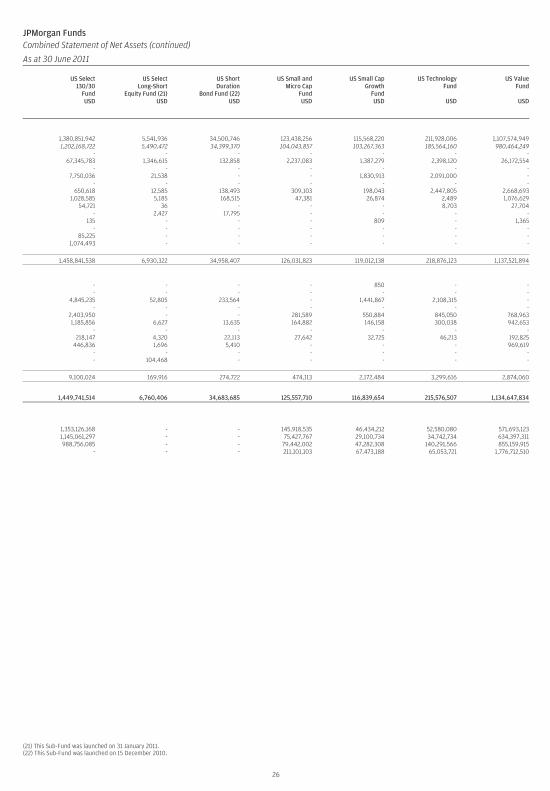
1,380,851,942 5,541,936 34,500,746 123,438,256 115,568,220 211,928,006 1,107,574,9491,202,168,722 5,490,472 34,399,370 104,043,857 103,267,363 185,564,160 980,464,249
- - - - - - -67,345,783 1,346,615 132,858 2,237,083 1,387,279 2,398,120 26,172,554
- - - - - - -7,750,036 21,538 - - 1,830,913 2,091,000 -
- - - - - - -650,618 12,585 138,493 309,103 198,043 2,447,805 2,668,693
1,028,585 5,185 168,515 47,381 26,874 2,489 1,076,62954,721 36 - - - 8,703 27,704
- 2,427 17,795 - - - -135 - - - 809 - 1,365
- - - - - - -85,225 - - - - - -
1,074,493 - - - - - -
1,458,841,538 6,930,322 34,958,407 126,031,823 119,012,138 218,876,123 1,137,521,894
- - - - 850 - -- - - - - - -
4,845,235 52,805 233,564 - 1,441,867 2,108,315 -- - - - - - -
2,403,950 - - 281,589 550,884 845,050 768,9631,185,856 6,627 13,635 164,882 146,158 300,038 942,653
- - - - - - -218,147 4,320 22,113 27,642 32,725 46,213 192,825
446,836 1,696 5,410 - - - 969,619- - - - - - -- 104,468 - - - - -
9,100,024 169,916 274,722 474,113 2,172,484 3,299,616 2,874,060
1,449,741,514 6,760,406 34,683,685 125,557,710 116,839,654 215,576,507 1,134,647,834
1,353,126,168 - - 145,918,535 46,434,212 52,580,080 571,693,1231,145,061,297 - - 75,427,767 29,100,734 34,742,734 634,397,311988,756,085 - - 79,442,002 47,282,308 140,291,566 855,159,915
- - - 211,101,103 67,473,188 65,053,721 1,776,712,510
(21) This Sub-Fund was launched on 31 January 2011.(22) This Sub-Fund was launched on 15 December 2010.
26

This page has been left blank intentionally
27
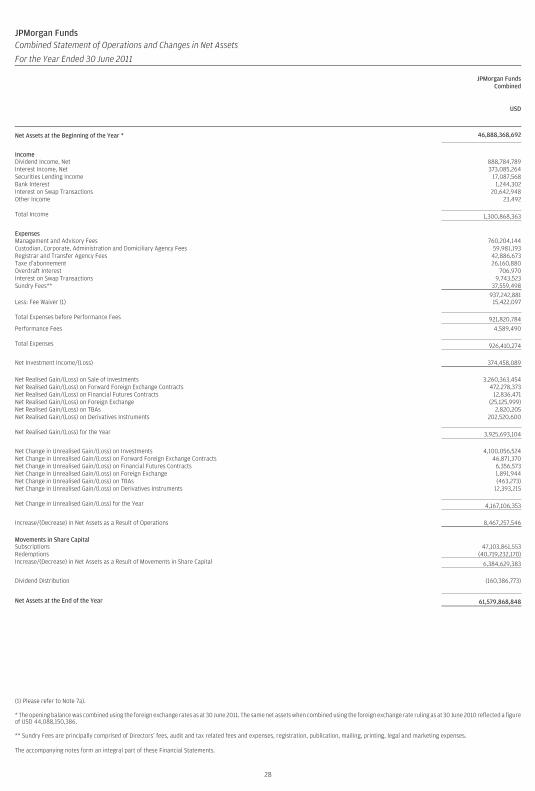
JPMorgan FundsCombined Statement of Operations and Changes in Net Assets
For the Year Ended 30 June 2011
JPMorgan FundsCombined
USD
Net Assets at the Beginning of the Year * 46,888,368,692
IncomeDividend Income, Net 888,784,789Interest Income, Net 373,085,264Securities Lending Income 17,087,568Bank Interest 1,244,302Interest on Swap Transactions 20,642,948Other Income 23,492
Total Income 1,300,868,363
ExpensesManagement and Advisory Fees 760,204,144Custodian, Corporate, Administration and Domiciliary Agency Fees 59,981,193Registrar and Transfer Agency Fees 42,886,673Taxe d’abonnement 26,160,880Overdraft Interest 706,970Interest on Swap Transactions 9,743,523Sundry Fees** 37,559,498
937,242,881Less: Fee Waiver (1) 15,422,097
Total Expenses before Performance Fees 921,820,784
Performance Fees 4,589,490
Total Expenses 926,410,274
Net Investment Income/(Loss) 374,458,089
Net Realised Gain/(Loss) on Sale of Investments 3,260,363,454Net Realised Gain/(Loss) on Forward Foreign Exchange Contracts 472,278,373Net Realised Gain/(Loss) on Financial Futures Contracts 12,836,471Net Realised Gain/(Loss) on Foreign Exchange (25,125,999)Net Realised Gain/(Loss) on TBAs 2,820,205Net Realised Gain/(Loss) on Derivatives Instruments 202,520,600
Net Realised Gain/(Loss) for the Year 3,925,693,104
Net Change in Unrealised Gain/(Loss) on Investments 4,100,056,524Net Change in Unrealised Gain/(Loss) on Forward Foreign Exchange Contracts 46,871,370Net Change in Unrealised Gain/(Loss) on Financial Futures Contracts 6,356,573Net Change in Unrealised Gain/(Loss) on Foreign Exchange 1,891,944Net Change in Unrealised Gain/(Loss) on TBAs (463,273)Net Change in Unrealised Gain/(Loss) on Derivatives Instruments 12,393,215
Net Change in Unrealised Gain/(Loss) for the Year 4,167,106,353
Increase/(Decrease) in Net Assets as a Result of Operations 8,467,257,546
Movements in Share CapitalSubscriptions 47,103,861,553Redemptions (40,719,232,170)Increase/(Decrease) in Net Assets as a Result of Movements in Share Capital 6,384,629,383
Dividend Distribution (160,386,773)
Net Assets at the End of the Year 61,579,868,848
(1) Please refer to Note 7a).
* The opening balance was combined using the foreign exchange rates as at 30 June 2011. The same net assets when combined using the foreign exchange rate ruling as at 30 June 2010 reflected a figureof USD 44,088,150,386.
** Sundry Fees are principally comprised of Directors’ fees, audit and tax related fees and expenses, registration, publication, mailing, printing, legal and marketing expenses.
The accompanying notes form an integral part of these Financial Statements.
28
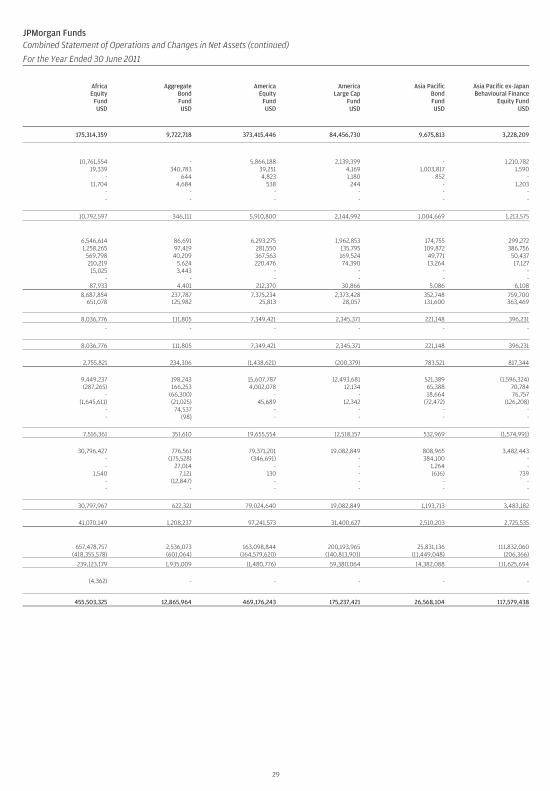
JPMorgan FundsCombined Statement of Operations and Changes in Net Assets (continued)
For the Year Ended 30 June 2011
AfricaEquity
FundUSD
AggregateBondFundUSD
AmericaEquity
FundUSD
AmericaLarge Cap
FundUSD
Asia PacificBondFundUSD
Asia Pacific ex-JapanBehavioural Finance
Equity FundUSD
175,314,359 9,722,718 373,415,446 84,456,730 9,675,813 3,228,209
10,761,554 - 5,866,188 2,139,399 - 1,210,78219,339 340,783 39,251 4,169 1,003,817 1,590
- 644 4,823 1,180 852 -11,704 4,684 538 244 - 1,203
- - - - - -- - - - - -
10,792,597 346,111 5,910,800 2,144,992 1,004,669 1,213,575
6,546,614 86,691 6,293,275 1,962,853 174,755 299,2721,258,265 97,419 281,550 135,795 109,872 386,756
569,798 40,209 367,563 169,524 49,771 50,437210,219 5,624 220,476 74,390 13,264 17,12715,025 3,443 - - - -
- - - - - -87,933 4,401 212,370 30,866 5,086 6,108
8,687,854 237,787 7,375,234 2,373,428 352,748 759,700651,078 125,982 25,813 28,057 131,600 363,469
8,036,776 111,805 7,349,421 2,345,371 221,148 396,231
- - - - - -
8,036,776 111,805 7,349,421 2,345,371 221,148 396,231
2,755,821 234,306 (1,438,621) (200,379) 783,521 817,344
9,449,237 198,243 15,607,787 12,493,681 521,389 (1,596,324)(287,265) 166,253 4,002,078 12,134 65,388 70,784
- (66,300) - - 18,664 76,757(1,645,611) (21,025) 45,689 12,342 (72,472) (126,208)
- 74,537 - - - -- (98) - - - -
7,516,361 351,610 19,655,554 12,518,157 532,969 (1,574,991)
30,796,427 776,561 79,371,201 19,082,849 808,965 3,482,443- (175,528) (346,691) - 384,100 -- 27,014 - - 1,264 -
1,540 7,121 130 - (616) 739- (12,847) - - - -- - - - - -
30,797,967 622,321 79,024,640 19,082,849 1,193,713 3,483,182
41,070,149 1,208,237 97,241,573 31,400,627 2,510,203 2,725,535
657,478,757 2,536,073 163,098,844 200,193,965 25,831,136 111,832,060(418,355,578) (601,064) (164,579,620) (140,813,901) (11,449,048) (206,366)
239,123,179 1,935,009 (1,480,776) 59,380,064 14,382,088 111,625,694
(4,362) - - - - -
455,503,325 12,865,964 469,176,243 175,237,421 26,568,104 117,579,438
29
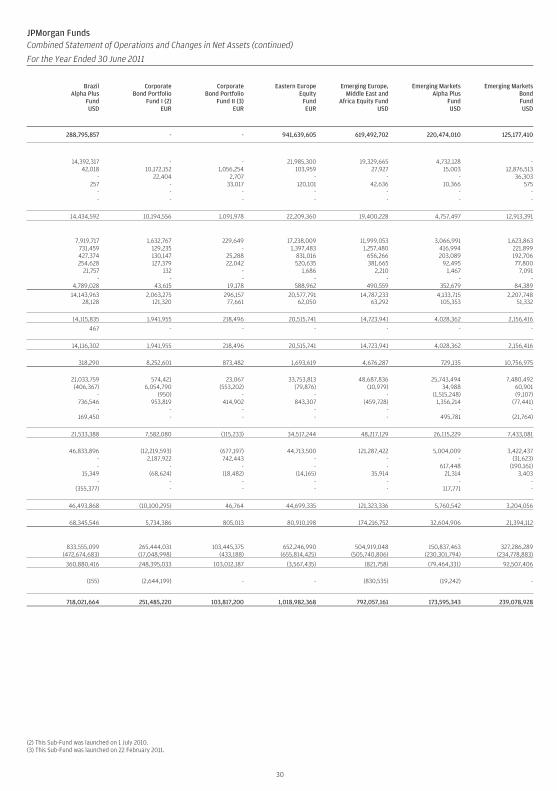
JPMorgan FundsCombined Statement of Operations and Changes in Net Assets (continued)
For the Year Ended 30 June 2011
BrazilAlpha Plus
FundUSD
CorporateBond Portfolio
Fund I (2)EUR
CorporateBond Portfolio
Fund II (3)EUR
Eastern EuropeEquity
FundEUR
Emerging Europe,Middle East and
Africa Equity FundUSD
Emerging MarketsAlpha Plus
FundUSD
Emerging MarketsBondFundUSD
288,795,857 - - 941,639,605 619,492,702 220,474,010 125,177,410
14,392,317 - - 21,985,300 19,329,665 4,732,128 -42,018 10,172,152 1,056,254 103,959 27,927 15,003 12,876,513
- 22,404 2,707 - - - 36,303257 - 33,017 120,101 42,636 10,366 575
- - - - - - -- - - - - - -
14,434,592 10,194,556 1,091,978 22,209,360 19,400,228 4,757,497 12,913,391
7,919,717 1,632,767 229,649 17,238,009 11,999,053 3,066,991 1,623,863731,459 129,235 - 1,397,483 1,257,480 416,994 221,899427,374 130,147 25,288 831,016 656,266 203,089 192,706254,628 127,379 22,042 520,635 381,665 92,495 77,800
21,757 132 - 1,686 2,210 1,467 7,091- - - - - - -
4,789,028 43,615 19,178 588,962 490,559 352,679 84,38914,143,963 2,063,275 296,157 20,577,791 14,787,233 4,133,715 2,207,748
28,128 121,320 77,661 62,050 63,292 105,353 51,332
14,115,835 1,941,955 218,496 20,515,741 14,723,941 4,028,362 2,156,416
467 - - - - - -
14,116,302 1,941,955 218,496 20,515,741 14,723,941 4,028,362 2,156,416
318,290 8,252,601 873,482 1,693,619 4,676,287 729,135 10,756,975
21,033,759 574,421 23,067 33,753,813 48,687,836 25,743,494 7,480,492(406,367) 6,054,790 (553,202) (79,876) (10,979) 34,988 60,901
- (950) - - - (1,515,248) (9,107)736,546 953,819 414,902 843,307 (459,728) 1,356,214 (77,441)
- - - - - - -169,450 - - - - 495,781 (21,764)
21,533,388 7,582,080 (115,233) 34,517,244 48,217,129 26,115,229 7,433,081
46,833,896 (12,219,593) (677,197) 44,713,500 121,287,422 5,004,009 3,422,437- 2,187,922 742,443 - - - (31,623)- - - - - 617,448 (190,161)
15,349 (68,624) (18,482) (14,165) 35,914 21,314 3,403- - - - - - -
(355,377) - - - - 117,771 -
46,493,868 (10,100,295) 46,764 44,699,335 121,323,336 5,760,542 3,204,056
68,345,546 5,734,386 805,013 80,910,198 174,216,752 32,604,906 21,394,112
833,555,099 265,444,031 103,445,375 652,246,990 504,919,048 150,837,463 327,286,289(472,674,683) (17,048,998) (433,188) (655,814,425) (505,740,806) (230,301,794) (234,778,883)
360,880,416 248,395,033 103,012,187 (3,567,435) (821,758) (79,464,331) 92,507,406
(155) (2,644,199) - - (830,535) (19,242) -
718,021,664 251,485,220 103,817,200 1,018,982,368 792,057,161 173,595,343 239,078,928
(2) This Sub-Fund was launched on 1 July 2010.(3) This Sub-Fund was launched on 22 February 2011.
30
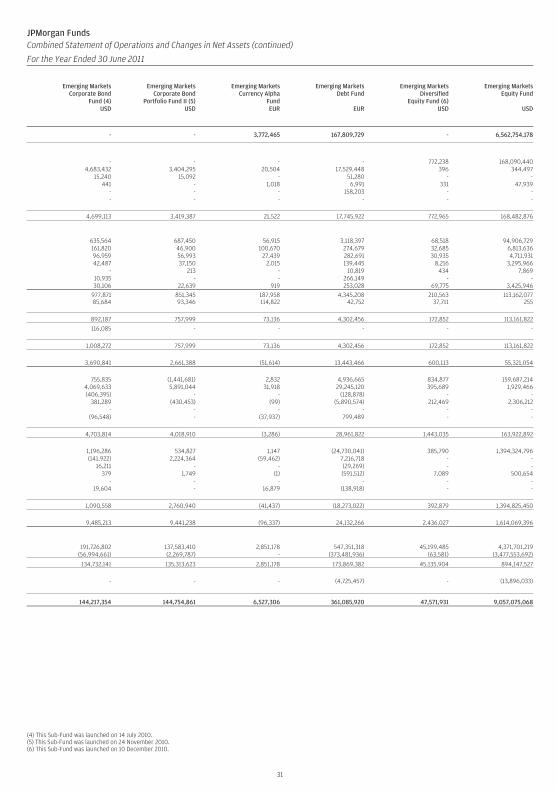
JPMorgan FundsCombined Statement of Operations and Changes in Net Assets (continued)
For the Year Ended 30 June 2011
Emerging MarketsCorporate Bond
Fund (4)USD
Emerging MarketsCorporate Bond
Portfolio Fund II (5)USD
Emerging MarketsCurrency Alpha
FundEUR
Emerging MarketsDebt Fund
EUR
Emerging MarketsDiversified
Equity Fund (6)USD
Emerging MarketsEquity Fund
USD
- - 3,772,465 167,809,729 - 6,562,754,178
- - - - 772,238 168,090,4404,683,432 3,404,295 20,504 17,529,448 396 344,497
15,240 15,092 - 51,280 - -441 - 1,018 6,991 331 47,939
- - - 158,203 - -- - - - - -
4,699,113 3,419,387 21,522 17,745,922 772,965 168,482,876
635,564 687,450 56,915 3,118,397 68,518 94,906,729161,820 46,900 100,670 274,679 32,685 6,813,63696,959 56,993 27,439 282,691 30,935 4,711,93142,487 37,150 2,015 139,445 8,216 3,295,966
- 213 - 10,819 434 7,86910,935 - - 266,149 - -30,106 22,639 919 253,028 69,775 3,425,946
977,871 851,345 187,958 4,345,208 210,563 113,162,07785,684 93,346 114,822 42,752 37,711 255
892,187 757,999 73,136 4,302,456 172,852 113,161,822
116,085 - - - - -
1,008,272 757,999 73,136 4,302,456 172,852 113,161,822
3,690,841 2,661,388 (51,614) 13,443,466 600,113 55,321,054
755,835 (1,441,681) 2,832 4,936,665 834,877 159,687,2144,069,633 5,891,044 31,918 29,245,120 395,689 1,929,466(406,395) - - (128,878) - -
381,289 (430,453) (99) (5,890,574) 212,469 2,306,212- - - - - -
(96,548) - (37,937) 799,489 - -
4,703,814 4,018,910 (3,286) 28,961,822 1,443,035 163,922,892
1,196,286 534,827 1,147 (24,730,041) 385,790 1,394,324,796(141,922) 2,224,364 (59,462) 7,216,718 - -
16,211 - - (29,269) - -379 1,749 (1) (591,512) 7,089 500,654
- - - - - -19,604 - 16,879 (138,918) - -
1,090,558 2,760,940 (41,437) (18,273,022) 392,879 1,394,825,450
9,485,213 9,441,238 (96,337) 24,132,266 2,436,027 1,614,069,396
191,726,802 137,583,410 2,851,178 547,351,318 45,199,485 4,371,701,219(56,994,661) (2,269,787) - (373,481,936) (63,581) (3,477,553,692)
134,732,141 135,313,623 2,851,178 173,869,382 45,135,904 894,147,527
- - - (4,725,457) - (13,896,033)
144,217,354 144,754,861 6,527,306 361,085,920 47,571,931 9,057,075,068
(4) This Sub-Fund was launched on 14 July 2010.(5) This Sub-Fund was launched on 24 November 2010.(6) This Sub-Fund was launched on 10 December 2010.
31
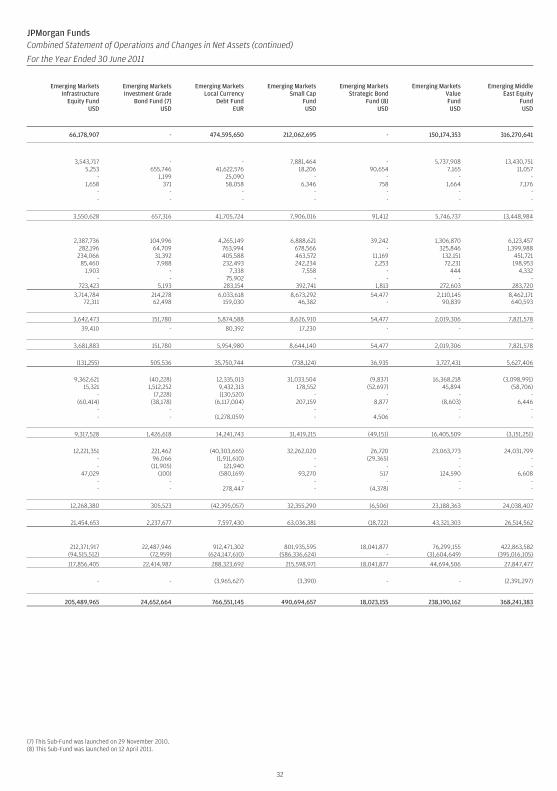
JPMorgan FundsCombined Statement of Operations and Changes in Net Assets (continued)
For the Year Ended 30 June 2011
Emerging MarketsInfrastructure
Equity FundUSD
Emerging MarketsInvestment Grade
Bond Fund (7)USD
Emerging MarketsLocal Currency
Debt FundEUR
Emerging MarketsSmall Cap
FundUSD
Emerging MarketsStrategic Bond
Fund (8)USD
Emerging MarketsValueFundUSD
Emerging MiddleEast Equity
FundUSD
66,178,907 - 474,595,650 212,062,695 - 150,174,353 316,270,641
3,543,717 - - 7,881,464 - 5,737,908 13,430,7515,253 655,746 41,622,576 18,206 90,654 7,165 11,057
- 1,199 25,090 - - - -1,658 371 58,058 6,346 758 1,664 7,176
- - - - - - -- - - - - - -
3,550,628 657,316 41,705,724 7,906,016 91,412 5,746,737 13,448,984
2,387,736 104,996 4,265,149 6,888,621 39,242 1,306,870 6,123,457282,196 64,709 763,994 678,566 - 325,846 1,399,988234,066 31,392 405,588 463,572 11,169 132,151 451,721
85,460 7,988 232,493 242,234 2,253 72,231 198,9531,903 - 7,338 7,558 - 444 4,332
- - 75,902 - - - -723,423 5,193 283,154 392,741 1,813 272,603 283,720
3,714,784 214,278 6,033,618 8,673,292 54,477 2,110,145 8,462,17172,311 62,498 159,030 46,382 - 90,839 640,593
3,642,473 151,780 5,874,588 8,626,910 54,477 2,019,306 7,821,578
39,410 - 80,392 17,230 - - -
3,681,883 151,780 5,954,980 8,644,140 54,477 2,019,306 7,821,578
(131,255) 505,536 35,750,744 (738,124) 36,935 3,727,431 5,627,406
9,362,621 (40,228) 12,335,013 31,033,504 (9,837) 16,368,218 (3,098,991)15,321 1,512,252 9,432,313 178,552 (52,697) 45,894 (58,706)
- (7,228) (130,520) - - - -(60,414) (38,178) (6,117,004) 207,159 8,877 (8,603) 6,446
- - - - - - -- - (1,278,059) - 4,506 - -
9,317,528 1,426,618 14,241,743 31,419,215 (49,151) 16,405,509 (3,151,251)
12,221,351 221,462 (40,303,665) 32,262,020 26,720 23,063,773 24,031,799- 96,066 (1,911,610) - (29,365) - -- (11,905) 121,940 - - - -
47,029 (100) (580,169) 93,270 517 124,590 6,608- - - - - - -- - 278,447 - (4,378) - -
12,268,380 305,523 (42,395,057) 32,355,290 (6,506) 23,188,363 24,038,407
21,454,653 2,237,677 7,597,430 63,036,381 (18,722) 43,321,303 26,514,562
212,371,917 22,487,946 912,471,302 801,935,595 18,041,877 76,299,155 422,863,582(94,515,512) (72,959) (624,147,610) (586,336,624) - (31,604,649) (395,016,105)
117,856,405 22,414,987 288,323,692 215,598,971 18,041,877 44,694,506 27,847,477
- - (3,965,627) (3,390) - - (2,391,297)
205,489,965 24,652,664 766,551,145 490,694,657 18,023,155 238,190,162 368,241,383
(7) This Sub-Fund was launched on 29 November 2010.(8) This Sub-Fund was launched on 12 April 2011.
32
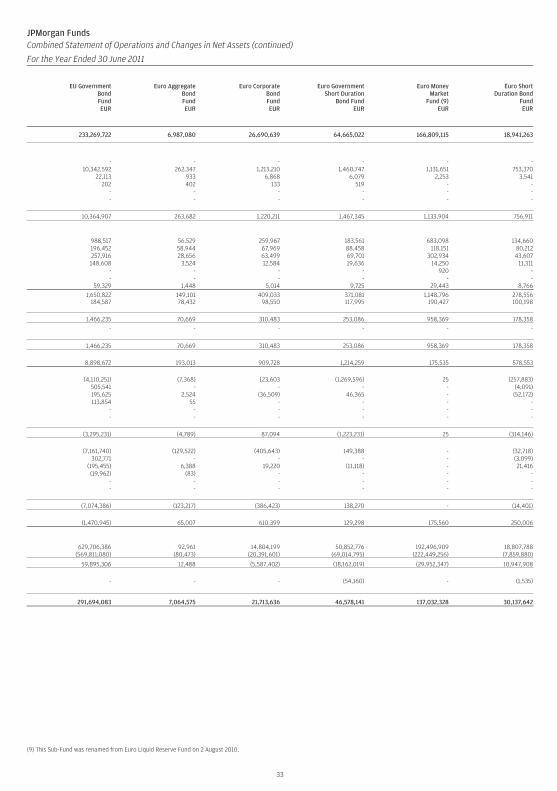
JPMorgan FundsCombined Statement of Operations and Changes in Net Assets (continued)
For the Year Ended 30 June 2011
EU GovernmentBondFundEUR
Euro AggregateBondFundEUR
Euro CorporateBondFundEUR
Euro GovernmentShort Duration
Bond FundEUR
Euro MoneyMarket
Fund (9)EUR
Euro ShortDuration Bond
FundEUR
233,269,722 6,987,080 26,690,639 64,665,022 166,809,115 18,941,263
- - - - - -10,342,592 262,347 1,213,210 1,460,747 1,131,651 753,370
22,113 933 6,868 6,079 2,253 3,541202 402 133 519 - -
- - - - - -- - - - - -
10,364,907 263,682 1,220,211 1,467,345 1,133,904 756,911
988,517 56,529 259,967 183,561 683,098 134,660196,452 58,944 67,969 88,458 118,151 80,212257,916 28,656 63,499 69,701 302,934 43,607148,608 3,524 12,584 19,636 14,250 11,311
- - - - 920 -- - - - - -
59,329 1,448 5,014 9,725 29,443 8,7661,650,822 149,101 409,033 371,081 1,148,796 278,556
184,587 78,432 98,550 117,995 190,427 100,198
1,466,235 70,669 310,483 253,086 958,369 178,358
- - - - - -
1,466,235 70,669 310,483 253,086 958,369 178,358
8,898,672 193,013 909,728 1,214,259 175,535 578,553
(4,110,251) (7,368) 123,603 (1,269,596) 25 (257,883)505,541 - - - - (4,091)195,625 2,524 (36,509) 46,365 - (52,172)113,854 55 - - - -
- - - - - -- - - - - -
(3,295,231) (4,789) 87,094 (1,223,231) 25 (314,146)
(7,161,740) (129,522) (405,643) 149,388 - (32,718)302,771 - - - - (3,099)
(195,455) 6,388 19,220 (11,118) - 21,416(19,962) (83) - - - -
- - - - - -- - - - - -
(7,074,386) (123,217) (386,423) 138,270 - (14,401)
(1,470,945) 65,007 610,399 129,298 175,560 250,006
629,706,386 92,961 14,804,199 50,852,776 192,496,909 18,807,788(569,811,080) (80,473) (20,391,601) (69,014,795) (222,449,256) (7,859,880)
59,895,306 12,488 (5,587,402) (18,162,019) (29,952,347) 10,947,908
- - - (54,160) - (1,535)
291,694,083 7,064,575 21,713,636 46,578,141 137,032,328 30,137,642
(9) This Sub-Fund was renamed from Euro Liquid Reserve Fund on 2 August 2010.
33
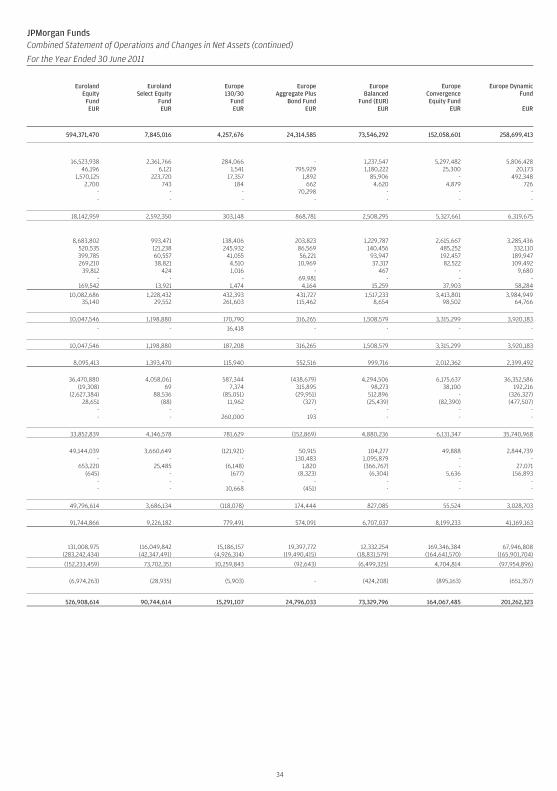
JPMorgan FundsCombined Statement of Operations and Changes in Net Assets (continued)
For the Year Ended 30 June 2011
EurolandEquity
FundEUR
EurolandSelect Equity
FundEUR
Europe130/30
FundEUR
EuropeAggregate Plus
Bond FundEUR
EuropeBalanced
Fund (EUR)EUR
EuropeConvergenceEquity Fund
EUR
Europe DynamicFund
EUR
594,371,470 7,845,016 4,257,676 24,314,585 73,546,292 152,058,601 258,699,413
16,523,938 2,361,766 284,066 - 1,237,547 5,297,482 5,806,42846,196 6,121 1,541 795,929 1,180,222 25,300 20,173
1,570,125 223,720 17,357 1,892 85,906 - 492,3482,700 743 184 662 4,620 4,879 726
- - - 70,298 - - -- - - - - - -
18,142,959 2,592,350 303,148 868,781 2,508,295 5,327,661 6,319,675
8,683,802 993,471 138,406 203,823 1,229,787 2,615,667 3,285,436520,535 121,238 245,932 86,569 140,456 485,252 332,110399,785 60,557 41,055 56,221 93,947 192,457 189,947269,210 38,821 4,510 10,969 37,317 82,522 109,492
39,812 424 1,016 - 467 - 9,680- - - 69,981 - - -
169,542 13,921 1,474 4,164 15,259 37,903 58,28410,082,686 1,228,432 432,393 431,727 1,517,233 3,413,801 3,984,949
35,140 29,552 261,603 115,462 8,654 98,502 64,766
10,047,546 1,198,880 170,790 316,265 1,508,579 3,315,299 3,920,183
- - 16,418 - - - -
10,047,546 1,198,880 187,208 316,265 1,508,579 3,315,299 3,920,183
8,095,413 1,393,470 115,940 552,516 999,716 2,012,362 2,399,492
36,470,880 4,058,061 587,344 (438,679) 4,294,506 6,175,637 36,352,586(19,308) 69 7,374 315,895 98,273 38,100 192,216
(2,627,384) 88,536 (85,051) (29,951) 512,896 - (326,327)28,651 (88) 11,962 (327) (25,439) (82,390) (477,507)
- - - - - - -- - 260,000 193 - - -
33,852,839 4,146,578 781,629 (152,869) 4,880,236 6,131,347 35,740,968
49,144,039 3,660,649 (121,921) 50,915 104,277 49,888 2,844,739- - - 130,483 1,095,879 - -
653,220 25,485 (6,148) 1,820 (366,767) - 27,071(645) - (677) (8,323) (6,304) 5,636 156,893
- - - - - - -- - 10,668 (451) - - -
49,796,614 3,686,134 (118,078) 174,444 827,085 55,524 3,028,703
91,744,866 9,226,182 779,491 574,091 6,707,037 8,199,233 41,169,163
131,008,975 116,049,842 15,186,157 19,397,772 12,332,254 169,346,384 67,946,808(283,242,434) (42,347,491) (4,926,314) (19,490,415) (18,831,579) (164,641,570) (165,901,704)
(152,233,459) 73,702,351 10,259,843 (92,643) (6,499,325) 4,704,814 (97,954,896)
(6,974,263) (28,935) (5,903) - (424,208) (895,163) (651,357)
526,908,614 90,744,614 15,291,107 24,796,033 73,329,796 164,067,485 201,262,323
34
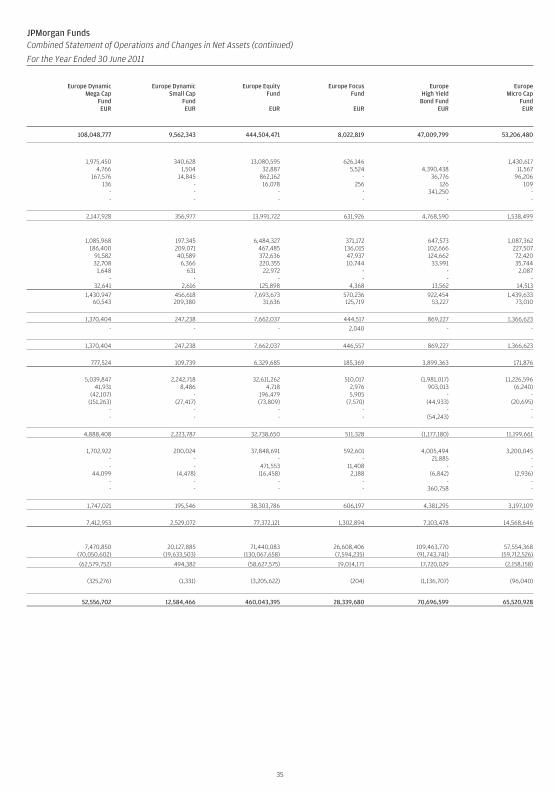
JPMorgan FundsCombined Statement of Operations and Changes in Net Assets (continued)
For the Year Ended 30 June 2011
Europe DynamicMega Cap
FundEUR
Europe DynamicSmall Cap
FundEUR
Europe EquityFund
EUR
Europe FocusFund
EUR
EuropeHigh Yield
Bond FundEUR
EuropeMicro Cap
FundEUR
108,048,777 9,562,343 444,504,471 8,022,819 47,009,799 53,206,480
1,975,450 340,628 13,080,595 626,146 - 1,430,6174,766 1,504 32,887 5,524 4,390,438 11,567
167,576 14,845 862,162 - 36,776 96,206136 - 16,078 256 126 109
- - - - 341,250 -- - - - - -
2,147,928 356,977 13,991,722 631,926 4,768,590 1,538,499
1,085,968 197,345 6,484,327 371,172 647,573 1,087,362186,400 209,071 467,485 136,015 102,666 227,507
91,582 40,589 372,636 47,937 124,662 72,42032,708 6,366 220,355 10,744 33,991 35,744
1,648 631 22,972 - - 2,087- - - - - -
32,641 2,616 125,898 4,368 13,562 14,5131,430,947 456,618 7,693,673 570,236 922,454 1,439,633
60,543 209,380 31,636 125,719 53,227 73,010
1,370,404 247,238 7,662,037 444,517 869,227 1,366,623
- - - 2,040 - -
1,370,404 247,238 7,662,037 446,557 869,227 1,366,623
777,524 109,739 6,329,685 185,369 3,899,363 171,876
5,039,847 2,242,718 32,611,262 510,017 (1,981,017) 11,226,59641,931 8,486 4,718 2,976 903,013 (6,240)
(42,107) - 196,479 5,905 - -(151,263) (27,417) (73,809) (7,570) (44,933) (20,695)
- - - - - -- - - - (54,243) -
4,888,408 2,223,787 32,738,650 511,328 (1,177,180) 11,199,661
1,702,922 200,024 37,848,691 592,601 4,005,494 3,200,045- - - - 21,885 -- - 471,553 11,408 - -
44,099 (4,478) (16,458) 2,188 (6,842) (2,936)- - - - - -- - - - 360,758 -
1,747,021 195,546 38,303,786 606,197 4,381,295 3,197,109
7,412,953 2,529,072 77,372,121 1,302,894 7,103,478 14,568,646
7,470,850 20,127,885 71,440,083 26,608,406 109,463,770 57,554,368(70,050,602) (19,633,503) (130,067,658) (7,594,235) (91,743,741) (59,712,526)
(62,579,752) 494,382 (58,627,575) 19,014,171 17,720,029 (2,158,158)
(325,276) (1,331) (3,205,622) (204) (1,136,707) (96,040)
52,556,702 12,584,466 460,043,395 28,339,680 70,696,599 65,520,928
35
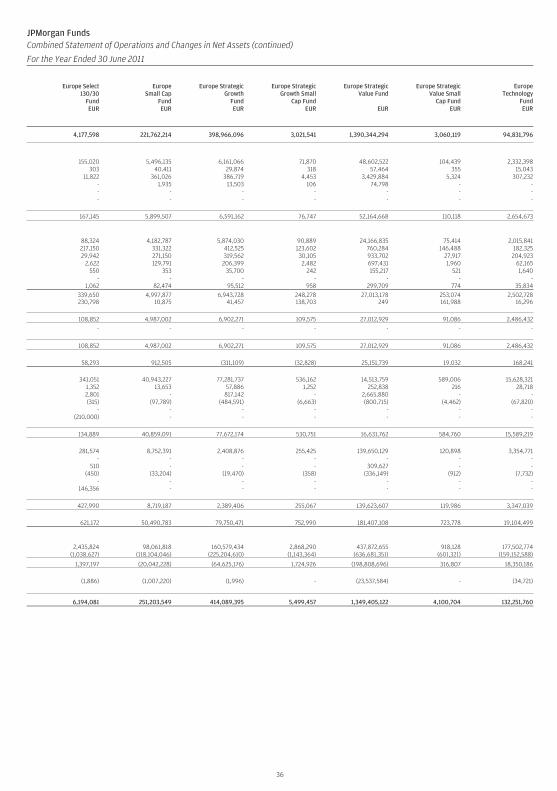
JPMorgan FundsCombined Statement of Operations and Changes in Net Assets (continued)
For the Year Ended 30 June 2011
Europe Select130/30
FundEUR
EuropeSmall Cap
FundEUR
Europe StrategicGrowth
FundEUR
Europe StrategicGrowth Small
Cap FundEUR
Europe StrategicValue Fund
EUR
Europe StrategicValue Small
Cap FundEUR
EuropeTechnology
FundEUR
4,177,598 221,762,214 398,966,096 3,021,541 1,390,344,294 3,060,119 94,831,796
155,020 5,496,135 6,161,066 71,870 48,602,522 104,439 2,332,398303 40,411 29,874 318 57,464 355 15,043
11,822 361,026 386,719 4,453 3,429,884 5,324 307,232- 1,935 13,503 106 74,798 - -- - - - - - -- - - - - - -
167,145 5,899,507 6,591,162 76,747 52,164,668 110,118 2,654,673
88,324 4,182,787 5,874,030 90,889 24,166,835 75,414 2,015,841217,150 331,322 412,525 123,602 760,284 146,488 182,32529,942 271,150 319,562 30,105 933,702 27,917 204,923
2,622 129,791 206,399 2,482 697,431 1,960 62,165550 353 35,700 242 155,217 521 1,640
- - - - - - -1,062 82,474 95,512 958 299,709 774 35,834
339,650 4,997,877 6,943,728 248,278 27,013,178 253,074 2,502,728230,798 10,875 41,457 138,703 249 161,988 16,296
108,852 4,987,002 6,902,271 109,575 27,012,929 91,086 2,486,432
- - - - - - -
108,852 4,987,002 6,902,271 109,575 27,012,929 91,086 2,486,432
58,293 912,505 (311,109) (32,828) 25,151,739 19,032 168,241
341,051 40,943,227 77,281,737 536,162 14,513,759 589,006 15,628,3211,352 13,653 57,886 1,252 252,838 216 28,7182,801 - 817,142 - 2,665,880 - -(315) (97,789) (484,591) (6,663) (800,715) (4,462) (67,820)
- - - - - - -(210,000) - - - - - -
134,889 40,859,091 77,672,174 530,751 16,631,762 584,760 15,589,219
281,574 8,752,391 2,408,876 255,425 139,650,129 120,898 3,354,771- - - - - - -
510 - - - 309,627 - -(450) (33,204) (19,470) (358) (336,149) (912) (7,732)
- - - - - - -146,356 - - - - - -
427,990 8,719,187 2,389,406 255,067 139,623,607 119,986 3,347,039
621,172 50,490,783 79,750,471 752,990 181,407,108 723,778 19,104,499
2,435,824 98,061,818 160,579,434 2,868,290 437,872,655 918,128 177,502,774(1,038,627) (118,104,046) (225,204,610) (1,143,364) (636,681,351) (601,321) (159,152,588)
1,397,197 (20,042,228) (64,625,176) 1,724,926 (198,808,696) 316,807 18,350,186
(1,886) (1,007,220) (1,996) - (23,537,584) - (34,721)
6,194,081 251,203,549 414,089,395 5,499,457 1,349,405,122 4,100,704 132,251,760
36
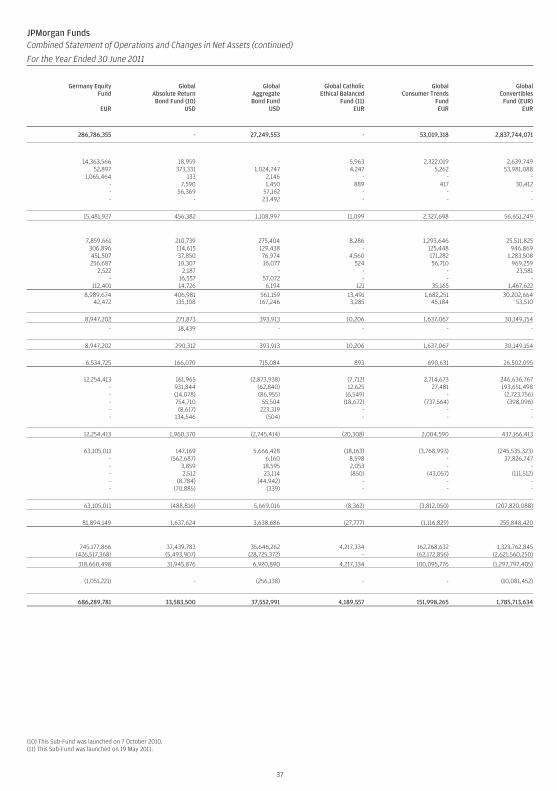
JPMorgan FundsCombined Statement of Operations and Changes in Net Assets (continued)
For the Year Ended 30 June 2011
Germany EquityFund
EUR
GlobalAbsolute ReturnBond Fund (10)
USD
GlobalAggregateBond Fund
USD
Global CatholicEthical Balanced
Fund (11)EUR
GlobalConsumer Trends
FundEUR
GlobalConvertibles
Fund (EUR)EUR
286,786,355 - 27,249,553 - 53,019,318 2,837,744,071
14,363,566 18,959 - 5,963 2,322,019 2,639,74952,897 373,331 1,024,747 4,247 5,262 53,981,088
1,065,464 133 2,146 - - -- 7,590 1,450 889 417 30,412- 56,369 57,162 - - -- - 23,492 - - -
15,481,927 456,382 1,108,997 11,099 2,327,698 56,651,249
7,859,661 210,739 275,404 8,286 1,293,646 25,511,825306,896 114,615 129,438 - 125,448 946,869451,507 37,850 76,974 4,560 171,282 1,283,508256,687 10,307 16,077 524 56,710 969,259
2,522 2,187 - - - 23,581- 16,557 57,072 - - -
112,401 14,726 6,194 121 35,165 1,467,6228,989,674 406,981 561,159 13,491 1,682,251 30,202,664
42,472 135,108 167,246 3,285 45,184 53,510
8,947,202 271,873 393,913 10,206 1,637,067 30,149,154
- 18,439 - - - -
8,947,202 290,312 393,913 10,206 1,637,067 30,149,154
6,534,725 166,070 715,084 893 690,631 26,502,095
12,254,413 161,965 (2,873,938) (7,712) 2,714,673 246,636,767- 931,844 (62,840) 12,625 27,481 193,651,498- (14,078) (86,955) (6,549) - (2,723,756)- 754,710 55,504 (18,672) (737,564) (398,096)- (8,617) 223,319 - - -- 134,546 (504) - - -
12,254,413 1,960,370 (2,745,414) (20,308) 2,004,590 437,166,413
63,105,011 147,169 5,666,428 (18,163) (3,768,993) (245,535,323)- (562,687) 6,160 8,598 - 37,826,747- 3,859 18,595 2,053 - -- 2,512 23,114 (850) (43,057) (111,512)- (8,784) (44,942) - - -- (70,885) (339) - - -
63,105,011 (488,816) 5,669,016 (8,362) (3,812,050) (207,820,088)
81,894,149 1,637,624 3,638,686 (27,777) (1,116,829) 255,848,420
745,177,866 37,439,783 35,646,262 4,217,334 162,268,632 1,323,762,845(426,517,368) (5,493,907) (28,725,372) - (62,172,856) (2,621,560,250)
318,660,498 31,945,876 6,920,890 4,217,334 100,095,776 (1,297,797,405)
(1,051,221) - (256,138) - - (10,081,452)
686,289,781 33,583,500 37,552,991 4,189,557 151,998,265 1,785,713,634
(10) This Sub-Fund was launched on 7 October 2010.(11) This Sub-Fund was launched on 19 May 2011.
37
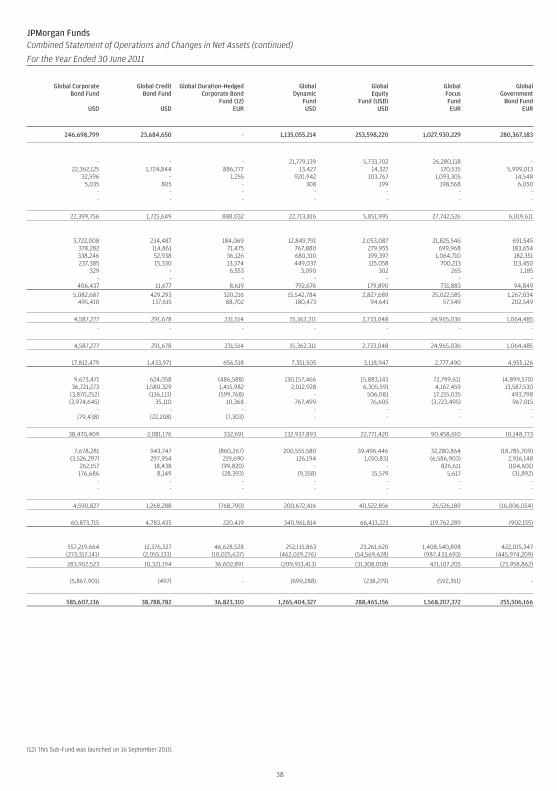
JPMorgan FundsCombined Statement of Operations and Changes in Net Assets (continued)
For the Year Ended 30 June 2011
Global CorporateBond Fund
USD
Global CreditBond Fund
USD
Global Duration-HedgedCorporate Bond
Fund (12)EUR
GlobalDynamic
FundUSD
GlobalEquity
Fund (USD)USD
GlobalFocusFundEUR
GlobalGovernment
Bond FundEUR
246,698,799 23,684,650 - 1,135,055,214 253,598,220 1,027,930,229 280,367,183
- - - 21,779,139 5,733,702 26,280,118 -22,362,125 1,724,844 886,777 13,427 14,327 170,535 5,999,013
32,596 - 1,255 920,942 103,767 1,093,305 14,5485,035 805 - 308 199 198,568 6,050
- - - - - - -- - - - - - -
22,399,756 1,725,649 888,032 22,713,816 5,851,995 27,742,526 6,019,611
3,722,008 234,487 184,069 12,849,791 2,053,087 21,825,546 691,545378,282 114,861 71,475 767,880 279,955 699,968 183,654338,246 52,938 36,126 680,310 199,397 1,064,710 182,351237,385 15,330 13,374 449,037 115,058 700,213 113,450
329 - 6,553 3,090 302 265 1,185- - - - - - -
406,437 11,677 8,619 792,676 179,890 731,883 94,8495,082,687 429,293 320,216 15,542,784 2,827,689 25,022,585 1,267,034
495,410 137,615 88,702 180,473 94,641 57,549 202,549
4,587,277 291,678 231,514 15,362,311 2,733,048 24,965,036 1,064,485
- - - - - - -
4,587,277 291,678 231,514 15,362,311 2,733,048 24,965,036 1,064,485
17,812,479 1,433,971 656,518 7,351,505 3,118,947 2,777,490 4,955,126
9,673,471 624,058 (486,588) 130,157,466 15,883,143 72,799,611 (4,899,570)36,721,273 1,580,329 1,415,982 2,012,928 6,305,591 4,167,459 13,587,530
(3,870,252) (136,113) (599,768) - 506,081 17,215,035 493,798(3,974,645) 35,110 10,368 767,499 76,605 (3,723,495) 967,015
- - - - - - -(79,438) (22,208) (7,303) - - - -
38,470,409 2,081,176 332,691 132,937,893 22,771,420 90,458,610 10,148,773
7,678,281 943,747 (860,267) 200,555,580 39,496,446 32,280,864 (18,785,709)(3,526,297) 297,954 219,690 126,194 1,010,831 (6,586,903) 2,916,148
262,157 18,438 (99,820) - - 826,611 (104,601)176,686 8,149 (28,393) (9,358) 15,579 5,617 (31,892)
- - - - - - -- - - - - - -
4,590,827 1,268,288 (768,790) 200,672,416 40,522,856 26,526,189 (16,006,054)
60,873,715 4,783,435 220,419 340,961,814 66,413,223 119,762,289 (902,155)
557,219,664 12,376,327 46,628,528 252,115,863 23,261,620 1,408,540,898 422,015,347(273,317,141) (2,055,133) (10,025,637) (462,029,276) (54,569,628) (987,433,693) (445,974,209)
283,902,523 10,321,194 36,602,891 (209,913,413) (31,308,008) 421,107,205 (23,958,862)
(5,867,901) (497) - (699,288) (238,279) (592,351) -
585,607,136 38,788,782 36,823,310 1,265,404,327 288,465,156 1,568,207,372 255,506,166
(12) This Sub-Fund was launched on 16 September 2010.
38
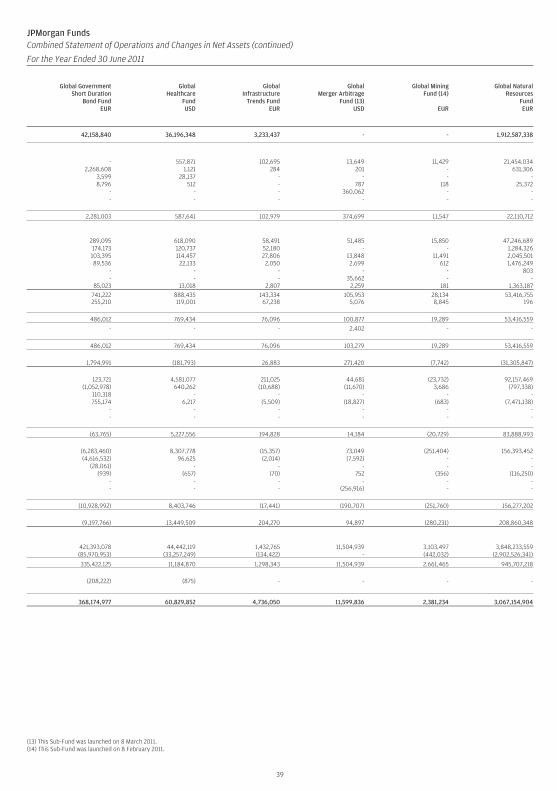
JPMorgan FundsCombined Statement of Operations and Changes in Net Assets (continued)
For the Year Ended 30 June 2011
Global GovernmentShort Duration
Bond FundEUR
GlobalHealthcare
FundUSD
GlobalInfrastructure
Trends FundEUR
GlobalMerger Arbitrage
Fund (13)USD
Global MiningFund (14)
EUR
Global NaturalResources
FundEUR
42,158,840 36,196,348 3,233,437 - - 1,912,587,338
- 557,871 102,695 13,649 11,429 21,454,0342,268,608 1,121 284 201 - 631,306
3,599 28,137 - - - -8,796 512 - 787 118 25,372
- - - 360,062 - -- - - - - -
2,281,003 587,641 102,979 374,699 11,547 22,110,712
289,095 618,090 58,491 51,485 15,850 47,246,689174,173 120,737 52,180 - - 1,284,326103,395 114,457 27,806 13,848 11,491 2,045,50189,536 22,133 2,050 2,699 612 1,476,249
- - - - - 803- - - 35,662 - -
85,023 13,018 2,807 2,259 181 1,363,187741,222 888,435 143,334 105,953 28,134 53,416,755255,210 119,001 67,238 5,076 8,845 196
486,012 769,434 76,096 100,877 19,289 53,416,559
- - - 2,402 - -
486,012 769,434 76,096 103,279 19,289 53,416,559
1,794,991 (181,793) 26,883 271,420 (7,742) (31,305,847)
123,721 4,581,077 211,025 44,681 (23,732) 92,157,469(1,052,978) 640,262 (10,688) (11,670) 3,686 (797,338)
110,318 - - - - -755,174 6,217 (5,509) (18,827) (683) (7,471,138)
- - - - - -- - - - - -
(63,765) 5,227,556 194,828 14,184 (20,729) 83,888,993
(6,283,460) 8,307,778 (15,357) 73,049 (251,404) 156,393,452(4,616,532) 96,625 (2,014) (7,592) - -
(28,061) - - - - -(939) (657) (70) 752 (356) (116,250)
- - - - - -- - - (256,916) - -
(10,928,992) 8,403,746 (17,441) (190,707) (251,760) 156,277,202
(9,197,766) 13,449,509 204,270 94,897 (280,231) 208,860,348
421,393,078 44,442,119 1,432,765 11,504,939 3,103,497 3,848,233,559(85,970,953) (33,257,249) (134,422) - (442,032) (2,902,526,341)
335,422,125 11,184,870 1,298,343 11,504,939 2,661,465 945,707,218
(208,222) (875) - - - -
368,174,977 60,829,852 4,736,050 11,599,836 2,381,234 3,067,154,904
(13) This Sub-Fund was launched on 8 March 2011.(14) This Sub-Fund was launched on 8 February 2011.
39
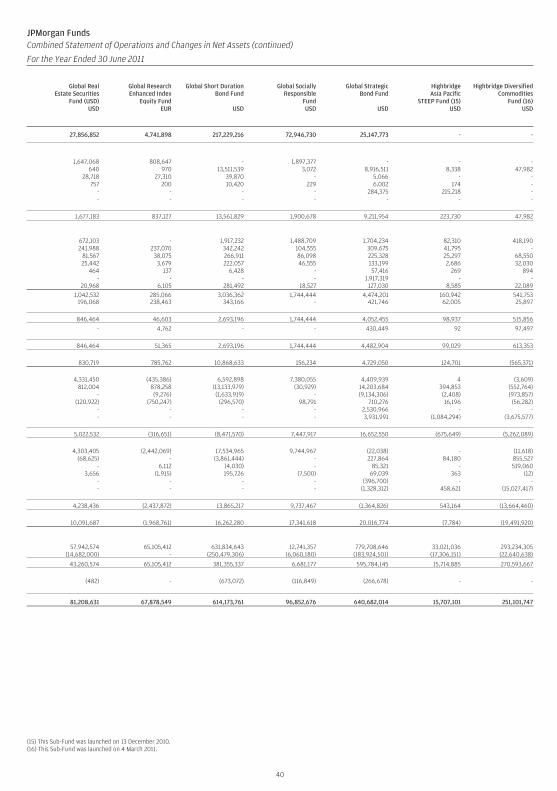
JPMorgan FundsCombined Statement of Operations and Changes in Net Assets (continued)
For the Year Ended 30 June 2011
Global RealEstate Securities
Fund (USD)USD
Global ResearchEnhanced Index
Equity FundEUR
Global Short DurationBond Fund
USD
Global SociallyResponsible
FundUSD
Global StrategicBond Fund
USD
HighbridgeAsia Pacific
STEEP Fund (15)USD
Highbridge DiversifiedCommodities
Fund (16)USD
27,856,852 4,741,898 217,229,216 72,946,730 25,147,773 - -
1,647,068 808,647 - 1,897,377 - - -640 970 13,511,539 3,072 8,916,511 8,338 47,982
28,718 27,310 39,870 - 5,066 - -757 200 10,420 229 6,002 174 -
- - - - 284,375 215,218 -- - - - - - -
1,677,183 837,127 13,561,829 1,900,678 9,211,954 223,730 47,982
672,103 - 1,917,232 1,488,709 1,704,234 82,310 418,190241,988 237,070 342,242 104,555 309,675 41,795 -
81,567 38,075 266,911 86,098 225,328 25,297 68,55025,442 3,679 222,057 46,555 133,199 2,686 32,030
464 137 6,428 - 57,416 269 894- - - - 1,917,319 - -
20,968 6,105 281,492 18,527 127,030 8,585 22,0891,042,532 285,066 3,036,362 1,744,444 4,474,201 160,942 541,753
196,068 238,463 343,166 - 421,746 62,005 25,897
846,464 46,603 2,693,196 1,744,444 4,052,455 98,937 515,856
- 4,762 - - 430,449 92 97,497
846,464 51,365 2,693,196 1,744,444 4,482,904 99,029 613,353
830,719 785,762 10,868,633 156,234 4,729,050 124,701 (565,371)
4,331,450 (435,386) 6,592,898 7,380,055 4,409,939 4 (3,609)812,004 878,258 (13,133,979) (30,929) 14,203,684 394,853 (552,764)
- (9,276) (1,633,919) - (9,134,306) (2,408) (973,857)(120,922) (750,247) (296,570) 98,791 710,276 16,196 (56,282)
- - - - 2,530,966 - -- - - - 3,931,991 (1,084,294) (3,675,577)
5,022,532 (316,651) (8,471,570) 7,447,917 16,652,550 (675,649) (5,262,089)
4,303,405 (2,442,069) 17,534,965 9,744,967 (22,038) - (11,618)(68,625) - (3,861,444) - 227,864 84,180 855,527
- 6,112 (4,030) - 85,321 - 519,0603,656 (1,915) 195,726 (7,500) 69,039 363 (12)
- - - - (396,700) - -- - - - (1,328,312) 458,621 (15,027,417)
4,238,436 (2,437,872) 13,865,217 9,737,467 (1,364,826) 543,164 (13,664,460)
10,091,687 (1,968,761) 16,262,280 17,341,618 20,016,774 (7,784) (19,491,920)
57,942,574 65,105,412 631,834,643 12,741,357 779,708,646 33,021,036 293,234,305(14,682,000) - (250,479,306) (6,060,180) (183,924,501) (17,306,151) (22,640,638)
43,260,574 65,105,412 381,355,337 6,681,177 595,784,145 15,714,885 270,593,667
(482) - (673,072) (116,849) (266,678) - -
81,208,631 67,878,549 614,173,761 96,852,676 640,682,014 15,707,101 251,101,747
(15) This Sub-Fund was launched on 13 December 2010.(16) This Sub-Fund was launched on 4 March 2011.
40
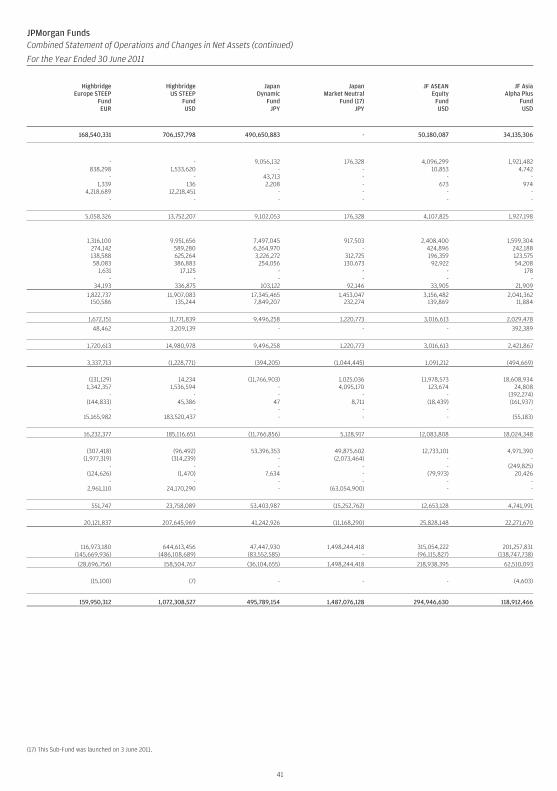
JPMorgan FundsCombined Statement of Operations and Changes in Net Assets (continued)
For the Year Ended 30 June 2011
HighbridgeEurope STEEP
FundEUR
HighbridgeUS STEEP
FundUSD
JapanDynamic
FundJPY
JapanMarket Neutral
Fund (17)JPY
JF ASEANEquity
FundUSD
JF AsiaAlpha Plus
FundUSD
168,540,331 706,157,798 490,650,883 - 50,180,087 34,135,306
- - 9,056,132 176,328 4,096,299 1,921,482838,298 1,533,620 - - 10,853 4,742
- - 43,713 - - -1,339 136 2,208 - 673 974
4,218,689 12,218,451 - - - -- - - - - -
5,058,326 13,752,207 9,102,053 176,328 4,107,825 1,927,198
1,316,100 9,951,656 7,497,045 917,503 2,408,400 1,599,304274,142 589,280 6,264,970 - 424,896 242,188138,588 625,264 3,226,272 312,725 196,359 123,57558,083 386,883 254,056 130,673 92,922 54,208
1,631 17,125 - - - 178- - - - - -
34,193 336,875 103,122 92,146 33,905 21,9091,822,737 11,907,083 17,345,465 1,453,047 3,156,482 2,041,362
150,586 135,244 7,849,207 232,274 139,869 11,884
1,672,151 11,771,839 9,496,258 1,220,773 3,016,613 2,029,478
48,462 3,209,139 - - - 392,389
1,720,613 14,980,978 9,496,258 1,220,773 3,016,613 2,421,867
3,337,713 (1,228,771) (394,205) (1,044,445) 1,091,212 (494,669)
(131,129) 14,234 (11,766,903) 1,025,036 11,978,573 18,608,9341,342,357 1,536,594 - 4,095,170 123,674 24,808
- - - - - (392,274)(144,833) 45,386 47 8,711 (18,439) (161,937)
- - - - - -15,165,982 183,520,437 - - - (55,183)
16,232,377 185,116,651 (11,766,856) 5,128,917 12,083,808 18,024,348
(307,418) (96,492) 53,396,353 49,875,602 12,733,101 4,971,390(1,977,319) (314,239) - (2,073,464) - -
- - - - - (249,825)(124,626) (1,470) 7,634 - (79,973) 20,426
- - - - - -2,961,110 24,170,290 - (63,054,900) - -
551,747 23,758,089 53,403,987 (15,252,762) 12,653,128 4,741,991
20,121,837 207,645,969 41,242,926 (11,168,290) 25,828,148 22,271,670
116,973,180 644,613,456 47,447,930 1,498,244,418 315,054,222 201,257,831(145,669,936) (486,108,689) (83,552,585) - (96,115,827) (138,747,738)
(28,696,756) 158,504,767 (36,104,655) 1,498,244,418 218,938,395 62,510,093
(15,100) (7) - - - (4,603)
159,950,312 1,072,308,527 495,789,154 1,487,076,128 294,946,630 118,912,466
(17) This Sub-Fund was launched on 3 June 2011.
41
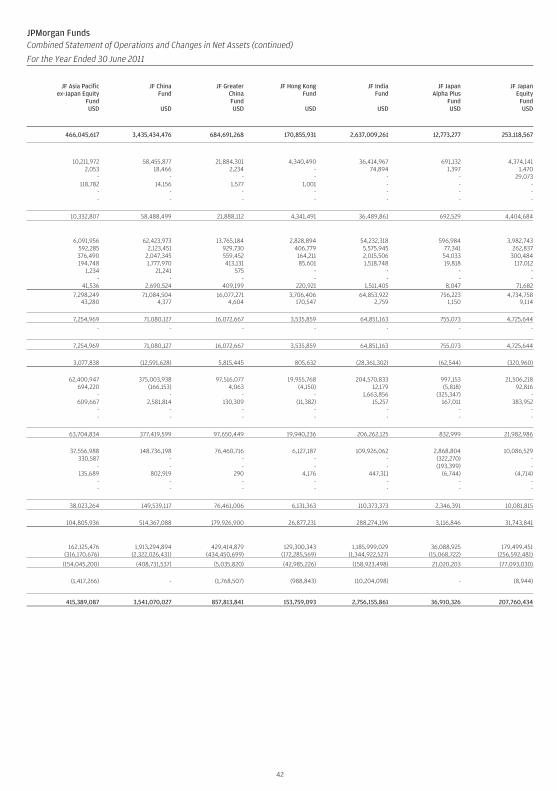
JPMorgan FundsCombined Statement of Operations and Changes in Net Assets (continued)
For the Year Ended 30 June 2011
JF Asia Pacificex-Japan Equity
FundUSD
JF ChinaFund
USD
JF GreaterChinaFundUSD
JF Hong KongFund
USD
JF IndiaFund
USD
JF JapanAlpha Plus
FundUSD
JF JapanEquity
FundUSD
466,045,617 3,435,434,476 684,691,268 170,855,931 2,637,009,261 12,773,277 253,118,567
10,211,972 58,455,877 21,884,301 4,340,490 36,414,967 691,132 4,374,1412,053 18,466 2,234 - 74,894 1,397 1,470
- - - - - - 29,073118,782 14,156 1,577 1,001 - - -
- - - - - - -- - - - - - -
10,332,807 58,488,499 21,888,112 4,341,491 36,489,861 692,529 4,404,684
6,091,956 62,423,973 13,765,184 2,828,894 54,232,318 596,984 3,982,743592,285 2,123,451 929,730 406,779 5,575,945 77,341 262,837376,490 2,047,345 559,452 164,211 2,015,506 54,033 300,484194,748 1,777,970 413,131 85,601 1,518,748 19,818 117,012
1,234 21,241 575 - - - -- - - - - - -
41,536 2,690,524 409,199 220,921 1,511,405 8,047 71,6827,298,249 71,084,504 16,077,271 3,706,406 64,853,922 756,223 4,734,758
43,280 4,377 4,604 170,547 2,759 1,150 9,114
7,254,969 71,080,127 16,072,667 3,535,859 64,851,163 755,073 4,725,644
- - - - - - -
7,254,969 71,080,127 16,072,667 3,535,859 64,851,163 755,073 4,725,644
3,077,838 (12,591,628) 5,815,445 805,632 (28,361,302) (62,544) (320,960)
62,400,947 375,003,938 97,516,077 19,955,768 204,570,833 997,153 21,506,218694,220 (166,153) 4,063 (4,150) 12,179 (5,818) 92,816
- - - - 1,663,856 (325,347) -609,667 2,581,814 130,309 (11,382) 15,257 167,011 383,952
- - - - - - -- - - - - - -
63,704,834 377,419,599 97,650,449 19,940,236 206,262,125 832,999 21,982,986
37,556,988 148,736,198 76,460,716 6,127,187 109,926,062 2,868,804 10,086,529330,587 - - - - (322,270) -
- - - - - (193,399) -135,689 802,919 290 4,176 447,311 (6,744) (4,714)
- - - - - - -- - - - - - -
38,023,264 149,539,117 76,461,006 6,131,363 110,373,373 2,346,391 10,081,815
104,805,936 514,367,088 179,926,900 26,877,231 288,274,196 3,116,846 31,743,841
162,125,476 1,913,294,894 429,414,879 129,300,343 1,185,999,029 36,088,925 179,499,451(316,170,676) (2,322,026,431) (434,450,699) (172,285,569) (1,344,922,527) (15,068,722) (256,592,481)
(154,045,200) (408,731,537) (5,035,820) (42,985,226) (158,923,498) 21,020,203 (77,093,030)
(1,417,266) - (1,768,507) (988,843) (10,204,098) - (8,944)
415,389,087 3,541,070,027 857,813,841 153,759,093 2,756,155,861 36,910,326 207,760,434
42
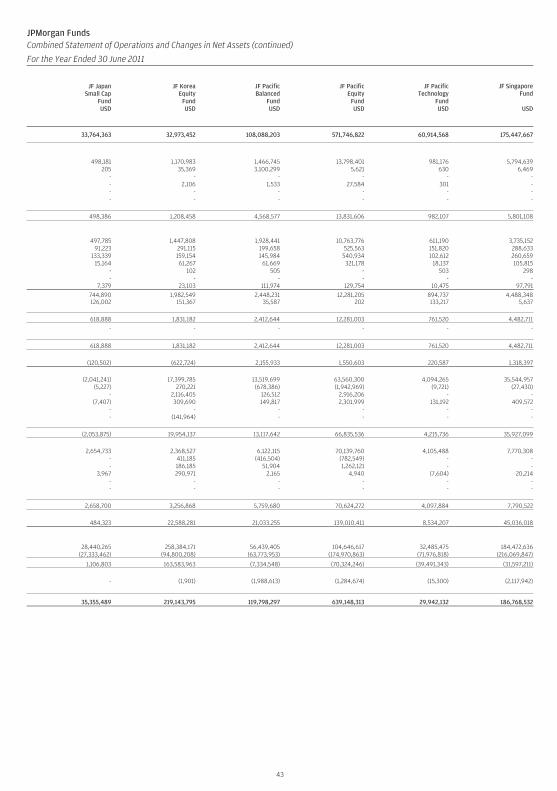
JPMorgan FundsCombined Statement of Operations and Changes in Net Assets (continued)
For the Year Ended 30 June 2011
JF JapanSmall Cap
FundUSD
JF KoreaEquity
FundUSD
JF PacificBalanced
FundUSD
JF PacificEquity
FundUSD
JF PacificTechnology
FundUSD
JF SingaporeFund
USD
33,764,363 32,973,452 108,088,203 571,746,822 60,914,568 175,447,667
498,181 1,170,983 1,466,745 13,798,401 981,176 5,794,639205 35,369 3,100,299 5,621 630 6,469
- - - - - -- 2,106 1,533 27,584 301 -- - - - - -- - - - - -
498,386 1,208,458 4,568,577 13,831,606 982,107 5,801,108
497,785 1,447,808 1,928,441 10,763,776 611,190 3,735,15291,223 291,115 199,658 525,563 151,820 288,633
133,339 159,154 145,984 540,934 102,612 260,65915,164 61,267 61,669 321,178 18,137 105,815
- 102 505 - 503 298- - - - - -
7,379 23,103 111,974 129,754 10,475 97,791744,890 1,982,549 2,448,231 12,281,205 894,737 4,488,348126,002 151,367 35,587 202 133,217 5,637
618,888 1,831,182 2,412,644 12,281,003 761,520 4,482,711
- - - - - -
618,888 1,831,182 2,412,644 12,281,003 761,520 4,482,711
(120,502) (622,724) 2,155,933 1,550,603 220,587 1,318,397
(2,041,241) 17,399,785 13,519,699 63,560,300 4,094,265 35,544,957(5,227) 270,221 (678,386) (1,942,969) (9,721) (27,430)
- 2,116,405 126,512 2,916,206 - -(7,407) 309,690 149,817 2,301,999 131,192 409,572
- - - - - -- (141,964) - - - -
(2,053,875) 19,954,137 13,117,642 66,835,536 4,215,736 35,927,099
2,654,733 2,368,527 6,122,115 70,139,760 4,105,488 7,770,308- 411,185 (416,504) (782,549) - -- 186,185 51,904 1,262,121 - -
3,967 290,971 2,165 4,940 (7,604) 20,214- - - - - -- - - - - -
2,658,700 3,256,868 5,759,680 70,624,272 4,097,884 7,790,522
484,323 22,588,281 21,033,255 139,010,411 8,534,207 45,036,018
28,440,265 258,384,171 56,439,405 104,646,617 32,485,475 184,472,636(27,333,462) (94,800,208) (63,773,953) (174,970,863) (71,976,818) (216,069,847)
1,106,803 163,583,963 (7,334,548) (70,324,246) (39,491,343) (31,597,211)
- (1,901) (1,988,613) (1,284,674) (15,300) (2,117,942)
35,355,489 219,143,795 119,798,297 639,148,313 29,942,132 186,768,532
43
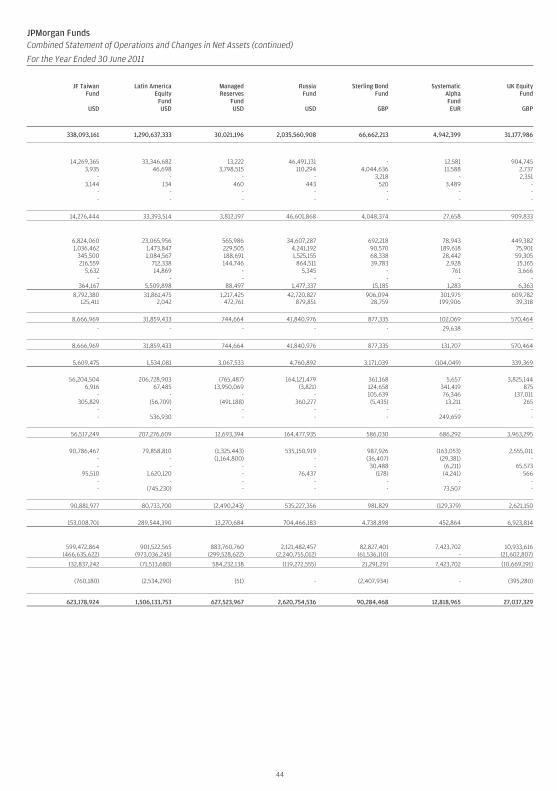
JPMorgan FundsCombined Statement of Operations and Changes in Net Assets (continued)
For the Year Ended 30 June 2011
JF TaiwanFund
USD
Latin AmericaEquity
FundUSD
ManagedReserves
FundUSD
RussiaFund
USD
Sterling BondFund
GBP
SystematicAlphaFundEUR
UK EquityFund
GBP
338,093,161 1,290,637,333 30,021,196 2,035,560,908 66,662,213 4,942,399 31,177,986
14,269,365 33,346,682 13,222 46,491,131 - 12,581 904,7453,935 46,698 3,798,515 110,294 4,044,636 11,588 2,737
- - - - 3,218 - 2,3513,144 134 460 443 520 3,489 -
- - - - - - -- - - - - - -
14,276,444 33,393,514 3,812,197 46,601,868 4,048,374 27,658 909,833
6,824,060 23,065,956 565,986 34,607,287 692,218 78,943 449,3821,036,462 1,473,847 229,505 4,241,192 90,570 189,618 75,901
345,500 1,084,567 188,691 1,525,155 68,338 28,442 59,305216,559 712,338 144,746 864,511 39,783 2,928 15,165
5,632 14,869 - 5,345 - 761 3,666- - - - - - -
364,167 5,509,898 88,497 1,477,337 15,185 1,283 6,3638,792,380 31,861,475 1,217,425 42,720,827 906,094 301,975 609,782
125,411 2,042 472,761 879,851 28,759 199,906 39,318
8,666,969 31,859,433 744,664 41,840,976 877,335 102,069 570,464
- - - - - 29,638 -
8,666,969 31,859,433 744,664 41,840,976 877,335 131,707 570,464
5,609,475 1,534,081 3,067,533 4,760,892 3,171,039 (104,049) 339,369
56,204,504 206,728,903 (765,487) 164,121,479 361,168 5,657 3,825,1446,916 67,485 13,950,069 (3,821) 124,658 341,419 875
- - - - 105,639 76,346 137,011305,829 (56,709) (491,188) 360,277 (5,435) 13,211 265
- - - - - - -- 536,930 - - - 249,659 -
56,517,249 207,276,609 12,693,394 164,477,935 586,030 686,292 3,963,295
90,786,467 79,858,810 (1,325,443) 535,150,919 987,926 (163,053) 2,555,011- - (1,164,800) - (36,407) (29,381) -- - - - 30,488 (6,211) 65,573
95,510 1,620,120 - 76,437 (178) (4,241) 566- - - - - - -- (745,230) - - - 73,507 -
90,881,977 80,733,700 (2,490,243) 535,227,356 981,829 (129,379) 2,621,150
153,008,701 289,544,390 13,270,684 704,466,183 4,738,898 452,864 6,923,814
599,472,864 901,522,565 883,760,760 2,121,482,457 82,827,401 7,423,702 10,933,616(466,635,622) (973,036,245) (299,528,622) (2,240,755,012) (61,536,110) - (21,602,807)
132,837,242 (71,513,680) 584,232,138 (119,272,555) 21,291,291 7,423,702 (10,669,191)
(760,180) (2,534,290) (51) - (2,407,934) - (395,280)
623,178,924 1,506,133,753 627,523,967 2,620,754,536 90,284,468 12,818,965 27,037,329
44
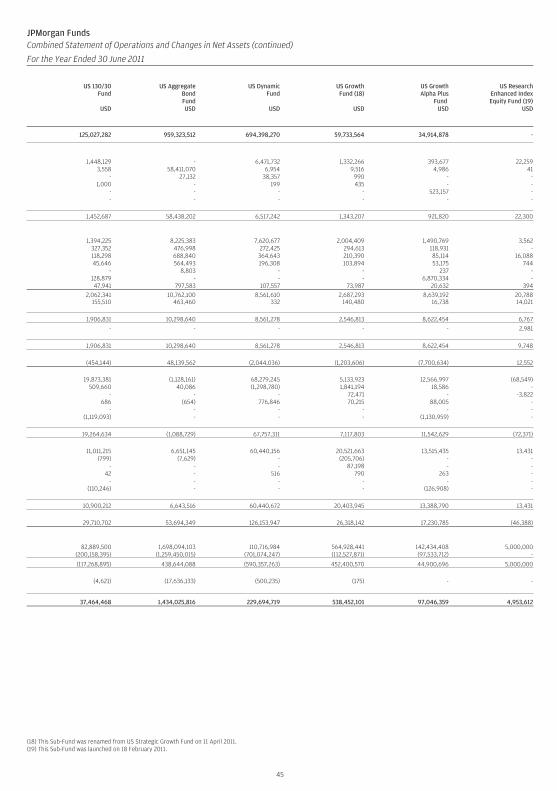
JPMorgan FundsCombined Statement of Operations and Changes in Net Assets (continued)
For the Year Ended 30 June 2011
US 130/30Fund
USD
US AggregateBondFundUSD
US DynamicFund
USD
US GrowthFund (18)
USD
US GrowthAlpha Plus
FundUSD
US ResearchEnhanced IndexEquity Fund (19)
USD
125,027,282 959,323,512 694,398,270 59,733,564 34,914,878 -
1,448,129 - 6,471,732 1,332,266 393,677 22,2593,558 58,411,070 6,954 9,516 4,986 41
- 27,132 38,357 990 - -1,000 - 199 435 - -
- - - - 523,157 -- - - - - -
1,452,687 58,438,202 6,517,242 1,343,207 921,820 22,300
1,394,225 8,225,383 7,620,677 2,004,409 1,490,769 3,562327,352 476,998 272,425 294,613 118,931 -118,298 688,840 364,643 210,390 85,114 16,08845,646 564,493 196,308 103,894 53,175 744
- 8,803 - - 237 -128,879 - - - 6,870,334 -47,941 797,583 107,557 73,987 20,632 394
2,062,341 10,762,100 8,561,610 2,687,293 8,639,192 20,788155,510 463,460 332 140,480 16,738 14,021
1,906,831 10,298,640 8,561,278 2,546,813 8,622,454 6,767
- - - - - 2,981
1,906,831 10,298,640 8,561,278 2,546,813 8,622,454 9,748
(454,144) 48,139,562 (2,044,036) (1,203,606) (7,700,634) 12,552
19,873,381 (1,128,161) 68,279,245 5,133,923 12,566,997 (68,549)509,660 40,086 (1,298,780) 1,841,194 18,586 -
- - - 72,471 - -3,822686 (654) 776,846 70,215 88,005 -
- - - - - -(1,119,093) - - - (1,130,959) -
19,264,634 (1,088,729) 67,757,311 7,117,803 11,542,629 (72,371)
11,011,215 6,651,145 60,440,156 20,521,663 13,515,435 13,431(799) (7,629) - (205,706) - -
- - - 87,198 - -42 - 516 790 263 -
- - - - - -(110,246) - - - (126,908) -
10,900,212 6,643,516 60,440,672 20,403,945 13,388,790 13,431
29,710,702 53,694,349 126,153,947 26,318,142 17,230,785 (46,388)
82,889,500 1,698,094,103 110,716,984 564,928,441 142,434,408 5,000,000(200,158,395) (1,259,450,015) (701,074,247) (112,527,871) (97,533,712) -
(117,268,895) 438,644,088 (590,357,263) 452,400,570 44,900,696 5,000,000
(4,621) (17,636,133) (500,235) (175) - -
37,464,468 1,434,025,816 229,694,719 538,452,101 97,046,359 4,953,612
(18) This Sub-Fund was renamed from US Strategic Growth Fund on 11 April 2011.(19) This Sub-Fund was launched on 18 February 2011.
45
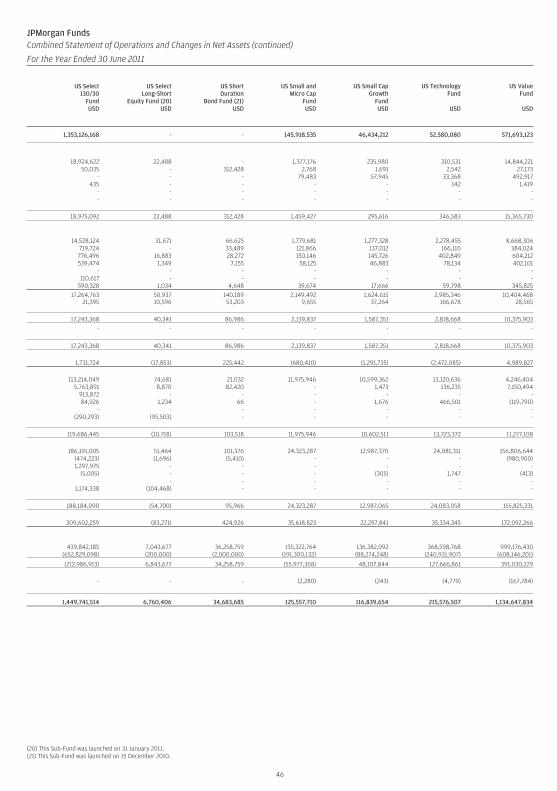
JPMorgan FundsCombined Statement of Operations and Changes in Net Assets (continued)
For the Year Ended 30 June 2011
US Select130/30
FundUSD
US SelectLong-Short
Equity Fund (20)USD
US ShortDuration
Bond Fund (21)USD
US Small andMicro Cap
FundUSD
US Small CapGrowth
FundUSD
US TechnologyFund
USD
US ValueFund
USD
1,353,126,168 - - 145,918,535 46,434,212 52,580,080 571,693,123
18,924,622 22,488 - 1,377,176 235,980 310,531 14,844,22150,035 - 312,428 2,768 1,691 2,542 27,173
- - - 79,483 57,945 33,368 492,917435 - - - - 142 1,419
- - - - - - -- - - - - - -
18,975,092 22,488 312,428 1,459,427 295,616 346,583 15,365,730
14,528,124 31,671 66,625 1,779,681 1,277,328 2,278,455 8,668,306719,724 - 33,489 121,866 137,012 166,110 384,024776,496 16,883 28,272 150,146 145,726 402,849 604,212539,474 1,349 7,155 58,125 46,883 78,134 402,101
- - - - - - -110,617 - - - - - -
590,328 1,034 4,648 39,674 17,666 59,798 345,82517,264,763 50,937 140,189 2,149,492 1,624,615 2,985,346 10,404,468
21,395 10,596 53,203 9,655 37,264 166,678 28,565
17,243,368 40,341 86,986 2,139,837 1,587,351 2,818,668 10,375,903
- - - - - - -
17,243,368 40,341 86,986 2,139,837 1,587,351 2,818,668 10,375,903
1,731,724 (17,853) 225,442 (680,410) (1,291,735) (2,472,085) 4,989,827
113,214,049 74,681 21,032 11,975,946 10,599,362 13,120,636 4,246,4045,763,891 8,870 82,420 - 1,473 136,235 7,150,494
913,872 - - - - - -84,926 1,234 66 - 1,676 466,501 (119,790)
- - - - - - -(290,293) (95,503) - - - - -
119,686,445 (10,718) 103,518 11,975,946 10,602,511 13,723,372 11,277,108
186,191,005 51,464 101,376 24,323,287 12,987,370 24,081,311 156,806,644(474,223) (1,696) (5,410) - - - (980,900)1,297,975 - - - - - -
(5,005) - - - (305) 1,747 (413)- - - - - - -
1,174,338 (104,468) - - - - -
188,184,090 (54,700) 95,966 24,323,287 12,987,065 24,083,058 155,825,331
309,602,259 (83,271) 424,926 35,618,823 22,297,841 35,334,345 172,092,266
439,842,185 7,043,677 36,258,759 135,322,764 136,382,092 368,598,768 999,176,430(652,829,098) (200,000) (2,000,000) (191,300,132) (88,274,248) (240,931,907) (608,146,201)
(212,986,913) 6,843,677 34,258,759 (55,977,368) 48,107,844 127,666,861 391,030,229
- - - (2,280) (243) (4,779) (167,784)
1,449,741,514 6,760,406 34,683,685 125,557,710 116,839,654 215,576,507 1,134,647,834
(20) This Sub-Fund was launched on 31 January 2011.(21) This Sub-Fund was launched on 15 December 2010.
46
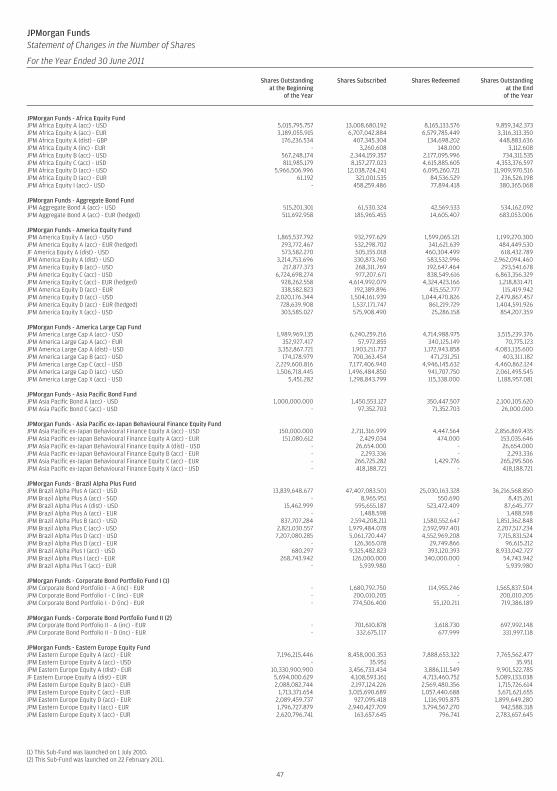
JPMorgan FundsStatement of Changes in the Number of Shares (continued)
For the Year Ended 30 June 2011
Shares Outstandingat the Beginning
of the Year
Shares Subscribed Shares Redeemed Shares Outstandingat the End
of the Year
JPMorgan Funds - Africa Equity FundJPM Africa Equity A (acc) - USD 5,015,795.757 13,008,680.192 8,165,133.576 9,859,342.373JPM Africa Equity A (acc) - EUR 3,189,055.915 6,707,042.884 6,579,785.449 3,316,313.350JPM Africa Equity A (dist) - GBP 176,236.534 407,345.304 134,698.202 448,883.636JPM Africa Equity A (inc) - EUR - 3,260.608 148.000 3,112.608JPM Africa Equity B (acc) - USD 567,248.174 2,344,159.357 2,177,095.996 734,311.535JPM Africa Equity C (acc) - USD 811,985.179 8,157,277.023 4,615,885.605 4,353,376.597JPM Africa Equity D (acc) - USD 5,966,506.996 12,038,724.241 6,095,260.721 11,909,970.516JPM Africa Equity D (acc) - EUR 61.192 321,001.535 84,536.529 236,526.198JPM Africa Equity I (acc) - USD - 458,259.486 77,894.418 380,365.068
JPMorgan Funds - Aggregate Bond FundJPM Aggregate Bond A (acc) - USD 515,201.301 61,530.324 42,569.533 534,162.092JPM Aggregate Bond A (acc) - EUR (hedged) 511,692.958 185,965.455 14,605.407 683,053.006
JPMorgan Funds - America Equity FundJPM America Equity A (acc) - USD 1,865,537.792 932,797.629 1,599,065.121 1,199,270.300JPM America Equity A (acc) - EUR (hedged) 293,772.467 532,298.702 341,621.639 484,449.530JF America Equity A (dist) - USD 573,582.270 505,155.018 460,304.499 618,432.789JPM America Equity A (dist) - USD 3,214,753.696 330,873.760 583,532.996 2,962,094.460JPM America Equity B (acc) - USD 217,877.373 268,311.769 192,647.464 293,541.678JPM America Equity C (acc) - USD 6,724,698.274 977,207.671 838,549.616 6,863,356.329JPM America Equity C (acc) - EUR (hedged) 928,262.558 4,614,992.079 4,324,423.166 1,218,831.471JPM America Equity D (acc) - EUR 338,582.823 192,389.896 415,552.777 115,419.942JPM America Equity D (acc) - USD 2,020,176.344 1,504,161.939 1,044,470.826 2,479,867.457JPM America Equity D (acc) - EUR (hedged) 728,639.908 1,537,171.747 861,219.729 1,404,591.926JPM America Equity X (acc) - USD 303,585.027 575,908.490 25,286.158 854,207.359
JPMorgan Funds - America Large Cap FundJPM America Large Cap A (acc) - USD 1,989,969.135 6,240,259.216 4,714,988.975 3,515,239.376JPM America Large Cap A (acc) - EUR 352,927.417 57,972.855 340,125.149 70,775.123JPM America Large Cap A (dist) - USD 3,352,867.721 1,903,211.737 1,172,943.858 4,083,135.600JPM America Large Cap B (acc) - USD 174,178.979 700,363.454 471,231.251 403,311.182JPM America Large Cap C (acc) - USD 2,229,600.816 7,177,406.940 4,946,145.632 4,460,862.124JPM America Large Cap D (acc) - USD 1,506,718.445 1,496,484.850 941,707.750 2,061,495.545JPM America Large Cap X (acc) - USD 5,451.282 1,298,843.799 115,338.000 1,188,957.081
JPMorgan Funds - Asia Pacific Bond FundJPM Asia Pacific Bond A (acc) - USD 1,000,000.000 1,450,553.127 350,447.507 2,100,105.620JPM Asia Pacific Bond C (acc) - USD - 97,352.703 71,352.703 26,000.000
JPMorgan Funds - Asia Pacific ex-Japan Behavioural Finance Equity FundJPM Asia Pacific ex-Japan Behavioural Finance Equity A (acc) - USD 150,000.000 2,711,316.999 4,447.564 2,856,869.435JPM Asia Pacific ex-Japan Behavioural Finance Equity A (acc) - EUR 151,080.612 2,429.034 474.000 153,035.646JPM Asia Pacific ex-Japan Behavioural Finance Equity A (dist) - USD - 26,654.000 - 26,654.000JPM Asia Pacific ex-Japan Behavioural Finance Equity B (acc) - EUR - 2,293.336 - 2,293.336JPM Asia Pacific ex-Japan Behavioural Finance Equity C (acc) - EUR - 266,725.282 1,429.776 265,295.506JPM Asia Pacific ex-Japan Behavioural Finance Equity X (acc) - USD - 418,188.721 - 418,188.721
JPMorgan Funds - Brazil Alpha Plus FundJPM Brazil Alpha Plus A (acc) - USD 13,839,648.677 47,407,083.501 25,030,163.328 36,216,568.850JPM Brazil Alpha Plus A (acc) - SGD - 8,965.951 550.690 8,415.261JPM Brazil Alpha Plus A (dist) - USD 15,462.999 595,655.187 523,472.409 87,645.777JPM Brazil Alpha Plus A (acc) - EUR - 1,488.598 - 1,488.598JPM Brazil Alpha Plus B (acc) - USD 837,707.284 2,594,208.211 1,580,552.647 1,851,362.848JPM Brazil Alpha Plus C (acc) - USD 2,821,030.557 1,979,484.078 2,592,997.401 2,207,517.234JPM Brazil Alpha Plus D (acc) - USD 7,207,080.285 5,061,720.447 4,552,969.208 7,715,831.524JPM Brazil Alpha Plus D (acc) - EUR - 126,365.078 29,749.866 96,615.212JPM Brazil Alpha Plus I (acc) - USD 680.297 9,325,482.823 393,120.393 8,933,042.727JPM Brazil Alpha Plus I (acc) - EUR 268,743.942 126,000.000 340,000.000 54,743.942JPM Brazil Alpha Plus T (acc) - EUR - 5,939.980 - 5,939.980
JPMorgan Funds - Corporate Bond Portfolio Fund I (1)JPM Corporate Bond Portfolio I - A (inc) - EUR - 1,680,792.750 114,955.246 1,565,837.504JPM Corporate Bond Portfolio I - C (inc) - EUR - 200,010.205 - 200,010.205JPM Corporate Bond Portfolio I - D (inc) - EUR - 774,506.400 55,120.211 719,386.189
JPMorgan Funds - Corporate Bond Portfolio Fund II (2)JPM Corporate Bond Portfolio II - A (inc) - EUR - 701,610.878 3,618.730 697,992.148JPM Corporate Bond Portfolio II - D (inc) - EUR - 332,675.117 677.999 331,997.118
JPMorgan Funds - Eastern Europe Equity FundJPM Eastern Europe Equity A (acc) - EUR 7,196,215.446 8,458,000.353 7,888,653.322 7,765,562.477JPM Eastern Europe Equity A (acc) - USD - 35.951 - 35.951JPM Eastern Europe Equity A (dist) - EUR 10,330,900.900 3,456,733.434 3,886,111.549 9,901,522.785JF Eastern Europe Equity A (dist) - EUR 5,694,000.629 4,108,593.161 4,713,460.752 5,089,133.038JPM Eastern Europe Equity B (acc) - EUR 2,088,082.744 2,197,124.226 2,569,480.356 1,715,726.614JPM Eastern Europe Equity C (acc) - EUR 1,713,371.654 3,015,690.689 1,057,440.688 3,671,621.655JPM Eastern Europe Equity D (acc) - EUR 2,089,459.737 927,095.418 1,116,905.875 1,899,649.280JPM Eastern Europe Equity I (acc) - EUR 1,796,727.879 2,940,427.709 3,794,567.270 942,588.318JPM Eastern Europe Equity X (acc) - EUR 2,620,796.741 163,657.645 796.741 2,783,657.645
(1) This Sub-Fund was launched on 1 July 2010.(2) This Sub-Fund was launched on 22 February 2011.
47
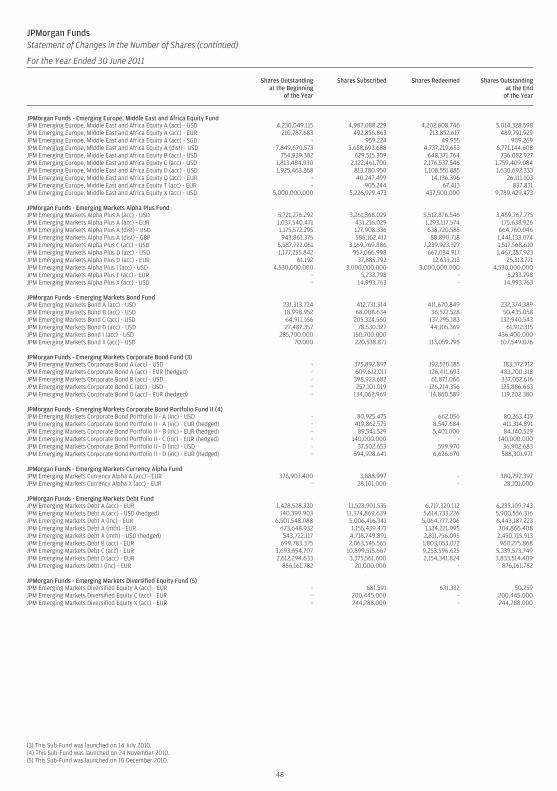
JPMorgan FundsStatement of Changes in the Number of Shares (continued)
For the Year Ended 30 June 2011
Shares Outstandingat the Beginning
of the Year
Shares Subscribed Shares Redeemed Shares Outstandingat the End
of the Year
JPMorgan Funds - Emerging Europe, Middle East and Africa Equity FundJPM Emerging Europe, Middle East and Africa Equity A (acc) - USD 4,230,049.115 4,987,088.229 4,202,808.746 5,014,328.598JPM Emerging Europe, Middle East and Africa Equity A (acc) - EUR 210,787.683 492,856.863 213,852.617 489,791.929JPM Emerging Europe, Middle East and Africa Equity A (acc) - SGD - 959.224 49.955 909.269JPM Emerging Europe, Middle East and Africa Equity A (dist) - USD 7,849,670.573 3,658,693.688 4,737,219.653 6,771,144.608JPM Emerging Europe, Middle East and Africa Equity B (acc) - USD 754,939.382 629,515.309 648,371.764 736,082.927JPM Emerging Europe, Middle East and Africa Equity C (acc) - USD 1,813,484.930 2,122,461.700 2,176,537.546 1,759,409.084JPM Emerging Europe, Middle East and Africa Equity D (acc) - USD 1,925,463.268 813,780.950 1,108,551.885 1,630,692.333JPM Emerging Europe, Middle East and Africa Equity D (acc) - EUR - 40,247.499 14,136.396 26,111.103JPM Emerging Europe, Middle East and Africa Equity T (acc) - EUR - 905.244 67.413 837.831JPM Emerging Europe, Middle East and Africa Equity X (acc) - USD 5,000,000.000 5,226,929.473 437,500.000 9,789,429.473
JPMorgan Funds - Emerging Markets Alpha Plus FundJPM Emerging Markets Alpha Plus A (acc) - USD 5,721,276.292 3,261,368.029 5,512,876.546 3,469,767.775JPM Emerging Markets Alpha Plus A (acc) - EUR 1,037,540.471 431,216.029 1,293,117.574 175,638.926JPM Emerging Markets Alpha Plus A (dist) - USD 1,175,572.295 127,908.336 638,720.585 664,760.046JPM Emerging Markets Alpha Plus A (dist) - GBP 943,861.375 586,162.417 88,890.718 1,441,133.074JPM Emerging Markets Alpha Plus C (acc) - USD 5,587,722.051 3,169,769.886 7,239,923.327 1,517,568.610JPM Emerging Markets Alpha Plus D (acc) - USD 1,177,255.842 957,066.998 667,034.917 1,467,287.923JPM Emerging Markets Alpha Plus D (acc) - EUR 61.192 37,885.792 12,633.213 25,313.771JPM Emerging Markets Alpha Plus I (acc) - USD 4,530,000.000 3,000,000.000 3,000,000.000 4,530,000.000JPM Emerging Markets Alpha Plus T (acc) - EUR - 5,233.798 - 5,233.798JPM Emerging Markets Alpha Plus X (acc) - USD - 14,993.763 - 14,993.763
JPMorgan Funds - Emerging Markets Bond FundJPM Emerging Markets Bond A (acc) - USD 231,313.724 412,731.514 411,670.849 232,374.389JPM Emerging Markets Bond B (acc) - USD 18,998.952 68,008.634 36,572.528 50,435.058JPM Emerging Markets Bond C (acc) - USD 64,911.166 205,324.560 137,295.183 132,940.543JPM Emerging Markets Bond D (acc) - USD 27,487.357 78,530.327 44,105.369 61,912.315JPM Emerging Markets Bond I (acc) - USD 285,700.000 150,700.000 - 436,400.000JPM Emerging Markets Bond X (acc) - USD 70.000 220,538.871 113,059.795 107,549.076
JPMorgan Funds - Emerging Markets Corporate Bond Fund (3)JPM Emerging Markets Corporate Bond A (acc) - USD - 375,892.897 192,520.185 183,372.712JPM Emerging Markets Corporate Bond A (acc) - EUR (hedged) - 609,612.011 126,411.693 483,200.318JPM Emerging Markets Corporate Bond B (acc) - USD - 398,923.682 61,871.066 337,052.616JPM Emerging Markets Corporate Bond C (acc) - USD - 252,101.019 126,214.356 125,886.663JPM Emerging Markets Corporate Bond D (acc) - EUR (hedged) - 134,062.969 14,860.589 119,202.380
JPMorgan Funds - Emerging Markets Corporate Bond Portfolio Fund II (4)JPM Emerging Markets Corporate Bond Portfolio II - A (inc) - USD - 80,925.475 662.056 80,263.419JPM Emerging Markets Corporate Bond Portfolio II - A (inc) - EUR (hedged) - 419,862.575 8,547.684 411,314.891JPM Emerging Markets Corporate Bond Portfolio II - B (inc) - EUR (hedged) - 89,541.529 5,401.000 84,140.529JPM Emerging Markets Corporate Bond Portfolio II - C (inc) - EUR (hedged) - 140,000.000 - 140,000.000JPM Emerging Markets Corporate Bond Portfolio II - D (inc) - USD - 37,502.653 599.970 36,902.683JPM Emerging Markets Corporate Bond Portfolio II - D (inc) - EUR (hedged) - 594,928.641 6,626.670 588,301.971
JPMorgan Funds - Emerging Markets Currency Alpha FundJPM Emerging Markets Currency Alpha A (acc) - EUR 376,903.400 3,888.997 - 380,792.397JPM Emerging Markets Currency Alpha X (acc) - EUR - 28,101.000 - 28,101.000
JPMorgan Funds - Emerging Markets Debt FundJPM Emerging Markets Debt A (acc) - EUR 1,428,528.320 11,523,901.535 6,717,320.112 6,235,109.743JPM Emerging Markets Debt A (acc) - USD (hedged) 140,399.903 11,374,869.639 5,614,733.226 5,900,536.316JPM Emerging Markets Debt A (inc) - EUR 6,501,548.088 5,006,416.341 5,064,777.206 6,443,187.223JPM Emerging Markets Debt A (mth) - EUR 673,648.932 1,155,439.471 1,124,221.995 704,866.408JPM Emerging Markets Debt A (mth) - USD (hedged) 543,722.117 4,718,749.891 2,811,756.095 2,450,715.913JPM Emerging Markets Debt B (acc) - EUR 699,783.375 2,063,545.565 1,803,053.072 960,275.868JPM Emerging Markets Debt C (acc) - EUR 3,693,654.707 10,899,515.667 9,253,596.625 5,339,573.749JPM Emerging Markets Debt D (acc) - EUR 2,612,294.633 3,375,561.600 2,154,341.824 3,833,514.409JPM Emerging Markets Debt I (inc) - EUR 856,161.782 20,000.000 - 876,161.782
JPMorgan Funds - Emerging Markets Diversified Equity Fund (5)JPM Emerging Markets Diversified Equity A (acc) - EUR - 681.591 631.332 50.259JPM Emerging Markets Diversified Equity C (acc) - EUR - 200,445.000 - 200,445.000JPM Emerging Markets Diversified Equity X (acc) - EUR - 244,288.000 - 244,288.000
(3) This Sub-Fund was launched on 14 July 2010.(4) This Sub-Fund was launched on 24 November 2010.(5) This Sub-Fund was launched on 10 December 2010.
48
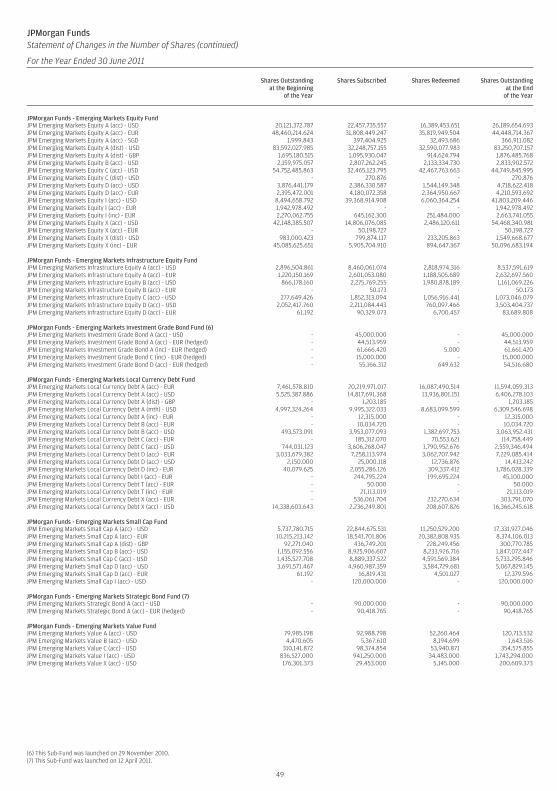
JPMorgan FundsStatement of Changes in the Number of Shares (continued)
For the Year Ended 30 June 2011
Shares Outstandingat the Beginning
of the Year
Shares Subscribed Shares Redeemed Shares Outstandingat the End
of the Year
JPMorgan Funds - Emerging Markets Equity FundJPM Emerging Markets Equity A (acc) - USD 20,121,372.787 22,457,735.557 16,389,453.651 26,189,654.693JPM Emerging Markets Equity A (acc) - EUR 48,460,214.624 31,808,449.247 35,819,949.504 44,448,714.367JPM Emerging Markets Equity A (acc) - SGD 1,999.843 397,404.925 32,493.686 366,911.082JPM Emerging Markets Equity A (dist) - USD 83,592,027.985 32,248,757.155 32,590,077.983 83,250,707.157JPM Emerging Markets Equity A (dist) - GBP 1,695,180.515 1,095,930.047 914,624.794 1,876,485.768JPM Emerging Markets Equity B (acc) - USD 2,159,975.057 2,807,262.245 2,133,334.730 2,833,902.572JPM Emerging Markets Equity C (acc) - USD 54,752,485.863 32,465,123.795 42,467,763.663 44,749,845.995JPM Emerging Markets Equity C (dist) - USD - 270.876 - 270.876JPM Emerging Markets Equity D (acc) - USD 3,876,441.179 2,386,330.587 1,544,149.348 4,718,622.418JPM Emerging Markets Equity D (acc) - EUR 2,395,472.001 4,180,072.358 2,364,950.667 4,210,593.692JPM Emerging Markets Equity I (acc) - USD 8,494,658.792 39,368,914.908 6,060,364.254 41,803,209.446JPM Emerging Markets Equity I (acc) - EUR 1,942,978.492 - - 1,942,978.492JPM Emerging Markets Equity I (inc) - EUR 2,270,062.755 645,162.300 251,484.000 2,663,741.055JPM Emerging Markets Equity X (acc) - USD 42,148,385.507 14,806,076.085 2,486,120.611 54,468,340.981JPM Emerging Markets Equity X (acc) - EUR - 50,198.727 - 50,198.727JPM Emerging Markets Equity X (dist) - USD 983,000.423 799,874.117 233,205.863 1,549,668.677JPM Emerging Markets Equity X (inc) - EUR 45,085,625.651 5,905,704.910 894,647.367 50,096,683.194
JPMorgan Funds - Emerging Markets Infrastructure Equity FundJPM Emerging Markets Infrastructure Equity A (acc) - USD 2,896,504.861 8,460,061.074 2,818,974.316 8,537,591.619JPM Emerging Markets Infrastructure Equity A (acc) - EUR 1,220,150.169 2,601,053.080 1,188,505.689 2,632,697.560JPM Emerging Markets Infrastructure Equity B (acc) - USD 866,178.160 2,275,769.255 1,980,878.189 1,161,069.226JPM Emerging Markets Infrastructure Equity B (acc) - EUR - 50.173 - 50.173JPM Emerging Markets Infrastructure Equity C (acc) - USD 277,649.426 1,852,313.094 1,056,916.441 1,073,046.079JPM Emerging Markets Infrastructure Equity D (acc) - USD 2,052,417.760 2,211,084.443 760,097.466 3,503,404.737JPM Emerging Markets Infrastructure Equity D (acc) - EUR 61.192 90,329.073 6,700.457 83,689.808
JPMorgan Funds - Emerging Markets Investment Grade Bond Fund (6)JPM Emerging Markets Investment Grade Bond A (acc) - USD - 45,000.000 - 45,000.000JPM Emerging Markets Investment Grade Bond A (acc) - EUR (hedged) - 44,513.959 - 44,513.959JPM Emerging Markets Investment Grade Bond A (inc) - EUR (hedged) - 61,666.420 5.000 61,661.420JPM Emerging Markets Investment Grade Bond C (inc) - EUR (hedged) - 15,000.000 - 15,000.000JPM Emerging Markets Investment Grade Bond D (acc) - EUR (hedged) - 55,166.312 649.632 54,516.680
JPMorgan Funds - Emerging Markets Local Currency Debt FundJPM Emerging Markets Local Currency Debt A (acc) - EUR 7,461,578.810 20,219,971.017 16,087,490.514 11,594,059.313JPM Emerging Markets Local Currency Debt A (acc) - USD 5,525,387.886 14,817,691.368 13,936,801.151 6,406,278.103JPM Emerging Markets Local Currency Debt A (dist) - GBP - 1,203.185 - 1,203.185JPM Emerging Markets Local Currency Debt A (mth) - USD 4,997,324.264 9,995,322.033 8,683,099.599 6,309,546.698JPM Emerging Markets Local Currency Debt A (inc) - EUR - 12,315.000 - 12,315.000JPM Emerging Markets Local Currency Debt B (acc) - EUR - 10,034.720 - 10,034.720JPM Emerging Markets Local Currency Debt B (acc) - USD 493,573.091 3,953,077.093 1,382,697.753 3,063,952.431JPM Emerging Markets Local Currency Debt C (acc) - EUR - 185,312.070 70,553.621 114,758.449JPM Emerging Markets Local Currency Debt C (acc) - USD 744,031.123 3,606,268.047 1,790,952.676 2,559,346.494JPM Emerging Markets Local Currency Debt D (acc) - EUR 3,033,679.382 7,258,113.974 3,062,707.942 7,229,085.414JPM Emerging Markets Local Currency Debt D (acc) - USD 2,150.000 25,000.118 12,736.876 14,413.242JPM Emerging Markets Local Currency Debt D (inc) - EUR 40,079.625 2,055,286.126 309,337.412 1,786,028.339JPM Emerging Markets Local Currency Debt I (acc) - EUR - 244,795.224 199,695.224 45,100.000JPM Emerging Markets Local Currency Debt T (acc) - EUR - 50.000 - 50.000JPM Emerging Markets Local Currency Debt T (inc) - EUR - 21,113.019 - 21,113.019JPM Emerging Markets Local Currency Debt X (acc) - EUR - 536,061.704 232,270.634 303,791.070JPM Emerging Markets Local Currency Debt X (acc) - USD 14,338,603.643 2,236,249.801 208,607.826 16,366,245.618
JPMorgan Funds - Emerging Markets Small Cap FundJPM Emerging Markets Small Cap A (acc) - USD 5,737,780.715 22,844,675.531 11,250,529.200 17,331,927.046JPM Emerging Markets Small Cap A (acc) - EUR 10,215,213.142 18,541,701.806 20,382,808.935 8,374,106.013JPM Emerging Markets Small Cap A (dist) - GBP 92,271.040 436,749.201 228,249.456 300,770.785JPM Emerging Markets Small Cap B (acc) - USD 1,155,092.556 8,925,906.607 8,233,926.716 1,847,072.447JPM Emerging Markets Small Cap C (acc) - USD 1,435,527.708 8,889,337.522 4,591,569.384 5,733,295.846JPM Emerging Markets Small Cap D (acc) - USD 3,691,571.467 4,960,987.359 3,584,729.681 5,067,829.145JPM Emerging Markets Small Cap D (acc) - EUR 61.192 16,819.431 4,501.027 12,379.596JPM Emerging Markets Small Cap I (acc) - USD - 120,000.000 - 120,000.000
JPMorgan Funds - Emerging Markets Strategic Bond Fund (7)JPM Emerging Markets Strategic Bond A (acc) - USD - 90,000.000 - 90,000.000JPM Emerging Markets Strategic Bond A (acc) - EUR (hedged) - 90,418.765 - 90,418.765
JPMorgan Funds - Emerging Markets Value FundJPM Emerging Markets Value A (acc) - USD 79,985.198 92,988.798 52,260.464 120,713.532JPM Emerging Markets Value B (acc) - USD 4,470.605 5,367.610 8,194.699 1,643.516JPM Emerging Markets Value C (acc) - USD 310,141.872 98,374.854 53,940.871 354,575.855JPM Emerging Markets Value I (acc) - USD 836,527.000 941,250.000 34,483.000 1,743,294.000JPM Emerging Markets Value X (acc) - USD 176,301.373 29,453.000 5,145.000 200,609.373
(6) This Sub-Fund was launched on 29 November 2010.(7) This Sub-Fund was launched on 12 April 2011.
49
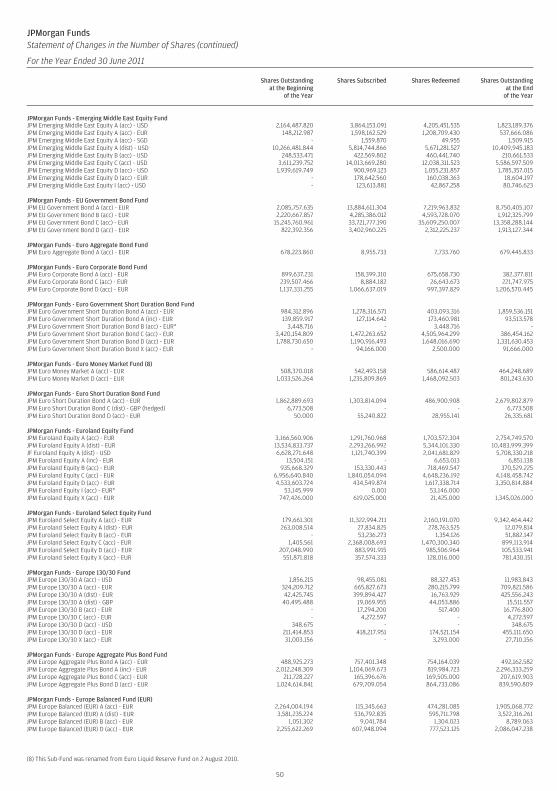
JPMorgan FundsStatement of Changes in the Number of Shares (continued)
For the Year Ended 30 June 2011
Shares Outstandingat the Beginning
of the Year
Shares Subscribed Shares Redeemed Shares Outstandingat the End
of the Year
JPMorgan Funds - Emerging Middle East Equity FundJPM Emerging Middle East Equity A (acc) - USD 2,164,487.820 3,864,153.091 4,205,451.535 1,823,189.376JPM Emerging Middle East Equity A (acc) - EUR 148,212.987 1,598,162.529 1,208,709.430 537,666.086JPM Emerging Middle East Equity A (acc) - SGD - 1,559.870 49.955 1,509.915JPM Emerging Middle East Equity A (dist) - USD 10,266,481.844 5,814,744.866 5,671,281.527 10,409,945.183JPM Emerging Middle East Equity B (acc) - USD 248,533.471 422,569.802 460,441.740 210,661.533JPM Emerging Middle East Equity C (acc) - USD 3,611,239.752 14,013,669.280 12,038,311.523 5,586,597.509JPM Emerging Middle East Equity D (acc) - USD 1,939,619.749 900,969.123 1,055,231.857 1,785,357.015JPM Emerging Middle East Equity D (acc) - EUR - 178,642.560 160,038.363 18,604.197JPM Emerging Middle East Equity I (acc) - USD - 123,613.881 42,867.258 80,746.623
JPMorgan Funds - EU Government Bond FundJPM EU Government Bond A (acc) - EUR 2,085,757.635 13,884,611.304 7,219,963.832 8,750,405.107JPM EU Government Bond B (acc) - EUR 2,220,667.857 4,285,386.012 4,593,728.070 1,912,325.799JPM EU Government Bond C (acc) - EUR 15,245,760.961 33,721,777.190 35,609,250.007 13,358,288.144JPM EU Government Bond D (acc) - EUR 822,392.356 3,402,960.225 2,312,225.237 1,913,127.344
JPMorgan Funds - Euro Aggregate Bond FundJPM Euro Aggregate Bond A (acc) - EUR 678,223.860 8,955.733 7,733.760 679,445.833
JPMorgan Funds - Euro Corporate Bond FundJPM Euro Corporate Bond A (acc) - EUR 899,637.231 158,399.310 675,658.730 382,377.811JPM Euro Corporate Bond C (acc) - EUR 239,507.466 8,884.182 26,643.673 221,747.975JPM Euro Corporate Bond D (acc) - EUR 1,137,331.255 1,066,637.019 997,397.829 1,206,570.445
JPMorgan Funds - Euro Government Short Duration Bond FundJPM Euro Government Short Duration Bond A (acc) - EUR 984,312.896 1,278,316.571 403,093.316 1,859,536.151JPM Euro Government Short Duration Bond A (inc) - EUR 139,859.917 127,114.642 173,460.981 93,513.578JPM Euro Government Short Duration Bond B (acc) - EUR* 3,448.716 - 3,448.716 -JPM Euro Government Short Duration Bond C (acc) - EUR 3,420,154.809 1,472,263.652 4,505,964.299 386,454.162JPM Euro Government Short Duration Bond D (acc) - EUR 1,788,730.650 1,190,916.493 1,648,016.690 1,331,630.453JPM Euro Government Short Duration Bond X (acc) - EUR - 94,166.000 2,500.000 91,666.000
JPMorgan Funds - Euro Money Market Fund (8)JPM Euro Money Market A (acc) - EUR 508,370.018 542,493.158 586,614.487 464,248.689JPM Euro Money Market D (acc) - EUR 1,033,526.264 1,235,809.869 1,468,092.503 801,243.630
JPMorgan Funds - Euro Short Duration Bond FundJPM Euro Short Duration Bond A (acc) - EUR 1,862,889.693 1,303,814.094 486,900.908 2,679,802.879JPM Euro Short Duration Bond C (dist) - GBP (hedged) 6,773.508 - - 6,773.508JPM Euro Short Duration Bond D (acc) - EUR 50.000 55,240.822 28,955.141 26,335.681
JPMorgan Funds - Euroland Equity FundJPM Euroland Equity A (acc) - EUR 3,166,560.906 1,291,760.968 1,703,572.304 2,754,749.570JPM Euroland Equity A (dist) - EUR 13,534,833.737 2,293,266.992 5,344,101.330 10,483,999.399JF Euroland Equity A (dist) - USD 6,628,271.648 1,121,740.399 2,041,681.829 5,708,330.218JPM Euroland Equity A (inc) - EUR 13,504.151 - 6,653.013 6,851.138JPM Euroland Equity B (acc) - EUR 935,668.329 153,330.443 718,469.547 370,529.225JPM Euroland Equity C (acc) - EUR 6,956,640.840 1,840,054.094 4,648,236.192 4,148,458.742JPM Euroland Equity D (acc) - EUR 4,533,603.724 434,549.874 1,617,338.714 3,350,814.884JPM Euroland Equity I (acc) - EUR* 53,145.999 0.001 53,146.000 -JPM Euroland Equity X (acc) - EUR 747,426.000 619,025.000 21,425.000 1,345,026.000
JPMorgan Funds - Euroland Select Equity FundJPM Euroland Select Equity A (acc) - EUR 179,661.301 11,322,994.211 2,160,191.070 9,342,464.442JPM Euroland Select Equity A (dist) - EUR 263,008.514 27,834.825 278,763.525 12,079.814JPM Euroland Select Equity B (acc) - EUR - 53,236.273 1,354.126 51,882.147JPM Euroland Select Equity C (acc) - EUR 1,405.561 2,368,008.693 1,470,300.340 899,113.914JPM Euroland Select Equity D (acc) - EUR 207,048.990 883,991.915 985,506.964 105,533.941JPM Euroland Select Equity X (acc) - EUR 551,871.818 357,574.333 128,016.000 781,430.151
JPMorgan Funds - Europe 130/30 FundJPM Europe 130/30 A (acc) - USD 1,856.215 98,455.081 88,327.453 11,983.843JPM Europe 130/30 A (acc) - EUR 324,209.712 665,827.673 280,215.799 709,821.586JPM Europe 130/30 A (dist) - EUR 42,425.745 399,894.427 16,763.929 425,556.243JPM Europe 130/30 A (dist) - GBP 40,495.488 19,069.955 44,053.886 15,511.557JPM Europe 130/30 B (acc) - EUR - 17,294.200 517.400 16,776.800JPM Europe 130/30 C (acc) - EUR - 4,272.597 - 4,272.597JPM Europe 130/30 D (acc) - USD 348.675 - - 348.675JPM Europe 130/30 D (acc) - EUR 211,414.853 418,217.951 174,521.154 455,111.650JPM Europe 130/30 X (acc) - EUR 31,003.156 - 3,293.000 27,710.156
JPMorgan Funds - Europe Aggregate Plus Bond FundJPM Europe Aggregate Plus Bond A (acc) - EUR 488,925.273 757,401.348 754,164.039 492,162.582JPM Europe Aggregate Plus Bond A (inc) - EUR 2,012,248.309 1,104,069.673 819,984.723 2,296,333.259JPM Europe Aggregate Plus Bond C (acc) - EUR 211,728.227 165,396.676 169,505.000 207,619.903JPM Europe Aggregate Plus Bond D (acc) - EUR 1,024,614.841 679,709.054 864,733.086 839,590.809
JPMorgan Funds - Europe Balanced Fund (EUR)JPM Europe Balanced (EUR) A (acc) - EUR 2,264,004.194 115,345.663 474,281.085 1,905,068.772JPM Europe Balanced (EUR) A (dist) - EUR 3,581,235.224 536,792.835 595,711.798 3,522,316.261JPM Europe Balanced (EUR) B (acc) - EUR 1,051.302 9,041.784 1,304.023 8,789.063JPM Europe Balanced (EUR) D (acc) - EUR 2,255,622.269 607,948.094 777,523.125 2,086,047.238
(8) This Sub-Fund was renamed from Euro Liquid Reserve Fund on 2 August 2010.
50
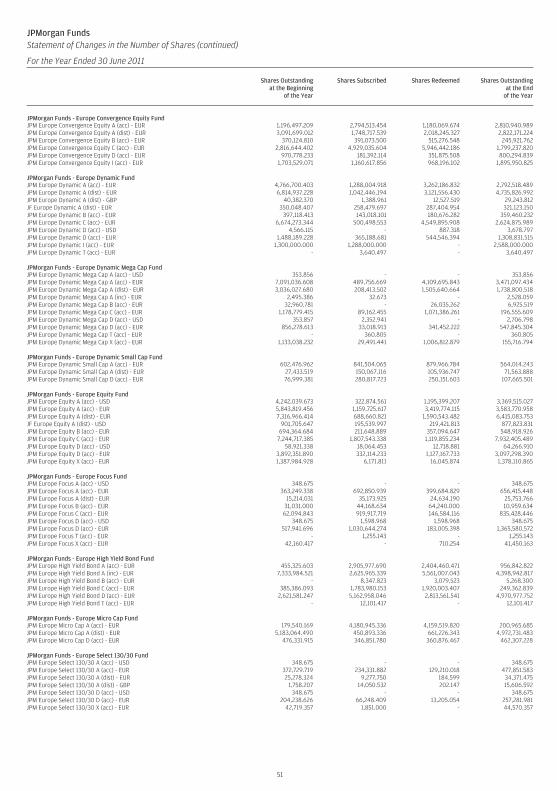
JPMorgan FundsStatement of Changes in the Number of Shares (continued)
For the Year Ended 30 June 2011
Shares Outstandingat the Beginning
of the Year
Shares Subscribed Shares Redeemed Shares Outstandingat the End
of the Year
JPMorgan Funds - Europe Convergence Equity FundJPM Europe Convergence Equity A (acc) - EUR 1,196,497.209 2,794,513.454 1,180,069.674 2,810,940.989JPM Europe Convergence Equity A (dist) - EUR 3,091,699.012 1,748,717.539 2,018,245.327 2,822,171.224JPM Europe Convergence Equity B (acc) - EUR 370,124.810 391,073.500 515,276.548 245,921.762JPM Europe Convergence Equity C (acc) - EUR 2,816,644.402 4,929,035.604 5,946,442.186 1,799,237.820JPM Europe Convergence Equity D (acc) - EUR 970,778.233 181,392.114 351,875.508 800,294.839JPM Europe Convergence Equity I (acc) - EUR 1,703,529.071 1,160,617.856 968,196.102 1,895,950.825
JPMorgan Funds - Europe Dynamic FundJPM Europe Dynamic A (acc) - EUR 4,766,700.403 1,288,004.918 3,262,186.832 2,792,518.489JPM Europe Dynamic A (dist) - EUR 6,814,937.228 1,042,446.194 3,121,556.430 4,735,826.992JPM Europe Dynamic A (dist) - GBP 40,382.370 1,388.961 12,527.519 29,243.812JF Europe Dynamic A (dist) - EUR 350,048.407 258,479.697 287,404.954 321,123.150JPM Europe Dynamic B (acc) - EUR 397,118.413 143,018.101 180,676.282 359,460.232JPM Europe Dynamic C (acc) - EUR 6,674,273.344 500,498.553 4,549,895.908 2,624,875.989JPM Europe Dynamic D (acc) - USD 4,566.115 - 887.318 3,678.797JPM Europe Dynamic D (acc) - EUR 1,488,189.228 365,188.681 544,546.394 1,308,831.515JPM Europe Dynamic I (acc) - EUR 1,300,000.000 1,288,000.000 - 2,588,000.000JPM Europe Dynamic T (acc) - EUR - 3,640.497 - 3,640.497
JPMorgan Funds - Europe Dynamic Mega Cap FundJPM Europe Dynamic Mega Cap A (acc) - USD 353.856 - - 353.856JPM Europe Dynamic Mega Cap A (acc) - EUR 7,091,036.608 489,756.669 4,109,695.843 3,471,097.434JPM Europe Dynamic Mega Cap A (dist) - EUR 3,036,027.680 208,413.502 1,505,640.664 1,738,800.518JPM Europe Dynamic Mega Cap A (inc) - EUR 2,495.386 32.673 - 2,528.059JPM Europe Dynamic Mega Cap B (acc) - EUR 32,960.781 - 26,035.262 6,925.519JPM Europe Dynamic Mega Cap C (acc) - EUR 1,178,779.415 89,162.455 1,071,386.261 196,555.609JPM Europe Dynamic Mega Cap D (acc) - USD 353.857 2,352.941 - 2,706.798JPM Europe Dynamic Mega Cap D (acc) - EUR 856,278.613 33,018.913 341,452.222 547,845.304JPM Europe Dynamic Mega Cap T (acc) - EUR - 360.805 - 360.805JPM Europe Dynamic Mega Cap X (acc) - EUR 1,133,038.232 29,491.441 1,006,812.879 155,716.794
JPMorgan Funds - Europe Dynamic Small Cap FundJPM Europe Dynamic Small Cap A (acc) - EUR 602,476.962 841,504.065 879,966.784 564,014.243JPM Europe Dynamic Small Cap A (dist) - EUR 27,433.519 150,067.116 105,936.747 71,563.888JPM Europe Dynamic Small Cap D (acc) - EUR 76,999.381 280,817.723 250,151.603 107,665.501
JPMorgan Funds - Europe Equity FundJPM Europe Equity A (acc) - USD 4,242,039.673 322,874.561 1,195,399.207 3,369,515.027JPM Europe Equity A (acc) - EUR 5,843,819.456 1,159,725.617 3,419,774.115 3,583,770.958JPM Europe Equity A (dist) - EUR 7,316,966.414 688,660.821 1,590,543.482 6,415,083.753JF Europe Equity A (dist) - USD 901,705.647 195,539.997 219,421.813 877,823.831JPM Europe Equity B (acc) - EUR 694,364.684 211,648.889 357,094.647 548,918.926JPM Europe Equity C (acc) - EUR 7,244,717.385 1,807,543.338 1,119,855.234 7,932,405.489JPM Europe Equity D (acc) - USD 58,921.338 18,064.453 12,718.881 64,266.910JPM Europe Equity D (acc) - EUR 3,892,351.890 332,114.233 1,127,167.733 3,097,298.390JPM Europe Equity X (acc) - EUR 1,387,984.928 6,171.811 16,045.874 1,378,110.865
JPMorgan Funds - Europe Focus FundJPM Europe Focus A (acc) - USD 348.675 - - 348.675JPM Europe Focus A (acc) - EUR 363,249.338 692,850.939 399,684.829 656,415.448JPM Europe Focus A (dist) - EUR 15,214.031 35,173.925 24,634.190 25,753.766JPM Europe Focus B (acc) - EUR 31,031.000 44,168.634 64,240.000 10,959.634JPM Europe Focus C (acc) - EUR 62,094.843 919,917.719 146,584.116 835,428.446JPM Europe Focus D (acc) - USD 348.675 1,598.968 1,598.968 348.675JPM Europe Focus D (acc) - EUR 517,941.696 1,030,644.274 183,005.398 1,365,580.572JPM Europe Focus T (acc) - EUR - 1,255.143 - 1,255.143JPM Europe Focus X (acc) - EUR 42,160.417 - 710.254 41,450.163
JPMorgan Funds - Europe High Yield Bond FundJPM Europe High Yield Bond A (acc) - EUR 455,325.603 2,905,977.690 2,404,460.471 956,842.822JPM Europe High Yield Bond A (inc) - EUR 7,333,984.521 2,625,965.339 5,561,007.043 4,398,942.817JPM Europe High Yield Bond B (acc) - EUR - 8,347.823 3,079.523 5,268.300JPM Europe High Yield Bond C (acc) - EUR 385,386.093 1,783,980.153 1,920,003.407 249,362.839JPM Europe High Yield Bond D (acc) - EUR 2,621,581.247 5,162,958.046 2,813,561.541 4,970,977.752JPM Europe High Yield Bond T (acc) - EUR - 12,101.417 - 12,101.417
JPMorgan Funds - Europe Micro Cap FundJPM Europe Micro Cap A (acc) - EUR 179,540.169 4,180,945.336 4,159,519.820 200,965.685JPM Europe Micro Cap A (dist) - EUR 5,183,064.490 450,893.336 661,226.343 4,972,731.483JPM Europe Micro Cap D (acc) - EUR 476,331.915 346,851.780 360,876.467 462,307.228
JPMorgan Funds - Europe Select 130/30 FundJPM Europe Select 130/30 A (acc) - USD 348.675 - - 348.675JPM Europe Select 130/30 A (acc) - EUR 372,729.719 234,331.882 129,210.018 477,851.583JPM Europe Select 130/30 A (dist) - EUR 25,278.324 9,277.750 184.599 34,371.475JPM Europe Select 130/30 A (dist) - GBP 1,758.207 14,050.532 202.147 15,606.592JPM Europe Select 130/30 D (acc) - USD 348.675 - - 348.675JPM Europe Select 130/30 D (acc) - EUR 204,238.626 66,248.409 13,205.054 257,281.981JPM Europe Select 130/30 X (acc) - EUR 42,719.357 1,851.000 - 44,570.357
51
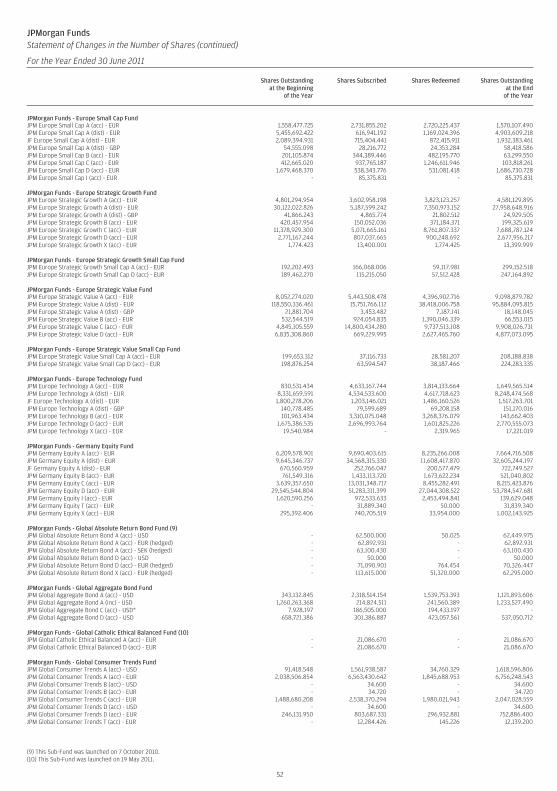
JPMorgan FundsStatement of Changes in the Number of Shares (continued)
For the Year Ended 30 June 2011
Shares Outstandingat the Beginning
of the Year
Shares Subscribed Shares Redeemed Shares Outstandingat the End
of the Year
JPMorgan Funds - Europe Small Cap FundJPM Europe Small Cap A (acc) - EUR 1,558,477.725 2,731,855.202 2,720,225.437 1,570,107.490JPM Europe Small Cap A (dist) - EUR 5,455,692.422 616,941.192 1,169,024.396 4,903,609.218JF Europe Small Cap A (dist) - EUR 2,089,394.931 715,404.441 872,415.911 1,932,383.461JPM Europe Small Cap A (dist) - GBP 54,555.098 28,216.772 24,353.284 58,418.586JPM Europe Small Cap B (acc) - EUR 201,105.874 344,389.446 482,195.770 63,299.550JPM Europe Small Cap C (acc) - EUR 412,665.020 937,765.187 1,246,611.946 103,818.261JPM Europe Small Cap D (acc) - EUR 1,679,468.370 538,343.776 531,081.418 1,686,730.728JPM Europe Small Cap I (acc) - EUR - 85,375.831 - 85,375.831
JPMorgan Funds - Europe Strategic Growth FundJPM Europe Strategic Growth A (acc) - EUR 4,801,294.954 3,602,958.198 3,823,123.257 4,581,129.895JPM Europe Strategic Growth A (dist) - EUR 30,122,022.826 5,187,599.242 7,350,973.152 27,958,648.916JPM Europe Strategic Growth A (dist) - GBP 41,866.243 4,865.774 21,802.512 24,929.505JPM Europe Strategic Growth B (acc) - EUR 420,457.954 150,052.036 371,184.371 199,325.619JPM Europe Strategic Growth C (acc) - EUR 11,378,929.300 5,071,665.161 8,761,807.337 7,688,787.124JPM Europe Strategic Growth D (acc) - EUR 2,771,167.244 807,037.665 900,248.692 2,677,956.217JPM Europe Strategic Growth X (acc) - EUR 1,774.423 13,400.001 1,774.425 13,399.999
JPMorgan Funds - Europe Strategic Growth Small Cap FundJPM Europe Strategic Growth Small Cap A (acc) - EUR 192,202.493 166,068.006 59,117.981 299,152.518JPM Europe Strategic Growth Small Cap D (acc) - EUR 189,462.270 115,215.050 57,512.428 247,164.892
JPMorgan Funds - Europe Strategic Value FundJPM Europe Strategic Value A (acc) - EUR 8,052,274.020 5,443,508.478 4,396,902.716 9,098,879.782JPM Europe Strategic Value A (dist) - EUR 118,550,336.461 15,751,766.112 38,418,006.758 95,884,095.815JPM Europe Strategic Value A (dist) - GBP 21,881.704 3,453.482 7,187.141 18,148.045JPM Europe Strategic Value B (acc) - EUR 532,544.519 924,054.835 1,390,046.339 66,553.015JPM Europe Strategic Value C (acc) - EUR 4,845,105.559 14,800,434.280 9,737,513.108 9,908,026.731JPM Europe Strategic Value D (acc) - EUR 6,835,308.860 669,229.995 2,627,465.760 4,877,073.095
JPMorgan Funds - Europe Strategic Value Small Cap FundJPM Europe Strategic Value Small Cap A (acc) - EUR 199,653.312 37,116.733 28,581.207 208,188.838JPM Europe Strategic Value Small Cap D (acc) - EUR 198,876.254 63,594.547 38,187.466 224,283.335
JPMorgan Funds - Europe Technology FundJPM Europe Technology A (acc) - EUR 830,531.434 4,633,167.744 3,814,133.664 1,649,565.514JPM Europe Technology A (dist) - EUR 8,331,659.591 4,534,533.600 4,617,718.623 8,248,474.568JF Europe Technology A (dist) - EUR 1,800,278.206 1,203,146.021 1,486,160.526 1,517,263.701JPM Europe Technology A (dist) - GBP 140,778.485 79,599.689 69,208.158 151,170.016JPM Europe Technology B (acc) - EUR 101,963.434 3,310,075.048 3,268,376.079 143,662.403JPM Europe Technology D (acc) - EUR 1,675,386.535 2,696,993.764 1,601,825.226 2,770,555.073JPM Europe Technology X (acc) - EUR 19,540.984 - 2,319.965 17,221.019
JPMorgan Funds - Germany Equity FundJPM Germany Equity A (acc) - EUR 6,209,578.901 9,690,403.615 8,235,266.008 7,664,716.508JPM Germany Equity A (dist) - EUR 9,645,346.737 34,568,315.330 11,608,417.870 32,605,244.197JF Germany Equity A (dist) - EUR 670,560.959 252,766.047 200,577.479 722,749.527JPM Germany Equity B (acc) - EUR 761,549.316 1,433,113.720 1,673,622.234 521,040.802JPM Germany Equity C (acc) - EUR 3,639,357.650 13,031,348.717 8,455,282.491 8,215,423.876JPM Germany Equity D (acc) - EUR 29,545,544.804 51,283,311.399 27,044,308.522 53,784,547.681JPM Germany Equity I (acc) - EUR 1,620,590.256 972,533.633 2,453,494.841 139,629.048JPM Germany Equity T (acc) - EUR - 31,889.340 50.000 31,839.340JPM Germany Equity X (acc) - EUR 295,392.406 740,705.519 33,954.000 1,002,143.925
JPMorgan Funds - Global Absolute Return Bond Fund (9)JPM Global Absolute Return Bond A (acc) - USD - 62,500.000 50.025 62,449.975JPM Global Absolute Return Bond A (acc) - EUR (hedged) - 62,892.931 - 62,892.931JPM Global Absolute Return Bond A (acc) - SEK (hedged) - 63,100.430 - 63,100.430JPM Global Absolute Return Bond D (acc) - USD - 50.000 - 50.000JPM Global Absolute Return Bond D (acc) - EUR (hedged) - 71,090.901 764.454 70,326.447JPM Global Absolute Return Bond X (acc) - EUR (hedged) - 113,615.000 51,320.000 62,295.000
JPMorgan Funds - Global Aggregate Bond FundJPM Global Aggregate Bond A (acc) - USD 343,132.845 2,318,514.154 1,539,753.393 1,121,893.606JPM Global Aggregate Bond A (inc) - USD 1,260,263.368 214,824.511 241,560.389 1,233,527.490JPM Global Aggregate Bond C (acc) - USD* 7,928.197 186,505.000 194,433.197 -JPM Global Aggregate Bond D (acc) - USD 658,721.386 301,386.887 423,057.561 537,050.712
JPMorgan Funds - Global Catholic Ethical Balanced Fund (10)JPM Global Catholic Ethical Balanced A (acc) - EUR - 21,086.670 - 21,086.670JPM Global Catholic Ethical Balanced D (acc) - EUR - 21,086.670 - 21,086.670
JPMorgan Funds - Global Consumer Trends FundJPM Global Consumer Trends A (acc) - USD 91,418.548 1,561,938.587 34,760.329 1,618,596.806JPM Global Consumer Trends A (acc) - EUR 2,038,506.854 6,563,430.642 1,845,688.953 6,756,248.543JPM Global Consumer Trends B (acc) - USD - 34.600 - 34.600JPM Global Consumer Trends B (acc) - EUR - 34.720 - 34.720JPM Global Consumer Trends C (acc) - EUR 1,488,680.208 2,538,370.294 1,980,021.943 2,047,028.559JPM Global Consumer Trends D (acc) - USD - 34.600 - 34.600JPM Global Consumer Trends D (acc) - EUR 246,131.950 803,687.331 296,932.881 752,886.400JPM Global Consumer Trends T (acc) - EUR - 12,284.426 145.226 12,139.200
(9) This Sub-Fund was launched on 7 October 2010.(10) This Sub-Fund was launched on 19 May 2011.
52
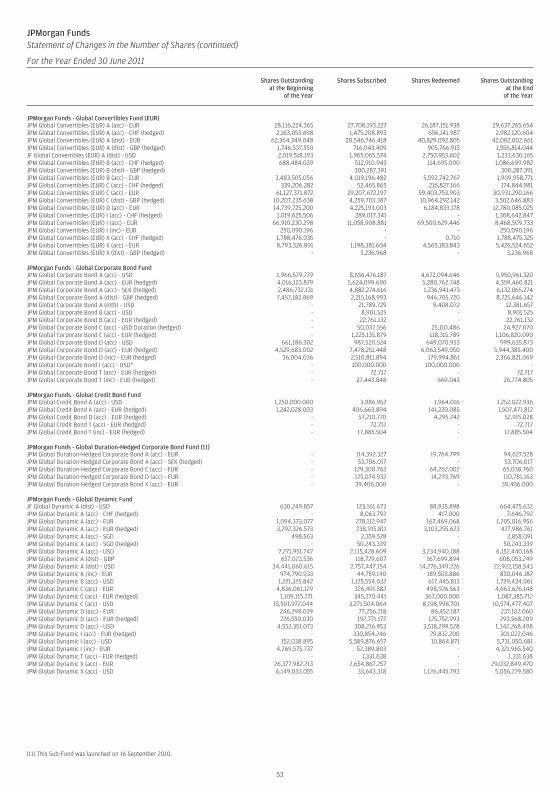
JPMorgan FundsStatement of Changes in the Number of Shares (continued)
For the Year Ended 30 June 2011
Shares Outstandingat the Beginning
of the Year
Shares Subscribed Shares Redeemed Shares Outstandingat the End
of the Year
JPMorgan Funds - Global Convertibles Fund (EUR)JPM Global Convertibles (EUR) A (acc) - EUR 28,116,224.365 27,708,193.227 26,187,151.938 29,637,265.654JPM Global Convertibles (EUR) A (acc) - CHF (hedged) 2,163,053.698 1,475,208.893 656,141.987 2,982,120.604JPM Global Convertibles (EUR) A (dist) - EUR 62,364,349.048 20,546,746.418 40,829,092.805 42,082,002.661JPM Global Convertibles (EUR) A (dist) - GBP (hedged) 1,746,537.550 716,043.409 905,766.915 1,556,814.044JF Global Convertibles (EUR) A (dist) - USD 2,019,518.193 1,965,065.574 2,750,953.602 1,233,630.165JPM Global Convertibles (EUR) B (acc) - CHF (hedged) 688,484.039 512,910.943 114,695.000 1,086,699.982JPM Global Convertibles (EUR) B (dist) - GBP (hedged) - 300,287.391 - 300,287.391JPM Global Convertibles (EUR) B (acc) - EUR 3,483,505.056 4,019,196.482 5,592,742.767 1,909,958.771JPM Global Convertibles (EUR) C (acc) - CHF (hedged) 339,206.282 52,465.865 216,827.166 174,844.981JPM Global Convertibles (EUR) C (acc) - EUR 61,127,371.872 29,207,672.197 59,403,753.903 30,931,290.166JPM Global Convertibles (EUR) C (dist) - GBP (hedged) 10,207,235.638 4,259,703.387 10,964,292.142 3,502,646.883JPM Global Convertibles (EUR) D (acc) - EUR 14,739,725.200 4,225,193.003 6,184,833.178 12,780,085.025JPM Global Convertibles (EUR) I (acc) - CHF (hedged) 1,019,625.506 289,017.341 - 1,308,642.847JPM Global Convertibles (EUR) I (acc) - EUR 66,910,230.298 11,058,908.881 69,500,629.446 8,468,509.733JPM Global Convertibles (EUR) I (inc) - EUR 250,090.196 - - 250,090.196JPM Global Convertibles (EUR) X (acc) - CHF (hedged) 1,788,476.035 - 0.710 1,788,475.325JPM Global Convertibles (EUR) X (acc) - EUR 8,793,326.891 1,198,381.604 4,565,183.843 5,426,524.652JPM Global Convertibles (EUR) X (dist) - GBP (hedged) - 3,236.968 - 3,236.968
JPMorgan Funds - Global Corporate Bond FundJPM Global Corporate Bond A (acc) - USD 1,966,579.779 8,656,476.187 4,672,094.646 5,950,961.320JPM Global Corporate Bond A (acc) - EUR (hedged) 4,016,123.879 5,624,099.690 5,280,762.748 4,359,460.821JPM Global Corporate Bond A (acc) - SEK (hedged) 2,486,732.131 4,882,274.616 1,236,941.473 6,132,065.274JPM Global Corporate Bond A (dist) - GBP (hedged) 7,457,182.869 2,215,168.993 946,705.720 8,725,646.142JPM Global Corporate Bond A (mth) - USD - 21,789.729 9,408.072 12,381.657JPM Global Corporate Bond B (acc) - USD - 8,901.525 - 8,901.525JPM Global Corporate Bond B (acc) - EUR (hedged) - 22,761.132 - 22,761.132JPM Global Corporate Bond C (acc) - USD Duration (hedged) - 50,037.556 25,110.486 24,927.070JPM Global Corporate Bond C (acc) - EUR (hedged) - 1,225,135.879 118,315.789 1,106,820.090JPM Global Corporate Bond D (acc) - USD 661,186.302 987,520.524 649,070.953 999,635.873JPM Global Corporate Bond D (acc) - EUR (hedged) 4,529,683.002 7,478,251.448 6,063,549.050 5,944,385.400JPM Global Corporate Bond D (inc) - EUR (hedged) 36,004.036 2,510,811.894 179,994.861 2,366,821.069JPM Global Corporate Bond I (acc) - USD* - 100,000.000 100,000.000 -JPM Global Corporate Bond T (acc) - EUR (hedged) - 72.717 - 72.717JPM Global Corporate Bond T (inc) - EUR (hedged) - 27,443.848 669.043 26,774.805
JPMorgan Funds - Global Credit Bond FundJPM Global Credit Bond A (acc) - USD 1,250,000.000 3,986.952 1,964.016 1,252,022.936JPM Global Credit Bond A (acc) - EUR (hedged) 1,242,028.003 406,663.894 141,220.085 1,507,471.812JPM Global Credit Bond D (acc) - EUR (hedged) - 57,210.770 4,295.742 52,915.028JPM Global Credit Bond T (acc) - EUR (hedged) - 72.717 - 72.717JPM Global Credit Bond T (inc) - EUR (hedged) - 17,885.504 - 17,885.504
JPMorgan Funds - Global Duration-Hedged Corporate Bond Fund (11)JPM Global Duration-Hedged Corporate Bond A (acc) - EUR - 114,392.327 19,764.799 94,627.528JPM Global Duration-Hedged Corporate Bond A (acc) - SEK (hedged) - 53,706.017 - 53,706.017JPM Global Duration-Hedged Corporate Bond C (acc) - EUR - 129,300.762 64,262.002 65,038.760JPM Global Duration-Hedged Corporate Bond D (acc) - EUR - 125,074.932 14,293.769 110,781.163JPM Global Duration-Hedged Corporate Bond X (acc) - EUR - 39,406.000 - 39,406.000
JPMorgan Funds - Global Dynamic FundJF Global Dynamic A (dist) - USD 630,249.857 123,161.673 88,935.898 664,475.632JPM Global Dynamic A (acc) - CHF (hedged) - 8,063.792 417.000 7,646.792JPM Global Dynamic A (acc) - EUR 1,094,373.077 278,112.947 167,469.068 1,205,016.956JPM Global Dynamic A (acc) - EUR (hedged) 3,292,326.573 238,915.811 3,103,255.623 427,986.761JPM Global Dynamic A (acc) - SGD 498.563 2,359.528 - 2,858.091JPM Global Dynamic A (acc) - SGD (hedged) - 50,243.339 - 50,243.339JPM Global Dynamic A (acc) - USD 7,271,951.747 2,115,428.609 3,234,940.188 6,152,440.168JPM Global Dynamic A (dist) - GBP 657,023.536 118,729.607 167,699.894 608,053.249JPM Global Dynamic A (dist) - USD 34,441,060.615 2,757,447.154 14,276,349.226 22,922,158.543JPM Global Dynamic A (inc) - EUR 974,790.933 44,759.140 189,503.886 830,046.187JPM Global Dynamic B (acc) - USD 1,221,325.842 1,125,554.032 617,445.813 1,729,434.061JPM Global Dynamic C (acc) - EUR 4,836,061.129 326,491.582 498,926.563 4,663,626.148JPM Global Dynamic C (acc) - EUR (hedged) 1,109,115.271 345,270.441 367,000.000 1,087,385.712JPM Global Dynamic C (acc) - USD 15,501,972.044 3,271,504.064 8,198,998.701 10,574,477.407JPM Global Dynamic D (acc) - EUR 246,298.029 77,256.218 86,452.187 237,102.060JPM Global Dynamic D (acc) - EUR (hedged) 226,550.030 192,771.172 125,752.993 293,568.209JPM Global Dynamic D (acc) - USD 4,552,351.073 308,216.953 3,518,299.528 1,342,268.498JPM Global Dynamic I (acc) - EUR (hedged) - 330,854.246 29,832.200 301,022.046JPM Global Dynamic I (acc) - USD 152,038.895 5,589,876.657 10,864.871 5,731,050.681JPM Global Dynamic I (inc) - EUR 4,269,575.737 52,389.803 - 4,321,965.540JPM Global Dynamic T (acc) - EUR (hedged) - 1,331.638 - 1,331.638JPM Global Dynamic X (acc) - EUR 26,377,982.213 2,654,867.257 - 29,032,849.470JPM Global Dynamic X (acc) - USD 6,149,032.055 33,643.318 1,126,445.793 5,056,229.580
(11) This Sub-Fund was launched on 16 September 2010.
53
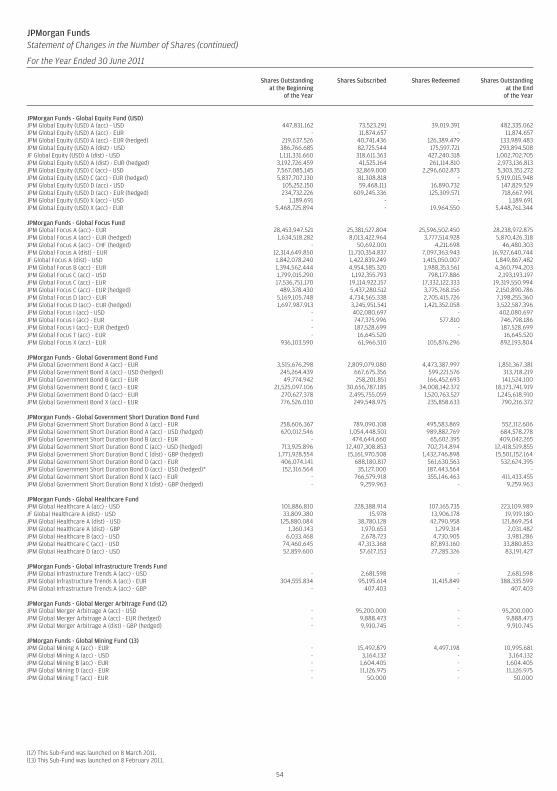
JPMorgan FundsStatement of Changes in the Number of Shares (continued)
For the Year Ended 30 June 2011
Shares Outstandingat the Beginning
of the Year
Shares Subscribed Shares Redeemed Shares Outstandingat the End
of the Year
JPMorgan Funds - Global Equity Fund (USD)JPM Global Equity (USD) A (acc) - USD 447,831.162 73,523.291 39,019.391 482,335.062JPM Global Equity (USD) A (acc) - EUR - 11,874.657 - 11,874.657JPM Global Equity (USD) A (acc) - EUR (hedged) 219,637.526 40,741.436 126,389.479 133,989.483JPM Global Equity (USD) A (dist) - USD 386,766.685 82,725.544 175,597.721 293,894.508JF Global Equity (USD) A (dist) - USD 1,111,331.660 318,611.363 427,240.318 1,002,702.705JPM Global Equity (USD) A (dist) - EUR (hedged) 3,192,726.459 41,525.164 261,114.810 2,973,136.813JPM Global Equity (USD) C (acc) - USD 7,567,085.145 32,869.000 2,296,602.873 5,303,351.272JPM Global Equity (USD) C (acc) - EUR (hedged) 5,837,707.130 81,308.818 - 5,919,015.948JPM Global Equity (USD) D (acc) - USD 105,252.150 59,468.111 16,890.732 147,829.529JPM Global Equity (USD) D (acc) - EUR (hedged) 234,732.226 609,245.336 125,309.571 718,667.991JPM Global Equity (USD) X (acc) - USD 1,189.691 - - 1,189.691JPM Global Equity (USD) X (acc) - EUR 5,468,725.894 - 19,964.550 5,448,761.344
JPMorgan Funds - Global Focus FundJPM Global Focus A (acc) - EUR 28,453,947.521 25,381,527.804 25,596,502.450 28,238,972.875JPM Global Focus A (acc) - EUR (hedged) 1,634,518.282 8,013,422.964 3,777,514.928 5,870,426.318JPM Global Focus A (acc) - CHF (hedged) - 50,692.001 4,211.698 46,480.303JPM Global Focus A (dist) - EUR 12,314,649.850 11,710,354.837 7,097,363.943 16,927,640.744JF Global Focus A (dist) - USD 1,842,078.240 1,422,839.249 1,415,050.007 1,849,867.482JPM Global Focus B (acc) - EUR 1,394,562.444 4,954,585.320 1,988,353.561 4,360,794.203JPM Global Focus C (acc) - USD 1,799,015.290 1,192,355.793 798,177.886 2,193,193.197JPM Global Focus C (acc) - EUR 17,536,751.170 19,114,922.157 17,332,122.333 19,319,550.994JPM Global Focus C (acc) - EUR (hedged) 489,378.430 5,437,280.512 3,775,768.156 2,150,890.786JPM Global Focus D (acc) - EUR 5,169,105.748 4,734,565.338 2,705,415.726 7,198,255.360JPM Global Focus D (acc) - EUR (hedged) 1,697,987.913 3,245,951.541 1,421,352.058 3,522,587.396JPM Global Focus I (acc) - USD - 402,080.697 - 402,080.697JPM Global Focus I (acc) - EUR - 747,375.996 577.810 746,798.186JPM Global Focus I (acc) - EUR (hedged) - 187,528.699 - 187,528.699JPM Global Focus T (acc) - EUR - 16,645.520 - 16,645.520JPM Global Focus X (acc) - EUR 936,103.590 61,966.510 105,876.296 892,193.804
JPMorgan Funds - Global Government Bond FundJPM Global Government Bond A (acc) - EUR 3,515,676.298 2,809,079.080 4,473,387.997 1,851,367.381JPM Global Government Bond A (acc) - USD (hedged) 245,264.439 667,675.356 599,221.576 313,718.219JPM Global Government Bond B (acc) - EUR 49,774.942 258,201.851 166,452.693 141,524.100JPM Global Government Bond C (acc) - EUR 21,525,097.106 30,656,787.185 34,008,142.372 18,173,741.919JPM Global Government Bond D (acc) - EUR 270,627.378 2,495,755.059 1,520,763.527 1,245,618.910JPM Global Government Bond X (acc) - EUR 776,526.030 249,548.975 235,858.633 790,216.372
JPMorgan Funds - Global Government Short Duration Bond FundJPM Global Government Short Duration Bond A (acc) - EUR 258,606.367 789,090.108 495,583.869 552,112.606JPM Global Government Short Duration Bond A (acc) - USD (hedged) 620,012.546 1,054,448.501 989,882.769 684,578.278JPM Global Government Short Duration Bond B (acc) - EUR - 474,644.660 65,602.395 409,042.265JPM Global Government Short Duration Bond C (acc) - USD (hedged) 713,925.896 12,407,308.853 702,714.894 12,418,519.855JPM Global Government Short Duration Bond C (dist) - GBP (hedged) 1,771,928.554 15,161,970.508 1,432,746.898 15,501,152.164JPM Global Government Short Duration Bond D (acc) - EUR 406,074.141 688,180.817 561,630.563 532,624.395JPM Global Government Short Duration Bond D (acc) - USD (hedged)* 152,316.564 35,127.000 187,443.564 -JPM Global Government Short Duration Bond X (acc) - EUR - 766,579.918 355,146.463 411,433.455JPM Global Government Short Duration Bond X (dist) - GBP (hedged) - 9,259.963 - 9,259.963
JPMorgan Funds - Global Healthcare FundJPM Global Healthcare A (acc) - USD 101,886.810 228,388.914 107,165.735 223,109.989JF Global Healthcare A (dist) - USD 33,809.380 15.978 13,906.178 19,919.180JPM Global Healthcare A (dist) - USD 125,880.084 38,780.128 42,790.958 121,869.254JPM Global Healthcare A (dist) - GBP 1,360.143 1,970.653 1,299.314 2,031.482JPM Global Healthcare B (acc) - USD 6,033.468 2,678.723 4,730.905 3,981.286JPM Global Healthcare C (acc) - USD 74,460.645 47,313.368 87,893.160 33,880.853JPM Global Healthcare D (acc) - USD 52,859.600 57,617.153 27,285.326 83,191.427
JPMorgan Funds - Global Infrastructure Trends FundJPM Global Infrastructure Trends A (acc) - USD - 2,681.598 - 2,681.598JPM Global Infrastructure Trends A (acc) - EUR 304,555.834 95,195.614 11,415.849 388,335.599JPM Global Infrastructure Trends A (acc) - GBP - 407.403 - 407.403
JPMorgan Funds - Global Merger Arbitrage Fund (12)JPM Global Merger Arbitrage A (acc) - USD - 95,200.000 - 95,200.000JPM Global Merger Arbitrage A (acc) - EUR (hedged) - 9,888.473 - 9,888.473JPM Global Merger Arbitrage A (dist) - GBP (hedged) - 9,910.745 - 9,910.745
JPMorgan Funds - Global Mining Fund (13)JPM Global Mining A (acc) - EUR - 15,492.879 4,497.198 10,995.681JPM Global Mining A (acc) - USD - 3,164.132 - 3,164.132JPM Global Mining B (acc) - EUR - 1,604.405 - 1,604.405JPM Global Mining D (acc) - EUR - 11,126.975 - 11,126.975JPM Global Mining T (acc) - EUR - 50.000 - 50.000
(12) This Sub-Fund was launched on 8 March 2011.(13) This Sub-Fund was launched on 8 February 2011.
54
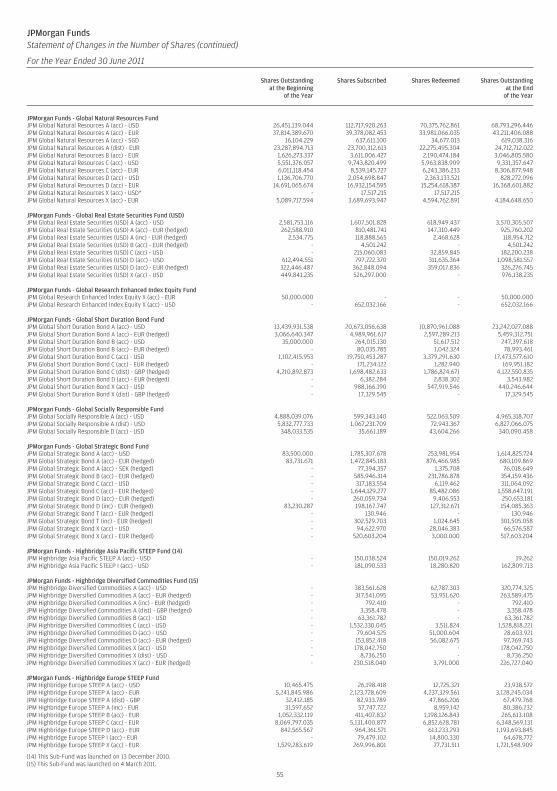
JPMorgan FundsStatement of Changes in the Number of Shares (continued)
For the Year Ended 30 June 2011
Shares Outstandingat the Beginning
of the Year
Shares Subscribed Shares Redeemed Shares Outstandingat the End
of the Year
JPMorgan Funds - Global Natural Resources FundJPM Global Natural Resources A (acc) - USD 26,451,139.044 112,717,920.263 70,375,762.861 68,793,296.446JPM Global Natural Resources A (acc) - EUR 37,814,389.670 39,378,082.453 33,981,066.035 43,211,406.088JPM Global Natural Resources A (acc) - SGD 16,104.229 637,611.100 34,677.013 619,038.316JPM Global Natural Resources A (dist) - EUR 23,287,894.713 23,700,312.613 22,275,495.304 24,712,712.022JPM Global Natural Resources B (acc) - EUR 1,626,273.337 3,611,006.427 2,190,474.184 3,046,805.580JPM Global Natural Resources C (acc) - USD 5,551,376.057 9,743,820.499 5,963,838.909 9,331,357.647JPM Global Natural Resources C (acc) - EUR 6,011,118.454 8,539,145.727 6,243,386.233 8,306,877.948JPM Global Natural Resources D (acc) - USD 1,136,706.770 2,054,698.847 2,363,133.521 828,272.096JPM Global Natural Resources D (acc) - EUR 14,691,065.674 16,932,154.595 15,254,618.387 16,368,601.882JPM Global Natural Resources X (acc) - USD* - 17,517.215 17,517.215 -JPM Global Natural Resources X (acc) - EUR 5,089,717.594 3,689,693.947 4,594,762.891 4,184,648.650
JPMorgan Funds - Global Real Estate Securities Fund (USD)JPM Global Real Estate Securities (USD) A (acc) - USD 2,581,753.116 1,607,501.828 618,949.437 3,570,305.507JPM Global Real Estate Securities (USD) A (acc) - EUR (hedged) 262,588.910 810,481.741 147,310.449 925,760.202JPM Global Real Estate Securities (USD) A (inc) - EUR (hedged) 2,534.775 118,888.565 2,468.628 118,954.712JPM Global Real Estate Securities (USD) B (acc) - EUR (hedged) - 4,501.242 - 4,501.242JPM Global Real Estate Securities (USD) C (acc) - USD - 215,060.083 32,859.845 182,200.238JPM Global Real Estate Securities (USD) D (acc) - USD 612,494.551 797,722.370 311,635.364 1,098,581.557JPM Global Real Estate Securities (USD) D (acc) - EUR (hedged) 322,446.487 362,848.094 359,017.836 326,276.745JPM Global Real Estate Securities (USD) X (acc) - USD 449,841.235 526,297.000 - 976,138.235
JPMorgan Funds - Global Research Enhanced Index Equity FundJPM Global Research Enhanced Index Equity X (acc) - EUR 50,000.000 - - 50,000.000JPM Global Research Enhanced Index Equity X (acc) - USD - 652,032.166 - 652,032.166
JPMorgan Funds - Global Short Duration Bond FundJPM Global Short Duration Bond A (acc) - USD 13,439,931.538 20,673,056.638 10,870,961.088 23,242,027.088JPM Global Short Duration Bond A (acc) - EUR (hedged) 3,066,640.347 4,989,961.617 2,597,289.213 5,459,312.751JPM Global Short Duration Bond B (acc) - USD 35,000.000 264,015.130 51,617.512 247,397.618JPM Global Short Duration Bond B (acc) - EUR (hedged) - 80,035.785 1,042.324 78,993.461JPM Global Short Duration Bond C (acc) - USD 1,102,415.953 19,750,453.287 3,379,291.630 17,473,577.610JPM Global Short Duration Bond C (acc) - EUR (hedged) - 171,234.122 1,282.940 169,951.182JPM Global Short Duration Bond C (dist) - GBP (hedged) 4,210,892.873 1,698,482.633 1,786,824.671 4,122,550.835JPM Global Short Duration Bond D (acc) - EUR (hedged) - 6,382.284 2,838.302 3,543.982JPM Global Short Duration Bond X (acc) - USD - 988,166.190 547,919.546 440,246.644JPM Global Short Duration Bond X (dist) - GBP (hedged) - 17,329.545 - 17,329.545
JPMorgan Funds - Global Socially Responsible FundJPM Global Socially Responsible A (acc) - USD 4,888,039.076 599,343.140 522,063.509 4,965,318.707JPM Global Socially Responsible A (dist) - USD 5,832,777.733 1,067,231.709 72,943.367 6,827,066.075JPM Global Socially Responsible D (acc) - USD 348,033.535 35,661.189 43,604.266 340,090.458
JPMorgan Funds - Global Strategic Bond FundJPM Global Strategic Bond A (acc) - USD 83,500.000 1,785,307.678 253,981.954 1,614,825.724JPM Global Strategic Bond A (acc) - EUR (hedged) 83,731.671 1,472,845.183 876,466.985 680,109.869JPM Global Strategic Bond A (acc) - SEK (hedged) - 77,394.357 1,375.708 76,018.649JPM Global Strategic Bond B (acc) - EUR (hedged) - 585,946.314 231,786.878 354,159.436JPM Global Strategic Bond C (acc) - USD - 317,183.554 6,119.462 311,064.092JPM Global Strategic Bond C (acc) - EUR (hedged) - 1,644,129.277 85,482.086 1,558,647.191JPM Global Strategic Bond D (acc) - EUR (hedged) - 260,059.734 9,406.553 250,653.181JPM Global Strategic Bond D (inc) - EUR (hedged) 83,230.287 198,167.747 127,312.671 154,085.363JPM Global Strategic Bond T (acc) - EUR (hedged) - 130.946 - 130.946JPM Global Strategic Bond T (inc) - EUR (hedged) - 302,529.703 1,024.645 301,505.058JPM Global Strategic Bond X (acc) - USD - 94,622.970 28,046.383 66,576.587JPM Global Strategic Bond X (acc) - EUR (hedged) - 520,603.204 3,000.000 517,603.204
JPMorgan Funds - Highbridge Asia Pacific STEEP Fund (14)JPM Highbridge Asia Pacific STEEP A (acc) - USD - 150,038.524 150,019.262 19.262JPM Highbridge Asia Pacific STEEP I (acc) - USD - 181,090.533 18,280.820 162,809.713
JPMorgan Funds - Highbridge Diversified Commodities Fund (15)JPM Highbridge Diversified Commodities A (acc) - USD - 383,561.628 62,787.303 320,774.325JPM Highbridge Diversified Commodities A (acc) - EUR (hedged) - 317,541.095 53,951.620 263,589.475JPM Highbridge Diversified Commodities A (inc) - EUR (hedged) - 792.410 - 792.410JPM Highbridge Diversified Commodities A (dist) - GBP (hedged) - 3,358.478 - 3,358.478JPM Highbridge Diversified Commodities B (acc) - USD - 63,361.782 - 63,361.782JPM Highbridge Diversified Commodities C (acc) - USD - 1,532,330.045 3,511.824 1,528,818.221JPM Highbridge Diversified Commodities D (acc) - USD - 79,604.525 51,000.604 28,603.921JPM Highbridge Diversified Commodities D (acc) - EUR (hedged) - 153,852.418 56,082.675 97,769.743JPM Highbridge Diversified Commodities X (acc) - USD - 178,042.750 - 178,042.750JPM Highbridge Diversified Commodities X (dist) - USD - 8,736.250 - 8,736.250JPM Highbridge Diversified Commodities X (acc) - EUR (hedged) - 230,518.040 3,791.000 226,727.040
JPMorgan Funds - Highbridge Europe STEEP FundJPM Highbridge Europe STEEP A (acc) - USD 10,465.475 26,198.418 12,725.321 23,938.572JPM Highbridge Europe STEEP A (acc) - EUR 5,241,845.986 2,123,728.609 4,237,329.561 3,128,245.034JPM Highbridge Europe STEEP A (dist) - GBP 32,412.185 82,933.789 47,866.206 67,479.768JPM Highbridge Europe STEEP A (inc) - EUR 31,597.652 57,747.722 8,959.142 80,386.232JPM Highbridge Europe STEEP B (acc) - EUR 1,052,332.119 411,407.832 1,198,126.843 265,613.108JPM Highbridge Europe STEEP C (acc) - EUR 8,069,797.035 5,131,400.877 6,852,628.781 6,348,569.131JPM Highbridge Europe STEEP D (acc) - EUR 842,565.567 964,361.571 613,233.293 1,193,693.845JPM Highbridge Europe STEEP I (acc) - EUR - 79,479.102 14,800.330 64,678.772JPM Highbridge Europe STEEP X (acc) - EUR 1,529,283.619 269,996.801 77,731.511 1,721,548.909
(14) This Sub-Fund was launched on 13 December 2010.(15) This Sub-Fund was launched on 4 March 2011.
55
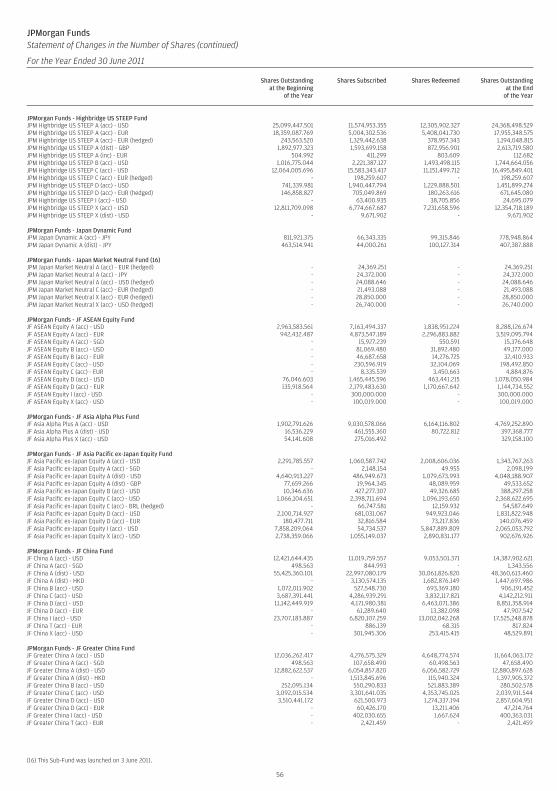
JPMorgan FundsStatement of Changes in the Number of Shares (continued)
For the Year Ended 30 June 2011
Shares Outstandingat the Beginning
of the Year
Shares Subscribed Shares Redeemed Shares Outstandingat the End
of the Year
JPMorgan Funds - Highbridge US STEEP FundJPM Highbridge US STEEP A (acc) - USD 25,099,447.501 11,574,953.355 12,305,902.327 24,368,498.529JPM Highbridge US STEEP A (acc) - EUR 18,359,087.769 5,004,302.536 5,408,041.730 17,955,348.575JPM Highbridge US STEEP A (acc) - EUR (hedged) 243,563.520 1,329,442.638 378,957.343 1,194,048.815JPM Highbridge US STEEP A (dist) - GBP 1,892,977.323 1,593,699.158 872,956.901 2,613,719.580JPM Highbridge US STEEP A (inc) - EUR 504.992 411.299 803.609 112.682JPM Highbridge US STEEP B (acc) - USD 1,016,775.044 2,221,387.127 1,493,498.115 1,744,664.056JPM Highbridge US STEEP C (acc) - USD 12,064,005.696 15,583,343.417 11,151,499.712 16,495,849.401JPM Highbridge US STEEP C (acc) - EUR (hedged) - 198,259.607 - 198,259.607JPM Highbridge US STEEP D (acc) - USD 741,339.981 1,940,447.794 1,229,888.501 1,451,899.274JPM Highbridge US STEEP D (acc) - EUR (hedged) 146,858.827 705,049.869 180,263.616 671,645.080JPM Highbridge US STEEP I (acc) - USD - 63,400.935 38,705.856 24,695.079JPM Highbridge US STEEP X (acc) - USD 12,811,709.098 6,774,667.687 7,231,658.596 12,354,718.189JPM Highbridge US STEEP X (dist) - USD - 9,671.902 - 9,671.902
JPMorgan Funds - Japan Dynamic FundJPM Japan Dynamic A (acc) - JPY 811,921.375 66,343.335 99,315.846 778,948.864JPM Japan Dynamic A (dist) - JPY 463,514.941 44,000.261 100,127.314 407,387.888
JPMorgan Funds - Japan Market Neutral Fund (16)JPM Japan Market Neutral A (acc) - EUR (hedged) - 24,369.251 - 24,369.251JPM Japan Market Neutral A (acc) - JPY - 24,372.000 - 24,372.000JPM Japan Market Neutral A (acc) - USD (hedged) - 24,088.646 - 24,088.646JPM Japan Market Neutral C (acc) - EUR (hedged) - 21,493.088 - 21,493.088JPM Japan Market Neutral X (acc) - EUR (hedged) - 28,850.000 - 28,850.000JPM Japan Market Neutral X (acc) - USD (hedged) - 26,740.000 - 26,740.000
JPMorgan Funds - JF ASEAN Equity FundJF ASEAN Equity A (acc) - USD 2,963,583.561 7,163,494.337 1,838,951.224 8,288,126.674JF ASEAN Equity A (acc) - EUR 942,432.487 4,873,547.189 2,296,883.882 3,519,095.794JF ASEAN Equity A (acc) - SGD - 15,927.239 550.591 15,376.648JF ASEAN Equity B (acc) - USD - 81,069.480 31,892.480 49,177.000JF ASEAN Equity B (acc) - EUR - 46,687.658 14,276.725 32,410.933JF ASEAN Equity C (acc) - USD - 230,596.919 32,104.069 198,492.850JF ASEAN Equity C (acc) - EUR - 8,335.539 3,450.663 4,884.876JF ASEAN Equity D (acc) - USD 76,046.603 1,465,445.596 463,441.215 1,078,050.984JF ASEAN Equity D (acc) - EUR 135,918.564 2,179,483.630 1,170,667.642 1,144,734.552JF ASEAN Equity I (acc) - USD - 300,000.000 - 300,000.000JF ASEAN Equity X (acc) - USD - 100,019.000 - 100,019.000
JPMorgan Funds - JF Asia Alpha Plus FundJF Asia Alpha Plus A (acc) - USD 1,902,791.626 9,030,578.066 6,164,116.802 4,769,252.890JF Asia Alpha Plus A (dist) - USD 16,536.229 461,555.360 80,722.812 397,368.777JF Asia Alpha Plus X (acc) - USD 54,141.608 275,016.492 - 329,158.100
JPMorgan Funds - JF Asia Pacific ex-Japan Equity FundJF Asia Pacific ex-Japan Equity A (acc) - USD 2,291,785.557 1,060,587.742 2,008,606.036 1,343,767.263JF Asia Pacific ex-Japan Equity A (acc) - SGD - 2,148.154 49.955 2,098.199JF Asia Pacific ex-Japan Equity A (dist) - USD 4,640,913.227 486,949.673 1,079,673.993 4,048,188.907JF Asia Pacific ex-Japan Equity A (dist) - GBP 77,659.266 19,964.345 48,089.959 49,533.652JF Asia Pacific ex-Japan Equity B (acc) - USD 10,346.636 427,277.307 49,326.685 388,297.258JF Asia Pacific ex-Japan Equity C (acc) - USD 1,066,104.651 2,398,711.694 1,096,193.650 2,368,622.695JF Asia Pacific ex-Japan Equity C (acc) - BRL (hedged) - 66,747.581 12,159.932 54,587.649JF Asia Pacific ex-Japan Equity D (acc) - USD 2,100,714.927 681,031.067 949,923.046 1,831,822.948JF Asia Pacific ex-Japan Equity D (acc) - EUR 180,477.711 32,816.584 73,217.836 140,076.459JF Asia Pacific ex-Japan Equity I (acc) - USD 7,858,209.064 54,734.537 5,847,889.809 2,065,053.792JF Asia Pacific ex-Japan Equity X (acc) - USD 2,738,359.066 1,055,149.037 2,890,831.177 902,676.926
JPMorgan Funds - JF China FundJF China A (acc) - USD 12,421,644.435 11,019,759.557 9,053,501.371 14,387,902.621JF China A (acc) - SGD 498.563 844.993 - 1,343.556JF China A (dist) - USD 55,425,360.101 22,997,080.179 30,061,826.820 48,360,613.460JF China A (dist) - HKD - 3,130,574.135 1,682,876.149 1,447,697.986JF China B (acc) - USD 1,072,011.902 527,548.730 693,369.180 906,191.452JF China C (acc) - USD 3,687,391.441 4,286,939.291 3,832,117.821 4,142,212.911JF China D (acc) - USD 11,142,449.919 4,171,980.381 6,463,071.386 8,851,358.914JF China D (acc) - EUR - 61,289.640 13,382.098 47,907.542JF China I (acc) - USD 23,707,183.887 6,820,107.259 13,002,042.268 17,525,248.878JF China T (acc) - EUR - 886.139 68.315 817.824JF China X (acc) - USD - 301,945.306 253,415.415 48,529.891
JPMorgan Funds - JF Greater China FundJF Greater China A (acc) - USD 12,036,262.417 4,276,575.329 4,648,774.574 11,664,063.172JF Greater China A (acc) - SGD 498.563 107,658.490 60,498.563 47,658.490JF Greater China A (dist) - USD 12,882,622.537 6,054,857.820 6,056,582.729 12,880,897.628JF Greater China A (dist) - HKD - 1,513,845.696 115,940.324 1,397,905.372JF Greater China B (acc) - USD 252,095.134 550,290.833 521,883.389 280,502.578JF Greater China C (acc) - USD 3,092,015.534 3,301,641.035 4,353,745.025 2,039,911.544JF Greater China D (acc) - USD 3,510,441.172 621,500.973 1,274,337.194 2,857,604.951JF Greater China D (acc) - EUR - 60,426.170 13,211.406 47,214.764JF Greater China I (acc) - USD - 402,030.655 1,667.624 400,363.031JF Greater China T (acc) - EUR - 2,421.459 - 2,421.459
(16) This Sub-Fund was launched on 3 June 2011.
56
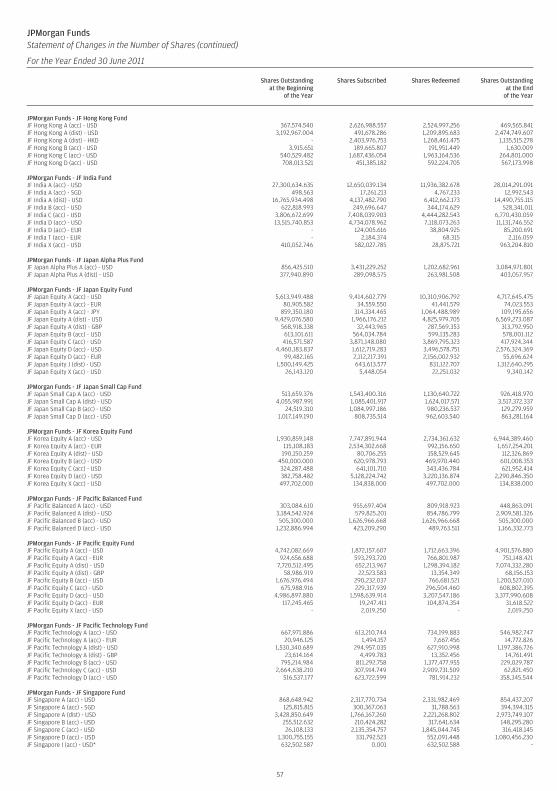
JPMorgan FundsStatement of Changes in the Number of Shares (continued)
For the Year Ended 30 June 2011
Shares Outstandingat the Beginning
of the Year
Shares Subscribed Shares Redeemed Shares Outstandingat the End
of the Year
JPMorgan Funds - JF Hong Kong FundJF Hong Kong A (acc) - USD 367,574.540 2,626,988.557 2,524,997.256 469,565.841JF Hong Kong A (dist) - USD 3,192,967.004 491,678.286 1,209,895.683 2,474,749.607JF Hong Kong A (dist) - HKD - 2,403,976.753 1,268,461.475 1,135,515.278JF Hong Kong B (acc) - USD 3,915.651 189,665.807 191,951.449 1,630.009JF Hong Kong C (acc) - USD 540,529.482 1,687,436.054 1,963,164.536 264,801.000JF Hong Kong D (acc) - USD 708,013.521 451,385.182 592,224.705 567,173.998
JPMorgan Funds - JF India FundJF India A (acc) - USD 27,300,634.635 12,650,039.134 11,936,382.678 28,014,291.091JF India A (acc) - SGD 498.563 17,261.213 4,767.233 12,992.543JF India A (dist) - USD 16,765,934.498 4,137,482.790 6,412,662.173 14,490,755.115JF India B (acc) - USD 622,818.993 249,696.647 344,174.629 528,341.011JF India C (acc) - USD 3,806,672.699 7,408,039.903 4,444,282.543 6,770,430.059JF India D (acc) - USD 13,515,740.853 4,734,078.962 7,118,073.263 11,131,746.552JF India D (acc) - EUR - 124,005.616 38,804.925 85,200.691JF India T (acc) - EUR - 2,184.374 68.315 2,116.059JF India X (acc) - USD 410,052.746 582,027.785 28,875.721 963,204.810
JPMorgan Funds - JF Japan Alpha Plus FundJF Japan Alpha Plus A (acc) - USD 856,425.510 3,431,229.252 1,202,682.961 3,084,971.801JF Japan Alpha Plus A (dist) - USD 377,940.890 289,098.575 263,981.508 403,057.957
JPMorgan Funds - JF Japan Equity FundJF Japan Equity A (acc) - USD 5,613,949.488 9,414,602.779 10,310,906.792 4,717,645.475JF Japan Equity A (acc) - EUR 80,905.582 34,559.550 41,441.579 74,023.553JF Japan Equity A (acc) - JPY 859,350.180 314,334.465 1,064,488.989 109,195.656JF Japan Equity A (dist) - USD 9,429,076.580 1,966,176.212 4,825,979.705 6,569,273.087JF Japan Equity A (dist) - GBP 568,918.338 32,443.965 287,569.353 313,792.950JF Japan Equity B (acc) - USD 613,101.611 564,034.784 599,135.283 578,001.112JF Japan Equity C (acc) - USD 416,571.587 3,871,148.080 3,869,795.323 417,924.344JF Japan Equity D (acc) - USD 4,460,183.837 1,612,719.283 3,496,578.751 2,576,324.369JF Japan Equity D (acc) - EUR 99,482.165 2,112,217.391 2,156,002.932 55,696.624JF Japan Equity J (dist) - USD 1,500,149.425 643,613.577 831,122.707 1,312,640.295JF Japan Equity X (acc) - USD 26,143.120 5,448.054 22,251.032 9,340.142
JPMorgan Funds - JF Japan Small Cap FundJF Japan Small Cap A (acc) - USD 513,659.376 1,543,400.316 1,130,640.722 926,418.970JF Japan Small Cap A (dist) - USD 4,055,987.991 1,085,401.917 1,624,017.571 3,517,372.337JF Japan Small Cap B (acc) - USD 24,519.310 1,084,997.186 980,236.537 129,279.959JF Japan Small Cap D (acc) - USD 1,017,149.190 808,735.514 962,603.540 863,281.164
JPMorgan Funds - JF Korea Equity FundJF Korea Equity A (acc) - USD 1,930,859.148 7,747,891.944 2,734,361.632 6,944,389.460JF Korea Equity A (acc) - EUR 115,108.183 2,534,302.668 992,156.650 1,657,254.201JF Korea Equity A (dist) - USD 190,150.259 80,706.255 158,529.645 112,326.869JF Korea Equity B (acc) - USD 450,000.000 620,978.793 469,970.440 601,008.353JF Korea Equity C (acc) - USD 324,287.488 641,101.710 343,436.784 621,952.414JF Korea Equity D (acc) - USD 382,758.482 5,128,224.742 3,220,136.874 2,290,846.350JF Korea Equity X (acc) - USD 497,702.000 134,838.000 497,702.000 134,838.000
JPMorgan Funds - JF Pacific Balanced FundJF Pacific Balanced A (acc) - USD 303,084.610 955,697.404 809,918.923 448,863.091JF Pacific Balanced A (dist) - USD 3,184,542.924 579,825.201 854,786.799 2,909,581.326JF Pacific Balanced B (acc) - USD 505,300.000 1,626,966.668 1,626,966.668 505,300.000JF Pacific Balanced D (acc) - USD 1,232,886.994 423,209.290 489,763.511 1,166,332.773
JPMorgan Funds - JF Pacific Equity FundJF Pacific Equity A (acc) - USD 4,742,082.669 1,872,157.607 1,712,663.396 4,901,576.880JF Pacific Equity A (acc) - EUR 924,656.688 593,293.720 766,801.987 751,148.421JF Pacific Equity A (dist) - USD 7,720,512.495 652,213.967 1,298,394.182 7,074,332.280JF Pacific Equity A (dist) - GBP 58,986.919 22,523.583 13,354.349 68,156.153JF Pacific Equity B (acc) - USD 1,676,976.494 290,232.037 766,681.521 1,200,527.010JF Pacific Equity C (acc) - USD 675,988.916 229,317.939 296,504.460 608,802.395JF Pacific Equity D (acc) - USD 4,986,897.880 1,598,639.914 3,207,547.186 3,377,990.608JF Pacific Equity D (acc) - EUR 117,245.465 19,247.411 104,874.354 31,618.522JF Pacific Equity X (acc) - USD - 2,019.250 - 2,019.250
JPMorgan Funds - JF Pacific Technology FundJF Pacific Technology A (acc) - USD 667,971.886 613,210.744 734,199.883 546,982.747JF Pacific Technology A (acc) - EUR 20,946.125 1,494.157 7,667.456 14,772.826JF Pacific Technology A (dist) - USD 1,530,340.689 294,957.035 627,910.998 1,197,386.726JF Pacific Technology A (dist) - GBP 23,614.164 4,499.783 13,352.456 14,761.491JF Pacific Technology B (acc) - USD 795,214.984 811,292.758 1,377,477.955 229,029.787JF Pacific Technology C (acc) - USD 2,664,638.210 307,914.749 2,909,731.509 62,821.450JF Pacific Technology D (acc) - USD 516,537.177 623,722.599 781,914.232 358,345.544
JPMorgan Funds - JF Singapore FundJF Singapore A (acc) - USD 868,648.942 2,317,770.734 2,331,982.469 854,437.207JF Singapore A (acc) - SGD 125,815.815 300,367.063 31,788.563 394,394.315JF Singapore A (dist) - USD 3,428,850.649 1,766,167.260 2,221,268.802 2,973,749.107JF Singapore B (acc) - USD 255,512.632 210,424.282 317,641.634 148,295.280JF Singapore C (acc) - USD 26,108.133 2,135,354.757 1,845,044.745 316,418.145JF Singapore D (acc) - USD 1,300,755.155 331,792.523 552,091.448 1,080,456.230JF Singapore I (acc) - USD* 632,502.587 0.001 632,502.588 -
57
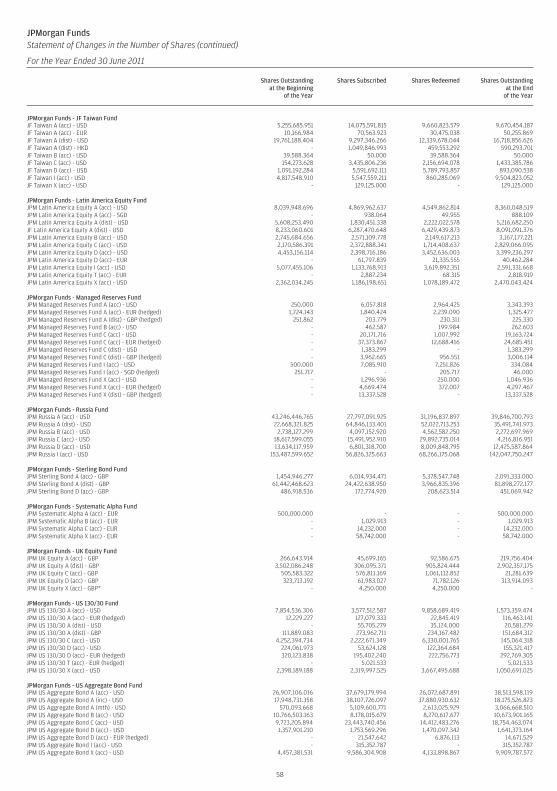
JPMorgan FundsStatement of Changes in the Number of Shares (continued)
For the Year Ended 30 June 2011
Shares Outstandingat the Beginning
of the Year
Shares Subscribed Shares Redeemed Shares Outstandingat the End
of the Year
JPMorgan Funds - JF Taiwan FundJF Taiwan A (acc) - USD 5,255,685.951 14,075,591.815 9,660,823.579 9,670,454.187JF Taiwan A (acc) - EUR 10,166.984 70,563.923 30,475.038 50,255.869JF Taiwan A (dist) - USD 19,761,188.404 9,297,346.266 12,339,678.044 16,718,856.626JF Taiwan A (dist) - HKD - 1,049,846.993 459,553.292 590,293.701JF Taiwan B (acc) - USD 39,588.364 50.000 39,588.364 50.000JF Taiwan C (acc) - USD 154,273.628 3,435,806.236 2,156,694.078 1,433,385.786JF Taiwan D (acc) - USD 1,091,192.284 5,591,692.111 5,789,793.857 893,090.538JF Taiwan I (acc) - USD 4,817,548.910 5,547,559.211 860,285.069 9,504,823.052JF Taiwan X (acc) - USD - 129,125.000 - 129,125.000
JPMorgan Funds - Latin America Equity FundJPM Latin America Equity A (acc) - USD 8,039,948.696 4,869,962.637 4,549,862.814 8,360,048.519JPM Latin America Equity A (acc) - SGD - 938.064 49.955 888.109JPM Latin America Equity A (dist) - USD 5,608,253.490 1,830,451.338 2,222,022.578 5,216,682.250JF Latin America Equity A (dist) - USD 8,233,060.601 6,287,470.648 6,429,439.873 8,091,091.376JPM Latin America Equity B (acc) - USD 2,745,684.656 2,571,109.778 2,149,617.213 3,167,177.221JPM Latin America Equity C (acc) - USD 2,170,586.391 2,372,888.341 1,714,408.637 2,829,066.095JPM Latin America Equity D (acc) - USD 4,453,156.114 2,398,716.186 3,452,636.003 3,399,236.297JPM Latin America Equity D (acc) - EUR - 61,797.839 21,335.555 40,462.284JPM Latin America Equity I (acc) - USD 5,077,455.106 1,133,768.913 3,619,892.351 2,591,331.668JPM Latin America Equity T (acc) - EUR - 2,887.234 68.315 2,818.919JPM Latin America Equity X (acc) - USD 2,362,034.245 1,186,198.651 1,078,189.472 2,470,043.424
JPMorgan Funds - Managed Reserves FundJPM Managed Reserves Fund A (acc) - USD 250.000 6,057.818 2,964.425 3,343.393JPM Managed Reserves Fund A (acc) - EUR (hedged) 1,724.143 1,840.424 2,239.090 1,325.477JPM Managed Reserves Fund A (dist) - GBP (hedged) 251.862 203.779 230.311 225.330JPM Managed Reserves Fund B (acc) - USD - 462.587 199.984 262.603JPM Managed Reserves Fund C (acc) - USD - 20,171.716 1,007.992 19,163.724JPM Managed Reserves Fund C (acc) - EUR (hedged) - 37,373.867 12,688.416 24,685.451JPM Managed Reserves Fund C (dist) - USD - 1,383.299 - 1,383.299JPM Managed Reserves Fund C (dist) - GBP (hedged) - 3,962.665 956.551 3,006.114JPM Managed Reserves Fund I (acc) - USD 500.000 7,085.910 7,251.826 334.084JPM Managed Reserves Fund I (acc) - SGD (hedged) 251.717 - 205.717 46.000JPM Managed Reserves Fund X (acc) - USD - 1,296.936 250.000 1,046.936JPM Managed Reserves Fund X (acc) - EUR (hedged) - 4,669.474 372.007 4,297.467JPM Managed Reserves Fund X (dist) - GBP (hedged) - 13,337.528 - 13,337.528
JPMorgan Funds - Russia FundJPM Russia A (acc) - USD 43,246,446.765 27,797,091.925 31,196,837.897 39,846,700.793JPM Russia A (dist) - USD 22,668,321.825 64,846,133.401 52,022,713.253 35,491,741.973JPM Russia B (acc) - USD 2,738,127.299 4,097,152.920 4,562,582.250 2,272,697.969JPM Russia C (acc) - USD 18,617,599.055 15,491,952.910 29,892,735.014 4,216,816.951JPM Russia D (acc) - USD 13,634,117.959 6,801,318.700 8,009,848.795 12,425,587.864JPM Russia I (acc) - USD 153,487,599.652 56,826,325.663 68,266,175.068 142,047,750.247
JPMorgan Funds - Sterling Bond FundJPM Sterling Bond A (acc) - GBP 1,454,946.277 6,014,934.471 5,378,547.748 2,091,333.000JPM Sterling Bond A (dist) - GBP 61,442,468.623 24,422,638.950 3,966,835.396 81,898,272.177JPM Sterling Bond D (acc) - GBP 486,918.536 172,774.920 208,623.514 451,069.942
JPMorgan Funds - Systematic Alpha FundJPM Systematic Alpha A (acc) - EUR 500,000.000 - - 500,000.000JPM Systematic Alpha B (acc) - EUR - 1,029.913 - 1,029.913JPM Systematic Alpha C (acc) - EUR - 14,232.000 - 14,232.000JPM Systematic Alpha X (acc) - EUR - 58,742.000 - 58,742.000
JPMorgan Funds - UK Equity FundJPM UK Equity A (acc) - GBP 266,643.914 45,699.165 92,586.675 219,756.404JPM UK Equity A (dist) - GBP 3,502,086.248 306,095.371 905,824.444 2,902,357.175JPM UK Equity C (acc) - GBP 505,583.322 576,811.169 1,061,112.852 21,281.639JPM UK Equity D (acc) - GBP 323,713.192 61,983.027 71,782.126 313,914.093JPM UK Equity X (acc) - GBP* - 4,250.000 4,250.000 -
JPMorgan Funds - US 130/30 FundJPM US 130/30 A (acc) - USD 7,854,536.306 3,577,512.587 9,858,689.419 1,573,359.474JPM US 130/30 A (acc) - EUR (hedged) 12,229.227 127,079.333 22,845.419 116,463.141JPM US 130/30 A (dist) - USD - 55,705.279 35,124.000 20,581.279JPM US 130/30 A (dist) - GBP 111,889.083 273,962.711 234,167.482 151,684.312JPM US 130/30 C (acc) - USD 4,252,394.734 2,222,671.349 6,330,001.765 145,064.318JPM US 130/30 D (acc) - USD 224,061.973 53,624.128 122,364.684 155,321.417JPM US 130/30 D (acc) - EUR (hedged) 320,123.838 195,402.240 222,756.773 292,769.305JPM US 130/30 T (acc) - EUR (hedged) - 5,021.533 - 5,021.533JPM US 130/30 X (acc) - USD 2,398,189.188 2,319,997.525 3,667,495.688 1,050,691.025
JPMorgan Funds - US Aggregate Bond FundJPM US Aggregate Bond A (acc) - USD 26,907,106.016 37,679,179.994 26,072,687.891 38,513,598.119JPM US Aggregate Bond A (inc) - USD 17,948,731.358 38,107,726.097 37,880,930.632 18,175,526.823JPM US Aggregate Bond A (mth) - USD 570,093.668 5,109,600.771 2,613,025.929 3,066,668.510JPM US Aggregate Bond B (acc) - USD 10,766,503.163 8,178,015.679 8,270,617.677 10,673,901.165JPM US Aggregate Bond C (acc) - USD 9,723,205.894 23,443,740.456 14,412,483.276 18,754,463.074JPM US Aggregate Bond D (acc) - USD 1,357,901.210 1,753,569.296 1,470,097.342 1,641,373.164JPM US Aggregate Bond D (acc) - EUR (hedged) - 21,547.642 6,876.113 14,671.529JPM US Aggregate Bond I (acc) - USD - 315,352.787 - 315,352.787JPM US Aggregate Bond X (acc) - USD 4,457,381.531 9,586,304.908 4,133,898.867 9,909,787.572
58
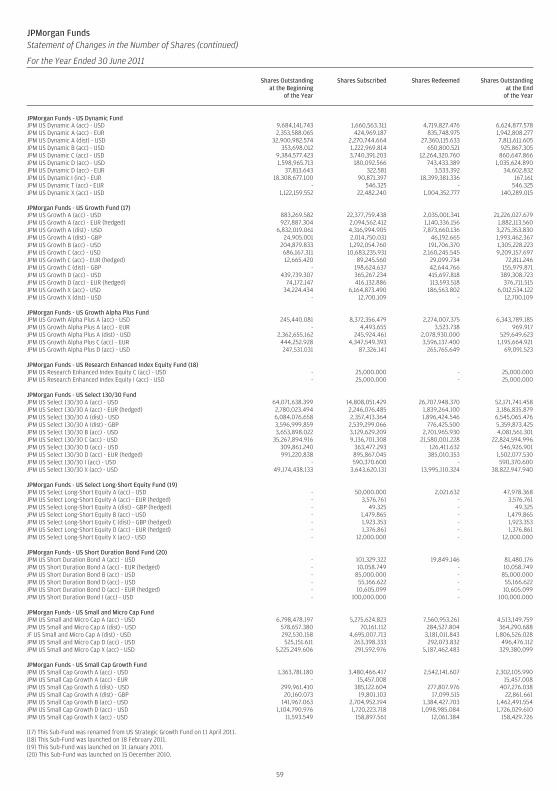
JPMorgan FundsStatement of Changes in the Number of Shares (continued)
For the Year Ended 30 June 2011
Shares Outstandingat the Beginning
of the Year
Shares Subscribed Shares Redeemed Shares Outstandingat the End
of the Year
JPMorgan Funds - US Dynamic FundJPM US Dynamic A (acc) - USD 9,684,141.743 1,660,563.311 4,719,827.476 6,624,877.578JPM US Dynamic A (acc) - EUR 2,353,588.065 424,969.187 835,748.975 1,942,808.277JPM US Dynamic A (dist) - USD 32,900,982.574 2,270,744.664 27,360,115.633 7,811,611.605JPM US Dynamic B (acc) - USD 353,698.012 1,222,969.814 650,800.521 925,867.305JPM US Dynamic C (acc) - USD 9,384,577.423 3,740,391.203 12,264,320.760 860,647.866JPM US Dynamic D (acc) - USD 1,598,965.713 180,092.566 743,433.389 1,035,624.890JPM US Dynamic D (acc) - EUR 37,813.643 322.581 3,533.392 34,602.832JPM US Dynamic I (inc) - EUR 18,308,677.100 90,871.397 18,399,381.336 167.161JPM US Dynamic T (acc) - EUR - 546.325 - 546.325JPM US Dynamic X (acc) - USD 1,122,159.552 22,482.240 1,004,352.777 140,289.015
JPMorgan Funds - US Growth Fund (17)JPM US Growth A (acc) - USD 883,269.582 22,377,759.438 2,035,001.341 21,226,027.679JPM US Growth A (acc) - EUR (hedged) 927,887.304 2,094,562.412 1,140,336.156 1,882,113.560JPM US Growth A (dist) - USD 6,832,019.061 4,316,994.905 7,873,660.136 3,275,353.830JPM US Growth A (dist) - GBP 24,905.001 2,014,750.031 46,192.665 1,993,462.367JPM US Growth B (acc) - USD 204,879.833 1,292,054.760 191,706.370 1,305,228.223JPM US Growth C (acc) - USD 686,167.311 10,683,235.931 2,160,245.545 9,209,157.697JPM US Growth C (acc) - EUR (hedged) 12,665.420 89,245.560 29,099.734 72,811.246JPM US Growth C (dist) - GBP - 198,624.637 42,644.766 155,979.871JPM US Growth D (acc) - USD 439,739.307 365,267.234 415,697.818 389,308.723JPM US Growth D (acc) - EUR (hedged) 74,172.147 416,132.886 113,593.518 376,711.515JPM US Growth X (acc) - USD 34,224.434 6,164,873.490 186,563.802 6,012,534.122JPM US Growth X (dist) - USD - 12,700.109 - 12,700.109
JPMorgan Funds - US Growth Alpha Plus FundJPM US Growth Alpha Plus A (acc) - USD 245,440.081 8,372,356.479 2,274,007.375 6,343,789.185JPM US Growth Alpha Plus A (acc) - EUR - 4,493.655 3,523.738 969.917JPM US Growth Alpha Plus A (dist) - USD 2,362,655.162 245,924.461 2,078,930.000 529,649.623JPM US Growth Alpha Plus C (acc) - EUR 444,252.928 4,347,549.393 3,596,137.400 1,195,664.921JPM US Growth Alpha Plus D (acc) - USD 247,531.031 87,326.141 265,765.649 69,091.523
JPMorgan Funds - US Research Enhanced Index Equity Fund (18)JPM US Research Enhanced Index Equity C (acc) - USD - 25,000.000 - 25,000.000JPM US Research Enhanced Index Equity I (acc) - USD - 25,000.000 - 25,000.000
JPMorgan Funds - US Select 130/30 FundJPM US Select 130/30 A (acc) - USD 64,071,638.399 14,808,051.429 26,707,948.370 52,171,741.458JPM US Select 130/30 A (acc) - EUR (hedged) 2,780,023.494 2,246,076.485 1,839,264.100 3,186,835.879JPM US Select 130/30 A (dist) - USD 6,084,076.658 2,357,413.364 1,896,424.546 6,545,065.476JPM US Select 130/30 A (dist) - GBP 3,596,999.859 2,539,299.066 776,425.500 5,359,873.425JPM US Select 130/30 B (acc) - USD 3,653,898.022 3,129,629.209 2,701,965.930 4,081,561.301JPM US Select 130/30 C (acc) - USD 35,267,894.916 9,136,701.308 21,580,001.228 22,824,594.996JPM US Select 130/30 D (acc) - USD 309,861.240 363,477.293 126,411.632 546,926.901JPM US Select 130/30 D (acc) - EUR (hedged) 991,220.838 895,867.045 385,010.353 1,502,077.530JPM US Select 130/30 I (acc) - USD - 590,370.600 - 590,370.600JPM US Select 130/30 X (acc) - USD 49,174,438.133 3,643,620.131 13,995,110.324 38,822,947.940
JPMorgan Funds - US Select Long-Short Equity Fund (19)JPM US Select Long-Short Equity A (acc) - USD - 50,000.000 2,021.632 47,978.368JPM US Select Long-Short Equity A (acc) - EUR (hedged) - 3,576.761 - 3,576.761JPM US Select Long-Short Equity A (dist) - GBP (hedged) - 49.325 - 49.325JPM US Select Long-Short Equity B (acc) - USD - 1,479.865 - 1,479.865JPM US Select Long-Short Equity C (dist) - GBP (hedged) - 1,923.353 - 1,923.353JPM US Select Long-Short Equity D (acc) - EUR (hedged) - 1,376.861 - 1,376.861JPM US Select Long-Short Equity X (acc) - USD - 12,000.000 - 12,000.000
JPMorgan Funds - US Short Duration Bond Fund (20)JPM US Short Duration Bond A (acc) - USD - 101,329.322 19,849.146 81,480.176JPM US Short Duration Bond A (acc) - EUR (hedged) - 10,058.749 - 10,058.749JPM US Short Duration Bond B (acc) - USD - 85,000.000 - 85,000.000JPM US Short Duration Bond D (acc) - USD - 55,166.622 - 55,166.622JPM US Short Duration Bond D (acc) - EUR (hedged) - 10,605.099 - 10,605.099JPM US Short Duration Bond I (acc) - USD - 100,000.000 - 100,000.000
JPMorgan Funds - US Small and Micro Cap FundJPM US Small and Micro Cap A (acc) - USD 6,798,478.197 5,275,624.823 7,560,953.261 4,513,149.759JPM US Small and Micro Cap A (dist) - USD 578,657.380 70,161.112 284,527.804 364,290.688JF US Small and Micro Cap A (dist) - USD 292,530.158 4,695,007.713 3,181,011.843 1,806,526.028JPM US Small and Micro Cap D (acc) - USD 525,151.611 263,398.333 292,073.832 496,476.112JPM US Small and Micro Cap X (acc) - USD 5,225,249.606 291,592.976 5,187,462.483 329,380.099
JPMorgan Funds - US Small Cap Growth FundJPM US Small Cap Growth A (acc) - USD 1,363,781.180 3,480,466.417 2,542,141.607 2,302,105.990JPM US Small Cap Growth A (acc) - EUR - 15,457.008 - 15,457.008JPM US Small Cap Growth A (dist) - USD 299,961.410 385,122.604 277,807.976 407,276.038JPM US Small Cap Growth A (dist) - GBP 20,160.073 19,801.103 17,099.515 22,861.661JPM US Small Cap Growth B (acc) - USD 141,967.063 2,704,952.194 1,384,427.703 1,462,491.554JPM US Small Cap Growth D (acc) - USD 1,104,790.976 1,720,223.718 1,098,985.084 1,726,029.610JPM US Small Cap Growth X (acc) - USD 11,593.549 158,897.561 12,061.384 158,429.726
(17) This Sub-Fund was renamed from US Strategic Growth Fund on 11 April 2011.(18) This Sub-Fund was launched on 18 February 2011.(19) This Sub-Fund was launched on 31 January 2011.(20) This Sub-Fund was launched on 15 December 2010.
59
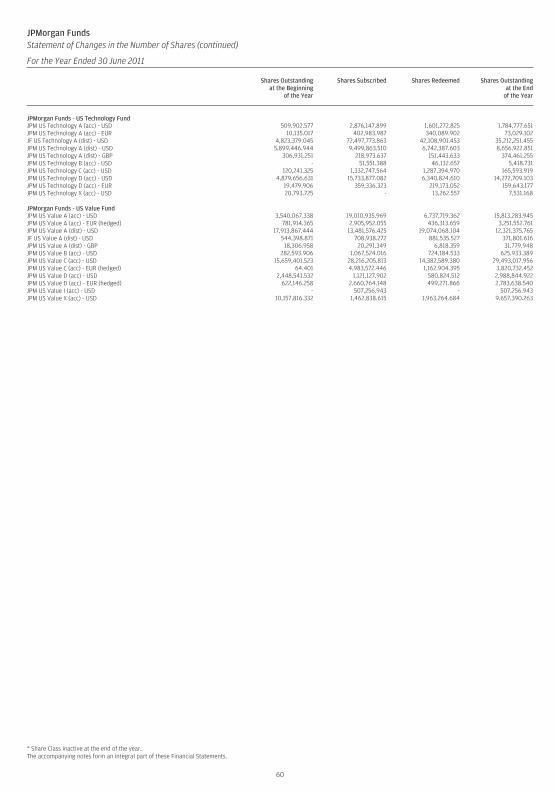
JPMorgan FundsStatement of Changes in the Number of Shares (continued)
For the Year Ended 30 June 2011
Shares Outstandingat the Beginning
of the Year
Shares Subscribed Shares Redeemed Shares Outstandingat the End
of the Year
JPMorgan Funds - US Technology FundJPM US Technology A (acc) - USD 509,902.577 2,876,147.899 1,601,272.825 1,784,777.651JPM US Technology A (acc) - EUR 10,135.017 402,983.987 340,089.902 73,029.102JF US Technology A (dist) - USD 4,823,379.045 72,497,773.863 42,108,901.453 35,212,251.455JPM US Technology A (dist) - USD 5,899,446.944 9,499,863.510 6,742,387.603 8,656,922.851JPM US Technology A (dist) - GBP 306,931.251 218,973.637 151,443.633 374,461.255JPM US Technology B (acc) - USD - 51,551.388 46,132.657 5,418.731JPM US Technology C (acc) - USD 120,241.325 1,332,747.564 1,287,394.970 165,593.919JPM US Technology D (acc) - USD 4,879,656.631 15,733,877.082 6,340,824.610 14,272,709.103JPM US Technology D (acc) - EUR 19,479.906 359,336.323 219,173.052 159,643.177JPM US Technology X (acc) - USD 20,793.725 - 13,262.557 7,531.168
JPMorgan Funds - US Value FundJPM US Value A (acc) - USD 3,540,067.338 19,010,935.969 6,737,719.362 15,813,283.945JPM US Value A (acc) - EUR (hedged) 781,914.365 2,905,952.055 436,313.659 3,251,552.761JPM US Value A (dist) - USD 17,913,867.444 13,481,576.425 19,074,068.104 12,321,375.765JF US Value A (dist) - USD 544,398.871 708,938.272 881,535.527 371,801.616JPM US Value A (dist) - GBP 18,306.958 20,291.349 6,818.359 31,779.948JPM US Value B (acc) - USD 282,593.906 1,067,524.016 724,184.533 625,933.389JPM US Value C (acc) - USD 15,659,401.523 28,216,205.813 14,382,589.380 29,493,017.956JPM US Value C (acc) - EUR (hedged) 64.401 4,983,572.446 1,162,904.395 3,820,732.452JPM US Value D (acc) - USD 2,448,541.532 1,121,127.902 580,824.512 2,988,844.922JPM US Value D (acc) - EUR (hedged) 622,146.258 2,660,764.148 499,271.866 2,783,638.540JPM US Value I (acc) - USD - 507,256.943 - 507,256.943JPM US Value X (acc) - USD 10,157,816.332 1,462,838.615 1,963,264.684 9,657,390.263
* Share Class inactive at the end of the year.The accompanying notes form an integral part of these Financial Statements.
60
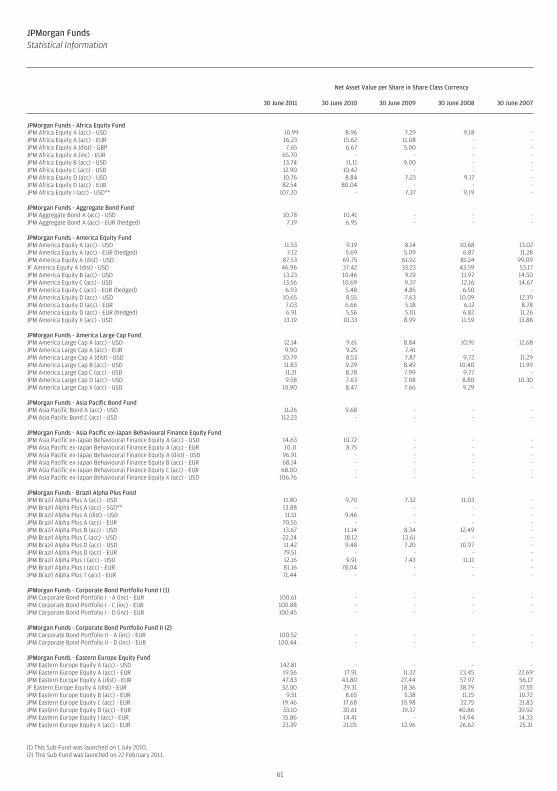
JPMorgan FundsStatistical Information (continued)
Net Asset Value per Share in Share Class Currency
30 June 2011 30 June 2010 30 June 2009 30 June 2008 30 June 2007
JPMorgan Funds - Africa Equity FundJPM Africa Equity A (acc) - USD 10.99 8.96 7.29 9.18 -JPM Africa Equity A (acc) - EUR 16.23 15.62 11.08 - -JPM Africa Equity A (dist) - GBP 7.65 6.67 5.00 - -JPM Africa Equity A (inc) - EUR 65.70 - - - -JPM Africa Equity B (acc) - USD 13.74 11.11 9.00 - -JPM Africa Equity C (acc) - USD 12.90 10.42 - - -JPM Africa Equity D (acc) - USD 10.76 8.84 7.23 9.17 -JPM Africa Equity D (acc) - EUR 82.54 80.04 - - -JPM Africa Equity I (acc) - USD** 107.20 - 7.37 9.19 -
JPMorgan Funds - Aggregate Bond FundJPM Aggregate Bond A (acc) - USD 10.78 10.41 - - -JPM Aggregate Bond A (acc) - EUR (hedged) 7.19 6.95 - - -
JPMorgan Funds - America Equity FundJPM America Equity A (acc) - USD 11.53 9.19 8.14 10.68 13.02JPM America Equity A (acc) - EUR (hedged) 7.12 5.69 5.09 6.87 11.28JPM America Equity A (dist) - USD 87.53 69.75 61.92 81.24 99.09JF America Equity A (dist) - USD 46.96 37.42 33.23 43.59 53.17JPM America Equity B (acc) - USD 13.23 10.46 9.19 11.97 14.50JPM America Equity C (acc) - USD 13.56 10.69 9.37 12.16 14.67JPM America Equity C (acc) - EUR (hedged) 6.93 5.48 4.85 6.50 -JPM America Equity D (acc) - USD 10.65 8.55 7.63 10.09 12.39JPM America Equity D (acc) - EUR 7.03 6.66 5.18 6.12 8.78JPM America Equity D (acc) - EUR (hedged) 6.91 5.56 5.01 6.82 11.26JPM America Equity X (acc) - USD 13.19 10.33 8.99 11.59 13.88
JPMorgan Funds - America Large Cap FundJPM America Large Cap A (acc) - USD 12.14 9.61 8.84 10.91 12.68JPM America Large Cap A (acc) - EUR 9.90 9.25 7.41 - -JPM America Large Cap A (dist) - USD 10.79 8.53 7.87 9.72 11.29JPM America Large Cap B (acc) - USD 11.83 9.29 8.49 10.40 11.99JPM America Large Cap C (acc) - USD 11.21 8.78 7.99 9.77 -JPM America Large Cap D (acc) - USD 9.58 7.63 7.08 8.80 10.30JPM America Large Cap X (acc) - USD 10.90 8.47 7.66 9.29 -
JPMorgan Funds - Asia Pacific Bond FundJPM Asia Pacific Bond A (acc) - USD 11.26 9.68 - - -JPM Asia Pacific Bond C (acc) - USD 112.23 - - - -
JPMorgan Funds - Asia Pacific ex-Japan Behavioural Finance Equity FundJPM Asia Pacific ex-Japan Behavioural Finance Equity A (acc) - USD 14.63 10.72 - - -JPM Asia Pacific ex-Japan Behavioural Finance Equity A (acc) - EUR 10.11 8.75 - - -JPM Asia Pacific ex-Japan Behavioural Finance Equity A (dist) - USD 96.91 - - - -JPM Asia Pacific ex-Japan Behavioural Finance Equity B (acc) - EUR 68.14 - - - -JPM Asia Pacific ex-Japan Behavioural Finance Equity C (acc) - EUR 68.00 - - - -JPM Asia Pacific ex-Japan Behavioural Finance Equity X (acc) - USD 106.76 - - - -
JPMorgan Funds - Brazil Alpha Plus FundJPM Brazil Alpha Plus A (acc) - USD 11.80 9.70 7.32 11.03 -JPM Brazil Alpha Plus A (acc) - SGD** 13.88 - - - -JPM Brazil Alpha Plus A (dist) - USD 11.51 9.46 - - -JPM Brazil Alpha Plus A (acc) - EUR 70.55 - - - -JPM Brazil Alpha Plus B (acc) - USD 13.67 11.14 8.34 12.49 -JPM Brazil Alpha Plus C (acc) - USD 22.24 18.12 13.61 - -JPM Brazil Alpha Plus D (acc) - USD 11.42 9.48 7.20 10.97 -JPM Brazil Alpha Plus D (acc) - EUR 79.51 - - - -JPM Brazil Alpha Plus I (acc) - USD 12.16 9.91 7.43 11.11 -JPM Brazil Alpha Plus I (acc) - EUR 81.16 78.04 - - -JPM Brazil Alpha Plus T (acc) - EUR 71.44 - - - -
JPMorgan Funds - Corporate Bond Portfolio Fund I (1)JPM Corporate Bond Portfolio I - A (inc) - EUR 100.61 - - - -JPM Corporate Bond Portfolio I - C (inc) - EUR 100.88 - - - -JPM Corporate Bond Portfolio I - D (inc) - EUR 100.45 - - - -
JPMorgan Funds - Corporate Bond Portfolio Fund II (2)JPM Corporate Bond Portfolio II - A (inc) - EUR 100.52 - - - -JPM Corporate Bond Portfolio II - D (inc) - EUR 100.44 - - - -
JPMorgan Funds - Eastern Europe Equity FundJPM Eastern Europe Equity A (acc) - USD 142.81 - - - -JPM Eastern Europe Equity A (acc) - EUR 19.56 17.91 11.22 23.45 22.69JPM Eastern Europe Equity A (dist) - EUR 47.83 43.80 27.44 57.97 56.17JF Eastern Europe Equity A (dist) - EUR 32.00 29.31 18.36 38.79 37.55JPM Eastern Europe Equity B (acc) - EUR 9.51 8.65 5.38 11.15 10.72JPM Eastern Europe Equity C (acc) - EUR 19.46 17.68 10.98 22.75 21.83JPM Eastern Europe Equity D (acc) - EUR 33.10 30.61 19.37 40.86 39.92JPM Eastern Europe Equity I (acc) - EUR 15.86 14.41 - 14.94 14.33JPM Eastern Europe Equity X (acc) - EUR 23.39 21.05 12.96 26.62 25.31
(1) This Sub-Fund was launched on 1 July 2010.(2) This Sub-Fund was launched on 22 February 2011.
61
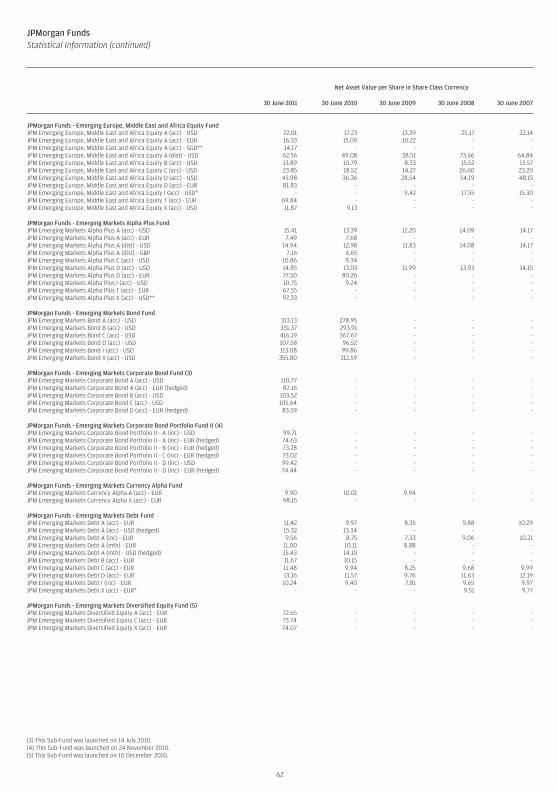
JPMorgan FundsStatistical Information (continued)
Net Asset Value per Share in Share Class Currency
30 June 2011 30 June 2010 30 June 2009 30 June 2008 30 June 2007
JPMorgan Funds - Emerging Europe, Middle East and Africa Equity FundJPM Emerging Europe, Middle East and Africa Equity A (acc) - USD 22.01 17.23 13.39 25.17 22.14JPM Emerging Europe, Middle East and Africa Equity A (acc) - EUR 16.33 15.09 10.22 - -JPM Emerging Europe, Middle East and Africa Equity A (acc) - SGD** 14.17 - - - -JPM Emerging Europe, Middle East and Africa Equity A (dist) - USD 62.56 49.08 38.51 73.66 64.84JPM Emerging Europe, Middle East and Africa Equity B (acc) - USD 13.89 10.79 8.33 15.52 13.57JPM Emerging Europe, Middle East and Africa Equity C (acc) - USD 23.85 18.52 14.27 26.60 23.20JPM Emerging Europe, Middle East and Africa Equity D (acc) - USD 45.98 36.36 28.54 54.19 48.15JPM Emerging Europe, Middle East and Africa Equity D (acc) - EUR 81.83 - - - -JPM Emerging Europe, Middle East and Africa Equity I (acc) - USD* - - 9.42 17.55 15.30JPM Emerging Europe, Middle East and Africa Equity T (acc) - EUR 69.84 - - - -JPM Emerging Europe, Middle East and Africa Equity X (acc) - USD 11.87 9.13 - - -
JPMorgan Funds - Emerging Markets Alpha Plus FundJPM Emerging Markets Alpha Plus A (acc) - USD 15.41 13.39 12.20 14.09 14.17JPM Emerging Markets Alpha Plus A (acc) - EUR 7.49 7.68 - - -JPM Emerging Markets Alpha Plus A (dist) - USD 14.94 12.98 11.83 14.08 14.17JPM Emerging Markets Alpha Plus A (dist) - GBP 7.16 6.65 - - -JPM Emerging Markets Alpha Plus C (acc) - USD 10.86 9.34 - - -JPM Emerging Markets Alpha Plus D (acc) - USD 14.85 13.03 11.99 13.93 14.15JPM Emerging Markets Alpha Plus D (acc) - EUR 77.50 80.26 - - -JPM Emerging Markets Alpha Plus I (acc) - USD 10.75 9.24 - - -JPM Emerging Markets Alpha Plus T (acc) - EUR 67.55 - - - -JPM Emerging Markets Alpha Plus X (acc) - USD** 97.33 - - - -
JPMorgan Funds - Emerging Markets Bond FundJPM Emerging Markets Bond A (acc) - USD 313.13 278.95 - - -JPM Emerging Markets Bond B (acc) - USD 331.37 293.91 - - -JPM Emerging Markets Bond C (acc) - USD 416.19 367.67 - - -JPM Emerging Markets Bond D (acc) - USD 107.58 96.52 - - -JPM Emerging Markets Bond I (acc) - USD 113.08 99.86 - - -JPM Emerging Markets Bond X (acc) - USD 355.80 312.59 - - -
JPMorgan Funds - Emerging Markets Corporate Bond Fund (3)JPM Emerging Markets Corporate Bond A (acc) - USD 110.77 - - - -JPM Emerging Markets Corporate Bond A (acc) - EUR (hedged) 87.16 - - - -JPM Emerging Markets Corporate Bond B (acc) - USD 103.52 - - - -JPM Emerging Markets Corporate Bond C (acc) - USD 105.64 - - - -JPM Emerging Markets Corporate Bond D (acc) - EUR (hedged) 83.59 - - - -
JPMorgan Funds - Emerging Markets Corporate Bond Portfolio Fund II (4)JPM Emerging Markets Corporate Bond Portfolio II - A (inc) - USD 99.71 - - - -JPM Emerging Markets Corporate Bond Portfolio II - A (inc) - EUR (hedged) 74.63 - - - -JPM Emerging Markets Corporate Bond Portfolio II - B (inc) - EUR (hedged) 73.28 - - - -JPM Emerging Markets Corporate Bond Portfolio II - C (inc) - EUR (hedged) 73.02 - - - -JPM Emerging Markets Corporate Bond Portfolio II - D (inc) - USD 99.42 - - - -JPM Emerging Markets Corporate Bond Portfolio II - D (inc) - EUR (hedged) 74.44 - - - -
JPMorgan Funds - Emerging Markets Currency Alpha FundJPM Emerging Markets Currency Alpha A (acc) - EUR 9.90 10.01 9.94 - -JPM Emerging Markets Currency Alpha X (acc) - EUR 98.15 - - - -
JPMorgan Funds - Emerging Markets Debt FundJPM Emerging Markets Debt A (acc) - EUR 11.42 9.97 8.35 9.88 10.29JPM Emerging Markets Debt A (acc) - USD (hedged) 15.32 13.34 - - -JPM Emerging Markets Debt A (inc) - EUR 9.56 8.75 7.33 9.06 10.21JPM Emerging Markets Debt A (mth) - EUR 11.00 10.11 8.88 - -JPM Emerging Markets Debt A (mth) - USD (hedged) 15.43 14.10 - - -JPM Emerging Markets Debt B (acc) - EUR 11.67 10.15 - - -JPM Emerging Markets Debt C (acc) - EUR 11.48 9.94 8.25 9.68 9.99JPM Emerging Markets Debt D (acc) - EUR 13.16 11.57 9.76 11.63 12.19JPM Emerging Markets Debt I (inc) - EUR 10.24 9.40 7.81 9.65 9.97JPM Emerging Markets Debt X (acc) - EUR* - - - 9.51 9.77
JPMorgan Funds - Emerging Markets Diversified Equity Fund (5)JPM Emerging Markets Diversified Equity A (acc) - EUR 72.65 - - - -JPM Emerging Markets Diversified Equity C (acc) - EUR 73.74 - - - -JPM Emerging Markets Diversified Equity X (acc) - EUR 74.07 - - - -
(3) This Sub-Fund was launched on 14 July 2010.(4) This Sub-Fund was launched on 24 November 2010.(5) This Sub-Fund was launched on 10 December 2010.
62
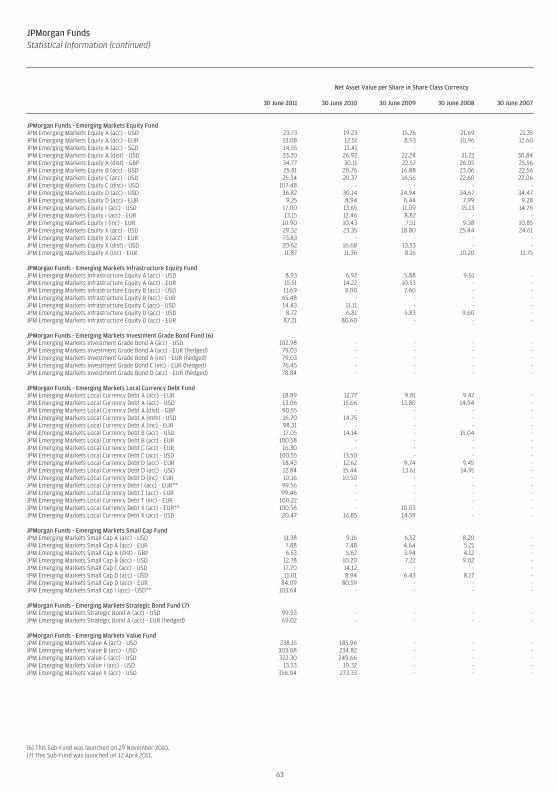
JPMorgan FundsStatistical Information (continued)
Net Asset Value per Share in Share Class Currency
30 June 2011 30 June 2010 30 June 2009 30 June 2008 30 June 2007
JPMorgan Funds - Emerging Markets Equity FundJPM Emerging Markets Equity A (acc) - USD 23.73 19.23 15.76 21.69 21.35JPM Emerging Markets Equity A (acc) - EUR 13.08 12.51 8.93 10.96 12.60JPM Emerging Markets Equity A (acc) - SGD 14.55 13.41 - - -JPM Emerging Markets Equity A (dist) - USD 33.20 26.92 22.24 31.22 30.84JPM Emerging Markets Equity A (dist) - GBP 34.77 30.11 22.57 26.05 25.56JPM Emerging Markets Equity B (acc) - USD 25.81 20.76 16.88 23.06 22.56JPM Emerging Markets Equity C (acc) - USD 25.34 20.37 16.56 22.60 22.06JPM Emerging Markets Equity C (dist) - USD 107.48 - - - -JPM Emerging Markets Equity D (acc) - USD 36.82 30.14 24.94 34.67 34.47JPM Emerging Markets Equity D (acc) - EUR 9.25 8.94 6.44 7.99 9.28JPM Emerging Markets Equity I (acc) - USD 17.00 13.65 11.09 15.13 14.76JPM Emerging Markets Equity I (acc) - EUR 13.15 12.46 8.82 - -JPM Emerging Markets Equity I (inc) - EUR 10.90 10.43 7.51 9.38 10.85JPM Emerging Markets Equity X (acc) - USD 29.32 23.35 18.80 25.44 24.61JPM Emerging Markets Equity X (acc) - EUR 73.83 - - - -JPM Emerging Markets Equity X (dist) - USD 20.62 16.68 13.53 - -JPM Emerging Markets Equity X (inc) - EUR 11.87 11.36 8.16 10.20 11.75
JPMorgan Funds - Emerging Markets Infrastructure Equity FundJPM Emerging Markets Infrastructure Equity A (acc) - USD 8.93 6.92 5.88 9.61 -JPM Emerging Markets Infrastructure Equity A (acc) - EUR 15.51 14.22 10.53 - -JPM Emerging Markets Infrastructure Equity B (acc) - USD 11.69 9.00 7.60 - -JPM Emerging Markets Infrastructure Equity B (acc) - EUR 65.48 - - - -JPM Emerging Markets Infrastructure Equity C (acc) - USD 14.43 11.11 - - -JPM Emerging Markets Infrastructure Equity D (acc) - USD 8.72 6.81 5.83 9.60 -JPM Emerging Markets Infrastructure Equity D (acc) - EUR 87.21 80.60 - - -
JPMorgan Funds - Emerging Markets Investment Grade Bond Fund (6)JPM Emerging Markets Investment Grade Bond A (acc) - USD 102.98 - - - -JPM Emerging Markets Investment Grade Bond A (acc) - EUR (hedged) 79.03 - - - -JPM Emerging Markets Investment Grade Bond A (inc) - EUR (hedged) 79.03 - - - -JPM Emerging Markets Investment Grade Bond C (inc) - EUR (hedged) 76.45 - - - -JPM Emerging Markets Investment Grade Bond D (acc) - EUR (hedged) 78.84 - - - -
JPMorgan Funds - Emerging Markets Local Currency Debt FundJPM Emerging Markets Local Currency Debt A (acc) - EUR 18.89 12.77 9.81 9.47 -JPM Emerging Markets Local Currency Debt A (acc) - USD 13.06 15.66 13.80 14.94 -JPM Emerging Markets Local Currency Debt A (dist) - GBP 90.55 - - - -JPM Emerging Markets Local Currency Debt A (mth) - USD 16.70 14.75 - - -JPM Emerging Markets Local Currency Debt A (inc) - EUR 98.31 - - - -JPM Emerging Markets Local Currency Debt B (acc) - USD 17.05 14.14 - 15.04 -JPM Emerging Markets Local Currency Debt B (acc) - EUR 100.58 - - - -JPM Emerging Markets Local Currency Debt C (acc) - EUR 16.30 - - - -JPM Emerging Markets Local Currency Debt C (acc) - USD 100.55 13.50 - - -JPM Emerging Markets Local Currency Debt D (acc) - EUR 18.43 12.62 9.74 9.45 -JPM Emerging Markets Local Currency Debt D (acc) - USD 12.84 15.44 13.61 14.91 -JPM Emerging Markets Local Currency Debt D (inc) - EUR 10.16 10.50 - - -JPM Emerging Markets Local Currency Debt I (acc) - EUR** 99.56 - - - -JPM Emerging Markets Local Currency Debt T (acc) - EUR 99.46 - - - -JPM Emerging Markets Local Currency Debt T (inc) - EUR 100.22 - - - -JPM Emerging Markets Local Currency Debt X (acc) - EUR** 100.56 - 10.03 - -JPM Emerging Markets Local Currency Debt X (acc) - USD 20.47 16.85 14.59 - -
JPMorgan Funds - Emerging Markets Small Cap FundJPM Emerging Markets Small Cap A (acc) - USD 11.38 9.16 6.52 8.20 -JPM Emerging Markets Small Cap A (acc) - EUR 7.88 7.48 4.64 5.21 -JPM Emerging Markets Small Cap A (dist) - GBP 6.53 5.62 3.94 4.12 -JPM Emerging Markets Small Cap B (acc) - USD 12.78 10.20 7.22 9.02 -JPM Emerging Markets Small Cap C (acc) - USD 17.70 14.12 - - -JPM Emerging Markets Small Cap D (acc) - USD 11.01 8.94 6.43 8.17 -JPM Emerging Markets Small Cap D (acc) - EUR 84.09 80.59 - - -JPM Emerging Markets Small Cap I (acc) - USD** 103.64 - - - -
JPMorgan Funds - Emerging Markets Strategic Bond Fund (7)JPM Emerging Markets Strategic Bond A (acc) - USD 99.93 - - - -JPM Emerging Markets Strategic Bond A (acc) - EUR (hedged) 69.02 - - - -
JPMorgan Funds - Emerging Markets Value FundJPM Emerging Markets Value A (acc) - USD 238.15 185.96 - - -JPM Emerging Markets Value B (acc) - USD 303.08 234.82 - - -JPM Emerging Markets Value C (acc) - USD 322.30 249.66 - - -JPM Emerging Markets Value I (acc) - USD 13.33 10.32 - - -JPM Emerging Markets Value X (acc) - USD 356.04 273.33 - - -
(6) This Sub-Fund was launched on 29 November 2010.(7) This Sub-Fund was launched on 12 April 2011.
63
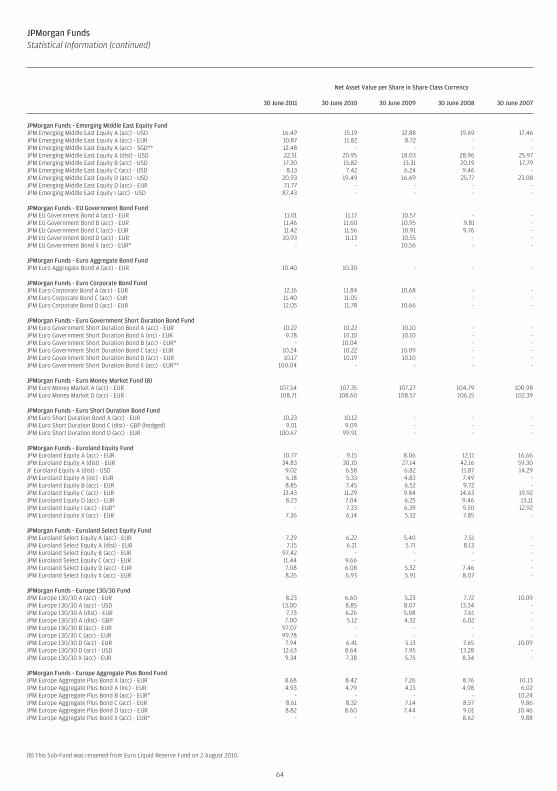
JPMorgan FundsStatistical Information (continued)
Net Asset Value per Share in Share Class Currency
30 June 2011 30 June 2010 30 June 2009 30 June 2008 30 June 2007
JPMorgan Funds - Emerging Middle East Equity FundJPM Emerging Middle East Equity A (acc) - USD 16.49 15.19 12.88 19.69 17.46JPM Emerging Middle East Equity A (acc) - EUR 10.87 11.82 8.72 - -JPM Emerging Middle East Equity A (acc) - SGD** 12.48 - - - -JPM Emerging Middle East Equity A (dist) - USD 22.51 20.95 18.03 28.96 25.97JPM Emerging Middle East Equity B (acc) - USD 17.30 15.82 13.31 20.19 17.79JPM Emerging Middle East Equity C (acc) - USD 8.13 7.42 6.24 9.46 -JPM Emerging Middle East Equity D (acc) - USD 20.93 19.49 16.69 25.77 23.08JPM Emerging Middle East Equity D (acc) - EUR 71.77 - - - -JPM Emerging Middle East Equity I (acc) - USD 87.43 - - - -
JPMorgan Funds - EU Government Bond FundJPM EU Government Bond A (acc) - EUR 11.01 11.17 10.57 - -JPM EU Government Bond B (acc) - EUR 11.46 11.60 10.95 9.81 -JPM EU Government Bond C (acc) - EUR 11.42 11.56 10.91 9.76 -JPM EU Government Bond D (acc) - EUR 10.93 11.13 10.55 - -JPM EU Government Bond X (acc) - EUR* - - 10.56 - -
JPMorgan Funds - Euro Aggregate Bond FundJPM Euro Aggregate Bond A (acc) - EUR 10.40 10.30 - - -
JPMorgan Funds - Euro Corporate Bond FundJPM Euro Corporate Bond A (acc) - EUR 12.16 11.84 10.68 - -JPM Euro Corporate Bond C (acc) - EUR 11.40 11.05 - - -JPM Euro Corporate Bond D (acc) - EUR 12.05 11.78 10.66 - -
JPMorgan Funds - Euro Government Short Duration Bond FundJPM Euro Government Short Duration Bond A (acc) - EUR 10.22 10.22 10.10 - -JPM Euro Government Short Duration Bond A (inc) - EUR 9.78 10.10 10.10 - -JPM Euro Government Short Duration Bond B (acc) - EUR* - 10.04 - - -JPM Euro Government Short Duration Bond C (acc) - EUR 10.24 10.22 10.09 - -JPM Euro Government Short Duration Bond D (acc) - EUR 10.17 10.19 10.10 - -JPM Euro Government Short Duration Bond X (acc) - EUR** 100.04 - - - -
JPMorgan Funds - Euro Money Market Fund (8)JPM Euro Money Market A (acc) - EUR 107.54 107.35 107.27 104.79 100.98JPM Euro Money Market D (acc) - EUR 108.71 108.60 108.57 106.15 102.39
JPMorgan Funds - Euro Short Duration Bond FundJPM Euro Short Duration Bond A (acc) - EUR 10.23 10.12 - - -JPM Euro Short Duration Bond C (dist) - GBP (hedged) 9.01 9.09 - - -JPM Euro Short Duration Bond D (acc) - EUR 100.67 99.91 - - -
JPMorgan Funds - Euroland Equity FundJPM Euroland Equity A (acc) - EUR 10.77 9.15 8.06 12.11 16.66JPM Euroland Equity A (dist) - EUR 34.83 30.10 27.14 42.16 59.30JF Euroland Equity A (dist) - USD 9.02 6.58 6.82 11.87 14.29JPM Euroland Equity A (inc) - EUR 6.18 5.33 4.83 7.49 -JPM Euroland Equity B (acc) - EUR 8.85 7.45 6.52 9.72 -JPM Euroland Equity C (acc) - EUR 13.43 11.29 9.84 14.63 19.92JPM Euroland Equity D (acc) - EUR 8.23 7.04 6.25 9.46 13.11JPM Euroland Equity I (acc) - EUR* - 7.33 6.39 9.50 12.92JPM Euroland Equity X (acc) - EUR 7.36 6.14 5.32 7.85 -
JPMorgan Funds - Euroland Select Equity FundJPM Euroland Select Equity A (acc) - EUR 7.29 6.22 5.40 7.51 -JPM Euroland Select Equity A (dist) - EUR 7.15 6.21 5.71 8.13 -JPM Euroland Select Equity B (acc) - EUR 97.42 - - - -JPM Euroland Select Equity C (acc) - EUR 11.44 9.66 - - -JPM Euroland Select Equity D (acc) - EUR 7.08 6.08 5.32 7.46 -JPM Euroland Select Equity X (acc) - EUR 8.26 6.93 5.91 8.07 -
JPMorgan Funds - Europe 130/30 FundJPM Europe 130/30 A (acc) - EUR 8.23 6.60 5.23 7.72 10.09JPM Europe 130/30 A (acc) - USD 13.00 8.85 8.07 13.34 -JPM Europe 130/30 A (dist) - EUR 7.73 6.26 5.08 7.61 -JPM Europe 130/30 A (dist) - GBP 7.00 5.12 4.32 6.02 -JPM Europe 130/30 B (acc) - EUR 97.07 - - - -JPM Europe 130/30 C (acc) - EUR 99.78 - - - -JPM Europe 130/30 D (acc) - EUR 7.94 6.41 5.13 7.65 10.09JPM Europe 130/30 D (acc) - USD 12.63 8.64 7.95 13.28 -JPM Europe 130/30 X (acc) - EUR 9.34 7.38 5.75 8.34 -
JPMorgan Funds - Europe Aggregate Plus Bond FundJPM Europe Aggregate Plus Bond A (acc) - EUR 8.68 8.42 7.26 8.76 10.13JPM Europe Aggregate Plus Bond A (inc) - EUR 4.93 4.79 4.13 4.98 6.02JPM Europe Aggregate Plus Bond B (acc) - EUR* - - - - 10.24JPM Europe Aggregate Plus Bond C (acc) - EUR 8.61 8.32 7.14 8.57 9.86JPM Europe Aggregate Plus Bond D (acc) - EUR 8.82 8.60 7.44 9.01 10.46JPM Europe Aggregate Plus Bond X (acc) - EUR* - - - 8.62 9.88
(8) This Sub-Fund was renamed from Euro Liquid Reserve Fund on 2 August 2010.
64
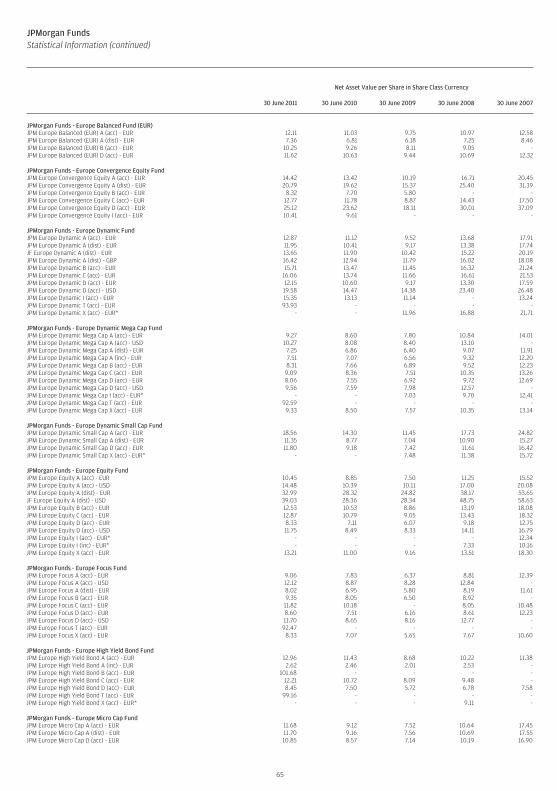
JPMorgan FundsStatistical Information (continued)
Net Asset Value per Share in Share Class Currency
30 June 2011 30 June 2010 30 June 2009 30 June 2008 30 June 2007
JPMorgan Funds - Europe Balanced Fund (EUR)JPM Europe Balanced (EUR) A (acc) - EUR 12.11 11.03 9.75 10.97 12.58JPM Europe Balanced (EUR) A (dist) - EUR 7.36 6.81 6.18 7.25 8.46JPM Europe Balanced (EUR) B (acc) - EUR 10.25 9.26 8.11 9.05 -JPM Europe Balanced (EUR) D (acc) - EUR 11.62 10.63 9.44 10.69 12.32
JPMorgan Funds - Europe Convergence Equity FundJPM Europe Convergence Equity A (acc) - EUR 14.42 13.42 10.19 16.71 20.45JPM Europe Convergence Equity A (dist) - EUR 20.79 19.62 15.37 25.40 31.39JPM Europe Convergence Equity B (acc) - EUR 8.32 7.70 5.80 - -JPM Europe Convergence Equity C (acc) - EUR 12.77 11.78 8.87 14.43 17.50JPM Europe Convergence Equity D (acc) - EUR 25.12 23.62 18.11 30.01 37.09JPM Europe Convergence Equity I (acc) - EUR 10.41 9.61 - - -
JPMorgan Funds - Europe Dynamic FundJPM Europe Dynamic A (acc) - EUR 12.87 11.12 9.52 13.68 17.91JPM Europe Dynamic A (dist) - EUR 11.95 10.41 9.17 13.38 17.74JF Europe Dynamic A (dist) - EUR 13.65 11.90 10.42 15.22 20.19JPM Europe Dynamic A (dist) - GBP 16.42 12.94 11.79 16.02 18.08JPM Europe Dynamic B (acc) - EUR 15.71 13.47 11.45 16.32 21.24JPM Europe Dynamic C (acc) - EUR 16.06 13.74 11.66 16.61 21.53JPM Europe Dynamic D (acc) - EUR 12.15 10.60 9.17 13.30 17.59JPM Europe Dynamic D (acc) - USD 19.58 14.47 14.38 23.40 26.48JPM Europe Dynamic I (acc) - EUR 15.35 13.13 11.14 - 13.24JPM Europe Dynamic T (acc) - EUR 93.93 - - - -JPM Europe Dynamic X (acc) - EUR* - - 11.96 16.88 21.71
JPMorgan Funds - Europe Dynamic Mega Cap FundJPM Europe Dynamic Mega Cap A (acc) - EUR 9.27 8.60 7.80 10.84 14.01JPM Europe Dynamic Mega Cap A (acc) - USD 10.27 8.08 8.40 13.10 -JPM Europe Dynamic Mega Cap A (dist) - EUR 7.25 6.86 6.40 9.07 11.91JPM Europe Dynamic Mega Cap A (inc) - EUR 7.51 7.07 6.56 9.32 12.20JPM Europe Dynamic Mega Cap B (acc) - EUR 8.31 7.66 6.89 9.52 12.23JPM Europe Dynamic Mega Cap C (acc) - EUR 9.09 8.36 7.51 10.35 13.26JPM Europe Dynamic Mega Cap D (acc) - EUR 8.06 7.55 6.92 9.72 12.69JPM Europe Dynamic Mega Cap D (acc) - USD 9.56 7.59 7.98 12.57 -JPM Europe Dynamic Mega Cap I (acc) - EUR* - - 7.03 9.70 12.41JPM Europe Dynamic Mega Cap T (acc) - EUR 92.59 - - - -JPM Europe Dynamic Mega Cap X (acc) - EUR 9.33 8.50 7.57 10.35 13.14
JPMorgan Funds - Europe Dynamic Small Cap FundJPM Europe Dynamic Small Cap A (acc) - EUR 18.56 14.30 11.45 17.73 24.82JPM Europe Dynamic Small Cap A (dist) - EUR 11.35 8.77 7.04 10.90 15.27JPM Europe Dynamic Small Cap D (acc) - EUR 11.80 9.18 7.42 11.61 16.42JPM Europe Dynamic Small Cap X (acc) - EUR* - - 7.48 11.38 15.72
JPMorgan Funds - Europe Equity FundJPM Europe Equity A (acc) - EUR 10.45 8.85 7.50 11.25 15.52JPM Europe Equity A (acc) - USD 14.48 10.39 10.11 17.00 20.08JPM Europe Equity A (dist) - EUR 32.99 28.32 24.82 38.17 53.65JF Europe Equity A (dist) - USD 39.03 28.36 28.34 48.75 58.63JPM Europe Equity B (acc) - EUR 12.53 10.53 8.86 13.19 18.08JPM Europe Equity C (acc) - EUR 12.87 10.79 9.05 13.43 18.32JPM Europe Equity D (acc) - EUR 8.33 7.11 6.07 9.18 12.75JPM Europe Equity D (acc) - USD 11.75 8.49 8.33 14.11 16.79JPM Europe Equity I (acc) - EUR* - - - - 12.34JPM Europe Equity I (inc) - EUR* - - - 7.33 10.16JPM Europe Equity X (acc) - EUR 13.21 11.00 9.16 13.51 18.30
JPMorgan Funds - Europe Focus FundJPM Europe Focus A (acc) - EUR 9.06 7.83 6.37 8.81 12.39JPM Europe Focus A (acc) - USD 12.12 8.87 8.28 12.84 -JPM Europe Focus A (dist) - EUR 8.02 6.95 5.80 8.19 11.61JPM Europe Focus B (acc) - EUR 9.35 8.05 6.50 8.92 -JPM Europe Focus C (acc) - EUR 11.82 10.18 - 8.05 10.48JPM Europe Focus D (acc) - EUR 8.60 7.51 6.16 8.61 12.23JPM Europe Focus D (acc) - USD 11.70 8.65 8.16 12.77 -JPM Europe Focus T (acc) - EUR 92.47 - - - -JPM Europe Focus X (acc) - EUR 8.33 7.07 5.65 7.67 10.60
JPMorgan Funds - Europe High Yield Bond FundJPM Europe High Yield Bond A (acc) - EUR 12.96 11.43 8.68 10.22 11.38JPM Europe High Yield Bond A (inc) - EUR 2.62 2.46 2.01 2.53 -JPM Europe High Yield Bond B (acc) - EUR 101.68 - - - -JPM Europe High Yield Bond C (acc) - EUR 12.21 10.72 8.09 9.48 -JPM Europe High Yield Bond D (acc) - EUR 8.45 7.50 5.72 6.78 7.58JPM Europe High Yield Bond T (acc) - EUR 99.16 - - - -JPM Europe High Yield Bond X (acc) - EUR* - - - 9.11 -
JPMorgan Funds - Europe Micro Cap FundJPM Europe Micro Cap A (acc) - EUR 11.68 9.12 7.52 10.64 17.45JPM Europe Micro Cap A (dist) - EUR 11.70 9.16 7.56 10.69 17.55JPM Europe Micro Cap D (acc) - EUR 10.85 8.57 7.14 10.19 16.90
65
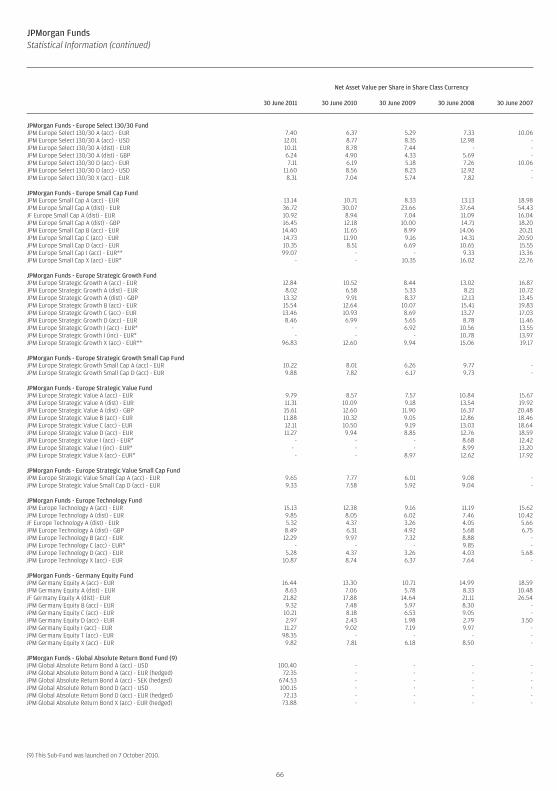
JPMorgan FundsStatistical Information (continued)
Net Asset Value per Share in Share Class Currency
30 June 2011 30 June 2010 30 June 2009 30 June 2008 30 June 2007
JPMorgan Funds - Europe Select 130/30 FundJPM Europe Select 130/30 A (acc) - EUR 7.40 6.37 5.29 7.33 10.06JPM Europe Select 130/30 A (acc) - USD 12.01 8.77 8.35 12.98 -JPM Europe Select 130/30 A (dist) - EUR 10.11 8.78 7.44 - -JPM Europe Select 130/30 A (dist) - GBP 6.24 4.90 4.33 5.69 -JPM Europe Select 130/30 D (acc) - EUR 7.11 6.19 5.18 7.26 10.06JPM Europe Select 130/30 D (acc) - USD 11.60 8.56 8.23 12.92 -JPM Europe Select 130/30 X (acc) - EUR 8.31 7.04 5.74 7.82 -
JPMorgan Funds - Europe Small Cap FundJPM Europe Small Cap A (acc) - EUR 13.14 10.71 8.33 13.13 18.98JPM Europe Small Cap A (dist) - EUR 36.72 30.07 23.66 37.64 54.43JF Europe Small Cap A (dist) - EUR 10.92 8.94 7.04 11.09 16.04JPM Europe Small Cap A (dist) - GBP 16.45 12.18 10.00 14.71 18.20JPM Europe Small Cap B (acc) - EUR 14.40 11.65 8.99 14.06 20.21JPM Europe Small Cap C (acc) - EUR 14.73 11.90 9.16 14.31 20.50JPM Europe Small Cap D (acc) - EUR 10.35 8.51 6.69 10.65 15.55JPM Europe Small Cap I (acc) - EUR** 99.07 - - 9.33 13.36JPM Europe Small Cap X (acc) - EUR* - - 10.35 16.02 22.76
JPMorgan Funds - Europe Strategic Growth FundJPM Europe Strategic Growth A (acc) - EUR 12.84 10.52 8.44 13.02 16.87JPM Europe Strategic Growth A (dist) - EUR 8.02 6.58 5.33 8.21 10.72JPM Europe Strategic Growth A (dist) - GBP 13.32 9.91 8.37 12.13 13.45JPM Europe Strategic Growth B (acc) - EUR 15.54 12.64 10.07 15.41 19.83JPM Europe Strategic Growth C (acc) - EUR 13.46 10.93 8.69 13.27 17.03JPM Europe Strategic Growth D (acc) - EUR 8.46 6.99 5.65 8.78 11.46JPM Europe Strategic Growth I (acc) - EUR* - - 6.92 10.56 13.55JPM Europe Strategic Growth I (inc) - EUR* - - - 10.78 13.97JPM Europe Strategic Growth X (acc) - EUR** 96.83 12.60 9.94 15.06 19.17
JPMorgan Funds - Europe Strategic Growth Small Cap FundJPM Europe Strategic Growth Small Cap A (acc) - EUR 10.22 8.01 6.26 9.77 -JPM Europe Strategic Growth Small Cap D (acc) - EUR 9.88 7.82 6.17 9.73 -
JPMorgan Funds - Europe Strategic Value FundJPM Europe Strategic Value A (acc) - EUR 9.79 8.57 7.57 10.84 15.67JPM Europe Strategic Value A (dist) - EUR 11.31 10.09 9.18 13.54 19.92JPM Europe Strategic Value A (dist) - GBP 15.61 12.60 11.90 16.37 20.48JPM Europe Strategic Value B (acc) - EUR 11.88 10.32 9.05 12.86 18.46JPM Europe Strategic Value C (acc) - EUR 12.11 10.50 9.19 13.03 18.64JPM Europe Strategic Value D (acc) - EUR 11.27 9.94 8.85 12.76 18.59JPM Europe Strategic Value I (acc) - EUR* - - - 8.68 12.42JPM Europe Strategic Value I (inc) - EUR* - - - 8.99 13.20JPM Europe Strategic Value X (acc) - EUR* - - 8.97 12.62 17.92
JPMorgan Funds - Europe Strategic Value Small Cap FundJPM Europe Strategic Value Small Cap A (acc) - EUR 9.65 7.77 6.01 9.08 -JPM Europe Strategic Value Small Cap D (acc) - EUR 9.33 7.58 5.92 9.04 -
JPMorgan Funds - Europe Technology FundJPM Europe Technology A (acc) - EUR 15.13 12.38 9.16 11.19 15.62JPM Europe Technology A (dist) - EUR 9.85 8.05 6.02 7.46 10.42JF Europe Technology A (dist) - EUR 5.32 4.37 3.26 4.05 5.66JPM Europe Technology A (dist) - GBP 8.49 6.31 4.92 5.68 6.75JPM Europe Technology B (acc) - EUR 12.29 9.97 7.32 8.88 -JPM Europe Technology C (acc) - EUR* - - - 9.85 -JPM Europe Technology D (acc) - EUR 5.28 4.37 3.26 4.03 5.68JPM Europe Technology X (acc) - EUR 10.87 8.74 6.37 7.64 -
JPMorgan Funds - Germany Equity FundJPM Germany Equity A (acc) - EUR 16.44 13.30 10.71 14.99 18.59JPM Germany Equity A (dist) - EUR 8.63 7.06 5.78 8.33 10.48JF Germany Equity A (dist) - EUR 21.82 17.88 14.64 21.11 26.54JPM Germany Equity B (acc) - EUR 9.32 7.48 5.97 8.30 -JPM Germany Equity C (acc) - EUR 10.21 8.18 6.53 9.05 -JPM Germany Equity D (acc) - EUR 2.97 2.43 1.98 2.79 3.50JPM Germany Equity I (acc) - EUR 11.27 9.02 7.19 9.97 -JPM Germany Equity T (acc) - EUR 98.35 - - - -JPM Germany Equity X (acc) - EUR 9.82 7.81 6.18 8.50 -
JPMorgan Funds - Global Absolute Return Bond Fund (9)JPM Global Absolute Return Bond A (acc) - USD 100.40 - - - -JPM Global Absolute Return Bond A (acc) - EUR (hedged) 72.35 - - - -JPM Global Absolute Return Bond A (acc) - SEK (hedged) 674.53 - - - -JPM Global Absolute Return Bond D (acc) - USD 100.15 - - - -JPM Global Absolute Return Bond D (acc) - EUR (hedged) 72.13 - - - -JPM Global Absolute Return Bond X (acc) - EUR (hedged) 73.88 - - - -
(9) This Sub-Fund was launched on 7 October 2010.
66
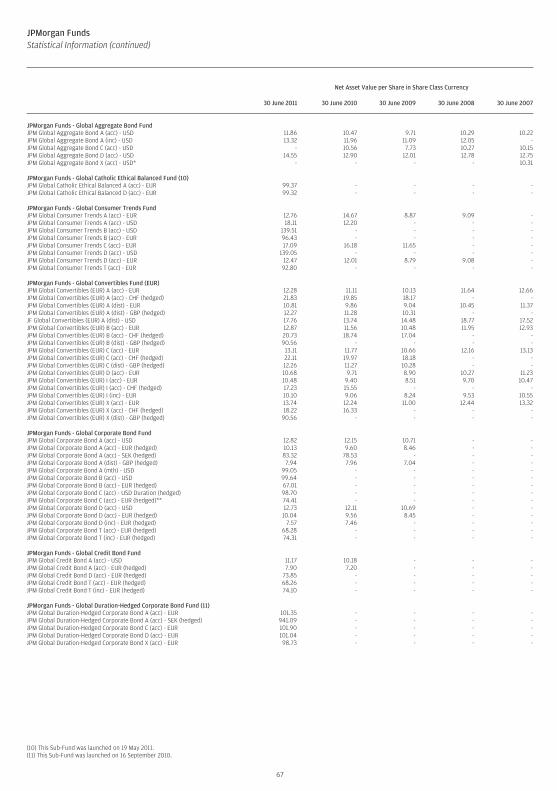
JPMorgan FundsStatistical Information (continued)
Net Asset Value per Share in Share Class Currency
30 June 2011 30 June 2010 30 June 2009 30 June 2008 30 June 2007
JPMorgan Funds - Global Aggregate Bond FundJPM Global Aggregate Bond A (acc) - USD 11.86 10.47 9.71 10.29 10.22JPM Global Aggregate Bond A (inc) - USD 13.32 11.96 11.09 12.05 -JPM Global Aggregate Bond C (acc) - USD - 10.56 7.73 10.27 10.15JPM Global Aggregate Bond D (acc) - USD 14.55 12.90 12.01 12.78 12.75JPM Global Aggregate Bond X (acc) - USD* - - - - 10.31
JPMorgan Funds - Global Catholic Ethical Balanced Fund (10)JPM Global Catholic Ethical Balanced A (acc) - EUR 99.37 - - - -JPM Global Catholic Ethical Balanced D (acc) - EUR 99.32 - - - -
JPMorgan Funds - Global Consumer Trends FundJPM Global Consumer Trends A (acc) - EUR 12.76 14.67 8.87 9.09 -JPM Global Consumer Trends A (acc) - USD 18.11 12.20 - - -JPM Global Consumer Trends B (acc) - USD 139.51 - - - -JPM Global Consumer Trends B (acc) - EUR 96.43 - - - -JPM Global Consumer Trends C (acc) - EUR 17.09 16.18 11.65 - -JPM Global Consumer Trends D (acc) - USD 139.05 - - - -JPM Global Consumer Trends D (acc) - EUR 12.47 12.01 8.79 9.08 -JPM Global Consumer Trends T (acc) - EUR 92.80 - - - -
JPMorgan Funds - Global Convertibles Fund (EUR)JPM Global Convertibles (EUR) A (acc) - EUR 12.28 11.11 10.13 11.64 12.66JPM Global Convertibles (EUR) A (acc) - CHF (hedged) 21.83 19.85 18.17 - -JPM Global Convertibles (EUR) A (dist) - EUR 10.81 9.86 9.04 10.45 11.37JPM Global Convertibles (EUR) A (dist) - GBP (hedged) 12.27 11.28 10.31 - -JF Global Convertibles (EUR) A (dist) - USD 17.76 13.74 14.48 18.77 17.52JPM Global Convertibles (EUR) B (acc) - EUR 12.87 11.56 10.48 11.95 12.93JPM Global Convertibles (EUR) B (acc) - CHF (hedged) 20.73 18.74 17.04 - -JPM Global Convertibles (EUR) B (dist) - GBP (hedged) 90.56 - - - -JPM Global Convertibles (EUR) C (acc) - EUR 13.11 11.77 10.66 12.16 13.13JPM Global Convertibles (EUR) C (acc) - CHF (hedged) 22.11 19.97 18.18 - -JPM Global Convertibles (EUR) C (dist) - GBP (hedged) 12.26 11.27 10.28 - -JPM Global Convertibles (EUR) D (acc) - EUR 10.68 9.71 8.90 10.27 11.23JPM Global Convertibles (EUR) I (acc) - EUR 10.48 9.40 8.51 9.70 10.47JPM Global Convertibles (EUR) I (acc) - CHF (hedged) 17.23 15.55 - - -JPM Global Convertibles (EUR) I (inc) - EUR 10.10 9.06 8.24 9.53 10.55JPM Global Convertibles (EUR) X (acc) - EUR 13.74 12.24 11.00 12.44 13.32JPM Global Convertibles (EUR) X (acc) - CHF (hedged) 18.22 16.33 - - -JPM Global Convertibles (EUR) X (dist) - GBP (hedged) 90.56 - - - -
JPMorgan Funds - Global Corporate Bond FundJPM Global Corporate Bond A (acc) - USD 12.82 12.15 10.71 - -JPM Global Corporate Bond A (acc) - EUR (hedged) 10.13 9.60 8.46 - -JPM Global Corporate Bond A (acc) - SEK (hedged) 83.32 78.53 - - -JPM Global Corporate Bond A (dist) - GBP (hedged) 7.94 7.96 7.04 - -JPM Global Corporate Bond A (mth) - USD 99.05 - - - -JPM Global Corporate Bond B (acc) - USD 99.64 - - - -JPM Global Corporate Bond B (acc) - EUR (hedged) 67.01 - - - -JPM Global Corporate Bond C (acc) - USD Duration (hedged) 98.70 - - - -JPM Global Corporate Bond C (acc) - EUR (hedged)** 74.41 - - - -JPM Global Corporate Bond D (acc) - USD 12.73 12.11 10.69 - -JPM Global Corporate Bond D (acc) - EUR (hedged) 10.04 9.56 8.45 - -JPM Global Corporate Bond D (inc) - EUR (hedged) 7.57 7.46 - - -JPM Global Corporate Bond T (acc) - EUR (hedged) 68.28 - - - -JPM Global Corporate Bond T (inc) - EUR (hedged) 74.31 - - - -
JPMorgan Funds - Global Credit Bond FundJPM Global Credit Bond A (acc) - USD 11.17 10.18 - - -JPM Global Credit Bond A (acc) - EUR (hedged) 7.90 7.20 - - -JPM Global Credit Bond D (acc) - EUR (hedged) 73.85 - - - -JPM Global Credit Bond T (acc) - EUR (hedged) 68.26 - - - -JPM Global Credit Bond T (inc) - EUR (hedged) 74.10 - - - -
JPMorgan Funds - Global Duration-Hedged Corporate Bond Fund (11)JPM Global Duration-Hedged Corporate Bond A (acc) - EUR 101.35 - - - -JPM Global Duration-Hedged Corporate Bond A (acc) - SEK (hedged) 941.09 - - - -JPM Global Duration-Hedged Corporate Bond C (acc) - EUR 101.90 - - - -JPM Global Duration-Hedged Corporate Bond D (acc) - EUR 101.04 - - - -JPM Global Duration-Hedged Corporate Bond X (acc) - EUR 98.73 - - - -
(10) This Sub-Fund was launched on 19 May 2011.(11) This Sub-Fund was launched on 16 September 2010.
67
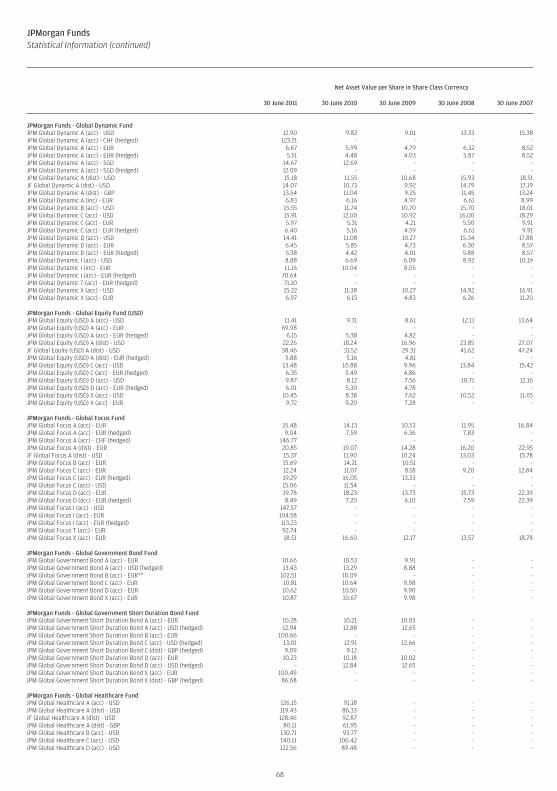
JPMorgan FundsStatistical Information (continued)
Net Asset Value per Share in Share Class Currency
30 June 2011 30 June 2010 30 June 2009 30 June 2008 30 June 2007
JPMorgan Funds - Global Dynamic FundJPM Global Dynamic A (acc) - USD 12.90 9.82 9.01 13.33 15.38JPM Global Dynamic A (acc) - CHF (hedged) 123.21 - - - -JPM Global Dynamic A (acc) - EUR 6.67 5.99 4.79 6.32 8.52JPM Global Dynamic A (acc) - EUR (hedged) 5.51 4.48 4.03 5.87 8.52JPM Global Dynamic A (acc) - SGD 14.67 12.69 - - -JPM Global Dynamic A (acc) - SGD (hedged) 12.09 - - - -JPM Global Dynamic A (dist) - USD 15.18 11.55 10.68 15.93 18.51JF Global Dynamic A (dist) - USD 14.07 10.73 9.92 14.79 17.19JPM Global Dynamic A (dist) - GBP 13.54 11.04 9.25 11.45 13.24JPM Global Dynamic A (inc) - EUR 6.83 6.16 4.97 6.61 8.99JPM Global Dynamic B (acc) - USD 15.55 11.74 10.70 15.70 18.01JPM Global Dynamic C (acc) - USD 15.91 12.00 10.92 16.00 18.29JPM Global Dynamic C (acc) - EUR 5.97 5.31 4.21 5.50 9.91JPM Global Dynamic C (acc) - EUR (hedged) 6.40 5.16 4.59 6.61 9.91JPM Global Dynamic D (acc) - USD 14.41 11.08 10.27 15.34 17.88JPM Global Dynamic D (acc) - EUR 6.45 5.85 4.73 6.30 8.57JPM Global Dynamic D (acc) - EUR (hedged) 5.38 4.42 4.01 5.88 8.57JPM Global Dynamic I (acc) - USD 8.88 6.69 6.09 8.92 10.19JPM Global Dynamic I (inc) - EUR 11.16 10.04 8.05 - -JPM Global Dynamic I (acc) - EUR (hedged) 70.64 - - - -JPM Global Dynamic T (acc) - EUR (hedged) 71.10 - - - -JPM Global Dynamic X (acc) - USD 15.22 11.38 10.27 14.92 16.91JPM Global Dynamic X (acc) - EUR 6.97 6.15 4.83 6.26 11.20
JPMorgan Funds - Global Equity Fund (USD)JPM Global Equity (USD) A (acc) - USD 11.41 9.31 8.61 12.11 13.64JPM Global Equity (USD) A (acc) - EUR 69.98 - - - -JPM Global Equity (USD) A (acc) - EUR (hedged) 6.15 5.38 4.82 - -JPM Global Equity (USD) A (dist) - USD 22.26 18.24 16.96 23.85 27.07JF Global Equity (USD) A (dist) - USD 38.46 31.52 29.31 41.62 47.24JPM Global Equity (USD) A (dist) - EUR (hedged) 5.88 5.16 4.81 - -JPM Global Equity (USD) C (acc) - USD 13.48 10.88 9.96 13.84 15.42JPM Global Equity (USD) C (acc) - EUR (hedged) 6.35 5.49 4.86 - -JPM Global Equity (USD) D (acc) - USD 9.87 8.12 7.56 10.71 12.16JPM Global Equity (USD) D (acc) - EUR (hedged) 6.01 5.30 4.78 - -JPM Global Equity (USD) X (acc) - USD 10.45 8.38 7.62 10.52 11.65JPM Global Equity (USD) X (acc) - EUR 9.72 9.20 7.28 - -
JPMorgan Funds - Global Focus FundJPM Global Focus A (acc) - EUR 15.48 14.13 10.53 11.95 16.84JPM Global Focus A (acc) - EUR (hedged) 9.04 7.59 6.36 7.83 -JPM Global Focus A (acc) - CHF (hedged) 146.77 - - - -JPM Global Focus A (dist) - EUR 20.85 19.07 14.28 16.20 22.95JF Global Focus A (dist) - USD 15.37 11.90 10.24 13.03 15.78JPM Global Focus B (acc) - EUR 15.69 14.21 10.51 - -JPM Global Focus C (acc) - EUR 12.24 11.07 8.18 9.20 12.84JPM Global Focus C (acc) - EUR (hedged) 19.29 16.05 13.33 - -JPM Global Focus C (acc) - USD 15.06 11.54 - - -JPM Global Focus D (acc) - EUR 19.78 18.23 13.73 15.73 22.39JPM Global Focus D (acc) - EUR (hedged) 8.49 7.20 6.10 7.59 22.39JPM Global Focus I (acc) - USD 147.57 - - - -JPM Global Focus I (acc) - EUR 104.58 - - - -JPM Global Focus I (acc) - EUR (hedged) 113.23 - - - -JPM Global Focus T (acc) - EUR 92.74 - - - -JPM Global Focus X (acc) - EUR 18.51 16.60 12.17 13.57 18.78
JPMorgan Funds - Global Government Bond FundJPM Global Government Bond A (acc) - EUR 10.66 10.53 9.91 - -JPM Global Government Bond A (acc) - USD (hedged) 13.43 13.29 8.88 - -JPM Global Government Bond B (acc) - EUR** 102.51 10.09 - - -JPM Global Government Bond C (acc) - EUR 10.81 10.64 9.98 - -JPM Global Government Bond D (acc) - EUR 10.62 10.50 9.90 - -JPM Global Government Bond X (acc) - EUR 10.87 10.67 9.98 - -
JPMorgan Funds - Global Government Short Duration Bond FundJPM Global Government Short Duration Bond A (acc) - EUR 10.28 10.21 10.03 - -JPM Global Government Short Duration Bond A (acc) - USD (hedged) 12.94 12.88 12.65 - -JPM Global Government Short Duration Bond B (acc) - EUR 100.66 - - - -JPM Global Government Short Duration Bond C (acc) - USD (hedged) 13.01 12.91 12.66 - -JPM Global Government Short Duration Bond C (dist) - GBP (hedged) 9.09 9.12 - - -JPM Global Government Short Duration Bond D (acc) - EUR 10.23 10.18 10.02 - -JPM Global Government Short Duration Bond D (acc) - USD (hedged) - 12.84 12.65 - -JPM Global Government Short Duration Bond X (acc) - EUR 100.49 - - - -JPM Global Government Short Duration Bond X (dist) - GBP (hedged) 86.68 - - - -
JPMorgan Funds - Global Healthcare FundJPM Global Healthcare A (acc) - USD 126.15 91.18 - - -JPM Global Healthcare A (dist) - USD 119.43 86.33 - - -JF Global Healthcare A (dist) - USD 128.46 92.87 - - -JPM Global Healthcare A (dist) - GBP 80.11 61.95 - - -JPM Global Healthcare B (acc) - USD 130.71 93.77 - - -JPM Global Healthcare C (acc) - USD 140.11 100.42 - - -JPM Global Healthcare D (acc) - USD 122.56 89.48 - - -
68
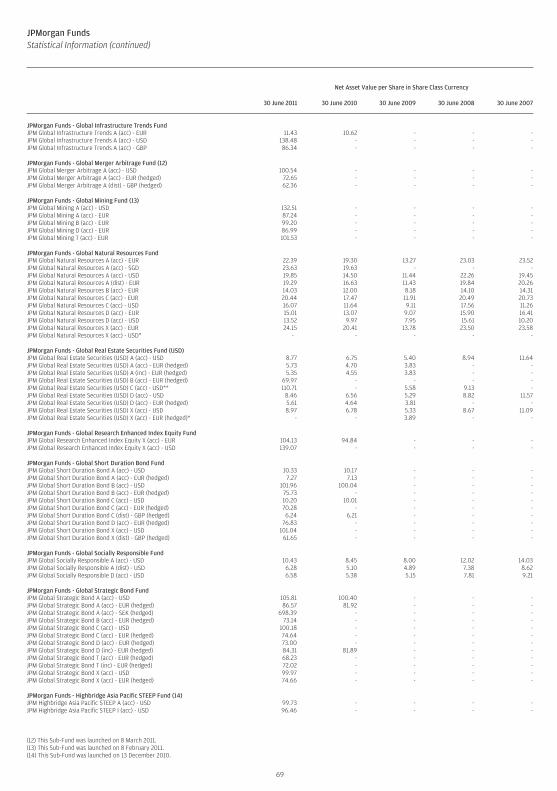
JPMorgan FundsStatistical Information (continued)
Net Asset Value per Share in Share Class Currency
30 June 2011 30 June 2010 30 June 2009 30 June 2008 30 June 2007
JPMorgan Funds - Global Infrastructure Trends FundJPM Global Infrastructure Trends A (acc) - EUR 11.43 10.62 - - -JPM Global Infrastructure Trends A (acc) - USD 138.48 - - - -JPM Global Infrastructure Trends A (acc) - GBP 86.34 - - - -
JPMorgan Funds - Global Merger Arbitrage Fund (12)JPM Global Merger Arbitrage A (acc) - USD 100.54 - - - -JPM Global Merger Arbitrage A (acc) - EUR (hedged) 72.65 - - - -JPM Global Merger Arbitrage A (dist) - GBP (hedged) 62.36 - - - -
JPMorgan Funds - Global Mining Fund (13)JPM Global Mining A (acc) - USD 132.51 - - - -JPM Global Mining A (acc) - EUR 87.24 - - - -JPM Global Mining B (acc) - EUR 99.20 - - - -JPM Global Mining D (acc) - EUR 86.99 - - - -JPM Global Mining T (acc) - EUR 101.53 - - - -
JPMorgan Funds - Global Natural Resources FundJPM Global Natural Resources A (acc) - EUR 22.39 19.30 13.27 23.03 23.52JPM Global Natural Resources A (acc) - SGD 23.63 19.63 - - -JPM Global Natural Resources A (acc) - USD 19.85 14.50 11.44 22.26 19.45JPM Global Natural Resources A (dist) - EUR 19.29 16.63 11.43 19.84 20.26JPM Global Natural Resources B (acc) - EUR 14.03 12.00 8.18 14.10 14.31JPM Global Natural Resources C (acc) - EUR 20.44 17.47 11.91 20.49 20.73JPM Global Natural Resources C (acc) - USD 16.07 11.64 9.11 17.56 11.26JPM Global Natural Resources D (acc) - EUR 15.01 13.07 9.07 15.90 16.41JPM Global Natural Resources D (acc) - USD 13.52 9.97 7.95 15.61 10.20JPM Global Natural Resources X (acc) - EUR 24.15 20.41 13.78 23.50 23.58JPM Global Natural Resources X (acc) - USD* - - - - -
JPMorgan Funds - Global Real Estate Securities Fund (USD)JPM Global Real Estate Securities (USD) A (acc) - USD 8.77 6.75 5.40 8.94 11.64JPM Global Real Estate Securities (USD) A (acc) - EUR (hedged) 5.73 4.70 3.83 - -JPM Global Real Estate Securities (USD) A (inc) - EUR (hedged) 5.35 4.55 3.83 - -JPM Global Real Estate Securities (USD) B (acc) - EUR (hedged) 69.97 - - - -JPM Global Real Estate Securities (USD) C (acc) - USD** 110.71 - 5.58 9.13 -JPM Global Real Estate Securities (USD) D (acc) - USD 8.46 6.56 5.29 8.82 11.57JPM Global Real Estate Securities (USD) D (acc) - EUR (hedged) 5.61 4.64 3.81 - -JPM Global Real Estate Securities (USD) X (acc) - USD 8.97 6.78 5.33 8.67 11.09JPM Global Real Estate Securities (USD) X (acc) - EUR (hedged)* - - 3.89 - -
JPMorgan Funds - Global Research Enhanced Index Equity FundJPM Global Research Enhanced Index Equity X (acc) - EUR 104.13 94.84 - - -JPM Global Research Enhanced Index Equity X (acc) - USD 139.07 - - - -
JPMorgan Funds - Global Short Duration Bond FundJPM Global Short Duration Bond A (acc) - USD 10.33 10.17 - - -JPM Global Short Duration Bond A (acc) - EUR (hedged) 7.27 7.13 - - -JPM Global Short Duration Bond B (acc) - USD 101.96 100.04 - - -JPM Global Short Duration Bond B (acc) - EUR (hedged) 75.73 - - - -JPM Global Short Duration Bond C (acc) - USD 10.20 10.01 - - -JPM Global Short Duration Bond C (acc) - EUR (hedged) 70.28 - - - -JPM Global Short Duration Bond C (dist) - GBP (hedged) 6.24 6.21 - - -JPM Global Short Duration Bond D (acc) - EUR (hedged) 76.83 - - - -JPM Global Short Duration Bond X (acc) - USD 101.04 - - - -JPM Global Short Duration Bond X (dist) - GBP (hedged) 61.65 - - - -
JPMorgan Funds - Global Socially Responsible FundJPM Global Socially Responsible A (acc) - USD 10.43 8.45 8.00 12.02 14.03JPM Global Socially Responsible A (dist) - USD 6.28 5.10 4.89 7.38 8.62JPM Global Socially Responsible D (acc) - USD 6.58 5.38 5.15 7.81 9.21
JPMorgan Funds - Global Strategic Bond FundJPM Global Strategic Bond A (acc) - USD 105.81 100.40 - - -JPM Global Strategic Bond A (acc) - EUR (hedged) 86.57 81.92 - - -JPM Global Strategic Bond A (acc) - SEK (hedged) 698.39 - - - -JPM Global Strategic Bond B (acc) - EUR (hedged) 73.14 - - - -JPM Global Strategic Bond C (acc) - USD 100.18 - - - -JPM Global Strategic Bond C (acc) - EUR (hedged) 74.64 - - - -JPM Global Strategic Bond D (acc) - EUR (hedged) 73.00 - - - -JPM Global Strategic Bond D (inc) - EUR (hedged) 84.31 81.89 - - -JPM Global Strategic Bond T (acc) - EUR (hedged) 68.23 - - - -JPM Global Strategic Bond T (inc) - EUR (hedged) 72.02 - - - -JPM Global Strategic Bond X (acc) - USD 99.97 - - - -JPM Global Strategic Bond X (acc) - EUR (hedged) 74.66 - - - -
JPMorgan Funds - Highbridge Asia Pacific STEEP Fund (14)JPM Highbridge Asia Pacific STEEP A (acc) - USD 99.73 - - - -JPM Highbridge Asia Pacific STEEP I (acc) - USD 96.46 - - - -
(12) This Sub-Fund was launched on 8 March 2011.(13) This Sub-Fund was launched on 8 February 2011.(14) This Sub-Fund was launched on 13 December 2010.
69
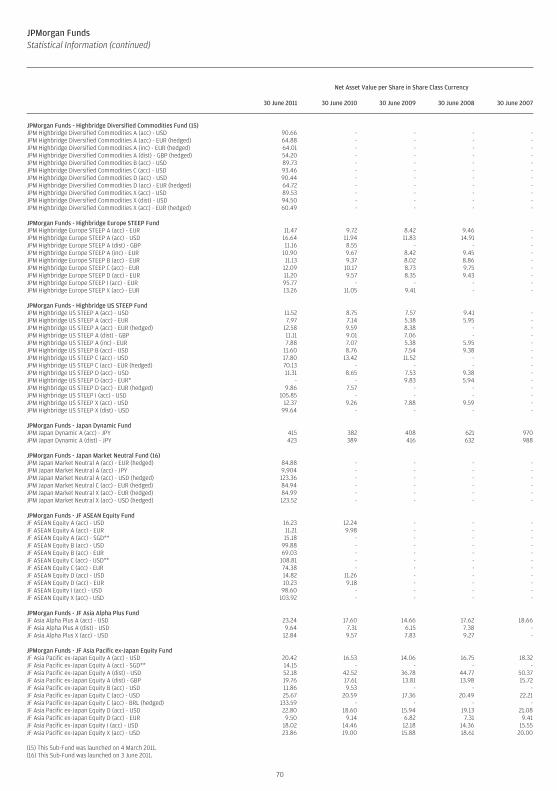
JPMorgan FundsStatistical Information (continued)
Net Asset Value per Share in Share Class Currency
30 June 2011 30 June 2010 30 June 2009 30 June 2008 30 June 2007
JPMorgan Funds - Highbridge Diversified Commodities Fund (15)JPM Highbridge Diversified Commodities A (acc) - USD 90.66 - - - -JPM Highbridge Diversified Commodities A (acc) - EUR (hedged) 64.88 - - - -JPM Highbridge Diversified Commodities A (inc) - EUR (hedged) 64.01 - - - -JPM Highbridge Diversified Commodities A (dist) - GBP (hedged) 54.20 - - - -JPM Highbridge Diversified Commodities B (acc) - USD 89.73 - - - -JPM Highbridge Diversified Commodities C (acc) - USD 93.46 - - - -JPM Highbridge Diversified Commodities D (acc) - USD 90.44 - - - -JPM Highbridge Diversified Commodities D (acc) - EUR (hedged) 64.72 - - - -JPM Highbridge Diversified Commodities X (acc) - USD 89.53 - - - -JPM Highbridge Diversified Commodities X (dist) - USD 94.50 - - - -JPM Highbridge Diversified Commodities X (acc) - EUR (hedged) 60.49 - - - -
JPMorgan Funds - Highbridge Europe STEEP FundJPM Highbridge Europe STEEP A (acc) - EUR 11.47 9.72 8.42 9.46 -JPM Highbridge Europe STEEP A (acc) - USD 16.64 11.94 11.83 14.91 -JPM Highbridge Europe STEEP A (dist) - GBP 11.16 8.55 - - -JPM Highbridge Europe STEEP A (inc) - EUR 10.90 9.67 8.42 9.45 -JPM Highbridge Europe STEEP B (acc) - EUR 11.13 9.37 8.02 8.86 -JPM Highbridge Europe STEEP C (acc) - EUR 12.09 10.17 8.73 9.75 -JPM Highbridge Europe STEEP D (acc) - EUR 11.20 9.57 8.35 9.43 -JPM Highbridge Europe STEEP I (acc) - EUR 95.77 - - - -JPM Highbridge Europe STEEP X (acc) - EUR 13.26 11.05 9.41 - -
JPMorgan Funds - Highbridge US STEEP FundJPM Highbridge US STEEP A (acc) - USD 11.52 8.75 7.57 9.41 -JPM Highbridge US STEEP A (acc) - EUR 7.97 7.14 5.38 5.95 -JPM Highbridge US STEEP A (acc) - EUR (hedged) 12.58 9.59 8.38 - -JPM Highbridge US STEEP A (dist) - GBP 11.11 9.01 7.06 - -JPM Highbridge US STEEP A (inc) - EUR 7.88 7.07 5.38 5.95 -JPM Highbridge US STEEP B (acc) - USD 11.60 8.76 7.54 9.38 -JPM Highbridge US STEEP C (acc) - USD 17.80 13.42 11.52 - -JPM Highbridge US STEEP C (acc) - EUR (hedged) 70.13 - - - -JPM Highbridge US STEEP D (acc) - USD 11.31 8.65 7.53 9.38 -JPM Highbridge US STEEP D (acc) - EUR* - - 9.83 5.94 -JPM Highbridge US STEEP D (acc) - EUR (hedged) 9.86 7.57 - - -JPM Highbridge US STEEP I (acc) - USD 105.85 - - - -JPM Highbridge US STEEP X (acc) - USD 12.37 9.26 7.88 9.59 -JPM Highbridge US STEEP X (dist) - USD 99.64 - - - -
JPMorgan Funds - Japan Dynamic FundJPM Japan Dynamic A (acc) - JPY 415 382 408 621 970JPM Japan Dynamic A (dist) - JPY 423 389 416 632 988
JPMorgan Funds - Japan Market Neutral Fund (16)JPM Japan Market Neutral A (acc) - EUR (hedged) 84.88 - - - -JPM Japan Market Neutral A (acc) - JPY 9,904 - - - -JPM Japan Market Neutral A (acc) - USD (hedged) 123.36 - - - -JPM Japan Market Neutral C (acc) - EUR (hedged) 84.94 - - - -JPM Japan Market Neutral X (acc) - EUR (hedged) 84.99 - - - -JPM Japan Market Neutral X (acc) - USD (hedged) 123.52 - - - -
JPMorgan Funds - JF ASEAN Equity FundJF ASEAN Equity A (acc) - USD 16.23 12.24 - - -JF ASEAN Equity A (acc) - EUR 11.21 9.98 - - -JF ASEAN Equity A (acc) - SGD** 15.18 - - - -JF ASEAN Equity B (acc) - USD 99.88 - - - -JF ASEAN Equity B (acc) - EUR 69.03 - - - -JF ASEAN Equity C (acc) - USD** 108.81 - - - -JF ASEAN Equity C (acc) - EUR 74.38 - - - -JF ASEAN Equity D (acc) - USD 14.82 11.26 - - -JF ASEAN Equity D (acc) - EUR 10.23 9.18 - - -JF ASEAN Equity I (acc) - USD 98.60 - - - -JF ASEAN Equity X (acc) - USD 103.92 - - - -
JPMorgan Funds - JF Asia Alpha Plus FundJF Asia Alpha Plus A (acc) - USD 23.24 17.60 14.66 17.62 18.66JF Asia Alpha Plus A (dist) - USD 9.64 7.31 6.15 7.38 -JF Asia Alpha Plus X (acc) - USD 12.84 9.57 7.83 9.27 -
JPMorgan Funds - JF Asia Pacific ex-Japan Equity FundJF Asia Pacific ex-Japan Equity A (acc) - USD 20.42 16.53 14.06 16.75 18.32JF Asia Pacific ex-Japan Equity A (acc) - SGD** 14.15 - - - -JF Asia Pacific ex-Japan Equity A (dist) - USD 52.18 42.52 36.78 44.77 50.37JF Asia Pacific ex-Japan Equity A (dist) - GBP 19.76 17.61 13.81 13.98 15.72JF Asia Pacific ex-Japan Equity B (acc) - USD 11.86 9.53 - - -JF Asia Pacific ex-Japan Equity C (acc) - USD 25.67 20.59 17.36 20.49 22.21JF Asia Pacific ex-Japan Equity C (acc) - BRL (hedged) 133.59 - - - -JF Asia Pacific ex-Japan Equity D (acc) - USD 22.80 18.60 15.94 19.13 21.08JF Asia Pacific ex-Japan Equity D (acc) - EUR 9.50 9.14 6.82 7.31 9.41JF Asia Pacific ex-Japan Equity I (acc) - USD 18.02 14.46 12.18 14.36 15.55JF Asia Pacific ex-Japan Equity X (acc) - USD 23.86 19.00 15.88 18.61 20.00
(15) This Sub-Fund was launched on 4 March 2011.(16) This Sub-Fund was launched on 3 June 2011.
70
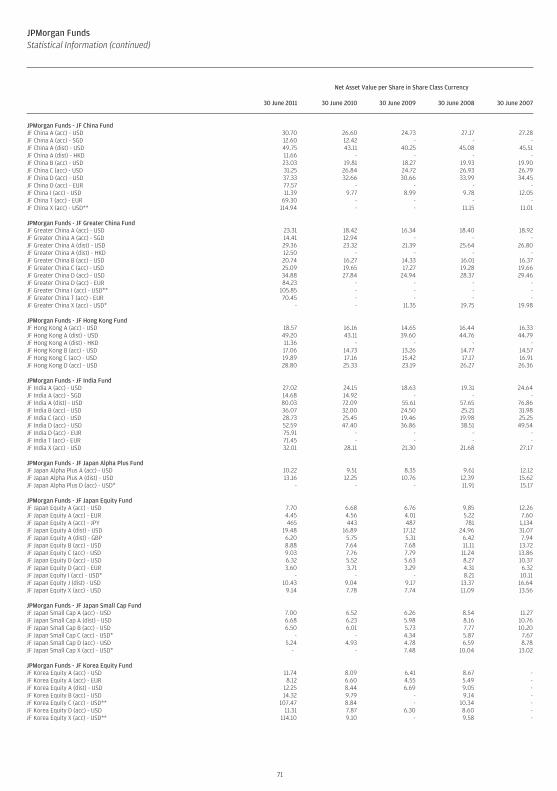
JPMorgan FundsStatistical Information (continued)
Net Asset Value per Share in Share Class Currency
30 June 2011 30 June 2010 30 June 2009 30 June 2008 30 June 2007
JPMorgan Funds - JF China FundJF China A (acc) - USD 30.70 26.60 24.73 27.17 27.28JF China A (acc) - SGD 12.60 12.42 - - -JF China A (dist) - USD 49.75 43.11 40.25 45.08 45.51JF China A (dist) - HKD 11.66 - - - -JF China B (acc) - USD 23.03 19.81 18.27 19.93 19.90JF China C (acc) - USD 31.25 26.84 24.72 26.93 26.79JF China D (acc) - USD 37.33 32.66 30.66 33.99 34.45JF China D (acc) - EUR 77.57 - - - -JF China I (acc) - USD 11.39 9.77 8.99 9.78 12.05JF China T (acc) - EUR 69.30 - - - -JF China X (acc) - USD** 114.94 - - 11.15 11.01
JPMorgan Funds - JF Greater China FundJF Greater China A (acc) - USD 23.31 18.42 16.34 18.40 18.92JF Greater China A (acc) - SGD 14.41 12.94 - - -JF Greater China A (dist) - USD 29.36 23.32 21.39 25.64 26.80JF Greater China A (dist) - HKD 12.50 - - - -JF Greater China B (acc) - USD 20.74 16.27 14.33 16.01 16.37JF Greater China C (acc) - USD 25.09 19.65 17.27 19.28 19.66JF Greater China D (acc) - USD 34.88 27.84 24.94 28.37 29.46JF Greater China D (acc) - EUR 84.23 - - - -JF Greater China I (acc) - USD** 105.85 - - - -JF Greater China T (acc) - EUR 70.45 - - - -JF Greater China X (acc) - USD* - - 11.35 19.75 19.98
JPMorgan Funds - JF Hong Kong FundJF Hong Kong A (acc) - USD 18.57 16.16 14.65 16.44 16.33JF Hong Kong A (dist) - USD 49.20 43.11 39.60 44.76 44.79JF Hong Kong A (dist) - HKD 11.36 - - - -JF Hong Kong B (acc) - USD 17.06 14.73 13.26 14.77 14.57JF Hong Kong C (acc) - USD 19.89 17.16 15.42 17.17 16.91JF Hong Kong D (acc) - USD 28.80 25.33 23.19 26.27 26.36
JPMorgan Funds - JF India FundJF India A (acc) - USD 27.02 24.15 18.63 19.31 24.64JF India A (acc) - SGD 14.68 14.92 - - -JF India A (dist) - USD 80.03 72.09 55.61 57.65 76.86JF India B (acc) - USD 36.07 32.00 24.50 25.21 31.98JF India C (acc) - USD 28.73 25.45 19.46 19.98 25.25JF India D (acc) - USD 52.59 47.40 36.86 38.51 49.54JF India D (acc) - EUR 75.91 - - - -JF India T (acc) - EUR 71.45 - - - -JF India X (acc) - USD 32.01 28.11 21.30 21.68 27.17
JPMorgan Funds - JF Japan Alpha Plus FundJF Japan Alpha Plus A (acc) - USD 10.22 9.51 8.35 9.61 12.12JF Japan Alpha Plus A (dist) - USD 13.16 12.25 10.76 12.39 15.62JF Japan Alpha Plus D (acc) - USD* - - - 11.91 15.17
JPMorgan Funds - JF Japan Equity FundJF Japan Equity A (acc) - USD 7.70 6.68 6.76 9.85 12.26JF Japan Equity A (acc) - EUR 4.45 4.56 4.01 5.22 7.60JF Japan Equity A (acc) - JPY 465 443 487 781 1,134JF Japan Equity A (dist) - USD 19.48 16.89 17.12 24.96 31.07JF Japan Equity A (dist) - GBP 6.20 5.75 5.31 6.42 7.94JF Japan Equity B (acc) - USD 8.88 7.64 7.68 11.11 13.72JF Japan Equity C (acc) - USD 9.03 7.76 7.79 11.24 13.86JF Japan Equity D (acc) - USD 6.32 5.52 5.63 8.27 10.37JF Japan Equity D (acc) - EUR 3.60 3.71 3.29 4.31 6.32JF Japan Equity I (acc) - USD* - - - 8.21 10.11JF Japan Equity J (dist) - USD 10.43 9.04 9.17 13.37 16.64JF Japan Equity X (acc) - USD 9.14 7.78 7.74 11.09 13.56
JPMorgan Funds - JF Japan Small Cap FundJF Japan Small Cap A (acc) - USD 7.00 6.52 6.26 8.54 11.27JF Japan Small Cap A (dist) - USD 6.68 6.23 5.98 8.16 10.76JF Japan Small Cap B (acc) - USD 6.50 6.01 5.73 7.77 10.20JF Japan Small Cap C (acc) - USD* - - 4.34 5.87 7.67JF Japan Small Cap D (acc) - USD 5.24 4.93 4.78 6.59 8.78JF Japan Small Cap X (acc) - USD* - - 7.48 10.04 13.02
JPMorgan Funds - JF Korea Equity FundJF Korea Equity A (acc) - USD 11.74 8.09 6.41 8.67 -JF Korea Equity A (acc) - EUR 8.12 6.60 4.55 5.49 -JF Korea Equity A (dist) - USD 12.25 8.44 6.69 9.05 -JF Korea Equity B (acc) - USD 14.32 9.79 - 9.14 -JF Korea Equity C (acc) - USD** 107.47 8.84 - 10.34 -JF Korea Equity D (acc) - USD 11.31 7.87 6.30 8.60 -JF Korea Equity X (acc) - USD** 114.10 9.10 - 9.58 -
71
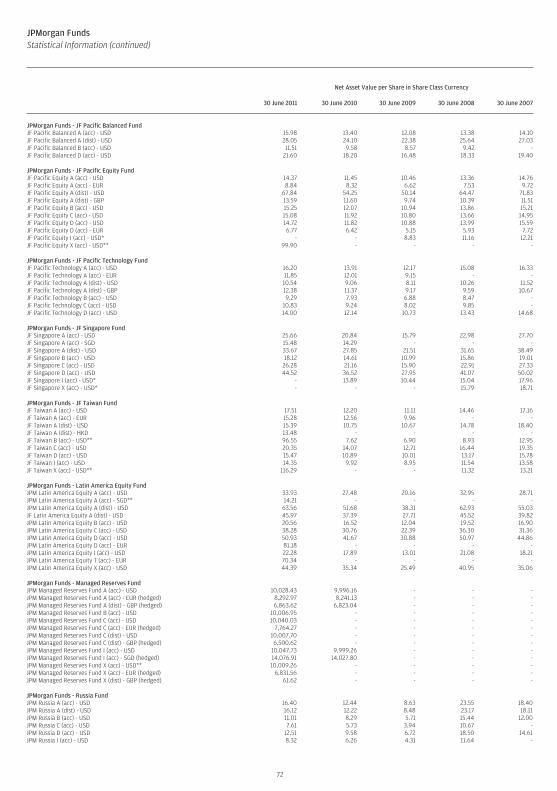
JPMorgan FundsStatistical Information (continued)
Net Asset Value per Share in Share Class Currency
30 June 2011 30 June 2010 30 June 2009 30 June 2008 30 June 2007
JPMorgan Funds - JF Pacific Balanced FundJF Pacific Balanced A (acc) - USD 15.98 13.40 12.08 13.38 14.10JF Pacific Balanced A (dist) - USD 28.05 24.10 22.38 25.64 27.03JF Pacific Balanced B (acc) - USD 11.51 9.58 8.57 9.42 -JF Pacific Balanced D (acc) - USD 21.60 18.20 16.48 18.33 19.40
JPMorgan Funds - JF Pacific Equity FundJF Pacific Equity A (acc) - USD 14.37 11.45 10.46 13.36 14.76JF Pacific Equity A (acc) - EUR 8.84 8.32 6.62 7.53 9.72JF Pacific Equity A (dist) - USD 67.84 54.25 50.14 64.47 71.83JF Pacific Equity A (dist) - GBP 13.59 11.60 9.74 10.39 11.51JF Pacific Equity B (acc) - USD 15.25 12.07 10.94 13.86 15.21JF Pacific Equity C (acc) - USD 15.08 11.92 10.80 13.66 14.95JF Pacific Equity D (acc) - USD 14.72 11.82 10.88 13.99 15.59JF Pacific Equity D (acc) - EUR 6.77 6.42 5.15 5.93 7.72JF Pacific Equity I (acc) - USD* - - 8.83 11.16 12.21JF Pacific Equity X (acc) - USD** 99.90 - - - -
JPMorgan Funds - JF Pacific Technology FundJF Pacific Technology A (acc) - USD 16.20 13.91 12.17 15.08 16.33JF Pacific Technology A (acc) - EUR 11.85 12.01 9.15 - -JF Pacific Technology A (dist) - USD 10.54 9.06 8.11 10.26 11.52JF Pacific Technology A (dist) - GBP 12.38 11.37 9.17 9.59 10.67JF Pacific Technology B (acc) - USD 9.29 7.93 6.88 8.47 -JF Pacific Technology C (acc) - USD 10.83 9.24 8.02 9.85 -JF Pacific Technology D (acc) - USD 14.00 12.14 10.73 13.43 14.68
JPMorgan Funds - JF Singapore FundJF Singapore A (acc) - USD 25.66 20.84 15.79 22.98 27.70JF Singapore A (acc) - SGD 15.48 14.29 - - -JF Singapore A (dist) - USD 33.67 27.85 21.51 31.65 38.49JF Singapore B (acc) - USD 18.12 14.61 10.99 15.86 19.01JF Singapore C (acc) - USD 26.28 21.16 15.90 22.91 27.33JF Singapore D (acc) - USD 44.52 36.52 27.95 41.07 50.02JF Singapore I (acc) - USD* - 13.89 10.44 15.04 17.96JF Singapore X (acc) - USD* - - - 15.79 18.71
JPMorgan Funds - JF Taiwan FundJF Taiwan A (acc) - USD 17.51 12.20 11.11 14.46 17.16JF Taiwan A (acc) - EUR 15.28 12.56 9.96 - -JF Taiwan A (dist) - USD 15.39 10.75 10.67 14.78 18.40JF Taiwan A (dist) - HKD 13.48 - - - -JF Taiwan B (acc) - USD** 96.55 7.62 6.90 8.93 12.95JF Taiwan C (acc) - USD 20.35 14.07 12.71 16.44 19.35JF Taiwan D (acc) - USD 15.47 10.89 10.01 13.17 15.78JF Taiwan I (acc) - USD 14.35 9.92 8.95 11.54 13.58JF Taiwan X (acc) - USD** 116.29 - - 11.32 13.21
JPMorgan Funds - Latin America Equity FundJPM Latin America Equity A (acc) - USD 33.93 27.48 20.16 32.95 28.71JPM Latin America Equity A (acc) - SGD** 14.21 - - - -JPM Latin America Equity A (dist) - USD 63.56 51.68 38.31 62.93 55.03JF Latin America Equity A (dist) - USD 45.97 37.39 27.71 45.52 39.82JPM Latin America Equity B (acc) - USD 20.56 16.52 12.04 19.52 16.90JPM Latin America Equity C (acc) - USD 38.28 30.76 22.39 36.30 31.36JPM Latin America Equity D (acc) - USD 50.93 41.67 30.88 50.97 44.86JPM Latin America Equity D (acc) - EUR 81.18 - - - -JPM Latin America Equity I (acc) - USD 22.28 17.89 13.01 21.08 18.21JPM Latin America Equity T (acc) - EUR 70.34 - - - -JPM Latin America Equity X (acc) - USD 44.39 35.34 25.49 40.95 35.06
JPMorgan Funds - Managed Reserves FundJPM Managed Reserves Fund A (acc) - USD 10,028.43 9,996.16 - - -JPM Managed Reserves Fund A (acc) - EUR (hedged) 8,292.97 8,241.13 - - -JPM Managed Reserves Fund A (dist) - GBP (hedged) 6,863.62 6,823.04 - - -JPM Managed Reserves Fund B (acc) - USD 10,006.95 - - - -JPM Managed Reserves Fund C (acc) - USD 10,040.03 - - - -JPM Managed Reserves Fund C (acc) - EUR (hedged) 7,764.27 - - - -JPM Managed Reserves Fund C (dist) - USD 10,007.70 - - - -JPM Managed Reserves Fund C (dist) - GBP (hedged) 6,500.62 - - - -JPM Managed Reserves Fund I (acc) - USD 10,047.73 9,999.26 - - -JPM Managed Reserves Fund I (acc) - SGD (hedged) 14,076.91 14,027.80 - - -JPM Managed Reserves Fund X (acc) - USD** 10,009.26 - - - -JPM Managed Reserves Fund X (acc) - EUR (hedged) 6,831.56 - - - -JPM Managed Reserves Fund X (dist) - GBP (hedged) 61.62 - - - -
JPMorgan Funds - Russia FundJPM Russia A (acc) - USD 16.40 12.44 8.63 23.55 18.40JPM Russia A (dist) - USD 16.12 12.22 8.48 23.17 18.11JPM Russia B (acc) - USD 11.01 8.29 5.71 15.44 12.00JPM Russia C (acc) - USD 7.61 5.73 3.94 10.67 -JPM Russia D (acc) - USD 12.51 9.58 6.72 18.50 14.61JPM Russia I (acc) - USD 8.32 6.26 4.31 11.64 -
72
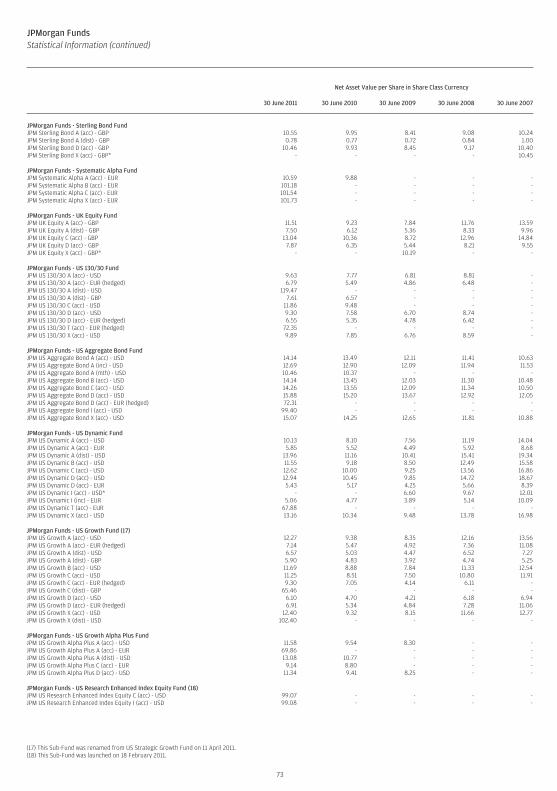
JPMorgan FundsStatistical Information (continued)
Net Asset Value per Share in Share Class Currency
30 June 2011 30 June 2010 30 June 2009 30 June 2008 30 June 2007
JPMorgan Funds - Sterling Bond FundJPM Sterling Bond A (acc) - GBP 10.55 9.95 8.41 9.08 10.24JPM Sterling Bond A (dist) - GBP 0.78 0.77 0.72 0.84 1.00JPM Sterling Bond D (acc) - GBP 10.46 9.93 8.45 9.17 10.40JPM Sterling Bond X (acc) - GBP* - - - - 10.45
JPMorgan Funds - Systematic Alpha FundJPM Systematic Alpha A (acc) - EUR 10.59 9.88 - - -JPM Systematic Alpha B (acc) - EUR 101.18 - - - -JPM Systematic Alpha C (acc) - EUR 101.54 - - - -JPM Systematic Alpha X (acc) - EUR 101.73 - - - -
JPMorgan Funds - UK Equity FundJPM UK Equity A (acc) - GBP 11.51 9.23 7.84 11.76 13.59JPM UK Equity A (dist) - GBP 7.50 6.12 5.36 8.33 9.96JPM UK Equity C (acc) - GBP 13.04 10.36 8.72 12.96 14.84JPM UK Equity D (acc) - GBP 7.87 6.35 5.44 8.21 9.55JPM UK Equity X (acc) - GBP* - - 10.19 - -
JPMorgan Funds - US 130/30 FundJPM US 130/30 A (acc) - USD 9.63 7.77 6.81 8.81 -JPM US 130/30 A (acc) - EUR (hedged) 6.79 5.49 4.86 6.48 -JPM US 130/30 A (dist) - USD 119.47 - - - -JPM US 130/30 A (dist) - GBP 7.61 6.57 - - -JPM US 130/30 C (acc) - USD 11.86 9.48 - - -JPM US 130/30 D (acc) - USD 9.30 7.58 6.70 8.74 -JPM US 130/30 D (acc) - EUR (hedged) 6.55 5.35 4.78 6.42 -JPM US 130/30 T (acc) - EUR (hedged) 72.35 - - - -JPM US 130/30 X (acc) - USD 9.89 7.85 6.76 8.59 -
JPMorgan Funds - US Aggregate Bond FundJPM US Aggregate Bond A (acc) - USD 14.14 13.49 12.11 11.41 10.63JPM US Aggregate Bond A (inc) - USD 12.69 12.90 12.09 11.94 11.53JPM US Aggregate Bond A (mth) - USD 10.46 10.37 - - -JPM US Aggregate Bond B (acc) - USD 14.14 13.45 12.03 11.30 10.48JPM US Aggregate Bond C (acc) - USD 14.26 13.55 12.09 11.34 10.50JPM US Aggregate Bond D (acc) - USD 15.88 15.20 13.67 12.92 12.05JPM US Aggregate Bond D (acc) - EUR (hedged) 72.31 - - - -JPM US Aggregate Bond I (acc) - USD 99.40 - - - -JPM US Aggregate Bond X (acc) - USD 15.07 14.25 12.65 11.81 10.88
JPMorgan Funds - US Dynamic FundJPM US Dynamic A (acc) - USD 10.13 8.10 7.56 11.19 14.04JPM US Dynamic A (acc) - EUR 5.85 5.52 4.49 5.92 8.68JPM US Dynamic A (dist) - USD 13.96 11.16 10.41 15.41 19.34JPM US Dynamic B (acc) - USD 11.55 9.18 8.50 12.49 15.58JPM US Dynamic C (acc) - USD 12.62 10.00 9.25 13.56 16.86JPM US Dynamic D (acc) - USD 12.94 10.45 9.85 14.72 18.67JPM US Dynamic D (acc) - EUR 5.43 5.17 4.25 5.66 8.39JPM US Dynamic I (acc) - USD* - - 6.60 9.67 12.01JPM US Dynamic I (inc) - EUR 5.06 4.77 3.89 5.14 10.09JPM US Dynamic T (acc) - EUR 67.88 - - - -JPM US Dynamic X (acc) - USD 13.16 10.34 9.48 13.78 16.98
JPMorgan Funds - US Growth Fund (17)JPM US Growth A (acc) - USD 12.27 9.38 8.35 12.16 13.56JPM US Growth A (acc) - EUR (hedged) 7.14 5.47 4.92 7.36 11.08JPM US Growth A (dist) - USD 6.57 5.03 4.47 6.52 7.27JPM US Growth A (dist) - GBP 5.90 4.83 3.92 4.74 5.25JPM US Growth B (acc) - USD 11.69 8.88 7.84 11.33 12.54JPM US Growth C (acc) - USD 11.25 8.51 7.50 10.80 11.91JPM US Growth C (acc) - EUR (hedged) 9.30 7.05 4.14 6.11 -JPM US Growth C (dist) - GBP 65.46 - - - -JPM US Growth D (acc) - USD 6.10 4.70 4.21 6.18 6.94JPM US Growth D (acc) - EUR (hedged) 6.91 5.34 4.84 7.28 11.06JPM US Growth X (acc) - USD 12.40 9.32 8.15 11.66 12.77JPM US Growth X (dist) - USD 102.40 - - - -
JPMorgan Funds - US Growth Alpha Plus FundJPM US Growth Alpha Plus A (acc) - USD 11.58 9.54 8.30 - -JPM US Growth Alpha Plus A (acc) - EUR 69.86 - - - -JPM US Growth Alpha Plus A (dist) - USD 13.08 10.77 - - -JPM US Growth Alpha Plus C (acc) - EUR 9.14 8.80 - - -JPM US Growth Alpha Plus D (acc) - USD 11.34 9.41 8.25 - -
JPMorgan Funds - US Research Enhanced Index Equity Fund (18)JPM US Research Enhanced Index Equity C (acc) - USD 99.07 - - - -JPM US Research Enhanced Index Equity I (acc) - USD 99.08 - - - -
(17) This Sub-Fund was renamed from US Strategic Growth Fund on 11 April 2011.(18) This Sub-Fund was launched on 18 February 2011.
73
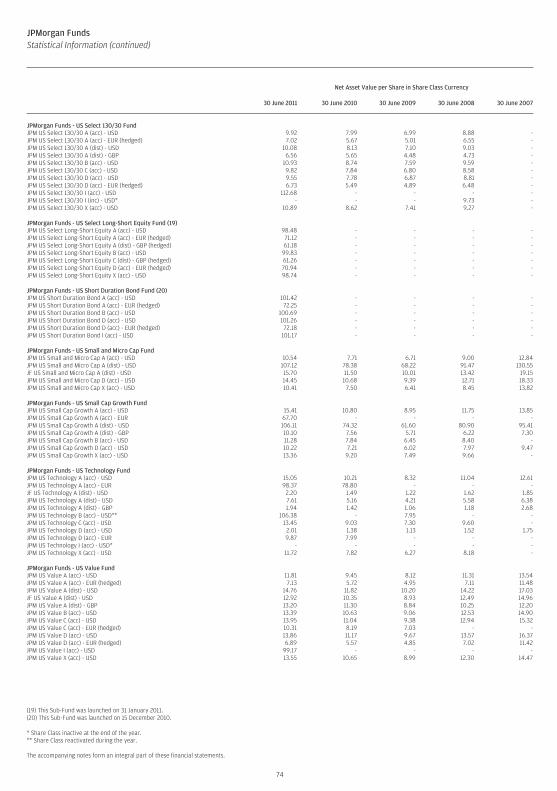
JPMorgan FundsStatistical Information (continued)
Net Asset Value per Share in Share Class Currency
30 June 2011 30 June 2010 30 June 2009 30 June 2008 30 June 2007
JPMorgan Funds - US Select 130/30 FundJPM US Select 130/30 A (acc) - USD 9.92 7.99 6.99 8.88 -JPM US Select 130/30 A (acc) - EUR (hedged) 7.02 5.67 5.01 6.55 -JPM US Select 130/30 A (dist) - USD 10.08 8.13 7.10 9.03 -JPM US Select 130/30 A (dist) - GBP 6.56 5.65 4.48 4.73 -JPM US Select 130/30 B (acc) - USD 10.93 8.74 7.59 9.59 -JPM US Select 130/30 C (acc) - USD 9.82 7.84 6.80 8.58 -JPM US Select 130/30 D (acc) - USD 9.55 7.78 6.87 8.81 -JPM US Select 130/30 D (acc) - EUR (hedged) 6.73 5.49 4.89 6.48 -JPM US Select 130/30 I (acc) - USD 112.68 - - - -JPM US Select 130/30 I (inc) - USD* - - - 9.73 -JPM US Select 130/30 X (acc) - USD 10.89 8.62 7.41 9.27 -
JPMorgan Funds - US Select Long-Short Equity Fund (19)JPM US Select Long-Short Equity A (acc) - USD 98.48 - - - -JPM US Select Long-Short Equity A (acc) - EUR (hedged) 71.12 - - - -JPM US Select Long-Short Equity A (dist) - GBP (hedged) 61.18 - - - -JPM US Select Long-Short Equity B (acc) - USD 99.83 - - - -JPM US Select Long-Short Equity C (dist) - GBP (hedged) 61.26 - - - -JPM US Select Long-Short Equity D (acc) - EUR (hedged) 70.94 - - - -JPM US Select Long-Short Equity X (acc) - USD 98.74 - - - -
JPMorgan Funds - US Short Duration Bond Fund (20)JPM US Short Duration Bond A (acc) - USD 101.42 - - - -JPM US Short Duration Bond A (acc) - EUR (hedged) 72.25 - - - -JPM US Short Duration Bond B (acc) - USD 100.69 - - - -JPM US Short Duration Bond D (acc) - USD 101.26 - - - -JPM US Short Duration Bond D (acc) - EUR (hedged) 72.18 - - - -JPM US Short Duration Bond I (acc) - USD 101.17 - - - -
JPMorgan Funds - US Small and Micro Cap FundJPM US Small and Micro Cap A (acc) - USD 10.54 7.71 6.71 9.00 12.84JPM US Small and Micro Cap A (dist) - USD 107.12 78.38 68.22 91.47 130.55JF US Small and Micro Cap A (dist) - USD 15.70 11.50 10.01 13.42 19.15JPM US Small and Micro Cap D (acc) - USD 14.45 10.68 9.39 12.71 18.33JPM US Small and Micro Cap X (acc) - USD 10.41 7.50 6.41 8.45 13.82
JPMorgan Funds - US Small Cap Growth FundJPM US Small Cap Growth A (acc) - USD 15.41 10.80 8.95 11.75 13.85JPM US Small Cap Growth A (acc) - EUR 67.70 - - - -JPM US Small Cap Growth A (dist) - USD 106.11 74.32 61.60 80.90 95.41JPM US Small Cap Growth A (dist) - GBP 10.10 7.56 5.71 6.22 7.30JPM US Small Cap Growth B (acc) - USD 11.28 7.84 6.45 8.40 -JPM US Small Cap Growth D (acc) - USD 10.22 7.21 6.02 7.97 9.47JPM US Small Cap Growth X (acc) - USD 13.36 9.20 7.49 9.66 -
JPMorgan Funds - US Technology FundJPM US Technology A (acc) - USD 15.05 10.21 8.32 11.04 12.61JPM US Technology A (acc) - EUR 98.37 78.80 - - -JF US Technology A (dist) - USD 2.20 1.49 1.22 1.62 1.85JPM US Technology A (dist) - USD 7.61 5.16 4.21 5.58 6.38JPM US Technology A (dist) - GBP 1.94 1.42 1.06 1.18 2.68JPM US Technology B (acc) - USD** 106.38 - 7.95 - -JPM US Technology C (acc) - USD 13.45 9.03 7.30 9.60 -JPM US Technology D (acc) - USD 2.01 1.38 1.13 1.52 1.75JPM US Technology D (acc) - EUR 9.87 7.99 - - -JPM US Technology I (acc) - USD* - - - - -JPM US Technology X (acc) - USD 11.72 7.82 6.27 8.18 -
JPMorgan Funds - US Value FundJPM US Value A (acc) - USD 11.81 9.45 8.12 11.31 13.54JPM US Value A (acc) - EUR (hedged) 7.13 5.72 4.95 7.11 11.48JPM US Value A (dist) - USD 14.76 11.82 10.20 14.22 17.03JF US Value A (dist) - USD 12.92 10.35 8.93 12.49 14.96JPM US Value A (dist) - GBP 13.20 11.30 8.84 10.25 12.20JPM US Value B (acc) - USD 13.39 10.63 9.06 12.53 14.90JPM US Value C (acc) - USD 13.95 11.04 9.38 12.94 15.32JPM US Value C (acc) - EUR (hedged) 10.31 8.19 7.03 - -JPM US Value D (acc) - USD 13.86 11.17 9.67 13.57 16.37JPM US Value D (acc) - EUR (hedged) 6.89 5.57 4.85 7.02 11.42JPM US Value I (acc) - USD 99.17 - - - -JPM US Value X (acc) - USD 13.55 10.65 8.99 12.30 14.47
(19) This Sub-Fund was launched on 31 January 2011.(20) This Sub-Fund was launched on 15 December 2010.
* Share Class inactive at the end of the year.** Share Class reactivated during the year.
The accompanying notes form an integral part of these financial statements.
74
1. OrganisationJPMorgan Funds (the “SICAV”) is an investment company incorporated on 14 April 1969 under the name Multi Trust Fund S.A.. The name of the SICAV waschanged to Fleming International Fund on 3 July 1984, to Fleming Flagship Fund on 19 October 1988, to Fleming Funds on 2 June 2000, to JPMorgan FlemingFunds on 19 November 2001 and then to JPMorgan Funds on 12 September 2005.It is organised under the Luxembourg Law of 20 December 2002 on Undertakings for Collective Investment as amended, Part I, as a Société Anonymequalifying as a “Société d’Investissement à Capital Variable” (SICAV) until 30 June 2011 and under Part I of the Luxembourg Law of 17 December 2010 onUndertakings for Collective Investment from 1 July 2011. As at 30 June 2011, it comprises 117 Sub-Funds, each relating to a separate investment portfolioconsisting of securities, cash and other instruments.On 12 September 2005, JPMorgan Asset Management (Europe) S.à r.l. was appointed by the SICAV to act as Management Company. The Articles ofIncorporation were also modified so the SICAV complies with UCITS III regulations. From 1 July 2011, JPMorgan Asset Management (Europe) S.à r.l. is actingas a Chapter 15 Management Company under the Luxembourg Law of 17 December 2010.The SICAV is registered with the Registre de Commerce et des Sociétés of Luxembourg, under number B 8478.Each Sub-Fund may contain A, B, C, D, I, J, T and X Classes of Shares, which may differ in the minimum subscription amount, minimum holding amount,currency and/or eligibility requirements, the fees and expenses, and the dividend policy applicable to them. In addition, each Sub-Fund may contain Classesof Shares named either “JPM” or “JF”.Within each Sub-Fund, individual Classes of Shares may have a currency of denomination that differs from the currency of denomination of the Sub-Fund.The currency of denomination for each Class of Share is indicated by a suffix on the name of the Share Class.
2. Significant Accounting PoliciesThe Financial Statements are prepared in accordance with Luxembourg regulations relating to Undertakings for Collective Investment.
a) Investment ValuationTransferable securities which are admitted to an official exchange listing or dealt in on another regulated market are valued on the basis of the latestavailable price prevailing at the time of calculating the net asset value.If securities are listed or dealt in on several exchanges or markets, the latest available price, or if appropriate, the average price on the principal exchange ormarket will be applied.Transferable securities not admitted to an official exchange listing nor dealt in on another regulated market are valued at the latest available price. Thosesecurities for which no price is available or for which the latest available price is not representative are valued on the basis of their reasonably foreseeablesales price determined with prudence and in good faith by the Board of Directors.Securities issued by any open-ended investment funds are valued at the latest available price or net asset value, as reported or provided by such funds ortheir agents.Liquid assets and money market instruments may be valued at nominal values plus any accrued interest or on an amortised cost basis.The Financial Statements are presented on the basis of the net asset value calculated on 30 June 2011. In accordance with the prospectus, the net assetvalues were calculated using the latest exchange rates known at the time of calculation.
b) Swing Pricing AdjustmentA Sub-Fund may suffer dilution of the Net Asset Value per Share due to investors buying or selling Shares in a Sub-Fund at a price that does not reflect thedealing and other costs that arise when security trades are undertaken by the Investment Manager to accommodate cash inflows or outflows.In order to counter this impact, a Swing Pricing mechanism may be adopted to protect the interests of Shareholders of the Fund. If on any Valuation Day, theaggregate net transactions in Shares of a Sub-Fund exceed a pre-determined threshold, as determined and reviewed for each Sub-Fund on a periodic basisby the Management Company, the Net Asset Value per Share may be adjusted upwards or downwards to reflect net inflows and net outflows respectively.The net inflows and net outflows will be determined by the Management Company based on the latest available information at the time of calculation of theNet Asset Value per Share. The Swing Pricing mechanism may be applied across all Sub-Funds with the exception of JPMorgan Funds – Highbridge AsiaPacific STEEP Fund, JPMorgan Funds - Highbridge Diversified Commodities Fund, JPMorgan Funds – Highbridge Europe STEEP Fund, JPMorgan Funds –Highbridge US STEEP Fund and the money market Sub-Funds. The extent of the price adjustment will be set by the Management Company to reflect dealingand other costs. Such adjustment may vary from Sub-Fund to Sub-Fund and will not exceed 2% of the original Net Asset Value per Share.The official Net Asset Value per Share as at year end, disclosed in the Statistical Information section of this report may therefore include a Swing Pricingadjustment, which would not be recognised in the Combined Statement of Net Assets and in the Combined Statement of Operations and Changes in NetAssets. As at year end, a Swing Pricing adjustment has been applied to JPMorgan Funds - Corporate Bond Portfolio Fund I, JPMorgan Funds - Corporate BondPortfolio Fund II, JPMorgan Funds - Emerging Markets Corporate Bond Fund, JPMorgan Funds - Emerging Markets Corporate Bond Portfolio Fund II,JPMorgan Funds - Europe Dynamic Small Cap Fund, JPMorgan Funds - Global Healthcare Fund, JPMorgan Funds - Global Short Duration Bond Fund,JPMorgan Funds - JF Japan Alpha Plus Fund, JPMorgan Funds - JF Pacific Technology Fund and JPMorgan Funds - JF Singapore Fund. The net asset values ofJPMorgan Funds - Corporate Bond Portfolio Fund I, JPMorgan Funds - Corporate Bond Portfolio Fund II and JPMorgan Funds - Emerging Markets CorporateBond Portfolio Fund II had been adjusted downwards by a swing factor determined by the Management Company under its established procedures,irrespective of redemption flows. The decision to swing downwards is due to the specific nature of the product and the fact that after the initial subscriptionphase, no further subscriptions will be accepted into the Fund.
c) Realised and Unrealised Gains and Losses on InvestmentsInvestment transactions are accounted for on the trade date (the date the order to buy or sell is executed). For trades into other collective investmentschemes, transactions are accounted for on receipt of the trade confirmation from the underlying transfer agents.Realised gains and losses on sales of investments are calculated on the average book cost. The associated foreign exchange movement between the date ofpurchase and date of sale of investments is included in realised gains and losses on investments. Unrealised gains and losses on holdings of investments arecalculated on the total book cost and include the associated unrealised gains and losses on foreign exchange.
d) Income RecognitionInterest income is accrued daily and includes the amortisation of premiums and accretion of discounts, where applicable. Bank interest income is recognisedon an accrual basis. Dividend income is accrued on the ex-dividend date. This income is shown net of any withholding taxes and adjusted accordingly whentax reclaims apply.
e) Conversion of Foreign CurrenciesThe books and records of each Sub-Fund are denominated in the base currency of the corresponding Sub-Fund. Amounts denominated in other currencies aretranslated into the base currency on the following basis: (i) investment valuations and other assets and liabilities initially expressed in other currencies areconverted each business day into the base currency using currency exchange rates prevailing on each such business day; (ii) purchases and sales of foreigninvestments, income and expenses are converted into the base currency using currency exchange rates prevailing on the respective dates of such transactions.Net realised and unrealised gains or losses on foreign exchange transactions represent: (i) foreign exchange gains and losses from the sale and holding of foreigncurrencies and foreign cash equivalents; (ii) gains and losses between trade date and settlement date on securities transactions and forward foreign exchangecontracts; and (iii) gains and losses arising from the difference between amounts of dividends and interest recorded and the amounts actually received.
75
JPMorgan FundsNotes to the Financial Statements
As at 30 June 2011
The resulting gains and losses on translation are included in “Net Realised Gain/(Loss) on Foreign Exchange” in the Combined Statement of Operations andChanges in Net Assets.The reference currency of the Combined Statements is USD.The principal exchange rates applied as at 30 June 2011 are as follows:1 USD = 0.69115667 EUR1 USD = 80.59500000 JPY1 USD = 0.62484379 GBP
f) Forward Foreign Exchange ContractsUnrealised gains or losses on outstanding Forward Foreign Exchange Contracts are valued on the basis of currency exchange rates prevailing at the relevantvaluation date. The changes in such amounts are included in “Net Change in Unrealised Gain/(Loss) on Forward Foreign Exchange Contracts” in theCombined Statement of Operations and Changes in Net Assets. Unrealised gains or losses are recorded under “Unrealised Net Gain/(Loss) on ForwardForeign Exchange Contracts” in the Combined Statement of Net Assets.
g) Financial Futures Contracts on Securities and IndicesRegulated financial futures contracts are valued at the exchange quoted settlement price. Initial margin deposits are made upon entering into the contractsand can be either in cash or securities. During the year the contracts are open, changes in the value of the contracts are recognised as unrealised gains andlosses by “marking-to-market” on a daily basis to reflect the market value of the contracts at the end of each business day’s trading. Variation marginpayments are made or received, depending upon whether losses or gains are incurred. The frequency of those margin payments may differ depending onwhere the contract is traded. When a contract is closed, the SICAV records a realised gain or loss equal to the difference between the proceeds from, or costof, the closing transaction and the initial cost of the contract in “Net Realised Gain/(Loss) on Financial Futures Contracts” in the Combined Statement ofOperations and Changes in Net Assets.Unrealised gains or losses are recorded under “Unrealised Net Gain/(Loss) on Financial Futures Contracts” in the Combined Statement of Net Assets.Daily margin calls are recorded under “Net Realised Gain/(Loss) on Financial Futures Contracts” in the Combined Statement of Operations and Changes inNet Assets.
h) Option ContractsThe SICAV writes options on securities, futures and currencies. These options are settled in cash and subject the SICAV to unlimited risk of loss. The SICAV,however, is not subject to credit risk on written options as the counterparty has already performed its obligation by paying the premium at the inception ofthe contract. As of 30 June 2011, the SICAV had written options contracts outstanding as listed on its Schedule of Investments.Options purchased are recorded as investments; options written or sold are recorded as liabilities. When the exercise of an option results in a cashsettlement, the difference between the premium and the settlement proceeds is accounted for as a realised gain or loss. When securities are acquired ordelivered upon exercise of an option, the acquisition cost or sale proceeds are adjusted by the amount of the premium. When an option is closed, thedifference between the premium and the cost to close the position is accounted for as a realised gain or loss. When an option expires, the premium isaccounted for as a realised gain for options written or as a realised loss for options purchased.For options on futures, where the investment manager is based in the United Kingdom, variation margin payments are made or received daily, dependingupon whether losses or gains are incurred on the underlying futures contracts.
i) Total Return SwapsThe SICAV may enter into swap contracts in which the SICAV and the counterparty agree to exchange payments where one or both parties pay the returnsgenerated by a security, instrument, basket or index thereof. The payments made by the SICAV to the counterparty and vice versa are calculated byreference to a specific security, on a basket of securities, index, or instruments and an agreed upon notional amount. Any such underlying security orinstrument must be a transferable security and any such index must be an index of a regulated market.A Total Return Swap will exchange the total performance on a specific basket of securities, selected by the Investment Manager against a reference rate plusa spread. The total performance will include interests, dividends, gains and losses on the underlying securities during the contract period according to thetype of underlying. The risk of this type of instrument will depend on the uncertain evolution, at the time of the contract conclusion, of the performance of theunderlying. These underlying securities are listed on a primary exchange.
The value of the underlying securities shall be taken into account for the calculation of the investment and borrowing powers applicable to individual issuers. Therelevant indices include, but are not limited to, currencies, interest rates, prices and total return on interest rates indices, fixed income indices and stock indices.
The market values are recorded under “Derivatives Instruments at Market Value” in the Combined Statement of Net Assets. The changes in such amounts areincluded in the Combined Statement of Operations and Changes in Net Assets under “Net Change in Unrealised Gain/(Loss) on Derivatives Instruments”.When a contract is closed, the Realised Gain/(Loss) is recorded under “Net Realised Gain/(Loss) on Derivatives Instruments” in the Combined Statement ofOperations and Changes in Net Assets.JPMorgan Funds - Europe 130/30 Fund, JPMorgan Funds - Europe Select 130/30 Fund, JPMorgan Funds - Global Merger Arbitrage Fund, JPMorgan Funds -Highbridge Asia Pacific STEEP Fund, JPMorgan Funds - Highbridge Diversified Commodities Fund, JPMorgan Funds - Highbridge Europe STEEP Fund,JPMorgan Funds - Highbridge US STEEP Fund, JPMorgan Funds - Japan Market Neutral Fund, JPMorgan Funds - Systematic Alpha Fund, JPMorgan Funds -US 130/30 Fund, JPMorgan Funds - US Select 130/30 Fund and JPMorgan Funds - US Select Long-Short Equity Fund have each entered into Total ReturnSwaps (long/short, together “the Swaps”) on a basket of securities with selected counterparties.
j) Interest Rate SwapsAn interest rate swap is a bilateral agreement in which each of the parties agree to exchange a series of interest payments for another series of interestpayments (usually fixed/floating) based on a notional amount that serves as a computation basis and that is usually not exchanged.The market values are recorded under “Derivatives Instruments at Market Value” in the Combined Statement of Net Assets. The interests on interest rateswaps are recorded under “Net Interest on Swap Transactions” in the Combined Statement of Operations and Changes in Net Assets. The changes inunrealised gains or losses are included in the Combined Statement of Operations and Changes in Net Assets under “Net Change in Unrealised Gain/(Loss) onDerivatives Instruments”. When a contract is closed, the realised gains or losses are recorded under “Net Realised Gain/(Loss) on Derivatives Instruments” inthe Combined Statement of Operations and Changes in Net Assets.
k) Credit Default SwapsA Credit Default Swap is a credit derivative transaction in which two parties enter into an agreement, whereby one party pays the other a fixed periodiccoupon for the specified life of the agreement. The other party makes no payments unless a credit event, relating to a predetermined reference asset,occurs. If such an event occurs, the party will then make a payment to the first party, and the swap will terminate. The value of the underlying securities shallbe taken into account for the calculation of the investment and borrowing powers applicable to individual issuers.The market values are recorded under “Derivatives Instruments at Market Value” in the Combined Statement of Net Assets. The changes in unrealised gainsor losses are included in the Combined Statement of Operations and Changes in Net Assets under “Net Change in Unrealised Gain/(Loss) on DerivativesInstruments”. When a contract is closed, the realised gains or losses are recorded under “Net Realised Gain/(Loss) on Derivatives Instruments” in theCombined Statement of Operations and Changes in Net Assets.
76
JPMorgan FundsNotes to the Financial Statements (continued)
As at 30 June 2011
l) To Be Announced Securities (“TBA”)TBAs are related to mortgage backed securities issued by government sponsored agencies. These agencies usually pool mortgage loans and sell interests inthe pools created. TBAs relate to future pools of these agencies that are bought and sold for future settlement for which either the interest rate or thematurity date is not yet fixed. TBAs are separately disclosed in the Schedule of Investments.The Sub-Funds may enter into Dollar Rolls, principally using TBAs, in which the Sub-Funds sell mortgage-backed securities for delivery in the current monthand simultaneously contract to repurchase similar, but not identical, securities at an agreed-upon price on a fixed date. The Sub-Funds account for suchDollar Rolls as purchases and sales and receive compensation as consideration for entering into the commitment to repurchase. The Sub-Funds mustmaintain liquid securities having a value not less than the repurchase price (including accrued interest) for such Dollar Rolls. The market value of thesecurities that the Sub-Funds are required to purchase may decline below the agreed upon repurchase price of those securities.The Sub-Funds had TBA Dollar Rolls outstanding as of 30 June 2011, which are included in “Amounts Receivable on Sale of TBAs” and “Amounts Payable onPurchase of TBAs” in the Combined Statement of Net Assets.
m) Commodity Index SwapsA Commodity Index Swap is a bilateral agreement in which each of the parties agree to exchange the total return of a specified commodity index againstmoney market rate plus fees.The market values are recorded under “Derivatives Instruments at Market Value” in the Combined Statement of Net Assets. The changes in unrealised gainsor losses are included in the Combined Statement of Operations and Changes in Net Assets under “Net Change in Unrealised Gain/(Loss) on DerivativesInstruments”. When a contract is closed, the realised gains or losses are recorded under “Net Realised Gain/(Loss) on Derivatives Instruments” in theCombined Statement of Operations and Changes in Net Assets.
n) Repurchase AgreementsThe underlying obligations found to be satisfactory by the Investment Manager are transferred to an account of the SICAV as collateral. The securities aremarked-to-market daily and maintained at a value at least equal to the principal amount of the repurchase agreement (including accrued interest). Interestreceived or paid on Repurchase Agreements are recorded in the interest section of the Combined Statement of Net Assets. The Funds’ Investment Manageris responsible for determining that the value of the underlying securities remains in accordance with the market value requirements stated above.
o) Consolidation of Mauritian SubsidiaryAll income, expenses, receivables, payables and investments of Flagship Indian Investment Company (Mauritius) Limited (the “Subsidiary”), a wholly-ownedsubsidiary of JPMorgan Funds, are consolidated into the Combined Statement of Net Assets and the Combined Statement of Operations and Changes in NetAssets of JPMorgan Funds - JF India Fund. Securities owned by the Subsidiary are individually disclosed in the Schedule of Investments of JPMorgan Funds -JF India Fund. Intercompany balances are eliminated on consolidation.The use of the Mauritius Subsidiary and the tax treatment it is afforded, is based on the law and practice currently in force in the relevant countries, asunderstood by the Board of Directors. It is subject to any future changes and such changes may adversely affect the returns of the Sub-Fund. This includesany circumstances where the India/Mauritius Double Taxation Treaty may not be applied or ceases to be applied, resulting from, inter alia, any future rulingby the Indian tax authorities. Should the treaty not be applied, or cease to be applied, interest on securities listed on an Indian stock exchange would besubject to tax at a maximum rate of 20%. Capital gains on disposal of such investments would be subject to tax at rates of 0% to 30% until 31 March 2011 andof 0% to 15% from 1 April 2011 in respect of listed securities depending on the length of time the relevant investment has been held.
3. Value of Financial Instruments and Associated RisksThe SICAV entered into forward foreign exchange contracts, financial futures contracts, options and swaps which, to varying degrees, represent a marketrisk in excess of the amount reflected on the Combined Statement of Net Assets. The amount of the contracts represents the extent of the SICAV’sparticipation in these financial instruments. Market risks associated with such contracts arise due to the possible movements in foreign exchange rates,indices, and security values underlying these instruments.Investment in fixed income securities is subject to interest rate, sector, security and credit risks. High yield bonds are lower-rated securities and will usuallyoffer higher yields to compensate for the reduced creditworthiness or increased risk of default that these securities carry.Other market and credit risks include the possibility that there may be an illiquid market for the contracts, that a change in the value of the contracts may notdirectly correlate with changes in the value of the underlying currencies, indices, or securities, or that the counterparty to a contract defaults on itsobligation to perform under the terms of the contract.In emerging and less developed markets, in which some of the Sub-Funds will invest, the legal, judicial and regulatory infrastructure is still developing butthere is much legal uncertainty both for local market participants and their overseas counterparts. Some markets may carry higher risks for investors whoshould therefore ensure that, before investing, they understand the risks involved and are satisfied that an investment is suitable as part of their portfolio. Insome markets there may be no secure method of delivery against payment which would minimise the exposure to counterparty risk. It may be necessary tomake payment on a purchase or delivery on a sale before receipt of the securities or, as the case may be, sale proceeds.
4. Distribution PolicyDuring the year ended 30 June 2011, the SICAV paid dividends as follows:Class Currency Dividend Amount per Share Payment DateJPM Emerging Markets Debt A (mth) - EUR EUR 0.05 21-Jul-10JPM Emerging Markets Debt A (mth) - USD (hedged) USD 0.06 21-Jul-10JPM Emerging Markets Local Currency Debt A (mth) - USD USD 0.16 21-Jul-10JPM US Aggregate Bond A (mth) - USD USD 0.02 21-Jul-10JPM Emerging Markets Debt A (mth) - EUR EUR 0.06 20-Aug-10JPM Emerging Markets Debt A (mth) - USD (hedged) USD 0.06 20-Aug-10JPM Emerging Markets Local Currency Debt A (mth) - USD USD 0.14 20-Aug-10JPM Emerging Markets Local Currency Debt D (inc) - EUR EUR 0.13 20-Aug-10JPM Global Corporate Bond D (inc) - EUR (hedged) EUR 0.02 20-Aug-10JPM Global Strategic Bond D (inc) - EUR (hedged) EUR 0.14 20-Aug-10JPM US Aggregate Bond A (mth) - USD USD 0.03 20-Aug-10JPM Emerging Markets Debt A (mth) - EUR EUR 0.03 21-Sep-10JPM Emerging Markets Debt A (mth) - USD (hedged) USD 0.04 21-Sep-10JPM Emerging Markets Local Currency Debt A (mth) - USD USD 0.07 21-Sep-10JPM US Aggregate Bond A (mth) - USD USD 0.03 21-Sep-10JF Asia Alpha Plus A (dist) - USD USD 0.01 30-Sep-10JF Asia Pacific ex-Japan Equity A (dist) - GBP GBP 0.58 30-Sep-10JF Asia Pacific ex-Japan Equity A (dist) - USD USD 0.31 30-Sep-10JF Euroland Equity A (dist) - USD USD 0.11 30-Sep-10JF Europe Dynamic A (dist) - EUR EUR 0.12 30-Sep-10JF Europe Equity A (dist) - USD USD 0.42 30-Sep-10
77
JPMorgan FundsNotes to the Financial Statements (continued)
As at 30 June 2011
Class Currency Dividend Amount per Share Payment DateJF Europe Small Cap A (dist) - EUR EUR 0.05 30-Sep-10JF Europe Technology A (dist) - EUR EUR 0.02 30-Sep-10JF Germany Equity A (dist) - EUR EUR 0.25 30-Sep-10JF Global Convertibles (EUR) A (dist) - USD USD 0.11 30-Sep-10JF Global Dynamic A (dist) - USD USD 0.03 30-Sep-10JF Global Equity (USD) A (dist) - USD USD 0.13 30-Sep-10JF Global Focus A (dist) - USD USD 0.02 30-Sep-10JF Global Healthcare A (dist) - USD USD 0.02 30-Sep-10JF Greater China A (dist) - USD USD 0.14 30-Sep-10JF Hong Kong A (dist) - USD USD 0.31 30-Sep-10JF India A (dist) - USD USD 0.60 30-Sep-10JF Japan Equity A (dist) - GBP GBP 0.01 30-Sep-10JF Korea Equity A (dist) - USD USD 0.01 30-Sep-10JF Latin America Equity A (dist) - USD USD 0.17 30-Sep-10JF Pacific Balanced A (dist) - USD USD 0.63 30-Sep-10JF Pacific Equity A (dist) - GBP GBP 0.03 30-Sep-10JF Pacific Equity A (dist) - USD USD 0.17 30-Sep-10JF Pacific Technology A (dist) - GBP GBP 0.01 30-Sep-10JF Pacific Technology A (dist) - USD USD 0.01 30-Sep-10JF Singapore A (dist) - USD USD 0.58 30-Sep-10JF Taiwan A (dist) - USD USD 0.04 30-Sep-10JF US Small and Micro Cap A (dist) - USD USD 0.01 30-Sep-10JF US Value A (dist) - USD USD 0.01 30-Sep-10JPM Africa Equity A (dist) - GBP GBP 0.01 30-Sep-10JPM Brazil Alpha Plus A (dist) - USD USD 0.01 30-Sep-10JPM Emerging Europe, Middle East and Africa Equity A (dist) - USD USD 0.11 30-Sep-10JPM Emerging Markets Alpha Plus A (dist) - GBP GBP 0.01 30-Sep-10JPM Emerging Markets Debt A (inc) - EUR EUR 0.43 30-Sep-10JPM Emerging Markets Debt I (inc) - EUR EUR 0.58 30-Sep-10JPM Emerging Markets Equity A (dist) - GBP GBP 0.02 30-Sep-10JPM Emerging Markets Equity A (dist) - USD USD 0.01 30-Sep-10JPM Emerging Markets Equity I (inc) - EUR EUR 0.10 30-Sep-10JPM Emerging Markets Equity X (dist) - USD USD 0.29 30-Sep-10JPM Emerging Markets Equity X (inc) - EUR EUR 0.21 30-Sep-10JPM Emerging Markets Small Cap A (dist) - GBP GBP 0.01 30-Sep-10JPM Emerging Middle East Equity A (dist) - USD USD 0.24 30-Sep-10JPM Euro Government Short Duration Bond A (inc) - EUR EUR 0.31 30-Sep-10JPM Euro Short Duration Bond Fund C (dist) - GBP (hedged) GBP 0.19 30-Sep-10JPM Euroland Equity A (dist) - EUR EUR 0.56 30-Sep-10JPM Euroland Equity A (inc) - EUR EUR 0.09 30-Sep-10JPM Euroland Select Equity A (dist) - EUR EUR 0.11 30-Sep-10JPM Europe 130/30 A (dist) - EUR EUR 0.07 30-Sep-10JPM Europe 130/30 A (dist) - GBP GBP 0.05 30-Sep-10JPM Europe Balanced (EUR) A (dist) - EUR EUR 0.12 30-Sep-10JPM Europe Convergence Equity A (dist) - EUR EUR 0.30 30-Sep-10JPM Europe Dynamic A (dist) - EUR EUR 0.10 30-Sep-10JPM Europe Dynamic A (dist) - GBP GBP 0.12 30-Sep-10JPM Europe Dynamic Mega Cap A (dist) - EUR EUR 0.14 30-Sep-10JPM Europe Dynamic Mega Cap A (inc) - EUR EUR 0.10 30-Sep-10JPM Europe Dynamic Small Cap A (dist) - EUR EUR 0.03 30-Sep-10JPM Europe Equity A (dist) - EUR EUR 0.41 30-Sep-10JPM Europe Focus A (dist) - EUR EUR 0.01 30-Sep-10JPM Europe High Yield Bond A (inc) - EUR EUR 0.16 30-Sep-10JPM Europe Micro Cap A (dist) - EUR EUR 0.02 30-Sep-10JPM Europe Select 130/30 A (dist) - EUR EUR 0.07 30-Sep-10JPM Europe Select 130/30 A (dist) - GBP GBP 0.03 30-Sep-10JPM Europe Small Cap A (dist) - EUR EUR 0.17 30-Sep-10JPM Europe Small Cap A (dist) - GBP GBP 0.06 30-Sep-10JPM Europe Strategic Growth A (dist) - GBP GBP 0.04 30-Sep-10JPM Europe Strategic Value A (dist) - EUR EUR 0.21 30-Sep-10JPM Europe Strategic Value A (dist) - GBP GBP 0.26 30-Sep-10JPM Europe Technology A (dist) - GBP GBP 0.03 30-Sep-10JPM Germany Equity A (dist) - EUR EUR 0.09 30-Sep-10JPM Global Aggregate Bond A (inc) - USD USD 0.21 30-Sep-10JPM Global Convertibles (EUR) A (dist) - EUR EUR 0.09 30-Sep-10JPM Global Convertibles (EUR) A (dist) - GBP (hedged) GBP 0.20 30-Sep-10JPM Global Convertibles (EUR) C (dist) - GBP (hedged) GBP 0.28 30-Sep-10JPM Global Corporate Bond Fund A (dist) - GBP (hedged) GBP 0.46 30-Sep-10JPM Global Dynamic A (dist) - GBP GBP 0.04 30-Sep-10JPM Global Dynamic A (inc) - EUR EUR 0.02 30-Sep-10JPM Global Dynamic I (inc) - EUR EUR 0.11 30-Sep-10JPM Global Equity (USD) A (dist) - EUR (hedged) EUR 0.02 30-Sep-10JPM Global Equity (USD) A (dist) - USD USD 0.07 30-Sep-10JPM Global Focus A (dist) - EUR EUR 0.04 30-Sep-10JPM Global Government Short Duration Bond C (dist) - GBP (hedged) GBP 0.11 30-Sep-10JPM Global Healthcare A (dist) - GBP GBP 0.11 30-Sep-10
78
JPMorgan FundsNotes to the Financial Statements (continued)
As at 30 June 2011
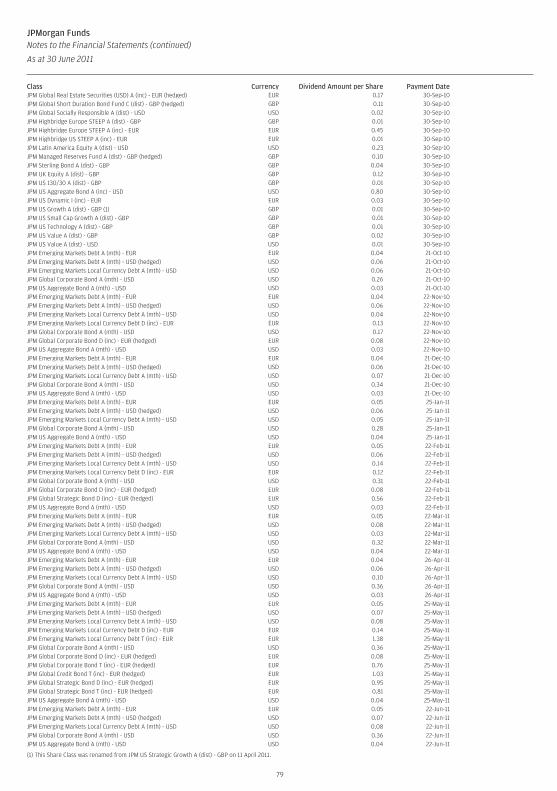
Class Currency Dividend Amount per Share Payment DateJPM Global Real Estate Securities (USD) A (inc) - EUR (hedged) EUR 0.17 30-Sep-10JPM Global Short Duration Bond Fund C (dist) - GBP (hedged) GBP 0.11 30-Sep-10JPM Global Socially Responsible A (dist) - USD USD 0.02 30-Sep-10JPM Highbridge Europe STEEP A (dist) - GBP GBP 0.01 30-Sep-10JPM Highbridge Europe STEEP A (inc) - EUR EUR 0.45 30-Sep-10JPM Highbridge US STEEP A (inc) - EUR EUR 0.01 30-Sep-10JPM Latin America Equity A (dist) - USD USD 0.23 30-Sep-10JPM Managed Reserves Fund A (dist) - GBP (hedged) GBP 0.10 30-Sep-10JPM Sterling Bond A (dist) - GBP GBP 0.04 30-Sep-10JPM UK Equity A (dist) - GBP GBP 0.12 30-Sep-10JPM US 130/30 A (dist) - GBP GBP 0.01 30-Sep-10JPM US Aggregate Bond A (inc) - USD USD 0.80 30-Sep-10JPM US Dynamic I (inc) - EUR EUR 0.03 30-Sep-10JPM US Growth A (dist) - GBP (1) GBP 0.01 30-Sep-10JPM US Small Cap Growth A (dist) - GBP GBP 0.01 30-Sep-10JPM US Technology A (dist) - GBP GBP 0.01 30-Sep-10JPM US Value A (dist) - GBP GBP 0.02 30-Sep-10JPM US Value A (dist) - USD USD 0.01 30-Sep-10JPM Emerging Markets Debt A (mth) - EUR EUR 0.04 21-Oct-10JPM Emerging Markets Debt A (mth) - USD (hedged) USD 0.06 21-Oct-10JPM Emerging Markets Local Currency Debt A (mth) - USD USD 0.06 21-Oct-10JPM Global Corporate Bond A (mth) - USD USD 0.26 21-Oct-10JPM US Aggregate Bond A (mth) - USD USD 0.03 21-Oct-10JPM Emerging Markets Debt A (mth) - EUR EUR 0.04 22-Nov-10JPM Emerging Markets Debt A (mth) - USD (hedged) USD 0.06 22-Nov-10JPM Emerging Markets Local Currency Debt A (mth) - USD USD 0.04 22-Nov-10JPM Emerging Markets Local Currency Debt D (inc) - EUR EUR 0.13 22-Nov-10JPM Global Corporate Bond A (mth) - USD USD 0.17 22-Nov-10JPM Global Corporate Bond D (inc) - EUR (hedged) EUR 0.08 22-Nov-10JPM US Aggregate Bond A (mth) - USD USD 0.03 22-Nov-10JPM Emerging Markets Debt A (mth) - EUR EUR 0.04 21-Dec-10JPM Emerging Markets Debt A (mth) - USD (hedged) USD 0.06 21-Dec-10JPM Emerging Markets Local Currency Debt A (mth) - USD USD 0.07 21-Dec-10JPM Global Corporate Bond A (mth) - USD USD 0.34 21-Dec-10JPM US Aggregate Bond A (mth) - USD USD 0.03 21-Dec-10JPM Emerging Markets Debt A (mth) - EUR EUR 0.05 25-Jan-11JPM Emerging Markets Debt A (mth) - USD (hedged) USD 0.06 25-Jan-11JPM Emerging Markets Local Currency Debt A (mth) - USD USD 0.05 25-Jan-11JPM Global Corporate Bond A (mth) - USD USD 0.28 25-Jan-11JPM US Aggregate Bond A (mth) - USD USD 0.04 25-Jan-11JPM Emerging Markets Debt A (mth) - EUR EUR 0.05 22-Feb-11JPM Emerging Markets Debt A (mth) - USD (hedged) USD 0.06 22-Feb-11JPM Emerging Markets Local Currency Debt A (mth) - USD USD 0.14 22-Feb-11JPM Emerging Markets Local Currency Debt D (inc) - EUR EUR 0.12 22-Feb-11JPM Global Corporate Bond A (mth) - USD USD 0.31 22-Feb-11JPM Global Corporate Bond D (inc) - EUR (hedged) EUR 0.08 22-Feb-11JPM Global Strategic Bond D (inc) - EUR (hedged) EUR 0.56 22-Feb-11JPM US Aggregate Bond A (mth) - USD USD 0.03 22-Feb-11JPM Emerging Markets Debt A (mth) - EUR EUR 0.05 22-Mar-11JPM Emerging Markets Debt A (mth) - USD (hedged) USD 0.08 22-Mar-11JPM Emerging Markets Local Currency Debt A (mth) - USD USD 0.03 22-Mar-11JPM Global Corporate Bond A (mth) - USD USD 0.32 22-Mar-11JPM US Aggregate Bond A (mth) - USD USD 0.04 22-Mar-11JPM Emerging Markets Debt A (mth) - EUR EUR 0.04 26-Apr-11JPM Emerging Markets Debt A (mth) - USD (hedged) USD 0.06 26-Apr-11JPM Emerging Markets Local Currency Debt A (mth) - USD USD 0.10 26-Apr-11JPM Global Corporate Bond A (mth) - USD USD 0.36 26-Apr-11JPM US Aggregate Bond A (mth) - USD USD 0.03 26-Apr-11JPM Emerging Markets Debt A (mth) - EUR EUR 0.05 25-May-11JPM Emerging Markets Debt A (mth) - USD (hedged) USD 0.07 25-May-11JPM Emerging Markets Local Currency Debt A (mth) - USD USD 0.08 25-May-11JPM Emerging Markets Local Currency Debt D (inc) - EUR EUR 0.14 25-May-11JPM Emerging Markets Local Currency Debt T (inc) - EUR EUR 1.38 25-May-11JPM Global Corporate Bond A (mth) - USD USD 0.36 25-May-11JPM Global Corporate Bond D (inc) - EUR (hedged) EUR 0.08 25-May-11JPM Global Corporate Bond T (inc) - EUR (hedged) EUR 0.76 25-May-11JPM Global Credit Bond T (inc) - EUR (hedged) EUR 1.03 25-May-11JPM Global Strategic Bond D (inc) - EUR (hedged) EUR 0.95 25-May-11JPM Global Strategic Bond T (inc) - EUR (hedged) EUR 0.81 25-May-11JPM US Aggregate Bond A (mth) - USD USD 0.04 25-May-11JPM Emerging Markets Debt A (mth) - EUR EUR 0.05 22-Jun-11JPM Emerging Markets Debt A (mth) - USD (hedged) USD 0.07 22-Jun-11JPM Emerging Markets Local Currency Debt A (mth) - USD USD 0.08 22-Jun-11JPM Global Corporate Bond A (mth) - USD USD 0.36 22-Jun-11JPM US Aggregate Bond A (mth) - USD USD 0.04 22-Jun-11
(1) This Share Class was renamed from JPM US Strategic Growth A (dist) - GBP on 11 April 2011.
79
JPMorgan FundsNotes to the Financial Statements (continued)
As at 30 June 2011
It is intended that all those Classes of Shares with the suffix “(dist)” will distribute at least 85% of the net investment income attributable to such Classes ofShares, computed broadly in accordance with the definition of net taxable income under United Kingdom corporation tax principles (subject to theapplication of any de minimis threshold) so that these Classes of Shares of the SICAV continue to qualify as “distributing” for the purposes of United Kingdomtax legislation relating to offshore Sub-Funds.Classes of Shares with the suffix “(inc)” may pay dividends but will not qualify as “distributing” for the purposes of United Kingdom tax legislation relating tooffshore Funds.Classes of Shares with the suffix “(mth)” will normally distribute all, or substantially all, of the net investment income on a monthly basis, based on the netinvestment income earned over the course of the prior month for Shares in issue at the dividend record date. They will not qualify as “distributing” for thepurposes of United Kingdom tax legislation relating to offshore funds.Those Classes of Shares with the suffix “(acc)” will not normally pay dividends.
5. TaxationUnder current law and practice in the Grand Duchy of Luxembourg, the SICAV is not liable to any income tax, nor are dividends distributed by the SICAV liableto any withholding tax. However, the SICAV, with the exception of those Share Classes identified in the Appendix, is liable to an asset based tax, the Taxed’abonnement, of 0.05% per annum, such tax being payable quarterly and calculated on the total net assets of each Sub-Fund at the end of the relevantquarter. For the Sub-Funds’ Share Classes identified in the Appendix, the rate is 0.01% per annum. No tax is payable on the portion of assets invested inother undertakings for collective investment already subject to the Taxe d’abonnement.No stamp duty or other tax is payable on the issue of shares in the SICAV in the Grand Duchy of Luxembourg. No tax is payable on realised or unrealisedcapital appreciation of the assets of the SICAV in the Grand Duchy of Luxembourg. Although the SICAV’s realised capital gains, whether short or long-term,are not expected to become taxable in another country, the shareholders must be aware and recognise that such a possibility is not totally excluded. Theregular income of the SICAV from some of its securities, as well as interest earned on its cash deposits in certain countries, may be subject to withholdingtaxes at varying rates, which normally cannot be recovered.Following recent case law precedent within Europe, the SICAV has instigated proceedings to reclaim tax withheld by certain Member States of the European Unionon dividend payments it has received. The decision to initiate proceedings against any particular Member State is the result of an analysis of the likely costs andpotential benefits of doing so. The likelihood of successfully reclaiming such amounts together with the estimated time to complete proceedings varies acrossMember States. Any costs associated with this decision have been charged to the relevant Sub-Funds and have been included within total costs for the purposes ofdetermining the relevant expense cap or TER and no amount has been recorded in the SICAV for any possible amounts to be received under this action.Certain Sub-Funds of the SICAV may invest on the Brazilian markets and are consequently subject to a local tax upon purchase of Brazilian Real, the BRL IOFTax. This tax has been recorded, where applicable, under Sundry Fees.
6. Statement of Changes in InvestmentsA list, specifying for each investment within each Sub-Fund the total purchases and sales which occurred during the year under review, may be obtained freeof charge upon request at the registered office of the SICAV. Additional information on investments within each Sub-Fund’s portfolio is available toshareholders at the registered office of the SICAV.
7. Fees and Expenses
a) All Sub-Funds - Share Classes A, B, C, D, J and TThe fees and expenses charged to these Classes of shares are set at a fixed percentage of the total net assets of each Class of shares. This fixed percentagecovers all fees and expenses connected with the management of these Classes of shares, including Investment Management Fees, Shareholder ServicingFees and Other Operating and Administrative Expenses, which include but are not limited to Custody, Registrar and Transfer Agent Fees; it does not covertaxes paid on investments, brokerage’s expense, the taxe d’abonnement, the interest, extraordinary costs or performance fees, if any.No other costs are charged to these Classes of shares, and the Investment Manager absorbs any difference that may arise between the actual costs of theoperations of these Classes of shares and the fixed percentage. To the extent that the actual operating costs are less than the fixed percentage, the excess ispaid to the Investment Manager and included within “Investment Management Fees”. To the extent that actual operating costs exceed the fixed percentage,the amount borne by the Investment Manager will be separately disclosed as a “Fee Waiver’’ in the Combined Statement of Net Assets and the CombinedStatement of Operations and Changes in Net Assets.This fixed annual rate of fees and expenses is categorised as a Total Expense Ratio. The fixed annual rates of fees for each Class of shares are shown in the Appendix.
b) All Sub-Funds - Share Class IThe maximum total fees and expenses to be borne by shareholders on these Classes of shares of any Sub-Fund will not exceed a capped percentage of thetotal net assets attributable to that Class. These capped fees and expenses comprise Investment Management Fees plus other Operating and AdministrativeExpenses including but not limited to Custody, Fiduciary, Accounting, Transfer Agency Fees and Taxes; it does not cover performance fees, if any.This capped annual rate of fees and expenses is categorised as a Capped Expense Ratio. The capped annual rates of fees for each Class of shares are shown inthe Appendix.
c) All Sub-Funds - Share Class XThe Annual Management Fee that would normally be payable in respect of the X Share Classes are administratively levied and collected by the GlobalDistributor directly from the shareholder or through the relevant J.P.Morgan Chase & Co entity.The maximum Operating and Administrative Expenses to be borne by the Class X shareholders of any Sub-Fund will not exceed a capped percentage of thetotal net assets attributable to that Class, as set out in the Appendix.Sub-Funds may invest in UCITS and other UCIs managed by the Management Company, the Investment Manager or any other member of JPMorgan Chase &Co. The avoidance of a double-charge of the Annual Management and Advisory Fee on such assets is achieved by either a) excluding the assets from the netassets on which the Annual Management and Advisory Fee is calculated; or b) investing in UCITS or UCIs via classes that do not accrue an AnnualManagement and Advisory Fee or other equivalent fees payable to the relevant Investment Manager’s group; or c) the Annual Management and AdvisoryFee being netted off by a rebate to the SICAV or Sub-Fund of the Annual Management and Advisory Fee (or equivalent) charged to the underlying UCITS orUCIs; or d) charging only the difference between the Annual Management and Advisory Fee of the SICAV or Sub-Fund and the Annual Management andAdvisory Fee (or equivalent) charged to the underlying UCITS or UCIs.The Management Company may decide from time to time, in order to protect the interests of the Fund’s shareholders, to reduce the fees payable to theManagement Company.
d) Performance FeesPursuant to the Investment Management Agreement, as set out in the Appendix to the Prospectus, the Investment Manager is entitled to receive from thenet assets of certain Sub-Funds or Classes, an annual performance-based incentive fee (the “Performance Fee”) if the performance of the Sub-Fund exceedsthe return from the benchmark, subject to the operation of a Claw-Back Mechanism or of a High Water Mark as defined in Appendix V and as specified inAppendix III for each Sub-Fund. On each Valuation Day, an accrual for the previous Valuation Day’s Performance Fee is made, when appropriate, and thefinal Performance Fee is payable annually. Pursuant to the provisions of the relevant Investment Management Agreement, the Investment Manager may beentitled to receive the performance Fee from the Management Company.
80
JPMorgan FundsNotes to the Financial Statements (continued)
As at 30 June 2011
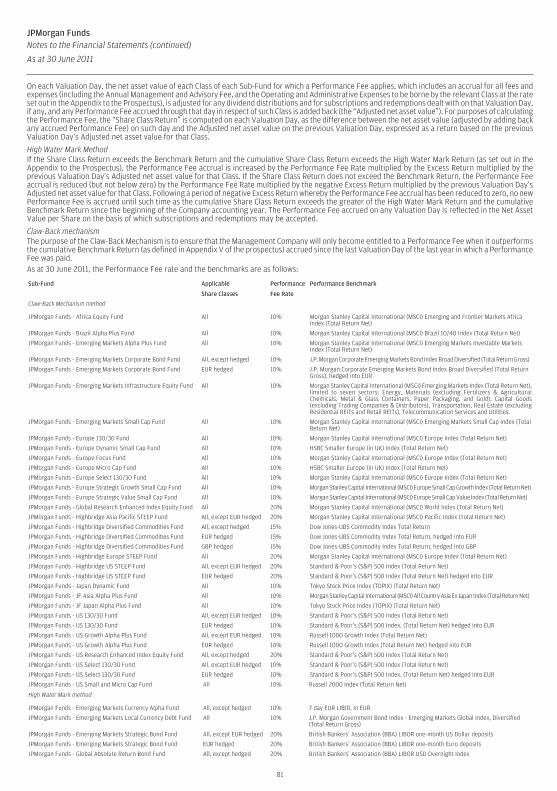
On each Valuation Day, the net asset value of each Class of each Sub-Fund for which a Performance Fee applies, which includes an accrual for all fees andexpenses (including the Annual Management and Advisory Fee, and the Operating and Administrative Expenses to be borne by the relevant Class at the rateset out in the Appendix to the Prospectus), is adjusted for any dividend distributions and for subscriptions and redemptions dealt with on that Valuation Day,if any, and any Performance Fee accrued through that day in respect of such Class is added back (the “Adjusted net asset value”). For purposes of calculatingthe Performance Fee, the “Share Class Return” is computed on each Valuation Day, as the difference between the net asset value (adjusted by adding backany accrued Performance Fee) on such day and the Adjusted net asset value on the previous Valuation Day, expressed as a return based on the previousValuation Day’s Adjusted net asset value for that Class.
High Water Mark MethodIf the Share Class Return exceeds the Benchmark Return and the cumulative Share Class Return exceeds the High Water Mark Return (as set out in theAppendix to the Prospectus), the Performance Fee accrual is increased by the Performance Fee Rate multiplied by the Excess Return multiplied by theprevious Valuation Day’s Adjusted net asset value for that Class. If the Share Class Return does not exceed the Benchmark Return, the Performance Feeaccrual is reduced (but not below zero) by the Performance Fee Rate multiplied by the negative Excess Return multiplied by the previous Valuation Day’sAdjusted net asset value for that Class. Following a period of negative Excess Return whereby the Performance Fee accrual has been reduced to zero, no newPerformance Fee is accrued until such time as the cumulative Share Class Return exceeds the greater of the High Water Mark Return and the cumulativeBenchmark Return since the beginning of the Company accounting year. The Performance Fee accrued on any Valuation Day is reflected in the Net AssetValue per Share on the basis of which subscriptions and redemptions may be accepted.
Claw-Back mechanismThe purpose of the Claw-Back Mechanism is to ensure that the Management Company will only become entitled to a Performance Fee when it outperformsthe cumulative Benchmark Return (as defined in Appendix V of the prospectus) accrued since the last Valuation Day of the last year in which a PerformanceFee was paid.As at 30 June 2011, the Performance Fee rate and the benchmarks are as follows:
Sub-Fund Applicable
Share Classes
Performance
Fee Rate
Performance Benchmark
Claw-Back Mechanism method
JPMorgan Funds - Africa Equity Fund All 10% Morgan Stanley Capital International (MSCI) Emerging and Frontier Markets AfricaIndex (Total Return Net)
JPMorgan Funds - Brazil Alpha Plus Fund All 10% Morgan Stanley Capital International (MSCI) Brazil 10/40 Index (Total Return Net)
JPMorgan Funds - Emerging Markets Alpha Plus Fund All 10% Morgan Stanley Capital International (MSCI) Emerging Markets Investable MarketsIndex (Total Return Net)
JPMorgan Funds - Emerging Markets Corporate Bond Fund All, except hedged 10% J.P. Morgan Corporate Emerging Markets Bond Index Broad Diversified (Total Return Gross)
JPMorgan Funds - Emerging Markets Corporate Bond Fund EUR hedged 10% J.P. Morgan Corporate Emerging Markets Bond Index Broad Diversified (Total ReturnGross), hedged into EUR
JPMorgan Funds - Emerging Markets Infrastructure Equity Fund All 10% Morgan Stanley Capital International (MSCI) Emerging Markets Index (Total Return Net),limited to seven sectors: Energy, Materials (excluding Fertilizers & AgriculturalChemicals, Metal & Glass Containers, Paper Packaging, and Gold), Capital Goods(excluding Trading Companies & Distributors), Transportation, Real Estate (excludingResidential REITs and Retail REITs), Telecommunication Services and Utilities.
JPMorgan Funds - Emerging Markets Small Cap Fund All 10% Morgan Stanley Capital International (MSCI) Emerging Markets Small Cap Index (TotalReturn Net)
JPMorgan Funds - Europe 130/30 Fund All 10% Morgan Stanley Capital International (MSCI) Europe Index (Total Return Net)
JPMorgan Funds - Europe Dynamic Small Cap Fund All 10% HSBC Smaller Europe (in UK) Index (Total Return Net)
JPMorgan Funds - Europe Focus Fund All 10% Morgan Stanley Capital International (MSCI) Europe Index (Total Return Net)
JPMorgan Funds - Europe Micro Cap Fund All 10% HSBC Smaller Europe (in UK) Index (Total Return Net)
JPMorgan Funds - Europe Select 130/30 Fund All 10% Morgan Stanley Capital International (MSCI) Europe Index (Total Return Net)
JPMorgan Funds - Europe Strategic Growth Small Cap Fund All 10% MorganStanleyCapital International (MSCI)EuropeSmallCapGrowth Index (TotalReturnNet)
JPMorgan Funds - Europe Strategic Value Small Cap Fund All 10% MorganStanleyCapital International (MSCI)EuropeSmallCapValue Index (TotalReturnNet)
JPMorgan Funds - Global Research Enhanced Index Equity Fund All 20% Morgan Stanley Capital International (MSCI) World Index (Total Return Net)
JPMorgan Funds - Highbridge Asia Pacific STEEP Fund All, except EUR hedged 20% Morgan Stanley Capital International (MSCI) Pacific Index (Total Return Net)
JPMorgan Funds - Highbridge Diversified Commodities Fund All, except hedged 15% Dow Jones-UBS Commodity Index Total Return
JPMorgan Funds - Highbridge Diversified Commodities Fund EUR hedged 15% Dow Jones-UBS Commodity Index Total Return, hedged into EUR
JPMorgan Funds - Highbridge Diversified Commodities Fund GBP hedged 15% Dow Jones-UBS Commodity Index Total Return, hedged into GBP
JPMorgan Funds - Highbridge Europe STEEP Fund All 20% Morgan Stanley Capital International (MSCI) Europe Index (Total Return Net)
JPMorgan Funds - Highbridge US STEEP Fund All, except EUR hedged 20% Standard & Poor’s (S&P) 500 Index (Total Return Net)
JPMorgan Funds - Highbridge US STEEP Fund EUR hedged 20% Standard & Poor’s (S&P) 500 Index (Total Return Net) hedged into EUR
JPMorgan Funds - Japan Dynamic Fund All 10% Tokyo Stock Price Index (TOPIX) (Total Return Net)
JPMorgan Funds - JF Asia Alpha Plus Fund All 10% MorganStanleyCapital International (MSCI)AllCountryAsiaExJapan Index (TotalReturnNet)
JPMorgan Funds - JF Japan Alpha Plus Fund All 10% Tokyo Stock Price Index (TOPIX) (Total Return Net)
JPMorgan Funds - US 130/30 Fund All, except EUR hedged 10% Standard & Poor’s (S&P) 500 Index (Total Return Net)
JPMorgan Funds - US 130/30 Fund EUR hedged 10% Standard & Poor’s (S&P) 500 Index, (Total Return Net) hedged into EUR
JPMorgan Funds - US Growth Alpha Plus Fund All, except EUR hedged 10% Russell 1000 Growth Index (Total Return Net)
JPMorgan Funds - US Growth Alpha Plus Fund EUR hedged 10% Russell 1000 Growth Index (Total Return Net) hedged into EUR
JPMorgan Funds - US Research Enhanced Index Equity Fund All, except hedged 20% Standard & Poor’s (S&P) 500 Index (Total Return Net)
JPMorgan Funds - US Select 130/30 Fund All, except EUR hedged 10% Standard & Poor’s (S&P) 500 Index (Total Return Net)
JPMorgan Funds - US Select 130/30 Fund EUR hedged 10% Standard & Poor’s (S&P) 500 Index, (Total Return Net) hedged into EUR
JPMorgan Funds - US Small and Micro Cap Fund All 10% Russell 2000 Index (Total Return Net)
High Water Mark method
JPMorgan Funds - Emerging Markets Currency Alpha Fund All, except hedged 10% 7 day EUR LIBID, in EUR
JPMorgan Funds - Emerging Markets Local Currency Debt Fund All 10% J.P. Morgan Government Bond Index - Emerging Markets Global Index, Diversified(Total Return Gross)
JPMorgan Funds - Emerging Markets Strategic Bond Fund All, except EUR hedged 20% British Bankers’ Association (BBA) LIBOR one-month US Dollar deposits
JPMorgan Funds - Emerging Markets Strategic Bond Fund EUR hedged 20% British Bankers’ Association (BBA) LIBOR one-month Euro deposits
JPMorgan Funds - Global Absolute Return Bond Fund All, except hedged 20% British Bankers’ Association (BBA) LIBOR USD Overnight Index
81
JPMorgan FundsNotes to the Financial Statements (continued)
As at 30 June 2011
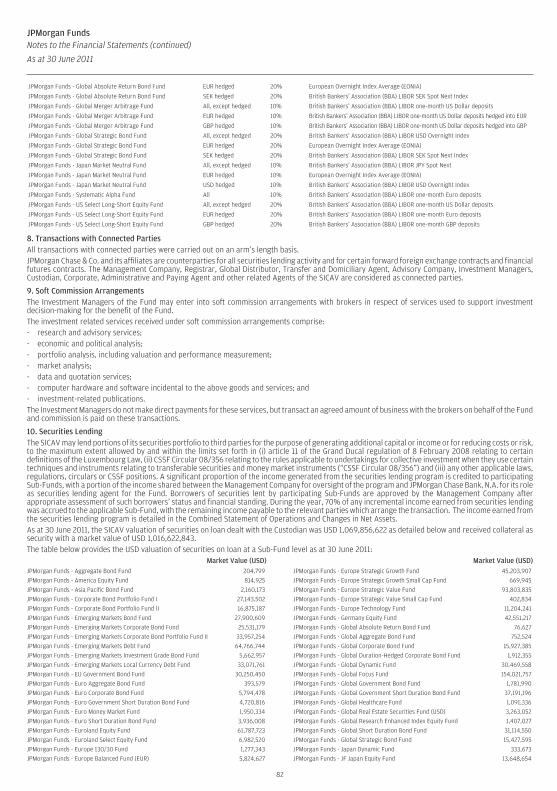
JPMorgan Funds - Global Absolute Return Bond Fund EUR hedged 20% European Overnight Index Average (EONIA)
JPMorgan Funds - Global Absolute Return Bond Fund SEK hedged 20% British Bankers’ Association (BBA) LIBOR SEK Spot Next Index
JPMorgan Funds - Global Merger Arbitrage Fund All, except hedged 10% British Bankers’ Association (BBA) LIBOR one-month US Dollar deposits
JPMorgan Funds - Global Merger Arbitrage Fund EUR hedged 10% British Bankers’ Association (BBA) LIBOR one-month US Dollar deposits hedged into EUR
JPMorgan Funds - Global Merger Arbitrage Fund GBP hedged 10% British Bankers’ Association (BBA) LIBOR one-month US Dollar deposits hedged into GBP
JPMorgan Funds - Global Strategic Bond Fund All, except hedged 20% British Bankers’ Association (BBA) LIBOR USD Overnight Index
JPMorgan Funds - Global Strategic Bond Fund EUR hedged 20% European Overnight Index Average (EONIA)
JPMorgan Funds - Global Strategic Bond Fund SEK hedged 20% British Bankers’ Association (BBA) LIBOR SEK Spot Next Index
JPMorgan Funds - Japan Market Neutral Fund All, except hedged 10% British Bankers’ Association (BBA) LIBOR JPY Spot Next
JPMorgan Funds - Japan Market Neutral Fund EUR hedged 10% European Overnight Index Average (EONIA)
JPMorgan Funds - Japan Market Neutral Fund USD hedged 10% British Bankers’ Association (BBA) LIBOR USD Overnight Index
JPMorgan Funds - Systematic Alpha Fund All 10% British Bankers’ Association (BBA) LIBOR one-month Euro deposits
JPMorgan Funds - US Select Long-Short Equity Fund All, except hedged 20% British Bankers’ Association (BBA) LIBOR one-month US Dollar deposits
JPMorgan Funds - US Select Long-Short Equity Fund EUR hedged 20% British Bankers’ Association (BBA) LIBOR one-month Euro deposits
JPMorgan Funds - US Select Long-Short Equity Fund GBP hedged 20% British Bankers’ Association (BBA) LIBOR one-month GBP deposits
8. Transactions with Connected PartiesAll transactions with connected parties were carried out on an arm’s length basis.JPMorgan Chase & Co. and its affiliates are counterparties for all securities lending activity and for certain forward foreign exchange contracts and financialfutures contracts. The Management Company, Registrar, Global Distributor, Transfer and Domiciliary Agent, Advisory Company, Investment Managers,Custodian, Corporate, Administrative and Paying Agent and other related Agents of the SICAV are considered as connected parties.
9. Soft Commission ArrangementsThe Investment Managers of the Fund may enter into soft commission arrangements with brokers in respect of services used to support investmentdecision-making for the benefit of the Fund.The investment related services received under soft commission arrangements comprise:- research and advisory services;- economic and political analysis;- portfolio analysis, including valuation and performance measurement;- market analysis;- data and quotation services;- computer hardware and software incidental to the above goods and services; and- investment-related publications.The Investment Managers do not make direct payments for these services, but transact an agreed amount of business with the brokers on behalf of the Fundand commission is paid on these transactions.
10. Securities LendingThe SICAV may lend portions of its securities portfolio to third parties for the purpose of generating additional capital or income or for reducing costs or risk,to the maximum extent allowed by and within the limits set forth in (i) article 11 of the Grand Ducal regulation of 8 February 2008 relating to certaindefinitions of the Luxembourg Law, (ii) CSSF Circular 08/356 relating to the rules applicable to undertakings for collective investment when they use certaintechniques and instruments relating to transferable securities and money market instruments (“CSSF Circular 08/356”) and (iii) any other applicable laws,regulations, circulars or CSSF positions. A significant proportion of the income generated from the securities lending program is credited to participatingSub-Funds, with a portion of the income shared between the Management Company for oversight of the program and JPMorgan Chase Bank, N.A. for its roleas securities lending agent for the Fund. Borrowers of securities lent by participating Sub-Funds are approved by the Management Company afterappropriate assessment of such borrowers’ status and financial standing. During the year, 70% of any incremental income earned from securities lendingwas accrued to the applicable Sub-Fund, with the remaining income payable to the relevant parties which arrange the transaction. The income earned fromthe securities lending program is detailed in the Combined Statement of Operations and Changes in Net Assets.As at 30 June 2011, the SICAV valuation of securities on loan dealt with the Custodian was USD 1,069,856,622 as detailed below and received collateral assecurity with a market value of USD 1,016,622,843.The table below provides the USD valuation of securities on loan at a Sub-Fund level as at 30 June 2011:
Market Value (USD) Market Value (USD)JPMorgan Funds - Aggregate Bond Fund 204,799 JPMorgan Funds - Europe Strategic Growth Fund 45,203,907
JPMorgan Funds - America Equity Fund 814,925 JPMorgan Funds - Europe Strategic Growth Small Cap Fund 669,945
JPMorgan Funds - Asia Pacific Bond Fund 2,160,173 JPMorgan Funds - Europe Strategic Value Fund 93,803,835
JPMorgan Funds - Corporate Bond Portfolio Fund I 27,143,502 JPMorgan Funds - Europe Strategic Value Small Cap Fund 402,834
JPMorgan Funds - Corporate Bond Portfolio Fund II 16,875,187 JPMorgan Funds - Europe Technology Fund 11,204,241
JPMorgan Funds - Emerging Markets Bond Fund 27,900,609 JPMorgan Funds - Germany Equity Fund 42,551,217
JPMorgan Funds - Emerging Markets Corporate Bond Fund 25,531,179 JPMorgan Funds - Global Absolute Return Bond Fund 76,627
JPMorgan Funds - Emerging Markets Corporate Bond Portfolio Fund II 33,957,254 JPMorgan Funds - Global Aggregate Bond Fund 752,524
JPMorgan Funds - Emerging Markets Debt Fund 64,766,744 JPMorgan Funds - Global Corporate Bond Fund 15,927,385
JPMorgan Funds - Emerging Markets Investment Grade Bond Fund 5,662,957 JPMorgan Funds - Global Duration-Hedged Corporate Bond Fund 1,912,355
JPMorgan Funds - Emerging Markets Local Currency Debt Fund 33,071,761 JPMorgan Funds - Global Dynamic Fund 30,469,558
JPMorgan Funds - EU Government Bond Fund 30,250,450 JPMorgan Funds - Global Focus Fund 154,021,757
JPMorgan Funds - Euro Aggregate Bond Fund 393,579 JPMorgan Funds - Global Government Bond Fund 1,781,990
JPMorgan Funds - Euro Corporate Bond Fund 5,794,478 JPMorgan Funds - Global Government Short Duration Bond Fund 37,191,196
JPMorgan Funds - Euro Government Short Duration Bond Fund 4,720,816 JPMorgan Funds - Global Healthcare Fund 1,091,336
JPMorgan Funds - Euro Money Market Fund 1,950,334 JPMorgan Funds - Global Real Estate Securities Fund (USD) 3,263,052
JPMorgan Funds - Euro Short Duration Bond Fund 3,936,008 JPMorgan Funds - Global Research Enhanced Index Equity Fund 1,407,027
JPMorgan Funds - Euroland Equity Fund 61,787,723 JPMorgan Funds - Global Short Duration Bond Fund 31,114,550
JPMorgan Funds - Euroland Select Equity Fund 6,982,520 JPMorgan Funds - Global Strategic Bond Fund 15,427,595
JPMorgan Funds - Europe 130/30 Fund 1,277,343 JPMorgan Funds - Japan Dynamic Fund 333,673
JPMorgan Funds - Europe Balanced Fund (EUR) 5,824,627 JPMorgan Funds - JF Japan Equity Fund 13,648,654
82
JPMorgan FundsNotes to the Financial Statements (continued)
As at 30 June 2011
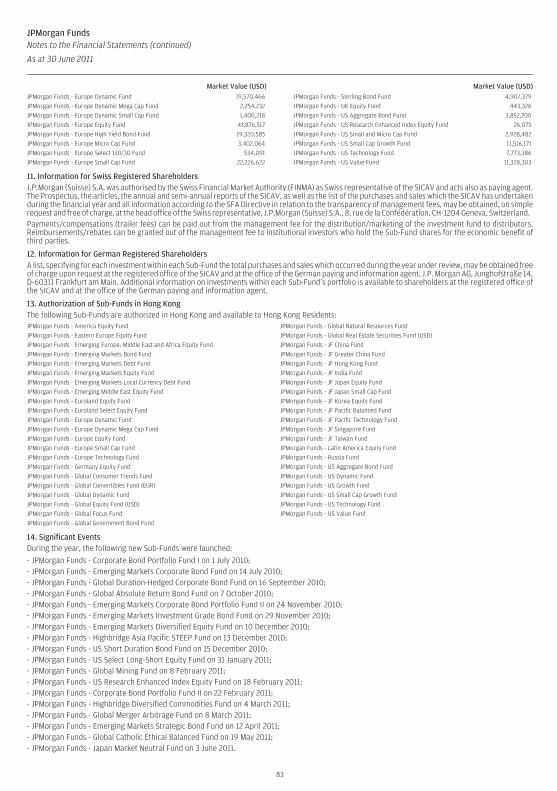
Market Value (USD) Market Value (USD)JPMorgan Funds - Europe Dynamic Fund 19,570,466 JPMorgan Funds - Sterling Bond Fund 4,907,379
JPMorgan Funds - Europe Dynamic Mega Cap Fund 2,254,232 JPMorgan Funds - UK Equity Fund 443,326
JPMorgan Funds - Europe Dynamic Small Cap Fund 1,400,218 JPMorgan Funds - US Aggregate Bond Fund 3,852,700
JPMorgan Funds - Europe Equity Fund 41,876,517 JPMorgan Funds - US Research Enhanced Index Equity Fund 26,075
JPMorgan Funds - Europe High Yield Bond Fund 19,320,585 JPMorgan Funds - US Small and Micro Cap Fund 2,928,482
JPMorgan Funds - Europe Micro Cap Fund 3,402,064 JPMorgan Funds - US Small Cap Growth Fund 11,516,171
JPMorgan Funds - Europe Select 130/30 Fund 534,091 JPMorgan Funds - US Technology Fund 7,773,386
JPMorgan Funds - Europe Small Cap Fund 22,226,622 JPMorgan Funds - US Value Fund 11,328,303
11. Information for Swiss Registered ShareholdersJ.P.Morgan (Suisse) S.A. was authorised by the Swiss Financial Market Authority (FINMA) as Swiss representative of the SICAV and acts also as paying agent.The Prospectus, the articles, the annual and semi-annual reports of the SICAV, as well as the list of the purchases and sales which the SICAV has undertakenduring the financial year and all information according to the SFA Directive in relation to the transparency of management fees, may be obtained, on simplerequest and free of charge, at the head office of the Swiss representative, J.P.Morgan (Suisse) S.A., 8, rue de la Confédération, CH-1204 Geneva, Switzerland.Payments/compensations (trailer fees) can be paid out from the management fee for the distribution/marketing of the investment fund to distributors.Reimbursements/rebates can be granted out of the management fee to institutional investors who hold the Sub-Fund shares for the economic benefit ofthird parties.
12. Information for German Registered ShareholdersA list, specifying for each investment within each Sub-Fund the total purchases and sales which occurred during the year under review, may be obtained freeof charge upon request at the registered office of the SICAV and at the office of the German paying and information agent, J.P. Morgan AG, Junghofstraße 14,D-60311 Frankfurt am Main. Additional information on investments within each Sub-Fund’s portfolio is available to shareholders at the registered office ofthe SICAV and at the office of the German paying and information agent.
13. Authorization of Sub-Funds in Hong KongThe following Sub-Funds are authorized in Hong Kong and available to Hong Kong Residents:JPMorgan Funds - America Equity Fund JPMorgan Funds - Global Natural Resources Fund
JPMorgan Funds - Eastern Europe Equity Fund JPMorgan Funds - Global Real Estate Securities Fund (USD)
JPMorgan Funds - Emerging Europe, Middle East and Africa Equity Fund JPMorgan Funds - JF China Fund
JPMorgan Funds - Emerging Markets Bond Fund JPMorgan Funds - JF Greater China Fund
JPMorgan Funds - Emerging Markets Debt Fund JPMorgan Funds - JF Hong Kong Fund
JPMorgan Funds - Emerging Markets Equity Fund JPMorgan Funds - JF India Fund
JPMorgan Funds - Emerging Markets Local Currency Debt Fund JPMorgan Funds - JF Japan Equity Fund
JPMorgan Funds - Emerging Middle East Equity Fund JPMorgan Funds - JF Japan Small Cap Fund
JPMorgan Funds - Euroland Equity Fund JPMorgan Funds - JF Korea Equity Fund
JPMorgan Funds - Euroland Select Equity Fund JPMorgan Funds - JF Pacific Balanced Fund
JPMorgan Funds - Europe Dynamic Fund JPMorgan Funds - JF Pacific Technology Fund
JPMorgan Funds - Europe Dynamic Mega Cap Fund JPMorgan Funds - JF Singapore Fund
JPMorgan Funds - Europe Equity Fund JPMorgan Funds - JF Taiwan Fund
JPMorgan Funds - Europe Small Cap Fund JPMorgan Funds - Latin America Equity Fund
JPMorgan Funds - Europe Technology Fund JPMorgan Funds - Russia Fund
JPMorgan Funds - Germany Equity Fund JPMorgan Funds - US Aggregate Bond Fund
JPMorgan Funds - Global Consumer Trends Fund JPMorgan Funds - US Dynamic Fund
JPMorgan Funds - Global Convertibles Fund (EUR) JPMorgan Funds - US Growth Fund
JPMorgan Funds - Global Dynamic Fund JPMorgan Funds - US Small Cap Growth Fund
JPMorgan Funds - Global Equity Fund (USD) JPMorgan Funds - US Technology Fund
JPMorgan Funds - Global Focus Fund JPMorgan Funds - US Value Fund
JPMorgan Funds - Global Government Bond Fund
14. Significant EventsDuring the year, the following new Sub-Funds were launched:
- JPMorgan Funds - Corporate Bond Portfolio Fund I on 1 July 2010;- JPMorgan Funds - Emerging Markets Corporate Bond Fund on 14 July 2010;- JPMorgan Funds - Global Duration-Hedged Corporate Bond Fund on 16 September 2010;- JPMorgan Funds - Global Absolute Return Bond Fund on 7 October 2010;- JPMorgan Funds - Emerging Markets Corporate Bond Portfolio Fund II on 24 November 2010;- JPMorgan Funds - Emerging Markets Investment Grade Bond Fund on 29 November 2010;- JPMorgan Funds - Emerging Markets Diversified Equity Fund on 10 December 2010;- JPMorgan Funds - Highbridge Asia Pacific STEEP Fund on 13 December 2010;- JPMorgan Funds - US Short Duration Bond Fund on 15 December 2010;- JPMorgan Funds - US Select Long-Short Equity Fund on 31 January 2011;- JPMorgan Funds - Global Mining Fund on 8 February 2011;- JPMorgan Funds - US Research Enhanced Index Equity Fund on 18 February 2011;- JPMorgan Funds - Corporate Bond Portfolio Fund II on 22 February 2011;- JPMorgan Funds - Highbridge Diversified Commodities Fund on 4 March 2011;- JPMorgan Funds - Global Merger Arbitrage Fund on 8 March 2011;- JPMorgan Funds - Emerging Markets Strategic Bond Fund on 12 April 2011;- JPMorgan Funds - Global Catholic Ethical Balanced Fund on 19 May 2011;- JPMorgan Funds - Japan Market Neutral Fund on 3 June 2011.
83
JPMorgan FundsNotes to the Financial Statements (continued)
As at 30 June 2011
JPMorgan Funds - Euro Liquid Reserve Fund changed its name to JPMorgan Funds - Euro Money Market Fund on 2 August 2010.
JPMorgan Funds - US Strategic Growth Fund changed its name to JPMorgan Funds - US Growth Fund on 11 April 2011.With effect from 1 July 2010, the following Sub-Funds changed their benchmark indexes as follows:- JPMorgan Funds - Asia Pacific Bond Fund changed from JPMorgan Asia Credit Index (Total Return Gross) with currency exposure weighted to 25% AUD, 25%SGD, 25% KRW and 25% CNY to HSBC Asian Local Bond Index (Total Return Gross);- JPMorgan Funds - EU Government Bond Fund changed from J.P. Morgan EMU Bond Index, in EUR (Total Return Gross) to J.P. Morgan EMU Government BondInvestment Grade Index in EUR (Total Return Gross);- JPMorgan Funds - Euro Government Short Duration Bond Fund changed from J.P. Morgan EMU Government Bond Index 1-3 years, in EUR (Total ReturnGross) to J.P. Morgan EMU Government Bond Investment Grade Index 1-3 years in EUR (Total Return Gross).With effect from 2 August 2010, the following Sub-Funds changed their benchmark indexes as follow:- JPMorgan Funds - Emerging Markets Debt Fund changed from J.P. Morgan Emerging Markets Bond Index Plus, hedged into EUR (Total Return Gross) to J.P.Morgan Emerging Markets Bond Index Global Diversified, hedged into EUR (Total Return Gross);and for its USD hedged Share class, from JPM Emerging Market Bond Index Plus (Total Return Gross) Hedged into USD to J.P. Morgan Emerging Markets BondIndex Global Diversified, hedged into USD (Total Return Gross);- JPMorgan Funds - Emerging Markets Local Currency Debt Fund changed from J.P. Morgan Government Bond Index – Emerging Markets Global Index (TotalReturn Gross) to J.P. Morgan Government Bond Index – Emerging Markets Global Index, Diversified (Total Return Gross);With effect from 30 September 2010, JPMorgan Funds - Emerging Markets Alpha Plus Fund changed from Morgan Stanley Capital International (MSCI)Emerging Markets Index (Total Return Net) to Morgan Stanley Capital International (MSCI) Emerging Markets Investable Market Index (Total Return Net).With effect from 3 January 2011 the majority of the Share Classes of the Sub-Funds were de-listed from the official list of the Luxembourg Stock Exchange.Those Share Classes where a listing still exists are currently as follows:JPMorgan Funds - Africa Equity Fund I (acc) USD;JPMorgan Funds - Global Convertibles Fund C (acc) EUR;JPMorgan Funds - Emerging Middle East Equity Fund I (acc) USD;JPMorgan Funds - JF Asia Pacific ex-Japan Equity Fund C (acc) USD (BRL hedged).
15. Subsequent EventsWith effect from 4 July 2011, the following Sub-Fund changed its benchmark index as follows:JPMorgan Funds - Emerging Markets Debt Fund changed from J.P. Morgan Emerging Markets Bond Index Global Diversified, hedged into EUR (Total ReturnGross) to J.P. Morgan Emerging Markets Bond Index Global Diversified, hedged into USD (Total Return Gross).On the same date, the base currency of the Sub-Fund JPMorgan Funds - Emerging Markets Debt Fund changed from EUR to USD.With effect from 16 August 2011, the following Sub-Funds changed their name as follows:- JPMorgan Funds - Brazil Alpha Plus Fund changed its name into JPMorgan Funds - Brazil Equity Fund;- JPMorgan Funds - US 130/30 Fund changed its name into JPMorgan Funds - US Dynamic 130/30 Fund;- JPMorgan Funds - US Small and Micro Cap Fund changed its name into JPMorgan Funds - US Smaller Companies Fund.From 18 August 2011, the JPMorgan Funds - Brazil Equity Fund ceased to be subject to performance fees calculation.Subsequent to the year end, the following new Sub-Funds were launched:- JPMorgan Funds - Euro Inflation-Linked Bond Fund on 24 August 2011;- JPMorgan Funds - Emerging Markets Multi-Asset Fund on 31 August 2011;- JPMorgan Funds - Europe Research Enhanced Index Equity Fund on 8 September 2011;- JPMorgan Funds - Euro Bond Portfolio Fund I on 12 September 2011;- JPMorgan Funds - Euroland Dynamic Fund on 20 September 2011;- JPMorgan Funds - Euroland Focus Fund on 20 September 2011.
16. Directors’ FeesThe only remuneration paid to Directors is an annual fee. This is waived by Mr Berndt May, Ms Andrea L. Hazen and Mr James B. Broderick.The total Directors’ fees for the year amount to EUR 172,360, of which the Chairman is due EUR 36,872.
84
JPMorgan FundsNotes to the Financial Statements (continued)
As at 30 June 2011
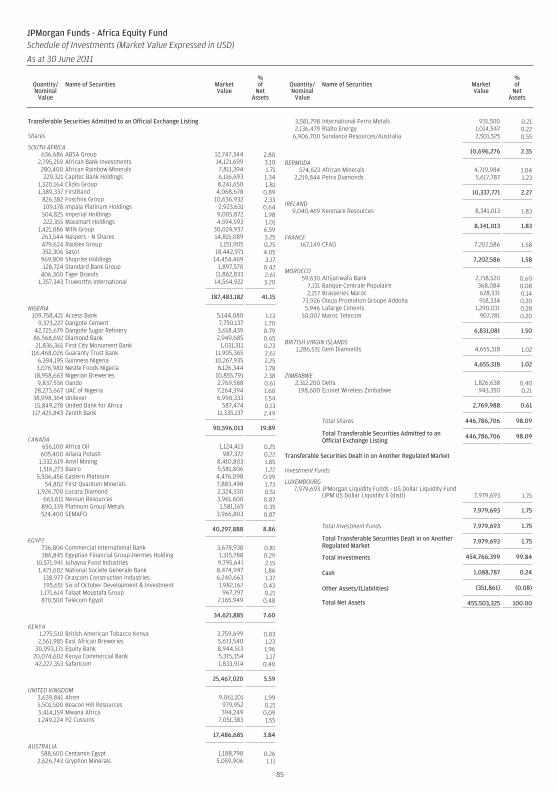
Transferable Securities Admitted to an Official Exchange Listing
Shares
SOUTH AFRICA636,686 ABSA Group 12,747,344 2.80
2,795,259 African Bank Investments 14,121,699 3.10280,400 African Rainbow Minerals 7,811,394 1.71229,321 Capitec Bank Holdings 6,116,693 1.34
1,320,164 Clicks Group 8,241,650 1.811,389,337 FirstRand 4,068,678 0.89
826,382 Foschini Group 10,636,932 2.33109,178 Impala Platinum Holdings 2,923,631 0.64504,825 Imperial Holdings 9,005,872 1.98222,355 Massmart Holdings 4,594,593 1.01
1,421,086 MTN Group 30,024,937 6.59263,544 Naspers - N Shares 14,815,089 3.25479,624 Raubex Group 1,151,905 0.25352,306 Sasol 18,442,971 4.05969,809 Shoprite Holdings 14,454,469 3.17128,724 Standard Bank Group 1,897,570 0.42
406,300 Tiger Brands 11,862,833 2.611,357,343 Truworths International 14,564,922 3.20
187,483,182 41.15
NIGERIA109,758,421 Access Bank 5,144,080 1.13
9,373,227 Dangote Cement 7,750,137 1.7042,725,679 Dangote Sugar Refinery 3,618,439 0.7986,568,692 Diamond Bank 2,949,685 0.6521,836,361 First City Monument Bank 1,031,311 0.23
116,468,026 Guaranty Trust Bank 11,905,365 2.616,394,195 Guinness Nigeria 10,267,935 2.253,076,980 Nestle Foods Nigeria 8,126,344 1.78
18,958,663 Nigerian Breweries 10,855,791 2.389,837,536 Oando 2,769,588 0.61
28,273,667 UAC of Nigeria 7,264,394 1.6038,998,364 Unilever 6,990,333 1.5415,849,278 United Bank for Africa 587,474 0.13
117,425,843 Zenith Bank 11,335,137 2.49
90,596,013 19.89
CANADA656,100 Africa Oil 1,124,413 0.25605,400 Allana Potash 987,372 0.22
1,332,619 Anvil Mining 8,410,803 1.851,516,273 Banro 5,581,806 1.22
5,506,456 Eastern Platinum 4,476,098 0.9954,802 First Quantum Minerals 7,883,498 1.73
1,926,700 Lucara Diamond 2,324,330 0.51663,611 Nevsun Resources 3,961,600 0.87
890,339 Platinum Group Metals 1,581,165 0.35524,400 SEMAFO 3,966,803 0.87
40,297,888 8.86
EGYPT736,806 Commercial International Bank 3,678,938 0.81386,845 Egyptian Financial Group-Hermes Holding 1,315,788 0.29
10,571,941 Juhayna Food Industries 9,795,641 2.151,421,602 National Societe Generale Bank 8,474,947 1.86
138,977 Orascom Construction Industries 6,240,663 1.37195,651 Six of October Development & Investment 1,982,162 0.43
1,171,614 Talaat Moustafa Group 967,797 0.21870,500 Telecom Egypt 2,165,949 0.48
34,621,885 7.60
KENYA1,275,510 British American Tobacco Kenya 3,759,699 0.832,561,985 East African Breweries 5,613,540 1.23
30,993,171 Equity Bank 8,944,513 1.9620,074,602 Kenya Commercial Bank 5,315,354 1.1742,227,353 Safaricom 1,833,914 0.40
25,467,020 5.59
UNITED KINGDOM3,639,841 Afren 9,061,101 1.995,501,500 Beacon Hill Resources 979,952 0.215,414,159 Mwana Africa 394,249 0.091,249,224 PZ Cussons 7,051,383 1.55
17,486,685 3.84
AUSTRALIA588,600 Centamin Egypt 1,188,798 0.26
2,626,743 Gryphon Minerals 5,059,906 1.11
3,581,798 International Ferro Metals 931,500 0.212,136,479 Rialto Energy 1,014,547 0.22
6,906,700 Sundance Resources/Australia 2,501,525 0.55
10,696,276 2.35
BERMUDA574,623 African Minerals 4,719,984 1.04
2,219,844 Petra Diamonds 5,617,787 1.23
10,337,771 2.27
IRELAND9,040,469 Kenmare Resources 8,341,013 1.83
8,341,013 1.83
FRANCE167,149 CFAO 7,202,586 1.58
7,202,586 1.58
MOROCCO59,630 Attijariwafa Bank 2,718,520 0.60
7,131 Banque Centrale Populaire 368,084 0.082,217 Brasseries Maroc 628,331 0.14
73,926 Douja Promotion Groupe Addoha 918,334 0.205,946 Lafarge Ciments 1,290,031 0.28
50,007 Maroc Telecom 907,781 0.20
6,831,081 1.50
BRITISH VIRGIN ISLANDS1,286,531 Gem Diamonds 4,655,318 1.02
4,655,318 1.02
ZIMBABWE2,312,200 Delta 1,826,638 0.40
198,600 Econet Wireless Zimbabwe 943,350 0.21
2,769,988 0.61
Total Shares 446,786,706 98.09
Total Transferable Securities Admitted to anOfficial Exchange Listing
446,786,706 98.09
Transferable Securities Dealt in on Another Regulated Market
Investment Funds
LUXEMBOURG7,979,693 JPMorgan Liquidity Funds - US Dollar Liquidity Fund
(JPM US Dollar Liquidity X (dist)) 7,979,693 1.75
7,979,693 1.75
Total Investment Funds 7,979,693 1.75
Total Transferable Securities Dealt in on AnotherRegulated Market
7,979,693 1.75
Total Investments 454,766,399 99.84
Cash 1,088,787 0.24
Other Assets/(Liabilities) (351,861) (0.08)
Total Net Assets 455,503,325 100.00
85
JPMorgan Funds - Africa Equity FundSchedule of Investments (Market Value Expressed in USD)
As at 30 June 2011
Quantity/Nominal
Value
Name of Securities MarketValue
%of
NetAssets
Quantity/Nominal
Value
Name of Securities MarketValue
%of
NetAssets
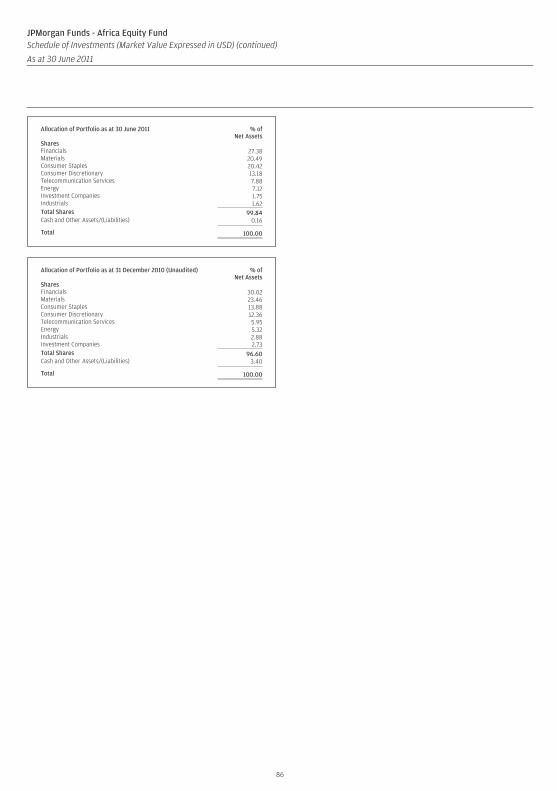
Allocation of Portfolio as at 30 June 2011 % ofNet Assets
SharesFinancials 27.38Materials 20.49Consumer Staples 20.42Consumer Discretionary 13.18Telecommunication Services 7.88Energy 7.12Investment Companies 1.75Industrials 1.62Total Shares 99.84Cash and Other Assets/(Liabilities) 0.16
Total 100.00
Allocation of Portfolio as at 31 December 2010 (Unaudited) % ofNet Assets
SharesFinancials 30.02Materials 23.46Consumer Staples 13.88Consumer Discretionary 12.36Telecommunication Services 5.95Energy 5.32Industrials 2.88Investment Companies 2.73Total Shares 96.60Cash and Other Assets/(Liabilities) 3.40
Total 100.00
86
JPMorgan Funds - Africa Equity FundSchedule of Investments (Market Value Expressed in USD) (continued)
As at 30 June 2011
Quantity/Nominal
Value
Name of Securities MarketValue
%of
NetAssets
Quantity/Nominal
Value
Name of Securities MarketValue
%of
NetAssets
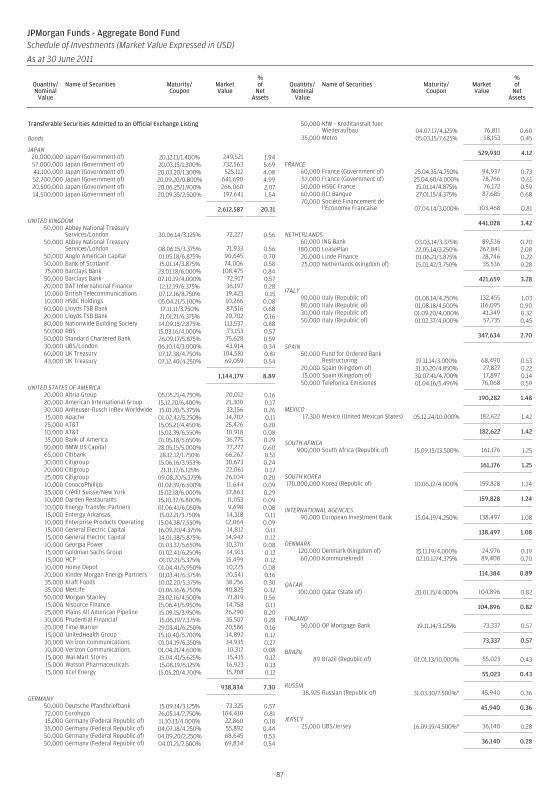
Transferable Securities Admitted to an Official Exchange Listing
Bonds
JAPAN20,000,000 Japan (Government of) 20.12.11/1.400% 249,521 1.9457,000,000 Japan (Government of) 20.03.15/1.300% 732,563 5.6941,100,000 Japan (Government of) 20.03.20/1.300% 525,112 4.0852,700,000 Japan (Government of) 20.09.20/0.800% 641,690 4.9920,500,000 Japan (Government of) 20.06.25/1.900% 266,060 2.0714,500,000 Japan (Government of) 20.09.35/2.500% 197,641 1.54
2,612,587 20.31
UNITED KINGDOM50,000 Abbey National Treasury
Services/London 30.06.14/3.125% 72,227 0.5650,000 Abbey National Treasury
Services/London 08.06.15/3.375% 71,933 0.5650,000 Anglo American Capital 01.05.18/6.875% 90,645 0.7050,000 Bank of Scotland 15.01.14/3.875% 74,006 0.5875,000 Barclays Bank 23.01.18/6.000% 108,475 0.8450,000 Barclays Bank 07.10.19/4.000% 72,917 0.5720,000 BAT International Finance 12.12.19/6.375% 36,197 0.2810,000 British Telecommunications 07.12.16/8.750% 19,423 0.1510,000 HSBC Holdings 05.04.21/5.100% 10,266 0.0860,000 Lloyds TSB Bank 17.11.11/3.750% 87,516 0.6820,000 Lloyds TSB Bank 21.01.21/6.375% 20,702 0.1680,000 Nationwide Building Society 14.09.15/2.875% 113,537 0.8850,000 RBS 15.03.16/4.000% 73,153 0.5750,000 Standard Chartered Bank 26.09.17/5.875% 75,628 0.5930,000 UBS/London 06.10.14/3.000% 43,914 0.3460,000 UK Treasury 07.12.38/4.750% 104,581 0.8143,000 UK Treasury 07.12.40/4.250% 69,059 0.54
1,144,179 8.89
UNITED STATES OF AMERICA20,000 Altria Group 05.05.21/4.750% 20,012 0.1620,000 American International Group 15.12.20/6.400% 21,300 0.1730,000 Anheuser-Busch InBev Worldwide 15.01.20/5.375% 33,156 0.2615,000 Apache 01.02.42/5.250% 14,702 0.1125,000 AT&T 15.05.21/4.450% 25,426 0.2010,000 AT&T 15.02.39/6.550% 10,918 0.0835,000 Bank of America 01.05.18/5.650% 36,775 0.2950,000 BMW US Capital 28.05.15/5.000% 77,277 0.6065,000 Citibank 28.12.12/1.750% 66,262 0.5130,000 Citigroup 15.06.16/3.953% 30,673 0.2420,000 Citigroup 21.11.17/6.125% 22,061 0.1725,000 Citigroup 09.08.20/5.375% 26,104 0.2010,000 ConocoPhillips 01.02.39/6.500% 11,644 0.0935,000 Crédit Suisse/New York 15.02.18/6.000% 37,863 0.2910,000 Darden Restaurants 15.10.37/6.800% 11,053 0.0910,000 Energy Transfer Partners 01.06.41/6.050% 9,698 0.0815,000 Entergy Arkansas 15.02.21/3.750% 14,318 0.1110,000 Enterprise Products Operating 15.04.38/7.550% 12,064 0.0915,000 General Electric Capital 16.09.20/4.375% 14,812 0.1115,000 General Electric Capital 14.01.38/5.875% 14,942 0.1210,000 Georgia Power 01.03.37/5.650% 10,370 0.0815,000 Goldman Sachs Group 01.02.41/6.250% 14,913 0.1215,000 HCP 01.02.21/5.375% 15,499 0.1210,000 Home Depot 01.04.41/5.950% 10,225 0.0820,000 Kinder Morgan Energy Partners 01.03.41/6.375% 20,541 0.1635,000 Kraft Foods 10.02.20/5.375% 38,256 0.3035,000 MetLife 01.06.16/6.750% 40,825 0.3250,000 Morgan Stanley 23.02.16/4.500% 71,819 0.5615,000 Nisource Finance 15.06.41/5.950% 14,758 0.1125,000 Plains All American Pipeline 15.09.15/3.950% 26,290 0.2030,000 Prudential Financial 15.06.19/7.375% 35,507 0.2820,000 Time Warner 29.03.41/6.250% 20,586 0.1615,000 UnitedHealth Group 15.10.40/5.700% 14,892 0.1230,000 Verizon Communications 01.04.19/6.350% 34,935 0.2710,000 Verizon Communications 01.04.21/4.600% 10,312 0.0815,000 Wal-Mart Stores 15.04.41/5.625% 15,415 0.1215,000 Watson Pharmaceuticals 15.08.19/6.125% 16,923 0.1315,000 Xcel Energy 15.05.20/4.700% 15,708 0.12
938,834 7.30
GERMANY50,000 Deutsche Pfandbriefbank 15.09.14/3.125% 73,325 0.5772,000 Eurohypo 26.05.14/2.750% 104,410 0.8115,000 Germany (Federal Republic of) 11.10.13/4.000% 22,860 0.1835,000 Germany (Federal Republic of) 04.07.18/4.250% 55,892 0.4450,000 Germany (Federal Republic of) 04.09.20/2.250% 68,645 0.5350,000 Germany (Federal Republic of) 04.01.21/2.500% 69,834 0.54
50,000 KfW - Kreditanstalt fuerWiederaufbau 04.07.17/4.125% 76,811 0.60
35,000 Metro 05.03.15/7.625% 58,153 0.45
529,930 4.12
FRANCE60,000 France (Government of) 25.04.35/4.750% 94,937 0.7357,000 France (Government of) 25.04.60/4.000% 78,766 0.6150,000 HSBC France 15.01.14/4.875% 76,172 0.5960,000 RCI Banque 27.01.15/4.375% 87,685 0.6870,000 Société Financement de
l’Economie Francaise 07.04.14/3.000% 103,468 0.81
441,028 3.42
NETHERLANDS60,000 ING Bank 03.03.14/3.375% 89,536 0.70
180,000 LeasePlan 22.05.14/3.250% 267,841 2.0820,000 Linde Finance 01.06.21/3.875% 28,746 0.2225,000 Netherlands (Kingdom of) 15.01.42/3.750% 35,536 0.28
421,659 3.28
ITALY90,000 Italy (Republic of) 01.08.14/4.250% 132,455 1.0380,000 Italy (Republic of) 01.08.18/4.500% 116,095 0.9030,000 Italy (Republic of) 01.09.20/4.000% 41,349 0.3250,000 Italy (Republic of) 01.02.37/4.000% 57,735 0.45
347,634 2.70
SPAIN50,000 Fund for Ordered Bank
Restructuring 19.11.14/3.000% 68,490 0.5320,000 Spain (Kingdom of) 31.10.20/4.850% 27,827 0.2215,000 Spain (Kingdom of) 30.07.41/4.700% 17,897 0.1450,000 Telefonica Emisiones 01.04.16/5.496% 76,068 0.59
190,282 1.48
MEXICO17,300 Mexico (United Mexican States) 05.12.24/10.000% 182,622 1.42
182,622 1.42
SOUTH AFRICA900,000 South Africa (Republic of) 15.09.15/13.500% 161,176 1.25
161,176 1.25
SOUTH KOREA170,000,000 Korea (Republic of) 10.06.12/4.000% 159,828 1.24
159,828 1.24
INTERNATIONAL AGENCIES90,000 European Investment Bank 15.04.19/4.250% 138,497 1.08
138,497 1.08
DENMARK120,000 Denmark (Kingdom of) 15.11.19/4.000% 24,976 0.1960,000 Kommunekredit 02.10.12/4.375% 89,408 0.70
114,384 0.89
QATAR100,000 Qatar (State of) 20.01.15/4.000% 104,896 0.82
104,896 0.82
FINLAND50,000 OP Mortgage Bank 19.11.14/3.125% 73,337 0.57
73,337 0.57
BRAZIL89 Brazil (Republic of) 01.01.13/10.000% 55,023 0.43
55,023 0.43
RUSSIA38,925 Russian (Republic of) 31.03.30/7.500%* 45,940 0.36
45,940 0.36
JERSEY25,000 UBS/Jersey 16.09.19/4.500%* 36,140 0.28
36,140 0.28
87
JPMorgan Funds - Aggregate Bond FundSchedule of Investments (Market Value Expressed in USD)
As at 30 June 2011
Quantity/Nominal
Value
Name of Securities Maturity/Coupon
MarketValue
%of
NetAssets
Quantity/Nominal
Value
Name of Securities Maturity/Coupon
MarketValue
%of
NetAssets
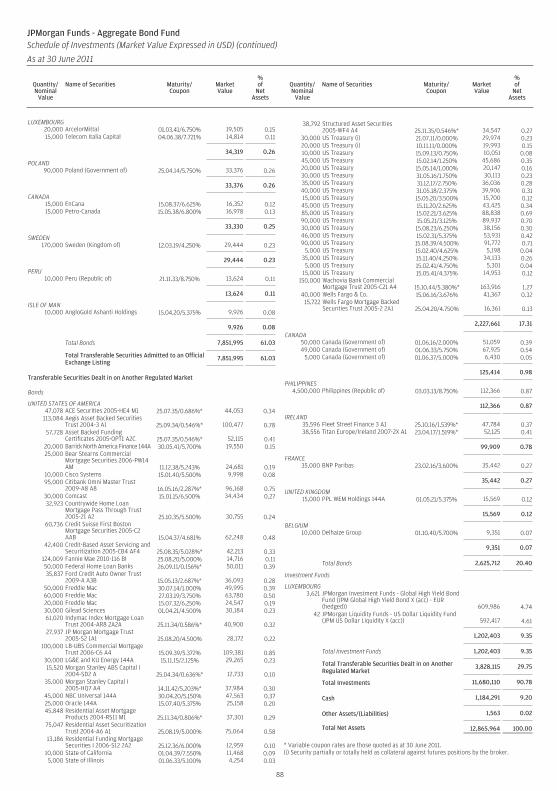
LUXEMBOURG20,000 ArcelorMittal 01.03.41/6.750% 19,505 0.1515,000 Telecom Italia Capital 04.06.38/7.721% 14,814 0.11
34,319 0.26
POLAND90,000 Poland (Government of) 25.04.14/5.750% 33,376 0.26
33,376 0.26
CANADA15,000 EnCana 15.08.37/6.625% 16,352 0.1215,000 Petro-Canada 15.05.38/6.800% 16,978 0.13
33,330 0.25
SWEDEN170,000 Sweden (Kingdom of) 12.03.19/4.250% 29,444 0.23
29,444 0.23
PERU10,000 Peru (Republic of) 21.11.33/8.750% 13,624 0.11
13,624 0.11
ISLE OF MAN10,000 AngloGold Ashanti Holdings 15.04.20/5.375% 9,926 0.08
9,926 0.08
Total Bonds 7,851,995 61.03
Total Transferable Securities Admitted to an OfficialExchange Listing
7,851,995 61.03
Transferable Securities Dealt in on Another Regulated Market
Bonds
UNITED STATES OF AMERICA47,078 ACE Securities 2005-HE4 M1 25.07.35/0.686%* 44,053 0.34
113,084 Aegis Asset Backed SecuritiesTrust 2004-3 A1 25.09.34/0.546%* 100,477 0.78
57,728 Asset Backed FundingCertificates 2005-OPT1 A2C 25.07.35/0.546%* 52,115 0.41
20,000 Barrick North America Finance 144A 30.05.41/5.700% 19,550 0.1525,000 Bear Stearns Commercial
Mortgage Securities 2006-PW14AM 11.12.38/5.243% 24,681 0.19
10,000 Cisco Systems 15.01.40/5.500% 9,998 0.0895,000 Citibank Omni Master Trust
2009-A8 A8 16.05.16/2.287%* 96,168 0.7530,000 Comcast 15.01.15/6.500% 34,434 0.2732,923 Countrywide Home Loan
Mortgage Pass Through Trust2005-21 A2 25.10.35/5.500% 30,755 0.24
60,736 Credit Suisse First BostonMortgage Securities 2005-C2AAB 15.04.37/4.681% 62,248 0.48
42,400 Credit-Based Asset Servicing andSecuritization 2005-CB4 AF4 25.08.35/5.028%* 42,213 0.33
124,009 Fannie Mae 2010-116 BI 25.08.20/5.000% 14,716 0.1150,000 Federal Home Loan Banks 26.09.11/0.156%* 50,011 0.3935,837 Ford Credit Auto Owner Trust
2009-A A3B 15.05.13/2.687%* 36,093 0.2850,000 Freddie Mac 30.07.14/1.000% 49,995 0.3960,000 Freddie Mac 27.03.19/3.750% 63,780 0.5020,000 Freddie Mac 15.07.32/6.250% 24,547 0.1930,000 Gilead Sciences 01.04.21/4.500% 30,184 0.2361,020 Indymac Index Mortgage Loan
Trust 2004-AR8 2A2A 25.11.34/0.586%* 40,900 0.3227,937 JP Morgan Mortgage Trust
2005-S2 1A1 25.08.20/4.500% 28,172 0.22100,000 LB-UBS Commercial Mortgage
Trust 2006-C6 A4 15.09.39/5.372% 109,381 0.8530,000 LG&E and KU Energy 144A 15.11.15/2.125% 29,265 0.2315,520 Morgan Stanley ABS Capital I
2004-SD2 A 25.04.34/0.636%* 12,733 0.1035,000 Morgan Stanley Capital I
2005-HQ7 A4 14.11.42/5.203%* 37,984 0.3045,000 NBC Universal 144A 30.04.20/5.150% 47,563 0.3725,000 Oracle 144A 15.07.40/5.375% 25,158 0.2045,848 Residential Asset Mortgage
Products 2004-RS11 M1 25.11.34/0.806%* 37,301 0.2975,047 Residential Asset Securitization
Trust 2004-A6 A1 25.08.19/5.000% 75,064 0.5813,186 Residential Funding Mortgage
Securities I 2006-S12 2A2 25.12.36/6.000% 12,959 0.1010,000 State of California 01.04.39/7.550% 11,468 0.095,000 State of Illinois 01.06.33/5.100% 4,254 0.03
38,792 Structured Asset Securities2005-WF4 A4 25.11.35/0.546%* 34,547 0.27
30,000 US Treasury (i) 21.07.11/0.000% 29,974 0.2320,000 US Treasury (i) 10.11.11/0.000% 19,993 0.1510,000 US Treasury 15.09.13/0.750% 10,051 0.0845,000 US Treasury 15.02.14/1.250% 45,686 0.3520,000 US Treasury 15.05.14/1.000% 20,147 0.1630,000 US Treasury 31.05.16/1.750% 30,113 0.2335,000 US Treasury 31.12.17/2.750% 36,036 0.2840,000 US Treasury 31.05.18/2.375% 39,906 0.3115,000 US Treasury 15.05.20/3.500% 15,700 0.1245,000 US Treasury 15.11.20/2.625% 43,425 0.3485,000 US Treasury 15.02.21/3.625% 88,838 0.6990,000 US Treasury 15.05.21/3.125% 89,937 0.7030,000 US Treasury 15.08.23/6.250% 38,156 0.3046,000 US Treasury 15.02.31/5.375% 53,931 0.4290,000 US Treasury 15.08.39/4.500% 91,772 0.71
5,000 US Treasury 15.02.40/4.625% 5,198 0.0435,000 US Treasury 15.11.40/4.250% 34,133 0.26
5,000 US Treasury 15.02.41/4.750% 5,301 0.0415,000 US Treasury 15.05.41/4.375% 14,953 0.12
150,000 Wachovia Bank CommercialMortgage Trust 2005-C21 A4 15.10.44/5.380%* 163,916 1.27
40,000 Wells Fargo & Co. 15.06.16/3.676% 41,367 0.3215,722 Wells Fargo Mortgage Backed
Securities Trust 2005-2 2A1 25.04.20/4.750% 16,361 0.13
2,227,661 17.31
CANADA50,000 Canada (Government of) 01.06.16/2.000% 51,059 0.3949,000 Canada (Government of) 01.06.33/5.750% 67,925 0.54
5,000 Canada (Government of) 01.06.37/5.000% 6,430 0.05
125,414 0.98
PHILIPPINES4,500,000 Philippines (Republic of) 03.03.13/8.750% 112,366 0.87
112,366 0.87
IRELAND35,596 Fleet Street Finance 3 A1 25.10.16/1.539%* 47,784 0.3738,556 Titan Europe/Ireland 2007-2X A1 23.04.17/1.519%* 52,125 0.41
99,909 0.78
FRANCE35,000 BNP Paribas 23.02.16/3.600% 35,442 0.27
35,442 0.27
UNITED KINGDOM15,000 PPL WEM Holdings 144A 01.05.21/5.375% 15,569 0.12
15,569 0.12
BELGIUM10,000 Delhaize Group 01.10.40/5.700% 9,351 0.07
9,351 0.07
Total Bonds 2,625,712 20.40
Investment Funds
LUXEMBOURG3,621 JPMorgan Investment Funds - Global High Yield Bond
Fund (JPM Global High Yield Bond X (acc) - EUR(hedged)) 609,986 4.74
42 JPMorgan Liquidity Funds - US Dollar Liquidity Fund(JPM US Dollar Liquidity X (acc)) 592,417 4.61
1,202,403 9.35
Total Investment Funds 1,202,403 9.35
Total Transferable Securities Dealt in on AnotherRegulated Market
3,828,115 29.75
Total Investments 11,680,110 90.78
Cash 1,184,291 9.20
Other Assets/(Liabilities) 1,563 0.02
Total Net Assets 12,865,964 100.00
* Variable coupon rates are those quoted as at 30 June 2011.(i) Security partially or totally held as collateral against futures positions by the broker.
88
JPMorgan Funds - Aggregate Bond FundSchedule of Investments (Market Value Expressed in USD) (continued)
As at 30 June 2011
Quantity/Nominal
Value
Name of Securities Maturity/Coupon
MarketValue
%of
NetAssets
Quantity/Nominal
Value
Name of Securities Maturity/Coupon
MarketValue
%of
NetAssets
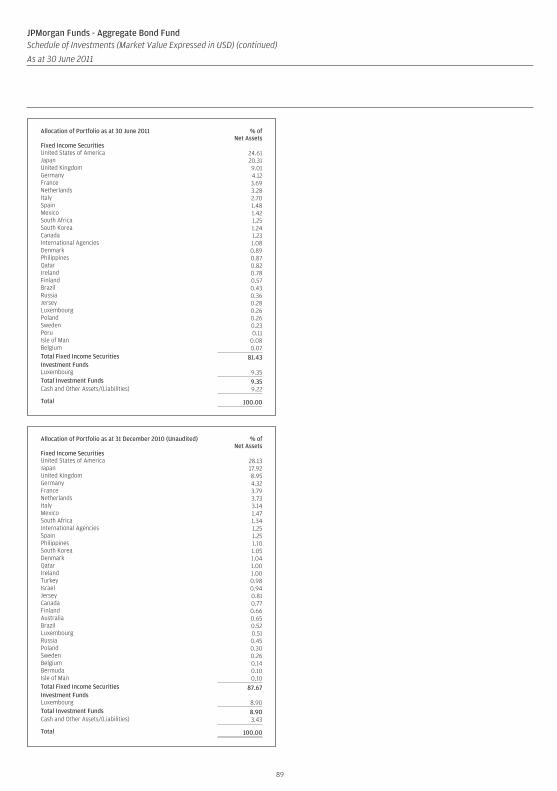
Allocation of Portfolio as at 30 June 2011 % ofNet Assets
Fixed Income SecuritiesUnited States of America 24.61Japan 20.31United Kingdom 9.01Germany 4.12France 3.69Netherlands 3.28Italy 2.70Spain 1.48Mexico 1.42South Africa 1.25South Korea 1.24Canada 1.23International Agencies 1.08Denmark 0.89Philippines 0.87Qatar 0.82Ireland 0.78Finland 0.57Brazil 0.43Russia 0.36Jersey 0.28Luxembourg 0.26Poland 0.26Sweden 0.23Peru 0.11Isle of Man 0.08Belgium 0.07Total Fixed Income Securities 81.43Investment FundsLuxembourg 9.35Total Investment Funds 9.35Cash and Other Assets/(Liabilities) 9.22
Total 100.00
Allocation of Portfolio as at 31 December 2010 (Unaudited) % ofNet Assets
Fixed Income SecuritiesUnited States of America 28.13Japan 17.92United Kingdom 8.95Germany 4.32France 3.79Netherlands 3.73Italy 3.14Mexico 1.47South Africa 1.34International Agencies 1.25Spain 1.25Philippines 1.10South Korea 1.05Denmark 1.04Qatar 1.00Ireland 1.00Turkey 0.98Israel 0.94Jersey 0.81Canada 0.77Finland 0.66Australia 0.65Brazil 0.52Luxembourg 0.51Russia 0.45Poland 0.30Sweden 0.26Belgium 0.14Bermuda 0.10Isle of Man 0.10Total Fixed Income Securities 87.67Investment FundsLuxembourg 8.90Total Investment Funds 8.90Cash and Other Assets/(Liabilities) 3.43
Total 100.00
89
JPMorgan Funds - Aggregate Bond FundSchedule of Investments (Market Value Expressed in USD) (continued)
As at 30 June 2011
Quantity/Nominal
Value
Name of Securities Maturity/Coupon
MarketValue
%of
NetAssets
Quantity/Nominal
Value
Name of Securities Maturity/Coupon
MarketValue
%of
NetAssets
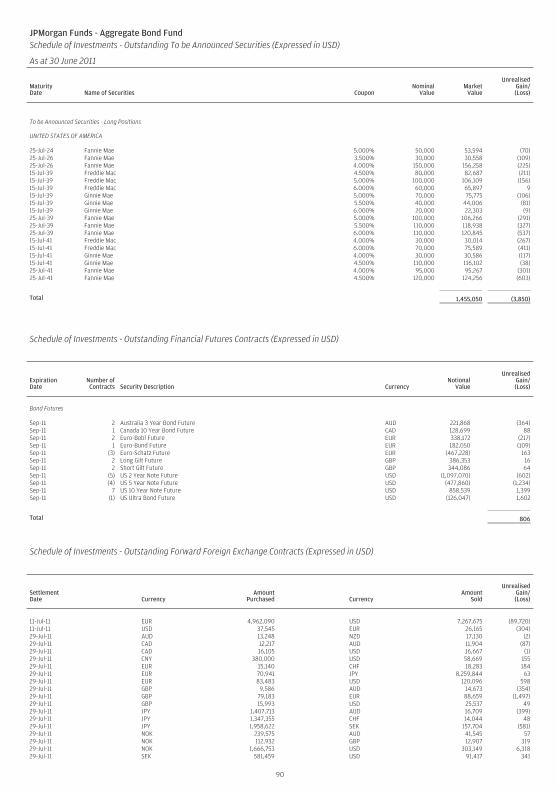
90
JPMorgan Funds - Aggregate Bond FundSchedule of Investments - Outstanding To be Announced Securities (Expressed in USD)
As at 30 June 2011
MaturityDate Name of Securities Coupon
NominalValue
MarketValue
UnrealisedGain/(Loss)
To be Announced Securities - Long Positions
UNITED STATES OF AMERICA
25-Jul-24 Fannie Mae 5.000% 50,000 53,594 (70)25-Jul-26 Fannie Mae 3.500% 30,000 30,558 (109)25-Jul-26 Fannie Mae 4.000% 150,000 156,258 (225)15-Jul-39 Freddie Mac 4.500% 80,000 82,687 (211)15-Jul-39 Freddie Mac 5.000% 100,000 106,109 (156)15-Jul-39 Freddie Mac 6.000% 60,000 65,897 915-Jul-39 Ginnie Mae 5.000% 70,000 75,775 (106)15-Jul-39 Ginnie Mae 5.500% 40,000 44,006 (81)15-Jul-39 Ginnie Mae 6.000% 20,000 22,303 (9)25-Jul-39 Fannie Mae 5.000% 100,000 106,266 (291)25-Jul-39 Fannie Mae 5.500% 110,000 118,938 (327)25-Jul-39 Fannie Mae 6.000% 110,000 120,845 (537)15-Jul-41 Freddie Mac 4.000% 30,000 30,014 (267)15-Jul-41 Freddie Mac 6.000% 70,000 75,589 (411)15-Jul-41 Ginnie Mae 4.000% 30,000 30,586 (117)15-Jul-41 Ginnie Mae 4.500% 110,000 116,102 (38)25-Jul-41 Fannie Mae 4.000% 95,000 95,267 (301)25-Jul-41 Fannie Mae 4.500% 120,000 124,256 (603)
Total 1,455,050 (3,850)
Schedule of Investments - Outstanding Financial Futures Contracts (Expressed in USD)
ExpirationDate
Number ofContracts Security Description Currency
NotionalValue
UnrealisedGain/(Loss)
Bond Futures
Sep-11 2 Australia 3 Year Bond Future AUD 221,868 (364)Sep-11 1 Canada 10 Year Bond Future CAD 128,699 88Sep-11 2 Euro-Bobl Future EUR 338,172 (217)Sep-11 1 Euro-Bund Future EUR 182,050 (109)Sep-11 (3) Euro-Schatz Future EUR (467,228) 163Sep-11 2 Long Gilt Future GBP 386,353 16Sep-11 2 Short Gilt Future GBP 344,086 64Sep-11 (5) US 2 Year Note Future USD (1,097,070) (602)Sep-11 (4) US 5 Year Note Future USD (477,860) (1,234)Sep-11 7 US 10 Year Note Future USD 858,539 1,399Sep-11 (1) US Ultra Bond Future USD (126,047) 1,602
Total 806
JPMorgan Funds - Aggregate Bond FundSchedule of Investments - Outstanding Forward Foreign Exchange Contracts (Expressed in USD) (continued)
As at 30 June 2011
SettlementDate Currency
AmountPurchased Currency
AmountSold
UnrealisedGain/(Loss)
11-Jul-11 EUR 4,962,090 USD 7,267,675 (89,720)11-Jul-11 USD 37,545 EUR 26,165 (304)29-Jul-11 AUD 13,248 NZD 17,130 (2)29-Jul-11 CAD 12,217 AUD 11,904 (87)29-Jul-11 CAD 16,105 USD 16,667 (1)29-Jul-11 CNY 380,000 USD 58,669 15529-Jul-11 EUR 15,140 CHF 18,283 18429-Jul-11 EUR 70,941 JPY 8,259,844 6329-Jul-11 EUR 83,483 USD 120,096 59829-Jul-11 GBP 9,586 AUD 14,673 (354)29-Jul-11 GBP 79,183 EUR 88,659 (1,497)29-Jul-11 GBP 15,993 USD 25,537 4929-Jul-11 JPY 1,407,713 AUD 16,709 (399)29-Jul-11 JPY 1,347,355 CHF 14,044 4829-Jul-11 JPY 1,958,622 SEK 157,704 (581)29-Jul-11 NOK 239,575 AUD 41,545 5729-Jul-11 NOK 112,932 GBP 12,907 31929-Jul-11 NOK 1,666,753 USD 303,149 6,31829-Jul-11 SEK 581,459 USD 91,417 341
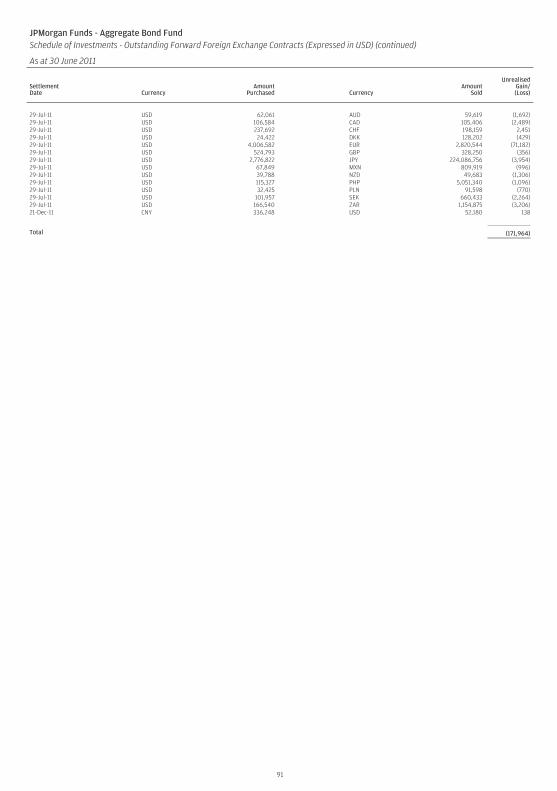
91
JPMorgan Funds - Aggregate Bond FundSchedule of Investments - Outstanding Forward Foreign Exchange Contracts (Expressed in USD) (continued)
As at 30 June 2011
SettlementDate Currency
AmountPurchased Currency
AmountSold
UnrealisedGain/(Loss)
29-Jul-11 USD 62,061 AUD 59,619 (1,692)29-Jul-11 USD 106,584 CAD 105,406 (2,489)29-Jul-11 USD 237,692 CHF 198,159 2,45129-Jul-11 USD 24,422 DKK 128,202 (429)29-Jul-11 USD 4,006,582 EUR 2,820,544 (71,182)29-Jul-11 USD 524,793 GBP 328,250 (356)29-Jul-11 USD 2,776,822 JPY 224,086,756 (3,954)29-Jul-11 USD 67,849 MXN 809,919 (996)29-Jul-11 USD 39,788 NZD 49,683 (1,306)29-Jul-11 USD 115,327 PHP 5,051,340 (1,096)29-Jul-11 USD 32,425 PLN 91,598 (770)29-Jul-11 USD 101,957 SEK 660,433 (2,264)29-Jul-11 USD 166,540 ZAR 1,154,875 (3,206)21-Dec-11 CNY 336,248 USD 52,180 138
Total (171,964)
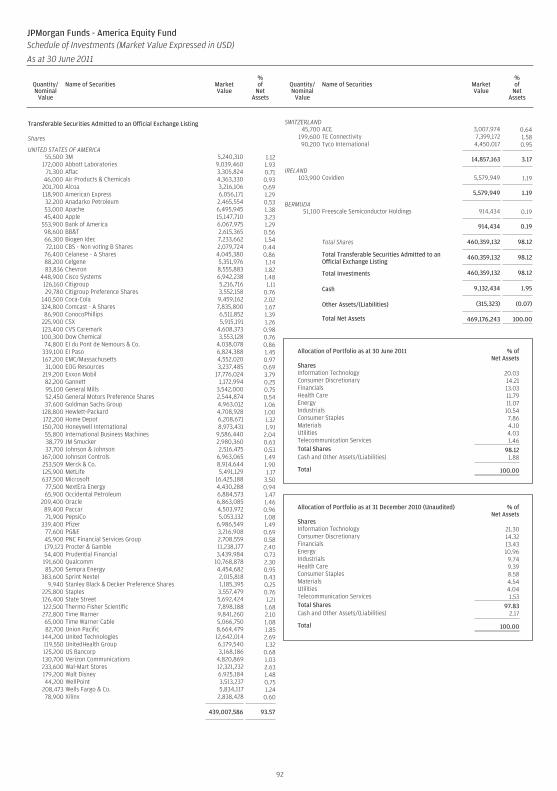
Transferable Securities Admitted to an Official Exchange Listing
Shares
UNITED STATES OF AMERICA55,500 3M 5,240,310 1.12
172,000 Abbott Laboratories 9,039,460 1.9371,300 Aflac 3,305,824 0.71
46,000 Air Products & Chemicals 4,363,330 0.93201,700 Alcoa 3,216,106 0.69118,900 American Express 6,056,171 1.2932,200 Anadarko Petroleum 2,465,554 0.5353,000 Apache 6,495,945 1.3845,400 Apple 15,147,710 3.23
553,900 Bank of America 6,067,975 1.2998,600 BB&T 2,615,365 0.5666,300 Biogen Idec 7,233,662 1.5472,100 CBS - Non voting B Shares 2,079,724 0.4476,400 Celanese - A Shares 4,045,380 0.8688,200 Celgene 5,351,976 1.1483,836 Chevron 8,555,883 1.82
448,900 Cisco Systems 6,942,238 1.48126,160 Citigroup 5,216,716 1.1129,780 Citigroup Preference Shares 3,552,158 0.76
140,500 Coca-Cola 9,459,162 2.02324,800 Comcast - A Shares 7,835,800 1.6786,900 ConocoPhillips 6,511,852 1.39
225,900 CSX 5,915,191 1.26123,400 CVS Caremark 4,608,373 0.98100,300 Dow Chemical 3,553,128 0.7674,800 EI du Pont de Nemours & Co. 4,038,078 0.86
339,100 El Paso 6,824,388 1.45167,200 EMC/Massachusetts 4,552,020 0.9731,000 EOG Resources 3,237,485 0.69
219,200 Exxon Mobil 17,776,024 3.7982,200 Gannett 1,172,994 0.2595,100 General Mills 3,542,000 0.7552,450 General Motors Preference Shares 2,544,874 0.5437,600 Goldman Sachs Group 4,963,012 1.06
128,800 Hewlett-Packard 4,708,928 1.00172,200 Home Depot 6,208,671 1.32150,700 Honeywell International 8,973,431 1.9155,800 International Business Machines 9,586,440 2.0438,779 JM Smucker 2,980,360 0.6337,700 Johnson & Johnson 2,516,475 0.53
167,000 Johnson Controls 6,963,065 1.49253,509 Merck & Co. 8,914,644 1.90125,900 MetLife 5,491,129 1.17637,500 Microsoft 16,425,188 3.50
77,500 NextEra Energy 4,430,288 0.9465,900 Occidental Petroleum 6,884,573 1.47
209,400 Oracle 6,863,085 1.4689,400 Paccar 4,503,972 0.9671,900 PepsiCo 5,053,132 1.08
339,400 Pfizer 6,986,549 1.4977,600 PG&E 3,216,908 0.6945,900 PNC Financial Services Group 2,708,559 0.58179,123 Procter & Gamble 11,238,177 2.4054,400 Prudential Financial 3,439,984 0.73191,600 Qualcomm 10,768,878 2.3085,200 Sempra Energy 4,454,682 0.95
383,600 Sprint Nextel 2,015,818 0.439,940 Stanley Black & Decker Preference Shares 1,185,395 0.25
225,800 Staples 3,557,479 0.76126,400 State Street 5,692,424 1.21122,500 Thermo Fisher Scientific 7,898,188 1.68272,800 Time Warner 9,841,260 2.1065,000 Time Warner Cable 5,066,750 1.0882,700 Union Pacific 8,664,479 1.85
144,200 United Technologies 12,642,014 2.69119,550 UnitedHealth Group 6,179,540 1.32125,200 US Bancorp 3,168,186 0.68130,700 Verizon Communications 4,820,869 1.03233,600 Wal-Mart Stores 12,321,232 2.63179,200 Walt Disney 6,925,184 1.4844,200 WellPoint 3,513,237 0.75
208,473 Wells Fargo & Co. 5,834,117 1.2478,900 Xilinx 2,838,428 0.60
439,007,586 93.57
SWITZERLAND45,700 ACE 3,007,974 0.64
199,600 TE Connectivity 7,399,172 1.5890,200 Tyco International 4,450,017 0.95
14,857,163 3.17
IRELAND103,900 Covidien 5,579,949 1.19
5,579,949 1.19
BERMUDA51,100 Freescale Semiconductor Holdings 914,434 0.19
914,434 0.19
Total Shares 460,359,132 98.12
Total Transferable Securities Admitted to anOfficial Exchange Listing
460,359,132 98.12
Total Investments 460,359,132 98.12
Cash 9,132,434 1.95
Other Assets/(Liabilities) (315,323) (0.07)
Total Net Assets 469,176,243 100.00
Allocation of Portfolio as at 30 June 2011 % ofNet Assets
SharesInformation Technology 20.03Consumer Discretionary 14.21Financials 13.03Health Care 11.79Energy 11.07Industrials 10.54Consumer Staples 7.86Materials 4.10Utilities 4.03Telecommunication Services 1.46Total Shares 98.12Cash and Other Assets/(Liabilities) 1.88
Total 100.00
Allocation of Portfolio as at 31 December 2010 (Unaudited) % ofNet Assets
SharesInformation Technology 21.30Consumer Discretionary 14.32Financials 13.43Energy 10.96Industrials 9.74Health Care 9.39Consumer Staples 8.58Materials 4.54Utilities 4.04Telecommunication Services 1.53Total Shares 97.83Cash and Other Assets/(Liabilities) 2.17
Total 100.00
92
JPMorgan Funds - America Equity FundSchedule of Investments (Market Value Expressed in USD)
As at 30 June 2011
Quantity/Nominal
Value
Name of Securities MarketValue
%of
NetAssets
Quantity/Nominal
Value
Name of Securities MarketValue
%of
NetAssets
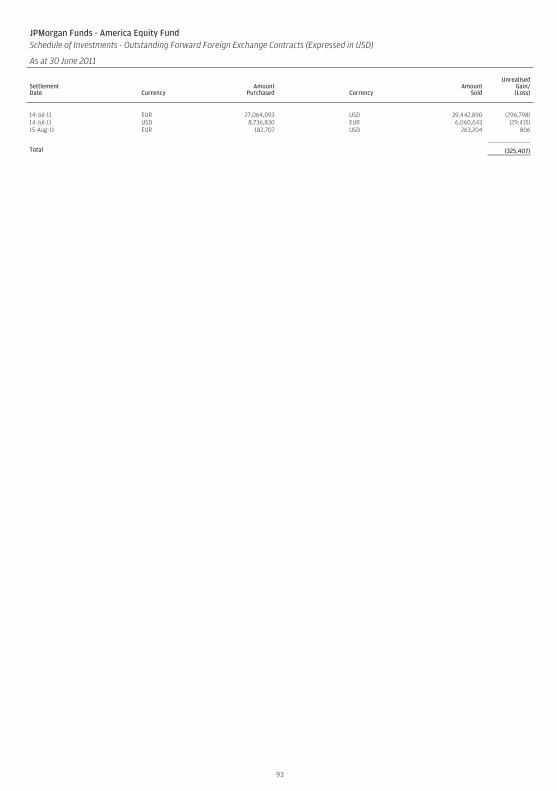
93
JPMorgan Funds - America Equity FundSchedule of Investments - Outstanding Forward Foreign Exchange Contracts (Expressed in USD)
As at 30 June 2011
SettlementDate Currency
AmountPurchased Currency
AmountSold
UnrealisedGain/(Loss)
14-Jul-11 EUR 27,064,093 USD 39,442,890 (296,798)14-Jul-11 USD 8,736,830 EUR 6,060,643 (29,415)15-Aug-11 EUR 182,707 USD 263,204 806
Total (325,407)
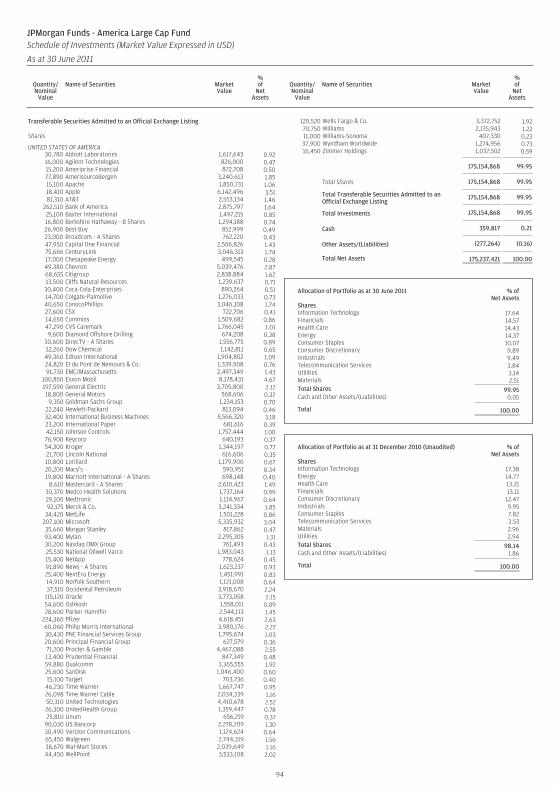
Transferable Securities Admitted to an Official Exchange Listing
Shares
UNITED STATES OF AMERICA30,780 Abbott Laboratories 1,617,643 0.9216,000 Agilent Technologies 826,000 0.4715,200 Ameriprise Financial 872,708 0.5077,890 AmerisourceBergen 3,240,613 1.8515,100 Apache 1,850,731 1.0618,410 Apple 6,142,496 3.5181,310 AT&T 2,553,134 1.46
262,510 Bank of America 2,875,797 1.6425,100 Baxter International 1,497,215 0.8516,800 Berkshire Hathaway - B Shares 1,294,188 0.7426,900 Best Buy 852,999 0.4923,000 Broadcom - A Shares 762,220 0.4347,950 Capital One Financial 2,506,826 1.4375,666 CenturyLink 3,046,313 1.7417,000 Chesapeake Energy 499,545 0.2849,380 Chevron 5,039,476 2.8768,655 Citigroup 2,838,884 1.6213,500 Cliffs Natural Resources 1,239,637 0.71
30,400 Coca-Cola Enterprises 890,264 0.5114,700 Colgate-Palmolive 1,276,033 0.7340,650 ConocoPhillips 3,046,108 1.7427,600 CSX 722,706 0.4114,650 Cummins 1,509,682 0.8647,290 CVS Caremark 1,766,045 1.019,600 Diamond Offshore Drilling 674,208 0.38
30,600 DirecTV - A Shares 1,556,775 0.8932,260 Dow Chemical 1,142,811 0.6549,360 Edison International 1,904,802 1.0924,820 EI du Pont de Nemours & Co. 1,339,908 0.7691,730 EMC/Massachusetts 2,497,349 1.43
100,850 Exxon Mobil 8,178,431 4.67197,590 General Electric 3,705,800 2.1218,800 General Motors 568,606 0.32
9,350 Goldman Sachs Group 1,234,153 0.7022,240 Hewlett-Packard 813,094 0.4632,400 International Business Machines 5,566,320 3.1823,200 International Paper 681,616 0.3942,150 Johnson Controls 1,757,444 1.0076,900 Keycorp 640,193 0.3754,300 Kroger 1,344,197 0.7721,700 Lincoln National 616,606 0.3510,800 Lorillard 1,179,900 0.6720,200 Macy’s 590,951 0.3419,800 Marriott International - A Shares 698,148 0.40
8,610 Mastercard - A Shares 2,610,423 1.4930,370 Medco Health Solutions 1,737,164 0.9929,100 Medtronic 1,114,967 0.6492,175 Merck & Co. 3,241,334 1.85
34,420 MetLife 1,501,228 0.86207,100 Microsoft 5,335,932 3.0435,660 Morgan Stanley 817,862 0.4793,400 Mylan 2,295,305 1.3130,200 Nasdaq OMX Group 761,493 0.4325,530 National Oilwell Varco 1,983,043 1.1315,400 NetApp 778,624 0.4591,890 News - A Shares 1,623,237 0.9325,400 NextEra Energy 1,451,991 0.8314,910 Norfolk Southern 1,121,008 0.6437,510 Occidental Petroleum 3,918,670 2.24
115,120 Oracle 3,773,058 2.1554,600 Oshkosh 1,558,011 0.8928,600 Parker Hannifin 2,544,113 1.45
224,360 Pfizer 4,618,451 2.6360,060 Philip Morris International 3,980,176 2.2730,430 PNC Financial Services Group 1,795,674 1.0320,600 Principal Financial Group 627,579 0.3671,200 Procter & Gamble 4,467,088 2.5513,400 Prudential Financial 847,349 0.4859,880 Qualcomm 3,365,555 1.9225,600 SanDisk 1,046,400 0.6015,100 Target 703,736 0.40
46,230 Time Warner 1,667,747 0.9526,098 Time Warner Cable 2,034,339 1.1650,310 United Technologies 4,410,678 2.5226,300 UnitedHealth Group 1,359,447 0.7825,810 Unum 656,219 0.37
90,030 US Bancorp 2,278,209 1.3030,490 Verizon Communications 1,124,624 0.6465,450 Walgreen 2,744,319 1.5638,670 Wal-Mart Stores 2,039,649 1.1644,450 WellPoint 3,533,108 2.02
120,520 Wells Fargo & Co. 3,372,752 1.9270,750 Williams 2,135,943 1.2211,000 Williams-Sonoma 407,330 0.2337,900 Wyndham Worldwide 1,274,956 0.7316,450 Zimmer Holdings 1,037,502 0.59
175,154,868 99.95
Total Shares 175,154,868 99.95
Total Transferable Securities Admitted to anOfficial Exchange Listing
175,154,868 99.95
Total Investments 175,154,868 99.95
Cash 359,817 0.21
Other Assets/(Liabilities) (277,264) (0.16)
Total Net Assets 175,237,421 100.00
Allocation of Portfolio as at 30 June 2011 % ofNet Assets
SharesInformation Technology 17.64Financials 14.57Health Care 14.43Energy 14.37Consumer Staples 10.07Consumer Discretionary 9.89Industrials 9.49Telecommunication Services 3.84Utilities 3.14Materials 2.51Total Shares 99.95Cash and Other Assets/(Liabilities) 0.05
Total 100.00
Allocation of Portfolio as at 31 December 2010 (Unaudited) % ofNet Assets
SharesInformation Technology 17.38Energy 14.77Health Care 13.21Financials 13.11Consumer Discretionary 12.47Industrials 9.95Consumer Staples 7.82Telecommunication Services 3.53Materials 2.96Utilities 2.94Total Shares 98.14Cash and Other Assets/(Liabilities) 1.86
Total 100.00
94
JPMorgan Funds - America Large Cap FundSchedule of Investments (Market Value Expressed in USD)
As at 30 June 2011
Quantity/Nominal
Value
Name of Securities MarketValue
%of
NetAssets
Quantity/Nominal
Value
Name of Securities MarketValue
%of
NetAssets
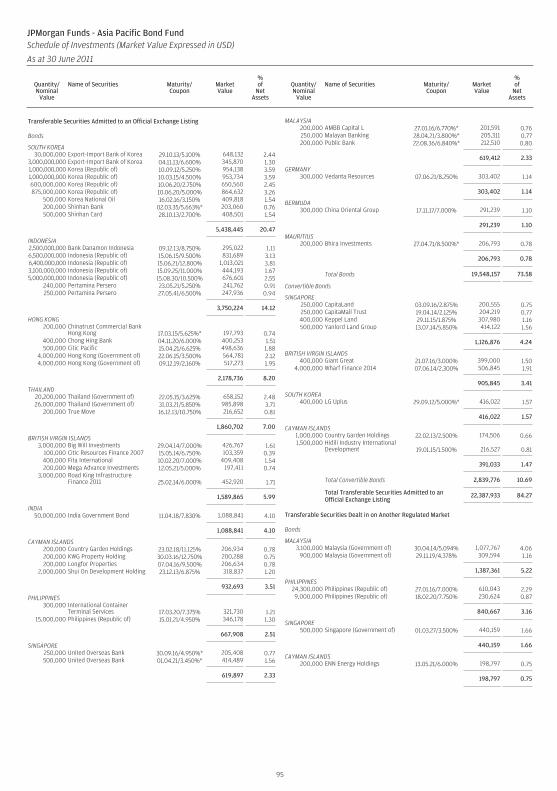
Transferable Securities Admitted to an Official Exchange Listing
Bonds
SOUTH KOREA30,000,000 Export-Import Bank of Korea 29.10.13/5.100% 648,132 2.44
3,000,000,000 Export-Import Bank of Korea 04.11.13/6.600% 345,870 1.301,000,000,000 Korea (Republic of) 10.09.12/5.250% 954,138 3.591,000,000,000 Korea (Republic of) 10.03.15/4.500% 953,734 3.59600,000,000 Korea (Republic of) 10.06.20/2.750% 650,560 2.45875,000,000 Korea (Republic of) 10.06.20/5.000% 864,632 3.26
500,000 Korea National Oil 16.02.16/3.150% 409,818 1.54200,000 Shinhan Bank 02.03.35/5.663%* 203,060 0.76500,000 Shinhan Card 28.10.13/2.700% 408,501 1.54
5,438,445 20.47
INDONESIA2,500,000,000 Bank Danamon Indonesia 09.12.13/8.750% 295,022 1.116,500,000,000 Indonesia (Republic of) 15.06.15/9.500% 831,689 3.136,400,000,000 Indonesia (Republic of) 15.06.21/12.800% 1,013,021 3.813,100,000,000 Indonesia (Republic of) 15.09.25/11.000% 444,193 1.675,000,000,000 Indonesia (Republic of) 15.08.30/10.500% 676,601 2.55
240,000 Pertamina Persero 23.05.21/5.250% 241,762 0.91250,000 Pertamina Persero 27.05.41/6.500% 247,936 0.94
3,750,224 14.12
HONG KONG200,000 Chinatrust Commercial Bank
Hong Kong 17.03.15/5.625%* 197,793 0.74400,000 Chong Hing Bank 04.11.20/6.000% 400,253 1.51500,000 Citic Pacific 15.04.21/6.625% 498,636 1.88
4,000,000 Hong Kong (Government of) 22.06.15/3.500% 564,781 2.124,000,000 Hong Kong (Government of) 09.12.19/2.160% 517,273 1.95
2,178,736 8.20
THAILAND20,200,000 Thailand (Government of) 22.05.15/3.625% 658,152 2.4826,000,000 Thailand (Government of) 31.03.21/5.850% 985,898 3.71
200,000 True Move 16.12.13/10.750% 216,652 0.81
1,860,702 7.00
BRITISH VIRGIN ISLANDS3,000,000 Big Will Investments 29.04.14/7.000% 426,767 1.61
100,000 Citic Resources Finance 2007 15.05.14/6.750% 103,359 0.39400,000 Fita International 10.02.20/7.000% 409,408 1.54200,000 Mega Advance Investments 12.05.21/5.000% 197,411 0.74
3,000,000 Road King InfrastructureFinance 2011 25.02.14/6.000% 452,920 1.71
1,589,865 5.99
INDIA50,000,000 India Government Bond 11.04.18/7.830% 1,088,841 4.10
1,088,841 4.10
CAYMAN ISLANDS200,000 Country Garden Holdings 23.02.18/11.125% 206,934 0.78200,000 KWG Property Holding 30.03.16/12.750% 200,288 0.75200,000 Longfor Properties 07.04.16/9.500% 206,634 0.78
2,000,000 Shui On Development Holding 23.12.13/6.875% 318,837 1.20
932,693 3.51
PHILIPPINES300,000 International Container
Terminal Services 17.03.20/7.375% 321,730 1.2115,000,000 Philippines (Republic of) 15.01.21/4.950% 346,178 1.30
667,908 2.51
SINGAPORE250,000 United Overseas Bank 30.09.16/4.950%* 205,408 0.77500,000 United Overseas Bank 01.04.21/3.450%* 414,489 1.56
619,897 2.33
MALAYSIA200,000 AMBB Capital L 27.01.16/6.770%* 201,591 0.76250,000 Malayan Banking 28.04.21/3.800%* 205,311 0.77200,000 Public Bank 22.08.36/6.840%* 212,510 0.80
619,412 2.33
GERMANY300,000 Vedanta Resources 07.06.21/8.250% 303,402 1.14
303,402 1.14
BERMUDA300,000 China Oriental Group 17.11.17/7.000% 291,239 1.10
291,239 1.10
MAURITIUS200,000 Bhira Investments 27.04.71/8.500%* 206,793 0.78
206,793 0.78
Total Bonds 19,548,157 73.58
Convertible Bonds
SINGAPORE250,000 CapitaLand 03.09.16/2.875% 200,555 0.75250,000 CapitaMall Trust 19.04.14/2.125% 204,219 0.77400,000 Keppel Land 29.11.15/1.875% 307,980 1.16500,000 Yanlord Land Group 13.07.14/5.850% 414,122 1.56
1,126,876 4.24
BRITISH VIRGIN ISLANDS400,000 Giant Great 21.07.16/3.000% 399,000 1.50
4,000,000 Wharf Finance 2014 07.06.14/2.300% 506,845 1.91
905,845 3.41
SOUTH KOREA400,000 LG Uplus 29.09.12/5.000%* 416,022 1.57
416,022 1.57
CAYMAN ISLANDS1,000,000 Country Garden Holdings 22.02.13/2.500% 174,506 0.661,500,000 Hidili Industry International
Development 19.01.15/1.500% 216,527 0.81
391,033 1.47
Total Convertible Bonds 2,839,776 10.69
Total Transferable Securities Admitted to anOfficial Exchange Listing
22,387,933 84.27
Transferable Securities Dealt in on Another Regulated Market
Bonds
MALAYSIA3,100,000 Malaysia (Government of) 30.04.14/5.094% 1,077,767 4.06
900,000 Malaysia (Government of) 29.11.19/4.378% 309,594 1.16
1,387,361 5.22
PHILIPPINES24,300,000 Philippines (Republic of) 27.01.16/7.000% 610,043 2.299,000,000 Philippines (Republic of) 18.02.20/7.750% 230,624 0.87
840,667 3.16
SINGAPORE500,000 Singapore (Government of) 01.03.27/3.500% 440,159 1.66
440,159 1.66
CAYMAN ISLANDS200,000 ENN Energy Holdings 13.05.21/6.000% 198,797 0.75
198,797 0.75
95
JPMorgan Funds - Asia Pacific Bond FundSchedule of Investments (Market Value Expressed in USD)
As at 30 June 2011
Quantity/Nominal
Value
Name of Securities Maturity/Coupon
MarketValue
%of
NetAssets
Quantity/Nominal
Value
Name of Securities Maturity/Coupon
MarketValue
%of
NetAssets
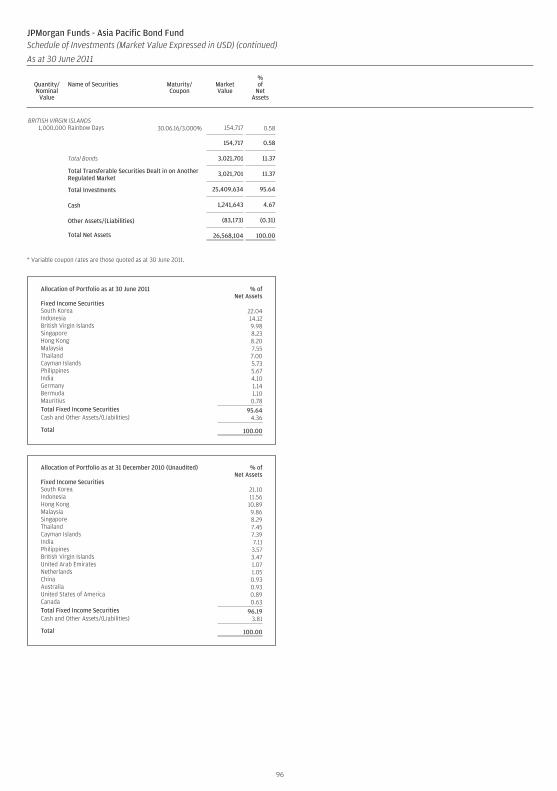
BRITISH VIRGIN ISLANDS1,000,000 Rainbow Days 30.06.16/3.000% 154,717 0.58
154,717 0.58
Total Bonds 3,021,701 11.37
Total Transferable Securities Dealt in on AnotherRegulated Market
3,021,701 11.37
Total Investments 25,409,634 95.64
Cash 1,241,643 4.67
Other Assets/(Liabilities) (83,173) (0.31)
Total Net Assets 26,568,104 100.00
* Variable coupon rates are those quoted as at 30 June 2011.
Allocation of Portfolio as at 30 June 2011 % ofNet Assets
Fixed Income SecuritiesSouth Korea 22.04Indonesia 14.12British Virgin Islands 9.98Singapore 8.23Hong Kong 8.20Malaysia 7.55Thailand 7.00Cayman Islands 5.73Philippines 5.67India 4.10Germany 1.14Bermuda 1.10Mauritius 0.78Total Fixed Income Securities 95.64Cash and Other Assets/(Liabilities) 4.36
Total 100.00
Allocation of Portfolio as at 31 December 2010 (Unaudited) % ofNet Assets
Fixed Income SecuritiesSouth Korea 21.10Indonesia 11.56Hong Kong 10.89Malaysia 9.86Singapore 8.29Thailand 7.45Cayman Islands 7.39India 7.11Philippines 3.57British Virgin Islands 3.47United Arab Emirates 1.07Netherlands 1.05China 0.93Australia 0.93United States of America 0.89Canada 0.63Total Fixed Income Securities 96.19Cash and Other Assets/(Liabilities) 3.81
Total 100.00
96
JPMorgan Funds - Asia Pacific Bond FundSchedule of Investments (Market Value Expressed in USD) (continued)
As at 30 June 2011
Quantity/Nominal
Value
Name of Securities Maturity/Coupon
MarketValue
%of
NetAssets
Quantity/Nominal
Value
Name of Securities Maturity/Coupon
MarketValue
%of
NetAssets
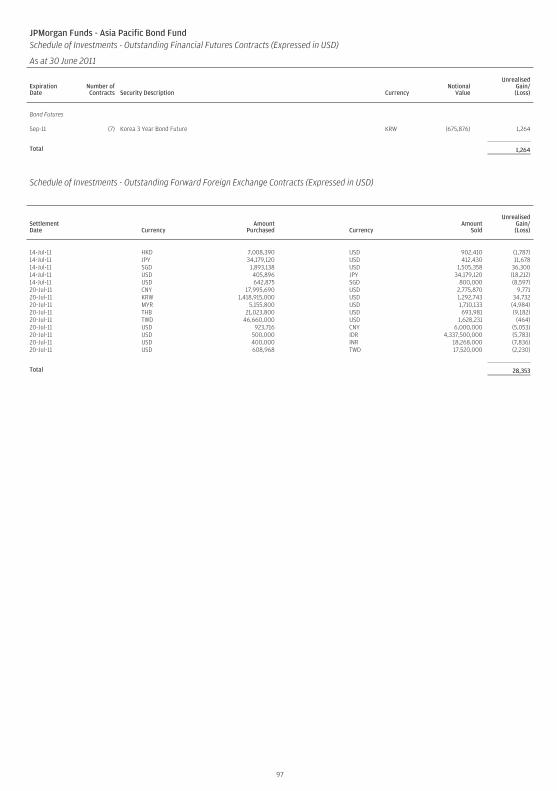
97
JPMorgan Funds - Asia Pacific Bond FundSchedule of Investments - Outstanding Financial Futures Contracts (Expressed in USD)
As at 30 June 2011
ExpirationDate
Number ofContracts Security Description Currency
NotionalValue
UnrealisedGain/(Loss)
Bond Futures
Sep-11 (7) Korea 3 Year Bond Future KRW (675,876) 1,264
Total 1,264
Schedule of Investments - Outstanding Forward Foreign Exchange Contracts (Expressed in USD)
SettlementDate Currency
AmountPurchased Currency
AmountSold
UnrealisedGain/(Loss)
14-Jul-11 HKD 7,008,390 USD 902,410 (1,787)14-Jul-11 JPY 34,179,120 USD 412,430 11,67814-Jul-11 SGD 1,893,138 USD 1,505,358 36,30014-Jul-11 USD 405,896 JPY 34,179,120 (18,212)14-Jul-11 USD 642,875 SGD 800,000 (8,597)20-Jul-11 CNY 17,995,690 USD 2,775,870 9,77120-Jul-11 KRW 1,418,915,000 USD 1,292,743 34,73220-Jul-11 MYR 5,155,800 USD 1,710,133 (4,984)20-Jul-11 THB 21,023,800 USD 693,981 (9,182)20-Jul-11 TWD 46,660,000 USD 1,628,231 (464)20-Jul-11 USD 923,716 CNY 6,000,000 (5,053)20-Jul-11 USD 500,000 IDR 4,337,500,000 (5,783)20-Jul-11 USD 400,000 INR 18,268,000 (7,836)20-Jul-11 USD 608,968 TWD 17,520,000 (2,230)
Total 28,353
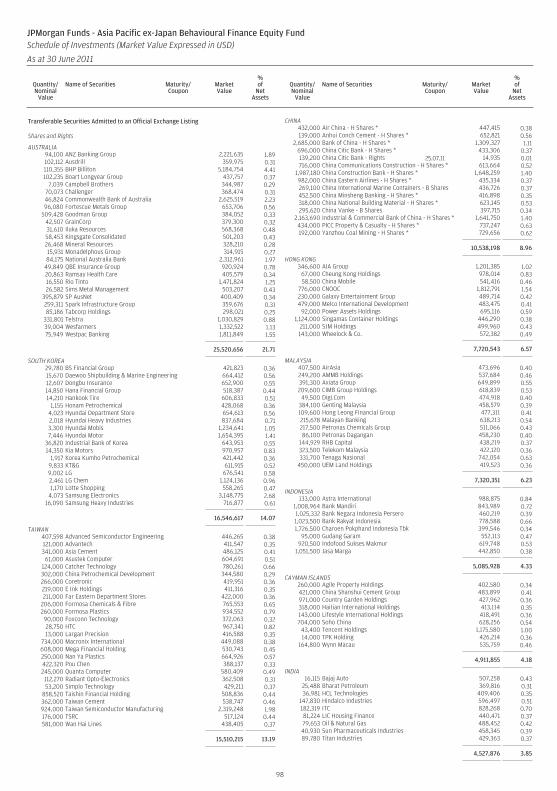
Transferable Securities Admitted to an Official Exchange Listing
Shares and Rights
AUSTRALIA94,100 ANZ Banking Group 2,221,635 1.89102,112 Ausdrill 359,975 0.31110,355 BHP Billiton 5,184,754 4.41102,235 Boart Longyear Group 437,757 0.37
7,039 Campbell Brothers 344,987 0.2970,073 Challenger 368,474 0.3146,824 Commonwealth Bank of Australia 2,625,519 2.2396,080 Fortescue Metals Group 653,706 0.56
509,428 Goodman Group 384,052 0.3342,507 GrainCorp 379,300 0.3231,610 Iluka Resources 568,368 0.4858,453 Kingsgate Consolidated 501,203 0.4326,468 Mineral Resources 328,210 0.2815,931 Monadelphous Group 314,915 0.2784,175 National Australia Bank 2,312,961 1.97
49,849 QBE Insurance Group 920,924 0.7820,863 Ramsay Health Care 405,579 0.3416,550 Rio Tinto 1,471,824 1.2526,582 Sims Metal Management 503,207 0.43
395,879 SP AusNet 400,409 0.34259,311 Spark Infrastructure Group 359,676 0.3185,186 Tabcorp Holdings 298,021 0.25
331,801 Telstra 1,030,829 0.8839,004 Wesfarmers 1,332,522 1.1375,949 Westpac Banking 1,811,849 1.55
25,520,656 21.71
SOUTH KOREA29,780 BS Financial Group 421,823 0.3615,670 Daewoo Shipbuilding & Marine Engineering 664,412 0.5612,607 Dongbu Insurance 652,900 0.5514,850 Hana Financial Group 518,387 0.4414,210 Hankook Tire 606,833 0.51
1,155 Honam Petrochemical 428,068 0.364,023 Hyundai Department Store 654,613 0.562,018 Hyundai Heavy Industries 837,684 0.713,300 Hyundai Mobis 1,234,641 1.057,446 Hyundai Motor 1,654,395 1.41
36,820 Industrial Bank of Korea 643,953 0.5514,350 Kia Motors 970,957 0.83
1,917 Korea Kumho Petrochemical 421,442 0.369,833 KT&G 611,915 0.529,002 LG 676,541 0.582,461 LG Chem 1,124,136 0.961,170 Lotte Shopping 558,265 0.47
4,073 Samsung Electronics 3,148,775 2.6816,090 Samsung Heavy Industries 716,877 0.61
16,546,617 14.07
TAIWAN407,598 Advanced Semiconductor Engineering 446,265 0.38121,000 Advantech 411,547 0.35341,000 Asia Cement 486,125 0.41
61,000 Asustek Computer 604,691 0.51124,000 Catcher Technology 780,261 0.66302,000 China Petrochemical Development 344,580 0.29266,000 Coretronic 419,951 0.36219,000 E Ink Holdings 411,316 0.35211,000 Far Eastern Department Stores 422,000 0.36
206,000 Formosa Chemicals & Fibre 765,553 0.65260,000 Formosa Plastics 934,552 0.7990,000 Foxconn Technology 372,063 0.3228,750 HTC 967,341 0.8213,000 Largan Precision 416,588 0.35
734,000 Macronix International 449,088 0.38608,000 Mega Financial Holding 530,743 0.45250,000 Nan Ya Plastics 664,926 0.57422,320 Pou Chen 388,137 0.33245,000 Quanta Computer 580,409 0.49112,270 Radiant Opto-Electronics 362,508 0.3153,200 Simplo Technology 429,211 0.37
858,520 Taishin Financial Holding 508,836 0.44362,000 Taiwan Cement 538,747 0.46924,000 Taiwan Semiconductor Manufacturing 2,319,248 1.98176,000 TSRC 517,124 0.44581,000 Wan Hai Lines 438,405 0.37
15,510,215 13.19
CHINA432,000 Air China - H Shares * 447,415 0.38139,000 Anhui Conch Cement - H Shares * 652,821 0.56
2,685,000 Bank of China - H Shares * 1,309,327 1.11696,000 China Citic Bank - H Shares * 433,306 0.37139,200 China Citic Bank - Rights 25.07.11 14,935 0.01716,000 China Communications Construction - H Shares * 613,664 0.52
1,987,180 China Construction Bank - H Shares * 1,648,259 1.40982,000 China Eastern Airlines - H Shares * 435,334 0.37269,100 China International Marine Containers - B Shares 436,726 0.37452,500 China Minsheng Banking - H Shares * 416,898 0.35318,000 China National Building Material - H Shares * 623,145 0.53295,620 China Vanke - B Shares 397,715 0.34
2,163,690 Industrial & Commercial Bank of China - H Shares * 1,641,750 1.40434,000 PICC Property & Casualty - H Shares * 737,247 0.63192,000 Yanzhou Coal Mining - H Shares * 729,656 0.62
10,538,198 8.96
HONG KONG346,600 AIA Group 1,201,385 1.02
67,000 Cheung Kong Holdings 978,014 0.8358,500 China Mobile 541,416 0.46
776,000 CNOOC 1,812,791 1.54230,000 Galaxy Entertainment Group 489,714 0.42479,000 Melco International Development 483,475 0.41
92,000 Power Assets Holdings 695,116 0.591,124,000 Singamas Container Holdings 446,290 0.38
211,000 SJM Holdings 499,960 0.43143,000 Wheelock & Co. 572,382 0.49
7,720,543 6.57
MALAYSIA407,500 AirAsia 473,696 0.40249,200 AMMB Holdings 537,684 0.46391,300 Axiata Group 649,899 0.55209,600 CIMB Group Holdings 618,839 0.53
49,500 Digi.Com 474,918 0.40384,100 Genting Malaysia 458,579 0.39109,600 Hong Leong Financial Group 477,311 0.41215,678 Malayan Banking 638,213 0.54217,500 Petronas Chemicals Group 511,066 0.4386,100 Petronas Dagangan 458,230 0.40
144,929 RHB Capital 438,219 0.37323,500 Telekom Malaysia 422,120 0.36331,700 Tenaga Nasional 742,054 0.63
450,000 UEM Land Holdings 419,523 0.36
7,320,351 6.23
INDONESIA133,000 Astra International 988,875 0.84
1,008,964 Bank Mandiri 843,989 0.721,025,332 Bank Negara Indonesia Persero 460,219 0.391,023,500 Bank Rakyat Indonesia 778,588 0.661,726,500 Charoen Pokphand Indonesia Tbk 399,546 0.34
95,000 Gudang Garam 552,113 0.47920,500 Indofood Sukses Makmur 619,748 0.53
1,051,500 Jasa Marga 442,850 0.38
5,085,928 4.33
CAYMAN ISLANDS260,000 Agile Property Holdings 402,580 0.34421,000 China Shanshui Cement Group 483,899 0.41971,000 Country Garden Holdings 427,962 0.36318,000 Haitian International Holdings 413,114 0.35143,000 Lifestyle International Holdings 418,491 0.36704,000 Soho China 628,256 0.54
43,400 Tencent Holdings 1,175,580 1.0014,000 TPK Holding 426,214 0.36
164,800 Wynn Macau 535,759 0.46
4,911,855 4.18
INDIA16,115 Bajaj Auto 507,258 0.43
25,488 Bharat Petroleum 369,816 0.3136,981 HCL Technologies 409,406 0.35
147,830 Hindalco Industries 596,497 0.51182,319 ITC 828,268 0.7081,224 LIC Housing Finance 440,471 0.3779,653 Oil & Natural Gas 488,452 0.4240,930 Sun Pharmaceuticals Industries 458,345 0.3989,780 Titan Industries 429,363 0.37
4,527,876 3.85
98
JPMorgan Funds - Asia Pacific ex-Japan Behavioural Finance Equity FundSchedule of Investments (Market Value Expressed in USD)
As at 30 June 2011
Quantity/Nominal
Value
Name of Securities Maturity/Coupon
MarketValue
%of
NetAssets
Quantity/Nominal
Value
Name of Securities Maturity/Coupon
MarketValue
%of
NetAssets
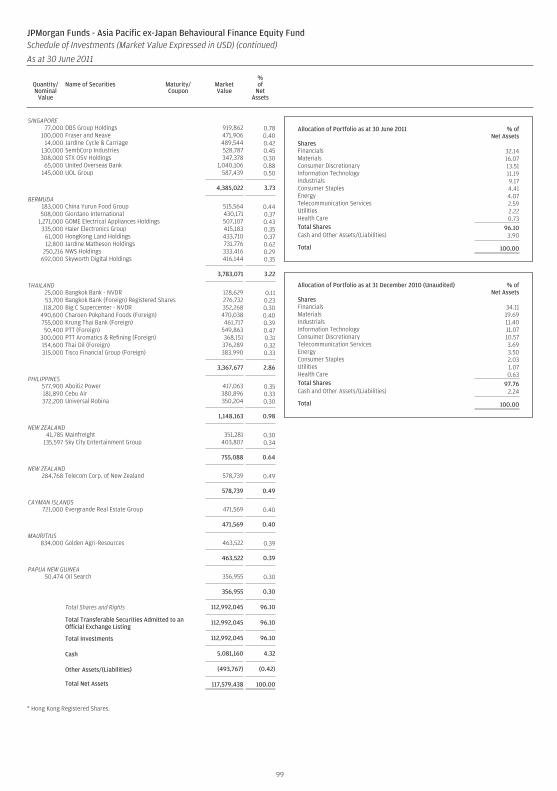
SINGAPORE77,000 DBS Group Holdings 919,862 0.78
100,000 Fraser and Neave 471,906 0.4014,000 Jardine Cycle & Carriage 489,544 0.42
130,000 SembCorp Industries 528,787 0.45308,000 STX OSV Holdings 347,378 0.30
65,000 United Overseas Bank 1,040,106 0.88145,000 UOL Group 587,439 0.50
4,385,022 3.73
BERMUDA183,000 China Yurun Food Group 515,564 0.44508,000 Giordano International 430,171 0.37
1,271,000 GOME Electrical Appliances Holdings 507,107 0.43335,000 Haier Electronics Group 415,183 0.35
61,000 HongKong Land Holdings 433,710 0.3712,800 Jardine Matheson Holdings 731,776 0.62
250,216 NWS Holdings 333,416 0.29692,000 Skyworth Digital Holdings 416,144 0.35
3,783,071 3.22
THAILAND25,000 Bangkok Bank - NVDR 128,629 0.1153,700 Bangkok Bank (Foreign) Registered Shares 276,732 0.23
118,200 Big C Supercenter - NVDR 352,268 0.30490,600 Charoen Pokphand Foods (Foreign) 470,038 0.40755,000 Krung Thai Bank (Foreign) 461,717 0.3950,400 PTT (Foreign) 549,863 0.47
300,000 PTT Aromatics & Refining (Foreign) 368,151 0.31154,600 Thai Oil (Foreign) 376,289 0.32315,000 Tisco Financial Group (Foreign) 383,990 0.33
3,367,677 2.86
PHILIPPINES577,900 Aboitiz Power 417,063 0.35181,890 Cebu Air 380,896 0.33372,200 Universal Robina 350,204 0.30
1,148,163 0.98
NEW ZEALAND41,785 Mainfreight 351,281 0.30
135,597 Sky City Entertainment Group 403,807 0.34
755,088 0.64
NEW ZEALAND284,768 Telecom Corp. of New Zealand 578,739 0.49
578,739 0.49
CAYMAN ISLANDS721,000 Evergrande Real Estate Group 471,569 0.40
471,569 0.40
MAURITIUS834,000 Golden Agri-Resources 463,522 0.39
463,522 0.39
PAPUA NEW GUINEA50,474 Oil Search 356,955 0.30
356,955 0.30
Total Shares and Rights 112,992,045 96.10
Total Transferable Securities Admitted to anOfficial Exchange Listing
112,992,045 96.10
Total Investments 112,992,045 96.10
Cash 5,081,160 4.32
Other Assets/(Liabilities) (493,767) (0.42)
Total Net Assets 117,579,438 100.00
* Hong Kong Registered Shares.
Allocation of Portfolio as at 30 June 2011 % ofNet Assets
SharesFinancials 32.14Materials 16.07Consumer Discretionary 13.51Information Technology 11.19Industrials 9.17Consumer Staples 4.41Energy 4.07Telecommunication Services 2.59Utilities 2.22Health Care 0.73Total Shares 96.10Cash and Other Assets/(Liabilities) 3.90
Total 100.00
Allocation of Portfolio as at 31 December 2010 (Unaudited) % ofNet Assets
SharesFinancials 34.11Materials 19.69Industrials 11.40Information Technology 11.07Consumer Discretionary 10.57Telecommunication Services 3.69Energy 3.50Consumer Staples 2.03Utilities 1.07Health Care 0.63Total Shares 97.76Cash and Other Assets/(Liabilities) 2.24
Total 100.00
99
JPMorgan Funds - Asia Pacific ex-Japan Behavioural Finance Equity FundSchedule of Investments (Market Value Expressed in USD) (continued)
As at 30 June 2011
Quantity/Nominal
Value
Name of Securities Maturity/Coupon
MarketValue
%of
NetAssets
Quantity/Nominal
Value
Name of Securities Maturity/Coupon
MarketValue
%of
NetAssets
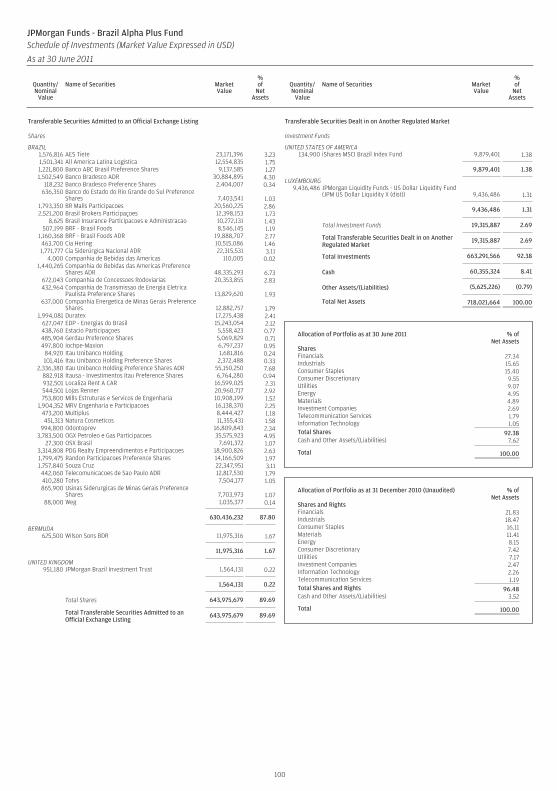
Transferable Securities Admitted to an Official Exchange Listing
Shares
BRAZIL1,576,816 AES Tiete 23,171,396 3.231,501,341 All America Latina Logistica 12,554,835 1.751,221,800 Banco ABC Brasil Preference Shares 9,137,585 1.271,502,549 Banco Bradesco ADR 30,884,895 4.30
118,232 Banco Bradesco Preference Shares 2,404,007 0.34636,350 Banco do Estado do Rio Grande do Sul Preference
Shares 7,403,541 1.031,793,350 BR Malls Participacoes 20,560,225 2.862,521,200 Brasil Brokers Participaçoes 12,398,153 1.73
8,625 Brasil Insurance Participacoes e Administracao 10,272,131 1.43507,199 BRF - Brasil Foods 8,546,145 1.19
1,160,368 BRF - Brasil Foods ADR 19,888,707 2.77463,700 Cia Hering 10,515,086 1.461,771,777 Cía Siderúrgica Nacional ADR 22,315,531 3.11
4,000 Companhia de Bebidas das Americas 110,005 0.021,440,265 Companhia de Bebidas das Americas Preference
Shares ADR 48,335,293 6.73672,043 Companhia de Concessoes Rodoviarias 20,353,855 2.83432,964 Companhia de Transmissao de Energia Eletrica
Paulista Preference Shares 13,829,620 1.93637,000 Companhia Energetica de Minas Gerais Preference
Shares 12,882,757 1.791,994,081 Duratex 17,275,438 2.41
627,047 EDP - Energias do Brasil 15,243,054 2.12438,760 Estacio Participaçoes 5,558,423 0.77485,904 Gerdau Preference Shares 5,069,829 0.71497,800 Iochpe-Maxion 6,797,237 0.95
84,920 Itau Unibanco Holding 1,681,816 0.24101,416 Itau Unibanco Holding Preference Shares 2,372,488 0.33
2,336,380 Itau Unibanco Holding Preference Shares ADR 55,150,250 7.68882,918 Itausa - Investimentos Itau Preference Shares 6,764,280 0.94932,501 Localiza Rent A CAR 16,599,025 2.31544,501 Lojas Renner 20,960,717 2.92753,800 Mills Estruturas e Servicos de Engenharia 10,908,199 1.52
1,904,352 MRV Engenharia e Participacoes 16,138,370 2.25473,200 Multiplus 8,444,427 1.18451,313 Natura Cosmeticos 11,355,431 1.58
994,800 Odontoprev 16,809,843 2.343,783,500 OGX Petroleo e Gas Participacoes 35,575,923 4.95
27,300 OSX Brasil 7,691,372 1.073,314,808 PDG Realty Empreendimentos e Participacoes 18,900,826 2.631,799,475 Randon Participacoes Preference Shares 14,166,509 1.971,757,840 Souza Cruz 22,347,951 3.11442,060 Telecomunicacoes de Sao Paulo ADR 12,817,530 1.79410,280 Totvs 7,504,177 1.05865,900 Usinas Siderurgicas de Minas Gerais Preference
Shares 7,703,973 1.0788,000 Weg 1,035,377 0.14
630,436,232 87.80
BERMUDA625,500 Wilson Sons BDR 11,975,316 1.67
11,975,316 1.67
UNITED KINGDOM951,180 JPMorgan Brazil Investment Trust 1,564,131 0.22
1,564,131 0.22
Total Shares 643,975,679 89.69
Total Transferable Securities Admitted to anOfficial Exchange Listing
643,975,679 89.69
Transferable Securities Dealt in on Another Regulated Market
Investment Funds
UNITED STATES OF AMERICA134,900 iShares MSCI Brazil Index Fund 9,879,401 1.38
9,879,401 1.38
LUXEMBOURG9,436,486 JPMorgan Liquidity Funds - US Dollar Liquidity Fund
(JPM US Dollar Liquidity X (dist)) 9,436,486 1.31
9,436,486 1.31
Total Investment Funds 19,315,887 2.69
Total Transferable Securities Dealt in on AnotherRegulated Market
19,315,887 2.69
Total Investments 663,291,566 92.38
Cash 60,355,324 8.41
Other Assets/(Liabilities) (5,625,226) (0.79)
Total Net Assets 718,021,664 100.00
Allocation of Portfolio as at 30 June 2011 % ofNet Assets
SharesFinancials 27.34Industrials 15.65Consumer Staples 15.40Consumer Discretionary 9.55Utilities 9.07Energy 4.95Materials 4.89Investment Companies 2.69Telecommunication Services 1.79Information Technology 1.05Total Shares 92.38Cash and Other Assets/(Liabilities) 7.62
Total 100.00
Allocation of Portfolio as at 31 December 2010 (Unaudited) % ofNet Assets
Shares and RightsFinancials 21.83Industrials 18.47Consumer Staples 16.11Materials 11.41Energy 8.15Consumer Discretionary 7.42Utilities 7.17Investment Companies 2.47Information Technology 2.26Telecommunication Services 1.19Total Shares and Rights 96.48Cash and Other Assets/(Liabilities) 3.52
Total 100.00
100
JPMorgan Funds - Brazil Alpha Plus FundSchedule of Investments (Market Value Expressed in USD)
As at 30 June 2011
Quantity/Nominal
Value
Name of Securities MarketValue
%of
NetAssets
Quantity/Nominal
Value
Name of Securities MarketValue
%of
NetAssets
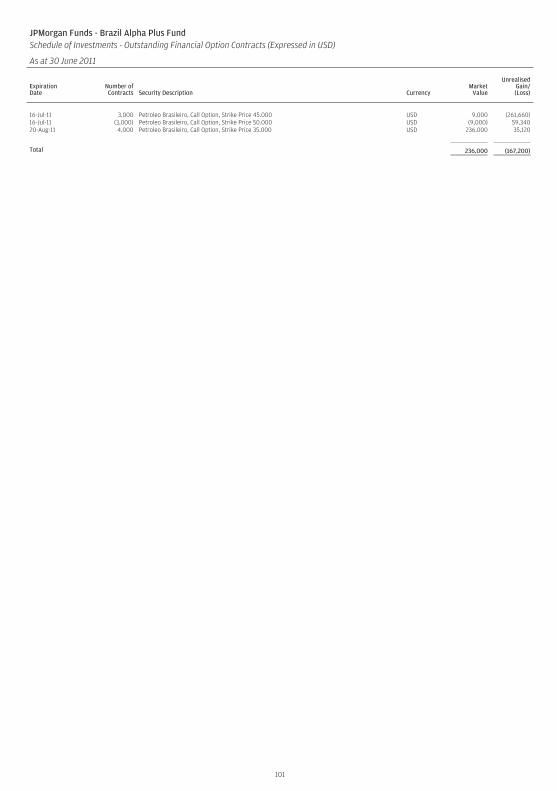
101
JPMorgan Funds - Brazil Alpha Plus FundSchedule of Investments - Outstanding Financial Option Contracts (Expressed in USD)
As at 30 June 2011
ExpirationDate
Number ofContracts Security Description Currency
MarketValue
UnrealisedGain/(Loss)
16-Jul-11 3,000 Petroleo Brasileiro, Call Option, Strike Price 45.000 USD 9,000 (261,660)16-Jul-11 (3,000) Petroleo Brasileiro, Call Option, Strike Price 50.000 USD (9,000) 59,34020-Aug-11 4,000 Petroleo Brasileiro, Call Option, Strike Price 35.000 USD 236,000 35,120
Total 236,000 (167,200)
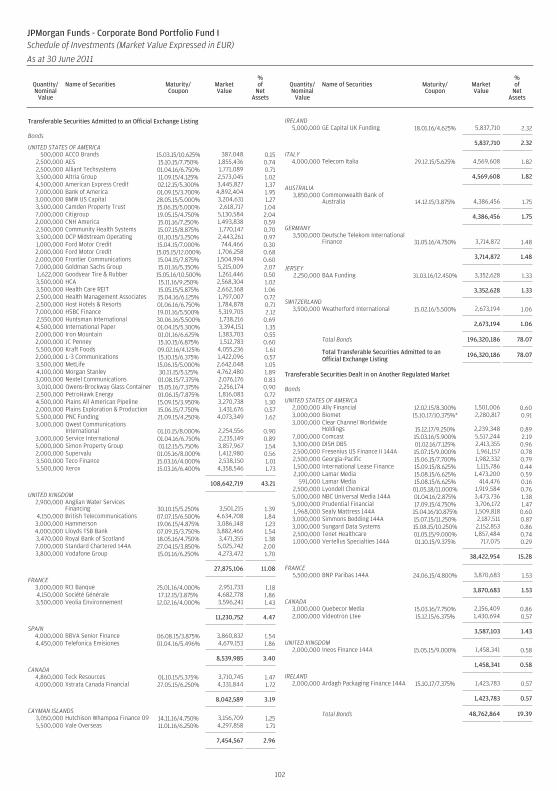
Transferable Securities Admitted to an Official Exchange Listing
Bonds
UNITED STATES OF AMERICA500,000 ACCO Brands 15.03.15/10.625% 387,048 0.15
2,500,000 AES 15.10.15/7.750% 1,855,436 0.742,500,000 Alliant Techsystems 01.04.16/6.750% 1,771,089 0.713,500,000 Altria Group 11.09.15/4.125% 2,573,045 1.024,500,000 American Express Credit 02.12.15/5.300% 3,445,827 1.377,000,000 Bank of America 01.09.15/3.700% 4,892,404 1.953,000,000 BMW US Capital 28.05.15/5.000% 3,204,631 1.273,500,000 Camden Property Trust 15.06.15/5.000% 2,618,717 1.047,000,000 Citigroup 19.05.15/4.750% 5,130,584 2.042,000,000 CNH America 15.01.16/7.250% 1,493,838 0.592,500,000 Community Health Systems 15.07.15/8.875% 1,770,147 0.703,500,000 DCP Midstream Operating 01.10.15/3.250% 2,443,261 0.971,000,000 Ford Motor Credit 15.04.15/7.000% 744,466 0.302,000,000 Ford Motor Credit 15.05.15/12.000% 1,706,258 0.682,000,000 Frontier Communications 15.04.15/7.875% 1,504,994 0.607,000,000 Goldman Sachs Group 15.01.16/5.350% 5,215,009 2.071,622,000 Goodyear Tire & Rubber 15.05.16/10.500% 1,261,446 0.503,500,000 HCA 15.11.16/9.250% 2,568,304 1.023,500,000 Health Care REIT 15.05.15/5.875% 2,662,368 1.062,500,000 Health Management Associates 15.04.16/6.125% 1,797,007 0.722,500,000 Host Hotels & Resorts 01.06.16/6.750% 1,784,878 0.717,000,000 HSBC Finance 19.01.16/5.500% 5,319,705 2.122,550,000 Huntsman International 30.06.16/5.500% 1,738,216 0.694,500,000 International Paper 01.04.15/5.300% 3,394,151 1.352,000,000 Iron Mountain 01.01.16/6.625% 1,383,703 0.552,000,000 JC Penney 15.10.15/6.875% 1,512,783 0.605,500,000 Kraft Foods 09.02.16/4.125% 4,055,236 1.612,000,000 L-3 Communications 15.10.15/6.375% 1,422,096 0.573,500,000 MetLife 15.06.15/5.000% 2,642,048 1.054,100,000 Morgan Stanley 30.11.15/5.125% 4,762,480 1.893,000,000 Nextel Communications 01.08.15/7.375% 2,076,176 0.833,010,000 Owens-Brockway Glass Container 15.05.16/7.375% 2,256,174 0.902,500,000 PetroHawk Energy 01.06.15/7.875% 1,816,083 0.724,500,000 Plains All American Pipeline 15.09.15/3.950% 3,270,738 1.302,000,000 Plains Exploration & Production 15.06.15/7.750% 1,431,676 0.575,500,000 PNC Funding 21.09.15/4.250% 4,073,349 1.623,000,000 Qwest Communications
International 01.10.15/8.000% 2,254,556 0.903,000,000 Service International 01.04.16/6.750% 2,235,149 0.895,000,000 Simon Property Group 01.12.15/5.750% 3,857,967 1.542,000,000 Supervalu 01.05.16/8.000% 1,412,980 0.563,500,000 Teco Finance 15.03.16/4.000% 2,538,150 1.015,500,000 Xerox 15.03.16/6.400% 4,358,546 1.73
108,642,719 43.21
UNITED KINGDOM2,900,000 Anglian Water Services
Financing 30.10.15/5.250% 3,501,215 1.394,150,000 British Telecommunications 07.07.15/6.500% 4,634,708 1.843,000,000 Hammerson 19.06.15/4.875% 3,086,148 1.234,000,000 Lloyds TSB Bank 07.09.15/3.750% 3,882,466 1.543,470,000 Royal Bank of Scotland 18.05.16/4.750% 3,471,355 1.387,000,000 Standard Chartered 144A 27.04.15/3.850% 5,025,742 2.003,800,000 Vodafone Group 15.01.16/6.250% 4,273,472 1.70
27,875,106 11.08
FRANCE3,000,000 RCI Banque 25.01.16/4.000% 2,951,733 1.184,150,000 Société Générale 17.12.15/3.875% 4,682,778 1.863,500,000 Veolia Environnement 12.02.16/4.000% 3,596,241 1.43
11,230,752 4.47
SPAIN4,000,000 BBVA Senior Finance 06.08.15/3.875% 3,860,832 1.544,450,000 Telefonica Emisiones 01.04.16/5.496% 4,679,153 1.86
8,539,985 3.40
CANADA4,860,000 Teck Resources 01.10.15/5.375% 3,710,745 1.474,000,000 Xstrata Canada Financial 27.05.15/6.250% 4,331,844 1.72
8,042,589 3.19
CAYMAN ISLANDS3,050,000 Hutchison Whampoa Finance 09 14.11.16/4.750% 3,156,709 1.255,500,000 Vale Overseas 11.01.16/6.250% 4,297,858 1.71
7,454,567 2.96
IRELAND5,000,000 GE Capital UK Funding 18.01.16/4.625% 5,837,710 2.32
5,837,710 2.32
ITALY4,000,000 Telecom Italia 29.12.15/5.625% 4,569,608 1.82
4,569,608 1.82
AUSTRALIA3,850,000 Commonwealth Bank of
Australia 14.12.15/3.875% 4,386,456 1.75
4,386,456 1.75
GERMANY3,500,000 Deutsche Telekom International
Finance 31.05.16/4.750% 3,714,872 1.48
3,714,872 1.48
JERSEY2,250,000 BAA Funding 31.03.16/12.450% 3,352,628 1.33
3,352,628 1.33
SWITZERLAND3,500,000 Weatherford International 15.02.16/5.500% 2,673,194 1.06
2,673,194 1.06
Total Bonds 196,320,186 78.07
Total Transferable Securities Admitted to anOfficial Exchange Listing
196,320,186 78.07
Transferable Securities Dealt in on Another Regulated Market
Bonds
UNITED STATES OF AMERICA2,000,000 Ally Financial 12.02.15/8.300% 1,501,006 0.603,000,000 Biomet 15.10.17/10.375%* 2,280,817 0.913,000,000 Clear Channel Worldwide
Holdings 15.12.17/9.250% 2,239,348 0.897,000,000 Comcast 15.03.16/5.900% 5,517,244 2.193,300,000 DISH DBS 01.02.16/7.125% 2,413,355 0.962,500,000 Fresenius US Finance II 144A 15.07.15/9.000% 1,961,157 0.782,500,000 Georgia-Pacific 15.06.15/7.700% 1,982,332 0.791,500,000 International Lease Finance 15.09.15/8.625% 1,115,786 0.442,100,000 Lamar Media 15.08.15/6.625% 1,473,200 0.59
591,000 Lamar Media 15.08.15/6.625% 414,476 0.162,500,000 Lyondell Chemical 01.05.18/11.000% 1,919,584 0.765,000,000 NBC Universal Media 144A 01.04.16/2.875% 3,473,736 1.385,000,000 Prudential Financial 17.09.15/4.750% 3,706,172 1.471,968,000 Sealy Mattress 144A 15.04.16/10.875% 1,509,818 0.603,000,000 Simmons Bedding 144A 15.07.15/11.250% 2,187,511 0.873,000,000 Sungard Data Systems 15.08.15/10.250% 2,152,853 0.862,500,000 Tenet Healthcare 01.05.15/9.000% 1,857,484 0.741,000,000 Vertellus Specialties 144A 01.10.15/9.375% 717,075 0.29
38,422,954 15.28
FRANCE5,500,000 BNP Paribas 144A 24.06.15/4.800% 3,870,683 1.53
3,870,683 1.53
CANADA3,000,000 Quebecor Media 15.03.16/7.750% 2,156,409 0.862,000,000 Videotron Ltee 15.12.15/6.375% 1,430,694 0.57
3,587,103 1.43
UNITED KINGDOM2,000,000 Ineos Finance 144A 15.05.15/9.000% 1,458,341 0.58
1,458,341 0.58
IRELAND2,000,000 Ardagh Packaging Finance 144A 15.10.17/7.375% 1,423,783 0.57
1,423,783 0.57
Total Bonds 48,762,864 19.39
102
JPMorgan Funds - Corporate Bond Portfolio Fund ISchedule of Investments (Market Value Expressed in EUR)
As at 30 June 2011
Quantity/Nominal
Value
Name of Securities Maturity/Coupon
MarketValue
%of
NetAssets
Quantity/Nominal
Value
Name of Securities Maturity/Coupon
MarketValue
%of
NetAssets
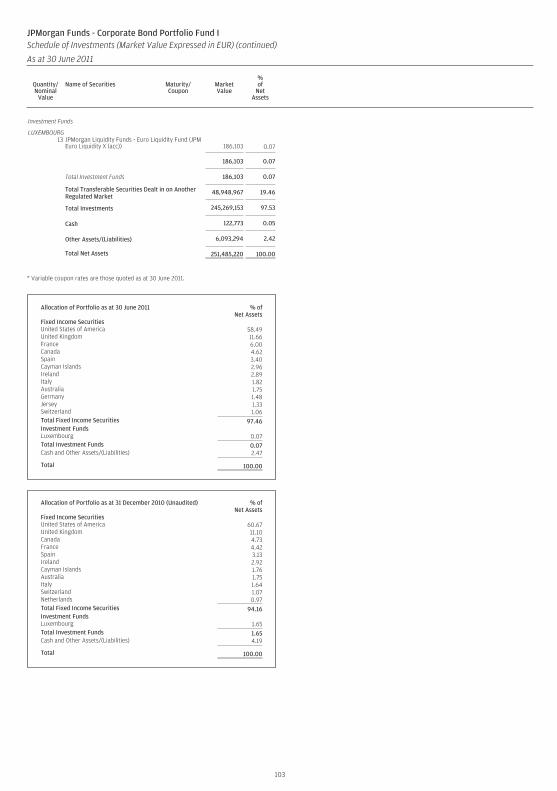
Investment Funds
LUXEMBOURG13 JPMorgan Liquidity Funds - Euro Liquidity Fund (JPM
Euro Liquidity X (acc)) 186,103 0.07
186,103 0.07
Total Investment Funds 186,103 0.07
Total Transferable Securities Dealt in on AnotherRegulated Market
48,948,967 19.46
Total Investments 245,269,153 97.53
Cash 122,773 0.05
Other Assets/(Liabilities) 6,093,294 2.42
Total Net Assets 251,485,220 100.00
* Variable coupon rates are those quoted as at 30 June 2011.
Allocation of Portfolio as at 30 June 2011 % ofNet Assets
Fixed Income SecuritiesUnited States of America 58.49United Kingdom 11.66France 6.00Canada 4.62Spain 3.40Cayman Islands 2.96Ireland 2.89Italy 1.82Australia 1.75Germany 1.48Jersey 1.33Switzerland 1.06Total Fixed Income Securities 97.46Investment FundsLuxembourg 0.07Total Investment Funds 0.07Cash and Other Assets/(Liabilities) 2.47
Total 100.00
Allocation of Portfolio as at 31 December 2010 (Unaudited) % ofNet Assets
Fixed Income SecuritiesUnited States of America 60.67United Kingdom 11.10Canada 4.73France 4.42Spain 3.13Ireland 2.92Cayman Islands 1.76Australia 1.75Italy 1.64Switzerland 1.07Netherlands 0.97Total Fixed Income Securities 94.16Investment FundsLuxembourg 1.65Total Investment Funds 1.65Cash and Other Assets/(Liabilities) 4.19
Total 100.00
103
JPMorgan Funds - Corporate Bond Portfolio Fund ISchedule of Investments (Market Value Expressed in EUR) (continued)
As at 30 June 2011
Quantity/Nominal
Value
Name of Securities Maturity/Coupon
MarketValue
%of
NetAssets
Quantity/Nominal
Value
Name of Securities Maturity/Coupon
MarketValue
%of
NetAssets
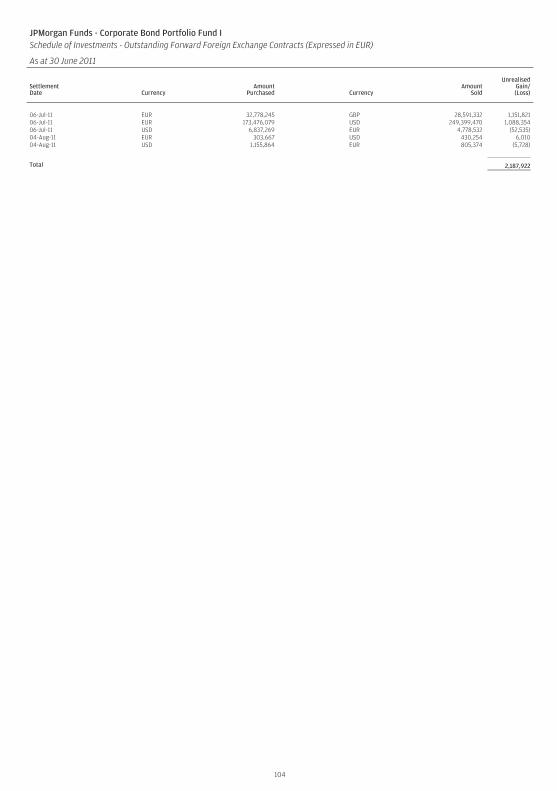
JPMorgan Funds - Corporate Bond Portfolio Fund ISchedule of Investments - Outstanding Forward Foreign Exchange Contracts (Expressed in EUR)
As at 30 June 2011
SettlementDate Currency
AmountPurchased Currency
AmountSold
UnrealisedGain/(Loss)
06-Jul-11 EUR 32,778,245 GBP 28,591,332 1,151,82106-Jul-11 EUR 173,476,079 USD 249,399,470 1,088,35406-Jul-11 USD 6,837,269 EUR 4,778,532 (52,535)04-Aug-11 EUR 303,667 USD 430,254 6,01004-Aug-11 USD 1,155,864 EUR 805,374 (5,728)
Total 2,187,922
104
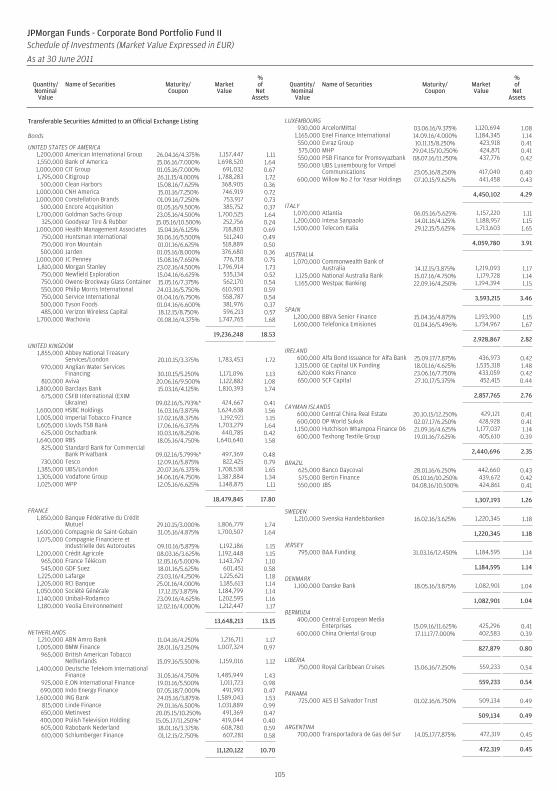
Transferable Securities Admitted to an Official Exchange Listing
Bonds
UNITED STATES OF AMERICA1,200,000 American International Group 26.04.16/4.375% 1,157,447 1.111,550,000 Bank of America 15.06.16/7.000% 1,698,520 1.641,000,000 CIT Group 01.05.16/7.000% 691,032 0.671,795,000 Citigroup 26.11.15/4.000% 1,788,283 1.72
500,000 Clean Harbors 15.08.16/7.625% 368,905 0.361,000,000 CNH America 15.01.16/7.250% 746,919 0.721,000,000 Constellation Brands 01.09.16/7.250% 753,917 0.73
500,000 Encore Acquisition 01.05.16/9.500% 385,752 0.371,700,000 Goldman Sachs Group 23.05.16/4.500% 1,700,525 1.64
325,000 Goodyear Tire & Rubber 15.05.16/10.500% 252,756 0.241,000,000 Health Management Associates 15.04.16/6.125% 718,803 0.69
750,000 Huntsman International 30.06.16/5.500% 511,240 0.49750,000 Iron Mountain 01.01.16/6.625% 518,889 0.50500,000 Jarden 01.05.16/8.000% 376,680 0.36
1,000,000 JC Penney 15.08.16/7.650% 776,718 0.751,810,000 Morgan Stanley 23.02.16/4.500% 1,796,914 1.73
750,000 Newfield Exploration 15.04.16/6.625% 535,134 0.52750,000 Owens-Brockway Glass Container 15.05.16/7.375% 562,170 0.54550,000 Philip Morris International 24.03.16/5.750% 610,903 0.59750,000 Service International 01.04.16/6.750% 558,787 0.54500,000 Tyson Foods 01.04.16/6.600% 381,976 0.37485,000 Verizon Wireless Capital 18.12.15/8.750% 596,213 0.57
1,700,000 Wachovia 01.08.16/4.375% 1,747,765 1.68
19,236,248 18.53
UNITED KINGDOM1,855,000 Abbey National Treasury
Services/London 20.10.15/3.375% 1,783,453 1.72970,000 Anglian Water Services
Financing 30.10.15/5.250% 1,171,096 1.13810,000 Aviva 20.06.16/9.500% 1,122,882 1.08
1,800,000 Barclays Bank 15.03.16/4.125% 1,810,393 1.74675,000 CSFB International (EXIM
Ukraine) 09.02.16/5.793%* 424,667 0.411,600,000 HSBC Holdings 16.03.16/3.875% 1,624,638 1.561,005,000 Imperial Tobacco Finance 17.02.16/8.375% 1,192,921 1.151,605,000 Lloyds TSB Bank 17.06.16/6.375% 1,703,279 1.64
625,000 Oschadbank 10.03.16/8.250% 440,785 0.421,640,000 RBS 18.05.16/4.750% 1,640,640 1.58
825,000 Standard Bank for CommercialBank Privatbank 09.02.16/5.799%* 497,369 0.48
730,000 Tesco 12.09.16/5.875% 822,425 0.791,385,000 UBS/London 20.07.16/6.375% 1,708,538 1.651,305,000 Vodafone Group 14.06.16/4.750% 1,387,884 1.341,025,000 WPP 12.05.16/6.625% 1,148,875 1.11
18,479,845 17.80
FRANCE1,850,000 Banque Fédérative du Crédit
Mutuel 29.10.15/3.000% 1,806,779 1.741,600,000 Compagnie de Saint-Gobain 31.05.16/4.875% 1,700,507 1.641,075,000 Compagnie Financiere et
Industrielle des Autoroutes 09.10.16/5.875% 1,192,186 1.151,200,000 Crédit Agricole 08.03.16/3.625% 1,192,448 1.15
965,000 France Télécom 12.05.16/5.000% 1,143,767 1.10545,000 GDF Suez 18.01.16/5.625% 601,451 0.58
1,225,000 Lafarge 23.03.16/4.250% 1,225,621 1.181,205,000 RCI Banque 25.01.16/4.000% 1,185,613 1.141,050,000 Société Générale 17.12.15/3.875% 1,184,799 1.141,140,000 Unibail-Rodamco 23.09.16/4.625% 1,202,595 1.161,180,000 Veolia Environnement 12.02.16/4.000% 1,212,447 1.17
13,648,213 13.15
NETHERLANDS1,210,000 ABN Amro Bank 11.04.16/4.250% 1,216,711 1.171,005,000 BMW Finance 28.01.16/3.250% 1,007,324 0.97
965,000 British American TobaccoNetherlands 15.09.16/5.500% 1,159,016 1.12
1,400,000 Deutsche Telekom InternationalFinance 31.05.16/4.750% 1,485,949 1.43
925,000 E.ON International Finance 19.01.16/5.500% 1,011,723 0.98690,000 Indo Energy Finance 07.05.18/7.000% 491,993 0.47
1,600,000 ING Bank 24.05.16/3.875% 1,589,043 1.53815,000 Linde Finance 29.01.16/6.500% 1,031,889 0.99650,000 Metinvest 20.05.15/10.250% 491,369 0.47400,000 Polish Television Holding 15.05.17/11.250%* 419,044 0.40605,000 Rabobank Nederland 18.01.16/3.375% 608,780 0.59610,000 Schlumberger Finance 01.12.15/2.750% 607,281 0.58
11,120,122 10.70
LUXEMBOURG930,000 ArcelorMittal 03.06.16/9.375% 1,120,694 1.08
1,165,000 Enel Finance International 14.09.16/4.000% 1,184,345 1.14550,000 Evraz Group 10.11.15/8.250% 423,918 0.41575,000 MHP 29.04.15/10.250% 424,871 0.41550,000 PSB Finance for Promsvyazbank 08.07.16/11.250% 437,776 0.42550,000 UBS Luxembourg for Vimpel
Communications 23.05.16/8.250% 417,040 0.40600,000 Willow No 2 for Yasar Holdings 07.10.15/9.625% 441,458 0.43
4,450,102 4.29
ITALY1,070,000 Atlantia 06.05.16/5.625% 1,157,220 1.111,200,000 Intesa Sanpaolo 14.01.16/4.125% 1,188,957 1.151,500,000 Telecom Italia 29.12.15/5.625% 1,713,603 1.65
4,059,780 3.91
AUSTRALIA1,070,000 Commonwealth Bank of
Australia 14.12.15/3.875% 1,219,093 1.171,125,000 National Australia Bank 15.07.16/4.750% 1,179,728 1.141,165,000 Westpac Banking 22.09.16/4.250% 1,194,394 1.15
3,593,215 3.46
SPAIN1,200,000 BBVA Senior Finance 15.04.16/4.875% 1,193,900 1.151,650,000 Telefonica Emisiones 01.04.16/5.496% 1,734,967 1.67
2,928,867 2.82
IRELAND600,000 Alfa Bond Issuance for Alfa Bank 25.09.17/7.875% 436,973 0.42
1,315,000 GE Capital UK Funding 18.01.16/4.625% 1,535,318 1.48620,000 Koks Finance 23.06.16/7.750% 433,059 0.42650,000 SCF Capital 27.10.17/5.375% 452,415 0.44
2,857,765 2.76
CAYMAN ISLANDS600,000 Central China Real Estate 20.10.15/12.250% 429,121 0.41600,000 DP World Sukuk 02.07.17/6.250% 428,928 0.41
1,150,000 Hutchison Whampoa Finance 06 21.09.16/4.625% 1,177,037 1.14600,000 Texhong Textile Group 19.01.16/7.625% 405,610 0.39
2,440,696 2.35
BRAZIL625,000 Banco Daycoval 28.01.16/6.250% 442,660 0.43575,000 Bertin Finance 05.10.16/10.250% 439,672 0.42550,000 JBS 04.08.16/10.500% 424,861 0.41
1,307,193 1.26
SWEDEN1,210,000 Svenska Handelsbanken 16.02.16/3.625% 1,220,345 1.18
1,220,345 1.18
JERSEY795,000 BAA Funding 31.03.16/12.450% 1,184,595 1.14
1,184,595 1.14
DENMARK1,100,000 Danske Bank 18.05.16/3.875% 1,082,901 1.04
1,082,901 1.04
BERMUDA400,000 Central European Media
Enterprises 15.09.16/11.625% 425,296 0.41600,000 China Oriental Group 17.11.17/7.000% 402,583 0.39
827,879 0.80
LIBERIA750,000 Royal Caribbean Cruises 15.06.16/7.250% 559,233 0.54
559,233 0.54
PANAMA725,000 AES El Salvador Trust 01.02.16/6.750% 509,134 0.49
509,134 0.49
ARGENTINA700,000 Transportadora de Gas del Sur 14.05.17/7.875% 472,319 0.45
472,319 0.45
105
JPMorgan Funds - Corporate Bond Portfolio Fund IISchedule of Investments (Market Value Expressed in EUR)
As at 30 June 2011
Quantity/Nominal
Value
Name of Securities Maturity/Coupon
MarketValue
%of
NetAssets
Quantity/Nominal
Value
Name of Securities Maturity/Coupon
MarketValue
%of
NetAssets
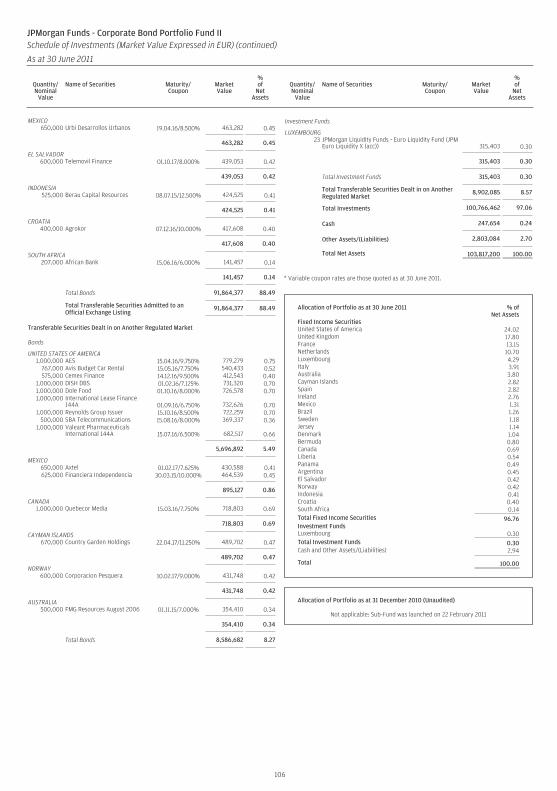
MEXICO650,000 Urbi Desarrollos Urbanos 19.04.16/8.500% 463,282 0.45
463,282 0.45
EL SALVADOR600,000 Telemovil Finance 01.10.17/8.000% 439,053 0.42
439,053 0.42
INDONESIA525,000 Berau Capital Resources 08.07.15/12.500% 424,525 0.41
424,525 0.41
CROATIA400,000 Agrokor 07.12.16/10.000% 417,608 0.40
417,608 0.40
SOUTH AFRICA207,000 African Bank 15.06.16/6.000% 141,457 0.14
141,457 0.14
Total Bonds 91,864,377 88.49
Total Transferable Securities Admitted to anOfficial Exchange Listing
91,864,377 88.49
Transferable Securities Dealt in on Another Regulated Market
Bonds
UNITED STATES OF AMERICA1,000,000 AES 15.04.16/9.750% 779,279 0.75
767,000 Avis Budget Car Rental 15.05.16/7.750% 540,433 0.52575,000 Cemex Finance 14.12.16/9.500% 412,543 0.40
1,000,000 DISH DBS 01.02.16/7.125% 731,320 0.701,000,000 Dole Food 01.10.16/8.000% 726,578 0.701,000,000 International Lease Finance
144A 01.09.16/6.750% 732,626 0.701,000,000 Reynolds Group Issuer 15.10.16/8.500% 722,259 0.70
500,000 SBA Telecommunications 15.08.16/8.000% 369,337 0.361,000,000 Valeant Pharmaceuticals
International 144A 15.07.16/6.500% 682,517 0.66
5,696,892 5.49
MEXICO650,000 Axtel 01.02.17/7.625% 430,588 0.41625,000 Financiera Independencia 30.03.15/10.000% 464,539 0.45
895,127 0.86
CANADA1,000,000 Quebecor Media 15.03.16/7.750% 718,803 0.69
718,803 0.69
CAYMAN ISLANDS670,000 Country Garden Holdings 22.04.17/11.250% 489,702 0.47
489,702 0.47
NORWAY600,000 Corporacion Pesquera 10.02.17/9.000% 431,748 0.42
431,748 0.42
AUSTRALIA500,000 FMG Resources August 2006 01.11.15/7.000% 354,410 0.34
354,410 0.34
Total Bonds 8,586,682 8.27
Investment Funds
LUXEMBOURG23 JPMorgan Liquidity Funds - Euro Liquidity Fund (JPM
Euro Liquidity X (acc)) 315,403 0.30
315,403 0.30
Total Investment Funds 315,403 0.30
Total Transferable Securities Dealt in on AnotherRegulated Market
8,902,085 8.57
Total Investments 100,766,462 97.06
Cash 247,654 0.24
Other Assets/(Liabilities) 2,803,084 2.70
Total Net Assets 103,817,200 100.00
* Variable coupon rates are those quoted as at 30 June 2011.
Allocation of Portfolio as at 30 June 2011 % ofNet Assets
Fixed Income SecuritiesUnited States of America 24.02United Kingdom 17.80France 13.15Netherlands 10.70Luxembourg 4.29Italy 3.91Australia 3.80Cayman Islands 2.82Spain 2.82Ireland 2.76Mexico 1.31Brazil 1.26Sweden 1.18Jersey 1.14Denmark 1.04Bermuda 0.80Canada 0.69Liberia 0.54Panama 0.49Argentina 0.45El Salvador 0.42Norway 0.42Indonesia 0.41Croatia 0.40South Africa 0.14Total Fixed Income Securities 96.76Investment FundsLuxembourg 0.30Total Investment Funds 0.30Cash and Other Assets/(Liabilities) 2.94
Total 100.00
Allocation of Portfolio as at 31 December 2010 (Unaudited)
Not applicable: Sub-Fund was launched on 22 February 2011
106
JPMorgan Funds - Corporate Bond Portfolio Fund IISchedule of Investments (Market Value Expressed in EUR) (continued)
As at 30 June 2011
Quantity/Nominal
Value
Name of Securities Maturity/Coupon
MarketValue
%of
NetAssets
Quantity/Nominal
Value
Name of Securities Maturity/Coupon
MarketValue
%of
NetAssets
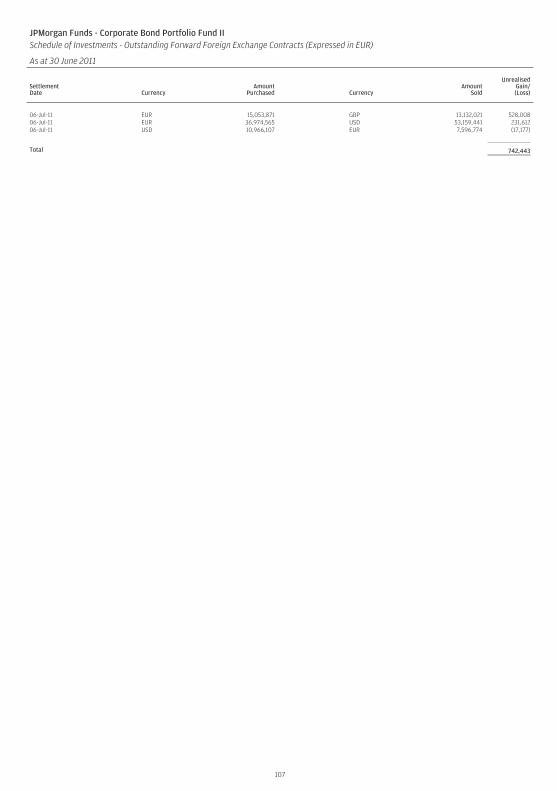
JPMorgan Funds - Corporate Bond Portfolio Fund IISchedule of Investments - Outstanding Forward Foreign Exchange Contracts (Expressed in EUR)
As at 30 June 2011
SettlementDate Currency
AmountPurchased Currency
AmountSold
UnrealisedGain/(Loss)
06-Jul-11 EUR 15,053,871 GBP 13,132,021 528,00806-Jul-11 EUR 36,974,565 USD 53,159,441 231,61206-Jul-11 USD 10,966,107 EUR 7,596,774 (17,177)
Total 742,443
107
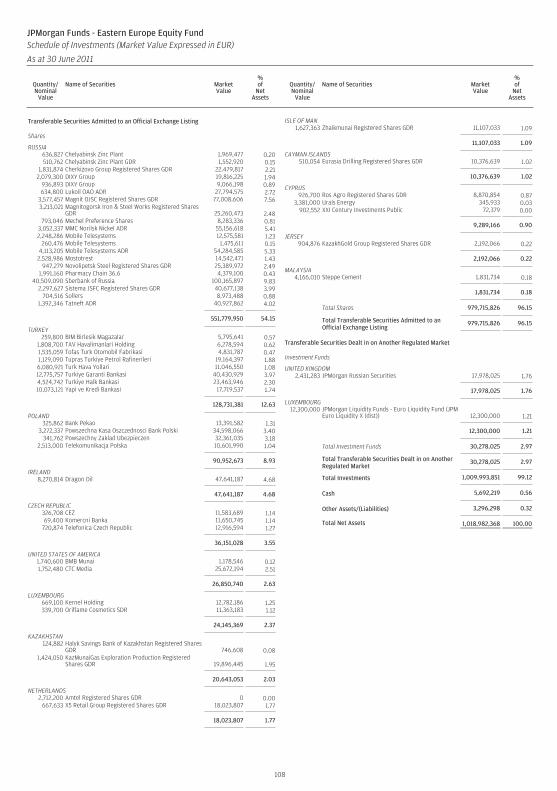
Transferable Securities Admitted to an Official Exchange Listing
Shares
RUSSIA636,827 Chelyabinsk Zinc Plant 1,969,477 0.20510,762 Chelyabinsk Zinc Plant GDR 1,552,920 0.15
1,831,874 Cherkizovo Group Registered Shares GDR 22,479,817 2.212,079,300 DIXY Group 19,816,225 1.94
936,893 DIXY Group 9,066,198 0.89634,800 Lukoil OAO ADR 27,794,575 2.72
3,577,457 Magnit OJSC Registered Shares GDR 77,008,606 7.563,213,021 Magnitogorsk Iron & Steel Works Registered Shares
GDR 25,260,473 2.48793,046 Mechel Preference Shares 8,283,336 0.81
3,052,337 MMC Norilsk Nickel ADR 55,156,618 5.412,248,286 Mobile Telesystems 12,575,581 1.23
260,476 Mobile Telesystems 1,475,611 0.154,113,205 Mobile Telesystems ADR 54,284,585 5.332,528,986 Mostotrest 14,542,471 1.43
947,279 Novolipetsk Steel Registered Shares GDR 25,389,972 2.491,991,160 Pharmacy Chain 36.6 4,379,100 0.43
40,509,090 Sberbank of Russia 100,165,897 9.832,297,627 Sistema JSFC Registered Shares GDR 40,677,138 3.99
704,516 Sollers 8,973,488 0.881,392,346 Tatneft ADR 40,927,862 4.02
551,779,950 54.15
TURKEY259,800 BIM Birlesik Magazalar 5,795,641 0.57
1,808,700 TAV Havalimanlari Holding 6,278,594 0.621,535,059 Tofas Turk Otomobil Fabrikasi 4,831,787 0.471,129,090 Tupras Turkiye Petrol Rafinerileri 19,164,397 1.886,080,921 Turk Hava Yollari 11,046,550 1.0812,775,757 Turkiye Garanti Bankasi 40,430,929 3.974,524,742 Turkiye Halk Bankasi 23,463,946 2.3010,073,121 Yapi ve Kredi Bankasi 17,719,537 1.74
128,731,381 12.63
POLAND325,862 Bank Pekao 13,391,582 1.31
3,272,337 Powszechna Kasa Oszczednosci Bank Polski 34,598,066 3.40341,762 Powszechny Zaklad Ubezpieczen 32,361,035 3.18
2,513,000 Telekomunikacja Polska 10,601,990 1.04
90,952,673 8.93
IRELAND8,270,814 Dragon Oil 47,641,187 4.68
47,641,187 4.68
CZECH REPUBLIC326,708 CEZ 11,583,689 1.1469,400 Komercni Banka 11,650,745 1.14
720,874 Telefonica Czech Republic 12,916,594 1.27
36,151,028 3.55
UNITED STATES OF AMERICA1,740,600 BMB Munai 1,178,546 0.121,752,480 CTC Media 25,672,194 2.51
26,850,740 2.63
LUXEMBOURG669,100 Kernel Holding 12,782,186 1.25339,700 Oriflame Cosmetics SDR 11,363,183 1.12
24,145,369 2.37
KAZAKHSTAN124,882 Halyk Savings Bank of Kazakhstan Registered Shares
GDR 746,608 0.081,424,050 KazMunaiGas Exploration Production Registered
Shares GDR 19,896,445 1.95
20,643,053 2.03
NETHERLANDS2,712,200 Amtel Registered Shares GDR 0 0.00
667,633 X5 Retail Group Registered Shares GDR 18,023,807 1.77
18,023,807 1.77
ISLE OF MAN1,627,363 Zhaikmunai Registered Shares GDR 11,107,033 1.09
11,107,033 1.09
CAYMAN ISLANDS510,054 Eurasia Drilling Registered Shares GDR 10,376,639 1.02
10,376,639 1.02
CYPRUS926,700 Ros Agro Registered Shares GDR 8,870,854 0.87
3,381,000 Urals Energy 345,933 0.03902,552 XXI Century Investments Public 72,379 0.00
9,289,166 0.90
JERSEY904,876 KazakhGold Group Registered Shares GDR 2,192,066 0.22
2,192,066 0.22
MALAYSIA4,166,010 Steppe Cement 1,831,734 0.18
1,831,734 0.18
Total Shares 979,715,826 96.15
Total Transferable Securities Admitted to anOfficial Exchange Listing
979,715,826 96.15
Transferable Securities Dealt in on Another Regulated Market
Investment Funds
UNITED KINGDOM2,431,283 JPMorgan Russian Securities 17,978,025 1.76
17,978,025 1.76
LUXEMBOURG12,300,000 JPMorgan Liquidity Funds - Euro Liquidity Fund (JPM
Euro Liquidity X (dist)) 12,300,000 1.21
12,300,000 1.21
Total Investment Funds 30,278,025 2.97
Total Transferable Securities Dealt in on AnotherRegulated Market
30,278,025 2.97
Total Investments 1,009,993,851 99.12
Cash 5,692,219 0.56
Other Assets/(Liabilities) 3,296,298 0.32
Total Net Assets 1,018,982,368 100.00
108
JPMorgan Funds - Eastern Europe Equity FundSchedule of Investments (Market Value Expressed in EUR)
As at 30 June 2011
Quantity/Nominal
Value
Name of Securities MarketValue
%of
NetAssets
Quantity/Nominal
Value
Name of Securities MarketValue
%of
NetAssets
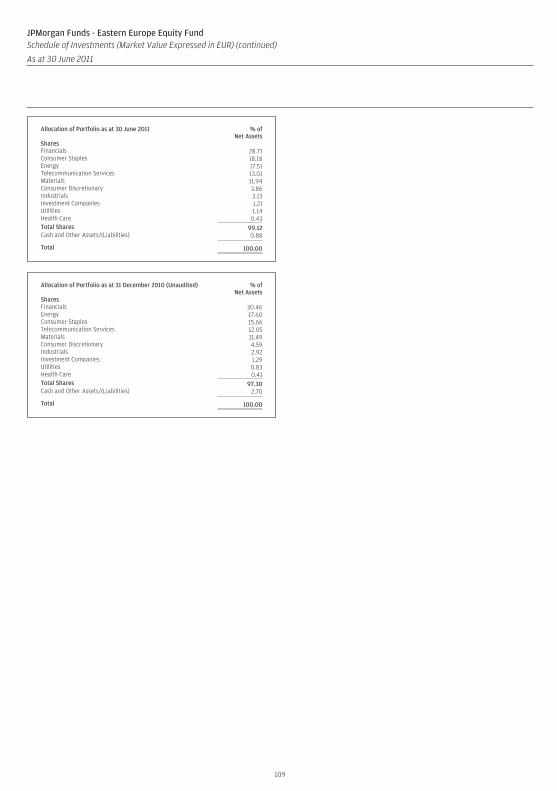
Allocation of Portfolio as at 30 June 2011 % ofNet Assets
SharesFinancials 28.71Consumer Staples 18.18Energy 17.51Telecommunication Services 13.01Materials 11.94Consumer Discretionary 3.86Industrials 3.13Investment Companies 1.21Utilities 1.14Health Care 0.43Total Shares 99.12Cash and Other Assets/(Liabilities) 0.88
Total 100.00
Allocation of Portfolio as at 31 December 2010 (Unaudited) % ofNet Assets
SharesFinancials 30.46Energy 17.60Consumer Staples 15.66Telecommunication Services 12.05Materials 11.49Consumer Discretionary 4.59Industrials 2.92Investment Companies 1.29Utilities 0.83Health Care 0.41Total Shares 97.30Cash and Other Assets/(Liabilities) 2.70
Total 100.00
109
JPMorgan Funds - Eastern Europe Equity FundSchedule of Investments (Market Value Expressed in EUR) (continued)
As at 30 June 2011
Quantity/Nominal
Value
Name of Securities MarketValue
%of
NetAssets
Quantity/Nominal
Value
Name of Securities MarketValue
%of
NetAssets
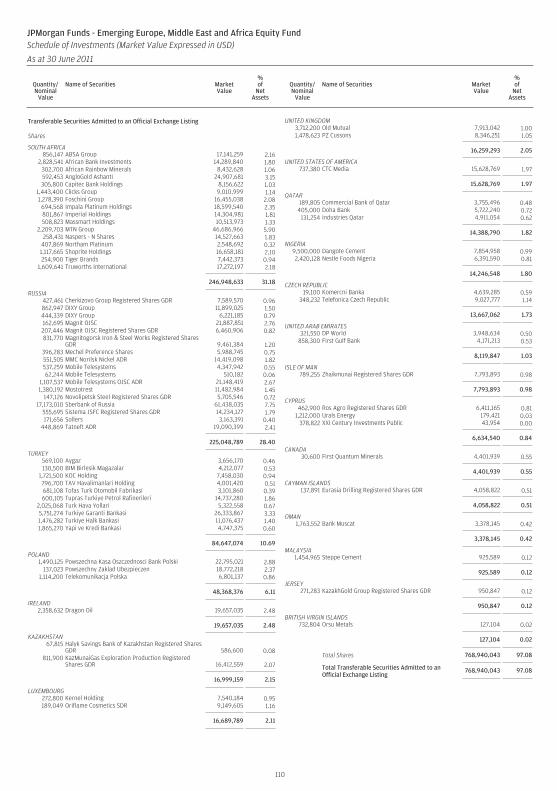
Transferable Securities Admitted to an Official Exchange Listing
Shares
SOUTH AFRICA856,147 ABSA Group 17,141,259 2.16
2,828,541 African Bank Investments 14,289,840 1.80302,700 African Rainbow Minerals 8,432,628 1.06592,453 AngloGold Ashanti 24,907,681 3.15305,800 Capitec Bank Holdings 8,156,622 1.03
1,443,400 Clicks Group 9,010,999 1.141,278,390 Foschini Group 16,455,038 2.08
694,568 Impala Platinum Holdings 18,599,540 2.35801,867 Imperial Holdings 14,304,981 1.81508,823 Massmart Holdings 10,513,973 1.33
2,209,703 MTN Group 46,686,966 5.90258,431 Naspers - N Shares 14,527,663 1.83
407,869 Northam Platinum 2,548,692 0.321,117,665 Shoprite Holdings 16,658,181 2.10254,900 Tiger Brands 7,442,373 0.94
1,609,641 Truworths International 17,272,197 2.18
246,948,633 31.18
RUSSIA427,461 Cherkizovo Group Registered Shares GDR 7,589,570 0.96862,947 DIXY Group 11,899,025 1.50444,339 DIXY Group 6,221,185 0.79162,695 Magnit OJSC 21,887,851 2.76207,446 Magnit OJSC Registered Shares GDR 6,460,906 0.82831,770 Magnitogorsk Iron & Steel Works Registered Shares
GDR 9,461,384 1.20396,283 Mechel Preference Shares 5,988,745 0.75551,505 MMC Norilsk Nickel ADR 14,419,098 1.82537,259 Mobile Telesystems 4,347,942 0.5562,244 Mobile Telesystems 510,182 0.06
1,107,537 Mobile Telesystems OJSC ADR 21,148,419 2.671,380,192 Mostotrest 11,482,984 1.45
147,126 Novolipetsk Steel Registered Shares GDR 5,705,546 0.7217,173,010 Sberbank of Russia 61,438,035 7.75
555,695 Sistema JSFC Registered Shares GDR 14,234,127 1.79171,656 Sollers 3,163,391 0.40
448,869 Tatneft ADR 19,090,399 2.41
225,048,789 28.40
TURKEY569,100 Aygaz 3,656,170 0.46130,500 BIM Birlesik Magazalar 4,212,077 0.53
1,721,500 KOC Holding 7,458,030 0.94796,700 TAV Havalimanlari Holding 4,001,420 0.51681,108 Tofas Turk Otomobil Fabrikasi 3,101,860 0.39600,105 Tupras Turkiye Petrol Rafinerileri 14,737,280 1.86
2,025,068 Turk Hava Yollari 5,322,558 0.675,751,274 Turkiye Garanti Bankasi 26,333,867 3.331,476,282 Turkiye Halk Bankasi 11,076,437 1.401,865,270 Yapi ve Kredi Bankasi 4,747,375 0.60
84,647,074 10.69
POLAND1,490,125 Powszechna Kasa Oszczednosci Bank Polski 22,795,021 2.88
137,023 Powszechny Zaklad Ubezpieczen 18,772,218 2.371,114,200 Telekomunikacja Polska 6,801,137 0.86
48,368,376 6.11
IRELAND2,358,632 Dragon Oil 19,657,035 2.48
19,657,035 2.48
KAZAKHSTAN67,815 Halyk Savings Bank of Kazakhstan Registered Shares
GDR 586,600 0.08811,900 KazMunaiGas Exploration Production Registered
Shares GDR 16,412,559 2.07
16,999,159 2.15
LUXEMBOURG272,800 Kernel Holding 7,540,184 0.95189,049 Oriflame Cosmetics SDR 9,149,605 1.16
16,689,789 2.11
UNITED KINGDOM3,712,200 Old Mutual 7,913,042 1.001,478,623 PZ Cussons 8,346,251 1.05
16,259,293 2.05
UNITED STATES OF AMERICA737,380 CTC Media 15,628,769 1.97
15,628,769 1.97
QATAR189,805 Commercial Bank of Qatar 3,755,496 0.48
405,000 Doha Bank 5,722,240 0.72131,254 Industries Qatar 4,911,054 0.62
14,388,790 1.82
NIGERIA9,500,000 Dangote Cement 7,854,958 0.992,420,128 Nestle Foods Nigeria 6,391,590 0.81
14,246,548 1.80
CZECH REPUBLIC19,100 Komercni Banka 4,639,285 0.59
348,232 Telefonica Czech Republic 9,027,777 1.14
13,667,062 1.73
UNITED ARAB EMIRATES321,550 DP World 3,948,634 0.50
858,300 First Gulf Bank 4,171,213 0.53
8,119,847 1.03
ISLE OF MAN789,255 Zhaikmunai Registered Shares GDR 7,793,893 0.98
7,793,893 0.98
CYPRUS462,900 Ros Agro Registered Shares GDR 6,411,165 0.81
1,212,000 Urals Energy 179,421 0.03378,822 XXI Century Investments Public 43,954 0.00
6,634,540 0.84
CANADA30,600 First Quantum Minerals 4,401,939 0.55
4,401,939 0.55
CAYMAN ISLANDS137,891 Eurasia Drilling Registered Shares GDR 4,058,822 0.51
4,058,822 0.51
OMAN1,763,552 Bank Muscat 3,378,145 0.42
3,378,145 0.42
MALAYSIA1,454,965 Steppe Cement 925,589 0.12
925,589 0.12
JERSEY271,283 KazakhGold Group Registered Shares GDR 950,847 0.12
950,847 0.12
BRITISH VIRGIN ISLANDS732,804 Orsu Metals 127,104 0.02
127,104 0.02
Total Shares 768,940,043 97.08
Total Transferable Securities Admitted to anOfficial Exchange Listing
768,940,043 97.08
110
JPMorgan Funds - Emerging Europe, Middle East and Africa Equity FundSchedule of Investments (Market Value Expressed in USD)
As at 30 June 2011
Quantity/Nominal
Value
Name of Securities MarketValue
%of
NetAssets
Quantity/Nominal
Value
Name of Securities MarketValue
%of
NetAssets
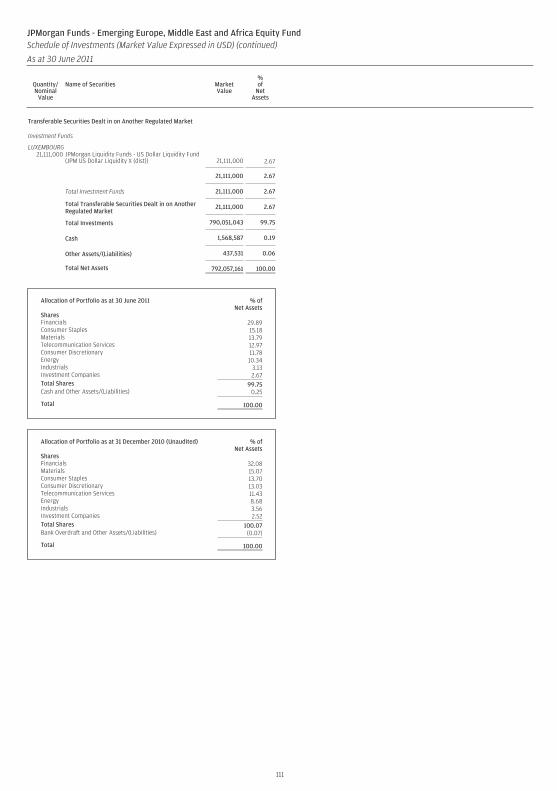
Transferable Securities Dealt in on Another Regulated Market
Investment Funds
LUXEMBOURG21,111,000 JPMorgan Liquidity Funds - US Dollar Liquidity Fund
(JPM US Dollar Liquidity X (dist)) 21,111,000 2.67
21,111,000 2.67
Total Investment Funds 21,111,000 2.67
Total Transferable Securities Dealt in on AnotherRegulated Market
21,111,000 2.67
Total Investments 790,051,043 99.75
Cash 1,568,587 0.19
Other Assets/(Liabilities) 437,531 0.06
Total Net Assets 792,057,161 100.00
Allocation of Portfolio as at 30 June 2011 % ofNet Assets
SharesFinancials 29.89Consumer Staples 15.18Materials 13.79Telecommunication Services 12.97Consumer Discretionary 11.78Energy 10.34Industrials 3.13Investment Companies 2.67Total Shares 99.75Cash and Other Assets/(Liabilities) 0.25
Total 100.00
Allocation of Portfolio as at 31 December 2010 (Unaudited) % ofNet Assets
SharesFinancials 32.08Materials 15.07Consumer Staples 13.70Consumer Discretionary 13.03Telecommunication Services 11.43Energy 8.68Industrials 3.56Investment Companies 2.52Total Shares 100.07Bank Overdraft and Other Assets/(Liabilities) (0.07)
Total 100.00
111
JPMorgan Funds - Emerging Europe, Middle East and Africa Equity FundSchedule of Investments (Market Value Expressed in USD) (continued)
As at 30 June 2011
Quantity/Nominal
Value
Name of Securities MarketValue
%of
NetAssets
Quantity/Nominal
Value
Name of Securities MarketValue
%of
NetAssets
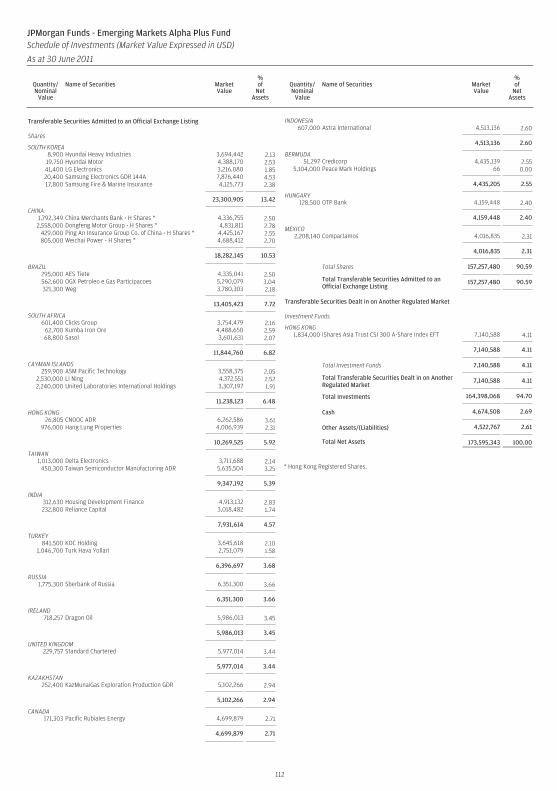
Transferable Securities Admitted to an Official Exchange Listing
Shares
SOUTH KOREA8,900 Hyundai Heavy Industries 3,694,442 2.1319,750 Hyundai Motor 4,388,170 2.5341,400 LG Electronics 3,216,080 1.8520,400 Samsung Electronics GDR 144A 7,876,440 4.5317,800 Samsung Fire & Marine Insurance 4,125,773 2.38
23,300,905 13.42
CHINA1,792,349 China Merchants Bank - H Shares * 4,336,755 2.502,558,000 Dongfeng Motor Group - H Shares * 4,831,811 2.78
429,000 Ping An Insurance Group Co. of China - H Shares * 4,425,167 2.55805,000 Weichai Power - H Shares * 4,688,412 2.70
18,282,145 10.53
BRAZIL295,000 AES Tiete 4,335,041 2.50562,600 OGX Petroleo e Gas Participacoes 5,290,079 3.04321,300 Weg 3,780,303 2.18
13,405,423 7.72
SOUTH AFRICA601,400 Clicks Group 3,754,479 2.16
62,700 Kumba Iron Ore 4,488,650 2.5968,800 Sasol 3,601,631 2.07
11,844,760 6.82
CAYMAN ISLANDS259,900 ASM Pacific Technology 3,558,375 2.05
2,530,000 Li Ning 4,372,551 2.522,240,000 United Laboratories International Holdings 3,307,197 1.91
11,238,123 6.48
HONG KONG26,805 CNOOC ADR 6,262,586 3.61
976,000 Hang Lung Properties 4,006,939 2.31
10,269,525 5.92
TAIWAN1,013,000 Delta Electronics 3,711,688 2.14
450,300 Taiwan Semiconductor Manufacturing ADR 5,635,504 3.25
9,347,192 5.39
INDIA312,630 Housing Development Finance 4,913,132 2.83232,800 Reliance Capital 3,018,482 1.74
7,931,614 4.57
TURKEY841,500 KOC Holding 3,645,618 2.10
1,046,700 Turk Hava Yollari 2,751,079 1.58
6,396,697 3.68
RUSSIA1,775,300 Sberbank of Russia 6,351,300 3.66
6,351,300 3.66
IRELAND718,257 Dragon Oil 5,986,013 3.45
5,986,013 3.45
UNITED KINGDOM229,757 Standard Chartered 5,977,014 3.44
5,977,014 3.44
KAZAKHSTAN252,400 KazMunaiGas Exploration Production GDR 5,102,266 2.94
5,102,266 2.94
CANADA171,303 Pacific Rubiales Energy 4,699,879 2.71
4,699,879 2.71
INDONESIA607,000 Astra International 4,513,136 2.60
4,513,136 2.60
BERMUDA51,297 Credicorp 4,435,139 2.55
5,104,000 Peace Mark Holdings 66 0.00
4,435,205 2.55
HUNGARY128,500 OTP Bank 4,159,448 2.40
4,159,448 2.40
MEXICO2,208,140 Compartamos 4,016,835 2.31
4,016,835 2.31
Total Shares 157,257,480 90.59
Total Transferable Securities Admitted to anOfficial Exchange Listing
157,257,480 90.59
Transferable Securities Dealt in on Another Regulated Market
Investment Funds
HONG KONG1,834,000 iShares Asia Trust CSI 300 A-Share Index EFT 7,140,588 4.11
7,140,588 4.11
Total Investment Funds 7,140,588 4.11
Total Transferable Securities Dealt in on AnotherRegulated Market
7,140,588 4.11
Total Investments 164,398,068 94.70
Cash 4,674,508 2.69
Other Assets/(Liabilities) 4,522,767 2.61
Total Net Assets 173,595,343 100.00
* Hong Kong Registered Shares.
112
JPMorgan Funds - Emerging Markets Alpha Plus FundSchedule of Investments (Market Value Expressed in USD)
As at 30 June 2011
Quantity/Nominal
Value
Name of Securities MarketValue
%of
NetAssets
Quantity/Nominal
Value
Name of Securities MarketValue
%of
NetAssets
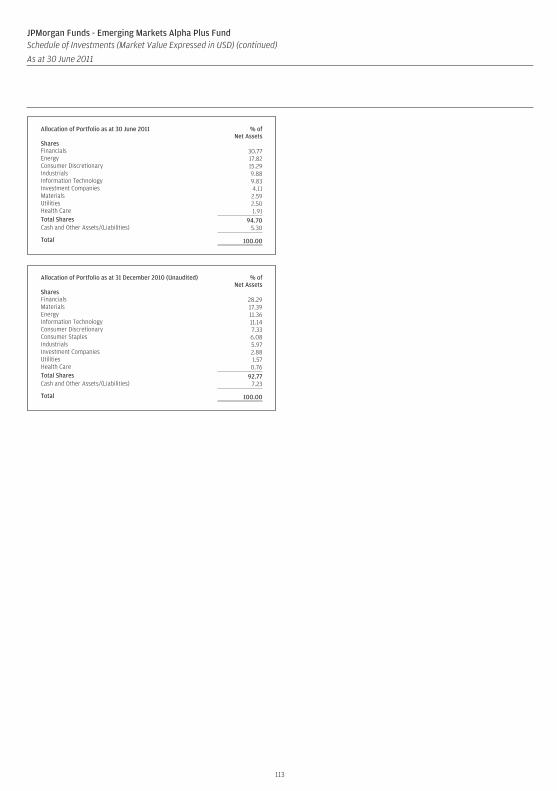
Allocation of Portfolio as at 30 June 2011 % ofNet Assets
SharesFinancials 30.77Energy 17.82Consumer Discretionary 15.29Industrials 9.88Information Technology 9.83Investment Companies 4.11Materials 2.59Utilities 2.50Health Care 1.91Total Shares 94.70Cash and Other Assets/(Liabilities) 5.30
Total 100.00
Allocation of Portfolio as at 31 December 2010 (Unaudited) % ofNet Assets
SharesFinancials 28.29Materials 17.39Energy 11.36Information Technology 11.14Consumer Discretionary 7.33Consumer Staples 6.08Industrials 5.97Investment Companies 2.88Utilities 1.57Health Care 0.76Total Shares 92.77Cash and Other Assets/(Liabilities) 7.23
Total 100.00
113
JPMorgan Funds - Emerging Markets Alpha Plus FundSchedule of Investments (Market Value Expressed in USD) (continued)
As at 30 June 2011
Quantity/Nominal
Value
Name of Securities MarketValue
%of
NetAssets
Quantity/Nominal
Value
Name of Securities MarketValue
%of
NetAssets
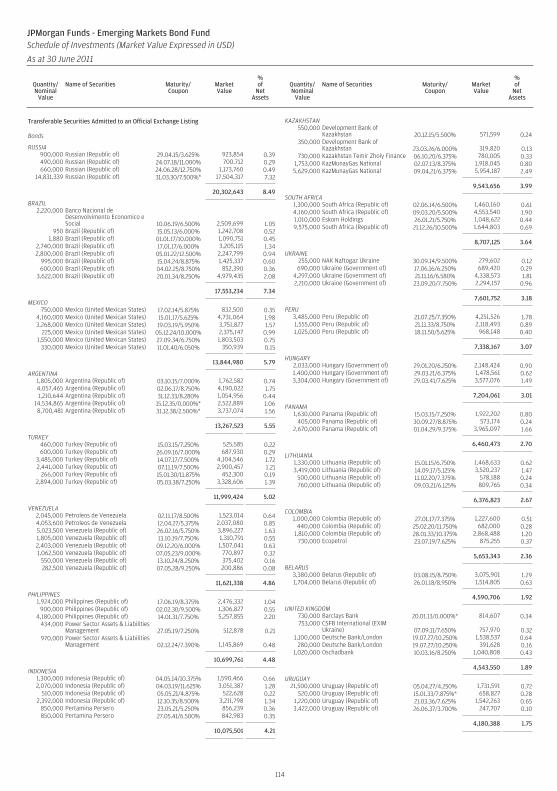
Transferable Securities Admitted to an Official Exchange Listing
Bonds
RUSSIA900,000 Russian (Republic of) 29.04.15/3.625% 923,854 0.39490,000 Russian (Republic of) 24.07.18/11.000% 700,712 0.29660,000 Russian (Republic of) 24.06.28/12.750% 1,173,760 0.49
14,831,339 Russian (Republic of) 31.03.30/7.500%* 17,504,317 7.32
20,302,643 8.49
BRAZIL2,220,000 Banco Nacional de
Desenvolvimento Economico eSocial 10.06.19/6.500% 2,509,699 1.05
950 Brazil (Republic of) 15.05.13/6.000% 1,242,708 0.521,880 Brazil (Republic of) 01.01.17/10.000% 1,090,751 0.45
2,740,000 Brazil (Republic of) 17.01.17/6.000% 3,205,115 1.342,800,000 Brazil (Republic of) 05.01.22/12.500% 2,247,799 0.94
995,000 Brazil (Republic of) 15.04.24/8.875% 1,425,337 0.60600,000 Brazil (Republic of) 04.02.25/8.750% 852,390 0.36
3,622,000 Brazil (Republic of) 20.01.34/8.250% 4,979,435 2.08
17,553,234 7.34
MEXICO750,000 Mexico (United Mexican States) 17.02.14/5.875% 832,500 0.35
4,160,000 Mexico (United Mexican States) 15.01.17/5.625% 4,731,064 1.983,268,000 Mexico (United Mexican States) 19.03.19/5.950% 3,751,827 1.57
225,000 Mexico (United Mexican States) 05.12.24/10.000% 2,375,147 0.991,550,000 Mexico (United Mexican States) 27.09.34/6.750% 1,803,503 0.75
330,000 Mexico (United Mexican States) 11.01.40/6.050% 350,939 0.15
13,844,980 5.79
ARGENTINA1,805,000 Argentina (Republic of) 03.10.15/7.000% 1,762,582 0.744,057,465 Argentina (Republic of) 02.06.17/8.750% 4,190,022 1.751,210,644 Argentina (Republic of) 31.12.33/8.280% 1,054,956 0.44
14,534,865 Argentina (Republic of) 15.12.35/0.000%* 2,522,889 1.068,700,481 Argentina (Republic of) 31.12.38/2.500%* 3,737,074 1.56
13,267,523 5.55
TURKEY460,000 Turkey (Republic of) 15.03.15/7.250% 525,585 0.22600,000 Turkey (Republic of) 26.09.16/7.000% 687,930 0.29
3,485,000 Turkey (Republic of) 14.07.17/7.500% 4,104,546 1.722,441,000 Turkey (Republic of) 07.11.19/7.500% 2,900,457 1.21
266,000 Turkey (Republic of) 15.01.30/11.875% 452,300 0.192,894,000 Turkey (Republic of) 05.03.38/7.250% 3,328,606 1.39
11,999,424 5.02
VENEZUELA2,045,000 Petroleos de Venezuela 02.11.17/8.500% 1,523,014 0.644,053,600 Petroleos de Venezuela 12.04.27/5.375% 2,037,080 0.855,023,500 Venezuela (Republic of) 26.02.16/5.750% 3,896,227 1.631,805,000 Venezuela (Republic of) 13.10.19/7.750% 1,310,791 0.552,403,000 Venezuela (Republic of) 09.12.20/6.000% 1,507,041 0.631,062,500 Venezuela (Republic of) 07.05.23/9.000% 770,897 0.32
550,000 Venezuela (Republic of) 13.10.24/8.250% 375,402 0.16282,500 Venezuela (Republic of) 07.05.28/9.250% 200,886 0.08
11,621,338 4.86
PHILIPPINES1,924,000 Philippines (Republic of) 17.06.19/8.375% 2,476,332 1.04
900,000 Philippines (Republic of) 02.02.30/9.500% 1,306,827 0.554,180,000 Philippines (Republic of) 14.01.31/7.750% 5,257,855 2.20
434,000 Power Sector Assets & LiabilitiesManagement 27.05.19/7.250% 512,878 0.21
970,000 Power Sector Assets & LiabilitiesManagement 02.12.24/7.390% 1,145,869 0.48
10,699,761 4.48
INDONESIA1,300,000 Indonesia (Republic of) 04.05.14/10.375% 1,590,466 0.662,070,000 Indonesia (Republic of) 04.03.19/11.625% 3,051,387 1.28
510,000 Indonesia (Republic of) 05.05.21/4.875% 522,628 0.222,392,000 Indonesia (Republic of) 12.10.35/8.500% 3,211,798 1.34
850,000 Pertamina Persero 23.05.21/5.250% 856,239 0.36850,000 Pertamina Persero 27.05.41/6.500% 842,983 0.35
10,075,501 4.21
KAZAKHSTAN550,000 Development Bank of
Kazakhstan 20.12.15/5.500% 571,599 0.24350,000 Development Bank of
Kazakhstan 23.03.26/6.000% 319,820 0.13730,000 Kazakhstan Temir Zholy Finance 06.10.20/6.375% 780,005 0.33
1,753,000 KazMunayGas National 02.07.13/8.375% 1,918,045 0.805,629,000 KazMunayGas National 09.04.21/6.375% 5,954,187 2.49
9,543,656 3.99
SOUTH AFRICA1,300,000 South Africa (Republic of) 02.06.14/6.500% 1,460,160 0.614,160,000 South Africa (Republic of) 09.03.20/5.500% 4,553,540 1.901,010,000 Eskom Holdings 26.01.21/5.750% 1,048,622 0.449,575,000 South Africa (Republic of) 21.12.26/10.500% 1,644,803 0.69
8,707,125 3.64
UKRAINE255,000 NAK Naftogaz Ukraine 30.09.14/9.500% 279,602 0.12690,000 Ukraine (Government of) 17.06.16/6.250% 689,420 0.29
4,297,000 Ukraine (Government of) 21.11.16/6.580% 4,338,573 1.812,210,000 Ukraine (Government of) 23.09.20/7.750% 2,294,157 0.96
7,601,752 3.18
PERU3,485,000 Peru (Republic of) 21.07.25/7.350% 4,251,526 1.781,555,000 Peru (Republic of) 21.11.33/8.750% 2,118,493 0.891,025,000 Peru (Republic of) 18.11.50/5.625% 968,148 0.40
7,338,167 3.07
HUNGARY2,033,000 Hungary (Government of) 29.01.20/6.250% 2,148,424 0.901,400,000 Hungary (Government of) 29.03.21/6.375% 1,478,561 0.623,304,000 Hungary (Government of) 29.03.41/7.625% 3,577,076 1.49
7,204,061 3.01
PANAMA1,630,000 Panama (Republic of) 15.03.15/7.250% 1,922,202 0.80
405,000 Panama (Republic of) 30.09.27/8.875% 573,174 0.242,670,000 Panama (Republic of) 01.04.29/9.375% 3,965,097 1.66
6,460,473 2.70
LITHUANIA1,330,000 Lithuania (Republic of) 15.01.15/6.750% 1,468,633 0.623,419,000 Lithuania (Republic of) 14.09.17/5.125% 3,520,237 1.47
500,000 Lithuania (Republic of) 11.02.20/7.375% 578,188 0.24760,000 Lithuania (Republic of) 09.03.21/6.125% 809,765 0.34
6,376,823 2.67
COLOMBIA1,000,000 Colombia (Republic of) 27.01.17/7.375% 1,227,600 0.51
440,000 Colombia (Republic of) 25.02.20/11.750% 682,000 0.281,810,000 Colombia (Republic of) 28.01.33/10.375% 2,868,488 1.20
730,000 Ecopetrol 23.07.19/7.625% 875,255 0.37
5,653,343 2.36
BELARUS3,380,000 Belarus (Republic of) 03.08.15/8.750% 3,075,901 1.291,704,000 Belarus (Republic of) 26.01.18/8.950% 1,514,805 0.63
4,590,706 1.92
UNITED KINGDOM730,000 Barclays Bank 20.01.13/0.000%* 814,607 0.34753,000 CSFB International (EXIM
Ukraine) 07.09.11/7.650% 757,970 0.321,100,000 Deutsche Bank/London 19.07.27/10.250% 1,538,537 0.64
280,000 Deutsche Bank/London 19.07.27/10.250% 391,628 0.161,020,000 Oschadbank 10.03.16/8.250% 1,040,808 0.43
4,543,550 1.89
URUGUAY21,500,000 Uruguay (Republic of) 05.04.27/4.250% 1,731,591 0.72
520,000 Uruguay (Republic of) 15.01.33/7.875%* 658,827 0.281,220,000 Uruguay (Republic of) 21.03.36/7.625% 1,542,263 0.653,422,000 Uruguay (Republic of) 26.06.37/3.700% 247,707 0.10
4,180,388 1.75
114
JPMorgan Funds - Emerging Markets Bond FundSchedule of Investments (Market Value Expressed in USD)
As at 30 June 2011
Quantity/Nominal
Value
Name of Securities Maturity/Coupon
MarketValue
%of
NetAssets
Quantity/Nominal
Value
Name of Securities Maturity/Coupon
MarketValue
%of
NetAssets
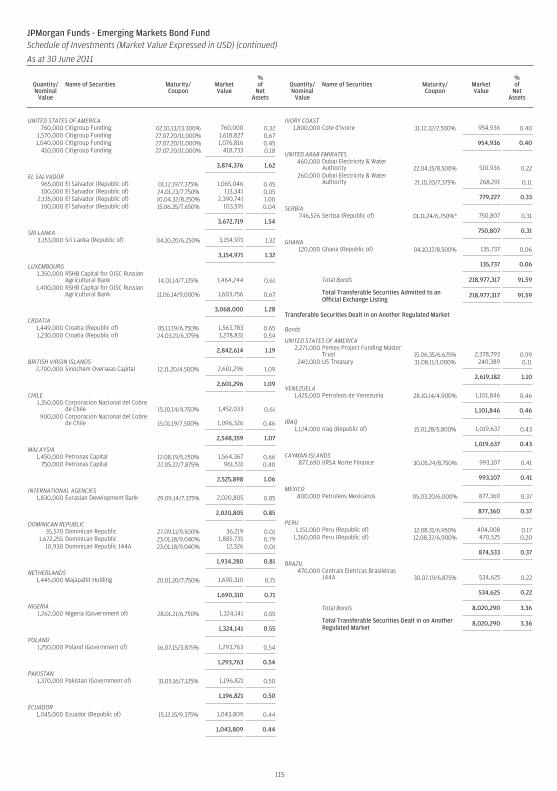
UNITED STATES OF AMERICA760,000 Citigroup Funding 02.10.13/13.300% 760,000 0.32
1,570,000 Citigroup Funding 27.07.20/11.000% 1,618,827 0.671,040,000 Citigroup Funding 27.07.20/11.000% 1,076,816 0.45
410,000 Citigroup Funding 27.07.20/11.000% 418,733 0.18
3,874,376 1.62
EL SALVADOR965,000 El Salvador (Republic of) 01.12.19/7.375% 1,065,046 0.45100,000 El Salvador (Republic of) 24.01.23/7.750% 113,341 0.05
2,135,000 El Salvador (Republic of) 10.04.32/8.250% 2,390,741 1.00100,000 El Salvador (Republic of) 15.06.35/7.650% 103,591 0.04
3,672,719 1.54
SRI LANKA3,153,000 Sri Lanka (Republic of) 04.10.20/6.250% 3,154,971 1.32
3,154,971 1.32
LUXEMBOURG1,350,000 RSHB Capital for OJSC Russian
Agricultural Bank 14.01.14/7.125% 1,464,244 0.611,400,000 RSHB Capital for OJSC Russian
Agricultural Bank 11.06.14/9.000% 1,603,756 0.67
3,068,000 1.28
CROATIA1,449,000 Croatia (Republic of) 05.11.19/6.750% 1,563,783 0.651,230,000 Croatia (Republic of) 24.03.21/6.375% 1,278,831 0.54
2,842,614 1.19
BRITISH VIRGIN ISLANDS2,700,000 Sinochem Overseas Capital 12.11.20/4.500% 2,601,296 1.09
2,601,296 1.09
CHILE1,350,000 Corporacion Nacional del Cobre
de Chile 15.10.14/4.750% 1,452,033 0.61900,000 Corporacion Nacional del Cobre
de Chile 15.01.19/7.500% 1,096,326 0.46
2,548,359 1.07
MALAYSIA1,450,000 Petronas Capital 12.08.19/5.250% 1,564,367 0.66
750,000 Petronas Capital 22.05.22/7.875% 961,531 0.40
2,525,898 1.06
INTERNATIONAL AGENCIES1,830,000 Eurasian Development Bank 29.09.14/7.375% 2,020,805 0.85
2,020,805 0.85
DOMINICAN REPUBLIC35,570 Dominican Republic 27.09.11/9.500% 36,219 0.01
1,672,255 Dominican Republic 23.01.18/9.040% 1,885,735 0.7910,930 Dominican Republic 144A 23.01.18/9.040% 12,326 0.01
1,934,280 0.81
NETHERLANDS1,445,000 Majapahit Holding 20.01.20/7.750% 1,690,310 0.71
1,690,310 0.71
NIGERIA1,262,000 Nigeria (Government of) 28.01.21/6.750% 1,324,141 0.55
1,324,141 0.55
POLAND1,250,000 Poland (Government of) 16.07.15/3.875% 1,293,763 0.54
1,293,763 0.54
PAKISTAN1,370,000 Pakistan (Government of) 31.03.16/7.125% 1,196,821 0.50
1,196,821 0.50
ECUADOR1,045,000 Ecuador (Republic of) 15.12.15/9.375% 1,043,809 0.44
1,043,809 0.44
IVORY COAST1,800,000 Cote d’Ivoire 31.12.32/2.500% 954,936 0.40
954,936 0.40
UNITED ARAB EMIRATES460,000 Dubai Electricity & Water
Authority 22.04.15/8.500% 510,936 0.22260,000 Dubai Electricity & Water
Authority 21.10.20/7.375% 268,291 0.11
779,227 0.33
SERBIA746,526 Serbsa (Republic of) 01.11.24/6.750%* 750,807 0.31
750,807 0.31
GHANA120,000 Ghana (Republic of) 04.10.17/8.500% 135,737 0.06
135,737 0.06
Total Bonds 218,977,317 91.59
Total Transferable Securities Admitted to anOfficial Exchange Listing
218,977,317 91.59
Transferable Securities Dealt in on Another Regulated Market
Bonds
UNITED STATES OF AMERICA2,271,000 Pemex Project Funding Master
Trust 15.06.35/6.625% 2,378,793 0.99240,000 US Treasury 31.08.11/1.000% 240,389 0.11
2,619,182 1.10
VENEZUELA1,425,000 Petroleos de Venezuela 28.10.14/4.900% 1,101,846 0.46
1,101,846 0.46
IRAQ1,124,000 Iraq (Republic of) 15.01.28/5.800% 1,019,637 0.43
1,019,637 0.43
CAYMAN ISLANDS877,690 IIRSA Norte Finance 30.05.24/8.750% 993,107 0.41
993,107 0.41
MEXICO800,000 Petroleos Mexicanos 05.03.20/6.000% 877,360 0.37
877,360 0.37
PERU1,151,000 Peru (Republic of) 12.08.31/6.950% 404,008 0.17
1,360,000 Peru (Republic of) 12.08.37/6.900% 470,525 0.20
874,533 0.37
BRAZIL470,000 Centrais Eletricas Brasileiras
144A 30.07.19/6.875% 534,625 0.22
534,625 0.22
Total Bonds 8,020,290 3.36
Total Transferable Securities Dealt in on AnotherRegulated Market
8,020,290 3.36
115
JPMorgan Funds - Emerging Markets Bond FundSchedule of Investments (Market Value Expressed in USD) (continued)
As at 30 June 2011
Quantity/Nominal
Value
Name of Securities Maturity/Coupon
MarketValue
%of
NetAssets
Quantity/Nominal
Value
Name of Securities Maturity/Coupon
MarketValue
%of
NetAssets
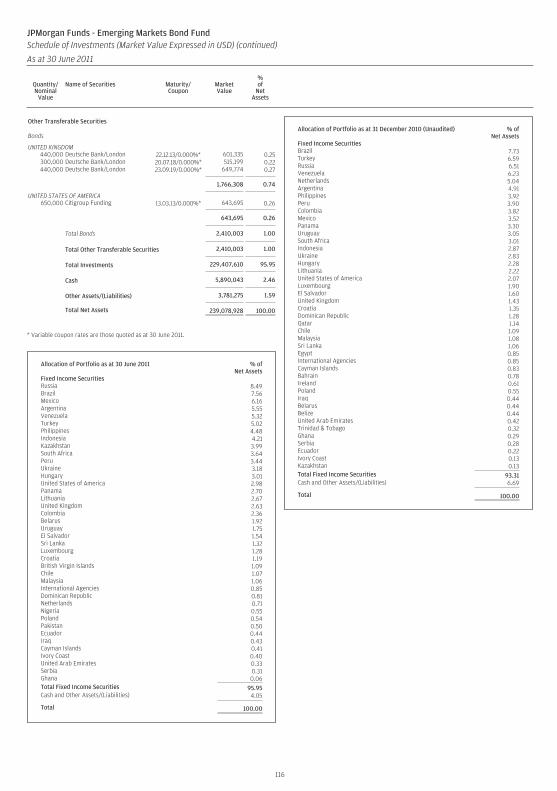
Other Transferable Securities
Bonds
UNITED KINGDOM440,000 Deutsche Bank/London 22.12.13/0.000%* 601,335 0.25300,000 Deutsche Bank/London 20.07.18/0.000%* 515,199 0.22440,000 Deutsche Bank/London 23.09.19/0.000%* 649,774 0.27
1,766,308 0.74
UNITED STATES OF AMERICA650,000 Citigroup Funding 13.03.13/0.000%* 643,695 0.26
643,695 0.26
Total Bonds 2,410,003 1.00
Total Other Transferable Securities 2,410,003 1.00
Total Investments 229,407,610 95.95
Cash 5,890,043 2.46
Other Assets/(Liabilities) 3,781,275 1.59
Total Net Assets 239,078,928 100.00
* Variable coupon rates are those quoted as at 30 June 2011.
Allocation of Portfolio as at 30 June 2011 % ofNet Assets
Fixed Income SecuritiesRussia 8.49Brazil 7.56Mexico 6.16Argentina 5.55Venezuela 5.32Turkey 5.02Philippines 4.48Indonesia 4.21Kazakhstan 3.99South Africa 3.64Peru 3.44Ukraine 3.18Hungary 3.01United States of America 2.98Panama 2.70Lithuania 2.67United Kingdom 2.63Colombia 2.36Belarus 1.92Uruguay 1.75El Salvador 1.54Sri Lanka 1.32Luxembourg 1.28Croatia 1.19British Virgin Islands 1.09Chile 1.07Malaysia 1.06International Agencies 0.85Dominican Republic 0.81Netherlands 0.71Nigeria 0.55Poland 0.54Pakistan 0.50Ecuador 0.44Iraq 0.43Cayman Islands 0.41Ivory Coast 0.40United Arab Emirates 0.33Serbia 0.31Ghana 0.06Total Fixed Income Securities 95.95Cash and Other Assets/(Liabilities) 4.05
Total 100.00
Allocation of Portfolio as at 31 December 2010 (Unaudited) % ofNet Assets
Fixed Income SecuritiesBrazil 7.73Turkey 6.59Russia 6.51Venezuela 6.23Netherlands 5.04Argentina 4.91Philippines 3.92Peru 3.90Colombia 3.82Mexico 3.52Panama 3.30Uruguay 3.05South Africa 3.01Indonesia 2.87Ukraine 2.83Hungary 2.28Lithuania 2.22United States of America 2.07Luxembourg 1.90El Salvador 1.60United Kingdom 1.43Croatia 1.35Dominican Republic 1.28Qatar 1.14Chile 1.09Malaysia 1.08Sri Lanka 1.06Egypt 0.85International Agencies 0.85Cayman Islands 0.83Bahrain 0.78Ireland 0.61Poland 0.55Iraq 0.44Belarus 0.44Belize 0.44United Arab Emirates 0.42Trinidad & Tobago 0.32Ghana 0.29Serbia 0.28Ecuador 0.22Ivory Coast 0.13Kazakhstan 0.13Total Fixed Income Securities 93.31Cash and Other Assets/(Liabilities) 6.69
Total 100.00
116
JPMorgan Funds - Emerging Markets Bond FundSchedule of Investments (Market Value Expressed in USD) (continued)
As at 30 June 2011
Quantity/Nominal
Value
Name of Securities Maturity/Coupon
MarketValue
%of
NetAssets
Quantity/Nominal
Value
Name of Securities Maturity/Coupon
MarketValue
%of
NetAssets
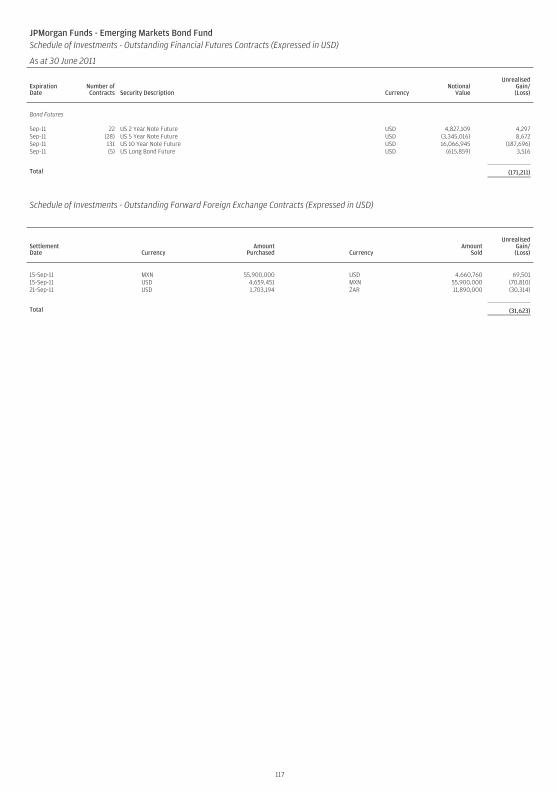
JPMorgan Funds - Emerging Markets Bond FundSchedule of Investments - Outstanding Financial Futures Contracts (Expressed in USD)
As at 30 June 2011
ExpirationDate
Number ofContracts Security Description Currency
NotionalValue
UnrealisedGain/(Loss)
Bond Futures
Sep-11 22 US 2 Year Note Future USD 4,827,109 4,297Sep-11 (28) US 5 Year Note Future USD (3,345,016) 8,672Sep-11 131 US 10 Year Note Future USD 16,066,945 (187,696)Sep-11 (5) US Long Bond Future USD (615,859) 3,516
Total (171,211)
Schedule of Investments - Outstanding Forward Foreign Exchange Contracts (Expressed in USD)
SettlementDate Currency
AmountPurchased Currency
AmountSold
UnrealisedGain/(Loss)
15-Sep-11 MXN 55,900,000 USD 4,660,760 69,50115-Sep-11 USD 4,659,451 MXN 55,900,000 (70,810)21-Sep-11 USD 1,703,194 ZAR 11,890,000 (30,314)
Total (31,623)
117
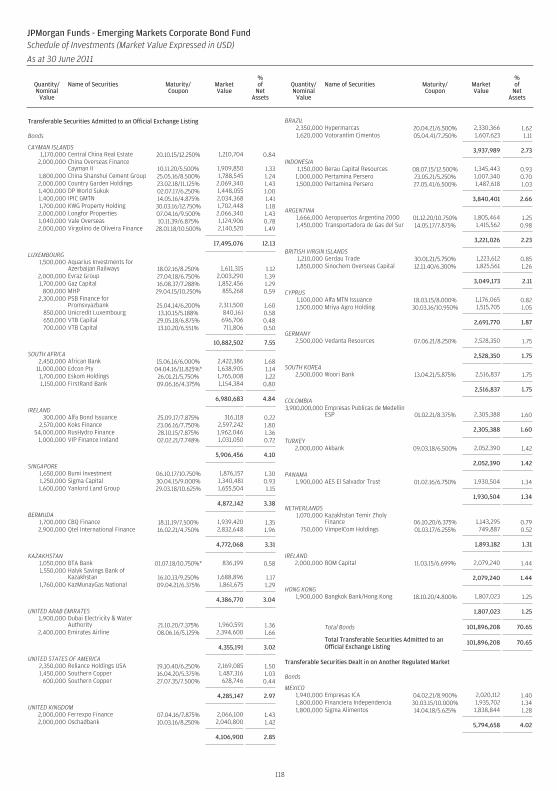
Transferable Securities Admitted to an Official Exchange Listing
Bonds
CAYMAN ISLANDS1,170,000 Central China Real Estate 20.10.15/12.250% 1,210,704 0.84
2,000,000 China Overseas FinanceCayman II 10.11.20/5.500% 1,909,850 1.33
1,800,000 China Shanshui Cement Group 25.05.16/8.500% 1,788,545 1.242,000,000 Country Garden Holdings 23.02.18/11.125% 2,069,340 1.431,400,000 DP World Sukuk 02.07.17/6.250% 1,448,055 1.001,400,000 IPIC GMTN 14.05.16/4.875% 2,034,368 1.411,700,000 KWG Property Holding 30.03.16/12.750% 1,702,448 1.182,000,000 Longfor Properties 07.04.16/9.500% 2,066,340 1.431,040,000 Vale Overseas 10.11.39/6.875% 1,124,906 0.782,000,000 Virgolino de Oliveira Finance 28.01.18/10.500% 2,140,520 1.49
17,495,076 12.13
LUXEMBOURG1,500,000 Aquarius Investments for
Azerbaijan Railways 18.02.16/8.250% 1,611,315 1.122,000,000 Evraz Group 27.04.18/6.750% 2,003,290 1.391,700,000 Gaz Capital 16.08.37/7.288% 1,852,456 1.29
800,000 MHP 29.04.15/10.250% 855,268 0.592,300,000 PSB Finance for
Promsvyazbank 25.04.14/6.200% 2,311,500 1.60850,000 Unicredit Luxembourg 13.10.15/5.188% 840,161 0.58650,000 VTB Capital 29.05.18/6.875% 696,706 0.48700,000 VTB Capital 13.10.20/6.551% 711,806 0.50
10,882,502 7.55
SOUTH AFRICA2,450,000 African Bank 15.06.16/6.000% 2,422,386 1.68
11,000,000 Edcon Pty 04.04.16/11.825%* 1,638,905 1.141,700,000 Eskom Holdings 26.01.21/5.750% 1,765,008 1.221,150,000 FirstRand Bank 09.06.16/4.375% 1,154,384 0.80
6,980,683 4.84
IRELAND300,000 Alfa Bond Issuance 25.09.17/7.875% 316,118 0.22
2,570,000 Koks Finance 23.06.16/7.750% 2,597,242 1.8054,000,000 RusHydro Finance 28.10.15/7.875% 1,962,046 1.36
1,000,000 VIP Finance Ireland 02.02.21/7.748% 1,031,050 0.72
5,906,456 4.10
SINGAPORE1,650,000 Bumi Investment 06.10.17/10.750% 1,876,157 1.301,250,000 Sigma Capital 30.04.15/9.000% 1,340,481 0.931,600,000 Yanlord Land Group 29.03.18/10.625% 1,655,504 1.15
4,872,142 3.38
BERMUDA1,700,000 CBQ Finance 18.11.19/7.500% 1,939,420 1.352,900,000 Qtel International Finance 16.02.21/4.750% 2,832,648 1.96
4,772,068 3.31
KAZAKHSTAN1,050,000 BTA Bank 01.07.18/10.750%* 836,199 0.581,550,000 Halyk Savings Bank of
Kazakhstan 16.10.13/9.250% 1,688,896 1.171,760,000 KazMunayGas National 09.04.21/6.375% 1,861,675 1.29
4,386,770 3.04
UNITED ARAB EMIRATES1,900,000 Dubai Electricity & Water
Authority 21.10.20/7.375% 1,960,591 1.362,400,000 Emirates Airline 08.06.16/5.125% 2,394,600 1.66
4,355,191 3.02
UNITED STATES OF AMERICA2,350,000 Reliance Holdings USA 19.10.40/6.250% 2,169,085 1.501,450,000 Southern Copper 16.04.20/5.375% 1,487,316 1.03
600,000 Southern Copper 27.07.35/7.500% 628,746 0.44
4,285,147 2.97
UNITED KINGDOM2,000,000 Ferrexpo Finance 07.04.16/7.875% 2,066,100 1.432,000,000 Oschadbank 10.03.16/8.250% 2,040,800 1.42
4,106,900 2.85
BRAZIL2,350,000 Hypermarcas 20.04.21/6.500% 2,330,366 1.621,620,000 Votorantim Cimentos 05.04.41/7.250% 1,607,623 1.11
3,937,989 2.73
INDONESIA1,150,000 Berau Capital Resources 08.07.15/12.500% 1,345,443 0.93
1,000,000 Pertamina Persero 23.05.21/5.250% 1,007,340 0.701,500,000 Pertamina Persero 27.05.41/6.500% 1,487,618 1.03
3,840,401 2.66
ARGENTINA1,666,000 Aeropuertos Argentina 2000 01.12.20/10.750% 1,805,464 1.251,450,000 Transportadora de Gas del Sur 14.05.17/7.875% 1,415,562 0.98
3,221,026 2.23
BRITISH VIRGIN ISLANDS1,210,000 Gerdau Trade 30.01.21/5.750% 1,223,612 0.851,850,000 Sinochem Overseas Capital 12.11.40/6.300% 1,825,561 1.26
3,049,173 2.11
CYPRUS1,100,000 Alfa MTN Issuance 18.03.15/8.000% 1,176,065 0.821,500,000 Mriya Agro Holding 30.03.16/10.950% 1,515,705 1.05
2,691,770 1.87
GERMANY2,500,000 Vedanta Resources 07.06.21/8.250% 2,528,350 1.75
2,528,350 1.75
SOUTH KOREA2,500,000 Woori Bank 13.04.21/5.875% 2,516,837 1.75
2,516,837 1.75
COLOMBIA3,900,000,000 Empresas Publicas de Medellin
ESP 01.02.21/8.375% 2,305,388 1.60
2,305,388 1.60
TURKEY2,000,000 Akbank 09.03.18/6.500% 2,052,390 1.42
2,052,390 1.42
PANAMA1,900,000 AES El Salvador Trust 01.02.16/6.750% 1,930,504 1.34
1,930,504 1.34
NETHERLANDS1,070,000 Kazakhstan Temir Zholy
Finance 06.10.20/6.375% 1,143,295 0.79750,000 VimpelCom Holdings 01.03.17/6.255% 749,887 0.52
1,893,182 1.31
IRELAND2,000,000 BOM Capital 11.03.15/6.699% 2,079,240 1.44
2,079,240 1.44
HONG KONG1,900,000 Bangkok Bank/Hong Kong 18.10.20/4.800% 1,807,023 1.25
1,807,023 1.25
Total Bonds 101,896,208 70.65
Total Transferable Securities Admitted to anOfficial Exchange Listing
101,896,208 70.65
Transferable Securities Dealt in on Another Regulated Market
Bonds
MEXICO1,940,000 Empresas ICA 04.02.21/8.900% 2,020,112 1.401,800,000 Financiera Independencia 30.03.15/10.000% 1,935,702 1.341,800,000 Sigma Alimentos 14.04.18/5.625% 1,838,844 1.28
5,794,658 4.02
118
JPMorgan Funds - Emerging Markets Corporate Bond FundSchedule of Investments (Market Value Expressed in USD)
As at 30 June 2011
Quantity/Nominal
Value
Name of Securities Maturity/Coupon
MarketValue
%of
NetAssets
Quantity/Nominal
Value
Name of Securities Maturity/Coupon
MarketValue
%of
NetAssets
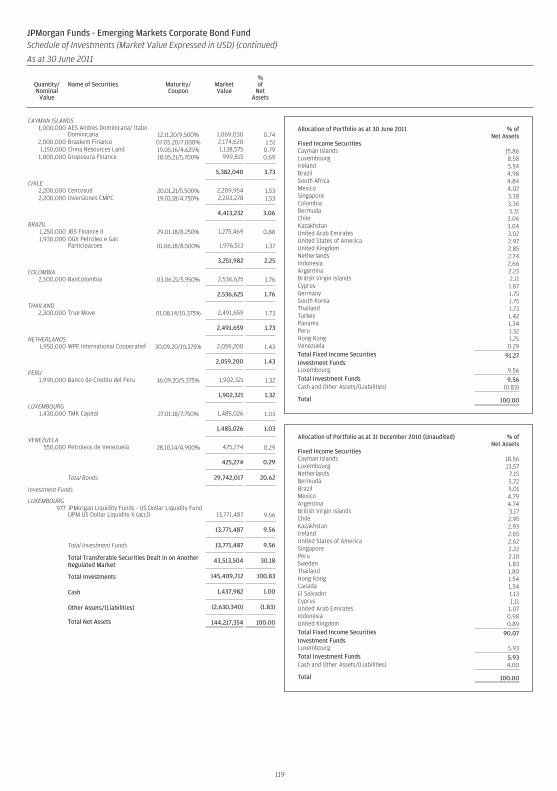
CAYMAN ISLANDS1,000,000 AES Andres Dominicana/ Itabo
Dominicana 12.11.20/9.500% 1,069,030 0.742,000,000 Braskem Finance 07.05.20/7.000% 2,174,620 1.511,150,000 China Resources Land 19.05.16/4.625% 1,138,575 0.79
1,000,000 Gruposura Finance 18.05.21/5.700% 999,815 0.69
5,382,040 3.73
CHILE2,200,000 Cencosud 20.01.21/5.500% 2,209,954 1.532,200,000 Inversiones CMPC 19.01.18/4.750% 2,203,278 1.53
4,413,232 3.06
BRAZIL1,250,000 JBS Finance II 29.01.18/8.250% 1,275,469 0.881,930,000 OGX Petroleo e Gas
Participacoes 01.06.18/8.500% 1,976,513 1.37
3,251,982 2.25
COLOMBIA2,500,000 BanColombia 03.06.21/5.950% 2,536,625 1.76
2,536,625 1.76
THAILAND2,300,000 True Move 01.08.14/10.375% 2,491,659 1.73
2,491,659 1.73
NETHERLANDS1,950,000 WPE International Cooperatief 30.09.20/10.375% 2,059,200 1.43
2,059,200 1.43
PERU1,990,000 Banco de Credito del Peru 16.09.20/5.375% 1,902,321 1.32
1,902,321 1.32
LUXEMBOURG1,430,000 TMK Capital 27.01.18/7.750% 1,485,026 1.03
1,485,026 1.03
VENEZUELA550,000 Petroleos de Venezuela 28.10.14/4.900% 425,274 0.29
425,274 0.29
Total Bonds 29,742,017 20.62
Investment Funds
LUXEMBOURG977 JPMorgan Liquidity Funds - US Dollar Liquidity Fund
(JPM US Dollar Liquidity X (acc)) 13,771,487 9.56
13,771,487 9.56
Total Investment Funds 13,771,487 9.56
Total Transferable Securities Dealt in on AnotherRegulated Market
43,513,504 30.18
Total Investments 145,409,712 100.83
Cash 1,437,982 1.00
Other Assets/(Liabilities) (2,630,340) (1.83)
Total Net Assets 144,217,354 100.00
Allocation of Portfolio as at 30 June 2011 % ofNet Assets
Fixed Income SecuritiesCayman Islands 15.86Luxembourg 8.58Ireland 5.54Brazil 4.98South Africa 4.84Mexico 4.02Singapore 3.38Colombia 3.36Bermuda 3.31Chile 3.06Kazakhstan 3.04United Arab Emirates 3.02United States of America 2.97United Kingdom 2.85Netherlands 2.74Indonesia 2.66Argentina 2.23British Virgin Islands 2.11Cyprus 1.87Germany 1.75South Korea 1.75Thailand 1.73Turkey 1.42Panama 1.34Peru 1.32Hong Kong 1.25Venezuela 0.29Total Fixed Income Securities 91.27Investment FundsLuxembourg 9.56Total Investment Funds 9.56Cash and Other Assets/(Liabilities) (0.83)
Total 100.00
Allocation of Portfolio as at 31 December 2010 (Unaudited) % ofNet Assets
Fixed Income SecuritiesCayman Islands 18.56Luxembourg 13.57Netherlands 7.15Bermuda 5.72Brazil 5.01Mexico 4.79Argentina 4.74British Virgin Islands 3.17Chile 2.95Kazakhstan 2.93Ireland 2.65United States of America 2.62Singapore 2.22Peru 2.10Sweden 1.83Thailand 1.80Hong Kong 1.54Canada 1.54El Salvador 1.13Cyprus 1.11United Arab Emirates 1.07Indonesia 0.98United Kingdom 0.89Total Fixed Income Securities 90.07Investment FundsLuxembourg 5.93Total Investment Funds 5.93Cash and Other Assets/(Liabilities) 4.00
Total 100.00
119
JPMorgan Funds - Emerging Markets Corporate Bond FundSchedule of Investments (Market Value Expressed in USD) (continued)
As at 30 June 2011
Quantity/Nominal
Value
Name of Securities Maturity/Coupon
MarketValue
%of
NetAssets
Quantity/Nominal
Value
Name of Securities Maturity/Coupon
MarketValue
%of
NetAssets
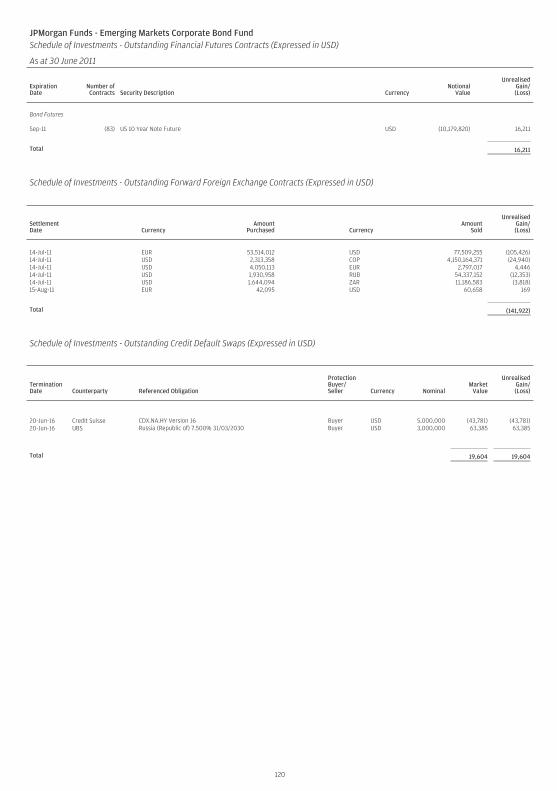
JPMorgan Funds - Emerging Markets Corporate Bond FundSchedule of Investments - Outstanding Financial Futures Contracts (Expressed in USD)
As at 30 June 2011
ExpirationDate
Number ofContracts Security Description Currency
NotionalValue
UnrealisedGain/(Loss)
Bond Futures
Sep-11 (83) US 10 Year Note Future USD (10,179,820) 16,211
Total 16,211
Schedule of Investments - Outstanding Forward Foreign Exchange Contracts (Expressed in USD)
SettlementDate Currency
AmountPurchased Currency
AmountSold
UnrealisedGain/(Loss)
14-Jul-11 EUR 53,514,012 USD 77,509,255 (105,426)14-Jul-11 USD 2,313,358 COP 4,150,164,371 (24,940)14-Jul-11 USD 4,050,113 EUR 2,797,017 4,44614-Jul-11 USD 1,930,958 RUB 54,337,152 (12,353)14-Jul-11 USD 1,644,094 ZAR 11,186,583 (3,818)15-Aug-11 EUR 42,095 USD 60,658 169
Total (141,922)
Schedule of Investments - Outstanding Credit Default Swaps (Expressed in USD)
TerminationDate Counterparty Referenced Obligation
ProtectionBuyer/Seller Currency Nominal
MarketValue
UnrealisedGain/(Loss)
20-Jun-16 Credit Suisse CDX.NA.HY Version 16 Buyer USD 5,000,000 (43,781) (43,781)20-Jun-16 UBS Russia (Republic of) 7.500% 31/03/2030 Buyer USD 3,000,000 63,385 63,385
Total 19,604 19,604
120
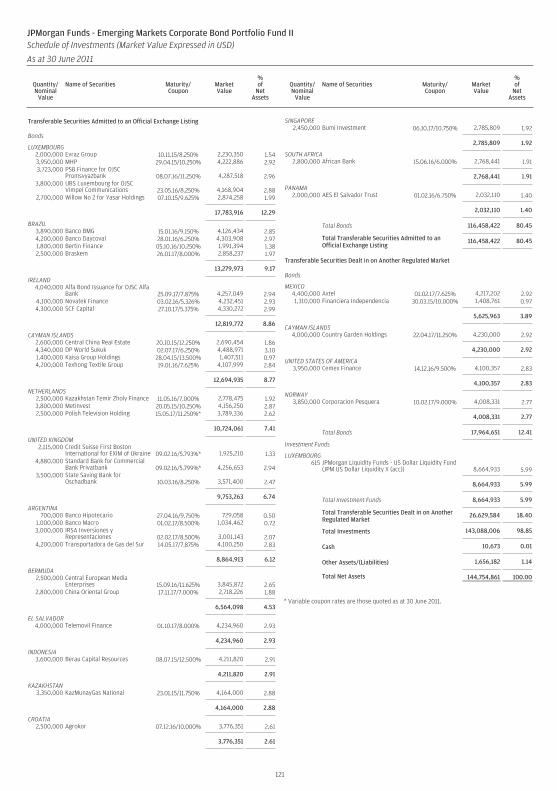
Transferable Securities Admitted to an Official Exchange Listing
Bonds
LUXEMBOURG2,000,000 Evraz Group 10.11.15/8.250% 2,230,350 1.543,950,000 MHP 29.04.15/10.250% 4,222,886 2.923,723,000 PSB Finance for OJSC
Promsvyazbank 08.07.16/11.250% 4,287,518 2.963,800,000 UBS Luxembourg for OJSC
Vimpel Communications 23.05.16/8.250% 4,168,904 2.882,700,000 Willow No 2 for Yasar Holdings 07.10.15/9.625% 2,874,258 1.99
17,783,916 12.29
BRAZIL3,890,000 Banco BMG 15.01.16/9.150% 4,126,434 2.854,200,000 Banco Daycoval 28.01.16/6.250% 4,303,908 2.971,800,000 Bertin Finance 05.10.16/10.250% 1,991,394 1.382,500,000 Braskem 26.01.17/8.000% 2,858,237 1.97
13,279,973 9.17
IRELAND4,040,000 Alfa Bond Issuance for OJSC Alfa
Bank 25.09.17/7.875% 4,257,049 2.944,100,000 Novatek Finance 03.02.16/5.326% 4,232,451 2.934,300,000 SCF Capital 27.10.17/5.375% 4,330,272 2.99
12,819,772 8.86
CAYMAN ISLANDS2,600,000 Central China Real Estate 20.10.15/12.250% 2,690,454 1.864,340,000 DP World Sukuk 02.07.17/6.250% 4,488,971 3.101,400,000 Kaisa Group Holdings 28.04.15/13.500% 1,407,511 0.974,200,000 Texhong Textile Group 19.01.16/7.625% 4,107,999 2.84
12,694,935 8.77
NETHERLANDS2,500,000 Kazakhstan Temir Zholy Finance 11.05.16/7.000% 2,778,475 1.923,800,000 Metinvest 20.05.15/10.250% 4,156,250 2.872,500,000 Polish Television Holding 15.05.17/11.250%* 3,789,336 2.62
10,724,061 7.41
UNITED KINGDOM2,115,000 Credit Suisse First Boston
International for EXIM of Ukraine 09.02.16/5.793%* 1,925,210 1.334,880,000 Standard Bank for Commercial
Bank Privatbank 09.02.16/5.799%* 4,256,653 2.943,500,000 State Saving Bank for
Oschadbank 10.03.16/8.250% 3,571,400 2.47
9,753,263 6.74
ARGENTINA700,000 Banco Hipotecario 27.04.16/9.750% 729,058 0.50
1,000,000 Banco Macro 01.02.17/8.500% 1,034,462 0.723,000,000 IRSA Inversiones y
Representaciones 02.02.17/8.500% 3,001,143 2.074,200,000 Transportadora de Gas del Sur 14.05.17/7.875% 4,100,250 2.83
8,864,913 6.12
BERMUDA2,500,000 Central European Media
Enterprises 15.09.16/11.625% 3,845,872 2.652,800,000 China Oriental Group 17.11.17/7.000% 2,718,226 1.88
6,564,098 4.53
EL SALVADOR4,000,000 Telemovil Finance 01.10.17/8.000% 4,234,960 2.93
4,234,960 2.93
INDONESIA3,600,000 Berau Capital Resources 08.07.15/12.500% 4,211,820 2.91
4,211,820 2.91
KAZAKHSTAN3,350,000 KazMunayGas National 23.01.15/11.750% 4,164,000 2.88
4,164,000 2.88
CROATIA2,500,000 Agrokor 07.12.16/10.000% 3,776,351 2.61
3,776,351 2.61
SINGAPORE2,450,000 Bumi Investment 06.10.17/10.750% 2,785,809 1.92
2,785,809 1.92
SOUTH AFRICA2,800,000 African Bank 15.06.16/6.000% 2,768,441 1.91
2,768,441 1.91
PANAMA2,000,000 AES El Salvador Trust 01.02.16/6.750% 2,032,110 1.40
2,032,110 1.40
Total Bonds 116,458,422 80.45
Total Transferable Securities Admitted to anOfficial Exchange Listing
116,458,422 80.45
Transferable Securities Dealt in on Another Regulated Market
Bonds
MEXICO4,400,000 Axtel 01.02.17/7.625% 4,217,202 2.921,310,000 Financiera Independencia 30.03.15/10.000% 1,408,761 0.97
5,625,963 3.89
CAYMAN ISLANDS4,000,000 Country Garden Holdings 22.04.17/11.250% 4,230,000 2.92
4,230,000 2.92
UNITED STATES OF AMERICA3,950,000 Cemex Finance 14.12.16/9.500% 4,100,357 2.83
4,100,357 2.83
NORWAY3,850,000 Corporacion Pesquera 10.02.17/9.000% 4,008,331 2.77
4,008,331 2.77
Total Bonds 17,964,651 12.41
Investment Funds
LUXEMBOURG615 JPMorgan Liquidity Funds - US Dollar Liquidity Fund
(JPM US Dollar Liquidity X (acc)) 8,664,933 5.99
8,664,933 5.99
Total Investment Funds 8,664,933 5.99
Total Transferable Securities Dealt in on AnotherRegulated Market
26,629,584 18.40
Total Investments 143,088,006 98.85
Cash 10,673 0.01
Other Assets/(Liabilities) 1,656,182 1.14
Total Net Assets 144,754,861 100.00
* Variable coupon rates are those quoted as at 30 June 2011.
121
JPMorgan Funds - Emerging Markets Corporate Bond Portfolio Fund IISchedule of Investments (Market Value Expressed in USD)
As at 30 June 2011
Quantity/Nominal
Value
Name of Securities Maturity/Coupon
MarketValue
%of
NetAssets
Quantity/Nominal
Value
Name of Securities Maturity/Coupon
MarketValue
%of
NetAssets
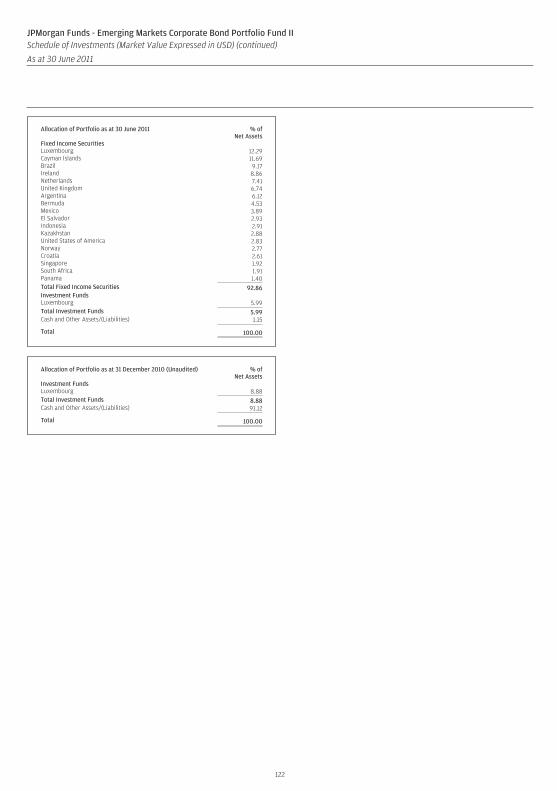
Allocation of Portfolio as at 30 June 2011 % ofNet Assets
Fixed Income SecuritiesLuxembourg 12.29Cayman Islands 11.69Brazil 9.17Ireland 8.86Netherlands 7.41United Kingdom 6.74Argentina 6.12Bermuda 4.53Mexico 3.89El Salvador 2.93Indonesia 2.91Kazakhstan 2.88United States of America 2.83Norway 2.77Croatia 2.61Singapore 1.92South Africa 1.91Panama 1.40Total Fixed Income Securities 92.86Investment FundsLuxembourg 5.99Total Investment Funds 5.99Cash and Other Assets/(Liabilities) 1.15
Total 100.00
Allocation of Portfolio as at 31 December 2010 (Unaudited) % ofNet Assets
Investment FundsLuxembourg 8.88Total Investment Funds 8.88Cash and Other Assets/(Liabilities) 91.12
Total 100.00
122
JPMorgan Funds - Emerging Markets Corporate Bond Portfolio Fund IISchedule of Investments (Market Value Expressed in USD) (continued)
As at 30 June 2011
Quantity/Nominal
Value
Name of Securities Maturity/Coupon
MarketValue
%of
NetAssets
Quantity/Nominal
Value
Name of Securities Maturity/Coupon
MarketValue
%of
NetAssets
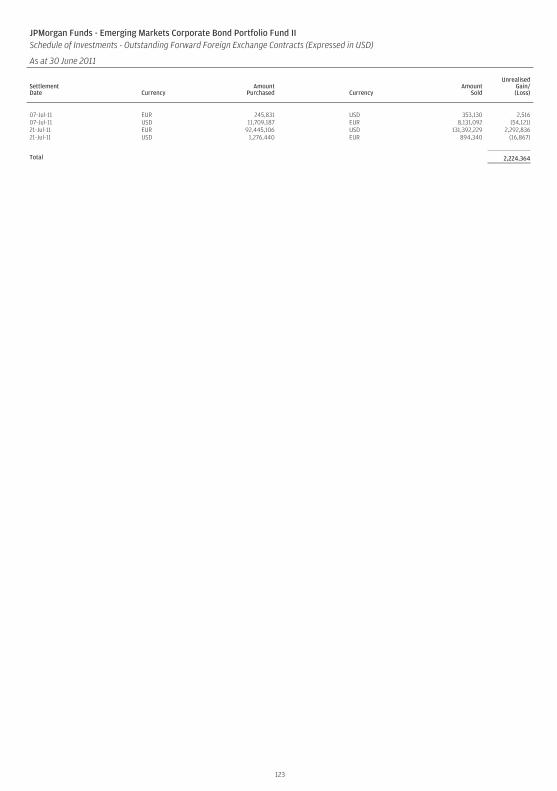
JPMorgan Funds - Emerging Markets Corporate Bond Portfolio Fund IISchedule of Investments - Outstanding Forward Foreign Exchange Contracts (Expressed in USD)
As at 30 June 2011
SettlementDate Currency
AmountPurchased Currency
AmountSold
UnrealisedGain/(Loss)
07-Jul-11 EUR 245,831 USD 353,130 2,51607-Jul-11 USD 11,709,187 EUR 8,131,092 (54,121)21-Jul-11 EUR 92,445,106 USD 131,392,229 2,292,83621-Jul-11 USD 1,276,440 EUR 894,340 (16,867)
Total 2,224,364
123
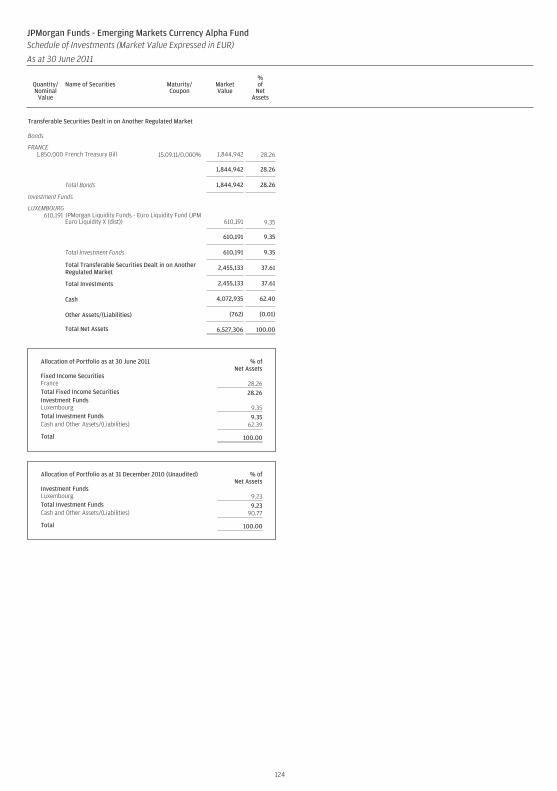
Transferable Securities Dealt in on Another Regulated Market
Bonds
FRANCE1,850,000 French Treasury Bill 15.09.11/0.000% 1,844,942 28.26
1,844,942 28.26
Total Bonds 1,844,942 28.26
Investment Funds
LUXEMBOURG610,191 JPMorgan Liquidity Funds - Euro Liquidity Fund (JPM
Euro Liquidity X (dist)) 610,191 9.35
610,191 9.35
Total Investment Funds 610,191 9.35
Total Transferable Securities Dealt in on AnotherRegulated Market
2,455,133 37.61
Total Investments 2,455,133 37.61
Cash 4,072,935 62.40
Other Assets/(Liabilities) (762) (0.01)
Total Net Assets 6,527,306 100.00
Allocation of Portfolio as at 30 June 2011 % ofNet Assets
Fixed Income SecuritiesFrance 28.26Total Fixed Income Securities 28.26Investment FundsLuxembourg 9.35Total Investment Funds 9.35Cash and Other Assets/(Liabilities) 62.39
Total 100.00
Allocation of Portfolio as at 31 December 2010 (Unaudited) % ofNet Assets
Investment FundsLuxembourg 9.23Total Investment Funds 9.23Cash and Other Assets/(Liabilities) 90.77
Total 100.00
124
JPMorgan Funds - Emerging Markets Currency Alpha FundSchedule of Investments (Market Value Expressed in EUR)
As at 30 June 2011
Quantity/Nominal
Value
Name of Securities Maturity/Coupon
MarketValue
%of
NetAssets
Quantity/Nominal
Value
Name of Securities Maturity/Coupon
MarketValue
%of
NetAssets
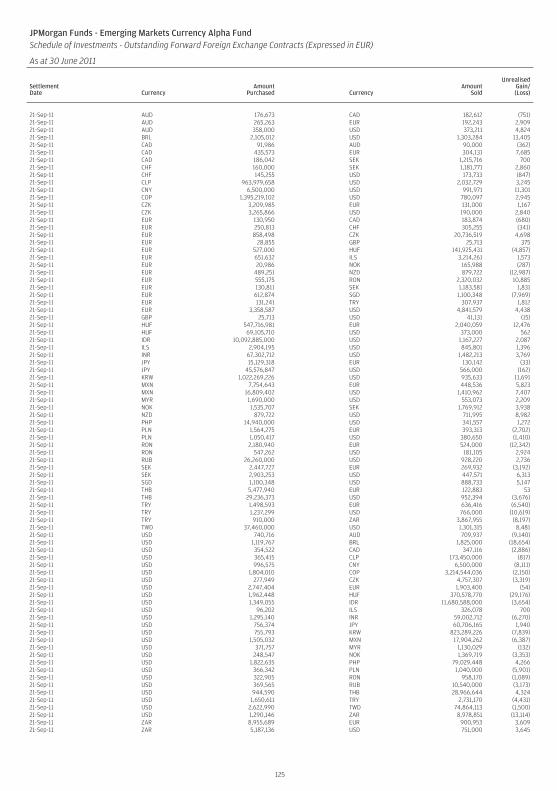
JPMorgan Funds - Emerging Markets Currency Alpha FundSchedule of Investments - Outstanding Forward Foreign Exchange Contracts (Expressed in EUR) (continued)
As at 30 June 2011
SettlementDate Currency
AmountPurchased Currency
AmountSold
UnrealisedGain/(Loss)
21-Sep-11 AUD 176,673 CAD 182,612 (751)21-Sep-11 AUD 265,263 EUR 192,243 2,90921-Sep-11 AUD 358,000 USD 373,211 4,82421-Sep-11 BRL 2,105,012 USD 1,303,284 13,40521-Sep-11 CAD 91,986 AUD 90,000 (362)21-Sep-11 CAD 435,573 EUR 304,131 7,68521-Sep-11 CAD 186,042 SEK 1,215,716 70021-Sep-11 CHF 160,000 SEK 1,181,771 2,86021-Sep-11 CHF 145,255 USD 173,733 (847)21-Sep-11 CLP 963,979,658 USD 2,032,729 3,24521-Sep-11 CNY 6,500,000 USD 991,971 11,30121-Sep-11 COP 1,395,219,102 USD 780,097 2,94521-Sep-11 CZK 3,209,985 EUR 131,000 1,16721-Sep-11 CZK 3,265,866 USD 190,000 2,84021-Sep-11 EUR 130,950 CAD 183,874 (680)21-Sep-11 EUR 250,813 CHF 305,255 (341)21-Sep-11 EUR 858,498 CZK 20,736,519 4,69821-Sep-11 EUR 28,855 GBP 25,713 37521-Sep-11 EUR 527,000 HUF 141,925,431 (4,857)21-Sep-11 EUR 651,632 ILS 3,214,261 1,57321-Sep-11 EUR 20,986 NOK 165,988 (287)21-Sep-11 EUR 489,251 NZD 879,722 (12,987)21-Sep-11 EUR 555,175 RON 2,320,032 10,88521-Sep-11 EUR 130,811 SEK 1,183,581 1,83121-Sep-11 EUR 612,874 SGD 1,100,348 (7,969)21-Sep-11 EUR 131,241 TRY 307,937 1,81221-Sep-11 EUR 3,358,587 USD 4,841,579 4,43821-Sep-11 GBP 25,713 USD 41,131 (15)21-Sep-11 HUF 547,716,981 EUR 2,040,059 12,47621-Sep-11 HUF 69,105,710 USD 373,000 56221-Sep-11 IDR 10,092,885,000 USD 1,167,227 2,08721-Sep-11 ILS 2,904,195 USD 845,801 1,39621-Sep-11 INR 67,302,712 USD 1,482,213 3,76921-Sep-11 JPY 15,129,318 EUR 130,142 (33)21-Sep-11 JPY 45,576,847 USD 566,000 (162)21-Sep-11 KRW 1,022,269,226 USD 935,633 11,69121-Sep-11 MXN 7,754,643 EUR 448,536 5,82321-Sep-11 MXN 16,809,402 USD 1,410,962 7,40721-Sep-11 MYR 1,690,000 USD 553,073 2,20921-Sep-11 NOK 1,535,707 SEK 1,769,912 3,93821-Sep-11 NZD 879,722 USD 711,995 8,98221-Sep-11 PHP 14,940,000 USD 341,557 1,27221-Sep-11 PLN 1,564,275 EUR 393,313 (2,702)21-Sep-11 PLN 1,050,417 USD 380,650 (1,410)21-Sep-11 RON 2,180,940 EUR 524,000 (12,342)21-Sep-11 RON 547,262 USD 181,105 2,92421-Sep-11 RUB 26,260,000 USD 928,220 2,73621-Sep-11 SEK 2,447,727 EUR 269,932 (3,192)21-Sep-11 SEK 2,903,253 USD 447,571 6,31321-Sep-11 SGD 1,100,348 USD 888,733 5,14721-Sep-11 THB 5,477,940 EUR 122,883 5321-Sep-11 THB 29,236,373 USD 952,394 (3,676)21-Sep-11 TRY 1,498,593 EUR 636,416 (6,540)21-Sep-11 TRY 1,237,299 USD 766,000 (10,619)21-Sep-11 TRY 910,000 ZAR 3,867,955 (8,197)21-Sep-11 TWD 37,460,000 USD 1,301,315 8,48121-Sep-11 USD 740,716 AUD 709,937 (9,140)21-Sep-11 USD 1,119,767 BRL 1,825,000 (18,654)21-Sep-11 USD 354,522 CAD 347,116 (2,886)21-Sep-11 USD 365,415 CLP 173,450,000 (817)21-Sep-11 USD 996,575 CNY 6,500,000 (8,111)21-Sep-11 USD 1,804,010 COP 3,214,544,036 (2,150)21-Sep-11 USD 277,949 CZK 4,757,307 (3,319)21-Sep-11 USD 2,747,404 EUR 1,903,400 (54)21-Sep-11 USD 1,962,448 HUF 370,578,770 (29,176)21-Sep-11 USD 1,349,055 IDR 11,680,588,000 (3,654)21-Sep-11 USD 96,202 ILS 326,078 70021-Sep-11 USD 1,295,140 INR 59,002,712 (6,270)21-Sep-11 USD 756,374 JPY 60,706,165 1,94021-Sep-11 USD 755,793 KRW 823,289,226 (7,839)21-Sep-11 USD 1,505,032 MXN 17,904,262 (6,387)21-Sep-11 USD 371,757 MYR 1,130,029 (132)21-Sep-11 USD 248,547 NOK 1,369,719 (3,353)21-Sep-11 USD 1,822,635 PHP 79,029,448 4,26621-Sep-11 USD 366,342 PLN 1,040,000 (5,901)21-Sep-11 USD 322,905 RON 958,170 (1,089)21-Sep-11 USD 369,565 RUB 10,540,000 (3,173)21-Sep-11 USD 944,590 THB 28,966,644 4,32421-Sep-11 USD 1,650,611 TRY 2,731,170 (4,431)21-Sep-11 USD 2,622,990 TWD 74,864,113 (1,500)21-Sep-11 USD 1,290,146 ZAR 8,978,851 (13,114)21-Sep-11 ZAR 8,955,689 EUR 900,953 3,60921-Sep-11 ZAR 5,187,136 USD 751,000 3,645
125
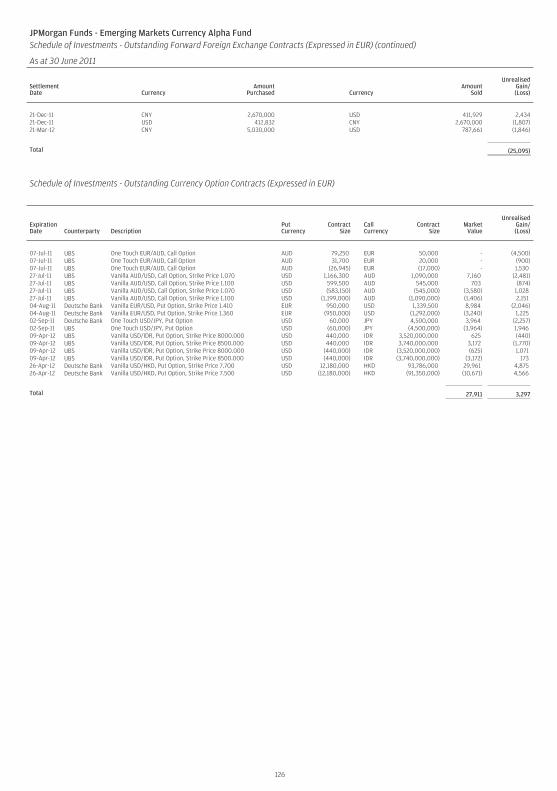
JPMorgan Funds - Emerging Markets Currency Alpha FundSchedule of Investments - Outstanding Forward Foreign Exchange Contracts (Expressed in EUR) (continued)
As at 30 June 2011
SettlementDate Currency
AmountPurchased Currency
AmountSold
UnrealisedGain/(Loss)
21-Dec-11 CNY 2,670,000 USD 411,929 2,43421-Dec-11 USD 412,832 CNY 2,670,000 (1,807)21-Mar-12 CNY 5,030,000 USD 787,661 (1,846)
Total (25,095)
Schedule of Investments - Outstanding Currency Option Contracts (Expressed in EUR)
ExpirationDate Counterparty Description
PutCurrency
ContractSize
CallCurrency
ContractSize
MarketValue
UnrealisedGain/(Loss)
07-Jul-11 UBS One Touch EUR/AUD, Call Option AUD 79,250 EUR 50,000 - (4,500)07-Jul-11 UBS One Touch EUR/AUD, Call Option AUD 31,700 EUR 20,000 - (900)07-Jul-11 UBS One Touch EUR/AUD, Call Option AUD (26,945) EUR (17,000) - 1,53027-Jul-11 UBS Vanilla AUD/USD, Call Option, Strike Price 1.070 USD 1,166,300 AUD 1,090,000 7,160 (2,481)27-Jul-11 UBS Vanilla AUD/USD, Call Option, Strike Price 1.100 USD 599,500 AUD 545,000 703 (874)27-Jul-11 UBS Vanilla AUD/USD, Call Option, Strike Price 1.070 USD (583,150) AUD (545,000) (3,580) 1,02827-Jul-11 UBS Vanilla AUD/USD, Call Option, Strike Price 1.100 USD (1,199,000) AUD (1,090,000) (1,406) 2,15104-Aug-11 Deutsche Bank Vanilla EUR/USD, Put Option, Strike Price 1.410 EUR 950,000 USD 1,339,500 8,984 (2,046)04-Aug-11 Deutsche Bank Vanilla EUR/USD, Put Option, Strike Price 1.360 EUR (950,000) USD (1,292,000) (3,240) 1,22502-Sep-11 Deutsche Bank One Touch USD/JPY, Put Option USD 60,000 JPY 4,500,000 3,964 (2,257)02-Sep-11 UBS One Touch USD/JPY, Put Option USD (60,000) JPY (4,500,000) (3,964) 1,94609-Apr-12 UBS Vanilla USD/IDR, Put Option, Strike Price 8000.000 USD 440,000 IDR 3,520,000,000 625 (440)09-Apr-12 UBS Vanilla USD/IDR, Put Option, Strike Price 8500.000 USD 440,000 IDR 3,740,000,000 3,172 (1,770)09-Apr-12 UBS Vanilla USD/IDR, Put Option, Strike Price 8000.000 USD (440,000) IDR (3,520,000,000) (625) 1,07109-Apr-12 UBS Vanilla USD/IDR, Put Option, Strike Price 8500.000 USD (440,000) IDR (3,740,000,000) (3,172) 17326-Apr-12 Deutsche Bank Vanilla USD/HKD, Put Option, Strike Price 7.700 USD 12,180,000 HKD 93,786,000 29,961 4,87526-Apr-12 Deutsche Bank Vanilla USD/HKD, Put Option, Strike Price 7.500 USD (12,180,000) HKD (91,350,000) (10,671) 4,566
Total 27,911 3,297
126
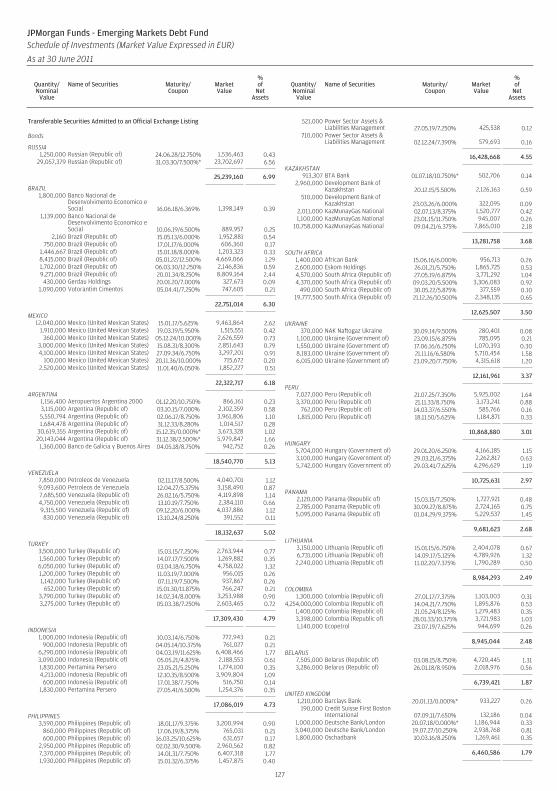
Transferable Securities Admitted to an Official Exchange Listing
Bonds
RUSSIA1,250,000 Russian (Republic of) 24.06.28/12.750% 1,536,463 0.43
29,057,379 Russian (Republic of) 31.03.30/7.500%* 23,702,697 6.56
25,239,160 6.99
BRAZIL1,800,000 Banco Nacional de
Desenvolvimento Economico eSocial 16.06.18/6.369% 1,398,149 0.39
1,139,000 Banco Nacional deDesenvolvimento Economico eSocial 10.06.19/6.500% 889,957 0.25
2,160 Brazil (Republic of) 15.05.13/6.000% 1,952,881 0.54750,000 Brazil (Republic of) 17.01.17/6.000% 606,360 0.17
1,446,667 Brazil (Republic of) 15.01.18/8.000% 1,203,323 0.338,415,000 Brazil (Republic of) 05.01.22/12.500% 4,669,066 1.291,702,000 Brazil (Republic of) 06.03.30/12.250% 2,146,836 0.599,271,000 Brazil (Republic of) 20.01.34/8.250% 8,809,164 2.44
430,000 Gerdau Holdings 20.01.20/7.000% 327,673 0.091,090,000 Votorantim Cimentos 05.04.41/7.250% 747,605 0.21
22,751,014 6.30
MEXICO12,040,000 Mexico (United Mexican States) 15.01.17/5.625% 9,463,864 2.62
1,910,000 Mexico (United Mexican States) 19.03.19/5.950% 1,515,551 0.42360,000 Mexico (United Mexican States) 05.12.24/10.000% 2,626,559 0.73
3,000,000 Mexico (United Mexican States) 15.08.31/8.300% 2,851,643 0.794,100,000 Mexico (United Mexican States) 27.09.34/6.750% 3,297,201 0.91
100,000 Mexico (United Mexican States) 20.11.36/10.000% 715,672 0.202,520,000 Mexico (United Mexican States) 11.01.40/6.050% 1,852,227 0.51
22,322,717 6.18
ARGENTINA1,156,400 Aeropuertos Argentina 2000 01.12.20/10.750% 866,161 0.233,115,000 Argentina (Republic of) 03.10.15/7.000% 2,102,359 0.585,550,794 Argentina (Republic of) 02.06.17/8.750% 3,961,806 1.101,684,478 Argentina (Republic of) 31.12.33/8.280% 1,014,517 0.28
30,619,355 Argentina (Republic of) 15.12.35/0.000%* 3,673,328 1.0220,143,044 Argentina (Republic of) 31.12.38/2.500%* 5,979,847 1.661,360,000 Banco de Galicia y Buenos Aires 04.05.18/8.750% 942,752 0.26
18,540,770 5.13
VENEZUELA7,850,000 Petroleos de Venezuela 02.11.17/8.500% 4,040,701 1.129,093,600 Petroleos de Venezuela 12.04.27/5.375% 3,158,490 0.877,685,500 Venezuela (Republic of) 26.02.16/5.750% 4,119,898 1.144,750,000 Venezuela (Republic of) 13.10.19/7.750% 2,384,110 0.669,315,500 Venezuela (Republic of) 09.12.20/6.000% 4,037,886 1.12830,000 Venezuela (Republic of) 13.10.24/8.250% 391,552 0.11
18,132,637 5.02
TURKEY3,500,000 Turkey (Republic of) 15.03.15/7.250% 2,763,944 0.771,560,000 Turkey (Republic of) 14.07.17/7.500% 1,269,882 0.356,050,000 Turkey (Republic of) 03.04.18/6.750% 4,758,022 1.321,200,000 Turkey (Republic of) 11.03.19/7.000% 956,015 0.261,142,000 Turkey (Republic of) 07.11.19/7.500% 937,867 0.26
652,000 Turkey (Republic of) 15.01.30/11.875% 766,247 0.213,790,000 Turkey (Republic of) 14.02.34/8.000% 3,253,988 0.903,275,000 Turkey (Republic of) 05.03.38/7.250% 2,603,465 0.72
17,309,430 4.79
INDONESIA1,000,000 Indonesia (Republic of) 10.03.14/6.750% 772,943 0.21
900,000 Indonesia (Republic of) 04.05.14/10.375% 761,027 0.216,290,000 Indonesia (Republic of) 04.03.19/11.625% 6,408,466 1.773,090,000 Indonesia (Republic of) 05.05.21/4.875% 2,188,553 0.611,830,000 Pertamina Persero 23.05.21/5.250% 1,274,100 0.354,213,000 Indonesia (Republic of) 12.10.35/8.500% 3,909,804 1.09600,000 Indonesia (Republic of) 17.01.38/7.750% 516,750 0.14
1,830,000 Pertamina Persero 27.05.41/6.500% 1,254,376 0.35
17,086,019 4.73
PHILIPPINES3,590,000 Philippines (Republic of) 18.01.17/9.375% 3,200,994 0.90
860,000 Philippines (Republic of) 17.06.19/8.375% 765,031 0.21600,000 Philippines (Republic of) 16.03.25/10.625% 631,657 0.17
2,950,000 Philippines (Republic of) 02.02.30/9.500% 2,960,562 0.827,370,000 Philippines (Republic of) 14.01.31/7.750% 6,407,318 1.771,930,000 Philippines (Republic of) 15.01.32/6.375% 1,457,875 0.40
521,000 Power Sector Assets &Liabilities Management 27.05.19/7.250% 425,538 0.12
710,000 Power Sector Assets &Liabilities Management 02.12.24/7.390% 579,693 0.16
16,428,668 4.55
KAZAKHSTAN913,307 BTA Bank 01.07.18/10.750%* 502,706 0.14
2,960,000 Development Bank ofKazakhstan 20.12.15/5.500% 2,126,163 0.59
510,000 Development Bank ofKazakhstan 23.03.26/6.000% 322,095 0.09
2,011,000 KazMunayGas National 02.07.13/8.375% 1,520,777 0.421,100,000 KazMunayGas National 23.01.15/11.750% 945,007 0.26
10,758,000 KazMunayGas National 09.04.21/6.375% 7,865,010 2.18
13,281,758 3.68
SOUTH AFRICA1,400,000 African Bank 15.06.16/6.000% 956,713 0.262,600,000 Eskom Holdings 26.01.21/5.750% 1,865,725 0.534,570,000 South Africa (Republic of) 27.05.19/6.875% 3,771,292 1.044,370,000 South Africa (Republic of) 09.03.20/5.500% 3,306,083 0.92
490,000 South Africa (Republic of) 30.05.22/5.875% 377,559 0.1019,777,500 South Africa (Republic of) 21.12.26/10.500% 2,348,135 0.65
12,625,507 3.50
UKRAINE370,000 NAK Naftogaz Ukraine 30.09.14/9.500% 280,401 0.08
1,100,000 Ukraine (Government of) 23.09.15/6.875% 785,095 0.211,550,000 Ukraine (Government of) 17.06.16/6.250% 1,070,393 0.308,183,000 Ukraine (Government of) 21.11.16/6.580% 5,710,454 1.586,015,000 Ukraine (Government of) 23.09.20/7.750% 4,315,618 1.20
12,161,961 3.37
PERU7,027,000 Peru (Republic of) 21.07.25/7.350% 5,925,002 1.643,370,000 Peru (Republic of) 21.11.33/8.750% 3,173,241 0.88
762,000 Peru (Republic of) 14.03.37/6.550% 585,766 0.161,815,000 Peru (Republic of) 18.11.50/5.625% 1,184,871 0.33
10,868,880 3.01
HUNGARY5,704,000 Hungary (Government of) 29.01.20/6.250% 4,166,185 1.153,100,000 Hungary (Government of) 29.03.21/6.375% 2,262,817 0.635,742,000 Hungary (Government of) 29.03.41/7.625% 4,296,629 1.19
10,725,631 2.97
PANAMA2,120,000 Panama (Republic of) 15.03.15/7.250% 1,727,921 0.482,785,000 Panama (Republic of) 30.09.27/8.875% 2,724,165 0.755,095,000 Panama (Republic of) 01.04.29/9.375% 5,229,537 1.45
9,681,623 2.68
LITHUANIA3,150,000 Lithuania (Republic of) 15.01.15/6.750% 2,404,078 0.676,731,000 Lithuania (Republic of) 14.09.17/5.125% 4,789,926 1.322,240,000 Lithuania (Republic of) 11.02.20/7.375% 1,790,289 0.50
8,984,293 2.49
COLOMBIA1,300,000 Colombia (Republic of) 27.01.17/7.375% 1,103,003 0.31
4,254,000,000 Colombia (Republic of) 14.04.21/7.750% 1,895,876 0.531,400,000 Colombia (Republic of) 21.05.24/8.125% 1,279,483 0.353,398,000 Colombia (Republic of) 28.01.33/10.375% 3,721,983 1.031,140,000 Ecopetrol 23.07.19/7.625% 944,699 0.26
8,945,044 2.48
BELARUS7,505,000 Belarus (Republic of) 03.08.15/8.750% 4,720,445 1.313,286,000 Belarus (Republic of) 26.01.18/8.950% 2,018,976 0.56
6,739,421 1.87
UNITED KINGDOM1,210,000 Barclays Bank 20.01.13/0.000%* 933,227 0.26
190,000 Credit Suisse First BostonInternational 07.09.11/7.650% 132,186 0.04
1,000,000 Deutsche Bank/London 20.07.18/0.000%* 1,186,944 0.333,040,000 Deutsche Bank/London 19.07.27/10.250% 2,938,768 0.811,800,000 Oschadbank 10.03.16/8.250% 1,269,461 0.35
6,460,586 1.79
127
JPMorgan Funds - Emerging Markets Debt FundSchedule of Investments (Market Value Expressed in EUR)
As at 30 June 2011
Quantity/Nominal
Value
Name of Securities Maturity/Coupon
MarketValue
%of
NetAssets
Quantity/Nominal
Value
Name of Securities Maturity/Coupon
MarketValue
%of
NetAssets
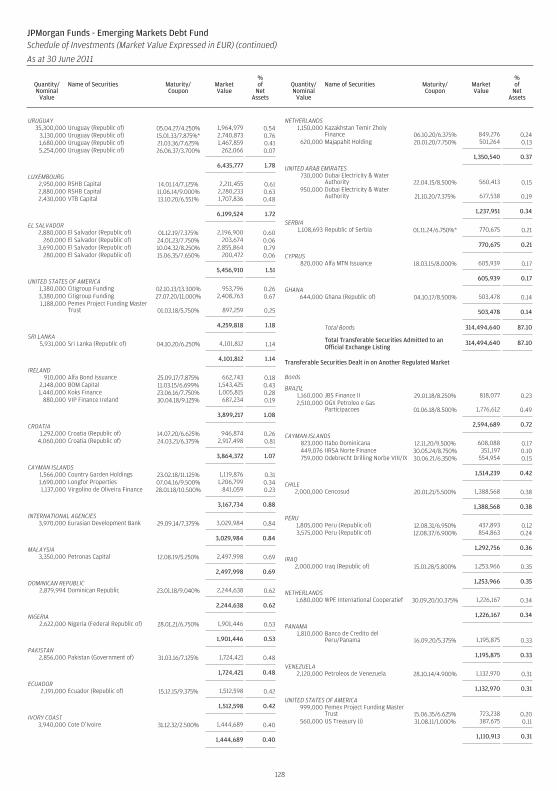
URUGUAY35,300,000 Uruguay (Republic of) 05.04.27/4.250% 1,964,979 0.54
3,130,000 Uruguay (Republic of) 15.01.33/7.875%* 2,740,873 0.761,680,000 Uruguay (Republic of) 21.03.36/7.625% 1,467,859 0.415,254,000 Uruguay (Republic of) 26.06.37/3.700% 262,066 0.07
6,435,777 1.78
LUXEMBOURG2,950,000 RSHB Capital 14.01.14/7.125% 2,211,455 0.612,880,000 RSHB Capital 11.06.14/9.000% 2,280,233 0.632,430,000 VTB Capital 13.10.20/6.551% 1,707,836 0.48
6,199,524 1.72
EL SALVADOR2,880,000 El Salvador (Republic of) 01.12.19/7.375% 2,196,900 0.60
260,000 El Salvador (Republic of) 24.01.23/7.750% 203,674 0.063,690,000 El Salvador (Republic of) 10.04.32/8.250% 2,855,864 0.79
280,000 El Salvador (Republic of) 15.06.35/7.650% 200,472 0.06
5,456,910 1.51
UNITED STATES OF AMERICA1,380,000 Citigroup Funding 02.10.13/13.300% 953,796 0.263,380,000 Citigroup Funding 27.07.20/11.000% 2,408,763 0.671,188,000 Pemex Project Funding Master
Trust 01.03.18/5.750% 897,259 0.25
4,259,818 1.18
SRI LANKA5,931,000 Sri Lanka (Republic of) 04.10.20/6.250% 4,101,812 1.14
4,101,812 1.14
IRELAND910,000 Alfa Bond Issuance 25.09.17/7.875% 662,743 0.18
2,148,000 BOM Capital 11.03.15/6.699% 1,543,425 0.431,440,000 Koks Finance 23.06.16/7.750% 1,005,815 0.28
880,000 VIP Finance Ireland 30.04.18/9.125% 687,234 0.19
3,899,217 1.08
CROATIA1,292,000 Croatia (Republic of) 14.07.20/6.625% 946,874 0.26
4,060,000 Croatia (Republic of) 24.03.21/6.375% 2,917,498 0.81
3,864,372 1.07
CAYMAN ISLANDS1,566,000 Country Garden Holdings 23.02.18/11.125% 1,119,876 0.311,690,000 Longfor Properties 07.04.16/9.500% 1,206,799 0.341,137,000 Virgolino de Oliveira Finance 28.01.18/10.500% 841,059 0.23
3,167,734 0.88
INTERNATIONAL AGENCIES3,970,000 Eurasian Development Bank 29.09.14/7.375% 3,029,984 0.84
3,029,984 0.84
MALAYSIA3,350,000 Petronas Capital 12.08.19/5.250% 2,497,998 0.69
2,497,998 0.69
DOMINICAN REPUBLIC2,879,994 Dominican Republic 23.01.18/9.040% 2,244,638 0.62
2,244,638 0.62
NIGERIA2,622,000 Nigeria (Federal Republic of) 28.01.21/6.750% 1,901,446 0.53
1,901,446 0.53
PAKISTAN2,856,000 Pakistan (Government of) 31.03.16/7.125% 1,724,421 0.48
1,724,421 0.48
ECUADOR2,191,000 Ecuador (Republic of) 15.12.15/9.375% 1,512,598 0.42
1,512,598 0.42
IVORY COAST3,940,000 Cote D’Ivoire 31.12.32/2.500% 1,444,689 0.40
1,444,689 0.40
NETHERLANDS1,150,000 Kazakhstan Temir Zholy
Finance 06.10.20/6.375% 849,276 0.24620,000 Majapahit Holding 20.01.20/7.750% 501,264 0.13
1,350,540 0.37
UNITED ARAB EMIRATES730,000 Dubai Electricity & Water
Authority 22.04.15/8.500% 560,413 0.15950,000 Dubai Electricity & Water
Authority 21.10.20/7.375% 677,538 0.19
1,237,951 0.34
SERBIA1,108,693 Republic of Serbia 01.11.24/6.750%* 770,675 0.21
770,675 0.21
CYPRUS820,000 Alfa MTN Issuance 18.03.15/8.000% 605,939 0.17
605,939 0.17
GHANA644,000 Ghana (Republic of) 04.10.17/8.500% 503,478 0.14
503,478 0.14
Total Bonds 314,494,640 87.10
Total Transferable Securities Admitted to anOfficial Exchange Listing
314,494,640 87.10
Transferable Securities Dealt in on Another Regulated Market
Bonds
BRAZIL1,160,000 JBS Finance II 29.01.18/8.250% 818,077 0.232,510,000 OGX Petroleo e Gas
Participacoes 01.06.18/8.500% 1,776,612 0.49
2,594,689 0.72
CAYMAN ISLANDS823,000 Itabo Dominicana 12.11.20/9.500% 608,088 0.17449,076 IIRSA Norte Finance 30.05.24/8.750% 351,197 0.10759,000 Odebrecht Drilling Norbe VIII/IX 30.06.21/6.350% 554,954 0.15
1,514,239 0.42
CHILE2,000,000 Cencosud 20.01.21/5.500% 1,388,568 0.38
1,388,568 0.38
PERU1,805,000 Peru (Republic of) 12.08.31/6.950% 437,893 0.123,575,000 Peru (Republic of) 12.08.37/6.900% 854,863 0.24
1,292,756 0.36
IRAQ2,000,000 Iraq (Republic of) 15.01.28/5.800% 1,253,966 0.35
1,253,966 0.35
NETHERLANDS1,680,000 WPE International Cooperatief 30.09.20/10.375% 1,226,167 0.34
1,226,167 0.34
PANAMA1,810,000 Banco de Credito del
Peru/Panama 16.09.20/5.375% 1,195,875 0.33
1,195,875 0.33
VENEZUELA2,120,000 Petroleos de Venezuela 28.10.14/4.900% 1,132,970 0.31
1,132,970 0.31
UNITED STATES OF AMERICA999,000 Pemex Project Funding Master
Trust 15.06.35/6.625% 723,238 0.20560,000 US Treasury (i) 31.08.11/1.000% 387,675 0.11
1,110,913 0.31
128
JPMorgan Funds - Emerging Markets Debt FundSchedule of Investments (Market Value Expressed in EUR) (continued)
As at 30 June 2011
Quantity/Nominal
Value
Name of Securities Maturity/Coupon
MarketValue
%of
NetAssets
Quantity/Nominal
Value
Name of Securities Maturity/Coupon
MarketValue
%of
NetAssets
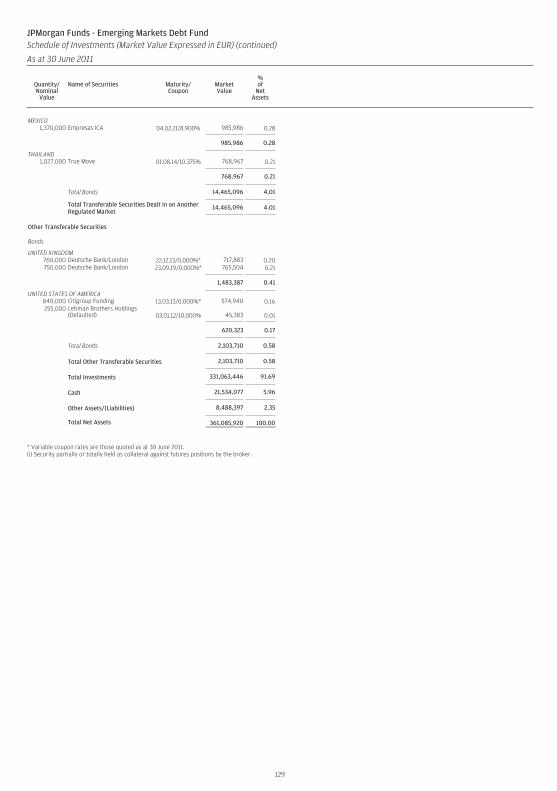
MEXICO1,370,000 Empresas ICA 04.02.21/8.900% 985,986 0.28
985,986 0.28
THAILAND1,027,000 True Move 01.08.14/10.375% 768,967 0.21
768,967 0.21
Total Bonds 14,465,096 4.01
Total Transferable Securities Dealt in on AnotherRegulated Market
14,465,096 4.01
Other Transferable Securities
Bonds
UNITED KINGDOM760,000 Deutsche Bank/London 22.12.13/0.000%* 717,883 0.20750,000 Deutsche Bank/London 23.09.19/0.000%* 765,504 0.21
1,483,387 0.41
UNITED STATES OF AMERICA840,000 Citigroup Funding 13.03.13/0.000%* 574,940 0.16255,000 Lehman Brothers Holdings
(Defaulted) 03.01.12/10.000% 45,383 0.01
620,323 0.17
Total Bonds 2,103,710 0.58
Total Other Transferable Securities 2,103,710 0.58
Total Investments 331,063,446 91.69
Cash 21,534,077 5.96
Other Assets/(Liabilities) 8,488,397 2.35
Total Net Assets 361,085,920 100.00
* Variable coupon rates are those quoted as at 30 June 2011.(i) Security partially or totally held as collateral against futures positions by the broker.
129
JPMorgan Funds - Emerging Markets Debt FundSchedule of Investments (Market Value Expressed in EUR) (continued)
As at 30 June 2011
Quantity/Nominal
Value
Name of Securities Maturity/Coupon
MarketValue
%of
NetAssets
Quantity/Nominal
Value
Name of Securities Maturity/Coupon
MarketValue
%of
NetAssets
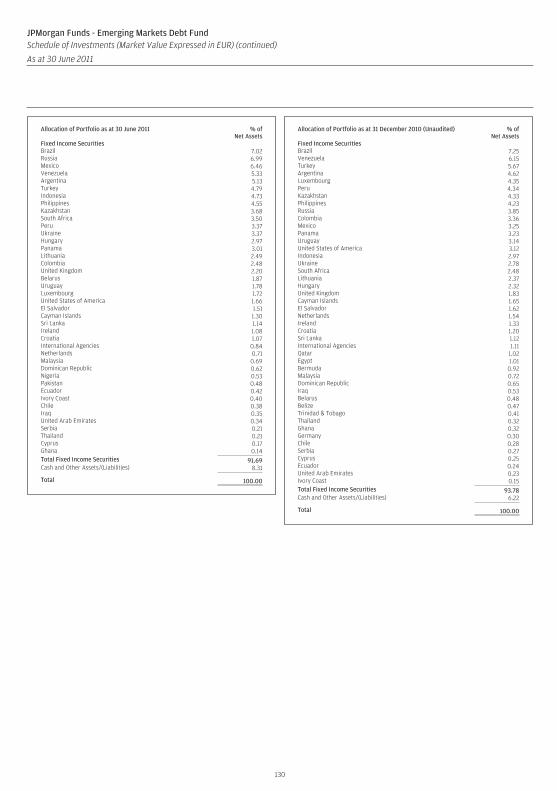
Allocation of Portfolio as at 30 June 2011 % ofNet Assets
Fixed Income SecuritiesBrazil 7.02Russia 6.99Mexico 6.46Venezuela 5.33Argentina 5.13Turkey 4.79Indonesia 4.73Philippines 4.55Kazakhstan 3.68South Africa 3.50Peru 3.37Ukraine 3.37Hungary 2.97Panama 3.01Lithuania 2.49Colombia 2.48United Kingdom 2.20Belarus 1.87Uruguay 1.78Luxembourg 1.72United States of America 1.66El Salvador 1.51Cayman Islands 1.30Sri Lanka 1.14Ireland 1.08Croatia 1.07International Agencies 0.84Netherlands 0.71Malaysia 0.69Dominican Republic 0.62Nigeria 0.53Pakistan 0.48Ecuador 0.42Ivory Coast 0.40Chile 0.38Iraq 0.35United Arab Emirates 0.34Serbia 0.21Thailand 0.21Cyprus 0.17Ghana 0.14Total Fixed Income Securities 91.69Cash and Other Assets/(Liabilities) 8.31
Total 100.00
Allocation of Portfolio as at 31 December 2010 (Unaudited) % ofNet Assets
Fixed Income SecuritiesBrazil 7.25Venezuela 6.15Turkey 5.67Argentina 4.62Luxembourg 4.35Peru 4.34Kazakhstan 4.33Philippines 4.23Russia 3.85Colombia 3.36Mexico 3.25Panama 3.23Uruguay 3.14United States of America 3.12Indonesia 2.97Ukraine 2.78South Africa 2.48Lithuania 2.37Hungary 2.32United Kingdom 1.83Cayman Islands 1.65El Salvador 1.62Netherlands 1.54Ireland 1.33Croatia 1.20Sri Lanka 1.12International Agencies 1.11Qatar 1.02Egypt 1.01Bermuda 0.92Malaysia 0.72Dominican Republic 0.65Iraq 0.53Belarus 0.48Belize 0.47Trinidad & Tobago 0.41Thailand 0.32Ghana 0.32Germany 0.30Chile 0.28Serbia 0.27Cyprus 0.25Ecuador 0.24United Arab Emirates 0.23Ivory Coast 0.15Total Fixed Income Securities 93.78Cash and Other Assets/(Liabilities) 6.22
Total 100.00
130
JPMorgan Funds - Emerging Markets Debt FundSchedule of Investments (Market Value Expressed in EUR) (continued)
As at 30 June 2011
Quantity/Nominal
Value
Name of Securities Maturity/Coupon
MarketValue
%of
NetAssets
Quantity/Nominal
Value
Name of Securities Maturity/Coupon
MarketValue
%of
NetAssets
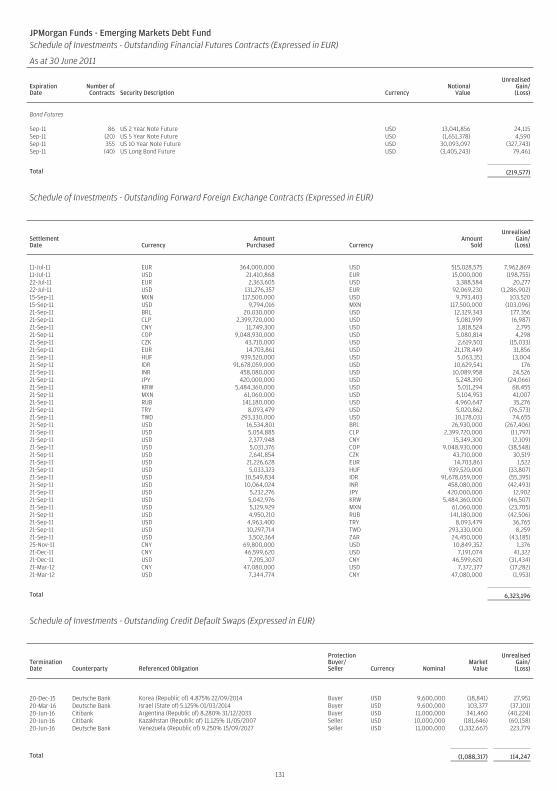
JPMorgan Funds - Emerging Markets Debt FundSchedule of Investments - Outstanding Financial Futures Contracts (Expressed in EUR)
As at 30 June 2011
ExpirationDate
Number ofContracts Security Description Currency
NotionalValue
UnrealisedGain/(Loss)
Bond Futures
Sep-11 86 US 2 Year Note Future USD 13,041,856 24,115Sep-11 (20) US 5 Year Note Future USD (1,651,378) 4,590Sep-11 355 US 10 Year Note Future USD 30,093,097 (327,743)Sep-11 (40) US Long Bond Future USD (3,405,243) 79,461
Total (219,577)
Schedule of Investments - Outstanding Forward Foreign Exchange Contracts (Expressed in EUR)
SettlementDate Currency
AmountPurchased Currency
AmountSold
UnrealisedGain/(Loss)
11-Jul-11 EUR 364,000,000 USD 515,028,575 7,962,86911-Jul-11 USD 21,410,868 EUR 15,000,000 (198,755)22-Jul-11 EUR 2,363,605 USD 3,388,584 20,27722-Jul-11 USD 131,276,357 EUR 92,069,230 (1,286,902)15-Sep-11 MXN 117,500,000 USD 9,793,403 103,52015-Sep-11 USD 9,794,016 MXN 117,500,000 (103,096)21-Sep-11 BRL 20,030,000 USD 12,329,343 177,35621-Sep-11 CLP 2,399,720,000 USD 5,081,999 (6,987)21-Sep-11 CNY 11,749,300 USD 1,818,524 2,79521-Sep-11 COP 9,048,930,000 USD 5,080,814 4,29821-Sep-11 CZK 43,710,000 USD 2,619,501 (15,033)21-Sep-11 EUR 14,703,861 USD 21,178,449 31,85621-Sep-11 HUF 939,520,000 USD 5,063,351 13,00421-Sep-11 IDR 91,678,059,000 USD 10,629,541 17621-Sep-11 INR 458,080,000 USD 10,089,958 24,52621-Sep-11 JPY 420,000,000 USD 5,248,390 (24,066)21-Sep-11 KRW 5,484,360,000 USD 5,011,294 68,45521-Sep-11 MXN 61,060,000 USD 5,104,953 41,00721-Sep-11 RUB 141,180,000 USD 4,960,647 35,27621-Sep-11 TRY 8,093,479 USD 5,020,862 (76,573)21-Sep-11 TWD 293,330,000 USD 10,178,031 74,65521-Sep-11 USD 16,534,801 BRL 26,930,000 (267,406)21-Sep-11 USD 5,054,885 CLP 2,399,720,000 (11,797)21-Sep-11 USD 2,377,948 CNY 15,349,300 (2,109)21-Sep-11 USD 5,031,376 COP 9,048,930,000 (38,548)21-Sep-11 USD 2,641,854 CZK 43,710,000 30,51921-Sep-11 USD 21,226,628 EUR 14,703,861 1,52221-Sep-11 USD 5,033,323 HUF 939,520,000 (33,807)21-Sep-11 USD 10,549,834 IDR 91,678,059,000 (55,395)21-Sep-11 USD 10,064,024 INR 458,080,000 (42,493)21-Sep-11 USD 5,232,276 JPY 420,000,000 12,90221-Sep-11 USD 5,042,976 KRW 5,484,360,000 (46,507)21-Sep-11 USD 5,129,929 MXN 61,060,000 (23,705)21-Sep-11 USD 4,950,210 RUB 141,180,000 (42,506)21-Sep-11 USD 4,963,400 TRY 8,093,479 36,76521-Sep-11 USD 10,297,714 TWD 293,330,000 8,25921-Sep-11 USD 3,502,364 ZAR 24,450,000 (43,185)25-Nov-11 CNY 69,800,000 USD 10,849,352 1,37621-Dec-11 CNY 46,599,620 USD 7,191,074 41,32221-Dec-11 USD 7,205,307 CNY 46,599,620 (31,434)21-Mar-12 CNY 47,080,000 USD 7,372,377 (17,282)21-Mar-12 USD 7,344,774 CNY 47,080,000 (1,953)
Total 6,323,196
Schedule of Investments - Outstanding Credit Default Swaps (Expressed in EUR)
TerminationDate Counterparty Referenced Obligation
ProtectionBuyer/Seller Currency Nominal
MarketValue
UnrealisedGain/(Loss)
20-Dec-15 Deutsche Bank Korea (Republic of) 4.875% 22/09/2014 Buyer USD 9,600,000 (18,841) 27,95120-Mar-16 Deutsche Bank Israel (State of) 5.125% 01/03/2014 Buyer USD 9,600,000 103,377 (37,101)20-Jun-16 Citibank Argentina (Republic of) 8.280% 31/12/2033 Buyer USD 11,000,000 341,460 (40,224)20-Jun-16 Citibank Kazakhstan (Republic of) 11.125% 11/05/2007 Seller USD 10,000,000 (181,646) (60,158)20-Jun-16 Deutsche Bank Venezuela (Republic of) 9.250% 15/09/2027 Seller USD 11,000,000 (1,332,667) 223,779
Total (1,088,317) 114,247
131
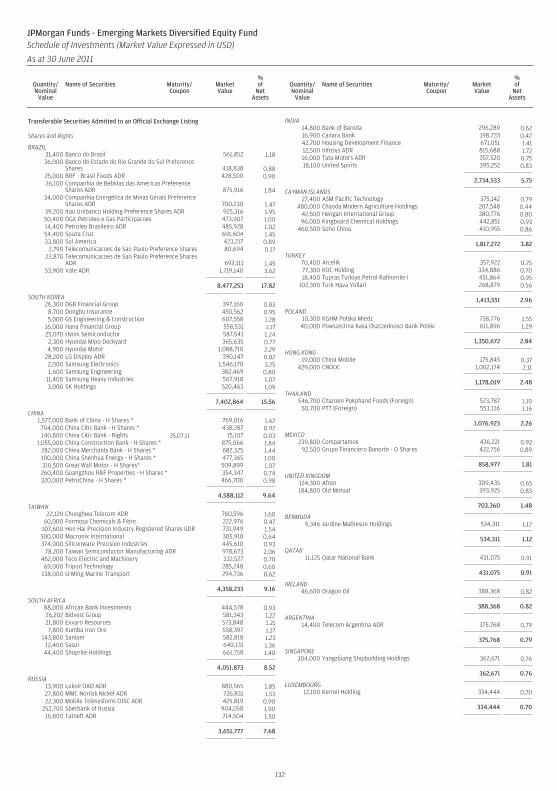
Transferable Securities Admitted to an Official Exchange Listing
Shares and Rights
BRAZIL31,400 Banco do Brasil 561,852 1.1836,000 Banco do Estado do Rio Grande do Sul Preference
Shares 418,838 0.8825,000 BRF - Brasil Foods ADR 428,500 0.9026,100 Companhia de Bebidas das Americas Preference
Shares ADR 875,916 1.8434,000 Companhia Energética de Minas Gerais Preference
Shares ADR 700,230 1.4739,200 Itau Unibanco Holding Preference Shares ADR 925,316 1.9550,400 OGX Petroleo e Gas Participacoes 473,907 1.0014,400 Petroleo Brasileiro ADR 485,928 1.0254,400 Souza Cruz 691,604 1.4533,800 Sul America 423,217 0.89
2,790 Telecomunicacoes de Sao Paulo Preference Shares 80,694 0.1723,870 Telecomunicacoes de Sao Paulo Preference Shares
ADR 692,111 1.4553,900 Vale ADR 1,719,140 3.62
8,477,253 17.82
SOUTH KOREA26,300 DGB Financial Group 397,160 0.83
8,700 Dongbu Insurance 450,562 0.955,000 GS Engineering & Construction 607,558 1.28
16,000 Hana Financial Group 558,531 1.1725,070 Hynix Semiconductor 587,541 1.242,300 Hyundai Mipo Dockyard 365,635 0.774,900 Hyundai Motor 1,088,710 2.29
28,200 LG Display ADR 390,147 0.822,000 Samsung Electronics 1,546,170 3.251,600 Samsung Engineering 382,469 0.80
11,400 Samsung Heavy Industries 507,918 1.073,000 SK Holdings 520,463 1.09
7,402,864 15.56
CHINA1,577,000 Bank of China - H Shares * 769,016 1.62704,000 China Citic Bank - H Shares * 438,287 0.92140,800 China Citic Bank - Rights 25.07.11 15,107 0.03
1,055,000 China Construction Bank - H Shares * 875,066 1.84282,000 China Merchants Bank - H Shares * 682,325 1.44100,000 China Shenhua Energy - H Shares * 477,365 1.00310,500 Great Wall Motor - H Shares* 509,899 1.07260,400 Guangzhou R&F Properties - H Shares * 354,347 0.74320,000 PetroChina - H Shares * 466,700 0.98
4,588,112 9.64
TAIWAN22,120 Chunghwa Telecom ADR 760,596 1.60
60,000 Formosa Chemicals & Fibre 222,976 0.47107,600 Hon Hai Precision Industry Registered Shares GDR 731,949 1.54500,000 Macronix International 305,918 0.64374,000 Siliconware Precision Industries 445,610 0.93
78,200 Taiwan Semiconductor Manufacturing ADR 978,673 2.06462,000 Teco Electric and Machinery 332,527 0.70
69,000 Tripod Technology 285,248 0.60138,000 U-Ming Marine Transport 294,736 0.62
4,358,233 9.16
SOUTH AFRICA88,000 African Bank Investments 444,578 0.9326,202 Bidvest Group 581,343 1.2221,800 Exxaro Resources 573,848 1.217,800 Kumba Iron Ore 558,397 1.17
143,800 Sanlam 582,818 1.2312,400 Sasol 649,131 1.36
44,400 Shoprite Holdings 661,758 1.40
4,051,873 8.52
RUSSIA13,900 Lukoil OAO ADR 880,565 1.8527,800 MMC Norilsk Nickel ADR 726,831 1.5322,300 Mobile Telesystems OJSC ADR 425,819 0.90
252,700 Sberbank of Russia 904,058 1.9016,800 Tatneft ADR 714,504 1.50
3,651,777 7.68
INDIA14,800 Bank of Baroda 296,289 0.6216,900 Canara Bank 198,733 0.4242,700 Housing Development Finance 671,051 1.4112,500 Infosys ADR 815,688 1.7216,000 Tata Motors ADR 357,520 0.7518,100 United Spirits 395,252 0.83
2,734,533 5.75
CAYMAN ISLANDS27,400 ASM Pacific Technology 375,142 0.79
480,000 Chaoda Modern Agriculture Holdings 207,548 0.4442,500 Hengan International Group 380,776 0.8096,000 Kingboard Chemical Holdings 442,851 0.93
460,500 Soho China 410,955 0.86
1,817,272 3.82
TURKEY70,400 Arcelik 357,922 0.7577,300 KOC Holding 334,886 0.7018,400 Tupras Turkiye Petrol Rafinerileri 451,864 0.95
102,300 Turk Hava Yollari 268,879 0.56
1,413,551 2.96
POLAND10,300 KGHM Polska Miedz 738,776 1.55
40,000 Powszechna Kasa Oszczednosci Bank Polski 611,896 1.29
1,350,672 2.84
HONG KONG19,000 China Mobile 175,845 0.37
429,000 CNOOC 1,002,174 2.11
1,178,019 2.48
THAILAND546,700 Charoen Pokphand Foods (Foreign) 523,787 1.10
50,700 PTT (Foreign) 553,136 1.16
1,076,923 2.26
MEXICO239,800 Compartamos 436,221 0.92
92,500 Grupo Financiero Banorte - O Shares 422,756 0.89
858,977 1.81
UNITED KINGDOM124,300 Afren 309,435 0.65184,800 Old Mutual 393,925 0.83
703,360 1.48
BERMUDA9,346 Jardine Matheson Holdings 534,311 1.12
534,311 1.12
QATAR11,125 Qatar National Bank 431,075 0.91
431,075 0.91
IRELAND46,600 Dragon Oil 388,368 0.82
388,368 0.82
ARGENTINA14,400 Telecom Argentina ADR 375,768 0.79
375,768 0.79
SINGAPORE304,000 Yangzijiang Shipbuilding Holdings 362,671 0.76
362,671 0.76
LUXEMBOURG12,100 Kernel Holding 334,444 0.70
334,444 0.70
132
JPMorgan Funds - Emerging Markets Diversified Equity FundSchedule of Investments (Market Value Expressed in USD)
As at 30 June 2011
Quantity/Nominal
Value
Name of Securities Maturity/Coupon
MarketValue
%of
NetAssets
Quantity/Nominal
Value
Name of Securities Maturity/Coupon
MarketValue
%of
NetAssets
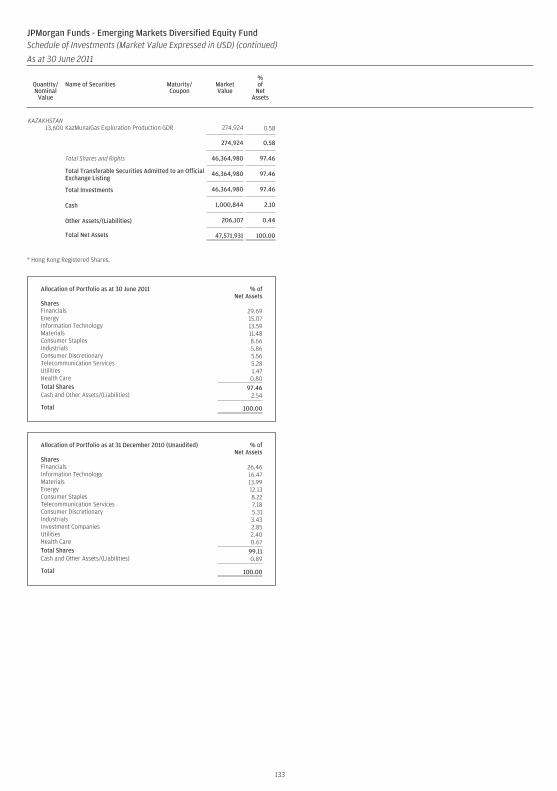
KAZAKHSTAN13,600 KazMunaiGas Exploration Production GDR 274,924 0.58
274,924 0.58
Total Shares and Rights 46,364,980 97.46
Total Transferable Securities Admitted to an OfficialExchange Listing
46,364,980 97.46
Total Investments 46,364,980 97.46
Cash 1,000,844 2.10
Other Assets/(Liabilities) 206,107 0.44
Total Net Assets 47,571,931 100.00
* Hong Kong Registered Shares.
Allocation of Portfolio as at 30 June 2011 % ofNet Assets
SharesFinancials 29.69Energy 15.07Information Technology 13.59Materials 11.48Consumer Staples 8.66Industrials 5.86Consumer Discretionary 5.56Telecommunication Services 5.28Utilities 1.47Health Care 0.80Total Shares 97.46Cash and Other Assets/(Liabilities) 2.54
Total 100.00
Allocation of Portfolio as at 31 December 2010 (Unaudited) % ofNet Assets
SharesFinancials 26.46Information Technology 16.47Materials 13.99Energy 12.13Consumer Staples 8.22Telecommunication Services 7.18Consumer Discretionary 5.31Industrials 3.43Investment Companies 2.85Utilities 2.40Health Care 0.67Total Shares 99.11Cash and Other Assets/(Liabilities) 0.89
Total 100.00
133
JPMorgan Funds - Emerging Markets Diversified Equity FundSchedule of Investments (Market Value Expressed in USD) (continued)
As at 30 June 2011
Quantity/Nominal
Value
Name of Securities Maturity/Coupon
MarketValue
%of
NetAssets
Quantity/Nominal
Value
Name of Securities Maturity/Coupon
MarketValue
%of
NetAssets
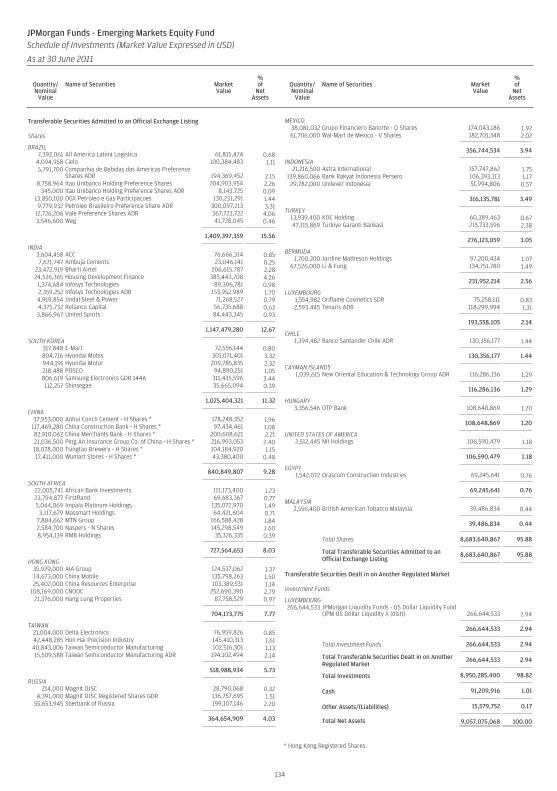
Transferable Securities Admitted to an Official Exchange Listing
Shares
BRAZIL7,392,061 All America Latina Logistica 61,815,474 0.68
4,094,958 Cielo 100,384,483 1.115,791,700 Companhia de Bebidas das Americas Preference
Shares ADR 194,369,452 2.158,758,964 Itau Unibanco Holding Preference Shares 204,903,954 2.26
345,000 Itau Unibanco Holding Preference Shares ADR 8,143,725 0.0913,850,100 OGX Petroleo e Gas Participacoes 130,231,291 1.449,779,932 Petroleo Brasileiro Preference Share ADR 300,097,213 3.31
12,726,206 Vale Preference Shares ADR 367,723,722 4.063,546,600 Weg 41,728,045 0.46
1,409,397,359 15.56
INDIA3,604,458 ACC 76,666,314 0.857,671,747 Ambuja Cements 23,046,141 0.25
23,472,919 Bharti Airtel 206,615,787 2.2824,526,365 Housing Development Finance 385,443,708 4.26
1,374,684 Infosys Technologies 89,306,781 0.982,359,252 Infosys Technologies ADR 153,952,989 1.704,919,854 Jindal Steel & Power 71,268,527 0.794,375,732 Reliance Capital 56,735,688 0.633,866,967 United Spirits 84,443,345 0.93
1,147,479,280 12.67
SOUTH KOREA317,848 E-Mart 72,556,144 0.80804,716 Hyundai Mobis 301,071,401 3.32944,191 Hyundai Motor 209,785,835 2.32218,488 POSCO 94,890,251 1.05806,619 Samsung Electronics GDR 144A 311,435,596 3.44112,257 Shinsegae 35,665,094 0.39
1,025,404,321 11.32
CHINA37,953,000 Anhui Conch Cement - H Shares * 178,248,352 1.96
117,469,280 China Construction Bank - H Shares * 97,434,461 1.0882,910,062 China Merchants Bank - H Shares * 200,608,621 2.2121,036,500 Ping An Insurance Group Co. of China - H Shares * 216,993,053 2.4018,078,000 Tsingtao Brewery - H Shares * 104,184,920 1.1517,411,000 Wumart Stores - H Shares * 43,380,400 0.48
840,849,807 9.28
SOUTH AFRICA22,005,741 African Bank Investments 111,173,400 1.2323,794,877 FirstRand 69,683,367 0.775,044,069 Impala Platinum Holdings 135,072,970 1.49
3,117,679 Massmart Holdings 64,421,604 0.717,884,662 MTN Group 166,588,428 1.842,584,700 Naspers - N Shares 145,298,549 1.608,954,139 RMB Holdings 35,326,335 0.39
727,564,653 8.03
HONG KONG35,929,000 AIA Group 124,537,062 1.3714,673,000 China Mobile 135,798,263 1.5025,402,000 China Resources Enterprise 103,389,531 1.14
108,169,000 CNOOC 252,690,390 2.7921,376,000 Hang Lung Properties 87,758,529 0.97
704,173,775 7.77
TAIWAN21,004,000 Delta Electronics 76,959,826 0.8542,448,285 Hon Hai Precision Industry 145,410,313 1.6140,843,006 Taiwan Semiconductor Manufacturing 102,516,301 1.1315,509,588 Taiwan Semiconductor Manufacturing ADR 194,102,494 2.14
518,988,934 5.73
RUSSIA214,000 Magnit OJSC 28,790,068 0.32
4,391,000 Magnit OJSC Registered Shares GDR 136,757,695 1.5155,653,945 Sberbank of Russia 199,107,146 2.20
364,654,909 4.03
MEXICO38,081,032 Grupo Financiero Banorte - O Shares 174,043,186 1.9261,706,000 Wal-Mart de Mexico - V Shares 182,701,348 2.02
356,744,534 3.94
INDONESIA21,216,500 Astra International 157,747,862 1.75
139,860,066 Bank Rakyat Indonesia Persero 106,393,113 1.1729,782,000 Unilever Indonesia 51,994,806 0.57
316,135,781 3.49
TURKEY13,939,400 KOC Holding 60,389,463 0.6747,115,869 Turkiye Garanti Bankasi 215,733,596 2.38
276,123,059 3.05
BERMUDA1,700,200 Jardine Matheson Holdings 97,200,434 1.07
67,526,000 Li & Fung 134,751,780 1.49
231,952,214 2.56
LUXEMBOURG1,554,982 Oriflame Cosmetics SDR 75,258,111 0.832,593,445 Tenaris ADR 118,299,994 1.31
193,558,105 2.14
CHILE1,394,482 Banco Santander Chile ADR 130,356,177 1.44
130,356,177 1.44
CAYMAN ISLANDS1,039,615 New Oriental Education & Technology Group ADR 116,286,136 1.29
116,286,136 1.29
HUNGARY3,356,546 OTP Bank 108,648,869 1.20
108,648,869 1.20
UNITED STATES OF AMERICA2,512,445 NII Holdings 106,590,479 1.18
106,590,479 1.18
EGYPT1,542,072 Orascom Construction Industries 69,245,641 0.76
69,245,641 0.76
MALAYSIA2,556,400 British American Tobacco Malaysia 39,486,834 0.44
39,486,834 0.44
Total Shares 8,683,640,867 95.88
Total Transferable Securities Admitted to anOfficial Exchange Listing
8,683,640,867 95.88
Transferable Securities Dealt in on Another Regulated Market
Investment Funds
LUXEMBOURG266,644,533 JPMorgan Liquidity Funds - US Dollar Liquidity Fund
(JPM US Dollar Liquidity X (dist)) 266,644,533 2.94
266,644,533 2.94
Total Investment Funds 266,644,533 2.94
Total Transferable Securities Dealt in on AnotherRegulated Market
266,644,533 2.94
Total Investments 8,950,285,400 98.82
Cash 91,209,916 1.01
Other Assets/(Liabilities) 15,579,752 0.17
Total Net Assets 9,057,075,068 100.00
* Hong Kong Registered Shares.
134
JPMorgan Funds - Emerging Markets Equity FundSchedule of Investments (Market Value Expressed in USD)
As at 30 June 2011
Quantity/Nominal
Value
Name of Securities MarketValue
%of
NetAssets
Quantity/Nominal
Value
Name of Securities MarketValue
%of
NetAssets
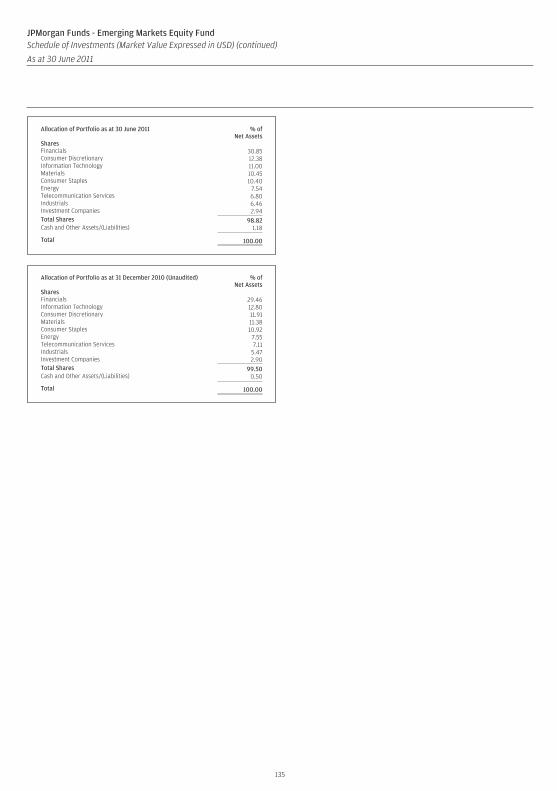
Allocation of Portfolio as at 30 June 2011 % ofNet Assets
SharesFinancials 30.85Consumer Discretionary 12.38Information Technology 11.00Materials 10.45Consumer Staples 10.40Energy 7.54Telecommunication Services 6.80Industrials 6.46Investment Companies 2.94Total Shares 98.82Cash and Other Assets/(Liabilities) 1.18
Total 100.00
Allocation of Portfolio as at 31 December 2010 (Unaudited) % ofNet Assets
SharesFinancials 29.46Information Technology 12.80Consumer Discretionary 11.91Materials 11.38Consumer Staples 10.92Energy 7.55Telecommunication Services 7.11Industrials 5.47Investment Companies 2.90Total Shares 99.50Cash and Other Assets/(Liabilities) 0.50
Total 100.00
135
JPMorgan Funds - Emerging Markets Equity FundSchedule of Investments (Market Value Expressed in USD) (continued)
As at 30 June 2011
Quantity/Nominal
Value
Name of Securities MarketValue
%of
NetAssets
Quantity/Nominal
Value
Name of Securities MarketValue
%of
NetAssets
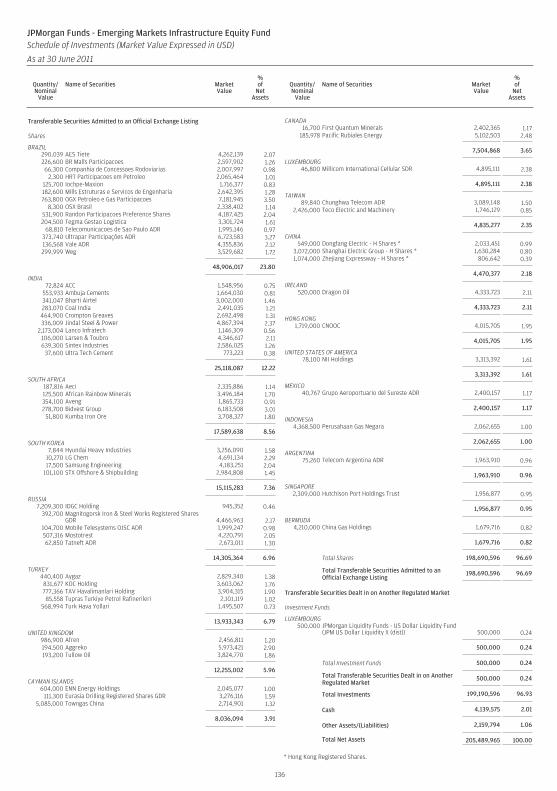
Transferable Securities Admitted to an Official Exchange Listing
Shares
BRAZIL290,039 AES Tiete 4,262,139 2.07226,600 BR Malls Participacoes 2,597,902 1.2666,300 Companhia de Concessoes Rodoviarias 2,007,997 0.98
2,300 HRT Participacoes em Petroleo 2,065,464 1.01125,700 Iochpe-Maxion 1,716,377 0.83182,600 Mills Estruturas e Servicos de Engenharia 2,642,395 1.28763,800 OGX Petroleo e Gas Participacoes 7,181,945 3.50
8,300 OSX Brasil 2,338,402 1.14531,900 Randon Participacoes Preference Shares 4,187,425 2.04204,500 Tegma Gestao Logistica 3,301,724 1.61
68,810 Telecomunicacoes de Sao Paulo ADR 1,995,146 0.97373,740 Ultrapar Participações ADR 6,723,583 3.27136,568 Vale ADR 4,355,836 2.12299,999 Weg 3,529,682 1.72
48,906,017 23.80
INDIA72,824 ACC 1,548,956 0.75
553,933 Ambuja Cements 1,664,030 0.81341,047 Bharti Airtel 3,002,000 1.46283,070 Coal India 2,491,035 1.21464,900 Crompton Greaves 2,692,498 1.31336,009 Jindal Steel & Power 4,867,394 2.37
2,173,004 Lanco Infratech 1,146,309 0.56106,000 Larsen & Toubro 4,346,617 2.11639,300 Sintex Industries 2,586,025 1.26
37,600 Ultra Tech Cement 773,223 0.38
25,118,087 12.22
SOUTH AFRICA187,816 Aeci 2,335,886 1.14125,500 African Rainbow Minerals 3,496,184 1.70354,100 Aveng 1,865,733 0.91278,700 Bidvest Group 6,183,508 3.01
51,800 Kumba Iron Ore 3,708,327 1.80
17,589,638 8.56
SOUTH KOREA7,844 Hyundai Heavy Industries 3,256,090 1.58
10,270 LG Chem 4,691,134 2.2917,500 Samsung Engineering 4,183,251 2.04
101,100 STX Offshore & Shipbuilding 2,984,808 1.45
15,115,283 7.36
RUSSIA7,209,300 IDGC Holding 945,352 0.46
392,700 Magnitogorsk Iron & Steel Works Registered SharesGDR 4,466,963 2.17
104,700 Mobile Telesystems OJSC ADR 1,999,247 0.98507,316 Mostotrest 4,220,791 2.0562,850 Tatneft ADR 2,673,011 1.30
14,305,364 6.96
TURKEY440,400 Aygaz 2,829,340 1.38831,677 KOC Holding 3,603,062 1.76777,366 TAV Havalimanlari Holding 3,904,315 1.9085,558 Tupras Turkiye Petrol Rafinerileri 2,101,119 1.02
568,994 Turk Hava Yollari 1,495,507 0.73
13,933,343 6.79
UNITED KINGDOM986,900 Afren 2,456,811 1.20194,500 Aggreko 5,973,421 2.90193,200 Tullow Oil 3,824,770 1.86
12,255,002 5.96
CAYMAN ISLANDS604,000 ENN Energy Holdings 2,045,077 1.00
111,300 Eurasia Drilling Registered Shares GDR 3,276,116 1.595,085,000 Towngas China 2,714,901 1.32
8,036,094 3.91
CANADA16,700 First Quantum Minerals 2,402,365 1.17
185,978 Pacific Rubiales Energy 5,102,503 2.48
7,504,868 3.65
LUXEMBOURG46,800 Millicom International Cellular SDR 4,895,111 2.38
4,895,111 2.38
TAIWAN89,840 Chunghwa Telecom ADR 3,089,148 1.50
2,426,000 Teco Electric and Machinery 1,746,129 0.85
4,835,277 2.35
CHINA549,000 Dongfang Electric - H Shares * 2,033,451 0.99
3,072,000 Shanghai Electric Group - H Shares * 1,630,284 0.801,074,000 Zhejiang Expressway - H Shares * 806,642 0.39
4,470,377 2.18
IRELAND520,000 Dragon Oil 4,333,723 2.11
4,333,723 2.11
HONG KONG1,719,000 CNOOC 4,015,705 1.95
4,015,705 1.95
UNITED STATES OF AMERICA78,100 NII Holdings 3,313,392 1.61
3,313,392 1.61
MEXICO40,767 Grupo Aeroportuario del Sureste ADR 2,400,157 1.17
2,400,157 1.17
INDONESIA4,368,500 Perusahaan Gas Negara 2,062,655 1.00
2,062,655 1.00
ARGENTINA75,260 Telecom Argentina ADR 1,963,910 0.96
1,963,910 0.96
SINGAPORE2,309,000 Hutchison Port Holdings Trust 1,956,877 0.95
1,956,877 0.95
BERMUDA4,210,000 China Gas Holdings 1,679,716 0.82
1,679,716 0.82
Total Shares 198,690,596 96.69
Total Transferable Securities Admitted to anOfficial Exchange Listing
198,690,596 96.69
Transferable Securities Dealt in on Another Regulated Market
Investment Funds
LUXEMBOURG500,000 JPMorgan Liquidity Funds - US Dollar Liquidity Fund
(JPM US Dollar Liquidity X (dist)) 500,000 0.24
500,000 0.24
Total Investment Funds 500,000 0.24
Total Transferable Securities Dealt in on AnotherRegulated Market
500,000 0.24
Total Investments 199,190,596 96.93
Cash 4,139,575 2.01
Other Assets/(Liabilities) 2,159,794 1.06
Total Net Assets 205,489,965 100.00
* Hong Kong Registered Shares.
136
JPMorgan Funds - Emerging Markets Infrastructure Equity FundSchedule of Investments (Market Value Expressed in USD)
As at 30 June 2011
Quantity/Nominal
Value
Name of Securities MarketValue
%of
NetAssets
Quantity/Nominal
Value
Name of Securities MarketValue
%of
NetAssets
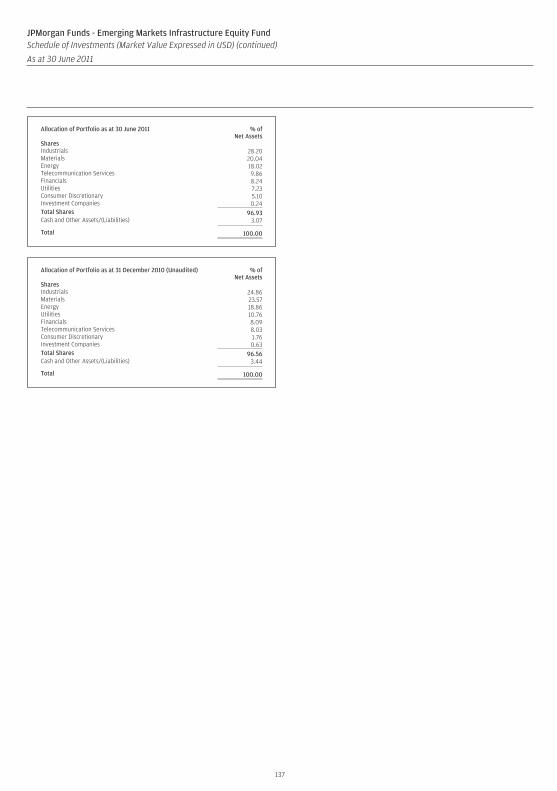
Allocation of Portfolio as at 30 June 2011 % ofNet Assets
SharesIndustrials 28.20Materials 20.04Energy 18.02Telecommunication Services 9.86Financials 8.24Utilities 7.23Consumer Discretionary 5.10Investment Companies 0.24Total Shares 96.93Cash and Other Assets/(Liabilities) 3.07
Total 100.00
Allocation of Portfolio as at 31 December 2010 (Unaudited) % ofNet Assets
SharesIndustrials 24.86Materials 23.57Energy 18.86Utilities 10.76Financials 8.09Telecommunication Services 8.03Consumer Discretionary 1.76Investment Companies 0.63Total Shares 96.56Cash and Other Assets/(Liabilities) 3.44
Total 100.00
137
JPMorgan Funds - Emerging Markets Infrastructure Equity FundSchedule of Investments (Market Value Expressed in USD) (continued)
As at 30 June 2011
Quantity/Nominal
Value
Name of Securities MarketValue
%of
NetAssets
Quantity/Nominal
Value
Name of Securities MarketValue
%of
NetAssets
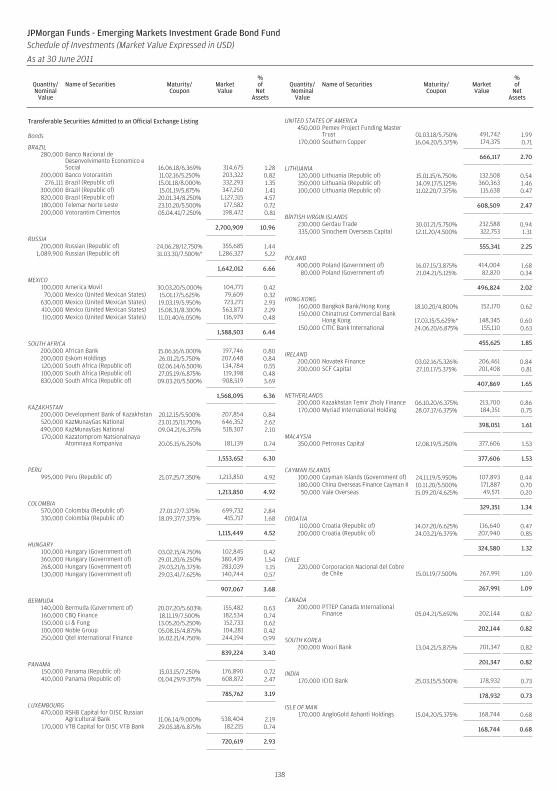
Transferable Securities Admitted to an Official Exchange Listing
Bonds
BRAZIL280,000 Banco Nacional de
Desenvolvimento Economico eSocial 16.06.18/6.369% 314,675 1.28
200,000 Banco Votorantim 11.02.16/5.250% 203,322 0.82276,111 Brazil (Republic of) 15.01.18/8.000% 332,293 1.35
300,000 Brazil (Republic of) 15.01.19/5.875% 347,250 1.41820,000 Brazil (Republic of) 20.01.34/8.250% 1,127,315 4.57180,000 Telemar Norte Leste 23.10.20/5.500% 177,582 0.72200,000 Votorantim Cimentos 05.04.41/7.250% 198,472 0.81
2,700,909 10.96
RUSSIA200,000 Russian (Republic of) 24.06.28/12.750% 355,685 1.44
1,089,900 Russian (Republic of) 31.03.30/7.500%* 1,286,327 5.22
1,642,012 6.66
MEXICO100,000 America Movil 30.03.20/5.000% 104,771 0.4270,000 Mexico (United Mexican States) 15.01.17/5.625% 79,609 0.32
630,000 Mexico (United Mexican States) 19.03.19/5.950% 723,271 2.93410,000 Mexico (United Mexican States) 15.08.31/8.300% 563,873 2.29110,000 Mexico (United Mexican States) 11.01.40/6.050% 116,979 0.48
1,588,503 6.44
SOUTH AFRICA200,000 African Bank 15.06.16/6.000% 197,746 0.80200,000 Eskom Holdings 26.01.21/5.750% 207,648 0.84120,000 South Africa (Republic of) 02.06.14/6.500% 134,784 0.55100,000 South Africa (Republic of) 27.05.19/6.875% 119,398 0.48830,000 South Africa (Republic of) 09.03.20/5.500% 908,519 3.69
1,568,095 6.36
KAZAKHSTAN200,000 Development Bank of Kazakhstan 20.12.15/5.500% 207,854 0.84520,000 KazMunayGas National 23.01.15/11.750% 646,352 2.62490,000 KazMunayGas National 09.04.21/6.375% 518,307 2.10170,000 Kazatomprom Natsionalnaya
Atomnaya Kompaniya 20.05.15/6.250% 181,139 0.74
1,553,652 6.30
PERU995,000 Peru (Republic of) 21.07.25/7.350% 1,213,850 4.92
1,213,850 4.92
COLOMBIA570,000 Colombia (Republic of) 27.01.17/7.375% 699,732 2.84330,000 Colombia (Republic of) 18.09.37/7.375% 415,717 1.68
1,115,449 4.52
HUNGARY100,000 Hungary (Government of) 03.02.15/4.750% 102,845 0.42360,000 Hungary (Government of) 29.01.20/6.250% 380,439 1.54268,000 Hungary (Government of) 29.03.21/6.375% 283,039 1.15130,000 Hungary (Government of) 29.03.41/7.625% 140,744 0.57
907,067 3.68
BERMUDA140,000 Bermuda (Government of) 20.07.20/5.603% 155,482 0.63160,000 CBQ Finance 18.11.19/7.500% 182,534 0.74150,000 Li & Fung 13.05.20/5.250% 152,733 0.62100,000 Noble Group 05.08.15/4.875% 104,281 0.42250,000 Qtel International Finance 16.02.21/4.750% 244,194 0.99
839,224 3.40
PANAMA150,000 Panama (Republic of) 15.03.15/7.250% 176,890 0.72410,000 Panama (Republic of) 01.04.29/9.375% 608,872 2.47
785,762 3.19
LUXEMBOURG470,000 RSHB Capital for OJSC Russian
Agricultural Bank 11.06.14/9.000% 538,404 2.19170,000 VTB Capital for OJSC VTB Bank 29.05.18/6.875% 182,215 0.74
720,619 2.93
UNITED STATES OF AMERICA450,000 Pemex Project Funding Master
Trust 01.03.18/5.750% 491,742 1.99170,000 Southern Copper 16.04.20/5.375% 174,375 0.71
666,117 2.70
LITHUANIA120,000 Lithuania (Republic of) 15.01.15/6.750% 132,508 0.54350,000 Lithuania (Republic of) 14.09.17/5.125% 360,363 1.46100,000 Lithuania (Republic of) 11.02.20/7.375% 115,638 0.47
608,509 2.47
BRITISH VIRGIN ISLANDS230,000 Gerdau Trade 30.01.21/5.750% 232,588 0.94335,000 Sinochem Overseas Capital 12.11.20/4.500% 322,753 1.31
555,341 2.25
POLAND400,000 Poland (Government of) 16.07.15/3.875% 414,004 1.68
80,000 Poland (Government of) 21.04.21/5.125% 82,820 0.34
496,824 2.02
HONG KONG160,000 Bangkok Bank/Hong Kong 18.10.20/4.800% 152,170 0.62150,000 Chinatrust Commercial Bank
Hong Kong 17.03.15/5.625%* 148,345 0.60150,000 CITIC Bank International 24.06.20/6.875% 155,110 0.63
455,625 1.85
IRELAND200,000 Novatek Finance 03.02.16/5.326% 206,461 0.84200,000 SCF Capital 27.10.17/5.375% 201,408 0.81
407,869 1.65
NETHERLANDS200,000 Kazakhstan Temir Zholy Finance 06.10.20/6.375% 213,700 0.86170,000 Myriad International Holding 28.07.17/6.375% 184,351 0.75
398,051 1.61
MALAYSIA350,000 Petronas Capital 12.08.19/5.250% 377,606 1.53
377,606 1.53
CAYMAN ISLANDS100,000 Cayman Islands (Government of) 24.11.19/5.950% 107,893 0.44180,000 China Overseas Finance Cayman II 10.11.20/5.500% 171,887 0.7050,000 Vale Overseas 15.09.20/4.625% 49,571 0.20
329,351 1.34
CROATIA110,000 Croatia (Republic of) 14.07.20/6.625% 116,640 0.47
200,000 Croatia (Republic of) 24.03.21/6.375% 207,940 0.85
324,580 1.32
CHILE220,000 Corporacion Nacional del Cobre
de Chile 15.01.19/7.500% 267,991 1.09
267,991 1.09
CANADA200,000 PTTEP Canada International
Finance 05.04.21/5.692% 202,144 0.82
202,144 0.82
SOUTH KOREA200,000 Woori Bank 13.04.21/5.875% 201,347 0.82
201,347 0.82
INDIA170,000 ICICI Bank 25.03.15/5.500% 178,932 0.73
178,932 0.73
ISLE OF MAN170,000 AngloGold Ashanti Holdings 15.04.20/5.375% 168,744 0.68
168,744 0.68
138
JPMorgan Funds - Emerging Markets Investment Grade Bond FundSchedule of Investments (Market Value Expressed in USD)
As at 30 June 2011
Quantity/Nominal
Value
Name of Securities Maturity/Coupon
MarketValue
%of
NetAssets
Quantity/Nominal
Value
Name of Securities Maturity/Coupon
MarketValue
%of
NetAssets
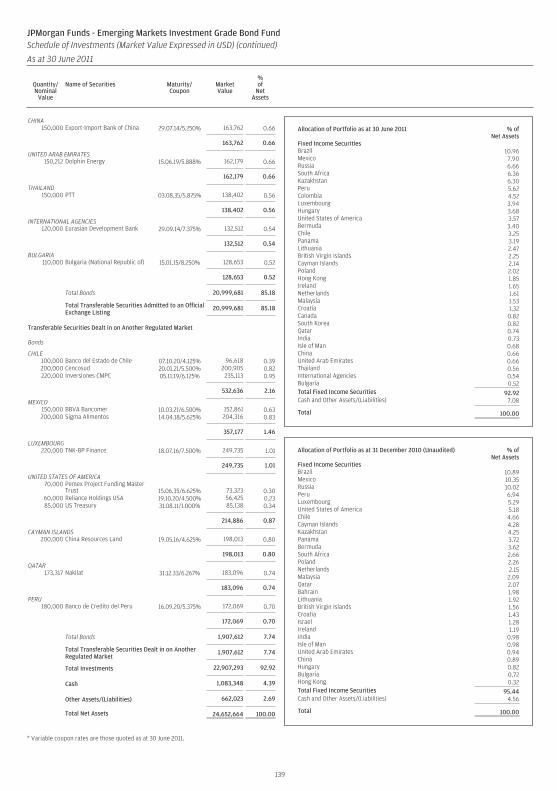
CHINA150,000 Export-Import Bank of China 29.07.14/5.250% 163,762 0.66
163,762 0.66
UNITED ARAB EMIRATES150,212 Dolphin Energy 15.06.19/5.888% 162,179 0.66
162,179 0.66
THAILAND150,000 PTT 03.08.35/5.875% 138,402 0.56
138,402 0.56
INTERNATIONAL AGENCIES120,000 Eurasian Development Bank 29.09.14/7.375% 132,512 0.54
132,512 0.54
BULGARIA110,000 Bulgaria (National Republic of) 15.01.15/8.250% 128,653 0.52
128,653 0.52
Total Bonds 20,999,681 85.18
Total Transferable Securities Admitted to an OfficialExchange Listing
20,999,681 85.18
Transferable Securities Dealt in on Another Regulated Market
Bonds
CHILE100,000 Banco del Estado de Chile 07.10.20/4.125% 96,618 0.39200,000 Cencosud 20.01.21/5.500% 200,905 0.82220,000 Inversiones CMPC 05.11.19/6.125% 235,113 0.95
532,636 2.16
MEXICO150,000 BBVA Bancomer 10.03.21/6.500% 152,861 0.63200,000 Sigma Alimentos 14.04.18/5.625% 204,316 0.83
357,177 1.46
LUXEMBOURG220,000 TNK-BP Finance 18.07.16/7.500% 249,735 1.01
249,735 1.01
UNITED STATES OF AMERICA70,000 Pemex Project Funding Master
Trust 15.06.35/6.625% 73,323 0.3060,000 Reliance Holdings USA 19.10.20/4.500% 56,425 0.2385,000 US Treasury 31.08.11/1.000% 85,138 0.34
214,886 0.87
CAYMAN ISLANDS200,000 China Resources Land 19.05.16/4.625% 198,013 0.80
198,013 0.80
QATAR173,317 Nakilat 31.12.33/6.267% 183,096 0.74
183,096 0.74
PERU180,000 Banco de Credito del Peru 16.09.20/5.375% 172,069 0.70
172,069 0.70
Total Bonds 1,907,612 7.74
Total Transferable Securities Dealt in on AnotherRegulated Market
1,907,612 7.74
Total Investments 22,907,293 92.92
Cash 1,083,348 4.39
Other Assets/(Liabilities) 662,023 2.69
Total Net Assets 24,652,664 100.00
* Variable coupon rates are those quoted as at 30 June 2011.
Allocation of Portfolio as at 30 June 2011 % ofNet Assets
Fixed Income SecuritiesBrazil 10.96Mexico 7.90Russia 6.66South Africa 6.36Kazakhstan 6.30Peru 5.62Colombia 4.52Luxembourg 3.94Hungary 3.68United States of America 3.57Bermuda 3.40Chile 3.25Panama 3.19Lithuania 2.47British Virgin Islands 2.25Cayman Islands 2.14Poland 2.02Hong Kong 1.85Ireland 1.65Netherlands 1.61Malaysia 1.53Croatia 1.32Canada 0.82South Korea 0.82Qatar 0.74India 0.73Isle of Man 0.68China 0.66United Arab Emirates 0.66Thailand 0.56International Agencies 0.54Bulgaria 0.52Total Fixed Income Securities 92.92Cash and Other Assets/(Liabilities) 7.08
Total 100.00
Allocation of Portfolio as at 31 December 2010 (Unaudited) % ofNet Assets
Fixed Income SecuritiesBrazil 10.89Mexico 10.35Russia 10.02Peru 6.94Luxembourg 5.29United States of America 5.18Chile 4.66Cayman Islands 4.28Kazakhstan 4.25Panama 3.72Bermuda 3.62South Africa 2.66Poland 2.26Netherlands 2.15Malaysia 2.09Qatar 2.07Bahrain 1.98Lithuania 1.92British Virgin Islands 1.56Croatia 1.43Israel 1.28Ireland 1.19India 0.98Isle of Man 0.98United Arab Emirates 0.94China 0.89Hungary 0.82Bulgaria 0.72Hong Kong 0.32Total Fixed Income Securities 95.44Cash and Other Assets/(Liabilities) 4.56
Total 100.00
139
JPMorgan Funds - Emerging Markets Investment Grade Bond FundSchedule of Investments (Market Value Expressed in USD) (continued)
As at 30 June 2011
Quantity/Nominal
Value
Name of Securities Maturity/Coupon
MarketValue
%of
NetAssets
Quantity/Nominal
Value
Name of Securities Maturity/Coupon
MarketValue
%of
NetAssets
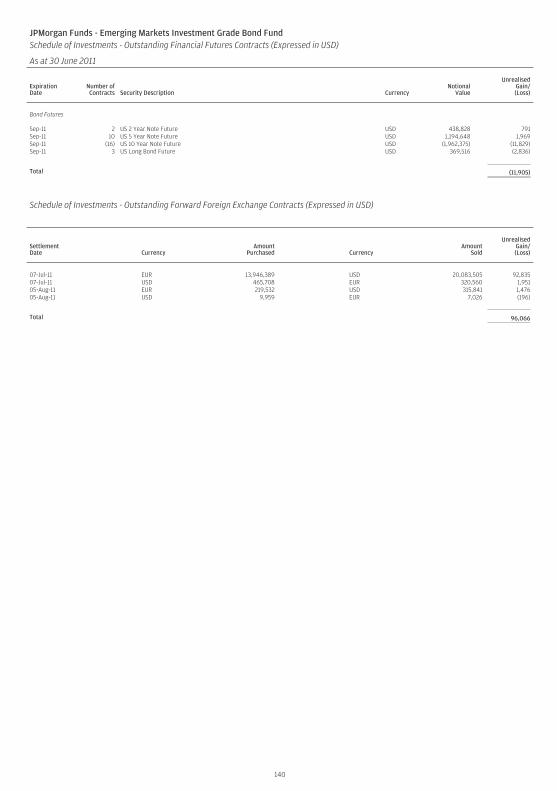
JPMorgan Funds - Emerging Markets Investment Grade Bond FundSchedule of Investments - Outstanding Financial Futures Contracts (Expressed in USD)
As at 30 June 2011
ExpirationDate
Number ofContracts Security Description Currency
NotionalValue
UnrealisedGain/(Loss)
Bond Futures
Sep-11 2 US 2 Year Note Future USD 438,828 791Sep-11 10 US 5 Year Note Future USD 1,194,648 1,969Sep-11 (16) US 10 Year Note Future USD (1,962,375) (11,829)Sep-11 3 US Long Bond Future USD 369,516 (2,836)
Total (11,905)
Schedule of Investments - Outstanding Forward Foreign Exchange Contracts (Expressed in USD)
SettlementDate Currency
AmountPurchased Currency
AmountSold
UnrealisedGain/(Loss)
07-Jul-11 EUR 13,946,389 USD 20,083,505 92,83507-Jul-11 USD 465,708 EUR 320,560 1,95105-Aug-11 EUR 219,532 USD 315,841 1,47605-Aug-11 USD 9,959 EUR 7,026 (196)
Total 96,066
140
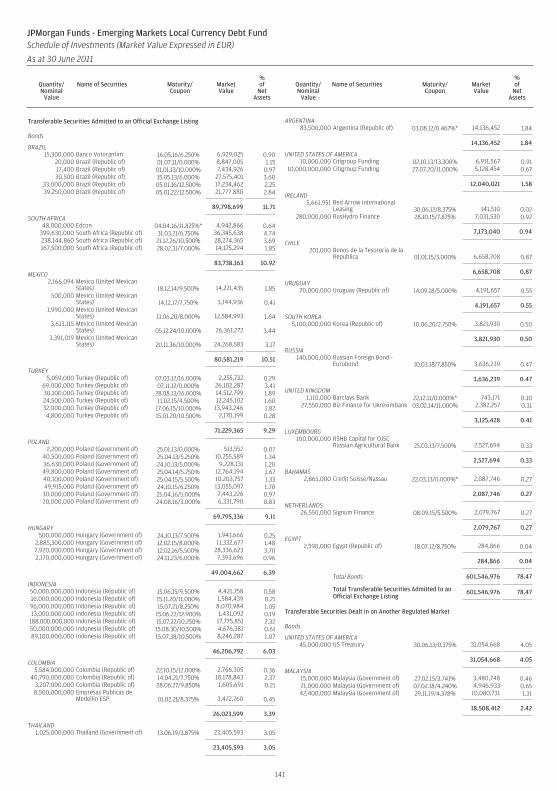
Transferable Securities Admitted to an Official Exchange Listing
Bonds
BRAZIL15,300,000 Banco Votorantim 16.05.16/6.250% 6,929,025 0.90
20,000 Brazil (Republic of) 01.07.11/0.000% 8,847,005 1.1517,400 Brazil (Republic of) 01.01.13/10.000% 7,434,926 0.9730,500 Brazil (Republic of) 15.05.13/6.000% 27,575,401 3.60
33,000,000 Brazil (Republic of) 05.01.16/12.500% 17,234,462 2.2539,250,000 Brazil (Republic of) 05.01.22/12.500% 21,777,880 2.84
89,798,699 11.71
SOUTH AFRICA48,000,000 Edcon 04.04.16/11.825%* 4,942,866 0.64
399,630,000 South Africa (Republic of) 31.03.21/6.750% 36,345,638 4.74238,144,860 South Africa (Republic of) 21.12.26/10.500% 28,274,365 3.69167,500,000 South Africa (Republic of) 28.02.31/7.000% 14,175,294 1.85
83,738,163 10.92
MEXICO2,166,094 Mexico (United Mexican
States) 18.12.14/9.500% 14,221,435 1.85500,000 Mexico (United Mexican
States) 14.12.17/7.750% 3,144,936 0.411,990,000 Mexico (United Mexican
States) 11.06.20/8.000% 12,584,993 1.643,613,115 Mexico (United Mexican
States) 05.12.24/10.000% 26,361,272 3.443,391,019 Mexico (United Mexican
States) 20.11.36/10.000% 24,268,583 3.17
80,581,219 10.51
TURKEY5,059,000 Turkey (Republic of) 07.03.12/16.000% 2,255,732 0.29
69,000,000 Turkey (Republic of) 07.11.12/0.000% 26,102,287 3.4130,100,000 Turkey (Republic of) 28.08.13/16.000% 14,512,799 1.8924,500,000 Turkey (Republic of) 11.02.15/4.500% 12,245,102 1.6032,000,000 Turkey (Republic of) 17.06.15/10.000% 13,943,246 1.824,800,000 Turkey (Republic of) 15.01.20/10.500% 2,170,199 0.28
71,229,365 9.29
POLAND2,200,000 Poland (Government of) 25.01.13/0.000% 513,552 0.07
40,500,000 Poland (Government of) 25.04.13/5.250% 10,255,589 1.3436,630,000 Poland (Government of) 24.10.13/5.000% 9,228,131 1.2049,800,000 Poland (Government of) 25.04.14/5.750% 12,764,194 1.6740,100,000 Poland (Government of) 25.04.15/5.500% 10,203,757 1.3349,915,000 Poland (Government of) 24.10.15/6.250% 13,055,097 1.70
30,000,000 Poland (Government of) 25.04.16/5.000% 7,443,226 0.9720,000,000 Poland (Government of) 24.08.16/3.000% 6,331,790 0.83
69,795,336 9.11
HUNGARY500,000,000 Hungary (Government of) 24.10.13/7.500% 1,941,666 0.25
2,885,300,000 Hungary (Government of) 12.02.15/8.000% 11,332,677 1.487,920,000,000 Hungary (Government of) 12.02.16/5.500% 28,336,623 3.702,170,000,000 Hungary (Government of) 24.11.23/6.000% 7,393,696 0.96
49,004,662 6.39
INDONESIA50,000,000,000 Indonesia (Republic of) 15.06.15/9.500% 4,421,758 0.5816,000,000,000 Indonesia (Republic of) 15.11.20/11.000% 1,584,439 0.2196,000,000,000 Indonesia (Republic of) 15.07.21/8.250% 8,070,984 1.0513,000,000,000 Indonesia (Republic of) 15.06.22/12.900% 1,431,092 0.19
188,000,000,000 Indonesia (Republic of) 15.07.22/10.250% 17,775,851 2.3250,000,000,000 Indonesia (Republic of) 15.08.30/10.500% 4,676,381 0.6189,100,000,000 Indonesia (Republic of) 15.07.38/10.500% 8,246,287 1.07
46,206,792 6.03
COLOMBIA5,584,000,000 Colombia (Republic of) 22.10.15/12.000% 2,766,305 0.36
40,790,000,000 Colombia (Republic of) 14.04.21/7.750% 18,178,843 2.373,207,000,000 Colombia (Republic of) 28.06.27/9.850% 1,605,691 0.218,500,000,000 Empresas Publicas de
Medellin ESP 01.02.21/8.375% 3,472,760 0.45
26,023,599 3.39
THAILAND1,025,000,000 Thailand (Government of) 13.06.19/3.875% 23,405,593 3.05
23,405,593 3.05
ARGENTINA83,500,000 Argentina (Republic of) 03.08.12/0.467%* 14,136,452 1.84
14,136,452 1.84
UNITED STATES OF AMERICA10,000,000 Citigroup Funding 02.10.13/13.300% 6,911,567 0.91
10,000,000,000 Citigroup Funding 27.07.20/11.000% 5,128,454 0.67
12,040,021 1.58
IRELAND5,661,951 Red Arrow International
Leasing 30.06.12/8.375% 141,510 0.02280,000,000 RusHydro Finance 28.10.15/7.875% 7,031,530 0.92
7,173,040 0.94
CHILE201,000 Bonos de la Tesoreria de la
Republica 01.01.15/3.000% 6,658,708 0.87
6,658,708 0.87
URUGUAY70,000,000 Uruguay (Republic of) 14.09.18/5.000% 4,191,657 0.55
4,191,657 0.55
SOUTH KOREA5,100,000,000 Korea (Republic of) 10.06.20/2.750% 3,821,930 0.50
3,821,930 0.50
RUSSIA140,000,000 Russian Foreign Bond -
Eurobond 10.03.18/7.850% 3,636,239 0.47
3,636,239 0.47
UNITED KINGDOM1,110,000 Barclays Bank 22.12.11/0.000%* 743,171 0.10
27,550,000 Biz Finance for Ukreximbank 03.02.14/11.000% 2,382,257 0.31
3,125,428 0.41
LUXEMBOURG100,000,000 RSHB Capital for OJSC
Russian Agricultural Bank 25.03.13/7.500% 2,527,694 0.33
2,527,694 0.33
BAHAMAS2,865,000 Credit Suisse/Nassau 22.03.13/0.000%* 2,087,746 0.27
2,087,746 0.27
NETHERLANDS26,550,000 Signum Finance 08.09.15/5.500% 2,079,767 0.27
2,079,767 0.27
EGYPT2,590,000 Egypt (Republic of) 18.07.12/8.750% 284,866 0.04
284,866 0.04
Total Bonds 601,546,976 78.47
Total Transferable Securities Admitted to anOfficial Exchange Listing
601,546,976 78.47
Transferable Securities Dealt in on Another Regulated Market
Bonds
UNITED STATES OF AMERICA45,000,000 US Treasury 30.06.13/0.375% 31,054,668 4.05
31,054,668 4.05
MALAYSIA15,000,000 Malaysia (Government of) 27.02.15/3.741% 3,480,748 0.4621,000,000 Malaysia (Government of) 07.02.18/4.240% 4,946,933 0.6542,400,000 Malaysia (Government of) 29.11.19/4.378% 10,080,731 1.31
18,508,412 2.42
141
JPMorgan Funds - Emerging Markets Local Currency Debt FundSchedule of Investments (Market Value Expressed in EUR)
As at 30 June 2011
Quantity/Nominal
Value
Name of Securities Maturity/Coupon
MarketValue
%of
NetAssets
Quantity/Nominal
Value
Name of Securities Maturity/Coupon
MarketValue
%of
NetAssets
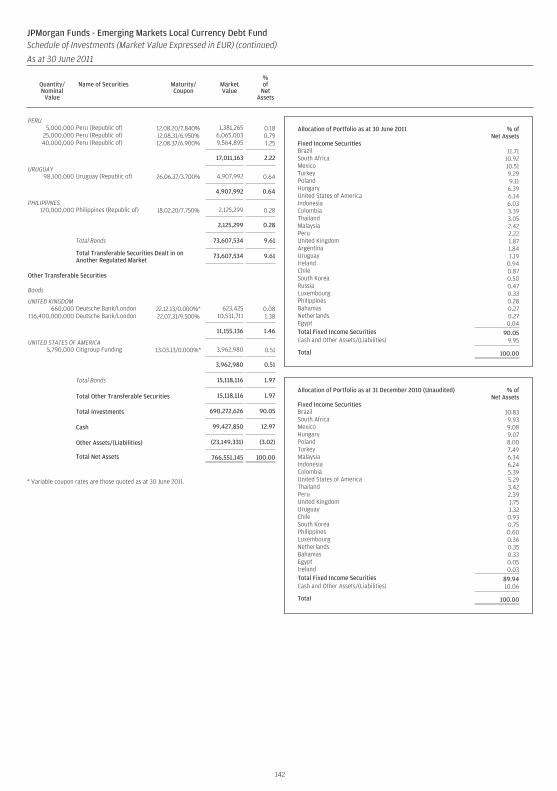
PERU5,000,000 Peru (Republic of) 12.08.20/7.840% 1,381,265 0.18
25,000,000 Peru (Republic of) 12.08.31/6.950% 6,065,003 0.7940,000,000 Peru (Republic of) 12.08.37/6.900% 9,564,895 1.25
17,011,163 2.22
URUGUAY98,100,000 Uruguay (Republic of) 26.06.37/3.700% 4,907,992 0.64
4,907,992 0.64
PHILIPPINES120,000,000 Philippines (Republic of) 18.02.20/7.750% 2,125,299 0.28
2,125,299 0.28
Total Bonds 73,607,534 9.61
Total Transferable Securities Dealt in onAnother Regulated Market
73,607,534 9.61
Other Transferable Securities
Bonds
UNITED KINGDOM660,000 Deutsche Bank/London 22.12.13/0.000%* 623,425 0.08
116,400,000,000 Deutsche Bank/London 22.07.31/9.500% 10,531,711 1.38
11,155,136 1.46
UNITED STATES OF AMERICA5,790,000 Citigroup Funding 13.03.13/0.000%* 3,962,980 0.51
3,962,980 0.51
Total Bonds 15,118,116 1.97
Total Other Transferable Securities 15,118,116 1.97
Total Investments 690,272,626 90.05
Cash 99,427,850 12.97
Other Assets/(Liabilities) (23,149,331) (3.02)
Total Net Assets 766,551,145 100.00
* Variable coupon rates are those quoted as at 30 June 2011.
Allocation of Portfolio as at 30 June 2011 % ofNet Assets
Fixed Income SecuritiesBrazil 11.71South Africa 10.92Mexico 10.51Turkey 9.29Poland 9.11Hungary 6.39United States of America 6.14Indonesia 6.03Colombia 3.39Thailand 3.05Malaysia 2.42Peru 2.22United Kingdom 1.87Argentina 1.84Uruguay 1.19Ireland 0.94Chile 0.87South Korea 0.50Russia 0.47Luxembourg 0.33Philippines 0.28Bahamas 0.27Netherlands 0.27Egypt 0.04Total Fixed Income Securities 90.05Cash and Other Assets/(Liabilities) 9.95
Total 100.00
Allocation of Portfolio as at 31 December 2010 (Unaudited) % ofNet Assets
Fixed Income SecuritiesBrazil 10.83South Africa 9.93Mexico 9.08Hungary 9.07Poland 8.00Turkey 7.49Malaysia 6.34Indonesia 6.24Colombia 5.39United States of America 5.29Thailand 3.42Peru 2.39United Kingdom 1.75Uruguay 1.32Chile 0.93South Korea 0.75Philippines 0.60Luxembourg 0.36Netherlands 0.35Bahamas 0.33Egypt 0.05Ireland 0.03Total Fixed Income Securities 89.94Cash and Other Assets/(Liabilities) 10.06
Total 100.00
142
JPMorgan Funds - Emerging Markets Local Currency Debt FundSchedule of Investments (Market Value Expressed in EUR) (continued)
As at 30 June 2011
Quantity/Nominal
Value
Name of Securities Maturity/Coupon
MarketValue
%of
NetAssets
Quantity/Nominal
Value
Name of Securities Maturity/Coupon
MarketValue
%of
NetAssets
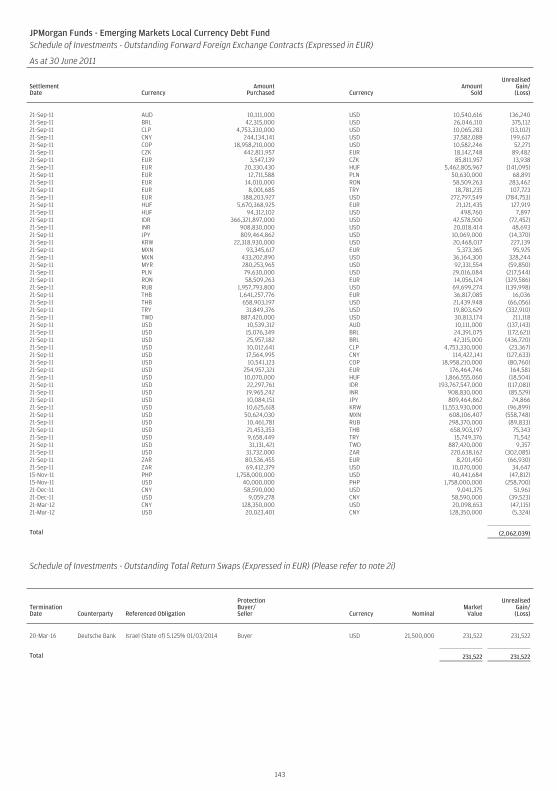
JPMorgan Funds - Emerging Markets Local Currency Debt FundSchedule of Investments - Outstanding Forward Foreign Exchange Contracts (Expressed in EUR)
As at 30 June 2011
SettlementDate Currency
AmountPurchased Currency
AmountSold
UnrealisedGain/(Loss)
21-Sep-11 AUD 10,111,000 USD 10,540,616 136,24021-Sep-11 BRL 42,315,000 USD 26,046,110 375,11221-Sep-11 CLP 4,753,330,000 USD 10,065,283 (13,102)21-Sep-11 CNY 244,134,141 USD 37,582,088 199,61721-Sep-11 COP 18,958,210,000 USD 10,582,246 52,27121-Sep-11 CZK 442,811,957 EUR 18,142,748 89,48221-Sep-11 EUR 3,547,139 CZK 85,811,957 13,93821-Sep-11 EUR 20,330,430 HUF 5,462,805,967 (141,095)21-Sep-11 EUR 12,711,588 PLN 50,630,000 68,89121-Sep-11 EUR 14,010,000 RON 58,509,263 283,46221-Sep-11 EUR 8,001,685 TRY 18,781,235 107,72321-Sep-11 EUR 188,203,927 USD 272,797,549 (784,753)21-Sep-11 HUF 5,670,368,925 EUR 21,121,435 127,91921-Sep-11 HUF 94,312,102 USD 498,760 7,89721-Sep-11 IDR 366,321,897,000 USD 42,578,500 (72,452)21-Sep-11 INR 908,830,000 USD 20,018,414 48,69321-Sep-11 JPY 809,464,862 USD 10,069,000 (14,370)21-Sep-11 KRW 22,318,930,000 USD 20,468,017 227,13921-Sep-11 MXN 93,345,617 EUR 5,373,365 95,92521-Sep-11 MXN 433,202,890 USD 36,164,300 328,24421-Sep-11 MYR 280,253,965 USD 92,331,554 (59,850)21-Sep-11 PLN 79,630,000 USD 29,016,084 (217,544)21-Sep-11 RON 58,509,263 EUR 14,056,124 (329,586)21-Sep-11 RUB 1,957,793,800 USD 69,699,274 (139,998)21-Sep-11 THB 1,641,257,776 EUR 36,817,085 16,03621-Sep-11 THB 658,903,197 USD 21,439,948 (66,056)21-Sep-11 TRY 31,849,376 USD 19,803,629 (332,910)21-Sep-11 TWD 887,420,000 USD 30,813,174 211,11821-Sep-11 USD 10,539,312 AUD 10,111,000 (137,143)21-Sep-11 USD 15,076,349 BRL 24,391,075 (172,621)21-Sep-11 USD 25,957,182 BRL 42,315,000 (436,720)21-Sep-11 USD 10,012,641 CLP 4,753,330,000 (23,367)21-Sep-11 USD 17,564,995 CNY 114,422,141 (127,633)21-Sep-11 USD 10,541,123 COP 18,958,210,000 (80,760)21-Sep-11 USD 254,957,321 EUR 176,464,746 164,58121-Sep-11 USD 10,070,000 HUF 1,866,555,060 (18,504)21-Sep-11 USD 22,297,761 IDR 193,767,547,000 (117,081)21-Sep-11 USD 19,965,242 INR 908,830,000 (85,529)21-Sep-11 USD 10,084,151 JPY 809,464,862 24,86621-Sep-11 USD 10,625,618 KRW 11,553,930,000 (96,899)21-Sep-11 USD 50,624,030 MXN 608,106,407 (558,748)21-Sep-11 USD 10,461,781 RUB 298,370,000 (89,833)21-Sep-11 USD 21,453,353 THB 658,903,197 75,34321-Sep-11 USD 9,658,449 TRY 15,749,376 71,54221-Sep-11 USD 31,131,421 TWD 887,420,000 9,35721-Sep-11 USD 31,732,000 ZAR 220,638,162 (302,085)21-Sep-11 ZAR 80,536,455 EUR 8,201,450 (66,930)21-Sep-11 ZAR 69,412,379 USD 10,070,000 34,64715-Nov-11 PHP 1,758,000,000 USD 40,441,684 (47,812)15-Nov-11 USD 40,000,000 PHP 1,758,000,000 (258,700)21-Dec-11 CNY 58,590,000 USD 9,041,375 51,96121-Dec-11 USD 9,059,278 CNY 58,590,000 (39,523)21-Mar-12 CNY 128,350,000 USD 20,098,653 (47,115)21-Mar-12 USD 20,023,401 CNY 128,350,000 (5,324)
Total (2,062,039)
Schedule of Investments - Outstanding Total Return Swaps (Expressed in EUR) (Please refer to note 2i)
TerminationDate Counterparty Referenced Obligation
ProtectionBuyer/Seller Currency Nominal
MarketValue
UnrealisedGain/(Loss)
20-Mar-16 Deutsche Bank Israel (State of) 5.125% 01/03/2014 Buyer USD 21,500,000 231,522 231,522
Total 231,522 231,522
143
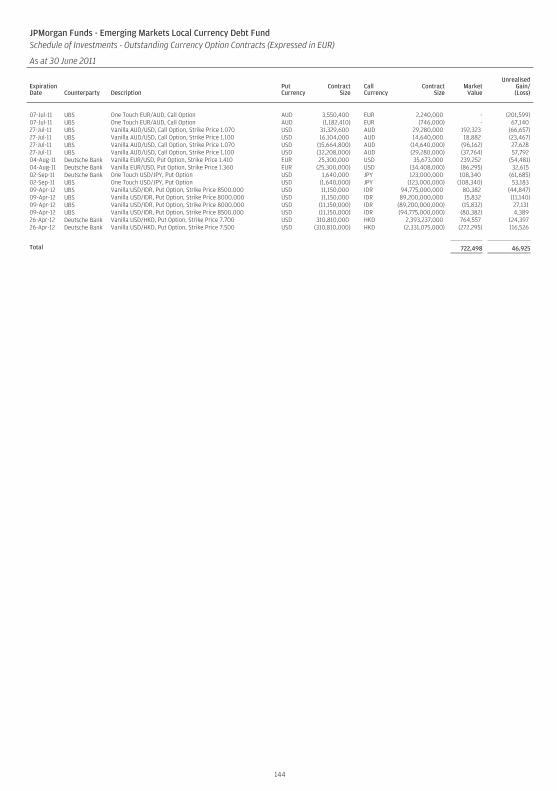
JPMorgan Funds - Emerging Markets Local Currency Debt FundSchedule of Investments - Outstanding Currency Option Contracts (Expressed in EUR)
As at 30 June 2011
ExpirationDate Counterparty Description
PutCurrency
ContractSize
CallCurrency
ContractSize
MarketValue
UnrealisedGain/(Loss)
07-Jul-11 UBS One Touch EUR/AUD, Call Option AUD 3,550,400 EUR 2,240,000 - (201,599)07-Jul-11 UBS One Touch EUR/AUD, Call Option AUD (1,182,410) EUR (746,000) - 67,14027-Jul-11 UBS Vanilla AUD/USD, Call Option, Strike Price 1.070 USD 31,329,600 AUD 29,280,000 192,323 (66,657)27-Jul-11 UBS Vanilla AUD/USD, Call Option, Strike Price 1.100 USD 16,104,000 AUD 14,640,000 18,882 (23,467)27-Jul-11 UBS Vanilla AUD/USD, Call Option, Strike Price 1.070 USD (15,664,800) AUD (14,640,000) (96,162) 27,62827-Jul-11 UBS Vanilla AUD/USD, Call Option, Strike Price 1.100 USD (32,208,000) AUD (29,280,000) (37,764) 57,79204-Aug-11 Deutsche Bank Vanilla EUR/USD, Put Option, Strike Price 1.410 EUR 25,300,000 USD 35,673,000 239,252 (54,481)04-Aug-11 Deutsche Bank Vanilla EUR/USD, Put Option, Strike Price 1.360 EUR (25,300,000) USD (34,408,000) (86,295) 32,61502-Sep-11 Deutsche Bank One Touch USD/JPY, Put Option USD 1,640,000 JPY 123,000,000 108,340 (61,685)02-Sep-11 UBS One Touch USD/JPY, Put Option USD (1,640,000) JPY (123,000,000) (108,340) 53,18309-Apr-12 UBS Vanilla USD/IDR, Put Option, Strike Price 8500.000 USD 11,150,000 IDR 94,775,000,000 80,382 (44,847)09-Apr-12 UBS Vanilla USD/IDR, Put Option, Strike Price 8000.000 USD 11,150,000 IDR 89,200,000,000 15,832 (11,140)09-Apr-12 UBS Vanilla USD/IDR, Put Option, Strike Price 8000.000 USD (11,150,000) IDR (89,200,000,000) (15,832) 27,13109-Apr-12 UBS Vanilla USD/IDR, Put Option, Strike Price 8500.000 USD (11,150,000) IDR (94,775,000,000) (80,382) 4,38926-Apr-12 Deutsche Bank Vanilla USD/HKD, Put Option, Strike Price 7.700 USD 310,810,000 HKD 2,393,237,000 764,557 124,39726-Apr-12 Deutsche Bank Vanilla USD/HKD, Put Option, Strike Price 7.500 USD (310,810,000) HKD (2,331,075,000) (272,295) 116,526
Total 722,498 46,925
144
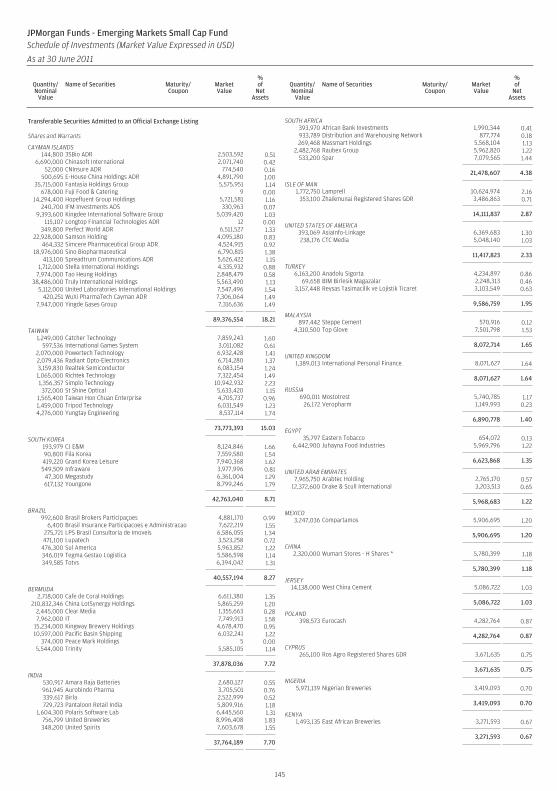
Transferable Securities Admitted to an Official Exchange Listing
Shares and Warrants
CAYMAN ISLANDS144,800 3SBio ADR 2,503,592 0.51
6,690,000 Chinasoft International 2,071,740 0.4252,000 CNInsure ADR 774,540 0.16
500,695 E-House China Holdings ADR 4,891,790 1.0035,715,000 Fantasia Holdings Group 5,575,951 1.14
678,000 Fuji Food & Catering 9 0.0014,294,400 Hopefluent Group Holdings 5,721,581 1.16
240,700 IFM Investments ADS 330,963 0.079,393,600 Kingdee International Software Group 5,039,420 1.03
115,107 Longtop Financial Technologies ADR 12 0.00349,800 Perfect World ADR 6,511,527 1.33
22,928,000 Samson Holding 4,095,180 0.83464,332 Simcere Pharmaceutical Group ADR 4,524,915 0.92
18,976,000 Sino Biopharmaceutical 6,790,815 1.38413,100 Spreadtrum Communications ADR 5,626,422 1.15
1,712,000 Stella International Holdings 4,335,932 0.887,974,000 Tao Heung Holdings 2,848,479 0.58
38,486,000 Truly International Holdings 5,563,490 1.135,112,000 United Laboratories International Holdings 7,547,496 1.54
420,251 WuXi PharmaTech Cayman ADR 7,306,064 1.497,947,000 Yingde Gases Group 7,316,636 1.49
89,376,554 18.21
TAIWAN1,249,000 Catcher Technology 7,859,243 1.60
597,536 International Games System 3,011,082 0.612,070,000 Powertech Technology 6,932,428 1.412,079,436 Radiant Opto-Electronics 6,714,280 1.373,159,830 Realtek Semiconductor 6,083,154 1.241,065,000 Richtek Technology 7,322,454 1.491,356,357 Simplo Technology 10,942,932 2.23372,000 St Shine Optical 5,633,420 1.15
1,565,400 Taiwan Hon Chuan Enterprise 4,705,737 0.961,459,000 Tripod Technology 6,031,549 1.234,276,000 Yungtay Engineering 8,537,114 1.74
73,773,393 15.03
SOUTH KOREA193,979 CJ E&M 8,124,846 1.6690,800 Fila Korea 7,559,580 1.54419,220 Grand Korea Leisure 7,940,368 1.62549,509 Infraware 3,977,996 0.81
47,300 Megastudy 6,361,004 1.29617,132 Youngone 8,799,246 1.79
42,763,040 8.71
BRAZIL992,600 Brasil Brokers Participaçoes 4,881,170 0.99
6,400 Brasil Insurance Participacoes e Administracao 7,622,219 1.55275,721 LPS Brasil Consultoria de Imoveis 6,586,055 1.34471,100 Lupatech 3,523,258 0.72
476,300 Sul America 5,963,852 1.22346,019 Tegma Gestao Logistica 5,586,598 1.14349,585 Totvs 6,394,042 1.31
40,557,194 8.27
BERMUDA2,718,000 Cafe de Coral Holdings 6,611,380 1.35
210,832,346 China LotSynergy Holdings 5,865,259 1.202,445,000 Clear Media 1,355,663 0.287,962,000 IT 7,749,913 1.58
15,234,000 Kingway Brewery Holdings 4,678,470 0.9510,597,000 Pacific Basin Shipping 6,032,241 1.22
374,000 Peace Mark Holdings 5 0.005,544,000 Trinity 5,585,105 1.14
37,878,036 7.72
INDIA530,917 Amara Raja Batteries 2,680,127 0.55961,945 Aurobindo Pharma 3,705,501 0.76339,617 Birla 2,522,999 0.52729,723 Pantaloon Retail India 5,809,916 1.18
1,604,300 Polaris Software Lab 6,445,560 1.31756,799 United Breweries 8,996,408 1.83348,200 United Spirits 7,603,678 1.55
37,764,189 7.70
SOUTH AFRICA393,970 African Bank Investments 1,990,344 0.41933,789 Distribution and Warehousing Network 877,774 0.18269,468 Massmart Holdings 5,568,104 1.13
2,482,768 Raubex Group 5,962,820 1.22533,200 Spar 7,079,565 1.44
21,478,607 4.38
ISLE OF MAN1,772,750 Lamprell 10,624,974 2.16
353,100 Zhaikmunai Registered Shares GDR 3,486,863 0.71
14,111,837 2.87
UNITED STATES OF AMERICA393,069 AsiaInfo-Linkage 6,369,683 1.30238,176 CTC Media 5,048,140 1.03
11,417,823 2.33
TURKEY6,163,200 Anadolu Sigorta 4,234,897 0.86
69,658 BIM Birlesik Magazalar 2,248,313 0.463,157,448 Reysas Tasimacilik ve Lojistik Ticaret 3,103,549 0.63
9,586,759 1.95
MALAYSIA897,442 Steppe Cement 570,916 0.12
4,310,500 Top Glove 7,501,798 1.53
8,072,714 1.65
UNITED KINGDOM1,389,013 International Personal Finance 8,071,627 1.64
8,071,627 1.64
RUSSIA690,011 Mostotrest 5,740,785 1.17
26,172 Veropharm 1,149,993 0.23
6,890,778 1.40
EGYPT35,797 Eastern Tobacco 654,072 0.13
6,442,900 Juhayna Food Industries 5,969,796 1.22
6,623,868 1.35
UNITED ARAB EMIRATES7,965,750 Arabtec Holding 2,765,170 0.57
12,372,600 Drake & Scull International 3,203,513 0.65
5,968,683 1.22
MEXICO3,247,036 Compartamos 5,906,695 1.20
5,906,695 1.20
CHINA2,320,000 Wumart Stores - H Shares * 5,780,399 1.18
5,780,399 1.18
JERSEY14,138,000 West China Cement 5,086,722 1.03
5,086,722 1.03
POLAND398,573 Eurocash 4,282,764 0.87
4,282,764 0.87
CYPRUS265,100 Ros Agro Registered Shares GDR 3,671,635 0.75
3,671,635 0.75
NIGERIA5,971,139 Nigerian Breweries 3,419,093 0.70
3,419,093 0.70
KENYA1,493,135 East African Breweries 3,271,593 0.67
3,271,593 0.67
145
JPMorgan Funds - Emerging Markets Small Cap FundSchedule of Investments (Market Value Expressed in USD)
As at 30 June 2011
Quantity/Nominal
Value
Name of Securities Maturity/Coupon
MarketValue
%of
NetAssets
Quantity/Nominal
Value
Name of Securities Maturity/Coupon
MarketValue
%of
NetAssets
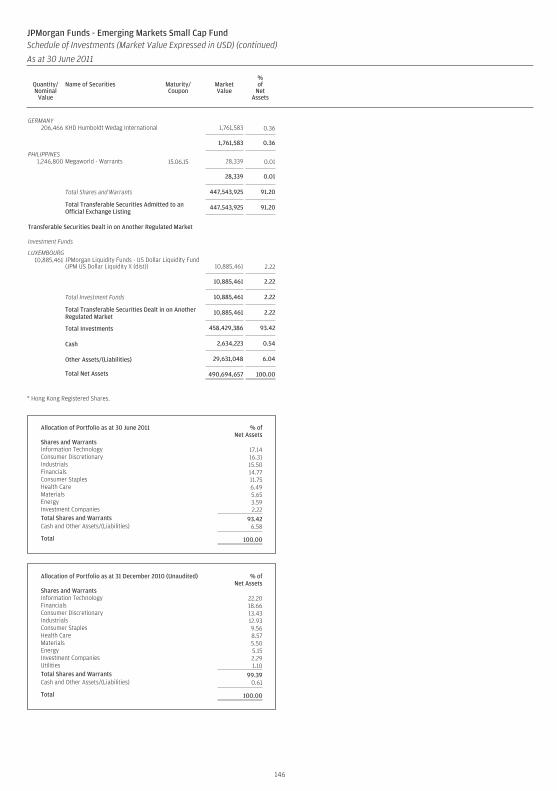
GERMANY206,466 KHD Humboldt Wedag International 1,761,583 0.36
1,761,583 0.36
PHILIPPINES1,246,800 Megaworld - Warrants 15.06.15 28,339 0.01
28,339 0.01
Total Shares and Warrants 447,543,925 91.20
Total Transferable Securities Admitted to anOfficial Exchange Listing
447,543,925 91.20
Transferable Securities Dealt in on Another Regulated Market
Investment Funds
LUXEMBOURG10,885,461 JPMorgan Liquidity Funds - US Dollar Liquidity Fund
(JPM US Dollar Liquidity X (dist)) 10,885,461 2.22
10,885,461 2.22
Total Investment Funds 10,885,461 2.22
Total Transferable Securities Dealt in on AnotherRegulated Market
10,885,461 2.22
Total Investments 458,429,386 93.42
Cash 2,634,223 0.54
Other Assets/(Liabilities) 29,631,048 6.04
Total Net Assets 490,694,657 100.00
* Hong Kong Registered Shares.
Allocation of Portfolio as at 30 June 2011 % ofNet Assets
Shares and WarrantsInformation Technology 17.14Consumer Discretionary 16.31Industrials 15.50Financials 14.77Consumer Staples 11.75Health Care 6.49Materials 5.65Energy 3.59Investment Companies 2.22Total Shares and Warrants 93.42Cash and Other Assets/(Liabilities) 6.58
Total 100.00
Allocation of Portfolio as at 31 December 2010 (Unaudited) % ofNet Assets
Shares and WarrantsInformation Technology 22.20Financials 18.66Consumer Discretionary 13.43Industrials 12.93Consumer Staples 9.56Health Care 8.57Materials 5.50Energy 5.15Investment Companies 2.29Utilities 1.10Total Shares and Warrants 99.39Cash and Other Assets/(Liabilities) 0.61
Total 100.00
146
JPMorgan Funds - Emerging Markets Small Cap FundSchedule of Investments (Market Value Expressed in USD) (continued)
As at 30 June 2011
Quantity/Nominal
Value
Name of Securities Maturity/Coupon
MarketValue
%of
NetAssets
Quantity/Nominal
Value
Name of Securities Maturity/Coupon
MarketValue
%of
NetAssets
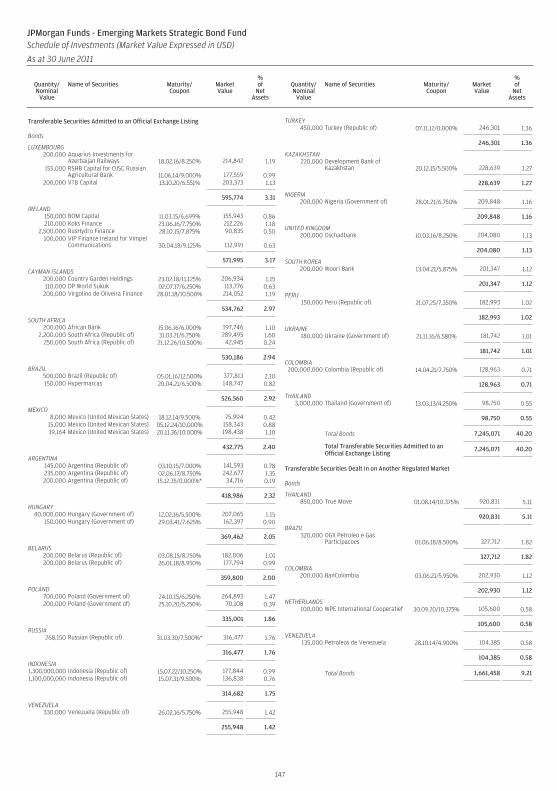
Transferable Securities Admitted to an Official Exchange Listing
Bonds
LUXEMBOURG200,000 Aquarius Investments for
Azerbaijan Railways 18.02.16/8.250% 214,842 1.19155,000 RSHB Capital for OJSC Russian
Agricultural Bank 11.06.14/9.000% 177,559 0.99200,000 VTB Capital 13.10.20/6.551% 203,373 1.13
595,774 3.31
IRELAND150,000 BOM Capital 11.03.15/6.699% 155,943 0.86210,000 Koks Finance 23.06.16/7.750% 212,226 1.18
2,500,000 RusHydro Finance 28.10.15/7.875% 90,835 0.50100,000 VIP Finance Ireland for Vimpel
Communications 30.04.18/9.125% 112,991 0.63
571,995 3.17
CAYMAN ISLANDS200,000 Country Garden Holdings 23.02.18/11.125% 206,934 1.15110,000 DP World Sukuk 02.07.17/6.250% 113,776 0.63
200,000 Virgolino de Oliveira Finance 28.01.18/10.500% 214,052 1.19
534,762 2.97
SOUTH AFRICA200,000 African Bank 15.06.16/6.000% 197,746 1.10
2,200,000 South Africa (Republic of) 31.03.21/6.750% 289,495 1.60250,000 South Africa (Republic of) 21.12.26/10.500% 42,945 0.24
530,186 2.94
BRAZIL500,000 Brazil (Republic of) 05.01.16/12.500% 377,813 2.10150,000 Hypermarcas 20.04.21/6.500% 148,747 0.82
526,560 2.92
MEXICO8,000 Mexico (United Mexican States) 18.12.14/9.500% 75,994 0.42
15,000 Mexico (United Mexican States) 05.12.24/10.000% 158,343 0.8819,164 Mexico (United Mexican States) 20.11.36/10.000% 198,438 1.10
432,775 2.40
ARGENTINA145,000 Argentina (Republic of) 03.10.15/7.000% 141,593 0.78235,000 Argentina (Republic of) 02.06.17/8.750% 242,677 1.35200,000 Argentina (Republic of) 15.12.35/0.000%* 34,716 0.19
418,986 2.32
HUNGARY40,000,000 Hungary (Government of) 12.02.16/5.500% 207,065 1.15
150,000 Hungary (Government of) 29.03.41/7.625% 162,397 0.90
369,462 2.05
BELARUS200,000 Belarus (Republic of) 03.08.15/8.750% 182,006 1.01200,000 Belarus (Republic of) 26.01.18/8.950% 177,794 0.99
359,800 2.00
POLAND700,000 Poland (Government of) 24.10.15/6.250% 264,893 1.47200,000 Poland (Government of) 25.10.20/5.250% 70,108 0.39
335,001 1.86
RUSSIA268,150 Russian (Republic of) 31.03.30/7.500%* 316,477 1.76
316,477 1.76
INDONESIA1,300,000,000 Indonesia (Republic of) 15.07.22/10.250% 177,844 0.991,100,000,000 Indonesia (Republic of) 15.07.31/9.500% 136,838 0.76
314,682 1.75
VENEZUELA330,000 Venezuela (Republic of) 26.02.16/5.750% 255,948 1.42
255,948 1.42
TURKEY450,000 Turkey (Republic of) 07.11.12/0.000% 246,301 1.36
246,301 1.36
KAZAKHSTAN220,000 Development Bank of
Kazakhstan 20.12.15/5.500% 228,639 1.27
228,639 1.27
NIGERIA200,000 Nigeria (Government of) 28.01.21/6.750% 209,848 1.16
209,848 1.16
UNITED KINGDOM200,000 Oschadbank 10.03.16/8.250% 204,080 1.13
204,080 1.13
SOUTH KOREA200,000 Woori Bank 13.04.21/5.875% 201,347 1.12
201,347 1.12
PERU150,000 Peru (Republic of) 21.07.25/7.350% 182,993 1.02
182,993 1.02
UKRAINE180,000 Ukraine (Government of) 21.11.16/6.580% 181,742 1.01
181,742 1.01
COLOMBIA200,000,000 Colombia (Republic of) 14.04.21/7.750% 128,963 0.71
128,963 0.71
THAILAND3,000,000 Thailand (Government of) 13.03.13/4.250% 98,750 0.55
98,750 0.55
Total Bonds 7,245,071 40.20
Total Transferable Securities Admitted to anOfficial Exchange Listing
7,245,071 40.20
Transferable Securities Dealt in on Another Regulated Market
Bonds
THAILAND850,000 True Move 01.08.14/10.375% 920,831 5.11
920,831 5.11
BRAZIL320,000 OGX Petroleo e Gas
Participacoes 01.06.18/8.500% 327,712 1.82
327,712 1.82
COLOMBIA200,000 BanColombia 03.06.21/5.950% 202,930 1.12
202,930 1.12
NETHERLANDS100,000 WPE International Cooperatief 30.09.20/10.375% 105,600 0.58
105,600 0.58
VENEZUELA135,000 Petroleos de Venezuela 28.10.14/4.900% 104,385 0.58
104,385 0.58
Total Bonds 1,661,458 9.21
147
JPMorgan Funds - Emerging Markets Strategic Bond FundSchedule of Investments (Market Value Expressed in USD)
As at 30 June 2011
Quantity/Nominal
Value
Name of Securities Maturity/Coupon
MarketValue
%of
NetAssets
Quantity/Nominal
Value
Name of Securities Maturity/Coupon
MarketValue
%of
NetAssets
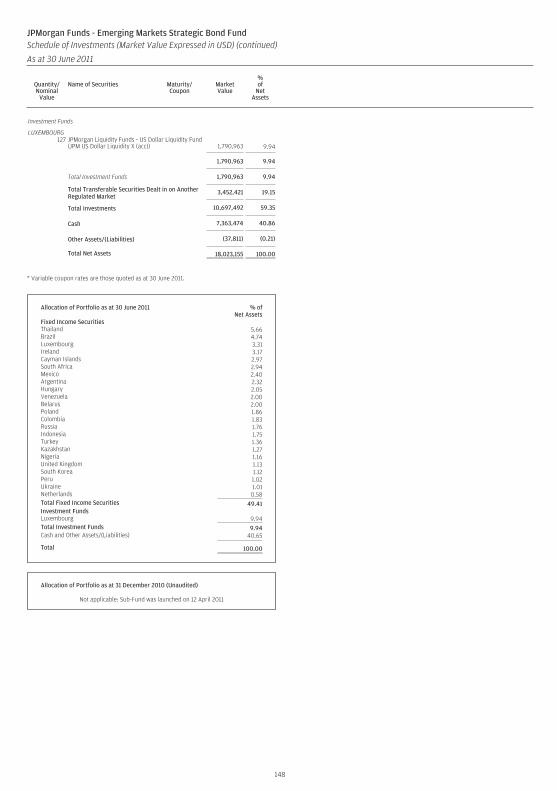
Investment Funds
LUXEMBOURG127 JPMorgan Liquidity Funds - US Dollar Liquidity Fund
(JPM US Dollar Liquidity X (acc)) 1,790,963 9.94
1,790,963 9.94
Total Investment Funds 1,790,963 9.94
Total Transferable Securities Dealt in on AnotherRegulated Market
3,452,421 19.15
Total Investments 10,697,492 59.35
Cash 7,363,474 40.86
Other Assets/(Liabilities) (37,811) (0.21)
Total Net Assets 18,023,155 100.00
* Variable coupon rates are those quoted as at 30 June 2011.
Allocation of Portfolio as at 30 June 2011 % ofNet Assets
Fixed Income SecuritiesThailand 5.66Brazil 4.74Luxembourg 3.31Ireland 3.17Cayman Islands 2.97South Africa 2.94Mexico 2.40Argentina 2.32Hungary 2.05Venezuela 2.00Belarus 2.00Poland 1.86Colombia 1.83Russia 1.76Indonesia 1.75Turkey 1.36Kazakhstan 1.27Nigeria 1.16United Kingdom 1.13South Korea 1.12Peru 1.02Ukraine 1.01Netherlands 0.58Total Fixed Income Securities 49.41Investment FundsLuxembourg 9.94Total Investment Funds 9.94Cash and Other Assets/(Liabilities) 40.65
Total 100.00
Allocation of Portfolio as at 31 December 2010 (Unaudited)
Not applicable: Sub-Fund was launched on 12 April 2011
148
JPMorgan Funds - Emerging Markets Strategic Bond FundSchedule of Investments (Market Value Expressed in USD) (continued)
As at 30 June 2011
Quantity/Nominal
Value
Name of Securities Maturity/Coupon
MarketValue
%of
NetAssets
Quantity/Nominal
Value
Name of Securities Maturity/Coupon
MarketValue
%of
NetAssets
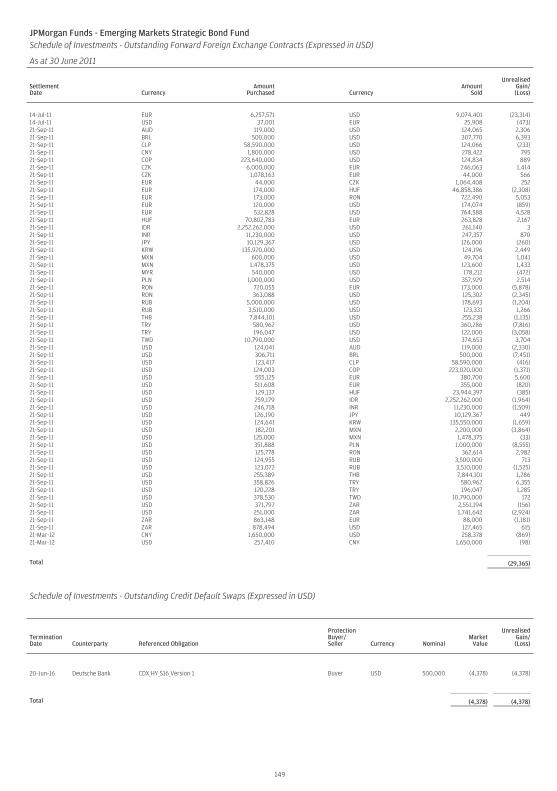
JPMorgan Funds - Emerging Markets Strategic Bond FundSchedule of Investments - Outstanding Forward Foreign Exchange Contracts (Expressed in USD)
As at 30 June 2011
SettlementDate Currency
AmountPurchased Currency
AmountSold
UnrealisedGain/(Loss)
14-Jul-11 EUR 6,257,571 USD 9,074,401 (23,314)14-Jul-11 USD 37,001 EUR 25,908 (473)21-Sep-11 AUD 119,000 USD 124,065 2,30621-Sep-11 BRL 500,000 USD 307,770 6,39321-Sep-11 CLP 58,590,000 USD 124,066 (233)21-Sep-11 CNY 1,800,000 USD 278,422 79521-Sep-11 COP 223,640,000 USD 124,834 88921-Sep-11 CZK 6,000,000 EUR 246,063 1,41421-Sep-11 CZK 1,078,163 EUR 44,000 56621-Sep-11 EUR 44,000 CZK 1,064,408 25221-Sep-11 EUR 174,000 HUF 46,858,386 (2,308)21-Sep-11 EUR 173,000 RON 722,490 5,05321-Sep-11 EUR 120,000 USD 174,074 (859)21-Sep-11 EUR 532,828 USD 764,588 4,52821-Sep-11 HUF 70,802,783 EUR 263,828 2,16721-Sep-11 IDR 2,252,262,000 USD 261,140 321-Sep-11 INR 11,230,000 USD 247,357 87021-Sep-11 JPY 10,129,367 USD 126,000 (260)21-Sep-11 KRW 135,920,000 USD 124,196 2,44921-Sep-11 MXN 600,000 USD 49,704 1,04121-Sep-11 MXN 1,478,375 USD 123,600 1,43321-Sep-11 MYR 540,000 USD 178,212 (472)21-Sep-11 PLN 1,000,000 USD 357,929 2,51421-Sep-11 RON 720,055 EUR 173,000 (5,878)21-Sep-11 RON 363,088 USD 125,302 (2,345)21-Sep-11 RUB 5,000,000 USD 178,693 (1,204)21-Sep-11 RUB 3,510,000 USD 123,331 1,26621-Sep-11 THB 7,844,101 USD 255,238 (1,135)21-Sep-11 TRY 580,962 USD 360,286 (7,816)21-Sep-11 TRY 196,047 USD 122,000 (3,058)21-Sep-11 TWD 10,790,000 USD 374,653 3,70421-Sep-11 USD 124,041 AUD 119,000 (2,330)21-Sep-11 USD 306,711 BRL 500,000 (7,451)21-Sep-11 USD 123,417 CLP 58,590,000 (416)21-Sep-11 USD 124,003 COP 223,020,000 (1,371)21-Sep-11 USD 555,125 EUR 380,700 5,60021-Sep-11 USD 511,608 EUR 355,000 (820)21-Sep-11 USD 129,137 HUF 23,944,397 (385)21-Sep-11 USD 259,179 IDR 2,252,262,000 (1,964)21-Sep-11 USD 246,718 INR 11,230,000 (1,509)21-Sep-11 USD 126,190 JPY 10,129,367 44921-Sep-11 USD 124,641 KRW 135,550,000 (1,659)21-Sep-11 USD 182,201 MXN 2,200,000 (3,864)21-Sep-11 USD 125,000 MXN 1,478,375 (33)21-Sep-11 USD 351,888 PLN 1,000,000 (8,555)21-Sep-11 USD 125,778 RON 362,614 2,98221-Sep-11 USD 124,955 RUB 3,500,000 71321-Sep-11 USD 123,072 RUB 3,510,000 (1,525)21-Sep-11 USD 255,389 THB 7,844,101 1,28621-Sep-11 USD 358,826 TRY 580,962 6,35521-Sep-11 USD 120,228 TRY 196,047 1,28521-Sep-11 USD 378,530 TWD 10,790,000 17221-Sep-11 USD 371,797 ZAR 2,551,194 (156)21-Sep-11 USD 251,000 ZAR 1,741,642 (2,924)21-Sep-11 ZAR 863,148 EUR 88,000 (1,181)21-Sep-11 ZAR 878,494 USD 127,465 61521-Mar-12 CNY 1,650,000 USD 258,378 (869)21-Mar-12 USD 257,410 CNY 1,650,000 (98)
Total (29,365)
Schedule of Investments - Outstanding Credit Default Swaps (Expressed in USD)
TerminationDate Counterparty Referenced Obligation
ProtectionBuyer/Seller Currency Nominal
MarketValue
UnrealisedGain/(Loss)
20-Jun-16 Deutsche Bank CDX_HY_S16_Version 1 Buyer USD 500,000 (4,378) (4,378)
Total (4,378) (4,378)
149
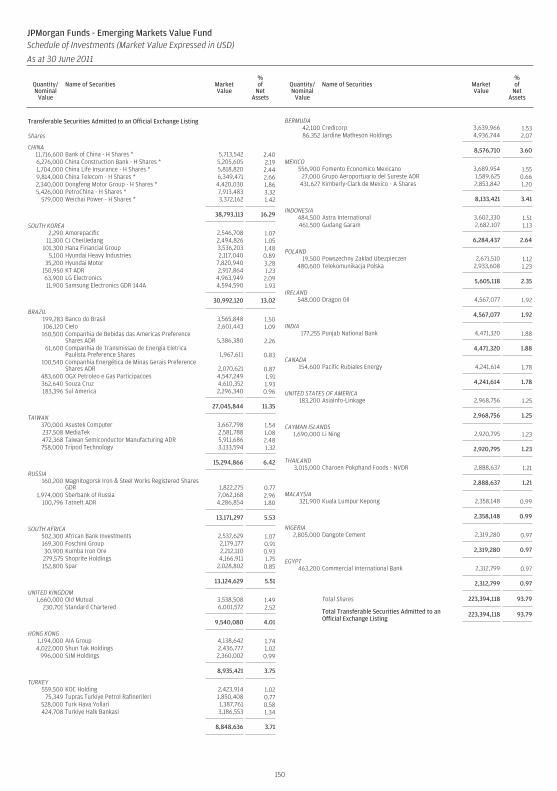
Transferable Securities Admitted to an Official Exchange Listing
Shares
CHINA11,716,600 Bank of China - H Shares * 5,713,542 2.406,276,000 China Construction Bank - H Shares * 5,205,605 2.191,704,000 China Life Insurance - H Shares * 5,818,820 2.449,814,000 China Telecom - H Shares * 6,349,471 2.662,340,000 Dongfeng Motor Group - H Shares * 4,420,030 1.865,426,000 PetroChina - H Shares * 7,913,483 3.32
579,000 Weichai Power - H Shares * 3,372,162 1.42
38,793,113 16.29
SOUTH KOREA2,290 Amorepacific 2,546,708 1.07
11,300 CJ CheilJedang 2,494,826 1.05101,300 Hana Financial Group 3,536,203 1.48
5,100 Hyundai Heavy Industries 2,117,040 0.8935,200 Hyundai Motor 7,820,940 3.28
150,950 KT ADR 2,917,864 1.2363,900 LG Electronics 4,963,949 2.0911,900 Samsung Electronics GDR 144A 4,594,590 1.93
30,992,120 13.02
BRAZIL199,283 Banco do Brasil 3,565,848 1.50106,120 Cielo 2,601,443 1.09160,500 Companhia de Bebidas das Americas Preference
Shares ADR 5,386,380 2.2661,600 Companhia de Transmissao de Energia Eletrica
Paulista Preference Shares 1,967,611 0.83100,540 Companhia Energética de Minas Gerais Preference
Shares ADR 2,070,621 0.87483,600 OGX Petroleo e Gas Participacoes 4,547,249 1.91362,640 Souza Cruz 4,610,352 1.93183,396 Sul America 2,296,340 0.96
27,045,844 11.35
TAIWAN370,000 Asustek Computer 3,667,798 1.54237,508 MediaTek 2,581,788 1.08472,368 Taiwan Semiconductor Manufacturing ADR 5,911,686 2.48758,000 Tripod Technology 3,133,594 1.32
15,294,866 6.42
RUSSIA160,200 Magnitogorsk Iron & Steel Works Registered Shares
GDR 1,822,275 0.771,974,000 Sberbank of Russia 7,062,168 2.96
100,796 Tatneft ADR 4,286,854 1.80
13,171,297 5.53
SOUTH AFRICA502,300 African Bank Investments 2,537,629 1.07169,300 Foschini Group 2,179,177 0.9130,900 Kumba Iron Ore 2,212,110 0.93279,575 Shoprite Holdings 4,166,911 1.75152,800 Spar 2,028,802 0.85
13,124,629 5.51
UNITED KINGDOM1,660,000 Old Mutual 3,538,508 1.49
230,701 Standard Chartered 6,001,572 2.52
9,540,080 4.01
HONG KONG1,194,000 AIA Group 4,138,642 1.744,022,000 Shun Tak Holdings 2,436,777 1.02
996,000 SJM Holdings 2,360,002 0.99
8,935,421 3.75
TURKEY559,500 KOC Holding 2,423,914 1.02
75,349 Tupras Turkiye Petrol Rafinerileri 1,850,408 0.77528,000 Turk Hava Yollari 1,387,761 0.58424,708 Turkiye Halk Bankasi 3,186,553 1.34
8,848,636 3.71
BERMUDA42,100 Credicorp 3,639,966 1.5386,352 Jardine Matheson Holdings 4,936,744 2.07
8,576,710 3.60
MEXICO556,900 Fomento Economico Mexicano 3,689,954 1.55
27,000 Grupo Aeroportuario del Sureste ADR 1,589,625 0.66431,627 Kimberly-Clark de Mexico - A Shares 2,853,842 1.20
8,133,421 3.41
INDONESIA484,500 Astra International 3,602,330 1.51461,500 Gudang Garam 2,682,107 1.13
6,284,437 2.64
POLAND19,500 Powszechny Zaklad Ubezpieczen 2,671,510 1.12
480,600 Telekomunikacja Polska 2,933,608 1.23
5,605,118 2.35
IRELAND548,000 Dragon Oil 4,567,077 1.92
4,567,077 1.92
INDIA177,255 Punjab National Bank 4,471,320 1.88
4,471,320 1.88
CANADA154,600 Pacific Rubiales Energy 4,241,614 1.78
4,241,614 1.78
UNITED STATES OF AMERICA183,200 AsiaInfo-Linkage 2,968,756 1.25
2,968,756 1.25
CAYMAN ISLANDS1,690,000 Li Ning 2,920,795 1.23
2,920,795 1.23
THAILAND3,015,000 Charoen Pokphand Foods - NVDR 2,888,637 1.21
2,888,637 1.21
MALAYSIA321,900 Kuala Lumpur Kepong 2,358,148 0.99
2,358,148 0.99
NIGERIA2,805,000 Dangote Cement 2,319,280 0.97
2,319,280 0.97
EGYPT463,200 Commercial International Bank 2,312,799 0.97
2,312,799 0.97
Total Shares 223,394,118 93.79
Total Transferable Securities Admitted to anOfficial Exchange Listing
223,394,118 93.79
150
JPMorgan Funds - Emerging Markets Value FundSchedule of Investments (Market Value Expressed in USD)
As at 30 June 2011
Quantity/Nominal
Value
Name of Securities MarketValue
%of
NetAssets
Quantity/Nominal
Value
Name of Securities MarketValue
%of
NetAssets
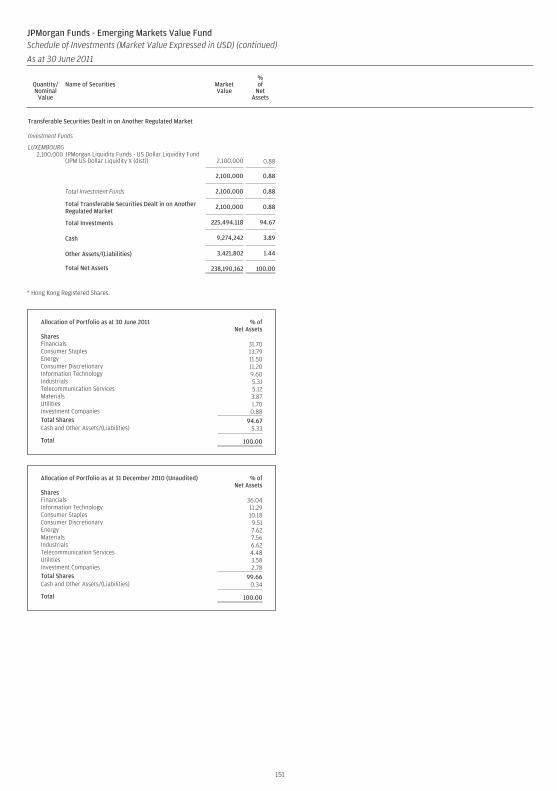
Transferable Securities Dealt in on Another Regulated Market
Investment Funds
LUXEMBOURG2,100,000 JPMorgan Liquidity Funds - US Dollar Liquidity Fund
(JPM US Dollar Liquidity X (dist)) 2,100,000 0.88
2,100,000 0.88
Total Investment Funds 2,100,000 0.88
Total Transferable Securities Dealt in on AnotherRegulated Market
2,100,000 0.88
Total Investments 225,494,118 94.67
Cash 9,274,242 3.89
Other Assets/(Liabilities) 3,421,802 1.44
Total Net Assets 238,190,162 100.00
* Hong Kong Registered Shares.
Allocation of Portfolio as at 30 June 2011 % ofNet Assets
SharesFinancials 31.70Consumer Staples 13.79Energy 11.50Consumer Discretionary 11.20Information Technology 9.60Industrials 5.31Telecommunication Services 5.12Materials 3.87Utilities 1.70Investment Companies 0.88Total Shares 94.67Cash and Other Assets/(Liabilities) 5.33
Total 100.00
Allocation of Portfolio as at 31 December 2010 (Unaudited) % ofNet Assets
SharesFinancials 36.04Information Technology 11.29Consumer Staples 10.18Consumer Discretionary 9.51Energy 7.62Materials 7.56Industrials 6.62Telecommunication Services 4.48Utilities 3.58Investment Companies 2.78Total Shares 99.66Cash and Other Assets/(Liabilities) 0.34
Total 100.00
151
JPMorgan Funds - Emerging Markets Value FundSchedule of Investments (Market Value Expressed in USD) (continued)
As at 30 June 2011
Quantity/Nominal
Value
Name of Securities MarketValue
%of
NetAssets
Quantity/Nominal
Value
Name of Securities MarketValue
%of
NetAssets
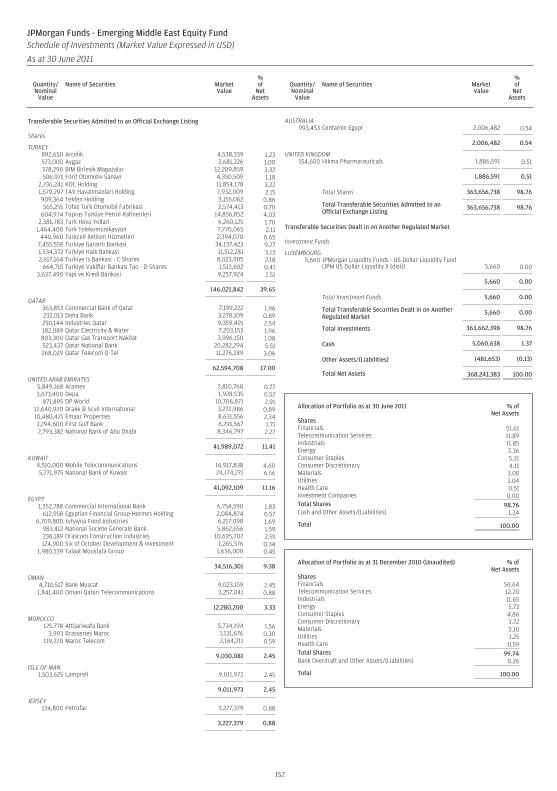
Transferable Securities Admitted to an Official Exchange Listing
Shares
TURKEY892,650 Arcelik 4,538,339 1.23573,000 Aygaz 3,681,226 1.00378,290 BIM Birlesik Magazalar 12,209,859 3.32506,971 Ford Otomotiv Sanayi 4,350,509 1.18
2,736,241 KOC Holding 11,854,178 3.221,579,297 TAV Havalimanlari Holding 7,932,009 2.15909,364 Tekfen Holding 3,155,062 0.86565,291 Tofas Turk Otomobil Fabrikasi 2,574,413 0.70
604,974 Tupras Turkiye Petrol Rafinerileri 14,856,852 4.032,381,783 Turk Hava Yollari 6,260,125 1.70
1,464,400 Turk Telekomunikasyon 7,770,065 2.11440,960 Turkcell Iletisim Hizmetleri 2,394,070 0.65
7,455,558 Turkiye Garanti Bankasi 34,137,423 9.271,534,372 Turkiye Halk Bankasi 11,512,281 3.132,617,164 Turkiye Is Bankasi - C Shares 8,023,905 2.18
664,715 Turkiye Vakiflar Bankasi Tao - D Shares 1,513,602 0.413,637,490 Yapi ve Kredi Bankasi 9,257,924 2.51
146,021,842 39.65
QATAR363,853 Commercial Bank of Qatar 7,199,222 1.96232,013 Doha Bank 3,278,109 0.89250,144 Industries Qatar 9,359,491 2.54182,089 Qatar Electricity & Water 7,203,153 1.96803,300 Qatar Gas Transport Nakilat 3,996,150 1.08523,437 Qatar National Bank 20,282,294 5.51268,029 Qatar Telecom Q-Tel 11,276,289 3.06
62,594,708 17.00
UNITED ARAB EMIRATES5,849,168 Aramex 2,810,760 0.773,673,400 Depa 1,928,535 0.52
871,895 DP World 10,706,871 2.9112,640,920 Drake & Scull International 3,272,986 0.8910,480,421 Emaar Properties 8,631,556 2.341,294,600 First Gulf Bank 6,291,567 1.712,793,382 National Bank of Abu Dhabi 8,346,797 2.27
41,989,072 11.41
KUWAIT4,510,000 Mobile Telecommunications 16,917,838 4.605,771,975 National Bank of Kuwait 24,174,271 6.56
41,092,109 11.16
EGYPT1,352,788 Commercial International Bank 6,754,590 1.83
612,958 Egyptian Financial Group-Hermes Holding 2,084,874 0.576,709,800 Juhayna Food Industries 6,217,098 1.69
983,412 National Societe Generale Bank 5,862,656 1.59238,189 Orascom Construction Industries 10,695,707 2.91124,900 Six of October Development & Investment 1,265,376 0.34
1,980,539 Talaat Moustafa Group 1,636,000 0.45
34,516,301 9.38
OMAN4,710,517 Bank Muscat 9,023,159 2.451,841,400 Omani Qatari Telecommunications 3,257,041 0.88
12,280,200 3.33
MOROCCO125,778 Attijariwafa Bank 5,734,194 1.56
3,993 Brasseries Maroc 1,131,676 0.30119,220 Maroc Telecom 2,164,211 0.59
9,030,081 2.45
ISLE OF MAN1,503,625 Lamprell 9,011,973 2.45
9,011,973 2.45
JERSEY134,800 Petrofac 3,227,379 0.88
3,227,379 0.88
AUSTRALIA993,453 Centamin Egypt 2,006,482 0.54
2,006,482 0.54
UNITED KINGDOM154,600 Hikma Pharmaceuticals 1,886,591 0.51
1,886,591 0.51
Total Shares 363,656,738 98.76
Total Transferable Securities Admitted to anOfficial Exchange Listing
363,656,738 98.76
Transferable Securities Dealt in on Another Regulated Market
Investment Funds
LUXEMBOURG5,660 JPMorgan Liquidity Funds - US Dollar Liquidity Fund
(JPM US Dollar Liquidity X (dist)) 5,660 0.00
5,660 0.00
Total Investment Funds 5,660 0.00
Total Transferable Securities Dealt in on AnotherRegulated Market
5,660 0.00
Total Investments 363,662,398 98.76
Cash 5,060,638 1.37
Other Assets/(Liabilities) (481,653) (0.13)
Total Net Assets 368,241,383 100.00
Allocation of Portfolio as at 30 June 2011 % ofNet Assets
SharesFinancials 51.61Telecommunication Services 11.89Industrials 11.85Energy 7.36Consumer Staples 5.31Consumer Discretionary 4.11Materials 3.08Utilities 3.04Health Care 0.51Investment Companies 0.00Total Shares 98.76Cash and Other Assets/(Liabilities) 1.24
Total 100.00
Allocation of Portfolio as at 31 December 2010 (Unaudited) % ofNet Assets
SharesFinancials 56.64Telecommunication Services 12.20Industrials 11.65Energy 5.73Consumer Staples 4.86Consumer Discretionary 3.72Materials 3.10Utilities 1.25Health Care 0.59Total Shares 99.74Bank Overdraft and Other Assets/(Liabilities) 0.26
Total 100.00
152
JPMorgan Funds - Emerging Middle East Equity FundSchedule of Investments (Market Value Expressed in USD)
As at 30 June 2011
Quantity/Nominal
Value
Name of Securities MarketValue
%of
NetAssets
Quantity/Nominal
Value
Name of Securities MarketValue
%of
NetAssets
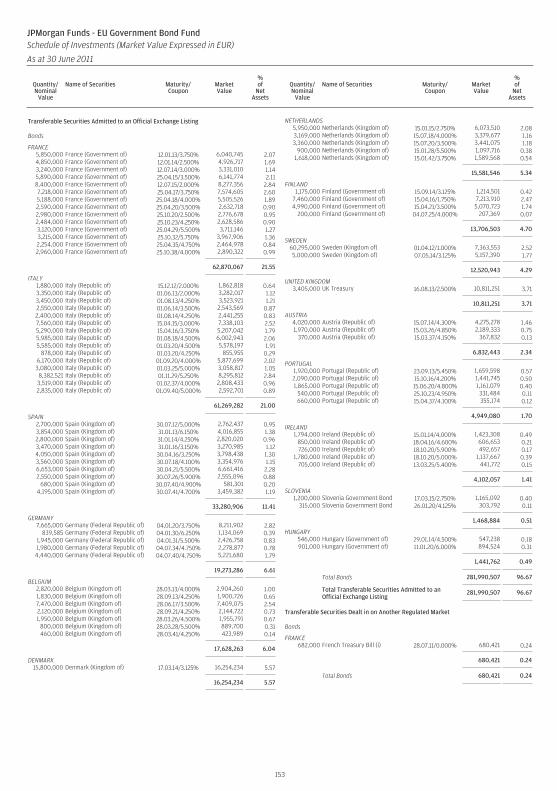
Transferable Securities Admitted to an Official Exchange Listing
Bonds
FRANCE5,850,000 France (Government of) 12.01.13/3.750% 6,040,745 2.074,850,000 France (Government of) 12.01.14/2.500% 4,926,717 1.693,240,000 France (Government of) 12.07.14/3.000% 3,331,010 1.145,890,000 France (Government of) 25.04.15/3.500% 6,141,774 2.118,400,000 France (Government of) 12.07.15/2.000% 8,277,356 2.847,218,000 France (Government of) 25.04.17/3.750% 7,574,605 2.605,188,000 France (Government of) 25.04.18/4.000% 5,505,526 1.892,590,000 France (Government of) 25.04.20/3.500% 2,632,718 0.902,980,000 France (Government of) 25.10.20/2.500% 2,776,678 0.952,484,000 France (Government of) 25.10.23/4.250% 2,628,586 0.903,120,000 France (Government of) 25.04.29/5.500% 3,711,146 1.273,215,000 France (Government of) 25.10.32/5.750% 3,967,906 1.362,254,000 France (Government of) 25.04.35/4.750% 2,464,978 0.842,960,000 France (Government of) 25.10.38/4.000% 2,890,322 0.99
62,870,067 21.55
ITALY1,880,000 Italy (Republic of) 15.12.12/2.000% 1,862,818 0.643,350,000 Italy (Republic of) 01.06.13/2.000% 3,282,017 1.123,450,000 Italy (Republic of) 01.08.13/4.250% 3,523,921 1.212,550,000 Italy (Republic of) 01.06.14/3.500% 2,543,569 0.872,400,000 Italy (Republic of) 01.08.14/4.250% 2,441,255 0.837,560,000 Italy (Republic of) 15.04.15/3.000% 7,338,103 2.525,290,000 Italy (Republic of) 15.04.16/3.750% 5,207,042 1.795,985,000 Italy (Republic of) 01.08.18/4.500% 6,002,943 2.065,585,000 Italy (Republic of) 01.03.20/4.500% 5,578,197 1.91
878,000 Italy (Republic of) 01.03.20/4.250% 855,955 0.296,170,000 Italy (Republic of) 01.09.20/4.000% 5,877,699 2.023,080,000 Italy (Republic of) 01.03.25/5.000% 3,058,817 1.058,382,521 Italy (Republic of) 01.11.29/5.250% 8,295,812 2.843,519,000 Italy (Republic of) 01.02.37/4.000% 2,808,433 0.962,835,000 Italy (Republic of) 01.09.40/5.000% 2,592,701 0.89
61,269,282 21.00
SPAIN2,700,000 Spain (Kingdom of) 30.07.12/5.000% 2,762,437 0.953,854,000 Spain (Kingdom of) 31.01.13/6.150% 4,016,855 1.382,800,000 Spain (Kingdom of) 31.01.14/4.250% 2,820,020 0.963,470,000 Spain (Kingdom of) 31.01.16/3.150% 3,270,985 1.124,050,000 Spain (Kingdom of) 30.04.16/3.250% 3,798,438 1.303,560,000 Spain (Kingdom of) 30.07.18/4.100% 3,354,976 1.156,653,000 Spain (Kingdom of) 30.04.21/5.500% 6,661,416 2.282,550,000 Spain (Kingdom of) 30.07.26/5.900% 2,555,096 0.88
680,000 Spain (Kingdom of) 30.07.40/4.900% 581,301 0.204,195,000 Spain (Kingdom of) 30.07.41/4.700% 3,459,382 1.19
33,280,906 11.41
GERMANY7,665,000 Germany (Federal Republic of) 04.01.20/3.750% 8,211,902 2.82
839,585 Germany (Federal Republic of) 04.01.30/6.250% 1,134,069 0.391,945,000 Germany (Federal Republic of) 04.01.31/5.500% 2,426,758 0.831,980,000 Germany (Federal Republic of) 04.07.34/4.750% 2,278,877 0.784,440,000 Germany (Federal Republic of) 04.07.40/4.750% 5,221,680 1.79
19,273,286 6.61
BELGIUM2,820,000 Belgium (Kingdom of) 28.03.13/4.000% 2,904,260 1.001,830,000 Belgium (Kingdom of) 28.09.13/4.250% 1,900,726 0.657,470,000 Belgium (Kingdom of) 28.06.17/3.500% 7,409,075 2.542,120,000 Belgium (Kingdom of) 28.09.21/4.250% 2,144,722 0.731,950,000 Belgium (Kingdom of) 28.03.26/4.500% 1,955,791 0.67
800,000 Belgium (Kingdom of) 28.03.28/5.500% 889,700 0.31460,000 Belgium (Kingdom of) 28.03.41/4.250% 423,989 0.14
17,628,263 6.04
DENMARK15,800,000 Denmark (Kingdom of) 17.03.14/3.125% 16,254,234 5.57
16,254,234 5.57
NETHERLANDS5,950,000 Netherlands (Kingdom of) 15.01.15/2.750% 6,073,510 2.083,169,000 Netherlands (Kingdom of) 15.07.18/4.000% 3,379,677 1.163,360,000 Netherlands (Kingdom of) 15.07.20/3.500% 3,441,075 1.18
900,000 Netherlands (Kingdom of) 15.01.28/5.500% 1,097,716 0.381,618,000 Netherlands (Kingdom of) 15.01.42/3.750% 1,589,568 0.54
15,581,546 5.34
FINLAND1,175,000 Finland (Government of) 15.09.14/3.125% 1,214,501 0.42
7,460,000 Finland (Government of) 15.04.16/1.750% 7,213,910 2.474,990,000 Finland (Government of) 15.04.21/3.500% 5,070,723 1.74
200,000 Finland (Government of) 04.07.25/4.000% 207,369 0.07
13,706,503 4.70
SWEDEN60,295,000 Sweden (Kingdom of) 01.04.12/1.000% 7,363,553 2.525,000,000 Sweden (Kingdom of) 07.05.14/3.125% 5,157,390 1.77
12,520,943 4.29
UNITED KINGDOM3,405,000 UK Treasury 16.08.13/2.500% 10,811,251 3.71
10,811,251 3.71
AUSTRIA4,020,000 Austria (Republic of) 15.07.14/4.300% 4,275,278 1.461,970,000 Austria (Republic of) 15.03.26/4.850% 2,189,333 0.75
370,000 Austria (Republic of) 15.03.37/4.150% 367,832 0.13
6,832,443 2.34
PORTUGAL1,920,000 Portugal (Republic of) 23.09.13/5.450% 1,659,598 0.572,090,000 Portugal (Republic of) 15.10.16/4.200% 1,441,745 0.501,865,000 Portugal (Republic of) 15.06.20/4.800% 1,161,079 0.40
540,000 Portugal (Republic of) 25.10.23/4.950% 331,484 0.11660,000 Portugal (Republic of) 15.04.37/4.100% 355,174 0.12
4,949,080 1.70
IRELAND1,794,000 Ireland (Republic of) 15.01.14/4.000% 1,423,308 0.49
850,000 Ireland (Republic of) 18.04.16/4.600% 606,653 0.21726,000 Ireland (Republic of) 18.10.20/5.900% 492,657 0.17
1,780,000 Ireland (Republic of) 18.10.20/5.000% 1,137,667 0.39705,000 Ireland (Republic of) 13.03.25/5.400% 441,772 0.15
4,102,057 1.41
SLOVENIA1,200,000 Slovenia Government Bond 17.03.15/2.750% 1,165,092 0.40
315,000 Slovenia Government Bond 26.01.20/4.125% 303,792 0.11
1,468,884 0.51
HUNGARY546,000 Hungary (Government of) 29.01.14/4.500% 547,238 0.18901,000 Hungary (Government of) 11.01.20/6.000% 894,524 0.31
1,441,762 0.49
Total Bonds 281,990,507 96.67
Total Transferable Securities Admitted to anOfficial Exchange Listing
281,990,507 96.67
Transferable Securities Dealt in on Another Regulated Market
Bonds
FRANCE682,000 French Treasury Bill (i) 28.07.11/0.000% 680,421 0.24
680,421 0.24
Total Bonds 680,421 0.24
153
JPMorgan Funds - EU Government Bond FundSchedule of Investments (Market Value Expressed in EUR)
As at 30 June 2011
Quantity/Nominal
Value
Name of Securities Maturity/Coupon
MarketValue
%of
NetAssets
Quantity/Nominal
Value
Name of Securities Maturity/Coupon
MarketValue
%of
NetAssets
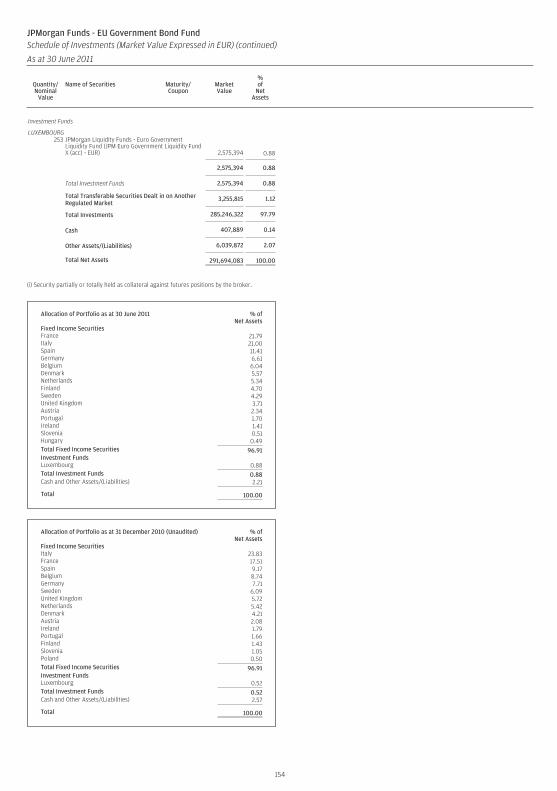
Investment Funds
LUXEMBOURG253 JPMorgan Liquidity Funds - Euro Government
Liquidity Fund (JPM Euro Government Liquidity FundX (acc) - EUR) 2,575,394 0.88
2,575,394 0.88
Total Investment Funds 2,575,394 0.88
Total Transferable Securities Dealt in on AnotherRegulated Market
3,255,815 1.12
Total Investments 285,246,322 97.79
Cash 407,889 0.14
Other Assets/(Liabilities) 6,039,872 2.07
Total Net Assets 291,694,083 100.00
(i) Security partially or totally held as collateral against futures positions by the broker.
Allocation of Portfolio as at 30 June 2011 % ofNet Assets
Fixed Income SecuritiesFrance 21.79Italy 21.00Spain 11.41Germany 6.61Belgium 6.04Denmark 5.57Netherlands 5.34Finland 4.70Sweden 4.29United Kingdom 3.71Austria 2.34Portugal 1.70Ireland 1.41Slovenia 0.51Hungary 0.49Total Fixed Income Securities 96.91Investment FundsLuxembourg 0.88Total Investment Funds 0.88Cash and Other Assets/(Liabilities) 2.21
Total 100.00
Allocation of Portfolio as at 31 December 2010 (Unaudited) % ofNet Assets
Fixed Income SecuritiesItaly 23.83France 17.51Spain 9.17Belgium 8.74Germany 7.71Sweden 6.09United Kingdom 5.72Netherlands 5.42Denmark 4.21Austria 2.08Ireland 1.79Portugal 1.66Finland 1.43Slovenia 1.05Poland 0.50Total Fixed Income Securities 96.91Investment FundsLuxembourg 0.52Total Investment Funds 0.52Cash and Other Assets/(Liabilities) 2.57
Total 100.00
154
JPMorgan Funds - EU Government Bond FundSchedule of Investments (Market Value Expressed in EUR) (continued)
As at 30 June 2011
Quantity/Nominal
Value
Name of Securities Maturity/Coupon
MarketValue
%of
NetAssets
Quantity/Nominal
Value
Name of Securities Maturity/Coupon
MarketValue
%of
NetAssets
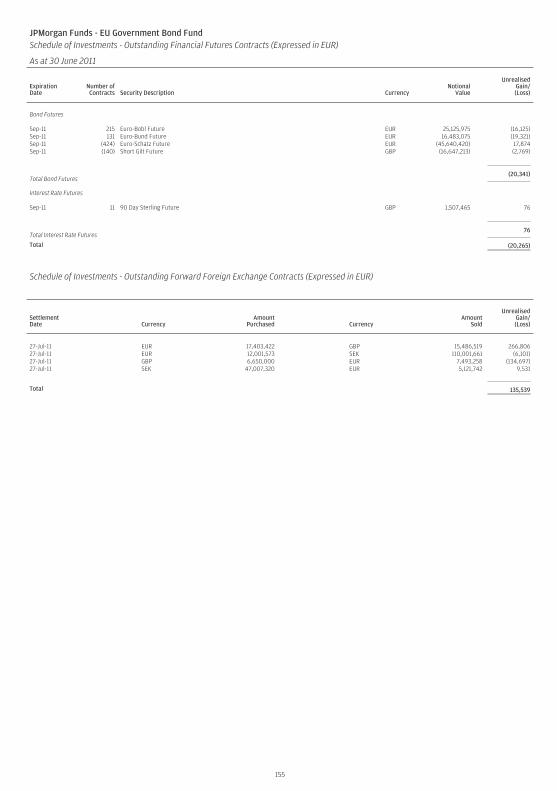
JPMorgan Funds - EU Government Bond FundSchedule of Investments - Outstanding Financial Futures Contracts (Expressed in EUR)
As at 30 June 2011
ExpirationDate
Number ofContracts Security Description Currency
NotionalValue
UnrealisedGain/(Loss)
Bond Futures
Sep-11 215 Euro-Bobl Future EUR 25,125,975 (16,125)Sep-11 131 Euro-Bund Future EUR 16,483,075 (19,321)Sep-11 (424) Euro-Schatz Future EUR (45,640,420) 17,874Sep-11 (140) Short Gilt Future GBP (16,647,213) (2,769)
Total Bond Futures(20,341)
Interest Rate Futures
Sep-11 11 90 Day Sterling Future GBP 1,507,465 76
Total Interest Rate Futures76
Total (20,265)
Schedule of Investments - Outstanding Forward Foreign Exchange Contracts (Expressed in EUR)
SettlementDate Currency
AmountPurchased Currency
AmountSold
UnrealisedGain/(Loss)
27-Jul-11 EUR 17,403,422 GBP 15,486,519 266,80627-Jul-11 EUR 12,001,573 SEK 110,001,661 (6,101)27-Jul-11 GBP 6,650,000 EUR 7,493,258 (134,697)27-Jul-11 SEK 47,007,320 EUR 5,121,742 9,531
Total 135,539
155
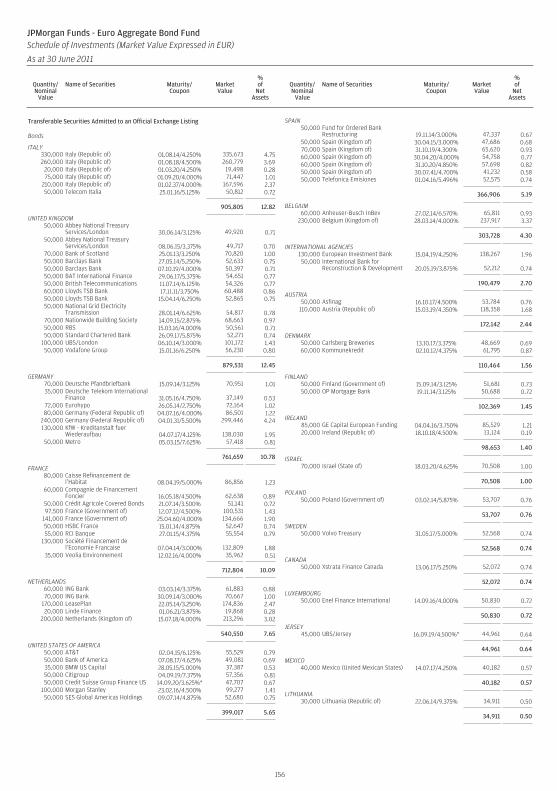
Transferable Securities Admitted to an Official Exchange Listing
Bonds
ITALY330,000 Italy (Republic of) 01.08.14/4.250% 335,673 4.75260,000 Italy (Republic of) 01.08.18/4.500% 260,779 3.69
20,000 Italy (Republic of) 01.03.20/4.250% 19,498 0.2875,000 Italy (Republic of) 01.09.20/4.000% 71,447 1.01
210,000 Italy (Republic of) 01.02.37/4.000% 167,596 2.3750,000 Telecom Italia 25.01.16/5.125% 50,812 0.72
905,805 12.82
UNITED KINGDOM50,000 Abbey National Treasury
Services/London 30.06.14/3.125% 49,920 0.7150,000 Abbey National Treasury
Services/London 08.06.15/3.375% 49,717 0.7070,000 Bank of Scotland 25.01.13/3.250% 70,820 1.0050,000 Barclays Bank 27.05.14/5.250% 52,633 0.7550,000 Barclays Bank 07.10.19/4.000% 50,397 0.7150,000 BAT International Finance 29.06.17/5.375% 54,651 0.7750,000 British Telecommunications 11.07.14/6.125% 54,326 0.7760,000 Lloyds TSB Bank 17.11.11/3.750% 60,488 0.8650,000 Lloyds TSB Bank 15.04.14/6.250% 52,865 0.7550,000 National Grid Electricity
Transmission 28.01.14/6.625% 54,817 0.7870,000 Nationwide Building Society 14.09.15/2.875% 68,663 0.9750,000 RBS 15.03.16/4.000% 50,561 0.7150,000 Standard Chartered Bank 26.09.17/5.875% 52,271 0.74
100,000 UBS/London 06.10.14/3.000% 101,172 1.4350,000 Vodafone Group 15.01.16/6.250% 56,230 0.80
879,531 12.45
GERMANY70,000 Deutsche Pfandbriefbank 15.09.14/3.125% 70,951 1.0135,000 Deutsche Telekom International
Finance 31.05.16/4.750% 37,149 0.5372,000 Eurohypo 26.05.14/2.750% 72,164 1.0280,000 Germany (Federal Republic of) 04.07.16/4.000% 86,501 1.22
240,000 Germany (Federal Republic of) 04.01.31/5.500% 299,446 4.24130,000 KfW - Kreditanstalt fuer
Wiederaufbau 04.07.17/4.125% 138,030 1.9550,000 Metro 05.03.15/7.625% 57,418 0.81
761,659 10.78
FRANCE80,000 Caisse Refinancement de
l’Habitat 08.04.19/5.000% 86,856 1.2360,000 Compagnie de Financement
Foncier 16.05.18/4.500% 62,638 0.8950,000 Crédit Agricole Covered Bonds 21.07.14/3.500% 51,141 0.7297,500 France (Government of) 12.07.12/4.500% 100,531 1.43
141,000 France (Government of) 25.04.60/4.000% 134,666 1.9050,000 HSBC France 15.01.14/4.875% 52,647 0.7455,000 RCI Banque 27.01.15/4.375% 55,554 0.79
130,000 Société Financement del’Economie Francaise 07.04.14/3.000% 132,809 1.88
35,000 Veolia Environnement 12.02.16/4.000% 35,962 0.51
712,804 10.09
NETHERLANDS60,000 ING Bank 03.03.14/3.375% 61,883 0.8870,000 ING Bank 30.09.14/3.000% 70,667 1.00
170,000 LeasePlan 22.05.14/3.250% 174,836 2.4720,000 Linde Finance 01.06.21/3.875% 19,868 0.28
200,000 Netherlands (Kingdom of) 15.07.18/4.000% 213,296 3.02
540,550 7.65
UNITED STATES OF AMERICA50,000 AT&T 02.04.15/6.125% 55,529 0.7950,000 Bank of America 07.08.17/4.625% 49,081 0.6935,000 BMW US Capital 28.05.15/5.000% 37,387 0.5350,000 Citigroup 04.09.19/7.375% 57,356 0.8150,000 Credit Suisse Group Finance US 14.09.20/3.625%* 47,707 0.67
100,000 Morgan Stanley 23.02.16/4.500% 99,277 1.4150,000 SES Global Americas Holdings 09.07.14/4.875% 52,680 0.75
399,017 5.65
SPAIN50,000 Fund for Ordered Bank
Restructuring 19.11.14/3.000% 47,337 0.6750,000 Spain (Kingdom of) 30.04.15/3.000% 47,686 0.6870,000 Spain (Kingdom of) 31.10.19/4.300% 65,620 0.9360,000 Spain (Kingdom of) 30.04.20/4.000% 54,758 0.7760,000 Spain (Kingdom of) 31.10.20/4.850% 57,698 0.8250,000 Spain (Kingdom of) 30.07.41/4.700% 41,232 0.5850,000 Telefonica Emisiones 01.04.16/5.496% 52,575 0.74
366,906 5.19
BELGIUM60,000 Anheuser-Busch InBev 27.02.14/6.570% 65,811 0.93
230,000 Belgium (Kingdom of) 28.03.14/4.000% 237,917 3.37
303,728 4.30
INTERNATIONAL AGENCIES130,000 European Investment Bank 15.04.19/4.250% 138,267 1.9650,000 International Bank for
Reconstruction & Development 20.05.19/3.875% 52,212 0.74
190,479 2.70
AUSTRIA50,000 Asfinag 16.10.17/4.500% 53,784 0.76
110,000 Austria (Republic of) 15.03.19/4.350% 118,358 1.68
172,142 2.44
DENMARK50,000 Carlsberg Breweries 13.10.17/3.375% 48,669 0.6960,000 Kommunekredit 02.10.12/4.375% 61,795 0.87
110,464 1.56
FINLAND50,000 Finland (Government of) 15.09.14/3.125% 51,681 0.7350,000 OP Mortgage Bank 19.11.14/3.125% 50,688 0.72
102,369 1.45
IRELAND85,000 GE Capital European Funding 04.04.16/3.750% 85,529 1.2120,000 Ireland (Republic of) 18.10.18/4.500% 13,124 0.19
98,653 1.40
ISRAEL70,000 Israel (State of) 18.03.20/4.625% 70,508 1.00
70,508 1.00
POLAND50,000 Poland (Government of) 03.02.14/5.875% 53,707 0.76
53,707 0.76
SWEDEN50,000 Volvo Treasury 31.05.17/5.000% 52,568 0.74
52,568 0.74
CANADA50,000 Xstrata Finance Canada 13.06.17/5.250% 52,072 0.74
52,072 0.74
LUXEMBOURG50,000 Enel Finance International 14.09.16/4.000% 50,830 0.72
50,830 0.72
JERSEY45,000 UBS/Jersey 16.09.19/4.500%* 44,961 0.64
44,961 0.64
MEXICO40,000 Mexico (United Mexican States) 14.07.17/4.250% 40,182 0.57
40,182 0.57
LITHUANIA30,000 Lithuania (Republic of) 22.06.14/9.375% 34,911 0.50
34,911 0.50
156
JPMorgan Funds - Euro Aggregate Bond FundSchedule of Investments (Market Value Expressed in EUR)
As at 30 June 2011
Quantity/Nominal
Value
Name of Securities Maturity/Coupon
MarketValue
%of
NetAssets
Quantity/Nominal
Value
Name of Securities Maturity/Coupon
MarketValue
%of
NetAssets
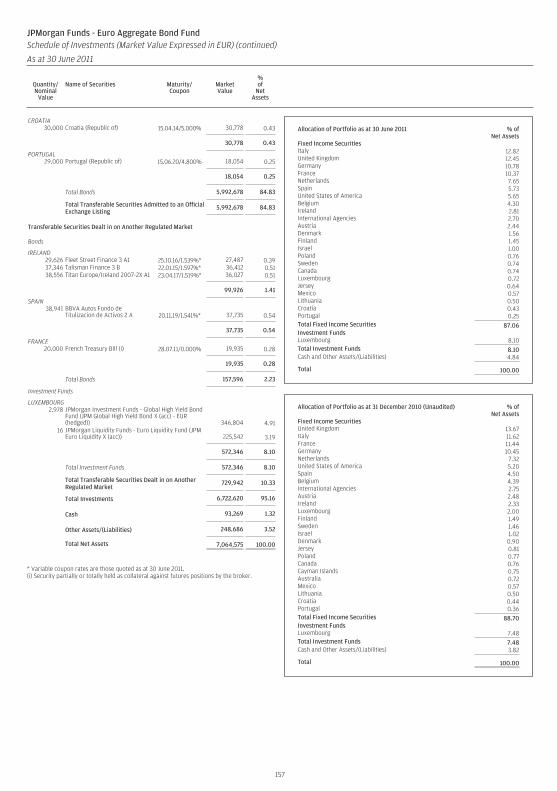
CROATIA30,000 Croatia (Republic of) 15.04.14/5.000% 30,778 0.43
30,778 0.43
PORTUGAL29,000 Portugal (Republic of) 15.06.20/4.800% 18,054 0.25
18,054 0.25
Total Bonds 5,992,678 84.83
Total Transferable Securities Admitted to an OfficialExchange Listing
5,992,678 84.83
Transferable Securities Dealt in on Another Regulated Market
Bonds
IRELAND29,626 Fleet Street Finance 3 A1 25.10.16/1.539%* 27,487 0.3937,346 Talisman Finance 3 B 22.01.15/1.597%* 36,412 0.5138,556 Titan Europe/Ireland 2007-2X A1 23.04.17/1.519%* 36,027 0.51
99,926 1.41
SPAIN38,941 BBVA Autos Fondo de
Titulizacion de Activos 2 A 20.11.19/1.541%* 37,735 0.54
37,735 0.54
FRANCE20,000 French Treasury Bill (i) 28.07.11/0.000% 19,935 0.28
19,935 0.28
Total Bonds 157,596 2.23
Investment Funds
LUXEMBOURG2,978 JPMorgan Investment Funds - Global High Yield Bond
Fund (JPM Global High Yield Bond X (acc) - EUR(hedged)) 346,804 4.91
16 JPMorgan Liquidity Funds - Euro Liquidity Fund (JPMEuro Liquidity X (acc)) 225,542 3.19
572,346 8.10
Total Investment Funds 572,346 8.10
Total Transferable Securities Dealt in on AnotherRegulated Market
729,942 10.33
Total Investments 6,722,620 95.16
Cash 93,269 1.32
Other Assets/(Liabilities) 248,686 3.52
Total Net Assets 7,064,575 100.00
* Variable coupon rates are those quoted as at 30 June 2011.(i) Security partially or totally held as collateral against futures positions by the broker.
Allocation of Portfolio as at 30 June 2011 % ofNet Assets
Fixed Income SecuritiesItaly 12.82United Kingdom 12.45Germany 10.78France 10.37Netherlands 7.65Spain 5.73United States of America 5.65Belgium 4.30Ireland 2.81International Agencies 2.70Austria 2.44Denmark 1.56Finland 1.45Israel 1.00Poland 0.76Sweden 0.74Canada 0.74Luxembourg 0.72Jersey 0.64Mexico 0.57Lithuania 0.50Croatia 0.43Portugal 0.25Total Fixed Income Securities 87.06Investment FundsLuxembourg 8.10Total Investment Funds 8.10Cash and Other Assets/(Liabilities) 4.84
Total 100.00
Allocation of Portfolio as at 31 December 2010 (Unaudited) % ofNet Assets
Fixed Income SecuritiesUnited Kingdom 13.67Italy 11.62France 11.44Germany 10.45Netherlands 7.32United States of America 5.20Spain 4.50Belgium 4.39International Agencies 2.75Austria 2.48Ireland 2.33Luxembourg 2.00Finland 1.49Sweden 1.46Israel 1.02Denmark 0.90Jersey 0.81Poland 0.77Canada 0.76Cayman Islands 0.75Australia 0.72Mexico 0.57Lithuania 0.50Croatia 0.44Portugal 0.36Total Fixed Income Securities 88.70Investment FundsLuxembourg 7.48Total Investment Funds 7.48Cash and Other Assets/(Liabilities) 3.82
Total 100.00
157
JPMorgan Funds - Euro Aggregate Bond FundSchedule of Investments (Market Value Expressed in EUR) (continued)
As at 30 June 2011
Quantity/Nominal
Value
Name of Securities Maturity/Coupon
MarketValue
%of
NetAssets
Quantity/Nominal
Value
Name of Securities Maturity/Coupon
MarketValue
%of
NetAssets

JPMorgan Funds - Euro Aggregate Bond FundSchedule of Investments - Outstanding Financial Futures Contracts (Expressed in EUR)
As at 30 June 2011
ExpirationDate
Number ofContracts Security Description Currency
NotionalValue
UnrealisedGain/(Loss)
Bond Futures
Sep-11 (1) Euro-Bobl Future EUR (116,865) 44Sep-11 6 Euro-Bund Future EUR 754,950 (450)Sep-11 (4) Euro-Schatz Future EUR (430,570) 206
Total (200)
158
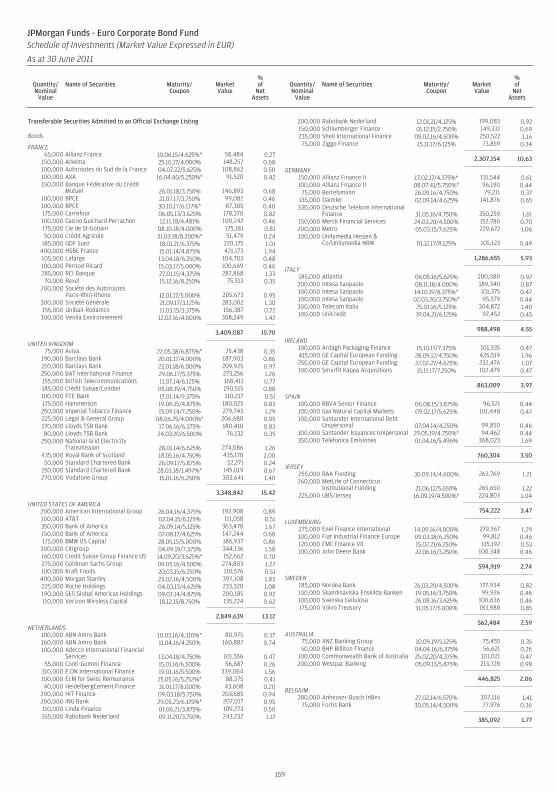
Transferable Securities Admitted to an Official Exchange Listing
Bonds
FRANCE65,000 Allianz France 10.06.15/4.625%* 58,484 0.27
150,000 Arkema 25.10.17/4.000% 148,257 0.68100,000 Autoroutes du Sud de la France 04.07.22/5.625% 108,862 0.50100,000 AXA 16.04.40/5.250%* 91,520 0.42150,000 Banque Fédérative du Crédit
Mutuel 26.01.18/3.750% 146,893 0.68100,000 BPCE 21.07.17/3.750% 99,082 0.46100,000 BPCE 30.10.17/6.117%* 87,305 0.40175,000 Carrefour 06.05.13/3.625% 178,370 0.82100,000 Casino Guichard Perrachon 12.11.18/4.481% 100,242 0.46175,000 Cie de St-Gobain 08.10.18/4.000% 175,181 0.8150,000 Crédit Agricole 31.03.18/8.200%* 51,479 0.24
185,000 GDF Suez 18.01.21/6.375% 220,175 1.01400,000 HSBC France 15.01.14/4.875% 421,173 1.94105,000 Lafarge 13.04.18/6.250% 104,703 0.48100,000 Pernod-Ricard 15.03.17/5.000% 100,669 0.46285,000 RCI Banque 27.01.15/4.375% 287,868 1.3370,000 Rexel 15.12.16/8.250% 75,513 0.35
200,000 Société des AutoroutesParis-Rhin-Rhone 12.01.17/5.000% 205,673 0.95
300,000 Société Générale 21.09.17/3.125% 283,002 1.30155,000 Unibail-Rodamco 11.03.15/3.375% 156,387 0.72
300,000 Veolia Environnement 12.02.16/4.000% 308,249 1.42
3,409,087 15.70
UNITED KINGDOM75,000 Aviva 22.05.38/6.875%* 75,438 0.35
190,000 Barclays Bank 20.01.17/4.000% 187,903 0.86210,000 Barclays Bank 23.01.18/6.000% 209,925 0.97250,000 BAT International Finance 29.06.17/5.375% 273,256 1.26155,000 British Telecommunications 11.07.14/6.125% 168,411 0.77185,000 Crédit Suisse/London 05.08.19/4.750% 190,515 0.88100,000 FCE Bank 17.01.14/9.375% 110,217 0.51175,000 Hammerson 19.06.15/4.875% 180,025 0.83250,000 Imperial Tobacco Finance 15.09.14/7.250% 279,743 1.29225,000 Legal & General Group 08.06.25/4.000%* 206,680 0.95170,000 Lloyds TSB Bank 17.06.16/6.375% 180,410 0.8380,000 Lloyds TSB Bank 24.03.20/6.500% 76,132 0.35
250,000 National Grid ElectricityTransmission 28.01.14/6.625% 274,086 1.26
435,000 Royal Bank of Scotland 18.05.16/4.750% 435,170 2.0050,000 Standard Chartered Bank 26.09.17/5.875% 52,271 0.24
150,000 Standard Chartered Bank 28.03.18/1.497%* 145,019 0.67270,000 Vodafone Group 15.01.16/6.250% 303,641 1.40
3,348,842 15.42
UNITED STATES OF AMERICA200,000 American International Group 26.04.16/4.375% 192,908 0.89100,000 AT&T 02.04.15/6.125% 111,058 0.51350,000 Bank of America 26.09.14/5.125% 363,478 1.67150,000 Bank of America 07.08.17/4.625% 147,244 0.68175,000 BMW US Capital 28.05.15/5.000% 186,937 0.86
300,000 Citigroup 04.09.19/7.375% 344,136 1.58160,000 Credit Suisse Group Finance US 14.09.20/3.625%* 152,662 0.70275,000 Goldman Sachs Group 09.05.16/4.500% 274,803 1.27100,000 Kraft Foods 20.03.15/6.250% 110,576 0.51400,000 Morgan Stanley 23.02.16/4.500% 397,108 1.83225,000 Roche Holdings 04.03.13/4.625% 233,320 1.08190,000 SES Global Americas Holdings 09.07.14/4.875% 200,185 0.92110,000 Verizon Wireless Capital 18.12.15/8.750% 135,224 0.62
2,849,639 13.12
NETHERLANDS100,000 ABN Amro Bank 10.03.16/4.310%* 80,975 0.37160,000 ABN Amro Bank 11.04.16/4.250% 160,887 0.74100,000 Adecco International Financial
Services 13.04.18/4.750% 101,556 0.4755,000 Conti-Gummi Finance 15.01.16/6.500% 56,687 0.26
310,000 E.ON International Finance 19.01.16/5.500% 339,064 1.56100,000 ELM for Swiss Reinsurance 25.05.16/5.252%* 88,375 0.4140,000 HeidelbergCement Finance 31.01.17/8.000% 43,608 0.20
200,000 HIT Finance 09.03.18/5.750% 203,685 0.94200,000 ING Bank 29.05.23/6.125%* 207,017 0.95110,000 Linde Finance 01.06.21/3.875% 109,273 0.50265,000 Rabobank Nederland 09.11.20/3.750% 243,232 1.12
200,000 Rabobank Nederland 12.01.21/4.125% 199,083 0.92150,000 Schlumberger Finance 01.12.15/2.750% 149,331 0.69235,000 Shell International Finance 09.02.16/4.500% 250,522 1.16
75,000 Ziggo Finance 15.11.17/6.125% 73,859 0.34
2,307,154 10.63
GERMANY150,000 Allianz Finance II 17.02.17/4.375%* 131,544 0.61100,000 Allianz Finance II 08.07.41/5.750%* 96,190 0.44
75,000 Bertelsmann 26.09.16/4.750% 79,211 0.37135,000 Daimler 02.09.14/4.625% 141,876 0.65330,000 Deutsche Telekom International
Finance 31.05.16/4.750% 350,259 1.61150,000 Merck Financial Services 24.03.20/4.500% 152,780 0.70200,000 Metro 05.03.15/7.625% 229,672 1.06100,000 Unitymedia Hessen &
Co/Unitymedia NRW 01.12.17/8.125% 105,123 0.49
1,286,655 5.93
ITALY185,000 Atlantia 06.05.16/5.625% 200,080 0.92200,000 Intesa Sanpaolo 08.11.18/4.000% 189,340 0.87100,000 Intesa Sanpaolo 14.10.19/8.375%* 101,375 0.47100,000 Intesa Sanpaolo 02.03.20/3.750%* 95,379 0.44300,000 Telecom Italia 25.01.16/5.125% 304,872 1.40100,000 UniCredit 19.04.21/6.125% 97,452 0.45
988,498 4.55
IRELAND100,000 Ardagh Packaging Finance 15.10.17/7.375% 101,535 0.47415,000 GE Capital European Funding 28.09.12/4.750% 426,519 1.96250,000 GE Capital European Funding 22.02.27/4.625% 232,476 1.07100,000 Smurfit Kappa Acquisitions 15.11.17/7.250% 102,479 0.47
863,009 3.97
SPAIN100,000 BBVA Senior Finance 06.08.15/3.875% 96,521 0.44100,000 Gas Natural Capital Markets 09.02.17/5.625% 101,448 0.47100,000 Santander International Debt
Unipersonal 07.04.14/4.250% 99,850 0.46100,000 Santander Issuances Unipersonal 29.05.19/4.750%* 94,462 0.44350,000 Telefonica Emisiones 01.04.16/5.496% 368,023 1.69
760,304 3.50
JERSEY255,000 BAA Funding 30.09.14/4.600% 263,769 1.21260,000 MetLife of Connecticut
Institutional Funding 21.06.12/5.650% 265,650 1.22225,000 UBS/Jersey 16.09.19/4.500%* 224,803 1.04
754,222 3.47
LUXEMBOURG275,000 Enel Finance International 14.09.16/4.000% 279,567 1.29100,000 Fiat Industrial Finance Europe 09.03.18/6.250% 99,812 0.46120,000 FMC Finance VII 15.02.21/6.250% 115,192 0.53100,000 John Deere Bank 22.06.16/3.250% 100,348 0.46
594,919 2.74
SWEDEN185,000 Nordea Bank 26.03.20/4.500% 177,934 0.82100,000 Skandinaviska Enskilda Banken 19.05.16/3.750% 99,926 0.46100,000 Svenska Cellulosa 26.08.16/3.625% 100,636 0.46175,000 Volvo Treasury 31.05.17/5.000% 183,988 0.85
562,484 2.59
AUSTRALIA75,000 ANZ Banking Group 10.09.19/5.125% 75,455 0.3550,000 BHP Billiton Finance 04.04.16/6.375% 56,621 0.26
100,000 Commonwealth Bank of Australia 25.02.20/4.375% 101,021 0.47200,000 Westpac Banking 05.09.13/5.875% 213,728 0.98
446,825 2.06
BELGIUM280,000 Anheuser-Busch InBev 27.02.14/6.570% 307,116 1.41
75,000 Fortis Bank 30.05.14/4.500% 77,976 0.36
385,092 1.77
159
JPMorgan Funds - Euro Corporate Bond FundSchedule of Investments (Market Value Expressed in EUR)
As at 30 June 2011
Quantity/Nominal
Value
Name of Securities Maturity/Coupon
MarketValue
%of
NetAssets
Quantity/Nominal
Value
Name of Securities Maturity/Coupon
MarketValue
%of
NetAssets
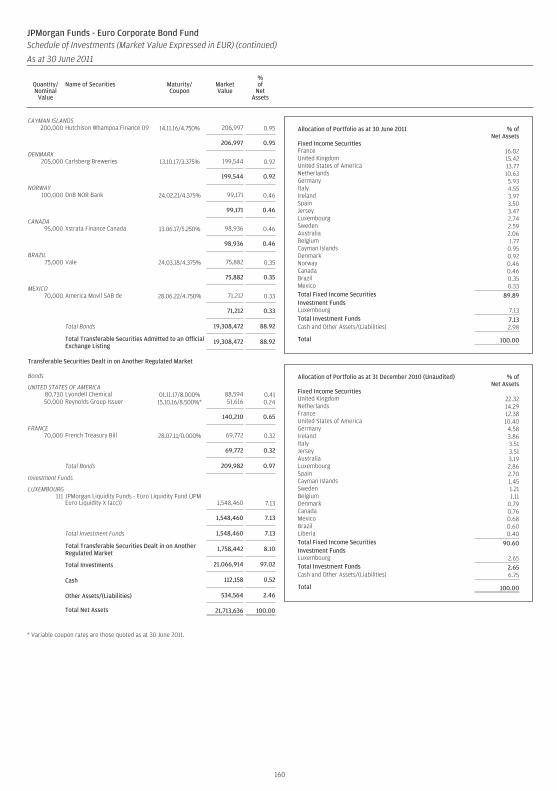
CAYMAN ISLANDS200,000 Hutchison Whampoa Finance 09 14.11.16/4.750% 206,997 0.95
206,997 0.95
DENMARK205,000 Carlsberg Breweries 13.10.17/3.375% 199,544 0.92
199,544 0.92
NORWAY100,000 DnB NOR Bank 24.02.21/4.375% 99,171 0.46
99,171 0.46
CANADA95,000 Xstrata Finance Canada 13.06.17/5.250% 98,936 0.46
98,936 0.46
BRAZIL75,000 Vale 24.03.18/4.375% 75,882 0.35
75,882 0.35
MEXICO70,000 America Movil SAB de 28.06.22/4.750% 71,212 0.33
71,212 0.33
Total Bonds 19,308,472 88.92
Total Transferable Securities Admitted to an OfficialExchange Listing
19,308,472 88.92
Transferable Securities Dealt in on Another Regulated Market
Bonds
UNITED STATES OF AMERICA80,730 Lyondell Chemical 01.11.17/8.000% 88,594 0.4150,000 Reynolds Group Issuer 15.10.16/8.500%* 51,616 0.24
140,210 0.65
FRANCE70,000 French Treasury Bill 28.07.11/0.000% 69,772 0.32
69,772 0.32
Total Bonds 209,982 0.97
Investment Funds
LUXEMBOURG111 JPMorgan Liquidity Funds - Euro Liquidity Fund (JPM
Euro Liquidity X (acc)) 1,548,460 7.13
1,548,460 7.13
Total Investment Funds 1,548,460 7.13
Total Transferable Securities Dealt in on AnotherRegulated Market
1,758,442 8.10
Total Investments 21,066,914 97.02
Cash 112,158 0.52
Other Assets/(Liabilities) 534,564 2.46
Total Net Assets 21,713,636 100.00
* Variable coupon rates are those quoted as at 30 June 2011.
Allocation of Portfolio as at 30 June 2011 % ofNet Assets
Fixed Income SecuritiesFrance 16.02United Kingdom 15.42United States of America 13.77Netherlands 10.63Germany 5.93Italy 4.55Ireland 3.97Spain 3.50Jersey 3.47Luxembourg 2.74Sweden 2.59Australia 2.06Belgium 1.77Cayman Islands 0.95Denmark 0.92Norway 0.46Canada 0.46Brazil 0.35Mexico 0.33Total Fixed Income Securities 89.89Investment FundsLuxembourg 7.13Total Investment Funds 7.13Cash and Other Assets/(Liabilities) 2.98
Total 100.00
Allocation of Portfolio as at 31 December 2010 (Unaudited) % ofNet Assets
Fixed Income SecuritiesUnited Kingdom 22.32Netherlands 14.29France 12.38United States of America 10.40Germany 4.58Ireland 3.86Italy 3.51Jersey 3.51Australia 3.19Luxembourg 2.86Spain 2.70Cayman Islands 1.45Sweden 1.21Belgium 1.11Denmark 0.79Canada 0.76Mexico 0.68Brazil 0.60Liberia 0.40Total Fixed Income Securities 90.60Investment FundsLuxembourg 2.65Total Investment Funds 2.65Cash and Other Assets/(Liabilities) 6.75
Total 100.00
160
JPMorgan Funds - Euro Corporate Bond FundSchedule of Investments (Market Value Expressed in EUR) (continued)
As at 30 June 2011
Quantity/Nominal
Value
Name of Securities Maturity/Coupon
MarketValue
%of
NetAssets
Quantity/Nominal
Value
Name of Securities Maturity/Coupon
MarketValue
%of
NetAssets
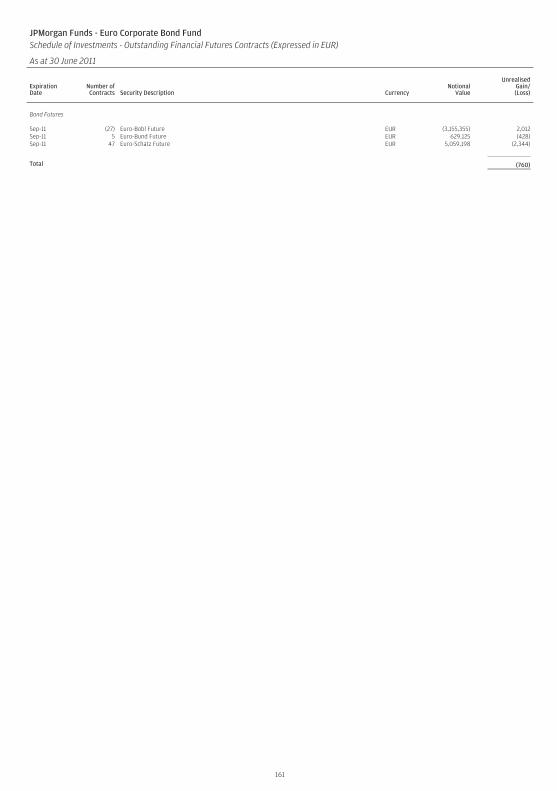
JPMorgan Funds - Euro Corporate Bond FundSchedule of Investments - Outstanding Financial Futures Contracts (Expressed in EUR)
As at 30 June 2011
ExpirationDate
Number ofContracts Security Description Currency
NotionalValue
UnrealisedGain/(Loss)
Bond Futures
Sep-11 (27) Euro-Bobl Future EUR (3,155,355) 2,012Sep-11 5 Euro-Bund Future EUR 629,125 (428)Sep-11 47 Euro-Schatz Future EUR 5,059,198 (2,344)
Total (760)
161
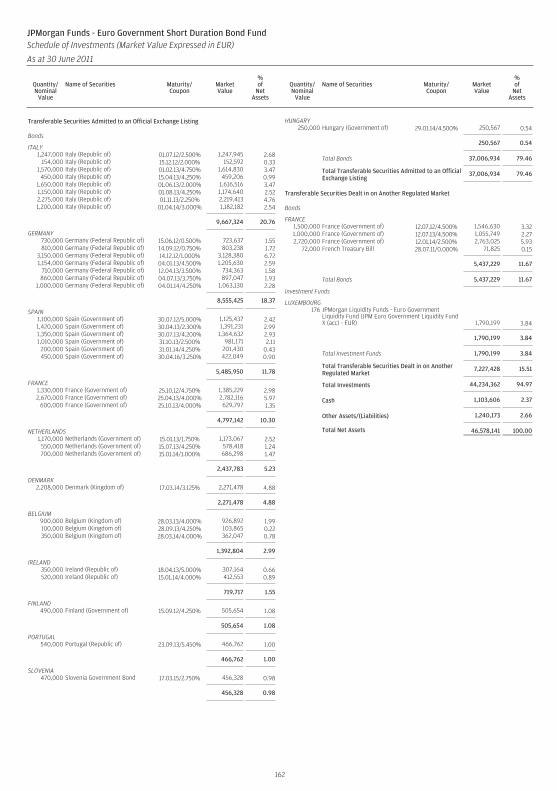
Transferable Securities Admitted to an Official Exchange Listing
Bonds
ITALY1,247,000 Italy (Republic of) 01.07.12/2.500% 1,247,945 2.68
154,000 Italy (Republic of) 15.12.12/2.000% 152,592 0.331,570,000 Italy (Republic of) 01.02.13/4.750% 1,614,830 3.47
450,000 Italy (Republic of) 15.04.13/4.250% 459,206 0.991,650,000 Italy (Republic of) 01.06.13/2.000% 1,616,516 3.471,150,000 Italy (Republic of) 01.08.13/4.250% 1,174,640 2.522,275,000 Italy (Republic of) 01.11.13/2.250% 2,219,413 4.761,200,000 Italy (Republic of) 01.04.14/3.000% 1,182,182 2.54
9,667,324 20.76
GERMANY730,000 Germany (Federal Republic of) 15.06.12/0.500% 723,637 1.55810,000 Germany (Federal Republic of) 14.09.12/0.750% 803,238 1.72
3,150,000 Germany (Federal Republic of) 14.12.12/1.000% 3,128,380 6.721,154,000 Germany (Federal Republic of) 04.01.13/4.500% 1,205,630 2.59
710,000 Germany (Federal Republic of) 12.04.13/3.500% 734,363 1.58860,000 Germany (Federal Republic of) 04.07.13/3.750% 897,047 1.93
1,000,000 Germany (Federal Republic of) 04.01.14/4.250% 1,063,130 2.28
8,555,425 18.37
SPAIN1,100,000 Spain (Government of) 30.07.12/5.000% 1,125,437 2.421,420,000 Spain (Government of) 30.04.13/2.300% 1,391,231 2.991,350,000 Spain (Government of) 30.07.13/4.200% 1,364,632 2.931,010,000 Spain (Government of) 31.10.13/2.500% 981,171 2.11
200,000 Spain (Government of) 31.01.14/4.250% 201,430 0.43450,000 Spain (Government of) 30.04.16/3.250% 422,049 0.90
5,485,950 11.78
FRANCE1,330,000 France (Government of) 25.10.12/4.750% 1,385,229 2.982,670,000 France (Government of) 25.04.13/4.000% 2,782,116 5.97
600,000 France (Government of) 25.10.13/4.000% 629,797 1.35
4,797,142 10.30
NETHERLANDS1,170,000 Netherlands (Government of) 15.01.13/1.750% 1,173,067 2.52
550,000 Netherlands (Government of) 15.07.13/4.250% 578,418 1.24700,000 Netherlands (Government of) 15.01.14/1.000% 686,298 1.47
2,437,783 5.23
DENMARK2,208,000 Denmark (Kingdom of) 17.03.14/3.125% 2,271,478 4.88
2,271,478 4.88
BELGIUM900,000 Belgium (Kingdom of) 28.03.13/4.000% 926,892 1.99100,000 Belgium (Kingdom of) 28.09.13/4.250% 103,865 0.22350,000 Belgium (Kingdom of) 28.03.14/4.000% 362,047 0.78
1,392,804 2.99
IRELAND350,000 Ireland (Republic of) 18.04.13/5.000% 307,164 0.66520,000 Ireland (Republic of) 15.01.14/4.000% 412,553 0.89
719,717 1.55
FINLAND490,000 Finland (Government of) 15.09.12/4.250% 505,654 1.08
505,654 1.08
PORTUGAL540,000 Portugal (Republic of) 23.09.13/5.450% 466,762 1.00
466,762 1.00
SLOVENIA470,000 Slovenia Government Bond 17.03.15/2.750% 456,328 0.98
456,328 0.98
HUNGARY250,000 Hungary (Government of) 29.01.14/4.500% 250,567 0.54
250,567 0.54
Total Bonds 37,006,934 79.46
Total Transferable Securities Admitted to an OfficialExchange Listing
37,006,934 79.46
Transferable Securities Dealt in on Another Regulated Market
Bonds
FRANCE1,500,000 France (Government of) 12.07.12/4.500% 1,546,630 3.321,000,000 France (Government of) 12.07.13/4.500% 1,055,749 2.272,720,000 France (Government of) 12.01.14/2.500% 2,763,025 5.93
72,000 French Treasury Bill 28.07.11/0.000% 71,825 0.15
5,437,229 11.67
Total Bonds 5,437,229 11.67
Investment Funds
LUXEMBOURG176 JPMorgan Liquidity Funds - Euro Government
Liquidity Fund (JPM Euro Government Liquidity FundX (acc) - EUR) 1,790,199 3.84
1,790,199 3.84
Total Investment Funds 1,790,199 3.84
Total Transferable Securities Dealt in on AnotherRegulated Market
7,227,428 15.51
Total Investments 44,234,362 94.97
Cash 1,103,606 2.37
Other Assets/(Liabilities) 1,240,173 2.66
Total Net Assets 46,578,141 100.00
162
JPMorgan Funds - Euro Government Short Duration Bond FundSchedule of Investments (Market Value Expressed in EUR)
As at 30 June 2011
Quantity/Nominal
Value
Name of Securities Maturity/Coupon
MarketValue
%of
NetAssets
Quantity/Nominal
Value
Name of Securities Maturity/Coupon
MarketValue
%of
NetAssets
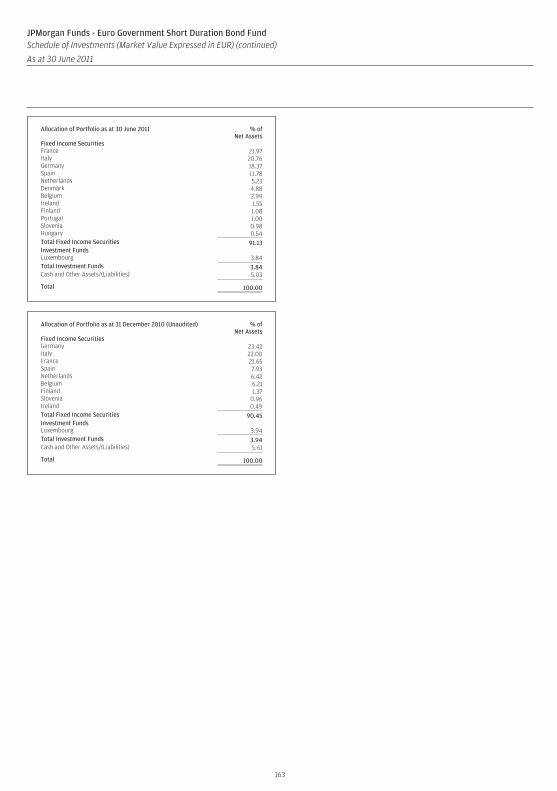
Allocation of Portfolio as at 30 June 2011 % ofNet Assets
Fixed Income SecuritiesFrance 21.97Italy 20.76Germany 18.37Spain 11.78Netherlands 5.23Denmark 4.88Belgium 2.99Ireland 1.55Finland 1.08Portugal 1.00Slovenia 0.98Hungary 0.54Total Fixed Income Securities 91.13Investment FundsLuxembourg 3.84Total Investment Funds 3.84Cash and Other Assets/(Liabilities) 5.03
Total 100.00
Allocation of Portfolio as at 31 December 2010 (Unaudited) % ofNet Assets
Fixed Income SecuritiesGermany 23.42Italy 22.00France 21.65Spain 7.93Netherlands 6.42Belgium 6.21Finland 1.37Slovenia 0.96Ireland 0.49Total Fixed Income Securities 90.45Investment FundsLuxembourg 3.94Total Investment Funds 3.94Cash and Other Assets/(Liabilities) 5.61
Total 100.00
163
JPMorgan Funds - Euro Government Short Duration Bond FundSchedule of Investments (Market Value Expressed in EUR) (continued)
As at 30 June 2011
Quantity/Nominal
Value
Name of Securities Maturity/Coupon
MarketValue
%of
NetAssets
Quantity/Nominal
Value
Name of Securities Maturity/Coupon
MarketValue
%of
NetAssets
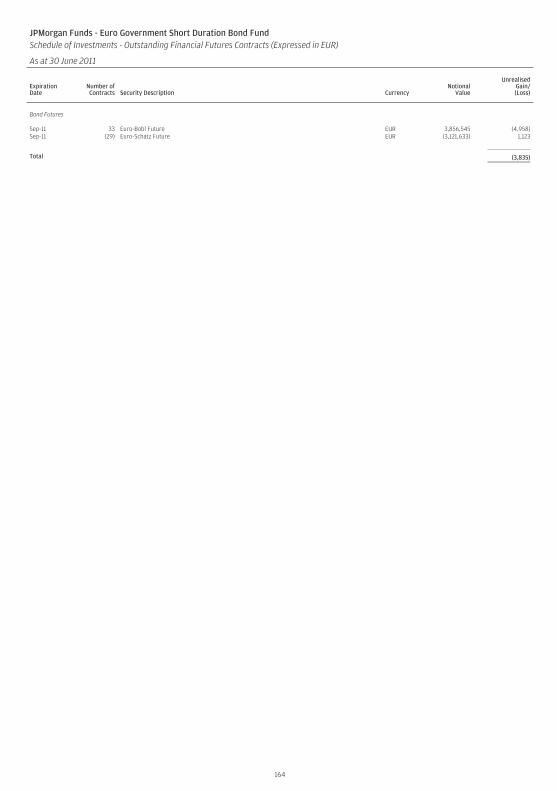
JPMorgan Funds - Euro Government Short Duration Bond FundSchedule of Investments - Outstanding Financial Futures Contracts (Expressed in EUR)
As at 30 June 2011
ExpirationDate
Number ofContracts Security Description Currency
NotionalValue
UnrealisedGain/(Loss)
Bond Futures
Sep-11 33 Euro-Bobl Future EUR 3,856,545 (4,958)Sep-11 (29) Euro-Schatz Future EUR (3,121,633) 1,123
Total (3,835)
164
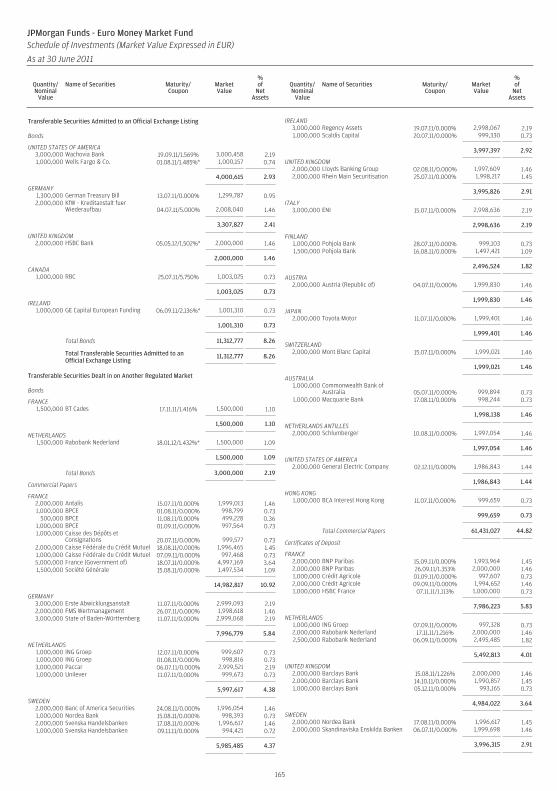
Transferable Securities Admitted to an Official Exchange Listing
Bonds
UNITED STATES OF AMERICA3,000,000 Wachovia Bank 19.09.11/1.569% 3,000,458 2.191,000,000 Wells Fargo & Co. 01.08.11/1.485%* 1,000,157 0.74
4,000,615 2.93
GERMANY1,300,000 German Treasury Bill 13.07.11/0.000% 1,299,787 0.952,000,000 KfW - Kreditanstalt fuer
Wiederaufbau 04.07.11/5.000% 2,008,040 1.46
3,307,827 2.41
UNITED KINGDOM2,000,000 HSBC Bank 05.05.12/1.502%* 2,000,000 1.46
2,000,000 1.46
CANADA1,000,000 RBC 25.07.11/5.750% 1,003,025 0.73
1,003,025 0.73
IRELAND1,000,000 GE Capital European Funding 06.09.11/2.136%* 1,001,310 0.73
1,001,310 0.73
Total Bonds 11,312,777 8.26
Total Transferable Securities Admitted to anOfficial Exchange Listing
11,312,777 8.26
Transferable Securities Dealt in on Another Regulated Market
Bonds
FRANCE1,500,000 BT Cades 17.11.11/1.416% 1,500,000 1.10
1,500,000 1.10
NETHERLANDS1,500,000 Rabobank Nederland 18.01.12/1.432%* 1,500,000 1.09
1,500,000 1.09
Total Bonds 3,000,000 2.19
Commercial Papers
FRANCE2,000,000 Antalis 15.07.11/0.000% 1,999,013 1.461,000,000 BPCE 01.08.11/0.000% 998,799 0.73
500,000 BPCE 11.08.11/0.000% 499,228 0.361,000,000 BPCE 01.09.11/0.000% 997,564 0.731,000,000 Caisse des Dépôts et
Consignations 20.07.11/0.000% 999,577 0.732,000,000 Caisse Fédérale du Crédit Mutuel 18.08.11/0.000% 1,996,465 1.451,000,000 Caisse Fédérale du Crédit Mutuel 07.09.11/0.000% 997,468 0.735,000,000 France (Government of) 18.07.11/0.000% 4,997,169 3.641,500,000 Société Générale 15.08.11/0.000% 1,497,534 1.09
14,982,817 10.92
GERMANY3,000,000 Erste Abwicklungsanstalt 11.07.11/0.000% 2,999,093 2.192,000,000 FMS Wertmanagement 26.07.11/0.000% 1,998,618 1.463,000,000 State of Baden-Württemberg 11.07.11/0.000% 2,999,068 2.19
7,996,779 5.84
NETHERLANDS1,000,000 ING Groep 12.07.11/0.000% 999,607 0.731,000,000 ING Groep 01.08.11/0.000% 998,816 0.733,000,000 Paccar 06.07.11/0.000% 2,999,521 2.191,000,000 Unilever 11.07.11/0.000% 999,673 0.73
5,997,617 4.38
SWEDEN2,000,000 Banc of America Securities 24.08.11/0.000% 1,996,054 1.461,000,000 Nordea Bank 15.08.11/0.000% 998,393 0.732,000,000 Svenska Handelsbanken 17.08.11/0.000% 1,996,617 1.461,000,000 Svenska Handelsbanken 09.11.11/0.000% 994,421 0.72
5,985,485 4.37
IRELAND3,000,000 Regency Assets 19.07.11/0.000% 2,998,067 2.191,000,000 Scaldis Capital 20.07.11/0.000% 999,330 0.73
3,997,397 2.92
UNITED KINGDOM2,000,000 Lloyds Banking Group 02.08.11/0.000% 1,997,609 1.462,000,000 Rhein Main Securitisation 25.07.11/0.000% 1,998,217 1.45
3,995,826 2.91
ITALY3,000,000 ENI 15.07.11/0.000% 2,998,636 2.19
2,998,636 2.19
FINLAND1,000,000 Pohjola Bank 28.07.11/0.000% 999,103 0.731,500,000 Pohjola Bank 16.08.11/0.000% 1,497,421 1.09
2,496,524 1.82
AUSTRIA2,000,000 Austria (Republic of) 04.07.11/0.000% 1,999,830 1.46
1,999,830 1.46
JAPAN2,000,000 Toyota Motor 11.07.11/0.000% 1,999,401 1.46
1,999,401 1.46
SWITZERLAND2,000,000 Mont Blanc Capital 15.07.11/0.000% 1,999,021 1.46
1,999,021 1.46
AUSTRALIA1,000,000 Commonwealth Bank of
Australia 05.07.11/0.000% 999,894 0.731,000,000 Macquarie Bank 17.08.11/0.000% 998,244 0.73
1,998,138 1.46
NETHERLANDS ANTILLES2,000,000 Schlumberger 10.08.11/0.000% 1,997,054 1.46
1,997,054 1.46
UNITED STATES OF AMERICA2,000,000 General Electric Company 02.12.11/0.000% 1,986,843 1.44
1,986,843 1.44
HONG KONG1,000,000 BCA Interest Hong Kong 11.07.11/0.000% 999,659 0.73
999,659 0.73
Total Commercial Papers 61,431,027 44.82
Certificates of Deposit
FRANCE2,000,000 BNP Paribas 15.09.11/0.000% 1,993,964 1.452,000,000 BNP Paribas 26.09.11/1.353% 2,000,000 1.461,000,000 Crédit Agricole 01.09.11/0.000% 997,607 0.732,000,000 Crédit Agricole 09.09.11/0.000% 1,994,652 1.461,000,000 HSBC France 07.11.11/1.113% 1,000,000 0.73
7,986,223 5.83
NETHERLANDS1,000,000 ING Groep 07.09.11/0.000% 997,328 0.732,000,000 Rabobank Nederland 17.11.11/1.216% 2,000,000 1.462,500,000 Rabobank Nederland 06.09.11/0.000% 2,495,485 1.82
5,492,813 4.01
UNITED KINGDOM2,000,000 Barclays Bank 15.08.11/1.226% 2,000,000 1.462,000,000 Barclays Bank 14.10.11/0.000% 1,990,857 1.451,000,000 Barclays Bank 05.12.11/0.000% 993,165 0.73
4,984,022 3.64
SWEDEN2,000,000 Nordea Bank 17.08.11/0.000% 1,996,617 1.452,000,000 Skandinaviska Enskilda Banken 06.07.11/0.000% 1,999,698 1.46
3,996,315 2.91
165
JPMorgan Funds - Euro Money Market FundSchedule of Investments (Market Value Expressed in EUR)
As at 30 June 2011
Quantity/Nominal
Value
Name of Securities Maturity/Coupon
MarketValue
%of
NetAssets
Quantity/Nominal
Value
Name of Securities Maturity/Coupon
MarketValue
%of
NetAssets
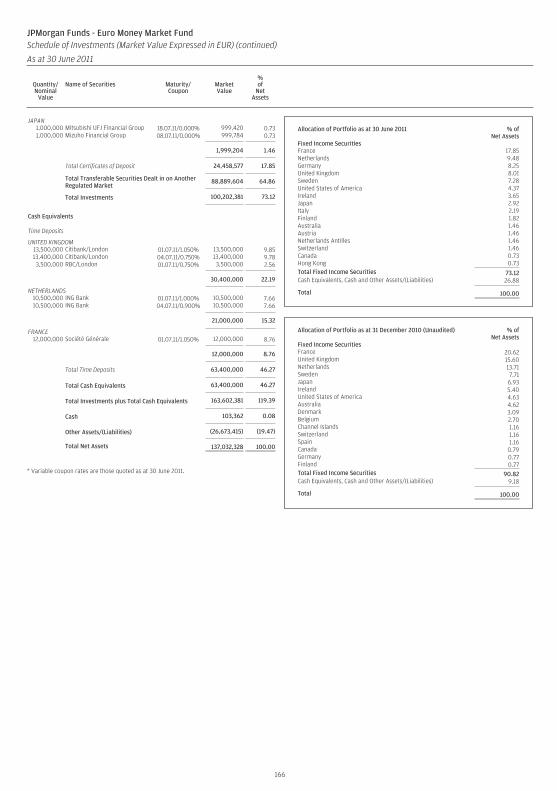
JAPAN1,000,000 Mitsubishi UFJ Financial Group 18.07.11/0.000% 999,420 0.731,000,000 Mizuho Financial Group 08.07.11/0.000% 999,784 0.73
1,999,204 1.46
Total Certificates of Deposit 24,458,577 17.85
Total Transferable Securities Dealt in on AnotherRegulated Market
88,889,604 64.86
Total Investments 100,202,381 73.12
Cash Equivalents
Time Deposits
UNITED KINGDOM13,500,000 Citibank/London 01.07.11/1.050% 13,500,000 9.8513,400,000 Citibank/London 04.07.11/0.750% 13,400,000 9.783,500,000 RBC/London 01.07.11/0.750% 3,500,000 2.56
30,400,000 22.19
NETHERLANDS10,500,000 ING Bank 01.07.11/1.000% 10,500,000 7.6610,500,000 ING Bank 04.07.11/0.900% 10,500,000 7.66
21,000,000 15.32
FRANCE12,000,000 Société Générale 01.07.11/1.050% 12,000,000 8.76
12,000,000 8.76
Total Time Deposits 63,400,000 46.27
Total Cash Equivalents 63,400,000 46.27
Total Investments plus Total Cash Equivalents 163,602,381 119.39
Cash 103,362 0.08
Other Assets/(Liabilities) (26,673,415) (19.47)
Total Net Assets 137,032,328 100.00
* Variable coupon rates are those quoted as at 30 June 2011.
Allocation of Portfolio as at 30 June 2011 % ofNet Assets
Fixed Income SecuritiesFrance 17.85Netherlands 9.48Germany 8.25United Kingdom 8.01Sweden 7.28United States of America 4.37Ireland 3.65Japan 2.92Italy 2.19Finland 1.82Australia 1.46Austria 1.46Netherlands Antilles 1.46Switzerland 1.46Canada 0.73Hong Kong 0.73Total Fixed Income Securities 73.12Cash Equivalents, Cash and Other Assets/(Liabilities) 26.88
Total 100.00
Allocation of Portfolio as at 31 December 2010 (Unaudited) % ofNet Assets
Fixed Income SecuritiesFrance 20.62United Kingdom 15.60Netherlands 13.71Sweden 7.71Japan 6.93Ireland 5.40United States of America 4.63Australia 4.62Denmark 3.09Belgium 2.70Channel Islands 1.16Switzerland 1.16Spain 1.16Canada 0.79Germany 0.77Finland 0.77Total Fixed Income Securities 90.82Cash Equivalents, Cash and Other Assets/(Liabilities) 9.18
Total 100.00
166
JPMorgan Funds - Euro Money Market FundSchedule of Investments (Market Value Expressed in EUR) (continued)
As at 30 June 2011
Quantity/Nominal
Value
Name of Securities Maturity/Coupon
MarketValue
%of
NetAssets
Quantity/Nominal
Value
Name of Securities Maturity/Coupon
MarketValue
%of
NetAssets
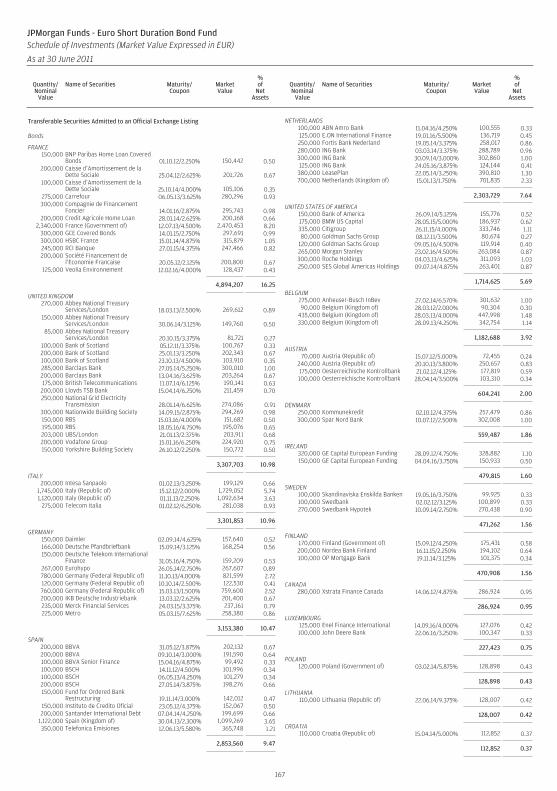
Transferable Securities Admitted to an Official Exchange Listing
Bonds
FRANCE150,000 BNP Paribas Home Loan Covered
Bonds 01.10.12/2.250% 150,442 0.50200,000 Caisse d’Amortissement de la
Dette Sociale 25.04.12/2.625% 201,726 0.67100,000 Caisse d’Amortissement de la
Dette Sociale 25.10.14/4.000% 105,106 0.35275,000 Carrefour 06.05.13/3.625% 280,296 0.93300,000 Compagnie de Financement
Foncier 14.01.16/2.875% 295,743 0.98200,000 Credit Agricole Home Loan 28.01.14/2.625% 200,168 0.66
2,340,000 France (Government of) 12.07.13/4.500% 2,470,453 8.20300,000 GCE Covered Bonds 14.01.15/2.750% 297,691 0.99300,000 HSBC France 15.01.14/4.875% 315,879 1.05245,000 RCI Banque 27.01.15/4.375% 247,466 0.82200,000 Société Financement de
l’Economie Francaise 20.05.12/2.125% 200,800 0.67125,000 Veolia Environnement 12.02.16/4.000% 128,437 0.43
4,894,207 16.25
UNITED KINGDOM270,000 Abbey National Treasury
Services/London 18.03.13/2.500% 269,612 0.89150,000 Abbey National Treasury
Services/London 30.06.14/3.125% 149,760 0.5085,000 Abbey National Treasury
Services/London 20.10.15/3.375% 81,721 0.27100,000 Bank of Scotland 05.12.11/3.375% 100,767 0.33200,000 Bank of Scotland 25.01.13/3.250% 202,343 0.67100,000 Bank of Scotland 23.10.13/4.500% 103,910 0.35285,000 Barclays Bank 27.05.14/5.250% 300,010 1.00200,000 Barclays Bank 13.04.16/3.625% 203,264 0.67175,000 British Telecommunications 11.07.14/6.125% 190,141 0.63
200,000 Lloyds TSB Bank 15.04.14/6.250% 211,459 0.70250,000 National Grid Electricity
Transmission 28.01.14/6.625% 274,086 0.91300,000 Nationwide Building Society 14.09.15/2.875% 294,269 0.98150,000 RBS 15.03.16/4.000% 151,682 0.50195,000 RBS 18.05.16/4.750% 195,076 0.65203,000 UBS/London 21.01.13/2.375% 203,911 0.68200,000 Vodafone Group 15.01.16/6.250% 224,920 0.75150,000 Yorkshire Building Society 26.10.12/2.250% 150,772 0.50
3,307,703 10.98
ITALY200,000 Intesa Sanpaolo 01.02.13/3.250% 199,129 0.66
1,745,000 Italy (Republic of) 15.12.12/2.000% 1,729,052 5.741,120,000 Italy (Republic of) 01.11.13/2.250% 1,092,634 3.63
275,000 Telecom Italia 01.02.12/6.250% 281,038 0.93
3,301,853 10.96
GERMANY150,000 Daimler 02.09.14/4.625% 157,640 0.52166,000 Deutsche Pfandbriefbank 15.09.14/3.125% 168,254 0.56150,000 Deutsche Telekom International
Finance 31.05.16/4.750% 159,209 0.53267,000 Eurohypo 26.05.14/2.750% 267,607 0.89780,000 Germany (Federal Republic of) 11.10.13/4.000% 821,599 2.72120,000 Germany (Federal Republic of) 10.10.14/2.500% 122,530 0.41760,000 Germany (Federal Republic of) 15.03.13/1.500% 759,600 2.52200,000 IKB Deutsche Industriebank 13.03.12/2.625% 201,400 0.67235,000 Merck Financial Services 24.03.15/3.375% 237,161 0.79225,000 Metro 05.03.15/7.625% 258,380 0.86
3,153,380 10.47
SPAIN200,000 BBVA 31.05.12/3.875% 202,132 0.67200,000 BBVA 09.10.14/3.000% 191,590 0.64100,000 BBVA Senior Finance 15.04.16/4.875% 99,492 0.33100,000 BSCH 14.11.12/4.500% 101,996 0.34100,000 BSCH 06.05.13/4.250% 101,279 0.34200,000 BSCH 27.05.14/3.875% 198,276 0.66150,000 Fund for Ordered Bank
Restructuring 19.11.14/3.000% 142,012 0.47150,000 Instituto de Credito Oficial 23.05.12/4.375% 152,067 0.50200,000 Santander International Debt 07.04.14/4.250% 199,699 0.66
1,122,000 Spain (Kingdom of) 30.04.13/2.300% 1,099,269 3.65350,000 Telefonica Emisiones 12.06.13/5.580% 365,748 1.21
2,853,560 9.47
NETHERLANDS100,000 ABN Amro Bank 11.04.16/4.250% 100,555 0.33125,000 E.ON International Finance 19.01.16/5.500% 136,719 0.45250,000 Fortis Bank Nederland 19.05.14/3.375% 258,017 0.86280,000 ING Bank 03.03.14/3.375% 288,789 0.96300,000 ING Bank 30.09.14/3.000% 302,860 1.00125,000 ING Bank 24.05.16/3.875% 124,144 0.41
380,000 LeasePlan 22.05.14/3.250% 390,810 1.30700,000 Netherlands (Kingdom of) 15.01.13/1.750% 701,835 2.33
2,303,729 7.64
UNITED STATES OF AMERICA150,000 Bank of America 26.09.14/5.125% 155,776 0.52175,000 BMW US Capital 28.05.15/5.000% 186,937 0.62335,000 Citigroup 26.11.15/4.000% 333,746 1.1180,000 Goldman Sachs Group 08.12.11/3.500% 80,674 0.27
120,000 Goldman Sachs Group 09.05.16/4.500% 119,914 0.40265,000 Morgan Stanley 23.02.16/4.500% 263,084 0.87300,000 Roche Holdings 04.03.13/4.625% 311,093 1.03250,000 SES Global Americas Holdings 09.07.14/4.875% 263,401 0.87
1,714,625 5.69
BELGIUM275,000 Anheuser-Busch InBev 27.02.14/6.570% 301,632 1.0090,000 Belgium (Kingdom of) 28.03.12/2.000% 90,304 0.30
435,000 Belgium (Kingdom of) 28.03.13/4.000% 447,998 1.48330,000 Belgium (Kingdom of) 28.09.13/4.250% 342,754 1.14
1,182,688 3.92
AUSTRIA70,000 Austria (Republic of) 15.07.12/5.000% 72,455 0.24
240,000 Austria (Republic of) 20.10.13/3.800% 250,657 0.83175,000 Oesterreichische Kontrollbank 21.02.12/4.125% 177,819 0.59100,000 Oesterreichische Kontrollbank 28.04.14/3.500% 103,310 0.34
604,241 2.00
DENMARK250,000 Kommunekredit 02.10.12/4.375% 257,479 0.86300,000 Spar Nord Bank 10.07.12/2.500% 302,008 1.00
559,487 1.86
IRELAND320,000 GE Capital European Funding 28.09.12/4.750% 328,882 1.10150,000 GE Capital European Funding 04.04.16/3.750% 150,933 0.50
479,815 1.60
SWEDEN100,000 Skandinaviska Enskilda Banken 19.05.16/3.750% 99,925 0.33100,000 Swedbank 02.02.12/3.125% 100,899 0.33270,000 Swedbank Hypotek 10.09.14/2.750% 270,438 0.90
471,262 1.56
FINLAND170,000 Finland (Government of) 15.09.12/4.250% 175,431 0.58200,000 Nordea Bank Finland 16.11.15/2.250% 194,102 0.64100,000 OP Mortgage Bank 19.11.14/3.125% 101,375 0.34
470,908 1.56
CANADA280,000 Xstrata Finance Canada 14.06.12/4.875% 286,924 0.95
286,924 0.95
LUXEMBOURG125,000 Enel Finance International 14.09.16/4.000% 127,076 0.42100,000 John Deere Bank 22.06.16/3.250% 100,347 0.33
227,423 0.75
POLAND120,000 Poland (Government of) 03.02.14/5.875% 128,898 0.43
128,898 0.43
LITHUANIA110,000 Lithuania (Republic of) 22.06.14/9.375% 128,007 0.42
128,007 0.42
CROATIA110,000 Croatia (Republic of) 15.04.14/5.000% 112,852 0.37
112,852 0.37
167
JPMorgan Funds - Euro Short Duration Bond FundSchedule of Investments (Market Value Expressed in EUR)
As at 30 June 2011
Quantity/Nominal
Value
Name of Securities Maturity/Coupon
MarketValue
%of
NetAssets
Quantity/Nominal
Value
Name of Securities Maturity/Coupon
MarketValue
%of
NetAssets
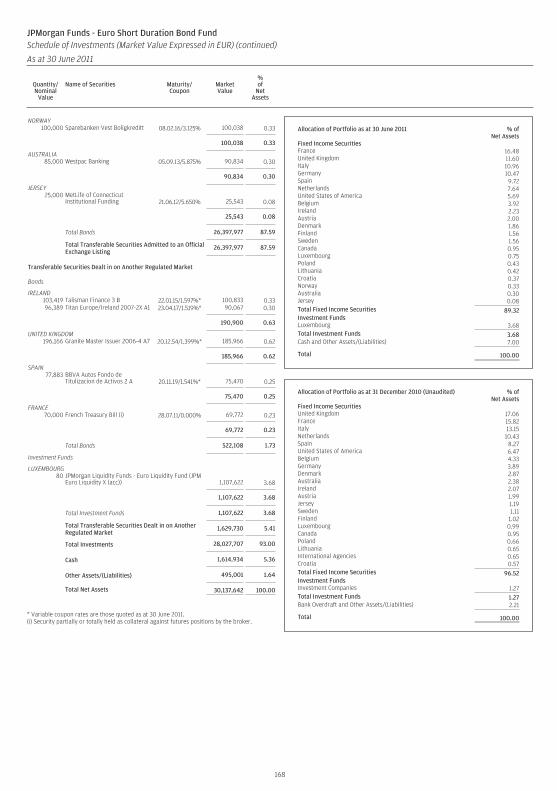
NORWAY100,000 Sparebanken Vest Boligkreditt 08.02.16/3.125% 100,038 0.33
100,038 0.33
AUSTRALIA85,000 Westpac Banking 05.09.13/5.875% 90,834 0.30
90,834 0.30
JERSEY25,000 MetLife of Connecticut
Institutional Funding 21.06.12/5.650% 25,543 0.08
25,543 0.08
Total Bonds 26,397,977 87.59
Total Transferable Securities Admitted to an OfficialExchange Listing
26,397,977 87.59
Transferable Securities Dealt in on Another Regulated Market
Bonds
IRELAND103,419 Talisman Finance 3 B 22.01.15/1.597%* 100,833 0.3396,389 Titan Europe/Ireland 2007-2X A1 23.04.17/1.519%* 90,067 0.30
190,900 0.63
UNITED KINGDOM196,166 Granite Master Issuer 2006-4 A7 20.12.54/1.399%* 185,966 0.62
185,966 0.62
SPAIN77,883 BBVA Autos Fondo de
Titulizacion de Activos 2 A 20.11.19/1.541%* 75,470 0.25
75,470 0.25
FRANCE70,000 French Treasury Bill (i) 28.07.11/0.000% 69,772 0.23
69,772 0.23
Total Bonds 522,108 1.73
Investment Funds
LUXEMBOURG80 JPMorgan Liquidity Funds - Euro Liquidity Fund (JPM
Euro Liquidity X (acc)) 1,107,622 3.68
1,107,622 3.68
Total Investment Funds 1,107,622 3.68
Total Transferable Securities Dealt in on AnotherRegulated Market
1,629,730 5.41
Total Investments 28,027,707 93.00
Cash 1,614,934 5.36
Other Assets/(Liabilities) 495,001 1.64
Total Net Assets 30,137,642 100.00
* Variable coupon rates are those quoted as at 30 June 2011.(i) Security partially or totally held as collateral against futures positions by the broker.
Allocation of Portfolio as at 30 June 2011 % ofNet Assets
Fixed Income SecuritiesFrance 16.48United Kingdom 11.60Italy 10.96Germany 10.47Spain 9.72Netherlands 7.64United States of America 5.69Belgium 3.92Ireland 2.23Austria 2.00Denmark 1.86Finland 1.56Sweden 1.56Canada 0.95Luxembourg 0.75Poland 0.43Lithuania 0.42Croatia 0.37Norway 0.33Australia 0.30Jersey 0.08Total Fixed Income Securities 89.32Investment FundsLuxembourg 3.68Total Investment Funds 3.68Cash and Other Assets/(Liabilities) 7.00
Total 100.00
Allocation of Portfolio as at 31 December 2010 (Unaudited) % ofNet Assets
Fixed Income SecuritiesUnited Kingdom 17.06France 15.82Italy 13.15Netherlands 10.43Spain 8.27United States of America 6.47Belgium 4.33Germany 3.89Denmark 2.87Australia 2.38Ireland 2.07Austria 1.99Jersey 1.19Sweden 1.11Finland 1.02Luxembourg 0.99Canada 0.95Poland 0.66Lithuania 0.65International Agencies 0.65Croatia 0.57Total Fixed Income Securities 96.52Investment FundsInvestment Companies 1.27Total Investment Funds 1.27Bank Overdraft and Other Assets/(Liabilities) 2.21
Total 100.00
168
JPMorgan Funds - Euro Short Duration Bond FundSchedule of Investments (Market Value Expressed in EUR) (continued)
As at 30 June 2011
Quantity/Nominal
Value
Name of Securities Maturity/Coupon
MarketValue
%of
NetAssets
Quantity/Nominal
Value
Name of Securities Maturity/Coupon
MarketValue
%of
NetAssets
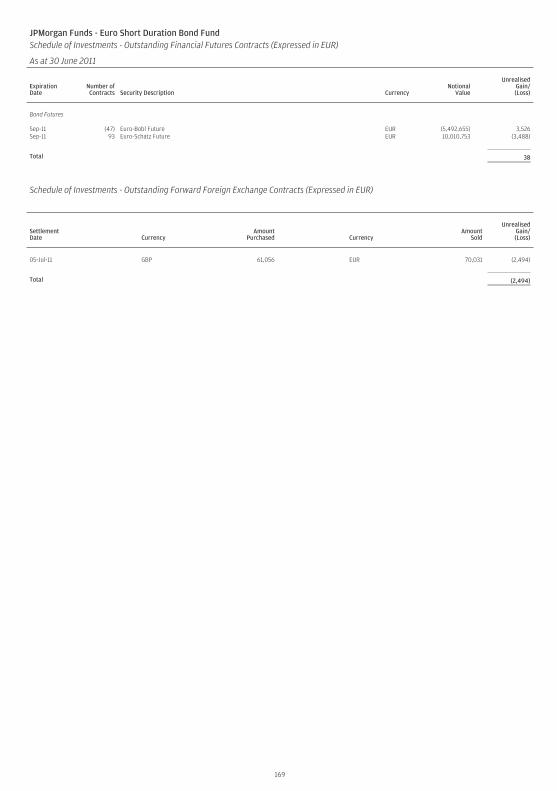
JPMorgan Funds - Euro Short Duration Bond FundSchedule of Investments - Outstanding Financial Futures Contracts (Expressed in EUR)
As at 30 June 2011
ExpirationDate
Number ofContracts Security Description Currency
NotionalValue
UnrealisedGain/(Loss)
Bond Futures
Sep-11 (47) Euro-Bobl Future EUR (5,492,655) 3,526Sep-11 93 Euro-Schatz Future EUR 10,010,753 (3,488)
Total 38
Schedule of Investments - Outstanding Forward Foreign Exchange Contracts (Expressed in EUR)
SettlementDate Currency
AmountPurchased Currency
AmountSold
UnrealisedGain/(Loss)
05-Jul-11 GBP 61,056 EUR 70,031 (2,494)
Total (2,494)
169
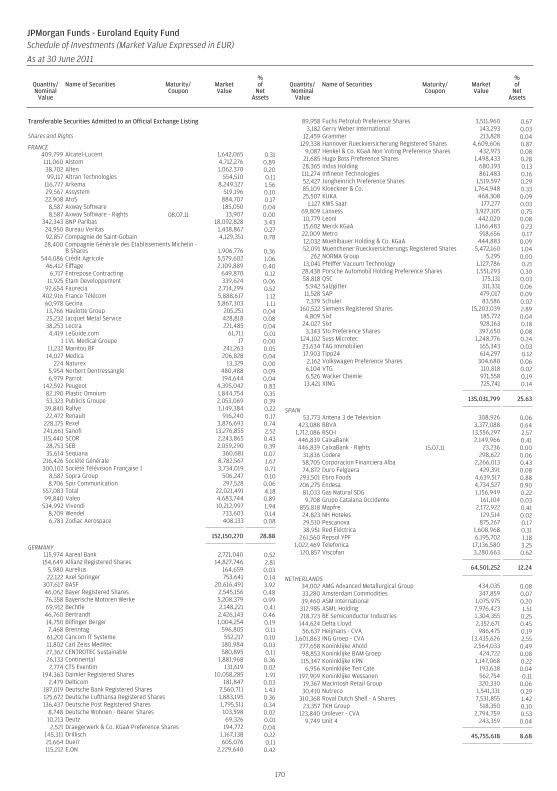
Transferable Securities Admitted to an Official Exchange Listing
Shares and Rights
FRANCE409,799 Alcatel-Lucent 1,642,065 0.31111,060 Alstom 4,712,276 0.8938,702 Alten 1,062,370 0.2099,117 Altran Technologies 554,510 0.11
116,777 Arkema 8,249,127 1.5629,567 Assystem 519,196 0.1022,908 AtoS 884,707 0.17
8,587 Axway Software 185,050 0.048,587 Axway Software - Rights 08.07.11 13,907 0.00
342,343 BNP Paribas 18,092,828 3.4324,950 Bureau Veritas 1,438,867 0.2792,857 Compagnie de Saint-Gobain 4,129,351 0.7828,400 Compagnie Générale des Etablissements Michelin -
B Shares 1,906,776 0.36544,086 Crédit Agricole 5,579,602 1.06
46,412 Eiffage 2,109,889 0.406,717 Entrepose Contracting 649,870 0.12
11,925 Etam Developpement 339,624 0.0692,654 Faurecia 2,714,299 0.52
402,916 France Télécom 5,888,617 1.1260,978 Gecina 5,867,303 1.1113,766 Haulotte Group 205,251 0.0425,232 Jacquet Metal Service 428,818 0.0838,253 Lectra 221,485 0.044,419 LeGuide.com 61,711 0.01
1 LVL Medical Groupe 17 0.0011,232 Manitou BF 241,263 0.0514,027 Medica 206,828 0.04
224 Naturex 13,329 0.005,954 Norbert Dentressangle 480,488 0.096,979 Parrot 194,644 0.04
142,592 Peugeot 4,395,042 0.8382,190 Plastic Omnium 1,844,754 0.3553,323 Publicis Groupe 2,053,069 0.39
39,840 Rallye 1,149,384 0.2222,472 Renault 916,240 0.17
228,175 Rexel 3,876,693 0.74241,661 Sanofi 13,276,855 2.52115,440 SCOR 2,243,865 0.4328,753 SEB 2,059,290 0.3935,614 Sequana 360,681 0.07
216,426 Société Générale 8,782,567 1.67300,102 Société Télévision Française 1 3,734,019 0.71
8,587 Sopra Group 506,247 0.108,706 Spir Communication 297,528 0.06
557,083 Total 22,021,491 4.1899,840 Valeo 4,683,744 0.89
534,992 Vivendi 10,212,997 1.948,709 Wendel 733,603 0.146,783 Zodiac Aerospace 408,133 0.08
152,150,270 28.88
GERMANY115,974 Aareal Bank 2,721,040 0.52154,649 Allianz Registered Shares 14,827,746 2.81
5,980 Aurelius 164,659 0.0322,122 Axel Springer 753,641 0.14
307,617 BASF 20,616,491 3.9246,062 Bayer Registered Shares 2,545,156 0.4876,358 Bayerische Motoren Werke 5,208,379 0.9969,912 Bechtle 2,148,221 0.4146,760 Bertrandt 2,426,143 0.4614,750 Bilfinger Berger 1,004,254 0.197,468 Brenntag 596,805 0.1161,201 Cancom IT Systeme 552,217 0.1011,802 Carl Zeiss Meditec 180,984 0.0327,362 CENTROTEC Sustainable 580,895 0.1126,133 Continental 1,881,968 0.362,774 CTS Eventim 131,619 0.02
194,363 Daimler Registered Shares 10,058,285 1.912,479 Delticom 181,847 0.03
187,019 Deutsche Bank Registered Shares 7,560,711 1.43125,672 Deutsche Lufthansa Registered Shares 1,883,195 0.36136,437 Deutsche Post Registered Shares 1,795,511 0.34
8,748 Deutsche Wohnen - Bearer Shares 103,598 0.0210,213 Deutz 69,326 0.012,521 Draegerwerk & Co. KGaA Preference Shares 194,772 0.04
145,311 Drillisch 1,167,138 0.2221,664 Duerr 605,076 0.11115,212 E.ON 2,229,640 0.42
89,958 Fuchs Petrolub Preference Shares 3,511,960 0.673,182 Gerry Weber International 143,293 0.03
12,459 Grammer 213,828 0.04129,338 Hannover Rueckversicherung Registered Shares 4,609,606 0.87
9,087 Henkel & Co. KGaA Non Voting Preference Shares 432,973 0.0821,685 Hugo Boss Preference Shares 1,498,433 0.2828,365 Indus Holding 680,193 0.13111,274 Infineon Technologies 861,483 0.1652,427 Jungheinrich Preference Shares 1,519,597 0.2985,109 Kloeckner & Co. 1,764,948 0.3325,507 KUKA 468,308 0.09
1,127 KWS Saat 177,277 0.0369,809 Lanxess 3,927,105 0.7510,779 Leoni 442,020 0.0815,602 Merck KGaA 1,166,483 0.2322,009 Metro 918,656 0.1712,032 Muehlbauer Holding & Co. KGaA 444,883 0.0952,091 Muenchener Rueckversicherungs Registered Shares 5,472,160 1.04
262 NORMA Group 5,295 0.0013,041 Pfeiffer Vacuum Technology 1,127,786 0.2128,438 Porsche Automobil Holding Preference Shares 1,551,293 0.3058,818 QSC 175,131 0.035,942 Salzgitter 311,331 0.0611,528 SAP 479,017 0.097,379 Schuler 83,586 0.02
160,522 Siemens Registered Shares 15,203,039 2.894,809 Sixt 185,772 0.04
24,027 Sixt 928,163 0.183,343 Sto Preference Shares 397,650 0.08
124,102 Suss Microtec 1,248,776 0.2423,634 TAG Immobilien 165,343 0.0317,903 Tipp24 614,297 0.12
2,162 Volkswagen Preference Shares 304,680 0.066,104 VTG 110,818 0.026,526 Wacker Chemie 971,558 0.19
13,421 XING 725,741 0.14
135,031,799 25.63
SPAIN53,773 Antena 3 de Television 308,926 0.06
423,088 BBVA 3,377,088 0.641,712,086 BSCH 13,556,297 2.57446,839 CaixaBank 2,149,966 0.41446,839 CaixaBank - Rights 15.07.11 23,236 0.00
31,836 Codere 298,622 0.0658,705 Corporacion Financiera Alba 2,266,013 0.4374,872 Duro Felguera 429,391 0.08
293,501 Ebro Foods 4,639,517 0.88206,275 Endesa 4,734,527 0.90
81,033 Gas Natural SDG 1,156,949 0.229,708 Grupo Catalana Occidente 161,104 0.03
855,818 Mapfre 2,172,922 0.4124,823 NH Hoteles 129,514 0.0229,510 Pescanova 875,267 0.1738,951 Red Eléctrica 1,608,968 0.31
261,560 Repsol YPF 6,195,702 1.181,022,469 Telefonica 17,136,580 3.25
120,857 Viscofan 3,280,663 0.62
64,501,252 12.24
NETHERLANDS34,002 AMG Advanced Metallurgical Group 434,035 0.0833,280 Amsterdam Commodities 347,859 0.0739,460 ASM International 1,075,975 0.20312,985 ASML Holding 7,976,423 1.51218,723 BE Semiconductor Industries 1,304,355 0.25144,624 Delta Lloyd 2,352,671 0.45
56,637 Heijmans - CVA 986,475 0.191,601,863 ING Groep - CVA 13,435,626 2.55
277,658 Koninklijke Ahold 2,564,033 0.4998,853 Koninklijke BAM Groep 424,722 0.08115,347 Koninklijke KPN 1,147,068 0.22
6,956 Koninklijke Ten Cate 193,638 0.04197,909 Koninklijke Wessanen 562,754 0.11
19,367 Macintosh Retail Group 320,330 0.0630,410 Nutreco 1,541,331 0.29
310,368 Royal Dutch Shell - A Shares 7,531,855 1.4223,357 TKH Group 518,350 0.10
123,840 Unilever - CVA 2,794,759 0.539,749 Unit 4 243,359 0.04
45,755,618 8.68
170
JPMorgan Funds - Euroland Equity FundSchedule of Investments (Market Value Expressed in EUR)
As at 30 June 2011
Quantity/Nominal
Value
Name of Securities Maturity/Coupon
MarketValue
%of
NetAssets
Quantity/Nominal
Value
Name of Securities Maturity/Coupon
MarketValue
%of
NetAssets
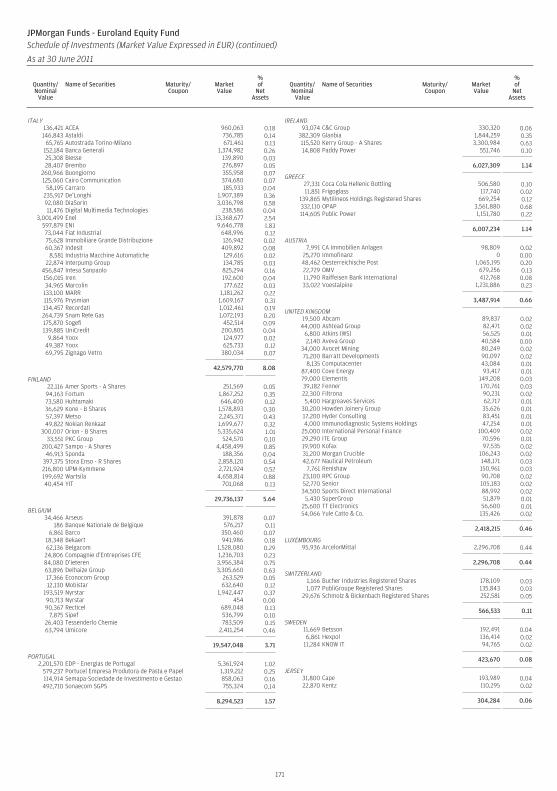
ITALY136,421 ACEA 960,063 0.18146,843 Astaldi 736,785 0.14
65,765 Autostrada Torino-Milano 671,461 0.13152,184 Banca Generali 1,374,982 0.2625,308 Biesse 139,890 0.0328,407 Brembo 276,897 0.05
260,966 Buongiorno 355,958 0.07125,060 Cairo Communication 374,680 0.07
58,195 Carraro 185,933 0.04235,917 De’Longhi 1,907,389 0.3692,080 DiaSorin 3,036,798 0.5811,476 Digital Multimedia Technologies 238,586 0.04
3,001,499 Enel 13,368,677 2.54597,879 ENI 9,646,778 1.8373,044 Fiat Industrial 648,996 0.1275,628 Immobiliare Grande Distribuzione 126,942 0.0260,367 Indesit 409,892 0.08
8,581 Industria Macchine Automatiche 129,616 0.0222,874 Interpump Group 134,785 0.03
456,847 Intesa Sanpaolo 825,294 0.16156,015 Iren 192,600 0.0434,965 Marcolin 177,622 0.03
133,100 MARR 1,181,262 0.22115,976 Prysmian 1,609,167 0.31134,457 Recordati 1,012,461 0.19264,739 Snam Rete Gas 1,072,193 0.20175,870 Sogefi 452,514 0.09139,885 UniCredit 200,805 0.04
9,864 Yoox 124,977 0.0249,387 Yoox 625,733 0.1269,795 Zignago Vetro 380,034 0.07
42,579,770 8.08
FINLAND22,116 Amer Sports - A Shares 251,569 0.05
94,163 Fortum 1,867,252 0.3573,580 Huhtamaki 646,400 0.1236,629 Kone - B Shares 1,578,893 0.3057,397 Metso 2,245,371 0.4349,822 Nokian Renkaat 1,699,677 0.32
300,007 Orion - B Shares 5,335,624 1.0133,551 PKC Group 524,570 0.10
200,427 Sampo - A Shares 4,458,499 0.8546,913 Sponda 188,356 0.04
397,375 Stora Enso - R Shares 2,858,120 0.54216,800 UPM-Kymmene 2,721,924 0.52199,692 Wartsila 4,658,814 0.8840,454 YIT 701,068 0.13
29,736,137 5.64
BELGIUM34,466 Arseus 391,878 0.07
186 Banque Nationale de Belgique 576,217 0.116,861 Barco 350,460 0.07
18,348 Bekaert 941,986 0.1862,136 Belgacom 1,528,080 0.2924,806 Compagnie d’Entreprises CFE 1,236,703 0.2384,080 D’ieteren 3,956,384 0.7563,896 Delhaize Group 3,305,660 0.6317,366 Econocom Group 263,529 0.0512,130 Mobistar 632,640 0.12
193,519 Nyrstar 1,942,447 0.3790,713 Nyrstar 454 0.0090,367 Recticel 689,048 0.13
7,875 Sipef 536,799 0.1026,403 Tessenderlo Chemie 783,509 0.1563,794 Umicore 2,411,254 0.46
19,547,048 3.71
PORTUGAL2,201,570 EDP - Energias de Portugal 5,361,924 1.02
579,237 Portucel Empresa Produtora de Pasta e Papel 1,319,212 0.25114,914 Semapa-Sociedade de Investimento e Gestao 858,063 0.16492,710 Sonaecom SGPS 755,324 0.14
8,294,523 1.57
IRELAND93,074 C&C Group 330,320 0.06
382,309 Glanbia 1,844,259 0.35115,520 Kerry Group - A Shares 3,300,984 0.6314,808 Paddy Power 551,746 0.10
6,027,309 1.14
GREECE27,331 Coca Cola Hellenic Bottling 506,580 0.1011,851 Frigoglass 117,740 0.02
139,865 Mytilineos Holdings Registered Shares 669,254 0.12332,110 OPAP 3,561,880 0.68114,605 Public Power 1,151,780 0.22
6,007,234 1.14
AUSTRIA7,991 CA Immobilien Anlagen 98,809 0.02
25,270 Immofinanz 0 0.0048,462 Oesterreichische Post 1,065,195 0.2022,729 OMV 679,256 0.1311,790 Raiffeisen Bank International 412,768 0.0833,022 Voestalpine 1,231,886 0.23
3,487,914 0.66
UNITED KINGDOM19,500 Abcam 89,837 0.02
44,000 Ashtead Group 82,471 0.026,800 Atkins (WS) 56,525 0.012,140 Aveva Group 40,584 0.00
34,000 Avocet Mining 80,249 0.0271,200 Barratt Developments 90,097 0.02
8,135 Computacenter 43,084 0.0187,400 Cove Energy 93,417 0.0179,000 Elementis 149,208 0.0339,182 Fenner 170,761 0.0322,300 Filtrona 90,231 0.025,400 Hargreaves Services 62,717 0.01
30,200 Howden Joinery Group 35,626 0.0117,200 Hyder Consulting 83,451 0.014,000 Immunodiagnostic Systems Holdings 47,254 0.01
25,000 International Personal Finance 100,409 0.0229,290 ITE Group 70,596 0.0119,900 Kofax 97,535 0.0231,200 Morgan Crucible 106,243 0.0242,677 Nautical Petroleum 148,171 0.03
7,761 Renishaw 150,961 0.0323,100 RPC Group 90,708 0.0252,770 Senior 105,183 0.0234,500 Sports Direct International 88,992 0.02
5,430 SuperGroup 51,879 0.0125,600 TT Electronics 56,600 0.0154,066 Yule Catto & Co. 135,426 0.02
2,418,215 0.46
LUXEMBOURG95,936 ArcelorMittal 2,296,708 0.44
2,296,708 0.44
SWITZERLAND1,166 Bucher Industries Registered Shares 178,109 0.031,077 PubliGroupe Registered Shares 135,843 0.03
29,676 Schmolz & Bickenbach Registered Shares 252,581 0.05
566,533 0.11
SWEDEN11,669 Betsson 192,491 0.046,861 Hexpol 136,414 0.02
11,284 KNOW IT 94,765 0.02
423,670 0.08
JERSEY31,800 Cape 193,989 0.0422,870 Kentz 110,295 0.02
304,284 0.06
171
JPMorgan Funds - Euroland Equity FundSchedule of Investments (Market Value Expressed in EUR) (continued)
As at 30 June 2011
Quantity/Nominal
Value
Name of Securities Maturity/Coupon
MarketValue
%of
NetAssets
Quantity/Nominal
Value
Name of Securities Maturity/Coupon
MarketValue
%of
NetAssets
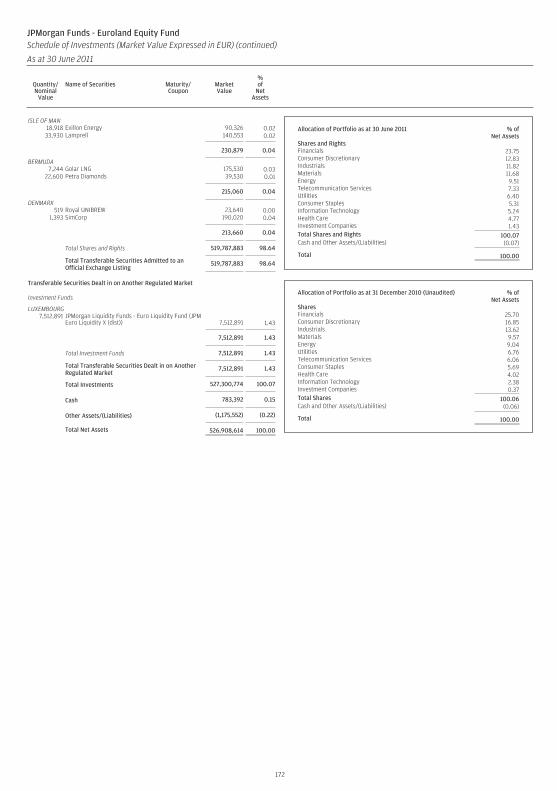
ISLE OF MAN18,918 Exillon Energy 90,326 0.0233,930 Lamprell 140,553 0.02
230,879 0.04
BERMUDA7,244 Golar LNG 175,530 0.03
22,600 Petra Diamonds 39,530 0.01
215,060 0.04
DENMARK519 Royal UNIBREW 23,640 0.00
1,393 SimCorp 190,020 0.04
213,660 0.04
Total Shares and Rights 519,787,883 98.64
Total Transferable Securities Admitted to anOfficial Exchange Listing
519,787,883 98.64
Transferable Securities Dealt in on Another Regulated Market
Investment Funds
LUXEMBOURG7,512,891 JPMorgan Liquidity Funds - Euro Liquidity Fund (JPM
Euro Liquidity X (dist)) 7,512,891 1.43
7,512,891 1.43
Total Investment Funds 7,512,891 1.43
Total Transferable Securities Dealt in on AnotherRegulated Market
7,512,891 1.43
Total Investments 527,300,774 100.07
Cash 783,392 0.15
Other Assets/(Liabilities) (1,175,552) (0.22)
Total Net Assets 526,908,614 100.00
Allocation of Portfolio as at 30 June 2011 % ofNet Assets
Shares and RightsFinancials 23.75Consumer Discretionary 12.83Industrials 11.82Materials 11.68Energy 9.51Telecommunication Services 7.33Utilities 6.40Consumer Staples 5.31Information Technology 5.24Health Care 4.77Investment Companies 1.43Total Shares and Rights 100.07Cash and Other Assets/(Liabilities) (0.07)
Total 100.00
Allocation of Portfolio as at 31 December 2010 (Unaudited) % ofNet Assets
SharesFinancials 25.70Consumer Discretionary 16.85Industrials 13.62Materials 9.57Energy 9.04Utilities 6.76Telecommunication Services 6.06Consumer Staples 5.69Health Care 4.02Information Technology 2.38Investment Companies 0.37Total Shares 100.06Cash and Other Assets/(Liabilities) (0.06)
Total 100.00
172
JPMorgan Funds - Euroland Equity FundSchedule of Investments (Market Value Expressed in EUR) (continued)
As at 30 June 2011
Quantity/Nominal
Value
Name of Securities Maturity/Coupon
MarketValue
%of
NetAssets
Quantity/Nominal
Value
Name of Securities Maturity/Coupon
MarketValue
%of
NetAssets
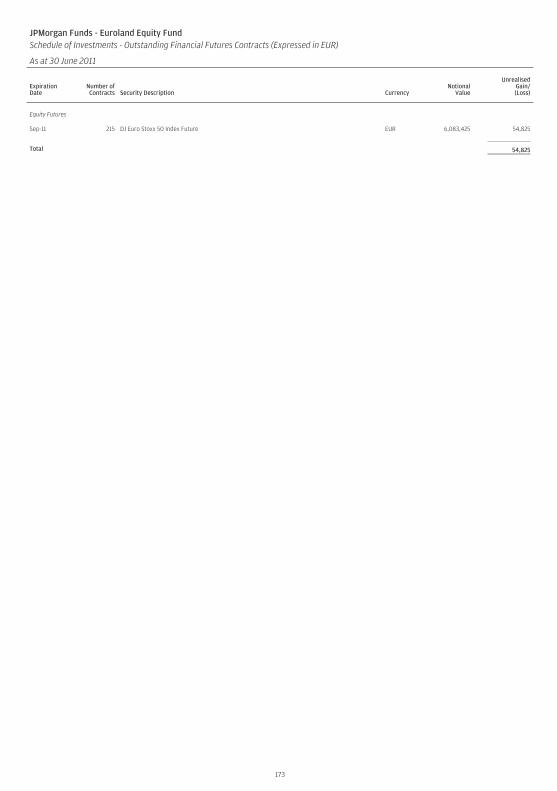
JPMorgan Funds - Euroland Equity FundSchedule of Investments - Outstanding Financial Futures Contracts (Expressed in EUR)
As at 30 June 2011
ExpirationDate
Number ofContracts Security Description Currency
NotionalValue
UnrealisedGain/(Loss)
Equity Futures
Sep-11 215 DJ Euro Stoxx 50 Index Future EUR 6,083,425 54,825
Total 54,825
173
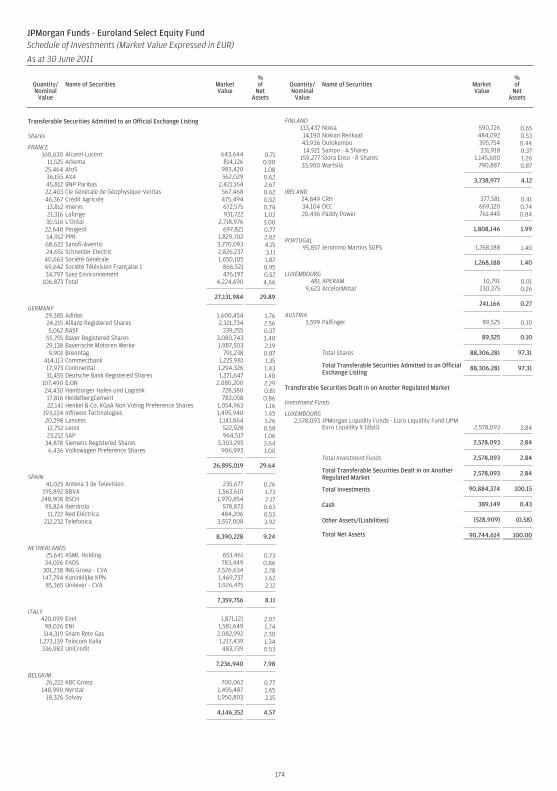
Transferable Securities Admitted to an Official Exchange Listing
Shares
FRANCE160,630 Alcatel-Lucent 643,644 0.71
11,525 Arkema 814,126 0.9025,464 AtoS 983,420 1.0836,155 AXA 562,029 0.6245,812 BNP Paribas 2,421,164 2.6722,403 Cie Générale de Géophysique-Veritas 567,468 0.6246,367 Crédit Agricole 475,494 0.5213,812 Imerys 672,575 0.7421,316 Lafarge 931,722 1.0330,516 L’Oréal 2,718,976 3.0022,640 Peugeot 697,821 0.7714,912 PPR 1,829,702 2.0268,622 Sanofi-Aventis 3,770,093 4.1524,651 Schneider Electric 2,826,237 3.11
40,663 Société Générale 1,650,105 1.8269,642 Société Télévision Française 1 866,521 0.9534,797 Suez Environnement 476,197 0.52
106,873 Total 4,224,690 4.66
27,131,984 29.89
GERMANY29,385 Adidas 1,600,454 1.7624,215 Allianz Registered Shares 2,321,734 2.565,062 BASF 339,255 0.37
55,755 Bayer Registered Shares 3,080,743 3.4029,138 Bayerische Motoren Werke 1,987,503 2.199,901 Brenntag 791,238 0.87
414,113 Commerzbank 1,225,981 1.3517,973 Continental 1,294,326 1.4331,455 Deutsche Bank Registered Shares 1,271,647 1.40
107,490 E.ON 2,080,200 2.2924,430 Hamburger Hafen und Logistik 728,380 0.8117,816 HeidelbergCement 783,058 0.8622,141 Henkel & Co. KGaA Non Voting Preference Shares 1,054,963 1.16
193,224 Infineon Technologies 1,495,940 1.6520,298 Lanxess 1,141,864 1.2612,752 Leoni 522,928 0.5823,212 SAP 964,517 1.06
34,878 Siemens Registered Shares 3,303,295 3.646,436 Volkswagen Preference Shares 906,993 1.00
26,895,019 29.64
SPAIN41,023 Antena 3 de Television 235,677 0.26
195,892 BBVA 1,563,610 1.73248,908 BSCH 1,970,854 2.17
95,824 Iberdrola 578,873 0.6311,722 Red Eléctrica 484,206 0.53
212,232 Telefonica 3,557,008 3.92
8,390,228 9.24
NETHERLANDS25,641 ASML Holding 653,461 0.7334,026 EADS 783,449 0.86
301,238 ING Groep - CVA 2,526,634 2.78147,794 Koninklijke KPN 1,469,737 1.6285,365 Unilever - CVA 1,926,475 2.12
7,359,756 8.11
ITALY420,099 Enel 1,871,121 2.07
98,026 ENI 1,581,649 1.74514,319 Snam Rete Gas 2,082,992 2.30
1,273,139 Telecom Italia 1,217,439 1.34336,983 UniCredit 483,739 0.53
7,236,940 7.98
BELGIUM26,222 KBC Groep 700,062 0.77
148,990 Nyrstar 1,495,487 1.6518,326 Solvay 1,950,803 2.15
4,146,352 4.57
FINLAND133,437 Nokia 590,726 0.6514,190 Nokian Renkaat 484,092 0.5343,936 Outokumpu 395,754 0.4414,921 Sampo - A Shares 331,918 0.37
159,277 Stora Enso - R Shares 1,145,600 1.2633,900 Wartsila 790,887 0.87
3,738,977 4.12
IRELAND24,849 CRH 377,581 0.4134,104 DCC 669,120 0.7420,436 Paddy Power 761,445 0.84
1,808,146 1.99
PORTUGAL95,857 Jeronimo Martins SGPS 1,268,188 1.40
1,268,188 1.40
LUXEMBOURG481 APERAM 10,791 0.01
9,623 ArcelorMittal 230,375 0.26
241,166 0.27
AUSTRIA3,599 Palfinger 89,525 0.10
89,525 0.10
Total Shares 88,306,281 97.31
Total Transferable Securities Admitted to an OfficialExchange Listing
88,306,281 97.31
Transferable Securities Dealt in on Another Regulated Market
Investment Funds
LUXEMBOURG2,578,093 JPMorgan Liquidity Funds - Euro Liquidity Fund (JPM
Euro Liquidity X (dist)) 2,578,093 2.84
2,578,093 2.84
Total Investment Funds 2,578,093 2.84
Total Transferable Securities Dealt in on AnotherRegulated Market
2,578,093 2.84
Total Investments 90,884,374 100.15
Cash 389,149 0.43
Other Assets/(Liabilities) (528,909) (0.58)
Total Net Assets 90,744,614 100.00
174
JPMorgan Funds - Euroland Select Equity FundSchedule of Investments (Market Value Expressed in EUR)
As at 30 June 2011
Quantity/Nominal
Value
Name of Securities MarketValue
%of
NetAssets
Quantity/Nominal
Value
Name of Securities MarketValue
%of
NetAssets
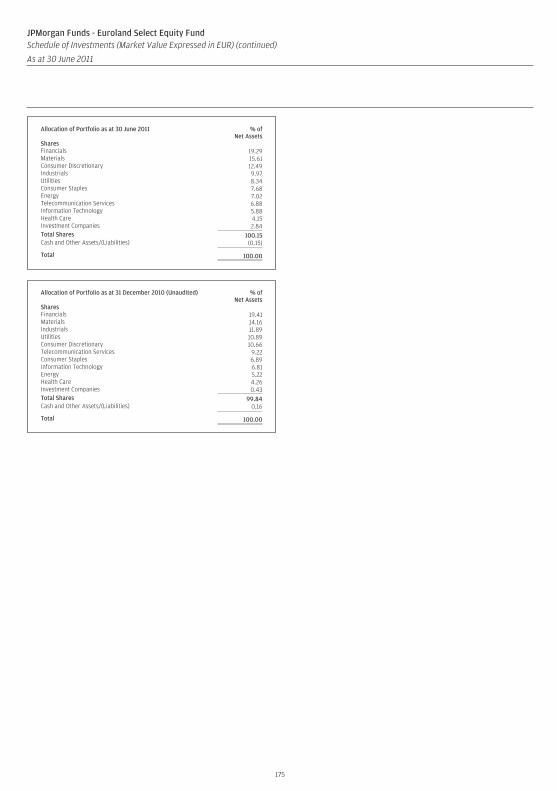
Allocation of Portfolio as at 30 June 2011 % ofNet Assets
SharesFinancials 19.29Materials 15.61Consumer Discretionary 12.49Industrials 9.97Utilities 8.34Consumer Staples 7.68Energy 7.02Telecommunication Services 6.88Information Technology 5.88Health Care 4.15Investment Companies 2.84Total Shares 100.15Cash and Other Assets/(Liabilities) (0.15)
Total 100.00
Allocation of Portfolio as at 31 December 2010 (Unaudited) % ofNet Assets
SharesFinancials 19.41Materials 14.16Industrials 11.89Utilities 10.89Consumer Discretionary 10.66Telecommunication Services 9.22Consumer Staples 6.89Information Technology 6.81Energy 5.22Health Care 4.26Investment Companies 0.43Total Shares 99.84Cash and Other Assets/(Liabilities) 0.16
Total 100.00
175
JPMorgan Funds - Euroland Select Equity FundSchedule of Investments (Market Value Expressed in EUR) (continued)
As at 30 June 2011
Quantity/Nominal
Value
Name of Securities MarketValue
%of
NetAssets
Quantity/Nominal
Value
Name of Securities MarketValue
%of
NetAssets
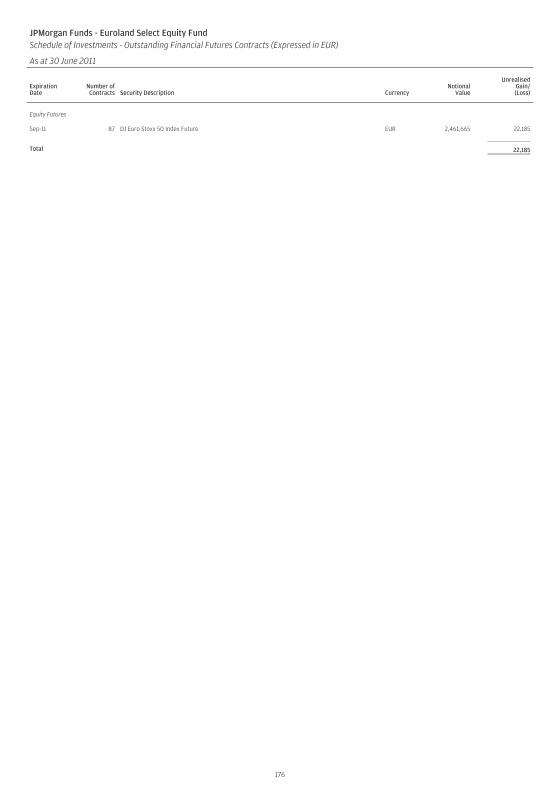
JPMorgan Funds - Euroland Select Equity FundSchedule of Investments - Outstanding Financial Futures Contracts (Expressed in EUR)
As at 30 June 2011
ExpirationDate
Number ofContracts Security Description Currency
NotionalValue
UnrealisedGain/(Loss)
Equity Futures
Sep-11 87 DJ Euro Stoxx 50 Index Future EUR 2,461,665 22,185
Total 22,185
176
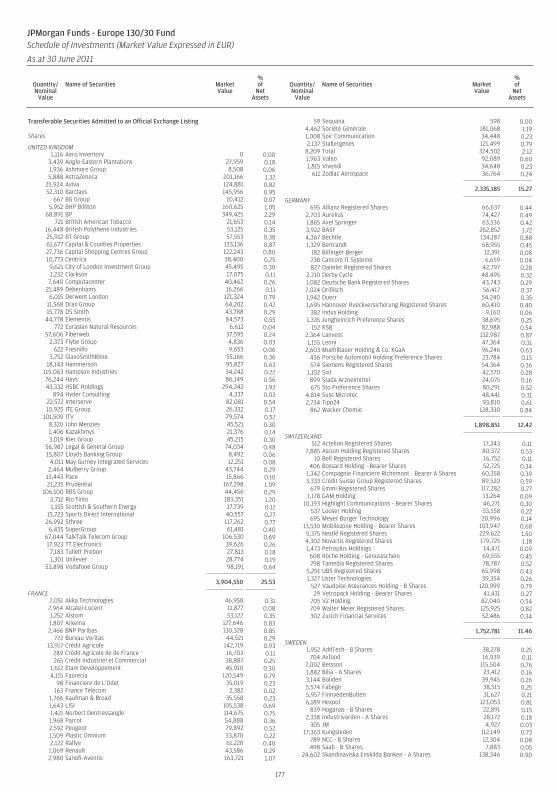
Transferable Securities Admitted to an Official Exchange Listing
Shares
UNITED KINGDOM1,116 Aero Inventory 0 0.00
3,439 Anglo-Eastern Plantations 27,959 0.181,936 Ashmore Group 8,508 0.065,888 AstraZeneca 201,166 1.32
25,924 Aviva 124,881 0.8252,310 Barclays 145,956 0.95
667 BG Group 10,412 0.075,952 BHP Billiton 160,625 1.05
68,891 BP 349,425 2.29721 British American Tobacco 21,653 0.14
16,448 British Polythene Industries 53,125 0.3525,912 BT Group 57,553 0.3861,677 Capital & Counties Properties 133,136 0.8727,736 Capital Shopping Centres Group 122,243 0.8010,773 Centrica 38,400 0.259,621 City of London Investment Group 45,495 0.301,232 Clarkson 17,075 0.11
7,640 Computacenter 40,462 0.2621,489 Debenhams 16,266 0.11
6,015 Derwent London 121,324 0.7911,568 Drax Group 64,202 0.4215,778 DS Smith 43,788 0.29
44,778 Elementis 84,573 0.55772 Eurasian Natural Resources 6,612 0.04
57,606 Fiberweb 37,595 0.242,373 Flybe Group 4,836 0.03
622 Fresnillo 9,653 0.063,752 GlaxoSmithKline 55,166 0.36
18,143 Hammerson 95,827 0.63119,063 Hampson Industries 34,242 0.2276,244 Hays 86,149 0.5643,332 HSBC Holdings 294,342 1.92
894 Hyder Consulting 4,337 0.0322,572 Interserve 82,081 0.5410,925 ITE Group 26,332 0.17
101,509 ITV 79,574 0.528,320 John Menzies 45,521 0.301,406 Kazakhmys 21,376 0.143,019 Kier Group 45,215 0.30
56,987 Legal & General Group 74,034 0.4815,807 Lloyds Banking Group 8,492 0.06
4,011 May Gurney Integrated Services 12,251 0.082,464 Mulberry Group 43,744 0.29
13,443 Pace 15,866 0.1021,235 Prudential 167,298 1.09
106,100 RBS Group 44,456 0.293,712 Rio Tinto 183,351 1.201,155 Scottish & Southern Energy 17,739 0.12
15,723 Sports Direct International 40,557 0.2726,992 Sthree 117,262 0.77
6,435 SuperGroup 61,481 0.4067,044 TalkTalk Telecom Group 106,530 0.6917,923 TT Electronics 39,626 0.267,183 Tullett Prebon 27,813 0.181,301 Unilever 28,774 0.19
53,898 Vodafone Group 98,191 0.64
3,904,550 25.53
FRANCE2,051 Akka Technologies 46,958 0.312,964 Alcatel-Lucent 11,877 0.081,252 Alstom 53,122 0.351,807 Arkema 127,646 0.832,466 BNP Paribas 130,328 0.85
772 Bureau Veritas 44,521 0.2913,917 Crédit Agricole 142,719 0.93
289 Crédit Agricole Ile de France 16,703 0.11265 Crédit Industriel et Commercial 38,887 0.25
1,612 Etam Developpement 45,910 0.304,115 Faurecia 120,549 0.79
98 Financiere de L’Odet 35,019 0.23163 France Télécom 2,382 0.02
1,766 Kaufman & Broad 35,558 0.231,643 LISI 105,538 0.691,421 Norbert Dentressangle 114,675 0.751,968 Parrot 54,888 0.362,592 Peugeot 79,892 0.521,509 Plastic Omnium 33,870 0.222,122 Rallye 61,220 0.401,069 Renault 43,586 0.292,980 Sanofi-Aventis 163,721 1.07
59 Sequana 598 0.004,462 Société Générale 181,068 1.191,008 Spir Communication 34,448 0.232,137 Stallergenes 121,499 0.79
8,209 Total 324,502 2.121,963 Valeo 92,089 0.601,815 Vivendi 34,648 0.23
611 Zodiac Aerospace 36,764 0.24
2,335,185 15.27
GERMANY695 Allianz Registered Shares 66,637 0.44
2,703 Aurelius 74,427 0.491,865 Axel Springer 63,536 0.423,922 BASF 262,852 1.724,367 Bechtle 134,187 0.881,329 Bertrandt 68,955 0.45
182 Bilfinger Berger 12,391 0.08738 Cancom IT Systeme 6,659 0.04827 Daimler Registered Shares 42,797 0.28
2,710 Derby Cycle 48,495 0.321,082 Deutsche Bank Registered Shares 43,743 0.297,024 Drillisch 56,417 0.371,942 Duerr 54,240 0.351,695 Hannover Rueckversicherung Registered Shares 60,410 0.40
382 Indus Holding 9,160 0.061,335 Jungheinrich Preference Shares 38,695 0.25
152 KSB 82,988 0.542,364 Lanxess 132,987 0.871,155 Leoni 47,364 0.31
2,603 Muehlbauer Holding & Co. KGaA 96,246 0.63436 Porsche Automobil Holding Preference Shares 23,784 0.15574 Siemens Registered Shares 54,364 0.36
1,102 Sixt 42,570 0.28899 Stada Arzneimittel 24,075 0.16675 Sto Preference Shares 80,291 0.52
4,814 Suss Microtec 48,441 0.312,734 Tipp24 93,810 0.61
862 Wacker Chemie 128,330 0.84
1,898,851 12.42
SWITZERLAND512 Actelion Registered Shares 17,343 0.11
7,885 Ascom Holding Registered Shares 80,372 0.5310 Bell Registered Shares 16,752 0.11
406 Bossard Holding - Bearer Shares 52,725 0.341,342 Compagnie Financiere Richemont - Bearer A Shares 60,358 0.393,333 Crédit Suisse Group Registered Shares 89,520 0.59
679 Emmi Registered Shares 117,282 0.771,178 GAM Holding 13,264 0.09
10,193 Highlight Communications - Bearer Shares 46,271 0.30537 Looser Holding 33,558 0.22695 Meyer Burger Technology 20,996 0.14
13,530 Mobilezone Holding - Bearer Shares 103,947 0.685,375 Nestlé Registered Shares 229,622 1.504,302 Novartis Registered Shares 179,725 1.181,473 Petroplus Holdings 14,471 0.09
608 Roche Holding - Genussschein 69,555 0.45798 Tamedia Registered Shares 78,787 0.52
5,291 UBS Registered Shares 65,998 0.431,327 Uster Technologies 39,354 0.26
527 Vaudoise Assurances Holding - B Shares 120,999 0.7929 Vetropack Holding - Bearer Shares 41,431 0.27
705 VZ Holding 82,040 0.54709 Walter Meier Registered Shares 125,925 0.82302 Zurich Financial Services 52,486 0.34
1,752,781 11.46
SWEDEN1,952 AddTech - B Shares 38,278 0.25
704 Axfood 16,939 0.117,002 Betsson 115,504 0.761,882 Bilia - A Shares 23,412 0.163,144 Boliden 39,945 0.265,574 Fabege 38,515 0.255,957 FinnvedenBulten 31,627 0.216,189 Hexpol 123,053 0.81
839 Hoganas - B Shares 22,891 0.152,338 Industrivarden - A Shares 28,172 0.18
305 JM 4,927 0.0317,363 Kungsleden 112,149 0.73
789 NCC - B Shares 12,304 0.08498 Saab - B Shares 7,883 0.05
24,602 Skandinaviska Enskilda Banken - A Shares 138,346 0.90
177
JPMorgan Funds - Europe 130/30 FundSchedule of Investments (Market Value Expressed in EUR)
As at 30 June 2011
Quantity/Nominal
Value
Name of Securities MarketValue
%of
NetAssets
Quantity/Nominal
Value
Name of Securities MarketValue
%of
NetAssets
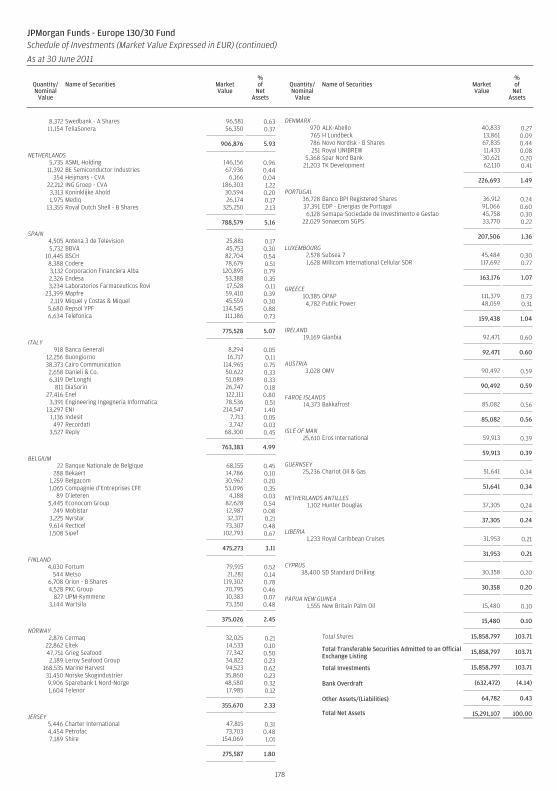
8,372 Swedbank - A Shares 96,581 0.6311,154 TeliaSonera 56,350 0.37
906,876 5.93
NETHERLANDS5,735 ASML Holding 146,156 0.96
11,392 BE Semiconductor Industries 67,936 0.44354 Heijmans - CVA 6,166 0.04
22,212 ING Groep - CVA 186,303 1.223,313 Koninklijke Ahold 30,594 0.201,975 Mediq 26,174 0.17
13,355 Royal Dutch Shell - B Shares 325,250 2.13
788,579 5.16
SPAIN4,505 Antena 3 de Television 25,881 0.175,732 BBVA 45,753 0.30
10,445 BSCH 82,704 0.548,388 Codere 78,679 0.513,132 Corporacion Financiera Alba 120,895 0.792,326 Endesa 53,388 0.353,234 Laboratorios Farmaceuticos Rovi 17,528 0.11
23,399 Mapfre 59,410 0.392,119 Miquel y Costas & Miquel 45,559 0.30
5,680 Repsol YPF 134,545 0.886,634 Telefonica 111,186 0.73
775,528 5.07
ITALY918 Banca Generali 8,294 0.05
12,256 Buongiorno 16,717 0.1138,373 Cairo Communication 114,965 0.752,658 Danieli & Co. 50,622 0.336,319 De’Longhi 51,089 0.33
811 DiaSorin 26,747 0.1827,416 Enel 122,111 0.80
3,391 Engineering Ingegneria Informatica 78,536 0.5113,297 ENI 214,547 1.40
1,136 Indesit 7,713 0.05497 Recordati 3,742 0.03
3,527 Reply 68,300 0.45
763,383 4.99
BELGIUM22 Banque Nationale de Belgique 68,155 0.45
288 Bekaert 14,786 0.101,259 Belgacom 30,962 0.201,065 Compagnie d’Entreprises CFE 53,096 0.35
89 D’ieteren 4,188 0.035,445 Econocom Group 82,628 0.54
249 Mobistar 12,987 0.083,225 Nyrstar 32,371 0.219,614 Recticel 73,307 0.481,508 Sipef 102,793 0.67
475,273 3.11
FINLAND4,030 Fortum 79,915 0.52
544 Metso 21,281 0.146,708 Orion - B Shares 119,302 0.784,528 PKC Group 70,795 0.46
827 UPM-Kymmene 10,383 0.073,144 Wartsila 73,350 0.48
375,026 2.45
NORWAY2,876 Cermaq 32,025 0.21
22,862 Eltek 14,533 0.1047,751 Grieg Seafood 77,342 0.502,189 Leroy Seafood Group 34,822 0.23
168,535 Marine Harvest 94,523 0.6231,450 Norske Skogindustrier 35,860 0.239,906 Sparebank 1 Nord-Norge 48,580 0.321,604 Telenor 17,985 0.12
355,670 2.33
JERSEY5,446 Charter International 47,815 0.314,454 Petrofac 73,703 0.487,189 Shire 154,069 1.01
275,587 1.80
DENMARK970 ALK-Abello 40,833 0.27765 H Lundbeck 13,861 0.09786 Novo Nordisk - B Shares 67,835 0.44251 Royal UNIBREW 11,433 0.08
5,368 Spar Nord Bank 30,621 0.2021,203 TK Development 62,110 0.41
226,693 1.49
PORTUGAL36,728 Banco BPI Registered Shares 36,912 0.2437,391 EDP - Energias de Portugal 91,066 0.606,128 Semapa-Sociedade de Investimento e Gestao 45,758 0.30
22,029 Sonaecom SGPS 33,770 0.22
207,506 1.36
LUXEMBOURG2,578 Subsea 7 45,484 0.301,628 Millicom International Cellular SDR 117,692 0.77
163,176 1.07
GREECE10,385 OPAP 111,379 0.734,782 Public Power 48,059 0.31
159,438 1.04
IRELAND19,169 Glanbia 92,471 0.60
92,471 0.60
AUSTRIA3,028 OMV 90,492 0.59
90,492 0.59
FAROE ISLANDS14,373 Bakkafrost 85,082 0.56
85,082 0.56
ISLE OF MAN25,610 Eros International 59,913 0.39
59,913 0.39
GUERNSEY25,236 Chariot Oil & Gas 51,641 0.34
51,641 0.34
NETHERLANDS ANTILLES1,102 Hunter Douglas 37,305 0.24
37,305 0.24
LIBERIA1,233 Royal Caribbean Cruises 31,953 0.21
31,953 0.21
CYPRUS38,400 SD Standard Drilling 30,358 0.20
30,358 0.20
PAPUA NEW GUINEA1,555 New Britain Palm Oil 15,480 0.10
15,480 0.10
Total Shares 15,858,797 103.71
Total Transferable Securities Admitted to an OfficialExchange Listing
15,858,797 103.71
Total Investments 15,858,797 103.71
Bank Overdraft (632,472) (4.14)
Other Assets/(Liabilities) 64,782 0.43
Total Net Assets 15,291,107 100.00
178
JPMorgan Funds - Europe 130/30 FundSchedule of Investments (Market Value Expressed in EUR) (continued)
As at 30 June 2011
Quantity/Nominal
Value
Name of Securities MarketValue
%of
NetAssets
Quantity/Nominal
Value
Name of Securities MarketValue
%of
NetAssets
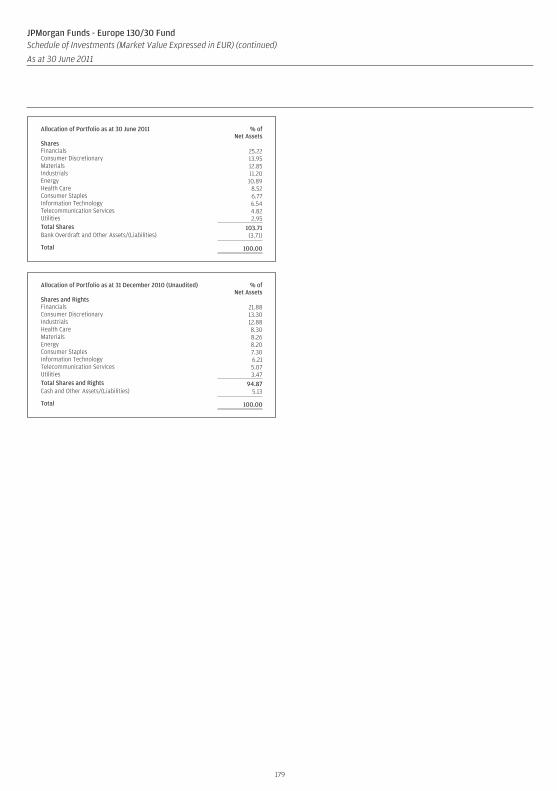
Allocation of Portfolio as at 30 June 2011 % ofNet Assets
SharesFinancials 25.22Consumer Discretionary 13.95Materials 12.85Industrials 11.20Energy 10.89Health Care 8.52Consumer Staples 6.77Information Technology 6.54Telecommunication Services 4.82Utilities 2.95Total Shares 103.71Bank Overdraft and Other Assets/(Liabilities) (3.71)
Total 100.00
Allocation of Portfolio as at 31 December 2010 (Unaudited) % ofNet Assets
Shares and RightsFinancials 21.88Consumer Discretionary 13.30Industrials 12.88Health Care 8.30Materials 8.26Energy 8.20Consumer Staples 7.30Information Technology 6.21Telecommunication Services 5.07Utilities 3.47Total Shares and Rights 94.87Cash and Other Assets/(Liabilities) 5.13
Total 100.00
179
JPMorgan Funds - Europe 130/30 FundSchedule of Investments (Market Value Expressed in EUR) (continued)
As at 30 June 2011
Quantity/Nominal
Value
Name of Securities MarketValue
%of
NetAssets
Quantity/Nominal
Value
Name of Securities MarketValue
%of
NetAssets
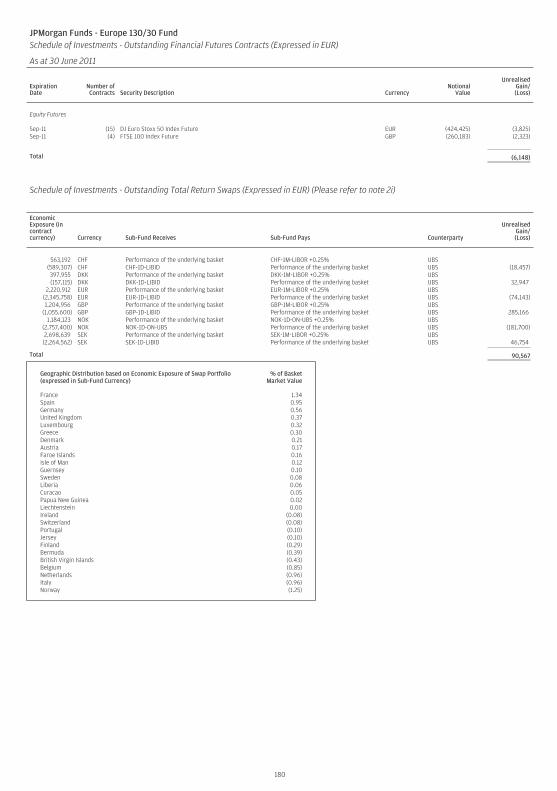
JPMorgan Funds - Europe 130/30 FundSchedule of Investments - Outstanding Financial Futures Contracts (Expressed in EUR)
As at 30 June 2011
ExpirationDate
Number ofContracts Security Description Currency
NotionalValue
UnrealisedGain/(Loss)
Equity Futures
Sep-11 (15) DJ Euro Stoxx 50 Index Future EUR (424,425) (3,825)Sep-11 (4) FTSE 100 Index Future GBP (260,183) (2,323)
Total (6,148)
Schedule of Investments - Outstanding Total Return Swaps (Expressed in EUR) (Please refer to note 2i)
EconomicExposure (incontractcurrency) Currency Sub-Fund Receives Sub-Fund Pays Counterparty
UnrealisedGain/(Loss)
563,192 CHF Performance of the underlying basket CHF-1M-LIBOR +0.25% UBS(589,307) CHF CHF-1D-LIBID Performance of the underlying basket UBS (18,457)397,955 DKK Performance of the underlying basket DKK-1M-LIBOR +0.25% UBS(157,115) DKK DKK-1D-LIBID Performance of the underlying basket UBS 32,947
2,220,912 EUR Performance of the underlying basket EUR-1M-LIBOR +0.25% UBS(2,345,758) EUR EUR-1D-LIBID Performance of the underlying basket UBS (74,143)1,204,956 GBP Performance of the underlying basket GBP-1M-LIBOR +0.25% UBS
(1,055,600) GBP GBP-1D-LIBID Performance of the underlying basket UBS 285,1661,184,123 NOK Performance of the underlying basket NOK-1D-ON-UBS +0.25% UBS
(2,757,400) NOK NOK-1D-ON-UBS Performance of the underlying basket UBS (181,700)2,698,639 SEK Performance of the underlying basket SEK-1M-LIBOR +0.25% UBS(2,264,562) SEK SEK-1D-LIBID Performance of the underlying basket UBS 46,754
Total 90,567
Geographic Distribution based on Economic Exposure of Swap Portfolio(expressed in Sub-Fund Currency)
% of BasketMarket Value
France 1.34Spain 0.95Germany 0.56United Kingdom 0.37Luxembourg 0.32Greece 0.30Denmark 0.21Austria 0.17Faroe Islands 0.16Isle of Man 0.12Guernsey 0.10Sweden 0.08Liberia 0.06Curacao 0.05Papua New Guinea 0.02Liechtenstein 0.00Ireland (0.08)Switzerland (0.08)Portugal (0.10)Jersey (0.10)Finland (0.29)Bermuda (0.39)British Virgin Islands (0.43)Belgium (0.85)Netherlands (0.96)Italy (0.96)Norway (1.25)
180
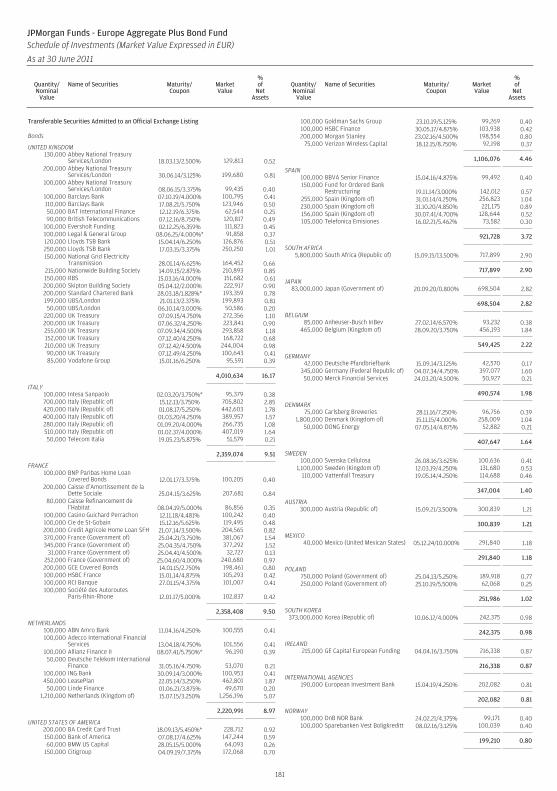
Transferable Securities Admitted to an Official Exchange Listing
Bonds
UNITED KINGDOM130,000 Abbey National Treasury
Services/London 18.03.13/2.500% 129,813 0.52200,000 Abbey National Treasury
Services/London 30.06.14/3.125% 199,680 0.81100,000 Abbey National Treasury
Services/London 08.06.15/3.375% 99,435 0.40100,000 Barclays Bank 07.10.19/4.000% 100,795 0.41110,000 Barclays Bank 17.08.21/5.750% 123,946 0.5050,000 BAT International Finance 12.12.19/6.375% 62,544 0.2590,000 British Telecommunications 07.12.16/8.750% 120,817 0.49
100,000 Eversholt Funding 02.12.25/6.359% 111,823 0.45100,000 Legal & General Group 08.06.25/4.000%* 91,858 0.37120,000 Lloyds TSB Bank 15.04.14/6.250% 126,876 0.51250,000 Lloyds TSB Bank 17.03.15/3.375% 250,250 1.01150,000 National Grid Electricity
Transmission 28.01.14/6.625% 164,452 0.66215,000 Nationwide Building Society 14.09.15/2.875% 210,893 0.85150,000 RBS 15.03.16/4.000% 151,682 0.61200,000 Skipton Building Society 05.04.12/2.000% 222,917 0.90200,000 Standard Chartered Bank 28.03.18/1.828%* 193,359 0.78199,000 UBS/London 21.01.13/2.375% 199,893 0.8150,000 UBS/London 06.10.14/3.000% 50,586 0.20
220,000 UK Treasury 07.09.15/4.750% 272,356 1.10200,000 UK Treasury 07.06.32/4.250% 223,841 0.90255,000 UK Treasury 07.09.34/4.500% 293,858 1.18152,000 UK Treasury 07.12.40/4.250% 168,722 0.68210,000 UK Treasury 07.12.42/4.500% 244,004 0.9890,000 UK Treasury 07.12.49/4.250% 100,643 0.4185,000 Vodafone Group 15.01.16/6.250% 95,591 0.39
4,010,634 16.17
ITALY100,000 Intesa Sanpaolo 02.03.20/3.750%* 95,379 0.38700,000 Italy (Republic of) 15.12.13/3.750% 705,802 2.85420,000 Italy (Republic of) 01.08.17/5.250% 442,603 1.78400,000 Italy (Republic of) 01.03.20/4.250% 389,957 1.57280,000 Italy (Republic of) 01.09.20/4.000% 266,735 1.08510,000 Italy (Republic of) 01.02.37/4.000% 407,019 1.6450,000 Telecom Italia 19.05.23/5.875% 51,579 0.21
2,359,074 9.51
FRANCE100,000 BNP Paribas Home Loan
Covered Bonds 12.01.17/3.375% 100,205 0.40200,000 Caisse d’Amortissement de la
Dette Sociale 25.04.15/3.625% 207,681 0.8480,000 Caisse Refinancement de
l’Habitat 08.04.19/5.000% 86,856 0.35100,000 Casino Guichard Perrachon 12.11.18/4.481% 100,242 0.40100,000 Cie de St-Gobain 15.12.16/5.625% 119,495 0.48200,000 Credit Agricole Home Loan SFH 21.07.14/3.500% 204,565 0.82370,000 France (Government of) 25.04.21/3.750% 381,067 1.54345,000 France (Government of) 25.04.35/4.750% 377,292 1.52
31,000 France (Government of) 25.04.41/4.500% 32,727 0.13252,000 France (Government of) 25.04.60/4.000% 240,680 0.97200,000 GCE Covered Bonds 14.01.15/2.750% 198,461 0.80100,000 HSBC France 15.01.14/4.875% 105,293 0.42100,000 RCI Banque 27.01.15/4.375% 101,007 0.41100,000 Société des Autoroutes
Paris-Rhin-Rhone 12.01.17/5.000% 102,837 0.42
2,358,408 9.50
NETHERLANDS100,000 ABN Amro Bank 11.04.16/4.250% 100,555 0.41100,000 Adecco International Financial
Services 13.04.18/4.750% 101,556 0.41100,000 Allianz Finance II 08.07.41/5.750%* 96,190 0.3950,000 Deutsche Telekom International
Finance 31.05.16/4.750% 53,070 0.21100,000 ING Bank 30.09.14/3.000% 100,953 0.41450,000 LeasePlan 22.05.14/3.250% 462,801 1.87
50,000 Linde Finance 01.06.21/3.875% 49,670 0.201,210,000 Netherlands (Kingdom of) 15.07.15/3.250% 1,256,196 5.07
2,220,991 8.97
UNITED STATES OF AMERICA200,000 BA Credit Card Trust 18.09.13/5.450%* 228,712 0.92150,000 Bank of America 07.08.17/4.625% 147,244 0.5960,000 BMW US Capital 28.05.15/5.000% 64,093 0.26
150,000 Citigroup 04.09.19/7.375% 172,068 0.70
100,000 Goldman Sachs Group 23.10.19/5.125% 99,269 0.40100,000 HSBC Finance 30.05.17/4.875% 103,938 0.42200,000 Morgan Stanley 23.02.16/4.500% 198,554 0.80
75,000 Verizon Wireless Capital 18.12.15/8.750% 92,198 0.37
1,106,076 4.46
SPAIN100,000 BBVA Senior Finance 15.04.16/4.875% 99,492 0.40150,000 Fund for Ordered Bank
Restructuring 19.11.14/3.000% 142,012 0.57255,000 Spain (Kingdom of) 31.01.14/4.250% 256,823 1.04230,000 Spain (Kingdom of) 31.10.20/4.850% 221,175 0.89156,000 Spain (Kingdom of) 30.07.41/4.700% 128,644 0.52105,000 Telefonica Emisiones 16.02.21/5.462% 73,582 0.30
921,728 3.72
SOUTH AFRICA5,800,000 South Africa (Republic of) 15.09.15/13.500% 717,899 2.90
717,899 2.90
JAPAN83,000,000 Japan (Government of) 20.09.20/0.800% 698,504 2.82
698,504 2.82
BELGIUM85,000 Anheuser-Busch InBev 27.02.14/6.570% 93,232 0.38
465,000 Belgium (Kingdom of) 28.09.20/3.750% 456,193 1.84
549,425 2.22
GERMANY42,000 Deutsche Pfandbriefbank 15.09.14/3.125% 42,570 0.17
345,000 Germany (Federal Republic of) 04.07.34/4.750% 397,077 1.6050,000 Merck Financial Services 24.03.20/4.500% 50,927 0.21
490,574 1.98
DENMARK75,000 Carlsberg Breweries 28.11.16/7.250% 96,756 0.39
1,800,000 Denmark (Kingdom of) 15.11.15/4.000% 258,009 1.0450,000 DONG Energy 07.05.14/4.875% 52,882 0.21
407,647 1.64
SWEDEN100,000 Svenska Cellulosa 26.08.16/3.625% 100,636 0.41
1,100,000 Sweden (Kingdom of) 12.03.19/4.250% 131,680 0.53110,000 Vattenfall Treasury 19.05.14/4.250% 114,688 0.46
347,004 1.40
AUSTRIA300,000 Austria (Republic of) 15.09.21/3.500% 300,839 1.21
300,839 1.21
MEXICO40,000 Mexico (United Mexican States) 05.12.24/10.000% 291,840 1.18
291,840 1.18
POLAND750,000 Poland (Government of) 25.04.13/5.250% 189,918 0.77250,000 Poland (Government of) 25.10.19/5.500% 62,068 0.25
251,986 1.02
SOUTH KOREA373,000,000 Korea (Republic of) 10.06.12/4.000% 242,375 0.98
242,375 0.98
IRELAND215,000 GE Capital European Funding 04.04.16/3.750% 216,338 0.87
216,338 0.87
INTERNATIONAL AGENCIES190,000 European Investment Bank 15.04.19/4.250% 202,082 0.81
202,082 0.81
NORWAY100,000 DnB NOR Bank 24.02.21/4.375% 99,171 0.40100,000 Sparebanken Vest Boligkreditt 08.02.16/3.125% 100,039 0.40
199,210 0.80
181
JPMorgan Funds - Europe Aggregate Plus Bond FundSchedule of Investments (Market Value Expressed in EUR)
As at 30 June 2011
Quantity/Nominal
Value
Name of Securities Maturity/Coupon
MarketValue
%of
NetAssets
Quantity/Nominal
Value
Name of Securities Maturity/Coupon
MarketValue
%of
NetAssets
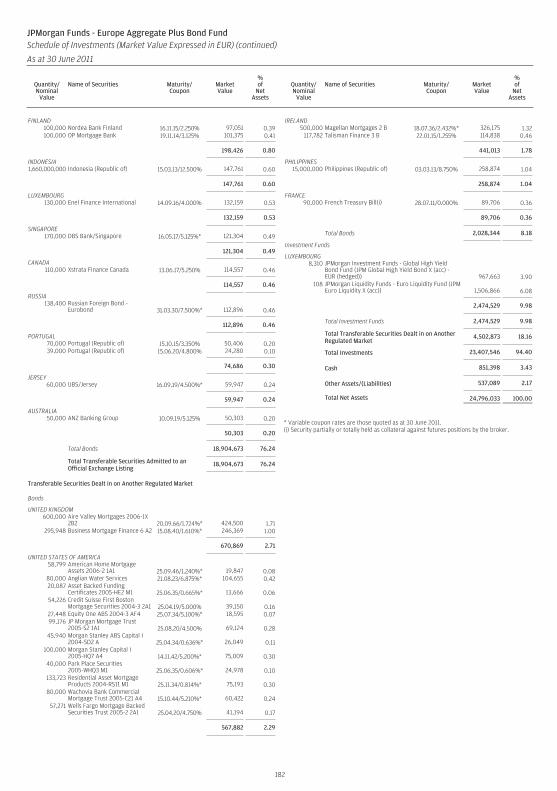
FINLAND100,000 Nordea Bank Finland 16.11.15/2.250% 97,051 0.39100,000 OP Mortgage Bank 19.11.14/3.125% 101,375 0.41
198,426 0.80
INDONESIA1,660,000,000 Indonesia (Republic of) 15.03.13/12.500% 147,761 0.60
147,761 0.60
LUXEMBOURG130,000 Enel Finance International 14.09.16/4.000% 132,159 0.53
132,159 0.53
SINGAPORE170,000 DBS Bank/Singapore 16.05.17/5.125%* 121,304 0.49
121,304 0.49
CANADA110,000 Xstrata Finance Canada 13.06.17/5.250% 114,557 0.46
114,557 0.46
RUSSIA138,400 Russian Foreign Bond -
Eurobond 31.03.30/7.500%* 112,896 0.46
112,896 0.46
PORTUGAL70,000 Portugal (Republic of) 15.10.15/3.350% 50,406 0.2039,000 Portugal (Republic of) 15.06.20/4.800% 24,280 0.10
74,686 0.30
JERSEY60,000 UBS/Jersey 16.09.19/4.500%* 59,947 0.24
59,947 0.24
AUSTRALIA50,000 ANZ Banking Group 10.09.19/5.125% 50,303 0.20
50,303 0.20
Total Bonds 18,904,673 76.24
Total Transferable Securities Admitted to anOfficial Exchange Listing
18,904,673 76.24
Transferable Securities Dealt in on Another Regulated Market
Bonds
UNITED KINGDOM600,000 Aire Valley Mortgages 2006-1X
2B2 20.09.66/1.724%* 424,500 1.71295,948 Business Mortgage Finance 6 A2 15.08.40/1.610%* 246,369 1.00
670,869 2.71
UNITED STATES OF AMERICA58,799 American Home Mortgage
Assets 2006-2 1A1 25.09.46/1.240%* 19,847 0.0880,000 Anglian Water Services 21.08.23/6.875%* 104,655 0.4220,087 Asset Backed Funding
Certificates 2005-HE2 M1 25.06.35/0.665%* 13,666 0.0654,226 Credit Suisse First Boston
Mortgage Securities 2004-3 2A1 25.04.19/5.000% 39,150 0.1627,448 Equity One ABS 2004-3 AF4 25.07.34/5.100%* 18,595 0.0799,176 JP Morgan Mortgage Trust
2005-S2 1A1 25.08.20/4.500% 69,124 0.2845,940 Morgan Stanley ABS Capital I
2004-SD2 A 25.04.34/0.636%* 26,049 0.11100,000 Morgan Stanley Capital I
2005-HQ7 A4 14.11.42/5.200%* 75,009 0.3040,000 Park Place Securities
2005-WHQ3 M1 25.06.35/0.606%* 24,978 0.10133,723 Residential Asset Mortgage
Products 2004-RS11 M1 25.11.34/0.814%* 75,193 0.3080,000 Wachovia Bank Commercial
Mortgage Trust 2005-C21 A4 15.10.44/5.210%* 60,422 0.2457,271 Wells Fargo Mortgage Backed
Securities Trust 2005-2 2A1 25.04.20/4.750% 41,194 0.17
567,882 2.29
IRELAND500,000 Magellan Mortgages 2 B 18.07.36/2.432%* 326,175 1.32
117,782 Talisman Finance 3 B 22.01.15/1.255% 114,838 0.46
441,013 1.78
PHILIPPINES15,000,000 Philippines (Republic of) 03.03.13/8.750% 258,874 1.04
258,874 1.04
FRANCE90,000 French Treasury Bill(i) 28.07.11/0.000% 89,706 0.36
89,706 0.36
Total Bonds 2,028,344 8.18
Investment Funds
LUXEMBOURG8,310 JPMorgan Investment Funds - Global High Yield
Bond Fund (JPM Global High Yield Bond X (acc) -EUR (hedged)) 967,663 3.90
108 JPMorgan Liquidity Funds - Euro Liquidity Fund (JPMEuro Liquidity X (acc)) 1,506,866 6.08
2,474,529 9.98
Total Investment Funds 2,474,529 9.98
Total Transferable Securities Dealt in on AnotherRegulated Market
4,502,873 18.16
Total Investments 23,407,546 94.40
Cash 851,398 3.43
Other Assets/(Liabilities) 537,089 2.17
Total Net Assets 24,796,033 100.00
* Variable coupon rates are those quoted as at 30 June 2011.(i) Security partially or totally held as collateral against futures positions by the broker.
182
JPMorgan Funds - Europe Aggregate Plus Bond FundSchedule of Investments (Market Value Expressed in EUR) (continued)
As at 30 June 2011
Quantity/Nominal
Value
Name of Securities Maturity/Coupon
MarketValue
%of
NetAssets
Quantity/Nominal
Value
Name of Securities Maturity/Coupon
MarketValue
%of
NetAssets
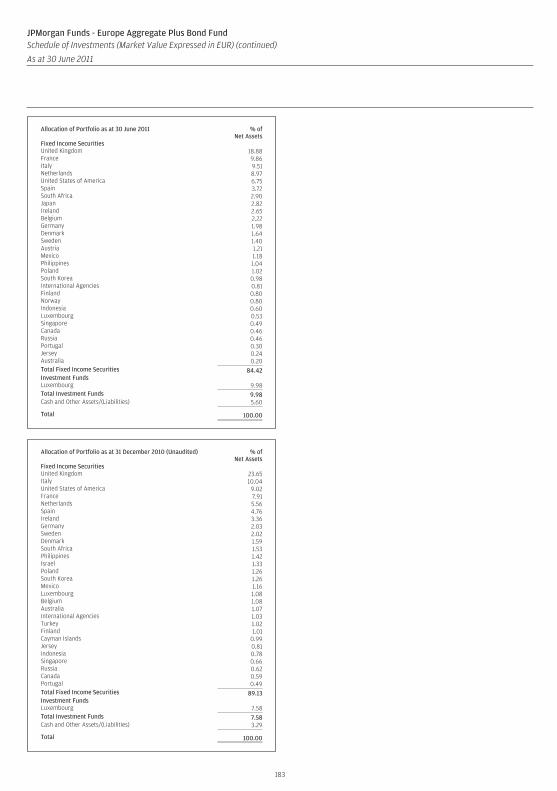
Allocation of Portfolio as at 30 June 2011 % ofNet Assets
Fixed Income SecuritiesUnited Kingdom 18.88France 9.86Italy 9.51Netherlands 8.97United States of America 6.75Spain 3.72South Africa 2.90Japan 2.82Ireland 2.65Belgium 2.22Germany 1.98Denmark 1.64Sweden 1.40Austria 1.21Mexico 1.18Philippines 1.04Poland 1.02South Korea 0.98International Agencies 0.81Finland 0.80Norway 0.80Indonesia 0.60Luxembourg 0.53Singapore 0.49Canada 0.46Russia 0.46Portugal 0.30Jersey 0.24Australia 0.20Total Fixed Income Securities 84.42Investment FundsLuxembourg 9.98Total Investment Funds 9.98Cash and Other Assets/(Liabilities) 5.60
Total 100.00
Allocation of Portfolio as at 31 December 2010 (Unaudited) % ofNet Assets
Fixed Income SecuritiesUnited Kingdom 23.65Italy 10.04United States of America 9.02France 7.91Netherlands 5.56Spain 4.76Ireland 3.36Germany 2.03Sweden 2.02Denmark 1.59South Africa 1.53Philippines 1.42Israel 1.33Poland 1.26South Korea 1.26Mexico 1.16Luxembourg 1.08Belgium 1.08Australia 1.07International Agencies 1.03Turkey 1.02Finland 1.01Cayman Islands 0.99Jersey 0.81Indonesia 0.78Singapore 0.66Russia 0.62Canada 0.59Portugal 0.49Total Fixed Income Securities 89.13Investment FundsLuxembourg 7.58Total Investment Funds 7.58Cash and Other Assets/(Liabilities) 3.29
Total 100.00
183
JPMorgan Funds - Europe Aggregate Plus Bond FundSchedule of Investments (Market Value Expressed in EUR) (continued)
As at 30 June 2011
Quantity/Nominal
Value
Name of Securities Maturity/Coupon
MarketValue
%of
NetAssets
Quantity/Nominal
Value
Name of Securities Maturity/Coupon
MarketValue
%of
NetAssets
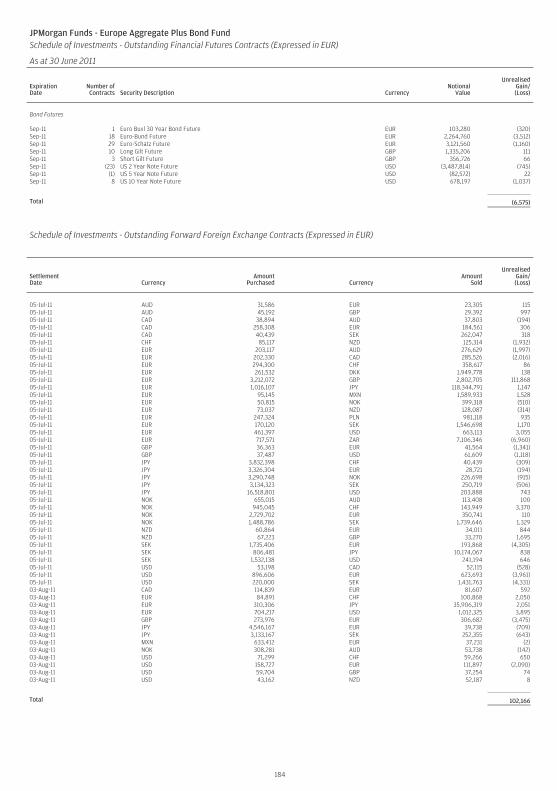
JPMorgan Funds - Europe Aggregate Plus Bond FundSchedule of Investments - Outstanding Financial Futures Contracts (Expressed in EUR)
As at 30 June 2011
ExpirationDate
Number ofContracts Security Description Currency
NotionalValue
UnrealisedGain/(Loss)
Bond Futures
Sep-11 1 Euro Buxl 30 Year Bond Future EUR 103,280 (320)Sep-11 18 Euro-Bund Future EUR 2,264,760 (3,512)Sep-11 29 Euro-Schatz Future EUR 3,121,560 (1,160)Sep-11 10 Long Gilt Future GBP 1,335,206 111Sep-11 3 Short Gilt Future GBP 356,726 66Sep-11 (23) US 2 Year Note Future USD (3,487,814) (745)Sep-11 (1) US 5 Year Note Future USD (82,572) 22Sep-11 8 US 10 Year Note Future USD 678,197 (1,037)
Total (6,575)
Schedule of Investments - Outstanding Forward Foreign Exchange Contracts (Expressed in EUR)
SettlementDate Currency
AmountPurchased Currency
AmountSold
UnrealisedGain/(Loss)
05-Jul-11 AUD 31,586 EUR 23,305 11505-Jul-11 AUD 45,192 GBP 29,392 99705-Jul-11 CAD 38,894 AUD 37,803 (194)05-Jul-11 CAD 258,308 EUR 184,561 30605-Jul-11 CAD 40,439 SEK 262,047 31805-Jul-11 CHF 85,117 NZD 125,314 (1,932)05-Jul-11 EUR 203,117 AUD 276,629 (1,997)05-Jul-11 EUR 202,330 CAD 285,526 (2,016)05-Jul-11 EUR 294,300 CHF 358,617 8605-Jul-11 EUR 261,532 DKK 1,949,778 13805-Jul-11 EUR 3,212,072 GBP 2,802,705 111,86805-Jul-11 EUR 1,016,107 JPY 118,344,791 1,14705-Jul-11 EUR 95,145 MXN 1,589,933 1,52805-Jul-11 EUR 50,815 NOK 399,318 (510)05-Jul-11 EUR 73,037 NZD 128,087 (314)05-Jul-11 EUR 247,324 PLN 981,118 93505-Jul-11 EUR 170,120 SEK 1,546,698 1,17005-Jul-11 EUR 461,397 USD 663,113 3,05505-Jul-11 EUR 717,571 ZAR 7,106,346 (6,960)05-Jul-11 GBP 36,363 EUR 41,564 (1,341)05-Jul-11 GBP 37,487 USD 61,609 (1,118)05-Jul-11 JPY 3,832,398 CHF 40,439 (309)05-Jul-11 JPY 3,326,304 EUR 28,721 (194)05-Jul-11 JPY 3,290,748 NOK 226,698 (915)05-Jul-11 JPY 3,134,323 SEK 250,719 (506)05-Jul-11 JPY 16,518,801 USD 203,888 74305-Jul-11 NOK 655,015 AUD 113,408 10005-Jul-11 NOK 945,045 CHF 143,949 3,37005-Jul-11 NOK 2,729,702 EUR 350,741 11005-Jul-11 NOK 1,488,786 SEK 1,739,646 1,32905-Jul-11 NZD 60,864 EUR 34,011 84405-Jul-11 NZD 67,223 GBP 33,270 1,69505-Jul-11 SEK 1,735,406 EUR 193,868 (4,305)05-Jul-11 SEK 806,481 JPY 10,174,067 83805-Jul-11 SEK 1,532,138 USD 241,194 64605-Jul-11 USD 53,198 CAD 52,115 (528)05-Jul-11 USD 896,606 EUR 623,693 (3,961)05-Jul-11 USD 220,000 SEK 1,431,763 (4,331)03-Aug-11 CAD 114,839 EUR 81,607 59203-Aug-11 EUR 84,891 CHF 100,868 2,05003-Aug-11 EUR 310,306 JPY 35,906,319 2,05103-Aug-11 EUR 704,217 USD 1,012,325 3,89503-Aug-11 GBP 273,976 EUR 306,682 (3,475)03-Aug-11 JPY 4,546,167 EUR 39,738 (709)03-Aug-11 JPY 3,133,167 SEK 252,355 (643)03-Aug-11 MXN 633,412 EUR 37,231 (2)03-Aug-11 NOK 308,281 AUD 53,738 (142)03-Aug-11 USD 71,299 CHF 59,266 65003-Aug-11 USD 158,727 EUR 111,897 (2,090)03-Aug-11 USD 59,704 GBP 37,254 7403-Aug-11 USD 43,162 NZD 52,187 8
Total 102,166
184
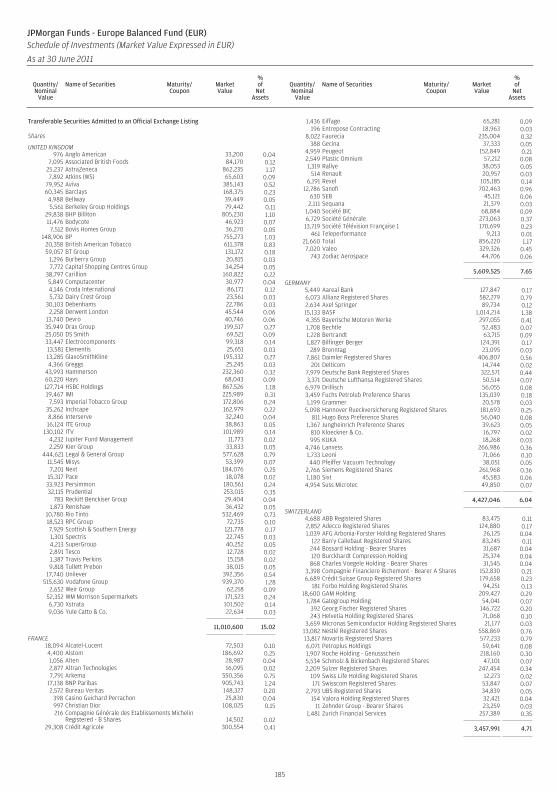
Transferable Securities Admitted to an Official Exchange Listing
Shares
UNITED KINGDOM976 Anglo American 33,200 0.04
7,095 Associated British Foods 84,170 0.1225,237 AstraZeneca 862,235 1.177,892 Atkins (WS) 65,603 0.09
79,952 Aviva 385,143 0.5260,345 Barclays 168,375 0.234,988 Bellway 39,449 0.055,561 Berkeley Group Holdings 79,442 0.11
29,838 BHP Billiton 805,230 1.1011,476 Bodycote 46,923 0.07
7,512 Bovis Homes Group 36,270 0.05148,906 BP 755,273 1.03
20,358 British American Tobacco 611,378 0.8359,057 BT Group 131,172 0.18
1,296 Burberry Group 20,815 0.037,772 Capital Shopping Centres Group 34,254 0.05
38,797 Carillion 160,822 0.225,849 Computacenter 30,977 0.044,146 Croda International 86,171 0.125,732 Dairy Crest Group 23,561 0.03
30,103 Debenhams 22,786 0.032,258 Derwent London 45,544 0.06
13,740 Devro 40,746 0.0635,949 Drax Group 199,517 0.2725,050 DS Smith 69,521 0.0933,447 Electrocomponents 99,318 0.1413,581 Elementis 25,651 0.0313,285 GlaxoSmithKline 195,332 0.274,366 Greggs 25,245 0.03
43,993 Hammerson 232,360 0.3260,220 Hays 68,043 0.09127,714 HSBC Holdings 867,526 1.1819,467 IMI 225,989 0.31
7,593 Imperial Tobacco Group 172,806 0.2435,262 Inchcape 162,979 0.228,866 Interserve 32,240 0.0416,124 ITE Group 38,863 0.05
130,102 ITV 101,989 0.144,232 Jupiter Fund Management 11,773 0.022,259 Kier Group 33,833 0.05
444,621 Legal & General Group 577,628 0.7911,545 Misys 53,399 0.077,201 Next 184,076 0.25
15,317 Pace 18,078 0.0233,923 Persimmon 180,561 0.2432,115 Prudential 253,015 0.35
783 Reckitt Benckiser Group 29,404 0.041,873 Renishaw 36,432 0.05
10,780 Rio Tinto 532,469 0.7318,523 RPC Group 72,735 0.107,929 Scottish & Southern Energy 121,778 0.171,301 Spectris 22,745 0.034,213 SuperGroup 40,252 0.052,891 Tesco 12,728 0.021,387 Travis Perkins 15,158 0.029,818 Tullett Prebon 38,015 0.05
17,740 Unilever 392,356 0.54515,630 Vodafone Group 939,370 1.28
2,652 Weir Group 62,218 0.0952,352 WM Morrison Supermarkets 171,523 0.246,730 Xstrata 101,502 0.149,036 Yule Catto & Co. 22,634 0.03
11,010,600 15.02
FRANCE18,094 Alcatel-Lucent 72,503 0.104,400 Alstom 186,692 0.251,056 Alten 28,987 0.042,877 Altran Technologies 16,095 0.027,791 Arkema 550,356 0.75
17,138 BNP Paribas 905,743 1.242,572 Bureau Veritas 148,327 0.20
398 Casino Guichard Perrachon 25,830 0.04997 Christian Dior 108,025 0.15216 Compagnie Générale des Etablissements Michelin
Registered - B Shares 14,502 0.0229,308 Crédit Agricole 300,554 0.41
1,436 Eiffage 65,281 0.09196 Entrepose Contracting 18,963 0.03
8,022 Faurecia 235,004 0.32388 Gecina 37,333 0.05
4,959 Peugeot 152,849 0.212,549 Plastic Omnium 57,212 0.081,319 Rallye 38,053 0.05
514 Renault 20,957 0.036,191 Rexel 105,185 0.14
12,786 Sanofi 702,463 0.96630 SEB 45,121 0.06
2,111 Sequana 21,379 0.031,040 Société BIC 68,884 0.096,729 Société Générale 273,063 0.37
13,719 Société Télévision Française 1 170,699 0.23461 Teleperformance 9,213 0.01
21,660 Total 856,220 1.177,020 Valeo 329,326 0.45
743 Zodiac Aerospace 44,706 0.06
5,609,525 7.65
GERMANY5,449 Aareal Bank 127,847 0.176,073 Allianz Registered Shares 582,279 0.792,634 Axel Springer 89,734 0.1215,133 BASF 1,014,214 1.384,355 Bayerische Motoren Werke 297,055 0.411,708 Bechtle 52,483 0.071,228 Bertrandt 63,715 0.091,827 Bilfinger Berger 124,391 0.17
289 Brenntag 23,095 0.037,861 Daimler Registered Shares 406,807 0.56
201 Delticom 14,744 0.027,979 Deutsche Bank Registered Shares 322,571 0.443,371 Deutsche Lufthansa Registered Shares 50,514 0.07
6,979 Drillisch 56,055 0.083,459 Fuchs Petrolub Preference Shares 135,039 0.181,199 Grammer 20,578 0.03
5,098 Hannover Rueckversicherung Registered Shares 181,693 0.25811 Hugo Boss Preference Shares 56,040 0.08
1,367 Jungheinrich Preference Shares 39,623 0.05810 Kloeckner & Co. 16,797 0.02995 KUKA 18,268 0.03
4,746 Lanxess 266,986 0.361,733 Leoni 71,066 0.10440 Pfeiffer Vacuum Technology 38,051 0.05
2,766 Siemens Registered Shares 261,968 0.361,180 Sixt 45,583 0.06
4,954 Suss Microtec 49,850 0.07
4,427,046 6.04
SWITZERLAND4,688 ABB Registered Shares 83,475 0.112,852 Adecco Registered Shares 124,880 0.171,039 AFG Arbonia-Forster Holding Registered Shares 26,125 0.04
122 Barry Callebaut Registered Shares 83,245 0.11244 Bossard Holding - Bearer Shares 31,687 0.04120 Burckhardt Compression Holding 25,374 0.04868 Charles Voegele Holding - Bearer Shares 31,545 0.04
3,398 Compagnie Financiere Richemont - Bearer A Shares 152,830 0.216,689 Crédit Suisse Group Registered Shares 179,658 0.23
181 Forbo Holding Registered Shares 94,251 0.1318,600 GAM Holding 209,427 0.29
1,784 Gategroup Holding 54,041 0.07392 Georg Fischer Registered Shares 146,722 0.20243 Helvetia Holding Registered Shares 71,068 0.10
3,659 Micronas Semiconductor Holding Registered Shares 21,177 0.0313,082 Nestlé Registered Shares 558,869 0.7613,817 Novartis Registered Shares 577,233 0.796,071 Petroplus Holdings 59,641 0.081,907 Roche Holding - Genussschein 218,160 0.305,534 Schmolz & Bickenbach Registered Shares 47,101 0.072,209 Sulzer Registered Shares 247,454 0.34
109 Swiss Life Holding Registered Shares 12,273 0.02171 Swisscom Registered Shares 53,847 0.07
2,793 UBS Registered Shares 34,839 0.05154 Valora Holding Registered Shares 32,421 0.04
11 Zehnder Group - Bearer Shares 23,259 0.031,481 Zurich Financial Services 257,389 0.35
3,457,991 4.71
185
JPMorgan Funds - Europe Balanced Fund (EUR)Schedule of Investments (Market Value Expressed in EUR)
As at 30 June 2011
Quantity/Nominal
Value
Name of Securities Maturity/Coupon
MarketValue
%of
NetAssets
Quantity/Nominal
Value
Name of Securities Maturity/Coupon
MarketValue
%of
NetAssets
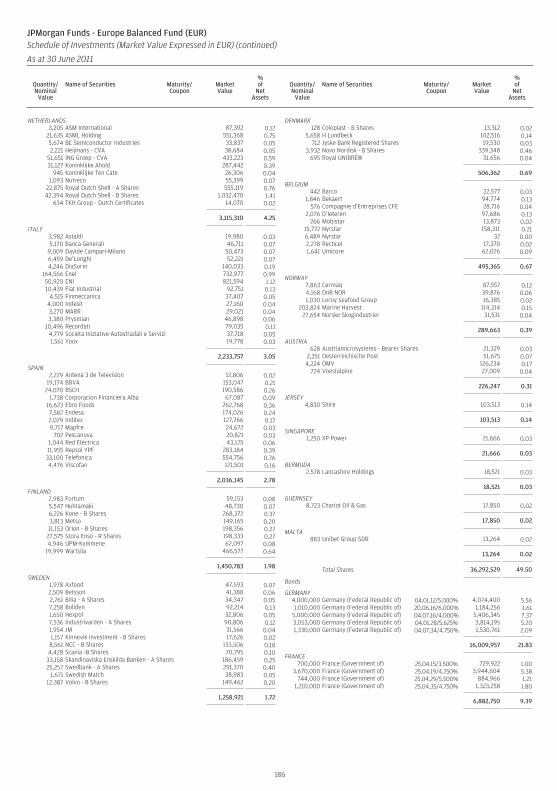
NETHERLANDS3,205 ASM International 87,392 0.12
21,635 ASML Holding 551,368 0.755,674 BE Semiconductor Industries 33,837 0.052,221 Heijmans - CVA 38,684 0.05
51,651 ING Groep - CVA 433,223 0.5931,127 Koninklijke Ahold 287,442 0.39
945 Koninklijke Ten Cate 26,306 0.041,093 Nutreco 55,399 0.07
22,875 Royal Dutch Shell - A Shares 555,119 0.7642,394 Royal Dutch Shell - B Shares 1,032,470 1.41
634 TKH Group - Dutch Certificates 14,070 0.02
3,115,310 4.25
ITALY3,982 Astaldi 19,980 0.035,170 Banca Generali 46,711 0.07
9,009 Davide Campari-Milano 50,473 0.076,459 De’Longhi 52,221 0.074,246 DiaSorin 140,033 0.19
164,566 Enel 732,977 0.9950,920 ENI 821,594 1.1210,439 Fiat Industrial 92,751 0.13
4,515 Finmeccanica 37,407 0.054,000 Indesit 27,160 0.043,270 MARR 29,021 0.043,380 Prysmian 46,898 0.06
10,496 Recordati 79,035 0.114,779 Societa Iniziative Autostradali e Servizi 37,718 0.051,561 Yoox 19,778 0.03
2,233,757 3.05
SPAIN2,229 Antena 3 de Television 12,806 0.02
19,174 BBVA 153,047 0.2124,070 BSCH 190,586 0.26
1,738 Corporacion Financiera Alba 67,087 0.0916,623 Ebro Foods 262,768 0.367,582 Endesa 174,026 0.242,029 Inditex 127,766 0.179,717 Mapfre 24,672 0.03
702 Pescanova 20,821 0.031,044 Red Eléctrica 43,125 0.0611,955 Repsol YPF 283,184 0.3933,100 Telefonica 554,756 0.764,476 Viscofan 121,501 0.16
2,036,145 2.78
FINLAND2,983 Fortum 59,153 0.085,547 Huhtamaki 48,730 0.076,226 Kone - B Shares 268,372 0.373,813 Metso 149,165 0.2011,153 Orion - B Shares 198,356 0.27
27,575 Stora Enso - R Shares 198,333 0.274,946 UPM-Kymmene 62,097 0.08
19,999 Wartsila 466,577 0.64
1,450,783 1.98
SWEDEN1,978 Axfood 47,593 0.072,509 Betsson 41,388 0.062,761 Bilia - A Shares 34,347 0.057,258 Boliden 92,214 0.131,650 Hexpol 32,806 0.057,536 Industrivarden - A Shares 90,806 0.121,954 JM 31,566 0.041,157 Kinnevik Investment - B Shares 17,626 0.028,561 NCC - B Shares 133,506 0.184,428 Scania -B Shares 70,795 0.10
33,158 Skandinaviska Enskilda Banken - A Shares 186,459 0.2525,257 Swedbank - A Shares 291,370 0.40
1,671 Swedish Match 38,983 0.0512,387 Volvo - B Shares 149,462 0.20
1,258,921 1.72
DENMARK128 Coloplast - B Shares 13,312 0.02
5,658 H Lundbeck 102,516 0.14712 Jyske Bank Registered Shares 19,530 0.03
3,932 Novo Nordisk - B Shares 339,348 0.46695 Royal UNIBREW 31,656 0.04
506,362 0.69
BELGIUM442 Barco 22,577 0.03
1,846 Bekaert 94,774 0.13576 Compagnie d’Entreprises CFE 28,716 0.04
2,076 D’Ieteren 97,686 0.13266 Mobistar 13,873 0.02
15,772 Nyrstar 158,311 0.216,489 Nyrstar 32 0.002,278 Recticel 17,370 0.021,641 Umicore 62,026 0.09
495,365 0.67
NORWAY7,863 Cermaq 87,557 0.124,168 DnB NOR 39,876 0.061,030 Leroy Seafood Group 16,385 0.02
203,824 Marine Harvest 114,314 0.1527,654 Norske Skogindustrier 31,531 0.04
289,663 0.39
AUSTRIA628 Austriamicrosystems - Bearer Shares 21,329 0.03
2,351 Oesterreichische Post 51,675 0.074,224 OMV 126,234 0.17
724 Voestalpine 27,009 0.04
226,247 0.31
JERSEY4,830 Shire 103,513 0.14
103,513 0.14
SINGAPORE1,250 XP Power 21,666 0.03
21,666 0.03
BERMUDA2,578 Lancashire Holdings 18,521 0.03
18,521 0.03
GUERNSEY8,723 Chariot Oil & Gas 17,850 0.02
17,850 0.02
MALTA883 Unibet Group SDR 13,264 0.02
13,264 0.02
Total Shares 36,292,529 49.50
Bonds
GERMANY4,000,000 Germany (Federal Republic of) 04.01.12/5.000% 4,074,400 5.561,010,000 Germany (Federal Republic of) 20.06.16/6.000% 1,184,256 1.61
5,000,000 Germany (Federal Republic of) 04.07.16/4.000% 5,406,345 7.373,053,000 Germany (Federal Republic of) 04.01.28/5.625% 3,814,195 5.201,330,000 Germany (Federal Republic of) 04.07.34/4.750% 1,530,761 2.09
16,009,957 21.83
FRANCE700,000 France (Government of) 25.04.15/3.500% 729,922 1.00
3,670,000 France (Government of) 25.04.19/4.250% 3,944,604 5.38744,000 France (Government of) 25.04.29/5.500% 884,966 1.21
1,210,000 France (Government of) 25.04.35/4.750% 1,323,258 1.80
6,882,750 9.39
186
JPMorgan Funds - Europe Balanced Fund (EUR)Schedule of Investments (Market Value Expressed in EUR) (continued)
As at 30 June 2011
Quantity/Nominal
Value
Name of Securities Maturity/Coupon
MarketValue
%of
NetAssets
Quantity/Nominal
Value
Name of Securities Maturity/Coupon
MarketValue
%of
NetAssets
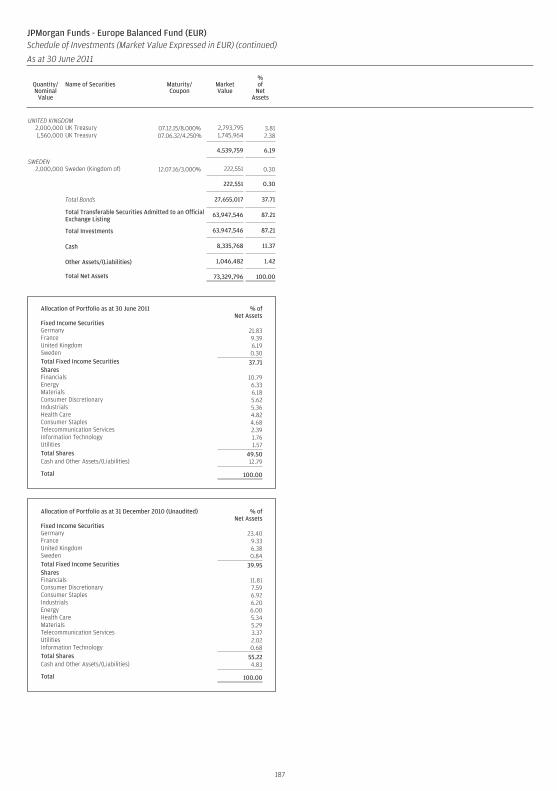
UNITED KINGDOM2,000,000 UK Treasury 07.12.15/8.000% 2,793,795 3.811,560,000 UK Treasury 07.06.32/4.250% 1,745,964 2.38
4,539,759 6.19
SWEDEN2,000,000 Sweden (Kingdom of) 12.07.16/3.000% 222,551 0.30
222,551 0.30
Total Bonds 27,655,017 37.71
Total Transferable Securities Admitted to an OfficialExchange Listing
63,947,546 87.21
Total Investments 63,947,546 87.21
Cash 8,335,768 11.37
Other Assets/(Liabilities) 1,046,482 1.42
Total Net Assets 73,329,796 100.00
Allocation of Portfolio as at 30 June 2011 % ofNet Assets
Fixed Income SecuritiesGermany 21.83France 9.39United Kingdom 6.19Sweden 0.30Total Fixed Income Securities 37.71SharesFinancials 10.79Energy 6.33Materials 6.18Consumer Discretionary 5.62Industrials 5.36Health Care 4.82Consumer Staples 4.68Telecommunication Services 2.39Information Technology 1.76Utilities 1.57Total Shares 49.50Cash and Other Assets/(Liabilities) 12.79
Total 100.00
Allocation of Portfolio as at 31 December 2010 (Unaudited) % ofNet Assets
Fixed Income SecuritiesGermany 23.40France 9.33United Kingdom 6.38Sweden 0.84Total Fixed Income Securities 39.95SharesFinancials 11.81Consumer Discretionary 7.59Consumer Staples 6.92Industrials 6.20Energy 6.00Health Care 5.34Materials 5.29Telecommunication Services 3.37Utilities 2.02Information Technology 0.68Total Shares 55.22Cash and Other Assets/(Liabilities) 4.83
Total 100.00
187
JPMorgan Funds - Europe Balanced Fund (EUR)Schedule of Investments (Market Value Expressed in EUR) (continued)
As at 30 June 2011
Quantity/Nominal
Value
Name of Securities Maturity/Coupon
MarketValue
%of
NetAssets
Quantity/Nominal
Value
Name of Securities Maturity/Coupon
MarketValue
%of
NetAssets
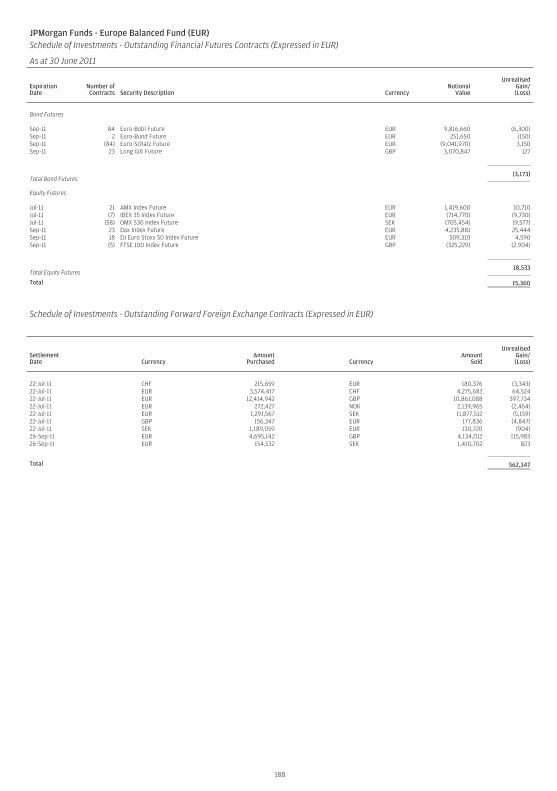
JPMorgan Funds - Europe Balanced Fund (EUR)Schedule of Investments - Outstanding Financial Futures Contracts (Expressed in EUR)
As at 30 June 2011
ExpirationDate
Number ofContracts Security Description Currency
NotionalValue
UnrealisedGain/(Loss)
Bond Futures
Sep-11 84 Euro-Bobl Future EUR 9,816,660 (6,300)Sep-11 2 Euro-Bund Future EUR 251,650 (150)Sep-11 (84) Euro-Schatz Future EUR (9,041,970) 3,150Sep-11 23 Long Gilt Future GBP 3,070,847 127
Total Bond Futures(3,173)
Equity Futures
Jul-11 21 AMX Index Future EUR 1,419,600 10,710Jul-11 (7) IBEX 35 Index Future EUR (714,770) (9,730)Jul-11 (58) OMX S30 Index Future SEK (705,454) (9,577)Sep-11 23 Dax Index Future EUR 4,235,881 25,444Sep-11 18 DJ Euro Stoxx 50 Index Future EUR 509,310 4,590Sep-11 (5) FTSE 100 Index Future GBP (325,229) (2,904)
Total Equity Futures18,533
Total 15,360
Schedule of Investments - Outstanding Forward Foreign Exchange Contracts (Expressed in EUR)
SettlementDate Currency
AmountPurchased Currency
AmountSold
UnrealisedGain/(Loss)
22-Jul-11 CHF 215,659 EUR 180,376 (3,343)22-Jul-11 EUR 3,574,417 CHF 4,275,682 64,52422-Jul-11 EUR 12,414,942 GBP 10,861,088 397,73422-Jul-11 EUR 272,427 NOK 2,139,965 (2,464)22-Jul-11 EUR 1,291,567 SEK 11,877,512 (5,159)22-Jul-11 GBP 156,347 EUR 177,836 (4,847)22-Jul-11 SEK 1,189,059 EUR 130,720 (904)26-Sep-11 EUR 4,695,142 GBP 4,134,012 115,98326-Sep-11 EUR 154,532 SEK 1,410,702 823
Total 562,347
188
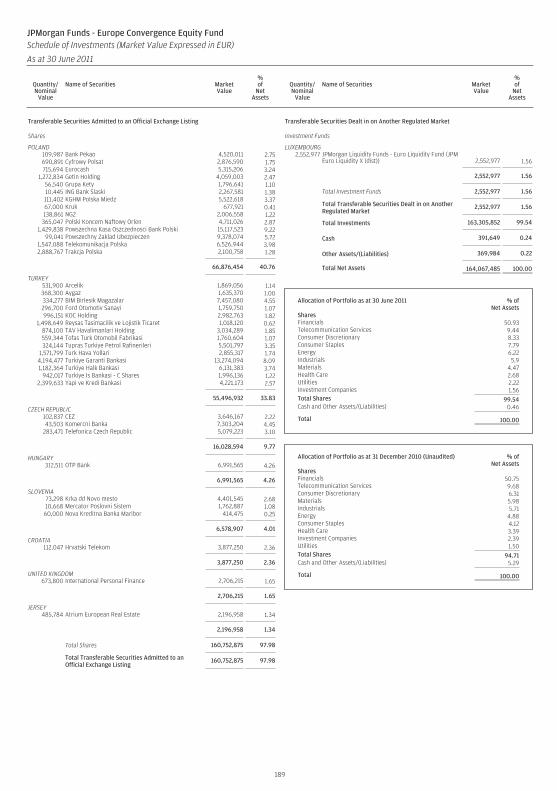
Transferable Securities Admitted to an Official Exchange Listing
Shares
POLAND109,987 Bank Pekao 4,520,011 2.75690,891 Cyfrowy Polsat 2,876,590 1.75715,694 Eurocash 5,315,206 3.24
1,272,834 Getin Holding 4,059,003 2.4756,540 Grupa Kety 1,796,641 1.1010,445 ING Bank Slaski 2,267,581 1.38111,402 KGHM Polska Miedz 5,522,618 3.3767,000 Kruk 677,921 0.41138,861 NG2 2,006,558 1.22365,047 Polski Koncem Naftowy Orlen 4,711,026 2.87
1,429,838 Powszechna Kasa Oszczednosci Bank Polski 15,117,523 9.2299,041 Powszechny Zaklad Ubezpieczen 9,378,074 5.72
1,547,088 Telekomunikacja Polska 6,526,944 3.982,888,767 Trakcja Polska 2,100,758 1.28
66,876,454 40.76
TURKEY531,900 Arcelik 1,869,056 1.14368,300 Aygaz 1,635,370 1.00334,277 BIM Birlesik Magazalar 7,457,080 4.55296,700 Ford Otomotiv Sanayi 1,759,750 1.07996,151 KOC Holding 2,982,763 1.82
1,498,649 Reysas Tasimacilik ve Lojistik Ticaret 1,018,120 0.62874,100 TAV Havalimanlari Holding 3,034,289 1.85559,344 Tofas Turk Otomobil Fabrikasi 1,760,604 1.07324,144 Tupras Turkiye Petrol Rafinerileri 5,501,797 3.35
1,571,799 Turk Hava Yollari 2,855,317 1.744,194,477 Turkiye Garanti Bankasi 13,274,094 8.091,182,364 Turkiye Halk Bankasi 6,131,383 3.74
942,017 Turkiye Is Bankasi - C Shares 1,996,136 1.222,399,633 Yapi ve Kredi Bankasi 4,221,173 2.57
55,496,932 33.83
CZECH REPUBLIC102,837 CEZ 3,646,167 2.2243,503 Komercni Banka 7,303,204 4.45
283,471 Telefonica Czech Republic 5,079,223 3.10
16,028,594 9.77
HUNGARY312,511 OTP Bank 6,991,565 4.26
6,991,565 4.26
SLOVENIA73,298 Krka dd Novo mesto 4,401,545 2.6810,668 Mercator Poslovni Sistem 1,762,887 1.0860,000 Nova Kreditna Banka Maribor 414,475 0.25
6,578,907 4.01
CROATIA112,047 Hrvatski Telekom 3,877,250 2.36
3,877,250 2.36
UNITED KINGDOM673,800 International Personal Finance 2,706,215 1.65
2,706,215 1.65
JERSEY485,784 Atrium European Real Estate 2,196,958 1.34
2,196,958 1.34
Total Shares 160,752,875 97.98
Total Transferable Securities Admitted to anOfficial Exchange Listing
160,752,875 97.98
Transferable Securities Dealt in on Another Regulated Market
Investment Funds
LUXEMBOURG2,552,977 JPMorgan Liquidity Funds - Euro Liquidity Fund (JPM
Euro Liquidity X (dist)) 2,552,977 1.56
2,552,977 1.56
Total Investment Funds 2,552,977 1.56
Total Transferable Securities Dealt in on AnotherRegulated Market
2,552,977 1.56
Total Investments 163,305,852 99.54
Cash 391,649 0.24
Other Assets/(Liabilities) 369,984 0.22
Total Net Assets 164,067,485 100.00
Allocation of Portfolio as at 30 June 2011 % ofNet Assets
SharesFinancials 50.93Telecommunication Services 9.44Consumer Discretionary 8.33Consumer Staples 7.79Energy 6.22Industrials 5.9Materials 4.47Health Care 2.68Utilities 2.22Investment Companies 1.56Total Shares 99.54Cash and Other Assets/(Liabilities) 0.46
Total 100.00
Allocation of Portfolio as at 31 December 2010 (Unaudited) % ofNet Assets
SharesFinancials 50.75Telecommunication Services 9.68Consumer Discretionary 6.31Materials 5.98Industrials 5.71Energy 4.88Consumer Staples 4.12Health Care 3.39Investment Companies 2.39Utilities 1.50Total Shares 94.71Cash and Other Assets/(Liabilities) 5.29
Total 100.00
189
JPMorgan Funds - Europe Convergence Equity FundSchedule of Investments (Market Value Expressed in EUR)
As at 30 June 2011
Quantity/Nominal
Value
Name of Securities MarketValue
%of
NetAssets
Quantity/Nominal
Value
Name of Securities MarketValue
%of
NetAssets
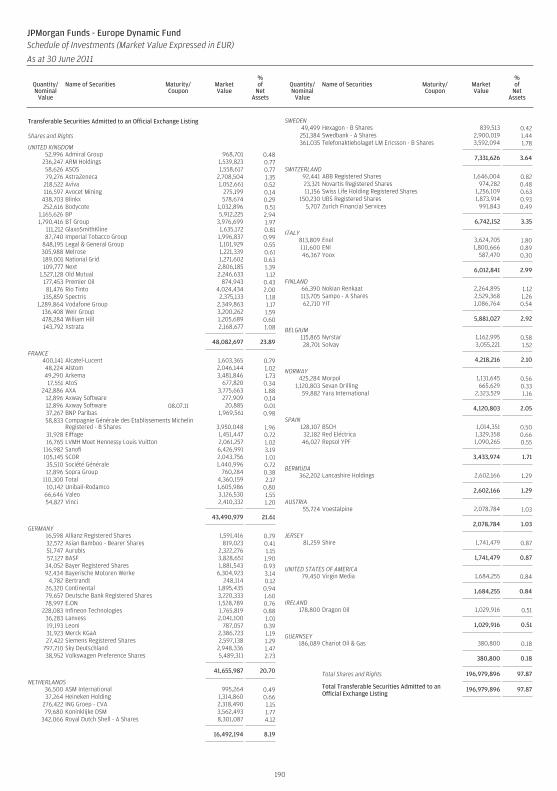
Transferable Securities Admitted to an Official Exchange Listing
Shares and Rights
UNITED KINGDOM52,996 Admiral Group 968,701 0.48
236,247 ARM Holdings 1,539,823 0.7758,626 ASOS 1,558,617 0.7779,276 AstraZeneca 2,708,504 1.35
218,522 Aviva 1,052,661 0.52116,597 Avocet Mining 275,199 0.14
438,703 Blinkx 578,674 0.29252,616 Bodycote 1,032,896 0.51
1,165,626 BP 5,912,225 2.941,790,416 BT Group 3,976,699 1.97
111,212 GlaxoSmithKline 1,635,172 0.8187,740 Imperial Tobacco Group 1,996,837 0.99
848,195 Legal & General Group 1,101,929 0.55305,988 Melrose 1,221,339 0.61189,001 National Grid 1,271,602 0.63109,777 Next 2,806,185 1.39
1,527,128 Old Mutual 2,246,633 1.12177,453 Premier Oil 874,943 0.4381,476 Rio Tinto 4,024,434 2.00
135,859 Spectris 2,375,133 1.181,289,864 Vodafone Group 2,349,863 1.17
136,408 Weir Group 3,200,262 1.59478,284 William Hill 1,205,689 0.60143,792 Xstrata 2,168,677 1.08
48,082,697 23.89
FRANCE400,141 Alcatel-Lucent 1,603,365 0.7948,224 Alstom 2,046,144 1.0249,290 Arkema 3,481,846 1.7317,551 AtoS 677,820 0.34
242,886 AXA 3,775,663 1.8812,896 Axway Software 277,909 0.1412,896 Axway Software 08.07.11 20,885 0.0137,267 BNP Paribas 1,969,561 0.9858,833 Compagnie Générale des Etablissements Michelin
Registered - B Shares 3,950,048 1.9631,928 Eiffage 1,451,447 0.7216,765 LVMH Moet Hennessy Louis Vuitton 2,061,257 1.02
116,982 Sanofi 6,426,991 3.19105,145 SCOR 2,043,756 1.0135,510 Société Générale 1,440,996 0.7212,896 Sopra Group 760,284 0.38
110,300 Total 4,360,159 2.1710,142 Unibail-Rodamco 1,605,986 0.80
66,646 Valeo 3,126,530 1.5554,827 Vinci 2,410,332 1.20
43,490,979 21.61
GERMANY16,598 Allianz Registered Shares 1,591,416 0.7932,572 Asian Bamboo - Bearer Shares 819,023 0.4151,747 Aurubis 2,322,276 1.1557,127 BASF 3,828,651 1.90
34,052 Bayer Registered Shares 1,881,543 0.9392,434 Bayerische Motoren Werke 6,304,923 3.14
4,782 Bertrandt 248,114 0.1226,320 Continental 1,895,435 0.9479,657 Deutsche Bank Registered Shares 3,220,333 1.6078,997 E.ON 1,528,789 0.76
228,083 Infineon Technologies 1,765,819 0.8836,283 Lanxess 2,041,100 1.0119,193 Leoni 787,057 0.3931,923 Merck KGaA 2,386,723 1.1927,422 Siemens Registered Shares 2,597,138 1.29
797,710 Sky Deutschland 2,948,336 1.4738,952 Volkswagen Preference Shares 5,489,311 2.73
41,655,987 20.70
NETHERLANDS36,500 ASM International 995,264 0.4937,264 Heineken Holding 1,314,860 0.66
276,422 ING Groep - CVA 2,318,490 1.1579,680 Koninklijke DSM 3,562,493 1.77
342,066 Royal Dutch Shell - A Shares 8,301,087 4.12
16,492,194 8.19
SWEDEN49,499 Hexagon - B Shares 839,513 0.42251,384 Swedbank - A Shares 2,900,019 1.44361,035 Telefonaktiebolaget LM Ericsson - B Shares 3,592,094 1.78
7,331,626 3.64
SWITZERLAND92,441 ABB Registered Shares 1,646,004 0.8223,321 Novartis Registered Shares 974,282 0.4811,156 Swiss Life Holding Registered Shares 1,256,109 0.63
150,230 UBS Registered Shares 1,873,914 0.935,707 Zurich Financial Services 991,843 0.49
6,742,152 3.35
ITALY813,809 Enel 3,624,705 1.80111,600 ENI 1,800,666 0.8946,367 Yoox 587,470 0.30
6,012,841 2.99
FINLAND66,390 Nokian Renkaat 2,264,895 1.12113,705 Sampo - A Shares 2,529,368 1.2662,710 YIT 1,086,764 0.54
5,881,027 2.92
BELGIUM115,865 Nyrstar 1,162,995 0.5828,701 Solvay 3,055,221 1.52
4,218,216 2.10
NORWAY425,284 Morpol 1,131,645 0.56
1,120,803 Sevan Drilling 665,629 0.3359,882 Yara International 2,323,529 1.16
4,120,803 2.05
SPAIN128,107 BSCH 1,014,351 0.5032,182 Red Eléctrica 1,329,358 0.66
46,027 Repsol YPF 1,090,265 0.55
3,433,974 1.71
BERMUDA362,202 Lancashire Holdings 2,602,166 1.29
2,602,166 1.29
AUSTRIA55,724 Voestalpine 2,078,784 1.03
2,078,784 1.03
JERSEY81,259 Shire 1,741,479 0.87
1,741,479 0.87
UNITED STATES OF AMERICA79,450 Virgin Media 1,684,255 0.84
1,684,255 0.84
IRELAND178,800 Dragon Oil 1,029,916 0.51
1,029,916 0.51
GUERNSEY186,089 Chariot Oil & Gas 380,800 0.18
380,800 0.18
Total Shares and Rights 196,979,896 97.87
Total Transferable Securities Admitted to anOfficial Exchange Listing
196,979,896 97.87
190
JPMorgan Funds - Europe Dynamic FundSchedule of Investments (Market Value Expressed in EUR)
As at 30 June 2011
Quantity/Nominal
Value
Name of Securities Maturity/Coupon
MarketValue
%of
NetAssets
Quantity/Nominal
Value
Name of Securities Maturity/Coupon
MarketValue
%of
NetAssets
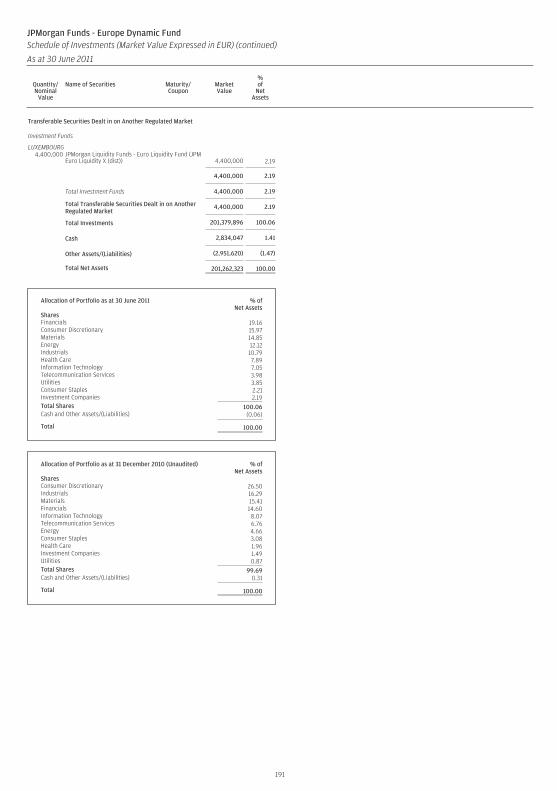
Transferable Securities Dealt in on Another Regulated Market
Investment Funds
LUXEMBOURG4,400,000 JPMorgan Liquidity Funds - Euro Liquidity Fund (JPM
Euro Liquidity X (dist)) 4,400,000 2.19
4,400,000 2.19
Total Investment Funds 4,400,000 2.19
Total Transferable Securities Dealt in on AnotherRegulated Market
4,400,000 2.19
Total Investments 201,379,896 100.06
Cash 2,834,047 1.41
Other Assets/(Liabilities) (2,951,620) (1.47)
Total Net Assets 201,262,323 100.00
Allocation of Portfolio as at 30 June 2011 % ofNet Assets
SharesFinancials 19.16Consumer Discretionary 15.97Materials 14.85Energy 12.12Industrials 10.79Health Care 7.89Information Technology 7.05Telecommunication Services 3.98Utilities 3.85Consumer Staples 2.21Investment Companies 2.19Total Shares 100.06Cash and Other Assets/(Liabilities) (0.06)
Total 100.00
Allocation of Portfolio as at 31 December 2010 (Unaudited) % ofNet Assets
SharesConsumer Discretionary 26.50Industrials 16.29Materials 15.41Financials 14.60Information Technology 8.07Telecommunication Services 6.76Energy 4.66Consumer Staples 3.08Health Care 1.96Investment Companies 1.49Utilities 0.87Total Shares 99.69Cash and Other Assets/(Liabilities) 0.31
Total 100.00
191
JPMorgan Funds - Europe Dynamic FundSchedule of Investments (Market Value Expressed in EUR) (continued)
As at 30 June 2011
Quantity/Nominal
Value
Name of Securities Maturity/Coupon
MarketValue
%of
NetAssets
Quantity/Nominal
Value
Name of Securities Maturity/Coupon
MarketValue
%of
NetAssets
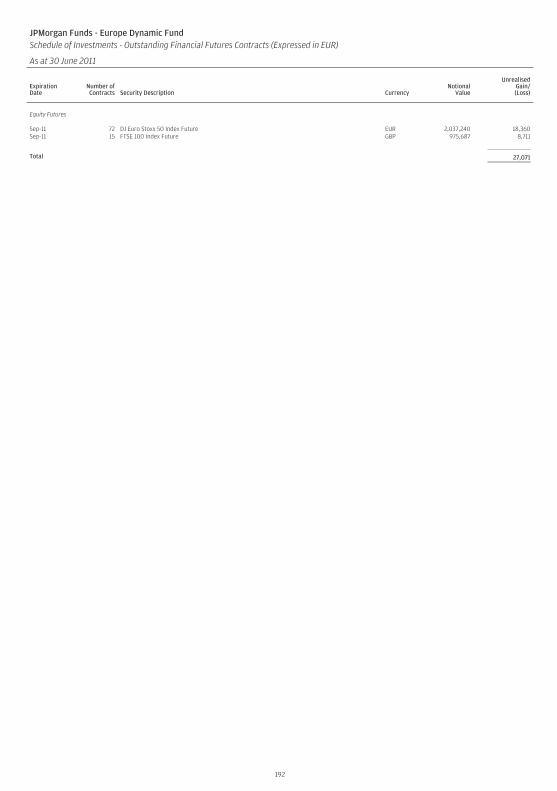
JPMorgan Funds - Europe Dynamic FundSchedule of Investments - Outstanding Financial Futures Contracts (Expressed in EUR)
As at 30 June 2011
ExpirationDate
Number ofContracts Security Description Currency
NotionalValue
UnrealisedGain/(Loss)
Equity Futures
Sep-11 72 DJ Euro Stoxx 50 Index Future EUR 2,037,240 18,360Sep-11 15 FTSE 100 Index Future GBP 975,687 8,711
Total 27,071
192
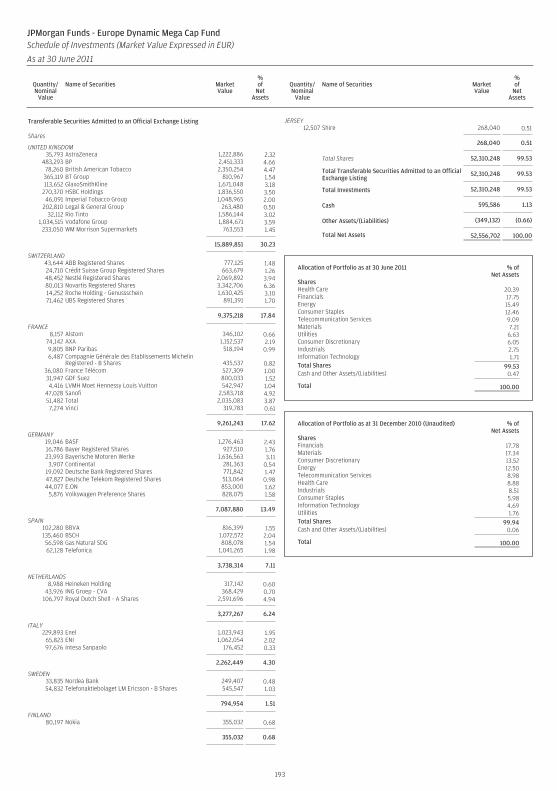
Transferable Securities Admitted to an Official Exchange Listing
Shares
UNITED KINGDOM35,793 AstraZeneca 1,222,886 2.32
483,293 BP 2,451,333 4.6678,260 British American Tobacco 2,350,254 4.47365,119 BT Group 810,967 1.54113,652 GlaxoSmithKline 1,671,048 3.18
270,370 HSBC Holdings 1,836,550 3.5046,091 Imperial Tobacco Group 1,048,965 2.00
202,810 Legal & General Group 263,480 0.5032,112 Rio Tinto 1,586,144 3.02
1,034,515 Vodafone Group 1,884,671 3.59233,050 WM Morrison Supermarkets 763,553 1.45
15,889,851 30.23
SWITZERLAND43,644 ABB Registered Shares 777,125 1.4824,710 Crédit Suisse Group Registered Shares 663,679 1.2648,452 Nestlé Registered Shares 2,069,892 3.9480,013 Novartis Registered Shares 3,342,706 6.3614,252 Roche Holding - Genussschein 1,630,425 3.1071,462 UBS Registered Shares 891,391 1.70
9,375,218 17.84
FRANCE8,157 Alstom 346,102 0.66
74,142 AXA 1,152,537 2.199,805 BNP Paribas 518,194 0.996,487 Compagnie Générale des Etablissements Michelin
Registered - B Shares 435,537 0.8236,080 France Télécom 527,309 1.0031,947 GDF Suez 800,033 1.524,416 LVMH Moet Hennessy Louis Vuitton 542,947 1.04
47,028 Sanofi 2,583,718 4.9251,482 Total 2,035,083 3.877,274 Vinci 319,783 0.61
9,261,243 17.62
GERMANY19,046 BASF 1,276,463 2.4316,786 Bayer Registered Shares 927,510 1.7623,993 Bayerische Motoren Werke 1,636,563 3.113,907 Continental 281,363 0.54
19,092 Deutsche Bank Registered Shares 771,842 1.4747,827 Deutsche Telekom Registered Shares 513,064 0.9844,077 E.ON 853,000 1.62
5,876 Volkswagen Preference Shares 828,075 1.58
7,087,880 13.49
SPAIN102,280 BBVA 816,399 1.55135,460 BSCH 1,072,572 2.0456,598 Gas Natural SDG 808,078 1.5462,128 Telefonica 1,041,265 1.98
3,738,314 7.11
NETHERLANDS8,988 Heineken Holding 317,142 0.60
43,926 ING Groep - CVA 368,429 0.70106,797 Royal Dutch Shell - A Shares 2,591,696 4.94
3,277,267 6.24
ITALY229,893 Enel 1,023,943 1.95
65,823 ENI 1,062,054 2.0297,676 Intesa Sanpaolo 176,452 0.33
2,262,449 4.30
SWEDEN33,835 Nordea Bank 249,407 0.4854,832 Telefonaktiebolaget LM Ericsson - B Shares 545,547 1.03
794,954 1.51
FINLAND80,197 Nokia 355,032 0.68
355,032 0.68
JERSEY12,507 Shire 268,040 0.51
268,040 0.51
Total Shares 52,310,248 99.53
Total Transferable Securities Admitted to an OfficialExchange Listing
52,310,248 99.53
Total Investments 52,310,248 99.53
Cash 595,586 1.13
Other Assets/(Liabilities) (349,132) (0.66)
Total Net Assets 52,556,702 100.00
Allocation of Portfolio as at 30 June 2011 % ofNet Assets
SharesHealth Care 20.39Financials 17.75Energy 15.49Consumer Staples 12.46Telecommunication Services 9.09Materials 7.21Utilities 6.63Consumer Discretionary 6.05Industrials 2.75Information Technology 1.71Total Shares 99.53Cash and Other Assets/(Liabilities) 0.47
Total 100.00
Allocation of Portfolio as at 31 December 2010 (Unaudited) % ofNet Assets
SharesFinancials 17.78Materials 17.34Consumer Discretionary 13.52Energy 12.50Telecommunication Services 8.98Health Care 8.88Industrials 8.51Consumer Staples 5.98Information Technology 4.69Utilities 1.76Total Shares 99.94Cash and Other Assets/(Liabilities) 0.06
Total 100.00
193
JPMorgan Funds - Europe Dynamic Mega Cap FundSchedule of Investments (Market Value Expressed in EUR)
As at 30 June 2011
Quantity/Nominal
Value
Name of Securities MarketValue
%of
NetAssets
Quantity/Nominal
Value
Name of Securities MarketValue
%of
NetAssets
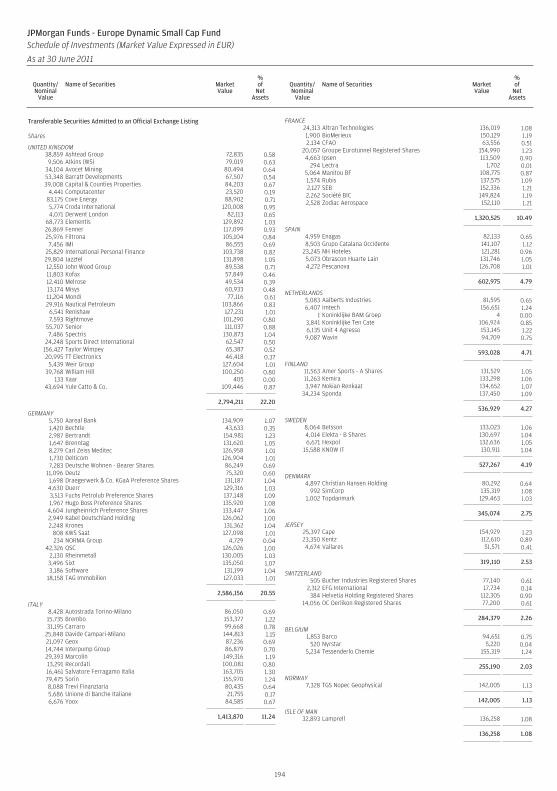
Transferable Securities Admitted to an Official Exchange Listing
Shares
UNITED KINGDOM38,859 Ashtead Group 72,835 0.589,506 Atkins (WS) 79,019 0.63
34,104 Avocet Mining 80,494 0.6453,348 Barratt Developments 67,507 0.5439,008 Capital & Counties Properties 84,203 0.67
4,441 Computacenter 23,520 0.1983,175 Cove Energy 88,902 0.715,774 Croda International 120,008 0.954,071 Derwent London 82,113 0.65
68,773 Elementis 129,892 1.0326,869 Fenner 117,099 0.9325,976 Filtrona 105,104 0.847,456 IMI 86,555 0.69
25,829 International Personal Finance 103,738 0.8229,804 Jazztel 131,898 1.0512,550 John Wood Group 89,538 0.7111,803 Kofax 57,849 0.4612,410 Melrose 49,534 0.3913,174 Misys 60,933 0.4811,204 Mondi 77,116 0.6129,916 Nautical Petroleum 103,866 0.83
6,541 Renishaw 127,231 1.017,593 Rightmove 101,290 0.80
55,707 Senior 111,037 0.887,486 Spectris 130,873 1.04
24,248 Sports Direct International 62,547 0.50156,427 Taylor Wimpey 65,387 0.5220,995 TT Electronics 46,418 0.37
5,439 Weir Group 127,604 1.0139,768 William Hill 100,250 0.80
133 Xaar 405 0.0043,694 Yule Catto & Co. 109,446 0.87
2,794,211 22.20
GERMANY5,750 Aareal Bank 134,909 1.071,420 Bechtle 43,633 0.352,987 Bertrandt 154,981 1.231,647 Brenntag 131,620 1.058,279 Carl Zeiss Meditec 126,958 1.011,730 Delticom 126,904 1.017,283 Deutsche Wohnen - Bearer Shares 86,249 0.69
11,096 Deutz 75,320 0.601,698 Draegerwerk & Co. KGaA Preference Shares 131,187 1.044,630 Duerr 129,316 1.033,513 Fuchs Petrolub Preference Shares 137,148 1.091,967 Hugo Boss Preference Shares 135,920 1.08
4,604 Jungheinrich Preference Shares 133,447 1.062,949 Kabel Deutschland Holding 126,062 1.002,248 Krones 131,362 1.04
808 KWS Saat 127,098 1.01234 NORMA Group 4,729 0.04
42,326 QSC 126,026 1.002,130 Rheinmetall 130,005 1.033,496 Sixt 135,050 1.073,186 Software 131,199 1.04
18,158 TAG Immobilien 127,033 1.01
2,586,156 20.55
ITALY8,428 Autostrada Torino-Milano 86,050 0.6915,735 Brembo 153,377 1.2231,195 Carraro 99,668 0.78
25,848 Davide Campari-Milano 144,813 1.1521,097 Geox 87,236 0.6914,744 Interpump Group 86,879 0.7029,393 Marcolin 149,316 1.1913,291 Recordati 100,081 0.8016,461 Salvatore Ferragamo Italia 163,705 1.3079,475 Sorin 155,970 1.248,088 Trevi Finanziaria 80,435 0.645,686 Unione di Banche Italiane 21,755 0.176,676 Yoox 84,585 0.67
1,413,870 11.24
FRANCE24,313 Altran Technologies 136,019 1.081,900 BioMerieux 150,129 1.192,134 CFAO 63,556 0.51
20,057 Groupe Eurotunnel Registered Shares 154,990 1.234,663 Ipsen 113,509 0.90
294 Lectra 1,702 0.015,064 Manitou BF 108,775 0.871,574 Rubis 137,575 1.092,127 SEB 152,336 1.212,262 Société BIC 149,824 1.192,528 Zodiac Aerospace 152,110 1.21
1,320,525 10.49
SPAIN4,959 Enagas 82,133 0.658,503 Grupo Catalana Occidente 141,107 1.12
23,245 NH Hoteles 121,281 0.965,073 Obrascon Huarte Lain 131,746 1.054,272 Pescanova 126,708 1.01
602,975 4.79
NETHERLANDS5,083 Aalberts Industries 81,595 0.656,407 Imtech 156,651 1.24
1 Koninklijke BAM Groep 4 0.003,841 Koninklijke Ten Cate 106,924 0.856,135 Unit 4 Agresso 153,145 1.229,087 Wavin 94,709 0.75
593,028 4.71
FINLAND11,563 Amer Sports - A Shares 131,529 1.0511,263 Kemira 133,298 1.063,947 Nokian Renkaat 134,652 1.07
34,234 Sponda 137,450 1.09
536,929 4.27
SWEDEN8,064 Betsson 133,023 1.064,014 Elekta - B Shares 130,697 1.046,671 Hexpol 132,636 1.05
15,588 KNOW IT 130,911 1.04
527,267 4.19
DENMARK4,897 Christian Hansen Holding 80,292 0.64
992 SimCorp 135,319 1.081,002 Topdanmark 129,463 1.03
345,074 2.75
JERSEY25,397 Cape 154,929 1.2323,350 Kentz 112,610 0.894,674 Vallares 51,571 0.41
319,110 2.53
SWITZERLAND505 Bucher Industries Registered Shares 77,140 0.61
2,312 EFG International 17,734 0.14384 Helvetia Holding Registered Shares 112,305 0.90
14,056 OC Oerlikon Registered Shares 77,200 0.61
284,379 2.26
BELGIUM1,853 Barco 94,651 0.75
520 Nyrstar 5,220 0.045,234 Tessenderlo Chemie 155,319 1.24
255,190 2.03
NORWAY7,328 TGS Nopec Geophysical 142,005 1.13
142,005 1.13
ISLE OF MAN32,893 Lamprell 136,258 1.08
136,258 1.08
194
JPMorgan Funds - Europe Dynamic Small Cap FundSchedule of Investments (Market Value Expressed in EUR)
As at 30 June 2011
Quantity/Nominal
Value
Name of Securities MarketValue
%of
NetAssets
Quantity/Nominal
Value
Name of Securities MarketValue
%of
NetAssets
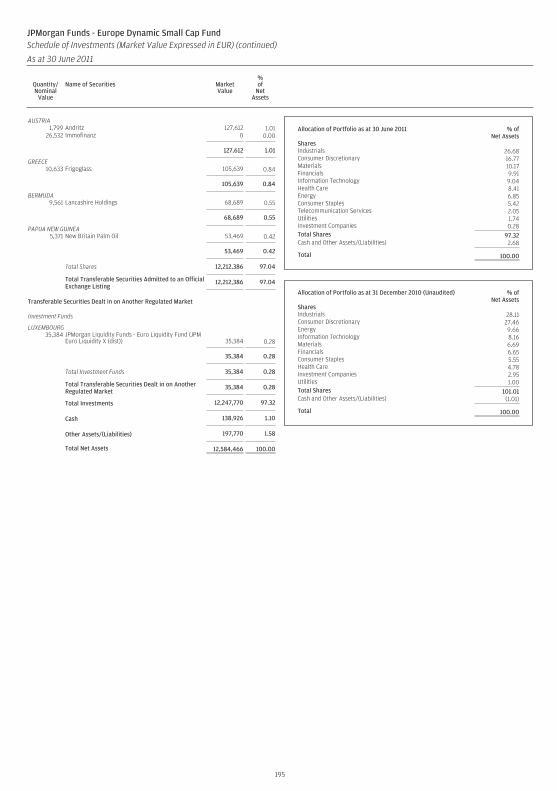
AUSTRIA1,799 Andritz 127,612 1.01
26,532 Immofinanz 0 0.00
127,612 1.01
GREECE10,633 Frigoglass 105,639 0.84
105,639 0.84
BERMUDA9,561 Lancashire Holdings 68,689 0.55
68,689 0.55
PAPUA NEW GUINEA5,371 New Britain Palm Oil 53,469 0.42
53,469 0.42
Total Shares 12,212,386 97.04
Total Transferable Securities Admitted to an OfficialExchange Listing
12,212,386 97.04
Transferable Securities Dealt in on Another Regulated Market
Investment Funds
LUXEMBOURG35,384 JPMorgan Liquidity Funds - Euro Liquidity Fund (JPM
Euro Liquidity X (dist)) 35,384 0.28
35,384 0.28
Total Investment Funds 35,384 0.28
Total Transferable Securities Dealt in on AnotherRegulated Market
35,384 0.28
Total Investments 12,247,770 97.32
Cash 138,926 1.10
Other Assets/(Liabilities) 197,770 1.58
Total Net Assets 12,584,466 100.00
Allocation of Portfolio as at 30 June 2011 % ofNet Assets
SharesIndustrials 26.68Consumer Discretionary 16.77Materials 10.17Financials 9.91Information Technology 9.04Health Care 8.41Energy 6.85Consumer Staples 5.42Telecommunication Services 2.05Utilities 1.74Investment Companies 0.28Total Shares 97.32Cash and Other Assets/(Liabilities) 2.68
Total 100.00
Allocation of Portfolio as at 31 December 2010 (Unaudited) % ofNet Assets
SharesIndustrials 28.11Consumer Discretionary 27.46Energy 9.66Information Technology 8.16Materials 6.69Financials 6.65Consumer Staples 5.55Health Care 4.78Investment Companies 2.95Utilities 1.00Total Shares 101.01Cash and Other Assets/(Liabilities) (1.01)
Total 100.00
195
JPMorgan Funds - Europe Dynamic Small Cap FundSchedule of Investments (Market Value Expressed in EUR) (continued)
As at 30 June 2011
Quantity/Nominal
Value
Name of Securities MarketValue
%of
NetAssets
Quantity/Nominal
Value
Name of Securities MarketValue
%of
NetAssets
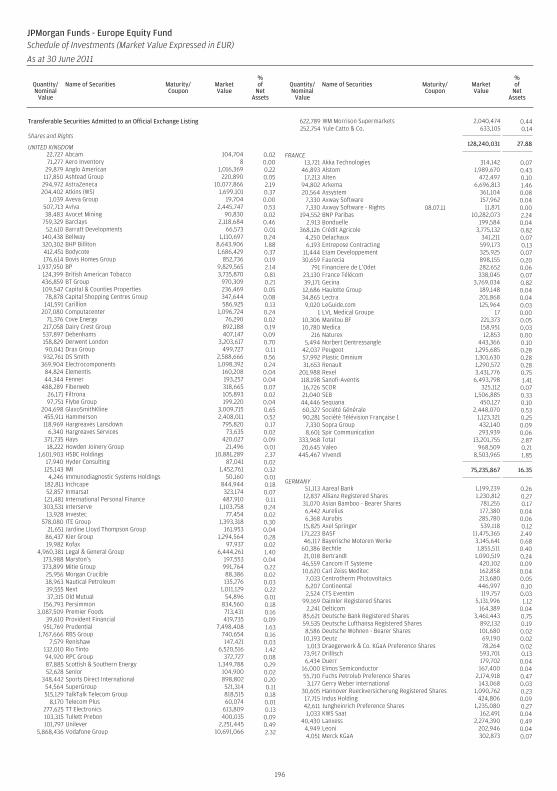
Transferable Securities Admitted to an Official Exchange Listing
Shares and Rights
UNITED KINGDOM22,727 Abcam 104,704 0.0271,277 Aero Inventory 8 0.00
29,879 Anglo American 1,016,369 0.22117,850 Ashtead Group 220,890 0.05294,972 AstraZeneca 10,077,866 2.19204,402 Atkins (WS) 1,699,101 0.37
1,039 Aveva Group 19,704 0.00507,713 Aviva 2,445,747 0.5338,483 Avocet Mining 90,830 0.02
759,329 Barclays 2,118,684 0.4652,610 Barratt Developments 66,573 0.01
140,438 Bellway 1,110,697 0.24320,302 BHP Billiton 8,643,906 1.88412,451 Bodycote 1,686,429 0.37176,614 Bovis Homes Group 852,736 0.19
1,937,950 BP 9,829,565 2.14124,399 British American Tobacco 3,735,870 0.81436,859 BT Group 970,309 0.21109,547 Capital & Counties Properties 236,469 0.0578,878 Capital Shopping Centres Group 347,644 0.08141,591 Carillion 586,925 0.13
207,080 Computacenter 1,096,724 0.2471,376 Cove Energy 76,290 0.02
217,058 Dairy Crest Group 892,188 0.19537,897 Debenhams 407,147 0.09158,829 Derwent London 3,203,617 0.7090,041 Drax Group 499,727 0.11
932,761 DS Smith 2,588,666 0.56369,904 Electrocomponents 1,098,392 0.24
84,824 Elementis 160,208 0.0444,344 Fenner 193,257 0.04
488,289 Fiberweb 318,665 0.0726,171 Filtrona 105,893 0.0297,751 Flybe Group 199,220 0.04
204,698 GlaxoSmithKline 3,009,715 0.65455,911 Hammerson 2,408,011 0.52118,969 Hargreaves Lansdown 795,820 0.17
6,340 Hargreaves Services 73,635 0.02371,735 Hays 420,027 0.0918,222 Howden Joinery Group 21,496 0.01
1,601,903 HSBC Holdings 10,881,289 2.3717,940 Hyder Consulting 87,041 0.02
125,143 IMI 1,452,761 0.324,246 Immunodiagnostic Systems Holdings 50,160 0.01
182,811 Inchcape 844,944 0.1852,857 Inmarsat 323,174 0.07
121,481 International Personal Finance 487,910 0.11303,531 Interserve 1,103,758 0.2413,928 Investec 77,454 0.02
578,080 ITE Group 1,393,318 0.3021,651 Jardine Lloyd Thompson Group 161,953 0.04
86,437 Kier Group 1,294,564 0.2819,982 Kofax 97,937 0.02
4,960,381 Legal & General Group 6,444,261 1.40173,988 Marston’s 197,553 0.04373,899 Mitie Group 991,764 0.22
25,956 Morgan Crucible 88,386 0.0238,963 Nautical Petroleum 135,276 0.0339,555 Next 1,011,129 0.2237,315 Old Mutual 54,896 0.01
156,793 Persimmon 834,560 0.183,087,509 Premier Foods 713,431 0.16
39,610 Provident Financial 419,735 0.09951,769 Prudential 7,498,408 1.63
1,767,666 RBS Group 740,654 0.167,579 Renishaw 147,421 0.03
132,010 Rio Tinto 6,520,516 1.4294,920 RPC Group 372,727 0.0887,885 Scottish & Southern Energy 1,349,788 0.2952,628 Senior 104,900 0.02
348,442 Sports Direct International 898,802 0.2054,564 SuperGroup 521,314 0.11515,129 TalkTalk Telecom Group 818,515 0.18
8,170 Telecom Plus 60,074 0.01277,625 TT Electronics 613,809 0.13103,315 Tullett Prebon 400,035 0.09101,797 Unilever 2,251,445 0.49
5,868,436 Vodafone Group 10,691,066 2.32
622,789 WM Morrison Supermarkets 2,040,474 0.44252,754 Yule Catto & Co. 633,105 0.14
128,240,031 27.88
FRANCE13,721 Akka Technologies 314,142 0.07
46,893 Alstom 1,989,670 0.4317,213 Alten 472,497 0.10
94,802 Arkema 6,696,813 1.4620,564 Assystem 361,104 0.08
7,330 Axway Software 157,962 0.047,330 Axway Software - Rights 08.07.11 11,871 0.00
194,552 BNP Paribas 10,282,073 2.242,913 Bonduelle 199,584 0.04
368,126 Crédit Agricole 3,775,132 0.824,250 Delachaux 341,211 0.076,193 Entrepose Contracting 599,173 0.13
11,444 Etam Developpement 325,925 0.0730,659 Faurecia 898,155 0.20
791 Financiere de L’Odet 282,652 0.0623,130 France Télécom 338,045 0.0739,171 Gecina 3,769,034 0.8212,686 Haulotte Group 189,148 0.0434,865 Lectra 201,868 0.049,020 LeGuide.com 125,964 0.03
1 LVL Medical Groupe 17 0.0010,306 Manitou BF 221,373 0.0510,780 Medica 158,951 0.03
216 Naturex 12,853 0.005,494 Norbert Dentressangle 443,366 0.10
42,037 Peugeot 1,295,685 0.2857,992 Plastic Omnium 1,301,630 0.2831,653 Renault 1,290,572 0.28
201,988 Rexel 3,431,776 0.75118,198 Sanofi-Aventis 6,493,798 1.4116,726 SCOR 325,112 0.0721,040 SEB 1,506,885 0.3344,446 Sequana 450,127 0.1060,327 Société Générale 2,448,070 0.5390,281 Société Télévision Française 1 1,123,321 0.257,330 Sopra Group 432,140 0.098,601 Spir Communication 293,939 0.06
333,968 Total 13,201,755 2.8720,645 Valeo 968,509 0.21
445,467 Vivendi 8,503,965 1.85
75,235,867 16.35
GERMANY51,113 Aareal Bank 1,199,239 0.2612,837 Allianz Registered Shares 1,230,812 0.2731,070 Asian Bamboo - Bearer Shares 781,255 0.176,442 Aurelius 177,380 0.046,368 Aurubis 285,780 0.06
15,825 Axel Springer 539,118 0.12171,223 BASF 11,475,365 2.4946,117 Bayerische Motoren Werke 3,145,641 0.68
60,386 Bechtle 1,855,511 0.4021,018 Bertrandt 1,090,519 0.24
46,559 Cancom IT Systeme 420,102 0.0910,620 Carl Zeiss Meditec 162,858 0.04
7,033 Centrotherm Photovoltaics 213,680 0.056,207 Continental 446,997 0.102,524 CTS Eventim 119,757 0.03
99,169 Daimler Registered Shares 5,131,996 1.122,241 Delticom 164,389 0.04
85,621 Deutsche Bank Registered Shares 3,461,443 0.7559,535 Deutsche Lufthansa Registered Shares 892,132 0.198,586 Deutsche Wohnen - Bearer Shares 101,680 0.02
10,193 Deutz 69,190 0.021,013 Draegerwerk & Co. KGaA Preference Shares 78,264 0.02
73,917 Drillisch 593,701 0.136,434 Duerr 179,702 0.04
16,000 Elmos Semiconductor 167,400 0.0455,710 Fuchs Petrolub Preference Shares 2,174,918 0.47
3,177 Gerry Weber International 143,068 0.0330,605 Hannover Rueckversicherung Registered Shares 1,090,762 0.2317,715 Indus Holding 424,806 0.0942,611 Jungheinrich Preference Shares 1,235,080 0.271,033 KWS Saat 162,491 0.04
40,430 Lanxess 2,274,390 0.494,949 Leoni 202,946 0.044,051 Merck KGaA 302,873 0.07
196
JPMorgan Funds - Europe Equity FundSchedule of Investments (Market Value Expressed in EUR)
As at 30 June 2011
Quantity/Nominal
Value
Name of Securities Maturity/Coupon
MarketValue
%of
NetAssets
Quantity/Nominal
Value
Name of Securities Maturity/Coupon
MarketValue
%of
NetAssets
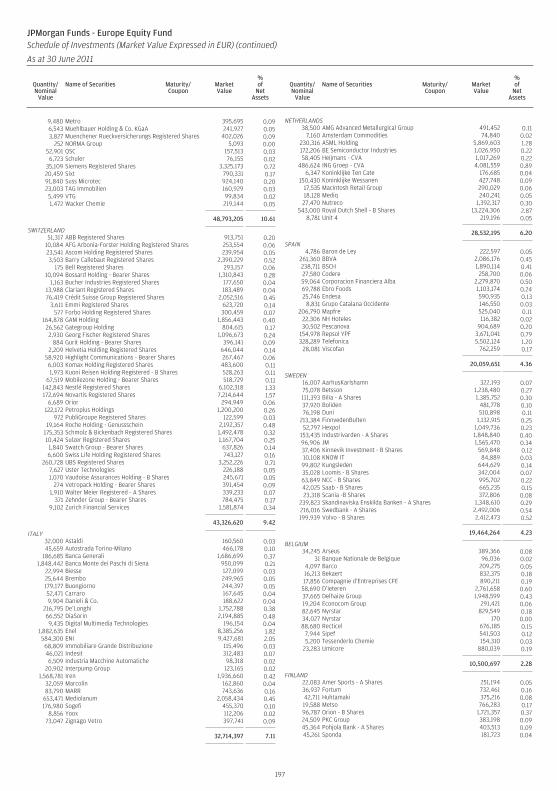
9,480 Metro 395,695 0.096,543 Muehlbauer Holding & Co. KGaA 241,927 0.053,827 Muenchener Rueckversicherungs Registered Shares 402,026 0.09
252 NORMA Group 5,093 0.0052,901 QSC 157,513 0.036,723 Schuler 76,155 0.02
35,109 Siemens Registered Shares 3,325,173 0.7220,459 Sixt 790,331 0.1791,840 Suss Microtec 924,140 0.2023,003 TAG Immobilien 160,929 0.035,499 VTG 99,834 0.021,472 Wacker Chemie 219,144 0.05
48,793,205 10.61
SWITZERLAND51,317 ABB Registered Shares 913,751 0.20
10,084 AFG Arbonia-Forster Holding Registered Shares 253,554 0.0623,541 Ascom Holding Registered Shares 239,954 0.053,503 Barry Callebaut Registered Shares 2,390,229 0.52
175 Bell Registered Shares 293,157 0.0610,094 Bossard Holding - Bearer Shares 1,310,843 0.28
1,163 Bucher Industries Registered Shares 177,650 0.0413,988 Clariant Registered Shares 183,489 0.0476,419 Crédit Suisse Group Registered Shares 2,052,516 0.45
3,611 Emmi Registered Shares 623,720 0.14577 Forbo Holding Registered Shares 300,459 0.07
164,878 GAM Holding 1,856,443 0.4026,562 Gategroup Holding 804,615 0.172,930 Georg Fischer Registered Shares 1,096,673 0.24
884 Gurit Holding - Bearer Shares 396,141 0.092,209 Helvetia Holding Registered Shares 646,044 0.14
58,920 Highlight Communications - Bearer Shares 267,467 0.066,003 Komax Holding Registered Shares 483,600 0.111,973 Kuoni Reisen Holding Registered - B Shares 528,263 0.11
67,519 Mobilezone Holding - Bearer Shares 518,729 0.11142,843 Nestlé Registered Shares 6,102,318 1.33172,694 Novartis Registered Shares 7,214,644 1.57
6,689 Orior 294,949 0.06122,172 Petroplus Holdings 1,200,200 0.26
972 PubliGroupe Registered Shares 122,599 0.0319,164 Roche Holding - Genussschein 2,192,357 0.48
175,353 Schmolz & Bickenbach Registered Shares 1,492,478 0.3210,424 Sulzer Registered Shares 1,167,704 0.25
1,840 Swatch Group - Bearer Shares 637,826 0.146,600 Swiss Life Holding Registered Shares 743,127 0.16
260,728 UBS Registered Shares 3,252,226 0.717,627 Uster Technologies 226,188 0.051,070 Vaudoise Assurances Holding - B Shares 245,671 0.05
274 Vetropack Holding - Bearer Shares 391,454 0.091,910 Walter Meier Registered - A Shares 339,233 0.07
371 Zehnder Group - Bearer Shares 784,475 0.179,102 Zurich Financial Services 1,581,874 0.34
43,326,620 9.42
ITALY32,000 Astaldi 160,560 0.0345,659 Autostrada Torino-Milano 466,178 0.10
186,685 Banca Generali 1,686,699 0.371,848,442 Banca Monte dei Paschi di Siena 950,099 0.21
22,994 Biesse 127,099 0.0325,644 Brembo 249,965 0.05179,177 Buongiorno 244,397 0.0552,471 Carraro 167,645 0.049,904 Danieli & Co. 188,622 0.04
216,795 De’Longhi 1,752,788 0.3866,552 DiaSorin 2,194,885 0.489,435 Digital Multimedia Technologies 196,154 0.04
1,882,635 Enel 8,385,256 1.82584,300 ENI 9,427,681 2.0568,809 Immobiliare Grande Distribuzione 115,496 0.0346,021 Indesit 312,483 0.076,509 Industria Macchine Automatiche 98,318 0.02
20,902 Interpump Group 123,165 0.021,568,781 Iren 1,936,660 0.42
32,059 Marcolin 162,860 0.0483,790 MARR 743,636 0.16
653,471 Mediolanum 2,058,434 0.45176,980 Sogefi 455,370 0.10
8,856 Yoox 112,206 0.0273,047 Zignago Vetro 397,741 0.09
32,714,397 7.11
NETHERLANDS38,500 AMG Advanced Metallurgical Group 491,452 0.11
7,160 Amsterdam Commodities 74,840 0.02230,316 ASML Holding 5,869,603 1.28172,206 BE Semiconductor Industries 1,026,950 0.2258,405 Heijmans - CVA 1,017,269 0.22
486,624 ING Groep - CVA 4,081,559 0.896,347 Koninklijke Ten Cate 176,685 0.04
150,430 Koninklijke Wessanen 427,748 0.0917,535 Macintosh Retail Group 290,029 0.0618,128 Mediq 240,241 0.0527,470 Nutreco 1,392,317 0.30
543,000 Royal Dutch Shell - B Shares 13,224,306 2.878,781 Unit 4 219,196 0.05
28,532,195 6.20
SPAIN4,786 Baron de Ley 222,597 0.05
261,360 BBVA 2,086,176 0.45238,711 BSCH 1,890,114 0.4127,580 Codere 258,700 0.0659,064 Corporacion Financiera Alba 2,279,870 0.5069,788 Ebro Foods 1,103,174 0.2425,746 Endesa 590,935 0.13
8,831 Grupo Catalana Occidente 146,550 0.03206,790 Mapfre 525,040 0.11
22,306 NH Hoteles 116,382 0.0230,502 Pescanova 904,689 0.20
154,978 Repsol YPF 3,671,041 0.79328,289 Telefonica 5,502,124 1.20
28,081 Viscofan 762,259 0.17
20,059,651 4.36
SWEDEN16,007 AarhusKarlshamn 322,193 0.0775,078 Betsson 1,238,480 0.27111,393 Bilia - A Shares 1,385,752 0.3037,920 Boliden 481,778 0.1076,198 Duni 510,898 0.11
213,384 FinnvedenBulten 1,132,915 0.2552,797 Hexpol 1,049,736 0.23
153,435 Industrivarden - A Shares 1,848,840 0.4096,906 JM 1,565,470 0.3437,406 Kinnevik Investment - B Shares 569,848 0.1210,108 KNOW IT 84,889 0.0399,802 Kungsleden 644,629 0.1435,028 Loomis - B Shares 342,004 0.0763,849 NCC - B Shares 995,702 0.2242,025 Saab - B Shares 665,235 0.1523,318 Scania -B Shares 372,806 0.08
239,823 Skandinaviska Enskilda Banken - A Shares 1,348,610 0.29216,016 Swedbank - A Shares 2,492,006 0.54199,939 Volvo - B Shares 2,412,473 0.52
19,464,264 4.23
BELGIUM34,245 Arseus 389,366 0.08
31 Banque Nationale de Belgique 96,036 0.024,097 Barco 209,275 0.0516,213 Bekaert 832,375 0.1817,856 Compagnie d’Entreprises CFE 890,211 0.19
58,690 D’ieteren 2,761,658 0.6037,665 Delhaize Group 1,948,599 0.4319,204 Econocom Group 291,421 0.0682,645 Nyrstar 829,549 0.1834,027 Nyrstar 170 0.0088,680 Recticel 676,185 0.15
7,944 Sipef 541,503 0.125,200 Tessenderlo Chemie 154,310 0.03
23,283 Umicore 880,039 0.19
10,500,697 2.28
FINLAND22,083 Amer Sports - A Shares 251,194 0.0536,937 Fortum 732,461 0.1642,711 Huhtamaki 375,216 0.0819,588 Metso 766,283 0.1796,787 Orion - B Shares 1,721,357 0.3724,509 PKC Group 383,198 0.0945,364 Pohjola Bank - A Shares 403,513 0.0945,261 Sponda 181,723 0.04
197
JPMorgan Funds - Europe Equity FundSchedule of Investments (Market Value Expressed in EUR) (continued)
As at 30 June 2011
Quantity/Nominal
Value
Name of Securities Maturity/Coupon
MarketValue
%of
NetAssets
Quantity/Nominal
Value
Name of Securities Maturity/Coupon
MarketValue
%of
NetAssets
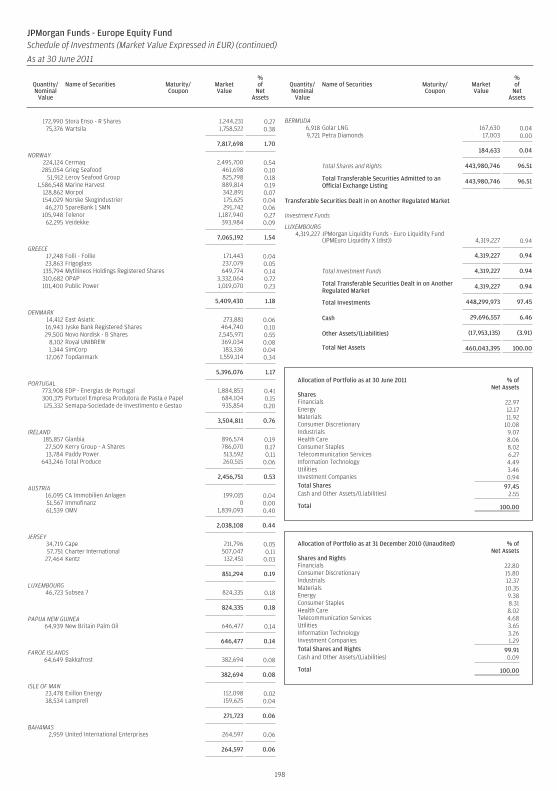
172,990 Stora Enso - R Shares 1,244,231 0.2775,376 Wartsila 1,758,522 0.38
7,817,698 1.70
NORWAY224,124 Cermaq 2,495,700 0.54285,054 Grieg Seafood 461,698 0.10
51,912 Leroy Seafood Group 825,798 0.181,586,548 Marine Harvest 889,814 0.19
128,862 Morpol 342,891 0.07154,029 Norske Skogindustrier 175,625 0.0446,270 SpareBank 1 SMN 291,742 0.06
105,948 Telenor 1,187,940 0.2762,295 Veidekke 393,984 0.09
7,065,192 1.54
GREECE17,248 Folli - Follie 171,443 0.0423,863 Frigoglass 237,079 0.05
135,794 Mytilineos Holdings Registered Shares 649,774 0.14310,682 OPAP 3,332,064 0.72101,400 Public Power 1,019,070 0.23
5,409,430 1.18
DENMARK14,412 East Asiatic 273,881 0.0616,943 Jyske Bank Registered Shares 464,740 0.1029,500 Novo Nordisk - B Shares 2,545,971 0.55
8,102 Royal UNIBREW 369,034 0.081,344 SimCorp 183,336 0.04
12,067 Topdanmark 1,559,114 0.34
5,396,076 1.17
PORTUGAL773,908 EDP - Energias de Portugal 1,884,853 0.41300,375 Portucel Empresa Produtora de Pasta e Papel 684,104 0.15125,332 Semapa-Sociedade de Investimento e Gestao 935,854 0.20
3,504,811 0.76
IRELAND185,857 Glanbia 896,574 0.1927,509 Kerry Group - A Shares 786,070 0.1713,784 Paddy Power 513,592 0.11
643,246 Total Produce 260,515 0.06
2,456,751 0.53
AUSTRIA16,095 CA Immobilien Anlagen 199,015 0.0451,567 Immofinanz 0 0.0061,539 OMV 1,839,093 0.40
2,038,108 0.44
JERSEY34,719 Cape 211,796 0.0557,751 Charter International 507,047 0.11
27,464 Kentz 132,451 0.03
851,294 0.19
LUXEMBOURG46,723 Subsea 7 824,335 0.18
824,335 0.18
PAPUA NEW GUINEA64,939 New Britain Palm Oil 646,477 0.14
646,477 0.14
FAROE ISLANDS64,649 Bakkafrost 382,694 0.08
382,694 0.08
ISLE OF MAN23,478 Exillon Energy 112,098 0.0238,534 Lamprell 159,625 0.04
271,723 0.06
BAHAMAS2,959 United International Enterprises 264,597 0.06
264,597 0.06
BERMUDA6,918 Golar LNG 167,630 0.049,721 Petra Diamonds 17,003 0.00
184,633 0.04
Total Shares and Rights 443,980,746 96.51
Total Transferable Securities Admitted to anOfficial Exchange Listing
443,980,746 96.51
Transferable Securities Dealt in on Another Regulated Market
Investment Funds
LUXEMBOURG4,319,227 JPMorgan Liquidity Funds - Euro Liquidity Fund
(JPMEuro Liquidity X (dist)) 4,319,227 0.94
4,319,227 0.94
Total Investment Funds 4,319,227 0.94
Total Transferable Securities Dealt in on AnotherRegulated Market
4,319,227 0.94
Total Investments 448,299,973 97.45
Cash 29,696,557 6.46
Other Assets/(Liabilities) (17,953,135) (3.91)
Total Net Assets 460,043,395 100.00
Allocation of Portfolio as at 30 June 2011 % ofNet Assets
SharesFinancials 22.97Energy 12.17Materials 11.92Consumer Discretionary 10.08Industrials 9.07Health Care 8.06Consumer Staples 8.02Telecommunication Services 6.27Information Technology 4.49Utilities 3.46Investment Companies 0.94Total Shares 97.45Cash and Other Assets/(Liabilities) 2.55
Total 100.00
Allocation of Portfolio as at 31 December 2010 (Unaudited) % ofNet Assets
Shares and RightsFinancials 22.80Consumer Discretionary 15.80Industrials 12.37Materials 10.35Energy 9.38Consumer Staples 8.31Health Care 8.02Telecommunication Services 4.68Utilities 3.65Information Technology 3.26Investment Companies 1.29Total Shares and Rights 99.91Cash and Other Assets/(Liabilities) 0.09
Total 100.00
198
JPMorgan Funds - Europe Equity FundSchedule of Investments (Market Value Expressed in EUR) (continued)
As at 30 June 2011
Quantity/Nominal
Value
Name of Securities Maturity/Coupon
MarketValue
%of
NetAssets
Quantity/Nominal
Value
Name of Securities Maturity/Coupon
MarketValue
%of
NetAssets

JPMorgan Funds - Europe Equity FundSchedule of Investments - Outstanding Financial Futures Contracts (Expressed in EUR)
As at 30 June 2011
ExpirationDate
Number ofContracts Security Description Currency
NotionalValue
UnrealisedGain/(Loss)
Equity Futures
Sep-11 316 DJ Euro Stoxx 50 Index Future EUR 8,941,220 21,741Sep-11 86 FTSE 100 Index Future GBP 5,593,939 25,144
Total 46,885
199
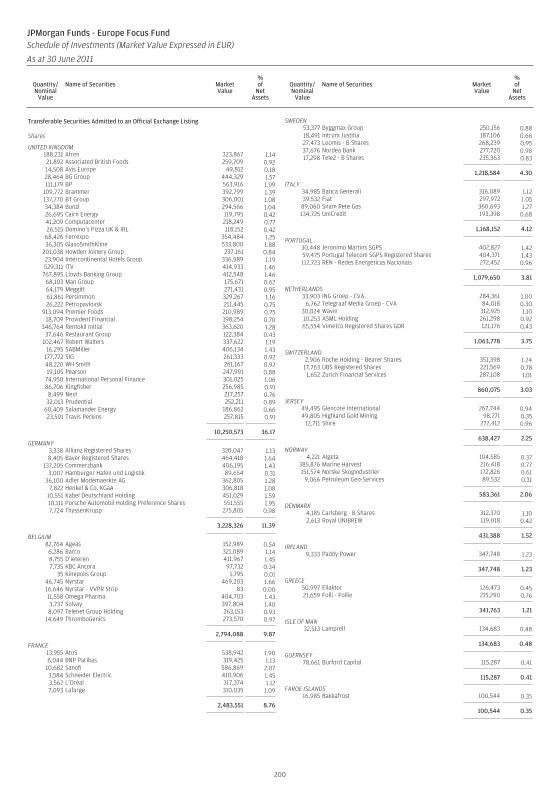
Transferable Securities Admitted to an Official Exchange Listing
Shares
UNITED KINGDOM188,231 Afren 323,867 1.1421,892 Associated British Foods 259,709 0.9214,508 Avis Europe 49,812 0.1828,464 BG Group 444,329 1.57111,179 BP 563,916 1.99
109,772 Brammer 392,799 1.39137,770 BT Group 306,001 1.0834,384 Bunzl 294,566 1.0426,695 Cairn Energy 119,795 0.4241,209 Computacenter 218,249 0.7726,515 Domino’s Pizza UK & IRL 118,152 0.42
68,426 Ferrexpo 354,484 1.2536,305 GlaxoSmithKline 533,800 1.88
201,038 Howden Joinery Group 237,161 0.8423,904 Intercontinental Hotels Group 336,989 1.19529,311 ITV 414,933 1.46
767,895 Lloyds Banking Group 412,548 1.4668,103 Man Group 175,671 0.6264,179 Meggitt 271,431 0.9561,861 Persimmon 329,267 1.1626,222 Petropavlovsk 211,445 0.75
913,094 Premier Foods 210,989 0.7518,709 Provident Financial 198,254 0.70
346,764 Rentokil Initial 363,620 1.2837,646 Restaurant Group 122,384 0.43
102,467 Robert Walters 337,622 1.1916,295 SABMiller 406,134 1.43
177,772 SIG 261,333 0.9248,220 WH Smith 261,167 0.9219,105 Pearson 247,991 0.88
74,950 International Personal Finance 301,025 1.0686,706 Kingfisher 256,985 0.918,499 Next 217,257 0.7632,013 Prudential 252,211 0.89
60,409 Salamander Energy 186,862 0.6623,591 Travis Perkins 257,815 0.91
10,250,573 36.17
GERMANY3,338 Allianz Registered Shares 320,047 1.138,405 Bayer Registered Shares 464,418 1.64
137,205 Commerzbank 406,195 1.433,007 Hamburger Hafen und Logistik 89,654 0.31
36,100 Adler Modemaerkte AG 362,805 1.287,822 Henkel & Co. KGaA 306,818 1.08
10,551 Kabel Deutschland Holding 451,029 1.5910,111 Porsche Automobil Holding Preference Shares 551,555 1.957,724 ThyssenKrupp 275,805 0.98
3,228,326 11.39
BELGIUM82,764 Ageas 152,989 0.54
6,286 Barco 321,089 1.148,755 D’ieteren 411,967 1.457,735 KBC Ancora 97,732 0.34
35 Kinepolis Group 1,795 0.0146,745 Nyrstar 469,203 1.6616,646 Nyrstar - VVPR Strip 83 0.0011,558 Omega Pharma 404,703 1.433,737 Solvay 397,804 1.408,097 Telenet Group Holding 263,153 0.93
14,649 ThromboGenics 273,570 0.97
2,794,088 9.87
FRANCE13,955 AtoS 538,942 1.906,044 BNP Paribas 319,425 1.13
10,682 Sanofi 586,869 2.073,584 Schneider Electric 410,906 1.453,562 L’Oréal 317,374 1.127,093 Lafarge 310,035 1.09
2,483,551 8.76
SWEDEN53,377 Byggmax Group 250,156 0.8818,491 Intrum Justitia 187,106 0.6627,473 Loomis - B Shares 268,239 0.9537,676 Nordea Bank 277,720 0.9817,298 Tele2 - B Shares 235,363 0.83
1,218,584 4.30
ITALY34,985 Banca Generali 316,089 1.1239,532 Fiat 297,972 1.05
89,060 Snam Rete Gas 360,693 1.27134,725 UniCredit 193,398 0.68
1,168,152 4.12
PORTUGAL30,448 Jeronimo Martins SGPS 402,827 1.4259,475 Portugal Telecom SGPS Registered Shares 404,371 1.43112,723 REN - Redes Energeticas Nacionais 272,452 0.96
1,079,650 3.81
NETHERLANDS33,903 ING Groep - CVA 284,361 1.00
6,762 Telegraaf Media Groep - CVA 84,018 0.3030,024 Wavin 312,925 1.1010,253 ASML Holding 261,298 0.9265,554 Vimetco Registered Shares GDR 121,176 0.43
1,063,778 3.75
SWITZERLAND2,906 Roche Holding - Bearer Shares 351,398 1.2417,763 UBS Registered Shares 221,569 0.781,652 Zurich Financial Services 287,108 1.01
860,075 3.03
JERSEY49,495 Glencore International 267,744 0.9449,805 Highland Gold Mining 98,271 0.35
12,711 Shire 272,412 0.96
638,427 2.25
NORWAY4,221 Algeta 104,585 0.37
385,876 Marine Harvest 216,418 0.77151,574 Norske Skogindustrier 172,826 0.61
9,066 Petroleum Geo-Services 89,532 0.31
583,361 2.06
DENMARK4,185 Carlsberg - B Shares 312,370 1.102,613 Royal UNIBREW 119,018 0.42
431,388 1.52
IRELAND9,333 Paddy Power 347,748 1.23
347,748 1.23
GREECE50,997 Ellaktor 126,473 0.4521,659 Folli - Follie 215,290 0.76
341,763 1.21
ISLE OF MAN32,513 Lamprell 134,683 0.48
134,683 0.48
GUERNSEY78,661 Burford Capital 115,287 0.41
115,287 0.41
FAROE ISLANDS16,985 Bakkafrost 100,544 0.35
100,544 0.35
200
JPMorgan Funds - Europe Focus FundSchedule of Investments (Market Value Expressed in EUR)
As at 30 June 2011
Quantity/Nominal
Value
Name of Securities MarketValue
%of
NetAssets
Quantity/Nominal
Value
Name of Securities MarketValue
%of
NetAssets
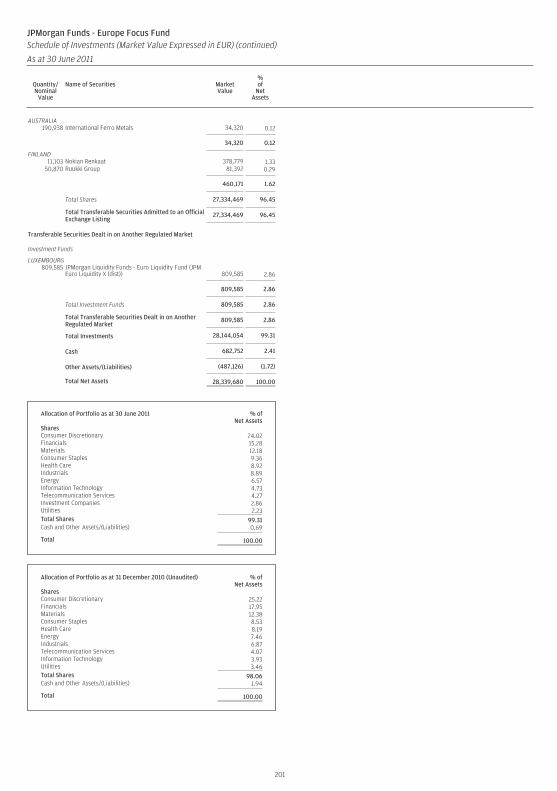
AUSTRALIA190,938 International Ferro Metals 34,320 0.12
34,320 0.12
FINLAND11,103 Nokian Renkaat 378,779 1.33
50,870 Ruukki Group 81,392 0.29
460,171 1.62
Total Shares 27,334,469 96.45
Total Transferable Securities Admitted to an OfficialExchange Listing
27,334,469 96.45
Transferable Securities Dealt in on Another Regulated Market
Investment Funds
LUXEMBOURG809,585 JPMorgan Liquidity Funds - Euro Liquidity Fund (JPM
Euro Liquidity X (dist)) 809,585 2.86
809,585 2.86
Total Investment Funds 809,585 2.86
Total Transferable Securities Dealt in on AnotherRegulated Market
809,585 2.86
Total Investments 28,144,054 99.31
Cash 682,752 2.41
Other Assets/(Liabilities) (487,126) (1.72)
Total Net Assets 28,339,680 100.00
Allocation of Portfolio as at 30 June 2011 % ofNet Assets
SharesConsumer Discretionary 24.02Financials 15.28Materials 12.18Consumer Staples 9.36Health Care 8.92Industrials 8.89Energy 6.57Information Technology 4.73Telecommunication Services 4.27Investment Companies 2.86Utilities 2.23Total Shares 99.31Cash and Other Assets/(Liabilities) 0.69
Total 100.00
Allocation of Portfolio as at 31 December 2010 (Unaudited) % ofNet Assets
SharesConsumer Discretionary 25.22Financials 17.95Materials 12.38Consumer Staples 8.53Health Care 8.19Energy 7.46Industrials 6.87Telecommunication Services 4.07Information Technology 3.93Utilities 3.46Total Shares 98.06Cash and Other Assets/(Liabilities) 1.94
Total 100.00
201
JPMorgan Funds - Europe Focus FundSchedule of Investments (Market Value Expressed in EUR) (continued)
As at 30 June 2011
Quantity/Nominal
Value
Name of Securities MarketValue
%of
NetAssets
Quantity/Nominal
Value
Name of Securities MarketValue
%of
NetAssets
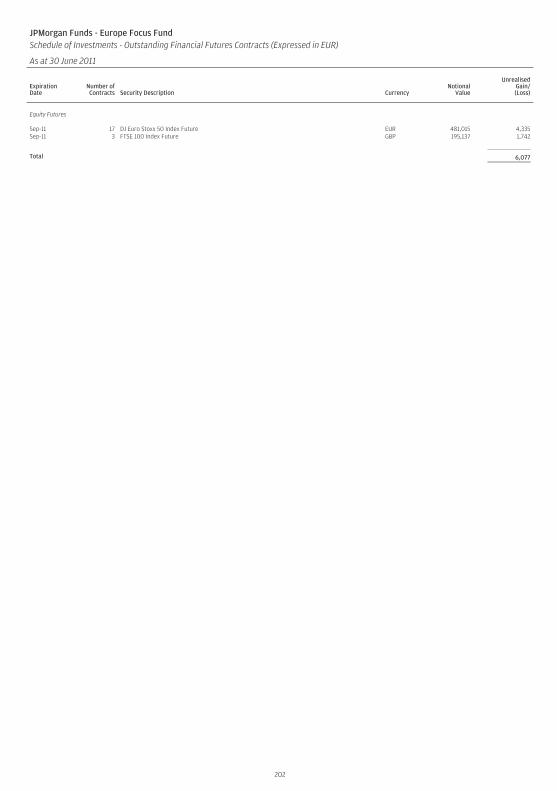
JPMorgan Funds - Europe Focus FundSchedule of Investments - Outstanding Financial Futures Contracts (Expressed in EUR)
As at 30 June 2011
ExpirationDate
Number ofContracts Security Description Currency
NotionalValue
UnrealisedGain/(Loss)
Equity Futures
Sep-11 17 DJ Euro Stoxx 50 Index Future EUR 481,015 4,335Sep-11 3 FTSE 100 Index Future GBP 195,137 1,742
Total 6,077
202
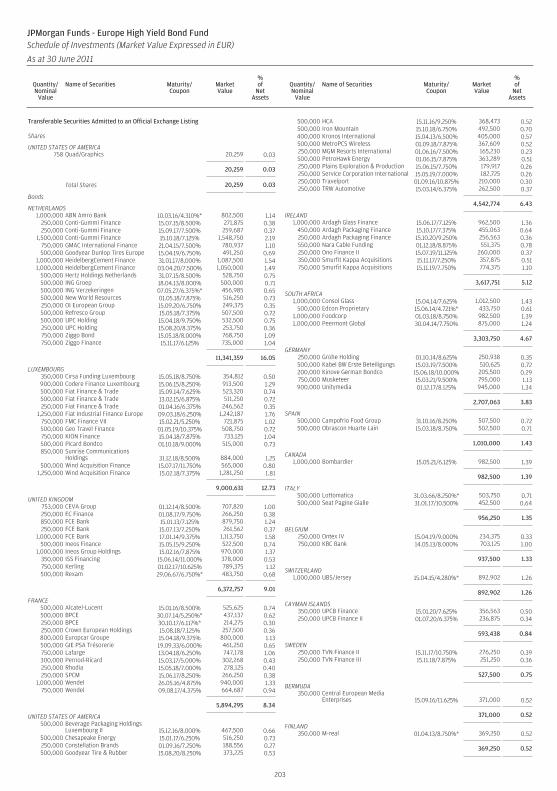
Transferable Securities Admitted to an Official Exchange Listing
Shares
UNITED STATES OF AMERICA758 Quad/Graphics 20,259 0.03
20,259 0.03
Total Shares 20,259 0.03
Bonds
NETHERLANDS1,000,000 ABN Amro Bank 10.03.16/4.310%* 802,500 1.14
250,000 Conti-Gummi Finance 15.07.15/8.500% 271,875 0.38250,000 Conti-Gummi Finance 15.09.17/7.500% 259,687 0.37
1,500,000 Conti-Gummi Finance 15.10.18/7.125% 1,548,750 2.19750,000 GMAC International Finance 21.04.15/7.500% 780,937 1.10500,000 Goodyear Dunlop Tires Europe 15.04.19/6.750% 491,250 0.69
1,000,000 HeidelbergCement Finance 31.01.17/8.000% 1,087,500 1.541,000,000 HeidelbergCement Finance 03.04.20/7.500% 1,050,000 1.49
500,000 Hertz Holdings Netherlands 31.07.15/8.500% 528,750 0.75500,000 ING Groep 18.04.13/8.000% 500,000 0.71500,000 ING Verzekeringen 07.05.27/6.375%* 456,985 0.65500,000 New World Resources 01.05.18/7.875% 516,250 0.73250,000 OI European Group 15.09.20/6.750% 249,375 0.35500,000 Refresco Group 15.05.18/7.375% 507,500 0.72500,000 UPC Holding 15.04.18/9.750% 532,500 0.75250,000 UPC Holding 15.08.20/8.375% 253,750 0.36750,000 Ziggo Bond 15.05.18/8.000% 768,750 1.09750,000 Ziggo Finance 15.11.17/6.125% 735,000 1.04
11,341,359 16.05
LUXEMBOURG350,000 Cirsa Funding Luxembourg 15.05.18/8.750% 354,812 0.50900,000 Codere Finance Luxembourg 15.06.15/8.250% 913,500 1.29500,000 Fiat Finance & Trade 15.09.14/7.625% 523,320 0.74500,000 Fiat Finance & Trade 13.02.15/6.875% 511,250 0.72250,000 Fiat Finance & Trade 01.04.16/6.375% 246,562 0.35
1,250,000 Fiat Industrial Finance Europe 09.03.18/6.250% 1,242,187 1.76750,000 FMC Finance VII 15.02.21/5.250% 721,875 1.02500,000 Geo Travel Finance 01.05.19/10.375% 508,750 0.72750,000 KION Finance 15.04.18/7.875% 733,125 1.04500,000 Picard Bondco 01.10.18/9.000% 515,000 0.73850,000 Sunrise Communications
Holdings 31.12.18/8.500% 884,000 1.25500,000 Wind Acquisition Finance 15.07.17/11.750% 565,000 0.80
1,250,000 Wind Acquisition Finance 15.02.18/7.375% 1,281,250 1.81
9,000,631 12.73
UNITED KINGDOM753,000 CEVA Group 01.12.14/8.500% 707,820 1.00250,000 EC Finance 01.08.17/9.750% 266,250 0.38850,000 FCE Bank 15.01.13/7.125% 879,750 1.24250,000 FCE Bank 15.07.13/7.250% 261,562 0.37
1,000,000 FCE Bank 17.01.14/9.375% 1,113,750 1.58500,000 Ineos Finance 15.05.15/9.250% 522,500 0.74
1,000,000 Ineos Group Holdings 15.02.16/7.875% 970,000 1.37350,000 ISS Financing 15.06.14/11.000% 378,000 0.53750,000 Kerling 01.02.17/10.625% 789,375 1.12500,000 Rexam 29.06.67/6.750%* 483,750 0.68
6,372,757 9.01
FRANCE500,000 Alcatel-Lucent 15.01.16/8.500% 525,625 0.74500,000 BPCE 30.07.14/5.250%* 437,137 0.62250,000 BPCE 30.10.17/6.117%* 214,275 0.30250,000 Crown European Holdings 15.08.18/7.125% 257,500 0.36800,000 Europcar Groupe 15.04.18/9.375% 800,000 1.13500,000 GIE PSA Trésorerie 19.09.33/6.000% 461,250 0.65750,000 Lafarge 13.04.18/6.250% 747,178 1.06300,000 Pernod-Ricard 15.03.17/5.000% 302,268 0.43250,000 Rhodia 15.05.18/7.000% 278,125 0.40250,000 SPCM 15.06.17/8.250% 266,250 0.38
1,000,000 Wendel 26.05.16/4.875% 940,000 1.33750,000 Wendel 09.08.17/4.375% 664,687 0.94
5,894,295 8.34
UNITED STATES OF AMERICA500,000 Beverage Packaging Holdings
Luxembourg II 15.12.16/8.000% 467,500 0.66500,000 Chesapeake Energy 15.01.17/6.250% 516,250 0.73250,000 Constellation Brands 01.09.16/7.250% 188,556 0.27500,000 Goodyear Tire & Rubber 15.08.20/8.250% 373,225 0.53
500,000 HCA 15.11.16/9.250% 368,473 0.52500,000 Iron Mountain 15.10.18/6.750% 492,500 0.70400,000 Kronos International 15.04.13/6.500% 405,000 0.57500,000 MetroPCS Wireless 01.09.18/7.875% 367,609 0.52250,000 MGM Resorts International 01.06.16/7.500% 165,230 0.23500,000 PetroHawk Energy 01.06.15/7.875% 363,289 0.51250,000 Plains Exploration & Production 15.06.15/7.750% 179,917 0.26250,000 Service Corporation International 15.05.19/7.000% 182,725 0.26250,000 Travelport 01.09.16/10.875% 210,000 0.30250,000 TRW Automotive 15.03.14/6.375% 262,500 0.37
4,542,774 6.43
IRELAND1,000,000 Ardagh Glass Finance 15.06.17/7.125% 962,500 1.36
450,000 Ardagh Packaging Finance 15.10.17/7.375% 455,063 0.64250,000 Ardagh Packaging Finance 15.10.20/9.250% 256,563 0.36550,000 Nara Cable Funding 01.12.18/8.875% 551,375 0.78250,000 Ono Finance II 15.07.19/11.125% 260,000 0.37350,000 Smurfit Kappa Acquisitions 15.11.17/7.250% 357,875 0.51750,000 Smurfit Kappa Acquisitions 15.11.19/7.750% 774,375 1.10
3,617,751 5.12
SOUTH AFRICA1,000,000 Consol Glass 15.04.14/7.625% 1,012,500 1.43
500,000 Edcon Proprietary 15.06.14/4.721%* 433,750 0.611,000,000 Foodcorp 01.03.18/8.750% 982,500 1.391,000,000 Peermont Global 30.04.14/7.750% 875,000 1.24
3,303,750 4.67
GERMANY250,000 Grohe Holding 01.10.14/8.625% 250,938 0.35500,000 Kabel BW Erste Beteiligungs 15.03.19/7.500% 510,625 0.72200,000 Kinove German Bondco 15.06.18/10.000% 205,500 0.29750,000 Musketeer 15.03.21/9.500% 795,000 1.13900,000 Unitymedia 01.12.17/8.125% 945,000 1.34
2,707,063 3.83
SPAIN500,000 Campofrio Food Group 31.10.16/8.250% 507,500 0.72500,000 Obrascon Huarte Lain 15.03.18/8.750% 502,500 0.71
1,010,000 1.43
CANADA1,000,000 Bombardier 15.05.21/6.125% 982,500 1.39
982,500 1.39
ITALY500,000 Lottomatica 31.03.66/8.250%* 503,750 0.71500,000 Seat Pagine Gialle 31.01.17/10.500% 452,500 0.64
956,250 1.35
BELGIUM250,000 Ontex IV 15.04.19/9.000% 234,375 0.33750,000 KBC Bank 14.05.13/8.000% 703,125 1.00
937,500 1.33
SWITZERLAND1,000,000 UBS/Jersey 15.04.15/4.280%* 892,902 1.26
892,902 1.26
CAYMAN ISLANDS350,000 UPCB Finance 15.01.20/7.625% 356,563 0.50250,000 UPCB Finance II 01.07.20/6.375% 236,875 0.34
593,438 0.84
SWEDEN250,000 TVN Finance II 15.11.17/10.750% 276,250 0.39250,000 TVN Finance III 15.11.18/7.875% 251,250 0.36
527,500 0.75
BERMUDA350,000 Central European Media
Enterprises 15.09.16/11.625% 371,000 0.52
371,000 0.52
FINLAND350,000 M-real 01.04.13/8.750%* 369,250 0.52
369,250 0.52
203
JPMorgan Funds - Europe High Yield Bond FundSchedule of Investments (Market Value Expressed in EUR)
As at 30 June 2011
Quantity/Nominal
Value
Name of Securities Maturity/Coupon
MarketValue
%of
NetAssets
Quantity/Nominal
Value
Name of Securities Maturity/Coupon
MarketValue
%of
NetAssets
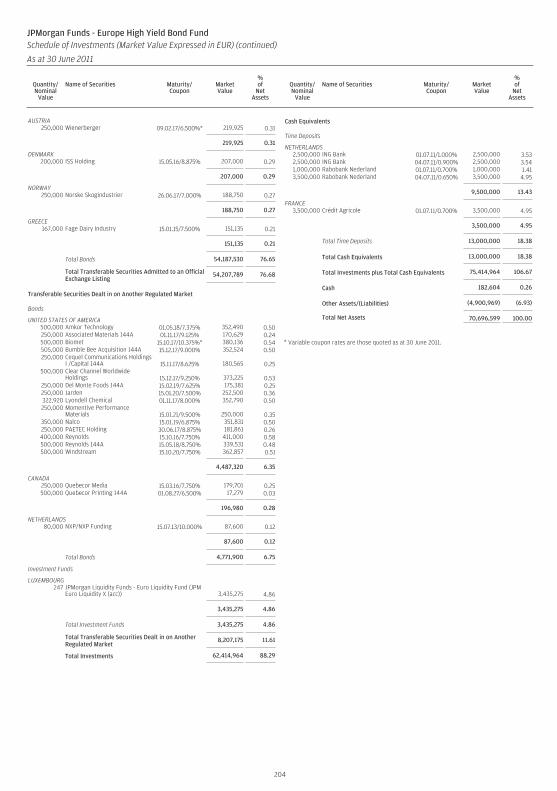
AUSTRIA250,000 Wienerberger 09.02.17/6.500%* 219,925 0.31
219,925 0.31
DENMARK200,000 ISS Holding 15.05.16/8.875% 207,000 0.29
207,000 0.29
NORWAY250,000 Norske Skogindustrier 26.06.17/7.000% 188,750 0.27
188,750 0.27
GREECE167,000 Fage Dairy Industry 15.01.15/7.500% 151,135 0.21
151,135 0.21
Total Bonds 54,187,530 76.65
Total Transferable Securities Admitted to an OfficialExchange Listing
54,207,789 76.68
Transferable Securities Dealt in on Another Regulated Market
Bonds
UNITED STATES OF AMERICA500,000 Amkor Technology 01.05.18/7.375% 352,490 0.50250,000 Associated Materials 144A 01.11.17/9.125% 170,629 0.24500,000 Biomet 15.10.17/10.375%* 380,136 0.54505,000 Bumble Bee Acquisition 144A 15.12.17/9.000% 352,524 0.50250,000 Cequel Communications Holdings
I /Capital 144A 15.11.17/8.625% 180,565 0.25500,000 Clear Channel Worldwide
Holdings 15.12.17/9.250% 373,225 0.53250,000 Del Monte Foods 144A 15.02.19/7.625% 175,381 0.25250,000 Jarden 15.01.20/7.500% 252,500 0.36322,920 Lyondell Chemical 01.11.17/8.000% 352,790 0.50250,000 Momentive Performance
Materials 15.01.21/9.500% 250,000 0.35350,000 Nalco 15.01.19/6.875% 351,831 0.50250,000 PAETEC Holding 30.06.17/8.875% 181,861 0.26400,000 Reynolds 15.10.16/7.750% 411,000 0.58500,000 Reynolds 144A 15.05.18/8.750% 339,531 0.48500,000 Windstream 15.10.20/7.750% 362,857 0.51
4,487,320 6.35
CANADA250,000 Quebecor Media 15.03.16/7.750% 179,701 0.25500,000 Quebecor Printing 144A 01.08.27/6.500% 17,279 0.03
196,980 0.28
NETHERLANDS80,000 NXP/NXP Funding 15.07.13/10.000% 87,600 0.12
87,600 0.12
Total Bonds 4,771,900 6.75
Investment Funds
LUXEMBOURG247 JPMorgan Liquidity Funds - Euro Liquidity Fund (JPM
Euro Liquidity X (acc)) 3,435,275 4.86
3,435,275 4.86
Total Investment Funds 3,435,275 4.86
Total Transferable Securities Dealt in on AnotherRegulated Market
8,207,175 11.61
Total Investments 62,414,964 88.29
Cash Equivalents
Time Deposits
NETHERLANDS2,500,000 ING Bank 01.07.11/1.000% 2,500,000 3.532,500,000 ING Bank 04.07.11/0.900% 2,500,000 3.541,000,000 Rabobank Nederland 01.07.11/0.700% 1,000,000 1.413,500,000 Rabobank Nederland 04.07.11/0.650% 3,500,000 4.95
9,500,000 13.43
FRANCE3,500,000 Crédit Agricole 01.07.11/0.700% 3,500,000 4.95
3,500,000 4.95
Total Time Deposits 13,000,000 18.38
Total Cash Equivalents 13,000,000 18.38
Total Investments plus Total Cash Equivalents 75,414,964 106.67
Cash 182,604 0.26
Other Assets/(Liabilities) (4,900,969) (6.93)
Total Net Assets 70,696,599 100.00
* Variable coupon rates are those quoted as at 30 June 2011.
204
JPMorgan Funds - Europe High Yield Bond FundSchedule of Investments (Market Value Expressed in EUR) (continued)
As at 30 June 2011
Quantity/Nominal
Value
Name of Securities Maturity/Coupon
MarketValue
%of
NetAssets
Quantity/Nominal
Value
Name of Securities Maturity/Coupon
MarketValue
%of
NetAssets
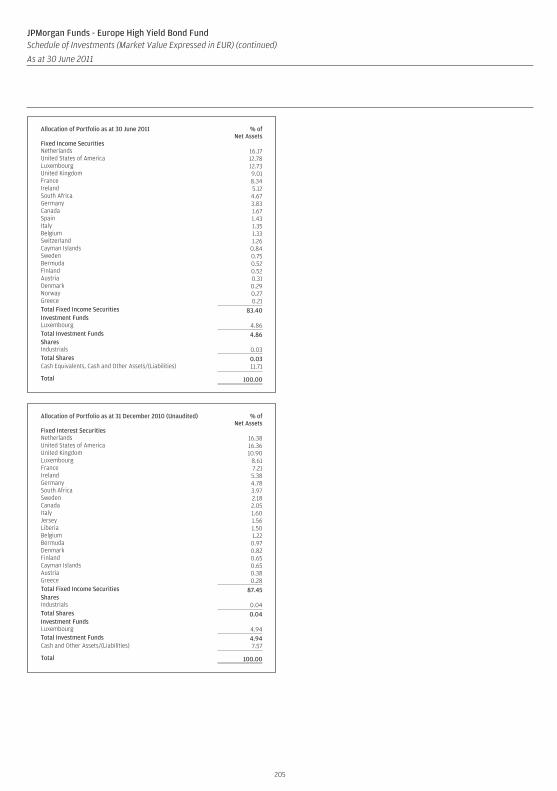
Allocation of Portfolio as at 30 June 2011 % ofNet Assets
Fixed Income SecuritiesNetherlands 16.17United States of America 12.78Luxembourg 12.73United Kingdom 9.01France 8.34Ireland 5.12South Africa 4.67Germany 3.83Canada 1.67Spain 1.43Italy 1.35Belgium 1.33Switzerland 1.26Cayman Islands 0.84Sweden 0.75Bermuda 0.52Finland 0.52Austria 0.31Denmark 0.29Norway 0.27Greece 0.21Total Fixed Income Securities 83.40Investment FundsLuxembourg 4.86Total Investment Funds 4.86SharesIndustrials 0.03Total Shares 0.03Cash Equivalents, Cash and Other Assets/(Liabilities) 11.71
Total 100.00
Allocation of Portfolio as at 31 December 2010 (Unaudited) % ofNet Assets
Fixed Interest SecuritiesNetherlands 16.38United States of America 16.36United Kingdom 10.90Luxembourg 8.61France 7.21Ireland 5.38Germany 4.78South Africa 3.97Sweden 2.18Canada 2.05Italy 1.60Jersey 1.56Liberia 1.50Belgium 1.22Bermuda 0.97Denmark 0.82Finland 0.65Cayman Islands 0.65Austria 0.38Greece 0.28Total Fixed Income Securities 87.45SharesIndustrials 0.04Total Shares 0.04Investment FundsLuxembourg 4.94Total Investment Funds 4.94Cash and Other Assets/(Liabilities) 7.57
Total 100.00
205
JPMorgan Funds - Europe High Yield Bond FundSchedule of Investments (Market Value Expressed in EUR) (continued)
As at 30 June 2011
Quantity/Nominal
Value
Name of Securities Maturity/Coupon
MarketValue
%of
NetAssets
Quantity/Nominal
Value
Name of Securities Maturity/Coupon
MarketValue
%of
NetAssets
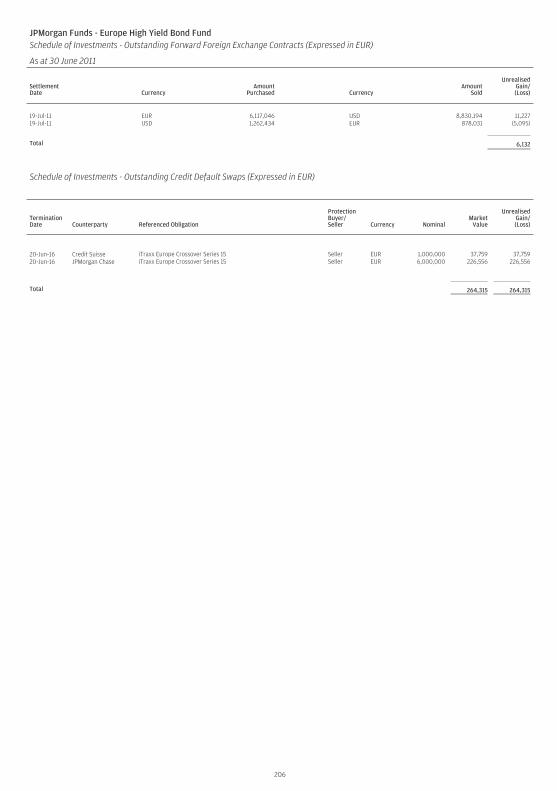
JPMorgan Funds - Europe High Yield Bond FundSchedule of Investments - Outstanding Forward Foreign Exchange Contracts (Expressed in EUR)
As at 30 June 2011
SettlementDate Currency
AmountPurchased Currency
AmountSold
UnrealisedGain/(Loss)
19-Jul-11 EUR 6,117,046 USD 8,830,194 11,22719-Jul-11 USD 1,262,434 EUR 878,031 (5,095)
Total 6,132
Schedule of Investments - Outstanding Credit Default Swaps (Expressed in EUR)
TerminationDate Counterparty Referenced Obligation
ProtectionBuyer/Seller Currency Nominal
MarketValue
UnrealisedGain/(Loss)
20-Jun-16 Credit Suisse iTraxx Europe Crossover Series 15 Seller EUR 1,000,000 37,759 37,75920-Jun-16 JPMorgan Chase iTraxx Europe Crossover Series 15 Seller EUR 6,000,000 226,556 226,556
Total 264,315 264,315
206
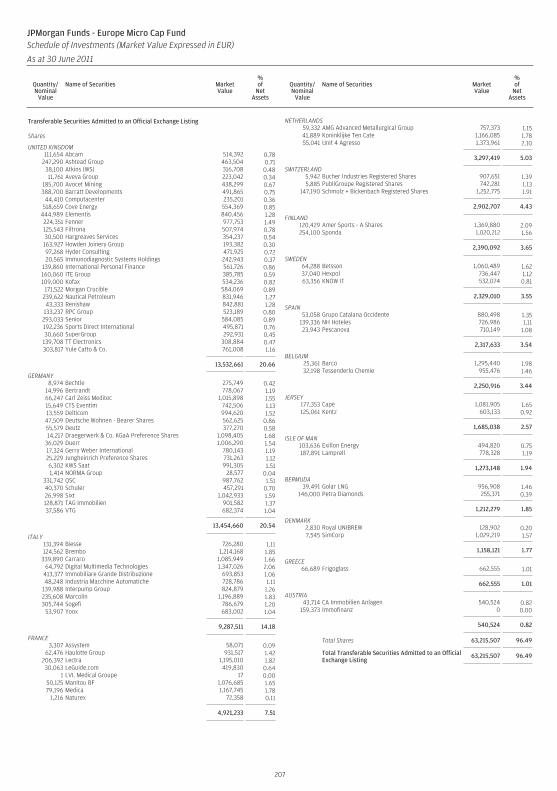
Transferable Securities Admitted to an Official Exchange Listing
Shares
UNITED KINGDOM111,654 Abcam 514,392 0.78
247,290 Ashtead Group 463,504 0.7138,100 Atkins (WS) 316,708 0.4811,761 Aveva Group 223,042 0.34
185,700 Avocet Mining 438,299 0.67388,700 Barratt Developments 491,865 0.75
44,410 Computacenter 235,201 0.36518,659 Cove Energy 554,369 0.85
444,989 Elementis 840,456 1.28224,351 Fenner 977,753 1.49125,543 Filtrona 507,974 0.7830,500 Hargreaves Services 354,237 0.54163,927 Howden Joinery Group 193,382 0.3097,268 Hyder Consulting 471,925 0.7220,565 Immunodiagnostic Systems Holdings 242,943 0.37
139,860 International Personal Finance 561,726 0.86160,060 ITE Group 385,785 0.59109,000 Kofax 534,236 0.82
171,522 Morgan Crucible 584,069 0.89239,622 Nautical Petroleum 831,946 1.2743,333 Renishaw 842,881 1.28
133,237 RPC Group 523,189 0.80293,033 Senior 584,085 0.89192,236 Sports Direct International 495,871 0.7630,660 SuperGroup 292,931 0.45
139,708 TT Electronics 308,884 0.47303,817 Yule Catto & Co. 761,008 1.16
13,532,661 20.66
GERMANY8,974 Bechtle 275,749 0.42
14,996 Bertrandt 778,067 1.1966,247 Carl Zeiss Meditec 1,015,898 1.5515,649 CTS Eventim 742,506 1.1313,559 Delticom 994,620 1.5247,509 Deutsche Wohnen - Bearer Shares 562,625 0.8655,579 Deutz 377,270 0.5814,217 Draegerwerk & Co. KGaA Preference Shares 1,098,405 1.68
36,029 Duerr 1,006,290 1.5417,324 Gerry Weber International 780,143 1.1925,229 Jungheinrich Preference Shares 731,263 1.126,302 KWS Saat 991,305 1.511,414 NORMA Group 28,577 0.04
331,742 QSC 987,762 1.5140,370 Schuler 457,291 0.7026,998 Sixt 1,042,933 1.59128,871 TAG Immobilien 901,582 1.3737,586 VTG 682,374 1.04
13,454,660 20.54
ITALY131,394 Biesse 726,280 1.11124,562 Brembo 1,214,168 1.85
339,890 Carraro 1,085,949 1.6664,792 Digital Multimedia Technologies 1,347,026 2.06
413,377 Immobiliare Grande Distribuzione 693,853 1.0648,248 Industria Macchine Automatiche 728,786 1.11
139,988 Interpump Group 824,879 1.26235,608 Marcolin 1,196,889 1.83305,744 Sogefi 786,679 1.20
53,907 Yoox 683,002 1.04
9,287,511 14.18
FRANCE3,307 Assystem 58,071 0.09
62,476 Haulotte Group 931,517 1.42206,392 Lectra 1,195,010 1.8230,063 LeGuide.com 419,830 0.64
1 LVL Medical Groupe 17 0.0050,125 Manitou BF 1,076,685 1.6579,196 Medica 1,167,745 1.78
1,216 Naturex 72,358 0.11
4,921,233 7.51
NETHERLANDS59,332 AMG Advanced Metallurgical Group 757,373 1.1541,889 Koninklijke Ten Cate 1,166,085 1.7855,041 Unit 4 Agresso 1,373,961 2.10
3,297,419 5.03
SWITZERLAND5,942 Bucher Industries Registered Shares 907,651 1.395,885 PubliGroupe Registered Shares 742,281 1.13
147,190 Schmolz + Bickenbach Registered Shares 1,252,775 1.91
2,902,707 4.43
FINLAND120,429 Amer Sports - A Shares 1,369,880 2.09254,100 Sponda 1,020,212 1.56
2,390,092 3.65
SWEDEN64,288 Betsson 1,060,489 1.6237,040 Hexpol 736,447 1.1263,356 KNOW IT 532,074 0.81
2,329,010 3.55
SPAIN53,058 Grupo Catalana Occidente 880,498 1.35
139,336 NH Hoteles 726,986 1.1123,943 Pescanova 710,149 1.08
2,317,633 3.54
BELGIUM25,361 Barco 1,295,440 1.9832,198 Tessenderlo Chemie 955,476 1.46
2,250,916 3.44
JERSEY177,353 Cape 1,081,905 1.65125,061 Kentz 603,133 0.92
1,685,038 2.57
ISLE OF MAN103,636 Exillon Energy 494,820 0.75187,891 Lamprell 778,328 1.19
1,273,148 1.94
BERMUDA39,491 Golar LNG 956,908 1.46
146,000 Petra Diamonds 255,371 0.39
1,212,279 1.85
DENMARK2,830 Royal UNIBREW 128,902 0.207,545 SimCorp 1,029,219 1.57
1,158,121 1.77
GREECE66,689 Frigoglass 662,555 1.01
662,555 1.01
AUSTRIA43,714 CA Immobilien Anlagen 540,524 0.82
159,373 Immofinanz 0 0.00
540,524 0.82
Total Shares 63,215,507 96.49
Total Transferable Securities Admitted to an OfficialExchange Listing
63,215,507 96.49
207
JPMorgan Funds - Europe Micro Cap FundSchedule of Investments (Market Value Expressed in EUR)
As at 30 June 2011
Quantity/Nominal
Value
Name of Securities MarketValue
%of
NetAssets
Quantity/Nominal
Value
Name of Securities MarketValue
%of
NetAssets
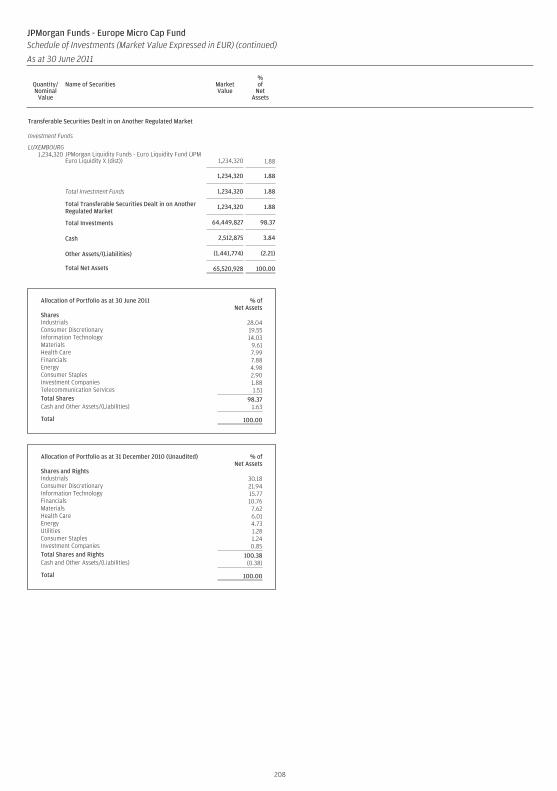
Transferable Securities Dealt in on Another Regulated Market
Investment Funds
LUXEMBOURG1,234,320 JPMorgan Liquidity Funds - Euro Liquidity Fund (JPM
Euro Liquidity X (dist)) 1,234,320 1.88
1,234,320 1.88
Total Investment Funds 1,234,320 1.88
Total Transferable Securities Dealt in on AnotherRegulated Market
1,234,320 1.88
Total Investments 64,449,827 98.37
Cash 2,512,875 3.84
Other Assets/(Liabilities) (1,441,774) (2.21)
Total Net Assets 65,520,928 100.00
Allocation of Portfolio as at 30 June 2011 % ofNet Assets
SharesIndustrials 28.04Consumer Discretionary 19.55Information Technology 14.03Materials 9.61Health Care 7.99Financials 7.88Energy 4.98Consumer Staples 2.90Investment Companies 1.88Telecommunication Services 1.51Total Shares 98.37Cash and Other Assets/(Liabilities) 1.63
Total 100.00
Allocation of Portfolio as at 31 December 2010 (Unaudited) % ofNet Assets
Shares and RightsIndustrials 30.18Consumer Discretionary 21.94Information Technology 15.77Financials 10.76Materials 7.62Health Care 6.01Energy 4.73Utilities 1.28Consumer Staples 1.24Investment Companies 0.85Total Shares and Rights 100.38Cash and Other Assets/(Liabilities) (0.38)
Total 100.00
208
JPMorgan Funds - Europe Micro Cap FundSchedule of Investments (Market Value Expressed in EUR) (continued)
As at 30 June 2011
Quantity/Nominal
Value
Name of Securities MarketValue
%of
NetAssets
Quantity/Nominal
Value
Name of Securities MarketValue
%of
NetAssets
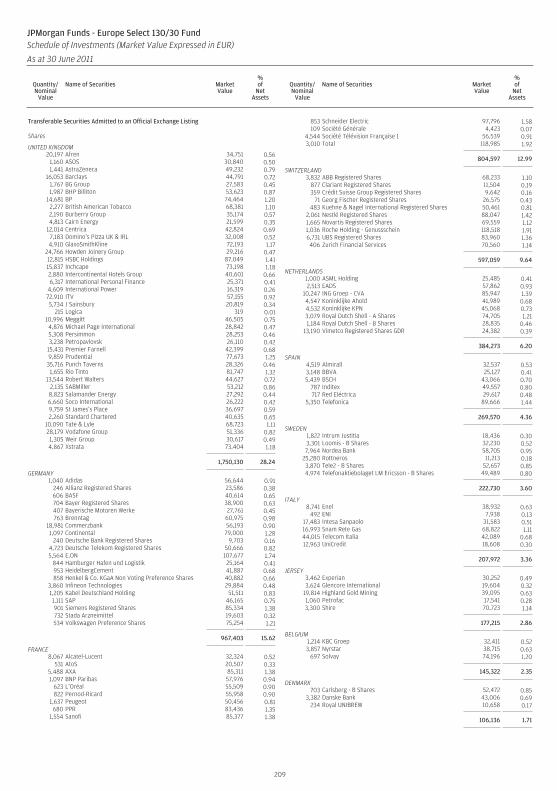
Transferable Securities Admitted to an Official Exchange Listing
Shares
UNITED KINGDOM20,197 Afren 34,751 0.56
1,160 ASOS 30,840 0.501,441 AstraZeneca 49,232 0.79
16,053 Barclays 44,791 0.721,767 BG Group 27,583 0.451,987 BHP Billiton 53,623 0.87
14,681 BP 74,464 1.202,277 British American Tobacco 68,381 1.102,190 Burberry Group 35,174 0.574,813 Cairn Energy 21,599 0.35
12,014 Centrica 42,824 0.697,183 Domino’s Pizza UK & IRL 32,008 0.524,910 GlaxoSmithKline 72,193 1.17
24,766 Howden Joinery Group 29,216 0.4712,815 HSBC Holdings 87,049 1.4115,837 Inchcape 73,198 1.182,880 Intercontinental Hotels Group 40,601 0.666,317 International Personal Finance 25,371 0.41
4,609 International Power 16,319 0.2672,910 ITV 57,155 0.925,734 J Sainsbury 20,819 0.34
215 Logica 319 0.0110,996 Meggitt 46,505 0.754,876 Michael Page International 28,842 0.475,308 Persimmon 28,253 0.463,238 Petropavlovsk 26,110 0.42
15,431 Premier Farnell 42,399 0.689,859 Prudential 77,673 1.25
35,716 Punch Taverns 28,326 0.461,655 Rio Tinto 81,747 1.32
13,544 Robert Walters 44,627 0.722,135 SABMiller 53,212 0.868,823 Salamander Energy 27,292 0.446,660 Soco International 26,222 0.429,759 St James’s Place 36,697 0.592,260 Standard Chartered 40,635 0.65
10,090 Tate & Lyle 68,723 1.1128,179 Vodafone Group 51,336 0.821,305 Weir Group 30,617 0.494,867 Xstrata 73,404 1.18
1,750,130 28.24
GERMANY1,040 Adidas 56,644 0.91
246 Allianz Registered Shares 23,586 0.38606 BASF 40,614 0.65704 Bayer Registered Shares 38,900 0.63407 Bayerische Motoren Werke 27,761 0.45763 Brenntag 60,975 0.98
18,981 Commerzbank 56,193 0.901,097 Continental 79,000 1.28
240 Deutsche Bank Registered Shares 9,703 0.164,723 Deutsche Telekom Registered Shares 50,666 0.825,564 E.ON 107,677 1.74
844 Hamburger Hafen und Logistik 25,164 0.41953 HeidelbergCement 41,887 0.68858 Henkel & Co. KGaA Non Voting Preference Shares 40,882 0.66
3,860 Infineon Technologies 29,884 0.481,205 Kabel Deutschland Holding 51,511 0.831,111 SAP 46,165 0.75901 Siemens Registered Shares 85,334 1.38732 Stada Arzneimittel 19,603 0.32534 Volkswagen Preference Shares 75,254 1.21
967,403 15.62
FRANCE8,067 Alcatel-Lucent 32,324 0.52
531 AtoS 20,507 0.335,488 AXA 85,311 1.381,097 BNP Paribas 57,976 0.94
623 L’Oréal 55,509 0.90822 Pernod-Ricard 55,958 0.90
1,637 Peugeot 50,456 0.81680 PPR 83,436 1.35
1,554 Sanofi 85,377 1.38
853 Schneider Electric 97,796 1.58109 Société Générale 4,423 0.07
4,544 Société Télévision Française 1 56,539 0.913,010 Total 118,985 1.92
804,597 12.99
SWITZERLAND3,832 ABB Registered Shares 68,233 1.10
877 Clariant Registered Shares 11,504 0.19359 Crédit Suisse Group Registered Shares 9,642 0.16
71 Georg Fischer Registered Shares 26,575 0.43483 Kuehne & Nagel International Registered Shares 50,461 0.81
2,061 Nestlé Registered Shares 88,047 1.421,665 Novartis Registered Shares 69,559 1.121,036 Roche Holding - Genussschein 118,518 1.916,731 UBS Registered Shares 83,960 1.36406 Zurich Financial Services 70,560 1.14
597,059 9.64
NETHERLANDS1,000 ASML Holding 25,485 0.412,513 EADS 57,862 0.93
10,247 ING Groep - CVA 85,947 1.394,547 Koninklijke Ahold 41,989 0.684,532 Koninklijke KPN 45,068 0.733,079 Royal Dutch Shell - A Shares 74,705 1.211,184 Royal Dutch Shell - B Shares 28,835 0.46
13,190 Vimetco Registered Shares GDR 24,382 0.39
384,273 6.20
SPAIN4,519 Almirall 32,537 0.533,148 BBVA 25,127 0.415,439 BSCH 43,066 0.70
787 Inditex 49,557 0.80717 Red Eléctrica 29,617 0.48
5,350 Telefonica 89,666 1.44
269,570 4.36
SWEDEN1,822 Intrum Justitia 18,436 0.303,301 Loomis - B Shares 32,230 0.527,964 Nordea Bank 58,705 0.95
25,280 Rottneros 11,213 0.183,870 Tele2 - B Shares 52,657 0.854,974 Telefonaktiebolaget LM Ericsson - B Shares 49,489 0.80
222,730 3.60
ITALY8,741 Enel 38,932 0.63
492 ENI 7,938 0.1317,483 Intesa Sanpaolo 31,583 0.5116,993 Snam Rete Gas 68,822 1.1144,015 Telecom Italia 42,089 0.6812,963 UniCredit 18,608 0.30
207,972 3.36
JERSEY3,462 Experian 30,252 0.493,624 Glencore International 19,604 0.32
19,814 Highland Gold Mining 39,095 0.631,060 Petrofac 17,541 0.283,300 Shire 70,723 1.14
177,215 2.86
BELGIUM1,214 KBC Groep 32,411 0.523,857 Nyrstar 38,715 0.63
697 Solvay 74,196 1.20
145,322 2.35
DENMARK703 Carlsberg - B Shares 52,472 0.85
3,382 Danske Bank 43,006 0.69234 Royal UNIBREW 10,658 0.17
106,136 1.71
209
JPMorgan Funds - Europe Select 130/30 FundSchedule of Investments (Market Value Expressed in EUR)
As at 30 June 2011
Quantity/Nominal
Value
Name of Securities MarketValue
%of
NetAssets
Quantity/Nominal
Value
Name of Securities MarketValue
%of
NetAssets
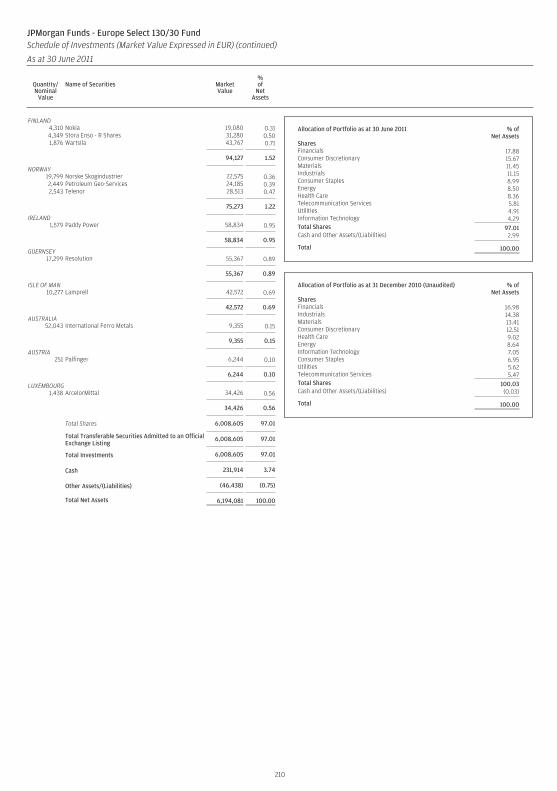
FINLAND4,310 Nokia 19,080 0.314,349 Stora Enso - R Shares 31,280 0.501,876 Wartsila 43,767 0.71
94,127 1.52
NORWAY19,799 Norske Skogindustrier 22,575 0.362,449 Petroleum Geo-Services 24,185 0.392,543 Telenor 28,513 0.47
75,273 1.22
IRELAND1,579 Paddy Power 58,834 0.95
58,834 0.95
GUERNSEY17,299 Resolution 55,367 0.89
55,367 0.89
ISLE OF MAN10,277 Lamprell 42,572 0.69
42,572 0.69
AUSTRALIA52,043 International Ferro Metals 9,355 0.15
9,355 0.15
AUSTRIA251 Palfinger 6,244 0.10
6,244 0.10
LUXEMBOURG1,438 ArcelorMittal 34,426 0.56
34,426 0.56
Total Shares 6,008,605 97.01
Total Transferable Securities Admitted to an OfficialExchange Listing
6,008,605 97.01
Total Investments 6,008,605 97.01
Cash 231,914 3.74
Other Assets/(Liabilities) (46,438) (0.75)
Total Net Assets 6,194,081 100.00
Allocation of Portfolio as at 30 June 2011 % ofNet Assets
SharesFinancials 17.88Consumer Discretionary 15.67Materials 11.45Industrials 11.15Consumer Staples 8.99Energy 8.50Health Care 8.36Telecommunication Services 5.81Utilities 4.91Information Technology 4.29Total Shares 97.01Cash and Other Assets/(Liabilities) 2.99
Total 100.00
Allocation of Portfolio as at 31 December 2010 (Unaudited) % ofNet Assets
SharesFinancials 16.98Industrials 14.38Materials 13.41Consumer Discretionary 12.51Health Care 9.02Energy 8.64Information Technology 7.05Consumer Staples 6.95Utilities 5.62Telecommunication Services 5.47Total Shares 100.03Cash and Other Assets/(Liabilities) (0.03)
Total 100.00
210
JPMorgan Funds - Europe Select 130/30 FundSchedule of Investments (Market Value Expressed in EUR) (continued)
As at 30 June 2011
Quantity/Nominal
Value
Name of Securities MarketValue
%of
NetAssets
Quantity/Nominal
Value
Name of Securities MarketValue
%of
NetAssets
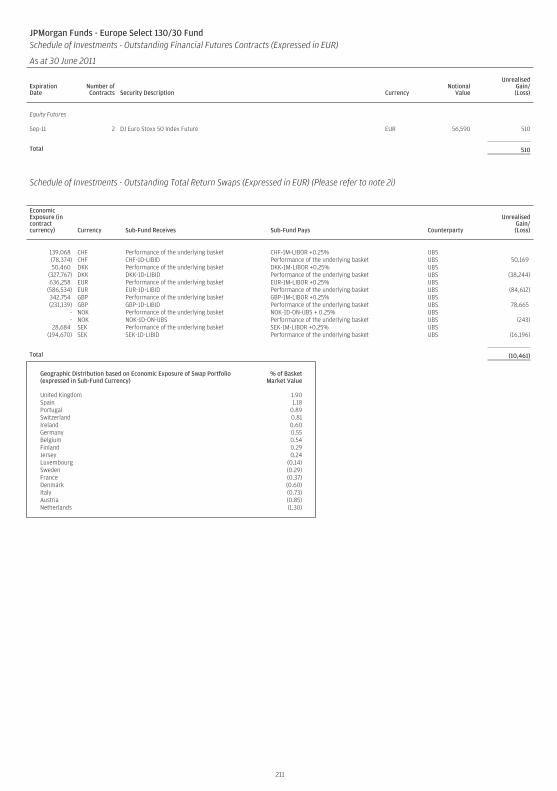
JPMorgan Funds - Europe Select 130/30 FundSchedule of Investments - Outstanding Financial Futures Contracts (Expressed in EUR)
As at 30 June 2011
ExpirationDate
Number ofContracts Security Description Currency
NotionalValue
UnrealisedGain/(Loss)
Equity Futures
Sep-11 2 DJ Euro Stoxx 50 Index Future EUR 56,590 510
Total 510
Schedule of Investments - Outstanding Total Return Swaps (Expressed in EUR) (Please refer to note 2i)
EconomicExposure (incontractcurrency) Currency Sub-Fund Receives Sub-Fund Pays Counterparty
UnrealisedGain/(Loss)
139,068 CHF Performance of the underlying basket CHF-1M-LIBOR +0.25% UBS(78,374) CHF CHF-1D-LIBID Performance of the underlying basket UBS 50,16950,460 DKK Performance of the underlying basket DKK-1M-LIBOR +0.25% UBS
(327,767) DKK DKK-1D-LIBID Performance of the underlying basket UBS (38,244)636,258 EUR Performance of the underlying basket EUR-1M-LIBOR +0.25% UBS
(586,534) EUR EUR-1D-LIBID Performance of the underlying basket UBS (84,612)342,754 GBP Performance of the underlying basket GBP-1M-LIBOR +0.25% UBS(231,139) GBP GBP-1D-LIBID Performance of the underlying basket UBS 78,665
- NOK Performance of the underlying basket NOK-1D-ON-UBS + 0.25% UBS- NOK NOK-1D-ON-UBS Performance of the underlying basket UBS (243)
28,684 SEK Performance of the underlying basket SEK-1M-LIBOR +0.25% UBS(194,670) SEK SEK-1D-LIBID Performance of the underlying basket UBS (16,196)
Total (10,461)
Geographic Distribution based on Economic Exposure of Swap Portfolio(expressed in Sub-Fund Currency)
% of BasketMarket Value
United Kingdom 1.90Spain 1.18Portugal 0.89Switzerland 0.81Ireland 0.60Germany 0.55Belgium 0.54Finland 0.29Jersey 0.24Luxembourg (0.14)Sweden (0.29)France (0.37)Denmark (0.60)Italy (0.73)Austria (0.85)Netherlands (1.30)
211
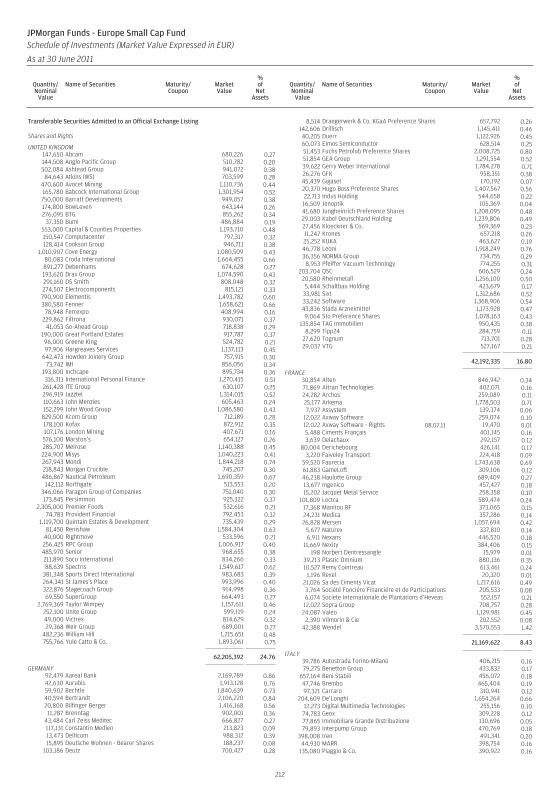
Transferable Securities Admitted to an Official Exchange Listing
Shares and Rights
UNITED KINGDOM147,650 Abcam 680,226 0.27144,508 Anglo Pacific Group 510,782 0.20502,084 Ashtead Group 941,072 0.38
84,643 Atkins (WS) 703,599 0.28470,600 Avocet Mining 1,110,736 0.44165,780 Babcock International Group 1,301,954 0.52750,000 Barratt Developments 949,057 0.38174,800 BowLeven 643,144 0.26276,095 BTG 855,262 0.34
37,350 Bumi 486,884 0.19553,000 Capital & Counties Properties 1,193,710 0.48150,547 Computacenter 797,317 0.32128,414 Cookson Group 946,711 0.38
1,010,907 Cove Energy 1,080,509 0.4380,083 Croda International 1,664,455 0.66891,277 Debenhams 674,628 0.27193,620 Drax Group 1,074,590 0.43291,160 DS Smith 808,048 0.32274,507 Electrocomponents 815,121 0.33790,900 Elementis 1,493,782 0.60380,580 Fenner 1,658,621 0.66
78,948 Ferrexpo 408,994 0.16229,862 Filtrona 930,071 0.37
41,053 Go-Ahead Group 718,838 0.29190,000 Great Portland Estates 917,787 0.3796,000 Greene King 524,782 0.2197,906 Hargreaves Services 1,137,113 0.45
642,473 Howden Joinery Group 757,915 0.3073,742 IMI 856,056 0.34
193,800 Inchcape 895,734 0.36316,311 International Personal Finance 1,270,415 0.51
261,428 ITE Group 630,107 0.25296,919 Jazztel 1,314,015 0.52110,663 John Menzies 605,463 0.24152,299 John Wood Group 1,086,580 0.43
829,500 Kcom Group 712,189 0.28178,100 Kofax 872,912 0.35107,176 London Mining 407,671 0.16576,100 Marston’s 654,127 0.26285,707 Melrose 1,140,388 0.45224,900 Misys 1,040,223 0.41267,943 Mondi 1,844,218 0.74218,843 Morgan Crucible 745,207 0.30486,867 Nautical Petroleum 1,690,359 0.67
142,112 Northgate 513,553 0.20346,066 Paragon Group of Companies 751,040 0.30173,845 Persimmon 925,322 0.37
2,305,000 Premier Foods 532,616 0.2174,783 Provident Financial 792,453 0.32
1,119,700 Quintain Estates & Development 735,439 0.2981,450 Renishaw 1,584,304 0.63
40,000 Rightmove 533,596 0.21256,425 RPC Group 1,006,917 0.40485,970 Senior 968,655 0.38211,890 Soco International 834,266 0.3388,639 Spectris 1,549,617 0.62
381,348 Sports Direct International 983,683 0.39264,341 St James’s Place 993,996 0.40322,876 Stagecoach Group 914,998 0.3669,550 SuperGroup 664,493 0.27
2,769,369 Taylor Wimpey 1,157,611 0.46252,100 Unite Group 599,119 0.2449,000 Victrex 814,629 0.3229,368 Weir Group 689,001 0.27
482,236 William Hill 1,215,651 0.48755,766 Yule Catto & Co. 1,893,061 0.75
62,205,392 24.76
GERMANY92,479 Aareal Bank 2,169,789 0.8642,630 Aurubis 1,913,128 0.7659,902 Bechtle 1,840,639 0.7340,594 Bertrandt 2,106,220 0.8420,800 Bilfinger Berger 1,416,168 0.5611,287 Brenntag 902,001 0.36
43,484 Carl Zeiss Meditec 666,827 0.27117,131 Constantin Medien 213,823 0.0913,473 Delticom 988,312 0.3915,895 Deutsche Wohnen - Bearer Shares 188,237 0.08
103,186 Deutz 700,427 0.28
8,514 Draegerwerk & Co. KGaA Preference Shares 657,792 0.26142,606 Drillisch 1,145,411 0.4640,205 Duerr 1,122,926 0.4560,073 Elmos Semiconductor 628,514 0.2551,453 Fuchs Petrolub Preference Shares 2,008,725 0.8051,854 GEA Group 1,291,554 0.5239,622 Gerry Weber International 1,784,278 0.7126,276 GFK 958,351 0.3845,439 Gigaset 170,192 0.0720,370 Hugo Boss Preference Shares 1,407,567 0.5622,713 Indus Holding 544,658 0.2216,509 Jenoptik 105,369 0.0441,680 Jungheinrich Preference Shares 1,208,095 0.4829,003 Kabel Deutschland Holding 1,239,806 0.4927,456 Kloeckner & Co. 569,369 0.2311,247 Krones 657,218 0.2625,252 KUKA 463,627 0.1946,778 Leoni 1,918,249 0.7636,356 NORMA Group 734,755 0.29
8,953 Pfeiffer Vacuum Technology 774,255 0.31203,704 QSC 606,529 0.24
20,580 Rheinmetall 1,256,100 0.505,444 Schaltbau Holding 423,679 0.17
33,981 Sixt 1,312,686 0.5233,242 Software 1,368,906 0.5443,836 Stada Arzneimittel 1,173,928 0.479,064 Sto Preference Shares 1,078,163 0.43
135,854 TAG Immobilien 950,435 0.388,299 Tipp24 284,759 0.11
27,620 Tognum 713,701 0.2829,037 VTG 527,167 0.21
42,192,335 16.80
FRANCE30,854 Alten 846,942 0.3471,869 Altran Technologies 402,071 0.1624,282 Archos 259,089 0.1125,177 Arkema 1,778,503 0.717,937 Assystem 139,374 0.06
12,022 Axway Software 259,074 0.1012,022 Axway Software - Rights 08.07.11 19,470 0.015,488 Ciments Français 401,145 0.163,639 Delachaux 292,157 0.12
80,004 Derichebourg 426,141 0.173,220 Faiveley Transport 224,418 0.09
59,520 Faurecia 1,743,638 0.6961,883 GameLoft 309,106 0.1246,238 Haulotte Group 689,409 0.2713,677 Ingenico 457,427 0.1815,202 Jacquet Metal Service 258,358 0.10
101,809 Lectra 589,474 0.2417,368 Manitou BF 373,065 0.1524,231 Medica 357,286 0.1426,828 Mersen 1,057,694 0.42
5,677 Naturex 337,810 0.146,911 Nexans 446,520 0.18
11,669 Nexity 384,406 0.15198 Norbert Dentressangle 15,979 0.01
39,213 Plastic Omnium 880,136 0.3510,527 Remy Cointreau 613,461 0.24
1,196 Rexel 20,320 0.0121,026 Sa des Ciments Vicat 1,217,616 0.493,764 Société Fonciére Financiére et de Participations 205,533 0.086,074 Societe Internationale de Plantations d’Heveas 552,157 0.2112,022 Sopra Group 708,757 0.2824,087 Valeo 1,129,981 0.45
2,390 Vilmorin & Cie 202,552 0.0842,388 Wendel 3,570,553 1.42
21,169,622 8.43
ITALY39,786 Autostrada Torino-Milano 406,215 0.1679,275 Benetton Group 433,832 0.17
657,164 Beni Stabili 456,072 0.1847,746 Brembo 465,404 0.1997,321 Carraro 310,941 0.12
204,609 De’Longhi 1,654,264 0.6612,273 Digital Multimedia Technologies 255,156 0.1074,783 Geox 309,228 0.1277,865 Immobiliare Grande Distribuzione 130,696 0.0579,893 Interpump Group 470,769 0.18
398,008 Iren 491,341 0.2044,930 MARR 398,754 0.16
135,080 Piaggio & Co. 390,922 0.16
212
JPMorgan Funds - Europe Small Cap FundSchedule of Investments (Market Value Expressed in EUR)
As at 30 June 2011
Quantity/Nominal
Value
Name of Securities Maturity/Coupon
MarketValue
%of
NetAssets
Quantity/Nominal
Value
Name of Securities Maturity/Coupon
MarketValue
%of
NetAssets
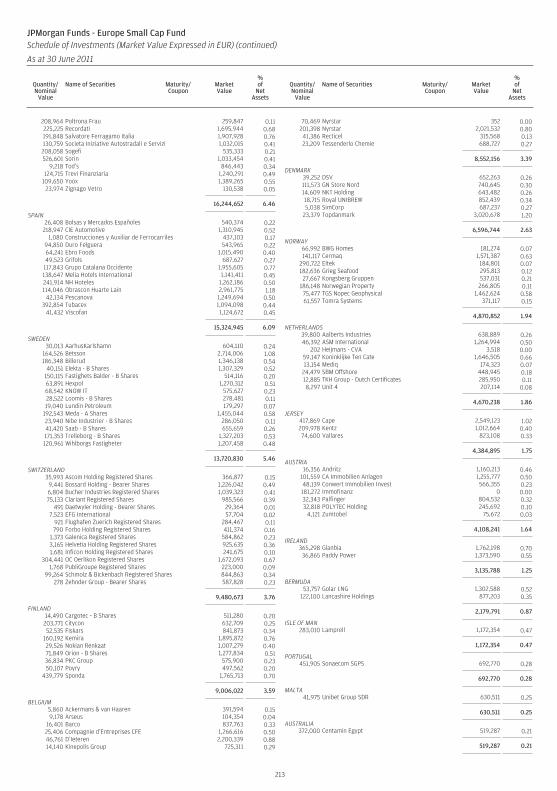
208,964 Poltrona Frau 259,847 0.11225,225 Recordati 1,695,944 0.68191,848 Salvatore Ferragamo Italia 1,907,928 0.76130,759 Societa Iniziative Autostradali e Servizi 1,032,015 0.41208,058 Sogefi 535,333 0.21526,601 Sorin 1,033,454 0.41
9,218 Tod’s 846,443 0.34124,715 Trevi Finanziaria 1,240,291 0.49
109,650 Yoox 1,389,265 0.5523,974 Zignago Vetro 130,538 0.05
16,244,652 6.46
SPAIN26,408 Bolsas y Mercados Españoles 540,374 0.22
218,947 CIE Automotive 1,310,945 0.521,080 Construcciones y Auxiliar de Ferrocarriles 437,103 0.17
94,850 Duro Felguera 543,965 0.2264,241 Ebro Foods 1,015,490 0.4049,523 Grifols 687,627 0.27
117,843 Grupo Catalana Occidente 1,955,605 0.77138,647 Melia Hotels International 1,141,411 0.45241,914 NH Hoteles 1,262,186 0.50114,046 Obrascon Huarte Lain 2,961,775 1.18
42,134 Pescanova 1,249,694 0.50392,854 Tubacex 1,094,098 0.44
41,432 Viscofan 1,124,672 0.45
15,324,945 6.09
SWEDEN30,013 AarhusKarlshamn 604,110 0.24
164,526 Betsson 2,714,006 1.08186,348 Billerud 1,346,138 0.54
40,151 Elekta - B Shares 1,307,329 0.52150,115 Fastighets Balder - B Shares 514,116 0.2063,891 Hexpol 1,270,312 0.5168,542 KNOW IT 575,627 0.2328,522 Loomis - B Shares 278,481 0.1119,040 Lundin Petroleum 179,297 0.07
192,543 Meda - A Shares 1,455,044 0.5823,940 Nibe Industrier - B Shares 286,050 0.1141,420 Saab - B Shares 655,659 0.26171,353 Trelleborg - B Shares 1,327,203 0.53120,961 Wihlborgs Fastigheter 1,207,458 0.48
13,720,830 5.46
SWITZERLAND35,993 Ascom Holding Registered Shares 366,877 0.15
9,441 Bossard Holding - Bearer Shares 1,226,042 0.496,804 Bucher Industries Registered Shares 1,039,323 0.4175,133 Clariant Registered Shares 985,566 0.39
491 Daetwyler Holding - Bearer Shares 29,364 0.017,523 EFG International 57,704 0.02
921 Flughafen Zuerich Registered Shares 284,467 0.11790 Forbo Holding Registered Shares 411,374 0.16
1,373 Galenica Registered Shares 584,862 0.233,165 Helvetia Holding Registered Shares 925,635 0.361,681 Inficon Holding Registered Shares 241,675 0.10
304,441 OC Oerlikon Registered Shares 1,672,093 0.671,768 PubliGroupe Registered Shares 223,000 0.09
99,264 Schmolz & Bickenbach Registered Shares 844,863 0.34278 Zehnder Group - Bearer Shares 587,828 0.23
9,480,673 3.76
FINLAND14,490 Cargotec - B Shares 511,280 0.20
203,771 Citycon 632,709 0.2552,535 Fiskars 841,873 0.34
160,192 Kemira 1,895,872 0.7629,526 Nokian Renkaat 1,007,279 0.4071,849 Orion - B Shares 1,277,834 0.5136,834 PKC Group 575,900 0.2350,107 Poyry 497,562 0.20
439,779 Sponda 1,765,713 0.70
9,006,022 3.59
BELGIUM5,860 Ackermans & van Haaren 391,594 0.159,178 Arseus 104,354 0.04
16,401 Barco 837,763 0.3325,406 Compagnie d’Entreprises CFE 1,266,616 0.5046,761 D’Ieteren 2,200,339 0.8814,140 Kinepolis Group 725,311 0.29
70,469 Nyrstar 352 0.00201,398 Nyrstar 2,021,532 0.8041,386 Recticel 315,568 0.1323,209 Tessenderlo Chemie 688,727 0.27
8,552,156 3.39
DENMARK39,252 DSV 652,263 0.26111,573 GN Store Nord 740,645 0.3014,609 NKT Holding 643,482 0.2618,715 Royal UNIBREW 852,439 0.345,038 SimCorp 687,237 0.27
23,379 Topdanmark 3,020,678 1.20
6,596,744 2.63
NORWAY66,992 BWG Homes 181,274 0.07141,117 Cermaq 1,571,387 0.63
290,722 Eltek 184,801 0.07182,636 Grieg Seafood 295,813 0.1227,667 Kongsberg Gruppen 537,031 0.21
186,148 Norwegian Property 266,805 0.1175,477 TGS Nopec Geophysical 1,462,624 0.5861,557 Tomra Systems 371,117 0.15
4,870,852 1.94
NETHERLANDS39,800 Aalberts Industries 638,889 0.2646,392 ASM International 1,264,994 0.50
202 Heijmans - CVA 3,518 0.0059,147 Koninklijke Ten Cate 1,646,505 0.6613,154 Mediq 174,323 0.07
24,479 SBM Offshore 448,945 0.1812,885 TKH Group - Dutch Certificates 285,950 0.118,297 Unit 4 207,114 0.08
4,670,238 1.86
JERSEY417,869 Cape 2,549,123 1.02209,978 Kentz 1,012,664 0.4074,600 Vallares 823,108 0.33
4,384,895 1.75
AUSTRIA16,356 Andritz 1,160,213 0.46
101,559 CA Immobilien Anlagen 1,255,777 0.5048,139 Conwert Immobilien Invest 566,355 0.23181,272 Immofinanz 0 0.0032,343 Palfinger 804,532 0.3232,818 POLYTEC Holding 245,692 0.10
4,121 Zumtobel 75,672 0.03
4,108,241 1.64
IRELAND365,298 Glanbia 1,762,198 0.7036,865 Paddy Power 1,373,590 0.55
3,135,788 1.25
BERMUDA53,757 Golar LNG 1,302,588 0.52
122,100 Lancashire Holdings 877,203 0.35
2,179,791 0.87
ISLE OF MAN283,010 Lamprell 1,172,354 0.47
1,172,354 0.47
PORTUGAL451,905 Sonaecom SGPS 692,770 0.28
692,770 0.28
MALTA41,975 Unibet Group SDR 630,511 0.25
630,511 0.25
AUSTRALIA372,000 Centamin Egypt 519,287 0.21
519,287 0.21
213
JPMorgan Funds - Europe Small Cap FundSchedule of Investments (Market Value Expressed in EUR) (continued)
As at 30 June 2011
Quantity/Nominal
Value
Name of Securities Maturity/Coupon
MarketValue
%of
NetAssets
Quantity/Nominal
Value
Name of Securities Maturity/Coupon
MarketValue
%of
NetAssets
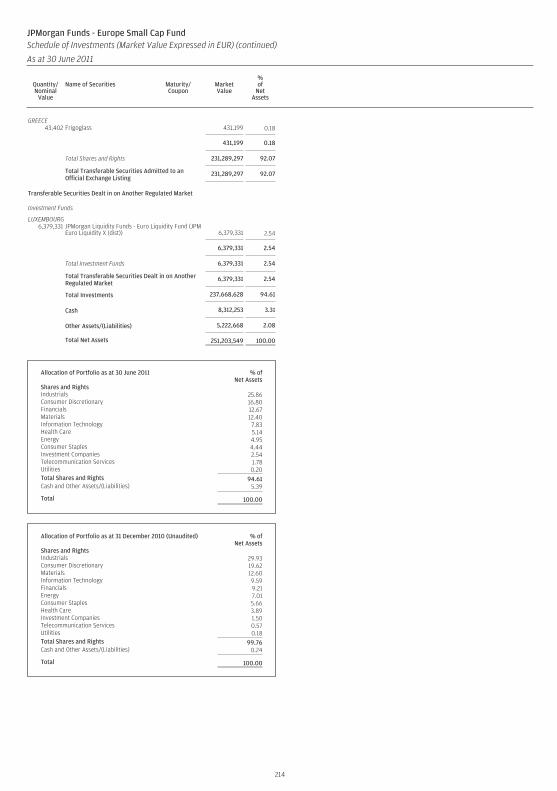
GREECE43,402 Frigoglass 431,199 0.18
431,199 0.18
Total Shares and Rights 231,289,297 92.07
Total Transferable Securities Admitted to anOfficial Exchange Listing
231,289,297 92.07
Transferable Securities Dealt in on Another Regulated Market
Investment Funds
LUXEMBOURG6,379,331 JPMorgan Liquidity Funds - Euro Liquidity Fund (JPM
Euro Liquidity X (dist)) 6,379,331 2.54
6,379,331 2.54
Total Investment Funds 6,379,331 2.54
Total Transferable Securities Dealt in on AnotherRegulated Market
6,379,331 2.54
Total Investments 237,668,628 94.61
Cash 8,312,253 3.31
Other Assets/(Liabilities) 5,222,668 2.08
Total Net Assets 251,203,549 100.00
Allocation of Portfolio as at 30 June 2011 % ofNet Assets
Shares and RightsIndustrials 25.86Consumer Discretionary 16.80Financials 12.67Materials 12.40Information Technology 7.83Health Care 5.14Energy 4.95Consumer Staples 4.44Investment Companies 2.54Telecommunication Services 1.78Utilities 0.20Total Shares and Rights 94.61Cash and Other Assets/(Liabilities) 5.39
Total 100.00
Allocation of Portfolio as at 31 December 2010 (Unaudited) % ofNet Assets
Shares and RightsIndustrials 29.93Consumer Discretionary 19.62Materials 12.60Information Technology 9.59Financials 9.21Energy 7.01Consumer Staples 5.66Health Care 3.89Investment Companies 1.50Telecommunication Services 0.57Utilities 0.18Total Shares and Rights 99.76Cash and Other Assets/(Liabilities) 0.24
Total 100.00
214
JPMorgan Funds - Europe Small Cap FundSchedule of Investments (Market Value Expressed in EUR) (continued)
As at 30 June 2011
Quantity/Nominal
Value
Name of Securities Maturity/Coupon
MarketValue
%of
NetAssets
Quantity/Nominal
Value
Name of Securities Maturity/Coupon
MarketValue
%of
NetAssets
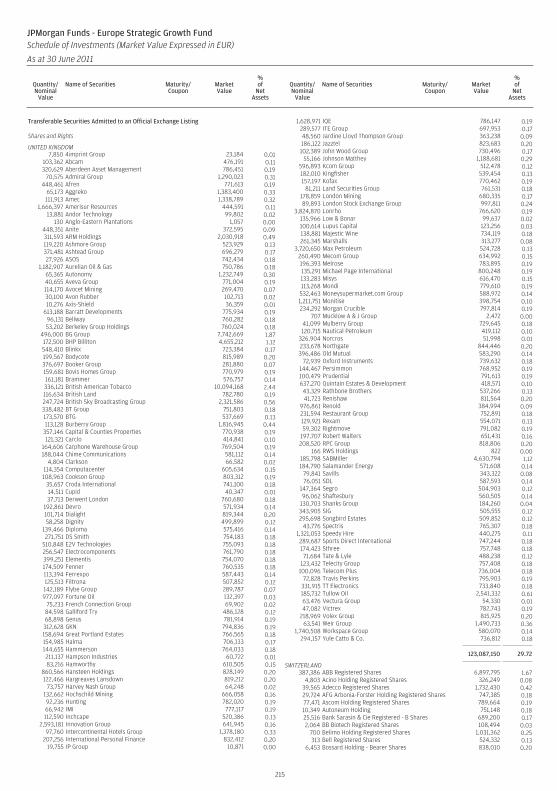
Transferable Securities Admitted to an Official Exchange Listing
Shares and Rights
UNITED KINGDOM7,850 4imprint Group 23,184 0.01
103,362 Abcam 476,191 0.11320,629 Aberdeen Asset Management 786,451 0.19
70,575 Admiral Group 1,290,023 0.31448,461 Afren 771,613 0.19
65,173 Aggreko 1,383,400 0.33111,913 Amec 1,338,789 0.32
1,666,397 Amerisur Resources 444,591 0.1113,881 Andor Technology 99,802 0.02
130 Anglo-Eastern Plantations 1,057 0.00448,351 Anite 372,595 0.09311,593 ARM Holdings 2,030,918 0.49119,220 Ashmore Group 523,929 0.13371,481 Ashtead Group 696,279 0.1727,926 ASOS 742,434 0.18
1,182,907 Aurelian Oil & Gas 750,786 0.1865,365 Autonomy 1,232,749 0.3040,655 Aveva Group 771,004 0.19114,170 Avocet Mining 269,470 0.0730,100 Avon Rubber 102,713 0.0210,276 Axis-Shield 36,359 0.01
613,188 Barratt Developments 775,934 0.1996,131 Bellway 760,282 0.1853,202 Berkeley Group Holdings 760,024 0.18
496,000 BG Group 7,742,669 1.87172,500 BHP Billiton 4,655,212 1.12548,410 Blinkx 723,384 0.17199,567 Bodycote 815,989 0.20376,697 Booker Group 281,880 0.07159,681 Bovis Homes Group 770,979 0.19161,181 Brammer 576,757 0.14336,121 British American Tobacco 10,094,168 2.44116,634 British Land 782,780 0.19247,724 British Sky Broadcasting Group 2,321,586 0.56338,482 BT Group 751,803 0.18173,570 BTG 537,669 0.13113,128 Burberry Group 1,816,945 0.44
357,146 Capital & Counties Properties 770,938 0.19121,321 Carclo 414,841 0.10
164,606 Carphone Warehouse Group 769,504 0.19188,044 Chime Communications 581,112 0.14
4,804 Clarkson 66,582 0.02114,354 Computacenter 605,634 0.15108,963 Cookson Group 803,312 0.19
35,657 Croda International 741,100 0.1814,511 Cupid 40,347 0.0137,713 Derwent London 760,680 0.18
192,861 Devro 571,934 0.14101,714 Dialight 819,344 0.2058,258 Dignity 499,899 0.12
139,466 Diploma 575,416 0.14271,751 DS Smith 754,183 0.18
510,848 E2V Technologies 755,093 0.18256,547 Electrocomponents 761,790 0.18399,251 Elementis 754,070 0.18174,509 Fenner 760,535 0.18113,394 Ferrexpo 587,443 0.14125,513 Filtrona 507,852 0.12142,189 Flybe Group 289,787 0.07977,097 Fortune Oil 132,397 0.03
75,233 French Connection Group 69,902 0.0284,598 Galliford Try 486,128 0.1268,898 Genus 781,914 0.19312,628 GKN 794,836 0.19158,694 Great Portland Estates 766,565 0.18154,985 Halma 706,133 0.17144,655 Hammerson 764,033 0.18211,137 Hampson Industries 60,722 0.0183,216 Hamworthy 610,505 0.15
860,566 Hansteen Holdings 828,149 0.20122,466 Hargreaves Lansdown 819,212 0.20
73,757 Harvey Nash Group 64,248 0.02132,662 Hochschild Mining 666,058 0.1692,236 Hunting 782,020 0.1966,942 IMI 777,117 0.19112,590 Inchcape 520,386 0.13
2,593,181 Innovation Group 641,945 0.1697,760 Intercontinental Hotels Group 1,378,180 0.33
207,256 International Personal Finance 832,412 0.2019,755 IP Group 10,871 0.00
1,628,971 IQE 786,147 0.19289,577 ITE Group 697,953 0.1748,560 Jardine Lloyd Thompson Group 363,238 0.09186,122 Jazztel 823,683 0.20102,389 John Wood Group 730,496 0.17
55,166 Johnson Matthey 1,188,681 0.29596,893 Kcom Group 512,478 0.12182,010 Kingfisher 539,454 0.13157,197 Kofax 770,462 0.19
81,211 Land Securities Group 761,531 0.18178,859 London Mining 680,335 0.1789,893 London Stock Exchange Group 997,811 0.24
3,824,870 Lonrho 766,620 0.19135,966 Low & Bonar 99,637 0.02100,614 Lupus Capital 123,256 0.03138,881 Majestic Wine 734,119 0.18261,345 Marshalls 313,277 0.08
3,720,650 Max Petroleum 524,728 0.13260,490 Mecom Group 634,992 0.15196,393 Melrose 783,895 0.19135,291 Michael Page International 800,248 0.19133,283 Misys 616,470 0.15113,268 Mondi 779,610 0.19532,463 Moneysupermarket.com Group 588,972 0.141,211,751 Monitise 398,754 0.10234,292 Morgan Crucible 797,814 0.19
707 Mucklow A & J Group 2,472 0.0041,099 Mulberry Group 729,645 0.18120,715 Nautical Petroleum 419,112 0.10
326,904 Norcros 51,998 0.01233,678 Northgate 844,446 0.20396,486 Old Mutual 583,290 0.14
72,939 Oxford Instruments 739,632 0.18144,467 Persimmon 768,952 0.19100,479 Prudential 791,613 0.19637,270 Quintain Estates & Development 418,571 0.1043,329 Rathbone Brothers 537,266 0.1341,723 Renishaw 811,564 0.20
976,861 Renold 384,994 0.09231,594 Restaurant Group 752,891 0.18129,921 Rexam 554,071 0.1359,302 Rightmove 791,082 0.19
197,707 Robert Walters 651,431 0.16208,520 RPC Group 818,806 0.20
166 RWS Holdings 822 0.00185,798 SABMiller 4,630,794 1.12184,790 Salamander Energy 571,608 0.14
79,841 Savills 343,322 0.0876,051 SDL 587,593 0.14
147,364 Segro 504,903 0.1296,062 Shaftesbury 560,505 0.14
130,703 Shanks Group 184,260 0.04343,905 SIG 505,555 0.12295,698 Songbird Estates 509,852 0.12
43,776 Spectris 765,307 0.181,321,053 Speedy Hire 440,275 0.11289,687 Sports Direct International 747,244 0.18174,423 Sthree 757,748 0.1871,684 Tate & Lyle 488,238 0.12
123,432 Telecity Group 757,408 0.18100,096 Telecom Plus 736,004 0.18
72,828 Travis Perkins 795,903 0.19331,915 TT Electronics 733,840 0.18185,732 Tullow Oil 2,541,332 0.6163,476 Vectura Group 54,330 0.0147,082 Victrex 782,743 0.19
218,969 Volex Group 815,925 0.2063,541 Weir Group 1,490,733 0.36
1,740,508 Workspace Group 580,070 0.14294,157 Yule Catto & Co. 736,812 0.18
123,087,150 29.72
SWITZERLAND387,386 ABB Registered Shares 6,897,795 1.67
4,803 Acino Holding Registered Shares 326,249 0.0839,565 Adecco Registered Shares 1,732,430 0.4229,724 AFG Arbonia-Forster Holding Registered Shares 747,385 0.1877,471 Ascom Holding Registered Shares 789,664 0.1910,349 Autoneum Holding 751,148 0.1825,516 Bank Sarasin & Cie Registered - B Shares 689,200 0.172,064 BB Biotech Registered Shares 108,494 0.03
700 Belimo Holding Registered Shares 1,031,362 0.25313 Bell Registered Shares 524,332 0.13
6,453 Bossard Holding - Bearer Shares 838,010 0.20
215
JPMorgan Funds - Europe Strategic Growth FundSchedule of Investments (Market Value Expressed in EUR)
As at 30 June 2011
Quantity/Nominal
Value
Name of Securities Maturity/Coupon
MarketValue
%of
NetAssets
Quantity/Nominal
Value
Name of Securities Maturity/Coupon
MarketValue
%of
NetAssets
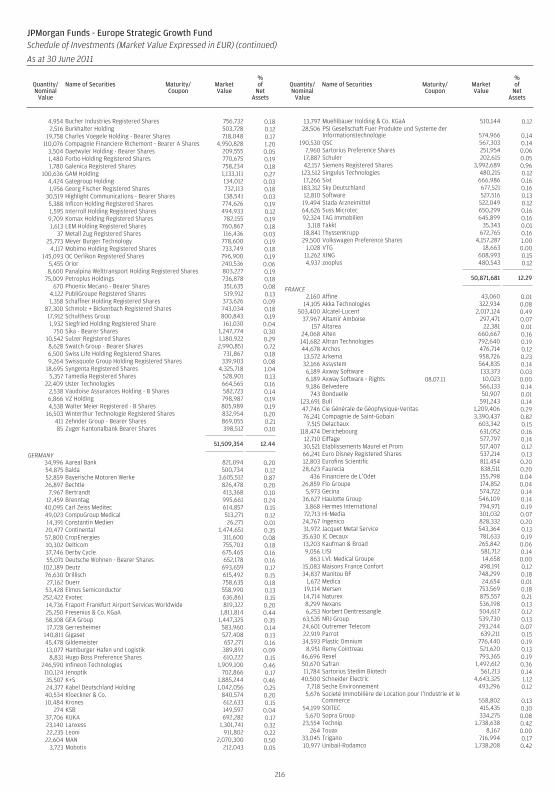
4,954 Bucher Industries Registered Shares 756,732 0.182,516 Burkhalter Holding 503,728 0.12
19,758 Charles Voegele Holding - Bearer Shares 718,048 0.17110,076 Compagnie Financiere Richemont - Bearer A Shares 4,950,828 1.20
3,504 Daetwyler Holding - Bearer Shares 209,555 0.051,480 Forbo Holding Registered Shares 770,675 0.191,780 Galenica Registered Shares 758,234 0.18
100,636 GAM Holding 1,133,111 0.274,424 Gategroup Holding 134,012 0.031,956 Georg Fischer Registered Shares 732,113 0.18
30,519 Highlight Communications - Bearer Shares 138,541 0.035,388 Inficon Holding Registered Shares 774,626 0.191,595 Interroll Holding Registered Shares 494,933 0.129,709 Komax Holding Registered Shares 782,155 0.191,613 LEM Holding Registered Shares 760,867 0.18
37 Metall Zug Registered Shares 116,436 0.0325,773 Meyer Burger Technology 778,600 0.19
4,117 Mobimo Holding Registered Shares 733,749 0.18145,093 OC Oerlikon Registered Shares 796,900 0.19
5,455 Orior 240,536 0.068,600 Panalpina Welttransport Holding Registered Shares 803,227 0.19
75,009 Petroplus Holdings 736,878 0.18670 Phoenix Mecano - Bearer Shares 351,635 0.08
4,122 PubliGroupe Registered Shares 519,912 0.131,358 Schaffner Holding Registered Shares 373,626 0.09
87,300 Schmolz + Bickenbach Registered Shares 743,034 0.1817,912 Schulthess Group 800,843 0.191,932 Siegfried Holding Registered Share 161,030 0.04
750 Sika - Bearer Shares 1,247,774 0.3010,542 Sulzer Registered Shares 1,180,922 0.298,628 Swatch Group - Bearer Shares 2,990,851 0.726,500 Swiss Life Holding Registered Shares 731,867 0.189,264 Swissquote Group Holding Registered Shares 339,903 0.08
18,695 Syngenta Registered Shares 4,325,718 1.045,357 Tamedia Registered Shares 528,901 0.13
22,409 Uster Technologies 664,565 0.162,538 Vaudoise Assurances Holding - B Shares 582,723 0.146,866 VZ Holding 798,987 0.194,538 Walter Meier Registered - B Shares 805,989 0.19
16,503 Winterthur Technologie Registered Shares 832,954 0.20411 Zehnder Group - Bearer Shares 869,055 0.2185 Zuger Kantonalbank Bearer Shares 398,512 0.10
51,509,354 12.44
GERMANY34,996 Aareal Bank 821,094 0.2054,875 Balda 500,734 0.1252,859 Bayerische Motoren Werke 3,605,512 0.8726,897 Bechtle 826,478 0.20
7,967 Bertrandt 413,368 0.1012,459 Brenntag 995,661 0.24
40,095 Carl Zeiss Meditec 614,857 0.1549,023 CompuGroup Medical 513,271 0.1214,391 Constantin Medien 26,271 0.0120,477 Continental 1,474,651 0.3557,800 CropEnergies 311,600 0.0810,302 Delticom 755,703 0.1837,746 Derby Cycle 675,465 0.1655,071 Deutsche Wohnen - Bearer Shares 652,178 0.16
102,189 Deutz 693,659 0.1776,630 Drillisch 615,492 0.1527,162 Duerr 758,635 0.1853,428 Elmos Semiconductor 558,990 0.13
252,422 Evotec 636,861 0.1514,736 Fraport Frankfurt Airport Services Worldwide 819,322 0.2025,250 Fresenius & Co. KGaA 1,811,814 0.4458,108 GEA Group 1,447,325 0.3517,728 Gerresheimer 583,960 0.14
140,811 Gigaset 527,408 0.1345,478 Gildemeister 657,271 0.1613,077 Hamburger Hafen und Logistik 389,891 0.098,831 Hugo Boss Preference Shares 610,222 0.15
246,590 Infineon Technologies 1,909,100 0.46110,124 Jenoptik 702,866 0.1735,507 K+S 1,885,244 0.4624,377 Kabel Deutschland Holding 1,042,056 0.2540,534 Kloeckner & Co. 840,574 0.2010,484 Krones 612,633 0.15
274 KSB 149,597 0.0437,706 KUKA 692,282 0.1723,140 Lanxess 1,301,741 0.3222,235 Leoni 911,802 0.2222,604 MAN 2,070,300 0.50
3,723 Mobotix 212,043 0.05
13,797 Muehlbauer Holding & Co. KGaA 510,144 0.1228,506 PSI Gesellschaft Fuer Produkte und Systeme der
Informationstechnologie 574,966 0.14190,530 QSC 567,303 0.14
7,960 Sartorius Preference Shares 251,954 0.0617,887 Schuler 202,615 0.0542,157 Siemens Registered Shares 3,992,689 0.96
123,512 Singulus Technologies 480,215 0.1217,266 Sixt 666,986 0.16
183,312 Sky Deutschland 677,521 0.1612,810 Software 527,516 0.1319,494 Stada Arzneimittel 522,049 0.1264,626 Suss Microtec 650,299 0.1692,324 TAG Immobilien 645,899 0.16
3,118 Takkt 35,343 0.0118,841 ThyssenKrupp 672,765 0.1629,500 Volkswagen Preference Shares 4,157,287 1.00
1,028 VTG 18,663 0.0011,262 XING 608,993 0.154,937 zooplus 480,543 0.12
50,871,681 12.29
FRANCE2,160 Affine 43,060 0.01
14,105 Akka Technologies 322,934 0.08503,400 Alcatel-Lucent 2,017,124 0.49
37,967 Altamir Amboise 297,471 0.07157 Altarea 22,381 0.01
24,068 Alten 660,667 0.16141,682 Altran Technologies 792,640 0.1944,678 Archos 476,714 0.1213,572 Arkema 958,726 0.2332,166 Assystem 564,835 0.146,189 Axway Software 133,373 0.036,189 Axway Software - Rights 08.07.11 10,023 0.009,186 Belvedere 566,133 0.14
743 Bonduelle 50,907 0.01123,691 Bull 591,243 0.1447,746 Cie Générale de Géophysique-Veritas 1,209,406 0.2976,241 Compagnie de Saint-Gobain 3,390,437 0.82
7,515 Delachaux 603,342 0.15118,474 Derichebourg 631,052 0.16
12,710 Eiffage 577,797 0.1430,521 Etablissements Maurel et Prom 517,407 0.1266,241 Euro Disney Registered Shares 537,214 0.1312,803 Eurofins Scientific 811,454 0.2028,623 Faurecia 838,511 0.20
436 Financiere de L’Odet 155,798 0.0426,859 Flo Groupe 174,852 0.04
5,973 Gecina 574,722 0.1436,627 Haulotte Group 546,109 0.143,868 Hermes International 794,971 0.1972,713 Hi-Media 301,032 0.0724,767 Ingenico 828,332 0.2031,972 Jacquet Metal Service 543,364 0.1335,630 JC Decaux 781,633 0.1913,203 Kaufman & Broad 265,842 0.069,056 LISI 581,712 0.14
863 LVL Medical Groupe 14,658 0.0015,083 Maisons France Confort 498,191 0.1234,837 Manitou BF 748,299 0.18
1,672 Medica 24,654 0.0119,114 Mersen 753,569 0.1814,714 Naturex 875,557 0.218,299 Nexans 536,198 0.136,253 Norbert Dentressangle 504,617 0.12
63,535 NRJ Group 539,730 0.1324,601 Outremer Telecom 293,244 0.0722,919 Parrot 639,211 0.1534,593 Plastic Omnium 776,440 0.19
8,951 Remy Cointreau 521,620 0.1346,696 Rexel 793,365 0.1950,670 Safran 1,492,612 0.3611,784 Sartorius Stedim Biotech 561,213 0.14
40,500 Schneider Electric 4,643,325 1.127,718 Seche Environnement 493,296 0.125,676 Societé Immobilière de Location pour l’Industrie et le
Commerce 558,802 0.1354,199 SOITEC 415,435 0.105,670 Sopra Group 334,275 0.08
23,554 Technip 1,738,638 0.42264 Touax 8,167 0.00
33,045 Trigano 716,994 0.1710,977 Unibail-Rodamco 1,738,208 0.42
216
JPMorgan Funds - Europe Strategic Growth FundSchedule of Investments (Market Value Expressed in EUR) (continued)
As at 30 June 2011
Quantity/Nominal
Value
Name of Securities Maturity/Coupon
MarketValue
%of
NetAssets
Quantity/Nominal
Value
Name of Securities Maturity/Coupon
MarketValue
%of
NetAssets
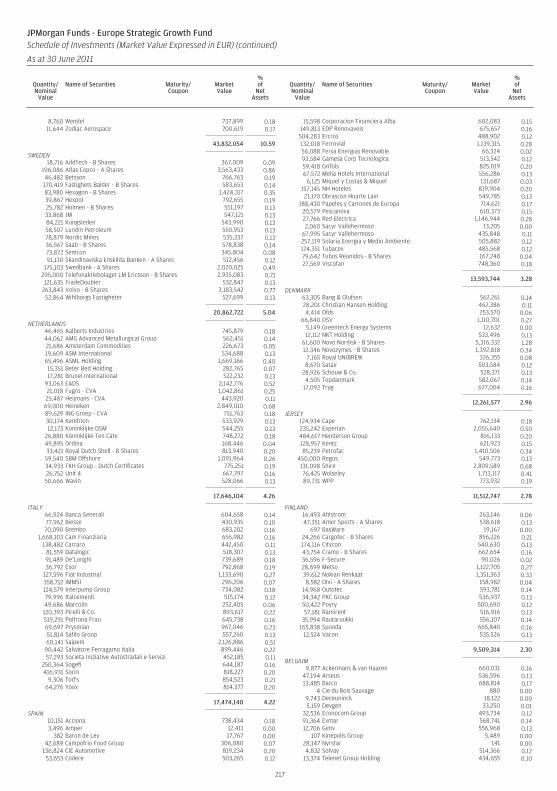
8,760 Wendel 737,899 0.1811,644 Zodiac Aerospace 700,619 0.17
43,832,054 10.59
SWEDEN18,716 AddTech - B Shares 367,009 0.09
196,086 Atlas Copco - A Shares 3,563,433 0.8646,482 Betsson 766,763 0.19170,419 Fastighets Balder - B Shares 583,653 0.1483,980 Hexagon - B Shares 1,424,317 0.3539,867 Hexpol 792,655 0.1925,782 Holmen - B Shares 551,197 0.1333,868 JM 547,121 0.1384,221 Kungsleden 543,990 0.1358,507 Lundin Petroleum 550,953 0.1378,879 Nordic Mines 535,337 0.1336,567 Saab - B Shares 578,838 0.1473,872 Semcon 345,804 0.0891,130 Skandinaviska Enskilda Banken - A Shares 512,456 0.12
175,103 Swedbank - A Shares 2,020,025 0.49295,000 Telefonaktiebolaget LM Ericsson - B Shares 2,935,083 0.71121,635 TradeDoubler 532,847 0.13
263,843 Volvo - B Shares 3,183,542 0.7752,864 Wihlborgs Fastigheter 527,699 0.13
20,862,722 5.04
NETHERLANDS46,465 Aalberts Industries 745,879 0.1844,062 AMG Advanced Metallurgical Group 562,451 0.1421,686 Amsterdam Commodities 226,673 0.0519,609 ASM International 534,688 0.1365,496 ASML Holding 1,669,166 0.4015,351 Beter Bed Holding 282,765 0.0717,281 Brunel International 522,232 0.13
93,063 EADS 2,142,776 0.5221,018 Fugro - CVA 1,042,861 0.2525,487 Heijmans - CVA 443,920 0.11
69,000 Heineken 2,849,010 0.6889,629 ING Groep - CVA 751,763 0.1830,174 Kendrion 533,929 0.1312,173 Koninklijke DSM 544,255 0.13
26,880 Koninklijke Ten Cate 748,272 0.1849,895 Ordina 168,446 0.0433,421 Royal Dutch Shell - B Shares 813,940 0.2059,540 SBM Offshore 1,091,964 0.2634,933 TKH Group - Dutch Certificates 775,251 0.1926,752 Unit 4 667,797 0.1650,666 Wavin 528,066 0.13
17,646,104 4.26
ITALY66,924 Banca Generali 604,658 0.1477,962 Biesse 430,935 0.1070,090 Brembo 683,202 0.16
1,668,103 Cam Finanziaria 656,982 0.16138,482 Carraro 442,450 0.11
81,559 Datalogic 518,307 0.1391,489 De’Longhi 739,689 0.1836,792 Exor 792,868 0.19
127,596 Fiat Industrial 1,133,690 0.27358,712 IMMSI 296,206 0.07124,579 Interpump Group 734,082 0.1879,996 Italcementi 515,174 0.1249,686 Marcolin 252,405 0.06120,393 Pirelli & Co. 893,617 0.22519,291 Poltrona Frau 645,738 0.1669,697 Prysmian 967,046 0.2351,814 Safilo Group 557,260 0.1360,141 Saipem 2,126,886 0.51
90,442 Salvatore Ferragamo Italia 899,446 0.2257,293 Societa Iniziative Autostradali e Servizi 452,185 0.11
250,364 Sogefi 644,187 0.16416,931 Sorin 818,227 0.20
9,306 Tod’s 854,523 0.2164,276 Yoox 814,377 0.20
17,474,140 4.22
SPAIN10,151 Acciona 738,434 0.183,496 Amper 12,411 0.00
382 Baron de Ley 17,767 0.0042,689 Campofrio Food Group 306,080 0.07
136,824 CIE Automotive 819,234 0.2053,653 Codere 503,265 0.12
15,598 Corporacion Financiera Alba 602,083 0.15149,813 EDP Renovaveis 675,657 0.16504,283 Ercros 488,902 0.12132,018 Ferrovial 1,139,315 0.2856,088 Fersa Energias Renovable 66,324 0.0293,584 Gamesa Corp Tecnologica 513,542 0.1259,418 Grifols 825,019 0.2067,572 Melia Hotels International 556,286 0.13
6,125 Miquel y Costas & Miquel 131,687 0.03157,145 NH Hoteles 819,904 0.2021,170 Obrascon Huarte Lain 549,785 0.13
188,430 Papeles y Cartones de Europa 714,621 0.1720,579 Pescanova 610,373 0.1527,766 Red Eléctrica 1,146,944 0.282,060 Sacyr Vallehermoso 13,205 0.00
67,995 Sacyr Vallehermoso 435,848 0.11257,119 Solaria Energia y Medio Ambiente 505,882 0.12174,351 Tubacex 485,568 0.1279,642 Tubos Reunidos - B Shares 167,248 0.0427,569 Viscofan 748,360 0.18
13,593,744 3.28
DENMARK63,305 Bang & Olufsen 562,261 0.1428,201 Christian Hansen Holding 462,386 0.114,414 Dfds 253,570 0.06
66,840 DSV 1,110,701 0.275,149 Greentech Energy Systems 12,632 0.0012,112 NKT Holding 533,496 0.13
61,600 Novo Nordisk - B Shares 5,316,332 1.2812,346 Novozymes - B Shares 1,392,818 0.34
7,165 Royal UNIBREW 326,355 0.088,670 Satair 503,584 0.12
28,926 Schouw & Co. 528,371 0.134,505 Topdanmark 582,067 0.14
17,092 Tryg 677,004 0.16
12,261,577 2.96
JERSEY124,934 Cape 762,134 0.18235,242 Experian 2,055,640 0.50484,617 Henderson Group 816,133 0.20128,957 Kentz 621,923 0.1585,239 Petrofac 1,410,506 0.34
450,000 Regus 549,773 0.13131,098 Shire 2,809,589 0.6876,425 Wolseley 1,713,117 0.4189,731 WPP 773,932 0.19
11,512,747 2.78
FINLAND16,493 Ahlstrom 263,146 0.0647,351 Amer Sports - A Shares 538,618 0.13
697 BasWare 19,167 0.0024,266 Cargotec - B Shares 856,226 0.21174,116 Citycon 540,630 0.1343,754 Cramo - B Shares 662,654 0.1636,596 F-Secure 90,026 0.0228,699 Metso 1,122,705 0.2739,612 Nokian Renkaat 1,351,363 0.338,582 Olvi - A Shares 158,982 0.04
14,968 Outotec 593,781 0.1434,342 PKC Group 536,937 0.1350,422 Poyry 500,690 0.1257,181 Ramirent 516,916 0.13
35,994 Rautaruukki 556,107 0.14165,838 Sponda 665,840 0.16
12,524 Vacon 535,526 0.13
9,509,314 2.30
BELGIUM9,877 Ackermans & van Haaren 660,031 0.16
47,194 Arseus 536,596 0.1313,485 Barco 688,814 0.17
4 Cie du Bois Sauvage 880 0.009,743 Deceuninck 18,122 0.005,159 Devgen 33,250 0.01
32,536 Econocom Group 493,734 0.1291,364 Exmar 568,741 0.1412,706 Gimv 556,968 0.13
107 Kinepolis Group 5,489 0.0028,147 Nyrstar 141 0.004,832 Solvay 514,366 0.12
13,374 Telenet Group Holding 434,655 0.10
217
JPMorgan Funds - Europe Strategic Growth FundSchedule of Investments (Market Value Expressed in EUR) (continued)
As at 30 June 2011
Quantity/Nominal
Value
Name of Securities Maturity/Coupon
MarketValue
%of
NetAssets
Quantity/Nominal
Value
Name of Securities Maturity/Coupon
MarketValue
%of
NetAssets
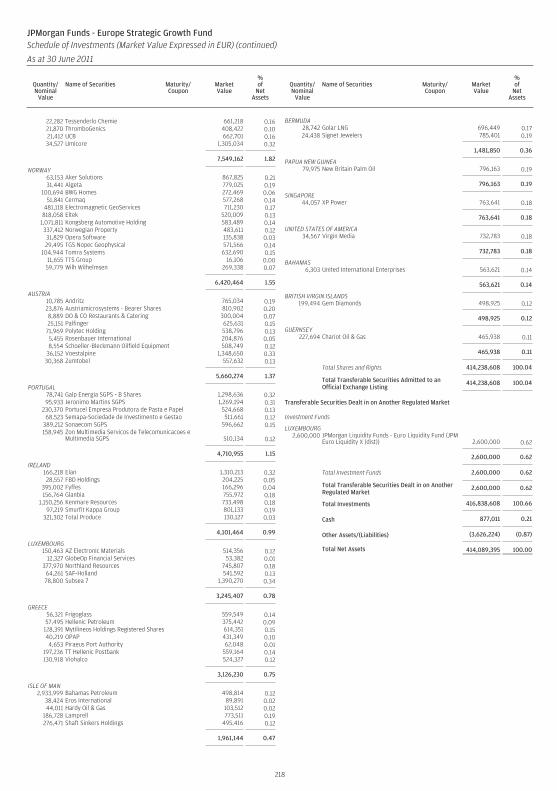
22,282 Tessenderlo Chemie 661,218 0.1621,870 ThromboGenics 408,422 0.1021,412 UCB 662,701 0.1634,527 Umicore 1,305,034 0.32
7,549,162 1.82
NORWAY63,153 Aker Solutions 867,825 0.2131,441 Algeta 779,025 0.19
100,694 BWG Homes 272,469 0.0651,841 Cermaq 577,268 0.14
481,118 Electromagnetic GeoServices 711,230 0.17818,058 Eltek 520,009 0.13
1,071,811 Kongsberg Automotive Holding 583,489 0.14337,412 Norwegian Property 483,611 0.1231,829 Opera Software 135,838 0.0329,495 TGS Nopec Geophysical 571,566 0.14
104,944 Tomra Systems 632,690 0.1511,655 TTS Group 16,106 0.0059,779 Wilh Wilhelmsen 269,338 0.07
6,420,464 1.55
AUSTRIA10,785 Andritz 765,034 0.1923,876 Austriamicrosystems - Bearer Shares 810,902 0.208,889 DO & CO Restaurants & Catering 300,004 0.0725,151 Palfinger 625,631 0.15
71,969 Polytec Holding 538,796 0.135,455 Rosenbauer International 204,876 0.058,554 Schoeller-Bleckmann Oilfield Equipment 508,749 0.12
36,152 Voestalpine 1,348,650 0.3330,368 Zumtobel 557,632 0.13
5,660,274 1.37
PORTUGAL78,741 Galp Energia SGPS - B Shares 1,298,636 0.3295,933 Jeronimo Martins SGPS 1,269,194 0.31
230,370 Portucel Empresa Produtora de Pasta e Papel 524,668 0.1368,523 Semapa-Sociedade de Investimento e Gestao 511,661 0.12
389,212 Sonaecom SGPS 596,662 0.15158,945 Zon Multimedia Servicos de Telecomunicacoes e
Multimedia SGPS 510,134 0.12
4,710,955 1.15
IRELAND166,218 Elan 1,310,213 0.3228,557 FBD Holdings 204,225 0.05
395,002 Fyffes 166,296 0.04156,764 Glanbia 755,972 0.18
1,150,256 Kenmare Resources 733,498 0.1897,219 Smurfit Kappa Group 801,133 0.19
321,302 Total Produce 130,127 0.03
4,101,464 0.99
LUXEMBOURG150,463 AZ Electronic Materials 514,356 0.12
12,327 GlobeOp Financial Services 53,382 0.01377,970 Northland Resources 745,807 0.18
64,261 SAF-Holland 541,592 0.1378,800 Subsea 7 1,390,270 0.34
3,245,407 0.78
GREECE56,321 Frigoglass 559,549 0.1457,495 Hellenic Petroleum 375,442 0.09
128,391 Mytilineos Holdings Registered Shares 614,351 0.1540,219 OPAP 431,349 0.104,653 Piraeus Port Authority 62,048 0.01
197,236 TT Hellenic Postbank 559,164 0.14130,918 Viohalco 524,327 0.12
3,126,230 0.75
ISLE OF MAN2,933,999 Bahamas Petroleum 498,814 0.12
38,424 Eros International 89,891 0.0244,011 Hardy Oil & Gas 103,512 0.02
186,728 Lamprell 773,511 0.19276,471 Shaft Sinkers Holdings 495,416 0.12
1,961,144 0.47
BERMUDA28,742 Golar LNG 696,449 0.1724,438 Signet Jewelers 785,401 0.19
1,481,850 0.36
PAPUA NEW GUINEA79,975 New Britain Palm Oil 796,163 0.19
796,163 0.19
SINGAPORE44,057 XP Power 763,641 0.18
763,641 0.18
UNITED STATES OF AMERICA34,567 Virgin Media 732,783 0.18
732,783 0.18
BAHAMAS6,303 United International Enterprises 563,621 0.14
563,621 0.14
BRITISH VIRGIN ISLANDS199,494 Gem Diamonds 498,925 0.12
498,925 0.12
GUERNSEY227,694 Chariot Oil & Gas 465,938 0.11
465,938 0.11
Total Shares and Rights 414,238,608 100.04
Total Transferable Securities Admitted to anOfficial Exchange Listing
414,238,608 100.04
Transferable Securities Dealt in on Another Regulated Market
Investment Funds
LUXEMBOURG2,600,000 JPMorgan Liquidity Funds - Euro Liquidity Fund (JPM
Euro Liquidity X (dist)) 2,600,000 0.62
2,600,000 0.62
Total Investment Funds 2,600,000 0.62
Total Transferable Securities Dealt in on AnotherRegulated Market
2,600,000 0.62
Total Investments 416,838,608 100.66
Cash 877,011 0.21
Other Assets/(Liabilities) (3,626,224) (0.87)
Total Net Assets 414,089,395 100.00
218
JPMorgan Funds - Europe Strategic Growth FundSchedule of Investments (Market Value Expressed in EUR) (continued)
As at 30 June 2011
Quantity/Nominal
Value
Name of Securities Maturity/Coupon
MarketValue
%of
NetAssets
Quantity/Nominal
Value
Name of Securities Maturity/Coupon
MarketValue
%of
NetAssets
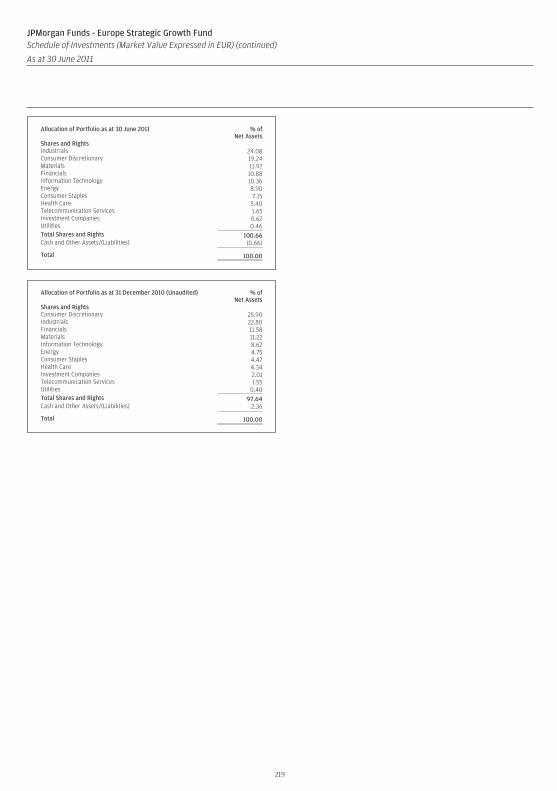
Allocation of Portfolio as at 30 June 2011 % ofNet Assets
Shares and RightsIndustrials 24.08Consumer Discretionary 19.24Materials 11.92Financials 10.88Information Technology 10.36Energy 8.90Consumer Staples 7.15Health Care 5.40Telecommunication Services 1.65Investment Companies 0.62Utilities 0.46Total Shares and Rights 100.66Cash and Other Assets/(Liabilities) (0.66)
Total 100.00
Allocation of Portfolio as at 31 December 2010 (Unaudited) % ofNet Assets
Shares and RightsConsumer Discretionary 25.90Industrials 22.80Financials 11.58Materials 11.22Information Technology 8.62Energy 4.75Consumer Staples 4.47Health Care 4.34Investment Companies 2.01Telecommunication Services 1.55Utilities 0.40Total Shares and Rights 97.64Cash and Other Assets/(Liabilities) 2.36
Total 100.00
219
JPMorgan Funds - Europe Strategic Growth FundSchedule of Investments (Market Value Expressed in EUR) (continued)
As at 30 June 2011
Quantity/Nominal
Value
Name of Securities Maturity/Coupon
MarketValue
%of
NetAssets
Quantity/Nominal
Value
Name of Securities Maturity/Coupon
MarketValue
%of
NetAssets
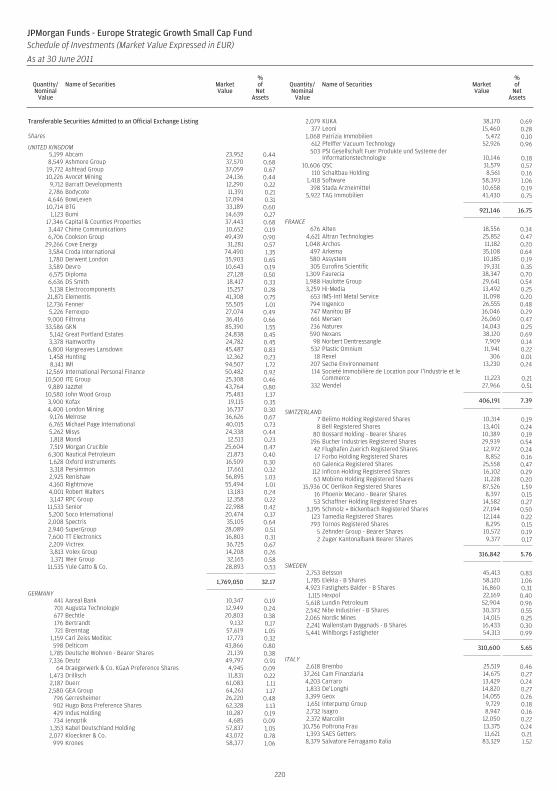
Transferable Securities Admitted to an Official Exchange Listing
Shares
UNITED KINGDOM5,199 Abcam 23,952 0.448,549 Ashmore Group 37,570 0.6819,772 Ashtead Group 37,059 0.6710,226 Avocet Mining 24,136 0.44
9,712 Barratt Developments 12,290 0.222,786 Bodycote 11,391 0.214,646 BowLeven 17,094 0.3110,714 BTG 33,189 0.60
1,123 Bumi 14,639 0.2717,346 Capital & Counties Properties 37,443 0.683,447 Chime Communications 10,652 0.196,706 Cookson Group 49,439 0.90
29,266 Cove Energy 31,281 0.573,584 Croda International 74,490 1.351,780 Derwent London 35,903 0.653,589 Devro 10,643 0.196,575 Diploma 27,128 0.506,636 DS Smith 18,417 0.335,138 Electrocomponents 15,257 0.28
21,871 Elementis 41,308 0.7512,736 Fenner 55,505 1.015,226 Ferrexpo 27,074 0.49
9,000 Filtrona 36,416 0.6633,586 GKN 85,390 1.55
5,142 Great Portland Estates 24,838 0.453,378 Hamworthy 24,782 0.456,800 Hargreaves Lansdown 45,487 0.831,458 Hunting 12,362 0.238,141 IMI 94,507 1.72
12,569 International Personal Finance 50,482 0.9210,500 ITE Group 25,308 0.469,889 Jazztel 43,764 0.80
10,580 John Wood Group 75,483 1.373,900 Kofax 19,115 0.354,400 London Mining 16,737 0.309,176 Melrose 36,626 0.676,765 Michael Page International 40,015 0.735,262 Misys 24,338 0.441,818 Mondi 12,513 0.237,519 Morgan Crucible 25,604 0.47
6,300 Nautical Petroleum 21,873 0.401,628 Oxford Instruments 16,509 0.303,318 Persimmon 17,661 0.322,925 Renishaw 56,895 1.034,160 Rightmove 55,494 1.014,001 Robert Walters 13,183 0.243,147 RPC Group 12,358 0.22
11,533 Senior 22,988 0.425,200 Soco International 20,474 0.372,008 Spectris 35,105 0.642,940 SuperGroup 28,089 0.517,600 TT Electronics 16,803 0.312,209 Victrex 36,725 0.673,813 Volex Group 14,208 0.261,371 Weir Group 32,165 0.58
11,535 Yule Catto & Co. 28,893 0.53
1,769,050 32.17
GERMANY441 Aareal Bank 10,347 0.19701 Augusta Technologie 12,949 0.24677 Bechtle 20,803 0.38176 Bertrandt 9,132 0.17721 Brenntag 57,619 1.05
1,159 Carl Zeiss Meditec 17,773 0.32598 Delticom 43,866 0.80
1,785 Deutsche Wohnen - Bearer Shares 21,139 0.387,336 Deutz 49,797 0.91
64 Draegerwerk & Co. KGaA Preference Shares 4,945 0.091,473 Drillisch 11,831 0.222,187 Duerr 61,083 1.112,580 GEA Group 64,261 1.17
796 Gerresheimer 26,220 0.48902 Hugo Boss Preference Shares 62,328 1.13429 Indus Holding 10,287 0.19734 Jenoptik 4,685 0.09
1,353 Kabel Deutschland Holding 57,837 1.052,077 Kloeckner & Co. 43,072 0.78
999 Krones 58,377 1.06
2,079 KUKA 38,170 0.69377 Leoni 15,460 0.28
1,068 Patrizia Immobilien 5,472 0.10612 Pfeiffer Vacuum Technology 52,926 0.96503 PSI Gesellschaft Fuer Produkte und Systeme der
Informationstechnologie 10,146 0.1810,606 QSC 31,579 0.57
110 Schaltbau Holding 8,561 0.161,418 Software 58,393 1.06
398 Stada Arzneimittel 10,658 0.195,922 TAG Immobilien 41,430 0.75
921,146 16.75
FRANCE676 Alten 18,556 0.34
4,621 Altran Technologies 25,852 0.471,048 Archos 11,182 0.20
497 Arkema 35,108 0.64580 Assystem 10,185 0.19305 Eurofins Scientific 19,331 0.35
1,309 Faurecia 38,347 0.701,988 Haulotte Group 29,641 0.543,259 Hi-Media 13,492 0.25
653 IMS-Intl Metal Service 11,098 0.20794 Ingenico 26,555 0.48747 Manitou BF 16,046 0.29661 Mersen 26,060 0.47236 Naturex 14,043 0.25590 Nexans 38,120 0.69
98 Norbert Dentressangle 7,909 0.14532 Plastic Omnium 11,941 0.22
18 Rexel 306 0.01207 Seche Environnement 13,230 0.24114 Societé Immobilière de Location pour l’Industrie et le
Commerce 11,223 0.21332 Wendel 27,966 0.51
406,191 7.39
SWITZERLAND7 Belimo Holding Registered Shares 10,314 0.198 Bell Registered Shares 13,401 0.24
80 Bossard Holding - Bearer Shares 10,389 0.19196 Bucher Industries Registered Shares 29,939 0.5442 Flughafen Zuerich Registered Shares 12,972 0.2417 Forbo Holding Registered Shares 8,852 0.16
60 Galenica Registered Shares 25,558 0.47112 Inficon Holding Registered Shares 16,102 0.2963 Mobimo Holding Registered Shares 11,228 0.20
15,936 OC Oerlikon Registered Shares 87,526 1.5916 Phoenix Mecano - Bearer Shares 8,397 0.1553 Schaffner Holding Registered Shares 14,582 0.27
3,195 Schmolz + Bickenbach Registered Shares 27,194 0.50123 Tamedia Registered Shares 12,144 0.22793 Tornos Registered Shares 8,295 0.15
5 Zehnder Group - Bearer Shares 10,572 0.192 Zuger Kantonalbank Bearer Shares 9,377 0.17
316,842 5.76
SWEDEN2,753 Betsson 45,413 0.831,785 Elekta - B Shares 58,120 1.064,923 Fastighets Balder - B Shares 16,860 0.311,115 Hexpol 22,169 0.40
5,618 Lundin Petroleum 52,904 0.962,542 Nibe Industrier - B Shares 30,373 0.552,065 Nordic Mines 14,015 0.252,241 Wallenstam Byggnads - B Shares 16,433 0.305,441 Wihlborgs Fastigheter 54,313 0.99
310,600 5.65
ITALY2,618 Brembo 25,519 0.46
37,261 Cam Finanziaria 14,675 0.274,203 Carraro 13,429 0.241,833 De’Longhi 14,820 0.273,399 Geox 14,055 0.261,651 Interpump Group 9,729 0.182,732 Isagro 8,947 0.162,372 Marcolin 12,050 0.22
10,756 Poltrona Frau 13,375 0.241,393 SAES Getters 11,621 0.218,379 Salvatore Ferragamo Italia 83,329 1.52
220
JPMorgan Funds - Europe Strategic Growth Small Cap FundSchedule of Investments (Market Value Expressed in EUR)
As at 30 June 2011
Quantity/Nominal
Value
Name of Securities MarketValue
%of
NetAssets
Quantity/Nominal
Value
Name of Securities MarketValue
%of
NetAssets
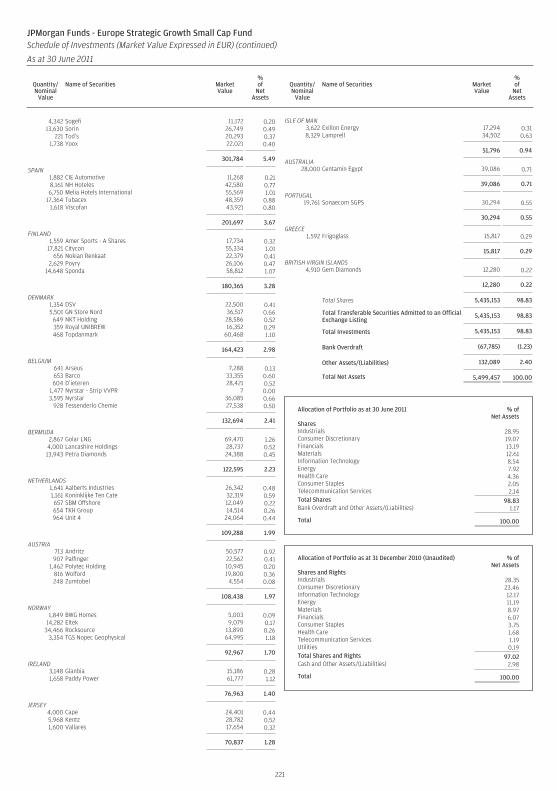
4,342 Sogefi 11,172 0.2013,630 Sorin 26,749 0.49
221 Tod’s 20,293 0.371,738 Yoox 22,021 0.40
301,784 5.49
SPAIN1,882 CIE Automotive 11,268 0.218,161 NH Hoteles 42,580 0.776,750 Melia Hotels International 55,569 1.01
17,364 Tubacex 48,359 0.881,618 Viscofan 43,921 0.80
201,697 3.67
FINLAND1,559 Amer Sports - A Shares 17,734 0.32
17,821 Citycon 55,334 1.01656 Nokian Renkaat 22,379 0.41
2,629 Poyry 26,106 0.4714,648 Sponda 58,812 1.07
180,365 3.28
DENMARK1,354 DSV 22,500 0.415,501 GN Store Nord 36,517 0.66
649 NKT Holding 28,586 0.52359 Royal UNIBREW 16,352 0.29468 Topdanmark 60,468 1.10
164,423 2.98
BELGIUM641 Arseus 7,288 0.13653 Barco 33,355 0.60604 D’ieteren 28,421 0.52
1,477 Nyrstar - Strip VVPR 7 0.003,595 Nyrstar 36,085 0.66
928 Tessenderlo Chemie 27,538 0.50
132,694 2.41
BERMUDA2,867 Golar LNG 69,470 1.264,000 Lancashire Holdings 28,737 0.5213,943 Petra Diamonds 24,388 0.45
122,595 2.23
NETHERLANDS1,641 Aalberts Industries 26,342 0.481,161 Koninklijke Ten Cate 32,319 0.59657 SBM Offshore 12,049 0.22654 TKH Group 14,514 0.26964 Unit 4 24,064 0.44
109,288 1.99
AUSTRIA713 Andritz 50,577 0.92907 Palfinger 22,562 0.41
1,462 Polytec Holding 10,945 0.20816 Wolford 19,800 0.36248 Zumtobel 4,554 0.08
108,438 1.97
NORWAY1,849 BWG Homes 5,003 0.09
14,282 Eltek 9,079 0.1734,466 Rocksource 13,890 0.26
3,354 TGS Nopec Geophysical 64,995 1.18
92,967 1.70
IRELAND3,148 Glanbia 15,186 0.281,658 Paddy Power 61,777 1.12
76,963 1.40
JERSEY4,000 Cape 24,401 0.445,968 Kentz 28,782 0.521,600 Vallares 17,654 0.32
70,837 1.28
ISLE OF MAN3,622 Exillon Energy 17,294 0.318,329 Lamprell 34,502 0.63
51,796 0.94
AUSTRALIA28,000 Centamin Egypt 39,086 0.71
39,086 0.71
PORTUGAL19,761 Sonaecom SGPS 30,294 0.55
30,294 0.55
GREECE1,592 Frigoglass 15,817 0.29
15,817 0.29
BRITISH VIRGIN ISLANDS4,910 Gem Diamonds 12,280 0.22
12,280 0.22
Total Shares 5,435,153 98.83
Total Transferable Securities Admitted to an OfficialExchange Listing
5,435,153 98.83
Total Investments 5,435,153 98.83
Bank Overdraft (67,785) (1.23)
Other Assets/(Liabilities) 132,089 2.40
Total Net Assets 5,499,457 100.00
Allocation of Portfolio as at 30 June 2011 % ofNet Assets
SharesIndustrials 28.95Consumer Discretionary 19.07Financials 13.19Materials 12.61Information Technology 8.54Energy 7.92Health Care 4.36Consumer Staples 2.05Telecommunication Services 2.14Total Shares 98.83Bank Overdraft and Other Assets/(Liabilities) 1.17
Total 100.00
Allocation of Portfolio as at 31 December 2010 (Unaudited) % ofNet Assets
Shares and RightsIndustrials 28.35Consumer Discretionary 23.46Information Technology 12.17Energy 11.19Materials 8.97Financials 6.07Consumer Staples 3.75Health Care 1.68Telecommunication Services 1.19Utilities 0.19Total Shares and Rights 97.02Cash and Other Assets/(Liabilities) 2.98
Total 100.00
221
JPMorgan Funds - Europe Strategic Growth Small Cap FundSchedule of Investments (Market Value Expressed in EUR) (continued)
As at 30 June 2011
Quantity/Nominal
Value
Name of Securities MarketValue
%of
NetAssets
Quantity/Nominal
Value
Name of Securities MarketValue
%of
NetAssets
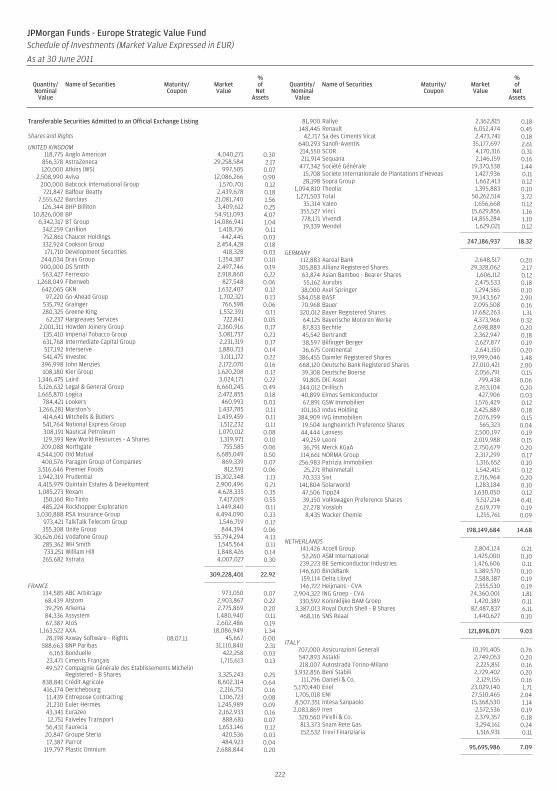
Transferable Securities Admitted to an Official Exchange Listing
Shares and Rights
UNITED KINGDOM118,775 Anglo American 4,040,271 0.30
856,378 AstraZeneca 29,258,584 2.17120,000 Atkins (WS) 997,505 0.07
2,508,990 Aviva 12,086,266 0.90200,000 Babcock International Group 1,570,701 0.12721,847 Balfour Beatty 2,439,678 0.18
7,555,622 Barclays 21,081,740 1.56126,344 BHP Billiton 3,409,612 0.25
10,826,008 BP 54,911,093 4.076,342,317 BT Group 14,086,941 1.04
342,259 Carillion 1,418,736 0.11752,861 Chaucer Holdings 442,445 0.03332,924 Cookson Group 2,454,428 0.18171,710 Development Securities 418,328 0.03
244,034 Drax Group 1,354,387 0.10900,000 DS Smith 2,497,746 0.19563,427 Ferrexpo 2,918,860 0.22
1,268,049 Fiberweb 827,548 0.06642,065 GKN 1,632,407 0.12
97,220 Go-Ahead Group 1,702,321 0.13535,792 Grainger 766,598 0.06280,325 Greene King 1,532,391 0.11
62,237 Hargreaves Services 722,841 0.052,001,311 Howden Joinery Group 2,360,916 0.17
135,410 Imperial Tobacco Group 3,081,737 0.23631,768 Intermediate Capital Group 2,231,319 0.17517,192 Interserve 1,880,713 0.14541,475 Investec 3,011,172 0.22
396,998 John Menzies 2,172,070 0.16108,180 Kier Group 1,620,208 0.12
1,346,475 Laird 3,024,171 0.225,126,632 Legal & General Group 6,660,245 0.491,665,870 Logica 2,472,855 0.18
784,421 Lookers 460,993 0.031,266,281 Marston’s 1,437,785 0.11
414,641 Mitchells & Butlers 1,439,459 0.11541,764 National Express Group 1,512,232 0.11308,191 Nautical Petroleum 1,070,012 0.08129,393 New World Resources - A Shares 1,319,971 0.10
209,088 Northgate 755,585 0.064,544,100 Old Mutual 6,685,049 0.50
400,576 Paragon Group of Companies 869,339 0.073,516,646 Premier Foods 812,591 0.061,942,319 Prudential 15,302,348 1.134,415,979 Quintain Estates & Development 2,900,496 0.211,085,273 Rexam 4,628,335 0.35
150,160 Rio Tinto 7,417,019 0.55485,224 Rockhopper Exploration 1,449,840 0.11
3,030,888 RSA Insurance Group 4,494,090 0.33973,421 TalkTalk Telecom Group 1,546,719 0.12355,308 Unite Group 844,394 0.06
30,626,061 Vodafone Group 55,794,294 4.13285,362 WH Smith 1,545,564 0.11733,251 William Hill 1,848,426 0.14
265,682 Xstrata 4,007,027 0.30
309,228,401 22.92
FRANCE134,585 ABC Arbitrage 973,050 0.0768,439 Alstom 2,903,867 0.2239,296 Arkema 2,775,869 0.2084,336 Assystem 1,480,940 0.1167,387 AtoS 2,602,486 0.19
1,163,522 AXA 18,086,949 1.3428,198 Axway Software - Rights 08.07.11 45,667 0.00
588,663 BNP Paribas 31,110,840 2.316,163 Bonduelle 422,258 0.03
23,471 Ciments Français 1,715,613 0.1349,527 Compagnie Générale des Etablissements Michelin
Registered - B Shares 3,325,243 0.25838,841 Crédit Agricole 8,602,314 0.64416,174 Derichebourg 2,216,751 0.16
11,439 Entrepose Contracting 1,106,723 0.0821,230 Euler Hermès 1,245,989 0.0943,341 Eurazeo 2,162,933 0.1612,751 Faiveley Transport 888,681 0.07
56,431 Faurecia 1,653,146 0.1220,847 Groupe Steria 420,536 0.0317,387 Parrot 484,923 0.04
119,797 Plastic Omnium 2,688,844 0.20
81,900 Rallye 2,362,815 0.18148,445 Renault 6,052,474 0.45
42,717 Sa des Ciments Vicat 2,473,741 0.18640,293 Sanofi-Aventis 35,177,697 2.61214,550 SCOR 4,170,316 0.31211,914 Sequana 2,146,159 0.16
477,342 Société Générale 19,370,538 1.4415,708 Societe Internationale de Plantations d’Heveas 1,427,936 0.1128,198 Sopra Group 1,662,413 0.12
1,094,810 Theolia 1,395,883 0.101,271,503 Total 50,262,514 3.72
35,314 Valeo 1,656,668 0.12355,527 Vinci 15,629,856 1.16778,171 Vivendi 14,855,284 1.1019,339 Wendel 1,629,021 0.12
247,186,937 18.32
GERMANY112,883 Aareal Bank 2,648,517 0.20
305,883 Allianz Registered Shares 29,328,062 2.1763,874 Asian Bamboo - Bearer Shares 1,606,112 0.1255,162 Aurubis 2,475,533 0.18
38,000 Axel Springer 1,294,565 0.10584,058 BASF 39,143,567 2.90
70,968 Bauer 2,095,508 0.16320,012 Bayer Registered Shares 17,682,263 1.31
64,125 Bayerische Motoren Werke 4,373,966 0.3287,833 Bechtle 2,698,889 0.2045,542 Bertrandt 2,362,947 0.1838,597 Bilfinger Berger 2,627,877 0.1936,675 Continental 2,641,150 0.20
386,455 Daimler Registered Shares 19,999,046 1.48668,120 Deutsche Bank Registered Shares 27,010,421 2.0039,308 Deutsche Boerse 2,056,791 0.1591,805 DIC Asset 799,438 0.06
344,012 Drillisch 2,763,104 0.2040,899 Elmos Semiconductor 427,906 0.0367,891 GSW Immobilien 1,576,429 0.12
101,163 Indus Holding 2,425,889 0.18384,909 IVG Immobilien 2,076,199 0.15
19,504 Jungheinrich Preference Shares 565,323 0.0444,444 Lanxess 2,500,197 0.1949,259 Leoni 2,019,988 0.1536,791 Merck KGaA 2,750,679 0.20
114,661 NORMA Group 2,317,299 0.17256,983 Patrizia Immobilien 1,316,652 0.10
25,271 Rheinmetall 1,542,415 0.1270,333 Sixt 2,716,964 0.20
141,804 Solarworld 1,283,184 0.1047,506 Tipp24 1,630,050 0.1239,150 Volkswagen Preference Shares 5,517,214 0.4127,278 Vossloh 2,619,779 0.198,435 Wacker Chemie 1,255,761 0.09
198,149,684 14.68
NETHERLANDS141,426 Accell Group 2,804,124 0.2152,260 ASM International 1,425,000 0.10
239,223 BE Semiconductor Industries 1,426,606 0.11146,610 BinckBank 1,389,570 0.10159,114 Delta Lloyd 2,588,387 0.19146,722 Heijmans - CVA 2,555,530 0.19
2,904,322 ING Groep - CVA 24,360,001 1.81330,592 Koninklijke BAM Groep 1,420,389 0.11
3,387,013 Royal Dutch Shell - B Shares 82,487,837 6.11468,116 SNS Reaal 1,440,627 0.10
121,898,071 9.03
ITALY707,000 Assicurazioni Generali 10,191,405 0.76547,893 Astaldi 2,749,053 0.20218,007 Autostrada Torino-Milano 2,225,851 0.16
3,932,856 Beni Stabili 2,729,402 0.20111,796 Danieli & Co. 2,129,155 0.16
5,170,440 Enel 23,029,140 1.711,705,018 ENI 27,510,465 2.048,507,351 Intesa Sanpaolo 15,368,530 1.14
2,083,869 Iren 2,572,536 0.19320,560 Pirelli & Co. 2,379,357 0.18813,373 Snam Rete Gas 3,294,161 0.24152,532 Trevi Finanziaria 1,516,931 0.11
95,695,986 7.09
222
JPMorgan Funds - Europe Strategic Value FundSchedule of Investments (Market Value Expressed in EUR)
As at 30 June 2011
Quantity/Nominal
Value
Name of Securities Maturity/Coupon
MarketValue
%of
NetAssets
Quantity/Nominal
Value
Name of Securities Maturity/Coupon
MarketValue
%of
NetAssets
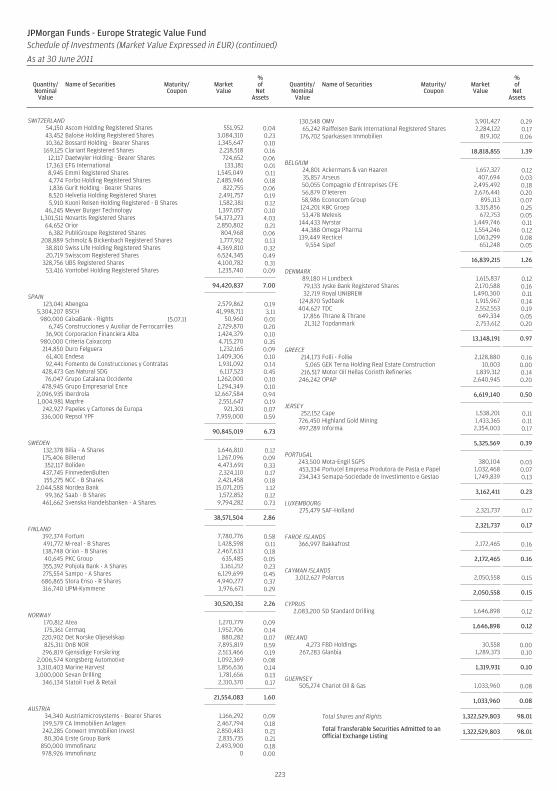
SWITZERLAND54,150 Ascom Holding Registered Shares 551,952 0.0443,452 Baloise Holding Registered Shares 3,084,310 0.2310,362 Bossard Holding - Bearer Shares 1,345,647 0.10
169,125 Clariant Registered Shares 2,218,518 0.1612,117 Daetwyler Holding - Bearer Shares 724,652 0.06
17,363 EFG International 133,181 0.018,945 Emmi Registered Shares 1,545,049 0.114,774 Forbo Holding Registered Shares 2,485,946 0.181,836 Gurit Holding - Bearer Shares 822,755 0.068,520 Helvetia Holding Registered Shares 2,491,757 0.195,910 Kuoni Reisen Holding Registered - B Shares 1,582,381 0.12
46,245 Meyer Burger Technology 1,397,057 0.101,301,511 Novartis Registered Shares 54,373,273 4.03
64,652 Orior 2,850,802 0.216,382 PubliGroupe Registered Shares 804,968 0.06
208,889 Schmolz & Bickenbach Registered Shares 1,777,912 0.1338,810 Swiss Life Holding Registered Shares 4,369,810 0.3220,719 Swisscom Registered Shares 6,524,345 0.49
328,756 UBS Registered Shares 4,100,782 0.3153,416 Vontobel Holding Registered Shares 1,235,740 0.09
94,420,837 7.00
SPAIN123,041 Abengoa 2,579,862 0.19
5,304,207 BSCH 41,998,711 3.11980,000 CaixaBank - Rights 15.07.11 50,960 0.01
6,745 Construcciones y Auxiliar de Ferrocarriles 2,729,870 0.2036,901 Corporacion Financiera Alba 1,424,379 0.10
980,000 Criteria Caixacorp 4,715,270 0.35214,850 Duro Felguera 1,232,165 0.09
61,401 Endesa 1,409,306 0.1092,441 Fomento de Construcciones y Contratas 1,931,092 0.14
428,473 Gas Natural SDG 6,117,523 0.4576,047 Grupo Catalana Occidente 1,262,000 0.10
478,945 Grupo Empresarial Ence 1,294,349 0.102,096,935 Iberdrola 12,667,584 0.941,004,981 Mapfre 2,551,647 0.19
242,927 Papeles y Cartones de Europa 921,301 0.07336,000 Repsol YPF 7,959,000 0.59
90,845,019 6.73
SWEDEN132,378 Bilia - A Shares 1,646,810 0.12175,406 Billerud 1,267,096 0.09352,117 Boliden 4,473,691 0.33
437,745 FinnvedenBulten 2,324,110 0.17155,275 NCC - B Shares 2,421,458 0.18
2,044,588 Nordea Bank 15,071,205 1.1299,362 Saab - B Shares 1,572,852 0.12
461,662 Svenska Handelsbanken - A Shares 9,794,282 0.73
38,571,504 2.86
FINLAND392,374 Fortum 7,780,776 0.58491,772 M-real - B Shares 1,428,598 0.11138,748 Orion - B Shares 2,467,633 0.1840,645 PKC Group 635,485 0.05
355,392 Pohjola Bank - A Shares 3,161,212 0.23275,554 Sampo - A Shares 6,129,699 0.45686,865 Stora Enso - R Shares 4,940,277 0.37316,740 UPM-Kymmene 3,976,671 0.29
30,520,351 2.26
NORWAY170,812 Atea 1,270,779 0.09175,361 Cermaq 1,952,706 0.14
220,902 Det Norske Oljeselskap 880,282 0.07825,311 DnB NOR 7,895,819 0.59
296,819 Gjensidige Forsikring 2,513,466 0.192,006,574 Kongsberg Automotive 1,092,369 0.083,310,403 Marine Harvest 1,856,636 0.14
3,000,000 Sevan Drilling 1,781,656 0.13346,134 Statoil Fuel & Retail 2,310,370 0.17
21,554,083 1.60
AUSTRIA34,340 Austriamicrosystems - Bearer Shares 1,166,292 0.09
199,579 CA Immobilien Anlagen 2,467,794 0.18242,285 Conwert Immobilien Invest 2,850,483 0.2180,304 Erste Group Bank 2,835,735 0.21
850,000 Immofinanz 2,493,900 0.18978,926 Immofinanz 0 0.00
130,548 OMV 3,901,427 0.2965,242 Raiffeisen Bank International Registered Shares 2,284,122 0.17
176,702 Sparkassen Immobilien 819,102 0.06
18,818,855 1.39
BELGIUM24,801 Ackermans & van Haaren 1,657,327 0.1235,857 Arseus 407,694 0.0350,055 Compagnie d’Entreprises CFE 2,495,492 0.1856,879 D’Ieteren 2,676,441 0.2058,986 Econocom Group 895,113 0.07124,201 KBC Groep 3,315,856 0.2553,478 Melexis 672,753 0.05
144,433 Nyrstar 1,449,746 0.1144,388 Omega Pharma 1,554,246 0.12
139,449 Recticel 1,063,299 0.089,554 Sipef 651,248 0.05
16,839,215 1.26
DENMARK89,180 H Lundbeck 1,615,837 0.1279,133 Jyske Bank Registered Shares 2,170,588 0.1632,719 Royal UNIBREW 1,490,300 0.11
124,870 Sydbank 1,915,967 0.14404,627 TDC 2,552,553 0.19
17,856 Thrane & Thrane 649,334 0.0521,312 Topdanmark 2,753,612 0.20
13,148,191 0.97
GREECE214,173 Folli - Follie 2,128,880 0.16
5,065 GEK Terna Holding Real Estate Construction 10,003 0.00216,517 Motor Oil Hellas Corinth Refineries 1,839,312 0.14
246,242 OPAP 2,640,945 0.20
6,619,140 0.50
JERSEY252,152 Cape 1,538,201 0.11
726,450 Highland Gold Mining 1,433,365 0.11497,289 Informa 2,354,003 0.17
5,325,569 0.39
PORTUGAL243,500 Mota-Engil SGPS 380,104 0.03453,334 Portucel Empresa Produtora de Pasta e Papel 1,032,468 0.07234,343 Semapa-Sociedade de Investimento e Gestao 1,749,839 0.13
3,162,411 0.23
LUXEMBOURG275,479 SAF-Holland 2,321,737 0.17
2,321,737 0.17
FAROE ISLANDS366,997 Bakkafrost 2,172,465 0.16
2,172,465 0.16
CAYMAN ISLANDS3,012,627 Polarcus 2,050,558 0.15
2,050,558 0.15
CYPRUS2,083,200 SD Standard Drilling 1,646,898 0.12
1,646,898 0.12
IRELAND4,273 FBD Holdings 30,558 0.00
267,283 Glanbia 1,289,373 0.10
1,319,931 0.10
GUERNSEY505,274 Chariot Oil & Gas 1,033,960 0.08
1,033,960 0.08
Total Shares and Rights 1,322,529,803 98.01
Total Transferable Securities Admitted to anOfficial Exchange Listing
1,322,529,803 98.01
223
JPMorgan Funds - Europe Strategic Value FundSchedule of Investments (Market Value Expressed in EUR) (continued)
As at 30 June 2011
Quantity/Nominal
Value
Name of Securities Maturity/Coupon
MarketValue
%of
NetAssets
Quantity/Nominal
Value
Name of Securities Maturity/Coupon
MarketValue
%of
NetAssets
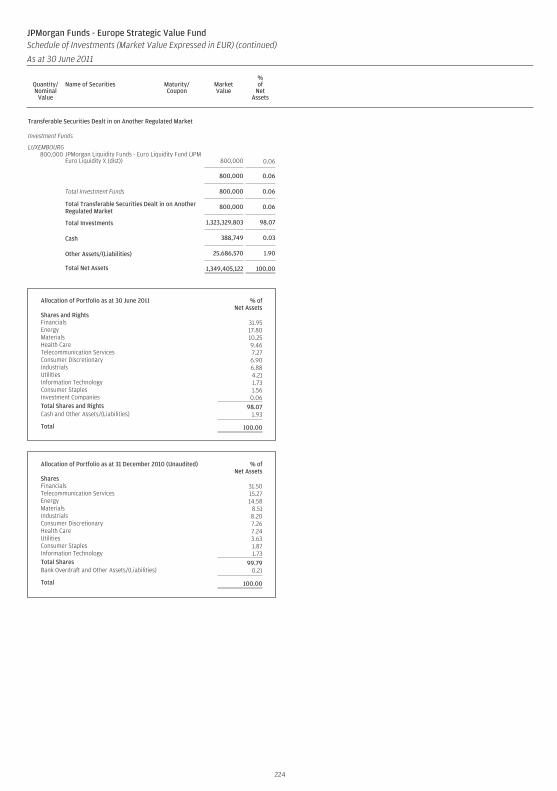
Transferable Securities Dealt in on Another Regulated Market
Investment Funds
LUXEMBOURG800,000 JPMorgan Liquidity Funds - Euro Liquidity Fund (JPM
Euro Liquidity X (dist)) 800,000 0.06
800,000 0.06
Total Investment Funds 800,000 0.06
Total Transferable Securities Dealt in on AnotherRegulated Market
800,000 0.06
Total Investments 1,323,329,803 98.07
Cash 388,749 0.03
Other Assets/(Liabilities) 25,686,570 1.90
Total Net Assets 1,349,405,122 100.00
Allocation of Portfolio as at 30 June 2011 % ofNet Assets
Shares and RightsFinancials 31.95Energy 17.80Materials 10.25Health Care 9.46Telecommunication Services 7.27Consumer Discretionary 6.90Industrials 6.88Utilities 4.21Information Technology 1.73Consumer Staples 1.56Investment Companies 0.06Total Shares and Rights 98.07Cash and Other Assets/(Liabilities) 1.93
Total 100.00
Allocation of Portfolio as at 31 December 2010 (Unaudited) % ofNet Assets
SharesFinancials 31.50Telecommunication Services 15.27Energy 14.58Materials 8.51Industrials 8.20Consumer Discretionary 7.26Health Care 7.24Utilities 3.63Consumer Staples 1.87Information Technology 1.73Total Shares 99.79Bank Overdraft and Other Assets/(Liabilities) 0.21
Total 100.00
224
JPMorgan Funds - Europe Strategic Value FundSchedule of Investments (Market Value Expressed in EUR) (continued)
As at 30 June 2011
Quantity/Nominal
Value
Name of Securities Maturity/Coupon
MarketValue
%of
NetAssets
Quantity/Nominal
Value
Name of Securities Maturity/Coupon
MarketValue
%of
NetAssets

JPMorgan Funds - Europe Strategic Value FundSchedule of Investments - Outstanding Financial Futures Contracts (Expressed in EUR)
As at 30 June 2011
ExpirationDate
Number ofContracts Security Description Currency
NotionalValue
UnrealisedGain/(Loss)
Equity Futures
Sep-11 555 DJ Euro Stoxx 50 Index Future EUR 15,703,725 141,525Sep-11 161 FTSE 100 Index Future GBP 10,472,375 93,495
Total 235,020
225
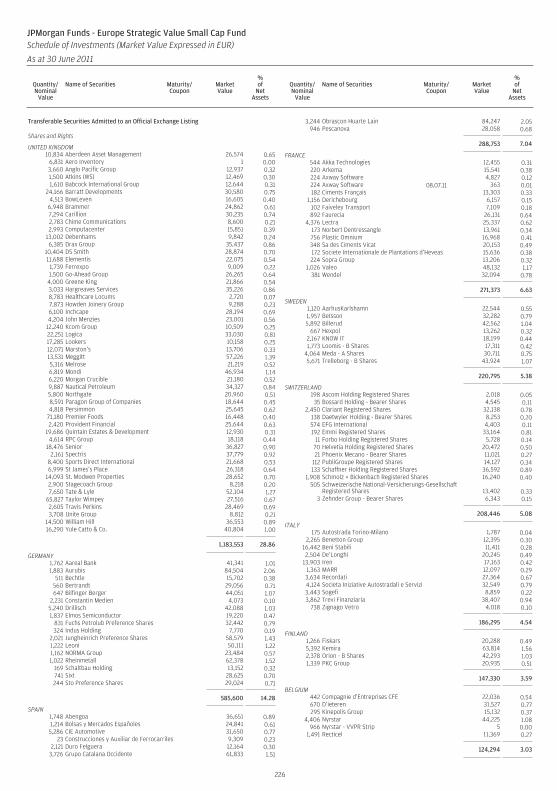
Transferable Securities Admitted to an Official Exchange Listing
Shares and Rights
UNITED KINGDOM10,834 Aberdeen Asset Management 26,574 0.65
6,831 Aero Inventory 1 0.003,660 Anglo Pacific Group 12,937 0.321,500 Atkins (WS) 12,469 0.301,610 Babcock International Group 12,644 0.31
24,166 Barratt Developments 30,580 0.754,513 BowLeven 16,605 0.40
6,948 Brammer 24,862 0.617,294 Carillion 30,235 0.742,783 Chime Communications 8,600 0.212,993 Computacenter 15,851 0.39
13,002 Debenhams 9,842 0.246,385 Drax Group 35,437 0.86
10,404 DS Smith 28,874 0.7011,688 Elementis 22,075 0.54
1,739 Ferrexpo 9,009 0.221,500 Go-Ahead Group 26,265 0.64
4,000 Greene King 21,866 0.543,033 Hargreaves Services 35,226 0.868,783 Healthcare Locums 2,720 0.077,873 Howden Joinery Group 9,288 0.236,100 Inchcape 28,194 0.694,204 John Menzies 23,001 0.56
12,240 Kcom Group 10,509 0.2522,251 Logica 33,030 0.8117,285 Lookers 10,158 0.2512,071 Marston’s 13,706 0.3313,531 Meggitt 57,226 1.395,316 Melrose 21,219 0.526,819 Mondi 46,934 1.146,220 Morgan Crucible 21,180 0.529,887 Nautical Petroleum 34,327 0.845,800 Northgate 20,960 0.518,591 Paragon Group of Companies 18,644 0.454,818 Persimmon 25,645 0.62
71,180 Premier Foods 16,448 0.402,420 Provident Financial 25,644 0.63
19,686 Quintain Estates & Development 12,930 0.314,614 RPC Group 18,118 0.44
18,476 Senior 36,827 0.902,161 Spectris 37,779 0.92
8,400 Sports Direct International 21,668 0.536,999 St James’s Place 26,318 0.64
14,093 St. Modwen Properties 28,652 0.702,900 Stagecoach Group 8,218 0.207,650 Tate & Lyle 52,104 1.27
65,827 Taylor Wimpey 27,516 0.672,605 Travis Perkins 28,469 0.693,708 Unite Group 8,812 0.21
14,500 William Hill 36,553 0.8916,290 Yule Catto & Co. 40,804 1.00
1,183,553 28.86
GERMANY1,762 Aareal Bank 41,341 1.011,883 Aurubis 84,504 2.06
511 Bechtle 15,702 0.38560 Bertrandt 29,056 0.71647 Bilfinger Berger 44,051 1.07
2,231 Constantin Medien 4,073 0.105,240 Drillisch 42,088 1.031,837 Elmos Semiconductor 19,220 0.47
831 Fuchs Petrolub Preference Shares 32,442 0.79324 Indus Holding 7,770 0.19
2,021 Jungheinrich Preference Shares 58,579 1.431,222 Leoni 50,111 1.221,162 NORMA Group 23,484 0.571,022 Rheinmetall 62,378 1.52
169 Schaltbau Holding 13,152 0.32741 Sixt 28,625 0.70244 Sto Preference Shares 29,024 0.71
585,600 14.28
SPAIN1,748 Abengoa 36,651 0.891,214 Bolsas y Mercados Españoles 24,841 0.615,286 CIE Automotive 31,650 0.77
23 Construcciones y Auxiliar de Ferrocarriles 9,309 0.232,121 Duro Felguera 12,164 0.30
3,726 Grupo Catalana Occidente 61,833 1.51
3,244 Obrascon Huarte Lain 84,247 2.05946 Pescanova 28,058 0.68
288,753 7.04
FRANCE544 Akka Technologies 12,455 0.31220 Arkema 15,541 0.38224 Axway Software 4,827 0.12224 Axway Software 08.07.11 363 0.01182 Ciments Français 13,303 0.33
1,156 Derichebourg 6,157 0.15102 Faiveley Transport 7,109 0.18892 Faurecia 26,131 0.64
4,376 Lectra 25,337 0.62173 Norbert Dentressangle 13,961 0.34756 Plastic Omnium 16,968 0.41348 Sa des Ciments Vicat 20,153 0.49172 Societe Internationale de Plantations d’Heveas 15,636 0.38224 Sopra Group 13,206 0.32
1,026 Valeo 48,132 1.17381 Wendel 32,094 0.78
271,373 6.63
SWEDEN1,120 AarhusKarlshamn 22,544 0.551,957 Betsson 32,282 0.795,892 Billerud 42,562 1.04
667 Hexpol 13,262 0.322,167 KNOW IT 18,199 0.441,773 Loomis - B Shares 17,311 0.42
4,064 Meda - A Shares 30,711 0.755,671 Trelleborg - B Shares 43,924 1.07
220,795 5.38
SWITZERLAND198 Ascom Holding Registered Shares 2,018 0.0535 Bossard Holding - Bearer Shares 4,545 0.11
2,450 Clariant Registered Shares 32,138 0.78138 Daetwyler Holding - Bearer Shares 8,253 0.20574 EFG International 4,403 0.11192 Emmi Registered Shares 33,164 0.81
11 Forbo Holding Registered Shares 5,728 0.1470 Helvetia Holding Registered Shares 20,472 0.5021 Phoenix Mecano - Bearer Shares 11,021 0.27
112 PubliGroupe Registered Shares 14,127 0.34133 Schaffner Holding Registered Shares 36,592 0.89
1,908 Schmolz + Bickenbach Registered Shares 16,240 0.40505 Schweizerische National-Versicherungs-Gesellschaft
Registered Shares 13,402 0.333 Zehnder Group - Bearer Shares 6,343 0.15
208,446 5.08
ITALY175 Autostrada Torino-Milano 1,787 0.04
2,265 Benetton Group 12,395 0.3016,442 Beni Stabili 11,411 0.282,504 De’Longhi 20,245 0.49
13,903 Iren 17,163 0.421,363 MARR 12,097 0.293,634 Recordati 27,364 0.674,124 Societa Iniziative Autostradali e Servizi 32,549 0.793,443 Sogefi 8,859 0.223,862 Trevi Finanziaria 38,407 0.94
738 Zignago Vetro 4,018 0.10
186,295 4.54
FINLAND1,266 Fiskars 20,288 0.495,392 Kemira 63,814 1.562,378 Orion - B Shares 42,293 1.031,339 PKC Group 20,935 0.51
147,330 3.59
BELGIUM442 Compagnie d’Entreprises CFE 22,036 0.54670 D’ieteren 31,527 0.77295 Kinepolis Group 15,132 0.37
4,406 Nyrstar 44,225 1.08966 Nyrstar - VVPR Strip 5 0.00
1,491 Recticel 11,369 0.27
124,294 3.03
226
JPMorgan Funds - Europe Strategic Value Small Cap FundSchedule of Investments (Market Value Expressed in EUR)
As at 30 June 2011
Quantity/Nominal
Value
Name of Securities Maturity/Coupon
MarketValue
%of
NetAssets
Quantity/Nominal
Value
Name of Securities Maturity/Coupon
MarketValue
%of
NetAssets
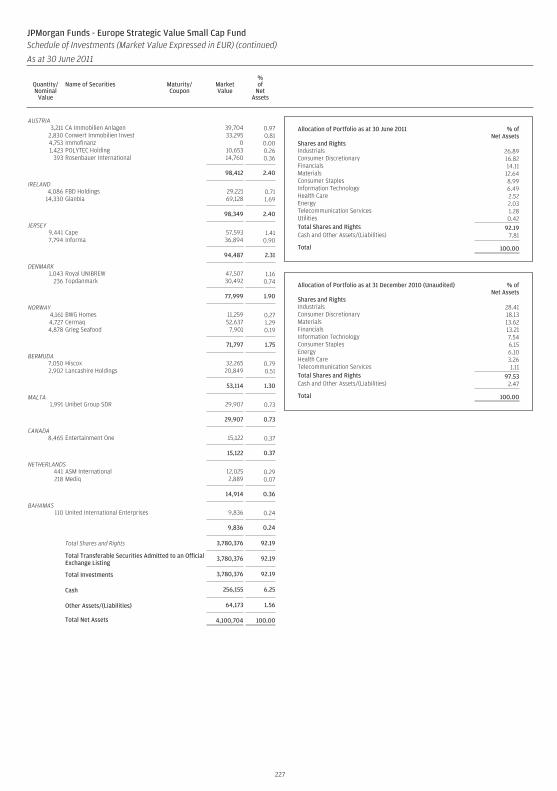
AUSTRIA3,211 CA Immobilien Anlagen 39,704 0.97
2,830 Conwert Immobilien Invest 33,295 0.814,753 Immofinanz 0 0.001,423 POLYTEC Holding 10,653 0.26
393 Rosenbauer International 14,760 0.36
98,412 2.40
IRELAND4,086 FBD Holdings 29,221 0.71
14,330 Glanbia 69,128 1.69
98,349 2.40
JERSEY9,441 Cape 57,593 1.417,794 Informa 36,894 0.90
94,487 2.31
DENMARK1,043 Royal UNIBREW 47,507 1.16
236 Topdanmark 30,492 0.74
77,999 1.90
NORWAY4,161 BWG Homes 11,259 0.274,727 Cermaq 52,637 1.294,878 Grieg Seafood 7,901 0.19
71,797 1.75
BERMUDA7,050 Hiscox 32,265 0.792,902 Lancashire Holdings 20,849 0.51
53,114 1.30
MALTA1,991 Unibet Group SDR 29,907 0.73
29,907 0.73
CANADA8,465 Entertainment One 15,122 0.37
15,122 0.37
NETHERLANDS441 ASM International 12,025 0.29218 Mediq 2,889 0.07
14,914 0.36
BAHAMAS110 United International Enterprises 9,836 0.24
9,836 0.24
Total Shares and Rights 3,780,376 92.19
Total Transferable Securities Admitted to an OfficialExchange Listing
3,780,376 92.19
Total Investments 3,780,376 92.19
Cash 256,155 6.25
Other Assets/(Liabilities) 64,173 1.56
Total Net Assets 4,100,704 100.00
Allocation of Portfolio as at 30 June 2011 % ofNet Assets
Shares and RightsIndustrials 26.89Consumer Discretionary 16.82Financials 14.11Materials 12.64Consumer Staples 8.99Information Technology 6.49Health Care 2.52Energy 2.03Telecommunication Services 1.28Utilities 0.42Total Shares and Rights 92.19Cash and Other Assets/(Liabilities) 7.81
Total 100.00
Allocation of Portfolio as at 31 December 2010 (Unaudited) % ofNet Assets
Shares and RightsIndustrials 28.41Consumer Discretionary 18.13Materials 13.62Financials 13.21Information Technology 7.54Consumer Staples 6.15Energy 6.10Health Care 3.26Telecommunication Services 1.11Total Shares and Rights 97.53Cash and Other Assets/(Liabilities) 2.47
Total 100.00
227
JPMorgan Funds - Europe Strategic Value Small Cap FundSchedule of Investments (Market Value Expressed in EUR) (continued)
As at 30 June 2011
Quantity/Nominal
Value
Name of Securities Maturity/Coupon
MarketValue
%of
NetAssets
Quantity/Nominal
Value
Name of Securities Maturity/Coupon
MarketValue
%of
NetAssets
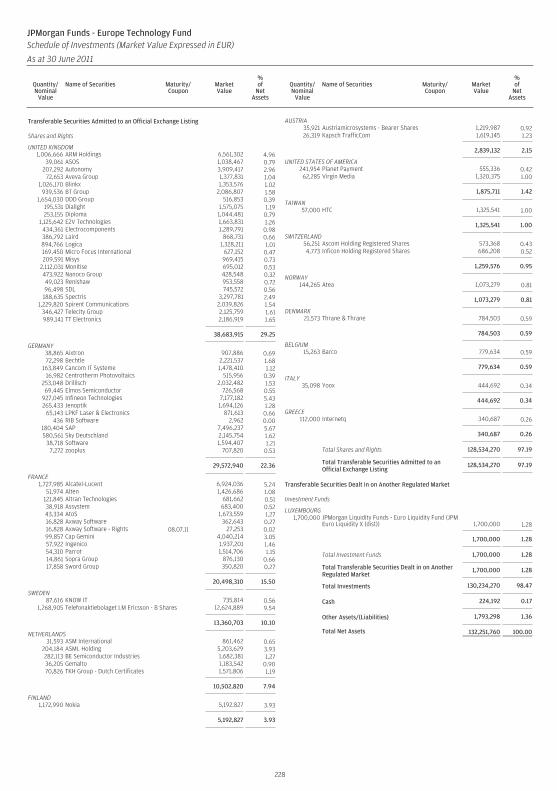
Transferable Securities Admitted to an Official Exchange Listing
Shares and Rights
UNITED KINGDOM1,006,666 ARM Holdings 6,561,302 4.96
39,061 ASOS 1,038,467 0.79207,292 Autonomy 3,909,417 2.96
72,653 Aveva Group 1,377,831 1.041,026,170 Blinkx 1,353,576 1.02
939,536 BT Group 2,086,807 1.581,654,030 DDD Group 516,853 0.39
195,531 Dialight 1,575,075 1.19253,155 Diploma 1,044,481 0.79
1,125,642 E2V Technologies 1,663,831 1.26434,361 Electrocomponents 1,289,791 0.98386,792 Laird 868,731 0.66894,766 Logica 1,328,211 1.01169,450 Micro Focus International 627,152 0.47209,591 Misys 969,415 0.73
2,112,031 Monitise 695,012 0.53473,922 Nanoco Group 428,548 0.3249,023 Renishaw 953,558 0.7296,498 SDL 745,572 0.56
188,635 Spectris 3,297,781 2.491,229,820 Spirent Communications 2,039,826 1.54
346,427 Telecity Group 2,125,759 1.61989,141 TT Electronics 2,186,919 1.65
38,683,915 29.25
GERMANY38,865 Aixtron 907,886 0.6972,298 Bechtle 2,221,537 1.68
163,849 Cancom IT Systeme 1,478,410 1.1216,982 Centrotherm Photovoltaics 515,956 0.39
253,048 Drillisch 2,032,482 1.5369,445 Elmos Semiconductor 726,568 0.55
927,045 Infineon Technologies 7,177,182 5.43265,433 Jenoptik 1,694,126 1.28
65,143 LPKF Laser & Electronics 871,613 0.66436 RIB Software 2,962 0.00
180,404 SAP 7,496,237 5.67580,561 Sky Deutschland 2,145,754 1.62
38,718 Software 1,594,407 1.217,272 zooplus 707,820 0.53
29,572,940 22.36
FRANCE1,727,985 Alcatel-Lucent 6,924,036 5.24
51,974 Alten 1,426,686 1.08121,845 Altran Technologies 681,662 0.5138,918 Assystem 683,400 0.5243,334 AtoS 1,673,559 1.2716,828 Axway Software 362,643 0.2716,828 Axway Software - Rights 08.07.11 27,253 0.0299,857 Cap Gemini 4,040,214 3.0557,922 Ingenico 1,937,201 1.4654,310 Parrot 1,514,706 1.1514,861 Sopra Group 876,130 0.6617,858 Sword Group 350,820 0.27
20,498,310 15.50
SWEDEN87,616 KNOW IT 735,814 0.56
1,268,905 Telefonaktiebolaget LM Ericsson - B Shares 12,624,889 9.54
13,360,703 10.10
NETHERLANDS31,593 ASM International 861,462 0.65
204,184 ASML Holding 5,203,629 3.93282,113 BE Semiconductor Industries 1,682,381 1.2736,205 Gemalto 1,183,542 0.9070,826 TKH Group - Dutch Certificates 1,571,806 1.19
10,502,820 7.94
FINLAND1,172,990 Nokia 5,192,827 3.93
5,192,827 3.93
AUSTRIA35,921 Austriamicrosystems - Bearer Shares 1,219,987 0.9226,319 Kapsch TrafficCom 1,619,145 1.23
2,839,132 2.15
UNITED STATES OF AMERICA241,954 Planet Payment 555,336 0.4262,285 Virgin Media 1,320,375 1.00
1,875,711 1.42
TAIWAN57,000 HTC 1,325,541 1.00
1,325,541 1.00
SWITZERLAND56,251 Ascom Holding Registered Shares 573,368 0.434,773 Inficon Holding Registered Shares 686,208 0.52
1,259,576 0.95
NORWAY144,265 Atea 1,073,279 0.81
1,073,279 0.81
DENMARK21,573 Thrane & Thrane 784,503 0.59
784,503 0.59
BELGIUM15,263 Barco 779,634 0.59
779,634 0.59
ITALY35,098 Yoox 444,692 0.34
444,692 0.34
GREECE112,000 Internetq 340,687 0.26
340,687 0.26
Total Shares and Rights 128,534,270 97.19
Total Transferable Securities Admitted to anOfficial Exchange Listing
128,534,270 97.19
Transferable Securities Dealt in on Another Regulated Market
Investment Funds
LUXEMBOURG1,700,000 JPMorgan Liquidity Funds - Euro Liquidity Fund (JPM
Euro Liquidity X (dist)) 1,700,000 1.28
1,700,000 1.28
Total Investment Funds 1,700,000 1.28
Total Transferable Securities Dealt in on AnotherRegulated Market
1,700,000 1.28
Total Investments 130,234,270 98.47
Cash 224,192 0.17
Other Assets/(Liabilities) 1,793,298 1.36
Total Net Assets 132,251,760 100.00
228
JPMorgan Funds - Europe Technology FundSchedule of Investments (Market Value Expressed in EUR)
As at 30 June 2011
Quantity/Nominal
Value
Name of Securities Maturity/Coupon
MarketValue
%of
NetAssets
Quantity/Nominal
Value
Name of Securities Maturity/Coupon
MarketValue
%of
NetAssets
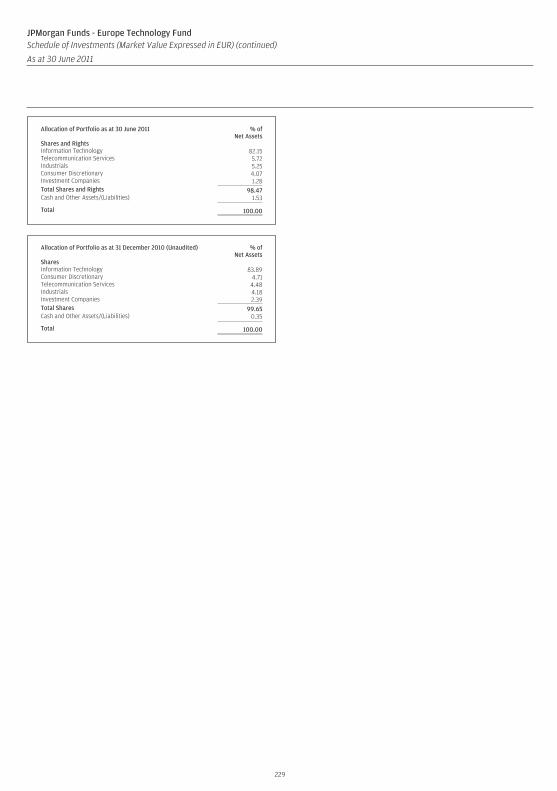
Allocation of Portfolio as at 30 June 2011 % ofNet Assets
Shares and RightsInformation Technology 82.15Telecommunication Services 5.72Industrials 5.25Consumer Discretionary 4.07Investment Companies 1.28Total Shares and Rights 98.47Cash and Other Assets/(Liabilities) 1.53
Total 100.00
Allocation of Portfolio as at 31 December 2010 (Unaudited) % ofNet Assets
SharesInformation Technology 83.89Consumer Discretionary 4.71Telecommunication Services 4.48Industrials 4.18Investment Companies 2.39Total Shares 99.65Cash and Other Assets/(Liabilities) 0.35
Total 100.00
229
JPMorgan Funds - Europe Technology FundSchedule of Investments (Market Value Expressed in EUR) (continued)
As at 30 June 2011
Quantity/Nominal
Value
Name of Securities Maturity/Coupon
MarketValue
%of
NetAssets
Quantity/Nominal
Value
Name of Securities Maturity/Coupon
MarketValue
%of
NetAssets
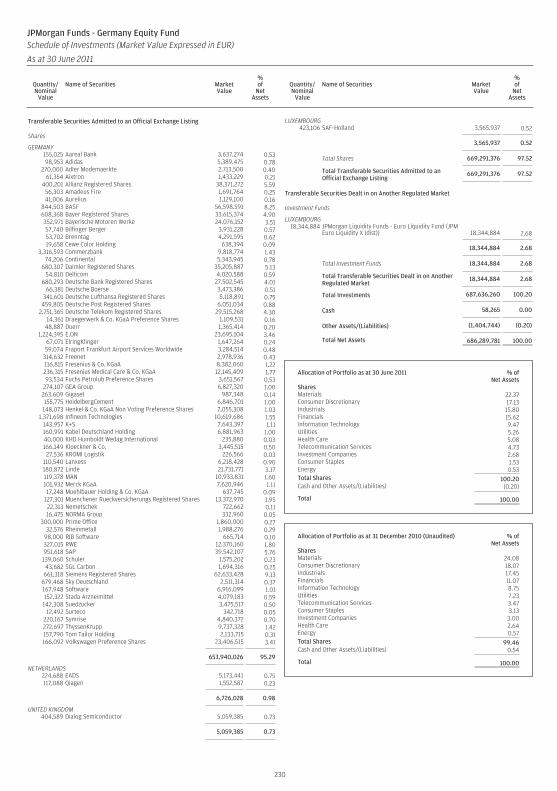
Transferable Securities Admitted to an Official Exchange Listing
Shares
GERMANY155,025 Aareal Bank 3,637,274 0.5398,953 Adidas 5,389,475 0.78
270,000 Adler Modemaerkte 2,713,500 0.4061,354 Aixtron 1,433,229 0.21
400,201 Allianz Registered Shares 38,371,272 5.5956,303 Amadeus Fire 1,691,764 0.2541,006 Aurelius 1,129,100 0.16
844,503 BASF 56,598,591 8.25608,368 Bayer Registered Shares 33,615,374 4.90352,971 Bayerische Motoren Werke 24,076,152 3.5157,740 Bilfinger Berger 3,931,228 0.5753,702 Brenntag 4,291,595 0.6219,658 Cewe Color Holding 638,394 0.09
3,316,593 Commerzbank 9,818,774 1.4374,206 Continental 5,343,945 0.78
680,307 Daimler Registered Shares 35,205,887 5.1354,810 Delticom 4,020,588 0.59
680,293 Deutsche Bank Registered Shares 27,502,545 4.0166,381 Deutsche Boerse 3,473,386 0.51
341,601 Deutsche Lufthansa Registered Shares 5,118,891 0.75459,805 Deutsche Post Registered Shares 6,051,034 0.88
2,751,365 Deutsche Telekom Registered Shares 29,515,268 4.3014,361 Draegerwerk & Co. KGaA Preference Shares 1,109,531 0.16
48,887 Duerr 1,365,414 0.201,224,395 E.ON 23,695,104 3.46
67,071 ElringKlinger 1,647,264 0.2459,074 Fraport Frankfurt Airport Services Worldwide 3,284,514 0.48
314,632 Freenet 2,978,936 0.43116,815 Fresenius & Co. KGaA 8,382,060 1.22236,315 Fresenius Medical Care & Co. KGaA 12,145,409 1.7793,534 Fuchs Petrolub Preference Shares 3,651,567 0.53
274,107 GEA Group 6,827,320 1.00263,609 Gigaset 987,348 0.14155,775 HeidelbergCement 6,846,701 1.00148,073 Henkel & Co. KGaA Non Voting Preference Shares 7,055,308 1.03
1,371,698 Infineon Technologies 10,619,686 1.55143,957 K+S 7,643,397 1.11160,991 Kabel Deutschland Holding 6,881,963 1.0040,000 KHD Humboldt Wedag International 235,880 0.03166,149 Kloeckner & Co. 3,445,515 0.5027,536 KROMI Logistik 226,566 0.03
110,540 Lanxess 6,218,428 0.90180,872 Linde 21,731,771 3.17119,378 MAN 10,933,831 1.60101,932 Merck KGaA 7,620,946 1.1117,248 Muehlbauer Holding & Co. KGaA 637,745 0.09
127,301 Muenchener Rueckversicherungs Registered Shares 13,372,970 1.9522,313 Nemetschek 722,662 0.1116,475 NORMA Group 332,960 0.05
300,000 Prime Office 1,860,000 0.2732,576 Rheinmetall 1,988,276 0.29
98,000 RIB Software 665,714 0.10327,015 RWE 12,370,160 1.80951,618 SAP 39,542,107 5.76139,060 Schuler 1,575,202 0.2343,682 SGL Carbon 1,694,316 0.25
661,318 Siemens Registered Shares 62,633,428 9.13679,468 Sky Deutschland 2,511,314 0.37167,948 Software 6,916,099 1.01152,322 Stada Arzneimittel 4,079,183 0.59142,308 Suedzucker 3,475,517 0.50
12,492 Surteco 342,718 0.05220,167 Symrise 4,840,372 0.70272,697 ThyssenKrupp 9,737,328 1.42157,790 Tom Tailor Holding 2,133,715 0.31166,092 Volkswagen Preference Shares 23,406,515 3.41
653,940,026 95.29
NETHERLANDS224,688 EADS 5,173,441 0.75117,088 Qiagen 1,552,587 0.23
6,726,028 0.98
UNITED KINGDOM404,589 Dialog Semiconductor 5,059,385 0.73
5,059,385 0.73
LUXEMBOURG423,106 SAF-Holland 3,565,937 0.52
3,565,937 0.52
Total Shares 669,291,376 97.52
Total Transferable Securities Admitted to anOfficial Exchange Listing
669,291,376 97.52
Transferable Securities Dealt in on Another Regulated Market
Investment Funds
LUXEMBOURG18,344,884 JPMorgan Liquidity Funds - Euro Liquidity Fund (JPM
Euro Liquidity X (dist)) 18,344,884 2.68
18,344,884 2.68
Total Investment Funds 18,344,884 2.68
Total Transferable Securities Dealt in on AnotherRegulated Market
18,344,884 2.68
Total Investments 687,636,260 100.20
Cash 58,265 0.00
Other Assets/(Liabilities) (1,404,744) (0.20)
Total Net Assets 686,289,781 100.00
Allocation of Portfolio as at 30 June 2011 % ofNet Assets
SharesMaterials 22.37Consumer Discretionary 17.13Industrials 15.80Financials 15.62Information Technology 9.47Utilities 5.26Health Care 5.08Telecommunication Services 4.73Investment Companies 2.68Consumer Staples 1.53Energy 0.53Total Shares 100.20Cash and Other Assets/(Liabilities) (0.20)
Total 100.00
Allocation of Portfolio as at 31 December 2010 (Unaudited) % ofNet Assets
SharesMaterials 24.08Consumer Discretionary 18.07Industrials 17.45Financials 11.07Information Technology 8.75Utilities 7.23Telecommunication Services 3.47Consumer Staples 3.13Investment Companies 3.00Health Care 2.64Energy 0.57Total Shares 99.46Cash and Other Assets/(Liabilities) 0.54
Total 100.00
230
JPMorgan Funds - Germany Equity FundSchedule of Investments (Market Value Expressed in EUR)
As at 30 June 2011
Quantity/Nominal
Value
Name of Securities MarketValue
%of
NetAssets
Quantity/Nominal
Value
Name of Securities MarketValue
%of
NetAssets
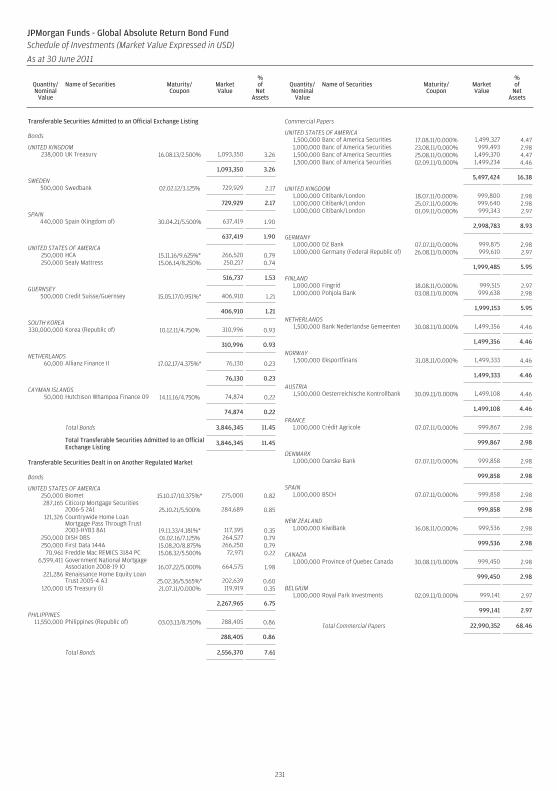
Transferable Securities Admitted to an Official Exchange Listing
Bonds
UNITED KINGDOM238,000 UK Treasury 16.08.13/2.500% 1,093,350 3.26
1,093,350 3.26
SWEDEN500,000 Swedbank 02.02.12/3.125% 729,929 2.17
729,929 2.17
SPAIN440,000 Spain (Kingdom of) 30.04.21/5.500% 637,419 1.90
637,419 1.90
UNITED STATES OF AMERICA250,000 HCA 15.11.16/9.625%* 266,520 0.79250,000 Sealy Mattress 15.06.14/8.250% 250,217 0.74
516,737 1.53
GUERNSEY500,000 Credit Suisse/Guernsey 15.05.17/0.951%* 406,910 1.21
406,910 1.21
SOUTH KOREA330,000,000 Korea (Republic of) 10.12.11/4.750% 310,996 0.93
310,996 0.93
NETHERLANDS60,000 Allianz Finance II 17.02.17/4.375%* 76,130 0.23
76,130 0.23
CAYMAN ISLANDS50,000 Hutchison Whampoa Finance 09 14.11.16/4.750% 74,874 0.22
74,874 0.22
Total Bonds 3,846,345 11.45
Total Transferable Securities Admitted to an OfficialExchange Listing
3,846,345 11.45
Transferable Securities Dealt in on Another Regulated Market
Bonds
UNITED STATES OF AMERICA250,000 Biomet 15.10.17/10.375%* 275,000 0.82287,165 Citicorp Mortgage Securities
2006-5 2A1 25.10.21/5.500% 284,689 0.85121,326 Countrywide Home Loan
Mortgage Pass Through Trust2003-HYB3 8A1 19.11.33/4.181%* 117,395 0.35
250,000 DISH DBS 01.02.16/7.125% 264,527 0.79250,000 First Data 144A 15.08.20/8.875% 266,250 0.79
70,961 Freddie Mac REMICS 3184 PC 15.08.32/5.500% 72,971 0.226,599,411 Government National Mortgage
Association 2008-19 IO 16.07.22/5.000% 664,575 1.98221,286 Renaissance Home Equity Loan
Trust 2005-4 A3 25.02.36/5.565%* 202,639 0.60120,000 US Treasury (i) 21.07.11/0.000% 119,919 0.35
2,267,965 6.75
PHILIPPINES11,550,000 Philippines (Republic of) 03.03.13/8.750% 288,405 0.86
288,405 0.86
Total Bonds 2,556,370 7.61
Commercial Papers
UNITED STATES OF AMERICA1,500,000 Banc of America Securities 17.08.11/0.000% 1,499,327 4.471,000,000 Banc of America Securities 23.08.11/0.000% 999,493 2.981,500,000 Banc of America Securities 25.08.11/0.000% 1,499,370 4.471,500,000 Banc of America Securities 02.09.11/0.000% 1,499,234 4.46
5,497,424 16.38
UNITED KINGDOM1,000,000 Citibank/London 18.07.11/0.000% 999,800 2.981,000,000 Citibank/London 25.07.11/0.000% 999,640 2.981,000,000 Citibank/London 01.09.11/0.000% 999,343 2.97
2,998,783 8.93
GERMANY1,000,000 DZ Bank 07.07.11/0.000% 999,875 2.981,000,000 Germany (Federal Republic of) 26.08.11/0.000% 999,610 2.97
1,999,485 5.95
FINLAND1,000,000 Fingrid 18.08.11/0.000% 999,515 2.971,000,000 Pohjola Bank 03.08.11/0.000% 999,638 2.98
1,999,153 5.95
NETHERLANDS1,500,000 Bank Nederlandse Gemeenten 30.08.11/0.000% 1,499,356 4.46
1,499,356 4.46
NORWAY1,500,000 Eksportfinans 31.08.11/0.000% 1,499,333 4.46
1,499,333 4.46
AUSTRIA1,500,000 Oesterreichische Kontrollbank 30.09.11/0.000% 1,499,108 4.46
1,499,108 4.46
FRANCE1,000,000 Crédit Agricole 07.07.11/0.000% 999,867 2.98
999,867 2.98
DENMARK1,000,000 Danske Bank 07.07.11/0.000% 999,858 2.98
999,858 2.98
SPAIN1,000,000 BSCH 07.07.11/0.000% 999,858 2.98
999,858 2.98
NEW ZEALAND1,000,000 KiwiBank 16.08.11/0.000% 999,536 2.98
999,536 2.98
CANADA1,000,000 Province of Quebec Canada 30.08.11/0.000% 999,450 2.98
999,450 2.98
BELGIUM1,000,000 Royal Park Investments 02.09.11/0.000% 999,141 2.97
999,141 2.97
Total Commercial Papers 22,990,352 68.46
231
JPMorgan Funds - Global Absolute Return Bond FundSchedule of Investments (Market Value Expressed in USD)
As at 30 June 2011
Quantity/Nominal
Value
Name of Securities Maturity/Coupon
MarketValue
%of
NetAssets
Quantity/Nominal
Value
Name of Securities Maturity/Coupon
MarketValue
%of
NetAssets
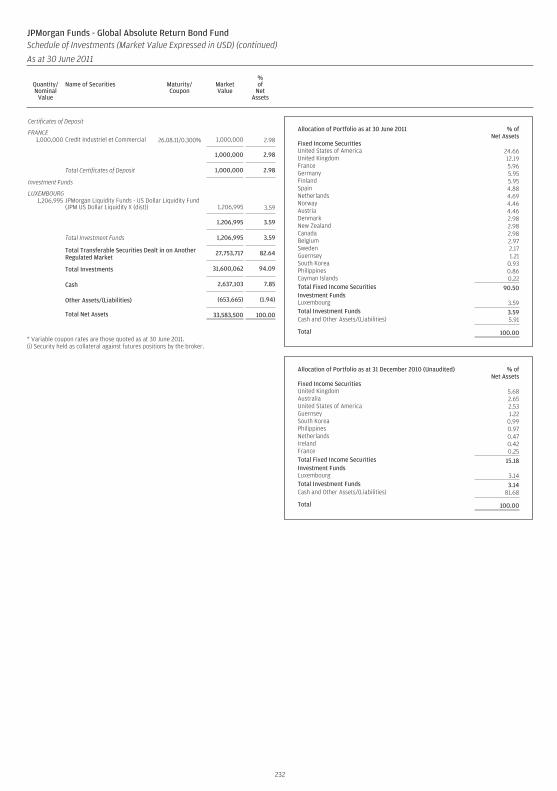
Certificates of Deposit
FRANCE1,000,000 Credit Industriel et Commercial 26.08.11/0.300% 1,000,000 2.98
1,000,000 2.98
Total Certificates of Deposit 1,000,000 2.98
Investment Funds
LUXEMBOURG1,206,995 JPMorgan Liquidity Funds - US Dollar Liquidity Fund
(JPM US Dollar Liquidity X (dist)) 1,206,995 3.59
1,206,995 3.59
Total Investment Funds 1,206,995 3.59
Total Transferable Securities Dealt in on AnotherRegulated Market
27,753,717 82.64
Total Investments 31,600,062 94.09
Cash 2,637,103 7.85
Other Assets/(Liabilities) (653,665) (1.94)
Total Net Assets 33,583,500 100.00
* Variable coupon rates are those quoted as at 30 June 2011.(i) Security held as collateral against futures positions by the broker.
Allocation of Portfolio as at 30 June 2011 % ofNet Assets
Fixed Income SecuritiesUnited States of America 24.66United Kingdom 12.19France 5.96Germany 5.95Finland 5.95Spain 4.88Netherlands 4.69Norway 4.46Austria 4.46Denmark 2.98New Zealand 2.98Canada 2.98Belgium 2.97Sweden 2.17Guernsey 1.21South Korea 0.93Philippines 0.86Cayman Islands 0.22Total Fixed Income Securities 90.50Investment FundsLuxembourg 3.59Total Investment Funds 3.59Cash and Other Assets/(Liabilities) 5.91
Total 100.00
Allocation of Portfolio as at 31 December 2010 (Unaudited) % ofNet Assets
Fixed Income SecuritiesUnited Kingdom 5.68Australia 2.65United States of America 2.53Guernsey 1.22South Korea 0.99Philippines 0.97Netherlands 0.47Ireland 0.42France 0.25Total Fixed Income Securities 15.18Investment FundsLuxembourg 3.14Total Investment Funds 3.14Cash and Other Assets/(Liabilities) 81.68
Total 100.00
232
JPMorgan Funds - Global Absolute Return Bond FundSchedule of Investments (Market Value Expressed in USD) (continued)
As at 30 June 2011
Quantity/Nominal
Value
Name of Securities Maturity/Coupon
MarketValue
%of
NetAssets
Quantity/Nominal
Value
Name of Securities Maturity/Coupon
MarketValue
%of
NetAssets
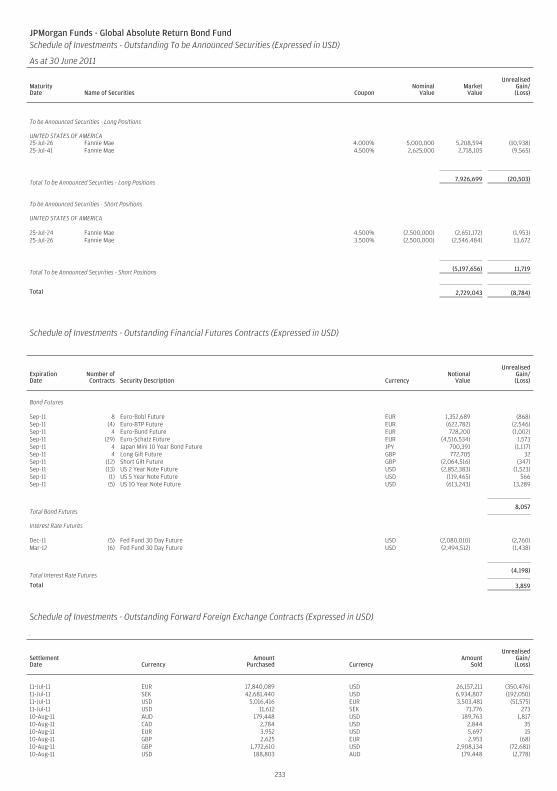
JPMorgan Funds - Global Absolute Return Bond FundSchedule of Investments - Outstanding To be Announced Securities (Expressed in USD)
As at 30 June 2011
MaturityDate Name of Securities Coupon
NominalValue
MarketValue
UnrealisedGain/(Loss)
To be Announced Securities - Long Positions
UNITED STATES OF AMERICA25-Jul-26 Fannie Mae 4.000% 5,000,000 5,208,594 (10,938)25-Jul-41 Fannie Mae 4.500% 2,625,000 2,718,105 (9,565)
Total To be Announced Securities - Long Positions 7,926,699 (20,503)
To be Announced Securities - Short Positions
UNITED STATES OF AMERICA
25-Jul-24 Fannie Mae 4.500% (2,500,000) (2,651,172) (1,953)25-Jul-26 Fannie Mae 3.500% (2,500,000) (2,546,484) 13,672
Total To be Announced Securities - Short Positions (5,197,656) 11,719
Total 2,729,043 (8,784)
Schedule of Investments - Outstanding Financial Futures Contracts (Expressed in USD)
ExpirationDate
Number ofContracts Security Description Currency
NotionalValue
UnrealisedGain/(Loss)
Bond Futures
Sep-11 8 Euro-Bobl Future EUR 1,352,689 (868)Sep-11 (4) Euro-BTP Future EUR (622,782) (2,546)Sep-11 4 Euro-Bund Future EUR 728,200 (1,002)Sep-11 (29) Euro-Schatz Future EUR (4,516,534) 1,573Sep-11 4 Japan Mini 10 Year Bond Future JPY 700,391 (1,117)Sep-11 4 Long Gilt Future GBP 772,705 32Sep-11 (12) Short Gilt Future GBP (2,064,516) (347)Sep-11 (13) US 2 Year Note Future USD (2,852,383) (1,523)Sep-11 (1) US 5 Year Note Future USD (119,465) 566Sep-11 (5) US 10 Year Note Future USD (613,243) 13,289
Total Bond Futures8,057
Interest Rate Futures
Dec-11 (5) Fed Fund 30 Day Future USD (2,080,010) (2,760)Mar-12 (6) Fed Fund 30 Day Future USD (2,494,512) (1,438)
Total Interest Rate Futures(4,198)
Total 3,859
JPMorgan Funds - Global Absolute Return Bond FundSchedule of Investments - Outstanding Forward Foreign Exchange Contracts (Expressed in USD) (continued)
As at 30 June 2011
SettlementDate Currency
AmountPurchased Currency
AmountSold
UnrealisedGain/(Loss)
11-Jul-11 EUR 17,840,089 USD 26,157,211 (350,476)11-Jul-11 SEK 42,681,440 USD 6,934,807 (192,050)11-Jul-11 USD 5,016,416 EUR 3,503,481 (51,575)11-Jul-11 USD 11,612 SEK 71,776 27310-Aug-11 AUD 179,448 USD 189,763 1,81710-Aug-11 CAD 2,784 USD 2,844 3510-Aug-11 EUR 3,952 USD 5,697 1510-Aug-11 GBP 2,625 EUR 2,953 (68)10-Aug-11 GBP 1,772,610 USD 2,908,134 (72,681)10-Aug-11 USD 188,803 AUD 179,448 (2,778)
233
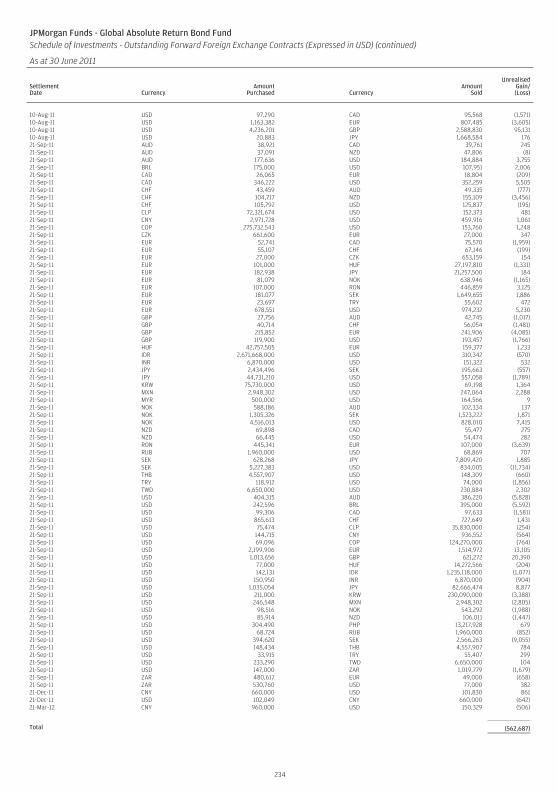
JPMorgan Funds - Global Absolute Return Bond FundSchedule of Investments - Outstanding Forward Foreign Exchange Contracts (Expressed in USD) (continued)
As at 30 June 2011
SettlementDate Currency
AmountPurchased Currency
AmountSold
UnrealisedGain/(Loss)
10-Aug-11 USD 97,290 CAD 95,568 (1,571)10-Aug-11 USD 1,163,382 EUR 807,485 (3,605)10-Aug-11 USD 4,236,201 GBP 2,588,830 95,13110-Aug-11 USD 20,883 JPY 1,668,584 17621-Sep-11 AUD 38,921 CAD 39,761 24521-Sep-11 AUD 37,091 NZD 47,806 (8)21-Sep-11 AUD 177,636 USD 184,884 3,75521-Sep-11 BRL 175,000 USD 107,951 2,00621-Sep-11 CAD 26,065 EUR 18,804 (209)21-Sep-11 CAD 346,222 USD 352,259 5,50521-Sep-11 CHF 43,459 AUD 49,335 (777)21-Sep-11 CHF 104,717 NZD 155,109 (3,456)21-Sep-11 CHF 105,792 USD 125,837 (195)21-Sep-11 CLP 72,321,674 USD 152,373 48121-Sep-11 CNY 2,971,728 USD 459,916 1,06121-Sep-11 COP 275,732,543 USD 153,760 1,24821-Sep-11 CZK 661,600 EUR 27,000 34721-Sep-11 EUR 52,741 CAD 75,570 (1,959)21-Sep-11 EUR 55,107 CHF 67,146 (199)21-Sep-11 EUR 27,000 CZK 653,159 15421-Sep-11 EUR 101,000 HUF 27,197,810 (1,331)21-Sep-11 EUR 182,938 JPY 21,257,500 18421-Sep-11 EUR 81,079 NOK 638,946 (1,165)21-Sep-11 EUR 107,000 RON 446,859 3,12521-Sep-11 EUR 181,077 SEK 1,649,655 1,88621-Sep-11 EUR 23,697 TRY 55,602 47221-Sep-11 EUR 678,551 USD 974,232 5,23021-Sep-11 GBP 27,756 AUD 42,745 (1,017)21-Sep-11 GBP 40,714 CHF 56,054 (1,481)21-Sep-11 GBP 215,852 EUR 241,906 (4,085)21-Sep-11 GBP 119,900 USD 193,457 (1,766)21-Sep-11 HUF 42,757,505 EUR 159,377 1,23321-Sep-11 IDR 2,671,668,000 USD 310,342 (570)21-Sep-11 INR 6,870,000 USD 151,322 53221-Sep-11 JPY 2,434,496 SEK 195,663 (557)21-Sep-11 JPY 44,731,210 USD 557,058 (1,789)21-Sep-11 KRW 75,730,000 USD 69,198 1,36421-Sep-11 MXN 2,948,302 USD 247,064 2,28821-Sep-11 MYR 500,000 USD 164,566 921-Sep-11 NOK 588,186 AUD 102,334 13721-Sep-11 NOK 1,305,326 SEK 1,523,222 1,87121-Sep-11 NOK 4,516,013 USD 828,010 7,41521-Sep-11 NZD 69,898 CAD 55,477 27521-Sep-11 NZD 66,445 USD 54,474 28221-Sep-11 RON 445,341 EUR 107,000 (3,639)21-Sep-11 RUB 1,960,000 USD 68,869 70721-Sep-11 SEK 628,268 JPY 7,809,420 1,88521-Sep-11 SEK 5,227,383 USD 834,005 (11,734)21-Sep-11 THB 4,557,907 USD 148,309 (660)21-Sep-11 TRY 118,912 USD 74,000 (1,856)21-Sep-11 TWD 6,650,000 USD 230,884 2,30221-Sep-11 USD 404,315 AUD 386,220 (5,828)21-Sep-11 USD 242,596 BRL 395,000 (5,592)21-Sep-11 USD 99,306 CAD 97,633 (1,581)21-Sep-11 USD 865,613 CHF 727,649 1,43121-Sep-11 USD 75,474 CLP 35,830,000 (254)21-Sep-11 USD 144,715 CNY 936,552 (564)21-Sep-11 USD 69,096 COP 124,270,000 (764)21-Sep-11 USD 2,199,906 EUR 1,514,972 13,10521-Sep-11 USD 1,013,656 GBP 621,272 20,39021-Sep-11 USD 77,000 HUF 14,272,566 (204)21-Sep-11 USD 142,131 IDR 1,235,118,000 (1,077)21-Sep-11 USD 150,950 INR 6,870,000 (904)21-Sep-11 USD 1,035,054 JPY 82,666,474 8,87721-Sep-11 USD 211,000 KRW 230,090,000 (3,388)21-Sep-11 USD 246,548 MXN 2,948,302 (2,805)21-Sep-11 USD 98,516 NOK 543,292 (1,988)21-Sep-11 USD 85,914 NZD 106,011 (1,447)21-Sep-11 USD 304,490 PHP 13,217,928 67921-Sep-11 USD 68,724 RUB 1,960,000 (852)21-Sep-11 USD 394,620 SEK 2,566,263 (9,055)21-Sep-11 USD 148,434 THB 4,557,907 78421-Sep-11 USD 33,915 TRY 55,407 29921-Sep-11 USD 233,290 TWD 6,650,000 10421-Sep-11 USD 147,000 ZAR 1,019,779 (1,679)21-Sep-11 ZAR 480,617 EUR 49,000 (658)21-Sep-11 ZAR 530,760 USD 77,000 38221-Dec-11 CNY 660,000 USD 101,830 86121-Dec-11 USD 102,049 CNY 660,000 (642)21-Mar-12 CNY 960,000 USD 150,329 (506)
Total (562,687)
234
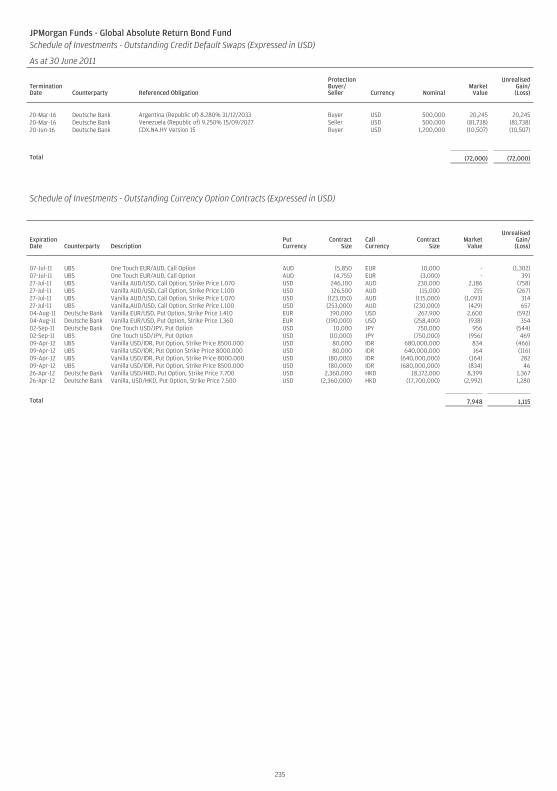
JPMorgan Funds - Global Absolute Return Bond FundSchedule of Investments - Outstanding Credit Default Swaps (Expressed in USD)
As at 30 June 2011
TerminationDate Counterparty Referenced Obligation
ProtectionBuyer/Seller Currency Nominal
MarketValue
UnrealisedGain/(Loss)
20-Mar-16 Deutsche Bank Argentina (Republic of) 8.280% 31/12/2033 Buyer USD 500,000 20,245 20,24520-Mar-16 Deutsche Bank Venezuela (Republic of) 9.250% 15/09/2027 Seller USD 500,000 (81,738) (81,738)20-Jun-16 Deutsche Bank CDX.NA.HY Version 15 Buyer USD 1,200,000 (10,507) (10,507)
Total (72,000) (72,000)
Schedule of Investments - Outstanding Currency Option Contracts (Expressed in USD)
ExpirationDate Counterparty Description
PutCurrency
ContractSize
CallCurrency
ContractSize
MarketValue
UnrealisedGain/(Loss)
07-Jul-11 UBS One Touch EUR/AUD, Call Option AUD 15,850 EUR 10,000 - (1,302)07-Jul-11 UBS One Touch EUR/AUD, Call Option AUD (4,755) EUR (3,000) - 39127-Jul-11 UBS Vanilla AUD/USD, Call Option, Strike Price 1.070 USD 246,100 AUD 230,000 2,186 (758)27-Jul-11 UBS Vanilla AUD/USD, Call Option, Strike Price 1.100 USD 126,500 AUD 115,000 215 (267)27-Jul-11 UBS Vanilla AUD/USD, Call Option, Strike Price 1.070 USD (123,050) AUD (115,000) (1,093) 31427-Jul-11 UBS Vanilla,AUD/USD, Call Option, Strike Price 1.100 USD (253,000) AUD (230,000) (429) 65704-Aug-11 Deutsche Bank Vanilla EUR/USD, Put Option, Strike Price 1.410 EUR 190,000 USD 267,900 2,600 (592)04-Aug-11 Deutsche Bank Vanilla EUR/USD, Put Option, Strike Price 1.360 EUR (190,000) USD (258,400) (938) 35402-Sep-11 Deutsche Bank One Touch USD/JPY, Put Option USD 10,000 JPY 750,000 956 (544)02-Sep-11 UBS One Touch USD/JPY, Put Option USD (10,000) JPY (750,000) (956) 46909-Apr-12 UBS Vanilla USD/IDR, Put Option, Strike Price 8500.000 USD 80,000 IDR 680,000,000 834 (466)09-Apr-12 UBS Vanilla USD/IDR, Put Option Strike Price 8000.000 USD 80,000 IDR 640,000,000 164 (116)09-Apr-12 UBS Vanilla USD/IDR, Put Option, Strike Price 8000.000 USD (80,000) IDR (640,000,000) (164) 28209-Apr-12 UBS Vanilla USD/IDR, Put Option, Strike Price 8500.000 USD (80,000) IDR (680,000,000) (834) 4626-Apr-12 Deutsche Bank Vanilla USD/HKD, Put Option, Strike Price 7.700 USD 2,360,000 HKD 18,172,000 8,399 1,36726-Apr-12 Deutsche Bank Vanilla, USD/HKD, Put Option, Strike Price 7.500 USD (2,360,000) HKD (17,700,000) (2,992) 1,280
Total 7,948 1,115
235
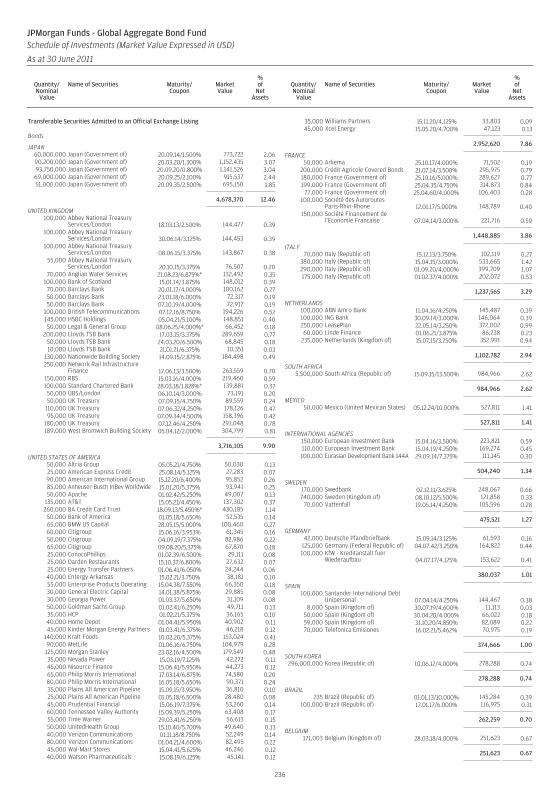
Transferable Securities Admitted to an Official Exchange Listing
Bonds
JAPAN60,000,000 Japan (Government of) 20.09.14/1.500% 773,722 2.0690,200,000 Japan (Government of) 20.03.20/1.300% 1,152,435 3.0793,750,000 Japan (Government of) 20.09.20/0.800% 1,141,526 3.0469,000,000 Japan (Government of) 20.09.25/2.100% 915,537 2.4451,000,000 Japan (Government of) 20.09.35/2.500% 695,150 1.85
4,678,370 12.46
UNITED KINGDOM100,000 Abbey National Treasury
Services/London 18.03.13/2.500% 144,477 0.39100,000 Abbey National Treasury
Services/London 30.06.14/3.125% 144,453 0.39100,000 Abbey National Treasury
Services/London 08.06.15/3.375% 143,867 0.3855,000 Abbey National Treasury
Services/London 20.10.15/3.375% 76,507 0.2070,000 Anglian Water Services 21.08.23/6.875%* 132,492 0.35
100,000 Bank of Scotland 15.01.14/3.875% 148,012 0.3970,000 Barclays Bank 20.01.17/4.000% 100,162 0.2750,000 Barclays Bank 23.01.18/6.000% 72,317 0.1950,000 Barclays Bank 07.10.19/4.000% 72,917 0.19
100,000 British Telecommunications 07.12.16/8.750% 194,226 0.52145,000 HSBC Holdings 05.04.21/5.100% 148,851 0.4050,000 Legal & General Group 08.06.25/4.000%* 66,452 0.18
200,000 Lloyds TSB Bank 17.03.15/3.375% 289,659 0.7750,000 Lloyds TSB Bank 24.03.20/6.500% 68,845 0.1810,000 Lloyds TSB Bank 21.01.21/6.375% 10,351 0.03
130,000 Nationwide Building Society 14.09.15/2.875% 184,498 0.49250,000 Network Rail Infrastructure
Finance 17.06.13/3.500% 263,559 0.70150,000 RBS 15.03.16/4.000% 219,460 0.59100,000 Standard Chartered Bank 28.03.18/1.828%* 139,881 0.3750,000 UBS/London 06.10.14/3.000% 73,191 0.2050,000 UK Treasury 07.09.15/4.750% 89,559 0.24
110,000 UK Treasury 07.06.32/4.250% 178,126 0.4795,000 UK Treasury 07.09.34/4.500% 158,396 0.42
180,000 UK Treasury 07.12.46/4.250% 291,048 0.78189,000 West Bromwich Building Society 05.04.12/2.000% 304,799 0.81
3,716,105 9.90
UNITED STATES OF AMERICA50,000 Altria Group 05.05.21/4.750% 50,030 0.1325,000 American Express Credit 25.08.14/5.125% 27,283 0.0790,000 American International Group 15.12.20/6.400% 95,852 0.2685,000 Anheuser-Busch InBev Worldwide 15.01.20/5.375% 93,941 0.2550,000 Apache 01.02.42/5.250% 49,007 0.13
135,000 AT&T 15.05.21/4.450% 137,302 0.37260,000 BA Credit Card Trust 18.09.13/5.450%* 430,185 1.14
50,000 Bank of America 01.05.18/5.650% 52,535 0.1465,000 BMW US Capital 28.05.15/5.000% 100,460 0.2760,000 Citigroup 15.06.16/3.953% 61,345 0.1650,000 Citigroup 04.09.19/7.375% 82,986 0.2265,000 Citigroup 09.08.20/5.375% 67,870 0.1825,000 ConocoPhillips 01.02.39/6.500% 29,111 0.0825,000 Darden Restaurants 15.10.37/6.800% 27,632 0.0725,000 Energy Transfer Partners 01.06.41/6.050% 24,244 0.0640,000 Entergy Arkansas 15.02.21/3.750% 38,181 0.1055,000 Enterprise Products Operating 15.04.38/7.550% 66,350 0.1830,000 General Electric Capital 14.01.38/5.875% 29,885 0.0830,000 Georgia Power 01.03.37/5.650% 31,109 0.0850,000 Goldman Sachs Group 01.02.41/6.250% 49,711 0.1335,000 HCP 01.02.21/5.375% 36,165 0.1040,000 Home Depot 01.04.41/5.950% 40,902 0.1145,000 Kinder Morgan Energy Partners 01.03.41/6.375% 46,218 0.12
140,000 Kraft Foods 10.02.20/5.375% 153,024 0.4190,000 MetLife 01.06.16/6.750% 104,979 0.28125,000 Morgan Stanley 23.02.16/4.500% 179,549 0.4835,000 Nevada Power 15.03.19/7.125% 42,272 0.1145,000 Nisource Finance 15.06.41/5.950% 44,273 0.1265,000 Philip Morris International 17.03.14/6.875% 74,580 0.2080,000 Philip Morris International 16.05.18/5.650% 90,371 0.2435,000 Plains All American Pipeline 15.09.15/3.950% 36,810 0.1025,000 Plains All American Pipeline 01.05.18/6.500% 28,480 0.0845,000 Prudential Financial 15.06.19/7.375% 53,260 0.1460,000 Tennessee Valley Authority 15.09.39/5.250% 63,408 0.1755,000 Time Warner 29.03.41/6.250% 56,613 0.1550,000 UnitedHealth Group 15.10.40/5.700% 49,640 0.1340,000 Verizon Communications 01.11.18/8.750% 52,249 0.1480,000 Verizon Communications 01.04.21/4.600% 82,495 0.2245,000 Wal-Mart Stores 15.04.41/5.625% 46,246 0.1240,000 Watson Pharmaceuticals 15.08.19/6.125% 45,141 0.12
35,000 Williams Partners 15.11.20/4.125% 33,803 0.0945,000 Xcel Energy 15.05.20/4.700% 47,123 0.13
2,952,620 7.86
FRANCE50,000 Arkema 25.10.17/4.000% 71,502 0.19
200,000 Crédit Agricole Covered Bonds 21.07.14/3.500% 295,975 0.79180,000 France (Government of) 25.10.16/5.000% 289,627 0.77199,000 France (Government of) 25.04.35/4.750% 314,873 0.84
77,000 France (Government of) 25.04.60/4.000% 106,403 0.28100,000 Société des Autoroutes
Paris-Rhin-Rhone 12.01.17/5.000% 148,789 0.40150,000 Société Financement de
l’Economie Francaise 07.04.14/3.000% 221,716 0.59
1,448,885 3.86
ITALY70,000 Italy (Republic of) 15.12.13/3.750% 102,119 0.27
380,000 Italy (Republic of) 15.04.15/3.000% 533,665 1.42290,000 Italy (Republic of) 01.09.20/4.000% 399,709 1.07175,000 Italy (Republic of) 01.02.37/4.000% 202,072 0.53
1,237,565 3.29
NETHERLANDS100,000 ABN Amro Bank 11.04.16/4.250% 145,487 0.39100,000 ING Bank 30.09.14/3.000% 146,064 0.39250,000 LeasePlan 22.05.14/3.250% 372,002 0.9960,000 Linde Finance 01.06.21/3.875% 86,238 0.23
235,000 Netherlands (Kingdom of) 15.07.15/3.250% 352,991 0.94
1,102,782 2.94
SOUTH AFRICA5,500,000 South Africa (Republic of) 15.09.15/13.500% 984,966 2.62
984,966 2.62
MEXICO50,000 Mexico (United Mexican States) 05.12.24/10.000% 527,811 1.41
527,811 1.41
INTERNATIONAL AGENCIES150,000 European Investment Bank 15.04.16/3.500% 223,821 0.59110,000 European Investment Bank 15.04.19/4.250% 169,274 0.45100,000 Eurasian Development Bank 144A 29.09.14/7.375% 111,145 0.30
504,240 1.34
SWEDEN170,000 Swedbank 02.12.11/3.625% 248,067 0.66740,000 Sweden (Kingdom of) 08.10.12/5.500% 121,858 0.33
70,000 Vattenfall 19.05.14/4.250% 105,596 0.28
475,521 1.27
GERMANY42,000 Deutsche Pfandbriefbank 15.09.14/3.125% 61,593 0.16
125,000 Germany (Federal Republic of) 04.07.42/3.250% 164,822 0.44100,000 KfW - Kreditanstalt fuer
Wiederaufbau 04.07.17/4.125% 153,622 0.41
380,037 1.01
SPAIN100,000 Santander International Debt
Unipersonal 07.04.14/4.250% 144,467 0.388,000 Spain (Kingdom of) 30.07.19/4.600% 11,113 0.03
50,000 Spain (Kingdom of) 30.04.20/4.000% 66,022 0.1859,000 Spain (Kingdom of) 31.10.20/4.850% 82,089 0.2270,000 Telefonica Emisiones 16.02.21/5.462% 70,975 0.19
374,666 1.00
SOUTH KOREA296,000,000 Korea (Republic of) 10.06.12/4.000% 278,288 0.74
278,288 0.74
BRAZIL235 Brazil (Republic of) 01.01.13/10.000% 145,284 0.39
100,000 Brazil (Republic of) 17.01.17/6.000% 116,975 0.31
262,259 0.70
BELGIUM171,003 Belgium (Kingdom of) 28.03.18/4.000% 251,623 0.67
251,623 0.67
236
JPMorgan Funds - Global Aggregate Bond FundSchedule of Investments (Market Value Expressed in USD)
As at 30 June 2011
Quantity/Nominal
Value
Name of Securities Maturity/Coupon
MarketValue
%of
NetAssets
Quantity/Nominal
Value
Name of Securities Maturity/Coupon
MarketValue
%of
NetAssets
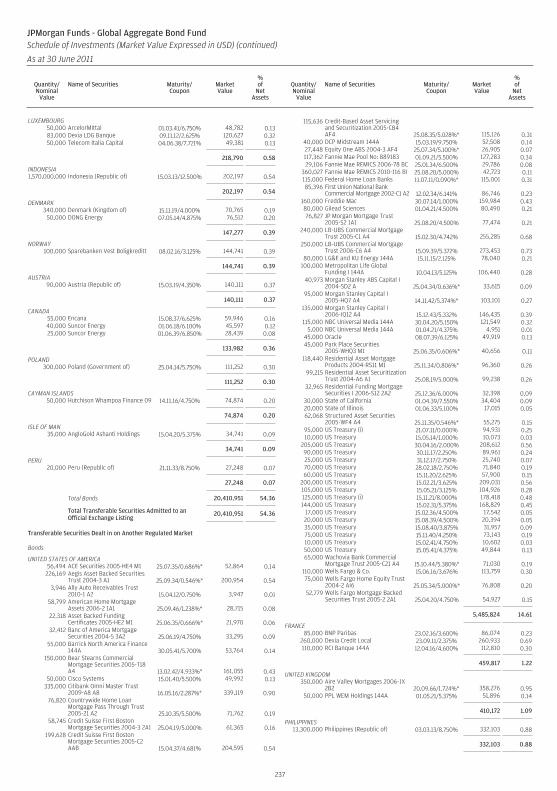
LUXEMBOURG50,000 ArcelorMittal 01.03.41/6.750% 48,782 0.1383,000 Dexia LDG Banque 09.11.12/2.625% 120,627 0.3250,000 Telecom Italia Capital 04.06.38/7.721% 49,381 0.13
218,790 0.58
INDONESIA1,570,000,000 Indonesia (Republic of) 15.03.13/12.500% 202,197 0.54
202,197 0.54
DENMARK340,000 Denmark (Kingdom of) 15.11.19/4.000% 70,765 0.19
50,000 DONG Energy 07.05.14/4.875% 76,512 0.20
147,277 0.39
NORWAY100,000 Sparebanken Vest Boligkreditt 08.02.16/3.125% 144,741 0.39
144,741 0.39
AUSTRIA90,000 Austria (Republic of) 15.03.19/4.350% 140,111 0.37
140,111 0.37
CANADA55,000 Encana 15.08.37/6.625% 59,946 0.1640,000 Suncor Energy 01.06.18/6.100% 45,597 0.1225,000 Suncor Energy 01.06.39/6.850% 28,439 0.08
133,982 0.36
POLAND300,000 Poland (Government of) 25.04.14/5.750% 111,252 0.30
111,252 0.30
CAYMAN ISLANDS50,000 Hutchison Whampoa Finance 09 14.11.16/4.750% 74,874 0.20
74,874 0.20
ISLE OF MAN35,000 AngloGold Ashanti Holdings 15.04.20/5.375% 34,741 0.09
34,741 0.09
PERU20,000 Peru (Republic of) 21.11.33/8.750% 27,248 0.07
27,248 0.07
Total Bonds 20,410,951 54.36
Total Transferable Securities Admitted to anOfficial Exchange Listing
20,410,951 54.36
Transferable Securities Dealt in on Another Regulated Market
Bonds
UNITED STATES OF AMERICA56,494 ACE Securities 2005-HE4 M1 25.07.35/0.686%* 52,864 0.14
226,169 Aegis Asset Backed SecuritiesTrust 2004-3 A1 25.09.34/0.546%* 200,954 0.54
3,946 Ally Auto Receivables Trust2010-1 A2 15.04.12/0.750% 3,947 0.01
58,799 American Home MortgageAssets 2006-2 1A1 25.09.46/1.238%* 28,715 0.08
22,318 Asset Backed FundingCertificates 2005-HE2 M1 25.06.35/0.666%* 21,970 0.06
32,412 Banc of America MortgageSecurities 2004-5 3A2 25.06.19/4.750% 33,295 0.09
55,000 Barrick North America Finance144A 30.05.41/5.700% 53,764 0.14
150,000 Bear Stearns CommercialMortgage Securities 2005-T18A4 13.02.42/4.933%* 161,055 0.43
50,000 Cisco Systems 15.01.40/5.500% 49,992 0.13335,000 Citibank Omni Master Trust
2009-A8 A8 16.05.16/2.287%* 339,119 0.9076,820 Countrywide Home Loan
Mortgage Pass Through Trust2005-21 A2 25.10.35/5.500% 71,762 0.19
58,745 Credit Suisse First BostonMortgage Securities 2004-3 2A1 25.04.19/5.000% 61,365 0.16
199,628 Credit Suisse First BostonMortgage Securities 2005-C2AAB 15.04.37/4.681% 204,595 0.54
115,636 Credit-Based Asset Servicingand Securitization 2005-CB4AF4 25.08.35/5.028%* 115,126 0.31
40,000 DCP Midstream 144A 15.03.19/9.750% 52,508 0.1427,448 Equity One ABS 2004-3 AF4 25.07.34/5.100%* 26,905 0.07117,362 Fannie Mae Pool No: 889183 01.09.21/5.500% 127,283 0.3429,106 Fannie Mae REMICS 2006-78 BC 25.01.34/6.500% 29,786 0.08
360,027 Fannie Mae REMICS 2010-116 BI 25.08.20/5.000% 42,723 0.11115,000 Federal Home Loan Banks 11.07.11/0.090%* 115,001 0.3185,396 First Union National Bank
Commercial Mortgage 2002-C1 A2 12.02.34/6.141% 86,746 0.23160,000 Freddie Mac 30.07.14/1.000% 159,984 0.4380,000 Gilead Sciences 01.04.21/4.500% 80,490 0.2176,827 JP Morgan Mortgage Trust
2005-S2 1A1 25.08.20/4.500% 77,474 0.21240,000 LB-UBS Commercial Mortgage
Trust 2005-C1 A4 15.02.30/4.742% 255,285 0.68250,000 LB-UBS Commercial Mortgage
Trust 2006-C6 A4 15.09.39/5.372% 273,453 0.7380,000 LG&E and KU Energy 144A 15.11.15/2.125% 78,040 0.21
100,000 Metropolitan Life GlobalFunding I 144A 10.04.13/5.125% 106,440 0.28
40,973 Morgan Stanley ABS Capital I2004-SD2 A 25.04.34/0.636%* 33,615 0.09
95,000 Morgan Stanley Capital I2005-HQ7 A4 14.11.42/5.374%* 103,101 0.27
135,000 Morgan Stanley Capital I2006-IQ12 A4 15.12.43/5.332% 146,435 0.39
115,000 NBC Universal Media 144A 30.04.20/5.150% 121,549 0.325,000 NBC Universal Media 144A 01.04.21/4.375% 4,951 0.01
45,000 Oracle 08.07.39/6.125% 49,919 0.1345,000 Park Place Securities
2005-WHQ3 M1 25.06.35/0.606%* 40,656 0.11118,440 Residential Asset Mortgage
Products 2004-RS11 M1 25.11.34/0.806%* 96,360 0.2699,215 Residential Asset Securitization
Trust 2004-A6 A1 25.08.19/5.000% 99,238 0.2632,965 Residential Funding Mortgage
Securities I 2006-S12 2A2 25.12.36/6.000% 32,398 0.0930,000 State of California 01.04.39/7.550% 34,404 0.0920,000 State of Illinois 01.06.33/5.100% 17,015 0.0562,068 Structured Asset Securities
2005-WF4 A4 25.11.35/0.546%* 55,275 0.1595,000 US Treasury (i) 21.07.11/0.000% 94,931 0.2510,000 US Treasury 15.05.14/1.000% 10,073 0.03
205,000 US Treasury 30.04.16/2.000% 208,612 0.5690,000 US Treasury 30.11.17/2.250% 89,961 0.2425,000 US Treasury 31.12.17/2.750% 25,740 0.0770,000 US Treasury 28.02.18/2.750% 71,840 0.1960,000 US Treasury 15.11.20/2.625% 57,900 0.15
200,000 US Treasury 15.02.21/3.625% 209,031 0.56105,000 US Treasury 15.05.21/3.125% 104,926 0.28125,000 US Treasury (i) 15.11.21/8.000% 178,418 0.48144,000 US Treasury 15.02.31/5.375% 168,829 0.45
17,000 US Treasury 15.02.36/4.500% 17,542 0.0520,000 US Treasury 15.08.39/4.500% 20,394 0.0535,000 US Treasury 15.08.40/3.875% 31,957 0.0975,000 US Treasury 15.11.40/4.250% 73,143 0.1910,000 US Treasury 15.02.41/4.750% 10,602 0.0350,000 US Treasury 15.05.41/4.375% 49,844 0.1365,000 Wachovia Bank Commercial
Mortgage Trust 2005-C21 A4 15.10.44/5.380%* 71,030 0.19110,000 Wells Fargo & Co. 15.06.16/3.676% 113,759 0.3075,000 Wells Fargo Home Equity Trust
2004-2 AI6 25.05.34/5.000%* 76,808 0.2052,779 Wells Fargo Mortgage Backed
Securities Trust 2005-2 2A1 25.04.20/4.750% 54,927 0.15
5,485,824 14.61
FRANCE85,000 BNP Paribas 23.02.16/3.600% 86,074 0.23
260,000 Dexia Credit Local 23.09.11/2.375% 260,933 0.69110,000 RCI Banque 144A 12.04.16/4.600% 112,810 0.30
459,817 1.22
UNITED KINGDOM350,000 Aire Valley Mortgages 2006-1X
2B2 20.09.66/1.724%* 358,276 0.9550,000 PPL WEM Holdings 144A 01.05.21/5.375% 51,896 0.14
410,172 1.09
PHILIPPINES13,300,000 Philippines (Republic of) 03.03.13/8.750% 332,103 0.88
332,103 0.88
237
JPMorgan Funds - Global Aggregate Bond FundSchedule of Investments (Market Value Expressed in USD) (continued)
As at 30 June 2011
Quantity/Nominal
Value
Name of Securities Maturity/Coupon
MarketValue
%of
NetAssets
Quantity/Nominal
Value
Name of Securities Maturity/Coupon
MarketValue
%of
NetAssets
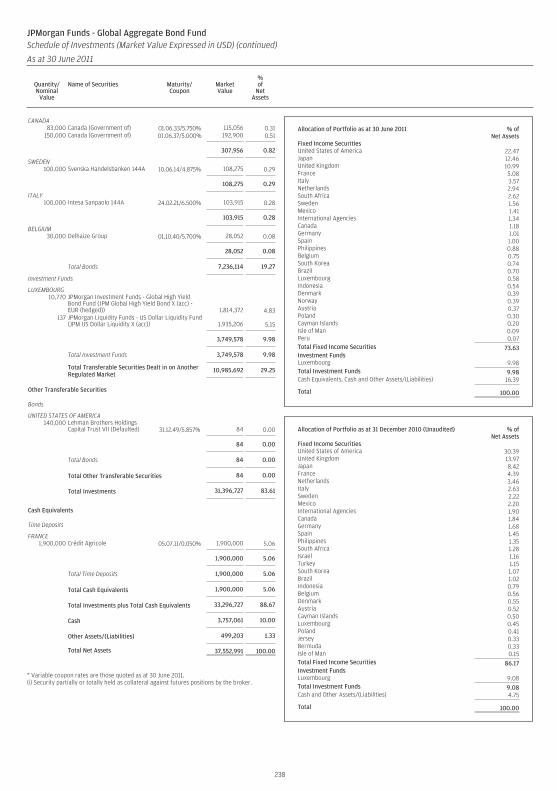
CANADA83,000 Canada (Government of) 01.06.33/5.750% 115,056 0.31
150,000 Canada (Government of) 01.06.37/5.000% 192,900 0.51
307,956 0.82
SWEDEN100,000 Svenska Handelsbanken 144A 10.06.14/4.875% 108,275 0.29
108,275 0.29
ITALY100,000 Intesa Sanpaolo 144A 24.02.21/6.500% 103,915 0.28
103,915 0.28
BELGIUM30,000 Delhaize Group 01.10.40/5.700% 28,052 0.08
28,052 0.08
Total Bonds 7,236,114 19.27
Investment Funds
LUXEMBOURG10,770 JPMorgan Investment Funds - Global High Yield
Bond Fund (JPM Global High Yield Bond X (acc) -EUR (hedged)) 1,814,372 4.83
137 JPMorgan Liquidity Funds - US Dollar Liquidity Fund(JPM US Dollar Liquidity X (acc)) 1,935,206 5.15
3,749,578 9.98
Total Investment Funds 3,749,578 9.98
Total Transferable Securities Dealt in on AnotherRegulated Market
10,985,692 29.25
Other Transferable Securities
Bonds
UNITED STATES OF AMERICA140,000 Lehman Brothers Holdings
Capital Trust VII (Defaulted) 31.12.49/5.857% 84 0.00
84 0.00
Total Bonds 84 0.00
Total Other Transferable Securities 84 0.00
Total Investments 31,396,727 83.61
Cash Equivalents
Time Deposits
FRANCE1,900,000 Crédit Agricole 05.07.11/0.050% 1,900,000 5.06
1,900,000 5.06
Total Time Deposits 1,900,000 5.06
Total Cash Equivalents 1,900,000 5.06
Total Investments plus Total Cash Equivalents 33,296,727 88.67
Cash 3,757,061 10.00
Other Assets/(Liabilities) 499,203 1.33
Total Net Assets 37,552,991 100.00
* Variable coupon rates are those quoted as at 30 June 2011.(i) Security partially or totally held as collateral against futures positions by the broker.
Allocation of Portfolio as at 30 June 2011 % ofNet Assets
Fixed Income SecuritiesUnited States of America 22.47Japan 12.46United Kingdom 10.99France 5.08Italy 3.57Netherlands 2.94South Africa 2.62Sweden 1.56Mexico 1.41International Agencies 1.34Canada 1.18Germany 1.01Spain 1.00Philippines 0.88Belgium 0.75South Korea 0.74Brazil 0.70Luxembourg 0.58Indonesia 0.54Denmark 0.39Norway 0.39Austria 0.37Poland 0.30Cayman Islands 0.20Isle of Man 0.09Peru 0.07Total Fixed Income Securities 73.63Investment FundsLuxembourg 9.98Total Investment Funds 9.98Cash Equivalents, Cash and Other Assets/(Liabilities) 16.39
Total 100.00
Allocation of Portfolio as at 31 December 2010 (Unaudited) % ofNet Assets
Fixed Income SecuritiesUnited States of America 30.39United Kingdom 13.97Japan 8.42France 4.39Netherlands 3.46Italy 2.63Sweden 2.22Mexico 2.20International Agencies 1.90Canada 1.84Germany 1.68Spain 1.45Philippines 1.35South Africa 1.28Israel 1.16Turkey 1.15South Korea 1.07Brazil 1.02Indonesia 0.79Belgium 0.56Denmark 0.55Austria 0.52Cayman Islands 0.50Luxembourg 0.45Poland 0.41Jersey 0.33Bermuda 0.33Isle of Man 0.15Total Fixed Income Securities 86.17Investment FundsLuxembourg 9.08Total Investment Funds 9.08Cash and Other Assets/(Liabilities) 4.75
Total 100.00
238
JPMorgan Funds - Global Aggregate Bond FundSchedule of Investments (Market Value Expressed in USD) (continued)
As at 30 June 2011
Quantity/Nominal
Value
Name of Securities Maturity/Coupon
MarketValue
%of
NetAssets
Quantity/Nominal
Value
Name of Securities Maturity/Coupon
MarketValue
%of
NetAssets
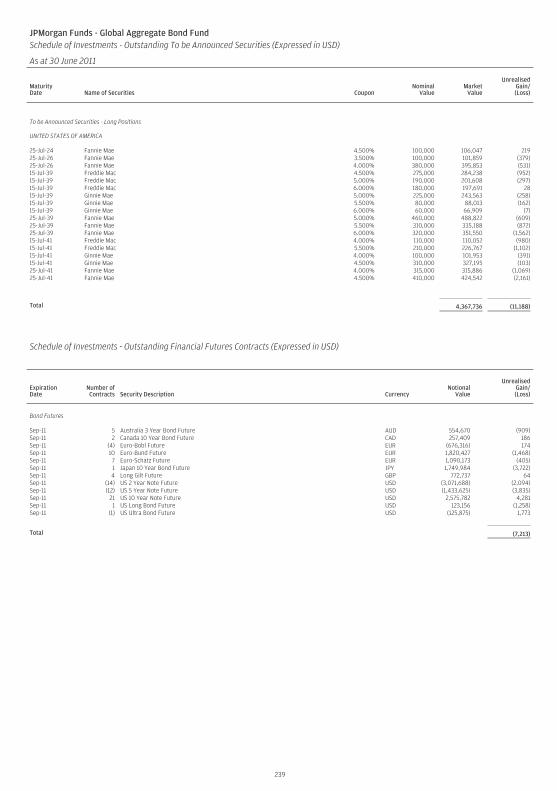
JPMorgan Funds - Global Aggregate Bond FundSchedule of Investments - Outstanding To be Announced Securities (Expressed in USD)
As at 30 June 2011
MaturityDate Name of Securities Coupon
NominalValue
MarketValue
UnrealisedGain/(Loss)
To be Announced Securities - Long Positions
UNITED STATES OF AMERICA
25-Jul-24 Fannie Mae 4.500% 100,000 106,047 21925-Jul-26 Fannie Mae 3.500% 100,000 101,859 (379)25-Jul-26 Fannie Mae 4.000% 380,000 395,853 (531)15-Jul-39 Freddie Mac 4.500% 275,000 284,238 (952)15-Jul-39 Freddie Mac 5.000% 190,000 201,608 (297)15-Jul-39 Freddie Mac 6.000% 180,000 197,691 2815-Jul-39 Ginnie Mae 5.000% 225,000 243,563 (258)15-Jul-39 Ginnie Mae 5.500% 80,000 88,013 (162)15-Jul-39 Ginnie Mae 6.000% 60,000 66,909 (7)25-Jul-39 Fannie Mae 5.000% 460,000 488,822 (609)25-Jul-39 Fannie Mae 5.500% 310,000 335,188 (872)25-Jul-39 Fannie Mae 6.000% 320,000 351,550 (1,562)15-Jul-41 Freddie Mac 4.000% 110,000 110,052 (980)15-Jul-41 Freddie Mac 5.500% 210,000 226,767 (1,102)15-Jul-41 Ginnie Mae 4.000% 100,000 101,953 (391)15-Jul-41 Ginnie Mae 4.500% 310,000 327,195 (103)25-Jul-41 Fannie Mae 4.000% 315,000 315,886 (1,069)25-Jul-41 Fannie Mae 4.500% 410,000 424,542 (2,161)
Total 4,367,736 (11,188)
Schedule of Investments - Outstanding Financial Futures Contracts (Expressed in USD)
ExpirationDate
Number ofContracts Security Description Currency
NotionalValue
UnrealisedGain/(Loss)
Bond Futures
Sep-11 5 Australia 3 Year Bond Future AUD 554,670 (909)Sep-11 2 Canada 10 Year Bond Future CAD 257,409 186Sep-11 (4) Euro-Bobl Future EUR (676,316) 174Sep-11 10 Euro-Bund Future EUR 1,820,427 (1,468)Sep-11 7 Euro-Schatz Future EUR 1,090,173 (405)Sep-11 1 Japan 10 Year Bond Future JPY 1,749,984 (3,722)Sep-11 4 Long Gilt Future GBP 772,737 64Sep-11 (14) US 2 Year Note Future USD (3,071,688) (2,094)Sep-11 (12) US 5 Year Note Future USD (1,433,625) (3,835)Sep-11 21 US 10 Year Note Future USD 2,575,782 4,281Sep-11 1 US Long Bond Future USD 123,156 (1,258)Sep-11 (1) US Ultra Bond Future USD (125,875) 1,773
Total (7,213)
239
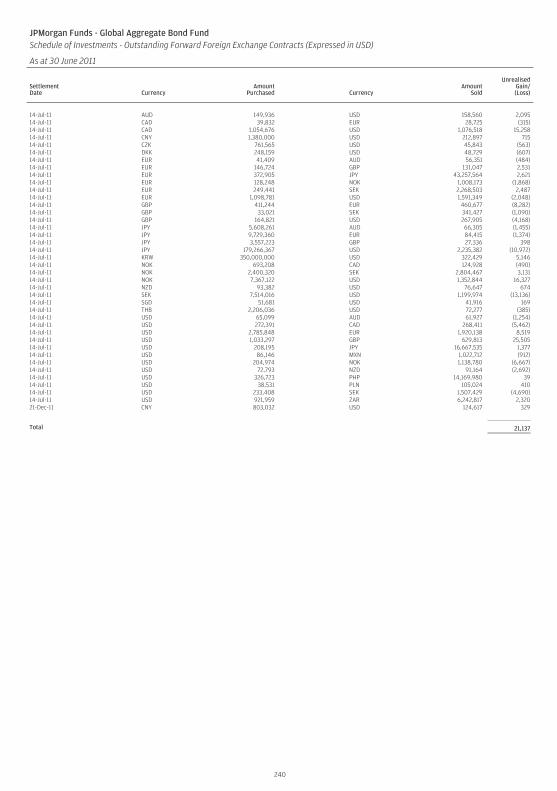
JPMorgan Funds - Global Aggregate Bond FundSchedule of Investments - Outstanding Forward Foreign Exchange Contracts (Expressed in USD)
As at 30 June 2011
SettlementDate Currency
AmountPurchased Currency
AmountSold
UnrealisedGain/(Loss)
14-Jul-11 AUD 149,936 USD 158,560 2,09514-Jul-11 CAD 39,832 EUR 28,725 (315)14-Jul-11 CAD 1,054,676 USD 1,076,518 15,25814-Jul-11 CNY 1,380,000 USD 212,897 71514-Jul-11 CZK 761,565 USD 45,843 (563)14-Jul-11 DKK 248,159 USD 48,729 (607)14-Jul-11 EUR 41,409 AUD 56,351 (484)14-Jul-11 EUR 146,724 GBP 131,047 2,53114-Jul-11 EUR 372,905 JPY 43,257,564 2,62114-Jul-11 EUR 128,248 NOK 1,008,173 (1,868)14-Jul-11 EUR 249,441 SEK 2,268,503 2,48714-Jul-11 EUR 1,098,781 USD 1,591,349 (2,048)14-Jul-11 GBP 411,244 EUR 460,677 (8,282)14-Jul-11 GBP 33,021 SEK 341,427 (1,090)14-Jul-11 GBP 164,821 USD 267,905 (4,168)14-Jul-11 JPY 5,608,261 AUD 66,305 (1,455)14-Jul-11 JPY 9,729,360 EUR 84,415 (1,374)14-Jul-11 JPY 3,557,223 GBP 27,336 39814-Jul-11 JPY 179,266,367 USD 2,235,382 (10,972)14-Jul-11 KRW 350,000,000 USD 322,429 5,14614-Jul-11 NOK 693,208 CAD 124,928 (490)14-Jul-11 NOK 2,400,320 SEK 2,804,467 3,13114-Jul-11 NOK 7,367,122 USD 1,352,844 16,32714-Jul-11 NZD 93,382 USD 76,647 67414-Jul-11 SEK 7,514,016 USD 1,199,974 (13,136)14-Jul-11 SGD 51,681 USD 41,916 16914-Jul-11 THB 2,206,036 USD 72,277 (385)14-Jul-11 USD 65,099 AUD 61,927 (1,254)14-Jul-11 USD 272,391 CAD 268,411 (5,462)14-Jul-11 USD 2,785,848 EUR 1,920,138 8,51914-Jul-11 USD 1,033,297 GBP 629,813 25,50514-Jul-11 USD 208,195 JPY 16,667,535 1,37714-Jul-11 USD 86,146 MXN 1,022,712 (912)14-Jul-11 USD 204,974 NOK 1,138,780 (6,667)14-Jul-11 USD 72,793 NZD 91,164 (2,692)14-Jul-11 USD 326,723 PHP 14,169,980 3914-Jul-11 USD 38,531 PLN 105,024 41014-Jul-11 USD 233,408 SEK 1,507,429 (4,690)14-Jul-11 USD 921,959 ZAR 6,242,817 2,32021-Dec-11 CNY 803,032 USD 124,617 329
Total 21,137
240
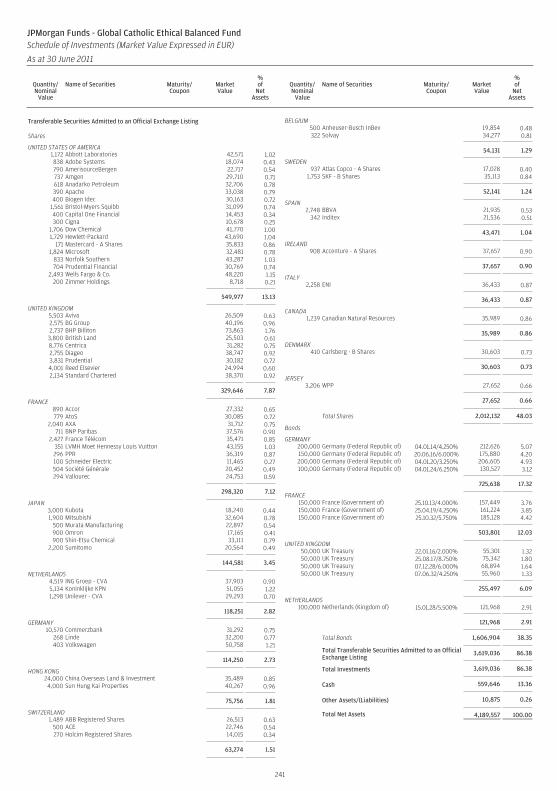
Transferable Securities Admitted to an Official Exchange Listing
Shares
UNITED STATES OF AMERICA1,172 Abbott Laboratories 42,571 1.02838 Adobe Systems 18,074 0.43790 AmerisourceBergen 22,717 0.54737 Amgen 29,710 0.71618 Anadarko Petroleum 32,706 0.78390 Apache 33,038 0.79400 Biogen Idec 30,163 0.72
1,561 Bristol-Myers Squibb 31,099 0.74400 Capital One Financial 14,453 0.34300 Cigna 10,678 0.25
1,706 Dow Chemical 41,770 1.001,729 Hewlett-Packard 43,690 1.04
171 Mastercard - A Shares 35,833 0.861,824 Microsoft 32,481 0.78
833 Norfolk Southern 43,287 1.03704 Prudential Financial 30,769 0.74
2,493 Wells Fargo & Co. 48,220 1.15200 Zimmer Holdings 8,718 0.21
549,977 13.13
UNITED KINGDOM5,503 Aviva 26,509 0.632,575 BG Group 40,196 0.962,737 BHP Billiton 73,863 1.76
3,800 British Land 25,503 0.618,776 Centrica 31,282 0.752,755 Diageo 38,747 0.923,831 Prudential 30,182 0.724,001 Reed Elsevier 24,994 0.602,134 Standard Chartered 38,370 0.92
329,646 7.87
FRANCE890 Accor 27,332 0.65779 AtoS 30,085 0.72
2,040 AXA 31,712 0.75711 BNP Paribas 37,576 0.90
2,427 France Télécom 35,471 0.85351 LVMH Moet Hennessy Louis Vuitton 43,155 1.03296 PPR 36,319 0.87100 Schneider Electric 11,465 0.27504 Société Générale 20,452 0.49294 Vallourec 24,753 0.59
298,320 7.12
JAPAN3,000 Kubota 18,240 0.441,900 Mitsubishi 32,604 0.78
500 Murata Manufacturing 22,897 0.54900 Omron 17,165 0.41900 Shin-Etsu Chemical 33,111 0.79
2,200 Sumitomo 20,564 0.49
144,581 3.45
NETHERLANDS4,519 ING Groep - CVA 37,903 0.905,134 Koninklijke KPN 51,055 1.221,298 Unilever - CVA 29,293 0.70
118,251 2.82
GERMANY10,570 Commerzbank 31,292 0.75
268 Linde 32,200 0.77403 Volkswagen 50,758 1.21
114,250 2.73
HONG KONG24,000 China Overseas Land & Investment 35,489 0.854,000 Sun Hung Kai Properties 40,267 0.96
75,756 1.81
SWITZERLAND1,489 ABB Registered Shares 26,513 0.63
500 ACE 22,746 0.54270 Holcim Registered Shares 14,015 0.34
63,274 1.51
BELGIUM500 Anheuser-Busch InBev 19,854 0.48322 Solvay 34,277 0.81
54,131 1.29
SWEDEN937 Atlas Copco - A Shares 17,028 0.40
1,753 SKF - B Shares 35,113 0.84
52,141 1.24
SPAIN2,748 BBVA 21,935 0.53
342 Inditex 21,536 0.51
43,471 1.04
IRELAND908 Accenture - A Shares 37,657 0.90
37,657 0.90
ITALY2,258 ENI 36,433 0.87
36,433 0.87
CANADA1,239 Canadian Natural Resources 35,989 0.86
35,989 0.86
DENMARK410 Carlsberg - B Shares 30,603 0.73
30,603 0.73
JERSEY3,206 WPP 27,652 0.66
27,652 0.66
Total Shares 2,012,132 48.03
Bonds
GERMANY200,000 Germany (Federal Republic of) 04.01.14/4.250% 212,626 5.07150,000 Germany (Federal Republic of) 20.06.16/6.000% 175,880 4.20200,000 Germany (Federal Republic of) 04.01.20/3.250% 206,605 4.93100,000 Germany (Federal Republic of) 04.01.24/6.250% 130,527 3.12
725,638 17.32
FRANCE150,000 France (Government of) 25.10.13/4.000% 157,449 3.76150,000 France (Government of) 25.04.19/4.250% 161,224 3.85150,000 France (Government of) 25.10.32/5.750% 185,128 4.42
503,801 12.03
UNITED KINGDOM50,000 UK Treasury 22.01.16/2.000% 55,301 1.3250,000 UK Treasury 25.08.17/8.750% 75,342 1.8050,000 UK Treasury 07.12.28/6.000% 68,894 1.6450,000 UK Treasury 07.06.32/4.250% 55,960 1.33
255,497 6.09
NETHERLANDS100,000 Netherlands (Kingdom of) 15.01.28/5.500% 121,968 2.91
121,968 2.91
Total Bonds 1,606,904 38.35
Total Transferable Securities Admitted to an OfficialExchange Listing
3,619,036 86.38
Total Investments 3,619,036 86.38
Cash 559,646 13.36
Other Assets/(Liabilities) 10,875 0.26
Total Net Assets 4,189,557 100.00
241
JPMorgan Funds - Global Catholic Ethical Balanced FundSchedule of Investments (Market Value Expressed in EUR)
As at 30 June 2011
Quantity/Nominal
Value
Name of Securities Maturity/Coupon
MarketValue
%of
NetAssets
Quantity/Nominal
Value
Name of Securities Maturity/Coupon
MarketValue
%of
NetAssets
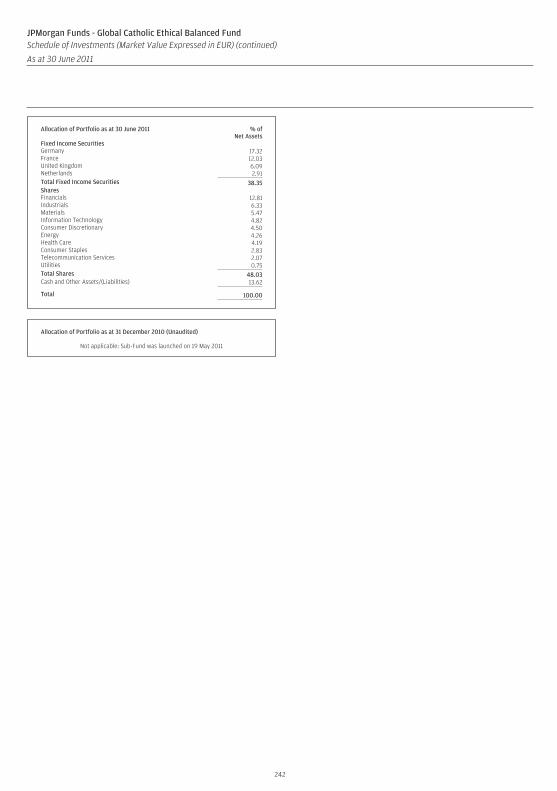
Allocation of Portfolio as at 30 June 2011 % ofNet Assets
Fixed Income SecuritiesGermany 17.32France 12.03United Kingdom 6.09Netherlands 2.91Total Fixed Income Securities 38.35SharesFinancials 12.81Industrials 6.33Materials 5.47Information Technology 4.82Consumer Discretionary 4.50Energy 4.26Health Care 4.19Consumer Staples 2.83Telecommunication Services 2.07Utilities 0.75Total Shares 48.03Cash and Other Assets/(Liabilities) 13.62
Total 100.00
Allocation of Portfolio as at 31 December 2010 (Unaudited)
Not applicable: Sub-Fund was launched on 19 May 2011
242
JPMorgan Funds - Global Catholic Ethical Balanced FundSchedule of Investments (Market Value Expressed in EUR) (continued)
As at 30 June 2011
Quantity/Nominal
Value
Name of Securities Maturity/Coupon
MarketValue
%of
NetAssets
Quantity/Nominal
Value
Name of Securities Maturity/Coupon
MarketValue
%of
NetAssets
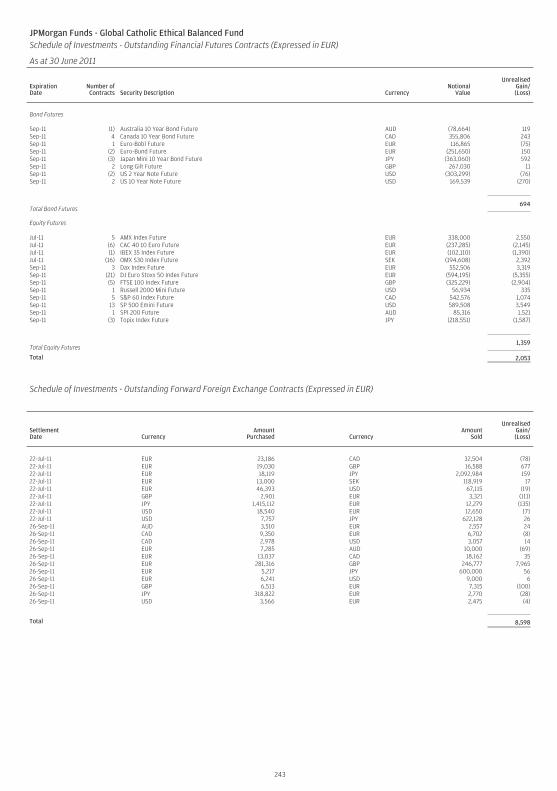
JPMorgan Funds - Global Catholic Ethical Balanced FundSchedule of Investments - Outstanding Financial Futures Contracts (Expressed in EUR)
As at 30 June 2011
ExpirationDate
Number ofContracts Security Description Currency
NotionalValue
UnrealisedGain/(Loss)
Bond Futures
Sep-11 (1) Australia 10 Year Bond Future AUD (78,664) 119Sep-11 4 Canada 10 Year Bond Future CAD 355,806 243Sep-11 1 Euro-Bobl Future EUR 116,865 (75)Sep-11 (2) Euro-Bund Future EUR (251,650) 150Sep-11 (3) Japan Mini 10 Year Bond Future JPY (363,060) 592Sep-11 2 Long Gilt Future GBP 267,030 11Sep-11 (2) US 2 Year Note Future USD (303,299) (76)Sep-11 2 US 10 Year Note Future USD 169,539 (270)
Total Bond Futures694
Equity Futures
Jul-11 5 AMX Index Future EUR 338,000 2,550Jul-11 (6) CAC 40 10 Euro Future EUR (237,285) (2,145)Jul-11 (1) IBEX 35 Index Future EUR (102,110) (1,390)Jul-11 (16) OMX S30 Index Future SEK (194,608) 2,392Sep-11 3 Dax Index Future EUR 552,506 3,319Sep-11 (21) DJ Euro Stoxx 50 Index Future EUR (594,195) (5,355)Sep-11 (5) FTSE 100 Index Future GBP (325,229) (2,904)Sep-11 1 Russell 2000 Mini Future USD 56,934 335Sep-11 5 S&P 60 Index Future CAD 542,576 1,074Sep-11 13 SP 500 Emini Future USD 589,508 3,549Sep-11 1 SPI 200 Future AUD 85,316 1,521Sep-11 (3) Topix Index Future JPY (218,551) (1,587)
Total Equity Futures1,359
Total 2,053
Schedule of Investments - Outstanding Forward Foreign Exchange Contracts (Expressed in EUR)
SettlementDate Currency
AmountPurchased Currency
AmountSold
UnrealisedGain/(Loss)
22-Jul-11 EUR 23,186 CAD 32,504 (78)22-Jul-11 EUR 19,030 GBP 16,588 67722-Jul-11 EUR 18,119 JPY 2,092,984 15922-Jul-11 EUR 13,000 SEK 118,919 1722-Jul-11 EUR 46,393 USD 67,115 (19)22-Jul-11 GBP 2,901 EUR 3,321 (111)22-Jul-11 JPY 1,415,112 EUR 12,279 (135)22-Jul-11 USD 18,540 EUR 12,650 17122-Jul-11 USD 7,757 JPY 622,128 2626-Sep-11 AUD 3,510 EUR 2,557 2426-Sep-11 CAD 9,350 EUR 6,702 (8)26-Sep-11 CAD 2,978 USD 3,057 1426-Sep-11 EUR 7,285 AUD 10,000 (69)26-Sep-11 EUR 13,037 CAD 18,162 3526-Sep-11 EUR 281,316 GBP 246,777 7,96526-Sep-11 EUR 5,217 JPY 600,000 5626-Sep-11 EUR 6,241 USD 9,000 626-Sep-11 GBP 6,513 EUR 7,315 (100)26-Sep-11 JPY 318,822 EUR 2,770 (28)26-Sep-11 USD 3,566 EUR 2,475 (4)
Total 8,598
243
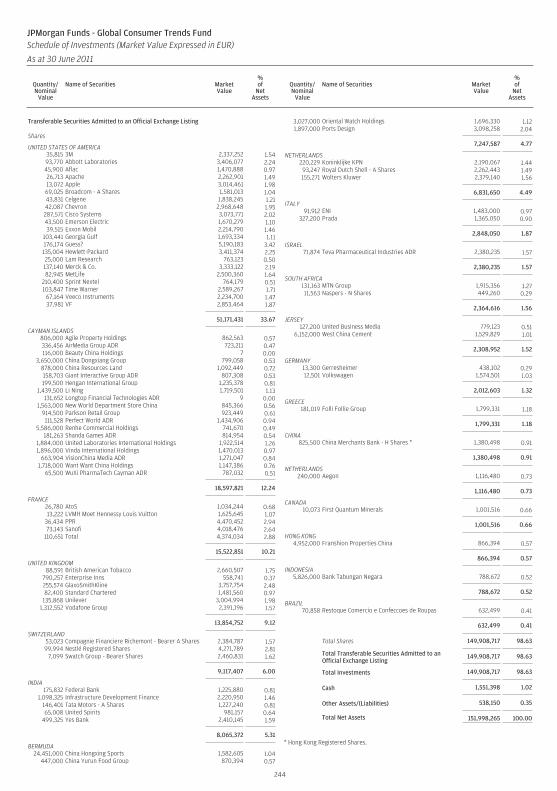
Transferable Securities Admitted to an Official Exchange Listing
Shares
UNITED STATES OF AMERICA35,815 3M 2,337,252 1.5493,770 Abbott Laboratories 3,406,077 2.2445,900 Aflac 1,470,888 0.9726,713 Apache 2,262,901 1.4913,072 Apple 3,014,461 1.9869,025 Broadcom - A Shares 1,581,013 1.0443,831 Celgene 1,838,245 1.2142,087 Chevron 2,968,648 1.95287,571 Cisco Systems 3,073,771 2.0243,500 Emerson Electric 1,670,279 1.1039,515 Exxon Mobil 2,214,790 1.46
103,441 Georgia Gulf 1,693,334 1.11176,174 Guess? 5,190,183 3.42
135,004 Hewlett-Packard 3,411,374 2.2525,000 Lam Research 763,123 0.50137,140 Merck & Co. 3,333,122 2.1982,945 MetLife 2,500,360 1.64
210,400 Sprint Nextel 764,179 0.51103,847 Time Warner 2,589,267 1.71
67,164 Veeco Instruments 2,234,700 1.4737,981 VF 2,853,464 1.87
51,171,431 33.67
CAYMAN ISLANDS806,000 Agile Property Holdings 862,563 0.57336,456 AirMedia Group ADR 723,211 0.47116,000 Beauty China Holdings 7 0.00
3,650,000 China Dongxiang Group 799,058 0.53878,000 China Resources Land 1,092,449 0.72158,703 Giant Interactive Group ADR 807,308 0.53199,500 Hengan International Group 1,235,378 0.81
1,439,500 Li Ning 1,719,501 1.13131,652 Longtop Financial Technologies ADR 9 0.00
1,563,000 New World Department Store China 845,366 0.56914,500 Parkson Retail Group 923,449 0.61111,528 Perfect World ADR 1,434,906 0.94
5,586,000 Renhe Commercial Holdings 741,670 0.49181,263 Shanda Games ADR 814,954 0.54
1,884,000 United Laboratories International Holdings 1,922,514 1.261,896,000 Vinda International Holdings 1,470,013 0.97
663,904 VisionChina Media ADR 1,271,047 0.841,718,000 Want Want China Holdings 1,147,386 0.76
65,500 WuXi PharmaTech Cayman ADR 787,032 0.51
18,597,821 12.24
FRANCE26,780 AtoS 1,034,244 0.6813,222 LVMH Moet Hennessy Louis Vuitton 1,625,645 1.07
36,434 PPR 4,470,452 2.9473,143 Sanofi 4,018,476 2.64
110,651 Total 4,374,034 2.88
15,522,851 10.21
UNITED KINGDOM88,591 British American Tobacco 2,660,507 1.75
790,257 Enterprise Inns 558,741 0.37255,574 GlaxoSmithKline 3,757,754 2.4882,400 Standard Chartered 1,481,560 0.97
135,868 Unilever 3,004,994 1.981,312,552 Vodafone Group 2,391,196 1.57
13,854,752 9.12
SWITZERLAND53,023 Compagnie Financiere Richemont - Bearer A Shares 2,384,787 1.5799,994 Nestlé Registered Shares 4,271,789 2.81
7,099 Swatch Group - Bearer Shares 2,460,831 1.62
9,117,407 6.00
INDIA175,832 Federal Bank 1,225,880 0.81
1,098,325 Infrastructure Development Finance 2,220,950 1.46146,401 Tata Motors - A Shares 1,227,240 0.8165,008 United Spirits 981,157 0.64
499,325 Yes Bank 2,410,145 1.59
8,065,372 5.31
BERMUDA24,451,000 China Hongxing Sports 1,582,605 1.04
447,000 China Yurun Food Group 870,394 0.57
3,027,000 Oriental Watch Holdings 1,696,330 1.121,897,000 Ports Design 3,098,258 2.04
7,247,587 4.77
NETHERLANDS220,229 Koninklijke KPN 2,190,067 1.4493,247 Royal Dutch Shell - A Shares 2,262,443 1.49155,271 Wolters Kluwer 2,379,140 1.56
6,831,650 4.49
ITALY91,912 ENI 1,483,000 0.97
327,200 Prada 1,365,050 0.90
2,848,050 1.87
ISRAEL71,874 Teva Pharmaceutical Industries ADR 2,380,235 1.57
2,380,235 1.57
SOUTH AFRICA131,163 MTN Group 1,915,356 1.2711,563 Naspers - N Shares 449,260 0.29
2,364,616 1.56
JERSEY127,200 United Business Media 779,123 0.51
6,152,000 West China Cement 1,529,829 1.01
2,308,952 1.52
GERMANY13,300 Gerresheimer 438,102 0.2912,501 Volkswagen 1,574,501 1.03
2,012,603 1.32
GREECE181,019 Folli Follie Group 1,799,331 1.18
1,799,331 1.18
CHINA825,500 China Merchants Bank - H Shares * 1,380,498 0.91
1,380,498 0.91
NETHERLANDS240,000 Aegon 1,116,480 0.73
1,116,480 0.73
CANADA10,073 First Quantum Minerals 1,001,516 0.66
1,001,516 0.66
HONG KONG4,952,000 Franshion Properties China 866,394 0.57
866,394 0.57
INDONESIA5,826,000 Bank Tabungan Negara 788,672 0.52
788,672 0.52
BRAZIL70,858 Restoque Comercio e Confeccoes de Roupas 632,499 0.41
632,499 0.41
Total Shares 149,908,717 98.63
Total Transferable Securities Admitted to anOfficial Exchange Listing
149,908,717 98.63
Total Investments 149,908,717 98.63
Cash 1,551,398 1.02
Other Assets/(Liabilities) 538,150 0.35
Total Net Assets 151,998,265 100.00
* Hong Kong Registered Shares.
244
JPMorgan Funds - Global Consumer Trends FundSchedule of Investments (Market Value Expressed in EUR)
As at 30 June 2011
Quantity/Nominal
Value
Name of Securities MarketValue
%of
NetAssets
Quantity/Nominal
Value
Name of Securities MarketValue
%of
NetAssets
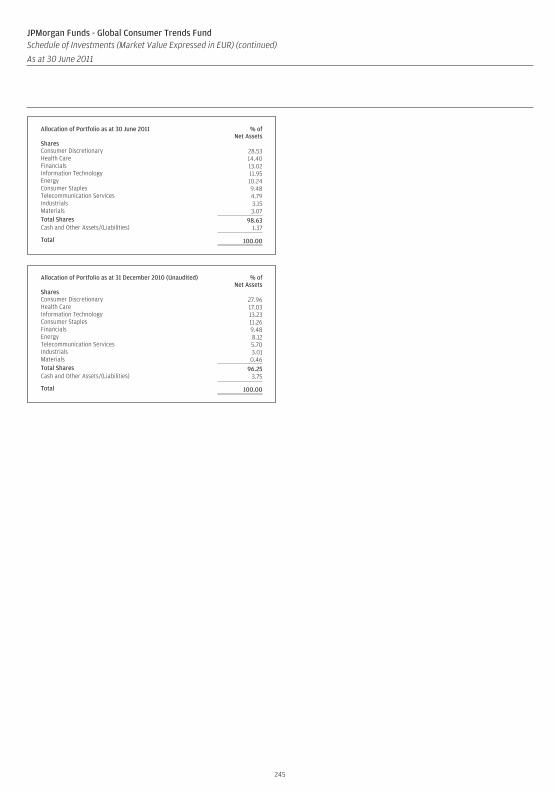
Allocation of Portfolio as at 30 June 2011 % ofNet Assets
SharesConsumer Discretionary 28.53Health Care 14.40Financials 13.02Information Technology 11.95Energy 10.24Consumer Staples 9.48Telecommunication Services 4.79Industrials 3.15Materials 3.07Total Shares 98.63Cash and Other Assets/(Liabilities) 1.37
Total 100.00
Allocation of Portfolio as at 31 December 2010 (Unaudited) % ofNet Assets
SharesConsumer Discretionary 27.96Health Care 17.03Information Technology 13.23Consumer Staples 11.26Financials 9.48Energy 8.12Telecommunication Services 5.70Industrials 3.01Materials 0.46Total Shares 96.25Cash and Other Assets/(Liabilities) 3.75
Total 100.00
245
JPMorgan Funds - Global Consumer Trends FundSchedule of Investments (Market Value Expressed in EUR) (continued)
As at 30 June 2011
Quantity/Nominal
Value
Name of Securities MarketValue
%of
NetAssets
Quantity/Nominal
Value
Name of Securities MarketValue
%of
NetAssets
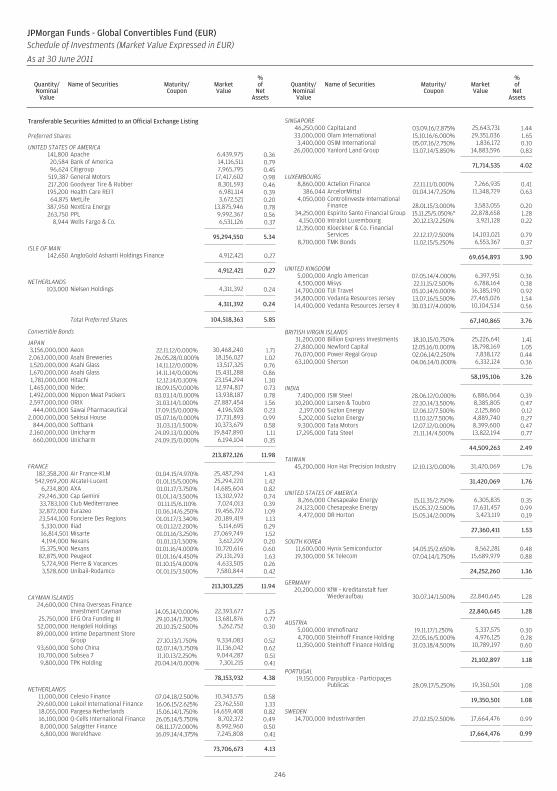
Transferable Securities Admitted to an Official Exchange Listing
Preferred Shares
UNITED STATES OF AMERICA141,800 Apache 6,439,975 0.3620,584 Bank of America 14,116,511 0.7996,624 Citigroup 7,965,795 0.45
519,387 General Motors 17,417,602 0.98217,200 Goodyear Tire & Rubber 8,301,593 0.46195,200 Health Care REIT 6,981,114 0.3964,875 MetLife 3,672,521 0.20
387,950 NextEra Energy 13,875,946 0.78263,750 PPL 9,992,367 0.56
8,944 Wells Fargo & Co. 6,531,126 0.37
95,294,550 5.34
ISLE OF MAN142,650 AngloGold Ashanti Holdings Finance 4,912,421 0.27
4,912,421 0.27
NETHERLANDS103,000 Nielsen Holdings 4,311,392 0.24
4,311,392 0.24
Total Preferred Shares 104,518,363 5.85
Convertible Bonds
JAPAN3,156,000,000 Aeon 22.11.12/0.000% 30,468,240 1.712,063,000,000 Asahi Breweries 26.05.28/0.000% 18,156,027 1.021,520,000,000 Asahi Glass 14.11.12/0.000% 13,517,325 0.761,670,000,000 Asahi Glass 14.11.14/0.000% 15,431,288 0.861,781,000,000 Hitachi 12.12.14/0.100% 23,154,294 1.301,465,000,000 Nidec 18.09.15/0.000% 12,974,817 0.731,492,000,000 Nippon Meat Packers 03.03.14/0.000% 13,938,187 0.782,597,000,000 ORIX 31.03.14/1.000% 27,887,454 1.56
444,000,000 Sawai Pharmaceutical 17.09.15/0.000% 4,196,928 0.232,000,000,000 Sekisui House 05.07.16/0.000% 17,731,893 0.99
844,000,000 Softbank 31.03.13/1.500% 10,373,679 0.582,160,000,000 Unicharm 24.09.13/0.000% 19,847,890 1.11
660,000,000 Unicharm 24.09.15/0.000% 6,194,104 0.35
213,872,126 11.98
FRANCE182,358,200 Air France-KLM 01.04.15/4.970% 25,487,294 1.43542,969,200 Alcatel-Lucent 01.01.15/5.000% 25,294,220 1.42
6,234,800 AXA 01.01.17/3.750% 14,685,604 0.8229,246,300 Cap Gemini 01.01.14/3.500% 13,302,972 0.7433,783,100 Club Mediterranee 01.11.15/6.110% 7,024,013 0.3932,872,000 Eurazeo 10.06.14/6.250% 19,456,772 1.0923,544,100 Fonciere Des Regions 01.01.17/3.340% 20,189,419 1.135,330,000 Iliad 01.01.12/2.200% 5,114,695 0.2916,814,501 Misarte 01.01.16/3.250% 27,069,749 1.524,194,000 Nexans 01.01.13/1.500% 3,612,229 0.20
15,375,900 Nexans 01.01.16/4.000% 10,720,616 0.6082,875,900 Peugeot 01.01.16/4.450% 29,131,293 1.63
5,724,900 Pierre & Vacances 01.10.15/4.000% 4,633,505 0.263,528,600 Unibail-Rodamco 01.01.15/3.500% 7,580,844 0.42
213,303,225 11.94
CAYMAN ISLANDS24,600,000 China Overseas Finance
Investment Cayman 14.05.14/0.000% 22,393,677 1.2525,750,000 EFG Ora Funding III 29.10.14/1.700% 13,681,876 0.7752,000,000 Hengdeli Holdings 20.10.15/2.500% 5,262,752 0.3089,000,000 Intime Department Store
Group 27.10.13/1.750% 9,334,083 0.5293,600,000 Soho China 02.07.14/3.750% 11,136,042 0.6210,700,000 Subsea 7 11.10.13/2.250% 9,044,287 0.519,800,000 TPK Holding 20.04.14/0.000% 7,301,215 0.41
78,153,932 4.38
NETHERLANDS11,000,000 Celesio Finance 07.04.18/2.500% 10,343,575 0.5829,600,000 Lukoil International Finance 16.06.15/2.625% 23,762,550 1.3318,055,000 Pargesa Netherlands 15.06.14/1.750% 14,659,408 0.8216,100,000 Q-Cells International Finance 26.05.14/5.750% 8,702,372 0.498,000,000 Salzgitter Finance 08.11.17/2.000% 8,992,960 0.506,800,000 Wereldhave 16.09.14/4.375% 7,245,808 0.41
73,706,673 4.13
SINGAPORE46,250,000 CapitaLand 03.09.16/2.875% 25,643,731 1.4433,000,000 Olam International 15.10.16/6.000% 29,351,036 1.65
3,400,000 OSIM International 05.07.16/2.750% 1,836,172 0.1026,000,000 Yanlord Land Group 13.07.14/5.850% 14,883,596 0.83
71,714,535 4.02
LUXEMBOURG8,860,000 Actelion Finance 22.11.11/0.000% 7,266,935 0.41
386,044 ArcelorMittal 01.04.14/7.250% 11,348,729 0.634,050,000 Controlinveste International
Finance 28.01.15/3.000% 3,583,055 0.2034,250,000 Espirito Santo Financial Group 15.11.25/5.050%* 22,878,658 1.28
4,150,000 Intralot Luxembourg 20.12.13/2.250% 3,921,128 0.2212,350,000 Kloeckner & Co. Financial
Services 22.12.17/2.500% 14,103,021 0.798,700,000 TMK Bonds 11.02.15/5.250% 6,553,367 0.37
69,654,893 3.90
UNITED KINGDOM5,000,000 Anglo American 07.05.14/4.000% 6,397,951 0.364,500,000 Misys 22.11.15/2.500% 6,788,164 0.38
14,700,000 TUI Travel 05.10.14/6.000% 16,385,190 0.9234,800,000 Vedanta Resources Jersey 13.07.16/5.500% 27,465,026 1.5414,400,000 Vedanta Resources Jersey II 30.03.17/4.000% 10,104,534 0.56
67,140,865 3.76
BRITISH VIRGIN ISLANDS31,200,000 Billion Express Investments 18.10.15/0.750% 25,226,641 1.4127,800,000 Newford Capital 12.05.16/0.000% 18,798,169 1.0576,070,000 Power Regal Group 02.06.14/2.250% 7,838,172 0.4463,100,000 Sherson 04.06.14/0.000% 6,332,124 0.36
58,195,106 3.26
INDIA7,400,000 JSW Steel 28.06.12/0.000% 6,886,064 0.39
10,200,000 Larsen & Toubro 22.10.14/3.500% 8,385,805 0.472,197,000 Suzlon Energy 12.06.12/7.500% 2,125,860 0.125,202,000 Suzlon Energy 11.10.12/7.500% 4,889,740 0.279,300,000 Tata Motors 12.07.12/0.000% 8,399,600 0.4717,295,000 Tata Steel 21.11.14/4.500% 13,822,194 0.77
44,509,263 2.49
TAIWAN45,200,000 Hon Hai Precision Industry 12.10.13/0.000% 31,420,069 1.76
31,420,069 1.76
UNITED STATES OF AMERICA8,266,000 Chesapeake Energy 15.11.35/2.750% 6,305,835 0.35
24,123,000 Chesapeake Energy 15.05.37/2.500% 17,631,457 0.994,472,000 DR Horton 15.05.14/2.000% 3,423,119 0.19
27,360,411 1.53
SOUTH KOREA11,600,000 Hynix Semiconductor 14.05.15/2.650% 8,562,281 0.4819,300,000 SK Telecom 07.04.14/1.750% 15,689,979 0.88
24,252,260 1.36
GERMANY20,200,000 KfW - Kreditanstalt fuer
Wiederaufbau 30.07.14/1.500% 22,840,645 1.28
22,840,645 1.28
AUSTRIA5,000,000 Immofinanz 19.11.17/1.250% 5,337,575 0.304,700,000 Steinhoff Finance Holding 22.05.16/5.000% 4,976,125 0.2811,350,000 Steinhoff Finance Holding 31.03.18/4.500% 10,789,197 0.60
21,102,897 1.18
PORTUGAL19,150,000 Parpublica - Participaçes
Publicas 28.09.17/5.250% 19,350,501 1.08
19,350,501 1.08
SWEDEN14,700,000 Industrivarden 27.02.15/2.500% 17,664,476 0.99
17,664,476 0.99
246
JPMorgan Funds - Global Convertibles Fund (EUR)Schedule of Investments (Market Value Expressed in EUR)
As at 30 June 2011
Quantity/Nominal
Value
Name of Securities Maturity/Coupon
MarketValue
%of
NetAssets
Quantity/Nominal
Value
Name of Securities Maturity/Coupon
MarketValue
%of
NetAssets
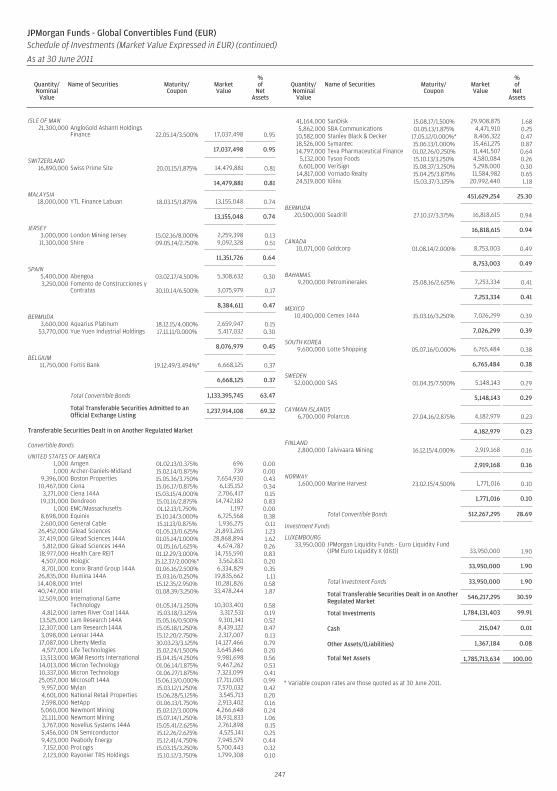
ISLE OF MAN21,300,000 AngloGold Ashanti Holdings
Finance 22.05.14/3.500% 17,037,498 0.95
17,037,498 0.95
SWITZERLAND16,890,000 Swiss Prime Site 20.01.15/1.875% 14,479,881 0.81
14,479,881 0.81
MALAYSIA18,000,000 YTL Finance Labuan 18.03.15/1.875% 13,155,048 0.74
13,155,048 0.74
JERSEY3,000,000 London Mining Jersey 15.02.16/8.000% 2,259,398 0.1311,300,000 Shire 09.05.14/2.750% 9,092,328 0.51
11,351,726 0.64
SPAIN5,400,000 Abengoa 03.02.17/4.500% 5,308,632 0.303,250,000 Fomento de Construcciones y
Contratas 30.10.14/6.500% 3,075,979 0.17
8,384,611 0.47
BERMUDA3,600,000 Aquarius Platinum 18.12.15/4.000% 2,659,947 0.15
53,770,000 Yue Yuen Industrial Holdings 17.11.11/0.000% 5,417,032 0.30
8,076,979 0.45
BELGIUM11,750,000 Fortis Bank 19.12.49/3.494%* 6,668,125 0.37
6,668,125 0.37
Total Convertible Bonds 1,133,395,745 63.47
Total Transferable Securities Admitted to anOfficial Exchange Listing
1,237,914,108 69.32
Transferable Securities Dealt in on Another Regulated Market
Convertible Bonds
UNITED STATES OF AMERICA1,000 Amgen 01.02.13/0.375% 696 0.001,000 Archer-Daniels-Midland 15.02.14/0.875% 739 0.00
9,396,000 Boston Properties 15.05.36/3.750% 7,654,930 0.4310,467,000 Ciena 15.06.17/0.875% 6,135,152 0.34
3,271,000 Ciena 144A 15.03.15/4.000% 2,706,417 0.1519,131,000 Dendreon 15.01.16/2.875% 14,742,182 0.83
1,000 EMC/Massachusetts 01.12.13/1.750% 1,197 0.008,698,000 Equinix 15.10.14/3.000% 6,725,568 0.382,600,000 General Cable 15.11.13/0.875% 1,936,275 0.11
26,452,000 Gilead Sciences 01.05.13/0.625% 21,893,265 1.2337,419,000 Gilead Sciences 144A 01.05.14/1.000% 28,868,894 1.62
5,812,000 Gilead Sciences 144A 01.05.16/1.625% 4,674,787 0.2618,977,000 Health Care REIT 01.12.29/3.000% 14,755,590 0.834,507,000 Hologic 15.12.37/2.000%* 3,562,831 0.208,701,000 Iconix Brand Group 144A 01.06.16/2.500% 6,334,829 0.35
26,835,000 Illumina 144A 15.03.16/0.250% 19,835,662 1.1114,408,000 Intel 15.12.35/2.950% 10,281,826 0.5840,747,000 Intel 01.08.39/3.250% 33,478,244 1.8712,509,000 International Game
Technology 01.05.14/3.250% 10,303,401 0.584,812,000 James River Coal 144A 15.03.18/3.125% 3,317,531 0.19
13,525,000 Lam Research 144A 15.05.16/0.500% 9,301,341 0.5212,307,000 Lam Research 144A 15.05.18/1.250% 8,439,122 0.473,098,000 Lennar 144A 15.12.20/2.750% 2,317,007 0.13
17,087,000 Liberty Media 30.03.23/3.125% 14,127,466 0.794,577,000 Life Technologies 15.02.24/1.500% 3,645,846 0.20
13,513,000 MGM Resorts International 15.04.15/4.250% 9,981,698 0.5614,013,000 Micron Technology 01.06.14/1.875% 9,467,262 0.5310,337,000 Micron Technology 01.06.27/1.875% 7,323,099 0.4125,057,000 Microsoft 144A 15.06.13/0.000% 17,711,005 0.999,957,000 Mylan 15.03.12/1.250% 7,570,032 0.424,601,000 National Retail Properties 15.06.28/5.125% 3,545,713 0.202,598,000 NetApp 01.06.13/1.750% 2,913,402 0.165,060,000 Newmont Mining 15.02.12/3.000% 4,266,648 0.2421,111,000 Newmont Mining 15.07.14/1.250% 18,931,833 1.063,767,000 Novellus Systems 144A 15.05.41/2.625% 2,761,898 0.155,456,000 ON Semiconductor 15.12.26/2.625% 4,525,141 0.259,423,000 Peabody Energy 15.12.41/4.750% 7,945,579 0.447,152,000 ProLogis 15.03.15/3.250% 5,700,443 0.322,123,000 Rayonier TRS Holdings 15.10.12/3.750% 1,799,308 0.10
41,164,000 SanDisk 15.08.17/1.500% 29,908,875 1.685,862,000 SBA Communications 01.05.13/1.875% 4,471,910 0.25
10,582,000 Stanley Black & Decker 17.05.12/0.000%* 8,406,322 0.4718,526,000 Symantec 15.06.13/1.000% 15,461,275 0.8714,797,000 Teva Pharmaceutical Finance 01.02.26/0.250% 11,441,507 0.64
5,132,000 Tyson Foods 15.10.13/3.250% 4,580,084 0.266,601,000 VeriSign 15.08.37/3.250% 5,298,000 0.30
14,817,000 Vornado Realty 15.04.25/3.875% 11,584,982 0.6524,519,000 Xilinx 15.03.37/3.125% 20,992,440 1.18
451,629,254 25.30
BERMUDA20,500,000 Seadrill 27.10.17/3.375% 16,818,615 0.94
16,818,615 0.94
CANADA10,071,000 Goldcorp 01.08.14/2.000% 8,753,003 0.49
8,753,003 0.49
BAHAMAS9,200,000 Petrominerales 25.08.16/2.625% 7,253,334 0.41
7,253,334 0.41
MEXICO10,400,000 Cemex 144A 15.03.16/3.250% 7,026,299 0.39
7,026,299 0.39
SOUTH KOREA9,600,000 Lotte Shopping 05.07.16/0.000% 6,765,484 0.38
6,765,484 0.38
SWEDEN52,000,000 SAS 01.04.15/7.500% 5,148,143 0.29
5,148,143 0.29
CAYMAN ISLANDS6,700,000 Polarcus 27.04.16/2.875% 4,182,979 0.23
4,182,979 0.23
FINLAND2,800,000 Talvivaara Mining 16.12.15/4.000% 2,919,168 0.16
2,919,168 0.16
NORWAY1,600,000 Marine Harvest 23.02.15/4.500% 1,771,016 0.10
1,771,016 0.10
Total Convertible Bonds 512,267,295 28.69
Investment Funds
LUXEMBOURG33,950,000 JPMorgan Liquidity Funds - Euro Liquidity Fund
(JPM Euro Liquidity X (dist)) 33,950,000 1.90
33,950,000 1.90
Total Investment Funds 33,950,000 1.90
Total Transferable Securities Dealt in on AnotherRegulated Market
546,217,295 30.59
Total Investments 1,784,131,403 99.91
Cash 215,047 0.01
Other Assets/(Liabilities) 1,367,184 0.08
Total Net Assets 1,785,713,634 100.00
* Variable coupon rates are those quoted as at 30 June 2011.
247
JPMorgan Funds - Global Convertibles Fund (EUR)Schedule of Investments (Market Value Expressed in EUR) (continued)
As at 30 June 2011
Quantity/Nominal
Value
Name of Securities Maturity/Coupon
MarketValue
%of
NetAssets
Quantity/Nominal
Value
Name of Securities Maturity/Coupon
MarketValue
%of
NetAssets
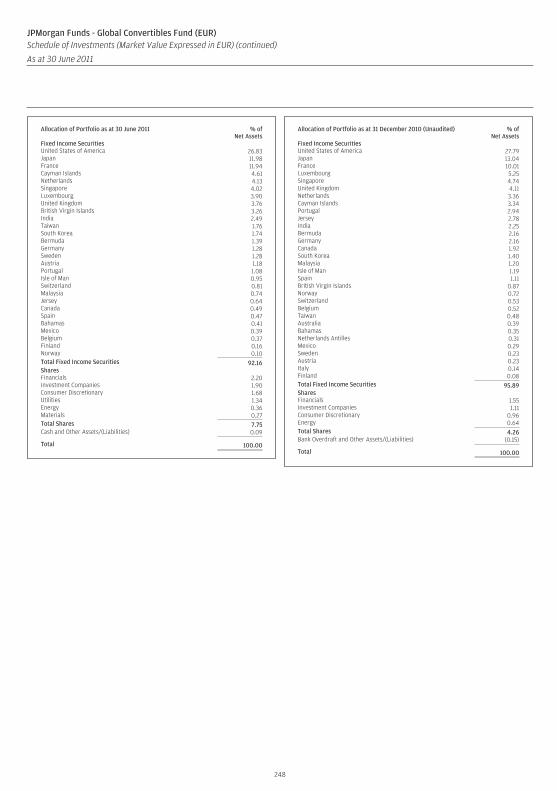
Allocation of Portfolio as at 30 June 2011 % ofNet Assets
Fixed Income SecuritiesUnited States of America 26.83Japan 11.98France 11.94Cayman Islands 4.61Netherlands 4.13Singapore 4.02Luxembourg 3.90United Kingdom 3.76British Virgin Islands 3.26India 2.49Taiwan 1.76South Korea 1.74Bermuda 1.39Germany 1.28Sweden 1.28Austria 1.18Portugal 1.08Isle of Man 0.95Switzerland 0.81Malaysia 0.74Jersey 0.64Canada 0.49Spain 0.47Bahamas 0.41Mexico 0.39Belgium 0.37Finland 0.16Norway 0.10Total Fixed Income Securities 92.16SharesFinancials 2.20Investment Companies 1.90Consumer Discretionary 1.68Utilities 1.34Energy 0.36Materials 0.27Total Shares 7.75Cash and Other Assets/(Liabilities) 0.09
Total 100.00
Allocation of Portfolio as at 31 December 2010 (Unaudited) % ofNet Assets
Fixed Income SecuritiesUnited States of America 27.79Japan 13.04France 10.01Luxembourg 5.25Singapore 4.74United Kingdom 4.11Netherlands 3.36Cayman Islands 3.34Portugal 2.94Jersey 2.78India 2.25Bermuda 2.16Germany 2.16Canada 1.92South Korea 1.40Malaysia 1.20Isle of Man 1.19Spain 1.11British Virgin Islands 0.87Norway 0.72Switzerland 0.53Belgium 0.52Taiwan 0.48Australia 0.39Bahamas 0.35Netherlands Antilles 0.31Mexico 0.29Sweden 0.23Austria 0.23Italy 0.14Finland 0.08Total Fixed Income Securities 95.89SharesFinancials 1.55Investment Companies 1.11Consumer Discretionary 0.96Energy 0.64Total Shares 4.26Bank Overdraft and Other Assets/(Liabilities) (0.15)
Total 100.00
248
JPMorgan Funds - Global Convertibles Fund (EUR)Schedule of Investments (Market Value Expressed in EUR) (continued)
As at 30 June 2011
Quantity/Nominal
Value
Name of Securities Maturity/Coupon
MarketValue
%of
NetAssets
Quantity/Nominal
Value
Name of Securities Maturity/Coupon
MarketValue
%of
NetAssets
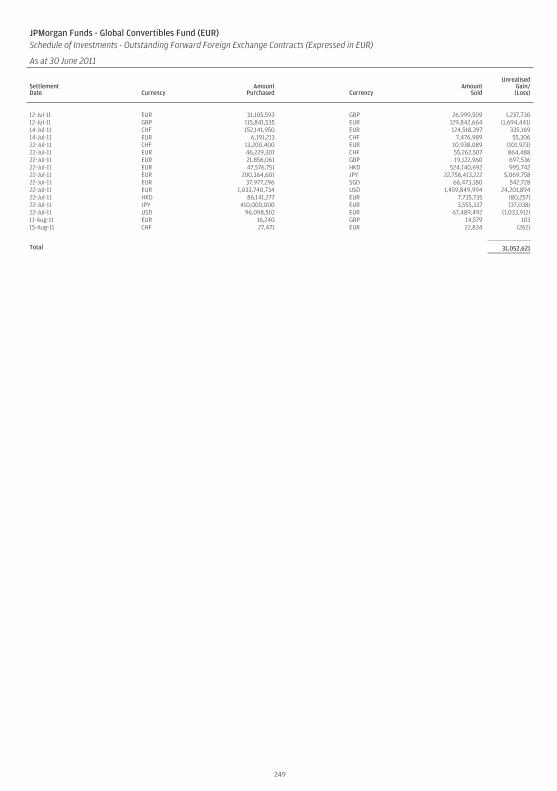
JPMorgan Funds - Global Convertibles Fund (EUR)Schedule of Investments - Outstanding Forward Foreign Exchange Contracts (Expressed in EUR)
As at 30 June 2011
SettlementDate Currency
AmountPurchased Currency
AmountSold
UnrealisedGain/(Loss)
12-Jul-11 EUR 31,105,593 GBP 26,999,509 1,237,73012-Jul-11 GBP 115,841,535 EUR 129,842,664 (1,694,441)14-Jul-11 CHF 152,141,950 EUR 124,518,397 335,16914-Jul-11 EUR 6,191,213 CHF 7,476,989 55,30622-Jul-11 CHF 13,200,400 EUR 10,938,089 (101,923)22-Jul-11 EUR 46,229,301 CHF 55,262,507 864,48822-Jul-11 EUR 21,856,061 GBP 19,122,960 697,53622-Jul-11 EUR 47,576,751 HKD 524,140,692 995,74222-Jul-11 EUR 200,364,601 JPY 22,758,413,222 5,069,75822-Jul-11 EUR 37,977,296 SGD 66,473,180 542,72822-Jul-11 EUR 1,033,740,734 USD 1,459,849,994 24,201,89422-Jul-11 HKD 86,141,277 EUR 7,735,735 (80,257)22-Jul-11 JPY 410,000,000 EUR 3,555,337 (37,038)22-Jul-11 USD 96,098,510 EUR 67,489,492 (1,033,912)11-Aug-11 EUR 16,240 GBP 14,579 10315-Aug-11 CHF 27,471 EUR 22,834 (262)
Total 31,052,621
249
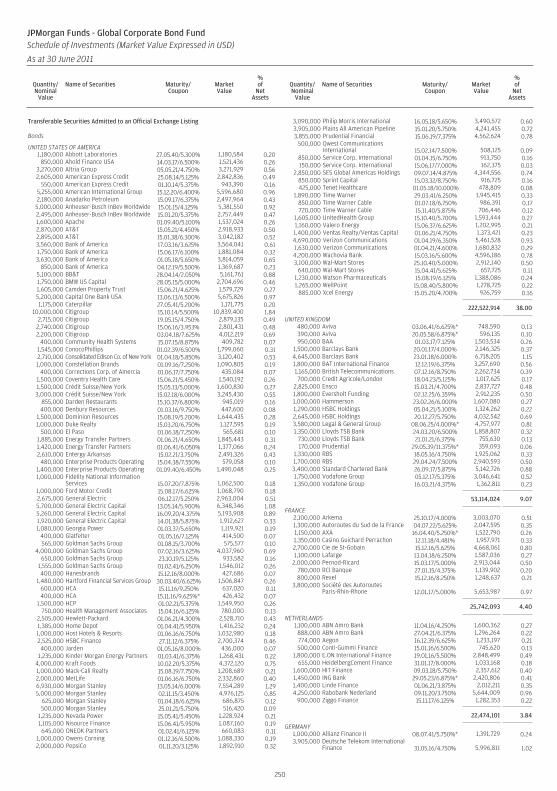
Transferable Securities Admitted to an Official Exchange Listing
Bonds
UNITED STATES OF AMERICA1,180,000 Abbott Laboratories 27.05.40/5.300% 1,180,584 0.20
850,000 Ahold Finance USA 14.03.17/6.500% 1,521,436 0.263,270,000 Altria Group 05.05.21/4.750% 3,271,929 0.562,605,000 American Express Credit 25.08.14/5.125% 2,842,836 0.49
550,000 American Express Credit 01.10.14/5.375% 943,390 0.165,255,000 American International Group 15.12.20/6.400% 5,596,680 0.962,180,000 Anadarko Petroleum 15.09.17/6.375% 2,497,964 0.435,000,000 Anheuser-Busch InBev Worldwide 15.01.15/4.125% 5,381,550 0.922,495,000 Anheuser-Busch InBev Worldwide 15.01.20/5.375% 2,757,449 0.471,600,000 Apache 01.09.40/5.100% 1,537,024 0.262,870,000 AT&T 15.05.21/4.450% 2,918,933 0.502,895,000 AT&T 15.01.38/6.300% 3,042,182 0.523,560,000 Bank of America 17.03.16/3.625% 3,564,041 0.611,750,000 Bank of America 15.06.17/6.100% 1,881,084 0.323,630,000 Bank of America 01.05.18/5.650% 3,814,059 0.65
850,000 Bank of America 04.12.19/5.500% 1,369,687 0.235,100,000 BB&T 28.04.14/2.050% 5,161,761 0.881,750,000 BMW US Capital 28.05.15/5.000% 2,704,696 0.461,605,000 Camden Property Trust 15.06.21/4.625% 1,579,729 0.275,200,000 Capital One Bank USA 13.06.13/6.500% 5,675,826 0.971,175,000 Caterpillar 27.05.41/5.200% 1,171,775 0.20
10,000,000 Citigroup 15.10.14/5.500% 10,839,400 1.842,715,000 Citigroup 19.05.15/4.750% 2,879,135 0.49
2,740,000 Citigroup 15.06.16/3.953% 2,801,431 0.482,200,000 Citigroup 03.04.18/7.625% 4,012,219 0.69
400,000 Community Health Systems 15.07.15/8.875% 409,782 0.071,545,000 ConocoPhillips 01.02.39/6.500% 1,799,060 0.312,710,000 Consolidated Edison Co. of New York 01.04.18/5.850% 3,120,402 0.531,000,000 Constellation Brands 01.09.16/7.250% 1,090,805 0.19
400,000 Corrections Corp. of Amercia 01.06.17/7.750% 435,084 0.071,500,000 Coventry Health Care 15.06.21/5.450% 1,540,192 0.261,500,000 Crédit Suisse/New York 15.05.13/5.000% 1,600,830 0.273,000,000 Crédit Suisse/New York 15.02.18/6.000% 3,245,430 0.55
855,000 Darden Restaurants 15.10.37/6.800% 945,019 0.16400,000 Denbury Resources 01.03.16/9.750% 447,600 0.08
1,500,000 Dominion Resources 15.08.19/5.200% 1,644,435 0.281,000,000 Duke Realty 15.03.20/6.750% 1,127,595 0.19
500,000 El Paso 01.06.18/7.250% 565,681 0.101,885,000 Energy Transfer Partners 01.06.21/4.650% 1,845,443 0.311,420,000 Energy Transfer Partners 01.06.41/6.050% 1,377,066 0.242,610,000 Entergy Arkansas 15.02.21/3.750% 2,491,326 0.43
480,000 Enterprise Products Operating 15.04.38/7.550% 579,058 0.101,400,000 Enterprise Products Operating 01.09.40/6.450% 1,490,048 0.251,000,000 Fidelity National Information
Services 15.07.20/7.875% 1,062,500 0.181,000,000 Ford Motor Credit 15.08.17/6.625% 1,068,790 0.182,675,000 General Electric 06.12.17/5.250% 2,963,004 0.515,700,000 General Electric Capital 13.05.14/5.900% 6,348,346 1.085,260,000 General Electric Capital 16.09.20/4.375% 5,193,908 0.891,920,000 General Electric Capital 14.01.38/5.875% 1,912,627 0.331,080,000 Georgia Power 01.03.37/5.650% 1,119,921 0.19
400,000 Glatfelter 01.05.16/7.125% 414,500 0.07565,000 Goldman Sachs Group 01.08.15/3.700% 575,577 0.10
4,000,000 Goldman Sachs Group 07.02.16/3.625% 4,037,960 0.69650,000 Goldman Sachs Group 23.10.19/5.125% 933,582 0.16
1,555,000 Goldman Sachs Group 01.02.41/6.250% 1,546,012 0.26400,000 Hanesbrands 15.12.16/8.000% 427,686 0.07
1,480,000 Hartford Financial Services Group 30.03.40/6.625% 1,506,847 0.26600,000 HCA 15.11.16/9.250% 637,020 0.11400,000 HCA 15.11.16/9.625%* 426,432 0.07
1,500,000 HCP 01.02.21/5.375% 1,549,950 0.26750,000 Health Management Associates 15.04.16/6.125% 780,000 0.13
2,505,000 Hewlett-Packard 01.06.21/4.300% 2,528,710 0.431,385,000 Home Depot 01.04.41/5.950% 1,416,232 0.241,000,000 Host Hotels & Resorts 01.06.16/6.750% 1,032,980 0.182,525,000 HSBC Finance 27.11.12/6.375% 2,700,374 0.46400,000 Jarden 01.05.16/8.000% 436,000 0.07
1,235,000 Kinder Morgan Energy Partners 01.03.41/6.375% 1,268,431 0.224,000,000 Kraft Foods 10.02.20/5.375% 4,372,120 0.751,000,000 Mack-Cali Realty 15.08.19/7.750% 1,208,689 0.212,000,000 MetLife 01.06.16/6.750% 2,332,860 0.406,930,000 Morgan Stanley 13.05.14/6.000% 7,554,289 1.295,000,000 Morgan Stanley 02.11.15/3.450% 4,976,125 0.85
625,000 Morgan Stanley 01.04.18/6.625% 686,875 0.12500,000 Morgan Stanley 25.01.21/5.750% 516,420 0.09
1,235,000 Nevada Power 15.05.41/5.450% 1,228,924 0.211,105,000 Nisource Finance 15.06.41/5.950% 1,087,160 0.19645,000 ONEOK Partners 01.02.41/6.125% 660,083 0.11
1,000,000 Owens Corning 01.12.16/6.500% 1,088,330 0.192,000,000 PepsiCo 01.11.20/3.125% 1,892,910 0.32
3,090,000 Philip Morris International 16.05.18/5.650% 3,490,572 0.603,905,000 Plains All American Pipeline 15.01.20/5.750% 4,241,455 0.723,855,000 Prudential Financial 15.06.19/7.375% 4,562,624 0.78
500,000 Qwest CommunicationsInternational 15.02.14/7.500% 508,125 0.09
850,000 Service Corp. International 01.04.15/6.750% 913,750 0.16150,000 Service Corp. International 15.06.17/7.000% 162,375 0.03
2,850,000 SES Global Americas Holdings 09.07.14/4.875% 4,344,556 0.74850,000 Sprint Capital 15.03.32/8.750% 916,725 0.16425,000 Tenet Healthcare 01.05.18/10.000% 478,809 0.08
1,890,000 Time Warner 29.03.41/6.250% 1,945,415 0.33850,000 Time Warner Cable 01.07.18/6.750% 986,391 0.17720,000 Time Warner Cable 15.11.40/5.875% 706,446 0.12
1,605,000 UnitedHealth Group 15.10.40/5.700% 1,593,444 0.271,160,000 Valero Energy 15.06.37/6.625% 1,202,995 0.211,400,000 Ventas Realty/Ventas Capital 01.06.21/4.750% 1,373,421 0.234,690,000 Verizon Communications 01.04.19/6.350% 5,461,528 0.931,630,000 Verizon Communications 01.04.21/4.600% 1,680,832 0.294,200,000 Wachovia Bank 15.03.16/5.600% 4,596,186 0.783,100,000 Wal-Mart Stores 25.10.40/5.000% 2,912,140 0.50
640,000 Wal-Mart Stores 15.04.41/5.625% 657,725 0.111,230,000 Watson Pharmaceuticals 15.08.19/6.125% 1,388,086 0.241,265,000 WellPoint 15.08.40/5.800% 1,278,725 0.22
885,000 Xcel Energy 15.05.20/4.700% 926,759 0.16
222,522,914 38.00
UNITED KINGDOM480,000 Aviva 03.06.41/6.625%* 748,590 0.13390,000 Aviva 20.05.58/6.875%* 596,135 0.10950,000 BAA 01.03.17/7.125% 1,503,534 0.26
1,500,000 Barclays Bank 20.01.17/4.000% 2,146,325 0.374,645,000 Barclays Bank 23.01.18/6.000% 6,718,205 1.151,800,000 BAT International Finance 12.12.19/6.375% 3,257,690 0.561,165,000 British Telecommunications 07.12.16/8.750% 2,262,734 0.39700,000 Credit Agricole/London 18.04.23/5.125% 1,017,625 0.17
2,825,000 Ensco 15.03.21/4.700% 2,837,727 0.481,800,000 Eversholt Funding 02.12.25/6.359% 2,912,235 0.501,000,000 Hammerson 23.02.26/6.000% 1,607,080 0.271,290,000 HSBC Holdings 05.04.21/5.100% 1,324,262 0.222,645,000 HSBC Holdings 20.12.27/5.750% 4,032,542 0.693,580,000 Legal & General Group 08.06.25/4.000%* 4,757,977 0.811,350,000 Lloyds TSB Bank 24.03.20/6.500% 1,858,807 0.32
730,000 Lloyds TSB Bank 21.01.21/6.375% 755,630 0.13170,000 Prudential 29.05.39/11.375%* 359,093 0.06
1,330,000 RBS 18.05.16/4.750% 1,925,062 0.331,700,000 RBS 29.04.24/7.500% 2,940,593 0.503,400,000 Standard Chartered Bank 26.09.17/5.875% 5,142,726 0.881,750,000 Vodafone Group 05.12.17/5.375% 3,046,641 0.521,350,000 Vodafone Group 16.03.21/4.375% 1,362,811 0.23
53,114,024 9.07
FRANCE2,100,000 Arkema 25.10.17/4.000% 3,003,070 0.511,300,000 Autoroutes du Sud de la France 04.07.22/5.625% 2,047,595 0.351,150,000 AXA 16.04.40/5.250%* 1,522,790 0.261,350,000 Casino Guichard Perrachon 12.11.18/4.481% 1,957,971 0.332,700,000 Cie de St-Gobain 15.12.16/5.625% 4,668,061 0.801,100,000 Lafarge 13.04.18/6.250% 1,587,036 0.27
2,000,000 Pernod-Ricard 15.03.17/5.000% 2,913,044 0.50780,000 RCI Banque 27.01.15/4.375% 1,139,902 0.20800,000 Rexel 15.12.16/8.250% 1,248,637 0.21
3,800,000 Société des AutoroutesParis-Rhin-Rhone 12.01.17/5.000% 5,653,987 0.97
25,742,093 4.40
NETHERLANDS1,100,000 ABN Amro Bank 11.04.16/4.250% 1,600,362 0.27
888,000 ABN Amro Bank 27.04.21/6.375% 1,296,264 0.22774,000 Aegon 16.12.39/6.625% 1,233,197 0.21500,000 Conti-Gummi Finance 15.01.16/6.500% 745,620 0.13
1,800,000 E.ON International Finance 19.01.16/5.500% 2,848,499 0.49655,000 HeidelbergCement Finance 31.01.17/8.000% 1,033,168 0.18
1,600,000 HIT Finance 09.03.18/5.750% 2,357,612 0.401,450,000 ING Bank 29.05.23/6.875%* 2,420,806 0.411,400,000 Linde Finance 01.06.21/3.875% 2,012,211 0.354,250,000 Rabobank Nederland 09.11.20/3.750% 5,644,009 0.96
900,000 Ziggo Finance 15.11.17/6.125% 1,282,353 0.22
22,474,101 3.84
GERMANY1,000,000 Allianz Finance II 08.07.41/5.750%* 1,391,729 0.243,905,000 Deutsche Telekom International
Finance 31.05.16/4.750% 5,996,811 1.02
250
JPMorgan Funds - Global Corporate Bond FundSchedule of Investments (Market Value Expressed in USD)
As at 30 June 2011
Quantity/Nominal
Value
Name of Securities Maturity/Coupon
MarketValue
%of
NetAssets
Quantity/Nominal
Value
Name of Securities Maturity/Coupon
MarketValue
%of
NetAssets
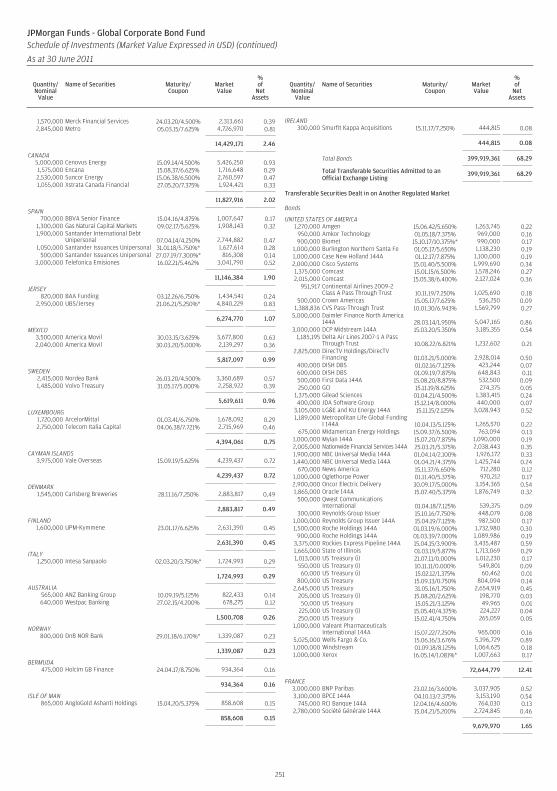
1,570,000 Merck Financial Services 24.03.20/4.500% 2,313,661 0.392,845,000 Metro 05.03.15/7.625% 4,726,970 0.81
14,429,171 2.46
CANADA5,000,000 Cenovus Energy 15.09.14/4.500% 5,426,250 0.931,575,000 Encana 15.08.37/6.625% 1,716,648 0.292,530,000 Suncor Energy 15.06.38/6.500% 2,760,597 0.471,055,000 Xstrata Canada Financial 27.05.20/7.375% 1,924,421 0.33
11,827,916 2.02
SPAIN700,000 BBVA Senior Finance 15.04.16/4.875% 1,007,647 0.17
1,300,000 Gas Natural Capital Markets 09.02.17/5.625% 1,908,143 0.321,900,000 Santander International Debt
Unipersonal 07.04.14/4.250% 2,744,882 0.471,050,000 Santander Issuances Unipersonal 31.01.18/5.750%* 1,627,614 0.28
500,000 Santander Issuances Unipersonal 27.07.19/7.300%* 816,308 0.143,000,000 Telefonica Emisiones 16.02.21/5.462% 3,041,790 0.52
11,146,384 1.90
JERSEY820,000 BAA Funding 03.12.26/6.750% 1,434,541 0.24
2,950,000 UBS/Jersey 21.06.21/5.250%* 4,840,229 0.83
6,274,770 1.07
MEXICO3,500,000 America Movil 30.03.15/3.625% 3,677,800 0.632,040,000 America Movil 30.03.20/5.000% 2,139,297 0.36
5,817,097 0.99
SWEDEN2,415,000 Nordea Bank 26.03.20/4.500% 3,360,689 0.571,485,000 Volvo Treasury 31.05.17/5.000% 2,258,922 0.39
5,619,611 0.96
LUXEMBOURG1,720,000 ArcelorMittal 01.03.41/6.750% 1,678,092 0.292,750,000 Telecom Italia Capital 04.06.38/7.721% 2,715,969 0.46
4,394,061 0.75
CAYMAN ISLANDS3,975,000 Vale Overseas 15.09.19/5.625% 4,239,437 0.72
4,239,437 0.72
DENMARK1,545,000 Carlsberg Breweries 28.11.16/7.250% 2,883,817 0.49
2,883,817 0.49
FINLAND1,600,000 UPM-Kymmene 23.01.17/6.625% 2,631,390 0.45
2,631,390 0.45
ITALY1,250,000 Intesa Sanpaolo 02.03.20/3.750%* 1,724,993 0.29
1,724,993 0.29
AUSTRALIA565,000 ANZ Banking Group 10.09.19/5.125% 822,433 0.14640,000 Westpac Banking 27.02.15/4.200% 678,275 0.12
1,500,708 0.26
NORWAY800,000 DnB NOR Bank 29.01.18/6.170%* 1,339,087 0.23
1,339,087 0.23
BERMUDA475,000 Holcim GB Finance 24.04.17/8.750% 934,364 0.16
934,364 0.16
ISLE OF MAN865,000 AngloGold Ashanti Holdings 15.04.20/5.375% 858,608 0.15
858,608 0.15
IRELAND300,000 Smurfit Kappa Acquisitions 15.11.17/7.250% 444,815 0.08
444,815 0.08
Total Bonds 399,919,361 68.29
Total Transferable Securities Admitted to anOfficial Exchange Listing
399,919,361 68.29
Transferable Securities Dealt in on Another Regulated Market
Bonds
UNITED STATES OF AMERICA1,270,000 Amgen 15.06.42/5.650% 1,263,745 0.22
950,000 Amkor Technology 01.05.18/7.375% 969,000 0.16900,000 Biomet 15.10.17/10.375%* 990,000 0.17
1,000,000 Burlington Northern Santa Fe 01.05.17/5.650% 1,138,230 0.191,000,000 Case New Holland 144A 01.12.17/7.875% 1,100,000 0.192,000,000 Cisco Systems 15.01.40/5.500% 1,999,690 0.341,375,000 Comcast 15.01.15/6.500% 1,578,246 0.272,015,000 Comcast 15.05.38/6.400% 2,127,024 0.36
951,917 Continental Airlines 2009-2Class A Pass Through Trust 10.11.19/7.250% 1,025,690 0.18
500,000 Crown Americas 15.05.17/7.625% 536,250 0.091,388,836 CVS Pass-Through Trust 10.01.30/6.943% 1,569,799 0.27
5,000,000 Daimler Finance North America144A 28.03.14/1.950% 5,047,165 0.86
3,000,000 DCP Midstream 144A 15.03.20/5.350% 3,185,355 0.541,185,195 Delta Air Lines 2007-1 A Pass
Through Trust 10.08.22/6.821% 1,232,602 0.212,825,000 DirecTV Holdings/DirecTV
Financing 01.03.21/5.000% 2,928,014 0.50400,000 DISH DBS 01.02.16/7.125% 423,244 0.07600,000 DISH DBS 01.09.19/7.875% 648,843 0.11500,000 First Data 144A 15.08.20/8.875% 532,500 0.09250,000 GCI 15.11.19/8.625% 274,375 0.05
1,375,000 Gilead Sciences 01.04.21/4.500% 1,383,415 0.24400,000 JDA Software Group 15.12.14/8.000% 440,000 0.07
3,105,000 LG&E and KU Energy 144A 15.11.15/2.125% 3,028,943 0.521,189,000 Metropolitan Life Global Funding
I 144A 10.04.13/5.125% 1,265,570 0.22675,000 Midamerican Energy Holdings 15.09.37/6.500% 763,094 0.13
1,000,000 Mylan 144A 15.07.20/7.875% 1,090,000 0.192,005,000 Nationwide Financial Services 144A 25.03.21/5.375% 2,038,443 0.351,900,000 NBC Universal Media 144A 01.04.14/2.100% 1,926,172 0.331,440,000 NBC Universal Media 144A 01.04.21/4.375% 1,425,744 0.24
670,000 News America 15.11.37/6.650% 712,280 0.121,000,000 Oglethorpe Power 01.11.40/5.375% 970,212 0.172,900,000 Oncor Electric Delivery 30.09.17/5.000% 3,154,365 0.541,865,000 Oracle 144A 15.07.40/5.375% 1,876,749 0.32
500,000 Qwest CommunicationsInternational 01.04.18/7.125% 539,375 0.09
300,000 Reynolds Group Issuer 15.10.16/7.750% 448,079 0.081,000,000 Reynolds Group Issuer 144A 15.04.19/7.125% 987,500 0.171,500,000 Roche Holdings 144A 01.03.19/6.000% 1,732,980 0.30
900,000 Roche Holdings 144A 01.03.39/7.000% 1,089,986 0.193,375,000 Rockies Express Pipeline 144A 15.04.15/3.900% 3,435,487 0.591,665,000 State of Illinois 01.03.19/5.877% 1,713,069 0.291,013,000 US Treasury (i) 21.07.11/0.000% 1,012,230 0.17
550,000 US Treasury (i) 10.11.11/0.000% 549,801 0.0960,000 US Treasury (i) 15.02.12/1.375% 60,462 0.01
800,000 US Treasury 15.09.13/0.750% 804,094 0.142,645,000 US Treasury 31.05.16/1.750% 2,654,919 0.45
205,000 US Treasury (i) 15.08.20/2.625% 198,770 0.0350,000 US Treasury 15.05.21/3.125% 49,965 0.01
225,000 US Treasury (i) 15.05.40/4.375% 224,227 0.04250,000 US Treasury 15.02.41/4.750% 265,059 0.05
1,000,000 Valeant PharmaceuticalsInternational 144A 15.07.22/7.250% 965,000 0.16
5,025,000 Wells Fargo & Co. 15.06.16/3.676% 5,196,729 0.891,000,000 Windstream 01.09.18/8.125% 1,064,625 0.181,000,000 Xerox 16.05.14/1.081%* 1,007,663 0.17
72,644,779 12.41
FRANCE3,000,000 BNP Paribas 23.02.16/3.600% 3,037,905 0.523,100,000 BPCE 144A 04.10.13/2.375% 3,153,190 0.54
745,000 RCI Banque 144A 12.04.16/4.600% 764,030 0.132,780,000 Société Générale 144A 15.04.21/5.200% 2,724,845 0.46
9,679,970 1.65
251
JPMorgan Funds - Global Corporate Bond FundSchedule of Investments (Market Value Expressed in USD) (continued)
As at 30 June 2011
Quantity/Nominal
Value
Name of Securities Maturity/Coupon
MarketValue
%of
NetAssets
Quantity/Nominal
Value
Name of Securities Maturity/Coupon
MarketValue
%of
NetAssets
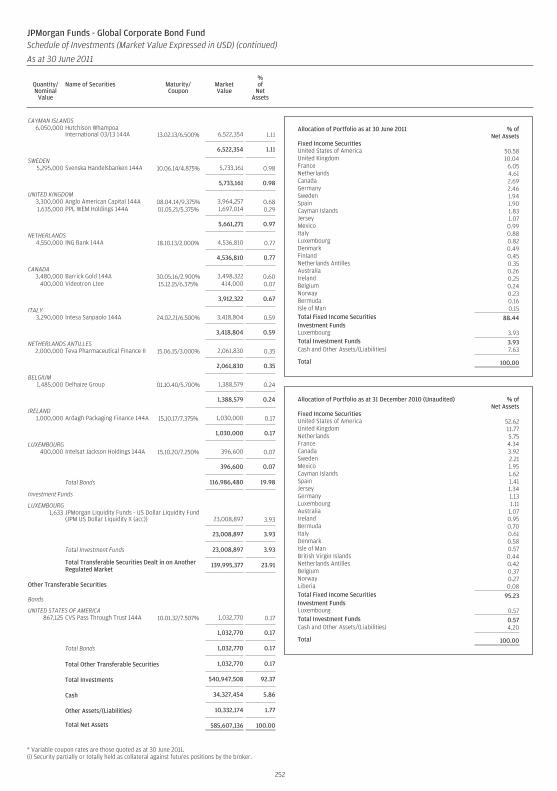
CAYMAN ISLANDS6,050,000 Hutchison Whampoa
International 03/13 144A 13.02.13/6.500% 6,522,354 1.11
6,522,354 1.11
SWEDEN5,295,000 Svenska Handelsbanken 144A 10.06.14/4.875% 5,733,161 0.98
5,733,161 0.98
UNITED KINGDOM3,300,000 Anglo American Capital 144A 08.04.14/9.375% 3,964,257 0.681,635,000 PPL WEM Holdings 144A 01.05.21/5.375% 1,697,014 0.29
5,661,271 0.97
NETHERLANDS4,550,000 ING Bank 144A 18.10.13/2.000% 4,536,810 0.77
4,536,810 0.77
CANADA3,480,000 Barrick Gold 144A 30.05.16/2.900% 3,498,322 0.60
400,000 Videotron Ltee 15.12.15/6.375% 414,000 0.07
3,912,322 0.67
ITALY3,290,000 Intesa Sanpaolo 144A 24.02.21/6.500% 3,418,804 0.59
3,418,804 0.59
NETHERLANDS ANTILLES2,000,000 Teva Pharmaceutical Finance II 15.06.15/3.000% 2,061,830 0.35
2,061,830 0.35
BELGIUM1,485,000 Delhaize Group 01.10.40/5.700% 1,388,579 0.24
1,388,579 0.24
IRELAND1,000,000 Ardagh Packaging Finance 144A 15.10.17/7.375% 1,030,000 0.17
1,030,000 0.17
LUXEMBOURG400,000 Intelsat Jackson Holdings 144A 15.10.20/7.250% 396,600 0.07
396,600 0.07
Total Bonds 116,986,480 19.98
Investment Funds
LUXEMBOURG1,633 JPMorgan Liquidity Funds - US Dollar Liquidity Fund
(JPM US Dollar Liquidity X (acc)) 23,008,897 3.93
23,008,897 3.93
Total Investment Funds 23,008,897 3.93
Total Transferable Securities Dealt in on AnotherRegulated Market
139,995,377 23.91
Other Transferable Securities
Bonds
UNITED STATES OF AMERICA867,125 CVS Pass Through Trust 144A 10.01.32/7.507% 1,032,770 0.17
1,032,770 0.17
Total Bonds 1,032,770 0.17
Total Other Transferable Securities 1,032,770 0.17
Total Investments 540,947,508 92.37
Cash 34,327,454 5.86
Other Assets/(Liabilities) 10,332,174 1.77
Total Net Assets 585,607,136 100.00
* Variable coupon rates are those quoted as at 30 June 2011.(i) Security partially or totally held as collateral against futures positions by the broker.
Allocation of Portfolio as at 30 June 2011 % ofNet Assets
Fixed Income SecuritiesUnited States of America 50.58United Kingdom 10.04France 6.05Netherlands 4.61Canada 2.69Germany 2.46Sweden 1.94Spain 1.90Cayman Islands 1.83Jersey 1.07Mexico 0.99Italy 0.88Luxembourg 0.82Denmark 0.49Finland 0.45Netherlands Antilles 0.35Australia 0.26Ireland 0.25Belgium 0.24Norway 0.23Bermuda 0.16Isle of Man 0.15Total Fixed Income Securities 88.44Investment FundsLuxembourg 3.93Total Investment Funds 3.93Cash and Other Assets/(Liabilities) 7.63
Total 100.00
Allocation of Portfolio as at 31 December 2010 (Unaudited) % ofNet Assets
Fixed Income SecuritiesUnited States of America 52.62United Kingdom 11.77Netherlands 5.75France 4.34Canada 3.92Sweden 2.21Mexico 1.95Cayman Islands 1.62Spain 1.41Jersey 1.34Germany 1.13Luxembourg 1.11Australia 1.07Ireland 0.95Bermuda 0.70Italy 0.61Denmark 0.58Isle of Man 0.57British Virgin Islands 0.44Netherlands Antilles 0.42Belgium 0.37Norway 0.27Liberia 0.08Total Fixed Income Securities 95.23Investment FundsLuxembourg 0.57Total Investment Funds 0.57Cash and Other Assets/(Liabilities) 4.20
Total 100.00
252
JPMorgan Funds - Global Corporate Bond FundSchedule of Investments (Market Value Expressed in USD) (continued)
As at 30 June 2011
Quantity/Nominal
Value
Name of Securities Maturity/Coupon
MarketValue
%of
NetAssets
Quantity/Nominal
Value
Name of Securities Maturity/Coupon
MarketValue
%of
NetAssets
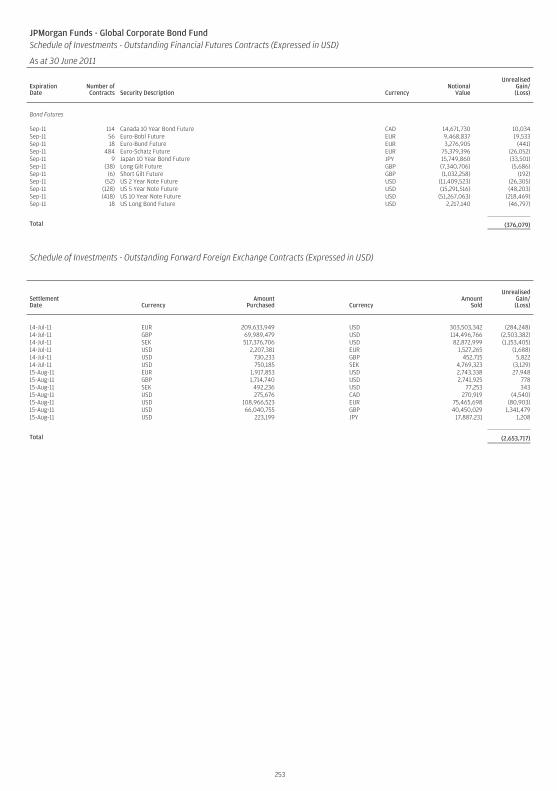
JPMorgan Funds - Global Corporate Bond FundSchedule of Investments - Outstanding Financial Futures Contracts (Expressed in USD)
As at 30 June 2011
ExpirationDate
Number ofContracts Security Description Currency
NotionalValue
UnrealisedGain/(Loss)
Bond Futures
Sep-11 114 Canada 10 Year Bond Future CAD 14,671,730 10,034Sep-11 56 Euro-Bobl Future EUR 9,468,837 19,533Sep-11 18 Euro-Bund Future EUR 3,276,905 (441)Sep-11 484 Euro-Schatz Future EUR 75,379,396 (26,052)Sep-11 9 Japan 10 Year Bond Future JPY 15,749,860 (33,501)Sep-11 (38) Long Gilt Future GBP (7,340,706) (5,686)Sep-11 (6) Short Gilt Future GBP (1,032,258) (192)Sep-11 (52) US 2 Year Note Future USD (11,409,523) (26,305)Sep-11 (128) US 5 Year Note Future USD (15,291,516) (48,203)Sep-11 (418) US 10 Year Note Future USD (51,267,063) (218,469)Sep-11 18 US Long Bond Future USD 2,217,140 (46,797)
Total (376,079)
Schedule of Investments - Outstanding Forward Foreign Exchange Contracts (Expressed in USD)
SettlementDate Currency
AmountPurchased Currency
AmountSold
UnrealisedGain/(Loss)
14-Jul-11 EUR 209,633,949 USD 303,503,342 (284,248)14-Jul-11 GBP 69,989,479 USD 114,496,766 (2,503,382)14-Jul-11 SEK 517,376,706 USD 82,872,999 (1,153,405)14-Jul-11 USD 2,207,381 EUR 1,527,265 (1,688)14-Jul-11 USD 730,233 GBP 452,715 5,82214-Jul-11 USD 750,185 SEK 4,769,323 (3,129)15-Aug-11 EUR 1,917,853 USD 2,743,338 27,94815-Aug-11 GBP 1,714,740 USD 2,741,925 77815-Aug-11 SEK 492,236 USD 77,253 34315-Aug-11 USD 275,676 CAD 270,919 (4,540)15-Aug-11 USD 108,966,523 EUR 75,465,698 (80,903)15-Aug-11 USD 66,040,755 GBP 40,450,029 1,341,47915-Aug-11 USD 223,199 JPY 17,887,231 1,208
Total (2,653,717)
253
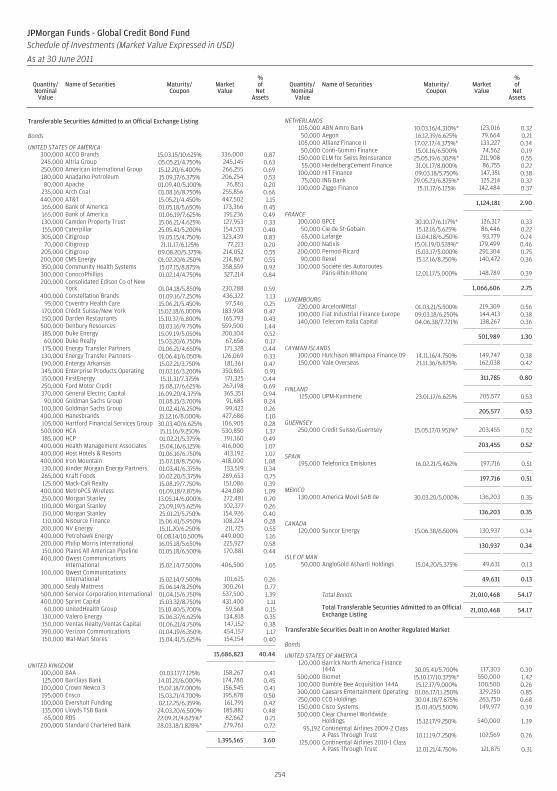
Transferable Securities Admitted to an Official Exchange Listing
Bonds
UNITED STATES OF AMERICA300,000 ACCO Brands 15.03.15/10.625% 336,000 0.87245,000 Altria Group 05.05.21/4.750% 245,145 0.63250,000 American International Group 15.12.20/6.400% 266,255 0.69180,000 Anadarko Petroleum 15.09.17/6.375% 206,254 0.5380,000 Apache 01.09.40/5.100% 76,851 0.20
235,000 Arch Coal 01.08.16/8.750% 255,856 0.66440,000 AT&T 15.05.21/4.450% 447,502 1.15165,000 Bank of America 01.05.18/5.650% 173,366 0.45165,000 Bank of America 01.06.19/7.625% 191,236 0.49130,000 Camden Property Trust 15.06.21/4.625% 127,953 0.33155,000 Caterpillar 25.05.41/5.200% 154,533 0.40305,000 Citigroup 19.05.15/4.750% 323,439 0.83
70,000 Citigroup 21.11.17/6.125% 77,213 0.20205,000 Citigroup 09.08.20/5.375% 214,052 0.55200,000 CMS Energy 01.02.20/6.250% 214,867 0.55350,000 Community Health Systems 15.07.15/8.875% 358,559 0.92300,000 ConocoPhillips 01.02.14/4.750% 327,214 0.84200,000 Consolidated Edison Co of New
York 01.04.18/5.850% 230,288 0.59400,000 Constellation Brands 01.09.16/7.250% 436,322 1.13
95,000 Coventry Health Care 15.06.21/5.450% 97,546 0.25170,000 Crédit Suisse/New York 15.02.18/6.000% 183,908 0.47150,000 Darden Restaurants 15.10.37/6.800% 165,793 0.43500,000 Denbury Resources 01.03.16/9.750% 559,500 1.44185,000 Duke Energy 15.09.19/5.050% 200,104 0.5260,000 Duke Realty 15.03.20/6.750% 67,656 0.17175,000 Energy Transfer Partners 01.06.21/4.650% 171,328 0.44130,000 Energy Transfer Partners 01.06.41/6.050% 126,069 0.33190,000 Entergy Arkansas 15.02.21/3.750% 181,361 0.47345,000 Enterprise Products Operating 01.02.16/3.200% 350,865 0.91150,000 FirstEnergy 15.11.31/7.375% 171,325 0.44250,000 Ford Motor Credit 15.08.17/6.625% 267,198 0.69370,000 General Electric Capital 16.09.20/4.375% 365,351 0.9490,000 Goldman Sachs Group 01.08.15/3.700% 91,685 0.24
100,000 Goldman Sachs Group 01.02.41/6.250% 99,422 0.26400,000 Hanesbrands 15.12.16/8.000% 427,686 1.10105,000 Hartford Financial Services Group 30.03.40/6.625% 106,905 0.28500,000 HCA 15.11.16/9.250% 530,850 1.37185,000 HCP 01.02.21/5.375% 191,160 0.49
400,000 Health Management Associates 15.04.16/6.125% 416,000 1.07400,000 Host Hotels & Resorts 01.06.16/6.750% 413,192 1.07400,000 Iron Mountain 15.07.18/8.750% 418,000 1.08130,000 Kinder Morgan Energy Partners 01.03.41/6.375% 133,519 0.34265,000 Kraft Foods 10.02.20/5.375% 289,653 0.75125,000 Mack-Cali Realty 15.08.19/7.750% 151,086 0.39
400,000 MetroPCS Wireless 01.09.18/7.875% 424,080 1.09250,000 Morgan Stanley 13.05.14/6.000% 272,481 0.70100,000 Morgan Stanley 23.09.19/5.625% 102,377 0.26150,000 Morgan Stanley 25.01.21/5.750% 154,926 0.40110,000 Nisource Finance 15.06.41/5.950% 108,224 0.28
200,000 NV Energy 15.11.20/6.250% 211,725 0.55400,000 Petrohawk Energy 01.08.14/10.500% 449,000 1.16200,000 Philip Morris International 16.05.18/5.650% 225,927 0.58150,000 Plains All American Pipeline 01.05.18/6.500% 170,881 0.44
400,000 Qwest CommunicationsInternational 15.02.14/7.500% 406,500 1.05
100,000 Qwest CommunicationsInternational 15.02.14/7.500% 101,625 0.26
300,000 Sealy Mattress 15.06.14/8.250% 300,261 0.77500,000 Service Corporation International 01.04.15/6.750% 537,500 1.39400,000 Sprint Capital 15.03.32/8.750% 431,400 1.11
60,000 UnitedHealth Group 15.10.40/5.700% 59,568 0.15130,000 Valero Energy 15.06.37/6.625% 134,818 0.35150,000 Ventas Realty/Ventas Capital 01.06.21/4.750% 147,152 0.38390,000 Verizon Communications 01.04.19/6.350% 454,157 1.17150,000 Wal-Mart Stores 15.04.41/5.625% 154,154 0.40
15,686,823 40.44
UNITED KINGDOM100,000 BAA 01.03.17/7.125% 158,267 0.41125,000 Barclays Bank 14.01.21/6.000% 174,780 0.45100,000 Crown Newco 3 15.02.18/7.000% 156,545 0.41195,000 Ensco 15.03.21/4.700% 195,878 0.50100,000 Eversholt Funding 02.12.25/6.359% 161,791 0.42135,000 Lloyds TSB Bank 24.03.20/6.500% 185,881 0.4865,000 RBS 22.09.21/4.625%* 82,662 0.21
200,000 Standard Chartered Bank 28.03.18/1.828%* 279,761 0.72
1,395,565 3.60
NETHERLANDS105,000 ABN Amro Bank 10.03.16/4.310%* 123,016 0.3250,000 Aegon 16.12.39/6.625% 79,664 0.21
105,000 Allianz Finance II 17.02.17/4.375%* 133,227 0.3450,000 Conti-Gummi Finance 15.01.16/6.500% 74,562 0.19
150,000 ELM for Swiss Reinsurance 25.05.19/6.302%* 211,908 0.5555,000 HeidelbergCement Finance 31.01.17/8.000% 86,755 0.22
100,000 HIT Finance 09.03.18/5.750% 147,351 0.3875,000 ING Bank 29.05.23/6.875%* 125,214 0.32
100,000 Ziggo Finance 15.11.17/6.125% 142,484 0.37
1,124,181 2.90
FRANCE100,000 BPCE 30.10.17/6.117%* 126,317 0.3350,000 Cie de St-Gobain 15.12.16/5.625% 86,446 0.2265,000 Lafarge 13.04.18/6.250% 93,779 0.24
200,000 Natixis 15.01.19/0.528%* 179,499 0.46200,000 Pernod-Ricard 15.03.17/5.000% 291,304 0.75
90,000 Rexel 15.12.16/8.250% 140,472 0.36100,000 Société des Autoroutes
Paris-Rhin-Rhone 12.01.17/5.000% 148,789 0.39
1,066,606 2.75
LUXEMBOURG220,000 ArcelorMittal 01.03.21/5.500% 219,309 0.56100,000 Fiat Industrial Finance Europe 09.03.18/6.250% 144,413 0.38140,000 Telecom Italia Capital 04.06.38/7.721% 138,267 0.36
501,989 1.30
CAYMAN ISLANDS100,000 Hutchison Whampoa Finance 09 14.11.16/4.750% 149,747 0.38150,000 Vale Overseas 21.11.36/6.875% 162,038 0.42
311,785 0.80
FINLAND125,000 UPM-Kymmene 23.01.17/6.625% 205,577 0.53
205,577 0.53
GUERNSEY250,000 Credit Suisse/Guernsey 15.05.17/0.951%* 203,455 0.52
203,455 0.52
SPAIN195,000 Telefonica Emisiones 16.02.21/5.462% 197,716 0.51
197,716 0.51
MEXICO130,000 America Movil SAB de 30.03.20/5.000% 136,203 0.35
136,203 0.35
CANADA120,000 Suncor Energy 15.06.38/6.500% 130,937 0.34
130,937 0.34
ISLE OF MAN50,000 AngloGold Ashanti Holdings 15.04.20/5.375% 49,631 0.13
49,631 0.13
Total Bonds 21,010,468 54.17
Total Transferable Securities Admitted to an OfficialExchange Listing
21,010,468 54.17
Transferable Securities Dealt in on Another Regulated Market
Bonds
UNITED STATES OF AMERICA120,000 Barrick North America Finance
144A 30.05.41/5.700% 117,303 0.30500,000 Biomet 15.10.17/10.375%* 550,000 1.42100,000 Bumble Bee Acquisition 144A 15.12.17/9.000% 100,500 0.26300,000 Caesars Entertainment Operating 01.06.17/11.250% 329,250 0.85250,000 CCO Holdings 30.04.18/7.875% 263,750 0.68150,000 Cisco Systems 15.01.40/5.500% 149,977 0.39500,000 Clear Channel Worldwide
Holdings 15.12.17/9.250% 540,000 1.3995,192 Continental Airlines 2009-2 Class
A Pass Through Trust 10.11.19/7.250% 102,569 0.26125,000 Continental Airlines 2010-1 Class
A Pass Through Trust 12.01.21/4.750% 121,875 0.31
254
JPMorgan Funds - Global Credit Bond FundSchedule of Investments (Market Value Expressed in USD)
As at 30 June 2011
Quantity/Nominal
Value
Name of Securities Maturity/Coupon
MarketValue
%of
NetAssets
Quantity/Nominal
Value
Name of Securities Maturity/Coupon
MarketValue
%of
NetAssets
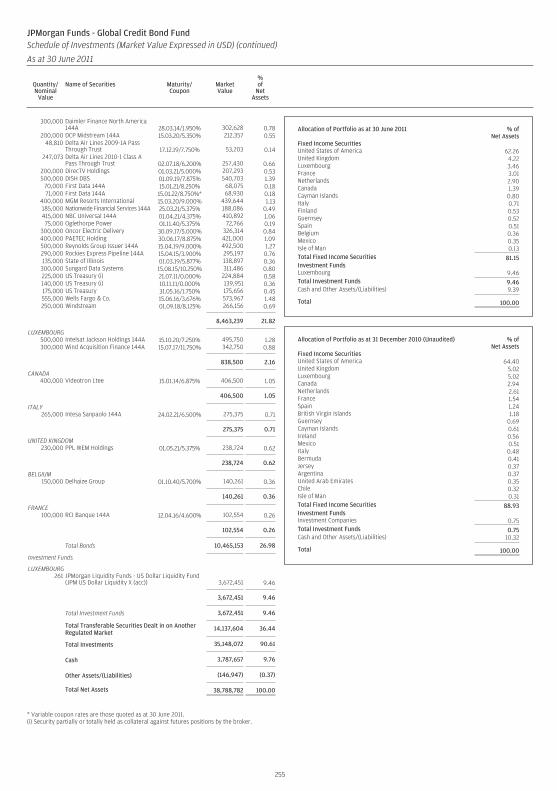
300,000 Daimler Finance North America144A 28.03.14/1.950% 302,628 0.78
200,000 DCP Midstream 144A 15.03.20/5.350% 212,357 0.5548,810 Delta Air Lines 2009-1A Pass
Through Trust 17.12.19/7.750% 53,203 0.14247,073 Delta Air Lines 2010-1 Class A
Pass Through Trust 02.07.18/6.200% 257,430 0.66200,000 DirecTV Holdings 01.03.21/5.000% 207,293 0.53500,000 DISH DBS 01.09.19/7.875% 540,703 1.39
70,000 First Data 144A 15.01.21/8.250% 68,075 0.1871,000 First Data 144A 15.01.22/8.750%* 68,930 0.18
400,000 MGM Resorts International 15.03.20/9.000% 439,644 1.13185,000 Nationwide Financial Services 144A 25.03.21/5.375% 188,086 0.49415,000 NBC Universal 144A 01.04.21/4.375% 410,892 1.0675,000 Oglethorpe Power 01.11.40/5.375% 72,766 0.19
300,000 Oncor Electric Delivery 30.09.17/5.000% 326,314 0.84400,000 PAETEC Holding 30.06.17/8.875% 421,000 1.09500,000 Reynolds Group Issuer 144A 15.04.19/9.000% 492,500 1.27290,000 Rockies Express Pipeline 144A 15.04.15/3.900% 295,197 0.76135,000 State of Illinois 01.03.19/5.877% 138,897 0.36
300,000 Sungard Data Systems 15.08.15/10.250% 311,486 0.80225,000 US Treasury (i) 21.07.11/0.000% 224,884 0.58140,000 US Treasury (i) 10.11.11/0.000% 139,951 0.36175,000 US Treasury 31.05.16/1.750% 175,656 0.45555,000 Wells Fargo & Co. 15.06.16/3.676% 573,967 1.48250,000 Windstream 01.09.18/8.125% 266,156 0.69
8,463,239 21.82
LUXEMBOURG500,000 Intelsat Jackson Holdings 144A 15.10.20/7.250% 495,750 1.28300,000 Wind Acquisition Finance 144A 15.07.17/11.750% 342,750 0.88
838,500 2.16
CANADA400,000 Videotron Ltee 15.01.14/6.875% 406,500 1.05
406,500 1.05
ITALY265,000 Intesa Sanpaolo 144A 24.02.21/6.500% 275,375 0.71
275,375 0.71
UNITED KINGDOM230,000 PPL WEM Holdings 01.05.21/5.375% 238,724 0.62
238,724 0.62
BELGIUM150,000 Delhaize Group 01.10.40/5.700% 140,261 0.36
140,261 0.36
FRANCE100,000 RCI Banque 144A 12.04.16/4.600% 102,554 0.26
102,554 0.26
Total Bonds 10,465,153 26.98
Investment Funds
LUXEMBOURG261 JPMorgan Liquidity Funds - US Dollar Liquidity Fund
(JPM US Dollar Liquidity X (acc)) 3,672,451 9.46
3,672,451 9.46
Total Investment Funds 3,672,451 9.46
Total Transferable Securities Dealt in on AnotherRegulated Market
14,137,604 36.44
Total Investments 35,148,072 90.61
Cash 3,787,657 9.76
Other Assets/(Liabilities) (146,947) (0.37)
Total Net Assets 38,788,782 100.00
* Variable coupon rates are those quoted as at 30 June 2011.(i) Security partially or totally held as collateral against futures positions by the broker.
Allocation of Portfolio as at 30 June 2011 % ofNet Assets
Fixed Income SecuritiesUnited States of America 62.26United Kingdom 4.22Luxembourg 3.46France 3.01Netherlands 2.90Canada 1.39Cayman Islands 0.80Italy 0.71Finland 0.53Guernsey 0.52Spain 0.51Belgium 0.36Mexico 0.35Isle of Man 0.13Total Fixed Income Securities 81.15Investment FundsLuxembourg 9.46Total Investment Funds 9.46Cash and Other Assets/(Liabilities) 9.39
Total 100.00
Allocation of Portfolio as at 31 December 2010 (Unaudited) % ofNet Assets
Fixed Income SecuritiesUnited States of America 64.40United Kingdom 5.02Luxembourg 5.02Canada 2.94Netherlands 2.61France 1.54Spain 1.24British Virgin Islands 1.18Guernsey 0.69Cayman Islands 0.61Ireland 0.56Mexico 0.51Italy 0.48Bermuda 0.41Jersey 0.37Argentina 0.37United Arab Emirates 0.35Chile 0.32Isle of Man 0.31Total Fixed Income Securities 88.93Investment FundsInvestment Companies 0.75Total Investment Funds 0.75Cash and Other Assets/(Liabilities) 10.32
Total 100.00
255
JPMorgan Funds - Global Credit Bond FundSchedule of Investments (Market Value Expressed in USD) (continued)
As at 30 June 2011
Quantity/Nominal
Value
Name of Securities Maturity/Coupon
MarketValue
%of
NetAssets
Quantity/Nominal
Value
Name of Securities Maturity/Coupon
MarketValue
%of
NetAssets
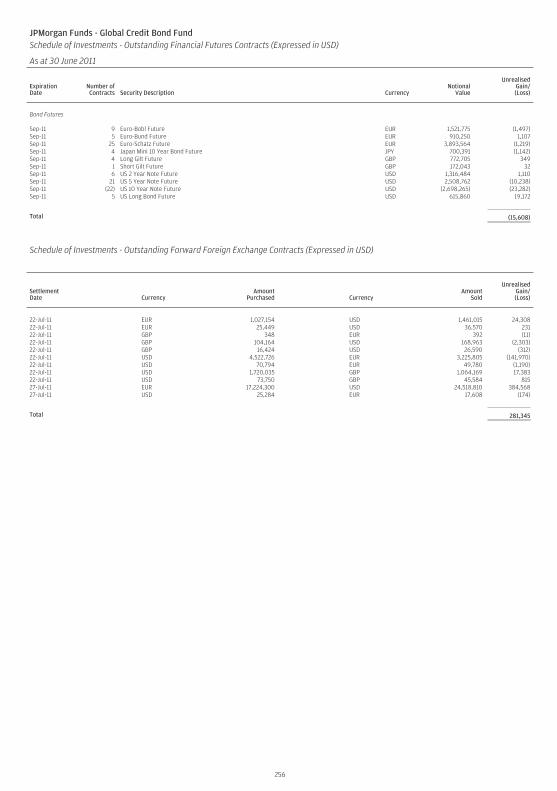
JPMorgan Funds - Global Credit Bond FundSchedule of Investments - Outstanding Financial Futures Contracts (Expressed in USD)
As at 30 June 2011
ExpirationDate
Number ofContracts Security Description Currency
NotionalValue
UnrealisedGain/(Loss)
Bond Futures
Sep-11 9 Euro-Bobl Future EUR 1,521,775 (1,497)Sep-11 5 Euro-Bund Future EUR 910,250 1,107Sep-11 25 Euro-Schatz Future EUR 3,893,564 (1,219)Sep-11 4 Japan Mini 10 Year Bond Future JPY 700,391 (1,142)Sep-11 4 Long Gilt Future GBP 772,705 349Sep-11 1 Short Gilt Future GBP 172,043 32Sep-11 6 US 2 Year Note Future USD 1,316,484 1,110Sep-11 21 US 5 Year Note Future USD 2,508,762 (10,238)Sep-11 (22) US 10 Year Note Future USD (2,698,265) (23,282)Sep-11 5 US Long Bond Future USD 615,860 19,172
Total (15,608)
Schedule of Investments - Outstanding Forward Foreign Exchange Contracts (Expressed in USD)
SettlementDate Currency
AmountPurchased Currency
AmountSold
UnrealisedGain/(Loss)
22-Jul-11 EUR 1,027,154 USD 1,461,015 24,30822-Jul-11 EUR 25,449 USD 36,570 23122-Jul-11 GBP 348 EUR 392 (11)22-Jul-11 GBP 104,164 USD 168,963 (2,303)22-Jul-11 GBP 16,424 USD 26,590 (312)22-Jul-11 USD 4,522,726 EUR 3,225,805 (141,970)22-Jul-11 USD 70,794 EUR 49,780 (1,190)22-Jul-11 USD 1,720,035 GBP 1,064,169 17,38322-Jul-11 USD 73,750 GBP 45,584 81527-Jul-11 EUR 17,224,300 USD 24,518,810 384,56827-Jul-11 USD 25,284 EUR 17,608 (174)
Total 281,345
256
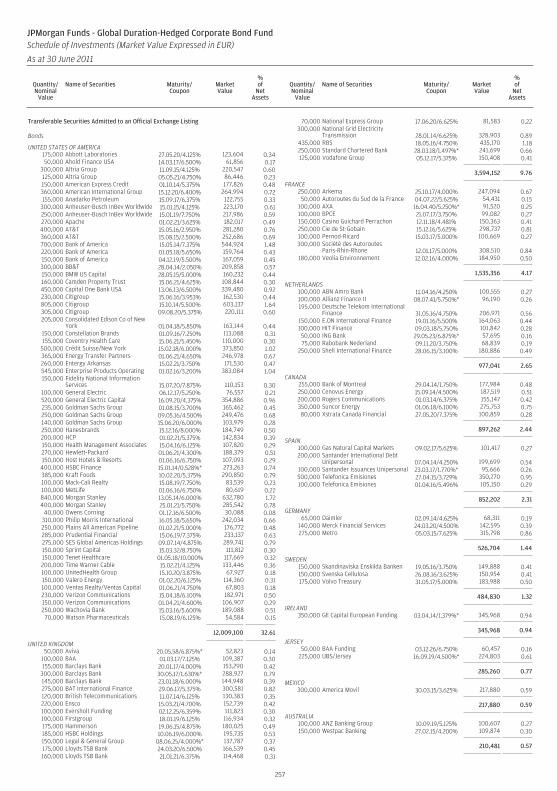
Transferable Securities Admitted to an Official Exchange Listing
Bonds
UNITED STATES OF AMERICA175,000 Abbott Laboratories 27.05.20/4.125% 123,604 0.3450,000 Ahold Finance USA 14.03.17/6.500% 61,856 0.17
300,000 Altria Group 11.09.15/4.125% 220,547 0.60125,000 Altria Group 05.05.21/4.750% 86,446 0.23150,000 American Express Credit 01.10.14/5.375% 177,826 0.48360,000 American International Group 15.12.20/6.400% 264,994 0.72155,000 Anadarko Petroleum 15.09.17/6.375% 122,755 0.33
300,000 Anheuser-Busch InBev Worldwide 15.01.15/4.125% 223,170 0.61250,000 Anheuser-Busch InBev Worldwide 15.01.19/7.750% 217,986 0.59270,000 Apache 01.02.21/3.625% 182,017 0.49400,000 AT&T 15.05.16/2.950% 281,280 0.76360,000 AT&T 15.08.15/2.500% 252,686 0.69700,000 Bank of America 15.05.14/7.375% 544,924 1.48220,000 Bank of America 01.05.18/5.650% 159,764 0.43150,000 Bank of America 04.12.19/5.500% 167,059 0.45300,000 BB&T 28.04.14/2.050% 209,858 0.57150,000 BMW US Capital 28.05.15/5.000% 160,232 0.44160,000 Camden Property Trust 15.06.21/4.625% 108,844 0.30450,000 Capital One Bank USA 13.06.13/6.500% 339,480 0.92230,000 Citigroup 15.06.16/3.953% 162,530 0.44805,000 Citigroup 15.10.14/5.500% 603,137 1.64305,000 Citigroup 09.08.20/5.375% 220,111 0.60205,000 Consolidated Edison Co of New
York 01.04.18/5.850% 163,144 0.44150,000 Constellation Brands 01.09.16/7.250% 113,088 0.31155,000 Coventry Health Care 15.06.21/5.450% 110,000 0.30
500,000 Crédit Suisse/New York 15.02.18/6.000% 373,850 1.02365,000 Energy Transfer Partners 01.06.21/4.650% 246,978 0.67260,000 Entergy Arkansas 15.02.21/3.750% 171,530 0.47545,000 Enterprise Products Operating 01.02.16/3.200% 383,084 1.04150,000 Fidelity National Information
Services 15.07.20/7.875% 110,153 0.30100,000 General Electric 06.12.17/5.250% 76,557 0.21520,000 General Electric Capital 16.09.20/4.375% 354,886 0.96235,000 Goldman Sachs Group 01.08.15/3.700% 165,462 0.45250,000 Goldman Sachs Group 09.05.16/4.500% 249,476 0.68140,000 Goldman Sachs Group 15.06.20/6.000% 103,979 0.28250,000 Hanesbrands 15.12.16/8.000% 184,749 0.50200,000 HCP 01.02.21/5.375% 142,834 0.39150,000 Health Management Associates 15.04.16/6.125% 107,820 0.29270,000 Hewlett-Packard 01.06.21/4.300% 188,379 0.51150,000 Host Hotels & Resorts 01.06.16/6.750% 107,093 0.29
400,000 HSBC Finance 15.01.14/0.528%* 273,263 0.74385,000 Kraft Foods 10.02.20/5.375% 290,850 0.79100,000 Mack-Cali Realty 15.08.19/7.750% 83,539 0.23100,000 MetLife 01.06.16/6.750% 80,619 0.22840,000 Morgan Stanley 13.05.14/6.000% 632,780 1.72400,000 Morgan Stanley 25.01.21/5.750% 285,542 0.78
40,000 Owens Corning 01.12.16/6.500% 30,088 0.08310,000 Philip Morris International 16.05.18/5.650% 242,034 0.66250,000 Plains All American Pipeline 01.02.21/5.000% 176,772 0.48285,000 Prudential Financial 15.06.19/7.375% 233,137 0.63275,000 SES Global Americas Holdings 09.07.14/4.875% 289,741 0.79150,000 Sprint Capital 15.03.32/8.750% 111,812 0.30150,000 Tenet Healthcare 01.05.18/10.000% 117,669 0.32200,000 Time Warner Cable 15.02.21/4.125% 133,446 0.36100,000 UnitedHealth Group 15.10.20/3.875% 67,927 0.18150,000 Valero Energy 01.02.20/6.125% 114,360 0.31100,000 Ventas Realty/Ventas Capital 01.06.21/4.750% 67,803 0.18230,000 Verizon Communications 15.04.18/6.100% 182,971 0.50150,000 Verizon Communications 01.04.21/4.600% 106,907 0.29250,000 Wachovia Bank 15.03.16/5.600% 189,088 0.5170,000 Watson Pharmaceuticals 15.08.19/6.125% 54,584 0.15
12,009,100 32.61
UNITED KINGDOM50,000 Aviva 20.05.58/6.875%* 52,823 0.14
100,000 BAA 01.03.17/7.125% 109,387 0.30155,000 Barclays Bank 20.01.17/4.000% 153,290 0.42
300,000 Barclays Bank 30.05.17/1.630%* 288,927 0.79145,000 Barclays Bank 23.01.18/6.000% 144,948 0.39275,000 BAT International Finance 29.06.17/5.375% 300,581 0.82120,000 British Telecommunications 11.07.14/6.125% 130,383 0.35220,000 Ensco 15.03.21/4.700% 152,739 0.42100,000 Eversholt Funding 02.12.25/6.359% 111,823 0.30100,000 Firstgroup 18.01.19/6.125% 116,934 0.32175,000 Hammerson 19.06.15/4.875% 180,025 0.49185,000 HSBC Holdings 10.06.19/6.000% 195,735 0.53150,000 Legal & General Group 08.06.25/4.000%* 137,787 0.37175,000 Lloyds TSB Bank 24.03.20/6.500% 166,539 0.45160,000 Lloyds TSB Bank 21.01.21/6.375% 114,468 0.31
70,000 National Express Group 17.06.20/6.625% 81,583 0.22300,000 National Grid Electricity
Transmission 28.01.14/6.625% 328,903 0.89435,000 RBS 18.05.16/4.750% 435,170 1.18250,000 Standard Chartered Bank 28.03.18/1.497%* 241,699 0.66125,000 Vodafone Group 05.12.17/5.375% 150,408 0.41
3,594,152 9.76
FRANCE250,000 Arkema 25.10.17/4.000% 247,094 0.6750,000 Autoroutes du Sud de la France 04.07.22/5.625% 54,431 0.15
100,000 AXA 16.04.40/5.250%* 91,520 0.25100,000 BPCE 21.07.17/3.750% 99,082 0.27150,000 Casino Guichard Perrachon 12.11.18/4.481% 150,363 0.41250,000 Cie de St-Gobain 15.12.16/5.625% 298,737 0.81100,000 Pernod-Ricard 15.03.17/5.000% 100,669 0.27300,000 Société des Autoroutes
Paris-Rhin-Rhone 12.01.17/5.000% 308,510 0.84180,000 Veolia Environnement 12.02.16/4.000% 184,950 0.50
1,535,356 4.17
NETHERLANDS100,000 ABN Amro Bank 11.04.16/4.250% 100,555 0.27100,000 Allianz Finance II 08.07.41/5.750%* 96,190 0.26195,000 Deutsche Telekom International
Finance 31.05.16/4.750% 206,971 0.56150,000 E.ON International Finance 19.01.16/5.500% 164,063 0.44100,000 HIT Finance 09.03.18/5.750% 101,842 0.2850,000 ING Bank 29.05.23/6.875%* 57,695 0.1675,000 Rabobank Nederland 09.11.20/3.750% 68,839 0.19
250,000 Shell International Finance 28.06.15/3.100% 180,886 0.49
977,041 2.65
CANADA255,000 Bank of Montreal 29.04.14/1.750% 177,984 0.48250,000 Cenovus Energy 15.09.14/4.500% 187,519 0.51200,000 Rogers Communications 01.03.14/6.375% 155,147 0.42350,000 Suncor Energy 01.06.18/6.100% 275,753 0.7580,000 Xstrata Canada Financial 27.05.20/7.375% 100,859 0.28
897,262 2.44
SPAIN100,000 Gas Natural Capital Markets 09.02.17/5.625% 101,417 0.27200,000 Santander International Debt
Unipersonal 07.04.14/4.250% 199,699 0.54100,000 Santander Issuances Unipersonal 23.03.17/1.770%* 95,666 0.26500,000 Telefonica Emisiones 27.04.15/3.729% 350,270 0.95100,000 Telefonica Emisiones 01.04.16/5.496% 105,150 0.29
852,202 2.31
GERMANY65,000 Daimler 02.09.14/4.625% 68,311 0.19
140,000 Merck Financial Services 24.03.20/4.500% 142,595 0.39275,000 Metro 05.03.15/7.625% 315,798 0.86
526,704 1.44
SWEDEN150,000 Skandinaviska Enskilda Banken 19.05.16/3.750% 149,888 0.41150,000 Svenska Cellulosa 26.08.16/3.625% 150,954 0.41175,000 Volvo Treasury 31.05.17/5.000% 183,988 0.50
484,830 1.32
IRELAND350,000 GE Capital European Funding 03.04.14/1.379%* 345,968 0.94
345,968 0.94
JERSEY50,000 BAA Funding 03.12.26/6.750% 60,457 0.16
225,000 UBS/Jersey 16.09.19/4.500%* 224,803 0.61
285,260 0.77
MEXICO300,000 America Movil 30.03.15/3.625% 217,880 0.59
217,880 0.59
AUSTRALIA100,000 ANZ Banking Group 10.09.19/5.125% 100,607 0.27150,000 Westpac Banking 27.02.15/4.200% 109,874 0.30
210,481 0.57
257
JPMorgan Funds - Global Duration-Hedged Corporate Bond FundSchedule of Investments (Market Value Expressed in EUR)
As at 30 June 2011
Quantity/Nominal
Value
Name of Securities Maturity/Coupon
MarketValue
%of
NetAssets
Quantity/Nominal
Value
Name of Securities Maturity/Coupon
MarketValue
%of
NetAssets
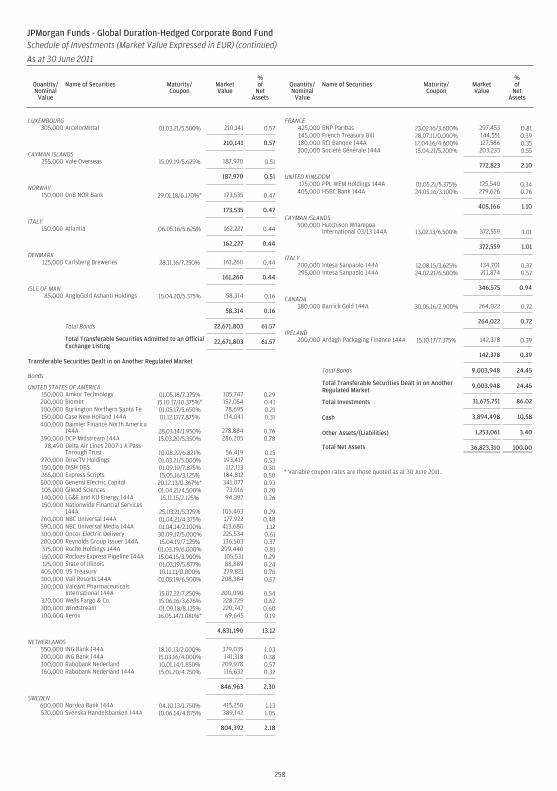
LUXEMBOURG305,000 ArcelorMittal 01.03.21/5.500% 210,141 0.57
210,141 0.57
CAYMAN ISLANDS255,000 Vale Overseas 15.09.19/5.625% 187,970 0.51
187,970 0.51
NORWAY150,000 DnB NOR Bank 29.01.18/6.170%* 173,535 0.47
173,535 0.47
ITALY150,000 Atlantia 06.05.16/5.625% 162,227 0.44
162,227 0.44
DENMARK125,000 Carlsberg Breweries 28.11.16/7.250% 161,260 0.44
161,260 0.44
ISLE OF MAN85,000 AngloGold Ashanti Holdings 15.04.20/5.375% 58,314 0.16
58,314 0.16
Total Bonds 22,671,803 61.57
Total Transferable Securities Admitted to an OfficialExchange Listing
22,671,803 61.57
Transferable Securities Dealt in on Another Regulated Market
Bonds
UNITED STATES OF AMERICA150,000 Amkor Technology 01.05.18/7.375% 105,747 0.29200,000 Biomet 15.10.17/10.375%* 152,054 0.41100,000 Burlington Northern Santa Fe 01.05.17/5.650% 78,695 0.21150,000 Case New Holland 144A 01.12.17/7.875% 114,041 0.31
400,000 Daimler Finance North America144A 28.03.14/1.950% 278,884 0.76
390,000 DCP Midstream 144A 15.03.20/5.350% 286,205 0.7878,490 Delta Air Lines 2007-1 A Pass
Through Trust 10.08.22/6.821% 56,419 0.15270,000 DirecTV Holdings 01.03.21/5.000% 193,417 0.53150,000 DISH DBS 01.09.19/7.875% 112,113 0.30265,000 Express Scripts 15.05.16/3.125% 184,812 0.50500,000 General Electric Capital 20.12.13/0.367%* 341,077 0.93105,000 Gilead Sciences 01.04.21/4.500% 73,016 0.20140,000 LG&E and KU Energy 144A 15.11.15/2.125% 94,392 0.26150,000 Nationwide Financial Services
144A 25.03.21/5.375% 105,403 0.29260,000 NBC Universal 144A 01.04.21/4.375% 177,922 0.48590,000 NBC Universal Media 144A 01.04.14/2.100% 413,680 1.12300,000 Oncor Electric Delivery 30.09.17/5.000% 225,534 0.61200,000 Reynolds Group Issuer 144A 15.04.19/7.125% 136,503 0.37375,000 Roche Holdings 144A 01.03.19/6.000% 299,440 0.81150,000 Rockies Express Pipeline 144A 15.04.15/3.900% 105,531 0.29125,000 State of Illinois 01.03.19/5.877% 88,889 0.24
405,000 US Treasury 10.11.11/0.000% 279,821 0.76300,000 Vail Resorts 144A 01.05.19/6.500% 208,384 0.57300,000 Valeant Pharmaceuticals
International 144A 15.07.22/7.250% 200,090 0.54320,000 Wells Fargo & Co. 15.06.16/3.676% 228,729 0.62300,000 Windstream 01.09.18/8.125% 220,747 0.60100,000 Xerox 16.05.14/1.081%* 69,645 0.19
4,831,190 13.12
NETHERLANDS550,000 ING Bank 144A 18.10.13/2.000% 379,035 1.03200,000 ING Bank 144A 15.03.16/4.000% 141,318 0.38300,000 Rabobank Nederland 10.01.14/1.850% 209,978 0.57160,000 Rabobank Nederland 144A 15.01.20/4.750% 116,632 0.32
846,963 2.30
SWEDEN600,000 Nordea Bank 144A 04.10.13/1.750% 415,250 1.13520,000 Svenska Handelsbanken 144A 10.06.14/4.875% 389,142 1.05
804,392 2.18
FRANCE425,000 BNP Paribas 23.02.16/3.600% 297,453 0.81145,000 French Treasury Bill 28.07.11/0.000% 144,551 0.39180,000 RCI Banque 144A 12.04.16/4.600% 127,586 0.35300,000 Société Générale 144A 15.04.21/5.200% 203,233 0.55
772,823 2.10
UNITED KINGDOM175,000 PPL WEM Holdings 144A 01.05.21/5.375% 125,540 0.34
405,000 HSBC Bank 144A 24.05.16/3.100% 279,626 0.76
405,166 1.10
CAYMAN ISLANDS500,000 Hutchison Whampoa
International 03/13 144A 13.02.13/6.500% 372,559 1.01
372,559 1.01
ITALY200,000 Intesa Sanpaolo 144A 12.08.15/3.625% 134,701 0.37295,000 Intesa Sanpaolo 144A 24.02.21/6.500% 211,874 0.57
346,575 0.94
CANADA380,000 Barrick Gold 144A 30.05.16/2.900% 264,022 0.72
264,022 0.72
IRELAND200,000 Ardagh Packaging Finance 144A 15.10.17/7.375% 142,378 0.39
142,378 0.39
Total Bonds 9,003,948 24.45
Total Transferable Securities Dealt in on AnotherRegulated Market
9,003,948 24.45
Total Investments 31,675,751 86.02
Cash 3,894,498 10.58
Other Assets/(Liabilities) 1,253,061 3.40
Total Net Assets 36,823,310 100.00
* Variable coupon rates are those quoted as at 30 June 2011.
258
JPMorgan Funds - Global Duration-Hedged Corporate Bond FundSchedule of Investments (Market Value Expressed in EUR) (continued)
As at 30 June 2011
Quantity/Nominal
Value
Name of Securities Maturity/Coupon
MarketValue
%of
NetAssets
Quantity/Nominal
Value
Name of Securities Maturity/Coupon
MarketValue
%of
NetAssets
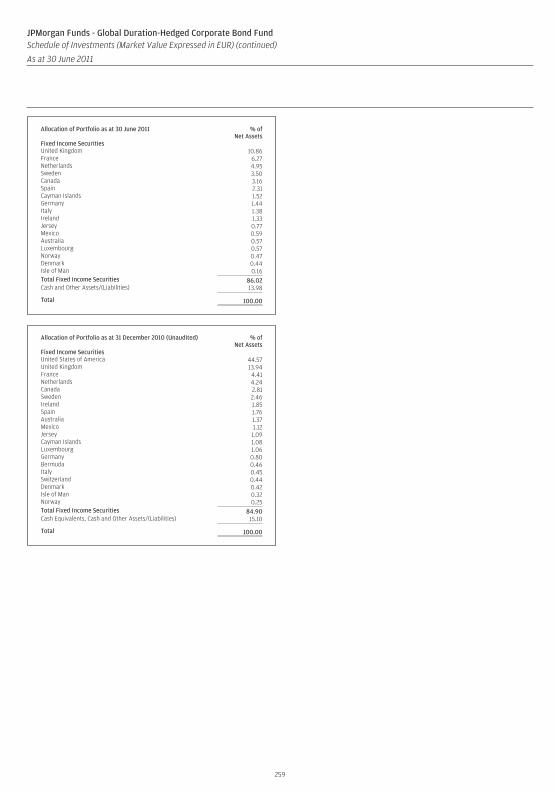
Allocation of Portfolio as at 30 June 2011 % ofNet Assets
Fixed Income SecuritiesUnited Kingdom 10.86France 6.27Netherlands 4.95Sweden 3.50Canada 3.16Spain 2.31Cayman Islands 1.52Germany 1.44Italy 1.38Ireland 1.33Jersey 0.77Mexico 0.59Australia 0.57Luxembourg 0.57Norway 0.47Denmark 0.44Isle of Man 0.16Total Fixed Income Securities 86.02Cash and Other Assets/(Liabilities) 13.98
Total 100.00
Allocation of Portfolio as at 31 December 2010 (Unaudited) % ofNet Assets
Fixed Income SecuritiesUnited States of America 44.57United Kingdom 13.94France 4.41Netherlands 4.24Canada 2.81Sweden 2.46Ireland 1.85Spain 1.76Australia 1.37Mexico 1.12Jersey 1.09Cayman Islands 1.08Luxembourg 1.06Germany 0.80Bermuda 0.46Italy 0.45Switzerland 0.44Denmark 0.42Isle of Man 0.32Norway 0.25Total Fixed Income Securities 84.90Cash Equivalents, Cash and Other Assets/(Liabilities) 15.10
Total 100.00
259
JPMorgan Funds - Global Duration-Hedged Corporate Bond FundSchedule of Investments (Market Value Expressed in EUR) (continued)
As at 30 June 2011
Quantity/Nominal
Value
Name of Securities Maturity/Coupon
MarketValue
%of
NetAssets
Quantity/Nominal
Value
Name of Securities Maturity/Coupon
MarketValue
%of
NetAssets
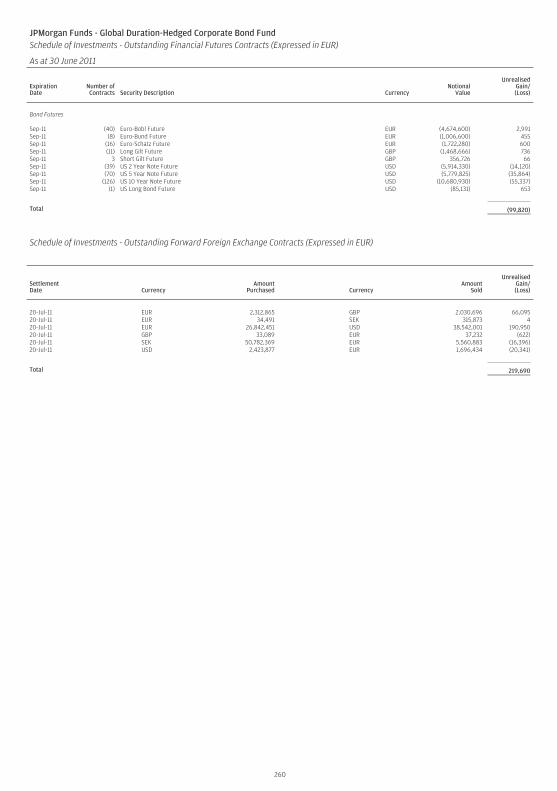
JPMorgan Funds - Global Duration-Hedged Corporate Bond FundSchedule of Investments - Outstanding Financial Futures Contracts (Expressed in EUR)
As at 30 June 2011
ExpirationDate
Number ofContracts Security Description Currency
NotionalValue
UnrealisedGain/(Loss)
Bond Futures
Sep-11 (40) Euro-Bobl Future EUR (4,674,600) 2,991Sep-11 (8) Euro-Bund Future EUR (1,006,600) 455Sep-11 (16) Euro-Schatz Future EUR (1,722,280) 600Sep-11 (11) Long Gilt Future GBP (1,468,666) 736Sep-11 3 Short Gilt Future GBP 356,726 66Sep-11 (39) US 2 Year Note Future USD (5,914,330) (14,120)Sep-11 (70) US 5 Year Note Future USD (5,779,825) (35,864)Sep-11 (126) US 10 Year Note Future USD (10,680,930) (55,337)Sep-11 (1) US Long Bond Future USD (85,131) 653
Total (99,820)
Schedule of Investments - Outstanding Forward Foreign Exchange Contracts (Expressed in EUR)
SettlementDate Currency
AmountPurchased Currency
AmountSold
UnrealisedGain/(Loss)
20-Jul-11 EUR 2,312,865 GBP 2,030,696 66,09520-Jul-11 EUR 34,491 SEK 315,873 420-Jul-11 EUR 26,842,451 USD 38,542,001 190,95020-Jul-11 GBP 33,089 EUR 37,232 (622)20-Jul-11 SEK 50,782,369 EUR 5,560,883 (16,396)20-Jul-11 USD 2,423,877 EUR 1,696,434 (20,341)
Total 219,690
260
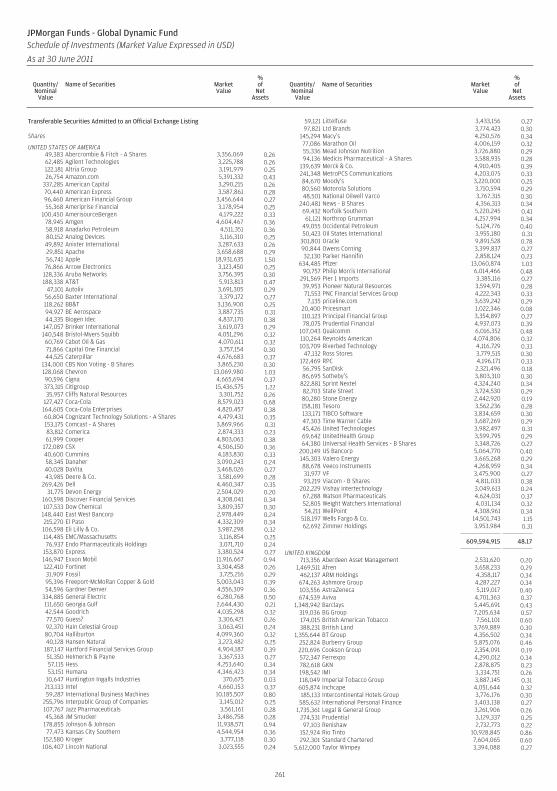
Transferable Securities Admitted to an Official Exchange Listing
Shares
UNITED STATES OF AMERICA49,383 Abercrombie & Fitch - A Shares 3,356,069 0.2662,485 Agilent Technologies 3,225,788 0.26122,181 Altria Group 3,191,979 0.2526,754 Amazon.com 5,391,332 0.43
337,285 American Capital 3,290,215 0.2670,440 American Express 3,587,861 0.2896,460 American Financial Group 3,456,644 0.2755,368 Ameriprise Financial 3,178,954 0.25
100,450 AmerisourceBergen 4,179,222 0.3378,945 Amgen 4,604,467 0.3658,918 Anadarko Petroleum 4,511,351 0.3680,152 Analog Devices 3,116,310 0.2549,892 Anixter International 3,287,633 0.2629,851 Apache 3,658,688 0.2956,741 Apple 18,931,635 1.5076,866 Arrow Electronics 3,123,450 0.25
128,336 Aruba Networks 3,756,395 0.30188,338 AT&T 5,913,813 0.47
47,101 Autoliv 3,691,305 0.2956,650 Baxter International 3,379,172 0.27118,262 BB&T 3,136,900 0.2594,927 BE Aerospace 3,887,735 0.3144,335 Biogen Idec 4,837,170 0.38
147,057 Brinker International 3,619,073 0.29140,548 Bristol-Myers Squibb 4,051,296 0.3260,769 Cabot Oil & Gas 4,070,611 0.3271,866 Capital One Financial 3,757,154 0.3044,525 Caterpillar 4,676,683 0.37
134,000 CBS Non Voting - B Shares 3,865,230 0.30128,068 Chevron 13,069,980 1.0390,596 Cigna 4,665,694 0.37373,315 Citigroup 15,436,575 1.2235,957 Cliffs Natural Resources 3,301,752 0.26
127,427 Coca-Cola 8,579,023 0.68164,605 Coca-Cola Enterprises 4,820,457 0.3860,804 Cognizant Technology Solutions - A Shares 4,479,431 0.35153,175 Comcast - A Shares 3,869,966 0.3183,812 Comerica 2,874,333 0.2361,999 Cooper 4,803,063 0.38
172,089 CSX 4,506,150 0.3640,600 Cummins 4,183,830 0.3358,345 Danaher 3,090,243 0.2440,028 DaVita 3,468,026 0.2743,985 Deere & Co. 3,581,699 0.28
269,426 Dell 4,460,347 0.3531,775 Devon Energy 2,504,029 0.20
160,598 Discover Financial Services 4,308,041 0.34107,533 Dow Chemical 3,809,357 0.30
148,440 East West Bancorp 2,978,449 0.24215,270 El Paso 4,332,309 0.34106,598 Eli Lilly & Co. 3,987,298 0.32114,485 EMC/Massachusetts 3,116,854 0.2576,937 Endo Pharmaceuticals Holdings 3,071,710 0.24
153,870 Express 3,380,524 0.27146,947 Exxon Mobil 11,916,667 0.94122,410 Fortinet 3,304,458 0.2631,909 Fossil 3,725,216 0.2995,396 Freeport-McMoRan Copper & Gold 5,003,043 0.3954,596 Gardner Denver 4,556,309 0.36
334,885 General Electric 6,280,768 0.50111,650 Georgia Gulf 2,644,430 0.2142,544 Goodrich 4,035,298 0.3277,570 Guess? 3,306,421 0.2692,370 Hain Celestial Group 3,063,451 0.2480,704 Halliburton 4,099,360 0.3240,128 Hansen Natural 3,223,482 0.25
187,147 Hartford Financial Services Group 4,904,187 0.3951,350 Helmerich & Payne 3,367,533 0.2757,115 Hess 4,253,640 0.3453,151 Humana 4,346,423 0.34
10,647 Huntington Ingalls Industries 370,675 0.03213,133 Intel 4,660,153 0.3759,287 International Business Machines 10,185,507 0.80
255,796 Interpublic Group of Companies 3,145,012 0.25107,767 Jazz Pharmaceuticals 3,561,161 0.2845,368 JM Smucker 3,486,758 0.28
178,855 Johnson & Johnson 11,938,571 0.9477,473 Kansas City Southern 4,544,954 0.36
152,580 Kroger 3,777,118 0.30106,407 Lincoln National 3,023,555 0.24
59,121 Littelfuse 3,433,156 0.2797,821 Ltd Brands 3,774,423 0.30
145,294 Macy’s 4,250,576 0.3477,086 Marathon Oil 4,006,159 0.3255,336 Mead Johnson Nutrition 3,726,880 0.2994,136 Medicis Pharmaceutical - A Shares 3,588,935 0.28
139,639 Merck & Co. 4,910,405 0.39241,348 MetroPCS Communications 4,203,075 0.3384,670 Moody’s 3,220,000 0.2580,560 Motorola Solutions 3,710,594 0.2948,501 National Oilwell Varco 3,767,315 0.30
240,481 News - B Shares 4,356,313 0.3469,432 Norfolk Southern 5,220,245 0.4161,121 Northrop Grumman 4,257,994 0.34
49,055 Occidental Petroleum 5,124,776 0.4050,423 Oil States International 3,955,180 0.31
301,801 Oracle 9,891,528 0.7890,844 Owens Corning 3,399,837 0.2732,130 Parker Hannifin 2,858,124 0.23
634,485 Pfizer 13,060,874 1.0390,757 Philip Morris International 6,014,466 0.48
291,569 Pier 1 Imports 3,385,116 0.2739,953 Pioneer Natural Resources 3,594,971 0.2871,553 PNC Financial Services Group 4,222,343 0.337,135 priceline.com 3,639,242 0.29
20,400 Pricesmart 1,022,346 0.08110,123 Principal Financial Group 3,354,897 0.2778,075 Prudential Financial 4,937,073 0.39
107,043 Qualcomm 6,016,352 0.48110,264 Reynolds American 4,074,806 0.32103,709 Riverbed Technology 4,116,729 0.33
47,132 Ross Stores 3,779,515 0.30172,469 RPC 4,196,171 0.3356,795 SanDisk 2,321,496 0.1886,695 Sotheby’s 3,803,310 0.30
822,881 Sprint Nextel 4,324,240 0.3482,703 State Street 3,724,530 0.2980,280 Stone Energy 2,442,920 0.19158,181 Tesoro 3,562,236 0.28133,171 TIBCO Software 3,834,659 0.3047,303 Time Warner Cable 3,687,269 0.2945,426 United Technologies 3,982,497 0.3169,642 UnitedHealth Group 3,599,795 0.2964,380 Universal Health Services - B Shares 3,348,726 0.27
200,149 US Bancorp 5,064,770 0.40145,303 Valero Energy 3,665,268 0.2988,678 Veeco Instruments 4,268,959 0.3431,977 VF 3,475,900 0.2793,219 Viacom - B Shares 4,811,033 0.38
202,229 Vishay Intertechnology 3,049,613 0.2467,288 Watson Pharmaceuticals 4,624,031 0.3752,805 Weight Watchers International 4,031,134 0.3254,211 WellPoint 4,308,961 0.34
518,197 Wells Fargo & Co. 14,501,743 1.1562,692 Zimmer Holdings 3,953,984 0.31
609,594,915 48.17
UNITED KINGDOM713,356 Aberdeen Asset Management 2,531,620 0.20
1,469,511 Afren 3,658,233 0.29462,137 ARM Holdings 4,358,117 0.34674,263 Ashmore Group 4,287,227 0.34103,556 AstraZeneca 5,119,017 0.40674,539 Aviva 4,701,363 0.37
1,348,942 Barclays 5,445,691 0.43319,036 BG Group 7,205,634 0.57174,015 British American Tobacco 7,561,101 0.60388,231 British Land 3,769,889 0.30
1,355,644 BT Group 4,356,502 0.34252,824 Burberry Group 5,875,076 0.46220,696 Cookson Group 2,354,091 0.19572,347 Ferrexpo 4,290,012 0.34782,618 GKN 2,878,875 0.23198,542 IMI 3,334,751 0.26118,049 Imperial Tobacco Group 3,887,145 0.31605,874 Inchcape 4,051,644 0.32185,133 Intercontinental Hotels Group 3,776,176 0.30585,632 International Personal Finance 3,403,138 0.27
1,735,361 Legal & General Group 3,261,906 0.26274,531 Prudential 3,129,337 0.2597,103 Renishaw 2,732,773 0.22
152,924 Rio Tinto 10,928,845 0.86292,301 Standard Chartered 7,604,065 0.60
5,612,000 Taylor Wimpey 3,394,088 0.27
261
JPMorgan Funds - Global Dynamic FundSchedule of Investments (Market Value Expressed in USD)
As at 30 June 2011
Quantity/Nominal
Value
Name of Securities MarketValue
%of
NetAssets
Quantity/Nominal
Value
Name of Securities MarketValue
%of
NetAssets
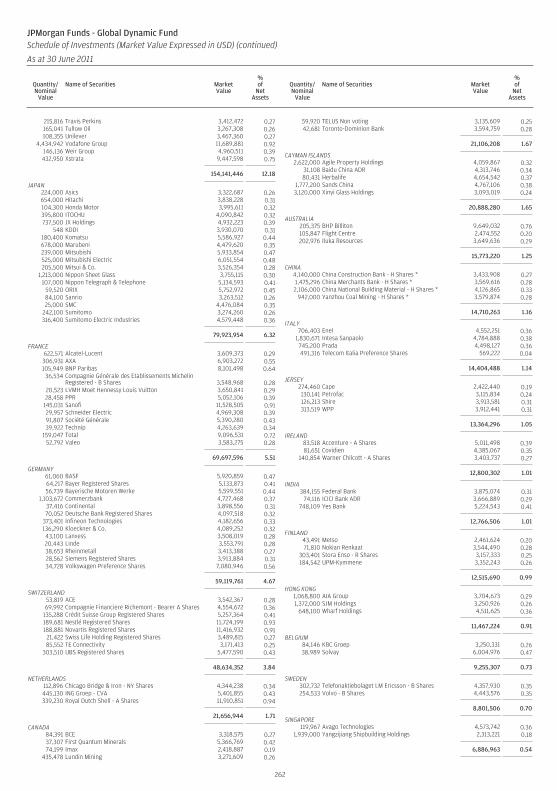
215,816 Travis Perkins 3,412,472 0.27165,041 Tullow Oil 3,267,308 0.26108,355 Unilever 3,467,360 0.27
4,434,942 Vodafone Group 11,689,881 0.92146,136 Weir Group 4,960,511 0.39432,950 Xstrata 9,447,598 0.75
154,141,446 12.18
JAPAN224,000 Asics 3,322,687 0.26654,000 Hitachi 3,838,228 0.31104,300 Honda Motor 3,995,611 0.32395,800 ITOCHU 4,090,842 0.32737,500 JX Holdings 4,932,223 0.39
548 KDDI 3,930,070 0.31180,400 Komatsu 5,586,927 0.44678,000 Marubeni 4,479,620 0.35239,000 Mitsubishi 5,933,854 0.47525,000 Mitsubishi Electric 6,051,554 0.48205,500 Mitsui & Co. 3,526,354 0.28
1,213,000 Nippon Sheet Glass 3,755,115 0.30107,000 Nippon Telegraph & Telephone 5,134,593 0.41
59,520 ORIX 5,752,972 0.4584,100 Sanrio 3,263,512 0.2625,000 SMC 4,476,084 0.35
242,100 Sumitomo 3,274,260 0.26316,400 Sumitomo Electric Industries 4,579,448 0.36
79,923,954 6.32
FRANCE622,571 Alcatel-Lucent 3,609,373 0.29306,931 AXA 6,903,272 0.55105,949 BNP Paribas 8,101,498 0.64
36,534 Compagnie Générale des Etablissements MichelinRegistered - B Shares 3,548,968 0.28
20,523 LVMH Moet Hennessy Louis Vuitton 3,650,841 0.2928,458 PPR 5,052,106 0.39
145,031 Sanofi 11,528,505 0.9129,957 Schneider Electric 4,969,308 0.3991,807 Société Générale 5,390,280 0.4339,922 Technip 4,263,639 0.34
159,047 Total 9,096,531 0.7252,792 Valeo 3,583,275 0.28
69,697,596 5.51
GERMANY61,060 BASF 5,920,859 0.4764,217 Bayer Registered Shares 5,133,873 0.4156,739 Bayerische Motoren Werke 5,599,551 0.44
1,103,672 Commerzbank 4,727,468 0.3737,416 Continental 3,898,556 0.3170,052 Deutsche Bank Registered Shares 4,097,518 0.32
373,401 Infineon Technologies 4,182,656 0.33136,290 Kloeckner & Co. 4,089,252 0.3243,100 Lanxess 3,508,019 0.2820,443 Linde 3,553,791 0.2838,653 Rheinmetall 3,413,388 0.2728,562 Siemens Registered Shares 3,913,884 0.3134,728 Volkswagen Preference Shares 7,080,946 0.56
59,119,761 4.67
SWITZERLAND53,819 ACE 3,542,367 0.2869,992 Compagnie Financiere Richemont - Bearer A Shares 4,554,672 0.36
135,288 Crédit Suisse Group Registered Shares 5,257,364 0.41189,681 Nestlé Registered Shares 11,724,199 0.93188,881 Novartis Registered Shares 11,416,932 0.91
21,422 Swiss Life Holding Registered Shares 3,489,815 0.2785,552 TE Connectivity 3,171,413 0.25
303,510 UBS Registered Shares 5,477,590 0.43
48,634,352 3.84
NETHERLANDS112,896 Chicago Bridge & Iron - NY Shares 4,344,238 0.34445,130 ING Groep - CVA 5,401,855 0.43339,230 Royal Dutch Shell - A Shares 11,910,851 0.94
21,656,944 1.71
CANADA84,391 BCE 3,318,575 0.2737,307 First Quantum Minerals 5,366,769 0.4274,199 Imax 2,418,887 0.19
435,478 Lundin Mining 3,271,609 0.26
59,920 TELUS Non voting 3,135,609 0.2542,681 Toronto-Dominion Bank 3,594,759 0.28
21,106,208 1.67
CAYMAN ISLANDS2,622,000 Agile Property Holdings 4,059,867 0.32
31,108 Baidu China ADR 4,313,746 0.3480,431 Herbalife 4,654,542 0.37
1,777,200 Sands China 4,767,106 0.383,120,000 Xinyi Glass Holdings 3,093,019 0.24
20,888,280 1.65
AUSTRALIA205,375 BHP Billiton 9,649,032 0.76105,847 Flight Centre 2,474,552 0.20202,976 Iluka Resources 3,649,636 0.29
15,773,220 1.25
CHINA4,140,000 China Construction Bank - H Shares * 3,433,908 0.271,475,296 China Merchants Bank - H Shares * 3,569,616 0.282,106,000 China National Building Material - H Shares * 4,126,865 0.33
942,000 Yanzhou Coal Mining - H Shares * 3,579,874 0.28
14,710,263 1.16
ITALY706,403 Enel 4,552,251 0.36
1,830,671 Intesa Sanpaolo 4,784,888 0.38745,200 Prada 4,498,127 0.36491,316 Telecom Italia Preference Shares 569,222 0.04
14,404,488 1.14
JERSEY274,460 Cape 2,422,440 0.19130,141 Petrofac 3,115,834 0.24126,213 Shire 3,913,581 0.31313,519 WPP 3,912,441 0.31
13,364,296 1.05
IRELAND83,518 Accenture - A Shares 5,011,498 0.3981,651 Covidien 4,385,067 0.35
140,854 Warner Chilcott - A Shares 3,403,737 0.27
12,800,302 1.01
INDIA384,155 Federal Bank 3,875,074 0.31
74,116 ICICI Bank ADR 3,666,889 0.29748,109 Yes Bank 5,224,543 0.41
12,766,506 1.01
FINLAND43,491 Metso 2,461,624 0.2071,810 Nokian Renkaat 3,544,490 0.28
303,401 Stora Enso - R Shares 3,157,333 0.25184,542 UPM-Kymmene 3,352,243 0.26
12,515,690 0.99
HONG KONG1,068,800 AIA Group 3,704,673 0.291,372,000 SJM Holdings 3,250,926 0.26
648,100 Wharf Holdings 4,511,625 0.36
11,467,224 0.91
BELGIUM84,146 KBC Groep 3,250,331 0.2638,989 Solvay 6,004,976 0.47
9,255,307 0.73
SWEDEN302,732 Telefonaktiebolaget LM Ericsson - B Shares 4,357,930 0.35254,533 Volvo - B Shares 4,443,576 0.35
8,801,506 0.70
SINGAPORE119,967 Avago Technologies 4,573,742 0.36
1,939,000 Yangzijiang Shipbuilding Holdings 2,313,221 0.18
6,886,963 0.54
262
JPMorgan Funds - Global Dynamic FundSchedule of Investments (Market Value Expressed in USD) (continued)
As at 30 June 2011
Quantity/Nominal
Value
Name of Securities MarketValue
%of
NetAssets
Quantity/Nominal
Value
Name of Securities MarketValue
%of
NetAssets
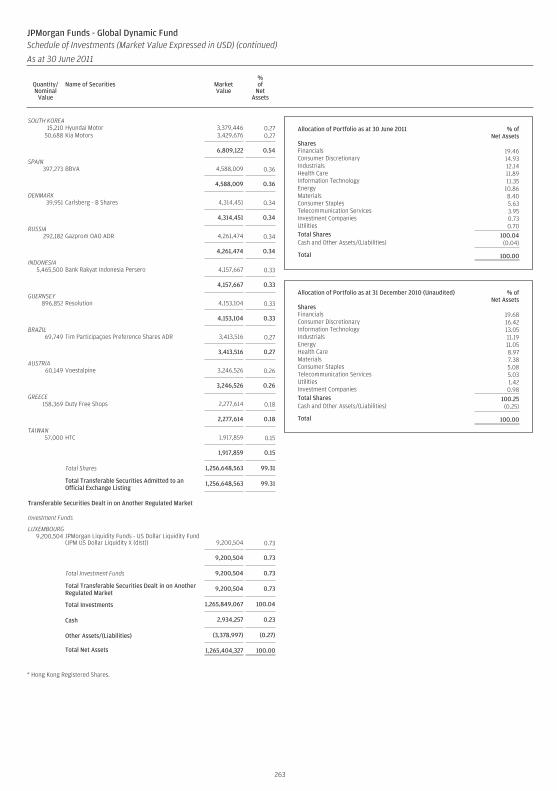
SOUTH KOREA15,210 Hyundai Motor 3,379,446 0.27
50,688 Kia Motors 3,429,676 0.27
6,809,122 0.54
SPAIN397,273 BBVA 4,588,009 0.36
4,588,009 0.36
DENMARK39,951 Carlsberg - B Shares 4,314,451 0.34
4,314,451 0.34
RUSSIA292,182 Gazprom OAO ADR 4,261,474 0.34
4,261,474 0.34
INDONESIA5,465,500 Bank Rakyat Indonesia Persero 4,157,667 0.33
4,157,667 0.33
GUERNSEY896,852 Resolution 4,153,104 0.33
4,153,104 0.33
BRAZIL69,749 Tim Participaçoes Preference Shares ADR 3,413,516 0.27
3,413,516 0.27
AUSTRIA60,149 Voestalpine 3,246,526 0.26
3,246,526 0.26
GREECE158,369 Duty Free Shops 2,277,614 0.18
2,277,614 0.18
TAIWAN57,000 HTC 1,917,859 0.15
1,917,859 0.15
Total Shares 1,256,648,563 99.31
Total Transferable Securities Admitted to anOfficial Exchange Listing
1,256,648,563 99.31
Transferable Securities Dealt in on Another Regulated Market
Investment Funds
LUXEMBOURG9,200,504 JPMorgan Liquidity Funds - US Dollar Liquidity Fund
(JPM US Dollar Liquidity X (dist)) 9,200,504 0.73
9,200,504 0.73
Total Investment Funds 9,200,504 0.73
Total Transferable Securities Dealt in on AnotherRegulated Market
9,200,504 0.73
Total Investments 1,265,849,067 100.04
Cash 2,934,257 0.23
Other Assets/(Liabilities) (3,378,997) (0.27)
Total Net Assets 1,265,404,327 100.00
* Hong Kong Registered Shares.
Allocation of Portfolio as at 30 June 2011 % ofNet Assets
SharesFinancials 19.46Consumer Discretionary 14.93Industrials 12.14Health Care 11.89Information Technology 11.35Energy 10.86Materials 8.40Consumer Staples 5.63Telecommunication Services 3.95Investment Companies 0.73Utilities 0.70Total Shares 100.04Cash and Other Assets/(Liabilities) (0.04)
Total 100.00
Allocation of Portfolio as at 31 December 2010 (Unaudited) % ofNet Assets
SharesFinancials 19.68Consumer Discretionary 16.42Information Technology 13.05Industrials 11.19Energy 11.05Health Care 8.97Materials 7.38Consumer Staples 5.08Telecommunication Services 5.03Utilities 1.42Investment Companies 0.98Total Shares 100.25Cash and Other Assets/(Liabilities) (0.25)
Total 100.00
263
JPMorgan Funds - Global Dynamic FundSchedule of Investments (Market Value Expressed in USD) (continued)
As at 30 June 2011
Quantity/Nominal
Value
Name of Securities MarketValue
%of
NetAssets
Quantity/Nominal
Value
Name of Securities MarketValue
%of
NetAssets
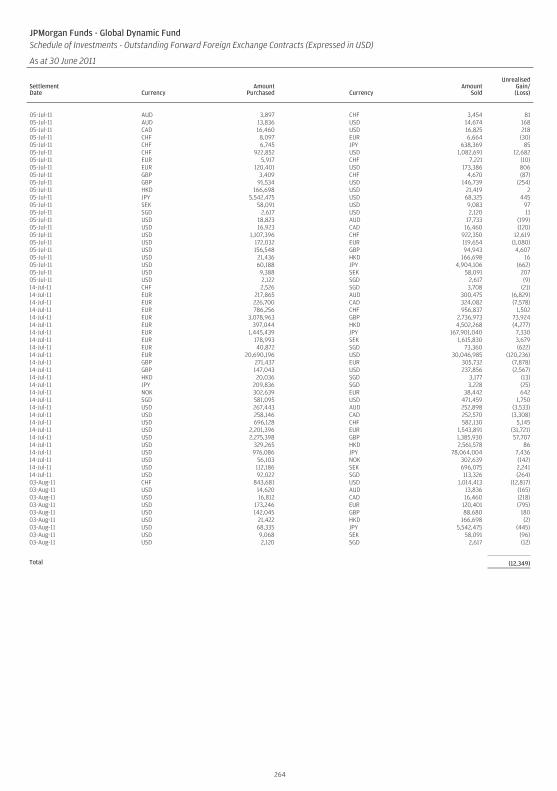
JPMorgan Funds - Global Dynamic FundSchedule of Investments - Outstanding Forward Foreign Exchange Contracts (Expressed in USD)
As at 30 June 2011
SettlementDate Currency
AmountPurchased Currency
AmountSold
UnrealisedGain/(Loss)
05-Jul-11 AUD 3,897 CHF 3,454 8105-Jul-11 AUD 13,836 USD 14,674 16805-Jul-11 CAD 16,460 USD 16,825 21805-Jul-11 CHF 8,097 EUR 6,664 (30)05-Jul-11 CHF 6,745 JPY 638,369 8505-Jul-11 CHF 922,852 USD 1,082,691 12,68205-Jul-11 EUR 5,917 CHF 7,221 (10)05-Jul-11 EUR 120,401 USD 173,386 80605-Jul-11 GBP 3,409 CHF 4,670 (87)05-Jul-11 GBP 91,534 USD 146,739 (254)05-Jul-11 HKD 166,698 USD 21,419 205-Jul-11 JPY 5,542,475 USD 68,325 44505-Jul-11 SEK 58,091 USD 9,083 9705-Jul-11 SGD 2,617 USD 2,120 1105-Jul-11 USD 18,823 AUD 17,733 (199)05-Jul-11 USD 16,923 CAD 16,460 (120)05-Jul-11 USD 1,107,396 CHF 922,350 12,61905-Jul-11 USD 172,032 EUR 119,654 (1,080)05-Jul-11 USD 156,548 GBP 94,943 4,60705-Jul-11 USD 21,436 HKD 166,698 1605-Jul-11 USD 60,188 JPY 4,904,106 (662)05-Jul-11 USD 9,388 SEK 58,091 20705-Jul-11 USD 2,122 SGD 2,617 (9)14-Jul-11 CHF 2,526 SGD 3,708 (21)14-Jul-11 EUR 217,865 AUD 300,475 (6,829)14-Jul-11 EUR 226,700 CAD 324,082 (7,578)14-Jul-11 EUR 786,256 CHF 956,837 1,50214-Jul-11 EUR 3,078,963 GBP 2,736,973 73,92414-Jul-11 EUR 397,044 HKD 4,502,268 (4,277)14-Jul-11 EUR 1,445,439 JPY 167,901,040 7,33014-Jul-11 EUR 178,993 SEK 1,615,830 3,67914-Jul-11 EUR 40,872 SGD 73,360 (622)14-Jul-11 EUR 20,690,196 USD 30,046,985 (120,236)14-Jul-11 GBP 271,437 EUR 305,732 (7,878)14-Jul-11 GBP 147,043 USD 237,856 (2,567)14-Jul-11 HKD 20,036 SGD 3,177 (13)14-Jul-11 JPY 209,836 SGD 3,228 (25)14-Jul-11 NOK 302,639 EUR 38,442 64214-Jul-11 SGD 581,095 USD 471,459 1,75014-Jul-11 USD 267,443 AUD 252,898 (3,533)14-Jul-11 USD 258,146 CAD 252,570 (3,308)14-Jul-11 USD 696,128 CHF 582,130 5,14514-Jul-11 USD 2,201,396 EUR 1,543,891 (31,721)14-Jul-11 USD 2,275,398 GBP 1,385,930 57,70714-Jul-11 USD 329,265 HKD 2,561,578 8614-Jul-11 USD 976,086 JPY 78,064,004 7,43614-Jul-11 USD 56,103 NOK 302,639 (142)14-Jul-11 USD 112,186 SEK 696,075 2,24114-Jul-11 USD 92,022 SGD 113,326 (264)03-Aug-11 CHF 843,681 USD 1,014,413 (12,817)03-Aug-11 USD 14,620 AUD 13,836 (165)03-Aug-11 USD 16,812 CAD 16,460 (218)03-Aug-11 USD 173,246 EUR 120,401 (795)03-Aug-11 USD 142,045 GBP 88,680 18003-Aug-11 USD 21,422 HKD 166,698 (2)03-Aug-11 USD 68,335 JPY 5,542,475 (445)03-Aug-11 USD 9,068 SEK 58,091 (96)03-Aug-11 USD 2,120 SGD 2,617 (12)
Total (12,349)
264
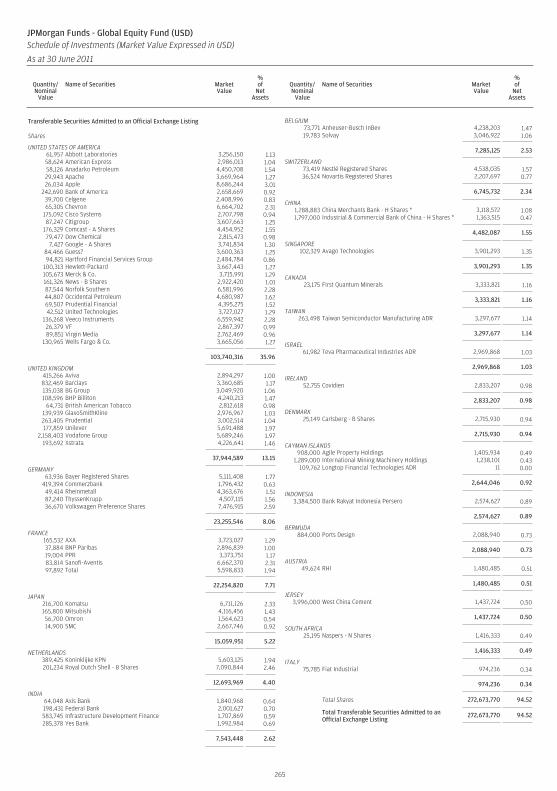
Transferable Securities Admitted to an Official Exchange Listing
Shares
UNITED STATES OF AMERICA61,957 Abbott Laboratories 3,256,150 1.1358,624 American Express 2,986,013 1.0458,126 Anadarko Petroleum 4,450,708 1.5429,943 Apache 3,669,964 1.2726,034 Apple 8,686,244 3.01
242,690 Bank of America 2,658,669 0.9239,700 Celgene 2,408,996 0.8365,305 Chevron 6,664,702 2.31
175,092 Cisco Systems 2,707,798 0.9487,247 Citigroup 3,607,663 1.25
176,329 Comcast - A Shares 4,454,952 1.5579,477 Dow Chemical 2,815,473 0.98
7,427 Google - A Shares 3,741,834 1.3084,466 Guess? 3,600,363 1.2594,821 Hartford Financial Services Group 2,484,784 0.86
100,313 Hewlett-Packard 3,667,443 1.27105,673 Merck & Co. 3,715,991 1.29161,326 News - B Shares 2,922,420 1.0187,544 Norfolk Southern 6,581,996 2.2844,807 Occidental Petroleum 4,680,987 1.6269,507 Prudential Financial 4,395,275 1.5242,512 United Technologies 3,727,027 1.29
136,268 Veeco Instruments 6,559,942 2.2826,379 VF 2,867,397 0.9989,851 Virgin Media 2,762,469 0.96
130,965 Wells Fargo & Co. 3,665,056 1.27
103,740,316 35.96
UNITED KINGDOM415,266 Aviva 2,894,297 1.00832,469 Barclays 3,360,685 1.17135,038 BG Group 3,049,920 1.06108,596 BHP Billiton 4,240,213 1.47
64,731 British American Tobacco 2,812,618 0.98139,939 GlaxoSmithKline 2,976,967 1.03263,405 Prudential 3,002,514 1.04177,859 Unilever 5,691,488 1.97
2,158,403 Vodafone Group 5,689,246 1.97193,692 Xstrata 4,226,641 1.46
37,944,589 13.15
GERMANY63,936 Bayer Registered Shares 5,111,408 1.77
419,394 Commerzbank 1,796,432 0.6349,414 Rheinmetall 4,363,676 1.5187,240 ThyssenKrupp 4,507,115 1.5636,670 Volkswagen Preference Shares 7,476,915 2.59
23,255,546 8.06
FRANCE165,532 AXA 3,723,027 1.2937,884 BNP Paribas 2,896,839 1.0019,004 PPR 3,373,751 1.1783,814 Sanofi-Aventis 6,662,370 2.3197,892 Total 5,598,833 1.94
22,254,820 7.71
JAPAN216,700 Komatsu 6,711,126 2.33165,800 Mitsubishi 4,116,456 1.4356,700 Omron 1,564,623 0.5414,900 SMC 2,667,746 0.92
15,059,951 5.22
NETHERLANDS389,425 Koninklijke KPN 5,603,125 1.94201,234 Royal Dutch Shell - B Shares 7,090,844 2.46
12,693,969 4.40
INDIA64,048 Axis Bank 1,840,968 0.64198,431 Federal Bank 2,001,627 0.70583,745 Infrastructure Development Finance 1,707,869 0.59285,378 Yes Bank 1,992,984 0.69
7,543,448 2.62
BELGIUM73,771 Anheuser-Busch InBev 4,238,203 1.4719,783 Solvay 3,046,922 1.06
7,285,125 2.53
SWITZERLAND73,419 Nestlé Registered Shares 4,538,035 1.5736,524 Novartis Registered Shares 2,207,697 0.77
6,745,732 2.34
CHINA1,288,883 China Merchants Bank - H Shares * 3,118,572 1.081,797,000 Industrial & Commercial Bank of China - H Shares * 1,363,515 0.47
4,482,087 1.55
SINGAPORE102,329 Avago Technologies 3,901,293 1.35
3,901,293 1.35
CANADA23,175 First Quantum Minerals 3,333,821 1.16
3,333,821 1.16
TAIWAN263,498 Taiwan Semiconductor Manufacturing ADR 3,297,677 1.14
3,297,677 1.14
ISRAEL61,982 Teva Pharmaceutical Industries ADR 2,969,868 1.03
2,969,868 1.03
IRELAND52,755 Covidien 2,833,207 0.98
2,833,207 0.98
DENMARK25,149 Carlsberg - B Shares 2,715,930 0.94
2,715,930 0.94
CAYMAN ISLANDS908,000 Agile Property Holdings 1,405,934 0.49
1,289,000 International Mining Machinery Holdings 1,238,101 0.43109,762 Longtop Financial Technologies ADR 11 0.00
2,644,046 0.92
INDONESIA3,384,500 Bank Rakyat Indonesia Persero 2,574,627 0.89
2,574,627 0.89
BERMUDA884,000 Ports Design 2,088,940 0.73
2,088,940 0.73
AUSTRIA49,624 RHI 1,480,485 0.51
1,480,485 0.51
JERSEY3,996,000 West China Cement 1,437,724 0.50
1,437,724 0.50
SOUTH AFRICA25,195 Naspers - N Shares 1,416,333 0.49
1,416,333 0.49
ITALY75,785 Fiat Industrial 974,236 0.34
974,236 0.34
Total Shares 272,673,770 94.52
Total Transferable Securities Admitted to anOfficial Exchange Listing
272,673,770 94.52
265
JPMorgan Funds - Global Equity Fund (USD)Schedule of Investments (Market Value Expressed in USD)
As at 30 June 2011
Quantity/Nominal
Value
Name of Securities MarketValue
%of
NetAssets
Quantity/Nominal
Value
Name of Securities MarketValue
%of
NetAssets
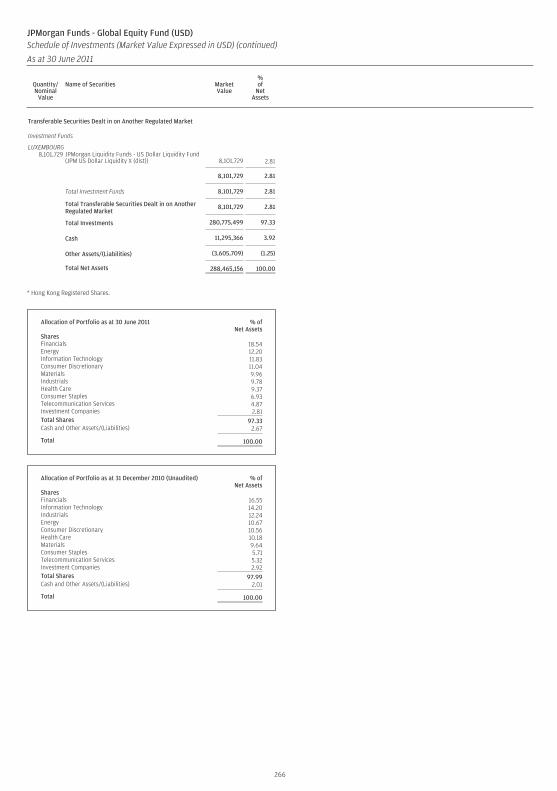
Transferable Securities Dealt in on Another Regulated Market
Investment Funds
LUXEMBOURG8,101,729 JPMorgan Liquidity Funds - US Dollar Liquidity Fund
(JPM US Dollar Liquidity X (dist)) 8,101,729 2.81
8,101,729 2.81
Total Investment Funds 8,101,729 2.81
Total Transferable Securities Dealt in on AnotherRegulated Market
8,101,729 2.81
Total Investments 280,775,499 97.33
Cash 11,295,366 3.92
Other Assets/(Liabilities) (3,605,709) (1.25)
Total Net Assets 288,465,156 100.00
* Hong Kong Registered Shares.
Allocation of Portfolio as at 30 June 2011 % ofNet Assets
SharesFinancials 18.54Energy 12.20Information Technology 11.83Consumer Discretionary 11.04Materials 9.96Industrials 9.78Health Care 9.37Consumer Staples 6.93Telecommunication Services 4.87Investment Companies 2.81Total Shares 97.33Cash and Other Assets/(Liabilities) 2.67
Total 100.00
Allocation of Portfolio as at 31 December 2010 (Unaudited) % ofNet Assets
SharesFinancials 16.55Information Technology 14.20Industrials 12.24Energy 10.67Consumer Discretionary 10.56Health Care 10.18Materials 9.64Consumer Staples 5.71Telecommunication Services 5.32Investment Companies 2.92Total Shares 97.99Cash and Other Assets/(Liabilities) 2.01
Total 100.00
266
JPMorgan Funds - Global Equity Fund (USD)Schedule of Investments (Market Value Expressed in USD) (continued)
As at 30 June 2011
Quantity/Nominal
Value
Name of Securities MarketValue
%of
NetAssets
Quantity/Nominal
Value
Name of Securities MarketValue
%of
NetAssets
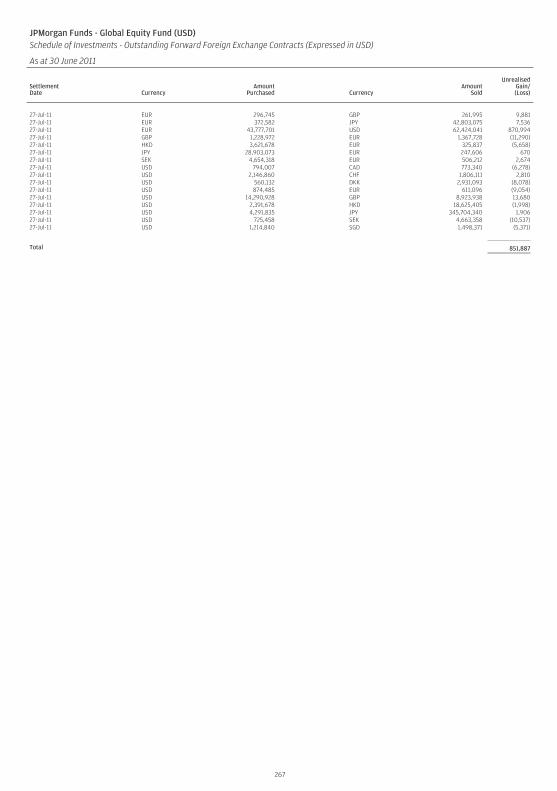
JPMorgan Funds - Global Equity Fund (USD)Schedule of Investments - Outstanding Forward Foreign Exchange Contracts (Expressed in USD)
As at 30 June 2011
SettlementDate Currency
AmountPurchased Currency
AmountSold
UnrealisedGain/(Loss)
27-Jul-11 EUR 296,745 GBP 261,995 9,88127-Jul-11 EUR 372,582 JPY 42,803,075 7,53627-Jul-11 EUR 43,777,701 USD 62,424,041 870,99427-Jul-11 GBP 1,228,972 EUR 1,367,728 (11,290)27-Jul-11 HKD 3,621,678 EUR 325,837 (5,658)27-Jul-11 JPY 28,903,073 EUR 247,606 67027-Jul-11 SEK 4,654,318 EUR 506,212 2,67427-Jul-11 USD 794,007 CAD 773,340 (6,278)27-Jul-11 USD 2,146,860 CHF 1,806,111 2,81027-Jul-11 USD 560,132 DKK 2,931,093 (8,078)27-Jul-11 USD 874,485 EUR 611,096 (9,054)27-Jul-11 USD 14,290,928 GBP 8,923,938 13,68027-Jul-11 USD 2,391,678 HKD 18,625,405 (1,998)27-Jul-11 USD 4,291,835 JPY 345,704,340 1,90627-Jul-11 USD 725,458 SEK 4,663,358 (10,537)27-Jul-11 USD 1,214,840 SGD 1,498,371 (5,371)
Total 851,887
267
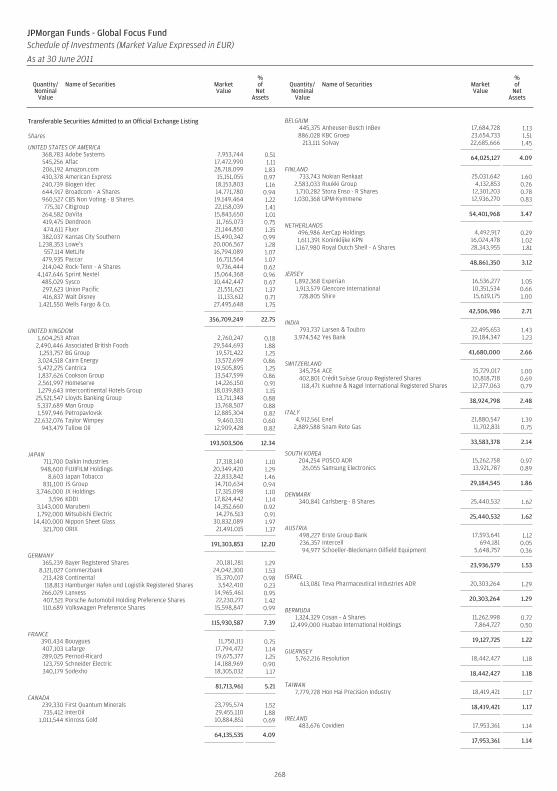
Transferable Securities Admitted to an Official Exchange Listing
Shares
UNITED STATES OF AMERICA368,783 Adobe Systems 7,953,744 0.51545,256 Aflac 17,472,990 1.11206,192 Amazon.com 28,718,099 1.83430,378 American Express 15,151,055 0.97240,739 Biogen Idec 18,153,803 1.16644,917 Broadcom - A Shares 14,771,780 0.94960,527 CBS Non Voting - B Shares 19,149,464 1.22775,317 Citigroup 22,158,039 1.41
264,582 DaVita 15,843,650 1.01419,475 Dendreon 11,765,073 0.75474,611 Fluor 21,144,850 1.35382,037 Kansas City Southern 15,490,342 0.99
1,238,353 Lowe’s 20,006,567 1.28557,114 MetLife 16,794,089 1.07
479,935 Paccar 16,711,564 1.07214,042 Rock-Tenn - A Shares 9,736,444 0.62
4,147,646 Sprint Nextel 15,064,368 0.96485,029 Sysco 10,442,447 0.67297,623 Union Pacific 21,551,621 1.37416,837 Walt Disney 11,133,612 0.71
1,421,550 Wells Fargo & Co. 27,495,648 1.75
356,709,249 22.75
UNITED KINGDOM1,604,253 Afren 2,760,247 0.18
2,490,446 Associated British Foods 29,544,693 1.881,253,757 BG Group 19,571,422 1.253,024,518 Cairn Energy 13,572,699 0.865,472,275 Centrica 19,505,895 1.251,837,626 Cookson Group 13,547,599 0.862,561,997 Homeserve 14,226,150 0.911,279,643 Intercontinental Hotels Group 18,039,883 1.15
25,521,547 Lloyds Banking Group 13,711,348 0.885,337,689 Man Group 13,768,507 0.881,597,946 Petropavlovsk 12,885,304 0.82
22,632,076 Taylor Wimpey 9,460,331 0.60943,479 Tullow Oil 12,909,428 0.82
193,503,506 12.34
JAPAN711,700 Daikin Industries 17,318,140 1.10
948,600 FUJIFILM Holdings 20,349,420 1.298,603 Japan Tobacco 22,833,842 1.46
831,100 JS Group 14,710,634 0.943,746,000 JX Holdings 17,315,098 1.10
3,596 KDDI 17,824,442 1.143,143,000 Marubeni 14,352,660 0.921,792,000 Mitsubishi Electric 14,276,513 0.91
14,410,000 Nippon Sheet Glass 30,832,089 1.97321,700 ORIX 21,491,015 1.37
191,303,853 12.20
GERMANY365,239 Bayer Registered Shares 20,181,281 1.29
8,121,027 Commerzbank 24,042,300 1.53213,428 Continental 15,370,017 0.98118,813 Hamburger Hafen und Logistik Registered Shares 3,542,410 0.23
266,029 Lanxess 14,965,461 0.95407,521 Porsche Automobil Holding Preference Shares 22,230,271 1.42110,689 Volkswagen Preference Shares 15,598,847 0.99
115,930,587 7.39
FRANCE390,434 Bouygues 11,750,111 0.75407,103 Lafarge 17,794,472 1.14289,025 Pernod-Ricard 19,675,377 1.25123,759 Schneider Electric 14,188,969 0.90340,179 Sodexho 18,305,032 1.17
81,713,961 5.21
CANADA239,330 First Quantum Minerals 23,795,574 1.52735,412 InterOil 29,455,110 1.88
1,011,544 Kinross Gold 10,884,851 0.69
64,135,535 4.09
BELGIUM445,375 Anheuser-Busch InBev 17,684,728 1.13886,028 KBC Groep 23,654,733 1.51
213,111 Solvay 22,685,666 1.45
64,025,127 4.09
FINLAND733,743 Nokian Renkaat 25,031,642 1.60
2,583,033 Ruukki Group 4,132,853 0.261,710,282 Stora Enso - R Shares 12,301,203 0.78
1,030,368 UPM-Kymmene 12,936,270 0.83
54,401,968 3.47
NETHERLANDS496,986 AerCap Holdings 4,492,917 0.291,611,391 Koninklijke KPN 16,024,478 1.02
1,167,980 Royal Dutch Shell - A Shares 28,343,955 1.81
48,861,350 3.12
JERSEY1,892,368 Experian 16,536,277 1.051,913,579 Glencore International 10,351,534 0.66728,805 Shire 15,619,175 1.00
42,506,986 2.71
INDIA793,737 Larsen & Toubro 22,495,653 1.43
3,974,542 Yes Bank 19,184,347 1.23
41,680,000 2.66
SWITZERLAND345,754 ACE 15,729,017 1.00402,801 Crédit Suisse Group Registered Shares 10,818,718 0.69118,471 Kuehne & Nagel International Registered Shares 12,377,063 0.79
38,924,798 2.48
ITALY4,912,561 Enel 21,880,547 1.39
2,889,588 Snam Rete Gas 11,702,831 0.75
33,583,378 2.14
SOUTH KOREA204,254 POSCO ADR 15,262,758 0.97
26,055 Samsung Electronics 13,921,787 0.89
29,184,545 1.86
DENMARK340,841 Carlsberg - B Shares 25,440,532 1.62
25,440,532 1.62
AUSTRIA498,227 Erste Group Bank 17,593,641 1.12236,357 Intercell 694,181 0.0594,977 Schoeller-Bleckmann Oilfield Equipment 5,648,757 0.36
23,936,579 1.53
ISRAEL613,081 Teva Pharmaceutical Industries ADR 20,303,264 1.29
20,303,264 1.29
BERMUDA1,324,329 Cosan - A Shares 11,262,998 0.72
12,499,000 Huabao International Holdings 7,864,727 0.50
19,127,725 1.22
GUERNSEY5,762,216 Resolution 18,442,427 1.18
18,442,427 1.18
TAIWAN7,779,728 Hon Hai Precision Industry 18,419,421 1.17
18,419,421 1.17
IRELAND483,676 Covidien 17,953,361 1.14
17,953,361 1.14
268
JPMorgan Funds - Global Focus FundSchedule of Investments (Market Value Expressed in EUR)
As at 30 June 2011
Quantity/Nominal
Value
Name of Securities MarketValue
%of
NetAssets
Quantity/Nominal
Value
Name of Securities MarketValue
%of
NetAssets
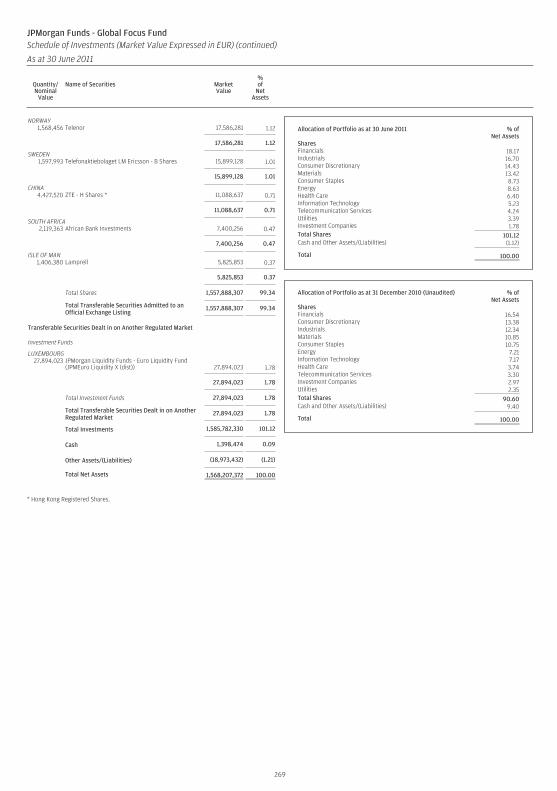
NORWAY1,568,456 Telenor 17,586,281 1.12
17,586,281 1.12
SWEDEN1,597,993 Telefonaktiebolaget LM Ericsson - B Shares 15,899,128 1.01
15,899,128 1.01
CHINA4,427,520 ZTE - H Shares * 11,088,637 0.71
11,088,637 0.71
SOUTH AFRICA2,119,363 African Bank Investments 7,400,256 0.47
7,400,256 0.47
ISLE OF MAN1,406,380 Lamprell 5,825,853 0.37
5,825,853 0.37
Total Shares 1,557,888,307 99.34
Total Transferable Securities Admitted to anOfficial Exchange Listing
1,557,888,307 99.34
Transferable Securities Dealt in on Another Regulated Market
Investment Funds
LUXEMBOURG27,894,023 JPMorgan Liquidity Funds - Euro Liquidity Fund
(JPMEuro Liquidity X (dist)) 27,894,023 1.78
27,894,023 1.78
Total Investment Funds 27,894,023 1.78
Total Transferable Securities Dealt in on AnotherRegulated Market
27,894,023 1.78
Total Investments 1,585,782,330 101.12
Cash 1,398,474 0.09
Other Assets/(Liabilities) (18,973,432) (1.21)
Total Net Assets 1,568,207,372 100.00
* Hong Kong Registered Shares.
Allocation of Portfolio as at 30 June 2011 % ofNet Assets
SharesFinancials 18.17Industrials 16.70Consumer Discretionary 14.43Materials 13.42Consumer Staples 8.73Energy 8.63Health Care 6.40Information Technology 5.23Telecommunication Services 4.24Utilities 3.39Investment Companies 1.78Total Shares 101.12Cash and Other Assets/(Liabilities) (1.12)
Total 100.00
Allocation of Portfolio as at 31 December 2010 (Unaudited) % ofNet Assets
SharesFinancials 16.54Consumer Discretionary 13.38Industrials 12.34Materials 10.85Consumer Staples 10.75Energy 7.21Information Technology 7.17Health Care 3.74Telecommunication Services 3.30Investment Companies 2.97Utilities 2.35Total Shares 90.60Cash and Other Assets/(Liabilities) 9.40
Total 100.00
269
JPMorgan Funds - Global Focus FundSchedule of Investments (Market Value Expressed in EUR) (continued)
As at 30 June 2011
Quantity/Nominal
Value
Name of Securities MarketValue
%of
NetAssets
Quantity/Nominal
Value
Name of Securities MarketValue
%of
NetAssets
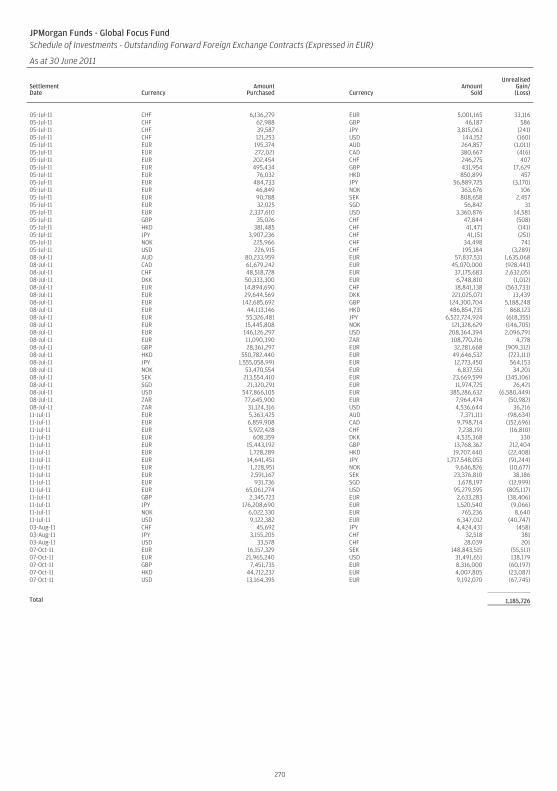
JPMorgan Funds - Global Focus FundSchedule of Investments - Outstanding Forward Foreign Exchange Contracts (Expressed in EUR)
As at 30 June 2011
SettlementDate Currency
AmountPurchased Currency
AmountSold
UnrealisedGain/(Loss)
05-Jul-11 CHF 6,136,279 EUR 5,001,165 33,11605-Jul-11 CHF 62,988 GBP 46,187 58605-Jul-11 CHF 39,587 JPY 3,815,063 (241)05-Jul-11 CHF 121,253 USD 144,152 (160)05-Jul-11 EUR 195,374 AUD 264,857 (1,011)05-Jul-11 EUR 272,021 CAD 380,667 (416)05-Jul-11 EUR 202,454 CHF 246,275 40705-Jul-11 EUR 495,434 GBP 431,954 17,62905-Jul-11 EUR 76,032 HKD 850,899 45705-Jul-11 EUR 484,733 JPY 56,889,725 (3,170)05-Jul-11 EUR 46,849 NOK 363,676 10605-Jul-11 EUR 90,788 SEK 808,658 2,45705-Jul-11 EUR 32,025 SGD 56,842 3105-Jul-11 EUR 2,337,610 USD 3,360,876 14,58105-Jul-11 GBP 35,026 CHF 47,844 (508)05-Jul-11 HKD 381,485 CHF 41,471 (141)05-Jul-11 JPY 3,907,236 CHF 41,151 (251)05-Jul-11 NOK 225,966 CHF 34,498 74105-Jul-11 USD 226,915 CHF 195,184 (3,289)08-Jul-11 AUD 80,233,959 EUR 57,837,531 1,635,06808-Jul-11 CAD 61,679,242 EUR 45,070,000 (928,441)08-Jul-11 CHF 48,518,728 EUR 37,175,683 2,632,05108-Jul-11 DKK 50,333,300 EUR 6,748,810 (1,012)08-Jul-11 EUR 14,894,690 CHF 18,841,138 (563,733)08-Jul-11 EUR 29,644,569 DKK 221,025,071 13,43908-Jul-11 EUR 142,685,692 GBP 124,300,704 5,188,24808-Jul-11 EUR 44,113,146 HKD 486,854,735 868,12308-Jul-11 EUR 55,326,481 JPY 6,522,724,924 (618,355)08-Jul-11 EUR 15,445,808 NOK 121,328,629 (146,705)08-Jul-11 EUR 146,126,297 USD 208,364,394 2,096,79108-Jul-11 EUR 11,090,390 ZAR 108,770,216 4,77808-Jul-11 GBP 28,361,297 EUR 32,281,668 (909,312)08-Jul-11 HKD 550,782,440 EUR 49,646,532 (723,111)08-Jul-11 JPY 1,555,058,991 EUR 12,773,450 564,15308-Jul-11 NOK 53,470,554 EUR 6,837,551 34,20108-Jul-11 SEK 213,554,410 EUR 23,669,599 (345,106)08-Jul-11 SGD 21,320,291 EUR 11,974,725 26,42108-Jul-11 USD 547,866,105 EUR 385,286,632 (6,580,449)08-Jul-11 ZAR 77,645,900 EUR 7,964,474 (50,982)08-Jul-11 ZAR 31,124,316 USD 4,536,644 36,21611-Jul-11 EUR 5,363,425 AUD 7,371,111 (98,634)11-Jul-11 EUR 6,859,908 CAD 9,798,714 (152,696)11-Jul-11 EUR 5,922,428 CHF 7,238,191 (16,810)11-Jul-11 EUR 608,359 DKK 4,535,368 33011-Jul-11 EUR 15,443,192 GBP 13,768,362 212,40411-Jul-11 EUR 1,728,289 HKD 19,707,440 (22,408)11-Jul-11 EUR 14,641,451 JPY 1,717,548,053 (91,244)11-Jul-11 EUR 1,228,951 NOK 9,646,826 (10,677)11-Jul-11 EUR 2,591,167 SEK 23,376,810 38,18611-Jul-11 EUR 931,736 SGD 1,678,197 (12,999)11-Jul-11 EUR 65,061,274 USD 95,279,595 (805,117)11-Jul-11 GBP 2,345,723 EUR 2,633,283 (38,406)11-Jul-11 JPY 176,208,690 EUR 1,520,540 (9,066)11-Jul-11 NOK 6,022,330 EUR 765,236 8,64011-Jul-11 USD 9,122,382 EUR 6,347,012 (40,747)03-Aug-11 CHF 45,692 JPY 4,424,431 (458)03-Aug-11 JPY 3,155,205 CHF 32,518 38103-Aug-11 USD 33,578 CHF 28,039 20107-Oct-11 EUR 16,157,329 SEK 148,843,515 (55,511)07-Oct-11 EUR 21,965,240 USD 31,491,651 138,17907-Oct-11 GBP 7,451,735 EUR 8,316,000 (60,197)07-Oct-11 HKD 44,712,237 EUR 4,007,805 (23,087)07-Oct-11 USD 13,164,395 EUR 9,192,070 (67,745)
Total 1,185,726
270
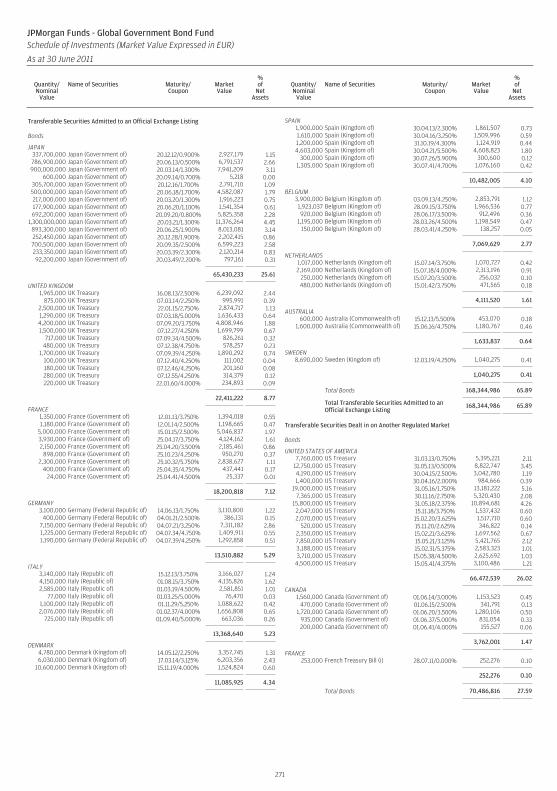
Transferable Securities Admitted to an Official Exchange Listing
Bonds
JAPAN337,700,000 Japan (Government of) 20.12.12/0.900% 2,927,179 1.15786,900,000 Japan (Government of) 20.06.13/0.500% 6,791,537 2.66900,000,000 Japan (Government of) 20.03.14/1.300% 7,941,209 3.11
600,000 Japan (Government of) 20.09.14/0.700% 5,218 0.00305,700,000 Japan (Government of) 20.12.16/1.700% 2,791,710 1.09500,000,000 Japan (Government of) 20.06.18/1.700% 4,582,087 1.79217,000,000 Japan (Government of) 20.03.20/1.300% 1,916,223 0.75177,900,000 Japan (Government of) 20.06.20/1.100% 1,541,354 0.61692,200,000 Japan (Government of) 20.09.20/0.800% 5,825,358 2.28
1,300,000,000 Japan (Government of) 20.03.21/1.300% 11,376,264 4.45893,300,000 Japan (Government of) 20.06.25/1.900% 8,013,081 3.14252,450,000 Japan (Government of) 20.12.28/1.900% 2,202,415 0.86700,500,000 Japan (Government of) 20.09.35/2.500% 6,599,223 2.58233,350,000 Japan (Government of) 20.03.39/2.300% 2,120,214 0.8392,200,000 Japan (Government of) 20.03.49/2.200% 797,161 0.31
65,430,233 25.61
UNITED KINGDOM1,965,000 UK Treasury 16.08.13/2.500% 6,239,092 2.44
875,000 UK Treasury 07.03.14/2.250% 995,991 0.392,500,000 UK Treasury 22.01.15/2.750% 2,874,717 1.131,290,000 UK Treasury 07.03.18/5.000% 1,636,433 0.644,200,000 UK Treasury 07.09.20/3.750% 4,808,946 1.881,500,000 UK Treasury 07.12.27/4.250% 1,699,799 0.67
717,000 UK Treasury 07.09.34/4.500% 826,261 0.32480,000 UK Treasury 07.12.38/4.750% 578,257 0.23
1,700,000 UK Treasury 07.09.39/4.250% 1,890,292 0.74100,000 UK Treasury 07.12.40/4.250% 111,002 0.04180,000 UK Treasury 07.12.46/4.250% 201,160 0.08280,000 UK Treasury 07.12.55/4.250% 314,379 0.12220,000 UK Treasury 22.01.60/4.000% 234,893 0.09
22,411,222 8.77
FRANCE1,350,000 France (Government of) 12.01.13/3.750% 1,394,018 0.551,180,000 France (Government of) 12.01.14/2.500% 1,198,665 0.47
5,000,000 France (Government of) 15.01.15/2.500% 5,046,837 1.973,930,000 France (Government of) 25.04.17/3.750% 4,124,162 1.612,150,000 France (Government of) 25.04.20/3.500% 2,185,461 0.86
898,000 France (Government of) 25.10.23/4.250% 950,270 0.372,300,000 France (Government of) 25.10.32/5.750% 2,838,627 1.11
400,000 France (Government of) 25.04.35/4.750% 437,441 0.1724,000 France (Government of) 25.04.41/4.500% 25,337 0.01
18,200,818 7.12
GERMANY3,100,000 Germany (Federal Republic of) 14.06.13/1.750% 3,110,800 1.22
400,000 Germany (Federal Republic of) 04.01.21/2.500% 386,131 0.157,150,000 Germany (Federal Republic of) 04.07.21/3.250% 7,311,182 2.861,225,000 Germany (Federal Republic of) 04.07.34/4.750% 1,409,911 0.551,190,000 Germany (Federal Republic of) 04.07.39/4.250% 1,292,858 0.51
13,510,882 5.29
ITALY3,140,000 Italy (Republic of) 15.12.13/3.750% 3,166,027 1.244,150,000 Italy (Republic of) 01.08.15/3.750% 4,135,826 1.622,585,000 Italy (Republic of) 01.03.19/4.500% 2,581,851 1.01
77,000 Italy (Republic of) 01.03.25/5.000% 76,470 0.031,100,000 Italy (Republic of) 01.11.29/5.250% 1,088,622 0.422,076,000 Italy (Republic of) 01.02.37/4.000% 1,656,808 0.65
725,000 Italy (Republic of) 01.09.40/5.000% 663,036 0.26
13,368,640 5.23
DENMARK4,780,000 Denmark (Kingdom of) 14.05.12/2.250% 3,357,745 1.316,030,000 Denmark (Kingdom of) 17.03.14/3.125% 6,203,356 2.43
10,600,000 Denmark (Kingdom of) 15.11.19/4.000% 1,524,824 0.60
11,085,925 4.34
SPAIN1,900,000 Spain (Kingdom of) 30.04.13/2.300% 1,861,507 0.731,610,000 Spain (Kingdom of) 30.04.16/3.250% 1,509,996 0.591,200,000 Spain (Kingdom of) 31.10.19/4.300% 1,124,919 0.444,603,000 Spain (Kingdom of) 30.04.21/5.500% 4,608,823 1.80
300,000 Spain (Kingdom of) 30.07.26/5.900% 300,600 0.121,305,000 Spain (Kingdom of) 30.07.41/4.700% 1,076,160 0.42
10,482,005 4.10
BELGIUM3,900,000 Belgium (Kingdom of) 03.09.13/4.250% 2,853,791 1.121,923,037 Belgium (Kingdom of) 28.09.15/3.750% 1,966,536 0.77920,000 Belgium (Kingdom of) 28.06.17/3.500% 912,496 0.36
1,195,000 Belgium (Kingdom of) 28.03.26/4.500% 1,198,549 0.47150,000 Belgium (Kingdom of) 28.03.41/4.250% 138,257 0.05
7,069,629 2.77
NETHERLANDS1,017,000 Netherlands (Kingdom of) 15.07.14/3.750% 1,070,727 0.422,169,000 Netherlands (Kingdom of) 15.07.18/4.000% 2,313,196 0.91
250,000 Netherlands (Kingdom of) 15.07.20/3.500% 256,032 0.10480,000 Netherlands (Kingdom of) 15.01.42/3.750% 471,565 0.18
4,111,520 1.61
AUSTRALIA600,000 Australia (Commonwealth of) 15.12.13/5.500% 453,070 0.18
1,600,000 Australia (Commonwealth of) 15.06.16/4.750% 1,180,767 0.46
1,633,837 0.64
SWEDEN8,690,000 Sweden (Kingdom of) 12.03.19/4.250% 1,040,275 0.41
1,040,275 0.41
Total Bonds 168,344,986 65.89
Total Transferable Securities Admitted to anOfficial Exchange Listing
168,344,986 65.89
Transferable Securities Dealt in on Another Regulated Market
Bonds
UNITED STATES OF AMERICA7,760,000 US Treasury 31.03.13/0.750% 5,395,221 2.11
12,750,000 US Treasury 31.05.13/0.500% 8,822,747 3.454,190,000 US Treasury 30.04.15/2.500% 3,042,780 1.191,400,000 US Treasury 30.04.16/2.000% 984,666 0.39
19,000,000 US Treasury 31.05.16/1.750% 13,181,222 5.167,365,000 US Treasury 30.11.16/2.750% 5,320,430 2.08
15,800,000 US Treasury 31.05.18/2.375% 10,894,681 4.262,047,000 US Treasury 15.11.18/3.750% 1,537,432 0.602,070,000 US Treasury 15.02.20/3.625% 1,517,710 0.60
520,000 US Treasury 15.11.20/2.625% 346,822 0.142,350,000 US Treasury 15.02.21/3.625% 1,697,562 0.677,850,000 US Treasury 15.05.21/3.125% 5,421,765 2.123,188,000 US Treasury 15.02.31/5.375% 2,583,323 1.013,710,000 US Treasury 15.05.38/4.500% 2,625,692 1.03
4,500,000 US Treasury 15.05.41/4.375% 3,100,486 1.21
66,472,539 26.02
CANADA1,560,000 Canada (Government of) 01.06.14/3.000% 1,153,523 0.45
470,000 Canada (Government of) 01.06.15/2.500% 341,791 0.131,720,000 Canada (Government of) 01.06.20/3.500% 1,280,106 0.50
935,000 Canada (Government of) 01.06.37/5.000% 831,054 0.33200,000 Canada (Government of) 01.06.41/4.000% 155,527 0.06
3,762,001 1.47
FRANCE253,000 French Treasury Bill (i) 28.07.11/0.000% 252,276 0.10
252,276 0.10
Total Bonds 70,486,816 27.59
271
JPMorgan Funds - Global Government Bond FundSchedule of Investments (Market Value Expressed in EUR)
As at 30 June 2011
Quantity/Nominal
Value
Name of Securities Maturity/Coupon
MarketValue
%of
NetAssets
Quantity/Nominal
Value
Name of Securities Maturity/Coupon
MarketValue
%of
NetAssets
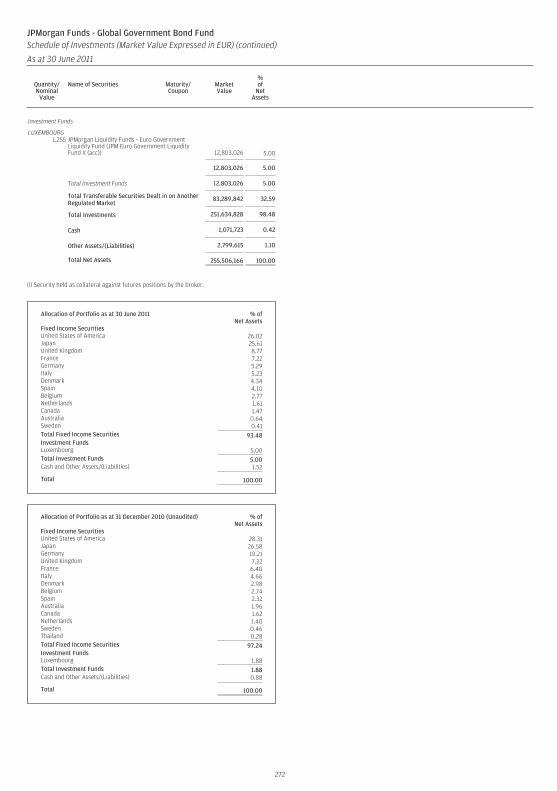
Investment Funds
LUXEMBOURG1,255 JPMorgan Liquidity Funds - Euro Government
Liquidity Fund (JPM Euro Government LiquidityFund X (acc)) 12,803,026 5.00
12,803,026 5.00
Total Investment Funds 12,803,026 5.00
Total Transferable Securities Dealt in on AnotherRegulated Market
83,289,842 32.59
Total Investments 251,634,828 98.48
Cash 1,071,723 0.42
Other Assets/(Liabilities) 2,799,615 1.10
Total Net Assets 255,506,166 100.00
(i) Security held as collateral against futures positions by the broker.
Allocation of Portfolio as at 30 June 2011 % ofNet Assets
Fixed Income SecuritiesUnited States of America 26.02Japan 25.61United Kingdom 8.77France 7.22Germany 5.29Italy 5.23Denmark 4.34Spain 4.10Belgium 2.77Netherlands 1.61Canada 1.47Australia 0.64Sweden 0.41Total Fixed Income Securities 93.48Investment FundsLuxembourg 5.00Total Investment Funds 5.00Cash and Other Assets/(Liabilities) 1.52
Total 100.00
Allocation of Portfolio as at 31 December 2010 (Unaudited) % ofNet Assets
Fixed Income SecuritiesUnited States of America 28.31Japan 26.58Germany 10.21United Kingdom 7.32France 6.40Italy 4.66Denmark 2.98Belgium 2.74Spain 2.32Australia 1.96Canada 1.62Netherlands 1.40Sweden 0.46Thailand 0.28Total Fixed Income Securities 97.24Investment FundsLuxembourg 1.88Total Investment Funds 1.88Cash and Other Assets/(Liabilities) 0.88
Total 100.00
272
JPMorgan Funds - Global Government Bond FundSchedule of Investments (Market Value Expressed in EUR) (continued)
As at 30 June 2011
Quantity/Nominal
Value
Name of Securities Maturity/Coupon
MarketValue
%of
NetAssets
Quantity/Nominal
Value
Name of Securities Maturity/Coupon
MarketValue
%of
NetAssets
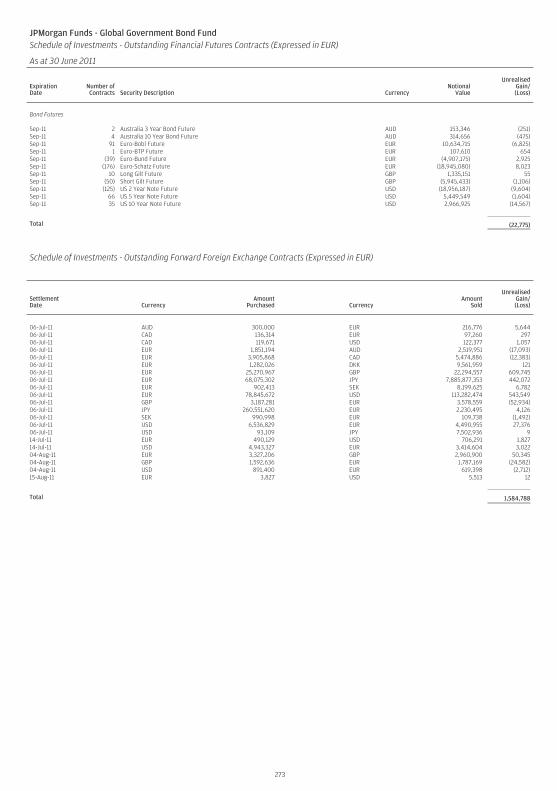
JPMorgan Funds - Global Government Bond FundSchedule of Investments - Outstanding Financial Futures Contracts (Expressed in EUR)
As at 30 June 2011
ExpirationDate
Number ofContracts Security Description Currency
NotionalValue
UnrealisedGain/(Loss)
Bond Futures
Sep-11 2 Australia 3 Year Bond Future AUD 153,346 (251)Sep-11 4 Australia 10 Year Bond Future AUD 314,656 (475)Sep-11 91 Euro-Bobl Future EUR 10,634,715 (6,825)Sep-11 1 Euro-BTP Future EUR 107,610 654Sep-11 (39) Euro-Bund Future EUR (4,907,175) 2,925Sep-11 (176) Euro-Schatz Future EUR (18,945,080) 8,023Sep-11 10 Long Gilt Future GBP 1,335,151 55Sep-11 (50) Short Gilt Future GBP (5,945,433) (1,106)Sep-11 (125) US 2 Year Note Future USD (18,956,187) (9,604)Sep-11 66 US 5 Year Note Future USD 5,449,549 (1,604)Sep-11 35 US 10 Year Note Future USD 2,966,925 (14,567)
Total (22,775)
Schedule of Investments - Outstanding Forward Foreign Exchange Contracts (Expressed in EUR)
SettlementDate Currency
AmountPurchased Currency
AmountSold
UnrealisedGain/(Loss)
06-Jul-11 AUD 300,000 EUR 216,776 5,64406-Jul-11 CAD 136,314 EUR 97,260 29706-Jul-11 CAD 119,671 USD 122,377 1,05706-Jul-11 EUR 1,851,194 AUD 2,519,951 (17,093)06-Jul-11 EUR 3,905,868 CAD 5,474,886 (12,383)06-Jul-11 EUR 1,282,026 DKK 9,561,959 12106-Jul-11 EUR 25,270,967 GBP 22,294,557 609,74506-Jul-11 EUR 68,075,302 JPY 7,885,877,353 442,07206-Jul-11 EUR 902,413 SEK 8,199,625 6,78206-Jul-11 EUR 78,845,672 USD 113,282,474 543,54906-Jul-11 GBP 3,187,281 EUR 3,578,559 (52,934)06-Jul-11 JPY 260,551,620 EUR 2,230,495 4,12606-Jul-11 SEK 990,998 EUR 109,738 (1,492)06-Jul-11 USD 6,536,829 EUR 4,490,955 27,37606-Jul-11 USD 93,109 JPY 7,502,936 914-Jul-11 EUR 490,129 USD 706,291 1,82714-Jul-11 USD 4,943,327 EUR 3,414,604 3,02204-Aug-11 EUR 3,327,206 GBP 2,960,900 50,34504-Aug-11 GBP 1,592,636 EUR 1,787,169 (24,582)04-Aug-11 USD 891,400 EUR 619,398 (2,712)15-Aug-11 EUR 3,827 USD 5,513 12
Total 1,584,788
273
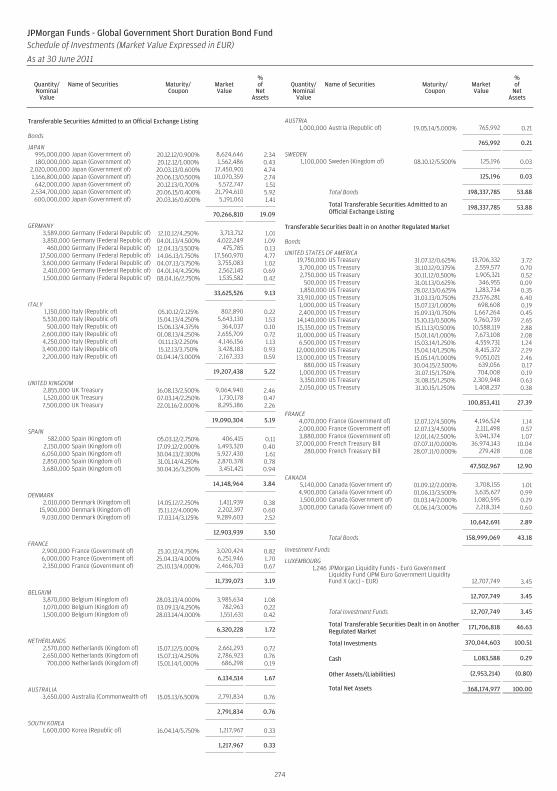
Transferable Securities Admitted to an Official Exchange Listing
Bonds
JAPAN995,000,000 Japan (Government of) 20.12.12/0.900% 8,624,646 2.34180,000,000 Japan (Government of) 20.12.12/1.000% 1,562,486 0.43
2,020,000,000 Japan (Government of) 20.03.13/0.600% 17,450,901 4.741,166,800,000 Japan (Government of) 20.06.13/0.500% 10,070,359 2.74642,000,000 Japan (Government of) 20.12.13/0.700% 5,572,747 1.51
2,534,700,000 Japan (Government of) 20.06.15/0.400% 21,794,610 5.92600,000,000 Japan (Government of) 20.03.16/0.600% 5,191,061 1.41
70,266,810 19.09
GERMANY3,589,000 Germany (Federal Republic of) 12.10.12/4.250% 3,713,712 1.013,850,000 Germany (Federal Republic of) 04.01.13/4.500% 4,022,249 1.09
460,000 Germany (Federal Republic of) 12.04.13/3.500% 475,785 0.1317,500,000 Germany (Federal Republic of) 14.06.13/1.750% 17,560,970 4.773,600,000 Germany (Federal Republic of) 04.07.13/3.750% 3,755,083 1.022,410,000 Germany (Federal Republic of) 04.01.14/4.250% 2,562,145 0.691,500,000 Germany (Federal Republic of) 08.04.16/2.750% 1,535,582 0.42
33,625,526 9.13
ITALY1,150,000 Italy (Republic of) 05.10.12/2.125% 802,890 0.225,530,000 Italy (Republic of) 15.04.13/4.250% 5,643,130 1.53
500,000 Italy (Republic of) 15.06.13/4.375% 364,037 0.102,600,000 Italy (Republic of) 01.08.13/4.250% 2,655,709 0.724,250,000 Italy (Republic of) 01.11.13/2.250% 4,146,156 1.133,400,000 Italy (Republic of) 15.12.13/3.750% 3,428,183 0.932,200,000 Italy (Republic of) 01.04.14/3.000% 2,167,333 0.59
19,207,438 5.22
UNITED KINGDOM2,855,000 UK Treasury 16.08.13/2.500% 9,064,940 2.461,520,000 UK Treasury 07.03.14/2.250% 1,730,178 0.477,500,000 UK Treasury 22.01.16/2.000% 8,295,186 2.26
19,090,304 5.19
SPAIN582,000 Spain (Kingdom of) 05.03.12/2.750% 406,415 0.11
2,150,000 Spain (Kingdom of) 17.09.12/2.000% 1,493,320 0.406,050,000 Spain (Kingdom of) 30.04.13/2.300% 5,927,430 1.612,850,000 Spain (Kingdom of) 31.01.14/4.250% 2,870,378 0.783,680,000 Spain (Kingdom of) 30.04.16/3.250% 3,451,421 0.94
14,148,964 3.84
DENMARK2,010,000 Denmark (Kingdom of) 14.05.12/2.250% 1,411,939 0.38
15,900,000 Denmark (Kingdom of) 15.11.12/4.000% 2,202,397 0.609,030,000 Denmark (Kingdom of) 17.03.14/3.125% 9,289,603 2.52
12,903,939 3.50
FRANCE2,900,000 France (Government of) 25.10.12/4.750% 3,020,424 0.826,000,000 France (Government of) 25.04.13/4.000% 6,251,946 1.702,350,000 France (Government of) 25.10.13/4.000% 2,466,703 0.67
11,739,073 3.19
BELGIUM3,870,000 Belgium (Kingdom of) 28.03.13/4.000% 3,985,634 1.081,070,000 Belgium (Kingdom of) 03.09.13/4.250% 782,963 0.221,500,000 Belgium (Kingdom of) 28.03.14/4.000% 1,551,631 0.42
6,320,228 1.72
NETHERLANDS2,570,000 Netherlands (Kingdom of) 15.07.12/5.000% 2,661,293 0.722,650,000 Netherlands (Kingdom of) 15.07.13/4.250% 2,786,923 0.76
700,000 Netherlands (Kingdom of) 15.01.14/1.000% 686,298 0.19
6,134,514 1.67
AUSTRALIA3,650,000 Australia (Commonwealth of) 15.05.13/6.500% 2,791,834 0.76
2,791,834 0.76
SOUTH KOREA1,600,000 Korea (Republic of) 16.04.14/5.750% 1,217,967 0.33
1,217,967 0.33
AUSTRIA1,000,000 Austria (Republic of) 19.05.14/5.000% 765,992 0.21
765,992 0.21
SWEDEN1,100,000 Sweden (Kingdom of) 08.10.12/5.500% 125,196 0.03
125,196 0.03
Total Bonds 198,337,785 53.88
Total Transferable Securities Admitted to anOfficial Exchange Listing
198,337,785 53.88
Transferable Securities Dealt in on Another Regulated Market
Bonds
UNITED STATES OF AMERICA19,750,000 US Treasury 31.07.12/0.625% 13,706,332 3.723,700,000 US Treasury 31.10.12/0.375% 2,559,577 0.702,750,000 US Treasury 30.11.12/0.500% 1,905,321 0.52
500,000 US Treasury 31.01.13/0.625% 346,955 0.091,850,000 US Treasury 28.02.13/0.625% 1,283,734 0.35
33,910,000 US Treasury 31.03.13/0.750% 23,576,281 6.401,000,000 US Treasury 15.07.13/1.000% 698,608 0.192,400,000 US Treasury 15.09.13/0.750% 1,667,264 0.45
14,140,000 US Treasury 15.10.13/0.500% 9,760,739 2.6515,350,000 US Treasury 15.11.13/0.500% 10,588,119 2.8811,000,000 US Treasury 15.01.14/1.000% 7,673,108 2.086,500,000 US Treasury 15.03.14/1.250% 4,559,731 1.24
12,000,000 US Treasury 15.04.14/1.250% 8,415,372 2.2913,000,000 US Treasury 15.05.14/1.000% 9,051,021 2.46
880,000 US Treasury 30.04.15/2.500% 639,056 0.171,000,000 US Treasury 31.07.15/1.750% 704,008 0.193,350,000 US Treasury 31.08.15/1.250% 2,309,948 0.632,050,000 US Treasury 31.10.15/1.250% 1,408,237 0.38
100,853,411 27.39
FRANCE4,070,000 France (Government of) 12.07.12/4.500% 4,196,524 1.142,000,000 France (Government of) 12.07.13/4.500% 2,111,498 0.573,880,000 France (Government of) 12.01.14/2.500% 3,941,374 1.07
37,000,000 French Treasury Bill 07.07.11/0.000% 36,974,143 10.04280,000 French Treasury Bill 28.07.11/0.000% 279,428 0.08
47,502,967 12.90
CANADA5,140,000 Canada (Government of) 01.09.12/2.000% 3,708,155 1.014,900,000 Canada (Government of) 01.06.13/3.500% 3,635,627 0.991,500,000 Canada (Government of) 01.03.14/2.000% 1,080,595 0.293,000,000 Canada (Government of) 01.06.14/3.000% 2,218,314 0.60
10,642,691 2.89
Total Bonds 158,999,069 43.18
Investment Funds
LUXEMBOURG1,246 JPMorgan Liquidity Funds - Euro Government
Liquidity Fund (JPM Euro Government LiquidityFund X (acc) - EUR) 12,707,749 3.45
12,707,749 3.45
Total Investment Funds 12,707,749 3.45
Total Transferable Securities Dealt in on AnotherRegulated Market
171,706,818 46.63
Total Investments 370,044,603 100.51
Cash 1,083,588 0.29
Other Assets/(Liabilities) (2,953,214) (0.80)
Total Net Assets 368,174,977 100.00
274
JPMorgan Funds - Global Government Short Duration Bond FundSchedule of Investments (Market Value Expressed in EUR)
As at 30 June 2011
Quantity/Nominal
Value
Name of Securities Maturity/Coupon
MarketValue
%of
NetAssets
Quantity/Nominal
Value
Name of Securities Maturity/Coupon
MarketValue
%of
NetAssets
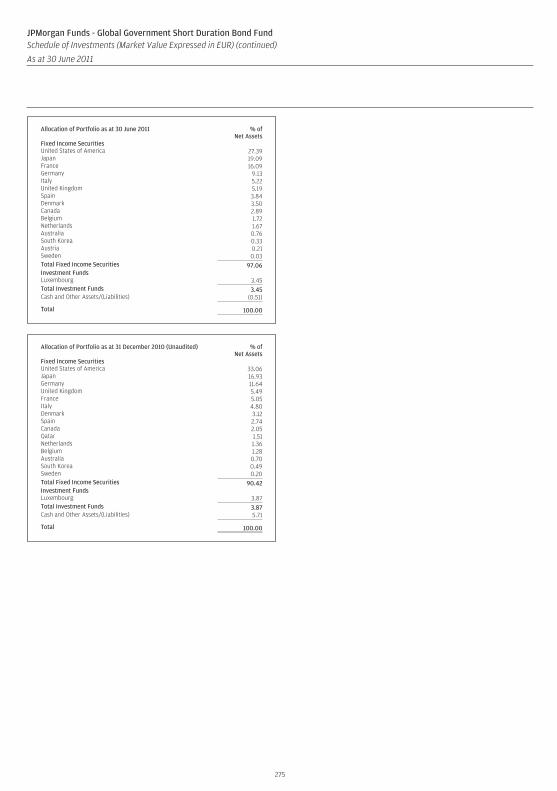
Allocation of Portfolio as at 30 June 2011 % ofNet Assets
Fixed Income SecuritiesUnited States of America 27.39Japan 19.09France 16.09Germany 9.13Italy 5.22United Kingdom 5.19Spain 3.84Denmark 3.50Canada 2.89Belgium 1.72Netherlands 1.67Australia 0.76South Korea 0.33Austria 0.21Sweden 0.03Total Fixed Income Securities 97.06Investment FundsLuxembourg 3.45Total Investment Funds 3.45Cash and Other Assets/(Liabilities) (0.51)
Total 100.00
Allocation of Portfolio as at 31 December 2010 (Unaudited) % ofNet Assets
Fixed Income SecuritiesUnited States of America 33.06Japan 16.93Germany 11.64United Kingdom 5.49France 5.05Italy 4.80Denmark 3.12Spain 2.74Canada 2.05Qatar 1.51Netherlands 1.36Belgium 1.28Australia 0.70South Korea 0.49Sweden 0.20Total Fixed Income Securities 90.42Investment FundsLuxembourg 3.87Total Investment Funds 3.87Cash and Other Assets/(Liabilities) 5.71
Total 100.00
275
JPMorgan Funds - Global Government Short Duration Bond FundSchedule of Investments (Market Value Expressed in EUR) (continued)
As at 30 June 2011
Quantity/Nominal
Value
Name of Securities Maturity/Coupon
MarketValue
%of
NetAssets
Quantity/Nominal
Value
Name of Securities Maturity/Coupon
MarketValue
%of
NetAssets
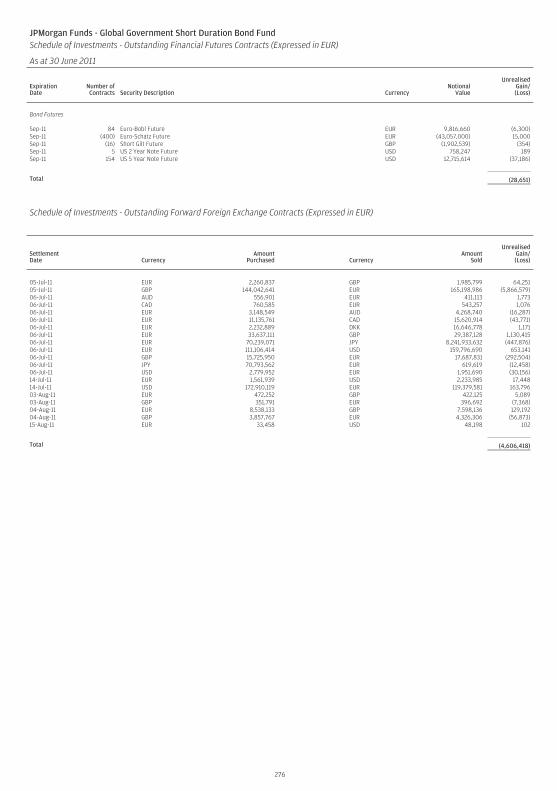
JPMorgan Funds - Global Government Short Duration Bond FundSchedule of Investments - Outstanding Financial Futures Contracts (Expressed in EUR)
As at 30 June 2011
ExpirationDate
Number ofContracts Security Description Currency
NotionalValue
UnrealisedGain/(Loss)
Bond Futures
Sep-11 84 Euro-Bobl Future EUR 9,816,660 (6,300)Sep-11 (400) Euro-Schatz Future EUR (43,057,000) 15,000Sep-11 (16) Short Gilt Future GBP (1,902,539) (354)Sep-11 5 US 2 Year Note Future USD 758,247 189Sep-11 154 US 5 Year Note Future USD 12,715,614 (37,186)
Total (28,651)
Schedule of Investments - Outstanding Forward Foreign Exchange Contracts (Expressed in EUR)
SettlementDate Currency
AmountPurchased Currency
AmountSold
UnrealisedGain/(Loss)
05-Jul-11 EUR 2,260,837 GBP 1,985,799 64,25105-Jul-11 GBP 144,042,641 EUR 165,198,986 (5,866,579)06-Jul-11 AUD 556,901 EUR 411,113 1,77306-Jul-11 CAD 760,585 EUR 543,257 1,07606-Jul-11 EUR 3,148,549 AUD 4,268,740 (16,287)06-Jul-11 EUR 11,135,761 CAD 15,620,914 (43,771)06-Jul-11 EUR 2,232,889 DKK 16,646,778 1,17106-Jul-11 EUR 33,637,111 GBP 29,387,128 1,130,41506-Jul-11 EUR 70,239,071 JPY 8,241,933,632 (447,876)06-Jul-11 EUR 111,106,414 USD 159,796,690 653,14106-Jul-11 GBP 15,725,950 EUR 17,687,831 (292,504)06-Jul-11 JPY 70,793,562 EUR 619,619 (12,458)06-Jul-11 USD 2,779,952 EUR 1,951,690 (30,156)14-Jul-11 EUR 1,561,939 USD 2,233,985 17,44814-Jul-11 USD 172,910,119 EUR 119,379,581 163,79603-Aug-11 EUR 472,252 GBP 422,125 5,08903-Aug-11 GBP 351,791 EUR 396,692 (7,368)04-Aug-11 EUR 8,538,133 GBP 7,598,136 129,19204-Aug-11 GBP 3,857,767 EUR 4,326,306 (56,873)15-Aug-11 EUR 33,458 USD 48,198 102
Total (4,606,418)
276
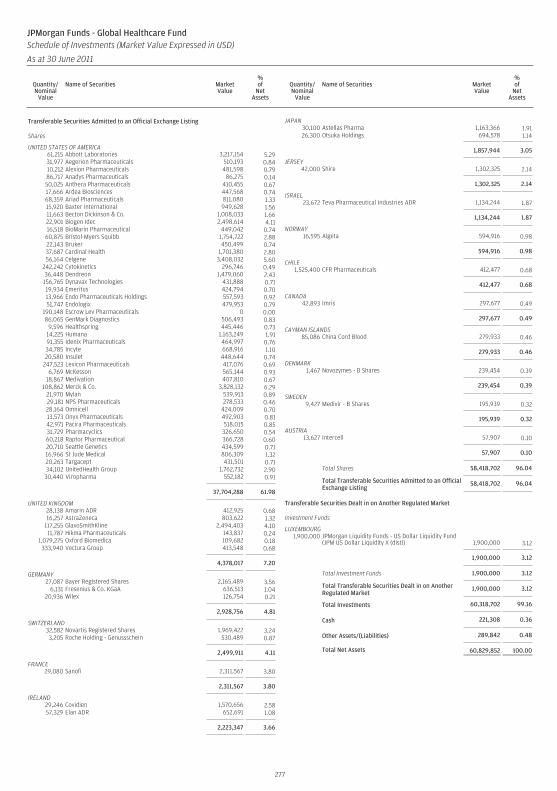
Transferable Securities Admitted to an Official Exchange Listing
Shares
UNITED STATES OF AMERICA61,215 Abbott Laboratories 3,217,154 5.2931,977 Aegerion Pharmaceuticals 510,193 0.8410,212 Alexion Pharmaceuticals 481,598 0.7986,717 Anadys Pharmaceuticals 86,275 0.1450,025 Anthera Pharmaceuticals 410,455 0.6717,666 Ardea Biosciences 447,568 0.7468,359 Ariad Pharmaceuticals 811,080 1.3315,920 Baxter International 949,628 1.5611,663 Becton Dickinson & Co. 1,008,033 1.6622,901 Biogen Idec 2,498,614 4.1116,518 BioMarin Pharmaceutical 449,042 0.74
60,875 Bristol-Myers Squibb 1,754,722 2.8822,143 Bruker 450,499 0.7437,687 Cardinal Health 1,701,380 2.8056,164 Celgene 3,408,032 5.60
242,242 Cytokinetics 296,746 0.4936,448 Dendreon 1,479,060 2.43156,765 Dynavax Technologies 431,888 0.7119,934 Emeritus 424,794 0.7013,966 Endo Pharmaceuticals Holdings 557,593 0.9251,747 Endologix 479,953 0.79
190,148 Escrow Lev Pharmaceuticals 0 0.0086,065 GenMark Diagnostics 506,493 0.83
9,596 Healthspring 445,446 0.7314,225 Humana 1,163,249 1.9191,355 Idenix Pharmaceuticals 464,997 0.7634,785 Incyte 668,916 1.1020,580 Insulet 448,644 0.74
247,523 Lexicon Pharmaceuticals 417,076 0.696,769 McKesson 565,144 0.93
18,867 Medivation 407,810 0.67108,862 Merck & Co. 3,828,132 6.29
21,970 Mylan 539,913 0.8929,181 NPS Pharmaceuticals 278,533 0.4628,164 Omnicell 424,009 0.7013,573 Onyx Pharmaceuticals 492,903 0.8142,971 Pacira Pharmaceuticals 518,015 0.8531,729 Pharmacyclics 326,650 0.5460,218 Raptor Pharmaceutical 366,728 0.6020,710 Seattle Genetics 434,599 0.7116,966 St Jude Medical 806,309 1.3220,263 Targacept 431,501 0.7134,102 UnitedHealth Group 1,762,732 2.90
30,440 Viropharma 552,182 0.91
37,704,288 61.98
UNITED KINGDOM28,138 Amarin ADR 412,925 0.6816,257 AstraZeneca 803,622 1.32
117,255 GlaxoSmithKline 2,494,403 4.1011,787 Hikma Pharmaceuticals 143,837 0.24
1,079,275 Oxford Biomedica 109,682 0.18333,940 Vectura Group 413,548 0.68
4,378,017 7.20
GERMANY27,087 Bayer Registered Shares 2,165,489 3.56
6,131 Fresenius & Co. KGaA 636,513 1.0420,936 Wilex 126,754 0.21
2,928,756 4.81
SWITZERLAND32,582 Novartis Registered Shares 1,969,422 3.243,205 Roche Holding - Genussschein 530,489 0.87
2,499,911 4.11
FRANCE29,080 Sanofi 2,311,567 3.80
2,311,567 3.80
IRELAND29,246 Covidien 1,570,656 2.5857,329 Elan ADR 652,691 1.08
2,223,347 3.66
JAPAN30,100 Astellas Pharma 1,163,366 1.9126,300 Otsuka Holdings 694,578 1.14
1,857,944 3.05
JERSEY42,000 Shire 1,302,325 2.14
1,302,325 2.14
ISRAEL23,672 Teva Pharmaceutical Industries ADR 1,134,244 1.87
1,134,244 1.87
NORWAY16,595 Algeta 594,916 0.98
594,916 0.98
CHILE1,525,400 CFR Pharmaceuticals 412,477 0.68
412,477 0.68
CANADA42,893 Imris 297,677 0.49
297,677 0.49
CAYMAN ISLANDS85,086 China Cord Blood 279,933 0.46
279,933 0.46
DENMARK1,467 Novozymes - B Shares 239,454 0.39
239,454 0.39
SWEDEN9,427 Medivir - B Shares 195,939 0.32
195,939 0.32
AUSTRIA13,627 Intercell 57,907 0.10
57,907 0.10
Total Shares 58,418,702 96.04
Total Transferable Securities Admitted to an OfficialExchange Listing
58,418,702 96.04
Transferable Securities Dealt in on Another Regulated Market
Investment Funds
LUXEMBOURG1,900,000 JPMorgan Liquidity Funds - US Dollar Liquidity Fund
(JPM US Dollar Liquidity X (dist)) 1,900,000 3.12
1,900,000 3.12
Total Investment Funds 1,900,000 3.12
Total Transferable Securities Dealt in on AnotherRegulated Market
1,900,000 3.12
Total Investments 60,318,702 99.16
Cash 221,308 0.36
Other Assets/(Liabilities) 289,842 0.48
Total Net Assets 60,829,852 100.00
277
JPMorgan Funds - Global Healthcare FundSchedule of Investments (Market Value Expressed in USD)
As at 30 June 2011
Quantity/Nominal
Value
Name of Securities MarketValue
%of
NetAssets
Quantity/Nominal
Value
Name of Securities MarketValue
%of
NetAssets
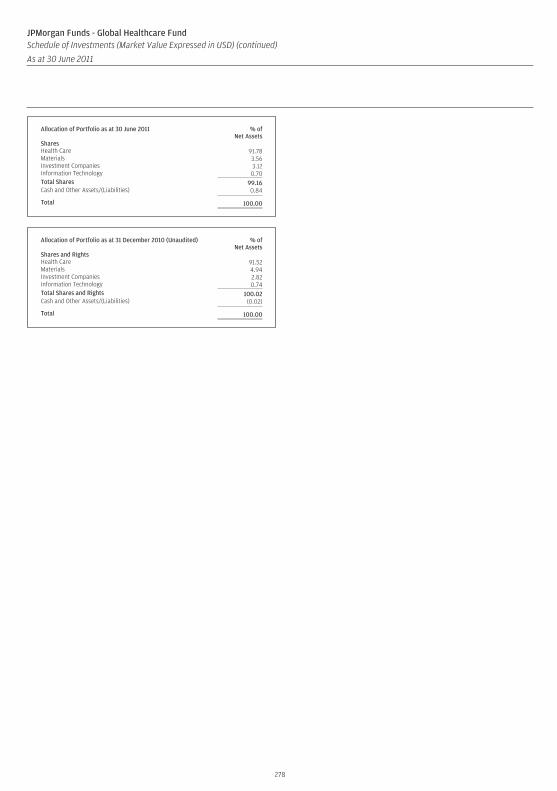
Allocation of Portfolio as at 30 June 2011 % ofNet Assets
SharesHealth Care 91.78Materials 3.56Investment Companies 3.12Information Technology 0.70Total Shares 99.16Cash and Other Assets/(Liabilities) 0.84
Total 100.00
Allocation of Portfolio as at 31 December 2010 (Unaudited) % ofNet Assets
Shares and RightsHealth Care 91.52Materials 4.94Investment Companies 2.82Information Technology 0.74Total Shares and Rights 100.02Cash and Other Assets/(Liabilities) (0.02)
Total 100.00
278
JPMorgan Funds - Global Healthcare FundSchedule of Investments (Market Value Expressed in USD) (continued)
As at 30 June 2011
Quantity/Nominal
Value
Name of Securities MarketValue
%of
NetAssets
Quantity/Nominal
Value
Name of Securities MarketValue
%of
NetAssets
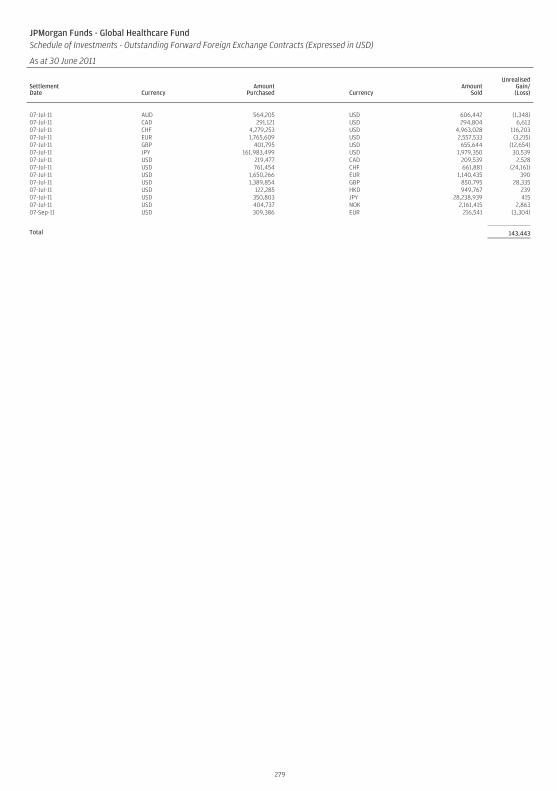
JPMorgan Funds - Global Healthcare FundSchedule of Investments - Outstanding Forward Foreign Exchange Contracts (Expressed in USD)
As at 30 June 2011
SettlementDate Currency
AmountPurchased Currency
AmountSold
UnrealisedGain/(Loss)
07-Jul-11 AUD 564,205 USD 606,442 (1,348)07-Jul-11 CAD 291,121 USD 294,804 6,61307-Jul-11 CHF 4,279,253 USD 4,963,028 116,20307-Jul-11 EUR 1,765,609 USD 2,557,533 (3,215)07-Jul-11 GBP 401,795 USD 655,644 (12,654)07-Jul-11 JPY 161,983,499 USD 1,979,350 30,53907-Jul-11 USD 219,477 CAD 209,539 2,52807-Jul-11 USD 761,454 CHF 661,881 (24,161)07-Jul-11 USD 1,650,266 EUR 1,140,435 39007-Jul-11 USD 1,389,854 GBP 850,795 28,33507-Jul-11 USD 122,285 HKD 949,767 23907-Jul-11 USD 350,803 JPY 28,238,939 41507-Jul-11 USD 404,737 NOK 2,161,415 2,86307-Sep-11 USD 309,386 EUR 216,541 (3,304)
Total 143,443
279
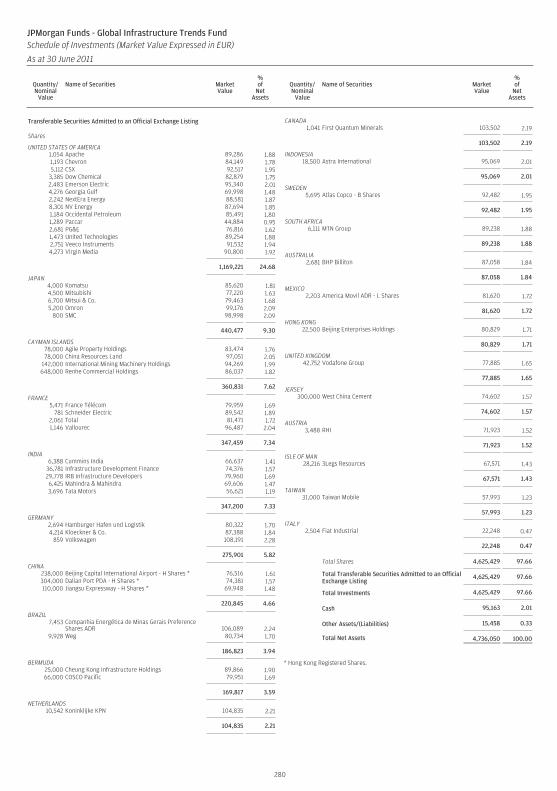
Transferable Securities Admitted to an Official Exchange Listing
Shares
UNITED STATES OF AMERICA1,054 Apache 89,286 1.881,193 Chevron 84,149 1.785,112 CSX 92,517 1.95
3,385 Dow Chemical 82,879 1.752,483 Emerson Electric 95,340 2.014,276 Georgia Gulf 69,998 1.482,242 NextEra Energy 88,581 1.878,301 NV Energy 87,694 1.851,184 Occidental Petroleum 85,491 1.801,289 Paccar 44,884 0.952,681 PG&E 76,816 1.621,473 United Technologies 89,254 1.882,751 Veeco Instruments 91,532 1.944,273 Virgin Media 90,800 1.92
1,169,221 24.68
JAPAN4,000 Komatsu 85,620 1.814,500 Mitsubishi 77,220 1.636,700 Mitsui & Co. 79,463 1.685,200 Omron 99,176 2.09
800 SMC 98,998 2.09
440,477 9.30
CAYMAN ISLANDS78,000 Agile Property Holdings 83,474 1.7678,000 China Resources Land 97,051 2.05
142,000 International Mining Machinery Holdings 94,269 1.99648,000 Renhe Commercial Holdings 86,037 1.82
360,831 7.62
FRANCE5,471 France Télécom 79,959 1.69
781 Schneider Electric 89,542 1.892,061 Total 81,471 1.721,146 Vallourec 96,487 2.04
347,459 7.34
INDIA6,388 Cummins India 66,637 1.41
36,781 Infrastructure Development Finance 74,376 1.5729,778 IRB Infrastructure Developers 79,960 1.696,425 Mahindra & Mahindra 69,606 1.473,696 Tata Motors 56,621 1.19
347,200 7.33
GERMANY2,694 Hamburger Hafen und Logistik 80,322 1.704,214 Kloeckner & Co. 87,388 1.84
859 Volkswagen 108,191 2.28
275,901 5.82
CHINA238,000 Beijing Capital International Airport - H Shares * 76,516 1.61304,000 Dalian Port PDA - H Shares * 74,381 1.57110,000 Jiangsu Expressway - H Shares * 69,948 1.48
220,845 4.66
BRAZIL7,453 Companhia Energética de Minas Gerais Preference
Shares ADR 106,089 2.249,928 Weg 80,734 1.70
186,823 3.94
BERMUDA25,000 Cheung Kong Infrastructure Holdings 89,866 1.9066,000 COSCO Pacific 79,951 1.69
169,817 3.59
NETHERLANDS10,542 Koninklijke KPN 104,835 2.21
104,835 2.21
CANADA1,041 First Quantum Minerals 103,502 2.19
103,502 2.19
INDONESIA18,500 Astra International 95,069 2.01
95,069 2.01
SWEDEN5,695 Atlas Copco - B Shares 92,482 1.95
92,482 1.95
SOUTH AFRICA6,111 MTN Group 89,238 1.88
89,238 1.88
AUSTRALIA2,681 BHP Billiton 87,058 1.84
87,058 1.84
MEXICO2,203 America Movil ADR - L Shares 81,620 1.72
81,620 1.72
HONG KONG22,500 Beijing Enterprises Holdings 80,829 1.71
80,829 1.71
UNITED KINGDOM42,752 Vodafone Group 77,885 1.65
77,885 1.65
JERSEY300,000 West China Cement 74,602 1.57
74,602 1.57
AUSTRIA3,488 RHI 71,923 1.52
71,923 1.52
ISLE OF MAN28,216 3Legs Resources 67,571 1.43
67,571 1.43
TAIWAN31,000 Taiwan Mobile 57,993 1.23
57,993 1.23
ITALY2,504 Fiat Industrial 22,248 0.47
22,248 0.47
Total Shares 4,625,429 97.66
Total Transferable Securities Admitted to an OfficialExchange Listing
4,625,429 97.66
Total Investments 4,625,429 97.66
Cash 95,163 2.01
Other Assets/(Liabilities) 15,458 0.33
Total Net Assets 4,736,050 100.00
* Hong Kong Registered Shares.
280
JPMorgan Funds - Global Infrastructure Trends FundSchedule of Investments (Market Value Expressed in EUR)
As at 30 June 2011
Quantity/Nominal
Value
Name of Securities MarketValue
%of
NetAssets
Quantity/Nominal
Value
Name of Securities MarketValue
%of
NetAssets
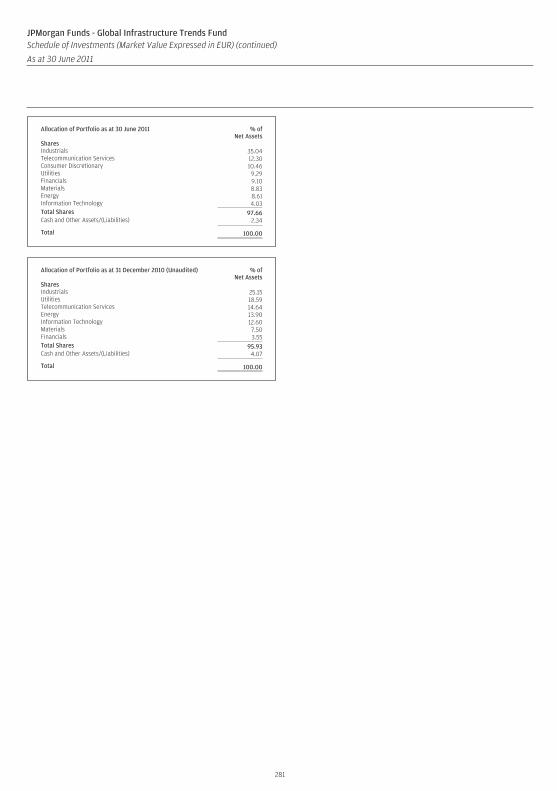
Allocation of Portfolio as at 30 June 2011 % ofNet Assets
SharesIndustrials 35.04Telecommunication Services 12.30Consumer Discretionary 10.46Utilities 9.29Financials 9.10Materials 8.83Energy 8.61Information Technology 4.03Total Shares 97.66Cash and Other Assets/(Liabilities) 2.34
Total 100.00
Allocation of Portfolio as at 31 December 2010 (Unaudited) % ofNet Assets
SharesIndustrials 25.15Utilities 18.59Telecommunication Services 14.64Energy 13.90Information Technology 12.60Materials 7.50Financials 3.55Total Shares 95.93Cash and Other Assets/(Liabilities) 4.07
Total 100.00
281
JPMorgan Funds - Global Infrastructure Trends FundSchedule of Investments (Market Value Expressed in EUR) (continued)
As at 30 June 2011
Quantity/Nominal
Value
Name of Securities MarketValue
%of
NetAssets
Quantity/Nominal
Value
Name of Securities MarketValue
%of
NetAssets
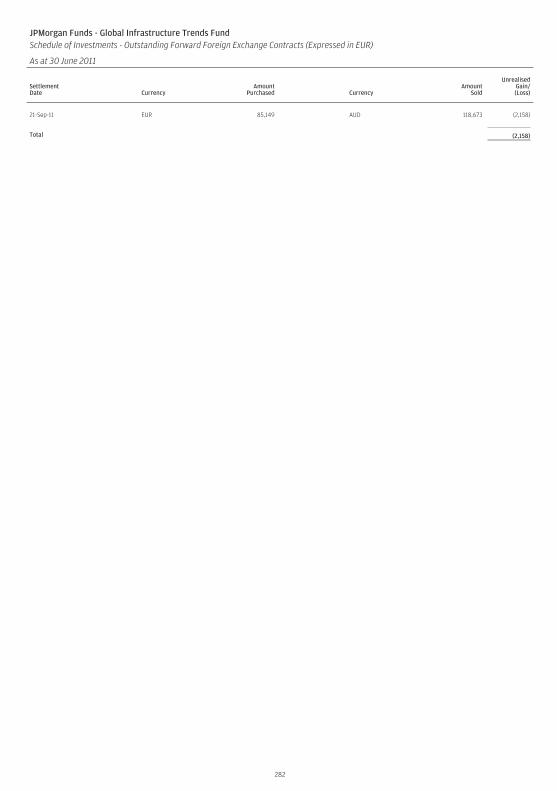
JPMorgan Funds - Global Infrastructure Trends FundSchedule of Investments - Outstanding Forward Foreign Exchange Contracts (Expressed in EUR)
As at 30 June 2011
SettlementDate Currency
AmountPurchased Currency
AmountSold
UnrealisedGain/(Loss)
21-Sep-11 EUR 85,149 AUD 118,673 (2,158)
Total (2,158)
282
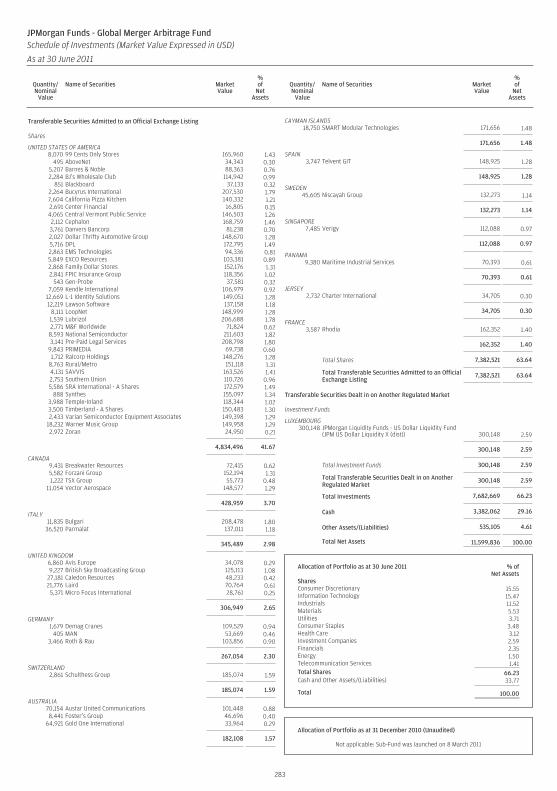
Transferable Securities Admitted to an Official Exchange Listing
Shares
UNITED STATES OF AMERICA8,070 99 Cents Only Stores 165,960 1.43
495 AboveNet 34,343 0.305,207 Barnes & Noble 88,363 0.762,284 BJ’s Wholesale Club 114,942 0.99
851 Blackboard 37,133 0.322,264 Bucyrus International 207,530 1.797,604 California Pizza Kitchen 140,332 1.212,691 Center Financial 16,805 0.154,065 Central Vermont Public Service 146,503 1.262,112 Cephalon 168,759 1.463,761 Danvers Bancorp 81,238 0.702,027 Dollar Thrifty Automotive Group 148,670 1.285,716 DPL 172,795 1.492,863 EMS Technologies 94,336 0.815,849 EXCO Resources 103,381 0.892,868 Family Dollar Stores 152,176 1.312,841 FPIC Insurance Group 118,356 1.02
543 Gen-Probe 37,581 0.327,059 Kendle International 106,979 0.92
12,669 L-1 Identity Solutions 149,051 1.2812,219 Lawson Software 137,158 1.18
8,111 LoopNet 148,999 1.281,539 Lubrizol 206,688 1.782,771 M&F Worldwide 71,824 0.62
8,593 National Semiconductor 211,603 1.823,141 Pre-Paid Legal Services 208,798 1.80
9,843 PRIMEDIA 69,738 0.601,712 Ralcorp Holdings 148,276 1.28
8,763 Rural/Metro 151,118 1.314,131 SAVVIS 163,526 1.412,753 Southern Union 110,726 0.965,586 SRA International - A Shares 172,579 1.49
888 Synthes 155,097 1.343,988 Temple-Inland 118,344 1.023,500 Timberland - A Shares 150,483 1.302,433 Varian Semiconductor Equipment Associates 149,398 1.29
18,232 Warner Music Group 149,958 1.292,972 Zoran 24,950 0.21
4,834,496 41.67
CANADA9,431 Breakwater Resources 72,415 0.625,582 Forzani Group 152,194 1.311,222 TSX Group 55,773 0.48
11,054 Vector Aerospace 148,577 1.29
428,959 3.70
ITALY11,835 Bulgari 208,478 1.80
36,520 Parmalat 137,011 1.18
345,489 2.98
UNITED KINGDOM6,860 Avis Europe 34,078 0.299,227 British Sky Broadcasting Group 125,113 1.08
27,181 Caledon Resources 48,233 0.4221,776 Laird 70,764 0.61
5,371 Micro Focus International 28,761 0.25
306,949 2.65
GERMANY1,679 Demag Cranes 109,529 0.94
405 MAN 53,669 0.463,466 Roth & Rau 103,856 0.90
267,054 2.30
SWITZERLAND2,861 Schulthess Group 185,074 1.59
185,074 1.59
AUSTRALIA70,154 Austar United Communications 101,448 0.888,441 Foster’s Group 46,696 0.40
64,921 Gold One International 33,964 0.29
182,108 1.57
CAYMAN ISLANDS18,750 SMART Modular Technologies 171,656 1.48
171,656 1.48
SPAIN3,747 Telvent GIT 148,925 1.28
148,925 1.28
SWEDEN45,605 Niscayah Group 132,273 1.14
132,273 1.14
SINGAPORE7,485 Verigy 112,088 0.97
112,088 0.97
PANAMA9,380 Maritime Industrial Services 70,393 0.61
70,393 0.61
JERSEY2,732 Charter International 34,705 0.30
34,705 0.30
FRANCE3,587 Rhodia 162,352 1.40
162,352 1.40
Total Shares 7,382,521 63.64
Total Transferable Securities Admitted to an OfficialExchange Listing
7,382,521 63.64
Transferable Securities Dealt in on Another Regulated Market
Investment Funds
LUXEMBOURG300,148 JPMorgan Liquidity Funds - US Dollar Liquidity Fund
(JPM US Dollar Liquidity X (dist)) 300,148 2.59
300,148 2.59
Total Investment Funds 300,148 2.59
Total Transferable Securities Dealt in on AnotherRegulated Market
300,148 2.59
Total Investments 7,682,669 66.23
Cash 3,382,062 29.16
Other Assets/(Liabilities) 535,105 4.61
Total Net Assets 11,599,836 100.00
Allocation of Portfolio as at 30 June 2011 % ofNet Assets
SharesConsumer Discretionary 15.55Information Technology 15.47Industrials 11.52Materials 5.53Utilities 3.71Consumer Staples 3.48Health Care 3.12Investment Companies 2.59Financials 2.35Energy 1.50Telecommunication Services 1.41Total Shares 66.23Cash and Other Assets/(Liabilities) 33.77
Total 100.00
Allocation of Portfolio as at 31 December 2010 (Unaudited)
Not applicable: Sub-Fund was launched on 8 March 2011
283
JPMorgan Funds - Global Merger Arbitrage FundSchedule of Investments (Market Value Expressed in USD)
As at 30 June 2011
Quantity/Nominal
Value
Name of Securities MarketValue
%of
NetAssets
Quantity/Nominal
Value
Name of Securities MarketValue
%of
NetAssets
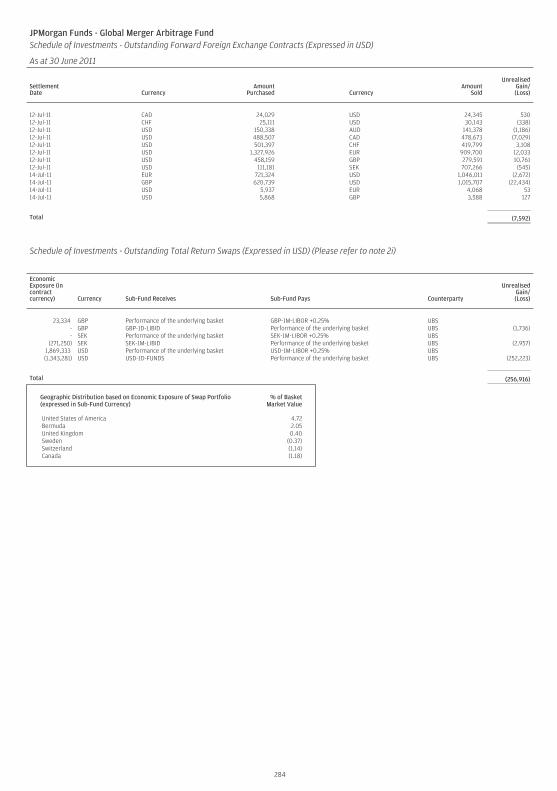
JPMorgan Funds - Global Merger Arbitrage FundSchedule of Investments - Outstanding Forward Foreign Exchange Contracts (Expressed in USD)
As at 30 June 2011
SettlementDate Currency
AmountPurchased Currency
AmountSold
UnrealisedGain/(Loss)
12-Jul-11 CAD 24,029 USD 24,345 53012-Jul-11 CHF 25,111 USD 30,143 (338)12-Jul-11 USD 150,338 AUD 141,378 (1,186)12-Jul-11 USD 488,507 CAD 478,673 (7,029)12-Jul-11 USD 501,397 CHF 419,799 3,10812-Jul-11 USD 1,327,926 EUR 909,700 12,03312-Jul-11 USD 458,159 GBP 279,591 10,76112-Jul-11 USD 111,181 SEK 707,266 (545)14-Jul-11 EUR 721,324 USD 1,046,011 (2,672)14-Jul-11 GBP 620,739 USD 1,015,707 (22,434)14-Jul-11 USD 5,937 EUR 4,068 5314-Jul-11 USD 5,868 GBP 3,588 127
Total (7,592)
Schedule of Investments - Outstanding Total Return Swaps (Expressed in USD) (Please refer to note 2i)
EconomicExposure (incontractcurrency) Currency Sub-Fund Receives Sub-Fund Pays Counterparty
UnrealisedGain/(Loss)
23,334 GBP Performance of the underlying basket GBP-1M-LIBOR +0.25% UBS- GBP GBP-1D-LIBID Performance of the underlying basket UBS (1,736)- SEK Performance of the underlying basket SEK-1M-LIBOR +0.25% UBS
(271,250) SEK SEK-1M-LIBID Performance of the underlying basket UBS (2,957)1,869,333 USD Performance of the underlying basket USD-1M-LIBOR +0.25% UBS(1,343,281) USD USD-1D-FUNDS Performance of the underlying basket UBS (252,223)
Total (256,916)
Geographic Distribution based on Economic Exposure of Swap Portfolio(expressed in Sub-Fund Currency)
% of BasketMarket Value
United States of America 4.72Bermuda 2.05United Kingdom 0.40Sweden (0.37)Switzerland (1.14)Canada (1.18)
284
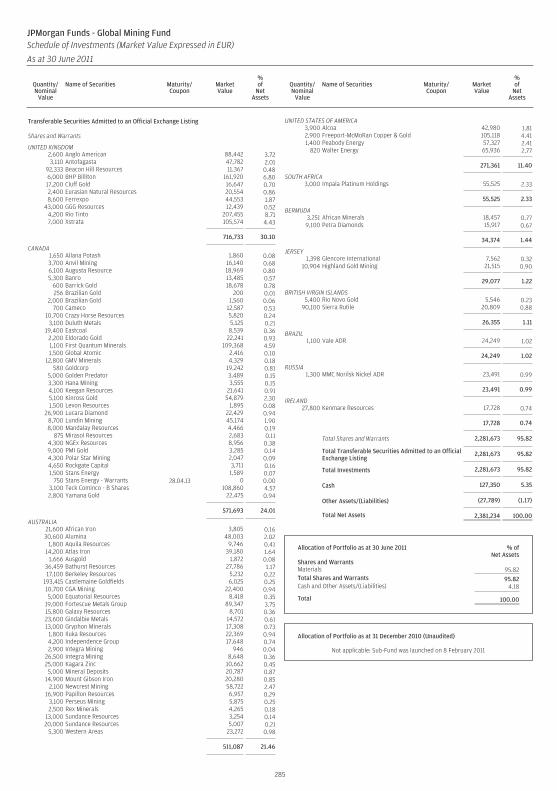
Transferable Securities Admitted to an Official Exchange Listing
Shares and Warrants
UNITED KINGDOM2,600 Anglo American 88,442 3.723,110 Antofagasta 47,782 2.01
92,333 Beacon Hill Resources 11,367 0.486,000 BHP Billiton 161,920 6.8017,200 Cluff Gold 16,647 0.702,400 Eurasian Natural Resources 20,554 0.868,600 Ferrexpo 44,553 1.87
43,000 GGG Resources 12,439 0.524,200 Rio Tinto 207,455 8.717,000 Xstrata 105,574 4.43
716,733 30.10
CANADA1,650 Allana Potash 1,860 0.083,700 Anvil Mining 16,140 0.686,100 Augusta Resource 18,969 0.805,300 Banro 13,485 0.57
600 Barrick Gold 18,678 0.78256 Brazilian Gold 200 0.01
2,000 Brazilian Gold 1,560 0.06700 Cameco 12,587 0.53
10,700 Crazy Horse Resources 5,820 0.243,100 Duluth Metals 5,125 0.21
19,400 Eastcoal 8,539 0.362,200 Eldorado Gold 22,241 0.931,100 First Quantum Minerals 109,368 4.591,500 Global Atomic 2,416 0.10
12,800 GMV Minerals 4,329 0.18580 Goldcorp 19,242 0.81
5,000 Golden Predator 3,489 0.153,300 Hana Mining 3,555 0.154,100 Keegan Resources 21,641 0.915,100 Kinross Gold 54,879 2.301,500 Levon Resources 1,895 0.08
26,900 Lucara Diamond 22,429 0.948,700 Lundin Mining 45,174 1.908,000 Mandalay Resources 4,466 0.19
875 Mirasol Resources 2,683 0.114,300 NGEx Resources 8,956 0.389,000 PMI Gold 3,285 0.144,300 Polar Star Mining 2,047 0.094,650 Rockgate Capital 3,711 0.161,500 Stans Energy 1,589 0.07
750 Stans Energy - Warrants 28.04.13 0 0.003,100 Teck Cominco - B Shares 108,860 4.572,800 Yamana Gold 22,475 0.94
571,693 24.01
AUSTRALIA21,600 African Iron 3,805 0.1630,600 Alumina 48,003 2.02
1,800 Aquila Resources 9,746 0.4114,200 Atlas Iron 39,180 1.64
1,666 Ausgold 1,872 0.0836,459 Bathurst Resources 27,786 1.1717,100 Berkeley Resources 5,232 0.22
193,415 Castlemaine Goldfields 6,025 0.2510,700 CGA Mining 22,400 0.945,000 Equatorial Resources 8,418 0.35
19,000 Fortescue Metals Group 89,347 3.7515,800 Galaxy Resources 8,701 0.3623,600 Gindalbie Metals 14,572 0.6113,000 Gryphon Minerals 17,308 0.73
1,800 Iluka Resources 22,369 0.944,200 Independence Group 17,648 0.742,900 Integra Mining 946 0.04
26,500 Integra Mining 8,648 0.3625,000 Kagara Zinc 10,662 0.455,000 Mineral Deposits 20,787 0.87
14,900 Mount Gibson Iron 20,280 0.852,100 Newcrest Mining 58,722 2.47
16,900 Papillon Resources 6,957 0.293,100 Perseus Mining 5,875 0.252,500 Rex Minerals 4,265 0.18
13,000 Sundance Resources 3,254 0.1420,000 Sundance Resources 5,007 0.21
5,300 Western Areas 23,272 0.98
511,087 21.46
UNITED STATES OF AMERICA3,900 Alcoa 42,980 1.812,900 Freeport-McMoRan Copper & Gold 105,118 4.411,400 Peabody Energy 57,327 2.41
820 Walter Energy 65,936 2.77
271,361 11.40
SOUTH AFRICA3,000 Impala Platinum Holdings 55,525 2.33
55,525 2.33
BERMUDA3,251 African Minerals 18,457 0.779,100 Petra Diamonds 15,917 0.67
34,374 1.44
JERSEY1,398 Glencore International 7,562 0.32
10,904 Highland Gold Mining 21,515 0.90
29,077 1.22
BRITISH VIRGIN ISLANDS5,400 Rio Novo Gold 5,546 0.23
90,100 Sierra Rutile 20,809 0.88
26,355 1.11
BRAZIL1,100 Vale ADR 24,249 1.02
24,249 1.02
RUSSIA1,300 MMC Norilsk Nickel ADR 23,491 0.99
23,491 0.99
IRELAND27,800 Kenmare Resources 17,728 0.74
17,728 0.74
Total Shares and Warrants 2,281,673 95.82
Total Transferable Securities Admitted to an OfficialExchange Listing
2,281,673 95.82
Total Investments 2,281,673 95.82
Cash 127,350 5.35
Other Assets/(Liabilities) (27,789) (1.17)
Total Net Assets 2,381,234 100.00
Allocation of Portfolio as at 30 June 2011 % ofNet Assets
Shares and WarrantsMaterials 95.82Total Shares and Warrants 95.82Cash and Other Assets/(Liabilities) 4.18
Total 100.00
Allocation of Portfolio as at 31 December 2010 (Unaudited)
Not applicable: Sub-Fund was launched on 8 February 2011
285
JPMorgan Funds - Global Mining FundSchedule of Investments (Market Value Expressed in EUR)
As at 30 June 2011
Quantity/Nominal
Value
Name of Securities Maturity/Coupon
MarketValue
%of
NetAssets
Quantity/Nominal
Value
Name of Securities Maturity/Coupon
MarketValue
%of
NetAssets
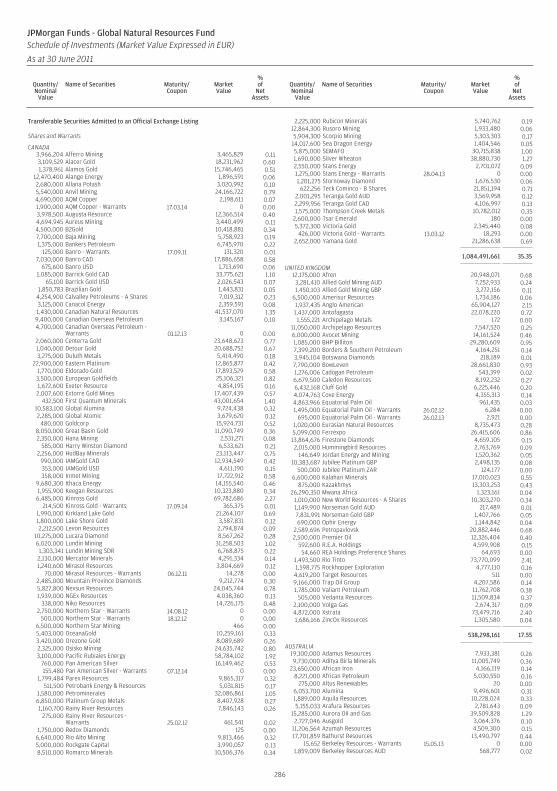
Transferable Securities Admitted to an Official Exchange Listing
Shares and Warrants
CANADA3,966,204 Afferro Mining 3,465,829 0.113,109,529 Alacer Gold 18,231,962 0.601,378,961 Alamos Gold 15,746,465 0.51
12,470,400 Alange Energy 1,896,591 0.062,680,000 Allana Potash 3,020,992 0.105,540,000 Anvil Mining 24,166,722 0.794,690,000 AQM Copper 2,198,611 0.071,900,000 AQM Copper - Warrants 17.03.14 0 0.003,978,500 Augusta Resource 12,366,514 0.404,694,945 Aureus Mining 3,440,499 0.114,500,000 B2Gold 10,418,881 0.347,700,000 Baja Mining 5,758,923 0.191,375,000 Bankers Petroleum 6,745,970 0.22
125,000 Banro - Warrants 17.09.11 131,320 0.017,030,000 Banro CAD 17,886,658 0.58
675,600 Banro USD 1,713,690 0.061,085,000 Barrick Gold CAD 33,775,621 1.10
65,100 Barrick Gold USD 2,026,543 0.071,850,783 Brazilian Gold 1,443,831 0.05
4,254,900 Calvalley Petroleums - A Shares 7,019,312 0.233,125,000 Canacol Energy 2,359,591 0.081,430,000 Canadian Natural Resources 41,537,070 1.359,400,000 Canadian Overseas Petroleum 3,145,167 0.104,700,000 Canadian Overseas Petroleum -
Warrants 01.12.13 0 0.002,060,000 Centerra Gold 23,648,623 0.771,040,000 Detour Gold 20,688,752 0.673,275,000 Duluth Metals 5,414,490 0.18
22,900,000 Eastern Platinum 12,865,877 0.421,770,000 Eldorado Gold 17,893,529 0.583,500,000 European Goldfields 25,106,321 0.821,672,600 Exeter Resource 4,854,195 0.162,007,600 Extorre Gold Mines 17,407,439 0.57
432,500 First Quantum Minerals 43,001,654 1.4010,583,100 Global Alumina 9,724,438 0.322,285,000 Global Atomic 3,679,620 0.12
480,000 Goldcorp 15,924,731 0.528,050,000 Great Basin Gold 11,090,749 0.362,350,000 Hana Mining 2,531,271 0.08
585,000 Harry Winston Diamond 6,533,621 0.212,256,000 HudBay Minerals 23,113,447 0.75
990,000 IAMGold CAD 12,934,549 0.42353,000 IAMGold USD 4,611,190 0.15358,000 Inmet Mining 17,722,912 0.58
9,680,300 Ithaca Energy 14,155,540 0.461,955,900 Keegan Resources 10,323,880 0.34
6,485,000 Kinross Gold 69,782,686 2.27214,500 Kinross Gold - Warrants 17.09.14 365,375 0.01
1,990,000 Kirkland Lake Gold 21,264,107 0.691,800,000 Lake Shore Gold 3,587,831 0.122,212,500 Levon Resources 2,794,874 0.09
10,275,000 Lucara Diamond 8,567,262 0.286,020,000 Lundin Mining 31,258,503 1.021,303,341 Lundin Mining SDR 6,768,875 0.222,130,000 Mercator Minerals 4,291,334 0.141,240,600 Mirasol Resources 3,804,669 0.12
70,000 Mirasol Resources - Warrants 06.12.11 14,278 0.002,485,000 Mountain Province Diamonds 9,212,774 0.305,827,800 Nevsun Resources 24,045,744 0.781,939,000 NGEx Resources 4,038,360 0.13
338,000 Niko Resources 14,726,175 0.482,750,000 Northern Star - Warrants 14.08.12 0 0.00
500,000 Northern Star - Warrants 18.12.12 0 0.006,500,000 Northern Star Mining 466 0.005,403,000 OceanaGold 10,259,161 0.333,420,000 Orezone Gold 8,089,689 0.262,325,000 Osisko Mining 24,635,742 0.803,100,000 Pacific Rubiales Energy 58,784,102 1.92
760,000 Pan American Silver 16,149,462 0.53155,480 Pan American Silver - Warrants 07.12.14 0 0.00
1,799,484 Parex Resources 9,865,317 0.32511,500 Petrobank Energy & Resources 5,031,815 0.17
1,580,000 Petrominerales 32,086,861 1.056,850,000 Platinum Group Metals 8,407,928 0.271,160,700 Rainy River Resources 7,846,143 0.26
275,000 Rainy River Resources -Warrants 25.02.12 461,541 0.02
1,750,000 Redox Diamonds 125 0.006,640,000 Rio Alto Mining 9,813,466 0.325,000,000 Rockgate Capital 3,990,057 0.138,510,000 Romarco Minerals 10,506,376 0.34
2,225,000 Rubicon Minerals 5,740,762 0.1912,864,300 Rusoro Mining 1,933,480 0.065,904,300 Scorpio Mining 5,303,303 0.17
14,017,600 Sea Dragon Energy 1,404,546 0.055,875,000 SEMAFO 30,715,838 1.001,690,000 Silver Wheaton 38,880,730 1.272,550,000 Stans Energy 2,701,072 0.091,275,000 Stans Energy - Warrants 28.04.13 0 0.001,201,275 Stornoway Diamond 1,676,530 0.06622,256 Teck Cominco - B Shares 21,851,194 0.71
2,001,295 Teranga Gold AUD 3,569,958 0.122,299,956 Teranga Gold CAD 4,106,997 0.131,575,000 Thompson Creek Metals 10,782,012 0.35
2,600,000 Tsar Emerald 180 0.005,372,300 Victoria Gold 2,345,440 0.08
426,000 Victoria Gold - Warrants 13.03.12 18,293 0.002,652,000 Yamana Gold 21,286,638 0.69
1,084,491,661 35.35
UNITED KINGDOM12,175,000 Afren 20,948,071 0.68
3,281,410 Allied Gold Mining AUD 7,252,933 0.241,450,103 Allied Gold Mining GBP 3,272,156 0.11
6,500,000 Amerisur Resources 1,734,186 0.061,937,435 Anglo American 65,904,127 2.151,437,000 Antofagasta 22,078,220 0.721,555,221 Archipelago Metals 172 0.00
11,050,000 Archipelago Resources 7,547,520 0.256,000,000 Avocet Mining 14,161,524 0.461,085,000 BHP Billiton 29,280,609 0.957,399,200 Borders & Southern Petroleum 4,164,251 0.143,945,104 Botswana Diamonds 218,189 0.017,790,000 BowLeven 28,661,830 0.931,276,006 Cadogan Petroleum 543,399 0.026,679,500 Caledon Resources 8,192,232 0.276,432,168 Cluff Gold 6,225,446 0.204,074,763 Cove Energy 4,355,313 0.144,863,966 Equatorial Palm Oil 961,435 0.031,495,000 Equatorial Palm Oil - Warrants 26.02.12 6,284 0.00
695,000 Equatorial Palm Oil - Warrants 26.02.13 2,921 0.001,020,000 Eurasian Natural Resources 8,735,473 0.285,099,000 Ferrexpo 26,415,606 0.8613,864,676 Firestone Diamonds 4,659,105 0.152,015,000 Hummingbird Resources 2,763,769 0.09
146,649 Jordan Energy and Mining 1,520,362 0.0510,383,687 Jubilee Platinum GBP 2,498,135 0.08
500,000 Jubilee Platinum ZAR 124,177 0.006,600,000 Kalahari Minerals 17,010,023 0.55
875,000 Kazakhmys 13,303,253 0.4326,290,350 Mwana Africa 1,323,161 0.04
1,010,000 New World Resources - A Shares 10,303,270 0.341,149,900 Norseman Gold AUD 217,489 0.017,831,991 Norseman Gold GBP 1,407,766 0.05690,000 Ophir Energy 1,144,842 0.04
2,589,696 Petropavlovsk 20,882,446 0.682,500,000 Premier Oil 12,326,404 0.40
592,600 R.E.A. Holdings 4,599,908 0.1554,660 REA Holdings Preference Shares 64,693 0.00
1,493,500 Rio Tinto 73,770,099 2.411,598,775 Rockhopper Exploration 4,777,110 0.16
4,619,200 Target Resources 511 0.009,166,000 Trap Oil Group 4,207,586 0.141,785,000 Valiant Petroleum 11,762,708 0.38
505,000 Vedanta Resources 11,509,834 0.372,100,000 Volga Gas 2,674,317 0.094,872,000 Xstrata 73,479,716 2.401,686,166 ZincOx Resources 1,305,580 0.04
538,298,161 17.55
AUSTRALIA19,100,000 Adamus Resources 7,933,381 0.269,730,000 Aditya Birla Minerals 11,005,749 0.36
23,650,000 African Iron 4,166,119 0.148,221,000 African Petroleum 5,030,550 0.16
275,000 Altus Renewables 20 0.006,053,700 Alumina 9,496,601 0.311,889,000 Aquila Resources 10,228,024 0.335,155,033 Arafura Resources 2,781,643 0.09
15,285,000 Aurora Oil and Gas 39,509,828 1.292,727,046 Ausgold 3,064,376 0.10
11,206,564 Azumah Resources 4,509,300 0.1517,701,859 Bathurst Resources 13,490,797 0.44
15,652 Berkeley Resources - Warrants 15.05.13 0 0.001,859,009 Berkeley Resources AUD 568,777 0.02
286
JPMorgan Funds - Global Natural Resources FundSchedule of Investments (Market Value Expressed in EUR)
As at 30 June 2011
Quantity/Nominal
Value
Name of Securities Maturity/Coupon
MarketValue
%of
NetAssets
Quantity/Nominal
Value
Name of Securities Maturity/Coupon
MarketValue
%of
NetAssets
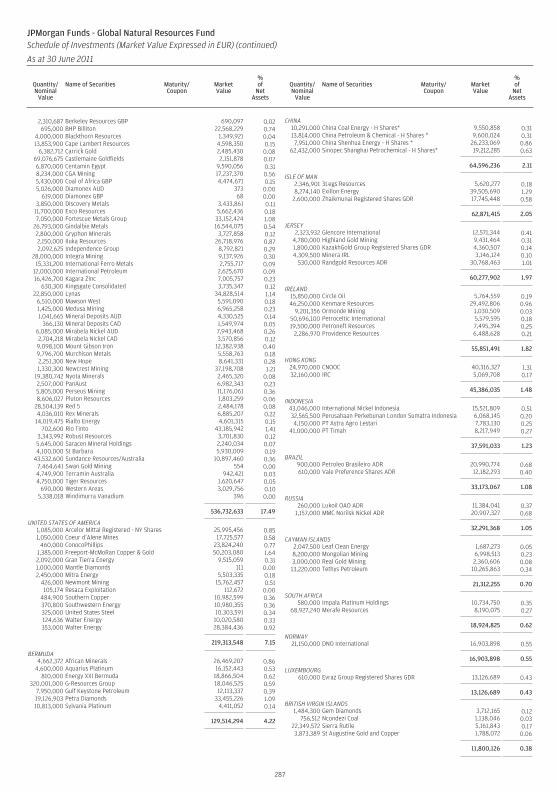
2,310,687 Berkeley Resources GBP 690,097 0.02695,000 BHP Billiton 22,568,229 0.74
4,000,000 Blackthorn Resources 1,349,921 0.0413,853,900 Cape Lambert Resources 4,598,350 0.15
6,382,712 Carrick Gold 2,485,430 0.0869,076,675 Castlemaine Goldfields 2,151,878 0.076,870,000 Centamin Egypt 9,590,056 0.318,234,000 CGA Mining 17,237,370 0.565,430,000 Coal of Africa GBP 4,474,671 0.155,026,000 Diamonex AUD 373 0.00
619,000 Diamonex GBP 68 0.003,850,000 Discovery Metals 3,433,861 0.11
11,700,000 Exco Resources 5,662,436 0.187,050,000 Fortescue Metals Group 33,152,424 1.08
26,793,000 Gindalbie Metals 16,544,075 0.542,800,000 Gryphon Minerals 3,727,858 0.122,150,000 Iluka Resources 26,718,976 0.872,092,625 Independence Group 8,792,821 0.29
28,000,000 Integra Mining 9,137,926 0.3015,331,200 International Ferro Metals 2,755,717 0.09
12,000,000 International Petroleum 2,625,670 0.0916,426,700 Kagara Zinc 7,005,757 0.23
630,300 Kingsgate Consolidated 3,735,347 0.1222,850,000 Lynas 34,828,514 1.14
6,510,000 Mawson West 5,591,090 0.181,425,000 Medusa Mining 6,965,258 0.231,041,665 Mineral Deposits AUD 4,330,525 0.14
366,130 Mineral Deposits CAD 1,549,974 0.056,085,000 Mirabela Nickel AUD 7,943,468 0.262,704,218 Mirabela Nickel CAD 3,570,856 0.129,098,100 Mount Gibson Iron 12,382,938 0.409,796,700 Murchison Metals 5,558,763 0.182,251,300 New Hope 8,641,331 0.281,330,300 Newcrest Mining 37,198,708 1.21
19,380,742 Nyota Minerals 2,465,320 0.082,507,000 PanAust 6,982,343 0.235,805,000 Perseus Mining 11,176,061 0.368,606,027 Pluton Resources 1,803,259 0.06
28,504,139 Red 5 2,484,178 0.084,036,010 Rex Minerals 6,885,207 0.22
14,019,475 Rialto Energy 4,601,315 0.15702,600 Rio Tinto 43,185,942 1.41
3,343,992 Robust Resources 3,701,830 0.125,645,000 Saracen Mineral Holdings 2,240,034 0.074,100,000 St Barbara 5,930,009 0.19
43,532,600 Sundance Resources/Australia 10,897,460 0.367,464,641 Swan Gold Mining 554 0.004,749,900 Terramin Australia 942,421 0.034,750,000 Tiger Resources 1,620,647 0.05
690,000 Western Areas 3,029,756 0.105,338,018 Windimurra Vanadium 396 0.00
536,732,633 17.49
UNITED STATES OF AMERICA1,085,000 Arcelor Mittal Registered - NY Shares 25,995,456 0.851,050,000 Coeur d’Alene Mines 17,725,577 0.58
460,000 ConocoPhillips 23,824,240 0.771,385,000 Freeport-McMoRan Copper & Gold 50,203,080 1.642,092,000 Gran Tierra Energy 9,515,059 0.311,000,000 Mantle Diamonds 111 0.002,450,000 Mitra Energy 5,503,335 0.18
426,000 Newmont Mining 15,762,457 0.51105,174 Resaca Exploitation 112,672 0.00
484,900 Southern Copper 10,982,599 0.36370,800 Southwestern Energy 10,980,355 0.36325,000 United States Steel 10,303,591 0.34124,636 Walter Energy 10,020,580 0.33353,000 Walter Energy 28,384,436 0.92
219,313,548 7.15
BERMUDA4,662,372 African Minerals 26,469,207 0.86
4,600,000 Aquarius Platinum 16,152,443 0.53810,000 Energy XXI Bermuda 18,866,504 0.62
320,001,000 G-Resources Group 18,046,525 0.597,950,000 Gulf Keystone Petroleum 12,113,337 0.3919,126,903 Petra Diamonds 33,455,226 1.0910,813,000 Sylvania Platinum 4,411,052 0.14
129,514,294 4.22
CHINA10,291,000 China Coal Energy - H Shares* 9,550,858 0.3113,814,000 China Petroleum & Chemical - H Shares * 9,600,024 0.317,951,000 China Shenhua Energy - H Shares * 26,233,069 0.86
62,432,000 Sinopec Shanghai Petrochemical - H Shares* 19,212,285 0.63
64,596,236 2.11
ISLE OF MAN2,346,901 3Legs Resources 5,620,277 0.188,274,140 Exillon Energy 39,505,690 1.29
2,600,000 Zhaikmunai Registered Shares GDR 17,745,448 0.58
62,871,415 2.05
JERSEY2,323,932 Glencore International 12,571,344 0.41
4,780,000 Highland Gold Mining 9,431,464 0.311,800,000 KazakhGold Group Registered Shares GDR 4,360,507 0.144,309,500 Minera IRL 3,146,124 0.10
530,000 Randgold Resources ADR 30,768,463 1.01
60,277,902 1.97
IRELAND15,850,000 Circle Oil 5,764,559 0.1946,250,000 Kenmare Resources 29,492,806 0.96
9,201,356 Ormonde Mining 1,030,509 0.0350,696,100 Petroceltic International 5,579,595 0.1819,500,000 Petroneft Resources 7,495,394 0.25
2,286,970 Providence Resources 6,488,628 0.21
55,851,491 1.82
HONG KONG24,970,000 CNOOC 40,316,327 1.3132,160,000 IRC 5,069,708 0.17
45,386,035 1.48
INDONESIA43,046,000 International Nickel Indonesia 15,521,809 0.5132,565,500 Perusahaan Perkebunan London Sumatra Indonesia 6,068,145 0.204,150,000 PT Astra Agro Lestari 7,783,130 0.25
41,000,000 PT Timah 8,217,949 0.27
37,591,033 1.23
BRAZIL900,000 Petroleo Brasileiro ADR 20,990,774 0.68610,000 Vale Preference Shares ADR 12,182,293 0.40
33,173,067 1.08
RUSSIA260,000 Lukoil OAO ADR 11,384,041 0.37
1,157,000 MMC Norilsk Nickel ADR 20,907,327 0.68
32,291,368 1.05
CAYMAN ISLANDS2,047,500 Leaf Clean Energy 1,687,273 0.058,200,000 Mongolian Mining 6,998,513 0.233,000,000 Real Gold Mining 2,360,606 0.0813,220,000 Tethys Petroleum 10,265,863 0.34
21,312,255 0.70
SOUTH AFRICA580,000 Impala Platinum Holdings 10,734,750 0.35
68,927,240 Merafe Resources 8,190,075 0.27
18,924,825 0.62
NORWAY21,150,000 DNO International 16,903,898 0.55
16,903,898 0.55
LUXEMBOURG610,000 Evraz Group Registered Shares GDR 13,126,689 0.43
13,126,689 0.43
BRITISH VIRGIN ISLANDS1,484,300 Gem Diamonds 3,712,165 0.12
756,512 Ncondezi Coal 1,138,046 0.0322,349,572 Sierra Rutile 5,161,843 0.173,873,389 St Augustine Gold and Copper 1,788,072 0.06
11,800,126 0.38
287
JPMorgan Funds - Global Natural Resources FundSchedule of Investments (Market Value Expressed in EUR) (continued)
As at 30 June 2011
Quantity/Nominal
Value
Name of Securities Maturity/Coupon
MarketValue
%of
NetAssets
Quantity/Nominal
Value
Name of Securities Maturity/Coupon
MarketValue
%of
NetAssets
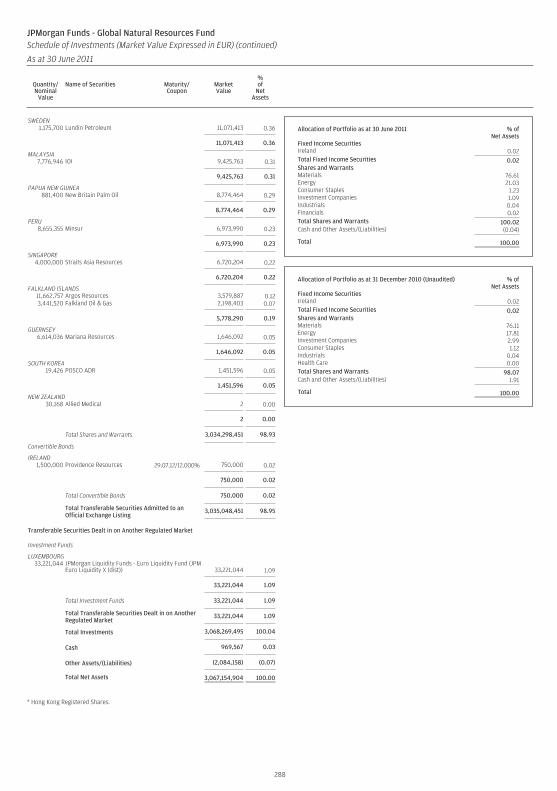
SWEDEN1,175,700 Lundin Petroleum 11,071,413 0.36
11,071,413 0.36
MALAYSIA7,776,946 IOI 9,425,763 0.31
9,425,763 0.31
PAPUA NEW GUINEA881,400 New Britain Palm Oil 8,774,464 0.29
8,774,464 0.29
PERU8,655,355 Minsur 6,973,990 0.23
6,973,990 0.23
SINGAPORE4,000,000 Straits Asia Resources 6,720,204 0.22
6,720,204 0.22
FALKLAND ISLANDS11,662,757 Argos Resources 3,579,887 0.123,441,520 Falkland Oil & Gas 2,198,403 0.07
5,778,290 0.19
GUERNSEY6,614,036 Mariana Resources 1,646,092 0.05
1,646,092 0.05
SOUTH KOREA19,426 POSCO ADR 1,451,596 0.05
1,451,596 0.05
NEW ZEALAND30,168 Allied Medical 2 0.00
2 0.00
Total Shares and Warrants 3,034,298,451 98.93
Convertible Bonds
IRELAND1,500,000 Providence Resources 29.07.12/12.000% 750,000 0.02
750,000 0.02
Total Convertible Bonds 750,000 0.02
Total Transferable Securities Admitted to anOfficial Exchange Listing
3,035,048,451 98.95
Transferable Securities Dealt in on Another Regulated Market
Investment Funds
LUXEMBOURG33,221,044 JPMorgan Liquidity Funds - Euro Liquidity Fund (JPM
Euro Liquidity X (dist)) 33,221,044 1.09
33,221,044 1.09
Total Investment Funds 33,221,044 1.09
Total Transferable Securities Dealt in on AnotherRegulated Market
33,221,044 1.09
Total Investments 3,068,269,495 100.04
Cash 969,567 0.03
Other Assets/(Liabilities) (2,084,158) (0.07)
Total Net Assets 3,067,154,904 100.00
* Hong Kong Registered Shares.
Allocation of Portfolio as at 30 June 2011 % ofNet Assets
Fixed Income SecuritiesIreland 0.02Total Fixed Income Securities 0.02Shares and WarrantsMaterials 76.61Energy 21.03Consumer Staples 1.23Investment Companies 1.09Industrials 0.04Financials 0.02Total Shares and Warrants 100.02Cash and Other Assets/(Liabilities) (0.04)
Total 100.00
Allocation of Portfolio as at 31 December 2010 (Unaudited) % ofNet Assets
Fixed Income SecuritiesIreland 0.02Total Fixed Income Securities 0.02Shares and WarrantsMaterials 76.11Energy 17.81Investment Companies 2.99Consumer Staples 1.12Industrials 0.04Health Care 0.00Total Shares and Warrants 98.07Cash and Other Assets/(Liabilities) 1.91
Total 100.00
288
JPMorgan Funds - Global Natural Resources FundSchedule of Investments (Market Value Expressed in EUR) (continued)
As at 30 June 2011
Quantity/Nominal
Value
Name of Securities Maturity/Coupon
MarketValue
%of
NetAssets
Quantity/Nominal
Value
Name of Securities Maturity/Coupon
MarketValue
%of
NetAssets
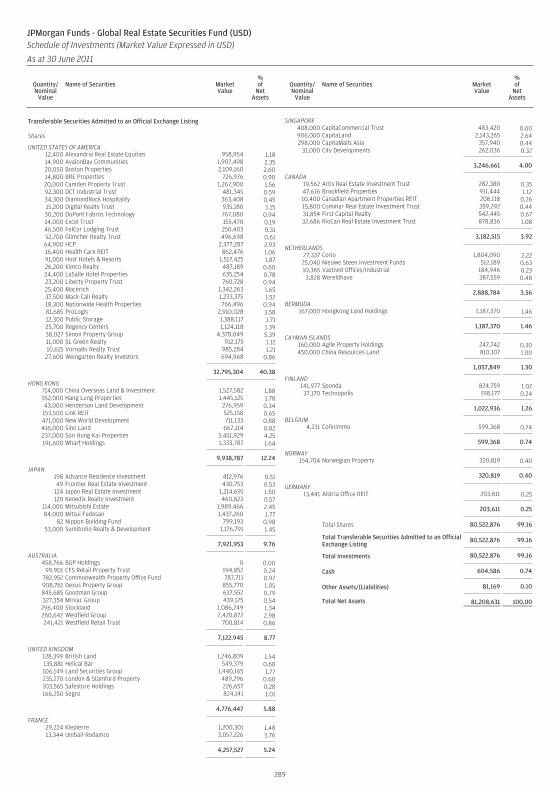
Transferable Securities Admitted to an Official Exchange Listing
Shares
UNITED STATES OF AMERICA12,400 Alexandria Real Estate Equities 958,954 1.1814,900 AvalonBay Communities 1,907,498 2.3520,050 Boston Properties 2,109,160 2.6014,800 BRE Properties 726,976 0.9020,000 Camden Property Trust 1,267,900 1.5692,300 DCT Industrial Trust 481,345 0.5934,300 DiamondRock Hospitality 363,408 0.4515,200 Digital Realty Trust 935,180 1.1530,200 DuPont Fabros Technology 767,080 0.9414,000 Excel Trust 155,470 0.1946,500 FelCor Lodging Trust 250,403 0.3152,700 Glimcher Realty Trust 496,698 0.6164,900 HCP 2,377,287 2.9316,400 Health Care REIT 862,476 1.0691,000 Host Hotels & Resorts 1,517,425 1.8726,200 Kimco Realty 487,189 0.6024,400 LaSalle Hotel Properties 635,254 0.7823,200 Liberty Property Trust 760,728 0.9425,400 Macerich 1,342,263 1.6537,500 Mack-Cali Realty 1,233,375 1.5218,300 Nationwide Health Properties 766,496 0.9481,685 ProLogis 2,910,028 3.5812,300 Public Storage 1,388,117 1.7125,700 Regency Centers 1,124,118 1.3938,027 Simon Property Group 4,378,049 5.3911,000 SL Green Realty 912,175 1.1210,615 Vornado Realty Trust 985,284 1.21
27,600 Weingarten Realty Investors 694,968 0.86
32,795,304 40.38
HONG KONG714,000 China Overseas Land & Investment 1,527,582 1.88352,000 Hang Lung Properties 1,445,125 1.7843,000 Henderson Land Development 276,959 0.34153,500 Link REIT 525,158 0.65471,000 New World Development 711,133 0.88416,000 Sino Land 667,114 0.82237,000 Sun Hung Kai Properties 3,451,929 4.25191,600 Wharf Holdings 1,333,787 1.64
9,938,787 12.24
JAPAN198 Advance Residence Investment 412,976 0.5149 Frontier Real Estate Investment 430,753 0.53
124 Japan Real Estate Investment 1,214,691 1.50120 Kenedix Realty Investment 460,823 0.57
114,000 Mitsubishi Estate 1,989,466 2.4584,000 Mitsui Fudosan 1,437,260 1.77
82 Nippon Building Fund 799,193 0.9853,000 Sumitomo Realty & Development 1,176,791 1.45
7,921,953 9.76
AUSTRALIA458,766 BGP Holdings 0 0.00
99,901 CFS Retail Property Trust 194,852 0.24782,952 Commonwealth Property Office Fund 787,711 0.97908,761 Dexus Property Group 855,770 1.05845,685 Goodman Group 637,552 0.79327,354 Mirvac Group 439,125 0.54
296,400 Stockland 1,086,249 1.34260,642 Westfield Group 2,420,872 2.98241,421 Westfield Retail Trust 700,814 0.86
7,122,945 8.77
UNITED KINGDOM128,399 British Land 1,246,809 1.54135,881 Helical Bar 549,379 0.68106,149 Land Securities Group 1,440,165 1.77235,270 London & Stamford Property 489,296 0.60103,565 Safestore Holdings 226,657 0.28166,250 Segro 824,141 1.01
4,776,447 5.88
FRANCE29,224 Klepierre 1,200,301 1.4813,344 Unibail-Rodamco 3,057,226 3.76
4,257,527 5.24
SINGAPORE408,000 CapitaCommercial Trust 483,420 0.60906,000 CapitaLand 2,143,265 2.64298,000 CapitaMalls Asia 357,940 0.44
31,000 City Developments 262,036 0.32
3,246,661 4.00
CANADA19,562 Artis Real Estate Investment Trust 282,380 0.3547,616 Brookfield Properties 911,444 1.1210,400 Canadian Apartment Properties REIT 208,118 0.2615,800 Cominar Real Estate Investment Trust 359,292 0.4431,854 First Capital Realty 542,445 0.6732,686 RioCan Real Estate Investment Trust 878,836 1.08
3,182,515 3.92
NETHERLANDS27,337 Corio 1,804,090 2.22
25,040 Nieuwe Steen Investment Funds 512,189 0.6310,365 Vastned Offices/Industrial 184,946 0.233,828 Wereldhave 387,559 0.48
2,888,784 3.56
BERMUDA167,000 HongKong Land Holdings 1,187,370 1.46
1,187,370 1.46
CAYMAN ISLANDS160,000 Agile Property Holdings 247,742 0.30450,000 China Resources Land 810,107 1.00
1,057,849 1.30
FINLAND141,977 Sponda 824,759 1.0237,170 Technopolis 198,177 0.24
1,022,936 1.26
BELGIUM4,231 Cofinimmo 599,368 0.74
599,368 0.74
NORWAY154,704 Norwegian Property 320,819 0.40
320,819 0.40
GERMANY13,441 Alstria Office REIT 203,611 0.25
203,611 0.25
Total Shares 80,522,876 99.16
Total Transferable Securities Admitted to an OfficialExchange Listing
80,522,876 99.16
Total Investments 80,522,876 99.16
Cash 604,586 0.74
Other Assets/(Liabilities) 81,169 0.10
Total Net Assets 81,208,631 100.00
289
JPMorgan Funds - Global Real Estate Securities Fund (USD)Schedule of Investments (Market Value Expressed in USD)
As at 30 June 2011
Quantity/Nominal
Value
Name of Securities MarketValue
%of
NetAssets
Quantity/Nominal
Value
Name of Securities MarketValue
%of
NetAssets
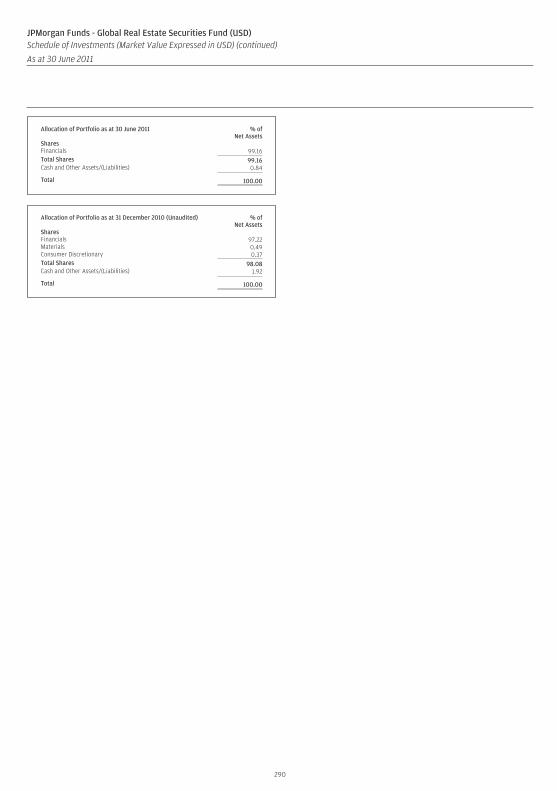
Allocation of Portfolio as at 30 June 2011 % ofNet Assets
SharesFinancials 99.16Total Shares 99.16Cash and Other Assets/(Liabilities) 0.84
Total 100.00
Allocation of Portfolio as at 31 December 2010 (Unaudited) % ofNet Assets
SharesFinancials 97.22Materials 0.49Consumer Discretionary 0.37Total Shares 98.08Cash and Other Assets/(Liabilities) 1.92
Total 100.00
290
JPMorgan Funds - Global Real Estate Securities Fund (USD)Schedule of Investments (Market Value Expressed in USD) (continued)
As at 30 June 2011
Quantity/Nominal
Value
Name of Securities MarketValue
%of
NetAssets
Quantity/Nominal
Value
Name of Securities MarketValue
%of
NetAssets
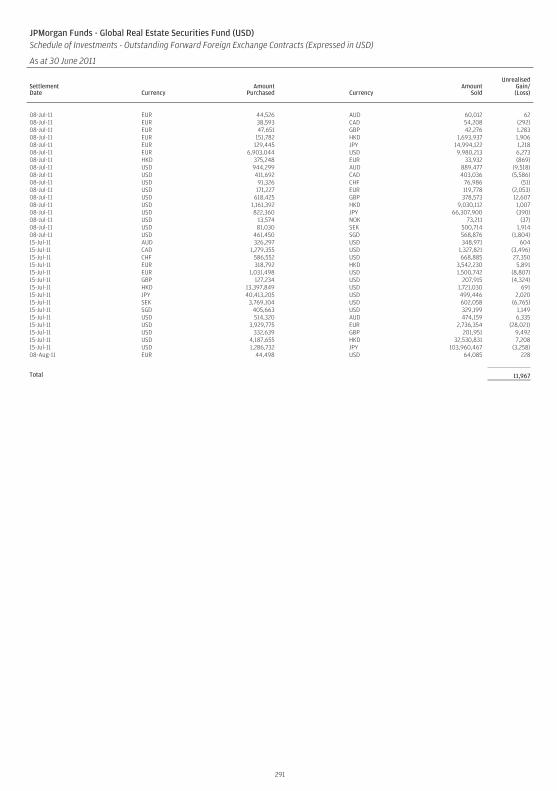
JPMorgan Funds - Global Real Estate Securities Fund (USD)Schedule of Investments - Outstanding Forward Foreign Exchange Contracts (Expressed in USD)
As at 30 June 2011
SettlementDate Currency
AmountPurchased Currency
AmountSold
UnrealisedGain/(Loss)
08-Jul-11 EUR 44,526 AUD 60,012 6208-Jul-11 EUR 38,593 CAD 54,208 (292)08-Jul-11 EUR 47,651 GBP 42,276 1,28308-Jul-11 EUR 151,782 HKD 1,693,937 1,90608-Jul-11 EUR 129,445 JPY 14,994,122 1,21808-Jul-11 EUR 6,903,044 USD 9,980,213 6,27308-Jul-11 HKD 375,248 EUR 33,932 (869)08-Jul-11 USD 944,299 AUD 889,477 (9,518)08-Jul-11 USD 411,692 CAD 403,036 (5,586)08-Jul-11 USD 91,326 CHF 76,986 (51)08-Jul-11 USD 171,227 EUR 119,778 (2,053)08-Jul-11 USD 618,425 GBP 378,573 12,60708-Jul-11 USD 1,161,392 HKD 9,030,112 1,00708-Jul-11 USD 822,360 JPY 66,307,900 (390)08-Jul-11 USD 13,574 NOK 73,211 (37)08-Jul-11 USD 81,030 SEK 500,714 1,91408-Jul-11 USD 461,450 SGD 568,876 (1,804)15-Jul-11 AUD 326,297 USD 348,971 60415-Jul-11 CAD 1,279,355 USD 1,327,821 (3,496)15-Jul-11 CHF 586,552 USD 668,885 27,35015-Jul-11 EUR 318,792 HKD 3,542,230 5,89115-Jul-11 EUR 1,031,498 USD 1,500,742 (8,807)15-Jul-11 GBP 127,234 USD 207,915 (4,324)15-Jul-11 HKD 13,397,849 USD 1,721,030 69115-Jul-11 JPY 40,413,205 USD 499,446 2,02015-Jul-11 SEK 3,769,104 USD 602,058 (6,765)15-Jul-11 SGD 405,663 USD 329,199 1,14915-Jul-11 USD 514,320 AUD 474,159 6,33515-Jul-11 USD 3,929,775 EUR 2,736,354 (28,021)15-Jul-11 USD 332,639 GBP 201,951 9,49215-Jul-11 USD 4,187,655 HKD 32,530,831 7,20815-Jul-11 USD 1,286,732 JPY 103,960,467 (3,258)08-Aug-11 EUR 44,498 USD 64,085 228
Total 11,967
291
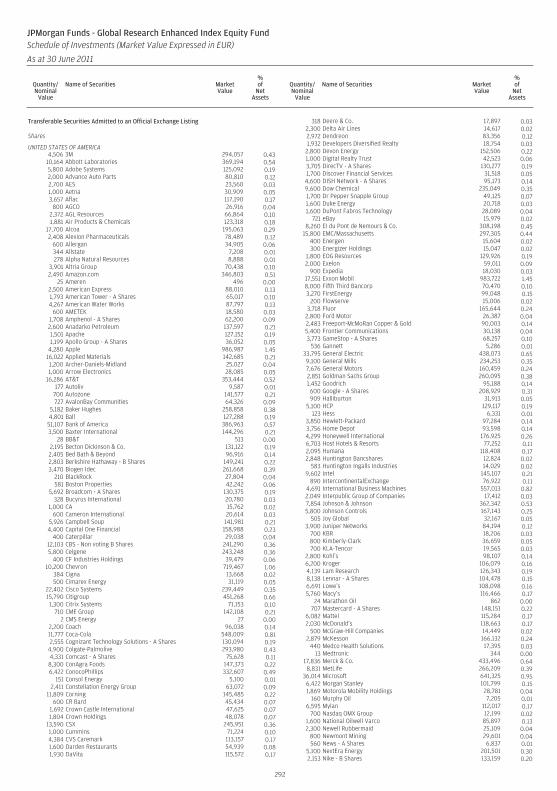
Transferable Securities Admitted to an Official Exchange Listing
Shares
UNITED STATES OF AMERICA4,506 3M 294,057 0.43
10,164 Abbott Laboratories 369,194 0.545,800 Adobe Systems 125,092 0.192,000 Advance Auto Parts 80,810 0.122,700 AES 23,560 0.031,000 Aetna 30,909 0.053,657 Aflac 117,190 0.17
800 AGCO 26,916 0.042,372 AGL Resources 66,864 0.101,881 Air Products & Chemicals 123,318 0.18
17,700 Alcoa 195,063 0.292,408 Alexion Pharmaceuticals 78,489 0.12
600 Allergan 34,905 0.06344 Allstate 7,208 0.01278 Alpha Natural Resources 8,888 0.01
3,901 Altria Group 70,438 0.102,490 Amazon.com 346,803 0.51
25 Ameren 496 0.002,500 American Express 88,010 0.131,793 American Tower - A Shares 65,017 0.104,267 American Water Works 87,797 0.13
600 AMETEK 18,580 0.031,708 Amphenol - A Shares 62,200 0.092,600 Anadarko Petroleum 137,597 0.211,501 Apache 127,152 0.191,199 Apollo Group - A Shares 36,052 0.05
4,280 Apple 986,987 1.4516,022 Applied Materials 142,685 0.211,200 Archer-Daniels-Midland 25,027 0.041,000 Arrow Electronics 28,085 0.05
16,286 AT&T 353,444 0.52177 Autoliv 9,587 0.01
700 Autozone 141,577 0.21727 AvalonBay Communities 64,326 0.09
5,182 Baker Hughes 258,858 0.384,801 Ball 127,288 0.1951,107 Bank of America 386,963 0.573,500 Baxter International 144,296 0.21
28 BB&T 513 0.002,195 Becton Dickinson & Co. 131,122 0.192,405 Bed Bath & Beyond 96,916 0.142,803 Berkshire Hathaway - B Shares 149,241 0.223,470 Biogen Idec 261,668 0.39
210 BlackRock 27,804 0.04581 Boston Properties 42,242 0.06
5,692 Broadcom - A Shares 130,375 0.19328 Bucyrus International 20,780 0.03
1,000 CA 15,762 0.02600 Cameron International 20,614 0.03
5,926 Campbell Soup 141,981 0.214,400 Capital One Financial 158,988 0.23
400 Caterpillar 29,038 0.0412,103 CBS - Non voting B Shares 241,290 0.365,800 Celgene 243,248 0.36
400 CF Industries Holdings 39,479 0.0610,200 Chevron 719,467 1.06
384 Cigna 13,668 0.02500 Cimarex Energy 31,119 0.05
22,402 Cisco Systems 239,449 0.3515,790 Citigroup 451,268 0.661,300 Citrix Systems 71,153 0.10
710 CME Group 142,108 0.212 CMS Energy 27 0.00
2,200 Coach 96,038 0.1411,777 Coca-Cola 548,009 0.812,555 Cognizant Technology Solutions - A Shares 130,094 0.19
4,900 Colgate-Palmolive 293,980 0.434,331 Comcast - A Shares 75,628 0.118,300 ConAgra Foods 147,373 0.226,422 ConocoPhillips 332,607 0.49
151 Consol Energy 5,100 0.012,411 Constellation Energy Group 63,072 0.09
11,809 Corning 145,485 0.22600 CR Bard 45,434 0.07
1,692 Crown Castle International 47,625 0.071,804 Crown Holdings 48,078 0.07
13,590 CSX 245,951 0.361,000 Cummins 71,224 0.104,384 CVS Caremark 113,157 0.171,600 Darden Restaurants 54,939 0.081,930 DaVita 115,572 0.17
318 Deere & Co. 17,897 0.032,300 Delta Air Lines 14,617 0.022,972 Dendreon 83,356 0.121,932 Developers Diversified Realty 18,754 0.03
2,800 Devon Energy 152,506 0.221,000 Digital Realty Trust 42,523 0.063,705 DirecTV - A Shares 130,277 0.191,700 Discover Financial Services 31,518 0.05
4,600 DISH Network - A Shares 95,173 0.149,600 Dow Chemical 235,049 0.351,700 Dr Pepper Snapple Group 49,125 0.071,600 Duke Energy 20,718 0.031,600 DuPont Fabros Technology 28,089 0.04
721 eBay 15,979 0.028,260 EI du Pont de Nemours & Co. 308,198 0.45
15,800 EMC/Massachusetts 297,305 0.44400 Energen 15,604 0.02300 Energizer Holdings 15,047 0.02
1,800 EOG Resources 129,926 0.192,000 Exelon 59,011 0.09
900 Expedia 18,030 0.0317,551 Exxon Mobil 983,722 1.458,000 Fifth Third Bancorp 70,470 0.103,270 FirstEnergy 99,048 0.15
200 Flowserve 15,006 0.023,718 Fluor 165,644 0.24
2,800 Ford Motor 26,387 0.042,483 Freeport-McMoRan Copper & Gold 90,003 0.145,400 Frontier Communications 30,138 0.043,773 GameStop - A Shares 68,257 0.10
536 Gannett 5,286 0.0133,795 General Electric 438,073 0.659,100 General Mills 234,253 0.357,676 General Motors 160,459 0.242,851 Goldman Sachs Group 260,095 0.381,452 Goodrich 95,188 0.14600 Google - A Shares 208,929 0.31909 Halliburton 31,913 0.05
5,100 HCP 129,117 0.19123 Hess 6,331 0.01
3,850 Hewlett-Packard 97,284 0.143,756 Home Depot 93,598 0.144,299 Honeywell International 176,925 0.266,703 Host Hotels & Resorts 77,252 0.112,095 Humana 118,408 0.172,848 Huntington Bancshares 12,824 0.02
583 Huntington Ingalls Industries 14,029 0.029,602 Intel 145,107 0.21
890 IntercontinentalExchange 76,922 0.114,691 International Business Machines 557,013 0.822,049 Interpublic Group of Companies 17,412 0.037,854 Johnson & Johnson 362,342 0.535,800 Johnson Controls 167,143 0.25
505 Joy Global 32,167 0.053,900 Juniper Networks 84,194 0.12
700 KBR 18,206 0.03800 Kimberly-Clark 36,659 0.05700 KLA-Tencor 19,565 0.03
2,800 Kohl’s 98,107 0.146,200 Kroger 106,079 0.164,139 Lam Research 126,343 0.198,138 Lennar - A Shares 104,478 0.156,691 Lowe’s 108,098 0.165,760 Macy’s 116,466 0.17
24 Marathon Oil 862 0.00707 Mastercard - A Shares 148,151 0.22
6,082 Mattel 115,284 0.172,030 McDonald’s 118,663 0.17
500 McGraw-Hill Companies 14,449 0.022,879 McKesson 166,132 0.24
440 Medco Health Solutions 17,395 0.0313 Medtronic 344 0.00
17,836 Merck & Co. 433,496 0.648,831 MetLife 266,209 0.39
36,014 Microsoft 641,325 0.956,422 Morgan Stanley 101,799 0.151,869 Motorola Mobility Holdings 28,781 0.04
160 Murphy Oil 7,205 0.016,595 Mylan 112,017 0.17
700 Nasdaq OMX Group 12,199 0.021,600 National Oilwell Varco 85,897 0.132,300 Newell Rubbermaid 25,109 0.04
800 Newmont Mining 29,601 0.04560 News - A Shares 6,837 0.01
5,100 NextEra Energy 201,501 0.302,153 Nike - B Shares 133,159 0.20
292
JPMorgan Funds - Global Research Enhanced Index Equity FundSchedule of Investments (Market Value Expressed in EUR)
As at 30 June 2011
Quantity/Nominal
Value
Name of Securities MarketValue
%of
NetAssets
Quantity/Nominal
Value
Name of Securities MarketValue
%of
NetAssets
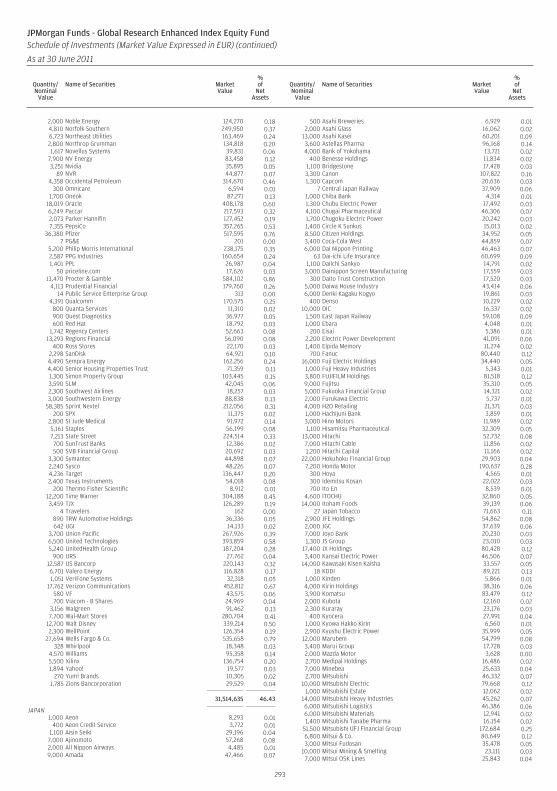
2,000 Noble Energy 124,270 0.184,810 Norfolk Southern 249,950 0.376,723 Northeast Utilities 163,469 0.242,800 Northrop Grumman 134,818 0.201,617 Novellus Systems 39,831 0.06
7,900 NV Energy 83,458 0.123,251 Nvidia 35,895 0.05
89 NVR 44,877 0.074,358 Occidental Petroleum 314,670 0.46
300 Omnicare 6,594 0.011,700 Oneok 87,271 0.13
18,019 Oracle 408,178 0.606,249 Paccar 217,593 0.322,073 Parker Hannifin 127,452 0.197,355 PepsiCo 357,265 0.53
36,380 Pfizer 517,595 0.767 PG&E 201 0.00
5,200 Philip Morris International 238,175 0.352,587 PPG Industries 160,654 0.241,401 PPL 26,987 0.04
50 priceline.com 17,626 0.0313,470 Procter & Gamble 584,102 0.86
4,113 Prudential Financial 179,760 0.2614 Public Service Enterprise Group 313 0.00
4,391 Qualcomm 170,575 0.25800 Quanta Services 11,310 0.02900 Quest Diagnostics 36,977 0.05600 Red Hat 18,792 0.03
1,742 Regency Centers 52,663 0.0813,293 Regions Financial 56,090 0.08
400 Ross Stores 22,170 0.032,298 SanDisk 64,921 0.104,490 Sempra Energy 162,256 0.244,400 Senior Housing Properties Trust 71,359 0.111,300 Simon Property Group 103,445 0.153,590 SLM 42,045 0.062,300 Southwest Airlines 18,257 0.033,000 Southwestern Energy 88,838 0.13
58,385 Sprint Nextel 212,056 0.31200 SPX 11,375 0.02
2,800 St Jude Medical 91,972 0.145,161 Staples 56,199 0.087,213 State Street 224,514 0.33700 SunTrust Banks 12,386 0.02500 SVB Financial Group 20,692 0.03
3,300 Symantec 44,898 0.072,240 Sysco 48,226 0.074,236 Target 136,447 0.202,400 Texas Instruments 54,018 0.08
200 Thermo Fisher Scientific 8,912 0.0112,200 Time Warner 304,188 0.453,459 TJX 126,289 0.19
4 Travelers 162 0.00890 TRW Automotive Holdings 36,336 0.05642 UGI 14,133 0.02
3,700 Union Pacific 267,926 0.396,500 United Technologies 393,859 0.585,240 UnitedHealth Group 187,204 0.28
900 URS 27,762 0.0412,587 US Bancorp 220,143 0.326,701 Valero Energy 116,828 0.171,051 VeriFone Systems 32,318 0.05
17,762 Verizon Communications 452,812 0.67580 VF 43,575 0.06700 Viacom - B Shares 24,969 0.04
3,156 Walgreen 91,462 0.137,700 Wal-Mart Stores 280,704 0.41
12,700 Walt Disney 339,214 0.502,300 WellPoint 126,354 0.19
27,694 Wells Fargo & Co. 535,658 0.79328 Whirlpool 18,348 0.03
4,570 Williams 95,358 0.145,500 Xilinx 136,754 0.201,894 Yahoo! 19,577 0.03
270 Yum! Brands 10,305 0.021,785 Zions Bancorporation 29,529 0.04
31,514,635 46.43
JAPAN1,000 Aeon 8,293 0.01
400 Aeon Credit Service 3,772 0.011,100 Aisin Seiki 29,196 0.04
7,000 Ajinomoto 57,268 0.082,000 All Nippon Airways 4,485 0.019,000 Amada 47,466 0.07
500 Asahi Breweries 6,929 0.012,000 Asahi Glass 16,062 0.02
13,000 Asahi Kasei 60,201 0.093,600 Astellas Pharma 96,168 0.144,000 Bank of Yokohama 13,721 0.02
400 Benesse Holdings 11,834 0.021,100 Bridgestone 17,428 0.033,300 Canon 107,822 0.161,300 Capcom 20,636 0.03
7 Central Japan Railway 37,909 0.061,000 Chiba Bank 4,314 0.011,300 Chubu Electric Power 17,492 0.034,100 Chugai Pharmaceutical 46,306 0.071,700 Chugoku Electric Power 20,242 0.031,400 Circle K Sunkus 15,013 0.028,500 Citizen Holdings 34,952 0.053,400 Coca-Cola West 44,859 0.076,000 Dai Nippon Printing 46,463 0.07
63 Dai-ichi Life Insurance 60,699 0.091,100 Daiichi Sankyo 14,791 0.02
3,000 Dainippon Screen Manufacturing 17,559 0.03300 Daito Trust Construction 17,520 0.03
5,000 Daiwa House Industry 43,414 0.066,000 Denki Kagaku Kogyo 19,861 0.03
400 Denso 10,229 0.0210,000 DIC 16,337 0.02
1,500 East Japan Railway 59,108 0.091,000 Ebara 4,048 0.01
200 Eisai 5,386 0.012,200 Electric Power Development 41,091 0.061,400 Elpida Memory 11,274 0.02
700 Fanuc 80,440 0.1216,000 Fuji Electric Holdings 34,440 0.05
1,000 Fuji Heavy Industries 5,343 0.013,800 FUJIFILM Holdings 81,518 0.129,000 Fujitsu 35,310 0.055,000 Fukuoka Financial Group 14,321 0.022,000 Furukawa Electric 5,737 0.014,000 H2O Retailing 21,371 0.031,000 Hachijuni Bank 3,859 0.013,000 Hino Motors 11,989 0.021,100 Hisamitsu Pharmaceutical 32,309 0.05
13,000 Hitachi 52,732 0.087,000 Hitachi Cable 11,856 0.021,200 Hitachi Capital 11,166 0.02
22,000 Hokuhoku Financial Group 29,903 0.047,200 Honda Motor 190,637 0.28
300 Hoya 4,565 0.01300 Idemitsu Kosan 22,022 0.03700 Ito En 8,539 0.01
4,600 ITOCHU 32,860 0.0514,000 Itoham Foods 39,139 0.06
27 Japan Tobacco 71,663 0.112,900 JFE Holdings 54,862 0.082,000 JGC 37,639 0.067,000 Joyo Bank 20,230 0.031,300 JS Group 23,010 0.03
17,400 JX Holdings 80,428 0.123,400 Kansai Electric Power 46,506 0.07
14,000 Kawasaki Kisen Kaisha 33,557 0.0518 KDDI 89,221 0.13
1,000 Kinden 5,866 0.014,000 Kirin Holdings 38,316 0.063,900 Komatsu 83,479 0.122,000 Kubota 12,160 0.022,300 Kuraray 23,176 0.03
400 Kyocera 27,991 0.041,000 Kyowa Hakko Kirin 6,560 0.012,900 Kyushu Electric Power 35,999 0.05
12,000 Marubeni 54,799 0.083,400 Marui Group 17,728 0.032,000 Mazda Motor 3,628 0.002,700 Medipal Holdings 16,486 0.027,000 Minebea 25,633 0.042,700 Mitsubishi 46,332 0.07
10,000 Mitsubishi Electric 79,668 0.121,000 Mitsubishi Estate 12,062 0.02
14,000 Mitsubishi Heavy Industries 45,262 0.076,000 Mitsubishi Logistics 46,386 0.066,000 Mitsubishi Materials 12,941 0.021,400 Mitsubishi Tanabe Pharma 16,154 0.02
51,500 Mitsubishi UFJ Financial Group 172,684 0.256,800 Mitsui & Co. 80,649 0.123,000 Mitsui Fudosan 35,478 0.05
10,000 Mitsui Mining & Smelting 23,111 0.037,000 Mitsui OSK Lines 25,843 0.04
293
JPMorgan Funds - Global Research Enhanced Index Equity FundSchedule of Investments (Market Value Expressed in EUR) (continued)
As at 30 June 2011
Quantity/Nominal
Value
Name of Securities MarketValue
%of
NetAssets
Quantity/Nominal
Value
Name of Securities MarketValue
%of
NetAssets
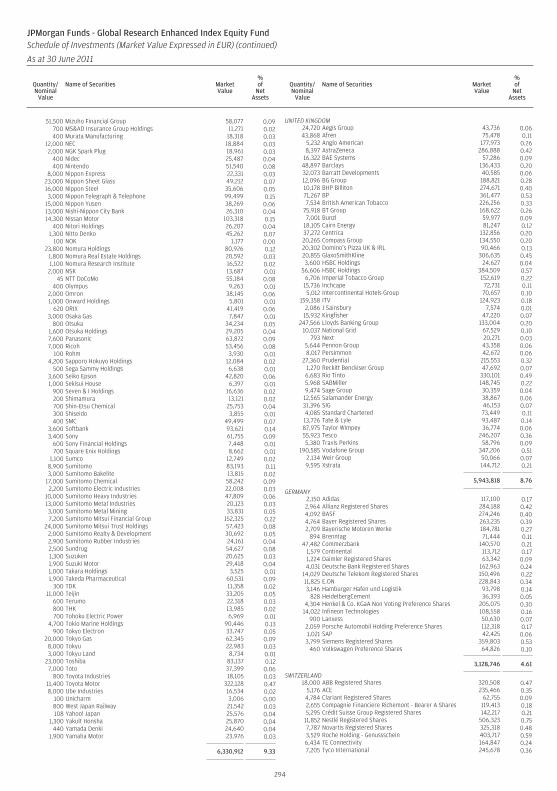
51,500 Mizuho Financial Group 58,077 0.09700 MS&AD Insurance Group Holdings 11,271 0.02400 Murata Manufacturing 18,318 0.03
12,000 NEC 18,884 0.032,000 NGK Spark Plug 18,961 0.03
400 Nidec 25,487 0.04400 Nintendo 51,540 0.08
8,000 Nippon Express 22,331 0.0323,000 Nippon Sheet Glass 49,212 0.0716,000 Nippon Steel 35,606 0.053,000 Nippon Telegraph & Telephone 99,499 0.15
15,000 Nippon Yusen 38,269 0.0613,000 Nishi-Nippon City Bank 26,310 0.0414,300 Nissan Motor 103,318 0.15
400 Nitori Holdings 26,207 0.041,300 Nitto Denko 45,262 0.07
100 NOK 1,177 0.0023,800 Nomura Holdings 80,926 0.12
1,800 Nomura Real Estate Holdings 20,592 0.031,100 Nomura Research Institute 16,522 0.02
2,000 NSK 13,687 0.0145 NTT DoCoMo 55,184 0.08
400 Olympus 9,263 0.012,000 Omron 38,145 0.061,000 Onward Holdings 5,801 0.01
620 ORIX 41,419 0.063,000 Osaka Gas 7,847 0.01
800 Otsuka 34,234 0.051,600 Otsuka Holdings 29,205 0.047,600 Panasonic 63,872 0.097,000 Ricoh 53,456 0.08
100 Rohm 3,930 0.014,200 Sapporo Hokuyo Holdings 12,084 0.02
500 Sega Sammy Holdings 6,638 0.013,600 Seiko Epson 42,820 0.061,000 Sekisui House 6,397 0.01
900 Seven & I Holdings 16,636 0.02200 Shimamura 13,121 0.02700 Shin-Etsu Chemical 25,753 0.04300 Shiseido 3,855 0.01400 SMC 49,499 0.07
3,600 Softbank 93,621 0.143,400 Sony 61,755 0.09
600 Sony Financial Holdings 7,448 0.01700 Square Enix Holdings 8,662 0.01
1,100 Sumco 12,749 0.028,900 Sumitomo 83,193 0.113,000 Sumitomo Bakelite 13,815 0.02
17,000 Sumitomo Chemical 58,242 0.092,200 Sumitomo Electric Industries 22,008 0.03
10,000 Sumitomo Heavy Industries 47,809 0.0613,000 Sumitomo Metal Industries 20,123 0.033,000 Sumitomo Metal Mining 33,831 0.057,200 Sumitomo Mitsui Financial Group 152,325 0.22
24,000 Sumitomo Mitsui Trust Holdings 57,423 0.082,000 Sumitomo Realty & Development 30,692 0.052,900 Sumitomo Rubber Industries 24,161 0.042,500 Sundrug 54,627 0.081,300 Suzuken 20,625 0.031,900 Suzuki Motor 29,418 0.041,000 Takara Holdings 3,525 0.011,900 Takeda Pharmaceutical 60,531 0.09
300 TDK 11,358 0.0211,000 Teijin 33,205 0.05
600 Terumo 22,318 0.03800 THK 13,985 0.02700 Tohoku Electric Power 6,969 0.01
4,700 Tokio Marine Holdings 90,446 0.13900 Tokyo Electron 33,747 0.05
20,000 Tokyo Gas 62,345 0.098,000 Tokyu 22,983 0.033,000 Tokyu Land 8,734 0.01
23,000 Toshiba 83,137 0.127,000 Toto 37,399 0.06
800 Toyota Industries 18,105 0.0311,400 Toyota Motor 322,128 0.478,000 Ube Industries 16,534 0.02
100 Unicharm 3,006 0.00800 West Japan Railway 21,542 0.03108 Yahoo! Japan 25,576 0.04
1,300 Yakult Honsha 25,870 0.04440 Yamada Denki 24,640 0.04
1,900 Yamaha Motor 23,976 0.03
6,330,912 9.33
UNITED KINGDOM24,720 Aegis Group 43,736 0.0643,868 Afren 75,478 0.11
5,232 Anglo American 177,973 0.268,397 AstraZeneca 286,888 0.42
16,322 BAE Systems 57,286 0.0948,897 Barclays 136,433 0.2032,073 Barratt Developments 40,585 0.0612,096 BG Group 188,821 0.2810,178 BHP Billiton 274,671 0.4071,267 BP 361,477 0.537,534 British American Tobacco 226,256 0.33
75,918 BT Group 168,622 0.267,001 Bunzl 59,977 0.09
18,105 Cairn Energy 81,247 0.1237,272 Centrica 132,856 0.2020,265 Compass Group 134,550 0.2020,302 Domino’s Pizza UK & IRL 90,466 0.1320,855 GlaxoSmithKline 306,635 0.453,600 HSBC Holdings 24,627 0.04
56,606 HSBC Holdings 384,509 0.576,706 Imperial Tobacco Group 152,619 0.22
15,736 Inchcape 72,731 0.115,012 Intercontinental Hotels Group 70,657 0.10
159,358 ITV 124,923 0.182,086 J Sainsbury 7,574 0.01
15,932 Kingfisher 47,220 0.07247,566 Lloyds Banking Group 133,004 0.20
10,037 National Grid 67,529 0.10793 Next 20,271 0.03
5,644 Pennon Group 43,358 0.068,017 Persimmon 42,672 0.06
27,360 Prudential 215,553 0.321,270 Reckitt Benckiser Group 47,692 0.076,683 Rio Tinto 330,101 0.495,968 SABMiller 148,745 0.229,474 Sage Group 30,359 0.0412,565 Salamander Energy 38,867 0.0631,396 SIG 46,153 0.074,085 Standard Chartered 73,449 0.1113,726 Tate & Lyle 93,487 0.1487,975 Taylor Wimpey 36,774 0.0655,923 Tesco 246,207 0.365,380 Travis Perkins 58,796 0.09
190,585 Vodafone Group 347,206 0.512,134 Weir Group 50,066 0.079,595 Xstrata 144,712 0.21
5,943,818 8.76
GERMANY2,150 Adidas 117,100 0.172,964 Allianz Registered Shares 284,188 0.424,092 BASF 274,246 0.404,764 Bayer Registered Shares 263,235 0.392,709 Bayerische Motoren Werke 184,781 0.27
894 Brenntag 71,444 0.1147,482 Commerzbank 140,570 0.21
1,579 Continental 113,712 0.171,224 Daimler Registered Shares 63,342 0.094,031 Deutsche Bank Registered Shares 162,963 0.24
14,029 Deutsche Telekom Registered Shares 150,496 0.2211,825 E.ON 228,843 0.343,146 Hamburger Hafen und Logistik 93,798 0.14
828 HeidelbergCement 36,393 0.054,304 Henkel & Co. KGaA Non Voting Preference Shares 205,075 0.30
14,022 Infineon Technologies 108,558 0.16900 Lanxess 50,630 0.07
2,059 Porsche Automobil Holding Preference Shares 112,318 0.171,021 SAP 42,425 0.063,799 Siemens Registered Shares 359,803 0.53
460 Volkswagen Preference Shares 64,826 0.10
3,128,746 4.61
SWITZERLAND18,000 ABB Registered Shares 320,508 0.47
5,176 ACE 235,466 0.354,784 Clariant Registered Shares 62,755 0.092,655 Compagnie Financiere Richemont - Bearer A Shares 119,413 0.185,295 Crédit Suisse Group Registered Shares 142,217 0.21
11,852 Nestlé Registered Shares 506,323 0.757,787 Novartis Registered Shares 325,318 0.483,529 Roche Holding - Genussschein 403,717 0.596,434 TE Connectivity 164,847 0.247,205 Tyco International 245,678 0.36
294
JPMorgan Funds - Global Research Enhanced Index Equity FundSchedule of Investments (Market Value Expressed in EUR) (continued)
As at 30 June 2011
Quantity/Nominal
Value
Name of Securities MarketValue
%of
NetAssets
Quantity/Nominal
Value
Name of Securities MarketValue
%of
NetAssets
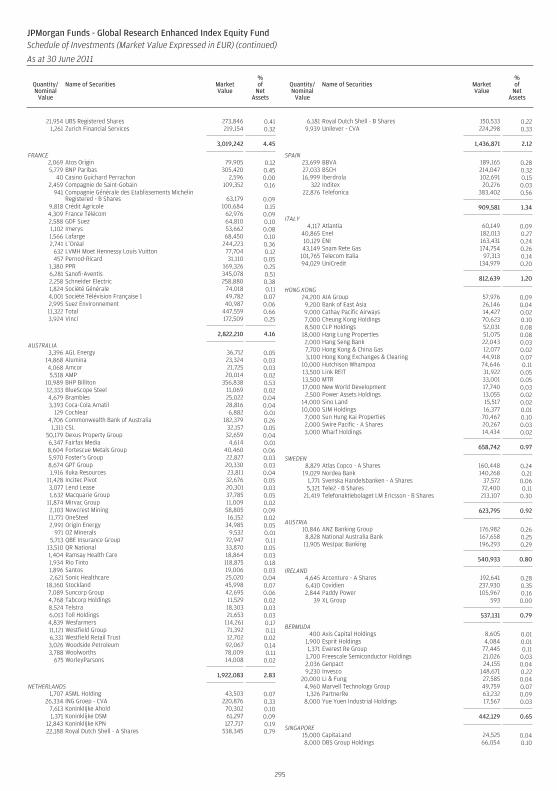
21,954 UBS Registered Shares 273,846 0.411,261 Zurich Financial Services 219,154 0.32
3,019,242 4.45
FRANCE2,069 Atos Origin 79,905 0.125,779 BNP Paribas 305,420 0.45
40 Casino Guichard Perrachon 2,596 0.002,459 Compagnie de Saint-Gobain 109,352 0.16
941 Compagnie Générale des Etablissements MichelinRegistered - B Shares 63,179 0.09
9,818 Crédit Agricole 100,684 0.154,309 France Télécom 62,976 0.092,588 GDF Suez 64,810 0.101,102 Imerys 53,662 0.081,566 Lafarge 68,450 0.102,741 L’Oréal 244,223 0.36
632 LVMH Moet Hennessy Louis Vuitton 77,704 0.12457 Pernod-Ricard 31,110 0.05
1,380 PPR 169,326 0.256,281 Sanofi-Aventis 345,078 0.512,258 Schneider Electric 258,880 0.381,824 Société Générale 74,018 0.114,001 Société Télévision Française 1 49,782 0.072,995 Suez Environnement 40,987 0.0611,322 Total 447,559 0.663,924 Vinci 172,509 0.25
2,822,210 4.16
AUSTRALIA3,396 AGL Energy 36,712 0.05
14,868 Alumina 23,324 0.034,068 Amcor 21,725 0.035,518 AMP 20,014 0.02
10,989 BHP Billiton 356,838 0.5312,333 BlueScope Steel 11,069 0.024,679 Brambles 25,022 0.043,393 Coca-Cola Amatil 28,816 0.04
129 Cochlear 6,882 0.014,706 Commonwealth Bank of Australia 182,379 0.26
1,311 CSL 32,157 0.0550,179 Dexus Property Group 32,659 0.046,347 Fairfax Media 4,614 0.018,604 Fortescue Metals Group 40,460 0.065,970 Foster’s Group 22,827 0.038,674 GPT Group 20,330 0.031,916 Iluka Resources 23,811 0.04
11,428 Incitec Pivot 32,676 0.053,077 Lend Lease 20,301 0.031,632 Macquarie Group 37,785 0.05
11,874 Mirvac Group 11,009 0.022,103 Newcrest Mining 58,805 0.0911,771 OneSteel 16,152 0.022,991 Origin Energy 34,985 0.05
971 OZ Minerals 9,532 0.015,713 QBE Insurance Group 72,947 0.11
13,510 QR National 33,870 0.051,404 Ramsay Health Care 18,864 0.031,934 Rio Tinto 118,875 0.181,896 Santos 19,006 0.032,621 Sonic Healthcare 25,020 0.04
18,160 Stockland 45,998 0.077,089 Suncorp Group 42,695 0.064,768 Tabcorp Holdings 11,529 0.028,524 Telstra 18,303 0.036,013 Toll Holdings 21,653 0.034,839 Wesfarmers 114,261 0.1711,121 Westfield Group 71,392 0.116,331 Westfield Retail Trust 12,702 0.023,026 Woodside Petroleum 92,067 0.143,788 Woolworths 78,009 0.11
675 WorleyParsons 14,008 0.02
1,922,083 2.83
NETHERLANDS1,707 ASML Holding 43,503 0.07
26,334 ING Groep - CVA 220,876 0.337,613 Koninklijke Ahold 70,302 0.101,371 Koninklijke DSM 61,297 0.09
12,843 Koninklijke KPN 127,717 0.1922,188 Royal Dutch Shell - A Shares 538,345 0.79
6,181 Royal Dutch Shell - B Shares 150,533 0.229,939 Unilever - CVA 224,298 0.33
1,436,871 2.12
SPAIN23,699 BBVA 189,165 0.2827,033 BSCH 214,047 0.3216,999 Iberdrola 102,691 0.15
322 Inditex 20,276 0.0322,876 Telefonica 383,402 0.56
909,581 1.34
ITALY4,117 Atlantia 60,149 0.09
40,865 Enel 182,013 0.2710,129 ENI 163,431 0.2443,149 Snam Rete Gas 174,754 0.26
101,765 Telecom Italia 97,313 0.1494,029 UniCredit 134,979 0.20
812,639 1.20
HONG KONG24,200 AIA Group 57,976 0.09
9,200 Bank of East Asia 26,146 0.049,000 Cathay Pacific Airways 14,427 0.027,000 Cheung Kong Holdings 70,623 0.108,500 CLP Holdings 52,031 0.08
18,000 Hang Lung Properties 51,075 0.082,000 Hang Seng Bank 22,043 0.037,700 Hong Kong & China Gas 12,077 0.023,100 Hong Kong Exchanges & Clearing 44,918 0.07
10,000 Hutchison Whampoa 74,646 0.1113,500 Link REIT 31,922 0.0513,500 MTR 33,001 0.0517,000 New World Development 17,740 0.032,500 Power Assets Holdings 13,055 0.02
14,000 Sino Land 15,517 0.0210,000 SJM Holdings 16,377 0.017,000 Sun Hung Kai Properties 70,467 0.102,000 Swire Pacific - A Shares 20,267 0.033,000 Wharf Holdings 14,434 0.02
658,742 0.97
SWEDEN8,829 Atlas Copco - A Shares 160,448 0.24
19,029 Nordea Bank 140,268 0.211,771 Svenska Handelsbanken - A Shares 37,572 0.065,321 Tele2 - B Shares 72,400 0.11
21,419 Telefonaktiebolaget LM Ericsson - B Shares 213,107 0.30
623,795 0.92
AUSTRIA10,846 ANZ Banking Group 176,982 0.26
8,828 National Australia Bank 167,658 0.2511,905 Westpac Banking 196,293 0.29
540,933 0.80
IRELAND4,645 Accenture - A Shares 192,641 0.286,410 Covidien 237,930 0.352,844 Paddy Power 105,967 0.16
39 XL Group 593 0.00
537,131 0.79
BERMUDA400 Axis Capital Holdings 8,605 0.01
1,900 Esprit Holdings 4,084 0.011,371 Everest Re Group 77,445 0.11
1,700 Freescale Semiconductor Holdings 21,026 0.032,036 Genpact 24,155 0.049,230 Invesco 148,671 0.22
20,000 Li & Fung 27,585 0.044,960 Marvell Technology Group 49,759 0.071,326 PartnerRe 63,232 0.09
8,000 Yue Yuen Industrial Holdings 17,567 0.03
442,129 0.65
SINGAPORE15,000 CapitaLand 24,525 0.048,000 DBS Group Holdings 66,054 0.10
295
JPMorgan Funds - Global Research Enhanced Index Equity FundSchedule of Investments (Market Value Expressed in EUR) (continued)
As at 30 June 2011
Quantity/Nominal
Value
Name of Securities MarketValue
%of
NetAssets
Quantity/Nominal
Value
Name of Securities MarketValue
%of
NetAssets
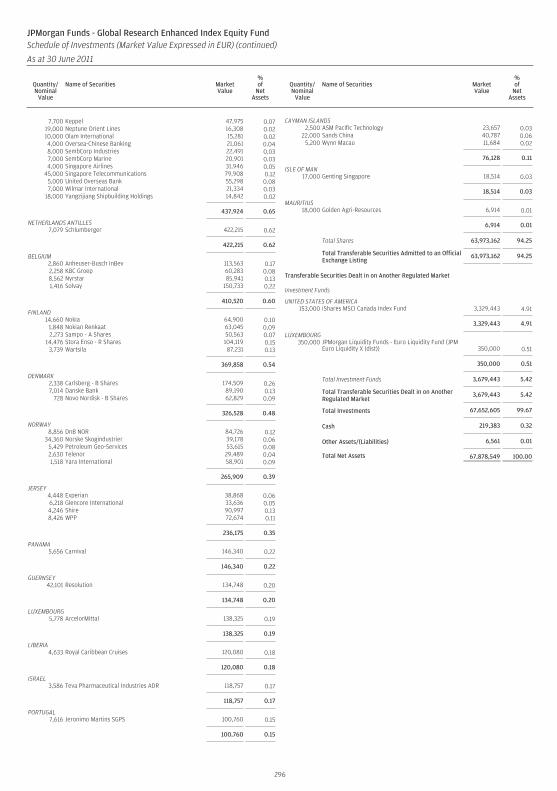
7,700 Keppel 47,975 0.0719,000 Neptune Orient Lines 16,308 0.0210,000 Olam International 15,281 0.024,000 Oversea-Chinese Banking 21,061 0.048,000 SembCorp Industries 22,491 0.037,000 SembCorp Marine 20,901 0.034,000 Singapore Airlines 31,946 0.05
45,000 Singapore Telecommunications 79,908 0.125,000 United Overseas Bank 55,298 0.087,000 Wilmar International 21,334 0.03
18,000 Yangzijiang Shipbuilding Holdings 14,842 0.02
437,924 0.65
NETHERLANDS ANTILLES7,079 Schlumberger 422,215 0.62
422,215 0.62
BELGIUM2,860 Anheuser-Busch InBev 113,563 0.172,258 KBC Groep 60,283 0.088,562 Nyrstar 85,941 0.131,416 Solvay 150,733 0.22
410,520 0.60
FINLAND14,660 Nokia 64,900 0.10
1,848 Nokian Renkaat 63,045 0.092,273 Sampo - A Shares 50,563 0.07
14,476 Stora Enso - R Shares 104,119 0.153,739 Wartsila 87,231 0.13
369,858 0.54
DENMARK2,338 Carlsberg - B Shares 174,509 0.267,014 Danske Bank 89,190 0.13
728 Novo Nordisk - B Shares 62,829 0.09
326,528 0.48
NORWAY8,856 DnB NOR 84,726 0.12
34,360 Norske Skogindustrier 39,178 0.065,429 Petroleum Geo-Services 53,615 0.082,630 Telenor 29,489 0.041,518 Yara International 58,901 0.09
265,909 0.39
JERSEY4,448 Experian 38,868 0.066,218 Glencore International 33,636 0.054,246 Shire 90,997 0.138,426 WPP 72,674 0.11
236,175 0.35
PANAMA5,656 Carnival 146,340 0.22
146,340 0.22
GUERNSEY42,101 Resolution 134,748 0.20
134,748 0.20
LUXEMBOURG5,778 ArcelorMittal 138,325 0.19
138,325 0.19
LIBERIA4,633 Royal Caribbean Cruises 120,080 0.18
120,080 0.18
ISRAEL3,586 Teva Pharmaceutical Industries ADR 118,757 0.17
118,757 0.17
PORTUGAL7,616 Jeronimo Martins SGPS 100,760 0.15
100,760 0.15
CAYMAN ISLANDS2,500 ASM Pacific Technology 23,657 0.03
22,000 Sands China 40,787 0.065,200 Wynn Macau 11,684 0.02
76,128 0.11
ISLE OF MAN17,000 Genting Singapore 18,514 0.03
18,514 0.03
MAURITIUS18,000 Golden Agri-Resources 6,914 0.01
6,914 0.01
Total Shares 63,973,162 94.25
Total Transferable Securities Admitted to an OfficialExchange Listing
63,973,162 94.25
Transferable Securities Dealt in on Another Regulated Market
Investment Funds
UNITED STATES OF AMERICA153,000 iShares MSCI Canada Index Fund 3,329,443 4.91
3,329,443 4.91
LUXEMBOURG350,000 JPMorgan Liquidity Funds - Euro Liquidity Fund (JPM
Euro Liquidity X (dist)) 350,000 0.51
350,000 0.51
Total Investment Funds 3,679,443 5.42
Total Transferable Securities Dealt in on AnotherRegulated Market
3,679,443 5.42
Total Investments 67,652,605 99.67
Cash 219,383 0.32
Other Assets/(Liabilities) 6,561 0.01
Total Net Assets 67,878,549 100.00
296
JPMorgan Funds - Global Research Enhanced Index Equity FundSchedule of Investments (Market Value Expressed in EUR) (continued)
As at 30 June 2011
Quantity/Nominal
Value
Name of Securities MarketValue
%of
NetAssets
Quantity/Nominal
Value
Name of Securities MarketValue
%of
NetAssets
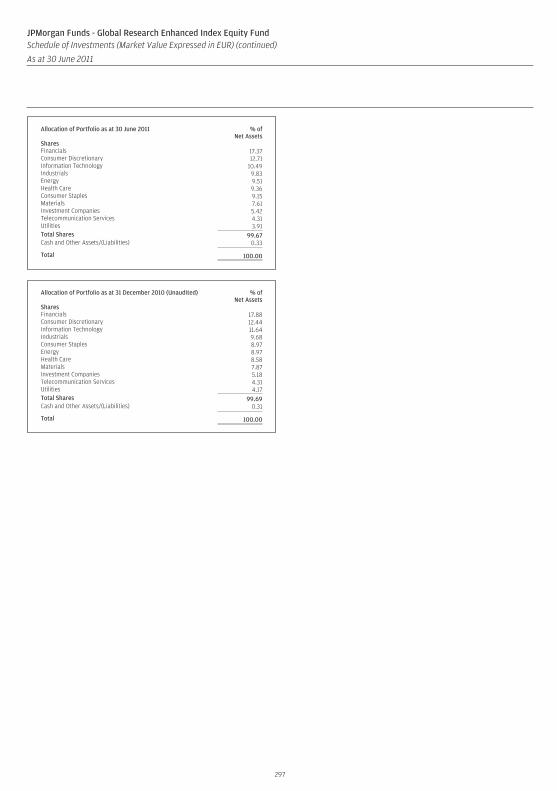
Allocation of Portfolio as at 30 June 2011 % ofNet Assets
SharesFinancials 17.37Consumer Discretionary 12.71Information Technology 10.49Industrials 9.83Energy 9.51Health Care 9.36Consumer Staples 9.15Materials 7.61Investment Companies 5.42Telecommunication Services 4.31Utilities 3.91Total Shares 99.67Cash and Other Assets/(Liabilities) 0.33
Total 100.00
Allocation of Portfolio as at 31 December 2010 (Unaudited) % ofNet Assets
SharesFinancials 17.88Consumer Discretionary 12.44Information Technology 11.64Industrials 9.68Consumer Staples 8.97Energy 8.97Health Care 8.58Materials 7.87Investment Companies 5.18Telecommunication Services 4.31Utilities 4.17Total Shares 99.69Cash and Other Assets/(Liabilities) 0.31
Total 100.00
297
JPMorgan Funds - Global Research Enhanced Index Equity FundSchedule of Investments (Market Value Expressed in EUR) (continued)
As at 30 June 2011
Quantity/Nominal
Value
Name of Securities MarketValue
%of
NetAssets
Quantity/Nominal
Value
Name of Securities MarketValue
%of
NetAssets
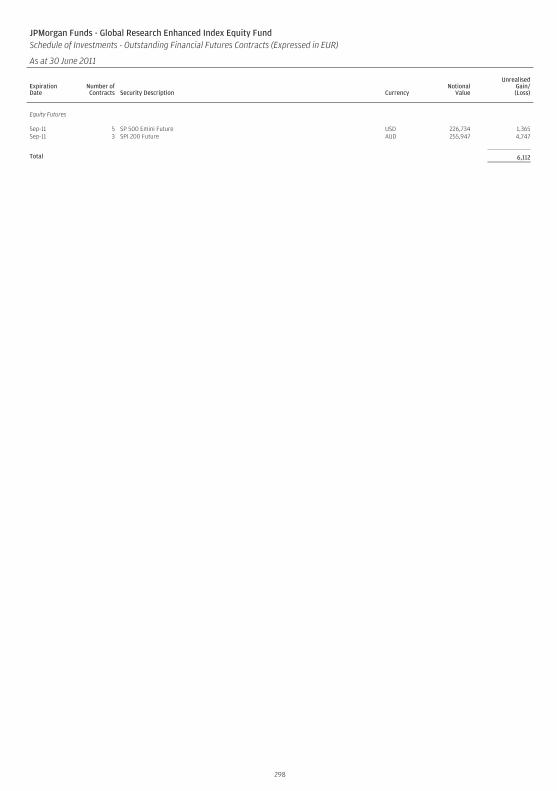
JPMorgan Funds - Global Research Enhanced Index Equity FundSchedule of Investments - Outstanding Financial Futures Contracts (Expressed in EUR)
As at 30 June 2011
ExpirationDate
Number ofContracts Security Description Currency
NotionalValue
UnrealisedGain/(Loss)
Equity Futures
Sep-11 5 SP 500 Emini Future USD 226,734 1,365Sep-11 3 SPI 200 Future AUD 255,947 4,747
Total 6,112
298
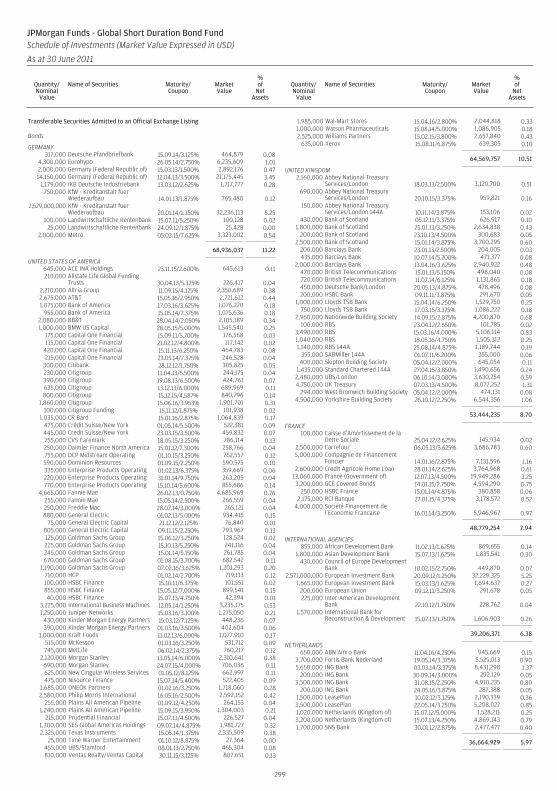
Transferable Securities Admitted to an Official Exchange Listing
Bonds
GERMANY317,000 Deutsche Pfandbriefbank 15.09.14/3.125% 464,879 0.08
4,300,000 Eurohypo 26.05.14/2.750% 6,235,609 1.012,000,000 Germany (Federal Republic of) 15.03.13/1.500% 2,892,176 0.4714,150,000 Germany (Federal Republic of) 12.04.13/3.500% 21,175,445 3.45
1,179,000 IKB Deutsche Industriebank 13.03.12/2.625% 1,717,777 0.28750,000 KfW - Kreditanstalt fuer
Wiederaufbau 14.01.13/1.875% 765,480 0.122,529,000,000 KfW - Kreditanstalt fuer
Wiederaufbau 20.01.14/1.350% 32,236,113 5.25100,000 Landwirtschaftliche Rentenbank 15.07.11/5.250% 100,128 0.02
25,000 Landwirtschaftliche Rentenbank 24.09.12/1.875% 25,428 0.002,000,000 Metro 05.03.15/7.625% 3,323,002 0.54
68,936,037 11.22
UNITED STATES OF AMERICA645,000 ACE INA Holdings 23.11.15/2.600% 645,613 0.11210,000 Allstate Life Global Funding
Trusts 30.04.13/5.375% 226,417 0.042,210,000 Altria Group 11.09.15/4.125% 2,350,689 0.382,675,000 AT&T 15.05.16/2.950% 2,721,612 0.441,075,000 Bank of America 17.03.16/3.625% 1,076,220 0.18
955,000 Bank of America 15.05.14/7.375% 1,075,636 0.182,080,000 BB&T 28.04.14/2.050% 2,105,189 0.341,000,000 BMW US Capital 28.05.15/5.000% 1,545,540 0.25
175,000 Capital One Financial 15.09.11/5.700% 176,568 0.03115,000 Capital One Financial 21.02.12/4.800% 117,142 0.02
420,000 Capital One Financial 15.11.13/6.250% 464,783 0.08215,000 Capital One Financial 23.05.14/7.375% 246,528 0.04
300,000 Citibank 28.12.12/1.750% 305,825 0.05230,000 Citigroup 11.04.13/5.500% 244,175 0.04390,000 Citigroup 19.08.13/6.500% 424,761 0.07635,000 Citigroup 13.12.13/6.000% 689,969 0.11800,000 Citigroup 15.12.15/4.587% 840,796 0.14
1,860,000 Citigroup 15.06.16/3.953% 1,901,701 0.31100,000 Citigroup Funding 15.11.12/1.875% 101,938 0.02
1,035,000 CR Bard 15.01.16/2.875% 1,064,839 0.17475,000 Crédit Suisse/New York 01.05.14/5.500% 522,381 0.09445,000 Credit Suisse/New York 23.03.15/3.500% 459,832 0.07755,000 CVS Caremark 18.05.15/3.250% 786,114 0.13250,000 Daimler Finance North America 15.01.12/7.300% 258,766 0.04755,000 DCP Midstream Operating 01.10.15/3.250% 762,557 0.12590,000 Dominion Resources 01.09.15/2.250% 590,575 0.10335,000 Enterprise Products Operating 01.02.13/6.375% 359,669 0.06220,000 Enterprise Products Operating 31.01.14/9.750% 263,205 0.04770,000 Enterprise Products Operating 15.10.14/5.600% 855,686 0.14
4,665,000 Fannie Mae 26.02.13/0.750% 4,685,969 0.76255,000 Fannie Mae 15.05.14/2.500% 266,559 0.04250,000 Freddie Mac 28.07.14/3.000% 265,121 0.04880,000 General Electric 01.02.13/5.000% 934,415 0.15
75,000 General Electric Capital 21.12.12/2.125% 76,840 0.01805,000 General Electric Capital 09.11.15/2.250% 793,967 0.13125,000 Goldman Sachs Group 15.06.12/3.250% 128,524 0.02225,000 Goldman Sachs Group 15.10.13/5.250% 241,116 0.04245,000 Goldman Sachs Group 15.01.14/5.150% 261,785 0.04670,000 Goldman Sachs Group 01.08.15/3.700% 682,542 0.11
1,190,000 Goldman Sachs Group 07.02.16/3.625% 1,201,293 0.20710,000 HCP 01.02.14/2.700% 719,113 0.12100,000 HSBC Finance 15.10.11/6.375% 101,551 0.02855,000 HSBC Finance 15.05.12/7.000% 899,541 0.1540,000 HSBC Finance 15.07.13/4.750% 42,394 0.01
3,225,000 International Business Machines 12.05.14/1.250% 3,235,175 0.531,250,000 Juniper Networks 15.03.16/3.100% 1,275,050 0.21
430,000 Kinder Morgan Energy Partners 15.03.12/7.125% 448,236 0.07390,000 Kinder Morgan Energy Partners 01.03.16/3.500% 402,604 0.06
1,000,000 Kraft Foods 11.02.13/6.000% 1,077,910 0.17515,000 McKesson 01.03.16/3.250% 531,712 0.09745,000 MetLife 06.02.14/2.375% 760,217 0.12
2,120,000 Morgan Stanley 13.05.14/6.000% 2,310,641 0.38690,000 Morgan Stanley 24.07.15/4.000% 706,036 0.11625,000 New Cingular Wireless Services 01.05.12/8.125% 662,997 0.11475,000 Nisource Finance 15.07.14/5.400% 522,405 0.09
1,685,000 ONEOK Partners 01.02.16/3.250% 1,718,060 0.282,580,000 Philip Morris International 16.05.16/2.500% 2,592,152 0.42
255,000 Plains All American Pipeline 01.09.12/4.250% 264,153 0.041,240,000 Plains All American Pipeline 15.09.15/3.950% 1,304,003 0.21
215,000 Prudential Financial 15.07.13/4.500% 226,527 0.041,300,000 SES Global Americas Holdings 09.07.14/4.875% 1,981,727 0.322,325,000 Texas Instruments 15.05.14/1.375% 2,335,509 0.38
25,000 Time Warner Entertainment 01.10.12/8.875% 27,364 0.00455,000 UBS/Stamford 08.01.13/2.750% 465,304 0.08810,000 Ventas Realty/Ventas Capital 30.11.15/3.125% 807,651 0.13
1,985,000 Wal-Mart Stores 15.04.16/2.800% 2,044,818 0.331,000,000 Watson Pharmaceuticals 15.08.14/5.000% 1,086,905 0.182,525,000 Williams Partners 15.02.15/3.800% 2,657,840 0.43
635,000 Xerox 15.08.11/6.875% 639,305 0.10
64,569,757 10.51
UNITED KINGDOM2,160,000 Abbey National Treasury
Services/London 18.03.13/2.500% 3,120,700 0.51690,000 Abbey National Treasury
Services/London 20.10.15/3.375% 959,821 0.16150,000 Abbey National Treasury
Services/London 144A 10.11.14/3.875% 153,106 0.02430,000 Bank of Scotland 05.12.11/3.375% 626,917 0.10
1,800,000 Bank of Scotland 25.01.13/3.250% 2,634,838 0.43200,000 Bank of Scotland 23.10.13/4.500% 300,683 0.05
2,500,000 Bank of Scotland 15.01.14/3.875% 3,700,295 0.60200,000 Barclays Bank 23.01.13/2.500% 204,005 0.03435,000 Barclays Bank 10.07.14/5.200% 471,377 0.08
2,000,000 Barclays Bank 13.04.16/3.625% 2,940,922 0.48470,000 British Telecommunications 15.01.13/5.150% 498,040 0.08720,000 British Telecommunications 11.07.14/6.125% 1,131,865 0.18450,000 Deutsche Bank/London 20.05.13/4.875% 478,496 0.08200,000 HSBC Bank 09.11.11/3.875% 291,670 0.05
1,000,000 Lloyds TSB Bank 15.04.14/6.250% 1,529,750 0.25750,000 Lloyds TSB Bank 17.03.15/3.375% 1,086,222 0.18
2,960,000 Nationwide Building Society 14.09.15/2.875% 4,200,870 0.68100,000 RBS 23.04.12/2.650% 101,785 0.02
3,490,000 RBS 15.03.16/4.000% 5,106,114 0.831,040,000 RBS 18.05.16/4.750% 1,505,312 0.251,140,000 RBS 144A 25.08.14/4.875% 1,189,744 0.19
355,000 SABMiller 144A 01.07.11/6.200% 355,000 0.06400,000 Skipton Building Society 05.04.12/2.000% 645,054 0.11
1,435,000 Standard Chartered 144A 27.04.15/3.850% 1,490,656 0.242,480,000 UBS/London 06.10.14/3.000% 3,630,254 0.594,750,000 UK Treasury 07.03.13/4.500% 8,072,252 1.31
294,000 West Bromwich Building Society 05.04.12/2.000% 474,131 0.084,500,000 Yorkshire Building Society 26.10.12/2.250% 6,544,356 1.06
53,444,235 8.70
FRANCE100,000 Caisse d’Amortissement de la
Dette Sociale 25.04.12/2.625% 145,934 0.022,500,000 Carrefour 06.05.13/3.625% 3,686,783 0.605,000,000 Compagnie de Financement
Foncier 14.01.16/2.875% 7,131,596 1.162,600,000 Credit Agricole Home Loan 28.01.14/2.625% 3,764,968 0.61
13,060,000 France (Government of) 12.07.13/4.500% 19,949,286 3.253,200,000 GCE Covered Bonds 14.01.15/2.750% 4,594,290 0.75
250,000 HSBC France 15.01.14/4.875% 380,858 0.062,175,000 RCI Banque 27.01.15/4.375% 3,178,572 0.52
4,000,000 Société Financement del’Economie Francaise 16.01.14/3.250% 5,946,967 0.97
48,779,254 7.94
INTERNATIONAL AGENCIES855,000 African Development Bank 11.02.13/1.625% 869,655 0.14
1,800,000 Asian Development Bank 15.07.13/1.625% 1,835,541 0.30430,000 Council of Europe Development
Bank 10.02.15/2.750% 449,870 0.072,571,000,000 European Investment Bank 20.09.12/1.250% 32,229,325 5.25
1,665,000 European Investment Bank 15.03.13/1.625% 1,694,637 0.27200,000 European Union 09.12.11/3.250% 291,678 0.05225,000 Inter-American Development
Bank 22.10.12/1.750% 228,762 0.041,570,000 International Bank for
Reconstruction & Development 15.07.13/1.750% 1,606,903 0.26
39,206,371 6.38
NETHERLANDS650,000 ABN Amro Bank 11.04.16/4.250% 945,669 0.15
3,700,000 Fortis Bank Nederland 19.05.14/3.375% 5,525,013 0.905,650,000 ING Bank 03.03.14/3.375% 8,431,298 1.37
200,000 ING Bank 30.09.14/3.000% 292,129 0.053,500,000 ING Bank 31.08.15/2.250% 4,910,235 0.80
200,000 ING Bank 24.05.16/3.875% 287,388 0.051,500,000 LeasePlan 10.02.12/3.125% 2,190,339 0.363,500,000 LeasePlan 22.05.14/3.250% 5,208,027 0.851,020,000 Netherlands (Kingdom of) 15.07.12/5.000% 1,528,211 0.253,200,000 Netherlands (Kingdom of) 15.07.13/4.250% 4,869,143 0.791,700,000 SNS Bank 30.01.12/2.875% 2,477,477 0.40
36,664,929 5.97
299
JPMorgan Funds - Global Short Duration Bond FundSchedule of Investments (Market Value Expressed in USD)
As at 30 June 2011
Quantity/Nominal
Value
Name of Securities Maturity/Coupon
MarketValue
%of
NetAssets
Quantity/Nominal
Value
Name of Securities Maturity/Coupon
MarketValue
%of
NetAssets
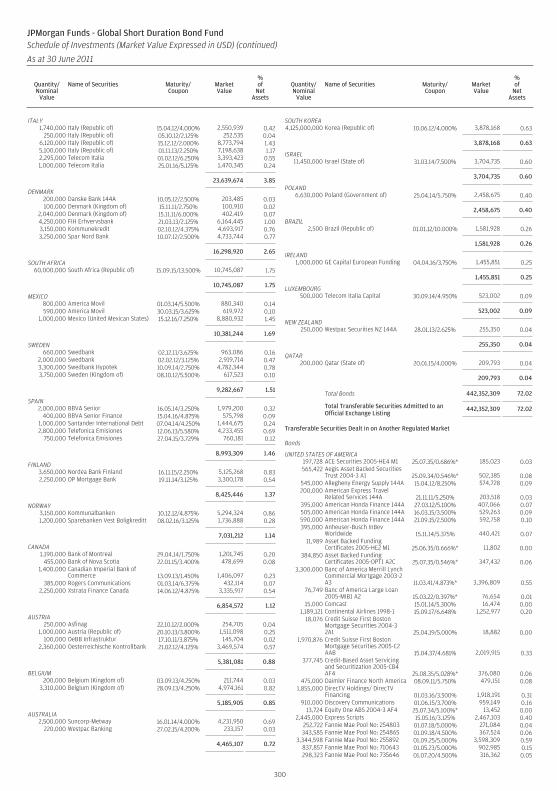
ITALY1,740,000 Italy (Republic of) 15.04.12/4.000% 2,550,939 0.42
250,000 Italy (Republic of) 05.10.12/2.125% 252,535 0.046,120,000 Italy (Republic of) 15.12.12/2.000% 8,773,794 1.435,100,000 Italy (Republic of) 01.11.13/2.250% 7,198,638 1.172,295,000 Telecom Italia 01.02.12/6.250% 3,393,423 0.551,000,000 Telecom Italia 25.01.16/5.125% 1,470,345 0.24
23,639,674 3.85
DENMARK200,000 Danske Bank 144A 10.05.12/2.500% 203,485 0.03100,000 Denmark (Kingdom of) 15.11.11/2.750% 100,910 0.02
2,040,000 Denmark (Kingdom of) 15.11.11/6.000% 402,419 0.074,250,000 FIH Erhvervsbank 21.03.13/2.125% 6,164,445 1.003,150,000 Kommunekredit 02.10.12/4.375% 4,693,917 0.763,250,000 Spar Nord Bank 10.07.12/2.500% 4,733,744 0.77
16,298,920 2.65
SOUTH AFRICA60,000,000 South Africa (Republic of) 15.09.15/13.500% 10,745,087 1.75
10,745,087 1.75
MEXICO800,000 America Movil 01.03.14/5.500% 880,340 0.14590,000 America Movil 30.03.15/3.625% 619,972 0.10
1,000,000 Mexico (United Mexican States) 15.12.16/7.250% 8,880,932 1.45
10,381,244 1.69
SWEDEN660,000 Swedbank 02.12.11/3.625% 963,086 0.16
2,000,000 Swedbank 02.02.12/3.125% 2,919,714 0.473,300,000 Swedbank Hypotek 10.09.14/2.750% 4,782,344 0.783,750,000 Sweden (Kingdom of) 08.10.12/5.500% 617,523 0.10
9,282,667 1.51
SPAIN2,000,000 BBVA Senior 16.05.14/3.250% 1,979,200 0.32
400,000 BBVA Senior Finance 15.04.16/4.875% 575,798 0.091,000,000 Santander International Debt 07.04.14/4.250% 1,444,675 0.242,800,000 Telefonica Emisiones 12.06.13/5.580% 4,233,455 0.69
750,000 Telefonica Emisiones 27.04.15/3.729% 760,181 0.12
8,993,309 1.46
FINLAND3,650,000 Nordea Bank Finland 16.11.15/2.250% 5,125,268 0.832,250,000 OP Mortgage Bank 19.11.14/3.125% 3,300,178 0.54
8,425,446 1.37
NORWAY3,150,000 Kommunalbanken 10.12.12/4.875% 5,294,324 0.861,200,000 Sparebanken Vest Boligkreditt 08.02.16/3.125% 1,736,888 0.28
7,031,212 1.14
CANADA1,190,000 Bank of Montreal 29.04.14/1.750% 1,201,745 0.20
455,000 Bank of Nova Scotia 22.01.15/3.400% 478,699 0.081,400,000 Canadian Imperial Bank of
Commerce 13.09.13/1.450% 1,406,097 0.23385,000 Rogers Communications 01.03.14/6.375% 432,114 0.07
2,250,000 Xstrata Finance Canada 14.06.12/4.875% 3,335,917 0.54
6,854,572 1.12
AUSTRIA250,000 Asfinag 22.10.12/2.000% 254,705 0.04
1,000,000 Austria (Republic of) 20.10.13/3.800% 1,511,098 0.25100,000 OeBB Infrastruktur 17.10.11/3.875% 145,704 0.02
2,360,000 Oesterreichische Kontrollbank 21.02.12/4.125% 3,469,574 0.57
5,381,081 0.88
BELGIUM200,000 Belgium (Kingdom of) 03.09.13/4.250% 211,744 0.03
3,310,000 Belgium (Kingdom of) 28.09.13/4.250% 4,974,161 0.82
5,185,905 0.85
AUSTRALIA2,500,000 Suncorp-Metway 16.01.14/4.000% 4,231,950 0.69
220,000 Westpac Banking 27.02.15/4.200% 233,157 0.03
4,465,107 0.72
SOUTH KOREA4,125,000,000 Korea (Republic of) 10.06.12/4.000% 3,878,168 0.63
3,878,168 0.63
ISRAEL11,450,000 Israel (State of) 31.03.14/7.500% 3,704,735 0.60
3,704,735 0.60
POLAND6,630,000 Poland (Government of) 25.04.14/5.750% 2,458,675 0.40
2,458,675 0.40
BRAZIL2,500 Brazil (Republic of) 01.01.12/10.000% 1,581,928 0.26
1,581,928 0.26
IRELAND1,000,000 GE Capital European Funding 04.04.16/3.750% 1,455,851 0.25
1,455,851 0.25
LUXEMBOURG500,000 Telecom Italia Capital 30.09.14/4.950% 523,002 0.09
523,002 0.09
NEW ZEALAND250,000 Westpac Securities NZ 144A 28.01.13/2.625% 255,350 0.04
255,350 0.04
QATAR200,000 Qatar (State of) 20.01.15/4.000% 209,793 0.04
209,793 0.04
Total Bonds 442,352,309 72.02
Total Transferable Securities Admitted to anOfficial Exchange Listing
442,352,309 72.02
Transferable Securities Dealt in on Another Regulated Market
Bonds
UNITED STATES OF AMERICA197,728 ACE Securities 2005-HE4 M1 25.07.35/0.686%* 185,023 0.03565,422 Aegis Asset Backed Securities
Trust 2004-3 A1 25.09.34/0.546%* 502,385 0.08545,000 Allegheny Energy Supply 144A 15.04.12/8.250% 574,728 0.09200,000 American Express Travel
Related Services 144A 21.11.11/5.250% 203,518 0.03395,000 American Honda Finance 144A 27.03.12/5.100% 407,066 0.07505,000 American Honda Finance 144A 16.03.15/3.500% 529,263 0.09590,000 American Honda Finance 144A 21.09.15/2.500% 592,758 0.10395,000 Anheuser-Busch InBev
Worldwide 15.11.14/5.375% 440,421 0.0711,989 Asset Backed Funding
Certificates 2005-HE2 M1 25.06.35/0.666%* 11,802 0.00384,850 Asset Backed Funding
Certificates 2005-OPT1 A2C 25.07.35/0.546%* 347,432 0.063,300,000 Banc of America Merrill Lynch
Commercial Mortgage 2003-2A3 11.03.41/4.873%* 3,396,809 0.55
76,749 Banc of America Large Loan2005-MIB1 A2 15.03.22/0.397%* 76,654 0.01
15,000 Comcast 15.01.14/5.300% 16,474 0.001,189,121 Continental Airlines 1998-1 15.09.17/6.648% 1,252,977 0.20
18,076 Credit Suisse First BostonMortgage Securities 2004-32A1 25.04.19/5.000% 18,882 0.00
1,970,876 Credit Suisse First BostonMortgage Securities 2005-C2AAB 15.04.37/4.681% 2,019,915 0.33
377,745 Credit-Based Asset Servicingand Securitization 2005-CB4AF4 25.08.35/5.028%* 376,080 0.06
475,000 Daimler Finance North America 08.09.11/5.750% 479,151 0.081,855,000 DirecTV Holdings/ DirecTV
Financing 01.03.16/3.500% 1,918,191 0.31910,000 Discovery Communications 01.06.15/3.700% 959,149 0.16
13,724 Equity One ABS 2004-3 AF4 25.07.34/5.100%* 13,452 0.002,445,000 Express Scripts 15.05.16/3.125% 2,467,103 0.40
252,722 Fannie Mae Pool No: 254803 01.07.18/5.000% 271,084 0.04343,585 Fannie Mae Pool No: 254865 01.09.18/4.500% 367,524 0.06
3,344,598 Fannie Mae Pool No: 255892 01.09.25/5.000% 3,598,309 0.59837,857 Fannie Mae Pool No: 710643 01.05.23/5.000% 902,985 0.15298,323 Fannie Mae Pool No: 735646 01.07.20/4.500% 316,362 0.05
300
JPMorgan Funds - Global Short Duration Bond FundSchedule of Investments (Market Value Expressed in USD) (continued)
As at 30 June 2011
Quantity/Nominal
Value
Name of Securities Maturity/Coupon
MarketValue
%of
NetAssets
Quantity/Nominal
Value
Name of Securities Maturity/Coupon
MarketValue
%of
NetAssets
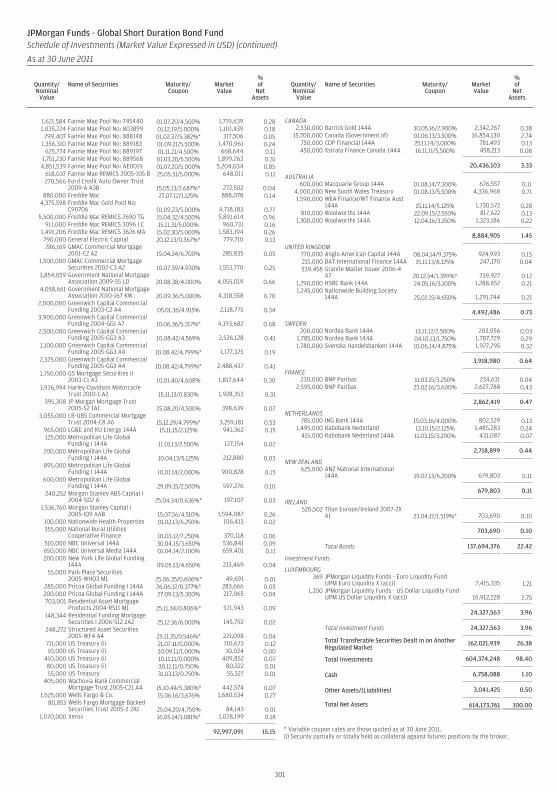
1,621,584 Fannie Mae Pool No: 745440 01.07.20/4.500% 1,719,639 0.281,035,224 Fannie Mae Pool No: 803899 01.12.19/5.000% 1,110,439 0.18
299,407 Fannie Mae Pool No: 888148 01.02.37/5.382%* 317,506 0.051,356,310 Fannie Mae Pool No: 889183 01.09.21/5.500% 1,470,961 0.24
625,274 Fannie Mae Pool No: 889197 01.11.21/4.500% 668,644 0.111,751,230 Fannie Mae Pool No: 889568 01.03.20/5.500% 1,899,263 0.314,851,539 Fannie Mae Pool No: AE0019 01.07.20/5.000% 5,204,034 0.85
618,037 Fannie Mae REMICS 2005-105 B 25.05.31/5.000% 648,011 0.11270,566 Ford Credit Auto Owner Trust
2009-A A3B 15.05.13/2.687%* 272,502 0.04880,000 Freddie Mac 27.07.12/1.125% 888,078 0.14
4,375,598 Freddie Mac Gold Pool No:C90706 01.09.23/5.000% 4,718,183 0.77
5,500,000 Freddie Mac REMICS 2690 TG 15.04.32/4.500% 5,891,614 0.96911,000 Freddie Mac REMICS 3096 LC 15.11.31/5.000% 960,731 0.16
1,491,206 Freddie Mac REMICS 3626 MA 15.02.30/5.000% 1,583,194 0.26790,000 General Electric Capital 20.12.13/0.367%* 779,710 0.13286,169 GMAC Commercial Mortgage
2001-C2 A2 15.04.34/6.700% 285,835 0.051,500,000 GMAC Commercial Mortgage
Securities 2002-C3 A2 10.07.39/4.930% 1,553,770 0.253,854,059 Government National Mortgage
Association 2009-55 LD 20.08.38/4.000% 4,055,019 0.664,058,661 Government National Mortgage
Association 2010-167 KW 20.09.36/5.000% 4,318,558 0.702,000,000 Greenwich Capital Commercial
Funding 2003-C2 A4 05.01.36/4.915% 2,118,775 0.343,900,000 Greenwich Capital Commercial
Funding 2004-GG1 A7 10.06.36/5.317%* 4,193,682 0.682,500,000 Greenwich Capital Commercial
Funding 2005-GG3 A3 10.08.42/4.569% 2,526,128 0.411,100,000 Greenwich Capital Commercial
Funding 2005-GG3 A4 10.08.42/4.799%* 1,177,325 0.192,325,000 Greenwich Capital Commercial
Funding 2005-GG3 A4 10.08.42/4.799%* 2,488,437 0.411,750,000 GS Mortgage Securities II
2003-C1 A3 10.01.40/4.608% 1,817,644 0.301,926,994 Harley-Davidson Motorcycle
Trust 2010-1 A2 15.11.13/0.830% 1,928,353 0.31395,308 JP Morgan Mortgage Trust
2005-S2 1A1 25.08.20/4.500% 398,639 0.073,055,000 LB-UBS Commercial Mortgage
Trust 2004-C8 A6 15.12.29/4.799%* 3,259,181 0.53965,000 LG&E and KU Energy 144A 15.11.15/2.125% 941,362 0.15125,000 Metropolitan Life Global
Funding I 144A 11.01.13/2.500% 127,154 0.02200,000 Metropolitan Life Global
Funding I 144A 10.04.13/5.125% 212,880 0.03895,000 Metropolitan Life Global
Funding I 144A 10.01.14/2.000% 900,828 0.15600,000 Metropolitan Life Global
Funding I 144A 29.09.15/2.500% 597,276 0.10240,252 Morgan Stanley ABS Capital I
2004-SD2 A 25.04.34/0.636%* 197,107 0.031,536,760 Morgan Stanley Capital I
2005-IQ9 AAB 15.07.56/4.510% 1,594,087 0.26100,000 Nationwide Health Properties 01.02.13/6.250% 106,413 0.02355,000 National Rural Utilities
Cooperative Finance 01.03.12/7.250% 370,118 0.06510,000 NBC Universal 144A 30.04.15/3.650% 536,841 0.09650,000 NBC Universal Media 144A 01.04.14/2.100% 659,401 0.11200,000 New York Life Global Funding
144A 09.05.13/4.650% 213,469 0.0455,000 Park Place Securities
2005-WHQ3 M1 25.06.35/0.606%* 49,691 0.01285,000 Pricoa Global Funding I 144A 26.06.12/0.377%* 283,666 0.05200,000 Pricoa Global Funding I 144A 27.09.13/5.300% 217,065 0.04703,001 Residential Asset Mortgage
Products 2004-RS11 M1 25.11.34/0.806%* 571,943 0.09148,344 Residential Funding Mortgage
Securities I 2006-S12 2A2 25.12.36/6.000% 145,792 0.02248,272 Structured Asset Securities
2005-WF4 A4 25.11.35/0.546%* 221,098 0.04711,000 US Treasury (i) 21.07.11/0.000% 710,673 0.1210,000 US Treasury (i) 30.09.11/1.000% 10,024 0.00
410,000 US Treasury (i) 10.11.11/0.000% 409,852 0.0780,000 US Treasury (i) 30.11.11/0.750% 80,222 0.0155,000 US Treasury 31.03.13/0.750% 55,327 0.01
405,000 Wachovia Bank CommercialMortgage Trust 2005-C21 A4 15.10.44/5.380%* 442,574 0.07
1,625,000 Wells Fargo & Co. 15.06.16/3.676% 1,680,534 0.2780,853 Wells Fargo Mortgage Backed
Securities Trust 2005-2 2A1 25.04.20/4.750% 84,143 0.011,070,000 Xerox 16.05.14/1.081%* 1,078,199 0.18
92,997,091 15.15
CANADA2,330,000 Barrick Gold 144A 30.05.16/2.900% 2,342,267 0.38
15,700,000 Canada (Government of) 01.06.13/3.500% 16,854,130 2.74750,000 CDP Financial 144A 25.11.14/3.000% 781,493 0.13450,000 Xstrata Finance Canada 144A 16.11.11/5.500% 458,213 0.08
20,436,103 3.33
AUSTRALIA600,000 Macquarie Group 144A 01.08.14/7.300% 676,557 0.11
4,000,000 New South Wales Treasury 01.08.13/5.500% 4,336,968 0.711,590,000 WEA Finance/WT Finance Aust
144A 15.11.14/5.125% 1,730,572 0.28810,000 Woolworths 144A 22.09.15/2.550% 817,622 0.13
1,300,000 Woolworths 144A 12.04.16/3.150% 1,323,186 0.22
8,884,905 1.45
UNITED KINGDOM770,000 Anglo American Capital 144A 08.04.14/9.375% 924,993 0.15215,000 BAT International Finance 144A 15.11.13/8.125% 247,170 0.04539,458 Granite Master Issuer 2006-4
A7 20.12.54/1.399%* 739,927 0.121,290,000 HSBC Bank 144A 24.05.16/3.100% 1,288,652 0.211,245,000 Nationwide Building Society
144A 25.02.15/4.650% 1,291,744 0.21
4,492,486 0.73
SWEDEN200,000 Nordea Bank 144A 13.11.12/2.500% 203,956 0.03
1,785,000 Nordea Bank 144A 04.10.13/1.750% 1,787,729 0.291,780,000 Svenska Handelsbanken 144A 10.06.14/4.875% 1,927,295 0.32
3,918,980 0.64
FRANCE230,000 BNP Paribas 11.03.15/3.250% 234,631 0.04
2,595,000 BNP Paribas 23.02.16/3.600% 2,627,788 0.43
2,862,419 0.47
NETHERLANDS785,000 ING Bank 144A 15.03.16/4.000% 802,529 0.13
1,495,000 Rabobank Nederland 13.10.15/2.125% 1,485,283 0.24415,000 Rabobank Nederland 144A 11.03.15/3.200% 431,087 0.07
2,718,899 0.44
NEW ZEALAND625,000 ANZ National International
144A 19.07.13/6.200% 679,803 0.11
679,803 0.11
IRELAND520,502 Titan Europe/Ireland 2007-2X
A1 23.04.17/1.519%* 703,690 0.10
703,690 0.10
Total Bonds 137,694,376 22.42
Investment Funds
LUXEMBOURG369 JPMorgan Liquidity Funds - Euro Liquidity Fund
(JPM Euro Liquidity X (acc)) 7,415,335 1.211,200 JPMorgan Liquidity Funds - US Dollar Liquidity Fund
(JPM US Dollar Liquidity X (acc)) 16,912,228 2.75
24,327,563 3.96
Total Investment Funds 24,327,563 3.96
Total Transferable Securities Dealt in on AnotherRegulated Market
162,021,939 26.38
Total Investments 604,374,248 98.40
Cash 6,758,088 1.10
Other Assets/(Liabilities) 3,041,425 0.50
Total Net Assets 614,173,761 100.00
* Variable coupon rates are those quoted as at 30 June 2011.(i) Security partially or totally held as collateral against futures positions by the broker.
301
JPMorgan Funds - Global Short Duration Bond FundSchedule of Investments (Market Value Expressed in USD) (continued)
As at 30 June 2011
Quantity/Nominal
Value
Name of Securities Maturity/Coupon
MarketValue
%of
NetAssets
Quantity/Nominal
Value
Name of Securities Maturity/Coupon
MarketValue
%of
NetAssets
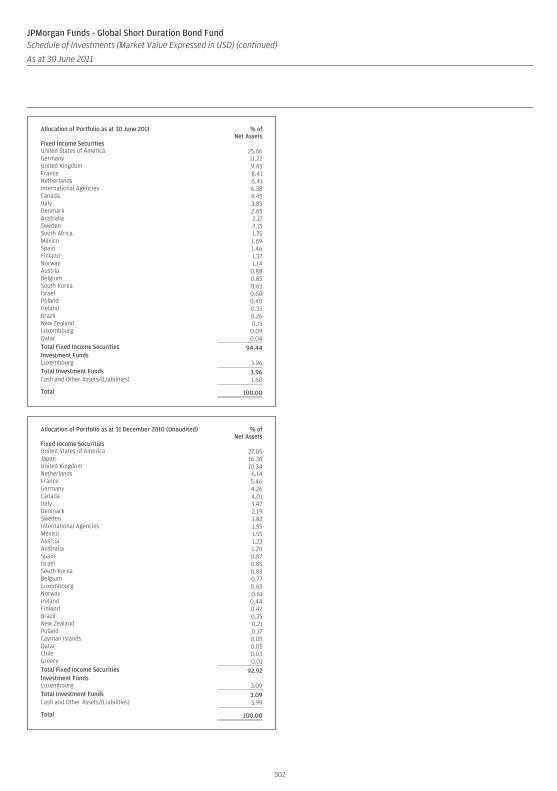
Allocation of Portfolio as at 30 June 2011 % ofNet Assets
Fixed Income SecuritiesUnited States of America 25.66Germany 11.22United Kingdom 9.43France 8.41Netherlands 6.41International Agencies 6.38Canada 4.45Italy 3.85Denmark 2.65Australia 2.17Sweden 2.15South Africa 1.75Mexico 1.69Spain 1.46Finland 1.37Norway 1.14Austria 0.88Belgium 0.85South Korea 0.63Israel 0.60Poland 0.40Ireland 0.35Brazil 0.26New Zealand 0.15Luxembourg 0.09Qatar 0.04Total Fixed Income Securities 94.44Investment FundsLuxembourg 3.96Total Investment Funds 3.96Cash and Other Assets/(Liabilities) 1.60
Total 100.00
Allocation of Portfolio as at 31 December 2010 (Unaudited) % ofNet Assets
Fixed Income SecuritiesUnited States of America 27.05Japan 16.36United Kingdom 10.34Netherlands 6.14France 5.46Germany 4.26Canada 4.01Italy 3.47Denmark 2.19Sweden 1.82International Agencies 1.55Mexico 1.55Austria 1.23Australia 1.20Spain 0.87Israel 0.85South Korea 0.83Belgium 0.77Luxembourg 0.63Norway 0.61Ireland 0.44Finland 0.42Brazil 0.35New Zealand 0.21Poland 0.17Cayman Islands 0.05Qatar 0.05Chile 0.03Greece 0.01Total Fixed Income Securities 92.92Investment FundsLuxembourg 3.09Total Investment Funds 3.09Cash and Other Assets/(Liabilities) 3.99
Total 100.00
302
JPMorgan Funds - Global Short Duration Bond FundSchedule of Investments (Market Value Expressed in USD) (continued)
As at 30 June 2011
Quantity/Nominal
Value
Name of Securities Maturity/Coupon
MarketValue
%of
NetAssets
Quantity/Nominal
Value
Name of Securities Maturity/Coupon
MarketValue
%of
NetAssets
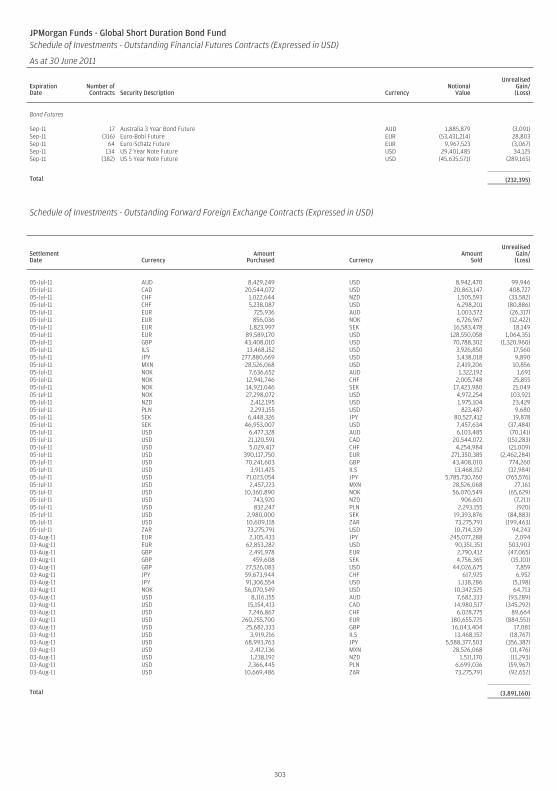
JPMorgan Funds - Global Short Duration Bond FundSchedule of Investments - Outstanding Financial Futures Contracts (Expressed in USD)
As at 30 June 2011
ExpirationDate
Number ofContracts Security Description Currency
NotionalValue
UnrealisedGain/(Loss)
Bond Futures
Sep-11 17 Australia 3 Year Bond Future AUD 1,885,879 (3,091)Sep-11 (316) Euro-Bobl Future EUR (53,431,214) 28,803Sep-11 64 Euro-Schatz Future EUR 9,967,523 (3,067)Sep-11 134 US 2 Year Note Future USD 29,401,485 34,125Sep-11 (382) US 5 Year Note Future USD (45,635,571) (289,165)
Total (232,395)
Schedule of Investments - Outstanding Forward Foreign Exchange Contracts (Expressed in USD)
SettlementDate Currency
AmountPurchased Currency
AmountSold
UnrealisedGain/(Loss)
05-Jul-11 AUD 8,429,249 USD 8,942,470 99,94605-Jul-11 CAD 20,544,072 USD 20,863,147 408,72705-Jul-11 CHF 1,022,644 NZD 1,505,593 (33,582)05-Jul-11 CHF 5,238,087 USD 6,298,201 (80,886)05-Jul-11 EUR 725,936 AUD 1,003,572 (26,317)05-Jul-11 EUR 856,036 NOK 6,726,967 (12,422)05-Jul-11 EUR 1,823,997 SEK 16,583,478 18,14905-Jul-11 EUR 89,589,170 USD 128,550,058 1,064,35105-Jul-11 GBP 43,408,010 USD 70,788,302 (1,320,960)05-Jul-11 ILS 13,468,152 USD 3,926,850 17,56005-Jul-11 JPY 277,880,669 USD 3,438,018 9,89005-Jul-11 MXN 28,526,068 USD 2,419,206 10,85605-Jul-11 NOK 7,636,652 AUD 1,322,192 1,69105-Jul-11 NOK 12,941,746 CHF 2,005,748 25,85505-Jul-11 NOK 14,921,046 SEK 17,423,980 21,04905-Jul-11 NOK 27,298,072 USD 4,972,254 103,92105-Jul-11 NZD 2,412,195 USD 1,975,104 23,42905-Jul-11 PLN 2,293,155 USD 823,487 9,68005-Jul-11 SEK 6,448,326 JPY 80,527,412 19,87805-Jul-11 SEK 46,953,007 USD 7,457,634 (37,484)05-Jul-11 USD 6,477,328 AUD 6,103,485 (70,141)05-Jul-11 USD 21,120,591 CAD 20,544,072 (151,283)05-Jul-11 USD 5,029,417 CHF 4,254,984 (21,009)05-Jul-11 USD 390,117,750 EUR 271,350,385 (2,462,284)05-Jul-11 USD 70,241,603 GBP 43,408,010 774,26005-Jul-11 USD 3,911,425 ILS 13,468,152 (32,984)05-Jul-11 USD 71,023,054 JPY 5,785,730,760 (765,576)05-Jul-11 USD 2,457,223 MXN 28,526,068 27,16105-Jul-11 USD 10,360,890 NOK 56,070,549 (65,629)05-Jul-11 USD 743,920 NZD 906,601 (7,211)05-Jul-11 USD 832,247 PLN 2,293,155 (920)05-Jul-11 USD 2,980,000 SEK 19,393,876 (84,883)05-Jul-11 USD 10,609,118 ZAR 73,275,791 (199,463)05-Jul-11 ZAR 73,275,791 USD 10,714,339 94,24303-Aug-11 EUR 2,105,433 JPY 245,077,288 2,09403-Aug-11 EUR 62,853,282 USD 90,351,351 503,90303-Aug-11 GBP 2,491,978 EUR 2,790,412 (47,065)03-Aug-11 GBP 459,608 SEK 4,756,365 (15,101)03-Aug-11 GBP 27,526,083 USD 44,026,675 7,85903-Aug-11 JPY 59,673,944 CHF 617,925 6,95203-Aug-11 JPY 91,306,554 USD 1,138,286 (5,198)03-Aug-11 NOK 56,070,549 USD 10,342,525 64,71303-Aug-11 USD 8,116,155 AUD 7,682,333 (93,289)03-Aug-11 USD 15,154,413 CAD 14,980,517 (345,292)03-Aug-11 USD 7,246,867 CHF 6,028,775 89,66403-Aug-11 USD 260,255,700 EUR 180,655,725 (884,551)03-Aug-11 USD 25,682,333 GBP 16,043,404 17,08103-Aug-11 USD 3,919,216 ILS 13,468,152 (18,767)03-Aug-11 USD 68,993,763 JPY 5,588,377,503 (356,387)03-Aug-11 USD 2,412,136 MXN 28,526,068 (11,476)03-Aug-11 USD 1,238,192 NZD 1,511,170 (11,293)03-Aug-11 USD 2,366,445 PLN 6,699,036 (59,967)03-Aug-11 USD 10,669,486 ZAR 73,275,791 (92,652)
Total (3,891,160)
303
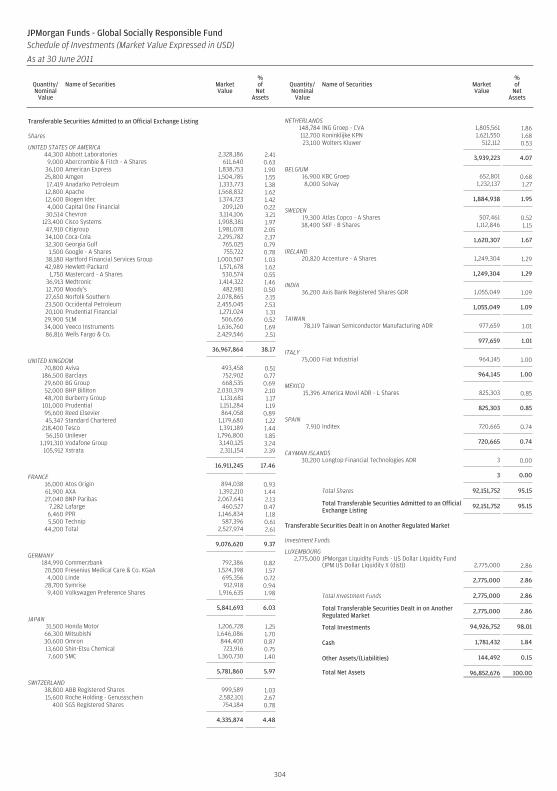
Transferable Securities Admitted to an Official Exchange Listing
Shares
UNITED STATES OF AMERICA44,300 Abbott Laboratories 2,328,186 2.41
9,000 Abercrombie & Fitch - A Shares 611,640 0.6336,100 American Express 1,838,753 1.9025,800 Amgen 1,504,785 1.5517,419 Anadarko Petroleum 1,333,773 1.3812,800 Apache 1,568,832 1.6212,600 Biogen Idec 1,374,723 1.424,000 Capital One Financial 209,120 0.2230,514 Chevron 3,114,106 3.21
123,400 Cisco Systems 1,908,381 1.9747,910 Citigroup 1,981,078 2.0534,100 Coca-Cola 2,295,782 2.3732,300 Georgia Gulf 765,025 0.79
1,500 Google - A Shares 755,722 0.7838,180 Hartford Financial Services Group 1,000,507 1.0342,989 Hewlett-Packard 1,571,678 1.62
1,750 Mastercard - A Shares 530,574 0.5536,913 Medtronic 1,414,322 1.4612,700 Moody’s 482,981 0.5027,650 Norfolk Southern 2,078,865 2.1523,500 Occidental Petroleum 2,455,045 2.5320,100 Prudential Financial 1,271,024 1.3129,900 SLM 506,656 0.5234,000 Veeco Instruments 1,636,760 1.6986,816 Wells Fargo & Co. 2,429,546 2.51
36,967,864 38.17
UNITED KINGDOM70,800 Aviva 493,458 0.51
186,500 Barclays 752,902 0.7729,600 BG Group 668,535 0.6952,000 BHP Billiton 2,030,379 2.1048,700 Burberry Group 1,131,681 1.17
101,000 Prudential 1,151,284 1.1995,600 Reed Elsevier 864,058 0.8945,347 Standard Chartered 1,179,680 1.22
218,400 Tesco 1,391,189 1.4456,150 Unilever 1,796,800 1.85
1,191,310 Vodafone Group 3,140,125 3.24105,912 Xstrata 2,311,154 2.39
16,911,245 17.46
FRANCE16,000 Atos Origin 894,038 0.9361,900 AXA 1,392,210 1.4427,040 BNP Paribas 2,067,641 2.13
7,282 Lafarge 460,527 0.476,460 PPR 1,146,834 1.185,500 Technip 587,396 0.61
44,200 Total 2,527,974 2.61
9,076,620 9.37
GERMANY184,990 Commerzbank 792,386 0.8220,500 Fresenius Medical Care & Co. KGaA 1,524,398 1.574,000 Linde 695,356 0.72
28,700 Symrise 912,918 0.949,400 Volkswagen Preference Shares 1,916,635 1.98
5,841,693 6.03
JAPAN31,500 Honda Motor 1,206,728 1.2566,300 Mitsubishi 1,646,086 1.7030,600 Omron 844,400 0.8713,600 Shin-Etsu Chemical 723,916 0.757,600 SMC 1,360,730 1.40
5,781,860 5.97
SWITZERLAND38,800 ABB Registered Shares 999,589 1.0315,600 Roche Holding - Genussschein 2,582,101 2.67
400 SGS Registered Shares 754,184 0.78
4,335,874 4.48
NETHERLANDS148,784 ING Groep - CVA 1,805,561 1.86112,700 Koninklijke KPN 1,621,550 1.6823,100 Wolters Kluwer 512,112 0.53
3,939,223 4.07
BELGIUM16,900 KBC Groep 652,801 0.688,000 Solvay 1,232,137 1.27
1,884,938 1.95
SWEDEN19,300 Atlas Copco - A Shares 507,461 0.5238,400 SKF - B Shares 1,112,846 1.15
1,620,307 1.67
IRELAND20,820 Accenture - A Shares 1,249,304 1.29
1,249,304 1.29
INDIA36,200 Axis Bank Registered Shares GDR 1,055,049 1.09
1,055,049 1.09
TAIWAN78,119 Taiwan Semiconductor Manufacturing ADR 977,659 1.01
977,659 1.01
ITALY75,000 Fiat Industrial 964,145 1.00
964,145 1.00
MEXICO15,396 America Movil ADR - L Shares 825,303 0.85
825,303 0.85
SPAIN7,910 Inditex 720,665 0.74
720,665 0.74
CAYMAN ISLANDS30,200 Longtop Financial Technologies ADR 3 0.00
3 0.00
Total Shares 92,151,752 95.15
Total Transferable Securities Admitted to an OfficialExchange Listing
92,151,752 95.15
Transferable Securities Dealt in on Another Regulated Market
Investment Funds
LUXEMBOURG2,775,000 JPMorgan Liquidity Funds - US Dollar Liquidity Fund
(JPM US Dollar Liquidity X (dist)) 2,775,000 2.86
2,775,000 2.86
Total Investment Funds 2,775,000 2.86
Total Transferable Securities Dealt in on AnotherRegulated Market
2,775,000 2.86
Total Investments 94,926,752 98.01
Cash 1,781,432 1.84
Other Assets/(Liabilities) 144,492 0.15
Total Net Assets 96,852,676 100.00
304
JPMorgan Funds - Global Socially Responsible FundSchedule of Investments (Market Value Expressed in USD)
As at 30 June 2011
Quantity/Nominal
Value
Name of Securities MarketValue
%of
NetAssets
Quantity/Nominal
Value
Name of Securities MarketValue
%of
NetAssets
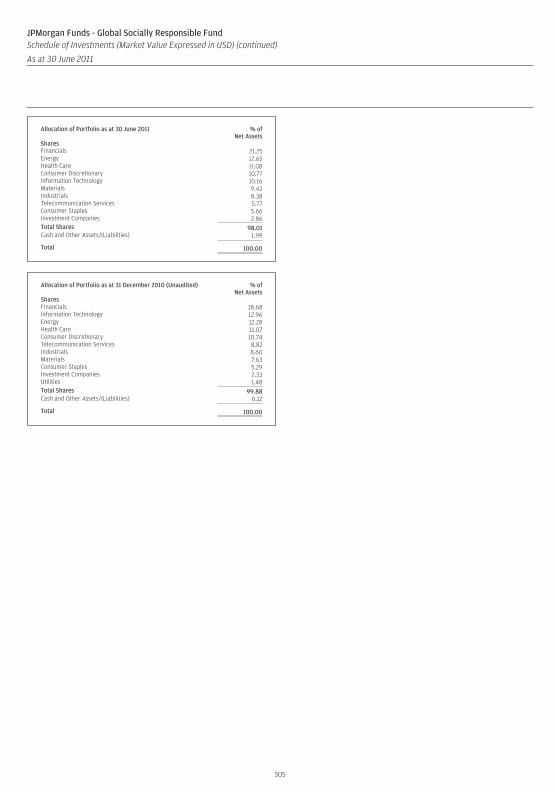
Allocation of Portfolio as at 30 June 2011 % ofNet Assets
SharesFinancials 21.25Energy 12.65Health Care 11.08Consumer Discretionary 10.77Information Technology 10.16Materials 9.43Industrials 8.38Telecommunication Services 5.77Consumer Staples 5.66Investment Companies 2.86Total Shares 98.01Cash and Other Assets/(Liabilities) 1.99
Total 100.00
Allocation of Portfolio as at 31 December 2010 (Unaudited) % ofNet Assets
SharesFinancials 18.68Information Technology 12.96Energy 12.28Health Care 11.07Consumer Discretionary 10.74Telecommunication Services 8.82Industrials 8.60Materials 7.63Consumer Staples 5.29Investment Companies 2.33Utilities 1.48Total Shares 99.88Cash and Other Assets/(Liabilities) 0.12
Total 100.00
305
JPMorgan Funds - Global Socially Responsible FundSchedule of Investments (Market Value Expressed in USD) (continued)
As at 30 June 2011
Quantity/Nominal
Value
Name of Securities MarketValue
%of
NetAssets
Quantity/Nominal
Value
Name of Securities MarketValue
%of
NetAssets
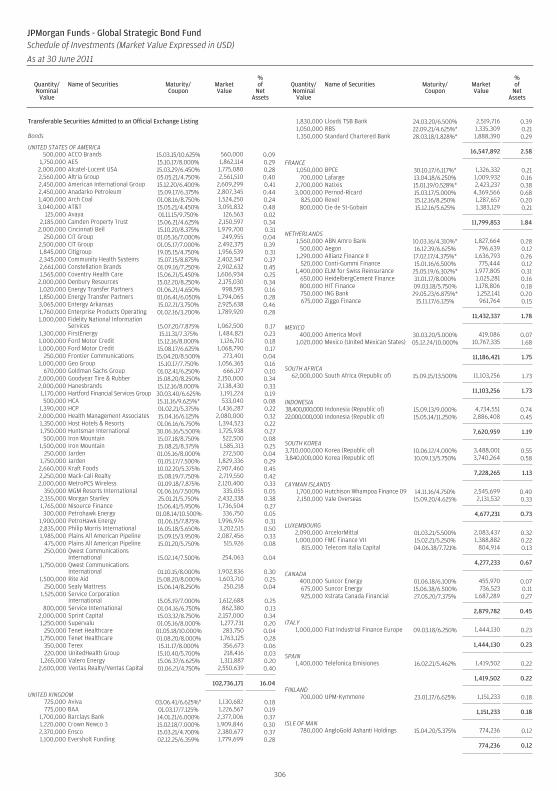
Transferable Securities Admitted to an Official Exchange Listing
Bonds
UNITED STATES OF AMERICA500,000 ACCO Brands 15.03.15/10.625% 560,000 0.09
1,750,000 AES 15.10.17/8.000% 1,862,114 0.292,000,000 Alcatel-Lucent USA 15.03.29/6.450% 1,775,080 0.282,560,000 Altria Group 05.05.21/4.750% 2,561,510 0.402,450,000 American International Group 15.12.20/6.400% 2,609,299 0.412,450,000 Anadarko Petroleum 15.09.17/6.375% 2,807,345 0.441,400,000 Arch Coal 01.08.16/8.750% 1,524,250 0.243,040,000 AT&T 15.05.21/4.450% 3,091,832 0.48
125,000 Avaya 01.11.15/9.750% 126,563 0.022,185,000 Camden Property Trust 15.06.21/4.625% 2,150,597 0.34
2,000,000 Cincinnati Bell 15.10.20/8.375% 1,979,700 0.31250,000 CIT Group 01.05.16/7.000% 249,955 0.04
2,500,000 CIT Group 01.05.17/7.000% 2,492,375 0.391,845,000 Citigroup 19.05.15/4.750% 1,956,539 0.312,345,000 Community Health Systems 15.07.15/8.875% 2,402,347 0.372,661,000 Constellation Brands 01.09.16/7.250% 2,902,632 0.451,565,000 Coventry Health Care 15.06.21/5.450% 1,606,934 0.25
2,000,000 Denbury Resources 15.02.20/8.250% 2,175,030 0.341,020,000 Energy Transfer Partners 01.06.21/4.650% 998,595 0.161,850,000 Energy Transfer Partners 01.06.41/6.050% 1,794,065 0.283,065,000 Entergy Arkansas 15.02.21/3.750% 2,925,638 0.461,760,000 Enterprise Products Operating 01.02.16/3.200% 1,789,920 0.281,000,000 Fidelity National Information
Services 15.07.20/7.875% 1,062,500 0.171,300,000 FirstEnergy 15.11.31/7.375% 1,484,821 0.231,000,000 Ford Motor Credit 15.12.16/8.000% 1,126,710 0.181,000,000 Ford Motor Credit 15.08.17/6.625% 1,068,790 0.17
250,000 Frontier Communications 15.04.20/8.500% 273,401 0.041,000,000 Geo Group 15.10.17/7.750% 1,056,365 0.16
670,000 Goldman Sachs Group 01.02.41/6.250% 666,127 0.102,000,000 Goodyear Tire & Rubber 15.08.20/8.250% 2,150,000 0.342,000,000 Hanesbrands 15.12.16/8.000% 2,138,430 0.331,170,000 Hartford Financial Services Group 30.03.40/6.625% 1,191,224 0.19500,000 HCA 15.11.16/9.625%* 533,040 0.08
1,390,000 HCP 01.02.21/5.375% 1,436,287 0.222,000,000 Health Management Associates 15.04.16/6.125% 2,080,000 0.321,350,000 Host Hotels & Resorts 01.06.16/6.750% 1,394,523 0.221,750,000 Huntsman International 30.06.16/5.500% 1,725,938 0.27
500,000 Iron Mountain 15.07.18/8.750% 522,500 0.081,500,000 Iron Mountain 15.08.21/8.375% 1,585,313 0.25
250,000 Jarden 01.05.16/8.000% 272,500 0.041,750,000 Jarden 01.05.17/7.500% 1,829,336 0.292,660,000 Kraft Foods 10.02.20/5.375% 2,907,460 0.452,250,000 Mack-Cali Realty 15.08.19/7.750% 2,719,550 0.422,000,000 MetroPCS Wireless 01.09.18/7.875% 2,120,400 0.33
350,000 MGM Resorts International 01.06.16/7.500% 335,055 0.052,355,000 Morgan Stanley 25.01.21/5.750% 2,432,338 0.381,765,000 Nisource Finance 15.06.41/5.950% 1,736,504 0.27
300,000 Petrohawk Energy 01.08.14/10.500% 336,750 0.051,900,000 PetroHawk Energy 01.06.15/7.875% 1,996,976 0.312,835,000 Philip Morris International 16.05.18/5.650% 3,202,515 0.501,985,000 Plains All American Pipeline 15.09.15/3.950% 2,087,456 0.33
475,000 Plains All American Pipeline 15.01.20/5.750% 515,926 0.08250,000 Qwest Communications
International 15.02.14/7.500% 254,063 0.041,750,000 Qwest Communications
International 01.10.15/8.000% 1,902,836 0.301,500,000 Rite Aid 15.08.20/8.000% 1,603,710 0.25
250,000 Sealy Mattress 15.06.14/8.250% 250,218 0.041,525,000 Service Corporation
International 15.05.19/7.000% 1,612,688 0.25800,000 Service International 01.04.16/6.750% 862,380 0.13
2,000,000 Sprint Capital 15.03.32/8.750% 2,157,000 0.341,250,000 Supervalu 01.05.16/8.000% 1,277,731 0.20
250,000 Tenet Healthcare 01.05.18/10.000% 283,750 0.041,750,000 Tenet Healthcare 01.08.20/8.000% 1,763,125 0.28
350,000 Terex 15.11.17/8.000% 356,673 0.06220,000 UnitedHealth Group 15.10.40/5.700% 218,416 0.03
1,265,000 Valero Energy 15.06.37/6.625% 1,311,887 0.202,600,000 Ventas Realty/Ventas Capital 01.06.21/4.750% 2,550,639 0.40
102,736,171 16.04
UNITED KINGDOM725,000 Aviva 03.06.41/6.625%* 1,130,682 0.18775,000 BAA 01.03.17/7.125% 1,226,567 0.19
1,700,000 Barclays Bank 14.01.21/6.000% 2,377,006 0.371,220,000 Crown Newco 3 15.02.18/7.000% 1,909,846 0.302,370,000 Ensco 15.03.21/4.700% 2,380,677 0.371,100,000 Eversholt Funding 02.12.25/6.359% 1,779,699 0.28
1,830,000 Lloyds TSB Bank 24.03.20/6.500% 2,519,716 0.391,050,000 RBS 22.09.21/4.625%* 1,335,309 0.211,350,000 Standard Chartered Bank 28.03.18/1.828%* 1,888,390 0.29
16,547,892 2.58
FRANCE1,050,000 BPCE 30.10.17/6.117%* 1,326,332 0.21
700,000 Lafarge 13.04.18/6.250% 1,009,932 0.162,700,000 Natixis 15.01.19/0.528%* 2,423,237 0.383,000,000 Pernod-Ricard 15.03.17/5.000% 4,369,566 0.68
825,000 Rexel 15.12.16/8.250% 1,287,657 0.20800,000 Cie de St-Gobain 15.12.16/5.625% 1,383,129 0.21
11,799,853 1.84
NETHERLANDS1,560,000 ABN Amro Bank 10.03.16/4.310%* 1,827,664 0.28
500,000 Aegon 16.12.39/6.625% 796,639 0.121,290,000 Allianz Finance II 17.02.17/4.375%* 1,636,793 0.26
520,000 Conti-Gummi Finance 15.01.16/6.500% 775,444 0.121,400,000 ELM for Swiss Reinsurance 25.05.19/6.302%* 1,977,805 0.31
650,000 HeidelbergCement Finance 31.01.17/8.000% 1,025,281 0.16800,000 HIT Finance 09.03.18/5.750% 1,178,806 0.18750,000 ING Bank 29.05.23/6.875%* 1,252,141 0.20675,000 Ziggo Finance 15.11.17/6.125% 961,764 0.15
11,432,337 1.78
MEXICO400,000 America Movil 30.03.20/5.000% 419,086 0.07
1,020,000 Mexico (United Mexican States) 05.12.24/10.000% 10,767,335 1.68
11,186,421 1.75
SOUTH AFRICA62,000,000 South Africa (Republic of) 15.09.15/13.500% 11,103,256 1.73
11,103,256 1.73
INDONESIA38,400,000,000 Indonesia (Republic of) 15.09.13/9.000% 4,734,551 0.7422,000,000,000 Indonesia (Republic of) 15.05.14/11.250% 2,886,408 0.45
7,620,959 1.19
SOUTH KOREA3,710,000,000 Korea (Republic of) 10.06.12/4.000% 3,488,001 0.553,840,000,000 Korea (Republic of) 10.09.13/5.750% 3,740,264 0.58
7,228,265 1.13
CAYMAN ISLANDS1,700,000 Hutchison Whampoa Finance 09 14.11.16/4.750% 2,545,699 0.402,150,000 Vale Overseas 15.09.20/4.625% 2,131,532 0.33
4,677,231 0.73
LUXEMBOURG2,090,000 ArcelorMittal 01.03.21/5.500% 2,083,437 0.321,000,000 FMC Finance VII 15.02.21/5.250% 1,388,882 0.22
815,000 Telecom Italia Capital 04.06.38/7.721% 804,914 0.13
4,277,233 0.67
CANADA400,000 Suncor Energy 01.06.18/6.100% 455,970 0.07675,000 Suncor Energy 15.06.38/6.500% 736,523 0.11925,000 Xstrata Canada Financial 27.05.20/7.375% 1,687,289 0.27
2,879,782 0.45
ITALY1,000,000 Fiat Industrial Finance Europe 09.03.18/6.250% 1,444,130 0.23
1,444,130 0.23
SPAIN1,400,000 Telefonica Emisiones 16.02.21/5.462% 1,419,502 0.22
1,419,502 0.22
FINLAND700,000 UPM-Kymmene 23.01.17/6.625% 1,151,233 0.18
1,151,233 0.18
ISLE OF MAN780,000 AngloGold Ashanti Holdings 15.04.20/5.375% 774,236 0.12
774,236 0.12
306
JPMorgan Funds - Global Strategic Bond FundSchedule of Investments (Market Value Expressed in USD)
As at 30 June 2011
Quantity/Nominal
Value
Name of Securities Maturity/Coupon
MarketValue
%of
NetAssets
Quantity/Nominal
Value
Name of Securities Maturity/Coupon
MarketValue
%of
NetAssets
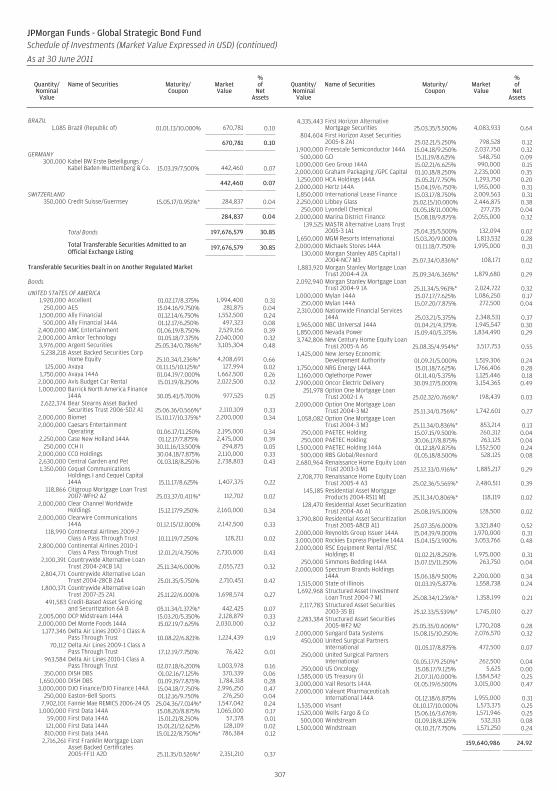
BRAZIL1,085 Brazil (Republic of) 01.01.13/10.000% 670,781 0.10
670,781 0.10
GERMANY300,000 Kabel BW Erste Beteiligungs /
Kabel Baden-Wurttemberg & Co. 15.03.19/7.500% 442,460 0.07
442,460 0.07
SWITZERLAND350,000 Credit Suisse/Guernsey 15.05.17/0.951%* 284,837 0.04
284,837 0.04
Total Bonds 197,676,579 30.85
Total Transferable Securities Admitted to anOfficial Exchange Listing
197,676,579 30.85
Transferable Securities Dealt in on Another Regulated Market
Bonds
UNITED STATES OF AMERICA1,920,000 Accellent 01.02.17/8.375% 1,994,400 0.31
250,000 AES 15.04.16/9.750% 281,875 0.041,500,000 Ally Financial 01.12.14/6.750% 1,552,500 0.24
500,000 Ally Financial 144A 01.12.17/6.250% 497,323 0.082,400,000 AMC Entertainment 01.06.19/8.750% 2,529,156 0.392,000,000 Amkor Technology 01.05.18/7.375% 2,040,000 0.323,976,000 Argent Securities 25.05.34/0.786%* 3,105,304 0.485,238,218 Asset Backed Securities Corp
Home Equity 25.10.34/1.236%* 4,208,691 0.66125,000 Avaya 01.11.15/10.125%* 127,994 0.02
1,750,000 Avaya 144A 01.04.19/7.000% 1,662,500 0.262,000,000 Avis Budget Car Rental 15.01.19/8.250% 2,022,500 0.321,000,000 Barrick North America Finance
144A 30.05.41/5.700% 977,525 0.152,622,374 Bear Stearns Asset Backed
Securities Trust 2006-SD2 A1 25.06.36/0.566%* 2,110,109 0.332,000,000 Biomet 15.10.17/10.375%* 2,200,000 0.342,000,000 Caesars Entertainment
Operating 01.06.17/11.250% 2,195,000 0.342,250,000 Case New Holland 144A 01.12.17/7.875% 2,475,000 0.39
250,000 CCH II 30.11.16/13.500% 294,875 0.052,000,000 CCO Holdings 30.04.18/7.875% 2,110,000 0.332,630,000 Central Garden and Pet 01.03.18/8.250% 2,738,803 0.431,350,000 Cequel Communications
Holdings I and Cequel Capital144A 15.11.17/8.625% 1,407,375 0.22
118,866 Citigroup Mortgage Loan Trust2007-WFH2 A2 25.03.37/0.411%* 112,702 0.02
2,000,000 Clear Channel WorldwideHoldings 15.12.17/9.250% 2,160,000 0.34
2,000,000 Clearwire Communications144A 01.12.15/12.000% 2,142,500 0.33
118,990 Continental Airlines 2009-2Class A Pass Through Trust 10.11.19/7.250% 128,211 0.02
2,800,000 Continental Airlines 2010-1Class A Pass Through Trust 12.01.21/4.750% 2,730,000 0.43
2,100,391 Countrywide Alternative LoanTrust 2004-24CB 1A1 25.11.34/6.000% 2,055,723 0.32
2,804,771 Countrywide Alternative LoanTrust 2004-28CB 2A4 25.01.35/5.750% 2,710,451 0.42
1,800,371 Countrywide Alternative LoanTrust 2007-25 2A1 25.11.22/6.000% 1,698,574 0.27
491,583 Credit-Based Asset Servicingand Securitization 6A B 05.11.34/1.372%* 442,425 0.07
2,005,000 DCP Midstream 144A 15.03.20/5.350% 2,128,879 0.332,000,000 Del Monte Foods 144A 15.02.19/7.625% 2,030,000 0.32
1,177,346 Delta Air Lines 2007-1 Class APass Through Trust 10.08.22/6.821% 1,224,439 0.19
70,112 Delta Air Lines 2009-1 Class APass Through Trust 17.12.19/7.750% 76,422 0.01
963,584 Delta Air Lines 2010-1 Class APass Through Trust 02.07.18/6.200% 1,003,978 0.16
350,000 DISH DBS 01.02.16/7.125% 370,339 0.061,650,000 DISH DBS 01.09.19/7.875% 1,784,318 0.283,000,000 DJO Finance/DJO Finance 144A 15.04.18/7.750% 2,996,250 0.47
250,000 Easton-Bell Sports 01.12.16/9.750% 276,250 0.047,902,101 Fannie Mae REMICS 2006-24 QS 25.04.36/7.014%* 1,547,042 0.24
1,000,000 First Data 144A 15.08.20/8.875% 1,065,000 0.1759,000 First Data 144A 15.01.21/8.250% 57,378 0.01121,000 First Data 144A 15.01.21/12.625% 128,109 0.02810,000 First Data 144A 15.01.22/8.750%* 786,384 0.12
2,716,261 First Franklin Mortgage LoanAsset Backed Certificates2005-FF11 A2D 25.11.35/0.526%* 2,351,210 0.37
4,335,443 First Horizon AlternativeMortgage Securities 25.03.35/5.500% 4,083,933 0.64
804,604 First Horizon Asset Securities2005-8 2A1 25.02.21/5.250% 798,528 0.12
1,900,000 Freescale Semiconductor 144A 15.04.18/9.250% 2,037,750 0.32500,000 GCI 15.11.19/8.625% 548,750 0.09
1,000,000 Geo Group 144A 15.02.21/6.625% 990,000 0.152,000,000 Graham Packaging /GPC Capital 01.10.18/8.250% 2,235,000 0.351,250,000 HCA Holdings 144A 15.05.21/7.750% 1,293,750 0.20
2,000,000 Hertz 144A 15.04.19/6.750% 1,955,000 0.311,850,000 International Lease Finance 15.03.17/8.750% 2,009,563 0.312,250,000 Libbey Glass 15.02.15/10.000% 2,446,875 0.38
250,000 Lyondell Chemical 01.05.18/11.000% 277,735 0.042,000,000 Marina District Finance 15.08.18/9.875% 2,055,000 0.32
139,525 MASTR Alternative Loans Trust2005-3 1A1 25.04.35/5.500% 132,094 0.02
1,650,000 MGM Resorts International 15.03.20/9.000% 1,813,532 0.282,000,000 Michaels Stores 144A 01.11.18/7.750% 1,995,000 0.31
130,000 Morgan Stanley ABS Capital I2004-NC7 M3 25.07.34/0.836%* 108,171 0.02
1,883,920 Morgan Stanley Mortgage LoanTrust 2004-4 2A 25.09.34/6.365%* 1,879,680 0.29
2,092,940 Morgan Stanley Mortgage LoanTrust 2004-9 1A 25.11.34/5.961%* 2,024,722 0.32
1,000,000 Mylan 144A 15.07.17/7.625% 1,086,250 0.17250,000 Mylan 144A 15.07.20/7.875% 272,500 0.04
2,310,000 Nationwide Financial Services144A 25.03.21/5.375% 2,348,531 0.37
1,965,000 NBC Universal 144A 01.04.21/4.375% 1,945,547 0.301,850,000 Nevada Power 15.09.40/5.375% 1,834,490 0.293,742,806 New Century Home Equity Loan
Trust 2005-A A6 25.08.35/4.954%* 3,517,753 0.551,425,000 New Jersey Economic
Development Authority 01.09.21/5.000% 1,519,306 0.241,750,000 NRG Energy 144A 15.01.18/7.625% 1,766,406 0.281,160,000 Oglethorpe Power 01.11.40/5.375% 1,125,446 0.18
2,900,000 Oncor Electric Delivery 30.09.17/5.000% 3,154,365 0.49251,978 Option One Mortgage Loan
Trust 2002-1 A 25.02.32/0.766%* 198,439 0.032,000,000 Option One Mortgage Loan
Trust 2004-3 M2 25.11.34/0.756%* 1,742,601 0.271,058,082 Option One Mortgage Loan
Trust 2004-3 M3 25.11.34/0.836%* 853,214 0.13250,000 PAETEC Holding 15.07.15/9.500% 260,312 0.04250,000 PAETEC Holding 30.06.17/8.875% 263,125 0.04
1,500,000 PAETEC Holding 144A 01.12.18/9.875% 1,552,500 0.24500,000 RBS Global/Rexnord 01.05.18/8.500% 528,125 0.08
2,680,964 Renaissance Home Equity LoanTrust 2003-3 M1 25.12.33/0.916%* 1,885,217 0.29
2,708,770 Renaissance Home Equity LoanTrust 2005-4 A3 25.02.36/5.565%* 2,480,511 0.39
145,185 Residential Asset MortgageProducts 2004-RS11 M1 25.11.34/0.806%* 118,119 0.02
128,470 Residential Asset SecuritizationTrust 2004-A6 A1 25.08.19/5.000% 128,500 0.02
3,790,800 Residential Asset SecuritizationTrust 2005-A8CB A11 25.07.35/6.000% 3,321,840 0.52
2,000,000 Reynolds Group Issuer 144A 15.04.19/9.000% 1,970,000 0.313,000,000 Rockies Express Pipeline 144A 15.04.15/3.900% 3,053,766 0.482,000,000 RSC Equipment Rental /RSC
Holdings III 01.02.21/8.250% 1,975,000 0.31250,000 Simmons Bedding 144A 15.07.15/11.250% 263,750 0.04
2,000,000 Spectrum Brands Holdings144A 15.06.18/9.500% 2,200,000 0.34
1,515,000 State of Illinois 01.03.19/5.877% 1,558,738 0.241,692,968 Structured Asset Investment
Loan Trust 2004-7 M1 25.08.34/1.236%* 1,358,199 0.212,117,783 Structured Asset Securities
2003-35 B1 25.12.33/5.539%* 1,745,010 0.272,283,384 Structured Asset Securities
2005-WF2 M2 25.05.35/0.606%* 1,770,208 0.282,000,000 Sungard Data Systems 15.08.15/10.250% 2,076,570 0.32
450,000 United Surgical PartnersInternational 01.05.17/8.875% 472,500 0.07
250,000 United Surgical PartnersInternational 01.05.17/9.250%* 262,500 0.04
250,000 US Oncology 15.08.17/9.125% 5,625 0.001,585,000 US Treasury (i) 21.07.11/0.000% 1,584,542 0.25
3,000,000 Vail Resorts 144A 01.05.19/6.500% 3,015,000 0.472,000,000 Valeant Pharmaceuticals
International 144A 01.12.18/6.875% 1,955,000 0.311,535,000 Visant 01.10.17/10.000% 1,573,375 0.251,520,000 Wells Fargo & Co 15.06.16/3.676% 1,571,946 0.25
500,000 Windstream 01.09.18/8.125% 532,313 0.081,500,000 Windstream 01.10.21/7.750% 1,571,250 0.24
159,640,986 24.92
307
JPMorgan Funds - Global Strategic Bond FundSchedule of Investments (Market Value Expressed in USD) (continued)
As at 30 June 2011
Quantity/Nominal
Value
Name of Securities Maturity/Coupon
MarketValue
%of
NetAssets
Quantity/Nominal
Value
Name of Securities Maturity/Coupon
MarketValue
%of
NetAssets
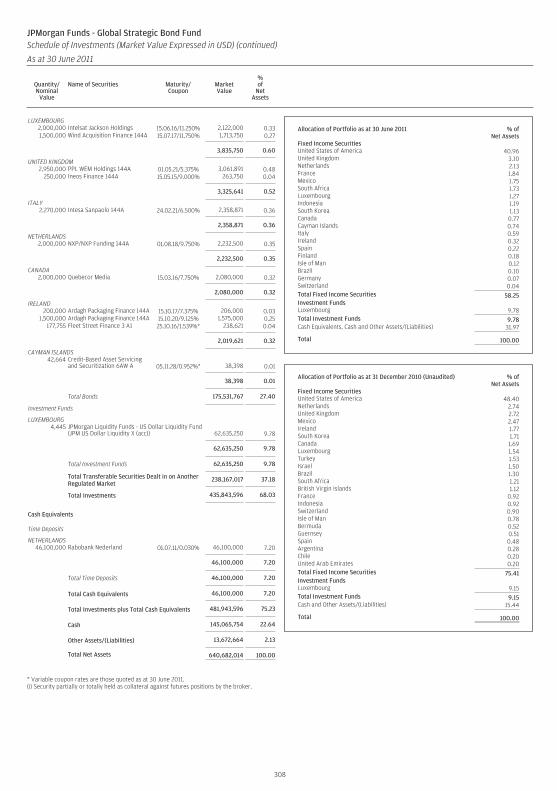
LUXEMBOURG2,000,000 Intelsat Jackson Holdings 15.06.16/11.250% 2,122,000 0.331,500,000 Wind Acquisition Finance 144A 15.07.17/11.750% 1,713,750 0.27
3,835,750 0.60
UNITED KINGDOM2,950,000 PPL WEM Holdings 144A 01.05.21/5.375% 3,061,891 0.48
250,000 Ineos Finance 144A 15.05.15/9.000% 263,750 0.04
3,325,641 0.52
ITALY2,270,000 Intesa Sanpaolo 144A 24.02.21/6.500% 2,358,871 0.36
2,358,871 0.36
NETHERLANDS2,000,000 NXP/NXP Funding 144A 01.08.18/9.750% 2,232,500 0.35
2,232,500 0.35
CANADA2,000,000 Quebecor Media 15.03.16/7.750% 2,080,000 0.32
2,080,000 0.32
IRELAND200,000 Ardagh Packaging Finance 144A 15.10.17/7.375% 206,000 0.03
1,500,000 Ardagh Packaging Finance 144A 15.10.20/9.125% 1,575,000 0.25177,755 Fleet Street Finance 3 A1 25.10.16/1.539%* 238,621 0.04
2,019,621 0.32
CAYMAN ISLANDS42,664 Credit-Based Asset Servicing
and Securitization 6AW A 05.11.28/0.952%* 38,398 0.01
38,398 0.01
Total Bonds 175,531,767 27.40
Investment Funds
LUXEMBOURG4,445 JPMorgan Liquidity Funds - US Dollar Liquidity Fund
(JPM US Dollar Liquidity X (acc)) 62,635,250 9.78
62,635,250 9.78
Total Investment Funds 62,635,250 9.78
Total Transferable Securities Dealt in on AnotherRegulated Market
238,167,017 37.18
Total Investments 435,843,596 68.03
Cash Equivalents
Time Deposits
NETHERLANDS46,100,000 Rabobank Nederland 01.07.11/0.030% 46,100,000 7.20
46,100,000 7.20
Total Time Deposits 46,100,000 7.20
Total Cash Equivalents 46,100,000 7.20
Total Investments plus Total Cash Equivalents 481,943,596 75.23
Cash 145,065,754 22.64
Other Assets/(Liabilities) 13,672,664 2.13
Total Net Assets 640,682,014 100.00
* Variable coupon rates are those quoted as at 30 June 2011.(i) Security partially or totally held as collateral against futures positions by the broker.
Allocation of Portfolio as at 30 June 2011 % ofNet Assets
Fixed Income SecuritiesUnited States of America 40.96United Kingdom 3.10Netherlands 2.13France 1.84Mexico 1.75South Africa 1.73Luxembourg 1.27Indonesia 1.19South Korea 1.13Canada 0.77Cayman Islands 0.74Italy 0.59Ireland 0.32Spain 0.22Finland 0.18Isle of Man 0.12Brazil 0.10Germany 0.07Switzerland 0.04Total Fixed Income Securities 58.25Investment FundsLuxembourg 9.78Total Investment Funds 9.78Cash Equivalents, Cash and Other Assets/(Liabilities) 31.97
Total 100.00
Allocation of Portfolio as at 31 December 2010 (Unaudited) % ofNet Assets
Fixed Income SecuritiesUnited States of America 48.40Netherlands 2.74United Kingdom 2.72Mexico 2.47Ireland 1.77South Korea 1.71Canada 1.69Luxembourg 1.54Turkey 1.53Israel 1.50Brazil 1.30South Africa 1.21British Virgin Islands 1.12France 0.92Indonesia 0.92Switzerland 0.90Isle of Man 0.78Bermuda 0.52Guernsey 0.51Spain 0.48Argentina 0.28Chile 0.20United Arab Emirates 0.20Total Fixed Income Securities 75.41Investment FundsLuxembourg 9.15Total Investment Funds 9.15Cash and Other Assets/(Liabilities) 15.44
Total 100.00
308
JPMorgan Funds - Global Strategic Bond FundSchedule of Investments (Market Value Expressed in USD) (continued)
As at 30 June 2011
Quantity/Nominal
Value
Name of Securities Maturity/Coupon
MarketValue
%of
NetAssets
Quantity/Nominal
Value
Name of Securities Maturity/Coupon
MarketValue
%of
NetAssets
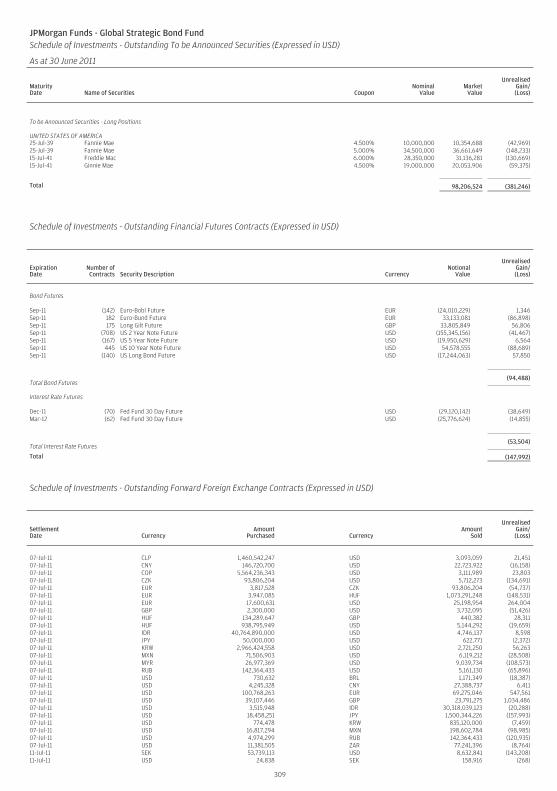
JPMorgan Funds - Global Strategic Bond FundSchedule of Investments - Outstanding To be Announced Securities (Expressed in USD)
As at 30 June 2011
MaturityDate Name of Securities Coupon
NominalValue
MarketValue
UnrealisedGain/(Loss)
To be Announced Securities - Long Positions
UNITED STATES OF AMERICA25-Jul-39 Fannie Mae 4.500% 10,000,000 10,354,688 (42,969)25-Jul-39 Fannie Mae 5.000% 34,500,000 36,661,649 (148,233)15-Jul-41 Freddie Mac 6.000% 28,350,000 31,136,281 (130,669)15-Jul-41 Ginnie Mae 4.500% 19,000,000 20,053,906 (59,375)
Total 98,206,524 (381,246)
Schedule of Investments - Outstanding Financial Futures Contracts (Expressed in USD)
ExpirationDate
Number ofContracts Security Description Currency
NotionalValue
UnrealisedGain/(Loss)
Bond Futures
Sep-11 (142) Euro-Bobl Future EUR (24,010,229) 1,346Sep-11 182 Euro-Bund Future EUR 33,133,081 (86,898)Sep-11 175 Long Gilt Future GBP 33,805,849 56,806Sep-11 (708) US 2 Year Note Future USD (155,345,156) (41,467)Sep-11 (167) US 5 Year Note Future USD (19,950,629) 6,564Sep-11 445 US 10 Year Note Future USD 54,578,555 (88,689)Sep-11 (140) US Long Bond Future USD (17,244,063) 57,850
Total Bond Futures(94,488)
Interest Rate Futures
Dec-11 (70) Fed Fund 30 Day Future USD (29,120,142) (38,649)Mar-12 (62) Fed Fund 30 Day Future USD (25,776,624) (14,855)
Total Interest Rate Futures(53,504)
Total (147,992)
JPMorgan Funds - Global Strategic Bond FundSchedule of Investments - Outstanding Forward Foreign Exchange Contracts (Expressed in USD) (continued)
As at 30 June 2011
SettlementDate Currency
AmountPurchased Currency
AmountSold
UnrealisedGain/(Loss)
07-Jul-11 CLP 1,460,542,247 USD 3,093,059 21,45107-Jul-11 CNY 146,720,700 USD 22,723,922 (16,158)07-Jul-11 COP 5,564,236,343 USD 3,111,989 23,80307-Jul-11 CZK 93,806,204 USD 5,712,273 (134,691)07-Jul-11 EUR 3,817,528 CZK 93,806,204 (54,737)07-Jul-11 EUR 3,947,085 HUF 1,073,291,248 (148,531)07-Jul-11 EUR 17,600,631 USD 25,198,954 264,00407-Jul-11 GBP 2,300,000 USD 3,732,095 (51,426)07-Jul-11 HUF 134,289,647 GBP 440,382 28,31107-Jul-11 HUF 938,795,949 USD 5,144,292 (19,659)07-Jul-11 IDR 40,764,890,000 USD 4,746,137 8,59807-Jul-11 JPY 50,000,000 USD 622,771 (2,372)07-Jul-11 KRW 2,966,424,558 USD 2,721,250 56,26307-Jul-11 MXN 71,506,903 USD 6,119,212 (28,508)07-Jul-11 MYR 26,977,369 USD 9,039,734 (108,573)07-Jul-11 RUB 142,364,433 USD 5,161,130 (65,896)07-Jul-11 USD 730,632 BRL 1,171,349 (18,387)07-Jul-11 USD 4,245,328 CNY 27,388,737 6,41107-Jul-11 USD 100,768,263 EUR 69,275,046 547,56107-Jul-11 USD 39,107,446 GBP 23,791,275 1,034,48607-Jul-11 USD 3,515,948 IDR 30,318,039,123 (20,288)07-Jul-11 USD 18,458,251 JPY 1,500,344,226 (157,993)07-Jul-11 USD 774,478 KRW 835,120,000 (7,459)07-Jul-11 USD 16,817,294 MXN 198,602,784 (98,985)07-Jul-11 USD 4,974,299 RUB 142,364,433 (120,935)07-Jul-11 USD 11,381,505 ZAR 77,241,396 (8,764)11-Jul-11 SEK 53,739,113 USD 8,632,841 (143,208)11-Jul-11 USD 24,838 SEK 158,916 (268)
309
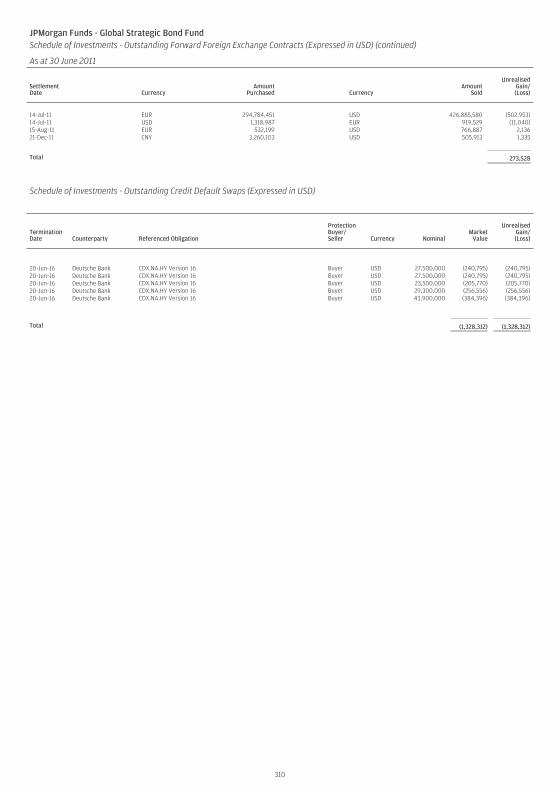
JPMorgan Funds - Global Strategic Bond FundSchedule of Investments - Outstanding Forward Foreign Exchange Contracts (Expressed in USD) (continued)
As at 30 June 2011
SettlementDate Currency
AmountPurchased Currency
AmountSold
UnrealisedGain/(Loss)
14-Jul-11 EUR 294,784,451 USD 426,885,580 (502,953)14-Jul-11 USD 1,318,987 EUR 919,529 (11,040)15-Aug-11 EUR 532,199 USD 766,887 2,13621-Dec-11 CNY 3,260,103 USD 505,913 1,335
Total 273,528
Schedule of Investments - Outstanding Credit Default Swaps (Expressed in USD)
TerminationDate Counterparty Referenced Obligation
ProtectionBuyer/Seller Currency Nominal
MarketValue
UnrealisedGain/(Loss)
20-Jun-16 Deutsche Bank CDX.NA.HY Version 16 Buyer USD 27,500,000 (240,795) (240,795)20-Jun-16 Deutsche Bank CDX.NA.HY Version 16 Buyer USD 27,500,000 (240,795) (240,795)20-Jun-16 Deutsche Bank CDX.NA.HY Version 16 Buyer USD 23,500,000 (205,770) (205,770)20-Jun-16 Deutsche Bank CDX.NA.HY Version 16 Buyer USD 29,300,000 (256,556) (256,556)20-Jun-16 Deutsche Bank CDX.NA.HY Version 16 Buyer USD 43,900,000 (384,396) (384,396)
Total (1,328,312) (1,328,312)
310
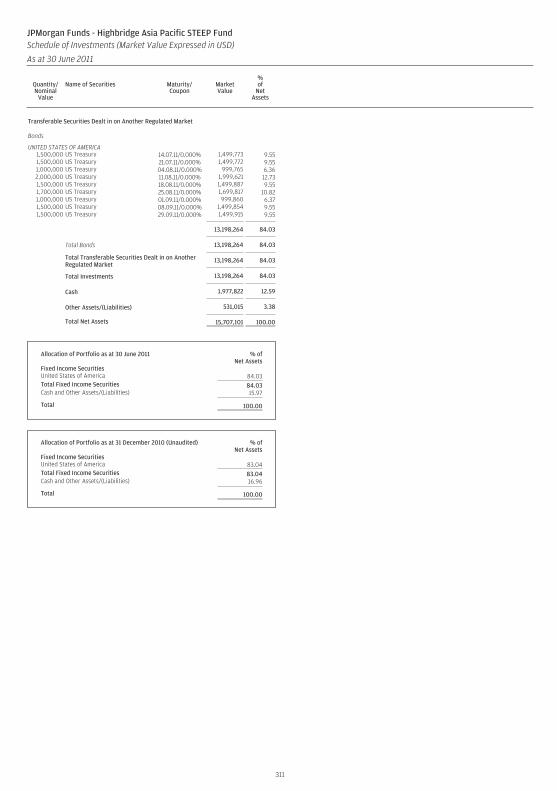
Transferable Securities Dealt in on Another Regulated Market
Bonds
UNITED STATES OF AMERICA1,500,000 US Treasury 14.07.11/0.000% 1,499,773 9.551,500,000 US Treasury 21.07.11/0.000% 1,499,772 9.551,000,000 US Treasury 04.08.11/0.000% 999,765 6.362,000,000 US Treasury 11.08.11/0.000% 1,999,621 12.731,500,000 US Treasury 18.08.11/0.000% 1,499,887 9.551,700,000 US Treasury 25.08.11/0.000% 1,699,817 10.821,000,000 US Treasury 01.09.11/0.000% 999,860 6.371,500,000 US Treasury 08.09.11/0.000% 1,499,854 9.551,500,000 US Treasury 29.09.11/0.000% 1,499,915 9.55
13,198,264 84.03
Total Bonds 13,198,264 84.03
Total Transferable Securities Dealt in on AnotherRegulated Market
13,198,264 84.03
Total Investments 13,198,264 84.03
Cash 1,977,822 12.59
Other Assets/(Liabilities) 531,015 3.38
Total Net Assets 15,707,101 100.00
Allocation of Portfolio as at 30 June 2011 % ofNet Assets
Fixed Income SecuritiesUnited States of America 84.03Total Fixed Income Securities 84.03Cash and Other Assets/(Liabilities) 15.97
Total 100.00
Allocation of Portfolio as at 31 December 2010 (Unaudited) % ofNet Assets
Fixed Income SecuritiesUnited States of America 83.04Total Fixed Income Securities 83.04Cash and Other Assets/(Liabilities) 16.96
Total 100.00
311
JPMorgan Funds - Highbridge Asia Pacific STEEP FundSchedule of Investments (Market Value Expressed in USD)
As at 30 June 2011
Quantity/Nominal
Value
Name of Securities Maturity/Coupon
MarketValue
%of
NetAssets
Quantity/Nominal
Value
Name of Securities Maturity/Coupon
MarketValue
%of
NetAssets
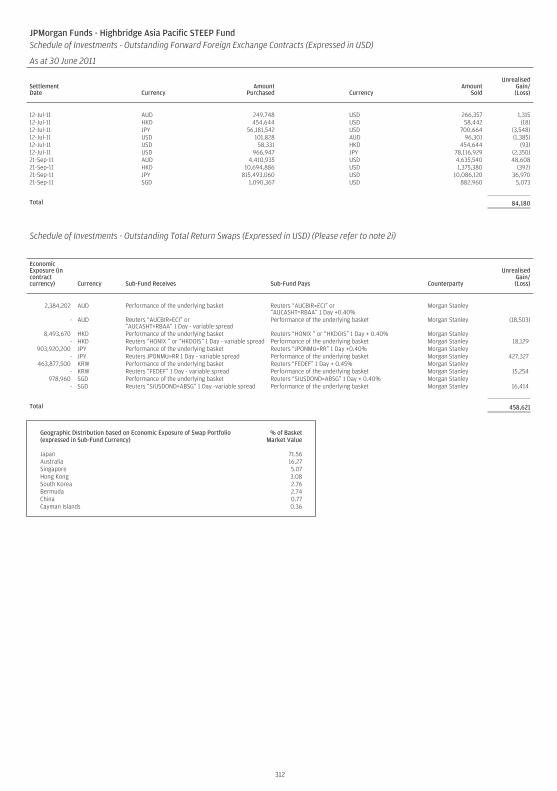
JPMorgan Funds - Highbridge Asia Pacific STEEP FundSchedule of Investments - Outstanding Forward Foreign Exchange Contracts (Expressed in USD)
As at 30 June 2011
SettlementDate Currency
AmountPurchased Currency
AmountSold
UnrealisedGain/(Loss)
12-Jul-11 AUD 249,748 USD 266,357 1,31512-Jul-11 HKD 454,644 USD 58,442 (18)12-Jul-11 JPY 56,181,542 USD 700,664 (3,548)12-Jul-11 USD 101,828 AUD 96,301 (1,385)12-Jul-11 USD 58,331 HKD 454,644 (93)12-Jul-11 USD 966,947 JPY 78,116,929 (2,350)21-Sep-11 AUD 4,410,935 USD 4,635,540 48,60821-Sep-11 HKD 10,694,886 USD 1,375,380 (392)21-Sep-11 JPY 815,493,060 USD 10,086,120 36,97021-Sep-11 SGD 1,090,367 USD 882,960 5,073
Total 84,180
Schedule of Investments - Outstanding Total Return Swaps (Expressed in USD) (Please refer to note 2i)
EconomicExposure (incontractcurrency) Currency Sub-Fund Receives Sub-Fund Pays Counterparty
UnrealisedGain/(Loss)
2,384,202 AUD Performance of the underlying basket Reuters “AUCBIR=ECI” or“AUCASHT=RBAA” 1 Day +0.40%
Morgan Stanley
- AUD Reuters “AUCBIR=ECI” or“AUCASHT=RBAA” 1 Day - variable spread
Performance of the underlying basket Morgan Stanley (18,503)
8,493,670 HKD Performance of the underlying basket Reuters “HONIX ” or “HKDOIS” 1 Day + 0.40% Morgan Stanley- HKD Reuters “HONIX ” or “HKDOIS” 1 Day - variable spread Performance of the underlying basket Morgan Stanley 18,129
903,920,200 JPY Performance of the underlying basket Reuters “JPONMU=RR” 1 Day +0.40% Morgan Stanley- JPY Reuters JPONMU=RR 1 Day - variable spread Performance of the underlying basket Morgan Stanley 427,327
463,877,500 KRW Performance of the underlying basket Reuters “FEDEF” 1 Day + 0.45% Morgan Stanley- KRW Reuters “FEDEF” 1 Day - variable spread Performance of the underlying basket Morgan Stanley 15,254
978,960 SGD Performance of the underlying basket Reuters “SIUSDOND=ABSG” 1 Day + 0.40% Morgan Stanley- SGD Reuters “SIUSDOND=ABSG” 1 Day -variable spread Performance of the underlying basket Morgan Stanley 16,414
Total 458,621
Geographic Distribution based on Economic Exposure of Swap Portfolio(expressed in Sub-Fund Currency)
% of BasketMarket Value
Japan 71.56Australia 16.27Singapore 5.07Hong Kong 3.08South Korea 2.76Bermuda 2.74China 0.77Cayman Islands 0.36
312
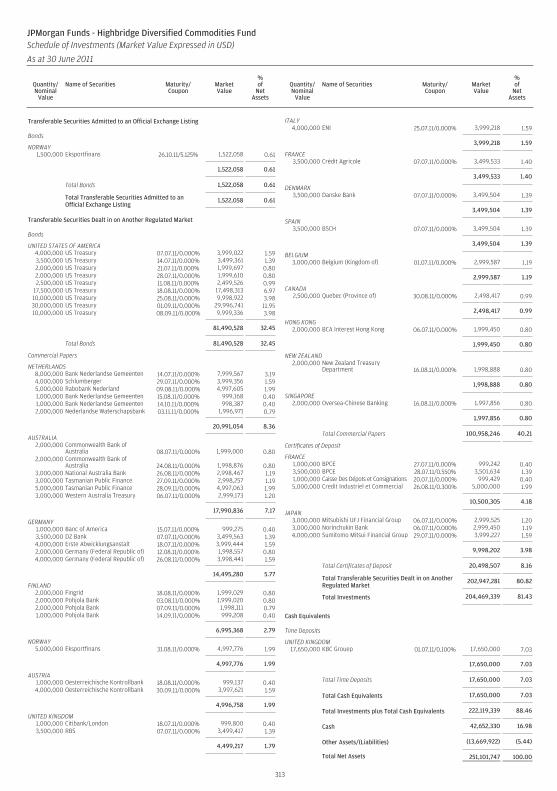
Transferable Securities Admitted to an Official Exchange Listing
Bonds
NORWAY1,500,000 Eksportfinans 26.10.11/5.125% 1,522,058 0.61
1,522,058 0.61
Total Bonds 1,522,058 0.61
Total Transferable Securities Admitted to anOfficial Exchange Listing
1,522,058 0.61
Transferable Securities Dealt in on Another Regulated Market
Bonds
UNITED STATES OF AMERICA4,000,000 US Treasury 07.07.11/0.000% 3,999,022 1.593,500,000 US Treasury 14.07.11/0.000% 3,499,361 1.392,000,000 US Treasury 21.07.11/0.000% 1,999,697 0.802,000,000 US Treasury 28.07.11/0.000% 1,999,610 0.802,500,000 US Treasury 11.08.11/0.000% 2,499,526 0.99
17,500,000 US Treasury 18.08.11/0.000% 17,498,313 6.9710,000,000 US Treasury 25.08.11/0.000% 9,998,922 3.9830,000,000 US Treasury 01.09.11/0.000% 29,996,741 11.9510,000,000 US Treasury 08.09.11/0.000% 9,999,336 3.98
81,490,528 32.45
Total Bonds 81,490,528 32.45
Commercial Papers
NETHERLANDS8,000,000 Bank Nederlandse Gemeenten 14.07.11/0.000% 7,999,567 3.194,000,000 Schlumberger 29.07.11/0.000% 3,999,356 1.595,000,000 Rabobank Nederland 09.08.11/0.000% 4,997,605 1.991,000,000 Bank Nederlandse Gemeenten 15.08.11/0.000% 999,168 0.401,000,000 Bank Nederlandse Gemeenten 14.10.11/0.000% 998,387 0.402,000,000 Nederlandse Waterschapsbank 03.11.11/0.000% 1,996,971 0.79
20,991,054 8.36
AUSTRALIA2,000,000 Commonwealth Bank of
Australia 08.07.11/0.000% 1,999,000 0.802,000,000 Commonwealth Bank of
Australia 24.08.11/0.000% 1,998,876 0.803,000,000 National Australia Bank 26.08.11/0.000% 2,998,467 1.193,000,000 Tasmanian Public Finance 27.09.11/0.000% 2,998,257 1.195,000,000 Tasmanian Public Finance 28.09.11/0.000% 4,997,063 1.993,000,000 Western Australia Treasury 06.07.11/0.000% 2,999,173 1.20
17,990,836 7.17
GERMANY1,000,000 Banc of America 15.07.11/0.000% 999,275 0.403,500,000 DZ Bank 07.07.11/0.000% 3,499,563 1.394,000,000 Erste Abwicklungsanstalt 18.07.11/0.000% 3,999,444 1.592,000,000 Germany (Federal Republic of) 12.08.11/0.000% 1,998,557 0.804,000,000 Germany (Federal Republic of) 26.08.11/0.000% 3,998,441 1.59
14,495,280 5.77
FINLAND2,000,000 Fingrid 18.08.11/0.000% 1,999,029 0.802,000,000 Pohjola Bank 03.08.11/0.000% 1,999,020 0.802,000,000 Pohjola Bank 07.09.11/0.000% 1,998,111 0.791,000,000 Pohjola Bank 14.09.11/0.000% 999,208 0.40
6,995,368 2.79
NORWAY5,000,000 Eksportfinans 31.08.11/0.000% 4,997,776 1.99
4,997,776 1.99
AUSTRIA1,000,000 Oesterreichische Kontrollbank 18.08.11/0.000% 999,137 0.404,000,000 Oesterreichische Kontrollbank 30.09.11/0.000% 3,997,621 1.59
4,996,758 1.99
UNITED KINGDOM1,000,000 Citibank/London 18.07.11/0.000% 999,800 0.403,500,000 RBS 07.07.11/0.000% 3,499,417 1.39
4,499,217 1.79
ITALY4,000,000 ENI 25.07.11/0.000% 3,999,218 1.59
3,999,218 1.59
FRANCE3,500,000 Crédit Agricole 07.07.11/0.000% 3,499,533 1.40
3,499,533 1.40
DENMARK3,500,000 Danske Bank 07.07.11/0.000% 3,499,504 1.39
3,499,504 1.39
SPAIN3,500,000 BSCH 07.07.11/0.000% 3,499,504 1.39
3,499,504 1.39
BELGIUM3,000,000 Belgium (Kingdom of) 01.07.11/0.000% 2,999,587 1.19
2,999,587 1.19
CANADA2,500,000 Quebec (Province of) 30.08.11/0.000% 2,498,417 0.99
2,498,417 0.99
HONG KONG2,000,000 BCA Interest Hong Kong 06.07.11/0.000% 1,999,450 0.80
1,999,450 0.80
NEW ZEALAND2,000,000 New Zealand Treasury
Department 16.08.11/0.000% 1,998,888 0.80
1,998,888 0.80
SINGAPORE2,000,000 Oversea-Chinese Banking 16.08.11/0.000% 1,997,856 0.80
1,997,856 0.80
Total Commercial Papers 100,958,246 40.21
Certificates of Deposit
FRANCE1,000,000 BPCE 27.07.11/0.000% 999,242 0.403,500,000 BPCE 28.07.11/0.550% 3,501,634 1.391,000,000 Caisse Des Dépots et Consignations 20.07.11/0.000% 999,429 0.405,000,000 Credit Industriel et Commercial 26.08.11/0.300% 5,000,000 1.99
10,500,305 4.18
JAPAN3,000,000 Mitsubishi UFJ Financial Group 06.07.11/0.000% 2,999,525 1.203,000,000 Norinchukin Bank 06.07.11/0.000% 2,999,450 1.194,000,000 Sumitomo Mitsui Financial Group 29.07.11/0.000% 3,999,227 1.59
9,998,202 3.98
Total Certificates of Deposit 20,498,507 8.16
Total Transferable Securities Dealt in on AnotherRegulated Market
202,947,281 80.82
Total Investments 204,469,339 81.43
Cash Equivalents
Time Deposits
UNITED KINGDOM17,650,000 KBC Grouep 01.07.11/0.100% 17,650,000 7.03
17,650,000 7.03
Total Time Deposits 17,650,000 7.03
Total Cash Equivalents 17,650,000 7.03
Total Investments plus Total Cash Equivalents 222,119,339 88.46
Cash 42,652,330 16.98
Other Assets/(Liabilities) (13,669,922) (5.44)
Total Net Assets 251,101,747 100.00
313
JPMorgan Funds - Highbridge Diversified Commodities FundSchedule of Investments (Market Value Expressed in USD)
As at 30 June 2011
Quantity/Nominal
Value
Name of Securities Maturity/Coupon
MarketValue
%of
NetAssets
Quantity/Nominal
Value
Name of Securities Maturity/Coupon
MarketValue
%of
NetAssets
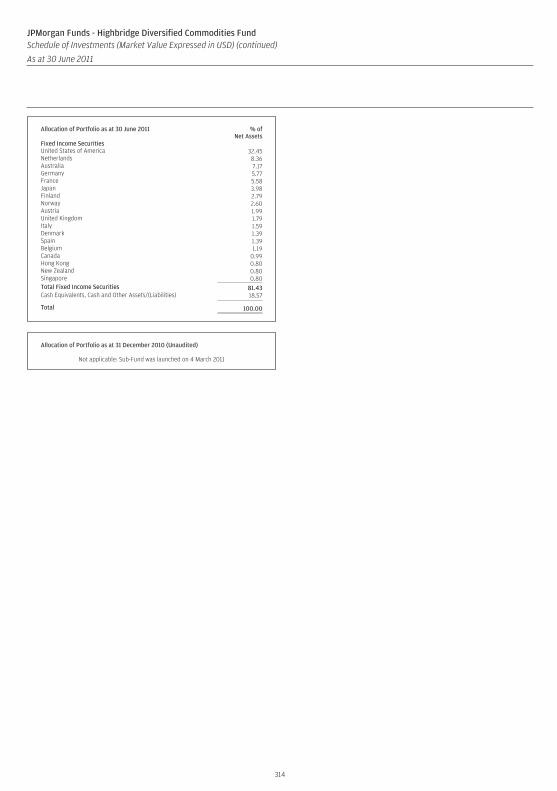
Allocation of Portfolio as at 30 June 2011 % ofNet Assets
Fixed Income SecuritiesUnited States of America 32.45Netherlands 8.36Australia 7.17Germany 5.77France 5.58Japan 3.98Finland 2.79Norway 2.60Austria 1.99United Kingdom 1.79Italy 1.59Denmark 1.39Spain 1.39Belgium 1.19Canada 0.99Hong Kong 0.80New Zealand 0.80Singapore 0.80Total Fixed Income Securities 81.43Cash Equivalents, Cash and Other Assets/(Liabilities) 18.57
Total 100.00
Allocation of Portfolio as at 31 December 2010 (Unaudited)
Not applicable: Sub-Fund was launched on 4 March 2011
314
JPMorgan Funds - Highbridge Diversified Commodities FundSchedule of Investments (Market Value Expressed in USD) (continued)
As at 30 June 2011
Quantity/Nominal
Value
Name of Securities Maturity/Coupon
MarketValue
%of
NetAssets
Quantity/Nominal
Value
Name of Securities Maturity/Coupon
MarketValue
%of
NetAssets
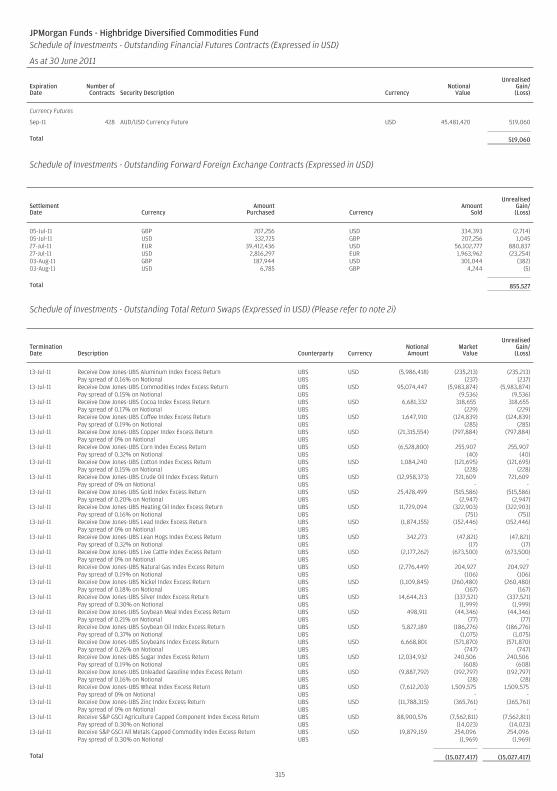
JPMorgan Funds - Highbridge Diversified Commodities FundSchedule of Investments - Outstanding Financial Futures Contracts (Expressed in USD)
As at 30 June 2011
ExpirationDate
Number ofContracts Security Description Currency
NotionalValue
UnrealisedGain/(Loss)
Currency Futures
Sep-11 428 AUD/USD Currency Future USD 45,481,420 519,060
Total 519,060
Schedule of Investments - Outstanding Forward Foreign Exchange Contracts (Expressed in USD)
SettlementDate Currency
AmountPurchased Currency
AmountSold
UnrealisedGain/(Loss)
05-Jul-11 GBP 207,256 USD 334,393 (2,714)05-Jul-11 USD 332,725 GBP 207,256 1,04527-Jul-11 EUR 39,412,436 USD 56,102,777 880,83727-Jul-11 USD 2,816,297 EUR 1,963,962 (23,254)03-Aug-11 GBP 187,944 USD 301,044 (382)03-Aug-11 USD 6,785 GBP 4,244 (5)
Total 855,527
Schedule of Investments - Outstanding Total Return Swaps (Expressed in USD) (Please refer to note 2i)
TerminationDate Description Counterparty Currency
NotionalAmount
MarketValue
UnrealisedGain/(Loss)
13-Jul-11 Receive Dow Jones-UBS Aluminum Index Excess Return UBS USD (5,986,418) (235,213) (235,213)Pay spread of 0.16% on Notional UBS (237) (237)
13-Jul-11 Receive Dow Jones-UBS Commodities Index Excess Return UBS USD 95,074,447 (5,983,874) (5,983,874)Pay spread of 0.15% on Notional UBS (9,536) (9,536)
13-Jul-11 Receive Dow Jones-UBS Cocoa Index Excess Return UBS USD 6,681,332 318,655 318,655Pay spread of 0.17% on Notional UBS (229) (229)
13-Jul-11 Receive Dow Jones-UBS Coffee Index Excess Return UBS USD 1,647,910 (124,839) (124,839)Pay spread of 0.19% on Notional UBS (285) (285)
13-Jul-11 Receive Dow Jones-UBS Copper Index Excess Return UBS USD (21,315,554) (797,884) (797,884)Pay spread of 0% on Notional UBS - -
13-Jul-11 Receive Dow Jones-UBS Corn Index Excess Return UBS USD (6,528,800) 255,907 255,907Pay spread of 0.32% on Notional UBS (40) (40)
13-Jul-11 Receive Dow Jones-UBS Cotton Index Excess Return UBS USD 1,084,240 (121,695) (121,695)Pay spread of 0.15% on Notional UBS (228) (228)
13-Jul-11 Receive Dow Jones-UBS Crude Oil Index Excess Return UBS USD (12,958,373) 721,609 721,609Pay spread of 0% on Notional UBS - -
13-Jul-11 Receive Dow Jones-UBS Gold Index Excess Return UBS USD 25,428,499 (515,586) (515,586)Pay spread of 0.20% on Notional UBS (2,947) (2,947)
13-Jul-11 Receive Dow Jones-UBS Heating Oil Index Excess Return UBS USD 11,729,094 (322,903) (322,903)Pay spread of 0.16% on Notional UBS (751) (751)
13-Jul-11 Receive Dow Jones-UBS Lead Index Excess Return UBS USD (1,874,155) (152,446) (152,446)Pay spread of 0% on Notional UBS - -
13-Jul-11 Receive Dow Jones-UBS Lean Hogs Index Excess Return UBS USD 342,273 (47,821) (47,821)Pay spread of 0.32% on Notional UBS (17) (17)
13-Jul-11 Receive Dow Jones-UBS Live Cattle Index Excess Return UBS USD (2,177,262) (673,500) (673,500)Pay spread of 0% on Notional UBS - -
13-Jul-11 Receive Dow Jones-UBS Natural Gas Index Excess Return UBS USD (2,776,449) 204,927 204,927Pay spread of 0.19% on Notional UBS (106) (106)
13-Jul-11 Receive Dow Jones-UBS Nickel Index Excess Return UBS USD (1,109,845) (260,480) (260,480)Pay spread of 0.18% on Notional UBS (167) (167)
13-Jul-11 Receive Dow Jones-UBS Silver Index Excess Return UBS USD 14,644,213 (337,521) (337,521)Pay spread of 0.30% on Notional UBS (1,999) (1,999)
13-Jul-11 Receive Dow Jones-UBS Soybean Meal Index Excess Return UBS USD 498,911 (44,346) (44,346)Pay spread of 0.21% on Notional UBS (77) (77)
13-Jul-11 Receive Dow Jones-UBS Soybean Oil Index Excess Return UBS USD 5,827,189 (186,276) (186,276)Pay spread of 0.37% on Notional UBS (1,075) (1,075)
13-Jul-11 Receive Dow Jones-UBS Soybeans Index Excess Return UBS USD 6,668,801 (571,870) (571,870)Pay spread of 0.26% on Notional UBS (747) (747)
13-Jul-11 Receive Dow Jones-UBS Sugar Index Excess Return UBS USD 12,034,932 240,506 240,506Pay spread of 0.19% on Notional UBS (608) (608)
13-Jul-11 Receive Dow Jones-UBS Unleaded Gasoline Index Excess Return UBS USD (9,887,792) (192,797) (192,797)Pay spread of 0.16% on Notional UBS (28) (28)
13-Jul-11 Receive Dow Jones-UBS Wheat Index Excess Return UBS USD (7,612,203) 1,509,575 1,509,575Pay spread of 0% on Notional UBS - -
13-Jul-11 Receive Dow Jones-UBS Zinc Index Excess Return UBS USD (11,788,315) (365,761) (365,761)Pay spread of 0% on Notional UBS - -
13-Jul-11 Receive S&P GSCI Agriculture Capped Component Index Excess Return UBS USD 88,900,576 (7,562,811) (7,562,811)Pay spread of 0.30% on Notional UBS (14,023) (14,023)
13-Jul-11 Receive S&P GSCI All Metals Capped Commodity Index Excess Return UBS USD 19,879,159 254,096 254,096Pay spread of 0.30% on Notional UBS (1,969) (1,969)
Total (15,027,417) (15,027,417)
315
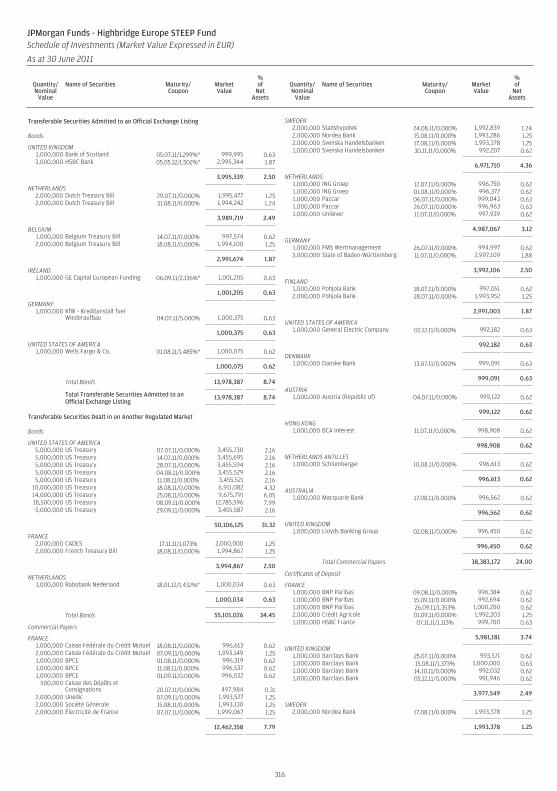
Transferable Securities Admitted to an Official Exchange Listing
Bonds
UNITED KINGDOM1,000,000 Bank of Scotland 05.07.11/1.299%* 999,995 0.633,000,000 HSBC Bank 05.05.12/1.502%* 2,995,344 1.87
3,995,339 2.50
NETHERLANDS2,000,000 Dutch Treasury Bill 29.07.11/0.000% 1,995,477 1.252,000,000 Dutch Treasury Bill 31.08.11/0.000% 1,994,242 1.24
3,989,719 2.49
BELGIUM1,000,000 Belgium Treasury Bill 14.07.11/0.000% 997,574 0.622,000,000 Belgium Treasury Bill 18.08.11/0.000% 1,994,100 1.25
2,991,674 1.87
IRELAND1,000,000 GE Capital European Funding 06.09.11/2.136%* 1,001,205 0.63
1,001,205 0.63
GERMANY1,000,000 KfW - Kreditanstalt fuer
Wiederaufbau 04.07.11/5.000% 1,000,375 0.63
1,000,375 0.63
UNITED STATES OF AMERICA1,000,000 Wells Fargo & Co. 01.08.11/1.485%* 1,000,075 0.62
1,000,075 0.62
Total Bonds 13,978,387 8.74
Total Transferable Securities Admitted to anOfficial Exchange Listing
13,978,387 8.74
Transferable Securities Dealt in on Another Regulated Market
Bonds
UNITED STATES OF AMERICA5,000,000 US Treasury 07.07.11/0.000% 3,455,730 2.165,000,000 US Treasury 14.07.11/0.000% 3,455,695 2.165,000,000 US Treasury 28.07.11/0.000% 3,455,594 2.165,000,000 US Treasury 04.08.11/0.000% 3,455,529 2.165,000,000 US Treasury 11.08.11/0.000% 3,455,521 2.16
10,000,000 US Treasury 18.08.11/0.000% 6,911,082 4.3214,000,000 US Treasury 25.08.11/0.000% 9,675,791 6.0518,500,000 US Treasury 08.09.11/0.000% 12,785,596 7.995,000,000 US Treasury 29.09.11/0.000% 3,455,587 2.16
50,106,125 31.32
FRANCE2,000,000 CADES 17.11.11/1.073% 2,000,000 1.252,000,000 French Treasury Bill 18.08.11/0.000% 1,994,867 1.25
3,994,867 2.50
NETHERLANDS1,000,000 Rabobank Nederland 18.01.12/1.432%* 1,000,034 0.63
1,000,034 0.63
Total Bonds 55,101,026 34.45
Commercial Papers
FRANCE1,000,000 Caisse Fédérale du Crédit Mutuel 18.08.11/0.000% 996,613 0.622,000,000 Caisse Fédérale du Crédit Mutuel 07.09.11/0.000% 1,993,149 1.251,000,000 BPCE 01.08.11/0.000% 996,319 0.621,000,000 BPCE 11.08.11/0.000% 996,537 0.621,000,000 BPCE 01.09.11/0.000% 996,032 0.62
500,000 Caisse des Dépôts etConsignations 20.07.11/0.000% 497,984 0.31
2,000,000 Unedic 07.09.11/0.000% 1,993,527 1.252,000,000 Société Générale 15.08.11/0.000% 1,993,130 1.252,000,000 Électricité de France 07.07.11/0.000% 1,999,067 1.25
12,462,358 7.79
SWEDEN2,000,000 Stadshypotek 24.08.11/0.000% 1,992,839 1.242,000,000 Nordea Bank 15.08.11/0.000% 1,993,286 1.252,000,000 Svenska Handelsbanken 17.08.11/0.000% 1,993,378 1.251,000,000 Svenska Handelsbanken 30.11.11/0.000% 992,207 0.62
6,971,710 4.36
NETHERLANDS1,000,000 ING Groep 12.07.11/0.000% 996,750 0.621,000,000 ING Groep 01.08.11/0.000% 996,372 0.621,000,000 Paccar 06.07.11/0.000% 999,043 0.631,000,000 Paccar 26.07.11/0.000% 996,963 0.631,000,000 Unilever 11.07.11/0.000% 997,939 0.62
4,987,067 3.12
GERMANY1,000,000 FMS Wertmanagement 26.07.11/0.000% 994,997 0.623,000,000 State of Baden-Württemberg 11.07.11/0.000% 2,997,109 1.88
3,992,106 2.50
FINLAND1,000,000 Pohjola Bank 18.07.11/0.000% 997,051 0.622,000,000 Pohjola Bank 28.07.11/0.000% 1,993,952 1.25
2,991,003 1.87
UNITED STATES OF AMERICA1,000,000 General Electric Company 02.12.11/0.000% 992,182 0.63
992,182 0.63
DENMARK1,000,000 Danske Bank 13.07.11/0.000% 999,091 0.63
999,091 0.63
AUSTRIA1,000,000 Austria (Republic of) 04.07.11/0.000% 999,122 0.62
999,122 0.62
HONG KONG1,000,000 BCA Interest 11.07.11/0.000% 998,908 0.62
998,908 0.62
NETHERLANDS ANTILLES1,000,000 Schlumberger 10.08.11/0.000% 996,613 0.62
996,613 0.62
AUSTRALIA1,000,000 Macquarie Bank 17.08.11/0.000% 996,562 0.62
996,562 0.62
UNITED KINGDOM1,000,000 Lloyds Banking Group 02.08.11/0.000% 996,450 0.62
996,450 0.62
Total Commercial Papers 38,383,172 24.00
Certificates of Deposit
FRANCE1,000,000 BNP Paribas 09.08.11/0.000% 996,384 0.621,000,000 BNP Paribas 15.09.11/0.000% 992,694 0.621,000,000 BNP Paribas 26.09.11/1.353% 1,000,200 0.622,000,000 Crédit Agricole 01.09.11/0.000% 1,992,203 1.251,000,000 HSBC France 07.11.11/1.113% 999,700 0.63
5,981,181 3.74
UNITED KINGDOM1,000,000 Barclays Bank 25.07.11/0.000% 993,571 0.621,000,000 Barclays Bank 15.08.11/1.373% 1,000,000 0.631,000,000 Barclays Bank 14.10.11/0.000% 992,032 0.621,000,000 Barclays Bank 05.12.11/0.000% 991,946 0.62
3,977,549 2.49
SWEDEN2,000,000 Nordea Bank 17.08.11/0.000% 1,993,378 1.25
1,993,378 1.25
316
JPMorgan Funds - Highbridge Europe STEEP FundSchedule of Investments (Market Value Expressed in EUR)
As at 30 June 2011
Quantity/Nominal
Value
Name of Securities Maturity/Coupon
MarketValue
%of
NetAssets
Quantity/Nominal
Value
Name of Securities Maturity/Coupon
MarketValue
%of
NetAssets
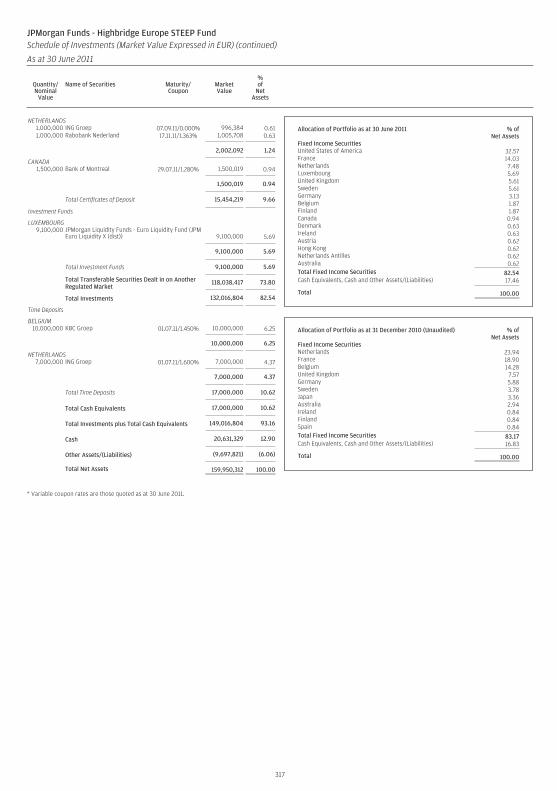
NETHERLANDS1,000,000 ING Groep 07.09.11/0.000% 996,384 0.611,000,000 Rabobank Nederland 17.11.11/1.363% 1,005,708 0.63
2,002,092 1.24
CANADA1,500,000 Bank of Montreal 29.07.11/1.280% 1,500,019 0.94
1,500,019 0.94
Total Certificates of Deposit 15,454,219 9.66
Investment Funds
LUXEMBOURG9,100,000 JPMorgan Liquidity Funds - Euro Liquidity Fund (JPM
Euro Liquidity X (dist)) 9,100,000 5.69
9,100,000 5.69
Total Investment Funds 9,100,000 5.69
Total Transferable Securities Dealt in on AnotherRegulated Market
118,038,417 73.80
Total Investments 132,016,804 82.54
Time Deposits
BELGIUM10,000,000 KBC Groep 01.07.11/1.450% 10,000,000 6.25
10,000,000 6.25
NETHERLANDS7,000,000 ING Groep 01.07.11/1.600% 7,000,000 4.37
7,000,000 4.37
Total Time Deposits 17,000,000 10.62
Total Cash Equivalents 17,000,000 10.62
Total Investments plus Total Cash Equivalents 149,016,804 93.16
Cash 20,631,329 12.90
Other Assets/(Liabilities) (9,697,821) (6.06)
Total Net Assets 159,950,312 100.00
* Variable coupon rates are those quoted as at 30 June 2011.
Allocation of Portfolio as at 30 June 2011 % ofNet Assets
Fixed Income SecuritiesUnited States of America 32.57France 14.03Netherlands 7.48Luxembourg 5.69United Kingdom 5.61Sweden 5.61Germany 3.13Belgium 1.87Finland 1.87Canada 0.94Denmark 0.63Ireland 0.63Austria 0.62Hong Kong 0.62Netherlands Antilles 0.62Australia 0.62Total Fixed Income Securities 82.54Cash Equivalents, Cash and Other Assets/(Liabilities) 17.46
Total 100.00
Allocation of Portfolio as at 31 December 2010 (Unaudited) % ofNet Assets
Fixed Income SecuritiesNetherlands 23.94France 18.90Belgium 14.28United Kingdom 7.57Germany 5.88Sweden 3.78Japan 3.36Australia 2.94Ireland 0.84Finland 0.84Spain 0.84Total Fixed Income Securities 83.17Cash Equivalents, Cash and Other Assets/(Liabilities) 16.83
Total 100.00
317
JPMorgan Funds - Highbridge Europe STEEP FundSchedule of Investments (Market Value Expressed in EUR) (continued)
As at 30 June 2011
Quantity/Nominal
Value
Name of Securities Maturity/Coupon
MarketValue
%of
NetAssets
Quantity/Nominal
Value
Name of Securities Maturity/Coupon
MarketValue
%of
NetAssets
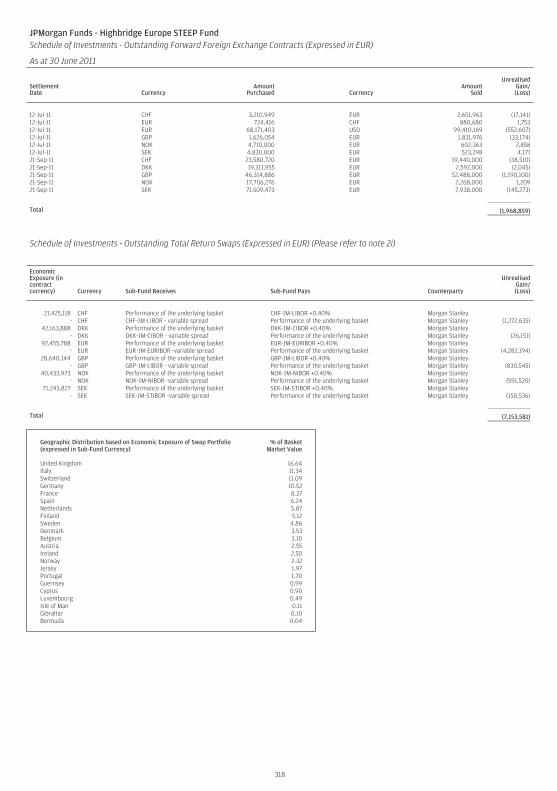
JPMorgan Funds - Highbridge Europe STEEP FundSchedule of Investments - Outstanding Forward Foreign Exchange Contracts (Expressed in EUR)
As at 30 June 2011
SettlementDate Currency
AmountPurchased Currency
AmountSold
UnrealisedGain/(Loss)
12-Jul-11 CHF 3,210,949 EUR 2,651,963 (17,141)12-Jul-11 EUR 724,416 CHF 880,680 1,75312-Jul-11 EUR 68,171,403 USD 99,410,169 (552,607)12-Jul-11 GBP 1,626,054 EUR 1,831,976 (33,174)12-Jul-11 NOK 4,710,000 EUR 602,363 2,85812-Jul-11 SEK 4,830,000 EUR 523,298 4,17121-Sep-11 CHF 23,580,720 EUR 19,440,000 (38,510)21-Sep-11 DKK 19,311,955 EUR 2,592,000 (2,045)21-Sep-11 GBP 46,314,886 EUR 52,488,000 (1,190,100)21-Sep-11 NOK 17,706,276 EUR 2,268,000 1,20921-Sep-11 SEK 71,509,473 EUR 7,938,000 (145,273)
Total (1,968,859)
Schedule of Investments - Outstanding Total Return Swaps (Expressed in EUR) (Please refer to note 2i)
EconomicExposure (incontractcurrency) Currency Sub-Fund Receives Sub-Fund Pays Counterparty
UnrealisedGain/(Loss)
21,425,118 CHF Performance of the underlying basket CHF-1M-LIBOR +0.40% Morgan Stanley- CHF CHF-1M-LIBOR - variable spread Performance of the underlying basket Morgan Stanley (1,272,635)
42,163,888 DKK Performance of the underlying basket DKK-1M-CIBOR +0.40% Morgan Stanley- DKK DKK-1M-CIBOR - variable spread Performance of the underlying basket Morgan Stanley (26,151)
92,455,788 EUR Performance of the underlying basket EUR-1M-EURIBOR +0.40% Morgan Stanley- EUR EUR-1M-EURIBOR -variable spread Performance of the underlying basket Morgan Stanley (4,282,194)
28,640,144 GBP Performance of the underlying basket GBP-1M-LIBOR +0.40% Morgan Stanley- GBP GBP-1M-LIBOR - variable spread Performance of the underlying basket Morgan Stanley (830,545)
40,433,973 NOK Performance of the underlying basket NOK-1M-NIBOR +0.40% Morgan Stanley- NOK NOK-1M-NIBOR -variable spread Performance of the underlying basket Morgan Stanley (591,520)
71,243,827 SEK Performance of the underlying basket SEK-1M-STIBOR +0.40% Morgan Stanley- SEK SEK-1M-STIBOR -variable spread Performance of the underlying basket Morgan Stanley (150,536)
Total (7,153,581)
Geographic Distribution based on Economic Exposure of Swap Portfolio(expressed in Sub-Fund Currency)
% of BasketMarket Value
United Kingdom 16.64Italy 11.34Switzerland 11.09Germany 10.52France 8.37Spain 6.24Netherlands 5.87Finland 5.12Sweden 4.86Denmark 3.53Belgium 3.10Austria 2.55Ireland 2.50Norway 2.32Jersey 1.97Portugal 1.70Guernsey 0.99Cyprus 0.90Luxembourg 0.49Isle of Man 0.11Gibraltar 0.10Bermuda 0.04
318
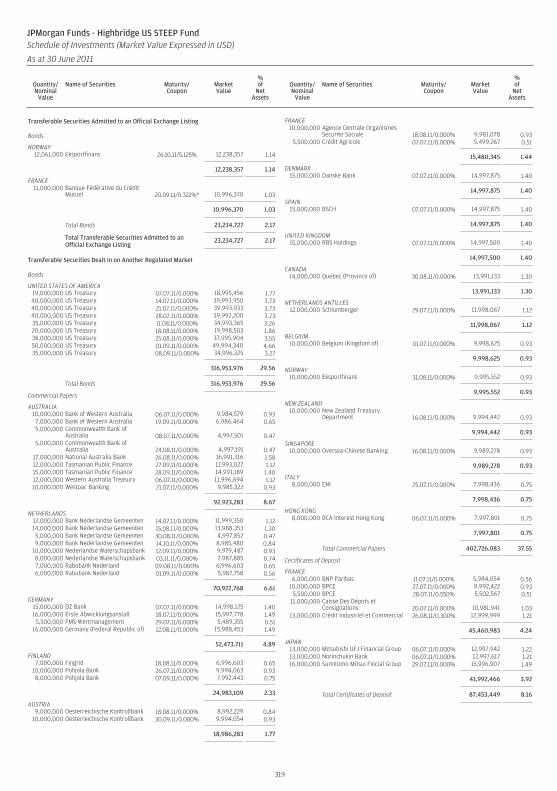
Transferable Securities Admitted to an Official Exchange Listing
Bonds
NORWAY12,061,000 Eksportfinans 26.10.11/5.125% 12,238,357 1.14
12,238,357 1.14
FRANCE11,000,000 Banque Fédérative du Crédit
Mutuel 20.09.11/0.322%* 10,996,370 1.03
10,996,370 1.03
Total Bonds 23,234,727 2.17
Total Transferable Securities Admitted to anOfficial Exchange Listing
23,234,727 2.17
Transferable Securities Dealt in on Another Regulated Market
Bonds
UNITED STATES OF AMERICA19,000,000 US Treasury 07.07.11/0.000% 18,995,456 1.7740,000,000 US Treasury 14.07.11/0.000% 39,993,950 3.7340,000,000 US Treasury 21.07.11/0.000% 39,993,933 3.7340,000,000 US Treasury 28.07.11/0.000% 39,992,200 3.7335,000,000 US Treasury 11.08.11/0.000% 34,993,365 3.2620,000,000 US Treasury 18.08.11/0.000% 19,998,503 1.8638,000,000 US Treasury 25.08.11/0.000% 37,995,904 3.5550,000,000 US Treasury 01.09.11/0.000% 49,994,340 4.6635,000,000 US Treasury 08.09.11/0.000% 34,996,325 3.27
316,953,976 29.56
Total Bonds 316,953,976 29.56
Commercial Papers
AUSTRALIA10,000,000 Bank of Western Australia 06.07.11/0.000% 9,984,579 0.937,000,000 Bank of Western Australia 19.09.11/0.000% 6,986,464 0.655,000,000 Commonwealth Bank of
Australia 08.07.11/0.000% 4,997,501 0.475,000,000 Commonwealth Bank of
Australia 24.08.11/0.000% 4,997,191 0.4717,000,000 National Australia Bank 26.08.11/0.000% 16,991,316 1.5812,000,000 Tasmanian Public Finance 27.09.11/0.000% 11,993,027 1.1215,000,000 Tasmanian Public Finance 28.09.11/0.000% 14,991,189 1.4012,000,000 Western Australia Treasury 06.07.11/0.000% 11,996,694 1.1210,000,000 Westpac Banking 21.07.11/0.000% 9,985,322 0.93
92,923,283 8.67
NETHERLANDS12,000,000 Bank Nederlandse Gemeenten 14.07.11/0.000% 11,999,350 1.1214,000,000 Bank Nederlandse Gemeenten 15.08.11/0.000% 13,988,353 1.305,000,000 Bank Nederlandse Gemeenten 30.08.11/0.000% 4,997,852 0.479,000,000 Bank Nederlandse Gemeenten 14.10.11/0.000% 8,985,480 0.84
10,000,000 Nederlandse Waterschapsbank 12.09.11/0.000% 9,979,487 0.938,000,000 Nederlandse Waterschapsbank 03.11.11/0.000% 7,987,885 0.747,000,000 Rabobank Nederland 09.08.11/0.000% 6,996,603 0.656,000,000 Rabobank Nederland 01.09.11/0.000% 5,987,758 0.56
70,922,768 6.61
GERMANY15,000,000 DZ Bank 07.07.11/0.000% 14,998,125 1.4016,000,000 Erste Abwicklungsanstalt 18.07.11/0.000% 15,997,778 1.49
5,500,000 FMS Wertmanagement 29.07.11/0.000% 5,489,355 0.5116,000,000 Germany (Federal Republic of) 12.08.11/0.000% 15,988,453 1.49
52,473,711 4.89
FINLAND7,000,000 Fingrid 18.08.11/0.000% 6,996,603 0.65
10,000,000 Pohjola Bank 26.07.11/0.000% 9,994,063 0.938,000,000 Pohjola Bank 07.09.11/0.000% 7,992,443 0.75
24,983,109 2.33
AUSTRIA9,000,000 Oesterreichische Kontrollbank 18.08.11/0.000% 8,992,229 0.84
10,000,000 Oesterreichische Kontrollbank 30.09.11/0.000% 9,994,054 0.93
18,986,283 1.77
FRANCE10,000,000 Agence Centrale Organismes
Securite Sociale 18.08.11/0.000% 9,981,078 0.935,500,000 Crédit Agricole 07.07.11/0.000% 5,499,267 0.51
15,480,345 1.44
DENMARK15,000,000 Danske Bank 07.07.11/0.000% 14,997,875 1.40
14,997,875 1.40
SPAIN15,000,000 BSCH 07.07.11/0.000% 14,997,875 1.40
14,997,875 1.40
UNITED KINGDOM15,000,000 RBS Holdings 07.07.11/0.000% 14,997,500 1.40
14,997,500 1.40
CANADA14,000,000 Quebec (Province of) 30.08.11/0.000% 13,991,133 1.30
13,991,133 1.30
NETHERLANDS ANTILLES12,000,000 Schlumberger 29.07.11/0.000% 11,998,067 1.12
11,998,067 1.12
BELGIUM10,000,000 Belgium (Kingdom of) 01.07.11/0.000% 9,998,625 0.93
9,998,625 0.93
NORWAY10,000,000 Eksportfinans 31.08.11/0.000% 9,995,552 0.93
9,995,552 0.93
NEW ZEALAND10,000,000 New Zealand Treasury
Department 16.08.11/0.000% 9,994,442 0.93
9,994,442 0.93
SINGAPORE10,000,000 Oversea-Chinese Banking 16.08.11/0.000% 9,989,278 0.93
9,989,278 0.93
ITALY8,000,000 ENI 25.07.11/0.000% 7,998,436 0.75
7,998,436 0.75
HONG KONG8,000,000 BCA Interest Hong Kong 06.07.11/0.000% 7,997,801 0.75
7,997,801 0.75
Total Commercial Papers 402,726,083 37.55
Certificates of Deposit
FRANCE6,000,000 BNP Paribas 11.07.11/0.000% 5,984,054 0.56
10,000,000 BPCE 27.07.11/0.000% 9,992,422 0.935,500,000 BPCE 28.07.11/0.550% 5,502,567 0.51
11,000,000 Caisse Des Dépots etConsignations 20.07.11/0.000% 10,981,941 1.03
13,000,000 Crédit Industriel et Commercial 26.08.11/0.300% 12,999,999 1.21
45,460,983 4.24
JAPAN13,000,000 Mitsubishi UFJ Financial Group 06.07.11/0.000% 12,997,942 1.2213,000,000 Norinchukin Bank 06.07.11/0.000% 12,997,617 1.2116,000,000 Sumitomo Mitsui Fincial Group 29.07.11/0.000% 15,996,907 1.49
41,992,466 3.92
Total Certificates of Deposit 87,453,449 8.16
319
JPMorgan Funds - Highbridge US STEEP FundSchedule of Investments (Market Value Expressed in USD)
As at 30 June 2011
Quantity/Nominal
Value
Name of Securities Maturity/Coupon
MarketValue
%of
NetAssets
Quantity/Nominal
Value
Name of Securities Maturity/Coupon
MarketValue
%of
NetAssets
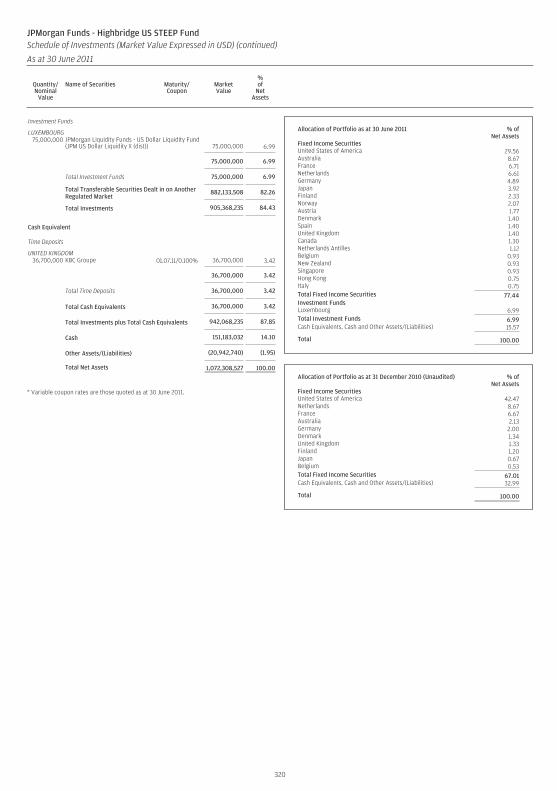
Investment Funds
LUXEMBOURG75,000,000 JPMorgan Liquidity Funds - US Dollar Liquidity Fund
(JPM US Dollar Liquidity X (dist)) 75,000,000 6.99
75,000,000 6.99
Total Investment Funds 75,000,000 6.99
Total Transferable Securities Dealt in on AnotherRegulated Market
882,133,508 82.26
Total Investments 905,368,235 84.43
Cash Equivalent
Time Deposits
UNITED KINGDOM36,700,000 KBC Groupe 01.07.11/0.100% 36,700,000 3.42
36,700,000 3.42
Total Time Deposits 36,700,000 3.42
Total Cash Equivalents 36,700,000 3.42
Total Investments plus Total Cash Equivalents 942,068,235 87.85
Cash 151,183,032 14.10
Other Assets/(Liabilities) (20,942,740) (1.95)
Total Net Assets 1,072,308,527 100.00
* Variable coupon rates are those quoted as at 30 June 2011.
Allocation of Portfolio as at 30 June 2011 % ofNet Assets
Fixed Income SecuritiesUnited States of America 29.56Australia 8.67France 6.71Netherlands 6.61Germany 4.89Japan 3.92Finland 2.33Norway 2.07Austria 1.77Denmark 1.40Spain 1.40United Kingdom 1.40Canada 1.30Netherlands Antilles 1.12Belgium 0.93New Zealand 0.93Singapore 0.93Hong Kong 0.75Italy 0.75Total Fixed Income Securities 77.44Investment FundsLuxembourg 6.99Total Investment Funds 6.99Cash Equivalents, Cash and Other Assets/(Liabilities) 15.57
Total 100.00
Allocation of Portfolio as at 31 December 2010 (Unaudited) % ofNet Assets
Fixed Income SecuritiesUnited States of America 42.47Netherlands 8.67France 6.67Australia 2.13Germany 2.00Denmark 1.34United Kingdom 1.33Finland 1.20Japan 0.67Belgium 0.53Total Fixed Income Securities 67.01Cash Equivalents, Cash and Other Assets/(Liabilities) 32.99
Total 100.00
320
JPMorgan Funds - Highbridge US STEEP FundSchedule of Investments (Market Value Expressed in USD) (continued)
As at 30 June 2011
Quantity/Nominal
Value
Name of Securities Maturity/Coupon
MarketValue
%of
NetAssets
Quantity/Nominal
Value
Name of Securities Maturity/Coupon
MarketValue
%of
NetAssets
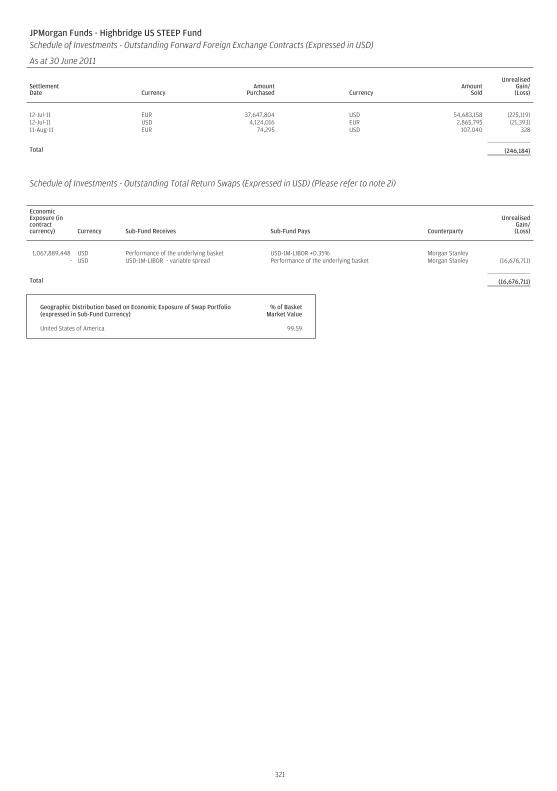
JPMorgan Funds - Highbridge US STEEP FundSchedule of Investments - Outstanding Forward Foreign Exchange Contracts (Expressed in USD)
As at 30 June 2011
SettlementDate Currency
AmountPurchased Currency
AmountSold
UnrealisedGain/(Loss)
12-Jul-11 EUR 37,647,804 USD 54,683,158 (225,119)12-Jul-11 USD 4,124,016 EUR 2,865,795 (21,393)11-Aug-11 EUR 74,295 USD 107,040 328
Total (246,184)
Schedule of Investments - Outstanding Total Return Swaps (Expressed in USD) (Please refer to note 2i)
EconomicExposure (incontractcurrency) Currency Sub-Fund Receives Sub-Fund Pays Counterparty
UnrealisedGain/(Loss)
1,067,889,448 USD Performance of the underlying basket USD-1M-LIBOR +0.35% Morgan Stanley- USD USD-1M-LIBOR - variable spread Performance of the underlying basket Morgan Stanley (16,676,711)
Total (16,676,711)
Geographic Distribution based on Economic Exposure of Swap Portfolio(expressed in Sub-Fund Currency)
% of BasketMarket Value
United States of America 99.59
321
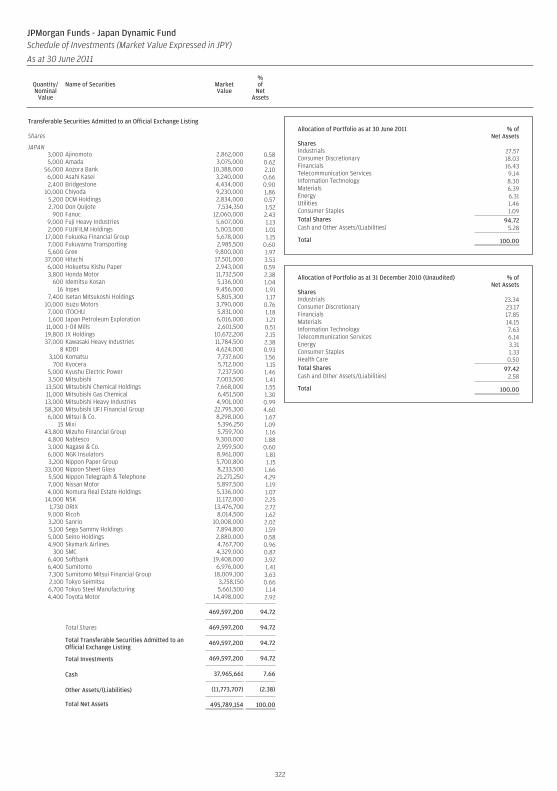
Transferable Securities Admitted to an Official Exchange Listing
Shares
JAPAN3,000 Ajinomoto 2,862,000 0.585,000 Amada 3,075,000 0.62
56,000 Aozora Bank 10,388,000 2.106,000 Asahi Kasei 3,240,000 0.662,400 Bridgestone 4,434,000 0.90
10,000 Chiyoda 9,230,000 1.865,200 DCM Holdings 2,834,000 0.572,700 Don Quijote 7,534,350 1.52
900 Fanuc 12,060,000 2.439,000 Fuji Heavy Industries 5,607,000 1.132,000 FUJIFILM Holdings 5,003,000 1.01
17,000 Fukuoka Financial Group 5,678,000 1.157,000 Fukuyama Transporting 2,985,500 0.605,600 Gree 9,800,000 1.97
37,000 Hitachi 17,501,000 3.536,000 Hokuetsu Kishu Paper 2,943,000 0.593,800 Honda Motor 11,732,500 2.38
600 Idemitsu Kosan 5,136,000 1.0416 Inpex 9,456,000 1.91
7,400 Isetan Mitsukoshi Holdings 5,805,300 1.1710,000 Isuzu Motors 3,790,000 0.767,000 ITOCHU 5,831,000 1.181,600 Japan Petroleum Exploration 6,016,000 1.21
11,000 J-Oil Mills 2,601,500 0.5119,800 JX Holdings 10,672,200 2.1537,000 Kawasaki Heavy Industries 11,784,500 2.38
8 KDDI 4,624,000 0.933,100 Komatsu 7,737,600 1.56
700 Kyocera 5,712,000 1.155,000 Kyushu Electric Power 7,237,500 1.463,500 Mitsubishi 7,003,500 1.41
13,500 Mitsubishi Chemical Holdings 7,668,000 1.5511,000 Mitsubishi Gas Chemical 6,451,500 1.3013,000 Mitsubishi Heavy Industries 4,901,000 0.9958,300 Mitsubishi UFJ Financial Group 22,795,300 4.606,000 Mitsui & Co. 8,298,000 1.67
15 Mixi 5,396,250 1.0943,800 Mizuho Financial Group 5,759,700 1.16
4,800 Nabtesco 9,300,000 1.883,000 Nagase & Co. 2,959,500 0.606,000 NGK Insulators 8,961,000 1.813,200 Nippon Paper Group 5,700,800 1.15
33,000 Nippon Sheet Glass 8,233,500 1.665,500 Nippon Telegraph & Telephone 21,271,250 4.297,000 Nissan Motor 5,897,500 1.194,000 Nomura Real Estate Holdings 5,336,000 1.07
14,000 NSK 11,172,000 2.251,730 ORIX 13,476,700 2.72
9,000 Ricoh 8,014,500 1.623,200 Sanrio 10,008,000 2.025,100 Sega Sammy Holdings 7,894,800 1.595,000 Seino Holdings 2,880,000 0.584,900 Skymark Airlines 4,767,700 0.96
300 SMC 4,329,000 0.876,400 Softbank 19,408,000 3.926,400 Sumitomo 6,976,000 1.417,300 Sumitomo Mitsui Financial Group 18,009,100 3.632,100 Tokyo Seimitsu 3,258,150 0.666,700 Tokyo Steel Manufacturing 5,661,500 1.144,400 Toyota Motor 14,498,000 2.92
469,597,200 94.72
Total Shares 469,597,200 94.72
Total Transferable Securities Admitted to anOfficial Exchange Listing
469,597,200 94.72
Total Investments 469,597,200 94.72
Cash 37,965,661 7.66
Other Assets/(Liabilities) (11,773,707) (2.38)
Total Net Assets 495,789,154 100.00
Allocation of Portfolio as at 30 June 2011 % ofNet Assets
SharesIndustrials 27.57Consumer Discretionary 18.03Financials 16.43Telecommunication Services 9.14Information Technology 8.30Materials 6.39Energy 6.31Utilities 1.46Consumer Staples 1.09Total Shares 94.72Cash and Other Assets/(Liabilities) 5.28
Total 100.00
Allocation of Portfolio as at 31 December 2010 (Unaudited) % ofNet Assets
SharesIndustrials 23.34Consumer Discretionary 23.17Financials 17.85Materials 14.15Information Technology 7.63Telecommunication Services 6.14Energy 3.31Consumer Staples 1.33Health Care 0.50Total Shares 97.42Cash and Other Assets/(Liabilities) 2.58
Total 100.00
322
JPMorgan Funds - Japan Dynamic FundSchedule of Investments (Market Value Expressed in JPY)
As at 30 June 2011
Quantity/Nominal
Value
Name of Securities MarketValue
%of
NetAssets
Quantity/Nominal
Value
Name of Securities MarketValue
%of
NetAssets
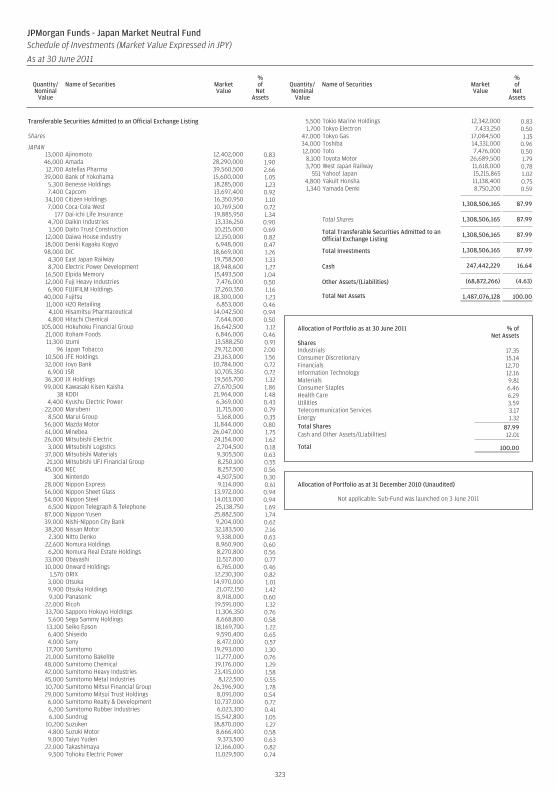
Transferable Securities Admitted to an Official Exchange Listing
Shares
JAPAN13,000 Ajinomoto 12,402,000 0.8346,000 Amada 28,290,000 1.9012,700 Astellas Pharma 39,560,500 2.66
39,000 Bank of Yokohama 15,600,000 1.055,300 Benesse Holdings 18,285,000 1.237,400 Capcom 13,697,400 0.92
34,100 Citizen Holdings 16,350,950 1.107,000 Coca-Cola West 10,769,500 0.72
177 Dai-ichi Life Insurance 19,885,950 1.344,700 Daikin Industries 13,336,250 0.901,500 Daito Trust Construction 10,215,000 0.69
12,000 Daiwa House Industry 12,150,000 0.8218,000 Denki Kagaku Kogyo 6,948,000 0.4798,000 DIC 18,669,000 1.26
4,300 East Japan Railway 19,758,500 1.338,700 Electric Power Development 18,948,600 1.27
16,500 Elpida Memory 15,493,500 1.0412,000 Fuji Heavy Industries 7,476,000 0.506,900 FUJIFILM Holdings 17,260,350 1.16
40,000 Fujitsu 18,300,000 1.2311,000 H2O Retailing 6,853,000 0.464,100 Hisamitsu Pharmaceutical 14,042,500 0.944,800 Hitachi Chemical 7,644,000 0.50
105,000 Hokuhoku Financial Group 16,642,500 1.1221,000 Itoham Foods 6,846,000 0.4611,300 Izumi 13,588,250 0.91
96 Japan Tobacco 29,712,000 2.0010,500 JFE Holdings 23,163,000 1.5632,000 Joyo Bank 10,784,000 0.726,900 JSR 10,705,350 0.72
36,300 JX Holdings 19,565,700 1.3299,000 Kawasaki Kisen Kaisha 27,670,500 1.86
38 KDDI 21,964,000 1.484,400 Kyushu Electric Power 6,369,000 0.43
22,000 Marubeni 11,715,000 0.798,500 Marui Group 5,168,000 0.35
56,000 Mazda Motor 11,844,000 0.8061,000 Minebea 26,047,000 1.7526,000 Mitsubishi Electric 24,154,000 1.62
3,000 Mitsubishi Logistics 2,704,500 0.1837,000 Mitsubishi Materials 9,305,500 0.6321,100 Mitsubishi UFJ Financial Group 8,250,100 0.55
45,000 NEC 8,257,500 0.56300 Nintendo 4,507,500 0.30
28,000 Nippon Express 9,114,000 0.6156,000 Nippon Sheet Glass 13,972,000 0.9454,000 Nippon Steel 14,013,000 0.94
6,500 Nippon Telegraph & Telephone 25,138,750 1.6987,000 Nippon Yusen 25,882,500 1.7439,000 Nishi-Nippon City Bank 9,204,000 0.6238,200 Nissan Motor 32,183,500 2.16
2,300 Nitto Denko 9,338,000 0.6322,600 Nomura Holdings 8,960,900 0.606,200 Nomura Real Estate Holdings 8,270,800 0.56
33,000 Obayashi 11,517,000 0.7710,000 Onward Holdings 6,765,000 0.46
1,570 ORIX 12,230,300 0.823,000 Otsuka 14,970,000 1.019,900 Otsuka Holdings 21,072,150 1.429,100 Panasonic 8,918,000 0.60
22,000 Ricoh 19,591,000 1.3233,700 Sapporo Hokuyo Holdings 11,306,350 0.765,600 Sega Sammy Holdings 8,668,800 0.5813,100 Seiko Epson 18,169,700 1.226,400 Shiseido 9,590,400 0.654,000 Sony 8,472,000 0.5717,700 Sumitomo 19,293,000 1.3021,000 Sumitomo Bakelite 11,277,000 0.7648,000 Sumitomo Chemical 19,176,000 1.2942,000 Sumitomo Heavy Industries 23,415,000 1.5845,000 Sumitomo Metal Industries 8,122,500 0.5510,700 Sumitomo Mitsui Financial Group 26,396,900 1.7829,000 Sumitomo Mitsui Trust Holdings 8,091,000 0.546,000 Sumitomo Realty & Development 10,737,000 0.726,200 Sumitomo Rubber Industries 6,023,300 0.416,100 Sundrug 15,542,800 1.05
10,200 Suzuken 18,870,000 1.274,800 Suzuki Motor 8,666,400 0.589,000 Taiyo Yuden 9,373,500 0.63
22,000 Takashimaya 12,166,000 0.829,500 Tohoku Electric Power 11,029,500 0.74
5,500 Tokio Marine Holdings 12,342,000 0.831,700 Tokyo Electron 7,433,250 0.50
47,000 Tokyo Gas 17,084,500 1.1534,000 Toshiba 14,331,000 0.9612,000 Toto 7,476,000 0.50
8,100 Toyota Motor 26,689,500 1.793,700 West Japan Railway 11,618,000 0.78
551 Yahoo! Japan 15,215,865 1.024,800 Yakult Honsha 11,138,400 0.751,340 Yamada Denki 8,750,200 0.59
1,308,506,165 87.99
Total Shares 1,308,506,165 87.99
Total Transferable Securities Admitted to anOfficial Exchange Listing
1,308,506,165 87.99
Total Investments 1,308,506,165 87.99
Cash 247,442,229 16.64
Other Assets/(Liabilities) (68,872,266) (4.63)
Total Net Assets 1,487,076,128 100.00
Allocation of Portfolio as at 30 June 2011 % ofNet Assets
SharesIndustrials 17.35Consumer Discretionary 15.14Financials 12.70Information Technology 12.16Materials 9.81Consumer Staples 6.46Health Care 6.29Utilities 3.59Telecommunication Services 3.17Energy 1.32Total Shares 87.99Cash and Other Assets/(Liabilities) 12.01
Total 100.00
Allocation of Portfolio as at 31 December 2010 (Unaudited)
Not applicable: Sub-Fund was launched on 3 June 2011
323
JPMorgan Funds - Japan Market Neutral FundSchedule of Investments (Market Value Expressed in JPY)
As at 30 June 2011
Quantity/Nominal
Value
Name of Securities MarketValue
%of
NetAssets
Quantity/Nominal
Value
Name of Securities MarketValue
%of
NetAssets
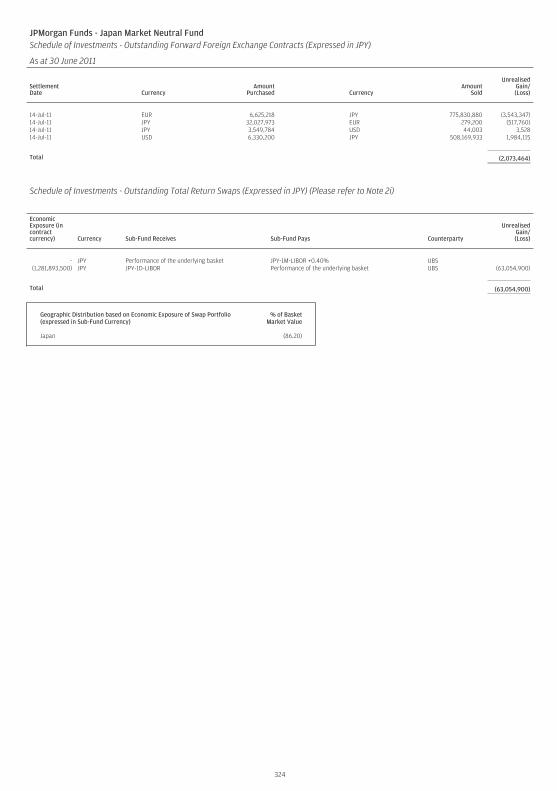
JPMorgan Funds - Japan Market Neutral FundSchedule of Investments - Outstanding Forward Foreign Exchange Contracts (Expressed in JPY)
As at 30 June 2011
SettlementDate Currency
AmountPurchased Currency
AmountSold
UnrealisedGain/(Loss)
14-Jul-11 EUR 6,625,218 JPY 775,830,880 (3,543,347)14-Jul-11 JPY 32,027,973 EUR 279,200 (517,760)14-Jul-11 JPY 3,549,784 USD 44,003 3,52814-Jul-11 USD 6,330,200 JPY 508,169,933 1,984,115
Total (2,073,464)
Schedule of Investments - Outstanding Total Return Swaps (Expressed in JPY) (Please refer to Note 2i)
EconomicExposure (incontractcurrency) Currency Sub-Fund Receives Sub-Fund Pays Counterparty
UnrealisedGain/(Loss)
- JPY Performance of the underlying basket JPY-1M-LIBOR +0.40% UBS(1,281,893,500) JPY JPY-1D-LIBOR Performance of the underlying basket UBS (63,054,900)
Total (63,054,900)
Geographic Distribution based on Economic Exposure of Swap Portfolio(expressed in Sub-Fund Currency)
% of BasketMarket Value
Japan (86.20)
324
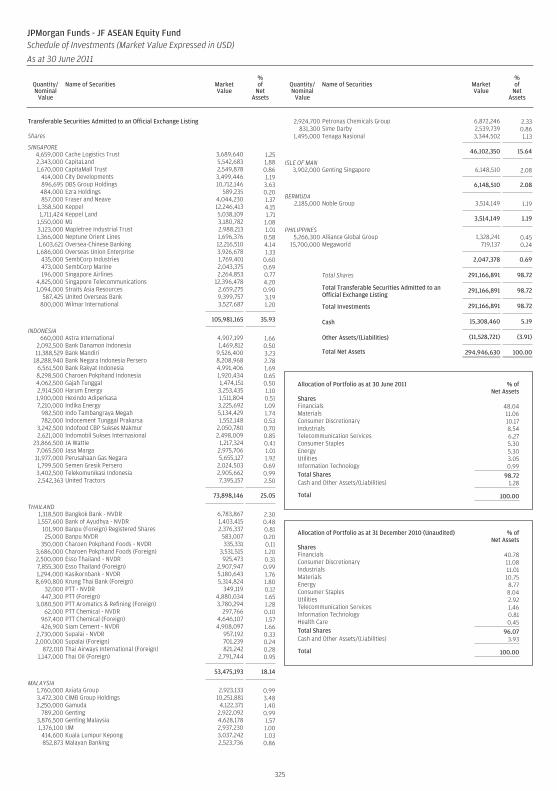
Transferable Securities Admitted to an Official Exchange Listing
Shares
SINGAPORE4,659,000 Cache Logistics Trust 3,689,640 1.252,343,000 CapitaLand 5,542,683 1.881,670,000 CapitaMall Trust 2,549,878 0.86
414,000 City Developments 3,499,446 1.19896,695 DBS Group Holdings 10,712,146 3.63484,000 Ezra Holdings 589,235 0.20857,000 Fraser and Neave 4,044,230 1.37
1,358,500 Keppel 12,246,413 4.151,711,424 Keppel Land 5,038,109 1.71
1,550,000 M1 3,180,782 1.083,123,000 Mapletree Industrial Trust 2,988,213 1.011,366,000 Neptune Orient Lines 1,696,376 0.581,603,621 Oversea-Chinese Banking 12,216,510 4.14
1,686,000 Overseas Union Enterprise 3,926,678 1.33435,000 SembCorp Industries 1,769,401 0.60473,000 SembCorp Marine 2,043,375 0.69196,000 Singapore Airlines 2,264,853 0.77
4,825,000 Singapore Telecommunications 12,396,478 4.201,094,000 Straits Asia Resources 2,659,275 0.90
587,425 United Overseas Bank 9,399,757 3.19800,000 Wilmar International 3,527,687 1.20
105,981,165 35.93
INDONESIA660,000 Astra International 4,907,199 1.66
2,092,500 Bank Danamon Indonesia 1,469,812 0.5011,388,529 Bank Mandiri 9,526,400 3.23
18,288,940 Bank Negara Indonesia Persero 8,208,968 2.786,561,500 Bank Rakyat Indonesia 4,991,406 1.698,298,500 Charoen Pokphand Indonesia 1,920,434 0.654,062,500 Gajah Tunggal 1,474,151 0.502,914,500 Harum Energy 3,253,435 1.101,900,000 Hexindo Adiperkasa 1,511,804 0.517,210,000 Indika Energy 3,225,692 1.09
982,500 Indo Tambangraya Megah 5,134,429 1.74782,000 Indocement Tunggal Prakarsa 1,552,148 0.53
3,242,500 Indofood CBP Sukses Makmur 2,050,780 0.702,621,000 Indomobil Sukses Internasional 2,498,009 0.85
23,866,500 JA Wattie 1,217,324 0.417,065,500 Jasa Marga 2,975,706 1.01
11,977,000 Perusahaan Gas Negara 5,655,127 1.921,799,500 Semen Gresik Persero 2,024,503 0.693,402,500 Telekomunikasi Indonesia 2,905,662 0.992,542,363 United Tractors 7,395,157 2.50
73,898,146 25.05
THAILAND1,318,500 Bangkok Bank - NVDR 6,783,867 2.301,557,600 Bank of Ayudhya - NVDR 1,403,415 0.48
101,900 Banpu (Foreign) Registered Shares 2,376,337 0.8125,000 Banpu NVDR 583,007 0.20
350,000 Charoen Pokphand Foods - NVDR 335,331 0.113,686,000 Charoen Pokphand Foods (Foreign) 3,531,515 1.202,500,000 Esso Thailand - NVDR 925,473 0.317,855,300 Esso Thailand (Foreign) 2,907,947 0.991,294,000 Kasikornbank - NVDR 5,180,643 1.768,690,800 Krung Thai Bank (Foreign) 5,314,824 1.80
32,000 PTT - NVDR 349,119 0.12447,300 PTT (Foreign) 4,880,034 1.65
3,080,500 PTT Aromatics & Refining (Foreign) 3,780,294 1.2862,000 PTT Chemical - NVDR 297,766 0.10
967,400 PTT Chemical (Foreign) 4,646,107 1.57426,900 Siam Cement - NVDR 4,908,097 1.66
2,730,000 Supalai - NVDR 957,192 0.332,000,000 Supalai (Foreign) 701,239 0.24
872,010 Thai Airways International (Foreign) 821,242 0.281,147,000 Thai Oil (Foreign) 2,791,744 0.95
53,475,193 18.14
MALAYSIA1,760,000 Axiata Group 2,923,133 0.993,472,300 CIMB Group Holdings 10,251,881 3.483,250,000 Gamuda 4,122,371 1.40
789,200 Genting 2,922,092 0.993,876,500 Genting Malaysia 4,628,178 1.571,376,100 IJM 2,937,230 1.00414,600 Kuala Lumpur Kepong 3,037,242 1.03852,873 Malayan Banking 2,523,736 0.86
2,924,700 Petronas Chemicals Group 6,872,246 2.33831,300 Sime Darby 2,539,739 0.86
1,495,000 Tenaga Nasional 3,344,502 1.13
46,102,350 15.64
ISLE OF MAN3,902,000 Genting Singapore 6,148,510 2.08
6,148,510 2.08
BERMUDA2,185,000 Noble Group 3,514,149 1.19
3,514,149 1.19
PHILIPPINES5,266,300 Alliance Global Group 1,328,241 0.45
15,700,000 Megaworld 719,137 0.24
2,047,378 0.69
Total Shares 291,166,891 98.72
Total Transferable Securities Admitted to anOfficial Exchange Listing
291,166,891 98.72
Total Investments 291,166,891 98.72
Cash 15,308,460 5.19
Other Assets/(Liabilities) (11,528,721) (3.91)
Total Net Assets 294,946,630 100.00
Allocation of Portfolio as at 30 June 2011 % ofNet Assets
SharesFinancials 48.04Materials 11.06Consumer Discretionary 10.17Industrials 8.54Telecommunication Services 6.27Consumer Staples 5.30Energy 5.30Utilities 3.05Information Technology 0.99Total Shares 98.72Cash and Other Assets/(Liabilities) 1.28
Total 100.00
Allocation of Portfolio as at 31 December 2010 (Unaudited) % ofNet Assets
SharesFinancials 40.78Consumer Discretionary 11.08Industrials 11.01Materials 10.75Energy 8.77Consumer Staples 8.04Utilities 2.92Telecommunication Services 1.46Information Technology 0.81Health Care 0.45Total Shares 96.07Cash and Other Assets/(Liabilities) 3.93
Total 100.00
325
JPMorgan Funds - JF ASEAN Equity FundSchedule of Investments (Market Value Expressed in USD)
As at 30 June 2011
Quantity/Nominal
Value
Name of Securities MarketValue
%of
NetAssets
Quantity/Nominal
Value
Name of Securities MarketValue
%of
NetAssets
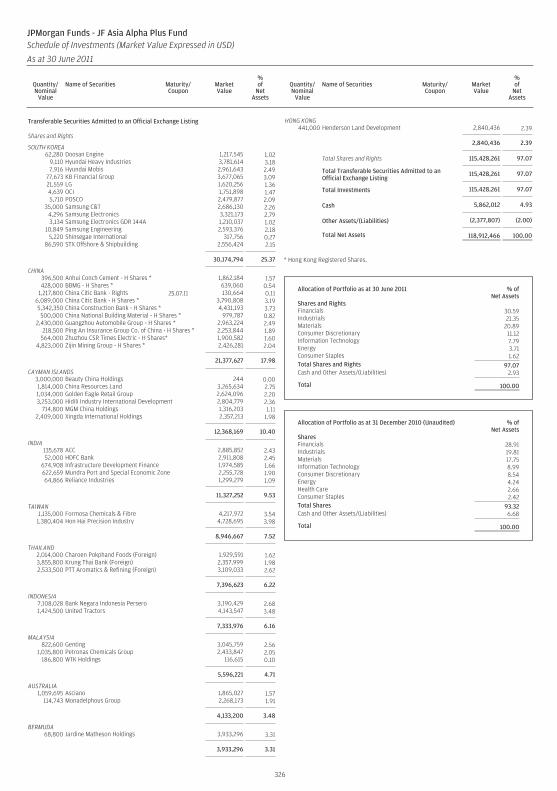
Transferable Securities Admitted to an Official Exchange Listing
Shares and Rights
SOUTH KOREA62,280 Doosan Engine 1,217,545 1.02
9,110 Hyundai Heavy Industries 3,781,614 3.187,916 Hyundai Mobis 2,961,643 2.49
77,673 KB Financial Group 3,677,065 3.0921,559 LG 1,620,256 1.364,639 OCI 1,751,898 1.475,710 POSCO 2,479,877 2.09
35,000 Samsung C&T 2,686,130 2.264,296 Samsung Electronics 3,321,173 2.793,134 Samsung Electronics GDR 144A 1,210,037 1.02
10,849 Samsung Engineering 2,593,376 2.185,220 Shinsegae International 317,756 0.27
86,590 STX Offshore & Shipbuilding 2,556,424 2.15
30,174,794 25.37
CHINA396,500 Anhui Conch Cement - H Shares * 1,862,184 1.57428,000 BBMG - H Shares * 639,060 0.54
1,217,800 China Citic Bank - Rights 25.07.11 130,664 0.116,089,000 China Citic Bank - H Shares * 3,790,808 3.195,342,350 China Construction Bank - H Shares * 4,431,193 3.73500,000 China National Building Material - H Shares * 979,787 0.82
2,430,000 Guangzhou Automobile Group - H Shares * 2,963,224 2.49218,500 Ping An Insurance Group Co. of China - H Shares * 2,253,844 1.89
564,000 Zhuzhou CSR Times Electric - H Shares* 1,900,582 1.604,823,000 Zijin Mining Group - H Shares * 2,426,281 2.04
21,377,627 17.98
CAYMAN ISLANDS3,000,000 Beauty China Holdings 244 0.001,814,000 China Resources Land 3,265,634 2.751,034,000 Golden Eagle Retail Group 2,624,096 2.203,253,000 Hidili Industry International Development 2,804,779 2.36
714,800 MGM China Holdings 1,316,203 1.112,409,000 Xingda International Holdings 2,357,213 1.98
12,368,169 10.40
INDIA135,678 ACC 2,885,852 2.4352,000 HDFC Bank 2,911,808 2.45
674,908 Infrastructure Development Finance 1,974,585 1.66622,659 Mundra Port and Special Economic Zone 2,255,728 1.9064,866 Reliance Industries 1,299,279 1.09
11,327,252 9.53
TAIWAN1,135,000 Formosa Chemicals & Fibre 4,217,972 3.541,380,404 Hon Hai Precision Industry 4,728,695 3.98
8,946,667 7.52
THAILAND2,014,000 Charoen Pokphand Foods (Foreign) 1,929,591 1.623,855,800 Krung Thai Bank (Foreign) 2,357,999 1.982,533,500 PTT Aromatics & Refining (Foreign) 3,109,033 2.62
7,396,623 6.22
INDONESIA7,108,028 Bank Negara Indonesia Persero 3,190,429 2.681,424,500 United Tractors 4,143,547 3.48
7,333,976 6.16
MALAYSIA822,600 Genting 3,045,759 2.56
1,035,800 Petronas Chemicals Group 2,433,847 2.05186,800 WTK Holdings 116,615 0.10
5,596,221 4.71
AUSTRALIA1,059,695 Asciano 1,865,027 1.57
114,743 Monadelphous Group 2,268,173 1.91
4,133,200 3.48
BERMUDA68,800 Jardine Matheson Holdings 3,933,296 3.31
3,933,296 3.31
HONG KONG441,000 Henderson Land Development 2,840,436 2.39
2,840,436 2.39
Total Shares and Rights 115,428,261 97.07
Total Transferable Securities Admitted to anOfficial Exchange Listing
115,428,261 97.07
Total Investments 115,428,261 97.07
Cash 5,862,012 4.93
Other Assets/(Liabilities) (2,377,807) (2.00)
Total Net Assets 118,912,466 100.00
* Hong Kong Registered Shares.
Allocation of Portfolio as at 30 June 2011 % ofNet Assets
Shares and RightsFinancials 30.59Industrials 21.35Materials 20.89Consumer Discretionary 11.12Information Technology 7.79Energy 3.71Consumer Staples 1.62Total Shares and Rights 97.07Cash and Other Assets/(Liabilities) 2.93
Total 100.00
Allocation of Portfolio as at 31 December 2010 (Unaudited) % ofNet Assets
SharesFinancials 28.91Industrials 19.81Materials 17.75Information Technology 8.99Consumer Discretionary 8.54Energy 4.24Health Care 2.66Consumer Staples 2.42Total Shares 93.32Cash and Other Assets/(Liabilities) 6.68
Total 100.00
326
JPMorgan Funds - JF Asia Alpha Plus FundSchedule of Investments (Market Value Expressed in USD)
As at 30 June 2011
Quantity/Nominal
Value
Name of Securities Maturity/Coupon
MarketValue
%of
NetAssets
Quantity/Nominal
Value
Name of Securities Maturity/Coupon
MarketValue
%of
NetAssets
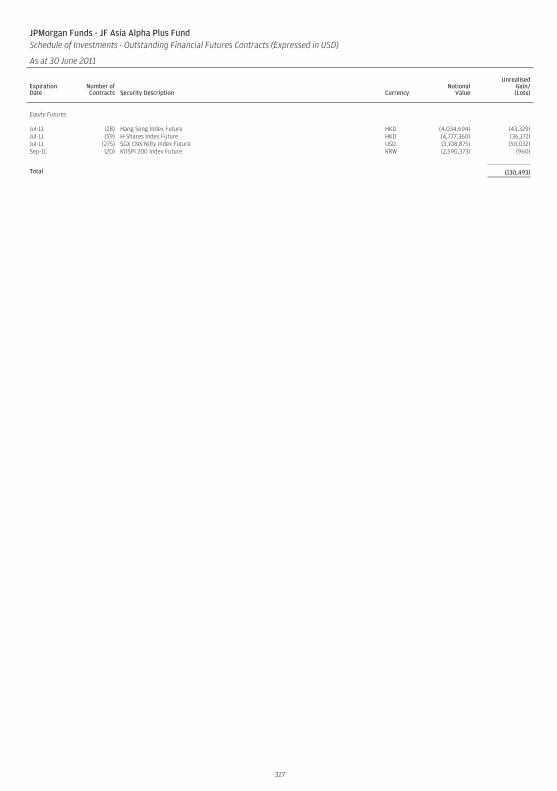
JPMorgan Funds - JF Asia Alpha Plus FundSchedule of Investments - Outstanding Financial Futures Contracts (Expressed in USD)
As at 30 June 2011
ExpirationDate
Number ofContracts Security Description Currency
NotionalValue
UnrealisedGain/(Loss)
Equity Futures
Jul-11 (28) Hang Seng Index Future HKD (4,034,694) (43,329)Jul-11 (59) H-Shares Index Future HKD (4,777,360) (36,172)Jul-11 (275) SGX CNX Nifty Index Future USD (3,108,875) (50,032)Sep-11 (20) KOSPI 200 Index Future KRW (2,590,373) (960)
Total (130,493)
327
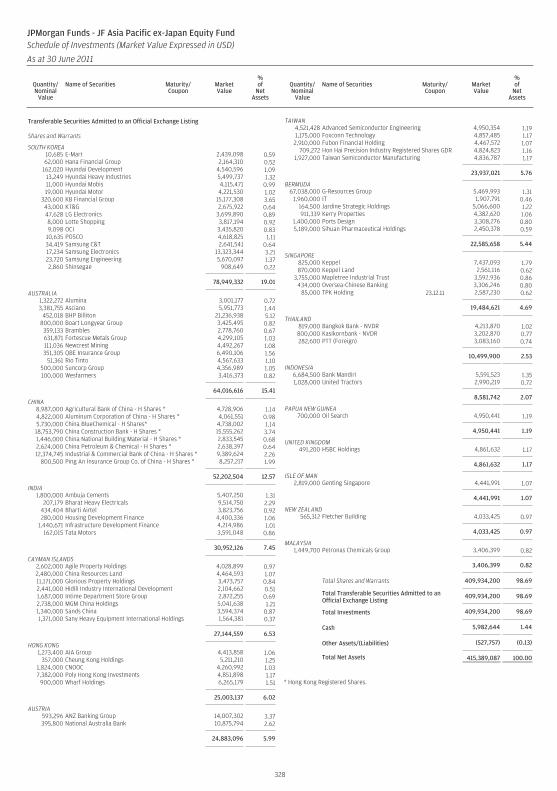
Transferable Securities Admitted to an Official Exchange Listing
Shares and Warrants
SOUTH KOREA10,685 E-Mart 2,439,098 0.5962,000 Hana Financial Group 2,164,310 0.52
162,020 Hyundai Development 4,540,596 1.0913,249 Hyundai Heavy Industries 5,499,737 1.3211,000 Hyundai Mobis 4,115,471 0.9919,000 Hyundai Motor 4,221,530 1.02
320,600 KB Financial Group 15,177,308 3.6543,000 KT&G 2,675,922 0.6447,628 LG Electronics 3,699,890 0.898,000 Lotte Shopping 3,817,194 0.929,098 OCI 3,435,820 0.83
10,635 POSCO 4,618,825 1.1134,419 Samsung C&T 2,641,541 0.6417,234 Samsung Electronics 13,323,344 3.2123,720 Samsung Engineering 5,670,097 1.372,860 Shinsegae 908,649 0.22
78,949,332 19.01
AUSTRALIA1,322,272 Alumina 3,001,177 0.723,381,755 Asciano 5,951,773 1.44
452,018 BHP Billiton 21,236,938 5.12800,000 Boart Longyear Group 3,425,495 0.82359,133 Brambles 2,778,760 0.67631,871 Fortescue Metals Group 4,299,105 1.03111,036 Newcrest Mining 4,492,267 1.08351,305 QBE Insurance Group 6,490,106 1.56
51,361 Rio Tinto 4,567,633 1.10500,000 Suncorp Group 4,356,989 1.05100,000 Wesfarmers 3,416,373 0.82
64,016,616 15.41
CHINA8,987,000 Agricultural Bank of China - H Shares * 4,728,906 1.144,822,000 Aluminum Corporation of China - H Shares * 4,061,551 0.985,730,000 China BlueChemical - H Shares* 4,738,002 1.1418,753,790 China Construction Bank - H Shares * 15,555,262 3.741,446,000 China National Building Material - H Shares * 2,833,545 0.682,624,000 China Petroleum & Chemical - H Shares * 2,638,397 0.6412,374,745 Industrial & Commercial Bank of China - H Shares * 9,389,624 2.26
800,500 Ping An Insurance Group Co. of China - H Shares * 8,257,217 1.99
52,202,504 12.57
INDIA1,800,000 Ambuja Cements 5,407,250 1.31
207,179 Bharat Heavy Electricals 9,514,750 2.29434,404 Bharti Airtel 3,823,756 0.92280,000 Housing Development Finance 4,400,336 1.06
1,440,671 Infrastructure Development Finance 4,214,986 1.01162,015 Tata Motors 3,591,048 0.86
30,952,126 7.45
CAYMAN ISLANDS2,602,000 Agile Property Holdings 4,028,899 0.972,480,000 China Resources Land 4,464,593 1.0711,171,000 Glorious Property Holdings 3,473,757 0.842,441,000 Hidili Industry International Development 2,104,662 0.511,687,000 Intime Department Store Group 2,872,255 0.692,738,000 MGM China Holdings 5,041,638 1.211,340,000 Sands China 3,594,374 0.871,371,000 Sany Heavy Equipment International Holdings 1,564,381 0.37
27,144,559 6.53
HONG KONG1,273,400 AIA Group 4,413,858 1.06
357,000 Cheung Kong Holdings 5,211,210 1.251,824,000 CNOOC 4,260,992 1.037,382,000 Poly Hong Kong Investments 4,851,898 1.17
900,000 Wharf Holdings 6,265,179 1.51
25,003,137 6.02
AUSTRIA593,296 ANZ Banking Group 14,007,302 3.37395,800 National Australia Bank 10,875,794 2.62
24,883,096 5.99
TAIWAN4,521,428 Advanced Semiconductor Engineering 4,950,354 1.191,175,000 Foxconn Technology 4,857,485 1.17
2,910,000 Fubon Financial Holding 4,467,572 1.07709,272 Hon Hai Precision Industry Registered Shares GDR 4,824,823 1.16
1,927,000 Taiwan Semiconductor Manufacturing 4,836,787 1.17
23,937,021 5.76
BERMUDA67,038,000 G-Resources Group 5,469,993 1.31
1,960,000 IT 1,907,791 0.46164,500 Jardine Strategic Holdings 5,066,600 1.22911,339 Kerry Properties 4,382,620 1.06
1,400,000 Ports Design 3,308,276 0.805,189,000 Sihuan Pharmaceutical Holdings 2,450,378 0.59
22,585,658 5.44
SINGAPORE825,000 Keppel 7,437,093 1.79870,000 Keppel Land 2,561,116 0.62
3,755,000 Mapletree Industrial Trust 3,592,936 0.86434,000 Oversea-Chinese Banking 3,306,246 0.80
85,000 TPK Holding 23.12.11 2,587,230 0.62
19,484,621 4.69
THAILAND819,000 Bangkok Bank - NVDR 4,213,870 1.02800,000 Kasikornbank - NVDR 3,202,870 0.77282,600 PTT (Foreign) 3,083,160 0.74
10,499,900 2.53
INDONESIA6,684,500 Bank Mandiri 5,591,523 1.351,028,000 United Tractors 2,990,219 0.72
8,581,742 2.07
PAPUA NEW GUINEA700,000 Oil Search 4,950,441 1.19
4,950,441 1.19
UNITED KINGDOM491,200 HSBC Holdings 4,861,632 1.17
4,861,632 1.17
ISLE OF MAN2,819,000 Genting Singapore 4,441,991 1.07
4,441,991 1.07
NEW ZEALAND565,312 Fletcher Building 4,033,425 0.97
4,033,425 0.97
MALAYSIA1,449,700 Petronas Chemicals Group 3,406,399 0.82
3,406,399 0.82
Total Shares and Warrants 409,934,200 98.69
Total Transferable Securities Admitted to anOfficial Exchange Listing
409,934,200 98.69
Total Investments 409,934,200 98.69
Cash 5,982,644 1.44
Other Assets/(Liabilities) (527,757) (0.13)
Total Net Assets 415,389,087 100.00
* Hong Kong Registered Shares.
328
JPMorgan Funds - JF Asia Pacific ex-Japan Equity FundSchedule of Investments (Market Value Expressed in USD)
As at 30 June 2011
Quantity/Nominal
Value
Name of Securities Maturity/Coupon
MarketValue
%of
NetAssets
Quantity/Nominal
Value
Name of Securities Maturity/Coupon
MarketValue
%of
NetAssets
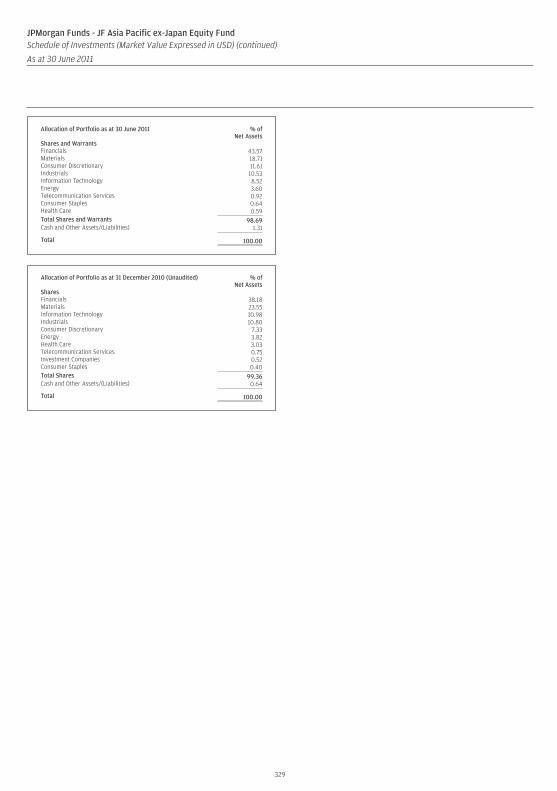
Allocation of Portfolio as at 30 June 2011 % ofNet Assets
Shares and WarrantsFinancials 43.57Materials 18.71Consumer Discretionary 11.61Industrials 10.53Information Technology 8.52Energy 3.60Telecommunication Services 0.92Consumer Staples 0.64Health Care 0.59Total Shares and Warrants 98.69Cash and Other Assets/(Liabilities) 1.31
Total 100.00
Allocation of Portfolio as at 31 December 2010 (Unaudited) % ofNet Assets
SharesFinancials 38.18Materials 23.55Information Technology 10.98Industrials 10.80Consumer Discretionary 7.33Energy 3.82Health Care 3.03Telecommunication Services 0.75Investment Companies 0.52Consumer Staples 0.40Total Shares 99.36Cash and Other Assets/(Liabilities) 0.64
Total 100.00
329
JPMorgan Funds - JF Asia Pacific ex-Japan Equity FundSchedule of Investments (Market Value Expressed in USD) (continued)
As at 30 June 2011
Quantity/Nominal
Value
Name of Securities Maturity/Coupon
MarketValue
%of
NetAssets
Quantity/Nominal
Value
Name of Securities Maturity/Coupon
MarketValue
%of
NetAssets
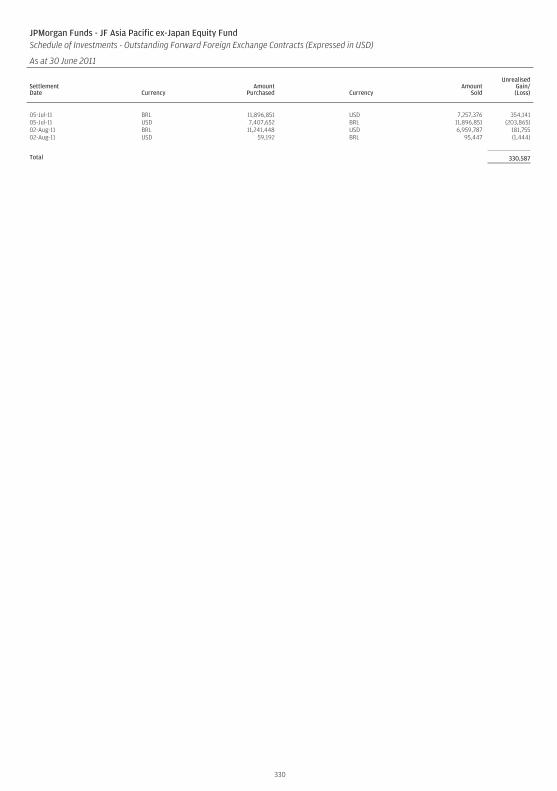
JPMorgan Funds - JF Asia Pacific ex-Japan Equity FundSchedule of Investments - Outstanding Forward Foreign Exchange Contracts (Expressed in USD)
As at 30 June 2011
SettlementDate Currency
AmountPurchased Currency
AmountSold
UnrealisedGain/(Loss)
05-Jul-11 BRL 11,896,851 USD 7,257,376 354,14105-Jul-11 USD 7,407,652 BRL 11,896,851 (203,865)02-Aug-11 BRL 11,241,448 USD 6,959,787 181,75502-Aug-11 USD 59,192 BRL 95,447 (1,444)
Total 330,587
330
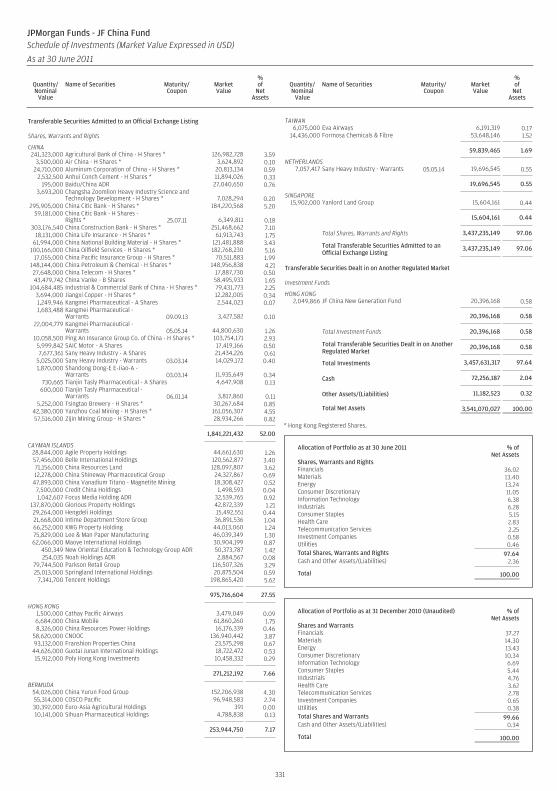
Transferable Securities Admitted to an Official Exchange Listing
Shares, Warrants and Rights
CHINA241,323,000 Agricultural Bank of China - H Shares * 126,982,728 3.59
3,500,000 Air China - H Shares * 3,624,892 0.1024,710,000 Aluminum Corporation of China - H Shares * 20,813,134 0.59
2,532,500 Anhui Conch Cement - H Shares * 11,894,026 0.33195,000 Baidu/China ADR 27,040,650 0.76
3,693,200 Changsha Zoomlion Heavy Industry Science andTechnology Development - H Shares * 7,028,294 0.20
295,905,000 China Citic Bank - H Shares * 184,220,568 5.2059,181,000 China Citic Bank - H Shares -
Rights * 25.07.11 6,349,811 0.18303,176,540 China Construction Bank - H Shares * 251,468,662 7.10
18,131,000 China Life Insurance - H Shares * 61,913,743 1.7561,994,000 China National Building Material - H Shares * 121,481,888 3.43
100,166,000 China Oilfield Services - H Shares * 182,768,230 5.1617,055,000 China Pacific Insurance Group - H Shares * 70,511,883 1.99
148,144,000 China Petroleum & Chemical - H Shares * 148,956,838 4.2127,648,000 China Telecom - H Shares * 17,887,730 0.5043,479,742 China Vanke - B Shares 58,495,933 1.65
104,684,485 Industrial & Commercial Bank of China - H Shares * 79,431,773 2.253,694,000 Jiangxi Copper - H Shares * 12,282,005 0.341,249,946 Kangmei Pharmaceutical - A Shares 2,544,023 0.071,683,488 Kangmei Pharmaceutical -
Warrants 09.09.13 3,427,582 0.1022,004,779 Kangmei Pharmaceutical -
Warrants 05.05.14 44,800,630 1.2610,058,500 Ping An Insurance Group Co. of China - H Shares * 103,754,171 2.935,999,842 SAIC Motor - A Shares 17,419,166 0.507,677,361 Sany Heavy Industry - A Shares 21,434,226 0.61
5,025,000 Sany Heavy Industry - Warrants 03.03.14 14,029,172 0.401,870,000 Shandong Dong-E E-Jiao-A -
Warrants 03.03.14 11,935,649 0.34730,665 Tianjin Tasly Pharmaceutical - A Shares 4,647,908 0.13
600,000 Tianjin Tasly Pharmaceutical -Warrants 06.01.14 3,817,860 0.11
5,252,000 Tsingtao Brewery - H Shares * 30,267,684 0.8542,380,000 Yanzhou Coal Mining - H Shares * 161,056,307 4.5557,516,000 Zijin Mining Group - H Shares * 28,934,266 0.82
1,841,221,432 52.00
CAYMAN ISLANDS28,844,000 Agile Property Holdings 44,661,630 1.2657,456,000 Belle International Holdings 120,562,877 3.4071,156,000 China Resources Land 128,097,807 3.6212,278,000 China Shineway Pharmaceutical Group 24,327,867 0.69
47,893,000 China Vanadium Titano - Magnetite Mining 18,308,427 0.527,500,000 Credit China Holdings 1,498,593 0.041,042,607 Focus Media Holding ADR 32,539,765 0.92
137,870,000 Glorious Property Holdings 42,872,339 1.2129,264,000 Hengdeli Holdings 15,492,551 0.4421,668,000 Intime Department Store Group 36,891,536 1.0466,252,000 KWG Property Holding 44,013,060 1.2475,829,000 Lee & Man Paper Manufacturing 46,039,349 1.3062,066,000 Maoye International Holdings 30,904,199 0.87
450,349 New Oriental Education & Technology Group ADR 50,373,787 1.42254,035 Noah Holdings ADR 2,884,567 0.08
79,744,500 Parkson Retail Group 116,507,326 3.2925,013,000 Springland International Holdings 20,875,504 0.59
7,341,700 Tencent Holdings 198,865,420 5.62
975,716,604 27.55
HONG KONG1,500,000 Cathay Pacific Airways 3,479,049 0.096,684,000 China Mobile 61,860,260 1.758,326,000 China Resources Power Holdings 16,176,339 0.46
58,620,000 CNOOC 136,940,442 3.8793,132,000 Franshion Properties China 23,575,298 0.67
44,626,000 Guotai Junan International Holdings 18,722,472 0.5315,912,000 Poly Hong Kong Investments 10,458,332 0.29
271,212,192 7.66
BERMUDA54,026,000 China Yurun Food Group 152,206,938 4.3055,314,000 COSCO Pacific 96,948,583 2.7430,392,000 Euro-Asia Agricultural Holdings 391 0.0010,141,000 Sihuan Pharmaceutical Holdings 4,788,838 0.13
253,944,750 7.17
TAIWAN6,075,000 Eva Airways 6,191,319 0.17
14,436,000 Formosa Chemicals & Fibre 53,648,146 1.52
59,839,465 1.69
NETHERLANDS7,057,417 Sany Heavy Industry - Warrants 05.05.14 19,696,545 0.55
19,696,545 0.55
SINGAPORE15,902,000 Yanlord Land Group 15,604,161 0.44
15,604,161 0.44
Total Shares, Warrants and Rights 3,437,235,149 97.06
Total Transferable Securities Admitted to anOfficial Exchange Listing
3,437,235,149 97.06
Transferable Securities Dealt in on Another Regulated Market
Investment Funds
HONG KONG2,049,866 JF China New Generation Fund 20,396,168 0.58
20,396,168 0.58
Total Investment Funds 20,396,168 0.58
Total Transferable Securities Dealt in on AnotherRegulated Market
20,396,168 0.58
Total Investments 3,457,631,317 97.64
Cash 72,256,187 2.04
Other Assets/(Liabilities) 11,182,523 0.32
Total Net Assets 3,541,070,027 100.00
* Hong Kong Registered Shares.
Allocation of Portfolio as at 30 June 2011 % ofNet Assets
Shares, Warrants and RightsFinancials 36.02Materials 13.40Energy 13.24Consumer Discretionary 11.05Information Technology 6.38Industrials 6.28Consumer Staples 5.15Health Care 2.83Telecommunication Services 2.25Investment Companies 0.58Utilities 0.46Total Shares, Warrants and Rights 97.64Cash and Other Assets/(Liabilities) 2.36
Total 100.00
Allocation of Portfolio as at 31 December 2010 (Unaudited) % ofNet Assets
Shares and WarrantsFinancials 37.27Materials 14.30Energy 13.43Consumer Discretionary 10.34Information Technology 6.69Consumer Staples 5.44Industrials 4.76Health Care 3.62Telecommunication Services 2.78Investment Companies 0.65Utilities 0.38Total Shares and Warrants 99.66Cash and Other Assets/(Liabilities) 0.34
Total 100.00
331
JPMorgan Funds - JF China FundSchedule of Investments (Market Value Expressed in USD)
As at 30 June 2011
Quantity/Nominal
Value
Name of Securities Maturity/Coupon
MarketValue
%of
NetAssets
Quantity/Nominal
Value
Name of Securities Maturity/Coupon
MarketValue
%of
NetAssets
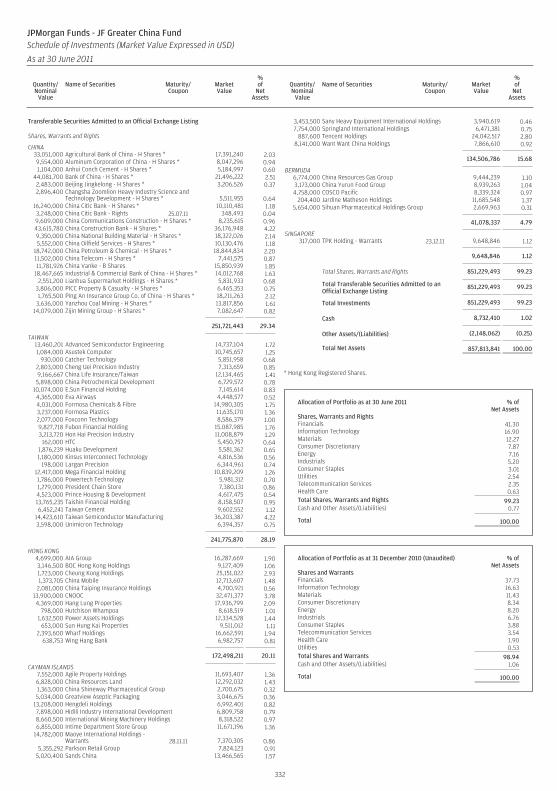
Transferable Securities Admitted to an Official Exchange Listing
Shares, Warrants and Rights
CHINA33,051,000 Agricultural Bank of China - H Shares * 17,391,240 2.039,554,000 Aluminum Corporation of China - H Shares * 8,047,296 0.941,104,000 Anhui Conch Cement - H Shares * 5,184,997 0.60
44,081,700 Bank of China - H Shares * 21,496,222 2.512,483,000 Beijing Jingkelong - H Shares * 3,206,526 0.372,896,400 Changsha Zoomlion Heavy Industry Science and
Technology Development - H Shares * 5,511,955 0.6416,240,000 China Citic Bank - H Shares * 10,110,481 1.183,248,000 China Citic Bank - Rights 25.07.11 348,493 0.049,609,000 China Communications Construction - H Shares * 8,235,615 0.9643,615,780 China Construction Bank - H Shares * 36,176,948 4.229,350,000 China National Building Material - H Shares * 18,322,026 2.145,552,000 China Oilfield Services - H Shares * 10,130,476 1.18
18,742,000 China Petroleum & Chemical - H Shares * 18,844,834 2.2011,502,000 China Telecom - H Shares * 7,441,575 0.8711,781,926 China Vanke - B Shares 15,850,939 1.85
18,467,665 Industrial & Commercial Bank of China - H Shares * 14,012,768 1.632,551,200 Lianhua Supermarket Holdings - H Shares * 5,831,933 0.68
3,806,000 PICC Property & Casualty - H Shares * 6,465,353 0.751,765,500 Ping An Insurance Group Co. of China - H Shares * 18,211,263 2.12
3,636,000 Yanzhou Coal Mining - H Shares * 13,817,856 1.6114,079,000 Zijin Mining Group - H Shares * 7,082,647 0.82
251,721,443 29.34
TAIWAN13,460,201 Advanced Semiconductor Engineering 14,737,104 1.721,084,000 Asustek Computer 10,745,657 1.25
930,000 Catcher Technology 5,851,958 0.682,803,000 Cheng Uei Precision Industry 7,313,659 0.859,166,667 China Life Insurance/Taiwan 12,134,465 1.415,898,000 China Petrochemical Development 6,729,572 0.78
10,074,000 E.Sun Financial Holding 7,145,614 0.834,365,000 Eva Airways 4,448,577 0.524,031,000 Formosa Chemicals & Fibre 14,980,305 1.753,237,000 Formosa Plastics 11,635,170 1.362,077,000 Foxconn Technology 8,586,379 1.009,827,718 Fubon Financial Holding 15,087,985 1.763,213,720 Hon Hai Precision Industry 11,008,879 1.29
162,000 HTC 5,450,757 0.641,876,239 Huaku Development 5,581,362 0.651,180,000 Kinsus Interconnect Technology 4,816,536 0.56
198,000 Largan Precision 6,344,961 0.7412,417,000 Mega Financial Holding 10,839,209 1.261,786,000 Powertech Technology 5,981,312 0.701,279,000 President Chain Store 7,380,131 0.864,523,000 Prince Housing & Development 4,617,475 0.5413,765,235 Taishin Financial Holding 8,158,507 0.956,452,241 Taiwan Cement 9,602,552 1.12
14,423,610 Taiwan Semiconductor Manufacturing 36,203,387 4.223,598,000 Unimicron Technology 6,394,357 0.75
241,775,870 28.19
HONG KONG4,699,000 AIA Group 16,287,669 1.903,146,500 BOC Hong Kong Holdings 9,127,409 1.061,723,000 Cheung Kong Holdings 25,151,022 2.931,373,705 China Mobile 12,713,607 1.48
2,081,000 China Taiping Insurance Holdings 4,700,921 0.5613,900,000 CNOOC 32,471,377 3.784,369,000 Hang Lung Properties 17,936,799 2.09
798,000 Hutchison Whampoa 8,618,519 1.011,632,500 Power Assets Holdings 12,334,528 1.44
653,000 Sun Hung Kai Properties 9,511,012 1.112,393,600 Wharf Holdings 16,662,591 1.94
638,753 Wing Hang Bank 6,982,757 0.81
172,498,211 20.11
CAYMAN ISLANDS7,552,000 Agile Property Holdings 11,693,407 1.366,828,000 China Resources Land 12,292,032 1.431,363,000 China Shineway Pharmaceutical Group 2,700,675 0.325,034,000 Greatview Aseptic Packaging 3,046,675 0.36
13,208,000 Hengdeli Holdings 6,992,401 0.827,898,000 Hidili Industry International Development 6,809,758 0.798,660,500 International Mining Machinery Holdings 8,318,522 0.976,855,000 Intime Department Store Group 11,671,196 1.36
14,782,000 Maoye International Holdings -Warrants 28.11.11 7,370,305 0.86
5,355,292 Parkson Retail Group 7,824,123 0.915,020,400 Sands China 13,466,565 1.57
3,453,500 Sany Heavy Equipment International Holdings 3,940,619 0.467,754,000 Springland International Holdings 6,471,381 0.75
887,600 Tencent Holdings 24,042,517 2.808,141,000 Want Want China Holdings 7,866,610 0.92
134,506,786 15.68
BERMUDA6,774,000 China Resources Gas Group 9,444,239 1.103,173,000 China Yurun Food Group 8,939,263 1.044,758,000 COSCO Pacific 8,339,324 0.97
204,400 Jardine Matheson Holdings 11,685,548 1.375,654,000 Sihuan Pharmaceutical Holdings Group 2,669,963 0.31
41,078,337 4.79
SINGAPORE317,000 TPK Holding - Warrants 23.12.11 9,648,846 1.12
9,648,846 1.12
Total Shares, Warrants and Rights 851,229,493 99.23
Total Transferable Securities Admitted to anOfficial Exchange Listing
851,229,493 99.23
Total Investments 851,229,493 99.23
Cash 8,732,410 1.02
Other Assets/(Liabilities) (2,148,062) (0.25)
Total Net Assets 857,813,841 100.00
* Hong Kong Registered Shares.
Allocation of Portfolio as at 30 June 2011 % ofNet Assets
Shares, Warrants and RightsFinancials 41.30Information Technology 16.90Materials 12.27Consumer Discretionary 7.87Energy 7.16Industrials 5.20Consumer Staples 3.01Utilities 2.54Telecommunication Services 2.35Health Care 0.63Total Shares, Warrants and Rights 99.23Cash and Other Assets/(Liabilities) 0.77
Total 100.00
Allocation of Portfolio as at 31 December 2010 (Unaudited) % ofNet Assets
Shares and WarrantsFinancials 37.73Information Technology 16.63Materials 11.43Consumer Discretionary 8.34Energy 8.20Industrials 6.76Consumer Staples 3.88Telecommunication Services 3.54Health Care 1.90Utilities 0.53Total Shares and Warrants 98.94Cash and Other Assets/(Liabilities) 1.06
Total 100.00
332
JPMorgan Funds - JF Greater China FundSchedule of Investments (Market Value Expressed in USD)
As at 30 June 2011
Quantity/Nominal
Value
Name of Securities Maturity/Coupon
MarketValue
%of
NetAssets
Quantity/Nominal
Value
Name of Securities Maturity/Coupon
MarketValue
%of
NetAssets
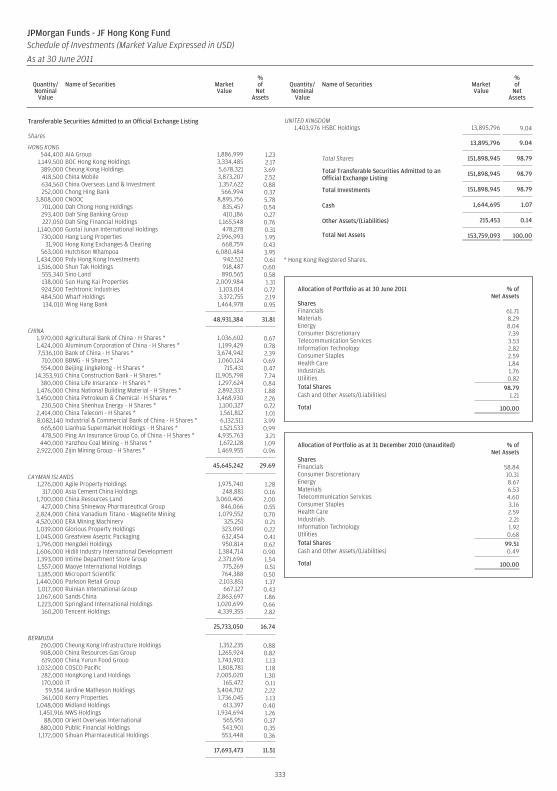
Transferable Securities Admitted to an Official Exchange Listing
Shares
HONG KONG544,400 AIA Group 1,886,999 1.23
1,149,500 BOC Hong Kong Holdings 3,334,485 2.17389,000 Cheung Kong Holdings 5,678,321 3.69418,500 China Mobile 3,873,207 2.52634,560 China Overseas Land & Investment 1,357,622 0.88252,000 Chong Hing Bank 566,994 0.37
3,808,000 CNOOC 8,895,756 5.78701,000 Dah Chong Hong Holdings 835,457 0.54293,400 Dah Sing Banking Group 410,186 0.27227,050 Dah Sing Financial Holdings 1,165,548 0.76
1,140,000 Guotai Junan International Holdings 478,278 0.31730,000 Hang Lung Properties 2,996,993 1.95
31,900 Hong Kong Exchanges & Clearing 668,759 0.43563,000 Hutchison Whampoa 6,080,484 3.95
1,434,000 Poly Hong Kong Investments 942,512 0.611,516,000 Shun Tak Holdings 918,487 0.60
555,340 Sino Land 890,565 0.58138,000 Sun Hung Kai Properties 2,009,984 1.31924,500 Techtronic Industries 1,103,014 0.72484,500 Wharf Holdings 3,372,755 2.19134,010 Wing Hang Bank 1,464,978 0.95
48,931,384 31.81
CHINA1,970,000 Agricultural Bank of China - H Shares * 1,036,602 0.671,424,000 Aluminum Corporation of China - H Shares * 1,199,429 0.787,536,100 Bank of China - H Shares * 3,674,942 2.39
710,000 BBMG - H Shares * 1,060,124 0.69554,000 Beijing Jingkelong - H Shares * 715,431 0.47
14,353,910 China Construction Bank - H Shares * 11,905,798 7.74380,000 China Life Insurance - H Shares * 1,297,624 0.84
1,476,000 China National Building Material - H Shares * 2,892,333 1.883,450,000 China Petroleum & Chemical - H Shares * 3,468,930 2.26
230,500 China Shenhua Energy - H Shares * 1,100,327 0.722,414,000 China Telecom - H Shares * 1,561,812 1.018,082,140 Industrial & Commercial Bank of China - H Shares * 6,132,511 3.99
665,600 Lianhua Supermarket Holdings - H Shares * 1,521,533 0.99478,500 Ping An Insurance Group Co. of China - H Shares * 4,935,763 3.21440,000 Yanzhou Coal Mining - H Shares * 1,672,128 1.09
2,922,000 Zijin Mining Group - H Shares * 1,469,955 0.96
45,645,242 29.69
CAYMAN ISLANDS1,276,000 Agile Property Holdings 1,975,740 1.28
317,000 Asia Cement China Holdings 248,881 0.161,700,000 China Resources Land 3,060,406 2.00
427,000 China Shineway Pharmaceutical Group 846,066 0.552,824,000 China Vanadium Titano - Magnetite Mining 1,079,552 0.704,520,000 ERA Mining Machinery 325,251 0.211,039,000 Glorious Property Holdings 323,090 0.221,045,000 Greatview Aseptic Packaging 632,454 0.411,796,000 Hengdeli Holdings 950,814 0.621,606,000 Hidili Industry International Development 1,384,714 0.901,393,000 Intime Department Store Group 2,371,696 1.541,557,000 Maoye International Holdings 775,269 0.511,185,000 Microport Scientific 764,388 0.50
1,440,000 Parkson Retail Group 2,103,851 1.371,017,000 Ruinian International Group 667,127 0.431,067,600 Sands China 2,863,697 1.861,223,000 Springland International Holdings 1,020,699 0.66
160,200 Tencent Holdings 4,339,355 2.82
25,733,050 16.74
BERMUDA260,000 Cheung Kong Infrastructure Holdings 1,352,235 0.88908,000 China Resources Gas Group 1,265,924 0.82619,000 China Yurun Food Group 1,743,903 1.13
1,032,000 COSCO Pacific 1,808,781 1.18282,000 HongKong Land Holdings 2,005,020 1.30170,000 IT 165,472 0.11
59,554 Jardine Matheson Holdings 3,404,702 2.22361,000 Kerry Properties 1,736,045 1.13
1,048,000 Midland Holdings 613,397 0.401,451,916 NWS Holdings 1,934,694 1.26
88,000 Orient Overseas International 565,951 0.37880,000 Public Financial Holdings 543,901 0.35
1,172,000 Sihuan Pharmaceutical Holdings 553,448 0.36
17,693,473 11.51
UNITED KINGDOM1,403,976 HSBC Holdings 13,895,796 9.04
13,895,796 9.04
Total Shares 151,898,945 98.79
Total Transferable Securities Admitted to anOfficial Exchange Listing
151,898,945 98.79
Total Investments 151,898,945 98.79
Cash 1,644,695 1.07
Other Assets/(Liabilities) 215,453 0.14
Total Net Assets 153,759,093 100.00
* Hong Kong Registered Shares.
Allocation of Portfolio as at 30 June 2011 % ofNet Assets
SharesFinancials 61.71Materials 8.29Energy 8.04Consumer Discretionary 7.39Telecommunication Services 3.53Information Technology 2.82Consumer Staples 2.59Health Care 1.84Industrials 1.76Utilities 0.82Total Shares 98.79Cash and Other Assets/(Liabilities) 1.21
Total 100.00
Allocation of Portfolio as at 31 December 2010 (Unaudited) % ofNet Assets
SharesFinancials 58.84Consumer Discretionary 10.31Energy 8.67Materials 6.53Telecommunication Services 4.60Consumer Staples 3.16Health Care 2.59Industrials 2.21Information Technology 1.92Utilities 0.68Total Shares 99.51Cash and Other Assets/(Liabilities) 0.49
Total 100.00
333
JPMorgan Funds - JF Hong Kong FundSchedule of Investments (Market Value Expressed in USD)
As at 30 June 2011
Quantity/Nominal
Value
Name of Securities MarketValue
%of
NetAssets
Quantity/Nominal
Value
Name of Securities MarketValue
%of
NetAssets
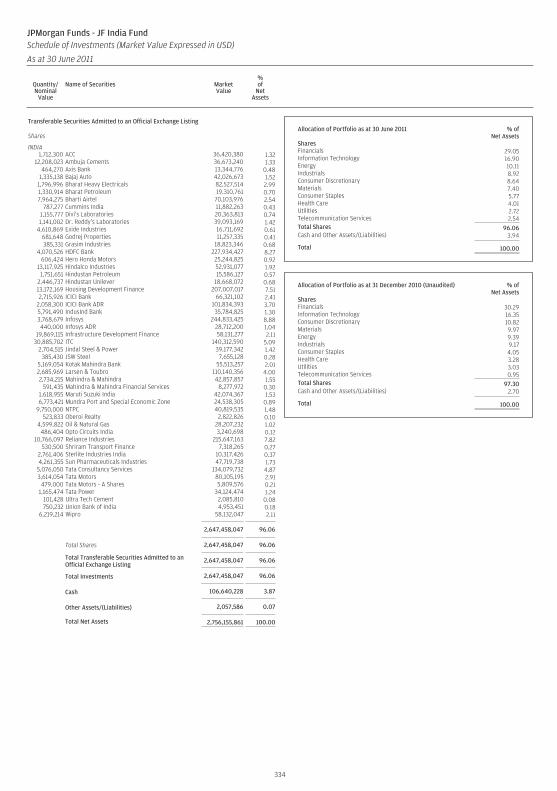
Transferable Securities Admitted to an Official Exchange Listing
Shares
INDIA1,712,300 ACC 36,420,380 1.32
12,208,023 Ambuja Cements 36,673,240 1.33464,270 Axis Bank 13,344,776 0.48
1,335,138 Bajaj Auto 42,026,673 1.521,796,996 Bharat Heavy Electricals 82,527,514 2.991,330,914 Bharat Petroleum 19,310,761 0.707,964,275 Bharti Airtel 70,103,976 2.54
787,277 Cummins India 11,882,263 0.431,155,777 Divi’s Laboratories 20,363,813 0.741,141,002 Dr. Reddy’s Laboratories 39,093,169 1.42
4,610,869 Exide Industries 16,711,692 0.61681,648 Godrej Properties 11,257,335 0.41385,331 Grasim Industries 18,823,346 0.68
4,070,526 HDFC Bank 227,934,427 8.27606,424 Hero Honda Motors 25,244,825 0.92
13,117,925 Hindalco Industries 52,931,077 1.921,751,651 Hindustan Petroleum 15,586,127 0.57
2,446,737 Hindustan Unilever 18,668,072 0.6813,172,169 Housing Development Finance 207,007,017 7.512,715,926 ICICI Bank 66,321,102 2.41
2,058,300 ICICI Bank ADR 101,834,393 3.705,791,490 IndusInd Bank 35,784,825 1.303,768,679 Infosys 244,833,425 8.88440,000 Infosys ADR 28,712,200 1.04
19,869,115 Infrastructure Development Finance 58,131,277 2.1130,885,702 ITC 140,312,590 5.09
2,704,515 Jindal Steel & Power 39,177,342 1.42385,430 JSW Steel 7,655,128 0.28
5,169,054 Kotak Mahindra Bank 55,513,257 2.012,685,969 Larsen & Toubro 110,140,356 4.002,734,215 Mahindra & Mahindra 42,857,857 1.55
591,435 Mahindra & Mahindra Financial Services 8,277,972 0.301,618,955 Maruti Suzuki India 42,074,367 1.536,773,421 Mundra Port and Special Economic Zone 24,538,305 0.89
9,750,000 NTPC 40,819,535 1.48523,833 Oberoi Realty 2,822,826 0.10
4,599,822 Oil & Natural Gas 28,207,232 1.02486,404 Opto Circuits India 3,240,698 0.12
10,766,097 Reliance Industries 215,647,163 7.82530,500 Shriram Transport Finance 7,318,265 0.27
2,761,406 Sterlite Industries India 10,317,426 0.374,261,355 Sun Pharmaceuticals Industries 47,719,738 1.73
5,076,050 Tata Consultancy Services 134,079,732 4.873,614,054 Tata Motors 80,105,195 2.91
479,000 Tata Motors - A Shares 5,809,576 0.211,165,474 Tata Power 34,124,474 1.24
101,428 Ultra Tech Cement 2,085,810 0.08750,232 Union Bank of India 4,953,451 0.18
6,219,214 Wipro 58,132,047 2.11
2,647,458,047 96.06
Total Shares 2,647,458,047 96.06
Total Transferable Securities Admitted to anOfficial Exchange Listing
2,647,458,047 96.06
Total Investments 2,647,458,047 96.06
Cash 106,640,228 3.87
Other Assets/(Liabilities) 2,057,586 0.07
Total Net Assets 2,756,155,861 100.00
Allocation of Portfolio as at 30 June 2011 % ofNet Assets
SharesFinancials 29.05Information Technology 16.90Energy 10.11Industrials 8.92Consumer Discretionary 8.64Materials 7.40Consumer Staples 5.77Health Care 4.01Utilities 2.72Telecommunication Services 2.54Total Shares 96.06Cash and Other Assets/(Liabilities) 3.94
Total 100.00
Allocation of Portfolio as at 31 December 2010 (Unaudited) % ofNet Assets
SharesFinancials 30.29Information Technology 16.35Consumer Discretionary 10.82Materials 9.97Energy 9.39Industrials 9.17Consumer Staples 4.05Health Care 3.28Utilities 3.03Telecommunication Services 0.95Total Shares 97.30Cash and Other Assets/(Liabilities) 2.70
Total 100.00
334
JPMorgan Funds - JF India FundSchedule of Investments (Market Value Expressed in USD)
As at 30 June 2011
Quantity/Nominal
Value
Name of Securities MarketValue
%of
NetAssets
Quantity/Nominal
Value
Name of Securities MarketValue
%of
NetAssets
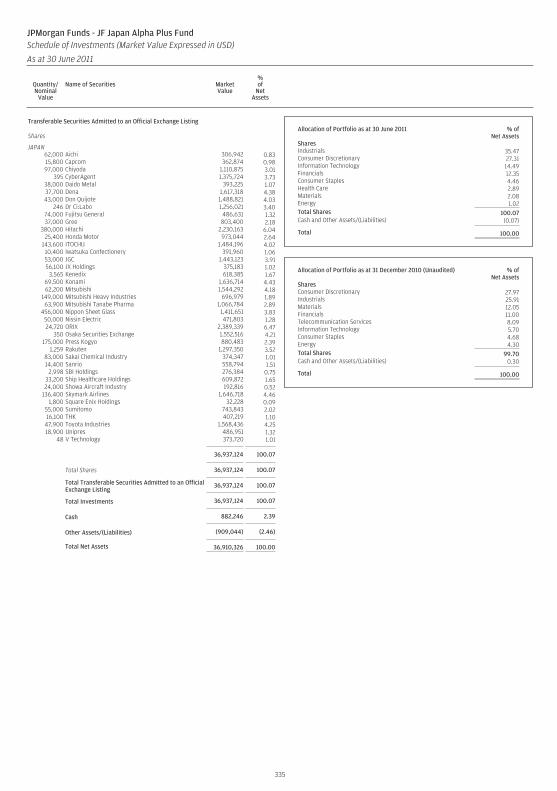
Transferable Securities Admitted to an Official Exchange Listing
Shares
JAPAN62,000 Aichi 306,942 0.8315,800 Capcom 362,874 0.9897,000 Chiyoda 1,110,875 3.01
395 CyberAgent 1,375,724 3.7338,000 Daido Metal 393,225 1.0737,700 Dena 1,617,318 4.3843,000 Don Quijote 1,488,821 4.03
246 Dr Ci:Labo 1,256,021 3.4074,000 Fujitsu General 486,631 1.3237,000 Gree 803,400 2.18
380,000 Hitachi 2,230,163 6.0425,400 Honda Motor 973,044 2.64
143,600 ITOCHU 1,484,196 4.0210,400 Iwatsuka Confectionery 391,960 1.0653,000 JGC 1,443,123 3.9156,100 JX Holdings 375,183 1.02
3,565 Kenedix 618,385 1.6769,500 Konami 1,636,714 4.4362,200 Mitsubishi 1,544,292 4.18
149,000 Mitsubishi Heavy Industries 696,979 1.8963,900 Mitsubishi Tanabe Pharma 1,066,784 2.89
456,000 Nippon Sheet Glass 1,411,651 3.8350,000 Nissin Electric 471,803 1.2824,720 ORIX 2,389,339 6.47
350 Osaka Securities Exchange 1,552,516 4.21175,000 Press Kogyo 880,483 2.39
1,259 Rakuten 1,297,350 3.5283,000 Sakai Chemical Industry 374,347 1.0114,400 Sanrio 558,794 1.51
2,998 SBI Holdings 276,384 0.7533,200 Ship Healthcare Holdings 609,872 1.6524,000 Showa Aircraft Industry 192,816 0.52
136,400 Skymark Airlines 1,646,718 4.461,800 Square Enix Holdings 32,228 0.09
55,000 Sumitomo 743,843 2.0216,100 THK 407,219 1.10
47,900 Toyota Industries 1,568,436 4.2518,900 Unipres 486,951 1.32
48 V Technology 373,720 1.01
36,937,124 100.07
Total Shares 36,937,124 100.07
Total Transferable Securities Admitted to an OfficialExchange Listing
36,937,124 100.07
Total Investments 36,937,124 100.07
Cash 882,246 2.39
Other Assets/(Liabilities) (909,044) (2.46)
Total Net Assets 36,910,326 100.00
Allocation of Portfolio as at 30 June 2011 % ofNet Assets
SharesIndustrials 35.47Consumer Discretionary 27.31Information Technology 14.49Financials 12.35Consumer Staples 4.46Health Care 2.89Materials 2.08Energy 1.02Total Shares 100.07Cash and Other Assets/(Liabilities) (0.07)
Total 100.00
Allocation of Portfolio as at 31 December 2010 (Unaudited) % ofNet Assets
SharesConsumer Discretionary 27.97Industrials 25.91Materials 12.05Financials 11.00Telecommunication Services 8.09Information Technology 5.70Consumer Staples 4.68Energy 4.30Total Shares 99.70Cash and Other Assets/(Liabilities) 0.30
Total 100.00
335
JPMorgan Funds - JF Japan Alpha Plus FundSchedule of Investments (Market Value Expressed in USD)
As at 30 June 2011
Quantity/Nominal
Value
Name of Securities MarketValue
%of
NetAssets
Quantity/Nominal
Value
Name of Securities MarketValue
%of
NetAssets
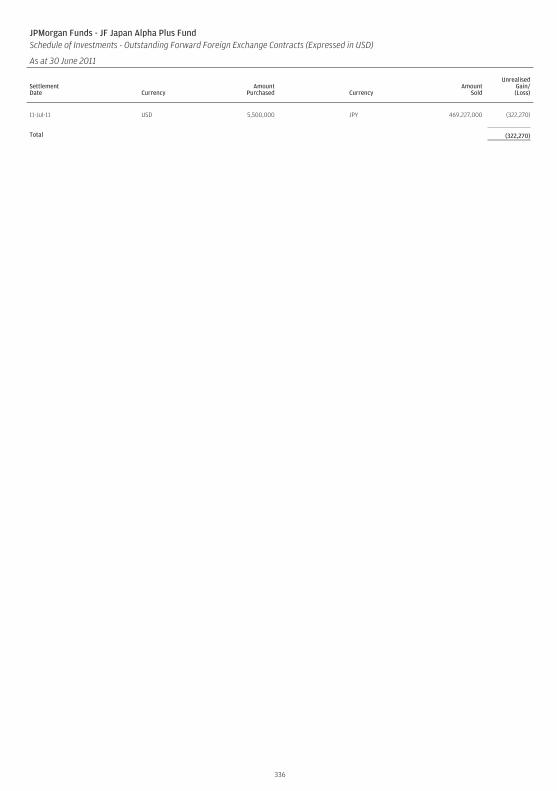
JPMorgan Funds - JF Japan Alpha Plus FundSchedule of Investments - Outstanding Forward Foreign Exchange Contracts (Expressed in USD)
As at 30 June 2011
SettlementDate Currency
AmountPurchased Currency
AmountSold
UnrealisedGain/(Loss)
11-Jul-11 USD 5,500,000 JPY 469,227,000 (322,270)
Total (322,270)
336
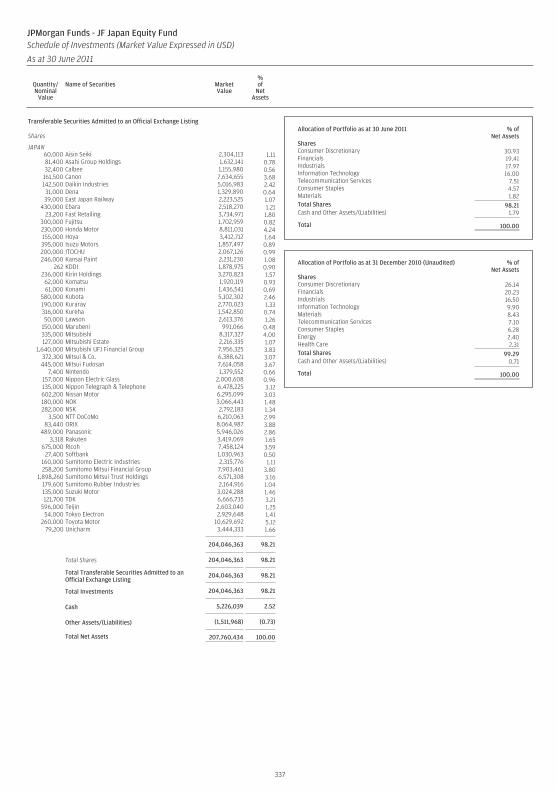
Transferable Securities Admitted to an Official Exchange Listing
Shares
JAPAN60,000 Aisin Seiki 2,304,113 1.1181,400 Asahi Group Holdings 1,632,141 0.7832,400 Calbee 1,155,980 0.56
161,500 Canon 7,634,655 3.68142,500 Daikin Industries 5,016,983 2.4231,000 Dena 1,329,890 0.6439,000 East Japan Railway 2,223,525 1.07
430,000 Ebara 2,518,270 1.2123,200 Fast Retailing 3,734,971 1.80
300,000 Fujitsu 1,702,959 0.82230,000 Honda Motor 8,811,031 4.24155,000 Hoya 3,412,712 1.64395,000 Isuzu Motors 1,857,497 0.89200,000 ITOCHU 2,067,126 0.99246,000 Kansai Paint 2,231,230 1.08
262 KDDI 1,878,975 0.90236,000 Kirin Holdings 3,270,823 1.57
62,000 Komatsu 1,920,119 0.9361,000 Konami 1,436,541 0.69
580,000 Kubota 5,102,302 2.46190,000 Kuraray 2,770,023 1.33316,000 Kureha 1,542,850 0.7450,000 Lawson 2,613,376 1.26
150,000 Marubeni 991,066 0.48335,000 Mitsubishi 8,317,327 4.00127,000 Mitsubishi Estate 2,216,335 1.07
1,640,000 Mitsubishi UFJ Financial Group 7,956,325 3.83372,300 Mitsui & Co. 6,388,621 3.07445,000 Mitsui Fudosan 7,614,058 3.67
7,400 Nintendo 1,379,552 0.66157,000 Nippon Electric Glass 2,000,608 0.96135,000 Nippon Telegraph & Telephone 6,478,225 3.12602,200 Nissan Motor 6,295,099 3.03180,000 NOK 3,066,443 1.48282,000 NSK 2,792,183 1.34
3,500 NTT DoCoMo 6,210,063 2.9983,440 ORIX 8,064,987 3.88
489,000 Panasonic 5,946,026 2.863,318 Rakuten 3,419,069 1.65
675,000 Ricoh 7,458,124 3.5927,400 Softbank 1,030,963 0.50
160,000 Sumitomo Electric Industries 2,315,776 1.11258,200 Sumitomo Mitsui Financial Group 7,903,461 3.80
1,898,260 Sumitomo Mitsui Trust Holdings 6,571,308 3.16179,600 Sumitomo Rubber Industries 2,164,916 1.04135,000 Suzuki Motor 3,024,288 1.46121,700 TDK 6,666,735 3.21
596,000 Teijin 2,603,040 1.2554,000 Tokyo Electron 2,929,648 1.41
260,000 Toyota Motor 10,629,692 5.1279,200 Unicharm 3,444,333 1.66
204,046,363 98.21
Total Shares 204,046,363 98.21
Total Transferable Securities Admitted to anOfficial Exchange Listing
204,046,363 98.21
Total Investments 204,046,363 98.21
Cash 5,226,039 2.52
Other Assets/(Liabilities) (1,511,968) (0.73)
Total Net Assets 207,760,434 100.00
Allocation of Portfolio as at 30 June 2011 % ofNet Assets
SharesConsumer Discretionary 30.93Financials 19.41Industrials 17.97Information Technology 16.00Telecommunication Services 7.51Consumer Staples 4.57Materials 1.82Total Shares 98.21Cash and Other Assets/(Liabilities) 1.79
Total 100.00
Allocation of Portfolio as at 31 December 2010 (Unaudited) % ofNet Assets
SharesConsumer Discretionary 26.14Financials 20.23Industrials 16.50Information Technology 9.90Materials 8.43Telecommunication Services 7.10Consumer Staples 6.28Energy 2.40Health Care 2.31Total Shares 99.29Cash and Other Assets/(Liabilities) 0.71
Total 100.00
337
JPMorgan Funds - JF Japan Equity FundSchedule of Investments (Market Value Expressed in USD)
As at 30 June 2011
Quantity/Nominal
Value
Name of Securities MarketValue
%of
NetAssets
Quantity/Nominal
Value
Name of Securities MarketValue
%of
NetAssets
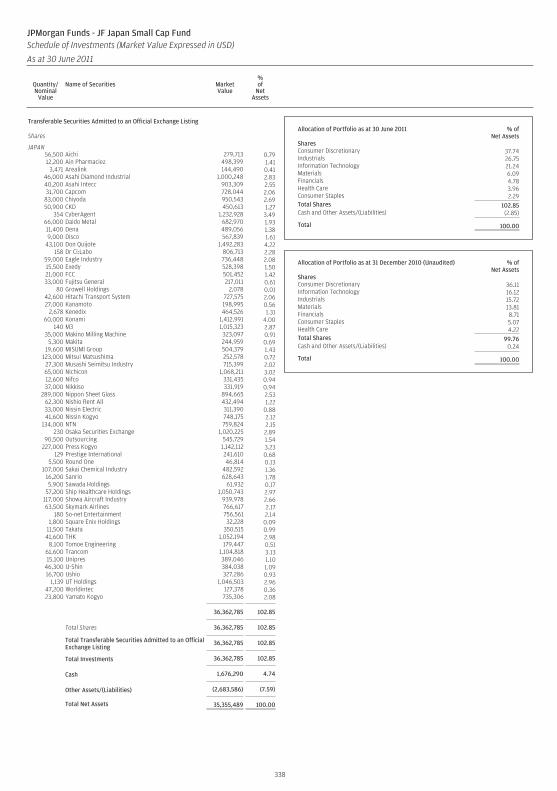
Transferable Securities Admitted to an Official Exchange Listing
Shares
JAPAN56,500 Aichi 279,713 0.7912,200 Ain Pharmaciez 498,399 1.41
3,471 Arealink 144,490 0.4146,000 Asahi Diamond Industrial 1,000,248 2.8340,200 Asahi Intecc 903,309 2.5531,700 Capcom 728,044 2.06
83,000 Chiyoda 950,543 2.6950,900 CKD 450,613 1.27
354 CyberAgent 1,232,928 3.4966,000 Daido Metal 682,970 1.9311,400 Dena 489,056 1.389,000 Disco 567,839 1.61
43,100 Don Quijote 1,492,283 4.22158 Dr Ci:Labo 806,713 2.28
59,000 Eagle Industry 736,448 2.0815,500 Exedy 528,398 1.5021,000 FCC 501,452 1.4233,000 Fujitsu General 217,011 0.61
80 Growell Holdings 2,078 0.0142,600 Hitachi Transport System 727,575 2.0627,000 Kanamoto 198,995 0.56
2,678 Kenedix 464,526 1.3160,000 Konami 1,412,991 4.00
140 M3 1,015,323 2.8735,000 Makino Milling Machine 323,097 0.91
5,300 Makita 244,959 0.6919,600 MISUMI Group 504,379 1.43
123,000 Mitsui Matsushima 252,578 0.7227,300 Musashi Seimitsu Industry 715,399 2.0265,000 Nichicon 1,068,211 3.0212,600 Nifco 331,435 0.9437,000 Nikkiso 331,919 0.94
289,000 Nippon Sheet Glass 894,665 2.5362,300 Nishio Rent All 432,494 1.2233,000 Nissin Electric 311,390 0.8841,600 Nissin Kogyo 748,175 2.12
134,000 NTN 759,824 2.15230 Osaka Securities Exchange 1,020,225 2.89
90,500 Outsourcing 545,729 1.54227,000 Press Kogyo 1,142,112 3.23
129 Prestige International 241,610 0.685,500 Round One 46,814 0.13
107,000 Sakai Chemical Industry 482,592 1.3616,200 Sanrio 628,643 1.785,900 Sawada Holdings 61,932 0.17
57,200 Ship Healthcare Holdings 1,050,743 2.97117,000 Showa Aircraft Industry 939,978 2.6663,500 Skymark Airlines 766,617 2.17
180 So-net Entertainment 756,561 2.141,800 Square Enix Holdings 32,228 0.09
11,500 Takata 350,515 0.9941,600 THK 1,052,194 2.98
8,100 Tomoe Engineering 179,447 0.5161,600 Trancom 1,104,818 3.1315,100 Unipres 389,046 1.10
46,300 U-Shin 384,038 1.0916,700 Ushio 327,286 0.93
1,139 UT Holdings 1,046,503 2.9647,200 Worldintec 127,378 0.3623,800 Yamato Kogyo 735,306 2.08
36,362,785 102.85
Total Shares 36,362,785 102.85
Total Transferable Securities Admitted to an OfficialExchange Listing
36,362,785 102.85
Total Investments 36,362,785 102.85
Cash 1,676,290 4.74
Other Assets/(Liabilities) (2,683,586) (7.59)
Total Net Assets 35,355,489 100.00
Allocation of Portfolio as at 30 June 2011 % ofNet Assets
SharesConsumer Discretionary 37.74Industrials 26.75Information Technology 21.24Materials 6.09Financials 4.78Health Care 3.96Consumer Staples 2.29Total Shares 102.85Cash and Other Assets/(Liabilities) (2.85)
Total 100.00
Allocation of Portfolio as at 31 December 2010 (Unaudited) % ofNet Assets
SharesConsumer Discretionary 36.11Information Technology 16.12Industrials 15.72Materials 13.81Financials 8.71Consumer Staples 5.07Health Care 4.22Total Shares 99.76Cash and Other Assets/(Liabilities) 0.24
Total 100.00
338
JPMorgan Funds - JF Japan Small Cap FundSchedule of Investments (Market Value Expressed in USD)
As at 30 June 2011
Quantity/Nominal
Value
Name of Securities MarketValue
%of
NetAssets
Quantity/Nominal
Value
Name of Securities MarketValue
%of
NetAssets
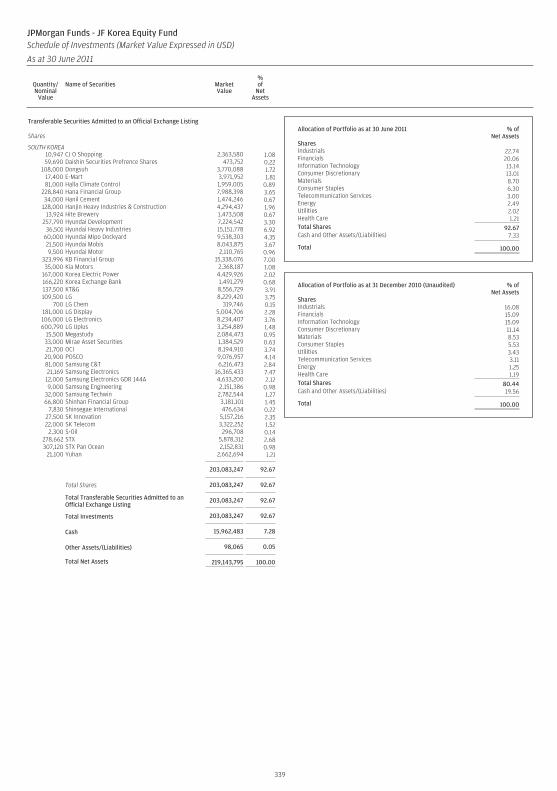
Transferable Securities Admitted to an Official Exchange Listing
Shares
SOUTH KOREA10,947 CJ O Shopping 2,363,580 1.0859,690 Daishin Securities Prefrence Shares 473,752 0.22
108,000 Dongsuh 3,770,088 1.7217,400 E-Mart 3,971,952 1.8181,000 Halla Climate Control 1,959,005 0.89
228,840 Hana Financial Group 7,988,398 3.6534,000 Hanil Cement 1,474,246 0.67
128,000 Hanjin Heavy Industries & Construction 4,294,437 1.9613,924 Hite Brewery 1,473,508 0.67
257,790 Hyundai Development 7,224,542 3.3036,501 Hyundai Heavy Industries 15,151,778 6.92
60,000 Hyundai Mipo Dockyard 9,538,303 4.3521,500 Hyundai Mobis 8,043,875 3.679,500 Hyundai Motor 2,110,765 0.96
323,996 KB Financial Group 15,338,076 7.0035,000 Kia Motors 2,368,187 1.08
167,000 Korea Electric Power 4,429,926 2.02166,220 Korea Exchange Bank 1,491,279 0.68137,500 KT&G 8,556,729 3.91109,500 LG 8,229,420 3.75
700 LG Chem 319,746 0.15181,000 LG Display 5,004,706 2.28106,000 LG Electronics 8,234,407 3.76600,790 LG Uplus 3,254,889 1.48
15,500 Megastudy 2,084,473 0.9533,000 Mirae Asset Securities 1,384,529 0.6321,700 OCI 8,194,910 3.74
20,900 POSCO 9,076,957 4.1481,000 Samsung C&T 6,216,473 2.8421,169 Samsung Electronics 16,365,433 7.4712,000 Samsung Electronics GDR 144A 4,633,200 2.129,000 Samsung Engineering 2,151,386 0.98
32,000 Samsung Techwin 2,782,544 1.2766,800 Shinhan Financial Group 3,181,101 1.45
7,830 Shinsegae International 476,634 0.2227,500 SK Innovation 5,157,216 2.3522,000 SK Telecom 3,322,252 1.52
2,300 S-Oil 296,708 0.14278,662 STX 5,878,312 2.68307,120 STX Pan Ocean 2,152,831 0.98
21,100 Yuhan 2,662,694 1.21
203,083,247 92.67
Total Shares 203,083,247 92.67
Total Transferable Securities Admitted to anOfficial Exchange Listing
203,083,247 92.67
Total Investments 203,083,247 92.67
Cash 15,962,483 7.28
Other Assets/(Liabilities) 98,065 0.05
Total Net Assets 219,143,795 100.00
Allocation of Portfolio as at 30 June 2011 % ofNet Assets
SharesIndustrials 22.74Financials 20.06Information Technology 13.14Consumer Discretionary 13.01Materials 8.70Consumer Staples 6.30Telecommunication Services 3.00Energy 2.49Utilities 2.02Health Care 1.21Total Shares 92.67Cash and Other Assets/(Liabilities) 7.33
Total 100.00
Allocation of Portfolio as at 31 December 2010 (Unaudited) % ofNet Assets
SharesIndustrials 16.08Financials 15.09Information Technology 15.09Consumer Discretionary 11.14Materials 8.53Consumer Staples 5.53Utilities 3.43Telecommunication Services 3.11Energy 1.25Health Care 1.19Total Shares 80.44Cash and Other Assets/(Liabilities) 19.56
Total 100.00
339
JPMorgan Funds - JF Korea Equity FundSchedule of Investments (Market Value Expressed in USD)
As at 30 June 2011
Quantity/Nominal
Value
Name of Securities MarketValue
%of
NetAssets
Quantity/Nominal
Value
Name of Securities MarketValue
%of
NetAssets
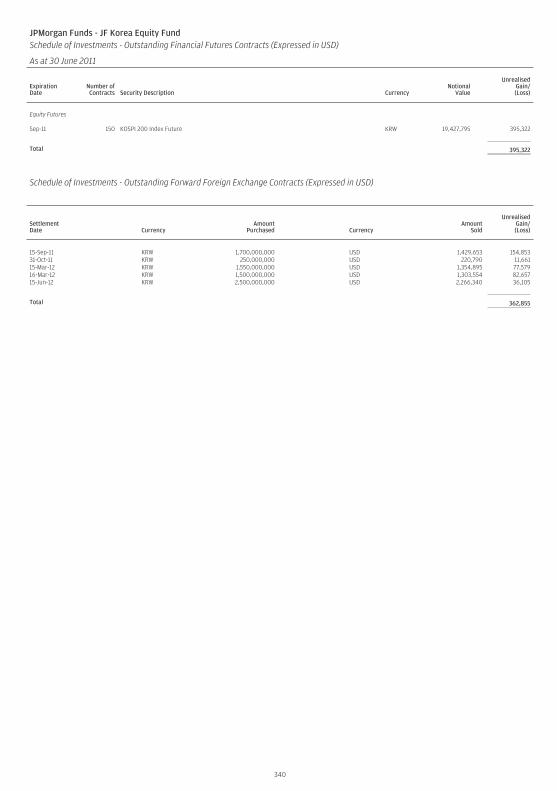
JPMorgan Funds - JF Korea Equity FundSchedule of Investments - Outstanding Financial Futures Contracts (Expressed in USD)
As at 30 June 2011
ExpirationDate
Number ofContracts Security Description Currency
NotionalValue
UnrealisedGain/(Loss)
Equity Futures
Sep-11 150 KOSPI 200 Index Future KRW 19,427,795 395,322
Total 395,322
Schedule of Investments - Outstanding Forward Foreign Exchange Contracts (Expressed in USD)
SettlementDate Currency
AmountPurchased Currency
AmountSold
UnrealisedGain/(Loss)
15-Sep-11 KRW 1,700,000,000 USD 1,429,653 154,85331-Oct-11 KRW 250,000,000 USD 220,790 11,66115-Mar-12 KRW 1,550,000,000 USD 1,354,895 77,57916-Mar-12 KRW 1,500,000,000 USD 1,303,554 82,65715-Jun-12 KRW 2,500,000,000 USD 2,266,340 36,105
Total 362,855
340
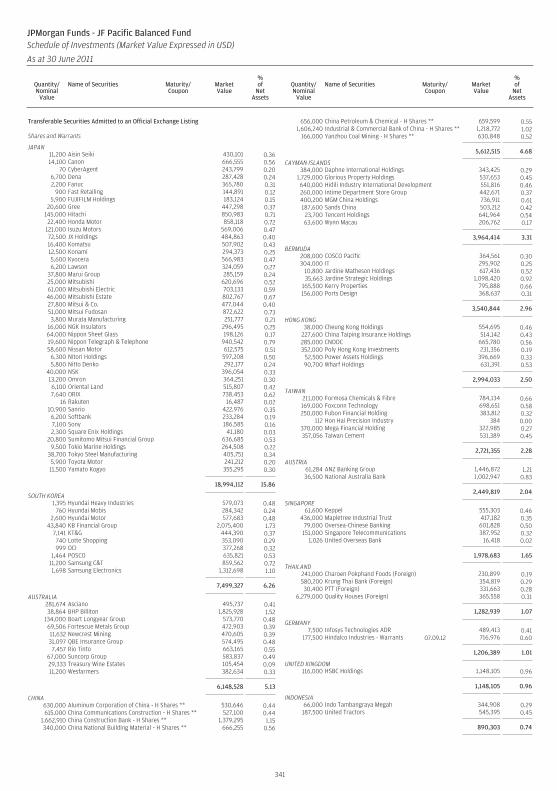
Transferable Securities Admitted to an Official Exchange Listing
Shares and Warrants
JAPAN11,200 Aisin Seiki 430,101 0.3614,100 Canon 666,555 0.56
70 CyberAgent 243,799 0.206,700 Dena 287,428 0.242,200 Fanuc 365,780 0.31
900 Fast Retailing 144,891 0.125,900 FUJIFILM Holdings 183,124 0.15
20,600 Gree 447,298 0.37145,000 Hitachi 850,983 0.7122,400 Honda Motor 858,118 0.72
121,000 Isuzu Motors 569,006 0.4772,500 JX Holdings 484,863 0.4016,400 Komatsu 507,902 0.4312,500 Konami 294,373 0.255,600 Kyocera 566,983 0.476,200 Lawson 324,059 0.27
37,800 Marui Group 285,159 0.2425,000 Mitsubishi 620,696 0.5261,000 Mitsubishi Electric 703,133 0.5946,000 Mitsubishi Estate 802,767 0.6727,800 Mitsui & Co. 477,044 0.4051,000 Mitsui Fudosan 872,622 0.733,800 Murata Manufacturing 251,777 0.21
16,000 NGK Insulators 296,495 0.2564,000 Nippon Sheet Glass 198,126 0.1719,600 Nippon Telegraph & Telephone 940,542 0.7958,600 Nissan Motor 612,575 0.51
6,300 Nitori Holdings 597,208 0.505,800 Nitto Denko 292,177 0.24
40,000 NSK 396,054 0.3313,200 Omron 364,251 0.306,100 Oriental Land 515,807 0.427,640 ORIX 738,453 0.62
16 Rakuten 16,487 0.0210,900 Sanrio 422,976 0.356,200 Softbank 233,284 0.197,100 Sony 186,585 0.162,300 Square Enix Holdings 41,180 0.03
20,800 Sumitomo Mitsui Financial Group 636,685 0.539,500 Tokio Marine Holdings 264,508 0.22
38,700 Tokyo Steel Manufacturing 405,751 0.345,900 Toyota Motor 241,212 0.2011,500 Yamato Kogyo 355,295 0.30
18,994,112 15.86
SOUTH KOREA1,395 Hyundai Heavy Industries 579,073 0.48
760 Hyundai Mobis 284,342 0.242,600 Hyundai Motor 577,683 0.48
43,840 KB Financial Group 2,075,400 1.737,141 KT&G 444,390 0.37740 Lotte Shopping 353,090 0.29999 OCI 377,268 0.32
1,464 POSCO 635,821 0.5311,200 Samsung C&T 859,562 0.721,698 Samsung Electronics 1,312,698 1.10
7,499,327 6.26
AUSTRALIA281,674 Asciano 495,737 0.4138,864 BHP Billiton 1,825,928 1.52
134,000 Boart Longyear Group 573,770 0.4869,506 Fortescue Metals Group 472,903 0.3911,632 Newcrest Mining 470,605 0.3931,097 QBE Insurance Group 574,495 0.487,457 Rio Tinto 663,165 0.55
67,000 Suncorp Group 583,837 0.4929,333 Treasury Wine Estates 105,454 0.0911,200 Wesfarmers 382,634 0.33
6,148,528 5.13
CHINA630,000 Aluminum Corporation of China - H Shares ** 530,646 0.44615,000 China Communications Construction - H Shares ** 527,100 0.44
1,662,910 China Construction Bank - H Shares ** 1,379,295 1.15340,000 China National Building Material - H Shares ** 666,255 0.56
656,000 China Petroleum & Chemical - H Shares ** 659,599 0.551,606,240 Industrial & Commercial Bank of China - H Shares ** 1,218,772 1.02
166,000 Yanzhou Coal Mining - H Shares ** 630,848 0.52
5,612,515 4.68
CAYMAN ISLANDS384,000 Daphne International Holdings 343,425 0.29
1,729,000 Glorious Property Holdings 537,653 0.45640,000 Hidili Industry International Development 551,816 0.46260,000 Intime Department Store Group 442,671 0.37400,200 MGM China Holdings 736,911 0.61187,600 Sands China 503,212 0.42
23,700 Tencent Holdings 641,964 0.5463,600 Wynn Macau 206,762 0.17
3,964,414 3.31
BERMUDA208,000 COSCO Pacific 364,561 0.30304,000 IT 295,902 0.25
10,800 Jardine Matheson Holdings 617,436 0.5235,663 Jardine Strategic Holdings 1,098,420 0.92
165,500 Kerry Properties 795,888 0.66156,000 Ports Design 368,637 0.31
3,540,844 2.96
HONG KONG38,000 Cheung Kong Holdings 554,695 0.46
227,600 China Taiping Insurance Holdings 514,142 0.43285,000 CNOOC 665,780 0.56352,000 Poly Hong Kong Investments 231,356 0.19
52,500 Power Assets Holdings 396,669 0.3390,700 Wharf Holdings 631,391 0.53
2,994,033 2.50
TAIWAN211,000 Formosa Chemicals & Fibre 784,134 0.66169,000 Foxconn Technology 698,651 0.58250,000 Fubon Financial Holding 383,812 0.32
112 Hon Hai Precision Industry 384 0.00370,000 Mega Financial Holding 322,985 0.27357,056 Taiwan Cement 531,389 0.45
2,721,355 2.28
AUSTRIA61,284 ANZ Banking Group 1,446,872 1.2136,500 National Australia Bank 1,002,947 0.83
2,449,819 2.04
SINGAPORE61,600 Keppel 555,303 0.46
436,000 Mapletree Industrial Trust 417,182 0.3579,000 Oversea-Chinese Banking 601,828 0.50151,000 Singapore Telecommunications 387,952 0.32
1,026 United Overseas Bank 16,418 0.02
1,978,683 1.65
THAILAND241,000 Charoen Pokphand Foods (Foreign) 230,899 0.19580,200 Krung Thai Bank (Foreign) 354,819 0.2930,400 PTT (Foreign) 331,663 0.28
6,279,000 Quality Houses (Foreign) 365,558 0.31
1,282,939 1.07
GERMANY7,500 Infosys Technologies ADR 489,413 0.41
177,500 Hindalco Industries - Warrants 07.09.12 716,976 0.60
1,206,389 1.01
UNITED KINGDOM116,000 HSBC Holdings 1,148,105 0.96
1,148,105 0.96
INDONESIA66,000 Indo Tambangraya Megah 344,908 0.29187,500 United Tractors 545,395 0.45
890,303 0.74
341
JPMorgan Funds - JF Pacific Balanced FundSchedule of Investments (Market Value Expressed in USD)
As at 30 June 2011
Quantity/Nominal
Value
Name of Securities Maturity/Coupon
MarketValue
%of
NetAssets
Quantity/Nominal
Value
Name of Securities Maturity/Coupon
MarketValue
%of
NetAssets
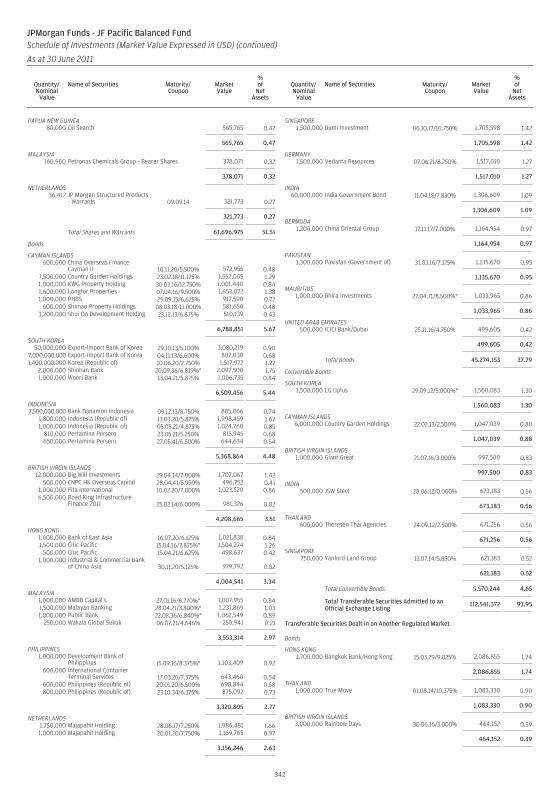
PAPUA NEW GUINEA80,000 Oil Search 565,765 0.47
565,765 0.47
MALAYSIA160,900 Petronas Chemicals Group - Bearer Shares 378,071 0.32
378,071 0.32
NETHERLANDS36,412 JP Morgan Structured Products
- Warrants 09.09.14 321,773 0.27
321,773 0.27
Total Shares and Warrants 61,696,975 51.51
Bonds
CAYMAN ISLANDS600,000 China Overseas Finance
Cayman II 10.11.20/5.500% 572,955 0.481,500,000 Country Garden Holdings 23.02.18/11.125% 1,552,005 1.291,000,000 KWG Property Holding 30.03.16/12.750% 1,001,440 0.841,600,000 Longfor Properties 07.04.16/9.500% 1,653,072 1.381,000,000 PHBS 29.09.15/6.625% 917,590 0.77
600,000 Shimao Property Holdings 08.03.18/11.000% 581,650 0.483,200,000 Shui On Development Holding 23.12.13/6.875% 510,139 0.43
6,788,851 5.67
SOUTH KOREA50,000,000 Export-Import Bank of Korea 29.10.13/5.100% 1,080,219 0.90
7,000,000,000 Export-Import Bank of Korea 04.11.13/6.600% 807,030 0.681,400,000,000 Korea (Republic of) 10.06.20/2.750% 1,517,972 1.27
2,000,000 Shinhan Bank 20.09.36/6.819%* 2,097,500 1.751,000,000 Woori Bank 13.04.21/5.875% 1,006,735 0.84
6,509,456 5.44
INDONESIA7,500,000,000 Bank Danamon Indonesia 09.12.13/8.750% 885,066 0.74
1,800,000 Indonesia (Republic of) 13.03.20/5.875% 1,998,459 1.671,000,000 Indonesia (Republic of) 05.05.21/4.875% 1,024,760 0.85
810,000 Pertamina Persero 23.05.21/5.250% 815,945 0.68650,000 Pertamina Persero 27.05.41/6.500% 644,634 0.54
5,368,864 4.48
BRITISH VIRGIN ISLANDS12,000,000 Big Will Investments 29.04.14/7.000% 1,707,067 1.42
500,000 CNPC HK Overseas Capital 28.04.41/5.950% 496,752 0.411,000,000 Fita International 10.02.20/7.000% 1,023,520 0.866,500,000 Road King Infrastructure
Finance 2011 25.02.14/6.000% 981,326 0.82
4,208,665 3.51
HONG KONG1,000,000 Bank of East Asia 16.07.20/6.125% 1,021,838 0.841,500,000 Citic Pacific 15.04.16/7.875%* 1,504,274 1.26
500,000 Citic Pacific 15.04.21/6.625% 498,637 0.421,000,000 Industrial & Commercial Bank
of China Asia 30.11.20/5.125% 979,792 0.82
4,004,541 3.34
MALAYSIA1,000,000 AMBB Capital L 27.01.16/6.770%* 1,007,955 0.841,500,000 Malayan Banking 28.04.21/3.800%* 1,231,869 1.031,000,000 Public Bank 22.08.36/6.840%* 1,062,549 0.89
250,000 Wakala Global Sukuk 06.07.21/4.646% 250,941 0.21
3,553,314 2.97
PHILIPPINES1,000,000 Development Bank of
Philippines 15.09.16/8.375%* 1,103,409 0.92600,000 International Container
Terminal Services 17.03.20/7.375% 643,460 0.54600,000 Philippines (Republic of) 20.01.20/6.500% 698,844 0.58800,000 Philippines (Republic of) 23.10.34/6.375% 875,092 0.73
3,320,805 2.77
NETHERLANDS1,750,000 Majapahit Holding 28.06.17/7.250% 1,986,481 1.661,000,000 Majapahit Holding 20.01.20/7.750% 1,169,765 0.97
3,156,246 2.63
SINGAPORE1,500,000 Bumi Investment 06.10.17/10.750% 1,705,598 1.42
1,705,598 1.42
GERMANY1,500,000 Vedanta Resources 07.06.21/8.250% 1,517,010 1.27
1,517,010 1.27
INDIA60,000,000 India Government Bond 11.04.18/7.830% 1,306,609 1.09
1,306,609 1.09
BERMUDA1,200,000 China Oriental Group 17.11.17/7.000% 1,164,954 0.97
1,164,954 0.97
PAKISTAN1,300,000 Pakistan (Government of) 31.03.16/7.125% 1,135,670 0.95
1,135,670 0.95
MAURITIUS1,000,000 Bhira Investments 27.04.71/8.500%* 1,033,965 0.86
1,033,965 0.86
UNITED ARAB EMIRATES500,000 ICICI Bank/Dubai 25.11.16/4.750% 499,605 0.42
499,605 0.42
Total Bonds 45,274,153 37.79
Convertible Bonds
SOUTH KOREA1,500,000 LG Uplus 29.09.12/5.000%* 1,560,083 1.30
1,560,083 1.30
CAYMAN ISLANDS6,000,000 Country Garden Holdings 22.02.13/2.500% 1,047,039 0.88
1,047,039 0.88
BRITISH VIRGIN ISLANDS1,000,000 Giant Great 21.07.16/3.000% 997,500 0.83
997,500 0.83
INDIA500,000 JSW Steel 28.06.12/0.000% 673,183 0.56
673,183 0.56
THAILAND600,000 Thoresen Thai Agencies 24.09.12/2.500% 671,256 0.56
671,256 0.56
SINGAPORE750,000 Yanlord Land Group 13.07.14/5.850% 621,183 0.52
621,183 0.52
Total Convertible Bonds 5,570,244 4.65
Total Transferable Securities Admitted to anOfficial Exchange Listing
112,541,372 93.95
Transferable Securities Dealt in on Another Regulated Market
Bonds
HONG KONG1,700,000 Bangkok Bank/Hong Kong 15.03.29/9.025% 2,086,855 1.74
2,086,855 1.74
THAILAND1,000,000 True Move 01.08.14/10.375% 1,083,330 0.90
1,083,330 0.90
BRITISH VIRGIN ISLANDS3,000,000 Rainbow Days 30.06.16/3.000% 464,152 0.39
464,152 0.39
342
JPMorgan Funds - JF Pacific Balanced FundSchedule of Investments (Market Value Expressed in USD) (continued)
As at 30 June 2011
Quantity/Nominal
Value
Name of Securities Maturity/Coupon
MarketValue
%of
NetAssets
Quantity/Nominal
Value
Name of Securities Maturity/Coupon
MarketValue
%of
NetAssets
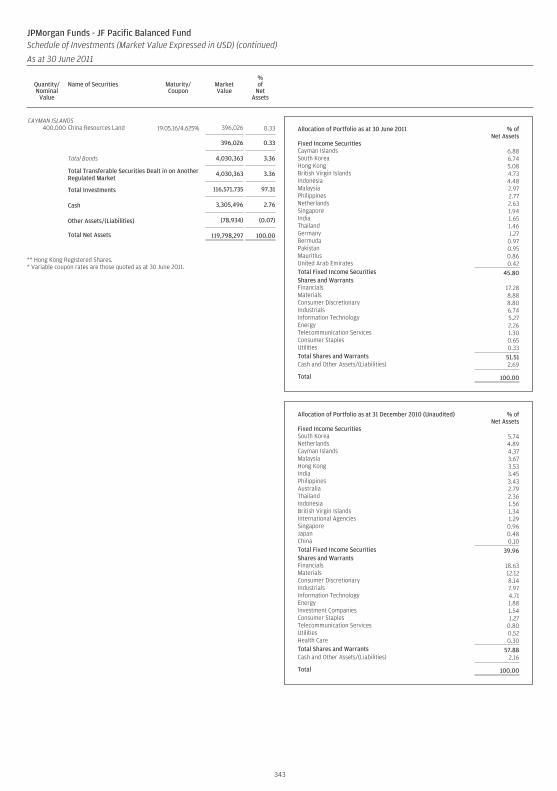
CAYMAN ISLANDS400,000 China Resources Land 19.05.16/4.625% 396,026 0.33
396,026 0.33
Total Bonds 4,030,363 3.36
Total Transferable Securities Dealt in on AnotherRegulated Market
4,030,363 3.36
Total Investments 116,571,735 97.31
Cash 3,305,496 2.76
Other Assets/(Liabilities) (78,934) (0.07)
Total Net Assets 119,798,297 100.00
** Hong Kong Registered Shares.* Variable coupon rates are those quoted as at 30 June 2011.
Allocation of Portfolio as at 30 June 2011 % ofNet Assets
Fixed Income SecuritiesCayman Islands 6.88South Korea 6.74Hong Kong 5.08British Virgin Islands 4.73Indonesia 4.48Malaysia 2.97Philippines 2.77Netherlands 2.63Singapore 1.94India 1.65Thailand 1.46Germany 1.27Bermuda 0.97Pakistan 0.95Mauritius 0.86United Arab Emirates 0.42Total Fixed Income Securities 45.80Shares and WarrantsFinancials 17.28Materials 8.88Consumer Discretionary 8.80Industrials 6.74Information Technology 5.27Energy 2.26Telecommunication Services 1.30Consumer Staples 0.65Utilities 0.33Total Shares and Warrants 51.51Cash and Other Assets/(Liabilities) 2.69
Total 100.00
Allocation of Portfolio as at 31 December 2010 (Unaudited) % ofNet Assets
Fixed Income SecuritiesSouth Korea 5.74Netherlands 4.89Cayman Islands 4.37Malaysia 3.67Hong Kong 3.53India 3.45Philippines 3.43Australia 2.79Thailand 2.36Indonesia 1.56British Virgin Islands 1.34International Agencies 1.29Singapore 0.96Japan 0.48China 0.10Total Fixed Income Securities 39.96Shares and WarrantsFinancials 18.63Materials 12.12Consumer Discretionary 8.14Industrials 7.97Information Technology 4.71Energy 1.88Investment Companies 1.54Consumer Staples 1.27Telecommunication Services 0.80Utilities 0.52Health Care 0.30Total Shares and Warrants 57.88Cash and Other Assets/(Liabilities) 2.16
Total 100.00
343
JPMorgan Funds - JF Pacific Balanced FundSchedule of Investments (Market Value Expressed in USD) (continued)
As at 30 June 2011
Quantity/Nominal
Value
Name of Securities Maturity/Coupon
MarketValue
%of
NetAssets
Quantity/Nominal
Value
Name of Securities Maturity/Coupon
MarketValue
%of
NetAssets
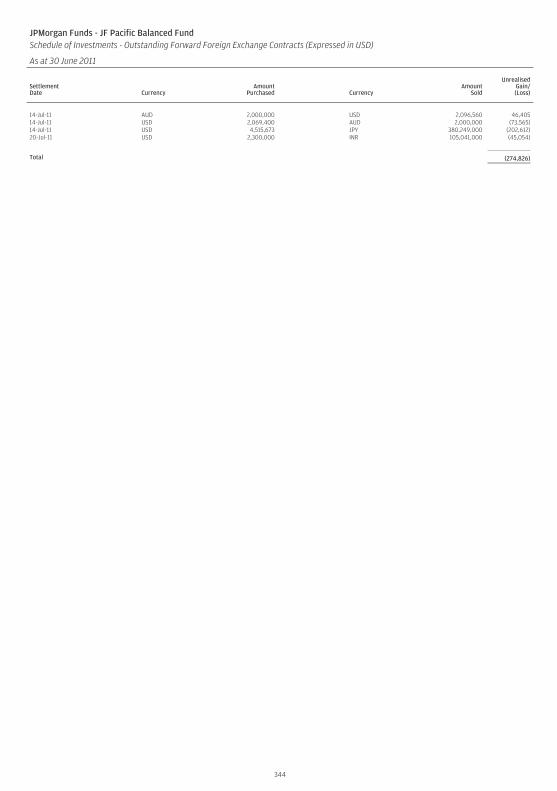
JPMorgan Funds - JF Pacific Balanced FundSchedule of Investments - Outstanding Forward Foreign Exchange Contracts (Expressed in USD)
As at 30 June 2011
SettlementDate Currency
AmountPurchased Currency
AmountSold
UnrealisedGain/(Loss)
14-Jul-11 AUD 2,000,000 USD 2,096,560 46,40514-Jul-11 USD 2,069,400 AUD 2,000,000 (73,565)14-Jul-11 USD 4,515,673 JPY 380,249,000 (202,612)20-Jul-11 USD 2,300,000 INR 105,041,000 (45,054)
Total (274,826)
344
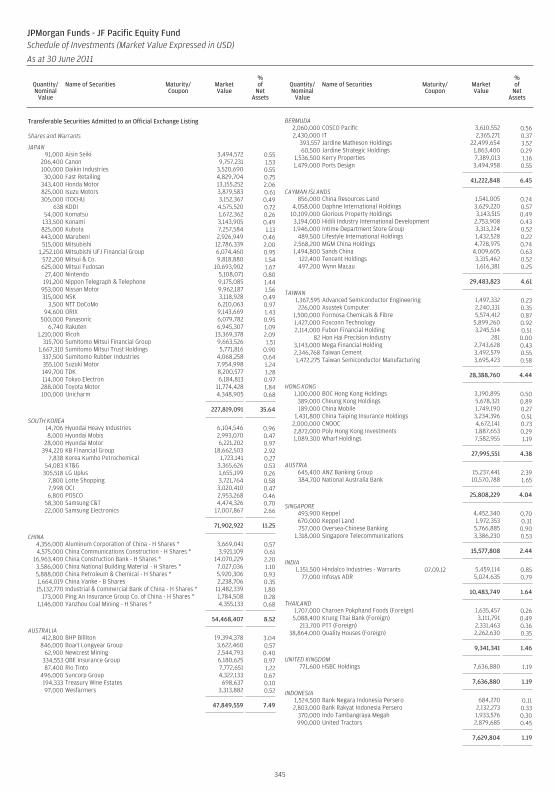
Transferable Securities Admitted to an Official Exchange Listing
Shares and Warrants
JAPAN91,000 Aisin Seiki 3,494,572 0.55
206,400 Canon 9,757,231 1.53100,000 Daikin Industries 3,520,690 0.5530,000 Fast Retailing 4,829,704 0.75
343,400 Honda Motor 13,155,252 2.06825,000 Isuzu Motors 3,879,583 0.61305,000 ITOCHU 3,152,367 0.49
638 KDDI 4,575,520 0.7254,000 Komatsu 1,672,362 0.26
133,500 Konami 3,143,905 0.49825,000 Kubota 7,257,584 1.13443,000 Marubeni 2,926,949 0.46515,000 Mitsubishi 12,786,339 2.00
1,252,100 Mitsubishi UFJ Financial Group 6,074,460 0.95572,200 Mitsui & Co. 9,818,880 1.54625,000 Mitsui Fudosan 10,693,902 1.67
27,400 Nintendo 5,108,071 0.80191,200 Nippon Telegraph & Telephone 9,175,085 1.44
953,000 Nissan Motor 9,962,187 1.56315,000 NSK 3,118,928 0.49
3,500 NTT DoCoMo 6,210,063 0.9794,600 ORIX 9,143,669 1.43
500,000 Panasonic 6,079,782 0.956,740 Rakuten 6,945,307 1.09
1,210,000 Ricoh 13,369,378 2.09315,700 Sumitomo Mitsui Financial Group 9,663,526 1.51
1,667,310 Sumitomo Mitsui Trust Holdings 5,771,816 0.90337,500 Sumitomo Rubber Industries 4,068,258 0.64355,100 Suzuki Motor 7,954,998 1.24149,700 TDK 8,200,577 1.28114,000 Tokyo Electron 6,184,813 0.97288,000 Toyota Motor 11,774,428 1.84100,000 Unicharm 4,348,905 0.68
227,819,091 35.64
SOUTH KOREA14,706 Hyundai Heavy Industries 6,104,546 0.968,000 Hyundai Mobis 2,993,070 0.47
28,000 Hyundai Motor 6,221,202 0.97394,220 KB Financial Group 18,662,503 2.92
7,838 Korea Kumho Petrochemical 1,723,141 0.2754,083 KT&G 3,365,626 0.53
305,518 LG Uplus 1,655,199 0.267,800 Lotte Shopping 3,721,764 0.587,998 OCI 3,020,410 0.476,800 POSCO 2,953,268 0.46
58,300 Samsung C&T 4,474,326 0.7022,000 Samsung Electronics 17,007,867 2.66
71,902,922 11.25
CHINA4,356,000 Aluminum Corporation of China - H Shares * 3,669,041 0.574,575,000 China Communications Construction - H Shares * 3,921,109 0.61
16,963,400 China Construction Bank - H Shares * 14,070,229 2.203,586,000 China National Building Material - H Shares * 7,027,036 1.105,888,000 China Petroleum & Chemical - H Shares * 5,920,306 0.931,664,019 China Vanke - B Shares 2,238,706 0.3515,132,770 Industrial & Commercial Bank of China - H Shares * 11,482,339 1.80
173,000 Ping An Insurance Group Co. of China - H Shares * 1,784,508 0.281,146,000 Yanzhou Coal Mining - H Shares * 4,355,133 0.68
54,468,407 8.52
AUSTRALIA412,800 BHP Billiton 19,394,378 3.04
846,000 Boart Longyear Group 3,622,460 0.5762,900 Newcrest Mining 2,544,793 0.40
334,553 QBE Insurance Group 6,180,625 0.9787,400 Rio Tinto 7,772,651 1.22
496,000 Suncorp Group 4,322,133 0.67194,333 Treasury Wine Estates 698,637 0.1097,000 Wesfarmers 3,313,882 0.52
47,849,559 7.49
BERMUDA2,060,000 COSCO Pacific 3,610,552 0.562,430,000 IT 2,365,271 0.37
393,557 Jardine Matheson Holdings 22,499,654 3.5260,500 Jardine Strategic Holdings 1,863,400 0.29
1,536,500 Kerry Properties 7,389,013 1.161,479,000 Ports Design 3,494,958 0.55
41,222,848 6.45
CAYMAN ISLANDS856,000 China Resources Land 1,541,005 0.24
4,058,000 Daphne International Holdings 3,629,220 0.5710,109,000 Glorious Property Holdings 3,143,515 0.493,194,000 Hidili Industry International Development 2,753,908 0.431,946,000 Intime Department Store Group 3,313,224 0.52
489,500 Lifestyle International Holdings 1,432,528 0.222,568,200 MGM China Holdings 4,728,975 0.741,494,800 Sands China 4,009,605 0.63
122,400 Tencent Holdings 3,315,462 0.52497,200 Wynn Macau 1,616,381 0.25
29,483,823 4.61
TAIWAN1,367,595 Advanced Semiconductor Engineering 1,497,332 0.23226,000 Asustek Computer 2,240,331 0.35
1,500,000 Formosa Chemicals & Fibre 5,574,412 0.871,427,000 Foxconn Technology 5,899,260 0.922,114,000 Fubon Financial Holding 3,245,514 0.51
82 Hon Hai Precision Industry 281 0.003,143,000 Mega Financial Holding 2,743,628 0.432,346,768 Taiwan Cement 3,492,579 0.551,472,275 Taiwan Semiconductor Manufacturing 3,695,423 0.58
28,388,760 4.44
HONG KONG1,100,000 BOC Hong Kong Holdings 3,190,895 0.50
389,000 Cheung Kong Holdings 5,678,321 0.89189,000 China Mobile 1,749,190 0.27
1,431,800 China Taiping Insurance Holdings 3,234,396 0.512,000,000 CNOOC 4,672,141 0.732,872,000 Poly Hong Kong Investments 1,887,653 0.291,089,300 Wharf Holdings 7,582,955 1.19
27,995,551 4.38
AUSTRIA645,400 ANZ Banking Group 15,237,441 2.39384,700 National Australia Bank 10,570,788 1.65
25,808,229 4.04
SINGAPORE493,900 Keppel 4,452,340 0.70670,000 Keppel Land 1,972,353 0.31757,000 Oversea-Chinese Banking 5,766,885 0.90
1,318,000 Singapore Telecommunications 3,386,230 0.53
15,577,808 2.44
INDIA1,351,500 Hindalco Industries - Warrants 07.09.12 5,459,114 0.85
77,000 Infosys ADR 5,024,635 0.79
10,483,749 1.64
THAILAND1,707,000 Charoen Pokphand Foods (Foreign) 1,635,457 0.265,088,400 Krung Thai Bank (Foreign) 3,111,791 0.49
213,700 PTT (Foreign) 2,331,463 0.3638,864,000 Quality Houses (Foreign) 2,262,630 0.35
9,341,341 1.46
UNITED KINGDOM771,600 HSBC Holdings 7,636,880 1.19
7,636,880 1.19
INDONESIA1,524,500 Bank Negara Indonesia Persero 684,270 0.11
2,803,000 Bank Rakyat Indonesia Persero 2,132,273 0.33370,000 Indo Tambangraya Megah 1,933,576 0.30990,000 United Tractors 2,879,685 0.45
7,629,804 1.19
345
JPMorgan Funds - JF Pacific Equity FundSchedule of Investments (Market Value Expressed in USD)
As at 30 June 2011
Quantity/Nominal
Value
Name of Securities Maturity/Coupon
MarketValue
%of
NetAssets
Quantity/Nominal
Value
Name of Securities Maturity/Coupon
MarketValue
%of
NetAssets
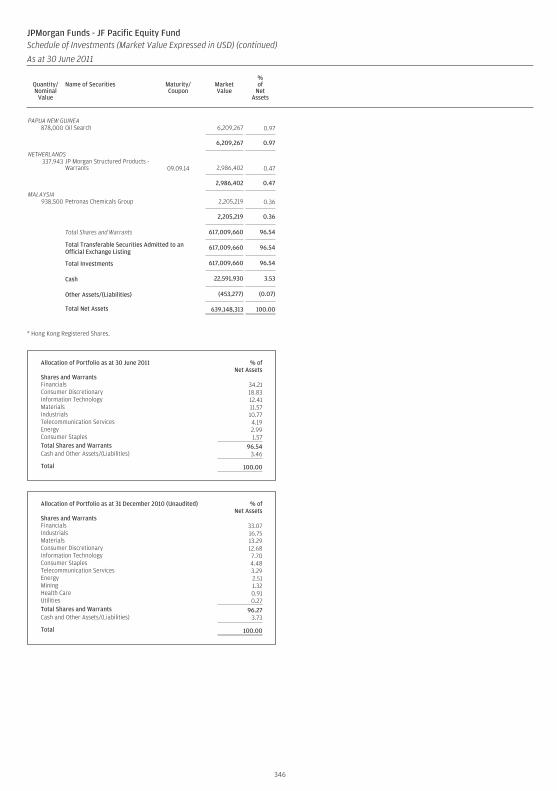
PAPUA NEW GUINEA878,000 Oil Search 6,209,267 0.97
6,209,267 0.97
NETHERLANDS337,943 JP Morgan Structured Products -
Warrants 09.09.14 2,986,402 0.47
2,986,402 0.47
MALAYSIA938,500 Petronas Chemicals Group 2,205,219 0.36
2,205,219 0.36
Total Shares and Warrants 617,009,660 96.54
Total Transferable Securities Admitted to anOfficial Exchange Listing
617,009,660 96.54
Total Investments 617,009,660 96.54
Cash 22,591,930 3.53
Other Assets/(Liabilities) (453,277) (0.07)
Total Net Assets 639,148,313 100.00
* Hong Kong Registered Shares.
Allocation of Portfolio as at 30 June 2011 % ofNet Assets
Shares and WarrantsFinancials 34.21Consumer Discretionary 18.83Information Technology 12.41Materials 11.57Industrials 10.77Telecommunication Services 4.19Energy 2.99Consumer Staples 1.57Total Shares and Warrants 96.54Cash and Other Assets/(Liabilities) 3.46
Total 100.00
Allocation of Portfolio as at 31 December 2010 (Unaudited) % ofNet Assets
Shares and WarrantsFinancials 33.07Industrials 16.75Materials 13.29Consumer Discretionary 12.68Information Technology 7.70Consumer Staples 4.48Telecommunication Services 3.29Energy 2.51Mining 1.32Health Care 0.91Utilities 0.27Total Shares and Warrants 96.27Cash and Other Assets/(Liabilities) 3.73
Total 100.00
346
JPMorgan Funds - JF Pacific Equity FundSchedule of Investments (Market Value Expressed in USD) (continued)
As at 30 June 2011
Quantity/Nominal
Value
Name of Securities Maturity/Coupon
MarketValue
%of
NetAssets
Quantity/Nominal
Value
Name of Securities Maturity/Coupon
MarketValue
%of
NetAssets
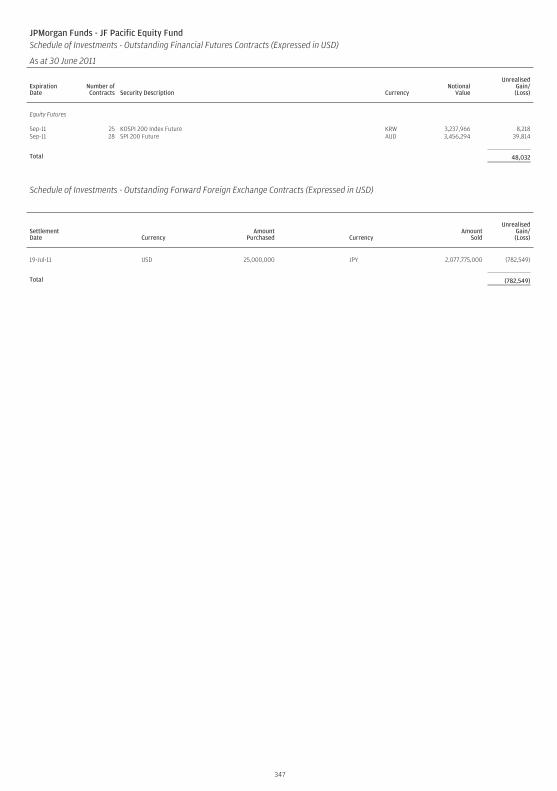
JPMorgan Funds - JF Pacific Equity FundSchedule of Investments - Outstanding Financial Futures Contracts (Expressed in USD)
As at 30 June 2011
ExpirationDate
Number ofContracts Security Description Currency
NotionalValue
UnrealisedGain/(Loss)
Equity Futures
Sep-11 25 KOSPI 200 Index Future KRW 3,237,966 8,218Sep-11 28 SPI 200 Future AUD 3,456,294 39,814
Total 48,032
Schedule of Investments - Outstanding Forward Foreign Exchange Contracts (Expressed in USD)
SettlementDate Currency
AmountPurchased Currency
AmountSold
UnrealisedGain/(Loss)
19-Jul-11 USD 25,000,000 JPY 2,077,775,000 (782,549)
Total (782,549)
347
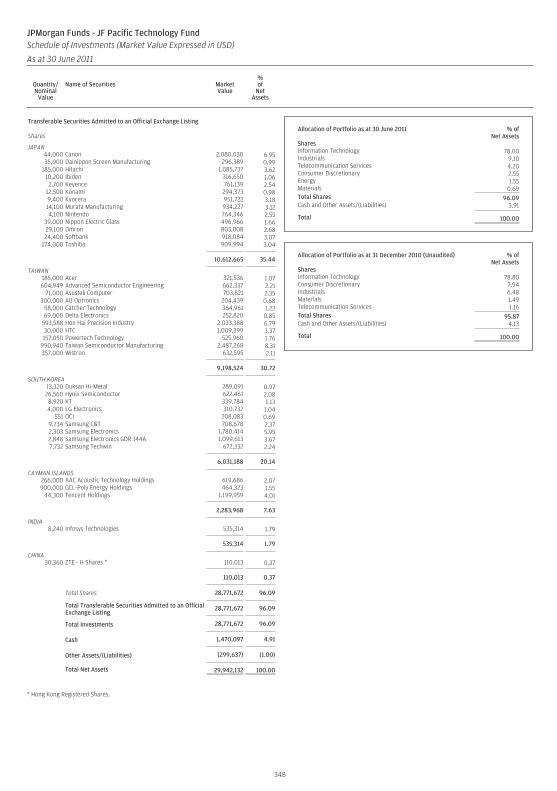
Transferable Securities Admitted to an Official Exchange Listing
Shares
JAPAN44,000 Canon 2,080,030 6.9535,000 Dainippon Screen Manufacturing 296,389 0.99
185,000 Hitachi 1,085,737 3.6210,200 Ibiden 316,650 1.062,700 Keyence 761,139 2.54
12,500 Konami 294,373 0.989,400 Kyocera 951,722 3.1814,100 Murata Manufacturing 934,227 3.124,100 Nintendo 764,346 2.55
39,000 Nippon Electric Glass 496,966 1.6629,100 Omron 803,008 2.6824,400 Softbank 918,084 3.07
174,000 Toshiba 909,994 3.04
10,612,665 35.44
TAIWAN185,000 Acer 321,536 1.07604,949 Advanced Semiconductor Engineering 662,337 2.21
71,000 Asustek Computer 703,821 2.35300,000 AU Optronics 204,439 0.68
58,000 Catcher Technology 364,961 1.2269,000 Delta Electronics 252,820 0.85
593,588 Hon Hai Precision Industry 2,033,388 6.7930,000 HTC 1,009,399 3.37157,050 Powertech Technology 525,960 1.76
990,940 Taiwan Semiconductor Manufacturing 2,487,268 8.31357,000 Wistron 632,595 2.11
9,198,524 30.72
SOUTH KOREA13,320 Duksan Hi-Metal 289,091 0.9726,560 Hynix Semiconductor 622,461 2.088,920 KT 339,784 1.134,000 LG Electronics 310,732 1.04
551 OCI 208,083 0.699,234 Samsung C&T 708,678 2.372,303 Samsung Electronics 1,780,414 5.952,848 Samsung Electronics GDR 144A 1,099,613 3.677,732 Samsung Techwin 672,332 2.24
6,031,188 20.14
CAYMAN ISLANDS266,000 AAC Acoustic Technology Holdings 619,686 2.07900,000 GCL-Poly Energy Holdings 464,323 1.55
44,300 Tencent Holdings 1,199,959 4.01
2,283,968 7.63
INDIA8,240 Infosys Technologies 535,314 1.79
535,314 1.79
CHINA30,360 ZTE - H Shares * 110,013 0.37
110,013 0.37
Total Shares 28,771,672 96.09
Total Transferable Securities Admitted to an OfficialExchange Listing
28,771,672 96.09
Total Investments 28,771,672 96.09
Cash 1,470,097 4.91
Other Assets/(Liabilities) (299,637) (1.00)
Total Net Assets 29,942,132 100.00
* Hong Kong Registered Shares.
Allocation of Portfolio as at 30 June 2011 % ofNet Assets
SharesInformation Technology 78.00Industrials 9.10Telecommunication Services 4.20Consumer Discretionary 2.55Energy 1.55Materials 0.69Total Shares 96.09Cash and Other Assets/(Liabilities) 3.91
Total 100.00
Allocation of Portfolio as at 31 December 2010 (Unaudited) % ofNet Assets
SharesInformation Technology 78.80Consumer Discretionary 7.94Industrials 6.48Materials 1.49Telecommunication Services 1.16Total Shares 95.87Cash and Other Assets/(Liabilities) 4.13
Total 100.00
348
JPMorgan Funds - JF Pacific Technology FundSchedule of Investments (Market Value Expressed in USD)
As at 30 June 2011
Quantity/Nominal
Value
Name of Securities MarketValue
%of
NetAssets
Quantity/Nominal
Value
Name of Securities MarketValue
%of
NetAssets
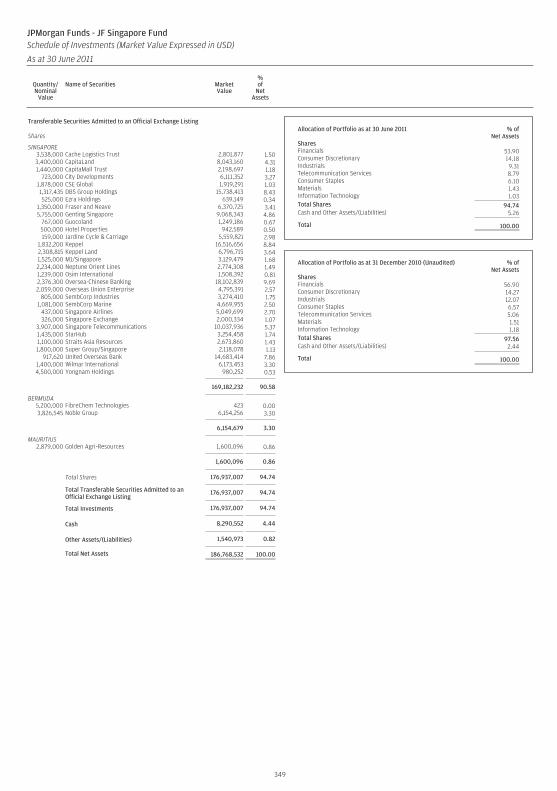
Transferable Securities Admitted to an Official Exchange Listing
Shares
SINGAPORE3,538,000 Cache Logistics Trust 2,801,877 1.503,400,000 CapitaLand 8,043,160 4.311,440,000 CapitaMall Trust 2,198,697 1.18
723,000 City Developments 6,111,352 3.271,878,000 CSE Global 1,919,291 1.031,317,435 DBS Group Holdings 15,738,413 8.43525,000 Ezra Holdings 639,149 0.34
1,350,000 Fraser and Neave 6,370,725 3.415,755,000 Genting Singapore 9,068,343 4.86
767,000 Guocoland 1,249,186 0.67500,000 Hotel Properties 942,589 0.50159,000 Jardine Cycle & Carriage 5,559,821 2.98
1,832,200 Keppel 16,516,656 8.842,308,815 Keppel Land 6,796,715 3.641,525,000 M1/Singapore 3,129,479 1.682,234,000 Neptune Orient Lines 2,774,308 1.491,239,000 Osim International 1,508,392 0.812,376,300 Oversea-Chinese Banking 18,102,839 9.692,059,000 Overseas Union Enterprise 4,795,391 2.57
805,000 SembCorp Industries 3,274,410 1.751,081,000 SembCorp Marine 4,669,955 2.50
437,000 Singapore Airlines 5,049,699 2.70326,000 Singapore Exchange 2,000,334 1.07
3,907,000 Singapore Telecommunications 10,037,936 5.371,435,000 StarHub 3,254,458 1.741,100,000 Straits Asia Resources 2,673,860 1.431,800,000 Super Group/Singapore 2,118,078 1.13
917,620 United Overseas Bank 14,683,414 7.861,400,000 Wilmar International 6,173,453 3.304,500,000 Yongnam Holdings 980,252 0.53
169,182,232 90.58
BERMUDA5,200,000 FibreChem Technologies 423 0.003,826,545 Noble Group 6,154,256 3.30
6,154,679 3.30
MAURITIUS2,879,000 Golden Agri-Resources 1,600,096 0.86
1,600,096 0.86
Total Shares 176,937,007 94.74
Total Transferable Securities Admitted to anOfficial Exchange Listing
176,937,007 94.74
Total Investments 176,937,007 94.74
Cash 8,290,552 4.44
Other Assets/(Liabilities) 1,540,973 0.82
Total Net Assets 186,768,532 100.00
Allocation of Portfolio as at 30 June 2011 % ofNet Assets
SharesFinancials 53.90Consumer Discretionary 14.18Industrials 9.31Telecommunication Services 8.79Consumer Staples 6.10Materials 1.43Information Technology 1.03Total Shares 94.74Cash and Other Assets/(Liabilities) 5.26
Total 100.00
Allocation of Portfolio as at 31 December 2010 (Unaudited) % ofNet Assets
SharesFinancials 56.90Consumer Discretionary 14.27Industrials 12.07Consumer Staples 6.57Telecommunication Services 5.06Materials 1.51Information Technology 1.18Total Shares 97.56Cash and Other Assets/(Liabilities) 2.44
Total 100.00
349
JPMorgan Funds - JF Singapore FundSchedule of Investments (Market Value Expressed in USD)
As at 30 June 2011
Quantity/Nominal
Value
Name of Securities MarketValue
%of
NetAssets
Quantity/Nominal
Value
Name of Securities MarketValue
%of
NetAssets
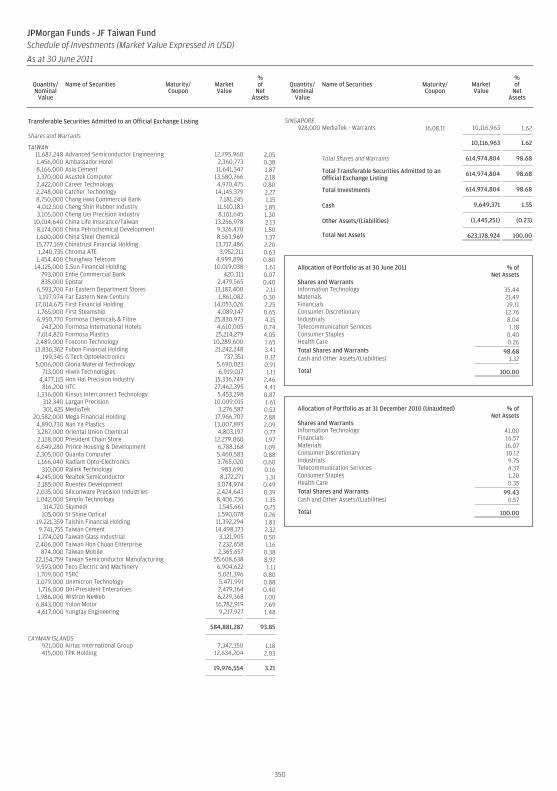
Transferable Securities Admitted to an Official Exchange Listing
Shares and Warrants
TAIWAN11,687,248 Advanced Semiconductor Engineering 12,795,960 2.051,456,000 Ambassador Hotel 2,360,773 0.388,166,000 Asia Cement 11,641,347 1.871,370,000 Asustek Computer 13,580,766 2.182,422,000 Career Technology 4,970,475 0.802,248,000 Catcher Technology 14,145,379 2.278,750,000 Chang Hwa Commercial Bank 7,181,245 1.154,012,500 Cheng Shin Rubber Industry 11,510,183 1.853,105,000 Cheng Uei Precision Industry 8,101,645 1.30
10,014,640 China Life Insurance/Taiwan 13,256,978 2.138,174,000 China Petrochemical Development 9,326,470 1.501,600,000 China Steel Chemical 8,563,969 1.3715,777,169 Chinatrust Financial Holding 13,717,486 2.201,240,735 Chroma ATE 3,952,211 0.631,454,400 Chunghwa Telecom 4,999,896 0.80
14,125,000 E.Sun Financial Holding 10,019,038 1.61793,000 Entie Commercial Bank 420,311 0.07835,000 Epistar 2,479,565 0.40
6,593,700 Far Eastern Department Stores 13,187,400 2.111,197,974 Far Eastern New Century 1,861,082 0.30
17,014,675 First Financial Holding 14,053,026 2.251,765,000 First Steamship 4,089,147 0.656,950,770 Formosa Chemicals & Fibre 25,830,973 4.15
243,200 Formosa International Hotels 4,610,005 0.747,014,820 Formosa Plastics 25,214,279 4.05
2,489,000 Foxconn Technology 10,289,600 1.6513,836,362 Fubon Financial Holding 21,242,248 3.41
199,345 G Tech Optoelectronics 737,351 0.125,006,000 Gloria Material Technology 5,690,023 0.91
713,000 Hiwin Technologies 6,919,017 1.114,477,115 Hon Hai Precision Industry 15,336,749 2.46816,200 HTC 27,462,395 4.41
1,336,000 Kinsus Interconnect Technology 5,453,298 0.87312,340 Largan Precision 10,009,015 1.61301,425 MediaTek 3,276,587 0.53
20,582,000 Mega Financial Holding 17,966,707 2.884,890,730 Nan Ya Plastics 13,007,895 2.093,287,000 Oriental Union Chemical 4,803,197 0.772,128,000 President Chain Store 12,279,060 1.976,649,280 Prince Housing & Development 6,788,168 1.092,305,000 Quanta Computer 5,460,583 0.881,166,040 Radiant Opto-Electronics 3,765,020 0.60
310,000 Ralink Technology 983,690 0.164,245,000 Realtek Semiconductor 8,172,271 1.312,185,000 Ruentex Development 3,074,974 0.492,035,000 Siliconware Precision Industries 2,424,643 0.391,042,000 Simplo Technology 8,406,736 1.35
314,720 Skymedi 1,545,661 0.25105,000 St Shine Optical 1,590,078 0.26
19,221,359 Taishin Financial Holding 11,392,294 1.839,741,755 Taiwan Cement 14,498,173 2.321,774,020 Taiwan Glass Industrial 3,121,905 0.50
2,406,000 Taiwan Hon Chuan Enterprise 7,232,658 1.16874,000 Taiwan Mobile 2,365,657 0.38
22,154,759 Taiwan Semiconductor Manufacturing 55,608,638 8.929,593,000 Teco Electric and Machinery 6,904,622 1.111,709,000 TSRC 5,021,396 0.803,079,000 Unimicron Technology 5,471,991 0.881,716,000 Uni-President Enterprises 2,479,164 0.401,986,000 Wistron NeWeb 6,229,368 1.006,843,000 Yulon Motor 16,782,919 2.694,617,000 Yungtay Engineering 9,217,927 1.48
584,881,287 93.85
CAYMAN ISLANDS921,000 Airtac International Group 7,342,350 1.18415,000 TPK Holding 12,634,204 2.03
19,976,554 3.21
SINGAPORE928,000 MediaTek - Warrants 16.08.11 10,116,963 1.62
10,116,963 1.62
Total Shares and Warrants 614,974,804 98.68
Total Transferable Securities Admitted to anOfficial Exchange Listing
614,974,804 98.68
Total Investments 614,974,804 98.68
Cash 9,649,371 1.55
Other Assets/(Liabilities) (1,445,251) (0.23)
Total Net Assets 623,178,924 100.00
Allocation of Portfolio as at 30 June 2011 % ofNet Assets
Shares and WarrantsInformation Technology 35.44Materials 21.49Financials 19.11Consumer Discretionary 12.76Industrials 8.04Telecommunication Services 1.18Consumer Staples 0.40Health Care 0.26Total Shares and Warrants 98.68Cash and Other Assets/(Liabilities) 1.32
Total 100.00
Allocation of Portfolio as at 31 December 2010 (Unaudited) % ofNet Assets
Shares and WarrantsInformation Technology 41.00Financials 16.57Materials 16.07Consumer Discretionary 10.12Industrials 9.75Telecommunication Services 4.37Consumer Staples 1.20Health Care 0.35Total Shares and Warrants 99.43Cash and Other Assets/(Liabilities) 0.57
Total 100.00
350
JPMorgan Funds - JF Taiwan FundSchedule of Investments (Market Value Expressed in USD)
As at 30 June 2011
Quantity/Nominal
Value
Name of Securities Maturity/Coupon
MarketValue
%of
NetAssets
Quantity/Nominal
Value
Name of Securities Maturity/Coupon
MarketValue
%of
NetAssets
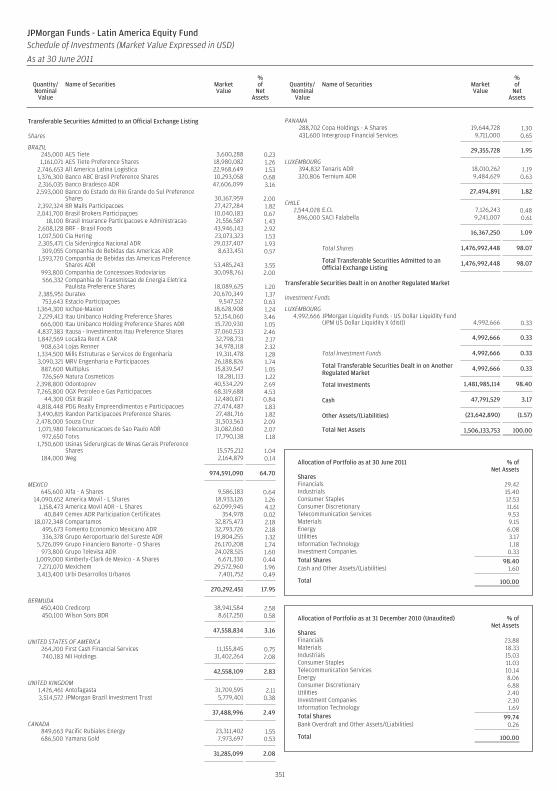
Transferable Securities Admitted to an Official Exchange Listing
Shares
BRAZIL245,000 AES Tiete 3,600,288 0.231,161,071 AES Tiete Preference Shares 18,980,082 1.26
2,746,653 All America Latina Logistica 22,968,649 1.531,376,300 Banco ABC Brasil Preference Shares 10,293,058 0.682,316,035 Banco Bradesco ADR 47,606,099 3.16
2,593,000 Banco do Estado do Rio Grande do Sul PreferenceShares 30,167,959 2.00
2,392,324 BR Malls Participacoes 27,427,284 1.822,041,700 Brasil Brokers Participaçoes 10,040,183 0.67
18,100 Brasil Insurance Participacoes e Administracao 21,556,587 1.432,608,128 BRF - Brasil Foods 43,946,143 2.921,017,500 Cia Hering 23,073,323 1.532,305,471 Cía Siderúrgica Nacional ADR 29,037,407 1.93
309,055 Companhia de Bebidas das Americas ADR 8,633,451 0.571,593,720 Companhia de Bebidas das Americas Preference
Shares ADR 53,485,243 3.55993,800 Companhia de Concessoes Rodoviarias 30,098,761 2.00566,332 Companhia de Transmissao de Energia Eletrica
Paulista Preference Shares 18,089,625 1.202,385,951 Duratex 20,670,349 1.37
753,643 Estacio Participaçoes 9,547,512 0.631,364,300 Iochpe-Maxion 18,628,908 1.242,229,413 Itau Unibanco Holding Preference Shares 52,154,060 3.46666,000 Itau Unibanco Holding Preference Shares ADR 15,720,930 1.05
4,837,383 Itausa - Investimentos Itau Preference Shares 37,060,533 2.461,842,569 Localiza Rent A CAR 32,798,731 2.17
908,634 Lojas Renner 34,978,118 2.321,334,500 Mills Estruturas e Servicos de Engenharia 19,311,478 1.283,090,321 MRV Engenharia e Participacoes 26,188,826 1.74
887,600 Multiplus 15,839,547 1.05726,569 Natura Cosmeticos 18,281,113 1.22
2,398,800 Odontoprev 40,534,229 2.697,265,800 OGX Petroleo e Gas Participacoes 68,319,688 4.53
44,300 OSX Brasil 12,480,871 0.844,818,448 PDG Realty Empreendimentos e Participacoes 27,474,487 1.833,490,815 Randon Participacoes Preference Shares 27,481,716 1.822,478,000 Souza Cruz 31,503,563 2.091,071,980 Telecomunicacoes de Sao Paulo ADR 31,082,060 2.07
972,650 Totvs 17,790,138 1.181,750,600 Usinas Siderurgicas de Minas Gerais Preference
Shares 15,575,212 1.04184,000 Weg 2,164,879 0.14
974,591,090 64.70
MEXICO645,600 Alfa - A Shares 9,586,183 0.64
14,090,652 America Movil - L Shares 18,933,126 1.261,158,473 America Movil ADR - L Shares 62,099,945 4.12
40,849 Cemex ADR Participation Certificates 354,978 0.0218,072,348 Compartamos 32,875,473 2.18
495,673 Fomento Economico Mexicano ADR 32,793,726 2.18336,378 Grupo Aeroportuario del Sureste ADR 19,804,255 1.32
5,726,099 Grupo Financiero Banorte - O Shares 26,170,208 1.74973,800 Grupo Televisa ADR 24,028,515 1.60
1,009,000 Kimberly-Clark de Mexico - A Shares 6,671,330 0.447,271,070 Mexichem 29,572,960 1.963,413,400 Urbi Desarrollos Urbanos 7,401,752 0.49
270,292,451 17.95
BERMUDA450,400 Credicorp 38,941,584 2.58450,100 Wilson Sons BDR 8,617,250 0.58
47,558,834 3.16
UNITED STATES OF AMERICA264,200 First Cash Financial Services 11,155,845 0.75740,183 NII Holdings 31,402,264 2.08
42,558,109 2.83
UNITED KINGDOM1,426,461 Antofagasta 31,709,595 2.113,514,572 JPMorgan Brazil Investment Trust 5,779,401 0.38
37,488,996 2.49
CANADA849,663 Pacific Rubiales Energy 23,311,402 1.55686,500 Yamana Gold 7,973,697 0.53
31,285,099 2.08
PANAMA288,702 Copa Holdings - A Shares 19,644,728 1.30431,600 Intergroup Financial Services 9,711,000 0.65
29,355,728 1.95
LUXEMBOURG394,832 Tenaris ADR 18,010,262 1.19320,806 Ternium ADR 9,484,629 0.63
27,494,891 1.82
CHILE2,544,028 E.CL 7,126,243 0.48
896,000 SACI Falabella 9,241,007 0.61
16,367,250 1.09
Total Shares 1,476,992,448 98.07
Total Transferable Securities Admitted to anOfficial Exchange Listing
1,476,992,448 98.07
Transferable Securities Dealt in on Another Regulated Market
Investment Funds
LUXEMBOURG4,992,666 JPMorgan Liquidity Funds - US Dollar Liquidity Fund
(JPM US Dollar Liquidity X (dist)) 4,992,666 0.33
4,992,666 0.33
Total Investment Funds 4,992,666 0.33
Total Transferable Securities Dealt in on AnotherRegulated Market
4,992,666 0.33
Total Investments 1,481,985,114 98.40
Cash 47,791,529 3.17
Other Assets/(Liabilities) (23,642,890) (1.57)
Total Net Assets 1,506,133,753 100.00
Allocation of Portfolio as at 30 June 2011 % ofNet Assets
SharesFinancials 29.42Industrials 15.40Consumer Staples 12.53Consumer Discretionary 11.61Telecommunication Services 9.53Materials 9.15Energy 6.08Utilities 3.17Information Technology 1.18Investment Companies 0.33Total Shares 98.40Cash and Other Assets/(Liabilities) 1.60
Total 100.00
Allocation of Portfolio as at 31 December 2010 (Unaudited) % ofNet Assets
SharesFinancials 23.88Materials 18.33Industrials 15.03Consumer Staples 11.03Telecommunication Services 10.14Energy 8.06Consumer Discretionary 6.88Utilities 2.40Investment Companies 2.30Information Technology 1.69Total Shares 99.74Bank Overdraft and Other Assets/(Liabilities) 0.26
Total 100.00
351
JPMorgan Funds - Latin America Equity FundSchedule of Investments (Market Value Expressed in USD)
As at 30 June 2011
Quantity/Nominal
Value
Name of Securities MarketValue
%of
NetAssets
Quantity/Nominal
Value
Name of Securities MarketValue
%of
NetAssets
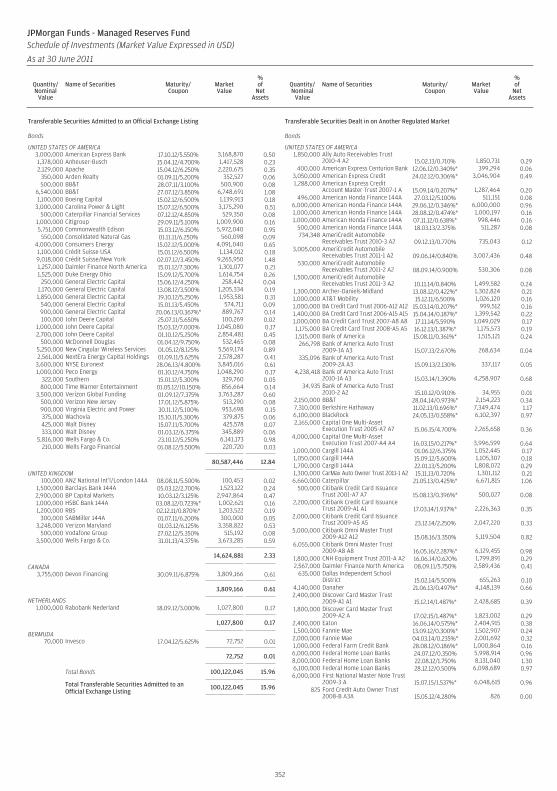
Transferable Securities Admitted to an Official Exchange Listing
Bonds
UNITED STATES OF AMERICA3,000,000 American Express Bank 17.10.12/5.550% 3,168,870 0.501,378,000 Anheuser-Busch 15.04.12/4.700% 1,417,528 0.232,129,000 Apache 15.04.12/6.250% 2,220,675 0.35
350,000 Arden Realty 01.09.11/5.200% 352,527 0.06500,000 BB&T 28.07.11/3.100% 500,900 0.08
6,540,000 BB&T 27.07.12/3.850% 6,748,691 1.081,100,000 Boeing Capital 15.02.12/6.500% 1,139,913 0.18
3,000,000 Carolina Power & Light 15.07.12/6.500% 3,175,290 0.51500,000 Caterpillar Financial Services 07.12.12/4.850% 529,350 0.08
1,000,000 Citigroup 29.09.11/5.100% 1,009,900 0.165,751,000 Commonwealth Edison 15.03.12/6.150% 5,972,040 0.95
550,000 Consolidated Natural Gas 01.11.11/6.250% 560,098 0.094,000,000 Consumers Energy 15.02.12/5.000% 4,091,040 0.651,100,000 Crédit Suisse USA 15.01.12/6.500% 1,134,012 0.189,018,000 Crédit Suisse/New York 02.07.12/3.450% 9,265,950 1.481,257,000 Daimler Finance North America 15.01.12/7.300% 1,301,077 0.211,525,000 Duke Energy Ohio 15.09.12/5.700% 1,614,754 0.26
250,000 General Electric Capital 15.06.12/4.250% 258,442 0.041,170,000 General Electric Capital 13.08.12/3.500% 1,205,334 0.191,850,000 General Electric Capital 19.10.12/5.250% 1,953,581 0.31
540,000 General Electric Capital 15.01.13/5.450% 574,711 0.09900,000 General Electric Capital 20.06.13/0.367%* 889,767 0.14100,000 John Deere Capital 25.07.11/5.650% 100,269 0.02
1,000,000 John Deere Capital 15.03.12/7.000% 1,045,080 0.172,700,000 John Deere Capital 01.10.12/5.250% 2,854,481 0.45
500,000 McDonnell Douglas 01.04.12/9.750% 532,465 0.085,250,000 New Cingular Wireless Services 01.05.12/8.125% 5,569,174 0.892,561,000 NextEra Energy Capital Holdings 01.09.11/5.625% 2,578,287 0.41
3,600,000 NYSE Euronext 28.06.13/4.800% 3,845,016 0.611,000,000 Peco Energy 01.10.12/4.750% 1,048,290 0.17
322,000 Southern 15.01.12/5.300% 329,760 0.05800,000 Time Warner Entertainment 01.05.12/10.150% 856,664 0.14
3,500,000 Verizon Global Funding 01.09.12/7.375% 3,763,287 0.60500,000 Verizon New Jersey 17.01.12/5.875% 513,290 0.08900,000 Virginia Electric and Power 30.11.12/5.100% 953,698 0.15375,000 Wachovia 15.10.11/5.300% 379,875 0.06425,000 Walt Disney 15.07.11/5.700% 425,578 0.07333,000 Walt Disney 01.03.12/6.375% 345,889 0.06
5,816,000 Wells Fargo & Co. 23.10.12/5.250% 6,141,173 0.98210,000 Wells Fargo Financial 01.08.12/5.500% 220,720 0.03
80,587,446 12.84
UNITED KINGDOM100,000 ANZ National Int’l/London 144A 08.08.11/5.500% 100,453 0.02
1,500,000 Barclays Bank 144A 05.03.12/2.700% 1,523,122 0.242,900,000 BP Capital Markets 10.03.12/3.125% 2,947,864 0.471,000,000 HSBC Bank 144A 03.08.12/0.723%* 1,002,621 0.161,200,000 RBS 02.12.11/0.870%* 1,203,522 0.19
300,000 SABMiller 144A 01.07.11/6.200% 300,000 0.053,248,000 Verizon Maryland 01.03.12/6.125% 3,358,822 0.53
500,000 Vodafone Group 27.02.12/5.350% 515,192 0.083,500,000 Wells Fargo & Co. 31.01.13/4.375% 3,673,285 0.59
14,624,881 2.33
CANADA3,755,000 Devon Financing 30.09.11/6.875% 3,809,166 0.61
3,809,166 0.61
NETHERLANDS1,000,000 Rabobank Nederland 18.09.12/3.000% 1,027,800 0.17
1,027,800 0.17
BERMUDA70,000 Invesco 17.04.12/5.625% 72,752 0.01
72,752 0.01
Total Bonds 100,122,045 15.96
Total Transferable Securities Admitted to anOfficial Exchange Listing
100,122,045 15.96
Transferable Securities Dealt in on Another Regulated Market
Bonds
UNITED STATES OF AMERICA1,850,000 Ally Auto Receivables Trust
2010-4 A2 15.02.13/0.710% 1,850,731 0.29400,000 American Express Centurion Bank 12.06.12/0.340%* 399,294 0.06
3,050,000 American Express Credit 24.02.12/0.306%* 3,046,904 0.491,288,000 American Express Credit
Account Master Trust 2007-1 A 15.09.14/0.207%* 1,287,464 0.20496,000 American Honda Finance 144A 27.03.12/5.100% 511,151 0.08
6,000,000 American Honda Finance 144A 29.06.12/0.346%* 6,000,000 0.961,000,000 American Honda Finance 144A 28.08.12/0.474%* 1,000,197 0.161,000,000 American Honda Finance 144A 07.11.12/0.638%* 998,446 0.16
500,000 American Honda Finance 144A 18.03.13/2.375% 511,287 0.08734,348 AmeriCredit Automobile
Receivables Trust 2010-3 A2 09.12.13/0.770% 735,043 0.123,005,000 AmeriCredit Automobile
Receivables Trust 2011-1 A2 09.06.14/0.840% 3,007,436 0.48530,000 AmeriCredit Automobile
Receivables Trust 2011-2 A2 08.09.14/0.900% 530,306 0.081,500,000 AmeriCredit Automobile
Receivables Trust 2011-3 A2 10.11.14/0.840% 1,499,582 0.241,300,000 Archer-Daniels-Midland 13.08.12/0.422%* 1,302,824 0.211,000,000 AT&T Mobility 15.12.11/6.500% 1,026,120 0.161,000,000 BA Credit Card Trust 2006-A12 A12 15.03.14/0.207%* 999,512 0.161,400,000 BA Credit Card Trust 2006-A15 A15 15.04.14/0.187%* 1,399,542 0.221,000,000 BA Credit Card Trust 2007-A8 A8 17.11.14/5.590% 1,049,029 0.171,175,000 BA Credit Card Trust 2008-A5 A5 16.12.13/1.387%* 1,175,573 0.191,515,000 Bank of America 15.08.11/0.361%* 1,515,121 0.24
266,798 Bank of America Auto Trust2009-1A A3 15.07.13/2.670% 268,634 0.04
335,096 Bank of America Auto Trust2009-2A A3 15.09.13/2.130% 337,117 0.05
4,238,418 Bank of America Auto Trust2010-1A A3 15.03.14/1.390% 4,258,907 0.68
34,935 Bank of America Auto Trust2010-2 A2 15.10.12/0.910% 34,955 0.01
2,150,000 BB&T 28.04.14/0.973%* 2,154,223 0.347,310,000 Berkshire Hathaway 11.02.13/0.696%* 7,349,474 1.176,100,000 BlackRock 24.05.13/0.558%* 6,102,397 0.972,165,000 Capital One Multi-Asset
Execution Trust 2005-A7 A7 15.06.15/4.700% 2,265,658 0.364,000,000 Capital One Multi-Asset
Execution Trust 2007-A4 A4 16.03.15/0.217%* 3,996,599 0.641,000,000 Cargill 144A 01.06.12/6.375% 1,052,445 0.171,050,000 Cargill 144A 15.09.12/5.600% 1,105,307 0.181,700,000 Cargill 144A 22.01.13/5.200% 1,808,072 0.291,300,000 CarMax Auto Owner Trust 2011-1 A2 15.11.13/0.720% 1,301,112 0.216,660,000 Caterpillar 21.05.13/0.425%* 6,671,815 1.06
500,000 Citibank Credit Card IssuanceTrust 2001-A7 A7 15.08.13/0.396%* 500,027 0.08
2,200,000 Citibank Credit Card IssuanceTrust 2009-A1 A1 17.03.14/1.937%* 2,226,363 0.35
2,000,000 Citibank Credit Card IssuanceTrust 2009-A5 A5 23.12.14/2.250% 2,047,220 0.33
5,000,000 Citibank Omni Master Trust2009-A12 A12 15.08.16/3.350% 5,119,504 0.82
6,055,000 Citibank Omni Master Trust2009-A8 A8 16.05.16/2.287%* 6,129,455 0.98
1,800,000 CNH Equipment Trust 2011-A A2 16.06.14/0.620% 1,799,891 0.292,567,000 Daimler Finance North America 08.09.11/5.750% 2,589,436 0.41
635,000 Dallas Independent SchoolDistrict 15.02.14/5.500% 655,263 0.10
4,140,000 Danaher 21.06.13/0.497%* 4,148,139 0.662,400,000 Discover Card Master Trust
2009-A1 A1 15.12.14/1.487%* 2,428,685 0.391,800,000 Discover Card Master Trust
2009-A2 A 17.02.15/1.487%* 1,823,002 0.292,400,000 Eaton 16.06.14/0.575%* 2,404,915 0.381,500,000 Fannie Mae 13.09.12/0.300%* 1,502,907 0.242,000,000 Fannie Mae 04.03.14/0.235%* 2,001,692 0.321,000,000 Federal Farm Credit Bank 28.08.12/0.186%* 1,000,864 0.166,000,000 Federal Home Loan Banks 24.07.12/0.350% 5,998,914 0.968,000,000 Federal Home Loan Banks 22.08.12/1.750% 8,131,040 1.306,100,000 Federal Home Loan Banks 28.12.12/0.500% 6,098,689 0.976,000,000 First National Master Note Trust
2009-3 A 15.07.15/1.537%* 6,048,615 0.96825 Ford Credit Auto Owner Trust
2008-B A3A 15.05.12/4.280% 826 0.00
352
JPMorgan Funds - Managed Reserves FundSchedule of Investments (Market Value Expressed in USD)
As at 30 June 2011
Quantity/Nominal
Value
Name of Securities Maturity/Coupon
MarketValue
%of
NetAssets
Quantity/Nominal
Value
Name of Securities Maturity/Coupon
MarketValue
%of
NetAssets
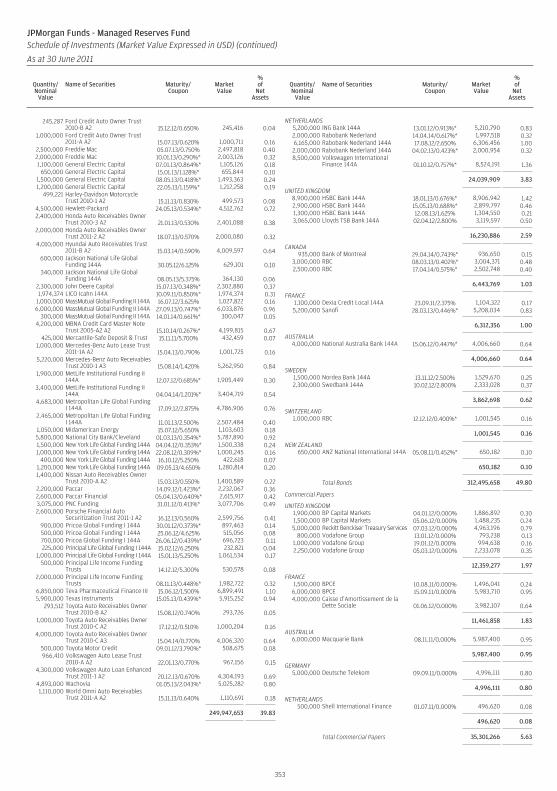
245,287 Ford Credit Auto Owner Trust2010-B A2 15.12.12/0.650% 245,416 0.04
1,000,000 Ford Credit Auto Owner Trust2011-A A2 15.07.13/0.620% 1,000,711 0.16
2,500,000 Freddie Mac 05.07.13/0.750% 2,497,818 0.402,000,000 Freddie Mac 10.01.13/0.290%* 2,003,126 0.321,100,000 General Electric Capital 07.01.13/0.864%* 1,105,126 0.18
650,000 General Electric Capital 15.01.13/1.128%* 655,844 0.101,500,000 General Electric Capital 08.05.13/0.418%* 1,493,363 0.241,200,000 General Electric Capital 22.05.13/1.159%* 1,212,258 0.19
499,221 Harley-Davidson MotorcycleTrust 2010-1 A2 15.11.13/0.830% 499,573 0.08
4,500,000 Hewlett-Packard 24.05.13/0.534%* 4,512,762 0.722,400,000 Honda Auto Receivables Owner
Trust 2010-3 A2 21.01.13/0.530% 2,401,088 0.382,000,000 Honda Auto Receivables Owner
Trust 2011-2 A2 18.07.13/0.570% 2,000,080 0.324,010,000 Hyundai Auto Receivables Trust
2011-B A2 15.03.14/0.590% 4,009,597 0.64600,000 Jackson National Life Global
Funding 144A 30.05.12/6.125% 629,101 0.10340,000 Jackson National Life Global
Funding 144A 08.05.13/5.375% 364,130 0.062,300,000 John Deere Capital 15.07.13/0.348%* 2,302,880 0.371,974,374 LICO Icahn 144A 10.09.11/0.850%* 1,974,374 0.31
1,000,000 MassMutual Global Funding II 144A 16.07.12/3.625% 1,027,822 0.166,000,000 MassMutual Global Funding II 144A 27.09.13/0.747%* 6,033,876 0.96
300,000 MassMutual Global Funding II 144A 14.01.14/0.661%* 300,047 0.054,200,000 MBNA Credit Card Master Note
Trust 2005-A2 A2 15.10.14/0.267%* 4,199,815 0.67425,000 Mercantile-Safe Deposit & Trust 15.11.11/5.700% 432,459 0.07
1,000,000 Mercedes-Benz Auto Lease Trust2011-1A A2 15.04.13/0.790% 1,001,725 0.16
5,220,000 Mercedes-Benz Auto ReceivablesTrust 2010-1 A3 15.08.14/1.420% 5,262,950 0.84
1,900,000 MetLife Institutional Funding II144A 12.07.12/0.685%* 1,905,449 0.30
3,400,000 MetLife Institutional Funding II144A 04.04.14/1.201%* 3,404,719 0.54
4,683,000 Metropolitan Life Global FundingI 144A 17.09.12/2.875% 4,786,906 0.76
2,465,000 Metropolitan Life Global FundingI 144A 11.01.13/2.500% 2,507,484 0.40
1,050,000 Midamerican Energy 15.07.12/5.650% 1,103,603 0.185,800,000 National City Bank/Cleveland 01.03.13/0.354%* 5,787,890 0.921,500,000 New York Life Global Funding 144A 04.04.12/0.353%* 1,500,338 0.241,000,000 New York Life Global Funding 144A 22.08.12/0.309%* 1,000,245 0.16
400,000 New York Life Global Funding 144A 16.10.12/5.250% 422,618 0.071,200,000 New York Life Global Funding 144A 09.05.13/4.650% 1,280,814 0.201,400,000 Nissan Auto Receivables Owner
Trust 2010-A A2 15.03.13/0.550% 1,400,589 0.222,200,000 Paccar 14.09.12/1.423%* 2,232,067 0.362,600,000 Paccar Financial 05.04.13/0.640%* 2,615,917 0.423,075,000 PNC Funding 31.01.12/0.413%* 3,077,706 0.492,600,000 Porsche Financial Auto
Securitization Trust 2011-1 A2 16.12.13/0.560% 2,599,756 0.41900,000 Pricoa Global Funding I 144A 30.01.12/0.373%* 897,463 0.14500,000 Pricoa Global Funding I 144A 25.06.12/4.625% 515,056 0.08700,000 Pricoa Global Funding I 144A 26.06.12/0.439%* 696,723 0.11225,000 Principal Life Global Funding I 144A 15.02.12/6.250% 232,821 0.04
1,000,000 Principal Life Global Funding I 144A 15.01.13/5.250% 1,061,534 0.17500,000 Principal Life Income Funding
Trusts 14.12.12/5.300% 530,578 0.082,000,000 Principal Life Income Funding
Trusts 08.11.13/0.448%* 1,982,722 0.326,850,000 Teva Pharmaceutical Finance III 15.06.12/1.500% 6,899,491 1.105,900,000 Texas Instruments 15.05.13/0.439%* 5,915,252 0.94
293,512 Toyota Auto Receivables OwnerTrust 2010-B A2 15.08.12/0.740% 293,726 0.05
1,000,000 Toyota Auto Receivables OwnerTrust 2010-C A2 17.12.12/0.510% 1,000,204 0.16
4,000,000 Toyota Auto Receivables OwnerTrust 2010-C A3 15.04.14/0.770% 4,006,320 0.64
500,000 Toyota Motor Credit 09.01.12/3.790%* 508,675 0.08966,410 Volkswagen Auto Lease Trust
2010-A A2 22.01.13/0.770% 967,156 0.154,300,000 Volkswagen Auto Loan Enhanced
Trust 2011-1 A2 20.12.13/0.670% 4,304,193 0.694,893,000 Wachovia 01.05.13/2.043%* 5,025,282 0.801,110,000 World Omni Auto Receivables
Trust 2011-A A2 15.11.13/0.640% 1,110,691 0.18
249,947,653 39.83
NETHERLANDS5,200,000 ING Bank 144A 13.01.12/0.913%* 5,210,790 0.832,000,000 Rabobank Nederland 14.04.14/0.617%* 1,997,518 0.326,165,000 Rabobank Nederland 144A 17.08.12/2.650% 6,306,456 1.002,000,000 Rabobank Nederland 144A 04.02.13/0.423%* 2,000,954 0.328,500,000 Volkswagen International
Finance 144A 01.10.12/0.757%* 8,524,191 1.36
24,039,909 3.83
UNITED KINGDOM8,900,000 HSBC Bank 144A 18.01.13/0.676%* 8,906,942 1.422,900,000 HSBC Bank 144A 15.05.13/0.688%* 2,899,797 0.461,300,000 HSBC Bank 144A 12.08.13/1.625% 1,304,550 0.213,065,000 Lloyds TSB Bank 144A 02.04.12/2.800% 3,119,597 0.50
16,230,886 2.59
CANADA935,000 Bank of Montreal 29.04.14/0.743%* 936,650 0.15
3,000,000 RBC 08.03.13/0.402%* 3,004,371 0.482,500,000 RBC 17.04.14/0.575%* 2,502,748 0.40
6,443,769 1.03
FRANCE1,100,000 Dexia Credit Local 144A 23.09.11/2.375% 1,104,322 0.175,200,000 Sanofi 28.03.13/0.446%* 5,208,034 0.83
6,312,356 1.00
AUSTRALIA4,000,000 National Australia Bank 144A 15.06.12/0.447%* 4,006,660 0.64
4,006,660 0.64
SWEDEN1,500,000 Nordea Bank 144A 13.11.12/2.500% 1,529,670 0.252,300,000 Swedbank 144A 10.02.12/2.800% 2,333,028 0.37
3,862,698 0.62
SWITZERLAND1,000,000 RBC 12.12.12/0.400%* 1,001,545 0.16
1,001,545 0.16
NEW ZEALAND650,000 ANZ National International 144A 05.08.11/0.452%* 650,182 0.10
650,182 0.10
Total Bonds 312,495,658 49.80
Commercial Papers
UNITED KINGDOM1,900,000 BP Capital Markets 04.01.12/0.000% 1,886,892 0.301,500,000 BP Capital Markets 05.06.12/0.000% 1,488,235 0.245,000,000 Reckitt Benckiser Treasury Services 07.03.12/0.000% 4,963,196 0.79
800,000 Vodafone Group 13.01.12/0.000% 793,238 0.131,000,000 Vodafone Group 19.01.12/0.000% 994,638 0.162,250,000 Vodafone Group 05.03.12/0.000% 2,233,078 0.35
12,359,277 1.97
FRANCE1,500,000 BPCE 10.08.11/0.000% 1,496,041 0.246,000,000 BPCE 15.09.11/0.000% 5,983,710 0.954,000,000 Caisse d’Amortissement de la
Dette Sociale 01.06.12/0.000% 3,982,107 0.64
11,461,858 1.83
AUSTRALIA6,000,000 Macquarie Bank 08.11.11/0.000% 5,987,400 0.95
5,987,400 0.95
GERMANY5,000,000 Deutsche Telekom 09.09.11/0.000% 4,996,111 0.80
4,996,111 0.80
NETHERLANDS500,000 Shell International Finance 01.07.11/0.000% 496,620 0.08
496,620 0.08
Total Commercial Papers 35,301,266 5.63
353
JPMorgan Funds - Managed Reserves FundSchedule of Investments (Market Value Expressed in USD) (continued)
As at 30 June 2011
Quantity/Nominal
Value
Name of Securities Maturity/Coupon
MarketValue
%of
NetAssets
Quantity/Nominal
Value
Name of Securities Maturity/Coupon
MarketValue
%of
NetAssets
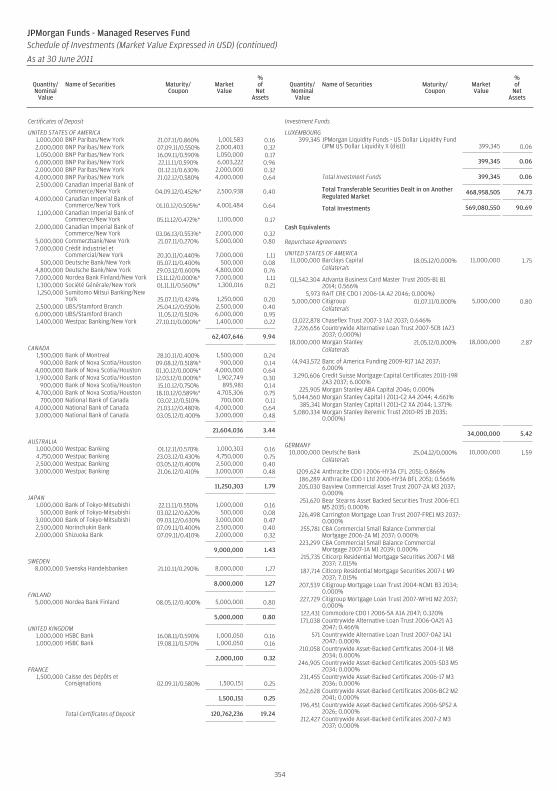
Certificates of Deposit
UNITED STATES OF AMERICA1,000,000 BNP Paribas/New York 21.07.11/0.860% 1,001,583 0.162,000,000 BNP Paribas/New York 07.09.11/0.550% 2,000,403 0.321,050,000 BNP Paribas/New York 16.09.11/0.590% 1,050,000 0.176,000,000 BNP Paribas/New York 22.11.11/0.590% 6,003,222 0.962,000,000 BNP Paribas/New York 01.12.11/0.630% 2,000,000 0.324,000,000 BNP Paribas/New York 21.02.12/0.580% 4,000,000 0.642,500,000 Canadian Imperial Bank of
Commerce/New York 04.09.12/0.452%* 2,500,938 0.404,000,000 Canadian Imperial Bank of
Commerce/New York 01.10.12/0.505%* 4,001,484 0.641,100,000 Canadian Imperial Bank of
Commerce/New York 05.11.12/0.472%* 1,100,000 0.172,000,000 Canadian Imperial Bank of
Commerce/New York 03.06.13/0.553%* 2,000,000 0.325,000,000 Commerzbank/New York 21.07.11/0.270% 5,000,000 0.807,000,000 Crédit Industriel et
Commercial/New York 20.10.11/0.440% 7,000,000 1.11500,000 Deutsche Bank/New York 05.07.11/0.400% 500,000 0.08
4,800,000 Deutsche Bank/New York 29.03.12/0.600% 4,800,000 0.767,000,000 Nordea Bank Finland/New York 13.11.12/0.000%* 7,000,000 1.111,300,000 Société Générale/New York 01.11.11/0.560%* 1,300,016 0.211,250,000 Sumitomo Mitsui Banking/New
York 25.07.11/0.424% 1,250,000 0.202,500,000 UBS/Stamford Branch 25.04.12/0.550% 2,500,000 0.406,000,000 UBS/Stamford Branch 11.05.12/0.510% 6,000,000 0.951,400,000 Westpac Banking/New York 27.10.11/0.000%* 1,400,000 0.22
62,407,646 9.94
CANADA1,500,000 Bank of Montreal 28.10.11/0.400% 1,500,000 0.24
900,000 Bank of Nova Scotia/Houston 09.08.12/0.518%* 900,000 0.144,000,000 Bank of Nova Scotia/Houston 01.10.12/0.000%* 4,000,000 0.641,900,000 Bank of Nova Scotia/Houston 12.03.12/0.000%* 1,902,749 0.30
900,000 Bank of Nova Scotia/Houston 15.10.12/0.750% 895,981 0.144,700,000 Bank of Nova Scotia/Houston 18.10.12/0.589%* 4,705,306 0.75
700,000 National Bank of Canada 03.02.12/0.510% 700,000 0.114,000,000 National Bank of Canada 21.03.12/0.480% 4,000,000 0.643,000,000 National Bank of Canada 03.05.12/0.400% 3,000,000 0.48
21,604,036 3.44
AUSTRALIA1,000,000 Westpac Banking 01.12.11/0.570% 1,000,303 0.164,750,000 Westpac Banking 23.03.12/0.430% 4,750,000 0.752,500,000 Westpac Banking 03.05.12/0.400% 2,500,000 0.403,000,000 Westpac Banking 21.06.12/0.410% 3,000,000 0.48
11,250,303 1.79
JAPAN1,000,000 Bank of Tokyo-Mitsubishi 22.11.11/0.550% 1,000,000 0.16
500,000 Bank of Tokyo-Mitsubishi 03.02.12/0.620% 500,000 0.083,000,000 Bank of Tokyo-Mitsubishi 09.03.12/0.630% 3,000,000 0.472,500,000 Norinchukin Bank 07.09.11/0.400% 2,500,000 0.402,000,000 Shizuoka Bank 07.09.11/0.410% 2,000,000 0.32
9,000,000 1.43
SWEDEN8,000,000 Svenska Handelsbanken 21.10.11/0.290% 8,000,000 1.27
8,000,000 1.27
FINLAND5,000,000 Nordea Bank Finland 08.05.12/0.400% 5,000,000 0.80
5,000,000 0.80
UNITED KINGDOM1,000,000 HSBC Bank 16.08.11/0.590% 1,000,050 0.161,000,000 HSBC Bank 19.08.11/0.570% 1,000,050 0.16
2,000,100 0.32
FRANCE1,500,000 Caisse des Dépôts et
Consignations 02.09.11/0.580% 1,500,151 0.25
1,500,151 0.25
Total Certificates of Deposit 120,762,236 19.24
Investment Funds
LUXEMBOURG399,345 JPMorgan Liquidity Funds - US Dollar Liquidity Fund
(JPM US Dollar Liquidity X (dist)) 399,345 0.06
399,345 0.06
Total Investment Funds 399,345 0.06
Total Transferable Securities Dealt in on AnotherRegulated Market
468,958,505 74.73
Total Investments 569,080,550 90.69
Cash Equivalents
Repurchase Agreements
UNITED STATES OF AMERICA11,000,000 Barclays Capital 18.05.12/0.000% 11,000,000 1.75
Collaterals
(11,542,304 Advanta Business Card Master Trust 2005-B1 B12014; 0.566%
5,973 RAIT CRE CDO I 2006-1A A2 2046; 0.000%)5,000,000 Citigroup 01.07.11/0.000% 5,000,000 0.80
Collaterals
(3,022,878 Chaseflex Trust 2007-3 1A2 2037; 0.646%2,226,656 Countrywide Alternative Loan Trust 2007-5CB 1A23
2037; 0.000%)18,000,000 Morgan Stanley 21.05.12/0.000% 18,000,000 2.87
Collaterals
(4,943,572 Banc of America Funding 2009-R17 1A2 2037;6.000%
3,290,606 Credit Suisse Mortgage Capital Certificates 2010-19R2A3 2037; 6.000%
225,905 Morgan Stanley ABA Capital 2046; 0.000%5,044,560 Morgan Stanley Capital I 2011-C2 A4 2044; 4.661%
385,341 Morgan Stanley Capital I 2011-C2 XA 2044; 1.371%5,080,334 Morgan Stanley Reremic Trust 2010-R5 1B 2035;
0.000%)
34,000,000 5.42
GERMANY10,000,000 Deutsche Bank 25.04.12/0.000% 10,000,000 1.59
Collaterals
(209,624 Anthracite CDO I 2006-HY3A CFL 2051; 0.866%186,289 Anthracite CDO I Ltd 2006-HY3A BFL 2051; 0.566%205,030 Bayview Commercial Asset Trust 2007-2A M3 2037;
0.000%251,620 Bear Stearns Asset Backed Securities Trust 2006-EC1
M5 2035; 0.000%226,498 Carrington Mortgage Loan Trust 2007-FRE1 M3 2037;
0.000%255,781 CBA Commercial Small Balance Commercial
Mortgage 2006-2A M1 2037; 0.000%223,299 CBA Commercial Small Balance Commercial
Mortgage 2007-1A M1 2039; 0.000%215,735 Citicorp Residential Mortgage Securities 2007-1 M8
2037; 7.015%187,714 Citicorp Residential Mortgage Securities 2007-1 M9
2037; 7.015%207,539 Citigroup Mortgage Loan Trust 2004-NCM1 B3 2034;
0.000%227,729 Citigroup Mortgage Loan Trust 2007-WFH1 M2 2037;
0.000%122,431 Commodore CDO I 2006-5A A1A 2047; 0.320%171,038 Countrywide Alternative Loan Trust 2006-OA21 A3
2047; 0.466%571 Countrywide Alternative Loan Trust 2007-OA2 1A1
2047; 0.000%210,058 Countrywide Asset-Backed Certificates 2004-11 M8
2034; 0.000%246,905 Countrywide Asset-Backed Certificates 2005-SD3 M5
2034; 0.000%231,455 Countrywide Asset-Backed Certificates 2006-17 M3
2036; 0.000%262,628 Countrywide Asset-Backed Certificates 2006-BC2 M2
2041; 0.000%196,451 Countrywide Asset-Backed Certificates 2006-SPS2 A
2026; 0.000%212,427 Countrywide Asset-Backed Certificates 2007-2 M3
2037; 0.000%
354
JPMorgan Funds - Managed Reserves FundSchedule of Investments (Market Value Expressed in USD) (continued)
As at 30 June 2011
Quantity/Nominal
Value
Name of Securities Maturity/Coupon
MarketValue
%of
NetAssets
Quantity/Nominal
Value
Name of Securities Maturity/Coupon
MarketValue
%of
NetAssets
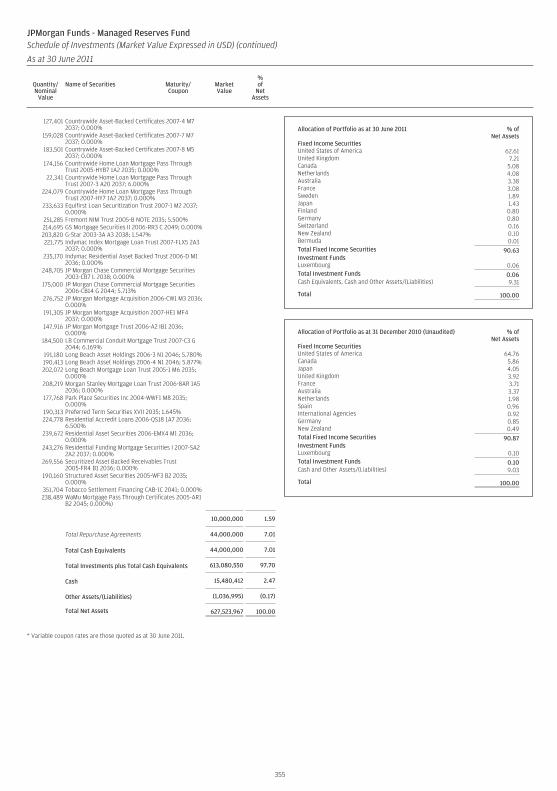
127,401 Countrywide Asset-Backed Certificates 2007-4 M72037; 0.000%
159,028 Countrywide Asset-Backed Certificates 2007-7 M72037; 0.000%
183,501 Countrywide Asset-Backed Certificates 2007-8 M52037; 0.000%
174,156 Countrywide Home Loan Mortgage Pass ThroughTrust 2005-HYB7 1A2 2035; 0.000%
22,341 Countrywide Home Loan Mortgage Pass ThroughTrust 2007-3 A20 2037; 6.000%
224,079 Countrywide Home Loan Mortgage Pass ThroughTrust 2007-HY7 1A2 2037; 0.000%
233,633 Equifirst Loan Securitization Trust 2007-1 M2 2037;0.000%
251,285 Fremont NIM Trust 2005-B NOTE 2035; 5.500%214,695 GS Mortgage Securities II 2006-RR3 C 2049; 0.000%203,820 G-Star 2003-3A A3 2038; 1.547%221,775 Indymac Index Mortgage Loan Trust 2007-FLX5 2A3
2037; 0.000%235,170 Indymac Residential Asset Backed Trust 2006-D M1
2036; 0.000%248,705 JP Morgan Chase Commercial Mortgage Securities
2003-CB7 L 2038; 0.000%175,000 JP Morgan Chase Commercial Mortgage Securities
2006-CB14 G 2044; 5.713%276,752 JP Morgan Mortgage Acquisition 2006-CW1 M3 2036;
0.000%191,305 JP Morgan Mortgage Acquisition 2007-HE1 MF4
2037; 0.000%147,916 JP Morgan Mortgage Trust 2006-A2 IB1 2036;
0.000%184,500 LB Commercial Conduit Mortgage Trust 2007-C3 G
2044; 6.169%191,180 Long Beach Asset Holdings 2006-3 N1 2046; 5.780%190,413 Long Beach Asset Holdings 2006-4 N1 2046; 5.877%202,072 Long Beach Mortgage Loan Trust 2005-1 M6 2035;
0.000%208,219 Morgan Stanley Mortgage Loan Trust 2006-8AR 1A5
2036; 0.000%177,768 Park Place Securities Inc 2004-WWF1 M8 2035;
0.000%190,313 Preferred Term Securities XVII 2035; 1.645%224,778 Residential Accredit Loans 2006-QS18 1A7 2036;
6.500%239,672 Residential Asset Securities 2006-EMX4 M1 2036;
0.000%243,276 Residential Funding Mortgage Securities I 2007-SA2
2A2 2037; 0.000%269,556 Securitized Asset Backed Receivables Trust
2005-FR4 B1 2036; 0.000%190,160 Structured Asset Securities 2005-WF3 B2 2035;
0.000%351,704 Tobacco Settlement Financing CAB-1C 2041; 0.000%238,489 WaMu Mortgage Pass Through Certificates 2005-AR1
B2 2045; 0.000%)
10,000,000 1.59
Total Repurchase Agreements 44,000,000 7.01
Total Cash Equivalents 44,000,000 7.01
Total Investments plus Total Cash Equivalents 613,080,550 97.70
Cash 15,480,412 2.47
Other Assets/(Liabilities) (1,036,995) (0.17)
Total Net Assets 627,523,967 100.00
* Variable coupon rates are those quoted as at 30 June 2011.
Allocation of Portfolio as at 30 June 2011 % ofNet Assets
Fixed Income SecuritiesUnited States of America 62.61United Kingdom 7.21Canada 5.08Netherlands 4.08Australia 3.38France 3.08Sweden 1.89Japan 1.43Finland 0.80Germany 0.80Switzerland 0.16New Zealand 0.10Bermuda 0.01Total Fixed Income Securities 90.63Investment FundsLuxembourg 0.06Total Investment Funds 0.06Cash Equivalents, Cash and Other Assets/(Liabilities) 9.31
Total 100.00
Allocation of Portfolio as at 31 December 2010 (Unaudited) % ofNet Assets
Fixed Income SecuritiesUnited States of America 64.76Canada 5.86Japan 4.05United Kingdom 3.92France 3.71Australia 3.37Netherlands 1.98Spain 0.96International Agencies 0.92Germany 0.85New Zealand 0.49Total Fixed Income Securities 90.87Investment FundsLuxembourg 0.10Total Investment Funds 0.10Cash and Other Assets/(Liabilities) 9.03
Total 100.00
355
JPMorgan Funds - Managed Reserves FundSchedule of Investments (Market Value Expressed in USD) (continued)
As at 30 June 2011
Quantity/Nominal
Value
Name of Securities Maturity/Coupon
MarketValue
%of
NetAssets
Quantity/Nominal
Value
Name of Securities Maturity/Coupon
MarketValue
%of
NetAssets
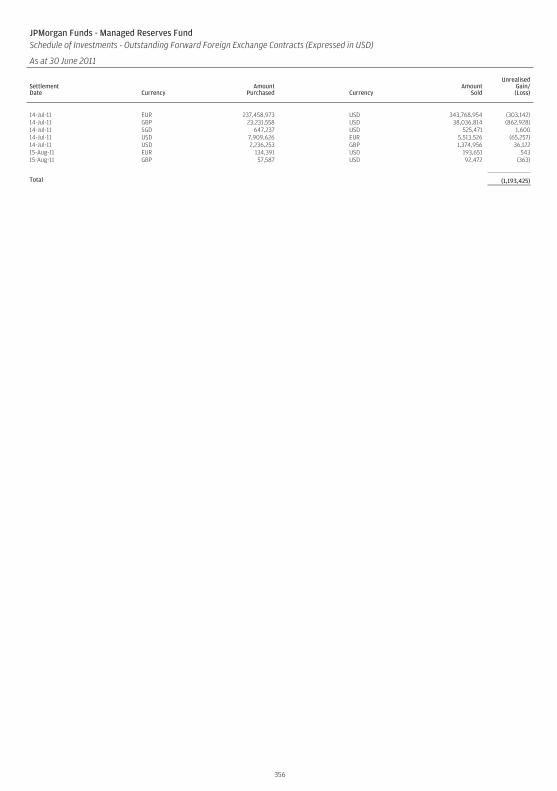
JPMorgan Funds - Managed Reserves FundSchedule of Investments - Outstanding Forward Foreign Exchange Contracts (Expressed in USD)
As at 30 June 2011
SettlementDate Currency
AmountPurchased Currency
AmountSold
UnrealisedGain/(Loss)
14-Jul-11 EUR 237,458,973 USD 343,768,954 (303,142)14-Jul-11 GBP 23,231,558 USD 38,036,814 (862,928)14-Jul-11 SGD 647,237 USD 525,471 1,60014-Jul-11 USD 7,909,626 EUR 5,513,526 (65,257)14-Jul-11 USD 2,236,253 GBP 1,374,956 36,12215-Aug-11 EUR 134,391 USD 193,651 54315-Aug-11 GBP 57,587 USD 92,472 (363)
Total (1,193,425)
356
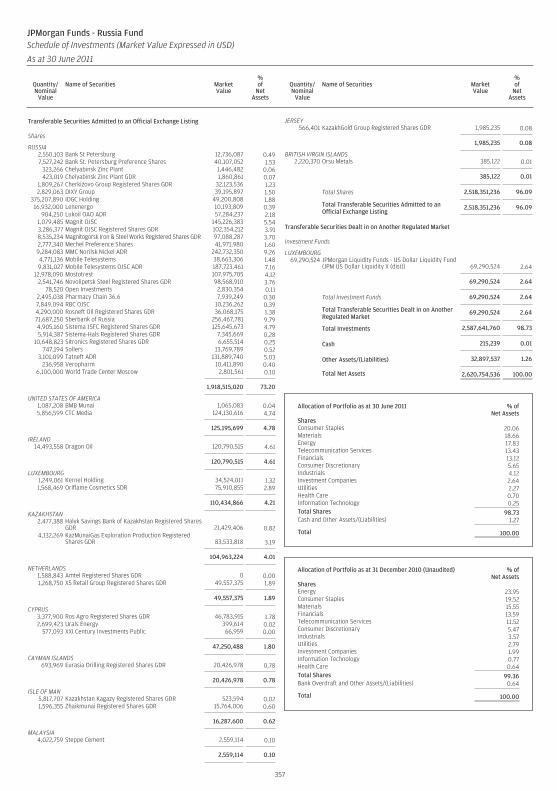
Transferable Securities Admitted to an Official Exchange Listing
Shares
RUSSIA2,550,103 Bank St Petersburg 12,736,087 0.497,527,242 Bank St. Petersburg Preference Shares 40,107,052 1.53
323,266 Chelyabinsk Zinc Plant 1,446,482 0.06423,019 Chelyabinsk Zinc Plant GDR 1,860,861 0.07
1,809,267 Cherkizovo Group Registered Shares GDR 32,123,536 1.232,829,063 DIXY Group 39,195,897 1.50
375,207,890 IDGC Holding 49,200,808 1.8816,932,000 Lenenergo 10,193,809 0.39
904,250 Lukoil OAO ADR 57,284,237 2.181,079,485 Magnit OJSC 145,226,383 5.543,286,377 Magnit OJSC Registered Shares GDR 102,354,212 3.918,535,234 Magnitogorsk Iron & Steel Works Registered Shares GDR 97,088,287 3.702,777,340 Mechel Preference Shares 41,971,980 1.609,284,083 MMC Norilsk Nickel ADR 242,732,350 9.264,771,136 Mobile Telesystems 38,663,306 1.489,831,027 Mobile Telesystems OJSC ADR 187,723,461 7.16
12,978,090 Mostotrest 107,975,705 4.122,541,746 Novolipetsk Steel Registered Shares GDR 98,568,910 3.76
78,520 Open Investments 2,830,354 0.112,495,038 Pharmacy Chain 36.6 7,939,249 0.307,849,094 RBC OJSC 10,236,262 0.394,290,000 Rosneft Oil Registered Shares GDR 36,068,175 1.3871,687,250 Sberbank of Russia 256,467,781 9.794,905,160 Sistema JSFC Registered Shares GDR 125,645,673 4.795,914,387 Sistema-Hals Registered Shares GDR 7,345,669 0.28
10,648,823 Sitronics Registered Shares GDR 6,655,514 0.25747,194 Sollers 13,769,789 0.52
3,101,099 Tatneft ADR 131,889,740 5.03236,958 Veropharm 10,411,890 0.40
6,100,000 World Trade Center Moscow 2,801,561 0.10
1,918,515,020 73.20
UNITED STATES OF AMERICA1,087,208 BMB Munai 1,065,083 0.045,856,599 CTC Media 124,130,616 4.74
125,195,699 4.78
IRELAND14,493,558 Dragon Oil 120,790,515 4.61
120,790,515 4.61
LUXEMBOURG1,249,061 Kernel Holding 34,524,011 1.321,568,469 Oriflame Cosmetics SDR 75,910,855 2.89
110,434,866 4.21
KAZAKHSTAN2,477,388 Halyk Savings Bank of Kazakhstan Registered Shares
GDR 21,429,406 0.824,132,269 KazMunaiGas Exploration Production Registered
Shares GDR 83,533,818 3.19
104,963,224 4.01
NETHERLANDS1,588,843 Amtel Registered Shares GDR 0 0.001,268,750 X5 Retail Group Registered Shares GDR 49,557,375 1.89
49,557,375 1.89
CYPRUS3,377,900 Ros Agro Registered Shares GDR 46,783,915 1.782,699,423 Urals Energy 399,614 0.02
577,093 XXI Century Investments Public 66,959 0.00
47,250,488 1.80
CAYMAN ISLANDS693,969 Eurasia Drilling Registered Shares GDR 20,426,978 0.78
20,426,978 0.78
ISLE OF MAN5,817,707 Kazakhstan Kagazy Registered Shares GDR 523,594 0.021,596,355 Zhaikmunai Registered Shares GDR 15,764,006 0.60
16,287,600 0.62
MALAYSIA4,022,759 Steppe Cement 2,559,114 0.10
2,559,114 0.10
JERSEY566,401 KazakhGold Group Registered Shares GDR 1,985,235 0.08
1,985,235 0.08
BRITISH VIRGIN ISLANDS2,220,370 Orsu Metals 385,122 0.01
385,122 0.01
Total Shares 2,518,351,236 96.09
Total Transferable Securities Admitted to anOfficial Exchange Listing
2,518,351,236 96.09
Transferable Securities Dealt in on Another Regulated Market
Investment Funds
LUXEMBOURG69,290,524 JPMorgan Liquidity Funds - US Dollar Liquidity Fund
(JPM US Dollar Liquidity X (dist)) 69,290,524 2.64
69,290,524 2.64
Total Investment Funds 69,290,524 2.64
Total Transferable Securities Dealt in on AnotherRegulated Market
69,290,524 2.64
Total Investments 2,587,641,760 98.73
Cash 215,239 0.01
Other Assets/(Liabilities) 32,897,537 1.26
Total Net Assets 2,620,754,536 100.00
Allocation of Portfolio as at 30 June 2011 % ofNet Assets
SharesConsumer Staples 20.06Materials 18.66Energy 17.83Telecommunication Services 13.43Financials 13.12Consumer Discretionary 5.65Industrials 4.12Investment Companies 2.64Utilities 2.27Health Care 0.70Information Technology 0.25Total Shares 98.73Cash and Other Assets/(Liabilities) 1.27
Total 100.00
Allocation of Portfolio as at 31 December 2010 (Unaudited) % ofNet Assets
SharesEnergy 23.95Consumer Staples 19.52Materials 15.55Financials 13.59Telecommunication Services 11.52Consumer Discretionary 5.47Industrials 3.57Utilities 2.79Investment Companies 1.99Information Technology 0.77Health Care 0.64Total Shares 99.36Bank Overdraft and Other Assets/(Liabilities) 0.64
Total 100.00
357
JPMorgan Funds - Russia FundSchedule of Investments (Market Value Expressed in USD)
As at 30 June 2011
Quantity/Nominal
Value
Name of Securities MarketValue
%of
NetAssets
Quantity/Nominal
Value
Name of Securities MarketValue
%of
NetAssets
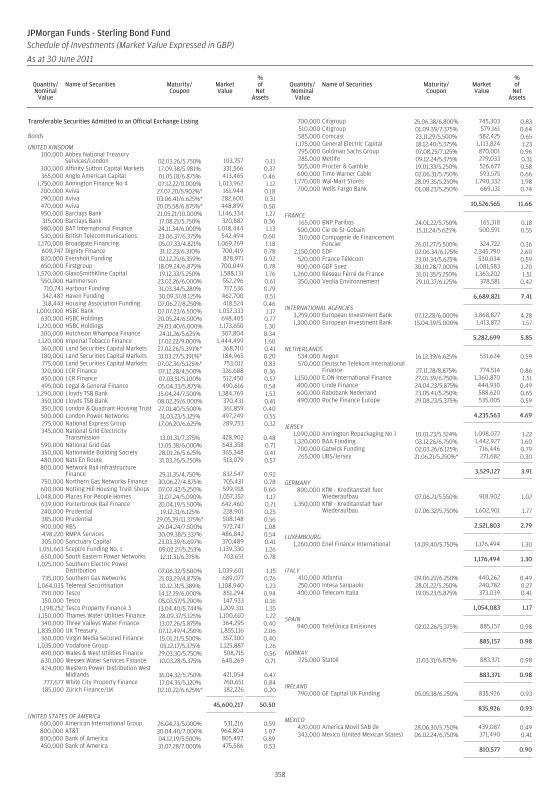
Transferable Securities Admitted to an Official Exchange Listing
Bonds
UNITED KINGDOM100,000 Abbey National Treasury
Services/London 02.03.26/5.750% 103,757 0.11300,000 Affinity Sutton Capital Markets 17.09.38/5.981% 331,566 0.37365,000 Anglo American Capital 01.05.18/6.875% 413,465 0.46
1,750,000 Annington Finance No 4 07.12.22/0.000% 1,013,962 1.12200,000 Aviva 27.07.20/5.902%* 161,944 0.18290,000 Aviva 03.06.41/6.625%* 282,600 0.31470,000 Aviva 20.05.58/6.875%* 448,899 0.50950,000 Barclays Bank 21.05.21/10.000% 1,146,334 1.27315,000 Barclays Bank 17.08.21/5.750% 320,882 0.36
980,000 BAT International Finance 24.11.34/6.000% 1,018,444 1.13530,000 British Telecommunications 23.06.37/6.375% 542,494 0.60
1,170,000 Broadgate Financing 05.07.33/4.821% 1,069,269 1.18609,747 Dignity Finance 31.12.23/6.310% 700,419 0.78820,000 Eversholt Funding 02.12.25/6.359% 828,971 0.92650,000 Firstgroup 18.09.24/6.875% 700,049 0.78
1,570,000 GlaxoSmithKline Capital 19.12.33/5.250% 1,588,131 1.76550,000 Hammerson 23.02.26/6.000% 552,296 0.61710,741 Harbour Funding 31.03.34/5.280% 717,536 0.79
342,487 Haven Funding 30.09.37/8.125% 462,700 0.51318,443 Housing Association Funding 07.06.27/8.250% 418,524 0.46
1,000,000 HSBC Bank 07.07.23/6.500% 1,052,333 1.17630,000 HSBC Holdings 20.05.24/6.500% 698,405 0.77
1,220,000 HSBC Holdings 29.03.40/6.000% 1,173,650 1.30300,000 Hutchison Whampoa Finance 24.11.26/5.625% 307,804 0.34
1,120,000 Imperial Tobacco Finance 17.02.22/9.000% 1,444,499 1.60360,000 Land Securities Capital Markets 27.02.26/5.391%* 368,710 0.41180,000 Land Securities Capital Markets 31.03.27/5.391%* 184,965 0.20775,000 Land Securities Capital Markets 07.02.36/5.125%* 753,012 0.83320,000 LCR Finance 07.12.28/4.500% 326,688 0.36450,000 LCR Finance 07.03.51/5.100% 512,450 0.57495,000 Legal & General Finance 05.04.33/5.875% 490,616 0.54
1,290,000 Lloyds TSB Bank 15.04.24/7.500% 1,384,769 1.53350,000 Lloyds TSB Bank 08.02.29/6.000% 370,431 0.41350,000 London & Quadrant Housing Trust 27.01.40/5.500% 361,859 0.40500,000 London Power Networks 31.03.23/5.125% 497,249 0.55275,000 National Express Group 17.06.20/6.625% 289,753 0.32345,000 National Grid Electricity
Transmission 13.01.31/7.375% 428,902 0.48590,000 National Grid Gas 13.05.38/6.000% 643,358 0.71350,000 Nationwide Building Society 28.01.26/5.625% 365,348 0.41480,000 Nats En Route 31.03.26/5.250% 513,079 0.57800,000 Network Rail Infrastructure
Finance 29.11.35/4.750% 832,547 0.92750,000 Northern Gas Networks Finance 30.06.27/4.875% 705,431 0.78600,000 Notting Hill Housing Trust Shops 07.07.42/5.250% 599,918 0.66
1,048,000 Places For People Homes 31.07.24/5.090% 1,057,352 1.17639,000 Porterbrook Rail Finance 20.04.19/5.500% 642,460 0.71240,000 Prudential 19.12.31/6.125% 228,901 0.25385,000 Prudential 29.05.39/11.375%* 508,148 0.56900,000 RBS 29.04.24/7.500% 972,747 1.08498,220 RMPA Services 30.09.38/5.337% 486,842 0.54305,000 Sanctuary Capital 23.03.39/6.697% 370,489 0.41
1,051,663 Sceptre Funding No. 1 09.02.27/5.253% 1,139,330 1.26650,000 South Eastern Power Networks 12.11.31/6.375% 703,651 0.78
1,025,000 Southern Electric PowerDistribution 07.06.32/5.500% 1,039,601 1.15
735,000 Southern Gas Networks 21.03.29/4.875% 689,077 0.761,064,035 Telereal Securitisation 10.12.31/5.389% 1,108,940 1.23
790,000 Tesco 14.12.29/6.000% 851,294 0.94150,000 Tesco 05.03.57/5.200% 147,933 0.16
1,198,252 Tesco Property Finance 3 13.04.40/5.744% 1,209,311 1.351,150,000 Thames Water Utilities Finance 28.09.37/5.125% 1,100,610 1.22340,000 Three Valleys Water Finance 13.07.26/5.875% 364,295 0.40
1,835,000 UK Treasury 07.12.49/4.250% 1,855,116 2.06360,000 Virgin Media Secured Finance 15.01.21/5.500% 357,300 0.40
1,035,000 Vodafone Group 05.12.17/5.375% 1,125,887 1.26490,000 Wales & West Utilities Finance 29.03.30/5.750% 508,715 0.56630,000 Wessex Water Services Finance 10.03.28/5.375% 640,269 0.71424,000 Western Power Distribution West
Midlands 16.04.32/5.750% 421,054 0.47777,677 White City Property Finance 17.04.35/5.120% 760,651 0.84185,000 Zürich Finance/UK 02.10.22/6.625%* 182,226 0.20
45,600,217 50.50
UNITED STATES OF AMERICA600,000 American International Group 26.04.23/5.000% 531,216 0.59800,000 AT&T 30.04.40/7.000% 964,804 1.07800,000 Bank of America 04.12.19/5.500% 805,497 0.89450,000 Bank of America 31.07.28/7.000% 475,586 0.53
700,000 Citigroup 25.06.38/6.800% 745,303 0.83510,000 Citigroup 01.09.39/7.375% 579,161 0.64585,000 Comcast 23.11.29/5.500% 582,425 0.65
1,175,000 General Electric Capital 18.12.40/5.375% 1,113,824 1.23795,000 Goldman Sachs Group 07.08.25/7.125% 870,001 0.96285,000 Metlife 09.12.24/5.375% 279,033 0.31505,000 Procter & Gamble 19.01.33/5.250% 526,677 0.58600,000 Time Warner Cable 02.06.31/5.750% 593,575 0.66
1,770,000 Wal-Mart Stores 28.09.35/5.250% 1,790,332 1.98700,000 Wells Fargo Bank 01.08.23/5.250% 669,131 0.74
10,526,565 11.66
FRANCE165,000 BNP Paribas 24.01.22/5.750% 165,318 0.18500,000 Cie de St-Gobain 15.11.24/5.625% 500,591 0.55310,000 Compagnie de Financement
Foncier 26.01.27/5.500% 324,722 0.362,150,000 EDF 02.06.34/6.125% 2,345,790 2.60
520,000 France Télécom 23.01.34/5.625% 530,034 0.59900,000 GDF Suez 30.10.28/7.000% 1,081,583 1.20
1,260,000 Réseau Férré de France 31.01.35/5.250% 1,363,202 1.51350,000 Veolia Environnement 29.10.37/6.125% 378,581 0.42
6,689,821 7.41
INTERNATIONAL AGENCIES3,259,000 European Investment Bank 07.12.28/6.000% 3,868,827 4.281,300,000 European Investment Bank 15.04.39/5.000% 1,413,872 1.57
5,282,699 5.85
NETHERLANDS534,000 Aegon 16.12.39/6.625% 531,624 0.59570,000 Deutsche Telekom International
Finance 27.11.28/8.875% 774,514 0.861,150,000 E.ON International Finance 27.01.39/6.750% 1,360,870 1.51400,000 Linde Finance 24.04.23/5.875% 444,930 0.49600,000 Rabobank Nederland 23.05.41/5.250% 588,620 0.65490,000 Roche Finance Europe 29.08.23/5.375% 535,005 0.59
4,235,563 4.69
JERSEY1,090,000 Annington Repackaging No 1 10.01.23/5.324% 1,098,072 1.221,320,000 BAA Funding 03.12.26/6.750% 1,442,927 1.60
700,000 Gatwick Funding 02.03.26/6.125% 716,446 0.79265,000 UBS/Jersey 21.06.21/5.250%* 271,682 0.30
3,529,127 3.91
GERMANY800,000 KfW - Kreditanstalt fuer
Wiederaufbau 07.06.21/5.550% 918,902 1.021,350,000 KfW - Kreditanstalt fuer
Wiederaufbau 07.06.32/5.750% 1,602,901 1.77
2,521,803 2.79
LUXEMBOURG1,260,000 Enel Finance International 14.09.40/5.750% 1,176,494 1.30
1,176,494 1.30
ITALY410,000 Atlantia 09.06.22/6.250% 440,262 0.49250,000 Intesa Sanpaolo 28.01.22/5.250% 240,782 0.27400,000 Telecom Italia 19.05.23/5.875% 373,039 0.41
1,054,083 1.17
SPAIN940,000 Telefónica Emisiones 02.02.26/5.375% 885,157 0.98
885,157 0.98
NORWAY725,000 Statoil 11.03.31/6.875% 883,371 0.98
883,371 0.98
IRELAND790,000 GE Capital UK Funding 05.05.38/6.250% 835,926 0.93
835,926 0.93
MEXICO420,000 America Movil SAB de 28.06.30/5.750% 439,087 0.49343,000 Mexico (United Mexican States) 06.02.24/6.750% 371,490 0.41
810,577 0.90
358
JPMorgan Funds - Sterling Bond FundSchedule of Investments (Market Value Expressed in GBP)
As at 30 June 2011
Quantity/Nominal
Value
Name of Securities Maturity/Coupon
MarketValue
%of
NetAssets
Quantity/Nominal
Value
Name of Securities Maturity/Coupon
MarketValue
%of
NetAssets
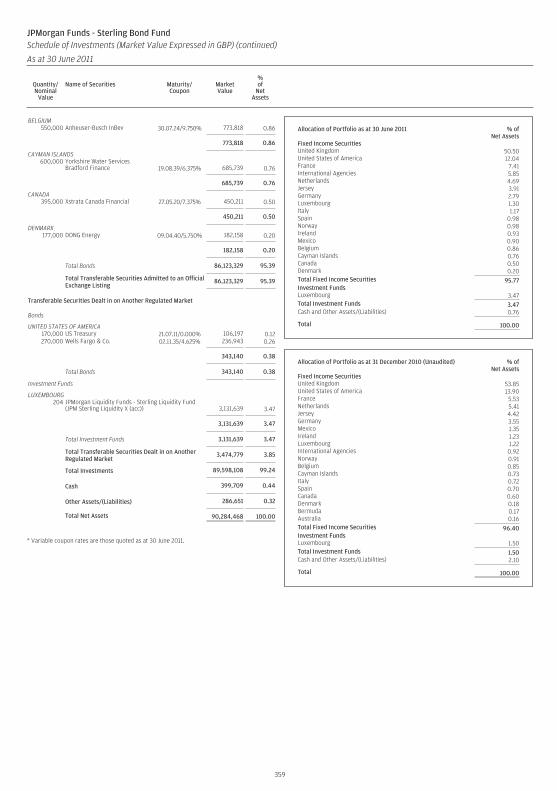
BELGIUM550,000 Anheuser-Busch InBev 30.07.24/9.750% 773,818 0.86
773,818 0.86
CAYMAN ISLANDS600,000 Yorkshire Water Services
Bradford Finance 19.08.39/6.375% 685,739 0.76
685,739 0.76
CANADA395,000 Xstrata Canada Financial 27.05.20/7.375% 450,211 0.50
450,211 0.50
DENMARK177,000 DONG Energy 09.04.40/5.750% 182,158 0.20
182,158 0.20
Total Bonds 86,123,329 95.39
Total Transferable Securities Admitted to an OfficialExchange Listing
86,123,329 95.39
Transferable Securities Dealt in on Another Regulated Market
Bonds
UNITED STATES OF AMERICA170,000 US Treasury 21.07.11/0.000% 106,197 0.12270,000 Wells Fargo & Co. 02.11.35/4.625% 236,943 0.26
343,140 0.38
Total Bonds 343,140 0.38
Investment Funds
LUXEMBOURG204 JPMorgan Liquidity Funds - Sterling Liquidity Fund
(JPM Sterling Liquidity X (acc)) 3,131,639 3.47
3,131,639 3.47
Total Investment Funds 3,131,639 3.47
Total Transferable Securities Dealt in on AnotherRegulated Market
3,474,779 3.85
Total Investments 89,598,108 99.24
Cash 399,709 0.44
Other Assets/(Liabilities) 286,651 0.32
Total Net Assets 90,284,468 100.00
* Variable coupon rates are those quoted as at 30 June 2011.
Allocation of Portfolio as at 30 June 2011 % ofNet Assets
Fixed Income SecuritiesUnited Kingdom 50.50United States of America 12.04France 7.41International Agencies 5.85Netherlands 4.69Jersey 3.91Germany 2.79Luxembourg 1.30Italy 1.17Spain 0.98Norway 0.98Ireland 0.93Mexico 0.90Belgium 0.86Cayman Islands 0.76Canada 0.50Denmark 0.20Total Fixed Income Securities 95.77Investment FundsLuxembourg 3.47Total Investment Funds 3.47Cash and Other Assets/(Liabilities) 0.76
Total 100.00
Allocation of Portfolio as at 31 December 2010 (Unaudited) % ofNet Assets
Fixed Income SecuritiesUnited Kingdom 53.85United States of America 13.90France 5.53Netherlands 5.41Jersey 4.42Germany 3.55Mexico 1.35Ireland 1.23Luxembourg 1.22International Agencies 0.92Norway 0.91Belgium 0.85Cayman Islands 0.73Italy 0.72Spain 0.70Canada 0.60Denmark 0.18Bermuda 0.17Australia 0.16Total Fixed Income Securities 96.40Investment FundsLuxembourg 1.50Total Investment Funds 1.50Cash and Other Assets/(Liabilities) 2.10
Total 100.00
359
JPMorgan Funds - Sterling Bond FundSchedule of Investments (Market Value Expressed in GBP) (continued)
As at 30 June 2011
Quantity/Nominal
Value
Name of Securities Maturity/Coupon
MarketValue
%of
NetAssets
Quantity/Nominal
Value
Name of Securities Maturity/Coupon
MarketValue
%of
NetAssets
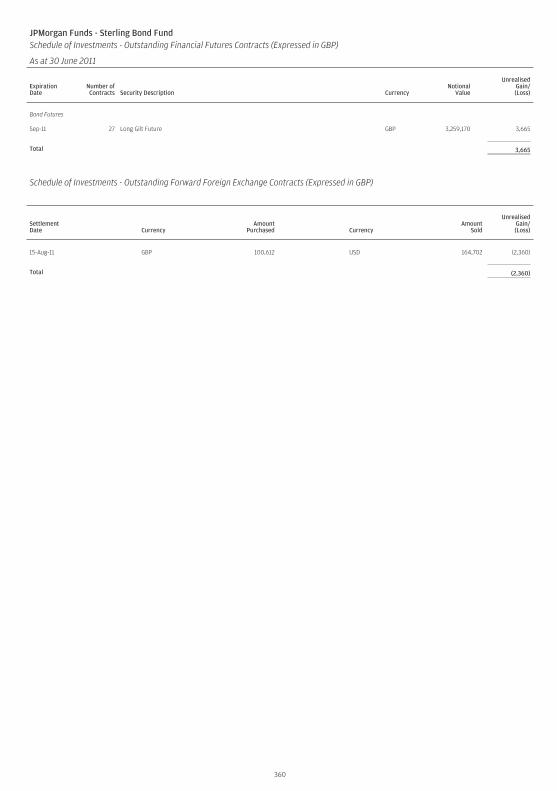
JPMorgan Funds - Sterling Bond FundSchedule of Investments - Outstanding Financial Futures Contracts (Expressed in GBP)
As at 30 June 2011
ExpirationDate
Number ofContracts Security Description Currency
NotionalValue
UnrealisedGain/(Loss)
Bond Futures
Sep-11 27 Long Gilt Future GBP 3,259,170 3,665
Total 3,665
Schedule of Investments - Outstanding Forward Foreign Exchange Contracts (Expressed in GBP)
SettlementDate Currency
AmountPurchased Currency
AmountSold
UnrealisedGain/(Loss)
15-Aug-11 GBP 100,612 USD 164,702 (2,360)
Total (2,360)
360
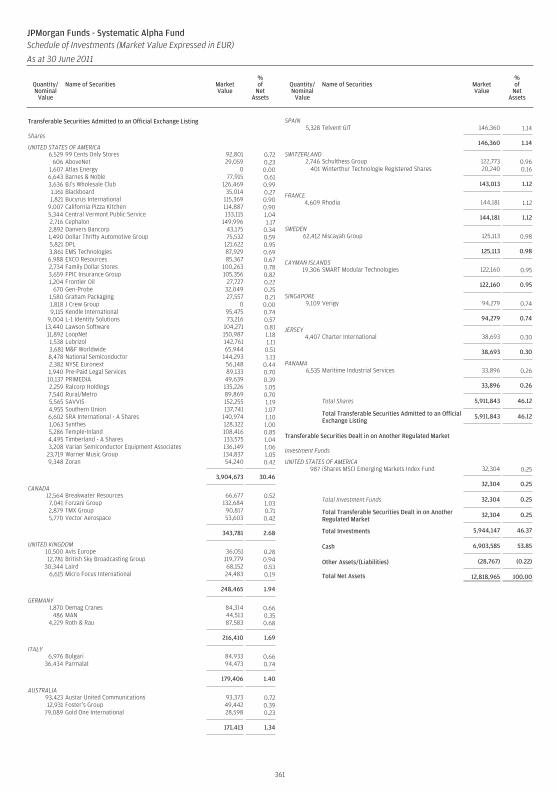
Transferable Securities Admitted to an Official Exchange Listing
Shares
UNITED STATES OF AMERICA6,529 99 Cents Only Stores 92,801 0.72
606 AboveNet 29,059 0.231,607 Atlas Energy 0 0.006,643 Barnes & Noble 77,915 0.613,636 BJ’s Wholesale Club 126,469 0.991,161 Blackboard 35,014 0.271,821 Bucyrus International 115,369 0.90
9,007 California Pizza Kitchen 114,887 0.905,344 Central Vermont Public Service 133,115 1.042,716 Cephalon 149,996 1.172,892 Danvers Bancorp 43,175 0.341,490 Dollar Thrifty Automotive Group 75,532 0.595,821 DPL 121,622 0.953,861 EMS Technologies 87,929 0.696,988 EXCO Resources 85,367 0.672,734 Family Dollar Stores 100,263 0.783,659 FPIC Insurance Group 105,356 0.821,204 Frontier Oil 27,727 0.22
670 Gen-Probe 32,049 0.251,580 Graham Packaging 27,557 0.211,818 J Crew Group 0 0.009,115 Kendle International 95,475 0.74
9,004 L-1 Identity Solutions 73,216 0.5713,440 Lawson Software 104,271 0.8111,892 LoopNet 150,987 1.181,538 Lubrizol 142,761 1.113,681 M&F Worldwide 65,944 0.518,478 National Semiconductor 144,293 1.132,382 NYSE Euronext 56,148 0.441,940 Pre-Paid Legal Services 89,133 0.70
10,137 PRIMEDIA 49,639 0.392,259 Ralcorp Holdings 135,226 1.057,540 Rural/Metro 89,869 0.705,565 SAVVIS 152,255 1.194,955 Southern Union 137,741 1.076,602 SRA International - A Shares 140,974 1.101,063 Synthes 128,322 1.005,286 Temple-Inland 108,416 0.854,495 Timberland - A Shares 133,575 1.043,208 Varian Semiconductor Equipment Associates 136,149 1.06
23,719 Warner Music Group 134,837 1.059,348 Zoran 54,240 0.42
3,904,673 30.46
CANADA12,564 Breakwater Resources 66,677 0.527,041 Forzani Group 132,684 1.032,879 TMX Group 90,817 0.715,770 Vector Aerospace 53,603 0.42
343,781 2.68
UNITED KINGDOM10,500 Avis Europe 36,051 0.2812,781 British Sky Broadcasting Group 119,779 0.94
30,344 Laird 68,152 0.536,615 Micro Focus International 24,483 0.19
248,465 1.94
GERMANY1,870 Demag Cranes 84,314 0.66
486 MAN 44,513 0.354,229 Roth & Rau 87,583 0.68
216,410 1.69
ITALY6,976 Bulgari 84,933 0.66
36,434 Parmalat 94,473 0.74
179,406 1.40
AUSTRALIA93,423 Austar United Communications 93,373 0.7212,931 Foster’s Group 49,442 0.39
79,089 Gold One International 28,598 0.23
171,413 1.34
SPAIN5,328 Telvent GIT 146,360 1.14
146,360 1.14
SWITZERLAND2,746 Schulthess Group 122,773 0.96
401 Winterthur Technologie Registered Shares 20,240 0.16
143,013 1.12
FRANCE4,609 Rhodia 144,181 1.12
144,181 1.12
SWEDEN62,412 Niscayah Group 125,113 0.98
125,113 0.98
CAYMAN ISLANDS19,306 SMART Modular Technologies 122,160 0.95
122,160 0.95
SINGAPORE9,109 Verigy 94,279 0.74
94,279 0.74
JERSEY4,407 Charter International 38,693 0.30
38,693 0.30
PANAMA6,535 Maritime Industrial Services 33,896 0.26
33,896 0.26
Total Shares 5,911,843 46.12
Total Transferable Securities Admitted to an OfficialExchange Listing
5,911,843 46.12
Transferable Securities Dealt in on Another Regulated Market
Investment Funds
UNITED STATES OF AMERICA987 iShares MSCI Emerging Markets Index Fund 32,304 0.25
32,304 0.25
Total Investment Funds 32,304 0.25
Total Transferable Securities Dealt in on AnotherRegulated Market
32,304 0.25
Total Investments 5,944,147 46.37
Cash 6,903,585 53.85
Other Assets/(Liabilities) (28,767) (0.22)
Total Net Assets 12,818,965 100.00
361
JPMorgan Funds - Systematic Alpha FundSchedule of Investments (Market Value Expressed in EUR)
As at 30 June 2011
Quantity/Nominal
Value
Name of Securities MarketValue
%of
NetAssets
Quantity/Nominal
Value
Name of Securities MarketValue
%of
NetAssets

Allocation of Portfolio as at 30 June 2011 % ofNet Assets
SharesInformation Technology 11.69Consumer Discretionary 10.95Industrials 6.62Materials 4.04Utilities 3.06Consumer Staples 2.69Health Care 2.42Financials 2.31Telecommunication Services 1.19Energy 1.15Investment Companies 0.25Total Shares 46.37Cash and Other Assets/(Liabilities) 53.63
Total 100.00
Allocation of Portfolio as at 31 December 2010 (Unaudited) % ofNet Assets
SharesInformation Technology 9.13Health Care 7.80Consumer Discretionary 7.71Energy 6.60Materials 6.20Industrials 5.10Financials 4.77Consumer Staples 2.31Telecommunication Services 1.02Investment Companies 0.69Total Shares 51.33Cash and Other Assets/(Liabilities) 48.67
Total 100.00
362
JPMorgan Funds - Systematic Alpha FundSchedule of Investments (Market Value Expressed in EUR) (continued)
As at 30 June 2011
Quantity/Nominal
Value
Name of Securities MarketValue
%of
NetAssets
Quantity/Nominal
Value
Name of Securities MarketValue
%of
NetAssets
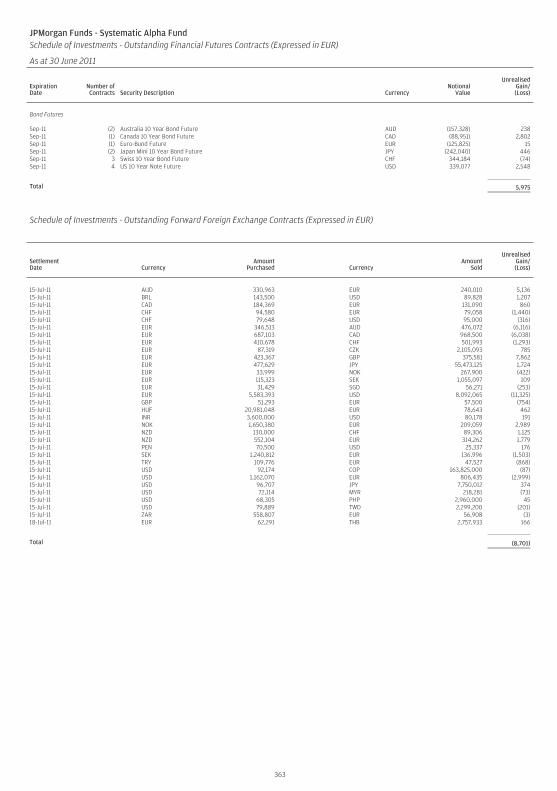
JPMorgan Funds - Systematic Alpha FundSchedule of Investments - Outstanding Financial Futures Contracts (Expressed in EUR)
As at 30 June 2011
ExpirationDate
Number ofContracts Security Description Currency
NotionalValue
UnrealisedGain/(Loss)
Bond Futures
Sep-11 (2) Australia 10 Year Bond Future AUD (157,328) 238Sep-11 (1) Canada 10 Year Bond Future CAD (88,951) 2,802Sep-11 (1) Euro-Bund Future EUR (125,825) 15Sep-11 (2) Japan Mini 10 Year Bond Future JPY (242,040) 446Sep-11 3 Swiss 10 Year Bond Future CHF 344,184 (74)Sep-11 4 US 10 Year Note Future USD 339,077 2,548
Total 5,975
Schedule of Investments - Outstanding Forward Foreign Exchange Contracts (Expressed in EUR)
SettlementDate Currency
AmountPurchased Currency
AmountSold
UnrealisedGain/(Loss)
15-Jul-11 AUD 330,963 EUR 240,010 5,13615-Jul-11 BRL 143,500 USD 89,828 1,20715-Jul-11 CAD 184,369 EUR 131,090 86015-Jul-11 CHF 94,580 EUR 79,058 (1,440)15-Jul-11 CHF 79,648 USD 95,000 (316)15-Jul-11 EUR 346,513 AUD 476,072 (6,116)15-Jul-11 EUR 687,103 CAD 968,500 (6,038)15-Jul-11 EUR 410,678 CHF 501,993 (1,293)15-Jul-11 EUR 87,319 CZK 2,105,093 78515-Jul-11 EUR 423,367 GBP 375,581 7,86215-Jul-11 EUR 477,629 JPY 55,473,125 1,72415-Jul-11 EUR 33,999 NOK 267,900 (422)15-Jul-11 EUR 115,323 SEK 1,055,097 10915-Jul-11 EUR 31,429 SGD 56,271 (253)15-Jul-11 EUR 5,583,393 USD 8,092,065 (11,325)15-Jul-11 GBP 51,293 EUR 57,500 (754)15-Jul-11 HUF 20,981,048 EUR 78,643 46215-Jul-11 INR 3,600,000 USD 80,178 19115-Jul-11 NOK 1,650,380 EUR 209,059 2,98915-Jul-11 NZD 130,000 CHF 89,306 1,12515-Jul-11 NZD 552,104 EUR 314,262 1,77915-Jul-11 PEN 70,500 USD 25,337 17615-Jul-11 SEK 1,240,812 EUR 136,996 (1,503)15-Jul-11 TRY 109,776 EUR 47,527 (868)15-Jul-11 USD 92,174 COP 163,825,000 (87)15-Jul-11 USD 1,162,070 EUR 806,435 (2,999)15-Jul-11 USD 96,707 JPY 7,750,012 37415-Jul-11 USD 72,114 MYR 218,281 (73)15-Jul-11 USD 68,305 PHP 2,960,000 4515-Jul-11 USD 79,889 TWD 2,299,200 (201)15-Jul-11 ZAR 558,807 EUR 56,908 (3)18-Jul-11 EUR 62,291 THB 2,757,933 166
Total (8,701)
363
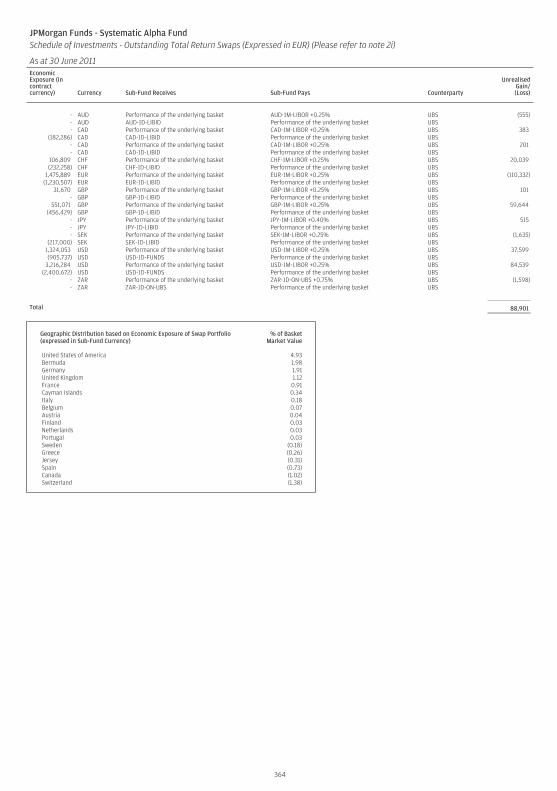
JPMorgan Funds - Systematic Alpha FundSchedule of Investments - Outstanding Total Return Swaps (Expressed in EUR) (Please refer to note 2i)
As at 30 June 2011EconomicExposure (incontractcurrency) Currency Sub-Fund Receives Sub-Fund Pays Counterparty
UnrealisedGain/(Loss)
- AUD Performance of the underlying basket AUD-1M-LIBOR +0.25% UBS (555)- AUD AUD-1D-LIBID Performance of the underlying basket UBS- CAD Performance of the underlying basket CAD-1M-LIBOR +0.25% UBS 383
(182,286) CAD CAD-1D-LIBID Performance of the underlying basket UBS- CAD Performance of the underlying basket CAD-1M-LIBOR +0.25% UBS 201- CAD CAD-1D-LIBID Performance of the underlying basket UBS
106,809 CHF Performance of the underlying basket CHF-1M-LIBOR +0.25% UBS 20,039(232,258) CHF CHF-1D-LIBID Performance of the underlying basket UBS
1,475,889 EUR Performance of the underlying basket EUR-1M-LIBOR +0.25% UBS (110,332)(1,230,507) EUR EUR-1D-LIBID Performance of the underlying basket UBS
31,670 GBP Performance of the underlying basket GBP-1M-LIBOR +0.25% UBS 101- GBP GBP-1D-LIBID Performance of the underlying basket UBS
551,071 GBP Performance of the underlying basket GBP-1M-LIBOR +0.25% UBS 59,644(456,429) GBP GBP-1D-LIBID Performance of the underlying basket UBS
- JPY Performance of the underlying basket JPY-1M-LIBOR +0.40% UBS 515- JPY JPY-1D-LIBID Performance of the underlying basket UBS- SEK Performance of the underlying basket SEK-1M-LIBOR +0.25% UBS (1,635)
(217,000) SEK SEK-1D-LIBID Performance of the underlying basket UBS1,324,053 USD Performance of the underlying basket USD-1M-LIBOR +0.25% UBS 37,599(905,737) USD USD-1D-FUNDS Performance of the underlying basket UBS
3,216,284 USD Performance of the underlying basket USD-1M-LIBOR +0.25% UBS 84,539(2,400,672) USD USD-1D-FUNDS Performance of the underlying basket UBS
- ZAR Performance of the underlying basket ZAR-1D-ON-UBS +0.75% UBS (1,598)- ZAR ZAR-1D-ON-UBS Performance of the underlying basket UBS
Total 88,901
Geographic Distribution based on Economic Exposure of Swap Portfolio(expressed in Sub-Fund Currency)
% of BasketMarket Value
United States of America 4.93Bermuda 1.98Germany 1.91United Kingdom 1.12France 0.91Cayman Islands 0.34Italy 0.18Belgium 0.07Austria 0.04Finland 0.03Netherlands 0.03Portugal 0.03Sweden (0.18)Greece (0.26)Jersey (0.31)Spain (0.73)Canada (1.02)Switzerland (1.38)
364
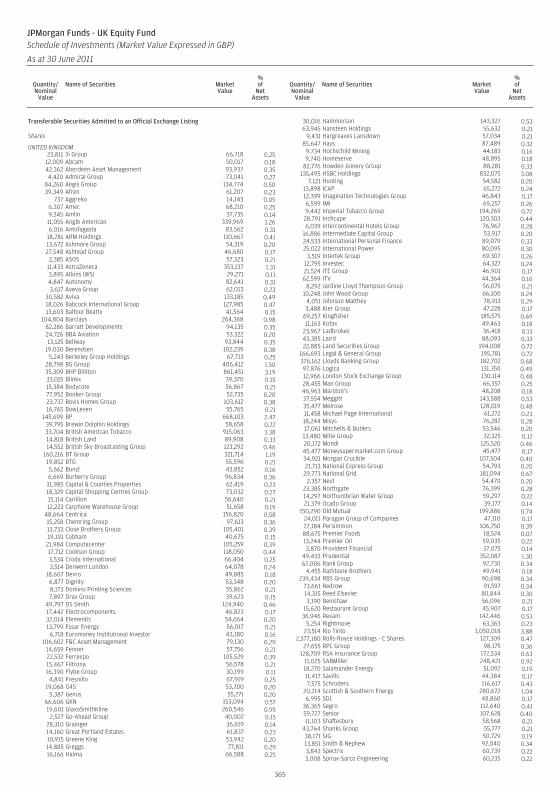
Transferable Securities Admitted to an Official Exchange Listing
Shares
UNITED KINGDOM23,811 3i Group 66,718 0.25
12,009 Abcam 50,017 0.1842,362 Aberdeen Asset Management 93,937 0.354,420 Admiral Group 73,041 0.27
84,260 Aegis Group 134,774 0.5039,349 Afren 61,207 0.23
737 Aggreko 14,143 0.056,307 Amec 68,210 0.259,345 Amlin 37,735 0.1411,055 Anglo American 339,969 1.266,016 Antofagasta 83,562 0.31
18,781 ARM Holdings 110,667 0.4113,672 Ashmore Group 54,319 0.2027,548 Ashtead Group 46,680 0.17
2,385 ASOS 57,323 0.2111,433 AstraZeneca 353,137 1.313,895 Atkins (WS) 29,271 0.114,847 Autonomy 82,641 0.313,617 Aveva Group 62,013 0.23
30,582 Aviva 133,185 0.4918,026 Babcock International Group 127,985 0.4713,603 Balfour Beatty 41,564 0.15
104,804 Barclays 264,368 0.9882,286 Barratt Developments 94,135 0.3524,726 BBA Aviation 53,322 0.2013,125 Bellway 93,844 0.35
19,030 Berendsen 102,239 0.385,243 Berkeley Group Holdings 67,713 0.25
28,798 BG Group 406,412 1.5035,309 BHP Billiton 861,451 3.1933,015 Blinkx 39,370 0.1515,384 Bodycote 56,867 0.2177,952 Booker Group 52,735 0.2023,737 Bovis Homes Group 103,612 0.3816,765 BowLeven 55,765 0.21
145,699 BP 668,103 2.4739,795 Brewin Dolphin Holdings 58,658 0.2233,704 British American Tobacco 915,063 3.3814,818 British Land 89,908 0.3314,552 British Sky Broadcasting Group 123,292 0.46
160,216 BT Group 321,714 1.1919,852 BTG 55,596 0.215,662 Bunzl 43,852 0.166,669 Burberry Group 96,834 0.36
31,985 Capital & Counties Properties 62,419 0.2318,329 Capital Shopping Centres Group 73,032 0.2715,114 Carillion 56,640 0.2112,223 Carphone Warehouse Group 51,658 0.19
48,664 Centrica 156,820 0.5815,258 Chemring Group 97,613 0.3613,733 Close Brothers Group 105,401 0.3919,191 Cobham 40,675 0.15
21,984 Computacenter 105,259 0.3917,712 Cookson Group 118,050 0.443,534 Croda International 66,404 0.253,514 Derwent London 64,078 0.24
18,607 Devro 49,885 0.186,877 Dignity 53,348 0.208,173 Domino Printing Sciences 55,862 0.217,897 Drax Group 39,623 0.15
49,797 DS Smith 124,940 0.4617,442 Electrocomponents 46,823 0.1732,014 Elementis 54,664 0.2013,799 Essar Energy 56,017 0.21
6,718 Euromoney Institutional Investor 43,180 0.16106,602 F&C Asset Management 79,130 0.29
14,659 Fenner 57,756 0.2122,532 Ferrexpo 105,529 0.3915,467 Filtrona 56,578 0.2116,390 Flybe Group 30,199 0.114,841 Fresnillo 67,919 0.25
19,068 G4S 53,200 0.205,387 Genus 55,271 0.20
66,606 GKN 153,094 0.5719,601 GlaxoSmithKline 260,546 0.95
2,527 Go-Ahead Group 40,002 0.1528,310 Grainger 36,619 0.1414,160 Great Portland Estates 61,837 0.2310,915 Greene King 53,942 0.2014,885 Greggs 77,811 0.2916,166 Halma 66,588 0.25
30,016 Hammerson 143,327 0.5363,945 Hansteen Holdings 55,632 0.21
9,431 Hargreaves Lansdown 57,034 0.2185,647 Hays 87,489 0.32
9,734 Hochschild Mining 44,183 0.169,740 Homeserve 48,895 0.18
82,776 Howden Joinery Group 88,281 0.33135,495 HSBC Holdings 832,075 3.08
7,121 Hunting 54,582 0.2013,898 ICAP 65,272 0.2412,399 Imagination Technologies Group 46,843 0.176,599 IMI 69,257 0.269,442 Imperial Tobacco Group 194,269 0.72
28,791 Inchcape 120,303 0.446,039 Intercontinental Hotels Group 76,967 0.28
16,886 Intermediate Capital Group 53,917 0.2024,533 International Personal Finance 89,079 0.3325,022 International Power 80,095 0.30
3,519 Intertek Group 69,307 0.2612,795 Investec 64,327 0.2421,524 ITE Group 46,901 0.1762,599 ITV 44,364 0.16
8,292 Jardine Lloyd Thompson Group 56,075 0.2110,248 John Wood Group 66,100 0.24
4,051 Johnson Matthey 78,913 0.293,488 Kier Group 47,228 0.17
69,257 Kingfisher 185,575 0.6911,163 Kofax 49,463 0.18
23,967 Ladbrokes 36,418 0.1343,385 Laird 88,093 0.3322,885 Land Securities Group 194,008 0.72
166,693 Legal & General Group 195,781 0.72376,162 Lloyds Banking Group 182,702 0.6897,876 Logica 131,350 0.4912,966 London Stock Exchange Group 130,114 0.4828,455 Man Group 66,357 0.2546,963 Marston’s 48,208 0.1837,554 Meggitt 143,588 0.5335,477 Melrose 128,019 0.4811,458 Michael Page International 61,272 0.2318,244 Misys 76,287 0.2817,061 Mitchells & Butlers 53,546 0.2013,480 Mitie Group 32,325 0.1220,172 Mondi 125,520 0.4645,477 Moneysupermarket.com Group 45,477 0.1734,921 Morgan Crucible 107,504 0.4021,713 National Express Group 54,793 0.2029,773 National Grid 181,094 0.67
2,357 Next 54,470 0.2023,385 Northgate 76,399 0.2814,297 Northumbrian Water Group 59,297 0.2221,379 Ocado Group 39,177 0.14
150,290 Old Mutual 199,886 0.7424,011 Paragon Group of Companies 47,110 0.1722,184 Persimmon 106,750 0.3988,675 Premier Foods 18,524 0.0713,244 Premier Oil 59,035 0.223,870 Provident Financial 37,075 0.14
49,433 Prudential 352,087 1.3062,006 Rank Group 92,730 0.34
4,455 Rathbone Brothers 49,941 0.18239,434 RBS Group 90,698 0.34
73,661 Redrow 91,597 0.3414,315 Reed Elsevier 80,844 0.303,190 Renishaw 56,096 0.21
15,620 Restaurant Group 45,907 0.1736,946 Rexam 142,446 0.53
5,254 Rightmove 63,363 0.2323,514 Rio Tinto 1,050,018 3.88
2,377,180 Rolls-Royce Holdings - C Shares 127,309 0.4727,655 RPC Group 98,175 0.36
128,709 RSA Insurance Group 172,534 0.6311,025 SABMiller 248,421 0.9218,270 Salamander Energy 51,092 0.1911,417 Savills 44,384 0.177,575 Schroders 116,617 0.43
20,214 Scottish & Southern Energy 280,672 1.046,995 SDL 48,860 0.17
36,365 Segro 112,640 0.4159,727 Senior 107,628 0.4011,103 Shaftesbury 58,568 0.21
43,764 Shanks Group 55,777 0.2138,171 SIG 50,729 0.1913,851 Smith & Nephew 92,040 0.343,843 Spectris 60,739 0.223,008 Spirax-Sarco Engineering 60,235 0.22
365
JPMorgan Funds - UK Equity FundSchedule of Investments (Market Value Expressed in GBP)
As at 30 June 2011
Quantity/Nominal
Value
Name of Securities MarketValue
%of
NetAssets
Quantity/Nominal
Value
Name of Securities MarketValue
%of
NetAssets
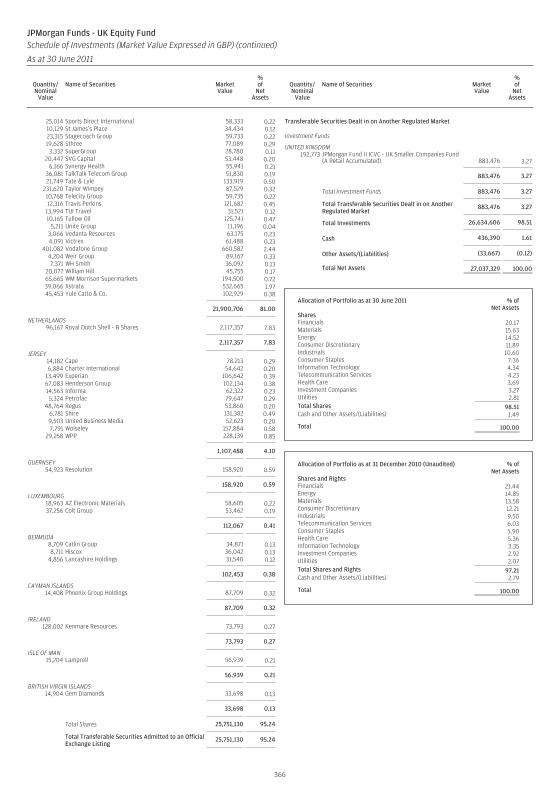
25,014 Sports Direct International 58,333 0.2210,129 St James’s Place 34,434 0.1223,315 Stagecoach Group 59,733 0.2219,628 Sthree 77,089 0.29
3,332 SuperGroup 28,780 0.1120,447 SVG Capital 53,448 0.20
6,166 Synergy Health 55,941 0.2136,081 TalkTalk Telecom Group 51,830 0.1921,749 Tate & Lyle 133,919 0.50
231,620 Taylor Wimpey 87,529 0.3210,768 Telecity Group 59,735 0.2212,316 Travis Perkins 121,682 0.4513,994 TUI Travel 31,521 0.1210,165 Tullow Oil 125,741 0.47
5,211 Unite Group 11,196 0.043,066 Vedanta Resources 63,175 0.234,091 Victrex 61,488 0.23
401,082 Vodafone Group 660,582 2.444,204 Weir Group 89,167 0.337,371 WH Smith 36,092 0.13
20,077 William Hill 45,755 0.1765,665 WM Morrison Supermarkets 194,500 0.7239,066 Xstrata 532,665 1.9745,453 Yule Catto & Co. 102,929 0.38
21,900,706 81.00
NETHERLANDS96,167 Royal Dutch Shell - B Shares 2,117,357 7.83
2,117,357 7.83
JERSEY14,182 Cape 78,213 0.296,884 Charter International 54,642 0.20
13,499 Experian 106,642 0.3967,083 Henderson Group 102,134 0.3814,563 Informa 62,322 0.235,324 Petrofac 79,647 0.29
48,764 Regus 53,860 0.206,781 Shire 131,382 0.499,503 United Business Media 52,623 0.207,791 Wolseley 157,884 0.58
29,258 WPP 228,139 0.85
1,107,488 4.10
GUERNSEY54,923 Resolution 158,920 0.59
158,920 0.59
LUXEMBOURG18,963 AZ Electronic Materials 58,605 0.2237,256 Colt Group 53,462 0.19
112,067 0.41
BERMUDA8,709 Catlin Group 34,871 0.138,711 Hiscox 36,042 0.13
4,856 Lancashire Holdings 31,540 0.12
102,453 0.38
CAYMAN ISLANDS14,408 Phoenix Group Holdings 87,709 0.32
87,709 0.32
IRELAND128,002 Kenmare Resources 73,793 0.27
73,793 0.27
ISLE OF MAN15,204 Lamprell 56,939 0.21
56,939 0.21
BRITISH VIRGIN ISLANDS14,904 Gem Diamonds 33,698 0.13
33,698 0.13
Total Shares 25,751,130 95.24
Total Transferable Securities Admitted to an OfficialExchange Listing
25,751,130 95.24
Transferable Securities Dealt in on Another Regulated Market
Investment Funds
UNITED KINGDOM192,773 JPMorgan Fund II ICVC - UK Smaller Companies Fund
(A Retail Accumulated) 883,476 3.27
883,476 3.27
Total Investment Funds 883,476 3.27
Total Transferable Securities Dealt in on AnotherRegulated Market
883,476 3.27
Total Investments 26,634,606 98.51
Cash 436,390 1.61
Other Assets/(Liabilities) (33,667) (0.12)
Total Net Assets 27,037,329 100.00
Allocation of Portfolio as at 30 June 2011 % ofNet Assets
SharesFinancials 20.17Materials 15.63Energy 14.52Consumer Discretionary 11.89Industrials 10.60Consumer Staples 7.36Information Technology 4.34Telecommunication Services 4.23Health Care 3.69Investment Companies 3.27Utilities 2.81Total Shares 98.51Cash and Other Assets/(Liabilities) 1.49
Total 100.00
Allocation of Portfolio as at 31 December 2010 (Unaudited) % ofNet Assets
Shares and RightsFinancials 21.44Energy 14.85Materials 13.58Consumer Discretionary 12.21Industrials 9.50Telecommunication Services 6.03Consumer Staples 5.90Health Care 5.36Information Technology 3.35Investment Companies 2.92Utilities 2.07Total Shares and Rights 97.21Cash and Other Assets/(Liabilities) 2.79
Total 100.00
366
JPMorgan Funds - UK Equity FundSchedule of Investments (Market Value Expressed in GBP) (continued)
As at 30 June 2011
Quantity/Nominal
Value
Name of Securities MarketValue
%of
NetAssets
Quantity/Nominal
Value
Name of Securities MarketValue
%of
NetAssets
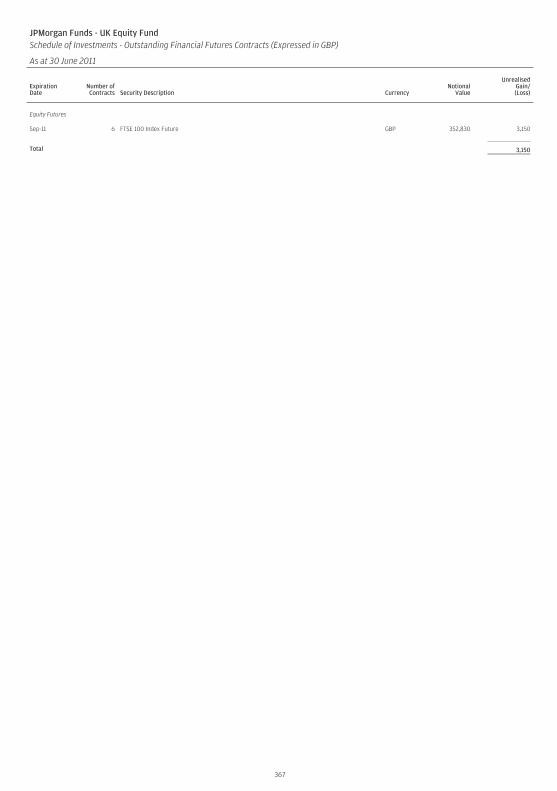
JPMorgan Funds - UK Equity FundSchedule of Investments - Outstanding Financial Futures Contracts (Expressed in GBP)
As at 30 June 2011
ExpirationDate
Number ofContracts Security Description Currency
NotionalValue
UnrealisedGain/(Loss)
Equity Futures
Sep-11 6 FTSE 100 Index Future GBP 352,830 3,150
Total 3,150
367
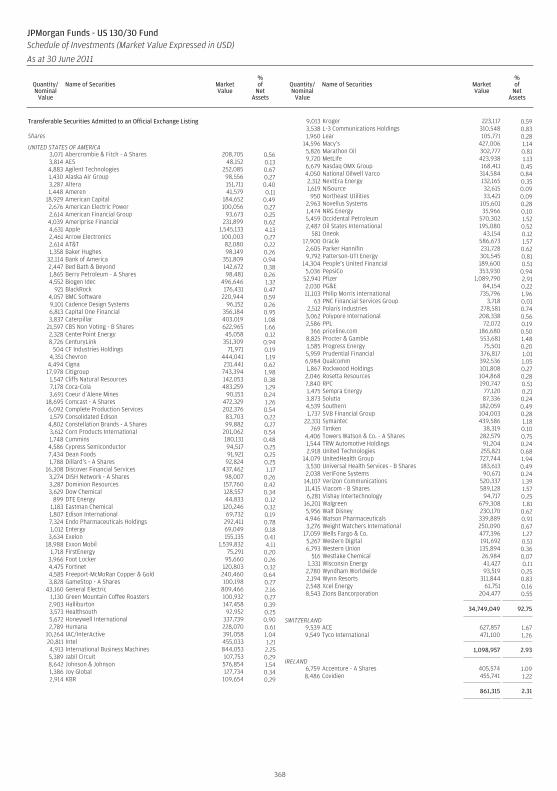
Transferable Securities Admitted to an Official Exchange Listing
Shares
UNITED STATES OF AMERICA3,071 Abercrombie & Fitch - A Shares 208,705 0.563,814 AES 48,152 0.134,883 Agilent Technologies 252,085 0.671,430 Alaska Air Group 98,556 0.273,287 Altera 151,711 0.401,448 Ameren 41,579 0.11
18,929 American Capital 184,652 0.492,676 American Electric Power 100,056 0.272,614 American Financial Group 93,673 0.254,039 Ameriprise Financial 231,899 0.624,631 Apple 1,545,133 4.132,461 Arrow Electronics 100,003 0.272,614 AT&T 82,080 0.221,358 Baker Hughes 98,149 0.26
32,114 Bank of America 351,809 0.942,447 Bed Bath & Beyond 142,672 0.381,865 Berry Petroleum - A Shares 98,481 0.264,552 Biogen Idec 496,646 1.32
921 BlackRock 176,431 0.474,057 BMC Software 220,944 0.599,101 Cadence Design Systems 96,152 0.266,813 Capital One Financial 356,184 0.953,837 Caterpillar 403,019 1.08
21,597 CBS Non Voting - B Shares 622,965 1.662,328 CenterPoint Energy 45,058 0.128,726 CenturyLink 351,309 0.94
504 CF Industries Holdings 71,971 0.194,351 Chevron 444,041 1.19
4,494 Cigna 231,441 0.6217,978 Citigroup 743,394 1.98
1,547 Cliffs Natural Resources 142,053 0.387,178 Coca-Cola 483,259 1.293,691 Coeur d’Alene Mines 90,153 0.24
18,695 Comcast - A Shares 472,329 1.266,092 Complete Production Services 202,376 0.541,579 Consolidated Edison 83,703 0.22
4,802 Constellation Brands - A Shares 99,882 0.273,612 Corn Products International 201,062 0.541,748 Cummins 180,131 0.484,586 Cypress Semiconductor 94,517 0.257,434 Dean Foods 91,921 0.251,788 Dillard’s - A Shares 92,824 0.25
16,308 Discover Financial Services 437,462 1.173,274 DISH Network - A Shares 98,007 0.263,287 Dominion Resources 157,760 0.423,629 Dow Chemical 128,557 0.34
899 DTE Energy 44,833 0.121,183 Eastman Chemical 120,246 0.321,807 Edison International 69,732 0.197,324 Endo Pharmaceuticals Holdings 292,411 0.781,012 Entergy 69,049 0.18
3,634 Exelon 155,135 0.4118,988 Exxon Mobil 1,539,832 4.11
1,718 FirstEnergy 75,291 0.203,966 Foot Locker 95,660 0.264,475 Fortinet 120,803 0.324,585 Freeport-McMoRan Copper & Gold 240,460 0.643,828 GameStop - A Shares 100,198 0.27
43,160 General Electric 809,466 2.161,130 Green Mountain Coffee Roasters 100,932 0.27
2,903 Halliburton 147,458 0.393,573 Healthsouth 92,952 0.255,672 Honeywell International 337,739 0.902,789 Humana 228,070 0.61
10,264 IAC/InterActive 391,058 1.0420,811 Intel 455,033 1.214,913 International Business Machines 844,053 2.255,389 Jabil Circuit 107,753 0.298,642 Johnson & Johnson 576,854 1.541,386 Joy Global 127,734 0.342,914 KBR 109,654 0.29
9,013 Kroger 223,117 0.593,538 L-3 Communications Holdings 310,548 0.831,960 Lear 105,771 0.28
14,596 Macy’s 427,006 1.145,826 Marathon Oil 302,777 0.819,720 MetLife 423,938 1.136,679 Nasdaq OMX Group 168,411 0.454,050 National Oilwell Varco 314,584 0.842,312 NextEra Energy 132,165 0.351,619 NiSource 32,615 0.09
950 Northeast Utilities 33,421 0.092,963 Novellus Systems 105,601 0.281,474 NRG Energy 35,966 0.105,459 Occidental Petroleum 570,302 1.522,487 Oil States International 195,080 0.52
581 Oneok 43,154 0.1217,900 Oracle 586,673 1.572,605 Parker Hannifin 231,728 0.629,792 Patterson-UTI Energy 301,545 0.81
14,304 People’s United Financial 189,600 0.515,036 PepsiCo 353,930 0.94
52,941 Pfizer 1,089,790 2.912,030 PG&E 84,154 0.2211,103 Philip Morris International 735,796 1.96
63 PNC Financial Services Group 3,718 0.012,512 Polaris Industries 278,581 0.74
3,062 Polypore International 208,338 0.562,586 PPL 72,072 0.19
366 priceline.com 186,680 0.508,825 Procter & Gamble 553,681 1.481,585 Progress Energy 75,501 0.205,959 Prudential Financial 376,817 1.016,984 Qualcomm 392,536 1.051,867 Rockwood Holdings 101,808 0.272,046 Rosetta Resources 104,868 0.287,840 RPC 190,747 0.511,475 Sempra Energy 77,120 0.213,873 Solutia 87,336 0.244,539 Southern 182,059 0.491,737 SVB Financial Group 104,003 0.28
22,331 Symantec 439,586 1.18769 Timken 38,319 0.10
4,406 Towers Watson & Co. - A Shares 282,579 0.751,544 TRW Automotive Holdings 91,204 0.242,918 United Technologies 255,821 0.68
14,079 UnitedHealth Group 727,744 1.943,530 Universal Health Services - B Shares 183,613 0.492,038 VeriFone Systems 90,671 0.24
14,107 Verizon Communications 520,337 1.3911,415 Viacom - B Shares 589,128 1.576,281 Vishay Intertechnology 94,717 0.25
16,201 Walgreen 679,308 1.815,956 Walt Disney 230,170 0.624,946 Watson Pharmaceuticals 339,889 0.913,276 Weight Watchers International 250,090 0.67
17,059 Wells Fargo & Co. 477,396 1.275,267 Western Digital 191,692 0.516,793 Western Union 135,894 0.36
516 Westlake Chemical 26,984 0.071,331 Wisconsin Energy 41,427 0.11
2,780 Wyndham Worldwide 93,519 0.252,194 Wynn Resorts 311,844 0.832,548 Xcel Energy 61,751 0.168,543 Zions Bancorporation 204,477 0.55
34,749,049 92.75
SWITZERLAND9,539 ACE 627,857 1.679,549 Tyco International 471,100 1.26
1,098,957 2.93
IRELAND6,759 Accenture - A Shares 405,574 1.098,486 Covidien 455,741 1.22
861,315 2.31
368
JPMorgan Funds - US 130/30 FundSchedule of Investments (Market Value Expressed in USD)
As at 30 June 2011
Quantity/Nominal
Value
Name of Securities MarketValue
%of
NetAssets
Quantity/Nominal
Value
Name of Securities MarketValue
%of
NetAssets
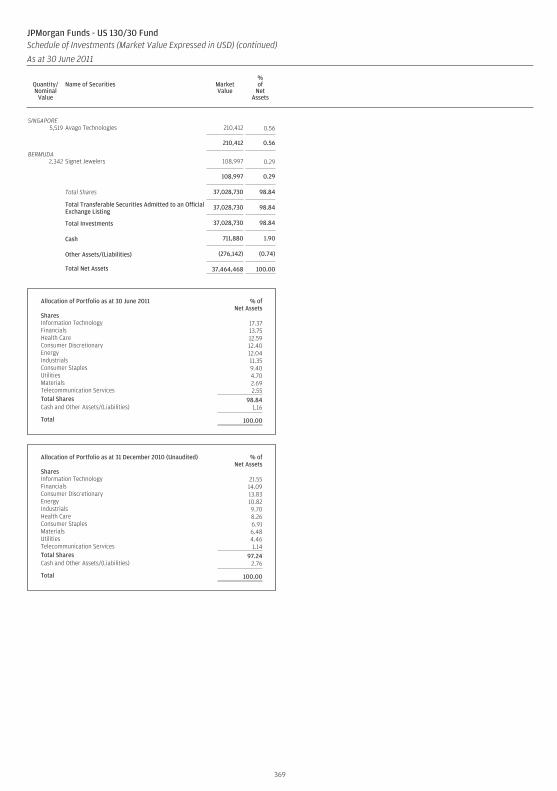
SINGAPORE5,519 Avago Technologies 210,412 0.56
210,412 0.56
BERMUDA2,342 Signet Jewelers 108,997 0.29
108,997 0.29
Total Shares 37,028,730 98.84
Total Transferable Securities Admitted to an OfficialExchange Listing
37,028,730 98.84
Total Investments 37,028,730 98.84
Cash 711,880 1.90
Other Assets/(Liabilities) (276,142) (0.74)
Total Net Assets 37,464,468 100.00
Allocation of Portfolio as at 30 June 2011 % ofNet Assets
SharesInformation Technology 17.37Financials 13.75Health Care 12.59Consumer Discretionary 12.40Energy 12.04Industrials 11.35Consumer Staples 9.40Utilities 4.70Materials 2.69Telecommunication Services 2.55Total Shares 98.84Cash and Other Assets/(Liabilities) 1.16
Total 100.00
Allocation of Portfolio as at 31 December 2010 (Unaudited) % ofNet Assets
SharesInformation Technology 21.55Financials 14.09Consumer Discretionary 13.83Energy 10.82Industrials 9.70Health Care 8.26Consumer Staples 6.91Materials 6.48Utilities 4.46Telecommunication Services 1.14Total Shares 97.24Cash and Other Assets/(Liabilities) 2.76
Total 100.00
369
JPMorgan Funds - US 130/30 FundSchedule of Investments (Market Value Expressed in USD) (continued)
As at 30 June 2011
Quantity/Nominal
Value
Name of Securities MarketValue
%of
NetAssets
Quantity/Nominal
Value
Name of Securities MarketValue
%of
NetAssets
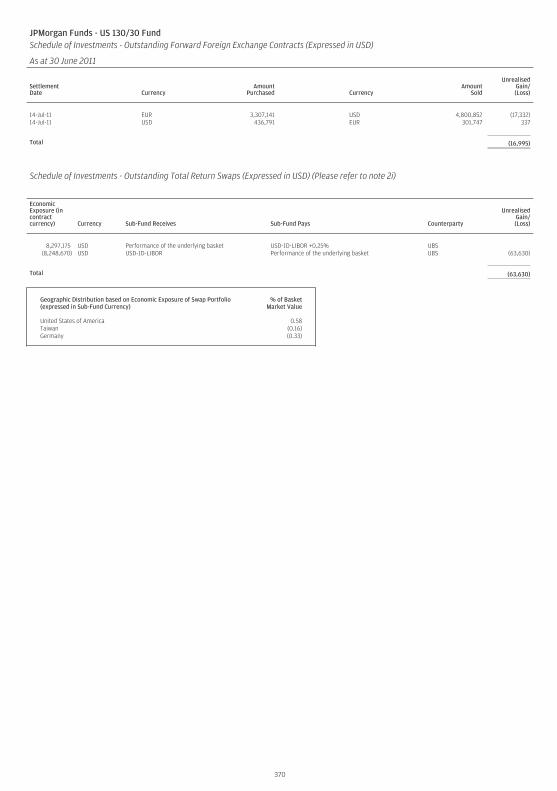
JPMorgan Funds - US 130/30 FundSchedule of Investments - Outstanding Forward Foreign Exchange Contracts (Expressed in USD)
As at 30 June 2011
SettlementDate Currency
AmountPurchased Currency
AmountSold
UnrealisedGain/(Loss)
14-Jul-11 EUR 3,307,141 USD 4,800,852 (17,332)14-Jul-11 USD 436,791 EUR 301,747 337
Total (16,995)
Schedule of Investments - Outstanding Total Return Swaps (Expressed in USD) (Please refer to note 2i)
EconomicExposure (incontractcurrency) Currency Sub-Fund Receives Sub-Fund Pays Counterparty
UnrealisedGain/(Loss)
8,297,175 USD Performance of the underlying basket USD-1D-LIBOR +0.25% UBS(8,248,670) USD USD-1D-LIBOR Performance of the underlying basket UBS (63,630)
Total (63,630)
Geographic Distribution based on Economic Exposure of Swap Portfolio(expressed in Sub-Fund Currency)
% of BasketMarket Value
United States of America 0.58Taiwan (0.16)Germany (0.33)
370
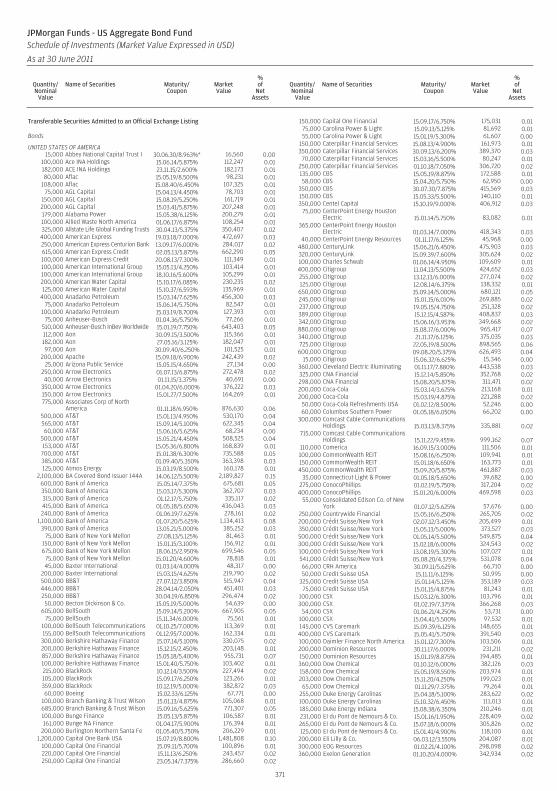
Transferable Securities Admitted to an Official Exchange Listing
Bonds
UNITED STATES OF AMERICA15,000 Abbey National Capital Trust I 30.06.30/8.963%* 16,560 0.00
100,000 Ace INA Holdings 15.06.14/5.875% 112,247 0.01182,000 ACE INA Holdings 23.11.15/2.600% 182,173 0.0180,000 Aflac 15.05.19/8.500% 98,231 0.01
108,000 Aflac 15.08.40/6.450% 107,325 0.0175,000 AGL Capital 15.04.13/4.450% 78,703 0.01
150,000 AGL Capital 15.08.19/5.250% 161,719 0.01200,000 AGL Capital 15.03.41/5.875% 207,248 0.01179,000 Alabama Power 15.05.38/6.125% 200,279 0.01100,000 Allied Waste North America 01.06.17/6.875% 108,254 0.01325,000 Allstate Life Global Funding Trusts 30.04.13/5.375% 350,407 0.02400,000 American Express 19.03.18/7.000% 472,697 0.03250,000 American Express Centurion Bank 13.09.17/6.000% 284,017 0.02615,000 American Express Credit 02.05.13/5.875% 662,290 0.05100,000 American Express Credit 20.08.13/7.300% 111,349 0.01100,000 American International Group 15.05.13/4.250% 103,414 0.01100,000 American International Group 18.10.16/5.600% 105,299 0.01200,000 American Water Capital 15.10.17/6.085% 230,235 0.02125,000 American Water Capital 15.10.37/6.593% 135,969 0.01
400,000 Anadarko Petroleum 15.03.14/7.625% 456,300 0.0375,000 Anadarko Petroleum 15.06.14/5.750% 82,547 0.01
100,000 Anadarko Petroleum 15.03.19/8.700% 127,393 0.0175,000 Anheuser-Busch 01.04.36/5.750% 77,266 0.01
510,000 Anheuser-Busch InBev Worldwide 15.01.19/7.750% 643,403 0.05112,000 Aon 30.09.15/3.500% 115,366 0.01182,000 Aon 27.05.16/3.125% 182,047 0.0197,000 Aon 30.09.40/6.250% 101,525 0.01
200,000 Apache 15.09.18/6.900% 242,439 0.0225,000 Arizona Public Service 15.05.15/4.650% 27,134 0.00
250,000 Arrow Electronics 01.07.13/6.875% 272,478 0.0240,000 Arrow Electronics 01.11.15/3.375% 40,691 0.00
350,000 Arrow Electronics 01.04.20/6.000% 376,222 0.03150,000 Arrow Electronics 15.01.27/7.500% 164,269 0.01775,000 Associates Corp of North
America 01.11.18/6.950% 876,630 0.06500,000 AT&T 15.01.13/4.950% 530,170 0.04565,000 AT&T 15.09.14/5.100% 622,345 0.0460,000 AT&T 15.06.16/5.625% 68,234 0.00
500,000 AT&T 15.05.21/4.450% 508,525 0.04153,000 AT&T 15.05.36/6.800% 168,839 0.01700,000 AT&T 15.01.38/6.300% 735,588 0.05385,000 AT&T 01.09.40/5.350% 363,398 0.03125,000 Atmos Energy 15.03.19/8.500% 160,178 0.01
2,100,000 BA Covered Bond Issuer 144A 14.06.12/5.500% 2,189,827 0.15600,000 Bank of America 15.05.14/7.375% 675,681 0.05350,000 Bank of America 15.03.17/5.300% 362,707 0.03315,000 Bank of America 01.12.17/5.750% 335,117 0.02415,000 Bank of America 01.05.18/5.650% 436,043 0.03240,000 Bank of America 01.06.19/7.625% 278,161 0.02
1,100,000 Bank of America 01.07.20/5.625% 1,134,413 0.08390,000 Bank of America 13.05.21/5.000% 385,252 0.03
75,000 Bank of New York Mellon 27.08.13/5.125% 81,463 0.01150,000 Bank of New York Mellon 15.01.15/3.100% 156,912 0.01675,000 Bank of New York Mellon 18.06.15/2.950% 699,546 0.05
75,000 Bank of New York Mellon 15.01.20/4.600% 78,818 0.0145,000 Baxter International 01.03.14/4.000% 48,317 0.00
200,000 Baxter International 15.03.15/4.625% 219,790 0.02500,000 BB&T 27.07.12/3.850% 515,947 0.04446,000 BB&T 28.04.14/2.050% 451,401 0.03250,000 BB&T 30.04.19/6.850% 296,474 0.0250,000 Becton Dickinson & Co. 15.05.19/5.000% 54,639 0.00
605,000 BellSouth 15.09.14/5.200% 667,905 0.0575,000 BellSouth 15.11.34/6.000% 75,561 0.01
100,000 BellSouth Telecommunications 01.10.25/7.000% 113,369 0.01155,000 BellSouth Telecommunications 01.12.95/7.000% 162,334 0.01
300,000 Berkshire Hathaway Finance 15.07.14/5.100% 330,075 0.02200,000 Berkshire Hathaway Finance 15.12.15/2.450% 203,148 0.01857,000 Berkshire Hathaway Finance 15.05.18/5.400% 955,731 0.07100,000 Berkshire Hathaway Finance 15.01.40/5.750% 103,402 0.01215,000 BlackRock 10.12.14/3.500% 227,494 0.02105,000 BlackRock 15.09.17/6.250% 123,266 0.01359,000 BlackRock 10.12.19/5.000% 382,872 0.0360,000 Boeing 15.02.33/6.125% 67,771 0.00
100,000 Branch Banking & Trust Wilson 15.01.13/4.875% 105,068 0.01685,000 Branch Banking & Trust Wilson 15.09.16/5.625% 771,307 0.05100,000 Bunge Finance 15.05.13/5.875% 106,587 0.01161,000 Bunge NA Finance 01.04.17/5.900% 176,394 0.01
200,000 Burlington Northern Santa Fe 01.05.40/5.750% 206,229 0.011,200,000 Capital One Bank USA 15.07.19/8.800% 1,481,808 0.10
100,000 Capital One Financial 15.09.11/5.700% 100,896 0.01220,000 Capital One Financial 15.11.13/6.250% 243,457 0.02250,000 Capital One Financial 23.05.14/7.375% 286,660 0.02
150,000 Capital One Financial 15.09.17/6.750% 175,031 0.0175,000 Carolina Power & Light 15.09.13/5.125% 81,692 0.0155,000 Carolina Power & Light 15.01.19/5.300% 61,607 0.00
150,000 Caterpillar Financial Services 15.08.13/4.900% 161,973 0.01350,000 Caterpillar Financial Services 30.09.13/6.200% 389,370 0.03
70,000 Caterpillar Financial Services 15.03.16/5.500% 80,247 0.01250,000 Caterpillar Financial Services 01.10.18/7.050% 306,720 0.02135,000 CBS 15.05.19/8.875% 172,588 0.0158,000 CBS 15.04.20/5.750% 62,950 0.00
350,000 CBS 30.07.30/7.875% 415,569 0.03150,000 CBS 15.05.33/5.500% 140,110 0.01350,000 Centel Capital 15.10.19/9.000% 406,912 0.03
75,000 CenterPoint Energy HoustonElectric 15.01.14/5.750% 83,082 0.01
365,000 CenterPoint Energy HoustonElectric 01.03.14/7.000% 418,343 0.03
40,000 CenterPoint Energy Resources 01.11.17/6.125% 45,968 0.00480,000 CenturyLink 15.06.21/6.450% 475,903 0.03320,000 CenturyLink 15.09.39/7.600% 305,624 0.02100,000 Charles Schwab 01.06.14/4.950% 109,609 0.01400,000 Citigroup 11.04.13/5.500% 424,652 0.03255,000 Citigroup 13.12.13/6.000% 277,074 0.02125,000 Citigroup 12.08.14/6.375% 138,332 0.01
650,000 Citigroup 15.09.14/5.000% 680,121 0.05245,000 Citigroup 15.01.15/6.010% 269,885 0.02237,000 Citigroup 19.05.15/4.750% 251,328 0.02389,000 Citigroup 15.12.15/4.587% 408,837 0.03342,000 Citigroup 15.06.16/3.953% 349,668 0.02880,000 Citigroup 15.08.17/6.000% 965,417 0.07340,000 Citigroup 21.11.17/6.125% 375,035 0.03725,000 Citigroup 22.05.19/8.500% 898,565 0.06600,000 Citigroup 09.08.20/5.375% 626,493 0.04
15,000 Citigroup 15.06.32/6.625% 15,346 0.00360,000 Cleveland Electric Illuminating 01.11.17/7.880% 443,538 0.03325,000 CNA Financial 15.12.14/5.850% 352,768 0.02298,000 CNA Financial 15.08.20/5.875% 311,471 0.02200,000 Coca-Cola 15.03.14/3.625% 213,168 0.01200,000 Coca-Cola 15.03.19/4.875% 221,288 0.02
50,000 Coca-Cola Refreshments USA 01.02.12/8.500% 52,246 0.0060,000 Columbus Southern Power 01.05.18/6.050% 66,202 0.00
300,000 Comcast Cable CommunicationsHoldings 15.03.13/8.375% 335,881 0.02
715,000 Comcast Cable CommunicationsHoldings 15.11.22/9.455% 999,162 0.07
110,000 Comerica 16.09.15/3.000% 111,506 0.01100,000 CommonWealth REIT 15.08.16/6.250% 109,941 0.01150,000 CommonWealth REIT 15.01.18/6.650% 163,773 0.01450,000 CommonWealth REIT 15.09.20/5.875% 461,887 0.03
35,000 Connecticut Light & Power 01.05.18/5.650% 39,682 0.00275,000 ConocoPhillips 01.02.19/5.750% 317,204 0.02
400,000 ConocoPhillips 15.01.20/6.000% 469,598 0.0355,000 Consolidated Edison Co. of New
York 01.07.12/5.625% 57,676 0.00250,000 Countrywide Financial 15.05.16/6.250% 265,705 0.02200,000 Crédit Suisse/New York 02.07.12/3.450% 205,499 0.01350,000 Crédit Suisse/New York 15.05.13/5.000% 373,527 0.03500,000 Crédit Suisse/New York 01.05.14/5.500% 549,875 0.04300,000 Crédit Suisse/New York 15.02.18/6.000% 324,543 0.02100,000 Crédit Suisse/New York 13.08.19/5.300% 107,027 0.01541,000 Crédit Suisse/New York 05.08.20/4.375% 531,078 0.0466,000 CRH America 30.09.11/5.625% 66,710 0.0050,000 Credit Suisse USA 15.11.11/6.125% 50,995 0.00
325,000 Credit Suisse USA 15.01.14/5.125% 353,189 0.0375,000 Credit Suisse USA 15.01.15/4.875% 81,243 0.01
100,000 CSX 15.03.12/6.300% 103,796 0.01300,000 CSX 01.02.19/7.375% 366,268 0.03
54,000 CSX 01.06.21/4.250% 53,731 0.00100,000 CSX 15.04.41/5.500% 97,532 0.01145,000 CVS Caremark 15.09.39/6.125% 148,655 0.01
400,000 CVS Caremark 15.05.41/5.750% 391,540 0.03100,000 Daimler Finance North America 15.01.12/7.300% 103,506 0.01200,000 Dominion Resources 30.11.17/6.000% 231,211 0.02150,000 Dominion Resources 15.01.19/8.875% 194,485 0.01360,000 Dow Chemical 01.10.12/6.000% 382,126 0.03158,000 Dow Chemical 15.05.19/8.550% 203,974 0.01203,000 Dow Chemical 15.11.20/4.250% 199,023 0.01
65,000 Dow Chemical 01.11.29/7.375% 79,264 0.01255,000 Duke Energy Carolinas 15.04.18/5.100% 283,622 0.02100,000 Duke Energy Carolinas 15.10.32/6.450% 111,013 0.01185,000 Duke Energy Indiana 15.08.38/6.350% 210,246 0.01231,000 EI du Pont de Nemours & Co. 15.01.16/1.950% 228,409 0.02265,000 EI du Pont de Nemours & Co. 15.07.18/6.000% 305,826 0.02125,000 EI du Pont de Nemours & Co. 15.01.41/4.900% 118,100 0.01
200,000 Eli Lilly & Co. 06.03.12/3.550% 204,087 0.01300,000 EOG Resources 01.02.21/4.100% 298,098 0.02360,000 Exelon Generation 01.10.20/4.000% 342,934 0.02
371
JPMorgan Funds - US Aggregate Bond FundSchedule of Investments (Market Value Expressed in USD)
As at 30 June 2011
Quantity/Nominal
Value
Name of Securities Maturity/Coupon
MarketValue
%of
NetAssets
Quantity/Nominal
Value
Name of Securities Maturity/Coupon
MarketValue
%of
NetAssets
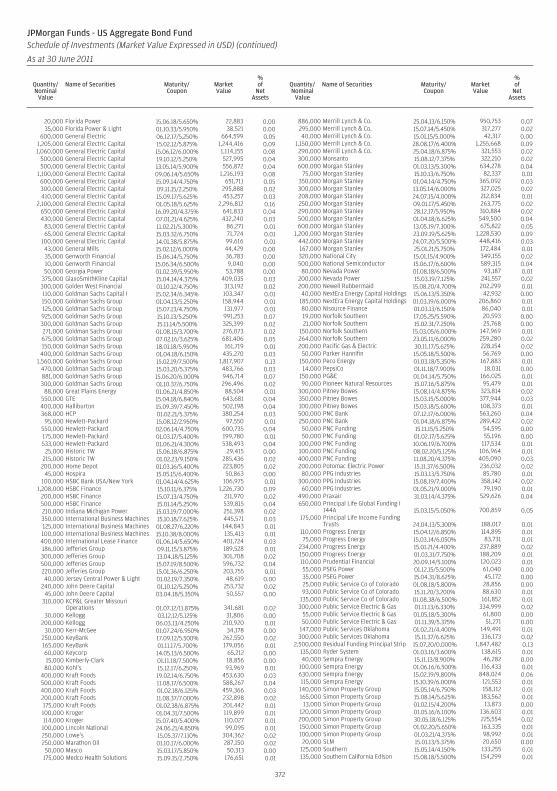
20,000 Florida Power 15.06.18/5.650% 22,883 0.0035,000 Florida Power & Light 01.10.33/5.950% 38,521 0.00
600,000 General Electric 06.12.17/5.250% 664,599 0.051,205,000 General Electric Capital 15.02.12/5.875% 1,244,416 0.091,060,000 General Electric Capital 15.06.12/6.000% 1,114,155 0.08
500,000 General Electric Capital 19.10.12/5.250% 527,995 0.04500,000 General Electric Capital 13.05.14/5.900% 556,872 0.04
1,100,000 General Electric Capital 09.06.14/5.650% 1,216,193 0.08600,000 General Electric Capital 15.09.14/4.750% 651,711 0.05300,000 General Electric Capital 09.11.15/2.250% 295,888 0.02410,000 General Electric Capital 15.09.17/5.625% 453,257 0.03
2,100,000 General Electric Capital 01.05.18/5.625% 2,296,812 0.16650,000 General Electric Capital 16.09.20/4.375% 641,833 0.04430,000 General Electric Capital 07.01.21/4.625% 432,240 0.03
83,000 General Electric Capital 11.02.21/5.300% 86,271 0.0165,000 General Electric Capital 15.03.32/6.750% 71,724 0.01
100,000 General Electric Capital 14.01.38/5.875% 99,616 0.0143,000 General Mills 15.02.12/6.000% 44,429 0.0035,000 Genworth Financial 15.06.14/5.750% 36,783 0.0010,000 Genworth Financial 15.06.34/6.500% 9,040 0.0050,000 Georgia Power 01.02.39/5.950% 53,788 0.00
375,000 GlaxoSmithKline Capital 15.04.14/4.375% 409,035 0.03300,000 Golden West Financial 01.10.12/4.750% 313,192 0.02110,000 Goldman Sachs Capital I 15.02.34/6.345% 103,347 0.01150,000 Goldman Sachs Group 01.04.13/5.250% 158,944 0.01125,000 Goldman Sachs Group 15.07.13/4.750% 131,977 0.01925,000 Goldman Sachs Group 15.10.13/5.250% 991,253 0.07300,000 Goldman Sachs Group 15.11.14/5.500% 325,399 0.02271,000 Goldman Sachs Group 01.08.15/3.700% 276,073 0.02675,000 Goldman Sachs Group 07.02.16/3.625% 681,406 0.05150,000 Goldman Sachs Group 18.01.18/5.950% 161,719 0.01
400,000 Goldman Sachs Group 01.04.18/6.150% 435,270 0.031,560,000 Goldman Sachs Group 15.02.19/7.500% 1,817,907 0.13
470,000 Goldman Sachs Group 15.03.20/5.375% 483,766 0.03881,000 Goldman Sachs Group 15.06.20/6.000% 946,714 0.07300,000 Goldman Sachs Group 01.10.37/6.750% 296,496 0.02
88,000 Great Plains Energy 01.06.21/4.850% 88,504 0.01550,000 GTE 15.04.18/6.840% 643,681 0.04400,000 Halliburton 15.09.39/7.450% 502,198 0.04368,000 HCP 01.02.21/5.375% 380,254 0.03
95,000 Hewlett-Packard 15.08.12/2.950% 97,550 0.01550,000 Hewlett-Packard 02.06.14/4.750% 600,735 0.04175,000 Hewlett-Packard 01.03.17/5.400% 199,780 0.01533,000 Hewlett-Packard 01.06.21/4.300% 538,493 0.04
25,000 Historic TW 15.06.18/6.875% 29,415 0.00215,000 Historic TW 01.02.23/9.150% 285,436 0.02
200,000 Home Depot 01.03.16/5.400% 223,805 0.0245,000 Hospira 15.05.15/6.400% 50,863 0.00
100,000 HSBC Bank USA/New York 01.04.14/4.625% 106,975 0.011,208,000 HSBC Finance 15.10.11/6.375% 1,226,730 0.09
200,000 HSBC Finance 15.07.13/4.750% 211,970 0.02500,000 HSBC Finance 15.01.14/5.250% 539,815 0.04210,000 Indiana Michigan Power 15.03.19/7.000% 251,398 0.02350,000 International Business Machines 15.10.18/7.625% 445,571 0.03125,000 International Business Machines 01.08.27/6.220% 144,843 0.01100,000 International Business Machines 15.10.38/8.000% 135,413 0.01400,000 International Lease Finance 01.06.14/5.650% 401,724 0.03186,000 Jefferies Group 09.11.15/3.875% 189,528 0.01300,000 Jefferies Group 13.04.18/5.125% 301,708 0.02500,000 Jefferies Group 15.07.19/8.500% 596,732 0.04220,000 Jefferies Group 15.01.36/6.250% 203,755 0.0140,000 Jersey Central Power & Light 01.02.19/7.350% 48,619 0.00
240,000 John Deere Capital 01.10.12/5.250% 253,732 0.0245,000 John Deere Capital 03.04.18/5.350% 50,557 0.00
310,000 KCP&L Greater MissouriOperations 01.07.12/11.875% 341,681 0.02
30,000 Kellogg 03.12.12/5.125% 31,806 0.00200,000 Kellogg 06.03.13/4.250% 210,920 0.01
30,000 Kerr-McGee 01.07.24/6.950% 34,178 0.00250,000 KeyBank 17.09.12/5.500% 262,550 0.02165,000 KeyBank 01.11.17/5.700% 179,056 0.0160,000 Keycorp 14.05.13/6.500% 65,212 0.0015,000 Kimberly-Clark 01.11.18/7.500% 18,856 0.0080,000 Kohl’s 15.12.17/6.250% 93,969 0.01
400,000 Kraft Foods 19.02.14/6.750% 453,630 0.03500,000 Kraft Foods 11.08.17/6.500% 588,267 0.04400,000 Kraft Foods 01.02.18/6.125% 459,366 0.03200,000 Kraft Foods 11.08.37/7.000% 232,898 0.02175,000 Kraft Foods 01.02.38/6.875% 201,442 0.01100,000 Kroger 01.04.31/7.500% 119,899 0.01114,000 Kroger 15.07.40/5.400% 110,027 0.01100,000 Lincoln National 24.06.21/4.850% 99,095 0.01250,000 Lowe’s 15.05.37/7.110% 304,362 0.02250,000 Marathon Oil 01.10.17/6.000% 287,150 0.0250,000 Masco 15.03.17/5.850% 50,313 0.00
175,000 Medco Health Solutions 15.09.15/2.750% 176,651 0.01
886,000 Merrill Lynch & Co. 25.04.13/6.150% 950,753 0.07295,000 Merrill Lynch & Co. 15.07.14/5.450% 317,277 0.0240,000 Merrill Lynch & Co. 15.01.15/5.000% 42,317 0.00
1,150,000 Merrill Lynch & Co. 28.08.17/6.400% 1,255,668 0.09290,000 Merrill Lynch & Co. 25.04.18/6.875% 321,553 0.02300,000 Monsanto 15.08.12/7.375% 322,210 0.02600,000 Morgan Stanley 01.03.13/5.300% 634,278 0.04
75,000 Morgan Stanley 15.10.13/6.750% 82,337 0.01350,000 Morgan Stanley 01.04.14/4.750% 365,092 0.03300,000 Morgan Stanley 13.05.14/6.000% 327,025 0.02208,000 Morgan Stanley 24.07.15/4.000% 212,834 0.01250,000 Morgan Stanley 09.01.17/5.450% 263,775 0.02290,000 Morgan Stanley 28.12.17/5.950% 310,884 0.02500,000 Morgan Stanley 01.04.18/6.625% 549,500 0.04600,000 Morgan Stanley 13.05.19/7.300% 675,822 0.05
1,200,000 Morgan Stanley 23.09.19/5.625% 1,228,530 0.09442,000 Morgan Stanley 24.07.20/5.500% 448,416 0.03167,000 Morgan Stanley 25.01.21/5.750% 172,484 0.01320,000 National City 15.01.15/4.900% 349,155 0.02500,000 National Semiconductor 15.06.17/6.600% 589,315 0.04
80,000 Nevada Power 01.08.18/6.500% 93,187 0.01200,000 Nevada Power 15.03.19/7.125% 241,557 0.02200,000 Newell Rubbermaid 15.08.20/4.700% 202,299 0.0140,000 NextEra Energy Capital Holdings 15.06.13/5.350% 42,932 0.00
185,000 NextEra Energy Capital Holdings 01.03.19/6.000% 206,860 0.0180,000 Nisource Finance 01.03.13/6.150% 86,040 0.0119,000 Norfolk Southern 17.05.25/5.590% 20,593 0.0021,000 Norfolk Southern 15.02.31/7.250% 25,768 0.00
150,000 Norfolk Southern 15.03.05/6.000% 147,969 0.01264,000 Norfolk Southern 23.05.11/6.000% 259,280 0.02200,000 Pacific Gas & Electric 30.11.17/5.625% 228,154 0.02
50,000 Parker Hannifin 15.05.18/5.500% 56,769 0.00150,000 Peco Energy 01.03.18/5.350% 167,883 0.01
14,000 PepsiCo 01.11.18/7.900% 18,031 0.00150,000 PG&E 01.04.14/5.750% 166,025 0.0190,000 Pioneer Natural Resources 15.07.16/5.875% 95,479 0.01
300,000 Pitney Bowes 15.08.14/4.875% 323,814 0.02350,000 Pitney Bowes 15.03.15/5.000% 377,944 0.03100,000 Pitney Bowes 15.03.18/5.600% 108,373 0.01500,000 PNC Bank 07.12.17/6.000% 563,260 0.04250,000 PNC Bank 01.04.18/6.875% 289,422 0.0250,000 PNC Funding 15.11.15/5.250% 54,595 0.0050,000 PNC Funding 01.02.17/5.625% 55,196 0.00
100,000 PNC Funding 10.06.19/6.700% 117,534 0.01100,000 PNC Funding 08.02.20/5.125% 106,964 0.01400,000 PNC Funding 11.08.20/4.375% 405,090 0.03200,000 Potomac Electric Power 15.11.37/6.500% 236,032 0.02
80,000 PPG Industries 15.03.13/5.750% 85,780 0.01300,000 PPG Industries 15.08.19/7.400% 358,142 0.02
60,000 PPG Industries 01.05.21/9.000% 79,190 0.01490,000 Praxair 31.03.14/4.375% 529,626 0.04650,000 Principal Life Global Funding I
144A 15.03.15/5.050% 700,859 0.05175,000 Principal Life Income Funding
Trusts 24.04.13/5.300% 188,017 0.01110,000 Progress Energy 15.04.12/6.850% 114,895 0.0175,000 Progress Energy 15.03.14/6.050% 83,731 0.01
234,000 Progress Energy 15.01.21/4.400% 237,889 0.02150,000 Progress Energy 01.03.31/7.750% 188,209 0.01110,000 Prudential Financial 20.09.14/5.100% 120,023 0.0155,000 PSEG Power 01.12.15/5.500% 61,040 0.0035,000 PSEG Power 15.04.31/8.625% 45,172 0.0025,000 Public Service Co of Colorado 01.08.18/5.800% 28,856 0.0093,000 Public Service Co of Colorado 15.11.20/3.200% 88,630 0.01
135,000 Public Service Co of Colorado 01.08.38/6.500% 161,852 0.01300,000 Public Service Electric & Gas 01.11.13/6.330% 334,999 0.02
55,000 Public Service Electric & Gas 01.05.18/5.300% 61,800 0.0050,000 Public Service Electric & Gas 01.11.39/5.375% 51,271 0.00
147,000 Public Services Oklahoma 01.02.21/4.400% 149,491 0.01300,000 Public Services Oklahoma 15.11.37/6.625% 336,173 0.02
2,500,000 Residual Funding Principal Strip 15.07.20/0.000% 1,847,482 0.13135,000 Ryder System 01.03.16/3.600% 138,615 0.0140,000 Sempra Energy 15.11.13/8.900% 46,282 0.00
100,000 Sempra Energy 01.06.16/6.500% 116,433 0.01630,000 Sempra Energy 15.02.19/9.800% 848,024 0.06115,000 Sempra Energy 15.10.39/6.000% 121,553 0.01
140,000 Simon Property Group 15.05.14/6.750% 158,112 0.01165,000 Simon Property Group 15.08.14/5.625% 183,562 0.01
13,000 Simon Property Group 01.02.15/4.200% 13,873 0.00120,000 Simon Property Group 01.05.16/6.100% 136,603 0.01200,000 Simon Property Group 30.05.18/6.125% 225,554 0.02150,000 Simon Property Group 01.02.20/5.650% 163,335 0.01100,000 Simon Property Group 01.03.21/4.375% 98,992 0.0120,000 SLM 15.01.13/5.375% 20,650 0.00
125,000 Southern 15.05.14/4.150% 133,255 0.01135,000 Southern California Edison 15.08.18/5.500% 154,299 0.01
372
JPMorgan Funds - US Aggregate Bond FundSchedule of Investments (Market Value Expressed in USD) (continued)
As at 30 June 2011
Quantity/Nominal
Value
Name of Securities Maturity/Coupon
MarketValue
%of
NetAssets
Quantity/Nominal
Value
Name of Securities Maturity/Coupon
MarketValue
%of
NetAssets
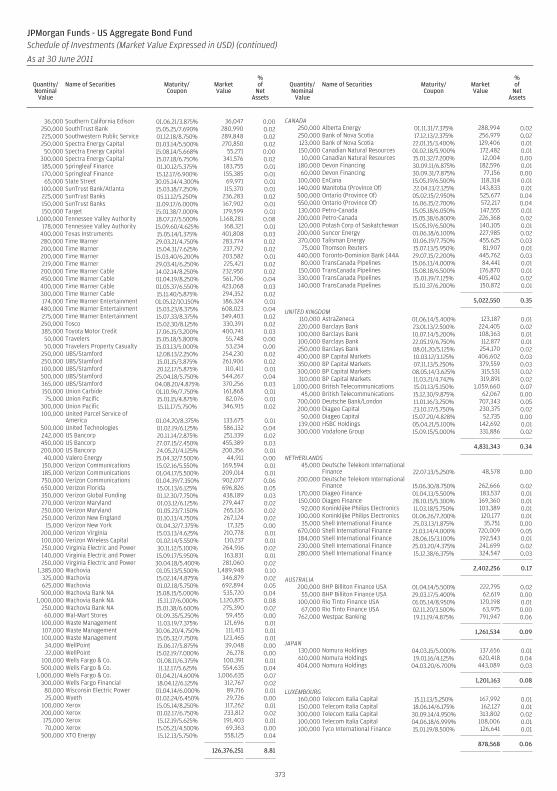
36,000 Southern California Edison 01.06.21/3.875% 36,047 0.00250,000 SouthTrust Bank 15.05.25/7.690% 280,990 0.02225,000 Southwestern Public Service 01.12.18/8.750% 289,848 0.02250,000 Spectra Energy Capital 01.03.14/5.500% 270,850 0.0250,000 Spectra Energy Capital 15.08.14/5.668% 55,271 0.00
300,000 Spectra Energy Capital 15.07.18/6.750% 341,576 0.02185,000 Springleaf Finance 01.10.12/5.375% 183,755 0.01170,000 Springleaf Finance 15.12.17/6.900% 155,385 0.0165,000 State Street 30.05.14/4.300% 69,971 0.01
100,000 SunTrust Bank/Atlanta 15.03.18/7.250% 115,370 0.01225,000 SunTrust Banks 05.11.12/5.250% 236,283 0.02150,000 SunTrust Banks 11.09.17/6.000% 167,902 0.01150,000 Target 15.01.38/7.000% 179,599 0.01
1,000,000 Tennessee Valley Authority 18.07.17/5.500% 1,168,281 0.08178,000 Tennessee Valley Authority 15.09.60/4.625% 168,321 0.01
400,000 Texas Instruments 15.05.14/1.375% 401,808 0.03280,000 Time Warner 29.03.21/4.750% 283,774 0.02200,000 Time Warner 15.04.31/7.625% 237,792 0.02200,000 Time Warner 15.03.40/6.200% 203,582 0.01219,000 Time Warner 29.03.41/6.250% 225,421 0.02200,000 Time Warner Cable 14.02.14/8.250% 232,950 0.02450,000 Time Warner Cable 01.04.19/8.250% 561,706 0.04400,000 Time Warner Cable 01.05.37/6.550% 423,068 0.03300,000 Time Warner Cable 15.11.40/5.875% 294,352 0.02174,000 Time Warner Entertainment 01.05.12/10.150% 186,324 0.01
480,000 Time Warner Entertainment 15.03.23/8.375% 608,023 0.04275,000 Time Warner Entertainment 15.07.33/8.375% 349,403 0.02250,000 Tosco 15.02.30/8.125% 330,391 0.02385,000 Toyota Motor Credit 17.06.15/3.200% 400,741 0.0350,000 Travelers 15.05.18/5.800% 55,748 0.0050,000 Travelers Property Casualty 15.03.13/5.000% 53,234 0.00
250,000 UBS/Stamford 12.08.13/2.250% 254,230 0.02250,000 UBS/Stamford 15.01.15/3.875% 261,906 0.02100,000 UBS/Stamford 20.12.17/5.875% 110,411 0.01500,000 UBS/Stamford 25.04.18/5.750% 544,267 0.04365,000 UBS/Stamford 04.08.20/4.875% 370,256 0.03150,000 Union Carbide 01.10.96/7.750% 161,868 0.0175,000 Union Pacific 15.01.15/4.875% 82,076 0.01
300,000 Union Pacific 15.11.17/5.750% 346,915 0.02100,000 United Parcel Service of
America 01.04.20/8.375% 133,675 0.01500,000 United Technologies 01.02.19/6.125% 586,132 0.04242,000 US Bancorp 20.11.14/2.875% 251,339 0.02450,000 US Bancorp 27.07.15/2.450% 455,389 0.03200,000 US Bancorp 24.05.21/4.125% 200,356 0.0140,000 Valero Energy 15.04.32/7.500% 44,911 0.00
150,000 Verizon Communications 15.02.16/5.550% 169,594 0.01185,000 Verizon Communications 01.04.17/5.500% 209,014 0.01750,000 Verizon Communications 01.04.39/7.350% 902,077 0.06650,000 Verizon Florida 15.01.13/6.125% 696,826 0.05350,000 Verizon Global Funding 01.12.30/7.750% 438,189 0.03270,000 Verizon Maryland 01.03.12/6.125% 279,447 0.02250,000 Verizon Maryland 01.05.23/7.150% 265,136 0.02250,000 Verizon New England 01.10.13/4.750% 267,124 0.02
15,000 Verizon New York 01.04.32/7.375% 17,325 0.00200,000 Verizon Virginia 15.03.13/4.625% 210,778 0.01100,000 Verizon Wireless Capital 01.02.14/5.550% 110,237 0.01250,000 Virginia Electric and Power 30.11.12/5.100% 264,916 0.02140,000 Virginia Electric and Power 15.09.17/5.950% 163,831 0.01250,000 Virginia Electric and Power 30.04.18/5.400% 281,060 0.02
1,385,000 Wachovia 01.05.13/5.500% 1,489,948 0.10325,000 Wachovia 15.02.14/4.875% 346,879 0.02625,000 Wachovia 01.02.18/5.750% 692,894 0.05500,000 Wachovia Bank NA 15.08.15/5.000% 535,720 0.04
1,000,000 Wachovia Bank NA 15.11.17/6.000% 1,120,875 0.08250,000 Wachovia Bank NA 15.01.38/6.600% 275,390 0.0260,000 Wal-Mart Stores 01.09.35/5.250% 59,455 0.00
100,000 Waste Management 11.03.19/7.375% 121,696 0.01107,000 Waste Management 30.06.20/4.750% 111,413 0.01100,000 Waste Management 15.05.32/7.750% 123,465 0.0134,000 WellPoint 15.06.17/5.875% 39,048 0.0022,000 WellPoint 15.02.19/7.000% 26,278 0.00
100,000 Wells Fargo & Co. 01.08.11/6.375% 100,391 0.01500,000 Wells Fargo & Co. 11.12.17/5.625% 554,635 0.04
1,000,000 Wells Fargo & Co. 01.04.21/4.600% 1,006,635 0.07300,000 Wells Fargo Financial 18.04.12/6.125% 312,767 0.02
80,000 Wisconsin Electric Power 01.04.14/6.000% 89,716 0.0125,000 Wyeth 01.02.24/6.450% 29,726 0.00
100,000 Xerox 15.05.14/8.250% 117,262 0.01200,000 Xerox 01.02.17/6.750% 233,812 0.02175,000 Xerox 15.12.19/5.625% 191,403 0.0170,000 Xerox 15.05.21/4.500% 69,363 0.00
500,000 XTO Energy 15.12.13/5.750% 558,125 0.04
126,376,251 8.81
CANADA250,000 Alberta Energy 01.11.31/7.375% 288,994 0.02250,000 Bank of Nova Scotia 17.12.13/2.375% 256,979 0.02123,000 Bank of Nova Scotia 22.01.15/3.400% 129,406 0.01150,000 Canadian Natural Resources 01.02.18/5.900% 172,482 0.0110,000 Canadian Natural Resources 15.01.32/7.200% 12,004 0.00
180,000 Devon Financing 30.09.11/6.875% 182,596 0.0160,000 Devon Financing 30.09.31/7.875% 77,156 0.00
100,000 EnCana 15.05.19/6.500% 118,314 0.01140,000 Manitoba (Province Of) 22.04.13/2.125% 143,833 0.01500,000 Ontario (Province Of) 05.02.15/2.950% 525,677 0.04550,000 Ontario (Province Of) 16.06.15/2.700% 572,217 0.04130,000 Petro-Canada 15.05.18/6.050% 147,555 0.01200,000 Petro-Canada 15.05.38/6.800% 226,368 0.02120,000 Potash Corp of Saskatchewan 15.05.19/6.500% 140,105 0.01200,000 Suncor Energy 01.06.18/6.100% 227,985 0.02370,000 Talisman Energy 01.06.19/7.750% 455,625 0.03
75,000 Thomson Reuters 15.07.13/5.950% 81,907 0.01440,000 Toronto-Dominion Bank 144A 29.07.15/2.200% 445,762 0.03
80,000 TransCanada Pipelines 15.06.13/4.000% 84,441 0.01150,000 TransCanada Pipelines 15.08.18/6.500% 176,870 0.01330,000 TransCanada Pipelines 15.01.19/7.125% 405,402 0.02140,000 TransCanada Pipelines 15.10.37/6.200% 150,872 0.01
5,022,550 0.35
UNITED KINGDOM110,000 AstraZeneca 01.06.14/5.400% 123,187 0.01220,000 Barclays Bank 23.01.13/2.500% 224,405 0.02100,000 Barclays Bank 10.07.14/5.200% 108,363 0.01100,000 Barclays Bank 22.05.19/6.750% 112,877 0.01250,000 Barclays Bank 08.01.20/5.125% 254,170 0.02400,000 BP Capital Markets 10.03.12/3.125% 406,602 0.03350,000 BP Capital Markets 07.11.13/5.250% 379,559 0.03300,000 BP Capital Markets 08.05.14/3.625% 315,531 0.02310,000 BP Capital Markets 11.03.21/4.742% 319,891 0.02
1,000,000 British Telecommunications 15.01.13/5.150% 1,059,660 0.0745,000 British Telecommunications 15.12.30/9.875% 62,067 0.00
700,000 Deutsche Bank/London 11.01.16/3.250% 707,343 0.05200,000 Diageo Capital 23.10.17/5.750% 230,375 0.02
50,000 Diageo Capital 15.07.20/4.828% 52,735 0.00139,000 HSBC Holdings 05.04.21/5.100% 142,692 0.01300,000 Vodafone Group 15.09.15/5.000% 331,886 0.02
4,831,343 0.34
NETHERLANDS45,000 Deutsche Telekom International
Finance 22.07.13/5.250% 48,578 0.00200,000 Deutsche Telekom International
Finance 15.06.30/8.750% 262,666 0.02170,000 Diageo Finance 01.04.13/5.500% 183,537 0.01150,000 Diageo Finance 28.10.15/5.300% 169,360 0.0192,000 Koninklijke Philips Electronics 11.03.18/5.750% 103,389 0.01
100,000 Koninklijke Philips Electronics 01.06.26/7.200% 120,177 0.0135,000 Shell International Finance 25.03.13/1.875% 35,751 0.00
670,000 Shell International Finance 21.03.14/4.000% 720,009 0.05184,000 Shell International Finance 28.06.15/3.100% 192,543 0.01230,000 Shell International Finance 25.03.20/4.375% 241,699 0.02280,000 Shell International Finance 15.12.38/6.375% 324,547 0.03
2,402,256 0.17
AUSTRALIA200,000 BHP Billiton Finance USA 01.04.14/5.500% 222,795 0.02
55,000 BHP Billiton Finance USA 29.03.17/5.400% 62,619 0.00100,000 Rio Tinto Finance USA 01.05.14/8.950% 120,198 0.01
67,000 Rio Tinto Finance USA 02.11.20/3.500% 63,975 0.00762,000 Westpac Banking 19.11.19/4.875% 791,947 0.06
1,261,534 0.09
JAPAN130,000 Nomura Holdings 04.03.15/5.000% 137,656 0.01610,000 Nomura Holdings 19.01.16/4.125% 620,418 0.04404,000 Nomura Holdings 04.03.20/6.700% 443,089 0.03
1,201,163 0.08
LUXEMBOURG160,000 Telecom Italia Capital 15.11.13/5.250% 167,992 0.01150,000 Telecom Italia Capital 18.06.14/6.175% 162,127 0.01300,000 Telecom Italia Capital 30.09.14/4.950% 313,802 0.02100,000 Telecom Italia Capital 04.06.18/6.999% 108,006 0.01100,000 Tyco International Finance 15.01.19/8.500% 126,641 0.01
878,568 0.06
373
JPMorgan Funds - US Aggregate Bond FundSchedule of Investments (Market Value Expressed in USD) (continued)
As at 30 June 2011
Quantity/Nominal
Value
Name of Securities Maturity/Coupon
MarketValue
%of
NetAssets
Quantity/Nominal
Value
Name of Securities Maturity/Coupon
MarketValue
%of
NetAssets
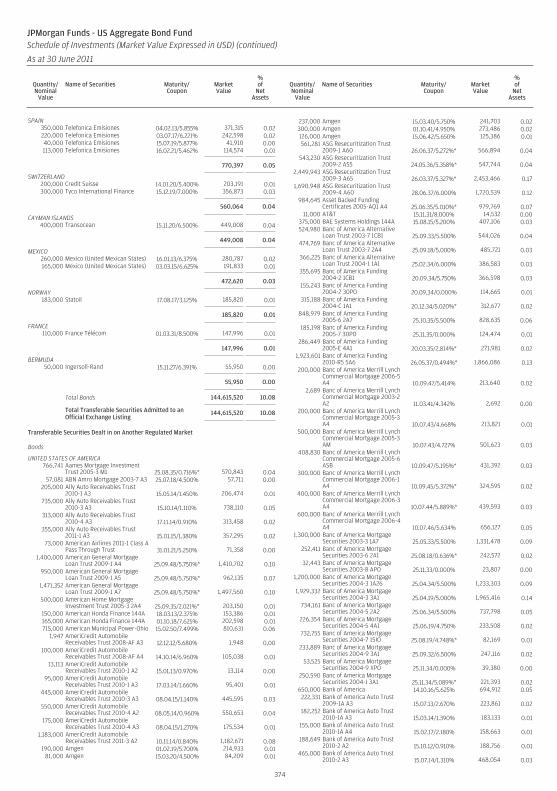
SPAIN350,000 Telefonica Emisiones 04.02.13/5.855% 371,315 0.02220,000 Telefonica Emisiones 03.07.17/6.221% 242,598 0.0240,000 Telefonica Emisiones 15.07.19/5.877% 41,910 0.00113,000 Telefonica Emisiones 16.02.21/5.462% 114,574 0.01
770,397 0.05
SWITZERLAND200,000 Credit Suisse 14.01.20/5.400% 203,191 0.01300,000 Tyco International Finance 15.12.19/7.000% 356,873 0.03
560,064 0.04
CAYMAN ISLANDS400,000 Transocean 15.11.20/6.500% 449,008 0.04
449,008 0.04
MEXICO260,000 Mexico (United Mexican States) 16.01.13/6.375% 280,787 0.02165,000 Mexico (United Mexican States) 03.03.15/6.625% 191,833 0.01
472,620 0.03
NORWAY183,000 Statoil 17.08.17/3.125% 185,820 0.01
185,820 0.01
FRANCE110,000 France Télécom 01.03.31/8.500% 147,996 0.01
147,996 0.01
BERMUDA50,000 Ingersoll-Rand 15.11.27/6.391% 55,950 0.00
55,950 0.00
Total Bonds 144,615,520 10.08
Total Transferable Securities Admitted to anOfficial Exchange Listing
144,615,520 10.08
Transferable Securities Dealt in on Another Regulated Market
Bonds
UNITED STATES OF AMERICA766,741 Aames Mortgage Investment
Trust 2005-3 M1 25.08.35/0.716%* 570,843 0.0457,081 ABN Amro Mortgage 2003-7 A3 25.07.18/4.500% 57,711 0.00
205,000 Ally Auto Receivables Trust2010-1 A3 15.05.14/1.450% 206,474 0.01
735,000 Ally Auto Receivables Trust2010-3 A3 15.10.14/1.110% 738,110 0.05
313,000 Ally Auto Receivables Trust2010-4 A3 17.11.14/0.910% 313,458 0.02
355,000 Ally Auto Receivables Trust2011-1 A3 15.01.15/1.380% 357,295 0.02
73,000 American Airlines 2011-1 Class APass Through Trust 31.01.21/5.250% 71,358 0.00
1,400,000 American General MortgageLoan Trust 2009-1 A4 25.09.48/5.750%* 1,410,702 0.10
950,000 American General MortgageLoan Trust 2009-1 A5 25.09.48/5.750%* 962,135 0.07
1,471,352 American General MortgageLoan Trust 2009-1 A7 25.09.48/5.750%* 1,497,560 0.10
500,000 American Home MortgageInvestment Trust 2005-3 2A4 25.09.35/2.021%* 203,150 0.01
150,000 American Honda Finance 144A 18.03.13/2.375% 153,386 0.01165,000 American Honda Finance 144A 01.10.18/7.625% 202,598 0.01715,000 American Municipal Power-Ohio 15.02.50/7.499% 810,631 0.06
1,947 AmeriCredit AutomobileReceivables Trust 2008-AF A3 12.12.12/5.680% 1,948 0.00
100,000 AmeriCredit AutomobileReceivables Trust 2008-AF A4 14.10.14/6.960% 105,038 0.01
13,113 AmeriCredit AutomobileReceivables Trust 2010-1 A2 15.01.13/0.970% 13,114 0.00
95,000 AmeriCredit AutomobileReceivables Trust 2010-1 A3 17.03.14/1.660% 95,401 0.01
445,000 AmeriCredit AutomobileReceivables Trust 2010-3 A3 08.04.15/1.140% 445,595 0.03
550,000 AmeriCredit AutomobileReceivables Trust 2010-4 A2 08.05.14/0.960% 550,653 0.04
175,000 AmeriCredit AutomobileReceivables Trust 2010-4 A3 08.04.15/1.270% 175,534 0.01
1,183,000 AmeriCredit AutomobileReceivables Trust 2011-3 A2 10.11.14/0.840% 1,182,671 0.08
190,000 Amgen 01.02.19/5.700% 214,933 0.0181,000 Amgen 15.03.20/4.500% 84,209 0.01
237,000 Amgen 15.03.40/5.750% 241,703 0.02300,000 Amgen 01.10.41/4.950% 273,486 0.02126,000 Amgen 15.06.42/5.650% 125,386 0.01561,281 ASG Resecuritization Trust
2009-1 A60 26.06.37/5.272%* 566,894 0.04543,230 ASG Resecuritization Trust
2009-2 A55 24.05.36/5.358%* 547,744 0.042,449,943 ASG Resecuritization Trust
2009-3 A65 26.03.37/5.327%* 2,453,466 0.171,690,948 ASG Resecuritization Trust
2009-4 A60 28.06.37/6.000% 1,720,539 0.12984,645 Asset Backed Funding
Certificates 2005-AQ1 A4 25.06.35/5.010%* 979,769 0.0711,000 AT&T 15.11.31/8.000% 14,532 0.00
375,000 BAE Systems Holdings 144A 15.08.15/5.200% 407,106 0.03524,980 Banc of America Alternative
Loan Trust 2003-7 1CB1 25.09.33/5.500% 544,026 0.04474,769 Banc of America Alternative
Loan Trust 2003-7 2A4 25.09.18/5.000% 485,721 0.03366,225 Banc of America Alternative
Loan Trust 2004-1 1A1 25.02.34/6.000% 386,583 0.03355,695 Banc of America Funding
2004-2 1CB1 20.09.34/5.750% 366,598 0.03155,243 Banc of America Funding
2004-2 30PO 20.09.34/0.000% 114,665 0.01315,188 Banc of America Funding
2004-C 1A1 20.12.34/5.020%* 312,677 0.02848,979 Banc of America Funding
2005-6 2A7 25.10.35/5.500% 828,635 0.06185,198 Banc of America Funding
2005-7 30PO 25.11.35/0.000% 124,474 0.01286,449 Banc of America Funding
2005-E 4A1 20.03.35/2.814%* 271,981 0.021,923,601 Banc of America Funding
2010-R5 5A6 26.05.37/0.494%* 1,866,086 0.13200,000 Banc of America Merrill Lynch
Commercial Mortgage 2006-5A4 10.09.47/5.414% 213,640 0.02
2,689 Banc of America Merrill LynchCommercial Mortgage 2003-2A2 11.03.41/4.342% 2,692 0.00
200,000 Banc of America Merrill LynchCommercial Mortgage 2005-3A4 10.07.43/4.668% 213,821 0.01
500,000 Banc of America Merrill LynchCommercial Mortgage 2005-3AM 10.07.43/4.727% 501,623 0.03
408,830 Banc of America Merrill LynchCommercial Mortgage 2005-6ASB 10.09.47/5.195%* 431,392 0.03
300,000 Banc of America Merrill LynchCommercial Mortgage 2006-1A4 10.09.45/5.372%* 324,595 0.02
400,000 Banc of America Merrill LynchCommercial Mortgage 2006-3A4 10.07.44/5.889%* 439,593 0.03
600,000 Banc of America Merrill LynchCommercial Mortgage 2006-4A4 10.07.46/5.634% 656,127 0.05
1,300,000 Banc of America MortgageSecurities 2003-3 1A7 25.05.33/5.500% 1,331,478 0.09
252,411 Banc of America MortgageSecurities 2003-6 2A1 25.08.18/0.636%* 242,572 0.02
32,443 Banc of America MortgageSecurities 2003-8 APO 25.11.33/0.000% 23,807 0.00
1,200,000 Banc of America MortgageSecurities 2004-3 1A26 25.04.34/5.500% 1,233,303 0.09
1,929,332 Banc of America MortgageSecurities 2004-3 3A1 25.04.19/5.000% 1,965,416 0.14
734,161 Banc of America MortgageSecurities 2004-5 2A2 25.06.34/5.500% 737,798 0.05
226,354 Banc of America MortgageSecurities 2004-5 4A1 25.06.19/4.750% 233,508 0.02
732,755 Banc of America MortgageSecurities 2004-7 15IO 25.08.19/4.748%* 82,169 0.01
233,889 Banc of America MortgageSecurities 2004-9 3A1 25.09.32/6.500% 247,116 0.02
53,525 Banc of America MortgageSecurities 2004-9 XPO 25.11.34/0.000% 39,380 0.00
250,590 Banc of America MortgageSecurities 2004-J 3A1 25.11.34/5.089%* 221,393 0.02
650,000 Bank of America 14.10.16/5.625% 694,912 0.05222,331 Bank of America Auto Trust
2009-1A A3 15.07.13/2.670% 223,861 0.02182,252 Bank of America Auto Trust
2010-1A A3 15.03.14/1.390% 183,133 0.01155,000 Bank of America Auto Trust
2010-1A A4 15.02.17/2.180% 158,663 0.01188,649 Bank of America Auto Trust
2010-2 A2 15.10.12/0.910% 188,756 0.01465,000 Bank of America Auto Trust
2010-2 A3 15.07.14/1.310% 468,054 0.03
374
JPMorgan Funds - US Aggregate Bond FundSchedule of Investments (Market Value Expressed in USD) (continued)
As at 30 June 2011
Quantity/Nominal
Value
Name of Securities Maturity/Coupon
MarketValue
%of
NetAssets
Quantity/Nominal
Value
Name of Securities Maturity/Coupon
MarketValue
%of
NetAssets
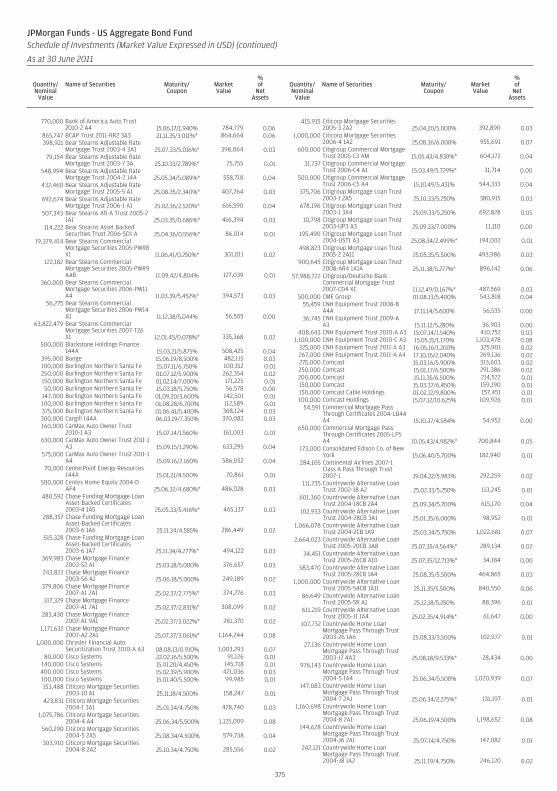
770,000 Bank of America Auto Trust2010-2 A4 15.06.17/1.940% 784,779 0.06
865,747 BCAP Trust 2011-RR2 3A3 21.11.35/3.011%* 864,664 0.06398,921 Bear Stearns Adjustable Rate
Mortgage Trust 2003-4 3A1 25.07.33/5.016%* 398,064 0.0379,154 Bear Stearns Adjustable Rate
Mortgage Trust 2003-7 3A 25.10.33/2.789%* 75,755 0.01548,994 Bear Stearns Adjustable Rate
Mortgage Trust 2004-2 14A 25.05.34/5.089%* 558,718 0.04432,460 Bear Stearns Adjustable Rate
Mortgage Trust 2005-5 A1 25.08.35/2.340%* 407,764 0.03692,674 Bear Stearns Adjustable Rate
Mortgage Trust 2006-1 A1 25.02.36/2.520%* 616,590 0.04507,343 Bear Stearns Alt-A Trust 2005-2
1A1 25.03.35/0.686%* 416,394 0.03114,222 Bear Stearns Asset Backed
Securities Trust 2006-SD1 A 25.04.36/0.556%* 86,014 0.0119,379,414 Bear Stearns Commercial
Mortgage Securities 2005-PWR8X1 11.06.41/0.250%* 301,011 0.02
122,182 Bear Stearns CommercialMortgage Securities 2005-PWR9AAB 11.09.42/4.804% 127,039 0.01
360,000 Bear Stearns CommercialMortgage Securities 2006-PW11A4 11.03.39/5.452%* 394,573 0.03
56,275 Bear Stearns CommercialMortgage Securities 2006-PW14A1 11.12.38/5.044% 56,505 0.00
63,822,479 Bear Stearns CommercialMortgage Securities 2007-T26X1 12.01.45/0.078%* 335,368 0.02
500,000 Blackstone Holdings Finance144A 15.03.21/5.875% 508,425 0.04
395,000 Bunge 15.06.19/8.500% 482,115 0.03100,000 Burlington Northern Santa Fe 15.07.11/6.750% 100,152 0.01250,000 Burlington Northern Santa Fe 01.07.12/5.900% 262,354 0.02150,000 Burlington Northern Santa Fe 01.02.14/7.000% 171,225 0.0150,000 Burlington Northern Santa Fe 15.03.18/5.750% 56,578 0.00
147,000 Burlington Northern Santa Fe 01.09.20/3.600% 142,501 0.01100,000 Burlington Northern Santa Fe 01.08.28/6.700% 112,589 0.01375,000 Burlington Northern Santa Fe 01.06.41/5.400% 368,124 0.03300,000 Cargill 144A 06.03.19/7.350% 370,082 0.03160,000 CarMax Auto Owner Trust
2010-1 A3 15.07.14/1.560% 161,003 0.01630,000 CarMax Auto Owner Trust 2011-1
A3 15.09.15/1.290% 633,295 0.04575,000 CarMax Auto Owner Trust 2011-1
A4 15.09.16/2.160% 586,052 0.0470,000 CenterPoint Energy Resources
144A 15.01.21/4.500% 70,861 0.01500,000 Centex Home Equity 2004-D
AF4 25.06.32/4.680%* 486,028 0.03480,592 Chase Funding Mortgage Loan
Asset-Backed Certificates2003-4 1A5 25.05.33/5.416%* 465,137 0.03
288,357 Chase Funding Mortgage LoanAsset-Backed Certificates2003-6 1A6 25.11.34/4.585% 286,449 0.02
515,328 Chase Funding Mortgage LoanAsset-Backed Certificates2003-6 1A7 25.11.34/4.277%* 494,122 0.03
369,983 Chase Mortgage Finance2003-S2 A1 25.03.18/5.000% 376,657 0.03
243,822 Chase Mortgage Finance2003-S6 A1 25.06.18/5.000% 249,189 0.02
379,806 Chase Mortgage Finance2007-A1 2A1 25.02.37/2.775%* 374,276 0.03
317,329 Chase Mortgage Finance2007-A1 7A1 25.02.37/2.831%* 308,099 0.02
283,430 Chase Mortgage Finance2007-A1 9A1 25.02.37/3.022%* 281,370 0.02
1,171,632 Chase Mortgage Finance2007-A2 2A1 25.07.37/3.061%* 1,164,244 0.08
1,000,000 Chrysler Financial AutoSecuritization Trust 2010-A A3 08.08.13/0.910% 1,003,293 0.07
80,000 Cisco Systems 22.02.16/5.500% 91,126 0.01140,000 Cisco Systems 15.01.20/4.450% 145,718 0.01400,000 Cisco Systems 15.02.39/5.900% 421,036 0.03100,000 Cisco Systems 15.01.40/5.500% 99,985 0.01153,488 Citicorp Mortgage Securities
2003-10 A1 25.11.18/4.500% 158,247 0.01423,831 Citicorp Mortgage Securities
2004-1 3A1 25.01.34/4.750% 428,740 0.031,075,786 Citicorp Mortgage Securities
2004-4 A4 25.06.34/5.500% 1,125,009 0.08560,290 Citicorp Mortgage Securities
2004-5 2A5 25.08.34/4.500% 579,738 0.04303,910 Citicorp Mortgage Securities
2004-8 2A2 25.10.34/4.750% 285,556 0.02
415,915 Citicorp Mortgage Securities2005-3 2A2 25.04.20/5.000% 392,890 0.03
1,000,000 Citicorp Mortgage Securities2006-4 1A2 25.08.36/6.000% 955,691 0.07
600,000 Citigroup Commercial MortgageTrust 2005-C3 AM 15.05.43/4.830%* 604,172 0.04
31,737 Citigroup Commercial MortgageTrust 2006-C4 A1 15.03.49/5.729%* 31,714 0.00
500,000 Citigroup Commercial MortgageTrust 2006-C5 A4 15.10.49/5.431% 544,333 0.04
375,706 Citigroup Mortgage Loan Trust2003-1 2A5 25.10.33/5.250% 380,915 0.03
678,196 Citigroup Mortgage Loan Trust2003-1 3A4 25.09.33/5.250% 692,828 0.05
10,798 Citigroup Mortgage Loan Trust2003-UP3 A3 25.09.33/7.000% 11,110 0.00
195,490 Citigroup Mortgage Loan Trust2004-UST1 A3 25.08.34/2.499%* 194,002 0.01
498,823 Citigroup Mortgage Loan Trust2005-2 2A11 25.05.35/5.500% 493,986 0.03
900,645 Citigroup Mortgage Loan Trust2008-AR4 1A1A 25.11.38/5.277%* 896,142 0.06
57,988,722 Citigroup/Deutsche BankCommercial Mortgage Trust2007-CD4 XC 11.12.49/0.167%* 487,569 0.03
500,000 CME Group 01.08.13/5.400% 543,818 0.0455,459 CNH Equipment Trust 2008-B
A4A 17.11.14/5.600% 56,535 0.0036,745 CNH Equipment Trust 2009-A
A3 15.11.12/5.280% 36,903 0.00408,643 CNH Equipment Trust 2010-A A3 15.07.14/1.540% 410,752 0.03
1,100,000 CNH Equipment Trust 2010-C A3 15.05.15/1.170% 1,103,478 0.08325,000 CNH Equipment Trust 2011-A A3 16.05.16/1.200% 325,901 0.02267,000 CNH Equipment Trust 2011-A A4 17.10.16/2.040% 269,136 0.02275,000 Comcast 15.03.16/5.900% 313,603 0.02250,000 Comcast 15.01.17/6.500% 291,386 0.02200,000 Comcast 15.11.35/6.500% 214,522 0.01150,000 Comcast 15.03.37/6.450% 159,190 0.01150,000 Comcast Cable Holdings 01.02.12/9.800% 157,451 0.01100,000 Comcast Holdings 15.07.12/10.625% 109,926 0.01
54,591 Commercial Mortgage PassThrough Certificates 2004-LB4AA4 15.10.37/4.584% 54,952 0.00
650,000 Commercial Mortgage PassThrough Certificates 2005-LP5A4 10.05.43/4.982%* 700,844 0.05
173,000 Consolidated Edison Co. of NewYork 15.06.40/5.700% 182,940 0.01
284,105 Continental Airlines 2007-1Class A Pass Through Trust2007-1 19.04.22/5.983% 292,259 0.02
111,735 Countrywide Alternative LoanTrust 2002-18 A2 25.02.33/5.250% 113,245 0.01
601,360 Countrywide Alternative LoanTrust 2004-18CB 2A4 25.09.34/5.700% 615,170 0.04
102,933 Countrywide Alternative LoanTrust 2004-28CB 3A1 25.01.35/6.000% 98,952 0.01
1,066,078 Countrywide Alternative LoanTrust 2004-2CB 1A9 25.03.34/5.750% 1,022,681 0.07
2,664,023 Countrywide Alternative LoanTrust 2005-20CB 3A8 25.07.35/4.564%* 289,134 0.02
34,451 Countrywide Alternative LoanTrust 2005-26CB A10 25.07.35/12.713%* 34,184 0.00
583,470 Countrywide Alternative LoanTrust 2005-28CB 1A4 25.08.35/5.500% 464,865 0.03
1,000,000 Countrywide Alternative LoanTrust 2005-54CB 1A11 25.11.35/5.500% 840,550 0.06
86,649 Countrywide Alternative LoanTrust 2005-5R A1 25.12.18/5.250% 88,396 0.01
611,219 Countrywide Alternative LoanTrust 2005-J1 1A4 25.02.35/4.914%* 61,647 0.00
107,732 Countrywide Home LoanMortgage Pass Through Trust2003-26 1A6 25.08.33/3.500% 102,977 0.01
27,136 Countrywide Home LoanMortgage Pass Through Trust2003-J7 4A3 25.08.18/9.533%* 28,434 0.00
976,143 Countrywide Home LoanMortgage Pass Through Trust2004-5 1A4 25.06.34/5.500% 1,020,939 0.07
147,083 Countrywide Home LoanMortgage Pass Through Trust2004-7 2A1 25.06.34/2.275%* 131,197 0.01
1,160,698 Countrywide Home LoanMortgage Pass Through Trust2004-8 2A1 25.06.19/4.500% 1,198,652 0.08
144,628 Countrywide Home LoanMortgage Pass Through Trust2004-J6 2A1 25.07.14/4.750% 147,082 0.01
242,121 Countrywide Home LoanMortgage Pass Through Trust2004-J8 1A2 25.11.19/4.750% 246,120 0.02
375
JPMorgan Funds - US Aggregate Bond FundSchedule of Investments (Market Value Expressed in USD) (continued)
As at 30 June 2011
Quantity/Nominal
Value
Name of Securities Maturity/Coupon
MarketValue
%of
NetAssets
Quantity/Nominal
Value
Name of Securities Maturity/Coupon
MarketValue
%of
NetAssets
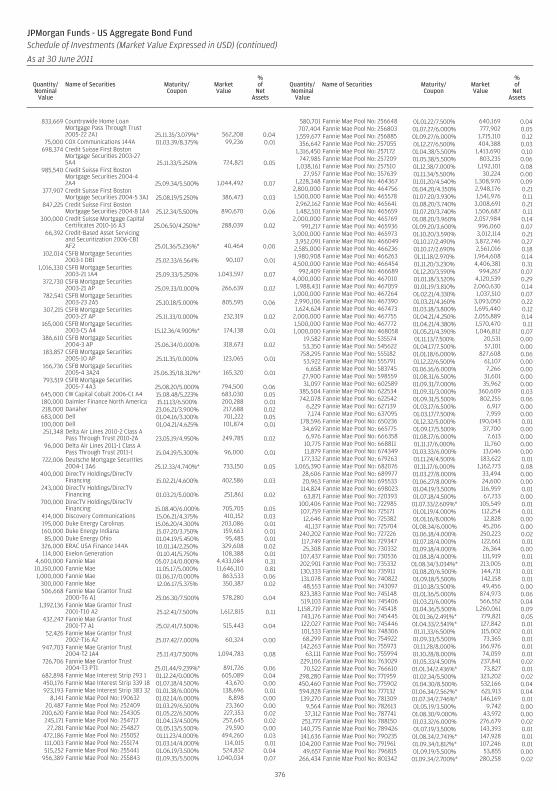
833,669 Countrywide Home LoanMortgage Pass Through Trust2005-22 2A1 25.11.35/3.079%* 562,208 0.04
75,000 COX Communications 144A 01.03.39/8.375% 99,236 0.01698,374 Credit Suisse First Boston
Mortgage Securities 2003-275A4 25.11.33/5.250% 724,821 0.05
985,540 Credit Suisse First BostonMortgage Securities 2004-42A4 25.09.34/5.500% 1,044,492 0.07
377,907 Credit Suisse First BostonMortgage Securities 2004-5 3A1 25.08.19/5.250% 386,473 0.03
847,225 Credit Suisse First BostonMortgage Securities 2004-8 1A4 25.12.34/5.500% 890,670 0.06
300,000 Credit Suisse Mortgage CapitalCertificates 2010-16 A3 25.06.50/4.250%* 288,039 0.02
66,392 Credit-Based Asset Servicingand Securitization 2006-CB1AF2 25.01.36/5.236%* 40,464 0.00
102,014 CSFB Mortgage Securities2003-1 DB1 25.02.33/6.564% 90,107 0.01
1,016,330 CSFB Mortgage Securities2003-21 1A4 25.09.33/5.250% 1,043,597 0.07
372,730 CSFB Mortgage Securities2003-21 AP 25.09.33/0.000% 266,639 0.02
782,541 CSFB Mortgage Securities2003-23 2A5 25.10.18/5.000% 805,595 0.06
307,215 CSFB Mortgage Securities2003-27 AP 25.11.33/0.000% 232,319 0.02
165,000 CSFB Mortgage Securities2003-C5 A4 15.12.36/4.900%* 174,138 0.01
386,610 CSFB Mortgage Securities2004-3 AP 25.06.34/0.000% 318,673 0.02
183,857 CSFB Mortgage Securities2005-10 AP 25.11.35/0.000% 123,065 0.01
166,736 CSFB Mortgage Securities2005-4 3A24 25.06.35/18.312%* 165,320 0.01
793,519 CSFB Mortgage Securities2005-7 4A3 25.08.20/5.000% 794,500 0.06
645,000 CW Capital Cobalt 2006-C1 A4 15.08.48/5.223% 683,030 0.05180,000 Daimler Finance North America 15.11.13/6.500% 200,288 0.01218,000 Danaher 23.06.21/3.900% 217,688 0.02683,000 Dell 01.04.16/3.100% 701,222 0.05100,000 Dell 01.04.21/4.625% 101,874 0.01251,348 Delta Air Lines 2010-2 Class A
Pass Through Trust 2010-2A 23.05.19/4.950% 249,785 0.0296,000 Delta Air Lines 2011-1 Class A
Pass Through Trust 2011-1 15.04.19/5.300% 96,000 0.01722,006 Deutsche Mortgage Securities
2004-1 3A6 25.12.33/4.740%* 733,150 0.05400,000 DirecTV Holdings/DirecTV
Financing 15.02.21/4.600% 402,586 0.03243,000 DirecTV Holdings/DirecTV
Financing 01.03.21/5.000% 251,861 0.02700,000 DirecTV Holdings/DirecTV
Financing 15.08.40/6.000% 705,705 0.05414,000 Discovery Communications 15.06.21/4.375% 410,152 0.03195,000 Duke Energy Carolinas 15.06.20/4.300% 203,086 0.01160,000 Duke Energy Indiana 15.07.20/3.750% 159,663 0.0185,000 Duke Energy Ohio 01.04.19/5.450% 95,485 0.01
326,000 ERAC USA Finance 144A 10.01.14/2.250% 329,608 0.02114,000 Exelon Generation 01.10.41/5.750% 108,388 0.01
4,600,000 Fannie Mae 05.07.14/0.000% 4,433,084 0.3110,150,000 Fannie Mae 11.05.17/5.000% 11,646,110 0.811,000,000 Fannie Mae 01.06.17/0.000% 863,533 0.06
300,000 Fannie Mae 12.06.17/5.375% 350,387 0.02506,668 Fannie Mae Grantor Trust
2000-T6 A1 25.06.30/7.500% 578,280 0.041,392,136 Fannie Mae Grantor Trust
2001-T10 A2 25.12.41/7.500% 1,612,815 0.11432,247 Fannie Mae Grantor Trust
2001-T7 A1 25.02.41/7.500% 515,443 0.0452,426 Fannie Mae Grantor Trust
2002-T16 A2 25.07.42/7.000% 60,324 0.00947,703 Fannie Mae Grantor Trust
2004-T2 1A4 25.11.43/7.500% 1,094,783 0.08726,706 Fannie Mae Grantor Trust
2004-T3 PT1 25.01.44/9.239%* 891,726 0.06682,898 Fannie Mae Interest Strip 293 1 01.12.24/0.000% 605,089 0.04450,176 Fannie Mae Interest Strip 339 18 01.07.18/4.500% 43,670 0.00923,193 Fannie Mae Interest Strip 383 32 01.01.38/6.000% 138,696 0.01
8,141 Fannie Mae Pool No: 190632 01.02.14/6.000% 8,898 0.0020,487 Fannie Mae Pool No: 252409 01.03.29/6.500% 23,360 0.00
200,620 Fannie Mae Pool No: 254305 01.05.22/6.500% 227,353 0.02245,171 Fannie Mae Pool No: 254717 01.04.13/4.500% 257,645 0.0227,281 Fannie Mae Pool No: 254827 01.05.13/5.500% 29,590 0.00
472,186 Fannie Mae Pool No: 255052 01.11.23/4.000% 494,260 0.03111,003 Fannie Mae Pool No: 255174 01.03.14/4.000% 114,015 0.01515,252 Fannie Mae Pool No: 255441 01.06.19/3.500% 524,832 0.04
956,389 Fannie Mae Pool No: 255843 01.09.35/5.500% 1,040,034 0.07
580,701 Fannie Mae Pool No: 256648 01.01.22/7.500% 640,169 0.04707,404 Fannie Mae Pool No: 256803 01.07.27/6.000% 777,902 0.05
1,559,677 Fannie Mae Pool No: 256885 01.09.27/6.000% 1,715,110 0.12356,642 Fannie Mae Pool No: 257055 01.12.27/6.500% 404,388 0.03
1,316,450 Fannie Mae Pool No: 257172 01.04.38/5.500% 1,413,690 0.10747,985 Fannie Mae Pool No: 257209 01.05.38/5.500% 803,235 0.06
1,038,161 Fannie Mae Pool No: 257510 01.12.38/7.000% 1,192,101 0.0827,957 Fannie Mae Pool No: 357639 01.11.34/5.500% 30,224 0.00
1,228,348 Fannie Mae Pool No: 464367 01.01.20/4.540% 1,308,970 0.092,800,000 Fannie Mae Pool No: 464756 01.04.20/4.350% 2,948,176 0.211,500,000 Fannie Mae Pool No: 465578 01.07.20/3.930% 1,541,976 0.112,962,162 Fannie Mae Pool No: 465641 01.08.20/3.740% 3,008,691 0.211,482,501 Fannie Mae Pool No: 465659 01.07.20/3.740% 1,506,687 0.11
2,000,000 Fannie Mae Pool No: 465769 01.08.20/3.960% 2,057,984 0.14991,217 Fannie Mae Pool No: 465936 01.09.20/3.600% 996,060 0.07
3,000,000 Fannie Mae Pool No: 465973 01.10.20/3.590% 3,012,114 0.213,952,091 Fannie Mae Pool No: 466049 01.10.17/2.490% 3,872,746 0.272,585,000 Fannie Mae Pool No: 466236 01.10.17/2.690% 2,561,016 0.181,980,908 Fannie Mae Pool No: 466263 01.11.18/2.970% 1,964,608 0.144,500,000 Fannie Mae Pool No: 466454 01.11.20/3.230% 4,406,381 0.31
992,409 Fannie Mae Pool No: 466689 01.12.20/3.590% 994,267 0.074,000,000 Fannie Mae Pool No: 467010 01.01.18/3.520% 4,120,539 0.29
1,988,431 Fannie Mae Pool No: 467059 01.01.19/3.810% 2,060,630 0.141,000,000 Fannie Mae Pool No: 467264 01.02.21/4.330% 1,037,510 0.072,990,106 Fannie Mae Pool No: 467390 01.03.21/4.160% 3,093,050 0.221,624,624 Fannie Mae Pool No: 467473 01.03.18/3.800% 1,695,440 0.12
2,000,000 Fannie Mae Pool No: 467755 01.04.21/4.250% 2,055,889 0.141,500,000 Fannie Mae Pool No: 467772 01.04.21/4.380% 1,570,470 0.111,000,000 Fannie Mae Pool No: 468058 01.05.21/4.390% 1,046,812 0.07
19,582 Fannie Mae Pool No: 535574 01.11.13/7.500% 20,531 0.0053,350 Fannie Mae Pool No: 545622 01.04.17/7.500% 57,101 0.00
758,295 Fannie Mae Pool No: 555182 01.01.18/6.000% 827,608 0.0653,922 Fannie Mae Pool No: 555791 01.12.22/6.500% 61,107 0.006,658 Fannie Mae Pool No: 583745 01.06.16/6.000% 7,266 0.00
27,900 Fannie Mae Pool No: 598559 01.08.31/6.500% 31,601 0.0031,097 Fannie Mae Pool No: 602589 01.09.31/7.000% 35,962 0.00
385,504 Fannie Mae Pool No: 622534 01.09.31/3.000% 360,609 0.03742,078 Fannie Mae Pool No: 622542 01.09.31/5.500% 802,255 0.06
6,229 Fannie Mae Pool No: 627139 01.03.17/6.500% 6,917 0.007,174 Fannie Mae Pool No: 637095 01.03.17/7.500% 7,959 0.00
178,596 Fannie Mae Pool No: 650236 01.12.32/5.000% 190,043 0.0134,692 Fannie Mae Pool No: 665775 01.09.17/5.500% 37,700 0.00
6,976 Fannie Mae Pool No: 666358 01.08.17/6.000% 7,613 0.0010,775 Fannie Mae Pool No: 668811 01.11.17/6.000% 11,760 0.0011,879 Fannie Mae Pool No: 674349 01.03.33/6.000% 13,046 0.00
177,332 Fannie Mae Pool No: 679263 01.11.24/4.500% 183,622 0.011,065,390 Fannie Mae Pool No: 682076 01.11.17/6.000% 1,162,773 0.08
28,606 Fannie Mae Pool No: 689977 01.03.27/8.000% 33,494 0.0020,963 Fannie Mae Pool No: 695533 01.06.27/8.000% 24,600 0.00
114,824 Fannie Mae Pool No: 698023 01.04.19/3.500% 116,959 0.0163,871 Fannie Mae Pool No: 720393 01.07.18/4.500% 67,733 0.00
100,406 Fannie Mae Pool No: 722985 01.07.33/2.609%* 105,549 0.01107,759 Fannie Mae Pool No: 725171 01.01.19/4.000% 112,254 0.0112,646 Fannie Mae Pool No: 725382 01.01.16/8.000% 12,828 0.0041,137 Fannie Mae Pool No: 725704 01.08.34/6.000% 45,206 0.00
240,202 Fannie Mae Pool No: 727226 01.06.18/4.000% 250,223 0.02117,749 Fannie Mae Pool No: 729347 01.07.18/4.000% 122,661 0.0125,308 Fannie Mae Pool No: 730332 01.09.18/4.000% 26,364 0.00
107,437 Fannie Mae Pool No: 730536 01.08.18/4.000% 111,919 0.01202,901 Fannie Mae Pool No: 735332 01.08.34/3.034%* 213,005 0.01130,333 Fannie Mae Pool No: 735911 01.08.20/6.500% 144,731 0.01131,078 Fannie Mae Pool No: 740822 01.09.18/5.500% 142,158 0.0148,553 Fannie Mae Pool No: 743097 01.10.18/3.500% 49,456 0.00
823,383 Fannie Mae Pool No: 745148 01.01.36/5.000% 874,973 0.06519,103 Fannie Mae Pool No: 745406 01.03.21/6.000% 566,552 0.04
1,158,719 Fannie Mae Pool No: 745418 01.04.36/5.500% 1,260,061 0.09743,176 Fannie Mae Pool No: 745445 01.01.36/2.491%* 779,821 0.05122,027 Fannie Mae Pool No: 745446 01.04.33/2.541%* 127,842 0.01101,533 Fannie Mae Pool No: 748306 01.11.33/6.500% 115,002 0.0168,299 Fannie Mae Pool No: 754922 01.09.33/5.500% 73,365 0.01
142,263 Fannie Mae Pool No: 755973 01.11.28/8.000% 166,976 0.0163,111 Fannie Mae Pool No: 755994 01.10.28/8.000% 74,059 0.01
229,106 Fannie Mae Pool No: 763029 01.05.33/4.500% 237,841 0.0270,522 Fannie Mae Pool No: 766610 01.01.34/2.436%* 73,827 0.01
298,280 Fannie Mae Pool No: 771959 01.02.34/5.500% 323,202 0.02450,460 Fannie Mae Pool No: 775902 01.04.30/8.500% 532,166 0.04594,828 Fannie Mae Pool No: 777132 01.06.34/2.562%* 621,913 0.04139,270 Fannie Mae Pool No: 781309 01.07.34/2.746%* 146,169 0.01
9,564 Fannie Mae Pool No: 782613 01.05.19/3.500% 9,742 0.0037,312 Fannie Mae Pool No: 787741 01.08.30/9.000% 43,972 0.00
251,777 Fannie Mae Pool No: 788150 01.03.32/6.000% 276,679 0.02140,775 Fannie Mae Pool No: 789426 01.07.19/3.500% 143,393 0.01141,636 Fannie Mae Pool No: 790235 01.08.34/2.741%* 147,928 0.01104,200 Fannie Mae Pool No: 791961 01.09.34/1.812%* 107,246 0.01
49,657 Fannie Mae Pool No: 796815 01.09.19/5.500% 53,855 0.00266,434 Fannie Mae Pool No: 801342 01.09.34/2.700%* 280,258 0.02
376
JPMorgan Funds - US Aggregate Bond FundSchedule of Investments (Market Value Expressed in USD) (continued)
As at 30 June 2011
Quantity/Nominal
Value
Name of Securities Maturity/Coupon
MarketValue
%of
NetAssets
Quantity/Nominal
Value
Name of Securities Maturity/Coupon
MarketValue
%of
NetAssets
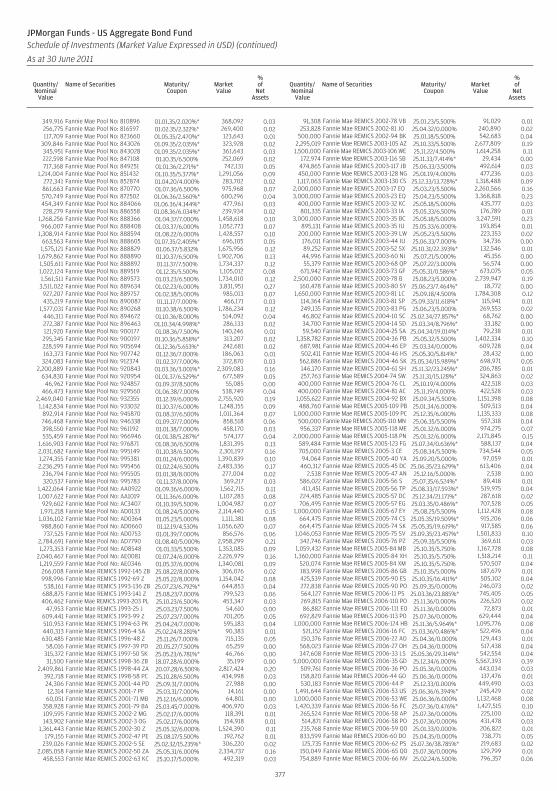
349,916 Fannie Mae Pool No: 810896 01.01.35/2.020%* 368,092 0.03256,775 Fannie Mae Pool No: 816597 01.02.35/2.322%* 269,400 0.02117,709 Fannie Mae Pool No: 823660 01.05.35/2.470%* 123,643 0.01
309,846 Fannie Mae Pool No: 843026 01.09.35/2.035%* 323,928 0.02345,951 Fannie Mae Pool No: 843028 01.09.35/2.035%* 361,643 0.03222,598 Fannie Mae Pool No: 847108 01.10.35/6.500% 252,069 0.02717,368 Fannie Mae Pool No: 849251 01.01.36/2.271%* 742,131 0.05
1,214,004 Fannie Mae Pool No: 851432 01.10.35/5.377%* 1,291,056 0.09272,341 Fannie Mae Pool No: 852874 01.04.20/4.000% 283,702 0.02861,663 Fannie Mae Pool No: 870770 01.07.36/6.500% 975,968 0.07570,749 Fannie Mae Pool No: 872502 01.06.36/2.560%* 600,296 0.04454,349 Fannie Mae Pool No: 884066 01.06.36/4.144%* 477,961 0.03228,279 Fannie Mae Pool No: 886558 01.08.36/6.034%* 239,934 0.02
1,268,256 Fannie Mae Pool No: 888366 01.04.37/7.000% 1,458,618 0.10966,007 Fannie Mae Pool No: 888408 01.03.37/6.000% 1,052,773 0.07
1,308,914 Fannie Mae Pool No: 888594 01.08.22/6.000% 1,428,557 0.10663,563 Fannie Mae Pool No: 888605 01.07.35/2.405%* 696,105 0.051,575,121 Fannie Mae Pool No: 888829 01.06.37/5.832% 1,675,956 0.12
1,679,862 Fannie Mae Pool No: 888890 01.10.37/6.500% 1,902,706 0.131,505,611 Fannie Mae Pool No: 888892 01.11.37/7.500% 1,734,337 0.121,022,124 Fannie Mae Pool No: 889519 01.12.35/5.500% 1,105,012 0.081,561,511 Fannie Mae Pool No: 889573 01.03.23/6.500% 1,734,010 0.123,511,022 Fannie Mae Pool No: 889634 01.02.23/6.000% 3,831,951 0.27
927,207 Fannie Mae Pool No: 889757 01.02.38/5.000% 985,013 0.07435,219 Fannie Mae Pool No: 890087 01.11.17/7.000% 466,171 0.03
1,577,031 Fannie Mae Pool No: 890268 01.10.38/6.500% 1,786,234 0.12446,311 Fannie Mae Pool No: 894672 01.10.36/8.000% 514,092 0.04272,387 Fannie Mae Pool No: 896463 01.10.34/4.998%* 286,133 0.02121,920 Fannie Mae Pool No: 900177 01.08.36/7.500% 140,246 0.01295,345 Fannie Mae Pool No: 900197 01.10.36/5.858%* 313,207 0.02228,599 Fannie Mae Pool No: 905694 01.12.36/5.653%* 242,681 0.02163,373 Fannie Mae Pool No: 907742 01.12.36/7.000% 186,063 0.01
324,083 Fannie Mae Pool No: 912374 01.02.37/7.000% 372,870 0.032,200,889 Fannie Mae Pool No: 920843 01.03.36/3.001%* 2,309,083 0.16
634,830 Fannie Mae Pool No: 920954 01.01.37/6.529%* 677,589 0.0546,962 Fannie Mae Pool No: 924857 01.09.37/8.500% 55,085 0.00
466,473 Fannie Mae Pool No: 929560 01.06.38/7.000% 538,749 0.042,469,040 Fannie Mae Pool No: 932355 01.12.39/6.000% 2,755,920 0.191,142,834 Fannie Mae Pool No: 933032 01.10.37/6.000% 1,248,155 0.09
892,914 Fannie Mae Pool No: 945870 01.08.37/6.500% 1,011,364 0.07746,468 Fannie Mae Pool No: 946338 01.09.37/7.000% 858,518 0.06398,550 Fannie Mae Pool No: 961192 01.01.38/7.000% 458,170 0.03535,459 Fannie Mae Pool No: 966946 01.01.38/5.287%* 574,177 0.04
1,616,903 Fannie Mae Pool No: 976871 01.08.36/6.500% 1,831,395 0.132,031,682 Fannie Mae Pool No: 995149 01.10.38/6.500% 2,301,197 0.161,274,355 Fannie Mae Pool No: 995381 01.01.24/6.000% 1,390,839 0.102,236,295 Fannie Mae Pool No: 995456 01.02.24/6.500% 2,483,336 0.17
236,794 Fannie Mae Pool No: 995505 01.01.38/8.000% 277,004 0.02320,537 Fannie Mae Pool No: 995783 01.11.37/8.000% 369,217 0.03
1,422,064 Fannie Mae Pool No: AA0922 01.09.36/6.000% 1,562,715 0.111,007,622 Fannie Mae Pool No: AA1019 01.11.36/6.000% 1,107,283 0.08
929,602 Fannie Mae Pool No: AC3407 01.10.39/5.500% 1,004,987 0.071,971,218 Fannie Mae Pool No: AD0133 01.08.24/5.000% 2,114,440 0.151,036,102 Fannie Mae Pool No: AD0364 01.05.23/5.000% 1,111,381 0.08988,860 Fannie Mae Pool No: AD0660 01.12.19/4.530% 1,056,620 0.07737,525 Fannie Mae Pool No: AD0753 01.01.39/7.000% 856,576 0.06
2,784,691 Fannie Mae Pool No: AD7790 01.08.40/5.000% 2,958,299 0.211,273,353 Fannie Mae Pool No: AD8548 01.01.33/5.500% 1,353,085 0.09
2,040,467 Fannie Mae Pool No: AE0081 01.07.24/6.000% 2,226,979 0.161,219,559 Fannie Mae Pool No: AE0346 01.05.37/6.000% 1,340,081 0.09266,008 Fannie Mae REMICS 1992-145 ZB 25.08.22/8.000% 306,076 0.02998,996 Fannie Mae REMICS 1992-69 Z 25.05.22/8.000% 1,154,042 0.08538,161 Fannie Mae REMICS 1993-136 ZB 25.07.23/6.792%* 644,853 0.04
688,875 Fannie Mae REMICS 1993-141 Z 25.08.23/7.000% 799,523 0.06406,462 Fannie Mae REMICS 1993-203 PL 25.10.23/6.500% 453,347 0.03
47,953 Fannie Mae REMICS 1993-25 J 25.03.23/7.500% 54,610 0.00609,441 Fannie Mae REMICS 1993-99 Z 25.07.23/7.000% 701,205 0.05510,953 Fannie Mae REMICS 1994-63 PK 25.04.24/7.000% 595,183 0.04440,313 Fannie Mae REMICS 1996-4 SA 25.02.24/8.281%* 90,383 0.01630,485 Fannie Mae REMICS 1996-48 Z 25.11.26/7.000% 715,135 0.05
58,016 Fannie Mae REMICS 1997-39 PD 20.05.27/7.500% 65,259 0.00315,372 Fannie Mae REMICS 1997-50 SK 25.05.23/6.781%* 46,766 0.0031,500 Fannie Mae REMICS 1998-36 ZB 18.07.28/6.000% 35,199 0.00
2,409,861 Fannie Mae REMICS 1998-44 ZA 20.07.28/6.500% 2,817,424 0.20392,718 Fannie Mae REMICS 1998-58 PC 25.10.28/6.500% 434,998 0.0324,306 Fannie Mae REMICS 2001-44 PD 25.09.31/7.000% 27,988 0.0012,314 Fannie Mae REMICS 2001-7 PF 25.03.31/7.000% 14,161 0.0060,051 Fannie Mae REMICS 2001-71 MB 25.12.16/6.000% 64,801 0.00
358,928 Fannie Mae REMICS 2001-79 BA 25.03.45/7.000% 406,970 0.03109,595 Fannie Mae REMICS 2002-2 MG 25.02.17/6.000% 118,391 0.01143,902 Fannie Mae REMICS 2002-3 OG 25.02.17/6.000% 154,918 0.01
1,361,443 Fannie Mae REMICS 2002-30 Z 25.05.32/6.000% 1,524,390 0.11179,155 Fannie Mae REMICS 2002-47 PE 25.08.17/5.500% 192,762 0.01
239,026 Fannie Mae REMICS 2002-5 SE 25.02.32/15.235%* 306,220 0.022,085,058 Fannie Mae REMICS 2002-50 ZA 25.05.31/6.000% 2,334,737 0.16
458,553 Fannie Mae REMICS 2002-63 KC 25.10.17/5.000% 492,319 0.03
91,308 Fannie Mae REMICS 2002-78 VB 25.01.23/5.500% 91,029 0.01253,828 Fannie Mae REMICS 2002-81 JO 25.04.32/0.000% 240,890 0.02
500,000 Fannie Mae REMICS 2002-94 BK 25.01.18/5.500% 542,683 0.042,295,019 Fannie Mae REMICS 2003-105 AZ 25.10.33/5.500% 2,677,809 0.191,500,000 Fannie Mae REMICS 2003-106 WE 25.11.22/4.500% 1,614,258 0.11
172,974 Fannie Mae REMICS 2003-116 SB 25.11.33/7.414%* 29,434 0.00474,865 Fannie Mae REMICS 2003-117 JB 25.06.33/3.500% 492,614 0.03450,000 Fannie Mae REMICS 2003-128 NG 25.01.19/4.000% 477,236 0.031,117,063 Fannie Mae REMICS 2003-130 CS 25.12.33/13.728%* 1,318,488 0.09
2,000,000 Fannie Mae REMICS 2003-17 EQ 25.03.23/5.500% 2,260,566 0.163,000,000 Fannie Mae REMICS 2003-23 EQ 25.04.23/5.500% 3,368,818 0.23
400,000 Fannie Mae REMICS 2003-32 KC 25.05.18/5.000% 435,777 0.03801,335 Fannie Mae REMICS 2003-33 IA 25.05.33/6.500% 176,789 0.01
3,000,000 Fannie Mae REMICS 2003-35 BC 25.05.18/5.000% 3,247,591 0.23895,131 Fannie Mae REMICS 2003-35 IU 25.05.33/6.000% 193,854 0.01
200,000 Fannie Mae REMICS 2003-39 LW 25.05.23/5.500% 223,353 0.02176,011 Fannie Mae REMICS 2003-44 IU 25.06.33/7.000% 34,736 0.0089,252 Fannie Mae REMICS 2003-52 SX 25.10.31/22.393%* 132,546 0.0144,996 Fannie Mae REMICS 2003-60 NJ 25.07.21/5.000% 45,156 0.0055,379 Fannie Mae REMICS 2003-68 QP 25.07.22/3.000% 56,574 0.00
671,942 Fannie Mae REMICS 2003-73 GF 25.05.31/0.586%* 673,075 0.052,500,000 Fannie Mae REMICS 2003-78 B 25.08.23/5.000% 2,739,947 0.19
160,478 Fannie Mae REMICS 2003-80 SY 25.06.23/7.464%* 18,772 0.001,650,000 Fannie Mae REMICS 2003-81 LC 25.09.18/4.500% 1,784,308 0.12
114,364 Fannie Mae REMICS 2003-81 SP 25.09.33/11.618%* 115,941 0.01249,135 Fannie Mae REMICS 2003-83 PG 25.06.23/5.000% 269,553 0.0246,802 Fannie Mae REMICS 2004-10 SC 25.02.34/27.857%* 68,762 0.0034,700 Fannie Mae REMICS 2004-14 SD 25.03.34/8.796%* 33,182 0.0059,540 Fannie Mae REMICS 2004-25 SA 25.04.34/19.014%* 79,238 0.01
1,358,782 Fannie Mae REMICS 2004-36 PB 25.05.32/5.500% 1,402,334 0.10687,981 Fannie Mae REMICS 2004-46 EP 25.03.34/0.000% 609,728 0.04502,411 Fannie Mae REMICS 2004-46 HS 25.05.30/5.814%* 28,432 0.00
562,886 Fannie Mae REMICS 2004-46 SK 25.05.34/15.989%* 698,971 0.05146,170 Fannie Mae REMICS 2004-61 SH 25.11.32/23.245%* 206,785 0.01257,763 Fannie Mae REMICS 2004-74 SW 25.11.31/15.128%* 324,863 0.02
400,000 Fannie Mae REMICS 2004-76 CL 25.10.19/4.000% 422,518 0.03400,000 Fannie Mae REMICS 2004-81 AC 25.11.19/4.000% 422,528 0.03
1,055,622 Fannie Mae REMICS 2004-92 BX 25.09.34/5.500% 1,151,398 0.08488,760 Fannie Mae REMICS 2005-109 PB 25.01.34/6.000% 509,513 0.04
1,000,000 Fannie Mae REMICS 2005-109 PC 25.12.35/6.000% 1,135,333 0.08500,000 Fannie Mae REMICS 2005-110 MN 25.06.35/5.500% 557,318 0.04956,337 Fannie Mae REMICS 2005-118 ME 25.01.32/6.000% 974,275 0.07
2,000,000 Fannie Mae REMICS 2005-118 PN 25.01.32/6.000% 2,171,845 0.15589,484 Fannie Mae REMICS 2005-123 FG 25.07.34/0.636%* 588,137 0.04705,000 Fannie Mae REMICS 2005-3 CE 25.08.34/5.500% 734,544 0.0594,064 Fannie Mae REMICS 2005-40 YA 25.09.20/5.000% 97,059 0.01
460,312 Fannie Mae REMICS 2005-45 DC 25.06.35/23.629%* 613,406 0.042,538 Fannie Mae REMICS 2005-47 AN 25.12.16/5.000% 2,538 0.00
586,022 Fannie Mae REMICS 2005-56 S 25.07.35/6.524%* 89,418 0.01411,451 Fannie Mae REMICS 2005-56 TP 25.08.33/17.593%* 519,975 0.04
224,485 Fannie Mae REMICS 2005-57 DC 25.12.34/21.171%* 287,618 0.02706,495 Fannie Mae REMICS 2005-57 EG 25.03.35/0.486%* 707,528 0.05
1,000,000 Fannie Mae REMICS 2005-67 EY 25.08.25/5.500% 1,112,428 0.08664,475 Fannie Mae REMICS 2005-74 CS 25.05.35/19.509%* 915,206 0.06664,475 Fannie Mae REMICS 2005-74 SK 25.05.35/19.619%* 917,585 0.06
1,046,053 Fannie Mae REMICS 2005-75 SV 25.09.35/23.457%* 1,501,833 0.10342,746 Fannie Mae REMICS 2005-76 PZ 25.09.35/5.500% 369,611 0.03
1,059,432 Fannie Mae REMICS 2005-84 MB 25.10.35/5.750% 1,167,728 0.081,360,000 Fannie Mae REMICS 2005-84 XH 25.10.35/5.750% 1,518,214 0.11
520,074 Fannie Mae REMICS 2005-84 XM 25.10.35/5.750% 570,507 0.04183,998 Fannie Mae REMICS 2005-86 GB 25.10.35/5.000% 187,679 0.01425,539 Fannie Mae REMICS 2005-90 ES 25.10.35/16.411%* 505,102 0.04272,838 Fannie Mae REMICS 2005-90 PO 25.09.35/0.000% 246,073 0.02564,127 Fannie Mae REMICS 2006-11 PS 25.03.36/23.885%* 745,405 0.05269,815 Fannie Mae REMICS 2006-110 PO 25.11.36/0.000% 226,520 0.0286,882 Fannie Mae REMICS 2006-111 EO 25.11.36/0.000% 72,873 0.01
692,829 Fannie Mae REMICS 2006-113 PO 25.07.36/0.000% 629,444 0.041,000,000 Fannie Mae REMICS 2006-124 HB 25.11.36/5.964%* 1,095,776 0.08
521,152 Fannie Mae REMICS 2006-16 FC 25.03.36/0.486%* 522,496 0.04150,376 Fannie Mae REMICS 2006-22 AO 25.04.36/0.000% 129,443 0.01568,023 Fannie Mae REMICS 2006-27 OH 25.04.36/0.000% 517,438 0.04347,608 Fannie Mae REMICS 2006-33 LS 25.05.36/29.314%* 542,554 0.04
5,000,000 Fannie Mae REMICS 2006-35 GD 25.12.34/6.000% 5,567,393 0.39509,761 Fannie Mae REMICS 2006-36 PO 25.05.36/0.000% 443,034 0.03158,820 Fannie Mae REMICS 2006-44 GO 25.06.36/0.000% 137,476 0.01530,183 Fannie Mae REMICS 2006-44 P 25.12.33/0.000% 449,490 0.03
1,491,644 Fannie Mae REMICS 2006-53 US 25.06.36/6.394%* 245,429 0.021,000,000 Fannie Mae REMICS 2006-53 WE 25.06.36/6.000% 1,132,468 0.081,420,339 Fannie Mae REMICS 2006-56 FC 25.07.36/0.476%* 1,427,515 0.10
265,524 Fannie Mae REMICS 2006-58 AP 25.07.36/0.000% 225,100 0.02514,871 Fannie Mae REMICS 2006-58 PO 25.07.36/0.000% 431,478 0.03235,768 Fannie Mae REMICS 2006-59 QO 25.01.33/0.000% 206,822 0.01833,599 Fannie Mae REMICS 2006-60 DO 25.04.35/0.000% 738,771 0.05125,735 Fannie Mae REMICS 2006-62 PS 25.07.36/38.785%* 219,683 0.02
150,049 Fannie Mae REMICS 2006-65 QO 25.07.36/0.000% 129,799 0.01754,889 Fannie Mae REMICS 2006-66 NV 25.02.24/6.500% 796,357 0.06
377
JPMorgan Funds - US Aggregate Bond FundSchedule of Investments (Market Value Expressed in USD) (continued)
As at 30 June 2011
Quantity/Nominal
Value
Name of Securities Maturity/Coupon
MarketValue
%of
NetAssets
Quantity/Nominal
Value
Name of Securities Maturity/Coupon
MarketValue
%of
NetAssets
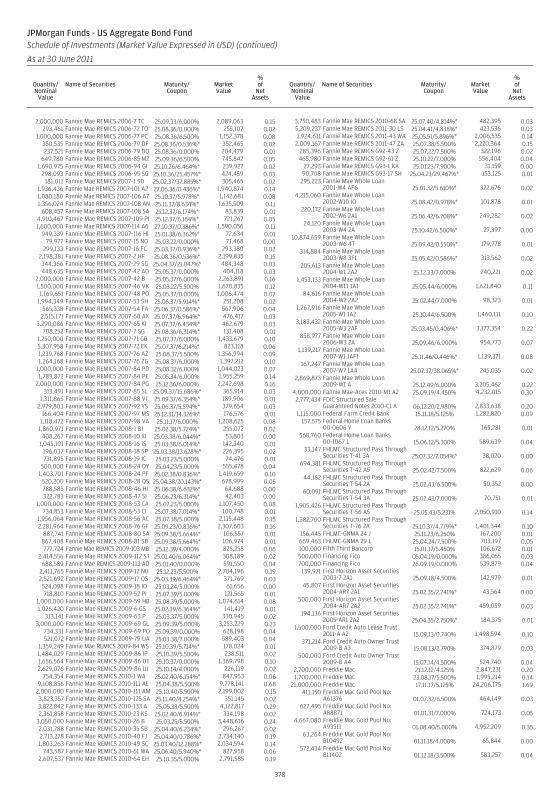
2,000,000 Fannie Mae REMICS 2006-7 TC 25.09.33/6.000% 2,089,063 0.15293,461 Fannie Mae REMICS 2006-72 TO 25.08.36/0.000% 255,107 0.02
1,000,000 Fannie Mae REMICS 2006-77 PC 25.08.36/6.500% 1,152,378 0.08350,535 Fannie Mae REMICS 2006-79 DF 25.08.36/0.536%* 352,465 0.02237,521 Fannie Mae REMICS 2006-79 DO 25.08.36/0.000% 204,479 0.01
649,780 Fannie Mae REMICS 2006-85 MZ 25.09.36/6.500% 745,842 0.051,690,975 Fannie Mae REMICS 2006-94 GI 25.10.26/6.464%* 239,927 0.02
298,093 Fannie Mae REMICS 2006-95 SG 25.10.36/25.457%* 424,459 0.03181,011 Fannie Mae REMICS 2007-1 SD 25.02.37/37.885%* 305,465 0.02
1,936,436 Fannie Mae REMICS 2007-101 A2 27.06.36/0.436%* 1,940,874 0.141,080,180 Fannie Mae REMICS 2007-106 A7 25.10.37/5.978%* 1,142,681 0.081,356,024 Fannie Mae REMICS 2007-108 AN 25.11.37/8.634%* 1,635,509 0.11
608,457 Fannie Mae REMICS 2007-108 SA 25.12.37/6.174%* 83,839 0.014,910,467 Fannie Mae REMICS 2007-109 PI 25.12.37/6.164%* 721,267 0.051,600,000 Fannie Mae REMICS 2007-114 A6 27.10.37/0.386%* 1,590,056 0.11
949,339 Fannie Mae REMICS 2007-116 HI 25.01.38/6.362%* 72,634 0.0179,977 Fannie Mae REMICS 2007-15 NO 25.03.22/0.000% 71,468 0.00
299,133 Fannie Mae REMICS 2007-16 FC 25.03.37/0.936%* 293,380 0.022,198,381 Fannie Mae REMICS 2007-2 HF 25.08.36/0.536%* 2,199,835 0.15344,366 Fannie Mae REMICS 2007-29 SG 25.04.37/21.047%* 484,348 0.03448,635 Fannie Mae REMICS 2007-42 AO 25.05.37/0.000% 404,118 0.03
2,000,000 Fannie Mae REMICS 2007-42 B 25.05.37/6.000% 2,263,891 0.161,500,000 Fannie Mae REMICS 2007-46 VK 25.03.22/5.500% 1,670,835 0.121,169,651 Fannie Mae REMICS 2007-48 PO 25.05.37/0.000% 1,006,474 0.07
1,994,349 Fannie Mae REMICS 2007-53 SH 25.06.37/5.914%* 251,208 0.02565,338 Fannie Mae REMICS 2007-54 FA 25.06.37/0.586%* 567,906 0.04
2,515,171 Fannie Mae REMICS 2007-60 AX 25.07.37/6.964%* 476,417 0.033,290,086 Fannie Mae REMICS 2007-65 KI 25.07.37/6.434%* 462,679 0.03
708,252 Fannie Mae REMICS 2007-7 SG 25.08.36/6.314%* 131,408 0.011,250,000 Fannie Mae REMICS 2007-71 GB 25.07.37/6.000% 1,433,679 0.105,307,958 Fannie Mae REMICS 2007-72 EK 25.07.37/6.214%* 823,118 0.061,239,768 Fannie Mae REMICS 2007-76 AZ 25.08.37/5.500% 1,356,994 0.091,264,168 Fannie Mae REMICS 2007-76 ZG 25.08.37/6.000% 1,397,212 0.10
1,000,000 Fannie Mae REMICS 2007-84 PD 25.08.32/6.000% 1,044,023 0.071,789,872 Fannie Mae REMICS 2007-84 PE 25.05.34/6.000% 1,955,259 0.14
2,000,000 Fannie Mae REMICS 2007-84 PG 25.12.36/6.000% 2,242,698 0.16313,491 Fannie Mae REMICS 2007-85 SL 25.09.37/15.686%* 365,914 0.03
1,311,865 Fannie Mae REMICS 2007-88 VI 25.09.37/6.354%* 189,906 0.012,979,803 Fannie Mae REMICS 2007-92 YS 25.06.37/5.594%* 379,654 0.03
166,404 Fannie Mae REMICS 2007-97 MS 25.12.31/14.326%* 176,576 0.011,118,472 Fannie Mae REMICS 2007-98 VA 25.11.17/6.000% 1,208,625 0.081,860,971 Fannie Mae REMICS 2008-1 BI 25.02.38/5.724%* 255,072 0.02
408,267 Fannie Mae REMICS 2008-10 XI 25.03.38/6.044%* 53,803 0.001,045,101 Fannie Mae REMICS 2008-16 IS 25.03.38/6.014%* 142,340 0.01
196,037 Fannie Mae REMICS 2008-18 SP 25.03.38/13.628%* 226,395 0.02731,895 Fannie Mae REMICS 2008-19 IC 25.03.23/5.000% 74,476 0.01
500,000 Fannie Mae REMICS 2008-24 DY 25.04.23/5.000% 555,478 0.041,403,701 Fannie Mae REMICS 2008-24 PF 25.02.38/0.836%* 1,419,659 0.10
520,200 Fannie Mae REMICS 2008-28 QS 25.04.38/20.143%* 678,999 0.05788,585 Fannie Mae REMICS 2008-46 HI 25.06.38/6.632%* 64,688 0.00322,783 Fannie Mae REMICS 2008-47 SI 25.06.23/6.314%* 42,403 0.00
1,000,000 Fannie Mae REMICS 2008-53 CA 25.07.23/5.000% 1,107,450 0.08734,853 Fannie Mae REMICS 2008-53 CI 25.07.38/7.014%* 100,748 0.01
1,956,064 Fannie Mae REMICS 2008-56 AC 25.07.38/5.000% 2,115,448 0.152,281,964 Fannie Mae REMICS 2008-76 GF 25.09.23/0.836%* 2,307,603 0.16
887,741 Fannie Mae REMICS 2008-80 SA 25.09.38/5.664%* 106,557 0.01867,408 Fannie Mae REMICS 2008-81 SB 25.09.38/5.664%* 106,974 0.01777,724 Fannie Mae REMICS 2009-103 MB 25.12.39/4.000% 825,258 0.06
2,414,556 Fannie Mae REMICS 2009-112 ST 25.01.40/6.064%* 308,189 0.02688,589 Fannie Mae REMICS 2009-113 AO 25.01.40/0.000% 591,550 0.04
2,411,765 Fannie Mae REMICS 2009-12 NU 25.12.23/5.500% 2,704,196 0.192,521,692 Fannie Mae REMICS 2009-17 QS 25.03.39/6.464%* 371,769 0.03524,098 Fannie Mae REMICS 2009-18 IO 25.03.24/5.000% 61,656 0.00718,810 Fannie Mae REMICS 2009-52 PI 25.07.39/5.000% 121,565 0.01
1,000,000 Fannie Mae REMICS 2009-59 HB 25.08.39/5.000% 1,074,614 0.081,026,420 Fannie Mae REMICS 2009-6 GS 25.02.39/6.364%* 141,419 0.01
313,141 Fannie Mae REMICS 2009-63 P 25.03.37/5.000% 330,945 0.023,000,000 Fannie Mae REMICS 2009-69 GL 25.09.39/5.000% 3,253,229 0.23
734,331 Fannie Mae REMICS 2009-69 PO 25.09.39/0.000% 628,198 0.04521,072 Fannie Mae REMICS 2009-79 UA 25.03.38/7.000% 589,403 0.04
1,359,249 Fannie Mae REMICS 2009-84 WS 25.10.39/5.714%* 178,024 0.011,484,029 Fannie Mae REMICS 2009-86 IP 25.10.39/5.500% 238,511 0.021,656,564 Fannie Mae REMICS 2009-86 OT 25.10.37/0.000% 1,369,798 0.102,629,076 Fannie Mae REMICS 2009-86 UI 25.10.14/4.000% 226,119 0.02
754,354 Fannie Mae REMICS 2010-1 WA 25.02.40/6.154%* 847,953 0.069,108,856 Fannie Mae REMICS 2010-111 AE 25.04.38/5.500% 9,778,141 0.68
2,000,000 Fannie Mae REMICS 2010-111 AM 25.10.40/5.500% 2,199,002 0.153,823,357 Fannie Mae REMICS 2010-125 SA 25.11.40/4.254%* 351,145 0.023,822,842 Fannie Mae REMICS 2010-133 A 25.05.38/5.500% 4,122,817 0.292,361,858 Fannie Mae REMICS 2010-23 KS 25.02.40/6.914%* 334,198 0.02
3,050,000 Fannie Mae REMICS 2010-26 B 25.03.25/5.500% 3,448,616 0.242,031,788 Fannie Mae REMICS 2010-35 SB 25.04.40/6.234%* 296,267 0.022,713,278 Fannie Mae REMICS 2010-40 FJ 25.04.40/0.786%* 2,734,140 0.191,803,263 Fannie Mae REMICS 2010-49 SC 25.03.40/12.288%* 2,034,594 0.14
743,587 Fannie Mae REMICS 2010-61 WA 25.06.40/5.940%* 827,958 0.062,607,537 Fannie Mae REMICS 2010-64 EH 25.10.35/5.000% 2,791,585 0.19
3,750,483 Fannie Mae REMICS 2010-68 SA 25.07.40/4.814%* 482,395 0.035,209,237 Fannie Mae REMICS 2011-30 LS 25.04.41/4.838%* 423,536 0.031,924,611 Fannie Mae REMICS 2011-43 WA 25.05.51/5.896%* 2,006,535 0.14
2,009,167 Fannie Mae REMICS 2011-47 ZA 25.07.38/5.500% 2,220,364 0.15285,396 Fannie Mae REMICS G92-43 Z 25.07.22/7.500% 322,196 0.02465,980 Fannie Mae REMICS G92-61 Z 25.10.22/7.000% 556,404 0.04
27,293 Fannie Mae REMICS G93-1 KA 25.01.23/7.900% 31,159 0.0090,708 Fannie Mae REMICS G93-17 SH 25.04.23/29.467%* 153,125 0.01
295,223 Fannie Mae Whole Loan2001-W4 AF6 25.01.32/5.610%* 322,676 0.02
4,215,060 Fannie Mae Whole Loan2002-W10 IO 25.08.42/0.978%* 101,878 0.01
220,172 Fannie Mae Whole Loan2002-W6 2A1 25.06.42/6.708%* 249,282 0.02
24,120 Fannie Mae Whole Loan2003-W4 2A 25.10.42/6.500%* 27,397 0.00
10,874,659 Fannie Mae Whole Loan2003-W6 4T 25.09.42/0.550%* 179,778 0.01
314,884 Fannie Mae Whole Loan2003-W8 3F1 25.05.42/0.586%* 313,562 0.02
205,613 Fannie Mae Whole Loan2004-W1 2A2 25.12.33/7.000% 240,221 0.02
1,453,133 Fannie Mae Whole Loan2004-W11 1A1 25.05.44/6.000% 1,621,840 0.11
84,616 Fannie Mae Whole Loan2004-W2 2A2 25.02.44/7.000% 98,323 0.01
1,267,916 Fannie Mae Whole Loan2005-W1 1A2 25.10.44/6.500% 1,460,111 0.10
3,183,432 Fannie Mae Whole Loan2005-W3 2AF 25.03.45/0.406%* 3,177,354 0.22
858,977 Fannie Mae Whole Loan2006-W3 2A 25.09.46/6.000% 954,773 0.07
1,139,217 Fannie Mae Whole Loan2007-W1 1AF1 25.11.46/0.446%* 1,139,371 0.08
167,247 Fannie Mae Whole Loan2007-W7 1A4 25.07.37/38.065%* 245,035 0.02
2,869,873 Fannie Mae Whole Loan2009-W1 A 25.12.49/6.000% 3,205,462 0.22
4,000,000 Fannie Mae-Aces 2010-M1 A2 25.09.19/4.450% 4,232,015 0.302,777,434 FDIC Structured Sale
Guaranteed Notes 2010-C1 A 06.12.20/2.980% 2,833,638 0.201,115,000 Federal Farm Credit Bank 15.11.18/5.125% 1,282,820 0.09
157,575 Federal Home Loan Banks00-0606 Y 28.12.12/5.270% 165,281 0.01
568,760 Federal Home Loan Banks00-1067 1 15.06.12/5.300% 589,639 0.04
33,147 FHLMC Structured Pass ThroughSecurities T-41 3A 25.07.32/7.054%* 38,020 0.00
694,381 FHLMC Structured Pass ThroughSecurities T-42 A5 25.02.42/7.500% 822,629 0.06
44,182 FHLMC Structured Pass ThroughSecurities T-54 2A 25.02.43/6.500% 50,352 0.00
60,091 FHLMC Structured Pass ThroughSecurities T-54 3A 25.02.43/7.000% 70,751 0.01
1,905,426 FHLMC Structured Pass ThroughSecurities T-56 A5 25.05.43/5.231% 2,050,910 0.14
1,382,700 FHLMC Structured Pass ThroughSecurities T-76 2A 25.10.37/4.779%* 1,401,344 0.10
156,445 FHLMC-GNMA 24 J 25.11.23/6.250% 167,200 0.01669,463 FHLMC-GNMA 29 L 25.04.24/7.500% 703,197 0.05100,000 Fifth Third Bancorp 15.01.17/5.450% 106,672 0.01500,000 Financing Fico 05.04.19/0.000% 386,055 0.03700,000 Financing Fico 26.09.19/0.000% 539,879 0.04
139,971 First Horizon Asset Securities2003-7 2A1 25.09.18/4.500% 142,979 0.01
45,807 First Horizon Asset Securities2004-AR7 2A1 25.02.35/2.741%* 43,564 0.00
500,000 First Horizon Asset Securities2004-AR7 2A2 25.02.35/2.741%* 459,059 0.03
194,136 First Horizon Asset Securities2005-AR1 2A2 25.04.35/2.750%* 184,375 0.01
1,500,000 Ford Credit Auto Lease Trust2011-A A2 15.09.13/0.740% 1,498,594 0.10
371,214 Ford Credit Auto Owner Trust2009-B A3 15.08.13/2.790% 374,879 0.03
500,000 Ford Credit Auto Owner Trust2009-B A4 15.07.14/4.500% 524,740 0.04
2,700,000 Freddie Mac 21.12.12/4.125% 2,847,231 0.201,700,000 Freddie Mac 23.08.17/5.500% 1,995,214 0.14
21,000,000 Freddie Mac 17.11.17/5.125% 24,206,175 1.69411,150 Freddie Mac Gold Pool No:
A61376 01.07.32/6.500% 464,149 0.03627,495 Freddie Mac Gold Pool No:
A88871 01.01.31/7.000% 724,173 0.054,667,080 Freddie Mac Gold Pool No:
A93511 01.08.40/5.000% 4,952,209 0.3563,264 Freddie Mac Gold Pool No:
B10492 01.11.18/4.000% 65,844 0.00572,434 Freddie Mac Gold Pool No:
B11402 01.12.18/3.500% 583,257 0.04
378
JPMorgan Funds - US Aggregate Bond FundSchedule of Investments (Market Value Expressed in USD) (continued)
As at 30 June 2011
Quantity/Nominal
Value
Name of Securities Maturity/Coupon
MarketValue
%of
NetAssets
Quantity/Nominal
Value
Name of Securities Maturity/Coupon
MarketValue
%of
NetAssets
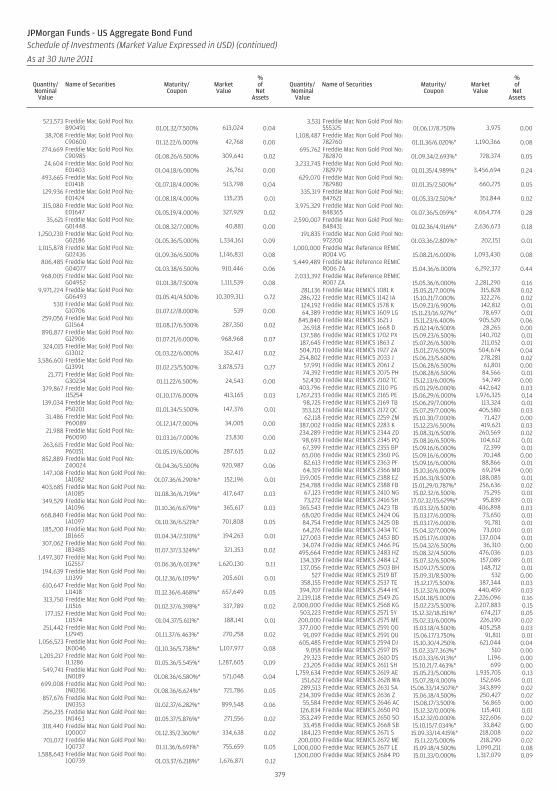
523,573 Freddie Mac Gold Pool No:B90491 01.01.32/7.500% 613,024 0.04
38,708 Freddie Mac Gold Pool No:C90600 01.12.22/6.000% 42,768 0.00
274,669 Freddie Mac Gold Pool No:C90985 01.08.26/6.500% 309,641 0.02
24,604 Freddie Mac Gold Pool No:E01403 01.04.18/6.000% 26,761 0.00
493,665 Freddie Mac Gold Pool No:E01418 01.07.18/4.000% 513,798 0.04
129,936 Freddie Mac Gold Pool No:E01424 01.08.18/4.000% 135,235 0.01
315,080 Freddie Mac Gold Pool No:E01647 01.05.19/4.000% 327,929 0.02
35,621 Freddie Mac Gold Pool No:G01448 01.08.32/7.000% 40,881 0.00
1,250,230 Freddie Mac Gold Pool No:G02186 01.05.36/5.000% 1,334,161 0.09
1,015,878 Freddie Mac Gold Pool No:G02436 01.09.36/6.500% 1,146,831 0.08
806,485 Freddie Mac Gold Pool No:G04077 01.03.38/6.500% 910,446 0.06
968,005 Freddie Mac Gold Pool No:G04952 01.01.38/7.500% 1,111,539 0.08
9,971,224 Freddie Mac Gold Pool No:G06493 01.05.41/4.500% 10,309,311 0.72
530 Freddie Mac Gold Pool No:G10706 01.07.12/8.000% 539 0.00
259,056 Freddie Mac Gold Pool No:G11564 01.08.17/6.500% 287,350 0.02
890,877 Freddie Mac Gold Pool No:G12906 01.07.21/6.000% 968,968 0.07
324,015 Freddie Mac Gold Pool No:G13012 01.03.22/6.000% 352,417 0.02
3,586,601 Freddie Mac Gold Pool No:G13991 01.02.23/5.500% 3,878,573 0.27
21,771 Freddie Mac Gold Pool No:G30234 01.11.22/6.500% 24,543 0.00
379,867 Freddie Mac Gold Pool No:J15254 01.10.17/6.000% 413,165 0.03
139,034 Freddie Mac Gold Pool No:P50201 01.01.34/5.500% 147,376 0.01
31,486 Freddie Mac Gold Pool No:P60089 01.12.14/7.000% 34,005 0.00
21,988 Freddie Mac Gold Pool No:P60090 01.03.16/7.000% 23,830 0.00
263,615 Freddie Mac Gold Pool No:P60151 01.05.19/6.000% 287,615 0.02
852,889 Freddie Mac Gold Pool No:Z40024 01.04.36/5.500% 920,987 0.06
147,108 Freddie Mac Non Gold Pool No:1A1082 01.07.36/6.290%* 152,196 0.01
403,685 Freddie Mac Non Gold Pool No:1A1085 01.08.36/6.719%* 417,647 0.03
349,529 Freddie Mac Non Gold Pool No:1A1096 01.10.36/6.679%* 365,617 0.03
668,840 Freddie Mac Non Gold Pool No:1A1097 01.10.36/6.521%* 701,808 0.05
185,200 Freddie Mac Non Gold Pool No:1B1665 01.04.34/2.510%* 194,263 0.01
307,062 Freddie Mac Non Gold Pool No:1B3485 01.07.37/3.324%* 321,353 0.02
1,497,307 Freddie Mac Non Gold Pool No:1G2557 01.06.36/6.013%* 1,620,130 0.11
194,639 Freddie Mac Non Gold Pool No:1J1399 01.12.36/6.109%* 205,601 0.01
610,647 Freddie Mac Non Gold Pool No:1J1418 01.12.36/6.468%* 657,649 0.05
313,750 Freddie Mac Non Gold Pool No:1J1516 01.02.37/6.398%* 337,789 0.02
177,152 Freddie Mac Non Gold Pool No:1J1574 01.04.37/5.611%* 188,141 0.01
251,442 Freddie Mac Non Gold Pool No:1J2945 01.11.37/6.463%* 270,258 0.02
1,056,523 Freddie Mac Non Gold Pool No:1K0046 01.10.36/5.738%* 1,107,977 0.08
1,205,217 Freddie Mac Non Gold Pool No:1L1286 01.05.36/5.545%* 1,287,605 0.09
549,741 Freddie Mac Non Gold Pool No:1N0189 01.08.36/6.580%* 571,048 0.04
699,008 Freddie Mac Non Gold Pool No:1N0206 01.08.36/6.624%* 721,786 0.05
857,676 Freddie Mac Non Gold Pool No:1N0353 01.02.37/6.282%* 899,548 0.06
256,235 Freddie Mac Non Gold Pool No:1N1463 01.05.37/5.876%* 271,556 0.02
318,440 Freddie Mac Non Gold Pool No:1Q0007 01.12.35/2.360%* 334,638 0.02
701,072 Freddie Mac Non Gold Pool No:1Q0737 01.11.36/6.691%* 755,659 0.05
1,588,643 Freddie Mac Non Gold Pool No:1Q0739 01.03.37/6.218%* 1,676,871 0.12
3,531 Freddie Mac Non Gold Pool No:555325 01.06.17/8.750% 3,975 0.00
1,108,487 Freddie Mac Non Gold Pool No:782760 01.11.36/6.020%* 1,190,366 0.08
695,762 Freddie Mac Non Gold Pool No:782870 01.09.34/2.693%* 728,374 0.05
3,233,745 Freddie Mac Non Gold Pool No:782979 01.01.35/4.989%* 3,456,694 0.24
629,070 Freddie Mac Non Gold Pool No:782980 01.01.35/2.500%* 660,275 0.05
335,319 Freddie Mac Non Gold Pool No:847621 01.05.33/2.510%* 351,844 0.02
3,975,329 Freddie Mac Non Gold Pool No:848365 01.07.36/5.059%* 4,064,774 0.28
2,590,007 Freddie Mac Non Gold Pool No:848431 01.02.36/4.916%* 2,636,673 0.18
191,835 Freddie Mac Non Gold Pool No:972200 01.03.36/2.809%* 202,151 0.01
1,000,000 Freddie Mac Reference REMICR004 VG 15.08.21/6.000% 1,093,430 0.08
5,449,489 Freddie Mac Reference REMICR006 ZA 15.04.36/6.000% 6,292,372 0.44
2,033,392 Freddie Mac Reference REMICR007 ZA 15.05.36/6.000% 2,281,290 0.16
281,136 Freddie Mac REMICS 1081 K 15.05.21/7.000% 315,828 0.02286,722 Freddie Mac REMICS 1142 IA 15.10.21/7.000% 322,276 0.02124,192 Freddie Mac REMICS 1578 K 15.09.23/6.900% 142,812 0.0164,389 Freddie Mac REMICS 1609 LG 15.11.23/16.927%* 78,697 0.01
845,840 Freddie Mac REMICS 1621 J 15.11.23/6.400% 905,520 0.0626,918 Freddie Mac REMICS 1668 D 15.02.14/6.500% 28,265 0.00
137,586 Freddie Mac REMICS 1702 PX 15.09.23/6.500% 140,702 0.01187,645 Freddie Mac REMICS 1863 Z 15.07.26/6.500% 211,052 0.01504,710 Freddie Mac REMICS 1927 ZA 15.01.27/6.500% 504,674 0.04254,802 Freddie Mac REMICS 2033 J 15.06.23/5.600% 278,281 0.02
57,991 Freddie Mac REMICS 2061 Z 15.06.28/6.500% 61,801 0.0074,392 Freddie Mac REMICS 2075 PH 15.08.28/6.500% 84,566 0.0152,430 Freddie Mac REMICS 2102 TC 15.12.13/6.000% 54,749 0.00
403,796 Freddie Mac REMICS 2110 PG 15.01.29/6.000% 442,642 0.031,767,233 Freddie Mac REMICS 2165 PE 15.06.29/6.000% 1,976,325 0.14
98,725 Freddie Mac REMICS 2169 TB 15.06.29/7.000% 113,324 0.01353,121 Freddie Mac REMICS 2172 QC 15.07.29/7.000% 405,580 0.0362,118 Freddie Mac REMICS 2259 ZM 15.10.30/7.000% 71,427 0.00
387,002 Freddie Mac REMICS 2283 K 15.12.23/6.500% 419,621 0.03234,289 Freddie Mac REMICS 2344 ZD 15.08.31/6.500% 260,569 0.0298,693 Freddie Mac REMICS 2345 PQ 15.08.16/6.500% 104,612 0.0167,399 Freddie Mac REMICS 2355 BP 15.09.16/6.000% 72,399 0.0165,006 Freddie Mac REMICS 2360 PG 15.09.16/6.000% 70,148 0.0082,613 Freddie Mac REMICS 2363 PF 15.09.16/6.000% 88,866 0.0164,319 Freddie Mac REMICS 2366 MD 15.10.16/6.000% 69,294 0.00
159,005 Freddie Mac REMICS 2388 EZ 15.06.31/8.500% 188,085 0.01254,788 Freddie Mac REMICS 2388 FB 15.01.29/0.787%* 256,636 0.02
67,123 Freddie Mac REMICS 2410 NG 15.02.32/6.500% 75,295 0.0173,272 Freddie Mac REMICS 2416 SH 17.02.32/15.629%* 95,839 0.01
365,543 Freddie Mac REMICS 2423 TB 15.03.32/6.500% 406,898 0.0368,020 Freddie Mac REMICS 2424 OG 15.03.17/6.000% 73,650 0.0184,754 Freddie Mac REMICS 2425 OB 15.03.17/6.000% 91,781 0.0164,276 Freddie Mac REMICS 2434 TC 15.04.32/7.000% 73,010 0.01
127,003 Freddie Mac REMICS 2453 BD 15.05.17/6.000% 137,004 0.0134,074 Freddie Mac REMICS 2466 PG 15.04.32/6.500% 36,310 0.00
495,664 Freddie Mac REMICS 2483 HZ 15.08.32/4.500% 476,036 0.03134,339 Freddie Mac REMICS 2484 LZ 15.07.32/6.500% 157,089 0.01137,056 Freddie Mac REMICS 2503 BH 15.09.17/5.500% 148,712 0.01
527 Freddie Mac REMICS 2519 BT 15.09.31/8.500% 532 0.00358,155 Freddie Mac REMICS 2537 TE 15.12.17/5.500% 387,344 0.03394,707 Freddie Mac REMICS 2544 HC 15.12.32/6.000% 440,459 0.03
2,139,118 Freddie Mac REMICS 2549 ZG 15.01.18/5.000% 2,226,096 0.162,000,000 Freddie Mac REMICS 2568 KG 15.02.23/5.500% 2,207,883 0.15
503,223 Freddie Mac REMICS 2571 SY 15.12.32/18.151%* 674,217 0.05200,000 Freddie Mac REMICS 2575 ME 15.02.33/6.000% 226,190 0.02377,000 Freddie Mac REMICS 2591 QO 15.03.18/4.500% 405,258 0.03
91,097 Freddie Mac REMICS 2591 QU 15.06.17/3.750% 91,811 0.01605,485 Freddie Mac REMICS 2594 DJ 15.10.30/4.250% 621,044 0.04
9,058 Freddie Mac REMICS 2597 DS 15.02.33/7.363%* 510 0.0029,323 Freddie Mac REMICS 2610 DS 15.03.33/6.913%* 1,196 0.0023,205 Freddie Mac REMICS 2611 SH 15.10.21/7.463%* 699 0.00
1,759,634 Freddie Mac REMICS 2619 AE 15.05.23/5.000% 1,935,705 0.13151,622 Freddie Mac REMICS 2628 WA 15.07.28/4.000% 152,696 0.01289,513 Freddie Mac REMICS 2631 SA 15.06.33/14.507%* 343,899 0.02234,309 Freddie Mac REMICS 2636 Z 15.06.18/4.500% 250,427 0.02
55,584 Freddie Mac REMICS 2646 AC 15.08.17/3.500% 56,865 0.00126,834 Freddie Mac REMICS 2650 PO 15.12.32/0.000% 115,401 0.01353,249 Freddie Mac REMICS 2650 SO 15.12.32/0.000% 322,606 0.0233,458 Freddie Mac REMICS 2668 SB 15.10.15/7.034%* 33,842 0.00
184,123 Freddie Mac REMICS 2671 S 15.09.33/14.415%* 218,008 0.02200,000 Freddie Mac REMICS 2672 ME 15.11.22/5.000% 218,290 0.02
1,000,000 Freddie Mac REMICS 2677 LE 15.09.18/4.500% 1,090,211 0.081,500,000 Freddie Mac REMICS 2684 PO 15.01.33/0.000% 1,317,079 0.09
379
JPMorgan Funds - US Aggregate Bond FundSchedule of Investments (Market Value Expressed in USD) (continued)
As at 30 June 2011
Quantity/Nominal
Value
Name of Securities Maturity/Coupon
MarketValue
%of
NetAssets
Quantity/Nominal
Value
Name of Securities Maturity/Coupon
MarketValue
%of
NetAssets
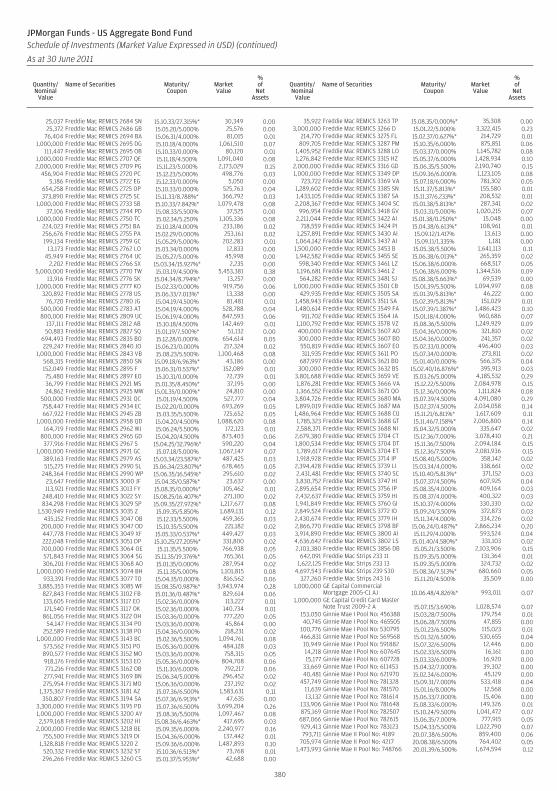
25,037 Freddie Mac REMICS 2684 SN 15.10.33/27.315%* 30,349 0.0025,372 Freddie Mac REMICS 2686 GB 15.05.20/5.000% 25,576 0.00
76,404 Freddie Mac REMICS 2694 BA 15.06.31/4.000% 81,015 0.011,000,000 Freddie Mac REMICS 2695 DG 15.10.18/4.000% 1,061,510 0.07
111,447 Freddie Mac REMICS 2695 OB 15.10.33/0.000% 80,120 0.011,000,000 Freddie Mac REMICS 2707 QE 15.11.18/4.500% 1,091,040 0.082,000,000 Freddie Mac REMICS 2709 PG 15.11.23/5.000% 2,173,029 0.15
456,904 Freddie Mac REMICS 2720 PC 15.12.23/5.000% 498,776 0.035,186 Freddie Mac REMICS 2722 EG 15.12.33/0.000% 5,050 0.00
654,258 Freddie Mac REMICS 2725 OP 15.10.33/0.000% 525,763 0.04373,890 Freddie Mac REMICS 2725 SC 15.11.33/8.788%* 366,792 0.03
1,000,000 Freddie Mac REMICS 2733 SB 15.10.33/7.842%* 1,079,478 0.0837,106 Freddie Mac REMICS 2744 PD 15.08.33/5.500% 37,525 0.00
1,000,000 Freddie Mac REMICS 2750 TC 15.02.34/5.250% 1,105,336 0.08224,023 Freddie Mac REMICS 2751 BA 15.10.18/4.000% 233,186 0.02256,676 Freddie Mac REMICS 2755 PA 15.02.29/0.000% 253,161 0.02199,134 Freddie Mac REMICS 2759 GC 15.05.29/5.000% 202,283 0.01
13,173 Freddie Mac REMICS 2762 LO 15.03.34/0.000% 12,833 0.0045,949 Freddie Mac REMICS 2764 UC 15.05.27/5.000% 45,998 0.00
2,202 Freddie Mac REMICS 2766 SX 15.03.34/15.927%* 2,235 0.005,000,000 Freddie Mac REMICS 2770 TW 15.03.19/4.500% 5,453,381 0.38
13,916 Freddie Mac REMICS 2776 SK 15.04.34/8.794%* 13,257 0.001,000,000 Freddie Mac REMICS 2777 KO 15.02.33/0.000% 919,756 0.06
320,892 Freddie Mac REMICS 2778 US 15.06.33/7.013%* 13,338 0.0076,720 Freddie Mac REMICS 2780 JG 15.04.19/4.500% 81,481 0.01
500,000 Freddie Mac REMICS 2783 AT 15.04.19/4.000% 528,788 0.04800,000 Freddie Mac REMICS 2809 UC 15.06.19/4.000% 847,593 0.06
137,111 Freddie Mac REMICS 2812 AB 15.10.18/4.500% 142,469 0.0150,883 Freddie Mac REMICS 2827 SQ 15.01.19/7.500%* 51,132 0.00
694,493 Freddie Mac REMICS 2835 BO 15.12.28/0.000% 654,614 0.05229,247 Freddie Mac REMICS 2840 JO 15.06.23/0.000% 217,324 0.02
1,000,000 Freddie Mac REMICS 2843 VB 15.08.23/5.500% 1,100,468 0.08568,315 Freddie Mac REMICS 2850 SN 15.09.18/6.963%* 43,186 0.00152,049 Freddie Mac REMICS 2895 F 15.06.31/0.537%* 152,089 0.0175,480 Freddie Mac REMICS 2897 EO 15.10.31/0.000% 72,739 0.0136,799 Freddie Mac REMICS 2921 MS 15.01.35/8.450%* 37,195 0.0024,862 Freddie Mac REMICS 2925 MW 15.01.35/0.000%* 24,810 0.00
500,000 Freddie Mac REMICS 2931 QC 15.01.19/4.500% 527,777 0.04758,447 Freddie Mac REMICS 2934 EC 15.02.20/0.000% 693,269 0.05667,922 Freddie Mac REMICS 2945 ZB 15.03.35/5.500% 725,652 0.05
1,000,000 Freddie Mac REMICS 2958 QD 15.04.20/4.500% 1,088,620 0.08164,719 Freddie Mac REMICS 2962 WJ 15.06.24/5.500% 172,123 0.01
800,000 Freddie Mac REMICS 2965 GD 15.04.20/4.500% 873,403 0.06377,916 Freddie Mac REMICS 2967 S 15.04.25/32.796%* 590,220 0.04
1,000,000 Freddie Mac REMICS 2971 GC 15.07.18/5.000% 1,067,147 0.07389,163 Freddie Mac REMICS 2979 AS 15.03.34/23.587%* 487,425 0.03515,275 Freddie Mac REMICS 2990 SL 15.06.34/23.807%* 678,465 0.05
248,364 Freddie Mac REMICS 2990 WP 15.06.35/16.545%* 295,610 0.0223,647 Freddie Mac REMICS 3000 JF 15.04.35/0.587%* 23,637 0.00113,921 Freddie Mac REMICS 3013 FY 15.08.35/0.000%* 105,462 0.01
248,410 Freddie Mac REMICS 3022 SY 15.08.25/16.407%* 271,100 0.02834,298 Freddie Mac REMICS 3029 SP 15.09.35/27.972%* 1,217,677 0.08
1,530,949 Freddie Mac REMICS 3035 Z 15.09.35/5.850% 1,689,131 0.12435,152 Freddie Mac REMICS 3047 OB 15.12.33/5.500% 459,365 0.03
200,000 Freddie Mac REMICS 3047 OD 15.10.35/5.500% 221,182 0.02447,778 Freddie Mac REMICS 3049 XF 15.05.33/0.537%* 449,427 0.03222,048 Freddie Mac REMICS 3051 DP 15.10.25/27.205%* 331,800 0.02700,000 Freddie Mac REMICS 3064 OE 15.11.35/5.500% 766,938 0.05571,843 Freddie Mac REMICS 3064 SG 15.11.35/19.376%* 765,361 0.05306,201 Freddie Mac REMICS 3068 AO 15.01.35/0.000% 287,954 0.02
1,000,000 Freddie Mac REMICS 3074 BH 15.11.35/5.000% 1,101,815 0.08933,391 Freddie Mac REMICS 3077 TO 15.04.35/0.000% 816,562 0.06
3,885,353 Freddie Mac REMICS 3085 WF 15.08.35/0.987%* 3,943,974 0.28827,843 Freddie Mac REMICS 3102 FB 15.01.36/0.487%* 829,614 0.06133,605 Freddie Mac REMICS 3117 EO 15.02.36/0.000% 113,227 0.01171,540 Freddie Mac REMICS 3117 OK 15.02.36/0.000% 140,734 0.01861,056 Freddie Mac REMICS 3122 OH 15.03.36/0.000% 777,220 0.05
54,147 Freddie Mac REMICS 3134 PO 15.03.36/0.000% 45,864 0.00252,589 Freddie Mac REMICS 3138 PO 15.04.36/0.000% 218,231 0.02
1,000,000 Freddie Mac REMICS 3143 BC 15.02.36/5.500% 1,094,761 0.08573,562 Freddie Mac REMICS 3151 PO 15.05.36/0.000% 484,128 0.03890,577 Freddie Mac REMICS 3152 MO 15.03.36/0.000% 758,315 0.05918,176 Freddie Mac REMICS 3153 EO 15.05.36/0.000% 804,708 0.06771,216 Freddie Mac REMICS 3162 OB 15.11.30/6.000% 792,217 0.06277,941 Freddie Mac REMICS 3169 BN 15.06.34/5.000% 296,452 0.02275,954 Freddie Mac REMICS 3171 MO 15.06.36/0.000% 237,192 0.02
1,375,367 Freddie Mac REMICS 3181 AZ 15.07.36/6.500% 1,583,631 0.11350,807 Freddie Mac REMICS 3194 SA 15.07.36/6.913%* 47,635 0.00
3,300,000 Freddie Mac REMICS 3195 PD 15.07.36/6.500% 3,699,204 0.261,000,000 Freddie Mac REMICS 3200 AY 15.08.36/5.500% 1,097,467 0.082,579,168 Freddie Mac REMICS 3202 HI 15.08.36/6.463%* 417,695 0.03
2,000,000 Freddie Mac REMICS 3218 BE 15.09.35/6.000% 2,240,977 0.16755,500 Freddie Mac REMICS 3219 DI 15.04.36/6.000% 137,442 0.01
1,328,818 Freddie Mac REMICS 3220 Z 15.09.36/6.000% 1,487,893 0.10520,332 Freddie Mac REMICS 3232 ST 15.10.36/6.513%* 73,768 0.01296,266 Freddie Mac REMICS 3260 CS 15.01.37/5.953%* 42,688 0.00
35,922 Freddie Mac REMICS 3263 TP 15.08.35/0.000%* 35,308 0.003,000,000 Freddie Mac REMICS 3266 D 15.01.22/5.000% 3,322,415 0.23
214,770 Freddie Mac REMICS 3275 FL 15.02.37/0.627%* 214,729 0.01809,705 Freddie Mac REMICS 3287 PM 15.10.35/6.000% 875,851 0.06
1,405,952 Freddie Mac REMICS 3288 LO 15.03.37/0.000% 1,145,782 0.081,276,842 Freddie Mac REMICS 3315 HZ 15.05.37/6.000% 1,428,934 0.10
2,000,000 Freddie Mac REMICS 3316 GD 15.06.35/5.500% 2,190,740 0.151,000,000 Freddie Mac REMICS 3349 DP 15.09.36/6.000% 1,123,105 0.08
723,722 Freddie Mac REMICS 3369 VA 15.07.18/6.000% 781,302 0.051,289,602 Freddie Mac REMICS 3385 SN 15.11.37/5.813%* 155,580 0.011,433,105 Freddie Mac REMICS 3387 SA 15.11.37/6.233%* 208,532 0.012,208,367 Freddie Mac REMICS 3404 SC 15.01.38/5.813%* 287,341 0.02
996,954 Freddie Mac REMICS 3418 GV 15.03.31/5.000% 1,020,215 0.072,211,044 Freddie Mac REMICS 3422 AI 15.01.38/0.250%* 15,048 0.00
718,559 Freddie Mac REMICS 3424 PI 15.04.38/6.613%* 108,961 0.011,257,891 Freddie Mac REMICS 3430 AI 15.09.12/1.417% 13,613 0.001,064,142 Freddie Mac REMICS 3437 AI 15.09.11/1.335% 1,181 0.001,500,000 Freddie Mac REMICS 3453 B 15.05.38/5.500% 1,641,113 0.111,942,582 Freddie Mac REMICS 3455 SE 15.06.38/6.013%* 265,359 0.02
598,340 Freddie Mac REMICS 3461 LZ 15.06.38/6.000% 668,517 0.051,196,681 Freddie Mac REMICS 3461 Z 15.06.38/6.000% 1,344,516 0.09564,282 Freddie Mac REMICS 3481 SJ 15.08.38/5.663%* 69,539 0.00
1,000,000 Freddie Mac REMICS 3501 CB 15.01.39/5.500% 1,094,997 0.08429,935 Freddie Mac REMICS 3505 SA 15.01.39/5.813%* 46,222 0.00
1,458,943 Freddie Mac REMICS 3511 SA 15.02.39/5.813%* 151,029 0.011,480,614 Freddie Mac REMICS 3549 FA 15.07.39/1.387%* 1,486,423 0.10
911,702 Freddie Mac REMICS 3564 JA 15.01.18/4.000% 960,686 0.071,100,792 Freddie Mac REMICS 3578 VZ 15.08.36/5.500% 1,249,929 0.09400,000 Freddie Mac REMICS 3607 AO 15.04.36/0.000% 321,810 0.02300,000 Freddie Mac REMICS 3607 BO 15.04.36/0.000% 241,357 0.02550,819 Freddie Mac REMICS 3607 EO 15.02.33/0.000% 496,400 0.03311,935 Freddie Mac REMICS 3611 PO 15.07.34/0.000% 273,811 0.02
687,997 Freddie Mac REMICS 3621 BO 15.01.40/0.000% 566,375 0.04300,000 Freddie Mac REMICS 3632 BS 15.02.40/16.876%* 395,913 0.03
3,801,688 Freddie Mac REMICS 3659 VE 15.03.26/5.000% 4,185,532 0.291,876,281 Freddie Mac REMICS 3666 VA 15.12.22/5.500% 2,084,978 0.151,366,552 Freddie Mac REMICS 3671 QO 15.12.36/0.000% 1,111,824 0.083,804,726 Freddie Mac REMICS 3680 MA 15.07.39/4.500% 4,091,080 0.291,899,019 Freddie Mac REMICS 3687 MA 15.02.37/4.500% 2,034,058 0.141,486,964 Freddie Mac REMICS 3688 CU 15.11.21/6.811%* 1,617,609 0.111,785,323 Freddie Mac REMICS 3688 GT 15.11.46/7.158%* 2,006,800 0.142,588,371 Freddie Mac REMICS 3688 NI 15.04.32/5.000% 335,647 0.022,679,380 Freddie Mac REMICS 3704 CT 15.12.36/7.000% 3,078,410 0.211,800,534 Freddie Mac REMICS 3704 DT 15.11.36/7.500% 2,094,184 0.151,789,617 Freddie Mac REMICS 3704 ET 15.12.36/7.500% 2,081,936 0.151,918,928 Freddie Mac REMICS 3714 IP 15.08.40/5.000% 358,142 0.022,394,428 Freddie Mac REMICS 3739 LI 15.03.34/4.000% 338,661 0.022,431,481 Freddie Mac REMICS 3740 SC 15.10.40/5.813%* 371,152 0.033,830,752 Freddie Mac REMICS 3747 HI 15.07.37/4.500% 607,925 0.042,895,654 Freddie Mac REMICS 3756 IP 15.08.35/4.000% 409,164 0.032,432,637 Freddie Mac REMICS 3759 HI 15.08.37/4.000% 400,322 0.031,941,849 Freddie Mac REMICS 3760 GI 15.10.37/4.000% 330,330 0.022,849,524 Freddie Mac REMICS 3772 IO 15.09.24/3.500% 372,873 0.032,430,674 Freddie Mac REMICS 3779 IH 15.11.34/4.000% 334,226 0.022,866,770 Freddie Mac REMICS 3798 BF 15.06.24/0.487%* 2,866,234 0.203,914,890 Freddie Mac REMICS 3800 AI 15.11.29/4.000% 593,524 0.044,636,642 Freddie Mac REMICS 3802 LS 15.01.40/4.580%* 331,103 0.022,103,380 Freddie Mac REMICS 3856 DB 15.05.21/3.500% 2,103,906 0.15
642,091 Freddie Mac Strips 233 11 15.09.35/5.000% 131,364 0.011,622,125 Freddie Mac Strips 233 13 15.09.35/5.000% 324,732 0.02
4,697,543 Freddie Mac Strips 239 S30 15.08.36/7.513%* 680,660 0.05327,260 Freddie Mac Strips 243 16 15.11.20/4.500% 35,509 0.00
1,000,000 GE Capital CommercialMortgage 2005-C1 AJ 10.06.48/4.826%* 993,011 0.07
1,000,000 GE Capital Credit Card MasterNote Trust 2009-2 A 15.07.15/3.690% 1,028,574 0.07
153,050 Ginnie Mae I Pool No: 456388 15.03.28/7.500% 179,754 0.0140,745 Ginnie Mae I Pool No: 465505 15.06.28/7.500% 47,855 0.00
100,776 Ginnie Mae I Pool No: 530795 15.01.23/6.500% 115,023 0.01466,831 Ginnie Mae I Pool No: 569568 15.01.32/6.500% 530,655 0.0410,949 Ginnie Mae I Pool No: 591882 15.07.32/6.500% 12,446 0.0014,218 Ginnie Mae I Pool No: 607645 15.02.33/6.500% 16,161 0.0015,177 Ginnie Mae I Pool No: 607728 15.03.33/6.000% 16,920 0.00
33,669 Ginnie Mae I Pool No: 611453 15.04.32/7.000% 39,302 0.0040,481 Ginnie Mae I Pool No: 621970 15.02.34/6.000% 45,129 0.00
457,749 Ginnie Mae I Pool No: 781328 15.09.31/7.000% 533,418 0.0411,639 Ginnie Mae I Pool No: 781570 15.01.16/8.000% 12,568 0.0013,132 Ginnie Mae I Pool No: 781614 15.06.33/7.000% 15,406 0.00
133,906 Ginnie Mae I Pool No: 781648 15.08.33/6.000% 149,326 0.01875,169 Ginnie Mae I Pool No: 782507 15.10.24/9.500% 1,041,472 0.07687,066 Ginnie Mae I Pool No: 782615 15.06.35/7.000% 777,915 0.05929,413 Ginnie Mae I Pool No: 783123 15.04.33/5.500% 1,022,790 0.07793,711 Ginnie Mae II Pool No: 4189 20.07.38/6.500% 859,400 0.06
705,974 Ginnie Mae II Pool No: 4217 20.08.38/6.500% 764,402 0.051,473,993 Ginnie Mae II Pool No: 748766 20.01.39/6.500% 1,674,594 0.12
380
JPMorgan Funds - US Aggregate Bond FundSchedule of Investments (Market Value Expressed in USD) (continued)
As at 30 June 2011
Quantity/Nominal
Value
Name of Securities Maturity/Coupon
MarketValue
%of
NetAssets
Quantity/Nominal
Value
Name of Securities Maturity/Coupon
MarketValue
%of
NetAssets
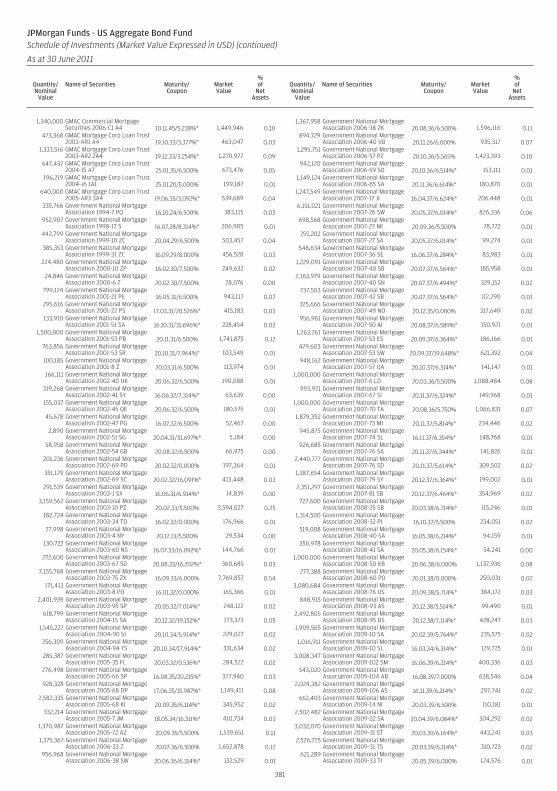
1,340,000 GMAC Commercial MortgageSecurities 2006-C1 A4 10.11.45/5.238%* 1,449,946 0.10
473,368 GMAC Mortgage Corp Loan Trust2003-AR1 A4 19.10.33/3.377%* 463,047 0.03
1,333,516 GMAC Mortgage Corp Loan Trust2003-AR2 2A4 19.12.33/3.254%* 1,270,977 0.09
647,437 GMAC Mortgage Corp Loan Trust2004-J5 A7 25.01.35/6.500% 673,476 0.05
196,219 GMAC Mortgage Corp Loan Trust2004-J6 1A1 25.01.20/5.000% 199,187 0.01
640,000 GMAC Mortgage Corp Loan Trust2005-AR3 3A4 19.06.35/3.092%* 539,689 0.04
335,766 Government National MortgageAssociation 1994-7 PQ 16.10.24/6.500% 383,115 0.03
952,907 Government National MortgageAssociation 1998-17 S 16.07.28/8.314%* 206,905 0.01
442,799 Government National MortgageAssociation 1999-10 ZC 20.04.29/6.500% 503,457 0.04
385,353 Government National MortgageAssociation 1999-31 ZC 16.09.29/8.000% 456,528 0.03
224,480 Government National MortgageAssociation 2000-10 ZP 16.02.30/7.500% 249,632 0.02
24,846 Government National MortgageAssociation 2000-6 Z 20.02.30/7.500% 28,076 0.00
799,124 Government National MortgageAssociation 2001-21 PE 16.05.31/6.500% 943,117 0.07
295,616 Government National MortgageAssociation 2001-22 PS 17.03.31/20.526%* 415,183 0.03
133,910 Government National MortgageAssociation 2001-51 SA 16.10.31/31.696%* 228,454 0.02
1,500,000 Government National MortgageAssociation 2001-53 PB 20.11.31/6.500% 1,741,875 0.12
763,856 Government National MortgageAssociation 2001-53 SR 20.10.31/7.964%* 103,549 0.01
100,185 Government National MortgageAssociation 2001-8 Z 20.03.31/6.500% 113,974 0.01
166,111 Government National MortgageAssociation 2002-40 UK 20.06.32/6.500% 190,088 0.01
319,268 Government National MortgageAssociation 2002-41 SY 16.06.32/7.314%* 63,639 0.00
155,037 Government National MortgageAssociation 2002-45 QE 20.06.32/6.500% 180,575 0.01
45,678 Government National MortgageAssociation 2002-47 PG 16.07.32/6.500% 52,467 0.00
2,890 Government National MortgageAssociation 2002-51 SG 20.04.31/31.697%* 5,184 0.00
58,958 Government National MortgageAssociation 2002-54 GB 20.08.32/6.500% 66,975 0.00
201,236 Government National MortgageAssociation 2002-69 PO 20.02.32/0.000% 197,364 0.01
351,129 Government National MortgageAssociation 2002-69 SC 20.02.32/16.091%* 413,448 0.03
291,539 Government National MortgageAssociation 2003-1 SX 16.06.31/6.914%* 14,839 0.00
3,159,562 Government National MortgageAssociation 2003-10 PZ 20.02.33/5.500% 3,594,027 0.25
182,724 Government National MortgageAssociation 2003-34 TO 16.02.32/0.000% 176,966 0.01
27,998 Government National MortgageAssociation 2003-4 NY 20.12.13/5.500% 29,534 0.00
130,722 Government National MortgageAssociation 2003-60 NS 16.07.33/16.092%* 144,766 0.01
272,600 Government National MortgageAssociation 2003-67 SD 20.08.33/16.202%* 360,685 0.03
7,155,768 Government National MortgageAssociation 2003-75 ZX 16.09.33/6.000% 7,769,857 0.54
171,413 Government National MortgageAssociation 2003-8 PO 16.01.32/0.000% 165,366 0.01
2,401,939 Government National MortgageAssociation 2003-95 SP 20.05.32/7.014%* 248,122 0.02
618,799 Government National MortgageAssociation 2004-15 SA 20.12.32/19.152%* 773,373 0.05
1,545,227 Government National MortgageAssociation 2004-90 SI 20.10.34/5.914%* 229,027 0.02
256,309 Government National MortgageAssociation 2004-94 TS 20.10.34/17.914%* 331,634 0.02
285,387 Government National MortgageAssociation 2005-35 FL 20.03.32/0.536%* 284,522 0.02
276,498 Government National MortgageAssociation 2005-66 SP 16.08.35/20.215%* 377,940 0.03
928,328 Government National MortgageAssociation 2005-68 DP 17.06.35/15.987%* 1,149,411 0.08
2,582,335 Government National MortgageAssociation 2005-68 KI 20.09.35/6.114%* 345,952 0.02
332,214 Government National MortgageAssociation 2005-7 JM 18.05.34/16.311%* 410,734 0.03
1,370,982 Government National MortgageAssociation 2005-72 AZ 20.09.35/5.500% 1,539,651 0.11
1,375,367 Government National MortgageAssociation 2006-33 Z 20.07.36/6.500% 1,652,878 0.12
956,968 Government National MortgageAssociation 2006-38 SW 20.06.36/6.314%* 132,529 0.01
1,367,958 Government National MortgageAssociation 2006-38 ZK 20.08.36/6.500% 1,596,116 0.11
894,729 Government National MortgageAssociation 2006-40 VB 20.11.26/6.000% 935,317 0.07
1,295,751 Government National MortgageAssociation 2006-57 PZ 20.10.36/5.565% 1,423,393 0.10
942,120 Government National MortgageAssociation 2006-59 SD 20.10.36/6.514%* 153,111 0.01
1,149,124 Government National MortgageAssociation 2006-65 SA 20.11.36/6.614%* 180,870 0.01
1,247,549 Government National MortgageAssociation 2007-17 JI 16.04.37/6.624%* 206,448 0.01
6,151,021 Government National MortgageAssociation 2007-26 SW 20.05.37/6.014%* 826,336 0.06
698,568 Government National MortgageAssociation 2007-27 MI 20.09.36/5.500% 78,772 0.01
755,202 Government National MortgageAssociation 2007-27 SA 20.05.37/6.014%* 99,274 0.01
548,634 Government National MortgageAssociation 2007-36 SE 16.06.37/6.284%* 83,983 0.01
1,229,091 Government National MortgageAssociation 2007-40 SB 20.07.37/6.564%* 185,958 0.01
2,163,979 Government National MortgageAssociation 2007-40 SN 20.07.37/6.494%* 329,152 0.02
737,503 Government National MortgageAssociation 2007-42 SB 20.07.37/6.564%* 112,290 0.01
325,666 Government National MortgageAssociation 2007-49 NO 20.12.35/0.000% 317,649 0.02
956,961 Government National MortgageAssociation 2007-50 AI 20.08.37/6.589%* 150,921 0.01
1,263,261 Government National MortgageAssociation 2007-53 ES 20.09.37/6.364%* 186,166 0.01
479,603 Government National MortgageAssociation 2007-53 SW 20.09.37/19.648%* 621,392 0.04
948,162 Government National MortgageAssociation 2007-57 QA 20.10.37/6.314%* 141,147 0.01
1,000,000 Government National MortgageAssociation 2007-6 LD 20.03.36/5.500% 1,088,484 0.08
993,971 Government National MortgageAssociation 2007-67 SI 20.11.37/6.324%* 149,968 0.01
1,000,000 Government National MortgageAssociation 2007-70 TA 20.08.36/5.750% 1,066,831 0.07
1,879,392 Government National MortgageAssociation 2007-73 MI 20.11.37/5.814%* 234,446 0.02
945,875 Government National MortgageAssociation 2007-74 SL 16.11.37/6.354%* 148,768 0.01
926,685 Government National MortgageAssociation 2007-76 SA 20.11.37/6.344%* 141,826 0.01
2,440,777 Government National MortgageAssociation 2007-76 SD 20.11.37/5.614%* 309,502 0.02
1,387,654 Government National MortgageAssociation 2007-79 SY 20.12.37/6.364%* 199,002 0.01
2,351,297 Government National MortgageAssociation 2007-81 SB 20.12.37/6.464%* 354,969 0.02
727,600 Government National MortgageAssociation 2008-25 SB 20.03.38/6.714%* 115,246 0.01
1,314,500 Government National MortgageAssociation 2008-32 PI 16.10.37/5.500% 234,051 0.02
519,008 Government National MortgageAssociation 2008-40 SA 16.05.38/6.214%* 94,159 0.01
350,978 Government National MortgageAssociation 2008-41 SA 20.05.38/6.154%* 54,241 0.00
1,000,000 Government National MortgageAssociation 2008-50 KB 20.06.38/6.000% 1,137,936 0.08
277,388 Government National MortgageAssociation 2008-60 PO 20.01.38/0.000% 250,031 0.02
3,080,684 Government National MortgageAssociation 2008-76 US 20.09.38/5.714%* 384,172 0.03
848,915 Government National MortgageAssociation 2008-93 AS 20.12.38/5.514%* 99,490 0.01
2,492,805 Government National MortgageAssociation 2008-95 DS 20.12.38/7.114%* 428,247 0.03
1,909,565 Government National MortgageAssociation 2009-10 SA 20.02.39/5.764%* 235,575 0.02
1,016,911 Government National MortgageAssociation 2009-10 SL 16.03.34/6.314%* 129,725 0.01
3,008,347 Government National MortgageAssociation 2009-102 SM 16.06.39/6.214%* 400,336 0.03
543,020 Government National MortgageAssociation 2009-104 AB 16.08.39/7.000% 638,546 0.04
2,024,382 Government National MortgageAssociation 2009-106 AS 16.11.39/6.214%* 297,741 0.02
662,403 Government National MortgageAssociation 2009-14 NI 20.03.39/6.500% 110,181 0.01
2,502,482 Government National MortgageAssociation 2009-22 SA 20.04.39/6.084%* 304,292 0.02
3,032,070 Government National MortgageAssociation 2009-31 ST 20.03.39/6.164%* 443,241 0.03
2,526,725 Government National MortgageAssociation 2009-31 TS 20.03.39/6.114%* 310,723 0.02
621,289 Government National MortgageAssociation 2009-33 TI 20.05.39/6.000% 124,576 0.01
381
JPMorgan Funds - US Aggregate Bond FundSchedule of Investments (Market Value Expressed in USD) (continued)
As at 30 June 2011
Quantity/Nominal
Value
Name of Securities Maturity/Coupon
MarketValue
%of
NetAssets
Quantity/Nominal
Value
Name of Securities Maturity/Coupon
MarketValue
%of
NetAssets
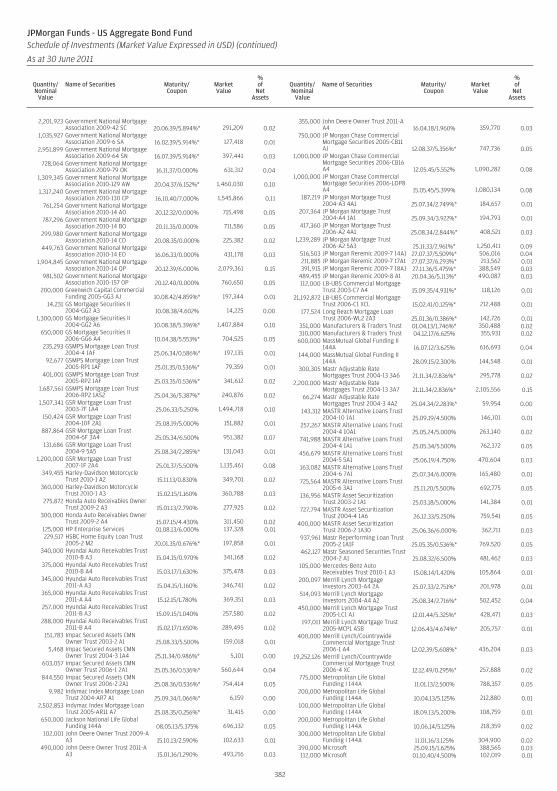
2,201,923 Government National MortgageAssociation 2009-42 SC 20.06.39/5.894%* 291,209 0.02
1,035,927 Government National MortgageAssociation 2009-6 SA 16.02.39/5.914%* 127,418 0.01
2,951,899 Government National MortgageAssociation 2009-64 SN 16.07.39/5.914%* 397,441 0.03
728,064 Government National MortgageAssociation 2009-79 OK 16.11.37/0.000% 631,312 0.04
1,309,345 Government National MortgageAssociation 2010-129 AW 20.04.37/6.152%* 1,460,030 0.10
1,317,240 Government National MortgageAssociation 2010-130 CP 16.10.40/7.000% 1,545,866 0.11
761,254 Government National MortgageAssociation 2010-14 AO 20.12.32/0.000% 715,498 0.05
787,296 Government National MortgageAssociation 2010-14 BO 20.11.35/0.000% 711,586 0.05
299,980 Government National MortgageAssociation 2010-14 CO 20.08.35/0.000% 225,382 0.02
449,763 Government National MortgageAssociation 2010-14 EO 16.06.33/0.000% 431,178 0.03
1,904,845 Government National MortgageAssociation 2010-14 QP 20.12.39/6.000% 2,079,361 0.15
981,502 Government National MortgageAssociation 2010-157 OP 20.12.40/0.000% 760,650 0.05
200,000 Greenwich Capital CommercialFunding 2005-GG3 AJ 10.08.42/4.859%* 197,344 0.01
14,231 GS Mortgage Securities II2004-GG2 A3 10.08.38/4.602% 14,225 0.00
1,300,000 GS Mortgage Securities II2004-GG2 A6 10.08.38/5.396%* 1,407,884 0.10
650,000 GS Mortgage Securities II2006-GG6 A4 10.04.38/5.553%* 704,525 0.05
235,293 GSMPS Mortgage Loan Trust2004-4 1AF 25.06.34/0.586%* 197,135 0.01
92,677 GSMPS Mortgage Loan Trust2005-RP1 1AF 25.01.35/0.536%* 79,359 0.01
401,001 GSMPS Mortgage Loan Trust2005-RP2 1AF 25.03.35/0.536%* 341,612 0.02
1,687,561 GSMPS Mortgage Loan Trust2006-RP2 1AS2 25.04.36/5.387%* 240,876 0.02
1,507,341 GSR Mortgage Loan Trust2003-7F 1A4 25.06.33/5.250% 1,494,718 0.10
150,424 GSR Mortgage Loan Trust2004-10F 2A1 25.08.19/5.000% 151,882 0.01
887,864 GSR Mortgage Loan Trust2004-6F 3A4 25.05.34/6.500% 951,382 0.07
131,686 GSR Mortgage Loan Trust2004-9 5A5 25.08.34/2.285%* 131,043 0.01
1,200,000 GSR Mortgage Loan Trust2007-1F 2A4 25.01.37/5.500% 1,135,461 0.08
349,455 Harley-Davidson MotorcycleTrust 2010-1 A2 15.11.13/0.830% 349,701 0.02
360,000 Harley-Davidson MotorcycleTrust 2010-1 A3 15.02.15/1.160% 360,788 0.03
275,872 Honda Auto Receivables OwnerTrust 2009-2 A3 15.01.13/2.790% 277,925 0.02
300,000 Honda Auto Receivables OwnerTrust 2009-2 A4 15.07.15/4.430% 311,450 0.02
125,000 HP Enterprise Services 01.08.13/6.000% 137,328 0.01229,517 HSBC Home Equity Loan Trust
2005-2 M2 20.01.35/0.676%* 197,858 0.01340,000 Hyundai Auto Receivables Trust
2010-B A3 15.04.15/0.970% 341,168 0.02375,000 Hyundai Auto Receivables Trust
2010-B A4 15.03.17/1.630% 375,478 0.03345,000 Hyundai Auto Receivables Trust
2011-A A3 15.04.15/1.160% 346,741 0.02365,000 Hyundai Auto Receivables Trust
2011-A A4 15.12.15/1.780% 369,351 0.03257,000 Hyundai Auto Receivables Trust
2011-B A3 15.09.15/1.040% 257,580 0.02288,000 Hyundai Auto Receivables Trust
2011-B A4 15.02.17/1.650% 289,495 0.02151,783 Impac Secured Assets CMN
Owner Trust 2003-2 A1 25.08.33/5.500% 159,018 0.015,468 Impac Secured Assets CMN
Owner Trust 2004-3 1A4 25.11.34/0.986%* 5,101 0.00603,057 Impac Secured Assets CMN
Owner Trust 2006-1 2A1 25.05.36/0.536%* 560,644 0.04844,550 Impac Secured Assets CMN
Owner Trust 2006-2 2A1 25.08.36/0.536%* 754,414 0.059,982 Indymac Index Mortgage Loan
Trust 2004-AR7 A1 25.09.34/1.066%* 6,159 0.002,502,853 Indymac Index Mortgage Loan
Trust 2005-AR11 A7 25.08.35/0.256%* 31,415 0.00650,000 Jackson National Life Global
Funding 144A 08.05.13/5.375% 696,132 0.05102,001 John Deere Owner Trust 2009-A
A3 15.10.13/2.590% 102,633 0.01490,000 John Deere Owner Trust 2011-A
A3 15.01.16/1.290% 493,216 0.03
355,000 John Deere Owner Trust 2011-AA4 16.04.18/1.960% 359,770 0.03
750,000 JP Morgan Chase CommercialMortgage Securities 2005-CB11AJ 12.08.37/5.356%* 747,736 0.05
1,000,000 JP Morgan Chase CommercialMortgage Securities 2006-CB16A4 12.05.45/5.552% 1,090,282 0.08
1,000,000 JP Morgan Chase CommercialMortgage Securities 2006-LDP8A4 15.05.45/5.399% 1,080,134 0.08
187,219 JP Morgan Mortgage Trust2004-A3 4A1 25.07.34/2.749%* 184,657 0.01
207,364 JP Morgan Mortgage Trust2004-A4 1A1 25.09.34/3.922%* 194,793 0.01
417,360 JP Morgan Mortgage Trust2006-A2 4A1 25.08.34/2.844%* 408,521 0.03
1,239,289 JP Morgan Mortgage Trust2006-A2 5A3 25.11.33/2.961%* 1,250,411 0.09
516,503 JP Morgan Reremic 2009-7 14A1 27.07.37/5.509%* 506,016 0.04211,885 JP Morgan Reremic 2009-7 17A1 27.07.37/6.293%* 213,562 0.01391,915 JP Morgan Reremic 2009-7 18A1 27.11.36/5.475%* 388,549 0.03
489,455 JP Morgan Reremic 2009-8 A1 20.04.36/5.113%* 490,087 0.03112,000 LB-UBS Commercial Mortgage
Trust 2003-C7 A4 15.09.35/4.931%* 118,126 0.0121,192,872 LB-UBS Commercial Mortgage
Trust 2006-C1 XCL 15.02.41/0.125%* 212,488 0.01177,524 Long Beach Mortgage Loan
Trust 2006-WL2 2A3 25.01.36/0.386%* 142,726 0.01351,000 Manufacturers & Traders Trust 01.04.13/1.746%* 350,488 0.02310,000 Manufacturers & Traders Trust 04.12.17/6.625% 355,931 0.02600,000 MassMutual Global Funding II
144A 16.07.12/3.625% 616,693 0.04144,000 MassMutual Global Funding II
144A 28.09.15/2.300% 144,548 0.01300,305 Mastr Adjustable Rate
Mortgages Trust 2004-13 3A6 21.11.34/2.836%* 295,778 0.022,200,000 Mastr Adjustable Rate
Mortgages Trust 2004-13 3A7 21.11.34/2.836%* 2,105,556 0.1566,274 Mastr Adjustable Rate
Mortgages Trust 2004-3 4A2 25.04.34/2.283%* 59,954 0.00143,312 MASTR Alternative Loans Trust
2004-10 1A1 25.09.19/4.500% 146,101 0.01257,267 MASTR Alternative Loans Trust
2004-4 10A1 25.05.24/5.000% 263,140 0.02741,988 MASTR Alternative Loans Trust
2004-4 1A1 25.05.34/5.500% 762,372 0.05456,679 MASTR Alternative Loans Trust
2004-5 5A1 25.06.19/4.750% 470,604 0.03163,082 MASTR Alternative Loans Trust
2004-6 7A1 25.07.34/6.000% 165,480 0.01725,564 MASTR Alternative Loans Trust
2005-6 3A1 25.11.20/5.500% 692,775 0.05136,956 MASTR Asset Securitization
Trust 2003-2 1A1 25.03.18/5.000% 141,384 0.01727,794 MASTR Asset Securitization
Trust 2004-4 1A6 26.12.33/5.250% 759,541 0.05400,000 MASTR Asset Securitization
Trust 2006-2 1A30 25.06.36/6.000% 362,711 0.03937,961 Mastr Reperforming Loan Trust
2005-2 1A1F 25.05.35/0.536%* 769,520 0.05462,127 Mastr Seasoned Securities Trust
2004-2 A1 25.08.32/6.500% 481,462 0.03105,000 Mercedes-Benz Auto
Receivables Trust 2010-1 A3 15.08.14/1.420% 105,864 0.01200,097 Merrill Lynch Mortgage
Investors 2003-A4 2A 25.07.33/2.751%* 201,978 0.01514,093 Merrill Lynch Mortgage
Investors 2004-A4 A2 25.08.34/2.716%* 502,452 0.04450,000 Merrill Lynch Mortgage Trust
2005-LC1 AJ 12.01.44/5.325%* 428,471 0.03197,011 Merrill Lynch Mortgage Trust
2005-MCP1 ASB 12.06.43/4.674%* 205,757 0.01400,000 Merrill Lynch/Countrywide
Commercial Mortgage Trust2006-1 A4 12.02.39/5.608%* 436,204 0.03
19,252,126 Merrill Lynch/CountrywideCommercial Mortgage Trust2006-4 XC 12.12.49/0.295%* 257,888 0.02
775,000 Metropolitan Life GlobalFunding I 144A 11.01.13/2.500% 788,357 0.05
200,000 Metropolitan Life GlobalFunding I 144A 10.04.13/5.125% 212,880 0.01
100,000 Metropolitan Life GlobalFunding I 144A 18.09.13/5.200% 108,759 0.01
200,000 Metropolitan Life GlobalFunding I 144A 10.06.14/5.125% 218,359 0.02
300,000 Metropolitan Life GlobalFunding I 144A 11.01.16/3.125% 304,900 0.02
390,000 Microsoft 25.09.15/1.625% 388,565 0.03112,000 Microsoft 01.10.40/4.500% 102,019 0.01
382
JPMorgan Funds - US Aggregate Bond FundSchedule of Investments (Market Value Expressed in USD) (continued)
As at 30 June 2011
Quantity/Nominal
Value
Name of Securities Maturity/Coupon
MarketValue
%of
NetAssets
Quantity/Nominal
Value
Name of Securities Maturity/Coupon
MarketValue
%of
NetAssets
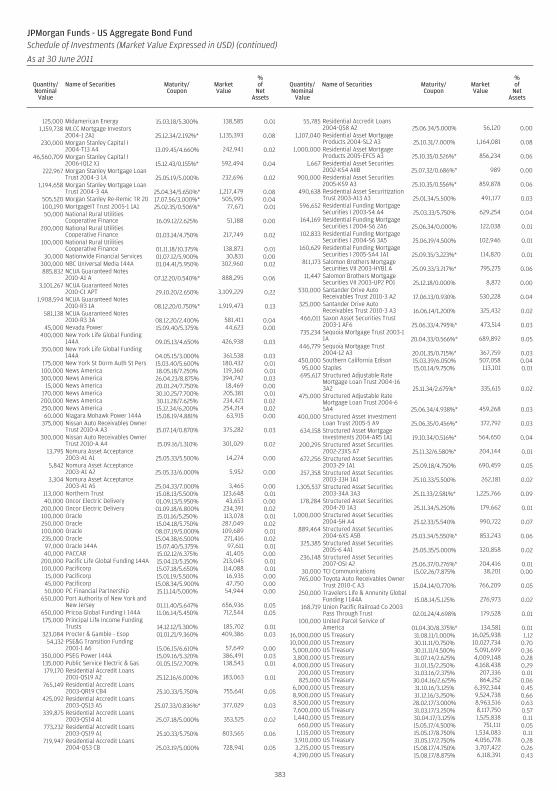
125,000 Midamerican Energy 15.03.18/5.300% 138,585 0.011,159,738 MLCC Mortgage Investors
2004-1 2A1 25.12.34/2.192%* 1,135,393 0.08230,000 Morgan Stanley Capital I
2004-T13 A4 13.09.45/4.660% 242,941 0.0246,560,709 Morgan Stanley Capital I
2006-IQ12 X1 15.12.43/0.155%* 592,494 0.04222,967 Morgan Stanley Mortgage Loan
Trust 2004-3 1A 25.05.19/5.000% 232,696 0.021,194,658 Morgan Stanley Mortgage Loan
Trust 2004-3 4A 25.04.34/5.650%* 1,217,479 0.08505,520 Morgan Stanley Re-Remic TR 20 17.07.56/3.000%* 505,995 0.04100,190 MortgageIT Trust 2005-1 1A1 25.02.35/0.506%* 77,671 0.0150,000 National Rural Utilities
Cooperative Finance 16.09.12/2.625% 51,188 0.00200,000 National Rural Utilities
Cooperative Finance 01.03.14/4.750% 217,749 0.02100,000 National Rural Utilities
Cooperative Finance 01.11.18/10.375% 138,873 0.0130,000 Nationwide Financial Services 01.07.12/5.900% 30,831 0.00
300,000 NBC Universal Media 144A 01.04.41/5.950% 302,960 0.02885,832 NCUA Guaranteed Notes
2010-A1 A 07.12.20/0.540%* 888,295 0.063,101,267 NCUA Guaranteed Notes
2010-C1 APT 29.10.20/2.650% 3,109,229 0.221,908,594 NCUA Guaranteed Notes
2010-R3 1A 08.12.20/0.750%* 1,919,473 0.13581,138 NCUA Guaranteed Notes
2010-R3 3A 08.12.20/2.400% 581,411 0.0445,000 Nevada Power 15.09.40/5.375% 44,623 0.00
400,000 New York Life Global Funding144A 09.05.13/4.650% 426,938 0.03
350,000 New York Life Global Funding144A 04.05.15/3.000% 361,538 0.03
175,000 New York St Dorm Auth St Pers 15.03.40/5.600% 180,432 0.01100,000 News America 18.05.18/7.250% 119,360 0.01300,000 News America 26.04.23/8.875% 394,742 0.03
15,000 News America 20.01.24/7.750% 18,469 0.00170,000 News America 30.10.25/7.700% 205,381 0.01200,000 News America 30.11.28/7.625% 234,421 0.02250,000 News America 15.12.34/6.200% 254,214 0.0260,000 Niagara Mohawk Power 144A 15.08.19/4.881% 63,915 0.00
375,000 Nissan Auto Receivables OwnerTrust 2010-A A3 15.07.14/0.870% 375,282 0.03
300,000 Nissan Auto Receivables OwnerTrust 2010-A A4 15.09.16/1.310% 301,029 0.02
13,795 Nomura Asset Acceptance2003-A1 A1 25.05.33/5.500% 14,274 0.00
5,842 Nomura Asset Acceptance2003-A1 A2 25.05.33/6.000% 5,952 0.00
3,304 Nomura Asset Acceptance2003-A1 A5 25.04.33/7.000% 3,465 0.00
113,000 Northern Trust 15.08.13/5.500% 123,648 0.0140,000 Oncor Electric Delivery 01.09.13/5.950% 43,653 0.00
200,000 Oncor Electric Delivery 01.09.18/6.800% 234,391 0.02100,000 Oracle 15.01.16/5.250% 113,078 0.01250,000 Oracle 15.04.18/5.750% 287,049 0.02100,000 Oracle 08.07.19/5.000% 109,689 0.01235,000 Oracle 15.04.38/6.500% 271,416 0.0297,000 Oracle 144A 15.07.40/5.375% 97,611 0.0140,000 PACCAR 15.02.12/6.375% 41,405 0.00
200,000 Pacific Life Global Funding 144A 15.04.13/5.150% 213,045 0.01100,000 Pacificorp 15.07.18/5.650% 114,088 0.01
15,000 Pacificorp 15.01.19/5.500% 16,935 0.0045,000 Pacificorp 15.08.34/5.900% 47,750 0.0050,000 PC Financial Partnership 15.11.14/5.000% 54,944 0.00
650,000 Port Authority of New York andNew Jersey 01.11.40/5.647% 656,936 0.05
650,000 Pricoa Global Funding I 144A 11.06.14/5.450% 712,544 0.05175,000 Principal Life Income Funding
Trusts 14.12.12/5.300% 185,702 0.01323,084 Procter & Gamble - Esop 01.01.21/9.360% 409,386 0.03
54,132 PSE&G Transition Funding2001-1 A6 15.06.15/6.610% 57,649 0.00
350,000 PSEG Power 144A 15.09.16/5.320% 386,491 0.03135,000 Public Service Electric & Gas 01.05.15/2.700% 138,543 0.01179,170 Residential Accredit Loans
2001-QS19 A2 25.12.16/6.000% 183,063 0.01765,149 Residential Accredit Loans
2003-QR19 CB4 25.10.33/5.750% 755,641 0.05425,092 Residential Accredit Loans
2003-QS13 A5 25.07.33/0.836%* 377,029 0.03339,875 Residential Accredit Loans
2003-QS14 A1 25.07.18/5.000% 353,525 0.02773,232 Residential Accredit Loans
2003-QS19 A1 25.10.33/5.750% 803,565 0.06719,947 Residential Accredit Loans
2004-QS3 CB 25.03.19/5.000% 728,941 0.05
55,785 Residential Accredit Loans2004-QS8 A2 25.06.34/5.000% 56,120 0.00
1,107,040 Residential Asset MortgageProducts 2004-SL2 A3 25.10.31/7.000% 1,164,081 0.08
1,000,000 Residential Asset MortgageProducts 2005-EFC5 A3 25.10.35/0.526%* 856,234 0.06
1,667 Residential Asset Securities2002-KS4 AIIB 25.07.32/0.686%* 989 0.00
900,000 Residential Asset Securities2005-KS9 A3 25.10.35/0.556%* 859,878 0.06
490,638 Residential Asset SecuritizationTrust 2003-A13 A3 25.01.34/5.500% 491,177 0.03
596,652 Residential Funding MortgageSecurities I 2003-S4 A4 25.03.33/5.750% 629,254 0.04
164,169 Residential Funding MortgageSecurities I 2004-S6 2A6 25.06.34/0.000% 122,038 0.01
102,833 Residential Funding MortgageSecurities I 2004-S6 3A5 25.06.19/4.500% 102,946 0.01
160,629 Residential Funding MortgageSecurities I 2005-SA4 1A1 25.09.35/3.223%* 114,820 0.01
811,173 Salomon Brothers MortgageSecurities VII 2003-HYB1 A 25.09.33/3.217%* 795,275 0.06
11,447 Salomon Brothers MortgageSecurities VII 2003-UP2 PO1 25.12.18/0.000% 8,872 0.00
530,000 Santander Drive AutoReceivables Trust 2010-3 A2 17.06.13/0.930% 530,228 0.04
325,000 Santander Drive AutoReceivables Trust 2010-3 A3 16.06.14/1.200% 325,432 0.02
466,011 Saxon Asset Securities Trust2003-1 AF6 25.06.33/4.795%* 473,514 0.03
735,234 Sequoia Mortgage Trust 2003-11A 20.04.33/0.566%* 689,892 0.05
446,779 Sequoia Mortgage Trust2004-12 A3 20.01.35/0.715%* 367,759 0.03
450,000 Southern California Edison 15.03.39/6.050% 507,058 0.0495,000 Staples 15.01.14/9.750% 113,101 0.01695,617 Structured Adjustable Rate
Mortgage Loan Trust 2004-163A2 25.11.34/2.675%* 335,615 0.02
475,000 Structured Adjustable RateMortgage Loan Trust 2004-65A4 25.06.34/4.938%* 459,268 0.03
400,000 Structured Asset InvestmentLoan Trust 2005-5 A9 25.06.35/0.456%* 372,792 0.03
634,158 Structured Asset MortgageInvestments 2004-AR5 1A1 19.10.34/0.516%* 564,650 0.04
200,295 Structured Asset Securities2002-23XS A7 25.11.32/6.580%* 204,144 0.01
672,256 Structured Asset Securities2003-29 1A1 25.09.18/4.750% 690,459 0.05
257,358 Structured Asset Securities2003-33H 1A1 25.10.33/5.500% 262,181 0.02
1,305,537 Structured Asset Securities2003-34A 3A3 25.11.33/2.581%* 1,225,766 0.09
178,284 Structured Asset Securities2004-20 1A3 25.11.34/5.250% 179,662 0.01
1,000,000 Structured Asset Securities2004-5H A4 25.12.33/5.540% 990,722 0.07
889,464 Structured Asset Securities2004-6XS A5B 25.03.34/5.550%* 853,243 0.06
325,385 Structured Asset Securities2005-6 4A1 25.05.35/5.000% 320,858 0.02
236,148 Structured Asset Securities2007-OSI A2 25.06.37/0.276%* 204,416 0.01
30,000 TCI Communications 15.02.26/7.875% 38,201 0.00765,000 Toyota Auto Receivables Owner
Trust 2010-C A3 15.04.14/0.770% 766,209 0.05250,000 Travelers Life & Annunity Global
Funding I 144A 15.08.14/5.125% 276,973 0.02168,719 Union Pacific Railroad Co 2003
Pass Through Trust 02.01.24/4.698% 179,528 0.01100,000 United Parcel Service of
America 01.04.30/8.375%* 134,581 0.0116,000,000 US Treasury 31.08.11/1.000% 16,025,938 1.1210,000,000 US Treasury 30.11.11/0.750% 10,027,734 0.705,000,000 US Treasury 30.11.11/4.500% 5,091,699 0.363,800,000 US Treasury 31.07.14/2.625% 4,009,148 0.284,000,000 US Treasury 31.01.15/2.250% 4,168,438 0.29
200,000 US Treasury 31.03.16/2.375% 207,336 0.01825,000 US Treasury 30.04.16/2.625% 864,252 0.06
6,000,000 US Treasury 31.10.16/3.125% 6,392,344 0.458,900,000 US Treasury 31.12.16/3.250% 9,524,738 0.668,500,000 US Treasury 28.02.17/3.000% 8,963,516 0.637,600,000 US Treasury 31.03.17/3.250% 8,117,750 0.571,440,000 US Treasury 30.04.17/3.125% 1,525,838 0.11
660,000 US Treasury 15.05.17/4.500% 751,111 0.051,115,000 US Treasury 15.05.17/8.750% 1,534,083 0.11
3,910,000 US Treasury 31.05.17/2.750% 4,056,778 0.283,215,000 US Treasury 15.08.17/4.750% 3,707,422 0.26
4,390,000 US Treasury 15.08.17/8.875% 6,118,391 0.43
383
JPMorgan Funds - US Aggregate Bond FundSchedule of Investments (Market Value Expressed in USD) (continued)
As at 30 June 2011
Quantity/Nominal
Value
Name of Securities Maturity/Coupon
MarketValue
%of
NetAssets
Quantity/Nominal
Value
Name of Securities Maturity/Coupon
MarketValue
%of
NetAssets
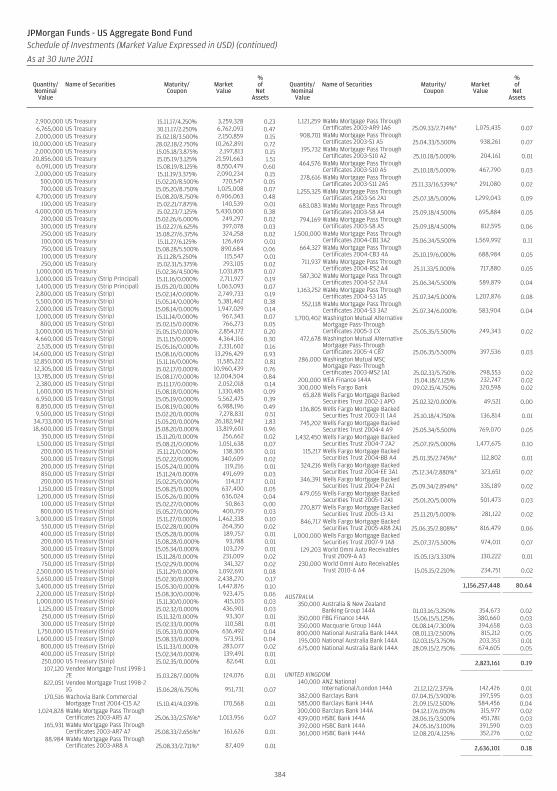
2,900,000 US Treasury 15.11.17/4.250% 3,259,328 0.236,765,000 US Treasury 30.11.17/2.250% 6,762,093 0.472,000,000 US Treasury 15.02.18/3.500% 2,150,859 0.15
10,000,000 US Treasury 28.02.18/2.750% 10,262,891 0.722,000,000 US Treasury 15.05.18/3.875% 2,197,813 0.15
20,856,000 US Treasury 15.05.19/3.125% 21,591,663 1.516,091,000 US Treasury 15.08.19/8.125% 8,550,479 0.602,000,000 US Treasury 15.11.19/3.375% 2,090,234 0.15
500,000 US Treasury 15.02.20/8.500% 720,547 0.05700,000 US Treasury 15.05.20/8.750% 1,025,008 0.07
4,700,000 US Treasury 15.08.20/8.750% 6,906,063 0.48100,000 US Treasury 15.02.21/7.875% 140,539 0.01
4,000,000 US Treasury 15.02.23/7.125% 5,430,000 0.38200,000 US Treasury 15.02.26/6.000% 249,297 0.02300,000 US Treasury 15.02.27/6.625% 397,078 0.03250,000 US Treasury 15.08.27/6.375% 324,258 0.02100,000 US Treasury 15.11.27/6.125% 126,469 0.01750,000 US Treasury 15.08.28/5.500% 890,684 0.06100,000 US Treasury 15.11.28/5.250% 115,547 0.01250,000 US Treasury 15.02.31/5.375% 293,105 0.02
1,000,000 US Treasury 15.02.36/4.500% 1,031,875 0.073,000,000 US Treasury (Strip Principal) 15.11.16/0.000% 2,711,927 0.191,400,000 US Treasury (Strip Principal) 15.05.20/0.000% 1,063,093 0.072,800,000 US Treasury (Strip) 15.02.14/0.000% 2,749,733 0.195,500,000 US Treasury (Strip) 15.05.14/0.000% 5,381,462 0.382,000,000 US Treasury (Strip) 15.08.14/0.000% 1,947,029 0.141,000,000 US Treasury (Strip) 15.11.14/0.000% 967,343 0.07
800,000 US Treasury (Strip) 15.02.15/0.000% 766,273 0.053,000,000 US Treasury (Strip) 15.05.15/0.000% 2,854,172 0.204,660,000 US Treasury (Strip) 15.11.15/0.000% 4,364,116 0.302,535,000 US Treasury (Strip) 15.05.16/0.000% 2,331,602 0.16
14,600,000 US Treasury (Strip) 15.08.16/0.000% 13,296,429 0.9312,850,000 US Treasury (Strip) 15.11.16/0.000% 11,585,222 0.8112,305,000 US Treasury (Strip) 15.02.17/0.000% 10,960,439 0.7613,785,000 US Treasury (Strip) 15.08.17/0.000% 12,004,504 0.842,380,000 US Treasury (Strip) 15.11.17/0.000% 2,052,018 0.141,600,000 US Treasury (Strip) 15.08.18/0.000% 1,330,485 0.096,950,000 US Treasury (Strip) 15.05.19/0.000% 5,562,475 0.398,850,000 US Treasury (Strip) 15.08.19/0.000% 6,988,196 0.499,500,000 US Treasury (Strip) 15.02.20/0.000% 7,278,831 0.51
34,733,000 US Treasury (Strip) 15.05.20/0.000% 26,182,942 1.8318,600,000 US Treasury (Strip) 15.08.20/0.000% 13,819,601 0.96
350,000 US Treasury (Strip) 15.11.20/0.000% 256,662 0.021,500,000 US Treasury (Strip) 15.08.21/0.000% 1,051,638 0.07
200,000 US Treasury (Strip) 15.11.21/0.000% 138,305 0.01500,000 US Treasury (Strip) 15.02.22/0.000% 340,609 0.02200,000 US Treasury (Strip) 15.05.24/0.000% 119,216 0.01850,000 US Treasury (Strip) 15.11.24/0.000% 491,699 0.03200,000 US Treasury (Strip) 15.02.25/0.000% 114,117 0.01
1,150,000 US Treasury (Strip) 15.08.25/0.000% 637,400 0.051,200,000 US Treasury (Strip) 15.05.26/0.000% 636,024 0.04
100,000 US Treasury (Strip) 15.02.27/0.000% 50,863 0.00800,000 US Treasury (Strip) 15.05.27/0.000% 400,719 0.03
3,000,000 US Treasury (Strip) 15.11.27/0.000% 1,462,338 0.10550,000 US Treasury (Strip) 15.02.28/0.000% 264,350 0.02400,000 US Treasury (Strip) 15.05.28/0.000% 189,757 0.01200,000 US Treasury (Strip) 15.08.28/0.000% 93,788 0.01300,000 US Treasury (Strip) 15.05.34/0.000% 103,279 0.01500,000 US Treasury (Strip) 15.11.28/0.000% 231,009 0.02750,000 US Treasury (Strip) 15.02.29/0.000% 341,327 0.02
2,500,000 US Treasury (Strip) 15.11.29/0.000% 1,092,691 0.085,650,000 US Treasury (Strip) 15.02.30/0.000% 2,438,270 0.173,400,000 US Treasury (Strip) 15.05.30/0.000% 1,447,876 0.102,200,000 US Treasury (Strip) 15.08.30/0.000% 923,475 0.061,000,000 US Treasury (Strip) 15.11.30/0.000% 415,103 0.031,125,000 US Treasury (Strip) 15.02.32/0.000% 436,901 0.03250,000 US Treasury (Strip) 15.11.32/0.000% 93,307 0.01300,000 US Treasury (Strip) 15.02.33/0.000% 110,581 0.01
1,750,000 US Treasury (Strip) 15.05.33/0.000% 636,492 0.041,600,000 US Treasury (Strip) 15.08.33/0.000% 573,951 0.04
800,000 US Treasury (Strip) 15.11.33/0.000% 283,077 0.02400,000 US Treasury (Strip) 15.02.34/0.000% 139,491 0.01250,000 US Treasury (Strip) 15.02.35/0.000% 82,641 0.01107,120 Vendee Mortgage Trust 1998-1
2E 15.03.28/7.000% 124,076 0.01822,051 Vendee Mortgage Trust 1998-2
1G 15.06.28/6.750% 951,731 0.07170,516 Wachovia Bank Commercial
Mortgage Trust 2004-C15 A2 15.10.41/4.039% 170,568 0.011,024,828 WaMu Mortgage Pass Through
Certificates 2003-AR5 A7 25.06.33/2.576%* 1,013,956 0.07165,931 WaMu Mortgage Pass Through
Certificates 2003-AR7 A7 25.08.33/2.656%* 161,626 0.0188,984 WaMu Mortgage Pass Through
Certificates 2003-AR8 A 25.08.33/2.711%* 87,409 0.01
1,121,259 WaMu Mortgage Pass ThroughCertificates 2003-AR9 1A6 25.09.33/2.714%* 1,075,435 0.07
908,701 WaMu Mortgage Pass ThroughCertificates 2003-S1 A5 25.04.33/5.500% 938,261 0.07
195,732 WaMu Mortgage Pass ThroughCertificates 2003-S10 A2 25.10.18/5.000% 204,161 0.01
464,576 WaMu Mortgage Pass ThroughCertificates 2003-S10 A5 25.10.18/5.000% 467,790 0.03
278,616 WaMu Mortgage Pass ThroughCertificates 2003-S11 2A5 25.11.33/16.539%* 291,080 0.02
1,255,325 WaMu Mortgage Pass ThroughCertificates 2003-S6 2A1 25.07.18/5.000% 1,299,043 0.09
683,083 WaMu Mortgage Pass ThroughCertificates 2003-S8 A4 25.09.18/4.500% 695,884 0.05
794,169 WaMu Mortgage Pass ThroughCertificates 2003-S8 A5 25.09.18/4.500% 812,595 0.06
1,500,000 WaMu Mortgage Pass ThroughCertificates 2004-CB1 3A2 25.06.34/5.500% 1,569,992 0.11
664,327 WaMu Mortgage Pass ThroughCertificates 2004-CB3 4A 25.10.19/6.000% 688,984 0.05
711,937 WaMu Mortgage Pass ThroughCertificates 2004-RS2 A4 25.11.33/5.000% 717,880 0.05
587,302 WaMu Mortgage Pass ThroughCertificates 2004-S2 2A4 25.06.34/5.500% 589,879 0.04
1,163,252 WaMu Mortgage Pass ThroughCertificates 2004-S3 1A5 25.07.34/5.000% 1,207,876 0.08
552,118 WaMu Mortgage Pass ThroughCertificates 2004-S3 3A2 25.07.34/6.000% 583,904 0.04
1,700,402 Washington Mutual AlternativeMortgage Pass-ThroughCertificates 2005-3 CX 25.05.35/5.500% 249,343 0.02
472,678 Washington Mutual AlternativeMortgage Pass-ThroughCertificates 2005-4 CB7 25.06.35/5.500% 397,536 0.03
286,000 Washington Mutual MSCMortgage Pass-ThroughCertificates 2003-MS2 1A1 25.02.33/5.750% 298,553 0.02
200,000 WEA Finance 144A 15.04.18/7.125% 232,747 0.02300,000 Wells Fargo Bank 09.02.15/4.750% 320,598 0.02
65,828 Wells Fargo Mortgage BackedSecurities Trust 2002-1 APO 25.02.32/0.000% 49,521 0.00
136,805 Wells Fargo Mortgage BackedSecurities Trust 2003-11 1A4 25.10.18/4.750% 136,814 0.01
745,202 Wells Fargo Mortgage BackedSecurities Trust 2004-4 A9 25.05.34/5.500% 769,070 0.05
1,432,450 Wells Fargo Mortgage BackedSecurities Trust 2004-7 2A2 25.07.19/5.000% 1,477,675 0.10
115,217 Wells Fargo Mortgage BackedSecurities Trust 2004-BB A4 25.01.35/2.745%* 112,802 0.01
324,216 Wells Fargo Mortgage BackedSecurities Trust 2004-EE 3A1 25.12.34/2.880%* 323,651 0.02
346,391 Wells Fargo Mortgage BackedSecurities Trust 2004-P 2A1 25.09.34/2.894%* 335,189 0.02
479,055 Wells Fargo Mortgage BackedSecurities Trust 2005-1 2A1 25.01.20/5.000% 501,473 0.03
270,877 Wells Fargo Mortgage BackedSecurities Trust 2005-13 A1 25.11.20/5.000% 281,122 0.02
846,717 Wells Fargo Mortgage BackedSecurities Trust 2005-AR8 2A1 25.06.35/2.808%* 816,479 0.06
1,000,000 Wells Fargo Mortgage BackedSecurities Trust 2007-9 1A8 25.07.37/5.500% 974,011 0.07
129,203 World Omni Auto ReceivablesTrust 2009-A A3 15.05.13/3.330% 130,222 0.01
230,000 World Omni Auto ReceivablesTrust 2010-A A4 15.05.15/2.210% 234,751 0.02
1,156,257,448 80.64
AUSTRALIA350,000 Australia & New Zealand
Banking Group 144A 01.03.16/3.250% 354,673 0.02350,000 FBG Finance 144A 15.06.15/5.125% 380,660 0.03350,000 Macquarie Group 144A 01.08.14/7.300% 394,658 0.03800,000 National Australia Bank 144A 08.01.13/2.500% 815,212 0.05195,000 National Australia Bank 144A 02.03.15/3.750% 203,353 0.01675,000 National Australia Bank 144A 28.09.15/2.750% 674,605 0.05
2,823,161 0.19
UNITED KINGDOM140,000 ANZ National
International/London 144A 21.12.12/2.375% 142,426 0.01382,000 Barclays Bank 07.04.15/3.900% 397,595 0.03585,000 Barclays Bank 144A 21.09.15/2.500% 584,456 0.04300,000 Barclays Bank 144A 04.12.17/6.050% 315,977 0.02439,000 HSBC Bank 144A 28.06.15/3.500% 451,781 0.03392,000 HSBC Bank 144A 24.05.16/3.100% 391,590 0.03361,000 HSBC Bank 144A 12.08.20/4.125% 352,276 0.02
2,636,101 0.18
384
JPMorgan Funds - US Aggregate Bond FundSchedule of Investments (Market Value Expressed in USD) (continued)
As at 30 June 2011
Quantity/Nominal
Value
Name of Securities Maturity/Coupon
MarketValue
%of
NetAssets
Quantity/Nominal
Value
Name of Securities Maturity/Coupon
MarketValue
%of
NetAssets
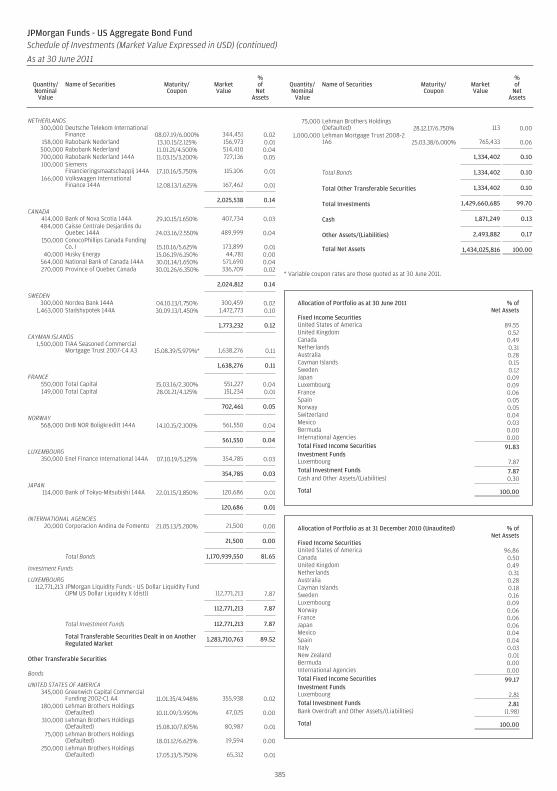
NETHERLANDS300,000 Deutsche Telekom International
Finance 08.07.19/6.000% 344,451 0.02158,000 Rabobank Nederland 13.10.15/2.125% 156,973 0.01500,000 Rabobank Nederland 11.01.21/4.500% 514,410 0.04700,000 Rabobank Nederland 144A 11.03.15/3.200% 727,136 0.05100,000 Siemens
Financieringsmaatschappij 144A 17.10.16/5.750% 115,106 0.01166,000 Volkswagen International
Finance 144A 12.08.13/1.625% 167,462 0.01
2,025,538 0.14
CANADA414,000 Bank of Nova Scotia 144A 29.10.15/1.650% 407,734 0.03484,000 Caisse Centrale Desjardins du
Quebec 144A 24.03.16/2.550% 489,999 0.04150,000 ConocoPhillips Canada Funding
Co. I 15.10.16/5.625% 173,899 0.0140,000 Husky Energy 15.06.19/6.150% 44,781 0.00
564,000 National Bank of Canada 144A 30.01.14/1.650% 571,690 0.04270,000 Province of Quebec Canada 30.01.26/6.350% 336,709 0.02
2,024,812 0.14
SWEDEN300,000 Nordea Bank 144A 04.10.13/1.750% 300,459 0.02
1,463,000 Stadshypotek 144A 30.09.13/1.450% 1,472,773 0.10
1,773,232 0.12
CAYMAN ISLANDS1,500,000 TIAA Seasoned Commercial
Mortgage Trust 2007-C4 A3 15.08.39/5.979%* 1,638,276 0.11
1,638,276 0.11
FRANCE550,000 Total Capital 15.03.16/2.300% 551,227 0.04149,000 Total Capital 28.01.21/4.125% 151,234 0.01
702,461 0.05
NORWAY568,000 DnB NOR Boligkreditt 144A 14.10.15/2.100% 561,550 0.04
561,550 0.04
LUXEMBOURG350,000 Enel Finance International 144A 07.10.19/5.125% 354,785 0.03
354,785 0.03
JAPAN114,000 Bank of Tokyo-Mitsubishi 144A 22.01.15/3.850% 120,686 0.01
120,686 0.01
INTERNATIONAL AGENCIES20,000 Corporacion Andina de Fomento 21.05.13/5.200% 21,500 0.00
21,500 0.00
Total Bonds 1,170,939,550 81.65
Investment Funds
LUXEMBOURG112,771,213 JPMorgan Liquidity Funds - US Dollar Liquidity Fund
(JPM US Dollar Liquidity X (dist)) 112,771,213 7.87
112,771,213 7.87
Total Investment Funds 112,771,213 7.87
Total Transferable Securities Dealt in on AnotherRegulated Market
1,283,710,763 89.52
Other Transferable Securities
Bonds
UNITED STATES OF AMERICA345,000 Greenwich Capital Commercial
Funding 2002-C1 A4 11.01.35/4.948% 355,938 0.02180,000 Lehman Brothers Holdings
(Defaulted) 10.11.09/3.950% 47,025 0.00310,000 Lehman Brothers Holdings
(Defaulted) 15.08.10/7.875% 80,987 0.0175,000 Lehman Brothers Holdings
(Defaulted) 18.01.12/6.625% 19,594 0.00250,000 Lehman Brothers Holdings
(Defaulted) 17.05.13/5.750% 65,312 0.01
75,000 Lehman Brothers Holdings(Defaulted) 28.12.17/6.750% 113 0.00
1,000,000 Lehman Mortgage Trust 2008-21A6 25.03.38/6.000% 765,433 0.06
1,334,402 0.10
Total Bonds 1,334,402 0.10
Total Other Transferable Securities 1,334,402 0.10
Total Investments 1,429,660,685 99.70
Cash 1,871,249 0.13
Other Assets/(Liabilities) 2,493,882 0.17
Total Net Assets 1,434,025,816 100.00
* Variable coupon rates are those quoted as at 30 June 2011.
Allocation of Portfolio as at 30 June 2011 % ofNet Assets
Fixed Income SecuritiesUnited States of America 89.55United Kingdom 0.52Canada 0.49Netherlands 0.31Australia 0.28Cayman Islands 0.15Sweden 0.12Japan 0.09Luxembourg 0.09France 0.06Spain 0.05Norway 0.05Switzerland 0.04Mexico 0.03Bermuda 0.00International Agencies 0.00Total Fixed Income Securities 91.83Investment FundsLuxembourg 7.87Total Investment Funds 7.87Cash and Other Assets/(Liabilities) 0.30
Total 100.00
Allocation of Portfolio as at 31 December 2010 (Unaudited) % ofNet Assets
Fixed Income SecuritiesUnited States of America 96.86Canada 0.50United Kingdom 0.49Netherlands 0.31Australia 0.28Cayman Islands 0.18Sweden 0.16Luxembourg 0.09Norway 0.06France 0.06Japan 0.06Mexico 0.04Spain 0.04Italy 0.03New Zealand 0.01Bermuda 0.00International Agencies 0.00Total Fixed Income Securities 99.17Investment FundsLuxembourg 2.81Total Investment Funds 2.81Bank Overdraft and Other Assets/(Liabilities) (1.98)
Total 100.00
385
JPMorgan Funds - US Aggregate Bond FundSchedule of Investments (Market Value Expressed in USD) (continued)
As at 30 June 2011
Quantity/Nominal
Value
Name of Securities Maturity/Coupon
MarketValue
%of
NetAssets
Quantity/Nominal
Value
Name of Securities Maturity/Coupon
MarketValue
%of
NetAssets

JPMorgan Funds - US Aggregate Bond FundSchedule of Investments - Outstanding Forward Foreign Exchange Contracts (Expressed in USD)
As at 30 June 2011
SettlementDate Currency
AmountPurchased Currency
AmountSold
UnrealisedGain/(Loss)
11-Jul-11 EUR 1,129,883 USD 1,642,681 (8,239)11-Jul-11 USD 89,187 EUR 61,233 610
Total (7,629)
386
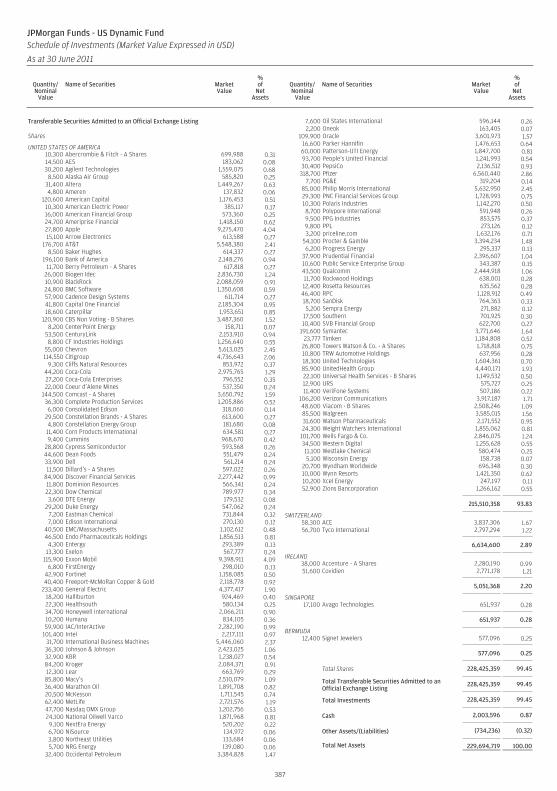
Transferable Securities Admitted to an Official Exchange Listing
Shares
UNITED STATES OF AMERICA10,300 Abercrombie & Fitch - A Shares 699,988 0.3114,500 AES 183,062 0.0830,200 Agilent Technologies 1,559,075 0.68
8,500 Alaska Air Group 585,820 0.2531,400 Altera 1,449,267 0.634,800 Ameren 137,832 0.06
120,600 American Capital 1,176,453 0.5110,300 American Electric Power 385,117 0.1716,000 American Financial Group 573,360 0.2524,700 Ameriprise Financial 1,418,150 0.6227,800 Apple 9,275,470 4.0415,100 Arrow Electronics 613,588 0.27
176,700 AT&T 5,548,380 2.418,500 Baker Hughes 614,337 0.27
196,100 Bank of America 2,148,276 0.9411,700 Berry Petroleum - A Shares 617,818 0.27
26,000 Biogen Idec 2,836,730 1.2410,900 BlackRock 2,088,059 0.9124,800 BMC Software 1,350,608 0.5957,900 Cadence Design Systems 611,714 0.2741,800 Capital One Financial 2,185,304 0.9518,600 Caterpillar 1,953,651 0.85
120,900 CBS Non Voting - B Shares 3,487,360 1.528,200 CenterPoint Energy 158,711 0.07
53,500 CenturyLink 2,153,910 0.948,800 CF Industries Holdings 1,256,640 0.55
55,000 Chevron 5,613,025 2.45114,550 Citigroup 4,736,643 2.06
9,300 Cliffs Natural Resources 853,972 0.3744,200 Coca-Cola 2,975,765 1.2927,200 Coca-Cola Enterprises 796,552 0.3522,000 Coeur d’Alene Mines 537,350 0.24
144,500 Comcast - A Shares 3,650,792 1.5936,300 Complete Production Services 1,205,886 0.526,000 Consolidated Edison 318,060 0.14
29,500 Constellation Brands - A Shares 613,600 0.274,800 Constellation Energy Group 181,680 0.0811,400 Corn Products International 634,581 0.279,400 Cummins 968,670 0.42
28,800 Cypress Semiconductor 593,568 0.2644,600 Dean Foods 551,479 0.2433,900 Dell 561,214 0.2411,500 Dillard’s - A Shares 597,022 0.26
84,900 Discover Financial Services 2,277,442 0.9911,800 Dominion Resources 566,341 0.2422,300 Dow Chemical 789,977 0.343,600 DTE Energy 179,532 0.08
29,200 Duke Energy 547,062 0.247,200 Eastman Chemical 731,844 0.327,000 Edison International 270,130 0.12
40,500 EMC/Massachusetts 1,102,612 0.4846,500 Endo Pharmaceuticals Holdings 1,856,513 0.81
4,300 Entergy 293,389 0.1313,300 Exelon 567,777 0.24
115,900 Exxon Mobil 9,398,911 4.096,800 FirstEnergy 298,010 0.13
42,900 Fortinet 1,158,085 0.5040,400 Freeport-McMoRan Copper & Gold 2,118,778 0.92
233,400 General Electric 4,377,417 1.9018,200 Halliburton 924,469 0.4022,300 Healthsouth 580,134 0.2534,700 Honeywell International 2,066,211 0.9010,200 Humana 834,105 0.3659,900 IAC/InterActive 2,282,190 0.99
101,400 Intel 2,217,111 0.9731,700 International Business Machines 5,446,060 2.3736,300 Johnson & Johnson 2,423,025 1.0632,900 KBR 1,238,027 0.5484,200 Kroger 2,084,371 0.9112,300 Lear 663,769 0.2985,800 Macy’s 2,510,079 1.0936,400 Marathon Oil 1,891,708 0.8220,500 McKesson 1,711,545 0.7462,400 MetLife 2,721,576 1.1947,700 Nasdaq OMX Group 1,202,756 0.5324,100 National Oilwell Varco 1,871,968 0.81
9,100 NextEra Energy 520,202 0.226,700 NiSource 134,972 0.063,800 Northeast Utilities 133,684 0.065,700 NRG Energy 139,080 0.06
32,400 Occidental Petroleum 3,384,828 1.47
7,600 Oil States International 596,144 0.262,200 Oneok 163,405 0.07
109,900 Oracle 3,601,973 1.5716,600 Parker Hannifin 1,476,653 0.6460,000 Patterson-UTI Energy 1,847,700 0.8193,700 People’s United Financial 1,241,993 0.5430,400 PepsiCo 2,136,512 0.93
318,700 Pfizer 6,560,440 2.867,700 PG&E 319,204 0.14
85,000 Philip Morris International 5,632,950 2.4529,300 PNC Financial Services Group 1,728,993 0.7510,300 Polaris Industries 1,142,270 0.508,700 Polypore International 591,948 0.269,500 PPG Industries 853,575 0.379,800 PPL 273,126 0.123,200 priceline.com 1,632,176 0.71
54,100 Procter & Gamble 3,394,234 1.486,200 Progress Energy 295,337 0.13
37,900 Prudential Financial 2,396,607 1.0410,600 Public Service Enterprise Group 343,387 0.1543,500 Qualcomm 2,444,918 1.0611,700 Rockwood Holdings 638,001 0.2812,400 Rosetta Resources 635,562 0.2846,400 RPC 1,128,912 0.4918,700 SanDisk 764,363 0.335,200 Sempra Energy 271,882 0.12
17,500 Southern 701,925 0.3010,400 SVB Financial Group 622,700 0.27
191,600 Symantec 3,771,646 1.6423,777 Timken 1,184,808 0.52
26,800 Towers Watson & Co. - A Shares 1,718,818 0.7510,800 TRW Automotive Holdings 637,956 0.2818,300 United Technologies 1,604,361 0.7085,900 UnitedHealth Group 4,440,171 1.9322,100 Universal Health Services - B Shares 1,149,532 0.5012,900 URS 575,727 0.2511,400 VeriFone Systems 507,186 0.22
106,200 Verizon Communications 3,917,187 1.7148,600 Viacom - B Shares 2,508,246 1.0985,500 Walgreen 3,585,015 1.5631,600 Watson Pharmaceuticals 2,171,552 0.9524,300 Weight Watchers International 1,855,062 0.81
101,700 Wells Fargo & Co. 2,846,075 1.2434,500 Western Digital 1,255,628 0.5511,100 Westlake Chemical 580,474 0.255,100 Wisconsin Energy 158,738 0.07
20,700 Wyndham Worldwide 696,348 0.3010,000 Wynn Resorts 1,421,350 0.6210,200 Xcel Energy 247,197 0.1152,900 Zions Bancorporation 1,266,162 0.55
215,510,358 93.83
SWITZERLAND58,300 ACE 3,837,306 1.6756,700 Tyco International 2,797,294 1.22
6,634,600 2.89
IRELAND38,000 Accenture - A Shares 2,280,190 0.9951,600 Covidien 2,771,178 1.21
5,051,368 2.20
SINGAPORE17,100 Avago Technologies 651,937 0.28
651,937 0.28
BERMUDA12,400 Signet Jewelers 577,096 0.25
577,096 0.25
Total Shares 228,425,359 99.45
Total Transferable Securities Admitted to anOfficial Exchange Listing
228,425,359 99.45
Total Investments 228,425,359 99.45
Cash 2,003,596 0.87
Other Assets/(Liabilities) (734,236) (0.32)
Total Net Assets 229,694,719 100.00
387
JPMorgan Funds - US Dynamic FundSchedule of Investments (Market Value Expressed in USD)
As at 30 June 2011
Quantity/Nominal
Value
Name of Securities MarketValue
%of
NetAssets
Quantity/Nominal
Value
Name of Securities MarketValue
%of
NetAssets
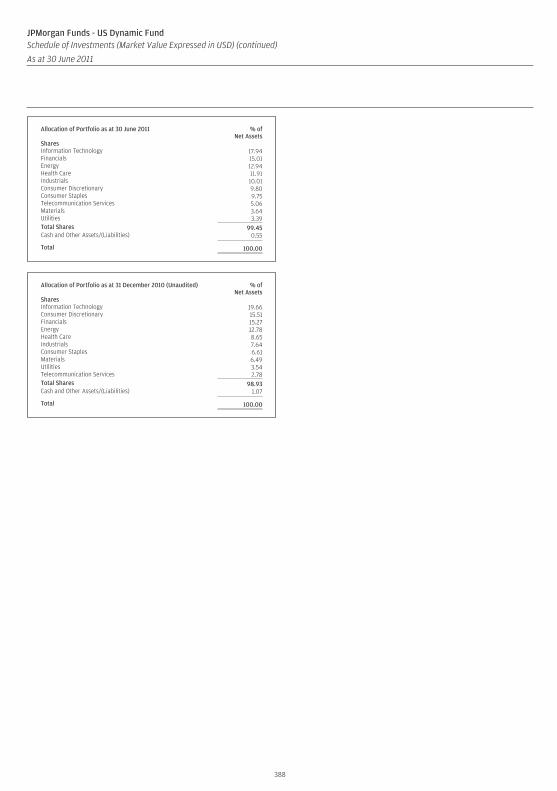
Allocation of Portfolio as at 30 June 2011 % ofNet Assets
SharesInformation Technology 17.94Financials 15.01Energy 12.94Health Care 11.91Industrials 10.01Consumer Discretionary 9.80Consumer Staples 9.75Telecommunication Services 5.06Materials 3.64Utilities 3.39Total Shares 99.45Cash and Other Assets/(Liabilities) 0.55
Total 100.00
Allocation of Portfolio as at 31 December 2010 (Unaudited) % ofNet Assets
SharesInformation Technology 19.66Consumer Discretionary 15.51Financials 15.27Energy 12.78Health Care 8.65Industrials 7.64Consumer Staples 6.61Materials 6.49Utilities 3.54Telecommunication Services 2.78Total Shares 98.93Cash and Other Assets/(Liabilities) 1.07
Total 100.00
388
JPMorgan Funds - US Dynamic FundSchedule of Investments (Market Value Expressed in USD) (continued)
As at 30 June 2011
Quantity/Nominal
Value
Name of Securities MarketValue
%of
NetAssets
Quantity/Nominal
Value
Name of Securities MarketValue
%of
NetAssets
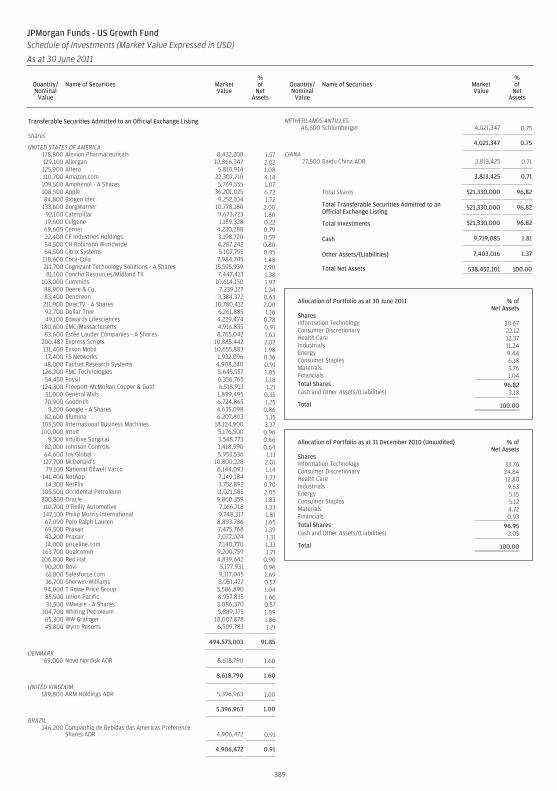
Transferable Securities Admitted to an Official Exchange Listing
Shares
UNITED STATES OF AMERICA178,800 Alexion Pharmaceuticals 8,432,208 1.57129,100 Allergan 10,866,347 2.02125,900 Altera 5,810,914 1.08110,700 Amazon.com 22,307,710 4.14109,500 Amphenol - A Shares 5,769,555 1.07108,500 Apple 36,201,025 6.7284,800 Biogen Idec 9,252,104 1.72
133,600 BorgWarner 10,778,180 2.0092,100 Caterpillar 9,673,723 1.8019,600 Celgene 1,189,328 0.2269,600 Cerner 4,230,288 0.7922,400 CF Industries Holdings 3,198,720 0.5954,500 CH Robinson Worldwide 4,287,242 0.8064,500 Citrix Systems 5,107,755 0.95
118,600 Coca-Cola 7,984,745 1.48211,700 Cognizant Technology Solutions - A Shares 15,595,939 2.9081,100 Concho Resources/Midland TX 7,447,413 1.38
103,000 Cummins 10,614,150 1.9788,900 Deere & Co. 7,239,127 1.3483,400 Dendreon 3,384,372 0.63211,900 DirecTV - A Shares 10,780,412 2.0092,700 Dollar Tree 6,261,885 1.1649,100 Edwards Lifesciences 4,229,474 0.78
180,600 EMC/Massachusetts 4,916,835 0.9183,600 Estée Lauder Companies - A Shares 8,765,042 1.63
200,487 Express Scripts 10,885,442 2.02131,400 Exxon Mobil 10,655,883 1.9817,400 F5 Networks 1,932,096 0.36
48,000 Factset Research Systems 4,908,240 0.91126,200 FMC Technologies 5,645,557 1.0554,450 Fossil 6,356,765 1.18
124,300 Freeport-McMoRan Copper & Gold 6,518,913 1.2151,000 General Mills 1,899,495 0.3570,900 Goodrich 6,724,865 1.25
9,200 Google - A Shares 4,635,098 0.8682,600 Illumina 6,207,803 1.15
105,500 International Business Machines 18,124,900 3.37100,000 Intuit 5,176,500 0.96
9,500 Intuitive Surgical 3,548,773 0.6682,000 Johnson Controls 3,418,990 0.6464,600 Joy Global 5,953,536 1.11127,700 McDonald’s 10,800,228 2.0179,100 National Oilwell Varco 6,144,093 1.14
141,400 NetApp 7,149,184 1.3314,300 NetFlix 3,752,892 0.70
105,500 Occidental Petroleum 11,021,585 2.05300,850 Oracle 9,860,359 1.83110,700 O’Reilly Automotive 7,166,718 1.33147,100 Philip Morris International 9,748,317 1.8167,090 Polo Ralph Lauren 8,893,786 1.6569,500 Praxair 7,475,768 1.3943,200 Praxair 7,077,024 1.3114,000 priceline.com 7,140,770 1.33
163,700 Qualcomm 9,200,759 1.71106,800 Red Hat 4,839,642 0.9090,200 Rovi 5,177,931 0.9661,800 Salesforce.com 9,117,045 1.6936,700 Sherwin-Williams 3,051,422 0.5794,000 T Rowe Price Group 5,586,890 1.0485,500 Union Pacific 8,957,835 1.6631,500 VMware - A Shares 3,086,370 0.57
104,700 Whiting Petroleum 5,889,375 1.0965,300 WW Grainger 10,007,878 1.8645,800 Wynn Resorts 6,509,783 1.21
494,573,003 91.85
DENMARK69,000 Novo Nordisk ADR 8,618,790 1.60
8,618,790 1.60
UNITED KINGDOM189,800 ARM Holdings ADR 5,396,963 1.00
5,396,963 1.00
BRAZIL146,200 Companhia de Bebidas das Americas Preference
Shares ADR 4,906,472 0.91
4,906,472 0.91
NETHERLANDS ANTILLES46,600 Schlumberger 4,021,347 0.75
4,021,347 0.75
CHINA27,500 Baidu China ADR 3,813,425 0.71
3,813,425 0.71
Total Shares 521,330,000 96.82
Total Transferable Securities Admitted to anOfficial Exchange Listing
521,330,000 96.82
Total Investments 521,330,000 96.82
Cash 9,719,085 1.81
Other Assets/(Liabilities) 7,403,016 1.37
Total Net Assets 538,452,101 100.00
Allocation of Portfolio as at 30 June 2011 % ofNet Assets
SharesInformation Technology 30.67Consumer Discretionary 22.12Health Care 12.37Industrials 11.24Energy 9.44Consumer Staples 6.18Materials 3.76Financials 1.04Total Shares 96.82Cash and Other Assets/(Liabilities) 3.18
Total 100.00
Allocation of Portfolio as at 31 December 2010 (Unaudited) % ofNet Assets
SharesInformation Technology 33.76Consumer Discretionary 24.84Health Care 12.80Industrials 9.63Energy 5.15Consumer Staples 5.12Materials 4.72Financials 0.93Total Shares 96.95Cash and Other Assets/(Liabilities) 3.05
Total 100.00
389
JPMorgan Funds - US Growth FundSchedule of Investments (Market Value Expressed in USD)
As at 30 June 2011
Quantity/Nominal
Value
Name of Securities MarketValue
%of
NetAssets
Quantity/Nominal
Value
Name of Securities MarketValue
%of
NetAssets

JPMorgan Funds - US Growth FundSchedule of Investments - Outstanding Forward Foreign Exchange Contracts (Expressed in USD)
As at 30 June 2011
SettlementDate Currency
AmountPurchased Currency
AmountSold
UnrealisedGain/(Loss)
14-Jul-11 EUR 16,553,758 USD 24,123,608 (179,893)14-Jul-11 USD 1,414,438 EUR 979,098 (1,751)15-Aug-11 EUR 850,308 USD 1,224,823 3,868
Total (177,776)
390
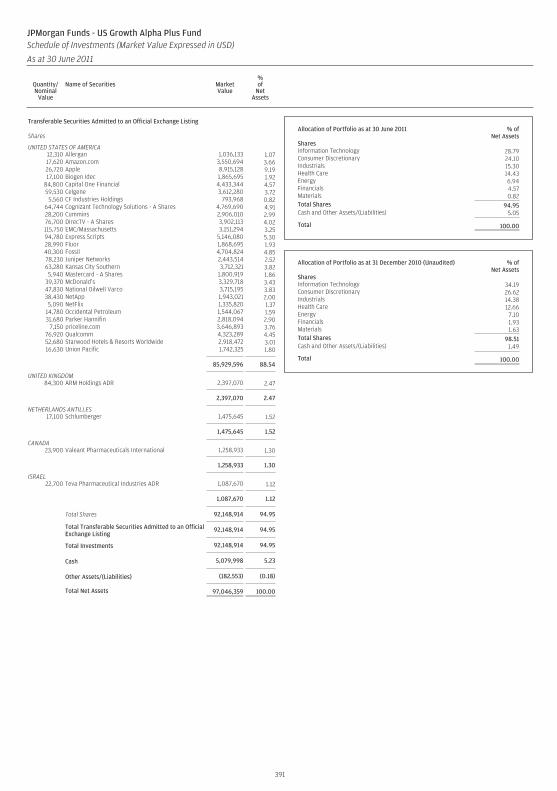
Transferable Securities Admitted to an Official Exchange Listing
Shares
UNITED STATES OF AMERICA12,310 Allergan 1,036,133 1.0717,620 Amazon.com 3,550,694 3.6626,720 Apple 8,915,128 9.1917,100 Biogen Idec 1,865,695 1.92
84,800 Capital One Financial 4,433,344 4.5759,530 Celgene 3,612,280 3.72
5,560 CF Industries Holdings 793,968 0.8264,744 Cognizant Technology Solutions - A Shares 4,769,690 4.9128,200 Cummins 2,906,010 2.9976,700 DirecTV - A Shares 3,902,113 4.02115,750 EMC/Massachusetts 3,151,294 3.2594,780 Express Scripts 5,146,080 5.3028,990 Fluor 1,868,695 1.9340,300 Fossil 4,704,824 4.8578,230 Juniper Networks 2,443,514 2.5263,280 Kansas City Southern 3,712,321 3.825,940 Mastercard - A Shares 1,800,919 1.86
39,370 McDonald’s 3,329,718 3.4347,830 National Oilwell Varco 3,715,195 3.8338,430 NetApp 1,943,021 2.00
5,090 NetFlix 1,335,820 1.3714,780 Occidental Petroleum 1,544,067 1.5931,680 Parker Hannifin 2,818,094 2.90
7,150 priceline.com 3,646,893 3.7676,920 Qualcomm 4,323,289 4.4552,680 Starwood Hotels & Resorts Worldwide 2,918,472 3.0116,630 Union Pacific 1,742,325 1.80
85,929,596 88.54
UNITED KINGDOM84,300 ARM Holdings ADR 2,397,070 2.47
2,397,070 2.47
NETHERLANDS ANTILLES17,100 Schlumberger 1,475,645 1.52
1,475,645 1.52
CANADA23,900 Valeant Pharmaceuticals International 1,258,933 1.30
1,258,933 1.30
ISRAEL22,700 Teva Pharmaceutical Industries ADR 1,087,670 1.12
1,087,670 1.12
Total Shares 92,148,914 94.95
Total Transferable Securities Admitted to an OfficialExchange Listing
92,148,914 94.95
Total Investments 92,148,914 94.95
Cash 5,079,998 5.23
Other Assets/(Liabilities) (182,553) (0.18)
Total Net Assets 97,046,359 100.00
Allocation of Portfolio as at 30 June 2011 % ofNet Assets
SharesInformation Technology 28.79Consumer Discretionary 24.10Industrials 15.30Health Care 14.43Energy 6.94Financials 4.57Materials 0.82Total Shares 94.95Cash and Other Assets/(Liabilities) 5.05
Total 100.00
Allocation of Portfolio as at 31 December 2010 (Unaudited) % ofNet Assets
SharesInformation Technology 34.19Consumer Discretionary 26.62Industrials 14.38Health Care 12.66Energy 7.10Financials 1.93Materials 1.63Total Shares 98.51Cash and Other Assets/(Liabilities) 1.49
Total 100.00
391
JPMorgan Funds - US Growth Alpha Plus FundSchedule of Investments (Market Value Expressed in USD)
As at 30 June 2011
Quantity/Nominal
Value
Name of Securities MarketValue
%of
NetAssets
Quantity/Nominal
Value
Name of Securities MarketValue
%of
NetAssets
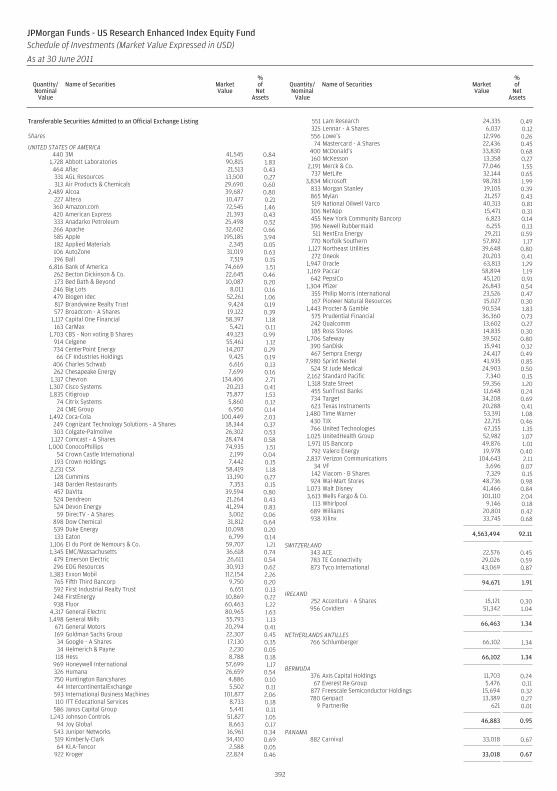
Transferable Securities Admitted to an Official Exchange Listing
Shares
UNITED STATES OF AMERICA440 3M 41,545 0.84
1,728 Abbott Laboratories 90,815 1.83464 Aflac 21,513 0.43331 AGL Resources 13,500 0.27313 Air Products & Chemicals 29,690 0.60
2,489 Alcoa 39,687 0.80227 Altera 10,477 0.21360 Amazon.com 72,545 1.46420 American Express 21,393 0.43333 Anadarko Petroleum 25,498 0.52266 Apache 32,602 0.66585 Apple 195,185 3.94182 Applied Materials 2,345 0.05106 AutoZone 31,019 0.63196 Ball 7,519 0.15
6,816 Bank of America 74,669 1.51262 Becton Dickinson & Co. 22,645 0.46173 Bed Bath & Beyond 10,087 0.20246 Big Lots 8,011 0.16479 Biogen Idec 52,261 1.06817 Brandywine Realty Trust 9,424 0.19577 Broadcom - A Shares 19,122 0.39
1,117 Capital One Financial 58,397 1.18163 CarMax 5,421 0.11
1,703 CBS - Non voting B Shares 49,123 0.99914 Celgene 55,461 1.12734 CenterPoint Energy 14,207 0.2966 CF Industries Holdings 9,425 0.19
406 Charles Schwab 6,616 0.13262 Chesapeake Energy 7,699 0.16
1,317 Chevron 134,406 2.711,307 Cisco Systems 20,213 0.411,835 Citigroup 75,877 1.53
74 Citrix Systems 5,860 0.1224 CME Group 6,950 0.14
1,492 Coca-Cola 100,449 2.03249 Cognizant Technology Solutions - A Shares 18,344 0.37303 Colgate-Palmolive 26,302 0.53
1,127 Comcast - A Shares 28,474 0.581,000 ConocoPhillips 74,935 1.51
54 Crown Castle International 2,199 0.04193 Crown Holdings 7,442 0.15
2,231 CSX 58,419 1.18128 Cummins 13,190 0.27148 Darden Restaurants 7,353 0.15457 DaVita 39,594 0.80524 Dendreon 21,264 0.43524 Devon Energy 41,294 0.83
59 DirecTV - A Shares 3,002 0.06898 Dow Chemical 31,812 0.64539 Duke Energy 10,098 0.20133 Eaton 6,799 0.14
1,106 EI du Pont de Nemours & Co. 59,707 1.211,345 EMC/Massachusetts 36,618 0.74
479 Emerson Electric 26,611 0.54296 EOG Resources 30,913 0.62
1,383 Exxon Mobil 112,154 2.26765 Fifth Third Bancorp 9,750 0.20592 First Industrial Realty Trust 6,651 0.13248 FirstEnergy 10,869 0.22938 Fluor 60,463 1.22
4,317 General Electric 80,965 1.631,498 General Mills 55,793 1.13
671 General Motors 20,294 0.41169 Goldman Sachs Group 22,307 0.4534 Google - A Shares 17,130 0.3534 Helmerich & Payne 2,230 0.05
118 Hess 8,788 0.18969 Honeywell International 57,699 1.17326 Humana 26,659 0.54750 Huntington Bancshares 4,886 0.1044 IntercontinentalExchange 5,502 0.11
593 International Business Machines 101,877 2.06110 ITT Educational Services 8,733 0.18586 Janus Capital Group 5,441 0.11
1,243 Johnson Controls 51,827 1.0594 Joy Global 8,663 0.17
543 Juniper Networks 16,961 0.34519 Kimberly-Clark 34,410 0.6964 KLA-Tencor 2,588 0.05
922 Kroger 22,824 0.46
551 Lam Research 24,335 0.49325 Lennar - A Shares 6,037 0.12556 Lowe’s 12,996 0.2674 Mastercard - A Shares 22,436 0.45
400 McDonald’s 33,830 0.68160 McKesson 13,358 0.27
2,191 Merck & Co. 77,046 1.55737 MetLife 32,144 0.65
3,834 Microsoft 98,783 1.99833 Morgan Stanley 19,105 0.39865 Mylan 21,257 0.43519 National Oilwell Varco 40,313 0.81306 NetApp 15,471 0.31455 New York Community Bancorp 6,823 0.14396 Newell Rubbermaid 6,255 0.13511 NextEra Energy 29,211 0.59
770 Norfolk Southern 57,892 1.171,127 Northeast Utilities 39,648 0.80
272 Oneok 20,203 0.411,947 Oracle 63,813 1.291,169 Paccar 58,894 1.19
642 PepsiCo 45,120 0.911,304 Pfizer 26,843 0.54
355 Philip Morris International 23,526 0.47167 Pioneer Natural Resources 15,027 0.30
1,443 Procter & Gamble 90,534 1.83575 Prudential Financial 36,360 0.73242 Qualcomm 13,602 0.27185 Ross Stores 14,835 0.30
1,706 Safeway 39,502 0.80390 SanDisk 15,941 0.32467 Sempra Energy 24,417 0.49
7,980 Sprint Nextel 41,935 0.85524 St Jude Medical 24,903 0.50
2,162 Standard Pacific 7,340 0.151,318 State Street 59,356 1.20
455 SunTrust Banks 11,648 0.24734 Target 34,208 0.69623 Texas Instruments 20,288 0.41
1,480 Time Warner 53,391 1.08430 TJX 22,715 0.46766 United Technologies 67,155 1.35
1,025 UnitedHealth Group 52,982 1.071,971 US Bancorp 49,876 1.01
792 Valero Energy 19,978 0.402,837 Verizon Communications 104,643 2.11
34 VF 3,696 0.07142 Viacom - B Shares 7,329 0.15924 Wal-Mart Stores 48,736 0.98
1,073 Walt Disney 41,466 0.843,613 Wells Fargo & Co. 101,110 2.04
113 Whirlpool 9,146 0.18689 Williams 20,801 0.42938 Xilinx 33,745 0.68
4,563,494 92.11
SWITZERLAND343 ACE 22,576 0.45783 TE Connectivity 29,026 0.59873 Tyco International 43,069 0.87
94,671 1.91
IRELAND252 Accenture - A Shares 15,121 0.30956 Covidien 51,342 1.04
66,463 1.34
NETHERLANDS ANTILLES766 Schlumberger 66,102 1.34
66,102 1.34
BERMUDA376 Axis Capital Holdings 11,703 0.24
67 Everest Re Group 5,476 0.11877 Freescale Semiconductor Holdings 15,694 0.32780 Genpact 13,389 0.27
9 PartnerRe 621 0.01
46,883 0.95
PANAMA882 Carnival 33,018 0.67
33,018 0.67
392
JPMorgan Funds - US Research Enhanced Index Equity FundSchedule of Investments (Market Value Expressed in USD)
As at 30 June 2011
Quantity/Nominal
Value
Name of Securities MarketValue
%of
NetAssets
Quantity/Nominal
Value
Name of Securities MarketValue
%of
NetAssets
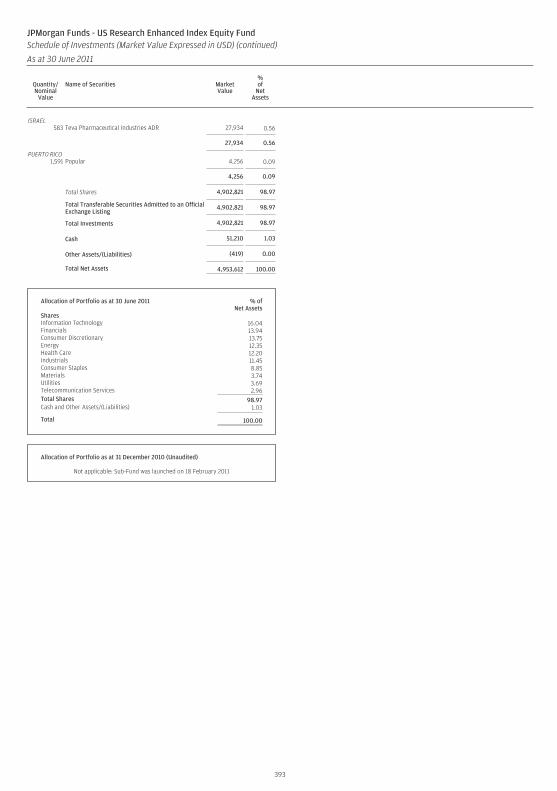
ISRAEL583 Teva Pharmaceutical Industries ADR 27,934 0.56
27,934 0.56
PUERTO RICO1,591 Popular 4,256 0.09
4,256 0.09
Total Shares 4,902,821 98.97
Total Transferable Securities Admitted to an OfficialExchange Listing
4,902,821 98.97
Total Investments 4,902,821 98.97
Cash 51,210 1.03
Other Assets/(Liabilities) (419) 0.00
Total Net Assets 4,953,612 100.00
Allocation of Portfolio as at 30 June 2011 % ofNet Assets
SharesInformation Technology 16.04Financials 13.94Consumer Discretionary 13.75Energy 12.35Health Care 12.20Industrials 11.45Consumer Staples 8.85Materials 3.74Utilities 3.69Telecommunication Services 2.96Total Shares 98.97Cash and Other Assets/(Liabilities) 1.03
Total 100.00
Allocation of Portfolio as at 31 December 2010 (Unaudited)
Not applicable: Sub-Fund was launched on 18 February 2011
393
JPMorgan Funds - US Research Enhanced Index Equity FundSchedule of Investments (Market Value Expressed in USD) (continued)
As at 30 June 2011
Quantity/Nominal
Value
Name of Securities MarketValue
%of
NetAssets
Quantity/Nominal
Value
Name of Securities MarketValue
%of
NetAssets
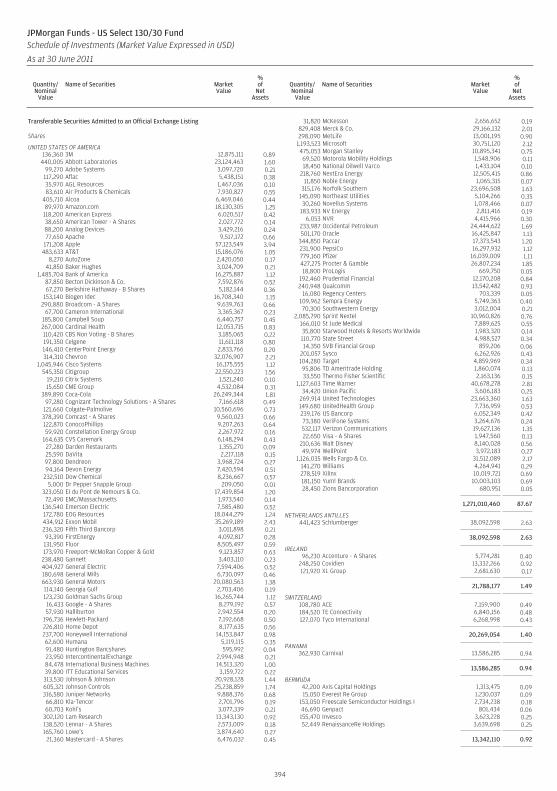
Transferable Securities Admitted to an Official Exchange Listing
Shares
UNITED STATES OF AMERICA136,360 3M 12,875,111 0.89
440,005 Abbott Laboratories 23,124,463 1.6099,270 Adobe Systems 3,097,720 0.21117,290 Aflac 5,438,151 0.3835,970 AGL Resources 1,467,036 0.1083,610 Air Products & Chemicals 7,930,827 0.55
405,710 Alcoa 6,469,046 0.4489,970 Amazon.com 18,130,305 1.25
118,200 American Express 6,020,517 0.4238,650 American Tower - A Shares 2,027,772 0.1488,200 Analog Devices 3,429,216 0.2477,650 Apache 9,517,172 0.66
171,208 Apple 57,123,549 3.94483,633 AT&T 15,186,076 1.05
8,270 AutoZone 2,420,050 0.1741,850 Baker Hughes 3,024,709 0.21
1,485,704 Bank of America 16,275,887 1.1287,850 Becton Dickinson & Co. 7,592,876 0.5267,270 Berkshire Hathaway - B Shares 5,182,144 0.36
153,140 Biogen Idec 16,708,340 1.15290,880 Broadcom - A Shares 9,639,763 0.66
67,700 Cameron International 3,365,367 0.23185,800 Campbell Soup 6,440,757 0.45267,000 Cardinal Health 12,053,715 0.83110,420 CBS Non Voting - B Shares 3,185,065 0.22191,350 Celgene 11,611,118 0.80146,410 CenterPoint Energy 2,833,766 0.20314,310 Chevron 32,076,907 2.21
1,045,946 Cisco Systems 16,175,555 1.12545,350 Citigroup 22,550,223 1.56
19,210 Citrix Systems 1,521,240 0.1015,650 CME Group 4,532,084 0.31
389,890 Coca-Cola 26,249,344 1.8197,280 Cognizant Technology Solutions - A Shares 7,166,618 0.49
121,660 Colgate-Palmolive 10,560,696 0.73378,390 Comcast - A Shares 9,560,023 0.66122,870 ConocoPhillips 9,207,263 0.6459,920 Constellation Energy Group 2,267,972 0.16
164,635 CVS Caremark 6,148,294 0.4327,280 Darden Restaurants 1,355,270 0.0925,590 DaVita 2,217,118 0.1597,800 Dendreon 3,968,724 0.2794,164 Devon Energy 7,420,594 0.51
232,510 Dow Chemical 8,236,667 0.575,000 Dr Pepper Snapple Group 209,050 0.01
323,050 EI du Pont de Nemours & Co. 17,439,854 1.2072,490 EMC/Massachusetts 1,973,540 0.14
136,540 Emerson Electric 7,585,480 0.52172,780 EOG Resources 18,044,279 1.24434,912 Exxon Mobil 35,269,189 2.43236,320 Fifth Third Bancorp 3,011,898 0.2193,390 FirstEnergy 4,092,817 0.28131,950 Fluor 8,505,497 0.59173,970 Freeport-McMoRan Copper & Gold 9,123,857 0.63238,480 Gannett 3,403,110 0.23404,927 General Electric 7,594,406 0.52180,698 General Mills 6,730,097 0.46663,930 General Motors 20,080,563 1.38114,140 Georgia Gulf 2,703,406 0.19123,230 Goldman Sachs Group 16,265,744 1.1216,433 Google - A Shares 8,279,192 0.5757,930 Halliburton 2,942,554 0.20
196,736 Hewlett-Packard 7,192,668 0.50226,810 Home Depot 8,177,635 0.56237,700 Honeywell International 14,153,847 0.9862,600 Humana 5,119,115 0.3591,480 Huntington Bancshares 595,992 0.0423,950 IntercontinentalExchange 2,994,948 0.2184,478 International Business Machines 14,513,320 1.0039,800 ITT Educational Services 3,159,722 0.22313,530 Johnson & Johnson 20,928,128 1.44605,321 Johnson Controls 25,238,859 1.74316,580 Juniper Networks 9,888,376 0.6866,810 Kla-Tencor 2,701,796 0.1960,703 Kohl’s 3,077,339 0.21
302,120 Lam Research 13,343,130 0.92138,520 Lennar - A Shares 2,573,009 0.18165,760 Lowe’s 3,874,640 0.27
21,360 Mastercard - A Shares 6,476,032 0.45
31,820 McKesson 2,656,652 0.19829,408 Merck & Co. 29,166,132 2.01298,090 MetLife 13,001,195 0.90
1,193,523 Microsoft 30,751,120 2.12475,053 Morgan Stanley 10,895,341 0.7569,520 Motorola Mobility Holdings 1,548,906 0.1118,450 National Oilwell Varco 1,433,104 0.10
218,760 NextEra Energy 12,505,415 0.8611,850 Noble Energy 1,065,315 0.07
315,176 Norfolk Southern 23,696,508 1.63145,090 Northeast Utilities 5,104,266 0.3530,260 Novellus Systems 1,078,466 0.07
183,933 NV Energy 2,811,416 0.196,053 NVR 4,415,966 0.30
233,987 Occidental Petroleum 24,444,622 1.69501,170 Oracle 16,425,847 1.13
344,850 Paccar 17,373,543 1.20231,900 PepsiCo 16,297,932 1.12779,160 Pfizer 16,039,009 1.11427,275 Procter & Gamble 26,807,234 1.8518,800 ProLogis 669,750 0.05
192,460 Prudential Financial 12,170,208 0.84240,948 Qualcomm 13,542,482 0.93
16,080 Regency Centers 703,339 0.05109,962 Sempra Energy 5,749,363 0.4070,300 Southwestern Energy 3,012,004 0.21
2,085,790 Sprint Nextel 10,960,826 0.76166,010 St Jude Medical 7,889,625 0.5535,800 Starwood Hotels & Resorts Worldwide 1,983,320 0.14110,770 State Street 4,988,527 0.3414,350 SVB Financial Group 859,206 0.06
201,057 Sysco 6,262,926 0.43104,280 Target 4,859,969 0.3495,806 TD Ameritrade Holding 1,860,074 0.1333,550 Thermo Fisher Scientific 2,163,136 0.15
1,127,603 Time Warner 40,678,278 2.8134,420 Union Pacific 3,606,183 0.25
269,914 United Technologies 23,663,360 1.63149,680 UnitedHealth Group 7,736,959 0.53239,176 US Bancorp 6,052,349 0.4273,380 VeriFone Systems 3,264,676 0.24532,117 Verizon Communications 19,627,136 1.3522,650 Visa - A Shares 1,947,560 0.13
210,636 Walt Disney 8,140,028 0.5649,974 WellPoint 3,972,183 0.27
1,126,035 Wells Fargo & Co. 31,512,089 2.17141,270 Williams 4,264,941 0.29278,519 Xilinx 10,019,721 0.69181,150 Yum! Brands 10,003,103 0.6928,450 Zions Bancorporation 680,951 0.05
1,271,010,460 87.67
NETHERLANDS ANTILLES441,423 Schlumberger 38,092,598 2.63
38,092,598 2.63
IRELAND96,230 Accenture - A Shares 5,774,281 0.40
248,250 Covidien 13,332,266 0.92121,920 XL Group 2,681,630 0.17
21,788,177 1.49
SWITZERLAND108,780 ACE 7,159,900 0.49184,520 TE Connectivity 6,840,156 0.48127,070 Tyco International 6,268,998 0.43
20,269,054 1.40
PANAMA362,930 Carnival 13,586,285 0.94
13,586,285 0.94
BERMUDA42,200 Axis Capital Holdings 1,313,475 0.0915,050 Everest Re Group 1,230,037 0.09
153,050 Freescale Semiconductor Holdings I 2,734,238 0.1846,690 Genpact 801,434 0.06155,470 Invesco 3,623,228 0.2552,449 RenaissanceRe Holdings 3,639,698 0.25
13,342,110 0.92
394
JPMorgan Funds - US Select 130/30 FundSchedule of Investments (Market Value Expressed in USD)
As at 30 June 2011
Quantity/Nominal
Value
Name of Securities MarketValue
%of
NetAssets
Quantity/Nominal
Value
Name of Securities MarketValue
%of
NetAssets
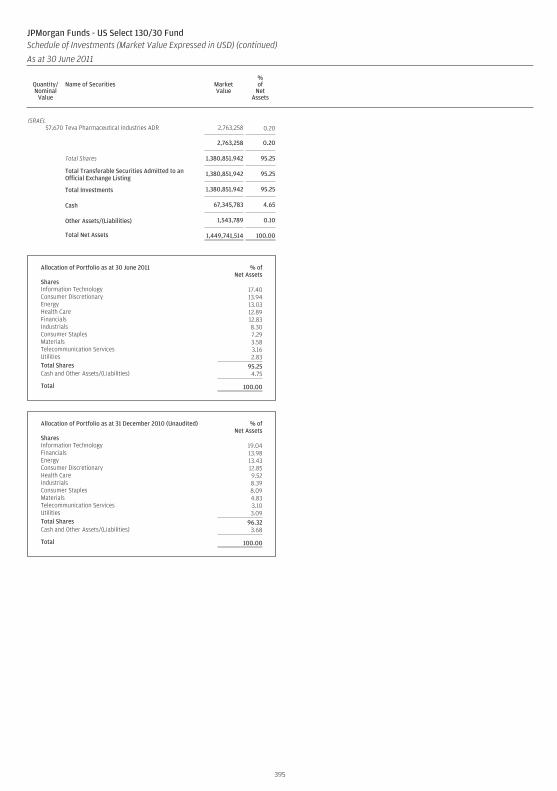
ISRAEL57,670 Teva Pharmaceutical Industries ADR 2,763,258 0.20
2,763,258 0.20
Total Shares 1,380,851,942 95.25
Total Transferable Securities Admitted to anOfficial Exchange Listing
1,380,851,942 95.25
Total Investments 1,380,851,942 95.25
Cash 67,345,783 4.65
Other Assets/(Liabilities) 1,543,789 0.10
Total Net Assets 1,449,741,514 100.00
Allocation of Portfolio as at 30 June 2011 % ofNet Assets
SharesInformation Technology 17.40Consumer Discretionary 13.94Energy 13.03Health Care 12.89Financials 12.83Industrials 8.30Consumer Staples 7.29Materials 3.58Telecommunication Services 3.16Utilities 2.83Total Shares 95.25Cash and Other Assets/(Liabilities) 4.75
Total 100.00
Allocation of Portfolio as at 31 December 2010 (Unaudited) % ofNet Assets
SharesInformation Technology 19.04Financials 13.98Energy 13.43Consumer Discretionary 12.85Health Care 9.52Industrials 8.39Consumer Staples 8.09Materials 4.83Telecommunication Services 3.10Utilities 3.09Total Shares 96.32Cash and Other Assets/(Liabilities) 3.68
Total 100.00
395
JPMorgan Funds - US Select 130/30 FundSchedule of Investments (Market Value Expressed in USD) (continued)
As at 30 June 2011
Quantity/Nominal
Value
Name of Securities MarketValue
%of
NetAssets
Quantity/Nominal
Value
Name of Securities MarketValue
%of
NetAssets
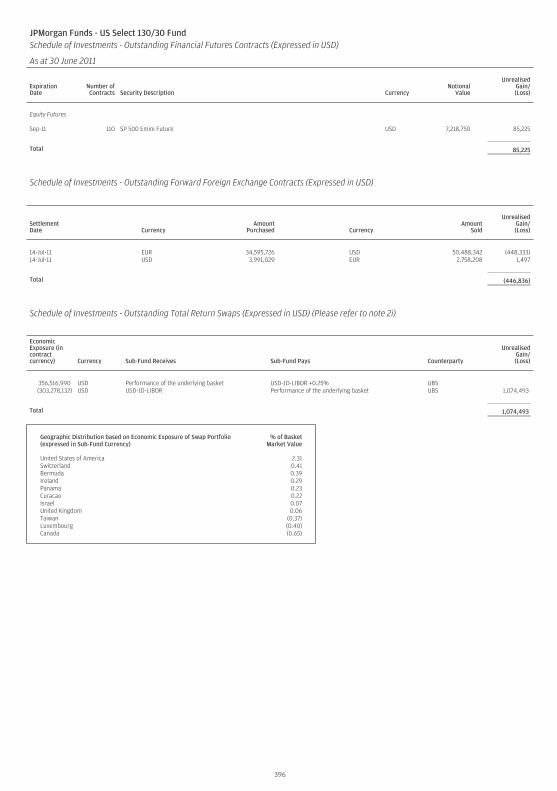
JPMorgan Funds - US Select 130/30 FundSchedule of Investments - Outstanding Financial Futures Contracts (Expressed in USD)
As at 30 June 2011
ExpirationDate
Number ofContracts Security Description Currency
NotionalValue
UnrealisedGain/(Loss)
Equity Futures
Sep-11 110 SP 500 Emini Future USD 7,218,750 85,225
Total 85,225
Schedule of Investments - Outstanding Forward Foreign Exchange Contracts (Expressed in USD)
SettlementDate Currency
AmountPurchased Currency
AmountSold
UnrealisedGain/(Loss)
14-Jul-11 EUR 34,595,726 USD 50,488,342 (448,333)14-Jul-11 USD 3,991,029 EUR 2,758,208 1,497
Total (446,836)
Schedule of Investments - Outstanding Total Return Swaps (Expressed in USD) (Please refer to note 2i)
EconomicExposure (incontractcurrency) Currency Sub-Fund Receives Sub-Fund Pays Counterparty
UnrealisedGain/(Loss)
356,516,990 USD Performance of the underlying basket USD-1D-LIBOR +0.25% UBS(303,278,132) USD USD-1D-LIBOR Performance of the underlying basket UBS 1,074,493
Total 1,074,493
Geographic Distribution based on Economic Exposure of Swap Portfolio(expressed in Sub-Fund Currency)
% of BasketMarket Value
United States of America 2.31Switzerland 0.41Bermuda 0.39Ireland 0.29Panama 0.23Curacao 0.22Israel 0.07United Kingdom 0.06Taiwan (0.37)Luxembourg (0.40)Canada (0.65)
396
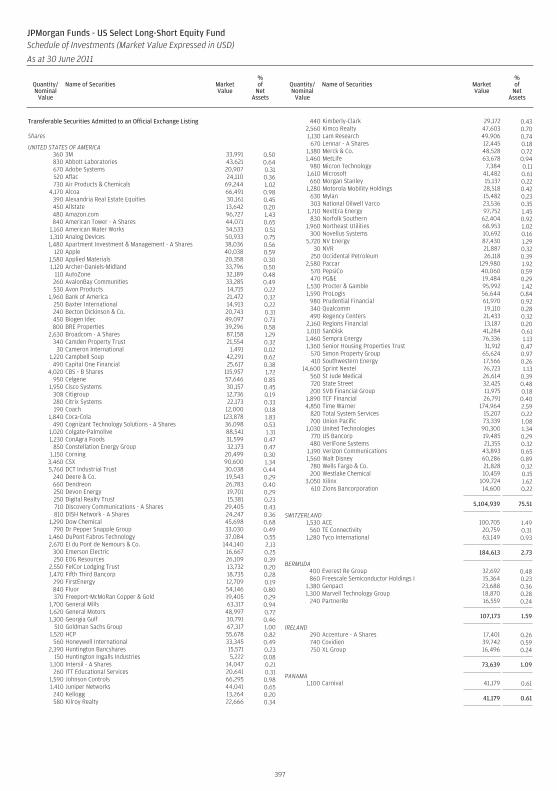
Transferable Securities Admitted to an Official Exchange Listing
Shares
UNITED STATES OF AMERICA360 3M 33,991 0.50830 Abbott Laboratories 43,621 0.64670 Adobe Systems 20,907 0.31520 Aflac 24,110 0.36730 Air Products & Chemicals 69,244 1.02
4,170 Alcoa 66,491 0.98390 Alexandria Real Estate Equities 30,161 0.45450 Allstate 13,642 0.20480 Amazon.com 96,727 1.43840 American Tower - A Shares 44,071 0.65
1,160 American Water Works 34,533 0.511,310 Analog Devices 50,933 0.751,480 Apartment Investment & Management - A Shares 38,036 0.56
120 Apple 40,038 0.591,580 Applied Materials 20,358 0.301,120 Archer-Daniels-Midland 33,796 0.50
110 AutoZone 32,189 0.48260 AvalonBay Communities 33,285 0.49530 Avon Products 14,715 0.22
1,960 Bank of America 21,472 0.32250 Baxter International 14,913 0.22240 Becton Dickinson & Co. 20,743 0.31450 Biogen Idec 49,097 0.73800 BRE Properties 39,296 0.58
2,630 Broadcom - A Shares 87,158 1.29340 Camden Property Trust 21,554 0.32
30 Cameron International 1,491 0.021,220 Campbell Soup 42,291 0.62490 Capital One Financial 25,617 0.38
4,020 CBS - B Shares 115,957 1.72950 Celgene 57,646 0.85
1,950 Cisco Systems 30,157 0.45308 Citigroup 12,736 0.19280 Citrix Systems 22,173 0.33190 Coach 12,000 0.18
1,840 Coca-Cola 123,878 1.83490 Cognizant Technology Solutions - A Shares 36,098 0.53
1,020 Colgate-Palmolive 88,541 1.311,230 ConAgra Foods 31,599 0.47
850 Constellation Energy Group 32,173 0.471,150 Corning 20,499 0.30
3,460 CSX 90,600 1.345,760 DCT Industrial Trust 30,038 0.44
240 Deere & Co. 19,543 0.29660 Dendreon 26,783 0.40250 Devon Energy 19,701 0.29250 Digital Realty Trust 15,381 0.23710 Discovery Communications - A Shares 29,405 0.43810 DISH Network - A Shares 24,247 0.36
1,290 Dow Chemical 45,698 0.68790 Dr Pepper Snapple Group 33,030 0.49
1,460 DuPont Fabros Technology 37,084 0.552,670 EI du Pont de Nemours & Co. 144,140 2.13
300 Emerson Electric 16,667 0.25250 EOG Resources 26,109 0.39
2,550 FelCor Lodging Trust 13,732 0.201,470 Fifth Third Bancorp 18,735 0.28
290 FirstEnergy 12,709 0.19840 Fluor 54,146 0.80370 Freeport-McMoRan Copper & Gold 19,405 0.29
1,700 General Mills 63,317 0.941,620 General Motors 48,997 0.721,300 Georgia Gulf 30,791 0.46
510 Goldman Sachs Group 67,317 1.001,520 HCP 55,678 0.82
560 Honeywell International 33,345 0.492,390 Huntington Bancshares 15,571 0.23
150 Huntington Ingalls Industries 5,222 0.081,100 Intersil - A Shares 14,047 0.21
260 ITT Educational Services 20,641 0.311,590 Johnson Controls 66,295 0.981,410 Juniper Networks 44,041 0.65
240 Kellogg 13,264 0.20580 Kilroy Realty 22,666 0.34
440 Kimberly-Clark 29,172 0.432,560 Kimco Realty 47,603 0.701,130 Lam Research 49,906 0.74
670 Lennar - A Shares 12,445 0.181,380 Merck & Co. 48,528 0.721,460 MetLife 63,678 0.94
980 Micron Technology 7,384 0.111,610 Microsoft 41,482 0.61660 Morgan Stanley 15,137 0.22
1,280 Motorola Mobility Holdings 28,518 0.42630 Mylan 15,482 0.23303 National Oilwell Varco 23,536 0.35
1,710 NextEra Energy 97,752 1.45830 Norfolk Southern 62,404 0.92
1,960 Northeast Utilities 68,953 1.02300 Novellus Systems 10,692 0.16
5,720 NV Energy 87,430 1.2930 NVR 21,887 0.32
250 Occidental Petroleum 26,118 0.392,580 Paccar 129,980 1.92
570 PepsiCo 40,060 0.59470 PG&E 19,484 0.29
1,530 Procter & Gamble 95,992 1.421,590 ProLogis 56,644 0.84
980 Prudential Financial 61,970 0.92340 Qualcomm 19,110 0.28490 Regency Centers 21,433 0.32
2,160 Regions Financial 13,187 0.201,010 SanDisk 41,284 0.611,460 Sempra Energy 76,336 1.131,360 Senior Housing Properties Trust 31,912 0.47
570 Simon Property Group 65,624 0.97410 Southwestern Energy 17,566 0.26
14,600 Sprint Nextel 76,723 1.13560 St Jude Medical 26,614 0.39720 State Street 32,425 0.48200 SVB Financial Group 11,975 0.18
1,890 TCF Financial 26,791 0.404,850 Time Warner 174,964 2.59
820 Total System Services 15,207 0.22700 Union Pacific 73,339 1.08
1,030 United Technologies 90,300 1.34770 US Bancorp 19,485 0.29480 VeriFone Systems 21,355 0.32
1,190 Verizon Communications 43,893 0.651,560 Walt Disney 60,286 0.89
780 Wells Fargo & Co. 21,828 0.32200 Westlake Chemical 10,459 0.15
3,050 Xilinx 109,724 1.62610 Zions Bancorporation 14,600 0.22
5,104,939 75.51
SWITZERLAND1,530 ACE 100,705 1.49
560 TE Connectivity 20,759 0.311,280 Tyco International 63,149 0.93
184,613 2.73
BERMUDA400 Everest Re Group 32,692 0.48860 Freescale Semiconductor Holdings I 15,364 0.23
1,380 Genpact 23,688 0.361,300 Marvell Technology Group 18,870 0.28
240 PartnerRe 16,559 0.24
107,173 1.59
IRELAND290 Accenture - A Shares 17,401 0.26740 Covidien 39,742 0.59750 XL Group 16,496 0.24
73,639 1.09
PANAMA1,100 Carnival 41,179 0.61
41,179 0.61
397
JPMorgan Funds - US Select Long-Short Equity FundSchedule of Investments (Market Value Expressed in USD)
As at 30 June 2011
Quantity/Nominal
Value
Name of Securities MarketValue
%of
NetAssets
Quantity/Nominal
Value
Name of Securities MarketValue
%of
NetAssets
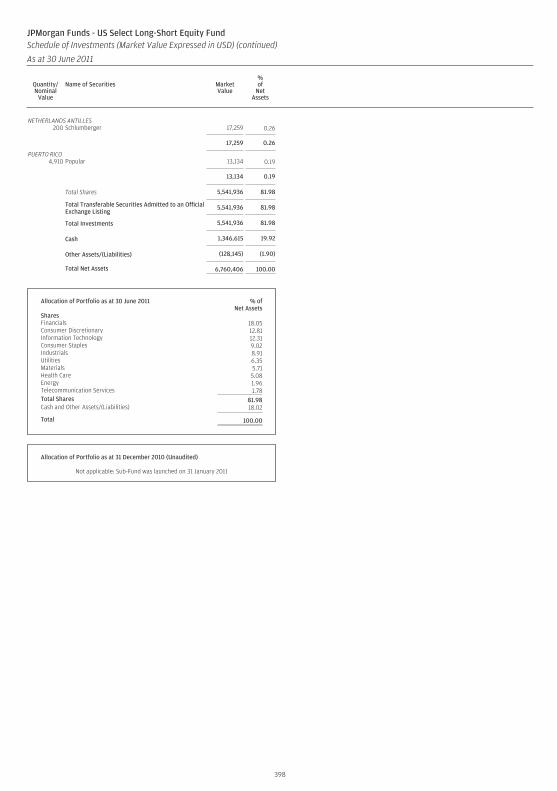
NETHERLANDS ANTILLES200 Schlumberger 17,259 0.26
17,259 0.26
PUERTO RICO4,910 Popular 13,134 0.19
13,134 0.19
Total Shares 5,541,936 81.98
Total Transferable Securities Admitted to an OfficialExchange Listing
5,541,936 81.98
Total Investments 5,541,936 81.98
Cash 1,346,615 19.92
Other Assets/(Liabilities) (128,145) (1.90)
Total Net Assets 6,760,406 100.00
Allocation of Portfolio as at 30 June 2011 % ofNet Assets
SharesFinancials 18.05Consumer Discretionary 12.81Information Technology 12.31Consumer Staples 9.02Industrials 8.91Utilities 6.35Materials 5.71Health Care 5.08Energy 1.96Telecommunication Services 1.78Total Shares 81.98Cash and Other Assets/(Liabilities) 18.02
Total 100.00
Allocation of Portfolio as at 31 December 2010 (Unaudited)
Not applicable: Sub-Fund was launched on 31 January 2011
398
JPMorgan Funds - US Select Long-Short Equity FundSchedule of Investments (Market Value Expressed in USD) (continued)
As at 30 June 2011
Quantity/Nominal
Value
Name of Securities MarketValue
%of
NetAssets
Quantity/Nominal
Value
Name of Securities MarketValue
%of
NetAssets
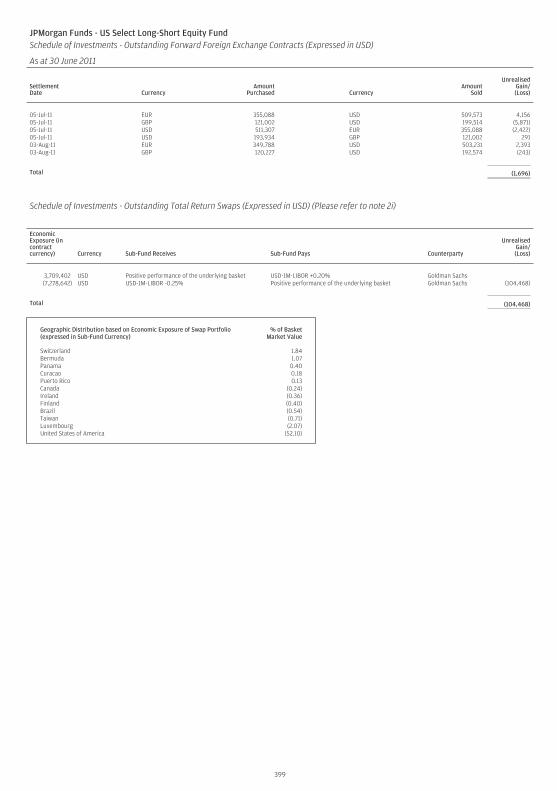
JPMorgan Funds - US Select Long-Short Equity FundSchedule of Investments - Outstanding Forward Foreign Exchange Contracts (Expressed in USD)
As at 30 June 2011
SettlementDate Currency
AmountPurchased Currency
AmountSold
UnrealisedGain/(Loss)
05-Jul-11 EUR 355,088 USD 509,573 4,15605-Jul-11 GBP 121,002 USD 199,514 (5,871)05-Jul-11 USD 511,307 EUR 355,088 (2,422)05-Jul-11 USD 193,934 GBP 121,002 29103-Aug-11 EUR 349,788 USD 503,231 2,39303-Aug-11 GBP 120,227 USD 192,574 (243)
Total (1,696)
Schedule of Investments - Outstanding Total Return Swaps (Expressed in USD) (Please refer to note 2i)
EconomicExposure (incontractcurrency) Currency Sub-Fund Receives Sub-Fund Pays Counterparty
UnrealisedGain/(Loss)
3,709,402 USD Positive performance of the underlying basket USD-1M-LIBOR +0.20% Goldman Sachs(7,278,642) USD USD-1M-LIBOR -0.25% Positive performance of the underlying basket Goldman Sachs (104,468)
Total (104,468)
Geographic Distribution based on Economic Exposure of Swap Portfolio(expressed in Sub-Fund Currency)
% of BasketMarket Value
Switzerland 1.84Bermuda 1.07Panama 0.40Curacao 0.18Puerto Rico 0.13Canada (0.24)Ireland (0.36)Finland (0.40)Brazil (0.54)Taiwan (0.71)Luxembourg (2.07)United States of America (52.10)
399
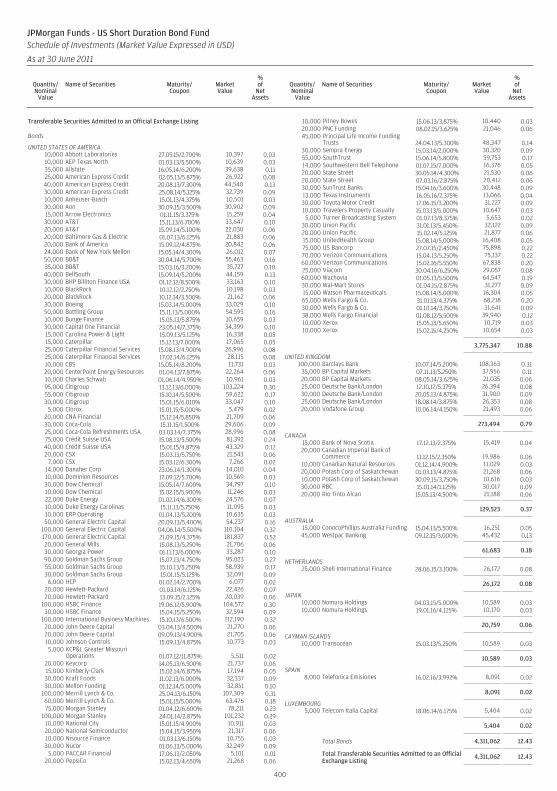
Transferable Securities Admitted to an Official Exchange Listing
Bonds
UNITED STATES OF AMERICA10,000 Abbott Laboratories 27.05.15/2.700% 10,397 0.0310,000 AEP Texas North 01.03.13/5.500% 10,639 0.0335,000 Allstate 16.05.14/6.200% 39,638 0.1125,000 American Express Credit 02.05.13/5.875% 26,922 0.0840,000 American Express Credit 20.08.13/7.300% 44,540 0.1330,000 American Express Credit 25.08.14/5.125% 32,739 0.0910,000 Anheuser-Busch 15.01.13/4.375% 10,501 0.0330,000 Aon 30.09.15/3.500% 30,902 0.0915,000 Arrow Electronics 01.11.15/3.375% 15,259 0.0430,000 AT&T 15.11.13/6.700% 33,647 0.1020,000 AT&T 15.09.14/5.100% 22,030 0.0620,000 Baltimore Gas & Electric 01.07.13/6.125% 21,883 0.0620,000 Bank of America 15.09.12/4.875% 20,842 0.0624,000 Bank of New York Mellon 15.05.14/4.300% 26,012 0.0750,000 BB&T 30.04.14/5.700% 55,463 0.1635,000 BB&T 15.03.16/3.200% 35,727 0.1040,000 BellSouth 15.09.14/5.200% 44,159 0.1330,000 BHP Billiton Finance USA 01.12.12/8.500% 33,163 0.1010,000 BlackRock 10.12.12/2.250% 10,198 0.0320,000 BlackRock 10.12.14/3.500% 21,162 0.0630,000 Boeing 15.03.14/5.000% 33,029 0.1050,000 Bottling Group 15.11.13/5.000% 54,595 0.1610,000 Bunge Finance 15.05.13/5.875% 10,659 0.0330,000 Capital One Financial 23.05.14/7.375% 34,399 0.1015,000 Carolina Power & Light 15.09.13/5.125% 16,338 0.0515,000 Caterpillar 15.12.13/7.000% 17,065 0.0525,000 Caterpillar Financial Services 15.08.13/4.900% 26,996 0.0825,000 Caterpillar Financial Services 17.02.14/6.125% 28,115 0.0810,000 CBS 15.05.14/8.200% 11,731 0.0320,000 CenterPoint Energy Resources 01.04.13/7.875% 22,264 0.0610,000 Charles Schwab 01.06.14/4.950% 10,961 0.0395,000 Citigroup 13.12.13/6.000% 103,224 0.3055,000 Citigroup 15.10.14/5.500% 59,622 0.1730,000 Citigroup 15.01.15/6.010% 33,047 0.10
5,000 Clorox 15.01.15/5.000% 5,479 0.0220,000 CNA Financial 15.12.14/5.850% 21,709 0.0630,000 Coca-Cola 15.11.15/1.500% 29,606 0.0925,000 Coca-Cola Refreshments USA 03.03.14/7.375% 28,996 0.0875,000 Crédit Suisse USA 15.08.13/5.500% 81,392 0.2440,000 Crédit Suisse USA 15.01.15/4.875% 43,329 0.1220,000 CSX 15.03.13/5.750% 21,543 0.06
7,000 CSX 15.03.12/6.300% 7,266 0.0214,000 Danaher Corp 23.06.14/1.300% 14,010 0.0410,000 Dominion Resources 17.09.12/5.700% 10,569 0.0330,000 Dow Chemical 15.05.14/7.600% 34,797 0.1010,000 Dow Chemical 15.02.15/5.900% 11,246 0.0322,000 Duke Energy 01.02.14/6.300% 24,576 0.0710,000 Duke Energy Carolinas 15.11.13/5.750% 11,095 0.0310,000 ERP Operating 01.04.13/5.200% 10,635 0.0350,000 General Electric Capital 20.09.13/5.400% 54,237 0.16
100,000 General Electric Capital 04.06.14/5.500% 110,104 0.32170,000 General Electric Capital 21.09.15/4.375% 181,837 0.5220,000 General Mills 15.08.13/5.250% 21,706 0.0630,000 Georgia Power 01.11.13/6.000% 33,287 0.1090,000 Goldman Sachs Group 15.07.13/4.750% 95,023 0.2755,000 Goldman Sachs Group 15.10.13/5.250% 58,939 0.1730,000 Goldman Sachs Group 15.01.15/5.125% 32,091 0.09
6,000 HCP 01.02.14/2.700% 6,077 0.0220,000 Hewlett-Packard 01.03.14/6.125% 22,426 0.0720,000 Hewlett-Packard 13.09.15/2.125% 20,039 0.06
100,000 HSBC Finance 19.06.12/5.900% 104,572 0.3030,000 HSBC Finance 15.04.15/5.250% 32,594 0.09
100,000 International Business Machines 15.10.13/6.500% 112,190 0.3220,000 John Deere Capital 03.04.13/4.500% 21,270 0.0620,000 John Deere Capital 09.09.13/4.900% 21,705 0.0610,000 Johnson Controls 15.09.13/4.875% 10,773 0.035,000 KCP&L Greater Missouri
Operations 01.07.12/11.875% 5,511 0.0220,000 Keycorp 14.05.13/6.500% 21,737 0.0615,000 Kimberly-Clark 15.02.14/6.875% 17,194 0.0530,000 Kraft Foods 11.02.13/6.000% 32,337 0.0930,000 Mellon Funding 01.12.14/5.000% 32,851 0.10
100,000 Merrill Lynch & Co. 25.04.13/6.150% 107,309 0.3160,000 Merrill Lynch & Co. 15.01.15/5.000% 63,476 0.1875,000 Morgan Stanley 01.04.12/6.600% 78,211 0.23
100,000 Morgan Stanley 24.01.14/2.875% 101,232 0.2910,000 National City 15.01.15/4.900% 10,911 0.0320,000 National Semiconductor 15.04.15/3.950% 21,317 0.0610,000 Nisource Finance 01.03.13/6.150% 10,755 0.0330,000 Nucor 01.06.13/5.000% 32,249 0.09
5,000 PACCAR Financial 17.06.13/2.050% 5,101 0.0120,000 PepsiCo 15.02.13/4.650% 21,268 0.06
10,000 Pitney Bowes 15.06.13/3.875% 10,440 0.0320,000 PNC Funding 08.02.15/3.625% 21,046 0.0645,000 Principal Life Income Funding
Trusts 24.04.13/5.300% 48,347 0.1430,000 Sempra Energy 15.03.14/2.000% 30,320 0.0955,000 SouthTrust 15.06.14/5.800% 59,753 0.1714,000 Southwestern Bell Telephone 01.07.15/7.000% 16,376 0.0520,000 State Street 30.05.14/4.300% 21,530 0.0620,000 State Street 07.03.16/2.875% 20,412 0.0630,000 SunTrust Banks 15.04.16/3.600% 30,448 0.0913,000 Texas Instruments 16.05.16/2.375% 13,066 0.0430,000 Toyota Motor Credit 17.06.15/3.200% 31,227 0.0910,000 Travelers Property Casualty 15.03.13/5.000% 10,647 0.035,000 Turner Broadcasting System 01.07.13/8.375% 5,653 0.02
30,000 Union Pacific 31.01.13/5.450% 32,122 0.0920,000 Union Pacific 15.02.14/5.125% 21,877 0.0615,000 UnitedHealth Group 15.08.14/5.000% 16,408 0.0575,000 US Bancorp 27.07.15/2.450% 75,898 0.2270,000 Verizon Communications 15.04.13/5.250% 75,137 0.2260,000 Verizon Communications 15.02.16/5.550% 67,838 0.2025,000 Viacom 30.04.16/6.250% 29,057 0.0860,000 Wachovia 01.05.13/5.500% 64,547 0.1930,000 Wal-Mart Stores 01.04.15/2.875% 31,277 0.0915,000 Watson Pharmaceuticals 15.08.14/5.000% 16,304 0.0565,000 Wells Fargo & Co. 31.01.13/4.375% 68,218 0.2030,000 Wells Fargo & Co. 01.10.14/3.750% 31,641 0.0938,000 Wells Fargo Financial 01.08.12/5.500% 39,940 0.1210,000 Xerox 15.05.13/5.650% 10,719 0.0310,000 Xerox 15.02.15/4.250% 10,654 0.03
3,775,347 10.88
UNITED KINGDOM100,000 Barclays Bank 10.07.14/5.200% 108,363 0.31
35,000 BP Capital Markets 07.11.13/5.250% 37,956 0.1120,000 BP Capital Markets 08.05.14/3.625% 21,035 0.0625,000 Deutsche Bank/London 12.10.12/5.375% 26,394 0.0830,000 Deutsche Bank/London 20.05.13/4.875% 31,900 0.0925,000 Deutsche Bank/London 18.08.14/3.875% 26,353 0.0820,000 Vodafone Group 10.06.14/4.150% 21,493 0.06
273,494 0.79
CANADA15,000 Bank of Nova Scotia 17.12.13/2.375% 15,419 0.0420,000 Canadian Imperial Bank of
Commerce 11.12.15/2.350% 19,986 0.0610,000 Canadian Natural Resources 01.12.14/4.900% 11,029 0.0320,000 Potash Corp of Saskatchewan 01.03.13/4.875% 21,268 0.0610,000 Potash Corp of Saskatchewan 30.09.15/3.750% 10,616 0.0330,000 RBC 15.01.14/1.125% 30,017 0.0920,000 Rio Tinto Alcan 15.05.13/4.500% 21,188 0.06
129,523 0.37
AUSTRALIA15,000 ConocoPhillips Australia Funding 15.04.13/5.500% 16,251 0.0545,000 Westpac Banking 09.12.15/3.000% 45,432 0.13
61,683 0.18
NETHERLANDS25,000 Shell International Finance 28.06.15/3.100% 26,172 0.08
26,172 0.08
JAPAN10,000 Nomura Holdings 04.03.15/5.000% 10,589 0.0310,000 Nomura Holdings 19.01.16/4.125% 10,170 0.03
20,759 0.06
CAYMAN ISLANDS10,000 Transocean 15.03.13/5.250% 10,589 0.03
10,589 0.03
SPAIN8,000 Telefonica Emisiones 16.02.16/3.992% 8,091 0.02
8,091 0.02
LUXEMBOURG5,000 Telecom Italia Capital 18.06.14/6.175% 5,404 0.02
5,404 0.02
Total Bonds 4,311,062 12.43
Total Transferable Securities Admitted to an OfficialExchange Listing
4,311,062 12.43
400
JPMorgan Funds - US Short Duration Bond FundSchedule of Investments (Market Value Expressed in USD)
As at 30 June 2011
Quantity/Nominal
Value
Name of Securities Maturity/Coupon
MarketValue
%of
NetAssets
Quantity/Nominal
Value
Name of Securities Maturity/Coupon
MarketValue
%of
NetAssets
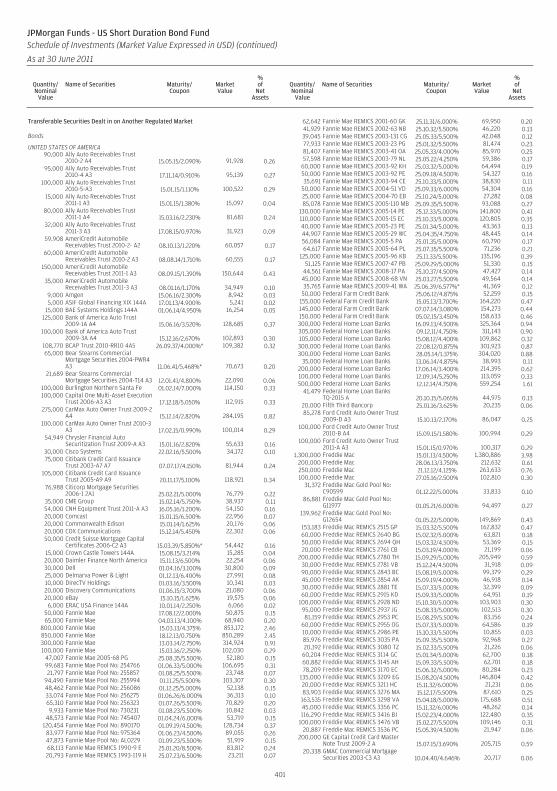
Transferable Securities Dealt in on Another Regulated Market
Bonds
UNITED STATES OF AMERICA90,000 Ally Auto Receivables Trust
2010-2 A4 15.05.15/2.090% 91,928 0.2695,000 Ally Auto Receivables Trust
2010-4 A3 17.11.14/0.910% 95,139 0.27100,000 Ally Auto Receivables Trust
2010-5-A3 15.01.15/1.110% 100,522 0.2915,000 Ally Auto Receivables Trust
2011-1 A3 15.01.15/1.380% 15,097 0.0480,000 Ally Auto Receivables Trust
2011-1 A4 15.03.16/2.230% 81,681 0.2432,000 Ally Auto Receivables Trust
2011-3 A3 17.08.15/0.970% 31,923 0.0959,908 AmeriCredit Automobile
Receivables Trust 2010-2- A2 08.10.13/1.220% 60,057 0.1760,000 AmeriCredit Automobile
Receivables Trust 2010-2 A3 08.08.14/1.710% 60,555 0.17150,000 AmeriCredit Automobile
Receivables Trust 2011-1 A3 08.09.15/1.390% 150,644 0.4335,000 AmeriCredit Automobile
Receivables Trust 2011-3 A3 08.01.16/1.170% 34,949 0.109,000 Amgen 15.06.16/2.300% 8,942 0.035,000 ASIF Global Financing XIX 144A 17.01.13/4.900% 5,241 0.02
15,000 BAE Systems Holdings 144A 01.06.14/4.950% 16,254 0.05125,000 Bank of America Auto Trust
2009-1A A4 15.06.16/3.520% 128,685 0.37100,000 Bank of America Auto Trust
2009-3A A4 15.12.16/2.670% 102,893 0.30108,770 BCAP Trust 2010-RR10 4A5 26.09.37/4.000%* 109,382 0.3265,000 Bear Stearns Commercial
Mortgage Securities 2004-PWR4A3 11.06.41/5.468%* 70,673 0.20
21,689 Bear Stearns CommercialMortgage Securities 2004-T14 A3 12.01.41/4.800% 22,090 0.06
100,000 Burlington Northern Santa Fe 01.02.14/7.000% 114,150 0.33100,000 Capital One Multi-Asset Execution
Trust 2006-A3 A3 17.12.18/5.050% 112,915 0.33275,000 CarMax Auto Owner Trust 2009-2
A4 15.12.14/2.820% 284,195 0.82100,000 CarMax Auto Owner Trust 2010-3
A3 17.02.15/0.990% 100,014 0.2954,949 Chrysler Financial Auto
Securitization Trust 2009-A A3 15.01.16/2.820% 55,633 0.1630,000 Cisco Systems 22.02.16/5.500% 34,172 0.1075,000 Citibank Credit Card Issuance
Trust 2003-A7 A7 07.07.17/4.150% 81,944 0.24105,000 Citibank Credit Card Issuance
Trust 2005-A9 A9 20.11.17/5.100% 118,921 0.3476,988 Citicorp Mortgage Securities
2006-1 2A1 25.02.21/5.000% 76,779 0.2235,000 CME Group 15.02.14/5.750% 38,937 0.1154,000 CNH Equipment Trust 2011-A A3 16.05.16/1.200% 54,150 0.1620,000 Comcast 15.01.15/6.500% 22,956 0.0720,000 Commonwealth Edison 15.01.14/1.625% 20,176 0.0620,000 COX Communications 15.12.14/5.450% 22,302 0.0650,000 Credit Suisse Mortgage Capital
Certificates 2006-C2 A3 15.03.39/5.850%* 54,442 0.1615,000 Crown Castle Towers 144A 15.08.15/3.214% 15,285 0.0420,000 Daimler Finance North America 15.11.13/6.500% 22,254 0.0630,000 Dell 01.04.16/3.100% 30,800 0.0925,000 Delmarva Power & Light 01.12.13/6.400% 27,991 0.0810,000 DirecTV Holdings 01.03.16/3.500% 10,341 0.0320,000 Discovery Communications 01.06.15/3.700% 21,080 0.0620,000 eBay 15.10.15/1.625% 19,575 0.06
6,000 ERAC USA Finance 144A 10.01.14/2.250% 6,066 0.0250,000 Fannie Mae 17.08.12/2.000% 50,875 0.1565,000 Fannie Mae 04.03.13/4.100% 68,940 0.20
800,000 Fannie Mae 15.03.13/4.375% 853,172 2.46850,000 Fannie Mae 18.12.13/0.750% 850,289 2.45300,000 Fannie Mae 13.03.14/2.750% 314,924 0.91100,000 Fannie Mae 15.03.16/2.250% 102,030 0.29
47,007 Fannie Mae 2005-68 PG 25.08.35/5.500% 52,180 0.1599,683 Fannie Mae Pool No: 254766 01.06.33/5.000% 106,695 0.3121,797 Fannie Mae Pool No: 255857 01.08.25/5.500% 23,748 0.07
94,490 Fannie Mae Pool No: 255994 01.11.25/5.500% 103,307 0.3048,462 Fannie Mae Pool No: 256086 01.12.25/5.000% 52,138 0.1533,074 Fannie Mae Pool No: 256275 01.06.26/6.000% 36,313 0.1065,310 Fannie Mae Pool No: 256323 01.07.26/5.500% 70,829 0.209,933 Fannie Mae Pool No: 730231 01.08.23/5.500% 10,842 0.03
48,573 Fannie Mae Pool No: 745407 01.04.24/6.000% 53,719 0.15120,454 Fannie Mae Pool No: 890170 01.09.19/4.500% 128,734 0.37
83,977 Fannie Mae Pool No: 975364 01.06.23/4.500% 89,055 0.2647,873 Fannie Mae Pool No: AL0229 01.09.23/5.500% 51,919 0.1568,113 Fannie Mae REMICS 1990-9 E 25.01.20/8.500% 83,812 0.2420,793 Fannie Mae REMICS 1993-119 H 25.07.23/6.500% 23,211 0.07
62,642 Fannie Mae REMICS 2001-60 GK 25.11.31/6.000% 69,950 0.2041,929 Fannie Mae REMICS 2002-63 NB 25.10.32/5.500% 46,220 0.1339,045 Fannie Mae REMICS 2003-131 CG 25.05.33/5.500% 42,048 0.1277,933 Fannie Mae REMICS 2003-23 PG 25.01.32/5.500% 81,474 0.2381,407 Fannie Mae REMICS 2003-41 OA 25.05.33/4.000% 85,970 0.2557,598 Fannie Mae REMICS 2003-79 NL 25.05.22/4.250% 59,386 0.17
60,000 Fannie Mae REMICS 2003-92 KH 25.03.32/5.000% 64,494 0.1950,000 Fannie Mae REMICS 2003-92 PE 25.09.18/4.500% 54,327 0.1635,691 Fannie Mae REMICS 2003-94 CE 25.10.33/5.000% 38,830 0.11
50,000 Fannie Mae REMICS 2004-51 VD 25.09.33/6.000% 54,304 0.1625,000 Fannie Mae REMICS 2004-70 EB 25.10.24/5.000% 27,282 0.0885,078 Fannie Mae REMICS 2005-110 MB 25.09.35/5.500% 93,088 0.27
130,000 Fannie Mae REMICS 2005-14 PE 25.12.33/5.000% 141,800 0.41110,000 Fannie Mae REMICS 2005-15 EC 25.10.33/5.000% 120,805 0.3540,000 Fannie Mae REMICS 2005-23 PE 25.01.34/5.000% 43,363 0.1344,907 Fannie Mae REMICS 2005-29 WC 25.04.35/4.750% 48,445 0.1456,084 Fannie Mae REMICS 2005-5 PA 25.01.35/5.000% 60,790 0.1764,617 Fannie Mae REMICS 2005-64 PL 25.07.35/5.500% 71,236 0.21
125,000 Fannie Mae REMICS 2005-96 KB 25.11.33/5.500% 135,196 0.3951,125 Fannie Mae REMICS 2007-47 PB 25.09.29/5.000% 51,330 0.15
44,561 Fannie Mae REMICS 2008-17 PA 25.10.37/4.500% 47,427 0.1445,000 Fannie Mae REMICS 2008-68 VN 25.03.27/5.500% 49,564 0.1435,765 Fannie Mae REMICS 2009-41 WA 25.06.39/6.577%* 41,369 0.12
50,000 Federal Farm Credit Bank 25.06.12/4.875% 52,259 0.15155,000 Federal Farm Credit Bank 15.05.13/3.700% 164,220 0.47145,000 Federal Farm Credit Bank 07.07.14/3.080% 154,273 0.44150,000 Federal Farm Credit Bank 05.02.15/3.450% 158,633 0.46300,000 Federal Home Loan Banks 16.09.13/4.500% 325,364 0.94305,000 Federal Home Loan Banks 09.12.11/4.750% 311,143 0.90105,000 Federal Home Loan Banks 15.08.12/4.400% 109,862 0.32300,000 Federal Home Loan Banks 22.08.12/0.875% 301,923 0.87300,000 Federal Home Loan Banks 28.05.14/1.375% 304,020 0.88
35,000 Federal Home Loan Banks 13.06.14/4.875% 38,993 0.11200,000 Federal Home Loan Banks 17.06.14/3.400% 214,395 0.62100,000 Federal Home Loan Banks 12.09.14/5.250% 113,059 0.33500,000 Federal Home Loan Banks 12.12.14/4.750% 559,254 1.61
41,479 Federal Home Loan BanksTQ-2015 A 20.10.15/5.065% 44,975 0.13
20,000 Fifth Third Bancorp 25.01.16/3.625% 20,235 0.0685,278 Ford Credit Auto Owner Trust
2009-D A3 15.10.13/2.170% 86,047 0.25100,000 Ford Credit Auto Owner Trust
2010-B A4 15.09.15/1.580% 100,994 0.29100,000 Ford Credit Auto Owner Trust
2011-A A3 15.01.15/0.970% 100,317 0.291,300,000 Freddie Mac 15.01.13/4.500% 1,380,886 3.98
200,000 Freddie Mac 28.06.13/3.750% 212,632 0.61250,000 Freddie Mac 21.12.12/4.125% 263,633 0.76100,000 Freddie Mac 27.05.16/2.500% 102,810 0.30
31,372 Freddie Mac Gold Pool No:C90599 01.12.22/5.000% 33,833 0.10
86,881 Freddie Mac Gold Pool No:G11977 01.05.21/6.000% 94,497 0.27
139,962 Freddie Mac Gold Pool No:G12654 01.05.22/5.000% 149,869 0.43
153,183 Freddie Mac REMICS 2515 GP 15.03.32/5.500% 162,832 0.4760,000 Freddie Mac REMICS 2640 BG 15.02.32/5.000% 63,821 0.1850,000 Freddie Mac REMICS 2694 QH 15.03.32/4.500% 53,369 0.1520,000 Freddie Mac REMICS 2761 CB 15.03.19/4.000% 21,199 0.06
200,000 Freddie Mac REMICS 2780 TH 15.09.29/5.000% 205,949 0.5930,000 Freddie Mac REMICS 2781 VB 15.12.24/4.500% 31,918 0.0990,000 Freddie Mac REMICS 2843 BC 15.08.19/5.000% 99,379 0.2945,000 Freddie Mac REMICS 2854 AK 15.09.19/4.000% 46,918 0.1430,000 Freddie Mac REMICS 2881 TE 15.07.33/5.000% 32,399 0.0960,000 Freddie Mac REMICS 2915 KD 15.09.33/5.000% 64,951 0.19
100,000 Freddie Mac REMICS 2928 ND 15.10.30/5.000% 103,903 0.3095,000 Freddie Mac REMICS 2937 JG 15.08.33/5.000% 102,513 0.3081,159 Freddie Mac REMICS 2953 PC 15.08.29/5.500% 83,156 0.24
60,000 Freddie Mac REMICS 2955 OG 15.07.33/5.000% 64,586 0.1910,000 Freddie Mac REMICS 2986 PE 15.10.33/5.500% 10,855 0.0385,976 Freddie Mac REMICS 3035 PA 15.09.35/5.500% 92,968 0.2720,192 Freddie Mac REMICS 3080 TZ 15.02.33/5.500% 21,226 0.06
60,204 Freddie Mac REMICS 3114 GC 15.01.34/5.000% 62,700 0.1860,882 Freddie Mac REMICS 3145 AH 15.09.33/5.500% 62,701 0.1878,209 Freddie Mac REMICS 3170 EC 15.06.32/5.000% 80,284 0.23
135,000 Freddie Mac REMICS 3209 EG 15.08.20/4.500% 146,804 0.4220,000 Freddie Mac REMICS 3211 HC 15.11.32/6.000% 21,231 0.0683,903 Freddie Mac REMICS 3276 MA 15.12.17/5.500% 87,610 0.25
163,535 Freddie Mac REMICS 3298 VA 15.04.18/5.000% 175,688 0.5145,000 Freddie Mac REMICS 3356 PC 15.11.32/6.000% 48,262 0.14116,290 Freddie Mac REMICS 3416 BJ 15.02.23/4.000% 122,480 0.35
100,000 Freddie Mac REMICS 3476 VB 15.02.27/5.500% 109,146 0.3120,887 Freddie Mac REMICS 3536 PC 15.05.39/4.500% 21,947 0.06
200,000 GE Capital Credit Card MasterNote Trust 2009-2 A 15.07.15/3.690% 205,715 0.59
20,338 GMAC Commercial MortgageSecurities 2003-C3 A3 10.04.40/4.646% 20,717 0.06
401
JPMorgan Funds - US Short Duration Bond FundSchedule of Investments (Market Value Expressed in USD) (continued)
As at 30 June 2011
Quantity/Nominal
Value
Name of Securities Maturity/Coupon
MarketValue
%of
NetAssets
Quantity/Nominal
Value
Name of Securities Maturity/Coupon
MarketValue
%of
NetAssets
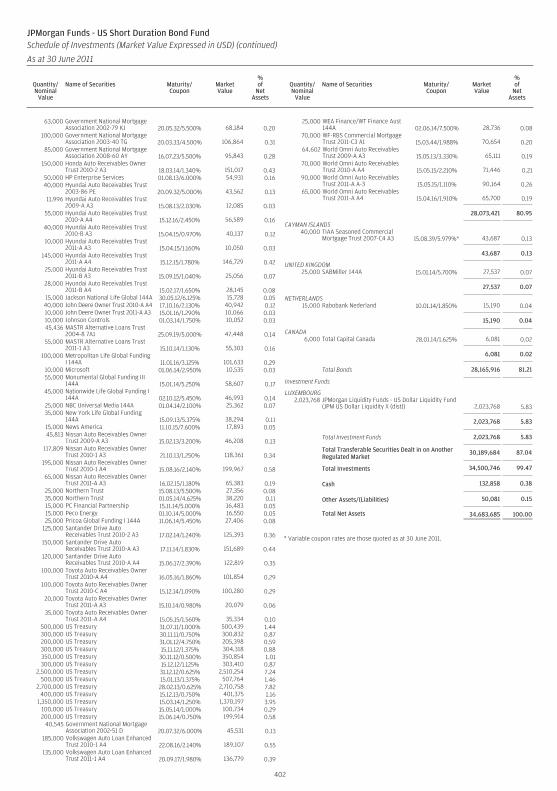
63,000 Government National MortgageAssociation 2002-79 KJ 20.05.32/5.500% 68,184 0.20
100,000 Government National MortgageAssociation 2003-40 TG 20.03.33/4.500% 106,864 0.31
85,000 Government National MortgageAssociation 2008-60 AY 16.07.23/5.500% 95,843 0.28
150,000 Honda Auto Receivables OwnerTrust 2010-2 A3 18.03.14/1.340% 151,017 0.43
50,000 HP Enterprise Services 01.08.13/6.000% 54,931 0.1640,000 Hyundai Auto Receivables Trust
2003-86 PE 20.09.32/5.000% 43,562 0.1311,996 Hyundai Auto Receivables Trust
2009-A A3 15.08.13/2.030% 12,085 0.0355,000 Hyundai Auto Receivables Trust
2010-A A4 15.12.16/2.450% 56,589 0.1640,000 Hyundai Auto Receivables Trust
2010-B A3 15.04.15/0.970% 40,137 0.1210,000 Hyundai Auto Receivables Trust
2011-A A3 15.04.15/1.160% 10,050 0.03145,000 Hyundai Auto Receivables Trust
2011-A A4 15.12.15/1.780% 146,729 0.4225,000 Hyundai Auto Receivables Trust
2011-B A3 15.09.15/1.040% 25,056 0.0728,000 Hyundai Auto Receivables Trust
2011-B A4 15.02.17/1.650% 28,145 0.0815,000 Jackson National Life Global 144A 30.05.12/6.125% 15,728 0.05
40,000 John Deere Owner Trust 2010-A A4 17.10.16/2.130% 40,942 0.1210,000 John Deere Owner Trust 2011-A A3 15.01.16/1.290% 10,066 0.0310,000 Johnson Controls 01.03.14/1.750% 10,052 0.0345,436 MASTR Alternative Loans Trust
2004-8 7A1 25.09.19/5.000% 47,448 0.1455,000 MASTR Alternative Loans Trust
2011-1 A3 15.10.14/1.130% 55,303 0.16100,000 Metropolitan Life Global Funding
I 144A 11.01.16/3.125% 101,633 0.2910,000 Microsoft 01.06.14/2.950% 10,535 0.0355,000 Monumental Global Funding III
144A 15.01.14/5.250% 58,607 0.1745,000 Nationwide Life Global Funding I
144A 02.10.12/5.450% 46,993 0.1425,000 NBC Universal Media 144A 01.04.14/2.100% 25,362 0.0735,000 New York Life Global Funding
144A 15.09.13/5.375% 38,294 0.1115,000 News America 11.10.15/7.600% 17,893 0.0545,813 Nissan Auto Receivables Owner
Trust 2009-A A3 15.02.13/3.200% 46,208 0.13117,809 Nissan Auto Receivables Owner
Trust 2010-1 A3 21.10.13/1.250% 118,361 0.34195,000 Nissan Auto Receivables Owner
Trust 2010-1 A4 15.08.16/2.140% 199,967 0.5865,000 Nissan Auto Receivables Owner
Trust 2011-A A3 16.02.15/1.180% 65,383 0.1925,000 Northern Trust 15.08.13/5.500% 27,356 0.0835,000 Northern Trust 01.05.14/4.625% 38,220 0.1115,000 PC Financial Partnership 15.11.14/5.000% 16,483 0.0515,000 Peco Energy 01.10.14/5.000% 16,550 0.0525,000 Pricoa Global Funding I 144A 11.06.14/5.450% 27,406 0.08
125,000 Santander Drive AutoReceivables Trust 2010-2 A3 17.02.14/1.240% 125,393 0.36
150,000 Santander Drive AutoReceivables Trust 2010-A A3 17.11.14/1.830% 151,689 0.44
120,000 Santander Drive AutoReceivables Trust 2010-A A4 15.06.17/2.390% 122,819 0.35
100,000 Toyota Auto Receivables OwnerTrust 2010-A A4 16.05.16/1.860% 101,854 0.29
100,000 Toyota Auto Receivables OwnerTrust 2010-C A4 15.12.14/1.090% 100,280 0.29
20,000 Toyota Auto Receivables OwnerTrust 2011-A A3 15.10.14/0.980% 20,079 0.06
35,000 Toyota Auto Receivables OwnerTrust 2011-A A4 15.05.15/1.560% 35,334 0.10
500,000 US Treasury 31.07.11/1.000% 500,439 1.44300,000 US Treasury 30.11.11/0.750% 300,832 0.87200,000 US Treasury 31.01.12/4.750% 205,398 0.59300,000 US Treasury 15.11.12/1.375% 304,318 0.88350,000 US Treasury 30.11.12/0.500% 350,854 1.01300,000 US Treasury 15.12.12/1.125% 303,410 0.87
2,500,000 US Treasury 31.12.12/0.625% 2,510,254 7.24500,000 US Treasury 15.01.13/1.375% 507,764 1.46
2,700,000 US Treasury 28.02.13/0.625% 2,710,758 7.82400,000 US Treasury 15.12.13/0.750% 401,375 1.16
1,350,000 US Treasury 15.03.14/1.250% 1,370,197 3.95100,000 US Treasury 15.05.14/1.000% 100,734 0.29200,000 US Treasury 15.06.14/0.750% 199,914 0.58
40,545 Government National MortgageAssociation 2002-51 D 20.07.32/6.000% 45,531 0.13
185,000 Volkswagen Auto Loan EnhancedTrust 2010-1 A4 22.08.16/2.140% 189,107 0.55
135,000 Volkswagen Auto Loan EnhancedTrust 2011-1 A4 20.09.17/1.980% 136,779 0.39
25,000 WEA Finance/WT Finance Aust144A 02.06.14/7.500% 28,736 0.08
70,000 WF-RBS Commercial MortgageTrust 2011-C3 A1 15.03.44/1.988% 70,654 0.20
64,602 World Omni Auto ReceivablesTrust 2009-A A3 15.05.13/3.330% 65,111 0.19
70,000 World Omni Auto ReceivablesTrust 2010-A A4 15.05.15/2.210% 71,446 0.21
90,000 World Omni Auto ReceivablesTrust 2011-A A-3 15.05.15/1.110% 90,164 0.26
65,000 World Omni Auto ReceivablesTrust 2011-A A4 15.04.16/1.910% 65,700 0.19
28,073,421 80.95
CAYMAN ISLANDS40,000 TIAA Seasoned Commercial
Mortgage Trust 2007-C4 A3 15.08.39/5.979%* 43,687 0.13
43,687 0.13
UNITED KINGDOM25,000 SABMiller 144A 15.01.14/5.700% 27,537 0.07
27,537 0.07
NETHERLANDS15,000 Rabobank Nederland 10.01.14/1.850% 15,190 0.04
15,190 0.04
CANADA6,000 Total Capital Canada 28.01.14/1.625% 6,081 0.02
6,081 0.02
Total Bonds 28,165,916 81.21
Investment Funds
LUXEMBOURG2,023,768 JPMorgan Liquidity Funds - US Dollar Liquidity Fund
(JPM US Dollar Liquidity X (dist)) 2,023,768 5.83
2,023,768 5.83
Total Investment Funds 2,023,768 5.83
Total Transferable Securities Dealt in on AnotherRegulated Market
30,189,684 87.04
Total Investments 34,500,746 99.47
Cash 132,858 0.38
Other Assets/(Liabilities) 50,081 0.15
Total Net Assets 34,683,685 100.00
* Variable coupon rates are those quoted as at 30 June 2011.
402
JPMorgan Funds - US Short Duration Bond FundSchedule of Investments (Market Value Expressed in USD) (continued)
As at 30 June 2011
Quantity/Nominal
Value
Name of Securities Maturity/Coupon
MarketValue
%of
NetAssets
Quantity/Nominal
Value
Name of Securities Maturity/Coupon
MarketValue
%of
NetAssets
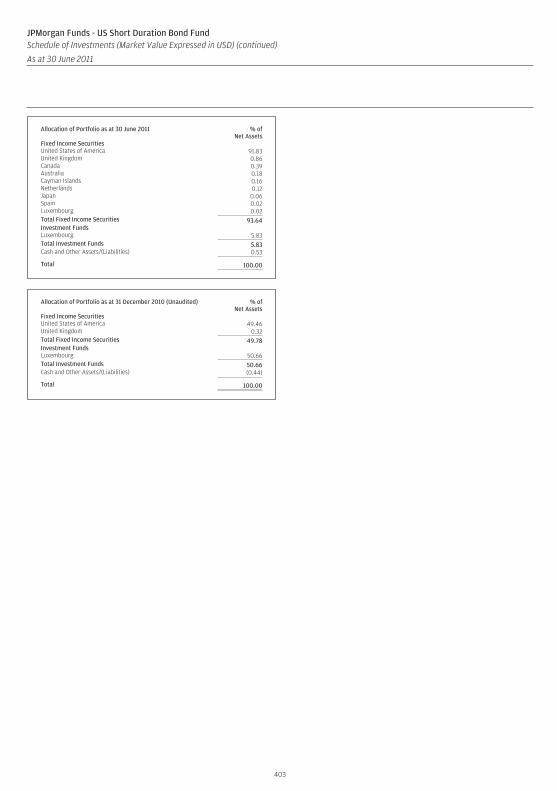
Allocation of Portfolio as at 30 June 2011 % ofNet Assets
Fixed Income SecuritiesUnited States of America 91.83United Kingdom 0.86Canada 0.39Australia 0.18Cayman Islands 0.16Netherlands 0.12Japan 0.06Spain 0.02Luxembourg 0.02Total Fixed Income Securities 93.64Investment FundsLuxembourg 5.83Total Investment Funds 5.83Cash and Other Assets/(Liabilities) 0.53
Total 100.00
Allocation of Portfolio as at 31 December 2010 (Unaudited) % ofNet Assets
Fixed Income SecuritiesUnited States of America 49.46United Kingdom 0.32Total Fixed Income Securities 49.78Investment FundsLuxembourg 50.66Total Investment Funds 50.66Cash and Other Assets/(Liabilities) (0.44)
Total 100.00
403
JPMorgan Funds - US Short Duration Bond FundSchedule of Investments (Market Value Expressed in USD) (continued)
As at 30 June 2011
Quantity/Nominal
Value
Name of Securities Maturity/Coupon
MarketValue
%of
NetAssets
Quantity/Nominal
Value
Name of Securities Maturity/Coupon
MarketValue
%of
NetAssets
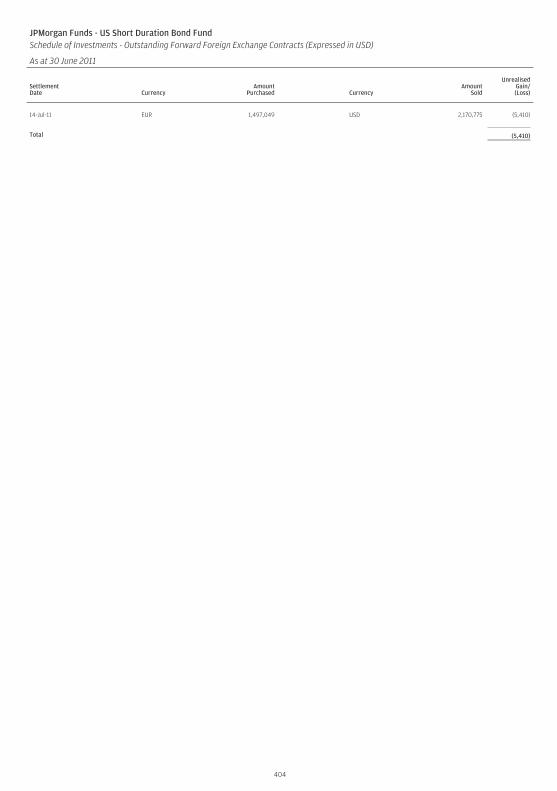
JPMorgan Funds - US Short Duration Bond FundSchedule of Investments - Outstanding Forward Foreign Exchange Contracts (Expressed in USD)
As at 30 June 2011
SettlementDate Currency
AmountPurchased Currency
AmountSold
UnrealisedGain/(Loss)
14-Jul-11 EUR 1,497,049 USD 2,170,775 (5,410)
Total (5,410)
404
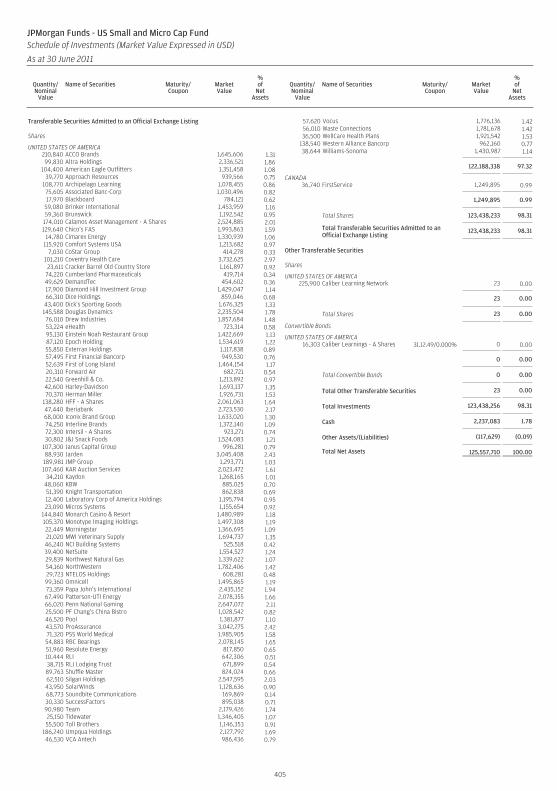
Transferable Securities Admitted to an Official Exchange Listing
Shares
UNITED STATES OF AMERICA210,840 ACCO Brands 1,645,606 1.3199,830 Altra Holdings 2,336,521 1.86
104,400 American Eagle Outfitters 1,351,458 1.0839,770 Approach Resources 939,566 0.75
108,770 Archipelago Learning 1,078,455 0.8675,605 Associated Banc-Corp 1,030,496 0.8217,970 Blackboard 784,121 0.62
59,080 Brinker International 1,453,959 1.1659,360 Brunswick 1,192,542 0.95
174,010 Calamos Asset Management - A Shares 2,524,885 2.01129,640 Chico’s FAS 1,993,863 1.59
14,780 Cimarex Energy 1,330,939 1.06115,920 Comfort Systems USA 1,213,682 0.97
7,030 CoStar Group 414,278 0.33101,210 Coventry Health Care 3,732,625 2.9723,611 Cracker Barrel Old Country Store 1,161,897 0.92
74,220 Cumberland Pharmaceuticals 419,714 0.3449,629 DemandTec 454,602 0.3617,900 Diamond Hill Investment Group 1,429,047 1.1466,310 Dice Holdings 859,046 0.6843,400 Dick’s Sporting Goods 1,676,325 1.33145,588 Douglas Dynamics 2,235,504 1.7876,010 Drew Industries 1,857,684 1.4853,224 eHealth 723,314 0.5895,130 Einstein Noah Restaurant Group 1,422,669 1.1387,120 Epoch Holding 1,534,619 1.2255,850 Exterran Holdings 1,117,838 0.8957,495 First Financial Bancorp 949,530 0.7652,639 First of Long Island 1,464,154 1.1720,310 Forward Air 682,721 0.5422,540 Greenhill & Co. 1,213,892 0.9742,600 Harley-Davidson 1,693,137 1.3570,370 Herman Miller 1,926,731 1.53
138,280 HFF - A Shares 2,061,063 1.6447,440 Iberiabank 2,723,530 2.1768,000 Iconix Brand Group 1,633,020 1.3074,250 Interline Brands 1,372,140 1.0972,300 Intersil - A Shares 923,271 0.7430,802 J&J Snack Foods 1,524,083 1.21
107,300 Janus Capital Group 996,281 0.7988,930 Jarden 3,045,408 2.43189,981 JMP Group 1,293,771 1.03107,460 KAR Auction Services 2,023,472 1.61
34,210 Kaydon 1,268,165 1.0148,060 KBW 885,025 0.7051,390 Knight Transportation 862,838 0.6912,400 Laboratory Corp of America Holdings 1,195,794 0.9523,090 Micros Systems 1,155,654 0.92
144,840 Monarch Casino & Resort 1,480,989 1.18105,370 Monotype Imaging Holdings 1,497,308 1.1922,449 Morningstar 1,366,695 1.0921,020 MWI Veterinary Supply 1,694,737 1.3546,240 NCI Building Systems 525,518 0.4239,400 NetSuite 1,554,527 1.2429,839 Northwest Natural Gas 1,339,622 1.0754,160 NorthWestern 1,782,406 1.4229,723 NTELOS Holdings 608,281 0.4899,360 Omnicell 1,495,865 1.1973,359 Papa John’s International 2,435,152 1.9467,490 Patterson-UTI Energy 2,078,355 1.6666,020 Penn National Gaming 2,647,072 2.1125,500 PF Chang’s China Bistro 1,028,542 0.8246,520 Pool 1,381,877 1.1043,570 ProAssurance 3,042,275 2.4271,320 PSS World Medical 1,985,905 1.5854,883 RBC Bearings 2,078,145 1.6551,960 Resolute Energy 817,850 0.6510,444 RLI 642,306 0.5138,715 RLJ Lodging Trust 671,899 0.5489,763 Shuffle Master 824,024 0.6662,510 Silgan Holdings 2,547,595 2.0343,950 SolarWinds 1,128,636 0.9068,773 Soundbite Communications 169,869 0.1430,330 SuccessFactors 895,038 0.7190,980 Team 2,179,426 1.7425,150 Tidewater 1,346,405 1.0755,500 Toll Brothers 1,146,353 0.91
186,240 Umpqua Holdings 2,127,792 1.6946,530 VCA Antech 986,436 0.79
57,620 Vocus 1,776,136 1.4256,010 Waste Connections 1,781,678 1.4236,500 WellCare Health Plans 1,921,542 1.53
138,540 Western Alliance Bancorp 962,160 0.7738,644 Williams-Sonoma 1,430,987 1.14
122,188,338 97.32
CANADA36,740 FirstService 1,249,895 0.99
1,249,895 0.99
Total Shares 123,438,233 98.31
Total Transferable Securities Admitted to anOfficial Exchange Listing
123,438,233 98.31
Other Transferable Securities
Shares
UNITED STATES OF AMERICA225,900 Caliber Learning Network 23 0.00
23 0.00
Total Shares 23 0.00
Convertible Bonds
UNITED STATES OF AMERICA16,303 Caliber Learnings - A Shares 31.12.49/0.000% 0 0.00
0 0.00
Total Convertible Bonds 0 0.00
Total Other Transferable Securities 23 0.00
Total Investments 123,438,256 98.31
Cash 2,237,083 1.78
Other Assets/(Liabilities) (117,629) (0.09)
Total Net Assets 125,557,710 100.00
405
JPMorgan Funds - US Small and Micro Cap FundSchedule of Investments (Market Value Expressed in USD)
As at 30 June 2011
Quantity/Nominal
Value
Name of Securities Maturity/Coupon
MarketValue
%of
NetAssets
Quantity/Nominal
Value
Name of Securities Maturity/Coupon
MarketValue
%of
NetAssets
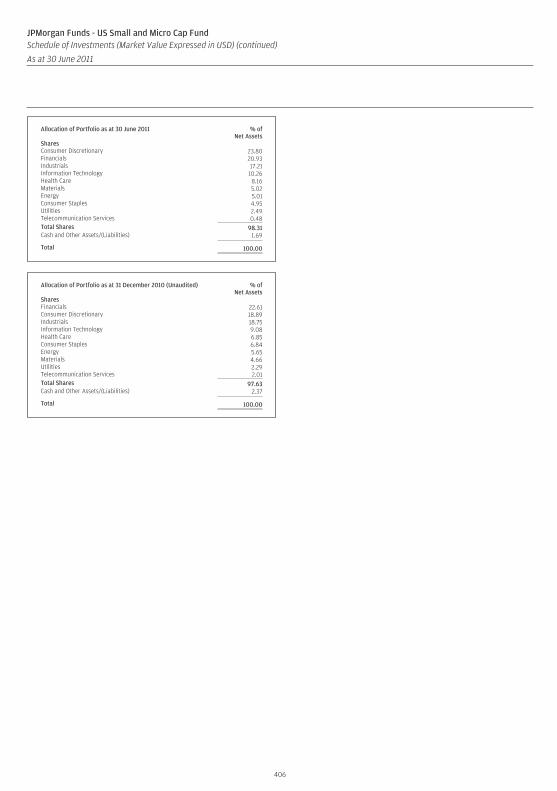
Allocation of Portfolio as at 30 June 2011 % ofNet Assets
SharesConsumer Discretionary 23.80Financials 20.93Industrials 17.21Information Technology 10.26Health Care 8.16Materials 5.02Energy 5.01Consumer Staples 4.95Utilities 2.49Telecommunication Services 0.48Total Shares 98.31Cash and Other Assets/(Liabilities) 1.69
Total 100.00
Allocation of Portfolio as at 31 December 2010 (Unaudited) % ofNet Assets
SharesFinancials 22.61Consumer Discretionary 18.89Industrials 18.75Information Technology 9.08Health Care 6.85Consumer Staples 6.84Energy 5.65Materials 4.66Utilities 2.29Telecommunication Services 2.01Total Shares 97.63Cash and Other Assets/(Liabilities) 2.37
Total 100.00
406
JPMorgan Funds - US Small and Micro Cap FundSchedule of Investments (Market Value Expressed in USD) (continued)
As at 30 June 2011
Quantity/Nominal
Value
Name of Securities Maturity/Coupon
MarketValue
%of
NetAssets
Quantity/Nominal
Value
Name of Securities Maturity/Coupon
MarketValue
%of
NetAssets
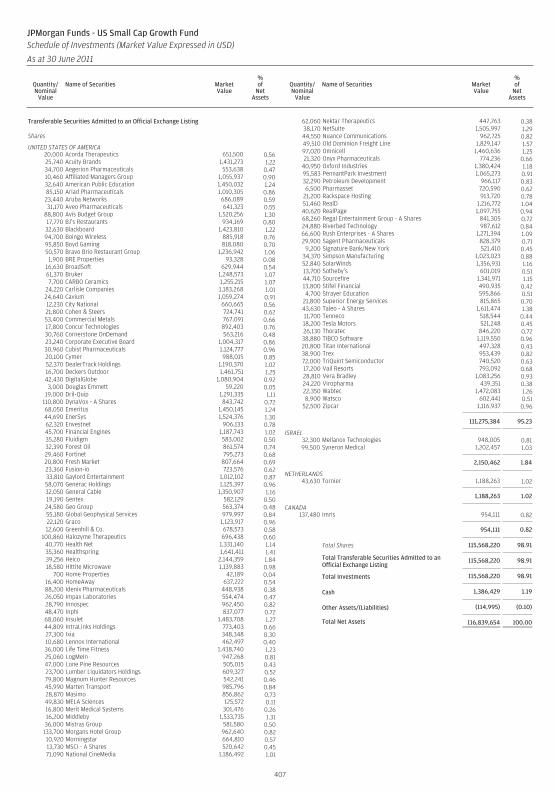
Transferable Securities Admitted to an Official Exchange Listing
Shares
UNITED STATES OF AMERICA20,000 Acorda Therapeutics 651,500 0.5625,740 Acuity Brands 1,431,273 1.2234,700 Aegerion Pharmaceuticals 553,638 0.4710,460 Affiliated Managers Group 1,055,937 0.9032,640 American Public Education 1,450,032 1.2485,150 Ariad Pharmaceuticals 1,010,305 0.8623,440 Aruba Networks 686,089 0.5931,170 Aveo Pharmaceuticals 641,323 0.55
88,800 Avis Budget Group 1,520,256 1.3017,770 BJ’s Restaurants 934,169 0.8032,630 Blackboard 1,423,810 1.2294,700 Boingo Wireless 885,918 0.7695,850 Boyd Gaming 818,080 0.7050,570 Bravo Brio Restaurant Group 1,236,942 1.06
1,900 BRE Properties 93,328 0.0816,630 BroadSoft 629,944 0.5461,370 Bruker 1,248,573 1.077,700 CARBO Ceramics 1,255,215 1.07
24,220 Carlisle Companies 1,183,268 1.0124,640 Cavium 1,059,274 0.9112,230 City National 660,665 0.5621,800 Cohen & Steers 724,741 0.6253,400 Commercial Metals 767,091 0.6617,800 Concur Technologies 892,403 0.7630,760 Cornerstone OnDemand 563,216 0.4823,240 Corporate Executive Board 1,004,317 0.8630,960 Cubist Pharmaceuticals 1,124,777 0.9620,100 Cymer 988,015 0.8552,370 DealerTrack Holdings 1,190,370 1.0216,700 Deckers Outdoor 1,461,751 1.2542,430 DigitalGlobe 1,080,904 0.923,000 Douglas Emmett 59,220 0.05
19,000 Dril-Quip 1,291,335 1.11110,800 DynaVox - A Shares 843,742 0.7268,050 Emeritus 1,450,145 1.2444,690 EnerSys 1,524,376 1.3062,320 Envestnet 906,133 0.7845,700 Financial Engines 1,187,743 1.0235,280 Fluidigm 583,002 0.5032,390 Forest Oil 861,574 0.7429,460 Fortinet 795,273 0.6820,800 Fresh Market 807,664 0.6923,360 Fusion-io 723,576 0.6233,810 Gaylord Entertainment 1,012,102 0.8758,070 Generac Holdings 1,125,397 0.9632,050 General Cable 1,350,907 1.1619,190 Gentex 582,129 0.5024,580 Geo Group 563,374 0.4855,180 Global Geophysical Services 979,997 0.8422,120 Graco 1,123,917 0.9612,600 Greenhill & Co. 678,573 0.58
100,860 Halozyme Therapeutics 696,438 0.6040,770 Health Net 1,331,140 1.1435,360 Healthspring 1,641,411 1.4139,256 Heico 2,144,359 1.8418,580 Hittite Microwave 1,139,883 0.98
700 Home Properties 42,189 0.0416,400 HomeAway 637,222 0.5488,200 Idenix Pharmaceuticals 448,938 0.3826,050 Impax Laboratories 554,474 0.4728,790 Innospec 962,450 0.8248,470 Inphi 837,077 0.7268,060 Insulet 1,483,708 1.2744,809 IntraLinks Holdings 773,403 0.6627,300 Ixia 348,348 0.3010,680 Lennox International 462,497 0.4036,000 Life Time Fitness 1,438,740 1.2325,060 LogMeIn 947,268 0.8147,000 Lone Pine Resources 505,015 0.4323,700 Lumber Liquidators Holdings 609,327 0.5279,800 Magnum Hunter Resources 542,241 0.4645,990 Marten Transport 985,796 0.8428,870 Masimo 856,862 0.7349,830 MELA Sciences 125,572 0.1116,800 Merit Medical Systems 301,476 0.2616,200 Middleby 1,533,735 1.3136,000 Mistras Group 581,580 0.50133,700 Morgans Hotel Group 962,640 0.8210,920 Morningstar 664,810 0.5713,730 MSCI - A Shares 520,642 0.4571,090 National CineMedia 1,186,492 1.01
62,060 Nektar Therapeutics 447,763 0.3838,170 NetSuite 1,505,997 1.2944,550 Nuance Communications 962,725 0.8249,510 Old Dominion Freight Line 1,829,147 1.5797,020 Omnicell 1,460,636 1.2521,320 Onyx Pharmaceuticals 774,236 0.66
40,950 Oxford Industries 1,380,424 1.1895,583 PennantPark Investment 1,065,273 0.9132,290 Petroleum Development 966,117 0.836,500 Pharmasset 720,590 0.62
21,200 Rackspace Hosting 913,720 0.7851,460 RealD 1,216,772 1.0440,620 RealPage 1,097,755 0.9468,260 Regal Entertainment Group - A Shares 841,305 0.7224,880 Riverbed Technology 987,612 0.8466,600 Rush Enterprises - A Shares 1,271,394 1.0929,900 Sagent Pharmaceuticals 828,379 0.71
9,200 Signature Bank/New York 521,410 0.4534,370 Simpson Manufacturing 1,023,023 0.8852,840 SolarWinds 1,356,931 1.1613,700 Sotheby’s 601,019 0.5144,710 Sourcefire 1,341,971 1.1513,800 Stifel Financial 490,935 0.424,700 Strayer Education 595,866 0.51
21,800 Superior Energy Services 815,865 0.7043,630 Taleo - A Shares 1,611,474 1.3811,700 Tenneco 518,544 0.4418,200 Tesla Motors 521,248 0.4526,130 Thoratec 846,220 0.7238,880 TIBCO Software 1,119,550 0.9620,800 Titan International 497,328 0.4338,900 Trex 953,439 0.8272,000 TriQuint Semiconductor 740,520 0.6317,200 Vail Resorts 793,092 0.6828,810 Vera Bradley 1,083,256 0.9324,220 Viropharma 439,351 0.3822,350 Wabtec 1,472,083 1.268,900 Watsco 602,441 0.51
52,500 Zipcar 1,116,937 0.96
111,275,384 95.23
ISRAEL32,300 Mellanox Technologies 948,005 0.8199,500 Syneron Medical 1,202,457 1.03
2,150,462 1.84
NETHERLANDS43,630 Tornier 1,188,263 1.02
1,188,263 1.02
CANADA137,480 Imris 954,111 0.82
954,111 0.82
Total Shares 115,568,220 98.91
Total Transferable Securities Admitted to anOfficial Exchange Listing
115,568,220 98.91
Total Investments 115,568,220 98.91
Cash 1,386,429 1.19
Other Assets/(Liabilities) (114,995) (0.10)
Total Net Assets 116,839,654 100.00
407
JPMorgan Funds - US Small Cap Growth FundSchedule of Investments (Market Value Expressed in USD)
As at 30 June 2011
Quantity/Nominal
Value
Name of Securities MarketValue
%of
NetAssets
Quantity/Nominal
Value
Name of Securities MarketValue
%of
NetAssets
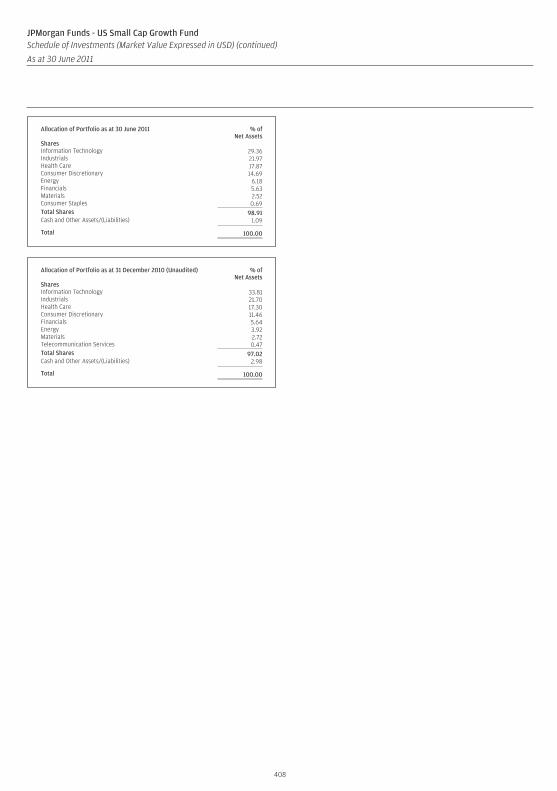
Allocation of Portfolio as at 30 June 2011 % ofNet Assets
SharesInformation Technology 29.36Industrials 21.97Health Care 17.87Consumer Discretionary 14.69Energy 6.18Financials 5.63Materials 2.52Consumer Staples 0.69Total Shares 98.91Cash and Other Assets/(Liabilities) 1.09
Total 100.00
Allocation of Portfolio as at 31 December 2010 (Unaudited) % ofNet Assets
SharesInformation Technology 33.81Industrials 21.70Health Care 17.30Consumer Discretionary 11.46Financials 5.64Energy 3.92Materials 2.72Telecommunication Services 0.47Total Shares 97.02Cash and Other Assets/(Liabilities) 2.98
Total 100.00
408
JPMorgan Funds - US Small Cap Growth FundSchedule of Investments (Market Value Expressed in USD) (continued)
As at 30 June 2011
Quantity/Nominal
Value
Name of Securities MarketValue
%of
NetAssets
Quantity/Nominal
Value
Name of Securities MarketValue
%of
NetAssets
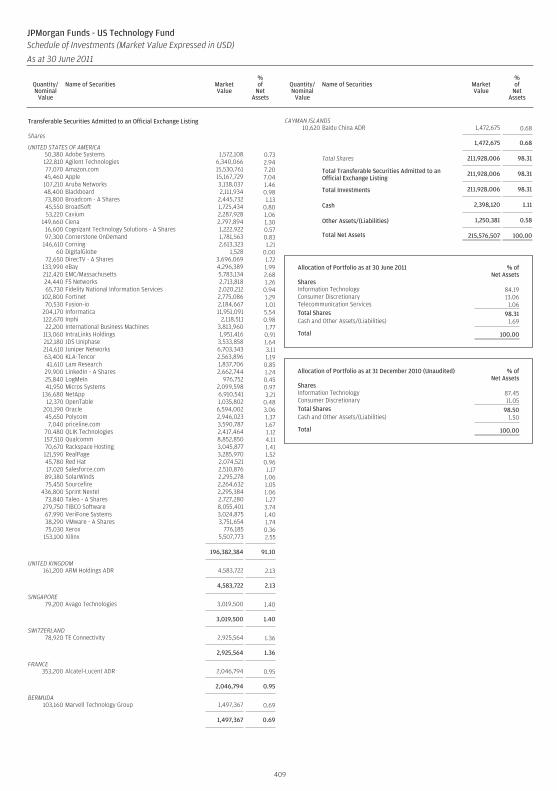
Transferable Securities Admitted to an Official Exchange Listing
Shares
UNITED STATES OF AMERICA50,380 Adobe Systems 1,572,108 0.73122,810 Agilent Technologies 6,340,066 2.9477,070 Amazon.com 15,530,761 7.2045,460 Apple 15,167,729 7.04107,210 Aruba Networks 3,138,037 1.4648,400 Blackboard 2,111,934 0.9873,800 Broadcom - A Shares 2,445,732 1.1345,550 BroadSoft 1,725,434 0.8053,220 Cavium 2,287,928 1.06
149,660 Ciena 2,797,894 1.3016,600 Cognizant Technology Solutions - A Shares 1,222,922 0.5797,300 Cornerstone OnDemand 1,781,563 0.83
146,610 Corning 2,613,323 1.2160 DigitalGlobe 1,528 0.00
72,650 DirecTV - A Shares 3,696,069 1.72133,990 eBay 4,296,389 1.99212,420 EMC/Massachusetts 5,783,134 2.6824,440 F5 Networks 2,713,818 1.2665,730 Fidelity National Information Services 2,020,212 0.94
102,800 Fortinet 2,775,086 1.2970,530 Fusion-io 2,184,667 1.01
204,170 Informatica 11,951,091 5.54122,670 Inphi 2,118,511 0.9822,200 International Business Machines 3,813,960 1.77
113,060 IntraLinks Holdings 1,951,416 0.91212,180 JDS Uniphase 3,533,858 1.64214,610 Juniper Networks 6,703,343 3.1163,400 KLA-Tencor 2,563,896 1.1941,610 Lam Research 1,837,706 0.85
29,900 LinkedIn - A Shares 2,662,744 1.2425,840 LogMeIn 976,752 0.4541,950 Micros Systems 2,099,598 0.97
136,680 NetApp 6,910,541 3.2112,370 OpenTable 1,035,802 0.48
201,190 Oracle 6,594,002 3.0645,650 Polycom 2,946,023 1.377,040 priceline.com 3,590,787 1.67
70,480 QLIK Technologies 2,417,464 1.12157,510 Qualcomm 8,852,850 4.1170,670 Rackspace Hosting 3,045,877 1.41121,590 RealPage 3,285,970 1.5245,780 Red Hat 2,074,521 0.9617,020 Salesforce.com 2,510,876 1.1789,380 SolarWinds 2,295,278 1.0675,450 Sourcefire 2,264,632 1.05
436,800 Sprint Nextel 2,295,384 1.0673,840 Taleo - A Shares 2,727,280 1.27
279,750 TIBCO Software 8,055,401 3.7467,990 VeriFone Systems 3,024,875 1.4038,290 VMware - A Shares 3,751,654 1.7475,030 Xerox 776,185 0.36
153,100 Xilinx 5,507,773 2.55
196,382,384 91.10
UNITED KINGDOM161,200 ARM Holdings ADR 4,583,722 2.13
4,583,722 2.13
SINGAPORE79,200 Avago Technologies 3,019,500 1.40
3,019,500 1.40
SWITZERLAND78,920 TE Connectivity 2,925,564 1.36
2,925,564 1.36
FRANCE353,200 Alcatel-Lucent ADR 2,046,794 0.95
2,046,794 0.95
BERMUDA103,160 Marvell Technology Group 1,497,367 0.69
1,497,367 0.69
CAYMAN ISLANDS10,620 Baidu China ADR 1,472,675 0.68
1,472,675 0.68
Total Shares 211,928,006 98.31
Total Transferable Securities Admitted to anOfficial Exchange Listing
211,928,006 98.31
Total Investments 211,928,006 98.31
Cash 2,398,120 1.11
Other Assets/(Liabilities) 1,250,381 0.58
Total Net Assets 215,576,507 100.00
Allocation of Portfolio as at 30 June 2011 % ofNet Assets
SharesInformation Technology 84.19Consumer Discretionary 13.06Telecommunication Services 1.06Total Shares 98.31Cash and Other Assets/(Liabilities) 1.69
Total 100.00
Allocation of Portfolio as at 31 December 2010 (Unaudited) % ofNet Assets
SharesInformation Technology 87.45Consumer Discretionary 11.05Total Shares 98.50Cash and Other Assets/(Liabilities) 1.50
Total 100.00
409
JPMorgan Funds - US Technology FundSchedule of Investments (Market Value Expressed in USD)
As at 30 June 2011
Quantity/Nominal
Value
Name of Securities MarketValue
%of
NetAssets
Quantity/Nominal
Value
Name of Securities MarketValue
%of
NetAssets
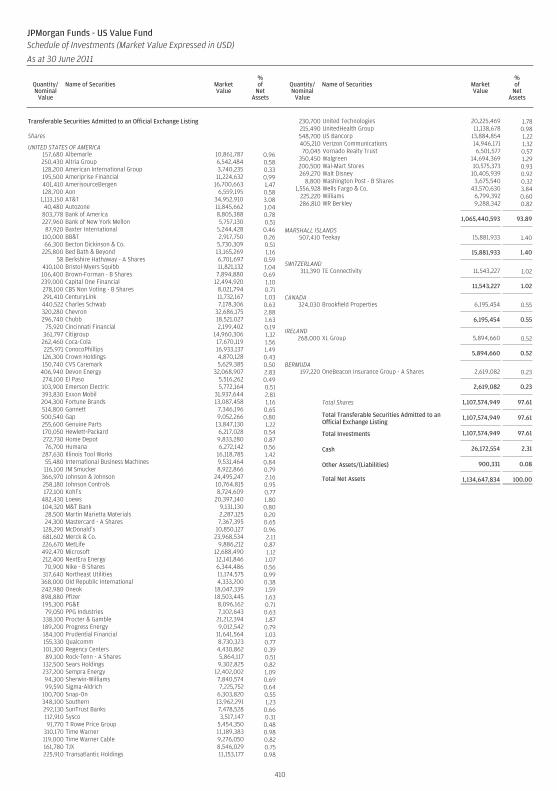
Transferable Securities Admitted to an Official Exchange Listing
Shares
UNITED STATES OF AMERICA157,680 Albemarle 10,861,787 0.96250,430 Altria Group 6,542,484 0.58128,200 American International Group 3,740,235 0.33195,500 Ameriprise Financial 11,224,632 0.99401,410 AmerisourceBergen 16,700,663 1.47128,700 Aon 6,559,195 0.58
1,113,150 AT&T 34,952,910 3.0840,480 Autozone 11,845,662 1.04
803,778 Bank of America 8,805,388 0.78227,960 Bank of New York Mellon 5,757,130 0.5187,920 Baxter International 5,244,428 0.46
110,000 BB&T 2,917,750 0.2666,300 Becton Dickinson & Co. 5,730,309 0.51
225,800 Bed Bath & Beyond 13,165,269 1.1658 Berkshire Hathaway - A Shares 6,701,697 0.59
410,100 Bristol-Myers Squibb 11,821,132 1.04106,400 Brown-Forman - B Shares 7,894,880 0.69239,000 Capital One Financial 12,494,920 1.10278,100 CBS Non Voting - B Shares 8,021,794 0.71291,410 CenturyLink 11,732,167 1.03440,522 Charles Schwab 7,178,306 0.63320,280 Chevron 32,686,175 2.88296,740 Chubb 18,521,027 1.63
75,920 Cincinnati Financial 2,199,402 0.19361,797 Citigroup 14,960,306 1.32
262,460 Coca-Cola 17,670,119 1.56225,971 ConocoPhillips 16,933,137 1.49126,300 Crown Holdings 4,870,128 0.43150,740 CVS Caremark 5,629,385 0.50
406,940 Devon Energy 32,068,907 2.83274,100 El Paso 5,516,262 0.49103,900 Emerson Electric 5,772,164 0.51393,830 Exxon Mobil 31,937,644 2.81204,300 Fortune Brands 13,087,458 1.16514,800 Gannett 7,346,196 0.65500,540 Gap 9,052,266 0.80255,600 Genuine Parts 13,847,130 1.22170,050 Hewlett-Packard 6,217,028 0.54272,730 Home Depot 9,833,280 0.8776,700 Humana 6,272,142 0.56
287,630 Illinois Tool Works 16,118,785 1.4255,480 International Business Machines 9,531,464 0.84116,100 JM Smucker 8,922,866 0.79
366,970 Johnson & Johnson 24,495,247 2.16258,180 Johnson Controls 10,764,815 0.95172,100 Kohl’s 8,724,609 0.77
482,430 Loews 20,397,140 1.80104,320 M&T Bank 9,131,130 0.8028,500 Martin Marietta Materials 2,287,125 0.2024,300 Mastercard - A Shares 7,367,395 0.65
128,290 McDonald’s 10,850,127 0.96681,602 Merck & Co. 23,968,534 2.11226,670 MetLife 9,886,212 0.87492,470 Microsoft 12,688,490 1.12212,400 NextEra Energy 12,141,846 1.0770,900 Nike - B Shares 6,344,486 0.56
317,640 Northeast Utilities 11,174,575 0.99368,000 Old Republic International 4,333,200 0.38242,980 Oneok 18,047,339 1.59898,880 Pfizer 18,503,445 1.63195,300 PG&E 8,096,162 0.7179,050 PPG Industries 7,102,643 0.63
338,100 Procter & Gamble 21,212,394 1.87189,200 Progress Energy 9,012,542 0.79184,100 Prudential Financial 11,641,564 1.03155,330 Qualcomm 8,730,323 0.77101,300 Regency Centers 4,430,862 0.3989,100 Rock-Tenn - A Shares 5,864,117 0.51
132,500 Sears Holdings 9,302,825 0.82237,200 Sempra Energy 12,402,002 1.0994,300 Sherwin-Williams 7,840,574 0.6999,590 Sigma-Aldrich 7,225,752 0.64
100,700 Snap-On 6,303,820 0.55348,100 Southern 13,962,291 1.23292,130 SunTrust Banks 7,478,528 0.66112,910 Sysco 3,517,147 0.3191,770 T Rowe Price Group 5,454,350 0.48
310,170 Time Warner 11,189,383 0.98119,000 Time Warner Cable 9,276,050 0.82161,780 TJX 8,546,029 0.75225,910 Transatlantic Holdings 11,153,177 0.98
230,700 United Technologies 20,225,469 1.78215,490 UnitedHealth Group 11,138,678 0.98548,700 US Bancorp 13,884,854 1.22405,210 Verizon Communications 14,946,171 1.3270,045 Vornado Realty Trust 6,501,577 0.57
350,450 Walgreen 14,694,369 1.29200,500 Wal-Mart Stores 10,575,373 0.93269,270 Walt Disney 10,405,939 0.92
8,800 Washington Post - B Shares 3,675,540 0.321,556,928 Wells Fargo & Co. 43,570,630 3.84
225,220 Williams 6,799,392 0.60286,810 WR Berkley 9,288,342 0.82
1,065,440,593 93.89
MARSHALL ISLANDS507,410 Teekay 15,881,933 1.40
15,881,933 1.40
SWITZERLAND311,390 TE Connectivity 11,543,227 1.02
11,543,227 1.02
CANADA324,030 Brookfield Properties 6,195,454 0.55
6,195,454 0.55
IRELAND268,000 XL Group 5,894,660 0.52
5,894,660 0.52
BERMUDA197,220 OneBeacon Insurance Group - A Shares 2,619,082 0.23
2,619,082 0.23
Total Shares 1,107,574,949 97.61
Total Transferable Securities Admitted to anOfficial Exchange Listing
1,107,574,949 97.61
Total Investments 1,107,574,949 97.61
Cash 26,172,554 2.31
Other Assets/(Liabilities) 900,331 0.08
Total Net Assets 1,134,647,834 100.00
410
JPMorgan Funds - US Value FundSchedule of Investments (Market Value Expressed in USD)
As at 30 June 2011
Quantity/Nominal
Value
Name of Securities MarketValue
%of
NetAssets
Quantity/Nominal
Value
Name of Securities MarketValue
%of
NetAssets
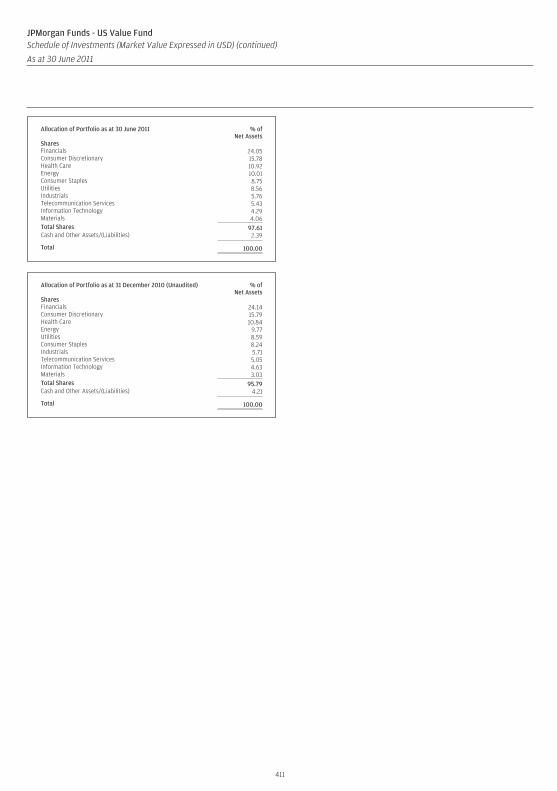
Allocation of Portfolio as at 30 June 2011 % ofNet Assets
SharesFinancials 24.05Consumer Discretionary 15.78Health Care 10.92Energy 10.01Consumer Staples 8.75Utilities 8.56Industrials 5.76Telecommunication Services 5.43Information Technology 4.29Materials 4.06Total Shares 97.61Cash and Other Assets/(Liabilities) 2.39
Total 100.00
Allocation of Portfolio as at 31 December 2010 (Unaudited) % ofNet Assets
SharesFinancials 24.14Consumer Discretionary 15.79Health Care 10.84Energy 9.77Utilities 8.59Consumer Staples 8.24Industrials 5.71Telecommunication Services 5.05Information Technology 4.63Materials 3.03Total Shares 95.79Cash and Other Assets/(Liabilities) 4.21
Total 100.00
411
JPMorgan Funds - US Value FundSchedule of Investments (Market Value Expressed in USD) (continued)
As at 30 June 2011
Quantity/Nominal
Value
Name of Securities MarketValue
%of
NetAssets
Quantity/Nominal
Value
Name of Securities MarketValue
%of
NetAssets
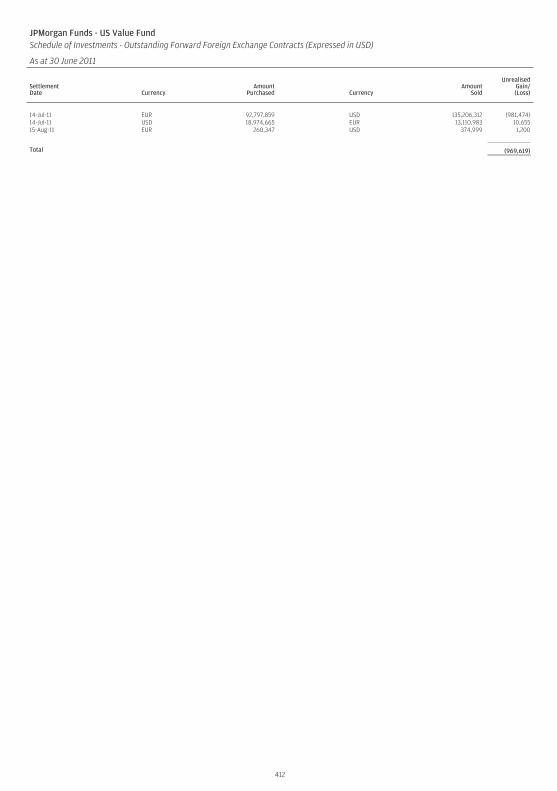
JPMorgan Funds - US Value FundSchedule of Investments - Outstanding Forward Foreign Exchange Contracts (Expressed in USD)
As at 30 June 2011
SettlementDate Currency
AmountPurchased Currency
AmountSold
UnrealisedGain/(Loss)
14-Jul-11 EUR 92,797,859 USD 135,206,312 (981,474)14-Jul-11 USD 18,974,665 EUR 13,110,983 10,65515-Aug-11 EUR 260,347 USD 374,999 1,200
Total (969,619)
412
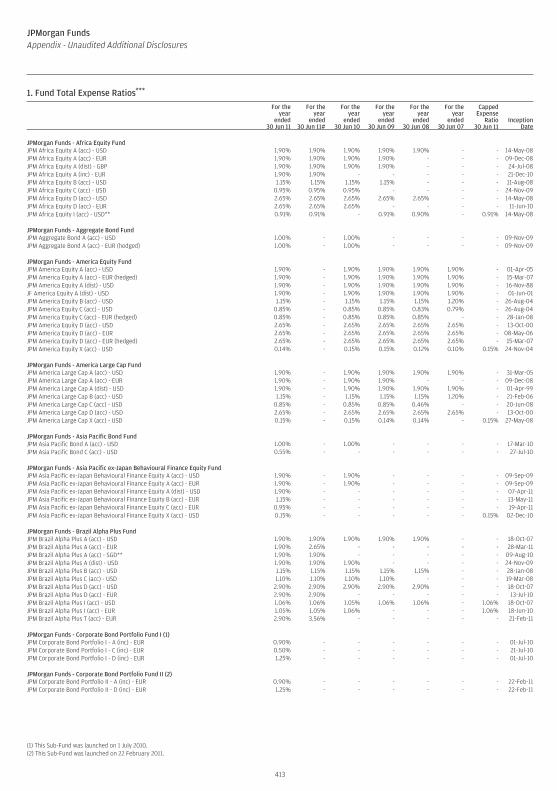
1. Fund Total Expense Ratios (continued)For the
yearended
30 Jun 11
For theyear
ended30 Jun 11#
For theyear
ended30 Jun 10
For theyear
ended30 Jun 09
For theyear
ended30 Jun 08
For theyear
ended30 Jun 07
CappedExpense
Ratio30 Jun 11
InceptionDate
JPMorgan Funds - Africa Equity FundJPM Africa Equity A (acc) - USD 1.90% 1.90% 1.90% 1.90% 1.90% - - 14-May-08JPM Africa Equity A (acc) - EUR 1.90% 1.90% 1.90% 1.90% - - - 09-Dec-08JPM Africa Equity A (dist) - GBP 1.90% 1.90% 1.90% 1.90% - - - 24-Jul-08JPM Africa Equity A (inc) - EUR 1.90% 1.90% - - - - - 21-Dec-10JPM Africa Equity B (acc) - USD 1.15% 1.15% 1.15% 1.15% - - - 11-Aug-08JPM Africa Equity C (acc) - USD 0.95% 0.95% 0.95% - - - - 24-Nov-09JPM Africa Equity D (acc) - USD 2.65% 2.65% 2.65% 2.65% 2.65% - - 14-May-08JPM Africa Equity D (acc) - EUR 2.65% 2.65% 2.65% - - - - 11-Jun-10JPM Africa Equity I (acc) - USD** 0.91% 0.91% - 0.91% 0.90% - 0.91% 14-May-08
JPMorgan Funds - Aggregate Bond FundJPM Aggregate Bond A (acc) - USD 1.00% - 1.00% - - - - 09-Nov-09JPM Aggregate Bond A (acc) - EUR (hedged) 1.00% - 1.00% - - - - 09-Nov-09
JPMorgan Funds - America Equity FundJPM America Equity A (acc) - USD 1.90% - 1.90% 1.90% 1.90% 1.90% - 01-Apr-05JPM America Equity A (acc) - EUR (hedged) 1.90% - 1.90% 1.90% 1.90% 1.90% - 15-Mar-07JPM America Equity A (dist) - USD 1.90% - 1.90% 1.90% 1.90% 1.90% - 16-Nov-88JF America Equity A (dist) - USD 1.90% - 1.90% 1.90% 1.90% 1.90% - 01-Jun-01JPM America Equity B (acc) - USD 1.15% - 1.15% 1.15% 1.15% 1.20% - 26-Aug-04JPM America Equity C (acc) - USD 0.85% - 0.85% 0.85% 0.83% 0.79% - 26-Aug-04JPM America Equity C (acc) - EUR (hedged) 0.85% - 0.85% 0.85% 0.85% - - 28-Jan-08JPM America Equity D (acc) - USD 2.65% - 2.65% 2.65% 2.65% 2.65% - 13-Oct-00JPM America Equity D (acc) - EUR 2.65% - 2.65% 2.65% 2.65% 2.65% - 08-May-06JPM America Equity D (acc) - EUR (hedged) 2.65% - 2.65% 2.65% 2.65% 2.65% - 15-Mar-07JPM America Equity X (acc) - USD 0.14% - 0.15% 0.15% 0.12% 0.10% 0.15% 24-Nov-04
JPMorgan Funds - America Large Cap FundJPM America Large Cap A (acc) - USD 1.90% - 1.90% 1.90% 1.90% 1.90% - 31-Mar-05JPM America Large Cap A (acc) - EUR 1.90% - 1.90% 1.90% - - - 09-Dec-08JPM America Large Cap A (dist) - USD 1.90% - 1.90% 1.90% 1.90% 1.90% - 01-Apr-99JPM America Large Cap B (acc) - USD 1.15% - 1.15% 1.15% 1.15% 1.20% - 21-Feb-06JPM America Large Cap C (acc) - USD 0.85% - 0.85% 0.85% 0.46% - - 20-Jun-08JPM America Large Cap D (acc) - USD 2.65% - 2.65% 2.65% 2.65% 2.65% - 13-Oct-00JPM America Large Cap X (acc) - USD 0.15% - 0.15% 0.14% 0.14% - 0.15% 27-May-08
JPMorgan Funds - Asia Pacific Bond FundJPM Asia Pacific Bond A (acc) - USD 1.00% - 1.00% - - - - 17-Mar-10JPM Asia Pacific Bond C (acc) - USD 0.55% - - - - - - 27-Jul-10
JPMorgan Funds - Asia Pacific ex-Japan Behavioural Finance Equity FundJPM Asia Pacific ex-Japan Behavioural Finance Equity A (acc) - USD 1.90% - 1.90% - - - - 09-Sep-09JPM Asia Pacific ex-Japan Behavioural Finance Equity A (acc) - EUR 1.90% - 1.90% - - - - 09-Sep-09JPM Asia Pacific ex-Japan Behavioural Finance Equity A (dist) - USD 1.90% - - - - - - 07-Apr-11JPM Asia Pacific ex-Japan Behavioural Finance Equity B (acc) - EUR 1.15% - - - - - - 13-May-11JPM Asia Pacific ex-Japan Behavioural Finance Equity C (acc) - EUR 0.95% - - - - - - 19-Apr-11JPM Asia Pacific ex-Japan Behavioural Finance Equity X (acc) - USD 0.15% - - - - - 0.15% 02-Dec-10
JPMorgan Funds - Brazil Alpha Plus FundJPM Brazil Alpha Plus A (acc) - USD 1.90% 1.90% 1.90% 1.90% 1.90% - - 18-Oct-07JPM Brazil Alpha Plus A (acc) - EUR 1.90% 2.65% - - - - - 28-Mar-11JPM Brazil Alpha Plus A (acc) - SGD** 1.90% 1.90% - - - - - 09-Aug-10JPM Brazil Alpha Plus A (dist) - USD 1.90% 1.90% 1.90% - - - - 24-Nov-09JPM Brazil Alpha Plus B (acc) - USD 1.15% 1.15% 1.15% 1.15% 1.15% - - 28-Jan-08JPM Brazil Alpha Plus C (acc) - USD 1.10% 1.10% 1.10% 1.10% - - - 19-Mar-08JPM Brazil Alpha Plus D (acc) - USD 2.90% 2.90% 2.90% 2.90% 2.90% - - 18-Oct-07JPM Brazil Alpha Plus D (acc) - EUR 2.90% 2.90% - - - - - 13-Jul-10JPM Brazil Alpha Plus I (acc) - USD 1.06% 1.06% 1.05% 1.06% 1.06% - 1.06% 18-Oct-07JPM Brazil Alpha Plus I (acc) - EUR 1.05% 1.05% 1.06% - - - 1.06% 18-Jun-10JPM Brazil Alpha Plus T (acc) - EUR 2.90% 3.56% - - - - - 21-Feb-11
JPMorgan Funds - Corporate Bond Portfolio Fund I (1)JPM Corporate Bond Portfolio I - A (inc) - EUR 0.90% - - - - - - 01-Jul-10JPM Corporate Bond Portfolio I - C (inc) - EUR 0.50% - - - - - - 21-Jul-10JPM Corporate Bond Portfolio I - D (inc) - EUR 1.25% - - - - - - 01-Jul-10
JPMorgan Funds - Corporate Bond Portfolio Fund II (2)JPM Corporate Bond Portfolio II - A (inc) - EUR 0.90% - - - - - - 22-Feb-11JPM Corporate Bond Portfolio II - D (inc) - EUR 1.25% - - - - - - 22-Feb-11
(1) This Sub-Fund was launched on 1 July 2010.(2) This Sub-Fund was launched on 22 February 2011.
413
JPMorgan FundsAppendix - Unaudited Additional Disclosures
***
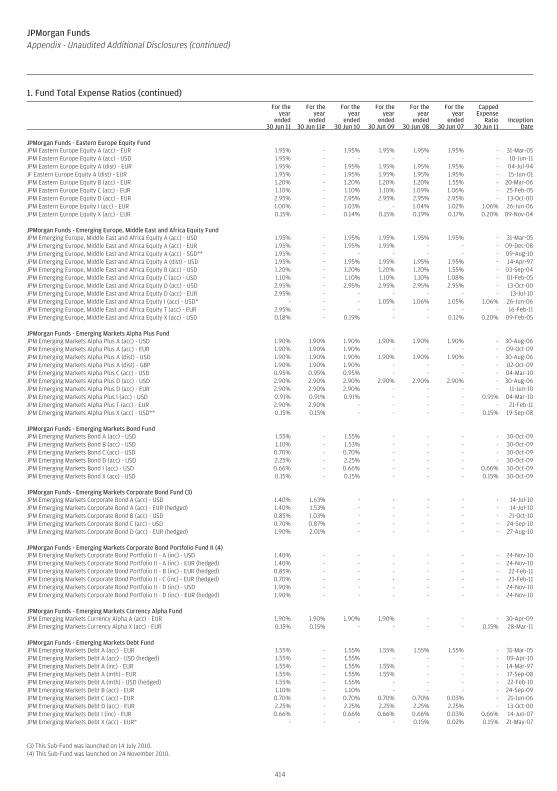
1. Fund Total Expense Ratios (continued)For the
yearended
30 Jun 11
For theyear
ended30 Jun 11#
For theyear
ended30 Jun 10
For theyear
ended30 Jun 09
For theyear
ended30 Jun 08
For theyear
ended30 Jun 07
CappedExpense
Ratio30 Jun 11
InceptionDate
JPMorgan Funds - Eastern Europe Equity FundJPM Eastern Europe Equity A (acc) - EUR 1.95% - 1.95% 1.95% 1.95% 1.95% - 31-Mar-05JPM Eastern Europe Equity A (acc) - USD 1.95% - - - - - - 10-Jun-11JPM Eastern Europe Equity A (dist) - EUR 1.95% - 1.95% 1.95% 1.95% 1.95% - 04-Jul-94JF Eastern Europe Equity A (dist) - EUR 1.95% - 1.95% 1.95% 1.95% 1.95% - 15-Jun-01JPM Eastern Europe Equity B (acc) - EUR 1.20% - 1.20% 1.20% 1.20% 1.55% - 20-Mar-06JPM Eastern Europe Equity C (acc) - EUR 1.10% - 1.10% 1.10% 1.09% 1.06% - 25-Feb-05JPM Eastern Europe Equity D (acc) - EUR 2.95% - 2.95% 2.95% 2.95% 2.95% - 13-Oct-00JPM Eastern Europe Equity I (acc) - EUR 1.00% - 1.03% - 1.04% 1.02% 1.06% 26-Jun-06JPM Eastern Europe Equity X (acc) - EUR 0.15% - 0.14% 0.15% 0.19% 0.17% 0.20% 09-Nov-04
JPMorgan Funds - Emerging Europe, Middle East and Africa Equity FundJPM Emerging Europe, Middle East and Africa Equity A (acc) - USD 1.95% - 1.95% 1.95% 1.95% 1.95% - 31-Mar-05JPM Emerging Europe, Middle East and Africa Equity A (acc) - EUR 1.95% - 1.95% 1.95% - - - 09-Dec-08JPM Emerging Europe, Middle East and Africa Equity A (acc) - SGD** 1.95% - - - - - - 09-Aug-10JPM Emerging Europe, Middle East and Africa Equity A (dist) - USD 1.95% - 1.95% 1.95% 1.95% 1.95% - 14-Apr-97JPM Emerging Europe, Middle East and Africa Equity B (acc) - USD 1.20% - 1.20% 1.20% 1.20% 1.55% - 03-Sep-04JPM Emerging Europe, Middle East and Africa Equity C (acc) - USD 1.10% - 1.10% 1.10% 1.10% 1.08% - 01-Feb-05JPM Emerging Europe, Middle East and Africa Equity D (acc) - USD 2.95% - 2.95% 2.95% 2.95% 2.95% - 13-Oct-00JPM Emerging Europe, Middle East and Africa Equity D (acc) - EUR 2.95% - - - - - - 13-Jul-10JPM Emerging Europe, Middle East and Africa Equity I (acc) - USD* - - - 1.05% 1.06% 1.05% 1.06% 26-Jun-06JPM Emerging Europe, Middle East and Africa Equity T (acc) - EUR 2.95% - - - - - - 16-Feb-11JPM Emerging Europe, Middle East and Africa Equity X (acc) - USD 0.18% - 0.19% - - 0.12% 0.20% 09-Feb-05
JPMorgan Funds - Emerging Markets Alpha Plus FundJPM Emerging Markets Alpha Plus A (acc) - USD 1.90% 1.90% 1.90% 1.90% 1.90% 1.90% - 30-Aug-06JPM Emerging Markets Alpha Plus A (acc) - EUR 1.90% 1.90% 1.90% - - - - 09-Oct-09JPM Emerging Markets Alpha Plus A (dist) - USD 1.90% 1.90% 1.90% 1.90% 1.90% 1.90% - 30-Aug-06JPM Emerging Markets Alpha Plus A (dist) - GBP 1.90% 1.90% 1.90% - - - - 02-Oct-09JPM Emerging Markets Alpha Plus C (acc) - USD 0.95% 0.95% 0.95% - - - - 04-Mar-10JPM Emerging Markets Alpha Plus D (acc) - USD 2.90% 2.90% 2.90% 2.90% 2.90% 2.90% - 30-Aug-06JPM Emerging Markets Alpha Plus D (acc) - EUR 2.90% 2.90% 2.90% - - - - 11-Jun-10JPM Emerging Markets Alpha Plus I (acc) - USD 0.91% 0.91% 0.91% - - - 0.91% 04-Mar-10JPM Emerging Markets Alpha Plus T (acc) - EUR 2.90% 2.90% - - - - - 21-Feb-11JPM Emerging Markets Alpha Plus X (acc) - USD** 0.15% 0.15% - - - - 0.15% 19-Sep-08
JPMorgan Funds - Emerging Markets Bond FundJPM Emerging Markets Bond A (acc) - USD 1.55% - 1.55% - - - - 30-Oct-09JPM Emerging Markets Bond B (acc) - USD 1.10% - 1.53% - - - - 30-Oct-09JPM Emerging Markets Bond C (acc) - USD 0.70% - 0.70% - - - - 30-Oct-09JPM Emerging Markets Bond D (acc) - USD 2.25% - 2.25% - - - - 30-Oct-09JPM Emerging Markets Bond I (acc) - USD 0.66% - 0.66% - - - 0.66% 30-Oct-09JPM Emerging Markets Bond X (acc) - USD 0.15% - 0.15% - - - 0.15% 30-Oct-09
JPMorgan Funds - Emerging Markets Corporate Bond Fund (3)JPM Emerging Markets Corporate Bond A (acc) - USD 1.40% 1.63% - - - - - 14-Jul-10JPM Emerging Markets Corporate Bond A (acc) - EUR (hedged) 1.40% 1.53% - - - - - 14-Jul-10JPM Emerging Markets Corporate Bond B (acc) - USD 0.85% 1.03% - - - - - 21-Oct-10JPM Emerging Markets Corporate Bond C (acc) - USD 0.70% 0.87% - - - - - 24-Sep-10JPM Emerging Markets Corporate Bond D (acc) - EUR (hedged) 1.90% 2.01% - - - - - 27-Aug-10
JPMorgan Funds - Emerging Markets Corporate Bond Portfolio Fund II (4)JPM Emerging Markets Corporate Bond Portfolio II - A (inc) - USD 1.40% - - - - - - 24-Nov-10JPM Emerging Markets Corporate Bond Portfolio II - A (inc) - EUR (hedged) 1.40% - - - - - - 24-Nov-10JPM Emerging Markets Corporate Bond Portfolio II - B (inc) - EUR (hedged) 0.85% - - - - - - 22-Feb-11JPM Emerging Markets Corporate Bond Portfolio II - C (inc) - EUR (hedged) 0.70% - - - - - - 23-Feb-11JPM Emerging Markets Corporate Bond Portfolio II - D (inc) - USD 1.90% - - - - - - 24-Nov-10JPM Emerging Markets Corporate Bond Portfolio II - D (inc) - EUR (hedged) 1.90% - - - - - - 24-Nov-10
JPMorgan Funds - Emerging Markets Currency Alpha FundJPM Emerging Markets Currency Alpha A (acc) - EUR 1.90% 1.90% 1.90% 1.90% - - - 30-Apr-09JPM Emerging Markets Currency Alpha X (acc) - EUR 0.15% 0.15% - - - - 0.15% 28-Mar-11
JPMorgan Funds - Emerging Markets Debt FundJPM Emerging Markets Debt A (acc) - EUR 1.55% - 1.55% 1.55% 1.55% 1.55% - 31-Mar-05JPM Emerging Markets Debt A (acc) - USD (hedged) 1.55% - 1.55% - - - - 09-Apr-10JPM Emerging Markets Debt A (inc) - EUR 1.55% - 1.55% 1.55% - - - 14-Mar-97JPM Emerging Markets Debt A (mth) - EUR 1.55% - 1.55% 1.55% - - - 17-Sep-08JPM Emerging Markets Debt A (mth) - USD (hedged) 1.55% - 1.55% - - - - 22-Feb-10JPM Emerging Markets Debt B (acc) - EUR 1.10% - 1.10% - - - - 24-Sep-09JPM Emerging Markets Debt C (acc) - EUR 0.70% - 0.70% 0.70% 0.70% 0.03% - 21-Jun-06JPM Emerging Markets Debt D (acc) - EUR 2.25% - 2.25% 2.25% 2.25% 2.25% - 13-Oct-00JPM Emerging Markets Debt I (inc) - EUR 0.66% - 0.66% 0.66% 0.66% 0.03% 0.66% 14-Jun-07JPM Emerging Markets Debt X (acc) - EUR* - - - - 0.15% 0.02% 0.15% 21-May-07
(3) This Sub-Fund was launched on 14 July 2010.(4) This Sub-Fund was launched on 24 November 2010.
414
JPMorgan FundsAppendix - Unaudited Additional Disclosures (continued)
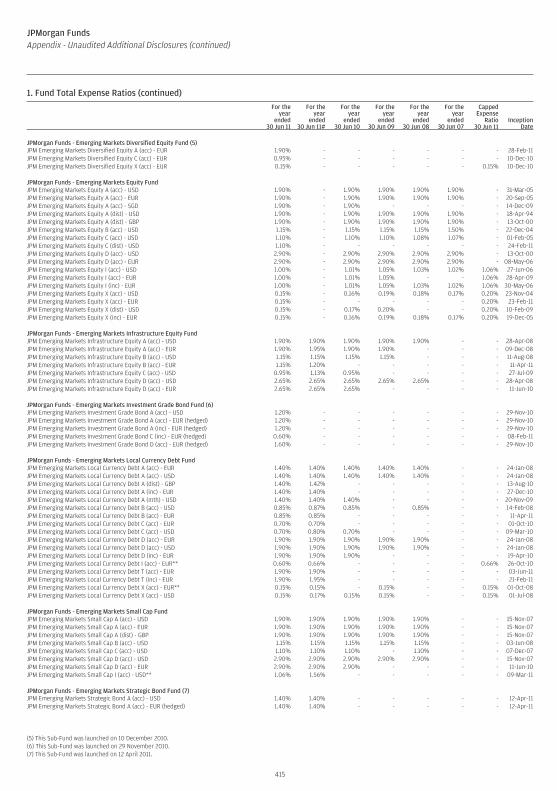
1. Fund Total Expense Ratios (continued)For the
yearended
30 Jun 11
For theyear
ended30 Jun 11#
For theyear
ended30 Jun 10
For theyear
ended30 Jun 09
For theyear
ended30 Jun 08
For theyear
ended30 Jun 07
CappedExpense
Ratio30 Jun 11
InceptionDate
JPMorgan Funds - Emerging Markets Diversified Equity Fund (5)JPM Emerging Markets Diversified Equity A (acc) - EUR 1.90% - - - - - - 28-Feb-11JPM Emerging Markets Diversified Equity C (acc) - EUR 0.95% - - - - - - 10-Dec-10JPM Emerging Markets Diversified Equity X (acc) - EUR 0.15% - - - - - 0.15% 10-Dec-10
JPMorgan Funds - Emerging Markets Equity FundJPM Emerging Markets Equity A (acc) - USD 1.90% - 1.90% 1.90% 1.90% 1.90% - 31-Mar-05JPM Emerging Markets Equity A (acc) - EUR 1.90% - 1.90% 1.90% 1.90% 1.90% - 20-Sep-05JPM Emerging Markets Equity A (acc) - SGD 1.90% - 1.90% - - - - 14-Dec-09JPM Emerging Markets Equity A (dist) - USD 1.90% - 1.90% 1.90% 1.90% 1.90% - 18-Apr-94JPM Emerging Markets Equity A (dist) - GBP 1.90% - 1.90% 1.90% 1.90% 1.90% - 13-Oct-00JPM Emerging Markets Equity B (acc) - USD 1.15% - 1.15% 1.15% 1.15% 1.50% - 22-Dec-04JPM Emerging Markets Equity C (acc) - USD 1.10% - 1.10% 1.10% 1.08% 1.07% - 01-Feb-05JPM Emerging Markets Equity C (dist) - USD 1.10% - - - - - - 24-Feb-11JPM Emerging Markets Equity D (acc) - USD 2.90% - 2.90% 2.90% 2.90% 2.90% - 13-Oct-00JPM Emerging Markets Equity D (acc) - EUR 2.90% - 2.90% 2.90% 2.90% 2.90% - 08-May-06JPM Emerging Markets Equity I (acc) - USD 1.00% - 1.01% 1.05% 1.03% 1.02% 1.06% 27-Jun-06JPM Emerging Markets Equity I (acc) - EUR 1.00% - 1.01% 1.05% - - 1.06% 28-Apr-09JPM Emerging Markets Equity I (inc) - EUR 1.00% - 1.01% 1.05% 1.03% 1.02% 1.06% 30-May-06JPM Emerging Markets Equity X (acc) - USD 0.15% - 0.16% 0.19% 0.18% 0.17% 0.20% 23-Nov-04JPM Emerging Markets Equity X (acc) - EUR 0.15% - - - - - 0.20% 23-Feb-11JPM Emerging Markets Equity X (dist) - USD 0.15% - 0.17% 0.20% - - 0.20% 10-Feb-09JPM Emerging Markets Equity X (inc) - EUR 0.15% - 0.16% 0.19% 0.18% 0.17% 0.20% 19-Dec-05
JPMorgan Funds - Emerging Markets Infrastructure Equity FundJPM Emerging Markets Infrastructure Equity A (acc) - USD 1.90% 1.90% 1.90% 1.90% 1.90% - - 28-Apr-08JPM Emerging Markets Infrastructure Equity A (acc) - EUR 1.90% 1.95% 1.90% 1.90% - - - 09-Dec-08JPM Emerging Markets Infrastructure Equity B (acc) - USD 1.15% 1.15% 1.15% 1.15% - - - 11-Aug-08JPM Emerging Markets Infrastructure Equity B (acc) - EUR 1.15% 1.20% - - - - - 11-Apr-11JPM Emerging Markets Infrastructure Equity C (acc) - USD 0.95% 1.13% 0.95% - - - - 27-Jul-09JPM Emerging Markets Infrastructure Equity D (acc) - USD 2.65% 2.65% 2.65% 2.65% 2.65% - - 28-Apr-08JPM Emerging Markets Infrastructure Equity D (acc) - EUR 2.65% 2.65% 2.65% - - - - 11-Jun-10
JPMorgan Funds - Emerging Markets Investment Grade Bond Fund (6)JPM Emerging Markets Investment Grade Bond A (acc) - USD 1.20% - - - - - - 29-Nov-10JPM Emerging Markets Investment Grade Bond A (acc) - EUR (hedged) 1.20% - - - - - - 29-Nov-10JPM Emerging Markets Investment Grade Bond A (inc) - EUR (hedged) 1.20% - - - - - - 29-Nov-10JPM Emerging Markets Investment Grade Bond C (inc) - EUR (hedged) 0.60% - - - - - - 08-Feb-11JPM Emerging Markets Investment Grade Bond D (acc) - EUR (hedged) 1.60% - - - - - - 29-Nov-10
JPMorgan Funds - Emerging Markets Local Currency Debt FundJPM Emerging Markets Local Currency Debt A (acc) - EUR 1.40% 1.40% 1.40% 1.40% 1.40% - - 24-Jan-08JPM Emerging Markets Local Currency Debt A (acc) - USD 1.40% 1.40% 1.40% 1.40% 1.40% - - 24-Jan-08JPM Emerging Markets Local Currency Debt A (dist) - GBP 1.40% 1.42% - - - - - 13-Aug-10JPM Emerging Markets Local Currency Debt A (inc) - EUR 1.40% 1.40% - - - - - 27-Dec-10JPM Emerging Markets Local Currency Debt A (mth) - USD 1.40% 1.40% 1.40% - - - - 20-Nov-09JPM Emerging Markets Local Currency Debt B (acc) - USD 0.85% 0.87% 0.85% - 0.85% - - 14-Feb-08JPM Emerging Markets Local Currency Debt B (acc) - EUR 0.85% 0.85% - - - - - 11-Apr-11JPM Emerging Markets Local Currency Debt C (acc) - EUR 0.70% 0.70% - - - - - 01-Oct-10JPM Emerging Markets Local Currency Debt C (acc) - USD 0.70% 0.80% 0.70% - - - - 09-Mar-10JPM Emerging Markets Local Currency Debt D (acc) - EUR 1.90% 1.90% 1.90% 1.90% 1.90% - - 24-Jan-08JPM Emerging Markets Local Currency Debt D (acc) - USD 1.90% 1.90% 1.90% 1.90% 1.90% - - 24-Jan-08JPM Emerging Markets Local Currency Debt D (inc) - EUR 1.90% 1.90% 1.90% - - - - 19-Apr-10JPM Emerging Markets Local Currency Debt I (acc) - EUR** 0.60% 0.66% - - - - 0.66% 26-Oct-10JPM Emerging Markets Local Currency Debt T (acc) - EUR 1.90% 1.90% - - - - - 03-Jun-11JPM Emerging Markets Local Currency Debt T (inc) - EUR 1.90% 1.95% - - - - - 21-Feb-11JPM Emerging Markets Local Currency Debt X (acc) - EUR** 0.15% 0.15% - 0.15% - - 0.15% 01-Oct-08JPM Emerging Markets Local Currency Debt X (acc) - USD 0.15% 0.17% 0.15% 0.15% - - 0.15% 01-Jul-08
JPMorgan Funds - Emerging Markets Small Cap FundJPM Emerging Markets Small Cap A (acc) - USD 1.90% 1.90% 1.90% 1.90% 1.90% - - 15-Nov-07JPM Emerging Markets Small Cap A (acc) - EUR 1.90% 1.90% 1.90% 1.90% 1.90% - - 15-Nov-07JPM Emerging Markets Small Cap A (dist) - GBP 1.90% 1.90% 1.90% 1.90% 1.90% - - 15-Nov-07JPM Emerging Markets Small Cap B (acc) - USD 1.15% 1.15% 1.15% 1.15% 1.15% - - 03-Jun-08JPM Emerging Markets Small Cap C (acc) - USD 1.10% 1.10% 1.10% - 1.10% - - 07-Dec-07JPM Emerging Markets Small Cap D (acc) - USD 2.90% 2.90% 2.90% 2.90% 2.90% - - 15-Nov-07JPM Emerging Markets Small Cap D (acc) - EUR 2.90% 2.90% 2.90% - - - - 11-Jun-10JPM Emerging Markets Small Cap I (acc) - USD** 1.06% 1.56% - - - - - 09-Mar-11
JPMorgan Funds - Emerging Markets Strategic Bond Fund (7)JPM Emerging Markets Strategic Bond A (acc) - USD 1.40% 1.40% - - - - - 12-Apr-11JPM Emerging Markets Strategic Bond A (acc) - EUR (hedged) 1.40% 1.40% - - - - - 12-Apr-11
(5) This Sub-Fund was launched on 10 December 2010.(6) This Sub-Fund was launched on 29 November 2010.(7) This Sub-Fund was launched on 12 April 2011.
415
JPMorgan FundsAppendix - Unaudited Additional Disclosures (continued)
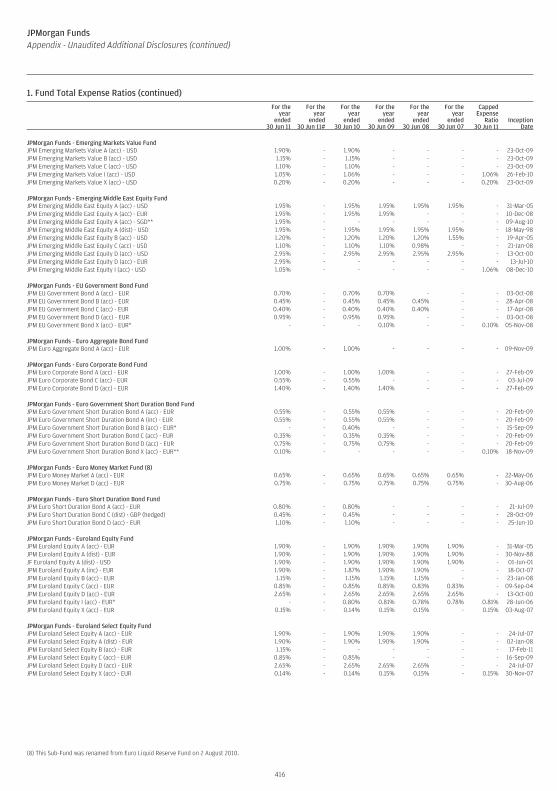
1. Fund Total Expense Ratios (continued)For the
yearended
30 Jun 11
For theyear
ended30 Jun 11#
For theyear
ended30 Jun 10
For theyear
ended30 Jun 09
For theyear
ended30 Jun 08
For theyear
ended30 Jun 07
CappedExpense
Ratio30 Jun 11
InceptionDate
JPMorgan Funds - Emerging Markets Value FundJPM Emerging Markets Value A (acc) - USD 1.90% - 1.90% - - - - 23-Oct-09JPM Emerging Markets Value B (acc) - USD 1.15% - 1.15% - - - - 23-Oct-09JPM Emerging Markets Value C (acc) - USD 1.10% - 1.10% - - - - 23-Oct-09JPM Emerging Markets Value I (acc) - USD 1.05% - 1.06% - - - 1.06% 26-Feb-10JPM Emerging Markets Value X (acc) - USD 0.20% - 0.20% - - - 0.20% 23-Oct-09
JPMorgan Funds - Emerging Middle East Equity FundJPM Emerging Middle East Equity A (acc) - USD 1.95% - 1.95% 1.95% 1.95% 1.95% - 31-Mar-05JPM Emerging Middle East Equity A (acc) - EUR 1.95% - 1.95% 1.95% - - - 10-Dec-08JPM Emerging Middle East Equity A (acc) - SGD** 1.95% - - - - - - 09-Aug-10JPM Emerging Middle East Equity A (dist) - USD 1.95% - 1.95% 1.95% 1.95% 1.95% - 18-May-98JPM Emerging Middle East Equity B (acc) - USD 1.20% - 1.20% 1.20% 1.20% 1.55% - 19-Apr-05JPM Emerging Middle East Equity C (acc) - USD 1.10% - 1.10% 1.10% 0.98% - - 21-Jan-08JPM Emerging Middle East Equity D (acc) - USD 2.95% - 2.95% 2.95% 2.95% 2.95% - 13-Oct-00JPM Emerging Middle East Equity D (acc) - EUR 2.95% - - - - - - 13-Jul-10JPM Emerging Middle East Equity I (acc) - USD 1.05% - - - - - 1.06% 08-Dec-10
JPMorgan Funds - EU Government Bond FundJPM EU Government Bond A (acc) - EUR 0.70% - 0.70% 0.70% - - - 03-Oct-08JPM EU Government Bond B (acc) - EUR 0.45% - 0.45% 0.45% 0.45% - - 28-Apr-08JPM EU Government Bond C (acc) - EUR 0.40% - 0.40% 0.40% 0.40% - - 17-Apr-08JPM EU Government Bond D (acc) - EUR 0.95% - 0.95% 0.95% - - - 03-Oct-08JPM EU Government Bond X (acc) - EUR* - - - 0.10% - - 0.10% 05-Nov-08
JPMorgan Funds - Euro Aggregate Bond FundJPM Euro Aggregate Bond A (acc) - EUR 1.00% - 1.00% - - - - 09-Nov-09
JPMorgan Funds - Euro Corporate Bond FundJPM Euro Corporate Bond A (acc) - EUR 1.00% - 1.00% 1.00% - - - 27-Feb-09JPM Euro Corporate Bond C (acc) - EUR 0.55% - 0.55% - - - - 03-Jul-09JPM Euro Corporate Bond D (acc) - EUR 1.40% - 1.40% 1.40% - - - 27-Feb-09
JPMorgan Funds - Euro Government Short Duration Bond FundJPM Euro Government Short Duration Bond A (acc) - EUR 0.55% - 0.55% 0.55% - - - 20-Feb-09JPM Euro Government Short Duration Bond A (inc) - EUR 0.55% - 0.55% 0.55% - - - 20-Feb-09JPM Euro Government Short Duration Bond B (acc) - EUR* - - 0.40% - - - - 15-Sep-09JPM Euro Government Short Duration Bond C (acc) - EUR 0.35% - 0.35% 0.35% - - - 20-Feb-09JPM Euro Government Short Duration Bond D (acc) - EUR 0.75% - 0.75% 0.75% - - - 20-Feb-09JPM Euro Government Short Duration Bond X (acc) - EUR** 0.10% - - - - - 0.10% 18-Nov-09
JPMorgan Funds - Euro Money Market Fund (8)JPM Euro Money Market A (acc) - EUR 0.65% - 0.65% 0.65% 0.65% 0.65% - 22-May-06JPM Euro Money Market D (acc) - EUR 0.75% - 0.75% 0.75% 0.75% 0.75% - 30-Aug-06
JPMorgan Funds - Euro Short Duration Bond FundJPM Euro Short Duration Bond A (acc) - EUR 0.80% - 0.80% - - - - 21-Jul-09JPM Euro Short Duration Bond C (dist) - GBP (hedged) 0.45% - 0.45% - - - - 28-Oct-09JPM Euro Short Duration Bond D (acc) - EUR 1.10% - 1.10% - - - - 25-Jun-10
JPMorgan Funds - Euroland Equity FundJPM Euroland Equity A (acc) - EUR 1.90% - 1.90% 1.90% 1.90% 1.90% - 31-Mar-05JPM Euroland Equity A (dist) - EUR 1.90% - 1.90% 1.90% 1.90% 1.90% - 30-Nov-88JF Euroland Equity A (dist) - USD 1.90% - 1.90% 1.90% 1.90% 1.90% - 01-Jun-01JPM Euroland Equity A (inc) - EUR 1.90% - 1.87% 1.90% 1.90% - - 18-Oct-07JPM Euroland Equity B (acc) - EUR 1.15% - 1.15% 1.15% 1.15% - - 23-Jan-08JPM Euroland Equity C (acc) - EUR 0.85% - 0.85% 0.85% 0.83% 0.83% - 09-Sep-04JPM Euroland Equity D (acc) - EUR 2.65% - 2.65% 2.65% 2.65% 2.65% - 13-Oct-00JPM Euroland Equity I (acc) - EUR* - - 0.80% 0.81% 0.78% 0.78% 0.81% 28-Jun-06JPM Euroland Equity X (acc) - EUR 0.15% - 0.14% 0.15% 0.15% - 0.15% 03-Aug-07
JPMorgan Funds - Euroland Select Equity FundJPM Euroland Select Equity A (acc) - EUR 1.90% - 1.90% 1.90% 1.90% - - 24-Jul-07JPM Euroland Select Equity A (dist) - EUR 1.90% - 1.90% 1.90% 1.90% - - 02-Jan-08JPM Euroland Select Equity B (acc) - EUR 1.15% - - - - - - 17-Feb-11JPM Euroland Select Equity C (acc) - EUR 0.85% - 0.85% - - - - 16-Sep-09JPM Euroland Select Equity D (acc) - EUR 2.65% - 2.65% 2.65% 2.65% - - 24-Jul-07JPM Euroland Select Equity X (acc) - EUR 0.14% - 0.14% 0.15% 0.15% - 0.15% 30-Nov-07
(8) This Sub-Fund was renamed from Euro Liquid Reserve Fund on 2 August 2010.
416
JPMorgan FundsAppendix - Unaudited Additional Disclosures (continued)
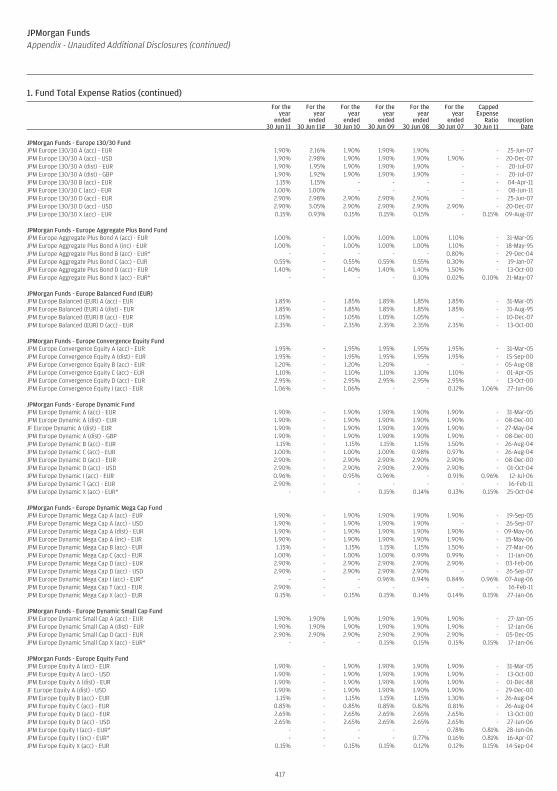
1. Fund Total Expense Ratios (continued)For the
yearended
30 Jun 11
For theyear
ended30 Jun 11#
For theyear
ended30 Jun 10
For theyear
ended30 Jun 09
For theyear
ended30 Jun 08
For theyear
ended30 Jun 07
CappedExpense
Ratio30 Jun 11
InceptionDate
JPMorgan Funds - Europe 130/30 FundJPM Europe 130/30 A (acc) - EUR 1.90% 2.16% 1.90% 1.90% 1.90% - - 25-Jun-07JPM Europe 130/30 A (acc) - USD 1.90% 2.98% 1.90% 1.90% 1.90% 1.90% - 20-Dec-07JPM Europe 130/30 A (dist) - EUR 1.90% 1.95% 1.90% 1.90% 1.90% - - 20-Jul-07JPM Europe 130/30 A (dist) - GBP 1.90% 1.92% 1.90% 1.90% 1.90% - - 20-Jul-07JPM Europe 130/30 B (acc) - EUR 1.15% 1.15% - - - - - 04-Apr-11JPM Europe 130/30 C (acc) - EUR 1.00% 1.00% - - - - - 08-Jun-11JPM Europe 130/30 D (acc) - EUR 2.90% 2.98% 2.90% 2.90% 2.90% - - 25-Jun-07JPM Europe 130/30 D (acc) - USD 2.90% 3.05% 2.90% 2.90% 2.90% 2.90% - 20-Dec-07JPM Europe 130/30 X (acc) - EUR 0.15% 0.93% 0.15% 0.15% 0.15% - 0.15% 09-Aug-07
JPMorgan Funds - Europe Aggregate Plus Bond FundJPM Europe Aggregate Plus Bond A (acc) - EUR 1.00% - 1.00% 1.00% 1.00% 1.10% - 31-Mar-05JPM Europe Aggregate Plus Bond A (inc) - EUR 1.00% - 1.00% 1.00% 1.00% 1.10% - 18-May-95JPM Europe Aggregate Plus Bond B (acc) - EUR* - - - - - 0.80% - 29-Dec-04JPM Europe Aggregate Plus Bond C (acc) - EUR 0.55% - 0.55% 0.55% 0.55% 0.30% - 19-Jan-07JPM Europe Aggregate Plus Bond D (acc) - EUR 1.40% - 1.40% 1.40% 1.40% 1.50% - 13-Oct-00JPM Europe Aggregate Plus Bond X (acc) - EUR* - - - - 0.10% 0.02% 0.10% 21-May-07
JPMorgan Funds - Europe Balanced Fund (EUR)JPM Europe Balanced (EUR) A (acc) - EUR 1.85% - 1.85% 1.85% 1.85% 1.85% - 31-Mar-05JPM Europe Balanced (EUR) A (dist) - EUR 1.85% - 1.85% 1.85% 1.85% 1.85% - 31-Aug-95JPM Europe Balanced (EUR) B (acc) - EUR 1.05% - 1.05% 1.05% 1.05% - - 10-Dec-07JPM Europe Balanced (EUR) D (acc) - EUR 2.35% - 2.35% 2.35% 2.35% 2.35% - 13-Oct-00
JPMorgan Funds - Europe Convergence Equity FundJPM Europe Convergence Equity A (acc) - EUR 1.95% - 1.95% 1.95% 1.95% 1.95% - 31-Mar-05JPM Europe Convergence Equity A (dist) - EUR 1.95% - 1.95% 1.95% 1.95% 1.95% - 15-Sep-00JPM Europe Convergence Equity B (acc) - EUR 1.20% - 1.20% 1.20% - - - 05-Aug-08JPM Europe Convergence Equity C (acc) - EUR 1.10% - 1.10% 1.10% 1.10% 1.10% - 01-Apr-05JPM Europe Convergence Equity D (acc) - EUR 2.95% - 2.95% 2.95% 2.95% 2.95% - 13-Oct-00JPM Europe Convergence Equity I (acc) - EUR 1.06% - 1.06% - - 0.12% 1.06% 27-Jun-06
JPMorgan Funds - Europe Dynamic FundJPM Europe Dynamic A (acc) - EUR 1.90% - 1.90% 1.90% 1.90% 1.90% - 31-Mar-05JPM Europe Dynamic A (dist) - EUR 1.90% - 1.90% 1.90% 1.90% 1.90% - 08-Dec-00JF Europe Dynamic A (dist) - EUR 1.90% - 1.90% 1.90% 1.90% 1.90% - 27-May-04JPM Europe Dynamic A (dist) - GBP 1.90% - 1.90% 1.90% 1.90% 1.90% - 08-Dec-00JPM Europe Dynamic B (acc) - EUR 1.15% - 1.15% 1.15% 1.15% 1.50% - 26-Aug-04JPM Europe Dynamic C (acc) - EUR 1.00% - 1.00% 1.00% 0.98% 0.97% - 26-Aug-04JPM Europe Dynamic D (acc) - EUR 2.90% - 2.90% 2.90% 2.90% 2.90% - 08-Dec-00JPM Europe Dynamic D (acc) - USD 2.90% - 2.90% 2.90% 2.90% 2.90% - 01-Oct-04JPM Europe Dynamic I (acc) - EUR 0.96% - 0.95% 0.96% - 0.91% 0.96% 12-Jul-06JPM Europe Dynamic T (acc) - EUR 2.90% - - - - - - 16-Feb-11JPM Europe Dynamic X (acc) - EUR* - - - 0.15% 0.14% 0.13% 0.15% 25-Oct-04
JPMorgan Funds - Europe Dynamic Mega Cap FundJPM Europe Dynamic Mega Cap A (acc) - EUR 1.90% - 1.90% 1.90% 1.90% 1.90% - 19-Sep-05JPM Europe Dynamic Mega Cap A (acc) - USD 1.90% - 1.90% 1.90% 1.90% - - 26-Sep-07JPM Europe Dynamic Mega Cap A (dist) - EUR 1.90% - 1.90% 1.90% 1.90% 1.90% - 09-May-06JPM Europe Dynamic Mega Cap A (inc) - EUR 1.90% - 1.90% 1.90% 1.90% 1.90% - 15-May-06JPM Europe Dynamic Mega Cap B (acc) - EUR 1.15% - 1.15% 1.15% 1.15% 1.50% - 27-Mar-06JPM Europe Dynamic Mega Cap C (acc) - EUR 1.00% - 1.00% 1.00% 0.99% 0.99% - 11-Jan-06JPM Europe Dynamic Mega Cap D (acc) - EUR 2.90% - 2.90% 2.90% 2.90% 2.90% - 03-Feb-06JPM Europe Dynamic Mega Cap D (acc) - USD 2.90% - 2.90% 2.90% 2.90% - - 26-Sep-07JPM Europe Dynamic Mega Cap I (acc) - EUR* - - - 0.96% 0.94% 0.84% 0.96% 07-Aug-06JPM Europe Dynamic Mega Cap T (acc) - EUR 2.90% - - - - - - 16-Feb-11JPM Europe Dynamic Mega Cap X (acc) - EUR 0.15% - 0.15% 0.15% 0.14% 0.14% 0.15% 27-Jan-06
JPMorgan Funds - Europe Dynamic Small Cap FundJPM Europe Dynamic Small Cap A (acc) - EUR 1.90% 1.90% 1.90% 1.90% 1.90% 1.90% - 27-Jan-05JPM Europe Dynamic Small Cap A (dist) - EUR 1.90% 1.90% 1.90% 1.90% 1.90% 1.90% - 12-Jan-06JPM Europe Dynamic Small Cap D (acc) - EUR 2.90% 2.90% 2.90% 2.90% 2.90% 2.90% - 05-Dec-05JPM Europe Dynamic Small Cap X (acc) - EUR* - - - 0.15% 0.15% 0.15% 0.15% 17-Jan-06
JPMorgan Funds - Europe Equity FundJPM Europe Equity A (acc) - EUR 1.90% - 1.90% 1.90% 1.90% 1.90% - 31-Mar-05JPM Europe Equity A (acc) - USD 1.90% - 1.90% 1.90% 1.90% 1.90% - 13-Oct-00JPM Europe Equity A (dist) - EUR 1.90% - 1.90% 1.90% 1.90% 1.90% - 01-Dec-88JF Europe Equity A (dist) - USD 1.90% - 1.90% 1.90% 1.90% 1.90% - 29-Dec-00JPM Europe Equity B (acc) - EUR 1.15% - 1.15% 1.15% 1.15% 1.30% - 26-Aug-04JPM Europe Equity C (acc) - EUR 0.85% - 0.85% 0.85% 0.82% 0.81% - 26-Aug-04JPM Europe Equity D (acc) - EUR 2.65% - 2.65% 2.65% 2.65% 2.65% - 13-Oct-00JPM Europe Equity D (acc) - USD 2.65% - 2.65% 2.65% 2.65% 2.65% - 27-Jun-06JPM Europe Equity I (acc) - EUR* - - - - - 0.78% 0.81% 28-Jun-06JPM Europe Equity I (inc) - EUR* - - - - 0.77% 0.16% 0.81% 16-Apr-07JPM Europe Equity X (acc) - EUR 0.15% - 0.15% 0.15% 0.12% 0.12% 0.15% 14-Sep-04
417
JPMorgan FundsAppendix - Unaudited Additional Disclosures (continued)
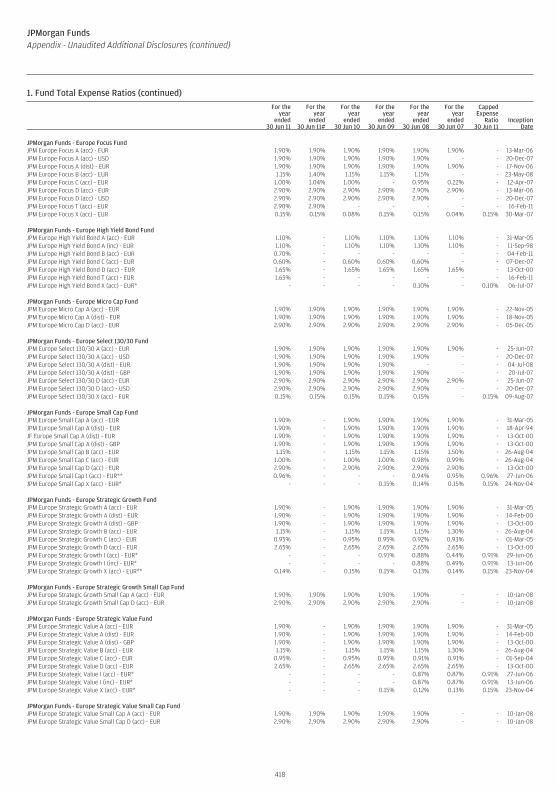
1. Fund Total Expense Ratios (continued)For the
yearended
30 Jun 11
For theyear
ended30 Jun 11#
For theyear
ended30 Jun 10
For theyear
ended30 Jun 09
For theyear
ended30 Jun 08
For theyear
ended30 Jun 07
CappedExpense
Ratio30 Jun 11
InceptionDate
JPMorgan Funds - Europe Focus FundJPM Europe Focus A (acc) - EUR 1.90% 1.90% 1.90% 1.90% 1.90% 1.90% - 13-Mar-06JPM Europe Focus A (acc) - USD 1.90% 1.90% 1.90% 1.90% 1.90% - - 20-Dec-07JPM Europe Focus A (dist) - EUR 1.90% 1.90% 1.90% 1.90% 1.90% 1.90% - 17-Nov-06JPM Europe Focus B (acc) - EUR 1.15% 1.40% 1.15% 1.15% 1.15% - - 23-May-08JPM Europe Focus C (acc) - EUR 1.00% 1.04% 1.00% - 0.95% 0.22% - 12-Apr-07JPM Europe Focus D (acc) - EUR 2.90% 2.90% 2.90% 2.90% 2.90% 2.90% - 13-Mar-06JPM Europe Focus D (acc) - USD 2.90% 2.90% 2.90% 2.90% 2.90% - - 20-Dec-07JPM Europe Focus T (acc) - EUR 2.90% 2.90% - - - - - 16-Feb-11JPM Europe Focus X (acc) - EUR 0.15% 0.15% 0.08% 0.15% 0.15% 0.04% 0.15% 30-Mar-07
JPMorgan Funds - Europe High Yield Bond FundJPM Europe High Yield Bond A (acc) - EUR 1.10% - 1.10% 1.10% 1.10% 1.10% - 31-Mar-05JPM Europe High Yield Bond A (inc) - EUR 1.10% - 1.10% 1.10% 1.10% 1.10% - 11-Sep-98JPM Europe High Yield Bond B (acc) - EUR 0.70% - - - - - - 04-Feb-11JPM Europe High Yield Bond C (acc) - EUR 0.60% - 0.60% 0.60% 0.60% - - 07-Dec-07JPM Europe High Yield Bond D (acc) - EUR 1.65% - 1.65% 1.65% 1.65% 1.65% - 13-Oct-00JPM Europe High Yield Bond T (acc) - EUR 1.65% - - - - - - 16-Feb-11JPM Europe High Yield Bond X (acc) - EUR* - - - - 0.10% - 0.10% 06-Jul-07
JPMorgan Funds - Europe Micro Cap FundJPM Europe Micro Cap A (acc) - EUR 1.90% 1.90% 1.90% 1.90% 1.90% 1.90% - 22-Nov-05JPM Europe Micro Cap A (dist) - EUR 1.90% 1.90% 1.90% 1.90% 1.90% 1.90% - 18-Nov-05JPM Europe Micro Cap D (acc) - EUR 2.90% 2.90% 2.90% 2.90% 2.90% 2.90% - 05-Dec-05
JPMorgan Funds - Europe Select 130/30 FundJPM Europe Select 130/30 A (acc) - EUR 1.90% 1.90% 1.90% 1.90% 1.90% 1.90% - 25-Jun-07JPM Europe Select 130/30 A (acc) - USD 1.90% 1.90% 1.90% 1.90% 1.90% - - 20-Dec-07JPM Europe Select 130/30 A (dist) - EUR 1.90% 1.90% 1.90% 1.90% - - - 04-Jul-08JPM Europe Select 130/30 A (dist) - GBP 1.90% 1.90% 1.90% 1.90% 1.90% - - 20-Jul-07JPM Europe Select 130/30 D (acc) - EUR 2.90% 2.90% 2.90% 2.90% 2.90% 2.90% - 25-Jun-07JPM Europe Select 130/30 D (acc) - USD 2.90% 2.90% 2.90% 2.90% 2.90% - - 20-Dec-07JPM Europe Select 130/30 X (acc) - EUR 0.15% 0.15% 0.15% 0.15% 0.15% - 0.15% 09-Aug-07
JPMorgan Funds - Europe Small Cap FundJPM Europe Small Cap A (acc) - EUR 1.90% - 1.90% 1.90% 1.90% 1.90% - 31-Mar-05JPM Europe Small Cap A (dist) - EUR 1.90% - 1.90% 1.90% 1.90% 1.90% - 18-Apr-94JF Europe Small Cap A (dist) - EUR 1.90% - 1.90% 1.90% 1.90% 1.90% - 13-Oct-00JPM Europe Small Cap A (dist) - GBP 1.90% - 1.90% 1.90% 1.90% 1.90% - 13-Oct-00JPM Europe Small Cap B (acc) - EUR 1.15% - 1.15% 1.15% 1.15% 1.50% - 26-Aug-04JPM Europe Small Cap C (acc) - EUR 1.00% - 1.00% 1.00% 0.98% 0.99% - 26-Aug-04JPM Europe Small Cap D (acc) - EUR 2.90% - 2.90% 2.90% 2.90% 2.90% - 13-Oct-00JPM Europe Small Cap I (acc) - EUR** 0.96% - - - 0.94% 0.95% 0.96% 27-Jun-06JPM Europe Small Cap X (acc) - EUR* - - - 0.15% 0.14% 0.15% 0.15% 24-Nov-04
JPMorgan Funds - Europe Strategic Growth FundJPM Europe Strategic Growth A (acc) - EUR 1.90% - 1.90% 1.90% 1.90% 1.90% - 31-Mar-05JPM Europe Strategic Growth A (dist) - EUR 1.90% - 1.90% 1.90% 1.90% 1.90% - 14-Feb-00JPM Europe Strategic Growth A (dist) - GBP 1.90% - 1.90% 1.90% 1.90% 1.90% - 13-Oct-00JPM Europe Strategic Growth B (acc) - EUR 1.15% - 1.15% 1.15% 1.15% 1.30% - 26-Aug-04JPM Europe Strategic Growth C (acc) - EUR 0.95% - 0.95% 0.95% 0.92% 0.93% - 01-Mar-05JPM Europe Strategic Growth D (acc) - EUR 2.65% - 2.65% 2.65% 2.65% 2.65% - 13-Oct-00JPM Europe Strategic Growth I (acc) - EUR* - - - 0.91% 0.88% 0.44% 0.91% 29-Jun-06JPM Europe Strategic Growth I (inc) - EUR* - - - - 0.88% 0.49% 0.91% 13-Jun-06JPM Europe Strategic Growth X (acc) - EUR** 0.14% - 0.15% 0.15% 0.13% 0.14% 0.15% 23-Nov-04
JPMorgan Funds - Europe Strategic Growth Small Cap FundJPM Europe Strategic Growth Small Cap A (acc) - EUR 1.90% 1.90% 1.90% 1.90% 1.90% - - 10-Jan-08JPM Europe Strategic Growth Small Cap D (acc) - EUR 2.90% 2.90% 2.90% 2.90% 2.90% - - 10-Jan-08
JPMorgan Funds - Europe Strategic Value FundJPM Europe Strategic Value A (acc) - EUR 1.90% - 1.90% 1.90% 1.90% 1.90% - 31-Mar-05JPM Europe Strategic Value A (dist) - EUR 1.90% - 1.90% 1.90% 1.90% 1.90% - 14-Feb-00JPM Europe Strategic Value A (dist) - GBP 1.90% - 1.90% 1.90% 1.90% 1.90% - 13-Oct-00JPM Europe Strategic Value B (acc) - EUR 1.15% - 1.15% 1.15% 1.15% 1.30% - 26-Aug-04JPM Europe Strategic Value C (acc) - EUR 0.95% - 0.95% 0.95% 0.91% 0.91% - 01-Sep-04JPM Europe Strategic Value D (acc) - EUR 2.65% - 2.65% 2.65% 2.65% 2.65% - 13-Oct-00JPM Europe Strategic Value I (acc) - EUR* - - - - 0.87% 0.87% 0.91% 27-Jun-06JPM Europe Strategic Value I (inc) - EUR* - - - - 0.87% 0.87% 0.91% 13-Jun-06JPM Europe Strategic Value X (acc) - EUR* - - - 0.15% 0.12% 0.13% 0.15% 23-Nov-04
JPMorgan Funds - Europe Strategic Value Small Cap FundJPM Europe Strategic Value Small Cap A (acc) - EUR 1.90% 1.90% 1.90% 1.90% 1.90% - - 10-Jan-08JPM Europe Strategic Value Small Cap D (acc) - EUR 2.90% 2.90% 2.90% 2.90% 2.90% - - 10-Jan-08
418
JPMorgan FundsAppendix - Unaudited Additional Disclosures (continued)
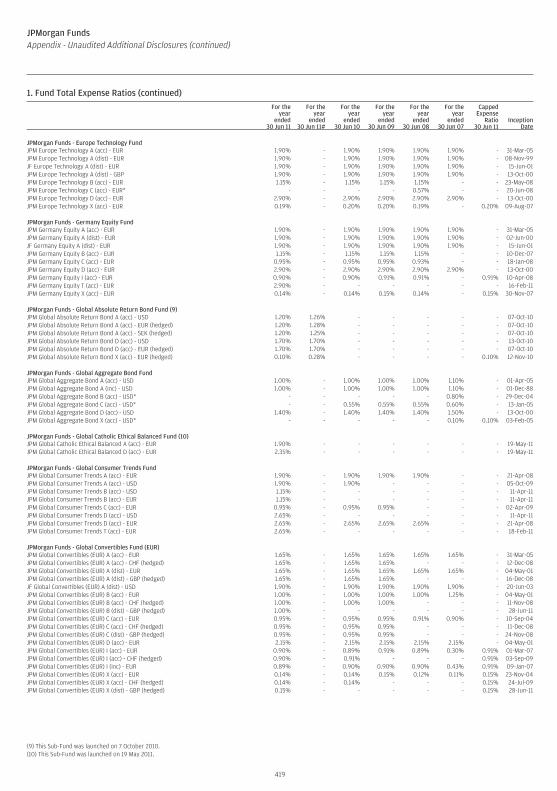
1. Fund Total Expense Ratios (continued)For the
yearended
30 Jun 11
For theyear
ended30 Jun 11#
For theyear
ended30 Jun 10
For theyear
ended30 Jun 09
For theyear
ended30 Jun 08
For theyear
ended30 Jun 07
CappedExpense
Ratio30 Jun 11
InceptionDate
JPMorgan Funds - Europe Technology FundJPM Europe Technology A (acc) - EUR 1.90% - 1.90% 1.90% 1.90% 1.90% - 31-Mar-05JPM Europe Technology A (dist) - EUR 1.90% - 1.90% 1.90% 1.90% 1.90% - 08-Nov-99JF Europe Technology A (dist) - EUR 1.90% - 1.90% 1.90% 1.90% 1.90% - 15-Jun-01JPM Europe Technology A (dist) - GBP 1.90% - 1.90% 1.90% 1.90% 1.90% - 13-Oct-00JPM Europe Technology B (acc) - EUR 1.15% - 1.15% 1.15% 1.15% - - 23-May-08JPM Europe Technology C (acc) - EUR* - - - - 0.57% - - 20-Jun-08JPM Europe Technology D (acc) - EUR 2.90% - 2.90% 2.90% 2.90% 2.90% - 13-Oct-00JPM Europe Technology X (acc) - EUR 0.19% - 0.20% 0.20% 0.19% - 0.20% 09-Aug-07
JPMorgan Funds - Germany Equity FundJPM Germany Equity A (acc) - EUR 1.90% - 1.90% 1.90% 1.90% 1.90% - 31-Mar-05JPM Germany Equity A (dist) - EUR 1.90% - 1.90% 1.90% 1.90% 1.90% - 02-Jun-00JF Germany Equity A (dist) - EUR 1.90% - 1.90% 1.90% 1.90% 1.90% - 15-Jun-01JPM Germany Equity B (acc) - EUR 1.15% - 1.15% 1.15% 1.15% - - 10-Dec-07JPM Germany Equity C (acc) - EUR 0.95% - 0.95% 0.95% 0.93% - - 18-Jan-08JPM Germany Equity D (acc) - EUR 2.90% - 2.90% 2.90% 2.90% 2.90% - 13-Oct-00JPM Germany Equity I (acc) - EUR 0.90% - 0.90% 0.91% 0.91% - 0.91% 10-Apr-08JPM Germany Equity T (acc) - EUR 2.90% - - - - - - 16-Feb-11JPM Germany Equity X (acc) - EUR 0.14% - 0.14% 0.15% 0.14% - 0.15% 30-Nov-07
JPMorgan Funds - Global Absolute Return Bond Fund (9)JPM Global Absolute Return Bond A (acc) - USD 1.20% 1.26% - - - - - 07-Oct-10JPM Global Absolute Return Bond A (acc) - EUR (hedged) 1.20% 1.28% - - - - - 07-Oct-10JPM Global Absolute Return Bond A (acc) - SEK (hedged) 1.20% 1.25% - - - - - 07-Oct-10JPM Global Absolute Return Bond D (acc) - USD 1.70% 1.70% - - - - - 13-Oct-10JPM Global Absolute Return Bond D (acc) - EUR (hedged) 1.70% 1.70% - - - - - 07-Oct-10JPM Global Absolute Return Bond X (acc) - EUR (hedged) 0.10% 0.28% - - - - 0.10% 12-Nov-10
JPMorgan Funds - Global Aggregate Bond FundJPM Global Aggregate Bond A (acc) - USD 1.00% - 1.00% 1.00% 1.00% 1.10% - 01-Apr-05JPM Global Aggregate Bond A (inc) - USD 1.00% - 1.00% 1.00% 1.00% 1.10% - 01-Dec-88JPM Global Aggregate Bond B (acc) - USD* - - - - - 0.80% - 29-Dec-04JPM Global Aggregate Bond C (acc) - USD* - - 0.55% 0.55% 0.55% 0.60% - 13-Jan-05JPM Global Aggregate Bond D (acc) - USD 1.40% - 1.40% 1.40% 1.40% 1.50% - 13-Oct-00JPM Global Aggregate Bond X (acc) - USD* - - - - - 0.10% 0.10% 03-Feb-05
JPMorgan Funds - Global Catholic Ethical Balanced Fund (10)JPM Global Catholic Ethical Balanced A (acc) - EUR 1.90% - - - - - - 19-May-11JPM Global Catholic Ethical Balanced D (acc) - EUR 2.35% - - - - - - 19-May-11
JPMorgan Funds - Global Consumer Trends FundJPM Global Consumer Trends A (acc) - EUR 1.90% - 1.90% 1.90% 1.90% - - 21-Apr-08JPM Global Consumer Trends A (acc) - USD 1.90% - 1.90% - - - - 05-Oct-09JPM Global Consumer Trends B (acc) - USD 1.15% - - - - - - 11-Apr-11JPM Global Consumer Trends B (acc) - EUR 1.15% - - - - - - 11-Apr-11JPM Global Consumer Trends C (acc) - EUR 0.95% - 0.95% 0.95% - - - 02-Apr-09JPM Global Consumer Trends D (acc) - USD 2.65% - - - - - - 11-Apr-11JPM Global Consumer Trends D (acc) - EUR 2.65% - 2.65% 2.65% 2.65% - - 21-Apr-08JPM Global Consumer Trends T (acc) - EUR 2.65% - - - - - - 18-Feb-11
JPMorgan Funds - Global Convertibles Fund (EUR)JPM Global Convertibles (EUR) A (acc) - EUR 1.65% - 1.65% 1.65% 1.65% 1.65% - 31-Mar-05JPM Global Convertibles (EUR) A (acc) - CHF (hedged) 1.65% - 1.65% 1.65% - - - 12-Dec-08JPM Global Convertibles (EUR) A (dist) - EUR 1.65% - 1.65% 1.65% 1.65% 1.65% - 04-May-01JPM Global Convertibles (EUR) A (dist) - GBP (hedged) 1.65% - 1.65% 1.65% - - - 16-Dec-08JF Global Convertibles (EUR) A (dist) - USD 1.90% - 1.90% 1.90% 1.90% 1.90% - 20-Jun-03JPM Global Convertibles (EUR) B (acc) - EUR 1.00% - 1.00% 1.00% 1.00% 1.25% - 04-May-01JPM Global Convertibles (EUR) B (acc) - CHF (hedged) 1.00% - 1.00% 1.00% - - - 11-Nov-08JPM Global Convertibles (EUR) B (dist) - GBP (hedged) 1.00% - - - - - - 28-Jun-11JPM Global Convertibles (EUR) C (acc) - EUR 0.95% - 0.95% 0.95% 0.91% 0.90% - 10-Sep-04JPM Global Convertibles (EUR) C (acc) - CHF (hedged) 0.95% - 0.95% 0.95% - - - 11-Dec-08JPM Global Convertibles (EUR) C (dist) - GBP (hedged) 0.95% - 0.95% 0.95% - - - 24-Nov-08JPM Global Convertibles (EUR) D (acc) - EUR 2.15% - 2.15% 2.15% 2.15% 2.15% - 04-May-01JPM Global Convertibles (EUR) I (acc) - EUR 0.90% - 0.89% 0.91% 0.89% 0.30% 0.91% 01-Mar-07JPM Global Convertibles (EUR) I (acc) - CHF (hedged) 0.90% - 0.91% - - - 0.91% 03-Sep-09JPM Global Convertibles (EUR) I (inc) - EUR 0.89% - 0.90% 0.90% 0.90% 0.43% 0.91% 09-Jan-07JPM Global Convertibles (EUR) X (acc) - EUR 0.14% - 0.14% 0.15% 0.12% 0.11% 0.15% 23-Nov-04JPM Global Convertibles (EUR) X (acc) - CHF (hedged) 0.14% - 0.14% - - - 0.15% 24-Jul-09JPM Global Convertibles (EUR) X (dist) - GBP (hedged) 0.15% - - - - - 0.15% 28-Jun-11
(9) This Sub-Fund was launched on 7 October 2010.(10) This Sub-Fund was launched on 19 May 2011.
419
JPMorgan FundsAppendix - Unaudited Additional Disclosures (continued)
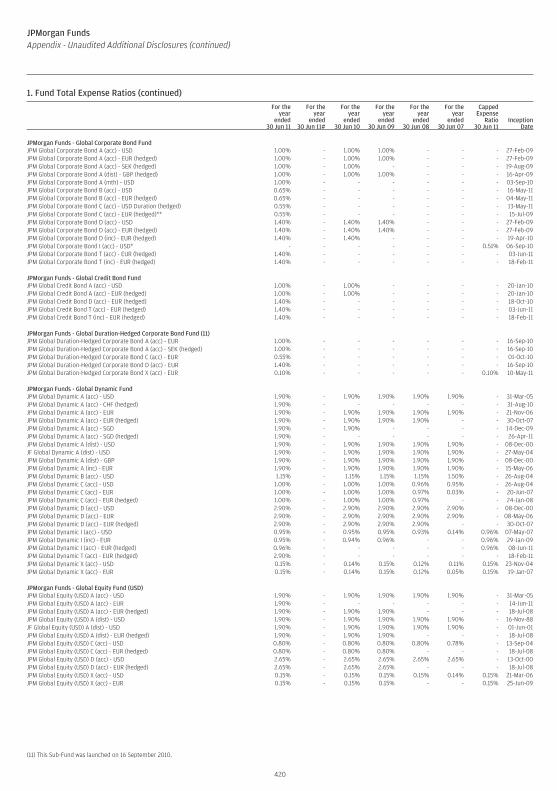
1. Fund Total Expense Ratios (continued)For the
yearended
30 Jun 11
For theyear
ended30 Jun 11#
For theyear
ended30 Jun 10
For theyear
ended30 Jun 09
For theyear
ended30 Jun 08
For theyear
ended30 Jun 07
CappedExpense
Ratio30 Jun 11
InceptionDate
JPMorgan Funds - Global Corporate Bond FundJPM Global Corporate Bond A (acc) - USD 1.00% - 1.00% 1.00% - - - 27-Feb-09JPM Global Corporate Bond A (acc) - EUR (hedged) 1.00% - 1.00% 1.00% - - - 27-Feb-09JPM Global Corporate Bond A (acc) - SEK (hedged) 1.00% - 1.00% - - - - 19-Aug-09JPM Global Corporate Bond A (dist) - GBP (hedged) 1.00% - 1.00% 1.00% - - - 16-Apr-09JPM Global Corporate Bond A (mth) - USD 1.00% - - - - - - 03-Sep-10JPM Global Corporate Bond B (acc) - USD 0.65% - - - - - - 16-May-11JPM Global Corporate Bond B (acc) - EUR (hedged) 0.65% - - - - - - 04-May-11JPM Global Corporate Bond C (acc) - USD Duration (hedged) 0.55% - - - - - - 13-May-11JPM Global Corporate Bond C (acc) - EUR (hedged)** 0.55% - - - - - - 15-Jul-09JPM Global Corporate Bond D (acc) - USD 1.40% - 1.40% 1.40% - - - 27-Feb-09JPM Global Corporate Bond D (acc) - EUR (hedged) 1.40% - 1.40% 1.40% - - - 27-Feb-09JPM Global Corporate Bond D (inc) - EUR (hedged) 1.40% - 1.40% - - - - 19-Apr-10JPM Global Corporate Bond I (acc) - USD* - - - - - - 0.51% 06-Sep-10JPM Global Corporate Bond T (acc) - EUR (hedged) 1.40% - - - - - - 03-Jun-11JPM Global Corporate Bond T (inc) - EUR (hedged) 1.40% - - - - - - 18-Feb-11
JPMorgan Funds - Global Credit Bond FundJPM Global Credit Bond A (acc) - USD 1.00% - 1.00% - - - - 20-Jan-10JPM Global Credit Bond A (acc) - EUR (hedged) 1.00% - 1.00% - - - - 20-Jan-10JPM Global Credit Bond D (acc) - EUR (hedged) 1.40% - - - - - - 18-Oct-10JPM Global Credit Bond T (acc) - EUR (hedged) 1.40% - - - - - - 03-Jun-11JPM Global Credit Bond T (inc) - EUR (hedged) 1.40% - - - - - - 18-Feb-11
JPMorgan Funds - Global Duration-Hedged Corporate Bond Fund (11)JPM Global Duration-Hedged Corporate Bond A (acc) - EUR 1.00% - - - - - - 16-Sep-10JPM Global Duration-Hedged Corporate Bond A (acc) - SEK (hedged) 1.00% - - - - - - 16-Sep-10JPM Global Duration-Hedged Corporate Bond C (acc) - EUR 0.55% - - - - - - 01-Oct-10JPM Global Duration-Hedged Corporate Bond D (acc) - EUR 1.40% - - - - - - 16-Sep-10JPM Global Duration-Hedged Corporate Bond X (acc) - EUR 0.10% - - - - - 0.10% 10-May-11
JPMorgan Funds - Global Dynamic FundJPM Global Dynamic A (acc) - USD 1.90% - 1.90% 1.90% 1.90% 1.90% - 31-Mar-05JPM Global Dynamic A (acc) - CHF (hedged) 1.90% - - - - - - 31-Aug-10JPM Global Dynamic A (acc) - EUR 1.90% - 1.90% 1.90% 1.90% 1.90% - 21-Nov-06JPM Global Dynamic A (acc) - EUR (hedged) 1.90% - 1.90% 1.90% 1.90% - - 30-Oct-07JPM Global Dynamic A (acc) - SGD 1.90% - 1.90% - - - - 14-Dec-09JPM Global Dynamic A (acc) - SGD (hedged) 1.90% - - - - - - 26-Apr-11JPM Global Dynamic A (dist) - USD 1.90% - 1.90% 1.90% 1.90% 1.90% - 08-Dec-00JF Global Dynamic A (dist) - USD 1.90% - 1.90% 1.90% 1.90% 1.90% - 27-May-04JPM Global Dynamic A (dist) - GBP 1.90% - 1.90% 1.90% 1.90% 1.90% - 08-Dec-00JPM Global Dynamic A (inc) - EUR 1.90% - 1.90% 1.90% 1.90% 1.90% - 15-May-06JPM Global Dynamic B (acc) - USD 1.15% - 1.15% 1.15% 1.15% 1.50% - 26-Aug-04JPM Global Dynamic C (acc) - USD 1.00% - 1.00% 1.00% 0.96% 0.95% - 26-Aug-04JPM Global Dynamic C (acc) - EUR 1.00% - 1.00% 1.00% 0.97% 0.03% - 20-Jun-07JPM Global Dynamic C (acc) - EUR (hedged) 1.00% - 1.00% 1.00% 0.97% - - 24-Jan-08JPM Global Dynamic D (acc) - USD 2.90% - 2.90% 2.90% 2.90% 2.90% - 08-Dec-00JPM Global Dynamic D (acc) - EUR 2.90% - 2.90% 2.90% 2.90% 2.90% - 08-May-06JPM Global Dynamic D (acc) - EUR (hedged) 2.90% - 2.90% 2.90% 2.90% - - 30-Oct-07JPM Global Dynamic I (acc) - USD 0.95% - 0.95% 0.95% 0.93% 0.14% 0.96% 07-May-07JPM Global Dynamic I (inc) - EUR 0.95% - 0.94% 0.96% - - 0.96% 29-Jan-09JPM Global Dynamic I (acc) - EUR (hedged) 0.96% - - - - - 0.96% 08-Jun-11JPM Global Dynamic T (acc) - EUR (hedged) 2.90% - - - - - - 18-Feb-11JPM Global Dynamic X (acc) - USD 0.15% - 0.14% 0.15% 0.12% 0.11% 0.15% 23-Nov-04JPM Global Dynamic X (acc) - EUR 0.15% - 0.14% 0.15% 0.12% 0.05% 0.15% 19-Jan-07
JPMorgan Funds - Global Equity Fund (USD)JPM Global Equity (USD) A (acc) - USD 1.90% - 1.90% 1.90% 1.90% 1.90% - 31-Mar-05JPM Global Equity (USD) A (acc) - EUR 1.90% - - - - - - 14-Jun-11JPM Global Equity (USD) A (acc) - EUR (hedged) 1.90% - 1.90% 1.90% - - - 18-Jul-08JPM Global Equity (USD) A (dist) - USD 1.90% - 1.90% 1.90% 1.90% 1.90% - 16-Nov-88JF Global Equity (USD) A (dist) - USD 1.90% - 1.90% 1.90% 1.90% 1.90% - 01-Jun-01JPM Global Equity (USD) A (dist) - EUR (hedged) 1.90% - 1.90% 1.90% - - - 18-Jul-08JPM Global Equity (USD) C (acc) - USD 0.80% - 0.80% 0.80% 0.80% 0.78% - 13-Sep-04JPM Global Equity (USD) C (acc) - EUR (hedged) 0.80% - 0.80% 0.80% - - - 18-Jul-08JPM Global Equity (USD) D (acc) - USD 2.65% - 2.65% 2.65% 2.65% 2.65% - 13-Oct-00JPM Global Equity (USD) D (acc) - EUR (hedged) 2.65% - 2.65% 2.65% - - - 18-Jul-08JPM Global Equity (USD) X (acc) - USD 0.15% - 0.15% 0.15% 0.15% 0.14% 0.15% 21-Mar-06JPM Global Equity (USD) X (acc) - EUR 0.15% - 0.15% 0.15% - - 0.15% 25-Jun-09
(11) This Sub-Fund was launched on 16 September 2010.
420
JPMorgan FundsAppendix - Unaudited Additional Disclosures (continued)
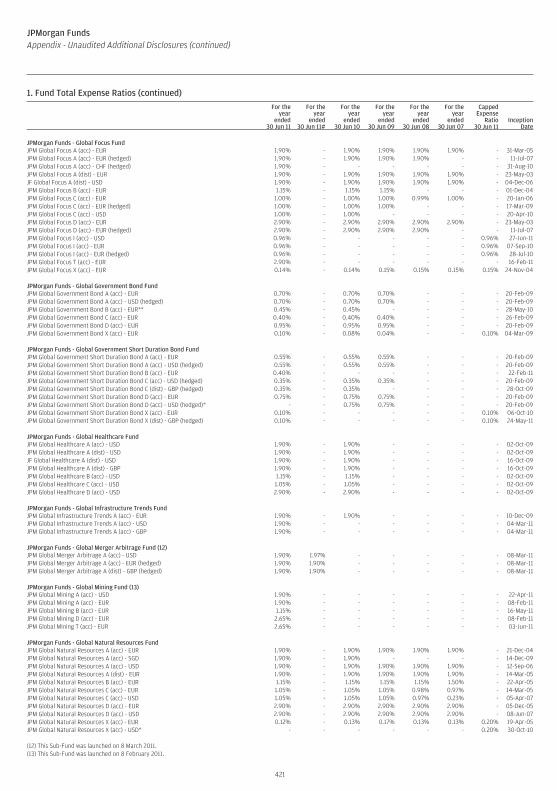
1. Fund Total Expense Ratios (continued)For the
yearended
30 Jun 11
For theyear
ended30 Jun 11#
For theyear
ended30 Jun 10
For theyear
ended30 Jun 09
For theyear
ended30 Jun 08
For theyear
ended30 Jun 07
CappedExpense
Ratio30 Jun 11
InceptionDate
JPMorgan Funds - Global Focus FundJPM Global Focus A (acc) - EUR 1.90% - 1.90% 1.90% 1.90% 1.90% - 31-Mar-05JPM Global Focus A (acc) - EUR (hedged) 1.90% - 1.90% 1.90% 1.90% - - 11-Jul-07JPM Global Focus A (acc) - CHF (hedged) 1.90% - - - - - - 31-Aug-10JPM Global Focus A (dist) - EUR 1.90% - 1.90% 1.90% 1.90% 1.90% - 23-May-03JF Global Focus A (dist) - USD 1.90% - 1.90% 1.90% 1.90% 1.90% - 04-Dec-06JPM Global Focus B (acc) - EUR 1.15% - 1.15% 1.15% - - - 01-Dec-04JPM Global Focus C (acc) - EUR 1.00% - 1.00% 1.00% 0.99% 1.00% - 20-Jan-06JPM Global Focus C (acc) - EUR (hedged) 1.00% - 1.00% 1.00% - - - 17-Mar-09JPM Global Focus C (acc) - USD 1.00% - 1.00% - - - - 20-Apr-10JPM Global Focus D (acc) - EUR 2.90% - 2.90% 2.90% 2.90% 2.90% - 23-May-03JPM Global Focus D (acc) - EUR (hedged) 2.90% - 2.90% 2.90% 2.90% - - 11-Jul-07JPM Global Focus I (acc) - USD 0.96% - - - - - 0.96% 27-Jun-11JPM Global Focus I (acc) - EUR 0.96% - - - - - 0.96% 07-Sep-10JPM Global Focus I (acc) - EUR (hedged) 0.96% - - - - - 0.96% 28-Jul-10JPM Global Focus T (acc) - EUR 2.90% - - - - - - 16-Feb-11JPM Global Focus X (acc) - EUR 0.14% - 0.14% 0.15% 0.15% 0.15% 0.15% 24-Nov-04
JPMorgan Funds - Global Government Bond FundJPM Global Government Bond A (acc) - EUR 0.70% - 0.70% 0.70% - - - 20-Feb-09JPM Global Government Bond A (acc) - USD (hedged) 0.70% - 0.70% 0.70% - - - 20-Feb-09JPM Global Government Bond B (acc) - EUR** 0.45% - 0.45% - - - - 28-May-10JPM Global Government Bond C (acc) - EUR 0.40% - 0.40% 0.40% - - - 26-Feb-09JPM Global Government Bond D (acc) - EUR 0.95% - 0.95% 0.95% - - - 20-Feb-09JPM Global Government Bond X (acc) - EUR 0.10% - 0.08% 0.04% - - 0.10% 04-Mar-09
JPMorgan Funds - Global Government Short Duration Bond FundJPM Global Government Short Duration Bond A (acc) - EUR 0.55% - 0.55% 0.55% - - - 20-Feb-09JPM Global Government Short Duration Bond A (acc) - USD (hedged) 0.55% - 0.55% 0.55% - - - 20-Feb-09JPM Global Government Short Duration Bond B (acc) - EUR 0.40% - - - - - - 22-Feb-11JPM Global Government Short Duration Bond C (acc) - USD (hedged) 0.35% - 0.35% 0.35% - - - 20-Feb-09JPM Global Government Short Duration Bond C (dist) - GBP (hedged) 0.35% - 0.35% - - - - 28-Oct-09JPM Global Government Short Duration Bond D (acc) - EUR 0.75% - 0.75% 0.75% - - - 20-Feb-09JPM Global Government Short Duration Bond D (acc) - USD (hedged)* - - 0.75% 0.75% - - - 20-Feb-09JPM Global Government Short Duration Bond X (acc) - EUR 0.10% - - - - - 0.10% 06-Oct-10JPM Global Government Short Duration Bond X (dist) - GBP (hedged) 0.10% - - - - - 0.10% 24-May-11
JPMorgan Funds - Global Healthcare FundJPM Global Healthcare A (acc) - USD 1.90% - 1.90% - - - - 02-Oct-09JPM Global Healthcare A (dist) - USD 1.90% - 1.90% - - - - 02-Oct-09JF Global Healthcare A (dist) - USD 1.90% - 1.90% - - - - 16-Oct-09JPM Global Healthcare A (dist) - GBP 1.90% - 1.90% - - - - 16-Oct-09JPM Global Healthcare B (acc) - USD 1.15% - 1.15% - - - - 02-Oct-09JPM Global Healthcare C (acc) - USD 1.05% - 1.05% - - - - 02-Oct-09JPM Global Healthcare D (acc) - USD 2.90% - 2.90% - - - - 02-Oct-09
JPMorgan Funds - Global Infrastructure Trends FundJPM Global Infrastructure Trends A (acc) - EUR 1.90% - 1.90% - - - - 10-Dec-09JPM Global Infrastructure Trends A (acc) - USD 1.90% - - - - - - 04-Mar-11JPM Global Infrastructure Trends A (acc) - GBP 1.90% - - - - - - 04-Mar-11
JPMorgan Funds - Global Merger Arbitrage Fund (12)JPM Global Merger Arbitrage A (acc) - USD 1.90% 1.97% - - - - - 08-Mar-11JPM Global Merger Arbitrage A (acc) - EUR (hedged) 1.90% 1.90% - - - - - 08-Mar-11JPM Global Merger Arbitrage A (dist) - GBP (hedged) 1.90% 1.90% - - - - - 08-Mar-11
JPMorgan Funds - Global Mining Fund (13)JPM Global Mining A (acc) - USD 1.90% - - - - - - 22-Apr-11JPM Global Mining A (acc) - EUR 1.90% - - - - - - 08-Feb-11JPM Global Mining B (acc) - EUR 1.15% - - - - - - 16-May-11JPM Global Mining D (acc) - EUR 2.65% - - - - - - 08-Feb-11JPM Global Mining T (acc) - EUR 2.65% - - - - - - 03-Jun-11
JPMorgan Funds - Global Natural Resources FundJPM Global Natural Resources A (acc) - EUR 1.90% - 1.90% 1.90% 1.90% 1.90% - 21-Dec-04JPM Global Natural Resources A (acc) - SGD 1.90% - 1.90% - - - - 14-Dec-09JPM Global Natural Resources A (acc) - USD 1.90% - 1.90% 1.90% 1.90% 1.90% - 12-Sep-06JPM Global Natural Resources A (dist) - EUR 1.90% - 1.90% 1.90% 1.90% 1.90% - 14-Mar-05JPM Global Natural Resources B (acc) - EUR 1.15% - 1.15% 1.15% 1.15% 1.50% - 22-Apr-05JPM Global Natural Resources C (acc) - EUR 1.05% - 1.05% 1.05% 0.98% 0.97% - 14-Mar-05JPM Global Natural Resources C (acc) - USD 1.05% - 1.05% 1.05% 0.97% 0.23% - 05-Apr-07JPM Global Natural Resources D (acc) - EUR 2.90% - 2.90% 2.90% 2.90% 2.90% - 05-Dec-05JPM Global Natural Resources D (acc) - USD 2.90% - 2.90% 2.90% 2.90% 2.90% - 08-Jun-07JPM Global Natural Resources X (acc) - EUR 0.12% - 0.13% 0.17% 0.13% 0.13% 0.20% 19-Apr-05JPM Global Natural Resources X (acc) - USD* - - - - - - 0.20% 30-Oct-10
(12) This Sub-Fund was launched on 8 March 2011.(13) This Sub-Fund was launched on 8 February 2011.
421
JPMorgan FundsAppendix - Unaudited Additional Disclosures (continued)
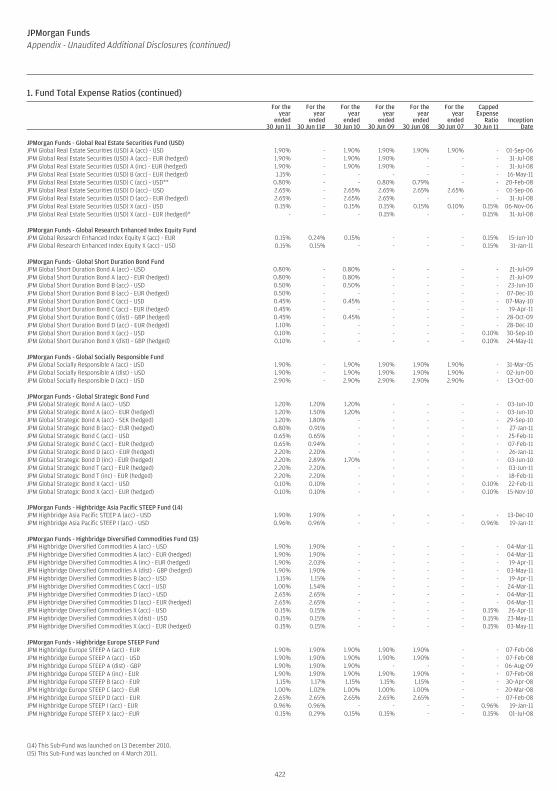
1. Fund Total Expense Ratios (continued)For the
yearended
30 Jun 11
For theyear
ended30 Jun 11#
For theyear
ended30 Jun 10
For theyear
ended30 Jun 09
For theyear
ended30 Jun 08
For theyear
ended30 Jun 07
CappedExpense
Ratio30 Jun 11
InceptionDate
JPMorgan Funds - Global Real Estate Securities Fund (USD)JPM Global Real Estate Securities (USD) A (acc) - USD 1.90% - 1.90% 1.90% 1.90% 1.90% - 01-Sep-06JPM Global Real Estate Securities (USD) A (acc) - EUR (hedged) 1.90% - 1.90% 1.90% - - - 31-Jul-08JPM Global Real Estate Securities (USD) A (inc) - EUR (hedged) 1.90% - 1.90% 1.90% - - - 31-Jul-08JPM Global Real Estate Securities (USD) B (acc) - EUR (hedged) 1.15% - - - - - - 16-May-11JPM Global Real Estate Securities (USD) C (acc) - USD** 0.80% - - 0.80% 0.79% - - 20-Feb-08JPM Global Real Estate Securities (USD) D (acc) - USD 2.65% - 2.65% 2.65% 2.65% 2.65% - 01-Sep-06JPM Global Real Estate Securities (USD) D (acc) - EUR (hedged) 2.65% - 2.65% 2.65% - - - 31-Jul-08JPM Global Real Estate Securities (USD) X (acc) - USD 0.15% - 0.15% 0.15% 0.15% 0.10% 0.15% 06-Nov-06JPM Global Real Estate Securities (USD) X (acc) - EUR (hedged)* - - - 0.15% - - 0.15% 31-Jul-08
JPMorgan Funds - Global Research Enhanced Index Equity FundJPM Global Research Enhanced Index Equity X (acc) - EUR 0.15% 0.24% 0.15% - - - 0.15% 15-Jun-10JPM Global Research Enhanced Index Equity X (acc) - USD 0.15% 0.15% - - - - 0.15% 31-Jan-11
JPMorgan Funds - Global Short Duration Bond FundJPM Global Short Duration Bond A (acc) - USD 0.80% - 0.80% - - - - 21-Jul-09JPM Global Short Duration Bond A (acc) - EUR (hedged) 0.80% - 0.80% - - - - 21-Jul-09JPM Global Short Duration Bond B (acc) - USD 0.50% - 0.50% - - - - 23-Jun-10JPM Global Short Duration Bond B (acc) - EUR (hedged) 0.50% - - - - - - 07-Dec-10JPM Global Short Duration Bond C (acc) - USD 0.45% - 0.45% - - - - 07-May-10JPM Global Short Duration Bond C (acc) - EUR (hedged) 0.45% - - - - - - 19-Apr-11JPM Global Short Duration Bond C (dist) - GBP (hedged) 0.45% - 0.45% - - - - 28-Oct-09JPM Global Short Duration Bond D (acc) - EUR (hedged) 1.10% - - - - - - 28-Dec-10JPM Global Short Duration Bond X (acc) - USD 0.10% - - - - - 0.10% 30-Sep-10JPM Global Short Duration Bond X (dist) - GBP (hedged) 0.10% - - - - - 0.10% 24-May-11
JPMorgan Funds - Global Socially Responsible FundJPM Global Socially Responsible A (acc) - USD 1.90% - 1.90% 1.90% 1.90% 1.90% - 31-Mar-05JPM Global Socially Responsible A (dist) - USD 1.90% - 1.90% 1.90% 1.90% 1.90% - 02-Jun-00JPM Global Socially Responsible D (acc) - USD 2.90% - 2.90% 2.90% 2.90% 2.90% - 13-Oct-00
JPMorgan Funds - Global Strategic Bond FundJPM Global Strategic Bond A (acc) - USD 1.20% 1.20% 1.20% - - - - 03-Jun-10JPM Global Strategic Bond A (acc) - EUR (hedged) 1.20% 1.50% 1.20% - - - - 03-Jun-10JPM Global Strategic Bond A (acc) - SEK (hedged) 1.20% 1.80% - - - - - 29-Sep-10JPM Global Strategic Bond B (acc) - EUR (hedged) 0.80% 0.91% - - - - - 27-Jan-11JPM Global Strategic Bond C (acc) - USD 0.65% 0.65% - - - - - 25-Feb-11JPM Global Strategic Bond C (acc) - EUR (hedged) 0.65% 0.94% - - - - - 07-Feb-11JPM Global Strategic Bond D (acc) - EUR (hedged) 2.20% 2.20% - - - - - 26-Jan-11JPM Global Strategic Bond D (inc) - EUR (hedged) 2.20% 2.89% 1.70% - - - - 03-Jun-10JPM Global Strategic Bond T (acc) - EUR (hedged) 2.20% 2.20% - - - - - 03-Jun-11JPM Global Strategic Bond T (inc) - EUR (hedged) 2.20% 2.20% - - - - - 18-Feb-11JPM Global Strategic Bond X (acc) - USD 0.10% 0.10% - - - - 0.10% 22-Feb-11JPM Global Strategic Bond X (acc) - EUR (hedged) 0.10% 0.10% - - - - 0.10% 15-Nov-10
JPMorgan Funds - Highbridge Asia Pacific STEEP Fund (14)JPM Highbridge Asia Pacific STEEP A (acc) - USD 1.90% 1.90% - - - - - 13-Dec-10JPM Highbridge Asia Pacific STEEP I (acc) - USD 0.96% 0.96% - - - - 0.96% 19-Jan-11
JPMorgan Funds - Highbridge Diversified Commodities Fund (15)JPM Highbridge Diversified Commodities A (acc) - USD 1.90% 1.90% - - - - - 04-Mar-11JPM Highbridge Diversified Commodities A (acc) - EUR (hedged) 1.90% 1.90% - - - - - 04-Mar-11JPM Highbridge Diversified Commodities A (inc) - EUR (hedged) 1.90% 2.03% - - - - - 19-Apr-11JPM Highbridge Diversified Commodities A (dist) - GBP (hedged) 1.90% 1.90% - - - - - 03-May-11JPM Highbridge Diversified Commodities B (acc) - USD 1.15% 1.15% - - - - - 19-Apr-11JPM Highbridge Diversified Commodities C (acc) - USD 1.00% 1.54% - - - - - 24-Mar-11JPM Highbridge Diversified Commodities D (acc) - USD 2.65% 2.65% - - - - - 04-Mar-11JPM Highbridge Diversified Commodities D (acc) - EUR (hedged) 2.65% 2.65% - - - - - 04-Mar-11JPM Highbridge Diversified Commodities X (acc) - USD 0.15% 0.15% - - - - 0.15% 26-Apr-11JPM Highbridge Diversified Commodities X (dist) - USD 0.15% 0.15% - - - - 0.15% 23-May-11JPM Highbridge Diversified Commodities X (acc) - EUR (hedged) 0.15% 0.15% - - - - 0.15% 03-May-11
JPMorgan Funds - Highbridge Europe STEEP FundJPM Highbridge Europe STEEP A (acc) - EUR 1.90% 1.90% 1.90% 1.90% 1.90% - - 07-Feb-08JPM Highbridge Europe STEEP A (acc) - USD 1.90% 1.90% 1.90% 1.90% 1.90% - - 07-Feb-08JPM Highbridge Europe STEEP A (dist) - GBP 1.90% 1.90% 1.90% - - - - 06-Aug-09JPM Highbridge Europe STEEP A (inc) - EUR 1.90% 1.90% 1.90% 1.90% 1.90% - - 07-Feb-08JPM Highbridge Europe STEEP B (acc) - EUR 1.15% 1.17% 1.15% 1.15% 1.15% - - 30-Apr-08JPM Highbridge Europe STEEP C (acc) - EUR 1.00% 1.02% 1.00% 1.00% 1.00% - - 20-Mar-08JPM Highbridge Europe STEEP D (acc) - EUR 2.65% 2.65% 2.65% 2.65% 2.65% - - 07-Feb-08JPM Highbridge Europe STEEP I (acc) - EUR 0.96% 0.96% - - - - 0.96% 19-Jan-11JPM Highbridge Europe STEEP X (acc) - EUR 0.15% 0.29% 0.15% 0.15% - - 0.15% 01-Jul-08
(14) This Sub-Fund was launched on 13 December 2010.(15) This Sub-Fund was launched on 4 March 2011.
422
JPMorgan FundsAppendix - Unaudited Additional Disclosures (continued)
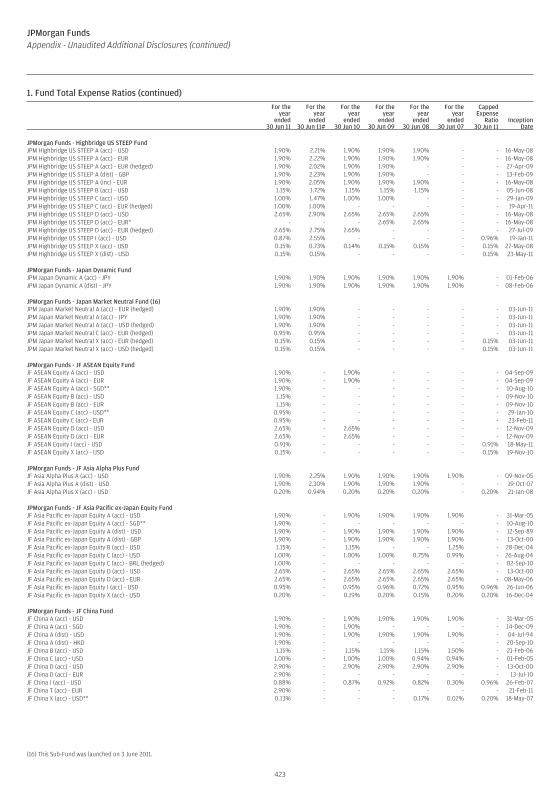
1. Fund Total Expense Ratios (continued)For the
yearended
30 Jun 11
For theyear
ended30 Jun 11#
For theyear
ended30 Jun 10
For theyear
ended30 Jun 09
For theyear
ended30 Jun 08
For theyear
ended30 Jun 07
CappedExpense
Ratio30 Jun 11
InceptionDate
JPMorgan Funds - Highbridge US STEEP FundJPM Highbridge US STEEP A (acc) - USD 1.90% 2.21% 1.90% 1.90% 1.90% - - 16-May-08JPM Highbridge US STEEP A (acc) - EUR 1.90% 2.22% 1.90% 1.90% 1.90% - - 16-May-08JPM Highbridge US STEEP A (acc) - EUR (hedged) 1.90% 2.02% 1.90% 1.90% - - - 27-Apr-09JPM Highbridge US STEEP A (dist) - GBP 1.90% 2.23% 1.90% 1.90% - - - 13-Feb-09JPM Highbridge US STEEP A (inc) - EUR 1.90% 2.05% 1.90% 1.90% 1.90% - - 16-May-08JPM Highbridge US STEEP B (acc) - USD 1.15% 1.72% 1.15% 1.15% 1.15% - - 05-Jun-08JPM Highbridge US STEEP C (acc) - USD 1.00% 1.47% 1.00% 1.00% - - - 29-Jan-09JPM Highbridge US STEEP C (acc) - EUR (hedged) 1.00% 1.00% - - - - - 19-Apr-11JPM Highbridge US STEEP D (acc) - USD 2.65% 2.90% 2.65% 2.65% 2.65% - - 16-May-08JPM Highbridge US STEEP D (acc) - EUR* - - - 2.65% 2.65% - - 16-May-08JPM Highbridge US STEEP D (acc) - EUR (hedged) 2.65% 2.75% 2.65% - - - - 27-Jul-09JPM Highbridge US STEEP I (acc) - USD 0.87% 2.55% - - - - 0.96% 19-Jan-11JPM Highbridge US STEEP X (acc) - USD 0.15% 0.73% 0.14% 0.15% 0.15% - 0.15% 27-May-08JPM Highbridge US STEEP X (dist) - USD 0.15% 0.15% - - - - 0.15% 23-May-11
JPMorgan Funds - Japan Dynamic FundJPM Japan Dynamic A (acc) - JPY 1.90% 1.90% 1.90% 1.90% 1.90% 1.90% - 01-Feb-06JPM Japan Dynamic A (dist) - JPY 1.90% 1.90% 1.90% 1.90% 1.90% 1.90% - 08-Feb-06
JPMorgan Funds - Japan Market Neutral Fund (16)JPM Japan Market Neutral A (acc) - EUR (hedged) 1.90% 1.90% - - - - - 03-Jun-11JPM Japan Market Neutral A (acc) - JPY 1.90% 1.90% - - - - - 03-Jun-11JPM Japan Market Neutral A (acc) - USD (hedged) 1.90% 1.90% - - - - - 03-Jun-11JPM Japan Market Neutral C (acc) - EUR (hedged) 0.95% 0.95% - - - - - 03-Jun-11JPM Japan Market Neutral X (acc) - EUR (hedged) 0.15% 0.15% - - - - 0.15% 03-Jun-11JPM Japan Market Neutral X (acc) - USD (hedged) 0.15% 0.15% - - - - 0.15% 03-Jun-11
JPMorgan Funds - JF ASEAN Equity FundJF ASEAN Equity A (acc) - USD 1.90% - 1.90% - - - - 04-Sep-09JF ASEAN Equity A (acc) - EUR 1.90% - 1.90% - - - - 04-Sep-09JF ASEAN Equity A (acc) - SGD** 1.90% - - - - - - 10-Aug-10JF ASEAN Equity B (acc) - USD 1.15% - - - - - - 09-Nov-10JF ASEAN Equity B (acc) - EUR 1.15% - - - - - - 09-Nov-10JF ASEAN Equity C (acc) - USD** 0.95% - - - - - - 29-Jan-10JF ASEAN Equity C (acc) - EUR 0.95% - - - - - - 23-Feb-11JF ASEAN Equity D (acc) - USD 2.65% - 2.65% - - - - 12-Nov-09JF ASEAN Equity D (acc) - EUR 2.65% - 2.65% - - - - 12-Nov-09JF ASEAN Equity I (acc) - USD 0.91% - - - - - 0.91% 18-May-11JF ASEAN Equity X (acc) - USD 0.15% - - - - - 0.15% 19-Nov-10
JPMorgan Funds - JF Asia Alpha Plus FundJF Asia Alpha Plus A (acc) - USD 1.90% 2.25% 1.90% 1.90% 1.90% 1.90% - 09-Nov-05JF Asia Alpha Plus A (dist) - USD 1.90% 2.30% 1.90% 1.90% 1.90% - - 19-Oct-07JF Asia Alpha Plus X (acc) - USD 0.20% 0.94% 0.20% 0.20% 0.20% - 0.20% 21-Jan-08
JPMorgan Funds - JF Asia Pacific ex-Japan Equity FundJF Asia Pacific ex-Japan Equity A (acc) - USD 1.90% - 1.90% 1.90% 1.90% 1.90% - 31-Mar-05JF Asia Pacific ex-Japan Equity A (acc) - SGD** 1.90% - - - - - - 10-Aug-10JF Asia Pacific ex-Japan Equity A (dist) - USD 1.90% - 1.90% 1.90% 1.90% 1.90% - 12-Sep-89JF Asia Pacific ex-Japan Equity A (dist) - GBP 1.90% - 1.90% 1.90% 1.90% 1.90% - 13-Oct-00JF Asia Pacific ex-Japan Equity B (acc) - USD 1.15% - 1.15% - - 1.25% - 28-Dec-04JF Asia Pacific ex-Japan Equity C (acc) - USD 1.00% - 1.00% 1.00% 0.75% 0.99% - 26-Aug-04JF Asia Pacific ex-Japan Equity C (acc) - BRL (hedged) 1.00% - - - - - - 02-Sep-10JF Asia Pacific ex-Japan Equity D (acc) - USD 2.65% - 2.65% 2.65% 2.65% 2.65% - 13-Oct-00JF Asia Pacific ex-Japan Equity D (acc) - EUR 2.65% - 2.65% 2.65% 2.65% 2.65% - 08-May-06JF Asia Pacific ex-Japan Equity I (acc) - USD 0.95% - 0.95% 0.96% 0.72% 0.95% 0.96% 26-Jun-06JF Asia Pacific ex-Japan Equity X (acc) - USD 0.20% - 0.19% 0.20% 0.15% 0.20% 0.20% 16-Dec-04
JPMorgan Funds - JF China FundJF China A (acc) - USD 1.90% - 1.90% 1.90% 1.90% 1.90% - 31-Mar-05JF China A (acc) - SGD 1.90% - 1.90% - - - - 14-Dec-09JF China A (dist) - USD 1.90% - 1.90% 1.90% 1.90% 1.90% - 04-Jul-94JF China A (dist) - HKD 1.90% - - - - - - 20-Sep-10JF China B (acc) - USD 1.15% - 1.15% 1.15% 1.15% 1.50% - 21-Feb-06JF China C (acc) - USD 1.00% - 1.00% 1.00% 0.94% 0.94% - 01-Feb-05JF China D (acc) - USD 2.90% - 2.90% 2.90% 2.90% 2.90% - 13-Oct-00JF China D (acc) - EUR 2.90% - - - - - - 13-Jul-10JF China I (acc) - USD 0.88% - 0.87% 0.92% 0.82% 0.30% 0.96% 26-Feb-07JF China T (acc) - EUR 2.90% - - - - - - 21-Feb-11JF China X (acc) - USD** 0.13% - - - 0.17% 0.02% 0.20% 18-May-07
(16) This Sub-Fund was launched on 3 June 2011.
423
JPMorgan FundsAppendix - Unaudited Additional Disclosures (continued)
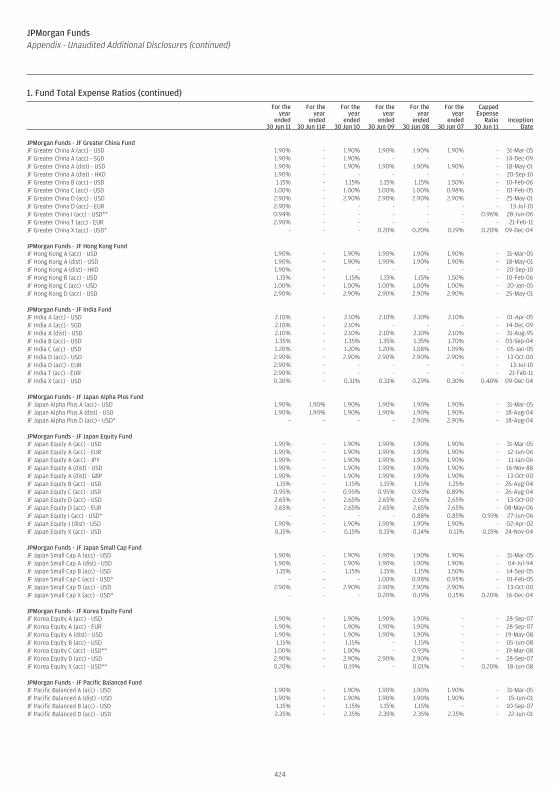
1. Fund Total Expense Ratios (continued)For the
yearended
30 Jun 11
For theyear
ended30 Jun 11#
For theyear
ended30 Jun 10
For theyear
ended30 Jun 09
For theyear
ended30 Jun 08
For theyear
ended30 Jun 07
CappedExpense
Ratio30 Jun 11
InceptionDate
JPMorgan Funds - JF Greater China FundJF Greater China A (acc) - USD 1.90% - 1.90% 1.90% 1.90% 1.90% - 31-Mar-05JF Greater China A (acc) - SGD 1.90% - 1.90% - - - - 14-Dec-09JF Greater China A (dist) - USD 1.90% - 1.90% 1.90% 1.90% 1.90% - 18-May-01JF Greater China A (dist) - HKD 1.90% - - - - - - 20-Sep-10JF Greater China B (acc) - USD 1.15% - 1.15% 1.15% 1.15% 1.50% - 10-Feb-06JF Greater China C (acc) - USD 1.00% - 1.00% 1.00% 1.00% 0.98% - 01-Feb-05JF Greater China D (acc) - USD 2.90% - 2.90% 2.90% 2.90% 2.90% - 25-May-01JF Greater China D (acc) - EUR 2.90% - - - - - - 13-Jul-10JF Greater China I (acc) - USD** 0.94% - - - - - 0.96% 28-Jun-06JF Greater China T (acc) - EUR 2.90% - - - - - - 21-Feb-11JF Greater China X (acc) - USD* - - - 0.20% 0.20% 0.19% 0.20% 09-Dec-04
JPMorgan Funds - JF Hong Kong FundJF Hong Kong A (acc) - USD 1.90% - 1.90% 1.90% 1.90% 1.90% - 31-Mar-05JF Hong Kong A (dist) - USD 1.90% - 1.90% 1.90% 1.90% 1.90% - 18-May-01JF Hong Kong A (dist) - HKD 1.90% - - - - - - 20-Sep-10JF Hong Kong B (acc) - USD 1.15% - 1.15% 1.15% 1.15% 1.50% - 10-Feb-06JF Hong Kong C (acc) - USD 1.00% - 1.00% 1.00% 1.00% 1.00% - 20-Jan-05JF Hong Kong D (acc) - USD 2.90% - 2.90% 2.90% 2.90% 2.90% - 25-May-01
JPMorgan Funds - JF India FundJF India A (acc) - USD 2.10% - 2.10% 2.10% 2.10% 2.10% - 01-Apr-05JF India A (acc) - SGD 2.10% - 2.10% - - - - 14-Dec-09JF India A (dist) - USD 2.10% - 2.10% 2.10% 2.10% 2.10% - 31-Aug-95JF India B (acc) - USD 1.35% - 1.35% 1.35% 1.35% 1.70% - 03-Sep-04JF India C (acc) - USD 1.20% - 1.20% 1.20% 1.08% 1.09% - 05-Jan-05JF India D (acc) - USD 2.90% - 2.90% 2.90% 2.90% 2.90% - 13-Oct-00JF India D (acc) - EUR 2.90% - - - - - - 13-Jul-10JF India T (acc) - EUR 2.90% - - - - - - 21-Feb-11JF India X (acc) - USD 0.30% - 0.31% 0.31% 0.29% 0.30% 0.40% 09-Dec-04
JPMorgan Funds - JF Japan Alpha Plus FundJF Japan Alpha Plus A (acc) - USD 1.90% 1.90% 1.90% 1.90% 1.90% 1.90% - 31-Mar-05JF Japan Alpha Plus A (dist) - USD 1.90% 1.90% 1.90% 1.90% 1.90% 1.90% - 18-Aug-04JF Japan Alpha Plus D (acc) - USD* - - - - 2.90% 2.90% - 18-Aug-04
JPMorgan Funds - JF Japan Equity FundJF Japan Equity A (acc) - USD 1.90% - 1.90% 1.90% 1.90% 1.90% - 31-Mar-05JF Japan Equity A (acc) - EUR 1.90% - 1.90% 1.90% 1.90% 1.90% - 12-Jun-06JF Japan Equity A (acc) - JPY 1.90% - 1.90% 1.90% 1.90% 1.90% - 11-Jan-06JF Japan Equity A (dist) - USD 1.90% - 1.90% 1.90% 1.90% 1.90% - 16-Nov-88JF Japan Equity A (dist) - GBP 1.90% - 1.90% 1.90% 1.90% 1.90% - 13-Oct-00JF Japan Equity B (acc) - USD 1.15% - 1.15% 1.15% 1.15% 1.25% - 26-Aug-04JF Japan Equity C (acc) - USD 0.95% - 0.95% 0.95% 0.93% 0.89% - 26-Aug-04JF Japan Equity D (acc) - USD 2.65% - 2.65% 2.65% 2.65% 2.65% - 13-Oct-00JF Japan Equity D (acc) - EUR 2.65% - 2.65% 2.65% 2.65% 2.65% - 08-May-06JF Japan Equity I (acc) - USD* - - - - 0.88% 0.85% 0.91% 27-Jun-06JF Japan Equity J (dist) - USD 1.90% - 1.90% 1.90% 1.90% 1.90% - 02-Apr-02JF Japan Equity X (acc) - USD 0.15% - 0.15% 0.15% 0.14% 0.11% 0.15% 24-Nov-04
JPMorgan Funds - JF Japan Small Cap FundJF Japan Small Cap A (acc) - USD 1.90% - 1.90% 1.90% 1.90% 1.90% - 31-Mar-05JF Japan Small Cap A (dist) - USD 1.90% - 1.90% 1.90% 1.90% 1.90% - 04-Jul-94JF Japan Small Cap B (acc) - USD 1.15% - 1.15% 1.15% 1.15% 1.50% - 14-Sep-05JF Japan Small Cap C (acc) - USD* - - - 1.00% 0.98% 0.95% - 01-Feb-05JF Japan Small Cap D (acc) - USD 2.90% - 2.90% 2.90% 2.90% 2.90% - 13-Oct-00JF Japan Small Cap X (acc) - USD* - - - 0.20% 0.19% 0.15% 0.20% 16-Dec-04
JPMorgan Funds - JF Korea Equity FundJF Korea Equity A (acc) - USD 1.90% - 1.90% 1.90% 1.90% - - 28-Sep-07JF Korea Equity A (acc) - EUR 1.90% - 1.90% 1.90% 1.90% - - 28-Sep-07JF Korea Equity A (dist) - USD 1.90% - 1.90% 1.90% 1.90% - - 19-May-08JF Korea Equity B (acc) - USD 1.15% - 1.15% - 1.15% - - 05-Jun-08JF Korea Equity C (acc) - USD** 1.00% - 1.00% - 0.93% - - 19-Mar-08JF Korea Equity D (acc) - USD 2.90% - 2.90% 2.90% 2.90% - - 28-Sep-07JF Korea Equity X (acc) - USD** 0.20% - 0.19% - 0.01% - 0.20% 18-Jun-08
JPMorgan Funds - JF Pacific Balanced FundJF Pacific Balanced A (acc) - USD 1.90% - 1.90% 1.90% 1.90% 1.90% - 31-Mar-05JF Pacific Balanced A (dist) - USD 1.90% - 1.90% 1.90% 1.90% 1.90% - 15-Jun-01JF Pacific Balanced B (acc) - USD 1.15% - 1.15% 1.15% 1.15% - - 10-Sep-07JF Pacific Balanced D (acc) - USD 2.35% - 2.35% 2.35% 2.35% 2.35% - 22-Jun-01
424
JPMorgan FundsAppendix - Unaudited Additional Disclosures (continued)
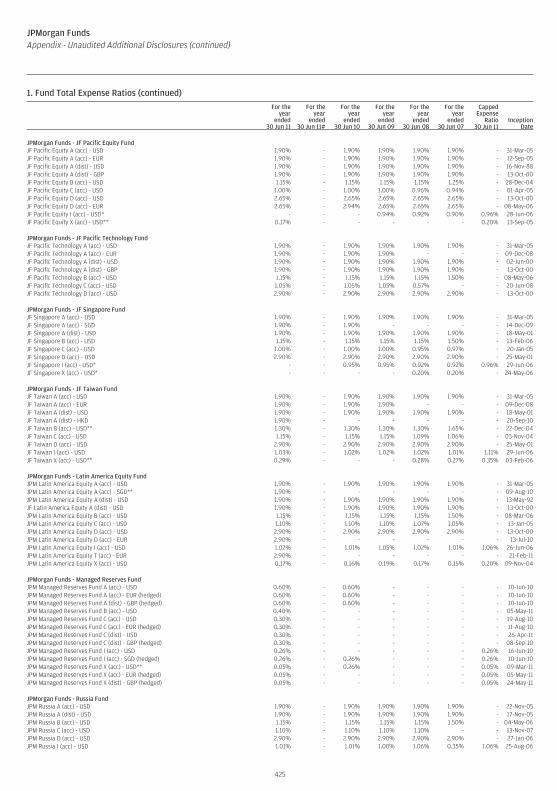
1. Fund Total Expense Ratios (continued)For the
yearended
30 Jun 11
For theyear
ended30 Jun 11#
For theyear
ended30 Jun 10
For theyear
ended30 Jun 09
For theyear
ended30 Jun 08
For theyear
ended30 Jun 07
CappedExpense
Ratio30 Jun 11
InceptionDate
JPMorgan Funds - JF Pacific Equity FundJF Pacific Equity A (acc) - USD 1.90% - 1.90% 1.90% 1.90% 1.90% - 31-Mar-05JF Pacific Equity A (acc) - EUR 1.90% - 1.90% 1.90% 1.90% 1.90% - 12-Sep-05JF Pacific Equity A (dist) - USD 1.90% - 1.90% 1.90% 1.90% 1.90% - 16-Nov-88JF Pacific Equity A (dist) - GBP 1.90% - 1.90% 1.90% 1.90% 1.90% - 13-Oct-00JF Pacific Equity B (acc) - USD 1.15% - 1.15% 1.15% 1.15% 1.25% - 28-Dec-04JF Pacific Equity C (acc) - USD 1.00% - 1.00% 1.00% 0.96% 0.94% - 01-Apr-05JF Pacific Equity D (acc) - USD 2.65% - 2.65% 2.65% 2.65% 2.65% - 13-Oct-00JF Pacific Equity D (acc) - EUR 2.65% - 2.94% 2.65% 2.65% 2.65% - 08-May-06JF Pacific Equity I (acc) - USD* - - - 0.94% 0.92% 0.90% 0.96% 28-Jun-06JF Pacific Equity X (acc) - USD** 0.17% - - - - - 0.20% 13-Sep-05
JPMorgan Funds - JF Pacific Technology FundJF Pacific Technology A (acc) - USD 1.90% - 1.90% 1.90% 1.90% 1.90% - 31-Mar-05JF Pacific Technology A (acc) - EUR 1.90% - 1.90% 1.90% - - - 09-Dec-08JF Pacific Technology A (dist) - USD 1.90% - 1.90% 1.90% 1.90% 1.90% - 02-Jun-00JF Pacific Technology A (dist) - GBP 1.90% - 1.90% 1.90% 1.90% 1.90% - 13-Oct-00JF Pacific Technology B (acc) - USD 1.15% - 1.15% 1.15% 1.15% 1.50% - 08-May-06JF Pacific Technology C (acc) - USD 1.05% - 1.05% 1.05% 0.57% - - 20-Jun-08JF Pacific Technology D (acc) - USD 2.90% - 2.90% 2.90% 2.90% 2.90% - 13-Oct-00
JPMorgan Funds - JF Singapore FundJF Singapore A (acc) - USD 1.90% - 1.90% 1.90% 1.90% 1.90% - 31-Mar-05JF Singapore A (acc) - SGD 1.90% - 1.90% - - - - 14-Dec-09JF Singapore A (dist) - USD 1.90% - 1.90% 1.90% 1.90% 1.90% - 18-May-01JF Singapore B (acc) - USD 1.15% - 1.15% 1.15% 1.15% 1.50% - 13-Feb-06JF Singapore C (acc) - USD 1.00% - 1.00% 1.00% 0.95% 0.97% - 20-Jan-05JF Singapore D (acc) - USD 2.90% - 2.90% 2.90% 2.90% 2.90% - 25-May-01JF Singapore I (acc) - USD* - - 0.95% 0.95% 0.92% 0.92% 0.96% 29-Jun-06JF Singapore X (acc) - USD* - - - - 0.20% 0.20% - 24-May-06
JPMorgan Funds - JF Taiwan FundJF Taiwan A (acc) - USD 1.90% - 1.90% 1.90% 1.90% 1.90% - 31-Mar-05JF Taiwan A (acc) - EUR 1.90% - 1.90% 1.90% - - - 09-Dec-08JF Taiwan A (dist) - USD 1.90% - 1.90% 1.90% 1.90% 1.90% - 18-May-01JF Taiwan A (dist) - HKD 1.90% - - - - - - 20-Sep-10JF Taiwan B (acc) - USD** 1.30% - 1.30% 1.30% 1.30% 1.65% - 22-Dec-04JF Taiwan C (acc) - USD 1.15% - 1.15% 1.15% 1.09% 1.06% - 03-Nov-04JF Taiwan D (acc) - USD 2.90% - 2.90% 2.90% 2.90% 2.90% - 25-May-01JF Taiwan I (acc) - USD 1.03% - 1.02% 1.02% 1.02% 1.01% 1.11% 29-Jun-06JF Taiwan X (acc) - USD** 0.29% - - - 0.28% 0.27% 0.35% 03-Feb-06
JPMorgan Funds - Latin America Equity FundJPM Latin America Equity A (acc) - USD 1.90% - 1.90% 1.90% 1.90% 1.90% - 31-Mar-05JPM Latin America Equity A (acc) - SGD** 1.90% - - - - - - 09-Aug-10JPM Latin America Equity A (dist) - USD 1.90% - 1.90% 1.90% 1.90% 1.90% - 13-May-92JF Latin America Equity A (dist) - USD 1.90% - 1.90% 1.90% 1.90% 1.90% - 13-Oct-00JPM Latin America Equity B (acc) - USD 1.15% - 1.15% 1.15% 1.15% 1.50% - 08-Mar-06JPM Latin America Equity C (acc) - USD 1.10% - 1.10% 1.10% 1.07% 1.05% - 13-Jan-05JPM Latin America Equity D (acc) - USD 2.90% - 2.90% 2.90% 2.90% 2.90% - 13-Oct-00JPM Latin America Equity D (acc) - EUR 2.90% - - - - - - 13-Jul-10JPM Latin America Equity I (acc) - USD 1.02% - 1.01% 1.05% 1.02% 1.01% 1.06% 26-Jun-06JPM Latin America Equity T (acc) - EUR 2.90% - - - - - - 21-Feb-11JPM Latin America Equity X (acc) - USD 0.17% - 0.16% 0.19% 0.17% 0.15% 0.20% 09-Nov-04
JPMorgan Funds - Managed Reserves FundJPM Managed Reserves Fund A (acc) - USD 0.60% - 0.60% - - - - 10-Jun-10JPM Managed Reserves Fund A (acc) - EUR (hedged) 0.60% - 0.60% - - - - 10-Jun-10JPM Managed Reserves Fund A (dist) - GBP (hedged) 0.60% - 0.60% - - - - 10-Jun-10JPM Managed Reserves Fund B (acc) - USD 0.40% - - - - - - 05-May-11JPM Managed Reserves Fund C (acc) - USD 0.30% - - - - - - 19-Aug-10JPM Managed Reserves Fund C (acc) - EUR (hedged) 0.30% - - - - - - 11-Aug-10JPM Managed Reserves Fund C (dist) - USD 0.30% - - - - - - 26-Apr-11JPM Managed Reserves Fund C (dist) - GBP (hedged) 0.30% - - - - - - 08-Sep-10JPM Managed Reserves Fund I (acc) - USD 0.26% - - - - - 0.26% 16-Jun-10JPM Managed Reserves Fund I (acc) - SGD (hedged) 0.26% - 0.26% - - - 0.26% 10-Jun-10JPM Managed Reserves Fund X (acc) - USD** 0.05% - 0.26% - - - 0.05% 09-Mar-11JPM Managed Reserves Fund X (acc) - EUR (hedged) 0.05% - - - - - 0.05% 05-May-11JPM Managed Reserves Fund X (dist) - GBP (hedged) 0.05% - - - - - 0.05% 24-May-11
JPMorgan Funds - Russia FundJPM Russia A (acc) - USD 1.90% - 1.90% 1.90% 1.90% 1.90% - 22-Nov-05JPM Russia A (dist) - USD 1.90% - 1.90% 1.90% 1.90% 1.90% - 17-Nov-05JPM Russia B (acc) - USD 1.15% - 1.15% 1.15% 1.15% 1.50% - 04-May-06JPM Russia C (acc) - USD 1.10% - 1.10% 1.10% 1.10% - - 13-Nov-07JPM Russia D (acc) - USD 2.90% - 2.90% 2.90% 2.90% 2.90% - 27-Jan-06JPM Russia I (acc) - USD 1.01% - 1.01% 1.00% 1.06% 0.35% 1.06% 25-Aug-06
425
JPMorgan FundsAppendix - Unaudited Additional Disclosures (continued)
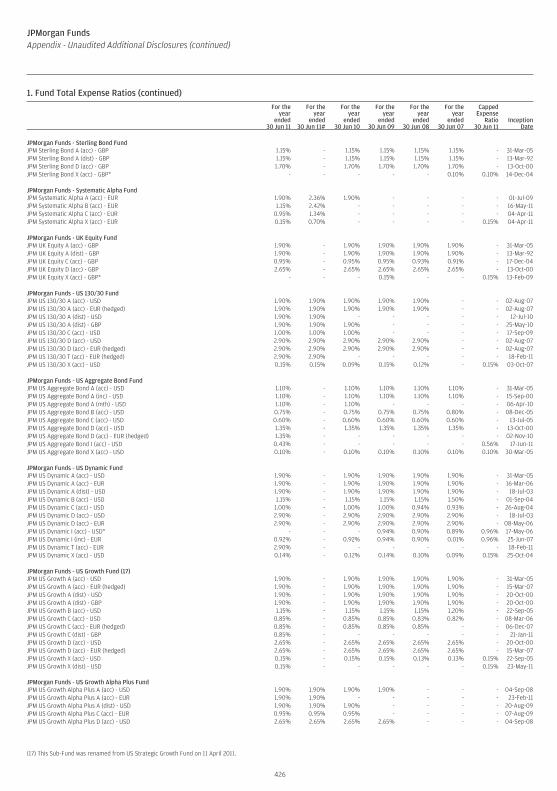
1. Fund Total Expense Ratios (continued)For the
yearended
30 Jun 11
For theyear
ended30 Jun 11#
For theyear
ended30 Jun 10
For theyear
ended30 Jun 09
For theyear
ended30 Jun 08
For theyear
ended30 Jun 07
CappedExpense
Ratio30 Jun 11
InceptionDate
JPMorgan Funds - Sterling Bond FundJPM Sterling Bond A (acc) - GBP 1.15% - 1.15% 1.15% 1.15% 1.15% - 31-Mar-05JPM Sterling Bond A (dist) - GBP 1.15% - 1.15% 1.15% 1.15% 1.15% - 13-Mar-92JPM Sterling Bond D (acc) - GBP 1.70% - 1.70% 1.70% 1.70% 1.70% - 13-Oct-00JPM Sterling Bond X (acc) - GBP* - - - - - 0.10% 0.10% 14-Dec-04
JPMorgan Funds - Systematic Alpha FundJPM Systematic Alpha A (acc) - EUR 1.90% 2.36% 1.90% - - - - 01-Jul-09JPM Systematic Alpha B (acc) - EUR 1.15% 2.42% - - - - - 16-May-11JPM Systematic Alpha C (acc) - EUR 0.95% 1.34% - - - - - 04-Apr-11JPM Systematic Alpha X (acc) - EUR 0.15% 0.70% - - - - 0.15% 04-Apr-11
JPMorgan Funds - UK Equity FundJPM UK Equity A (acc) - GBP 1.90% - 1.90% 1.90% 1.90% 1.90% - 31-Mar-05JPM UK Equity A (dist) - GBP 1.90% - 1.90% 1.90% 1.90% 1.90% - 13-Mar-92JPM UK Equity C (acc) - GBP 0.95% - 0.95% 0.95% 0.93% 0.91% - 17-Dec-04JPM UK Equity D (acc) - GBP 2.65% - 2.65% 2.65% 2.65% 2.65% - 13-Oct-00JPM UK Equity X (acc) - GBP* - - - 0.15% - - 0.15% 13-Feb-09
JPMorgan Funds - US 130/30 FundJPM US 130/30 A (acc) - USD 1.90% 1.90% 1.90% 1.90% 1.90% - - 02-Aug-07JPM US 130/30 A (acc) - EUR (hedged) 1.90% 1.90% 1.90% 1.90% 1.90% - - 02-Aug-07JPM US 130/30 A (dist) - USD 1.90% 1.90% - - - - - 12-Jul-10JPM US 130/30 A (dist) - GBP 1.90% 1.90% 1.90% - - - - 25-May-10JPM US 130/30 C (acc) - USD 1.00% 1.00% 1.00% - - - - 17-Sep-09JPM US 130/30 D (acc) - USD 2.90% 2.90% 2.90% 2.90% 2.90% - - 02-Aug-07JPM US 130/30 D (acc) - EUR (hedged) 2.90% 2.90% 2.90% 2.90% 2.90% - - 02-Aug-07JPM US 130/30 T (acc) - EUR (hedged) 2.90% 2.90% - - - - - 18-Feb-11JPM US 130/30 X (acc) - USD 0.15% 0.15% 0.09% 0.15% 0.12% - 0.15% 03-Oct-07
JPMorgan Funds - US Aggregate Bond FundJPM US Aggregate Bond A (acc) - USD 1.10% - 1.10% 1.10% 1.10% 1.10% - 31-Mar-05JPM US Aggregate Bond A (inc) - USD 1.10% - 1.10% 1.10% 1.10% 1.10% - 15-Sep-00JPM US Aggregate Bond A (mth) - USD 1.10% - 1.10% - - - - 06-Apr-10JPM US Aggregate Bond B (acc) - USD 0.75% - 0.75% 0.75% 0.75% 0.80% - 08-Dec-05JPM US Aggregate Bond C (acc) - USD 0.60% - 0.60% 0.60% 0.60% 0.60% - 13-Jul-05JPM US Aggregate Bond D (acc) - USD 1.35% - 1.35% 1.35% 1.35% 1.35% - 13-Oct-00JPM US Aggregate Bond D (acc) - EUR (hedged) 1.35% - - - - - - 02-Nov-10JPM US Aggregate Bond I (acc) - USD 0.43% - - - - - 0.56% 17-Jun-11JPM US Aggregate Bond X (acc) - USD 0.10% - 0.10% 0.10% 0.10% 0.10% 0.10% 30-Mar-05
JPMorgan Funds - US Dynamic FundJPM US Dynamic A (acc) - USD 1.90% - 1.90% 1.90% 1.90% 1.90% - 31-Mar-05JPM US Dynamic A (acc) - EUR 1.90% - 1.90% 1.90% 1.90% 1.90% - 16-Mar-06JPM US Dynamic A (dist) - USD 1.90% - 1.90% 1.90% 1.90% 1.90% - 18-Jul-03JPM US Dynamic B (acc) - USD 1.15% - 1.15% 1.15% 1.15% 1.50% - 01-Sep-04JPM US Dynamic C (acc) - USD 1.00% - 1.00% 1.00% 0.94% 0.93% - 26-Aug-04JPM US Dynamic D (acc) - USD 2.90% - 2.90% 2.90% 2.90% 2.90% - 18-Jul-03JPM US Dynamic D (acc) - EUR 2.90% - 2.90% 2.90% 2.90% 2.90% - 08-May-06JPM US Dynamic I (acc) - USD* - - - 0.94% 0.90% 0.89% 0.96% 17-May-06JPM US Dynamic I (inc) - EUR 0.92% - 0.92% 0.94% 0.90% 0.01% 0.96% 25-Jun-07JPM US Dynamic T (acc) - EUR 2.90% - - - - - - 18-Feb-11JPM US Dynamic X (acc) - USD 0.14% - 0.12% 0.14% 0.10% 0.09% 0.15% 25-Oct-04
JPMorgan Funds - US Growth Fund (17)JPM US Growth A (acc) - USD 1.90% - 1.90% 1.90% 1.90% 1.90% - 31-Mar-05JPM US Growth A (acc) - EUR (hedged) 1.90% - 1.90% 1.90% 1.90% 1.90% - 15-Mar-07JPM US Growth A (dist) - USD 1.90% - 1.90% 1.90% 1.90% 1.90% - 20-Oct-00JPM US Growth A (dist) - GBP 1.90% - 1.90% 1.90% 1.90% 1.90% - 20-Oct-00JPM US Growth B (acc) - USD 1.15% - 1.15% 1.15% 1.15% 1.20% - 22-Sep-05JPM US Growth C (acc) - USD 0.85% - 0.85% 0.85% 0.83% 0.82% - 08-Mar-06JPM US Growth C (acc) - EUR (hedged) 0.85% - 0.85% 0.85% 0.85% - - 06-Dec-07JPM US Growth C (dist) - GBP 0.85% - - - - - - 21-Jan-11JPM US Growth D (acc) - USD 2.65% - 2.65% 2.65% 2.65% 2.65% - 20-Oct-00JPM US Growth D (acc) - EUR (hedged) 2.65% - 2.65% 2.65% 2.65% 2.65% - 15-Mar-07JPM US Growth X (acc) - USD 0.15% - 0.15% 0.15% 0.13% 0.13% 0.15% 22-Sep-05JPM US Growth X (dist) - USD 0.15% - - - - - 0.15% 23-May-11
JPMorgan Funds - US Growth Alpha Plus FundJPM US Growth Alpha Plus A (acc) - USD 1.90% 1.90% 1.90% 1.90% - - - 04-Sep-08JPM US Growth Alpha Plus A (acc) - EUR 1.90% 1.90% - - - - - 23-Feb-11JPM US Growth Alpha Plus A (dist) - USD 1.90% 1.90% 1.90% - - - - 20-Aug-09JPM US Growth Alpha Plus C (acc) - EUR 0.95% 0.95% 0.95% - - - - 07-Aug-09JPM US Growth Alpha Plus D (acc) - USD 2.65% 2.65% 2.65% 2.65% - - - 04-Sep-08
(17) This Sub-Fund was renamed from US Strategic Growth Fund on 11 April 2011.
426
JPMorgan FundsAppendix - Unaudited Additional Disclosures (continued)
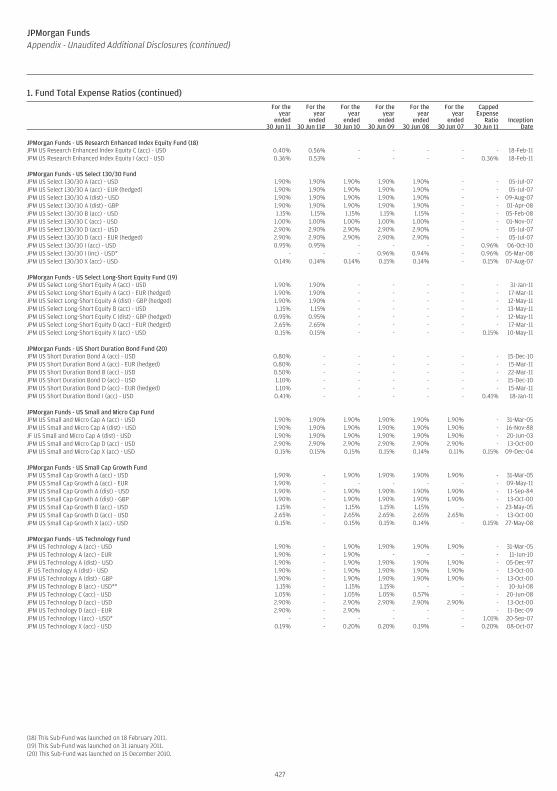
1. Fund Total Expense Ratios (continued)For the
yearended
30 Jun 11
For theyear
ended30 Jun 11#
For theyear
ended30 Jun 10
For theyear
ended30 Jun 09
For theyear
ended30 Jun 08
For theyear
ended30 Jun 07
CappedExpense
Ratio30 Jun 11
InceptionDate
JPMorgan Funds - US Research Enhanced Index Equity Fund (18)JPM US Research Enhanced Index Equity C (acc) - USD 0.40% 0.56% - - - - - 18-Feb-11JPM US Research Enhanced Index Equity I (acc) - USD 0.36% 0.53% - - - - 0.36% 18-Feb-11
JPMorgan Funds - US Select 130/30 FundJPM US Select 130/30 A (acc) - USD 1.90% 1.90% 1.90% 1.90% 1.90% - - 05-Jul-07JPM US Select 130/30 A (acc) - EUR (hedged) 1.90% 1.90% 1.90% 1.90% 1.90% - - 05-Jul-07JPM US Select 130/30 A (dist) - USD 1.90% 1.90% 1.90% 1.90% 1.90% - - 09-Aug-07JPM US Select 130/30 A (dist) - GBP 1.90% 1.90% 1.90% 1.90% 1.90% - - 01-Apr-08JPM US Select 130/30 B (acc) - USD 1.15% 1.15% 1.15% 1.15% 1.15% - - 05-Feb-08JPM US Select 130/30 C (acc) - USD 1.00% 1.00% 1.00% 1.00% 1.00% - - 01-Nov-07JPM US Select 130/30 D (acc) - USD 2.90% 2.90% 2.90% 2.90% 2.90% - - 05-Jul-07JPM US Select 130/30 D (acc) - EUR (hedged) 2.90% 2.90% 2.90% 2.90% 2.90% - - 05-Jul-07JPM US Select 130/30 I (acc) - USD 0.95% 0.95% - - - - 0.96% 06-Oct-10JPM US Select 130/30 I (inc) - USD* - - - 0.96% 0.94% - 0.96% 05-Mar-08JPM US Select 130/30 X (acc) - USD 0.14% 0.14% 0.14% 0.15% 0.14% - 0.15% 07-Aug-07
JPMorgan Funds - US Select Long-Short Equity Fund (19)JPM US Select Long-Short Equity A (acc) - USD 1.90% 1.90% - - - - - 31-Jan-11JPM US Select Long-Short Equity A (acc) - EUR (hedged) 1.90% 1.90% - - - - - 17-Mar-11JPM US Select Long-Short Equity A (dist) - GBP (hedged) 1.90% 1.90% - - - - - 12-May-11JPM US Select Long-Short Equity B (acc) - USD 1.15% 1.15% - - - - - 13-May-11JPM US Select Long-Short Equity C (dist) - GBP (hedged) 0.95% 0.95% - - - - - 12-May-11JPM US Select Long-Short Equity D (acc) - EUR (hedged) 2.65% 2.65% - - - - - 17-Mar-11JPM US Select Long-Short Equity X (acc) - USD 0.15% 0.15% - - - - 0.15% 10-May-11
JPMorgan Funds - US Short Duration Bond Fund (20)JPM US Short Duration Bond A (acc) - USD 0.80% - - - - - - 15-Dec-10JPM US Short Duration Bond A (acc) - EUR (hedged) 0.80% - - - - - - 15-Mar-11JPM US Short Duration Bond B (acc) - USD 0.50% - - - - - - 22-Mar-11JPM US Short Duration Bond D (acc) - USD 1.10% - - - - - - 15-Dec-10JPM US Short Duration Bond D (acc) - EUR (hedged) 1.10% - - - - - - 15-Mar-11JPM US Short Duration Bond I (acc) - USD 0.41% - - - - - 0.41% 18-Jan-11
JPMorgan Funds - US Small and Micro Cap FundJPM US Small and Micro Cap A (acc) - USD 1.90% 1.90% 1.90% 1.90% 1.90% 1.90% - 31-Mar-05JPM US Small and Micro Cap A (dist) - USD 1.90% 1.90% 1.90% 1.90% 1.90% 1.90% - 16-Nov-88JF US Small and Micro Cap A (dist) - USD 1.90% 1.90% 1.90% 1.90% 1.90% 1.90% - 20-Jun-03JPM US Small and Micro Cap D (acc) - USD 2.90% 2.90% 2.90% 2.90% 2.90% 2.90% - 13-Oct-00JPM US Small and Micro Cap X (acc) - USD 0.15% 0.15% 0.15% 0.15% 0.14% 0.11% 0.15% 09-Dec-04
JPMorgan Funds - US Small Cap Growth FundJPM US Small Cap Growth A (acc) - USD 1.90% - 1.90% 1.90% 1.90% 1.90% - 31-Mar-05JPM US Small Cap Growth A (acc) - EUR 1.90% - - - - - - 09-May-11JPM US Small Cap Growth A (dist) - USD 1.90% - 1.90% 1.90% 1.90% 1.90% - 11-Sep-84JPM US Small Cap Growth A (dist) - GBP 1.90% - 1.90% 1.90% 1.90% 1.90% - 13-Oct-00JPM US Small Cap Growth B (acc) - USD 1.15% - 1.15% 1.15% 1.15% - - 23-May-05JPM US Small Cap Growth D (acc) - USD 2.65% - 2.65% 2.65% 2.65% 2.65% - 13-Oct-00JPM US Small Cap Growth X (acc) - USD 0.15% - 0.15% 0.15% 0.14% - 0.15% 27-May-08
JPMorgan Funds - US Technology FundJPM US Technology A (acc) - USD 1.90% - 1.90% 1.90% 1.90% 1.90% - 31-Mar-05JPM US Technology A (acc) - EUR 1.90% - 1.90% - - - - 11-Jun-10JPM US Technology A (dist) - USD 1.90% - 1.90% 1.90% 1.90% 1.90% - 05-Dec-97JF US Technology A (dist) - USD 1.90% - 1.90% 1.90% 1.90% 1.90% - 13-Oct-00JPM US Technology A (dist) - GBP 1.90% - 1.90% 1.90% 1.90% 1.90% - 13-Oct-00JPM US Technology B (acc) - USD** 1.15% - 1.15% 1.15% - - - 10-Jul-08JPM US Technology C (acc) - USD 1.05% - 1.05% 1.05% 0.57% - - 20-Jun-08JPM US Technology D (acc) - USD 2.90% - 2.90% 2.90% 2.90% 2.90% - 13-Oct-00JPM US Technology D (acc) - EUR 2.90% - 2.90% - - - - 11-Dec-09JPM US Technology I (acc) - USD* - - - - - - 1.01% 20-Sep-07JPM US Technology X (acc) - USD 0.19% - 0.20% 0.20% 0.19% - 0.20% 08-Oct-07
(18) This Sub-Fund was launched on 18 February 2011.(19) This Sub-Fund was launched on 31 January 2011.(20) This Sub-Fund was launched on 15 December 2010.
427
JPMorgan FundsAppendix - Unaudited Additional Disclosures (continued)
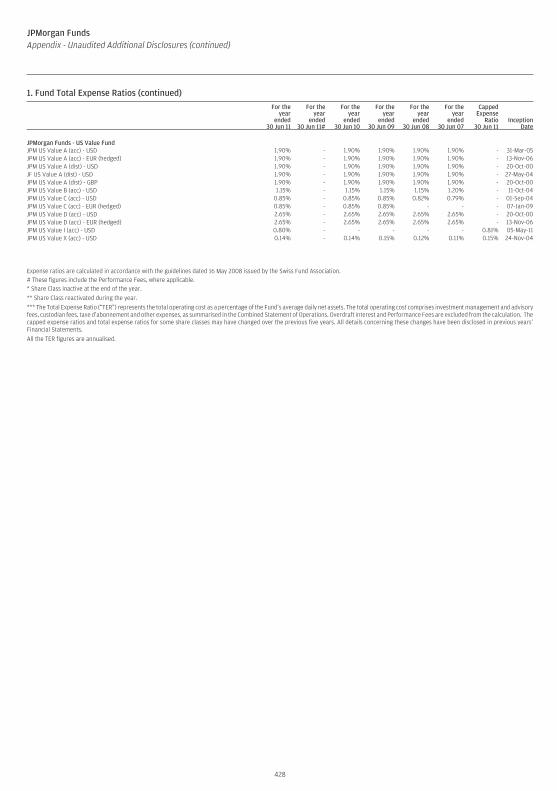
1. Fund Total Expense Ratios (continued)For the
yearended
30 Jun 11
For theyear
ended30 Jun 11#
For theyear
ended30 Jun 10
For theyear
ended30 Jun 09
For theyear
ended30 Jun 08
For theyear
ended30 Jun 07
CappedExpense
Ratio30 Jun 11
InceptionDate
JPMorgan Funds - US Value FundJPM US Value A (acc) - USD 1.90% - 1.90% 1.90% 1.90% 1.90% - 31-Mar-05JPM US Value A (acc) - EUR (hedged) 1.90% - 1.90% 1.90% 1.90% 1.90% - 13-Nov-06JPM US Value A (dist) - USD 1.90% - 1.90% 1.90% 1.90% 1.90% - 20-Oct-00JF US Value A (dist) - USD 1.90% - 1.90% 1.90% 1.90% 1.90% - 27-May-04JPM US Value A (dist) - GBP 1.90% - 1.90% 1.90% 1.90% 1.90% - 20-Oct-00JPM US Value B (acc) - USD 1.15% - 1.15% 1.15% 1.15% 1.20% - 11-Oct-04JPM US Value C (acc) - USD 0.85% - 0.85% 0.85% 0.82% 0.79% - 01-Sep-04JPM US Value C (acc) - EUR (hedged) 0.85% - 0.85% 0.85% - - - 07-Jan-09JPM US Value D (acc) - USD 2.65% - 2.65% 2.65% 2.65% 2.65% - 20-Oct-00JPM US Value D (acc) - EUR (hedged) 2.65% - 2.65% 2.65% 2.65% 2.65% - 13-Nov-06JPM US Value I (acc) - USD 0.80% - - - - - 0.81% 05-May-11JPM US Value X (acc) - USD 0.14% - 0.14% 0.15% 0.12% 0.11% 0.15% 24-Nov-04
Expense ratios are calculated in accordance with the guidelines dated 16 May 2008 issued by the Swiss Fund Association.# These figures include the Performance Fees, where applicable.* Share Class inactive at the end of the year.
** Share Class reactivated during the year.
*** The Total Expense Ratio (“TER”) represents the total operating cost as a percentage of the Fund’s average daily net assets. The total operating cost comprises investment management and advisoryfees, custodian fees, taxe d’abonnement and other expenses, as summarised in the Combined Statement of Operations. Overdraft interest and Performance Fees are excluded from the calculation. Thecapped expense ratios and total expense ratios for some share classes may have changed over the previous five years. All details concerning these changes have been disclosed in previous years’Financial Statements.
All the TER figures are annualised.
428
JPMorgan FundsAppendix - Unaudited Additional Disclosures (continued)
JPMorgan Funds – Africa Equity Fund
Seeks to provide long-term capital growth by investing primarily in a portfolio of African companies.
JPMorgan Funds – Aggregate Bond Fund
Seeks to achieve a return in excess of global bond markets by investing primarily in investment grade global fixed and floating rate debt securities, usingderivative strategies where appropriate.
JPMorgan Funds – America Equity Fund
Seeks to provide long-term capital growth by investing primarily in US companies.
JPMorgan Funds – America Large Cap Fund
Seeks to provide long-term capital growth by investing primarily in large capitalisation Blue Chip US companies.
JPMorgan Funds – Asia Pacific Bond Fund
Seeks to achieve a return in excess of Asia Pacific bond markets by investing primarily in Asia Pacific currencies and fixed and floating rate debt securities,using derivative strategies where appropriate.
JPMorgan Funds – Asia Pacific ex-Japan Behavioural Finance Equity Fund
Seeks to provide long-term capital growth by investing primarily in companies in the Asia Pacific Basin (excluding Japan).
JPMorgan Funds – Brazil Alpha Plus Fund
Seeks to provide superior long term capital growth by investing primarily in a concentrated portfolio of Brazilian companies.
JPMorgan Funds – Corporate Bond Portfolio Fund I
Seeks to achieve a return profile comparable to that achieved by holding, from purchase to maturity, a five-year corporate bond, but with increaseddiversification by investing primarily in a portfolio of corporate fixed and floating rate debt securities, with maturity dates within six months of thetermination of the Principal Investment Period.
JPMorgan Funds – Corporate Bond Portfolio Fund II
Seeks to achieve a return profile comparable to that achieved by holding, from purchase to maturity, a five-year corporate bond, but with increaseddiversification by investing primarily in a portfolio of corporate fixed and floating rate debt securities, with maturity dates within six months of thetermination of the Principal Investment Period.
JPMorgan Funds – Eastern Europe Equity Fund
Seeks to provide long-term capital growth by investing primarily in companies in central and eastern Europe (the “Eastern Europe Countries”).
JPMorgan Funds - Emerging Europe, Middle East and Africa Equity Fund
Seeks to provide long-term capital growth by investing primarily in companies of the emerging markets of central, eastern and southern Europe, Middle Eastand Africa.
JPMorgan Funds – Emerging Markets Alpha Plus Fund
Seeks to provide superior long term capital growth by investing primarily in a concentrated portfolio of emerging markets companies.
JPMorgan Funds – Emerging Markets Bond Fund
Seeks to achieve a return in excess of the bond markets of emerging countries by investing primarily in emerging market bond and other debt securities.
JPMorgan Funds – Emerging Markets Corporate Bond Fund
Seeks to achieve a return in excess of corporate bond markets of emerging market countries by investing primarily in emerging market corporate fixed andfloating rate debt securities, using derivatives where appropriate.
JPMorgan Funds – Emerging Markets Corporate Bond Portfolio Fund II
Seeks to achieve a return profile comparable to that achieved by holding, from purchase to maturity, a five-year below investment grade emerging marketcorporate bond, but with increased diversification by investing primarily in a portfolio of below investment grade emerging market corporate fixed andfloating rate debt securities, with maturity dates within twelve months of the termination of the Principal Investment Period.
JPMorgan Funds – Emerging Markets Currency Alpha Fund
Seeks to achieve a return in excess of its cash benchmark through exposure to emerging market currencies through the use of financial derivativeinstruments.
JPMorgan Funds – Emerging Markets Debt Fund
Seeks to achieve a return in excess of the bond markets of emerging countries by investing primarily in emerging market fixed and floating rate debtsecurities, including corporate securities and securities issued in local currencies, using derivatives where appropriate.
429
JPMorgan FundsAppendix - Unaudited Additional Disclosures (continued)
2. Summary of Investment Objectives of the Sub-Funds
JPMorgan Funds – Emerging Markets Diversified Equity Fund
Seeks to provide long-term capital growth by investing primarily in a diversified portfolio of emerging markets companies.
JPMorgan Funds – Emerging Markets Equity Fund
Seeks to provide long-term capital growth by investing primarily in emerging markets companies.
JPMorgan Funds – Emerging Markets Infrastructure Equity Fund
Seeks to provide long-term capital growth by investing primarily in emerging markets companies related to infrastructure opportunities.
JPMorgan Funds – Emerging Markets Investment Grade Bond Fund
Seeks to achieve a return in excess of investment grade bond markets of emerging countries by investing primarily in USD denominated investment gradeemerging market bonds and other debt securities, using derivatives where appropriate.
JPMorgan Funds – Emerging Markets Local Currency Debt Fund
Seeks to achieve a return in excess of government bond markets of emerging markets countries through exposure primarily to local currency emergingmarket fixed and floating rate debt instruments, using derivatives where appropriate.
JPMorgan Funds – Emerging Markets Small Cap Fund
Seeks to provide long-term capital growth by investing primarily in small capitalisation emerging markets companies.
JPMorgan Funds – Emerging Markets Strategic Bond Fund
Seeks to achieve a return in excess of the benchmark by exploiting investment opportunities in emerging market fixed income and emerging marketcurrency markets, using derivatives where appropriate.
JPMorgan Funds – Emerging Markets Value Fund
Seeks to provide long-term capital growth by investing primarily in a value style biased portfolio of emerging market companies.
JPMorgan Funds – Emerging Middle East Equity Fund
Seeks to provide long-term capital growth by investing primarily in companies of the emerging markets of the Middle East region.
JPMorgan Funds – EU Government Bond Fund
Seeks to achieve an investment return in line with the benchmark by investing primarily in a portfolio of EU-domiciled fixed and floating rate governmentdebt securities.
JPMorgan Funds – Euro Aggregate Bond Fund
Seeks to achieve a return in excess of EUR-denominated bond markets by investing primarily in investment grade EUR-denominated fixed and floating ratedebt securities, using derivatives where appropriate.
JPMorgan Funds – Euro Corporate Bond Fund
Seeks to achieve a return in excess of EUR-denominated corporate bond markets by investing primarily in EUR-denominated corporate fixed and floatingrate debt securities, using derivatives where appropriate.
JPMorgan Funds – Euro Government Short Duration Bond Fund
Seeks to achieve a return in line with the Benchmark by investing primarily in EUR-denominated short-term fixed and floating rate government debtsecurities issued by countries for which their domestic currency is the EUR.
JPMorgan Funds – Euro Money Market Fund
Seeks to achieve a competitive level of return in the reference currency and a high degree of liquidity by investing in EUR-denominated short term fixed andfloating rate debt securities.
JPMorgan Funds – Euro Short Duration Bond Fund
Seeks to achieve a return in excess of EUR-denominated short duration bond markets by investing in investment grade EUR-denominated short-term fixedand floating rate debt securities, using derivatives where appropriate.
JPMorgan Funds – Euroland Equity Fund
Seeks to provide long-term capital growth by investing primarily in companies of countries which are part of the Euro-zone (the “Euroland Countries”).
JPMorgan Funds – Euroland Select Equity Fund
Seeks to achieve a return in excess of Euro-zone equity markets by investing primarily in companies of countries which are part of the Euro-zone (the“Euroland Countries”).
430
JPMorgan FundsAppendix - Unaudited Additional Disclosures (continued)
2. Summary of Investment Objectives of the Sub-Funds (continued)
JPMorgan Funds – Europe 130/30 Fund
Seeks to provide long term capital growth, through exposure to European companies by direct investments in securities of such companies and through theuse of financial derivative instruments.
JPMorgan Funds – Europe Aggregate Plus Bond Fund
Seeks to achieve a return in excess of the European bond markets by investing primarily in European and non-European fixed and floating rate debtsecurities denominated in European currencies, using derivative strategies where appropriate.
JPMorgan Funds – Europe Balanced Fund (EUR)
Seeks to provide long-term capital growth and income by investing primarily in European companies and sovereign issuers.
JPMorgan Funds – Europe Convergence Equity Fund
Seeks to provide long-term capital growth by investing primarily in companies of those countries that joined the EU after 1 January 2004 or are applying orlikely to apply for membership of the European Union (the “Converging European Countries").
JPMorgan Funds – Europe Dynamic Fund
Seeks to maximise long-term capital growth by investing primarily in an aggressively managed portfolio of European companies.
JPMorgan Funds – Europe Dynamic Mega Cap Fund
Seeks to maximise long-term capital growth by investing primarily in an aggressively managed portfolio of mega capitalisation European companies.
JPMorgan Funds – Europe Dynamic Small Cap Fund
Seeks to maximise long-term capital growth by investing primarily in an aggressively managed portfolio of small capitalisation European companies.
JPMorgan Funds – Europe Equity Fund
Seeks to provide long-term capital growth by investing primarily in European companies.
JPMorgan Funds – Europe Focus Fund
Seeks to provide superior long-term capital growth by investing primarily in an aggressively managed portfolio of large, medium and small Europeancompanies.
JPMorgan Funds – Europe High Yield Bond Fund
Seeks to achieve a return in excess of European bond markets by investing primarily in below investment grade European and non-European bondsdenominated in European currencies and other debt securities, using derivative strategies where appropriate.
JPMorgan Funds – Europe Micro Cap Fund
Seeks to provide long-term capital growth by investing primarily in micro capitalisation European companies.
JPMorgan Funds – Europe Select 130/30 Fund
Seeks to provide long term capital growth, through exposure to European companies by direct investments in securities of such companies and through theuse of financial derivative instruments.
JPMorgan Funds – Europe Small Cap Fund
Seeks to provide long-term capital growth by investing primarily in small capitalisation European companies.
JPMorgan Funds – Europe Strategic Growth Fund
Seeks to provide long-term capital growth by investing primarily in a growth style biased portfolio of European companies.
JPMorgan Funds – Europe Strategic Growth Small Cap Fund
Seeks to provide long-term capital growth by investing primarily in a growth style biased portfolio of small capitalisation European companies.
JPMorgan Funds – Europe Strategic Value Fund
Seeks to provide long-term capital growth by investing primarily in a value style biased portfolio of European companies.
JPMorgan Funds – Europe Strategic Value Small Cap Fund
Seeks to provide long-term capital growth by investing primarily in a value style biased portfolio of small capitalisation European companies.
JPMorgan Funds – Europe Technology Fund
Seeks to provide long-term capital growth by investing primarily in technology (including media and telecommunication) related European companies.
JPMorgan Funds – Germany Equity Fund
Seeks to provide long-term capital growth by investing primarily in German companies.
431
JPMorgan FundsAppendix - Unaudited Additional Disclosures (continued)
2. Summary of Investment Objectives of the Sub-Funds (continued)
JPMorgan Funds – Global Absolute Return Bond Fund
Seeks to achieve a return in excess of cash with low volatility, by investing in a diversified portfolio of fixed and floating rate debt securities and usingfinancial derivative instruments.
JPMorgan Funds – Global Aggregate Bond Fund
Seeks to achieve a return in excess of global bond markets by investing primarily in global fixed and floating rate debt securities, using derivative strategieswhere appropriate.
JPMorgan Funds – Global Catholic Ethical Balanced Fund
Seeks to provide long-term capital growth by investing primarily in a portfolio of global equities and debt securities issued by EU governments, that satisfycertain ethical criteria, including environmental, social, corporate governance and Catholic principles (the “Investment Criteria”), as defined by ECPI, andusing financial derivative instruments giving exposure to securities, some of which will not meet the Investment Criteria.
JPMorgan Funds – Global Consumer Trends Fund
Seeks to provide long-term capital growth by investing primarily in companies benefiting from consumer driven opportunities, globally.
JPMorgan Funds – Global Convertibles Fund (EUR)
Seeks to provide a return by investing primarily in a diversified portfolio of convertible securities and warrants, globally.
JPMorgan Funds – Global Corporate Bond Fund
Seeks to achieve a return in excess of global corporate bond markets by investing primarily in global corporate fixed and floating rate debt securities, usingderivatives where appropriate.
JPMorgan Funds – Global Credit Bond Fund
Seeks to achieve a return in excess of global corporate bond markets by investing primarily in global corporate fixed and floating rate debt securities. Thesesecurities will be either investment grade, or a combination of investment grade and below investment grade, with active allocation between these securitytypes. Derivatives will be used where appropriate.
JPMorgan Funds – Global Duration-Hedged Corporate Bond Fund
Seeks to achieve a return in excess of the benchmark by investing primarily, directly or through the use of financial derivative instruments, in globalcorporate fixed rate debt securities; financial derivative instruments will also be used to manage interest rate risk.
JPMorgan Funds – Global Dynamic Fund
Seeks to maximise long-term capital growth by investing primarily in an aggressively managed portfolio of companies, globally.
JPMorgan Funds – Global Equity Fund (USD)
Seeks to provide long-term capital growth by investing primarily in companies, globally.
JPMorgan Funds – Global Focus Fund
Seeks to provide superior long-term capital growth by investing primarily in an aggressively managed portfolio of large, medium and small companies,globally, that the Investment Manager believes to be attractively valued and to have significant profit growth or earnings recovery potential.
JPMorgan Funds – Global Government Bond Fund
Seeks to achieve an investment return in line with the benchmark by investing primarily in a portfolio of global fixed and floating rate government debtsecurities.
JPMorgan Funds – Global Government Short Duration Bond Fund
Seeks to achieve a return in line with the Benchmark by investing primarily in global government short-term fixed and floating rate debt securities.
JPMorgan Funds – Global Healthcare Fund
Seeks to achieve a return by investing primarily in pharmaceutical, biotechnology, healthcare services, medical technology and life sciences companies(“Healthcare Companies”), globally.
JPMorgan Funds – Global Infrastructure Trends Fund
Seeks to provide long-term capital growth by investing primarily in companies benefiting from infrastructure opportunities, globally.
JPMorgan Funds – Global Merger Arbitrage Fund
Seeks to provide a return in excess of its cash benchmark by taking advantage of the “deal risk premium” factored into the price of companies which are, ormay become, involved in merger activity, takeovers, tender offers and other corporate activities anywhere in the world, using financial derivativeinstruments where appropriate.
JPMorgan Funds – Global Mining Fund
Seeks to provide long-term capital growth by investing primarily in companies engaged in mining and mining related activities, anywhere in the world.
432
JPMorgan FundsAppendix - Unaudited Additional Disclosures (continued)
2. Summary of Investment Objectives of the Sub-Funds (continued)
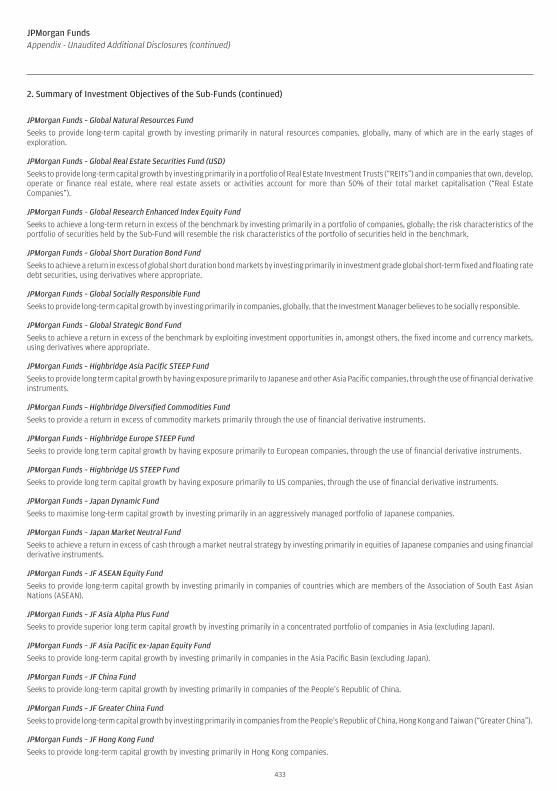
JPMorgan Funds – Global Natural Resources Fund
Seeks to provide long-term capital growth by investing primarily in natural resources companies, globally, many of which are in the early stages ofexploration.
JPMorgan Funds – Global Real Estate Securities Fund (USD)
Seeks to provide long-term capital growth by investing primarily in a portfolio of Real Estate Investment Trusts (“REITs”) and in companies that own, develop,operate or finance real estate, where real estate assets or activities account for more than 50% of their total market capitalisation (“Real EstateCompanies”).
JPMorgan Funds – Global Research Enhanced Index Equity Fund
Seeks to achieve a long-term return in excess of the benchmark by investing primarily in a portfolio of companies, globally; the risk characteristics of theportfolio of securities held by the Sub-Fund will resemble the risk characteristics of the portfolio of securities held in the benchmark.
JPMorgan Funds – Global Short Duration Bond Fund
Seeks to achieve a return in excess of global short duration bond markets by investing primarily in investment grade global short-term fixed and floating ratedebt securities, using derivatives where appropriate.
JPMorgan Funds – Global Socially Responsible Fund
Seeks to provide long-term capital growth by investing primarily in companies, globally, that the Investment Manager believes to be socially responsible.
JPMorgan Funds – Global Strategic Bond Fund
Seeks to achieve a return in excess of the benchmark by exploiting investment opportunities in, amongst others, the fixed income and currency markets,using derivatives where appropriate.
JPMorgan Funds – Highbridge Asia Pacific STEEP Fund
Seeks to provide long term capital growth by having exposure primarily to Japanese and other Asia Pacific companies, through the use of financial derivativeinstruments.
JPMorgan Funds – Highbridge Diversified Commodities Fund
Seeks to provide a return in excess of commodity markets primarily through the use of financial derivative instruments.
JPMorgan Funds – Highbridge Europe STEEP Fund
Seeks to provide long term capital growth by having exposure primarily to European companies, through the use of financial derivative instruments.
JPMorgan Funds – Highbridge US STEEP Fund
Seeks to provide long term capital growth by having exposure primarily to US companies, through the use of financial derivative instruments.
JPMorgan Funds – Japan Dynamic Fund
Seeks to maximise long-term capital growth by investing primarily in an aggressively managed portfolio of Japanese companies.
JPMorgan Funds – Japan Market Neutral Fund
Seeks to achieve a return in excess of cash through a market neutral strategy by investing primarily in equities of Japanese companies and using financialderivative instruments.
JPMorgan Funds – JF ASEAN Equity Fund
Seeks to provide long-term capital growth by investing primarily in companies of countries which are members of the Association of South East AsianNations (ASEAN).
JPMorgan Funds – JF Asia Alpha Plus Fund
Seeks to provide superior long term capital growth by investing primarily in a concentrated portfolio of companies in Asia (excluding Japan).
JPMorgan Funds – JF Asia Pacific ex-Japan Equity Fund
Seeks to provide long-term capital growth by investing primarily in companies in the Asia Pacific Basin (excluding Japan).
JPMorgan Funds – JF China Fund
Seeks to provide long-term capital growth by investing primarily in companies of the People’s Republic of China.
JPMorgan Funds – JF Greater China Fund
Seeks to provide long-term capital growth by investing primarily in companies from the People’s Republic of China, Hong Kong and Taiwan (“Greater China”).
JPMorgan Funds – JF Hong Kong Fund
Seeks to provide long-term capital growth by investing primarily in Hong Kong companies.
433
JPMorgan FundsAppendix - Unaudited Additional Disclosures (continued)
2. Summary of Investment Objectives of the Sub-Funds (continued)
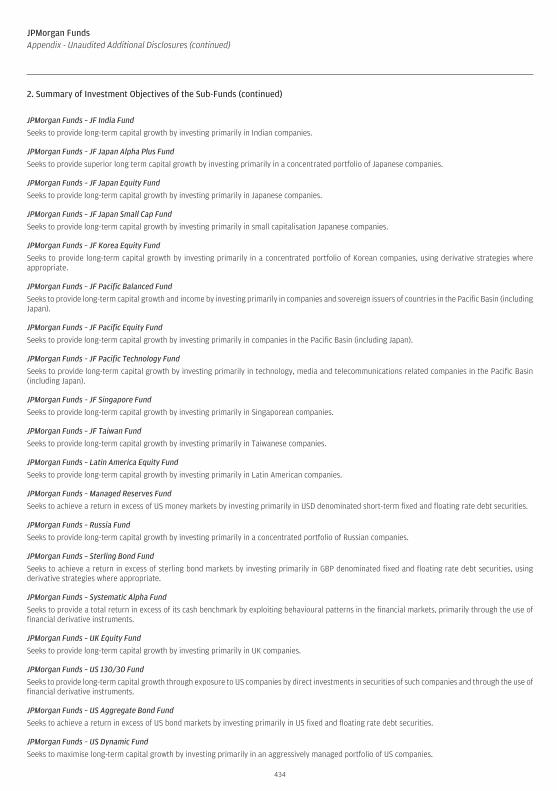
JPMorgan Funds – JF India Fund
Seeks to provide long-term capital growth by investing primarily in Indian companies.
JPMorgan Funds – JF Japan Alpha Plus Fund
Seeks to provide superior long term capital growth by investing primarily in a concentrated portfolio of Japanese companies.
JPMorgan Funds – JF Japan Equity Fund
Seeks to provide long-term capital growth by investing primarily in Japanese companies.
JPMorgan Funds – JF Japan Small Cap Fund
Seeks to provide long-term capital growth by investing primarily in small capitalisation Japanese companies.
JPMorgan Funds – JF Korea Equity Fund
Seeks to provide long-term capital growth by investing primarily in a concentrated portfolio of Korean companies, using derivative strategies whereappropriate.
JPMorgan Funds – JF Pacific Balanced Fund
Seeks to provide long-term capital growth and income by investing primarily in companies and sovereign issuers of countries in the Pacific Basin (includingJapan).
JPMorgan Funds – JF Pacific Equity Fund
Seeks to provide long-term capital growth by investing primarily in companies in the Pacific Basin (including Japan).
JPMorgan Funds – JF Pacific Technology Fund
Seeks to provide long-term capital growth by investing primarily in technology, media and telecommunications related companies in the Pacific Basin(including Japan).
JPMorgan Funds – JF Singapore Fund
Seeks to provide long-term capital growth by investing primarily in Singaporean companies.
JPMorgan Funds – JF Taiwan Fund
Seeks to provide long-term capital growth by investing primarily in Taiwanese companies.
JPMorgan Funds – Latin America Equity Fund
Seeks to provide long-term capital growth by investing primarily in Latin American companies.
JPMorgan Funds – Managed Reserves Fund
Seeks to achieve a return in excess of US money markets by investing primarily in USD denominated short-term fixed and floating rate debt securities.
JPMorgan Funds – Russia Fund
Seeks to provide long-term capital growth by investing primarily in a concentrated portfolio of Russian companies.
JPMorgan Funds – Sterling Bond Fund
Seeks to achieve a return in excess of sterling bond markets by investing primarily in GBP denominated fixed and floating rate debt securities, usingderivative strategies where appropriate.
JPMorgan Funds – Systematic Alpha Fund
Seeks to provide a total return in excess of its cash benchmark by exploiting behavioural patterns in the financial markets, primarily through the use offinancial derivative instruments.
JPMorgan Funds – UK Equity Fund
Seeks to provide long-term capital growth by investing primarily in UK companies.
JPMorgan Funds – US 130/30 Fund
Seeks to provide long-term capital growth through exposure to US companies by direct investments in securities of such companies and through the use offinancial derivative instruments.
JPMorgan Funds – US Aggregate Bond Fund
Seeks to achieve a return in excess of US bond markets by investing primarily in US fixed and floating rate debt securities.
JPMorgan Funds – US Dynamic Fund
Seeks to maximise long-term capital growth by investing primarily in an aggressively managed portfolio of US companies.
434
JPMorgan FundsAppendix - Unaudited Additional Disclosures (continued)
2. Summary of Investment Objectives of the Sub-Funds (continued)
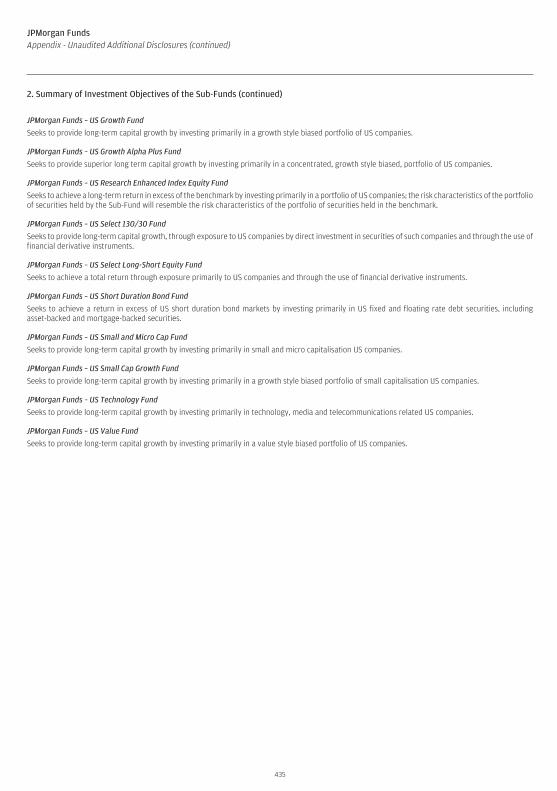
JPMorgan Funds – US Growth Fund
Seeks to provide long-term capital growth by investing primarily in a growth style biased portfolio of US companies.
JPMorgan Funds – US Growth Alpha Plus Fund
Seeks to provide superior long term capital growth by investing primarily in a concentrated, growth style biased, portfolio of US companies.
JPMorgan Funds – US Research Enhanced Index Equity Fund
Seeks to achieve a long-term return in excess of the benchmark by investing primarily in a portfolio of US companies; the risk characteristics of the portfolioof securities held by the Sub-Fund will resemble the risk characteristics of the portfolio of securities held in the benchmark.
JPMorgan Funds – US Select 130/30 Fund
Seeks to provide long-term capital growth, through exposure to US companies by direct investment in securities of such companies and through the use offinancial derivative instruments.
JPMorgan Funds – US Select Long-Short Equity Fund
Seeks to achieve a total return through exposure primarily to US companies and through the use of financial derivative instruments.
JPMorgan Funds – US Short Duration Bond Fund
Seeks to achieve a return in excess of US short duration bond markets by investing primarily in US fixed and floating rate debt securities, includingasset-backed and mortgage-backed securities.
JPMorgan Funds – US Small and Micro Cap Fund
Seeks to provide long-term capital growth by investing primarily in small and micro capitalisation US companies.
JPMorgan Funds – US Small Cap Growth Fund
Seeks to provide long-term capital growth by investing primarily in a growth style biased portfolio of small capitalisation US companies.
JPMorgan Funds – US Technology Fund
Seeks to provide long-term capital growth by investing primarily in technology, media and telecommunications related US companies.
JPMorgan Funds – US Value Fund
Seeks to provide long-term capital growth by investing primarily in a value style biased portfolio of US companies.
435
JPMorgan FundsAppendix - Unaudited Additional Disclosures (continued)
2. Summary of Investment Objectives of the Sub-Funds (continued)
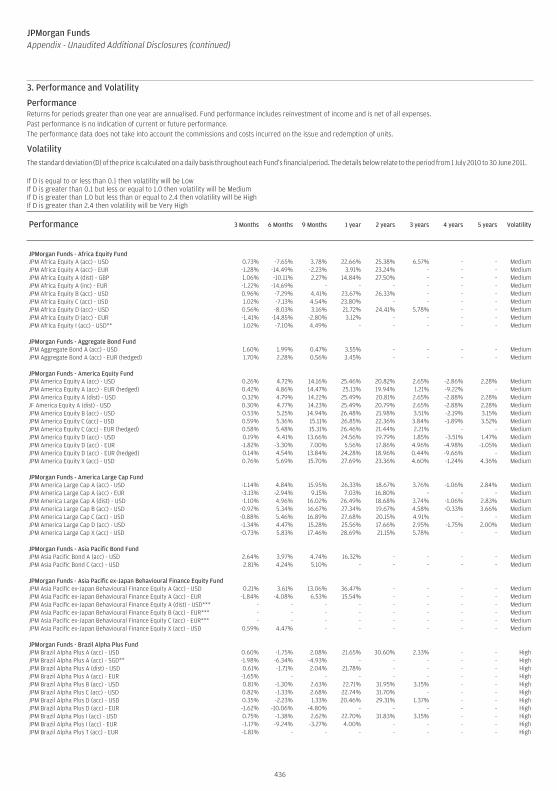
3. Performance and Volatility
PerformanceReturns for periods greater than one year are annualised. Fund performance includes reinvestment of income and is net of all expenses.Past performance is no indication of current or future performance.The performance data does not take into account the commissions and costs incurred on the issue and redemption of units.
Volatility
The standard deviation (D) of the price is calculated on a daily basis throughout each Fund’s financial period. The details below relate to the period from 1 July 2010 to 30 June 2011.
If D is equal to or less than 0.1 then volatility will be LowIf D is greater than 0.1 but less or equal to 1.0 then volatility will be MediumIf D is greater than 1.0 but less than or equal to 2.4 then volatility will be HighIf D is greater than 2.4 then volatility will be Very High
Performance (continued) 3 Months 6 Months 9 Months 1 year 2 years 3 years 4 years 5 years Volatility
JPMorgan Funds - Africa Equity FundJPM Africa Equity A (acc) - USD 0.73% -7.65% 3.78% 22.66% 25.38% 6.57% - - MediumJPM Africa Equity A (acc) - EUR -1.28% -14.49% -2.23% 3.91% 23.24% - - - MediumJPM Africa Equity A (dist) - GBP 1.06% -10.11% 2.27% 14.84% 27.50% - - - MediumJPM Africa Equity A (inc) - EUR -1.22% -14.69% - - - - - - MediumJPM Africa Equity B (acc) - USD 0.96% -7.29% 4.41% 23.67% 26.33% - - - MediumJPM Africa Equity C (acc) - USD 1.02% -7.13% 4.54% 23.80% - - - - MediumJPM Africa Equity D (acc) - USD 0.56% -8.03% 3.16% 21.72% 24.41% 5.78% - - MediumJPM Africa Equity D (acc) - EUR -1.41% -14.85% -2.80% 3.12% - - - - MediumJPM Africa Equity I (acc) - USD** 1.02% -7.10% 4.49% - - - - - Medium
JPMorgan Funds - Aggregate Bond FundJPM Aggregate Bond A (acc) - USD 1.60% 1.99% 0.47% 3.55% - - - - MediumJPM Aggregate Bond A (acc) - EUR (hedged) 1.70% 2.28% 0.56% 3.45% - - - - Medium
JPMorgan Funds - America Equity FundJPM America Equity A (acc) - USD 0.26% 4.72% 14.16% 25.46% 20.82% 2.65% -2.86% 2.28% MediumJPM America Equity A (acc) - EUR (hedged) 0.42% 4.86% 14.47% 25.13% 19.94% 1.21% -9.22% - MediumJPM America Equity A (dist) - USD 0.32% 4.79% 14.22% 25.49% 20.81% 2.65% -2.88% 2.28% MediumJF America Equity A (dist) - USD 0.30% 4.77% 14.23% 25.49% 20.79% 2.65% -2.88% 2.28% MediumJPM America Equity B (acc) - USD 0.53% 5.25% 14.94% 26.48% 21.98% 3.51% -2.19% 3.15% MediumJPM America Equity C (acc) - USD 0.59% 5.36% 15.11% 26.85% 22.36% 3.84% -1.89% 3.52% MediumJPM America Equity C (acc) - EUR (hedged) 0.58% 5.48% 15.31% 26.46% 21.44% 2.21% - - MediumJPM America Equity D (acc) - USD 0.19% 4.41% 13.66% 24.56% 19.79% 1.85% -3.51% 1.47% MediumJPM America Equity D (acc) - EUR -1.82% -3.30% 7.00% 5.56% 17.86% 4.96% -4.98% -1.05% MediumJPM America Equity D (acc) - EUR (hedged) 0.14% 4.54% 13.84% 24.28% 18.96% 0.44% -9.66% - MediumJPM America Equity X (acc) - USD 0.76% 5.69% 15.70% 27.69% 23.36% 4.60% -1.24% 4.36% Medium
JPMorgan Funds - America Large Cap FundJPM America Large Cap A (acc) - USD -1.14% 4.84% 15.95% 26.33% 18.67% 3.76% -1.06% 2.84% MediumJPM America Large Cap A (acc) - EUR -3.13% -2.94% 9.15% 7.03% 16.80% - - - MediumJPM America Large Cap A (dist) - USD -1.10% 4.96% 16.02% 26.49% 18.68% 3.74% -1.06% 2.83% MediumJPM America Large Cap B (acc) - USD -0.92% 5.34% 16.67% 27.34% 19.67% 4.58% -0.33% 3.66% MediumJPM America Large Cap C (acc) - USD -0.88% 5.46% 16.89% 27.68% 20.15% 4.91% - - MediumJPM America Large Cap D (acc) - USD -1.34% 4.47% 15.28% 25.56% 17.66% 2.95% -1.75% 2.00% MediumJPM America Large Cap X (acc) - USD -0.73% 5.83% 17.46% 28.69% 21.15% 5.78% - - Medium
JPMorgan Funds - Asia Pacific Bond FundJPM Asia Pacific Bond A (acc) - USD 2.64% 3.97% 4.74% 16.32% - - - - MediumJPM Asia Pacific Bond C (acc) - USD 2.81% 4.24% 5.10% - - - - - Medium
JPMorgan Funds - Asia Pacific ex-Japan Behavioural Finance Equity FundJPM Asia Pacific ex-Japan Behavioural Finance Equity A (acc) - USD 0.21% 3.61% 13.06% 36.47% - - - - MediumJPM Asia Pacific ex-Japan Behavioural Finance Equity A (acc) - EUR -1.84% -4.08% 6.53% 15.54% - - - - MediumJPM Asia Pacific ex-Japan Behavioural Finance Equity A (dist) - USD*** - - - - - - - - MediumJPM Asia Pacific ex-Japan Behavioural Finance Equity B (acc) - EUR*** - - - - - - - - MediumJPM Asia Pacific ex-Japan Behavioural Finance Equity C (acc) - EUR*** - - - - - - - - MediumJPM Asia Pacific ex-Japan Behavioural Finance Equity X (acc) - USD 0.59% 4.47% - - - - - - Medium
JPMorgan Funds - Brazil Alpha Plus FundJPM Brazil Alpha Plus A (acc) - USD 0.60% -1.75% 2.08% 21.65% 30.60% 2.33% - - HighJPM Brazil Alpha Plus A (acc) - SGD** -1.98% -6.34% -4.93% - - - - - HighJPM Brazil Alpha Plus A (dist) - USD 0.61% -1.71% 2.04% 21.78% - - - - HighJPM Brazil Alpha Plus A (acc) - EUR -1.65% - - - - - - - HighJPM Brazil Alpha Plus B (acc) - USD 0.81% -1.30% 2.63% 22.71% 31.95% 3.15% - - HighJPM Brazil Alpha Plus C (acc) - USD 0.82% -1.33% 2.68% 22.74% 31.70% - - - HighJPM Brazil Alpha Plus D (acc) - USD 0.35% -2.23% 1.33% 20.46% 29.31% 1.37% - - HighJPM Brazil Alpha Plus D (acc) - EUR -1.62% -10.06% -4.80% - - - - - HighJPM Brazil Alpha Plus I (acc) - USD 0.75% -1.38% 2.62% 22.70% 31.83% 3.15% - - HighJPM Brazil Alpha Plus I (acc) - EUR -1.17% -9.24% -3.27% 4.00% - - - - HighJPM Brazil Alpha Plus T (acc) - EUR -1.81% - - - - - - - High
436
JPMorgan FundsAppendix - Unaudited Additional Disclosures (continued)
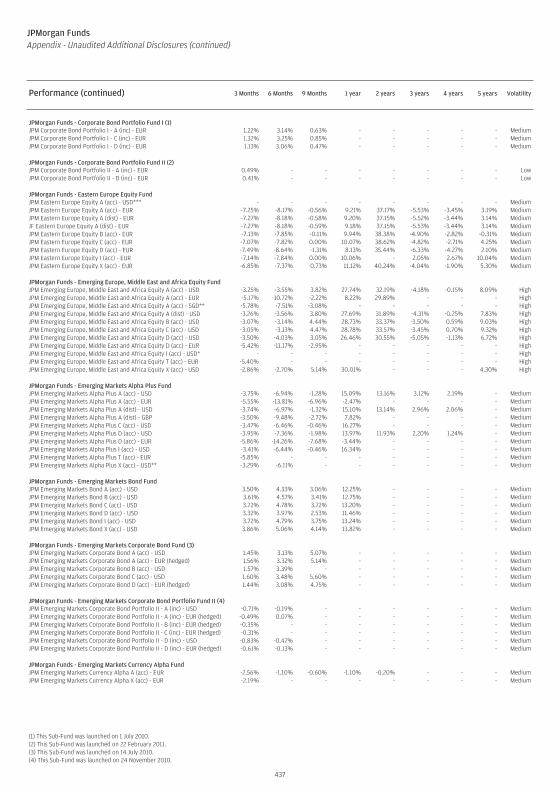
Performance (continued) 3 Months 6 Months 9 Months 1 year 2 years 3 years 4 years 5 years Volatility
JPMorgan Funds - Corporate Bond Portfolio Fund I (1)JPM Corporate Bond Portfolio I - A (inc) - EUR 1.22% 3.14% 0.63% - - - - - MediumJPM Corporate Bond Portfolio I - C (inc) - EUR 1.32% 3.25% 0.85% - - - - - MediumJPM Corporate Bond Portfolio I - D (inc) - EUR 1.13% 3.06% 0.47% - - - - - Medium
JPMorgan Funds - Corporate Bond Portfolio Fund II (2)JPM Corporate Bond Portfolio II - A (inc) - EUR 0.49% - - - - - - - LowJPM Corporate Bond Portfolio II - D (inc) - EUR 0.41% - - - - - - - Low
JPMorgan Funds - Eastern Europe Equity FundJPM Eastern Europe Equity A (acc) - USD*** - - - - - - - - MediumJPM Eastern Europe Equity A (acc) - EUR -7.25% -8.17% -0.56% 9.21% 37.17% -5.53% -3.45% 3.19% MediumJPM Eastern Europe Equity A (dist) - EUR -7.27% -8.18% -0.58% 9.20% 37.15% -5.52% -3.44% 3.14% MediumJF Eastern Europe Equity A (dist) - EUR -7.27% -8.18% -0.59% 9.18% 37.15% -5.53% -3.44% 3.14% MediumJPM Eastern Europe Equity B (acc) - EUR -7.13% -7.85% -0.11% 9.94% 38.38% -4.90% -2.82% -0.31% MediumJPM Eastern Europe Equity C (acc) - EUR -7.07% -7.82% 0.00% 10.07% 38.62% -4.82% -2.71% 4.25% MediumJPM Eastern Europe Equity D (acc) - EUR -7.49% -8.64% -1.31% 8.13% 35.44% -6.33% -4.27% 2.10% MediumJPM Eastern Europe Equity I (acc) - EUR -7.14% -7.84% 0.00% 10.06% - 2.05% 2.67% 10.04% MediumJPM Eastern Europe Equity X (acc) - EUR -6.85% -7.37% 0.73% 11.12% 40.24% -4.04% -1.90% 5.30% Medium
JPMorgan Funds - Emerging Europe, Middle East and Africa Equity FundJPM Emerging Europe, Middle East and Africa Equity A (acc) - USD -3.25% -3.55% 3.82% 27.74% 32.19% -4.18% -0.15% 8.09% HighJPM Emerging Europe, Middle East and Africa Equity A (acc) - EUR -5.17% -10.72% -2.22% 8.22% 29.89% - - - HighJPM Emerging Europe, Middle East and Africa Equity A (acc) - SGD** -5.78% -7.51% -3.08% - - - - - HighJPM Emerging Europe, Middle East and Africa Equity A (dist) - USD -3.26% -3.56% 3.80% 27.69% 31.89% -4.31% -0.25% 7.83% HighJPM Emerging Europe, Middle East and Africa Equity B (acc) - USD -3.07% -3.14% 4.44% 28.73% 33.37% -3.50% 0.59% 9.03% HighJPM Emerging Europe, Middle East and Africa Equity C (acc) - USD -3.05% -3.13% 4.47% 28.78% 33.57% -3.45% 0.70% 9.32% HighJPM Emerging Europe, Middle East and Africa Equity D (acc) - USD -3.50% -4.03% 3.05% 26.46% 30.55% -5.05% -1.13% 6.72% HighJPM Emerging Europe, Middle East and Africa Equity D (acc) - EUR -5.42% -11.17% -2.95% - - - - - HighJPM Emerging Europe, Middle East and Africa Equity I (acc) - USD* - - - - - - - - HighJPM Emerging Europe, Middle East and Africa Equity T (acc) - EUR -5.40% - - - - - - - HighJPM Emerging Europe, Middle East and Africa Equity X (acc) - USD -2.86% -2.70% 5.14% 30.01% - - - 4.30% High
JPMorgan Funds - Emerging Markets Alpha Plus FundJPM Emerging Markets Alpha Plus A (acc) - USD -3.75% -6.94% -1.28% 15.09% 13.16% 3.12% 2.19% - MediumJPM Emerging Markets Alpha Plus A (acc) - EUR -5.55% -13.81% -6.96% -2.47% - - - - MediumJPM Emerging Markets Alpha Plus A (dist) - USD -3.74% -6.97% -1.32% 15.10% 13.14% 2.96% 2.06% - MediumJPM Emerging Markets Alpha Plus A (dist) - GBP -3.50% -9.48% -2.72% 7.82% - - - - MediumJPM Emerging Markets Alpha Plus C (acc) - USD -3.47% -6.46% -0.46% 16.27% - - - - MediumJPM Emerging Markets Alpha Plus D (acc) - USD -3.95% -7.36% -1.98% 13.97% 11.93% 2.20% 1.24% - MediumJPM Emerging Markets Alpha Plus D (acc) - EUR -5.86% -14.26% -7.68% -3.44% - - - - MediumJPM Emerging Markets Alpha Plus I (acc) - USD -3.41% -6.44% -0.46% 16.34% - - - - MediumJPM Emerging Markets Alpha Plus T (acc) - EUR -5.85% - - - - - - - MediumJPM Emerging Markets Alpha Plus X (acc) - USD** -3.29% -6.11% - - - - - - Medium
JPMorgan Funds - Emerging Markets Bond FundJPM Emerging Markets Bond A (acc) - USD 3.50% 4.33% 3.06% 12.25% - - - - MediumJPM Emerging Markets Bond B (acc) - USD 3.61% 4.57% 3.41% 12.75% - - - - MediumJPM Emerging Markets Bond C (acc) - USD 3.72% 4.78% 3.72% 13.20% - - - - MediumJPM Emerging Markets Bond D (acc) - USD 3.32% 3.97% 2.53% 11.46% - - - - MediumJPM Emerging Markets Bond I (acc) - USD 3.72% 4.79% 3.75% 13.24% - - - - MediumJPM Emerging Markets Bond X (acc) - USD 3.86% 5.06% 4.14% 13.82% - - - - Medium
JPMorgan Funds - Emerging Markets Corporate Bond Fund (3)JPM Emerging Markets Corporate Bond A (acc) - USD 1.45% 3.13% 5.07% - - - - - MediumJPM Emerging Markets Corporate Bond A (acc) - EUR (hedged) 1.56% 3.32% 5.14% - - - - - MediumJPM Emerging Markets Corporate Bond B (acc) - USD 1.57% 3.39% - - - - - - MediumJPM Emerging Markets Corporate Bond C (acc) - USD 1.60% 3.48% 5.60% - - - - - MediumJPM Emerging Markets Corporate Bond D (acc) - EUR (hedged) 1.44% 3.08% 4.75% - - - - - Medium
JPMorgan Funds - Emerging Markets Corporate Bond Portfolio Fund II (4)JPM Emerging Markets Corporate Bond Portfolio II - A (inc) - USD -0.71% -0.19% - - - - - - MediumJPM Emerging Markets Corporate Bond Portfolio II - A (inc) - EUR (hedged) -0.49% 0.07% - - - - - - MediumJPM Emerging Markets Corporate Bond Portfolio II - B (inc) - EUR (hedged) -0.35% - - - - - - - MediumJPM Emerging Markets Corporate Bond Portfolio II - C (inc) - EUR (hedged) -0.31% - - - - - - - MediumJPM Emerging Markets Corporate Bond Portfolio II - D (inc) - USD -0.83% -0.42% - - - - - - MediumJPM Emerging Markets Corporate Bond Portfolio II - D (inc) - EUR (hedged) -0.61% -0.13% - - - - - - Medium
JPMorgan Funds - Emerging Markets Currency Alpha FundJPM Emerging Markets Currency Alpha A (acc) - EUR -2.56% -1.10% -0.60% -1.10% -0.20% - - - MediumJPM Emerging Markets Currency Alpha X (acc) - EUR -2.19% - - - - - - - Medium
(1) This Sub-Fund was launched on 1 July 2010.(2) This Sub-Fund was launched on 22 February 2011.(3) This Sub-Fund was launched on 14 July 2010.(4) This Sub-Fund was launched on 24 November 2010.
437
JPMorgan FundsAppendix - Unaudited Additional Disclosures (continued)
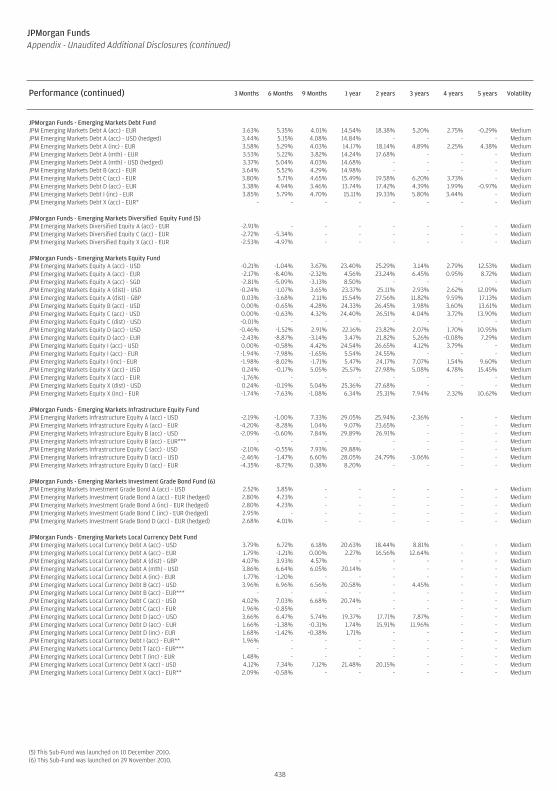
Performance (continued) 3 Months 6 Months 9 Months 1 year 2 years 3 years 4 years 5 years Volatility
JPMorgan Funds - Emerging Markets Debt FundJPM Emerging Markets Debt A (acc) - EUR 3.63% 5.35% 4.01% 14.54% 18.38% 5.20% 2.75% -0.29% MediumJPM Emerging Markets Debt A (acc) - USD (hedged) 3.44% 5.15% 4.08% 14.84% - - - - MediumJPM Emerging Markets Debt A (inc) - EUR 3.58% 5.29% 4.03% 14.17% 18.14% 4.89% 2.25% 4.38% MediumJPM Emerging Markets Debt A (mth) - EUR 3.53% 5.22% 3.82% 14.24% 17.68% - - - MediumJPM Emerging Markets Debt A (mth) - USD (hedged) 3.37% 5.04% 4.03% 14.68% - - - - MediumJPM Emerging Markets Debt B (acc) - EUR 3.64% 5.52% 4.29% 14.98% - - - - MediumJPM Emerging Markets Debt C (acc) - EUR 3.80% 5.71% 4.65% 15.49% 19.58% 6.20% 3.73% - MediumJPM Emerging Markets Debt D (acc) - EUR 3.38% 4.94% 3.46% 13.74% 17.42% 4.39% 1.99% -0.97% MediumJPM Emerging Markets Debt I (inc) - EUR 3.85% 5.79% 4.70% 15.11% 19.33% 5.80% 3.44% - MediumJPM Emerging Markets Debt X (acc) - EUR* - - - - - - - - Medium
JPMorgan Funds - Emerging Markets Diversified Equity Fund (5)JPM Emerging Markets Diversified Equity A (acc) - EUR -2.91% - - - - - - - MediumJPM Emerging Markets Diversified Equity C (acc) - EUR -2.72% -5.34% - - - - - - MediumJPM Emerging Markets Diversified Equity X (acc) - EUR -2.53% -4.97% - - - - - - Medium
JPMorgan Funds - Emerging Markets Equity FundJPM Emerging Markets Equity A (acc) - USD -0.21% -1.04% 3.67% 23.40% 25.29% 3.14% 2.79% 12.53% MediumJPM Emerging Markets Equity A (acc) - EUR -2.17% -8.40% -2.32% 4.56% 23.24% 6.45% 0.95% 8.72% MediumJPM Emerging Markets Equity A (acc) - SGD -2.81% -5.09% -3.13% 8.50% - - - - MediumJPM Emerging Markets Equity A (dist) - USD -0.24% -1.07% 3.65% 23.37% 25.11% 2.93% 2.62% 12.09% MediumJPM Emerging Markets Equity A (dist) - GBP 0.03% -3.68% 2.11% 15.54% 27.56% 11.82% 9.59% 17.13% MediumJPM Emerging Markets Equity B (acc) - USD 0.00% -0.65% 4.28% 24.33% 26.45% 3.98% 3.60% 13.61% MediumJPM Emerging Markets Equity C (acc) - USD 0.00% -0.63% 4.32% 24.40% 26.51% 4.04% 3.72% 13.90% MediumJPM Emerging Markets Equity C (dist) - USD -0.01% - - - - - - - MediumJPM Emerging Markets Equity D (acc) - USD -0.46% -1.52% 2.91% 22.16% 23.82% 2.07% 1.70% 10.95% MediumJPM Emerging Markets Equity D (acc) - EUR -2.43% -8.87% -3.14% 3.47% 21.82% 5.26% -0.08% 7.29% MediumJPM Emerging Markets Equity I (acc) - USD 0.00% -0.58% 4.42% 24.54% 26.65% 4.12% 3.79% - MediumJPM Emerging Markets Equity I (acc) - EUR -1.94% -7.98% -1.65% 5.54% 24.55% - - - MediumJPM Emerging Markets Equity I (inc) - EUR -1.98% -8.02% -1.71% 5.47% 24.17% 7.07% 1.54% 9.60% MediumJPM Emerging Markets Equity X (acc) - USD 0.24% -0.17% 5.05% 25.57% 27.98% 5.08% 4.78% 15.45% MediumJPM Emerging Markets Equity X (acc) - EUR -1.76% - - - - - - - MediumJPM Emerging Markets Equity X (dist) - USD 0.24% -0.19% 5.04% 25.36% 27.68% - - - MediumJPM Emerging Markets Equity X (inc) - EUR -1.74% -7.63% -1.08% 6.34% 25.31% 7.94% 2.32% 10.62% Medium
JPMorgan Funds - Emerging Markets Infrastructure Equity FundJPM Emerging Markets Infrastructure Equity A (acc) - USD -2.19% -1.00% 7.33% 29.05% 25.94% -2.36% - - MediumJPM Emerging Markets Infrastructure Equity A (acc) - EUR -4.20% -8.28% 1.04% 9.07% 23.65% - - - MediumJPM Emerging Markets Infrastructure Equity B (acc) - USD -2.09% -0.60% 7.84% 29.89% 26.91% - - - MediumJPM Emerging Markets Infrastructure Equity B (acc) - EUR*** - - - - - - - - MediumJPM Emerging Markets Infrastructure Equity C (acc) - USD -2.10% -0.55% 7.93% 29.88% - - - - MediumJPM Emerging Markets Infrastructure Equity D (acc) - USD -2.46% -1.47% 6.60% 28.05% 24.79% -3.06% - - MediumJPM Emerging Markets Infrastructure Equity D (acc) - EUR -4.35% -8.72% 0.38% 8.20% - - - - Medium
JPMorgan Funds - Emerging Markets Investment Grade Bond Fund (6)JPM Emerging Markets Investment Grade Bond A (acc) - USD 2.52% 3.85% - - - - - - MediumJPM Emerging Markets Investment Grade Bond A (acc) - EUR (hedged) 2.80% 4.23% - - - - - - MediumJPM Emerging Markets Investment Grade Bond A (inc) - EUR (hedged) 2.80% 4.23% - - - - - - MediumJPM Emerging Markets Investment Grade Bond C (inc) - EUR (hedged) 2.95% - - - - - - - MediumJPM Emerging Markets Investment Grade Bond D (acc) - EUR (hedged) 2.68% 4.01% - - - - - - Medium
JPMorgan Funds - Emerging Markets Local Currency Debt FundJPM Emerging Markets Local Currency Debt A (acc) - USD 3.79% 6.72% 6.18% 20.63% 18.44% 8.81% - - MediumJPM Emerging Markets Local Currency Debt A (acc) - EUR 1.79% -1.21% 0.00% 2.27% 16.56% 12.64% - - MediumJPM Emerging Markets Local Currency Debt A (dist) - GBP 4.07% 3.93% 4.57% - - - - - MediumJPM Emerging Markets Local Currency Debt A (mth) - USD 3.86% 6.64% 6.05% 20.14% - - - - MediumJPM Emerging Markets Local Currency Debt A (inc) - EUR 1.77% -1.20% - - - - - - MediumJPM Emerging Markets Local Currency Debt B (acc) - USD 3.96% 6.96% 6.56% 20.58% - 4.45% - - MediumJPM Emerging Markets Local Currency Debt B (acc) - EUR*** - - - - - - - - MediumJPM Emerging Markets Local Currency Debt C (acc) - USD 4.02% 7.03% 6.68% 20.74% - - - - MediumJPM Emerging Markets Local Currency Debt C (acc) - EUR 1.96% -0.85% - - - - - - MediumJPM Emerging Markets Local Currency Debt D (acc) - USD 3.66% 6.47% 5.74% 19.37% 17.71% 7.87% - - MediumJPM Emerging Markets Local Currency Debt D (acc) - EUR 1.66% -1.38% -0.31% 1.74% 15.91% 11.96% - - MediumJPM Emerging Markets Local Currency Debt D (inc) - EUR 1.68% -1.42% -0.38% 1.71% - - - - MediumJPM Emerging Markets Local Currency Debt I (acc) - EUR** 1.96% - - - - - - - MediumJPM Emerging Markets Local Currency Debt T (acc) - EUR*** - - - - - - - - MediumJPM Emerging Markets Local Currency Debt T (inc) - EUR 1.48% - - - - - - - MediumJPM Emerging Markets Local Currency Debt X (acc) - USD 4.12% 7.34% 7.12% 21.48% 20.15% - - - MediumJPM Emerging Markets Local Currency Debt X (acc) - EUR** 2.09% -0.58% - - - - - - Medium
(5) This Sub-Fund was launched on 10 December 2010.(6) This Sub-Fund was launched on 29 November 2010.
438
JPMorgan FundsAppendix - Unaudited Additional Disclosures (continued)
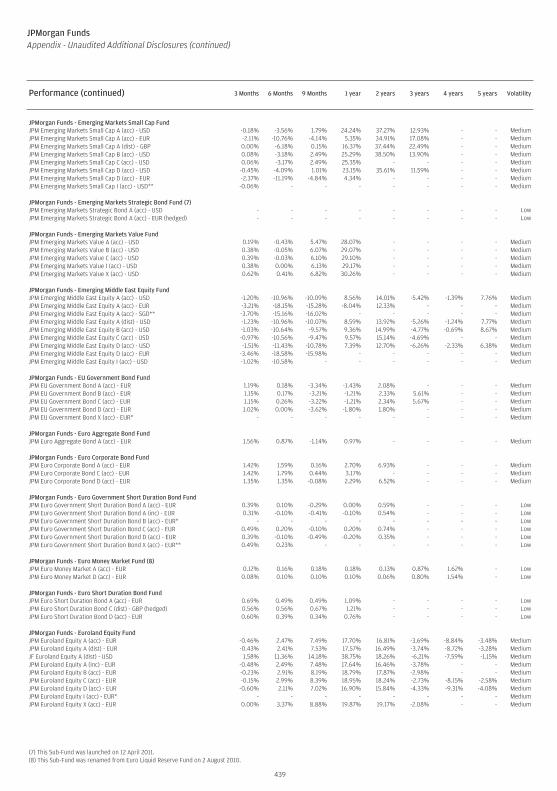
Performance (continued) 3 Months 6 Months 9 Months 1 year 2 years 3 years 4 years 5 years Volatility
JPMorgan Funds - Emerging Markets Small Cap FundJPM Emerging Markets Small Cap A (acc) - USD -0.18% -3.56% 1.79% 24.24% 37.27% 12.93% - - MediumJPM Emerging Markets Small Cap A (acc) - EUR -2.11% -10.76% -4.14% 5.35% 34.91% 17.08% - - MediumJPM Emerging Markets Small Cap A (dist) - GBP 0.00% -6.18% 0.15% 16.37% 37.44% 22.49% - - MediumJPM Emerging Markets Small Cap B (acc) - USD 0.08% -3.18% 2.49% 25.29% 38.50% 13.90% - - MediumJPM Emerging Markets Small Cap C (acc) - USD 0.06% -3.17% 2.49% 25.35% - - - - MediumJPM Emerging Markets Small Cap D (acc) - USD -0.45% -4.09% 1.01% 23.15% 35.61% 11.59% - - MediumJPM Emerging Markets Small Cap D (acc) - EUR -2.37% -11.19% -4.84% 4.34% - - - - MediumJPM Emerging Markets Small Cap I (acc) - USD** -0.06% - - - - - - - Medium
JPMorgan Funds - Emerging Markets Strategic Bond Fund (7)JPM Emerging Markets Strategic Bond A (acc) - USD - - - - - - - - LowJPM Emerging Markets Strategic Bond A (acc) - EUR (hedged) - - - - - - - - Low
JPMorgan Funds - Emerging Markets Value FundJPM Emerging Markets Value A (acc) - USD 0.19% -0.43% 5.47% 28.07% - - - - MediumJPM Emerging Markets Value B (acc) - USD 0.38% -0.05% 6.07% 29.07% - - - - MediumJPM Emerging Markets Value C (acc) - USD 0.39% -0.03% 6.10% 29.10% - - - - MediumJPM Emerging Markets Value I (acc) - USD 0.38% 0.00% 6.13% 29.17% - - - - MediumJPM Emerging Markets Value X (acc) - USD 0.62% 0.41% 6.82% 30.26% - - - - Medium
JPMorgan Funds - Emerging Middle East Equity FundJPM Emerging Middle East Equity A (acc) - USD -1.20% -10.96% -10.09% 8.56% 14.01% -5.42% -1.39% 7.76% MediumJPM Emerging Middle East Equity A (acc) - EUR -3.21% -18.15% -15.28% -8.04% 12.33% - - - MediumJPM Emerging Middle East Equity A (acc) - SGD** -3.70% -15.16% -16.02% - - - - - MediumJPM Emerging Middle East Equity A (dist) - USD -1.23% -10.96% -10.07% 8.59% 13.92% -5.26% -1.24% 7.77% MediumJPM Emerging Middle East Equity B (acc) - USD -1.03% -10.64% -9.57% 9.36% 14.99% -4.77% -0.69% 8.67% MediumJPM Emerging Middle East Equity C (acc) - USD -0.97% -10.56% -9.47% 9.57% 15.14% -4.69% - - MediumJPM Emerging Middle East Equity D (acc) - USD -1.51% -11.43% -10.78% 7.39% 12.70% -6.26% -2.33% 6.38% MediumJPM Emerging Middle East Equity D (acc) - EUR -3.46% -18.58% -15.98% - - - - - MediumJPM Emerging Middle East Equity I (acc) - USD -1.02% -10.58% - - - - - - Medium
JPMorgan Funds - EU Government Bond FundJPM EU Government Bond A (acc) - EUR 1.19% 0.18% -3.34% -1.43% 2.08% - - - MediumJPM EU Government Bond B (acc) - EUR 1.15% 0.17% -3.21% -1.21% 2.33% 5.61% - - MediumJPM EU Government Bond C (acc) - EUR 1.15% 0.26% -3.22% -1.21% 2.34% 5.67% - - MediumJPM EU Government Bond D (acc) - EUR 1.02% 0.00% -3.62% -1.80% 1.80% - - - MediumJPM EU Government Bond X (acc) - EUR* - - - - - - - - Medium
JPMorgan Funds - Euro Aggregate Bond FundJPM Euro Aggregate Bond A (acc) - EUR 1.56% 0.87% -1.14% 0.97% - - - - Medium
JPMorgan Funds - Euro Corporate Bond FundJPM Euro Corporate Bond A (acc) - EUR 1.42% 1.59% 0.16% 2.70% 6.93% - - - MediumJPM Euro Corporate Bond C (acc) - EUR 1.42% 1.79% 0.44% 3.17% - - - - MediumJPM Euro Corporate Bond D (acc) - EUR 1.35% 1.35% -0.08% 2.29% 6.52% - - - Medium
JPMorgan Funds - Euro Government Short Duration Bond FundJPM Euro Government Short Duration Bond A (acc) - EUR 0.39% 0.10% -0.29% 0.00% 0.59% - - - LowJPM Euro Government Short Duration Bond A (inc) - EUR 0.31% -0.10% -0.41% -0.10% 0.54% - - - LowJPM Euro Government Short Duration Bond B (acc) - EUR* - - - - - - - - LowJPM Euro Government Short Duration Bond C (acc) - EUR 0.49% 0.20% -0.10% 0.20% 0.74% - - - LowJPM Euro Government Short Duration Bond D (acc) - EUR 0.39% -0.10% -0.49% -0.20% 0.35% - - - LowJPM Euro Government Short Duration Bond X (acc) - EUR** 0.49% 0.23% - - - - - - Low
JPMorgan Funds - Euro Money Market Fund (8)JPM Euro Money Market A (acc) - EUR 0.12% 0.16% 0.18% 0.18% 0.13% 0.87% 1.62% - LowJPM Euro Money Market D (acc) - EUR 0.08% 0.10% 0.10% 0.10% 0.06% 0.80% 1.54% - Low
JPMorgan Funds - Euro Short Duration Bond FundJPM Euro Short Duration Bond A (acc) - EUR 0.69% 0.49% 0.49% 1.09% - - - - LowJPM Euro Short Duration Bond C (dist) - GBP (hedged) 0.56% 0.56% 0.67% 1.21% - - - - LowJPM Euro Short Duration Bond D (acc) - EUR 0.60% 0.39% 0.34% 0.76% - - - - Low
JPMorgan Funds - Euroland Equity FundJPM Euroland Equity A (acc) - EUR -0.46% 2.47% 7.49% 17.70% 16.81% -3.69% -8.84% -3.48% MediumJPM Euroland Equity A (dist) - EUR -0.43% 2.41% 7.53% 17.57% 16.49% -3.74% -8.72% -3.28% MediumJF Euroland Equity A (dist) - USD 1.58% 11.36% 14.18% 38.75% 18.26% -6.21% -7.59% -1.15% MediumJPM Euroland Equity A (inc) - EUR -0.48% 2.49% 7.48% 17.64% 16.46% -3.78% - - MediumJPM Euroland Equity B (acc) - EUR -0.23% 2.91% 8.19% 18.79% 17.87% -2.98% - - MediumJPM Euroland Equity C (acc) - EUR -0.15% 2.99% 8.39% 18.95% 18.24% -2.73% -8.15% -2.58% MediumJPM Euroland Equity D (acc) - EUR -0.60% 2.11% 7.02% 16.90% 15.84% -4.33% -9.31% -4.08% MediumJPM Euroland Equity I (acc) - EUR* - - - - - - - - MediumJPM Euroland Equity X (acc) - EUR 0.00% 3.37% 8.88% 19.87% 19.17% -2.08% - - Medium
(7) This Sub-Fund was launched on 12 April 2011.(8) This Sub-Fund was renamed from Euro Liquid Reserve Fund on 2 August 2010.
439
JPMorgan FundsAppendix - Unaudited Additional Disclosures (continued)
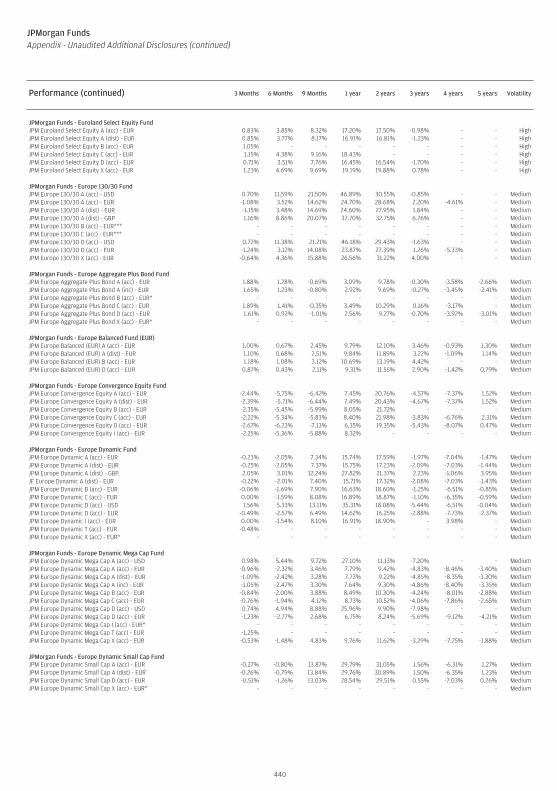
Performance (continued) 3 Months 6 Months 9 Months 1 year 2 years 3 years 4 years 5 years Volatility
JPMorgan Funds - Euroland Select Equity FundJPM Euroland Select Equity A (acc) - EUR 0.83% 3.85% 8.32% 17.20% 17.50% -0.98% - - HighJPM Euroland Select Equity A (dist) - EUR 0.85% 3.77% 8.17% 16.91% 16.81% -1.23% - - HighJPM Euroland Select Equity B (acc) - EUR 1.05% - - - - - - - HighJPM Euroland Select Equity C (acc) - EUR 1.15% 4.38% 9.16% 18.43% - - - - HighJPM Euroland Select Equity D (acc) - EUR 0.71% 3.51% 7.76% 16.45% 16.54% -1.70% - - HighJPM Euroland Select Equity X (acc) - EUR 1.23% 4.69% 9.69% 19.19% 19.88% 0.78% - - High
JPMorgan Funds - Europe 130/30 FundJPM Europe 130/30 A (acc) - USD 0.70% 11.59% 21.50% 46.89% 30.55% -0.85% - - MediumJPM Europe 130/30 A (acc) - EUR -1.08% 3.52% 14.62% 24.70% 28.68% 2.20% -4.61% - MediumJPM Europe 130/30 A (dist) - EUR -1.15% 3.48% 14.69% 24.60% 27.95% 1.84% - - MediumJPM Europe 130/30 A (dist) - GBP 1.16% 8.86% 20.07% 37.70% 32.75% 6.76% - - MediumJPM Europe 130/30 B (acc) - EUR*** - - - - - - - - MediumJPM Europe 130/30 C (acc) - EUR*** - - - - - - - - MediumJPM Europe 130/30 D (acc) - USD 0.72% 11.38% 21.21% 46.18% 29.43% -1.63% - - MediumJPM Europe 130/30 D (acc) - EUR -1.24% 3.12% 14.08% 23.87% 27.39% 1.26% -5.33% - MediumJPM Europe 130/30 X (acc) - EUR -0.64% 4.36% 15.88% 26.56% 31.22% 4.00% - - Medium
JPMorgan Funds - Europe Aggregate Plus Bond FundJPM Europe Aggregate Plus Bond A (acc) - EUR 1.88% 1.28% -0.69% 3.09% 9.78% -0.30% -3.58% -2.66% MediumJPM Europe Aggregate Plus Bond A (inc) - EUR 1.65% 1.23% -0.80% 2.92% 9.69% -0.27% -3.45% -2.41% MediumJPM Europe Aggregate Plus Bond B (acc) - EUR* - - - - - - - - MediumJPM Europe Aggregate Plus Bond C (acc) - EUR 1.89% 1.41% -0.35% 3.49% 10.29% 0.16% -3.17% - MediumJPM Europe Aggregate Plus Bond D (acc) - EUR 1.61% 0.92% -1.01% 2.56% 9.27% -0.70% -3.92% -3.01% MediumJPM Europe Aggregate Plus Bond X (acc) - EUR* - - - - - - - - Medium
JPMorgan Funds - Europe Balanced Fund (EUR)JPM Europe Balanced (EUR) A (acc) - EUR 1.00% 0.67% 2.45% 9.79% 12.10% 3.46% -0.93% 1.30% MediumJPM Europe Balanced (EUR) A (dist) - EUR 1.10% 0.68% 2.51% 9.84% 11.89% 3.22% -1.09% 1.14% MediumJPM Europe Balanced (EUR) B (acc) - EUR 1.18% 1.08% 3.12% 10.69% 13.19% 4.42% - - MediumJPM Europe Balanced (EUR) D (acc) - EUR 0.87% 0.43% 2.11% 9.31% 11.55% 2.90% -1.42% 0.79% Medium
JPMorgan Funds - Europe Convergence Equity FundJPM Europe Convergence Equity A (acc) - EUR -2.44% -5.75% -6.42% 7.45% 20.76% -4.57% -7.37% 1.52% MediumJPM Europe Convergence Equity A (dist) - EUR -2.39% -5.71% -6.44% 7.49% 20.43% -4.67% -7.37% 1.52% MediumJPM Europe Convergence Equity B (acc) - EUR -2.35% -5.45% -5.99% 8.05% 21.72% - - - MediumJPM Europe Convergence Equity C (acc) - EUR -2.22% -5.34% -5.83% 8.40% 21.98% -3.83% -6.76% 2.31% MediumJPM Europe Convergence Equity D (acc) - EUR -2.67% -6.23% -7.13% 6.35% 19.35% -5.43% -8.07% 0.47% MediumJPM Europe Convergence Equity I (acc) - EUR -2.25% -5.36% -5.88% 8.32% - - - - Medium
JPMorgan Funds - Europe Dynamic FundJPM Europe Dynamic A (acc) - EUR -0.23% -2.05% 7.34% 15.74% 17.59% -1.97% -7.04% -1.47% MediumJPM Europe Dynamic A (dist) - EUR -0.25% -2.05% 7.37% 15.75% 17.23% -2.09% -7.03% -1.44% MediumJPM Europe Dynamic A (dist) - GBP 2.05% 3.01% 12.24% 27.82% 21.37% 2.23% -1.06% 3.95% MediumJF Europe Dynamic A (dist) - EUR -0.22% -2.01% 7.40% 15.71% 17.32% -2.08% -7.03% -1.43% MediumJPM Europe Dynamic B (acc) - EUR -0.06% -1.69% 7.90% 16.63% 18.60% -1.25% -6.51% -0.85% MediumJPM Europe Dynamic C (acc) - EUR 0.00% -1.59% 8.08% 16.89% 18.87% -1.10% -6.35% -0.59% MediumJPM Europe Dynamic D (acc) - USD 1.56% 5.33% 13.11% 35.31% 18.08% -5.44% -6.51% -0.04% MediumJPM Europe Dynamic D (acc) - EUR -0.49% -2.57% 6.49% 14.62% 16.25% -2.88% -7.73% -2.37% MediumJPM Europe Dynamic I (acc) - EUR 0.00% -1.54% 8.10% 16.91% 18.90% - 3.98% - MediumJPM Europe Dynamic T (acc) - EUR -0.48% - - - - - - - MediumJPM Europe Dynamic X (acc) - EUR* - - - - - - - - Medium
JPMorgan Funds - Europe Dynamic Mega Cap FundJPM Europe Dynamic Mega Cap A (acc) - USD 0.98% 5.44% 9.72% 27.10% 11.13% -7.20% - - MediumJPM Europe Dynamic Mega Cap A (acc) - EUR -0.96% -2.32% 3.46% 7.79% 9.42% -4.83% -8.46% -3.40% MediumJPM Europe Dynamic Mega Cap A (dist) - EUR -1.09% -2.42% 3.28% 7.73% 9.22% -4.85% -8.35% -3.30% MediumJPM Europe Dynamic Mega Cap A (inc) - EUR -1.05% -2.47% 3.30% 7.64% 9.30% -4.86% -8.40% -3.35% MediumJPM Europe Dynamic Mega Cap B (acc) - EUR -0.84% -2.00% 3.88% 8.49% 10.30% -4.24% -8.01% -2.88% MediumJPM Europe Dynamic Mega Cap C (acc) - EUR -0.76% -1.94% 4.12% 8.73% 10.52% -4.06% -7.86% -2.65% MediumJPM Europe Dynamic Mega Cap D (acc) - USD 0.74% 4.94% 8.88% 25.96% 9.90% -7.98% - - MediumJPM Europe Dynamic Mega Cap D (acc) - EUR -1.23% -2.77% 2.68% 6.75% 8.24% -5.69% -9.12% -4.21% MediumJPM Europe Dynamic Mega Cap I (acc) - EUR* - - - - - - - - MediumJPM Europe Dynamic Mega Cap T (acc) - EUR -1.25% - - - - - - - MediumJPM Europe Dynamic Mega Cap X (acc) - EUR -0.53% -1.48% 4.83% 9.76% 11.62% -3.29% -7.25% -1.88% Medium
JPMorgan Funds - Europe Dynamic Small Cap FundJPM Europe Dynamic Small Cap A (acc) - EUR -0.27% -0.80% 13.87% 29.79% 31.05% 1.56% -6.31% 1.27% MediumJPM Europe Dynamic Small Cap A (dist) - EUR -0.26% -0.79% 13.84% 29.76% 30.89% 1.50% -6.35% 1.23% MediumJPM Europe Dynamic Small Cap D (acc) - EUR -0.51% -1.26% 13.03% 28.54% 29.51% 0.55% -7.03% 0.26% MediumJPM Europe Dynamic Small Cap X (acc) - EUR* - - - - - - - - Medium
440
JPMorgan FundsAppendix - Unaudited Additional Disclosures (continued)
Performance (continued) 3 Months 6 Months 9 Months 1 year 2 years 3 years 4 years 5 years Volatility
JPMorgan Funds - Europe Equity FundJPM Europe Equity A (acc) - USD 0.84% 8.22% 14.38% 39.36% 21.61% -4.94% -6.97% 3.78% MediumJPM Europe Equity A (acc) - EUR -1.04% 0.19% 7.84% 18.08% 19.67% -2.37% -8.17% -3.56% MediumJPM Europe Equity A (dist) - EUR -1.14% 0.18% 7.74% 17.94% 19.10% -2.58% -8.17% -3.49% MediumJF Europe Equity A (dist) - USD 0.88% 8.24% 14.39% 39.10% 21.05% -5.11% -6.98% -1.36% MediumJPM Europe Equity B (acc) - EUR -0.95% 0.56% 8.39% 18.99% 20.71% -1.67% -7.67% -2.98% MediumJPM Europe Equity C (acc) - EUR -0.92% 0.70% 8.61% 19.28% 21.10% -1.39% -7.44% -2.67% MediumJPM Europe Equity D (acc) - USD 0.69% 7.80% 13.75% 38.40% 20.53% -5.58% -7.50% -2.07% MediumJPM Europe Equity D (acc) - EUR -1.30% -0.24% 7.07% 17.16% 18.62% -3.09% -8.67% -4.18% MediumJPM Europe Equity I (acc) - EUR* - - - - - - - - MediumJPM Europe Equity I (inc) - EUR* - - - - - - - - MediumJPM Europe Equity X (acc) - EUR -0.68% 1.07% 9.17% 20.09% 22.11% -0.74% -6.95% -2.06% Medium
JPMorgan Funds - Europe Focus FundJPM Europe Focus A (acc) - USD -0.25% 6.41% 12.74% 36.64% 23.19% -1.87% - - MediumJPM Europe Focus A (acc) - EUR -2.48% -1.74% 6.09% 15.71% 21.11% 0.95% -6.72% -1.05% MediumJPM Europe Focus A (dist) - EUR -2.55% -1.84% 6.08% 15.54% 20.69% 0.69% -6.80% - MediumJPM Europe Focus B (acc) - EUR -2.09% -1.27% 6.49% 16.15% 21.92% 1.61% - - MediumJPM Europe Focus C (acc) - EUR -2.15% -1.42% 6.39% 16.11% - 15.61% 3.20% - MediumJPM Europe Focus D (acc) - USD -0.68% 5.69% 11.96% 35.26% 21.69% -2.79% - - MediumJPM Europe Focus D (acc) - EUR -2.71% -2.16% 5.39% 14.51% 19.81% -0.04% -7.42% -1.95% MediumJPM Europe Focus T (acc) - EUR -2.70% - - - - - - - MediumJPM Europe Focus X (acc) - EUR -2.00% -0.83% 7.62% 17.82% 23.72% 2.87% -5.35% - Medium
JPMorgan Funds - Europe High Yield Bond FundJPM Europe High Yield Bond A (acc) - EUR 0.54% 3.68% 6.84% 13.39% 24.65% 8.94% 3.47% 4.55% MediumJPM Europe High Yield Bond A (inc) - EUR 0.77% 3.97% 6.94% 13.01% 23.38% 7.64% - - MediumJPM Europe High Yield Bond B (acc) - EUR 0.57% - - - - - - - MediumJPM Europe High Yield Bond C (acc) - EUR 0.58% 3.91% 7.20% 13.90% 25.46% 9.60% - - MediumJPM Europe High Yield Bond D (acc) - EUR 0.36% 3.43% 6.42% 12.67% 23.86% 8.21% 2.87% 3.87% MediumJPM Europe High Yield Bond T (acc) - EUR 0.33% - - - - - - - MediumJPM Europe High Yield Bond X (acc) - EUR* - - - - - - - - Medium
JPMorgan Funds - Europe Micro Cap FundJPM Europe Micro Cap A (acc) - EUR -1.93% -0.09% 15.30% 28.07% 27.66% 3.26% -8.27% 0.21% MediumJPM Europe Micro Cap A (dist) - EUR -2.01% -0.09% 15.27% 27.95% 27.58% 3.24% -8.29% 0.19% MediumJPM Europe Micro Cap D (acc) - EUR -2.34% -0.64% 14.33% 26.60% 25.98% 2.16% -8.95% -0.78% Medium
JPMorgan Funds - Europe Select 130/30 FundJPM Europe Select 130/30 A (acc) - USD 2.47% 9.38% 13.30% 36.94% 21.92% -2.49% - - MediumJPM Europe Select 130/30 A (acc) - EUR 0.54% 1.37% 6.78% 16.17% 19.94% 0.32% -6.61% - MediumJPM Europe Select 130/30 A (dist) - EUR 0.40% 1.20% 6.65% 15.95% 19.56% - - - MediumJPM Europe Select 130/30 A (dist) - GBP 2.63% 6.30% 11.43% 27.96% 23.67% 4.69% - - MediumJPM Europe Select 130/30 D (acc) - USD 2.20% 8.82% 12.40% 35.51% 20.47% -3.41% - - MediumJPM Europe Select 130/30 D (acc) - EUR 0.28% 0.85% 5.96% 14.86% 18.63% -0.69% -7.33% - MediumJPM Europe Select 130/30 X (acc) - EUR 0.85% 2.09% 8.06% 18.04% 22.39% 2.09% - - Medium
JPMorgan Funds - Europe Small Cap FundJPM Europe Small Cap A (acc) - EUR -1.79% -3.31% 9.50% 22.69% 28.87% 0.03% -7.69% -1.67% MediumJPM Europe Small Cap A (dist) - EUR -1.77% -3.32% 9.51% 22.68% 28.57% -0.10% -7.76% -1.73% MediumJF Europe Small Cap A (dist) - EUR -1.80% -3.28% 9.53% 22.71% 28.55% -0.09% -7.76% -1.72% MediumJPM Europe Small Cap A (dist) - GBP 0.49% 1.67% 14.55% 35.55% 33.30% 4.58% -1.88% 3.79% MediumJPM Europe Small Cap B (acc) - EUR -1.64% -2.96% 10.09% 23.61% 30.09% 0.81% -7.19% -1.05% MediumJPM Europe Small Cap C (acc) - EUR -1.60% -2.90% 10.17% 23.78% 30.40% 0.98% -7.04% -0.80% MediumJPM Europe Small Cap D (acc) - EUR -1.99% -3.81% 8.72% 21.62% 27.35% -0.94% -8.36% -2.56% MediumJPM Europe Small Cap I (acc) - EUR** -1.55% - - - - - - - MediumJPM Europe Small Cap X (acc) - EUR* - - - - - - - - Medium
JPMorgan Funds - Europe Strategic Growth FundJPM Europe Strategic Growth A (acc) - EUR -1.00% -1.61% 9.46% 22.05% 26.07% -0.46% -5.97% -0.52% MediumJPM Europe Strategic Growth A (dist) - EUR -1.11% -1.72% 9.41% 21.88% 25.70% -0.57% -6.02% -0.54% MediumJPM Europe Strategic Growth A (dist) - GBP 1.22% 3.42% 14.43% 34.81% 30.41% 3.98% 0.39% 5.23% MediumJPM Europe Strategic Growth B (acc) - EUR -0.83% -1.21% 10.06% 22.94% 27.16% 0.28% -5.41% 0.18% MediumJPM Europe Strategic Growth C (acc) - EUR -0.81% -1.17% 10.24% 23.15% 27.45% 0.48% -5.24% 0.42% MediumJPM Europe Strategic Growth D (acc) - EUR -1.28% -2.08% 8.74% 21.03% 24.87% -1.21% -6.54% -1.24% MediumJPM Europe Strategic Growth I (acc) - EUR* - - - - - - - - MediumJPM Europe Strategic Growth I (inc) - EUR* - - - - - - - - MediumJPM Europe Strategic Growth X (acc) - EUR** -0.63% - - - - - - - Medium
JPMorgan Funds - Europe Strategic Growth Small Cap FundJPM Europe Strategic Growth Small Cap A (acc) - EUR -1.73% -3.22% 12.06% 27.59% 31.63% 1.54% - - MediumJPM Europe Strategic Growth Small Cap D (acc) - EUR -1.89% -3.61% 11.26% 26.34% 30.06% 0.51% - - Medium
441
JPMorgan FundsAppendix - Unaudited Additional Disclosures (continued)
Performance (continued) 3 Months 6 Months 9 Months 1 year 2 years 3 years 4 years 5 years Volatility
JPMorgan Funds - Europe Strategic Value FundJPM Europe Strategic Value A (acc) - EUR -1.81% 1.35% 4.48% 14.24% 14.66% -3.23% -9.38% -4.64% MediumJPM Europe Strategic Value A (dist) - EUR -1.82% 1.43% 4.53% 14.17% 14.38% -3.27% -9.29% -4.46% MediumJPM Europe Strategic Value A (dist) - GBP 0.45% 6.63% 9.31% 25.95% 18.24% 0.75% -4.17% -0.07% MediumJPM Europe Strategic Value B (acc) - EUR -1.66% 1.71% 5.13% 15.12% 15.64% -2.54% -8.91% -4.09% MediumJPM Europe Strategic Value C (acc) - EUR -1.54% 1.85% 5.30% 15.33% 15.89% -2.35% -8.76% -3.87% MediumJPM Europe Strategic Value D (acc) - EUR -2.00% 0.99% 3.97% 13.38% 13.67% -3.89% -9.84% -5.21% MediumJPM Europe Strategic Value I (acc) - EUR* - - - - - - - - MediumJPM Europe Strategic Value I (inc) - EUR* - - - - - - - - MediumJPM Europe Strategic Value X (acc) - EUR* - - - - - - - - Medium
JPMorgan Funds - Europe Strategic Value Small Cap FundJPM Europe Strategic Value Small Cap A (acc) - EUR -1.93% -2.53% 11.30% 24.20% 30.28% 2.09% - - MediumJPM Europe Strategic Value Small Cap D (acc) - EUR -2.10% -3.01% 10.55% 23.09% 28.80% 1.07% - - Medium
JPMorgan Funds - Europe Technology FundJPM Europe Technology A (acc) - EUR -1.69% 3.35% 14.88% 22.21% 32.59% 11.74% -0.78% 5.24% MediumJPM Europe Technology A (dist) - EUR -1.60% 3.36% 14.94% 22.36% 32.31% 11.53% -0.91% 5.07% MediumJF Europe Technology A (dist) - EUR -1.66% 3.50% 14.90% 22.20% 32.36% 11.52% -0.93% 4.99% MediumJPM Europe Technology A (dist) - GBP 0.59% 8.71% 20.25% 35.02% 37.20% 17.66% 7.19% 12.50% MediumJPM Europe Technology B (acc) - EUR -1.44% 3.80% 15.62% 23.27% 33.95% 12.80% - - MediumJPM Europe Technology C (acc) - EUR* - - - - - - - - MediumJPM Europe Technology D (acc) - EUR -2.04% 2.72% 14.04% 20.82% 30.98% 10.34% -1.76% 4.00% MediumJPM Europe Technology X (acc) - EUR -1.27% 4.22% 16.38% 24.37% 35.32% 14.09% - - Medium
JPMorgan Funds - Germany Equity FundJPM Germany Equity A (acc) - EUR 3.33% 4.18% 15.86% 23.61% 26.75% 3.22% -2.89% 5.39% MediumJPM Germany Equity A (dist) - EUR 3.48% 4.35% 15.99% 23.51% 26.30% 2.92% -3.05% 5.11% MediumJF Germany Equity A (dist) - EUR 3.36% 4.25% 15.88% 23.43% 26.26% 2.89% -3.07% 5.09% MediumJPM Germany Equity B (acc) - EUR 3.56% 4.60% 16.50% 24.60% 28.06% 4.10% - - MediumJPM Germany Equity C (acc) - EUR 3.55% 4.72% 16.69% 24.82% 28.18% 4.27% - - MediumJPM Germany Equity D (acc) - EUR 3.13% 3.48% 14.67% 22.22% 25.00% 2.15% -3.79% 4.15% MediumJPM Germany Equity I (acc) - EUR 3.58% 4.74% 16.79% 24.94% 28.37% 4.35% - - MediumJPM Germany Equity T (acc) - EUR 3.10% - - - - - - - MediumJPM Germany Equity X (acc) - EUR 3.81% 5.14% 17.32% 25.74% 29.45% 5.18% - - Medium
JPMorgan Funds - Global Absolute Return Bond Fund (9)JPM Global Absolute Return Bond A (acc) - USD 0.01% 0.50% - - - - - - MediumJPM Global Absolute Return Bond A (acc) - EUR (hedged) 0.31% 0.91% - - - - - - MediumJPM Global Absolute Return Bond A (acc) - SEK (hedged) 0.48% 1.31% - - - - - - MediumJPM Global Absolute Return Bond D (acc) - USD -0.10% 0.30% - - - - - - MediumJPM Global Absolute Return Bond D (acc) - EUR (hedged) 0.19% 0.71% - - - - - - MediumJPM Global Absolute Return Bond X (acc) - EUR (hedged) 0.54% 1.39% - - - - - - Medium
JPMorgan Funds - Global Aggregate Bond FundJPM Global Aggregate Bond A (acc) - USD 3.04% 5.24% 4.49% 13.28% 11.07% 5.09% 4.01% 4.13% MediumJPM Global Aggregate Bond A (inc) - USD 3.02% 5.21% 4.47% 13.13% 11.00% 4.90% - - MediumJPM Global Aggregate Bond C (acc) - USD* - - - - - - - - MediumJPM Global Aggregate Bond D (acc) - USD 2.90% 4.98% 4.15% 12.79% 10.57% 4.62% 3.53% 3.64% MediumJPM Global Aggregate Bond X (acc) - USD* - - - - - - - - Medium
JPMorgan Funds - Global Catholic Ethical Balanced Fund (10)JPM Global Catholic Ethical Balanced A (acc) - EUR*** - - - - - - - - MediumJPM Global Catholic Ethical Balanced D (acc) - EUR*** - - - - - - - - Medium
JPMorgan Funds - Global Consumer Trends FundJPM Global Consumer Trends A (acc) - USD -0.39% 1.40% 6.65% 48.44% - - - - MediumJPM Global Consumer Trends A (acc) - EUR -2.37% -6.18% 0.39% -13.02% 21.93% 13.46% - - MediumJPM Global Consumer Trends B (acc) - USD*** - - - - - - - - MediumJPM Global Consumer Trends B (acc) - EUR*** - - - - - - - - MediumJPM Global Consumer Trends C (acc) - EUR -2.12% -5.68% 1.18% 5.62% 23.35% - - - MediumJPM Global Consumer Trends D (acc) - USD*** - - - - - - - - MediumJPM Global Consumer Trends D (acc) - EUR -2.50% -6.45% -0.08% 3.83% 20.93% 12.44% - - MediumJPM Global Consumer Trends T (acc) - EUR -2.53% - - - - - - - Medium
(9) This Sub-Fund was launched on 7 October 2010.(10) This Sub-Fund was launched on 19 May 2011.
442
JPMorgan FundsAppendix - Unaudited Additional Disclosures (continued)
Performance (continued) 3 Months 6 Months 9 Months 1 year 2 years 3 years 4 years 5 years Volatility
JPMorgan Funds - Global Convertibles Fund (EUR)JPM Global Convertibles (EUR) A (acc) - EUR -1.60% 0.90% 4.42% 10.53% 10.61% 1.83% -0.75% 1.77% MediumJPM Global Convertibles (EUR) A (acc) - CHF (hedged) -1.80% 0.65% 4.00% 9.97% 10.07% - - - MediumJPM Global Convertibles (EUR) A (dist) - EUR -1.55% 0.93% 4.44% 10.55% 10.56% 1.82% -0.77% 1.76% MediumJPM Global Convertibles (EUR) A (dist) - GBP (hedged) -1.60% 0.90% 4.51% 10.55% 10.81% - - - MediumJF Global Convertibles (EUR) A (dist) - USD 0.34% 8.89% 10.65% 30.06% 11.91% -1.37% 0.68% 4.32% MediumJPM Global Convertibles (EUR) B (acc) - EUR -1.38% 1.34% 4.98% 11.33% 11.40% 2.57% -0.12% 2.42% MediumJPM Global Convertibles (EUR) B (acc) - CHF (hedged) -1.66% 0.93% 4.43% 10.62% 10.83% - - - MediumJPM Global Convertibles (EUR) B (dist) - GBP (hedged)*** - - - - - - - - MediumJPM Global Convertibles (EUR) C (acc) - EUR -1.43% 1.31% 5.05% 11.38% 11.49% 2.60% -0.04% 2.58% MediumJPM Global Convertibles (EUR) C (acc) - CHF (hedged) -1.60% 1.01% 4.49% 10.72% 10.81% - - - MediumJPM Global Convertibles (EUR) C (dist) - GBP (hedged) -1.45% 1.24% 5.06% 11.27% 11.58% - - - MediumJPM Global Convertibles (EUR) D (acc) - EUR -1.75% 0.66% 4.09% 9.99% 10.00% 1.33% -1.22% 1.23% MediumJPM Global Convertibles (EUR) I (acc) - EUR -1.32% 1.35% 5.12% 11.49% 11.57% 2.68% 0.02% - MediumJPM Global Convertibles (EUR) I (acc) - CHF (hedged) -1.60% 1.00% 4.55% 10.80% - - - - MediumJPM Global Convertibles (EUR) I (inc) - EUR -1.37% 1.30% 5.10% 11.48% 11.53% 2.59% -0.05% - MediumJPM Global Convertibles (EUR) X (acc) - EUR -1.22% 1.70% 5.69% 12.25% 12.45% 3.48% 0.79% 3.51% MediumJPM Global Convertibles (EUR) X (acc) - CHF (hedged) -1.46% 1.39% 5.14% 11.57% - - - - MediumJPM Global Convertibles (EUR) X (dist) - GBP (hedged)*** - - - - - - - - Medium
JPMorgan Funds - Global Corporate Bond FundJPM Global Corporate Bond A (acc) - USD 1.50% 2.40% 0.94% 5.51% 9.85% - - - MediumJPM Global Corporate Bond A (acc) - EUR (hedged) 1.71% 2.74% 1.10% 5.52% 9.87% - - - MediumJPM Global Corporate Bond A (acc) - SEK (hedged) 1.92% 3.13% 1.70% 6.10% - - - - MediumJPM Global Corporate Bond A (dist) - GBP (hedged) 1.66% 2.58% 1.15% 5.53% 10.16% - - - MediumJPM Global Corporate Bond A (mth) - USD 1.52% 2.39% 1.22% - - - - - MediumJPM Global Corporate Bond B (acc) - USD*** - - - - - - - - MediumJPM Global Corporate Bond B (acc) - EUR (hedged)*** - - - - - - - - MediumJPM Global Corporate Bond C (acc) - USD Duration (hedged)*** - - - - - - - - MediumJPM Global Corporate Bond C (acc) - EUR (hedged)** 1.85% 2.92% 1.42% - - - - - MediumJPM Global Corporate Bond D (acc) - USD 1.43% 2.25% 0.63% 5.12% 9.54% - - - MediumJPM Global Corporate Bond D (acc) - EUR (hedged) 1.62% 2.45% 0.80% 5.02% 9.41% - - - MediumJPM Global Corporate Bond D (inc) - EUR (hedged) 1.73% 2.52% 0.77% 4.96% - - - - MediumJPM Global Corporate Bond I (acc) - USD* - - - - - - - - MediumJPM Global Corporate Bond T (acc) - EUR (hedged)*** - - - - - - - - MediumJPM Global Corporate Bond T (inc) - EUR (hedged) 1.62% - - - - - - - Medium
JPMorgan Funds - Global Credit Bond FundJPM Global Credit Bond A (acc) - USD 1.45% 3.81% 4.30% 9.72% - - - - MediumJPM Global Credit Bond A (acc) - EUR (hedged) 1.67% 4.08% 4.64% 9.72% - - - - MediumJPM Global Credit Bond D (acc) - EUR (hedged) 1.58% 3.93% - - - - - - MediumJPM Global Credit Bond T (acc) - EUR (hedged)*** - - - - - - - - MediumJPM Global Credit Bond T (inc) - EUR (hedged) 1.58% - - - - - - - Medium
JPMorgan Funds - Global Duration-Hedged Corporate Bond Fund (11)JPM Global Duration-Hedged Corporate Bond A (acc) - EUR -0.73% 0.73% 1.63% - - - - - LowJPM Global Duration-Hedged Corporate Bond A (acc) - SEK (hedged) -0.47% 1.15% 2.28% - - - - - LowJPM Global Duration-Hedged Corporate Bond C (acc) - EUR -0.62% 0.97% 1.90% - - - - - LowJPM Global Duration-Hedged Corporate Bond D (acc) - EUR -0.83% 0.54% 1.34% - - - - - LowJPM Global Duration-Hedged Corporate Bond X (acc) - EUR*** - - - - - - - - Low
JPMorgan Funds - Global Dynamic FundJPM Global Dynamic A (acc) - USD 0.08% 4.88% 14.06% 31.36% 21.59% -1.08% -4.03% 1.18% MediumJPM Global Dynamic A (acc) - CHF (hedged) -1.28% 1.89% 10.75% - - - - - MediumJPM Global Dynamic A (acc) - EUR -1.91% -2.91% 7.41% 11.35% 19.62% 1.85% -5.43% - MediumJPM Global Dynamic A (acc) - EUR (hedged) -0.54% 2.61% 11.31% 22.99% 18.36% -2.04% -8.83% - MediumJPM Global Dynamic A (acc) - SGD -2.46% 0.69% 6.54% 15.60% - - - - MediumJPM Global Dynamic A (acc) - SGD (hedged)*** - - - - - - - - MediumJPM Global Dynamic A (dist) - USD 0.07% 4.91% 14.05% 31.43% 21.44% -1.13% -4.04% 1.17% MediumJF Global Dynamic A (dist) - USD 0.07% 4.92% 14.02% 31.41% 21.42% -1.13% -4.04% 1.15% MediumJPM Global Dynamic A (dist) - GBP 0.37% 2.19% 12.37% 23.01% 23.78% 6.72% 1.17% 4.29% MediumJPM Global Dynamic A (inc) - EUR -2.01% -2.84% 7.39% 11.20% 19.42% 1.77% -5.45% -1.32% MediumJPM Global Dynamic B (acc) - USD 0.26% 5.35% 14.76% 32.45% 22.66% -0.32% -3.41% 1.89% MediumJPM Global Dynamic C (acc) - USD 0.32% 5.43% 14.79% 32.58% 22.85% -0.19% -3.25% 2.17% MediumJPM Global Dynamic C (acc) - EUR -1.65% -2.45% 8.15% 12.43% 20.90% 2.85% -9.94% - MediumJPM Global Dynamic C (acc) - EUR (hedged) -0.31% 3.06% 12.08% 24.03% 19.72% -1.06% -8.85% - MediumJPM Global Dynamic D (acc) - USD -0.21% 4.34% 13.20% 30.05% 20.16% -2.02% -4.85% 0.14% MediumJPM Global Dynamic D (acc) - EUR -2.12% -3.30% 6.61% 10.26% 18.18% 0.79% -6.18% -2.21% MediumJPM Global Dynamic D (acc) - EUR (hedged) -0.74% 2.09% 10.70% 21.72% 17.08% -2.83% -9.31% -5.16% MediumJPM Global Dynamic I (acc) - USD 0.34% 5.46% 14.88% 32.74% 22.91% -0.15% -3.21% - MediumJPM Global Dynamic I (inc) - EUR -1.67% -2.45% 8.14% 12.25% 20.68% - - - MediumJPM Global Dynamic I (acc) - EUR (hedged)*** - - - - - - - - MediumJPM Global Dynamic T (acc) - EUR (hedged) -0.85% - - - - - - - MediumJPM Global Dynamic X (acc) - USD 0.53% 5.84% 15.57% 33.74% 24.10% 0.67% -2.50% 3.13% MediumJPM Global Dynamic X (acc) - EUR -1.55% -1.97% 8.91% 13.33% 22.15% 3.78% -9.44% - Medium
(11) This Sub-Fund was launched on 16 September 2010.
443
JPMorgan FundsAppendix - Unaudited Additional Disclosures (continued)
Performance (continued) 3 Months 6 Months 9 Months 1 year 2 years 3 years 4 years 5 years Volatility
JPMorgan Funds - Global Equity Fund (USD)JPM Global Equity (USD) A (acc) - USD -2.14% 2.61% 8.67% 22.56% 16.26% -1.93% -4.09% -0.61% MediumJPM Global Equity (USD) A (acc) - EUR*** - - - - - - - - MediumJPM Global Equity (USD) A (acc) - EUR (hedged) -3.00% -0.32% 5.85% 14.31% 13.80% - - - MediumJPM Global Equity (USD) A (dist) - USD -2.20% 2.63% 8.64% 22.42% 16.13% -1.98% -4.10% -0.61% MediumJF Global Equity (USD) A (dist) - USD -2.21% 2.61% 8.64% 22.43% 16.12% -1.98% -4.10% -0.61% MediumJPM Global Equity (USD) A (dist) - EUR (hedged) -2.97% -0.17% 5.95% 14.34% 13.51% - - - MediumJPM Global Equity (USD) C (acc) - USD -1.89% 3.22% 9.59% 23.90% 17.67% -0.87% -3.15% 0.49% MediumJPM Global Equity (USD) C (acc) - EUR (hedged) -2.76% 0.16% 6.72% 15.66% 15.33% - - - MediumJPM Global Equity (USD) D (acc) - USD -2.37% 2.28% 8.11% 21.55% 15.28% -2.61% -4.71% -1.32% MediumJPM Global Equity (USD) D (acc) - EUR (hedged) -3.22% -0.83% 5.25% 13.40% 12.87% - - - MediumJPM Global Equity (USD) X (acc) - USD -1.79% 3.57% 10.12% 24.70% 18.57% -0.22% -2.58% 1.18% MediumJPM Global Equity (USD) X (acc) - EUR -3.67% -4.14% 3.74% 5.65% 16.76% - - - Medium
JPMorgan Funds - Global Focus FundJPM Global Focus A (acc) - EUR -1.09% -4.15% 4.03% 9.55% 23.50% 9.85% -2.02% 3.37% MediumJPM Global Focus A (acc) - EUR (hedged) -0.33% 0.56% 7.11% 19.10% 21.07% 5.15% - - MediumJPM Global Focus A (acc) - CHF (hedged) -0.96% -0.28% 5.08% - - - - - MediumJPM Global Focus A (dist) - EUR -1.09% -4.18% 3.99% 9.54% 23.39% 9.79% -2.04% 3.32% MediumJF Global Focus A (dist) - USD 0.92% 3.50% 10.42% 29.33% 25.44% 6.19% -0.41% - MediumJPM Global Focus B (acc) - EUR -0.88% -3.80% 4.60% 10.42% 24.64% - - - MediumJPM Global Focus C (acc) - USD 1.14% 3.93% 11.14% 30.50% - - - - MediumJPM Global Focus C (acc) - EUR -0.89% -3.77% 4.70% 10.57% 24.82% 11.01% -1.17% 4.43% MediumJPM Global Focus C (acc) - EUR (hedged) -0.05% 0.99% 7.77% 20.19% 22.36% - - - MediumJPM Global Focus D (acc) - EUR -1.35% -4.63% 3.24% 8.50% 22.03% 8.58% -2.91% 2.22% MediumJPM Global Focus D (acc) - EUR (hedged) -0.59% 0.00% 6.26% 17.92% 19.59% 3.95% -15.52% -10.46% MediumJPM Global Focus I (acc) - USD*** - - - - - - - - MediumJPM Global Focus I (acc) - EUR -0.87% -3.73% 4.73% - - - - - MediumJPM Global Focus I (acc) - EUR (hedged) -0.03% 1.04% 7.84% - - - - - MediumJPM Global Focus T (acc) - EUR -1.35% - - - - - - - MediumJPM Global Focus X (acc) - EUR -0.70% -3.34% 5.35% 11.51% 26.05% 12.13% -0.36% 5.48% Medium
JPMorgan Funds - Global Government Bond FundJPM Global Government Bond A (acc) - EUR 2.01% 1.33% -0.84% 1.23% 3.78% - - - MediumJPM Global Government Bond A (acc) - USD (hedged) 1.74% 1.13% -1.03% 1.05% 25.62% - - - MediumJPM Global Government Bond B (acc) - EUR** 2.07% - - - - - - - MediumJPM Global Government Bond C (acc) - EUR 1.98% 1.60% -0.55% 1.60% 4.16% - - - MediumJPM Global Government Bond D (acc) - EUR 2.02% 1.34% -0.84% 1.14% 3.64% - - - MediumJPM Global Government Bond X (acc) - EUR 2.16% 1.68% -0.28% 1.87% 4.46% - - - Medium
JPMorgan Funds - Global Government Short Duration Bond FundJPM Global Government Short Duration Bond A (acc) - EUR 0.59% 0.49% 0.29% 0.69% 1.25% - - - MediumJPM Global Government Short Duration Bond A (acc) - USD (hedged) 0.47% 0.31% 0.00% 0.47% 1.15% - - - MediumJPM Global Government Short Duration Bond B (acc) - EUR 0.68% - - - - - - - MediumJPM Global Government Short Duration Bond C (acc) - USD (hedged) 0.54% 0.46% 0.23% 0.77% 1.38% - - - MediumJPM Global Government Short Duration Bond C (dist) - GBP (hedged) 0.55% 0.55% 0.33% 0.88% - - - - MediumJPM Global Government Short Duration Bond D (acc) - EUR 0.59% 0.39% 0.10% 0.49% 1.05% - - - MediumJPM Global Government Short Duration Bond D (acc) - USD (hedged)* - - - - - - - - MediumJPM Global Government Short Duration Bond X (acc) - EUR 0.76% 0.78% - - - - - - MediumJPM Global Government Short Duration Bond X (dist) - GBP (hedged)*** - - - - - - - - Medium
JPMorgan Funds - Global Healthcare FundJPM Global Healthcare A (acc) - USD 12.40% 17.59% 23.63% 38.35% - - - - MediumJPM Global Healthcare A (dist) - USD 12.39% 17.57% 23.61% 38.34% - - - - MediumJF Global Healthcare A (dist) - USD 12.40% 17.57% 23.61% 38.34% - - - - MediumJPM Global Healthcare A (dist) - GBP 12.67% 14.43% 21.77% 29.49% - - - - MediumJPM Global Healthcare B (acc) - USD 12.61% 18.02% 24.32% 39.39% - - - - MediumJPM Global Healthcare C (acc) - USD 12.64% 18.08% 24.41% 39.52% - - - - MediumJPM Global Healthcare D (acc) - USD 12.12% 17.00% 22.69% 36.97% - - - - Medium
JPMorgan Funds - Global Infrastructure Trends FundJPM Global Infrastructure Trends A (acc) - USD -4.05% - - - - - - - MediumJPM Global Infrastructure Trends A (acc) - EUR -6.00% -3.30% 3.91% 7.63% - - - - MediumJPM Global Infrastructure Trends A (acc) - GBP -3.80% - - - - - - - Medium
JPMorgan Funds - Global Merger Arbitrage Fund (12)JPM Global Merger Arbitrage A (acc) - USD 0.55% - - - - - - - MediumJPM Global Merger Arbitrage A (acc) - EUR (hedged) 0.78% - - - - - - - MediumJPM Global Merger Arbitrage A (dist) - GBP (hedged) 0.69% - - - - - - - Medium
JPMorgan Funds - Global Mining Fund (13)JPM Global Mining A (acc) - EUR -8.00% - - - - - - - HighJPM Global Mining A (acc) - USD*** - - - - - - - - HighJPM Global Mining B (acc) - EUR*** - - - - - - - - HighJPM Global Mining D (acc) - EUR -8.17% - - - - - - - HighJPM Global Mining T (acc) - EUR*** - - - - - - - - High
(12) This Sub-Fund was launched on 8 March 2011.(13) This Sub-Fund was launched on 8 February 2011.
444
JPMorgan FundsAppendix - Unaudited Additional Disclosures (continued)
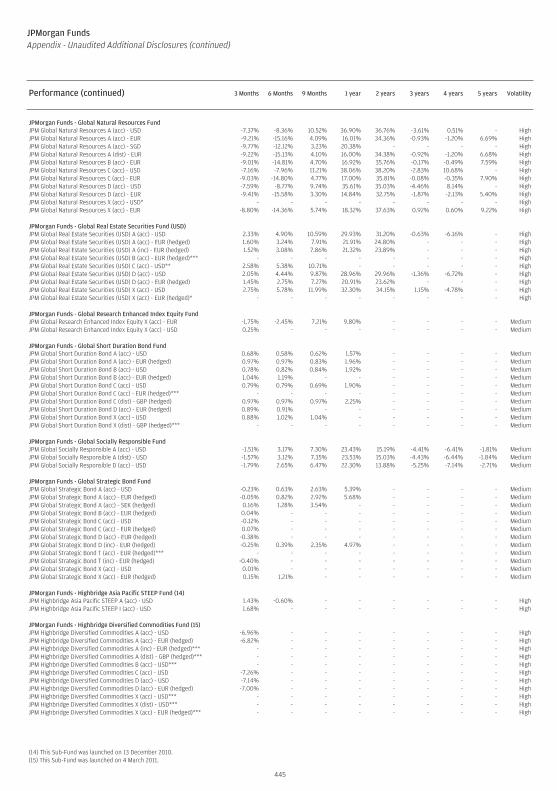
Performance (continued) 3 Months 6 Months 9 Months 1 year 2 years 3 years 4 years 5 years Volatility
JPMorgan Funds - Global Natural Resources FundJPM Global Natural Resources A (acc) - USD -7.37% -8.36% 10.52% 36.90% 36.76% -3.61% 0.51% - HighJPM Global Natural Resources A (acc) - EUR -9.21% -15.16% 4.09% 16.01% 34.36% -0.93% -1.20% 6.69% HighJPM Global Natural Resources A (acc) - SGD -9.77% -12.12% 3.23% 20.38% - - - - HighJPM Global Natural Resources A (dist) - EUR -9.22% -15.13% 4.10% 16.00% 34.38% -0.92% -1.20% 6.68% HighJPM Global Natural Resources B (acc) - EUR -9.01% -14.81% 4.70% 16.92% 35.76% -0.17% -0.49% 7.59% HighJPM Global Natural Resources C (acc) - USD -7.16% -7.96% 11.21% 38.06% 38.20% -2.83% 10.68% - HighJPM Global Natural Resources C (acc) - EUR -9.03% -14.80% 4.77% 17.00% 35.81% -0.08% -0.35% 7.90% HighJPM Global Natural Resources D (acc) - USD -7.59% -8.77% 9.74% 35.61% 35.03% -4.46% 8.14% - HighJPM Global Natural Resources D (acc) - EUR -9.41% -15.58% 3.30% 14.84% 32.75% -1.87% -2.13% 5.40% HighJPM Global Natural Resources X (acc) - USD* - - - - - - - - HighJPM Global Natural Resources X (acc) - EUR -8.80% -14.36% 5.74% 18.32% 37.63% 0.92% 0.60% 9.22% High
JPMorgan Funds - Global Real Estate Securities Fund (USD)JPM Global Real Estate Securities (USD) A (acc) - USD 2.33% 4.90% 10.59% 29.93% 31.20% -0.63% -6.16% - HighJPM Global Real Estate Securities (USD) A (acc) - EUR (hedged) 1.60% 3.24% 7.91% 21.91% 24.80% - - - HighJPM Global Real Estate Securities (USD) A (inc) - EUR (hedged) 1.52% 3.08% 7.86% 21.32% 23.89% - - - HighJPM Global Real Estate Securities (USD) B (acc) - EUR (hedged)*** - - - - - - - - HighJPM Global Real Estate Securities (USD) C (acc) - USD** 2.58% 5.38% 10.71% - - - - - HighJPM Global Real Estate Securities (USD) D (acc) - USD 2.05% 4.44% 9.87% 28.96% 29.96% -1.36% -6.72% - HighJPM Global Real Estate Securities (USD) D (acc) - EUR (hedged) 1.45% 2.75% 7.27% 20.91% 23.62% - - - HighJPM Global Real Estate Securities (USD) X (acc) - USD 2.75% 5.78% 11.99% 32.30% 34.15% 1.15% -4.78% - HighJPM Global Real Estate Securities (USD) X (acc) - EUR (hedged)* - - - - - - - - High
JPMorgan Funds - Global Research Enhanced Index Equity FundJPM Global Research Enhanced Index Equity X (acc) - EUR -1.75% -2.45% 7.21% 9.80% - - - - MediumJPM Global Research Enhanced Index Equity X (acc) - USD 0.25% - - - - - - - Medium
JPMorgan Funds - Global Short Duration Bond FundJPM Global Short Duration Bond A (acc) - USD 0.68% 0.58% 0.62% 1.57% - - - - MediumJPM Global Short Duration Bond A (acc) - EUR (hedged) 0.97% 0.97% 0.83% 1.96% - - - - MediumJPM Global Short Duration Bond B (acc) - USD 0.78% 0.82% 0.84% 1.92% - - - - MediumJPM Global Short Duration Bond B (acc) - EUR (hedged) 1.04% 1.19% - - - - - - MediumJPM Global Short Duration Bond C (acc) - USD 0.79% 0.79% 0.69% 1.90% - - - - MediumJPM Global Short Duration Bond C (acc) - EUR (hedged)*** - - - - - - - - MediumJPM Global Short Duration Bond C (dist) - GBP (hedged) 0.97% 0.97% 0.97% 2.25% - - - - MediumJPM Global Short Duration Bond D (acc) - EUR (hedged) 0.89% 0.91% - - - - - - MediumJPM Global Short Duration Bond X (acc) - USD 0.88% 1.02% 1.04% - - - - - MediumJPM Global Short Duration Bond X (dist) - GBP (hedged)*** - - - - - - - - Medium
JPMorgan Funds - Global Socially Responsible FundJPM Global Socially Responsible A (acc) - USD -1.51% 3.17% 7.30% 23.43% 15.19% -4.41% -6.41% -1.81% MediumJPM Global Socially Responsible A (dist) - USD -1.57% 3.12% 7.35% 23.53% 15.03% -4.43% -6.44% -1.84% MediumJPM Global Socially Responsible D (acc) - USD -1.79% 2.65% 6.47% 22.30% 13.88% -5.25% -7.14% -2.71% Medium
JPMorgan Funds - Global Strategic Bond FundJPM Global Strategic Bond A (acc) - USD -0.23% 0.63% 2.63% 5.39% - - - - MediumJPM Global Strategic Bond A (acc) - EUR (hedged) -0.05% 0.82% 2.92% 5.68% - - - - MediumJPM Global Strategic Bond A (acc) - SEK (hedged) 0.16% 1.28% 3.54% - - - - - MediumJPM Global Strategic Bond B (acc) - EUR (hedged) 0.04% - - - - - - - MediumJPM Global Strategic Bond C (acc) - USD -0.12% - - - - - - - MediumJPM Global Strategic Bond C (acc) - EUR (hedged) 0.07% - - - - - - - MediumJPM Global Strategic Bond D (acc) - EUR (hedged) -0.38% - - - - - - - MediumJPM Global Strategic Bond D (inc) - EUR (hedged) -0.25% 0.39% 2.35% 4.97% - - - - MediumJPM Global Strategic Bond T (acc) - EUR (hedged)*** - - - - - - - - MediumJPM Global Strategic Bond T (inc) - EUR (hedged) -0.40% - - - - - - - MediumJPM Global Strategic Bond X (acc) - USD 0.01% - - - - - - - MediumJPM Global Strategic Bond X (acc) - EUR (hedged) 0.15% 1.21% - - - - - - Medium
JPMorgan Funds - Highbridge Asia Pacific STEEP Fund (14)JPM Highbridge Asia Pacific STEEP A (acc) - USD 1.43% -0.60% - - - - - - HighJPM Highbridge Asia Pacific STEEP I (acc) - USD 1.68% - - - - - - - High
JPMorgan Funds - Highbridge Diversified Commodities Fund (15)JPM Highbridge Diversified Commodities A (acc) - USD -6.96% - - - - - - - HighJPM Highbridge Diversified Commodities A (acc) - EUR (hedged) -6.82% - - - - - - - HighJPM Highbridge Diversified Commodities A (inc) - EUR (hedged)*** - - - - - - - - HighJPM Highbridge Diversified Commodities A (dist) - GBP (hedged)*** - - - - - - - - HighJPM Highbridge Diversified Commodities B (acc) - USD*** - - - - - - - - HighJPM Highbridge Diversified Commodities C (acc) - USD -7.26% - - - - - - - HighJPM Highbridge Diversified Commodities D (acc) - USD -7.14% - - - - - - - HighJPM Highbridge Diversified Commodities D (acc) - EUR (hedged) -7.00% - - - - - - - HighJPM Highbridge Diversified Commodities X (acc) - USD*** - - - - - - - - HighJPM Highbridge Diversified Commodities X (dist) - USD*** - - - - - - - - HighJPM Highbridge Diversified Commodities X (acc) - EUR (hedged)*** - - - - - - - - High
(14) This Sub-Fund was launched on 13 December 2010.(15) This Sub-Fund was launched on 4 March 2011.
445
JPMorgan FundsAppendix - Unaudited Additional Disclosures (continued)
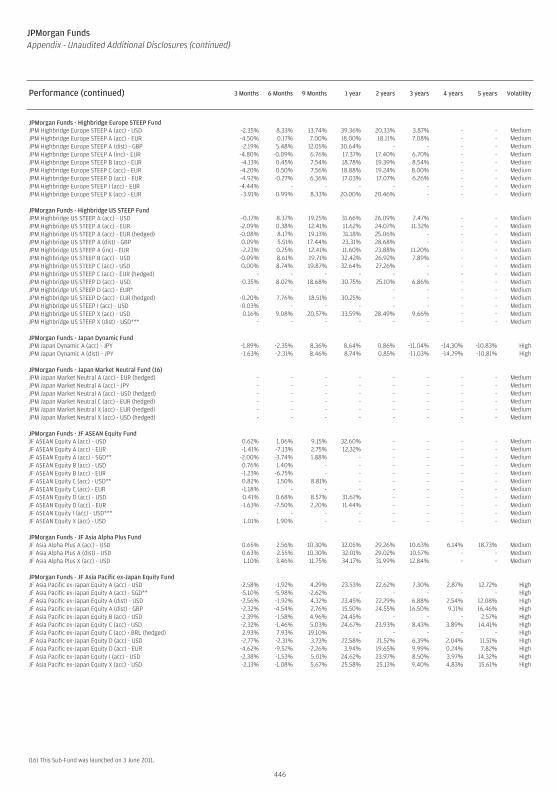
Performance (continued) 3 Months 6 Months 9 Months 1 year 2 years 3 years 4 years 5 years Volatility
JPMorgan Funds - Highbridge Europe STEEP FundJPM Highbridge Europe STEEP A (acc) - USD -2.35% 8.33% 13.74% 39.36% 20.33% 3.87% - - MediumJPM Highbridge Europe STEEP A (acc) - EUR -4.50% 0.17% 7.00% 18.00% 18.11% 7.08% - - MediumJPM Highbridge Europe STEEP A (dist) - GBP -2.19% 5.48% 12.05% 30.64% - - - - MediumJPM Highbridge Europe STEEP A (inc) - EUR -4.80% -0.09% 6.76% 17.37% 17.40% 6.70% - - MediumJPM Highbridge Europe STEEP B (acc) - EUR -4.13% 0.45% 7.54% 18.78% 19.39% 8.54% - - MediumJPM Highbridge Europe STEEP C (acc) - EUR -4.20% 0.50% 7.56% 18.88% 19.24% 8.00% - - MediumJPM Highbridge Europe STEEP D (acc) - EUR -4.92% -0.27% 6.36% 17.03% 17.07% 6.26% - - MediumJPM Highbridge Europe STEEP I (acc) - EUR -4.44% - - - - - - - MediumJPM Highbridge Europe STEEP X (acc) - EUR -3.91% 0.99% 8.33% 20.00% 20.46% - - - Medium
JPMorgan Funds - Highbridge US STEEP FundJPM Highbridge US STEEP A (acc) - USD -0.17% 8.37% 19.25% 31.66% 26.09% 7.47% - - MediumJPM Highbridge US STEEP A (acc) - EUR -2.09% 0.38% 12.41% 11.62% 24.07% 11.32% - - MediumJPM Highbridge US STEEP A (acc) - EUR (hedged) -0.08% 8.17% 19.13% 31.18% 25.06% - - - MediumJPM Highbridge US STEEP A (dist) - GBP 0.09% 5.51% 17.44% 23.31% 28.68% - - - MediumJPM Highbridge US STEEP A (inc) - EUR -2.23% 0.25% 12.41% 11.60% 23.88% 11.20% - - MediumJPM Highbridge US STEEP B (acc) - USD -0.09% 8.61% 19.71% 32.42% 26.92% 7.89% - - MediumJPM Highbridge US STEEP C (acc) - USD 0.00% 8.74% 19.87% 32.64% 27.26% - - - MediumJPM Highbridge US STEEP C (acc) - EUR (hedged) - - - - - - - - MediumJPM Highbridge US STEEP D (acc) - USD -0.35% 8.02% 18.68% 30.75% 25.10% 6.86% - - MediumJPM Highbridge US STEEP D (acc) - EUR* - - - - - - - - MediumJPM Highbridge US STEEP D (acc) - EUR (hedged) -0.20% 7.76% 18.51% 30.25% - - - - MediumJPM Highbridge US STEEP I (acc) - USD -0.03% - - - - - - - MediumJPM Highbridge US STEEP X (acc) - USD 0.16% 9.08% 20.57% 33.59% 28.49% 9.66% - - MediumJPM Highbridge US STEEP X (dist) - USD*** - - - - - - - - Medium
JPMorgan Funds - Japan Dynamic FundJPM Japan Dynamic A (acc) - JPY -1.89% -2.35% 8.36% 8.64% 0.86% -11.04% -14.30% -10.83% HighJPM Japan Dynamic A (dist) - JPY -1.63% -2.31% 8.46% 8.74% 0.85% -11.03% -14.29% -10.81% High
JPMorgan Funds - Japan Market Neutral Fund (16)JPM Japan Market Neutral A (acc) - EUR (hedged) - - - - - - - - MediumJPM Japan Market Neutral A (acc) - JPY - - - - - - - - MediumJPM Japan Market Neutral A (acc) - USD (hedged) - - - - - - - - MediumJPM Japan Market Neutral C (acc) - EUR (hedged) - - - - - - - - MediumJPM Japan Market Neutral X (acc) - EUR (hedged) - - - - - - - - MediumJPM Japan Market Neutral X (acc) - USD (hedged) - - - - - - - - Medium
JPMorgan Funds - JF ASEAN Equity FundJF ASEAN Equity A (acc) - USD 0.62% 1.06% 9.15% 32.60% - - - - MediumJF ASEAN Equity A (acc) - EUR -1.41% -7.13% 2.75% 12.32% - - - - MediumJF ASEAN Equity A (acc) - SGD** -2.00% -3.74% 1.88% - - - - - MediumJF ASEAN Equity B (acc) - USD 0.76% 1.40% - - - - - - MediumJF ASEAN Equity B (acc) - EUR -1.23% -6.75% - - - - - - MediumJF ASEAN Equity C (acc) - USD** 0.82% 1.50% 8.81% - - - - - MediumJF ASEAN Equity C (acc) - EUR -1.18% - - - - - - - MediumJF ASEAN Equity D (acc) - USD 0.41% 0.68% 8.57% 31.62% - - - - MediumJF ASEAN Equity D (acc) - EUR -1.63% -7.50% 2.20% 11.44% - - - - MediumJF ASEAN Equity I (acc) - USD*** - - - - - - - - MediumJF ASEAN Equity X (acc) - USD 1.01% 1.90% - - - - - - Medium
JPMorgan Funds - JF Asia Alpha Plus FundJF Asia Alpha Plus A (acc) - USD 0.65% 2.56% 10.30% 32.05% 29.26% 10.63% 6.14% 18.73% MediumJF Asia Alpha Plus A (dist) - USD 0.63% 2.55% 10.30% 32.01% 29.02% 10.57% - - MediumJF Asia Alpha Plus X (acc) - USD 1.10% 3.46% 11.75% 34.17% 31.99% 12.84% - - Medium
JPMorgan Funds - JF Asia Pacific ex-Japan Equity FundJF Asia Pacific ex-Japan Equity A (acc) - USD -2.58% -1.92% 4.29% 23.53% 22.62% 7.30% 2.87% 12.72% HighJF Asia Pacific ex-Japan Equity A (acc) - SGD** -5.10% -5.98% -2.62% - - - - - HighJF Asia Pacific ex-Japan Equity A (dist) - USD -2.56% -1.92% 4.32% 23.45% 22.29% 6.88% 2.54% 12.08% HighJF Asia Pacific ex-Japan Equity A (dist) - GBP -2.32% -4.54% 2.76% 15.50% 24.55% 16.50% 9.11% 16.46% HighJF Asia Pacific ex-Japan Equity B (acc) - USD -2.39% -1.58% 4.96% 24.45% - - - 2.57% HighJF Asia Pacific ex-Japan Equity C (acc) - USD -2.32% -1.46% 5.03% 24.67% 23.93% 8.43% 3.89% 14.41% HighJF Asia Pacific ex-Japan Equity C (acc) - BRL (hedged) 2.93% 7.93% 19.10% - - - - - HighJF Asia Pacific ex-Japan Equity D (acc) - USD -2.77% -2.31% 3.73% 22.58% 21.52% 6.39% 2.04% 11.51% HighJF Asia Pacific ex-Japan Equity D (acc) - EUR -4.62% -9.52% -2.26% 3.94% 19.65% 9.99% 0.24% 7.82% HighJF Asia Pacific ex-Japan Equity I (acc) - USD -2.38% -1.53% 5.01% 24.62% 23.97% 8.50% 3.97% 14.32% HighJF Asia Pacific ex-Japan Equity X (acc) - USD -2.13% -1.08% 5.67% 25.58% 25.13% 9.40% 4.83% 15.61% High
(16) This Sub-Fund was launched on 3 June 2011.
446
JPMorgan FundsAppendix - Unaudited Additional Disclosures (continued)
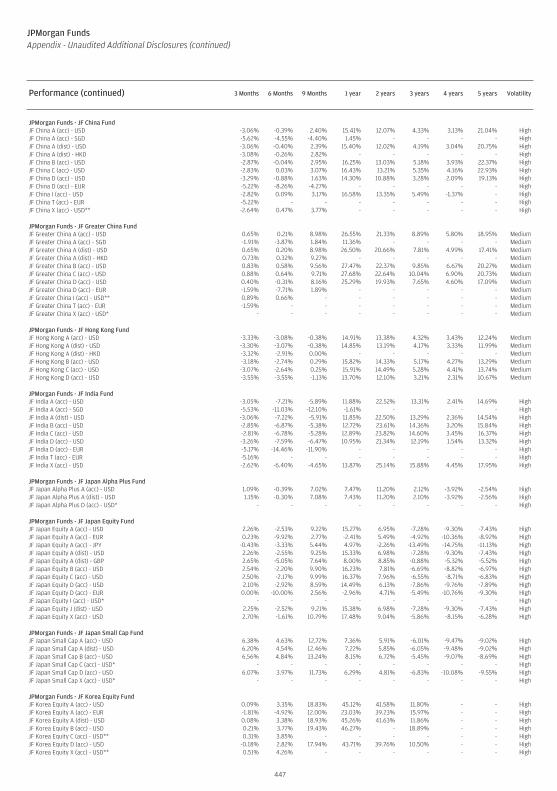
Performance (continued) 3 Months 6 Months 9 Months 1 year 2 years 3 years 4 years 5 years Volatility
JPMorgan Funds - JF China FundJF China A (acc) - USD -3.06% -0.39% 2.40% 15.41% 12.07% 4.33% 3.13% 21.04% HighJF China A (acc) - SGD -5.62% -4.55% -4.40% 1.45% - - - - HighJF China A (dist) - USD -3.06% -0.40% 2.39% 15.40% 12.02% 4.19% 3.04% 20.75% HighJF China A (dist) - HKD -3.08% -0.26% 2.82% - - - - - HighJF China B (acc) - USD -2.87% -0.04% 2.95% 16.25% 13.03% 5.18% 3.93% 22.37% HighJF China C (acc) - USD -2.83% 0.03% 3.07% 16.43% 13.21% 5.35% 4.16% 22.93% HighJF China D (acc) - USD -3.29% -0.88% 1.63% 14.30% 10.88% 3.28% 2.09% 19.13% HighJF China D (acc) - EUR -5.22% -8.26% -4.27% - - - - - HighJF China I (acc) - USD -2.82% 0.09% 3.17% 16.58% 13.35% 5.49% -1.37% - HighJF China T (acc) - EUR -5.22% - - - - - - - HighJF China X (acc) - USD** -2.64% 0.47% 3.77% - - - - - High
JPMorgan Funds - JF Greater China FundJF Greater China A (acc) - USD 0.65% 0.21% 8.98% 26.55% 21.33% 8.89% 5.80% 18.95% MediumJF Greater China A (acc) - SGD -1.91% -3.87% 1.84% 11.36% - - - - MediumJF Greater China A (dist) - USD 0.65% 0.20% 8.98% 26.50% 20.66% 7.81% 4.99% 17.41% MediumJF Greater China A (dist) - HKD 0.73% 0.32% 9.27% - - - - - MediumJF Greater China B (acc) - USD 0.83% 0.58% 9.56% 27.47% 22.37% 9.85% 6.67% 20.27% MediumJF Greater China C (acc) - USD 0.88% 0.64% 9.71% 27.68% 22.64% 10.04% 6.90% 20.73% MediumJF Greater China D (acc) - USD 0.40% -0.31% 8.16% 25.29% 19.93% 7.65% 4.60% 17.09% MediumJF Greater China D (acc) - EUR -1.59% -7.71% 1.89% - - - - - MediumJF Greater China I (acc) - USD** 0.89% 0.66% - - - - - - MediumJF Greater China T (acc) - EUR -1.59% - - - - - - - MediumJF Greater China X (acc) - USD* - - - - - - - - Medium
JPMorgan Funds - JF Hong Kong FundJF Hong Kong A (acc) - USD -3.33% -3.08% -0.38% 14.91% 13.38% 4.32% 3.43% 12.24% MediumJF Hong Kong A (dist) - USD -3.30% -3.07% -0.38% 14.85% 13.19% 4.17% 3.33% 11.99% MediumJF Hong Kong A (dist) - HKD -3.32% -2.91% 0.00% - - - - - MediumJF Hong Kong B (acc) - USD -3.18% -2.74% 0.29% 15.82% 14.33% 5.17% 4.27% 13.29% MediumJF Hong Kong C (acc) - USD -3.07% -2.64% 0.25% 15.91% 14.49% 5.28% 4.41% 13.74% MediumJF Hong Kong D (acc) - USD -3.55% -3.55% -1.13% 13.70% 12.10% 3.21% 2.31% 10.67% Medium
JPMorgan Funds - JF India FundJF India A (acc) - USD -3.05% -7.21% -5.89% 11.88% 22.52% 13.31% 2.41% 14.69% HighJF India A (acc) - SGD -5.53% -11.03% -12.10% -1.61% - - - - HighJF India A (dist) - USD -3.06% -7.22% -5.91% 11.85% 22.50% 13.29% 2.36% 14.54% HighJF India B (acc) - USD -2.85% -6.87% -5.38% 12.72% 23.61% 14.36% 3.20% 15.84% HighJF India C (acc) - USD -2.81% -6.78% -5.28% 12.89% 23.82% 14.60% 3.45% 16.37% HighJF India D (acc) - USD -3.26% -7.59% -6.47% 10.95% 21.34% 12.19% 1.54% 13.32% HighJF India D (acc) - EUR -5.17% -14.46% -11.90% - - - - - HighJF India T (acc) - EUR -5.16% - - - - - - - HighJF India X (acc) - USD -2.62% -6.40% -4.65% 13.87% 25.14% 15.88% 4.45% 17.95% High
JPMorgan Funds - JF Japan Alpha Plus FundJF Japan Alpha Plus A (acc) - USD 1.09% -0.39% 7.02% 7.47% 11.20% 2.12% -3.92% -2.54% HighJF Japan Alpha Plus A (dist) - USD 1.15% -0.30% 7.08% 7.43% 11.20% 2.10% -3.92% -2.56% HighJF Japan Alpha Plus D (acc) - USD* - - - - - - - - High
JPMorgan Funds - JF Japan Equity FundJF Japan Equity A (acc) - USD 2.26% -2.53% 9.22% 15.27% 6.95% -7.28% -9.30% -7.43% HighJF Japan Equity A (acc) - EUR 0.23% -9.92% 2.77% -2.41% 5.49% -4.92% -10.36% -8.92% HighJF Japan Equity A (acc) - JPY -0.43% -3.33% 5.44% 4.97% -2.26% -13.49% -14.75% -11.13% HighJF Japan Equity A (dist) - USD 2.26% -2.55% 9.25% 15.33% 6.98% -7.28% -9.30% -7.43% HighJF Japan Equity A (dist) - GBP 2.65% -5.05% 7.64% 8.00% 8.85% -0.88% -5.32% -5.52% HighJF Japan Equity B (acc) - USD 2.54% -2.20% 9.90% 16.23% 7.81% -6.69% -8.82% -6.97% HighJF Japan Equity C (acc) - USD 2.50% -2.17% 9.99% 16.37% 7.96% -6.55% -8.71% -6.83% HighJF Japan Equity D (acc) - USD 2.10% -2.92% 8.59% 14.49% 6.13% -7.86% -9.76% -7.89% HighJF Japan Equity D (acc) - EUR 0.00% -10.00% 2.56% -2.96% 4.71% -5.49% -10.76% -9.30% HighJF Japan Equity I (acc) - USD* - - - - - - - - HighJF Japan Equity J (dist) - USD 2.25% -2.52% 9.21% 15.38% 6.98% -7.28% -9.30% -7.43% HighJF Japan Equity X (acc) - USD 2.70% -1.61% 10.79% 17.48% 9.04% -5.86% -8.15% -6.28% High
JPMorgan Funds - JF Japan Small Cap FundJF Japan Small Cap A (acc) - USD 6.38% 4.63% 12.72% 7.36% 5.91% -6.01% -9.47% -9.02% HighJF Japan Small Cap A (dist) - USD 6.20% 4.54% 12.46% 7.22% 5.85% -6.05% -9.48% -9.02% HighJF Japan Small Cap B (acc) - USD 6.56% 4.84% 13.24% 8.15% 6.72% -5.45% -9.07% -8.69% HighJF Japan Small Cap C (acc) - USD* - - - - - - - - HighJF Japan Small Cap D (acc) - USD 6.07% 3.97% 11.73% 6.29% 4.81% -6.83% -10.08% -9.55% HighJF Japan Small Cap X (acc) - USD* - - - - - - - - High
JPMorgan Funds - JF Korea Equity FundJF Korea Equity A (acc) - USD 0.09% 3.35% 18.83% 45.12% 41.58% 11.80% - - HighJF Korea Equity A (acc) - EUR -1.81% -4.92% 12.00% 23.03% 39.23% 15.97% - - HighJF Korea Equity A (dist) - USD 0.08% 3.38% 18.93% 45.26% 41.63% 11.86% - - HighJF Korea Equity B (acc) - USD 0.21% 3.77% 19.43% 46.27% - 18.89% - - HighJF Korea Equity C (acc) - USD** 0.31% 3.85% - - - - - - HighJF Korea Equity D (acc) - USD -0.18% 2.82% 17.94% 43.71% 39.76% 10.50% - - HighJF Korea Equity X (acc) - USD** 0.51% 4.26% - - - - - - High
447
JPMorgan FundsAppendix - Unaudited Additional Disclosures (continued)
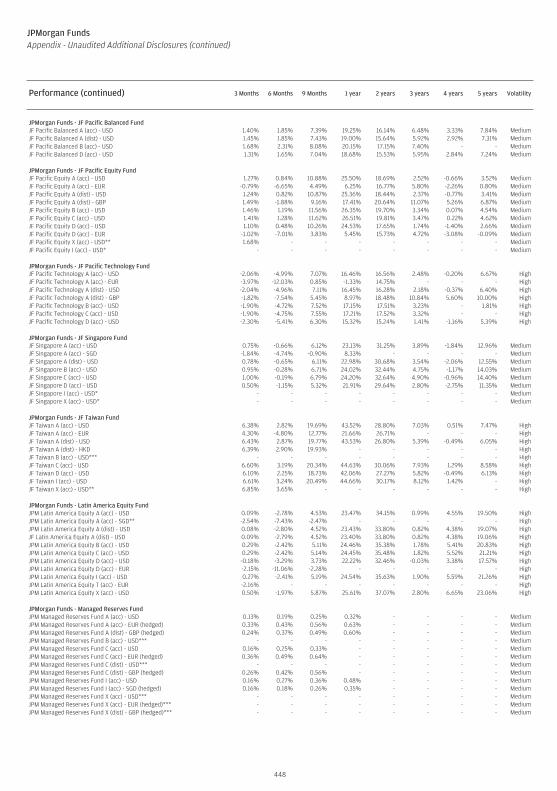
Performance (continued) 3 Months 6 Months 9 Months 1 year 2 years 3 years 4 years 5 years Volatility
JPMorgan Funds - JF Pacific Balanced FundJF Pacific Balanced A (acc) - USD 1.40% 1.85% 7.39% 19.25% 16.14% 6.48% 3.33% 7.84% MediumJF Pacific Balanced A (dist) - USD 1.45% 1.85% 7.43% 19.00% 15.64% 5.92% 2.92% 7.31% MediumJF Pacific Balanced B (acc) - USD 1.68% 2.31% 8.08% 20.15% 17.15% 7.40% - - MediumJF Pacific Balanced D (acc) - USD 1.31% 1.65% 7.04% 18.68% 15.53% 5.95% 2.84% 7.24% Medium
JPMorgan Funds - JF Pacific Equity FundJF Pacific Equity A (acc) - USD 1.27% 0.84% 10.88% 25.50% 18.69% 2.52% -0.66% 3.52% MediumJF Pacific Equity A (acc) - EUR -0.79% -6.65% 4.49% 6.25% 16.77% 5.80% -2.26% 0.80% MediumJF Pacific Equity A (dist) - USD 1.24% 0.82% 10.87% 25.36% 18.44% 2.37% -0.77% 3.41% MediumJF Pacific Equity A (dist) - GBP 1.49% -1.88% 9.16% 17.41% 20.64% 11.07% 5.26% 6.87% MediumJF Pacific Equity B (acc) - USD 1.46% 1.19% 11.56% 26.35% 19.70% 3.34% 0.07% 4.54% MediumJF Pacific Equity C (acc) - USD 1.41% 1.28% 11.62% 26.51% 19.81% 3.47% 0.22% 4.62% MediumJF Pacific Equity D (acc) - USD 1.10% 0.48% 10.26% 24.53% 17.65% 1.74% -1.40% 2.66% MediumJF Pacific Equity D (acc) - EUR -1.02% -7.01% 3.83% 5.45% 15.73% 4.72% -3.08% -0.09% MediumJF Pacific Equity X (acc) - USD** 1.68% - - - - - - - MediumJF Pacific Equity I (acc) - USD* - - - - - - - - Medium
JPMorgan Funds - JF Pacific Technology FundJF Pacific Technology A (acc) - USD -2.06% -4.99% 7.07% 16.46% 16.56% 2.48% -0.20% 6.67% HighJF Pacific Technology A (acc) - EUR -3.97% -12.03% 0.85% -1.33% 14.75% - - - HighJF Pacific Technology A (dist) - USD -2.04% -4.96% 7.11% 16.45% 16.28% 2.18% -0.37% 6.40% HighJF Pacific Technology A (dist) - GBP -1.82% -7.54% 5.45% 8.97% 18.48% 10.84% 5.60% 10.00% HighJF Pacific Technology B (acc) - USD -1.90% -4.72% 7.52% 17.15% 17.51% 3.23% - 1.81% HighJF Pacific Technology C (acc) - USD -1.90% -4.75% 7.55% 17.21% 17.52% 3.32% - - HighJF Pacific Technology D (acc) - USD -2.30% -5.41% 6.30% 15.32% 15.24% 1.41% -1.16% 5.39% High
JPMorgan Funds - JF Singapore FundJF Singapore A (acc) - USD 0.75% -0.66% 6.12% 23.13% 31.25% 3.89% -1.84% 12.96% MediumJF Singapore A (acc) - SGD -1.84% -4.74% -0.90% 8.33% - - - - MediumJF Singapore A (dist) - USD 0.78% -0.65% 6.11% 22.98% 30.68% 3.54% -2.06% 12.55% MediumJF Singapore B (acc) - USD 0.95% -0.28% 6.71% 24.02% 32.44% 4.75% -1.17% 14.03% MediumJF Singapore C (acc) - USD 1.00% -0.19% 6.79% 24.20% 32.64% 4.90% -0.96% 14.40% MediumJF Singapore D (acc) - USD 0.50% -1.15% 5.32% 21.91% 29.64% 2.80% -2.75% 11.35% MediumJF Singapore I (acc) - USD* - - - - - - - - MediumJF Singapore X (acc) - USD* - - - - - - - - Medium
JPMorgan Funds - JF Taiwan FundJF Taiwan A (acc) - USD 6.38% 2.82% 19.69% 43.52% 28.80% 7.03% 0.51% 7.47% HighJF Taiwan A (acc) - EUR 4.30% -4.80% 12.77% 21.66% 26.71% - - - HighJF Taiwan A (dist) - USD 6.43% 2.87% 19.77% 43.53% 26.80% 5.39% -0.49% 6.05% HighJF Taiwan A (dist) - HKD 6.39% 2.90% 19.93% - - - - - HighJF Taiwan B (acc) - USD*** - - - - - - - - HighJF Taiwan C (acc) - USD 6.60% 3.19% 20.34% 44.63% 30.06% 7.93% 1.29% 8.58% HighJF Taiwan D (acc) - USD 6.10% 2.25% 18.73% 42.06% 27.27% 5.82% -0.49% 6.13% HighJF Taiwan I (acc) - USD 6.61% 3.24% 20.49% 44.66% 30.17% 8.12% 1.42% - HighJF Taiwan X (acc) - USD** 6.85% 3.65% - - - - - - High
JPMorgan Funds - Latin America Equity FundJPM Latin America Equity A (acc) - USD 0.09% -2.78% 4.53% 23.47% 34.15% 0.99% 4.55% 19.50% HighJPM Latin America Equity A (acc) - SGD** -2.54% -7.43% -2.47% - - - - - HighJPM Latin America Equity A (dist) - USD 0.08% -2.80% 4.52% 23.43% 33.80% 0.82% 4.38% 19.07% HighJF Latin America Equity A (dist) - USD 0.09% -2.79% 4.52% 23.40% 33.80% 0.82% 4.38% 19.06% HighJPM Latin America Equity B (acc) - USD 0.29% -2.42% 5.11% 24.46% 35.38% 1.78% 5.41% 20.83% HighJPM Latin America Equity C (acc) - USD 0.29% -2.42% 5.14% 24.45% 35.48% 1.82% 5.52% 21.21% HighJPM Latin America Equity D (acc) - USD -0.18% -3.29% 3.73% 22.22% 32.46% -0.03% 3.38% 17.57% HighJPM Latin America Equity D (acc) - EUR -2.15% -11.06% -2.28% - - - - - HighJPM Latin America Equity I (acc) - USD 0.27% -2.41% 5.19% 24.54% 35.63% 1.90% 5.59% 21.26% HighJPM Latin America Equity T (acc) - EUR -2.16% - - - - - - - HighJPM Latin America Equity X (acc) - USD 0.50% -1.97% 5.87% 25.61% 37.07% 2.80% 6.65% 23.06% High
JPMorgan Funds - Managed Reserves FundJPM Managed Reserves Fund A (acc) - USD 0.13% 0.19% 0.25% 0.32% - - - - MediumJPM Managed Reserves Fund A (acc) - EUR (hedged) 0.33% 0.43% 0.56% 0.63% - - - - MediumJPM Managed Reserves Fund A (dist) - GBP (hedged) 0.24% 0.37% 0.49% 0.60% - - - - MediumJPM Managed Reserves Fund B (acc) - USD*** - - - - - - - - MediumJPM Managed Reserves Fund C (acc) - USD 0.16% 0.25% 0.33% - - - - - MediumJPM Managed Reserves Fund C (acc) - EUR (hedged) 0.36% 0.49% 0.64% - - - - - MediumJPM Managed Reserves Fund C (dist) - USD*** - - - - - - - - MediumJPM Managed Reserves Fund C (dist) - GBP (hedged) 0.26% 0.42% 0.56% - - - - - MediumJPM Managed Reserves Fund I (acc) - USD 0.16% 0.27% 0.36% 0.48% - - - - MediumJPM Managed Reserves Fund I (acc) - SGD (hedged) 0.16% 0.18% 0.26% 0.35% - - - - MediumJPM Managed Reserves Fund X (acc) - USD*** - - - - - - - - MediumJPM Managed Reserves Fund X (acc) - EUR (hedged)*** - - - - - - - - MediumJPM Managed Reserves Fund X (dist) - GBP (hedged)*** - - - - - - - - Medium
448
JPMorgan FundsAppendix - Unaudited Additional Disclosures (continued)
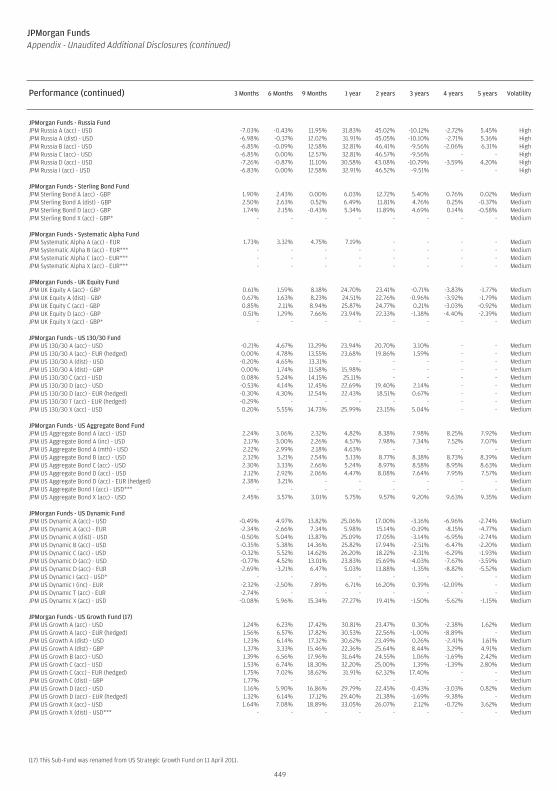
Performance (continued) 3 Months 6 Months 9 Months 1 year 2 years 3 years 4 years 5 years Volatility
JPMorgan Funds - Russia FundJPM Russia A (acc) - USD -7.03% -0.43% 11.95% 31.83% 45.02% -10.12% -2.72% 5.45% HighJPM Russia A (dist) - USD -6.98% -0.37% 12.02% 31.91% 45.05% -10.10% -2.71% 5.36% HighJPM Russia B (acc) - USD -6.85% -0.09% 12.58% 32.81% 46.41% -9.56% -2.06% 6.31% HighJPM Russia C (acc) - USD -6.85% 0.00% 12.57% 32.81% 46.57% -9.56% - - HighJPM Russia D (acc) - USD -7.26% -0.87% 11.10% 30.58% 43.08% -10.79% -3.59% 4.20% HighJPM Russia I (acc) - USD -6.83% 0.00% 12.58% 32.91% 46.52% -9.51% - - High
JPMorgan Funds - Sterling Bond FundJPM Sterling Bond A (acc) - GBP 1.90% 2.43% 0.00% 6.03% 12.72% 5.40% 0.76% 0.02% MediumJPM Sterling Bond A (dist) - GBP 2.50% 2.63% 0.52% 6.49% 11.81% 4.76% 0.25% -0.37% MediumJPM Sterling Bond D (acc) - GBP 1.74% 2.15% -0.43% 5.34% 11.89% 4.69% 0.14% -0.58% MediumJPM Sterling Bond X (acc) - GBP* - - - - - - - - Medium
JPMorgan Funds - Systematic Alpha FundJPM Systematic Alpha A (acc) - EUR 1.73% 3.32% 4.75% 7.19% - - - - MediumJPM Systematic Alpha B (acc) - EUR*** - - - - - - - - MediumJPM Systematic Alpha C (acc) - EUR*** - - - - - - - - MediumJPM Systematic Alpha X (acc) - EUR*** - - - - - - - - Medium
JPMorgan Funds - UK Equity FundJPM UK Equity A (acc) - GBP 0.61% 1.59% 8.18% 24.70% 23.41% -0.71% -3.83% -1.77% MediumJPM UK Equity A (dist) - GBP 0.67% 1.63% 8.23% 24.51% 22.76% -0.96% -3.92% -1.79% MediumJPM UK Equity C (acc) - GBP 0.85% 2.11% 8.94% 25.87% 24.77% 0.21% -3.03% -0.92% MediumJPM UK Equity D (acc) - GBP 0.51% 1.29% 7.66% 23.94% 22.33% -1.38% -4.40% -2.39% MediumJPM UK Equity X (acc) - GBP* - - - - - - - - Medium
JPMorgan Funds - US 130/30 FundJPM US 130/30 A (acc) - USD -0.21% 4.67% 13.29% 23.94% 20.70% 3.10% - - MediumJPM US 130/30 A (acc) - EUR (hedged) 0.00% 4.78% 13.55% 23.68% 19.86% 1.59% - - MediumJPM US 130/30 A (dist) - USD -0.20% 4.65% 13.31% - - - - - MediumJPM US 130/30 A (dist) - GBP 0.00% 1.74% 11.58% 15.98% - - - - MediumJPM US 130/30 C (acc) - USD 0.08% 5.24% 14.15% 25.11% - - - - MediumJPM US 130/30 D (acc) - USD -0.53% 4.14% 12.45% 22.69% 19.40% 2.14% - - MediumJPM US 130/30 D (acc) - EUR (hedged) -0.30% 4.30% 12.54% 22.43% 18.51% 0.67% - - MediumJPM US 130/30 T (acc) - EUR (hedged) -0.29% - - - - - - - MediumJPM US 130/30 X (acc) - USD 0.20% 5.55% 14.73% 25.99% 23.15% 5.04% - - Medium
JPMorgan Funds - US Aggregate Bond FundJPM US Aggregate Bond A (acc) - USD 2.24% 3.06% 2.32% 4.82% 8.38% 7.98% 8.25% 7.92% MediumJPM US Aggregate Bond A (inc) - USD 2.17% 3.00% 2.26% 4.57% 7.98% 7.34% 7.52% 7.07% MediumJPM US Aggregate Bond A (mth) - USD 2.22% 2.99% 2.18% 4.63% - - - - MediumJPM US Aggregate Bond B (acc) - USD 2.32% 3.21% 2.54% 5.13% 8.77% 8.38% 8.73% 8.39% MediumJPM US Aggregate Bond C (acc) - USD 2.30% 3.33% 2.66% 5.24% 8.97% 8.58% 8.95% 8.63% MediumJPM US Aggregate Bond D (acc) - USD 2.12% 2.92% 2.06% 4.47% 8.08% 7.64% 7.95% 7.57% MediumJPM US Aggregate Bond D (acc) - EUR (hedged) 2.38% 3.21% - - - - - - MediumJPM US Aggregate Bond I (acc) - USD*** - - - - - - - - MediumJPM US Aggregate Bond X (acc) - USD 2.45% 3.57% 3.01% 5.75% 9.57% 9.20% 9.63% 9.35% Medium
JPMorgan Funds - US Dynamic FundJPM US Dynamic A (acc) - USD -0.49% 4.97% 13.82% 25.06% 17.00% -3.16% -6.96% -2.74% MediumJPM US Dynamic A (acc) - EUR -2.34% -2.66% 7.34% 5.98% 15.14% -0.39% -8.15% -4.77% MediumJPM US Dynamic A (dist) - USD -0.50% 5.04% 13.87% 25.09% 17.05% -3.14% -6.95% -2.74% MediumJPM US Dynamic B (acc) - USD -0.35% 5.38% 14.36% 25.82% 17.94% -2.51% -6.47% -2.20% MediumJPM US Dynamic C (acc) - USD -0.32% 5.52% 14.62% 26.20% 18.22% -2.31% -6.29% -1.93% MediumJPM US Dynamic D (acc) - USD -0.77% 4.52% 13.01% 23.83% 15.69% -4.03% -7.67% -3.59% MediumJPM US Dynamic D (acc) - EUR -2.69% -3.21% 6.47% 5.03% 13.88% -1.35% -8.82% -5.52% MediumJPM US Dynamic I (acc) - USD* - - - - - - - - MediumJPM US Dynamic I (inc) - EUR -2.32% -2.50% 7.89% 6.71% 16.20% 0.39% -12.09% - MediumJPM US Dynamic T (acc) - EUR -2.74% - - - - - - - MediumJPM US Dynamic X (acc) - USD -0.08% 5.96% 15.34% 27.27% 19.41% -1.50% -5.62% -1.15% Medium
JPMorgan Funds - US Growth Fund (17)JPM US Growth A (acc) - USD 1.24% 6.23% 17.42% 30.81% 23.47% 0.30% -2.38% 1.62% MediumJPM US Growth A (acc) - EUR (hedged) 1.56% 6.57% 17.82% 30.53% 22.56% -1.00% -8.89% - MediumJPM US Growth A (dist) - USD 1.23% 6.14% 17.32% 30.62% 23.49% 0.26% -2.41% 1.61% MediumJPM US Growth A (dist) - GBP 1.37% 3.33% 15.46% 22.36% 25.64% 8.44% 3.29% 4.91% MediumJPM US Growth B (acc) - USD 1.39% 6.56% 17.96% 31.64% 24.55% 1.06% -1.69% 2.42% MediumJPM US Growth C (acc) - USD 1.53% 6.74% 18.30% 32.20% 25.00% 1.39% -1.39% 2.80% MediumJPM US Growth C (acc) - EUR (hedged) 1.75% 7.02% 18.62% 31.91% 62.32% 17.40% - - MediumJPM US Growth C (dist) - GBP 1.77% - - - - - - - MediumJPM US Growth D (acc) - USD 1.16% 5.90% 16.86% 29.79% 22.45% -0.43% -3.03% 0.82% MediumJPM US Growth D (acc) - EUR (hedged) 1.32% 6.14% 17.12% 29.40% 21.38% -1.69% -9.38% - MediumJPM US Growth X (acc) - USD 1.64% 7.08% 18.89% 33.05% 26.07% 2.12% -0.72% 3.62% MediumJPM US Growth X (dist) - USD*** - - - - - - - - Medium
(17) This Sub-Fund was renamed from US Strategic Growth Fund on 11 April 2011.
449
JPMorgan FundsAppendix - Unaudited Additional Disclosures (continued)
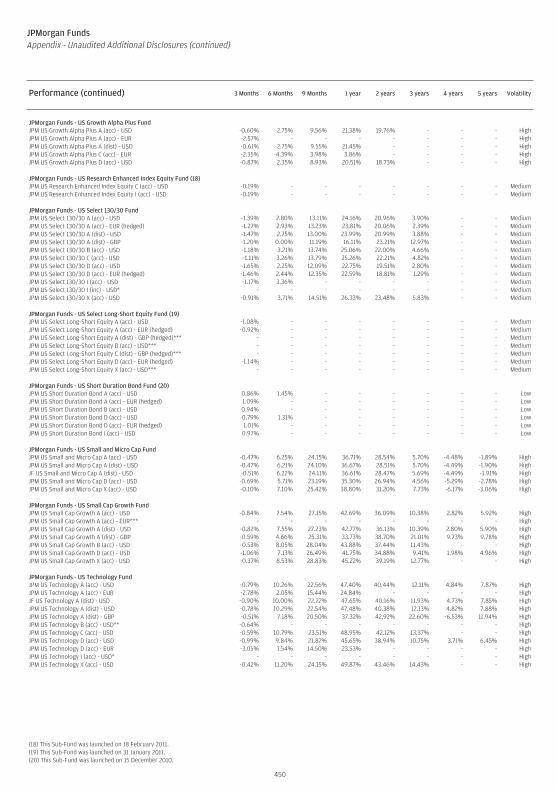
Performance (continued) 3 Months 6 Months 9 Months 1 year 2 years 3 years 4 years 5 years Volatility
JPMorgan Funds - US Growth Alpha Plus FundJPM US Growth Alpha Plus A (acc) - USD -0.60% 2.75% 9.56% 21.38% 19.76% - - - HighJPM US Growth Alpha Plus A (acc) - EUR -2.57% - - - - - - - HighJPM US Growth Alpha Plus A (dist) - USD -0.61% 2.75% 9.55% 21.45% - - - - HighJPM US Growth Alpha Plus C (acc) - EUR -2.35% -4.39% 3.98% 3.86% - - - - HighJPM US Growth Alpha Plus D (acc) - USD -0.87% 2.35% 8.93% 20.51% 18.73% - - - High
JPMorgan Funds - US Research Enhanced Index Equity Fund (18)JPM US Research Enhanced Index Equity C (acc) - USD -0.19% - - - - - - - MediumJPM US Research Enhanced Index Equity I (acc) - USD -0.19% - - - - - - - Medium
JPMorgan Funds - US Select 130/30 FundJPM US Select 130/30 A (acc) - USD -1.39% 2.80% 13.11% 24.16% 20.96% 3.90% - - MediumJPM US Select 130/30 A (acc) - EUR (hedged) -1.27% 2.93% 13.23% 23.81% 20.06% 2.39% - - MediumJPM US Select 130/30 A (dist) - USD -1.47% 2.75% 13.00% 23.99% 20.99% 3.88% - - MediumJPM US Select 130/30 A (dist) - GBP -1.20% 0.00% 11.19% 16.11% 23.21% 12.97% - - MediumJPM US Select 130/30 B (acc) - USD -1.18% 3.21% 13.74% 25.06% 22.00% 4.66% - - MediumJPM US Select 130/30 C (acc) - USD -1.11% 3.26% 13.79% 25.26% 22.21% 4.82% - - MediumJPM US Select 130/30 D (acc) - USD -1.65% 2.25% 12.09% 22.75% 19.51% 2.80% - - MediumJPM US Select 130/30 D (acc) - EUR (hedged) -1.46% 2.44% 12.35% 22.59% 18.81% 1.29% - - MediumJPM US Select 130/30 I (acc) - USD -1.17% 3.36% - - - - - - MediumJPM US Select 130/30 I (inc) - USD* - - - - - - - - MediumJPM US Select 130/30 X (acc) - USD -0.91% 3.71% 14.51% 26.33% 23.48% 5.83% - - Medium
JPMorgan Funds - US Select Long-Short Equity Fund (19)JPM US Select Long-Short Equity A (acc) - USD -1.08% - - - - - - - MediumJPM US Select Long-Short Equity A (acc) - EUR (hedged) -0.92% - - - - - - - MediumJPM US Select Long-Short Equity A (dist) - GBP (hedged)*** - - - - - - - - MediumJPM US Select Long-Short Equity B (acc) - USD*** - - - - - - - - MediumJPM US Select Long-Short Equity C (dist) - GBP (hedged)*** - - - - - - - - MediumJPM US Select Long-Short Equity D (acc) - EUR (hedged) -1.14% - - - - - - - MediumJPM US Select Long-Short Equity X (acc) - USD*** - - - - - - - - Medium
JPMorgan Funds - US Short Duration Bond Fund (20)JPM US Short Duration Bond A (acc) - USD 0.86% 1.45% - - - - - - LowJPM US Short Duration Bond A (acc) - EUR (hedged) 1.09% - - - - - - - LowJPM US Short Duration Bond B (acc) - USD 0.94% - - - - - - - LowJPM US Short Duration Bond D (acc) - USD 0.79% 1.31% - - - - - - LowJPM US Short Duration Bond D (acc) - EUR (hedged) 1.01% - - - - - - - LowJPM US Short Duration Bond I (acc) - USD 0.97% - - - - - - - Low
JPMorgan Funds - US Small and Micro Cap FundJPM US Small and Micro Cap A (acc) - USD -0.47% 6.25% 24.15% 36.71% 28.54% 5.70% -4.48% -1.89% HighJPM US Small and Micro Cap A (dist) - USD -0.47% 6.21% 24.10% 36.67% 28.51% 5.70% -4.49% -1.90% HighJF US Small and Micro Cap A (dist) - USD -0.51% 6.22% 24.11% 36.61% 28.47% 5.69% -4.49% -1.91% HighJPM US Small and Micro Cap D (acc) - USD -0.69% 5.71% 23.19% 35.30% 26.94% 4.56% -5.29% -2.78% HighJPM US Small and Micro Cap X (acc) - USD -0.10% 7.10% 25.42% 38.80% 31.20% 7.73% -6.17% -3.06% High
JPMorgan Funds - US Small Cap Growth FundJPM US Small Cap Growth A (acc) - USD -0.84% 7.54% 27.15% 42.69% 36.09% 10.38% 2.82% 5.92% HighJPM US Small Cap Growth A (acc) - EUR*** - - - - - - - - HighJPM US Small Cap Growth A (dist) - USD -0.82% 7.55% 27.23% 42.77% 36.13% 10.39% 2.80% 5.90% HighJPM US Small Cap Growth A (dist) - GBP -0.59% 4.66% 25.31% 33.73% 38.70% 21.01% 9.73% 9.78% HighJPM US Small Cap Growth B (acc) - USD -0.53% 8.05% 28.04% 43.88% 37.44% 11.43% - - HighJPM US Small Cap Growth D (acc) - USD -1.06% 7.13% 26.49% 41.75% 34.88% 9.41% 1.98% 4.96% HighJPM US Small Cap Growth X (acc) - USD -0.37% 8.53% 28.83% 45.22% 39.19% 12.77% - - High
JPMorgan Funds - US Technology FundJPM US Technology A (acc) - USD -0.79% 10.26% 22.56% 47.40% 40.44% 12.11% 4.84% 7.87% HighJPM US Technology A (acc) - EUR -2.78% 2.05% 15.44% 24.84% - - - - HighJF US Technology A (dist) - USD -0.90% 10.00% 22.22% 47.65% 40.16% 11.93% 4.73% 7.85% HighJPM US Technology A (dist) - USD -0.78% 10.29% 22.54% 47.48% 40.38% 12.13% 4.82% 7.88% HighJPM US Technology A (dist) - GBP -0.51% 7.18% 20.50% 37.32% 42.92% 22.60% -6.53% 11.94% HighJPM US Technology B (acc) - USD** -0.64% - - - - - - - HighJPM US Technology C (acc) - USD -0.59% 10.79% 23.51% 48.95% 42.12% 13.37% - - HighJPM US Technology D (acc) - USD -0.99% 9.84% 21.82% 45.65% 38.94% 10.75% 3.71% 6.45% HighJPM US Technology D (acc) - EUR -3.05% 1.54% 14.50% 23.53% - - - - HighJPM US Technology I (acc) - USD* - - - - - - - - HighJPM US Technology X (acc) - USD -0.42% 11.20% 24.15% 49.87% 43.46% 14.43% - - High
(18) This Sub-Fund was launched on 18 February 2011.(19) This Sub-Fund was launched on 31 January 2011.(20) This Sub-Fund was launched on 15 December 2010.
450
JPMorgan FundsAppendix - Unaudited Additional Disclosures (continued)
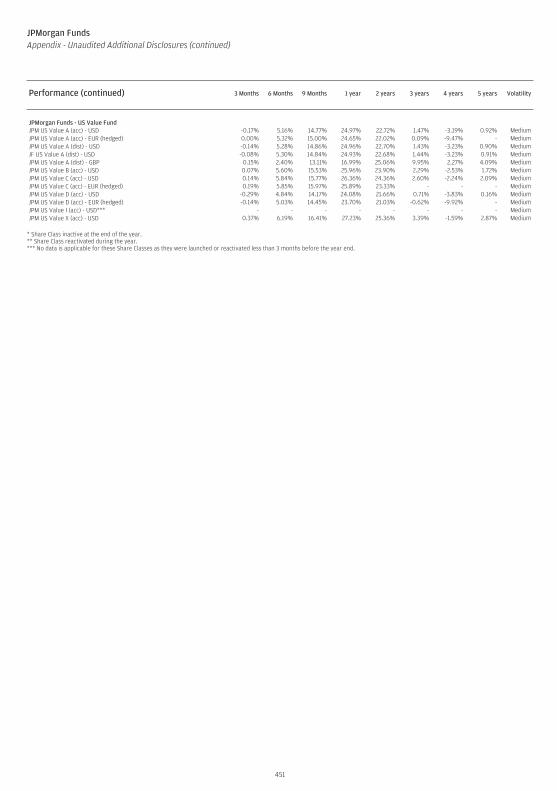
Performance (continued) 3 Months 6 Months 9 Months 1 year 2 years 3 years 4 years 5 years Volatility
JPMorgan Funds - US Value FundJPM US Value A (acc) - USD -0.17% 5.16% 14.77% 24.97% 22.72% 1.47% -3.19% 0.92% MediumJPM US Value A (acc) - EUR (hedged) 0.00% 5.32% 15.00% 24.65% 22.02% 0.09% -9.47% - MediumJPM US Value A (dist) - USD -0.14% 5.28% 14.86% 24.96% 22.70% 1.43% -3.23% 0.90% MediumJF US Value A (dist) - USD -0.08% 5.30% 14.84% 24.93% 22.68% 1.44% -3.23% 0.91% MediumJPM US Value A (dist) - GBP 0.15% 2.40% 13.11% 16.99% 25.06% 9.95% 2.27% 4.09% MediumJPM US Value B (acc) - USD 0.07% 5.60% 15.53% 25.96% 23.90% 2.29% -2.53% 1.72% MediumJPM US Value C (acc) - USD 0.14% 5.84% 15.77% 26.36% 24.36% 2.60% -2.24% 2.09% MediumJPM US Value C (acc) - EUR (hedged) 0.19% 5.85% 15.97% 25.89% 23.33% - - - MediumJPM US Value D (acc) - USD -0.29% 4.84% 14.17% 24.08% 21.66% 0.71% -3.83% 0.16% MediumJPM US Value D (acc) - EUR (hedged) -0.14% 5.03% 14.45% 23.70% 21.03% -0.62% -9.92% - MediumJPM US Value I (acc) - USD*** - - - - - - - - MediumJPM US Value X (acc) - USD 0.37% 6.19% 16.41% 27.23% 25.36% 3.39% -1.59% 2.87% Medium
* Share Class inactive at the end of the year.** Share Class reactivated during the year.*** No data is applicable for these Share Classes as they were launched or reactivated less than 3 months before the year end.
451
JPMorgan FundsAppendix - Unaudited Additional Disclosures (continued)
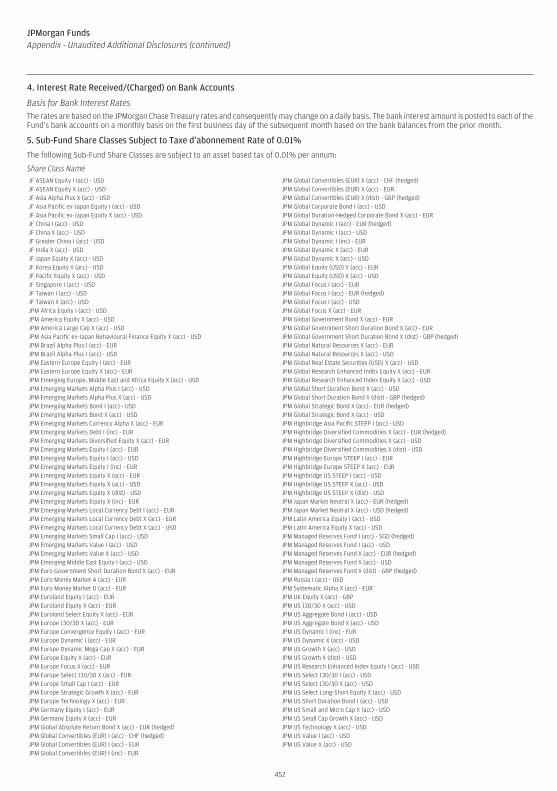
4. Interest Rate Received/(Charged) on Bank Accounts
Basis for Bank Interest RatesThe rates are based on the JPMorgan Chase Treasury rates and consequently may change on a daily basis. The bank interest amount is posted to each of theFund’s bank accounts on a monthly basis on the first business day of the subsequent month based on the bank balances from the prior month.
5. Sub-Fund Share Classes Subject to Taxe d’abonnement Rate of 0.01%
The following Sub-Fund Share Classes are subject to an asset based tax of 0.01% per annum:
Share Class NameJF ASEAN Equity I (acc) - USD JPM Global Convertibles (EUR) X (acc) - CHF (hedged)JF ASEAN Equity X (acc) - USD JPM Global Convertibles (EUR) X (acc) - EURJF Asia Alpha Plus X (acc) - USD JPM Global Convertibles (EUR) X (dist) - GBP (hedged)JF Asia Pacific ex-Japan Equity I (acc) - USD JPM Global Corporate Bond I (acc) - USDJF Asia Pacific ex-Japan Equity X (acc) - USD JPM Global Duration-Hedged Corporate Bond X (acc) - EURJF China I (acc) - USD JPM Global Dynamic I (acc) - EUR (hedged)JF China X (acc) - USD JPM Global Dynamic I (acc) - USDJF Greater China I (acc) - USD JPM Global Dynamic I (inc) - EURJF India X (acc) - USD JPM Global Dynamic X (acc) - EURJF Japan Equity X (acc) - USD JPM Global Dynamic X (acc) - USDJF Korea Equity X (acc) - USD JPM Global Equity (USD) X (acc) - EURJF Pacific Equity X (acc) - USD JPM Global Equity (USD) X (acc) - USDJF Singapore I (acc) - USD JPM Global Focus I (acc) - EURJF Taiwan I (acc) - USD JPM Global Focus I (acc) - EUR (hedged)JF Taiwan X (acc) - USD JPM Global Focus I (acc) - USDJPM Africa Equity I (acc) - USD JPM Global Focus X (acc) - EURJPM America Equity X (acc) - USD JPM Global Government Bond X (acc) - EURJPM America Large Cap X (acc) - USD JPM Global Government Short Duration Bond X (acc) - EURJPM Asia Pacific ex-Japan Behavioural Finance Equity X (acc) - USD JPM Global Government Short Duration Bond X (dist) - GBP (hedged)JPM Brazil Alpha Plus I (acc) - EUR JPM Global Natural Resources X (acc) - EURJPM Brazil Alpha Plus I (acc) - USD JPM Global Natural Resources X (acc) - USDJPM Eastern Europe Equity I (acc) - EUR JPM Global Real Estate Securities (USD) X (acc) - USDJPM Eastern Europe Equity X (acc) - EUR JPM Global Research Enhanced Index Equity X (acc) - EURJPM Emerging Europe, Middle East and Africa Equity X (acc) - USD JPM Global Research Enhanced Index Equity X (acc) - USDJPM Emerging Markets Alpha Plus I (acc) - USD JPM Global Short Duration Bond X (acc) - USDJPM Emerging Markets Alpha Plus X (acc) - USD JPM Global Short Duration Bond X (dist) - GBP (hedged)JPM Emerging Markets Bond I (acc) - USD JPM Global Strategic Bond X (acc) - EUR (hedged)JPM Emerging Markets Bond X (acc) - USD JPM Global Strategic Bond X (acc) - USDJPM Emerging Markets Currency Alpha X (acc) - EUR JPM Highbridge Asia Pacific STEEP I (acc) - USDJPM Emerging Markets Debt I (inc) - EUR JPM Highbridge Diversified Commodities X (acc) - EUR (hedged)JPM Emerging Markets Diversified Equity X (acc) - EUR JPM Highbridge Diversified Commodities X (acc) - USDJPM Emerging Markets Equity I (acc) - EUR JPM Highbridge Diversified Commodities X (dist) - USDJPM Emerging Markets Equity I (acc) - USD JPM Highbridge Europe STEEP I (acc) - EURJPM Emerging Markets Equity I (inc) - EUR JPM Highbridge Europe STEEP X (acc) - EURJPM Emerging Markets Equity X (acc) - EUR JPM Highbridge US STEEP I (acc) - USDJPM Emerging Markets Equity X (acc) - USD JPM Highbridge US STEEP X (acc) - USDJPM Emerging Markets Equity X (dist) - USD JPM Highbridge US STEEP X (dist) - USDJPM Emerging Markets Equity X (inc) - EUR JPM Japan Market Neutral X (acc) - EUR (hedged)JPM Emerging Markets Local Currency Debt I (acc) - EUR JPM Japan Market Neutral X (acc) - USD (hedged)JPM Emerging Markets Local Currency Debt X (acc) - EUR JPM Latin America Equity I (acc) - USDJPM Emerging Markets Local Currency Debt X (acc) - USD JPM Latin America Equity X (acc) - USDJPM Emerging Markets Small Cap I (acc) - USD JPM Managed Reserves Fund I (acc) - SGD (hedged)JPM Emerging Markets Value I (acc) - USD JPM Managed Reserves Fund I (acc) - USDJPM Emerging Markets Value X (acc) - USD JPM Managed Reserves Fund X (acc) - EUR (hedged)JPM Emerging Middle East Equity I (acc) - USD JPM Managed Reserves Fund X (acc) - USDJPM Euro Government Short Duration Bond X (acc) - EUR JPM Managed Reserves Fund X (dist) - GBP (hedged)JPM Euro Money Market A (acc) - EUR JPM Russia I (acc) - USDJPM Euro Money Market D (acc) - EUR JPM Systematic Alpha X (acc) - EURJPM Euroland Equity I (acc) - EUR JPM UK Equity X (acc) - GBPJPM Euroland Equity X (acc) - EUR JPM US 130/30 X (acc) - USDJPM Euroland Select Equity X (acc) - EUR JPM US Aggregate Bond I (acc) - USDJPM Europe 130/30 X (acc) - EUR JPM US Aggregate Bond X (acc) - USDJPM Europe Convergence Equity I (acc) - EUR JPM US Dynamic I (inc) - EURJPM Europe Dynamic I (acc) - EUR JPM US Dynamic X (acc) - USDJPM Europe Dynamic Mega Cap X (acc) - EUR JPM US Growth X (acc) - USDJPM Europe Equity X (acc) - EUR JPM US Growth X (dist) - USDJPM Europe Focus X (acc) - EUR JPM US Research Enhanced Index Equity I (acc) - USDJPM Europe Select 130/30 X (acc) - EUR JPM US Select 130/30 I (acc) - USDJPM Europe Small Cap I (acc) - EUR JPM US Select 130/30 X (acc) - USDJPM Europe Strategic Growth X (acc) - EUR JPM US Select Long-Short Equity X (acc) - USDJPM Europe Technology X (acc) - EUR JPM US Short Duration Bond I (acc) - USDJPM Germany Equity I (acc) - EUR JPM US Small and Micro Cap X (acc) - USDJPM Germany Equity X (acc) - EUR JPM US Small Cap Growth X (acc) - USDJPM Global Absolute Return Bond X (acc) - EUR (hedged) JPM US Technology X (acc) - USDJPM Global Convertibles (EUR) I (acc) - CHF (hedged) JPM US Value I (acc) - USDJPM Global Convertibles (EUR) I (acc) - EUR JPM US Value X (acc) - USDJPM Global Convertibles (EUR) I (inc) - EUR
452
JPMorgan FundsAppendix - Unaudited Additional Disclosures (continued)
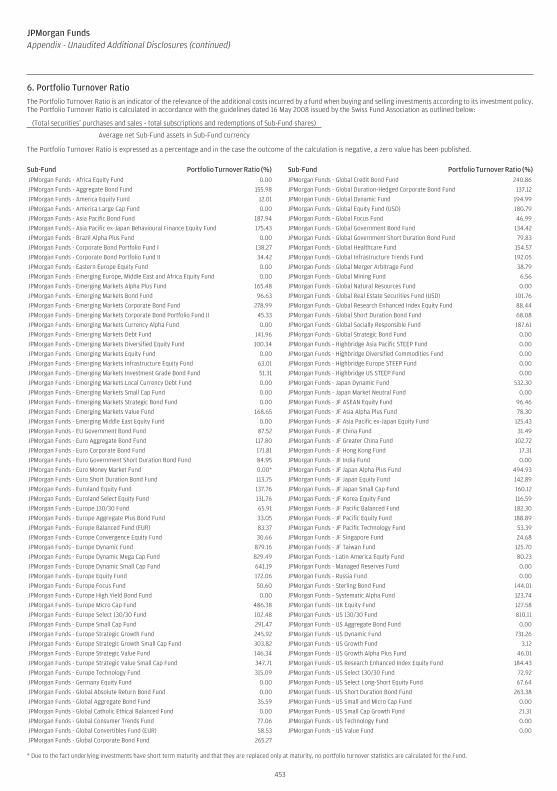
6. Portfolio Turnover Ratio
The Portfolio Turnover Ratio is an indicator of the relevance of the additional costs incurred by a fund when buying and selling investments according to its investment policy.The Portfolio Turnover Ratio is calculated in accordance with the guidelines dated 16 May 2008 issued by the Swiss Fund Association as outlined below:
(Total securities’ purchases and sales - total subscriptions and redemptions of Sub-Fund shares)
Average net Sub-Fund assets in Sub-Fund currency
The Portfolio Turnover Ratio is expressed as a percentage and in the case the outcome of the calculation is negative, a zero value has been published.
Sub-Fund Portfolio Turnover Ratio (%) Sub-Fund Portfolio Turnover Ratio (%)JPMorgan Funds - Africa Equity Fund 0.00 JPMorgan Funds - Global Credit Bond Fund 240.86
JPMorgan Funds - Aggregate Bond Fund 155.98 JPMorgan Funds - Global Duration-Hedged Corporate Bond Fund 137.12
JPMorgan Funds - America Equity Fund 12.01 JPMorgan Funds - Global Dynamic Fund 194.99
JPMorgan Funds - America Large Cap Fund 0.00 JPMorgan Funds - Global Equity Fund (USD) 180.79
JPMorgan Funds - Asia Pacific Bond Fund 187.94 JPMorgan Funds - Global Focus Fund 46.99
JPMorgan Funds - Asia Pacific ex-Japan Behavioural Finance Equity Fund 175.43 JPMorgan Funds - Global Government Bond Fund 134.42
JPMorgan Funds - Brazil Alpha Plus Fund 0.00 JPMorgan Funds - Global Government Short Duration Bond Fund 79.83
JPMorgan Funds - Corporate Bond Portfolio Fund I 138.27 JPMorgan Funds - Global Healthcare Fund 154.57
JPMorgan Funds - Corporate Bond Portfolio Fund II 34.42 JPMorgan Funds - Global Infrastructure Trends Fund 192.05
JPMorgan Funds - Eastern Europe Equity Fund 0.00 JPMorgan Funds - Global Merger Arbitrage Fund 38.79
JPMorgan Funds - Emerging Europe, Middle East and Africa Equity Fund 0.00 JPMorgan Funds - Global Mining Fund 6.56
JPMorgan Funds - Emerging Markets Alpha Plus Fund 165.48 JPMorgan Funds - Global Natural Resources Fund 0.00
JPMorgan Funds - Emerging Markets Bond Fund 96.63 JPMorgan Funds - Global Real Estate Securities Fund (USD) 101.76
JPMorgan Funds - Emerging Markets Corporate Bond Fund 278.99 JPMorgan Funds - Global Research Enhanced Index Equity Fund 88.44
JPMorgan Funds - Emerging Markets Corporate Bond Portfolio Fund II 45.33 JPMorgan Funds - Global Short Duration Bond Fund 68.08
JPMorgan Funds - Emerging Markets Currency Alpha Fund 0.00 JPMorgan Funds - Global Socially Responsible Fund 187.61
JPMorgan Funds - Emerging Markets Debt Fund 141.96 JPMorgan Funds - Global Strategic Bond Fund 0.00
JPMorgan Funds - Emerging Markets Diversified Equity Fund 100.34 JPMorgan Funds - Highbridge Asia Pacific STEEP Fund 0.00
JPMorgan Funds - Emerging Markets Equity Fund 0.00 JPMorgan Funds - Highbridge Diversified Commodities Fund 0.00
JPMorgan Funds - Emerging Markets Infrastructure Equity Fund 63.01 JPMorgan Funds - Highbridge Europe STEEP Fund 0.00
JPMorgan Funds - Emerging Markets Investment Grade Bond Fund 51.31 JPMorgan Funds - Highbridge US STEEP Fund 0.00
JPMorgan Funds - Emerging Markets Local Currency Debt Fund 0.00 JPMorgan Funds - Japan Dynamic Fund 532.30
JPMorgan Funds - Emerging Markets Small Cap Fund 0.00 JPMorgan Funds - Japan Market Neutral Fund 0.00
JPMorgan Funds - Emerging Markets Strategic Bond Fund 0.00 JPMorgan Funds - JF ASEAN Equity Fund 96.46
JPMorgan Funds - Emerging Markets Value Fund 168.65 JPMorgan Funds - JF Asia Alpha Plus Fund 78.30
JPMorgan Funds - Emerging Middle East Equity Fund 0.00 JPMorgan Funds - JF Asia Pacific ex-Japan Equity Fund 125.43
JPMorgan Funds - EU Government Bond Fund 87.52 JPMorgan Funds - JF China Fund 31.49
JPMorgan Funds - Euro Aggregate Bond Fund 117.80 JPMorgan Funds - JF Greater China Fund 102.72
JPMorgan Funds - Euro Corporate Bond Fund 171.81 JPMorgan Funds - JF Hong Kong Fund 17.31
JPMorgan Funds - Euro Government Short Duration Bond Fund 84.95 JPMorgan Funds - JF India Fund 0.00
JPMorgan Funds - Euro Money Market Fund 0.00* JPMorgan Funds - JF Japan Alpha Plus Fund 494.93
JPMorgan Funds - Euro Short Duration Bond Fund 113.75 JPMorgan Funds - JF Japan Equity Fund 142.89
JPMorgan Funds - Euroland Equity Fund 137.76 JPMorgan Funds - JF Japan Small Cap Fund 160.12
JPMorgan Funds - Euroland Select Equity Fund 131.76 JPMorgan Funds - JF Korea Equity Fund 116.59
JPMorgan Funds - Europe 130/30 Fund 65.91 JPMorgan Funds - JF Pacific Balanced Fund 182.30
JPMorgan Funds - Europe Aggregate Plus Bond Fund 33.05 JPMorgan Funds - JF Pacific Equity Fund 188.89
JPMorgan Funds - Europe Balanced Fund (EUR) 83.37 JPMorgan Funds - JF Pacific Technology Fund 53.39
JPMorgan Funds - Europe Convergence Equity Fund 30.66 JPMorgan Funds - JF Singapore Fund 24.68
JPMorgan Funds - Europe Dynamic Fund 879.16 JPMorgan Funds - JF Taiwan Fund 125.70
JPMorgan Funds - Europe Dynamic Mega Cap Fund 829.49 JPMorgan Funds - Latin America Equity Fund 80.23
JPMorgan Funds - Europe Dynamic Small Cap Fund 641.19 JPMorgan Funds - Managed Reserves Fund 0.00
JPMorgan Funds - Europe Equity Fund 172.06 JPMorgan Funds - Russia Fund 0.00
JPMorgan Funds - Europe Focus Fund 50.60 JPMorgan Funds - Sterling Bond Fund 144.01
JPMorgan Funds - Europe High Yield Bond Fund 0.00 JPMorgan Funds - Systematic Alpha Fund 123.74
JPMorgan Funds - Europe Micro Cap Fund 486.38 JPMorgan Funds - UK Equity Fund 127.58
JPMorgan Funds - Europe Select 130/30 Fund 102.48 JPMorgan Funds - US 130/30 Fund 810.11
JPMorgan Funds - Europe Small Cap Fund 291.47 JPMorgan Funds - US Aggregate Bond Fund 0.00
JPMorgan Funds - Europe Strategic Growth Fund 245.92 JPMorgan Funds - US Dynamic Fund 731.26
JPMorgan Funds - Europe Strategic Growth Small Cap Fund 303.82 JPMorgan Funds - US Growth Fund 3.12
JPMorgan Funds - Europe Strategic Value Fund 146.34 JPMorgan Funds - US Growth Alpha Plus Fund 46.01
JPMorgan Funds - Europe Strategic Value Small Cap Fund 347.71 JPMorgan Funds - US Research Enhanced Index Equity Fund 184.43
JPMorgan Funds - Europe Technology Fund 315.09 JPMorgan Funds - US Select 130/30 Fund 72.92
JPMorgan Funds - Germany Equity Fund 0.00 JPMorgan Funds - US Select Long-Short Equity Fund 67.64
JPMorgan Funds - Global Absolute Return Bond Fund 0.00 JPMorgan Funds - US Short Duration Bond Fund 263.38
JPMorgan Funds - Global Aggregate Bond Fund 35.59 JPMorgan Funds - US Small and Micro Cap Fund 0.00
JPMorgan Funds - Global Catholic Ethical Balanced Fund 0.00 JPMorgan Funds - US Small Cap Growth Fund 21.31
JPMorgan Funds - Global Consumer Trends Fund 77.06 JPMorgan Funds - US Technology Fund 0.00
JPMorgan Funds - Global Convertibles Fund (EUR) 58.53 JPMorgan Funds - US Value Fund 0.00
JPMorgan Funds - Global Corporate Bond Fund 265.27
* Due to the fact underlying investments have short term maturity and that they are replaced only at maturity, no portfolio turnover statistics are calculated for the Fund.
453
JPMorgan FundsAppendix - Unaudited Additional Disclosures (continued)
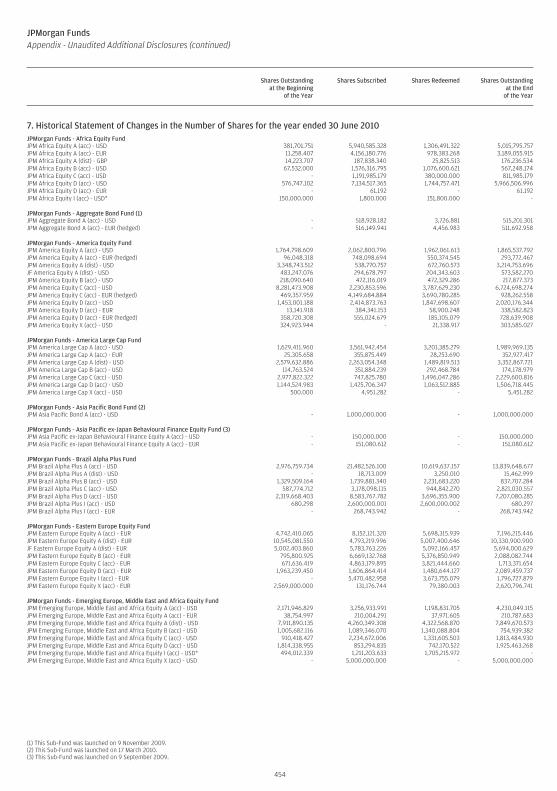
JPMorgan FundsAppendix - Unaudited Additional Disclosures (continued)
Shares Outstandingat the Beginning
of the Year
Shares Subscribed Shares Redeemed Shares Outstandingat the End
of the Year
7. Historical Statement of Changes in the Number of Shares for the year ended 30 June 2010 (continued)JPMorgan Funds - Africa Equity FundJPM Africa Equity A (acc) - USD 381,701.751 5,940,585.328 1,306,491.322 5,015,795.757JPM Africa Equity A (acc) - EUR 11,258.407 4,156,180.776 978,383.268 3,189,055.915JPM Africa Equity A (dist) - GBP 14,223.707 187,838.340 25,825.513 176,236.534JPM Africa Equity B (acc) - USD 67,532.000 1,576,316.795 1,076,600.621 567,248.174JPM Africa Equity C (acc) - USD - 1,191,985.179 380,000.000 811,985.179JPM Africa Equity D (acc) - USD 576,747.102 7,134,517.365 1,744,757.471 5,966,506.996JPM Africa Equity D (acc) - EUR - 61.192 - 61.192JPM Africa Equity I (acc) - USD* 150,000.000 1,800.000 151,800.000 -
JPMorgan Funds - Aggregate Bond Fund (1)JPM Aggregate Bond A (acc) - USD - 518,928.182 3,726.881 515,201.301JPM Aggregate Bond A (acc) - EUR (hedged) - 516,149.941 4,456.983 511,692.958
JPMorgan Funds - America Equity FundJPM America Equity A (acc) - USD 1,764,798.609 2,062,800.796 1,962,061.613 1,865,537.792JPM America Equity A (acc) - EUR (hedged) 96,048.318 748,098.694 550,374.545 293,772.467JPM America Equity A (dist) - USD 3,348,743.512 538,770.757 672,760.573 3,214,753.696JF America Equity A (dist) - USD 483,247.076 294,678.797 204,343.603 573,582.270JPM America Equity B (acc) - USD 218,090.640 472,116.019 472,329.286 217,877.373JPM America Equity C (acc) - USD 8,281,473.908 2,230,853.596 3,787,629.230 6,724,698.274JPM America Equity C (acc) - EUR (hedged) 469,357.959 4,149,684.884 3,690,780.285 928,262.558JPM America Equity D (acc) - USD 1,453,001.188 2,414,873.763 1,847,698.607 2,020,176.344JPM America Equity D (acc) - EUR 13,141.918 384,341.153 58,900.248 338,582.823JPM America Equity D (acc) - EUR (hedged) 358,720.308 555,024.679 185,105.079 728,639.908JPM America Equity X (acc) - USD 324,923.944 - 21,338.917 303,585.027
JPMorgan Funds - America Large Cap FundJPM America Large Cap A (acc) - USD 1,629,411.960 3,561,942.454 3,201,385.279 1,989,969.135JPM America Large Cap A (acc) - EUR 25,305.658 355,875.449 28,253.690 352,927.417JPM America Large Cap A (dist) - USD 2,579,632.886 2,263,054.348 1,489,819.513 3,352,867.721JPM America Large Cap B (acc) - USD 114,763.524 351,884.239 292,468.784 174,178.979JPM America Large Cap C (acc) - USD 2,977,822.322 747,825.780 1,496,047.286 2,229,600.816JPM America Large Cap D (acc) - USD 1,144,524.983 1,425,706.347 1,063,512.885 1,506,718.445JPM America Large Cap X (acc) - USD 500.000 4,951.282 - 5,451.282
JPMorgan Funds - Asia Pacific Bond Fund (2)JPM Asia Pacific Bond A (acc) - USD - 1,000,000.000 - 1,000,000.000
JPMorgan Funds - Asia Pacific ex-Japan Behavioural Finance Equity Fund (3)JPM Asia Pacific ex-Japan Behavioural Finance Equity A (acc) - USD - 150,000.000 - 150,000.000JPM Asia Pacific ex-Japan Behavioural Finance Equity A (acc) - EUR - 151,080.612 - 151,080.612
JPMorgan Funds - Brazil Alpha Plus FundJPM Brazil Alpha Plus A (acc) - USD 2,976,759.734 21,482,526.100 10,619,637.157 13,839,648.677JPM Brazil Alpha Plus A (dist) - USD - 18,713.009 3,250.010 15,462.999JPM Brazil Alpha Plus B (acc) - USD 1,329,509.164 1,739,881.340 2,231,683.220 837,707.284JPM Brazil Alpha Plus C (acc) - USD 587,774.712 3,178,098.115 944,842.270 2,821,030.557JPM Brazil Alpha Plus D (acc) - USD 2,319,668.403 8,583,767.782 3,696,355.900 7,207,080.285JPM Brazil Alpha Plus I (acc) - USD 680.298 2,600,000.001 2,600,000.002 680.297JPM Brazil Alpha Plus I (acc) - EUR - 268,743.942 - 268,743.942
JPMorgan Funds - Eastern Europe Equity FundJPM Eastern Europe Equity A (acc) - EUR 4,742,410.065 8,152,121.320 5,698,315.939 7,196,215.446JPM Eastern Europe Equity A (dist) - EUR 10,545,081.550 4,793,219.996 5,007,400.646 10,330,900.900JF Eastern Europe Equity A (dist) - EUR 5,002,403.860 5,783,763.226 5,092,166.457 5,694,000.629JPM Eastern Europe Equity B (acc) - EUR 795,800.925 6,669,132.768 5,376,850.949 2,088,082.744JPM Eastern Europe Equity C (acc) - EUR 671,636.419 4,863,179.895 3,821,444.660 1,713,371.654JPM Eastern Europe Equity D (acc) - EUR 1,963,239.450 1,606,864.414 1,480,644.127 2,089,459.737JPM Eastern Europe Equity I (acc) - EUR - 5,470,482.958 3,673,755.079 1,796,727.879JPM Eastern Europe Equity X (acc) - EUR 2,569,000.000 131,176.744 79,380.003 2,620,796.741
JPMorgan Funds - Emerging Europe, Middle East and Africa Equity FundJPM Emerging Europe, Middle East and Africa Equity A (acc) - USD 2,171,946.829 3,256,933.991 1,198,831.705 4,230,049.115JPM Emerging Europe, Middle East and Africa Equity A (acc) - EUR 38,754.997 210,004.291 37,971.605 210,787.683JPM Emerging Europe, Middle East and Africa Equity A (dist) - USD 7,911,890.135 4,260,349.308 4,322,568.870 7,849,670.573JPM Emerging Europe, Middle East and Africa Equity B (acc) - USD 1,005,682.116 1,089,346.070 1,340,088.804 754,939.382JPM Emerging Europe, Middle East and Africa Equity C (acc) - USD 910,418.427 2,234,672.006 1,331,605.503 1,813,484.930JPM Emerging Europe, Middle East and Africa Equity D (acc) - USD 1,814,338.955 853,294.835 742,170.522 1,925,463.268JPM Emerging Europe, Middle East and Africa Equity I (acc) - USD* 494,012.339 1,211,203.633 1,705,215.972 -JPM Emerging Europe, Middle East and Africa Equity X (acc) - USD - 5,000,000.000 - 5,000,000.000
(1) This Sub-Fund was launched on 9 November 2009.(2) This Sub-Fund was launched on 17 March 2010.(3) This Sub-Fund was launched on 9 September 2009.
454
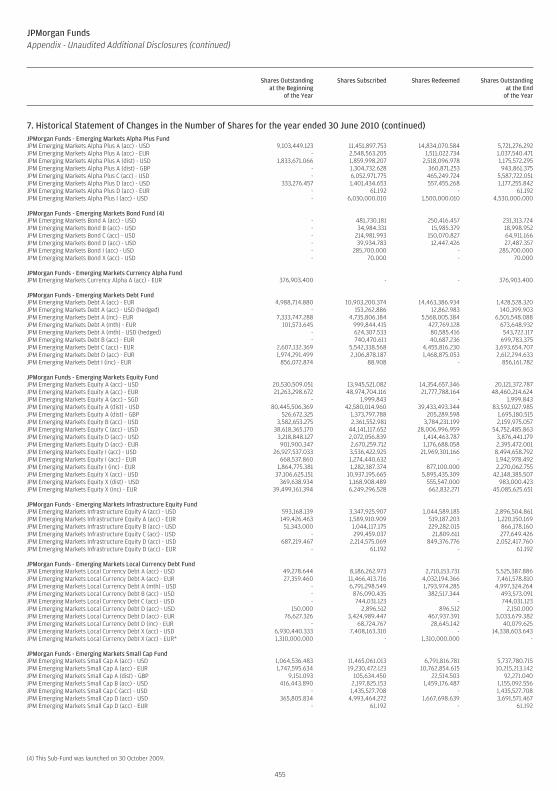
JPMorgan FundsAppendix - Unaudited Additional Disclosures (continued)
Shares Outstandingat the Beginning
of the Year
Shares Subscribed Shares Redeemed Shares Outstandingat the End
of the Year
7. Historical Statement of Changes in the Number of Shares for the year ended 30 June 2010 (continued)JPMorgan Funds - Emerging Markets Alpha Plus FundJPM Emerging Markets Alpha Plus A (acc) - USD 9,103,449.123 11,451,897.753 14,834,070.584 5,721,276.292JPM Emerging Markets Alpha Plus A (acc) - EUR - 2,548,563.205 1,511,022.734 1,037,540.471JPM Emerging Markets Alpha Plus A (dist) - USD 1,833,671.066 1,859,998.207 2,518,096.978 1,175,572.295JPM Emerging Markets Alpha Plus A (dist) - GBP - 1,304,732.628 360,871.253 943,861.375JPM Emerging Markets Alpha Plus C (acc) - USD - 6,052,971.775 465,249.724 5,587,722.051JPM Emerging Markets Alpha Plus D (acc) - USD 333,276.457 1,401,434.653 557,455.268 1,177,255.842JPM Emerging Markets Alpha Plus D (acc) - EUR - 61.192 - 61.192JPM Emerging Markets Alpha Plus I (acc) - USD - 6,030,000.010 1,500,000.010 4,530,000.000
JPMorgan Funds - Emerging Markets Bond Fund (4)JPM Emerging Markets Bond A (acc) - USD - 481,730.181 250,416.457 231,313.724JPM Emerging Markets Bond B (acc) - USD - 34,984.331 15,985.379 18,998.952JPM Emerging Markets Bond C (acc) - USD - 214,981.993 150,070.827 64,911.166JPM Emerging Markets Bond D (acc) - USD - 39,934.783 12,447.426 27,487.357JPM Emerging Markets Bond I (acc) - USD - 285,700.000 - 285,700.000JPM Emerging Markets Bond X (acc) - USD - 70.000 - 70.000
JPMorgan Funds - Emerging Markets Currency Alpha FundJPM Emerging Markets Currency Alpha A (acc) - EUR 376,903.400 - - 376,903.400
JPMorgan Funds - Emerging Markets Debt FundJPM Emerging Markets Debt A (acc) - EUR 4,988,714.880 10,903,200.374 14,463,386.934 1,428,528.320JPM Emerging Markets Debt A (acc) - USD (hedged) - 153,262.886 12,862.983 140,399.903JPM Emerging Markets Debt A (inc) - EUR 7,333,747.288 4,735,806.184 5,568,005.384 6,501,548.088JPM Emerging Markets Debt A (mth) - EUR 101,573.645 999,844.415 427,769.128 673,648.932JPM Emerging Markets Debt A (mth) - USD (hedged) - 624,307.533 80,585.416 543,722.117JPM Emerging Markets Debt B (acc) - EUR - 740,470.611 40,687.236 699,783.375JPM Emerging Markets Debt C (acc) - EUR 2,607,132.369 5,542,338.568 4,455,816.230 3,693,654.707JPM Emerging Markets Debt D (acc) - EUR 1,974,291.499 2,106,878.187 1,468,875.053 2,612,294.633JPM Emerging Markets Debt I (inc) - EUR 856,072.874 88.908 - 856,161.782
JPMorgan Funds - Emerging Markets Equity FundJPM Emerging Markets Equity A (acc) - USD 20,530,509.051 13,945,521.082 14,354,657.346 20,121,372.787JPM Emerging Markets Equity A (acc) - EUR 21,263,298.672 48,974,704.116 21,777,788.164 48,460,214.624JPM Emerging Markets Equity A (acc) - SGD - 1,999.843 - 1,999.843JPM Emerging Markets Equity A (dist) - USD 80,445,506.369 42,580,014.960 39,433,493.344 83,592,027.985JPM Emerging Markets Equity A (dist) - GBP 526,672.325 1,373,797.788 205,289.598 1,695,180.515JPM Emerging Markets Equity B (acc) - USD 3,582,653.275 2,361,552.981 3,784,231.199 2,159,975.057JPM Emerging Markets Equity C (acc) - USD 38,618,365.170 44,141,117.652 28,006,996.959 54,752,485.863JPM Emerging Markets Equity D (acc) - USD 3,218,848.127 2,072,056.839 1,414,463.787 3,876,441.179JPM Emerging Markets Equity D (acc) - EUR 901,900.347 2,670,259.712 1,176,688.058 2,395,472.001JPM Emerging Markets Equity I (acc) - USD 26,927,537.033 3,536,422.925 21,969,301.166 8,494,658.792JPM Emerging Markets Equity I (acc) - EUR 668,537.860 1,274,440.632 - 1,942,978.492JPM Emerging Markets Equity I (inc) - EUR 1,864,775.381 1,282,387.374 877,100.000 2,270,062.755JPM Emerging Markets Equity X (acc) - USD 37,106,625.151 10,937,195.665 5,895,435.309 42,148,385.507JPM Emerging Markets Equity X (dist) - USD 369,638.934 1,168,908.489 555,547.000 983,000.423JPM Emerging Markets Equity X (inc) - EUR 39,499,161.394 6,249,296.528 662,832.271 45,085,625.651
JPMorgan Funds - Emerging Markets Infrastructure Equity FundJPM Emerging Markets Infrastructure Equity A (acc) - USD 593,168.139 3,347,925.907 1,044,589.185 2,896,504.861JPM Emerging Markets Infrastructure Equity A (acc) - EUR 149,426.463 1,589,910.909 519,187.203 1,220,150.169JPM Emerging Markets Infrastructure Equity B (acc) - USD 51,343.000 1,044,117.175 229,282.015 866,178.160JPM Emerging Markets Infrastructure Equity C (acc) - USD - 299,459.037 21,809.611 277,649.426JPM Emerging Markets Infrastructure Equity D (acc) - USD 687,219.467 2,214,575.069 849,376.776 2,052,417.760JPM Emerging Markets Infrastructure Equity D (acc) - EUR - 61.192 - 61.192
JPMorgan Funds - Emerging Markets Local Currency Debt FundJPM Emerging Markets Local Currency Debt A (acc) - USD 49,278.644 8,186,262.973 2,710,153.731 5,525,387.886JPM Emerging Markets Local Currency Debt A (acc) - EUR 27,359.460 11,466,413.716 4,032,194.366 7,461,578.810JPM Emerging Markets Local Currency Debt A (mth) - USD - 6,791,298.549 1,793,974.285 4,997,324.264JPM Emerging Markets Local Currency Debt B (acc) - USD - 876,090.435 382,517.344 493,573.091JPM Emerging Markets Local Currency Debt C (acc) - USD - 744,031.123 - 744,031.123JPM Emerging Markets Local Currency Debt D (acc) - USD 150.000 2,896.512 896.512 2,150.000JPM Emerging Markets Local Currency Debt D (acc) - EUR 76,627.326 3,424,989.447 467,937.391 3,033,679.382JPM Emerging Markets Local Currency Debt D (inc) - EUR - 68,724.767 28,645.142 40,079.625JPM Emerging Markets Local Currency Debt X (acc) - USD 6,930,440.333 7,408,163.310 - 14,338,603.643JPM Emerging Markets Local Currency Debt X (acc) - EUR* 1,310,000.000 - 1,310,000.000 -
JPMorgan Funds - Emerging Markets Small Cap FundJPM Emerging Markets Small Cap A (acc) - USD 1,064,536.483 11,465,061.013 6,791,816.781 5,737,780.715JPM Emerging Markets Small Cap A (acc) - EUR 1,747,595.634 19,230,472.123 10,762,854.615 10,215,213.142JPM Emerging Markets Small Cap A (dist) - GBP 9,151.093 105,634.450 22,514.503 92,271.040JPM Emerging Markets Small Cap B (acc) - USD 416,443.890 2,197,825.153 1,459,176.487 1,155,092.556JPM Emerging Markets Small Cap C (acc) - USD - 1,435,527.708 - 1,435,527.708JPM Emerging Markets Small Cap D (acc) - USD 365,805.834 4,993,464.272 1,667,698.639 3,691,571.467JPM Emerging Markets Small Cap D (acc) - EUR - 61.192 - 61.192
(4) This Sub-Fund was launched on 30 October 2009.
455
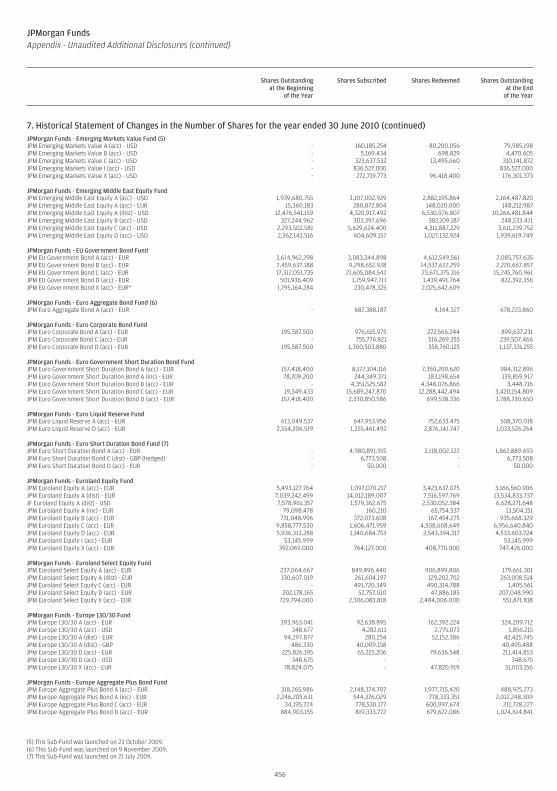
JPMorgan FundsAppendix - Unaudited Additional Disclosures (continued)
Shares Outstandingat the Beginning
of the Year
Shares Subscribed Shares Redeemed Shares Outstandingat the End
of the Year
7. Historical Statement of Changes in the Number of Shares for the year ended 30 June 2010 (continued)JPMorgan Funds - Emerging Markets Value Fund (5)JPM Emerging Markets Value A (acc) - USD - 160,185.254 80,200.056 79,985.198JPM Emerging Markets Value B (acc) - USD - 5,169.434 698.829 4,470.605JPM Emerging Markets Value C (acc) - USD - 323,637.532 13,495.660 310,141.872JPM Emerging Markets Value I (acc) - USD - 836,527.000 - 836,527.000JPM Emerging Markets Value X (acc) - USD - 272,719.773 96,418.400 176,301.373
JPMorgan Funds - Emerging Middle East Equity FundJPM Emerging Middle East Equity A (acc) - USD 1,939,680.755 3,107,002.929 2,882,195.864 2,164,487.820JPM Emerging Middle East Equity A (acc) - EUR 15,360.183 280,872.804 148,020.000 148,212.987JPM Emerging Middle East Equity A (dist) - USD 12,476,541.159 4,320,917.492 6,530,976.807 10,266,481.844JPM Emerging Middle East Equity B (acc) - USD 327,244.962 303,397.696 382,109.187 248,533.471JPM Emerging Middle East Equity C (acc) - USD 2,293,502.581 5,629,624.400 4,311,887.229 3,611,239.752JPM Emerging Middle East Equity D (acc) - USD 2,362,143.516 604,609.157 1,027,132.924 1,939,619.749
JPMorgan Funds - EU Government Bond FundJPM EU Government Bond A (acc) - EUR 3,614,962.298 3,083,344.898 4,612,549.561 2,085,757.635JPM EU Government Bond B (acc) - EUR 7,459,637.188 9,298,652.928 14,537,622.259 2,220,667.857JPM EU Government Bond C (acc) - EUR 17,312,051.735 21,605,084.542 23,671,375.316 15,245,760.961JPM EU Government Bond D (acc) - EUR 501,936.409 1,759,947.711 1,439,491.764 822,392.356JPM EU Government Bond X (acc) - EUR* 1,795,164.284 230,478.325 2,025,642.609 -
JPMorgan Funds - Euro Aggregate Bond Fund (6)JPM Euro Aggregate Bond A (acc) - EUR - 682,388.187 4,164.327 678,223.860
JPMorgan Funds - Euro Corporate Bond FundJPM Euro Corporate Bond A (acc) - EUR 195,587.500 976,615.975 272,566.244 899,637.231JPM Euro Corporate Bond C (acc) - EUR - 755,776.821 516,269.355 239,507.466JPM Euro Corporate Bond D (acc) - EUR 195,587.500 1,300,503.880 358,760.125 1,137,331.255
JPMorgan Funds - Euro Government Short Duration Bond FundJPM Euro Government Short Duration Bond A (acc) - EUR 157,418.400 8,177,104.116 7,350,209.620 984,312.896JPM Euro Government Short Duration Bond A (inc) - EUR 78,709.200 244,349.371 183,198.654 139,859.917JPM Euro Government Short Duration Bond B (acc) - EUR - 4,351,525.582 4,348,076.866 3,448.716JPM Euro Government Short Duration Bond C (acc) - EUR 19,349.433 15,689,247.870 12,288,442.494 3,420,154.809JPM Euro Government Short Duration Bond D (acc) - EUR 157,418.400 2,330,850.586 699,538.336 1,788,730.650
JPMorgan Funds - Euro Liquid Reserve FundJPM Euro Liquid Reserve A (acc) - EUR 613,049.537 647,953.956 752,633.475 508,370.018JPM Euro Liquid Reserve D (acc) - EUR 2,554,206.519 1,355,461.492 2,876,141.747 1,033,526.264
JPMorgan Funds - Euro Short Duration Bond Fund (7)JPM Euro Short Duration Bond A (acc) - EUR - 4,980,891.915 3,118,002.222 1,862,889.693JPM Euro Short Duration Bond C (dist) - GBP (hedged) - 6,773.508 - 6,773.508JPM Euro Short Duration Bond D (acc) - EUR - 50.000 - 50.000
JPMorgan Funds - Euroland Equity FundJPM Euroland Equity A (acc) - EUR 5,493,127.764 1,097,070.217 3,423,637.075 3,166,560.906JPM Euroland Equity A (dist) - EUR 7,039,242.499 14,012,189.007 7,516,597.769 13,534,833.737JF Euroland Equity A (dist) - USD 7,578,961.357 1,579,362.675 2,530,052.384 6,628,271.648JPM Euroland Equity A (inc) - EUR 79,098.478 160.210 65,754.537 13,504.151JPM Euroland Equity B (acc) - EUR 731,048.996 372,073.608 167,454.275 935,668.329JPM Euroland Equity C (acc) - EUR 9,858,777.530 1,606,471.959 4,508,608.649 6,956,640.840JPM Euroland Equity D (acc) - EUR 5,936,313.288 1,140,684.753 2,543,394.317 4,533,603.724JPM Euroland Equity I (acc) - EUR 53,145.999 - - 53,145.999JPM Euroland Equity X (acc) - EUR 392,069.000 764,127.000 408,770.000 747,426.000
JPMorgan Funds - Euroland Select Equity FundJPM Euroland Select Equity A (acc) - EUR 237,064.667 849,496.440 906,899.806 179,661.301JPM Euroland Select Equity A (dist) - EUR 130,607.019 261,604.197 129,202.702 263,008.514JPM Euroland Select Equity C (acc) - EUR - 491,720.349 490,314.788 1,405.561JPM Euroland Select Equity D (acc) - EUR 202,178.165 52,757.010 47,886.185 207,048.990JPM Euroland Select Equity X (acc) - EUR 729,794.000 2,306,083.818 2,484,006.000 551,871.818
JPMorgan Funds - Europe 130/30 FundJPM Europe 130/30 A (acc) - EUR 393,963.041 92,638.895 162,392.224 324,209.712JPM Europe 130/30 A (acc) - USD 348.677 4,282.611 2,775.073 1,856.215JPM Europe 130/30 A (dist) - EUR 94,297.877 280.254 52,152.386 42,425.745JPM Europe 130/30 A (dist) - GBP 486.330 40,009.158 - 40,495.488JPM Europe 130/30 D (acc) - EUR 225,826.195 65,225.206 79,636.548 211,414.853JPM Europe 130/30 D (acc) - USD 348.675 - - 348.675JPM Europe 130/30 X (acc) - EUR 78,824.075 - 47,820.919 31,003.156
JPMorgan Funds - Europe Aggregate Plus Bond FundJPM Europe Aggregate Plus Bond A (acc) - EUR 318,265.986 2,148,374.707 1,977,715.420 488,925.273JPM Europe Aggregate Plus Bond A (inc) - EUR 2,246,205.631 544,376.029 778,333.351 2,012,248.309JPM Europe Aggregate Plus Bond C (acc) - EUR 34,195.724 778,530.177 600,997.674 211,728.227JPM Europe Aggregate Plus Bond D (acc) - EUR 884,903.155 819,333.772 679,622.086 1,024,614.841
(5) This Sub-Fund was launched on 23 October 2009.(6) This Sub-Fund was launched on 9 November 2009.(7) This Sub-Fund was launched on 21 July 2009.
456
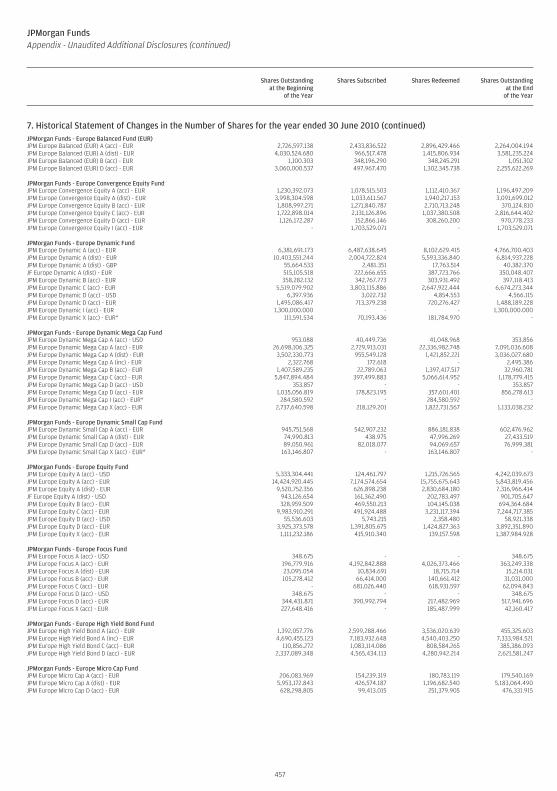
JPMorgan FundsAppendix - Unaudited Additional Disclosures (continued)
Shares Outstandingat the Beginning
of the Year
Shares Subscribed Shares Redeemed Shares Outstandingat the End
of the Year
7. Historical Statement of Changes in the Number of Shares for the year ended 30 June 2010 (continued)JPMorgan Funds - Europe Balanced Fund (EUR)JPM Europe Balanced (EUR) A (acc) - EUR 2,726,597.138 2,433,836.522 2,896,429.466 2,264,004.194JPM Europe Balanced (EUR) A (dist) - EUR 4,030,524.680 966,517.478 1,415,806.934 3,581,235.224JPM Europe Balanced (EUR) B (acc) - EUR 1,100.303 348,196.290 348,245.291 1,051.302JPM Europe Balanced (EUR) D (acc) - EUR 3,060,000.537 497,967.470 1,302,345.738 2,255,622.269
JPMorgan Funds - Europe Convergence Equity FundJPM Europe Convergence Equity A (acc) - EUR 1,230,392.073 1,078,515.503 1,112,410.367 1,196,497.209JPM Europe Convergence Equity A (dist) - EUR 3,998,304.598 1,033,611.567 1,940,217.153 3,091,699.012JPM Europe Convergence Equity B (acc) - EUR 1,808,997.271 1,271,840.787 2,710,713.248 370,124.810JPM Europe Convergence Equity C (acc) - EUR 1,722,898.014 2,131,126.896 1,037,380.508 2,816,644.402JPM Europe Convergence Equity D (acc) - EUR 1,126,172.287 152,866.146 308,260.200 970,778.233JPM Europe Convergence Equity I (acc) - EUR - 1,703,529.071 - 1,703,529.071
JPMorgan Funds - Europe Dynamic FundJPM Europe Dynamic A (acc) - EUR 6,381,691.173 6,487,638.645 8,102,629.415 4,766,700.403JPM Europe Dynamic A (dist) - EUR 10,403,551.244 2,004,722.824 5,593,336.840 6,814,937.228JPM Europe Dynamic A (dist) - GBP 55,664.533 2,481.351 17,763.514 40,382.370JF Europe Dynamic A (dist) - EUR 515,105.518 222,666.655 387,723.766 350,048.407JPM Europe Dynamic B (acc) - EUR 358,282.132 342,767.773 303,931.492 397,118.413JPM Europe Dynamic C (acc) - EUR 5,519,079.902 3,803,115.886 2,647,922.444 6,674,273.344JPM Europe Dynamic D (acc) - USD 6,397.936 3,022.732 4,854.553 4,566.115JPM Europe Dynamic D (acc) - EUR 1,495,086.417 713,379.238 720,276.427 1,488,189.228JPM Europe Dynamic I (acc) - EUR 1,300,000.000 - - 1,300,000.000JPM Europe Dynamic X (acc) - EUR* 111,591.534 70,193.436 181,784.970 -
JPMorgan Funds - Europe Dynamic Mega Cap FundJPM Europe Dynamic Mega Cap A (acc) - USD 953.088 40,449.736 41,048.968 353.856JPM Europe Dynamic Mega Cap A (acc) - EUR 26,698,106.325 2,729,913.031 22,336,982.748 7,091,036.608JPM Europe Dynamic Mega Cap A (dist) - EUR 3,502,330.773 955,549.128 1,421,852.221 3,036,027.680JPM Europe Dynamic Mega Cap A (inc) - EUR 2,322.768 172.618 - 2,495.386JPM Europe Dynamic Mega Cap B (acc) - EUR 1,407,589.235 22,789.063 1,397,417.517 32,960.781JPM Europe Dynamic Mega Cap C (acc) - EUR 5,847,894.484 397,499.883 5,066,614.952 1,178,779.415JPM Europe Dynamic Mega Cap D (acc) - USD 353.857 - - 353.857JPM Europe Dynamic Mega Cap D (acc) - EUR 1,035,056.819 178,823.195 357,601.401 856,278.613JPM Europe Dynamic Mega Cap I (acc) - EUR* 284,580.592 - 284,580.592 -JPM Europe Dynamic Mega Cap X (acc) - EUR 2,737,640.598 218,129.201 1,822,731.567 1,133,038.232
JPMorgan Funds - Europe Dynamic Small Cap FundJPM Europe Dynamic Small Cap A (acc) - EUR 945,751.568 542,907.232 886,181.838 602,476.962JPM Europe Dynamic Small Cap A (dist) - EUR 74,990.813 438.975 47,996.269 27,433.519JPM Europe Dynamic Small Cap D (acc) - EUR 89,050.961 82,018.077 94,069.657 76,999.381JPM Europe Dynamic Small Cap X (acc) - EUR* 163,146.807 - 163,146.807 -
JPMorgan Funds - Europe Equity FundJPM Europe Equity A (acc) - USD 5,333,304.441 124,461.797 1,215,726.565 4,242,039.673JPM Europe Equity A (acc) - EUR 14,424,920.445 7,174,574.654 15,755,675.643 5,843,819.456JPM Europe Equity A (dist) - EUR 9,520,752.356 626,898.238 2,830,684.180 7,316,966.414JF Europe Equity A (dist) - USD 943,126.654 161,362.490 202,783.497 901,705.647JPM Europe Equity B (acc) - EUR 328,959.509 469,550.213 104,145.038 694,364.684JPM Europe Equity C (acc) - EUR 9,983,910.291 491,924.488 3,231,117.394 7,244,717.385JPM Europe Equity D (acc) - USD 55,536.603 5,743.215 2,358.480 58,921.338JPM Europe Equity D (acc) - EUR 3,925,373.578 1,391,805.675 1,424,827.363 3,892,351.890JPM Europe Equity X (acc) - EUR 1,111,232.186 415,910.340 139,157.598 1,387,984.928
JPMorgan Funds - Europe Focus FundJPM Europe Focus A (acc) - USD 348.675 - - 348.675JPM Europe Focus A (acc) - EUR 196,779.916 4,192,842.888 4,026,373.466 363,249.338JPM Europe Focus A (dist) - EUR 23,095.054 10,834.691 18,715.714 15,214.031JPM Europe Focus B (acc) - EUR 105,278.412 66,414.000 140,661.412 31,031.000JPM Europe Focus C (acc) - EUR - 681,026.440 618,931.597 62,094.843JPM Europe Focus D (acc) - USD 348.675 - - 348.675JPM Europe Focus D (acc) - EUR 344,431.871 390,992.794 217,482.969 517,941.696JPM Europe Focus X (acc) - EUR 227,648.416 - 185,487.999 42,160.417
JPMorgan Funds - Europe High Yield Bond FundJPM Europe High Yield Bond A (acc) - EUR 1,392,057.776 2,599,288.466 3,536,020.639 455,325.603JPM Europe High Yield Bond A (inc) - EUR 4,690,455.123 7,183,932.648 4,540,403.250 7,333,984.521JPM Europe High Yield Bond C (acc) - EUR 110,856.272 1,083,114.086 808,584.265 385,386.093JPM Europe High Yield Bond D (acc) - EUR 2,337,089.348 4,565,434.113 4,280,942.214 2,621,581.247
JPMorgan Funds - Europe Micro Cap FundJPM Europe Micro Cap A (acc) - EUR 206,083.969 154,239.319 180,783.119 179,540.169JPM Europe Micro Cap A (dist) - EUR 5,953,172.843 426,574.187 1,196,682.540 5,183,064.490JPM Europe Micro Cap D (acc) - EUR 628,298.805 99,413.015 251,379.905 476,331.915
457
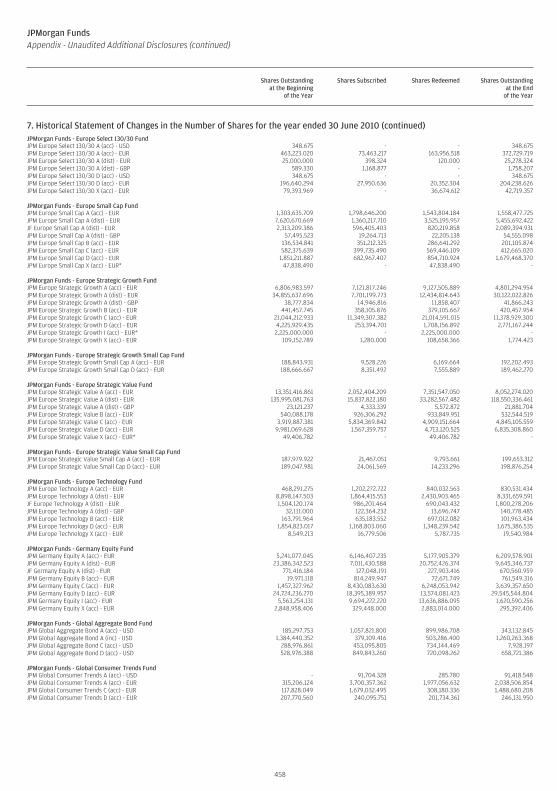
JPMorgan FundsAppendix - Unaudited Additional Disclosures (continued)
Shares Outstandingat the Beginning
of the Year
Shares Subscribed Shares Redeemed Shares Outstandingat the End
of the Year
7. Historical Statement of Changes in the Number of Shares for the year ended 30 June 2010 (continued)JPMorgan Funds - Europe Select 130/30 FundJPM Europe Select 130/30 A (acc) - USD 348.675 - - 348.675JPM Europe Select 130/30 A (acc) - EUR 463,223.020 73,463.217 163,956.518 372,729.719JPM Europe Select 130/30 A (dist) - EUR 25,000.000 398.324 120.000 25,278.324JPM Europe Select 130/30 A (dist) - GBP 589.330 1,168.877 - 1,758.207JPM Europe Select 130/30 D (acc) - USD 348.675 - - 348.675JPM Europe Select 130/30 D (acc) - EUR 196,640.294 27,950.636 20,352.304 204,238.626JPM Europe Select 130/30 X (acc) - EUR 79,393.969 - 36,674.612 42,719.357
JPMorgan Funds - Europe Small Cap FundJPM Europe Small Cap A (acc) - EUR 1,303,635.709 1,798,646.200 1,543,804.184 1,558,477.725JPM Europe Small Cap A (dist) - EUR 7,620,670.669 1,360,217.710 3,525,195.957 5,455,692.422JF Europe Small Cap A (dist) - EUR 2,313,209.386 596,405.403 820,219.858 2,089,394.931JPM Europe Small Cap A (dist) - GBP 57,495.523 19,264.713 22,205.138 54,555.098JPM Europe Small Cap B (acc) - EUR 136,534.841 351,212.325 286,641.292 201,105.874JPM Europe Small Cap C (acc) - EUR 582,375.639 399,735.490 569,446.109 412,665.020JPM Europe Small Cap D (acc) - EUR 1,851,211.887 682,967.407 854,710.924 1,679,468.370JPM Europe Small Cap X (acc) - EUR* 47,838.490 - 47,838.490 -
JPMorgan Funds - Europe Strategic Growth FundJPM Europe Strategic Growth A (acc) - EUR 6,806,983.597 7,121,817.246 9,127,505.889 4,801,294.954JPM Europe Strategic Growth A (dist) - EUR 34,855,637.696 7,701,199.773 12,434,814.643 30,122,022.826JPM Europe Strategic Growth A (dist) - GBP 38,777.834 14,946.816 11,858.407 41,866.243JPM Europe Strategic Growth B (acc) - EUR 441,457.745 358,105.876 379,105.667 420,457.954JPM Europe Strategic Growth C (acc) - EUR 21,044,212.933 11,349,307.382 21,014,591.015 11,378,929.300JPM Europe Strategic Growth D (acc) - EUR 4,225,929.435 253,394.701 1,708,156.892 2,771,167.244JPM Europe Strategic Growth I (acc) - EUR* 2,225,000.000 - 2,225,000.000 -JPM Europe Strategic Growth X (acc) - EUR 109,152.789 1,280.000 108,658.366 1,774.423
JPMorgan Funds - Europe Strategic Growth Small Cap FundJPM Europe Strategic Growth Small Cap A (acc) - EUR 188,843.931 9,528.226 6,169.664 192,202.493JPM Europe Strategic Growth Small Cap D (acc) - EUR 188,666.667 8,351.492 7,555.889 189,462.270
JPMorgan Funds - Europe Strategic Value FundJPM Europe Strategic Value A (acc) - EUR 13,351,416.861 2,052,404.209 7,351,547.050 8,052,274.020JPM Europe Strategic Value A (dist) - EUR 135,995,081.763 15,837,822.180 33,282,567.482 118,550,336.461JPM Europe Strategic Value A (dist) - GBP 23,121.237 4,333.339 5,572.872 21,881.704JPM Europe Strategic Value B (acc) - EUR 540,088.178 926,306.292 933,849.951 532,544.519JPM Europe Strategic Value C (acc) - EUR 3,919,887.381 5,834,369.842 4,909,151.664 4,845,105.559JPM Europe Strategic Value D (acc) - EUR 9,981,069.628 1,567,359.757 4,713,120.525 6,835,308.860JPM Europe Strategic Value X (acc) - EUR* 49,406.782 - 49,406.782 -
JPMorgan Funds - Europe Strategic Value Small Cap FundJPM Europe Strategic Value Small Cap A (acc) - EUR 187,979.922 21,467.051 9,793.661 199,653.312JPM Europe Strategic Value Small Cap D (acc) - EUR 189,047.981 24,061.569 14,233.296 198,876.254
JPMorgan Funds - Europe Technology FundJPM Europe Technology A (acc) - EUR 468,291.275 1,202,272.722 840,032.563 830,531.434JPM Europe Technology A (dist) - EUR 8,898,147.503 1,864,415.553 2,430,903.465 8,331,659.591JF Europe Technology A (dist) - EUR 1,504,120.174 986,201.464 690,043.432 1,800,278.206JPM Europe Technology A (dist) - GBP 32,111.000 122,364.232 13,696.747 140,778.485JPM Europe Technology B (acc) - EUR 163,791.964 635,183.552 697,012.082 101,963.434JPM Europe Technology D (acc) - EUR 1,854,823.017 1,168,803.060 1,348,239.542 1,675,386.535JPM Europe Technology X (acc) - EUR 8,549.213 16,779.506 5,787.735 19,540.984
JPMorgan Funds - Germany Equity FundJPM Germany Equity A (acc) - EUR 5,241,077.045 6,146,407.235 5,177,905.379 6,209,578.901JPM Germany Equity A (dist) - EUR 23,386,342.523 7,011,430.588 20,752,426.374 9,645,346.737JF Germany Equity A (dist) - EUR 771,416.184 127,048.191 227,903.416 670,560.959JPM Germany Equity B (acc) - EUR 19,971.118 814,249.947 72,671.749 761,549.316JPM Germany Equity C (acc) - EUR 1,457,327.962 8,430,083.630 6,248,053.942 3,639,357.650JPM Germany Equity D (acc) - EUR 24,724,236.270 18,395,389.957 13,574,081.423 29,545,544.804JPM Germany Equity I (acc) - EUR 5,563,254.131 9,694,222.220 13,636,886.095 1,620,590.256JPM Germany Equity X (acc) - EUR 2,848,958.406 329,448.000 2,883,014.000 295,392.406
JPMorgan Funds - Global Aggregate Bond FundJPM Global Aggregate Bond A (acc) - USD 185,297.753 1,057,821.800 899,986.708 343,132.845JPM Global Aggregate Bond A (inc) - USD 1,384,440.352 379,109.416 503,286.400 1,260,263.368JPM Global Aggregate Bond C (acc) - USD 288,976.861 453,095.805 734,144.469 7,928.197JPM Global Aggregate Bond D (acc) - USD 528,976.388 849,843.260 720,098.262 658,721.386
JPMorgan Funds - Global Consumer Trends FundJPM Global Consumer Trends A (acc) - USD - 91,704.328 285.780 91,418.548JPM Global Consumer Trends A (acc) - EUR 315,206.124 3,700,357.362 1,977,056.632 2,038,506.854JPM Global Consumer Trends C (acc) - EUR 117,828.049 1,679,032.495 308,180.336 1,488,680.208JPM Global Consumer Trends D (acc) - EUR 207,770.560 240,095.751 201,734.361 246,131.950
458
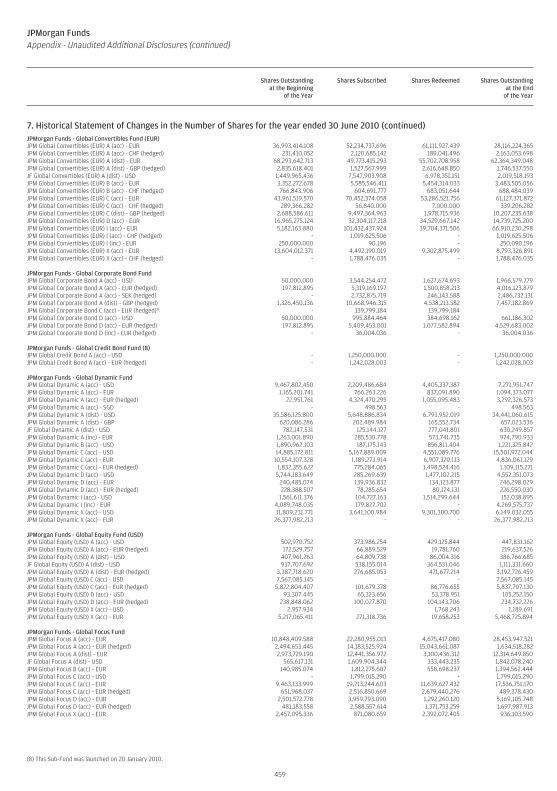
JPMorgan FundsAppendix - Unaudited Additional Disclosures (continued)
Shares Outstandingat the Beginning
of the Year
Shares Subscribed Shares Redeemed Shares Outstandingat the End
of the Year
7. Historical Statement of Changes in the Number of Shares for the year ended 30 June 2010 (continued)JPMorgan Funds - Global Convertibles Fund (EUR)JPM Global Convertibles (EUR) A (acc) - EUR 36,993,414.108 52,234,737.696 61,111,927.439 28,116,224.365JPM Global Convertibles (EUR) A (acc) - CHF (hedged) 231,410.052 2,120,685.142 189,041.496 2,163,053.698JPM Global Convertibles (EUR) A (dist) - EUR 68,293,642.713 49,773,415.293 55,702,708.958 62,364,349.048JPM Global Convertibles (EUR) A (dist) - GBP (hedged) 2,835,618.401 1,527,567.999 2,616,648.850 1,746,537.550JF Global Convertibles (EUR) A (dist) - USD 1,449,965.436 7,547,903.908 6,978,351.151 2,019,518.193JPM Global Convertibles (EUR) B (acc) - EUR 3,352,272.678 5,585,546.411 5,454,314.033 3,483,505.056JPM Global Convertibles (EUR) B (acc) - CHF (hedged) 766,843.906 604,691.777 683,051.644 688,484.039JPM Global Convertibles (EUR) C (acc) - EUR 43,961,519.570 70,452,374.058 53,286,521.756 61,127,371.872JPM Global Convertibles (EUR) C (acc) - CHF (hedged) 289,366.282 56,840.000 7,000.000 339,206.282JPM Global Convertibles (EUR) C (dist) - GBP (hedged) 2,688,586.611 9,497,364.963 1,978,715.936 10,207,235.638JPM Global Convertibles (EUR) D (acc) - EUR 16,965,275.124 32,304,117.218 34,529,667.142 14,739,725.200JPM Global Convertibles (EUR) I (acc) - EUR 5,182,163.880 101,432,437.924 39,704,371.506 66,910,230.298JPM Global Convertibles (EUR) I (acc) - CHF (hedged) - 1,019,625.506 - 1,019,625.506JPM Global Convertibles (EUR) I (inc) - EUR 250,000.000 90.196 - 250,090.196JPM Global Convertibles (EUR) X (acc) - EUR 13,604,012.371 4,492,190.019 9,302,875.499 8,793,326.891JPM Global Convertibles (EUR) X (acc) - CHF (hedged) - 1,788,476.035 - 1,788,476.035
JPMorgan Funds - Global Corporate Bond FundJPM Global Corporate Bond A (acc) - USD 50,000.000 3,544,254.472 1,627,674.693 1,966,579.779JPM Global Corporate Bond A (acc) - EUR (hedged) 197,812.895 5,319,169.197 1,500,858.213 4,016,123.879JPM Global Corporate Bond A (acc) - SEK (hedged) - 2,732,875.719 246,143.588 2,486,732.131JPM Global Corporate Bond A (dist) - GBP (hedged) 1,326,450.136 10,668,946.315 4,538,213.582 7,457,182.869JPM Global Corporate Bond C (acc) - EUR (hedged)* - 139,799.184 139,799.184 -JPM Global Corporate Bond D (acc) - USD 50,000.000 995,884.464 384,698.162 661,186.302JPM Global Corporate Bond D (acc) - EUR (hedged) 197,812.895 5,409,453.001 1,077,582.894 4,529,683.002JPM Global Corporate Bond D (inc) - EUR (hedged) - 36,004.036 - 36,004.036
JPMorgan Funds - Global Credit Bond Fund (8)JPM Global Credit Bond A (acc) - USD - 1,250,000.000 - 1,250,000.000JPM Global Credit Bond A (acc) - EUR (hedged) - 1,242,028.003 - 1,242,028.003
JPMorgan Funds - Global Dynamic FundJPM Global Dynamic A (acc) - USD 9,467,802.450 2,209,486.684 4,405,337.387 7,271,951.747JPM Global Dynamic A (acc) - EUR 1,165,201.741 766,263.226 837,091.890 1,094,373.077JPM Global Dynamic A (acc) - EUR (hedged) 22,951.761 4,324,470.295 1,055,095.483 3,292,326.573JPM Global Dynamic A (acc) - SGD - 498.563 - 498.563JPM Global Dynamic A (dist) - USD 35,586,125.800 5,648,886.834 6,793,952.019 34,441,060.615JPM Global Dynamic A (dist) - GBP 620,086.286 202,489.984 165,552.734 657,023.536JF Global Dynamic A (dist) - USD 782,147.531 125,144.127 277,041.801 630,249.857JPM Global Dynamic A (inc) - EUR 1,263,001.890 285,530.778 573,741.735 974,790.933JPM Global Dynamic B (acc) - USD 1,890,962.103 187,175.143 856,811.404 1,221,325.842JPM Global Dynamic C (acc) - USD 14,885,172.811 5,167,889.009 4,551,089.776 15,501,972.044JPM Global Dynamic C (acc) - EUR 10,554,107.328 1,189,273.914 6,907,320.113 4,836,061.129JPM Global Dynamic C (acc) - EUR (hedged) 1,832,355.622 775,284.065 1,498,524.416 1,109,115.271JPM Global Dynamic D (acc) - USD 5,744,183.649 285,269.639 1,477,102.215 4,552,351.073JPM Global Dynamic D (acc) - EUR 240,485.074 139,936.832 134,123.877 246,298.029JPM Global Dynamic D (acc) - EUR (hedged) 228,388.507 78,285.654 80,124.131 226,550.030JPM Global Dynamic I (acc) - USD 1,561,611.376 104,727.163 1,514,299.644 152,038.895JPM Global Dynamic I (inc) - EUR 4,089,748.035 179,827.702 - 4,269,575.737JPM Global Dynamic X (acc) - USD 11,809,231.771 3,641,100.984 9,301,300.700 6,149,032.055JPM Global Dynamic X (acc) - EUR 26,377,982.213 - - 26,377,982.213
JPMorgan Funds - Global Equity Fund (USD)JPM Global Equity (USD) A (acc) - USD 502,970.752 373,986.254 429,125.844 447,831.162JPM Global Equity (USD) A (acc) - EUR (hedged) 172,529.757 66,889.529 19,781.760 219,637.526JPM Global Equity (USD) A (dist) - USD 407,961.263 64,809.738 86,004.316 386,766.685JF Global Equity (USD) A (dist) - USD 937,707.692 538,155.014 364,531.046 1,111,331.660JPM Global Equity (USD) A (dist) - EUR (hedged) 3,387,718.620 276,685.053 471,677.214 3,192,726.459JPM Global Equity (USD) C (acc) - USD 7,567,085.145 - - 7,567,085.145JPM Global Equity (USD) C (acc) - EUR (hedged) 5,822,804.407 101,679.378 86,776.655 5,837,707.130JPM Global Equity (USD) D (acc) - USD 93,307.445 65,323.656 53,378.951 105,252.150JPM Global Equity (USD) D (acc) - EUR (hedged) 238,848.062 100,027.870 104,143.706 234,732.226JPM Global Equity (USD) X (acc) - USD 2,957.934 - 1,768.243 1,189.691JPM Global Equity (USD) X (acc) - EUR 5,217,065.411 271,318.736 19,658.253 5,468,725.894
JPMorgan Funds - Global Focus FundJPM Global Focus A (acc) - EUR 10,848,409.588 22,280,955.013 4,675,417.080 28,453,947.521JPM Global Focus A (acc) - EUR (hedged) 2,494,653.445 14,183,525.924 15,043,661.087 1,634,518.282JPM Global Focus A (dist) - EUR 2,973,729.190 12,441,356.972 3,100,436.312 12,314,649.850JF Global Focus A (dist) - USD 565,617.131 1,609,904.344 333,443.235 1,842,078.240JPM Global Focus B (acc) - EUR 140,985.074 1,812,275.607 558,698.237 1,394,562.444JPM Global Focus C (acc) - USD - 1,799,015.290 - 1,799,015.290JPM Global Focus C (acc) - EUR 9,463,133.999 19,713,244.603 11,639,627.432 17,536,751.170JPM Global Focus C (acc) - EUR (hedged) 651,968.037 2,516,850.669 2,679,440.276 489,378.430JPM Global Focus D (acc) - EUR 2,501,572.778 3,959,793.090 1,292,260.120 5,169,105.748JPM Global Focus D (acc) - EUR (hedged) 481,183.558 2,588,557.614 1,371,753.259 1,697,987.913JPM Global Focus X (acc) - EUR 2,457,095.336 871,080.659 2,392,072.405 936,103.590
(8) This Sub-Fund was launched on 20 January 2010.
459
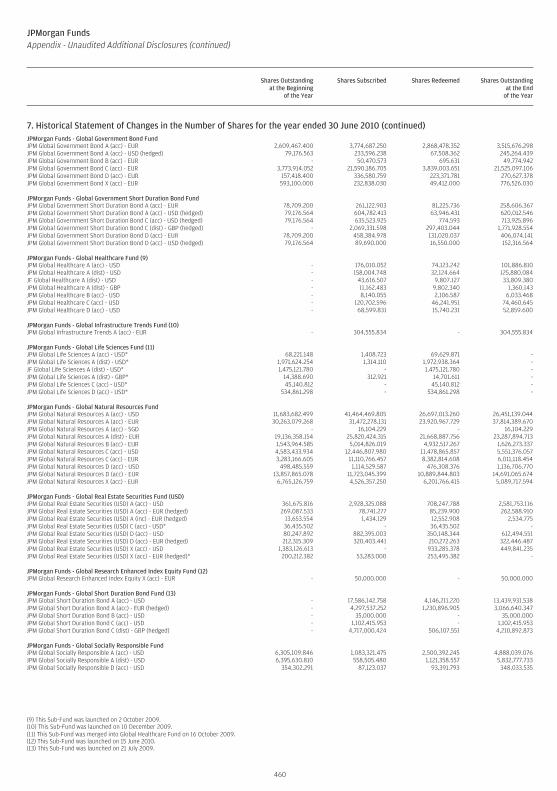
JPMorgan FundsAppendix - Unaudited Additional Disclosures (continued)
Shares Outstandingat the Beginning
of the Year
Shares Subscribed Shares Redeemed Shares Outstandingat the End
of the Year
7. Historical Statement of Changes in the Number of Shares for the year ended 30 June 2010 (continued)JPMorgan Funds - Global Government Bond FundJPM Global Government Bond A (acc) - EUR 2,609,467.400 3,774,687.250 2,868,478.352 3,515,676.298JPM Global Government Bond A (acc) - USD (hedged) 79,176.563 233,596.238 67,508.362 245,264.439JPM Global Government Bond B (acc) - EUR - 50,470.573 695.631 49,774.942JPM Global Government Bond C (acc) - EUR 3,773,914.052 21,590,186.705 3,839,003.651 21,525,097.106JPM Global Government Bond D (acc) - EUR 157,418.400 336,580.759 223,371.781 270,627.378JPM Global Government Bond X (acc) - EUR 593,100.000 232,838.030 49,412.000 776,526.030
JPMorgan Funds - Global Government Short Duration Bond FundJPM Global Government Short Duration Bond A (acc) - EUR 78,709.200 261,122.903 81,225.736 258,606.367JPM Global Government Short Duration Bond A (acc) - USD (hedged) 79,176.564 604,782.413 63,946.431 620,012.546JPM Global Government Short Duration Bond C (acc) - USD (hedged) 79,176.564 635,523.925 774.593 713,925.896JPM Global Government Short Duration Bond C (dist) - GBP (hedged) - 2,069,331.598 297,403.044 1,771,928.554JPM Global Government Short Duration Bond D (acc) - EUR 78,709.200 458,384.978 131,020.037 406,074.141JPM Global Government Short Duration Bond D (acc) - USD (hedged) 79,176.564 89,690.000 16,550.000 152,316.564
JPMorgan Funds - Global Healthcare Fund (9)JPM Global Healthcare A (acc) - USD - 176,010.052 74,123.242 101,886.810JPM Global Healthcare A (dist) - USD - 158,004.748 32,124.664 125,880.084JF Global Healthcare A (dist) - USD - 43,616.507 9,807.127 33,809.380JPM Global Healthcare A (dist) - GBP - 11,162.483 9,802.340 1,360.143JPM Global Healthcare B (acc) - USD - 8,140.055 2,106.587 6,033.468JPM Global Healthcare C (acc) - USD - 120,702.596 46,241.951 74,460.645JPM Global Healthcare D (acc) - USD - 68,599.831 15,740.231 52,859.600
JPMorgan Funds - Global Infrastructure Trends Fund (10)JPM Global Infrastructure Trends A (acc) - EUR - 304,555.834 - 304,555.834
JPMorgan Funds - Global Life Sciences Fund (11)JPM Global Life Sciences A (acc) - USD* 68,221.148 1,408.723 69,629.871 -JPM Global Life Sciences A (dist) - USD* 1,971,624.254 1,314.110 1,972,938.364 -JF Global Life Sciences A (dist) - USD* 1,475,121.780 - 1,475,121.780 -JPM Global Life Sciences A (dist) - GBP* 14,388.690 312.921 14,701.611 -JPM Global Life Sciences C (acc) - USD* 45,140.812 - 45,140.812 -JPM Global Life Sciences D (acc) - USD* 534,861.298 - 534,861.298 -
JPMorgan Funds - Global Natural Resources FundJPM Global Natural Resources A (acc) - USD 11,683,682.499 41,464,469.805 26,697,013.260 26,451,139.044JPM Global Natural Resources A (acc) - EUR 30,263,079.268 31,472,278.131 23,920,967.729 37,814,389.670JPM Global Natural Resources A (acc) - SGD - 16,104.229 - 16,104.229JPM Global Natural Resources A (dist) - EUR 19,136,358.154 25,820,424.315 21,668,887.756 23,287,894.713JPM Global Natural Resources B (acc) - EUR 1,543,964.585 5,014,826.019 4,932,517.267 1,626,273.337JPM Global Natural Resources C (acc) - USD 4,583,433.934 12,446,807.980 11,478,865.857 5,551,376.057JPM Global Natural Resources C (acc) - EUR 3,283,166.605 11,110,766.457 8,382,814.608 6,011,118.454JPM Global Natural Resources D (acc) - USD 498,485.559 1,114,529.587 476,308.376 1,136,706.770JPM Global Natural Resources D (acc) - EUR 13,857,865.078 11,723,045.399 10,889,844.803 14,691,065.674JPM Global Natural Resources X (acc) - EUR 6,765,126.759 4,526,357.250 6,201,766.415 5,089,717.594
JPMorgan Funds - Global Real Estate Securities Fund (USD)JPM Global Real Estate Securities (USD) A (acc) - USD 361,675.816 2,928,325.088 708,247.788 2,581,753.116JPM Global Real Estate Securities (USD) A (acc) - EUR (hedged) 269,087.533 78,741.277 85,239.900 262,588.910JPM Global Real Estate Securities (USD) A (inc) - EUR (hedged) 13,653.554 1,434.129 12,552.908 2,534.775JPM Global Real Estate Securities (USD) C (acc) - USD* 36,435.502 - 36,435.502 -JPM Global Real Estate Securities (USD) D (acc) - USD 80,247.892 882,395.003 350,148.344 612,494.551JPM Global Real Estate Securities (USD) D (acc) - EUR (hedged) 212,315.309 320,403.441 210,272.263 322,446.487JPM Global Real Estate Securities (USD) X (acc) - USD 1,383,126.613 - 933,285.378 449,841.235JPM Global Real Estate Securities (USD) X (acc) - EUR (hedged)* 200,212.382 53,283.000 253,495.382 -
JPMorgan Funds - Global Research Enhanced Index Equity Fund (12)JPM Global Research Enhanced Index Equity X (acc) - EUR - 50,000.000 - 50,000.000
JPMorgan Funds - Global Short Duration Bond Fund (13)JPM Global Short Duration Bond A (acc) - USD - 17,586,142.758 4,146,211.220 13,439,931.538JPM Global Short Duration Bond A (acc) - EUR (hedged) - 4,297,537.252 1,230,896.905 3,066,640.347JPM Global Short Duration Bond B (acc) - USD - 35,000.000 - 35,000.000JPM Global Short Duration Bond C (acc) - USD - 1,102,415.953 - 1,102,415.953JPM Global Short Duration Bond C (dist) - GBP (hedged) - 4,717,000.424 506,107.551 4,210,892.873
JPMorgan Funds - Global Socially Responsible FundJPM Global Socially Responsible A (acc) - USD 6,305,109.846 1,083,321.475 2,500,392.245 4,888,039.076JPM Global Socially Responsible A (dist) - USD 6,395,630.810 558,505.480 1,121,358.557 5,832,777.733JPM Global Socially Responsible D (acc) - USD 354,302.291 87,123.037 93,391.793 348,033.535
(9) This Sub-Fund was launched on 2 October 2009.(10) This Sub-Fund was launched on 10 December 2009.(11) This Sub-Fund was merged into Global Healthcare Fund on 16 October 2009.(12) This Sub-Fund was launched on 15 June 2010.(13) This Sub-Fund was launched on 21 July 2009.
460
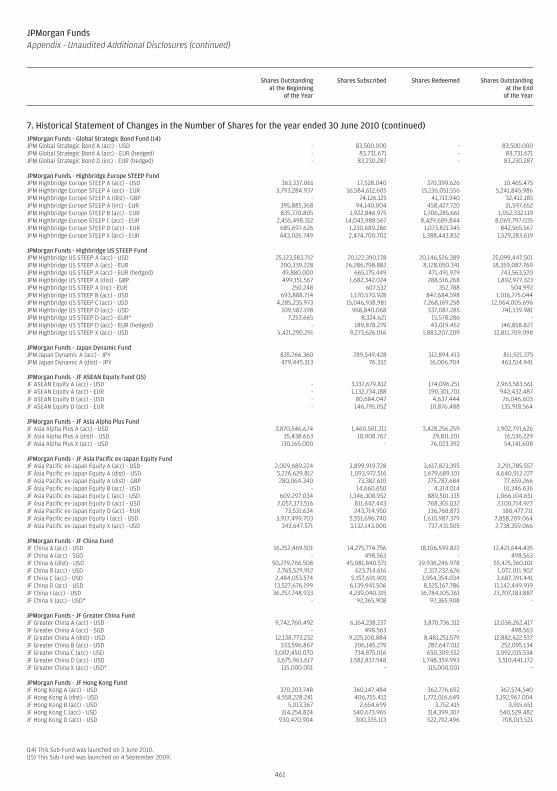
JPMorgan FundsAppendix - Unaudited Additional Disclosures (continued)
Shares Outstandingat the Beginning
of the Year
Shares Subscribed Shares Redeemed Shares Outstandingat the End
of the Year
7. Historical Statement of Changes in the Number of Shares for the year ended 30 June 2010 (continued)JPMorgan Funds - Global Strategic Bond Fund (14)JPM Global Strategic Bond A (acc) - USD - 83,500.000 - 83,500.000JPM Global Strategic Bond A (acc) - EUR (hedged) - 83,731.671 - 83,731.671JPM Global Strategic Bond D (inc) - EUR (hedged) - 83,230.287 - 83,230.287
JPMorgan Funds - Highbridge Europe STEEP FundJPM Highbridge Europe STEEP A (acc) - USD 363,337.061 17,528.040 370,399.626 10,465.475JPM Highbridge Europe STEEP A (acc) - EUR 3,793,284.937 16,584,612.605 15,136,051.556 5,241,845.986JPM Highbridge Europe STEEP A (dist) - GBP - 74,126.125 41,713.940 32,412.185JPM Highbridge Europe STEEP A (inc) - EUR 395,885.368 94,140.004 458,427.720 31,597.652JPM Highbridge Europe STEEP B (acc) - EUR 835,770.805 1,922,846.975 1,706,285.661 1,052,332.119JPM Highbridge Europe STEEP C (acc) - EUR 2,455,498.312 14,043,988.567 8,429,689.844 8,069,797.035JPM Highbridge Europe STEEP D (acc) - EUR 685,697.626 1,230,689.286 1,073,821.345 842,565.567JPM Highbridge Europe STEEP X (acc) - EUR 443,026.749 2,474,700.702 1,388,443.832 1,529,283.619
JPMorgan Funds - Highbridge US STEEP FundJPM Highbridge US STEEP A (acc) - USD 25,123,583.712 20,122,390.178 20,146,526.389 25,099,447.501JPM Highbridge US STEEP A (acc) - EUR 200,339.228 26,286,798.882 8,128,050.341 18,359,087.769JPM Highbridge US STEEP A (acc) - EUR (hedged) 49,880.000 665,175.449 471,491.929 243,563.520JPM Highbridge US STEEP A (dist) - GBP 499,151.567 1,682,342.024 288,516.268 1,892,977.323JPM Highbridge US STEEP A (inc) - EUR 250.248 607.532 352.788 504.992JPM Highbridge US STEEP B (acc) - USD 693,888.714 1,170,570.928 847,684.598 1,016,775.044JPM Highbridge US STEEP C (acc) - USD 4,285,235.973 15,046,938.981 7,268,169.258 12,064,005.696JPM Highbridge US STEEP D (acc) - USD 109,587.198 968,840.068 337,087.285 741,339.981JPM Highbridge US STEEP D (acc) - EUR* 7,253.665 8,324.621 15,578.286 -JPM Highbridge US STEEP D (acc) - EUR (hedged) - 189,878.279 43,019.452 146,858.827JPM Highbridge US STEEP X (acc) - USD 5,421,290.291 9,273,626.016 1,883,207.209 12,811,709.098
JPMorgan Funds - Japan Dynamic FundJPM Japan Dynamic A (acc) - JPY 835,266.360 289,549.428 312,894.413 811,921.375JPM Japan Dynamic A (dist) - JPY 479,445.313 76.332 16,006.704 463,514.941
JPMorgan Funds - JF ASEAN Equity Fund (15)JF ASEAN Equity A (acc) - USD - 3,137,679.812 174,096.251 2,963,583.561JF ASEAN Equity A (acc) - EUR - 1,132,734.188 190,301.701 942,432.487JF ASEAN Equity D (acc) - USD - 80,684.047 4,637.444 76,046.603JF ASEAN Equity D (acc) - EUR - 146,795.052 10,876.488 135,918.564
JPMorgan Funds - JF Asia Alpha Plus FundJF Asia Alpha Plus A (acc) - USD 3,870,546.674 1,460,501.211 3,428,256.259 1,902,791.626JF Asia Alpha Plus A (dist) - USD 35,438.663 10,908.767 29,811.201 16,536.229JF Asia Alpha Plus X (acc) - USD 130,165.000 - 76,023.392 54,141.608
JPMorgan Funds - JF Asia Pacific ex-Japan Equity FundJF Asia Pacific ex-Japan Equity A (acc) - USD 2,009,689.224 3,899,919.728 3,617,823.395 2,291,785.557JF Asia Pacific ex-Japan Equity A (dist) - USD 5,226,629.812 1,093,972.516 1,679,689.101 4,640,913.227JF Asia Pacific ex-Japan Equity A (dist) - GBP 280,064.340 73,382.610 275,787.684 77,659.266JF Asia Pacific ex-Japan Equity B (acc) - USD - 14,660.650 4,314.014 10,346.636JF Asia Pacific ex-Japan Equity C (acc) - USD 609,297.034 1,346,308.952 889,501.335 1,066,104.651JF Asia Pacific ex-Japan Equity D (acc) - USD 2,057,373.516 811,642.443 768,301.032 2,100,714.927JF Asia Pacific ex-Japan Equity D (acc) - EUR 73,531.634 243,714.950 136,768.873 180,477.711JF Asia Pacific ex-Japan Equity I (acc) - USD 3,917,499.703 5,551,696.740 1,610,987.379 7,858,209.064JF Asia Pacific ex-Japan Equity X (acc) - USD 343,647.571 3,132,143.000 737,431.505 2,738,359.066
JPMorgan Funds - JF China FundJF China A (acc) - USD 16,252,469.501 14,275,774.756 18,106,599.822 12,421,644.435JF China A (acc) - SGD - 498.563 - 498.563JF China A (dist) - USD 50,279,766.508 45,081,840.571 39,936,246.978 55,425,360.101JF China B (acc) - USD 2,765,529.912 623,714.616 2,317,232.626 1,072,011.902JF China C (acc) - USD 2,484,053.574 5,157,691.901 3,954,354.034 3,687,391.441JF China D (acc) - USD 13,527,676.199 6,139,941.506 8,525,167.786 11,142,449.919JF China I (acc) - USD 36,252,248.933 4,239,040.315 16,784,105.361 23,707,183.887JF China X (acc) - USD* - 92,365.908 92,365.908 -
JPMorgan Funds - JF Greater China FundJF Greater China A (acc) - USD 9,742,760.492 6,164,238.237 3,870,736.312 12,036,262.417JF Greater China A (acc) - SGD - 498.563 - 498.563JF Greater China A (dist) - USD 12,138,773.232 9,225,100.884 8,481,251.579 12,882,622.537JF Greater China B (acc) - USD 333,596.867 206,145.279 287,647.012 252,095.134JF Greater China C (acc) - USD 3,007,450.070 734,875.016 650,309.552 3,092,015.534JF Greater China D (acc) - USD 3,675,963.617 1,582,837.548 1,748,359.993 3,510,441.172JF Greater China X (acc) - USD* 115,000.001 - 115,000.001 -
JPMorgan Funds - JF Hong Kong FundJF Hong Kong A (acc) - USD 370,203.748 360,147.484 362,776.692 367,574.540JF Hong Kong A (dist) - USD 4,558,228.241 406,755.412 1,772,016.649 3,192,967.004JF Hong Kong B (acc) - USD 5,013.367 2,654.699 3,752.415 3,915.651JF Hong Kong C (acc) - USD 314,254.824 540,673.965 314,399.307 540,529.482JF Hong Kong D (acc) - USD 930,470.904 300,335.113 522,792.496 708,013.521
(14) This Sub-Fund was launched on 3 June 2010.(15) This Sub-Fund was launched on 4 September 2009.
461
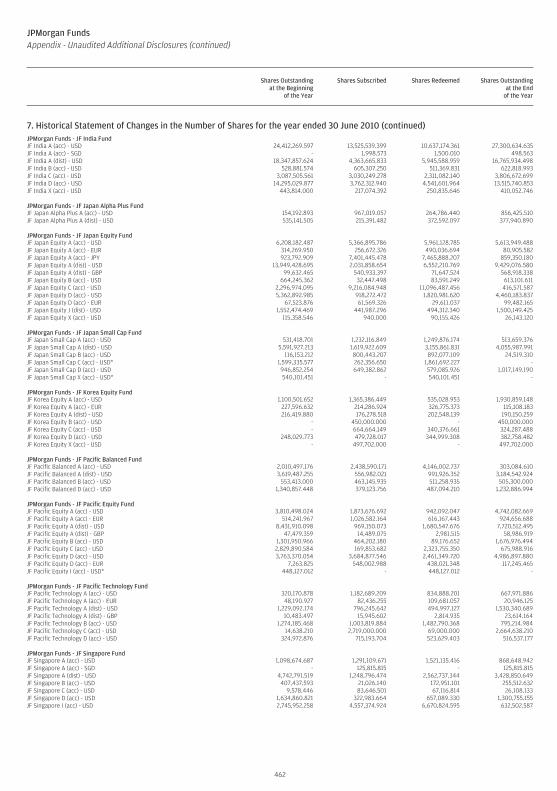
JPMorgan FundsAppendix - Unaudited Additional Disclosures (continued)
Shares Outstandingat the Beginning
of the Year
Shares Subscribed Shares Redeemed Shares Outstandingat the End
of the Year
7. Historical Statement of Changes in the Number of Shares for the year ended 30 June 2010 (continued)JPMorgan Funds - JF India FundJF India A (acc) - USD 24,412,269.597 13,525,539.399 10,637,174.361 27,300,634.635JF India A (acc) - SGD - 1,998.573 1,500.010 498.563JF India A (dist) - USD 18,347,857.624 4,363,665.833 5,945,588.959 16,765,934.498JF India B (acc) - USD 528,881.574 605,307.250 511,369.831 622,818.993JF India C (acc) - USD 3,087,505.561 3,030,249.278 2,311,082.140 3,806,672.699JF India D (acc) - USD 14,295,029.877 3,762,312.940 4,541,601.964 13,515,740.853JF India X (acc) - USD 443,814.000 217,074.392 250,835.646 410,052.746
JPMorgan Funds - JF Japan Alpha Plus FundJF Japan Alpha Plus A (acc) - USD 154,192.893 967,019.057 264,786.440 856,425.510JF Japan Alpha Plus A (dist) - USD 535,141.505 215,391.482 372,592.097 377,940.890
JPMorgan Funds - JF Japan Equity FundJF Japan Equity A (acc) - USD 6,208,182.487 5,366,895.786 5,961,128.785 5,613,949.488JF Japan Equity A (acc) - EUR 314,269.950 256,672.326 490,036.694 80,905.582JF Japan Equity A (acc) - JPY 923,792.909 7,401,445.478 7,465,888.207 859,350.180JF Japan Equity A (dist) - USD 13,949,428.695 2,031,858.654 6,552,210.769 9,429,076.580JF Japan Equity A (dist) - GBP 99,632.465 540,933.397 71,647.524 568,918.338JF Japan Equity B (acc) - USD 664,245.362 32,447.498 83,591.249 613,101.611JF Japan Equity C (acc) - USD 2,296,974.095 9,216,084.948 11,096,487.456 416,571.587JF Japan Equity D (acc) - USD 5,362,892.985 918,272.472 1,820,981.620 4,460,183.837JF Japan Equity D (acc) - EUR 67,523.876 61,569.326 29,611.037 99,482.165JF Japan Equity J (dist) - USD 1,552,474.469 441,987.296 494,312.340 1,500,149.425JF Japan Equity X (acc) - USD 115,358.546 940.000 90,155.426 26,143.120
JPMorgan Funds - JF Japan Small Cap FundJF Japan Small Cap A (acc) - USD 531,418.701 1,232,116.849 1,249,876.174 513,659.376JF Japan Small Cap A (dist) - USD 5,591,927.213 1,619,922.609 3,155,861.831 4,055,987.991JF Japan Small Cap B (acc) - USD 116,153.212 800,443.207 892,077.109 24,519.310JF Japan Small Cap C (acc) - USD* 1,599,335.577 262,356.650 1,861,692.227 -JF Japan Small Cap D (acc) - USD 946,852.254 649,382.862 579,085.926 1,017,149.190JF Japan Small Cap X (acc) - USD* 540,101.451 - 540,101.451 -
JPMorgan Funds - JF Korea Equity FundJF Korea Equity A (acc) - USD 1,100,501.652 1,365,386.449 535,028.953 1,930,859.148JF Korea Equity A (acc) - EUR 227,596.632 214,286.924 326,775.373 115,108.183JF Korea Equity A (dist) - USD 216,419.880 176,278.518 202,548.139 190,150.259JF Korea Equity B (acc) - USD - 450,000.000 - 450,000.000JF Korea Equity C (acc) - USD - 664,664.149 340,376.661 324,287.488JF Korea Equity D (acc) - USD 248,029.773 479,728.017 344,999.308 382,758.482JF Korea Equity X (acc) - USD - 497,702.000 - 497,702.000
JPMorgan Funds - JF Pacific Balanced FundJF Pacific Balanced A (acc) - USD 2,010,497.176 2,438,590.171 4,146,002.737 303,084.610JF Pacific Balanced A (dist) - USD 3,619,487.255 556,982.021 991,926.352 3,184,542.924JF Pacific Balanced B (acc) - USD 553,413.000 463,145.935 511,258.935 505,300.000JF Pacific Balanced D (acc) - USD 1,340,857.448 379,123.756 487,094.210 1,232,886.994
JPMorgan Funds - JF Pacific Equity FundJF Pacific Equity A (acc) - USD 3,810,498.024 1,873,676.692 942,092.047 4,742,082.669JF Pacific Equity A (acc) - EUR 514,241.967 1,026,582.164 616,167.443 924,656.688JF Pacific Equity A (dist) - USD 8,431,910.098 969,150.073 1,680,547.676 7,720,512.495JF Pacific Equity A (dist) - GBP 47,479.359 14,489.075 2,981.515 58,986.919JF Pacific Equity B (acc) - USD 1,301,950.966 464,202.180 89,176.652 1,676,976.494JF Pacific Equity C (acc) - USD 2,829,890.584 169,853.682 2,323,755.350 675,988.916JF Pacific Equity D (acc) - USD 3,763,370.054 3,684,877.546 2,461,349.720 4,986,897.880JF Pacific Equity D (acc) - EUR 7,263.825 548,002.988 438,021.348 117,245.465JF Pacific Equity I (acc) - USD* 448,127.012 - 448,127.012 -
JPMorgan Funds - JF Pacific Technology FundJF Pacific Technology A (acc) - USD 320,170.878 1,182,689.209 834,888.201 667,971.886JF Pacific Technology A (acc) - EUR 48,190.927 82,436.255 109,681.057 20,946.125JF Pacific Technology A (dist) - USD 1,229,092.174 796,245.642 494,997.127 1,530,340.689JF Pacific Technology A (dist) - GBP 10,483.497 15,945.602 2,814.935 23,614.164JF Pacific Technology B (acc) - USD 1,274,185.468 1,003,819.884 1,482,790.368 795,214.984JF Pacific Technology C (acc) - USD 14,638.210 2,719,000.000 69,000.000 2,664,638.210JF Pacific Technology D (acc) - USD 324,972.876 715,193.704 523,629.403 516,537.177
JPMorgan Funds - JF Singapore FundJF Singapore A (acc) - USD 1,098,674.687 1,291,109.671 1,521,135.416 868,648.942JF Singapore A (acc) - SGD - 125,815.815 - 125,815.815JF Singapore A (dist) - USD 4,742,791.519 1,248,796.474 2,562,737.344 3,428,850.649JF Singapore B (acc) - USD 407,437.593 21,026.140 172,951.101 255,512.632JF Singapore C (acc) - USD 9,578.446 83,646.501 67,116.814 26,108.133JF Singapore D (acc) - USD 1,634,860.821 322,983.664 657,089.330 1,300,755.155JF Singapore I (acc) - USD 2,745,952.258 4,557,374.924 6,670,824.595 632,502.587
462
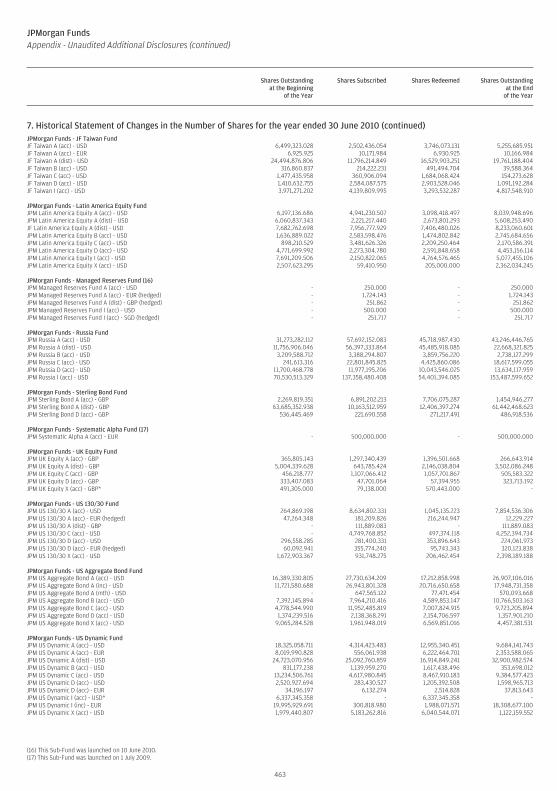
JPMorgan FundsAppendix - Unaudited Additional Disclosures (continued)
Shares Outstandingat the Beginning
of the Year
Shares Subscribed Shares Redeemed Shares Outstandingat the End
of the Year
7. Historical Statement of Changes in the Number of Shares for the year ended 30 June 2010 (continued)JPMorgan Funds - JF Taiwan FundJF Taiwan A (acc) - USD 6,499,323.028 2,502,436.054 3,746,073.131 5,255,685.951JF Taiwan A (acc) - EUR 6,925.925 10,171.984 6,930.925 10,166.984JF Taiwan A (dist) - USD 24,494,876.806 11,796,214.849 16,529,903.251 19,761,188.404JF Taiwan B (acc) - USD 316,860.837 214,222.231 491,494.704 39,588.364JF Taiwan C (acc) - USD 1,477,435.958 360,906.094 1,684,068.424 154,273.628JF Taiwan D (acc) - USD 1,410,632.755 2,584,087.575 2,903,528.046 1,091,192.284JF Taiwan I (acc) - USD 3,971,271.202 4,139,809.995 3,293,532.287 4,817,548.910
JPMorgan Funds - Latin America Equity FundJPM Latin America Equity A (acc) - USD 6,197,136.686 4,941,230.507 3,098,418.497 8,039,948.696JPM Latin America Equity A (dist) - USD 6,060,837.343 2,221,217.440 2,673,801.293 5,608,253.490JF Latin America Equity A (dist) - USD 7,682,762.698 7,956,777.929 7,406,480.026 8,233,060.601JPM Latin America Equity B (acc) - USD 1,636,889.022 2,583,598.476 1,474,802.842 2,745,684.656JPM Latin America Equity C (acc) - USD 898,210.529 3,481,626.326 2,209,250.464 2,170,586.391JPM Latin America Equity D (acc) - USD 4,771,699.992 2,273,304.780 2,591,848.658 4,453,156.114JPM Latin America Equity I (acc) - USD 7,691,209.506 2,150,822.065 4,764,576.465 5,077,455.106JPM Latin America Equity X (acc) - USD 2,507,623.295 59,410.950 205,000.000 2,362,034.245
JPMorgan Funds - Managed Reserves Fund (16)JPM Managed Reserves Fund A (acc) - USD - 250.000 - 250.000JPM Managed Reserves Fund A (acc) - EUR (hedged) - 1,724.143 - 1,724.143JPM Managed Reserves Fund A (dist) - GBP (hedged) - 251.862 - 251.862JPM Managed Reserves Fund I (acc) - USD - 500.000 - 500.000JPM Managed Reserves Fund I (acc) - SGD (hedged) - 251.717 - 251.717
JPMorgan Funds - Russia FundJPM Russia A (acc) - USD 31,273,282.112 57,692,152.083 45,718,987.430 43,246,446.765JPM Russia A (dist) - USD 11,756,906.046 56,397,333.864 45,485,918.085 22,668,321.825JPM Russia B (acc) - USD 3,209,588.712 3,388,294.807 3,859,756.220 2,738,127.299JPM Russia C (acc) - USD 241,613.316 22,801,845.825 4,425,860.086 18,617,599.055JPM Russia D (acc) - USD 11,700,468.778 11,977,195.206 10,043,546.025 13,634,117.959JPM Russia I (acc) - USD 70,530,513.329 137,358,480.408 54,401,394.085 153,487,599.652
JPMorgan Funds - Sterling Bond FundJPM Sterling Bond A (acc) - GBP 2,269,819.351 6,891,202.213 7,706,075.287 1,454,946.277JPM Sterling Bond A (dist) - GBP 63,685,352.938 10,163,512.959 12,406,397.274 61,442,468.623JPM Sterling Bond D (acc) - GBP 536,445.469 221,690.558 271,217.491 486,918.536
JPMorgan Funds - Systematic Alpha Fund (17)JPM Systematic Alpha A (acc) - EUR - 500,000.000 - 500,000.000
JPMorgan Funds - UK Equity FundJPM UK Equity A (acc) - GBP 365,805.143 1,297,340.439 1,396,501.668 266,643.914JPM UK Equity A (dist) - GBP 5,004,339.628 643,785.424 2,146,038.804 3,502,086.248JPM UK Equity C (acc) - GBP 456,218.777 1,107,066.412 1,057,701.867 505,583.322JPM UK Equity D (acc) - GBP 333,407.083 47,701.064 57,394.955 323,713.192JPM UK Equity X (acc) - GBP* 491,305.000 79,138.000 570,443.000 -
JPMorgan Funds - US 130/30 FundJPM US 130/30 A (acc) - USD 264,869.198 8,634,802.331 1,045,135.223 7,854,536.306JPM US 130/30 A (acc) - EUR (hedged) 47,264.348 181,209.826 216,244.947 12,229.227JPM US 130/30 A (dist) - GBP - 111,889.083 - 111,889.083JPM US 130/30 C (acc) - USD - 4,749,768.852 497,374.118 4,252,394.734JPM US 130/30 D (acc) - USD 296,558.285 281,400.331 353,896.643 224,061.973JPM US 130/30 D (acc) - EUR (hedged) 60,092.941 355,774.240 95,743.343 320,123.838JPM US 130/30 X (acc) - USD 1,672,903.367 931,748.275 206,462.454 2,398,189.188
JPMorgan Funds - US Aggregate Bond FundJPM US Aggregate Bond A (acc) - USD 16,389,330.805 27,730,634.209 17,212,858.998 26,907,106.016JPM US Aggregate Bond A (inc) - USD 11,721,580.688 26,943,801.328 20,716,650.658 17,948,731.358JPM US Aggregate Bond A (mth) - USD - 647,565.122 77,471.454 570,093.668JPM US Aggregate Bond B (acc) - USD 7,392,145.894 7,964,210.416 4,589,853.147 10,766,503.163JPM US Aggregate Bond C (acc) - USD 4,778,544.990 11,952,485.819 7,007,824.915 9,723,205.894JPM US Aggregate Bond D (acc) - USD 1,374,239.516 2,138,368.291 2,154,706.597 1,357,901.210JPM US Aggregate Bond X (acc) - USD 9,065,284.528 1,961,948.019 6,569,851.016 4,457,381.531
JPMorgan Funds - US Dynamic FundJPM US Dynamic A (acc) - USD 18,325,058.711 4,314,423.483 12,955,340.451 9,684,141.743JPM US Dynamic A (acc) - EUR 8,019,990.828 556,061.938 6,222,464.701 2,353,588.065JPM US Dynamic A (dist) - USD 24,723,070.956 25,092,760.859 16,914,849.241 32,900,982.574JPM US Dynamic B (acc) - USD 831,177.238 1,139,959.270 1,617,438.496 353,698.012JPM US Dynamic C (acc) - USD 13,234,506.761 4,617,980.845 8,467,910.183 9,384,577.423JPM US Dynamic D (acc) - USD 2,520,927.694 283,430.527 1,205,392.508 1,598,965.713JPM US Dynamic D (acc) - EUR 34,196.197 6,132.274 2,514.828 37,813.643JPM US Dynamic I (acc) - USD* 6,337,345.358 - 6,337,345.358 -JPM US Dynamic I (inc) - EUR 19,995,929.691 300,818.980 1,988,071.571 18,308,677.100JPM US Dynamic X (acc) - USD 1,979,440.807 5,183,262.816 6,040,544.071 1,122,159.552
(16) This Sub-Fund was launched on 10 June 2010.(17) This Sub-Fund was launched on 1 July 2009.
463
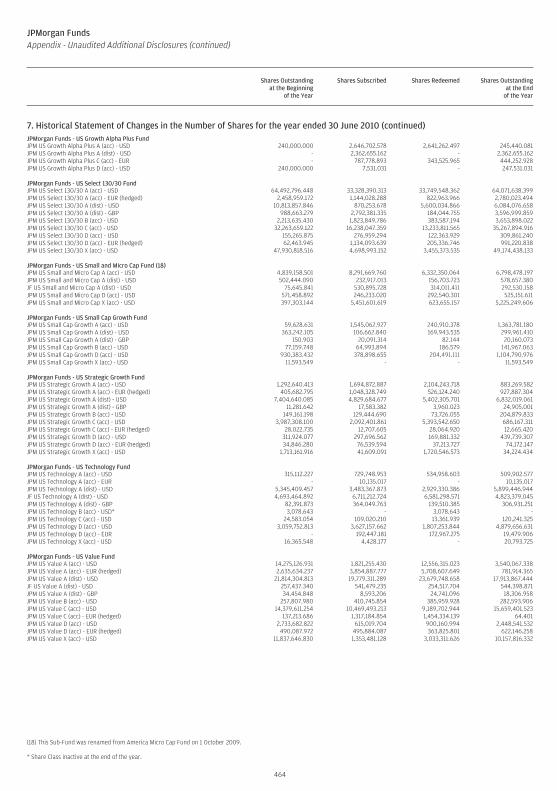
JPMorgan FundsAppendix - Unaudited Additional Disclosures (continued)
Shares Outstandingat the Beginning
of the Year
Shares Subscribed Shares Redeemed Shares Outstandingat the End
of the Year
7. Historical Statement of Changes in the Number of Shares for the year ended 30 June 2010 (continued)JPMorgan Funds - US Growth Alpha Plus FundJPM US Growth Alpha Plus A (acc) - USD 240,000.000 2,646,702.578 2,641,262.497 245,440.081JPM US Growth Alpha Plus A (dist) - USD - 2,362,655.162 - 2,362,655.162JPM US Growth Alpha Plus C (acc) - EUR - 787,778.893 343,525.965 444,252.928JPM US Growth Alpha Plus D (acc) - USD 240,000.000 7,531.031 - 247,531.031
JPMorgan Funds - US Select 130/30 FundJPM US Select 130/30 A (acc) - USD 64,492,796.448 33,328,390.313 33,749,548.362 64,071,638.399JPM US Select 130/30 A (acc) - EUR (hedged) 2,458,959.172 1,144,028.288 822,963.966 2,780,023.494JPM US Select 130/30 A (dist) - USD 10,813,857.846 870,253.678 5,600,034.866 6,084,076.658JPM US Select 130/30 A (dist) - GBP 988,663.279 2,792,381.335 184,044.755 3,596,999.859JPM US Select 130/30 B (acc) - USD 2,213,635.430 1,823,849.786 383,587.194 3,653,898.022JPM US Select 130/30 C (acc) - USD 32,263,659.122 16,238,047.359 13,233,811.565 35,267,894.916JPM US Select 130/30 D (acc) - USD 155,265.875 276,959.294 122,363.929 309,861.240JPM US Select 130/30 D (acc) - EUR (hedged) 62,463.945 1,134,093.639 205,336.746 991,220.838JPM US Select 130/30 X (acc) - USD 47,930,818.516 4,698,993.152 3,455,373.535 49,174,438.133
JPMorgan Funds - US Small and Micro Cap Fund (18)JPM US Small and Micro Cap A (acc) - USD 4,839,158.501 8,291,669.760 6,332,350.064 6,798,478.197JPM US Small and Micro Cap A (dist) - USD 502,444.090 232,917.013 156,703.723 578,657.380JF US Small and Micro Cap A (dist) - USD 75,645.841 530,895.728 314,011.411 292,530.158JPM US Small and Micro Cap D (acc) - USD 571,458.892 246,233.020 292,540.301 525,151.611JPM US Small and Micro Cap X (acc) - USD 397,303.144 5,451,601.619 623,655.157 5,225,249.606
JPMorgan Funds - US Small Cap Growth FundJPM US Small Cap Growth A (acc) - USD 59,628.631 1,545,062.927 240,910.378 1,363,781.180JPM US Small Cap Growth A (dist) - USD 363,242.105 106,662.840 169,943.535 299,961.410JPM US Small Cap Growth A (dist) - GBP 150.903 20,091.314 82.144 20,160.073JPM US Small Cap Growth B (acc) - USD 77,159.748 64,993.894 186.579 141,967.063JPM US Small Cap Growth D (acc) - USD 930,383.432 378,898.655 204,491.111 1,104,790.976JPM US Small Cap Growth X (acc) - USD 11,593.549 - - 11,593.549
JPMorgan Funds - US Strategic Growth FundJPM US Strategic Growth A (acc) - USD 1,292,640.413 1,694,872.887 2,104,243.718 883,269.582JPM US Strategic Growth A (acc) - EUR (hedged) 405,682.795 1,048,328.749 526,124.240 927,887.304JPM US Strategic Growth A (dist) - USD 7,404,640.085 4,829,684.677 5,402,305.701 6,832,019.061JPM US Strategic Growth A (dist) - GBP 11,281.642 17,583.382 3,960.023 24,905.001JPM US Strategic Growth B (acc) - USD 149,161.198 129,444.690 73,726.055 204,879.833JPM US Strategic Growth C (acc) - USD 3,987,308.100 2,092,401.861 5,393,542.650 686,167.311JPM US Strategic Growth C (acc) - EUR (hedged) 28,022.735 12,707.605 28,064.920 12,665.420JPM US Strategic Growth D (acc) - USD 311,924.077 297,696.562 169,881.332 439,739.307JPM US Strategic Growth D (acc) - EUR (hedged) 34,846.280 76,539.594 37,213.727 74,172.147JPM US Strategic Growth X (acc) - USD 1,713,161.916 41,609.091 1,720,546.573 34,224.434
JPMorgan Funds - US Technology FundJPM US Technology A (acc) - USD 315,112.227 729,748.953 534,958.603 509,902.577JPM US Technology A (acc) - EUR - 10,135.017 - 10,135.017JPM US Technology A (dist) - USD 5,345,409.457 3,483,367.873 2,929,330.386 5,899,446.944JF US Technology A (dist) - USD 4,693,464.892 6,711,212.724 6,581,298.571 4,823,379.045JPM US Technology A (dist) - GBP 82,391.873 364,049.763 139,510.385 306,931.251JPM US Technology B (acc) - USD* 3,078.643 - 3,078.643 -JPM US Technology C (acc) - USD 24,583.054 109,020.210 13,361.939 120,241.325JPM US Technology D (acc) - USD 3,059,752.813 3,627,157.662 1,807,253.844 4,879,656.631JPM US Technology D (acc) - EUR - 192,447.181 172,967.275 19,479.906JPM US Technology X (acc) - USD 16,365.548 4,428.177 - 20,793.725
JPMorgan Funds - US Value FundJPM US Value A (acc) - USD 14,275,126.931 1,821,255.430 12,556,315.023 3,540,067.338JPM US Value A (acc) - EUR (hedged) 2,635,634.237 3,854,887.777 5,708,607.649 781,914.365JPM US Value A (dist) - USD 21,814,304.813 19,779,311.289 23,679,748.658 17,913,867.444JF US Value A (dist) - USD 257,437.340 541,479.235 254,517.704 544,398.871JPM US Value A (dist) - GBP 34,454.848 8,593.206 24,741.096 18,306.958JPM US Value B (acc) - USD 257,807.980 410,745.854 385,959.928 282,593.906JPM US Value C (acc) - USD 14,379,611.254 10,469,493.213 9,189,702.944 15,659,401.523JPM US Value C (acc) - EUR (hedged) 137,213.686 1,317,184.854 1,454,334.139 64.401JPM US Value D (acc) - USD 2,733,682.822 615,019.704 900,160.994 2,448,541.532JPM US Value D (acc) - EUR (hedged) 490,087.972 495,884.087 363,825.801 622,146.258JPM US Value X (acc) - USD 11,837,646.830 1,353,481.128 3,033,311.626 10,157,816.332
(18) This Sub-Fund was renamed from America Micro Cap Fund on 1 October 2009.
* Share Class inactive at the end of the year.
464
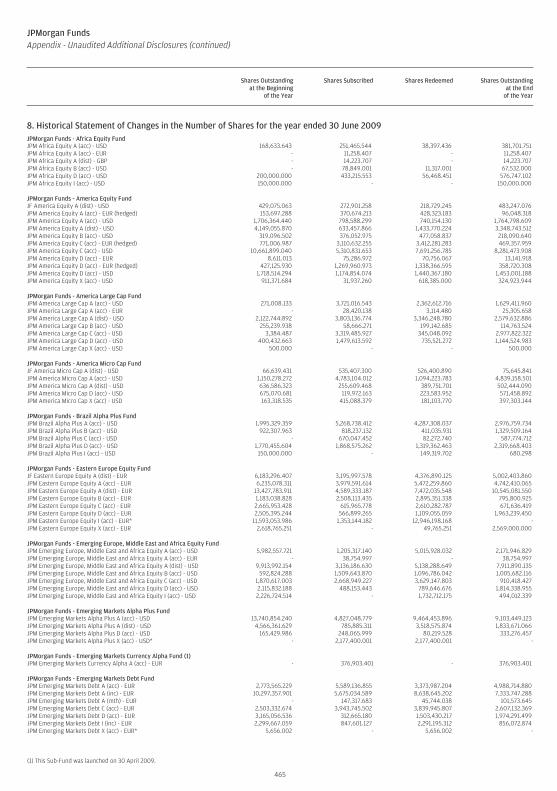
JPMorgan FundsAppendix - Unaudited Additional Disclosures (continued)
Shares Outstandingat the Beginning
of the Year
Shares Subscribed Shares Redeemed Shares Outstandingat the End
of the Year
8. Historical Statement of Changes in the Number of Shares for the year ended 30 June 2009 (continued)JPMorgan Funds - Africa Equity FundJPM Africa Equity A (acc) - USD 168,633.643 251,465.544 38,397.436 381,701.751JPM Africa Equity A (acc) - EUR - 11,258.407 - 11,258.407JPM Africa Equity A (dist) - GBP - 14,223.707 - 14,223.707JPM Africa Equity B (acc) - USD - 78,849.001 11,317.001 67,532.000JPM Africa Equity D (acc) - USD 200,000.000 433,215.553 56,468.451 576,747.102JPM Africa Equity I (acc) - USD 150,000.000 - - 150,000.000
JPMorgan Funds - America Equity FundJF America Equity A (dist) - USD 429,075.063 272,901.258 218,729.245 483,247.076JPM America Equity A (acc) - EUR (hedged) 153,697.288 370,674.213 428,323.183 96,048.318JPM America Equity A (acc) - USD 1,706,364.440 798,588.299 740,154.130 1,764,798.609JPM America Equity A (dist) - USD 4,149,055.870 633,457.866 1,433,770.224 3,348,743.512JPM America Equity B (acc) - USD 319,096.502 376,052.975 477,058.837 218,090.640JPM America Equity C (acc) - EUR (hedged) 771,006.987 3,110,632.255 3,412,281.283 469,357.959JPM America Equity C (acc) - USD 10,661,899.040 5,310,831.653 7,691,256.785 8,281,473.908JPM America Equity D (acc) - EUR 8,611.013 75,286.972 70,756.067 13,141.918JPM America Equity D (acc) - EUR (hedged) 427,125.930 1,269,960.973 1,338,366.595 358,720.308JPM America Equity D (acc) - USD 1,718,514.294 1,174,854.074 1,440,367.180 1,453,001.188JPM America Equity X (acc) - USD 911,371.684 31,937.260 618,385.000 324,923.944
JPMorgan Funds - America Large Cap FundJPM America Large Cap A (acc) - USD 271,008.133 3,721,016.543 2,362,612.716 1,629,411.960JPM America Large Cap A (acc) - EUR - 28,420.138 3,114.480 25,305.658JPM America Large Cap A (dist) - USD 2,122,744.892 3,803,136.774 3,346,248.780 2,579,632.886JPM America Large Cap B (acc) - USD 255,239.938 58,666.271 199,142.685 114,763.524JPM America Large Cap C (acc) - USD 3,384.487 3,319,485.927 345,048.092 2,977,822.322JPM America Large Cap D (acc) - USD 400,432.663 1,479,613.592 735,521.272 1,144,524.983JPM America Large Cap X (acc) - USD 500.000 - - 500.000
JPMorgan Funds - America Micro Cap FundJF America Micro Cap A (dist) - USD 66,639.431 535,407.300 526,400.890 75,645.841JPM America Micro Cap A (acc) - USD 1,150,278.272 4,783,104.012 1,094,223.783 4,839,158.501JPM America Micro Cap A (dist) - USD 636,586.323 255,609.468 389,751.701 502,444.090JPM America Micro Cap D (acc) - USD 675,070.681 119,972.163 223,583.952 571,458.892JPM America Micro Cap X (acc) - USD 163,318.535 415,088.379 181,103.770 397,303.144
JPMorgan Funds - Brazil Alpha Plus FundJPM Brazil Alpha Plus A (acc) - USD 1,995,329.359 5,268,738.412 4,287,308.037 2,976,759.734JPM Brazil Alpha Plus B (acc) - USD 922,307.963 818,237.132 411,035.931 1,329,509.164JPM Brazil Alpha Plus C (acc) - USD - 670,047.452 82,272.740 587,774.712JPM Brazil Alpha Plus D (acc) - USD 1,770,455.604 1,868,575.262 1,319,362.463 2,319,668.403JPM Brazil Alpha Plus I (acc) - USD 150,000.000 - 149,319.702 680.298
JPMorgan Funds - Eastern Europe Equity FundJF Eastern Europe Equity A (dist) - EUR 6,183,296.407 3,195,997.578 4,376,890.125 5,002,403.860JPM Eastern Europe Equity A (acc) - EUR 6,235,078.311 3,979,591.614 5,472,259.860 4,742,410.065JPM Eastern Europe Equity A (dist) - EUR 13,427,783.911 4,589,333.187 7,472,035.548 10,545,081.550JPM Eastern Europe Equity B (acc) - EUR 1,183,038.828 2,508,113.435 2,895,351.338 795,800.925JPM Eastern Europe Equity C (acc) - EUR 2,665,953.428 615,965.778 2,610,282.787 671,636.419JPM Eastern Europe Equity D (acc) - EUR 2,505,395.244 566,899.265 1,109,055.059 1,963,239.450JPM Eastern Europe Equity I (acc) - EUR* 11,593,053.986 1,353,144.182 12,946,198.168 -JPM Eastern Europe Equity X (acc) - EUR 2,618,765.251 - 49,765.251 2,569,000.000
JPMorgan Funds - Emerging Europe, Middle East and Africa Equity FundJPM Emerging Europe, Middle East and Africa Equity A (acc) - USD 5,982,557.721 1,205,317.140 5,015,928.032 2,171,946.829JPM Emerging Europe, Middle East and Africa Equity A (acc) - EUR - 38,754.997 - 38,754.997JPM Emerging Europe, Middle East and Africa Equity A (dist) - USD 9,913,992.154 3,136,186.630 5,138,288.649 7,911,890.135JPM Emerging Europe, Middle East and Africa Equity B (acc) - USD 592,824.288 1,509,643.870 1,096,786.042 1,005,682.116JPM Emerging Europe, Middle East and Africa Equity C (acc) - USD 1,870,617.003 2,668,949.227 3,629,147.803 910,418.427JPM Emerging Europe, Middle East and Africa Equity D (acc) - USD 2,115,832.188 488,153.443 789,646.676 1,814,338.955JPM Emerging Europe, Middle East and Africa Equity I (acc) - USD 2,226,724.514 - 1,732,712.175 494,012.339
JPMorgan Funds - Emerging Markets Alpha Plus FundJPM Emerging Markets Alpha Plus A (acc) - USD 13,740,854.240 4,827,048.779 9,464,453.896 9,103,449.123JPM Emerging Markets Alpha Plus A (dist) - USD 4,566,361.629 785,885.311 3,518,575.874 1,833,671.066JPM Emerging Markets Alpha Plus D (acc) - USD 165,429.986 248,065.999 80,219.528 333,276.457JPM Emerging Markets Alpha Plus X (acc) - USD* - 2,177,400.001 2,177,400.001 -
JPMorgan Funds - Emerging Markets Currency Alpha Fund (1)JPM Emerging Markets Currency Alpha A (acc) - EUR - 376,903.401 - 376,903.401
JPMorgan Funds - Emerging Markets Debt FundJPM Emerging Markets Debt A (acc) - EUR 2,773,565.229 5,589,136.855 3,373,987.204 4,988,714.880JPM Emerging Markets Debt A (inc) - EUR 10,297,357.901 5,675,034.589 8,638,645.202 7,333,747.288JPM Emerging Markets Debt A (mth) - EUR - 147,317.683 45,744.038 101,573.645JPM Emerging Markets Debt C (acc) - EUR 2,503,332.674 3,943,745.502 3,839,945.807 2,607,132.369JPM Emerging Markets Debt D (acc) - EUR 3,165,056.536 312,665.180 1,503,430.217 1,974,291.499JPM Emerging Markets Debt I (inc) - EUR 2,299,667.059 847,601.127 2,291,195.312 856,072.874JPM Emerging Markets Debt X (acc) - EUR* 5,656.002 - 5,656.002 -
(1) This Sub-Fund was launched on 30 April 2009.
465
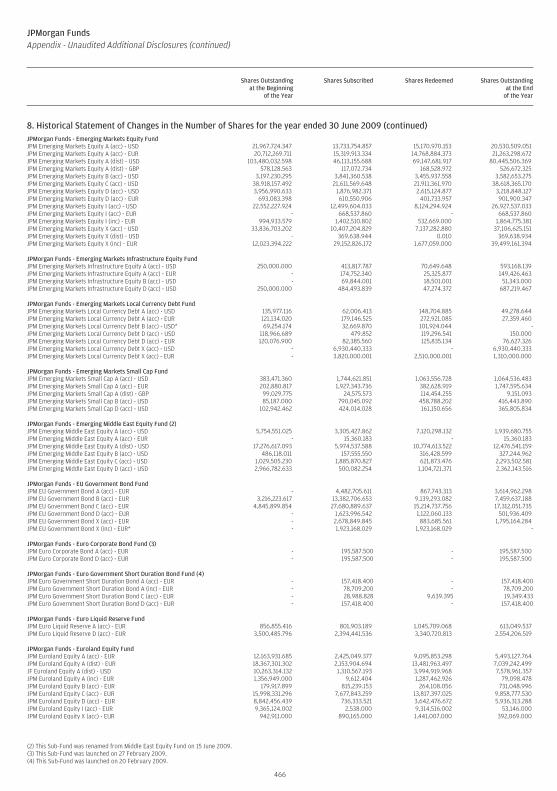
JPMorgan FundsAppendix - Unaudited Additional Disclosures (continued)
Shares Outstandingat the Beginning
of the Year
Shares Subscribed Shares Redeemed Shares Outstandingat the End
of the Year
8. Historical Statement of Changes in the Number of Shares for the year ended 30 June 2009 (continued)JPMorgan Funds - Emerging Markets Equity FundJPM Emerging Markets Equity A (acc) - USD 21,967,724.347 13,733,754.857 15,170,970.153 20,530,509.051JPM Emerging Markets Equity A (acc) - EUR 20,712,269.711 15,319,913.334 14,768,884.373 21,263,298.672JPM Emerging Markets Equity A (dist) - USD 103,480,032.598 46,113,155.688 69,147,681.917 80,445,506.369JPM Emerging Markets Equity A (dist) - GBP 578,128.563 117,072.734 168,528.972 526,672.325JPM Emerging Markets Equity B (acc) - USD 3,197,230.295 3,841,360.538 3,455,937.558 3,582,653.275JPM Emerging Markets Equity C (acc) - USD 38,918,157.492 21,611,569.648 21,911,361.970 38,618,365.170JPM Emerging Markets Equity D (acc) - USD 3,956,990.633 1,876,982.371 2,615,124.877 3,218,848.127JPM Emerging Markets Equity D (acc) - EUR 693,083.398 610,550.906 401,733.957 901,900.347JPM Emerging Markets Equity I (acc) - USD 22,552,227.924 12,499,604.033 8,124,294.924 26,927,537.033JPM Emerging Markets Equity I (acc) - EUR - 668,537.860 - 668,537.860JPM Emerging Markets Equity I (inc) - EUR 994,933.579 1,402,510.802 532,669.000 1,864,775.381JPM Emerging Markets Equity X (acc) - USD 33,836,703.202 10,407,204.829 7,137,282.880 37,106,625.151JPM Emerging Markets Equity X (dist) - USD - 369,638.944 0.010 369,638.934JPM Emerging Markets Equity X (inc) - EUR 12,023,394.222 29,152,826.172 1,677,059.000 39,499,161.394
JPMorgan Funds - Emerging Markets Infrastructure Equity FundJPM Emerging Markets Infrastructure Equity A (acc) - USD 250,000.000 413,817.787 70,649.648 593,168.139JPM Emerging Markets Infrastructure Equity A (acc) - EUR - 174,752.340 25,325.877 149,426.463JPM Emerging Markets Infrastructure Equity B (acc) - USD - 69,844.001 18,501.001 51,343.000JPM Emerging Markets Infrastructure Equity D (acc) - USD 250,000.000 484,493.839 47,274.372 687,219.467
JPMorgan Funds - Emerging Markets Local Currency Debt FundJPM Emerging Markets Local Currency Debt A (acc) - USD 135,977.116 62,006.413 148,704.885 49,278.644JPM Emerging Markets Local Currency Debt A (acc) - EUR 121,134.020 179,146.525 272,921.085 27,359.460JPM Emerging Markets Local Currency Debt B (acc) - USD* 69,254.174 32,669.870 101,924.044 -JPM Emerging Markets Local Currency Debt D (acc) - USD 118,966.689 479.852 119,296.541 150.000JPM Emerging Markets Local Currency Debt D (acc) - EUR 120,076.900 82,385.560 125,835.134 76,627.326JPM Emerging Markets Local Currency Debt X (acc) - USD - 6,930,440.333 - 6,930,440.333JPM Emerging Markets Local Currency Debt X (acc) - EUR - 3,820,000.001 2,510,000.001 1,310,000.000
JPMorgan Funds - Emerging Markets Small Cap FundJPM Emerging Markets Small Cap A (acc) - USD 383,471.360 1,744,621.851 1,063,556.728 1,064,536.483JPM Emerging Markets Small Cap A (acc) - EUR 202,880.817 1,927,343.736 382,628.919 1,747,595.634JPM Emerging Markets Small Cap A (dist) - GBP 99,029.775 24,575.573 114,454.255 9,151.093JPM Emerging Markets Small Cap B (acc) - USD 85,187.000 790,045.092 458,788.202 416,443.890JPM Emerging Markets Small Cap D (acc) - USD 102,942.462 424,014.028 161,150.656 365,805.834
JPMorgan Funds - Emerging Middle East Equity Fund (2)JPM Emerging Middle East Equity A (acc) - USD 5,754,551.025 3,305,427.862 7,120,298.132 1,939,680.755JPM Emerging Middle East Equity A (acc) - EUR - 15,360.183 - 15,360.183JPM Emerging Middle East Equity A (dist) - USD 17,276,617.093 5,974,537.588 10,774,613.522 12,476,541.159JPM Emerging Middle East Equity B (acc) - USD 486,118.011 157,555.550 316,428.599 327,244.962JPM Emerging Middle East Equity C (acc) - USD 1,029,505.230 1,885,870.827 621,873.476 2,293,502.581JPM Emerging Middle East Equity D (acc) - USD 2,966,782.633 500,082.254 1,104,721.371 2,362,143.516
JPMorgan Funds - EU Government Bond FundJPM EU Government Bond A (acc) - EUR - 4,482,705.611 867,743.313 3,614,962.298JPM EU Government Bond B (acc) - EUR 3,216,223.617 13,382,706.653 9,139,293.082 7,459,637.188JPM EU Government Bond C (acc) - EUR 4,845,899.854 27,680,889.637 15,214,737.756 17,312,051.735JPM EU Government Bond D (acc) - EUR - 1,623,996.542 1,122,060.133 501,936.409JPM EU Government Bond X (acc) - EUR - 2,678,849.845 883,685.561 1,795,164.284JPM EU Government Bond X (inc) - EUR* - 1,923,168.029 1,923,168.029 -
JPMorgan Funds - Euro Corporate Bond Fund (3)JPM Euro Corporate Bond A (acc) - EUR - 195,587.500 - 195,587.500JPM Euro Corporate Bond D (acc) - EUR - 195,587.500 - 195,587.500
JPMorgan Funds - Euro Government Short Duration Bond Fund (4)JPM Euro Government Short Duration Bond A (acc) - EUR - 157,418.400 - 157,418.400JPM Euro Government Short Duration Bond A (inc) - EUR - 78,709.200 - 78,709.200JPM Euro Government Short Duration Bond C (acc) - EUR - 28,988.828 9,639.395 19,349.433JPM Euro Government Short Duration Bond D (acc) - EUR - 157,418.400 - 157,418.400
JPMorgan Funds - Euro Liquid Reserve FundJPM Euro Liquid Reserve A (acc) - EUR 856,855.416 801,903.189 1,045,709.068 613,049.537JPM Euro Liquid Reserve D (acc) - EUR 3,500,485.796 2,394,441.536 3,340,720.813 2,554,206.519
JPMorgan Funds - Euroland Equity FundJPM Euroland Equity A (acc) - EUR 12,163,931.685 2,425,049.377 9,095,853.298 5,493,127.764JPM Euroland Equity A (dist) - EUR 18,367,301.302 2,153,904.694 13,481,963.497 7,039,242.499JF Euroland Equity A (dist) - USD 10,263,314.132 1,310,567.193 3,994,919.968 7,578,961.357JPM Euroland Equity A (inc) - EUR 1,356,949.000 9,612.404 1,287,462.926 79,098.478JPM Euroland Equity B (acc) - EUR 179,917.899 815,239.153 264,108.056 731,048.996JPM Euroland Equity C (acc) - EUR 15,998,331.296 7,677,843.259 13,817,397.025 9,858,777.530JPM Euroland Equity D (acc) - EUR 8,842,456.439 736,333.521 3,642,476.672 5,936,313.288JPM Euroland Equity I (acc) - EUR 9,365,124.002 2,538.000 9,314,516.002 53,146.000JPM Euroland Equity X (acc) - EUR 942,911.000 890,165.000 1,441,007.000 392,069.000
(2) This Sub-Fund was renamed from Middle East Equity Fund on 15 June 2009.(3) This Sub-Fund was launched on 27 February 2009.(4) This Sub-Fund was launched on 20 February 2009.
466
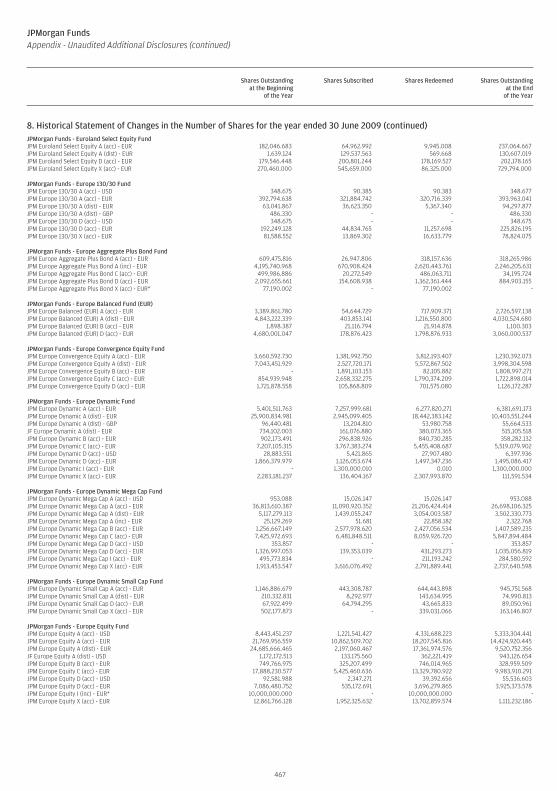
JPMorgan FundsAppendix - Unaudited Additional Disclosures (continued)
Shares Outstandingat the Beginning
of the Year
Shares Subscribed Shares Redeemed Shares Outstandingat the End
of the Year
8. Historical Statement of Changes in the Number of Shares for the year ended 30 June 2009 (continued)JPMorgan Funds - Euroland Select Equity FundJPM Euroland Select Equity A (acc) - EUR 182,046.683 64,962.992 9,945.008 237,064.667JPM Euroland Select Equity A (dist) - EUR 1,639.124 129,537.563 569.668 130,607.019JPM Euroland Select Equity D (acc) - EUR 179,546.448 200,801.244 178,169.527 202,178.165JPM Euroland Select Equity X (acc) - EUR 270,460.000 545,659.000 86,325.000 729,794.000
JPMorgan Funds - Europe 130/30 FundJPM Europe 130/30 A (acc) - USD 348.675 90.385 90.383 348.677JPM Europe 130/30 A (acc) - EUR 392,794.638 321,884.742 320,716.339 393,963.041JPM Europe 130/30 A (dist) - EUR 63,041.867 36,623.350 5,367.340 94,297.877JPM Europe 130/30 A (dist) - GBP 486.330 - - 486.330JPM Europe 130/30 D (acc) - USD 348.675 - - 348.675JPM Europe 130/30 D (acc) - EUR 192,249.128 44,834.765 11,257.698 225,826.195JPM Europe 130/30 X (acc) - EUR 81,588.552 13,869.302 16,633.779 78,824.075
JPMorgan Funds - Europe Aggregate Plus Bond FundJPM Europe Aggregate Plus Bond A (acc) - EUR 609,475.816 26,947.806 318,157.636 318,265.986JPM Europe Aggregate Plus Bond A (inc) - EUR 4,195,740.968 670,908.424 2,620,443.761 2,246,205.631JPM Europe Aggregate Plus Bond C (acc) - EUR 499,986.886 20,272.549 486,063.711 34,195.724JPM Europe Aggregate Plus Bond D (acc) - EUR 2,092,655.661 154,608.938 1,362,361.444 884,903.155JPM Europe Aggregate Plus Bond X (acc) - EUR* 77,190.002 - 77,190.002 -
JPMorgan Funds - Europe Balanced Fund (EUR)JPM Europe Balanced (EUR) A (acc) - EUR 3,389,861.780 54,644.729 717,909.371 2,726,597.138JPM Europe Balanced (EUR) A (dist) - EUR 4,843,222.339 403,853.141 1,216,550.800 4,030,524.680JPM Europe Balanced (EUR) B (acc) - EUR 1,898.387 21,116.794 21,914.878 1,100.303JPM Europe Balanced (EUR) D (acc) - EUR 4,680,001.047 178,876.423 1,798,876.933 3,060,000.537
JPMorgan Funds - Europe Convergence Equity FundJPM Europe Convergence Equity A (acc) - EUR 3,660,592.730 1,381,992.750 3,812,193.407 1,230,392.073JPM Europe Convergence Equity A (dist) - EUR 7,043,451.929 2,527,720.171 5,572,867.502 3,998,304.598JPM Europe Convergence Equity B (acc) - EUR - 1,891,103.153 82,105.882 1,808,997.271JPM Europe Convergence Equity C (acc) - EUR 854,939.948 2,658,332.275 1,790,374.209 1,722,898.014JPM Europe Convergence Equity D (acc) - EUR 1,721,878.558 105,868.809 701,575.080 1,126,172.287
JPMorgan Funds - Europe Dynamic FundJPM Europe Dynamic A (acc) - EUR 5,401,511.763 7,257,999.681 6,277,820.271 6,381,691.173JPM Europe Dynamic A (dist) - EUR 25,900,834.981 2,945,099.405 18,442,383.142 10,403,551.244JPM Europe Dynamic A (dist) - GBP 96,440.481 13,204.810 53,980.758 55,664.533JF Europe Dynamic A (dist) - EUR 734,102.003 161,076.880 380,073.365 515,105.518JPM Europe Dynamic B (acc) - EUR 902,173.491 296,838.926 840,730.285 358,282.132JPM Europe Dynamic C (acc) - EUR 7,207,105.315 3,767,383.274 5,455,408.687 5,519,079.902JPM Europe Dynamic D (acc) - USD 28,883.551 5,421.865 27,907.480 6,397.936JPM Europe Dynamic D (acc) - EUR 1,866,379.979 1,126,053.674 1,497,347.236 1,495,086.417JPM Europe Dynamic I (acc) - EUR - 1,300,000.010 0.010 1,300,000.000JPM Europe Dynamic X (acc) - EUR 2,283,181.237 136,404.167 2,307,993.870 111,591.534
JPMorgan Funds - Europe Dynamic Mega Cap FundJPM Europe Dynamic Mega Cap A (acc) - USD 953.088 15,026.147 15,026.147 953.088JPM Europe Dynamic Mega Cap A (acc) - EUR 36,813,610.387 11,090,920.352 21,206,424.414 26,698,106.325JPM Europe Dynamic Mega Cap A (dist) - EUR 5,117,279.113 1,439,055.247 3,054,003.587 3,502,330.773JPM Europe Dynamic Mega Cap A (inc) - EUR 25,129.269 51.681 22,858.182 2,322.768JPM Europe Dynamic Mega Cap B (acc) - EUR 1,256,667.149 2,577,978.620 2,427,056.534 1,407,589.235JPM Europe Dynamic Mega Cap C (acc) - EUR 7,425,972.693 6,481,848.511 8,059,926.720 5,847,894.484JPM Europe Dynamic Mega Cap D (acc) - USD 353.857 - - 353.857JPM Europe Dynamic Mega Cap D (acc) - EUR 1,326,997.053 139,353.039 431,293.273 1,035,056.819JPM Europe Dynamic Mega Cap I (acc) - EUR 495,773.834 - 211,193.242 284,580.592JPM Europe Dynamic Mega Cap X (acc) - EUR 1,913,453.547 3,616,076.492 2,791,889.441 2,737,640.598
JPMorgan Funds - Europe Dynamic Small Cap FundJPM Europe Dynamic Small Cap A (acc) - EUR 1,146,886.679 443,308.787 644,443.898 945,751.568JPM Europe Dynamic Small Cap A (dist) - EUR 210,332.831 8,292.977 143,634.995 74,990.813JPM Europe Dynamic Small Cap D (acc) - EUR 67,922.499 64,794.295 43,665.833 89,050.961JPM Europe Dynamic Small Cap X (acc) - EUR 502,177.873 - 339,031.066 163,146.807
JPMorgan Funds - Europe Equity FundJPM Europe Equity A (acc) - USD 8,443,451.237 1,221,541.427 4,331,688.223 5,333,304.441JPM Europe Equity A (acc) - EUR 21,769,956.559 10,862,509.702 18,207,545.816 14,424,920.445JPM Europe Equity A (dist) - EUR 24,685,666.465 2,197,060.467 17,361,974.576 9,520,752.356JF Europe Equity A (dist) - USD 1,172,172.513 133,175.560 362,221.419 943,126.654JPM Europe Equity B (acc) - EUR 749,766.975 325,207.499 746,014.965 328,959.509JPM Europe Equity C (acc) - EUR 17,888,230.577 5,425,460.636 13,329,780.922 9,983,910.291JPM Europe Equity D (acc) - USD 92,581.988 2,347.271 39,392.656 55,536.603JPM Europe Equity D (acc) - EUR 7,086,480.752 535,172.691 3,696,279.865 3,925,373.578JPM Europe Equity I (inc) - EUR* 10,000,000.000 - 10,000,000.000 -JPM Europe Equity X (acc) - EUR 12,861,766.128 1,952,325.632 13,702,859.574 1,111,232.186
467
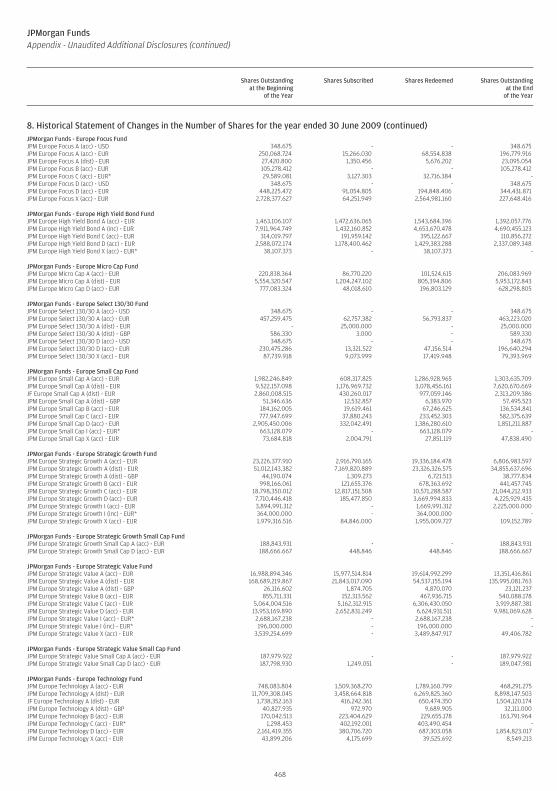
JPMorgan FundsAppendix - Unaudited Additional Disclosures (continued)
Shares Outstandingat the Beginning
of the Year
Shares Subscribed Shares Redeemed Shares Outstandingat the End
of the Year
8. Historical Statement of Changes in the Number of Shares for the year ended 30 June 2009 (continued)JPMorgan Funds - Europe Focus FundJPM Europe Focus A (acc) - USD 348.675 - - 348.675JPM Europe Focus A (acc) - EUR 250,068.724 15,266.030 68,554.838 196,779.916JPM Europe Focus A (dist) - EUR 27,420.800 1,350.456 5,676.202 23,095.054JPM Europe Focus B (acc) - EUR 105,278.412 - - 105,278.412JPM Europe Focus C (acc) - EUR* 29,589.081 3,127.303 32,716.384 -JPM Europe Focus D (acc) - USD 348.675 - - 348.675JPM Europe Focus D (acc) - EUR 448,225.472 91,054.805 194,848.406 344,431.871JPM Europe Focus X (acc) - EUR 2,728,377.627 64,251.949 2,564,981.160 227,648.416
JPMorgan Funds - Europe High Yield Bond FundJPM Europe High Yield Bond A (acc) - EUR 1,463,106.107 1,472,636.065 1,543,684.396 1,392,057.776JPM Europe High Yield Bond A (inc) - EUR 7,911,964.749 1,432,160.852 4,653,670.478 4,690,455.123JPM Europe High Yield Bond C (acc) - EUR 314,019.797 191,959.142 395,122.667 110,856.272JPM Europe High Yield Bond D (acc) - EUR 2,588,072.174 1,178,400.462 1,429,383.288 2,337,089.348JPM Europe High Yield Bond X (acc) - EUR* 38,107.373 - 38,107.373 -
JPMorgan Funds - Europe Micro Cap FundJPM Europe Micro Cap A (acc) - EUR 220,838.364 86,770.220 101,524.615 206,083.969JPM Europe Micro Cap A (dist) - EUR 5,554,320.547 1,204,247.102 805,394.806 5,953,172.843JPM Europe Micro Cap D (acc) - EUR 777,083.324 48,018.610 196,803.129 628,298.805
JPMorgan Funds - Europe Select 130/30 FundJPM Europe Select 130/30 A (acc) - USD 348.675 - - 348.675JPM Europe Select 130/30 A (acc) - EUR 457,259.475 62,757.382 56,793.837 463,223.020JPM Europe Select 130/30 A (dist) - EUR - 25,000.000 - 25,000.000JPM Europe Select 130/30 A (dist) - GBP 586.330 3.000 - 589.330JPM Europe Select 130/30 D (acc) - USD 348.675 - - 348.675JPM Europe Select 130/30 D (acc) - EUR 230,475.286 13,321.522 47,156.514 196,640.294JPM Europe Select 130/30 X (acc) - EUR 87,739.918 9,073.999 17,419.948 79,393.969
JPMorgan Funds - Europe Small Cap FundJPM Europe Small Cap A (acc) - EUR 1,982,246.849 608,317.825 1,286,928.965 1,303,635.709JPM Europe Small Cap A (dist) - EUR 9,522,157.098 1,176,969.732 3,078,456.161 7,620,670.669JF Europe Small Cap A (dist) - EUR 2,860,008.515 430,260.017 977,059.146 2,313,209.386JPM Europe Small Cap A (dist) - GBP 51,346.636 12,532.857 6,383.970 57,495.523JPM Europe Small Cap B (acc) - EUR 184,162.005 19,619.461 67,246.625 136,534.841JPM Europe Small Cap C (acc) - EUR 777,947.699 37,880.243 233,452.303 582,375.639JPM Europe Small Cap D (acc) - EUR 2,905,450.006 332,042.491 1,386,280.610 1,851,211.887JPM Europe Small Cap I (acc) - EUR* 663,128.079 - 663,128.079 -JPM Europe Small Cap X (acc) - EUR 73,684.818 2,004.791 27,851.119 47,838.490
JPMorgan Funds - Europe Strategic Growth FundJPM Europe Strategic Growth A (acc) - EUR 23,226,377.910 2,916,790.165 19,336,184.478 6,806,983.597JPM Europe Strategic Growth A (dist) - EUR 51,012,143.382 7,169,820.889 23,326,326.575 34,855,637.696JPM Europe Strategic Growth A (dist) - GBP 44,190.074 1,309.273 6,721.513 38,777.834JPM Europe Strategic Growth B (acc) - EUR 998,166.061 121,655.376 678,363.692 441,457.745JPM Europe Strategic Growth C (acc) - EUR 18,798,350.012 12,817,151.508 10,571,288.587 21,044,212.933JPM Europe Strategic Growth D (acc) - EUR 7,710,446.418 185,477.850 3,669,994.833 4,225,929.435JPM Europe Strategic Growth I (acc) - EUR 3,894,991.312 - 1,669,991.312 2,225,000.000JPM Europe Strategic Growth I (inc) - EUR* 364,000.000 - 364,000.000 -JPM Europe Strategic Growth X (acc) - EUR 1,979,316.516 84,846.000 1,955,009.727 109,152.789
JPMorgan Funds - Europe Strategic Growth Small Cap FundJPM Europe Strategic Growth Small Cap A (acc) - EUR 188,843.931 - - 188,843.931JPM Europe Strategic Growth Small Cap D (acc) - EUR 188,666.667 448.846 448.846 188,666.667
JPMorgan Funds - Europe Strategic Value FundJPM Europe Strategic Value A (acc) - EUR 16,988,894.346 15,977,514.814 19,614,992.299 13,351,416.861JPM Europe Strategic Value A (dist) - EUR 168,689,219.867 21,843,017.090 54,537,155.194 135,995,081.763JPM Europe Strategic Value A (dist) - GBP 26,116.602 1,874.705 4,870.070 23,121.237JPM Europe Strategic Value B (acc) - EUR 855,711.331 152,313.562 467,936.715 540,088.178JPM Europe Strategic Value C (acc) - EUR 5,064,004.516 5,162,312.915 6,306,430.050 3,919,887.381JPM Europe Strategic Value D (acc) - EUR 13,953,169.890 2,652,831.249 6,624,931.511 9,981,069.628JPM Europe Strategic Value I (acc) - EUR* 2,688,167.238 - 2,688,167.238 -JPM Europe Strategic Value I (inc) - EUR* 196,000.000 - 196,000.000 -JPM Europe Strategic Value X (acc) - EUR 3,539,254.699 - 3,489,847.917 49,406.782
JPMorgan Funds - Europe Strategic Value Small Cap FundJPM Europe Strategic Value Small Cap A (acc) - EUR 187,979.922 - - 187,979.922JPM Europe Strategic Value Small Cap D (acc) - EUR 187,798.930 1,249.051 - 189,047.981
JPMorgan Funds - Europe Technology FundJPM Europe Technology A (acc) - EUR 748,083.804 1,509,368.270 1,789,160.799 468,291.275JPM Europe Technology A (dist) - EUR 11,709,308.045 3,458,664.818 6,269,825.360 8,898,147.503JF Europe Technology A (dist) - EUR 1,738,352.163 416,242.361 650,474.350 1,504,120.174JPM Europe Technology A (dist) - GBP 40,827.935 972.970 9,689.905 32,111.000JPM Europe Technology B (acc) - EUR 170,042.513 223,404.629 229,655.178 163,791.964JPM Europe Technology C (acc) - EUR* 1,298.453 402,192.001 403,490.454 -JPM Europe Technology D (acc) - EUR 2,161,419.355 380,706.720 687,303.058 1,854,823.017JPM Europe Technology X (acc) - EUR 43,899.206 4,175.699 39,525.692 8,549.213
468
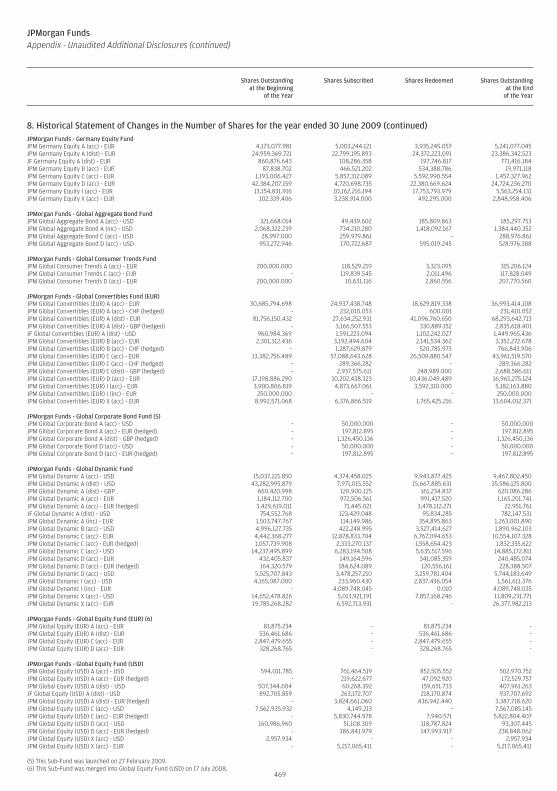
JPMorgan FundsAppendix - Unaudited Additional Disclosures (continued)
Shares Outstandingat the Beginning
of the Year
Shares Subscribed Shares Redeemed Shares Outstandingat the End
of the Year
8. Historical Statement of Changes in the Number of Shares for the year ended 30 June 2009 (continued)JPMorgan Funds - Germany Equity FundJPM Germany Equity A (acc) - EUR 4,173,077.981 5,003,244.121 3,935,245.057 5,241,077.045JPM Germany Equity A (dist) - EUR 24,959,369.721 22,799,195.893 24,372,223.091 23,386,342.523JF Germany Equity A (dist) - EUR 860,876.643 108,286.358 197,746.817 771,416.184JPM Germany Equity B (acc) - EUR 87,838.702 466,521.202 534,388.786 19,971.118JPM Germany Equity C (acc) - EUR 1,193,006.427 5,857,312.089 5,592,990.554 1,457,327.962JPM Germany Equity D (acc) - EUR 42,384,207.159 4,720,698.735 22,380,669.624 24,724,236.270JPM Germany Equity I (acc) - EUR 13,154,831.916 10,162,216.194 17,753,793.979 5,563,254.131JPM Germany Equity X (acc) - EUR 102,339.406 3,238,914.000 492,295.000 2,848,958.406
JPMorgan Funds - Global Aggregate Bond FundJPM Global Aggregate Bond A (acc) - USD 321,668.014 49,439.602 185,809.863 185,297.753JPM Global Aggregate Bond A (inc) - USD 2,068,322.239 734,210.280 1,418,092.167 1,384,440.352JPM Global Aggregate Bond C (acc) - USD 28,997.000 259,979.861 - 288,976.861JPM Global Aggregate Bond D (acc) - USD 953,272.946 170,722.687 595,019.245 528,976.388
JPMorgan Funds - Global Consumer Trends FundJPM Global Consumer Trends A (acc) - EUR 200,000.000 118,529.219 3,323.095 315,206.124JPM Global Consumer Trends C (acc) - EUR - 119,839.545 2,011.496 117,828.049JPM Global Consumer Trends D (acc) - EUR 200,000.000 10,631.116 2,860.556 207,770.560
JPMorgan Funds - Global Convertibles Fund (EUR)JPM Global Convertibles (EUR) A (acc) - EUR 30,685,794.698 24,937,438.748 18,629,819.338 36,993,414.108JPM Global Convertibles (EUR) A (acc) - CHF (hedged) - 232,010.053 600.001 231,410.052JPM Global Convertibles (EUR) A (dist) - EUR 81,756,150.432 27,634,252.931 41,096,760.650 68,293,642.713JPM Global Convertibles (EUR) A (dist) - GBP (hedged) - 3,166,507.553 330,889.152 2,835,618.401JF Global Convertibles (EUR) A (dist) - USD 960,984.369 1,591,223.094 1,102,242.027 1,449,965.436JPM Global Convertibles (EUR) B (acc) - EUR 2,301,312.436 3,192,494.604 2,141,534.362 3,352,272.678JPM Global Convertibles (EUR) B (acc) - CHF (hedged) - 1,287,629.879 520,785.973 766,843.906JPM Global Convertibles (EUR) C (acc) - EUR 13,382,756.489 57,088,643.628 26,509,880.547 43,961,519.570JPM Global Convertibles (EUR) C (acc) - CHF (hedged) - 289,366.282 - 289,366.282JPM Global Convertibles (EUR) C (dist) - GBP (hedged) - 2,937,575.611 248,989.000 2,688,586.611JPM Global Convertibles (EUR) D (acc) - EUR 17,198,886.290 10,202,438.323 10,436,049.489 16,965,275.124JPM Global Convertibles (EUR) I (acc) - EUR 3,900,806.819 4,873,667.061 3,592,310.000 5,182,163.880JPM Global Convertibles (EUR) I (inc) - EUR 250,000.000 - - 250,000.000JPM Global Convertibles (EUR) X (acc) - EUR 8,992,571.068 6,376,866.519 1,765,425.216 13,604,012.371
JPMorgan Funds - Global Corporate Bond Fund (5)JPM Global Corporate Bond A (acc) - USD - 50,000.000 - 50,000.000JPM Global Corporate Bond A (acc) - EUR (hedged) - 197,812.895 - 197,812.895JPM Global Corporate Bond A (dist) - GBP (hedged) - 1,326,450.136 - 1,326,450.136JPM Global Corporate Bond D (acc) - USD - 50,000.000 - 50,000.000JPM Global Corporate Bond D (acc) - EUR (hedged) - 197,812.895 - 197,812.895
JPMorgan Funds - Global Dynamic FundJPM Global Dynamic A (acc) - USD 15,037,221.850 4,374,458.025 9,943,877.425 9,467,802.450JPM Global Dynamic A (dist) - USD 43,282,995.879 7,971,015.552 15,667,885.631 35,586,125.800JPM Global Dynamic A (dist) - GBP 660,420.998 120,900.125 161,234.837 620,086.286JPM Global Dynamic A (acc) - EUR 1,184,112.700 972,506.561 991,417.520 1,165,201.741JPM Global Dynamic A (acc) - EUR (hedged) 3,429,619.011 71,445.021 3,478,112.271 22,951.761JF Global Dynamic A (dist) - USD 754,552.768 123,429.048 95,834.285 782,147.531JPM Global Dynamic A (inc) - EUR 1,503,747.767 114,149.986 354,895.863 1,263,001.890JPM Global Dynamic B (acc) - USD 4,996,127.735 422,248.995 3,527,414.627 1,890,962.103JPM Global Dynamic C (acc) - EUR 4,442,368.277 12,878,833.704 6,767,094.653 10,554,107.328JPM Global Dynamic C (acc) - EUR (hedged) 1,057,739.908 2,333,270.137 1,558,654.423 1,832,355.622JPM Global Dynamic C (acc) - USD 14,237,495.899 6,283,194.508 5,635,517.596 14,885,172.811JPM Global Dynamic D (acc) - EUR 432,405.837 149,164.596 341,085.359 240,485.074JPM Global Dynamic D (acc) - EUR (hedged) 164,320.579 184,624.089 120,556.161 228,388.507JPM Global Dynamic D (acc) - USD 5,525,707.843 3,478,257.210 3,259,781.404 5,744,183.649JPM Global Dynamic I (acc) - USD 4,165,087.000 233,960.430 2,837,436.054 1,561,611.376JPM Global Dynamic I (inc) - EUR - 4,089,748.045 0.010 4,089,748.035JPM Global Dynamic X (acc) - USD 14,652,478.826 5,013,921.191 7,857,168.246 11,809,231.771JPM Global Dynamic X (acc) - EUR 19,785,268.282 6,592,713.931 - 26,377,982.213
JPMorgan Funds - Global Equity Fund (EUR) (6)JPM Global Equity (EUR) A (acc) - EUR 81,875.234 - 81,875.234 -JPM Global Equity (EUR) A (dist) - EUR 536,461.686 - 536,461.686 -JPM Global Equity (EUR) C (acc) - EUR 2,847,479.655 - 2,847,479.655 -JPM Global Equity (EUR) D (acc) - EUR 328,268.765 - 328,268.765 -
JPMorgan Funds - Global Equity Fund (USD)JPM Global Equity (USD) A (acc) - USD 594,011.785 761,464.519 852,505.552 502,970.752JPM Global Equity (USD) A (acc) - EUR (hedged) - 219,622.677 47,092.920 172,529.757JPM Global Equity (USD) A (dist) - USD 507,344.604 60,268.392 159,651.733 407,961.263JF Global Equity (USD) A (dist) - USD 892,705.859 263,172.707 218,170.874 937,707.692JPM Global Equity (USD) A (dist) - EUR (hedged) - 3,824,661.060 436,942.440 3,387,718.620JPM Global Equity (USD) C (acc) - USD 7,562,935.932 4,149.213 - 7,567,085.145JPM Global Equity (USD) C (acc) - EUR (hedged) - 5,830,744.978 7,940.571 5,822,804.407JPM Global Equity (USD) D (acc) - USD 160,986.960 51,108.309 118,787.824 93,307.445JPM Global Equity (USD) D (acc) - EUR (hedged) - 386,841.979 147,993.917 238,848.062JPM Global Equity (USD) X (acc) - USD 2,957.934 - - 2,957.934JPM Global Equity (USD) X (acc) - EUR - 5,217,065.411 - 5,217,065.411
(5) This Sub-Fund was launched on 27 February 2009.(6) This Sub-Fund was merged into Global Equity Fund (USD) on 17 July 2008.
469
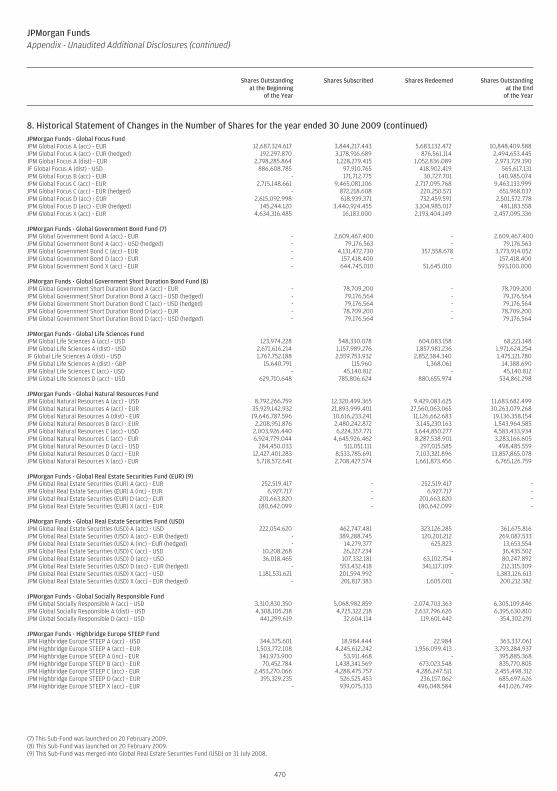
JPMorgan FundsAppendix - Unaudited Additional Disclosures (continued)
Shares Outstandingat the Beginning
of the Year
Shares Subscribed Shares Redeemed Shares Outstandingat the End
of the Year
8. Historical Statement of Changes in the Number of Shares for the year ended 30 June 2009 (continued)JPMorgan Funds - Global Focus FundJPM Global Focus A (acc) - EUR 12,687,324.617 3,844,217.443 5,683,132.472 10,848,409.588JPM Global Focus A (acc) - EUR (hedged) 192,297.870 3,178,916.689 876,561.114 2,494,653.445JPM Global Focus A (dist) - EUR 2,798,285.864 1,228,279.415 1,052,836.089 2,973,729.190JF Global Focus A (dist) - USD 886,608.785 97,910.765 418,902.419 565,617.131JPM Global Focus B (acc) - EUR - 171,712.775 30,727.701 140,985.074JPM Global Focus C (acc) - EUR 2,715,148.661 9,465,081.106 2,717,095.768 9,463,133.999JPM Global Focus C (acc) - EUR (hedged) - 872,218.608 220,250.571 651,968.037JPM Global Focus D (acc) - EUR 2,615,092.998 618,939.371 732,459.591 2,501,572.778JPM Global Focus D (acc) - EUR (hedged) 145,244.120 3,440,924.455 3,104,985.017 481,183.558JPM Global Focus X (acc) - EUR 4,634,316.485 16,183.000 2,193,404.149 2,457,095.336
JPMorgan Funds - Global Government Bond Fund (7)JPM Global Government Bond A (acc) - EUR - 2,609,467.400 - 2,609,467.400JPM Global Government Bond A (acc) - USD (hedged) - 79,176.563 - 79,176.563JPM Global Government Bond C (acc) - EUR - 4,131,472.730 357,558.678 3,773,914.052JPM Global Government Bond D (acc) - EUR - 157,418.400 - 157,418.400JPM Global Government Bond X (acc) - EUR - 644,745.010 51,645.010 593,100.000
JPMorgan Funds - Global Government Short Duration Bond Fund (8)JPM Global Government Short Duration Bond A (acc) - EUR - 78,709.200 - 78,709.200JPM Global Government Short Duration Bond A (acc) - USD (hedged) - 79,176.564 - 79,176.564JPM Global Government Short Duration Bond C (acc) - USD (hedged) - 79,176.564 - 79,176.564JPM Global Government Short Duration Bond D (acc) - EUR - 78,709.200 - 78,709.200JPM Global Government Short Duration Bond D (acc) - USD (hedged) - 79,176.564 - 79,176.564
JPMorgan Funds - Global Life Sciences FundJPM Global Life Sciences A (acc) - USD 123,974.228 548,330.078 604,083.158 68,221.148JPM Global Life Sciences A (dist) - USD 2,671,616.214 1,157,989.276 1,857,981.236 1,971,624.254JF Global Life Sciences A (dist) - USD 1,767,752.188 2,559,753.932 2,852,384.340 1,475,121.780JPM Global Life Sciences A (dist) - GBP 15,640.791 115.960 1,368.061 14,388.690JPM Global Life Sciences C (acc) - USD - 45,140.812 - 45,140.812JPM Global Life Sciences D (acc) - USD 629,710.648 785,806.624 880,655.974 534,861.298
JPMorgan Funds - Global Natural Resources FundJPM Global Natural Resources A (acc) - USD 8,792,266.759 12,320,499.365 9,429,083.625 11,683,682.499JPM Global Natural Resources A (acc) - EUR 35,929,142.932 21,893,999.401 27,560,063.065 30,263,079.268JPM Global Natural Resources A (dist) - EUR 19,646,787.596 10,616,233.241 11,126,662.683 19,136,358.154JPM Global Natural Resources B (acc) - EUR 2,208,951.876 2,480,242.872 3,145,230.163 1,543,964.585JPM Global Natural Resources C (acc) - USD 2,003,926.440 6,224,357.771 3,644,850.277 4,583,433.934JPM Global Natural Resources C (acc) - EUR 6,924,779.044 4,645,926.462 8,287,538.901 3,283,166.605JPM Global Natural Resources D (acc) - USD 284,450.033 511,051.111 297,015.585 498,485.559JPM Global Natural Resources D (acc) - EUR 12,427,401.283 8,533,785.691 7,103,321.896 13,857,865.078JPM Global Natural Resources X (acc) - EUR 5,718,572.641 2,708,427.574 1,661,873.456 6,765,126.759
JPMorgan Funds - Global Real Estate Securities Fund (EUR) (9)JPM Global Real Estate Securities (EUR) A (acc) - EUR 252,519.417 - 252,519.417 -JPM Global Real Estate Securities (EUR) A (inc) - EUR 6,927.717 - 6,927.717 -JPM Global Real Estate Securities (EUR) D (acc) - EUR 201,663.820 - 201,663.820 -JPM Global Real Estate Securities (EUR) X (acc) - EUR 180,642.099 - 180,642.099 -
JPMorgan Funds - Global Real Estate Securities Fund (USD)JPM Global Real Estate Securities (USD) A (acc) - USD 222,054.620 462,747.481 323,126.285 361,675.816JPM Global Real Estate Securities (USD) A (acc) - EUR (hedged) - 389,288.745 120,201.212 269,087.533JPM Global Real Estate Securities (USD) A (inc) - EUR (hedged) - 14,279.377 625.823 13,653.554JPM Global Real Estate Securities (USD) C (acc) - USD 10,208.268 26,227.234 - 36,435.502JPM Global Real Estate Securities (USD) D (acc) - USD 36,018.465 107,332.181 63,102.754 80,247.892JPM Global Real Estate Securities (USD) D (acc) - EUR (hedged) - 553,432.418 341,117.109 212,315.309JPM Global Real Estate Securities (USD) X (acc) - USD 1,181,531.621 201,594.992 - 1,383,126.613JPM Global Real Estate Securities (USD) X (acc) - EUR (hedged) - 201,817.383 1,605.001 200,212.382
JPMorgan Funds - Global Socially Responsible FundJPM Global Socially Responsible A (acc) - USD 3,310,830.350 5,068,982.859 2,074,703.363 6,305,109.846JPM Global Socially Responsible A (dist) - USD 4,308,105.218 4,725,322.218 2,637,796.626 6,395,630.810JPM Global Socially Responsible D (acc) - USD 441,299.619 32,604.114 119,601.442 354,302.291
JPMorgan Funds - Highbridge Europe STEEP FundJPM Highbridge Europe STEEP A (acc) - USD 344,375.601 18,984.444 22.984 363,337.061JPM Highbridge Europe STEEP A (acc) - EUR 1,503,772.108 4,245,612.242 1,956,099.413 3,793,284.937JPM Highbridge Europe STEEP A (inc) - EUR 341,973.900 53,911.468 - 395,885.368JPM Highbridge Europe STEEP B (acc) - EUR 70,452.784 1,438,341.569 673,023.548 835,770.805JPM Highbridge Europe STEEP C (acc) - EUR 2,453,270.066 4,288,475.757 4,286,247.511 2,455,498.312JPM Highbridge Europe STEEP D (acc) - EUR 395,329.235 526,525.453 236,157.062 685,697.626JPM Highbridge Europe STEEP X (acc) - EUR - 939,075.333 496,048.584 443,026.749
(7) This Sub-Fund was launched on 20 February 2009.(8) This Sub-Fund was launched on 20 February 2009.(9) This Sub-Fund was merged into Global Real Estate Securities Fund (USD) on 31 July 2008.
470
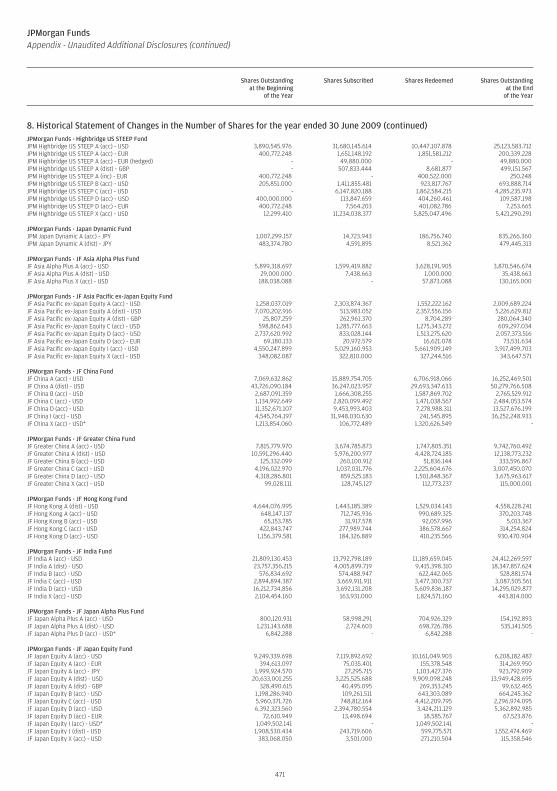
JPMorgan FundsAppendix - Unaudited Additional Disclosures (continued)
Shares Outstandingat the Beginning
of the Year
Shares Subscribed Shares Redeemed Shares Outstandingat the End
of the Year
8. Historical Statement of Changes in the Number of Shares for the year ended 30 June 2009 (continued)JPMorgan Funds - Highbridge US STEEP FundJPM Highbridge US STEEP A (acc) - USD 3,890,545.976 31,680,145.614 10,447,107.878 25,123,583.712JPM Highbridge US STEEP A (acc) - EUR 400,772.248 1,651,148.192 1,851,581.212 200,339.228JPM Highbridge US STEEP A (acc) - EUR (hedged) - 49,880.000 - 49,880.000JPM Highbridge US STEEP A (dist) - GBP - 507,833.444 8,681.877 499,151.567JPM Highbridge US STEEP A (inc) - EUR 400,772.248 - 400,522.000 250.248JPM Highbridge US STEEP B (acc) - USD 205,851.000 1,411,855.481 923,817.767 693,888.714JPM Highbridge US STEEP C (acc) - USD - 6,147,820.188 1,862,584.215 4,285,235.973JPM Highbridge US STEEP D (acc) - USD 400,000.000 113,847.659 404,260.461 109,587.198JPM Highbridge US STEEP D (acc) - EUR 400,772.248 7,564.203 401,082.786 7,253.665JPM Highbridge US STEEP X (acc) - USD 12,299.410 11,234,038.377 5,825,047.496 5,421,290.291
JPMorgan Funds - Japan Dynamic FundJPM Japan Dynamic A (acc) - JPY 1,007,299.157 14,723.943 186,756.740 835,266.360JPM Japan Dynamic A (dist) - JPY 483,374.780 4,591.895 8,521.362 479,445.313
JPMorgan Funds - JF Asia Alpha Plus FundJF Asia Alpha Plus A (acc) - USD 5,899,318.697 1,599,419.882 3,628,191.905 3,870,546.674JF Asia Alpha Plus A (dist) - USD 29,000.000 7,438.663 1,000.000 35,438.663JF Asia Alpha Plus X (acc) - USD 188,038.088 - 57,873.088 130,165.000
JPMorgan Funds - JF Asia Pacific ex-Japan Equity FundJF Asia Pacific ex-Japan Equity A (acc) - USD 1,258,037.019 2,303,874.367 1,552,222.162 2,009,689.224JF Asia Pacific ex-Japan Equity A (dist) - USD 7,070,202.916 513,983.052 2,357,556.156 5,226,629.812JF Asia Pacific ex-Japan Equity A (dist) - GBP 25,807.259 262,961.370 8,704.289 280,064.340JF Asia Pacific ex-Japan Equity C (acc) - USD 598,862.643 1,285,777.663 1,275,343.272 609,297.034JF Asia Pacific ex-Japan Equity D (acc) - USD 2,737,620.992 833,028.144 1,513,275.620 2,057,373.516JF Asia Pacific ex-Japan Equity D (acc) - EUR 69,180.133 20,972.579 16,621.078 73,531.634JF Asia Pacific ex-Japan Equity I (acc) - USD 4,550,247.899 5,029,160.953 5,661,909.149 3,917,499.703JF Asia Pacific ex-Japan Equity X (acc) - USD 348,082.087 322,810.000 327,244.516 343,647.571
JPMorgan Funds - JF China FundJF China A (acc) - USD 7,069,632.862 15,889,754.705 6,706,918.066 16,252,469.501JF China A (dist) - USD 43,726,090.184 36,247,023.957 29,693,347.633 50,279,766.508JF China B (acc) - USD 2,687,091.359 1,666,308.255 1,587,869.702 2,765,529.912JF China C (acc) - USD 1,134,992.649 2,820,099.492 1,471,038.567 2,484,053.574JF China D (acc) - USD 11,352,671.107 9,453,993.403 7,278,988.311 13,527,676.199JF China I (acc) - USD 4,545,764.197 31,948,030.630 241,545.895 36,252,248.933JF China X (acc) - USD* 1,213,854.060 106,772.489 1,320,626.549 -
JPMorgan Funds - JF Greater China FundJF Greater China A (acc) - USD 7,815,779.970 3,674,785.873 1,747,805.351 9,742,760.492JF Greater China A (dist) - USD 10,591,296.440 5,976,200.977 4,428,724.185 12,138,773.232JF Greater China B (acc) - USD 125,332.099 260,100.912 51,836.144 333,596.867JF Greater China C (acc) - USD 4,196,022.970 1,037,031.776 2,225,604.676 3,007,450.070JF Greater China D (acc) - USD 4,318,286.801 859,525.183 1,501,848.367 3,675,963.617JF Greater China X (acc) - USD 99,028.111 128,745.127 112,773.237 115,000.001
JPMorgan Funds - JF Hong Kong FundJF Hong Kong A (dist) - USD 4,644,076.995 1,443,185.389 1,529,034.143 4,558,228.241JF Hong Kong A (acc) - USD 648,147.137 712,745.936 990,689.325 370,203.748JF Hong Kong B (acc) - USD 65,153.785 31,917.578 92,057.996 5,013.367JF Hong Kong C (acc) - USD 422,843.747 277,989.744 386,578.667 314,254.824JF Hong Kong D (acc) - USD 1,156,379.581 184,326.889 410,235.566 930,470.904
JPMorgan Funds - JF India FundJF India A (acc) - USD 21,809,130.453 13,792,798.189 11,189,659.045 24,412,269.597JF India A (dist) - USD 23,757,356.215 4,005,899.719 9,415,398.310 18,347,857.624JF India B (acc) - USD 576,834.692 574,488.947 622,442.065 528,881.574JF India C (acc) - USD 2,894,894.387 3,669,911.911 3,477,300.737 3,087,505.561JF India D (acc) - USD 16,212,734.856 3,692,131.208 5,609,836.187 14,295,029.877JF India X (acc) - USD 2,104,454.160 163,931.000 1,824,571.160 443,814.000
JPMorgan Funds - JF Japan Alpha Plus FundJF Japan Alpha Plus A (acc) - USD 800,120.931 58,998.291 704,926.329 154,192.893JF Japan Alpha Plus A (dist) - USD 1,231,143.688 2,724.603 698,726.786 535,141.505JF Japan Alpha Plus D (acc) - USD* 6,842.288 - 6,842.288 -
JPMorgan Funds - JF Japan Equity FundJF Japan Equity A (acc) - USD 9,249,339.698 7,119,892.692 10,161,049.903 6,208,182.487JF Japan Equity A (acc) - EUR 394,613.097 75,035.401 155,378.548 314,269.950JF Japan Equity A (acc) - JPY 1,999,924.570 27,295.715 1,103,427.376 923,792.909JF Japan Equity A (dist) - USD 20,633,001.255 3,225,525.688 9,909,098.248 13,949,428.695JF Japan Equity A (dist) - GBP 328,490.615 40,495.095 269,353.245 99,632.465JF Japan Equity B (acc) - USD 1,198,286.940 109,261.511 643,303.089 664,245.362JF Japan Equity C (acc) - USD 5,960,371.726 748,812.164 4,412,209.795 2,296,974.095JF Japan Equity D (acc) - USD 6,392,323.560 2,394,780.554 3,424,211.129 5,362,892.985JF Japan Equity D (acc) - EUR 72,610.949 13,498.694 18,585.767 67,523.876JF Japan Equity I (acc) - USD* 1,049,502.141 - 1,049,502.141 -JF Japan Equity J (dist) - USD 1,908,530.434 243,719.606 599,775.571 1,552,474.469JF Japan Equity X (acc) - USD 383,068.050 3,501.000 271,210.504 115,358.546
471
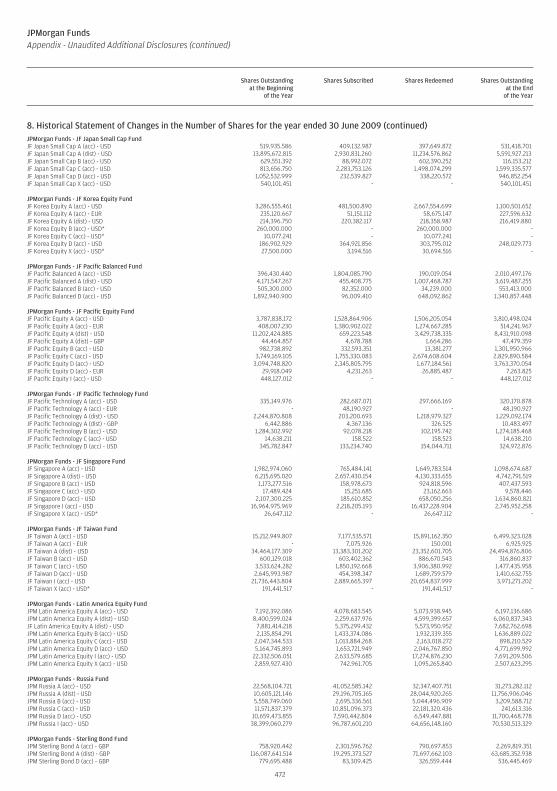
JPMorgan FundsAppendix - Unaudited Additional Disclosures (continued)
Shares Outstandingat the Beginning
of the Year
Shares Subscribed Shares Redeemed Shares Outstandingat the End
of the Year
8. Historical Statement of Changes in the Number of Shares for the year ended 30 June 2009 (continued)JPMorgan Funds - JF Japan Small Cap FundJF Japan Small Cap A (acc) - USD 519,935.586 409,132.987 397,649.872 531,418.701JF Japan Small Cap A (dist) - USD 13,895,672.815 2,930,831.260 11,234,576.862 5,591,927.213JF Japan Small Cap B (acc) - USD 629,551.392 88,992.072 602,390.252 116,153.212JF Japan Small Cap C (acc) - USD 813,656.750 2,283,753.126 1,498,074.299 1,599,335.577JF Japan Small Cap D (acc) - USD 1,052,532.999 232,539.827 338,220.572 946,852.254JF Japan Small Cap X (acc) - USD 540,101.451 - - 540,101.451
JPMorgan Funds - JF Korea Equity FundJF Korea Equity A (acc) - USD 3,286,555.461 481,500.890 2,667,554.699 1,100,501.652JF Korea Equity A (acc) - EUR 235,120.667 51,151.112 58,675.147 227,596.632JF Korea Equity A (dist) - USD 214,396.750 220,382.117 218,358.987 216,419.880JF Korea Equity B (acc) - USD* 260,000.000 - 260,000.000 -JF Korea Equity C (acc) - USD* 10,077.241 - 10,077.241 -JF Korea Equity D (acc) - USD 186,902.929 364,921.856 303,795.012 248,029.773JF Korea Equity X (acc) - USD* 27,500.000 3,194.516 30,694.516 -
JPMorgan Funds - JF Pacific Balanced FundJF Pacific Balanced A (acc) - USD 396,430.440 1,804,085.790 190,019.054 2,010,497.176JF Pacific Balanced A (dist) - USD 4,171,547.267 455,408.775 1,007,468.787 3,619,487.255JF Pacific Balanced B (acc) - USD 505,300.000 82,352.000 34,239.000 553,413.000JF Pacific Balanced D (acc) - USD 1,892,940.900 96,009.410 648,092.862 1,340,857.448
JPMorgan Funds - JF Pacific Equity FundJF Pacific Equity A (acc) - USD 3,787,838.172 1,528,864.906 1,506,205.054 3,810,498.024JF Pacific Equity A (acc) - EUR 408,007.230 1,380,902.022 1,274,667.285 514,241.967JF Pacific Equity A (dist) - USD 11,202,424.885 659,223.548 3,429,738.335 8,431,910.098JF Pacific Equity A (dist) - GBP 44,464.857 4,678.788 1,664.286 47,479.359JF Pacific Equity B (acc) - USD 982,738.892 332,593.351 13,381.277 1,301,950.966JF Pacific Equity C (acc) - USD 3,749,169.105 1,755,330.083 2,674,608.604 2,829,890.584JF Pacific Equity D (acc) - USD 3,094,748.820 2,345,805.795 1,677,184.561 3,763,370.054JF Pacific Equity D (acc) - EUR 29,918.049 4,231.263 26,885.487 7,263.825JF Pacific Equity I (acc) - USD 448,127.012 - - 448,127.012
JPMorgan Funds - JF Pacific Technology FundJF Pacific Technology A (acc) - USD 335,149.976 282,687.071 297,666.169 320,170.878JF Pacific Technology A (acc) - EUR - 48,190.927 - 48,190.927JF Pacific Technology A (dist) - USD 2,244,870.808 203,200.693 1,218,979.327 1,229,092.174JF Pacific Technology A (dist) - GBP 6,442.886 4,367.136 326.525 10,483.497JF Pacific Technology B (acc) - USD 1,284,302.992 92,078.218 102,195.742 1,274,185.468JF Pacific Technology C (acc) - USD 14,638.211 158.522 158.523 14,638.210JF Pacific Technology D (acc) - USD 345,782.847 133,234.740 154,044.711 324,972.876
JPMorgan Funds - JF Singapore FundJF Singapore A (acc) - USD 1,982,974.060 765,484.141 1,649,783.514 1,098,674.687JF Singapore A (dist) - USD 6,215,695.020 2,657,430.154 4,130,333.655 4,742,791.519JF Singapore B (acc) - USD 1,173,277.516 158,978.673 924,818.596 407,437.593JF Singapore C (acc) - USD 17,489.424 15,251.685 23,162.663 9,578.446JF Singapore D (acc) - USD 2,107,300.225 185,610.852 658,050.256 1,634,860.821JF Singapore I (acc) - USD 16,964,975.969 2,218,205.193 16,437,228.904 2,745,952.258JF Singapore X (acc) - USD* 26,647.112 - 26,647.112 -
JPMorgan Funds - JF Taiwan FundJF Taiwan A (acc) - USD 15,212,949.807 7,177,535.571 15,891,162.350 6,499,323.028JF Taiwan A (acc) - EUR - 7,075.926 150.001 6,925.925JF Taiwan A (dist) - USD 34,464,177.309 13,383,301.202 23,352,601.705 24,494,876.806JF Taiwan B (acc) - USD 600,129.018 603,402.362 886,670.543 316,860.837JF Taiwan C (acc) - USD 3,533,624.282 1,850,192.668 3,906,380.992 1,477,435.958JF Taiwan D (acc) - USD 2,645,993.987 454,398.347 1,689,759.579 1,410,632.755JF Taiwan I (acc) - USD 21,736,443.804 2,889,665.397 20,654,837.999 3,971,271.202JF Taiwan X (acc) - USD* 191,441.517 - 191,441.517 -
JPMorgan Funds - Latin America Equity FundJPM Latin America Equity A (acc) - USD 7,192,392.086 4,078,683.545 5,073,938.945 6,197,136.686JPM Latin America Equity A (dist) - USD 8,400,599.024 2,259,637.976 4,599,399.657 6,060,837.343JF Latin America Equity A (dist) - USD 7,881,414.218 5,375,299.432 5,573,950.952 7,682,762.698JPM Latin America Equity B (acc) - USD 2,135,854.291 1,433,374.086 1,932,339.355 1,636,889.022JPM Latin America Equity C (acc) - USD 2,047,344.533 1,013,884.268 2,163,018.272 898,210.529JPM Latin America Equity D (acc) - USD 5,164,745.893 1,653,721.949 2,046,767.850 4,771,699.992JPM Latin America Equity I (acc) - USD 22,332,506.051 2,633,579.685 17,274,876.230 7,691,209.506JPM Latin America Equity X (acc) - USD 2,859,927.430 742,961.705 1,095,265.840 2,507,623.295
JPMorgan Funds - Russia FundJPM Russia A (acc) - USD 22,568,104.721 41,052,585.142 32,347,407.751 31,273,282.112JPM Russia A (dist) - USD 10,605,121.146 29,196,705.165 28,044,920.265 11,756,906.046JPM Russia B (acc) - USD 5,558,749.060 2,695,336.561 5,044,496.909 3,209,588.712JPM Russia C (acc) - USD 11,571,837.379 10,851,096.373 22,181,320.436 241,613.316JPM Russia D (acc) - USD 10,659,473.855 7,590,442.804 6,549,447.881 11,700,468.778JPM Russia I (acc) - USD 38,399,060.279 96,787,601.210 64,656,148.160 70,530,513.329
JPMorgan Funds - Sterling Bond FundJPM Sterling Bond A (acc) - GBP 758,920.442 2,301,596.762 790,697.853 2,269,819.351JPM Sterling Bond A (dist) - GBP 116,087,641.514 19,295,373.527 71,697,662.103 63,685,352.938JPM Sterling Bond D (acc) - GBP 779,695.488 83,309.425 326,559.444 536,445.469
472
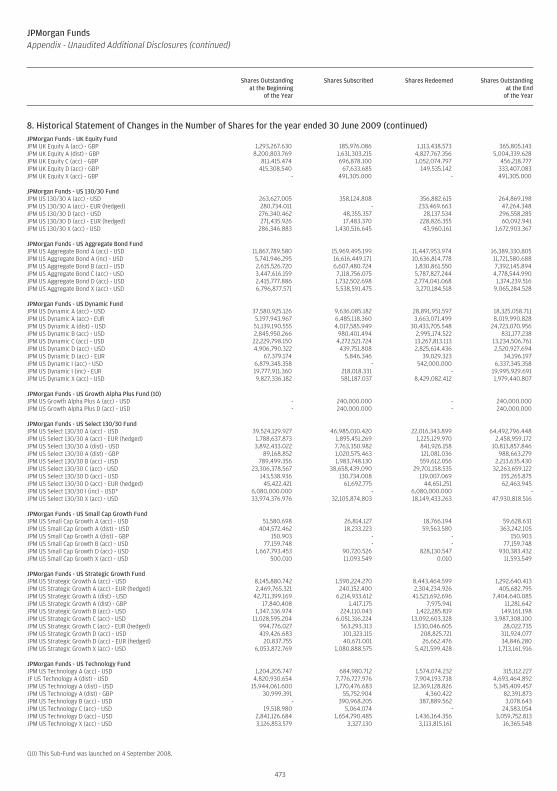
JPMorgan FundsAppendix - Unaudited Additional Disclosures (continued)
Shares Outstandingat the Beginning
of the Year
Shares Subscribed Shares Redeemed Shares Outstandingat the End
of the Year
8. Historical Statement of Changes in the Number of Shares for the year ended 30 June 2009 (continued)JPMorgan Funds - UK Equity FundJPM UK Equity A (acc) - GBP 1,293,267.630 185,976.086 1,113,438.573 365,805.143JPM UK Equity A (dist) - GBP 8,200,803.769 1,631,303.215 4,827,767.356 5,004,339.628JPM UK Equity C (acc) - GBP 811,415.474 696,878.100 1,052,074.797 456,218.777JPM UK Equity D (acc) - GBP 415,308.540 67,633.685 149,535.142 333,407.083JPM UK Equity X (acc) - GBP - 491,305.000 - 491,305.000
JPMorgan Funds - US 130/30 FundJPM US 130/30 A (acc) - USD 263,627.005 358,124.808 356,882.615 264,869.198JPM US 130/30 A (acc) - EUR (hedged) 280,734.011 - 233,469.663 47,264.348JPM US 130/30 D (acc) - USD 276,340.462 48,355.357 28,137.534 296,558.285JPM US 130/30 D (acc) - EUR (hedged) 271,435.926 17,483.370 228,826.355 60,092.941JPM US 130/30 X (acc) - USD 286,346.883 1,430,516.645 43,960.161 1,672,903.367
JPMorgan Funds - US Aggregate Bond FundJPM US Aggregate Bond A (acc) - USD 11,867,789.580 15,969,495.199 11,447,953.974 16,389,330.805JPM US Aggregate Bond A (inc) - USD 5,741,946.295 16,616,449.171 10,636,814.778 11,721,580.688JPM US Aggregate Bond B (acc) - USD 2,615,526.720 6,607,480.724 1,830,861.550 7,392,145.894JPM US Aggregate Bond C (acc) - USD 3,447,616.159 7,118,756.075 5,787,827.244 4,778,544.990JPM US Aggregate Bond D (acc) - USD 2,415,777.886 1,732,502.698 2,774,041.068 1,374,239.516JPM US Aggregate Bond X (acc) - USD 6,796,877.571 5,538,591.475 3,270,184.518 9,065,284.528
JPMorgan Funds - US Dynamic FundJPM US Dynamic A (acc) - USD 37,580,925.126 9,636,085.182 28,891,951.597 18,325,058.711JPM US Dynamic A (acc) - EUR 5,197,943.967 6,485,118.360 3,663,071.499 8,019,990.828JPM US Dynamic A (dist) - USD 51,139,190.555 4,017,585.949 30,433,705.548 24,723,070.956JPM US Dynamic B (acc) - USD 2,845,950.266 980,401.494 2,995,174.522 831,177.238JPM US Dynamic C (acc) - USD 22,229,798.150 4,272,521.724 13,267,813.113 13,234,506.761JPM US Dynamic D (acc) - USD 4,906,790.322 439,751.808 2,825,614.436 2,520,927.694JPM US Dynamic D (acc) - EUR 67,379.174 5,846.346 39,029.323 34,196.197JPM US Dynamic I (acc) - USD 6,879,345.358 - 542,000.000 6,337,345.358JPM US Dynamic I (inc) - EUR 19,777,911.360 218,018.331 - 19,995,929.691JPM US Dynamic X (acc) - USD 9,827,336.182 581,187.037 8,429,082.412 1,979,440.807
JPMorgan Funds - US Growth Alpha Plus Fund (10)JPM US Growth Alpha Plus A (acc) - USD - 240,000.000 - 240,000.000JPM US Growth Alpha Plus D (acc) - USD - 240,000.000 - 240,000.000
JPMorgan Funds - US Select 130/30 FundJPM US Select 130/30 A (acc) - USD 39,524,129.927 46,985,010.420 22,016,343.899 64,492,796.448JPM US Select 130/30 A (acc) - EUR (hedged) 1,788,637.873 1,895,451.269 1,225,129.970 2,458,959.172JPM US Select 130/30 A (dist) - USD 3,892,433.022 7,763,350.982 841,926.158 10,813,857.846JPM US Select 130/30 A (dist) - GBP 89,168.852 1,020,575.463 121,081.036 988,663.279JPM US Select 130/30 B (acc) - USD 789,499.356 1,983,748.130 559,612.056 2,213,635.430JPM US Select 130/30 C (acc) - USD 23,306,378.567 38,658,439.090 29,701,158.535 32,263,659.122JPM US Select 130/30 D (acc) - USD 143,538.936 130,734.008 119,007.069 155,265.875JPM US Select 130/30 D (acc) - EUR (hedged) 45,422.421 61,692.775 44,651.251 62,463.945JPM US Select 130/30 I (inc) - USD* 6,080,000.000 - 6,080,000.000 -JPM US Select 130/30 X (acc) - USD 33,974,376.976 32,105,874.803 18,149,433.263 47,930,818.516
JPMorgan Funds - US Small Cap Growth FundJPM US Small Cap Growth A (acc) - USD 51,580.698 26,814.127 18,766.194 59,628.631JPM US Small Cap Growth A (dist) - USD 404,572.462 18,233.223 59,563.580 363,242.105JPM US Small Cap Growth A (dist) - GBP 150.903 - - 150.903JPM US Small Cap Growth B (acc) - USD 77,159.748 - - 77,159.748JPM US Small Cap Growth D (acc) - USD 1,667,793.453 90,720.526 828,130.547 930,383.432JPM US Small Cap Growth X (acc) - USD 500.010 11,093.549 0.010 11,593.549
JPMorgan Funds - US Strategic Growth FundJPM US Strategic Growth A (acc) - USD 8,145,880.742 1,590,224.270 8,443,464.599 1,292,640.413JPM US Strategic Growth A (acc) - EUR (hedged) 2,469,765.321 240,152.400 2,304,234.926 405,682.795JPM US Strategic Growth A (dist) - USD 42,711,399.169 6,214,933.612 41,521,692.696 7,404,640.085JPM US Strategic Growth A (dist) - GBP 17,840.408 1,417.175 7,975.941 11,281.642JPM US Strategic Growth B (acc) - USD 1,347,336.974 224,110.043 1,422,285.819 149,161.198JPM US Strategic Growth C (acc) - USD 11,028,595.204 6,051,316.224 13,092,603.328 3,987,308.100JPM US Strategic Growth C (acc) - EUR (hedged) 994,776.027 563,293.313 1,530,046.605 28,022.735JPM US Strategic Growth D (acc) - USD 419,426.683 101,323.115 208,825.721 311,924.077JPM US Strategic Growth D (acc) - EUR (hedged) 20,837.755 40,671.001 26,662.476 34,846.280JPM US Strategic Growth X (acc) - USD 6,053,872.769 1,080,888.575 5,421,599.428 1,713,161.916
JPMorgan Funds - US Technology FundJPM US Technology A (acc) - USD 1,204,205.747 684,980.712 1,574,074.232 315,112.227JF US Technology A (dist) - USD 4,820,930.654 7,776,727.976 7,904,193.738 4,693,464.892JPM US Technology A (dist) - USD 15,944,061.600 1,770,476.683 12,369,128.826 5,345,409.457JPM US Technology A (dist) - GBP 30,999.391 55,752.904 4,360.422 82,391.873JPM US Technology B (acc) - USD - 390,968.205 387,889.562 3,078.643JPM US Technology C (acc) - USD 19,518.980 5,064.074 - 24,583.054JPM US Technology D (acc) - USD 2,841,126.684 1,654,790.485 1,436,164.356 3,059,752.813JPM US Technology X (acc) - USD 3,126,853.579 3,327.130 3,113,815.161 16,365.548
(10) This Sub-Fund was launched on 4 September 2008.
473
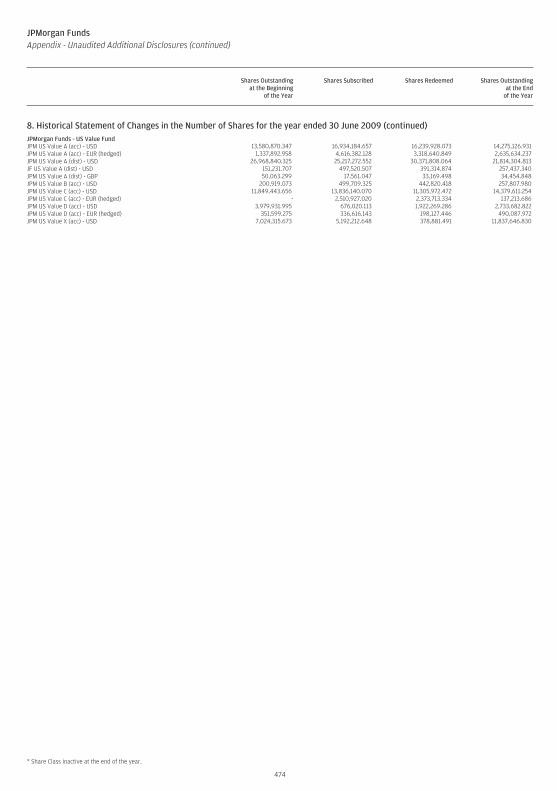
JPMorgan FundsAppendix - Unaudited Additional Disclosures (continued)
Shares Outstandingat the Beginning
of the Year
Shares Subscribed Shares Redeemed Shares Outstandingat the End
of the Year
8. Historical Statement of Changes in the Number of Shares for the year ended 30 June 2009 (continued)JPMorgan Funds - US Value FundJPM US Value A (acc) - USD 13,580,870.347 16,934,184.657 16,239,928.073 14,275,126.931JPM US Value A (acc) - EUR (hedged) 1,337,892.958 4,616,382.128 3,318,640.849 2,635,634.237JPM US Value A (dist) - USD 26,968,840.325 25,217,272.552 30,371,808.064 21,814,304.813JF US Value A (dist) - USD 151,231.707 497,520.507 391,314.874 257,437.340JPM US Value A (dist) - GBP 50,063.299 17,561.047 33,169.498 34,454.848JPM US Value B (acc) - USD 200,919.073 499,709.325 442,820.418 257,807.980JPM US Value C (acc) - USD 11,849,443.656 13,836,140.070 11,305,972.472 14,379,611.254JPM US Value C (acc) - EUR (hedged) - 2,510,927.020 2,373,713.334 137,213.686JPM US Value D (acc) - USD 3,979,931.995 676,020.113 1,922,269.286 2,733,682.822JPM US Value D (acc) - EUR (hedged) 351,599.275 336,616.143 198,127.446 490,087.972JPM US Value X (acc) - USD 7,024,315.673 5,192,212.648 378,881.491 11,837,646.830
* Share Class inactive at the end of the year.
474
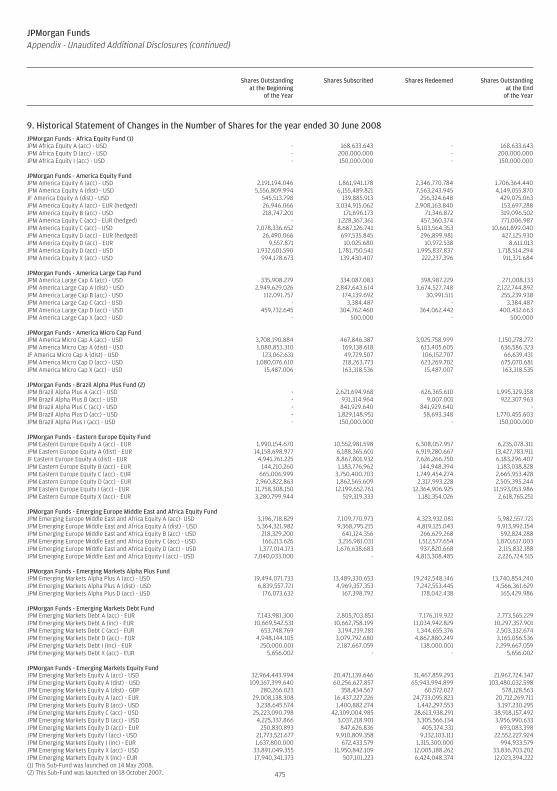
JPMorgan FundsAppendix - Unaudited Additional Disclosures (continued)
Shares Outstandingat the Beginning
of the Year
Shares Subscribed Shares Redeemed Shares Outstandingat the End
of the Year
9. Historical Statement of Changes in the Number of Shares for the year ended 30 June 2008 (continued)JPMorgan Funds - Africa Equity Fund (1)JPM Africa Equity A (acc) - USD - 168,633.643 - 168,633.643JPM Africa Equity D (acc) - USD - 200,000.000 - 200,000.000JPM Africa Equity I (acc) - USD - 150,000.000 - 150,000.000
JPMorgan Funds - America Equity FundJPM America Equity A (acc) - USD 2,191,194.046 1,861,941.178 2,346,770.784 1,706,364.440JPM America Equity A (dist) - USD 5,556,809.994 6,155,489.821 7,563,243.945 4,149,055.870JF America Equity A (dist) - USD 545,513.798 139,885.913 256,324.648 429,075.063JPM America Equity A (acc) - EUR (hedged) 26,946.066 3,034,915.062 2,908,163.840 153,697.288JPM America Equity B (acc) - USD 218,747.201 171,696.173 71,346.872 319,096.502JPM America Equity C (acc) - EUR (hedged) - 1,228,367.361 457,360.374 771,006.987JPM America Equity C (acc) - USD 7,078,336.652 8,687,126.741 5,103,564.353 10,661,899.040JPM America Equity D (acc) - EUR (hedged) 26,490.066 697,535.845 296,899.981 427,125.930JPM America Equity D (acc) - EUR 9,557.871 10,025.680 10,972.538 8,611.013JPM America Equity D (acc) - USD 1,932,601.590 1,781,750.541 1,995,837.837 1,718,514.294JPM America Equity X (acc) - USD 994,178.673 139,430.407 222,237.396 911,371.684
JPMorgan Funds - America Large Cap FundJPM America Large Cap A (acc) - USD 335,908.279 334,087.083 398,987.229 271,008.133JPM America Large Cap A (dist) - USD 2,949,629.026 2,847,643.614 3,674,527.748 2,122,744.892JPM America Large Cap B (acc) - USD 112,091.757 174,139.692 30,991.511 255,239.938JPM America Large Cap C (acc) - USD - 3,384.487 - 3,384.487JPM America Large Cap D (acc) - USD 459,732.645 304,762.460 364,062.442 400,432.663JPM America Large Cap X (acc) - USD - 500.000 - 500.000
JPMorgan Funds - America Micro Cap FundJPM America Micro Cap A (acc) - USD 3,708,190.884 467,846.387 3,025,758.999 1,150,278.272JPM America Micro Cap A (dist) - USD 1,080,853.310 169,138.618 613,405.605 636,586.323JF America Micro Cap A (dist) - USD 123,062.631 49,729.507 106,152.707 66,639.431JPM America Micro Cap D (acc) - USD 1,080,076.610 218,263.773 623,269.702 675,070.681JPM America Micro Cap X (acc) - USD 15,487.006 163,318.536 15,487.007 163,318.535
JPMorgan Funds - Brazil Alpha Plus Fund (2)JPM Brazil Alpha Plus A (acc) - USD - 2,621,694.968 626,365.610 1,995,329.358JPM Brazil Alpha Plus B (acc) - USD - 931,314.964 9,007.001 922,307.963JPM Brazil Alpha Plus C (acc) - USD - 841,929.640 841,929.640 -JPM Brazil Alpha Plus D (acc) - USD - 1,829,148.951 58,693.348 1,770,455.603JPM Brazil Alpha Plus I (acc) - USD - 150,000.000 - 150,000.000
JPMorgan Funds - Eastern Europe Equity FundJPM Eastern Europe Equity A (acc) - EUR 1,990,154.670 10,552,981.598 6,308,057.957 6,235,078.311JPM Eastern Europe Equity A (dist) - EUR 14,158,698.977 6,188,365.601 6,919,280.667 13,427,783.911JF Eastern Europe Equity A (dist) - EUR 4,941,761.225 8,867,801.932 7,626,266.750 6,183,296.407JPM Eastern Europe Equity B (acc) - EUR 144,210.260 1,183,776.962 144,948.394 1,183,038.828JPM Eastern Europe Equity C (acc) - EUR 665,006.999 3,750,400.703 1,749,454.274 2,665,953.428JPM Eastern Europe Equity D (acc) - EUR 2,960,822.863 1,862,565.609 2,317,993.228 2,505,395.244JPM Eastern Europe Equity I (acc) - EUR 11,758,308.150 12,199,652.761 12,364,906.925 11,593,053.986JPM Eastern Europe Equity X (acc) - EUR 3,280,799.944 519,319.333 1,181,354.026 2,618,765.251
JPMorgan Funds - Emerging Europe Middle East and Africa Equity FundJPM Emerging Europe Middle East and Africa Equity A (acc)- USD 3,196,718.829 7,109,770.973 4,323,932.081 5,982,557.721JPM Emerging Europe Middle East and Africa Equity A (dist) - USD 5,364,321.982 9,368,795.215 4,819,125.043 9,913,992.154JPM Emerging Europe Middle East and Africa Equity B (acc) - USD 218,329.200 641,124.356 266,629.268 592,824.288JPM Emerging Europe Middle East and Africa Equity C (acc) - USD 166,213.626 3,216,981.031 1,512,577.654 1,870,617.003JPM Emerging Europe Middle East and Africa Equity D (acc) - USD 1,377,014.173 1,676,638.683 937,820.668 2,115,832.188JPM Emerging Europe Middle East and Africa Equity I (acc) - USD 7,040,033.000 - 4,813,308.485 2,226,724.515
JPMorgan Funds - Emerging Markets Alpha Plus FundJPM Emerging Markets Alpha Plus A (acc) - USD 19,494,071.733 13,489,330.653 19,242,548.146 13,740,854.240JPM Emerging Markets Alpha Plus A (dist) - USD 6,839,557.721 4,969,357.353 7,242,553.445 4,566,361.629JPM Emerging Markets Alpha Plus D (acc) - USD 176,073.632 167,398.792 178,042.438 165,429.986
JPMorgan Funds - Emerging Markets Debt FundJPM Emerging Markets Debt A (acc) - EUR 7,143,981.300 2,805,703.851 7,176,119.922 2,773,565.229JPM Emerging Markets Debt A (inc) - EUR 10,669,542.531 10,662,758.199 11,034,942.829 10,297,357.901JPM Emerging Markets Debt C (acc) - EUR 653,748.769 3,194,239.281 1,344,655.376 2,503,332.674JPM Emerging Markets Debt D (acc) - EUR 4,948,144.105 3,079,792.680 4,862,880.249 3,165,056.536JPM Emerging Markets Debt I (Inc) - EUR 250,000.001 2,187,667.059 138,000.001 2,299,667.059JPM Emerging Markets Debt X (acc) - EUR 5,656.002 - - 5,656.002
JPMorgan Funds - Emerging Markets Equity FundJPM Emerging Markets Equity A (acc) - USD 32,964,443.994 20,471,139.646 31,467,859.293 21,967,724.347JPM Emerging Markets Equity A (dist) - USD 109,167,399.640 60,256,627.857 65,943,994.899 103,480,032.598JPM Emerging Markets Equity A (dist) - GBP 280,266.023 358,434.567 60,572.027 578,128.563JPM Emerging Markets Equity A (acc) - EUR 29,008,138.308 16,437,227.226 24,733,095.823 20,712,269.711JPM Emerging Markets Equity B (acc) - USD 3,238,645.574 1,400,882.274 1,442,297.553 3,197,230.295JPM Emerging Markets Equity C (acc) - USD 25,223,090.798 42,309,004.985 28,613,938.291 38,918,157.492JPM Emerging Markets Equity D (acc) - USD 4,225,337.866 3,037,218.901 3,305,566.134 3,956,990.633JPM Emerging Markets Equity D (acc) - EUR 250,830.893 847,626.836 405,374.331 693,083.398JPM Emerging Markets Equity I (acc) - USD 21,773,521.677 9,910,809.358 9,132,103.111 22,552,227.924JPM Emerging Markets Equity I (inc) - EUR 1,637,800.000 672,433.579 1,315,300.000 994,933.579JPM Emerging Markets Equity X (acc) - USD 33,891,049.355 11,950,842.109 12,005,188.262 33,836,703.202JPM Emerging Markets Equity X (inc) - EUR 17,940,341.373 507,101.223 6,424,048.374 12,023,394.222(1) This Sub-Fund was launched on 14 May 2008.(2) This Sub-Fund was launched on 18 October 2007. 475
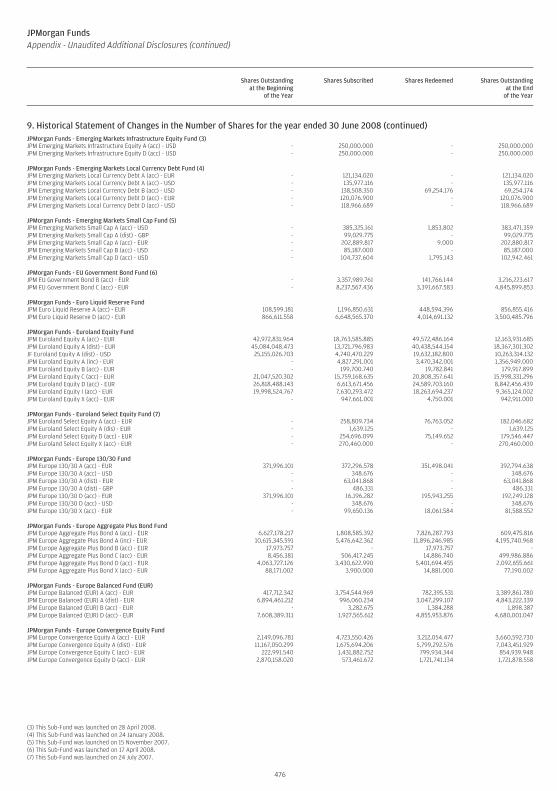
JPMorgan FundsAppendix - Unaudited Additional Disclosures (continued)
Shares Outstandingat the Beginning
of the Year
Shares Subscribed Shares Redeemed Shares Outstandingat the End
of the Year
9. Historical Statement of Changes in the Number of Shares for the year ended 30 June 2008 (continued)JPMorgan Funds - Emerging Markets Infrastructure Equity Fund (3)JPM Emerging Markets Infrastructure Equity A (acc) - USD - 250,000.000 - 250,000.000JPM Emerging Markets Infrastructure Equity D (acc) - USD - 250,000.000 - 250,000.000
JPMorgan Funds - Emerging Markets Local Currency Debt Fund (4)JPM Emerging Markets Local Currency Debt A (acc) - EUR - 121,134.020 - 121,134.020JPM Emerging Markets Local Currency Debt A (acc) - USD - 135,977.116 - 135,977.116JPM Emerging Markets Local Currency Debt B (acc) - USD - 138,508.350 69,254.176 69,254.174JPM Emerging Markets Local Currency Debt D (acc) - EUR - 120,076.900 - 120,076.900JPM Emerging Markets Local Currency Debt D (acc) - USD - 118,966.689 - 118,966.689
JPMorgan Funds - Emerging Markets Small Cap Fund (5)JPM Emerging Markets Small Cap A (acc) - USD - 385,325.161 1,853.802 383,471.359JPM Emerging Markets Small Cap A (dist) - GBP - 99,029.775 - 99,029.775JPM Emerging Markets Small Cap A (acc) - EUR - 202,889.817 9.000 202,880.817JPM Emerging Markets Small Cap B (acc) - USD - 85,187.000 - 85,187.000JPM Emerging Markets Small Cap D (acc) - USD - 104,737.604 1,795.143 102,942.461
JPMorgan Funds - EU Government Bond Fund (6)JPM EU Government Bond B (acc) - EUR - 3,357,989.761 141,766.144 3,216,223.617JPM EU Government Bond C (acc) - EUR - 8,237,567.436 3,391,667.583 4,845,899.853
JPMorgan Funds - Euro Liquid Reserve FundJPM Euro Liquid Reserve A (acc) - EUR 108,599.181 1,196,850.631 448,594.396 856,855.416JPM Euro Liquid Reserve D (acc) - EUR 866,611.558 6,648,565.370 4,014,691.132 3,500,485.796
JPMorgan Funds - Euroland Equity FundJPM Euroland Equity A (acc) - EUR 42,972,831.964 18,763,585.885 49,572,486.164 12,163,931.685JPM Euroland Equity A (dist) - EUR 45,084,048.473 13,721,796.983 40,438,544.154 18,367,301.302JF Euroland Equity A (dist) - USD 25,155,026.703 4,740,470.229 19,632,182.800 10,263,314.132JPM Euroland Equity A (inc) - EUR - 4,827,291.001 3,470,342.001 1,356,949.000JPM Euroland Equity B (acc) - EUR - 199,700.740 19,782.841 179,917.899JPM Euroland Equity C (acc) - EUR 21,047,520.302 15,759,168.635 20,808,357.641 15,998,331.296JPM Euroland Equity D (acc) - EUR 26,818,488.143 6,613,671.456 24,589,703.160 8,842,456.439JPM Euroland Equity I (acc) - EUR 19,998,524.767 7,630,293.472 18,263,694.237 9,365,124.002JPM Euroland Equity X (acc) - EUR - 947,661.001 4,750.001 942,911.000
JPMorgan Funds - Euroland Select Equity Fund (7)JPM Euroland Select Equity A (acc) - EUR - 258,809.734 76,763.052 182,046.682JPM Euroland Select Equity A (dis) - EUR - 1,639.125 - 1,639.125JPM Euroland Select Equity D (acc) - EUR - 254,696.099 75,149.652 179,546.447JPM Euroland Select Equity X (acc) - EUR - 270,460.000 - 270,460.000
JPMorgan Funds - Europe 130/30 FundJPM Europe 130/30 A (acc) - EUR 371,996.101 372,296.578 351,498.041 392,794.638JPM Europe 130/30 A (acc) - USD - 348.676 - 348.676JPM Europe 130/30 A (dist) - EUR - 63,041.868 - 63,041.868JPM Europe 130/30 A (dist) - GBP - 486.331 - 486.331JPM Europe 130/30 D (acc) - EUR 371,996.101 16,196.282 195,943.255 192,249.128JPM Europe 130/30 D (acc) - USD - 348.676 - 348.676JPM Europe 130/30 X (acc) - EUR - 99,650.136 18,061.584 81,588.552
JPMorgan Funds - Europe Aggregate Plus Bond FundJPM Europe Aggregate Plus Bond A (acc) - EUR 6,627,178.217 1,808,585.392 7,826,287.793 609,475.816JPM Europe Aggregate Plus Bond A (inc) - EUR 10,615,345.591 5,476,642.362 11,896,246.985 4,195,740.968JPM Europe Aggregate Plus Bond B (acc) - EUR 17,973.757 - 17,973.757 -JPM Europe Aggregate Plus Bond C (acc) - EUR 8,456.381 506,417.245 14,886.740 499,986.886JPM Europe Aggregate Plus Bond D (acc) - EUR 4,063,727.126 3,430,622.990 5,401,694.455 2,092,655.661JPM Europe Aggregate Plus Bond X (acc) - EUR 88,171.002 3,900.000 14,881.000 77,190.002
JPMorgan Funds - Europe Balanced Fund (EUR)JPM Europe Balanced (EUR) A (acc) - EUR 417,712.342 3,754,544.969 782,395.531 3,389,861.780JPM Europe Balanced (EUR) A (dist) - EUR 6,894,461.212 996,060.234 3,047,299.107 4,843,222.339JPM Europe Balanced (EUR) B (acc) - EUR - 3,282.675 1,384.288 1,898.387JPM Europe Balanced (EUR) D (acc) - EUR 7,608,389.311 1,927,565.612 4,855,953.876 4,680,001.047
JPMorgan Funds - Europe Convergence Equity FundJPM Europe Convergence Equity A (acc) - EUR 2,149,096.781 4,723,550.426 3,212,054.477 3,660,592.730JPM Europe Convergence Equity A (dist) - EUR 11,167,050.299 1,675,694.206 5,799,292.576 7,043,451.929JPM Europe Convergence Equity C (acc) - EUR 222,991.540 1,431,882.752 799,934.344 854,939.948JPM Europe Convergence Equity D (acc) - EUR 2,870,158.020 573,461.672 1,721,741.134 1,721,878.558
(3) This Sub-Fund was launched on 28 April 2008.(4) This Sub-Fund was launched on 24 January 2008.(5) This Sub-Fund was launched on 15 November 2007.(6) This Sub-Fund was launched on 17 April 2008.(7) This Sub-Fund was launched on 24 July 2007.
476
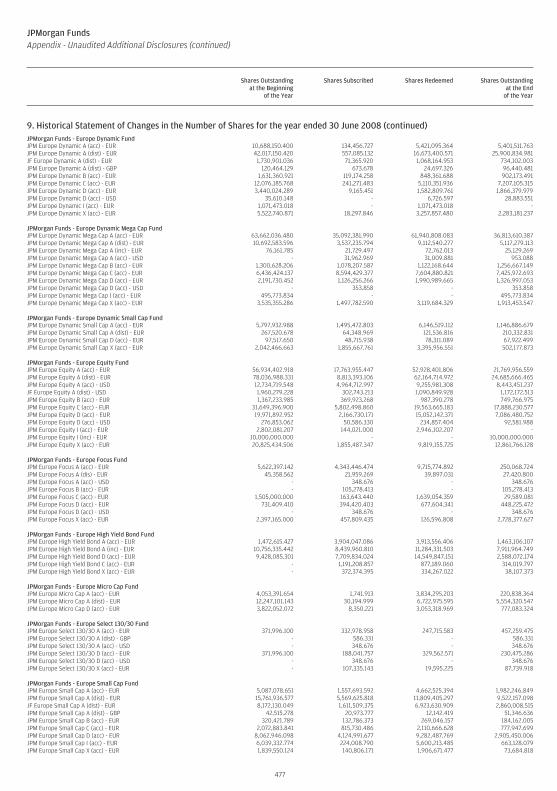
JPMorgan FundsAppendix - Unaudited Additional Disclosures (continued)
Shares Outstandingat the Beginning
of the Year
Shares Subscribed Shares Redeemed Shares Outstandingat the End
of the Year
9. Historical Statement of Changes in the Number of Shares for the year ended 30 June 2008 (continued)JPMorgan Funds - Europe Dynamic FundJPM Europe Dynamic A (acc) - EUR 10,688,150.400 134,456.727 5,421,095.364 5,401,511.763JPM Europe Dynamic A (dist) - EUR 42,017,150.420 557,085.132 16,673,400.571 25,900,834.981JF Europe Dynamic A (dist) - EUR 1,730,901.036 71,365.920 1,068,164.953 734,102.003JPM Europe Dynamic A (dist) - GBP 120,464.129 673.678 24,697.326 96,440.481JPM Europe Dynamic B (acc) - EUR 1,631,360.921 119,174.258 848,361.688 902,173.491JPM Europe Dynamic C (acc) - EUR 12,076,185.768 241,271.483 5,110,351.936 7,207,105.315JPM Europe Dynamic D (acc) - EUR 3,440,024.289 9,165.451 1,582,809.761 1,866,379.979JPM Europe Dynamic D (acc) - USD 35,610.148 - 6,726.597 28,883.551JPM Europe Dynamic I (acc) - EUR 1,071,473.018 - 1,071,473.018 -JPM Europe Dynamic X (acc) - EUR 5,522,740.871 18,297.846 3,257,857.480 2,283,181.237
JPMorgan Funds - Europe Dynamic Mega Cap FundJPM Europe Dynamic Mega Cap A (acc) - EUR 63,662,036.480 35,092,381.990 61,940,808.083 36,813,610.387JPM Europe Dynamic Mega Cap A (dist) - EUR 10,692,583.596 3,537,235.794 9,112,540.277 5,117,279.113JPM Europe Dynamic Mega Cap A (inc) - EUR 76,161.785 21,729.497 72,762.013 25,129.269JPM Europe Dynamic Mega Cap A (acc) - USD - 31,962.969 31,009.881 953.088JPM Europe Dynamic Mega Cap B (acc) - EUR 1,300,628.206 1,078,207.587 1,122,168.644 1,256,667.149JPM Europe Dynamic Mega Cap C (acc) - EUR 6,436,424.137 8,594,429.377 7,604,880.821 7,425,972.693JPM Europe Dynamic Mega Cap D (acc) - EUR 2,191,730.452 1,126,256.266 1,990,989.665 1,326,997.053JPM Europe Dynamic Mega Cap D (acc) - USD - 353.858 - 353.858JPM Europe Dynamic Mega Cap I (acc) - EUR 495,773.834 - - 495,773.834JPM Europe Dynamic Mega Cap X (acc) - EUR 3,535,355.286 1,497,782.590 3,119,684.329 1,913,453.547
JPMorgan Funds - Europe Dynamic Small Cap FundJPM Europe Dynamic Small Cap A (acc) - EUR 5,797,932.988 1,495,472.803 6,146,519.112 1,146,886.679JPM Europe Dynamic Small Cap A (dist) - EUR 267,520.678 64,348.969 121,536.816 210,332.831JPM Europe Dynamic Small Cap D (acc) - EUR 97,517.650 48,715.938 78,311.089 67,922.499JPM Europe Dynamic Small Cap X (acc) - EUR 2,042,466.663 1,855,667.761 3,395,956.551 502,177.873
JPMorgan Funds - Europe Equity FundJPM Europe Equity A (acc) - EUR 56,934,402.918 17,763,955.447 52,928,401.806 21,769,956.559JPM Europe Equity A (dist) - EUR 78,036,988.331 8,813,393.106 62,164,714.972 24,685,666.465JPM Europe Equity A (acc) - USD 12,734,719.548 4,964,712.997 9,255,981.308 8,443,451.237JF Europe Equity A (dist) - USD 1,960,279.228 302,743.213 1,090,849.928 1,172,172.513JPM Europe Equity B (acc) - EUR 1,367,233.985 369,923.268 987,390.278 749,766.975JPM Europe Equity C (acc) - EUR 31,649,396.900 5,802,498.860 19,563,665.183 17,888,230.577JPM Europe Equity D (acc) - EUR 19,971,892.952 2,166,730.171 15,052,142.371 7,086,480.752JPM Europe Equity D (acc) - USD 276,853.062 50,586.330 234,857.404 92,581.988JPM Europe Equity I (acc) - EUR 2,802,081.207 144,021.000 2,946,102.207 -JPM Europe Equity I (inc) - EUR 10,000,000.000 - - 10,000,000.000JPM Europe Equity X (acc) - EUR 20,825,434.506 1,855,487.347 9,819,155.725 12,861,766.128
JPMorgan Funds - Europe Focus FundJPM Europe Focus A (acc) - EUR 5,622,397.142 4,343,446.474 9,715,774.892 250,068.724JPM Europe Focus A (dis) - EUR 45,358.562 21,959.269 39,897.031 27,420.800JPM Europe Focus A (acc) - USD - 348.676 - 348.676JPM Europe Focus B (acc) - EUR - 105,278.413 - 105,278.413JPM Europe Focus C (acc) - EUR 1,505,000.000 163,643.440 1,639,054.359 29,589.081JPM Europe Focus D (acc) - EUR 731,409.410 394,420.403 677,604.341 448,225.472JPM Europe Focus D (acc) - USD - 348.676 - 348.676JPM Europe Focus X (acc) - EUR 2,397,165.000 457,809.435 126,596.808 2,728,377.627
JPMorgan Funds - Europe High Yield Bond FundJPM Europe High Yield Bond A (acc) - EUR 1,472,615.427 3,904,047.086 3,913,556.406 1,463,106.107JPM Europe High Yield Bond A (inc) - EUR 10,756,335.442 8,439,960.810 11,284,331.503 7,911,964.749JPM Europe High Yield Bond D (acc) - EUR 9,428,085.301 7,709,834.024 14,549,847.151 2,588,072.174JPM Europe High Yield Bond C (acc) - EUR - 1,191,208.857 877,189.060 314,019.797JPM Europe High Yield Bond X (acc) - EUR - 372,374.395 334,267.022 38,107.373
JPMorgan Funds - Europe Micro Cap FundJPM Europe Micro Cap A (acc) - EUR 4,053,391.654 1,741.913 3,834,295.203 220,838.364JPM Europe Micro Cap A (dist) - EUR 12,247,101.143 30,194.999 6,722,975.595 5,554,320.547JPM Europe Micro Cap D (acc) - EUR 3,822,052.072 8,350.221 3,053,318.969 777,083.324
JPMorgan Funds - Europe Select 130/30 FundJPM Europe Select 130/30 A (acc) - EUR 371,996.100 332,978.958 247,715.583 457,259.475JPM Europe Select 130/30 A (dist) - GBP - 586.331 - 586.331JPM Europe Select 130/30 A (acc) - USD - 348.676 - 348.676JPM Europe Select 130/30 D (acc) - EUR 371,996.100 188,041.757 329,562.571 230,475.286JPM Europe Select 130/30 D (acc) - USD - 348.676 - 348.676JPM Europe Select 130/30 X (acc) - EUR - 107,335.143 19,595.225 87,739.918
JPMorgan Funds - Europe Small Cap FundJPM Europe Small Cap A (acc) - EUR 5,087,078.651 1,557,693.592 4,662,525.394 1,982,246.849JPM Europe Small Cap A (dist) - EUR 15,761,936.577 5,569,625.818 11,809,405.297 9,522,157.098JF Europe Small Cap A (dist) - EUR 8,172,130.049 1,611,509.375 6,923,630.909 2,860,008.515JPM Europe Small Cap A (dist) - GBP 42,515.278 20,973.777 12,142.419 51,346.636JPM Europe Small Cap B (acc) - EUR 320,421.789 132,786.373 269,046.157 184,162.005JPM Europe Small Cap C (acc) - EUR 2,072,883.841 815,730.486 2,110,666.628 777,947.699JPM Europe Small Cap D (acc) - EUR 8,062,946.098 4,124,991.677 9,282,487.769 2,905,450.006JPM Europe Small Cap I (acc) - EUR 6,039,332.774 224,008.790 5,600,213.485 663,128.079JPM Europe Small Cap X (acc) - EUR 1,839,550.124 140,806.171 1,906,671.477 73,684.818
477
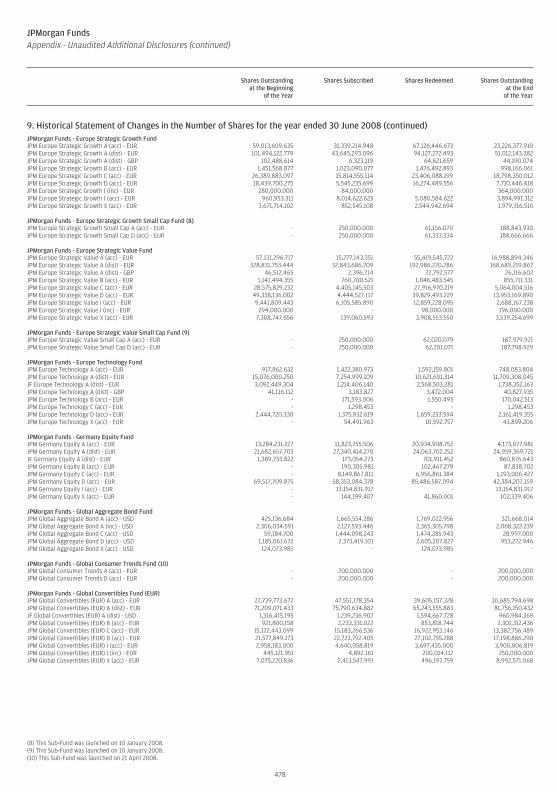
JPMorgan FundsAppendix - Unaudited Additional Disclosures (continued)
Shares Outstandingat the Beginning
of the Year
Shares Subscribed Shares Redeemed Shares Outstandingat the End
of the Year
9. Historical Statement of Changes in the Number of Shares for the year ended 30 June 2008 (continued)JPMorgan Funds - Europe Strategic Growth FundJPM Europe Strategic Growth A (acc) - EUR 59,013,609.635 31,339,214.948 67,126,446.673 23,226,377.910JPM Europe Strategic Growth A (dist) - EUR 101,494,122.779 43,645,293.096 94,127,272.493 51,012,143.382JPM Europe Strategic Growth A (dist) - GBP 102,488.614 6,323.119 64,621.659 44,190.074JPM Europe Strategic Growth B (acc) - EUR 1,451,568.877 1,023,090.077 1,476,492.893 998,166.061JPM Europe Strategic Growth C (acc) - EUR 26,389,883.097 15,814,555.114 23,406,088.199 18,798,350.012JPM Europe Strategic Growth D (acc) - EUR 18,439,700.275 5,545,235.699 16,274,489.556 7,710,446.418JPM Europe Strategic Growth I (inc) - EUR 280,000.000 84,000.000 - 364,000.000JPM Europe Strategic Growth I (acc) - EUR 960,953.311 8,014,622.623 5,080,584.622 3,894,991.312JPM Europe Strategic Growth X (acc) - EUR 3,671,714.102 852,545.108 2,544,942.694 1,979,316.516
JPMorgan Funds - Europe Strategic Growth Small Cap Fund (8)JPM Europe Strategic Growth Small Cap A (acc) - EUR - 250,000.000 61,156.070 188,843.930JPM Europe Strategic Growth Small Cap D (acc) - EUR - 250,000.000 61,333.334 188,666.666
JPMorgan Funds - Europe Strategic Value FundJPM Europe Strategic Value A (acc) - EUR 57,131,296.717 15,277,143.351 55,419,545.722 16,988,894.346JPM Europe Strategic Value A (dist) - EUR 328,831,753.444 32,843,686.709 192,986,220.286 168,689,219.867JPM Europe Strategic Value A (dist) - GBP 46,512.465 2,396.714 22,792.577 26,116.602JPM Europe Strategic Value B (acc) - EUR 1,141,494.355 760,700.521 1,046,483.545 855,711.331JPM Europe Strategic Value C (acc) - EUR 28,575,829.232 4,405,145.503 27,916,970.219 5,064,004.516JPM Europe Strategic Value D (acc) - EUR 49,338,136.002 4,444,527.117 39,829,493.229 13,953,169.890JPM Europe Strategic Value I (acc) - EUR 9,441,809.443 6,105,585.890 12,859,228.095 2,688,167.238JPM Europe Strategic Value I (inc) - EUR 294,000.000 - 98,000.000 196,000.000JPM Europe Strategic Value X (acc) - EUR 7,308,747.656 139,060.593 3,908,553.550 3,539,254.699
JPMorgan Funds - Europe Strategic Value Small Cap Fund (9)JPM Europe Strategic Value Small Cap A (acc) - EUR - 250,000.000 62,020.079 187,979.921JPM Europe Strategic Value Small Cap D (acc) - EUR - 250,000.000 62,201.071 187,798.929
JPMorgan Funds - Europe Technology FundJPM Europe Technology A (acc) - EUR 917,862.632 1,422,380.973 1,592,159.801 748,083.804JPM Europe Technology A (dist) - EUR 15,076,000.250 7,254,999.109 10,621,691.314 11,709,308.045JF Europe Technology A (dist) - EUR 3,092,449.304 1,214,406.140 2,568,503.281 1,738,352.163JPM Europe Technology A (dist) - GBP 41,116.112 3,183.827 3,472.004 40,827.935JPM Europe Technology B (acc) - EUR - 171,593.006 1,550.493 170,042.513JPM Europe Technology C (acc) - EUR - 1,298.453 - 1,298.453JPM Europe Technology D (acc) - EUR 2,444,720.330 1,375,932.619 1,659,233.594 2,161,419.355JPM Europe Technology X (acc) - EUR - 54,491.963 10,592.757 43,899.206
JPMorgan Funds - Germany Equity FundJPM Germany Equity A (acc) - EUR 13,284,231.227 11,823,755.506 20,934,908.752 4,173,077.981JPM Germany Equity A (dist) - EUR 21,682,657.703 27,340,414.270 24,063,702.252 24,959,369.721JF Germany Equity A (dist) - EUR 1,389,733.822 173,054.273 701,911.452 860,876.643JPM Germany Equity B (acc) - EUR - 190,305.981 102,467.279 87,838.702JPM Germany Equity C (acc) - EUR - 8,149,867.811 6,956,861.384 1,193,006.427JPM Germany Equity D (acc) - EUR 69,517,709.875 58,353,084.378 85,486,587.094 42,384,207.159JPM Germany Equity I (acc) - EUR - 13,154,831.917 - 13,154,831.917JPM Germany Equity X (acc) - EUR - 144,199.407 41,860.001 102,339.406
JPMorgan Funds - Global Aggregate Bond FundJPM Global Aggregate Bond A (acc) - USD 425,136.684 1,665,554.286 1,769,022.956 321,668.014JPM Global Aggregate Bond A (inc) - USD 2,306,034.591 2,127,593.446 2,365,305.798 2,068,322.239JPM Global Aggregate Bond C (acc) - USD 59,184.700 1,444,098.243 1,474,285.943 28,997.000JPM Global Aggregate Bond D (acc) - USD 1,185,061.672 2,373,419.101 2,605,207.827 953,272.946JPM Global Aggregate Bond X (acc) - USD 124,073.985 - 124,073.985 -
JPMorgan Funds - Global Consumer Trends Fund (10)JPM Global Consumer Trends A (acc) - EUR - 200,000.000 - 200,000.000JPM Global Consumer Trends D (acc) - EUR - 200,000.000 - 200,000.000
JPMorgan Funds - Global Convertibles Fund (EUR)JPM Global Convertibles (EUR) A (acc) - EUR 22,739,773.672 47,551,178.354 39,605,157.328 30,685,794.698JPM Global Convertibles (EUR) A (dist) - EUR 71,209,071.433 75,790,634.882 65,243,555.883 81,756,150.432JF Global Convertibles (EUR) A (dist) - USD 1,316,415.195 1,239,236.902 1,594,667.728 960,984.369JPM Global Convertibles (EUR) B (acc) - EUR 921,800.158 2,233,331.022 853,818.744 2,301,312.436JPM Global Convertibles (EUR) C (acc) - EUR 15,122,443.099 15,183,266.536 16,922,953.146 13,382,756.489JPM Global Convertibles (EUR) D (acc) - EUR 21,577,849.173 22,723,792.405 27,102,755.288 17,198,886.290JPM Global Convertibles (EUR) I (acc) - EUR 2,958,183.000 4,640,058.819 3,697,435.000 3,900,806.819JPM Global Convertibles (EUR) I (inc) - EUR 445,121.951 4,892.161 200,014.112 250,000.000JPM Global Convertibles (EUR) X (acc) - EUR 7,075,220.836 2,413,547.991 496,197.759 8,992,571.068
(8) This Sub-Fund was launched on 10 January 2008.(9) This Sub-Fund was launched on 10 January 2008.(10) This Sub-Fund was launched on 21 April 2008.
478
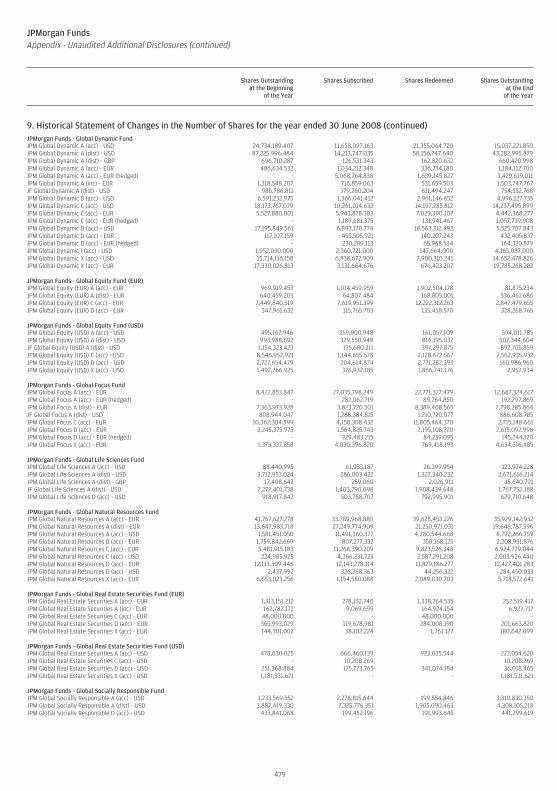
JPMorgan FundsAppendix - Unaudited Additional Disclosures (continued)
Shares Outstandingat the Beginning
of the Year
Shares Subscribed Shares Redeemed Shares Outstandingat the End
of the Year
9. Historical Statement of Changes in the Number of Shares for the year ended 30 June 2008 (continued)JPMorgan Funds - Global Dynamic FundJPM Global Dynamic A (acc) - USD 24,734,189.407 11,658,097.163 21,355,064.720 15,037,221.850JPM Global Dynamic A (dist) - USD 87,225,996.484 14,213,747.035 58,156,747.640 43,282,995.879JPM Global Dynamic A (dist) - GBP 696,710.287 126,531.343 162,820.632 660,420.998JPM Global Dynamic A (acc) - EUR 486,634.532 1,034,212.348 336,734.180 1,184,112.700JPM Global Dynamic A (acc) - EUR (hedged) - 5,068,764.838 1,639,145.827 3,429,619.011JPM Global Dynamic A (inc) - EUR 1,318,548.207 716,859.063 531,659.503 1,503,747.767JF Global Dynamic A (dist) - USD 986,786.811 379,260.204 611,494.247 754,552.768JPM Global Dynamic B (acc) - USD 6,591,232.975 1,366,041.412 2,961,146.652 4,996,127.735JPM Global Dynamic C (acc) - USD 18,173,767.079 10,261,014.632 14,197,285.812 14,237,495.899JPM Global Dynamic C (acc) - EUR 5,527,880.001 5,943,878.383 7,029,390.107 4,442,368.277JPM Global Dynamic C (acc) - EUR (hedged) - 1,189,681.375 131,941.467 1,057,739.908JPM Global Dynamic D (acc) - USD 17,195,849.561 6,893,170.774 18,563,312.492 5,525,707.843JPM Global Dynamic D (acc) - EUR 117,107.159 455,505.921 140,207.243 432,405.837JPM Global Dynamic D (acc) - EUR (hedged) - 230,289.113 65,968.534 164,320.579JPM Global Dynamic I (acc) - USD 1,952,030.000 2,360,721.000 147,664.000 4,165,087.000JPM Global Dynamic X (acc) - USD 15,714,116.158 6,838,672.909 7,900,310.241 14,652,478.826JPM Global Dynamic X (acc) - EUR 17,330,026.813 3,131,664.676 676,423.207 19,785,268.282
JPMorgan Funds - Global Equity Fund (EUR)JPM Global Equity (EUR) A (acc) - EUR 969,919.453 1,014,459.959 1,902,504.178 81,875.234JPM Global Equity (EUR) A (dist) - EUR 640,459.203 64,807.484 168,805.001 536,461.686JPM Global Equity (EUR) C (acc) - EUR 7,449,840.519 7,619,951.399 12,222,312.263 2,847,479.655JPM Global Equity (EUR) D (acc) - EUR 347,961.632 115,765.703 135,458.570 328,268.765
JPMorgan Funds - Global Equity Fund (USD)JPM Global Equity (USD) A (acc) - USD 495,167.946 259,900.948 161,057.109 594,011.785JPM Global Equity (USD) A (dist) - USD 993,988.692 329,550.949 816,195.037 507,344.604JF Global Equity (USD) A (dist) - USD 1,154,323.423 135,680.311 397,297.875 892,705.859JPM Global Equity (USD) C (acc) - USD 8,546,952.921 1,144,655.578 2,128,672.567 7,562,935.932JPM Global Equity (USD) D (acc) - USD 2,727,654.479 204,614.874 2,771,282.393 160,986.960JPM Global Equity (USD) X (acc) - USD 1,492,766.925 376,932.185 1,866,741.176 2,957.934
JPMorgan Funds - Global Focus FundJPM Global Focus A (acc) - EUR 8,422,853.847 27,035,798.249 22,771,327.479 12,687,324.617JPM Global Focus A (acc) - EUR (hedged) - 282,062.719 89,764.850 192,297.869JPM Global Focus A (dist) - EUR 7,363,973.928 3,823,720.501 8,389,408.565 2,798,285.864JF Global Focus A (dist) - USD 808,944.047 1,288,384.815 1,210,720.077 886,608.785JPM Global Focus C (acc) - EUR 10,362,304.599 4,158,308.432 11,805,464.370 2,715,148.661JPM Global Focus D (acc) - EUR 3,245,375.975 1,564,825.743 2,195,108.720 2,615,092.998JPM Global Focus D (acc) - EUR (hedged) - 229,483.215 84,239.095 145,244.120JPM Global Focus X (acc) - EUR 1,373,337.858 4,030,396.820 769,418.193 4,634,316.485
JPMorgan Funds - Global Life Sciences FundJPM Global Life Sciences A (acc) - USD 88,440.995 61,933.187 26,399.954 123,974.228JPM Global Life Sciences A (dist) - USD 3,712,953.024 286,003.422 1,327,340.232 2,671,616.214JPM Global Life Sciences A (dist) - GBP 17,408.642 259.060 2,026.911 15,640.791JF Global Life Sciences A (dist) - USD 2,272,401.738 1,403,790.098 1,908,439.648 1,767,752.188JPM Global Life Sciences D (acc) - USD 918,917.842 503,788.707 792,995.901 629,710.648
JPMorgan Funds - Global Natural Resources FundJPM Global Natural Resources A (acc) - EUR 41,767,627.278 33,789,968.880 39,628,453.226 35,929,142.932JPM Global Natural Resources A (dist) - EUR 13,647,983.718 27,249,774.909 21,250,971.031 19,646,787.596JPM Global Natural Resources A (acc) - USD 1,581,451.050 11,491,360.377 4,280,544.668 8,792,266.759JPM Global Natural Resources B (acc) - EUR 1,759,842.669 807,277.332 358,168.125 2,208,951.876JPM Global Natural Resources C (acc) - EUR 5,481,915.183 11,266,390.209 9,823,526.348 6,924,779.044JPM Global Natural Resources C (acc) - USD 224,985.925 4,366,231.723 2,587,291.208 2,003,926.440JPM Global Natural Resources D (acc) - EUR 12,113,309.446 12,143,278.114 11,829,186.277 12,427,401.283JPM Global Natural Resources D (acc) - USD 2,437.992 326,268.363 44,256.322 284,450.033JPM Global Natural Resources X (acc) - EUR 6,653,023.256 1,154,580.088 2,089,030.703 5,718,572.641
JPMorgan Funds - Global Real Estate Securities Fund (EUR)JPM Global Real Estate Securities A (acc) - EUR 1,313,151.212 278,132.740 1,338,764.535 252,519.417JPM Global Real Estate Securities A (inc) - EUR 162,782.172 9,069.699 164,924.154 6,927.717JPM Global Real Estate Securities C (acc) - EUR 48,000.000 - 48,000.000 -JPM Global Real Estate Securities D (acc) - EUR 365,993.029 119,678.981 284,008.190 201,663.820JPM Global Real Estate Securities X (acc) - EUR 144,301.002 38,102.224 1,761.127 180,642.099
JPMorgan Funds - Global Real Estate Securities Fund (USD)JPM Global Real Estate Securities A (acc) - USD 478,630.025 666,460.139 923,035.544 222,054.620JPM Global Real Estate Securities C (acc) - USD - 10,208.269 - 10,208.269JPM Global Real Estate Securities D (acc) - USD 251,368.884 125,723.765 341,074.184 36,018.465JPM Global Real Estate Securities X (acc) - USD 1,181,531.621 - - 1,181,531.621
JPMorgan Funds - Global Socially Responsible FundJPM Global Socially Responsible A (acc) - USD 1,233,569.552 2,276,815.644 199,554.846 3,310,830.350JPM Global Socially Responsible A (dist) - USD 3,887,419.330 2,325,776.351 1,905,090.463 4,308,105.218JPM Global Socially Responsible D (acc) - USD 433,841.068 199,452.196 191,993.645 441,299.619
479
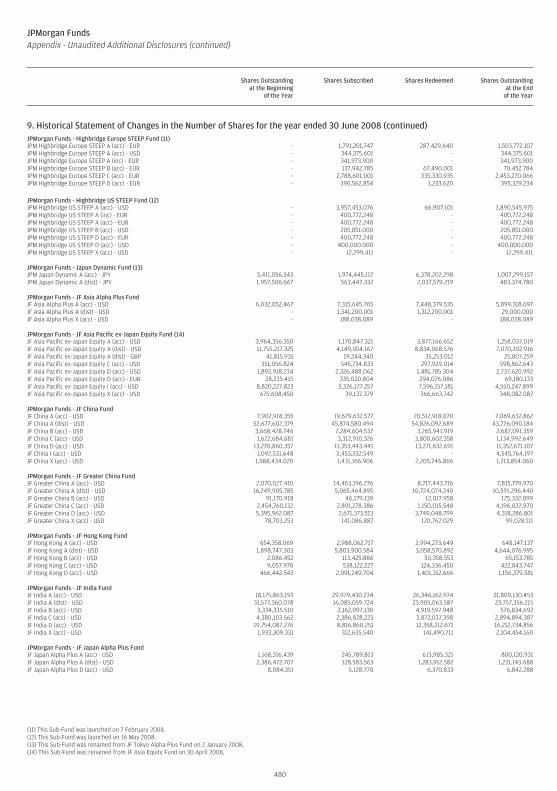
JPMorgan FundsAppendix - Unaudited Additional Disclosures (continued)
Shares Outstandingat the Beginning
of the Year
Shares Subscribed Shares Redeemed Shares Outstandingat the End
of the Year
9. Historical Statement of Changes in the Number of Shares for the year ended 30 June 2008 (continued)JPMorgan Funds - Highbridge Europe STEEP Fund (11)JPM Highbridge Europe STEEP A (acc) - EUR - 1,791,201.747 287,429.640 1,503,772.107JPM Highbridge Europe STEEP A (acc) - USD - 344,375.601 - 344,375.601JPM Highbridge Europe STEEP A (inc) - EUR - 341,973.900 - 341,973.900JPM Highbridge Europe STEEP B (acc) - EUR - 137,942.785 67,490.001 70,452.784JPM Highbridge Europe STEEP C (acc) - EUR - 2,788,601.001 335,330.935 2,453,270.066JPM Highbridge Europe STEEP D (acc) - EUR - 396,562.854 1,233.620 395,329.234
JPMorgan Funds - Highbridge US STEEP Fund (12)JPM Highbridge US STEEP A (acc) - USD - 3,957,453.076 66,907.101 3,890,545.975JPM Highbridge US STEEP A (inc) - EUR - 400,772.248 - 400,772.248JPM Highbridge US STEEP A (acc) - EUR - 400,772.248 - 400,772.248JPM Highbridge US STEEP B (acc) - USD - 205,851.000 - 205,851.000JPM Highbridge US STEEP D (acc) - EUR - 400,772.248 - 400,772.248JPM Highbridge US STEEP D (acc) - USD - 400,000.000 - 400,000.000JPM Highbridge US STEEP X (acc) - USD - 12,299.411 - 12,299.411
JPMorgan Funds - Japan Dynamic Fund (13)JPM Japan Dynamic A (acc) - JPY 5,411,056.343 1,974,445.112 6,378,202.298 1,007,299.157JPM Japan Dynamic A (dist) - JPY 1,957,506.667 563,447.332 2,037,579.219 483,374.780
JPMorgan Funds - JF Asia Alpha Plus FundJF Asia Alpha Plus A (acc) - USD 6,032,052.467 7,315,645.765 7,448,379.535 5,899,318.697JF Asia Alpha Plus A (dist) - USD - 1,341,200.001 1,312,200.001 29,000.000JF Asia Alpha Plus X (acc) - USD - 188,038.089 - 188,038.089
JPMorgan Funds - JF Asia Pacific ex-Japan Equity Fund (14)JF Asia Pacific ex-Japan Equity A (acc) - USD 3,964,356.350 1,170,847.321 3,877,166.652 1,258,037.019JF Asia Pacific ex-Japan Equity A (dist) - USD 11,755,217.325 4,149,054.167 8,834,068.576 7,070,202.916JF Asia Pacific ex-Japan Equity A (dist) - GBP 41,815.931 19,244.340 35,253.012 25,807.259JF Asia Pacific ex-Japan Equity C (acc) - USD 351,056.824 545,734.833 297,929.014 598,862.643JF Asia Pacific ex-Japan Equity D (acc) - USD 1,892,918.234 2,326,488.062 1,481,785.304 2,737,620.992JF Asia Pacific ex-Japan Equity D (acc) - EUR 28,235.415 335,020.804 294,076.086 69,180.133JF Asia Pacific ex-Japan Equity I (acc) - USD 8,820,227.823 3,326,177.257 7,596,157.181 4,550,247.899JF Asia Pacific ex-Japan Equity X (acc) - USD 675,608.450 39,137.379 366,663.742 348,082.087
JPMorgan Funds - JF China FundJF China A (acc) - USD 7,902,918.355 19,679,632.577 20,512,918.070 7,069,632.862JF China A (dist) - USD 52,677,602.379 45,874,580.494 54,826,092.689 43,726,090.184JF China B (acc) - USD 3,668,428.746 2,284,604.532 3,265,941.919 2,687,091.359JF China C (acc) - USD 1,622,684.681 3,312,910.326 3,800,602.358 1,134,992.649JF China D (acc) - USD 13,270,860.357 11,353,443.441 13,271,632.691 11,352,671.107JF China I (acc) - USD 1,092,531.648 3,453,232.549 - 4,545,764.197JF China X (acc) - USD 1,988,434.020 1,431,166.906 2,205,746.866 1,213,854.060
JPMorgan Funds - JF Greater China FundJF Greater China A (acc) - USD 2,070,027.410 14,463,196.276 8,717,443.716 7,815,779.970JF Greater China A (dist) - USD 16,249,905.785 5,065,464.895 10,724,074.240 10,591,296.440JF Greater China B (acc) - USD 91,170.918 46,179.139 12,017.958 125,332.099JF Greater China C (acc) - USD 2,454,760.132 2,891,278.386 1,150,015.548 4,196,022.970JF Greater China D (acc) - USD 5,395,962.087 2,671,373.513 3,749,048.799 4,318,286.801JF Greater China X (acc) - USD 78,703.253 141,086.887 120,762.029 99,028.111
JPMorgan Funds - JF Hong Kong FundJF Hong Kong A (acc) - USD 654,358.069 2,988,062.717 2,994,273.649 648,147.137JF Hong Kong A (dist) - USD 1,898,747.303 5,803,900.584 3,058,570.892 4,644,076.995JF Hong Kong B (acc) - USD 2,086.452 113,425.886 50,358.553 65,153.785JF Hong Kong C (acc) - USD 9,057.970 538,122.227 124,336.450 422,843.747JF Hong Kong D (acc) - USD 466,442.543 2,091,249.704 1,401,312.666 1,156,379.581
JPMorgan Funds - JF India FundJF India A (acc) - USD 18,175,863.193 29,979,430.234 26,346,162.974 21,809,130.453JF India A (dist) - USD 31,577,360.078 16,085,059.724 23,905,063.587 23,757,356.215JF India B (acc) - USD 3,334,335.510 2,162,097.130 4,919,597.948 576,834.692JF India C (acc) - USD 4,380,103.562 2,386,828.223 3,872,037.398 2,894,894.387JF India D (acc) - USD 19,754,087.276 8,816,860.251 12,358,212.671 16,212,734.856JF India X (acc) - USD 1,933,309.331 312,635.540 141,490.711 2,104,454.160
JPMorgan Funds - JF Japan Alpha Plus FundJF Japan Alpha Plus A (acc) - USD 1,168,316.439 245,789.813 613,985.321 800,120.931JF Japan Alpha Plus A (dist) - USD 2,386,472.707 128,583.563 1,283,912.582 1,231,143.688JF Japan Alpha Plus D (acc) - USD 8,084.351 5,128.770 6,370.833 6,842.288
(11) This Sub-Fund was launched on 7 February 2008.(12) This Sub-Fund was launched on 16 May 2008.(13) This Sub-Fund was renamed from JF Tokyo Alpha Plus Fund on 2 January 2008.(14) This Sub-Fund was renamed from JF Asia Equity Fund on 30 April 2008.
480
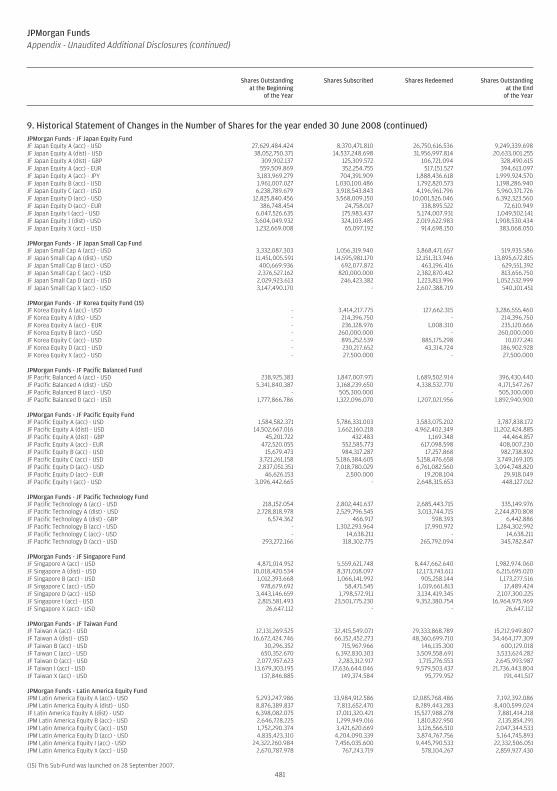
JPMorgan FundsAppendix - Unaudited Additional Disclosures (continued)
Shares Outstandingat the Beginning
of the Year
Shares Subscribed Shares Redeemed Shares Outstandingat the End
of the Year
9. Historical Statement of Changes in the Number of Shares for the year ended 30 June 2008 (continued)JPMorgan Funds - JF Japan Equity FundJF Japan Equity A (acc) - USD 27,629,484.424 8,370,471.810 26,750,616.536 9,249,339.698JF Japan Equity A (dist) - USD 38,052,750.371 14,537,248.698 31,956,997.814 20,633,001.255JF Japan Equity A (dist) - GBP 309,902.137 125,309.572 106,721.094 328,490.615JF Japan Equity A (acc) - EUR 559,509.869 352,254.755 517,151.527 394,613.097JF Japan Equity A (acc) - JPY 3,183,969.279 704,391.909 1,888,436.618 1,999,924.570JF Japan Equity B (acc) - USD 1,961,007.027 1,030,100.486 1,792,820.573 1,198,286.940JF Japan Equity C (acc) - USD 6,238,789.679 3,918,543.843 4,196,961.796 5,960,371.726JF Japan Equity D (acc) - USD 12,825,840.456 3,568,009.150 10,001,526.046 6,392,323.560JF Japan Equity D (acc) - EUR 386,748.454 24,758.017 338,895.522 72,610.949JF Japan Equity I (acc) - USD 6,047,526.635 175,983.437 5,174,007.931 1,049,502.141JF Japan Equity J (dist) - USD 3,604,049.932 324,103.485 2,019,622.983 1,908,530.434JF Japan Equity X (acc) - USD 1,232,669.008 65,097.192 914,698.150 383,068.050
JPMorgan Funds - JF Japan Small Cap FundJF Japan Small Cap A (acc) - USD 3,332,087.303 1,056,319.940 3,868,471.657 519,935.586JF Japan Small Cap A (dist) - USD 11,451,005.591 14,595,981.170 12,151,313.946 13,895,672.815JF Japan Small Cap B (acc) - USD 400,669.936 692,077.872 463,196.416 629,551.392JF Japan Small Cap C (acc) - USD 2,376,527.162 820,000.000 2,382,870.412 813,656.750JF Japan Small Cap D (acc) - USD 2,029,923.613 246,423.382 1,223,813.996 1,052,532.999JF Japan Small Cap X (acc) - USD 3,147,490.170 - 2,607,388.719 540,101.451
JPMorgan Funds - JF Korea Equity Fund (15)JF Korea Equity A (acc) - USD - 3,414,217.775 127,662.315 3,286,555.460JF Korea Equity A (dis) - USD - 214,396.750 - 214,396.750JF Korea Equity A (acc) - EUR - 236,128.976 1,008.310 235,120.666JF Korea Equity B (acc) - USD - 260,000.000 - 260,000.000JF Korea Equity C (acc) - USD - 895,252.539 885,175.298 10,077.241JF Korea Equity D (acc) - USD - 230,217.652 43,314.724 186,902.928JF Korea Equity X (acc) - USD - 27,500.000 - 27,500.000
JPMorgan Funds - JF Pacific Balanced FundJF Pacific Balanced A (acc) - USD 238,925.383 1,847,007.971 1,689,502.914 396,430.440JF Pacific Balanced A (dist) - USD 5,341,840.387 3,168,239.650 4,338,532.770 4,171,547.267JF Pacific Balanced B (acc) - USD - 505,300.000 - 505,300.000JF Pacific Balanced D (acc) - USD 1,777,866.786 1,322,096.070 1,207,021.956 1,892,940.900
JPMorgan Funds - JF Pacific Equity FundJF Pacific Equity A (acc) - USD 1,584,582.371 5,786,331.003 3,583,075.202 3,787,838.172JF Pacific Equity A (dist) - USD 14,502,667.016 1,662,160.218 4,962,402.349 11,202,424.885JF Pacific Equity A (dist) - GBP 45,201.722 432.483 1,169.348 44,464.857JF Pacific Equity A (acc) - EUR 472,520.055 552,585.773 617,098.598 408,007.230JF Pacific Equity B (acc) - USD 15,679.473 984,317.287 17,257.868 982,738.892JF Pacific Equity C (acc) - USD 3,721,261.158 5,186,384.605 5,158,476.658 3,749,169.105JF Pacific Equity D (acc) - USD 2,837,051.351 7,018,780.029 6,761,082.560 3,094,748.820JF Pacific Equity D (acc) - EUR 46,626.153 2,500.000 19,208.104 29,918.049JF Pacific Equity I (acc) - USD 3,096,442.665 - 2,648,315.653 448,127.012
JPMorgan Funds - JF Pacific Technology FundJF Pacific Technology A (acc) - USD 218,152.054 2,802,441.637 2,685,443.715 335,149.976JF Pacific Technology A (dist) - USD 2,728,818.978 2,529,796.545 3,013,744.715 2,244,870.808JF Pacific Technology A (dist) - GBP 6,574.362 466.917 598.393 6,442.886JF Pacific Technology B (acc) - USD - 1,302,293.964 17,990.972 1,284,302.992JF Pacific Technology C (acc) - USD - 14,638.211 - 14,638.211JF Pacific Technology D (acc) - USD 293,272.166 318,302.775 265,792.094 345,782.847
JPMorgan Funds - JF Singapore FundJF Singapore A (acc) - USD 4,871,014.952 5,559,621.748 8,447,662.640 1,982,974.060JF Singapore A (dist) - USD 10,018,420.534 8,371,018.097 12,173,743.611 6,215,695.020JF Singapore B (acc) - USD 1,012,393.668 1,066,141.992 905,258.144 1,173,277.516JF Singapore C (acc) - USD 978,679.692 58,471.545 1,019,661.813 17,489.424JF Singapore D (acc) - USD 3,443,146.659 1,798,572.911 3,134,419.345 2,107,300.225JF Singapore I (acc) - USD 2,815,581.493 23,501,775.230 9,352,380.754 16,964,975.969JF Singapore X (acc) - USD 26,647.112 - - 26,647.112
JPMorgan Funds - JF Taiwan FundJF Taiwan A (acc) - USD 12,131,269.525 32,415,549.071 29,333,868.789 15,212,949.807JF Taiwan A (dist) - USD 16,672,424.746 66,152,452.273 48,360,699.710 34,464,177.309JF Taiwan B (acc) - USD 30,296.352 715,967.966 146,135.300 600,129.018JF Taiwan C (acc) - USD 650,352.670 6,392,830.303 3,509,558.691 3,533,624.282JF Taiwan D (acc) - USD 2,077,957.623 2,283,312.917 1,715,276.553 2,645,993.987JF Taiwan I (acc) - USD 13,679,303.195 17,636,644.046 9,579,503.437 21,736,443.804JF Taiwan X (acc) - USD 137,846.885 149,374.584 95,779.952 191,441.517
JPMorgan Funds - Latin America Equity FundJPM Latin America Equity A (acc) - USD 5,293,247.986 13,984,912.586 12,085,768.486 7,192,392.086JPM Latin America Equity A (dist) - USD 8,876,389.837 7,813,652.470 8,289,443.283 8,400,599.024JF Latin America Equity A (dist) - USD 6,398,082.075 17,011,320.421 15,527,988.278 7,881,414.218JPM Latin America Equity B (acc) - USD 2,646,728.225 1,299,949.016 1,810,822.950 2,135,854.291JPM Latin America Equity C (acc) - USD 1,752,290.374 3,421,620.669 3,126,566.510 2,047,344.533JPM Latin America Equity D (acc) - USD 4,835,423.310 4,204,090.339 3,874,767.756 5,164,745.893JPM Latin America Equity I (acc) - USD 24,322,260.984 7,456,035.600 9,445,790.533 22,332,506.051JPM Latin America Equity X (acc) - USD 2,670,787.978 767,243.719 578,104.267 2,859,927.430
(15) This Sub-Fund was launched on 28 September 2007.
481
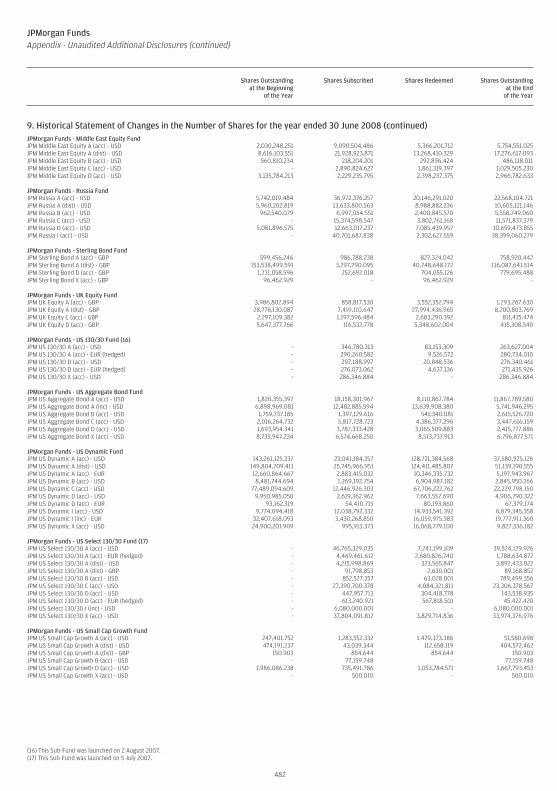
JPMorgan FundsAppendix - Unaudited Additional Disclosures (continued)
Shares Outstandingat the Beginning
of the Year
Shares Subscribed Shares Redeemed Shares Outstandingat the End
of the Year
9. Historical Statement of Changes in the Number of Shares for the year ended 30 June 2008 (continued)JPMorgan Funds - Middle East Equity FundJPM Middle East Equity A (acc) - USD 2,030,248.251 9,090,504.486 5,366,201.712 5,754,551.025JPM Middle East Equity A (dist) - USD 8,616,103.551 21,928,923.871 13,268,410.329 17,276,617.093JPM Middle East Equity B (acc) - USD 560,810.234 218,204.201 292,896.424 486,118.011JPM Middle East Equity C (acc) - USD - 2,890,824.627 1,861,319.397 1,029,505.230JPM Middle East Equity D (acc) - USD 3,135,784.213 2,229,235.795 2,398,237.375 2,966,782.633
JPMorgan Funds - Russia FundJPM Russia A (acc) - USD 5,742,019.484 36,972,376.257 20,146,291.020 22,568,104.721JPM Russia A (dist) - USD 5,960,202.819 13,633,800.563 8,988,882.236 10,605,121.146JPM Russia B (acc) - USD 962,540.079 6,997,054.551 2,400,845.570 5,558,749.060JPM Russia C (acc) - USD - 15,374,598.547 3,802,761.168 11,571,837.379JPM Russia D (acc) - USD 5,081,896.575 12,663,017.237 7,085,439.957 10,659,473.855JPM Russia I (acc) - USD - 40,701,687.838 2,302,627.559 38,399,060.279
JPMorgan Funds - Sterling Bond FundJPM Sterling Bond A (acc) - GBP 599,456.246 986,788.238 827,324.042 758,920.442JPM Sterling Bond A (dist) - GBP 153,538,499.591 3,297,790.095 40,748,648.172 116,087,641.514JPM Sterling Bond D (acc) - GBP 1,231,058.596 252,692.018 704,055.126 779,695.488JPM Sterling Bond X (acc) - GBP 96,462.929 - 96,462.929 -
JPMorgan Funds - UK Equity FundJPM UK Equity A (acc) - GBP 3,986,802.894 858,817.530 3,552,352.794 1,293,267.630JPM UK Equity A (dist) - GBP 28,776,130.087 7,419,110.647 27,994,436.965 8,200,803.769JPM UK Equity C (acc) - GBP 2,297,109.382 1,197,596.484 2,683,290.392 811,415.474JPM UK Equity D (acc) - GBP 5,647,377.766 116,532.778 5,348,602.004 415,308.540
JPMorgan Funds - US 130/30 Fund (16)JPM US 130/30 A (acc) - USD - 346,780.313 83,153.309 263,627.004JPM US 130/30 A (acc) - EUR (hedged) - 290,260.582 9,526.572 280,734.010JPM US 130/30 D (acc) - USD - 297,188.997 20,848.536 276,340.461JPM US 130/30 D (acc) - EUR (hedged) - 276,073.062 4,637.136 271,435.926JPM US 130/30 X (acc) - USD - 286,346.884 - 286,346.884
JPMorgan Funds - US Aggregate Bond FundJPM US Aggregate Bond A (acc) - USD 1,820,355.397 18,158,301.967 8,110,867.784 11,867,789.580JPM US Aggregate Bond A (inc) - USD 6,898,969.081 12,482,885.594 13,639,908.380 5,741,946.295JPM US Aggregate Bond B (acc) - USD 1,759,737.185 1,397,129.616 541,340.081 2,615,526.720JPM US Aggregate Bond C (acc) - USD 2,016,264.732 5,817,728.723 4,386,377.296 3,447,616.159JPM US Aggregate Bond D (acc) - USD 1,693,954.341 3,787,333.428 3,065,509.883 2,415,777.886JPM US Aggregate Bond X (acc) - USD 8,735,947.234 6,574,668.250 8,513,737.913 6,796,877.571
JPMorgan Funds - US Dynamic FundJPM US Dynamic A (acc) - USD 143,261,125.337 23,041,184.357 128,721,384.568 37,580,925.126JPM US Dynamic A (dist) - USD 149,804,709.411 25,745,966.951 124,411,485.807 51,139,190.555JPM US Dynamic A (acc) - EUR 12,660,864.667 2,883,415.032 10,346,335.732 5,197,943.967JPM US Dynamic B (acc) - USD 8,481,744.694 1,269,192.754 6,904,987.182 2,845,950.266JPM US Dynamic C (acc) - USD 77,489,094.609 12,446,926.303 67,706,222.762 22,229,798.150JPM US Dynamic D (acc) - USD 9,950,985.050 2,619,362.962 7,663,557.690 4,906,790.322JPM US Dynamic D (acc) - EUR 93,162.319 54,410.715 80,193.860 67,379.174JPM US Dynamic I (acc) - USD 9,774,094.418 12,038,792.332 14,933,541.392 6,879,345.358JPM US Dynamic I (inc) - EUR 32,407,618.093 3,430,268.850 16,059,975.583 19,777,911.360JPM US Dynamic X (acc) - USD 24,900,201.909 995,913.373 16,068,779.100 9,827,336.182
JPMorgan Funds - US Select 130/30 Fund (17)JPM US Select 130/30 A (acc) - USD - 46,765,329.035 7,241,199.109 39,524,129.926JPM US Select 130/30 A (acc) - EUR (hedged) - 4,469,461.612 2,680,826.740 1,788,634.872JPM US Select 130/30 A (dist) - USD - 4,215,998.869 323,565.847 3,892,433.022JPM US Select 130/30 A (dist) - GBP - 91,798.853 2,630.001 89,168.852JPM US Select 130/30 B (acc) - USD - 852,527.357 63,028.001 789,499.356JPM US Select 130/30 C (acc) - USD - 27,390,700.378 4,084,321.811 23,306,378.567JPM US Select 130/30 D (acc) - USD - 447,957.713 304,418.778 143,538.935JPM US Select 130/30 D (acc) - EUR (hedged) - 613,240.921 567,818.501 45,422.420JPM US Select 130/30 I (inc) - USD - 6,080,000.001 - 6,080,000.001JPM US Select 130/30 X (acc) - USD - 37,804,091.812 3,829,714.836 33,974,376.976
JPMorgan Funds - US Small Cap Growth FundJPM US Small Cap Growth A (acc) - USD 247,401.752 1,283,552.332 1,479,373.386 51,580.698JPM US Small Cap Growth A (dist) - USD 474,191.237 43,039.344 112,658.119 404,572.462JPM US Small Cap Growth A (dist) - GBP 150.903 854.644 854.644 150.903JPM US Small Cap Growth B (acc) - USD - 77,159.748 - 77,159.748JPM US Small Cap Growth D (acc) - USD 1,986,086.238 735,491.786 1,053,784.571 1,667,793.453JPM US Small Cap Growth X (acc) - USD - 500.010 - 500.010
(16) This Sub-Fund was launched on 2 August 2007.(17) This Sub-Fund was launched on 5 July 2007.
482
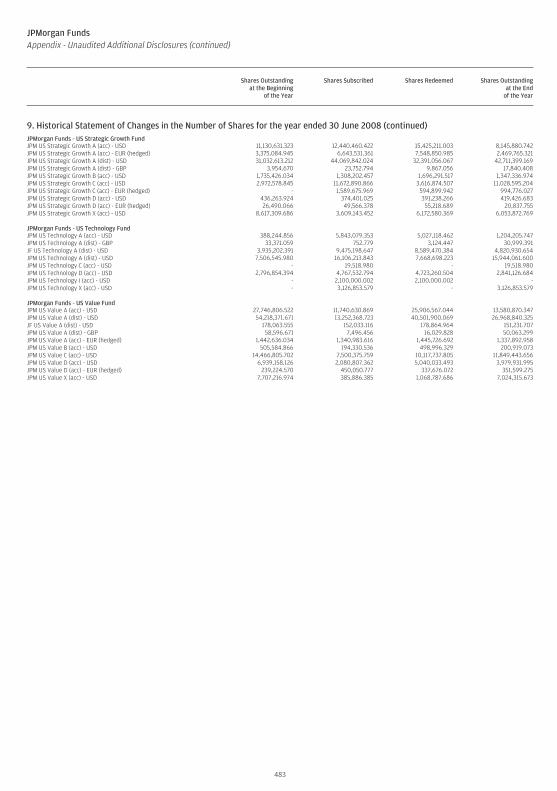
JPMorgan FundsAppendix - Unaudited Additional Disclosures (continued)
Shares Outstandingat the Beginning
of the Year
Shares Subscribed Shares Redeemed Shares Outstandingat the End
of the Year
9. Historical Statement of Changes in the Number of Shares for the year ended 30 June 2008 (continued)JPMorgan Funds - US Strategic Growth FundJPM US Strategic Growth A (acc) - USD 11,130,631.323 12,440,460.422 15,425,211.003 8,145,880.742JPM US Strategic Growth A (acc) - EUR (hedged) 3,375,084.945 6,643,531.361 7,548,850.985 2,469,765.321JPM US Strategic Growth A (dist) - USD 31,032,613.212 44,069,842.024 32,391,056.067 42,711,399.169JPM US Strategic Growth A (dist) - GBP 3,954.670 23,752.794 9,867.056 17,840.408JPM US Strategic Growth B (acc) - USD 1,735,426.034 1,308,202.457 1,696,291.517 1,347,336.974JPM US Strategic Growth C (acc) - USD 2,972,578.845 11,672,890.866 3,616,874.507 11,028,595.204JPM US Strategic Growth C (acc) - EUR (hedged) - 1,589,675.969 594,899.942 994,776.027JPM US Strategic Growth D (acc) - USD 436,263.924 374,401.025 391,238.266 419,426.683JPM US Strategic Growth D (acc) - EUR (hedged) 26,490.066 49,566.378 55,218.689 20,837.755JPM US Strategic Growth X (acc) - USD 8,617,309.686 3,609,143.452 6,172,580.369 6,053,872.769
JPMorgan Funds - US Technology FundJPM US Technology A (acc) - USD 388,244.856 5,843,079.353 5,027,118.462 1,204,205.747JPM US Technology A (dist) - GBP 33,371.059 752.779 3,124.447 30,999.391JF US Technology A (dist) - USD 3,935,202.391 9,475,198.647 8,589,470.384 4,820,930.654JPM US Technology A (dist) - USD 7,506,545.980 16,106,213.843 7,668,698.223 15,944,061.600JPM US Technology C (acc) - USD - 19,518.980 - 19,518.980JPM US Technology D (acc) - USD 2,796,854.394 4,767,532.794 4,723,260.504 2,841,126.684JPM US Technology I (acc) - USD - 2,100,000.002 2,100,000.002 -JPM US Technology X (acc) - USD - 3,126,853.579 - 3,126,853.579
JPMorgan Funds - US Value FundJPM US Value A (acc) - USD 27,746,806.522 11,740,630.869 25,906,567.044 13,580,870.347JPM US Value A (dist) - USD 54,218,371.671 13,252,368.723 40,501,900.069 26,968,840.325JF US Value A (dist) - USD 178,063.555 152,033.116 178,864.964 151,231.707JPM US Value A (dist) - GBP 58,596.671 7,496.456 16,029.828 50,063.299JPM US Value A (acc) - EUR (hedged) 1,442,636.034 1,340,983.616 1,445,726.692 1,337,892.958JPM US Value B (acc) - USD 505,584.866 194,330.536 498,996.329 200,919.073JPM US Value C (acc) - USD 14,466,805.702 7,500,375.759 10,117,737.805 11,849,443.656JPM US Value D (acc) - USD 6,939,158.126 2,080,807.362 5,040,033.493 3,979,931.995JPM US Value D (acc) - EUR (hedged) 239,224.570 450,050.777 337,676.072 351,599.275JPM US Value X (acc) - USD 7,707,216.974 385,886.385 1,068,787.686 7,024,315.673
483
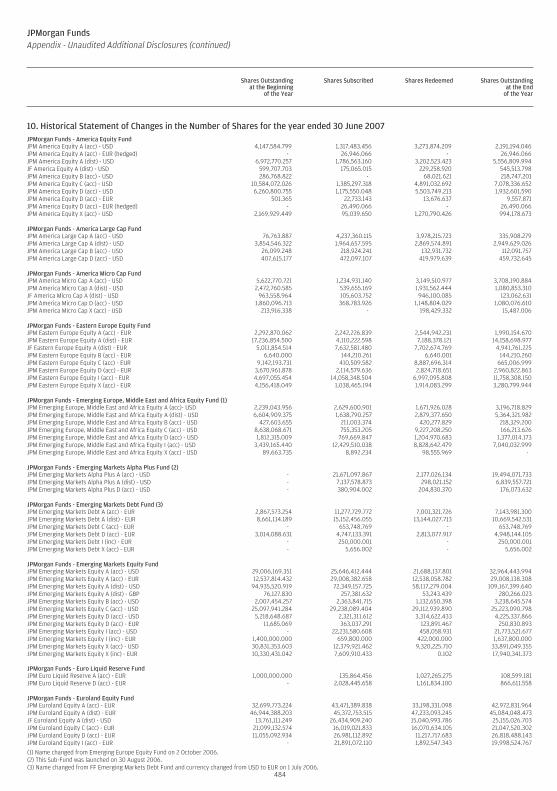
JPMorgan FundsAppendix - Unaudited Additional Disclosures (continued)
Shares Outstandingat the Beginning
of the Year
Shares Subscribed Shares Redeemed Shares Outstandingat the End
of the Year
10. Historical Statement of Changes in the Number of Shares for the year ended 30 June 2007 (continued)JPMorgan Funds - America Equity FundJPM America Equity A (acc) - USD 4,147,584.799 1,317,483.456 3,273,874.209 2,191,194.046JPM America Equity A (acc) - EUR (hedged) - 26,946.066 - 26,946.066JPM America Equity A (dist) - USD 6,972,770.257 1,786,563.160 3,202,523.423 5,556,809.994JF America Equity A (dist) - USD 599,707.703 175,065.015 229,258.920 545,513.798JPM America Equity B (acc) - USD 286,768.822 - 68,021.621 218,747.201JPM America Equity C (acc) - USD 10,584,072.026 1,385,297.318 4,891,032.692 7,078,336.652JPM America Equity D (acc) - USD 6,260,800.755 1,175,550.048 5,503,749.213 1,932,601.590JPM America Equity D (acc) - EUR 501.365 22,733.143 13,676.637 9,557.871JPM America Equity D (acc) - EUR (hedged) - 26,490.066 - 26,490.066JPM America Equity X (acc) - USD 2,169,929.449 95,039.650 1,270,790.426 994,178.673
JPMorgan Funds - America Large Cap FundJPM America Large Cap A (acc) - USD 76,763.887 4,237,360.115 3,978,215.723 335,908.279JPM America Large Cap A (dist) - USD 3,854,546.322 1,964,657.595 2,869,574.891 2,949,629.026JPM America Large Cap B (acc) - USD 26,099.248 218,924.241 132,931.732 112,091.757JPM America Large Cap D (acc) - USD 407,615.177 472,097.107 419,979.639 459,732.645
JPMorgan Funds - America Micro Cap FundJPM America Micro Cap A (acc) - USD 5,622,770.721 1,234,931.140 3,149,510.977 3,708,190.884JPM America Micro Cap A (dist) - USD 2,472,760.585 539,655.169 1,931,562.444 1,080,853.310JF America Micro Cap A (dist) - USD 963,558.964 105,603.752 946,100.085 123,062.631JPM America Micro Cap D (acc) - USD 1,860,096.713 368,783.926 1,148,804.029 1,080,076.610JPM America Micro Cap X (acc) - USD 213,916.338 - 198,429.332 15,487.006
JPMorgan Funds - Eastern Europe Equity FundJPM Eastern Europe Equity A (acc) - EUR 2,292,870.062 2,242,226.839 2,544,942.231 1,990,154.670JPM Eastern Europe Equity A (dist) - EUR 17,236,854.500 4,110,222.598 7,188,378.121 14,158,698.977JF Eastern Europe Equity A (dist) - EUR 5,011,854.514 7,632,581.480 7,702,674.769 4,941,761.225JPM Eastern Europe Equity B (acc) - EUR 6,640.000 144,210.261 6,640.001 144,210.260JPM Eastern Europe Equity C (acc) - EUR 9,142,193.731 410,509.582 8,887,696.314 665,006.999JPM Eastern Europe Equity D (acc) - EUR 3,670,961.878 2,114,579.636 2,824,718.651 2,960,822.863JPM Eastern Europe Equity I (acc) - EUR 4,697,055.454 14,058,348.504 6,997,095.808 11,758,308.150JPM Eastern Europe Equity X (acc) - EUR 4,156,418.049 1,038,465.194 1,914,083.299 3,280,799.944
JPMorgan Funds - Emerging Europe, Middle East and Africa Equity Fund (1)JPM Emerging Europe, Middle East and Africa Equity A (acc)- USD 2,239,043.956 2,629,600.901 1,671,926.028 3,196,718.829JPM Emerging Europe, Middle East and Africa Equity A (dist) - USD 6,604,909.375 1,638,790.257 2,879,377.650 5,364,321.982JPM Emerging Europe, Middle East and Africa Equity B (acc) - USD 427,603.655 211,003.374 420,277.829 218,329.200JPM Emerging Europe, Middle East and Africa Equity C (acc) - USD 8,638,068.671 755,353.205 9,227,208.250 166,213.626JPM Emerging Europe, Middle East and Africa Equity D (acc) - USD 1,812,315.009 769,669.847 1,204,970.683 1,377,014.173JPM Emerging Europe, Middle East and Africa Equity I (acc) - USD 3,439,165.440 12,429,510.038 8,828,642.479 7,040,032.999JPM Emerging Europe, Middle East and Africa Equity X (acc) - USD 89,663.735 8,892.234 98,555.969 -
JPMorgan Funds - Emerging Markets Alpha Plus Fund (2)JPM Emerging Markets Alpha Plus A (acc) - USD - 21,671,097.867 2,177,026.134 19,494,071.733JPM Emerging Markets Alpha Plus A (dist) - USD - 7,137,578.873 298,021.152 6,839,557.721JPM Emerging Markets Alpha Plus D (acc) - USD - 380,904.002 204,830.370 176,073.632
JPMorgan Funds - Emerging Markets Debt Fund (3)JPM Emerging Markets Debt A (acc) - EUR 2,867,573.254 11,277,729.772 7,001,321.726 7,143,981.300JPM Emerging Markets Debt A (dist) - EUR 8,661,114.189 15,152,456.055 13,144,027.713 10,669,542.531JPM Emerging Markets Debt C (acc) - EUR - 653,748.769 - 653,748.769JPM Emerging Markets Debt D (acc) - EUR 3,014,088.631 4,747,133.391 2,813,077.917 4,948,144.105JPM Emerging Markets Debt I (inc) - EUR - 250,000.001 - 250,000.001JPM Emerging Markets Debt X (acc) - EUR - 5,656.002 - 5,656.002
JPMorgan Funds - Emerging Markets Equity FundJPM Emerging Markets Equity A (acc) - USD 29,006,169.351 25,646,412.444 21,688,137.801 32,964,443.994JPM Emerging Markets Equity A (acc) - EUR 12,537,814.432 29,008,382.658 12,538,058.782 29,008,138.308JPM Emerging Markets Equity A (dist) - USD 94,935,520.919 72,349,157.725 58,117,279.004 109,167,399.640JPM Emerging Markets Equity A (dist) - GBP 76,127.830 257,381.632 53,243.439 280,266.023JPM Emerging Markets Equity B (acc) - USD 2,007,454.257 2,363,841.715 1,132,650.398 3,238,645.574JPM Emerging Markets Equity C (acc) - USD 25,097,941.284 29,238,089.404 29,112,939.890 25,223,090.798JPM Emerging Markets Equity D (acc) - USD 5,218,648.687 2,321,311.612 3,314,622.433 4,225,337.866JPM Emerging Markets Equity D (acc) - EUR 11,685.069 363,037.291 123,891.467 250,830.893JPM Emerging Markets Equity I (acc) - USD - 22,231,580.608 458,058.931 21,773,521.677JPM Emerging Markets Equity I (inc) - EUR 1,400,000.000 659,800.000 422,000.000 1,637,800.000JPM Emerging Markets Equity X (acc) - USD 30,831,353.603 12,379,921.462 9,320,225.710 33,891,049.355JPM Emerging Markets Equity X (inc) - EUR 10,330,431.042 7,609,910.433 0.102 17,940,341.373
JPMorgan Funds - Euro Liquid Reserve FundJPM Euro Liquid Reserve A (acc) - EUR 1,000,000.000 135,864.456 1,027,265.275 108,599.181JPM Euro Liquid Reserve D (acc) - EUR - 2,028,445.658 1,161,834.100 866,611.558
JPMorgan Funds - Euroland Equity FundJPM Euroland Equity A (acc) - EUR 32,699,773.224 43,471,389.838 33,198,331.098 42,972,831.964JPM Euroland Equity A (dist) - EUR 46,944,388.203 45,372,753.515 47,233,093.245 45,084,048.473JF Euroland Equity A (dist) - USD 13,761,111.249 26,434,909.240 15,040,993.786 25,155,026.703JPM Euroland Equity C (acc) - EUR 21,099,132.574 16,019,021.833 16,070,634.105 21,047,520.302JPM Euroland Equity D (acc) - EUR 11,055,092.934 26,981,112.892 11,217,717.683 26,818,488.143JPM Euroland Equity I (acc) - EUR - 21,891,072.110 1,892,547.343 19,998,524.767
(1) Name changed from Emerging Europe Equity Fund on 2 October 2006.(2) This Sub-Fund was launched on 30 August 2006.(3) Name changed from FF Emerging Markets Debt Fund and currency changed from USD to EUR on 1 July 2006.
484
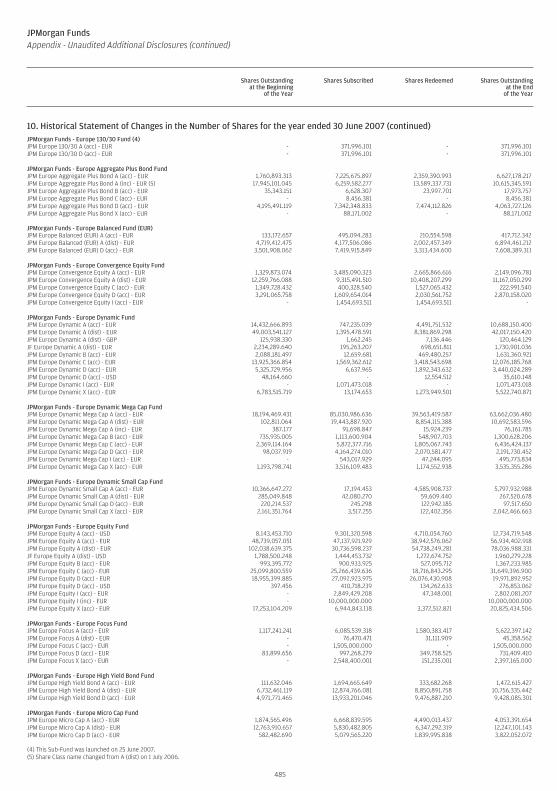
JPMorgan FundsAppendix - Unaudited Additional Disclosures (continued)
Shares Outstandingat the Beginning
of the Year
Shares Subscribed Shares Redeemed Shares Outstandingat the End
of the Year
10. Historical Statement of Changes in the Number of Shares for the year ended 30 June 2007 (continued)JPMorgan Funds - Europe 130/30 Fund (4)JPM Europe 130/30 A (acc) - EUR - 371,996.101 - 371,996.101JPM Europe 130/30 D (acc) - EUR - 371,996.101 - 371,996.101
JPMorgan Funds - Europe Aggregate Plus Bond FundJPM Europe Aggregate Plus Bond A (acc) - EUR 1,760,893.313 7,225,675.897 2,359,390.993 6,627,178.217JPM Europe Aggregate Plus Bond A (inc) - EUR (5) 17,945,101.045 6,259,582.277 13,589,337.731 10,615,345.591JPM Europe Aggregate Plus Bond B (acc) - EUR 35,343.151 6,628.307 23,997.701 17,973.757JPM Europe Aggregate Plus Bond C (acc) - EUR - 8,456.381 - 8,456.381JPM Europe Aggregate Plus Bond D (acc) - EUR 4,195,491.119 7,342,348.833 7,474,112.826 4,063,727.126JPM Europe Aggregate Plus Bond X (acc) - EUR - 88,171.002 - 88,171.002
JPMorgan Funds - Europe Balanced Fund (EUR)JPM Europe Balanced (EUR) A (acc) - EUR 133,172.657 495,094.283 210,554.598 417,712.342JPM Europe Balanced (EUR) A (dist) - EUR 4,719,412.475 4,177,506.086 2,002,457.349 6,894,461.212JPM Europe Balanced (EUR) D (acc) - EUR 3,501,908.062 7,419,915.849 3,313,434.600 7,608,389.311
JPMorgan Funds - Europe Convergence Equity FundJPM Europe Convergence Equity A (acc) - EUR 1,329,873.074 3,485,090.323 2,665,866.616 2,149,096.781JPM Europe Convergence Equity A (dist) - EUR 12,259,766.088 9,315,491.510 10,408,207.299 11,167,050.299JPM Europe Convergence Equity C (acc) - EUR 1,349,728.432 400,328.540 1,527,065.432 222,991.540JPM Europe Convergence Equity D (acc) - EUR 3,291,065.758 1,609,654.014 2,030,561.752 2,870,158.020JPM Europe Convergence Equity I (acc) - EUR - 1,454,693.511 1,454,693.511 -
JPMorgan Funds - Europe Dynamic FundJPM Europe Dynamic A (acc) - EUR 14,432,666.893 747,235.039 4,491,751.532 10,688,150.400JPM Europe Dynamic A (dist) - EUR 49,003,541.127 1,395,478.591 8,381,869.298 42,017,150.420JPM Europe Dynamic A (dist) - GBP 125,938.330 1,662.245 7,136.446 120,464.129JF Europe Dynamic A (dist) - EUR 2,234,289.640 195,263.207 698,651.811 1,730,901.036JPM Europe Dynamic B (acc) - EUR 2,088,181.497 12,659.681 469,480.257 1,631,360.921JPM Europe Dynamic C (acc) - EUR 13,925,366.854 1,569,362.612 3,418,543.698 12,076,185.768JPM Europe Dynamic D (acc) - EUR 5,325,729.956 6,637.965 1,892,343.632 3,440,024.289JPM Europe Dynamic D (acc) - USD 48,164.660 - 12,554.512 35,610.148JPM Europe Dynamic I (acc) - EUR - 1,071,473.018 - 1,071,473.018JPM Europe Dynamic X (acc) - EUR 6,783,515.719 13,174.653 1,273,949.501 5,522,740.871
JPMorgan Funds - Europe Dynamic Mega Cap FundJPM Europe Dynamic Mega Cap A (acc) - EUR 18,194,469.431 85,030,986.636 39,563,419.587 63,662,036.480JPM Europe Dynamic Mega Cap A (dist) - EUR 102,811.064 19,443,887.920 8,854,115.388 10,692,583.596JPM Europe Dynamic Mega Cap A (inc) - EUR 387.177 91,698.847 15,924.239 76,161.785JPM Europe Dynamic Mega Cap B (acc) - EUR 735,935.005 1,113,600.904 548,907.703 1,300,628.206JPM Europe Dynamic Mega Cap C (acc) - EUR 2,369,114.164 5,872,377.716 1,805,067.743 6,436,424.137JPM Europe Dynamic Mega Cap D (acc) - EUR 98,037.919 4,164,274.010 2,070,581.477 2,191,730.452JPM Europe Dynamic Mega Cap I (acc) - EUR - 543,017.929 47,244.095 495,773.834JPM Europe Dynamic Mega Cap X (acc) - EUR 1,193,798.741 3,516,109.483 1,174,552.938 3,535,355.286
JPMorgan Funds - Europe Dynamic Small Cap FundJPM Europe Dynamic Small Cap A (acc) - EUR 10,366,647.272 17,194.453 4,585,908.737 5,797,932.988JPM Europe Dynamic Small Cap A (dist) - EUR 285,049.848 42,080.270 59,609.440 267,520.678JPM Europe Dynamic Small Cap D (acc) - EUR 220,214.537 245.298 122,942.185 97,517.650JPM Europe Dynamic Small Cap X (acc) - EUR 2,161,351.764 3,517.255 122,402.356 2,042,466.663
JPMorgan Funds - Europe Equity FundJPM Europe Equity A (acc) - USD 8,143,453.710 9,301,320.598 4,710,054.760 12,734,719.548JPM Europe Equity A (acc) - EUR 48,739,057.051 47,137,921.929 38,942,576.062 56,934,402.918JPM Europe Equity A (dist) - EUR 102,038,639.375 30,736,598.237 54,738,249.281 78,036,988.331JF Europe Equity A (dist) - USD 1,788,500.248 1,444,453.732 1,272,674.752 1,960,279.228JPM Europe Equity B (acc) - EUR 993,395.772 900,933.925 527,095.712 1,367,233.985JPM Europe Equity C (acc) - EUR 25,099,800.559 25,266,439.636 18,716,843.295 31,649,396.900JPM Europe Equity D (acc) - EUR 18,955,399.885 27,092,923.975 26,076,430.908 19,971,892.952JPM Europe Equity D (acc) - USD 397.456 410,718.239 134,262.633 276,853.062JPM Europe Equity I (acc) - EUR - 2,849,429.208 47,348.001 2,802,081.207JPM Europe Equity I (inc) - EUR - 10,000,000.000 - 10,000,000.000JPM Europe Equity X (acc) - EUR 17,253,104.209 6,944,843.118 3,372,512.821 20,825,434.506
JPMorgan Funds - Europe Focus FundJPM Europe Focus A (acc) - EUR 1,117,241.241 6,085,539.318 1,580,383.417 5,622,397.142JPM Europe Focus A (dist) - EUR - 76,470.471 31,111.909 45,358.562JPM Europe Focus C (acc) - EUR - 1,505,000.000 - 1,505,000.000JPM Europe Focus D (acc) - EUR 83,899.656 997,268.279 349,758.525 731,409.410JPM Europe Focus X (acc) - EUR - 2,548,400.001 151,235.001 2,397,165.000
JPMorgan Funds - Europe High Yield Bond FundJPM Europe High Yield Bond A (acc) - EUR 111,632.046 1,694,665.649 333,682.268 1,472,615.427JPM Europe High Yield Bond A (dist) - EUR 6,732,461.119 12,874,766.081 8,850,891.758 10,756,335.442JPM Europe High Yield Bond D (acc) - EUR 4,971,771.465 13,933,201.046 9,476,887.210 9,428,085.301
JPMorgan Funds - Europe Micro Cap FundJPM Europe Micro Cap A (acc) - EUR 1,874,565.496 6,668,839.595 4,490,013.437 4,053,391.654JPM Europe Micro Cap A (dist) - EUR 12,763,910.657 5,830,482.805 6,347,292.319 12,247,101.143JPM Europe Micro Cap D (acc) - EUR 582,482.690 5,079,565.220 1,839,995.838 3,822,052.072
(4) This Sub-Fund was launched on 25 June 2007.(5) Share Class name changed from A (dist) on 1 July 2006.
485
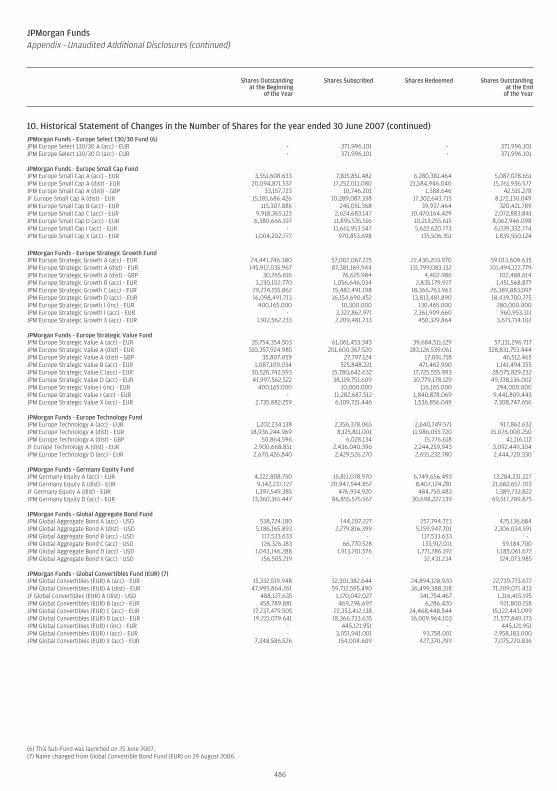
JPMorgan FundsAppendix - Unaudited Additional Disclosures (continued)
Shares Outstandingat the Beginning
of the Year
Shares Subscribed Shares Redeemed Shares Outstandingat the End
of the Year
10. Historical Statement of Changes in the Number of Shares for the year ended 30 June 2007 (continued)JPMorgan Funds - Europe Select 130/30 Fund (6)JPM Europe Select 130/30 A (acc) - EUR - 371,996.101 - 371,996.101JPM Europe Select 130/30 D (acc) - EUR - 371,996.101 - 371,996.101
JPMorgan Funds - Europe Small Cap FundJPM Europe Small Cap A (acc) - EUR 3,551,608.633 7,815,851.482 6,280,381.464 5,087,078.651JPM Europe Small Cap A (dist) - EUR 20,094,871.537 17,252,011.080 21,584,946.040 15,761,936.577JPM Europe Small Cap A (dist) - GBP 33,157.723 10,746.201 1,388.646 42,515.278JF Europe Small Cap A (dist) - EUR 15,185,686.426 10,289,087.338 17,302,643.715 8,172,130.049JPM Europe Small Cap B (acc) - EUR 115,307.885 245,051.368 39,937.464 320,421.789JPM Europe Small Cap C (acc) - EUR 9,918,365.123 2,624,683.147 10,470,164.429 2,072,883.841JPM Europe Small Cap D (acc) - EUR 6,380,666.197 11,895,535.516 10,213,255.615 8,062,946.098JPM Europe Small Cap I (acc) - EUR - 11,661,953.547 5,622,620.773 6,039,332.774JPM Europe Small Cap X (acc) - EUR 1,004,202.777 970,853.698 135,506.351 1,839,550.124
JPMorgan Funds - Europe Strategic Growth FundJPM Europe Strategic Growth A (acc) - EUR 24,441,746.380 57,002,067.225 22,430,203.970 59,013,609.635JPM Europe Strategic Growth A (dist) - EUR 145,912,035.967 87,381,169.944 131,799,083.132 101,494,122.779JPM Europe Strategic Growth A (dist) - GBP 30,265.616 76,625.984 4,402.986 102,488.614JPM Europe Strategic Growth B (acc) - EUR 3,230,102.770 1,056,646.034 2,835,179.927 1,451,568.877JPM Europe Strategic Growth C (acc) - EUR 29,274,155.862 15,482,491.198 18,366,763.963 26,389,883.097JPM Europe Strategic Growth D (acc) - EUR 16,098,491.713 16,154,690.452 13,813,481.890 18,439,700.275JPM Europe Strategic Growth I (inc) - EUR 400,165.000 10,300.000 130,465.000 280,000.000JPM Europe Strategic Growth I (acc) - EUR - 3,322,862.971 2,361,909.660 960,953.311JPM Europe Strategic Growth X (acc) - EUR 1,912,562.233 2,209,481.733 450,329.864 3,671,714.102
JPMorgan Funds - Europe Strategic Value FundJPM Europe Strategic Value A (acc) - EUR 35,754,354.503 61,061,453.343 39,684,511.129 57,131,296.717JPM Europe Strategic Value A (dist) - EUR 310,357,924.985 201,600,367.520 183,126,539.061 328,831,753.444JPM Europe Strategic Value A (dist) - GBP 35,807.059 27,797.124 17,091.718 46,512.465JPM Europe Strategic Value B (acc) - EUR 1,087,109.034 525,848.221 471,462.900 1,141,494.355JPM Europe Strategic Value C (acc) - EUR 30,520,742.593 15,780,642.632 17,725,555.993 28,575,829.232JPM Europe Strategic Value D (acc) - EUR 41,997,562.522 38,119,751.609 30,779,178.129 49,338,136.002JPM Europe Strategic Value I (inc) - EUR 400,165.000 10,000.000 116,165.000 294,000.000JPM Europe Strategic Value I (acc) - EUR - 11,282,687.512 1,840,878.069 9,441,809.443JPM Europe Strategic Value X (acc) - EUR 2,735,882.259 6,109,721.446 1,536,856.049 7,308,747.656
JPMorgan Funds - Europe Technology FundJPM Europe Technology A (acc) - EUR 1,202,234.138 2,356,378.065 2,640,749.571 917,862.632JPM Europe Technology A (dist) - EUR 18,936,244.969 8,125,811.001 11,986,055.720 15,076,000.250JPM Europe Technology A (dist) - GBP 50,864.596 6,028.134 15,776.618 41,116.112JF Europe Technology A (dist) - EUR 2,900,668.851 2,436,040.396 2,244,259.943 3,092,449.304JPM Europe Technology D (acc) - EUR 2,670,426.840 2,429,526.270 2,655,232.780 2,444,720.330
JPMorgan Funds - Germany Equity FundJPM Germany Equity A (acc) - EUR 4,222,808.750 15,811,078.970 6,749,656.493 13,284,231.227JPM Germany Equity A (dist) - EUR 9,142,237.127 20,947,544.857 8,407,124.281 21,682,657.703JF Germany Equity A (dist) - EUR 1,397,549.385 476,934.920 484,750.483 1,389,733.822JPM Germany Equity D (acc) - EUR 13,360,361.447 86,855,575.567 30,698,227.139 69,517,709.875
JPMorgan Funds - Global Aggregate Bond FundJPM Global Aggregate Bond A (acc) - USD 538,724.180 144,207.227 257,794.723 425,136.684JPM Global Aggregate Bond A (dist) - USD 5,186,165.893 2,279,816.399 5,159,947.701 2,306,034.591JPM Global Aggregate Bond B (acc) - USD 117,533.633 - 117,533.633 -JPM Global Aggregate Bond C (acc) - USD 126,326.183 66,770.528 133,912.011 59,184.700JPM Global Aggregate Bond D (acc) - USD 1,043,146.288 1,913,201.576 1,771,286.192 1,185,061.672JPM Global Aggregate Bond X (acc) - USD 156,505.219 - 32,431.234 124,073.985
JPMorgan Funds - Global Convertibles Fund (EUR) (7)JPM Global Convertibles (EUR) A (acc) - EUR 15,332,519.948 32,301,382.644 24,894,128.920 22,739,773.672JPM Global Convertibles (EUR) A (dist) - EUR 47,995,864.261 59,712,595.490 36,499,388.318 71,209,071.433JF Global Convertibles (EUR) A (dist) - USD 488,127.635 1,170,042.027 341,754.467 1,316,415.195JPM Global Convertibles (EUR) B (acc) - EUR 458,789.881 469,296.697 6,286.420 921,800.158JPM Global Convertibles (EUR) C (acc) - EUR 17,237,479.505 22,353,412.138 24,468,448.544 15,122,443.099JPM Global Convertibles (EUR) D (acc) - EUR 19,221,079.641 18,366,733.635 16,009,964.103 21,577,849.173JPM Global Convertibles (EUR) I (inc) - EUR - 445,121.951 - 445,121.951JPM Global Convertibles (EUR) I (acc) - EUR - 3,051,941.001 93,758.001 2,958,183.000JPM Global Convertibles (EUR) X (acc) - EUR 7,348,586.526 154,004.609 427,370.299 7,075,220.836
(6) This Sub-Fund was launched on 25 June 2007.(7) Name changed from Global Convertible Bond Fund (EUR) on 29 August 2006.
486
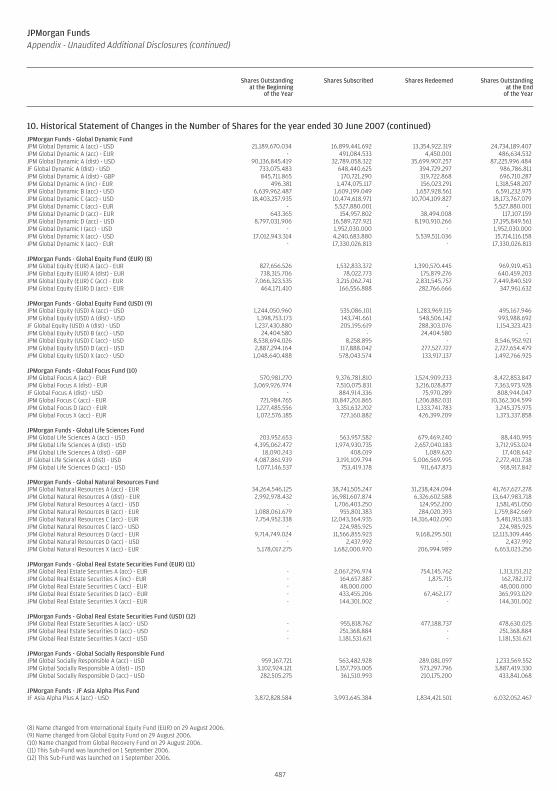
JPMorgan FundsAppendix - Unaudited Additional Disclosures (continued)
Shares Outstandingat the Beginning
of the Year
Shares Subscribed Shares Redeemed Shares Outstandingat the End
of the Year
10. Historical Statement of Changes in the Number of Shares for the year ended 30 June 2007 (continued)JPMorgan Funds - Global Dynamic FundJPM Global Dynamic A (acc) - USD 21,189,670.034 16,899,441.692 13,354,922.319 24,734,189.407JPM Global Dynamic A (acc) - EUR - 491,084.533 4,450.001 486,634.532JPM Global Dynamic A (dist) - USD 90,136,845.419 32,789,058.322 35,699,907.257 87,225,996.484JF Global Dynamic A (dist) - USD 733,075.483 648,440.625 394,729.297 986,786.811JPM Global Dynamic A (dist) - GBP 845,711.865 170,721.290 319,722.868 696,710.287JPM Global Dynamic A (inc) - EUR 496.381 1,474,075.117 156,023.291 1,318,548.207JPM Global Dynamic B (acc) - USD 6,639,962.487 1,609,199.049 1,657,928.561 6,591,232.975JPM Global Dynamic C (acc) - USD 18,403,257.935 10,474,618.971 10,704,109.827 18,173,767.079JPM Global Dynamic C (acc) - EUR - 5,527,880.001 - 5,527,880.001JPM Global Dynamic D (acc) - EUR 643.365 154,957.802 38,494.008 117,107.159JPM Global Dynamic D (acc) - USD 8,797,031.906 16,589,727.921 8,190,910.266 17,195,849.561JPM Global Dynamic I (acc) - USD - 1,952,030.000 - 1,952,030.000JPM Global Dynamic X (acc) - USD 17,012,943.314 4,240,683.880 5,539,511.036 15,714,116.158JPM Global Dynamic X (acc) - EUR - 17,330,026.813 - 17,330,026.813
JPMorgan Funds - Global Equity Fund (EUR) (8)JPM Global Equity (EUR) A (acc) - EUR 827,656.526 1,532,833.372 1,390,570.445 969,919.453JPM Global Equity (EUR) A (dist) - EUR 738,315.706 78,022.773 175,879.276 640,459.203JPM Global Equity (EUR) C (acc) - EUR 7,066,323.535 3,215,062.741 2,831,545.757 7,449,840.519JPM Global Equity (EUR) D (acc) - EUR 464,171.410 166,556.888 282,766.666 347,961.632
JPMorgan Funds - Global Equity Fund (USD) (9)JPM Global Equity (USD) A (acc) - USD 1,244,050.960 535,086.101 1,283,969.115 495,167.946JPM Global Equity (USD) A (dist) - USD 1,398,753.173 143,741.661 548,506.142 993,988.692JF Global Equity (USD) A (dist) - USD 1,237,430.880 205,195.619 288,303.076 1,154,323.423JPM Global Equity (USD) B (acc) - USD 24,404.580 - 24,404.580 -JPM Global Equity (USD) C (acc) - USD 8,538,694.026 8,258.895 - 8,546,952.921JPM Global Equity (USD) D (acc) - USD 2,887,294.164 117,888.042 277,527.727 2,727,654.479JPM Global Equity (USD) X (acc) - USD 1,048,640.488 578,043.574 133,917.137 1,492,766.925
JPMorgan Funds - Global Focus Fund (10)JPM Global Focus A (acc) - EUR 570,981.270 9,376,781.810 1,524,909.233 8,422,853.847JPM Global Focus A (dist) - EUR 3,069,926.974 7,510,075.831 3,216,028.877 7,363,973.928JF Global Focus A (dist) - USD - 884,914.336 75,970.289 808,944.047JPM Global Focus C (acc) - EUR 721,984.765 10,847,201.865 1,206,882.031 10,362,304.599JPM Global Focus D (acc) - EUR 1,227,485.556 3,351,632.202 1,333,741.783 3,245,375.975JPM Global Focus X (acc) - EUR 1,072,576.185 727,160.882 426,399.209 1,373,337.858
JPMorgan Funds - Global Life Sciences FundJPM Global Life Sciences A (acc) - USD 203,952.653 563,957.582 679,469.240 88,440.995JPM Global Life Sciences A (dist) - USD 4,395,062.472 1,974,930.735 2,657,040.183 3,712,953.024JPM Global Life Sciences A (dist) - GBP 18,090.243 408.019 1,089.620 17,408.642JF Global Life Sciences A (dist) - USD 4,087,861.939 3,191,109.794 5,006,569.995 2,272,401.738JPM Global Life Sciences D (acc) - USD 1,077,146.537 753,419.178 911,647.873 918,917.842
JPMorgan Funds - Global Natural Resources FundJPM Global Natural Resources A (acc) - EUR 34,264,546.125 38,741,505.247 31,238,424.094 41,767,627.278JPM Global Natural Resources A (dist) - EUR 2,992,978.432 16,981,607.874 6,326,602.588 13,647,983.718JPM Global Natural Resources A (acc) - USD - 1,706,403.250 124,952.200 1,581,451.050JPM Global Natural Resources B (acc) - EUR 1,088,061.679 955,801.383 284,020.393 1,759,842.669JPM Global Natural Resources C (acc) - EUR 7,754,952.338 12,043,364.935 14,316,402.090 5,481,915.183JPM Global Natural Resources C (acc) - USD - 224,985.925 - 224,985.925JPM Global Natural Resources D (acc) - EUR 9,714,749.024 11,566,855.923 9,168,295.501 12,113,309.446JPM Global Natural Resources D (acc) - USD - 2,437.992 - 2,437.992JPM Global Natural Resources X (acc) - EUR 5,178,017.275 1,682,000.970 206,994.989 6,653,023.256
JPMorgan Funds - Global Real Estate Securities Fund (EUR) (11)JPM Global Real Estate Securities A (acc) - EUR - 2,067,296.974 754,145.762 1,313,151.212JPM Global Real Estate Securities A (inc) - EUR - 164,657.887 1,875.715 162,782.172JPM Global Real Estate Securities C (acc) - EUR - 48,000.000 - 48,000.000JPM Global Real Estate Securities D (acc) - EUR - 433,455.206 67,462.177 365,993.029JPM Global Real Estate Securities X (acc) - EUR - 144,301.002 - 144,301.002
JPMorgan Funds - Global Real Estate Securities Fund (USD) (12)JPM Global Real Estate Securities A (acc) - USD - 955,818.762 477,188.737 478,630.025JPM Global Real Estate Securities D (acc) - USD - 251,368.884 - 251,368.884JPM Global Real Estate Securities X (acc) - USD - 1,181,531.621 - 1,181,531.621
JPMorgan Funds - Global Socially Responsible FundJPM Global Socially Responsible A (acc) - USD 959,167.721 563,482.928 289,081.097 1,233,569.552JPM Global Socially Responsible A (dist) - USD 3,102,924.121 1,357,793.005 573,297.796 3,887,419.330JPM Global Socially Responsible D (acc) - USD 282,505.275 361,510.993 210,175.200 433,841.068
JPMorgan Funds - JF Asia Alpha Plus FundJF Asia Alpha Plus A (acc) - USD 3,872,828.584 3,993,645.384 1,834,421.501 6,032,052.467
(8) Name changed from International Equity Fund (EUR) on 29 August 2006.(9) Name changed from Global Equity Fund on 29 August 2006.(10) Name changed from Global Recovery Fund on 29 August 2006.(11) This Sub-Fund was launched on 1 September 2006.(12) This Sub-Fund was launched on 1 September 2006.
487
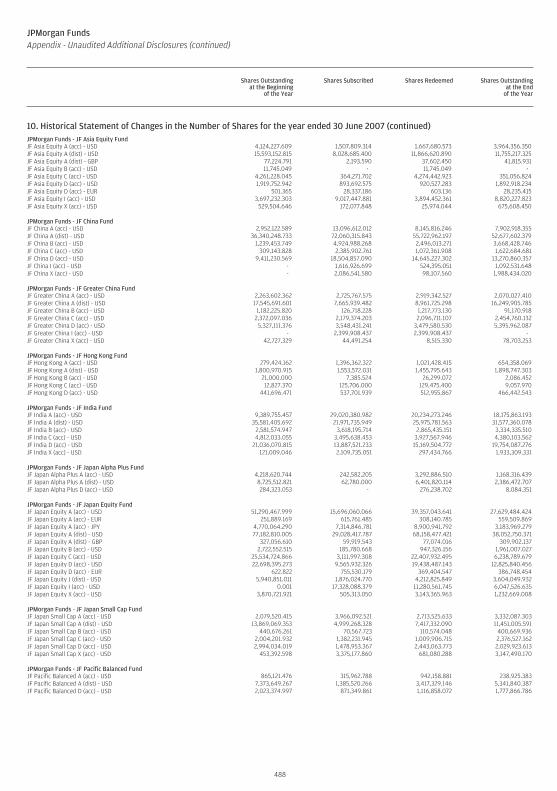
JPMorgan FundsAppendix - Unaudited Additional Disclosures (continued)
Shares Outstandingat the Beginning
of the Year
Shares Subscribed Shares Redeemed Shares Outstandingat the End
of the Year
10. Historical Statement of Changes in the Number of Shares for the year ended 30 June 2007 (continued)JPMorgan Funds - JF Asia Equity FundJF Asia Equity A (acc) - USD 4,124,227.609 1,507,809.314 1,667,680.573 3,964,356.350JF Asia Equity A (dist) - USD 15,593,152.815 8,028,685.400 11,866,620.890 11,755,217.325JF Asia Equity A (dist) - GBP 77,224.791 2,193.590 37,602.450 41,815.931JF Asia Equity B (acc) - USD 11,745.049 - 11,745.049 -JF Asia Equity C (acc) - USD 4,261,228.045 364,271.702 4,274,442.923 351,056.824JF Asia Equity D (acc) - USD 1,919,752.942 893,692.575 920,527.283 1,892,918.234JF Asia Equity D (acc) - EUR 501.365 28,337.186 603.136 28,235.415JF Asia Equity I (acc) - USD 3,697,232.303 9,017,447.881 3,894,452.361 8,820,227.823JF Asia Equity X (acc) - USD 529,504.646 172,077.848 25,974.044 675,608.450
JPMorgan Funds - JF China FundJF China A (acc) - USD 2,952,122.589 13,096,612.012 8,145,816.246 7,902,918.355JF China A (dist) - USD 36,340,248.733 72,060,315.843 55,722,962.197 52,677,602.379JF China B (acc) - USD 1,239,453.749 4,924,988.268 2,496,013.271 3,668,428.746JF China C (acc) - USD 309,143.828 2,385,902.761 1,072,361.908 1,622,684.681JF China D (acc) - USD 9,411,230.569 18,504,857.090 14,645,227.302 13,270,860.357JF China I (acc) - USD - 1,616,926.699 524,395.051 1,092,531.648JF China X (acc) - USD - 2,086,541.580 98,107.560 1,988,434.020
JPMorgan Funds - JF Greater China FundJF Greater China A (acc) - USD 2,263,602.362 2,725,767.575 2,919,342.527 2,070,027.410JF Greater China A (dist) - USD 17,545,691.601 7,665,939.482 8,961,725.298 16,249,905.785JF Greater China B (acc) - USD 1,182,225.820 126,718.228 1,217,773.130 91,170.918JF Greater China C (acc) - USD 2,372,097.036 2,179,374.203 2,096,711.107 2,454,760.132JF Greater China D (acc) - USD 5,327,111.376 3,548,431.241 3,479,580.530 5,395,962.087JF Greater China I (acc) - USD - 2,399,908.437 2,399,908.437 -JF Greater China X (acc) - USD 42,727.329 44,491.254 8,515.330 78,703.253
JPMorgan Funds - JF Hong Kong FundJF Hong Kong A (acc) - USD 279,424.162 1,396,362.322 1,021,428.415 654,358.069JF Hong Kong A (dist) - USD 1,800,970.915 1,553,572.031 1,455,795.643 1,898,747.303JF Hong Kong B (acc) - USD 21,000.000 7,385.524 26,299.072 2,086.452JF Hong Kong C (acc) - USD 12,827.370 125,706.000 129,475.400 9,057.970JF Hong Kong D (acc) - USD 441,696.471 537,701.939 512,955.867 466,442.543
JPMorgan Funds - JF India FundJF India A (acc) - USD 9,389,755.457 29,020,380.982 20,234,273.246 18,175,863.193JF India A (dist) - USD 35,581,405.692 21,971,735.949 25,975,781.563 31,577,360.078JF India B (acc) - USD 2,581,574.947 3,618,195.714 2,865,435.151 3,334,335.510JF India C (acc) - USD 4,812,033.055 3,495,638.453 3,927,567.946 4,380,103.562JF India D (acc) - USD 21,036,070.815 13,887,521.233 15,169,504.772 19,754,087.276JF India X (acc) - USD 121,009.046 2,109,735.051 297,434.766 1,933,309.331
JPMorgan Funds - JF Japan Alpha Plus FundJF Japan Alpha Plus A (acc) - USD 4,218,620.744 242,582.205 3,292,886.510 1,168,316.439JF Japan Alpha Plus A (dist) - USD 8,725,512.821 62,780.000 6,401,820.114 2,386,472.707JF Japan Alpha Plus D (acc) - USD 284,323.053 - 276,238.702 8,084.351
JPMorgan Funds - JF Japan Equity FundJF Japan Equity A (acc) - USD 51,290,467.999 15,696,060.066 39,357,043.641 27,629,484.424JF Japan Equity A (acc) - EUR 251,889.169 615,761.485 308,140.785 559,509.869JF Japan Equity A (acc) - JPY 4,770,064.290 7,314,846.781 8,900,941.792 3,183,969.279JF Japan Equity A (dist) - USD 77,182,810.005 29,028,417.787 68,158,477.421 38,052,750.371JF Japan Equity A (dist) - GBP 327,056.610 59,919.543 77,074.016 309,902.137JF Japan Equity B (acc) - USD 2,722,552.515 185,780.668 947,326.156 1,961,007.027JF Japan Equity C (acc) - USD 25,534,724.866 3,111,997.308 22,407,932.495 6,238,789.679JF Japan Equity D (acc) - USD 22,698,395.273 9,565,932.326 19,438,487.143 12,825,840.456JF Japan Equity D (acc) - EUR 622.822 755,530.179 369,404.547 386,748.454JF Japan Equity J (dist) - USD 5,940,851.011 1,876,024.770 4,212,825.849 3,604,049.932JF Japan Equity I (acc) - USD 0.001 17,328,088.379 11,280,561.745 6,047,526.635JF Japan Equity X (acc) - USD 3,870,721.921 505,313.050 3,143,365.963 1,232,669.008
JPMorgan Funds - JF Japan Small Cap FundJF Japan Small Cap A (acc) - USD 2,079,520.415 3,966,092.521 2,713,525.633 3,332,087.303JF Japan Small Cap A (dist) - USD 13,869,069.353 4,999,268.328 7,417,332.090 11,451,005.591JF Japan Small Cap B (acc) - USD 440,676.261 70,567.723 110,574.048 400,669.936JF Japan Small Cap C (acc) - USD 2,004,201.932 1,382,231.945 1,009,906.715 2,376,527.162JF Japan Small Cap D (acc) - USD 2,994,034.019 1,478,953.367 2,443,063.773 2,029,923.613JF Japan Small Cap X (acc) - USD 453,392.598 3,375,177.860 681,080.288 3,147,490.170
JPMorgan Funds - JF Pacific Balanced FundJF Pacific Balanced A (acc) - USD 865,121.476 315,962.788 942,158.881 238,925.383JF Pacific Balanced A (dist) - USD 7,373,649.267 1,385,520.266 3,417,329.146 5,341,840.387JF Pacific Balanced D (acc) - USD 2,023,374.997 871,349.861 1,116,858.072 1,777,866.786
488
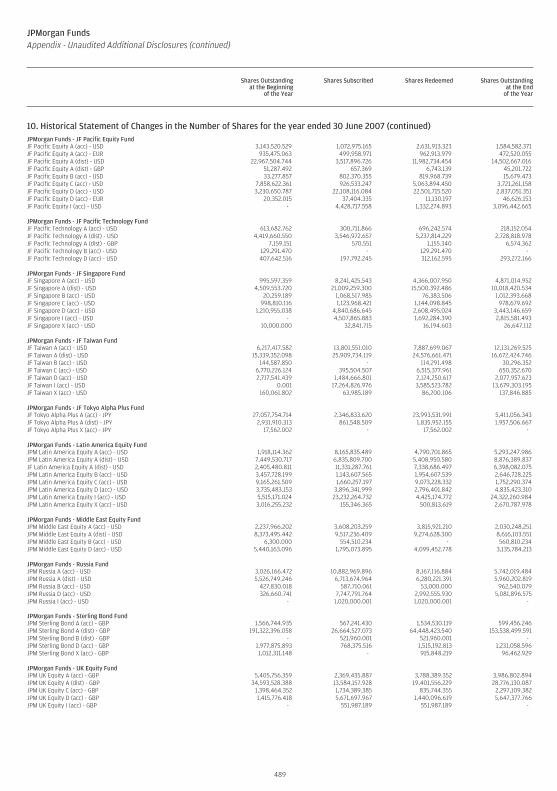
JPMorgan FundsAppendix - Unaudited Additional Disclosures (continued)
Shares Outstandingat the Beginning
of the Year
Shares Subscribed Shares Redeemed Shares Outstandingat the End
of the Year
10. Historical Statement of Changes in the Number of Shares for the year ended 30 June 2007 (continued)JPMorgan Funds - JF Pacific Equity FundJF Pacific Equity A (acc) - USD 3,143,520.529 1,072,975.165 2,631,913.323 1,584,582.371JF Pacific Equity A (acc) - EUR 935,475.063 499,958.971 962,913.979 472,520.055JF Pacific Equity A (dist) - USD 22,967,504.744 3,517,896.726 11,982,734.454 14,502,667.016JF Pacific Equity A (dist) - GBP 51,287.492 657.369 6,743.139 45,201.722JF Pacific Equity B (acc) - USD 33,277.857 802,370.355 819,968.739 15,679.473JF Pacific Equity C (acc) - USD 7,858,622.361 926,533.247 5,063,894.450 3,721,261.158JF Pacific Equity D (acc) - USD 3,230,650.787 22,108,116.084 22,501,715.520 2,837,051.351JF Pacific Equity D (acc) - EUR 20,352.015 37,404.335 11,130.197 46,626.153JF Pacific Equity I (acc) - USD - 4,428,717.558 1,332,274.893 3,096,442.665
JPMorgan Funds - JF Pacific Technology FundJF Pacific Technology A (acc) - USD 613,682.762 300,711.866 696,242.574 218,152.054JF Pacific Technology A (dist) - USD 4,419,660.550 3,546,972.657 5,237,814.229 2,728,818.978JF Pacific Technology A (dist) - GBP 7,159.151 570.551 1,155.340 6,574.362JF Pacific Technology B (acc) - USD 129,291.470 - 129,291.470 -JF Pacific Technology D (acc) - USD 407,642.516 197,792.245 312,162.595 293,272.166
JPMorgan Funds - JF Singapore FundJF Singapore A (acc) - USD 995,597.359 8,241,425.543 4,366,007.950 4,871,014.952JF Singapore A (dist) - USD 4,509,553.720 21,009,259.300 15,500,392.486 10,018,420.534JF Singapore B (acc) - USD 20,259.189 1,068,517.985 76,383.506 1,012,393.668JF Singapore C (acc) - USD 998,810.116 1,123,968.421 1,144,098.845 978,679.692JF Singapore D (acc) - USD 1,210,955.038 4,840,686.645 2,608,495.024 3,443,146.659JF Singapore I (acc) - USD - 4,507,865.883 1,692,284.390 2,815,581.493JF Singapore X (acc) - USD 10,000.000 32,841.715 16,194.603 26,647.112
JPMorgan Funds - JF Taiwan FundJF Taiwan A (acc) - USD 6,217,417.582 13,801,551.010 7,887,699.067 12,131,269.525JF Taiwan A (dist) - USD 15,339,352.098 25,909,734.119 24,576,661.471 16,672,424.746JF Taiwan B (acc) - USD 144,587.850 - 114,291.498 30,296.352JF Taiwan C (acc) - USD 6,770,226.124 395,504.507 6,515,377.961 650,352.670JF Taiwan D (acc) - USD 2,717,541.439 1,484,666.801 2,124,250.617 2,077,957.623JF Taiwan I (acc) - USD 0.001 17,264,826.976 3,585,523.782 13,679,303.195JF Taiwan X (acc) - USD 160,061.802 63,985.189 86,200.106 137,846.885
JPMorgan Funds - JF Tokyo Alpha Plus FundJF Tokyo Alpha Plus A (acc) - JPY 27,057,754.714 2,346,833.620 23,993,531.991 5,411,056.343JF Tokyo Alpha Plus A (dist) - JPY 2,931,910.313 861,548.509 1,835,952.155 1,957,506.667JF Tokyo Alpha Plus X (acc) - JPY 17,562.002 - 17,562.002 -
JPMorgan Funds - Latin America Equity FundJPM Latin America Equity A (acc) - USD 1,918,114.362 8,165,835.489 4,790,701.865 5,293,247.986JPM Latin America Equity A (dist) - USD 7,449,530.717 6,835,809.700 5,408,950.580 8,876,389.837JF Latin America Equity A (dist) - USD 2,405,480.811 11,331,287.761 7,338,686.497 6,398,082.075JPM Latin America Equity B (acc) - USD 3,457,728.199 1,143,607.565 1,954,607.539 2,646,728.225JPM Latin America Equity C (acc) - USD 9,165,261.509 1,660,257.197 9,073,228.332 1,752,290.374JPM Latin America Equity D (acc) - USD 3,735,483.153 3,896,341.999 2,796,401.842 4,835,423.310JPM Latin America Equity I (acc) - USD 5,515,171.024 23,232,264.732 4,425,174.772 24,322,260.984JPM Latin America Equity X (acc) - USD 3,016,255.232 155,346.365 500,813.619 2,670,787.978
JPMorgan Funds - Middle East Equity FundJPM Middle East Equity A (acc) - USD 2,237,966.202 3,608,203.259 3,815,921.210 2,030,248.251JPM Middle East Equity A (dist) - USD 8,373,495.442 9,517,236.409 9,274,628.300 8,616,103.551JPM Middle East Equity B (acc) - USD 6,300.000 554,510.234 - 560,810.234JPM Middle East Equity D (acc) - USD 5,440,163.096 1,795,073.895 4,099,452.778 3,135,784.213
JPMorgan Funds - Russia FundJPM Russia A (acc) - USD 3,026,166.472 10,882,969.896 8,167,116.884 5,742,019.484JPM Russia A (dist) - USD 5,526,749.246 6,713,674.964 6,280,221.391 5,960,202.819JPM Russia B (acc) - USD 427,830.018 587,710.061 53,000.000 962,540.079JPM Russia D (acc) - USD 326,660.741 7,747,791.764 2,992,555.930 5,081,896.575JPM Russia I (acc) - USD - 1,020,000.001 1,020,000.001 -
JPMorgan Funds - Sterling Bond FundJPM Sterling Bond A (acc) - GBP 1,566,744.935 567,241.430 1,534,530.119 599,456.246JPM Sterling Bond A (dist) - GBP 191,322,396.058 26,664,527.073 64,448,423.540 153,538,499.591JPM Sterling Bond B (dist) - GBP - 521,960.001 521,960.001 -JPM Sterling Bond D (acc) - GBP 1,977,875.893 768,375.516 1,515,192.813 1,231,058.596JPM Sterling Bond X (acc) - GBP 1,012,311.148 - 915,848.219 96,462.929
JPMorgan Funds - UK Equity FundJPM UK Equity A (acc) - GBP 5,405,756.359 2,369,435.887 3,788,389.352 3,986,802.894JPM UK Equity A (dist) - GBP 34,593,528.388 13,584,157.928 19,401,556.229 28,776,130.087JPM UK Equity C (acc) - GBP 1,398,464.352 1,734,389.385 835,744.355 2,297,109.382JPM UK Equity D (acc) - GBP 1,415,776.418 5,671,697.967 1,440,096.619 5,647,377.766JPM UK Equity I (acc) - GBP - 551,987.189 551,987.189 -
489
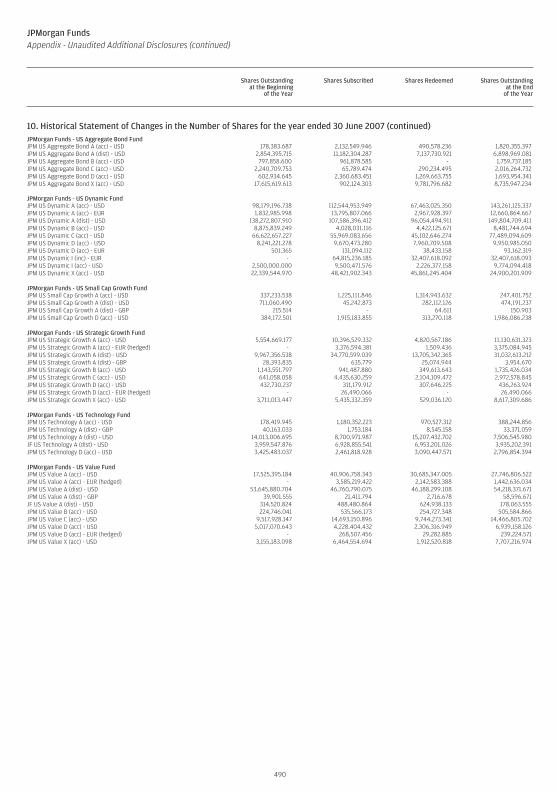
JPMorgan FundsAppendix - Unaudited Additional Disclosures (continued)
Shares Outstandingat the Beginning
of the Year
Shares Subscribed Shares Redeemed Shares Outstandingat the End
of the Year
10. Historical Statement of Changes in the Number of Shares for the year ended 30 June 2007 (continued)JPMorgan Funds - US Aggregate Bond FundJPM US Aggregate Bond A (acc) - USD 178,383.687 2,132,549.946 490,578.236 1,820,355.397JPM US Aggregate Bond A (dist) - USD 2,854,395.715 11,182,304.287 7,137,730.921 6,898,969.081JPM US Aggregate Bond B (acc) - USD 797,858.600 961,878.585 - 1,759,737.185JPM US Aggregate Bond C (acc) - USD 2,240,709.753 65,789.474 290,234.495 2,016,264.732JPM US Aggregate Bond D (acc) - USD 602,934.645 2,360,683.451 1,269,663.755 1,693,954.341JPM US Aggregate Bond X (acc) - USD 17,615,619.613 902,124.303 9,781,796.682 8,735,947.234
JPMorgan Funds - US Dynamic FundJPM US Dynamic A (acc) - USD 98,179,196.738 112,544,953.949 67,463,025.350 143,261,125.337JPM US Dynamic A (acc) - EUR 1,832,985.998 13,795,807.066 2,967,928.397 12,660,864.667JPM US Dynamic A (dist) - USD 138,272,807.910 107,586,396.412 96,054,494.911 149,804,709.411JPM US Dynamic B (acc) - USD 8,875,839.249 4,028,031.116 4,422,125.671 8,481,744.694JPM US Dynamic C (acc) - USD 66,622,657.227 55,969,083.656 45,102,646.274 77,489,094.609JPM US Dynamic D (acc) - USD 8,241,221.278 9,670,473.280 7,960,709.508 9,950,985.050JPM US Dynamic D (acc) - EUR 501.365 131,094.112 38,433.158 93,162.319JPM US Dynamic I (inc) - EUR - 64,815,236.185 32,407,618.092 32,407,618.093JPM US Dynamic I (acc) - USD 2,500,000.000 9,500,471.576 2,226,377.158 9,774,094.418JPM US Dynamic X (acc) - USD 22,339,544.970 48,421,902.343 45,861,245.404 24,900,201.909
JPMorgan Funds - US Small Cap Growth FundJPM US Small Cap Growth A (acc) - USD 337,233.538 1,225,111.846 1,314,943.632 247,401.752JPM US Small Cap Growth A (dist) - USD 711,060.490 45,242.873 282,112.126 474,191.237JPM US Small Cap Growth A (dist) - GBP 215.514 - 64.611 150.903JPM US Small Cap Growth D (acc) - USD 384,172.501 1,915,183.855 313,270.118 1,986,086.238
JPMorgan Funds - US Strategic Growth FundJPM US Strategic Growth A (acc) - USD 5,554,669.177 10,396,529.332 4,820,567.186 11,130,631.323JPM US Strategic Growth A (acc) - EUR (hedged) - 3,376,594.381 1,509.436 3,375,084.945JPM US Strategic Growth A (dist) - USD 9,967,356.538 34,770,599.039 13,705,342.365 31,032,613.212JPM US Strategic Growth A (dist) - GBP 28,393.835 635.779 25,074.944 3,954.670JPM US Strategic Growth B (acc) - USD 1,143,551.797 941,487.880 349,613.643 1,735,426.034JPM US Strategic Growth C (acc) - USD 641,058.058 4,435,630.259 2,104,109.472 2,972,578.845JPM US Strategic Growth D (acc) - USD 432,730.237 311,179.912 307,646.225 436,263.924JPM US Strategic Growth D (acc) - EUR (hedged) - 26,490.066 - 26,490.066JPM US Strategic Growth X (acc) - USD 3,711,013.447 5,435,332.359 529,036.120 8,617,309.686
JPMorgan Funds - US Technology FundJPM US Technology A (acc) - USD 178,419.945 1,180,352.223 970,527.312 388,244.856JPM US Technology A (dist) - GBP 40,163.033 1,753.184 8,545.158 33,371.059JPM US Technology A (dist) - USD 14,013,006.695 8,700,971.987 15,207,432.702 7,506,545.980JF US Technology A (dist) - USD 3,959,547.876 6,928,855.541 6,953,201.026 3,935,202.391JPM US Technology D (acc) - USD 3,425,483.037 2,461,818.928 3,090,447.571 2,796,854.394
JPMorgan Funds - US Value FundJPM US Value A (acc) - USD 17,525,395.184 40,906,758.343 30,685,347.005 27,746,806.522JPM US Value A (acc) - EUR (hedged) - 3,585,219.422 2,142,583.388 1,442,636.034JPM US Value A (dist) - USD 53,645,880.704 46,760,790.075 46,188,299.108 54,218,371.671JPM US Value A (dist) - GBP 39,901.555 21,411.794 2,716.678 58,596.671JF US Value A (dist) - USD 314,520.824 488,480.864 624,938.133 178,063.555JPM US Value B (acc) - USD 224,746.041 535,566.173 254,727.348 505,584.866JPM US Value C (acc) - USD 9,517,928.147 14,693,150.896 9,744,273.341 14,466,805.702JPM US Value D (acc) - USD 5,017,070.643 4,228,404.432 2,306,316.949 6,939,158.126JPM US Value D (acc) - EUR (hedged) - 268,507.456 29,282.885 239,224.571JPM US Value X (acc) - USD 3,155,183.098 6,464,554.694 1,912,520.818 7,707,216.974
490

Language Disclaimer Annual

JPMorgan Asset Management (Europe) S.à r.l.Postal Address: L-2888 LuxembourgTel No: (352) 34 101 Fax No: (352) 3410 8000E-mail: [email protected]
Internet: www.jpmorganassetmanagement.com
H102 10/11
For further information concerning JPMorgan Funds, please contact the Global Distributor:
GB
GB