
JPMorgan Chase & Co. - Luxembourg Stock Exchange
179
UNITED STATES SECURITIES AND EXCHANGE COMMISSION Washington, D.C. 20549 FORM 10-Q Quarterly report pursuant to Section 13 or 15(d) of the Securities Exchange Act of 1934 For the quarterly period ended Commission file March 31, 2021 number 1-5805 JPMorgan Chase & Co. (Exact name of registrant as specified in its charter) Delaware 13-2624428 (State or other jurisdiction of incorporation or organization) (I.R.S. employer identification no.) 383 Madison Avenue, New York, New York 10179 (Address of principal executive offices) (Zip Code) Registrant’s telephone number, including area code: (212) 270-6000 Securities registered pursuant to Section 12(b) of the Act: Title of each class Trading Symbol(s) Name of each exchange on which registered Common stock JPM The New York Stock Exchange Depositary Shares, each representing a one-four hundredth interest in a share of 6.10% Non- Cumulative Preferred Stock, Series AA JPM PR G The New York Stock Exchange Depositary Shares, each representing a one-four hundredth interest in a share of 6.15% Non- Cumulative Preferred Stock, Series BB JPM PR H The New York Stock Exchange Depositary Shares, each representing a one-four hundredth interest in a share of 5.75% Non- Cumulative Preferred Stock, Series DD JPM PR D The New York Stock Exchange Depositary Shares, each representing a one-four hundredth interest in a share of 6.00% Non- Cumulative Preferred Stock, Series EE JPM PR C The New York Stock Exchange Depositary Shares, each representing a one-four hundredth interest in a share of 4.75% Non- Cumulative Preferred Stock, Series GG JPM PR J The New York Stock Exchange Depositary Shares, each representing a one-four hundredth interest in a share of 4.55% Non- Cumulative Preferred Stock, Series JJ JPM PR K The New York Stock Exchange Alerian MLP Index ETNs due May 24, 2024 AMJ NYSE Arca, Inc. Guarantee of Callable Step-Up Fixed Rate Notes due April 26, 2028 of JPMorgan Chase Financial Company LLC JPM/28 The New York Stock Exchange Indicate by check mark whether the registrant (1) has filed all reports required to be filed by Section 13 or 15(d) of the Securities Exchange Act of 1934 during the preceding 12 months (or for such shorter period that the registrant was required to file such reports), and (2) has been subject to such filing requirements for the past 90 days. ☒ Yes ☐ No Indicate by check mark whether the registrant has submitted electronically every Interactive Data File required to be submitted pursuant to Rule 405 of Regulation S-T (§232.405 of this chapter) during the preceding 12 months (or for such shorter period that the registrant was required to submit such files). ☒ Yes ☐ No Indicate by check mark whether the registrant is a large accelerated filer, an accelerated filer, a non-accelerated filer, a smaller reporting company, or an emerging growth company. See the definitions of “large accelerated filer,” “accelerated filer,” “smaller reporting company,” and “emerging growth company” in Rule 12b-2 of the Exchange Act. Large accelerated filer ☒ Accelerated filer ☐ Non-accelerated filer ☐ Smaller reporting company ☐ Emerging growth company ☐ If an emerging growth company, indicate by check mark if the registrant has elected not to use the extended transition period for complying with any new or revised financial accounting standards provided pursuant to Section 13(a) of the Exchange Act. ☐ Indicate by check mark whether the registrant is a shell company (as defined in Rule 12b-2 of the Exchange Act). ☐ Yes ☒ No Number of shares of common stock outstanding as of March 31, 2021: 3,027,128,112
-
Upload
khangminh22 -
Category
Documents
-
view
1 -
download
0
Transcript of JPMorgan Chase & Co. - Luxembourg Stock Exchange

UNITED STATESSECURITIES AND EXCHANGE COMMISSION
Washington, D.C. 20549
FORM 10-QQuarterly report pursuant to Section 13 or 15(d) of
the Securities Exchange Act of 1934
For the quarterly period ended Commission fileMarch 31, 2021 number 1-5805
JPMorgan Chase & Co.(Exact name of registrant as specified in its charter)
Delaware 13-2624428(State or other jurisdiction of
incorporation or organization)(I.R.S. employer
identification no.)
383 Madison Avenue,New York, New York 10179
(Address of principal executive offices) (Zip Code)
Registrant’s telephone number, including area code: (212) 270-6000Securities registered pursuant to Section 12(b) of the Act:
Title of each class Trading Symbol(s) Name of each exchange on whichregistered
Common stock JPM The New York Stock ExchangeDepositary Shares, each representing a one-four hundredth interest in a share of 6.10% Non-
Cumulative Preferred Stock, Series AAJPM PR G The New York Stock Exchange
Depositary Shares, each representing a one-four hundredth interest in a share of 6.15% Non-Cumulative Preferred Stock, Series BB
JPM PR H The New York Stock Exchange
Depositary Shares, each representing a one-four hundredth interest in a share of 5.75% Non-Cumulative Preferred Stock, Series DD
JPM PR D The New York Stock Exchange
Depositary Shares, each representing a one-four hundredth interest in a share of 6.00% Non-Cumulative Preferred Stock, Series EE
JPM PR C The New York Stock Exchange
Depositary Shares, each representing a one-four hundredth interest in a share of 4.75% Non-Cumulative Preferred Stock, Series GG
JPM PR J The New York Stock Exchange
Depositary Shares, each representing a one-four hundredth interest in a share of 4.55% Non-Cumulative Preferred Stock, Series JJ
JPM PR K The New York Stock Exchange
Alerian MLP Index ETNs due May 24, 2024 AMJ NYSE Arca, Inc.Guarantee of Callable Step-Up Fixed Rate Notes due April 26, 2028 of JPMorgan Chase Financial
Company LLCJPM/28 The New York Stock Exchange
Indicate by check mark whether the registrant (1) has filed all reports required to be filed by Section 13 or 15(d) of the Securities Exchange Act of 1934 during the preceding 12 months (orfor such shorter period that the registrant was required to file such reports), and (2) has been subject to such filing requirements for the past 90 days. ☒ Yes ☐ NoIndicate by check mark whether the registrant has submitted electronically every Interactive Data File required to be submitted pursuant to Rule 405 of Regulation S-T (§232.405 of thischapter) during the preceding 12 months (or for such shorter period that the registrant was required to submit such files). ☒ Yes ☐ NoIndicate by check mark whether the registrant is a large accelerated filer, an accelerated filer, a non-accelerated filer, a smaller reporting company, or an emerging growth company. See thedefinitions of “large accelerated filer,” “accelerated filer,” “smaller reporting company,” and “emerging growth company” in Rule 12b-2 of the Exchange Act.
Large accelerated filer ☒ Accelerated filer ☐
Non-accelerated filer ☐ Smaller reporting company ☐
Emerging growth company ☐
If an emerging growth company, indicate by check mark if the registrant has elected not to use the extended transition period for complying with any new or revised financialaccounting standards provided pursuant to Section 13(a) of the Exchange Act. ☐
Indicate by check mark whether the registrant is a shell company (as defined in Rule 12b-2 of the Exchange Act). ☐ Yes ☒ No
Number of shares of common stock outstanding as of March 31, 2021: 3,027,128,112

FORM 10-QTABLE OF CONTENTS
Part I – Financial information PageItem 1. Financial Statements.
Consolidated Financial Statements – JPMorgan Chase & Co.:Consolidated statements of income (unaudited) for the three months ended March 31, 2021 and 2020 79Consolidated statements of comprehensive income (unaudited) for the three months ended March 31, 2021 and 2020 80Consolidated balance sheets (unaudited) at March 31, 2021 and December 31, 2020 81Consolidated statements of changes in stockholders’ equity (unaudited) for the three months ended March 31, 2021 and2020 82
Consolidated statements of cash flows (unaudited) for the three months ended March 31, 2021 and 2020 83Notes to Consolidated Financial Statements (unaudited) 84Report of Independent Registered Public Accounting Firm 161Consolidated Average Balance Sheets, Interest and Rates (unaudited) for the three months ended March 31, 2021 and 2020 162Glossary of Terms and Acronyms and Line of Business Metrics 163
Item 2. Management’s Discussion and Analysis of Financial Condition and Results of Operations.Consolidated Financial Highlights 3Introduction 4Executive Overview 5Consolidated Results of Operations 9Consolidated Balance Sheets and Cash Flows Analysis 12Off-Balance Sheet Arrangements 15Explanation and Reconciliation of the Firm’s Use of Non-GAAP Financial Measures 16Business Segment Results 18Firmwide Risk Management 35
Capital Risk Management 36Liquidity Risk Management 42Consumer Credit Portfolio 48Wholesale Credit Portfolio 53Investment Portfolio Risk Management 65Market Risk Management 66Country Risk Management 71Operational Risk Management 72Estimations and Model Risk Management 73
Critical Accounting Estimates Used by the Firm 74Accounting and Reporting Developments 77Forward-Looking Statements 78
Item 3. Quantitative and Qualitative Disclosures About Market Risk. 172Item 4. Controls and Procedures. 172Part II – Other informationItem 1. Legal Proceedings. 172Item 1A. Risk Factors. 172Item 2. Unregistered Sales of Equity Securities and Use of Proceeds. 173Item 3. Defaults Upon Senior Securities. 174Item 4. Mine Safety Disclosures. 174Item 5. Other Information. 174Item 6. Exhibits. 174
2

JPMorgan Chase & Co.Consolidated financial highlights (unaudited)
As of or for the period ended, (in millions, except per share, ratio, headcount dataand where otherwise noted)
1Q21 4Q20 3Q20 2Q20 1Q20Selected income statement dataTotal net revenue $ 32,266 $ 29,335 $ 29,255 $ 33,075 $ 28,286 Total noninterest expense 18,725 16,048 16,875 16,942 16,791 Pre-provision profit 13,541 13,287 12,380 16,133 11,495 Provision for credit losses (4,156) (1,889) 611 10,473 8,285 Income before income tax expense 17,697 15,176 11,769 5,660 3,210 Income tax expense 3,397 3,040 2,326 973 345
Net income $ 14,300 $ 12,136 $ 9,443 $ 4,687 $ 2,865
Earnings per share dataNet income: Basic $ 4.51 $ 3.80 $ 2.93 $ 1.39 $ 0.79
Diluted 4.50 3.79 2.92 1.38 0.78 Average shares: Basic 3,073.5 3,079.7 3,077.8 3,076.3 3,095.8
Diluted 3,078.9 3,085.1 3,082.8 3,081.0 3,100.7
Market and per common share dataMarket capitalization 460,820 387,492 293,451 286,658 274,323 Common shares at period-end 3,027.1 3,049.4 3,048.2 3,047.6 3,047.0 Book value per share 82.31 81.75 79.08 76.91 75.88 Tangible book value per share (“TBVPS”) 66.56 66.11 63.93 61.76 60.71 Cash dividends declared per share 0.90 0.90 0.90 0.90 0.90
Selected ratios and metricsReturn on common equity (“ROE”) 23 % 19 % 15 % 7 % 4 %Return on tangible common equity (“ROTCE”) 29 24 19 9 5 Return on assets 1.61 1.42 1.14 0.58 0.40 Overhead ratio 58 55 58 51 59 Loans-to-deposits ratio 44 47 49 52 57 Firm Liquidity coverage ratio (“LCR”) (average) 110 110 114 117 114 JPMorgan Chase Bank, N.A. LCR (average) 166 160 157 140 117 Common equity Tier 1 (“CET1”) capital ratio 13.1 13.1 13.1 12.4 11.5 Tier 1 capital ratio 15.0 15.0 15.0 14.3 13.3 Total capital ratio 17.2 17.3 17.3 16.7 15.5 Tier 1 leverage ratio 6.7 7.0 7.0 6.9 7.5 Supplementary leverage ratio (“SLR”) 6.7 6.9 7.0 6.8 6.0
Selected balance sheet data (period-end)Trading assets $ 544,052 $ 503,126 $ 505,822 $ 491,716 $ 510,923 Investment securities, net of allowance for credit losses 597,394 589,999 531,136 558,791 471,144 Loans 1,011,307 1,012,853 989,740 1,009,382 1,049,610 Total assets 3,689,336 3,384,757 3,245,061 3,212,643 3,138,530 Deposits 2,278,112 2,144,257 2,001,416 1,931,029 1,836,009 Long-term debt 279,427 281,685 279,175 317,003 299,344 Common stockholders’ equity 249,151 249,291 241,050 234,403 231,199 Total stockholders’ equity 280,714 279,354 271,113 264,466 261,262 Headcount 259,350 255,351 256,358 256,710 256,720
Credit quality metricsAllowances for loan losses and lending-related commitments $ 25,517 $ 30,737 $ 33,637 $ 34,301 $ 25,391 Allowance for loan losses to total retained loans 2.42 % 2.95 % 3.26 % 3.27 % 2.32 %Nonperforming assets $ 10,257 $ 10,906 $ 11,462 $ 9,715 $ 7,062 Net charge-offs 1,057 1,050 1,180 1,560 1,469 Net charge-off rate 0.45 % 0.44 % 0.49 % 0.64 % 0.62 %
(a) Prior-period amounts have been revised to conform with the current presentation. Refer to Note 1 for further information.(b) Pre-provision profit, TBVPS and ROTCE are each non-GAAP financial measures. Tangible common equity (“TCE”) is also a non-GAAP financial measure. Refer to
Explanation and Reconciliation of the Firm’s Use of Non-GAAP Financial Measures on pages 16-17 for a further discussion of these measures.(c) Quarterly ratios are based upon annualized amounts.(d) The capital metrics reflect the relief provided by the Federal Reserve Board in response to the COVID-19 pandemic, including the Current Expected Credit Losses ("CECL")
capital transition provisions that became effective in the first quarter of 2020. The SLR reflects the temporary exclusions of U.S. Treasury securities and deposits at FederalReserve Banks, which became effective April 1, 2020 and remained in effect through March 31, 2021. Refer to Capital Risk Management on pages 36-41 of this Form 10-Qand pages 91-101 of JPMorgan Chase’s 2020 Form 10-K for additional information.
(e) Prior-period amounts have been revised to conform with the current presentation.
(a)
(b)
(a)
(b)
(c)
(b)(c)
(c)
(a)
(d)
(d)
(d)
(d)
(d)
(a)
(e)
3

INTRODUCTION
The following is Management’s discussion and analysis of thefinancial condition and results of operations (“MD&A”) ofJPMorgan Chase & Co. (“JPMorgan Chase” or the “Firm”) for thefirst quarter of 2021.
This Quarterly Report on Form 10-Q for the first quarter of 2021(“Form 10-Q”) should be read together with JPMorgan Chase’sAnnual Report on Form 10-K for the year ended December 31,2020 (“2020 Form 10-K”). Refer to the Glossary of terms andacronyms and line of business (“LOB”) metrics on pages 163-171for definitions of terms and acronyms used throughout this Form10-Q.
The MD&A contains forward-looking statements within themeaning of the Private Securities Litigation Reform Act of 1995.These forward-looking statements are based on the current beliefsand expectations of JPMorgan Chase’s management, speak onlyas of the date of this Form 10-Q and are subject to significant risksand uncertainties. Refer to Forward-looking Statements on page78 of this Form 10-Q, Part II, Item 1A, Risk Factors on pages 172-173 of this Form 10-Q and Part I, Item 1A, Risk factors, on pages8-32 of the 2020 Form 10-K for a discussion of certain of thoserisks and uncertainties and the factors that could cause JPMorganChase’s actual results to differ materially because of those risksand uncertainties.
JPMorgan Chase & Co. (NYSE: JPM), a financial holdingcompany incorporated under Delaware law in 1968, is a leadingfinancial services firm based in the United States of America(“U.S.”), with operations worldwide. JPMorgan Chase had $3.7trillion in assets and $280.7 billion in stockholders’ equity as ofMarch 31, 2021. The Firm is a leader in investment banking,financial services for consumers and small businesses,commercial banking, financial transaction processing and assetmanagement. Under the J.P. Morgan and Chase brands, the Firmserves millions of customers in the U.S. and globally many of theworld’s most prominent corporate, institutional and governmentclients.
JPMorgan Chase’s principal bank subsidiary is JPMorgan ChaseBank, National Association (“JPMorgan Chase Bank, N.A.”), anational banking association with U.S. branches in 38 states andWashington, D.C. as of March 31, 2021. JPMorgan Chase’sprincipal non-bank subsidiary is J.P. Morgan Securities LLC (“J.P.Morgan Securities”), a U.S. broker-dealer. The bank and non-banksubsidiaries of JPMorgan Chase operate nationally as well asthrough overseas branches and subsidiaries, representativeoffices and subsidiary foreign banks. The Firm’s principaloperating subsidiary outside the U.S. is J.P. Morgan Securities plc,a U.K.-based subsidiary of JPMorgan Chase Bank, N.A.
For management reporting purposes, the Firm’s activities areorganized into four major reportable business segments, as wellas a Corporate segment. The Firm’s consumer business segmentis Consumer & Community Banking (“CCB”). The Firm’s wholesalebusiness segments are the Corporate & Investment Bank (“CIB”),Commercial Banking (“CB”), and Asset & Wealth Management(“AWM”). Refer to Note 25 of this Form 10-Q and Note 32 ofJPMorgan Chase’s 2020 Form 10-K for a description of the Firm’sbusiness segments and the products and services they provide totheir respective client bases.
The Firm's website is www.jpmorganchase.com. JPMorgan Chasemakes available on its website, free of charge, annual reports onForm 10-K, quarterly reports on Form 10-Q and current reports onForm 8-K pursuant to Section 13(a) or Section 15(d) of theSecurities Exchange Act of 1934, as soon as reasonablypracticable after it electronically files or furnishes such material tothe U.S. Securities and Exchange Commission (the “SEC”) atwww.sec.gov. JPMorgan Chase makes important informationabout the Firm available on its website, including the InvestorRelations section of its website athttps://www.jpmorganchase.com/ir.
4

EXECUTIVE OVERVIEWThis executive overview of the MD&A highlights selected information and does not contain all of the information that is important to readers ofthis Form 10-Q. For a complete description of the trends and uncertainties, as well as the risks and critical accounting estimates affecting theFirm and its various LOBs, this Form 10-Q and the 2020 Form 10-K should be read together and in their entirety.Financial performance of JPMorgan Chase(unaudited)As of or for the period ended,(in millions, except per share data
and ratios)
Three months ended March 31,
2021 2020 ChangeSelected income statement dataTotal net revenue $ 32,266 $ 28,286 14 %Total noninterest expense 18,725 16,791 12 Pre-provision profit 13,541 11,495 18 Provision for credit losses (4,156) 8,285 NMNet income 14,300 2,865 399 Diluted earnings per share $ 4.50 $ 0.78 477 Selected ratios and metricsReturn on common equity 23% 4%Return on tangible common equity 29 5Book value per share $ 82.31 $ 75.88 8 Tangible book value per share 66.56 60.71 10 Capital ratiosCET1 13.1% 11.5%Tier 1 capital 15.0 13.3Total capital 17.2 15.5
(a) Prior-period amount has been revised to conform with the current presentation.Refer to Note 1 for further information.
(b) The capital metrics reflect the relief provided by the Federal Reserve Board inresponse to the COVID-19 pandemic, including the CECL capital transitionprovisions that became effective in the first quarter of 2020. Refer to CapitalRisk Management on pages 36-41 of this Form 10-Q and pages 91-101 ofJPMorgan Chase’s 2020 Form 10-K for additional information.
Comparisons noted in the sections below are for the first quarter of2021 versus the first quarter of 2020, unless otherwise specified.
Firmwide overviewJPMorgan Chase reported net income of $14.3 billion for the firstquarter of 2021, or $4.50 per share, on net revenue of $32.3billion. The Firm reported ROE of 23% and ROTCE of 29%. TheFirm's results for the first quarter of 2021 included a reduction inthe allowance for credit losses of $5.2 billion compared to anincrease in the allowance for credit losses of $6.8 billion in theprior year, as well as a $550 million contribution to the Firm'sFoundation.• Net income was $14.3 billion, up $11.4 billion.• Total net revenue was up 14%. Noninterest revenue was $19.4
billion, up 40%, predominantly driven by higher CIB Marketsrevenue, higher Investment Banking fees, and the absence oflosses in Credit Adjustments and Other in CIB and markdownson held-for-sale positions in the bridge financing portfolio in CIBand CB recorded in the prior year. Net interest income was$12.9 billion, down 11%, predominantly driven by the impact oflower rates partially offset by balance sheet growth.
• Noninterest expense was $18.7 billion, up 12%, predominantlydriven by higher volume- and revenue-related expense andcontinued investments in the businesses. The increase inexpense also included a $550 million contribution to the Firm'sFoundation.
• The provision for credit losses was a net benefit of $4.2 billiondriven by net reductions in the allowance for credit losses of$5.2 billion, compared to an expense of $8.3 billion in the prioryear predominantly driven by net additions to the allowance forcredit losses of $6.8 billion.
• The total allowance for credit losses was $25.6 billion at March31, 2021. The Firm had an allowance for loan losses to retainedloans coverage ratio of 2.42%, compared with 2.95% in thefourth quarter of 2020, and 2.32% in the prior year; the decreasefrom the fourth quarter of 2020 was driven by net reductions inthe allowance for loan losses.
• The Firm’s nonperforming assets totaled $10.3 billion atMarch 31, 2021, an increase of $3.2 billion from the prior year,reflecting client credit deterioration across multiple industries,including Real Estate, in the wholesale portfolio; and in theconsumer portfolio, loans placed on nonaccrual status related tothe impact of the COVID-19 pandemic. In the first quarter of2021, nonperforming assets decreased $649 million fromDecember 31, 2020, driven by lower nonaccrual loans in thewholesale portfolio, reflecting the impact of net portfolio activityand select client upgrades in Oil & Gas and Individuals; andlower nonaccrual loans at fair value in the CIB consumerportfolio, due to sales.
• Firmwide average loans of $1.0 trillion were up 1%, driven byhigher loans in AWM and CIB, predominantly offset by lowerloans in CCB and CB. The increase in loans also reflects loansoriginated under the Paycheck Protection Program (“PPP”) inCCB and CB.
• Firmwide average deposits of $2.2 trillion were up 36%,reflecting significant inflows across the LOBs primarily driven bythe effect of certain government actions in response to theCOVID-19 pandemic.
• As of March 31, 2021, the Firm had average eligible HighQuality Liquid Assets (“HQLA”) of approximately $697 billion andunencumbered marketable securities with a fair value ofapproximately $841 billion, resulting in approximately $1.5 trillionof liquidity sources. Refer to Liquidity Risk Management onpages 42-46 for additional information.
(a)
(b)
5

Selected capital-related metrics• The Firm’s CET1 capital was $206 billion, and the Standardized
and Advanced CET1 ratios were 13.1% and 13.7%, respectively.• The Firm’s SLR was 6.7%, and without the temporary exclusions
of U.S. Treasury securities and deposits at Federal ReserveBanks, 5.5%.
• The Firm grew TBVPS, ending the first quarter of 2021 at$66.56, up 10% versus the prior year.
Pre-provision profit, ROTCE and TBVPS are non-GAAP financialmeasures. Refer to Explanation and Reconciliation of the Firm’sUse of Non-GAAP Financial Measures on pages 16-17 for afurther discussion of each of these measures.Business segment highlightsSelected business metrics for each of the Firm’s four LOBs arepresented below for the first quarter of 2021.
CCBROE 54%
• Average deposits up 32%; client investment assetsup 44%
• Average loans down 7%; debit and credit card salesvolume up 9%
• Active mobile customers up 9%
CIBROE 27%
• Global Investment Banking wallet share of 9.0% in1Q21
• Total Markets revenue of $9.1 billion, up 25%, withFixed Income Markets up 15% and Equity Markets up47%
CBROE 19%
• Gross Investment Banking revenue of $1.1 billion, up65%
• Average loans down 2%; average deposits up 54%
AWMROE 35%
• Assets under management (AUM) of $2.8 trillion, up28%
• Average loans up 18%; average deposits up 43%
Refer to the Business Segment Results on pages 18-34 for adetailed discussion of results by business segment.
Credit provided and capital raisedJPMorgan Chase continues to support consumers, businessesand communities around the globe. The Firm provided new andrenewed credit and raised capital for wholesale and consumerclients during the first three months of 2021, consisting of:
$804 billionTotal credit provided and capital raised(including loans and commitments)
$69billion
Credit for consumers
$4billion
Credit for U.S. small businesses
$300 billion Credit for corporations
$417 billionCapital raised for corporate clients and non-U.S. government entities
$14 billion
Credit and capital raised for nonprofit andU.S. government entities
$10 billionLoans under the Small BusinessAdministration’s Paycheck ProtectionProgram
(a) Excludes loans under the SBA’s PPP.(b) Includes states, municipalities, hospitals and universities.
(a)
(b)
6

Recent events• On April 15, 2021, JPMorgan Chase announced that it aims to
finance and facilitate more than $2.5 trillion to advance long-term solutions that address climate change and contribute tosustainable development beginning in 2021 through the end of2030. The target includes $1 trillion for green initiatives, such asrenewable energy and clean technologies.
OutlookThese current expectations are forward-looking statements withinthe meaning of the Private Securities Litigation Reform Act of1995. Such forward-looking statements are based on the currentbeliefs and expectations of JPMorgan Chase’s management,speak only as of the date of this Form 10-Q, and are subject tosignificant risks and uncertainties. Refer to Forward-LookingStatements on page 78 and Risk Factors on page 172 of this Form10-Q and pages 8–32 of JPMorgan Chase’s 2020 Form 10-K for afurther discussion of certain of those risks and uncertainties andthe other factors that could cause JPMorgan Chase’s actualresults to differ materially because of those risks and uncertainties.There is no assurance that actual results will be in line with theoutlook set forth below, and the Firm does not undertake to updateany forward-looking statements.JPMorgan Chase’s current outlook for 2021 should be viewedagainst the backdrop of the global and U.S. economies, theCOVID-19 pandemic, financial markets activity, the geopoliticalenvironment, the competitive environment, client and customeractivity levels, and regulatory and legislative developments in theU.S. and other countries where the Firm does business. Each ofthese factors will affect the performance of the Firm and its LOBs.The Firm will continue to make appropriate adjustments to itsbusinesses and operations in response to ongoing developmentsin the business, economic, regulatory and legal environments inwhich it operates. The outlook information contained in this Form10-Q supersedes all outlook information furnished by the Firm in itsperiodic reports filed with the SEC prior to the date of this Form 10-Q.
Full-year 2021• Management expects net interest income, on a managed basis,
to be approximately $55 billion, market dependent.• Management expects adjusted expense to be approximately $70
billion, market dependent.• Management expects the net charge-off rate in Card to be
approximately 2.5%.
Net interest income, on a managed basis, and adjusted expenseare non-GAAP financial measures. Refer to Explanation andReconciliation of the Firm’s Use of Non-GAAP Financial Measureson pages 16-17.
7
Business DevelopmentsCOVID-19 PandemicThroughout the COVID-19 pandemic, the Firm has remainedfocused on serving its clients, customers and communities, as wellas the well-being of its employees.The Firm has raised capital and provided credit to support itscustomers and clients. The Firm continues to participate in theSmall Business Association’s (“SBA”) PPP and since inception ofthe Program has funded approximately $40 billion as of April 30,2021. While the Firm’s temporary assistance measures for thoseimpacted by the pandemic have steadily declined since early2020, the Firm continues to assist those impacted, primarily in theform of payment deferrals.Refer to Credit Portfolio on page 47 for further information on PPP;Consumer Credit portfolio on pages 48-52 and Wholesale CreditPortfolio on pages 53-62 for further information on retained loansunder payment deferral. Refer to Credit Portfolio on page 113 ofJPMorgan Chase's 2020 Form 10-K for further information onPPP; Consumer Credit Portfolio on page 116 and WholesaleCredit Portfolio on page 122 of JPMorgan Chase's 2020 Form 10-K for further information on retained loans under payment deferral.The Firm remains focused on the well-being of its employees.While the vast majority of its global workforce continue to workfrom home, the Firm is actively monitoring the health and safetysituations at local and regional levels, and will adapt its plans asthese situations evolve.
Regulatory Developments Relating to the COVID-19 PandemicTo address the economic impact of the COVID-19 pandemic, theU.S. government as well as central banks and banking authoritiesaround the world have taken and continue to take actions to helpindividuals, households and businesses that have been adverselyaffected by the economic disruption caused by the pandemic. Inthe U.S., several stimulus packages were enacted including theCARES Act in March of 2020, the Consolidated Appropriations Actin December of 2020 and the American Rescue Plan Act in Marchof 2021, which provided funding to support loan facilities to assistconsumers and businesses and stimulus payments to individuals.Refer to Regulatory Developments Relating to the COVID-19Pandemic on pages 52-53 of JPMorgan Chase’s 2020 Form 10-Kfor further discussion on U.S. government actions impacting theFirm and U.S. government facilities and programs in which theFirm has participated.
Post BrexitPrior to December 31, 2020 the Firm substantially completed itsFirmwide Brexit Implementation program which was intended toensure the continuity of its business and operations with respect toEU clients. On March 26, 2021, the U.K. and the EU agreed on aMemorandum of Understanding that sets out a framework forregulatory cooperation in relation to cross-border financialservices. The Firm will monitor developments and take anynecessary actions to ensure business continuity with respect to theFirm's EU clients. Refer to Business Developments on page 50 ofthe 2020 Form 10-K for additional information.
Interbank Offered Rate (“IBOR”) transitionOn March 5, 2021, the Financial Conduct Authority confirmed thatthe publication of the principal tenors of U.S. dollar LIBOR (i.e.,overnight, one-month, three-month, six-month and 12-monthLIBOR) will cease immediately following a final publication on June30, 2023. The scheduled cessation date for U.K. sterling,Japanese yen, Swiss franc and Euro LIBOR, and the one-weekand two-month tenors of U.S. dollar LIBOR, remains December31, 2021, and the Firm is prioritizing those currencies and tenorsof LIBOR for contract remediation in 2021.The Firm continues to make progress on its initiatives toappropriately mitigate the risks associated with IBORdiscontinuation, including contract remediation. The Firm alsocontinues to monitor the transition relief being considered by theU.S. Treasury Department regarding the tax implications ofreference rate reform. Refer to Business Developments on page51 of the 2020 Form 10-K for a discussion of the Firm’s initiativesto address the expected discontinuation of the London InterbankOffered Rate (“LIBOR”) and other IBORs.
8

CONSOLIDATED RESULTS OF OPERATIONS
This section provides a comparative discussion of JPMorgan Chase’s Consolidated Results of Operations on a reported basis for the threemonths ended March 31, 2021 and 2020, unless otherwise specified. Factors that relate primarily to a single business segment arediscussed in more detail within that business segment's results. Refer to pages 74-76 of this Form 10-Q and pages 152-155 of JPMorganChase’s 2020 Form 10-K for a discussion of the Critical Accounting Estimates Used by the Firm that affect the Consolidated Results ofOperations.Revenue
Three months ended March 31,(in millions) 2021 2020 ChangeInvestment banking fees $ 2,970 $ 1,866 59 %Principal transactions 6,500 2,937 121 Lending- and deposit-related
fees 1,687 1,706 (1)Asset management,
administration andcommissions 5,029 4,540 11
Investment securities gains 14 233 (94)Mortgage fees and relatedincome 704 320 120 Card income 1,350 995 36 Other income 1,123 1,250 (10)Noninterest revenue 19,377 13,847 40 Net interest income 12,889 14,439 (11)Total net revenue $ 32,266 $ 28,286 14 %
(a) Included operating lease income of $1.3 billion and $1.4 billion for the threemonths ended March 31, 2021 and 2020.
(b) Prior-period amount has been revised to conform with the current presentation.Refer to Note 1 for further information.
Investment banking fees increased across products in CIB,reflecting:• higher equity underwriting fees largely driven by the IPO market
due to increased industry-wide fees• higher advisory fees driven by a higher number of completed
transactions, in part related to transactions announced in thesecond half of 2020, and
• higher debt underwriting fees driven by high-yield bonds andleveraged loans due to increased industry-wide fees and walletshare gains.
Refer to CIB segment results on pages 23-27 and Note 5 foradditional information.Principal transactions revenue increased, in part due to theabsence of two significant items in the prior year: a $951 millionloss in CIB’s Credit Adjustments & Other; and an $896 millionmarkdown on held-for-sale positions, in the bridge financingportfolio in CIB and CB.Excluding these two items, principal transactions revenueincreased in CIB driven by strong performance in:• Equity Markets across derivatives, Cash Equities, and prime
brokerage, and• Fixed Income Markets particularly in Securitized Products and
Credit, largely offset by lower revenue in Rates and Currencies& Emerging Markets compared to a strong prior year.
The increase in principal transactions revenue also reflected netgains on certain legacy private equity investments in Corporate,compared with net losses in the prior year.Principal transactions revenue in CIB may in certain cases haveoffsets across other revenue lines, including net interest income.The Firm assesses the performance of its CIB Markets businesson a total revenue basis.Refer to CIB and Corporate segment results on pages 23-27 andpages 33-34, and Note 5 for additional information.Lending- and deposit-related fees decreased reflecting:• lower deposit-related fees in CCB given the higher deposits held
in existing and new accounts,predominantly offset by• higher cash management fees in CIB and CB, and higher
lending-related fees, particularly loan commitment fees in CIB.Refer to CCB segment results on pages 20-22, CIB on pages 23-27 and CB on pages 28-29, respectively, and Note 5 for additionalinformation.Asset management, administration and commissions revenueincreased driven by higher asset management fees as a result of:• strong cumulative net inflows into long-term and liquidity
products and higher average market levels, net of liquidity feewaivers, in AWM, and to a lesser extent,
• higher levels of investment assets on higher average marketlevels and net inflows in CCB.
Refer to CCB and AWM segment results on pages 20-22 andpages 30-32, respectively, and Note 5 for information on assetmanagement, administration and commissions revenue.Investment securities gains in both periods reflected the impactof repositioning the investment securities portfolio. Refer toCorporate segment results on pages 33-34 and Note 9 forinformation on investment securities gains.Mortgage fees and related income increased predominantly dueto higher mortgage production revenue reflecting higherproduction margins and volumes.Refer to CCB segment results on pages 20-22, Note 5 and 14 forfurther information.Card income increased driven by lower acquisition costs, andhigher net interchange income in CCB, with debit and credit cardsales volume returning to pre-pandemic levels. Refer to CCBsegment results on pages 20-22 and Note 5 for furtherinformation.
(a)(b)
9

Other income decreased reflecting:• Weather-related write-downs on certain renewable energy
investments, as well as increased amortization on a higher levelof alternative energy investments in the tax-oriented investmentportfolio in CIB. The increased amortization was more thanoffset by lower income tax expense from the associated taxcredits
• lower gains on certain Corporate investments, and• lower operating lease income from a decline in auto operating
lease volume in CCB,partially offset by• net valuation gains on certain investments, compared with
losses in the prior year, in AWM, and• the absence of losses on certain equity investments in CIB in the
prior year.Net interest income decreased predominantly driven by theimpact of lower rates, partially offset by balance sheet growth.The Firm’s average interest-earning assets were $3.1 trillion, up$661 billion, predominantly driven by higher deposits with banksand investment securities, and the yield was 1.87%, down 127basis points (“bps”), primarily due to lower rates. The net yield onthese assets, on an FTE basis, was 1.69%, a decrease of 68 bps.The net yield excluding CIB Markets was 1.93%, down 108 bps.Net yield on an FTE basis, and net yield excluding CIB Marketsare non-GAAP financial measures. Refer to the Consolidatedaverage balance sheets, interest and rates schedule on page 162for further details; and the Explanation and Reconciliation of theFirm’s Use of Non-GAAP Financial Measures on pages 16-17 for afurther discussion of Net interest yield excluding CIB Markets.
Provision for credit lossesThree months ended March 31,
(in millions) 2021 2020 ChangeConsumer, excluding credit card $ (984) $ 619 NMCredit card (2,517) 5,063 NMTotal consumer (3,501) 5,682 NMWholesale (671) 2,594 NMInvestment securities 16 9 78 %Total provision for credit losses $ (4,156) $ 8,285 NM
The provision for credit losses decreased driven by netreductions in both the consumer and wholesale allowance forcredit losses.The decrease in consumer was driven by:• a $4.5 billion reduction in the allowance for credit losses,
including $3.5 billion in Card reflecting improvements in theFirm's macroeconomic scenarios, and $625 million in HomeLending primarily due to the continued improvement in homeprice index ("HPI") expectations and to a lesser extent portfoliorun-off, and
• lower net charge-offs predominantly in Card, reflecting lowercharge-offs and higher recoveries primarily benefiting frompayment assistance and government stimulus;
• the prior year included a $4.4 billion addition to the allowance forcredit losses.
The decrease in wholesale reflects a net reduction of $716 millionin the allowance for credit losses across the LOBs reflectingimprovements in the Firm's macroeconomic scenarios.Refer to CCB segment results on pages 20-22, CIB on pages 23-27, CB on pages 28-29, AWM on pages 30-32, the Allowance forCredit Losses on pages 63–64, and Notes 9 and 12 for additionalinformation on the credit portfolio and the allowance for creditlosses.
10

Noninterest expense
(in millions)Three months ended March 31,
2021 2020 ChangeCompensation expense $ 10,601 $ 8,895 19 %Noncompensation expense:
Occupancy 1,115 1,066 5 Technology, communications andequipment 2,519 2,578 (2)Professional and outside services 2,203 2,028 9 Marketing 751 800 (6)Other expense 1,536 1,424 8
Total noncompensation expense 8,124 7,896 3 Total noninterest expense $ 18,725 $ 16,791 12 %
(a) Included Firmwide legal expense of $28 million and $197 million for the threemonths ended March 31, 2021 and 2020, respectively.
(b) Included FDIC-related expense of $201 million and $99 million for the threemonths ended March 31, 2021 and 2020, respectively.
Compensation expense increased predominantly driven byhigher revenue-related expense in CIB, as well as the impact ofinvestments in the businesses.Noncompensation expense increased as a result of:• higher contribution expense, which included a $550 million
donation of equity investments to the Firm's Foundation• higher investments in the businesses, including technology, and• higher FDIC-related expense largely driven by balance sheet
growth,partially offset by• lower legal expense, predominantly in CIB, and• lower other structural expense, including lower travel and
entertainment across the businesses and lower operatinglosses.
Other volume- and revenue-related expense was relatively flat asthe increase in brokerage expense in CIB and distribution expensein AWM was offset by lower depreciation from the decline in autolease assets in CCB.
Income tax expense
(in millions)Three months ended March 31,
2021 2020 ChangeIncome before income taxexpense $ 17,697 $ 3,210 451 %Income tax expense 3,397 345 NMEffective tax rate 19.2 % 10.7 %
(a) Prior-period amounts have been revised to conform with the currentpresentation. Refer to Note 1 for further information.
The effective tax rate increased driven by a higher level of pre-taxincome that also reduced the relative impact of certain tax benefits,as well as the resolution of certain tax audits.
(a)(b)
(a)
(a)
11
CONSOLIDATED BALANCE SHEETS AND CASH FLOWS ANALYSIS
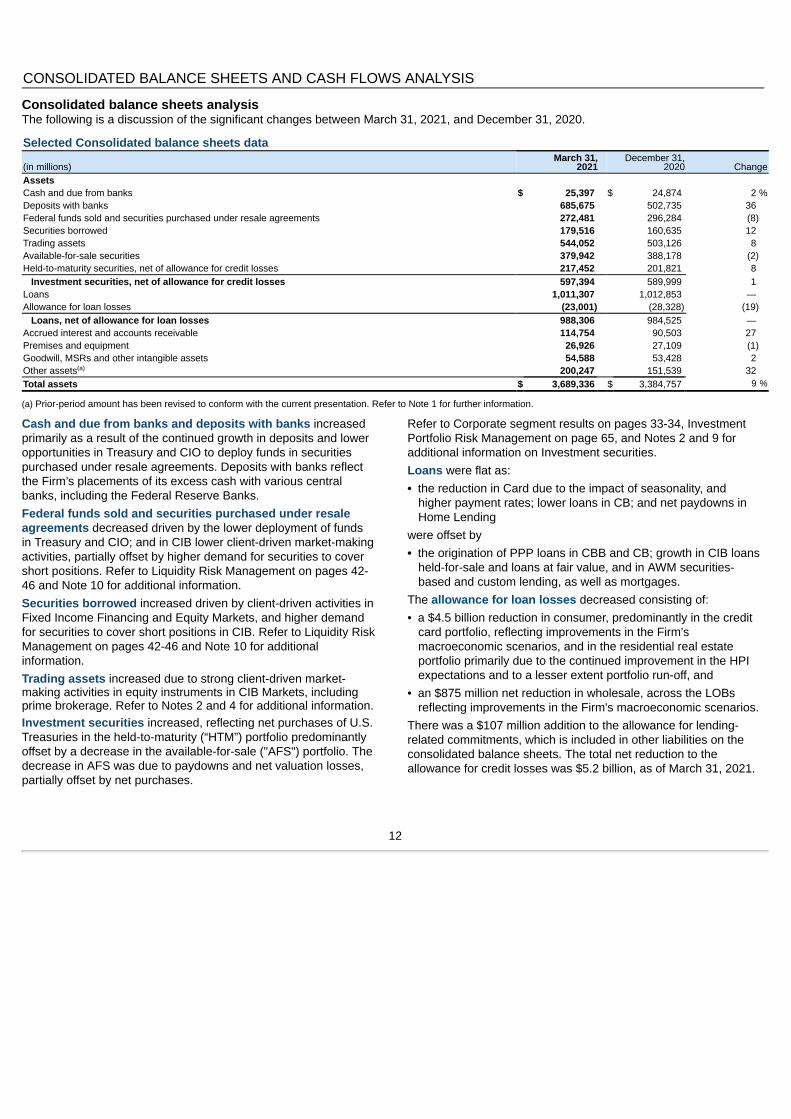
Consolidated balance sheets analysisThe following is a discussion of the significant changes between March 31, 2021, and December 31, 2020.
Selected Consolidated balance sheets data
(in millions)March 31,
2021December 31,
2020 ChangeAssetsCash and due from banks $ 25,397 $ 24,874 2 %Deposits with banks 685,675 502,735 36 Federal funds sold and securities purchased under resale agreements 272,481 296,284 (8)Securities borrowed 179,516 160,635 12 Trading assets 544,052 503,126 8 Available-for-sale securities 379,942 388,178 (2)Held-to-maturity securities, net of allowance for credit losses 217,452 201,821 8
Investment securities, net of allowance for credit losses 597,394 589,999 1 Loans 1,011,307 1,012,853 — Allowance for loan losses (23,001) (28,328) (19)
Loans, net of allowance for loan losses 988,306 984,525 — Accrued interest and accounts receivable 114,754 90,503 27 Premises and equipment 26,926 27,109 (1)Goodwill, MSRs and other intangible assets 54,588 53,428 2 Other assets 200,247 151,539 32 Total assets $ 3,689,336 $ 3,384,757 9 %
(a) Prior-period amount has been revised to conform with the current presentation. Refer to Note 1 for further information.
Cash and due from banks and deposits with banks increasedprimarily as a result of the continued growth in deposits and loweropportunities in Treasury and CIO to deploy funds in securitiespurchased under resale agreements. Deposits with banks reflectthe Firm’s placements of its excess cash with various centralbanks, including the Federal Reserve Banks.Federal funds sold and securities purchased under resaleagreements decreased driven by the lower deployment of fundsin Treasury and CIO; and in CIB lower client-driven market-makingactivities, partially offset by higher demand for securities to covershort positions. Refer to Liquidity Risk Management on pages 42-46 and Note 10 for additional information.Securities borrowed increased driven by client-driven activities inFixed Income Financing and Equity Markets, and higher demandfor securities to cover short positions in CIB. Refer to Liquidity RiskManagement on pages 42-46 and Note 10 for additionalinformation.Trading assets increased due to strong client-driven market-making activities in equity instruments in CIB Markets, includingprime brokerage. Refer to Notes 2 and 4 for additional information.Investment securities increased, reflecting net purchases of U.S.Treasuries in the held-to-maturity (“HTM”) portfolio predominantlyoffset by a decrease in the available-for-sale ("AFS") portfolio. Thedecrease in AFS was due to paydowns and net valuation losses,partially offset by net purchases.
Refer to Corporate segment results on pages 33-34, InvestmentPortfolio Risk Management on page 65, and Notes 2 and 9 foradditional information on Investment securities.Loans were flat as:• the reduction in Card due to the impact of seasonality, and
higher payment rates; lower loans in CB; and net paydowns inHome Lending
were offset by• the origination of PPP loans in CBB and CB; growth in CIB loans
held-for-sale and loans at fair value, and in AWM securities-based and custom lending, as well as mortgages.
The allowance for loan losses decreased consisting of:• a $4.5 billion reduction in consumer, predominantly in the credit
card portfolio, reflecting improvements in the Firm'smacroeconomic scenarios, and in the residential real estateportfolio primarily due to the continued improvement in the HPIexpectations and to a lesser extent portfolio run-off, and
• an $875 million net reduction in wholesale, across the LOBsreflecting improvements in the Firm's macroeconomic scenarios.
There was a $107 million addition to the allowance for lending-related commitments, which is included in other liabilities on theconsolidated balance sheets. The total net reduction to theallowance for credit losses was $5.2 billion, as of March 31, 2021.
(a)
12

Refer to Credit and Investment Risk Management on pages 47-65,and Notes 2, 3, 11 and 12 for a more detailed discussion of loansand the allowance for loan losses.Accrued interest and accounts receivable increased largely dueto higher client receivables related to client-driven activities in CIBprime brokerage.
Goodwill, MSRs and other intangibles increased driven byhigher MSRs as a result of lower prepayment speeds on higherrates, as well as net additions to the MSRs. Refer to Note 14 foradditional information.Other assets increased predominantly due to the impact ofsecurities financing transactions in CIB prime brokerage, as wellas higher cash collateral placed with central counterparties("CCPs"). Refer to Note 10 for additional information on securitieslending transactions.
Selected Consolidated balance sheets data (continued)
(in millions)March 31,
2021December 31,
2020 ChangeLiabilitiesDeposits $ 2,278,112 $ 2,144,257 6 %Federal funds purchased and securities loaned or sold under repurchase agreements 304,019 215,209 41 Short-term borrowings 54,978 45,208 22 Trading liabilities 191,349 170,181 12 Accounts payable and other liabilities 285,066 231,285 23 Beneficial interests issued by consolidated variable interest entities (“VIEs”) 15,671 17,578 (11)Long-term debt 279,427 281,685 (1)Total liabilities 3,408,622 3,105,403 10 Stockholders’ equity 280,714 279,354 — Total liabilities and stockholders’ equity $ 3,689,336 $ 3,384,757 9 %
(a) Prior-period amount has been revised to conform with the current presentation. Refer to Note 1 for further information.
Deposits increased across the LOBs primarily driven by the effectof certain government actions in response to the COVID 19pandemic. In CCB, the increase was also driven by lowerspending, as well as growth from existing and new accountsacross both consumer and small business customers. Refer toLiquidity Risk Management on pages 42-46 and Notes 2 and 15for additional information.Federal funds purchased and securities loaned or sold underrepurchase agreements increased reflecting:• higher secured financing of AFS investment securities in
Treasury and CIO, as well as higher trading assets in CIB, and• the impact of client activities in CIB.Refer to Liquidity Risk Management on pages 42-46 and Note 10for additional information.Short-term borrowings increased as a result of higher financingof prime brokerage activities, and net issuance of structured notesin CIB, as well as the issuance of commercial paper in Treasuryand CIO. Refer to pages 42-46 for information on changes inLiquidity Risk Management.
Trading liabilities increased due to client-driven market-makingactivities in CIB Fixed Income Markets, which resulted in higherlevels of short positions in debt instruments, partially offset bylower derivative payables as a result of market movements. Referto Notes 2 and 4 for additional information.Accounts payable and other liabilities increased largely due tothe impact of securities financing transactions in CIB primebrokerage. Refer to Note 10 for additional information on securitieslending transactions.Beneficial interests issued by consolidated VIEs decreaseddriven by lower issuances as a result of lower loan balances in theFirm-administered multi-seller conduits. Refer to Off-BalanceSheet Arrangements on page 15 and Notes 13 and 22 for furtherinformation on Firm-sponsored VIEs and loan securitization trusts.Long-term debt was relatively flat as maturities and fair valuehedge accounting adjustments related to higher rates were offsetby net issuances. Refer to Liquidity Risk Management on pages42-46 for additional information.Stockholders’ equity was relatively flat as net income was offsetby the impact of capital actions and a decrease in accumulatedother comprehensive income (“AOCI”). The decrease in AOCI wasdriven by the impact of higher rates on the AFS securities portfolioand cash flow hedges. Refer to page 82 for information onchanges in stockholders’ equity, Capital actions on pages 39-40,and Note 19 for additional information on AOCI.
(a)
13

Consolidated cash flows analysisThe following is a discussion of cash flow activities during thethree months ended March 31, 2021 and 2020.
(in millions)Three months ended March 31,
2021 2020Net cash provided by/(used in)Operating activities $ (43,872) $ (120,089)Investing activities 15,391 (135,833)Financing activities 218,911 362,305 Effect of exchange rate changes on cash (6,967) (2,480)Net increase in cash and due from banks and
deposits with banks $ 183,463 $ 103,903
Operating activities• In 2021, cash used resulted from higher trading assets, accrued
interest and accounts receivable, and securities borrowed,partially offset by higher accounts payable and other liabilitiesand lower other assets.
• In 2020, cash used resulted from higher trading assets, otherassets, and accrued interest and accounts receivable, partiallyoffset by higher trading liabilities and accounts payable andother liabilities.
Investing activities• In 2021, cash provided reflected lower securities purchased
under resale agreements and net proceeds from sales andsecuritizations of loans held-for-investment, partially offset by netpurchases of investment securities.
• In 2020, cash used reflected net purchases of investmentsecurities, net originations of loans, and purchases of assetsfrom money market mutual fund clients pursuant to nonrecourseadvances provided by the Federal Reserve Bank of Boston("FRBB") under the Money Market Mutual Fund Liquidity Facility("MMLF").
Financing activities• In 2021, cash provided reflected higher deposits and securities
loaned or sold under repurchase agreements, and net proceedsfrom long- and short-term borrowings.
• In 2020, cash provided reflected higher deposits and securitiesloaned or sold under repurchase agreements, and net proceedsfrom long- and short-term borrowings.
• For both periods, cash was used for repurchases of commonstock and cash dividends on common and preferred stock.
* * *Refer to Consolidated Balance Sheets Analysis on pages 12-13,Capital Risk Management on pages 36-41, and Liquidity RiskManagement on pages 42-46 of this Form 10-Q, and pages 102–108 of JPMorgan Chase’s 2020 Form 10-K for a further discussionof the activities affecting the Firm’s cash flows.
14

OFF-BALANCE SHEET ARRANGEMENTS
In the normal course of business, the Firm enters into various off-balance sheet arrangements and contractual obligations that may requirefuture cash payments. Certain obligations are recognized on-balance sheet, while others are disclosed as off-balance sheet underaccounting principles generally accepted in the U.S. (“U.S. GAAP”).
Special-purpose entitiesThe Firm has several types of off–balance sheet arrangements, including through nonconsolidated special-purpose entities (“SPEs”), whichare a type of VIE, and through lending-related financial instruments (e.g., commitments and guarantees).
The Firm holds capital, as appropriate, against all SPE-related transactions and related exposures, such as derivative contracts and lending-related commitments and guarantees.
The Firm has no commitments to issue its own stock to support any SPE transaction, and its policies require that transactions with SPEs beconducted at arm’s length and reflect market pricing.
The table below provides an index of where in this Form 10-Q discussions of the Firm’s various off-balance sheet arrangements can befound. Refer to Note 1 for additional information about the Firm’s consolidation policies.
Type of off-balance sheet arrangement Location of disclosure Page referencesSpecial-purpose entities: variable interests and otherobligations, including contingent obligations, arising fromvariable interests in nonconsolidated VIEs
Refer to Note 13 137-142
Off-balance sheet lending-related financial instruments,guarantees, and other commitments
Refer to Note 22 152-155
15

EXPLANATION AND RECONCILIATION OF THE FIRM’S USE OF NON-GAAP FINANCIAL MEASURES
The Firm prepares its Consolidated Financial Statements inaccordance with U.S. GAAP and this presentation is referred to as“reported” basis; these financial statements appear on pages 79-83.
In addition to analyzing the Firm’s results on a reported basis, theFirm also reviews and uses certain non-GAAP financial measuresat the Firmwide and segment level. These non-GAAP measuresinclude:• Firmwide “managed” basis results, including the overhead ratio,
which include certain reclassifications to present total netrevenue from investments that receive tax credits and tax-exempt securities on a basis comparable to taxable investmentsand securities (“FTE” basis)
• Pre-provision profit, which represents total net revenue less totalnoninterest expense
• Net interest income and net yield excluding CIB Markets• TCE, ROTCE, and TBVPS• Allowance for loan losses to period-end loans retained,
excluding trade finance and conduits.Refer to Explanation and Reconciliation of the Firm’s Use Of Non-GAAP Financial Measures and Key Performance Measures onpages 62–64 of JPMorgan Chase’s 2020 Form 10-K for a furtherdiscussion of management’s use of non-GAAP financial measures.
The following summary table provides a reconciliation from the Firm’s reported U.S. GAAP results to managed basis.Three months ended March 31,
2021 2020
(in millions, except ratios) Reported
Fully taxable-equivalent
adjustmentsManaged
basis Reported
Fully taxable-equivalent
adjustmentsManaged
basisOther income $ 1,123 $ 744 $ 1,867 $ 1,250 $ 614 $ 1,864 Total noninterest revenue 19,377 744 20,121 13,847 614 14,461 Net interest income 12,889 109 12,998 14,439 110 14,549 Total net revenue 32,266 853 33,119 28,286 724 29,010 Total noninterest expense 18,725 NA 18,725 16,791 NA 16,791 Pre-provision profit 13,541 853 14,394 11,495 724 12,219 Provision for credit losses (4,156) NA (4,156) 8,285 NA 8,285 Income before income tax expense 17,697 853 18,550 3,210 724 3,934 Income tax expense 3,397 853 4,250 345 724 1,069 Net income $ 14,300 NA $ 14,300 $ 2,865 NA $ 2,865
Overhead ratio 58 % NM 57 % 59 % NM 58 %
(a) Prior-period amounts have been revised to conform with the current presentation. Refer to Note 1 for further information.(b) Predominantly recognized in CIB, CB and Corporate.
The following table provides information on net interest income and net yield excluding CIB Markets.
(in millions, except rates)Three months ended March 31,
2021 2020 ChangeNet interest income – reported $ 12,889 $ 14,439 (11)%Fully taxable-equivalent adjustments 109 110 (1)Net interest income – managed basis $ 12,998 $ 14,549 (11)Less: CIB Markets net interest income 2,223 1,596 39 Net interest income excluding CIB Markets $ 10,775 $ 12,953 (17)
Average interest-earning assets $ 3,126,569 $ 2,465,549 27 Less: Average CIB Markets interest-earning assets 866,591 735,852 18 Average interest-earning assets excluding CIB Markets $ 2,259,978 $ 1,729,697 31 %Net yield on average interest-earning assets – managed basis 1.69 % 2.37 %Net yield on average CIB Markets interest-earning assets 1.04 0.87 Net yield on average interest-earning assets excluding CIB Markets 1.93 % 3.01 %
(a) Interest includes the effect of related hedges. Taxable-equivalent amounts are used where applicable.(b) Refer to page 26 for further information on CIB Markets.
(b) (b)
(a)
(a)
(a)
(a)
(b)
(a)
(b)
(b)
16

The following summary table provides a reconciliation from the Firm’s common stockholders’ equity to TCE.
Period-end Average
(in millions, except per share and ratio data)Mar 31,
2021Dec 31,
2020
Three months ended March 31,
2021 2020Common stockholders’ equity $ 249,151 $ 249,291 $ 245,542 $ 234,530 Less: Goodwill 49,243 49,248 49,249 47,812 Less: Other intangible assets 875 904 891 812 Add: Certain deferred tax liabilities 2,457 2,453 2,455 2,385 Tangible common equity $ 201,490 $ 201,592 $ 197,857 $ 188,291
Return on tangible common equity NA NA 29 % 5 %Tangible book value per share $ 66.56 $ 66.11 NA NA
(a) Represents deferred tax liabilities related to tax-deductible goodwill and to identifiable intangibles created in nontaxable transactions, which are netted against goodwill andother intangibles when calculating TCE.
(a)
17

BUSINESS SEGMENT RESULTS
The Firm is managed on an LOB basis. There are four majorreportable business segments – Consumer & Community Banking,Corporate & Investment Bank, Commercial Banking and Asset &Wealth Management. In addition, there is a Corporate segment.
The business segments are determined based on the productsand services provided, or the type of customer served, and theyreflect the manner in which financial information is currentlyevaluated by the Firm’s Operating Committee. Segment resultsare presented on a managed basis. Refer to Explanation andReconciliation of the Firm’s use of Non-GAAP Financial Measureson pages 16-17 for a definition of managed basis.
Description of business segment reporting methodologyResults of the business segments are intended to present eachsegment as if it were a stand-alone business. The managementreporting process that derives business segment results includesthe allocation of certain income and expense items. The Firmperiodically assesses the assumptions, methodologies andreporting classifications used for segment reporting, and furtherrefinements may be implemented in future periods. The Firm alsoassesses the level of capital required for each LOB on at least anannual basis. The Firm’s LOBs also provide various businessmetrics which are utilized by the Firm and its investors andanalysts in assessing performance.
Revenue sharingWhen business segments join efforts to sell products and servicesto the Firm’s clients, the participating business segments mayagree to share revenue from those transactions. Revenue isgenerally recognized in the segment responsible for the relatedproduct or service, with allocations to the other segment(s)involved in the transaction. The segment results reflect theserevenue-sharing agreements.
Capital allocationThe amount of capital assigned to each segment is referred to asequity. Periodically, the assumptions and methodologies used toallocate capital are assessed and as a result, the capital allocatedto the LOBs may change. Refer to Line of business equity on page39, and page 98 of JPMorgan Chase’s 2020 Form 10-K foradditional information on capital allocation.
Refer to Business Segment Results – Description of businesssegment reporting methodology on pages 65–66 of JPMorganChase’s 2020 Form 10-K for a further discussion of thosemethodologies.
18

Segment results – managed basisThe following tables summarize the Firm’s results by segment for the periods indicated.
Three months ended March 31, Consumer & Community Banking Corporate & Investment Bank Commercial Banking(in millions, except ratios) 2021 2020 Change 2021 2020 Change 2021 2020 ChangeTotal net revenue $ 12,517 $ 13,287 (6)% $ 14,605 $ 10,003 46% $ 2,393 $ 2,165 11%Total noninterest expense 7,202 7,269 (1) 7,104 5,955 19 969 986 (2)Pre-provision profit/(loss) 5,315 6,018 (12) 7,501 4,048 85 1,424 1,179 21Provision for credit losses (3,602) 5,772 NM (331) 1,401 NM (118) 1,010 NMNet income/(loss) 6,728 197 NM 5,740 1,985 189 1,168 139 NMReturn on equity (“ROE”) 54 % 1% 27 % 9% 19 % 2%
Three months ended March 31, Asset & Wealth Management Corporate Total(in millions, except ratios) 2021 2020 Change 2021 2020 Change 2021 2020 ChangeTotal net revenue $ 4,077 $ 3,389 20% $ (473) $ 166 NM $ 33,119 $ 29,010 14%Total noninterest expense 2,574 2,435 6 876 146 500 18,725 16,791 12Pre-provision profit/(loss) 1,503 954 58 (1,349) 20 NM 14,394 12,219 18Provision for credit losses (121) 94 NM 16 8 100 (4,156) 8,285 NMNet income/(loss) 1,244 669 86 (580) (125) (364) 14,300 2,865 399
ROE 35 % 25% NM NM 23 % 4%
The following sections provide a comparative discussion of the Firm’s results by segment as of or for the three months ended March 31,2021 versus the corresponding periods in the prior year, unless otherwise specified.
19

CONSUMER & COMMUNITY BANKINGRefer to pages 67–70 of JPMorgan Chase's 2020 Form 10-K andLine of Business Metrics on page 169 for a further discussion ofthe business profile of CCB.
Selected income statement dataThree months ended March 31,
(in millions, except ratios) 2021 2020 ChangeRevenueLending- and deposit-related
fees $ 742 $ 972 (24)%Asset management,
administration andcommissions 805 708 14
Mortgage fees and relatedincome 703 320 120
Card income 999 652 53 All other income 1,339 1,445 (7)Noninterest revenue 4,588 4,097 12 Net interest income 7,929 9,190 (14)Total net revenue 12,517 13,287 (6)
Provision for credit losses (3,602) 5,772 NM
Noninterest expenseCompensation expense 2,976 2,782 7 Noncompensation expense 4,226 4,487 (6)Total noninterest expense 7,202 7,269 (1)Income before income tax
expense 8,917 246 NMIncome tax expense 2,189 49 NMNet income $ 6,728 $ 197 NM
Revenue by line of businessConsumer & Business Banking $ 5,635 $ 6,266 (10)Home Lending 1,458 1,161 26 Card & Auto 5,424 5,860 (7)
Mortgage fees and relatedincome details:
Production revenue 757 319 137 Net mortgage servicing
revenue (54) 1 NMMortgage fees and related
income $ 703 $ 320 120 %
Financial ratiosReturn on equity 54 % 1 %Overhead ratio 58 55
(a) Included depreciation expense on leased assets of $916 million and $1.1 billionfor the three months ended March 31, 2021 and 2020, respectively.
(b) Included MSR risk management results of $(115) million and $(90) million forthe three months ended March 31, 2021 and 2020, respectively.
Quarterly resultsNet income was $6.7 billion, up $6.5 billion, driven by a decrease inthe provision for credit losses.Net revenue was $12.5 billion, a decrease of 6%.Net interest income was $7.9 billion, down 14%, driven by:• the impact of deposit margin compression in CBB, lower loans in
Card due to the cumulative impact of lower spend throughout2020 and higher payment rates, and lower loans in HomeLending due to net paydowns,
partially offset by• growth in deposits in CBB.Noninterest revenue was $4.6 billion, up 12%, driven by:• higher mortgage production revenue reflecting higher production
margins and volumes, and• higher card income due to lower acquisition costs and higher net
interchange income, with debit and credit card sales volumereturning to pre-pandemic levels,
partially offset by• lower deposit-related fees given the higher deposits held in
existing and new accounts, and• lower auto lease volume.Refer to Note 14 for further information regarding changes in thevalue of the MSR asset and related hedges, and mortgage feesand related income.Noninterest expense was $7.2 billion, relatively flat, reflecting:• higher investments in the businessoffset by• lower structural expenses, and• lower volume- and revenue-related expense, including lower
depreciation on auto lease assets.The provision for credit losses was a net benefit of $3.6 billion,compared with an expense of $5.8 billion in the prior year, drivenby:• a $4.6 billion reduction in the allowance for credit losses,
primarily reflecting improvements in the Firm's macroeconomicscenarios, consisting of $3.5 billion in Card, $625 million in HomeLending, primarily due to the continued improvement in HPIexpectations and to a lesser extent portfolio run-off, $350 millionin CBB and $150 million in Auto, and
• lower net charge-offs in Card, reflecting lower charge-offs andhigher recoveries primarily benefiting from payment assistanceand government stimulus.
The prior year included a $4.5 billion net addition to the allowancefor credit losses.
Refer to Credit and Investment Risk Management on pages 47-65and Allowance for Credit Losses on pages 63–64 for furtherdiscussions of the credit portfolios and the allowance for creditlosses.
(a)
(b)
20

Selected metricsAs of or for the three months
ended March 31,(in millions, except headcount) 2021 2020 ChangeSelected balance sheet data
(period-end)Total assets $ 487,978 $ 513,352 (5)%Loans:
Consumer & BusinessBanking 52,654 30,004 75
Home Lending 178,776 205,318 (13)Card 132,493 154,021 (14)Auto 67,662 61,468 10
Total loans 431,585 450,811 (4)Deposits 1,037,903 783,398 32 Equity 50,000 52,000 (4)Selected balance sheet data
(average)Total assets $ 484,524 $ 525,695 (8)Loans:
Consumer & BusinessBanking 49,868 29,570 69
Home Lending 182,247 211,333 (14)Card 134,884 162,660 (17)Auto 66,960 60,893 10
Total loans 433,959 464,456 (7)Deposits 979,686 739,709 32 Equity 50,000 52,000 (4)
Headcount 126,084 124,609 1 %
(a) At March 31, 2021 and 2020, Home Lending loans held-for-sale and loans at fairvalue were $13.2 billion and $10.8 billion, respectively.
(b) Average Home Lending loans held-for sale and loans at fair value were $12.5billion and $15.8 billion for the three months ended March 31, 2021 and 2020,respectively.
(c) At March 31, 2021, included $23.4 billion of loans in Business Banking under thePPP. Refer to Credit Portfolio on page 47 for a further discussion of the PPP.
Selected metricsAs of or for the three months
ended March 31,(in millions, except ratio data) 2021 2020 ChangeCredit data and quality
statisticsNonaccrual loans $ 5,672 $ 4,022 41 %
Net charge-offs/(recoveries)Consumer & Business
Banking 65 74 (12)Home Lending (51) (122) 58 Card 983 1,313 (25)Auto 26 48 (46)
Total net charge-offs/(recoveries) $ 1,023 $ 1,313 (22)
Net charge-off/(recovery) rateConsumer & Business
Banking 0.53 % 1.01 %Home Lending (0.12) (0.25)Card 2.97 3.25Auto 0.16 0.32
Total net charge-off/(recovery) rate 0.99 % 1.18 %
30+ day delinquency rateHome Lending 1.07 % 1.48 %Card 1.40 1.96 Auto 0.42 0.89
90+ day delinquency rate -Card 0.80 % 1.02 %
Allowance for loan lossesConsumer & Business
Banking $ 1,022 $ 884 16 Home Lending 1,238 2,137 (42)Card 14,300 14,950 (4)Auto 892 732 22
Total allowance for loanlosses $ 17,452 $ 18,703 (7)%
(a) At March 31, 2021 and 2020, nonaccrual loans excluded mortgage loans 90 ormore days past due and insured by U.S. government agencies of $458 million and$616 million, respectively. These amounts have been excluded based upon thegovernment guarantee.
(b) At March 31, 2021 and 2020, excluded mortgage loans insured by U.S.government agencies of $557 million and $1.0 billion, respectively, that are 30 ormore days past due. These amounts have been excluded based upon thegovernment guarantee.
(c) Generally excludes loans that were under payment deferral programs offered inresponse to the COVID-19 pandemic. Refer to Consumer Credit Portfolio on pages48-52 for further information on consumer payment assistance activity. The firstquarter of 2021 includes loans to customers that have exited COVID-19 paymentdeferral programs and are 90 or more days past due, predominantly all of whichare considered collateral-dependent. Collateral-dependent loans are chargeddown to the lower of amortized cost or fair value of the underlying collateral lesscosts to sell.
(d) At March 31, 2021, included $23.4 billion of loans in Business Banking under thePPP. Given that PPP loans are guaranteed by the SBA, the Firm does not expectto realize material credit losses on these loans. Refer to Credit Portfolio on page47 for a further discussion of the PPP.
(e) At March 31, 2021, the principal balance of loans in Home Lending, Card and Autounder payment deferral programs offered in response to the COVID-19 pandemicwere $8.1 billion, $105 million and $127 million, respectively. Loans that areperforming according to their modified terms are generally not considereddelinquent. Refer to Consumer Credit Portfolio on pages 48-52 for furtherinformation on consumer payment assistance activity.
(c)
(a)
(b)
(a) (c)
(d)
(b) (e)
(e)
(e)
(e)
21

Selected metricsAs of or for the three months
ended March 31,(in billions, except ratios and where otherwise noted) 2021 2020 ChangeBusiness MetricsNumber of branches 4,872 4,967 (2)%Active digital customers (in thousands) 56,671 53,833 5 Active mobile customers (in thousands) 41,872 38,256 9 Debit and credit card sales volume $ 290.3 $ 266.0 9
Consumer & Business BankingAverage deposits $ 960.7 $ 725.0 33 Deposit margin 1.29 % 2.05 %Business banking origination volume $ 10.0 $ 1.5 NMClient investment assets 637.0 442.6 44 Number of client advisors 4,500 4,291 5
Home LendingMortgage origination volume by channel
Retail $ 23.0 $ 14.1 63 Correspondent 16.3 14.0 16
Total mortgage origination volume $ 39.3 $ 28.1 40
Third-party mortgage loans serviced (period-end) 443.2 505.0 (12)MSR carrying value (period-end) 4.5 3.3 36 Ratio of MSR carrying value (period-end) to third-party mortgage loans serviced (period-end) 1.02 % 0.65 %MSR revenue multiple 3.78 x 2.10 x
Credit CardCredit card sales volume, excluding Commercial Card $ 183.7 $ 179.1 3 Net revenue rate 11.53 % 10.54 %
AutoLoan and lease origination volume $ 11.2 $ 8.3 35 Average auto operating lease assets 20.3 23.1 (12)%
(a) Users of all web and/or mobile platforms who have logged in within the past 90 days.(b) Users of all mobile platforms who have logged in within the past 90 days.(c) Includes assets invested in managed accounts and J.P. Morgan mutual funds where AWM is the investment manager. Refer to AWM segment results on pages 30-32 for
additional information.(d) Firmwide mortgage origination volume was $43.2 billion and $31.9 billion for the three months ended March 31, 2021 and 2020, respectively.(e) Represents the ratio of MSR carrying value (period-end) to third-party mortgage loans serviced (period-end) divided by the ratio of annualized loan servicing-related revenue
to third-party mortgage loans serviced (average).(f) Included $9.3 billion of origination volume under the PPP for the three months ended March 31, 2021. Refer to Credit Portfolio on page 47 for a further discussion of the
PPP.
(a)
(b)
(f)
(c)
(d)
(e)
22

CORPORATE & INVESTMENT BANK
Refer to pages 71–76 of JPMorgan Chase’s 2020 Form 10-K andLine of Business Metrics on page 169 for a further discussion ofthe business profile of CIB.
Selected income statement dataThree months ended March 31,
(in millions, except ratios) 2021 2020 ChangeRevenueInvestment banking fees $ 2,988 $ 1,907 57 %Principal transactions 6,045 3,188 90 Lending- and deposit-
related fees 593 450 32 Asset management,
administration andcommissions 1,286 1,261 2
All other income 176 90 96 Noninterest revenue 11,088 6,896 61 Net interest income 3,517 3,107 13 Total net revenue 14,605 10,003 46
Provision for credit losses (331) 1,401 NM
Noninterest expenseCompensation expense 4,329 3,006 44 Noncompensation expense 2,775 2,949 (6)Total noninterest expense 7,104 5,955 19 Income before income tax
expense 7,832 2,647 196 Income tax expense 2,092 662 216 Net income $ 5,740 $ 1,985 189 %Financial ratiosReturn on equity 27 % 9 %Overhead ratio 49 60 Compensation expense as
percentage of total netrevenue 30 30
(a) Includes tax-equivalent adjustments, predominantly due to income tax creditsrelated to alternative energy investments; income tax credits and amortizationof the cost of investments in affordable housing projects; and tax-exemptincome from municipal bonds of $703 million and $573 million for the threemonths ended March 31, 2021 and 2020, respectively. Prior-period tax-equivalent adjustment amounts have been revised to conform with the currentpresentation. Refer to Note 1 for further information.
Selected income statement dataThree months ended March 31,
(in millions) 2021 2020 ChangeRevenue by businessInvestment Banking $ 2,851 $ 886 222 %Wholesale Payments 1,392 1,414 (2)Lending 265 350 (24)Total Banking 4,508 2,650 70 Fixed Income Markets 5,761 4,993 15 Equity Markets 3,289 2,237 47 Securities Services 1,050 1,074 (2)Credit Adjustments & Other (3) (951) 100 Total Markets & Securities
Services 10,097 7,353 37 Total net revenue $ 14,605 $ 10,003 46 %
(a) Includes credit valuation adjustments (“CVA”) managed centrally within CIB andfunding valuation adjustments (“FVA”) on derivatives and certain components offair value option elected liabilities, which are primarily reported in principaltransactions revenue. Results are presented net of associated hedgingactivities and net of CVA and FVA amounts allocated to Fixed Income Marketsand Equity Markets.
Quarterly resultsNet income was $5.7 billion, up 189%.Net revenue was $14.6 billion, up 46%.Banking revenue was $4.5 billion, up 70%.• Investment Banking revenue was $2.9 billion, up 222%, driven
by higher Investment Banking fees, up 57%, reflecting higherfees across products, and the absence of prior year markdownson held-for-sale positions in the bridge financing portfolio. TheFirm ranked #2 for Global Investment Banking fees, according toDealogic.– Equity underwriting fees were $1.1 billion, up 219%, largely
driven by the IPO market due to increased industry-wide fees.– Debt underwriting fees were $1.3 billion, up 17%, driven by
high yield bonds and leveraged loans due to increasedindustry-wide fees and wallet share gains.
– Advisory fees were $680 million, up 35%, driven by a highernumber of completed transactions, in part related totransactions announced in the second half of 2020.
• Wholesale Payments revenue was $1.4 billion, down 2%, drivenby deposit margin compression, predominantly offset by theimpact of higher deposit balances.
• Lending revenue was $265 million, down 24%, predominantlydriven by fair value gains on hedges of accrual loans in the prioryear.
Markets & Securities Services revenue was $10.1 billion, up 37%.Markets revenue was $9.1 billion, up 25%.• Fixed Income Markets revenue was $5.8 billion, up 15%,
predominantly driven by strong performance in SecuritizedProducts and Credit, largely offset by lower
(a)
(a)
23

revenue in Rates and Currencies & Emerging Marketscompared to a strong prior year.
• Equity Markets revenue was $3.3 billion, up 47%, driven bystrong performance across derivatives, Cash Equities, andprime brokerage.
• Securities Services revenue was $1.1 billion, down 2%, withdeposit margin compression largely offset by deposit balancegrowth.
• Credit Adjustments & Other was a loss of $3 million, comparedwith a loss of $951 million in the prior year which waspredominantly driven by funding spread widening on derivatives.
Noninterest expense was $7.1 billion, up 19%, predominantlydriven by higher revenue-related compensation expense, partiallyoffset by lower legal expense.The provision for credit losses was a net benefit of $331 million,driven by a net reduction in the allowance for credit losses,compared with an expense of $1.4 billion in the prior year.Refer to Credit and Investment Risk Management on pages 47-65and Allowance for Credit Losses on pages 63–64 for furtherdiscussions of the credit portfolios and the allowance for creditlosses.
Selected metricsAs of or for the three months
ended March 31,(in millions, except
headcount) 2021 2020 ChangeSelected balance sheet
data (period-end)Total assets $ 1,355,123 $ 1,216,558 11 %Loans:
Loans retained 134,134 165,376 (19)Loans held-for-sale and
loans at fair value 45,846 34,644 32 Total loans 179,980 200,020 (10)
Equity 83,000 80,000 4 Selected balance sheet
data (average)Total assets $ 1,293,864 $ 1,081,912 20 Trading assets-debt and
equity instruments 464,692 398,504 17 Trading assets-derivative
receivables 77,735 55,133 41 Loans:
Loans retained $ 136,794 $ 128,838 6 Loans held-for-sale and
loans at fair value 45,671 35,211 30 Total loans $ 182,465 $ 164,049 11
Equity 83,000 80,000 4 Headcount 62,772 60,245 4 %
(a) Prior-period amounts have been revised to conform with the currentpresentation. Refer to Note 1 for further information.
(b) Loans retained includes credit portfolio loans, loans held by consolidated Firm-administered multi-seller conduits, trade finance loans, other held-for-investment loans and overdrafts.
(c) Loans held-for-sale and loans at fair value primarily reflect lending relatedpositions originated and purchased in CIB Markets, including loans held forsecuritization.
(a)
(b)
(c)
(a)
(b)
(c)
24

Selected metricsAs of or for the three months
ended March 31,(in millions, except ratios) 2021 2020 ChangeCredit data and quality
statisticsNet charge-
offs/(recoveries) $ (7) $ 55 NMNonperforming assets:
Nonaccrual loans:Nonaccrual loans
retained $ 842 $ 689 22 %Nonaccrual loans held-
for-sale and loans atfair value 1,266 766 65
Total nonaccrual loans 2,108 1,455 45 Derivative receivables 284 85 234 Assets acquired in loan
satisfactions 97 43 126 Total nonperforming
assets $ 2,489 $ 1,583 57 Allowance for credit losses:
Allowance for loanlosses $ 1,982 $ 1,422 39
Allowance for lending-related commitments 1,602 1,468 9
Total allowance for creditlosses $ 3,584 $ 2,890 24 %
Net charge-off/(recovery)rate (0.02)% 0.17 %
Allowance for loan lossesto period-end loansretained 1.48 0.86
Allowance for loan lossesto period-end loansretained, excluding tradefinance and conduits 2.06 1.11
Allowance for loan lossesto nonaccrual loansretained 235 206
Nonaccrual loans to totalperiod-end loans 1.17 % 0.73 %
(a) Allowance for loan losses of $174 million and $317 million were held againstthese nonaccrual loans at March 31, 2021 and 2020, respectively.
(b) At March 31, 2021 and 2020, nonaccrual loans excluded mortgage loans 90 ormore days past due and insured by U.S. government agencies of $340 millionand $124 million, respectively. These amounts have been excluded based uponthe government guarantee.
(c) Loans held-for-sale and loans at fair value were excluded when calculating thenet charge-off/(recovery) rate.
(d) Management uses allowance for loan losses to period-end loans retained,excluding trade finance and conduits, a non-GAAP financial measure, toprovide a more meaningful assessment of CIB’s allowance coverage ratio.
Investment banking feesThree months ended March 31,
(in millions) 2021 2020 ChangeAdvisory $ 680 $ 503 35 %Equity underwriting 1,056 331 219 Debt underwriting 1,252 1,073 17
Total investment bankingfees $ 2,988 $ 1,907 57 %
(a) Represents long-term debt and loan syndications.
(a)
(b)
(c)
(d)
(a)
(a)
25
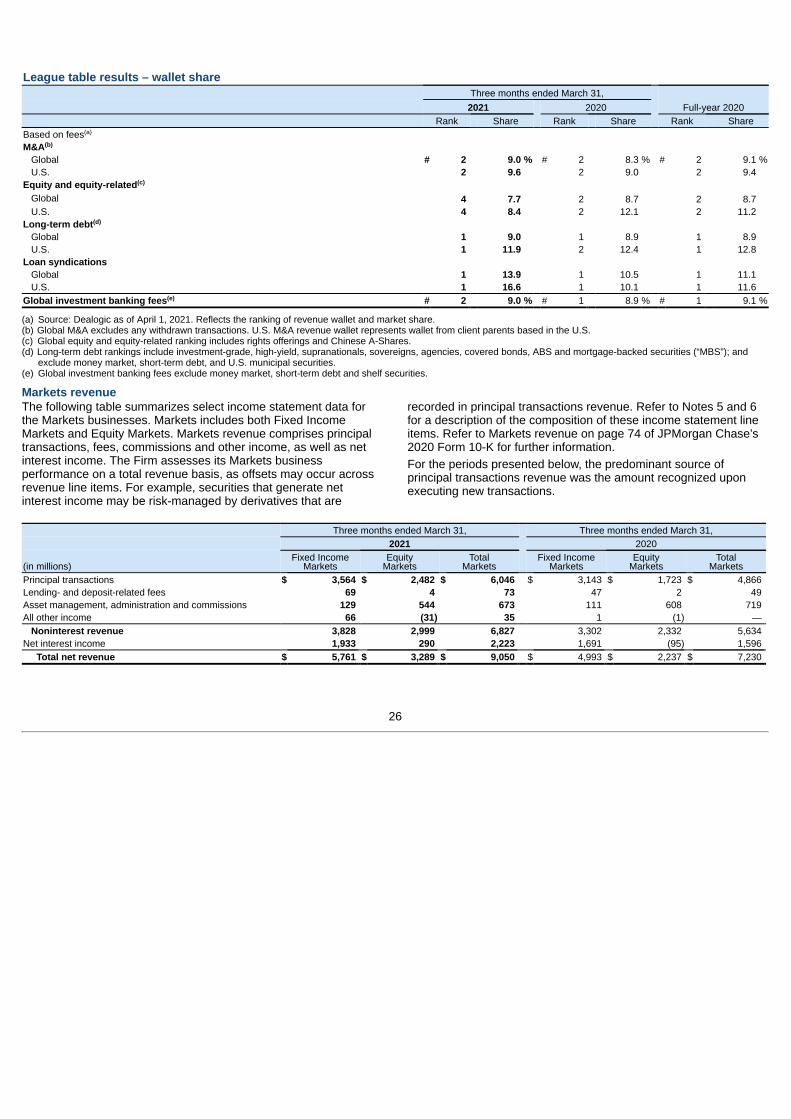
League table results – wallet shareThree months ended March 31,
Full-year 20202021 2020Rank Share Rank Share Rank Share
Based on feesM&A
Global # 2 9.0 % # 2 8.3 % # 2 9.1 %U.S. 2 9.6 2 9.0 2 9.4
Equity and equity-relatedGlobal 4 7.7 2 8.7 2 8.7 U.S. 4 8.4 2 12.1 2 11.2
Long-term debtGlobal 1 9.0 1 8.9 1 8.9 U.S. 1 11.9 2 12.4 1 12.8
Loan syndicationsGlobal 1 13.9 1 10.5 1 11.1 U.S. 1 16.6 1 10.1 1 11.6
Global investment banking fees # 2 9.0 % # 1 8.9 % # 1 9.1 %
(a) Source: Dealogic as of April 1, 2021. Reflects the ranking of revenue wallet and market share.(b) Global M&A excludes any withdrawn transactions. U.S. M&A revenue wallet represents wallet from client parents based in the U.S.(c) Global equity and equity-related ranking includes rights offerings and Chinese A-Shares.(d) Long-term debt rankings include investment-grade, high-yield, supranationals, sovereigns, agencies, covered bonds, ABS and mortgage-backed securities (“MBS”); and
exclude money market, short-term debt, and U.S. municipal securities.(e) Global investment banking fees exclude money market, short-term debt and shelf securities.
Markets revenueThe following table summarizes select income statement data forthe Markets businesses. Markets includes both Fixed IncomeMarkets and Equity Markets. Markets revenue comprises principaltransactions, fees, commissions and other income, as well as netinterest income. The Firm assesses its Markets businessperformance on a total revenue basis, as offsets may occur acrossrevenue line items. For example, securities that generate netinterest income may be risk-managed by derivatives that are
recorded in principal transactions revenue. Refer to Notes 5 and 6for a description of the composition of these income statement lineitems. Refer to Markets revenue on page 74 of JPMorgan Chase’s2020 Form 10-K for further information.For the periods presented below, the predominant source ofprincipal transactions revenue was the amount recognized uponexecuting new transactions.
Three months ended March 31, Three months ended March 31,2021 2020
(in millions)Fixed Income
MarketsEquity
MarketsTotal
MarketsFixed Income
MarketsEquity
MarketsTotal
MarketsPrincipal transactions $ 3,564 $ 2,482 $ 6,046 $ 3,143 $ 1,723 $ 4,866 Lending- and deposit-related fees 69 4 73 47 2 49 Asset management, administration and commissions 129 544 673 111 608 719 All other income 66 (31) 35 1 (1) —
Noninterest revenue 3,828 2,999 6,827 3,302 2,332 5,634 Net interest income 1,933 290 2,223 1,691 (95) 1,596
Total net revenue $ 5,761 $ 3,289 $ 9,050 $ 4,993 $ 2,237 $ 7,230
(a)
(b)
(c)
(d)
(e)
26

Selected metricsAs of or for the three months
ended March 31,(in millions, except where
otherwise noted) 2021 2020 ChangeAssets under custody (“AUC”)
by asset class (period-end)(in billions):Fixed Income $ 15,552 $ 13,572 15 %Equity 12,006 7,819 54 Other 3,693 3,018 22
Total AUC $ 31,251 $ 24,409 28 Merchant processing volume
(in billions) $ 425.7 $ 374.8 14 Client deposits and other third-
party liabilities (average) $ 705,764 $ 514,464 37 %
(a) Consists of mutual funds, unit investment trusts, currencies, annuities,insurance contracts, options and other contracts.
(b) Represents total merchant processing volume across CIB, CCB and CB.(c) Client deposits and other third-party liabilities pertain to the Wholesale
Payments and Securities Services businesses.
International metricsAs of or for the three months
ended March 31,(in millions, except where otherwise noted) 2021 2020 ChangeTotal net revenueEurope/Middle East/Africa $ 4,060 $ 2,591 57 %Asia-Pacific 2,261 1,776 27 Latin America/Caribbean 494 507 (3)Total international net
revenue 6,815 4,874 40 North America 7,790 5,129 52 Total net revenue $ 14,605 $ 10,003 46
Loans retained (period-end)Europe/Middle East/Africa $ 28,624 $ 31,607 (9)Asia-Pacific 13,944 16,667 (16)Latin America/Caribbean 5,518 8,129 (32)Total international loans 48,086 56,403 (15)North America 86,048 108,973 (21)Total loans retained $ 134,134 $ 165,376 (19)
Client deposits and otherthird-party liabilities(average)
Europe/Middle East/Africa $ 234,795 $ 190,976 23 Asia-Pacific 131,761 103,792 27 Latin America/Caribbean 43,927 30,849 42 Total international $ 410,483 $ 325,617 26 North America 295,281 188,847 56 Total client deposits and
other third-party liabilities $ 705,764 $ 514,464 37
AUC (period-end)(in billions)
North America $ 20,244 $ 15,590 30 All other regions 11,007 8,819 25 Total AUC $ 31,251 $ 24,409 28 %
(a) Total net revenue and loans retained (excluding loans held-for-sale and loans atfair value) are based on the location of the trading desk, booking location, ordomicile of the client, as applicable.
(b) Client deposits and other third-party liabilities pertaining to the WholesalePayments and Securities Services businesses, and AUC, are based on thedomicile of the client.
(a)
(b)
(c)
(a)
(a)
(b)
(b)
27
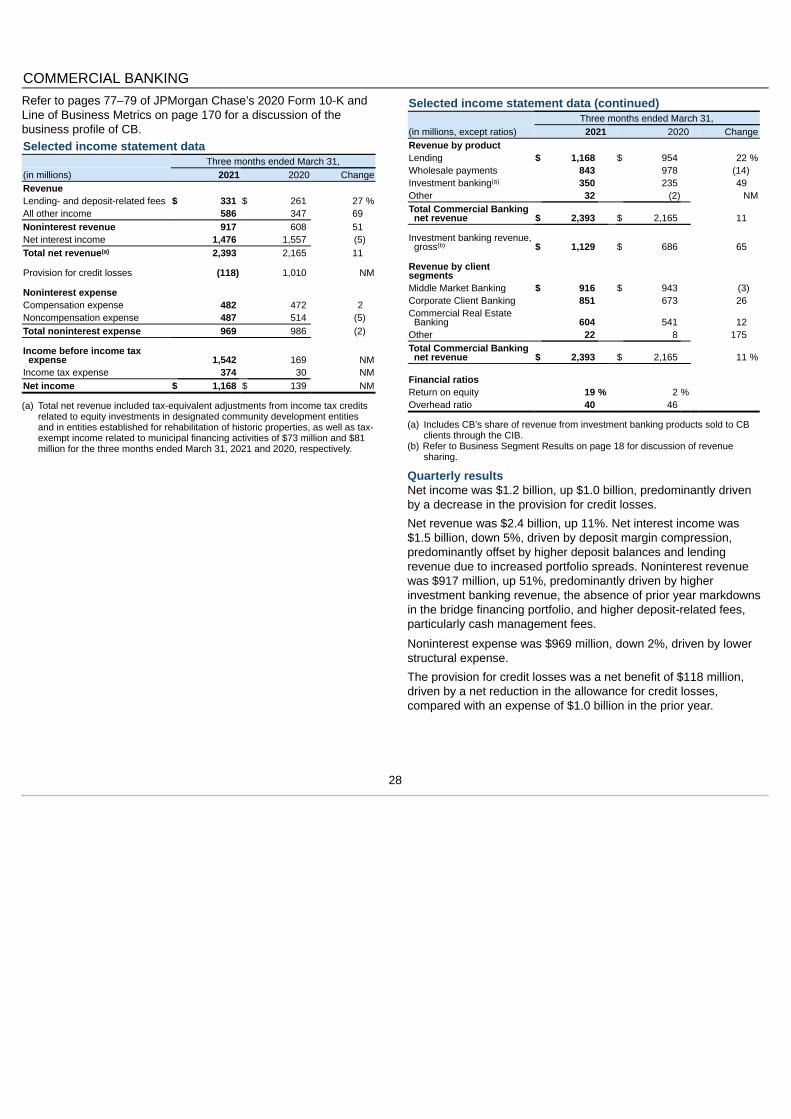
COMMERCIAL BANKINGRefer to pages 77–79 of JPMorgan Chase’s 2020 Form 10-K andLine of Business Metrics on page 170 for a discussion of thebusiness profile of CB.Selected income statement data
Three months ended March 31,(in millions) 2021 2020 ChangeRevenueLending- and deposit-related fees $ 331 $ 261 27 %All other income 586 347 69 Noninterest revenue 917 608 51 Net interest income 1,476 1,557 (5)Total net revenue 2,393 2,165 11
Provision for credit losses (118) 1,010 NM
Noninterest expenseCompensation expense 482 472 2 Noncompensation expense 487 514 (5)Total noninterest expense 969 986 (2)
Income before income taxexpense 1,542 169 NM
Income tax expense 374 30 NMNet income $ 1,168 $ 139 NM
(a) Total net revenue included tax-equivalent adjustments from income tax creditsrelated to equity investments in designated community development entitiesand in entities established for rehabilitation of historic properties, as well as tax-exempt income related to municipal financing activities of $73 million and $81million for the three months ended March 31, 2021 and 2020, respectively.
Selected income statement data (continued)Three months ended March 31,
(in millions, except ratios) 2021 2020 ChangeRevenue by productLending $ 1,168 $ 954 22 %Wholesale payments 843 978 (14)Investment banking 350 235 49 Other 32 (2) NMTotal Commercial Banking
net revenue $ 2,393 $ 2,165 11
Investment banking revenue,gross $ 1,129 $ 686 65
Revenue by clientsegmentsMiddle Market Banking $ 916 $ 943 (3)Corporate Client Banking 851 673 26 Commercial Real Estate
Banking 604 541 12 Other 22 8 175 Total Commercial Banking
net revenue $ 2,393 $ 2,165 11 %
Financial ratiosReturn on equity 19 % 2 %Overhead ratio 40 46
(a) Includes CB’s share of revenue from investment banking products sold to CBclients through the CIB.
(b) Refer to Business Segment Results on page 18 for discussion of revenuesharing.
Quarterly resultsNet income was $1.2 billion, up $1.0 billion, predominantly drivenby a decrease in the provision for credit losses.
Net revenue was $2.4 billion, up 11%. Net interest income was$1.5 billion, down 5%, driven by deposit margin compression,predominantly offset by higher deposit balances and lendingrevenue due to increased portfolio spreads. Noninterest revenuewas $917 million, up 51%, predominantly driven by higherinvestment banking revenue, the absence of prior year markdownsin the bridge financing portfolio, and higher deposit-related fees,particularly cash management fees.
Noninterest expense was $969 million, down 2%, driven by lowerstructural expense.
The provision for credit losses was a net benefit of $118 million,driven by a net reduction in the allowance for credit losses,compared with an expense of $1.0 billion in the prior year.
(a)
(a)
(b)
28

Selected metricsAs of or for the three months
ended March 31,(in millions, exceptheadcount) 2021 2020 ChangeSelected balance sheet data
(period-end)Total assets $ 223,583 $ 247,786 (10)%Loans:
Loans retained 202,975 232,254 (13)Loans held-for-sale and
loans at fair value 2,884 1,112 159 Total loans $ 205,859 $ 233,366 (12)
Equity 24,000 22,000 9
Period-end loans by clientsegment
Middle Market Banking $ 59,983 $ 60,317 (1)Corporate Client Banking 45,540 69,540 (35)Commercial Real Estate
Banking 100,035 102,799 (3)Other 301 710 (58)Total Commercial Banking
loans $ 205,859 $ 233,366 (12)
Selected balance sheet data(average)
Total assets $ 225,574 $ 226,071 — Loans:
Loans retained 204,164 209,988 (3)Loans held-for-sale and
loans at fair value 2,578 1,831 41 Total loans $ 206,742 $ 211,819 (2)
Average loans by clientsegment
Middle Market Banking $ 60,011 $ 56,045 7 Corporate Client Banking 45,719 53,032 (14)Commercial Real Estate
Banking 100,661 101,526 (1)Other 351 1,216 (71)Total Commercial Banking
loans $ 206,742 $ 211,819 (2)
Client deposits and otherthird-party liabilities $ 290,992 $ 188,808 54
Equity 24,000 22,000 9
Headcount 11,748 11,779 — %
(a) At March 31, 2021, total loans included $7.4 billion of loans under the PPP, ofwhich $7.2 billion were in Middle Market Banking. Refer to Credit Portfolio onpage 47 for a further discussion of the PPP.
Selected metrics (continued)As of or for the three months
ended March 31,(in millions, except ratios) 2021 2020 ChangeCredit data and quality
statisticsNet charge-offs/(recoveries) $ 29 $ 100 (71)%Nonperforming assetsNonaccrual loans:
Nonaccrual loans retained $ 1,134 $ 793 43 %Nonaccrual loans held-for-
sale and loans at fair value — — — Total nonaccrual loans $ 1,134 $ 793 43 Assets acquired in loan
satisfactions 24 24 — Total nonperforming assets $ 1,158 $ 817 42 Allowance for credit losses:
Allowance for loan losses $ 3,086 $ 2,680 15 Allowance for lending-
related commitments 753 505 49 Total allowance for credit
losses $ 3,839 $ 3,185 21 %Net charge-off/(recovery)
rate 0.06 % 0.19 %Allowance for loan losses to
period-end loans retained 1.52 1.15 Allowance for loan losses to
nonaccrual loans retained 272 338 Nonaccrual loans to period-
end total loans 0.55 0.34
(a) Allowance for loan losses of $227 million and $175 million was held againstnonaccrual loans retained at March 31, 2021 and 2020, respectively.
(b) Loans held-for-sale and loans at fair value were excluded when calculating thenet charge-off/(recovery) rate.
(a)
(a)
(a)
(b)
(a)
29

ASSET & WEALTH MANAGEMENT
Refer to pages 80–82 of JPMorgan Chase’s 2020 Form 10-K andLine of Business Metrics on pages 170-171 for a discussion of thebusiness profile of AWM.
Selected income statement data
(in millions, except ratios)
Three months ended March 31,
2021 2020 Change
RevenueAsset management,
administration andcommissions $ 2,888 $ 2,583 12 %
All other income 258 (54) NM
Noninterest revenue 3,146 2,529 24 Net interest income 931 860 8
Total net revenue 4,077 3,389 20
Provision for credit losses (121) 94 NM
Noninterest expenseCompensation expense 1,389 1,226 13 Noncompensation expense 1,185 1,209 (2)
Total noninterest expense 2,574 2,435 6
Income before income taxexpense 1,624 860 89
Income tax expense 380 191 99
Net income $ 1,244 $ 669 86
Revenue by line of businessAsset Management $ 2,185 $ 1,740 26 Global Private Bank 1,892 1,649 15
Total net revenue $ 4,077 $ 3,389 20 %
Financial ratiosReturn on equity 35 % 25 %Overhead ratio 63 72Pre-tax margin ratio:
Asset Management 35 24Global Private Bank 45 27Asset & Wealth Management 40 25
(a) In the first quarter of 2021, the Wealth Management business was renamedGlobal Private Bank. In the fourth quarter of 2020, certain wealth managementclients were transferred from AWM Global Private Bank to the J.P. MorganWealth Management unit in CCB’s Consumer & Business Banking business.For further information see page 80 of the 2020 Form 10-K.
Quarterly resultsNet income was $1.2 billion, up 86%.
Net revenue was $4.1 billion, up 20%. Net interest income was$931 million, up 8%. Noninterest revenue was $3.1 billion, up24%.
Revenue from Asset Management was $2.2 billion, up 26%,predominantly driven by:• higher asset management fees on strong cumulative net inflows
into long-term and liquidity products and higher average marketlevels, net of liquidity fee waivers, and
• net investment valuation gains, compared with losses in the prioryear.
Revenue from Global Private Bank was $1.9 billion, up 15%,largely driven by:
• higher deposit and loan balances, higher asset managementfees, loan margin expansion and an investment valuation gain,
largely offset by
• deposit margin compression.
Noninterest expense was $2.6 billion, up 6% predominantly drivenby higher volume- and revenue-related expense, partially offset bylower structural expense.
The provision for credit losses was a net benefit of $121 million,driven by a reduction in the allowance for credit losses.
Refer to Credit and Investment Risk Management on pages 47-65and Allowance for Credit Losses on pages 63–64 for furtherdiscussions of the credit portfolios and the allowance for creditlosses.
(a)
(a)
30
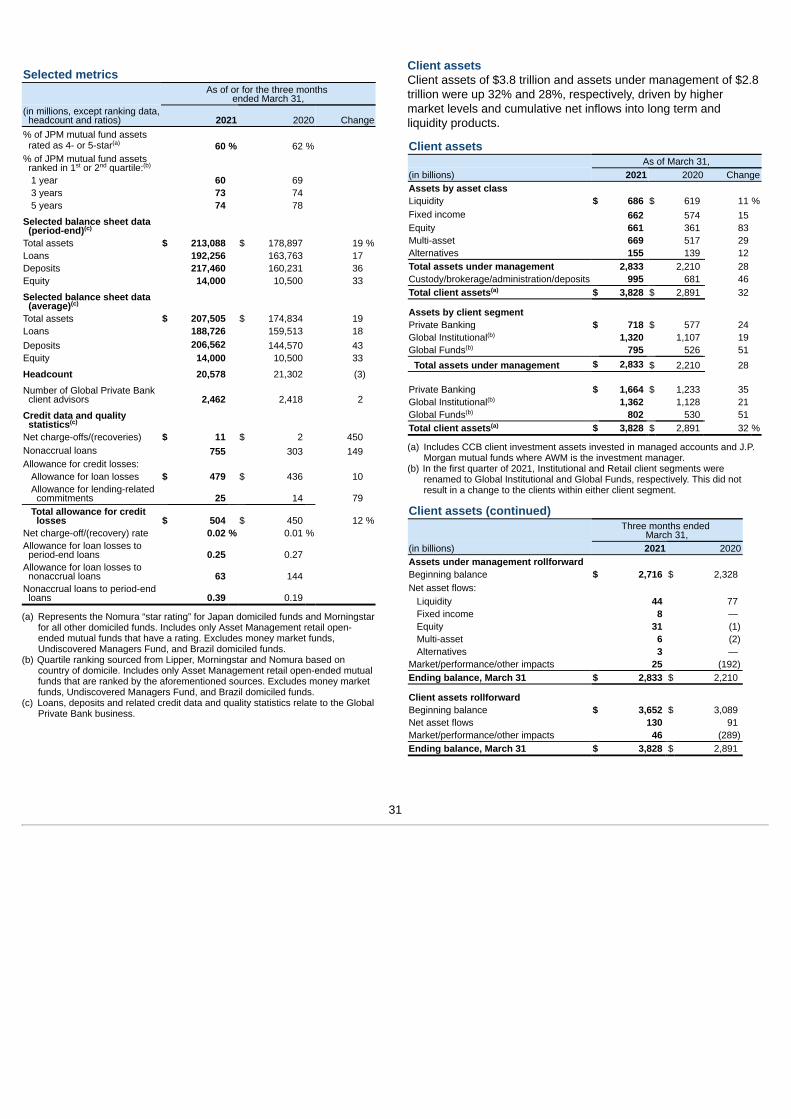
Selected metricsAs of or for the three months
ended March 31,(in millions, except ranking data,
headcount and ratios) 2021 2020 Change% of JPM mutual fund assets
rated as 4- or 5-star 60 % 62 %% of JPM mutual fund assets
ranked in 1 or 2 quartile:1 year 60 69 3 years 73 74 5 years 74 78
Selected balance sheet data(period-end)
Total assets $ 213,088 $ 178,897 19 %Loans 192,256 163,763 17 Deposits 217,460 160,231 36 Equity 14,000 10,500 33
Selected balance sheet data(average)
Total assets $ 207,505 $ 174,834 19 Loans 188,726 159,513 18 Deposits 206,562 144,570 43 Equity 14,000 10,500 33
Headcount 20,578 21,302 (3)
Number of Global Private Bankclient advisors 2,462 2,418 2
Credit data and qualitystatistics
Net charge-offs/(recoveries) $ 11 $ 2 450 Nonaccrual loans 755 303 149 Allowance for credit losses:
Allowance for loan losses $ 479 $ 436 10 Allowance for lending-related
commitments 25 14 79 Total allowance for credit
losses $ 504 $ 450 12 %Net charge-off/(recovery) rate 0.02 % 0.01 %Allowance for loan losses to
period-end loans 0.25 0.27 Allowance for loan losses to
nonaccrual loans 63 144 Nonaccrual loans to period-end
loans 0.39 0.19
(a) Represents the Nomura “star rating” for Japan domiciled funds and Morningstarfor all other domiciled funds. Includes only Asset Management retail open-ended mutual funds that have a rating. Excludes money market funds,Undiscovered Managers Fund, and Brazil domiciled funds.
(b) Quartile ranking sourced from Lipper, Morningstar and Nomura based oncountry of domicile. Includes only Asset Management retail open-ended mutualfunds that are ranked by the aforementioned sources. Excludes money marketfunds, Undiscovered Managers Fund, and Brazil domiciled funds.
(c) Loans, deposits and related credit data and quality statistics relate to the GlobalPrivate Bank business.
Client assetsClient assets of $3.8 trillion and assets under management of $2.8trillion were up 32% and 28%, respectively, driven by highermarket levels and cumulative net inflows into long term andliquidity products.
Client assetsAs of March 31,
(in billions) 2021 2020 ChangeAssets by asset classLiquidity $ 686 $ 619 11 %Fixed income 662 574 15 Equity 661 361 83 Multi-asset 669 517 29 Alternatives 155 139 12 Total assets under management 2,833 2,210 28 Custody/brokerage/administration/deposits 995 681 46 Total client assets $ 3,828 $ 2,891 32
Assets by client segmentPrivate Banking $ 718 $ 577 24 Global Institutional 1,320 1,107 19 Global Funds 795 526 51
Total assets under management $ 2,833 $ 2,210 28
Private Banking $ 1,664 $ 1,233 35 Global Institutional 1,362 1,128 21 Global Funds 802 530 51 Total client assets $ 3,828 $ 2,891 32 %
(a) Includes CCB client investment assets invested in managed accounts and J.P.Morgan mutual funds where AWM is the investment manager.
(b) In the first quarter of 2021, Institutional and Retail client segments wererenamed to Global Institutional and Global Funds, respectively. This did notresult in a change to the clients within either client segment.
Client assets (continued)Three months ended
March 31,(in billions) 2021 2020Assets under management rollforwardBeginning balance $ 2,716 $ 2,328 Net asset flows:
Liquidity 44 77 Fixed income 8 — Equity 31 (1)Multi-asset 6 (2)Alternatives 3 —
Market/performance/other impacts 25 (192)Ending balance, March 31 $ 2,833 $ 2,210
Client assets rollforwardBeginning balance $ 3,652 $ 3,089 Net asset flows 130 91 Market/performance/other impacts 46 (289)Ending balance, March 31 $ 3,828 $ 2,891
(a)
st nd (b)
(c)
(c)
(c)
(a)
(b)
(b)
(b)
(b)
(a)
31

International metricsThree months ended March 31,
(in millions) 2021 2020 ChangeTotal net revenue Europe/Middle East/Africa $ 834 $ 623 34 %Asia-Pacific 514 400 29 Latin America/Caribbean 214 188 14 Total international net revenue 1,562 1,211 29 North America 2,515 2,178 15 Total net revenue $ 4,077 $ 3,389 20 %
(a) Regional revenue is based on the domicile of the client.
As of March 31,(in billions) 2021 2020 ChangeAssets under managementEurope/Middle East/Africa $ 521 $ 395 32 %Asia-Pacific 228 174 31 Latin America/Caribbean 71 56 27 Total international assets under
management 820 625 31 North America 2,013 1,585 27 Total assets under management $ 2,833 $ 2,210 28
Client assetsEurope/Middle East/Africa $ 629 $ 479 31 Asia-Pacific 338 248 36 Latin America/Caribbean 168 134 25 Total international client assets 1,135 861 32 North America 2,693 2,030 33 Total client assets $ 3,828 $ 2,891 32 %
(a)
(a)
32

CORPORATE
Refer to pages 83–84 of JPMorgan Chase’s 2020 Form 10-K for adiscussion of Corporate.Selected income statement and balance sheet data
As of or for the three months ended March 31,
(in millions, except headcount) 2021 2020 ChangeRevenuePrincipal transactions $ 272 $ (113) NMInvestment securities gains 14 233 (94)%All other income 96 211 (55)Noninterest revenue 382 331 15 %Net interest income (855) (165) (418)%Total net revenue (473) 166 NM
Provision for credit losses 16 8 100
Noninterest expense 876 146 500 %Income/(loss) before income
tax expense/(benefit) (1,365) 12 NMIncome tax expense/(benefit) (785) 137 NMNet income/(loss) $ (580) $ (125) (364)Total net revenueTreasury and CIO $ (705) $ 169 NMOther Corporate 232 (3) NMTotal net revenue $ (473) $ 166 NMNet income/(loss)Treasury and CIO $ (675) $ 83 NMOther Corporate 95 (208) NMTotal net income/(loss) $ (580) $ (125) (364)Total assets (period-end) $ 1,409,564 $ 981,937 44 Loans (period-end) 1,627 1,650 (1)Headcount 38,168 38,785 (2)%
(a) Included tax-equivalent adjustments, driven by tax-exempt income frommunicipal bonds, of $67 million and $61 million for the three months endedMarch 31, 2021 and 2020, respectively.
Quarterly resultsNet loss was $580 million compared with a net loss of $125 millionin the prior year.
Net revenue was a loss of $473 million, down $639 million. Thedecrease was driven by:• lower net interest income on lower rates, as well as limited
opportunities to deploy funds in response to continued depositgrowth,
partially offset by• higher noninterest revenue reflecting net gains on certain legacy
private equity investments compared with net losses in the prioryear, offset by lower investment securities gains reflecting theimpact of repositioning the investment securities portfolio, aswell as lower gains on certain Corporate investments.
Noninterest expense of $876 million was up $730 million primarilydue to a higher contribution to the Firm's Foundation and higherstructural expense.The current period income tax benefit was driven by the change inthe level and mix of income and expenses subject to U.S. federal,and state and local taxes as well as the impact of the Firm’sestimated full-year expected tax rate relative to the level of year-to-date pretax income, partially offset by the resolution of certain taxaudits.
(a)
33

Treasury and CIO overviewAt March 31, 2021, the average credit rating of the Treasury andCIO investment securities comprising the portfolio in the tablebelow was AA+ (based upon external ratings where available and,where not available, based primarily upon internal risk ratings).Refer to Note 9 for further information on the Firm’s investmentsecurities portfolio and internal risk ratings.
Refer to Liquidity Risk Management on pages 42-46 for furtherinformation on liquidity and funding risk. Refer to Market RiskManagement on pages 66-70 for information on interest rate,foreign exchange and other risks.
Selected income statement and balance sheet dataAs of or for the three months
ended March 31,(in millions) 2021 2020 ChangeInvestment securities
gains $ 14 $ 233 (94)%Available-for-sale
securities (average) $ 372,443 $ 372,954 — %Held-to-maturity securities
(average) 207,957 46,673 346 Investment securities
portfolio (average) $ 580,400 $ 419,627 38 Available-for-sale
securities (period-end) $ 377,911 $ 397,891 (5)Held-to-maturity securities,
net of allowance forcredit losses (period-end) 217,452 71,200 205
Investment securitiesportfolio, net of allowancefor credit losses (period-end) $ 595,363 $ 469,091 27 %
(a) During 2020, the Firm transferred $164.2 billion of investment securities fromAFS to HTM for capital management purposes, including $26.1 billion in thefirst quarter of 2020.
(b) At March 31, 2021 and 2020, the allowance for credit losses on HTM securitieswas $94 million and $19 million, respectively.
(a)
(a)(b)
(b)
34

FIRMWIDE RISK MANAGEMENT
Risk is an inherent part of JPMorgan Chase’s business activities.When the Firm extends a consumer or wholesale loan, advisescustomers and clients on their investment decisions, makesmarkets in securities, or offers other products or services, the Firmtakes on some degree of risk. The Firm’s overall objective is tomanage its businesses, and the associated risks, in a manner thatbalances serving the interests of its clients, customers andinvestors and protects the safety and soundness of the Firm.
The Firm believes that effective risk management requires, amongother things:• Acceptance of responsibility, including identification and
escalation of risks by all individuals within the Firm;• Ownership of risk identification, assessment, data and
management within each of the LOBs and Corporate; and• Firmwide structures for risk governance.
The Firm follows a disciplined and balanced compensationframework with strong internal governance and independentoversight by the Board of Directors (the “Board”). The impact ofrisk and control issues is carefully considered in the Firm’sperformance evaluation and incentive compensation processes.
Risk governance and oversight frameworkThe Firm’s risk management governance and oversight frameworkinvolves understanding drivers of risks, types of risks, and impactsof risks.
Refer to pages 85-89 of JPMorgan Chase’s 2020 Form 10-K for afurther discussion of Firmwide risk management governance andoversight.
Risk governance and oversight functionsThe following sections of this Form 10-Q and the 2020 Form 10-Kdiscuss the risk governance and oversight functions in place tomanage the risks inherent in the Firm’s business activities.
Risk governance and oversight functions
Form 10-Qpage
reference
Form 10-Kpage
referenceStrategic risk 90Capital risk 36-41 91-101Liquidity risk 42-46 102-108Reputation risk 109Consumer credit risk 48-52 114-120Wholesale credit risk 53-62 121-131Investment portfolio risk 65 134Market risk 66-70 135-142Country risk 71 143-144Operational risk 72 145-151Compliance risk 148Conduct risk 149Legal risk 150Estimations and Model risk 73 151
35

CAPITAL RISK MANAGEMENT
Capital risk is the risk the Firm has an insufficient level orcomposition of capital to support the Firm’s business activities andassociated risks during normal economic environments and understressed conditions.
The Firm has been impacted by market events as a result of theCOVID-19 pandemic, but has remained well-capitalized.
Refer to pages 91-101 of JPMorgan Chase’s 2020 Form10-K, Note 21 of this Form 10-Q and the Firm’s Pillar 3 RegulatoryCapital Disclosures reports, which are available on the Firm’swebsite, for a further discussion of the Firm’s Capital RiskManagement, including capital planning and stress testing.
Basel III OverviewThe capital rules under Basel III establish minimum capital ratiosand overall capital adequacy standards for large andinternationally active U.S. Bank Holding Companies ("BHCs") andbanks, including the Firm and its insured depository institution(“IDI”) subsidiaries, including JPMorgan Chase Bank, N.A. Theminimum amount of regulatory capital that must be held by BHCsand banks is determined by calculating risk-weighted assets(“RWA”), which are on-balance sheet assets and off-balance sheetexposures, weighted according to risk. Two comprehensiveapproaches are prescribed for calculating RWA: a standardizedapproach (“Basel III Standardized”), and an advanced approach(“Basel III Advanced”). For each of the risk-based capital ratios,the capital adequacy of the Firm is evaluated against the lower ofthe Standardized or Advanced approaches compared to theirrespective minimum capital ratios.
The Firm’s Basel III Standardized-risk-based ratios are currentlymore binding than the Basel III Advanced-risk-based ratios.
Basel III also includes a requirement for Advanced Approachbanking organizations, including the Firm, to calculate the SLR.Refer to SLR on page 39 for additional information.
Key Regulatory DevelopmentsCECL regulatory capital transition delay. As part of their responseto the impact of the COVID-19 pandemic, the federal bankingagencies issued a final rule that provided the option beginningJanuary 1, 2020 to delay the effects of CECL on regulatory capitalfor two years, followed by a three-year transition period beginningJanuary 1, 2022 (“CECL capital transition provisions”).The Firm has elected to apply the CECL capital transitionprovisions, and accordingly, for the period ended March 31, 2021,the capital metrics of the Firm exclude $4.5 billion, which is the$2.7 billion day 1 impact to retained earnings and 25% of the $7.0billion increase in the allowance for credit losses from January 1,2020 (excluding allowances on PCD loans).
The impacts of the CECL capital transition provisions have alsobeen incorporated into Tier 2 capital, adjusted average assets, andtotal leverage exposure. Refer to Capital Risk Management onpages 91-101 and Note 1 of JPMorgan Chase’s 2020 Form 10-Kfor further information on CECL capital transition provisions andthe CECL accounting guidance.
SLR temporary revision. The Federal Reserve issued an interimfinal rule that requires, on a temporary basis, the calculation oftotal leverage exposure for purposes of calculating the SLR forbank holding companies, to exclude the on-balance sheetamounts of U.S. Treasury securities and deposits at FederalReserve Banks. These exclusions became effective April 1, 2020,and remained in effect through March 31, 2021.
On June 1, 2020, the Federal Reserve, Office of the Comptroller ofthe Currency ("OCC") and FDIC issued an interim final rule whichbecame effective April 1, 2020 and remained in effect throughMarch 31, 2021 that provides IDI subsidiaries with an option toapply this temporary exclusion subject to certain restrictions. As ofMarch 31, 2021, JPMorgan Chase Bank, N.A. did not elect toapply this exclusion.
PPP. On April 13, 2020, the federal banking agencies issued aninterim final rule (issued as final on September 29, 2020) toneutralize the regulatory capital effects of participating in the PPPon risk-based capital ratios by applying a zero percent risk weightto loans originated under the program. Given that PPP loans areguaranteed by the SBA, the Firm does not expect to realizematerial credit losses on these loans. As of March 31, 2021, theFirm had approximately $32 billion of loans under the program.
Total leverage exposure for purposes of calculating the SLRincludes PPP loans as the Firm did not participate in the FederalReserve’s Paycheck Protection Program Lending (“PPPL”) Facility,which would allow the Firm to exclude them under the final rule.
TLAC Holdings rule. On October 20, 2020, the federal bankingagencies issued a final rule prescribing the regulatory capitaltreatment for holdings of Total Loss-Absorbing Capacity ("TLAC")debt instruments by certain large banking organizations, such asthe Firm and JPMorgan Chase Bank, N.A. This rule expands thescope of the existing capital deductions rule around the holdings ofcapital instruments of financial institutions to also include TLACdebt instruments issued by systemically important bankingorganizations. The final rule became effective April 1, 2021 and isnot expected to have a material impact on the Firm’s risk-basedcapital metrics.
36

The following table presents the Firm’s risk-based and leverage-based capital metrics under both the Basel III Standardized and Advancedapproaches. Refer to Capital Risk Management on pages 91-101 of JPMorgan Chase’s 2020 Form 10-K for a further discussion of thesecapital metrics.
Standardized Advanced
(in millions, except ratios) March 31, 2021December 31,
2020Minimum capital
ratios March 31, 2021December 31,
2020Minimum capital
ratiosRisk-based capital metrics:
CET1 capital $ 206,078 $ 205,078 $ 206,078 $ 205,078 Tier 1 capital 237,333 234,844 237,333 234,844 Total capital 271,407 269,923 258,635 257,228 Risk-weighted assets 1,577,007 1,560,609 1,503,828 1,484,431 CET1 capital ratio 13.1 % 13.1 % 11.3 % 13.7 % 13.8 % 10.5 %Tier 1 capital ratio 15.0 15.0 12.8 15.8 15.8 12.0 Total capital ratio 17.2 17.3 14.8 17.2 17.3 14.0
Leverage-based capital metrics:Adjusted average assets $ 3,565,545 $ 3,353,319 $ 3,565,545 $ 3,353,319 Tier 1 leverage ratio 6.7 % 7.0 % 4.0 % 6.7 % 7.0 % 4.0 %Total leverage exposure NA NA $ 3,522,629 $ 3,401,542 SLR NA NA NA 6.7 % 6.9 % 5.0 %
(a) Adjusted average assets, for purposes of calculating the leverage ratios, includes total quarterly average assets adjusted for on-balance sheet assets that are subject todeduction from Tier 1 capital, predominantly goodwill and other intangible assets.
(b) Total leverage exposure for purposes of calculating the SLR excludes U.S. Treasury securities and deposits at Federal Reserve Banks, as provided by the rule issued by theFederal Reserve which became effective April 1, 2020 and remained in effect through March 31, 2021. The SLR excluding the relief was 5.5% and 5.8% for the periodsended March 31, 2021 and December 31, 2020, respectively.
(c) The capital metrics reflect the CECL capital transition provisions. Additionally, loans originated under the PPP receive a zero percent risk weight.(d) Represents minimum requirements and regulatory buffers applicable to the Firm. Refer to Note 21 for additional information.
(c) (c) (d) (c) (c) (d)
(a)
(b)
(b)
37

Capital componentsThe following table presents reconciliations of total stockholders’equity to Basel III CET1 capital, Tier 1 capital and Total capital asof March 31, 2021 and December 31, 2020.
(in millions)March 31,
2021December 31,
2020Total stockholders’ equity $ 280,714 $ 279,354 Less: Preferred stock 31,563 30,063 Common stockholders’ equity 249,151 249,291 Add:
Certain deferred tax liabilities 2,457 2,453 Other CET1 capital adjustments 4,588 3,486
Less:Goodwill 49,243 49,248 Other intangible assets 875 904
Standardized/Advanced CET1 capital 206,078 205,078 Preferred stock 31,563 30,063 Less: Other Tier 1 adjustments 308 297 Standardized/Advanced Tier 1 capital $ 237,333 $ 234,844 Long-term debt and other instruments
qualifying as Tier 2 capital $ 15,646 $ 16,645 Qualifying allowance for credit losses 18,486 18,372 Other (58) 62 Standardized Tier 2 capital $ 34,074 $ 35,079 Standardized Total capital $ 271,407 $ 269,923 Adjustment in qualifying allowance for credit
losses for Advanced Tier 2 capital (12,772) (12,695)Advanced Tier 2 capital $ 21,302 $ 22,384 Advanced Total capital $ 258,635 $ 257,228
(a) Represents deferred tax liabilities related to tax-deductible goodwill and toidentifiable intangibles created in nontaxable transactions, which are nettedagainst goodwill and other intangibles when calculating CET1 capital.
(b) As of March 31, 2021 and December 31, 2020, the impact of the CECL capitaltransition provision was an increase in CET1 capital of $4.5 billion and $5.7billion, respectively.
(c) Represents the allowance for credit losses eligible for inclusion in Tier 2 capitalup to 1.25% of credit risk RWA, including the impact of the CECL capitaltransition provision with any excess deducted from RWA.
(d) Represents an adjustment to qualifying allowance for credit losses for theexcess of eligible credit reserves over expected credit losses up to 0.6% ofcredit risk RWA, including the impact of the CECL capital transition provisionwith any excess deducted from RWA.
Capital rollforwardThe following table presents the changes in Basel III CET1 capital,Tier 1 capital and Tier 2 capital for the three months endedMarch 31, 2021.
Three months ended March 31,(in millions) 2021Standardized/Advanced CET1 capital at December 31, 2020 $ 205,078 Net income applicable to common equity 13,921 Dividends declared on common stock (2,760)Net purchase of treasury stock (3,967)Changes in additional paid-in capital (389)Changes related to AOCI (6,945)Adjustment related to AOCI 2,396 Changes related to other CET1 capital adjustments (1,256)Change in Standardized/Advanced CET1 capital 1,000 Standardized/Advanced CET1 capital at March 31, 2021 $ 206,078
Standardized/Advanced Tier 1 capital at December 31, 2020 $ 234,844 Change in CET1 capital 1,000 Net issuance of noncumulative perpetual preferred stock 1,500 Other (11)Change in Standardized/Advanced Tier 1 capital 2,489 Standardized/Advanced Tier 1 capital at March 31, 2021 $ 237,333
Standardized Tier 2 capital at December 31, 2020 $ 35,079 Change in long-term debt and other instruments qualifying as Tier 2 (999)Change in qualifying allowance for credit losses 114 Other (120)Change in Standardized Tier 2 capital (1,005)Standardized Tier 2 capital at March 31, 2021 $ 34,074 Standardized Total capital at March 31, 2021 $ 271,407
Advanced Tier 2 capital at December 31, 2020 $ 22,384 Change in long-term debt and other instruments qualifying as Tier 2 (999)Change in qualifying allowance for credit losses 37 Other (120)Change in Advanced Tier 2 capital (1,082)Advanced Tier 2 capital at March 31, 2021 $ 21,302 Advanced Total capital at March 31, 2021 $ 258,635
(a) Includes cash flow hedges and DVA related to structured notes recorded inAOCI.
(b) Includes the impact of the CECL capital transition provisions.
(a)
(b)
(c)
(d)
(a)
(b)
(b)
(b)
(b)
38

RWA rollforwardThe following table presents changes in the components of RWA under Basel III Standardized and Advanced approaches for the threemonths ended March 31, 2021. The amounts in the rollforward categories are estimates, based on the predominant driver of the change.
Standardized AdvancedThree months ended March 31, 2021(in millions) Credit risk RWA Market risk RWA Total RWA Credit risk RWA Market risk RWA
Operational risk RWA Total RWA
December 31, 2020 $ 1,464,219 $ 96,390 $ 1,560,609 $ 1,002,330 $ 96,910 $ 385,191 $ 1,484,431 Model & data changes — (1,100) (1,100) — (1,100) — (1,100)Portfolio runoff (1,200) — (1,200) (700) — — (700)Movement in portfolio levels 13,896 4,802 18,698 11,431 4,635 5,131 21,197 Changes in RWA 12,696 3,702 16,398 10,731 3,535 5,131 19,397 March 31, 2021 $ 1,476,915 $ 100,092 $ 1,577,007 $ 1,013,061 $ 100,445 $ 390,322 $ 1,503,828
(a) Model & data changes refer to material movements in levels of RWA as a result of revised methodologies and/or treatment per regulatory guidance (exclusive of rulechanges).
(b) Portfolio runoff for credit risk RWA primarily reflects reduced risk from position rolloffs in legacy portfolios in Home Lending.(c) Movement in portfolio levels (inclusive of rule changes) refers to: changes in book size, composition, credit quality, and market movements for credit risk RWA; changes in
position and market movements for market risk RWA; updates to cumulative losses for operational risk RWA; and deductions to credit risk RWA for excess eligible creditreserves not eligible for inclusion in Tier 2 capital.
Supplementary leverage ratioRefer to Supplementary Leverage Ratio on page 95 of JPMorganChase’s 2020 Form 10-K for additional information.
The following table presents the components of the Firm’s SLR.Three months ended(in millions, except ratio)
March 31,2021
December 31,2020
Tier 1 capital $ 237,333 $ 234,844 Total average assets 3,612,841 3,399,818 Less: Regulatory capital
adjustments 47,296 46,499 Total adjusted average assets 3,565,545 3,353,319 Add: Off-balance sheet exposures 757,651 729,978 Less: Exclusion for U.S. Treasuriesand Federal Reserve Bank deposits 800,567 681,755 Total leverage exposure $ 3,522,629 $ 3,401,542 SLR 6.7 % 6.9 %
(a) For purposes of calculating the SLR, includes total quarterly average assetsadjusted for on-balance sheet assets that are subject to deduction from Tier 1capital, predominantly goodwill, other intangible assets and adjustments for theCECL capital transition provisions.
(b) Adjusted average assets used for the calculation of Tier 1 leverage ratio.(c) Off-balance sheet exposures are calculated as the average of the three month-
end spot balances during the reporting quarter.(d) The SLR excluding the relief was 5.5% and 5.8% for the periods ended March
31, 2021 and December 31, 2020, respectively.
Refer to Note 21 for JPMorgan Chase Bank, N.A.’s SLR.
Line of business equityEach business segment is allocated capital by taking intoconsideration a variety of factors including capital levels ofsimilarly rated peers and applicable regulatory capitalrequirements. Refer to line of business equity on page 98 ofJPMorgan Chase’s 2020 Form 10-K for additional information oncapital allocation.
The following table presents the capital allocated to each businesssegment.
Line of business equity (Allocated capital)
(in billions)March 31,
2021December 31,
2020Consumer & Community Banking $ 50.0 $ 52.0 Corporate & Investment Bank 83.0 80.0 Commercial Banking 24.0 22.0 Asset & Wealth Management 14.0 10.5 Corporate 78.2 84.8 Total common stockholders’ equity $ 249.2 $ 249.3
Capital actionsCommon stock dividendsThe Firm’s quarterly common stock dividend is currently $0.90 pershare. The Firm’s dividends are subject to approval by the Boardof Directors on a quarterly basis.
Common stockOn March 15, 2020, in response to the economic disruptionscaused by the COVID-19 pandemic, the Firm temporarilysuspended repurchases of its common stock. Subsequently, theFederal Reserve directed all large banks, including the Firm, todiscontinue net share repurchases through the end of 2020. OnDecember 18, 2020, the Federal Reserve announced that all largebanks, including the Firm, could resume share repurchasescommencing in the first quarter of 2021. Subsequently, the Firmannounced that its Board of Directors authorized a new commonshare repurchase program for up to $30 billion. As directed by theFederal Reserve, total net repurchases and common stockdividends in the first quarter of 2021 were restricted and could notexceed the average of the Firm’s net income for the four precedingcalendar quarters. On March 25, 2021, the Federal Reserveextended these restrictions through at least the second quarter of2021.Refer to capital planning and stress testing on page 40 foradditional information.
(a)
(b)
(c)
(a)
(b)
(c)
(d)
39

The following table sets forth the Firm’s repurchases of commonstock for the three months ended March 31, 2021 and 2020.
Three months ended March 31,
(in millions) 2021 2020Total number of shares of common stock
repurchased 34.7 50.0 Aggregate purchase price of common stock
repurchases $ 4,999 $ 6,397
Refer to Part II, Item 2: Unregistered Sales of Equity Securitiesand Use of Proceeds and Part II, Item 5: Market for Registrant’sCommon Equity, Related Stockholder Matters and IssuerPurchases of Equity Securities on page 173 of this Form 10-Q andpage 34 of JPMorgan Chase’s 2020 Form 10-K, respectively, foradditional information regarding repurchases of the Firm’s equitysecurities.
Preferred stockPreferred stock dividends declared were $379 million for the threemonths ended March 31, 2021.On March 17, 2021, the Firm issued $1.5 billion of 4.55% non-cumulative preferred stock, Series JJ. On April 30, 2021, the Firmannounced that it will redeem on June 1, 2021 all $1.4 billion of itsoutstanding 6.10% non-cumulative preferred stock, Series AA andall $1.2 billion of its outstanding 6.15% non-cumulative preferredstock, Series BB. Refer to Note 17 of this Form 10-Q and Note 21of JPMorgan Chase’s 2020 Form 10-K for additional informationon the Firm’s preferred stock, including the issuance andredemption of preferred stock.
Capital planning and stress testingComprehensive Capital Analysis and ReviewOn April 5, 2021, the Firm submitted its 2021 Capital Plan to theFederal Reserve under the Federal Reserve’s 2021Comprehensive Capital Analysis and Review ("CCAR") process.The Firm anticipates that the Federal Reserve will disclose theFirm’s indicative Stress Capital Buffer ("SCB") requirement whichwill become effective October 1, 2021 and summary informationregarding the Firm’s stress test results by July 1, 2021. The Firm'sSCB is currently 3.3%.Based on the Federal Reserve's March 25, 2021 announcement, ifthe Firm remains above all of its minimum risk-based capitalrequirements based on the 2021 CCAR stress test results, thetemporary restrictions on capital distributions currently in effect willexpire as planned on June 30, 2021. However, if the Firm fallsbelow any of its minimum risk-based requirements in the 2021CCAR stress test it will remain subject to the temporary restrictionsthrough at least September 30, 2021.Refer to Capital planning and stress testing on pages 91-92 ofJPMorgan Chase’s 2020 Form 10-K for additional information onCCAR.
Other capital requirementsTotal Loss-Absorbing CapacityThe Federal Reserve’s TLAC rule requires the U.S. globalsystemically important bank (“GSIB”) top-tier holding companies,including the Firm, to maintain minimum levels of external TLACand eligible long-term debt (“eligible LTD”).Refer to other capital requirements on page 100 of JPMorganChase’s 2020 Form 10-K for additional information on TLAC.
The following table presents the TLAC and external long-term debtminimum requirements including applicable regulatory buffers, asof March 31, 2021 and December 31, 2020, except as notedbelow.
Minimum RequirementsTLAC to RWA 22.5 %TLAC to leverage exposure 9.5 External long-term debt to RWA 9.5 External long-term debt to leverage 4.5
(a) For the period ended December 31, 2020, the TLAC to RWA minimumrequirement was 23.0%.
The following table presents the eligible external TLAC and eligibleLTD amounts, as well as a representation of the amounts as apercentage of the Firm’s total RWA and total leverage exposureapplying the impact of the CECL capital transition provisions as ofMarch 31, 2021 and December 31, 2020.
March 31, 2021 December 31, 2020(in billions, exceptratio) External TLAC LTD External TLAC LTDTotal eligibleamount $ 432.5 $ 188.3 $ 421.0 $ 181.4 % of RWA 27.4 % 11.9 % 27.0 % 11.6 %Surplus/(shortfall) $ 77.6 $ 38.5 $ 62.1 $ 33.1
% of total leverageexposure 12.3 % 5.3 % 12.4 % 5.3 %Surplus/(shortfall) $ 97.8 $ 29.7 $ 97.9 $ 28.3
(a) Total leverage exposure excludes U.S. Treasury securities and deposits atFederal Reserve Banks, as provided by the rule issued by the Federal Reservewhich became effective April 1, 2020 and remained in effect through March 31,2021.
Refer to Liquidity Risk Management on pages 42-46 for furtherinformation on long-term debt issued by the Parent Company,including long-term debt issued subsequent to the period endedMarch 31, 2021.
Refer to Part I, Item 1A: Risk Factors on pages 8-32 of JPMorganChase’s 2020 Form 10-K for information on the financialconsequences to holders of the Firm’s debt and equity securities ina resolution scenario.
(a)
(a)
40

Broker-dealer regulatory capitalJ.P. Morgan SecuritiesJPMorgan Chase’s principal U.S. broker-dealer subsidiary is J.P.Morgan Securities. J.P. Morgan Securities is subject to Rule 15c3-1 under the Securities Exchange Act of 1934 (the “Net CapitalRule”). J.P. Morgan Securities is also registered as a futurescommission merchant and is subject to regulatory capitalrequirements, including those imposed by the SEC, CommodityFutures Trading Commission (“CFTC”), Financial IndustryRegulatory Authority (“FINRA”) and the National FuturesAssociation (“NFA”).
Refer to Capital risk management on pages 91-101 of JPMorganChase’s 2020 Form 10-K for a discussion on J.P. MorganSecurities’ capital requirements.
The following table presents J.P. Morgan Securities’ net capital:
March 31, 2021(in millions) Actual MinimumNet Capital $ 25,908 $ 4,966
J.P. Morgan Securities plcJ.P. Morgan Securities plc is a wholly-owned subsidiary ofJPMorgan Chase Bank, N.A. and has authority to engage inbanking, investment banking and broker-dealer activities. J.P.Morgan Securities plc is jointly regulated by the U.K. PrudentialRegulation Authority (“PRA”) and the Financial Conduct Authority(“FCA”). J.P. Morgan Securities plc is subject to the EuropeanUnion Capital Requirements Regulation, as adopted in the U.K.,and the PRA capital rules, each of which implement Basel III andthereby subject J.P. Morgan Securities plc to its requirements.
Refer to Capital risk management on pages 91-101 of JPMorganChase’s 2020 Form 10-K for a further discussion on J.P. MorganSecurities plc.
The Bank of England requires, on a transitional basis, that U.K.banks, including U.K. regulated subsidiaries of overseas groups,maintain a minimum requirement for own funds and eligibleliabilities (“MREL”). As of March 31, 2021, J.P. Morgan Securitiesplc was compliant with the requirements of the MREL rule.
The following table presents J.P. Morgan Securities plc’s capitalmetrics:
March 31, 2021(in millions, except ratios) Estimated Minimum ratiosTotal capital $ 54,673 CET1 ratio 17.2 % 4.5 %Total capital ratio 22.0 % 8.0 %
41

LIQUIDITY RISK MANAGEMENT
Liquidity risk is the risk that the Firm will be unable to meet itscontractual and contingent financial obligations as they arise or thatit does not have the appropriate amount, composition and tenor offunding and liquidity to support its assets and liabilities. Refer topages 102–108 of JPMorgan Chase’s 2020 Form 10-K and theFirm’s U.S. LCR Disclosure reports, which are available on theFirm’s website for a further discussion of the Firm’s Liquidity RiskManagement.
LCR and HQLAThe LCR rule requires that the Firm and JPMorgan Chase Bank,N.A. maintain an amount of eligible HQLA that is sufficient to meettheir respective estimated total net cash outflows over a prospective30 calendar-day period of significant stress. Under the LCR rule, theamount of eligible HQLA held by JPMorgan Chase Bank, N.A. that isin excess of its stand-alone 100% minimum LCR requirement, andthat is not transferable to non-bank affiliates, must be excluded fromthe Firm’s reported eligible HQLA. The LCR for both the Firm andJPMorgan Chase Bank, N.A. is required to be a minimum of 100%.Refer to page 103 of JPMorgan Chase’s 2020 Form 10-K and theFirm’s U.S. LCR Disclosure reports for additional information onHQLA and net cash outflows.The following table summarizes the Firm and JPMorgan ChaseBank, N.A.’s average LCR for the three months ended March 31,2021, December 31, 2020 and March 31, 2020 based on the Firm’sinterpretation of the LCR framework.
Three months endedAverage amount(in millions)
March 31,2021
December 31,2020
March 31,2020
JPMorgan Chase & Co.HQLAEligible cash $ 578,029 $ 455,612 $ 205,027 Eligible securities 118,542 241,447 343,124 Total HQLA $ 696,571 $ 697,059 $ 548,151 Net cash outflows $ 634,221 $ 634,037 $ 482,372 LCR 110 % 110 % 114 %Net excess eligibleHQLA $ 62,350 $ 63,022 $ 65,779 JPMorgan Chase BankN.A.:LCR 166 % 160 % 117 %Net excess eligibleHQLA $ 442,617 $ 401,903 $ 87,126
(a) Represents cash on deposit at central banks, primarily the Federal ReserveBanks.
(b) Predominantly U.S. Treasuries, U.S. GSE and government agency MBS, andsovereign bonds net of applicable haircuts under the LCR rule.
(c) Eligible HQLA eligible securities may be reported in securities borrowed orpurchased under resale agreements, trading assets, or investment securitieson the Firm’s Consolidated balance sheets.
(d) Excludes average excess eligible HQLA at JPMorgan Chase Bank, N.A. thatare not transferable to non-bank affiliates.
The Firm’s average LCR was 110% for the three months endedMarch 31, 2021 and December 31, 2020.
The Firm's average LCR decreased during the three months endedMarch 31, 2021, compared with the prior year period primarily due tothe relative impact on net cash outflows from a significant increase indeposits.
JPMorgan Chase Bank, N.A.’s average LCR increased during thethree months ended March 31, 2021, compared with both the threemonth periods ended December 31, 2020 and March 31, 2020primarily due to growth in deposits. Deposits continued to increase inthe first quarter primarily driven by the effect of certain governmentactions in response to the COVID-19 pandemic. The increase inexcess liquidity in JPMorgan Chase Bank, N.A. is excluded from theFirm’s reported LCR under the LCR rule.
The Firm’s average LCR fluctuates from period to period, due tochanges in its eligible HQLA and estimated net cash outflows as aresult of ongoing business activity.
Other liquidity sourcesIn addition to the assets reported in the Firm’s eligible HQLA above,the Firm had unencumbered marketable securities, such as equityand debt securities, that the Firm believes would be available toraise liquidity. This includes securities included as part of the excesseligible HQLA at JPMorgan Chase Bank, N.A. that are nottransferable to non-bank affiliates. The fair value of these securitieswas approximately $841 billion and $740 billion as of March 31,2021 and December 31, 2020, respectively, although the amount ofliquidity that could be raised would be dependent on prevailingmarket conditions. The fair value increased compared to December31, 2020, primarily due to an increase in CIB trading assets and anincrease in excess eligible HQLA at JPMorgan Chase Bank, N.A.which was primarily a result of increased deposits.
The Firm also had available borrowing capacity at the Federal HomeLoan Banks ("FHLBs") and the discount window at the FederalReserve Bank as a result of collateral pledged by the Firm to suchbanks of approximately $301 billion and $307 billion as of March 31,2021 and December 31, 2020, respectively. This borrowing capacityexcludes the benefit of cash and securities reported in the Firm’seligible HQLA or other unencumbered securities that are currentlypledged at the Federal Reserve Bank discount window and othercentral banks. Although available, the Firm does not view thisborrowing capacity at the Federal Reserve Bank discount windowand the other central banks as a primary source of liquidity.
NSFRThe net stable funding ratio (“NSFR”) is a liquidity requirement forlarge banking organizations that is intended to measure theadequacy of “available” and “required” amounts of stable fundingover a one-year horizon. On October 20, 2020, the federal bankingagencies issued a final NSFR rule under which large bankingorganizations such as the Firm will be required to maintain an NSFRof at least 100% on an ongoing basis. The final NSFR rule willbecome effective on July 1, 2021, and the Firm will be required topublicly disclose its quarterly average NSFR semi-annuallybeginning in 2023.The Firm estimates that it is compliant with the 100% minimumNSFR which becomes effective July 1, 2021, based on its currentunderstanding of the final rule.
(a)
(b)(c)
(d)
(d)
42

FundingSources of fundsManagement believes that the Firm’s unsecured and securedfunding capacity is sufficient to meet its on- and off-balance sheetobligations.The Firm funds its global balance sheet through diverse sources offunding including stable deposits, secured and unsecured fundingin the capital markets and stockholders’ equity. Deposits are theprimary funding source for JPMorgan Chase Bank, N.A.Additionally, JPMorgan Chase Bank, N.A. may also accessfunding through short- or long-term secured borrowings, throughthe issuance of
unsecured long-term debt, or from borrowings from the ParentCompany or the Intermediate Holding Company (“IHC”). TheFirm’s non-bank subsidiaries are primarily funded from long-termunsecured borrowings and short-term secured borrowings,primarily securities loaned or sold under repurchase agreements.Excess funding is invested by Treasury and CIO in the Firm’sinvestment securities portfolio or deployed in cash or other short-term liquid investments based on their interest rate and liquidityrisk characteristics.
DepositsThe table below summarizes, by LOB and Corporate, the period-end deposit balances as of March 31, 2021, and December 31, 2020, andthe average deposit balances for the three months ended March 31, 2021 and 2020, respectively.
March 31, 2021December 31,
2020
Three months ended March 31,Deposits Average(in millions) 2021 2020Consumer & Community Banking $ 1,037,903 $ 958,706 $ 979,686 $ 739,709 Corporate & Investment Bank 726,708 702,215 747,087 562,226 Commercial Banking 295,748 284,263 290,818 188,683 Asset & Wealth Management 217,460 198,755 206,562 144,570 Corporate 293 318 479 998 Total Firm $ 2,278,112 $ 2,144,257 $ 2,224,632 $ 1,636,186
Deposits provide a stable source of funding and reduce the Firm’sreliance on the wholesale funding markets. A significant portion ofthe Firm’s deposits are consumer deposits and wholesaleoperating deposits, which are both considered to be stablesources of liquidity. Wholesale operating deposits are consideredto be stable sources of liquidity because they are generated fromcustomers that maintain operating service relationships with theFirm.The table below shows the loan and deposit balances, the loans-to-deposits ratios, and deposits as a percentage of total liabilities,as of March 31, 2021 and December 31, 2020.
(in billions except ratios) March 31, 2021 December 31, 2020Deposits $ 2,278.1 $ 2,144.3 Deposits as a % of total liabilities 67 % 69 %Loans $ 1,011.3 $ 1,012.9 Loans-to-deposits ratio 44 % 47 %
The Firm believes that average deposit balances are generallymore representative of deposit trends than period-end depositbalances, over time. However, during periods of market disruptionthose trends could be affected.Average deposits increased for the three months ended March 31,2021 compared to the three months ended March 31, 2020,reflecting significant inflows across the LOBs primarily driven bythe effect of certain government actions in response to the COVID-19 pandemic. In CCB, the increase was also driven by lowerspending, as well as growth from existing and new accountsacross both consumer and small business customers.Refer to the discussion of the Firm’s Business Segment Resultsand the Consolidated Balance Sheets Analysis on pages 18-34and pages 12-13, respectively, for further information on depositand liability balance trends.
43

The following table summarizes short-term and long-term funding, excluding deposits, as of March 31, 2021, and December 31, 2020, andaverage balances for the three months ended March 31, 2021 and 2020, respectively. Refer to the Consolidated Balance Sheets Analysis onpages 12-13 and Note 10 for additional information.
March 31, 2021December 31,
2020
Three months ended March 31,Sources of funds (excluding deposits) Average
(in millions) 2021 2020Commercial paper $ 15,189 $ 12,031 $ 12,853 $ 13,974 Other borrowed funds 12,416 8,510 11,246 9,093 Total short-term unsecured funding $ 27,605 $ 20,541 $ 24,099 $ 23,067 Securities sold under agreements to repurchase $ 293,080 $ 207,877 $ 291,405 $ 234,394 Securities loaned 8,396 4,886 7,562 7,349 Other borrowed funds 27,373 24,667 25,959 19,761 Obligations of Firm-administered multi-seller conduits $ 9,030 $ 10,523 $ 10,211 $ 9,898 Total short-term secured funding $ 337,879 $ 247,953 $ 335,137 $ 271,402
Senior notes $ 166,960 $ 166,089 $ 167,453 $ 165,741 Subordinated debt 20,522 21,608 21,251 18,155 Structured notes 74,389 75,325 75,039 72,848 Total long-term unsecured funding $ 261,871 $ 263,022 $ 263,743 $ 256,744
Credit card securitization $ 4,319 $ 4,943 $ 4,825 $ 6,171 FHLB advances 13,121 14,123 13,733 27,128 Other long-term secured funding 4,435 4,540 4,626 4,408 Total long-term secured funding $ 21,875 $ 23,606 $ 23,184 $ 37,707
Preferred stock $ 31,563 $ 30,063 $ 30,312 $ 29,406 Common stockholders’ equity $ 249,151 $ 249,291 $ 245,542 $ 234,530
(a) Primarily consists of short-term securities loaned or sold under agreements to repurchase.(b) Included in beneficial interests issued by consolidated variable interest entities on the Firm’s Consolidated balance sheets.(c) Includes certain TLAC-eligible long-term unsecured debt issued by the Parent Company.(d) Includes long-term structured notes which are secured.(e) Refer to Capital Risk Management on pages 36-41 and Consolidated statements of changes in stockholders’ equity on page 82 of this Form 10-Q, and Note 21 and Note 22
of JPMorgan Chase’s 2020 Form 10-K for additional information on preferred stock and common stockholders’ equity.(f) Includes nonrecourse advances provided under the MMLF. Refer to page 106 of JPMorgan Chase’s 2020 Form 10-K for additional information on the MMLF.
Short-term fundingThe Firm’s sources of short-term secured funding primarily consistof securities loaned or sold under agreements to repurchase.These instruments are secured predominantly by high-qualitysecurities collateral, including government-issued debt and U.S.GSE and government agency MBS. Securities sold underagreements to repurchase increased at March 31, 2021, comparedwith December 31, 2020, reflecting higher secured financing ofAFS investment securities in Treasury and CIO, as well as highertrading assets in CIB, and the impact of client activities in CIB.
The balances associated with securities loaned or sold underagreements to repurchase fluctuate over time due to investmentand financing activities of clients, the Firm’s demand for financing,the ongoing management of the mix of the Firm’s liabilities,including its secured and unsecured financing (for both theinvestment securities and market-making portfolios), and othermarket and portfolio factors.The Firm’s sources of short-term unsecured funding consist ofother borrowed funds and issuance of wholesale commercialpaper. The increase in commercial paper at March 31, 2021, fromDecember 31, 2020 was due to higher net issuance primarily forshort-term liquidity management.
(a)
(a)
(f) (f) (f)
(b)
(c)
(b)
(d)
(e)
(e)
44

Long-term funding and issuanceLong-term funding provides an additional source of stable fundingand liquidity for the Firm. The Firm’s long-term funding plan isdriven primarily by expected client activity, liquidity considerations,and regulatory requirements, including TLAC. Long-term fundingobjectives include maintaining diversification, maximizing marketaccess and optimizing funding costs. The Firm evaluates variousfunding markets, tenors and currencies in creating its optimal long-term funding plan.
The significant majority of the Firm’s long-term unsecured fundingis issued by the Parent Company to provide flexibility in support ofboth bank and non-bank subsidiary funding needs. The ParentCompany advances substantially all net funding proceeds to itssubsidiary, the IHC. The IHC does not issue debt to externalcounterparties. The following table summarizes long-termunsecured issuance and maturities or redemptions for the threemonths ended March 31, 2021 and 2020. Refer to Liquidity RiskManagement on pages 102–108 and Note 20 of JPMorganChase’s 2020 Form 10-K for additional information on the IHC andlong-term debt.
Long-term unsecured fundingThree months ended
March 31,Three months ended
March 31,2021 2020 2021 2020
(Notional in millions) Parent Company SubsidiariesIssuanceSenior notes issued in the
U.S. market $ 9,250 $ 5,250 $ — $ — Senior notes issued in non-
U.S. markets 2,792 1,355 — — Total senior notes 12,042 6,605 — —
Subordinated debt — — — — Structured notes 1,496 2,782 10,495 9,252 Total long-term unsecured
funding – issuance $ 13,538 $ 9,387 $ 10,495 $ 9,252
Maturities/redemptionsSenior notes $ 2,700 $ 5,466 $ 66 $ 4,065 Subordinated debt — — — — Structured notes 1,970 1,525 8,514 9,382 Total long-term unsecured
funding –maturities/redemptions $ 4,670 $ 6,991 $ 8,580 $ 13,447
(a) Includes certain TLAC-eligible long-term unsecured debt issued by the ParentCompany.
Subsequent to March 31, 2021, the Parent Company issuedapproximately $16 billion of senior notes.
The Firm can also raise secured long-term funding throughsecuritization of consumer credit card loans and FHLB advances.The following table summarizes the securitization issuance andFHLB advances and their respective maturities or redemptions forthe three months ended March 31, 2021 and 2020, respectively.
Long-term secured fundingThree months ended March 31,
Issuance Maturities/Redemptions(in millions) 2021 2020 2021 2020Credit card securitization $ — $ 1,000 $ 625 $ 900 FHLB advances — 15,000 1,001 7,503 Other long-term secured
funding 138 234 108 205 Total long-term secured
funding $ 138 $ 16,234 $ 1,734 $ 8,608
(a) Includes long-term structured notes which are secured.
The Firm’s wholesale businesses also securitize loans for client-driven transactions; those client-driven loan securitizations are notconsidered to be a source of funding for the Firm and are notincluded in the table above. Refer to Note 14 of JPMorganChase’s 2020 Form 10-K for further description of the client-drivenloan securitizations.
(a)
(a)
45

Credit ratingsThe cost and availability of financing are influenced by creditratings. Reductions in these ratings could have an adverse effecton the Firm’s access to liquidity sources, increase the cost offunds, trigger additional collateral or funding requirements anddecrease the number of investors and counterparties willing tolend to the Firm. The nature and magnitude of the impact ofratings downgrades depends on numerous contractual andbehavioral factors, which the Firm believes are incorporated in itsliquidity risk and stress testing metrics. The Firm believes that itmaintains sufficient liquidity to withstand a potential decrease infunding capacity due to ratings downgrades.
Additionally, the Firm’s funding requirements for VIEs and otherthird-party commitments may be adversely affected by a decline incredit ratings. Refer to SPEs on page 15, and liquidity risk andcredit-related contingent features in Note 4 for additionalinformation on the impact of a credit ratings downgrade on thefunding requirements for VIEs, and on derivatives and collateralagreements.
The credit ratings of the Parent Company and the Firm’s principal bank and non-bank subsidiaries as of March 31, 2021, except as notedbelow, were as follows:
JPMorgan Chase & Co. JPMorgan Chase Bank, N.A.J.P. Morgan Securities LLCJ.P. Morgan Securities plc
March 31, 2021Long-term
issuerShort-term
issuer OutlookLong-term
issuerShort-term
issuer OutlookLong-term
issuerShort-term
issuer OutlookMoody’s Investors Service A2 P-1 Stable Aa2 P-1 Stable Aa3 P-1 StableStandard & Poor’s A- A-2 Stable A+ A-1 Stable A+ A-1 StableFitch Ratings AA- F1+ Stable AA F1+ Stable AA F1+ Stable
(a) On April 23, 2021, Fitch affirmed the credit ratings of the Parent Company and the Firm’s principal bank and non-bank subsidiaries, and revised the outlook from negative tostable.
Refer to page 108 of JPMorgan Chase’s 2020 Form 10-K for a discussion of the factors that could affect credit ratings of the ParentCompany and the Firm’s principal bank and non-bank subsidiaries.
(a)
46

CREDIT AND INVESTMENT RISK MANAGEMENT
Credit and investment risk is the risk associated with the default orchange in credit profile of a client, counterparty or customer; or lossof principal or a reduction in expected returns on investments,including consumer credit risk,wholesale credit risk, and investment portfolio risk. Refer toConsumer Credit Portfolio, Wholesale Credit Portfolio and
Allowance for Credit Losses on pages 48-64 for a further discussionof Credit Risk.Refer to page 65 for a further discussion of Investment PortfolioRisk. Refer to Credit and Investment Risk Management on pages110–134 of JPMorgan Chase’s 2020 Form 10-K for a furtherdiscussion of the Firm’s Credit and Investment Risk Managementframework.
CREDIT PORTFOLIO
Credit risk is the risk associated with the default or change in creditprofile of a client, counterparty or customer.In the following tables, reported loans include loans retained (i.e.,held-for-investment); loans held-for-sale; and certain loansaccounted for at fair value. The following tables do not include loanswhich the Firm accounts for at fair value and classifies as tradingassets; refer to Notes 2 and 3 for further information regarding theseloans. Refer to Notes 11, 22, and 4 for additional information on theFirm’s loans, lending-related commitments and derivativereceivables, including the Firm’s accounting policies.
Refer to Note 9 for information regarding the credit risk inherent inthe Firm’s investment securities portfolio; and refer to Note 10 forinformation regarding the credit risk inherent in the securitiesfinancing portfolio. Refer to Consumer Credit Portfolio on pages 48-52 and Note 11 for further discussions of the consumer creditenvironment and consumer loans. Refer to Wholesale CreditPortfolio on pages 53-62 and Note 11 for further discussions of thewholesale credit environment and wholesale loans.
Total credit portfolioCredit exposure Nonperforming
(in millions)Mar 31,
2021Dec 31,
2020Mar 31,
2021Dec 31,
2020Loans retained $ 948,642 $ 960,506 $ 8,397 $ 8,782 Loans held-for-sale 11,898 7,873 165 284 Loans at fair value 50,767 44,474 1,144 1,507 Total loans–reported 1,011,307 1,012,853 9,706 10,573 Derivative receivables 73,119 79,630 284 56 Receivables from
customers 58,180 47,710 — — Total credit-related
assets 1,142,606 1,140,193 9,990 10,629 Assets acquired in loan
satisfactionsReal estate owned NA NA 250 256 Other NA NA 17 21 Total assets acquired in
loan satisfactions NA NA 267 277 Lending-related
commitments 1,211,856 1,165,688 800 577 Total credit portfolio $ 2,354,462 $ 2,305,881 $ 11,057 $ 11,483
Credit derivatives usedin credit portfoliomanagement activities $ (22,649) $ (22,239) $ — $ —
Liquid securities andother cash collateralheld against derivatives (13,958) (14,806) NA NA
(in millions, except ratios)
Three months ended March 31,2021 2020
Net charge-offs $ 1,057 $ 1,469 Average retained loans 952,068 948,635 Net charge-off rates 0.45 % 0.62 %
(a) Receivables from customers reflect held-for-investment margin loans to brokerageclients in CIB, CCB and AWM; these are reported within accrued interest and accountsreceivable on the Consolidated balance sheets.
(b) Represents the net notional amount of protection purchased and sold through creditderivatives used to manage both performing and nonperforming wholesale creditexposures; these derivatives do not qualify for hedge accounting under U.S. GAAP.Refer to Credit derivatives on page 62 and Note 4 for additional information.
(c) At March 31, 2021, and December 31, 2020, nonperforming assets excluded mortgageloans 90 or more days past due and insured by U.S. government agencies of $798million and $874 million, respectively, and real estate owned (“REO”) insured by U.S.government agencies of $8 million and $9 million, respectively. These amounts havebeen excluded based upon the government guarantee. In addition, the Firm’s policy isgenerally to exempt credit card loans from being placed on nonaccrual status aspermitted by regulatory guidance.
The Firm has provided various forms of assistance to customers andclients impacted by the COVID-19 pandemic, including paymentdeferrals and covenant modifications. The majority of the Firm’sCOVID-19 related loan modifications have not been consideredtroubled debt restructurings (“TDRs”). Assistance provided inresponse to the COVID-19 pandemic could delay the recognition ofdelinquencies, nonaccrual status, and net charge-offs for thosecustomers and clients who would have otherwise moved into pastdue or nonaccrual status. Refer to Consumer Credit Portfolio onpages 48-52 and Wholesale Credit Portfolio on pages 53-62 forinformation on loan modifications as of March 31, 2021. Refer toNotes 12 and 13 of JPMorgan Chase's 2020 Form 10-K for furtherinformation on the Firm’s accounting policies for loan modificationsand the allowance for credit losses.Paycheck Protection ProgramThe Firm continues to participate in the PPP, for which theapplication deadline was extended to May 31, 2021. At March 31,2021 and December 31, 2020, the Firm had approximately $32billion and $27 billion of loans under the PPP, respectively, including$23 billion and $19 billion in the consumer portfolio, and $9 billionand $8 billion in the wholesale portfolio. The impact on interestincome related to PPP loans was not material for the three monthsended March 31, 2021.When certain criteria are met, PPP loans are subject to forgivenessand the Firm will receive payment of the forgiveness amount fromthe SBA. The Firm continues to process forgiveness applicationsand through March 31, 2021, approximately $7 billion of loans wereforgiven.Refer to Credit Portfolio on page 113 of JPMorgan Chase's 2020Form 10-K for a further discussion on the PPP.
(c)
(a)
(b)
47

CONSUMER CREDIT PORTFOLIO
The Firm’s retained consumer portfolio consists primarily ofresidential real estate loans, credit card loans, scored auto andbusiness banking loans, as well as associated lending-relatedcommitments. The Firm’s focus is on serving primarily the primesegment of the consumer credit market. In the first quarter of2021, the macroeconomic environment continued to improve. Thecredit performance of the consumer portfolio, including net charge-offs, benefited from government stimulus programs, paymentdeferrals and increasing home prices. The Firm may obtain
credit protection against certain pools of loans in the retainedconsumer portfolio through the issuance of credit linked notes.Refer to Note 11 of this Form 10-Q; and Consumer Credit Portfolioon pages 114-120 and Note 12 of JPMorgan Chase's 2020 Form10-K for further information on consumer loans, as well as theFirm’s nonaccrual and charge-off accounting policies. Refer toNote 22 of this Form 10-Q and Note 28 of JPMorgan Chase's 2020Form 10-K for further information on lending-related commitments.
The following table presents consumer credit-related information with respect to the scored credit portfolios held in CCB, AWM, CIB andCorporate.
Consumer credit portfolioThree months ended March 31,
(in millions, except ratios)
Credit exposure Nonaccrual loansNet charge-
offs/(recoveries) Net charge-off/(recovery) rate
Mar 31,2021
Dec 31,2020
Mar 31,2021
Dec 31,2020 2021 2020 2021 2020
Consumer, excluding credit cardResidential real estate $ 219,173 $ 225,302 $ 5,247 $ 5,313 $ (51) $ (120) (0.09)% (0.20)%Auto and other 83,219 76,825 135 151 72 114 0.37 0.89
Total loans – retained 302,392 302,127 5,382 5,464 21 (6) 0.03 (0.01)Loans held-for-sale 1,232 1,305 — — NA NA NA NALoans at fair value 21,284 15,147 608 1,003 NA NA NA NATotal consumer, excluding credit card loans 324,908 318,579 5,990 6,467 21 (6) 0.03 (0.01)Lending-related commitments 56,245 57,319
Total consumer exposure, excluding credit card 381,153 375,898 Credit card
Loans retained 131,772 143,432 NA NA 983 1,313 2.97 3.25 Loans held-for-sale 721 784 NA NA NA NA NA NATotal credit card loans 132,493 144,216 NA NA 983 1,313 2.97 3.25 Lending-related commitments 674,367 658,506
Total credit card exposure 806,860 802,722 Total consumer credit portfolio $ 1,188,013 $ 1,178,620 $ 5,990 $ 6,467 $ 1,004 $ 1,307 0.93 % 1.15 %
(a) Includes scored mortgage and home equity loans held in CCB and AWM, and scored mortgage loans held in Corporate.(b) At March 31, 2021 and December 31, 2020, excluded operating lease assets of $20.0 billion and $20.6 billion, respectively. These operating lease assets are included in
other assets on the Firm’s Consolidated balance sheets. Refer to Note 16 for further information.(c) Includes scored auto and business banking loans and overdrafts.(d) At March 31, 2021 and December 31, 2020, included $23.4 billion and $19.2 billion of loans, respectively, in Business Banking under the PPP. Given that PPP loans are
guaranteed by the SBA, the Firm does not expect to realize material credit losses on these loans. Refer to Credit Portfolio on page 47 for a further discussion of the PPP.(e) Includes scored mortgage loans held in CCB and CIB.(f) Credit card, home equity and certain business banking lending-related commitments represent the total available lines of credit for these products. The Firm has not
experienced, and does not anticipate, that all available lines of credit would be used at the same time. For credit card commitments, and if certain conditions are met, homeequity commitments and certain business banking commitments, the Firm can reduce or cancel these lines of credit by providing the borrower notice or, in some cases aspermitted by law, without notice. Refer to Note 22 for further information.
(g) Includes billed interest and fees.(h) Also includes commercial card lending-related commitments primarily in CB and CIB.(i) At March 31, 2021 and December 31, 2020, nonaccrual loans excluded mortgage loans 90 or more days past due and insured by U.S. government agencies of $798 million
and $874 million, respectively. These amounts have been excluded from nonaccrual loans based upon the government guarantee. In addition, the Firm’s policy is generallyto exempt credit card loans from being placed on nonaccrual status, as permitted by regulatory guidance.
(j) Generally excludes loans under payment deferral programs offered in response to the COVID-19 pandemic. Includes loans to customers that have exited COVID-19payment deferral programs and are 90 or more days past due, predominantly all of which are considered collateral-dependent and charged down to the lower of amortizedcost or fair value of the underlying collateral less costs to sell.
(k) Average consumer loans held-for-sale and loans at fair value were $21.3 billion and $22.4 billion for the three months ended March 31, 2021 and 2020, respectively. Theseamounts were excluded when calculating net charge-off/(recovery) rates.
(i)(j) (k)
(a)
(b)(c)(d) (d)
(e)
(f)
(g)
(f)(h)
(h)
(h)
48

Consumer assistanceIn March 2020, the Firm began providing assistance to customersin response to the COVID-19 pandemic, predominantly in the formof payment deferrals.As of March 31, 2021, the Firm had $9.3 billion of retained loansunder payment deferral programs, which represented a decreaseof approximately $1.5 billion from December 31, 2020, $3.0 billionfrom September 30, 2020 and $19.0 billion from June 30, 2020.During the first quarter of 2021, there were approximately $886million of new enrollments
in payment deferral programs predominantly in residential realestate and credit card. Predominantly all borrowers that exitedpayment deferral programs are current. The Firm continues tomonitor the credit risk associated with loans subject to paymentdeferrals throughout the deferral period and on an ongoing basisafter the borrowers are required to resume making regularlyscheduled payments and considers expected losses of principaland accrued interest on these loans in its allowance for creditlosses.
March 31, 2021 December31, 2020
September30, 2020
June 30,2020
(in millions, exceptratios)
Loanbalance
Percent ofloan classbalance
Percent ofaccounts who
exited paymentdeferral and are
current
Loanbalance
Loanbalance
Loanbalance Type of assistance
Residential realestate $ 9,059 4.1 % 96 % $ 10,106 $ 11,458 $ 20,548
Rolling three month payment deferral up to eighteenmonths; in most cases, deferred payments will be due atthe end of the loan term
Auto and other 127 0.2 96 377 457 3,357
• Auto: Currently offering one month payment deferral(initially offered three month payment deferral). Maturitydate is extended by number of months deferred
• Business Banking: Three month deferral with automaticdeferment to either maturity (loan) or one year forward(line)
Credit card 105 0.1 94 264 368 4,384 Currently offering deferral of one month minimum payment(initially offered three month minimum payment deferral).Interest continues to accrue during the deferral period andis added to the principal balance
Total consumer $ 9,291 2.1 % 94 % $ 10,747 $ 12,283 $ 28,289
(a) Excludes $11.0 billion, $13.4 billion, $17.1 billion and $34.0 billion of third-party mortgage loans serviced at March 31, 2021, December 31, 2020, September 30, 2020 andJune 30, 2020, respectively.
(b) The weighted average LTV ratio of residential real estate loans under payment deferral at March 31, 2021 was 52%.(c) Excludes risk-rated business banking and auto dealer loans held in CCB and auto operating lease assets that were still under payment deferral programs. Auto operating
lease asset payment assistance is currently offering one month payment deferral (initially offered three month payment deferral). Deferrals do not extend the term of thelease and all deferred payments are due at the end of the lease term.
(d) Includes $3.6 billion, $3.8 billion, $3.8 billion and $5.7 billion of loans that were accounted for as TDRs prior to payment deferral as of March 31, 2021, December 31, 2020,September 30, 2020 and June 30, 2020, respectively.
(e) Represents the unpaid principal balance of retained loans which were still under payment deferral programs, divided by the total unpaid principal balance of the respectiveloan classes retained loans.
(f) 89% of the balance that exited deferral were current at March 31, 2021.
Of the $9.3 billion of loans still under payment deferral programsas of March 31, 2021, approximately $3.9 billion were accountedfor as TDRs, either because they were accounted for as TDRsprior to payment deferral, or because they did not qualify for or theFirm did not elect the option to suspend TDR accounting guidanceprovided by the CARES Act and extended by the ConsolidatedAppropriations Act.Predominantly all borrowers, including those with loans accountedfor as TDRs, were current upon enrollment in payment deferralprograms and are expected to exit payment deferral programs in acurrent status, either because no payments are contractually dueduring the deferral period or because payments originallycontractually due during the deferral period will be due at maturityupon exit. For those borrowers that are unable to resume makingpayments in accordance with the original or modified contractualterms of their agreements upon exit from deferral programs, theywill be placed on nonaccrual status in line with the Firm’snonaccrual policy, except for credit cards as permitted byregulatory guidance, and charged off
or down in accordance with the Firm’s charge-off policies. Refer toNote 12 of JPMorgan Chase's 2020 Form 10-K for additionalinformation on the Firm’s nonaccrual and charge-off policies.
(e)
(a)(b)
(c)
(f)
(d)
49

Consumer, excluding credit cardPortfolio analysisLoan balances increased from December 31, 2020 driven byhigher loans in auto and other reflecting PPP loan originations,partially offset by lower residential real estate loans.Residential real estate: The residential real estate portfolio,including loans held-for-sale and loans at fair value, predominantlyconsists of prime mortgage loans and home equity lines of credit.
The retained loan portfolio declined from December 31, 2020 dueto paydowns predominantly in Home Lending which were largelyoffset by originations of prime mortgage loans in Home Lendingand AWM. Retained nonaccrual loans were relatively flat fromDecember 31, 2020. Net recoveries for the three months endedMarch 31, 2021 were lower when compared with the same periodin the prior year as the prior year benefited from a recovery on aloan sale in Home Lending.
The loans held-for-sale and loans at fair value portfolio increasedfrom December 31, 2020 largely driven by warehouse loans inHome Lending. Nonaccrual loans at fair value decreased fromDecember 31, 2020 largely due to sales in CIB.
The carrying value of home equity lines of credit outstanding was$22.2 billion at March 31, 2021. This amount included $8.6 billionof HELOCs that have recast from interest-only to fully amortizingpayments or have been modified and $7.3 billion of interest-onlyballoon HELOCs, which primarily mature after 2030. The Firmmanages the risk of HELOCs during their revolving period byclosing or reducing the undrawn line to the extent permitted by lawwhen borrowers are exhibiting a material deterioration in theircredit risk profile.
At March 31, 2021 and December 31, 2020, the carrying value ofinterest-only residential mortgage loans were $25.9 billion and$25.6 billion, respectively. These loans have an interest-onlypayment period generally followed by an adjustable-rate or fixed-rate fully amortizing payment period to maturity and are typicallyoriginated as higher-balance loans to higher-income borrowers,predominantly in AWM. Charge-offs for the three months endedMarch 31, 2021 were consistent with the broader residentialmortgage portfolio as the performance of this portfolio is generallyin line with the performance of the broader residential mortgageportfolio.
The following table provides a summary of the Firm’s residentialmortgage portfolio insured and/or guaranteed by U.S. governmentagencies, including loans held-for-sale and loans at fair value. TheFirm monitors its exposure to certain potential unrecoverable claimpayments related to government-insured loans and considers thisexposure in estimating the allowance for loan losses.
(in millions)March 31,
2021December 31,
2020Current $ 775 $ 669 30-89 days past due 146 235 90 or more days past due 798 874 Total government guaranteed loans $ 1,719 $ 1,778
Geographic composition and current estimated loan-to-valueratio of residential real estate loansRefer to Note 11 for information on the geographic compositionand current estimated LTVs of the Firm’s residential real estateloans.
Modified residential real estate loansThe following table presents information relating to modifiedretained residential real estate loans for which concessions havebeen granted to borrowers experiencing financial difficulty, whichinclude both TDRs and modified PCD loans not accounted for asTDRs. The following table does not include loans with short-termor other insignificant modifications that are not consideredconcessions and, therefore, are not TDRs, or loans for which theFirm has elected to apply the option to suspend the application ofaccounting guidance for TDRs as provided by the CARES Act andextended by the Consolidated Appropriations Act. Refer to Note11 for further information on modifications for the three monthsended and March 31, 2021 and 2020.
(in millions) March 31, 2021December 31,
2020Retained loans $ 14,943 $ 15,406 Nonaccrual retained loans $ 3,907 $ 3,899
(a) At March 31, 2021 and December 31, 2020, $9 million and $7 million,respectively, of loans modified subsequent to repurchase from Ginnie Mae inaccordance with the standards of the appropriate government agency (i.e.,Federal Housing Administration (“FHA”), U.S. Department of Veterans Affairs(“VA”), Rural Housing Service of the U.S. Department of Agriculture (“RHS”))are not included in the table above. When such loans perform subsequent tomodification in accordance with Ginnie Mae guidelines, they are generally soldback into Ginnie Mae loan pools. Modified loans that do not re-perform becomesubject to foreclosure. Refer to Note 13 for additional information about sales ofloans in securitization transactions with Ginnie Mae.
(b) At both March 31, 2021 and December 31, 2020, nonaccrual loans included$3.0 billion of TDRs for which the borrowers were less than 90 days past due.Refer to Note 11 for additional information about loans modified in a TDR thatare on nonaccrual status.
(a)
(b)
50

Auto and other: The auto and other loan portfolio, including loansat fair value, predominantly consists of prime-quality scored autoand business banking loans, as well as overdrafts. The portfolioincreased when compared with December 31, 2020 due to PPPloan originations net of forgiveness in Business Banking as well asfrom growth in the auto portfolio from loan originations, largelyoffset by paydowns and charge-offs or liquidation of delinquentloans. The scored auto portfolio net charge-off rates were 0.13%and 0.41% for the three months ended March 31, 2021 and 2020,respectively. Auto charge-offs for the three months endedMarch 31, 2021 benefited from government stimulus, paymentassistance programs, and high vehicle collateral values.
Nonperforming assetsThe following table presents information as of March 31, 2021 andDecember 31, 2020, about consumer, excluding credit card,nonperforming assets.Nonperforming assets
(in millions)March 31,
2021December 31,
2020Nonaccrual loansResidential real estate $ 5,855 $ 6,316 Auto and other 135 151 Total nonaccrual loans 5,990 6,467 Assets acquired in loan
satisfactionsReal estate owned 118 131 Other 17 21 Total assets acquired in loan
satisfactions 135 152 Total nonperforming assets $ 6,125 $ 6,619
(a) At March 31, 2021 and December 31, 2020, nonperforming assets excludedmortgage loans 90 or more days past due and insured by U.S. governmentagencies of $798 million and $874 million, respectively, and REO insured byU.S. government agencies of $8 million and $9 million, respectively. Theseamounts have been excluded based upon the government guarantee.
(b) Generally excludes loans under payment deferral programs offered in responseto the COVID-19 pandemic. Includes loans to customers that have exitedCOVID-19 payment deferral programs and are 90 or more days past due,predominantly all of which are considered collateral-dependent and chargeddown to the lower of amortized cost or fair value of the underlying collateral lesscosts to sell.
Nonaccrual loansThe following table presents changes in consumer, excludingcredit card, nonaccrual loans for the three months endedMarch 31, 2021 and 2020.
Nonaccrual loan activityThree months ended March 31,(in millions) 2021 2020Beginning balance $ 6,467 $ 3,366
Additions:PCD loans, upon adoption of CECL NA 708Other additions 673 1,016
Total additions 673 1,724
Reductions:Principal payments and other 598 341 Charge-offs 73 97 Returned to performing status 459 150 Foreclosures and other liquidations 20 103
Total reductions 1,150 691
Net changes (477) 1,033 Ending balance $ 5,990 $ 4,399
(a) Other reductions includes loan sales.
Active and suspended foreclosure: Refer to Note 11 forinformation on loans that were in the process of active orsuspended foreclosure.Refer to Note 11 for further information about the consumer creditportfolio, including information about delinquencies, loanmodifications and other credit quality indicators.Purchased credit deteriorated (“PCD”) loansThe following tables provide credit-related information for PCDloans, which are reported in the consumer, excluding credit cardportfolio’s residential real estate class.
(in millions, except ratios)March 31,
2021December 31,
2020Loan delinquency
Current $ 15,298 $ 16,036 30-149 days past due 362 432 150 or more days past due 545 573
Total PCD loans $ 16,205 $ 17,041
% of 30+ days past due to total retainedPCD loans 5.60 % 5.90 %
Nonaccrual loans $ 1,639 1,609
Three months ended March 31, (in millions, except ratios) 2021 2020Net charge-offs $ 13 $ 6 Net charge-off rate 0.32 % 0.12 %
(a) At March 31, 2021, loans under payment deferral programs offered in responseto the COVID-19 pandemic which are still within their deferral period andperforming according to their modified terms are generally not considereddelinquent.
(b) Includes loans to customers that have exited COVID-19 payment deferralprograms and are 90 or more days past due, predominantly all of which areconsidered collateral-dependent and charged down to the lower of amortizedcost or fair value of the underlying collateral less costs to sell.
(a)
(b)
(a)
(a)
(a)
(b)
51

Credit cardTotal credit card loans decreased from December 31, 2020reflecting the impact of seasonality as well as higher paymentrates. The March 31, 2021 30+ and 90+ day delinquency rates of1.40% and 0.80%, respectively, decreased compared to theDecember 31, 2020 30+ and 90+ day delinquency rates of 1.68%and 0.92%, respectively. The delinquency rates were positivelyimpacted by borrowers who received payment assistance andgovernment stimulus. Net charge-offs decreased for the threemonths ended March 31, 2021 compared with the same period inthe prior year reflecting lower charge-offs and higher recoveriesprimarily benefiting from payment assistance and governmentstimulus.
Consistent with the Firm’s policy, all credit card loans typicallyremain on accrual status until charged off. However, the Firm’sallowance for loan losses includes the estimated uncollectibleportion of accrued and billed interest and fee income. Refer toNote 11 for further information about this portfolio, includinginformation about delinquencies.
Geographic and FICO composition of credit card loansRefer to Note 11 for information on the geographic and FICOcomposition of the Firm’s credit card loans.
Modifications of credit card loansAt March 31, 2021, the Firm had $1.3 billion of credit card loansoutstanding that have been modified in TDRs, which does notinclude loans with short-term or other insignificant modificationsthat are not considered TDRs, compared to $1.4 billion atDecember 31, 2020. Refer to Note 11 for additional informationabout loan modification programs to borrowers.
52
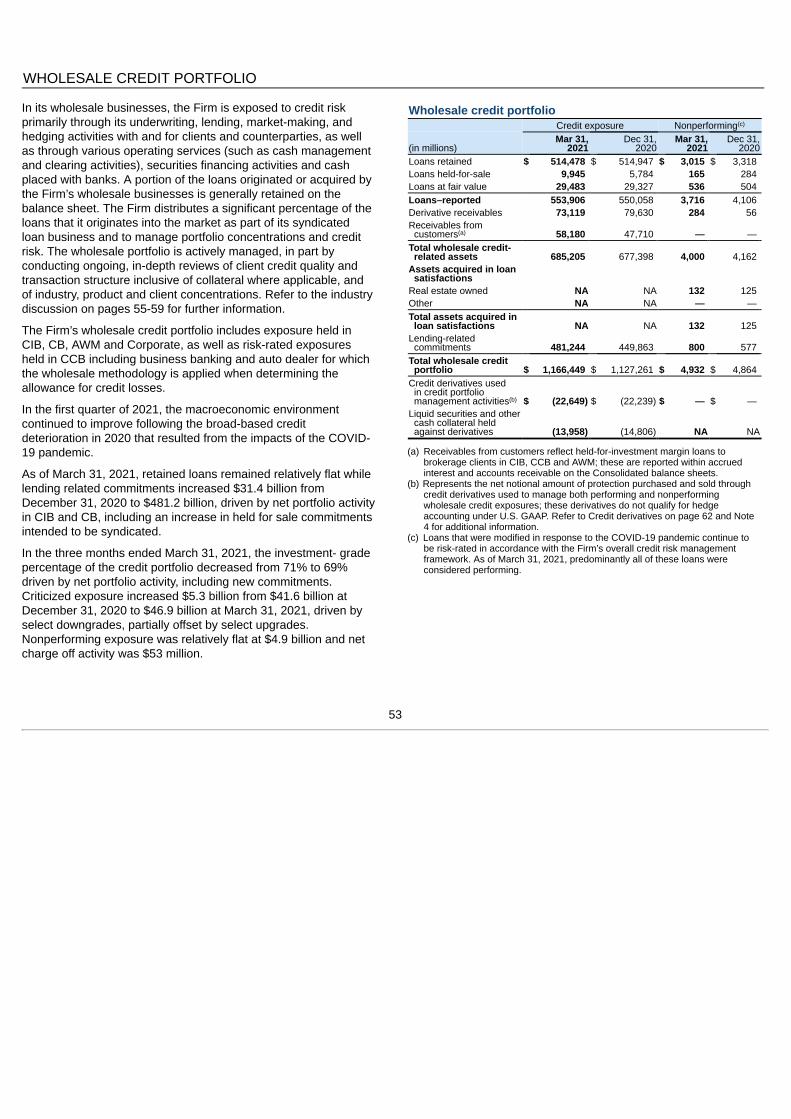
WHOLESALE CREDIT PORTFOLIO
In its wholesale businesses, the Firm is exposed to credit riskprimarily through its underwriting, lending, market-making, andhedging activities with and for clients and counterparties, as wellas through various operating services (such as cash managementand clearing activities), securities financing activities and cashplaced with banks. A portion of the loans originated or acquired bythe Firm’s wholesale businesses is generally retained on thebalance sheet. The Firm distributes a significant percentage of theloans that it originates into the market as part of its syndicatedloan business and to manage portfolio concentrations and creditrisk. The wholesale portfolio is actively managed, in part byconducting ongoing, in-depth reviews of client credit quality andtransaction structure inclusive of collateral where applicable, andof industry, product and client concentrations. Refer to the industrydiscussion on pages 55-59 for further information.
The Firm’s wholesale credit portfolio includes exposure held inCIB, CB, AWM and Corporate, as well as risk-rated exposuresheld in CCB including business banking and auto dealer for whichthe wholesale methodology is applied when determining theallowance for credit losses.
In the first quarter of 2021, the macroeconomic environmentcontinued to improve following the broad-based creditdeterioration in 2020 that resulted from the impacts of the COVID-19 pandemic.
As of March 31, 2021, retained loans remained relatively flat whilelending related commitments increased $31.4 billion fromDecember 31, 2020 to $481.2 billion, driven by net portfolio activityin CIB and CB, including an increase in held for sale commitmentsintended to be syndicated.
In the three months ended March 31, 2021, the investment- gradepercentage of the credit portfolio decreased from 71% to 69%driven by net portfolio activity, including new commitments.Criticized exposure increased $5.3 billion from $41.6 billion atDecember 31, 2020 to $46.9 billion at March 31, 2021, driven byselect downgrades, partially offset by select upgrades.Nonperforming exposure was relatively flat at $4.9 billion and netcharge off activity was $53 million.
Wholesale credit portfolioCredit exposure Nonperforming
(in millions)Mar 31,
2021Dec 31,
2020Mar 31,
2021Dec 31,
2020Loans retained $ 514,478 $ 514,947 $ 3,015 $ 3,318 Loans held-for-sale 9,945 5,784 165 284 Loans at fair value 29,483 29,327 536 504 Loans–reported 553,906 550,058 3,716 4,106 Derivative receivables 73,119 79,630 284 56 Receivables from
customers 58,180 47,710 — — Total wholesale credit-
related assets 685,205 677,398 4,000 4,162 Assets acquired in loan
satisfactionsReal estate owned NA NA 132 125 Other NA NA — — Total assets acquired in
loan satisfactions NA NA 132 125 Lending-related
commitments 481,244 449,863 800 577 Total wholesale credit
portfolio $ 1,166,449 $ 1,127,261 $ 4,932 $ 4,864 Credit derivatives used
in credit portfoliomanagement activities $ (22,649) $ (22,239) $ — $ —
Liquid securities and othercash collateral heldagainst derivatives (13,958) (14,806) NA NA
(a) Receivables from customers reflect held-for-investment margin loans tobrokerage clients in CIB, CCB and AWM; these are reported within accruedinterest and accounts receivable on the Consolidated balance sheets.
(b) Represents the net notional amount of protection purchased and sold throughcredit derivatives used to manage both performing and nonperformingwholesale credit exposures; these derivatives do not qualify for hedgeaccounting under U.S. GAAP. Refer to Credit derivatives on page 62 and Note4 for additional information.
(c) Loans that were modified in response to the COVID-19 pandemic continue tobe risk-rated in accordance with the Firm’s overall credit risk managementframework. As of March 31, 2021, predominantly all of these loans wereconsidered performing.
(c)
(a)
(b)
53

Wholesale assistanceIn March 2020, the Firm began providing assistance to clients inresponse to the COVID-19 pandemic, predominantly in the form ofpayment deferrals and covenant modifications.As of March 31, 2021, the Firm had approximately $1.3 billion ofretained loans still under payment deferral, representing 0.25% ofthe loan portfolio which has decreased approximately $0.3 billionfrom December 31, 2020, $5.0 billion from September 30, 2020,and $15.5 billion from June 30, 2020. Predominantly all clients that
exited deferral are current or have paid down their loans, and theFirm has not experienced significant new payment deferralrequests. The Firm continues to monitor the credit risk associatedwith loans subject to deferrals throughout the deferral period andon an ongoing basis after the borrowers are required to resumemaking regularly scheduled payments and considers expectedlosses of principal and accrued interest on these loans in itsallowance for credit losses.
(in millions, except ratios) March 31, 2021 December 31, 2020 September 30, 2020 June 30, 2020
Industry Loan balancePercent of total
industry loan balance
IG percentage of loanbalance in payment
deferral Loan balance Loan balance Loan balanceReal Estate $ 407 0.35 % 6 % $ 550 $ 4,385 $ 5,211 Transportation 369 5.94 98 394 346 294 Industrials 18 0.09 — 19 91 335 Consumer and Retail 15 0.04 — 82 413 690 Individuals and Individual Entities 6 0.01 100 402 691 809 Automotive — — — 22 15 8,827 Healthcare — — — 7 100 300 All Other Industries 479 0.26 77 147 233 309 Total wholesale $ 1,294 0.25 % 59 % $ 1,623 $ 6,274 $ 16,775
(a) As of March 31, 2021, predominantly SPEs.(b) Represents the balance of the retained loans which were still under payment deferral, divided by the respective industry total retained loans balance.
In addition, the Firm granted assistance in the form of covenant modifications. These types of assistance, both payment deferrals andcovenant modifications, are generally not reported as TDRs, either because the modifications were insignificant or they qualified for theoption to suspend the application of accounting guidance for TDRs as provided by the CARES Act and extended by the ConsolidatedAppropriations Act. Loans under assistance continue to be risk-rated in accordance with the Firm’s overall credit risk managementframework. As of March 31, 2021, predominantly all of these loans were considered performing.
Wholesale credit exposure – maturity and ratings profileThe following tables present the maturity and internal risk ratings profiles of the wholesale credit portfolio as of March 31, 2021, andDecember 31, 2020. The Firm generally considers internal ratings with qualitative characteristics equivalent to BBB-/Baa3 or higher asinvestment grade, and takes into consideration collateral and structural support when determining the internal risk rating for each creditfacility. Refer to Note 12 of JPMorgan Chase's 2020 Form 10-K for further information on internal risk ratings.
Maturity profile Ratings profile
1 year or less
1 yearthrough 5
years After 5 years Total Investment-gradeNoninvestment-
grade TotalTotal % of
IGMarch 31, 2021(in millions, except ratios)
Loans retained $ 190,787 $ 194,130 $ 129,561 $ 514,478 $ 379,827 $ 134,651 $ 514,478 74 %Derivative receivables 73,119 73,119 Less: Liquid securities and other cash collateral
held against derivatives (13,958) (13,958)Total derivative receivables, net of collateral 22,062 14,791 22,308 59,161 34,339 24,822 59,161 58 Lending-related commitments 132,273 326,744 22,227 481,244 315,860 165,384 481,244 66 Subtotal 345,122 535,665 174,096 1,054,883 730,026 324,857 1,054,883 69 Loans held-for-sale and loans at fair value 39,428 39,428 Receivables from customers 58,180 58,180 Total exposure – net of liquid securities and
other cash collateral held against derivatives $ 1,152,491 $ 1,152,491 Credit derivatives used in credit portfolio
management activities $ (10,219) $ (7,939) $ (4,491) $ (22,649) $ (18,458) $ (4,191) $ (22,649) 81 %
(b)
(a)
(d)
(a)
(b)(c)
54

Maturity profile Ratings profile
1 year or less
1 yearthrough 5
years After 5 years Total Investment-gradeNoninvestment-
grade TotalTotal % of
IGDecember 31, 2020(in millions, except ratios)
Loans retained $ 183,969 $ 197,905 $ 133,073 $ 514,947 $ 379,273 $ 135,674 $ 514,947 74 %Derivative receivables 79,630 79,630 Less: Liquid securities and other cash collateral held
against derivatives (14,806) (14,806)Total derivative receivables, net of collateral 18,456 17,599 28,769 64,824 38,941 25,883 64,824 60 Lending-related commitments 116,950 315,179 17,734 449,863 312,694 137,169 449,863 70 Subtotal 319,375 530,683 179,576 1,029,634 730,908 298,726 1,029,634 71 Loans held-for-sale and loans at fair value 35,111 35,111 Receivables from customers 47,710 47,710 Total exposure – net of liquid securities and other
cash collateral held against derivatives $ 1,112,455 $ 1,112,455 Credit derivatives used in credit portfolio
management activities $ (6,190) $ (13,223) $ (2,826) $ (22,239) $ (17,860) $ (4,379) $ (22,239) 80 %
(a) Represents loans held-for-sale, primarily related to syndicated loans and loans transferred from the retained portfolio, and loans at fair value.(b) These derivatives do not qualify for hedge accounting under U.S. GAAP.(c) The notional amounts are presented on a net basis by underlying reference entity and the ratings profile shown is based on the ratings of the reference entity on which
protection has been purchased. Predominantly all of the credit derivatives entered into by the Firm where it has purchased protection used in credit portfolio managementactivities are executed with investment-grade counterparties.
(d) The maturity profile of retained loans, lending-related commitments and derivative receivables is generally based on remaining contractual maturity. Derivative contracts thatare in a receivable position at March 31, 2021, may become payable prior to maturity based on their cash flow profile or changes in market conditions.
Wholesale credit exposure – industry exposuresThe Firm focuses on the management and diversification of itsindustry exposures, and pays particular attention to industries withactual or potential credit concerns.
Exposures deemed criticized align with the U.S. bankingregulators’ definition of criticized exposures, which consist of thespecial mention, substandard and doubtful categories. Totalcriticized exposure excluding loans held-for-sale and loans at fairvalue, was $46.9 billion at March 31, 2021, compared with $41.6billion at December 31, 2020, representing approximately 4.4%and 4.0% of total wholesale credit exposure, respectively. Theincrease in total criticized exposure was driven by selectdowngrades, partially offset by select upgrades . The totalcriticized exposure was largely undrawn and $42.8 billion wasperforming.
(d)
(a)
(b)(c)
55
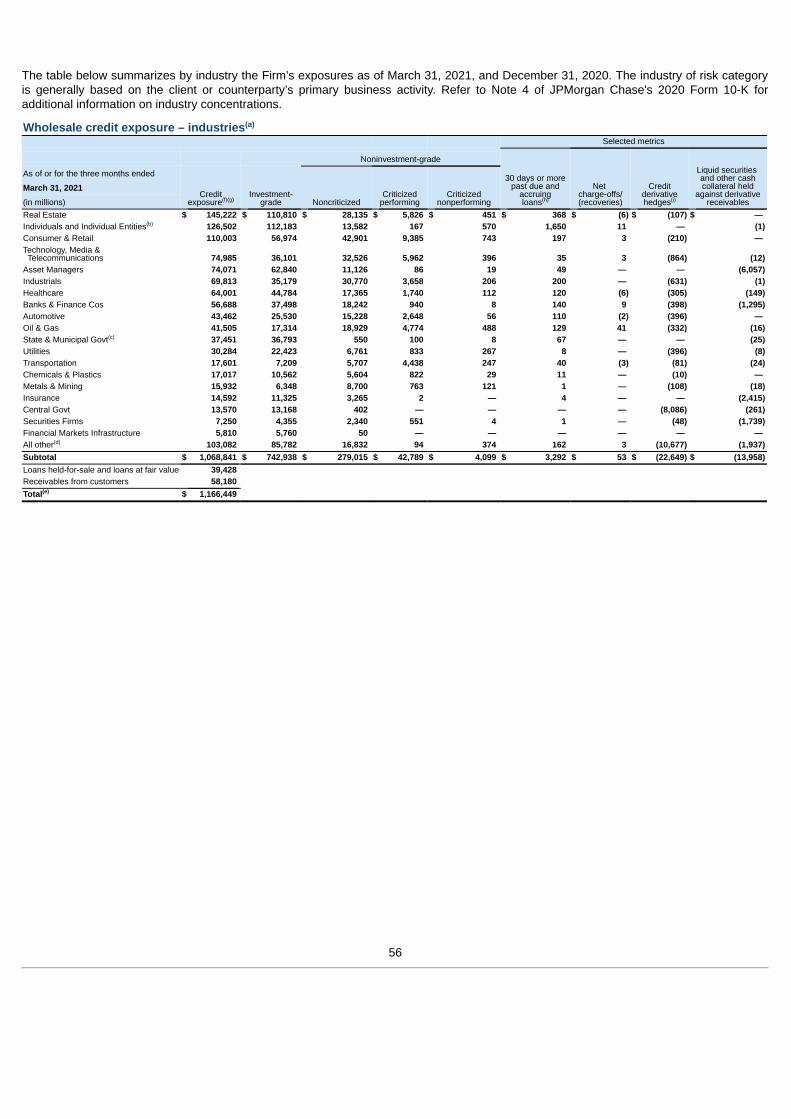
The table below summarizes by industry the Firm’s exposures as of March 31, 2021, and December 31, 2020. The industry of risk categoryis generally based on the client or counterparty’s primary business activity. Refer to Note 4 of JPMorgan Chase's 2020 Form 10-K foradditional information on industry concentrations.
Wholesale credit exposure – industriesSelected metrics
30 days or morepast due and
accruingloans
Net charge-offs/(recoveries)
Creditderivativehedges
Liquid securities and other cashcollateral held
against derivativereceivables
Noninvestment-grade
As of or for the three months ended
Creditexposure
Investment-grade Noncriticized
Criticizedperforming
Criticizednonperforming
March 31, 2021
(in millions)Real Estate $ 145,222 $ 110,810 $ 28,135 $ 5,826 $ 451 $ 368 $ (6) $ (107) $ — Individuals and Individual Entities 126,502 112,183 13,582 167 570 1,650 11 — (1)Consumer & Retail 110,003 56,974 42,901 9,385 743 197 3 (210) — Technology, Media & Telecommunications 74,985 36,101 32,526 5,962 396 35 3 (864) (12)Asset Managers 74,071 62,840 11,126 86 19 49 — — (6,057)Industrials 69,813 35,179 30,770 3,658 206 200 — (631) (1)Healthcare 64,001 44,784 17,365 1,740 112 120 (6) (305) (149)Banks & Finance Cos 56,688 37,498 18,242 940 8 140 9 (398) (1,295)Automotive 43,462 25,530 15,228 2,648 56 110 (2) (396) — Oil & Gas 41,505 17,314 18,929 4,774 488 129 41 (332) (16)State & Municipal Govt 37,451 36,793 550 100 8 67 — — (25)Utilities 30,284 22,423 6,761 833 267 8 — (396) (8)Transportation 17,601 7,209 5,707 4,438 247 40 (3) (81) (24)Chemicals & Plastics 17,017 10,562 5,604 822 29 11 — (10) — Metals & Mining 15,932 6,348 8,700 763 121 1 — (108) (18)Insurance 14,592 11,325 3,265 2 — 4 — — (2,415)Central Govt 13,570 13,168 402 — — — — (8,086) (261)Securities Firms 7,250 4,355 2,340 551 4 1 — (48) (1,739)Financial Markets Infrastructure 5,810 5,760 50 — — — — — — All other 103,082 85,782 16,832 94 374 162 3 (10,677) (1,937)Subtotal $ 1,068,841 $ 742,938 $ 279,015 $ 42,789 $ 4,099 $ 3,292 $ 53 $ (22,649) $ (13,958)Loans held-for-sale and loans at fair value 39,428 Receivables from customers 58,180 Total $ 1,166,449
(a)
(h) (i)(f)(g)
(b)
(c)
(d)
(e)
56

(continued from previous page)Selected metrics
30 days or morepast due and
accruingloans
Net charge-offs/(recoveries)
Creditderivativehedges
Liquid securities and other cashcollateral held
against derivativereceivables
Noninvestment-grade
As of or for the year ended
Creditexposure
Investment-grade Noncriticized
Criticizedperforming
Criticizednonperforming
December 31, 2020
(in millions)Real Estate $ 148,498 $ 116,124 $ 27,576 $ 4,294 $ 504 $ 374 $ 94 $ (110) $ — Individuals and Individual Entities 122,870 107,266 14,688 227 689 1,570 (17) — — Consumer & Retail 108,437 57,580 41,624 8,852 381 203 55 (381) (5)Technology, Media & Telecommunications 72,150 36,435 27,770 7,738 207 10 73 (934) (56)Asset Managers 66,573 57,582 8,885 85 21 19 1 — (4,685)Industrials 66,470 37,512 26,881 1,852 225 278 70 (658) (61)Healthcare 60,118 44,901 13,356 1,684 177 96 104 (378) (191)Banks & Finance Cos 54,032 35,115 17,820 1,045 52 20 13 (555) (1,648)Automotive 43,331 25,548 15,575 2,149 59 152 22 (434) — Oil & Gas 39,159 18,456 14,969 4,952 782 11 249 (238) (4)State & Municipal Govt 38,286 37,705 574 2 5 41 — — (41)Utilities 30,124 22,451 7,048 571 54 14 (7) (402) (1)Transportation 16,232 7,549 6,340 2,137 206 30 117 (83) (26)Chemicals & Plastics 17,176 10,622 5,703 822 29 6 — (83) — Metals & Mining 15,542 5,958 8,699 704 181 8 16 (141) (13)Insurance 13,141 10,177 2,960 3 1 7 — — (1,771)Central Govt 17,025 16,652 373 — — — — (8,364) (982)Securities Firms 8,048 6,116 1,927 1 4 — 18 (49) (3,423)Financial Markets Infrastructure 6,515 6,449 66 — — — — — (10)All other 100,713 84,650 15,185 504 374 83 (9) (9,429) (1,889)Subtotal $ 1,044,440 $ 744,848 $ 258,019 $ 37,622 $ 3,951 $ 2,922 $ 799 $ (22,239) $ (14,806)
Loans held-for-sale and loans at fair value 35,111 Receivables from customers 47,710 Total $ 1,127,261
(a) The industry rankings presented in the table as of December 31, 2020, are based on the industry rankings of the corresponding exposures at March 31, 2021, not actualrankings of such exposures at December 31, 2020.
(b) Individuals and Individual Entities predominantly consists of Global Private Bank clients within AWM and includes exposure to personal investment companies and personaland testamentary trusts.
(c) In addition to the credit risk exposure to states and municipal governments (both U.S. and non-U.S.) at March 31, 2021, and December 31, 2020, noted above, the Firmheld: $7.0 billion and $7.2 billion, respectively, of trading assets; $19.9 billion and $20.4 billion, respectively, of AFS securities; and $12.7 billion and $12.8 billion,respectively, of HTM securities, issued by U.S. state and municipal governments. Refer to Note 2 and Note 9 for further information.
(d) All other includes: SPEs, and Private education and civic organizations, representing approximately 92% and 8%, respectively, at both March 31, 2021, and December 31,2020.
(e) Excludes cash placed with banks of $700.7 billion and $516.9 billion, at March 31, 2021, and December 31, 2020, respectively, which is predominantly placed with variouscentral banks, primarily Federal Reserve Banks.
(f) Credit exposure is net of risk participations and excludes the benefit of credit derivatives used in credit portfolio management activities held against derivative receivables orloans and liquid securities and other cash collateral held against derivative receivables.
(g) Credit exposure includes held-for-sale and fair value option elected lending-related commitments.(h) Generally excludes loans under payment deferral programs offered in response to the COVID-19 pandemic.(i) Represents the net notional amounts of protection purchased and sold through credit derivatives used to manage the credit exposures; these derivatives do not qualify for
hedge accounting under U.S. GAAP. The All other category includes purchased credit protection on certain credit indices.
(h) (i)(f)(g)
(b)
(c)
(d)
(e)
57

Presented below is additional detail on certain of the Firm’s largest industry exposures and/or certain industries which present potentialheightened credit concerns.
Real EstateReal Estate exposure was $145.2 billion as of March 31, 2021, of which $84.3 billion was multifamily lending as shown in the table below.Criticized exposure increased by $1.5 billion from $4.8 billion to $6.3 billion, driven by select downgrades.
March 31, 2021
(in millions, except ratios)
Loans andLending-relatedCommitments
DerivativeReceivables Credit exposure
% Investment-grade % Drawn
Multifamily $ 84,092 $ 159 $ 84,251 85 % 92 %Office 16,223 240 16,463 74 71 Other Income Producing Properties 10,248 316 10,564 70 65 Retail 10,301 133 10,434 59 67 Industrial 9,356 59 9,415 82 67 Services and Non Income Producing 8,963 25 8,988 63 46 Lodging 5,033 74 5,107 11 30
Total Real Estate Exposure 144,216 1,006 145,222 76 79
December 31, 2020
(in millions, except ratios)
Loans and Lending-related
CommitmentsDerivative
Receivables Credit exposure% Investment-
grade % DrawnMultifamily $ 85,368 $ 183 $ 85,551 85 % 92 %Office 16,372 475 16,847 76 70 Other Income Producing Properties 13,435 421 13,856 76 55 Retail 10,573 199 10,772 60 69 Industrial 9,039 69 9,108 76 73 Services and Non Income Producing 9,242 22 9,264 62 47 Lodging 3,084 16 3,100 24 57
Total Real Estate Exposure 147,113 1,385 148,498 78 80
(a) Multifamily exposure is largely in California.(b) Other Income Producing Properties consists of clients with diversified property types or other property types outside of multifamily, office, retail, industrial and lodging with
less material exposures.(c) Real Estate exposure is approximately 81% secured; unsecured exposure is approximately 78% investment-grade.(d) Represents drawn exposure as a percentage of credit exposure.
(d)
(a)
(b)
(c)
(d)
(a)
(b)
58

Consumer & RetailConsumer & Retail exposure was $110.0 billion as of March 31, 2021, and predominantly included Retail, Food and Beverage, and Businessand Consumer Services as shown in the table below. Criticized exposure increased by $895 million from $9.2 billion to $10.1 billion, drivenby downgrades, partially offset by net portfolio activity.
March 31, 2021
(in millions, except ratios)
Loans andLending-relatedCommitments
DerivativeReceivables Credit exposure
% Investment-grade % Drawn
Retail $ 30,935 $ 998 $ 31,933 47 % 33 %Food and Beverage 28,574 934 29,508 62 34 Business and Consumer Services 26,844 423 27,267 53 37 Consumer Hard Goods 13,587 105 13,692 58 34 Leisure 7,420 183 7,603 18 43
Total Consumer & Retail 107,360 2,643 110,003 52 35
December 31, 2020
(in millions, except ratios)
Loans and Lending-related
CommitmentsDerivative
Receivables Credit exposure% Investment-
grade % DrawnRetail $ 32,486 $ 887 $ 33,373 52 % 33 %Food and Beverage 28,012 897 28,909 62 33 Business and Consumer Services 24,760 599 25,359 52 41 Consumer Hard Goods 12,937 178 13,115 59 36 Leisure 7,440 241 7,681 18 43
Total Consumer & Retail 105,635 2,802 108,437 53 36
(a) Retail consists of Home Improvement & Specialty Retailers, Restaurants, Supermarkets, Discount & Drug Stores, Specialty Apparel and Department Stores.(b) Leisure consists of Gaming, Arts & Culture, Travel Services and Sports & Recreation. As of March 31, 2021 approximately 74% of the noninvestment-grade Leisure portfolio
is secured.(c) Approximately 77% of the noninvestment-grade portfolio is secured.(d) Represents drawn exposure as a percent of credit exposure.
Oil & GasOil & Gas exposure was $41.5 billion as of March 31, 2021, including $20.4 billion of Exploration & Production and Oil field Services asshown in the table below. During the three months ended March 31, 2021, the investment-grade percentage decreased from 47% to 42%, asa result of new non-investment grade commitments. However, criticized exposure decreased by $472 million from $5.7 billion to $5.3 billion,driven by select upgrades and net portfolio activity, largely offset by select downgrades.
March 31, 2021
(in millions, except ratios)
Loans andLending-relatedCommitments
DerivativeReceivables Credit exposure
% Investment-grade % Drawn
Exploration & Production ("E&P") and Oil field Services $ 17,692 $ 2,676 $ 20,368 30 % 34 %Other Oil & Gas 20,564 573 21,137 53 21
Total Oil & Gas 38,256 3,249 41,505 42 27
December 31, 2020
(in millions, except ratios)
Loans and Lending-related
CommitmentsDerivative
Receivables Credit exposure% Investment-
grade % DrawnExploration & Production ("E&P") and Oil field Services $ 18,228 $ 1,048 $ 19,276 32 % 37 %Other Oil & Gas 19,288 595 19,883 62 21
Total Oil & Gas 37,516 1,643 39,159 47 29
(a) Other Oil & Gas includes Integrated Oil & Gas companies, Midstream/Oil Pipeline companies and refineries.(b) Secured lending was $16.4 billion and $13.2 billion at March 31, 2021 and December 31, 2020, respectively, approximately half of which is reserve-based lending to the
Exploration & Production sub-sector; unsecured exposure is largely investment-grade.(c) Represents drawn exposure as a percent of credit exposure.
(d)
(a)
(b)
(c)
(d)
(a)
(b)
(c)
(a)
(b)
(c)
(a)
(b)
59

LoansIn its wholesale businesses, the Firm provides loans to a variety ofclients, ranging from large corporate and institutional clients tohigh-net-worth individuals. Refer to Note 11 for a furtherdiscussion on loans, including information about delinquencies,loan modifications and other credit quality indicators.
The following table presents the change in the nonaccrual loanportfolio for the three months ended March 31, 2021 and 2020.Since March 31, 2020, nonaccrual loan exposure increased $1.5billion, driven by downgrades across multiple industries on clientcredit deterioration, with the largest concentration in Real Estate,predominantly within Retail and Lodging. In the three monthsended March 31, 2021, nonaccrual loan exposure decreased $390million, when compared to December 31, 2020 driven by netportfolio activity and select client upgrades in Oil & Gas andIndividuals.Wholesale nonaccrual loan activityThree months ended March 31,(in millions) 2021 2020Beginning balance $ 4,106 $ 1,271 Additions 847 1,333 Reductions:
Paydowns and other 819 171 Gross charge-offs 88 181 Returned to performing status 209 24 Sales 121 14
Total reductions 1,237 390 Net changes (390) 943 Ending balance $ 3,716 $ 2,214
(a) In the third quarter of 2020, the Firm reclassified certain fair value optionelected lending-related positions from trading assets to loans. Prior-periodamounts have been revised to conform with the current presentation.
The following table presents net charge-offs/recoveries, which aredefined as gross charge-offs less recoveries, for the three monthsended March 31, 2021 and 2020. The amounts in the table belowdo not include gains or losses from sales of nonaccrual loansrecognized in noninterest revenue.Wholesale net charge-offs/(recoveries)
(in millions, except ratios)
Three months ended March 31,2021 2020
Loans – reportedAverage loans retained $ 515,858 $ 491,819 Gross charge-offs 88 181 Gross recoveries collected (35) (19)Net charge-offs/(recoveries) 53 162 Net charge-off/(recovery) rate 0.04 % 0.13 %
(a)
60

Lending-related commitmentsThe Firm uses lending-related financial instruments, such ascommitments (including revolving credit facilities) and guarantees,to address the financing needs of its clients. The contractualamounts of these financial instruments represent the maximumpossible credit risk should the clients draw down on thesecommitments or when the Firm fulfills its obligations under theseguarantees, and the clients subsequently fail to perform accordingto the terms of these contracts. Most of these commitments andguarantees have historically been refinanced, extended,cancelled, or expired without being drawn upon or a defaultoccurring. As a result, the Firm does not believe that the totalcontractual amount of these wholesale lending-relatedcommitments is representative of the Firm’s expected future creditexposure or funding requirements. Refer to Note 22 for furtherinformation on wholesale lending-related commitments.
Receivables from customersReceivables from customers reflect held-for-investment marginloans to brokerage clients in CIB, CCB and AWM that arecollateralized by assets maintained in the clients’ brokerageaccounts (e.g., cash on deposit, liquid and readily marketable debtor equity securities). Because of this collateralization, no allowancefor credit losses is generally held against these receivables. Tomanage its credit risk the Firm establishes margin requirementsand monitors the required margin levels on an ongoing basis, andrequires clients to deposit additional cash or other collateral, or toreduce positions, when appropriate. These receivables arereported within accrued interest and accounts receivable on theFirm’s Consolidated balance sheets.
Derivative contractsDerivatives enable clients and counterparties to manage risksincluding credit risk and risks arising from fluctuations in interestrates, foreign exchange, equities, and commodities. The Firmmakes markets in derivatives in order to meet these needs anduses derivatives to manage certain risks associated with net openrisk positions from its market-making activities, including thecounterparty credit risk arising from derivative receivables. TheFirm also uses derivative instruments to manage its own credit riskand other market risk exposure. The nature of the counterpartyand the settlement mechanism of the derivative affect the creditrisk to which the Firm is exposed. For OTC derivatives the Firm isexposed to the credit risk of the derivative counterparty. Forexchange-traded derivatives (“ETD”), such as futures and options,and cleared over-the-counter (“OTC-cleared”) derivatives, the Firmcan also be exposed to the credit risk of the relevant CCP. Wherepossible, the Firm seeks to mitigate its credit risk exposuresarising from derivative contracts through the use of legallyenforceable master netting arrangements and collateralagreements.
The percentage of the Firm’s over-the-counter derivativetransactions subject to collateral agreements — excluding foreignexchange spot trades, which are not typically covered by collateralagreements due to their short maturity and centrally cleared tradesthat are settled daily — was approximately 88% at both March 31,2021, and December 31, 2020, respectively. Refer to Note 4 foradditional information on the Firm’s use of collateral agreements.Refer to Note 4 for a further discussion of derivative contracts,counterparties and settlement types.
The fair value of derivative receivables reported on theConsolidated balance sheets were $73.1 billion and $79.6 billionat March 31, 2021, and December 31, 2020, respectively, withdecreases in CIB resulting from market movements. Derivativereceivables represent the fair value of the derivative contracts aftergiving effect to legally enforceable master netting agreements andthe related cash collateral held by the Firm. In addition, the Firmheld liquid securities and other cash collateral that the Firmbelieves is legally enforceable and may be used as security whenthe fair value of the client’s exposure is in the Firm’s favor. Liquidsecurities represents high quality liquid assets as defined in theLCR rule. In management’s view, the appropriate measure ofcurrent credit risk should also take into consideration othercollateral, which generally represents securities that do not qualifyas high quality liquid assets under the LCR rule, but that the Firmbelieves is legally enforceable. The collateral amounts for eachcounterparty are limited to the net derivative receivables for thecounterparty. The following tables summarize the net derivativereceivables and the internal ratings profile for the periodspresented.
Derivative receivables
(in millions)March 31,
2021December 31,
2020Total, net of cash collateral $ 73,119 $ 79,630 Liquid securities and other cash collateral
held against derivative receivables (13,958) (14,806)Total, net of liquid securities and othercash collateral $ 59,161 $ 64,824 Other collateral held against derivativereceivables (5,716) (6,022)Total, net of collateral $ 53,445 $ 58,802
61

Ratings profile of derivative receivablesMarch 31, 2021 December 31, 2020
(in millions, except ratios)Exposure net of
collateral% of exposure net of
collateralExposure net of
collateral% of exposure net of
collateralInvestment-grade $ 32,774 61 % $ 37,013 63 %Noninvestment-grade 20,671 39 21,789 37 Total $ 53,445 100 % $ 58,802 100 %
The Firm also holds additional collateral (primarily cash, G7government securities, other liquid government agency andguaranteed securities, and corporate debt and equity securities)delivered by clients at the initiation of transactions, as well ascollateral related to contracts that have a non-daily call frequencyand collateral that the Firm has agreed to return but has not yetsettled as of the reporting date. Although this collateral does notreduce the balances and is not included in the table above, it isavailable as security against potential exposure that could ariseshould the fair value of the client’s derivative contracts move in theFirm’s favor. Refer to Note 4 for additional information on theFirm’s use of collateral agreements.
Credit derivativesThe Firm uses credit derivatives for two primary purposes: first, inits capacity as a market-maker, and second, as an end-user, tomanage the Firm’s own credit risk associated with variousexposures.
Credit portfolio management activitiesIncluded in the Firm’s end-user activities are credit derivativesused to mitigate the credit risk associated with traditional lendingactivities (loans and lending-related commitments) and derivativescounterparty exposure in the Firm’s wholesale businesses(collectively, “credit portfolio management activities"). Informationon credit portfolio management activities is provided in the tablebelow.
Credit derivatives used in credit portfolio managementactivities
Notional amount of protectionpurchased and sold
(in millions)March 31,
2021December 31,
2020Credit derivatives used to manage:
Loans and lending-related commitments $ 2,161 $ 3,877 Derivative receivables 20,488 18,362
Credit derivatives used in credit portfoliomanagement activities $ 22,649 $ 22,239
(a) Amounts are presented net, considering the Firm’s net protection purchased orsold with respect to each underlying reference entity or index.
Refer to Credit derivatives in Note 4 of this Form 10-Q and Note 5of JPMorgan Chase’s 2020 Form 10-K for further information oncredit derivatives and derivatives used in credit portfoliomanagement activities.
(a)
62

ALLOWANCE FOR CREDIT LOSSES
The Firm’s allowance for credit losses represents management'sestimate of expected credit losses over the remaining expected lifeof the Firm's financial assets measured at amortized cost andcertain off-balance sheet lending-related commitments. Theallowance for credit losses comprises:• the allowance for loan losses, which covers the Firm’s retained
loan portfolios (scored and risk-rated) and is presentedseparately on the Consolidated balance sheets,
• the allowance for lending-related commitments, which ispresented on the Consolidated balance sheets in accountspayable and other liabilities, and
• the allowance for credit losses on investment securities, whichcovers the Firm’s HTM and AFS securities and is recognizedwithin Investment Securities on the Consolidated balancesheets.
Discussion of changes in the allowanceThe allowance for credit losses as of March 31, 2021 decreasedwhen compared to December 31, 2020, consisting of:
• a $4.5 billion reduction in consumer, predominantly in the creditcard portfolio, reflecting improvements in the Firm'smacroeconomic scenarios, and in the residential real estateportfolio primarily due to the continued improvement in the HPIexpectations and to a lesser extent portfolio run-off, and
• a $716 million net reduction in wholesale, across the LOBsreflecting improvements in the Firm's macroeconomic scenarios
While the economy is showing signs of improvement, the COVID-19 pandemic has stressed many MEVs used in the Firm'sallowance estimate at a speed and to degrees not experienced inrecent history, which has created additional challenges in the useof modeled credit loss estimates and increased the reliance onmanagement judgment. These challenges in the use of modeledcredit loss estimates remain, albeit to a lesser extent thanexperienced during 2020. In periods where certain MEVs areoutside the range of historical experience on which the Firm’smodels have been trained, the Firm makes adjustments toappropriately address these economic circumstances.
Further, despite the improvement in the economy, uncertaintiesremain, including the health of underlying labor markets, vaccineefficacy against new virus strains, and the potential for changes inconsumer behavior that could have longer term impacts on certainsectors. As a result of these uncertainties, the Firm continued toplace significant weighting on its adverse scenarios, whichincorporate more punitive macroeconomic factors than the centralcase assumptions outlined below, resulting in weighted averageU.S. unemployment rates rising above eight percent in 2021 andremaining at approximately six percent into the second quarter of2022 with U.S. gross
domestic product ("GDP") returning to pre-pandemic levels in1Q22.
The Firm’s central case assumptions reflected U.S. unemploymentrates and U.S. real GDP as follows:
Assumptions at March 31, 20212Q21 4Q21 2Q22
U.S. unemployment rate 5.7 % 4.8 % 4.3 %Cumulative change in U.S. real
GDP from 12/31/2019 0.2 % 2.7 % 4.3 %
Assumptions at December 31, 20202Q21 4Q21 2Q22
U.S. unemployment rate 6.8 % 5.7 % 5.1 %Cumulative change in U.S. real
GDP from 12/31/2019 (1.9)% 0.6 % 2.0 %
(a) Reflects quarterly average of forecasted U.S. unemployment rate.
Subsequent changes to this forecast and related estimates will bereflected in the provision for credit losses in future periods.
Refer to Note 13 and Note 10 of JPMorgan Chase's 2020 Form10-K for a description of the policies, methodologies andjudgments used to determine the Firm’s allowances for creditlosses on loans, lending-related commitments, and investmentsecurities.
Refer to Critical Accounting Estimates Used by the Firm on pages74-76 for further information on the allowance for credit losses andrelated management judgments.Refer to Consumer Credit Portfolio on pages 48-52, WholesaleCredit Portfolio on pages 53-62 and Note 11 for additionalinformation on the consumer and wholesale credit portfolios.
(a)
(a)
63

Allowance for credit losses and related information2021 2020
Three months ended March 31, Consumer,excluding credit card Credit card Wholesale Total
Consumer,excluding credit card Credit card Wholesale Total(in millions, except ratios)
Allowance for loan lossesBeginning balance at January 1, $ 3,636 $ 17,800 $ 6,892 $ 28,328 $ 2,538 $ 5,683 $ 4,902 $ 13,123 Cumulative effect of a change in accountingprinciple NA NA NA NA 297 5,517 (1,642) 4,172 Gross charge-offs 166 1,214 88 1,468 233 1,488 181 1,902 Gross recoveries collected (145) (231) (35) (411) (239) (175) (19) (433)Net charge-offs/(recoveries) 21 983 53 1,057 (6) 1,313 162 1,469 Provision for loan losses (932) (2,517) (830) (4,279) 613 5,063 1,742 7,418 Other (1) — 10 9 — — — — Ending balance at March 31, $ 2,682 $ 14,300 $ 6,019 $ 23,001 $ 3,454 $ 14,950 $ 4,840 $ 23,244
Allowance for lending-related commitmentsBeginning balance at January 1, $ 187 $ — $ 2,222 $ 2,409 $ 12 $ — $ 1,179 $ 1,191 Cumulative effect of a change in accountingprinciple NA NA NA NA 133 — (35) 98 Provision for lending-related commitments (52) — 159 107 6 — 852 858 Other — — — — — — — — Ending balance at March 31, $ 135 $ — $ 2,381 $ 2,516 $ 151 $ — $ 1,996 $ 2,147
Impairment methodologyAsset-specific $ (348) $ 522 $ 529 $ 703 $ 223 $ 530 $ 556 $ 1,309 Portfolio-based 3,030 13,778 5,490 22,298 3,231 14,420 4,284 21,935 Total allowance for loan losses $ 2,682 $ 14,300 $ 6,019 $ 23,001 $ 3,454 $ 14,950 $ 4,840 $ 23,244
Impairment methodologyAsset-specific $ — $ — $ 144 $ 144 $ — $ — $ 187 $ 187 Portfolio-based 135 — 2,237 2,372 151 — 1,809 1,960 Total allowance for lending-related
commitments $ 135 $ — $ 2,381 $ 2,516 $ 151 $ — $ 1,996 $ 2,147
Total allowance for credit losses $ 2,817 $ 14,300 $ 8,400 $ 25,517 $ 3,605 $ 14,950 $ 6,836 $ 25,391
Memo:Retained loans, end of period $ 302,392 $ 131,772 $ 514,478 $ 948,642 $ 293,779 $ 154,021 $ 555,289 $ 1,003,089 Retained loans, average 302,055 134,155 515,858 952,068 294,156 162,660 491,819 948,635 Credit ratiosAllowance for loan losses to retained loans 0.89 % 10.85 % 1.17 % 2.42 % 1.18 % 9.71 % 0.87 % 2.32 %Allowance for loan losses to retained nonaccrual
loans 50 NM 200 274 89 NM 247 398 Allowance for loan losses to retained nonaccrual
loans excluding credit card 50 NM 200 104 89 NM 247 142 Net charge-off/(recovery) rates 0.03 2.97 0.04 0.45 (0.01) 3.25 0.13 0.62
(a) Includes collateral dependent loans, including those considered TDRs and those for which foreclosure is deemed probable, modified PCD loans, and non-collateraldependent loans that have been modified or are reasonably expected to be modified in a TDR. Also includes risk-rated loans that have been placed on nonaccrual status forthe wholesale portfolio segment. The asset-specific credit card allowance for loan losses modified or reasonably expected to be modified in a TDR is calculated based onthe loans’ original contractual interest rates and does not consider any incremental penalty rates.
(b) The Firm’s policy is generally to exempt credit card loans from being placed on nonaccrual status as permitted by regulatory guidance.(c) Excludes the allowance for credit losses on HTM securities. The allowance for credit losses on HTM securities was $94 million and $19 million as of March 31, 2021 and
2020, respectively.
(c) (c)
(a)
(b)
64

INVESTMENT PORTFOLIO RISK MANAGEMENT
Investment portfolio risk is the risk associated with the loss ofprincipal or a reduction in expected returns on investments arisingfrom the investment securities portfolio or from principalinvestments. The investment securities portfolio is predominantlyheld by Treasury and CIO in connection with the Firm’s balancesheet or asset-liability management objectives. Principalinvestments are predominantly privately-held non-traded financialinstruments and are managed in the LOBs and Corporate.Investments are typically intended to be held over extendedperiods and, accordingly, the Firm has no expectation for short-term realized gains with respect to these investments.
Investment securities riskInvestment securities risk includes the exposure associated with adefault in the payment of principal and interest. This risk ismitigated given that the investment securities portfolio held byTreasury and CIO is predominantly invested in high-qualitysecurities. At March 31, 2021, the Treasury and CIO investmentsecurities portfolio, net of allowance for credit losses, was $595.4billion, and the average credit rating of the securities comprisingthe portfolio was AA+ (based upon external ratings whereavailable and where not available, based primarily upon internalrisk ratings). Refer to Corporate segment results on pages 33-34and Note 9 for further information on the investment securitiesportfolio and internal risk ratings. Refer to Market RiskManagement on pages 66-70 for further information on the marketrisk inherent in the portfolio. Refer to Liquidity Risk Managementon pages 42-46 for further information on related liquidity risk.
Principal investment riskPrincipal investments are typically privately held non-tradedfinancial instruments representing ownership or other forms ofjunior capital and span multiple asset classes. These investmentsare made by dedicated investing businesses or as part of abroader business strategy. In general, principal investmentsinclude tax-oriented investments and investments made toenhance or accelerate the Firm’s business strategies. The Firm’sinvestments will continue to evolve in line with its strategies,including the Firm’s commitment to support underservedcommunities and minority-owned businesses. The Firm’s principalinvestments are managed by the LOBs and Corporate and arereflected within their respective financial results. The aggregatecarrying values of the principal investment portfolios have notbeen significantly affected as a result of the COVID-19 pandemic.However, uncertainties remain that could result in future negativeimpacts.The table below presents the aggregate carrying values of theprincipal investment portfolios as March 31, 2021 andDecember 31, 2020.
(in billions) March 31, 2021December 31,
2020Tax-oriented investments (e.g., affordable
housing and alternative energyinvestments) $ 19.5 $ 20.0
Private equity, various debt and equityinstruments, and real assets 5.8 6.2
Total carrying value $ 25.3 $ 26.2
(a) Prior-period amount has been revised to conform with the current presentation.Refer to Note 1 for further information.
Refer to page 134 of JPMorgan Chase’s 2020 Form 10-K for adiscussion of the Firm’s Investment Portfolio Risk Managementgovernance and oversight.
(a)
65

MARKET RISK MANAGEMENT
Market risk is the risk associated with the effect of changes inmarket factors such as interest and foreign exchange rates, equityand commodity prices, credit spreads or implied volatilities, on thevalue of assets and liabilities held for both the short and long term.Refer to Market Risk Management on pages 135–142 ofJPMorgan Chase’s 2020 Form 10-K for a discussion of the Firm’sMarket Risk Management organization, market risk measurement,risk monitoring and control, and predominant business activitiesthat give rise to market risk.
Market Risk Management continues to actively monitor the impactof the COVID-19 pandemic on market risk exposures byleveraging existing risk measures and controls.Models used to measure market risk are inherently imprecise andare limited in their ability to measure certain risks or to predictlosses. This imprecision may be heightened when sudden orsevere shifts in market conditions occur, such as those observedat the onset of the COVID-19 pandemic. For additional discussionon model uncertainty refer to Estimations and Model RiskManagement on page 73.Market Risk Management periodically reviews the Firm’s existingmarket risk measures to identify opportunities for enhancement,and to the extent appropriate, will calibrate those measuresaccordingly over time.
Value-at-riskJPMorgan Chase utilizes value-at-risk (“VaR”), a statistical riskmeasure, to estimate the potential loss from adverse marketmoves in the current market environment. The Firm has a singleVaR framework used as a basis for calculating Risk ManagementVaR and Regulatory VaR.The Firm’s Risk Management VaR is calculated assuming a one-day holding period and an expected tail-loss methodology whichapproximates a 95% confidence level. For risk managementpurposes, the Firm believes this methodology provides a dailymeasure of risk that is closely aligned to risk managementdecisions made by the LOBs and Corporate and, along with othermarket risk measures, provides the appropriate informationneeded to respond to risk events. The Firm calculates separately adaily aggregated VaR in accordance with regulatory rules(“Regulatory VaR”), which is used to derive the Firm’s regulatoryVaR-based capital requirements under Basel III.The Firm’s VaR model calculations are periodically evaluated andenhanced in response to changes in the composition of the Firm’sportfolios, changes in market conditions, improvements in theFirm’s modeling techniques and measurements, and other factors.Such changes may affect historical comparisons of VaR results.Refer to Estimations and Model Risk Management on page 151 ofJPMorgan Chase’s 2020 Form 10-K for information regardingmodel reviews and approvals.Refer to page 137 of JPMorgan Chase’s 2020 Form 10-K forfurther information regarding VaR, including the inherentlimitations, and the key differences between Risk ManagementVaR and Regulatory VaR. Refer to JPMorgan Chase’s Basel IIIPillar 3 Regulatory Capital Disclosures reports, which are availableon the Firm’s website, for additional information on RegulatoryVaR and the other components of market risk regulatory capital forthe Firm (e.g., VaR-based measure, stressed VaR-based measureand the respective backtesting). Refer to Other risk measures onpages 140-142 of JPMorgan Chase’s 2020 Form 10-K for furtherinformation regarding nonstatistical market risk measures used bythe Firm.
66

The table below shows the results of the Firm’s Risk Management VaR measure using a 95% confidence level. VaR can vary significantly aspositions change, market volatility fluctuates, and diversification benefits change.
Total VaRThree months ended
March 31, 2021 December 31, 2020 March 31, 2020(in millions) Avg. Min Max Avg. Min Max Avg. Min MaxCIB trading VaR by risk typeFixed income $ 125 $ 34 $ 153 $ 106 $ 87 $ 138 $ 60 $ 30 $ 156 Foreign exchange 11 5 27 12 7 18 7 4 11 Equities 22 19 38 23 21 30 20 13 41 Commodities and other 33 22 43 36 24 44 10 7 24 Diversification benefit to CIB trading VaR (90) NM NM (85) NM NM (40) NM NM
CIB trading VaR 101 40 134 92 72 117 57 27 160 Credit portfolio VaR 8 5 12 12 6 21 9 3 25 Diversification benefit to CIB VaR (10) NM NM (13) NM NM (8) NM NM
CIB VaR 99 39 133 91 69 117 58 27 162
CCB VaR 6 4 11 6 3 10 7 3 11
Corporate and other LOB VaR 45 20 94 35 17 82 11 9 14 Diversification benefit to other VaR (6) NM NM (6) NM NM (5) NM NM
Other VaR 45 21 94 35 17 82 13 10 16 Diversification benefit to CIB and other VaR (38) NM NM (30) NM NM (12) NM NM
Total VaR $ 106 $ 40 $ 153 $ 96 $ 67 $ 129 $ 59 $ 27 $ 164
(a) Diversification benefit represents the difference between the portfolio VaR and the sum of its individual components. This reflects the non-additive nature of VaR due toimperfect correlation across LOBs, Corporate, and risk types.
(b) Average and maximum Corporate and other LOB VaR were driven by a private equity position that became publicly traded at the end of the third quarter of 2020. As ofMarch 31, 2021 the Firm no longer holds this position.
(c) The maximum and minimum VaR for each portfolio may have occurred on different trading days than the components and consequently diversification benefit is notmeaningful.
Quarter over quarter resultsAverage total VaR increased by $10 million for the three monthsended March 31, 2021 when compared with the prior quarterdriven by increases in exposure in fixed income, partially offset byvolatility which occurred in late March of 2020 at the onset of theCOVID-19 pandemic rolling out of the one-year historical look-back period.
Year over year resultsAverage total VaR increased by $47 million for the three monthsended March 31, 2021, compared with the same period in the prioryear. This increase was driven by volatility which occurred at theonset of the COVID-19 pandemic and predominantly impactedexposure in fixed income, as well as increases from CorporateVaR due to the inclusion of a private equity position that becamepublicly traded at the end of the third quarter of 2020. Theseincreases were partially offset by risk reductions in equities.
Effective July 1, 2020, the Firm refined the scope of VaR toexclude certain asset-backed fair value option elected loans, andincluded them in other sensitivity-based measures to moreeffectively measure the risk from these loans. In the absence ofthis refinement, the average Total VaR and each of thecomponents would have been higher by the amounts reported inthe following table:
(in millions)
Amount by which reported average VaR wouldhave been higher for the three months ended
March 31, 2021CIB fixed income VaR $ 21 CIB trading VaR 19 CIB VaR 20 Total VaR 18
(a) (c) (c) (a) (c) (c) (a) (c) (c)
(a) (c) (c) (a) (c) (c) (a) (c) (c)
(b) (b) (b) (b)
(a) (c) (c) (a) (c) (c) (a) (c) (c)
(a) (c) (c) (a) (c) (c) (a) (c) (c)
67

The following graph presents daily Risk Management VaR for the five trailing quarters. As noted previously, average total VaR increased by$47 million for the three months ended March 31, 2021, compared with the same period in the prior year. However, as of March 31, 2021daily Risk Management VaR has declined from March 31, 2020 as the volatility which occurred in late March of 2020 at the onset of theCOVID-19 pandemic has begun to roll out of the one-year historical look-back period.
Daily Risk Management VaR
First Quarter2020
Second Quarter2020
Third Quarter2020
Fourth Quarter2020
First Quarter2021
VaR backtestingThe Firm performs daily VaR model backtesting, which compares the daily Risk Management VaR results with the daily gains and losses thatare utilized for VaR backtesting purposes. The gains and losses depicted in the chart below do not reflect the Firm’s reported revenue asthey exclude select components of total net revenue, such as those associated with the execution of new transactions (i.e., intraday client-driven trading and intraday risk management activities), fees, commissions, certain valuation adjustments and net interest income. Theseexcluded components of total net revenue may more than offset backtesting gains and losses on a particular day. The definition ofbacktesting gains and losses above is consistent with the requirements for backtesting under Basel III capital rules.For the 12 months ended March 31, 2021, the Firm posted backtesting gains on 165 of the 259 days, and observed two VaR backtestingexceptions. For the three months ended March 31, 2021, the Firm posted backtesting gains on 47 of the 63 days, and did not observe anyVaR backtesting exceptions.The following chart presents the distribution of Firmwide daily backtesting gains and losses for the trailing 12 months and three monthsended March 31, 2021. The daily backtesting losses are displayed as a percentage of the corresponding daily Risk Management VaR. Thecount of days with backtesting losses are shown in aggregate, in fifty percentage point intervals. A backtesting exception occurs when thedaily backtesting loss exceeds the daily Risk Management VaR for the prior day. Backtesting exceptions are displayed within the intervalsthat are greater than one hundred percent. The results in the chart below differ from the results of backtesting disclosed in the Market Risksection of the Firm’s Basel III Pillar 3 Regulatory Capital Disclosures reports, which are based on Regulatory VaR applied to the Firm’scovered positions.
Distribution of Daily Backtesting Gains and Losses
68

Earnings-at-riskThe effect of interest rate exposure on the Firm’s reported netincome is important as interest rate risk represents one of theFirm’s significant market risks. Interest rate risk arises not onlyfrom trading activities but also from the Firm’s traditional bankingactivities, which include extension of loans and credit facilities,taking deposits and issuing debt as well as from the investmentsecurities portfolio. Refer to the table on page 136 of JPMorganChase’s 2020 Form 10-K for a summary by LOB and Corporate,identifying positions included in earnings-at-risk.One way the Firm evaluates its structural interest rate risk isthrough earnings-at-risk. Earnings-at-risk estimates the Firm’sinterest rate exposure for a given interest rate scenario. It ispresented as a sensitivity to a baseline, which includes net interestincome and certain interest rate sensitive fees. The baseline usesmarket interest rates and in the case of deposits, pricingassumptions. The Firm conducts simulations of changes to thisbaseline for interest rate-sensitive assets and liabilitiesdenominated in U.S. dollars and other currencies (“non-U.S.dollar” currencies). These simulations primarily include retainedloans, deposits, deposits with banks, investment securities, long-term debt and any related interest rate hedges, and funds transferpricing of other positions in risk management VaR and othersensitivity-based measures as described on page 136 ofJPMorgan Chase’s 2020 Form 10-K.Earnings-at-risk scenarios estimate the potential change to a netinterest income baseline, over the following 12 months utilizingmultiple assumptions. These scenarios include a parallel shiftinvolving changes to both short-term and long-term rates by anequal amount; a steeper yield curve involving holding short-termrates constant and increasing long-term rates; and a flatter yieldcurve involving increasing short-term rates and holding long-termrates constant. These scenarios consider many different factors,including:• The impact on exposures as a result of instantaneous changes
in interest rates from baseline rates.• Forecasted balance sheet, as well as modeled prepayment and
reinvestment behavior, but do not include assumptions aboutactions that could be taken by the Firm or its clients andcustomers in response to any such instantaneous rate changes.Mortgage prepayment assumptions are based on the interestrates used in the scenarios compared with underlyingcontractual rates, the time since origination, and other factorswhich are updated periodically based on historical experience.
• The pricing sensitivity of deposits, known as deposit betas,represent the amount by which deposit rates paid could changeupon a given change in market interest rates over the cycle. Thedeposit rates paid in these scenarios may differ from actualdeposit rates paid, due to repricing lags and other factors.
The Firm’s earnings-at-risk scenarios are periodically evaluatedand enhanced in response to changes in the composition of theFirm’s balance sheet, changes in market conditions, improvementsin the Firm’s simulation and other factors. While a relevantmeasure of the Firm’s interest rate exposure, the earnings at riskanalysis does not represent a forecast of the Firm’s net interestincome (Refer to Outlook on page 7 for additional information).The Firm’s U.S. dollar sensitivities are presented in the tablebelow.
(in billions) March 31, 2021December 31,
2020Parallel shift:
+100 bps shift in rates $ 6.0 $ 6.9
Steeper yield curve:+100 bps shift in long-term rates 1.6 2.4
Flatter yield curve:+100 bps shift in short-term rates 4.4 4.5
The change in the Firm’s U.S. dollar sensitivities as of March 31,2021 compared to December 31, 2020 reflected updates to theFirm’s baseline for higher long-term rates as well as the impact ofchanges in the Firm’s balance sheet.The Firm’s sensitivity to rates is primarily a result of assetsrepricing at a faster pace than deposits.Based upon current and implied market rates as of March 31,2021, scenarios reflecting lower rates could result in negativeinterest rates. The U.S. has never experienced an interest rateenvironment where the Federal Reserve has a negative interestrate policy. While the impact of negative interest rates on theFirm's earnings-at-risk would vary by scenario, a parallel shiftdownward of up to 100bps would negatively impact net interestincome. In a negative interest rate environment, the modelingassumptions used for certain assets and liabilities requireadditional management judgment and therefore, the actualoutcomes may differ from these assumptions.The Firm’s non-U.S. dollar sensitivities are presented in the tablebelow.
(in billions) March 31, 2021December 31,
2020Parallel shift:
+100 bps shift in rates $ 0.9 $ 0.9
Flatter yield curve:+100 bps shift in short-term rates 0.9 0.8
The results of the non-U.S. dollar interest rate scenario involving asteeper yield curve with long-term rates rising by 100 basis pointsand short-term rates staying at current levels were not material tothe Firm’s earnings-at-risk at March 31, 2021 and December 31,2020.
69

Other sensitivity-based measuresThe Firm quantifies the market risk of certain debt and equity and funding activities by assessing the potential impact on net revenue, othercomprehensive income (“OCI”) and noninterest expense due to changes in relevant market variables. Refer to the predominant businessactivities that give rise to market risk on page 136 of JPMorgan Chase’s 2020 Form 10-K for additional information on the positions capturedin other sensitivity-based measures.The table below represents the potential impact to net revenue, OCI or noninterest expense for market risk-sensitive instruments that are notincluded in VaR or earnings-at-risk. Where appropriate, instruments used for hedging purposes are reported net of the positions beinghedged. The sensitivities disclosed in the table below may not be representative of the actual gain or loss that would have been realized atMarch 31, 2021 and December 31, 2020, as the movement in market parameters across maturities may vary and are not intended to implymanagement’s expectation of future changes in these sensitivities.
Gain/(loss) (in millions)March 31, 2021
December 31,2020Activity Description Sensitivity measure
Debt and equityAsset Management activities Consists of seed capital and related hedges; fund
co-investments ; and certain deferredcompensation and related hedges
10% decline in market value $ (51) $ (48)
Other debt and equity Consists of certain asset-backed fair value optionelected loans, privately held equity and otherinvestments held at fair value
10% decline in market value (885) (919)
Funding activitiesNon-USD LTD cross-currency basis Represents the basis risk on derivatives used to
hedge the foreign exchange risk on the non-USDLTD
1 basis point parallel tighteningof cross currency basis
(17) (16)
Non-USD LTD hedges foreigncurrency (“FX”) exposure
Primarily represents the foreign exchangerevaluation on the fair value of the derivativehedges
10% depreciation of currency 17 13
Derivatives – funding spread risk Impact of changes in the spread related toderivatives FVA
1 basis point parallel increase inspread
(3) (4)
Fair value option elected liabilities –funding spread risk
Impact of changes in the spread related to fairvalue option elected liabilities DVA
1 basis point parallel increase inspread
39 33
Fair value option elected liabilities –interest rate sensitivity
Interest rate sensitivity on fair value option liabilitiesresulting from a change in the Firm’s own creditspread
1 basis point parallel increase inspread
(1) (3)
Interest rate sensitivity related to risk managementof changes in the Firm’s own credit spread on fairvalue option liabilities
1 basis point parallel increase inspread
1 3
(a) Excludes equity securities without readily determinable fair values that are measured under the measurement alternative. Refer to Note 2 for additional information.(b) Impact recognized through net revenue.(c) Impact recognized through noninterest expense.(d) Impact recognized through OCI.
(a)
(b)(c)
(b)
(d)
(d)
(b)
(d)
(d)
(b)
70

COUNTRY RISK MANAGEMENT
The Firm, through its LOBs and Corporate, may be exposed tocountry risk resulting from financial, economic, political or othersignificant developments which adversely affect the value of theFirm’s exposures related to a particular country or set of countries.The Country Risk Management group actively monitors the variousportfolios which may be impacted by these developments andmeasures the extent to which the Firm’s exposures are diversifiedgiven the Firm’s strategy and risk tolerance relative to a country.
Given the remaining uncertainty around the COVID-19 pandemic,Country Risk Management continues to monitor the impact toindividual countries.
Refer to pages 143-144 of JPMorgan Chase’s 2020 Form 10-K fora further discussion of the Firm’s country risk management.
Risk ReportingThe following table presents the Firm’s top 20 exposures bycountry (excluding the U.S.) as of March 31, 2021 and theircomparative exposures as of December 31, 2020. The selection ofcountries represents the Firm’s largest total exposures byindividual country, based on the Firm’s internal country riskmanagement approach, and does not represent the Firm’s view ofany existing or potentially adverse credit conditions. Countryexposures may fluctuate from period to period due to client activityand market flows.
The increase in exposure to Australia was predominantly due toincreased cash placements with the central bank of Australia,driven by client activity following recent policy decisions in thecountry and growth in client deposits.
Top 20 country exposures (excluding the U.S.)
(in billions) March 31, 2021December31, 2020
Lending anddeposits
Trading andinvesting Other
Totalexposure
Totalexposure
Germany $ 110.1 $ 5.0 $ 0.5 $ 115.6 $ 127.2 United Kingdom 52.8 13.1 2.3 68.2 68.4 Japan 38.4 14.0 0.3 52.7 45.6 Australia 24.5 6.7 — 31.2 15.9 France 13.4 3.8 2.7 19.9 18.8 China 10.0 6.5 1.6 18.1 21.2 Switzerland 10.2 0.5 4.5 15.2 18.7 Brazil 5.8 8.1 — 13.9 10.8 Canada 12.4 0.5 0.2 13.1 14.5 Luxembourg 11.0 1.1 — 12.1 12.4 India 4.8 4.0 0.9 9.7 10.5 South Korea 4.4 4.7 0.4 9.5 10.1 Netherlands 7.4 0.1 2.0 9.5 7.7 Singapore 4.9 2.7 0.8 8.4 8.7 Italy 4.1 3.2 0.2 7.5 9.7 Hong KongSAR 4.6 1.8 0.2 6.6 6.2 Saudi Arabia 5.7 0.8 — 6.5 5.8 Spain 3.9 2.1 — 6.0 5.8 Belgium 2.8 1.6 0.1 4.5 4.0 Mexico 4.0 0.1 — 4.1 4.9
(a) Country exposures presented in the table reflect 89% and 90% of totalFirmwide non-U.S. exposure, where exposure is attributed to an individualcountry, at March 31, 2021, and December 31, 2020, respectively.
(b) Lending and deposits includes loans and accrued interest receivable, lendingrelated commitments (net of eligible collateral and the allowance for creditlosses), deposits with banks (including central banks), acceptances, othermonetary assets, and issued letters of credit net of participations. Excludesintra-day and operating exposures, such as those from settlement and clearingactivities.
(c) Includes market-making inventory, Investment securities, and counterpartyexposure on derivative and securities financings net of eligible collateral andhedging. Includes exposure from single reference entity (“single-name”), indexand other multiple reference entity transactions for which one or more of theunderlying reference entities is in a country listed in the above table.
(d) Predominantly includes physical commodity inventory.(e) The country rankings presented in the table as of December 31, 2020, are
based on the country rankings of the corresponding exposures at March 31,2021, not actual rankings of such exposures at December 31, 2020.
(a)
(e)
(b) (c) (d)
71

OPERATIONAL RISK MANAGEMENT
Operational risk is the risk of an adverse outcome resulting frominadequate or failed internal processes or systems; human factors;or external events impacting the Firm’s processes or systems;Operational Risk includes compliance, conduct, legal, andestimations and model risk. Operational risk is inherent in theFirm’s activities and can manifest itself in various ways, includingfraudulent acts, business interruptions, cyber attacks,inappropriate employee behavior, failure to comply with applicablelaws and regulations or failure of vendors to perform inaccordance with their agreements. Operational Risk Managementattempts to manage operational risk at appropriate levels in light ofthe Firm’s financial position, the characteristics of its businesses,and the markets and regulatory environments in which it operates.Refer to Operational Risk Management on pages 145-147 ofJPMorgan Chase’s 2020 Form 10-K for a discussion of the Firm’sOperational Risk Management.
Subcategories and examples of operational risksOperational risk can manifest itself in various ways. Operationalrisk subcategories such as Compliance risk, Conduct risk, Legalrisk, and Estimations and Model risk as well as other operationalrisks, can lead to losses which are captured through the Firm’soperational risk measurement processes. Refer to ComplianceRisk Management on page 148, Conduct Risk Management onpage 149, Legal Risk Management on page 150 and Estimationsand Model Risk Management on page 151 of JPMorgan Chase’s2020 Form 10-K for more information. Details on other selectexamples of operational risks are provided below.
Business and technology resiliency riskBusiness disruptions can occur due to forces beyond the Firm’scontrol such as the spread of infectious diseases or pandemics,severe weather, power or telecommunications loss, accidents,failure of a third party to provide expected services, cyberattack,flooding, transit strikes, terrorism, health emergencies. The safetyof the Firm’s employees and customers is of the highest priority.The Firmwide resiliency program is intended to enable the Firm torecover its critical business functions and supporting assets (i.e.,staff, technology and facilities) in the event of a businessinterruption. The program includes governance, awarenesstraining, and testing of recovery strategies, as well as strategic andtactical initiatives to identify, assess, and manage businessinterruption and public safety risks. The strength and proficiency ofthe Firmwide resiliency program has played an integral role inmaintaining the Firm’s business operations during and aftervarious events.
Cybersecurity RiskDue to the on-going impact of COVID-19, the Firm continues toleverage use of remote access and also video conferencingsolutions provided by third parties to facilitate remote work. As aresult, the Firm deployed additional precautionary measures tomitigate cybersecurity risks.
Payment Fraud RiskThe risk of payment fraud remains at a heightened level across theindustry, particularly during the COVID-19 pandemic due to theuse of contingent forms of payment authentication methods andthe perpetuation of scams involving the pandemic, including anincrease in the level of fraud attempts against consumers. Thecomplexities of these incidents and the strategies used byperpetrators continue to evolve. The Firm employs various controlsfor managing payment fraud risk as well as providing employeeand client education and awareness trainings.
72

ESTIMATIONS AND MODEL RISK MANAGEMENT
Estimations and Model risk, a subcategory of operational risk, isthe potential for adverse consequences from decisions based onincorrect or misused estimation outputs.
The Firm uses models and other analytical and judgment- basedestimations across various businesses and functions. Theestimation methods are of varying levels of sophistication and areused for many purposes, such as the valuation of positions andmeasurement of risk, assessing regulatory capital requirements,conducting stress testing, and making business decisions.
While models are inherently imprecise, the degree of imprecisionor uncertainty can be heightened by the market or economicenvironment. This is particularly true when the current andforecasted environment is significantly different from the historicalmacroeconomic environments upon which the models weretrained, as the Firm has experienced during the COVID-19pandemic. This uncertainty may necessitate a greater degree ofjudgment and analytics to inform adjustments to model outputsthan in typical periods.
Refer to Critical Accounting Estimates Used by the Firm on pages74-76 and Note 2 of this Form 10-Q, and Estimations and ModelRisk Management section on page 151 of JPMorgan Chase’s2020 Form 10-K for a summary of model-based valuations andother valuation techniques.
73

CRITICAL ACCOUNTING ESTIMATES USED BY THE FIRM
JPMorgan Chase’s accounting policies and use of estimates areintegral to understanding its reported results. The Firm’s mostcomplex accounting estimates require management’s judgment toascertain the appropriate carrying value of assets and liabilities.The Firm has established policies and control procedures intendedto ensure that estimation methods, including any judgments madeas part of such methods, are well-controlled, independentlyreviewed and applied consistently from period to period. Themethods used and judgments made reflect, among other factors,the nature of the assets or liabilities and the related business andrisk management strategies, which may vary across the Firm’sbusinesses and portfolios. In addition, the policies and proceduresare intended to ensure that the process for changingmethodologies occurs in an appropriate manner. The Firmbelieves its estimates for determining the carrying value of itsassets and liabilities are appropriate. The following is a briefdescription of the Firm’s critical accounting estimates involvingsignificant judgments.
Allowance for credit lossesThe Firm’s allowance for credit losses represents management’sestimate of expected credit losses over the remaining expected lifeof the Firm’s financial assets measured at amortized cost andcertain off-balance sheet lending-related commitments. Theallowance for credit losses comprises:
• The allowance for loan losses, which covers the Firm’s retainedloan portfolios (scored and risk-rated),
• The allowance for lending-related commitments, and
• The allowance for credit losses on investment securities, whichcovers the Firm’s HTM and AFS securities.
The allowance for credit losses involves significant judgment on anumber of matters including development and weighting ofmacroeconomic forecasts, incorporation of historical lossexperience, assessment of risk characteristics, assignment of riskratings, valuation of collateral, and the determination of remainingexpected life. Refer to Note 10 and Note 13 of JPMorgan Chase's2020 Form 10-K for further information on these judgments as wellas the Firm’s policies and methodologies used to determine theFirm’s allowance for credit losses; and refer to Allowance for creditlosses on pages 63–64 and Note 12 of this Form 10-Q for furtherinformation.
One of the most significant judgments involved in estimating theFirm’s allowance for credit losses relates to the macroeconomicforecasts used to estimate credit losses over the eight-quarterforecast period within the Firm’s methodology. The eight-quarterforecast incorporates hundreds of macroeconomic variables(“MEVs”) that are relevant for exposures across the Firm, withmodeled credit losses being driven primarily by a subset of lessthan twenty variables. The specific variables that have the greatest
effect on the modeled losses of each portfolio vary by portfolio andgeography.
• Key MEVs for the consumer portfolio include U.S.unemployment, HPI and U.S. real GDP.
• Key MEVs for the wholesale portfolio include U.S. real GDP,U.S. unemployment, U.S. equity prices, corporate creditspreads, oil prices, commercial real estate prices and HPI.
Changes in the Firm’s assumptions and forecasts of economicconditions could significantly affect its estimate of expected creditlosses in the portfolio at the balance sheet date or lead tosignificant changes in the estimate from one reporting period tothe next.
The COVID-19 pandemic resulted in a weak labor market andweak overall economic conditions that affected borrowers acrossthe Firm’s consumer and wholesale lending portfolios. While theeconomy is showing signs of improvement, uncertainties remain,including the health of underlying labor markets, vaccine efficacyagainst new virus strains, and the potential for changes inconsumer behavior that could have longer term impacts on certainsectors. Further, significant judgment is still required to estimatethe speed and trajectory of the economic recovery.
It is difficult to estimate how potential changes in any one factor orinput might affect the overall allowance for credit losses becausemanagement considers a wide variety of factors and inputs inestimating the allowance for credit losses. Changes in the factorsand inputs considered may not occur at the same rate and maynot be consistent across all geographies or product types, andchanges in factors and inputs may be directionally inconsistent,such that improvement in one factor or input may offsetdeterioration in others.
To consider the impact of a hypothetical alternate macroeconomicforecast, the Firm compared the modeled credit losses determinedusing its central and relative adverse macroeconomic scenarios,which are two of the five scenarios considered in estimating theallowances for loan losses and lending-related commitments. Thecentral and relative adverse scenarios each included a full suite ofMEVs, but differed in the levels, paths and peaks/troughs of thosevariables over the eight-quarter forecast period.
For example, compared to the Firm’s central scenario describedon page 63 and in Note 12, the Firm’s relative adverse scenarioassumes a significantly elevated U.S. unemployment rate through2021, averaging 2.4% higher over the eight-quarter forecast, witha peak difference of approximately 4.4% in the third quarter of2021; lower U.S. real GDP with a slower recovery, remaining 2.6%lower at the end of the eight-quarter forecast, with a peakdifference of nearly 6.6% in the third quarter of 2021; and lowernational HPI with a peak difference of 17.4% and a trough in thesecond quarter of 2022.
74

This analysis is not intended to estimate expected future changesin the allowance for credit losses, for a number of reasons,including:
• the Firm has placed significant weight on its adverse scenariosin estimating its allowance for credit losses as of March 31,2021, and accordingly, the existing allowance already reflectscredit losses beyond those estimated under the central scenario
• the impacts of changes in many MEVs are both interrelated andnonlinear, so the results of this analysis cannot be simplyextrapolated for more severe changes in macroeconomicvariables
• the COVID-19 pandemic has stressed many MEVs used in theFirm's allowance estimate at a speed and to degrees not seen inrecent history, which continues to add higher degrees ofuncertainty around modeled credit loss estimations
• significant changes in the expected severity and duration of theeconomic downturn caused by the COVID-19 pandemic, effectsof government support and customer assistance, and speed andtrajectory of the subsequent recovery could significantly affectthe Firm’s estimate of expected credit losses irrespective of theestimated sensitivities described below.
To demonstrate the sensitivity of credit loss estimates tomacroeconomic forecasts as of March 31, 2021, the Firmcompared the modeled estimates under its relative adversescenario to its central scenario. Without considering the additionalweight the Firm has placed on its adverse scenarios or any otheroffsetting or correlated effects in other qualitative components ofthe Firm’s allowance for credit losses for these lending exposures,the comparison between these two scenarios reflects the followingdifferences:
• An increase of approximately $700 million for residential realestate loans and lending-related commitments
• An increase of approximately $3.6 billion for credit card loans
• An increase of approximately $2.1 billion for wholesale loansand lending-related commitments
This analysis relates only to the modeled credit loss estimates andis not intended to estimate changes in the overall allowance forcredit losses as it does not reflect any potential changes in otheradjustments to the quantitative calculation, which would also beinfluenced by the judgment management applies to the modeledlifetime loss estimates to reflect the uncertainty and imprecision ofthese modeled lifetime loss estimates based on then-currentcircumstances and conditions.
Recognizing that forecasts of macroeconomic conditions areinherently uncertain, particularly in light of the recent economicconditions, the Firm believes that its process to consider theavailable information and associated risks and uncertainties isappropriately governed and that its
estimates of expected credit losses were reasonable andappropriate for the period ended March 31, 2021.
Fair valueJPMorgan Chase carries a portion of its assets and liabilities at fairvalue. The majority of such assets and liabilities are measured atfair value on a recurring basis, including, derivatives, structurednote products and certain securities financing agreements. Certainassets and liabilities are measured at fair value on a nonrecurringbasis, including certain mortgage, home equity and other loans,where the carrying value is based on the fair value of theunderlying collateral.
Assets measured at fair valueThe following table includes the Firm’s assets measured at fairvalue and the portion of such assets that are classified within level3 of the valuation hierarchy. Refer to Note 2 for further information.
March 31, 2021(in billions, except ratios)
Total assets at fairvalue
Total level 3assets
Federal funds sold and securitiespurchased under resale agreements $ 267.6 $ — Securities borrowed 66.3 — Trading assets:
Trading–debt and equity instruments $ 470.9 $ 2.7 Derivative receivables 73.1 7.9
Total trading assets 544.0 10.6 AFS securities 379.9 — Loans 50.8 1.8 MSRs 4.5 4.5 Other 383.7 0.5 Total assets measured at fair value on a
recurring basis 1,362.9 17.4 Total assets measured at fair value on a
nonrecurring basis 2.5 0.7 Total assets measured at fair value $ 1,365.4 $ 18.1 Total Firm assets $ 3,689.3 Level 3 assets at fair value as a
percentage of total Firm assets 0.5 %Level 3 assets at fair value as a
percentage of total Firm assets at fairvalue 1.3 %
(a) For purposes of the table above, the derivative receivables total reflects theimpact of netting adjustments; however, the $7.9 billion of derivativereceivables classified as level 3 does not reflect the netting adjustment assuch netting is not relevant to a presentation based on the transparency ofinputs to the valuation of an asset. The level 3 balances would be reduced ifnetting were applied, including the netting benefit associated with cashcollateral.
(a)
(a)
(a)
75

ValuationEstimating fair value requires the application of judgment. Thetype and level of judgment required is largely dependent on theamount of observable market information available to the Firm. Forinstruments valued using internally developed valuation modelsand other valuation techniques that use significant unobservableinputs and are therefore classified within level 3 of the valuationhierarchy, judgments used to estimate fair value are moresignificant than those required when estimating the fair value ofinstruments classified within levels 1 and 2.
In arriving at an estimate of fair value for an instrument within level3, management must first determine the appropriate valuationmodel or other valuation technique to use. Second, the lack ofobservability of certain significant inputs requires management toassess all relevant empirical data in deriving valuation inputsincluding, for example, transaction details, yield curves, interestrates, prepayment speed, default rates, volatilities, correlations,prices (such as commodity, equity or debt prices), valuations ofcomparable instruments, foreign exchange rates and credit curves.Refer to Note 2 for a further discussion of the valuation of level 3instruments, including unobservable inputs used.
For instruments classified in levels 2 and 3, managementjudgment must be applied to assess the appropriate level ofvaluation adjustments to reflect counterparty credit quality, theFirm’s creditworthiness, market funding rates, liquidityconsiderations, unobservable parameters, and for portfolios thatmeet specified criteria, the size of the net open risk position. Thejudgments made are typically affected by the type of product andits specific contractual terms, and the level of liquidity for theproduct or within the market as a whole. In periods of heightenedmarket volatility and uncertainty judgments are further affected bythe wider variation of reasonable valuation estimates, particularlyfor positions that are less liquid. Refer to Note 2 for a furtherdiscussion of valuation adjustments applied by the Firm.
Imprecision in estimating unobservable market inputs or otherfactors can affect the amount of gain or loss recorded for aparticular position. Furthermore, while the Firm believes itsvaluation methods are appropriate and consistent with those ofother market participants, the methods and assumptions usedreflect management judgment and may vary across the Firm’sbusinesses and portfolios.
The Firm uses various methodologies and assumptions in thedetermination of fair value. The use of methodologies orassumptions different than those used by the Firm could result in adifferent estimate of fair value at the reporting date. Refer to Note2 for a detailed discussion of the Firm’s valuation process andhierarchy, and its determination of fair value for individual financialinstruments.
Goodwill impairmentManagement applies significant judgment when testing goodwillfor impairment. The goodwill associated with each businesscombination is allocated to the related reporting units for goodwillimpairment testing. Refer to Goodwill impairment on page 154 ofJPMorgan Chase’s 2020 Form 10-K for a description of thesignificant valuation judgments associated with goodwillimpairment.
Refer to Note 14 for additional information on goodwill, includingthe goodwill impairment assessment as of March 31, 2021.
Credit card rewards liabilityThe credit card rewards liability was $8.0 billion and $7.7 billion atMarch 31, 2021 and December 31, 2020, respectively, and isrecorded in accounts payable and other liabilities on theConsolidated balance sheets. Refer to page 154 of JPMorganChase’s 2020 Form 10-K for a description of the significantassumptions and sensitivities, associated with the Firm’s creditcard rewards liability.
Income taxesRefer to Income taxes on page 154-155 of JPMorgan Chase’s2020 Form 10-K for a description of the significant assumptions,judgments and interpretations associated with the accounting forincome taxes.
Litigation reservesRefer to Note 24 of this Form 10-Q, and Note 30 of JPMorganChase’s 2020 Form 10-K for a description of the significantestimates and judgments associated with establishing litigationreserves.
76

ACCOUNTING AND REPORTING DEVELOPMENTS
Financial Accounting Standards Board (“FASB”) Standards Adopted since January 1, 2021
Standard Summary of guidance Effects on financial statements
Reference RateReform
Issued March2020 and updatedJanuary 2021
• Provides optional expedients and exceptions to currentaccounting guidance when financial instruments, hedgeaccounting relationships, and other transactions are amendeddue to reference rate reform.
• Provides an election to account for certain contractamendments related to reference rate reform as modificationsrather than extinguishments without the requirement to assessthe significance of the amendments.
• Allows for changes in critical terms of a hedge accountingrelationship without automatic termination of that relationship.Provides various practical expedients and elections designedto allow hedge accounting to continue uninterrupted duringthe transition period.
• Provides a one-time election to transfer securities out of theheld-to-maturity classification if certain criteria are met.
• The January 2021 update provides an election to account forderivatives modified to change the rate used for discounting,margining, or contract price alignment (collectively“discounting transition”) as modifications.
• Issued and effective March 12, 2020. The January 7, 2021update was effective when issued.
• The Firm elected to apply certain of the practical expedientsrelated to contract modifications and hedge accountingrelationships, and discounting transition beginning in the thirdquarter of 2020. The discounting transition election was appliedretrospectively. The main purpose of the practical expedients isto ease the administrative burden of accounting for contractsimpacted by reference rate reform. These elections did not havea material impact on the Consolidated Financial Statements.
77

FORWARD-LOOKING STATEMENTS
From time to time, the Firm has made and will make forward-lookingstatements. These statements can be identified by the fact that theydo not relate strictly to historical or current facts. Forward-lookingstatements often use words such as “anticipate,” “target,” “expect,”“estimate,” “intend,” “plan,” “goal,” “believe,” or other words of similarmeaning. Forward-looking statements provide JPMorgan Chase’scurrent expectations or forecasts of future events, circumstances,results or aspirations. JPMorgan Chase’s disclosures in this Form10-Q contain forward-looking statements within the meaning of thePrivate Securities Litigation Reform Act of 1995. The Firm also maymake forward-looking statements in its other documents filed orfurnished with the SEC. In addition, the Firm’s senior managementmay make forward-looking statements orally to investors, analysts,representatives of the media and others.All forward-looking statements are, by their nature, subject to risksand uncertainties, many of which are beyond the Firm’s control.JPMorgan Chase’s actual future results may differ materially fromthose set forth in its forward-looking statements. While there is noassurance that any list of risks and uncertainties or risk factors iscomplete, below are certain factors which could cause actual resultsto differ from those in the forward-looking statements:
• Economic, financial, reputational and other impacts of the COVID-19 pandemic;
• Local, regional and global business, economic and politicalconditions and geopolitical events;
• Changes in laws and regulatory requirements, including capitaland liquidity requirements affecting the Firm’s businesses, and theability of the Firm to address those requirements;
• Heightened regulatory and governmental oversight and scrutiny ofJPMorgan Chase’s business practices, including dealings withretail customers;
• Changes in trade, monetary and fiscal policies and laws;
• Changes in income tax laws and regulations;
• Securities and capital markets behavior, including changes inmarket liquidity and volatility;
• Changes in investor sentiment or consumer spending or savingsbehavior;
• Ability of the Firm to manage effectively its capital and liquidity;
• Changes in credit ratings assigned to the Firm or its subsidiaries;
• Damage to the Firm’s reputation;
• Ability of the Firm to appropriately address social, environmentaland sustainability concerns that may arise, including from itsbusiness activities;
• Ability of the Firm to deal effectively with an economic slowdownor other economic or market disruption, including, but not limitedto, in the interest rate environment;
• Technology changes instituted by the Firm, its counterparties orcompetitors;
• The effectiveness of the Firm’s control agenda;
• Ability of the Firm to develop or discontinue products andservices, and the extent to which products or services previouslysold by the Firm require the Firm to incur liabilities or absorblosses not contemplated at their initiation or origination;
• Acceptance of the Firm’s new and existing products and servicesby the marketplace and the ability of the Firm to innovate and toincrease market share;
• Ability of the Firm to attract and retain qualified and diverseemployees;
• Ability of the Firm to control expenses;
• Competitive pressures;
• Changes in the credit quality of the Firm’s clients, customers andcounterparties;
• Adequacy of the Firm’s risk management framework, disclosurecontrols and procedures and internal control over financialreporting;
• Adverse judicial or regulatory proceedings;
• Changes in applicable accounting policies, including theintroduction of new accounting standards;
• Ability of the Firm to determine accurate values of certain assetsand liabilities;
• Occurrence of natural or man-made disasters or calamities,including health emergencies, the spread of infectious diseases,pandemics or outbreaks of hostilities, or the effects of climatechange, and the Firm’s ability to deal effectively with disruptionscaused by the foregoing;
• Ability of the Firm to maintain the security of its financial,accounting, technology, data processing and other operationalsystems and facilities;
• Ability of the Firm to withstand disruptions that may be caused byany failure of its operational systems or those of third parties;
• Ability of the Firm to effectively defend itself against cyber attacksand other attempts by unauthorized parties to access informationof the Firm or its customers or to disrupt the Firm’s systems; and
• The other risks and uncertainties detailed in Part II,Item 1A: Risk Factors in this form 10-Q and Part I, Item 1A: RiskFactors in JPMorgan Chase’s 2020 Form 10-K.
Any forward-looking statements made by or on behalf of the Firmspeak only as of the date they are made, and JPMorgan Chase doesnot undertake to update any forward-looking statements. The readershould, however, consult any further disclosures of a forward-lookingnature the Firm may make in any subsequent Annual Reports onForm 10-K, Quarterly Reports on Form 10-Q or Current Reports onForm 8-K.
78

JPMorgan Chase & Co.Consolidated statements of income (unaudited)
Three months ended March 31,(in millions, except per share data) 2021 2020RevenueInvestment banking fees $ 2,970 $ 1,866 Principal transactions 6,500 2,937 Lending- and deposit-related fees 1,687 1,706 Asset management, administration and commissions 5,029 4,540 Investment securities gains 14 233 Mortgage fees and related income 704 320 Card income 1,350 995 Other income 1,123 1,250 Noninterest revenue 19,377 13,847 Interest income 14,271 19,161 Interest expense 1,382 4,722 Net interest income 12,889 14,439 Total net revenue 32,266 28,286
Provision for credit losses (4,156) 8,285
Noninterest expenseCompensation expense 10,601 8,895 Occupancy expense 1,115 1,066 Technology, communications and equipment expense 2,519 2,578 Professional and outside services 2,203 2,028 Marketing 751 800 Other expense 1,536 1,424 Total noninterest expense 18,725 16,791 Income before income tax expense 17,697 3,210 Income tax expense 3,397 345 Net income $ 14,300 $ 2,865 Net income applicable to common stockholders $ 13,851 $ 2,431 Net income per common share dataBasic earnings per share $ 4.51 $ 0.79 Diluted earnings per share 4.50 0.78
Weighted-average basic shares 3,073.5 3,095.8 Weighted-average diluted shares 3,078.9 3,100.7
(a) Prior-period amounts have been revised to conform with the current presentation. Refer to Note 1 for further information.
The Notes to Consolidated Financial Statements (unaudited) are an integral part of these statements.
(a)
(a)
79

JPMorgan Chase & Co.Consolidated statements of comprehensive income (unaudited)
Three months ended March 31,
(in millions) 2021 2020Net income $ 14,300 $ 2,865 Other comprehensive income/(loss), after–taxUnrealized gains/(losses) on investment securities (4,339) 1,119 Translation adjustments, net of hedges (250) (330)Fair value hedges (28) 88 Cash flow hedges (2,249) 2,465 Defined benefit pension and OPEB plans 68 33 DVA on fair value option elected liabilities (147) 2,474 Total other comprehensive income/(loss), after–tax (6,945) 5,849 Comprehensive income $ 7,355 $ 8,714
The Notes to Consolidated Financial Statements (unaudited) are an integral part of these statements.
80

JPMorgan Chase & Co.Consolidated balance sheets (unaudited)
(in millions, except share data) March 31, 2021December 31,
2020AssetsCash and due from banks $ 25,397 $ 24,874 Deposits with banks 685,675 502,735 Federal funds sold and securities purchased under resale agreements (included $267,613 and $238,015 at fair value) 272,481 296,284 Securities borrowed (included $66,277 and $52,983 at fair value) 179,516 160,635 Trading assets (included assets pledged of $117,020 and $130,645) 544,052 503,126 Available-for-sale securities (amortized cost of $378,756 and $381,729; included assets pledged of $64,540 and $32,227) 379,942 388,178 Held-to-maturity securities (net of allowance for credit losses of $94 and $78) 217,452 201,821
Investment securities, net of allowance for credit losses 597,394 589,999 Loans (included $50,767 and $44,474 at fair value) 1,011,307 1,012,853 Allowance for loan losses (23,001) (28,328)
Loans, net of allowance for loan losses 988,306 984,525 Accrued interest and accounts receivable 114,754 90,503 Premises and equipment 26,926 27,109 Goodwill, MSRs and other intangible assets 54,588 53,428 Other assets (included $50,492 and $13,827 at fair value and assets pledged of $37,581 and $3,739) 200,247 151,539 Total assets $ 3,689,336 $ 3,384,757 LiabilitiesDeposits (included $14,107 and $14,484 at fair value) $ 2,278,112 $ 2,144,257 Federal funds purchased and securities loaned or sold under repurchase agreements (included $197,834 and $155,735 atfair value) 304,019 215,209
Short-term borrowings (included $20,002 and $16,893 at fair value) 54,978 45,208 Trading liabilities 191,349 170,181 Accounts payable and other liabilities (included $42,824 and $3,476 at fair value) 285,066 231,285 Beneficial interests issued by consolidated VIEs (included $193 and $41 at fair value) 15,671 17,578 Long-term debt (included $75,693 and $76,817 at fair value) 279,427 281,685 Total liabilities 3,408,622 3,105,403 Commitments and contingencies (refer to Notes 22, 23 and 24)Stockholders’ equityPreferred stock ($1 par value; authorized 200,000,000 shares; issued 3,156,250 and 3,006,250 shares) 31,563 30,063 Common stock ($1 par value; authorized 9,000,000,000 shares; issued 4,104,933,895 shares) 4,105 4,105 Additional paid-in capital 88,005 88,394 Retained earnings 248,151 236,990 Accumulated other comprehensive income 1,041 7,986 Treasury stock, at cost (1,077,805,783 and 1,055,499,435 shares) (92,151) (88,184)Total stockholders’ equity 280,714 279,354 Total liabilities and stockholders’ equity $ 3,689,336 $ 3,384,757
(a) Prior-period amounts have been revised to conform with the current presentation. Refer to Note 1 for further information.(b) The following table presents information on assets and liabilities related to VIEs that are consolidated by the Firm at March 31, 2021, and December 31, 2020. The assets of
the consolidated VIEs are used to settle the liabilities of those entities. The holders of the beneficial interests generally do not have recourse to the general credit ofJPMorgan Chase. The assets and liabilities in the table below include third-party assets and liabilities of consolidated VIEs and exclude intercompany balances thateliminate in consolidation. Refer to Note 13 for a further discussion
(in millions) March 31, 2021December 31,
2020AssetsTrading assets $ 1,994 $ 1,934 Loans 33,509 37,619 All other assets 701 681 Total assets $ 36,204 $ 40,234 LiabilitiesBeneficial interests issued by consolidated VIEs $ 15,671 $ 17,578 All other liabilities 239 233 Total liabilities $ 15,910 $ 17,811
The Notes to Consolidated Financial Statements (unaudited) are an integral part of these statements.
(a)
(b)
(a)
(b)
81

JPMorgan Chase & Co.Consolidated statements of changes in stockholders’ equity (unaudited)
Three months ended March 31,(in millions, except per share data) 2021 2020Preferred stockBalance at the beginning of the period $ 30,063 $ 26,993 Issuance 1,500 4,500 Redemption — (1,430)Balance at March 31 31,563 30,063
Common stockBalance at the beginning and end of the period 4,105 4,105
Additional paid-in capitalBalance at the beginning of the period 88,394 88,522 Shares issued and commitments to issue common stock for employee share-based compensation awards, andrelated tax effects (363) (660)
Other (26) (5)Balance at March 31 88,005 87,857
Retained earningsBalance at the beginning of the period 236,990 223,211 Cumulative effect of change in accounting principles — (2,650)Net income 14,300 2,865 Dividends declared:
Preferred stock (379) (421)Common stock ($0.90 and $0.90 per share) (2,760) (2,779)
Balance at March 31 248,151 220,226
Accumulated other comprehensive income/(loss)Balance at the beginning of the period 7,986 1,569 Other comprehensive income/(loss), after-tax (6,945) 5,849 Balance at March 31 1,041 7,418
Shares held in RSU Trust, at costBalance at the beginning and end of the period — (21)
Treasury stock, at costBalance at the beginning of the period (88,184) (83,049)Repurchase (4,999) (6,397)Reissuance 1,032 1,060 Balance at March 31 (92,151) (88,386)
Total stockholders’ equity $ 280,714 $ 261,262
The Notes to Consolidated Financial Statements (unaudited) are an integral part of these statements.
82

JPMorgan Chase & Co.Consolidated statements of cash flows (unaudited)
Three months ended March 31,(in millions) 2021 2020Operating activitiesNet income $ 14,300 $ 2,865 Adjustments to reconcile net income to net cash used in operating activities:
Provision for credit losses (4,156) 8,285 Depreciation and amortization 2,070 2,197 Deferred tax (benefit)/expense 998 (1,235)Other 890 411
Originations and purchases of loans held-for-sale (85,457) (47,352)Proceeds from sales, securitizations and paydowns of loans held-for-sale 75,547 52,345 Net change in:
Trading assets (34,262) (167,827)Securities borrowed (18,951) 145 Accrued interest and accounts receivable (24,323) (49,323)Other assets 7,131 (61,897)Trading liabilities (7) 97,078 Accounts payable and other liabilities 23,559 45,020
Other operating adjustments (1,211) (801)Net cash (used in) operating activities (43,872) (120,089)Investing activitiesNet change in:
Federal funds sold and securities purchased under resale agreements 23,791 1,120 Held-to-maturity securities:
Proceeds from paydowns and maturities 14,700 2,599 Purchases (31,348) (205)
Available-for-sale securities:Proceeds from paydowns and maturities 14,096 12,420 Proceeds from sales 80,823 50,990 Purchases (95,958) (131,605)
Proceeds from sales and securitizations of loans held-for-investment 6,619 7,564 Other changes in loans, net 3,321 (65,608)Net purchases of assets pursuant to nonrecourse advances provided by the FRBB under the MMLF — (11,985)All other investing activities, net (653) (1,123)Net cash provided by/(used in) investing activities 15,391 (135,833)Financing activitiesNet change in:
Deposits 120,501 297,976 Federal funds purchased and securities loaned or sold under repurchase agreements 88,844 49,273 Short-term borrowings 9,387 12,455 Beneficial interests issued by consolidated VIEs (1,439) 1,613
Proceeds from long-term borrowings 24,162 34,851 Payments of long-term borrowings (14,983) (29,057)Proceeds from issuance of preferred stock 1,500 4,500 Redemption of preferred stock — (1,430)Treasury stock repurchased (4,806) (6,517)Dividends paid (3,193) (3,188)All other financing activities, net (1,062) 1,829 Net cash provided by financing activities 218,911 362,305 Effect of exchange rate changes on cash and due from banks and deposits with banks (6,967) (2,480)Net increase in cash and due from banks and deposits with banks 183,463 103,903 Cash and due from banks and deposits with banks at the beginning of the period 527,609 263,631 Cash and due from banks and deposits with banks at the end of the period $ 711,072 $ 367,534 Cash interest paid $ 1,127 $ 4,374 Cash income taxes paid, net 640 763
(a) Prior-period amounts have been revised to conform with the current presentation. Refer to Note 1 for further information.
The Notes to Consolidated Financial Statements (unaudited) are an integral part of these statements.
(a)
(a)
(a)
83

Refer to the Glossary of Terms and Acronyms on pages 163-171 for definitions of terms and acronyms used throughout the Notes to Consolidated Financial Statements.
NOTES TO CONSOLIDATED FINANCIAL STATEMENTS (unaudited)
Note 1 – Basis of presentationJPMorgan Chase & Co. (“JPMorgan Chase” or the “Firm”), afinancial holding company incorporated under Delaware law in1968, is a leading global financial services firm in the U.S., withoperations worldwide. The Firm is a leader in investment banking,financial services for consumers and small businesses,commercial banking, financial transaction processing and assetmanagement. Refer to Note 25 for a further discussion of theFirm’s business segments.
The accounting and financial reporting policies of JPMorganChase and its subsidiaries conform to U.S. GAAP. Additionally,where applicable, the policies conform to the accounting andreporting guidelines prescribed by regulatory authorities.
The unaudited Consolidated Financial Statements prepared inconformity with U.S. GAAP require management to makeestimates and assumptions that affect the reported amounts ofassets, liabilities, revenue and expense, and the disclosures ofcontingent assets and liabilities. Actual results could be differentfrom these estimates. In the opinion of management, all normal,recurring adjustments have been included such that this interimfinancial information is fairly stated.
These unaudited Consolidated Financial Statements should beread in conjunction with the audited Consolidated FinancialStatements, and related notes thereto, included in JPMorganChase’s 2020 Form 10-K.
Certain amounts reported in prior periods have been reclassifiedto conform with the current presentation, including certain deferredinvestment tax credits. In the first quarter of 2021 the Firmreclassified certain deferred investment tax credits from accountspayable and other liabilities to other assets to be a reduction to thecarrying value of certain tax-oriented investments. Thereclassification also resulted in an increase in income tax expenseand a corresponding increase in other income, with no effect onnet income. Prior-period amounts have been revised to conformwith the current presentation, including the Firm’s effective incometax rate. The reclassification did not change the Firm’s results ofoperations on a managed basis.
ConsolidationThe Consolidated Financial Statements include the accounts ofJPMorgan Chase and other entities in which the Firm has acontrolling financial interest. All material intercompany balancesand transactions have been eliminated.
Assets held for clients in an agency or fiduciary capacity by theFirm are not assets of JPMorgan Chase and are not included onthe Consolidated balance sheets.
The Firm determines whether it has a controlling financial interestin an entity by first evaluating whether the entity is a voting interestentity or a variable interest entity.
Refer to Notes 1 and 14 of JPMorgan Chase’s 2020 Form 10-Kfor a further description of JPMorgan Chase’s accounting policiesregarding consolidation.
Offsetting assets and liabilitiesU.S. GAAP permits entities to present derivative receivables andderivative payables with the same counterparty and the relatedcash collateral receivables and payables on a net basis on theConsolidated balance sheets when a legally enforceable masternetting agreement exists. U.S. GAAP also permits securitiesfinancing activities to be presented on a net basis when specifiedconditions are met, including the existence of a legally enforceablemaster netting agreement. The Firm has elected to net suchbalances when the specified conditions are met. Refer to Note 1 ofJPMorgan Chase’s 2020 Form 10-K for further information onoffsetting assets and liabilities.
84

Note 2 – Fair value measurementRefer to Note 2 of JPMorgan Chase’s 2020 Form 10-K for adiscussion of the Firm’s valuation methodologies for assets,liabilities and lending-related commitments measured at fair valueand the fair value hierarchy.
85

The following table presents the assets and liabilities reported at fair value as of March 31, 2021, and December 31, 2020, by major productcategory and fair value hierarchy.
Assets and liabilities measured at fair value on a recurring basisFair value hierarchy
Derivativenetting
adjustmentsMarch 31, 2021 (in millions) Level 1 Level 2 Level 3 Total fair value
Federal funds sold and securities purchased under resale agreements $ — $ 267,613 $ — $ — $ 267,613 Securities borrowed — 66,277 — — 66,277 Trading assets:
Debt instruments:Mortgage-backed securities:
U.S. GSEs and government agencies — 50,988 397 — 51,385 Residential – nonagency — 2,258 32 — 2,290 Commercial – nonagency — 1,183 2 — 1,185
Total mortgage-backed securities — 54,429 431 — 54,860 U.S. Treasury, GSEs and government agencies 74,980 10,095 — — 85,075 Obligations of U.S. states and municipalities — 7,009 8 — 7,017 Certificates of deposit, bankers’ acceptances and commercial paper — 1,584 — — 1,584 Non-U.S. government debt securities 40,535 51,757 177 — 92,469 Corporate debt securities — 28,118 370 — 28,488 Loans — 7,071 832 — 7,903 Asset-backed securities — 2,538 54 — 2,592
Total debt instruments 115,515 162,601 1,872 — 279,988 Equity securities 152,474 1,992 688 — 155,154 Physical commodities 10,769 6,314 — — 17,083 Other — 18,531 122 — 18,653
Total debt and equity instruments 278,758 189,438 2,682 — 470,878 Derivative receivables:
Interest rate 3,646 305,725 2,250 (283,073) 28,548 Credit — 13,575 637 (13,164) 1,048 Foreign exchange 144 185,794 689 (171,515) 15,112 Equity — 69,570 4,008 (53,825) 19,753 Commodity — 23,387 292 (15,021) 8,658
Total derivative receivables 3,790 598,051 7,876 (536,598) 73,119
Total trading assets 282,548 787,489 10,558 (536,598) 543,997
Available-for-sale securities:Mortgage-backed securities:
U.S. GSEs and government agencies 3 112,456 — — 112,459 Residential – nonagency — 10,601 — — 10,601 Commercial – nonagency — 3,029 — — 3,029
Total mortgage-backed securities 3 126,086 — — 126,089 U.S. Treasury and government agencies 194,784 — — — 194,784 Obligations of U.S. states and municipalities — 19,922 — — 19,922 Certificates of deposit — — — — — Non-U.S. government debt securities 12,270 8,603 — — 20,873 Corporate debt securities — 210 — — 210 Asset-backed securities:
Collateralized loan obligations — 11,329 — — 11,329 Other — 6,735 — — 6,735
Total available-for-sale securities 207,057 172,885 — — 379,942
Loans — 48,944 1,823 — 50,767 Mortgage servicing rights — — 4,470 — 4,470 Other assets 42,839 6,519 511 — 49,869
Total assets measured at fair value on a recurring basis $ 532,444 $ 1,349,727 $ 17,362 $ (536,598) $ 1,362,935
Deposits $ — $ 11,455 $ 2,652 $ — $ 14,107 Federal funds purchased and securities loaned or sold under repurchase agreements — 197,834 — — 197,834 Short-term borrowings — 16,338 3,664 — 20,002 Trading liabilities:
Debt and equity instruments 104,557 26,292 60 — 130,909 Derivative payables:
Interest rate 3,194 273,891 2,101 (268,442) 10,744 Credit — 13,961 641 (12,704) 1,898 Foreign exchange 154 184,124 1,228 (168,468) 17,038 Equity — 71,701 7,842 (57,143) 22,400 Commodity — 22,657 1,203 (15,500) 8,360
Total derivative payables 3,348 566,334 13,015 (522,257) 60,440
Total trading liabilities 107,905 592,626 13,075 (522,257) 191,349
Accounts payable and other liabilities 39,933 2,830 61 — 42,824 Beneficial interests issued by consolidated VIEs — 193 — — 193 Long-term debt — 53,118 22,575 — 75,693
Total liabilities measured at fair value on a recurring basis $ 147,838 $ 874,394 $ 42,027 $ (522,257) $ 542,002
(f)
(a)
(a)
(b)
(c)
(d)
(a)
(e)
(d)
(c)
86

Fair value hierarchyDerivative
nettingadjustmentsDecember 31, 2020 (in millions) Level 1 Level 2 Level 3 Total fair value
Federal funds sold and securities purchased under resale agreements $ — $ 238,015 $ — $ — $ 238,015 Securities borrowed — 52,983 — — 52,983 Trading assets:
Debt instruments:Mortgage-backed securities:
U.S. GSEs and government agencies — 68,395 449 — 68,844 Residential – nonagency — 2,138 28 — 2,166 Commercial – nonagency — 1,327 3 — 1,330
Total mortgage-backed securities — 71,860 480 — 72,340 U.S. Treasury, GSEs and government agencies 104,263 10,996 — — 115,259 Obligations of U.S. states and municipalities — 7,184 8 — 7,192 Certificates of deposit, bankers’ acceptances and commercial paper — 1,230 — — 1,230 Non-U.S. government debt securities 26,772 40,671 182 — 67,625 Corporate debt securities — 21,017 507 — 21,524 Loans — 6,101 893 — 6,994 Asset-backed securities — 2,304 28 — 2,332
Total debt instruments 131,035 161,363 2,098 — 294,496 Equity securities 97,035 2,652 476 — 100,163 Physical commodities 6,382 5,189 — — 11,571 Other — 17,165 49 — 17,214
Total debt and equity instruments 234,452 186,369 2,623 — 423,444 Derivative receivables:
Interest rate 2,318 386,865 2,307 (355,765) 35,725 Credit — 12,879 624 (12,823) 680
Foreign exchange 146 205,127 987 (190,479) 15,781
Equity — 71,279 3,519 (54,125) 20,673 Commodity — 21,272 231 (14,732) 6,771
Total derivative receivables 2,464 697,422 7,668 (627,924) 79,630
Total trading assets 236,916 883,791 10,291 (627,924) 503,074
Available-for-sale securities:Mortgage-backed securities:
U.S. GSEs and government agencies 7 113,294 — — 113,301 Residential – nonagency — 10,233 — — 10,233 Commercial – nonagency — 2,856 — — 2,856
Total mortgage-backed securities 7 126,383 — — 126,390 U.S. Treasury and government agencies 201,951 — — — 201,951 Obligations of U.S. states and municipalities — 20,396 — — 20,396 Certificates of deposit — — — — — Non-U.S. government debt securities 13,135 9,793 — — 22,928 Corporate debt securities — 216 — — 216 Asset-backed securities:
Collateralized loan obligations — 10,048 — — 10,048 Other — 6,249 — — 6,249
Total available-for-sale securities 215,093 173,085 — — 388,178
Loans — 42,169 2,305 — 44,474 Mortgage servicing rights — — 3,276 — 3,276 Other assets 8,110 4,561 538 — 13,209
Total assets measured at fair value on a recurring basis $ 460,119 $ 1,394,604 $ 16,410 $ (627,924) $ 1,243,209
Deposits $ — $ 11,571 $ 2,913 $ — $ 14,484 Federal funds purchased and securities loaned or sold under repurchase agreements — 155,735 — — 155,735 Short-term borrowings — 14,473 2,420 — 16,893 Trading liabilities:
Debt and equity instruments 82,669 16,838 51 — 99,558 Derivative payables:
Interest rate 2,496 349,082 2,049 (340,615) 13,012
Credit — 14,344 848 (13,197) 1,995
Foreign exchange 132 214,373 1,421 (194,493) 21,433
Equity — 74,032 7,381 (55,515) 25,898
Commodity — 21,767 962 (14,444) 8,285
Total derivative payables 2,628 673,598 12,661 (618,264) 70,623
Total trading liabilities 85,297 690,436 12,712 (618,264) 170,181
Accounts payable and other liabilities 2,895 513 68 — 3,476
Beneficial interests issued by consolidated VIEs — 41 — — 41
Long-term debt — 53,420 23,397 — 76,817
Total liabilities measured at fair value on a recurring basis $ 88,192 $ 926,189 $ 41,510 $ (618,264) $ 437,627
(a) At March 31, 2021, and December 31, 2020, included total U.S. GSE obligations of $96.3 billion and $117.6 billion, respectively, which were mortgage-related.(b) Physical commodities inventories are generally accounted for at the lower of cost or net realizable value. “Net realizable value” is a term defined in U.S. GAAP as not
exceeding fair value less costs to sell (“transaction costs”). Transaction costs for the Firm’s physical commodities inventories are either not applicable or immaterial to thevalue of the inventory. Therefore, net realizable value approximates fair value for the Firm’s physical commodities inventories. When fair value hedging has been applied (orwhen net realizable value is below cost), the carrying value of physical commodities approximates fair value, because under fair value hedge accounting, the cost basis isadjusted for changes in fair value. Refer to Note 4 for a further
(f)
(a)
(a)
(g)
(b)
(g)
(c)
(d)
(a)(g)
(e)
(d)
(c)
87

discussion of the Firm’s hedge accounting relationships. To provide consistent fair value disclosure information, all physical commodities inventories have been included ineach period presented.
(c) Balances reflect the reduction of securities owned (long positions) by the amount of identical securities sold but not yet purchased (short positions).(d) Certain investments that are measured at fair value using the net asset value per share (or its equivalent) as a practical expedient are not required to be classified in the fair
value hierarchy. At March 31, 2021, and December 31, 2020, the fair values of these investments, which include certain hedge funds, private equity funds, real estate andother funds, were $678 million and $670 million, respectively. Included in these balances at March 31, 2021, and December 31, 2020, were trading assets of $55 million and$52 million, respectively, and other assets of $623 million and $618 million, respectively.
(e) At March 31, 2021, and December 31, 2020, included within loans were $20.1 billion and $15.1 billion, respectively, of residential first-lien mortgages, and $6.0 billion and$6.3 billion, respectively, of commercial first-lien mortgages. Residential mortgage loans include conforming mortgage loans originated with the intent to sell to U.S. GSEsand government agencies of $11.9 billion and $8.4 billion, respectively.
(f) As permitted under U.S. GAAP, the Firm has elected to net derivative receivables and derivative payables and the related cash collateral received and paid when a legallyenforceable master netting agreement exists. The level 3 balances would be reduced if netting were applied, including the netting benefit associated with cash collateral.
(g) The prior-period amounts have been revised to conform with the current period presentation.
Level 3 valuationsRefer to Note 2 of JPMorgan Chase’s 2020 Form 10-K for furtherinformation on the Firm’s valuation process and a detaileddiscussion of the determination of fair value for individual financialinstruments.The following table presents the Firm’s primary level 3 financialinstruments, the valuation techniques used to measure the fairvalue of those financial instruments, the significant unobservableinputs, the range of values for those inputs and the weighted orarithmetic averages of such inputs. While the determination toclassify an instrument within level 3 is based on the significance ofthe unobservable inputs to the overall fair value measurement,level 3 financial instruments typically include observablecomponents (that is, components that are actively quoted and canbe validated to external sources) in addition to the unobservablecomponents. The level 1 and/or level 2 inputs are not included inthe table. In addition, the Firm manages the risk of the observablecomponents of level 3 financial instruments using securities andderivative positions that are classified within levels 1 or 2 of the fairvalue hierarchy.
The range of values presented in the table is representative of thehighest and lowest level input used to value the significant groupsof instruments within a product/instrument classification. Whereprovided, the weighted averages of the input values presented inthe table are calculated based on the fair value of the instrumentsthat the input is being used to value.In the Firm’s view, the input range, weighted and arithmeticaverage values do not reflect the degree of input uncertainty or anassessment of the reasonableness of the Firm’s estimates andassumptions. Rather, they reflect the characteristics of the variousinstruments held by the Firm and the relative distribution ofinstruments within the range of characteristics. For example, twooption contracts may have similar levels of market risk exposureand valuation uncertainty, but may have significantly differentimplied volatility levels because the option contracts have differentunderlyings, tenors, or strike prices. The input range and weightedaverage values will therefore vary from period-to-period andparameter-to-parameter based on the characteristics of theinstruments held by the Firm at each balance sheet date.
88

Level 3 inputsMarch 31, 2021
Product/InstrumentFair value(in millions)
Principal valuationtechnique Unobservable inputs Range of input values Average
Residential mortgage-backed securities andloans
$ 991 Discounted cash flows Yield 0% – 15% 6%
Prepayment speed 0% – 48% 9%Conditional default rate 0% – 30% 10%Loss severity 0% – 109% 8%
Commercial mortgage-backed securities andloans 516 Market comparables Price $0 – $100 $86
Corporate debt securities 370 Market comparables Price $10 – $120 $96Loans 1,579 Market comparables Price $5 – $111 $82Asset-backed securities 54 Market comparables Price $2 – $96 $61Net interest rate derivatives 130 Option pricing Interest rate volatility 7 bps – 723 bps 132 bps
Interest rate spread volatility 11 bps – 23 bps 15 bpsInterest rate correlation (65)% – 99% 36%IR-FX correlation (35)% – 50% (1)%
19 Discounted cash flows Prepayment speed 0% – 30% 8%Net credit derivatives (41) Discounted cash flows Credit correlation 37% – 65% 49%
Credit spread 1 bps – 1,501 bps 396 bpsRecovery rate 0% – 70% 47%Conditional default rate 2% – 100% 37%Loss severity 100% 100%
37 Market comparables Price $0 – $115 $69Net foreign exchange derivatives (424) Option pricing IR-FX correlation (40)% – 65% 17%
(115) Discounted cash flows Prepayment speed 9% 9%Net equity derivatives (3,834) Option pricing Forward equity price 61% – 130% 99%
Equity volatility 4% – 146% 33%Equity correlation 12% – 99% 55%Equity-FX correlation (79)% – 60% (26)%Equity-IR correlation 15% – 50% 28%
Net commodity derivatives (911) Option pricing OIl Commodity Forward $478 / MT – $553 / MT $516 / MTForward power price $13 / MWH – $55 / MWH $34 / MWHCommodity volatility 2% – 70% 36%Commodity correlation (50)% – 95% 23%
MSRs 4,470 Discounted cash flows Refer to Note 14Long-term debt, short-term borrowings, and
deposits27,985 Option pricing Interest rate volatility 7 bps – 723 bps 132 bps
Interest rate correlation (65)% – 99% 36%
IR-FX correlation (35)% – 50% (1)%
Equity correlation 12% – 99% 55%
Equity-FX correlation (79)% – 60% (26)%
Equity-IR correlation 15% – 50% 28%906 Discounted cash flows Credit correlation 37% – 65% 49%
Other level 3 assets and liabilities, net 1,385
(a) The categories presented in the table have been aggregated based upon the product type, which may differ from their classification on the Consolidated balance sheets.Furthermore, the inputs presented for each valuation technique in the table are, in some cases, not applicable to every instrument valued using the technique as thecharacteristics of the instruments can differ.
(b) Comprises U.S. GSE and government agency securities of $397 million, nonagency securities of $32 million and non-trading loans of $562 million.(c) Comprises nonagency securities of $2 million, trading loans of $41 million and non-trading loans of $473 million.(d) Comprises trading loans of $791 million and non-trading loans of $788 million.(e) Long-term debt, short-term borrowings and deposits include structured notes issued by the Firm that are financial instruments that typically contain embedded derivatives.
The estimation of the fair value of structured notes includes the derivative features embedded within the instrument. The significant unobservable inputs are broadlyconsistent with those presented for derivative receivables.
(f) Includes equity securities of $968 million, including $280 million in Other Assets, for which quoted prices are not readily available and the fair value is generally based oninternal valuation techniques such as EBITDA multiples and comparable analysis. All other level 3 assets and liabilities are insignificant both individually and in aggregate.
(g) Price is a significant unobservable input for certain instruments. When quoted market prices are not readily available, reliance is generally placed on price-based internalvaluation techniques. The price input is expressed assuming a par value of $100.
(h) Forward equity price is expressed as a percentage of the current equity price.(i) Amounts represent weighted averages except for derivative related inputs where arithmetic averages are used.
(a)
(g) (i)
(b)
(c)
(d)
(h)
(e)
(f)
89

Changes in and ranges of unobservable inputsRefer to Note 2 of JPMorgan Chase’s 2020 Form 10-K for adiscussion of the impact on fair value of changes in unobservableinputs and the relationships between unobservable inputs as wellas a description of attributes of the underlying instruments andexternal market factors that affect the range of inputs used in thevaluation of the Firm’s positions.
Changes in level 3 recurring fair value measurementsThe following tables include a rollforward of the Consolidatedbalance sheets amounts (including changes in fair value) forfinancial instruments classified by the Firm within level 3 of the fairvalue hierarchy for the three months ended March 31, 2021 and2020. When a determination is made to classify a financialinstrument within level 3, the determination is based on thesignificance of the unobservable inputs to the overall fair
value measurement. However, level 3 financial instrumentstypically include, in addition to the unobservable or level 3components, observable components (that is, components thatare actively quoted and can be validated to external sources);accordingly, the gains and losses in the table below includechanges in fair value due in part to observable factors that are partof the valuation methodology. Also, the Firm risk-manages theobservable components of level 3 financial instruments usingsecurities and derivative positions that are classified within level 1or 2 of the fair value hierarchy; as these level 1 and level 2 riskmanagement instruments are not included below, the gains orlosses in the following tables do not reflect the effect of the Firm’srisk management activities related to such level 3 instruments.
90
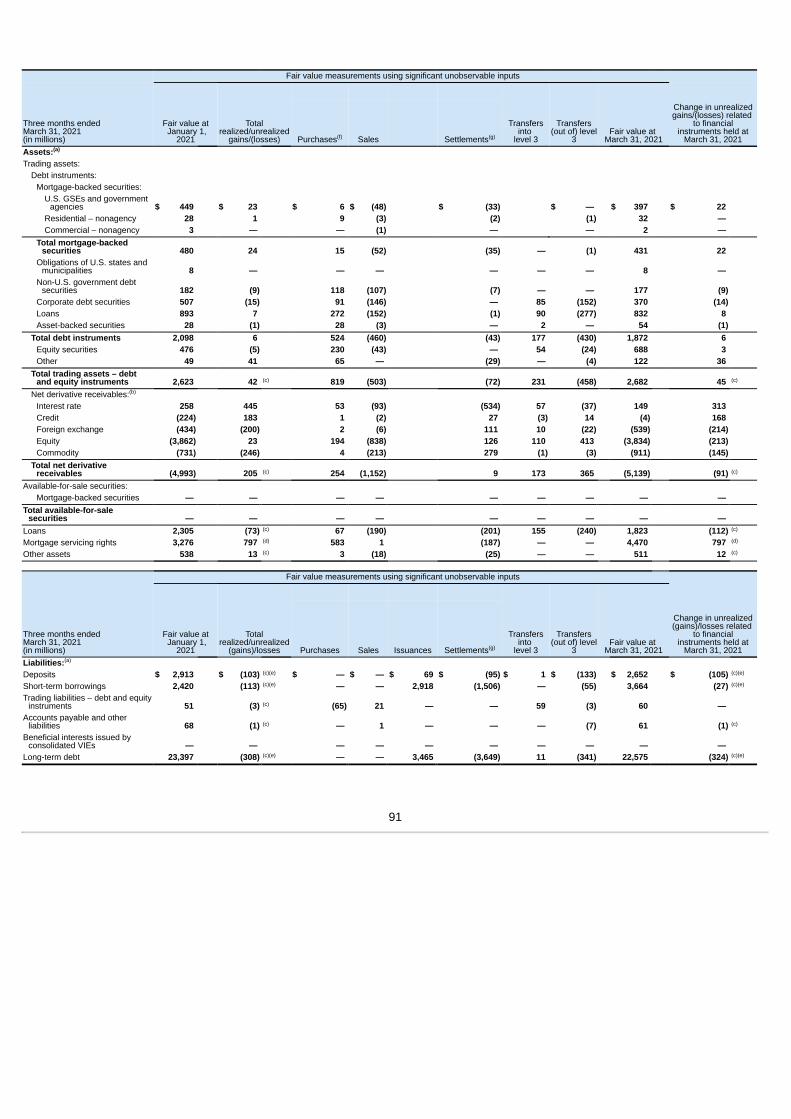
Fair value measurements using significant unobservable inputs
Three months ended March 31, 2021(in millions)
Fair value at January 1,
2021
Totalrealized/unrealized
gains/(losses)
Transfersinto
level 3
Transfers(out of) level
3Fair value at
March 31, 2021
Change in unrealizedgains/(losses) related
to financialinstruments held at
March 31, 2021Purchases Sales SettlementsAssets:Trading assets:
Debt instruments:Mortgage-backed securities:
U.S. GSEs and governmentagencies $ 449 $ 23 $ 6 $ (48) $ (33) $ — $ 397 $ 22
Residential – nonagency 28 1 9 (3) (2) (1) 32 — Commercial – nonagency 3 — — (1) — — 2 —
Total mortgage-backedsecurities 480 24 15 (52) (35) — (1) 431 22
Obligations of U.S. states andmunicipalities 8 — — — — — — 8 —
Non-U.S. government debtsecurities 182 (9) 118 (107) (7) — — 177 (9)
Corporate debt securities 507 (15) 91 (146) — 85 (152) 370 (14)Loans 893 7 272 (152) (1) 90 (277) 832 8 Asset-backed securities 28 (1) 28 (3) — 2 — 54 (1)
Total debt instruments 2,098 6 524 (460) (43) 177 (430) 1,872 6 Equity securities 476 (5) 230 (43) — 54 (24) 688 3 Other 49 41 65 — (29) — (4) 122 36
Total trading assets – debtand equity instruments 2,623 42 819 (503) (72) 231 (458) 2,682 45
Net derivative receivables:Interest rate 258 445 53 (93) (534) 57 (37) 149 313 Credit (224) 183 1 (2) 27 (3) 14 (4) 168 Foreign exchange (434) (200) 2 (6) 111 10 (22) (539) (214)Equity (3,862) 23 194 (838) 126 110 413 (3,834) (213)Commodity (731) (246) 4 (213) 279 (1) (3) (911) (145)
Total net derivativereceivables (4,993) 205 254 (1,152) 9 173 365 (5,139) (91)
Available-for-sale securities:Mortgage-backed securities — — — — — — — — —
Total available-for-salesecurities — — — — — — — — —
Loans 2,305 (73) 67 (190) (201) 155 (240) 1,823 (112)Mortgage servicing rights 3,276 797 583 1 (187) — — 4,470 797 Other assets 538 13 3 (18) (25) — — 511 12
Fair value measurements using significant unobservable inputs
Three months ended March 31, 2021(in millions)
Fair value at January 1,
2021
Totalrealized/unrealized
(gains)/losses
Transfersinto
level 3
Transfers(out of) level
3Fair value at
March 31, 2021
Change in unrealized(gains)/losses related
to financialinstruments held at
March 31, 2021Purchases Sales Issuances SettlementsLiabilities:Deposits $ 2,913 $ (103) $ — $ — $ 69 $ (95) $ 1 $ (133) $ 2,652 $ (105)Short-term borrowings 2,420 (113) — — 2,918 (1,506) — (55) 3,664 (27)Trading liabilities – debt and equity
instruments 51 (3) (65) 21 — — 59 (3) 60 — Accounts payable and other
liabilities 68 (1) — 1 — — — (7) 61 (1)Beneficial interests issued by
consolidated VIEs — — — — — — — — — — Long-term debt 23,397 (308) — — 3,465 (3,649) 11 (341) 22,575 (324)
(f) (g)
(a)
(c) (c)
(b)
(c) (c)
(c) (c)
(d) (d)
(c) (c)
(g)
(a)
(c)(e) (c)(e)
(c)(e) (c)(e)
(c)
(c) (c)
(c)(e) (c)(e)
91

Fair value measurements using significant unobservable inputs
Three months ended March 31, 2020(in millions)
Fair value atJanuary 1,
2020
Totalrealized/unrealized
gains/(losses)
Transfersinto
level 3
Transfers(out of)level 3
Fair value at March 31, 2020
Change inunrealized
gains/(losses)related
to financialinstruments held at
March 31, 2020Purchases Sales SettlementsAssets:Trading assets:
Debt instruments:Mortgage-backed securities:
U.S. GSEs and governmentagencies $ 797 $ (139) $ 19 $ (116) $ (42) $ — $ — $ 519 $ (131)
Residential – nonagency 23 (1) 2 — — — — 24 (1)Commercial – nonagency 4 — 1 — (1) 1 (2) 3 —
Total mortgage-backedsecurities 824 (140) 22 (116) (43) 1 (2) 546 (132)
Obligations of U.S. states andmunicipalities 10 — — (1) — — — 9 —
Non-U.S. government debtsecurities 155 (12) 90 (57) — — (1) 175 (10)
Corporate debt securities 558 (55) 292 (42) — 227 (27) 953 (50)Loans 673 (98) 497 (130) (16) 568 (108) 1,386 (127)Asset-backed securities 37 (2) 36 (15) (1) — (3) 52 (1)
Total debt instruments 2,257 (307) 937 (361) (60) 796 (141) 3,121 (320)Equity securities 196 (38) 10 (4) — 82 (33) 213 (39)Other 232 (1) 9 (5) (12) — (2) 221 2
Total trading assets – debtand equity instruments 2,685 (346) 956 (370) (72) 878 (176) 3,555 (357)
Net derivative receivables:
Interest rate (332) 642 66 (50) (241) (172) (49) (136) 282 Credit (139) 108 18 (128) (33) 60 3 (111) 65 Foreign exchange (607) (339) 38 (4) (14) — (1) (927) (508)
Equity (3,395) 3,037 59 (548) 583 (656) 94 (826) 3,707 Commodity (16) (403) 4 (15) 9 (6) 2 (425) (399)
Total net derivativereceivables (4,489) 3,045 185 (745) 304 (774) 49 (2,425) 3,147
Available-for-sale securities:
Mortgage-backed securities 1 — — — (1) — — — — Total available-for-sale
securities 1 — — — (1) — — — — Loans 516 (64) 191 (32) (9) 1,514 (31) 2,085 (63)Mortgage servicing rights 4,699 (1,382) 273 (75) (248) — — 3,267 (1,382)Other assets 917 (92) 13 (28) (228) — — 582 (91)
Fair value measurements using significant unobservable inputs
Three months ended March 31, 2020(in millions)
Fair value atJanuary 1,
2020
Totalrealized/unrealized
(gains)/losses
Transfersinto
level 3
Transfers(out of)level 3
Fair value at March 31, 2020
Change inunrealized
(gains)/lossesrelated
to financialinstruments held at
March 31, 2020Purchases Sales Issuances SettlementsLiabilities:Deposits $ 3,360 $ (149) $ — $ — $ 386 $ (172) $ 4 $ (250) $ 3,179 $ (135)Short-term borrowings 1,674 (345) — — 1,615 (929) 40 (16) 2,039 (409)Trading liabilities – debt and
equity instruments 41 3 (75) 7 — — 86 (1) 61 6 Accounts payable and other
liabilities 45 (8) (23) 1 — — — — 15 (7)Beneficial interests issued by
consolidated VIEs — — — — — — — — — —
Long-term debt 23,339 (4,110) — — 4,607 (3,549) 370 (516) 20,141 (3,984)
(a) Level 3 assets at fair value as a percentage of total Firm assets at fair value (including assets measured at fair value on a nonrecurring basis) were 1% at both March 31,2021 and December 31, 2020, respectively. Level 3 liabilities at fair value as a percentage of total Firm liabilities at fair value (including liabilities measured at fair value on anonrecurring basis) were 8% and 9%, at March 31, 2021 and December 31, 2020, respectively.
(b) All level 3 derivatives are presented on a net basis, irrespective of the underlying counterparty.
(f) (g)
(a)
(c) (c)
(b)
(c) (c)
(c) (c)
(d) (d)
(c) (c)
(g)
(a)
(c)(e) (c)(e)
(c)(e) (c)(e)
(c) (c)
(c) (c)
(c)(e) (c)(e)
92

(c) Predominantly reported in principal transactions revenue, except for changes in fair value for CCB mortgage loans and lending-related commitments originated with theintent to sell, and mortgage loan purchase commitments, which are reported in mortgage fees and related income.
(d) Changes in fair value for MSRs are reported in mortgage fees and related income.(e) Realized (gains)/losses due to DVA for fair value option elected liabilities are reported in principal transactions revenue, and were not material for the three months ended
March 31, 2021 and 2020. Unrealized (gains)/losses are reported in OCI, and were $(22) million and $(1.1) billion for the three months ended March 31, 2021 and 2020,respectively.
(f) Loan originations are included in purchases.(g) Includes financial assets and liabilities that have matured, been partially or fully repaid, impacts of modifications, deconsolidations associated with beneficial interests in VIEs
and other items.
Level 3 analysisConsolidated balance sheets changesLevel 3 assets at fair value, including assets measured at fairvalue on a nonrecurring basis, were 0.5% of total Firm assets atMarch 31, 2021. The following describes significant changes tolevel 3 assets since December 31, 2020, for those items measuredat fair value on a recurring basis. Refer to Assets and liabilitiesmeasured at fair value on a nonrecurring basis on page 94 forfurther information on changes impacting items measured at fairvalue on a nonrecurring basis.
Three months ended March 31, 2021Level 3 assets were $17.4 billion at March 31, 2021, reflecting anincrease of $952 million from December 31, 2020.
The increase for the three months ended March 31, 2021 waspredominantly driven by a $1.2 billion increase in MSRs. Refer toNote 14 for information on MSRs.
Refer to the sections below for additional information.
Transfers between levels for instruments carried at fair valueon a recurring basisFor the three months ended March 31, 2021, there were nosignificant transfers from level 2 into level 3 or from level 3 intolevel 2.
For the three months ended March 31, 2020, significant transfersfrom level 2 into level 3 included the following:
• $2.1 billion of total debt and equity instruments, predominantlytrading loans, driven by a decrease in observability.
• $1.0 billion of gross equity derivative receivables and $1.7 billionof gross equity derivative payables as a result of a decrease inobservability and an increase in the significance of unobservableinputs.
For the three months ended March 31, 2020, there were nosignificant transfers from level 3 into level 2.
All transfers are based on changes in the observability and/orsignificance of the valuation inputs and are assumed to occur atthe beginning of the quarterly reporting period in which they occur.
Gains and lossesThe following describes significant components of totalrealized/unrealized gains/(losses) for instruments measured at fairvalue on a recurring basis for the periods indicated. Theseamounts exclude any effects of the Firm’s risk managementactivities where the financial instruments are classified as level 1and 2 of the fair value hierarchy. Refer to Changes in level 3recurring fair value measurements rollforward tables on pages 90–93 for further information on these instruments.
Three months ended March 31, 2021• $984 million of net gains on assets, driven by MSRs reflecting
lower prepayment speeds on higher rates. Refer to Note 14 forinformation on MSRs.
• $528 million of net gains on liabilities, largely driven by marketmovements in long-term debt.
Three months ended March 31, 2020• $1.2 billion of net gains on assets, driven by gains in net equity
derivative receivables due to market movements largely offset bylosses in MSRs reflecting faster prepayment speeds on lower rates.Refer to Note 14 for information on MSRs.
• $4.6 billion of net gains on liabilities, predominantly driven bymarket movements in long-term debt.
Credit and funding adjustments — derivativesThe following table provides the impact of credit and fundingadjustments on principal transactions revenue in the respectiveperiods, excluding the effect of any associated hedging activities.The FVA presented below includes the impact of the Firm’s owncredit quality on the inception value of liabilities as well as theimpact of changes in the Firm’s own credit quality over time.
Three months ended March31,
(in millions) 2021 2020Credit and funding adjustments:
Derivatives CVA $ 240 $ (924)Derivatives FVA 105 (1,021)
Refer to Note 2 of JPMorgan Chase’s 2020 Form 10-K for furtherinformation about both credit and funding adjustments, as well asinformation about valuation adjustments on fair value optionelected liabilities.
93

Assets and liabilities measured at fair value on a nonrecurring basisThe following tables present the assets and liabilities held as of March 31, 2021 and 2020, for which nonrecurring fair value adjustments wererecorded during the three months ended March 31, 2021 and 2020, by major product category and fair value hierarchy.
Fair value hierarchy
Total fair valueMarch 31, 2021 (in millions) Level 1 Level 2 Level 3
Loans $ — $ 1,857 $ 303 $ 2,160 Other assets — 12 370 382 Total assets measured at fair value on a nonrecurring basis $ — $ 1,869 $ 673 $ 2,542 Accounts payable and other liabilities — — 14 14 Total liabilities measured at fair value on a nonrecurring basis $ — $ — $ 14 $ 14
Fair value hierarchyTotal fair valueMarch 31, 2020 (in millions) Level 1 Level 2 Level 3
Loans $ — $ 2,336 $ 559 $ 2,895
Other assets — 11 334 345 Total assets measured at fair value on a nonrecurring basis $ — $ 2,347 $ 893 $ 3,240
Accounts payable and other liabilities — — 775 775 Total liabilities measured at fair value on a nonrecurring basis $ — $ — $ 775 $ 775
(a) Primarily includes equity securities without readily determinable fair values that were adjusted based on observable price changes in orderly transactions from an identical orsimilar investment of the same issuer (measurement alternative). Of the $370 million in level 3 assets measured at fair value on a nonrecurring basis as of March 31, 2021,$316 million related to equity securities adjusted based on the measurement alternative. These equity securities are classified as level 3 due to the infrequency of theobservable prices and/or the restrictions on the shares.
(b) Of the $303 million in level 3 assets measured at fair value on a nonrecurring basis as of March 31, 2021, $137 million related to residential real estate loans carried at thenet realizable value of the underlying collateral (e.g., collateral-dependent loans). These amounts are classified as level 3 as they are valued using information from broker’sprice opinions, appraisals and automated valuation models and discounted based upon the Firm’s experience with actual liquidation values. These discounts ranged from13% to 45% with a weighted average of 26%.
Nonrecurring fair value changesThe following table presents the total change in value of assetsand liabilities for which fair value adjustments have beenrecognized for the three months ended March 31, 2021 and 2020,related to assets and liabilities held at those dates.
Three months ended March 31,
(in millions) 2021 2020
Loans $ (33) $ (267)
Other assets 2 (169)
Accounts payable and other liabilities (3) (775)Total nonrecurring fair value
gains/(losses) $ (34) $ (1,211)
(a) Included $6 million and $(154) million for the three months ended March 31,2021 and 2020, respectively, of net gains/(losses) as a result of themeasurement alternative.
Refer to Note 11 for further information about the measurement ofcollateral-dependent loans.
(b)
(a)
(a)
94

Equity securities without readily determinable fair valuesThe Firm measures certain equity securities without readily determinable fair values at cost less impairment (if any), plus or minusobservable price changes from an identical or similar investment of the same issuer, with such changes recognized in other income.
In its determination of the new carrying values upon observable price changes, the Firm may adjust the prices if deemed necessary to arriveat the Firm’s estimated fair values. Such adjustments may include adjustments to reflect the different rights and obligations of similarsecurities, and other adjustments that are consistent with the Firm’s valuation techniques for private equity direct investments.
The following table presents the carrying value of equity securities without readily determinable fair values held as of March 31, 2021 and2020, that are measured under the measurement alternative and the related adjustments recorded during the periods presented for thosesecurities with observable price changes. These securities are included in the nonrecurring fair value tables when applicable price changesare observable.
Three months ended March 31As of or for the period ended,(in millions) 2021 2020Other assetsCarrying value $ 2,302 $ 2,560
Upward carrying value changes 7 9 Downward carrying value changes/impairment (1) (162)
(a) The carrying value as of December 31, 2020 was $2.4 billion. The period-end carrying values reflect cumulative purchases and sales in addition to upward and downwardcarrying value changes.
(b) The cumulative upward carrying value changes between January 1, 2018 and March 31, 2021 were $618 million.(c) The cumulative downward carrying value changes/impairment between January 1, 2018 and March 31, 2021 were $(340) million.
Included in other assets above is the Firm’s interest in approximately 40 million Visa Class B common shares, recorded at a nominal carryingvalue. These shares are subject to certain transfer restrictions currently and will be convertible into Visa Class A common shares upon finalresolution of certain litigation matters involving Visa. The conversion rate of Visa Class B common shares into Visa Class A common sharesis 1.6228 at March 31, 2021, and may be adjusted by Visa depending on developments related to the litigation matters.
(a)
(b)
(c)
95

Additional disclosures about the fair value of financial instruments that are not carried on the Consolidated balance sheets at fairvalueThe following table presents, by fair value hierarchy classification, the carrying values and estimated fair values at March 31, 2021, andDecember 31, 2020, of financial assets and liabilities, excluding financial instruments that are carried at fair value on a recurring basis, andtheir classification within the fair value hierarchy.
March 31, 2021 December 31, 2020Estimated fair value hierarchy Estimated fair value hierarchy
(in billions)Carrying
value Level 1 Level 2 Level 3
Totalestimated fair value
Carrying value Level 1 Level 2 Level 3
Totalestimated fair value
Financial assetsCash and due from banks $ 25.4 $ 25.4 $ — $ — $ 25.4 $ 24.9 $ 24.9 $ — $ — $ 24.9 Deposits with banks 685.7 685.7 — — 685.7 502.7 502.7 — — 502.7 Accrued interest and accounts
receivable 113.6 — 113.5 0.1 113.6 89.4 — 89.3 0.1 89.4 Federal funds sold and securities
purchased under resaleagreements 4.9 — 4.9 — 4.9 58.3 — 58.3 — 58.3
Securities borrowed 113.4 — 113.2 — 113.2 107.7 — 107.7 — 107.7 Investment securities, held-to-
maturity 217.5 74.5 143.2 — 217.7 201.8 53.2 152.3 — 205.5 Loans, net of allowance for loan
losses 937.5 — 206.7 752.7 959.4 940.1 — 210.9 755.6 966.5 Other 95.0 — 93.2 1.9 95.1 81.8 — 80.0 1.9 81.9 Financial liabilitiesDeposits $ 2,264.0 $ — $ 2,264.0 $ — $ 2,264.0 $ 2,129.8 $ — $ 2,128.9 $ — $ 2,128.9 Federal funds purchased and
securities loaned or sold underrepurchase agreements 106.2 — 106.2 — 106.2 59.5 — 59.5 — 59.5
Short-term borrowings 35.0 — 35.0 — 35.0 28.3 — 28.3 — 28.3 Accounts payable and other
liabilities 205.9 — 201.6 3.9 205.5 186.6 — 181.9 4.3 186.2 Beneficial interests issued by
consolidated VIEs 15.5 — 15.5 — 15.5 17.5 — 17.6 — 17.6 Long-term debt 203.7 — 207.8 3.3 211.1 204.8 — 209.2 3.2 212.4
(a) Fair value is typically estimated using a discounted cash flow model that incorporates the characteristics of the underlying loans (including principal, contractual interest rateand contractual fees) and other key inputs, including expected lifetime credit losses, interest rates, prepayment rates, and primary origination or secondary market spreads.For certain loans, the fair value is measured based on the value of the underlying collateral. Carrying value of the loan takes into account the loan’s allowance for loanlosses, which represents the loan’s expected credit losses over its remaining expected life. The difference between the estimated fair value and carrying value of a loan isgenerally attributable to changes in market interest rates, including credit spreads, market liquidity premiums and other factors that affect the fair value of a loan but do notaffect its carrying value.
The majority of the Firm’s lending-related commitments are not carried at fair value on a recurring basis on the Consolidated balance sheets.The carrying value and the estimated fair value of these wholesale lending-related commitments were as follows for the periods indicated.
March 31, 2021 December 31, 2020Estimated fair value hierarchy Estimated fair value hierarchy
(in billions)Carryingvalue Level 1 Level 2 Level 3
Totalestimated fair
valueCarryingvalue Level 1 Level 2 Level 3
Totalestimated fair
valueWholesale lending-related
commitments $ 2.4 $ — $ — $ 2.8 $ 2.8 $ 2.2 $ — $ — $ 2.1 $ 2.1
(a) Excludes the current carrying values of the guarantee liability and the offsetting asset, each of which is recognized at fair value at the inception of the guarantees.(b) Includes the wholesale allowance for lending-related commitments.
The Firm does not estimate the fair value of consumer off-balance sheet lending-related commitments. In many cases, the Firm can reduceor cancel these commitments by providing the borrower notice or, in some cases as permitted by law, without notice. Refer to page 173 ofJPMorgan Chase’s 2020 Form 10-K for a further discussion of the valuation of lending-related commitments.
(a)
(a) (b) (a) (b)
96

Note 3 – Fair value optionThe fair value option provides an option to elect fair value as an alternative measurement for selected financial assets, financial liabilities,unrecognized firm commitments, and written loan commitments.The Firm has elected to measure certain instruments at fair value for several reasons including to mitigate income statement volatility causedby the differences between the measurement basis of elected instruments (e.g., certain instruments that otherwise would be accounted foron an accrual basis) and the associated risk management arrangements that are accounted for on a fair value basis, as well as to betterreflect those instruments that are managed on a fair value basis.The Firm’s election of fair value includes the following instruments:• Loans purchased or originated as part of securitization warehousing activity, subject to bifurcation accounting, or managed on a fair value
basis, including lending-related commitments• Certain securities financing agreements• Owned beneficial interests in securitized financial assets that contain embedded credit derivatives, which would otherwise be required to
be separately accounted for as a derivative instrument• Structured notes, which are predominantly financial instruments that contain embedded derivatives that are issued as part of client-driven
activities• Certain long-term beneficial interests issued by CIB’s consolidated securitization trusts where the underlying assets are carried at fair
value
Changes in fair value under the fair value option electionThe following table presents the changes in fair value included in the Consolidated statements of income for the three months endedMarch 31, 2021 and 2020, for items for which the fair value option was elected. The profit and loss information presented below only includesthe financial instruments that were elected to be measured at fair value; related risk management instruments, which are required to bemeasured at fair value, are not included in the table.
Three months ended March 31,2021 2020
(in millions)Principal
transactionsAll otherincome
Total changes in fairvalue recorded
Principaltransactions
All otherincome
Total changes in fairvalue recorded
Federal funds sold and securities purchased underresale agreements $ (12) $ — $ (12) $ 543 $ — $ 543
Securities borrowed (70) — (70) 226 — 226 Trading assets:
Debt and equity instruments, excluding loans 621 — 621 (2,438) (1) (2,439)Loans reported as trading assets:
Changes in instrument-specific credit risk 204 — 204 (656) — (656)Other changes in fair value (1) — (1) 1 — 1
Loans:Changes in instrument-specific credit risk 237 1 238 64 (23) 41 Other changes in fair value (250) 340 90 268 741 1,009
Other assets 19 (19) — 85 (17) 68 Deposits 167 — 167 (103) — (103)Federal funds purchased and securities loaned or sold
under repurchase agreements 34 — 34 (259) — (259)Short-term borrowings (122) — (122) 1,720 — 1,720 Trading liabilities — — — — — — Other liabilities 1 — 1 (35) — (35)Long-term debt 1,247 (5) 1,242 4,181 5 4,186
(a) Unrealized gains/(losses) due to instrument-specific credit risk (DVA) for liabilities for which the fair value option has been elected are recorded in OCI, while realizedgains/(losses) are recorded in principal transactions revenue. Realized gains/(losses) due to instrument-specific credit risk recorded in principal transactions revenue were$(2) million for both the three months ended March 31, 2021 and 2020, respectively.
(b) Long-term debt measured at fair value predominantly relates to structured notes. Although the risk associated with the structured notes is actively managed, thegains/(losses) reported in this table do not include the income statement impact of the risk management instruments used to manage such risk.
(c) Reported in mortgage fees and related income.(d) Reported in other income.(e) Changes in fair value exclude contractual interest, which is included in interest income and interest expense for all instruments other than certain hybrid financial instruments
recorded in CIB. Refer to Note 6 for further information regarding interest income and interest expense.
(e) (e)
(c)
(c) (c)
(a) (c) (c)
(d) (d)
(a)
(a)
(a)(b) (c)(d) (c)
97

Difference between aggregate fair value and aggregate remaining contractual principal balance outstandingThe following table reflects the difference between the aggregate fair value and the aggregate remaining contractual principal balanceoutstanding as of March 31, 2021, and December 31, 2020, for loans, long-term debt and long-term beneficial interests for which the fairvalue option has been elected.
March 31, 2021 December 31, 2020
(in millions)
Contractualprincipal
outstanding Fair value
Fair valueover/(under)contractual
principaloutstanding
Contractualprincipal
outstanding Fair value
Fair valueover/(under)contractual
principaloutstanding
LoansNonaccrual loans
Loans reported as trading assets $ 3,102 $ 426 $ (2,676) $ 3,386 $ 555 $ (2,831)Loans 1,388 1,144 (244) 1,867 1,507 (360)
Subtotal 4,490 1,570 (2,920) 5,253 2,062 (3,191)90 or more days past due and government guaranteed
Loans 355 340 (15) 328 317 (11)All other performing loans
Loans reported as trading assets 8,758 7,477 (1,281) 7,917 6,439 (1,478)Loans 49,143 49,283 140 42,022 42,650 628
Subtotal 57,901 56,760 (1,141) 49,939 49,089 (850)Total loans $ 62,746 $ 58,670 $ (4,076) $ 55,520 $ 51,468 $ (4,052)Long-term debtPrincipal-protected debt $ 39,625 $ 36,943 $ (2,682) $ 40,560 $ 40,526 $ (34)Nonprincipal-protected debt NA 38,750 NA NA 36,291 NATotal long-term debt NA $ 75,693 NA NA $ 76,817 NALong-term beneficial interestsNonprincipal-protected debt NA $ 193 NA NA $ 41 NATotal long-term beneficial interests NA $ 193 NA NA $ 41 NA
(a) These balances are excluded from nonaccrual loans as the loans are insured and/or guaranteed by U.S. government agencies.(b) There were no performing loans that were ninety days or more past due as of March 31, 2021, and December 31, 2020, respectively.(c) Remaining contractual principal is not applicable to nonprincipal-protected structured notes and long-term beneficial interests. Unlike principal-protected structured notes
and long-term beneficial interests, for which the Firm is obligated to return a stated amount of principal at maturity, nonprincipal-protected structured notes and long-termbeneficial interests do not obligate the Firm to return a stated amount of principal at maturity, but for structured notes to return an amount based on the performance of anunderlying variable or derivative feature embedded in the note. However, investors are exposed to the credit risk of the Firm as issuer for both nonprincipal-protected andprincipal-protected notes.
(d) Where the Firm issues principal-protected zero-coupon or discount notes, the balance reflects the contractual principal payment at maturity or, if applicable, the contractualprincipal payment at the Firm’s next call date.
At March 31, 2021, and December 31, 2020, the contractual amount of lending-related commitments for which the fair value option waselected was $20.9 billion and $18.1 billion, respectively, with a corresponding fair value of $75 million and $(39) million, respectively. Refer toNote 28 of JPMorgan Chase’s 2020 Form 10-K, and Note 22 of this Form 10-Q for further information regarding off-balance sheet lending-related financial instruments.
(a)
(b)
(d) (d)
(c)
(c)
98

Structured note products by balance sheet classification and risk componentThe following table presents the fair value of structured notes, by balance sheet classification and the primary risk type.
March 31, 2021 December 31, 2020
(in millions)Long-term
debtShort-termborrowings Deposits Total
Long-termdebt
Short-termborrowings Deposits Total
Risk exposureInterest rate $ 35,665 $ 115 $ 5,197 $ 40,977 $ 38,129 $ 65 $ 5,057 $ 43,251 Credit 6,492 1,630 — 8,122 6,409 1,022 — 7,431 Foreign exchange 3,357 526 231 4,114 3,613 92 — 3,705 Equity 28,719 7,414 6,382 42,515 26,943 5,021 6,893 38,857 Commodity 200 12 20 232 250 13 232 495
Total structured notes $ 74,433 $ 9,697 $ 11,830 $ 95,960 $ 75,344 $ 6,213 $ 12,182 $ 93,739
(a) Excludes deposits linked to precious metals for which the fair value option has not been elected of $717 million and $739 million for the periods ended March 31, 2021 andDecember 31, 2020, respectively.
(a) (a)
99
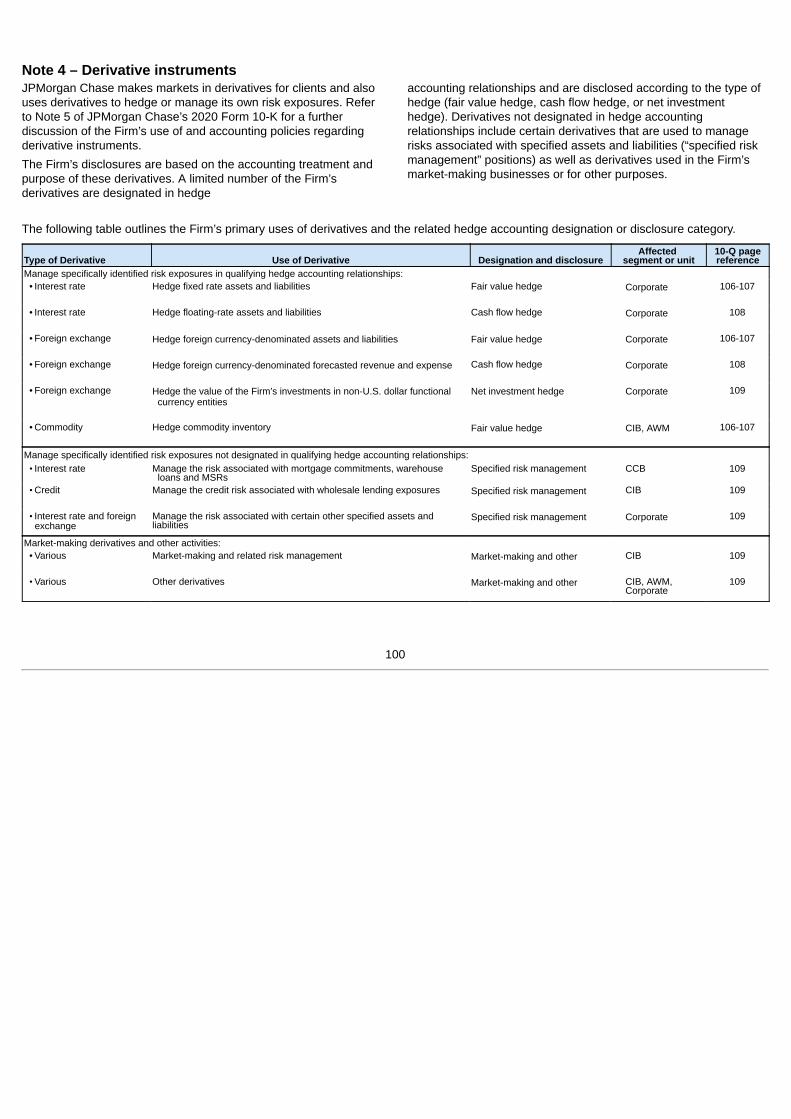
Note 4 – Derivative instrumentsJPMorgan Chase makes markets in derivatives for clients and alsouses derivatives to hedge or manage its own risk exposures. Referto Note 5 of JPMorgan Chase’s 2020 Form 10-K for a furtherdiscussion of the Firm’s use of and accounting policies regardingderivative instruments.
The Firm’s disclosures are based on the accounting treatment andpurpose of these derivatives. A limited number of the Firm’sderivatives are designated in hedge
accounting relationships and are disclosed according to the type ofhedge (fair value hedge, cash flow hedge, or net investmenthedge). Derivatives not designated in hedge accountingrelationships include certain derivatives that are used to managerisks associated with specified assets and liabilities (“specified riskmanagement” positions) as well as derivatives used in the Firm’smarket-making businesses or for other purposes.
The following table outlines the Firm’s primary uses of derivatives and the related hedge accounting designation or disclosure category.
Type of Derivative Use of Derivative Designation and disclosureAffected
segment or unit10-Q pagereference
Manage specifically identified risk exposures in qualifying hedge accounting relationships:• Interest rate Hedge fixed rate assets and liabilities Fair value hedge Corporate 106-107
• Interest rate Hedge floating-rate assets and liabilities Cash flow hedge Corporate 108
• Foreign exchange Hedge foreign currency-denominated assets and liabilities Fair value hedge Corporate 106-107
• Foreign exchange Hedge foreign currency-denominated forecasted revenue and expense Cash flow hedge Corporate 108
• Foreign exchange Hedge the value of the Firm’s investments in non-U.S. dollar functionalcurrency entities
Net investment hedge Corporate 109
• Commodity Hedge commodity inventory Fair value hedge CIB, AWM 106-107
Manage specifically identified risk exposures not designated in qualifying hedge accounting relationships:• Interest rate Manage the risk associated with mortgage commitments, warehouse
loans and MSRsSpecified risk management CCB 109
• Credit Manage the credit risk associated with wholesale lending exposures Specified risk management CIB 109
• Interest rate and foreignexchange
Manage the risk associated with certain other specified assets andliabilities
Specified risk management Corporate 109
Market-making derivatives and other activities:• Various Market-making and related risk management Market-making and other CIB 109
• Various Other derivatives Market-making and other CIB, AWM,Corporate
109
100

Notional amount of derivative contractsThe following table summarizes the notional amount of free-standing derivative contracts outstanding as of March 31, 2021,and December 31, 2020.
Notional amounts(in billions) March 31, 2021 December 31, 2020Interest rate contracts
Swaps $ 23,774 $ 20,986 Futures and forwards 5,186 3,057 Written options 3,412 3,375 Purchased options 3,707 3,675
Total interest rate contracts 36,079 31,093 Credit derivatives 1,335 1,201 Foreign exchange contracts
Cross-currency swaps 3,850 3,924 Spot, futures and forwards 7,647 6,871 Written options 837 830 Purchased options 827 825
Total foreign exchange contracts 13,161 12,450 Equity contracts
Swaps 496 448 Futures and forwards 138 140 Written options 695 676 Purchased options 638 621
Total equity contracts 1,967 1,885 Commodity contracts
Swaps 178 138 Spot, futures and forwards 199 198 Written options 142 124 Purchased options 126 105
Total commodity contracts 645 565 Total derivative notional amounts $ 53,187 $ 47,194
(a) Refer to the Credit derivatives discussion on page 110 for more information onvolumes and types of credit derivative contracts.
(b) Represents the sum of gross long and gross short third-party notional derivativecontracts.
While the notional amounts disclosed above give an indication ofthe volume of the Firm’s derivatives activity, the notional amountssignificantly exceed, in the Firm’s view, the possible losses thatcould arise from such transactions. For most derivative contracts,the notional amount is not exchanged; it is simply a referenceamount used to calculate payments.
(b)
(a)
101
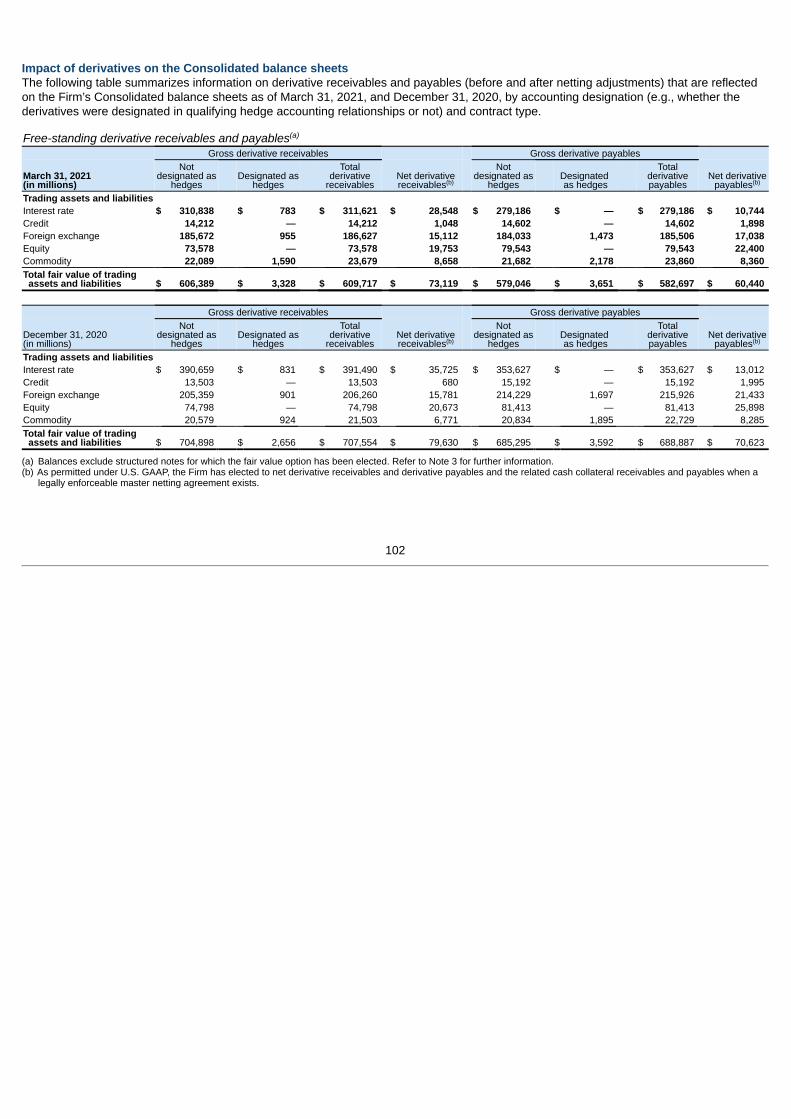
Impact of derivatives on the Consolidated balance sheetsThe following table summarizes information on derivative receivables and payables (before and after netting adjustments) that are reflectedon the Firm’s Consolidated balance sheets as of March 31, 2021, and December 31, 2020, by accounting designation (e.g., whether thederivatives were designated in qualifying hedge accounting relationships or not) and contract type.
Free-standing derivative receivables and payablesGross derivative receivables Gross derivative payables
March 31, 2021(in millions)
Notdesignated as
hedgesDesignated as
hedges
Totalderivative
receivablesNet derivativereceivables
Notdesignated as
hedgesDesignated as hedges
Totalderivativepayables
Net derivativepayables
Trading assets and liabilitiesInterest rate $ 310,838 $ 783 $ 311,621 $ 28,548 $ 279,186 $ — $ 279,186 $ 10,744 Credit 14,212 — 14,212 1,048 14,602 — 14,602 1,898 Foreign exchange 185,672 955 186,627 15,112 184,033 1,473 185,506 17,038 Equity 73,578 — 73,578 19,753 79,543 — 79,543 22,400 Commodity 22,089 1,590 23,679 8,658 21,682 2,178 23,860 8,360 Total fair value of trading
assets and liabilities $ 606,389 $ 3,328 $ 609,717 $ 73,119 $ 579,046 $ 3,651 $ 582,697 $ 60,440
Gross derivative receivables Gross derivative payables
December 31, 2020(in millions)
Notdesignated as
hedgesDesignated as
hedges
Totalderivative
receivablesNet derivativereceivables
Notdesignated as
hedgesDesignated as hedges
Totalderivativepayables
Net derivativepayables
Trading assets and liabilitiesInterest rate $ 390,659 $ 831 $ 391,490 $ 35,725 $ 353,627 $ — $ 353,627 $ 13,012 Credit 13,503 — 13,503 680 15,192 — 15,192 1,995 Foreign exchange 205,359 901 206,260 15,781 214,229 1,697 215,926 21,433 Equity 74,798 — 74,798 20,673 81,413 — 81,413 25,898 Commodity 20,579 924 21,503 6,771 20,834 1,895 22,729 8,285 Total fair value of trading
assets and liabilities $ 704,898 $ 2,656 $ 707,554 $ 79,630 $ 685,295 $ 3,592 $ 688,887 $ 70,623
(a) Balances exclude structured notes for which the fair value option has been elected. Refer to Note 3 for further information.(b) As permitted under U.S. GAAP, the Firm has elected to net derivative receivables and derivative payables and the related cash collateral receivables and payables when a
legally enforceable master netting agreement exists.
(a)
(b) (b)
(b) (b)
102

Derivatives nettingThe following tables present, as of March 31, 2021, and December 31, 2020, gross and net derivative receivables and payables by contractand settlement type. Derivative receivables and payables, as well as the related cash collateral from the same counterparty, have beennetted on the Consolidated balance sheets where the Firm has obtained an appropriate legal opinion with respect to the master nettingagreement. Where such a legal opinion has not been either sought or obtained, amounts are not eligible for netting on the Consolidatedbalance sheets, and those derivative receivables and payables are shown separately in the tables below.
In addition to the cash collateral received and transferred that is presented on a net basis with derivative receivables and payables, the Firmreceives and transfers additional collateral (financial instruments and cash). These amounts mitigate counterparty credit risk associated withthe Firm’s derivative instruments, but are not eligible for net presentation:
• collateral that consists of liquid securities and other cash collateral held at third-party custodians, which are shown separately as “Collateralnot nettable on the Consolidated balance sheets” in the tables below, up to the fair value exposure amount. Liquid securities represent highquality liquid assets as defined in the LCR rule;
• the amount of collateral held or transferred that exceeds the fair value exposure at the individual counterparty level, as of the datepresented, which is excluded from the tables below; and
• collateral held or transferred that relates to derivative receivables or payables where an appropriate legal opinion has not been eithersought or obtained with respect to the master netting agreement, which is excluded from the tables below.
March 31, 2021 December 31, 2020
(in millions)
Grossderivative
receivables
Amounts nettedon the
Consolidatedbalance sheets
Net derivativereceivables
Grossderivative
receivables
Amounts nettedon the
Consolidatedbalance sheets
Net derivativereceivables
U.S. GAAP nettable derivative receivablesInterest rate contracts:
Over-the-counter (“OTC”) $ 288,187 $ (265,270) $ 22,917 $ 367,056 $ (337,451) $ 29,605 OTC–cleared 17,627 (17,498) 129 18,340 (17,919) 421 Exchange-traded 334 (305) 29 554 (395) 159
Total interest rate contracts 306,148 (283,073) 23,075 385,950 (355,765) 30,185 Credit contracts:
OTC 9,229 (8,460) 769 9,052 (8,514) 538 OTC–cleared 4,758 (4,704) 54 4,326 (4,309) 17
Total credit contracts 13,987 (13,164) 823 13,378 (12,823) 555 Foreign exchange contracts:
OTC 181,701 (170,672) 11,029 201,349 (189,655) 11,694 OTC–cleared 891 (841) 50 834 (819) 15 Exchange-traded 18 (2) 16 35 (5) 30
Total foreign exchange contracts 182,610 (171,515) 11,095 202,218 (190,479) 11,739 Equity contracts:
OTC 30,396 (23,963) 6,433 34,030 (27,374) 6,656 Exchange-traded 30,633 (29,862) 771 28,294 (26,751) 1,543
Total equity contracts 61,029 (53,825) 7,204 62,324 (54,125) 8,199 Commodity contracts:
OTC 11,725 (6,789) 4,936 10,924 (7,901) 3,023 OTC–cleared 36 (36) — 20 (20) — Exchange-traded 8,378 (8,196) 182 6,833 (6,811) 22
Total commodity contracts 20,139 (15,021) 5,118 17,777 (14,732) 3,045 Derivative receivables with appropriate legal opinion 583,913 (536,598) 47,315 681,647 (627,924) 53,723 Derivative receivables where an appropriate legal opinion
has not been either sought or obtained 25,804 25,804 25,907 25,907 Total derivative receivables recognized on the
Consolidated balance sheets $ 609,717 $ 73,119 $ 707,554 $ 79,630 Collateral not nettable on the Consolidated balance
sheets (13,958) (14,806)Net amounts $ 59,161 $ 64,824
(a)
(a)
(a)
(a)
(d) (d)
(b)(c)
103

March 31, 2021 December 31, 2020
(in millions)
Grossderivativepayables
Amounts nettedon the
Consolidatedbalance sheets
Net derivativepayables
Grossderivativepayables
Amounts nettedon the
Consolidatedbalance sheets
Net derivativepayables
U.S. GAAP nettable derivative payablesInterest rate contracts:
OTC $ 257,384 $ (249,248) $ 8,136 $ 331,854 $ (320,780) $ 11,074 OTC–cleared 19,914 (18,884) 1,030 19,710 (19,494) 216 Exchange-traded 322 (310) 12 358 (341) 17
Total interest rate contracts 277,620 (268,442) 9,178 351,922 (340,615) 11,307 Credit contracts:
OTC 9,841 (8,412) 1,429 10,671 (9,141) 1,530 OTC–cleared 4,321 (4,292) 29 4,075 (4,056) 19
Total credit contracts 14,162 (12,704) 1,458 14,746 (13,197) 1,549 Foreign exchange contracts:
OTC 180,571 (167,627) 12,944 210,803 (193,672) 17,131 OTC–cleared 857 (841) 16 836 (819) 17 Exchange-traded 13 — 13 34 (2) 32
Total foreign exchange contracts 181,441 (168,468) 12,973 211,673 (194,493) 17,180 Equity contracts:
OTC 33,285 (27,282) 6,003 35,330 (28,763) 6,567 Exchange-traded 37,132 (29,861) 7,271 34,491 (26,752) 7,739
Total equity contracts 70,417 (57,143) 13,274 69,821 (55,515) 14,306 Commodity contracts:
OTC 10,338 (7,253) 3,085 10,365 (7,544) 2,821 OTC–cleared 53 (53) — 32 (32) — Exchange-traded 8,571 (8,194) 377 7,391 (6,868) 523
Total commodity contracts 18,962 (15,500) 3,462 17,788 (14,444) 3,344 Derivative payables with appropriate legal opinion 562,602 (522,257) 40,345 665,950 (618,264) 47,686 Derivative payables where an appropriate legal opinion
has not been either sought or obtained 20,095 20,095 22,937 22,937 Total derivative payables recognized on the Consolidated
balance sheets $ 582,697 $ 60,440 $ 688,887 $ 70,623 Collateral not nettable on the Consolidated balance
sheets (9,193) (11,964)Net amounts $ 51,247 $ 58,659
(a) Exchange-traded derivative balances that relate to futures contracts are settled daily.(b) Includes liquid securities and other cash collateral held at third-party custodians related to derivative instruments where an appropriate legal opinion has been obtained. For
some counterparties, the collateral amounts of financial instruments may exceed the derivative receivables and derivative payables balances. Where this is the case, thetotal amount reported is limited to the net derivative receivables and net derivative payables balances with that counterparty.
(c) Derivative collateral relates only to OTC and OTC-cleared derivative instruments.(d) Net derivatives receivable included cash collateral netted of $74.6 billion and $88.0 billion at March 31, 2021, and December 31, 2020, respectively. Net derivatives payable
included cash collateral netted of $60.2 billion and $78.4 billion at March 31, 2021, and December 31, 2020, respectively. Derivative cash collateral relates to OTC and OTC-cleared derivative instruments.
(a)
(a)
(a)
(a)
(d) (d)
(b)(c)
104

Liquidity risk and credit-related contingent featuresRefer to Note 5 of JPMorgan Chase’s 2020 Form 10-K for a more detailed discussion of liquidity risk and credit-related contingent featuresrelated to the Firm’s derivative contracts.
The following table shows the aggregate fair value of net derivative payables related to OTC and OTC-cleared derivatives that containcontingent collateral or termination features that may be triggered upon a ratings downgrade, and the associated collateral the Firm hasposted in the normal course of business, at March 31, 2021, and December 31, 2020.
OTC and OTC-cleared derivative payables containing downgrade triggers(in millions) March 31, 2021 December 31, 2020Aggregate fair value of net derivative payables $ 21,562 $ 26,945 Collateral posted 21,279 26,289
(a) Prior-period amount has been revised to conform with the current presentation.
The following table shows the impact of a single-notch and two-notch downgrade of the long-term issuer ratings of JPMorgan Chase & Co.and its subsidiaries, predominantly JPMorgan Chase Bank, N.A., at March 31, 2021, and December 31, 2020, related to OTC and OTC-cleared derivative contracts with contingent collateral or termination features that may be triggered upon a ratings downgrade. Derivativescontracts generally require additional collateral to be posted or terminations to be triggered when the predefined threshold rating is breached.A downgrade by a single rating agency that does not result in a rating lower than a preexisting corresponding rating provided by anothermajor rating agency will generally not result in additional collateral (except in certain instances in which additional initial margin may berequired upon a ratings downgrade), nor in termination payments requirements. The liquidity impact in the table is calculated based upon adowngrade below the lowest current rating of the rating agencies referred to in the derivative contract.
Liquidity impact of downgrade triggers on OTC and OTC-cleared derivativesMarch 31, 2021 December 31, 2020
(in millions)Single-notchdowngrade
Two-notchdowngrade
Single-notchdowngrade
Two-notchdowngrade
Amount of additional collateral to be posted upon downgrade$ 178 $ 1,448 $ 119 $ 1,243
Amount required to settle contracts with termination triggers upon downgrade127 833 153 1,682
(a) Includes the additional collateral to be posted for initial margin.(b) Amounts represent fair values of derivative payables, and do not reflect collateral posted.(c) Prior-period amount has been revised to conform with the current presentation.
Derivatives executed in contemplation of a sale of the underlying financial assetIn certain instances the Firm enters into transactions in which it transfers financial assets but maintains the economic exposure to thetransferred assets by entering into a derivative with the same counterparty in contemplation of the initial transfer. The Firm generallyaccounts for such transfers as collateralized financing transactions as described in Note 10, but in limited circumstances they may qualify tobe accounted for as a sale and a derivative under U.S. GAAP. The amount of such transfers accounted for as a sale where the associatedderivative was outstanding was not material at March 31, 2021 and December 31, 2020.
(a)
(a)
(b)
(c)
105

Impact of derivatives on the Consolidated statements of incomeThe following tables provide information related to gains and losses recorded on derivatives based on their hedge accounting designation orpurpose.
Fair value hedge gains and lossesThe following tables present derivative instruments, by contract type, used in fair value hedge accounting relationships, as well as pre-taxgains/(losses) recorded on such derivatives and the related hedged items for the three months ended March 31, 2021 and 2020,respectively. The Firm includes gains/(losses) on the hedging derivative in the same line item in the Consolidated statements of income asthe related hedged item.
Gains/(losses) recorded in incomeIncome statement impact of
excluded components OCI impact
Three months ended March 31, 2021 (in millions) Derivatives Hedged items
Income statementimpact
Amortizationapproach
Changes in fairvalue
Derivatives -Gains/(losses)
recorded in OCIContract typeInterest rate $ (5,121) $ 5,446 $ 325 $ — $ 436 $ — Foreign exchange (729) 747 18 (78) 18 (37)Commodity (1,261) 1,288 27 — 12 — Total $ (7,111) $ 7,481 $ 370 $ (78) $ 466 $ (37)
Gains/(losses) recorded in incomeIncome statement impact of
excluded components OCI impact
Three months ended March 31, 2020(in millions) Derivatives Hedged items
Income statementimpact
Amortizationapproach
Changes in fairvalue
Derivatives -Gains/(losses)
recorded in OCIContract typeInterest rate $ 4,087 $ (3,788) $ 299 $ — $ 214 $ — Foreign exchange 576 (488) 88 (179) 88 115 Commodity 1,528 (1,482) 46 — 49 — Total $ 6,191 $ (5,758) $ 433 $ (179) $ 351 $ 115
(a) Primarily consists of hedges of the benchmark (e.g., London Interbank Offered Rate (“LIBOR”)) interest rate risk of fixed-rate long-term debt and AFS securities. Gains andlosses were recorded in net interest income.
(b) Excludes the amortization expense associated with the inception hedge accounting adjustment applied to the hedged item. This expense is recorded in net interest incomeand substantially offsets the income statement impact of the excluded components. Also excludes the accrual of interest on interest rate swaps and the related hedgeditems.
(c) Primarily consists of hedges of the foreign currency risk of long-term debt and AFS securities for changes in spot foreign currency rates. Gains and losses related to thederivatives and the hedged items due to changes in foreign currency rates and the income statement impact of excluded components were recorded primarily in principaltransactions revenue and net interest income.
(d) Consists of overall fair value hedges of physical commodities inventories that are generally carried at the lower of cost or net realizable value (net realizable valueapproximates fair value). Gains and losses were recorded in principal transactions revenue.
(e) The assessment of hedge effectiveness excludes certain components of the changes in fair values of the derivatives and hedged items such as forward points on foreignexchange forward contracts, time values and cross-currency basis spreads. Excluded components may impact earnings either through amortization of the initial amount overthe life of the derivative, or through fair value changes recognized in the current period.
(f) Represents the change in value of amounts excluded from the assessment of effectiveness under the amortization approach, predominantly cross-currency basis spreads.The amount excluded at inception of the hedge is recognized in earnings over the life of the derivative.
(e)
(f)
(a)(b)
(c)
(d)
(e)
(f)
(a)(b)
(c)
(d)
106

As of March 31, 2021 and December 31, 2020, the following amounts were recorded on the Consolidated balance sheets related to certaincumulative fair value hedge basis adjustments that are expected to reverse through the income statement in future periods as an adjustmentto yield.
Carrying amount ofthe hedged items
Cumulative amount of fair value hedging adjustments included inthe carrying amount of hedged items:
March 31, 2021(in millions)
Active hedgingrelationships
Discontinued hedgingrelationships Total
AssetsInvestment securities - AFS $ 87,720 $ 502 $ 633 $ 1,135 LiabilitiesLong-term debt $ 176,622 $ (2,741) $ 9,190 $ 6,449 Beneficial interests issued by consolidated VIEs 747 — (2) (2)
Carrying amount ofthe hedged items
Cumulative amount of fair value hedging adjustments included inthe carrying amount of hedged items:
December 31, 2020(in millions)
Active hedgingrelationships
Discontinued hedgingrelationships Total
AssetsInvestment securities - AFS $ 139,684 $ 3,572 $ 847 $ 4,419 LiabilitiesLong-term debt $ 177,611 $ 3,194 $ 11,473 $ 14,667 Beneficial interests issued by consolidated VIEs 746 — (3) (3)
(a) Excludes physical commodities with a carrying value of $16.1 billion and $11.5 billion at March 31, 2021 and December 31, 2020, respectively, to which the Firm applies fairvalue hedge accounting. As a result of the application of hedge accounting, these inventories are carried at fair value, thus recognizing unrealized gains and losses incurrent periods. Since the Firm exits these positions at fair value, there is no incremental impact to net income in future periods.
(b) Excludes hedged items where only foreign currency risk is the designated hedged risk, as basis adjustments related to foreign currency hedges will not reverse through theincome statement in future periods. At March 31, 2021 and December 31, 2020, the carrying amount excluded for AFS securities is $15.5 billion and $14.5 billion,respectively, and for long-term debt is $6.4 billion and $6.6 billion, respectively.
(c) Carrying amount represents the amortized cost, net of allowance if applicable. Refer to Note 9 for additional information.(d) Represents basis adjustments existing on the balance sheet date associated with hedged items that have been de-designated from qualifying fair value hedging
relationships.(e) Positive amounts related to assets represent cumulative fair value hedge basis adjustments that will reduce net interest income in future periods. Positive (negative)
amounts related to liabilities represent cumulative fair value hedge basis adjustments that will increase (reduce) net interest income in future periods.
(a)(b) (d)(e)
(c)
(a)(b) (d)(e)
(c)
107

Cash flow hedge gains and lossesThe following tables present derivative instruments, by contract type, used in cash flow hedge accounting relationships, and the pre-taxgains/(losses) recorded on such derivatives, for the three months ended March 31, 2021 and 2020, respectively. The Firm includes thegains/(losses) on the hedging derivative in the same line item in the Consolidated statements of income as the change in cash flows on therelated hedged item.
Derivatives gains/(losses) recorded in income and other comprehensive income/(loss)Three months ended March 31, 2021 (in millions)
Amounts reclassifiedfrom AOCI to income
Amounts recorded in OCI
Total changein OCI for period
Contract typeInterest rate $ 237 $ (2,761) $ (2,998)Foreign exchange 27 66 39 Total $ 264 $ (2,695) $ (2,959)
Derivatives gains/(losses) recorded in income and other comprehensive income/(loss)
Three months ended March 31, 2020(in millions)
Amounts reclassifiedfrom AOCI to income
Amounts recorded in OCI
Total changein OCI for period
Contract typeInterest rate $ (9) $ 3,461 $ 3,470 Foreign exchange 17 (210) (227)Total $ 8 $ 3,251 $ 3,243
(a) Primarily consists of hedges of LIBOR-indexed floating-rate assets and floating-rate liabilities. Gains and losses were recorded in net interest income.(b) Primarily consists of hedges of the foreign currency risk of non-U.S. dollar-denominated revenue and expense. The income statement classification of gains and losses
follows the hedged item – primarily noninterest revenue and compensation expense.
The Firm did not experience any forecasted transactions that failed to occur for the three months ended March 31, 2021 and 2020.
Over the next 12 months, the Firm expects that approximately $926 million (after-tax) of net gains recorded in AOCI at March 31, 2021,related to cash flow hedges will be recognized in income. For cash flow hedges that have been terminated, the maximum length of time overwhich the derivative results recorded in AOCI will be recognized in earnings is approximately nine years, corresponding to the timing of theoriginally hedged forecasted cash flows. For open cash flow hedges, the maximum length of time over which forecasted transactions arehedged is approximately seven years. The Firm’s longer-dated forecasted transactions relate to core lending and borrowing activities.
(a)
(b)
(a)
(b)
108

Net investment hedge gains and lossesThe following table presents hedging instruments, by contract type, that were used in net investment hedge accounting relationships, and thepre-tax gains/(losses) recorded on such instruments for the three months ended March 31, 2021 and 2020.
Gains/(losses) recorded in income and other comprehensive income/(loss)2021 2020
Three months ended March 31,(in millions)
Amounts recorded inincome
Amounts recordedin OCI
Amounts recorded inincome
Amounts recorded inOCI
Foreign exchange derivatives $ (28) $ 1,200 $ 10 $ 1,589
(a) Certain components of hedging derivatives are permitted to be excluded from the assessment of hedge effectiveness, such as forward points on foreign exchange forwardcontracts. The Firm elects to record changes in fair value of these amounts directly in other income.
Gains and losses on derivatives used for specified riskmanagement purposesThe following table presents pre-tax gains/(losses) recorded on alimited number of derivatives, not designated in hedge accountingrelationships, that are used to manage risks associated withcertain specified assets and liabilities, including certain risksarising from mortgage commitments, warehouse loans, MSRs,wholesale lending exposures, and foreign currency-denominatedassets and liabilities.
Derivatives gains/(losses) recorded in income
Three months ended March 31,(in millions) 2021 2020Contract typeInterest rate $ (142) $ 1,292 Credit (40) 61 Foreign exchange 98 106 Total $ (84) $ 1,459
(a) Primarily represents interest rate derivatives used to hedge the interest rate riskinherent in mortgage commitments, warehouse loans and MSRs, as well aswritten commitments to originate warehouse loans. Gains and losses wererecorded predominantly in mortgage fees and related income.
(b) Relates to credit derivatives used to mitigate credit risk associated with lendingexposures in the Firm’s wholesale businesses. These derivatives do not includecredit derivatives used to mitigate counterparty credit risk arising from derivativereceivables, which is included in gains and losses on derivatives related tomarket-making activities and other derivatives. Gains and losses were recordedin principal transactions revenue.
(c) Primarily relates to derivatives used to mitigate foreign exchange risk ofspecified foreign currency-denominated assets and liabilities. Gains and losseswere recorded in principal transactions revenue.
Gains and losses on derivatives related to market-making activitiesand other derivativesThe Firm makes markets in derivatives in order to meet the needsof customers and uses derivatives to manage certain risksassociated with net open risk positions from its market-makingactivities, including the counterparty credit risk arising fromderivative receivables. All derivatives not included in the hedgeaccounting or specified risk management categories above areincluded in this category. Gains and losses on these derivativesare primarily recorded in principal transactions revenue. Refer toNote 5 for information on principal transactions revenue.
(a) (a)
(a)
(b)
(c)
109

Credit derivativesRefer to Note 5 of JPMorgan Chase’s 2020 Form 10-K for a more detailed discussion of credit derivatives. The following tables present asummary of the notional amounts of credit derivatives and credit-related notes the Firm sold and purchased as of March 31, 2021 andDecember 31, 2020. The Firm does not use notional amounts of credit derivatives as the primary measure of risk management for suchderivatives, because the notional amount does not take into account the probability of the occurrence of a credit event, the recovery value ofthe reference obligation, or related cash instruments and economic hedges, each of which reduces, in the Firm’s view, the risks associatedwith such derivatives.
Total credit derivatives and credit-related notes
Maximum payout/Notional amount
March 31, 2021 (in millions) Protection soldProtection purchased with
identical underlyingsNet protection
(sold)/purchasedOther protection
purchasedCredit derivativesCredit default swaps $ (595,343) $ 609,926 $ 14,583 $ 2,562 Other credit derivatives (45,961) 68,528 22,567 12,478 Total credit derivatives (641,304) 678,454 37,150 15,040 Credit-related notes — — — 10,847 Total $ (641,304) $ 678,454 $ 37,150 $ 25,887
Maximum payout/Notional amount
December 31, 2020 (in millions) Protection soldProtection purchased with
identical underlyingsNet protection
(sold)/purchasedOther protection
purchasedCredit derivativesCredit default swaps $ (535,094) $ 554,565 $ 19,471 $ 4,001
Other credit derivatives (40,084) 57,344 17,260 9,415 Total credit derivatives (575,178) 611,909 36,731 13,416 Credit-related notes — — — 10,248 Total $ (575,178) $ 611,909 $ 36,731 $ 23,664
(a) Other credit derivatives predominantly consist of credit swap options and total return swaps.(b) Represents the total notional amount of protection purchased where the underlying reference instrument is identical to the reference instrument on protection sold; the notional amount
of protection purchased for each individual identical underlying reference instrument may be greater or lower than the notional amount of protection sold.(c) Does not take into account the fair value of the reference obligation at the time of settlement, which would generally reduce the amount the seller of protection pays to the buyer of
protection in determining settlement value.(d) Represents protection purchased by the Firm on referenced instruments (single-name, portfolio or index) where the Firm has not sold any protection on the identical reference
instrument.
The following tables summarize the notional amounts by the ratings, maturity profile, and total fair value, of credit derivatives and credit-related notes as of March 31, 2021, and December 31, 2020, where JPMorgan Chase is the seller of protection. The maturity profile is basedon the remaining contractual maturity of the credit derivative contracts. The ratings profile is based on the rating of the reference entity onwhich the credit derivative contract is based. The ratings and maturity profile of credit derivatives and credit-related notes where JPMorganChase is the purchaser of protection are comparable to the profile reflected below.
Protection sold — credit derivatives and credit-related notes ratings /maturity profileMarch 31, 2021(in millions) <1 year 1–5 years >5 years
Total notional amount
Fair value ofreceivables
Fair value ofpayables
Net fairvalue
Risk rating of reference entityInvestment-grade $ (93,329) $ (304,945) $ (80,813) $ (479,087) $ 5,746 $ (651) $ 5,095 Noninvestment-grade (35,229) (100,052) (26,936) (162,217) 3,851 (2,418) 1,433 Total $ (128,558) $ (404,997) $ (107,749) $ (641,304) $ 9,597 $ (3,069) $ 6,528
December 31, 2020(in millions) <1 year 1–5 years >5 years
Total notional amount
Fair value ofreceivables
Fair value ofpayables
Net fairvalue
Risk rating of reference entityInvestment-grade $ (93,905) $ (307,648) $ (35,326) $ (436,879) $ 5,521 $ (835) $ 4,686 Noninvestment-grade (31,809) (97,337) (9,153) (138,299) 3,953 (2,542) 1,411 Total $ (125,714) $ (404,985) $ (44,479) $ (575,178) $ 9,474 $ (3,377) $ 6,097
(a) The ratings scale is primarily based on external credit ratings defined by S&P and Moody’s.(b) Amounts are shown on a gross basis, before the benefit of legally enforceable master netting agreements including cash collateral netting.
(b) (c) (d)
(a)
(b) (c) (d)
(a)
(a)
(b) (b)
(b) (b)
110

Note 5 – Noninterest revenue and noninterestexpenseNoninterest revenueRefer to Note 6 of JPMorgan Chase’s 2020 Form 10-K for adiscussion of the components of and accounting policies for theFirm’s noninterest revenue.
Investment banking feesThe following table presents the components of investmentbanking fees.
Three months ended March31,
(in millions) 2021 2020UnderwritingEquity $ 1,062 $ 327 Debt 1,221 1,044 Total underwriting 2,283 1,371 Advisory 687 495 Total investment banking fees $ 2,970 $ 1,866
Principal transactionsThe following table presents all realized and unrealized gains andlosses recorded in principal transactions revenue. This tableexcludes interest income and interest expense on trading assetsand liabilities, which are an integral part of the overall performanceof the Firm’s client-driven market-making activities in CIB and funddeployment activities in Treasury and CIO. Refer to Note 6 forfurther information on interest income and interest expense.Trading revenue is presented primarily by instrument type. TheFirm’s client-driven market-making businesses generally utilize avariety of instrument types in connection with their market-makingand related risk-management activities; accordingly, the tradingrevenue presented in the table below is not representative of thetotal revenue of any individual LOB.
Three months endedMarch 31,
(in millions) 2021 2020Trading revenue by instrument type
Interest rate $ 923 $ 452 Credit 1,270 (702)Foreign exchange 998 1,467 Equity 2,657 1,348 Commodity 549 437 Total trading revenue 6,397 3,002 Private equity gains/(losses) 103 (65)Principal transactions $ 6,500 $ 2,937
(a) Includes the impact of changes in funding valuation adjustments on derivatives.(b) Includes the impact of changes in credit valuation adjustments on derivatives,
net of the associated hedging activities.(c) Includes marks on held-for-sale positions, including unfunded commitments, in
the bridge financing portfolio.
Lending- and deposit-related feesThe following table presents the components of lending- anddeposit-related fees.
Three months ended March31,
(in millions) 2021 2020Lending-related fees $ 358 $ 291 Deposit-related fees 1,329 1,415 Total lending- and deposit-related fees $ 1,687 $ 1,706
Asset management, administration and commissionsThe following table presents the components of assetmanagement, administration and commissions.
Three months ended March31,
(in millions) 2021 2020Asset management feesInvestment management fees $ 3,257 $ 2,785 All other asset management fees 94 93 Total asset management fees 3,351 2,878
Total administration fees 633 554
Commissions and other feesBrokerage commissions 800 864 All other commissions and fees 245 244 Total commissions and fees 1,045 1,108 Total asset management, administration and
commissions $ 5,029 $ 4,540
(a) Represents fees earned from managing assets on behalf of the Firm’s clients,including investors in Firm-sponsored funds and owners of separately managedinvestment accounts.
(b) Represents fees for services that are ancillary to investment managementservices, such as commissions earned on the sales or distribution of mutualfunds to clients.
(c) Predominantly includes fees for custody, securities lending, funds services andsecurities clearance.
(d) Represents commissions earned when the Firm acts as a broker, by facilitatingits clients’ purchases and sales of securities and other financial instruments.
Card incomeThe following table presents the components of card income:
Three months ended March31,
(in millions) 2021 2020Interchange and merchant processing income $ 4,868 $ 4,782 Rewards costs and partner payments (3,534) (3,582)Other card income 16 (205)Total card income $ 1,350 $ 995
(a) Predominantly represents the amortization of account origination costs andannual fees.
Refer to Note 14 for further information on mortgage servicingrights, including risk management activities.
Refer to Note 16 for information on operating lease incomeincluded within other income.
(a)
(b) (c)
(a)
(b)
(c)
(d)
(a)
111

Noninterest expenseOther expenseOther expense on the Firm’s Consolidated statements of incomeincluded the following:
Three months ended March31,
(in millions) 2021 2020Legal expense $ 28 $ 197 FDIC-related expense 201 99
Note 6 – Interest income and Interest expenseRefer to Note 7 of JPMorgan Chase’s 2020 Form 10-K for adescription of JPMorgan Chase’s accounting policies regardinginterest income and interest expense.
The following table presents the components of interest incomeand interest expense.
Three months ended March 31,
(in millions) 2021 2020Interest incomeLoans $ 10,187 $ 12,305
Taxable securities 1,605 2,233 Non-taxable securities 277 300
Total investment securities 1,882 2,533 Trading assets - debt instruments 1,782 2,064
Federal funds sold and securities purchased underresale agreements 233 1,095
Securities borrowed (77) 152 Deposits with banks 65 569 All other interest-earning assets 199 443
Total interest income $ 14,271 $ 19,161
Interest expenseInterest-bearing deposits $ 146 $ 1,575
Federal funds purchased and securities loaned orsold under repurchase agreements 15 787
Short-term borrowings 33 151
Trading liabilities – debt and all other interest-bearing liabilities 27 372
Long-term debt 1,134 1,747 Beneficial interest issued by consolidated VIEs 27 90
Total interest expense $ 1,382 $ 4,722
Net interest income $ 12,889 $ 14,439 Provision for credit losses (4,156) 8,285
Net interest income after provision for creditlosses $ 17,045 $ 6,154
(a) Includes the amortization/accretion of unearned income (e.g., purchasepremiums/discounts and net deferred fees/costs).
(b) Represents securities which are tax-exempt for U.S. federal income taxpurposes.
(c) Negative interest income is related to the impact of current interest ratescombined with the fees paid on client-driven securities borrowed balances. Thenegative interest expense related to prime brokerage customer payables isrecognized in interest expense and reported within trading liabilities - debt andall other interest-bearing liabilities.
(d) Includes interest earned on brokerage-related held-for-investment customerreceivables, which are classified in accrued interest and accounts receivable,and all other interest-earning assets which are classified in other assets on theConsolidated balance sheets.
(e) Includes commercial paper.(f) All other interest-bearing liabilities includes interest expense on brokerage-
related customer payables.
(a)
(b)
(a)
(c)
(d)
(e)
(c)(f)
112

Note 7 – Pension and other postretirement employee benefit plansRefer to Note 8 of JPMorgan Chase’s 2020 Form 10-K for a discussion of JPMorgan Chase’s pension and OPEB plans.
The following table presents the components of net periodic benefit costs reported in the Consolidated statements of income for the Firm’sdefined benefit pension, defined contribution and OPEB plans.
(in millions)
Three months ended March 31,2021 2020Pension and OPEB plans
Components of net periodic benefit cost, U.S. defined benefit pension plansBenefits earned during the period $ — $ — Interest cost on benefit obligations 85 105 Expected return on plan assets (129) (158)Amortization:
Net (gain)/loss 3 2 Prior service (credit)/cost — —
Net periodic defined benefit plan cost/(credit), U.S. defined benefit pension plans (41) (51)Other defined benefit pension and OPEB plans (18) (21)Total net periodic defined benefit plan cost/(credit) (59) (72)Total defined contribution plans 321 299 Total pension and OPEB cost included in noninterest expense $ 262 $ 227
The following table presents the fair values of plan assets for the Firm's defined benefit pension and OPEB plans.
(in billions)March 31,
2021 December 31, 2020Fair value of plan assetsU.S. defined benefit pension plans $ 16.9 $ 17.6 Other defined benefit pension and OPEB plans 7.6 7.8
113

Note 8 – Employee share-based incentivesRefer to Note 9 of JPMorgan Chase’s 2020 Form 10-K for adiscussion of the accounting policies and other information relatingto employee share-based incentives.
The Firm recognized the following noncash compensationexpense related to its various employee share-based incentiveplans in its Consolidated statements of income.
Three months ended March 31,
(in millions) 2021 2020Cost of prior grants of RSUs, performance share
units (“PSUs”) and stock options that areamortized over their applicable vesting periods $ 356 $ 334
Accrual of estimated costs of share-basedawards to be granted in future periodspredominantly those to full-career eligibleemployees 548 310
Total noncash compensation expense relatedto employee share-based incentive plans $ 904 $ 644
In the first quarter of 2021, in connection with its annual incentivegrant for the 2020 performance year, the Firm granted 17 millionRSUs and 678 thousand PSUs with weighted-average grant datefair values of $137.38 per RSU and $136.94 per PSU.
114

Note 9 – Investment securitiesInvestment securities consist of debt securities that are classifiedas AFS or HTM. Debt securities classified as trading assets arediscussed in Note 2. Predominantly all of the Firm’s AFS and HTMsecurities are held by Treasury and CIO in connection with itsasset-liability management activities. At March 31, 2021, theinvestment securities portfolio consisted of debt securities with anaverage credit
rating of AA+ (based upon external ratings where available, andwhere not available, based primarily upon internal risk ratings).Refer to Note 10 of JPMorgan Chase’s 2020 Form 10-K foradditional information regarding the investment securities portfolio.
The amortized costs and estimated fair values of the investment securities portfolio were as follows for the dates indicated.
March 31, 2021 December 31, 2020
(in millions)Amortized
cost
Grossunrealized
gains
Grossunrealized
losses Fair valueAmortized
cost
Grossunrealized
gains
Grossunrealized
losses Fair valueAvailable-for-sale securitiesMortgage-backed securities:
U.S. GSEs and government agencies $ 112,356 $ 1,479 $ 1,376 $ 112,459 $ 110,979 $ 2,372 $ 50 $ 113,301 Residential:
U.S. 5,788 180 5 5,963 6,246 224 3 6,467 Non-U.S. 4,607 31 — 4,638 3,751 20 5 3,766
Commercial 3,004 52 27 3,029 2,819 71 34 2,856 Total mortgage-backed securities 125,755 1,742 1,408 126,089 123,795 2,687 92 126,390 U.S. Treasury and government agencies 195,423 1,586 2,225 194,784 199,910 2,141 100 201,951 Obligations of U.S. states and municipalities 18,651 1,276 5 19,922 18,993 1,404 1 20,396 Non-U.S. government debt securities 20,745 192 64 20,873 22,587 354 13 22,928 Corporate debt securities 210 4 4 210 215 4 3 216 Asset-backed securities:
Collateralized loan obligations 11,309 25 5 11,329 10,055 24 31 10,048 Other 6,663 79 7 6,735 6,174 91 16 6,249
Total available-for-sale securities 378,756 4,904 3,718 379,942 381,729 6,705 256 388,178 Held-to-maturity securitiesMortgage-backed securities:
U.S. GSEs and government agencies 97,626 2,020 630 99,016 107,889 2,968 29 110,828 U.S. Residential 4,640 3 43 4,600 4,345 8 30 4,323 Commercial 2,826 19 8 2,837 2,602 77 — 2,679
Total mortgage-backed securities 105,092 2,042 681 106,453 114,836 3,053 59 117,830 U.S. Treasury and government agencies 76,107 13 1,575 74,545 53,184 50 — 53,234 Obligations of U.S. states and municipalities 12,658 389 52 12,995 12,751 519 — 13,270 Asset-backed securities:
Collateralized loan obligations 23,595 125 3 23,717 21,050 90 2 21,138 Total held-to-maturity securities, net ofallowance for credit losses 217,452 2,569 2,311 217,710 201,821 3,712 61 205,472 Total investment securities, net of allowancefor credit losses $ 596,208 $ 7,473 $ 6,029 $ 597,652 $ 583,550 $ 10,417 $ 317 $ 593,650
(a) Includes AFS U.S. GSE obligations with fair values of $61.0 billion and $65.8 billion, and HTM U.S. GSE obligations with amortized cost of $78.8 billion and $86.3 billion, atMarch 31, 2021 and December 31, 2020, respectively. As of March 31, 2021, mortgage-backed securities issued by Fannie Mae and Freddie Mac each exceeded 10% ofJPMorgan Chase’s total stockholders’ equity; the amortized cost and fair value of such securities were $108.2 billion and $108.7 billion, and $31.9 billion and $32.3 billion,respectively.
(b) There was no allowance for credit losses on AFS securities at both March 31, 2021 and December 31, 2020.(c) The Firm purchased $31.3 billion and $205 million of HTM securities for the three months ended March 31, 2021 and 2020, respectively.(d) HTM securities measured at amortized cost are reported net of allowance for credit losses of $94 million and $78 million at March 31, 2021 and December 31, 2020,
respectively.(e) Excludes $1.8 billion and $2.1 billion of accrued interest receivables at March 31, 2021 and December 31, 2020, respectively. The Firm did not reverse through interest
income any accrued interest receivables for the three months ended March 31, 2021 and 2020.
(e) (e)
(a)
(b)
(c)
(a)
(d)
(d)
115

AFS securities impairmentThe following tables present the fair value and gross unrealized losses by aging category for AFS securities at March 31, 2021 andDecember 31, 2020. The tables exclude U.S. Treasury and government agency securities and U.S. GSE and government agency MBS withunrealized losses of $3.6 billion and $150 million, at March 31, 2021 and December 31, 2020, respectively; changes in the value of thesesecurities are generally driven by changes in interest rates rather than changes in their credit profile given the explicit or implicit guaranteesprovided by the U.S. government.
Available-for-sale securities with gross unrealized lossesLess than 12 months 12 months or more
March 31, 2021 (in millions) Fair valueGross
unrealized losses Fair valueGross
unrealized losses Total fair valueTotal gross unrealized
lossesAvailable-for-sale securitiesMortgage-backed securities:
Residential:U.S. $ 801 $ 5 $ 53 $ — $ 854 $ 5 Non-U.S. 769 — 33 — 802 —
Commercial 501 12 344 15 845 27 Total mortgage-backed securities 2,071 17 430 15 2,501 32 Obligations of U.S. states and municipalities 218 5 — — 218 5 Non-U.S. government debt securities 6,620 61 580 3 7,200 64 Corporate debt securities 52 3 42 1 94 4 Asset-backed securities:
Collateralized loan obligations 1,808 4 2,254 1 4,062 5 Other 325 1 489 6 814 7
Total available-for-sale securities with grossunrealized losses $ 11,094 $ 91 $ 3,795 $ 26 $ 14,889 $ 117
Available-for-sale securities with gross unrealized lossesLess than 12 months 12 months or more
December 31, 2020 (in millions) Fair valueGross
unrealized losses Fair valueGross
unrealized losses Total fair valueTotal gross unrealized
lossesAvailable-for-sale securitiesMortgage-backed securities:
Residential:U.S. $ 562 $ 3 $ 32 $ — $ 594 $ 3 Non-U.S. 2,507 4 235 1 2,742 5
Commercial 699 18 124 16 823 34 Total mortgage-backed securities 3,768 25 391 17 4,159 42 Obligations of U.S. states and municipalities 49 1 — — 49 1 Non-U.S. government debt securities 2,709 9 968 4 3,677 13 Corporate debt securities 91 3 5 — 96 3 Asset-backed securities:
Collateralized loan obligations 5,248 18 2,645 13 7,893 31 Other 268 1 685 15 953 16
Total available-for-sale securities with grossunrealized losses $ 12,133 $ 57 $ 4,694 $ 49 $ 16,827 $ 106
116

Allowance for credit lossesBased on its assessment, the Firm did not recognize an allowancefor credit losses on impaired AFS securities as of March 31, 2021and 2020.
HTM securities – credit riskCredit quality indicatorThe primary credit quality indicator for HTM securities is the riskrating assigned to each security. At March 31, 2021 andDecember 31, 2020, all HTM securities were rated investmentgrade and were current and accruing, with approximately 97% and98% rated at least AA+, respectively.
Allowance for credit lossesThe allowance for credit losses on HTM securities was $94 millionand $19 million as of March 31, 2021 and 2020, respectively.
Refer to Note 10 of JPMorgan Chase’s 2020 Form 10-K for furtherdiscussion of accounting policies for AFS and HTM securities.
Selected impacts of investment securities on theConsolidated statements of income
Three months ended March 31,(in millions) 2021 2020Realized gains $ 237 $ 1,095 Realized losses (223) (862)Net investment securities gains $ 14 $ 233
Provision for credit losses $ 16 $ 9
117

Contractual maturities and yieldsThe following table presents the amortized cost and estimated fair value at March 31, 2021, of JPMorgan Chase’s investment securities portfolio bycontractual maturity.
By remaining maturity March 31, 2021 (in millions)Due in one year or less
Due after one year throughfive years
Due after five years through10 years
Due after10 years Total
Available-for-sale securitiesMortgage-backed securities
Amortized cost $ — $ 2,226 $ 5,998 $ 117,531 $ 125,755 Fair value — 2,251 6,283 117,555 126,089 Average yield — % 1.40 % 1.79 % 2.50 % 2.44 %
U.S. Treasury and government agenciesAmortized cost $ 4,058 $ 129,668 $ 53,799 $ 7,898 $ 195,423 Fair value 4,088 129,830 52,724 8,142 194,784 Average yield 0.95 % 0.52 % 0.95 % 0.54 % 0.65 %
Obligations of U.S. states and municipalitiesAmortized cost $ 33 $ 207 $ 1,152 $ 17,259 $ 18,651 Fair value 33 214 1,219 18,456 19,922 Average yield 4.16 % 4.74 % 4.96 % 4.96 % 4.96 %
Non-U.S. government debt securitiesAmortized cost $ 7,029 $ 5,581 $ 4,511 $ 3,624 $ 20,745 Fair value 7,038 5,698 4,530 3,607 20,873 Average yield 1.19 % 2.05 % 0.78 % 0.52 % 1.21 %
Corporate debt securitiesAmortized cost $ — $ 139 $ 71 $ — $ 210 Fair value — 136 74 — 210 Average yield — % 1.18 % 1.89 % — % 1.42 %
Asset-backed securitiesAmortized cost $ 1,544 $ 1,995 $ 6,812 $ 7,621 $ 17,972 Fair value 1,545 2,011 6,831 7,677 18,064 Average yield 1.28 % 1.94 % 1.30 % 1.42 % 1.42 %
Total available-for-sale securitiesAmortized cost $ 12,664 $ 139,816 $ 72,343 $ 153,933 $ 378,756 Fair value 12,704 140,140 71,661 155,437 379,942 Average yield 1.13 % 0.62 % 1.11 % 2.57 % 1.52 %
Held-to-maturity securitiesMortgage-backed securities
Amortized cost $ — $ 423 $ 11,858 $ 92,851 $ 105,132 Fair value — 423 12,214 93,816 106,453 Average yield — % 1.12 % 2.36 % 2.93 % 2.86 %
U.S. Treasury and government agenciesAmortized cost $ 1,318 $ 42,176 $ 32,613 $ — $ 76,107 Fair value 1,319 42,161 31,065 — 74,545 Average yield 0.17 % 0.66 % 1.18 % — % 0.88 %
Obligations of U.S. states and municipalitiesAmortized cost $ — $ 65 $ 688 $ 11,959 $ 12,712 Fair value — 66 724 12,205 12,995 Average yield — % 3.23 % 3.76 % 3.77 % 3.77 %
Asset-backed securitiesAmortized cost $ — $ — $ 11,137 $ 12,458 $ 23,595 Fair value — — 11,192 12,525 23,717 Average yield — % — % 1.34 % 1.33 % 1.33 %
Total held-to-maturity securitiesAmortized cost $ 1,318 $ 42,664 $ 56,296 $ 117,268 $ 217,546 Fair value 1,319 42,650 55,195 118,546 217,710 Average yield 0.17 % 0.67 % 1.49 % 2.84 % 2.05 %
(a) Average yield is computed using the effective yield of each security owned at the end of the period, weighted based on the amortized cost of each security. The effectiveyield considers the contractual coupon, amortization of premiums and accretion of discounts, and the effect of related hedging derivatives. Taxable-equivalent amounts areused where applicable. The effective yield excludes unscheduled principal prepayments; and accordingly, actual maturities of securities may differ from their contractual orexpected maturities as certain securities may be prepaid. However, for certain callable debt securities, the average yield is calculated to the earliest call date.
(b) Substantially all of the Firm’s U.S. residential MBS and collateralized mortgage obligations are due in 10 years or more, based on contractual maturity. The estimatedweighted-average life, which reflects anticipated future prepayments, is approximately 6 years for agency residential MBS, 4 years for agency residential collateralizedmortgage obligations and 3 years for nonagency residential collateralized mortgage obligations.
(b)
(a)
(a)
(a)
(a)
(a)
(a)
(a)
(a)
(a)
(a)
(a)
(a)
118

Note 10 – Securities financing activitiesRefer to Note 11 of JPMorgan Chase’s 2020 Form 10-K for adiscussion of accounting policies relating to securities financingactivities. Refer to Note 3 for further information regardingsecurities borrowed and securities lending agreements for whichthe fair value option has been elected. Refer to Note 23 for furtherinformation regarding assets pledged and collateral received insecurities financing agreements.
The table below summarizes the gross and net amounts of theFirm’s securities financing agreements as of March 31, 2021 andDecember 31, 2020. When the Firm has obtained an appropriatelegal opinion with respect to a master netting agreement with acounterparty and where other relevant netting criteria under U.S.GAAP are met, the Firm nets, on the Consolidated balancesheets, the balances
outstanding under its securities financing agreements with thesame counterparty. In addition, the Firm exchanges securitiesand/or cash collateral with its counterparty to reduce the economicexposure with the counterparty, but such collateral is not eligiblefor net Consolidated balance sheet presentation. Where the Firmhas obtained an appropriate legal opinion with respect to thecounterparty master netting agreement, such collateral, along withsecurities financing balances that do not meet all these relevantnetting criteria under U.S. GAAP, is presented in the table belowas “Amounts not nettable on the Consolidated balance sheets,”and reduces the “Net amounts” presented. Where a legal opinionhas not been either sought or obtained, the securities financingbalances are presented gross in the “Net amounts” below.
March 31, 2021
(in millions) Gross amounts
Amounts netted on theConsolidated balance
sheets
Amounts presented onthe Consolidatedbalance sheets
Amounts not nettable onthe Consolidated balance
sheetsNet
amountsAssets
Securities purchased under resale agreements $ 555,370 $ (282,889) $ 272,481 $ (254,495) $ 17,986 Securities borrowed 182,414 (2,898) 179,516 (130,939) 48,577
LiabilitiesSecurities sold under repurchase agreements $ 575,969 $ (282,889) $ 293,080 $ (263,698) $ 29,382 Securities loaned and other 54,058 (2,898) 51,160 (49,574) 1,586
December 31, 2020
(in millions) Gross amounts
Amounts netted on theConsolidated balance
sheets
Amounts presented onthe Consolidatedbalance sheets
Amounts not nettable onthe Consolidated balance
sheetsNet
amountsAssets
Securities purchased under resale agreements $ 666,467 $ (370,183) $ 296,284 $ (273,206) $ 23,078 Securities borrowed 193,700 (33,065) 160,635 (115,219) 45,416
LiabilitiesSecurities sold under repurchase agreements $ 578,060 $ (370,183) $ 207,877 $ (191,980) $ 15,897 Securities loaned and other 41,366 (33,065) 8,301 (8,257) 44
(a) Includes securities-for-securities lending agreements of $42.8 billion and $3.4 billion at March 31, 2021 and December 31, 2020, respectively, accounted for at fair value,where the Firm is acting as lender. In the Consolidated balance sheets, the Firm recognizes the securities received at fair value within other assets and the obligation toreturn those securities within accounts payable and other liabilities.
(b) In some cases, collateral exchanged with a counterparty exceeds the net asset or liability balance with that counterparty. In such cases, the amounts reported in this columnare limited to the related net asset or liability with that counterparty.
(c) Includes securities financing agreements that provide collateral rights, but where an appropriate legal opinion with respect to the master netting agreement has not beeneither sought or obtained. At March 31, 2021 and December 31, 2020, included $12.8 billion and $17.0 billion, respectively, of securities purchased under resaleagreements; $45.5 billion and $42.1 billion, respectively, of securities borrowed; $27.4 billion and $14.5 billion, respectively, of securities sold under repurchase agreements;and $136 million and $8 million, respectively, of securities loaned and other.
(b) (c)
(a)
(b) (c)
(a)
119

The tables below present as of March 31, 2021, and December 31, 2020 the types of financial assets pledged in securities financingagreements and the remaining contractual maturity of the securities financing agreements.
Gross liability balanceMarch 31, 2021 December 31, 2020
(in millions)
Securities sold underrepurchaseagreements
Securities loanedand other
Securities sold underrepurchaseagreements
Securities loaned andother
Mortgage-backed securitiesU.S. GSEs and government agencies $ 76,335 $ — $ 56,744 $ — Residential - nonagency 522 — 1,016 — Commercial - nonagency 775 — 855 —
U.S. Treasury, GSEs and government agencies 274,254 184 315,834 143 Obligations of U.S. states and municipalities 1,626 — 1,525 2 Non-U.S. government debt 163,200 2,472 157,563 1,730 Corporate debt securities 28,522 2,563 22,849 1,864 Asset-backed securities 682 845 694 — Equity securities 30,053 47,994 20,980 37,627 Total $ 575,969 $ 54,058 $ 578,060 $ 41,366
Remaining contractual maturity of the agreements
Overnight andcontinuous
Greater than 90 daysMarch 31, 2021 (in millions) Up to 30 days 30 – 90 days Total
Total securities sold under repurchase agreements $ 228,510 $ 252,875 $ 46,361 $ 48,223 $ 575,969 Total securities loaned and other 52,440 395 799 424 54,058
Remaining contractual maturity of the agreements
Overnight andcontinuous
Greater than 90 daysDecember 31, 2020 (in millions) Up to 30 days 30 – 90 days Total
Total securities sold under repurchase agreements $ 238,667 $ 230,980 $ 70,777 $ 37,636 $ 578,060 Total securities loaned and other 37,887 1,647 500 1,332 41,366
Transfers not qualifying for sale accountingAt March 31, 2021, and December 31, 2020, the Firm held $603 million and $598 million, respectively, of financial assets for which the rightshave been transferred to third parties; however, the transfers did not qualify as a sale in accordance with U.S. GAAP. These transfers havebeen recognized as collateralized financing transactions. The transferred assets are recorded in trading assets and loans, and thecorresponding liabilities are recorded predominantly in short-term borrowings on the Consolidated balance sheets.
120
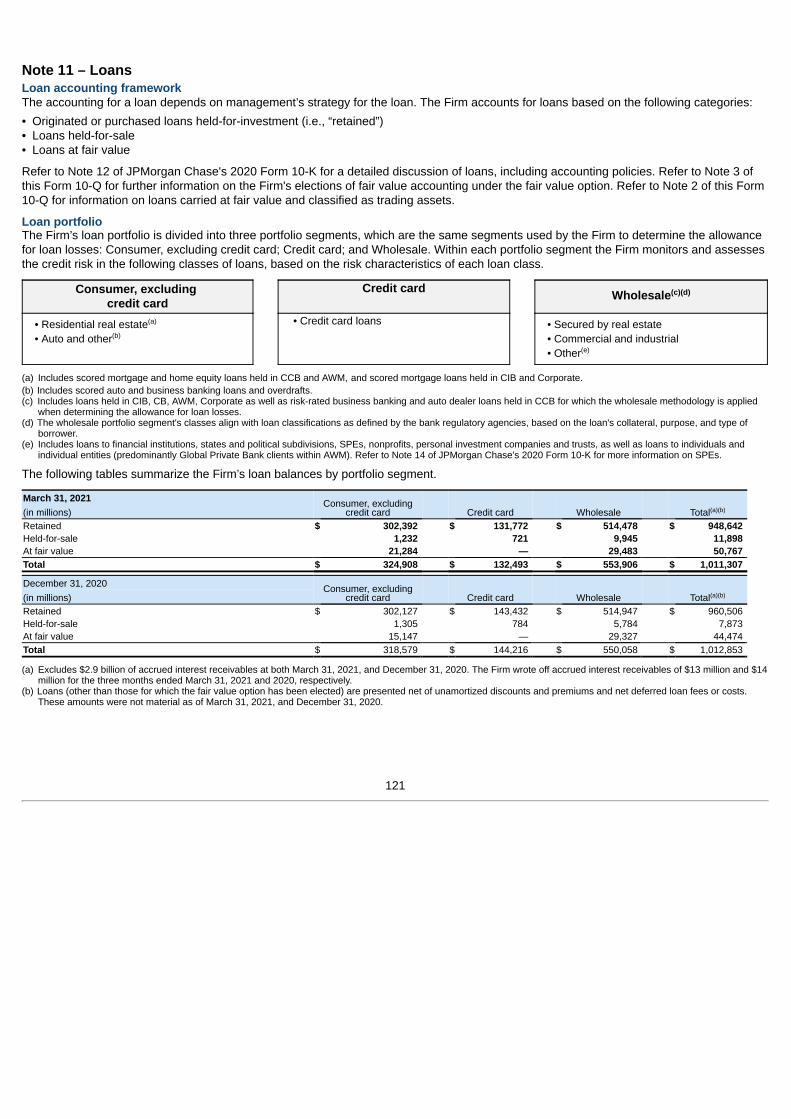
Note 11 – LoansLoan accounting frameworkThe accounting for a loan depends on management’s strategy for the loan. The Firm accounts for loans based on the following categories:
• Originated or purchased loans held-for-investment (i.e., “retained”)• Loans held-for-sale• Loans at fair value
Refer to Note 12 of JPMorgan Chase's 2020 Form 10-K for a detailed discussion of loans, including accounting policies. Refer to Note 3 ofthis Form 10-Q for further information on the Firm's elections of fair value accounting under the fair value option. Refer to Note 2 of this Form10-Q for information on loans carried at fair value and classified as trading assets.
Loan portfolioThe Firm’s loan portfolio is divided into three portfolio segments, which are the same segments used by the Firm to determine the allowancefor loan losses: Consumer, excluding credit card; Credit card; and Wholesale. Within each portfolio segment the Firm monitors and assessesthe credit risk in the following classes of loans, based on the risk characteristics of each loan class.
Consumer, excluding credit card
Credit card Wholesale
• Residential real estate• Auto and other
• Credit card loans • Secured by real estate• Commercial and industrial• Other
(a) Includes scored mortgage and home equity loans held in CCB and AWM, and scored mortgage loans held in CIB and Corporate.(b) Includes scored auto and business banking loans and overdrafts.(c) Includes loans held in CIB, CB, AWM, Corporate as well as risk-rated business banking and auto dealer loans held in CCB for which the wholesale methodology is applied
when determining the allowance for loan losses.(d) The wholesale portfolio segment's classes align with loan classifications as defined by the bank regulatory agencies, based on the loan's collateral, purpose, and type of
borrower.(e) Includes loans to financial institutions, states and political subdivisions, SPEs, nonprofits, personal investment companies and trusts, as well as loans to individuals and
individual entities (predominantly Global Private Bank clients within AWM). Refer to Note 14 of JPMorgan Chase’s 2020 Form 10-K for more information on SPEs.
The following tables summarize the Firm’s loan balances by portfolio segment.
March 31, 2021 Consumer, excludingcredit card Credit card Wholesale Total(in millions)
Retained $ 302,392 $ 131,772 $ 514,478 $ 948,642 Held-for-sale 1,232 721 9,945 11,898 At fair value 21,284 — 29,483 50,767 Total $ 324,908 $ 132,493 $ 553,906 $ 1,011,307
December 31, 2020 Consumer, excludingcredit card Credit card Wholesale Total(in millions)
Retained $ 302,127 $ 143,432 $ 514,947 $ 960,506 Held-for-sale 1,305 784 5,784 7,873 At fair value 15,147 — 29,327 44,474 Total $ 318,579 $ 144,216 $ 550,058 $ 1,012,853
(a) Excludes $2.9 billion of accrued interest receivables at both March 31, 2021, and December 31, 2020. The Firm wrote off accrued interest receivables of $13 million and $14million for the three months ended March 31, 2021 and 2020, respectively.
(b) Loans (other than those for which the fair value option has been elected) are presented net of unamortized discounts and premiums and net deferred loan fees or costs.These amounts were not material as of March 31, 2021, and December 31, 2020.
(c)(d)
(a)
(b)
(e)
(a)(b)
(a)(b)
121

The following table provides information about the carrying value of retained loans purchased, sold and reclassified to held-for-sale duringthe periods indicated. Loans that were reclassified to held-for-sale and sold in a subsequent period are excluded from the sales line of thistable.
2021 2020Three months ended March 31,(in millions)
Consumer, excludingcredit card Credit card Wholesale Total
Consumer, excluding credit card Credit card Wholesale Total
Purchases $ 191 $ — $ 226 $ 417 $ 1,172 $ — $ 386 $ 1,558 Sales 181 — 5,730 5,911 324 — 5,452 5,776 Retained loans reclassified to held-for-
sale 162 — 772 934 148 — 469 617
(a) Reclassifications of loans to held-for-sale are non-cash transactions.(b) Predominantly includes purchases of residential real estate loans, including the Firm’s voluntary repurchases of certain delinquent loans from loan pools as permitted by
Government National Mortgage Association (“Ginnie Mae”) guidelines for the three months ended March 31, 2021 and 2020. The Firm typically elects to repurchase thesedelinquent loans as it continues to service them and/or manage the foreclosure process in accordance with applicable requirements of Ginnie Mae, FHA, RHS, and/or VA.
(c) Excludes purchases of retained loans of $7.0 billion and $3.6 billion for the three months ended March 31, 2021 and 2020, respectively, which are predominantly sourcedthrough the correspondent origination channel and underwritten in accordance with the Firm’s standards.
Gains and losses on sales of loansNet gains/(losses) on sales of loans and lending-relatedcommitments (including adjustments to record loans and lending-related commitments held-for-sale at the lower of cost or fairvalue) recognized in noninterest revenue for the three monthsended March 31, 2021 was $132 million, of which $135 millionrelated to loans. Net losses on sales of loans and lending-relatedcommitments for the three months ended March 31, 2020 was$(913) million, of which $(142) million related to loans. In addition,the sale of loans may also result in write downs, recoveries orchanges in the allowance recognized in the provision for creditlosses.
Loan modificationsThe Firm has granted various forms of assistance to customersand clients impacted by the COVID-19 pandemic, includingpayment deferrals and covenant modifications. The majority of theFirm’s COVID-19 related loan modifications have not beenconsidered TDRs because:
• they represent short-term or other insignificant modifications,whether under the Firm’s regular loan modificationassessments or as permitted by regulatory guidance, or
• the Firm has elected to apply the option to suspend theapplication of accounting guidance for TDRs as provided by theCARES Act and extended by the Consolidated AppropriationsAct.
To the extent that certain modifications do not meet any of theabove criteria, the Firm accounts for them as TDRs.As permitted by regulatory guidance, the Firm does not placeloans with deferrals granted due to COVID-19 on nonaccrualstatus where such loans are not otherwise reportable asnonaccrual. The Firm considers expected losses of principal andaccrued interest associated with all COVID-19 related loanmodifications in its allowance for credit losses.Assistance provided in response to the COVID-19 pandemic coulddelay the recognition of delinquencies, nonaccrual status, and netcharge-offs for those customers who would have otherwise movedinto past due or nonaccrual status.
(b)(c) (b)(c)
(a)
122

Consumer, excluding credit card loan portfolioConsumer loans, excluding credit card loans, consist primarily ofscored residential mortgages, home equity loans and lines ofcredit, auto and business banking loans, with a focus on servingthe prime consumer credit market. The portfolio also includeshome equity loans secured by junior liens, prime mortgage loanswith an interest-only payment period and certain payment-optionloans that may result in negative amortization.The following table provides information about retained consumerloans, excluding credit card, by class.
(in millions)March 31,
2021December 31,
2020Residential real estate $ 219,173 $ 225,302 Auto and other 83,219 76,825 Total retained loans $ 302,392 $ 302,127
(a) At March 31, 2021 and December 31, 2020, included $23.4 billion and $19.2billion of loans, respectively, in Business Banking under the PPP.
Delinquency rates are the primary credit quality indicator forconsumer loans. Refer to Note 12 of JPMorgan Chase's 2020Form 10-K for further information on consumer credit qualityindicators.
(a)
123
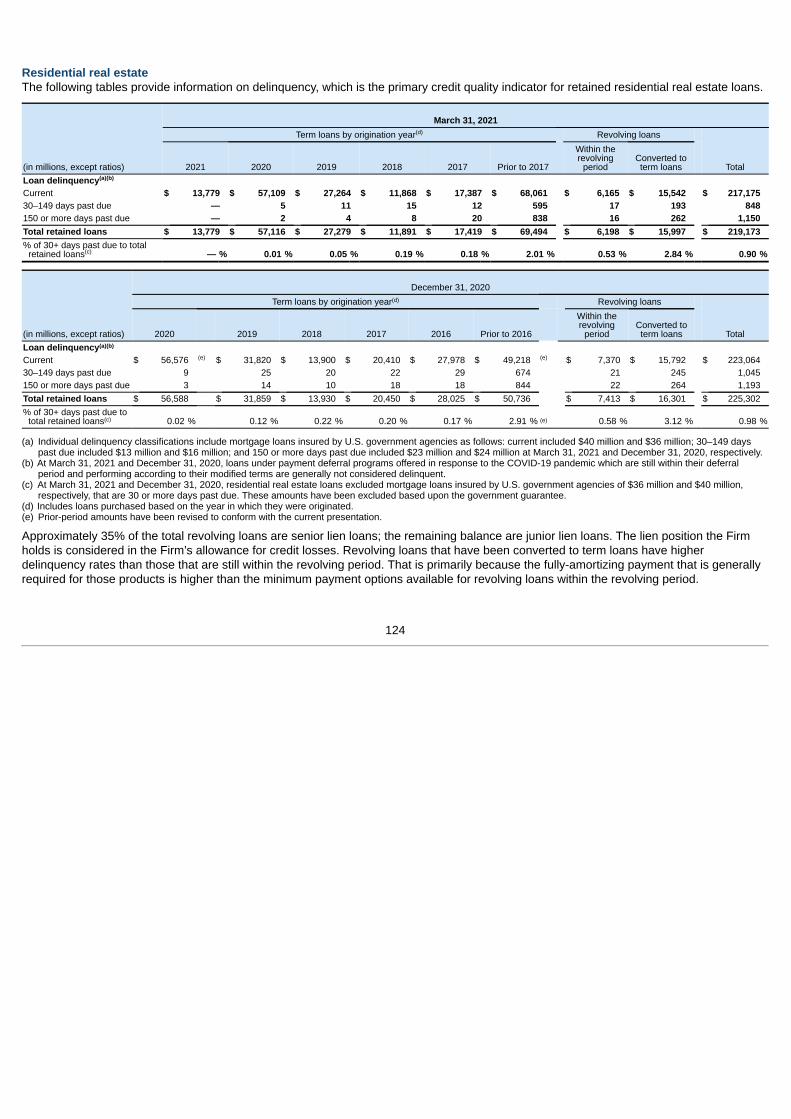
Residential real estateThe following tables provide information on delinquency, which is the primary credit quality indicator for retained residential real estate loans.
(in millions, except ratios)
March 31, 2021Term loans by origination year Revolving loans
Total2021 2020 2019 2018 2017 Prior to 2017
Within therevolving
periodConverted toterm loans
Loan delinquencyCurrent $ 13,779 $ 57,109 $ 27,264 $ 11,868 $ 17,387 $ 68,061 $ 6,165 $ 15,542 $ 217,17530–149 days past due — 5 11 15 12 595 17 193 848150 or more days past due — 2 4 8 20 838 16 262 1,150Total retained loans $ 13,779 $ 57,116 $ 27,279 $ 11,891 $ 17,419 $ 69,494 $ 6,198 $ 15,997 $ 219,173% of 30+ days past due to total
retained loans — % 0.01 % 0.05 % 0.19 % 0.18 % 2.01 % 0.53 % 2.84 % 0.90 %
(in millions, except ratios)
December 31, 2020
Term loans by origination year Revolving loans
Total2020 2019 2018 2017 2016 Prior to 2016
Within therevolving
periodConverted toterm loans
Loan delinquencyCurrent $ 56,576 $ 31,820 $ 13,900 $ 20,410 $ 27,978 $ 49,218 $ 7,370 $ 15,792 $ 223,06430–149 days past due 9 25 20 22 29 674 21 245 1,045150 or more days past due 3 14 10 18 18 844 22 264 1,193Total retained loans $ 56,588 $ 31,859 $ 13,930 $ 20,450 $ 28,025 $ 50,736 $ 7,413 $ 16,301 $ 225,302% of 30+ days past due to
total retained loans 0.02 % 0.12 % 0.22 % 0.20 % 0.17 % 2.91 % 0.58 % 3.12 % 0.98 %
(a) Individual delinquency classifications include mortgage loans insured by U.S. government agencies as follows: current included $40 million and $36 million; 30–149 dayspast due included $13 million and $16 million; and 150 or more days past due included $23 million and $24 million at March 31, 2021 and December 31, 2020, respectively.
(b) At March 31, 2021 and December 31, 2020, loans under payment deferral programs offered in response to the COVID-19 pandemic which are still within their deferralperiod and performing according to their modified terms are generally not considered delinquent.
(c) At March 31, 2021 and December 31, 2020, residential real estate loans excluded mortgage loans insured by U.S. government agencies of $36 million and $40 million,respectively, that are 30 or more days past due. These amounts have been excluded based upon the government guarantee.
(d) Includes loans purchased based on the year in which they were originated.(e) Prior-period amounts have been revised to conform with the current presentation.
Approximately 35% of the total revolving loans are senior lien loans; the remaining balance are junior lien loans. The lien position the Firmholds is considered in the Firm’s allowance for credit losses. Revolving loans that have been converted to term loans have higherdelinquency rates than those that are still within the revolving period. That is primarily because the fully-amortizing payment that is generallyrequired for those products is higher than the minimum payment options available for revolving loans within the revolving period.
(d)
(a)(b)
(c)
(d)
(a)(b)
(e) (e)
(c) (e)
124

Nonaccrual loans and other credit quality indicatorsThe following table provides information on nonaccrual and other credit quality indicators for retained residential real estate loans.
(in millions, except weighted-average data) March 31, 2021 December 31, 2020Nonaccrual loans $ 5,247 $ 5,313 90 or more days past due and government guaranteed 30 33
Current estimated LTV ratiosGreater than 125% and refreshed FICO scores:
Equal to or greater than 660 $ 19 $ 10 Less than 660 14 18
101% to 125% and refreshed FICO scores:Equal to or greater than 660 105 72 Less than 660 46 65
80% to 100% and refreshed FICO scores:Equal to or greater than 660 1,482 2,365 Less than 660 286 435
Less than 80% and refreshed FICO scores:Equal to or greater than 660 204,165 208,457 Less than 660 11,267 12,072
No FICO/LTV available 1,713 1,732 U.S. government-guaranteed 76 76 Total retained loans $ 219,173 $ 225,302
Weighted average LTV ratio 53 % 54 %Weighted average FICO 764 763
Geographic regionCalifornia $ 70,787 $ 73,444 New York 32,042 32,287 Florida 14,086 13,981 Texas 13,320 13,773 Illinois 12,350 13,130 Colorado 8,085 8,235 Washington 7,687 7,917 New Jersey 6,934 7,227 Massachusetts 5,715 5,784 Connecticut 5,012 5,024 All other 43,155 44,500 Total retained loans $ 219,173 $ 225,302
(a) Includes collateral-dependent residential real estate loans that are charged down to the fair value of the underlying collateral less costs to sell. The Firm reports, in accordance withregulatory guidance, residential real estate loans that have been discharged under Chapter 7 bankruptcy and not reaffirmed by the borrower (“Chapter 7 loans”) as collateral-dependent nonaccrual TDRs, regardless of their delinquency status. At March 31, 2021, approximately 7% of Chapter 7 residential real estate loans were 30 days or more pastdue.
(b) Generally, all consumer nonaccrual loans have an allowance. In accordance with regulatory guidance, certain nonaccrual loans that are considered collateral-dependent have beencharged down to the lower of amortized cost or the fair value of their underlying collateral less costs to sell. If the value of the underlying collateral has subsequently improved, therelated allowance may be negative.
(c) Interest income on nonaccrual loans recognized on a cash basis was $45 million and $43 million for the three months ended March 31, 2021 and 2020, respectively.(d) Generally excludes loans under payment deferral programs offered in response to the COVID-19 pandemic. Includes loans to customers that have exited COVID-19 payment
deferral programs and are 90 or more days past due, predominantly all of which are considered collateral-dependent and charged down to the lower of amortized cost or fair valueof the underlying collateral less costs to sell.
(e) These balances are excluded from nonaccrual loans as the loans are guaranteed by U.S government agencies. Typically the principal balance of the loans is insured and interest isguaranteed at a specified reimbursement rate subject to meeting agreed-upon servicing guidelines. At March 31, 2021 and December 31, 2020, these balances were no longeraccruing interest based on the agreed-upon servicing guidelines. There were no loans that were not guaranteed by U.S. government agencies that are 90 or more days past dueand still accruing interest at March 31, 2021 and December 31, 2020.
(f) Represents the aggregate unpaid principal balance of loans divided by the estimated current property value. Current property values are estimated, at a minimum, quarterly, basedon home valuation models using nationally recognized home price index valuation estimates incorporating actual data to the extent available and forecasted data where actual datais not available. Current estimated combined LTV for junior lien home equity loans considers all available lien positions, as well as unused lines, related to the property.
(g) Refreshed FICO scores represent each borrower’s most recent credit score, which is obtained by the Firm on at least a quarterly basis.(h) Excludes loans with no FICO and/or LTV data available.(i) The geographic regions presented in the table are ordered based on the magnitude of the corresponding loan balances at March 31, 2021.(j) At both March 31, 2021 and December 31, 2020, included mortgage loans insured by U.S. government agencies of $76 million. These amounts have been excluded from the
geographic regions presented based upon the government guarantee.
(a)(b)(c)(d)
(e)
(f)(g)
(f)(h)
(g)(h)
(i)
(j)
125

Loan modificationsModifications of residential real estate loans where the Firm grantsconcessions to borrowers who are experiencing financial difficultyare generally accounted for and reported as TDRs. Loans withshort-term or other insignificant modifications that are notconsidered concessions are not TDRs nor are loans for which theFirm has elected to apply the option to suspend the application ofaccounting guidance for TDRs as provided by the CARES Act andextended by the Consolidated Appropriations Act. The carryingvalue of new TDRs was $251 million and $142 million for the threemonths ended March 31, 2021 and 2020, respectively. There wereno additional commitments to lend to borrowers whose residentialreal estate loans have been modified in TDRs.
Nature and extent of modificationsThe Firm’s proprietary modification programs as well asgovernment programs, including U.S. GSE programs, generallyprovide various concessions to financially troubled borrowersincluding, but not limited to, interest rate reductions, term orpayment extensions and delays of principal and/or interestpayments that would otherwise have been required under theterms of the original agreement.
The following table provides information about how residential realestate loans were modified in TDRs under the Firm’s lossmitigation programs described above during the periodspresented. This table excludes Chapter 7 loans where the soleconcession granted is the discharge of debt, loans with short-termor other insignificant modifications that are not consideredconcessions, and loans for which the Firm has elected to apply theoption to suspend the application of accounting guidance for TDRsas provided by the CARES Act and extended by the ConsolidatedAppropriations Act.
Three months ended March 31,2021 2020
Number of loans approved for a trialmodification 1,401 1,996
Number of loans permanently modified 1,714 1,481 Concession granted:
Interest rate reduction 72 % 79 %Term or payment extension 40 81 Principal and/or interest deferred 31 11 Principal forgiveness 4 4 Other 51 55
(a) Represents concessions granted in permanent modifications as a percentageof the number of loans permanently modified. The sum of the percentagesexceeds 100% because predominantly all of the modifications include morethan one type of concession. Concessions offered on trial modifications aregenerally consistent with those granted on permanent modifications.
(b) Includes variable interest rate to fixed interest rate modifications and paymentdelays that meet the definition of a TDR.
Financial effects of modifications and redefaultsThe following table provides information about the financial effectsof the various concessions granted in modifications of residentialreal estate loans under the loss mitigation programs describedabove and about redefaults of certain loans modified in TDRs forthe periods presented. The following table presents only thefinancial effects of permanent modifications and do not includetemporary concessions offered through trial modifications. Thistable also excludes Chapter 7 loans where the sole concessiongranted is the discharge of debt, loans with short-term or otherinsignificant modifications that are not considered concessions,and loans for which the Firm has elected to apply the option tosuspend the application of accounting guidance for TDRs asprovided by the CARES Act and extended by the ConsolidatedAppropriations Act.
(in millions, except weighted-average data)
Three months ended March 31,
2021 2020Weighted-average interest rate of loans with
interest rate reductions – before TDR 4.57 % 5.20 %Weighted-average interest rate of loans with
interest rate reductions – after TDR 2.91 3.48 Weighted-average remaining contractual term
(in years) of loans with term or paymentextensions – before TDR 24 22
Weighted-average remaining contractual term(in years) of loans with term or paymentextensions – after TDR 39 39
Charge-offs recognized upon permanentmodification $ — $ —
Principal deferred 12 5 Principal forgiven 1 2 Balance of loans that redefaulted within one
year of permanent modification $ 24 $ 70
(a) Represents loans permanently modified in TDRs that experienced a paymentdefault in the periods presented, and for which the payment default occurredwithin one year of the modification. The dollar amounts presented represent thebalance of such loans at the end of the reporting period in which such loansdefaulted. For residential real estate loans modified in TDRs, payment defaultis deemed to occur when the loan becomes two contractual payments pastdue. In the event that a modified loan redefaults, it will generally be liquidatedthrough foreclosure or another similar type of liquidation transaction. Redefaultsof loans modified within the last twelve months may not be representative ofultimate redefault levels.
At March 31, 2021, the weighted-average estimated remaininglives of residential real estate loans permanently modified in TDRswere six years. The estimated remaining lives of these loansreflect estimated prepayments, both voluntary and involuntary(i.e., foreclosures and other forced liquidations).
(a)
(b)
(a)
126

Active and suspended foreclosureAt March 31, 2021 and December 31, 2020, the Firm hadresidential real estate loans, excluding those insured by U.S.government agencies, with a carrying value of $802 million and$846 million, respectively, that were not included in REO, but werein the process of active or suspended foreclosure.
In response to the COVID-19 pandemic, the Firm has temporarilysuspended certain foreclosure activities. This could delayrecognition of foreclosed properties until the foreclosuremoratoriums are lifted.
Auto and otherThe following tables provide information on delinquency, which is the primary credit quality indicator for retained auto and other consumerloans.
March 31, 2021
(in millions, except ratios)
Term Loans by origination year Revolving loans
2021 2020 2019 2018 2017 Prior to 2017
Within therevolving
periodConverted toterm loans Total
Loan delinquencyCurrent $ 17,719 $ 39,161 $ 11,405 $ 6,349 $ 3,706 $ 2,045 $ 2,369 $ 149 $ 82,90330–119 days past due 32 50 65 47 31 33 21 12 291120 or more days past due — — — 1 1 1 12 10 25Total retained loans $ 17,751 $ 39,211 $ 11,470 $ 6,397 $ 3,738 $ 2,079 $ 2,402 $ 171 $ 83,219% of 30+ days past due to
total retained loans 0.18% 0.13% 0.57 % 0.75 % 0.86 % 1.64 % 1.37 % 12.87 % 0.38 %
December 31, 2020
(in millions, except ratios)
Term Loans by origination year Revolving loans
2020 2019 2018 2017 2016 Prior to 2016
Within therevolving
periodConverted toterm loans Total
Loan delinquencyCurrent $ 46,169 $ 12,829 $ 7,367 $ 4,521 $ 2,058 $ 742 $ 2,517 $ 158 $ 76,36130–119 days past due 97 107 77 53 42 23 30 17 446120 or more days past due — — — 1 — 1 8 8 18Total retained loans $ 46,266 $ 12,936 $ 7,444 $ 4,575 $ 2,100 $ 766 $ 2,555 $ 183 $ 76,825% of 30+ days past due to
total retained loans 0.21% 0.83 % 1.03 % 1.18 % 2.00 % 3.13 % 1.49 % 13.66 % 0.60 %
(a) At March 31, 2021 and December 31, 2020, loans under payment deferral programs offered in response to the COVID-19 pandemic which are still within their deferralperiod and performing according to their modified terms are generally not considered delinquent.
(b) At March 31, 2021, included $8.7 billion of loans originated in 2021 and $14.7 billion of loans originated in 2020 in Business Banking under the PPP. PPP loans areguaranteed by the SBA. Other than in certain limited circumstances, the Firm typically does not recognize charge-offs, classify as nonaccrual nor record an allowance forloan losses on these loans.
(c) At December 31, 2020, included $19.2 billion of loans in Business Banking under the PPP.
(a)
(b) (b)
(a)
(c)
127

Nonaccrual and other credit quality indicatorsThe following table provides information on nonaccrual and othercredit quality indicators for retained auto and other consumerloans.
(in millions, except ratios)
Total Auto and other
March 31, 2021December 31,
2020Nonaccrual loans 135 151
Geographic regionCalifornia $ 13,514 $ 12,302 New York 10,551 8,824 Texas 8,746 8,235 Florida 5,117 4,668 Illinois 4,003 3,768 New Jersey 2,895 2,646 Arizona 2,619 2,465 Ohio 2,293 2,163 Colorado 2,021 1,910 Pennsylvania 2,004 1,924 All other 29,456 27,920
Total retained loans $ 83,219 $ 76,825
(a) There were no loans that were 90 or more days past due and still accruinginterest at March 31, 2021 and December 31, 2020.
(b) Generally, all consumer nonaccrual loans have an allowance. In accordancewith regulatory guidance, certain nonaccrual loans that are consideredcollateral-dependent have been charged down to the lower of amortized cost orthe fair value of their underlying collateral less costs to sell. If the value of theunderlying collateral has subsequently improved, the related allowance may benegative.
(c) Interest income on nonaccrual loans recognized on a cash basis was notmaterial for the three months ended March 31, 2021 and 2020.
(d) The geographic regions presented in this table are ordered based on themagnitude of the corresponding loan balances at March 31, 2021.
Loan modificationsCertain other consumer loan modifications are considered to beTDRs as they provide various concessions to borrowers who areexperiencing financial difficulty. Loans with short-term or otherinsignificant modifications that are not considered concessions arenot TDRs.
The impact of these modifications, as well as new TDRs, were notmaterial to the Firm for the three months ended March 31, 2021and 2020. Additional commitments to lend to borrowers whoseloans have been modified in TDRs as of March 31, 2021 andDecember 31, 2020 were not material.
(a)(b)(c)
(d)
128

Credit card loan portfolioThe credit card portfolio segment includes credit card loansoriginated and purchased by the Firm. Delinquency rates are theprimary credit quality indicator for credit card loans.
Refer to Note 12 of JPMorgan Chase's 2020 Form 10-K for furtherinformation on the credit card loan portfolio, including credit qualityindicators.
The following tables provide information on delinquency, which is the primary credit quality indicator for retained credit card loans.
(in millions, except ratios)
March 31, 2021
Within the revolving period Converted to term loans Total
Loan delinquencyCurrent and less than 30 days past due
and still accruing $ 128,749 $ 1,178 $ 129,927 30–89 days past due and still accruing 714 73 787 90 or more days past due and still accruing 1,018 40 1,058 Total retained loans $ 130,481 $ 1,291 $ 131,772 Loan delinquency ratios% of 30+ days past due to total retained loans 1.33 % 8.75 % 1.40 %% of 90+ days past due to total retained loans 0.78 3.10 0.80
(in millions, except ratios)
December 31, 2020
Within the revolving period Converted to term loans Total
Loan delinquencyCurrent and less than 30 days past due
and still accruing $ 139,783 $ 1,239 $ 141,022 30–89 days past due and still accruing 997 94 1,091 90 or more days past due and still accruing 1,277 42 1,319 Total retained loans $ 142,057 $ 1,375 $ 143,432 Loan delinquency ratios% of 30+ days past due to total retained loans 1.60 % 9.89 % 1.68 %% of 90+ days past due to total retained loans 0.90 3.05 0.92
(a) At March 31, 2021 and December 31, 2020, loans under payment deferral programs offered in response to the COVID-19 pandemic which are still within their deferralperiod and performing according to their modified terms are generally not considered delinquent.
(b) Represents TDRs.
Other credit quality indicatorsThe following table provides information on other credit quality indicators for retained credit card loans.
(in millions, except ratios) March 31, 2021 December 31, 2020Geographic regionCalifornia $ 19,266 $ 20,921 Texas 13,628 14,544 New York 10,935 11,919 Florida 8,889 9,562 Illinois 7,329 8,006 New Jersey 5,420 5,927 Ohio 4,254 4,673 Pennsylvania 4,036 4,476 Colorado 3,798 4,092 Michigan 3,245 3,553 All other 50,972 55,759 Total retained loans $ 131,772 $ 143,432 Percentage of portfolio based on carrying value with estimated refreshed FICO scores
Equal to or greater than 660 86.3 % 85.9 %Less than 660 13.5 13.9 No FICO available 0.2 0.2
(a) The geographic regions presented in the table are ordered based on the magnitude of the corresponding loan balances at March 31, 2021.
(b)
(a)
(b)
(a)
(a)
129

Loan modificationsThe Firm may offer one of a number of loan modification programsgranting concessions to credit card borrowers who areexperiencing financial difficulty. The Firm grants concessions formost of the credit card loans under long-term programs. Thesemodifications involve placing the customer on a fixed paymentplan, generally for 60 months, and typically include reducing theinterest rate on the credit card. Substantially all modificationsunder the Firm’s long-term programs are considered to be TDRs.Loans with short-term or other insignificant modifications that arenot considered concessions are not TDRs.If the cardholder does not comply with the modified paymentterms, then the credit card loan continues to age and will ultimatelybe charged-off in accordance with the Firm’s standard charge-offpolicy. In most cases, the Firm does not reinstate the borrower’sline of credit.
Financial effects of modifications and redefaultsThe following table provides information about the financial effectsof the concessions granted on credit card loans modified in TDRsand redefaults for the periods presented. For all periods disclosed,new enrollments were less than 1% of total retained credit cardloans.
(in millions, except weighted-average data)
Three months ended March31,
2021 2020Balance of new TDRs $ 143 $ 277Weighted-average interest rate of loans –
before TDR 17.74 % 18.82 %Weighted-average interest rate of loans – after
TDR 5.23 4.02 Balance of loans that redefaulted within one
year of modification $ 19 $ 36
(a) Represents the outstanding balance prior to modification.(b) Represents loans modified in TDRs that experienced a payment default in the
periods presented, and for which the payment default occurred within one yearof the modification. The amounts presented represent the balance of suchloans as of the end of the quarter in which they defaulted.
For credit card loans modified in TDRs, payment default isdeemed to have occurred when the borrower misses twoconsecutive contractual payments. Defaulted modified credit cardloans remain in the modification program and continue to becharged off in accordance with the Firm’s standard charge-offpolicy.
(a)
(b)
130
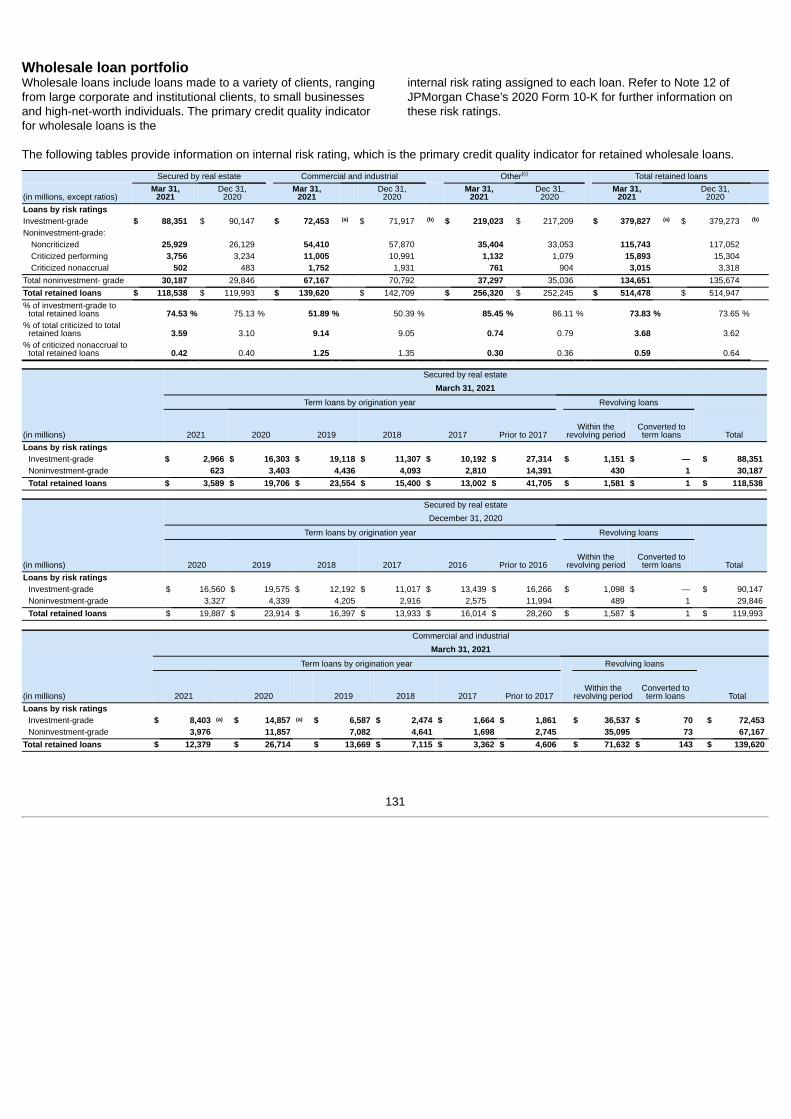
Wholesale loan portfolioWholesale loans include loans made to a variety of clients, rangingfrom large corporate and institutional clients, to small businessesand high-net-worth individuals. The primary credit quality indicatorfor wholesale loans is the
internal risk rating assigned to each loan. Refer to Note 12 ofJPMorgan Chase’s 2020 Form 10-K for further information onthese risk ratings.
The following tables provide information on internal risk rating, which is the primary credit quality indicator for retained wholesale loans.
Secured by real estate Commercial and industrial Other Total retained loans
(in millions, except ratios)Mar 31,
2021Dec 31,
2020Mar 31,
2021Dec 31,
2020Mar 31,
2021Dec 31,
2020Mar 31,
2021Dec 31,
2020Loans by risk ratingsInvestment-grade $ 88,351 $ 90,147 $ 72,453 $ 71,917 $ 219,023 $ 217,209 $ 379,827 $ 379,273 Noninvestment-grade:
Noncriticized 25,929 26,129 54,410 57,870 35,404 33,053 115,743 117,052 Criticized performing 3,756 3,234 11,005 10,991 1,132 1,079 15,893 15,304 Criticized nonaccrual 502 483 1,752 1,931 761 904 3,015 3,318
Total noninvestment- grade 30,187 29,846 67,167 70,792 37,297 35,036 134,651 135,674 Total retained loans $ 118,538 $ 119,993 $ 139,620 $ 142,709 $ 256,320 $ 252,245 $ 514,478 $ 514,947 % of investment-grade to
total retained loans 74.53 % 75.13 % 51.89 % 50.39 % 85.45 % 86.11 % 73.83 % 73.65 %% of total criticized to total
retained loans 3.59 3.10 9.14 9.05 0.74 0.79 3.68 3.62 % of criticized nonaccrual to
total retained loans 0.42 0.40 1.25 1.35 0.30 0.36 0.59 0.64
Secured by real estate
(in millions)
March 31, 2021
Term loans by origination year Revolving loans
2021 2020 2019 2018 2017 Prior to 2017Within the
revolving periodConverted toterm loans Total
Loans by risk ratingsInvestment-grade $ 2,966 $ 16,303 $ 19,118 $ 11,307 $ 10,192 $ 27,314 $ 1,151 $ — $ 88,351 Noninvestment-grade 623 3,403 4,436 4,093 2,810 14,391 430 1 30,187 Total retained loans $ 3,589 $ 19,706 $ 23,554 $ 15,400 $ 13,002 $ 41,705 $ 1,581 $ 1 $ 118,538
Secured by real estate
(in millions)
December 31, 2020
Term loans by origination year Revolving loans
2020 2019 2018 2017 2016 Prior to 2016Within the
revolving periodConverted toterm loans Total
Loans by risk ratingsInvestment-grade $ 16,560 $ 19,575 $ 12,192 $ 11,017 $ 13,439 $ 16,266 $ 1,098 $ — $ 90,147 Noninvestment-grade 3,327 4,339 4,205 2,916 2,575 11,994 489 1 29,846 Total retained loans $ 19,887 $ 23,914 $ 16,397 $ 13,933 $ 16,014 $ 28,260 $ 1,587 $ 1 $ 119,993
Commercial and industrial
(in millions)
March 31, 2021
Term loans by origination year Revolving loans
2021 2020 2019 2018 2017 Prior to 2017Within the
revolving periodConverted toterm loans Total
Loans by risk ratingsInvestment-grade $ 8,403 $ 14,857 $ 6,587 $ 2,474 $ 1,664 $ 1,861 $ 36,537 $ 70 $ 72,453 Noninvestment-grade 3,976 11,857 7,082 4,641 1,698 2,745 35,095 73 67,167
Total retained loans $ 12,379 $ 26,714 $ 13,669 $ 7,115 $ 3,362 $ 4,606 $ 71,632 $ 143 $ 139,620
(c)
(a) (b) (a) (b)
(a) (a)
131

Commercial and industrial
(in millions)
December 31, 2020
Term loans by origination year Revolving loans
2020 2019 2018 2017 2016 Prior to 2016Within the
revolving periodConverted toterm loans Total
Loans by risk ratingsInvestment-grade $ 21,211 $ 7,304 $ 2,934 $ 1,748 $ 1,032 $ 1,263 $ 36,424 $ 1 $ 71,917 Noninvestment-grade 15,060 8,636 5,131 2,104 497 2,439 36,852 73 70,792
Total retained loans $ 36,271 $ 15,940 $ 8,065 $ 3,852 $ 1,529 $ 3,702 $ 73,276 $ 74 $ 142,709
Other
(in millions)
March 31, 2021
Term loans by origination year Revolving loans
2021 2020 2019 2018 2017 Prior to 2017Within the
revolving periodConverted toterm loans Total
Loans by risk ratingsInvestment-grade $ 8,483 $ 25,689 $ 8,177 $ 5,052 $ 5,874 $ 16,897 $ 148,248 $ 603 $ 219,023 Noninvestment-grade 3,500 4,179 2,191 1,621 485 1,065 24,132 124 37,297
Total retained loans $ 11,983 $ 29,868 $ 10,368 $ 6,673 $ 6,359 $ 17,962 $ 172,380 $ 727 $ 256,320
Other
(in millions)
December 31, 2020
Term loans by origination year Revolving loans
2020 2019 2018 2017 2016 Prior to 2016Within the
revolving periodConverted toterm loans Total
Loans by risk ratingsInvestment-grade $ 31,389 $ 10,169 $ 6,994 $ 6,206 $ 3,553 $ 12,595 $ 145,524 $ 779 $ 217,209 Noninvestment-grade 5,009 2,220 1,641 550 146 636 24,710 124 35,036
Total retained loans $ 36,398 $ 12,389 $ 8,635 $ 6,756 $ 3,699 $ 13,231 $ 170,234 $ 903 $ 252,245
(a) At March 31, 2021, included $1.2 billion of loans originated in 2021 and $7.7 billion of loans originated in 2020 under the PPP, of which $1.2 billion and $7.1 billion areincluded in commercial and industrial, respectively. PPP loans are guaranteed by the SBA and considered investment-grade. Other than in certain limited circumstances, theFirm typically does not recognize charge-offs, classify as nonaccrual nor record an allowance for loan losses on these loans.
(b) At December 31, 2020, included $8.0 billion of loans under the PPP, of which $7.4 billion is included in commercial and industrial.(c) Includes loans to financial institutions, states and political subdivisions, SPEs, nonprofits, personal investment companies and trusts, as well as loans to individuals and
individual entities (predominantly Global Private Bank clients within AWM). Refer to Note 14 of JPMorgan Chase’s 2020 Form 10-K for more information on SPEs.
The following table presents additional information on retained loans secured by real estate, which consists of loans secured wholly orsubstantially by a lien or liens on real property at origination.
(in millions, except ratios)
Multifamily Other commercialTotal retained loans secured by real
estate
Mar 31,2021
Dec 31,2020
Mar 31,2021
Dec 31,2020
Mar 31,2021
Dec 31,2020
Retained loans secured by real estate $ 72,194 $ 73,078 $ 46,344 $ 46,915 $ 118,538 $ 119,993 Criticized 1,560 1,144 2,698 2,573 4,258 3,717 % of total criticized to total retained loans secured by real estate 2.16 % 1.57 % 5.82 % 5.48 % 3.59 % 3.10 %Criticized nonaccrual $ 70 $ 56 $ 432 $ 427 $ 502 $ 483 % of criticized nonaccrual loans to total retained loans secured by real estate 0.10 % 0.08 % 0.93 % 0.91 % 0.42 % 0.40 %
(b)
(c)
(c)
132

Geographic distribution and delinquencyThe following table provides information on the geographic distribution and delinquency for retained wholesale loans.
Secured by real estateCommercial
and industrial OtherTotal
retained loans(in millions, except ratios)
Mar 31,2021
Dec 31,2020
Mar 31,2021
Dec 31,2020
Mar 31,2021
Dec 31,2020
Mar 31,2021
Dec 31,2020
Loans by geographic distributionTotal U.S. $ 115,451 $ 116,990 $ 106,309 $ 109,273 $ 181,272 $ 180,583 $ 403,032 $ 406,846 Total non-U.S. 3,087 3,003 33,311 33,436 75,048 71,662 111,446 108,101
Total retained loans $ 118,538 $ 119,993 $ 139,620 $ 142,709 $ 256,320 $ 252,245 $ 514,478 $ 514,947 Loan delinquency
Current and less than 30 days past due and still accruing $ 117,559 $ 118,894 $ 136,980 $ 140,100 $ 253,632 $ 249,713 $ 508,171 $ 508,707 30–89 days past due and still accruing 462 601 830 658 1,769 1,606 3,061 2,865 90 or more days past due and still accruing 15 15 58 20 158 22 231 57 Criticized nonaccrual 502 483 1,752 1,931 761 904 3,015 3,318
Total retained loans $ 118,538 $ 119,993 $ 139,620 $ 142,709 $ 256,320 $ 252,245 $ 514,478 $ 514,947
(a) The U.S. and non-U.S. distribution is determined based predominantly on the domicile of the borrower.(b) The credit quality of wholesale loans is assessed primarily through ongoing review and monitoring of an obligor’s ability to meet contractual obligations rather than relying on
the past due status, which is generally a lagging indicator of credit quality. Generally excludes loans under payment deferral programs offered in response to the COVID-19pandemic.
(c) Represents loans that are considered well-collateralized and therefore still accruing interest.
The following table provides information about net charge-offs on retained wholesale loans.
Wholesale net charge-offs/(recoveries) Secured by real estateCommercial
and industrial OtherTotal
retained loansThree months ended March 31,(in millions) 2021 2020 2021 2020 2021 2020 2021 2020Net charge-offs/(recoveries) $ — $ — $ 50 $ 168 $ 3 $ (6) $ 53 $ 162
Nonaccrual loansThe following table provides information on retained wholesale nonaccrual loans.
(in millions)
Secured by real estateCommercial
and industrial OtherTotal
retained loans
Mar 31,2021
Dec 31,2020
Mar 31,2021
Dec 31,2020
Mar 31,2021
Dec 31,2020
Mar 31,2021
Dec 31,2020
Nonaccrual loansWith an allowance $ 398 $ 351 $ 1,329 $ 1,667 $ 544 $ 800 $ 2,271 $ 2,818 Without an allowance 104 132 423 264 217 104 744 500 Total nonaccrual loans $ 502 $ 483 $ 1,752 $ 1,931 $ 761 $ 904 $ 3,015 $ 3,318
(a) Loans that were modified in response to the COVID-19 pandemic continue to be risk-rated in accordance with the Firm’s overall credit risk management framework. As ofMarch 31, 2021, predominantly all of these loans were considered performing.
(b) When the discounted cash flows or collateral value equals or exceeds the amortized cost of the loan, the loan does not require an allowance. This typically occurs when theloans have been partially charged off and/or there have been interest payments received and applied to the loan balance.
(c) Interest income on nonaccrual loans recognized on a cash basis was not material for the three months ended March 31, 2021 and 2020.
Loan modificationsCertain loan modifications are considered to be TDRs as theyprovide various concessions to borrowers who are experiencingfinancial difficulty. Loans with short-term or other insignificantmodifications that are not considered concessions are not TDRsnor are loans for which the Firm has elected to apply the option tosuspend the application of accounting guidance for TDRs asprovided by the CARES Act and extended by the ConsolidatedAppropriations Act. The carrying value of TDRs was $1.2 billionand $954 million as of March 31, 2021, and December 31, 2020,respectively. The carrying value of new TDRs was $428 millionand $76 million for the three months ended March 31, 2021 and2020, respectively. The new TDRs for the three months endedMarch 31, 2021 were primarily from Commercial and Industrialloan modifications that included extending maturity dates and thereceipt of assets
in partial satisfaction of the loan. The impact of these modificationsresulting in new TDRs was not material to the Firm for the threemonths ended March 31, 2021 and 2020.
(a)
(b)
(c)
(a)
(b)
(c)
133

Note 12 – Allowance for credit lossesThe Firm's allowance for credit losses represents management'sestimate of expected credit losses over the remaining expected lifeof the Firm's financial assets measured at amortized cost andcertain off-balance sheet lending-related commitments.Refer to Note 13 of JPMorgan Chase's 2020 Form 10-K for adetailed discussion of the allowance for credit losses and therelated accounting policies.
134

Allowance for credit losses and related informationThe table below summarizes information about the allowances for loan losses and lending-related commitments, and includes a breakdownof loans and lending-related commitments by impairment methodology. Refer to Note 10 of JPMorgan Chase’s 2020 Form 10-K for furtherinformation on the allowance for credit losses on investment securities.
2021 2020
Three months ended March 31,(in millions)
Consumer,excluding credit card Credit card Wholesale Total
Consumer,excludingcredit card Credit card Wholesale Total
Allowance for loan lossesBeginning balance at January 1, $ 3,636 $ 17,800 $ 6,892 $ 28,328 $ 2,538 $ 5,683 $ 4,902 $ 13,123 Cumulative effect of a change in accounting principle NA NA NA NA 297 5,517 (1,642) 4,172 Gross charge-offs 166 1,214 88 1,468 233 1,488 181 1,902 Gross recoveries collected (145) (231) (35) (411) (239) (175) (19) (433)Net charge-offs/(recoveries) 21 983 53 1,057 (6) 1,313 162 1,469 Provision for loan losses (932) (2,517) (830) (4,279) 613 5,063 1,742 7,418 Other (1) — 10 9 — — — — Ending balance at March 31, $ 2,682 $ 14,300 $ 6,019 $ 23,001 $ 3,454 $ 14,950 $ 4,840 $ 23,244
Allowance for lending-related commitmentsBeginning balance at January 1, $ 187 $ — $ 2,222 $ 2,409 $ 12 $ — $ 1,179 $ 1,191 Cumulative effect of a change in accounting principle NA NA NA NA 133 — (35) 98 Provision for lending-related commitments (52) — 159 107 6 — 852 858 Other — — — — — — — — Ending balance at March 31, $ 135 $ — $ 2,381 $ 2,516 $ 151 $ — $ 1,996 $ 2,147
Total allowance for credit losses $ 2,817 $ 14,300 $ 8,400 $ 25,517 $ 3,605 $ 14,950 $ 6,836 $ 25,391
Allowance for loan losses by impairment methodologyAsset-specific $ (348) $ 522 $ 529 $ 703 $ 223 $ 530 $ 556 $ 1,309 Portfolio-based 3,030 13,778 5,490 22,298 3,231 14,420 4,284 21,935 Total allowance for loan losses $ 2,682 $ 14,300 $ 6,019 $ 23,001 $ 3,454 $ 14,950 $ 4,840 $ 23,244
Loans by impairment methodologyAsset-specific $ 16,008 $ 1,291 $ 3,394 $ 20,693 $ 17,036 $ 1,505 $ 2,021 $ 20,562 Portfolio-based 286,384 130,481 511,084 927,949 276,743 152,516 553,268 982,527 Total retained loans $ 302,392 $ 131,772 $ 514,478 $ 948,642 $ 293,779 $ 154,021 $ 555,289 $ 1,003,089
Collateral-dependent loansNet charge-offs $ 20 $ — $ 2 $ 22 $ 29 $ — $ 17 $ 46 Loans measured at fair value of collateral less cost to sell 4,790 — 354 5,144 2,941 — 94 3,035
Allowance for lending-related commitments byimpairment methodology
Asset-specific $ — $ — $ 144 $ 144 $ — $ — $ 187 $ 187 Portfolio-based 135 — 2,237 2,372 151 — 1,809 1,960 Total allowance for lending-related commitments $ 135 $ — $ 2,381 $ 2,516 $ 151 $ — $ 1,996 $ 2,147
Lending-related commitments by impairmentmethodology
Asset-specific $ — $ — $ 800 $ 800 $ — $ — $ 619 $ 619 Portfolio-based 34,468 — 440,830 475,298 33,498 — 338,580 372,078 Total lending-related commitments $ 34,468 $ — $ 441,630 $ 476,098 $ 33,498 $ — $ 339,199 $ 372,697
(a) Includes collateral dependent loans, including those considered TDRs and those for which foreclosure is deemed probable, modified PCD loans and non-collateraldependent loans that have been modified or are reasonably expected to be modified in a TDR. Also includes risk-rated loans that have been placed on nonaccrual status forthe wholesale portfolio segment. The asset-specific credit card allowance for loans modified, or reasonably expected to be modified, in a TDR is calculated based on theloans’ original contractual interest rates and does not consider any incremental penalty rates.
(b) The allowance for lending-related commitments is reported in accounts payable and other liabilities on the Consolidated balance sheets.(c) At March 31, 2021 and 2020, lending-related commitments excluded $21.8 billion and $8.0 billion, respectively, for the consumer, excluding credit card portfolio segment;
$674.4 billion and $681.4 billion, respectively, for the credit card portfolio segment; and $39.6 billion and $24.0 billion, respectively, for the wholesale portfolio segment,which were not subject to the allowance for lending-related commitments.
(d) Excludes the allowance for credit losses on HTM securities. The allowance for credit losses on HTM securities was $94 million and $19 million as of March 31, 2021 and2020, respectively.
(d) (d)
(a)
(a)
(b)
(c)
135

Discussion of changes in the allowanceThe allowance for credit losses as of March 31, 2021 decreasedwhen compared to December 31, 2020, consisting of:• a $4.5 billion reduction in consumer, predominantly in the credit
card portfolio, reflecting improvements in the Firm'smacroeconomic scenarios, and in the residential real estateportfolio primarily due to the continued improvement in the HPIexpectations and to a lesser extent portfolio run-off, and
• a $716 million net reduction in wholesale, across the LOBsreflecting improvements in the Firm's macroeconomic scenarios
While the economy is showing signs of improvement, the COVID-19 pandemic has stressed many MEVs used in the Firm'sallowance estimate at a speed and to degrees not experienced inrecent history, which has created additional challenges in the useof modeled credit loss estimates and increased the reliance onmanagement judgment. These challenges in the use of modeledcredit loss estimates remain, albeit to a lesser extent thanexperienced during 2020. In periods where certain MEVs areoutside the range of historical experience on which the Firm’smodels have been trained, the Firm makes adjustments toappropriately address these economic circumstances.
Further, despite the improvement in the economy, uncertaintiesremain, including the health of underlying labor markets, vaccineefficacy against new virus strains, and the potential for changes inconsumer behavior that could have longer term impacts on certainsectors. As a result of these uncertainties, the Firm continued toplace significant weighting on its adverse scenarios, whichincorporate more punitive macroeconomic factors than the centralcase assumptions outlined below, resulting in weighted averageU.S. unemployment rates rising above eight percent in 2021 andremaining at approximately six percent into the second quarter of2022 with U.S. GDP returning to pre-pandemic levels in 1Q22.
The Firm’s central case assumptions reflected U.S. unemploymentrates and U.S. real GDP as follows:
Assumptions at March 31, 20212Q21 4Q21 2Q22
U.S. unemployment rate 5.7 % 4.8 % 4.3 %Cumulative change in U.S. real
GDP from 12/31/2019 0.2 % 2.7 % 4.3 %
Assumptions at December 31, 20202Q21 4Q21 2Q22
U.S. unemployment rate 6.8 % 5.7 % 5.1 %Cumulative change in U.S. real
GDP from 12/31/2019 (1.9)% 0.6 % 2.0 %
(a) Reflects quarterly average of forecasted U.S. unemployment rate.
Subsequent changes to this forecast and related estimates will bereflected in the provision for credit losses in future periods.
(a)
(a)
136

Note 13 – Variable interest entitiesRefer to Note 1 of JPMorgan Chase’s 2020 Form 10-K for a further description of JPMorgan Chase’s accounting policies regardingconsolidation of VIEs.
The following table summarizes the most significant types of Firm-sponsored VIEs by business segment.
Line of Business Transaction Type Activity Form 10-Q page referencesCCB Credit card securitization trusts Securitization of originated credit card receivables 137
Mortgage securitization trusts Servicing and securitization of both originated andpurchased residential mortgages 137-139
CIB Mortgage and other securitization trusts Securitization of both originated and purchased residentialand commercial mortgages, and other consumer loans 137-139
Multi-seller conduitsAssist clients in accessing the financial markets in a cost-efficient manner and structures transactions to meet investorneeds
139
Municipal bond vehicles Financing of municipal bond investments 139
The Firm also invests in and provides financing and other services to VIEs sponsored by third parties. Refer to pages 140-141 of this Note formore information on the VIEs sponsored by third parties.
Significant Firm-sponsored VIEsCredit card securitizationsAs a result of the Firm’s continuing involvement, the Firm isconsidered to be the primary beneficiary of its Firm-sponsoredcredit card securitization trust, the Chase Issuance Trust. Refer tothe table on page 140 of this Note for further information onconsolidated VIE assets and liabilities.
Firm-sponsored mortgage and other securitization trustsThe Firm securitizes (or has securitized) originated and purchasedresidential mortgages, commercial mortgages and other consumerloans primarily in its CCB and CIB businesses. Depending on theparticular transaction, as well as the respective business involved,the Firm may act as the servicer of the loans and/or retain certainbeneficial interests in the securitization trusts.Refer to Note 14 of JPMorgan Chase’s 2020 Form 10-K for adetailed discussion of JPMorgan Chase's involvement with creditcard securitizations and Firm-sponsored mortgage and othersecuritization trusts, as well as the accounting treatment relating tosuch trusts.
137

The following table presents the total unpaid principal amount ofassets held in Firm-sponsored private-label securitization entities,including those in which the Firm has continuing involvement, andthose that are consolidated by the Firm. Continuing involvementincludes servicing the loans, holding senior interests orsubordinated interests (including amounts required to be heldpursuant to credit risk retention rules), recourse or guaranteearrangements, and derivative contracts. In certain instances, theFirm’s only continuing involvement is servicing the loans. The
Firm’s maximum loss exposure from retained and purchasedinterests is the carrying value of these interests. Refer toSecuritization activity on page 141 of this Note for furtherinformation regarding the Firm’s cash flows associated with andinterests retained in nonconsolidated VIEs, and pages 141-142 ofthis Note for information on the Firm’s loan sales and securitizationactivity related to U.S. GSEs and government agencies.
Principal amount outstandingJPMorgan Chase interest in securitized assets in
nonconsolidated VIEs
March 31, 2021 (in millions)Total assets held bysecuritization VIEs
Assets held in consolidatedsecuritization VIEs
Assets held innonconsolidated
securitization VIEswith continuing
involvementTradingassets
Investmentsecurities
Other financialassets
Total interestsheld by
JPMorgan Chase
Securitization-relatedResidential mortgage:
Prime/Alt-A and option ARMs $ 49,200 $ 1,502 $ 39,678 $ 484 $ 581 $ — $ 1,065 Subprime 12,427 146 11,602 6 — — 6
Commercial and other 121,213 — 86,649 741 1,780 278 2,799 Total $ 182,840 $ 1,648 $ 137,929 $ 1,231 $ 2,361 $ 278 $ 3,870
Principal amount outstandingJPMorgan Chase interest in securitized assets in
nonconsolidated VIEs
December 31, 2020 (in millions)Total assets held bysecuritization VIEs
Assets held in consolidatedsecuritization VIEs
Assets held innonconsolidated
securitization VIEswith continuing
involvementTradingassets
Investmentsecurities
Other financialassets
Total interestsheld by
JPMorgan Chase
Securitization-relatedResidential mortgage:
Prime/Alt-A and option ARMs $ 49,644 $ 1,693 $ 41,265 $ 574 $ 724 $ — $ 1,298 Subprime 12,896 46 12,154 9 — — 9
Commercial and other 119,732 — 92,351 955 1,549 262 2,766 Total $ 182,272 $ 1,739 $ 145,770 $ 1,538 $ 2,273 $ 262 $ 4,073
(a) Excludes U.S. GSEs and government agency securitizations and re-securitizations, which are not Firm-sponsored. Refer to pages 141-142 of this Note for information onthe Firm’s loan sales and securitization activity related to U.S. GSEs and government agencies.
(b) Consists of securities backed by commercial real estate loans and non-mortgage-related consumer receivables purchased from third parties.(c) Excludes the following: retained servicing; securities retained from loan sales and securitization activity related to U.S. GSEs and government agencies; interest rate and
foreign exchange derivatives primarily used to manage interest rate and foreign exchange risks of securitization entities; senior and subordinated securities of $74 millionand $39 million, respectively, at March 31, 2021, and $105 million and $40 million, respectively, at December 31, 2020, which the Firm purchased in connection with CIB’ssecondary market-making activities.
(d) Includes interests held in re-securitization transactions.(e) As of March 31, 2021, and December 31, 2020, 74% and 73%, respectively, of the Firm’s retained securitization interests, which are predominantly carried at fair value and
include amounts required to be held pursuant to credit risk retention rules, were risk-rated “A” or better, on an S&P-equivalent basis. The retained interests in primeresidential mortgages consisted of $1.0 billion and $1.3 billion of investment-grade retained interests, and $33 million and $41 million of noninvestment-grade retainedinterests at March 31, 2021, and December 31, 2020, respectively. The retained interests in commercial and other securitization trusts consisted of $2.0 billion ofinvestment-grade retained interests, and $753 million of noninvestment-grade retained interests at both March 31, 2021 and December 31, 2020.
(c)(d)(e)
(a)
(b)
(c)(d)(e)
(a)
(b)
138

Residential mortgageThe Firm securitizes residential mortgage loans originated byCCB, as well as residential mortgage loans purchased from thirdparties by either CCB or CIB. Refer to the table on page 140 ofthis Note for more information on the consolidated residentialmortgage securitizations, and the table on the previous page ofthis Note for further information on interests held innonconsolidated residential mortgage securitizations.
Commercial mortgages and other consumer securitizationsCIB originates and securitizes commercial mortgage loans, andengages in underwriting and trading activities involving thesecurities issued by securitization trusts. Refer to the table onpage 140 of this Note for more information on the consolidatedcommercial mortgage securitizations, and the table on theprevious page of this Note for further information on interests heldin nonconsolidated securitizations.
Re-securitizationsThe following table presents the principal amount of securitiestransferred to re-securitization VIEs.
Three months ended March 31,(in millions) 2021 2020Transfers of securities to VIEsU.S. GSEs and government agencies $ 13,105 $ 2,717
The Firm did not transfer any private label securities to re-securitization VIEs during the three months ended March 31, 2021and 2020, respectively, and retained interests in any such Firm-sponsored VIEs as of March 31, 2021 and December 31, 2020were immaterial.
The following table presents information on the Firm's interests innonconsolidated re-securitization VIEs.
Nonconsolidated re-securitization VIEs
(in millions) March 31, 2021December 31,
2020
U.S. GSEs and government agenciesInterest in VIEs $ 2,530 $ 2,631
As of March 31, 2021, and December 31, 2020, the Firm did notconsolidate any U.S. GSE and government agency re-securitization VIEs or any Firm-sponsored private-label re-securitization VIEs.
Multi-seller conduitsIn the normal course of business, JPMorgan Chase makesmarkets in and invests in commercial paper issued by the Firm-administered multi-seller conduits. The Firm held $10.9 billion and$13.5 billion of the commercial paper issued by the Firm-administered multi-seller conduits at March 31, 2021, andDecember 31, 2020, respectively, which have been eliminated inconsolidation. The Firm’s investments reflect the Firm’s fundingneeds and capacity and were not driven by market illiquidity. Otherthan the amounts required to be held pursuant to credit riskretention rules, the Firm is not obligated under any agreement topurchase the commercial paper issued by the Firm-administeredmulti-seller conduits.
Deal-specific liquidity facilities, program-wide liquidity and creditenhancement provided by the Firm have been eliminated inconsolidation. The Firm or the Firm-administered multi-sellerconduits provide lending-related commitments to certain clients ofthe Firm-administered multi-seller conduits. The unfundedcommitments were $14.2 billion and $12.2 billion at March 31,2021, and December 31, 2020, respectively, and are reported asoff-balance sheet lending-related commitments in other unfundedcommitments to extend credit. Refer to Note 22 for moreinformation on off-balance sheet lending-related commitments.Municipal bond vehiclesMunicipal bond vehicles or tender option bond (“TOB”) trusts allowinstitutions to finance their municipal bond investments at short-term rates. TOB transactions are known as customer TOB trustsand non-customer TOB trusts. Customer TOB trusts aresponsored by a third party, refer to page 141 of this Note forfurther information.The Firm serves as sponsor for all non-customer TOBtransactions.
Refer to Note 14 of JPMorgan Chase’s 2020 Form 10-K for a moredetailed description of JPMorgan Chase’s participation in certainre-securitization transactions, principal involvement with Firm-administered multi-seller conduits, and Municipal bond vehicles.
139

Consolidated VIE assets and liabilitiesThe following table presents information on assets and liabilities related to VIEs consolidated by the Firm as of March 31, 2021, andDecember 31, 2020.
Assets Liabilities
March 31, 2021 (in millions) Trading assets Loans Other Total
assets
Beneficialinterests in
VIE assets OtherTotal
liabilitiesVIE program typeFirm-sponsored credit card trusts $ — $ 10,716 $ 133 $ 10,849 $ 4,319 $ 2 $ 4,321Firm-administered multi-seller conduits 3 19,642 187 19,832 9,030 34 9,064Municipal bond vehicles 1,989 — 4 1,993 1,958 — 1,958Mortgage securitization entities — 1,520 102 1,622 305 102 407Other 2 1,631 275 1,908 59 101 160Total $ 1,994 $ 33,509 $ 701 $ 36,204 $ 15,671 $ 239 $ 15,910
Assets Liabilities
December 31, 2020 (in millions) Trading assets Loans Other Total
assets
Beneficialinterests in
VIE assets OtherTotal
liabilitiesVIE program typeFirm-sponsored credit card trusts $ — $ 11,962 $ 148 $ 12,110 $ 4,943 $ 3 $ 4,946Firm-administered multi-seller conduits 2 23,787 188 23,977 10,523 33 10,556Municipal bond vehicles 1,930 — 2 1,932 1,902 — 1,902Mortgage securitization entities — 1,694 94 1,788 210 108 318Other 2 176 249 427 — 89 89Total $ 1,934 $ 37,619 $ 681 $ 40,234 $ 17,578 $ 233 $ 17,811
(a) Includes residential and commercial mortgage securitizations.(b) Includes $1.2 billion of purchased auto loan securitizations in CIB.(c) Includes assets classified as cash and other assets on the Consolidated balance sheets.(d) The assets of the consolidated VIEs included in the program types above are used to settle the liabilities of those entities. The assets and liabilities include third-party assets
and liabilities of consolidated VIEs and exclude intercompany balances that eliminate in consolidation.(e) The interest-bearing beneficial interest liabilities issued by consolidated VIEs are classified in the line item on the Consolidated balance sheets titled, “Beneficial interests
issued by consolidated variable interest entities.” The holders of these beneficial interests generally do not have recourse to the general credit of JPMorgan Chase. Includedin beneficial interests in VIE assets are long-term beneficial interests of $4.7 billion and $5.2 billion at March 31, 2021, and December 31, 2020, respectively.
(f) Includes liabilities classified as accounts payable and other liabilities on the Consolidated balance sheets.
VIEs sponsored by third partiesThe Firm enters into transactions with VIEs structured by otherparties. These include, for example, acting as a derivativecounterparty, liquidity provider, investor, underwriter, placementagent, remarketing agent, trustee or custodian. These transactionsare conducted at arm’s-length, and individual credit decisions arebased on the analysis of the specific VIE, taking into considerationthe quality of the underlying assets. Where the Firm does not havethe power to direct the activities of the VIE that most significantlyimpact the VIE’s economic performance, or a variable interest thatcould potentially be significant, the Firm generally does notconsolidate the VIE, but it records and reports these positions onits Consolidated balance sheets in the same manner it wouldrecord and report positions in respect of any other third-partytransaction.
Tax credit vehiclesThe Firm holds investments in unconsolidated tax credit vehicles,which are limited partnerships and similar entities that own andoperate affordable housing, energy, and other projects. Theseentities are primarily considered VIEs. A third party is typically thegeneral partner or managing
member and has control over the significant activities of the taxcredit vehicles, and accordingly the Firm does not consolidate taxcredit vehicles. The Firm generally invests in these partnerships asa limited partner and earns a return primarily through the receipt oftax credits allocated to the projects. The maximum loss exposure,represented by equity investments and funding commitments, was$23.1 billion and $23.6 billion, of which $8.5 billion and $8.7 billionwas unfunded at March 31, 2021 and December 31, 2020,respectively. The prior-period maximum loss exposure amount hasbeen revised to conform with the current presentation. The Firmassesses each project and to reduce the risk of loss, may withholdvarying amounts of its capital investment until the project qualifiesfor tax credits. Refer to Note 25 of JPMorgan Chase’s 2020 Form10-K for further information on affordable housing tax credits andNote 22 of this Form 10-Q for more information on off-balancesheet lending-related commitments.
(c) (d) (e) (f)
(a)
(b)
(c) (d) (e) (f)
(a)
140

Customer municipal bond vehicles (TOB trusts)The Firm may provide various services to customer TOB trusts,including remarketing agent, liquidity or tender option provider. Incertain customer TOB transactions, the Firm, as liquidity provider,has entered into a reimbursement agreement with the Residualholder.In those transactions, upon the termination of the vehicle, the Firmhas recourse to the third-party Residual holders for any shortfall.The Firm does not have any intent to protect Residual holdersfrom potential losses on any of the underlying municipal bonds.The Firm does not consolidate customer TOB trusts, since theFirm does not have the power to make decisions that significantlyimpact the economic performance of the municipal bond vehicle.
The Firm’s maximum exposure as a liquidity provider to customerTOB trusts at March 31, 2021 and December 31, 2020 was $6.5billion and $6.7 billion, respectively. The fair value of assets heldby such VIEs at March 31, 2021 and December 31, 2020, was$10.2 billion and $10.5 billion, respectively.
Loan securitizationsThe Firm has securitized and sold a variety of loans, includingresidential mortgage, credit card, and commercial mortgage. Referto Note 14 of JPMorgan Chase’s 2020 Form 10-K for a furtherdescription of the Firm’s accounting policies regardingsecuritizations.
Securitization activityThe following table provides information related to the Firm’s securitization activities for the three months ended March 31, 2021 and 2020,related to assets held in Firm-sponsored securitization entities that were not consolidated by the Firm, and where sale accounting wasachieved at the time of the securitization.
Three months ended March 31,2021 2020
(in millions)Residentialmortgage
Commercialand other
Residentialmortgage
Commercialand other
Principal securitized $ 4,077 $ 1,912 $ 3,064 $ 3,188 All cash flows during the period:Proceeds received from loan sales as financial instruments $ 4,234 $ 1,970 $ 3,136 $ 3,273 Servicing fees collected 41 — 62 — Cash flows received on interests 183 52 117 29
(a) Excludes re-securitization transactions.(b) Predominantly includes Level 2 assets.(c) The carrying value of the loans accounted for at fair value approximated the proceeds received upon loan sale.(d) Represents prime mortgages. Excludes loan securitization activity related to U.S. GSEs and government agencies.(e) Includes commercial mortgage and other consumer loans.
Loans and excess MSRs sold to U.S. government-sponsoredenterprises and loans in securitization transactions pursuant toGinnie Mae guidelinesIn addition to the amounts reported in the securitization activitytables above, the Firm, in the normal course of business, sellsoriginated and purchased mortgage loans and certain originatedexcess MSRs on a nonrecourse basis, predominantly to U.S.GSEs. These loans and excess MSRs are sold primarily for thepurpose of securitization by the U.S. GSEs, who provide certainguarantee provisions (e.g., credit enhancement of the loans). TheFirm also sells loans into securitization transactions pursuant toGinnie Mae guidelines; these loans are typically insured orguaranteed by another U.S. government agency. The Firm doesnot consolidate the securitization vehicles underlying thesetransactions as it is not the primary beneficiary. For a limitednumber of loan sales, the Firm is obligated to share
a portion of the credit risk associated with the sold loans with thepurchaser. Refer to Note 22 of this Form 10-Q for additionalinformation about the Firm’s loan sales- and securitization-relatedindemnifications and Note 14 for additional information about theimpact of the Firm’s sale of certain excess MSRs.
(d) (e) (d) (e)
(a)
(b)(c)
141

The following table summarizes the activities related to loans soldto the U.S. GSEs, and loans in securitization transactions pursuantto Ginnie Mae guidelines.
Three months ended March31,
(in millions) 2021 2020Carrying value of loans sold $ 23,147 $ 24,935 Proceeds received from loan sales as cash 16 9 Proceeds from loan sales as securities 22,749 24,663
Total proceeds received from loan sales $ 22,765 $ 24,672 Gains/(losses) on loan sales $ 4 $ 4
(a) Includes securities from U.S. GSEs and Ginnie Mae that are generally soldshortly after receipt or retained as part of the Firm’s investment securitiesportfolio.
(b) Included in level 2 assets.(c) Excludes the value of MSRs retained upon the sale of loans.(d) Gains/(losses) on loan sales include the value of MSRs.(e) The carrying value of the loans accounted for at fair value approximated the
proceeds received upon loan sale.
Options to repurchase delinquent loansIn addition to the Firm’s obligation to repurchase certain loans dueto material breaches of representations and warranties asdiscussed in Note 22, the Firm also has the option to repurchasedelinquent loans that it services for Ginnie Mae loan pools, as wellas for other U.S. government agencies under certainarrangements. The Firm typically elects to repurchase delinquentloans from Ginnie Mae loan
pools as it continues to service them and/or manage theforeclosure process in accordance with the applicablerequirements, and such loans continue to be insured orguaranteed. When the Firm’s repurchase option becomesexercisable, such loans must be reported on the Consolidatedbalance sheets as a loan with a corresponding liability. Refer toNote 11 for additional information.The following table presents loans the Firm repurchased or had anoption to repurchase, real estate owned, and foreclosedgovernment-guaranteed residential mortgage loans recognized onthe Firm’s Consolidated balance sheets as of March 31, 2021 andDecember 31, 2020. Substantially all of these loans and realestate are insured or guaranteed by U.S. government agencies.
(in millions)Mar 31,
2021Dec 31,
2020
Loans repurchased or option to repurchase $ 1,332 $ 1,413
Real estate owned 8 9
Foreclosed government-guaranteed residentialmortgage loans 55 64
(a) Predominantly all of these amounts relate to loans that have been repurchasedfrom Ginnie Mae loan pools.
(b) Relates to voluntary repurchases of loans, which are included in accruedinterest and accounts receivable.
Loan delinquencies and liquidation lossesThe table below includes information about components of and delinquencies related to nonconsolidated securitized financial assets held inFirm-sponsored private-label securitization entities, in which the Firm has continuing involvement as of March 31, 2021, and December 31,2020.
Net liquidation losses
Securitized assets 90 days past dueThree months ended
March 31,
(in millions)Mar 31,
2021Dec 31,
2020Mar 31,
2021Dec 31,
2020 2021 2020Securitized loansResidential mortgage:
Prime / Alt-A & option ARMs $ 39,678 $ 41,265 $ 4,414 $ 4,988 $ 12 $ 99 Subprime 11,602 12,154 2,231 2,406 18 86
Commercial and other 86,649 92,351 4,753 5,958 21 10 Total loans securitized $ 137,929 $ 145,770 $ 11,398 $ 13,352 $ 51 $ 195
(a)(b)
(c)
(d)(e)
(a)
(b)
142

Note 14 – Goodwill and Mortgage servicing rightsRefer to Note 15 of JPMorgan Chase’s 2020 Form 10-K for adiscussion of the accounting policies related to goodwill andmortgage servicing rights.
GoodwillThe following table presents goodwill attributed to the businesssegments.
(in millions)March 31,
2021December 31,
2020Consumer & Community Banking $ 31,326 $ 31,311 Corporate & Investment Bank 7,912 7,913 Commercial Banking 2,985 2,985 Asset & Wealth Management 7,020 7,039 Total goodwill $ 49,243 $ 49,248
The following table presents changes in the carrying amount ofgoodwill.
Three months ended March 31,
(in millions) 2021 2020
Balance at beginningof period $ 49,248 $ 47,823
Changes during the period from:Other (5) (23)
Balance at March 31, $ 49,243 $ 47,800
(a) Includes adjustments to goodwill related to the prior period acquisitions ofcxLoyalty in CCB and 55ip in AWM during the fourth quarter of 2020. Refer toNote 15 of JPMorgan Chase’s 2020 Form 10-K for additional information onthese acquisitions.
(b) Primarily foreign currency adjustments.
Goodwill impairment testingGoodwill is tested for impairment during the fourth quarter of eachfiscal year, or more often if events or circumstances, such asadverse changes in the business climate, indicate that there maybe an impairment. Refer to Note 15 of JPMorgan Chase’s 2020Form 10-K for a further discussion of the Firm’s goodwillimpairment testing, including the primary method used to estimatethe fair value of the reporting units and the assumptions used inthe goodwill impairment test.
Unanticipated declines in business performance, increases incredit losses, increases in capital requirements, as well asdeterioration in economic or market conditions, adverse regulatoryor legislative changes or increases in the estimated market cost ofequity, could cause the estimated fair values of the Firm’sreporting units to decline in the future, which could result in amaterial impairment charge to earnings in a future period related tosome portion of the associated goodwill.
As of March 31, 2021, the Firm reviewed current economicconditions, including the potential impacts of the COVID-19pandemic on business performance, estimated market cost ofequity, as well as actual business results and projections ofbusiness performance for all its reporting units. The Firm hasconcluded that the goodwill allocated to its reporting units was notimpaired as of March 31, 2021, or December 31, 2020, nor wasgoodwill written off due to impairment during the three monthsended March 31, 2021 or 2020.
(a) (b)
143

Mortgage servicing rightsMSRs represent the fair value of expected future cash flows for performing servicing activities for others. The fair value considers estimatedfuture servicing fees and ancillary revenue, offset by estimated costs to service the loans, and generally declines over time as net servicingcash flows are received, effectively amortizing the MSR asset against contractual servicing and ancillary fee income. MSRs are eitherpurchased from third parties or recognized upon sale or securitization of mortgage loans if servicing is retained. Refer to Notes 2 and 15 ofJPMorgan Chase’s 2020 Form 10-K for a further description of the MSR asset, interest rate risk management, and the valuation of MSRs.
The following table summarizes MSR activity for the three months ended March 31, 2021 and 2020.
As of or for the three months ended March 31,
(in millions, except where otherwise noted) 2021 2020Fair value at beginning of period $ 3,276 $ 4,699 MSR activity:
Originations of MSRs 404 271 Purchase of MSRs 179 2 Disposition of MSRs 1 (75)
Net additions/(dispositions) 584 198
Changes due to collection/realization of expected cash flows (187) (248)
Changes in valuation due to inputs and assumptions:Changes due to market interest rates and other 836 (1,370)Changes in valuation due to other inputs and assumptions:
Projected cash flows (e.g., cost to service) (24) (1)Discount rates — — Prepayment model changes and other (15) (11)
Total changes in valuation due to other inputs and assumptions (39) (12)Total changes in valuation due to inputs and assumptions 797 (1,382)Fair value at March 31, $ 4,470 $ 3,267 Changes in unrealized gains/(losses) included in income related to MSRs held at March 31, $ 797 $ (1,382)Contractual service fees, late fees and other ancillary fees included in income 291 364 Third-party mortgage loans serviced at March 31, (in billions) 444 506 Servicer advances, net of an allowance for uncollectible amounts, at March 31, (in billions) 1.8 1.7
(a) Includes excess MSRs transferred to agency-sponsored trusts in exchange for stripped mortgage backed securities (“SMBS”). In each transaction, a portion of the SMBSwas acquired by third parties at the transaction date; the Firm acquired the remaining balance of those SMBS as trading securities.
(b) Represents both the impact of changes in estimated future prepayments due to changes in market interest rates, and the difference between actual and expectedprepayments.
(c) Represents changes in prepayments other than those attributable to changes in market interest rates.(d) Represents amounts the Firm pays as the servicer (e.g., scheduled principal and interest, taxes and insurance), which will generally be reimbursed within a short period of
time after the advance from future cash flows from the trust or the underlying loans. The Firm’s credit risk associated with these servicer advances is minimal becausereimbursement of the advances is typically senior to all cash payments to investors. In addition, the Firm maintains the right to stop payment to investors if the collateral isinsufficient to cover the advance. However, certain of these servicer advances may not be recoverable if they were not made in accordance with applicable rules andagreements.
(a)
(b)
(c)
(d)
144

The following table presents the components of mortgage fees and related income (including the impact of MSR risk management activities)for the three months ended March 31, 2021 and 2020.
Three months ended March 31,(in millions) 2021 2020CCB mortgage fees and related income
Production revenue $ 757 $ 319
Net mortgage servicing revenue:Operating revenue:
Loan servicing revenue 248 339 Changes in MSR asset fair value due to collection/realization of expected cash flows (187) (248)
Total operating revenue 61 91 Risk management:
Changes in MSR asset fair value due to market interest rates and other 836 (1,370)Other changes in MSR asset fair value due to other inputs and assumptions in model (39) (12)Changes in derivative fair value and other (912) 1,292
Total risk management (115) (90)Total net mortgage servicing revenue (54) 1
Total CCB mortgage fees and related income 703 320
All other 1 — Mortgage fees and related income $ 704 $ 320
(a) Represents both the impact of changes in estimated future prepayments due to changes in market interest rates, and the difference between actual and expectedprepayments.
(b) Represents the aggregate impact of changes in model inputs and assumptions such as projected cash flows (e.g., cost to service), discount rates and changes inprepayments other than those attributable to changes in market interest rates (e.g., changes in prepayments due to changes in home prices).
The table below outlines the key economic assumptions used todetermine the fair value of the Firm’s MSRs at March 31, 2021,and December 31, 2020, and outlines hypothetical sensitivities ofthose fair values to immediate adverse changes in thoseassumptions, as defined below.
(in millions, except rates)Mar 31,
2021Dec 31,
2020Weighted-average prepayment speed assumption
(constant prepayment rate) 10.28 % 14.90 %Impact on fair value of 10% adverse change $ (195) $ (206)Impact on fair value of 20% adverse change (375) (392)
Weighted-average option adjusted spread 6.65 % 7.19 %Impact on fair value of a 100 basis point adverse
change $ (197) $ (134)Impact on fair value of a 200 basis point adverse
change (379) (258)
(a) Includes the impact of operational risk and regulatory capital.
Changes in fair value based on variations in assumptionsgenerally cannot be easily extrapolated, because the relationshipof the change in the assumptions to the change in fair value areoften highly interrelated and may not be linear. In this table, theeffect that a change in a particular assumption may have on thefair value is calculated without changing any other assumption. Inreality, changes in one factor may result in changes in another,which would either magnify or counteract the impact of the initialchange.
(a)
(b)
(a)
145

Note 15 – DepositsRefer to Note 17 of JPMorgan Chase’s 2020 Form 10-K for furtherinformation on deposits.
At March 31, 2021, and December 31, 2020, noninterest-bearingand interest-bearing deposits were as follows.
(in millions)March 31,
2021December 31,
2020U.S. officesNoninterest-bearing (included $9,436 and$9,873 at fair value) $ 629,139 $ 572,711 Interest-bearing (included $2,579 and
$2,567 at fair value) 1,266,856 1,197,032 Total deposits in U.S. offices 1,895,995 1,769,743 Non-U.S. officesNoninterest-bearing (included $1,761 and$1,486 at fair value) 22,661 23,435 Interest-bearing (included $331 and $558
at fair value) 359,456 351,079 Total deposits in non-U.S. offices 382,117 374,514 Total deposits $ 2,278,112 $ 2,144,257
(a) Includes structured notes classified as deposits for which the fair value optionhas been elected. Refer to Note 3 for further information.
Note 16 – LeasesRefer to Note 18 of JPMorgan Chase’s 2020 Form 10-K for afurther discussion on leases.Firm as lesseeAt March 31, 2021, JPMorgan Chase and its subsidiaries wereobligated under a number of noncancellable leases, predominantlyoperating leases for premises and equipment used primarily forbusiness purposes.
Operating lease liabilities and right-of-use ("ROU") assets arerecognized at the lease commencement date based on thepresent value of the future minimum lease payments over thelease term.
The following table provides information related to the Firm’soperating leases:
(in millions)March 31,
2021December 31,
2020Right-of-use assets $ 7,938 $ 8,006 Lease liabilities 8,421 8,508
The Firm’s net rental expense was $490 million and $475 millionfor the three months ended March 31, 2021 and 2020,respectively.
Firm as lessorThe Firm’s lease financings are generally operating leases and areincluded in other assets on the Firm’s Consolidated balancesheets.
The following table presents the Firm’s operating lease income,included within other income, and the related depreciationexpense, included within technology, communications andequipment expense, on the Consolidated statements of income:
Three months ended March 31,
(in millions) 2021 2020Operating lease income $ 1,325 $ 1,413 Depreciation expense 934 1,140
(a)
(a)
(a)
(a)
146

Note 17 - Preferred stockRefer to Note 21 of JPMorgan Chase’s 2020 Form 10-K for a further discussion on preferred stock.
The following is a summary of JPMorgan Chase’s non-cumulative preferred stock outstanding as of March 31, 2021 and December 31, 2020,and the quarterly dividend declarations for the three months ended March 31, 2021 and 2020.
SharesCarrying value
(in millions)
Contractual rate ineffect at March 31,
2021Earliest
redemption date
Floatingannualized rate of
three-monthLIBOR/ TermSOFR plus:
Dividend declared per share
March 31, 2021December 31,
2020 March 31, 2021December 31,
2020 Issue date
Three months ended March 31,
2021 2020Fixed-rate:
Series Y — — $ — $ — 2/12/2015 — % 3/1/2020 NA $— $153.13Series AA 142,500 142,500 1,425 1,425 6/4/2015 6.100 9/1/2020 NA 152.50 152.50Series BB 115,000 115,000 1,150 1,150 7/29/2015 6.150 9/1/2020 NA 153.75 153.75Series DD 169,625 169,625 1,696 1,696 9/21/2018 5.750 12/1/2023 NA 143.75 143.75Series EE 185,000 185,000 1,850 1,850 1/24/2019 6.000 3/1/2024 NA 150.00 150.00Series GG 90,000 90,000 900 900 11/7/2019 4.750 12/1/2024 NA 118.75 150.42Series JJ 150,000 — 1,500 — 3/17/2021 4.550 6/1/2026 NA NA NA
Fixed-to-floating-rate:Series I 293,375 293,375 $ 2,934 $ 2,934 4/23/2008 LIBOR + 3.47% 4/30/2018 LIBOR + 3.47% $93.06 $132.44Series Q 150,000 150,000 1,500 1,500 4/23/2013 5.150 5/1/2023 LIBOR + 3.25 128.75 128.75Series R 150,000 150,000 1,500 1,500 7/29/2013 6.000 8/1/2023 LIBOR + 3.30 150.00 150.00Series S 200,000 200,000 2,000 2,000 1/22/2014 6.750 2/1/2024 LIBOR + 3.78 168.75 168.75Series U 100,000 100,000 1,000 1,000 3/10/2014 6.125 4/30/2024 LIBOR + 3.33 153.13 153.13Series V 250,000 250,000 2,500 2,500 6/9/2014 LIBOR + 3.32% 7/1/2019 LIBOR + 3.32 85.97 130.73Series X 160,000 160,000 1,600 1,600 9/23/2014 6.100 10/1/2024 LIBOR + 3.33 152.50 152.50Series Z 200,000 200,000 2,000 2,000 4/21/2015 LIBOR + 3.80% 5/1/2020 LIBOR + 3.80 101.24 132.50Series CC 125,750 125,750 1,258 1,258 10/20/2017 4.625 11/1/2022 LIBOR + 2.58 115.63 115.63Series FF 225,000 225,000 2,250 2,250 7/31/2019 5.000 8/1/2024 SOFR + 3.38 125.00 125.00Series HH 300,000 300,000 3,000 3,000 1/23/2020 4.600 2/1/2025 SOFR + 3.125 115.00 125.22Series II 150,000 150,000 1,500 1,500 2/24/2020 4.000 4/1/2025 SOFR + 2.745 100.00 NATotalpreferredstock 3,156,250 3,006,250 $ 31,563 $ 30,063
(a) Dividends in the amount of $150.42 per share were declared on January 8, 2020 and include dividends from the original issue date of November 7, 2019 through February29, 2020.
(b) No dividends were declared for Series JJ from the original issue date of March 17, 2021 through March 31, 2021.(c) The dividend rate for Series Z preferred stock became floating and payable quarterly starting on May 1, 2020; prior to which the dividend rate was fixed at 5.3% or $265.00
per share payable semi annually.(d) Dividends in the amount of $125.22 per share were declared on March 13, 2020 and include dividends from the original issue date of January 23, 2020 through April 30,
2020.(e) No dividends were declared for Series II from the original issue date of February 24, 2020 through March 31, 2020.
Each series of preferred stock has a liquidation value and redemption price per share of $10,000, plus accrued but unpaid dividends. Theaggregate liquidation value was $31.9 billion at March 31, 2021.
RedemptionsOn April 30, 2021, the Firm announced that it will redeem on June 1, 2021 all $1.4 billion of its outstanding 6.10% non-cumulative preferredstock, Series AA and all $1.2 billion of its outstanding 6.15% non-cumulative preferred stock, Series BB.
On March 1, 2020, the Firm redeemed all $1.43 billion of its 6.125% non-cumulative preferred stock, Series Y.
(a)
(b)
(c)
(d)
(e)
147

Note 18 – Earnings per shareRefer to Note 23 of JPMorgan Chase’s 2020 Form 10-K for adiscussion of the computation of basic and diluted earnings pershare (“EPS”). The following table presents the calculation of basicand diluted EPS for the three months ended March 31, 2021 and2020.
(in millions, except per share amounts)
Three months ended March 31,2021 2020
Basic earnings per shareNet income $ 14,300 $ 2,865 Less: Preferred stock dividends 379 421 Net income applicable to common equity 13,921 2,444 Less: Dividends and undistributed earnings allocated
to participating securities 70 13 Net income applicable to common stockholders $ 13,851 $ 2,431
Total weighted-average basic shares outstanding 3,073.5 3,095.8 Net income per share $ 4.51 $ 0.79
Diluted earnings per shareNet income applicable to common stockholders $ 13,851 $ 2,431 Total weighted-average basic shares outstanding 3,073.5 3,095.8 Add: Dilutive impact of SARs and employee stock
options, unvested PSUs and nondividend-earningRSUs 5.4 4.9
Total weighted-average diluted sharesoutstanding 3,078.9 3,100.7
Net income per share $ 4.50 $ 0.78
148

Note 19 – Accumulated other comprehensive income/(loss)AOCI includes the after-tax change in unrealized gains and losses on investment securities, foreign currency translation adjustments(including the impact of related derivatives), fair value changes of excluded components on fair value hedges, cash flow hedging activities,net loss and prior service costs/(credit) related to the Firm’s defined benefit pension and OPEB plans, and fair value option-elected liabilitiesarising from changes in the Firm’s own credit risk (DVA).
As of or for the three months ended March 31, 2021(in millions)
Unrealized gains/(losses) on investment
securities
Translationadjustments, net
of hedgesFair valuehedges
Cash flowhedges
Defined benefit pension and OPEB plans
DVA on fair valueoption elected
liabilities
Accumulated othercomprehensiveincome/(loss)
Balance at January 1, 2021 $ 8,180 $ (473) $ (112) $ 2,383 $ (1,132) $ (860) $ 7,986 Net change (4,339) (250) (28) (2,249) 68 (147) (6,945)Balance at March 31, 2021 $ 3,841 $ (723) $ (140) $ 134 $ (1,064) $ (1,007) $ 1,041
As of or for the three months ended March 31, 2020(in millions)
Unrealized gains/(losses) on investment
securities
Translationadjustments, net
of hedgesFair valuehedges
Cash flowhedges
Defined benefitpension and OPEB plans
DVA on fair valueoption elected
liabilities
Accumulated othercomprehensiveincome/(loss)
Balance at January 1, 2020 $ 4,057 $ (707) $ (131) $ 63 $ (1,344) $ (369) $ 1,569 Net change 1,119 (330) 88 2,465 33 2,474 5,849 Balance at March 31, 2020 $ 5,176 $ (1,037) $ (43) $ 2,528 $ (1,311) $ 2,105 $ 7,418
(a) As of March 31, 2021 and 2020, includes after-tax net unamortized unrealized gains of $2.9 billion and $737 million related to AFS securities that have been transferred toHTM, respectively. Refer to Note 10 of JPMorgan Chase's 2020 Form 10-K for further information.
The following table presents the pre-tax and after-tax changes in the components of OCI.2021 2020
Three months ended March 31,(in millions) Pre-tax Tax effect After-tax Pre-tax Tax effect After-taxUnrealized gains/(losses) on investment securities:Net unrealized gains/(losses) arising during the period $ (5,693) $ 1,365 $ (4,328) $ 1,709 $ (413) $ 1,296 Reclassification adjustment for realized (gains)/losses included in net income (14) 3 (11) (233) 56 (177)
Net change (5,707) 1,368 (4,339) 1,476 (357) 1,119 Translation adjustments:Translation (1,200) 39 (1,161) (1,592) 55 (1,537)Hedges 1,200 (289) 911 1,589 (382) 1,207
Net change — (250) (250) (3) (327) (330)
Fair value hedges, net change : (37) 9 (28) 115 (27) 88
Cash flow hedges:Net unrealized gains/(losses) arising during the period (2,695) 647 (2,048) 3,251 (780) 2,471 Reclassification adjustment for realized (gains)/losses included in net income (264) 63 (201) (8) 2 (6)
Net change (2,959) 710 (2,249) 3,243 (778) 2,465 Defined benefit pension and OPEB plans, net change: 91 (23) 68 45 (12) 33 DVA on fair value option elected liabilities, net change: (189) 42 (147) 3,255 (781) 2,474 Total other comprehensive income/(loss) $ (8,801) $ 1,856 $ (6,945) $ 8,131 $ (2,282) $ 5,849
(a) The pre-tax amount is reported in Investment securities gains/(losses) in the Consolidated statements of income.(b) Represents changes in fair value of cross-currency swaps attributable to changes in cross-currency basis spreads, which are excluded from the assessment of hedge
effectiveness and recorded in other comprehensive income. The initial cost of cross-currency basis spreads is recognized in earnings as part of the accrual of interest on thecross currency swaps.
(c) The pre-tax amounts are primarily recorded in noninterest revenue, net interest income and compensation expense in the Consolidated statements of income.
(a)
(a)
(a)
(b)
(c)
149

Note 20 – Restricted cash and other restrictedassetsRefer to Note 26 of JPMorgan Chase’s 2020 Form 10-K for adetailed discussion of the Firm’s restricted cash and otherrestricted assets.
Certain of the Firm’s cash and other assets are restricted as towithdrawal or usage. These restrictions are imposed by variousregulatory authorities based on the particular activities of theFirm’s subsidiaries.The Firm is also subject to rules and regulations established byother U.S. and non U.S. regulators. As part of its compliance withthe respective regulatory requirements, the Firm’s broker-dealeractivities are subject to certain restrictions on cash and otherassets.
The following table presents the components of the Firm’srestricted cash:
(in billions)March 31,
2021 December 31, 2020Segregated for the benefit of securities
and cleared derivative customers 15.7 19.3 Cash reserves at non-U.S. central
banks and held for other generalpurposes 5.4 5.1
Total restricted cash $ 21.1 $ 24.4
(a) Comprises $19.6 billion and $22.7 billion in deposits with banks, and $1.5billion and $1.7 billion in cash and due from banks on the Consolidated balancesheet as of March 31, 2021 and December 31, 2020, respectively.
Also, as of March 31, 2021 and December 31, 2020, the Firm hadthe following other restricted assets:• Cash and securities pledged with clearing organizations for the
benefit of customers of $39.2 billion and $37.2 billion,respectively.
• Securities with a fair value of $8.6 billion and $1.3 billion,respectively, were also restricted in relation to customer activity.
Note 21 – Regulatory capitalRefer to Note 27 of JPMorgan Chase’s 2020 Form 10-K for adetailed discussion on regulatory capital.The Federal Reserve establishes capital requirements, includingwell-capitalized requirements, for the consolidated financialholding company. The OCC establishes similar minimum capitalrequirements and standards for the Firm’s principal IDI subsidiary,JPMorgan Chase Bank, N.A.Under the risk-based capital and leverage-based guidelines of theFederal Reserve, JPMorgan Chase is required to maintainminimum ratios for CET1 capital, Tier 1 capital, Total capital, Tier 1leverage and the SLR. Failure to meet these minimumrequirements could cause the Federal Reserve to take action. IDIsubsidiaries are also subject to these capital requirementsestablished by their respective primary regulators.
The following table presents the minimum and well-capitalizedratios to which the Firm and its IDI subsidiaries were subject as ofMarch 31, 2021 and December 31, 2020.
StandardizedMinimum capital ratios
Advanced Minimumcapital ratios
Well-capitalizedratios
BHC IDI BHC IDI BHC IDICapitalratiosCET1capital 11.3 % 7.0 % 10.5 % 7.0 % NA 6.5 %Tier 1capital 12.8 8.5 12.0 8.5 6.0 % 8.0 Totalcapital 14.8 10.5 14.0 10.5 10.0 10.0 Tier 1leverage 4.0 4.0 4.0 4.0 NA 5.0 SLR NA NA 5.0 6.0 NA 6.0
Note: The table above is as defined by the regulations issued by the FederalReserve, OCC and FDIC and to which the Firm and its IDI subsidiaries are subject.(a) Represents the minimum capital ratios applicable to the Firm. The CET1, Tier 1
and Total capital minimum capital ratios each include a respective minimumrequirement plus a GSIB surcharge of 3.5% as calculated under Method 2; plusa 3.3% SCB for Basel III Standardized ratios and a fixed 2.5% capitalconservation buffer for Basel III Advanced ratios. The countercyclical buffer iscurrently set to 0% by the federal banking agencies.
(b) Represents minimum SLR requirement of 3.0%, as well as supplementaryleverage buffer requirements of 2.0% and 3.0% for BHC and IDI subsidiaries,respectively.
(c) Represents requirements for JPMorgan Chase’s IDI subsidiaries. The CET1,Tier 1 and Total capital minimum capital ratios include a fixed capitalconservation buffer requirement of 2.5% that is applicable to the IDIsubsidiaries. The IDI subsidiaries are not subject to the GSIB surcharge.
(d) Represents requirements for bank holding companies pursuant to regulationsissued by the Federal Reserve.
(e) Represents requirements for IDI subsidiaries pursuant to regulations issuedunder the FDIC Improvement Act.
(a)
(a) (c) (a)(b) (b)(c) (d) (e)
150

CECL regulatory capital transition delayAs part of their response to the impact of the COVID-19 pandemic,the federal banking agencies issued a final rule that provided theoption beginning January 1, 2020 to delay the effects of CECL onregulatory capital for two years, followed by a three-year transitionperiod beginning January 1, 2022.The Firm has elected to apply the CECL capital transitionprovisions, and accordingly, for the period ended March 31, 2021,the capital metrics of the Firm exclude $4.5 billion,
which is the $2.7 billion day 1 impact to retained earnings and25% of the $7.0 billion increase in the allowance for credit lossesfrom January 1, 2020 (excluding allowances on PCD loans).The impacts of the CECL capital transition provisions have alsobeen incorporated into Tier 2 capital, adjusted average assets, andtotal leverage exposure. Refer to Note 27 of JPMorgan Chase’s2020 Form 10-K for further information on CECL capital transitionprovisions.
The following tables present the risk-based and leverage-based capital metrics for JPMorgan Chase and JPMorgan Chase Bank, N.A. underboth the Basel III Standardized and Basel III Advanced Approaches. As of March 31, 2021 and December 31, 2020, JPMorgan Chase andJPMorgan Chase Bank, N.A. were well-capitalized and met all capital requirements to which each was subject.
March 31, 2021(in millions, except ratios)
Basel III Standardized Basel III AdvancedJPMorgan
Chase & Co.JPMorgan
Chase Bank, N.A.JPMorgan
Chase & Co.JPMorgan
Chase Bank, N.A.
Risk-based capital metrics:CET1 capital $ 206,078 $ 242,464 $ 206,078 $ 242,464 Tier 1 capital 237,333 242,466 237,333 242,466 Total capital 271,407 260,288 258,635 247,867 Risk-weighted assets 1,577,007 1,503,158 1,503,828 1,361,577 CET1 capital ratio 13.1 % 16.1 % 13.7 % 17.8 %Tier 1 capital ratio 15.0 16.1 15.8 17.8 Total capital ratio 17.2 17.3 17.2 18.2 Leverage-based capital metrics:Adjusted average assets $ 3,565,545 $ 3,120,770 $ 3,565,545 $ 3,120,770 Tier 1 leverage ratio 6.7 % 7.8 % 6.7 % 7.8 %Total leverage exposure NA NA $ 3,522,629 $ 3,867,720
SLR NA NA 6.7 % 6.3 %
December 31, 2020(in millions, except ratios)
Basel III Standardized Basel III Advanced
JPMorganChase & Co.
JPMorganChase Bank, N.A.
JPMorganChase & Co.
JPMorganChase Bank, N.A.
Risk-based capital metrics:CET1 capital $ 205,078 $ 234,235 $ 205,078 $ 234,235 Tier 1 capital 234,844 234,237 234,844 234,237 Total capital 269,923 252,045 257,228 239,673 Risk-weighted assets 1,560,609 1,492,138 1,484,431 1,343,185 CET1 capital ratio 13.1 % 15.7 % 13.8 % 17.4 %Tier 1 capital ratio 15.0 15.7 15.8 17.4 Total capital ratio 17.3 16.9 17.3 17.8 Leverage-based capital metrics:Adjusted average assets $ 3,353,319 $ 2,970,285 $ 3,353,319 $ 2,970,285 Tier 1 leverage ratio 7.0 % 7.9 % 7.0 % 7.9 %
Total leverage exposure NA NA $ 3,401,542 $ 3,688,797
SLR NA NA 6.9 % 6.3 %
(a) Adjusted average assets, for purposes of calculating the leverage ratio, includes total quarterly average assets adjusted for on-balance sheet assets that are subject todeduction from Tier 1 capital, predominantly goodwill and other intangible assets.
(b) JPMorgan Chase’s total leverage exposure for purposes of calculating the SLR, excludes on-balance sheet amounts of U.S. Treasury securities and deposits at FederalReserve Banks, as provided by the interim final rule issued by the Federal Reserve which became effective April 1, 2020 and remained in effect through March 31, 2021. OnJune 1, 2020, the Federal Reserve, OCC and FDIC issued an interim final rule which became effective April 1, 2020 and remained in effect through March 31, 2021 thatprovides IDI subsidiaries with an option to apply this temporary exclusion subject to certain restrictions. As of March 31, 2021 and December 31, 2020, JPMorgan ChaseBank, N.A. did not elect to apply this exclusion.
(c) The capital metrics reflect the CECL capital transition provisions. Additionally, loans originated under the PPP receive a zero percent risk weight.
(c) (c) (c) (c)
(a)
(b)
(b)
(c) (c) (c) (c)
(a)
(b)
(b)
151

Note 22 – Off–balance sheet lending-relatedfinancial instruments, guarantees, and othercommitmentsJPMorgan Chase provides lending-related financial instruments(e.g., commitments and guarantees) to address the financingneeds of its customers and clients. The contractual amount ofthese financial instruments represents the maximum possiblecredit risk to the Firm should the customer or client draw upon thecommitment or the Firm be required to fulfill its obligation underthe guarantee, and should the customer or client subsequently failto perform according to the terms of the contract. Most of thesecommitments and guarantees have historically been refinanced,extended, cancelled, or expired without being drawn or a defaultoccurring. As a result, the total contractual amount of theseinstruments is not, in the Firm’s view, representative of itsexpected future credit exposure or funding requirements. Refer toNote 28 of JPMorgan Chase’s 2020 Form 10-K for a furtherdiscussion of lending-related commitments and guarantees, andthe Firm’s related accounting policies.To provide for expected credit losses in wholesale and certainconsumer lending-related commitments, an allowance for creditlosses on lending-related commitments is maintained. Refer toNote 12 for further information regarding the allowance for creditlosses on lending-related commitments.
The following table summarizes the contractual amounts andcarrying values of off-balance sheet lending-related financialinstruments, guarantees and other commitments at March 31,2021, and December 31, 2020. The amounts in the table below forcredit card, home equity and certain scored business bankinglending-related commitments represent the total available credit forthese products. The Firm has not experienced, and does notanticipate, that all available lines of credit for these products will beutilized at the same time. The Firm can reduce or cancel creditcard and certain scored business banking lines of credit byproviding the borrower notice or, in some cases as permitted bylaw, without notice. In addition, the Firm typically closes credit cardlines when the borrower is 60 days or more past due. The Firmmay reduce or close HELOCs when there are significantdecreases in the value of the underlying property, or when therehas been a demonstrable decline in the creditworthiness of theborrower.
152

Off–balance sheet lending-related financial instruments, guarantees and other commitmentsContractual amount Carrying value
March 31, 2021Dec 31,
2020Mar 31,
2021Dec 31,
2020
By remaining maturity (in millions)
Expires in 1year or less
Expires after1 year
through 3 years
Expires after 3 yearsthrough 5 years
Expires after5 years Total Total
Lending-relatedConsumer, excluding credit card:
Residential real estate $ 25,751 $ 1,741 $ 4,347 $ 12,813 $ 44,652 $ 46,047 $ 203 $ 148 Auto and other 10,779 — 2 812 11,593 11,272 — —
Total consumer, excluding credit card 36,530 1,741 4,349 13,625 56,245 57,319 203 148 Credit card 674,367 — — — 674,367 658,506 — — Total consumer 710,897 1,741 4,349 13,625 730,612 715,825 203 148 Wholesale:
Other unfunded commitments to extend credit 111,754 179,670 130,536 20,902 442,862 415,828 2,290 2,148 Standby letters of credit and other financial guarantees 17,294 7,658 8,497 1,324 34,773 30,982 692 443 Other letters of credit 3,225 156 227 1 3,609 3,053 29 14
Total wholesale 132,273 187,484 139,260 22,227 481,244 449,863 3,011 2,605 Total lending-related $ 843,170 $ 189,225 $ 143,609 $ 35,852 $ 1,211,856 $ 1,165,688 $ 3,214 $ 2,753 Other guarantees and commitmentsSecurities lending indemnification agreements and
guarantees $ 297,754 $ — $ — $ — $ 297,754 $ 250,418 $ — $ — Derivatives qualifying as guarantees 2,142 195 12,043 39,200 53,580 54,415 318 322 Unsettled resale and securities borrowed agreements 151,549 2,618 — — 154,167 96,848 3 2 Unsettled repurchase and securities loaned agreements 107,597 836 — — 108,433 104,901 (1) (1)Loan sale and securitization-related indemnifications:Mortgage repurchase liability NA — NA NA NA NA 72 84
Loans sold with recourse NA — NA NA 823 889 23 23 Exchange & clearing house guarantees and commitments 84,852 — — — 84,852 142,003 — — Other guarantees and commitments 8,545 627 363 2,417 11,952 9,639 59 52
(a) Includes certain commitments to purchase loans from correspondents.(b) Also includes commercial card lending-related commitments primarily in CB and CIB.(c) Predominantly all consumer and wholesale lending-related commitments are in the U.S.(d) At March 31, 2021, and December 31, 2020, reflected the contractual amount net of risk participations totaling $61 million and $72 million, respectively, for other unfunded
commitments to extend credit; $8.1 billion and $8.5 billion, respectively, for standby letters of credit and other financial guarantees; and $597 million and $357 million,respectively, for other letters of credit. In regulatory filings with the Federal Reserve these commitments are shown gross of risk participations.
(e) At March 31, 2021, and December 31, 2020, collateral held by the Firm in support of securities lending indemnification agreements was $314.3 billion and $264.3 billion,respectively. Securities lending collateral primarily consists of cash, G7 government securities, and securities issued by U.S. GSEs and government agencies.
(f) At March 31, 2021, and December 31, 2020, includes guarantees to the Fixed Income Clearing Corporation under the sponsored member repo program and commitmentsand guarantees associated with the Firm’s membership in certain clearing houses.
(g) At March 31, 2021, and December 31, 2020, primarily includes unfunded commitments to purchase secondary market loans, unfunded commitments related to certain tax-oriented equity investments, and letters of credit hedged by derivative transactions and managed on a market risk basis.
(h) Prior-period amount has been revised to conform with the current presentation.(i) For lending-related products, the carrying value represents the allowance for lending-related commitments and the guarantee liability; for derivative-related products, and
lending-related commitments for which the fair value option was elected, the carrying value represents the fair value.
(i)
(a)
(b)
(b)(c)
(d)
(d)
(d)
(c)
(e)
(f)
(g) (h)
153
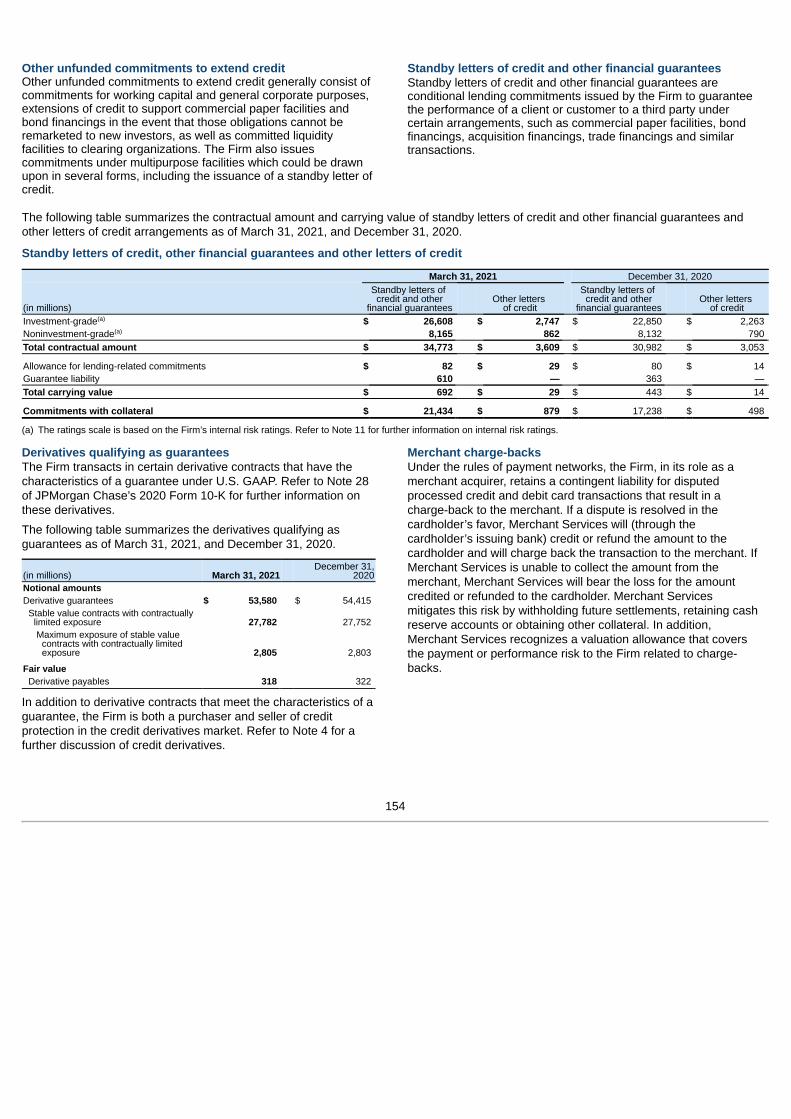
Other unfunded commitments to extend creditOther unfunded commitments to extend credit generally consist ofcommitments for working capital and general corporate purposes,extensions of credit to support commercial paper facilities andbond financings in the event that those obligations cannot beremarketed to new investors, as well as committed liquidityfacilities to clearing organizations. The Firm also issuescommitments under multipurpose facilities which could be drawnupon in several forms, including the issuance of a standby letter ofcredit.
Standby letters of credit and other financial guaranteesStandby letters of credit and other financial guarantees areconditional lending commitments issued by the Firm to guaranteethe performance of a client or customer to a third party undercertain arrangements, such as commercial paper facilities, bondfinancings, acquisition financings, trade financings and similartransactions.
The following table summarizes the contractual amount and carrying value of standby letters of credit and other financial guarantees andother letters of credit arrangements as of March 31, 2021, and December 31, 2020.
Standby letters of credit, other financial guarantees and other letters of credit
March 31, 2021 December 31, 2020
(in millions)
Standby letters of credit and other
financial guaranteesOther letters
of credit
Standby letters of credit and other
financial guaranteesOther letters
of creditInvestment-grade $ 26,608 $ 2,747 $ 22,850 $ 2,263 Noninvestment-grade 8,165 862 8,132 790 Total contractual amount $ 34,773 $ 3,609 $ 30,982 $ 3,053
Allowance for lending-related commitments $ 82 $ 29 $ 80 $ 14 Guarantee liability 610 — 363 — Total carrying value $ 692 $ 29 $ 443 $ 14
Commitments with collateral $ 21,434 $ 879 $ 17,238 $ 498
(a) The ratings scale is based on the Firm’s internal risk ratings. Refer to Note 11 for further information on internal risk ratings.
Derivatives qualifying as guaranteesThe Firm transacts in certain derivative contracts that have thecharacteristics of a guarantee under U.S. GAAP. Refer to Note 28of JPMorgan Chase’s 2020 Form 10-K for further information onthese derivatives.
The following table summarizes the derivatives qualifying asguarantees as of March 31, 2021, and December 31, 2020.
(in millions) March 31, 2021December 31,
2020Notional amountsDerivative guarantees $ 53,580 $ 54,415
Stable value contracts with contractuallylimited exposure 27,782 27,752 Maximum exposure of stable value
contracts with contractually limitedexposure 2,805 2,803
Fair valueDerivative payables 318 322
In addition to derivative contracts that meet the characteristics of aguarantee, the Firm is both a purchaser and seller of creditprotection in the credit derivatives market. Refer to Note 4 for afurther discussion of credit derivatives.
Merchant charge-backsUnder the rules of payment networks, the Firm, in its role as amerchant acquirer, retains a contingent liability for disputedprocessed credit and debit card transactions that result in acharge-back to the merchant. If a dispute is resolved in thecardholder’s favor, Merchant Services will (through thecardholder’s issuing bank) credit or refund the amount to thecardholder and will charge back the transaction to the merchant. IfMerchant Services is unable to collect the amount from themerchant, Merchant Services will bear the loss for the amountcredited or refunded to the cardholder. Merchant Servicesmitigates this risk by withholding future settlements, retaining cashreserve accounts or obtaining other collateral. In addition,Merchant Services recognizes a valuation allowance that coversthe payment or performance risk to the Firm related to charge-backs.
(a)
(a)
154

Loan sales- and securitization-related indemnificationsIn connection with the Firm’s mortgage loan sale and securitizationactivities with GSEs the Firm has made representations andwarranties that the loans sold meet certain requirements, and thatmay require the Firm to repurchase mortgage loans and/orindemnify the loan purchaser if such representations andwarranties are breached by the Firm.
The liability related to repurchase demands associated with privatelabel securitizations is separately evaluated by the Firm inestablishing its litigation reserves. Refer to Note 24 of this Form10-Q and Note 30 of JPMorgan Chase’s 2020 Form 10-K foradditional information regarding litigation.
Sponsored member repo programThe Firm acts as a sponsoring member to clear eligible overnightresale and repurchase agreements through the GovernmentSecurities Division of the Fixed Income Clearing Corporation(“FICC”) on behalf of clients that become sponsored membersunder the FICC’s rules. The Firm also guarantees to the FICC theprompt and full payment and performance of its sponsoredmember clients’ respective obligations under the FICC’s rules. TheFirm minimizes its liability under these overnight guarantees byobtaining a security interest in the cash or high-quality securitiescollateral that the clients place with the clearing house thereforethe Firm expects the risk of loss to be remote. The Firm’smaximum possible exposure, without taking into consideration theassociated collateral, is included in the Exchange & clearing houseguarantees and commitments line on page 153. Refer to Note 11of JPMorgan Chase’s 2020 Form 10-K for additional informationon credit risk mitigation practices on resale agreements and thetypes of collateral pledged under repurchase agreements.
Guarantees of subsidiariesThe Parent Company has guaranteed certain long-term debt andstructured notes of its subsidiaries, including JPMorgan ChaseFinancial Company LLC (“JPMFC”), a 100%-owned financesubsidiary. All securities issued by JPMFC are fully andunconditionally guaranteed by the Parent Company and no othersubsidiary of the Parent Company guarantees these securities.These guarantees, which rank on a parity with the Firm’sunsecured and unsubordinated indebtedness, are not included inthe table on page 153 of this Note. Refer to Note 20 of JPMorganChase’s 2020 Form 10-K for additional information.
Note 23 – Pledged assets and collateralRefer to Note 29 of JPMorgan Chase’s 2020 Form 10-K for adiscussion of the Firm’s pledged assets and collateral.
Pledged assetsThe Firm pledges financial assets that it owns to maintain potentialborrowing capacity at discount windows with Federal Reservebanks, various other central banks and FHLBs. Additionally, theFirm pledges assets for other purposes, including to collateralizerepurchase and other securities financing agreements, to covershort sales and to collateralize derivative contracts and deposits.Certain of these pledged assets may be sold or repledged orotherwise used by the secured parties and are parentheticallyidentified on the Consolidated balance sheets as assets pledged.The following table presents the Firm’s pledged assets.
(in billions) March 31, 2021December 31,
2020Assets that may be sold or repledged or
otherwise used by secured parties $ 219.1 $ 166.6 Assets that may not be sold or repledged or
otherwise used by secured parties 137.9 113.9 Assets pledged at Federal Reserve banks
and FHLBs 446.8 455.3 Total pledged assets $ 803.8 $ 735.8
Total pledged assets do not include assets of consolidated VIEs;these assets are used to settle the liabilities of those entities. Referto Note 13 for additional information on assets and liabilities ofconsolidated VIEs. Refer to Note 10 for additional information onthe Firm’s securities financing activities. Refer to Note 20 ofJPMorgan Chase’s 2020 Form 10-K for additional information onthe Firm’s long-term debt.
CollateralThe Firm accepts financial assets as collateral that it is permittedto sell or repledge, deliver or otherwise use. This collateral isgenerally obtained under resale and other securities financingagreements, prime brokerage-related held-for-investmentcustomer receivables and derivative contracts. Collateral isgenerally used under repurchase and other securities financingagreements, to cover short sales and to collateralize derivativecontracts and deposits.The following table presents the fair value of collateral accepted.
(in billions) March 31, 2021 December 31, 2020Collateral permitted to be sold or
repledged, delivered, or otherwiseused $ 1,340.6 $ 1,451.7
Collateral sold, repledged, delivered orotherwise used 1,004.0 1,038.9
155

Note 24 – LitigationContingenciesAs of March 31, 2021, the Firm and its subsidiaries and affiliatesare defendants, putative defendants or respondents in numerouslegal proceedings, including private, civil litigations andregulatory/government investigations. The litigations range fromindividual actions involving a single plaintiff to class action lawsuitswith potentially millions of class members. Investigations involveboth formal and informal proceedings, by both governmentalagencies and self-regulatory organizations. These legalproceedings are at varying stages of adjudication, arbitration orinvestigation, and involve each of the Firm’s lines of business andseveral geographies and a wide variety of claims (includingcommon law tort and contract claims and statutory antitrust,securities and consumer protection claims), some of which presentnovel legal theories.
The Firm believes the estimate of the aggregate range ofreasonably possible losses, in excess of reserves established, forits legal proceedings is from $0 to approximately $1.5 billion atMarch 31, 2021. This estimated aggregate range of reasonablypossible losses was based upon information available as of thatdate for those proceedings in which the Firm believes that anestimate of reasonably possible loss can be made. For certainmatters, the Firm does not believe that such an estimate can bemade, as of that date. The Firm’s estimate of the aggregate rangeof reasonably possible losses involves significant judgment, given:
• the number, variety and varying stages of the proceedings,including the fact that many are in preliminary stages,
• the existence in many such proceedings of multiple defendants,including the Firm, whose share of liability (if any) has yet to bedetermined,
• the numerous yet-unresolved issues in many of theproceedings, including issues regarding class certification andthe scope of many of the claims, and
• the attendant uncertainty of the various potential outcomes ofsuch proceedings, including where the Firm has madeassumptions concerning future rulings by the court or otheradjudicator, or about the behavior or incentives of adverseparties or regulatory authorities, and those assumptions proveto be incorrect.
In addition, the outcome of a particular proceeding may be a resultwhich the Firm did not take into account in its estimate becausethe Firm had deemed the likelihood of that outcome to be remote.Accordingly, the Firm’s estimate of the aggregate range ofreasonably possible losses will change from time to time, andactual losses may vary significantly.
Set forth below are descriptions of the Firm’s material legalproceedings.
Amrapali. India’s Enforcement Directorate (“ED”) is investigatingJPMorgan India Private Limited in connection with investmentsmade in 2010 and 2012 by two offshore funds formerly managedby JPMorgan Chase entities into residential housing projectsdeveloped by the Amrapali Group (“Amrapali”). In 2017, numerouscreditors filed civil claims against Amrapali including petitionsbrought by home buyers relating to delays in delivering or failure todeliver residential units. The home buyers’ petitions have beenoverseen by the Supreme Court of India since 2017 pursuant to itsjurisdiction over public interest litigation. In July 2019, the SupremeCourt of India issued an order making preliminary findings thatAmrapali and other parties, including unspecified JPMorganChase entities and the offshore funds that had invested in theprojects, violated certain currency control and money launderingprovisions, and ordering the ED to conduct a further inquiry underIndia’s Prevention of Money Laundering Act (“PMLA”) and ForeignExchange Management Act (“FEMA”). In May 2020, theEnforcement Directorate issued a provisional attachment order aspart of the criminal PMLA proceedings freezing approximately$25 million held by JPMorgan India Private Limited. In June 2020,the funds were transferred to an account held by the SupremeCourt of India. A separate civil proceeding relating to allegedFEMA violations is ongoing. The Firm is responding to andcooperating with the investigation.
Federal Republic of Nigeria Litigation. JPMorgan Chase Bank,N.A. operated an escrow and depository account for the FederalGovernment of Nigeria (“FGN”) and two major international oilcompanies. The account held approximately $1.1 billion inconnection with a dispute among the clients over rights to an oilfield. Following the settlement of the dispute, JPMorgan ChaseBank, N.A. paid out the monies in the account in 2011 and 2013 inaccordance with directions received from its clients. In November2017, the Federal Republic of Nigeria (“FRN”) commenced a claimin the English High Court for approximately $875 million inpayments made out of the accounts. The FRN, claiming to be thesame entity as the FGN, alleges that the payments were instructedas part of a complex fraud not involving JPMorgan Chase Bank,N.A., but that JPMorgan Chase Bank, N.A. was or should havebeen on notice that the payments may be fraudulent. JPMorganChase Bank, N.A. applied for summary judgment and wasunsuccessful. The claim is ongoing and a trial has been scheduledto commence in February 2022.
Foreign Exchange Investigations and Litigation. The Firmpreviously reported settlements with certain governmentauthorities relating to its foreign exchange (“FX”) sales and tradingactivities and controls related to those activities. Among thoseresolutions, in May 2015, the Firm pleaded
156

guilty to a single violation of federal antitrust law. In January 2017,the Firm was sentenced, with judgment entered thereafter and aterm of probation ending in January 2020. The term of probationhas concluded, with the Firm remaining in good standingthroughout the probation period. The Department of Labor grantedthe Firm a five-year exemption of disqualification that allows theFirm and its affiliates to continue to rely on the QualifiedProfessional Asset Manager exemption under the EmployeeRetirement Income Security Act (“ERISA”) until January 2023. TheFirm will need to reapply in due course for a further exemption tocover the remainder of the ten-year disqualification period. ASouth Africa Competition Commission matter is the remaining FX-related governmental inquiry, and is currently pending before theSouth Africa Competition Tribunal.
In August 2018, the United States District Court for the SouthernDistrict of New York granted final approval to the Firm’s settlementof a consolidated class action brought by U.S.-based plaintiffs,which principally alleged violations of federal antitrust laws basedon an alleged conspiracy to manipulate foreign exchange ratesand also sought damages on behalf of persons who transacted inFX futures and options on futures. Certain members of thesettlement class filed requests to the Court to be excluded fromthe class, and certain of them filed a complaint against the Firmand other foreign exchange dealers in November 2018. A numberof these actions remain pending. Further, a putative class actionhas been filed against the Firm and other foreign exchangedealers on behalf of certain consumers who purchased foreigncurrencies at allegedly inflated rates. Another putative class actionwas brought against the Firm and other foreign exchange dealerson behalf of purported indirect purchasers of FX instruments. In2020, the Court approved a settlement by the Firm and 11 otherdefendants of that class action for a total of $10 million. Inaddition, some FX-related individual and putative class actionsbased on similar alleged underlying conduct have been filedoutside the U.S., including in the U.K., Israel and Australia.
Interchange Litigation. Groups of merchants and retailassociations filed a series of class action complaints alleging thatVisa and Mastercard, as well as certain banks, conspired to setthe price of credit and debit card interchange fees and enactedrelated rules in violation of antitrust laws. In 2012, the partiesinitially settled the cases for a cash payment, a temporaryreduction of credit card interchange, and modifications to certaincredit card network rules. In 2017, after the approval of thatsettlement was reversed on appeal, the case was remanded to theUnited States District Court for the Eastern District of New York forfurther proceedings consistent with the appellate decision.
The original class action was divided into two separate actions,one seeking primarily monetary relief and the other seekingprimarily injunctive relief. In September 2018, the parties to theclass action seeking monetary relief finalized
an agreement which amends and supersedes the prior settlementagreement. Pursuant to this settlement, the defendants collectivelycontributed an additional $900 million to the approximately $5.3billion previously held in escrow from the original settlement. InDecember 2019, the amended agreement was approved by theDistrict Court. Certain merchants appealed the District Court’sapproval order, and those appeals are pending. Based on thepercentage of merchants that opted out of the amended classsettlement, $700 million has been returned to the defendants fromthe settlement escrow in accordance with the settlementagreement. The class action seeking primarily injunctive reliefcontinues separately.
In addition, certain merchants have filed individual actions raisingsimilar allegations against Visa and Mastercard, as well as againstthe Firm and other banks, and some of those actions remainpending.
LIBOR and Other Benchmark Rate Investigations and Litigation.JPMorgan Chase has responded to inquiries from variousgovernmental agencies and entities around the world relatingprimarily to the British Bankers Association’s ("BBA") LondonInterbank Offered Rate (“LIBOR”) for various currencies and theEuropean Banking Federation’s Euro Interbank Offered Rate(“EURIBOR”). The Swiss Competition Commission’s investigationrelating to EURIBOR, to which the Firm and other banks aresubject, continues. In December 2016, the European Commissionissued a decision against the Firm and other banks finding aninfringement of European antitrust rules relating to EURIBOR. TheFirm has filed an appeal of that decision with the EuropeanGeneral Court, and that appeal is pending.
In addition, the Firm has been named as a defendant along withother banks in various individual and putative class actions relatedto benchmark rates, including U.S. dollar LIBOR. In actions relatedto U.S. dollar LIBOR during the period that it was administered bythe BBA, the Firm has obtained dismissal of certain actions andresolved certain other actions, and others are in various stages oflitigation. The United States District Court for the Southern Districtof New York has granted class certification of antitrust claimsrelated to bonds and interest rate swaps sold directly by thedefendants, including the Firm. In a consolidated putative classaction related to the period that U.S. dollar LIBOR wasadministered by ICE Benchmark Administration, the District Courtgranted the motion by defendants, including the Firm, to dismissplaintiffs’ complaint, and the plaintiffs have appealed. In addition,in August 2020, a group of individual plaintiffs filed a lawsuitasserting antitrust claims, alleging that the Firm and otherdefendants were engaged in an unlawful agreement to set U.S.dollar LIBOR and conspired to monopolize the market for LIBOR-based consumer loans and credit cards. In November 2020,plaintiffs filed a motion for a preliminary injunction seeking toenjoin defendants from setting U.S. dollar LIBOR and to prohibitdefendants from enforcing any financial instruments that rely onU.S. dollar LIBOR. Defendants opposed that motion, whichremains pending. The Firm’s settlements of putative
157

class actions related to Swiss franc LIBOR, the SingaporeInterbank Offered Rate and the Singapore Swap Offer Rate, andthe Australian Bank Bill Swap Reference Rate remain subject tocourt approval.
Metals and U.S. Treasuries Investigations and Litigation andRelated Inquiries. The Firm previously reported that it and/orcertain of its subsidiaries had entered into resolutions with the U.S.Department of Justice (“DOJ”), the U.S. Commodity FuturesTrading Commission (“CFTC”) and the U.S. Securities andExchange Commission (“SEC”), which, collectively, resolved thoseagencies’ respective investigations relating to historical tradingpractices by former employees in the precious metals and U.S.treasuries markets and related conduct from 2008 to 2016.
The Firm entered into a Deferred Prosecution Agreement (“DPA”)with the DOJ in which it agreed to the filing of a criminalinformation charging JPMorgan Chase & Co. with two counts ofwire fraud and agreed, along with JPMorgan Chase Bank, N.A.and J.P. Morgan Securities LLC, to certain terms and obligationsas set forth therein. Under the terms of the DPA, the criminalinformation will be dismissed after three years, provided thatJPMorgan Chase & Co., JPMorgan Chase Bank, N.A. and J.P.Morgan Securities LLC fully comply with all of their obligations.
Across the three resolutions with the DOJ, CFTC and SEC,JPMorgan Chase & Co., JPMorgan Chase Bank, N.A. and J.P.Morgan Securities LLC agreed to pay a total monetary amount ofapproximately $920 million. A portion of the total monetary amountincludes victim compensation payments.
Several putative class action complaints have been filed in theUnited States District Court for the Southern District of New Yorkagainst the Firm and certain former employees, alleging a preciousmetals futures and options price manipulation scheme in violationof the Commodity Exchange Act. Some of the complaints alsoallege unjust enrichment and deceptive acts or practices under theGeneral Business Law of the State of New York. The Courtconsolidated these putative class actions in February 2019, andthe consolidated action is stayed through May 2021. In Canada,plaintiffs have moved to commence putative class actionproceedings based on similar alleged underlying conduct forprecious metals. In addition, several putative class actions havebeen filed in the United States District Courts for the NorthernDistrict of Illinois and Southern District of New York against theFirm, alleging manipulation of U.S. Treasury futures and options,and bringing claims under the Commodity Exchange Act. Some ofthe complaints also allege unjust enrichment. The actions in theNorthern District of Illinois have been transferred to the SouthernDistrict of New York. The Court consolidated these putative classactions in October 2020 and plaintiffs filed their consolidatedamended complaint in April 2021.
Two putative class action complaints have also been filed underthe Securities Exchange Act of 1934 in the United
States District Court for the Eastern District of New York againstthe Firm and certain individual defendants on behalf ofshareholders who acquired shares during the putative class periodalleging that certain SEC filings of the Firm were materially false ormisleading in that they did not disclose certain information relatingto the above-referenced investigations. The Court consolidatedthese putative class actions in January 2021, and plaintiffs filedtheir consolidated amended complaint in March 2021.
Securities Lending Antitrust Litigation. JPMorgan Chase Bank,N.A., J.P. Morgan Securities LLC, J.P. Morgan Prime, Inc., and J.P.Morgan Strategic Securities Lending Corp. are named asdefendants in a putative class action filed in the United StatesDistrict Court for the Southern District of New York. The complaintasserts violations of federal antitrust law and New York Statecommon law in connection with an alleged conspiracy to preventthe emergence of anonymous exchange trading for securitieslending transactions. Defendants’ motion to dismiss the complaintwas denied. Plaintiffs have moved to certify a class in this action,which defendants are opposing.
Wendel. Since 2012, the French criminal authorities have beeninvestigating a series of transactions entered into by seniormanagers of Wendel Investissement (“Wendel”) during the periodfrom 2004 through 2007 to restructure their shareholdings inWendel. JPMorgan Chase Bank, N.A., Paris branch providedfinancing for the transactions to a number of managers of Wendelin 2007. JPMorgan Chase cooperated with the investigation. Theinvestigating judges issued an ordonnance de renvoi in November2016, referring JPMorgan Chase Bank, N.A. to the French tribunalcorrectionnel for alleged complicity in tax fraud. In January 2018,the Paris Court of Appeal issued a decision cancelling the mise enexamen of JPMorgan Chase Bank, N.A. The Court of Cassation,France’s highest court, ruled in September 2018 that a mise enexamen is a prerequisite for an ordonnance de renvoi and inJanuary 2020 ordered the annulment of the ordonnance de renvoireferring JPMorgan Chase Bank, N.A. to the French tribunalcorrectionnel. The Court of Appeal found in January 2021 that ithad no power to take further action against JPMorgan Chasefollowing the Court of Cassation’s ruling. At the opening of a trial ofthe managers of Wendel in January 2021, the tribunalcorrectionnel directed the criminal authorities to clarify whether afurther investigation should be opened against JPMorgan Chase,pending which the trial was postponed. In April 2021, the Court ofCassation declined to hear JPMorgan Chase’s appeal of theJanuary 2021 decision of the tribunal correctionnel at this stage ofthe proceedings. In addition, a number of the managers havecommenced civil proceedings against JPMorgan Chase Bank,N.A. The claims are separate, involve different allegations and areat various stages of proceedings.
* * *
In addition to the various legal proceedings discussed above,JPMorgan Chase and its subsidiaries are named as defendants orare otherwise involved in a substantial number of other legalproceedings. The Firm believes it has
158

meritorious defenses to the claims asserted against it in itscurrently outstanding legal proceedings and it intends to defenditself vigorously. Additional legal proceedings may be initiated fromtime to time in the future.
The Firm has established reserves for several hundred of itscurrently outstanding legal proceedings. In accordance with theprovisions of U.S. GAAP for contingencies, the Firm accrues for alitigation-related liability when it is probable that such a liability hasbeen incurred and the amount of the loss can be reasonablyestimated. The Firm evaluates its outstanding legal proceedingseach quarter to assess its litigation reserves, and makesadjustments in such reserves, upward or downward, asappropriate, based on management’s best judgment afterconsultation with counsel. The Firm’s legal expense was $28million and $197 million for the three months ended March 31,2021 and 2020, respectively. There is no assurance that the Firm’slitigation reserves will not need to be adjusted in the future.
In view of the inherent difficulty of predicting the outcome of legalproceedings, particularly where the claimants seek very large orindeterminate damages, or where the matters present novel legaltheories, involve a large number of parties or are in early stages ofdiscovery, the Firm cannot state with confidence what will be theeventual outcomes of the currently pending matters, the timing oftheir ultimate resolution or the eventual losses, fines, penalties orconsequences related to those matters. JPMorgan Chasebelieves, based upon its current knowledge and after consultationwith counsel, consideration of the material legal proceedingsdescribed above and after taking into account its current litigationreserves and its estimated aggregate range of possible losses,that the other legal proceedings currently pending against it shouldnot have a material adverse effect on the Firm’s consolidatedfinancial condition. The Firm notes, however, that in light of theuncertainties involved in such proceedings, there is no assurancethat the ultimate resolution of these matters will not significantlyexceed the reserves it has currently accrued or that a matter willnot have material reputational consequences. As a result, theoutcome of a particular matter may be material to JPMorganChase’s operating results for a particular period, depending on,among other factors, the size of the loss or liability imposed andthe level of JPMorgan Chase’s income for that period.
159

Note 25 – Business segmentsThe Firm is managed on an LOB basis. There are four majorreportable business segments - Consumer & Community Banking,Corporate & Investment Bank, Commercial Banking and Asset &Wealth Management. In addition, there is a Corporate segment.The business segments are determined based on the productsand services provided, or the type of customer served, and theyreflect the manner in which financial information is currentlyevaluated by the Firm’s Operating Committee. Segment resultsare presented on a managed basis. Refer to Segment resultsbelow, and Note 32 of JPMorgan Chase’s 2020 Form 10-K for afurther discussion of JPMorgan Chase’s business segments.
Segment resultsThe following table provides a summary of the Firm’s segmentresults as of or for the three months ended March 31, 2021 and2020, on a managed basis. The Firm’s definition of managed basisstarts with the reported U.S. GAAP results and includes certainreclassifications to
present total net revenue for the Firm (and each of the reportablebusiness segments) on an FTE basis. Accordingly, revenue frominvestments that receive tax credits and tax-exempt securities ispresented in the managed results on a basis comparable totaxable investments and securities. Refer to Note 32 of JPMorganChase’s 2020 Form 10-K for additional information on the Firm’smanaged basis.
Capital allocationThe amount of capital assigned to each segment is referred to asequity. Periodically, the assumptions and methodologies used toallocate capital are assessed and as a result, the capital allocatedto the LOBs may change. Refer to Line of business equity on page98 of JPMorgan Chase’s 2020 Form 10-K for additionalinformation on capital allocation.
Segment results and reconciliationAs of or for the three months ended March 31, (in millions, except ratios)
Consumer & Community Banking
Corporate & Investment Bank Commercial Banking Asset & Wealth Management
2021 2020 2021 2020 2021 2020 2021 2020Noninterest revenue $ 4,588 $ 4,097 $ 11,088 $ 6,896 $ 917 $ 608 $ 3,146 $ 2,529Net interest income 7,929 9,190 3,517 3,107 1,476 1,557 931 860Total net revenue 12,517 13,287 14,605 10,003 2,393 2,165 4,077 3,389Provision for credit losses (3,602) 5,772 (331) 1,401 (118) 1,010 (121) 94Noninterest expense 7,202 7,269 7,104 5,955 969 986 2,574 2,435Income/(loss) before income
tax expense/(benefit) 8,917 246 7,832 2,647 1,542 169 1,624 860Income tax expense/(benefit) 2,189 49 2,092 662 374 30 380 191Net income/(loss) $ 6,728 $ 197 $ 5,740 $ 1,985 $ 1,168 $ 139 $ 1,244 $ 669Average equity $ 50,000 $ 52,000 $ 83,000 $ 80,000 $ 24,000 $ 22,000 $ 14,000 $ 10,500Total assets 487,978 513,352 1,355,123 1,216,558 223,583 247,786 213,088 178,897ROE 54 % 1 % 27 % 9 % 19 % 2 % 35 % 25 %Overhead ratio 58 55 49 60 40 46 63 72
As of or for the three months ended March 31, (in millions, except ratios)
Corporate Reconciling Items Total
2021 2020 2021 2020 2021 2020Noninterest revenue $ 382 $ 331 $ (744) $ (614) $ 19,377 $ 13,847Net interest income (855) (165) (109) (110) 12,889 14,439Total net revenue (473) 166 (853) (724) 32,266 28,286Provision for credit losses 16 8 — — (4,156) 8,285Noninterest expense 876 146 — — 18,725 16,791Income/(loss) before income tax expense/(benefit) (1,365) 12 (853) (724) 17,697 3,210Income tax expense/(benefit) (785) 137 (853) (724) 3,397 345Net income/(loss) $ (580) $ (125) $ — $ — $ 14,300 $ 2,865Average equity $ 74,542 $ 70,030 $ — $ — $ 245,542 $ 234,530Total assets 1,409,564 981,937 NA NA 3,689,336 3,138,530ROE NM NM NM NM 23 % 4 %Overhead ratio NM NM NM NM 58 59
(a) Segment managed results reflect revenue on an FTE basis with the corresponding income tax impact recorded within income tax expense/(benefit). These adjustments areeliminated in reconciling items to arrive at the Firm’s reported U.S. GAAP results.
(b) Prior-period amounts have been revised to conform with the current presentation. Refer to Note 1 for further information.
(a)
(b)
(a)
(b) (b)
(b) (b)
(b)
(b)
160

Report of Independent Registered Public Accounting Firm
To the Board of Directors and Shareholders of JPMorgan Chase &Co.:
Results of Review of Interim Financial StatementsWe have reviewed the accompanying consolidated balance sheetof JPMorgan Chase & Co. and its subsidiaries (the “Firm”) as ofMarch 31, 2021, and the related consolidated statements ofincome, comprehensive income, changes in stockholders’ equityand cash flows for the three-month periods ended March 31, 2021and 2020, including the related notes (collectively referred to asthe “interim financial statements”). Based on our reviews, we arenot aware of any material modifications that should be made to theaccompanying interim financial statements for them to be inconformity with accounting principles generally accepted in theUnited States of America.
We have previously audited, in accordance with the standards ofthe Public Company Accounting Oversight Board (United States),the consolidated balance sheet of the Firm as of December 31,2020, and the related consolidated statements of income,comprehensive income, changes in stockholders’ equity and cashflows for the year then ended (not presented herein), and in ourreport dated February 23, 2021, which included a paragraphdescribing a change in the manner of accounting for credit losseson certain financial instruments in the 2020 financial statements,we expressed an unqualified opinion on those consolidatedfinancial statements. In our opinion, the information set forth in theaccompanying consolidated balance sheet information as ofDecember 31, 2020, is fairly stated, in all material respects, inrelation to the consolidated balance sheet from which it has beenderived.
Basis for Review ResultsThese interim financial statements are the responsibility of theFirm’s management. We are a public accounting firm registeredwith the Public Company Accounting Oversight Board (UnitedStates) (PCAOB) and are required to be independent with respectto the Firm in accordance with the U.S. federal securities laws andthe applicable rules and regulations of the Securities andExchange Commission and the PCAOB. We conducted our reviewin accordance with the standards of the PCAOB. A review ofinterim financial information consists principally of applyinganalytical procedures and making inquiries of persons responsiblefor financial and accounting matters. It is substantially less inscope than an audit conducted in accordance with the standardsof the PCAOB, the objective of which is the expression of anopinion regarding the financial statements taken as a whole.Accordingly, we do not express such an opinion.
May 4, 2021
PricewaterhouseCoopers LLP, 300 Madison Avenue, New York, NY 10017
161

JPMorgan Chase & Co.Consolidated average balance sheets, interest and rates (unaudited)
(Taxable-equivalent interest and rates; in millions, except rates)
Three months ended March 31, 2021 Three months ended March 31, 2020Averagebalance Interest
Rate(annualized)
Averagebalance Interest
Rate(annualized)
AssetsDeposits with banks $ 631,606 $ 65 0.04 % $ 279,748 $ 569 0.82 %Federal funds sold and securities purchased under resale
agreements 289,763 233 0.33 253,403 1,095 1.74
Securities borrowed 175,019 (77) (0.18) 136,127 152 0.45 Trading assets – debt instruments 322,648 1,790 2.25 304,808 2,075 2.74
Taxable securities 550,579 1,605 1.18 388,223 2,233 2.31 Nontaxable securities 31,881 348 4.43 33,306 365 4.41
Total investment securities 582,460 1,953 1.36 421,529 2,598 2.48 Loans 1,013,524 10,217 4.09 1,001,504 12,339 4.96 All other interest-earning assets 111,549 199 0.72 68,430 443 2.60 Total interest-earning assets 3,126,569 14,380 1.87 2,465,549 19,271 3.14 Allowance for loan losses (28,268) (17,357)Cash and due from banks 25,168 21,668 Trading assets – equity and other instruments 159,727 114,479 Trading assets – derivative receivables 79,013 66,309 Goodwill, MSRs and other intangible Assets 53,932 52,690 All other noninterest-earning assets 196,700 185,986 Total assets $ 3,612,841 $ 2,889,324 LiabilitiesInterest-bearing deposits $ 1,610,467 $ 146 0.04 % $ 1,216,555 $ 1,575 0.52 %Federal funds purchased and securities loaned or sold under
repurchase agreements 301,386 15 0.02 243,922 787 1.30 Short-term borrowings 42,031 33 0.31 37,288 151 1.63 Trading liabilities – debt and all other interest-bearing
liabilities 230,922 27 0.05 192,950 372 0.77 Beneficial interests issued by consolidated VIEs 17,185 27 0.64 18,048 90 2.02 Long-term debt 239,398 1,134 1.92 243,996 1,747 2.88 Total interest-bearing liabilities 2,441,389 1,382 0.23 1,952,759 4,722 0.97 Noninterest-bearing deposits 614,165 419,631 Trading liabilities – equity and other instruments 35,029 30,721 Trading liabilities – derivative payables 67,960 54,990 All other liabilities, including the allowance for lending-related
commitments 178,444 167,287 Total liabilities 3,336,987 2,625,388 Stockholders’ equityPreferred stock 30,312 29,406 Common stockholders’ equity 245,542 234,530 Total stockholders’ equity 275,854 263,936 Total liabilities and stockholders’ equity $ 3,612,841 $ 2,889,324 Interest rate spread 1.64 % 2.17 %Net interest income and net yield on interest-earning assets $ 12,998 1.69 $ 14,549 2.37
(a) Represents securities which are tax-exempt for U.S. federal income tax purposes.(b) Includes brokerage-related held-for-investment customer receivables, which are classified in accrued interest and accounts receivable, and all other interest-earning assets,
which are classified in other assets on the Consolidated Balance Sheets.(c) Prior-period amounts have been revised to conform with the current presentation. Refer to Note 1 for further information.(d) Includes commercial paper.(e) All other interest-bearing liabilities include brokerage-related customer payables.(f) The combined balance of trading liabilities – debt and equity instruments was $126.3 billion and $101.1 billion for the three months ended March 31, 2021 and 2020,
respectively.(g) Interest includes the effect of certain related hedging derivatives. Taxable-equivalent amounts are used where applicable.(h) Negative interest income and yield are related to the impact of current interest rates combined with the fees paid on client-driven securities borrowed balances. The negative
interest expense related to prime brokerage customer payables is recognized in interest expense and reported within trading liabilities - debt and all other interest-bearingliabilities.
(i) The annualized rate for securities based on amortized cost was 1.38% and 2.52% for the three months ended March 31, 2021 and 2020, respectively, and does not give effectto changes in fair value that are reflected in AOCI.
(g) (g)
(h)
(a)
(i) (i)
(b)
(c)
(d)
(e)(f) (h)
(f)
(c)
162

GLOSSARY OF TERMS AND ACRONYMS
2020 Form 10-K: Annual report on Form 10-K for year endedDecember 31, 2020, filed with the U.S. Securities and ExchangeCommission.
ABS: Asset-backed securities
Active foreclosures: Loans referred to foreclosure where formalforeclosure proceedings are ongoing. Includes both judicial andnon-judicial states.
AFS: Available-for-sale
Allowance for loan losses to total retained loans: representsperiod-end allowance for loan losses divided by retained loans.
Amortized cost: Amount at which a financing receivable orinvestment is originated or acquired, adjusted for accretion oramortization of premium, discount, and net deferred fees or costs,collection of cash, charge-offs, foreign exchange, and fair valuehedge accounting adjustments. For AFS securities, amortized costis also reduced by any impairment losses recognized in earnings.Amortized cost is not reduced by the allowance for credit losses,except where explicitly presented net.
AOCI: Accumulated other comprehensive income/(loss)
ARM(s): Adjustable rate mortgage(s)
AUC: “Assets under custody”: Represents assets held directly orindirectly on behalf of clients under safekeeping, custody andservicing arrangements.
Auto loan and lease origination volume: Dollar amount of autoloans and leases originated.
AWM: Asset & Wealth Management
Beneficial interests issued by consolidated VIEs: representsthe interest of third-party holders of debt, equity securities, or otherobligations, issued by VIEs that JPMorgan Chase consolidates.
Benefit obligation: refers to the projected benefit obligation forpension plans and the accumulated postretirement benefitobligation for OPEB plans.
BHC: Bank holding company
Bridge Financing Portfolio: A portfolio of held-for-sale unfundedloan commitments and funded loans. The unfunded commitmentsinclude both short-term bridge loan commitments that willultimately be replaced by longer term financing as well as termloan commitments. The funded loans include term loans andfunded revolver facilities.
CB: Commercial Banking
CBB: Consumer & Business Banking
CCAR: Comprehensive Capital Analysis and Review
CCB: Consumer & Community Banking
CDS: Credit default swaps
CECL: Current Expected Credit Losses
CEO: Chief Executive Officer
CET1 capital: Common equity Tier 1 capital
CFTC: Commodity Futures Trading Commission
CFO: Chief Financial Officer
CIB: Corporate & Investment Bank
CIO: Chief Investment Office
Client assets: Represent assets under management as well ascustody, brokerage, administration and deposit accounts.
Client deposits and other third-party liabilities: Deposits, aswell as deposits that are swept to on-balance sheet liabilities (e.g.,commercial paper, federal funds purchased and securities loanedor sold under repurchase agreements) as part of client cashmanagement programs.
CLTV: Combined loan-to-value
Collateral-dependent: A loan is considered to be collateral-dependent when repayment of the loan is expected to be providedsubstantially through the operation or sale of the collateral whenthe borrower is experiencing financial difficulty, including whenforeclosure is deemed probable based on borrower delinquency.
Commercial Card: provides a wide range of payment services tocorporate and public sector clients worldwide through thecommercial card products. Services include procurement,corporate travel and entertainment, expense managementservices, and business-to-business payment solutions.
Credit derivatives: Financial instruments whose value is derivedfrom the credit risk associated with the debt of a third-party issuer(the reference entity) which allow one party (the protectionpurchaser) to transfer that risk to another party (the protectionseller). Upon the occurrence of a credit event by the referenceentity, which may include, among other events, the bankruptcy orfailure to pay its obligations, or certain restructurings of the debt ofthe reference entity, neither party has recourse to the referenceentity. The protection purchaser has recourse to the protectionseller for the difference between the face value of the CDScontract and the fair value at the time of settling the creditderivative contract. The determination as to whether a credit eventhas occurred is generally made by the relevant InternationalSwaps and Derivatives Association (“ISDA”) DeterminationsCommittee.
Criticized: Criticized loans, lending-related commitments andderivative receivables that are classified as special mention,substandard and doubtful categories for regulatory purposes andare generally consistent with a rating of CCC+/Caa1 and below, asdefined by S&P and Moody’s.
CRO: Chief Risk Officer
CVA: Credit valuation adjustment
DVA: Debit valuation adjustment
163

EC: European Commission
Eligible HQLA: Eligible high-quality liquid assets, for purposes ofcalculating the LCR, is the amount of unencumbered HQLA thatsatisfy certain operational considerations as defined in the LCRrule.
Eligible LTD: Long-term debt satisfying certain eligibility criteria
Embedded derivatives: are implicit or explicit terms or features ofa financial instrument that affect some or all of the cash flows orthe value of the instrument in a manner similar to a derivative. Aninstrument containing such terms or features is referred to as a“hybrid.” The component of the hybrid that is the non-derivativeinstrument is referred to as the “host.” For example, callable debtis a hybrid instrument that contains a plain vanilla debt instrument(i.e., the host) and an embedded option that allows the issuer toredeem the debt issue at a specified date for a specified amount(i.e., the embedded derivative). However, a floating rate instrumentis not a hybrid composed of a fixed-rate instrument and an interestrate swap.
ERISA: Employee Retirement Income Security Act of 1974
EPS: Earnings per share
Exchange-traded derivatives: Derivative contracts that areexecuted on an exchange and settled via a central clearing house.
Expense categories:• Volume- and/or revenue-related expenses generally correlate
with changes in the related business/transaction volume orrevenue. Examples of volume- and revenue-related expensesinclude commissions and incentive compensation, depreciationexpense related to operating lease assets, and brokerageexpense related to equities trading transaction volume.
• Investments include expenses associated with supportingmedium- to longer-term strategic plans of the Firm. Examples ofinvestments include initiatives in technology (including relatedcompensation), marketing, and compensation for new bankersand client advisors.
• Structural expenses are those associated with the day-to-daycost of running the bank and are expenses not covered by theabove two categories. Examples of structural expenses includeemployee salaries and benefits, as well as noncompensationcosts such as real estate and all other expenses.
EU: European Union
Fannie Mae: Federal National Mortgage Association
FASB: Financial Accounting Standards Board
FCA: Financial Conduct Authority
FDIC: Federal Deposit Insurance Corporation
Federal Reserve: The Board of the Governors of the FederalReserve System
FFIEC: Federal Financial Institutions Examination Council
FHA: Federal Housing Administration
FHLB: Federal Home Loan Bank
FICO score: A measure of consumer credit risk based oninformation in consumer credit reports produced by Fair IsaacCorporation. Because certain aged data is excluded from creditreports based on rules in the Fair Credit Reporting Act, FICOscores may not reflect all historical information about a consumer.
FINRA: Financial Industry Regulatory Authority
Firm: JPMorgan Chase & Co.
Follow-on offering: An issuance of shares following a company'sIPO.
Forward points: represents the interest rate differential betweentwo currencies, which is either added to or subtracted from thecurrent exchange rate (i.e., “spot rate”) to determine the forwardexchange rate.
FRBB: Federal Reserve Bank of Boston
FRBNY: Federal Reserve Bank of New York
Freddie Mac: Federal Home Loan Mortgage Corporation
Free-standing derivatives: is a derivative contract entered intoeither separate and apart from any of the Firm’s other financialinstruments or equity transactions. Or, in conjunction with someother transaction and is legally detachable and separatelyexercisable.
FTE: Fully taxable-equivalent
FVA: Funding valuation adjustment
FX: Foreign exchange
G7: “Group of Seven nations”: Countries in the G7 are Canada,France, Germany, Italy, Japan, the U.K. and the U.S.
G7 government securities: Securities issued by the governmentof one of the G7 nations.
Ginnie Mae: Government National Mortgage Association
GSIB: Global systemically important banks
HELOC: Home equity line of credit
Home equity – senior lien: represents loans and commitmentswhere JPMorgan Chase holds the first security interest on theproperty.
Home equity – junior lien: represents loans and commitmentswhere JPMorgan Chase holds a security interest that issubordinate in rank to other liens.
HQLA: High-quality liquid assets
HTM: Held-to-maturityIBOR: Interbank Offered RateIDI: Insured depository institutionsIHC: JPMorgan Chase Holdings LLC, an intermediate holdingcompanyIPO: Initial public offering
Investment-grade: An indication of credit quality based onJPMorgan Chase’s internal risk assessment system. “Investmentgrade” generally represents a risk profile similar to a rating of a“BBB-”/“Baa3” or better, as defined
164

by independent rating agencies.
IR: Interest rate
ISDA: International Swaps and Derivatives Association
JPMorgan Chase: JPMorgan Chase & Co.
JPMorgan Chase Bank, N.A.: JPMorgan Chase Bank, NationalAssociation
JPMorgan Chase Foundation or Foundation: a not-for-profitorganization that makes contributions for charitable andeducational purposes.
J.P. Morgan Securities: J.P. Morgan Securities LLC
LCR: Liquidity coverage ratio
LGD: Loss given default
LIBOR: London Interbank Offered Rate
LLC: Limited Liability Company
LOB: Line of business
LTV: “Loan-to-value ratio”: For residential real estate loans, therelationship, expressed as a percentage, between the principalamount of a loan and the appraised value of the collateral (i.e.,residential real estate) securing the loan.
Origination date LTV ratioThe LTV ratio at the origination date of the loan. Origination dateLTV ratios are calculated based on the actual appraised values ofcollateral (i.e., loan-level data) at the origination date.
Current estimated LTV ratioAn estimate of the LTV as of a certain date. The current estimatedLTV ratios are calculated using estimated collateral values derivedfrom a nationally recognized home price index measured at themetropolitan statistical area (“MSA”) level. These MSA-level homeprice indices consist of actual data to the extent available andforecasted data where actual data is not available. As a result, theestimated collateral values used to calculate these ratios do notrepresent actual appraised loan-level collateral values; as such,the resulting LTV ratios are necessarily imprecise and shouldtherefore be viewed as estimates.
Combined LTV ratioThe LTV ratio considering all available lien positions, as well asunused lines, related to the property. Combined LTV ratios areused for junior lien home equity products.
Managed basis: A non-GAAP presentation of Firmwide financialresults that includes reclassifications to present revenue on a fullytaxable-equivalent basis. Management also uses this financialmeasure at the segment level, because it believes this providesinformation to enable investors to understand the underlyingoperational performance and trends of the particular businesssegment and facilitates a comparison of the business segmentwith the performance of competitors.
Master netting agreement: A single agreement with acounterparty that permits multiple transactions governed by thatagreement to be terminated or accelerated and settled through asingle payment in a single currency in the event of a default (e.g.,bankruptcy, failure to make a required payment or securitiestransfer or deliver collateral or margin when due).
Measurement alternative: Measures equity securities withoutreadily determinable fair values at cost less impairment (if any),plus or minus observable price changes from an identical or similarinvestment of the same issuer.
Merchant Services: offers merchants payment processingcapabilities, fraud and risk management, data and analytics, andother payments services. Through Merchant Services, merchantsof all sizes can accept payments via credit and debit cards andpayments in multiple currencies.
MEV: Macroeconomic variable
MBS: Mortgage-backed securities
MD&A: Management’s discussion and analysis
MMLF: Money Market Mutual Fund Liquidity Facility
MMMF: Money market mutual funds
Moody’s: Moody’s Investor Services
Mortgage product types:
Alt-A
Alt-A loans are generally higher in credit quality than subprimeloans but have characteristics that would disqualify the borrowerfrom a traditional prime loan. Alt-A lending characteristics mayinclude one or more of the following: (i) limited documentation; (ii)a high CLTV ratio; (iii) loans secured by non-owner occupiedproperties; or (iv) a debt-to-income ratio above normal limits. Asubstantial proportion of the Firm’s Alt-A loans are those where aborrower does not provide complete documentation of his or herassets or the amount or source of his or her income.
Option ARMs
The option ARM real estate loan product is an adjustable-ratemortgage loan that provides the borrower with the option eachmonth to make a fully amortizing, interest-only or minimumpayment. The minimum payment on an option ARM loan is basedon the interest rate charged during the introductory period. Thisintroductory rate is usually significantly below the fully indexedrate. The fully indexed rate is calculated using an index rate plus amargin. Once the introductory period ends, the contractual interestrate charged on the loan increases to the fully indexed rate andadjusts monthly to reflect movements in the index. The minimumpayment is typically insufficient to cover interest accrued in theprior month, and any unpaid interest is deferred and added to theprincipal balance of the loan. Option ARM loans are subject topayment recast, which converts the loan to a variable-rate fullyamortizing loan upon meeting specified loan balance andanniversary date triggers.
165

Prime
Prime mortgage loans are made to borrowers with good creditrecords who meet specific underwriting requirements, includingprescriptive requirements related to income and overall debtlevels. New prime mortgage borrowers provide full documentationand generally have reliable payment histories.
Subprime
Subprime loans are loans that, prior to mid-2008, were offered tocertain customers with one or more high risk characteristics,including but not limited to: (i) unreliable or poor payment histories;(ii) a high LTV ratio of greater than 80% (without borrower-paidmortgage insurance); (iii) a high debt-to-income ratio; (iv) anoccupancy type for the loan is other than the borrower’s primaryresidence; or (v) a history of delinquencies or late payments on theloan.
MSA: Metropolitan statistical areas
MSR: Mortgage servicing rights
NA: Data is not applicable or available for the period presented.
NAV: Net Asset ValueNet Capital Rule: Rule 15c3-1 under the Securities Exchange Actof 1934.
Net charge-off/(recovery) rate: represents net charge-offs/(recoveries) (annualized) divided by average retained loansfor the reporting period.
Net interchange income includes the following components:
• Interchange income: Fees earned by credit and debit cardissuers on sales transactions.
• Rewards costs: The cost to the Firm for points earned bycardholders enrolled in credit card rewards programs generallytied to sales transactions.
• Partner payments: Payments to co-brand credit card partnersbased on the cost of loyalty program rewards earned bycardholders on credit card transactions.
Net yield on interest-earning assets: The average rate forinterest-earning assets less the average rate paid for all sources offunds.
NFA: National Futures Association
NM: Not meaningful
Nonaccrual loans: Loans for which interest income is notrecognized on an accrual basis. Loans (other than credit cardloans and certain consumer loans insured by U.S. governmentagencies) are placed on nonaccrual status when full payment ofprincipal and interest is not expected, regardless of delinquencystatus, or when principal and interest has been in default for aperiod of 90 days or more unless the loan is both well-secured andin the process of collection. Collateral-dependent loans aretypically maintained on nonaccrual status.
Nonperforming assets: Nonperforming assets includenonaccrual loans, nonperforming derivatives and certain assetsacquired in loan satisfactions, predominantly real estate ownedand other commercial and personal property.
NSFR: Net Stable Funding Ratio
OCC: Office of the Comptroller of the Currency
OCI: Other comprehensive income/(loss)
OPEB: Other postretirement employee benefit
OTC: “Over-the-counter derivatives”: Derivative contracts that arenegotiated, executed and settled bilaterally between two derivativecounterparties, where one or both counterparties is a derivativesdealer.
OTC cleared: “Over-the-counter cleared derivatives”: Derivativecontracts that are negotiated and executed bilaterally, butsubsequently settled via a central clearing house, such that eachderivative counterparty is only exposed to the default of thatclearing house.
Overhead ratio: Noninterest expense as a percentage of total netrevenue.
Parent Company: JPMorgan Chase & Co.
Participating securities: represents unvested share-basedcompensation awards containing nonforfeitable rights to dividendsor dividend equivalents (collectively, “dividends”), which areincluded in the earnings per share calculation using the two-classmethod. JPMorgan Chase grants restricted stock and RSUs tocertain employees under its share-based compensation programs,which entitle the recipients to receive nonforfeitable dividendsduring the vesting period on a basis equivalent to the dividendspaid to holders of common stock. These unvested awards meetthe definition of participating securities. Under the two-classmethod, all earnings (distributed and undistributed) are allocatedto each class of common stock and participating securities, basedon their respective rights to receive dividends.
PCD: “Purchased credit deteriorated” assets represent acquiredfinancial assets that as of the date of acquisition have experienceda more-than-insignificant deterioration in credit quality sinceorigination, as determined by the Firm.
PD: Probability of defaultPhishing: a type of social engineering cyberattack receivedthrough email or online messages.
PPP: Paycheck Protection Program under the Small BusinessAssociation ("SBA")
PPPL Facility: Paycheck Protection Program Lending Facility
PRA: Prudential Regulation Authority
Pre-provision profit/(loss): represents total net revenue lessnoninterest expense. The Firm believes that this financial measureis useful in assessing the ability of a lending institution to generateincome in excess of its provision for credit losses.
166

Principal transactions revenue: Principal transactions revenue isdriven by many factors, including the bid-offer spread, which is thedifference between the price at which the Firm is willing to buy afinancial or other instrument and the price at which the Firm iswilling to sell that instrument. It also consists of realized (as aresult of closing out or termination of transactions, or interim cashpayments) and unrealized (as a result of changes in valuation)gains and losses on financial and other instruments (includingthose accounted for under the fair value option) primarily used inclient-driven market-making activities and on private equityinvestments. In connection with its client-driven market-makingactivities, the Firm transacts in debt and equity instruments,derivatives and commodities (including physical commoditiesinventories and financial instruments that reference commodities).Principal transactions revenue also includes certain realized andunrealized gains and losses related to hedge accounting andspecified risk-management activities, including: (a) certainderivatives designated in qualifying hedge accountingrelationships (primarily fair value hedges of commodity and foreignexchange risk), (b) certain derivatives used for specific riskmanagement purposes, primarily to mitigate credit risk and foreignexchange risk, and (c) other derivatives.
PSU(s): Performance share units
Regulatory VaR: Daily aggregated VaR calculated in accordancewith regulatory rules.
REO: Real estate owned
Reported basis: Financial statements prepared under U.S. GAAP,which excludes the impact of taxable-equivalent adjustments.
Retained loans: Loans that are held-for-investment (i.e. excludesloans held-for-sale and loans at fair value).
Revenue wallet: Total fee revenue based on estimates ofinvestment banking fees generated across the industry (i.e., therevenue wallet) from investment banking transactions in M&A,equity and debt underwriting, and loan syndications. Source:Dealogic, a third-party provider of investment banking competitiveanalysis and volume based league tables for the above notedindustry products.RHS: Rural Housing Service of the U.S. Department of Agriculture
ROE: Return on equity
ROTCE: Return on tangible common equity
ROU assets: Right-of-use assets
RSU(s): Restricted stock units
RWA: “Risk-weighted assets”: Basel III establishes twocomprehensive approaches for calculating RWA (a Standardizedapproach and an Advanced approach) which include capitalrequirements for credit risk, market risk, and in the case of BaselIII Advanced, also operational risk. Key differences in thecalculation of credit risk RWA between the Standardized andAdvanced approaches are that for Basel III Advanced, credit riskRWA is based on risk-sensitive
approaches which largely rely on the use of internal credit modelsand parameters, whereas for Basel III Standardized, credit riskRWA is generally based on supervisory risk-weightings which varyprimarily by counterparty type and asset class. Market risk RWA iscalculated on a generally consistent basis between Basel IIIStandardized and Basel III Advanced.
Scored portfolios: Consumer loan portfolios that predominantlyinclude residential real estate loans, credit card loans, auto loansto individuals and certain small business loans.S&P: Standard and Poors
SAR(s): Stock appreciation rights
SCB: Stress capital buffer
SEC: U.S. Securities and Exchange Commission
Seed capital: Initial JPMorgan capital invested in products, suchas mutual funds, with the intention of ensuring the fund is ofsufficient size to represent a viable offering to clients, enablingpricing of its shares, and allowing the manager to develop a trackrecord. After these goals are achieved, the intent is to remove theFirm’s capital from the investment.
Shelf securities: Securities registered with the SEC under ashelf registration statement that have not been issued,offered or sold. These securities are not included in leaguetables until they have actually been issued.Single-name: Single reference-entities
SLR: Supplementary leverage ratio
SMBS: Stripped mortgage-backed securities
SOFR: Secured Overnight Financing Rate
SPEs: Special purpose entities
SPV: Special purpose vehicle
Structural interest rate risk: represents interest rate risk of thenon-trading assets and liabilities of the Firm.
Structured notes: Structured notes are financial instrumentswhose cash flows are linked to the movement in one or moreindexes, interest rates, foreign exchange rates, commoditiesprices, prepayment rates, underlying reference pool of loans orother market variables. The notes typically contain embedded (butnot separable or detachable) derivatives. Contractual cash flowsfor principal, interest, or both can vary in amount and timingthroughout the life of the note based on non-traditional indexes ornon-traditional uses of traditional interest rates or indexes.Suspended foreclosures: Loans referred to foreclosure whereformal foreclosure proceedings have started but are currently onhold, which could be due to bankruptcy or loss mitigation. Includesboth judicial and non-judicial states.
Taxable-equivalent basis: In presenting managed results, thetotal net revenue for each of the business segments and the Firmis presented on a tax-equivalent basis. Accordingly, revenue frominvestments that receive tax
167

credits and tax-exempt securities is presented in the managedresults on a basis comparable to taxable investments andsecurities; the corresponding income tax impact related to tax-exempt items is recorded within income tax expense.
TBVPS: Tangible book value per share
TCE: Tangible common equity
TDR: “Troubled debt restructuring” is deemed to occur when theFirm modifies the original terms of a loan agreement by granting aconcession to a borrower that is experiencing financial difficulty.Loans with short-term and other insignificant modifications that arenot considered concessions are not TDRs.
TLAC: Total Loss Absorbing Capacity
U.K.: United Kingdom
Unaudited: Financial statements and information that have notbeen subjected to auditing procedures sufficient to permit anindependent certified public accountant to express an opinion.
U.S.: United States of America
U.S. government agencies: U.S. government agencies include,but are not limited to, agencies such as Ginnie Mae and FHA, anddo not include Fannie Mae and Freddie Mac which are U.S.government-sponsored enterprises (“U.S. GSEs”). In general,obligations of U.S. government agencies are fully and explicitlyguaranteed as to the timely payment of principal and interest bythe full faith and credit of the U.S. government in the event of adefault.
U.S. GAAP: Accounting principles generally accepted in theUnited States of America.
U.S. GSE(s): “U.S. government-sponsored enterprises” are quasi-governmental, privately-held entities established or chartered bythe U.S. government to serve public purposes as specified by theU.S. Congress to improve the flow of credit to specific sectors ofthe economy and provide certain essential services to the public.U.S. GSEs include Fannie Mae and Freddie Mac, but do notinclude Ginnie Mae or FHA. U.S. GSE obligations are not explicitlyguaranteed as to the timely payment of principal and interest bythe full faith and credit of the U.S. government.
U.S. Treasury: U.S. Department of the Treasury
VA: U.S. Department of Veterans Affairs
VaR: “Value-at-risk” is a measure of the dollar amount ofpotential loss from adverse market moves in an ordinary marketenvironment.
VIEs: Variable interest entities
Warehouse loans: consist of prime mortgages originated with theintent to sell that are accounted for at fair value and classified asloans.
168

LINE OF BUSINESS METRICS
CONSUMER & COMMUNITY BANKING (“CCB”)
Debit and credit card sales volume: Dollar amount of cardmember purchases, net of returns.
Deposit margin/deposit spread: Represents net interest incomeexpressed as a percentage of average deposits.
Home Lending Production and Home Lending Servicing revenuecomprises the following:
Net mortgage servicing revenue: Includes operating revenueearned from servicing third-party mortgage loans, which isrecognized over the period in which the service is provided;changes in the fair value of MSRs; the impact of risk managementactivities associated with MSRs; and gains and losses onsecuritization of excess mortgage servicing. Net mortgageservicing revenue also includes gains and losses on sales andlower of cost or fair value adjustments of certain repurchasedloans insured by U.S. government agencies.
Production revenue: Includes fees and income recognized asearned on mortgage loans originated with the intent to sell, andthe impact of risk management activities associated with themortgage pipeline and warehouse loans. Production revenue alsoincludes gains and losses on sales and lower of cost or fair valueadjustments on mortgage loans held-for-sale (excluding certainrepurchased loans insured by U.S. government agencies), andchanges in the fair value of financial instruments measured underthe fair value option.
Mortgage origination channels comprise the following:
Retail: Borrowers who buy or refinance a home through directcontact with a mortgage banker employed by the Firm using abranch office, the Internet or by phone. Borrowers are frequentlyreferred to a mortgage banker by a banker in a Chase branch, realestate brokers, home builders or other third parties.
Correspondent: Banks, thrifts, other mortgage banks and otherfinancial institutions that sell closed loans to the Firm.
Credit Card: is a business that primarily issues credit cards toconsumers and small businesses.
Net revenue rate: represents Credit Card net revenue(annualized) expressed as a percentage of average loans for theperiod.
Auto loan and lease origination volume: Dollar amount of autoloans and leases originated.
CORPORATE & INVESTMENT BANK (“CIB”)
Definition of selected CIB revenue:
Investment Banking: incorporates all revenue associated withinvestment banking activities, and is reported net of investmentbanking revenue shared with other LOBs.
Wholesale Payments includes the following:
• Treasury Services: offers a broad range of products andservices that enable clients to manage payments and receipts,as well as invest and manage funds. Products include U.S.dollar and multi-currency clearing, automated clearing house,lockbox, disbursement and reconciliation services, checkdeposits, and currency-related services;
• Merchant Services: primarily processes transactions formerchants; and
• Trade Finance: which includes loans tied directly to goodscrossing borders, export/import loans, commercial letters ofcredit, standby letters of credit, and supply chain finance.
Lending: includes net interest income, fees, gains or losses onloan sale activity, gains or losses on securities received as part ofa loan restructuring, and the risk management results related tothe credit portfolio.
Fixed Income Markets: primarily includes revenue related tomarket-making across global fixed income markets, includingforeign exchange, interest rate, credit and commodities markets.
Equity Markets: primarily includes revenue related to market-making across global equity products, including cash instruments,derivatives, convertibles and prime brokerage.
Securities Services: primarily includes custody, fund accountingand administration, and securities lending products sold principallyto asset managers, insurance companies and public and privateinvestment funds. Also includes collateral management anddepositary receipts businesses which provide collateralmanagement products, and depositary bank services for Americanand global depositary receipt programs.
Description of certain business metrics:Assets under custody (“AUC”): represents activities associatedwith the safekeeping and servicing of assets on which SecuritiesServices earns fees.
Investment banking fees: represents advisory, equityunderwriting, bond underwriting and loan syndication fees.
169

COMMERCIAL BANKING (“CB”)Commercial Banking provides comprehensive financial solutions,including lending, wholesale payments, investment banking andasset management products across three primary client segments:Middle Market Banking, Corporate Client Banking and CommercialReal Estate Banking. Other includes amounts not aligned with aprimary client segment.
Middle Market Banking: covers small and midsized companies,local governments and nonprofit clients.
Corporate Client Banking: covers large corporations.
Commercial Real Estate Banking: covers investors, developers,and owners of multifamily, office, retail, industrial and affordablehousing properties.
CB product revenue comprises the following:Lending: includes a variety of financing alternatives, which areprimarily provided on a secured basis; collateral includesreceivables, inventory, equipment, real estate or other assets.Products include term loans, revolving lines of credit, bridgefinancing, asset-based structures, leases, and standby letters ofcredit.
Wholesale payments: includes revenue from a broad range ofproducts and services that enable CB clients to manage paymentsand receipts, as well as invest and manage funds.
Investment banking: includes revenue from a range of productsproviding CB clients with sophisticated capital-raising alternatives,as well as balance sheet and risk management tools throughadvisory, equity underwriting, and loan syndications. Revenuefrom fixed income and equity market products used by CB clientsis also included.
Other: product revenue primarily includes tax-equivalentadjustments generated from Community Development Bankingactivity and certain income derived from principal transactions.
ASSET & WEALTH MANAGEMENT (“AWM”)Assets under management (“AUM”): represent assets managedby AWM on behalf of its Private Banking, Global Institutional andGlobal Funds clients. Includes "Committed capital not Called."
Client assets: represent assets under management, as well ascustody, brokerage, administration and deposit accounts.
Multi-asset: Any fund or account that allocates assets undermanagement to more than one asset class.
Alternative assets: The following types of assets constitutealternative investments – hedge funds, currency, real estate,private equity and other investment funds designed to focus onnontraditional strategies.
AWM’s lines of business consist of the following:Asset Management: offers multi-asset investment managementsolutions across equities, fixed income, alternatives and moneymarket funds to institutional and retail investors providing for abroad range of clients’ investment needs.
Global Private Bank: provides retirement products and services,brokerage, custody, trusts and estates, loans, mortgages, depositsand investment management to high net worth clients.
AWM’s client segments consist of the following:Private Banking: clients include high- and ultra-high-net-worthindividuals, families, money managers and business owners.
Global Institutional: clients include both corporate and publicinstitutions, endowments, foundations, nonprofit organizations andgovernments worldwide.
Global Funds: clients include financial intermediaries andindividual investors.
Asset Management has two high-level measures of its overall fundperformance:
Percentage of mutual fund assets under management infunds rated 4- or 5-star: Mutual fund rating services rank fundsbased on their risk-adjusted performance over various periods. A5-star rating is the best rating and represents the top 10% ofindustry-wide ranked funds.
A 4-star rating represents the next 22.5% of industry-wide rankedfunds. A 3-star rating represents the next 35% of industry-wideranked funds. A 2-star rating represents the next 22.5% ofindustry-wide ranked funds. A 1-star rating is the worst rating andrepresents the bottom 10% of industry-wide ranked funds. The“overall Morningstar rating” is derived from a weighted average ofthe performance associated with a fund’s three-, five- and ten-year(if applicable) Morningstar Rating metrics. For U.S. domiciledfunds, separate star ratings are given at the individual share classlevel. The Nomura “star rating” is based on three-year risk-adjusted performance only. Funds with fewer than three years ofhistory are not rated and
170
hence excluded from this analysis. All ratings, the assigned peercategories and the asset values used to derive this analysis aresourced from these fund rating providers. The data providers re-denominate the asset values into U.S. dollars. This % of AUM isbased on star ratings at the share class level for U.S. domiciledfunds, and at a “primary share class” level to represent the starrating of all other funds except for Japan where Nomura providesratings at the fund level. The “primary share class”, as defined byMorningstar, denotes the share class recommended as being thebest proxy for the portfolio and in most cases will be the most retailversion (based upon annual management charge, minimuminvestment, currency and other factors). The performance datacould have been different if all funds/accounts would have beenincluded. Past performance is not indicative of future results.
Percentage of mutual fund assets under management infunds ranked in the 1st or 2nd quartile (one, three, and fiveyears): All quartile rankings, the assigned peer categories and theasset values used to derive this analysis are sourced from the fundranking providers. Quartile rankings are done on the net-of-feeabsolute return of each fund. The data providers re-denominatethe asset values into U.S. dollars. This % of AUM is based on fundperformance and associated peer rankings at the share class levelfor U.S. domiciled funds, at a “primary share class” level torepresent the quartile ranking of the U.K., Luxembourg and HongKong funds and at the fund level for all other funds. The “primaryshare class”, as defined by Morningstar, denotes the share classrecommended as being the best proxy for the portfolio and in mostcases will be the most retail version (based upon annualmanagement charge, minimum investment, currency and otherfactors). Where peer group rankings given for a fund are in morethan one “primary share class” territory both rankings are includedto reflect local market competitiveness (applies to “OffshoreTerritories” and “HK SFC Authorized” funds only). Theperformance data could have been different if all funds/accountswould have been included. Past performance is not indicative offuture results.
171

Item 3. Quantitative and Qualitative Disclosures About MarketRisk.Refer to the Market Risk Management section of Management’sdiscussion and analysis and pages 135–142 of JPMorgan Chase’s2020 Form 10-K for a discussion of the quantitative and qualitativedisclosures about market risk.
Item 4. Controls and Procedures.As of the end of the period covered by this report, an evaluationwas carried out under the supervision and with the participation ofthe Firm’s management, including its Chairman and ChiefExecutive Officer and its Chief Financial Officer, of theeffectiveness of its disclosure controls and procedures (as definedin Rule 13a-15(e) under the Securities Exchange Act of 1934).Based on that evaluation, the Chairman and Chief ExecutiveOfficer and the Chief Financial Officer concluded that thesedisclosure controls and procedures were effective. Refer toExhibits 31.1 and 31.2 for the Certifications furnished by theChairman and Chief Executive Officer and Chief Financial Officer,respectively.
The Firm is committed to maintaining high standards of internalcontrol over financial reporting. Nevertheless, because of itsinherent limitations, internal control over financial reporting maynot prevent or detect all misstatements. Deficiencies or lapses ininternal controls may occur from time to time, and there can be noassurance that any such deficiencies will not result in significantdeficiencies or material weaknesses in internal control in the futureand collateral consequences therefrom. Refer to “Management’sreport on internal control over financial reporting” on page 158 ofJPMorgan Chase’s 2020 Form 10-K for further information. Therewas no change in the Firm’s internal control over financialreporting (as defined in Rule 13a-15(f) under the SecuritiesExchange Act of 1934) that occurred during the three monthsended March 31, 2021, that has materially affected, or isreasonably likely to materially affect, the Firm’s internal controlover financial reporting.
Part II – Other InformationItem 1. Legal Proceedings.Refer to the discussion of the Firm’s material legal proceedings inNote 24 of this Form 10-Q for information that updates thedisclosures set forth under Part I, Item 3: Legal Proceedings, inJPMorgan Chase’s 2020 Form 10-K.
Item 1A. Risk Factors.The following discussion supplements the discussion of riskfactors affecting the Firm as set forth in Part I, Item 1A:Risk Factors on pages 8-32 of JPMorgan Chase’s 2020 Form 10-K. The discussion of risk factors, as so supplemented, sets forththe material risk factors that could affect JPMorgan Chase’sfinancial condition and operations. Readers should not considerany descriptions of such factors to be a complete set of allpotential risks that could affect the Firm.The COVID-19 pandemic has caused and is causingsignificant harm to the global economy and could furthernegatively affect certain of JPMorgan Chase’s businesses.
On March 11, 2020, the World Health Organization declared theoutbreak of a strain of novel coronavirus disease, COVID-19, to bea global pandemic. The COVID-19 pandemic and governmentalresponses to the pandemic led to the institution of socialdistancing and shelter-in-place requirements in certain areas of theU.S. and other countries resulting in ongoing severe impacts onglobal economic conditions, including:• significant disruption and volatility in the financial markets
• significant disruption of global supply chains, and
• closures of many businesses, leading to loss of revenues andincreased unemployment.
A prolongation or worsening of the pandemic, or the emergence ofother diseases that give rise to similar effects, could deepen theadverse impact on the global economy.
The adverse economic conditions caused by the pandemic havehad a negative impact on certain of JPMorgan Chase’s businessesand results of operations, including:
• reduction in demand for certain products and services fromJPMorgan Chase’s clients and customers, resulting in lowerrevenue, and
• increases in the allowance for credit losses.
Certain models used by JPMorgan Chase in connection with thedetermination of the allowance for credit losses have heightenedperformance risk in the economic environment precipitated by theeffects of the COVID-19 pandemic and government stimulus.There can be no assurance that, even after adjustments havebeen made to model outputs, JPMorgan Chase will not recognizeunexpected losses arising from the model uncertainty that hasresulted from these developments.
172
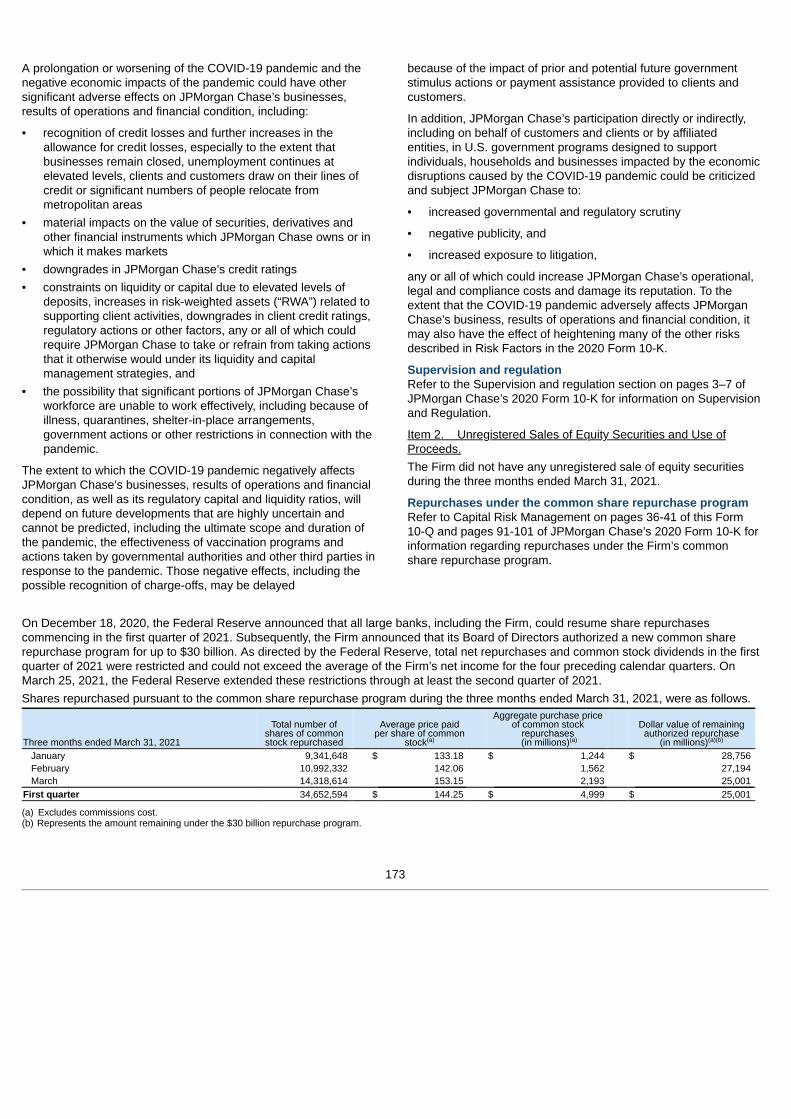
A prolongation or worsening of the COVID-19 pandemic and thenegative economic impacts of the pandemic could have othersignificant adverse effects on JPMorgan Chase’s businesses,results of operations and financial condition, including:
• recognition of credit losses and further increases in theallowance for credit losses, especially to the extent thatbusinesses remain closed, unemployment continues atelevated levels, clients and customers draw on their lines ofcredit or significant numbers of people relocate frommetropolitan areas
• material impacts on the value of securities, derivatives andother financial instruments which JPMorgan Chase owns or inwhich it makes markets
• downgrades in JPMorgan Chase’s credit ratings• constraints on liquidity or capital due to elevated levels of
deposits, increases in risk-weighted assets (“RWA”) related tosupporting client activities, downgrades in client credit ratings,regulatory actions or other factors, any or all of which couldrequire JPMorgan Chase to take or refrain from taking actionsthat it otherwise would under its liquidity and capitalmanagement strategies, and
• the possibility that significant portions of JPMorgan Chase’sworkforce are unable to work effectively, including because ofillness, quarantines, shelter-in-place arrangements,government actions or other restrictions in connection with thepandemic.
The extent to which the COVID-19 pandemic negatively affectsJPMorgan Chase’s businesses, results of operations and financialcondition, as well as its regulatory capital and liquidity ratios, willdepend on future developments that are highly uncertain andcannot be predicted, including the ultimate scope and duration ofthe pandemic, the effectiveness of vaccination programs andactions taken by governmental authorities and other third parties inresponse to the pandemic. Those negative effects, including thepossible recognition of charge-offs, may be delayed
because of the impact of prior and potential future governmentstimulus actions or payment assistance provided to clients andcustomers.
In addition, JPMorgan Chase’s participation directly or indirectly,including on behalf of customers and clients or by affiliatedentities, in U.S. government programs designed to supportindividuals, households and businesses impacted by the economicdisruptions caused by the COVID-19 pandemic could be criticizedand subject JPMorgan Chase to:
• increased governmental and regulatory scrutiny
• negative publicity, and
• increased exposure to litigation,
any or all of which could increase JPMorgan Chase’s operational,legal and compliance costs and damage its reputation. To theextent that the COVID-19 pandemic adversely affects JPMorganChase’s business, results of operations and financial condition, itmay also have the effect of heightening many of the other risksdescribed in Risk Factors in the 2020 Form 10-K.
Supervision and regulationRefer to the Supervision and regulation section on pages 3–7 ofJPMorgan Chase’s 2020 Form 10-K for information on Supervisionand Regulation.
Item 2. Unregistered Sales of Equity Securities and Use ofProceeds.The Firm did not have any unregistered sale of equity securitiesduring the three months ended March 31, 2021.
Repurchases under the common share repurchase programRefer to Capital Risk Management on pages 36-41 of this Form10-Q and pages 91-101 of JPMorgan Chase’s 2020 Form 10-K forinformation regarding repurchases under the Firm’s commonshare repurchase program.
On December 18, 2020, the Federal Reserve announced that all large banks, including the Firm, could resume share repurchasescommencing in the first quarter of 2021. Subsequently, the Firm announced that its Board of Directors authorized a new common sharerepurchase program for up to $30 billion. As directed by the Federal Reserve, total net repurchases and common stock dividends in the firstquarter of 2021 were restricted and could not exceed the average of the Firm’s net income for the four preceding calendar quarters. OnMarch 25, 2021, the Federal Reserve extended these restrictions through at least the second quarter of 2021.Shares repurchased pursuant to the common share repurchase program during the three months ended March 31, 2021, were as follows.
Three months ended March 31, 2021
Total number ofshares of commonstock repurchased
Average price paidper share of common
stock
Aggregate purchase priceof common stock
repurchases (in millions)
Dollar value of remainingauthorized repurchase
(in millions)January 9,341,648 $ 133.18 $ 1,244 $ 28,756 February 10,992,332 142.06 1,562 27,194 March 14,318,614 153.15 2,193 25,001
First quarter 34,652,594 $ 144.25 $ 4,999 $ 25,001
(a) Excludes commissions cost.(b) Represents the amount remaining under the $30 billion repurchase program.
(a) (a) (a)(b)
173

Item 3. Defaults Upon Senior Securities.None.
Item 4. Mine Safety Disclosures.Not applicable.
Item 5. Other Information.
None.
Item 6. Exhibits.
Exhibit No. Description of Exhibit
15 Letter re: Unaudited Interim Financial Information.
22 Subsidiary Guarantors and Issuers of Guaranteed Securities (incorporated by reference to Exhibit 22.2 to the Annual Report on Form10-K of JPMorgan Chase & Co. (File No. 1-5805) for the year ended December 31, 2020.)
31.1 Certification.
31.2 Certification.
32 Certification Pursuant to Section 906 of the Sarbanes-Oxley Act of 2002.
101.INS The instance document does not appear in the interactive data file because its XBRL tags are embedded within the Inline XBRLdocument.
101.SCH XBRL Taxonomy Extension Schema Document.101.CAL XBRL Taxonomy Extension Calculation Linkbase Document.101.DEF XBRL Taxonomy Extension Definition Linkbase Document.101.LAB XBRL Taxonomy Extension Label Linkbase Document.101.PRE XBRL Taxonomy Extension Presentation Linkbase Document.104 Cover Page Interactive Data File (embedded within the Inline XBRL document and included in Exhibit 101).
(a) Filed herewith.(b) Furnished herewith. This exhibit shall not be deemed “filed” for purposes of Section 18 of the Securities Exchange Act of 1934, or otherwise subject to the liability of that
Section. Such exhibit shall not be deemed incorporated into any filing under the Securities Act of 1933 or the Securities Exchange Act of 1934.(c) Pursuant to Rule 405 of Regulation S-T, includes the following financial information included in the Firm’s Quarterly Report on Form 10-Q for the quarterly period ended
March 31, 2021, formatted in XBRL (eXtensible Business Reporting Language) interactive data files: (i) the Consolidated statements of income (unaudited) for the threeand nine months ended March 31, 2021 and 2020, (ii) the Consolidated statements of comprehensive income (unaudited) for the three and nine months ended March 31,2021 and 2020, (iii) the Consolidated balance sheets (unaudited) as of March 31, 2021, and December 31, 2020, (iv) the Consolidated statements of changes instockholders’ equity (unaudited) for the three and nine months ended March 31, 2021 and 2020, (v) the Consolidated statements of cash flows (unaudited) for the threeand nine months ended March 31, 2021 and 2020, and (vi) the Notes to Consolidated Financial Statements (unaudited).
(a)
(a)
(a)
(b)
(c)
(a)
(a)
(a)
(a)
(a)
174

SIGNATURE
Pursuant to the requirements of the Securities Exchange Act of 1934, the registrant has duly caused this report to be signed on its behalf bythe undersigned thereunto duly authorized.
JPMorgan Chase & Co.(Registrant)
By: /s/ Elena KorablinaElena Korablina
Managing Director and Firmwide Controller(Principal Accounting Officer)
Date: May 4, 2021
175

Exhibit 15
May 4, 2021
Securities and Exchange Commission 100 F Street, N.E.Washington, DC 20549
Re: JPMorgan Chase & Co.
Registration Statements on Form S-3 (No. 333-236659) (No. 333-236659-01) (No. 333-230098)
Registration Statements on Form S-8 (No. 333-219702) (No. 333-219701) (No. 333-219699) (No. 333-185584) (No. 333-185582) (No. 333-185581) (No. 333-175681) (No. 333-158325) (No. 333-142109) (No. 333-125827) (No. 333-112967)
Commissioners:
We are aware that our report dated May 4, 2021 on our review of interim financial information of JPMorgan Chase & Co. and its subsidiaries(the “Firm”), which appears in this Quarterly Report on Form 10-Q, is incorporated by reference in the Registration Statements of the Firmreferred to above. Pursuant to Rule 436(c) under the Securities Act of 1933, such report should not be considered a part of such RegistrationStatements, and is not a report within the meaning of Sections 7 and 11 of that Act.
Very truly yours,
/s/ PricewaterhouseCoopers LLP
PricewaterhouseCoopers LLP, 300 Madison Avenue, New York, NY 10017

Exhibit 31.1JPMorgan Chase & Co.
CERTIFICATION
I, James Dimon, certify that:
1. I have reviewed this Quarterly Report on Form 10-Q of JPMorgan Chase & Co.;
2. Based on my knowledge, this report does not contain any untrue statement of a material fact or omit to state a material fact necessary tomake the statements made, in light of the circumstances under which such statements were made, not misleading with respect to theperiod covered by this report;
3. Based on my knowledge, the financial statements, and other financial information included in this report, fairly present in all materialrespects the financial condition, results of operations and cash flows of the registrant as of, and for, the periods presented in this report;
4. The registrant's other certifying officer and I are responsible for establishing and maintaining disclosure controls and procedures (asdefined in Exchange Act Rules 13a-15(e) and 15d-15(e)) and internal control over financial reporting (as defined in Exchange Act Rules13a-15(f) and 15d-15(f)) for the registrant and have:
(a) Designed such disclosure controls and procedures, or caused such disclosure controls and procedures to be designed under oursupervision, to ensure that material information relating to the registrant, including its consolidated subsidiaries, is made known to usby others within those entities, particularly during the period in which this report is being prepared;
(b) Designed such internal control over financial reporting, or caused such internal control over financial reporting to be designed underour supervision, to provide reasonable assurance regarding the reliability of financial reporting and the preparation of financialstatements for external purposes in accordance with generally accepted accounting principles;
(c) Evaluated the effectiveness of the registrant's disclosure controls and procedures and presented in this report our conclusionsabout the effectiveness of the disclosure controls and procedures, as of the end of the period covered by this report based on suchevaluation; and
(d) Disclosed in this report any change in the registrant's internal control over financial reporting that occurred during the registrant'smost recent fiscal quarter (the registrant's fourth quarter in the case of an annual report) that has materially affected, or is reasonablylikely to materially affect, the registrant's internal control over financial reporting; and
5. The registrant's other certifying officer and I have disclosed, based on our most recent evaluation of internal control over financialreporting, to the registrant's auditors and the audit committee of the registrant's board of directors (or persons performing the equivalentfunction):
(a) All significant deficiencies and material weaknesses in the design or operation of internal control over financial reporting which arereasonably likely to adversely affect the registrant's ability to record, process, summarize and report financial information; and
(b) Any fraud, whether or not material, that involves management or other employees who have a significant role in the registrant'sinternal control over financial reporting.
Date: May 4, 2021
/s/ James Dimon
James DimonChairman and Chief Executive Officer

Exhibit 31.2JPMorgan Chase & Co.
CERTIFICATION
I, Jennifer Piepszak, certify that:
1. I have reviewed this Quarterly Report on Form 10-Q of JPMorgan Chase & Co.;
2. Based on my knowledge, this report does not contain any untrue statement of a material fact or omit to state a material fact necessary tomake the statements made, in light of the circumstances under which such statements were made, not misleading with respect to theperiod covered by this report;
3. Based on my knowledge, the financial statements, and other financial information included in this report, fairly present in all materialrespects the financial condition, results of operations and cash flows of the registrant as of, and for, the periods presented in this report;
4. The registrant's other certifying officer and I are responsible for establishing and maintaining disclosure controls and procedures (asdefined in Exchange Act Rules 13a-15(e) and 15d-15(e)) and internal control over financial reporting (as defined in Exchange Act Rules13a-15(f) and 15d-15(f)) for the registrant and have:
(a) Designed such disclosure controls and procedures, or caused such disclosure controls and procedures to be designed under oursupervision, to ensure that material information relating to the registrant, including its consolidated subsidiaries, is made known to usby others within those entities, particularly during the period in which this report is being prepared;
(b) Designed such internal control over financial reporting, or caused such internal control over financial reporting to be designed underour supervision, to provide reasonable assurance regarding the reliability of financial reporting and the preparation of financialstatements for external purposes in accordance with generally accepted accounting principles;
(c) Evaluated the effectiveness of the registrant's disclosure controls and procedures and presented in this report our conclusionsabout the effectiveness of the disclosure controls and procedures, as of the end of the period covered by this report based on suchevaluation; and
(d) Disclosed in this report any change in the registrant's internal control over financial reporting that occurred during the registrant'smost recent fiscal quarter (the registrant's fourth quarter in the case of an annual report) that has materially affected, or is reasonablylikely to materially affect, the registrant's internal control over financial reporting; and
5. The registrant's other certifying officer and I have disclosed, based on our most recent evaluation of internal control over financialreporting, to the registrant's auditors and the audit committee of the registrant's board of directors (or persons performing the equivalentfunction):
(a) All significant deficiencies and material weaknesses in the design or operation of internal control over financial reporting which arereasonably likely to adversely affect the registrant's ability to record, process, summarize and report financial information; and
(b) Any fraud, whether or not material, that involves management or other employees who have a significant role in the registrant'sinternal control over financial reporting.
Date: May 4, 2021
/s/ Jennifer Piepszak
Jennifer PiepszakExecutive Vice President and Chief Financial Officer

Exhibit 32JPMorgan Chase & Co.
CERTIFICATION PURSUANT TO 18 U.S.C. SECTION 1350, AS ADOPTED PURSUANT TOSECTION 906 OF THE SARBANES-OXLEY ACT OF 2002
In connection with the Quarterly Report of JPMorgan Chase & Co. on Form 10-Q for the period ended March 31, 2021 as filed with theSecurities and Exchange Commission on the date hereof (the “Report”), each of the undersigned officers of JPMorgan Chase & Co., certify,pursuant to 18 U.S.C. Section 1350, as adopted pursuant to Section 906 of the Sarbanes-Oxley Act of 2002, that:
1. The Report fully complies with the requirements of Section 13(a) or 15(d) of the Securities Exchange Act of 1934; and
2. The information contained in the Report fairly presents, in all material respects, the financial condition and results of operations ofJPMorgan Chase & Co.
Date: May 4, 2021 By: /s/ James Dimon
James Dimon
Chairman and Chief Executive Officer
Date: May 4, 2021 By: /s/ Jennifer Piepszak
Jennifer Piepszak
Executive Vice President and Chief Financial Officer
This certification accompanies this Quarterly Report on Form 10-Q and shall not be deemed “filed” for purposes of Section 18 of theSecurities Exchange Act of 1934, or otherwise subject to the liability of that Section.
A signed original of this written statement required by Section 906 has been provided to, and will be retained by, JPMorgan Chase & Co. andfurnished to the Securities and Exchange Commission or its staff upon request.