Audited Annual Report - JPMorgan Funds
344
Audited Annual Report JPMorgan Funds Société d’Investissement à Capital Variable, Luxembourg (R.C.S. No. B 8478) 30 June 2021 Report for the attention of Investors in Taiwan
-
Upload
khangminh22 -
Category
Documents
-
view
24 -
download
0
Transcript of Audited Annual Report - JPMorgan Funds
Audited Annual Report
JPMorgan Funds
Société d’Investissement à Capital Variable, Luxembourg(R.C.S. No. B 8478)30 June 2021Report for the attention of Investors in Taiwan

This report is an abridged version of the audited annual report established in conformity with theLuxembourg Law of 17 December 2010 on Undertakings for Collective Investment. The completeversion is available on request from the Company’s registered office in Luxembourg and fromJPMorgan Asset Management (Taiwan) Limited.
This report does not constitute an offer of shares. Subscriptions are only valid if made on the basisof the current offering document distributing in Taiwan which is available free of charge on request,supplemented by the most recent audited annual report of the Fund and any subsequent unauditedsemi-annual report, from JPMorgan Asset Management (Taiwan) Limited.
Certain of the Sub-Funds of the Fund are not authorised for offer or distribution in or from Taiwan.Accordingly, no reference is made to these Sub-Funds in this audited annual report. The attention ofthe investors is drawn to the fact that certain figures in this audited annual report are expressed ona consolidated basis and, thus, include the assets of those Sub-Funds which are not registered inTaiwan.
JPMorgan FundsAudited Annual ReportAs at 30 June 2021
Contents (continued)
Board of Directors 1
Management and Administration 2
Board of Directors’ Report 3
Investment Managers’ Report 8
Audit Report on the Summary Financial Statements 11
Financial Statements and Statistical InformationCombined Statement of Net Assets 12Combined Statement of Operations and Changes in Net Assets 20Statement of Changes in the Number of Shares 28Statistical Information 43
Notes to the Financial Statements 58
Schedule of InvestmentsEquity Sub-Funds
JPMorgan Funds - America Equity Fund 70JPMorgan Funds - Asia Pacific Equity Fund 72JPMorgan Funds - Brazil Equity Fund 74JPMorgan Funds - China Fund 75JPMorgan Funds - Emerging Europe Equity Fund 77JPMorgan Funds - Emerging Markets Dividend Fund 78JPMorgan Funds - Emerging Markets Equity Fund 81JPMorgan Funds - Emerging Markets Opportunities Fund 84JPMorgan Funds - Emerging Markets Small Cap Fund 87JPMorgan Funds - Emerging Middle East Equity Fund 90JPMorgan Funds - Europe Dynamic Fund 91JPMorgan Funds - Europe Equity Fund 95JPMorgan Funds - Europe Small Cap Fund 99JPMorgan Funds - Global Growth Fund 102JPMorgan Funds - Global Healthcare Fund 104JPMorgan Funds - Global Natural Resources Fund 108JPMorgan Funds - Greater China Fund 110JPMorgan Funds - Japan Equity Fund 112JPMorgan Funds - Latin America Equity Fund 115JPMorgan Funds - Russia Fund 116JPMorgan Funds - Thematics - Genetic Therapies 117JPMorgan Funds - US Equity All Cap Fund 120JPMorgan Funds - US Growth Fund 123JPMorgan Funds - US Smaller Companies Fund 125JPMorgan Funds - US Technology Fund 127JPMorgan Funds - US Value Fund 128
Balanced and Mixed Asset Sub-FundsJPMorgan Funds - Asia Pacific Income Fund 130
Bond Sub-FundsJPMorgan Funds - Aggregate Bond Fund 139JPMorgan Funds - Emerging Markets Corporate Bond Fund 149JPMorgan Funds - Emerging Markets Debt Fund 156JPMorgan Funds - Emerging Markets Investment Grade Bond Fund 165JPMorgan Funds - Emerging Markets Local Currency Debt Fund 171JPMorgan Funds - Global Corporate Bond Duration-Hedged Fund 179JPMorgan Funds - Global Corporate Bond Fund 188JPMorgan Funds - Global Government Bond Fund 202JPMorgan Funds - Global Short Duration Bond Fund 209JPMorgan Funds - Global Strategic Bond Fund 215JPMorgan Funds - Income Fund 234JPMorgan Funds - US Aggregate Bond Fund 262
Money Market Sub-FundsJPMorgan Funds - USD Money Market VNAV Fund 288
Appendix - Unaudited Additional Disclosures1. Total Expense Ratios 2902. Summary of Investment Objectives of the Sub-Funds 3093. Performance and Volatility 3124. Interest Rate Received/(Charged) on Bank Accounts 3285. Sub-Fund Share Classes Taxe d’Abonnement Rates 3286. Portfolio Turnover Ratio 3287. Calculation Method of the Risk Exposure 3298. Collateral Received 3309. Securities Financing Transactions 33110. Exposure arising from financial derivative instruments 33811. UCITS Remuneration Disclosures 339

JPMorgan FundsBoard of Directors
Chairman
Iain O.S. SaundersDuine, ArdfernArgyll PA31 8QNUnited Kingdom
Directors
Jacques ElvingerElvinger Hoss Prussen, société anonyme2, place Winston ChurchillB.P. 425, L-2014 LuxembourgGrand Duchy of Luxembourg
Massimo GrecoJPMorgan Asset Management (UK) Limited60 Victoria EmbankmentLondon EC4Y 0JPUnited Kingdom
John Li How CheongThe Directors’ Office19, rue de BitbourgL-1273 LuxembourgGrand Duchy of Luxembourg
Marion Mulvey (appointed on 18 November 2020)JPMorgan Asset Management (UK) Limited60 Victoria EmbankmentLondon EC4Y 0JPUnited Kingdom
Registered Office
European Bank and Business Centre6, route de TrèvesL-2633 SenningerbergGrand Duchy of Luxembourg
Martin PorterThornhill, Hammerwood RoadAshurst WoodWest Sussex RH19 3SLUnited Kingdom
Peter Thomas SchwichtHumboldtstraße 17D-60318 Frankfurt am MainGermany
Susanne van DootinghNekkedelle 6B-3090 OverijseBelgium
Daniel J. WatkinsJPMorgan Asset Management (Asia Pacific) Limited21st Floor, Chater House8 Connaught RoadCentral Hong Kong
1

JPMorgan FundsManagement and Administration
Management Company, Registrar and Transfer Agent,Global Distributor and Domiciliary Agent
JPMorgan Asset Management (Europe) S.à r.l.European Bank & Business Centre6, route de TrèvesL-2633 SenningerbergGrand Duchy of Luxembourg
Investment Managers
JPMorgan Asset Management (Asia Pacific) Limited21st Floor, Chater House8 Connaught Road CentralHong Kong
J.P. Morgan Alternative Asset Management, Inc.383 Madison AvenueNew York, NY 10179United States of America
JPMorgan Asset Management (Singapore) Limited17th Floor, Capital Tower168, Robinson RoadSingapore 068912
JPMorgan Asset Management (UK) Limited60 Victoria EmbankmentLondon EC4Y 0JPUnited Kingdom
J.P. Morgan Investment Management Inc.383 Madison AvenueNew York, NY 10179United States of America
Depositary, Corporate, Administrative and Listing Agent
J.P. Morgan Bank Luxembourg S.A.European Bank and Business Centre6, route de TrèvesL-2633 SenningerbergGrand Duchy of Luxembourg
Auditor
PricewaterhouseCoopers, Société coopérative2, rue Gerhard MercatorB.P. 1443, L-1014 LuxembourgGrand Duchy of Luxembourg
Luxembourg Legal Adviser
Elvinger Hoss Prussen, société anonyme2, place Winston ChurchillB.P. 425, L-2014 LuxembourgGrand Duchy of Luxembourg
2
ChairmanIain O.S. SaundersChairman and Independent Non-Executive Director. A member of the Board since November 1996.Mr Saunders graduated in Economics from Bristol University and joined Robert Fleming in 1970. He held several senior positions with the group in HongKong, Japan and the US, before returning to the UK in 1988. He was appointed Deputy Chairman of Fleming Asset Management and retired in 2001 followingthe merger of the Robert Fleming group with JPMorgan. Mr Saunders is currently Chairman of several JPMorgan managed Luxembourg-domiciledinvestment funds and MB Asia Select Fund.
DirectorsJacques ElvingerNon-Executive Director. A member of the Board since January 2009.Mr Elvinger became a member of the Luxembourg Bar in 1984 and has been a partner of the Luxembourg law firm Elvinger Hoss Prussen since 1987. MrElvinger practices general corporate and banking law and specialises in the field of investment and pension funds. He is a member of the High Committee forthe Development of the Financial Sector instituted by the Luxembourg Government. He is also a member of the Advisory Committees to the LuxembourgCommission for the Supervision of the Financial Sector in the area of investment funds. Mr Elvinger currently holds a number of board mandates withLuxembourg investment funds including several JPMorgan managed Luxembourg-domiciled investment funds.
Massimo GrecoExecutive Director. A member of the Board since November 2015.Mr Greco, Managing Director, is responsible for JPMorgan Asset Management’s Global Funds business in Europe, based in London. He took on his currentresponsibilities in 2012. Mr Greco has been a JPMorgan employee since 1992, initially with the Investment Banking unit, moving to Asset Management in1998. Mr Greco holds a degree in Economics from the University of Turin and an MBA (Major in Finance) from the Anderson Graduate School of Managementat UCLA. Mr Greco is a Member of the Board of JPMorgan Asset Management (Europe) S.à r.l. as well as other Luxembourg domiciled SICAVs.
John Li How CheongIndependent Non-Executive Director. A member of the Board since June 2012.Mr Li is a fellow of the Institute of Chartered Accountants in England & Wales. Mr Li moved to Luxembourg in 1987 and has since been working in the financialsector. Mr Li was a Partner at KPMG Luxembourg for more than 20 years during which he was Managing Partner for 8 years before taking on the role ofChairman of the Supervisory Board for 3 years. Mr Li was also a member of the Global Investment Management Practice of KPMG. During these years Mr Li’sexperience included auditing and advising clients such as banks, investment funds, insurance companies from Europe, US, Japan and Asia offering Mr Li anextensive experience in dealing with international companies. Mr Li is a board member of the Institut Luxembourgeois des Administrateurs. Mr Li currentlyholds a number of board mandates with financial institutions including several JPMorgan managed Luxembourg-domiciled investment funds.
Marion MulveyExecutive Director. A member of the Board since 18 November 2020.Ms Mulvey is Co-CAO and Head of Asset Management Operations in EMEA for J.P. Morgan Asset Management. She also has global responsibility for FeeBilling, Equities Middle Office, Multi-Asset Solutions Middle Office and Distribution Middle Office Operations. Ms Mulvey joined J.P. Morgan in 2014 fromCitigroup, where her last role was as Product Head for the Alternatives Fund Administration business in EMEA. She spent 13 years with that business in totaland also held a number of senior operational roles including Head of Fund Accounting in EMEA. Previously, Ms Mulvey worked at Salomon Smith Barney for 3years, managing the European Equity Product Control team. She trained as a Chartered Accountant holding roles both in private practice and as an AuditManager in the financial services audit department at KPMG. Ms Mulvey is a Fellow of the Institute of Chartered Accountants in Ireland. She is also a memberof the Institute of Directors, holding a Certificate and Diploma in Company Direction. Ms Mulvey is currently a Director of several JPMorgan managedLuxembourg funds and also several UK legal entities.
Martin PorterIndependent Non-Executive Director. A member of the Board since 20 November 2019.Mr Porter joined Robert Fleming Asset Management in 1984 and ran equity portfolios in both London and Japan. During his tenure in Japan, he became aholding board director of Jardine Fleming, responsible for the Japanese business. Returning to the UK in 2000, he took up the role of Chief InvestmentOfficer, Equity and Balanced of Fleming Asset Management, before becoming Global Head of Equities of JP Morgan Asset Management, a position he heldfrom 2003 to 2016 when he retired. Mr Porter is currently a Director of several JPMorgan managed Luxembourg-domiciled investment funds.
Peter Thomas SchwichtIndependent Non-Executive Director. A member of the Board since June 2012.Mr Schwicht obtained a Business Economics degree from the University of Mannheim in Germany after having studied business, tax and accounting inHamburg, Norway and the USA and was an employee of JPMorgan Asset Management from 1987 until October 2014. Prior to his retirement Mr Schwicht wasthe Chief Executive of Investment Management - EMEA, JPMorgan Asset Management. He had previously held positions as the Head of the ContinentalEurope Institutional business and the Investment Management Country Head for Institutional and Retail business in Germany where he first developed thebusiness and then went on to expand this throughout Continental Europe. Mr Schwicht is currently a Director of several JPMorgan managedLuxembourg-domiciled investment funds.
Susanne van DootinghIndependent Non-Executive Director. A member of the Board since December 2017.Ms van Dootingh is an Independent Non-Executive Director of several domiciled investment funds and management companies. Prior to becoming anIndependent Non-Executive Director she was at State Street Global Advisors from 2002 to 2017 with her final position being Senior Managing Director, Headof European Governance and Regulatory Strategy EMEA. Prior to this she held various senior positions within State Street Global Advisors in Global Productand Global Fixed Income Product Engineering. Before joining SSGA in 2002 she worked at Fortis Investment Management, Barclays Global Investors, andABN AMRO Asset Management. Ms van Dootingh holds a number of board mandates with Luxembourg investment funds including several JPMorganmanaged Luxembourg-domiciled investment funds.
3
JPMorgan FundsBoard of Directors’ Report
Daniel WatkinsExecutive Director. A member of the Board since December 2014.Mr Watkins is the Chief Executive Officer of Asia Pacific, J.P. Morgan Asset Management. He is responsible for overseeing the Asset Management Asia Pacificbusiness, which operates in seven locations and includes more than 1,400 employees. Mr Watkins is a member of the Asset Management OperatingCommittee and the firm-wide Asia Pacific Management team.Mr Watkins has been an employee since 1997. Prior to taking his current role in 2019, he was Deputy CEO of JPMorgan Asset Management Europe and GlobalHead of AM Client Services and Business Platform. Mr Watkins has also held a number of positions at JPMorgan namely Head of Europe COO and Global IMOperations, Head of the European Operations Team, Head of the European Transfer Agency, Head of Luxembourg Operations, manager of EuropeanTransfer Agency and London Investment Operations and manager of the Flemings Investment Operations Teams.Mr Watkins obtained a BA in Politics from the University of York and is a qualified Financial Advisor. Mr Watkins is currently a Director of several JPMorganmanaged Luxembourg and Irish domiciled investment funds and also several Asia Pacific legal entities.
The Board of Directors (the “Board”) is pleased to present the Audited Annual Report of JPMorgan Funds (the “Fund”) for the year ended 30 June 2021, andconsiders that taken as a whole they are fair and balanced and provide the information necessary for Shareholders to assess the Fund’s position andperformance.
Structure of the FundThe Fund is a variable capital open-ended investment company, organised as a “Société Anonyme”, under the laws of the Grand Duchy of Luxembourg. TheBoard has appointed JPMorgan Asset Management (Europe) S.à r.l. (JPMAME) as Management Company of the Fund. The Fund is organised as an “umbrella”with a number of Sub-Funds each of which has its own investment objective, policies and restrictions.The objective of the Fund is to place the money available to it in transferable securities and other permitted assets of any kind, in accordance with the Fund’sProspectus, with the purpose of spreading investment risks and affording Shareholders the results of the management of their portfolios.The Fund qualifies as an Undertaking for Collective Investment in Transferable Securities (UCITS) under the EC Directive 2009/65/EC of 13 July 2009 and issubject to the Luxembourg law of 17 December 2010, as amended, on undertakings for collective investment. The Fund may therefore be offered for sale inEuropean Union Member States, subject to notification in countries other than the Grand Duchy of Luxembourg. In addition, applications to register the Fundand its Sub-Funds may be made in other countries.The Fund currently has 101 Sub-Funds. All of the Sub-Funds and Share Classes are registered for offer and distribution in the Grand Duchy of Luxembourgand a number of the Sub-Funds and Share Classes are registered for distribution in the following jurisdictions: Austria, Belgium, Chile, Croatia, Curacao andSint Maarten, Cyprus, Czech Republic, Denmark, Estonia, Finland, France, Germany, Greece, Hong Kong, Hungary, Iceland, Ireland, Italy, Jersey, Korea,Liechtenstein, Macau, The Netherlands, Norway, Peru, Poland, Portugal, Singapore, Slovakia, Spain, Sweden, Switzerland, Taiwan and the United Kingdom.During the year there were no de-registrations and no registrations.
Role and Responsibility of the BoardThe responsibility of the Board is governed exclusively by Luxembourg law. With respect to the annual accounts of the Fund, the duties of the Directors aregoverned by the law of 10 December 2010 on, inter alia, the accounting and annual accounts of undertakings for collective investment and by the law of17 December 2010, as amended, relating to undertakings for collective investment.A management agreement between the Fund and JPMorgan Asset Management (Europe) S.à r.l sets out the matters over which the Management Companyhas authority under Chapter 15 of the Law of 17 December 2010. This includes management of the Fund’s assets and the provision of administration,registration, domiciliation agent and marketing services. All other matters are reserved for approval by the Board and a schedule setting out such mattersfor clarity is in place between the Board and the Management Company. The matters reserved for the Board include determination of each Sub-Fund’sinvestment objective and policies, investment restrictions and powers, amendments to the Prospectus, reviewing and approving key investment andfinancial data, including the annual accounts, as well as the appointment of, and review of the services provided by, the Management Company, Auditor andDepositary.Prior to each Board meeting the Directors receive detailed and timely information allowing them to be prepared for the items under discussion during themeeting. For each quarterly meeting the Board requests, and receives, reports from, amongst others, the Management Company, the investment managers,risk management as well as proposals for changes to existing Sub-Funds or proposals to launch new ones as appropriate. Senior representatives of each ofthese functions attend Board meetings by invitation to enable the Directors to question the reports presented to them.The Directors take decisions in the interests of the Fund and its Shareholders as a whole and refrain from taking part in any deliberation or decision whichcreates a conflict of interest between their personal interests and those of the Fund and its Shareholders. The subject of conflicts of interest is documented inthe Prospectus and the Management Company’s policy on conflicts of interest is available for inspection on the website:https://am.jpmorgan.com/content/dam/jpm-am-aem/emea/lu/en/communications/lux-communication/conflicts-of-interest-ce-en.pdfThe Board can take independent professional advice if necessary and at the Fund’s expense.
Board CompositionThe Board is chaired by Mr. Saunders and consists of five Independent Non-Executive Directors, one Non-Executive Director and three Executive Directors.The Board defines an Executive Director as someone who is employed by JPMorgan Chase & Co or any of its affiliates, a Non-Executive Director as someonewho has a business, family or other relationship with the Fund or JPMorgan Chase & Co or any of its affiliates, and an Independent Non-Executive Director assomeone who is free of any business, family or other relationship with the Fund or JPMorgan Chase & Co or any of its affiliates. All Board meetings require amajority of Non-Executive Directors to be in attendance.In appointing a Director the Board takes into account the relative mix and composition of the Board, which as a whole has a breadth of investmentknowledge, financial skills, as well as legal and other experience relevant to the Fund’s business.The Board does not limit the number of years of Directors’ service and it does take into account the nature and requirements of the fund industry and of theFund’s business when making recommendation to Shareholders that Directors be elected. The terms of each Director’s appointment are set out in a contractfor services and these are available at the Fund’s registered office for inspection.At the Annual General Meeting of the Fund on 18 November 2020, the Shareholders appointed Marion Mulvey to the Board as a Non-Executive Director.
Induction and TrainingAll new Directors will receive an induction incorporating relevant information regarding the Fund and their duties and responsibilities as a Director. Inaddition, the Board takes active steps to keep up to date with developments relevant to the Fund and have ensured that a formal training programme is inplace.
4
JPMorgan FundsBoard of Directors’ Report (continued)

Board EvaluationThe Board carries out a biennial review of its performance.
Board RemunerationThe Board believes that the remuneration of its members should reflect the responsibilities and experience of the Board as a whole and be fair andappropriate given the size, complexity and investment objectives of the Fund. The remuneration is reviewed on an annual basis. The Chairman is paidEUR 86,000 and the other Directors EUR 68,000 per annum. The Chairman of the AML Committee is paid an additional EUR 10,200 and the Directors of theAML Committee are paid an additional EUR 6,800 per annum. All Executive Directors have agreed to waive their remuneration. No element of theremuneration paid by the Fund to the Directors is performance related.
Board Meetings and CommitteesThe Board meets quarterly but if necessary additional meetings will be arranged. Given the scope and nature of the business of the Fund, the Board does notcurrently consider it necessary to have a formal Audit or Remuneration Committee, but has established an AML Committee in October 2020. In addition,where there are specific matters that need further consideration, a Sub-Committee of the Board could be formed for the specific purpose. Suchcircumstances could be where the Board requests some amendments to the Prospectus and where it is not appropriate to wait till the next quarterly Boardmeeting for this to be approved. These Sub-Committee meetings are usually formed of a minimum of two Directors.There were eight Board meetings held during the year. Four of these were quarterly Board meetings where, amongst other matters, the agenda includedthose items highlighted under the section above called ‘Role and Responsibility of the Board’ and four were ad hoc Board meetings. In addition to the Boardmeeting where the Auditors present the report on the audit of the Fund accounts, the Non-Executive Directors also meet with them annually without theExecutive Directors being in attendance.
Internal ControlInvestment management and all administrative services are provided by the Management Company and custody of assets is provided by J.P. Morgan BankLuxembourg S.A. The Board’s system of internal control therefore mainly comprises monitoring the services provided by the Management Company and theDepositary, including the operational and compliance controls established by them to meet the Fund’s obligations to shareholders as set out in theProspectus, Articles of Incorporation as well as all relevant regulations. The Management Company formally reports to the Board on a quarterly basis on thevarious activities it is responsible for and in addition shall inform the Board without delay of any material administrative or accounting matters.
Corporate Governance and ALFI Code of ConductThe Board is responsible for ensuring that a high level of corporate governance is met and considers that the Fund has complied with the best practices in theLuxembourg funds industry.In particular the Board has adopted the ALFI Code of Conduct (the “Code”) which sets out principles of good governance. These principles are set out below:1. The Board should ensure that high standards of corporate governance are applied at all times;2. The Board should have good professional standing and appropriate experience and to ensure that it is collectively competent to fulfil its responsibilities;3. The Board should act fairly and independently in the best interests of the investors;4. The Board should act with due care and diligence in the performance of their duties;5. The Board should ensure compliance with all applicable laws and regulations and with the Fund’s constitutional documents;6. The Board should ensure that investors are properly informed, are fairly and equitably treated, and receive the benefits and services to which they areentitled;7. The Board should ensure that an effective risk management process and appropriate internal controls are in place;8. The Board should identify and manage fairly and effectively, to the best of its ability, any actual, potential or apparent conflict of interest and ensureappropriate disclosure;9. The Board should ensure that shareholder rights are exercised in a considered way and in the best interests of the Fund; and10. The Board should ensure that the remuneration of the Board members is reasonable and fair and adequately disclosed.The Board considers that the Fund has been in compliance with the principles of the Code in all material aspects throughout the financial year ended 30 June2021. The Board undertakes an annual review of ongoing compliance with the principles of the Code.
Proxy Voting PolicyThe Board delegates responsibility for proxy voting to the Management Company. The Management Company manages the voting rights of the sharesentrusted in a prudent and diligent manner, based exclusively on the reasonable judgement of what will best serve the financial interests of clients. So far asis practicable, the Management Company will vote at all of the meetings called by companies in which they are invested.A copy of the proxy voting policy is available from the Fund’s registered office upon request or on the website:https://am.jpmorgan.com/uk/institutional/corporate-governance
Environmental Social Governance (“ESG”)Certain Sub-Funds of JPMorgan Funds have included ESG as part of their investment policy. Details of these are included within the Prospectus.
Directors and Officers Indemnity InsuranceThe Fund’s Articles of Incorporation indemnify the Directors against expenses reasonably incurred in connection with any claim against them arising in thecourse of their duties or responsibilities as long as they have not acted fraudulently or dishonestly. To protect Shareholders against any such claim, theBoard has taken out Directors and Officers Indemnity Insurance which indemnifies the Directors against certain liabilities arising in the course of their dutiesand responsibilities but does not cover against any fraudulent or dishonest actions on their part.
Independent AuditorPricewaterhouseCoopers, Société coopérative, has been the Fund’s Auditor since December 1994. The provision of audit services was last put to competitivetender in 2016. The Board reviewed the services of PwC in 2016 and decided that, subject to any other influencing factor, they should continue to be proposedto the Shareholders to be appointed as Auditor.
5
JPMorgan FundsBoard of Directors’ Report (continued)
6
Annual General MeetingsThe next Annual General Meeting of the Fund will be held on 17 November 2021 at the Registered Office of the Fund to consider matters relating to the yearending on 30 June 2021. At this meeting Shareholders will be requested to consider the usual matters at such meetings including:1. The adoption of the financial statements and approval of the allocation of the results;2. The approval of Directors’ fees;3. The election of certain Directors;4. The election of the Auditor; and5. The discharge of Directors duties.No special business is being proposed by the Board.
Discharge of DirectorsOne of the resolutions in the AGM is, as required under Luxembourg Law, for Shareholders to vote on the discharge the directors of their duties for the fiscalyear in question. This discharge is only valid where the annual accounts contain no omission or false information concealing the real financial situation of theFund.
Privacy PolicyThe Management Company complies with a privacy policy that has been issued by J.P. Morgan Asset Management which can be accessed atwww.jpmorgan.com/emea-privacy-policy. This policy was updated during the year to comply with the General Data Protection Regulation.
Significant Events during the YearThe Board agreed the following corporate actions relating to Sub-Funds which were notified to clients as appropriate:
a) Sub-Fund restructuringThe following Sub-Funds were restructured during the year:JPMorgan Funds - Global Unconstrained Equity Fund was restructured to JPMorgan Funds - Global Growth Fund. Update to change the Sub-Fund’s name,Investment Objective, Approach and Policy to re-focus into a Growth-Style bias investment strategy - effective 1 April 2021;
d) EU Sustainable Finance Disclosure Regulation (SFDR)
12 May 2021Update to reflect that the Sub-Funds below were re-categorised from Article 6 to Article 8 under SFDR. The Sub-Funds were classified as “ESG Promote” andthe Sub-Fund descriptions were updated to reflect this categorisation and the following binding criteria:- At least 51% of assets are invested in companies/issuers with positive environmental and/or social characteristics that follow good governance practices;- Specific values and norms based exclusions
JPMorgan Funds - Aggregate Bond FundJPMorgan Funds - America Equity FundJPMorgan Funds - Asia Pacific Equity FundJPMorgan Funds - China FundJPMorgan Funds - Emerging Markets Corporate Bond FundJPMorgan Funds - Emerging Markets Debt FundJPMorgan Funds - Emerging Markets Dividend FundJPMorgan Funds - Emerging Markets Equity FundJPMorgan Funds - Emerging Markets Investment Grade Bond FundJPMorgan Funds - Emerging Markets Local Currency Debt FundJPMorgan Funds - Emerging Markets Opportunities FundJPMorgan Funds - Emerging Markets Small Cap FundJPMorgan Funds - Europe Dynamic FundJPMorgan Funds - Europe Equity FundJPMorgan Funds - Europe Small Cap FundJPMorgan Funds - Global Corporate Bond Duration-Hedged FundJPMorgan Funds - Global Corporate Bond FundJPMorgan Funds - Global Growth FundJPMorgan Funds - Global Healthcare FundJPMorgan Funds - Global Short Duration Bond FundJPMorgan Funds - Greater China FundJPMorgan Funds - Japan Equity FundJPMorgan Funds - Thematics - Genetic Therapies Fund
JPMorgan FundsBoard of Directors’ Report (continued)
Significant Events after the Year-End
a) EU Sustainable Finance Disclosure Regulation (SFDR)
1 July 2021Update to reflect that the Sub-Funds below were re-categorised from Article 6 to Article 8 under SFDR. The Sub-Funds were classified as “ESG Promote” andthe Sub-Fund Descriptions were updated to reflect this categorisation and the following binding criteria:
· At least 51% of assets are invested in companies/issuers with positive environmental and/or social characteristics that follow good governance practices;· Specific values and norms based exclusionsJPMorgan Funds - US Growth FundJPMorgan Funds - US Smaller Companies FundJPMorgan Funds - US Technology FundJPMorgan Funds - US Value Fund
b) Sub-Fund objective changesWith effect from 30 July 2021, JPMorgan Funds - Global Corporate Bond Fund and JPMorgan Funds - Global Corporate Bond Duration-Hedged Fund increasedthe limit of below investment grade debt securities from 10% to 20% and increased the limit of contingent convertible bonds (“CoCos”) from 5% to 10%.
Board of Directors
Luxembourg, 18 October 2021
7
JPMorgan FundsBoard of Directors’ Report (continued)
IntroductionThe 12 months ended June 2021 were marked by a sharp global economic recovery, the easing of social restrictions amid an accelerated pace of vaccinationsand continued global fiscal and monetary support. In 2021, investor concerns about rising inflation and a more contagious delta strain of Covid-19 affectedmarket sentiment, though investors appeared to take solace in the strong economic data and robust corporate earnings.
Equities
Developed Market Equities ReviewGlobal equity indexes provided remarkable returns during the period, with the MSCI World (net) Index gaining 39.0% (in USD) and the MSCI Europe (net)index increasing by 27.9% (in EUR).
The second half of 2020 saw Covid-19 infection rates continuing to accelerate across the world, triggering fresh quarantine requirements and localisedlockdowns. However, encouraging positive trial results of multiple Covid-19 vaccines and a significant injection of fiscal stimulus by the U.S. and the EU liftedglobal equity indexes to record highs. Additionally, economic data late in 2020 pointed to a steady, albeit softer, recovery as businesses started reopening.Against this backdrop, the U.S. Federal Reserve Bank (the “Fed”) indicated that it would continue its asset purchasing program, while the European CentralBank increased the size of its planned asset purchases by EUR 500 billion to EUR 1.85 trillion and extended the length of time to make its purchases.
In the U.S., Democrat Joe Biden was inaugurated as president in January 2021, with Democratic Party control of both houses of the U.S. Congress. In March, aUSD 1.9 trillion federal relief and recovery act was enacted to further aid the U.S. economy even as the pace of vaccinations continued to accelerate in the U.S.
In Europe, the equity market witnessed volatility, amid extended lockdowns across the region, growing concerns over new strains of Covid-19 and vaccineshortages. However, investor sentiment improved significantly largely due to positive economic data through the first quarter of 2021. Leading central bankscontinued to provide support through purchases of government bonds and sought to reassure investors that there would be no unexpected interest ratehikes in the immediate future.
Moving into the second quarter in Europe demand grew at its fastest rate in the last 15 years as the flash composite Purchasing Managers’ Index (PMI) surgedto 59.2 at the end of the period with the expansion turning increasingly broad-based. Furthermore, investors remained buoyant as the EuropeanCommission outlined plans to loosen Covid-19 restrictions on tourism.
In the second quarter of 2021, global equities prices continued their strong rally, supported by an accelerated pace of vaccinations and further reopening ofeconomies. In the U.S., demand in the services sector rose sharply along with manufacturing output. Job openings hit record highs and first-time joblessclaims hit their lowest levels since the start of the pandemic.
By the end of the period, the Fed acknowledged that its members had discussed tapering of its asset purchases, while the ECB sought to reassure the marketsthat any acceleration in inflation would be transitory.
Generally, global equities prices ended the period at high aggregate levels, as sector rotation over the period stabilised in the wake of economic dislocationcaused by the onset of the pandemic. Among equity markets, the automobiles, banking and semiconductors and technology hardware sectors performedthe strongest. Crude oil prices showed a strong rebound amid a decline in U.S. inventories, robust factory activity data from China and better-than-expectedresumption in most economic activity.
Developed Market Equities OutlookA successful increase in vaccination rates is enabling a reopening trend globally, with a surge in economic growth reflecting pent-up demand and massivefiscal stimulus. Existing vaccines appear to be effective against the Covid-19 variants, which indicates that a broader recovery should continue across themajor developed economies through the second half of 2021.
Earnings growth should be strong in 2021, but could slow as profit margins come under pressure from higher wages, rising commodity prices and a potentialincrease in corporate taxes. For now, a combination of booming demand and surging productivity continues to bolster profits. Though every crisis isdifferent, looking out into the next five years, we expect earnings growth to be substantial, front-loaded and not too dissimilar to the rebound from the GlobalFinancial Crisis. Cyclically geared markets, sectors and companies are likely to benefit, but it is crucial to differentiate cyclical from structural headwinds andtailwinds as the recovery takes shape. We believe, and as historical experience shows, that the potential for growth from a rebounding economy can often beunderestimated.
With extreme central bank policy accommodation likely behind us, the global economic backdrop now resembles a mid-cycle economy that will supportstock prices moving higher and interest rates rising along the yield curve. While value stocks remain attractive relative to the growth stocks, investors areinclined to also focus on quality stocks. The main concern within equity markets is understanding how leading central banks will react to potentiallyaccelerating economic growth. Investors are particularly worried that if inflation proves to be persistent rather than temporary, then central banks mayraise interest rates more quickly, which could impact equity valuations, particularly for the more expensive stocks where historically low interest rates havebeen used to justify elevated valuations. This concern has created some market volatility that is likely to persist through the end of the year.
However, equities should do well in an environment of modestly rising inflation, as rising sales tend to offset higher input prices that can be passed ontocustomers when demand is strong. We believe it makes sense to look for areas within equity markets that stand to benefit both from the cyclical rebound butalso from rising bond yields. Overall, equities had a strong start to 2021 and the outlook for the economy and equity markets remains positive.
Emerging Market Equities ReviewThe MSCI Emerging Markets Index returned 40.9% (USD) for the year ended 30 June 2021. Regional performance was similar: MSCI EM Asia returned 41.0%,MSCI EM EMEA 37.4% and MSCI EM Latin America 44.9%.
Emerging market equities had a strong third quarter of 2020. With North Asian countries showing the most success against the pandemic, it was technologyand e-commerce companies - and growth companies more generally – that largely drove equity markets higher during the period.
In the fourth quarter of 2020, emerging market equities outperformed global equities. A rally in commodity prices was supportive of emerging marketexporters, particularly Brazil and Russia. South Korean equities staged their strongest quarterly performance since 2003 on the back of strong exports in thesemiconductor and industrials sectors. Equity markets in China lagged behind the wider region as Beijing’s launch of an anti-trust investigation into AlibabaGroup Holding Ltd and further escalation in U.S.-China political tensions weighed on investor sentiment.
The first quarter of 2021 was dominated by rising bond yields and a value-led equity market rally. Emerging market equities registered a positive return forthe quarter and the best performing markets were in Taiwan, led by information technology stocks, and Chile, which was aided by rising copper prices and astrong start to vaccine roll-out. In contrast, equities in Turkey fell sharply as the central bank governor was unexpectedly replaced. In China, expectations forpolicy normalisation, regulatory uncertainty for select industries and ongoing geopolitical concerns hurt investor sentiment.
Emerging market equities continued to rise in the second quarter of 2021. Brazil was the best-performing market, with currency strength amplifying gains, whileequity prices in Russia were supported by higher crude oil prices. Chile and Peru were among the weakest emerging markets largely due to political uncertainty.
8
JPMorgan FundsInvestment Managers’ Report
Emerging Market Equities OutlookHow long the pandemic persists is a crucial question for economies and financial markets. Emerging market economies range from nearly no vaccinations upto about 40% of the population vaccinated. In North Asia, the closure of borders and rigid containment measures has meant that slower vaccination rollouthas not hindered economic reopening.
The path of the U.S. dollar will be a key for emerging market equities. A strong U.S. dollar typically accompanies U.S. growth outperformance, which shouldcontinue given emerging market pandemic challenges. A balance of a strong U.S. macro environment with a simultaneously contained U.S. dollar and stablebond yields would be ideal for emerging market equities.
The overall emerging market equities price-to-book ratio is higher than the long-term average, but we believe there are no reasons why earnings would notbe higher than last year if emerging market economies can fully reopen. We continue to look for opportunities in emerging market equities where earningsgrowth can compound over the long run.
Fixed Income
Global Markets ReviewMost fixed income markets posted a positive return for the 12 month period, supported by central banks’ policies, governments’ stimulus spending and thedevelopment and distribution of multiple Covid-19 vaccines.
The year 2021 started with the prospect - and later the passage - of a massive fiscal stimulus from the Biden administration in the U.S. which set the stage foreconomic growth expectations to rise significantly. The efficacy of multiple vaccines and their successful rollout also fueled higher growth expectations andpushed bond yields higher. Duration sensitive sectors underperformed at the start of the 2021. Spreads, however, held up well, and shorter duration assetclasses outperformed.
Emerging market nations’ re-opening progress was mixed due to the persistence of new waves of infection and slower vaccine distribution. However,economic activity has become increasingly resilient, allowing the economic recovery to continue. In an environment of strong global growth combined withaccommodative monetary and fiscal policies, we continued to be overweight in emerging markets and corporate credit.
Global Fixed Income OutlookThe Fed’s recent statements have reduced the prospect of runaway inflation in the U.S., meaning that further moves higher in U.S. Treasury bond yields willlikely be driven by the real-yield component of interest rates. Real yields could rise if U.S. growth accelerates faster than expected and the Fed is forced toraise interest rates sooner than expected. This narrative is also likely to spill over to economies capable of generating sustained inflation. In the meantime,vaccinations have broken the link between case counts and mortality rates (though investors need to consider the tail risks associated with the spread of theCovid-19 delta variant), and the economic recovery should continue over the next few months. With the Fed seemingly on top of the inflation data for now,this should remain a stable environment for carry (the return of holding a bond by earning yield versus holding cash).
Emerging Markets Debt OutlookThe reflation base scenario is moving past peak U.S. exceptionalism and peak policy accommodation. Emerging market headwinds are expected to befrontloaded, with a more supportive backdrop, as the Fed’s normalisation pace becomes less uncertain. We expect emerging markets growth to remainelevated through the end of 2021. We believe investment grade debt is looking expensive from a total return perspective and we see value in bonds rated BBand single B. We continue to prefer high yield debt over investment grade debt.
High Yield OutlookHigh Yield spreads have tightened significantly over the past year. A slow grind tighter will likely continue until there is a major catalyst to shock the markets,which seems unlikely in the near term. The default forecast keeps improving, with expectations that the year-end 2021 rate will be less than 1% in the U.S.high yield market, while we expect a default rate of 1.5% to 2.5% in the European high yield market. Until U.S. Treasury bond rates move higher, demand forthe asset class will be elevated as investors, and specifically fixed income allocators, search for higher yields. In the U.S., strong fundamental and technicalfactors within the high yield market, combined with GDP growth estimates of nearly 7%, bode well for high yield debt and we believe carry-like returns arethe base case outcome for 2021, with the biggest risk being U.S. Treasury bonds volatility. Within European high yield bonds, spreads have some room tocompress further toward their historical lows and the benign outlook for default rates can justify this. In the meantime, there remains a compelling argumentfor the asset class in relation to other fixed income alternatives and the BB-rated part of the bond market still looks relatively inexpensive compared withinvestment grade BBB-rated bonds.
Investment Grade OutlookFundamentals have shown signs of recovery, with median leverage metrics continuing to improve through the end of 2021, given very strong consensus cashflow growth estimates. It is unlikely debt growth will be able to keep up with cash flow growth, causing leverage to fall naturally. While some of the morepandemic-challenged sectors have yet to reach their leverage peaks, the patience of credit agencies has allowed companies the time and flexibility to focuson deleveraging and repairing their balance sheets. However, with leverage stabilising, some companies may opt for more shareholder friendly actions likemergers and acquisitions, dividends and share buybacks over the next months. Thus, the fundamental picture is characterised by some late-cycle behaviouras well, as unprecedented, and cheap liquidity continues to move the market to the “expansionary” phase of the credit cycle.
In spite of the significant spread tightening seen since the March 2020 widest point, the high quality bias and positive yield of the corporate market meansthat investment grade corporates remain relatively attractive, given the amount of negative yielding debt globally.
9
JPMorgan FundsInvestment Managers’ Report (continued)
Money Market Funds
Market ReviewAlthough concerns around inflation led longer-term interest rates to rise toward the end of the period, front-end rates have remained firmly anchored withcentral banks not expected to imminently raise rates. Money market yields remain at low levels in both Europe and the U.S.
The Fed’s announced a shift to average inflation targeting, allowing inflation to run above target for a while to compensate for periods of below-targetinflation. Eurozone inflation, meanwhile, fell below zero.
During the first half of 2021, sovereign yields rose substantially, with yield curves steepening across both Euro and U.S. dollar denominated debt. However,front-end rates remained anchored and central banks have emphasised that they expect the pickup in inflation to be transitory. With this in mind, the ECBcommitted to “significantly” increase the pace of asset purchases to maintain “favourable financing conditions.” The Fed, however, despite beginning theyear by stating that rates would remain on hold through 2023, has since re-assessed the data and is now forecasting two interest rate increases in 2023.
Investment Managers
18 October 2021
The information contained in this report is historical and not necessarily indicative of future performance.
10
JPMorgan FundsInvestment Managers’ Report (continued)
Audit Report on the Summary Financial Statements
To the Shareholders of
JPMorgan Funds
Our opinionIn our opinion, the accompanying Summary Financial Statements of JPMorgan Funds (the “Fund”) are consistent, in all material respects, with the auditedfinancial statements in accordance with the basis of preparation as disclosed in note 20 to the Summary Financial Statements.
The Summary Financial Statements
The Summary Financial Statements for the authorised sub-funds in Taiwan derived from the audited financial statements for the year ended 30 June 2021comprise:
• the Combined Statement of Net Assets as at 30 June 2021;
• the Schedule of Investments as at 30 June 2021;
• the Combined Statement of Operations and Changes in Net Assets for the year then ended;
• and the Notes to the Summary Financial Statements which include a summary of significant accounting policies.
The Summary Financial Statements do not contain all the disclosures required by Luxembourg legal and regulatory requirements relating to the preparationand presentation of the financial statements. Reading the Summary Financial Statements and the auditor’s report thereon, therefore, is not a substitute forreading the audited financial statements of the Fund and the auditor’s report thereon. The Summary Financial Statements and the audited financialstatements do not reflect the effects of events that occurred subsequent to the date of our report on the audited financial statements.
The audited financial statements and our report thereonWe expressed an unmodified audit opinion on the audited financial statements in our report dated 18 October 2021.
Responsibility of the Board of Directors of the Fund for the Summary Financial StatementsThe Board of Directors of the Fund is responsible for the preparation of the Summary Financial Statements in accordance with the basis of preparation asdisclosed in note 20 to the Summary Financial Statements.
Responsibilities of the “Réviseur d’entreprises agréé”Our responsibility is to express an opinion on whether the Summary Financial Statements are a fair summary of the audited financial statements based onour procedures, which were conducted in accordance with International Standards on Auditing (ISA) 810, Engagements to report on summary financialstatements, as adopted for Luxembourg by the “Institut des Réviseurs d’Entreprises”.
PricewaterhouseCoopers, Société coopérative Luxembourg, 25 October 2021
Represented by
John Michael Delano
PricewaterhouseCoopers, Société coopérative, 2 rue Gerhard Mercator, B.P. 1443, L-1014 LuxembourgT: +352 494848 1, F: +352 494848 2900, www.pwc.lu
Cabinet de révision agréé. Expert-comptable (autorisation gouvernementale n° 10028256)R.C.S. Luxembourg B 65 477 - TVA LU25482518
11
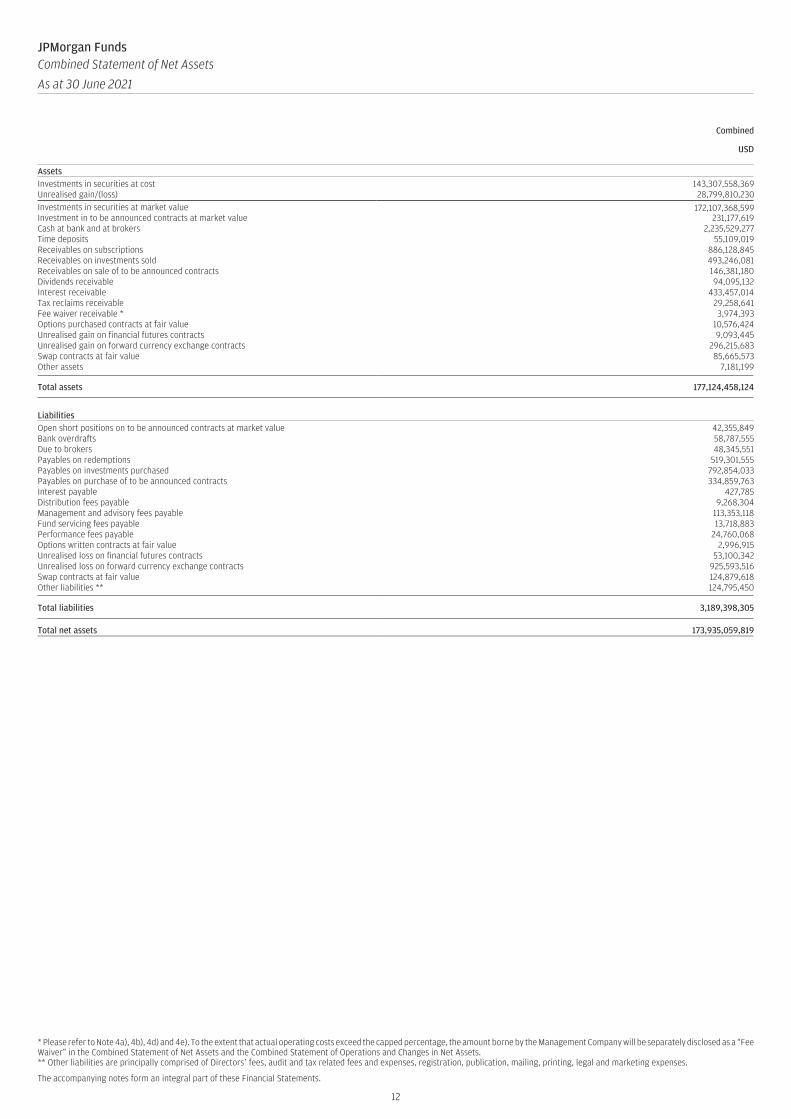
JPMorgan FundsCombined Statement of Net Assets
As at 30 June 2021
Combined
USD
AssetsInvestments in securities at cost 143,307,558,369Unrealised gain/(loss) 28,799,810,230Investments in securities at market value 172,107,368,599Investment in to be announced contracts at market value 231,177,619Cash at bank and at brokers 2,235,529,277Time deposits 55,109,019Receivables on subscriptions 886,128,845Receivables on investments sold 493,246,081Receivables on sale of to be announced contracts 146,381,180Dividends receivable 94,095,132Interest receivable 433,457,014Tax reclaims receivable 29,258,641Fee waiver receivable * 3,974,393Options purchased contracts at fair value 10,576,424Unrealised gain on financial futures contracts 9,093,445Unrealised gain on forward currency exchange contracts 296,215,683Swap contracts at fair value 85,665,573Other assets 7,181,199
Total assets 177,124,458,124
LiabilitiesOpen short positions on to be announced contracts at market value 42,355,849Bank overdrafts 58,787,555Due to brokers 48,345,551Payables on redemptions 519,301,555Payables on investments purchased 792,854,033Payables on purchase of to be announced contracts 334,859,763Interest payable 427,785Distribution fees payable 9,268,304Management and advisory fees payable 113,353,118Fund servicing fees payable 13,718,883Performance fees payable 24,760,068Options written contracts at fair value 2,996,915Unrealised loss on financial futures contracts 53,100,342Unrealised loss on forward currency exchange contracts 925,593,516Swap contracts at fair value 124,879,618Other liabilities ** 124,795,450
Total liabilities 3,189,398,305
Total net assets 173,935,059,819
* Please refer to Note 4a), 4b), 4d) and 4e). To the extent that actual operating costs exceed the capped percentage, the amount borne by the Management Company will be separately disclosed as a “FeeWaiver” in the Combined Statement of Net Assets and the Combined Statement of Operations and Changes in Net Assets.** Other liabilities are principally comprised of Directors’ fees, audit and tax related fees and expenses, registration, publication, mailing, printing, legal and marketing expenses.
The accompanying notes form an integral part of these Financial Statements.
12
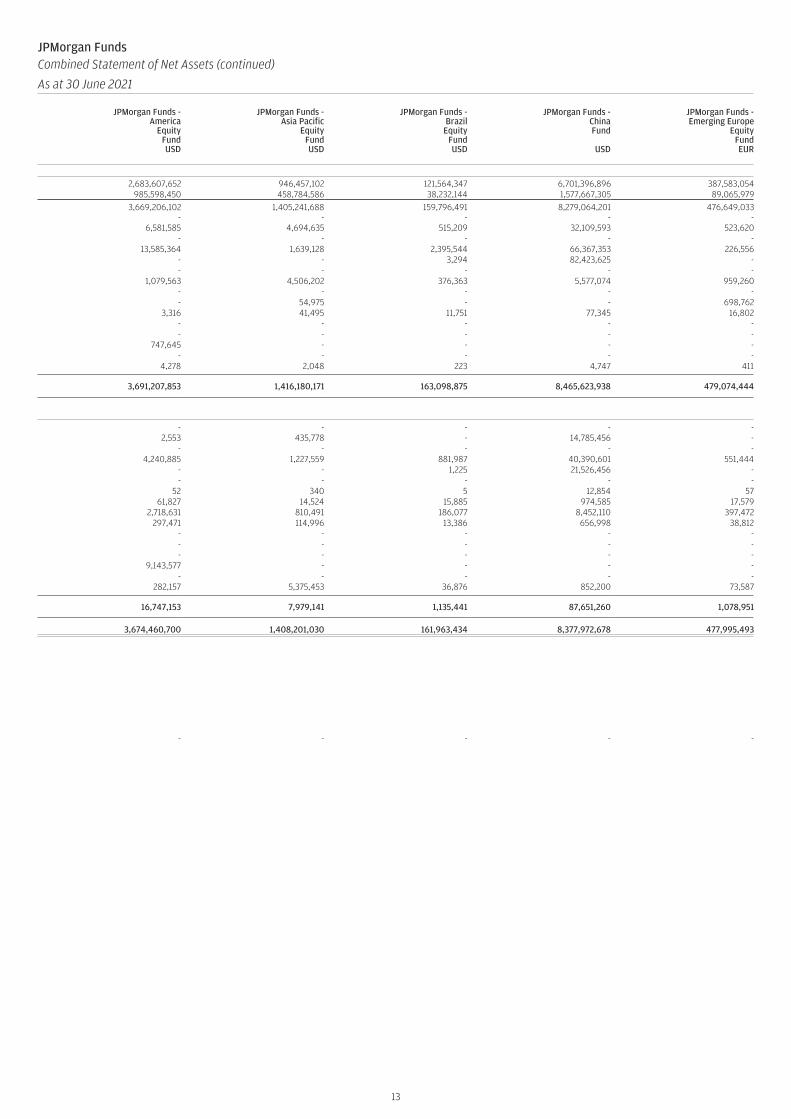
JPMorgan FundsCombined Statement of Net Assets (continued)
As at 30 June 2021
JPMorgan Funds -America
EquityFundUSD
JPMorgan Funds -Asia Pacific
EquityFundUSD
JPMorgan Funds -Brazil
EquityFundUSD
JPMorgan Funds -ChinaFund
USD
JPMorgan Funds -Emerging Europe
EquityFundEUR
2,683,607,652 946,457,102 121,564,347 6,701,396,896 387,583,054985,598,450 458,784,586 38,232,144 1,577,667,305 89,065,979
3,669,206,102 1,405,241,688 159,796,491 8,279,064,201 476,649,033- - - - -
6,581,585 4,694,635 515,209 32,109,593 523,620- - - - -
13,585,364 1,639,128 2,395,544 66,367,353 226,556- - 3,294 82,423,625 -- - - - -
1,079,563 4,506,202 376,363 5,577,074 959,260- - - - -- 54,975 - - 698,762
3,316 41,495 11,751 77,345 16,802- - - - -- - - - -
747,645 - - - -- - - - -
4,278 2,048 223 4,747 411
3,691,207,853 1,416,180,171 163,098,875 8,465,623,938 479,074,444
- - - - -2,553 435,778 - 14,785,456 -
- - - - -4,240,885 1,227,559 881,987 40,390,601 551,444
- - 1,225 21,526,456 -- - - - -
52 340 5 12,854 5761,827 14,524 15,885 974,585 17,579
2,718,631 810,491 186,077 8,452,110 397,472297,471 114,996 13,386 656,998 38,812
- - - - -- - - - -- - - - -
9,143,577 - - - -- - - - -
282,157 5,375,453 36,876 852,200 73,587
16,747,153 7,979,141 1,135,441 87,651,260 1,078,951
3,674,460,700 1,408,201,030 161,963,434 8,377,972,678 477,995,493
- - - - -
13
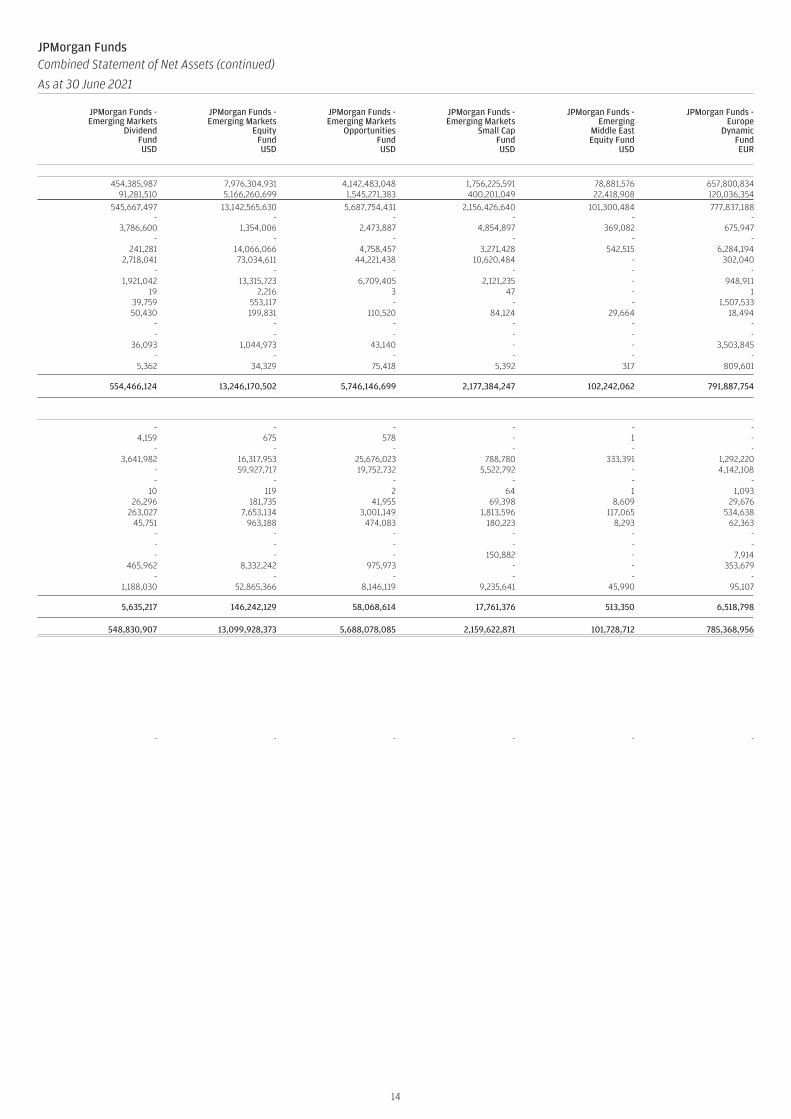
JPMorgan FundsCombined Statement of Net Assets (continued)
As at 30 June 2021
JPMorgan Funds -Emerging Markets
DividendFundUSD
JPMorgan Funds -Emerging Markets
EquityFundUSD
JPMorgan Funds -Emerging Markets
OpportunitiesFundUSD
JPMorgan Funds -Emerging Markets
Small CapFundUSD
JPMorgan Funds -Emerging
Middle EastEquity Fund
USD
JPMorgan Funds -Europe
DynamicFundEUR
454,385,987 7,976,304,931 4,142,483,048 1,756,225,591 78,881,576 657,800,83491,281,510 5,166,260,699 1,545,271,383 400,201,049 22,418,908 120,036,354
545,667,497 13,142,565,630 5,687,754,431 2,156,426,640 101,300,484 777,837,188- - - - - -
3,786,600 1,354,006 2,473,887 4,854,897 369,082 675,947- - - - - -
241,281 14,066,066 4,758,457 3,271,428 542,515 6,284,1942,718,041 73,034,611 44,221,438 10,620,484 - 302,040
- - - - - -1,921,042 13,315,723 6,709,405 2,121,235 - 948,911
19 2,216 3 47 - 139,759 553,117 - - - 1,507,53350,430 199,831 110,520 84,124 29,664 18,494
- - - - - -- - - - - -
36,093 1,044,973 43,140 - - 3,503,845- - - - - -
5,362 34,329 75,418 5,392 317 809,601
554,466,124 13,246,170,502 5,746,146,699 2,177,384,247 102,242,062 791,887,754
- - - - - -4,159 675 578 - 1 -
- - - - - -3,641,982 16,317,953 25,676,023 788,780 333,391 1,292,220
- 59,927,717 19,752,732 5,522,792 - 4,142,108- - - - - -
10 119 2 64 1 1,09326,296 181,735 41,955 69,398 8,609 29,676
263,027 7,653,134 3,001,149 1,813,596 117,065 534,63845,751 963,188 474,083 180,223 8,293 62,363
- - - - - -- - - - - -- - - 150,882 - 7,914
465,962 8,332,242 975,973 - - 353,679- - - - - -
1,188,030 52,865,366 8,146,119 9,235,641 45,990 95,107
5,635,217 146,242,129 58,068,614 17,761,376 513,350 6,518,798
548,830,907 13,099,928,373 5,688,078,085 2,159,622,871 101,728,712 785,368,956
- - - - - -
14
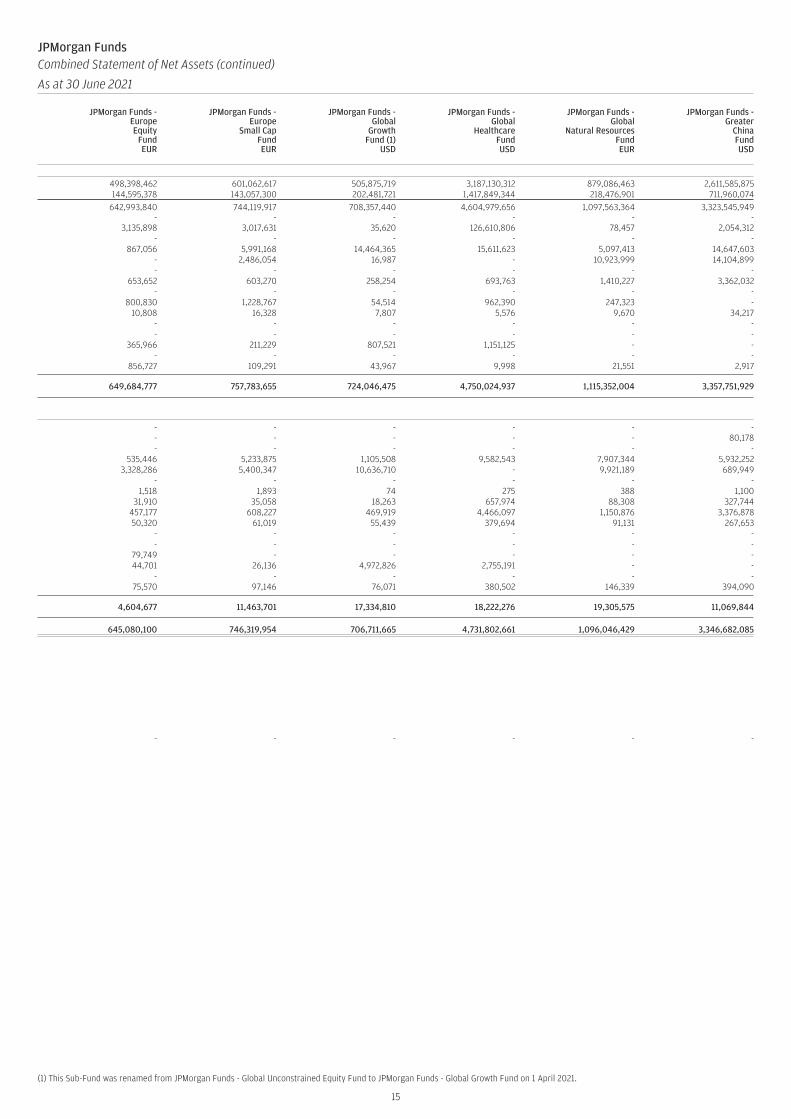
JPMorgan FundsCombined Statement of Net Assets (continued)
As at 30 June 2021
JPMorgan Funds -EuropeEquity
FundEUR
JPMorgan Funds -Europe
Small CapFundEUR
JPMorgan Funds -Global
GrowthFund (1)
USD
JPMorgan Funds -Global
HealthcareFundUSD
JPMorgan Funds -Global
Natural ResourcesFundEUR
JPMorgan Funds -Greater
ChinaFundUSD
498,398,462 601,062,617 505,875,719 3,187,130,312 879,086,463 2,611,585,875144,595,378 143,057,300 202,481,721 1,417,849,344 218,476,901 711,960,074
642,993,840 744,119,917 708,357,440 4,604,979,656 1,097,563,364 3,323,545,949- - - - - -
3,135,898 3,017,631 35,620 126,610,806 78,457 2,054,312- - - - - -
867,056 5,991,168 14,464,365 15,611,623 5,097,413 14,647,603- 2,486,054 16,987 - 10,923,999 14,104,899- - - - - -
653,652 603,270 258,254 693,763 1,410,227 3,362,032- - - - - -
800,830 1,228,767 54,514 962,390 247,323 -10,808 16,328 7,807 5,576 9,670 34,217
- - - - - -- - - - - -
365,966 211,229 807,521 1,151,125 - -- - - - - -
856,727 109,291 43,967 9,998 21,551 2,917
649,684,777 757,783,655 724,046,475 4,750,024,937 1,115,352,004 3,357,751,929
- - - - - -- - - - - 80,178- - - - - -
535,446 5,233,875 1,105,508 9,582,543 7,907,344 5,932,2523,328,286 5,400,347 10,636,710 - 9,921,189 689,949
- - - - - -1,518 1,893 74 275 388 1,100
31,910 35,058 18,263 657,974 88,308 327,744457,177 608,227 469,919 4,466,097 1,150,876 3,376,87850,320 61,019 55,439 379,694 91,131 267,653
- - - - - -- - - - - -
79,749 - - - - -44,701 26,136 4,972,826 2,755,191 - -
- - - - - -75,570 97,146 76,071 380,502 146,339 394,090
4,604,677 11,463,701 17,334,810 18,222,276 19,305,575 11,069,844
645,080,100 746,319,954 706,711,665 4,731,802,661 1,096,046,429 3,346,682,085
- - - - - -
(1) This Sub-Fund was renamed from JPMorgan Funds - Global Unconstrained Equity Fund to JPMorgan Funds - Global Growth Fund on 1 April 2021.
15
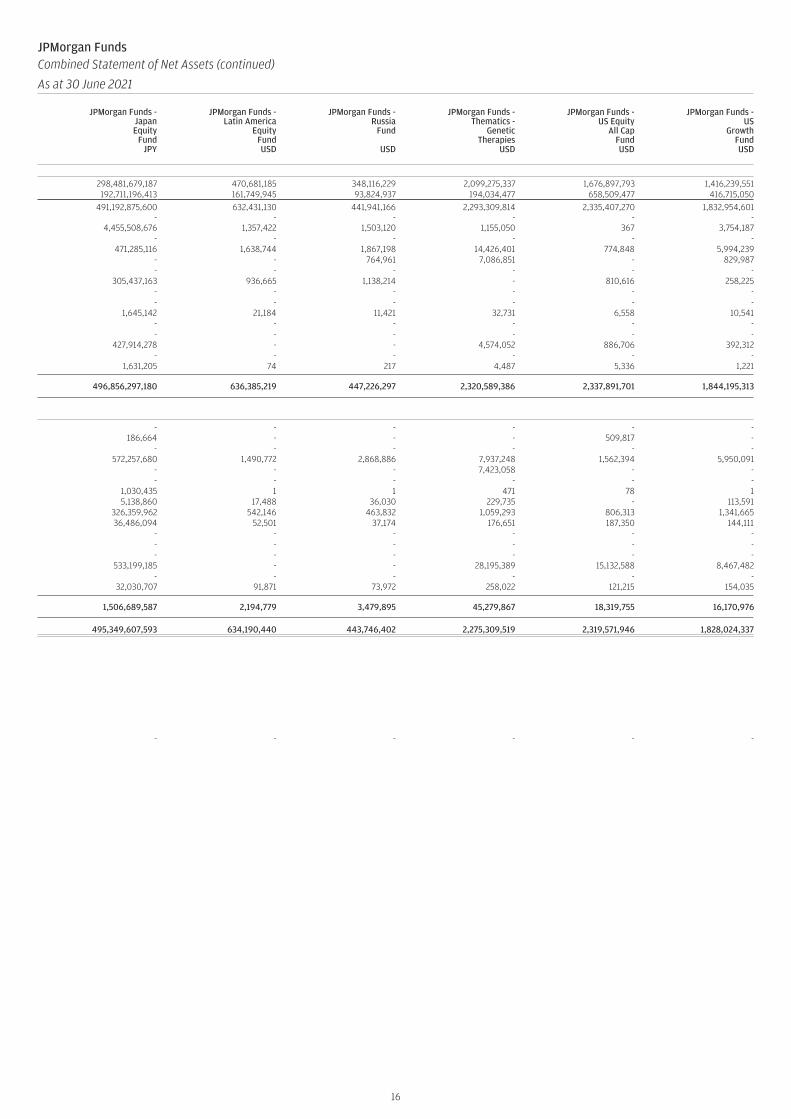
JPMorgan FundsCombined Statement of Net Assets (continued)
As at 30 June 2021
JPMorgan Funds -JapanEquity
FundJPY
JPMorgan Funds -Latin America
EquityFundUSD
JPMorgan Funds -Russia
Fund
USD
JPMorgan Funds -Thematics -
GeneticTherapies
USD
JPMorgan Funds -US Equity
All CapFundUSD
JPMorgan Funds -US
GrowthFundUSD
298,481,679,187 470,681,185 348,116,229 2,099,275,337 1,676,897,793 1,416,239,551192,711,196,413 161,749,945 93,824,937 194,034,477 658,509,477 416,715,050
491,192,875,600 632,431,130 441,941,166 2,293,309,814 2,335,407,270 1,832,954,601- - - - - -
4,455,508,676 1,357,422 1,503,120 1,155,050 367 3,754,187- - - - - -
471,285,116 1,638,744 1,867,198 14,426,401 774,848 5,994,239- - 764,961 7,086,851 - 829,987- - - - - -
305,437,163 936,665 1,138,214 - 810,616 258,225- - - - - -- - - - - -
1,645,142 21,184 11,421 32,731 6,558 10,541- - - - - -- - - - - -
427,914,278 - - 4,574,052 886,706 392,312- - - - - -
1,631,205 74 217 4,487 5,336 1,221
496,856,297,180 636,385,219 447,226,297 2,320,589,386 2,337,891,701 1,844,195,313
- - - - - -186,664 - - - 509,817 -
- - - - - -572,257,680 1,490,772 2,868,886 7,937,248 1,562,394 5,950,091
- - - 7,423,058 - -- - - - - -
1,030,435 1 1 471 78 15,138,860 17,488 36,030 229,735 - 113,591
326,359,962 542,146 463,832 1,059,293 806,313 1,341,66536,486,094 52,501 37,174 176,651 187,350 144,111
- - - - - -- - - - - -- - - - - -
533,199,185 - - 28,195,389 15,132,588 8,467,482- - - - - -
32,030,707 91,871 73,972 258,022 121,215 154,035
1,506,689,587 2,194,779 3,479,895 45,279,867 18,319,755 16,170,976
495,349,607,593 634,190,440 443,746,402 2,275,309,519 2,319,571,946 1,828,024,337
- - - - - -
16

JPMorgan FundsCombined Statement of Net Assets (continued)
As at 30 June 2021
JPMorgan Funds -US
Smaller CompaniesFundUSD
JPMorgan Funds -US
TechnologyFundUSD
JPMorgan Funds -US
ValueFundUSD
JPMorgan Funds -Asia Pacific
IncomeFundUSD
JPMorgan Funds -Aggregate
BondFundUSD
1,503,511,808 4,424,059,073 4,435,009,010 1,927,087,040 1,886,021,641395,189,585 2,034,339,130 953,927,456 267,395,997 9,595,302
1,898,701,393 6,458,398,203 5,388,936,466 2,194,483,037 1,895,616,943- - - - -
2,195,939 7,668 6,999,724 11,763,679 20,598,704- - - - -
3,736,746 49,319,109 18,851,933 5,549,378 3,308,771- - - 5,587,088 -- - - - 42,388,609
805,696 487,233 4,152,706 8,750,942 -- - - 8,425,340 8,949,012- - - - 78,295
1,326 2,733 8,526 21,207 101,120- - - - -- - - - 1,065,833
68,984 - 1,300,730 744,331 22,279,928- - - - 117,458- 10,117 7,461 3,203 3,359
1,905,510,084 6,508,225,063 5,420,257,546 2,235,328,205 1,994,508,032
- - - - 42,355,849355 - - 1,409,492 -
- - - - 239,6102,482,028 55,011,012 38,406,407 5,782,560 584,630
- 473,798 - 5,330,000 4,522,883- - - - -9 29 94 2 1,004
17,000 596,331 87,388 63,836 13,8021,484,558 6,297,887 3,067,596 2,735,817 325,561
156,605 505,220 428,170 183,693 156,876- - - - -- - - - -- - - - 1,573,392
851,607 - 19,204,497 14,428,955 23,761,709- - - - 525,368
127,521 569,507 382,953 772,005 252,411
5,119,683 63,453,784 61,577,105 30,706,360 74,313,095
1,900,390,401 6,444,771,279 5,358,680,441 2,204,621,845 1,920,194,937
- - - - -
17
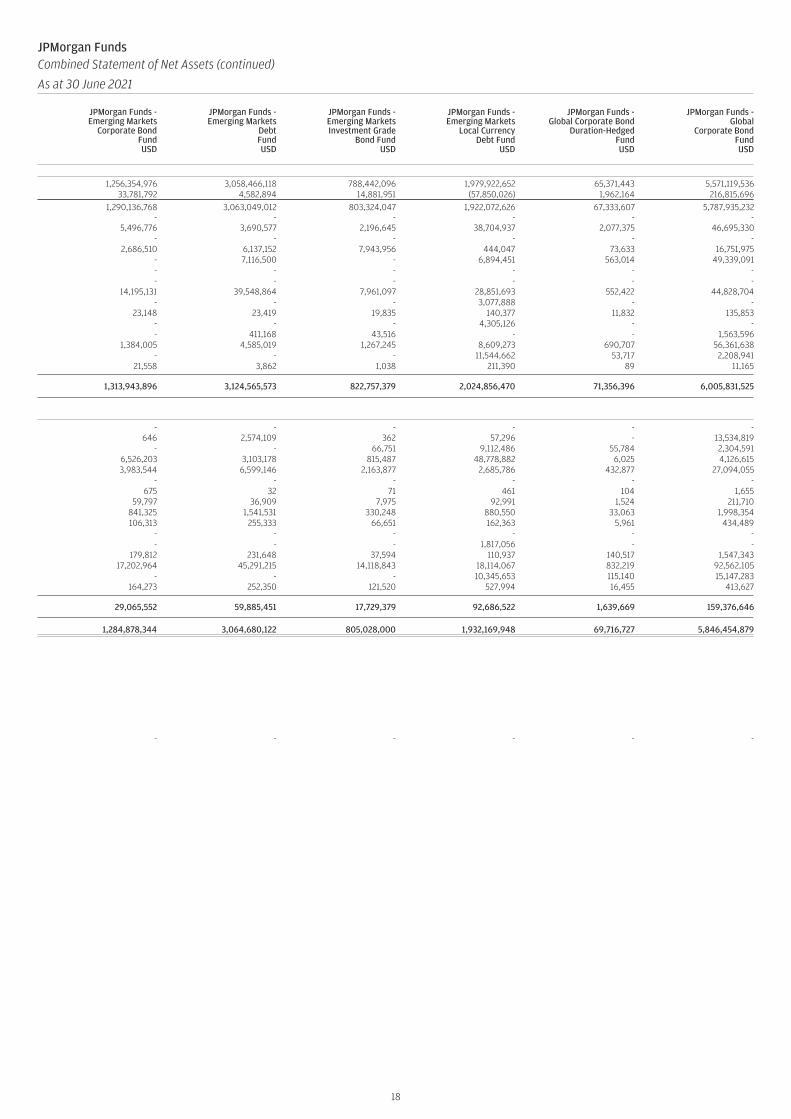
JPMorgan FundsCombined Statement of Net Assets (continued)
As at 30 June 2021
JPMorgan Funds -Emerging Markets
Corporate BondFundUSD
JPMorgan Funds -Emerging Markets
DebtFundUSD
JPMorgan Funds -Emerging MarketsInvestment Grade
Bond FundUSD
JPMorgan Funds -Emerging Markets
Local CurrencyDebt Fund
USD
JPMorgan Funds -Global Corporate Bond
Duration-HedgedFundUSD
JPMorgan Funds -Global
Corporate BondFundUSD
1,256,354,976 3,058,466,118 788,442,096 1,979,922,652 65,371,443 5,571,119,53633,781,792 4,582,894 14,881,951 (57,850,026) 1,962,164 216,815,696
1,290,136,768 3,063,049,012 803,324,047 1,922,072,626 67,333,607 5,787,935,232- - - - - -
5,496,776 3,690,577 2,196,645 38,704,937 2,077,375 46,695,330- - - - - -
2,686,510 6,137,152 7,943,956 444,047 73,633 16,751,975- 7,116,500 - 6,894,451 563,014 49,339,091- - - - - -- - - - - -
14,195,131 39,548,864 7,961,097 28,851,693 552,422 44,828,704- - - 3,077,888 - -
23,148 23,419 19,835 140,377 11,832 135,853- - - 4,305,126 - -- 411,168 43,516 - - 1,563,596
1,384,005 4,585,019 1,267,245 8,609,273 690,707 56,361,638- - - 11,544,662 53,717 2,208,941
21,558 3,862 1,038 211,390 89 11,165
1,313,943,896 3,124,565,573 822,757,379 2,024,856,470 71,356,396 6,005,831,525
- - - - - -646 2,574,109 362 57,296 - 13,534,819
- - 66,751 9,112,486 55,784 2,304,5916,526,203 3,103,178 815,487 48,778,882 6,025 4,126,6153,983,544 6,599,146 2,163,877 2,685,786 432,877 27,094,055
- - - - - -675 32 71 461 104 1,655
59,797 36,909 7,975 92,991 1,524 211,710841,325 1,541,531 330,248 880,550 33,063 1,998,354106,313 255,333 66,651 162,363 5,961 434,489
- - - - - -- - - 1,817,056 - -
179,812 231,648 37,594 110,937 140,517 1,547,34317,202,964 45,291,215 14,118,843 18,114,067 832,219 92,562,105
- - - 10,345,653 115,140 15,147,283164,273 252,350 121,520 527,994 16,455 413,627
29,065,552 59,885,451 17,729,379 92,686,522 1,639,669 159,376,646
1,284,878,344 3,064,680,122 805,028,000 1,932,169,948 69,716,727 5,846,454,879
- - - - - -
18

JPMorgan FundsCombined Statement of Net Assets (continued)
As at 30 June 2021
JPMorgan Funds -Global
Government BondFundEUR
JPMorgan Funds -Global
Short DurationBond Fund
USD
JPMorgan Funds -Global
Strategic BondFundUSD
JPMorgan Funds -Income
Fund
USD
JPMorgan Funds -US
Aggregate BondFundUSD
JPMorgan Funds -USD Money
Market VNAVFundUSD
1,410,258,714 722,504,983 2,385,856,634 9,567,531,673 4,138,639,657 383,831,068(24,459,805) 8,696,953 34,589,271 15,280,379 166,822,337 30,575
1,385,798,909 731,201,936 2,420,445,905 9,582,812,052 4,305,461,994 383,861,643- - 66,555,076 4,792,591 127,291,363 -
24,300,071 7,011,952 42,076,810 690,222,386 223,299 83,727,720- - - - - -
3,139,346 3,878,702 4,270,006 81,938,472 13,193,515 1,361,21916,428,916 1,207,964 746,468 2,472,500 1,457,396 -
- - - 4,794,703 99,197,868 -- - - - - -
4,312,998 3,762,812 16,792,764 82,988,876 20,686,994 83,622- - 36,904 - - -
72,094 45,684 98,445 237,027 131,968 29,385- - - - - -
251,283 31,172 11 867,682 - -13,199,029 10,008,179 17,292,553 3,272,209 2,459,908 -
908,288 46,983 12,147,716 7,481,505 - -7,603 8,139 4,360 9,837 5,339 -
1,448,418,537 757,203,523 2,580,467,018 10,461,889,840 4,570,109,644 469,063,589
- - - - - -273 83 - 903 1,646,242 -
- 61,648 12,414,577 3,124,067 - -1,425,049 3,909,952 1,835,636 10,553,059 7,381,627 2,258,387
28,396,017 1,212,461 5,904,024 9,650,017 9,928,070 -- - 66,600,303 9,591,864 226,106,981 -
16,270 214 948 4 5 -15,956 4,210 106,049 507,791 146,917 -
205,197 203,578 1,319,499 6,491,934 1,883,662 -113,942 60,921 199,894 741,253 360,156 38,678
- - 7,458,810 - - -- - - - - -
441,357 220,176 1,733,140 33,099,077 - -16,468,400 15,304,923 55,122,216 62,296,672 37,850,564 -
2,429,337 119,486 35,303 - - -145,070 96,505 225,968 972,702 301,567 46,302
49,656,868 21,194,157 152,956,367 137,029,343 285,605,791 2,343,367
1,398,761,669 736,009,366 2,427,510,651 10,324,860,497 4,284,503,853 466,720,222
- - - - - -
19
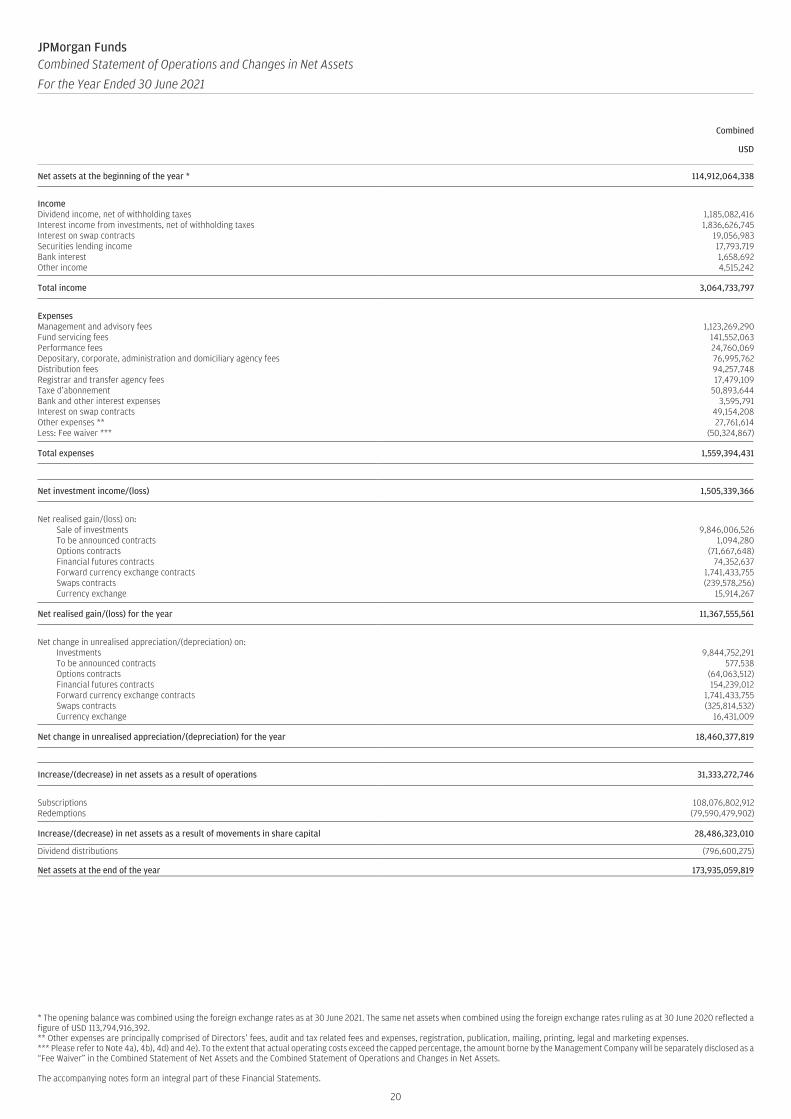
JPMorgan FundsCombined Statement of Operations and Changes in Net Assets
For the Year Ended 30 June 2021
Combined
USD
Net assets at the beginning of the year * 114,912,064,338
IncomeDividend income, net of withholding taxes 1,185,082,416Interest income from investments, net of withholding taxes 1,836,626,745Interest on swap contracts 19,056,983Securities lending income 17,793,719Bank interest 1,658,692Other income 4,515,242
Total income 3,064,733,797
ExpensesManagement and advisory fees 1,123,269,290Fund servicing fees 141,552,063Performance fees 24,760,069Depositary, corporate, administration and domiciliary agency fees 76,995,762Distribution fees 94,257,748Registrar and transfer agency fees 17,479,109Taxe d’abonnement 50,893,644Bank and other interest expenses 3,595,791Interest on swap contracts 49,154,208Other expenses ** 27,761,614Less: Fee waiver *** (50,324,867)
Total expenses 1,559,394,431
Net investment income/(loss) 1,505,339,366
Net realised gain/(loss) on:Sale of investments 9,846,006,526To be announced contracts 1,094,280Options contracts (71,667,648)Financial futures contracts 74,352,637Forward currency exchange contracts 1,741,433,755Swaps contracts (239,578,256)Currency exchange 15,914,267
Net realised gain/(loss) for the year 11,367,555,561
Net change in unrealised appreciation/(depreciation) on:Investments 9,844,752,291To be announced contracts 577,538Options contracts (64,063,512)Financial futures contracts 154,239,012Forward currency exchange contracts 1,741,433,755Swaps contracts (325,814,532)Currency exchange 16,431,009
Net change in unrealised appreciation/(depreciation) for the year 18,460,377,819
Increase/(decrease) in net assets as a result of operations 31,333,272,746
Subscriptions 108,076,802,912Redemptions (79,590,479,902)
Increase/(decrease) in net assets as a result of movements in share capital 28,486,323,010
Dividend distributions (796,600,275)
Net assets at the end of the year 173,935,059,819
* The opening balance was combined using the foreign exchange rates as at 30 June 2021. The same net assets when combined using the foreign exchange rates ruling as at 30 June 2020 reflected afigure of USD 113,794,916,392.** Other expenses are principally comprised of Directors’ fees, audit and tax related fees and expenses, registration, publication, mailing, printing, legal and marketing expenses.*** Please refer to Note 4a), 4b), 4d) and 4e). To the extent that actual operating costs exceed the capped percentage, the amount borne by the Management Company will be separately disclosed as a“Fee Waiver” in the Combined Statement of Net Assets and the Combined Statement of Operations and Changes in Net Assets.
The accompanying notes form an integral part of these Financial Statements.
20

JPMorgan FundsCombined Statement of Operations and Changes in Net Assets (continued)
For the Year Ended 30 June 2021
JPMorgan Funds -America
EquityFundUSD
JPMorgan Funds -Asia Pacific
EquityFundUSD
JPMorgan Funds -Brazil
EquityFundUSD
JPMorgan Funds -ChinaFund
USD
JPMorgan Funds -Emerging Europe
EquityFundEUR
2,214,701,982 932,166,897 173,061,345 1,919,508,650 426,099,377
25,656,579 25,971,279 4,139,249 36,394,582 20,787,670- - - - -- - - - -
59,060 184,869 - 1,954,613 46,51615,348 1,505 - 26,931 999
- - - - 1,871,053
25,730,987 26,157,653 4,139,249 38,376,126 22,706,238
25,032,744 8,518,515 2,345,918 63,383,715 4,434,8972,836,942 1,245,080 168,873 4,992,210 429,126
- - - - -681,463 960,473 228,238 2,528,727 457,117643,488 144,821 168,724 7,260,987 193,977287,849 147,521 104,243 704,803 116,803
1,209,168 298,347 74,196 2,334,625 168,285126 1,317 411 119,470 1,895
- - - - -372,537 145,356 120,926 1,203,359 123,804
(74,594) (481,263) (214,301) (598,977) (250,212)
30,989,723 10,980,167 2,997,228 81,928,919 5,675,692
(5,258,736) 15,177,486 1,142,021 (43,552,793) 17,030,546
434,706,086 149,588,739 21,580,926 284,567,124 20,558,353- - - - -- - - - -- - - - -
19,700,125 227 8,235 (24,336) -- - - - -
381,439 (424,378) (272,400) (2,600,390) (443,939)
454,787,650 149,164,588 21,316,761 281,942,398 20,114,414
644,592,526 305,703,863 38,623,919 1,025,547,823 53,500,233- - - - -- - - - -- - - - -
(10,325,369) - - - -- - - - -
(3,078) (4,063,248) 119,050 1,923,255 (9,448)
634,264,079 301,640,615 38,742,969 1,027,471,078 53,490,785
1,083,792,993 465,982,689 61,201,751 1,265,860,683 90,635,745
1,366,952,338 631,969,164 155,441,477 9,025,644,031 39,215,343(989,060,537) (621,330,986) (227,730,746) (3,832,711,343) (71,714,224)
377,891,801 10,638,178 (72,289,269) 5,192,932,688 (32,498,881)
(1,926,076) (586,734) (10,393) (329,343) (6,240,748)
3,674,460,700 1,408,201,030 161,963,434 8,377,972,678 477,995,493
21

JPMorgan FundsCombined Statement of Operations and Changes in Net Assets (continued)
For the Year Ended 30 June 2021
JPMorgan Funds -Emerging Markets
DividendFundUSD
JPMorgan Funds -Emerging Markets
EquityFundUSD
JPMorgan Funds -Emerging Markets
OpportunitiesFundUSD
JPMorgan Funds -Emerging Markets
Small CapFundUSD
JPMorgan Funds -Emerging
Middle EastEquity Fund
USD
JPMorgan Funds -Europe
DynamicFundEUR
473,889,282 8,472,286,653 3,671,644,618 1,333,286,064 84,637,203 602,755,515
16,914,895 115,898,464 85,018,693 34,652,708 2,371,636 15,828,355- 2,195 - - - -- - - - - -
61,227 1,052,660 276,115 325,373 - 199,3936,001 10,610 15,600 4,617 101 806
- 48,271 2,512 - - 234,994
16,982,123 117,012,200 85,312,920 34,982,698 2,371,737 16,263,548
2,976,098 79,021,109 31,255,369 17,587,415 1,260,884 5,263,200509,488 10,610,681 5,018,989 1,794,683 88,495 636,428
- - - - - -650,164 6,774,941 3,131,024 1,966,781 359,310 428,548273,453 1,757,661 467,519 699,250 92,560 265,723176,743 678,896 297,577 216,770 66,692 124,193146,397 2,780,599 1,102,925 681,027 45,476 202,811
75 3,431 2,005 5,987 1,479 10,129- - - - - -
216,279 2,206,470 432,571 169,907 91,893 163,723(679,644) (2,478,091) (1,291,356) (994,234) (396,618) (248,547)
4,269,053 101,355,697 40,416,623 22,127,586 1,610,171 6,846,208
12,713,070 15,656,503 44,896,297 12,855,112 761,566 9,417,340
66,074,258 792,494,686 325,499,116 277,698,271 4,728,468 83,975,618- - - - - -- - - - - -- - 6,165,438 8,191,615 - 1,430,606
1,915,174 10,855,164 886,572 69,848 22,796 (11,034,779)- - - - - -
40,160 538,178 346,753 790,162 (36,143) 585,374
68,029,592 803,888,028 332,897,879 286,749,896 4,715,121 74,956,819
101,499,493 3,143,320,767 1,201,886,384 384,972,602 25,118,447 95,246,527- - - - - -- - - - - -- - - (67,542) - 82,606
(699,921) (8,047,306) (1,108,662) - - 3,530,854- - - - - -
(395,484) (33,090,318) (5,122,248) (8,606,724) (485) (75,494)
100,404,088 3,102,183,143 1,195,655,474 376,298,336 25,117,962 98,784,493
181,146,750 3,921,727,674 1,573,449,650 675,903,344 30,594,649 183,158,652
155,779,956 4,134,351,241 1,971,791,526 874,374,781 27,789,395 296,091,559(254,112,683) (3,421,310,922) (1,524,786,207) (723,754,616) (40,442,897) (296,192,695)
(98,332,727) 713,040,319 447,005,319 150,620,165 (12,653,502) (101,136)
(7,872,398) (7,126,273) (4,021,502) (186,702) (849,638) (444,075)
548,830,907 13,099,928,373 5,688,078,085 2,159,622,871 101,728,712 785,368,956
22

JPMorgan FundsCombined Statement of Operations and Changes in Net Assets (continued)
For the Year Ended 30 June 2021
JPMorgan Funds -EuropeEquity
FundEUR
JPMorgan Funds -Europe
Small CapFundEUR
JPMorgan Funds -Global
GrowthFund (1)
USD
JPMorgan Funds -Global
HealthcareFundUSD
JPMorgan Funds -Global
Natural ResourcesFundEUR
JPMorgan Funds -Greater
ChinaFundUSD
439,143,292 486,231,728 456,613,443 3,108,124,762 611,180,464 923,987,306
13,844,701 11,146,848 3,764,487 32,806,451 30,213,855 21,726,502- - - - - 1,238,817- - - - - -
811,751 660,864 34,823 281,225 248,234 581,7585 81 148 63,649 108 92
255,439 30,129 12,878 604 - -
14,911,896 11,837,922 3,812,336 33,151,929 30,462,197 23,547,169
4,473,298 6,284,263 4,813,788 43,502,472 10,284,247 27,242,765498,827 568,484 595,159 3,922,866 794,924 2,203,943
- - - - - -323,719 374,828 322,585 870,087 376,655 1,436,085350,160 388,778 189,199 6,531,195 784,976 2,608,831108,654 123,718 107,389 512,611 230,471 367,391240,440 229,461 204,708 1,698,077 381,466 1,098,581
16,873 10,313 1,783 1,522 3,308 27,266- - - - - -
107,927 119,554 158,121 586,716 248,936 552,067(128,987) (188,094) (146,998) (79,451) (131,010) (375,533)
5,990,911 7,911,305 6,245,734 57,546,095 12,973,973 35,161,396
8,920,985 3,926,617 (2,433,398) (24,394,166) 17,488,224 (11,614,227)
9,234,073 97,116,643 110,569,275 173,815,163 (6,335,439) 213,814,920- - - - - -- - - - - -
(199,353) - - - - -(5,850,024) (488,569) 8,869,572 733,434 (5,988) -
- - - - - -124,652 38,217 (72,295) (919,149) (242,950) (1,942,435)
3,309,348 96,666,291 119,366,552 173,629,448 (6,584,377) 211,872,485
127,209,858 122,731,622 116,277,775 743,661,586 237,286,641 445,123,205- - - - - -- - - - - -
6,974 - - - - -258,856 181,361 (4,726,380) 1,805,848 - -
- - - - - -(252,322) 516 (371) 31,552 10,293 969,928
127,223,366 122,913,499 111,551,024 745,498,986 237,296,934 446,093,133
139,453,699 223,506,407 228,484,178 894,734,268 248,200,781 646,351,391
280,908,792 375,316,992 150,013,701 1,989,913,886 818,377,370 3,417,838,997(212,280,286) (338,648,158) (128,363,218) (1,260,954,424) (578,887,969) (1,641,305,176)
68,628,506 36,668,834 21,650,483 728,959,462 239,489,401 1,776,533,821
(2,145,397) (87,015) (36,439) (15,831) (2,824,217) (190,433)
645,080,100 746,319,954 706,711,665 4,731,802,661 1,096,046,429 3,346,682,085
(1) This Sub-Fund was renamed from JPMorgan Funds - Global Unconstrained Equity Fund to JPMorgan Funds - Global Growth Fund on 1 April 2021.
23

JPMorgan FundsCombined Statement of Operations and Changes in Net Assets (continued)
For the Year Ended 30 June 2021
JPMorgan Funds -JapanEquity
FundJPY
JPMorgan Funds -Latin America
EquityFundUSD
JPMorgan Funds -Russia
Fund
USD
JPMorgan Funds -Thematics -
GeneticTherapies
USD
JPMorgan Funds -US Equity
All CapFundUSD
JPMorgan Funds -US
GrowthFundUSD
574,098,993,593 458,107,214 440,250,085 566,574,901 1,899,926,083 1,289,301,124
4,613,877,796 14,553,608 26,967,521 5,738,156 22,343,260 5,081,301- - - - - (140)- - - - - -
278,648,217 - 55,947 - 68,557 98,80535,039 1,870 1,215 181 33,593 49,923
- - - - - -
4,892,561,052 14,555,478 27,024,683 5,738,337 22,445,410 5,229,889
4,636,142,121 5,624,486 5,748,961 7,309,036 7,478,687 13,169,833537,202,735 554,975 455,883 1,372,703 2,197,038 1,508,811
- - - - - -168,869,024 525,674 452,854 877,496 544,498 455,698
54,435,173 182,880 409,101 1,282,936 - 1,064,13748,212,779 165,714 150,751 259,056 57,415 274,809
134,788,563 204,221 202,146 744,154 414,281 528,48313,443,211 151 16 9,763 561 87
- - - - - -80,504,507 150,509 208,052 208,302 226,216 302,653(19,767,222) (311,391) (239,670) (512,639) (38,968) (129,285)
5,653,830,891 7,097,219 7,388,094 11,550,807 10,879,728 17,175,226
(761,269,839) 7,458,259 19,636,589 (5,812,470) 11,565,682 (11,945,337)
108,462,761,293 22,704,098 46,945,946 100,425,719 442,541,802 333,922,813- - - - - -- - - - - -- - - - - -
3,171,147,252 - - 21,854,241 34,261,317 12,376,891- - - - - -
(132,994,114) (805,565) 111,476 (913,144) 81,474 (406,490)
111,500,914,431 21,898,533 47,057,422 121,366,816 476,884,593 345,893,214
48,227,298,554 168,034,838 80,035,903 128,603,498 438,799,316 169,449,794- - - - - -- - - - - -- - - - - -
(285,786,056) - - (22,159,508) (17,388,574) (8,872,000)- - - - - -
(3,565,312) 266,500 17,925 (14,077) 8,378 (2,671)
47,937,947,186 168,301,338 80,053,828 106,429,913 421,419,120 160,575,123
158,677,591,778 197,658,130 146,747,839 221,984,259 909,869,395 494,523,000
281,977,725,861 294,550,370 332,036,086 2,106,697,820 527,459,585 1,723,387,005(519,384,974,012) (315,157,968) (464,910,563) (619,941,858) (1,017,582,727) (1,679,154,777)
(237,407,248,151) (20,607,598) (132,874,477) 1,486,755,962 (490,123,142) 44,232,228
(19,729,627) (967,306) (10,377,045) (5,603) (100,390) (32,015)
495,349,607,593 634,190,440 443,746,402 2,275,309,519 2,319,571,946 1,828,024,337
24
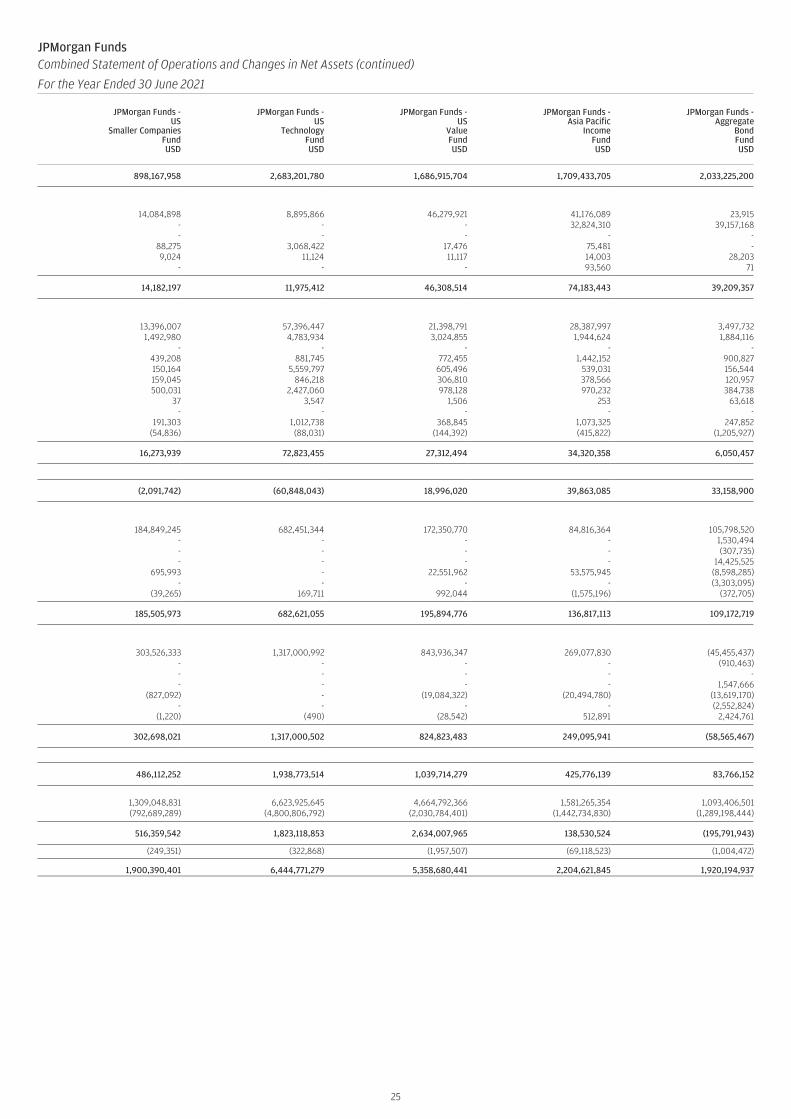
JPMorgan FundsCombined Statement of Operations and Changes in Net Assets (continued)
For the Year Ended 30 June 2021
JPMorgan Funds -US
Smaller CompaniesFundUSD
JPMorgan Funds -US
TechnologyFundUSD
JPMorgan Funds -US
ValueFundUSD
JPMorgan Funds -Asia Pacific
IncomeFundUSD
JPMorgan Funds -Aggregate
BondFundUSD
898,167,958 2,683,201,780 1,686,915,704 1,709,433,705 2,033,225,200
14,084,898 8,895,866 46,279,921 41,176,089 23,915- - - 32,824,310 39,157,168- - - - -
88,275 3,068,422 17,476 75,481 -9,024 11,124 11,117 14,003 28,203
- - - 93,560 71
14,182,197 11,975,412 46,308,514 74,183,443 39,209,357
13,396,007 57,396,447 21,398,791 28,387,997 3,497,7321,492,980 4,783,934 3,024,855 1,944,624 1,884,116
- - - - -439,208 881,745 772,455 1,442,152 900,827150,164 5,559,797 605,496 539,031 156,544159,045 846,218 306,810 378,566 120,957500,031 2,427,060 978,128 970,232 384,738
37 3,547 1,506 253 63,618- - - - -
191,303 1,012,738 368,845 1,073,325 247,852(54,836) (88,031) (144,392) (415,822) (1,205,927)
16,273,939 72,823,455 27,312,494 34,320,358 6,050,457
(2,091,742) (60,848,043) 18,996,020 39,863,085 33,158,900
184,849,245 682,451,344 172,350,770 84,816,364 105,798,520- - - - 1,530,494- - - - (307,735)- - - - 14,425,525
695,993 - 22,551,962 53,575,945 (8,598,285)- - - - (3,303,095)
(39,265) 169,711 992,044 (1,575,196) (372,705)
185,505,973 682,621,055 195,894,776 136,817,113 109,172,719
303,526,333 1,317,000,992 843,936,347 269,077,830 (45,455,437)- - - - (910,463)- - - - -- - - - 1,547,666
(827,092) - (19,084,322) (20,494,780) (13,619,170)- - - - (2,552,824)
(1,220) (490) (28,542) 512,891 2,424,761
302,698,021 1,317,000,502 824,823,483 249,095,941 (58,565,467)
486,112,252 1,938,773,514 1,039,714,279 425,776,139 83,766,152
1,309,048,831 6,623,925,645 4,664,792,366 1,581,265,354 1,093,406,501(792,689,289) (4,800,806,792) (2,030,784,401) (1,442,734,830) (1,289,198,444)
516,359,542 1,823,118,853 2,634,007,965 138,530,524 (195,791,943)
(249,351) (322,868) (1,957,507) (69,118,523) (1,004,472)
1,900,390,401 6,444,771,279 5,358,680,441 2,204,621,845 1,920,194,937
25
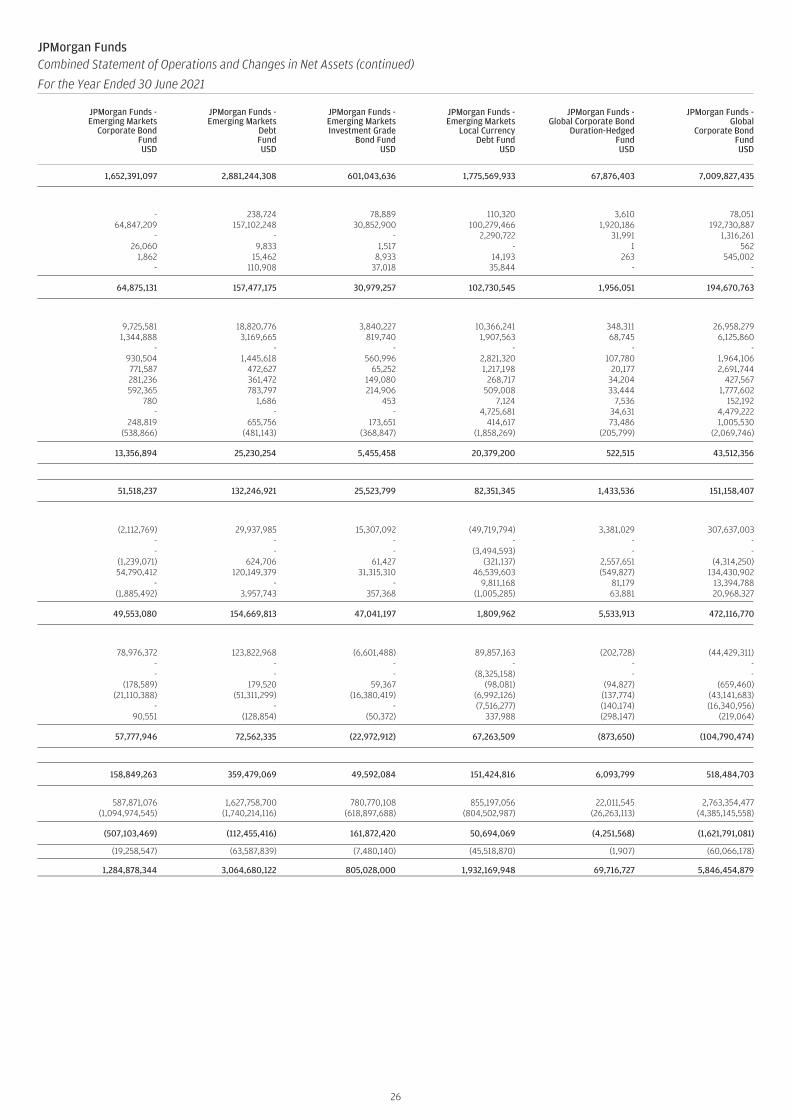
JPMorgan FundsCombined Statement of Operations and Changes in Net Assets (continued)
For the Year Ended 30 June 2021
JPMorgan Funds -Emerging Markets
Corporate BondFundUSD
JPMorgan Funds -Emerging Markets
DebtFundUSD
JPMorgan Funds -Emerging MarketsInvestment Grade
Bond FundUSD
JPMorgan Funds -Emerging Markets
Local CurrencyDebt Fund
USD
JPMorgan Funds -Global Corporate Bond
Duration-HedgedFundUSD
JPMorgan Funds -Global
Corporate BondFundUSD
1,652,391,097 2,881,244,308 601,043,636 1,775,569,933 67,876,403 7,009,827,435
- 238,724 78,889 110,320 3,610 78,05164,847,209 157,102,248 30,852,900 100,279,466 1,920,186 192,730,887
- - - 2,290,722 31,991 1,316,26126,060 9,833 1,517 - 1 562
1,862 15,462 8,933 14,193 263 545,002- 110,908 37,018 35,844 - -
64,875,131 157,477,175 30,979,257 102,730,545 1,956,051 194,670,763
9,725,581 18,820,776 3,840,227 10,366,241 348,311 26,958,2791,344,888 3,169,665 819,740 1,907,563 68,745 6,125,860
- - - - - -930,504 1,445,618 560,996 2,821,320 107,780 1,964,106771,587 472,627 65,252 1,217,198 20,177 2,691,744281,236 361,472 149,080 268,717 34,204 427,567592,365 783,797 214,906 509,008 33,444 1,777,602
780 1,686 453 7,124 7,536 152,192- - - 4,725,681 34,631 4,479,222
248,819 655,756 173,651 414,617 73,486 1,005,530(538,866) (481,143) (368,847) (1,858,269) (205,799) (2,069,746)
13,356,894 25,230,254 5,455,458 20,379,200 522,515 43,512,356
51,518,237 132,246,921 25,523,799 82,351,345 1,433,536 151,158,407
(2,112,769) 29,937,985 15,307,092 (49,719,794) 3,381,029 307,637,003- - - - - -- - - (3,494,593) - -
(1,239,071) 624,706 61,427 (321,137) 2,557,651 (4,314,250)54,790,412 120,149,379 31,315,310 46,539,603 (549,827) 134,430,902
- - - 9,811,168 81,179 13,394,788(1,885,492) 3,957,743 357,368 (1,005,285) 63,881 20,968,327
49,553,080 154,669,813 47,041,197 1,809,962 5,533,913 472,116,770
78,976,372 123,822,968 (6,601,488) 89,857,163 (202,728) (44,429,311)- - - - - -- - - (8,325,158) - -
(178,589) 179,520 59,367 (98,081) (94,827) (659,460)(21,110,388) (51,311,299) (16,380,419) (6,992,126) (137,774) (43,141,683)
- - - (7,516,277) (140,174) (16,340,956)90,551 (128,854) (50,372) 337,988 (298,147) (219,064)
57,777,946 72,562,335 (22,972,912) 67,263,509 (873,650) (104,790,474)
158,849,263 359,479,069 49,592,084 151,424,816 6,093,799 518,484,703
587,871,076 1,627,758,700 780,770,108 855,197,056 22,011,545 2,763,354,477(1,094,974,545) (1,740,214,116) (618,897,688) (804,502,987) (26,263,113) (4,385,145,558)
(507,103,469) (112,455,416) 161,872,420 50,694,069 (4,251,568) (1,621,791,081)
(19,258,547) (63,587,839) (7,480,140) (45,518,870) (1,907) (60,066,178)
1,284,878,344 3,064,680,122 805,028,000 1,932,169,948 69,716,727 5,846,454,879
26

JPMorgan FundsCombined Statement of Operations and Changes in Net Assets (continued)
For the Year Ended 30 June 2021
JPMorgan Funds -Global
Government BondFundEUR
JPMorgan Funds -Global
Short DurationBond Fund
USD
JPMorgan Funds -Global
Strategic BondFundUSD
JPMorgan Funds -Income
Fund
USD
JPMorgan Funds -US
Aggregate BondFundUSD
JPMorgan Funds -USD Money
Market VNAVFundUSD
1,525,412,024 676,060,657 1,625,086,088 6,087,308,674 4,462,174,658 591,887,823
- 12,384 625,117 5,678,856 658,475 -17,309,693 13,046,191 58,788,625 410,154,202 127,127,578 1,294,118
- - 3,021,706 9,155,495 - -481 243 535 1,211 23 -637 1,227 41,926 39,316 43,865 15,730
- - - - 1,297 -
17,310,811 13,060,045 62,477,909 425,029,080 127,831,238 1,309,848
2,734,905 2,584,565 13,945,957 64,977,423 26,022,403 264,9541,464,937 736,966 2,071,063 7,015,974 4,699,500 524,576
- - 7,458,808 - - -743,820 476,048 1,096,321 2,132,104 1,293,518 204,227188,916 51,194 1,513,599 6,560,862 2,122,891 -101,834 103,882 218,770 726,309 451,735 135,126346,339 206,644 705,165 3,788,114 1,417,325 51,672333,595 24,298 37,089 53,949 1,809 -
- - - 7,418,409 - -177,058 152,887 336,857 2,277,426 821,007 261,461
(905,108) (614,436) (1,211,673) (2,102,565) (1,722,747) (213,828)
5,186,296 3,722,048 26,171,956 92,848,005 35,107,441 1,228,188
12,124,515 9,337,997 36,305,953 332,181,075 92,723,797 81,660
6,869,643 9,174,768 44,764,903 (11,494,749) 47,767,994 1,381- - 3,359,066 (3,863,216) (361,309) -- - (1,296,079) (1,125,547) - -
(14,088,619) 1,255,509 24,692,015 36,028,359 - -10,667,800 10,900,578 112,935,534 140,053,662 114,404,487 -
371,717 401,150 (11,351,538) (54,072,230) - -(3,599,647) 3,549,396 4,332,070 (1,772,563) 1,582,189 -
220,894 25,281,401 177,435,971 103,753,716 163,393,361 1,381
(59,095,940) 1,395,755 (1,812,936) 291,243,126 (125,021,693) (248,646)- - (2,008,600) 10,721 206,392 -- - - - - -
(562,647) (36,557) (1,748,898) (31,788,058) - -(4,748,110) (10,289,573) (48,624,455) (70,950,316) (45,755,926) -(1,521,049) 104,175 12,592,453 36,391,082 - -
1,855,386 1,083,298 (5,783,772) 15,315,976 15,327 (1)
(64,072,360) (7,742,902) (47,386,208) 240,222,531 (170,555,900) (248,647)
(51,726,951) 26,876,496 166,355,716 676,157,322 85,561,258 (165,606)
837,026,843 569,610,403 1,133,096,162 7,621,842,696 2,949,673,191 498,157,284(911,949,875) (536,150,184) (492,328,253) (3,813,748,119) (3,185,957,169) (623,159,279)
(74,923,032) 33,460,219 640,767,909 3,808,094,577 (236,283,978) (125,001,995)
(372) (388,006) (4,699,062) (246,700,076) (26,948,085) -
1,398,761,669 736,009,366 2,427,510,651 10,324,860,497 4,284,503,853 466,720,222
27

JPMorgan FundsStatement of Changes in the Number of Shares (continued)
For the Year Ended 30 June 2021
Shares Outstandingat the Beginning
of the YearShares
SubscribedShares
Redeemed
Shares Outstandingat the End
of the Year
JPMorgan Funds - America Equity FundJPM America Equity A (acc) - AUD 263,715.944 555,318.935 522,963.361 296,071.518JPM America Equity A (acc) - AUD (hedged) 1,079,179.966 2,396,160.183 2,479,598.620 995,741.529JPM America Equity A (acc) - EUR 30,536.572 27,166.972 17,238.522 40,465.022JPM America Equity A (acc) - EUR (hedged) 1,975,151.200 2,405,074.701 1,481,804.278 2,898,421.623JPM America Equity A (acc) - HKD 3,622,306.444 9,426,479.797 6,333,765.947 6,715,020.294JPM America Equity A (acc) - USD 3,252,202.349 1,687,219.627 1,253,124.478 3,686,297.498JPM America Equity A (dist) - USD 2,267,932.566 1,192,184.942 1,054,550.962 2,405,566.546JPM America Equity C (acc) - EUR 395,637.185 229,872.125 54,892.976 570,616.334JPM America Equity C (acc) - EUR (hedged) 5,445,121.419 1,902,536.124 2,037,921.327 5,309,736.216JPM America Equity C (acc) - USD 7,275,445.693 2,563,459.192 2,544,760.052 7,294,144.833JPM America Equity C (dist) - GBP - 860.798 - 860.798JPM America Equity C (dist) - USD 2,425,202.307 956,773.696 410,736.026 2,971,239.977JPM America Equity D (acc) - EUR 67,565.212 28,724.398 23,019.117 73,270.493JPM America Equity D (acc) - EUR (hedged) 2,183,006.115 715,263.301 1,062,281.156 1,835,988.260JPM America Equity D (acc) - USD 1,618,093.494 497,630.921 625,586.920 1,490,137.495JPM America Equity I (acc) - EUR 505,071.512 854,283.640 423,649.373 935,705.779JPM America Equity I (acc) - USD 1,270,720.941 227,152.501 354,127.247 1,143,746.195JPM America Equity I2 (acc) - EUR (hedged) 6,673.459 30,209.807 2,836.425 34,046.841JPM America Equity I2 (acc) - USD 20,500.094 16,498.974 11,705.456 25,293.612JPM America Equity X (acc) - USD 3,181,782.628 491,328.178 256,431.470 3,416,679.336
JPMorgan Funds - Asia Pacific Equity FundJPM Asia Pacific Equity A (acc) - EUR 3,345,872.332 1,827,257.541 1,308,325.182 3,864,804.691JPM Asia Pacific Equity A (acc) - HKD 1,052,080.079 702,932.293 486,180.981 1,268,831.391JPM Asia Pacific Equity A (acc) - SGD 9,460.783 84,960.980 26,998.930 67,422.833JPM Asia Pacific Equity A (acc) - USD 4,890,117.212 2,992,014.882 6,238,212.830 1,643,919.264JPM Asia Pacific Equity A (dist) - GBP 5,076.304 5,335.335 64.200 10,347.439JPM Asia Pacific Equity A (dist) - USD 621,886.857 115,098.136 48,948.622 688,036.371JPM Asia Pacific Equity C (acc) - EUR 273,642.166 390,672.968 227,768.902 436,546.232JPM Asia Pacific Equity C (acc) - USD 137,358.928 35,047.403 26,949.350 145,456.981JPM Asia Pacific Equity C (dist) - USD 25,284.034 2,091.839 2,604.173 24,771.700JPM Asia Pacific Equity D (acc) - EUR 11,620.919 11,709.134 9,499.527 13,830.526JPM Asia Pacific Equity D (acc) - USD 87,375.681 42,490.767 27,569.345 102,297.103JPM Asia Pacific Equity I (acc) - EUR 858,197.273 359,123.703 625,024.556 592,296.420JPM Asia Pacific Equity I (acc) - USD 1,024,263.294 930,633.345 645,721.381 1,309,175.258JPM Asia Pacific Equity I2 (acc) - EUR 125,404.693 651,821.282 53,637.677 723,588.298JPM Asia Pacific Equity I2 (acc) - USD - 23,045.000 62.320 22,982.680JPM Asia Pacific Equity X (acc) - USD 1,746,186.810 77,904.031 294,166.563 1,529,924.278
JPMorgan Funds - Brazil Equity FundJPM Brazil Equity A (acc) - EUR 165,816.134 30,212.951 14,090.331 181,938.754JPM Brazil Equity A (acc) - SGD 216,552.167 576,426.396 564,000.338 228,978.225JPM Brazil Equity A (acc) - USD 25,056,544.147 12,749,253.118 24,403,976.202 13,401,821.063JPM Brazil Equity A (dist) - USD 367,108.822 59,916.885 117,473.524 309,552.183JPM Brazil Equity C (acc) - USD 322,938.063 2,788,722.002 2,766,978.755 344,681.310JPM Brazil Equity D (acc) - EUR 97,182.895 66,415.595 54,213.866 109,384.624JPM Brazil Equity D (acc) - USD 1,790,662.094 636,027.847 889,682.111 1,537,007.830JPM Brazil Equity I (acc) - USD 54,689.163 2,276,963.930 1,578,970.823 752,682.270JPM Brazil Equity T (acc) - EUR 18,384.885 6,161.401 5,121.677 19,424.609JPM Brazil Equity X (acc) - USD 60,045.489 1,433.075 16,205.174 45,273.390
JPMorgan Funds - China FundJPM China A (acc) - RMB - 2,315,292.410 641.678 2,314,650.732JPM China A (acc) - SGD 530,163.613 4,240,754.042 1,113,975.278 3,656,942.377JPM China A (acc) - USD 2,741,344.026 22,793,666.589 8,727,814.622 16,807,195.993JPM China A (dist) - HKD 10,365,583.138 39,674,407.534 21,059,588.996 28,980,401.676JPM China A (dist) - USD 12,190,398.666 19,298,785.180 11,483,238.441 20,005,945.405JPM China C (acc) - RMB^ - 114,820.299 641.678 114,178.621JPM China C (acc) - USD 3,219,183.076 12,006,399.354 7,446,352.556 7,779,229.874JPM China C (dist) - USD 61,778.682 432,921.320 58,582.366 436,117.636JPM China D (acc) - EUR 263,074.870 1,964,917.967 534,415.731 1,693,577.106JPM China D (acc) - USD 1,688,443.993 1,646,646.159 554,857.425 2,780,232.727JPM China F (acc) - USD 51,902.263 1,559,437.589 993,631.744 617,708.108JPM China I (acc) - USD 1,836,504.300 10,612,755.453 2,593,153.628 9,856,106.125JPM China I (dist) - USD^ - 12,173.044 10.000 12,163.044JPM China T (acc) - EUR 336,419.166 1,344,540.092 354,576.624 1,326,382.634JPM China X (acc) - USD 29,397.378 183,970.144 128,326.087 85,041.435
^ Share Class reactivated during the year.
28

JPMorgan FundsStatement of Changes in the Number of Shares (continued)
For the Year Ended 30 June 2021
Shares Outstandingat the Beginning
of the YearShares
SubscribedShares
Redeemed
Shares Outstandingat the End
of the Year
JPMorgan Funds - Emerging Europe Equity FundJPM Emerging Europe Equity A (acc) - EUR 1,166,135.723 161,513.742 284,519.349 1,043,130.116JPM Emerging Europe Equity A (acc) - USD 111,371.531 62,742.669 81,135.301 92,978.899JPM Emerging Europe Equity A (dist) - EUR 4,785,667.011 309,675.833 645,579.634 4,449,763.210JPM Emerging Europe Equity A (dist) - USD 562,283.726 44,109.425 102,549.335 503,843.816JPM Emerging Europe Equity C (acc) - EUR 1,693,737.716 504,921.185 795,624.951 1,403,033.950JPM Emerging Europe Equity C (acc) - USD 31,769.951 2,579.646 502.161 33,847.436JPM Emerging Europe Equity C (dist) - EUR 11,265.690 1,235.694 841.292 11,660.092JPM Emerging Europe Equity C (dist) - USD 1,505.531 146.660 112.675 1,539.516JPM Emerging Europe Equity D (acc) - EUR 464,357.014 67,320.991 114,402.973 417,275.032JPM Emerging Europe Equity D (acc) - USD 72,860.877 14,731.884 20,294.673 67,298.088JPM Emerging Europe Equity I (acc) - EUR 165,370.353 55,407.352 86,413.158 134,364.547JPM Emerging Europe Equity X (acc) - EUR 2,730,492.435 1.072 70,199.353 2,660,294.154JPM Emerging Europe Equity X (acc) - USD 405,778.382 - - 405,778.382
JPMorgan Funds - Emerging Markets Dividend FundJPM Emerging Markets Dividend A (acc) - CHF (hedged) 3,018.256 0.006 - 3,018.262JPM Emerging Markets Dividend A (acc) - EUR 151,807.322 25,461.156 86,960.989 90,307.489JPM Emerging Markets Dividend A (acc) - USD 47,409.321 23,236.640 40,423.665 30,222.296JPM Emerging Markets Dividend A (dist) - EUR 48,973.436 17,075.349 9,477.953 56,570.832JPM Emerging Markets Dividend A (dist) - GBP 1,400.123 717.505 1.306 2,116.322JPM Emerging Markets Dividend A (div) - EUR 218,112.203 52,588.275 47,479.409 223,221.069JPM Emerging Markets Dividend A (irc) - AUD (hedged) 1,589,046.797 1,506,718.973 1,905,129.891 1,190,635.879JPM Emerging Markets Dividend A (irc) - GBP (hedged) 166,787.557 97,454.153 104,674.128 159,567.582JPM Emerging Markets Dividend A (mth) - HKD 5,212,212.232 10,387,925.917 10,048,318.119 5,551,820.030JPM Emerging Markets Dividend A (mth) - SGD 251,415.573 69,689.184 145,116.432 175,988.325JPM Emerging Markets Dividend A (mth) - SGD (hedged) 1,101,422.887 233,562.631 490,544.019 844,441.499JPM Emerging Markets Dividend A (mth) - USD 337,815.217 171,253.766 194,175.609 314,893.374JPM Emerging Markets Dividend C (acc) - EUR 160,342.957 424,537.270 232,603.141 352,277.086JPM Emerging Markets Dividend C (acc) - USD 213,293.457 63,617.857 1,723.770 275,187.544JPM Emerging Markets Dividend C (dist) - EUR 683,655.000 19,674.000 689,940.000 13,389.000JPM Emerging Markets Dividend C (div) - EUR 247,187.722 15,812.000 20,183.952 242,815.770JPM Emerging Markets Dividend D (acc) - EUR 39,303.471 9,202.519 12,995.698 35,510.292JPM Emerging Markets Dividend D (div) - EUR 222,151.628 100,112.188 54,818.027 267,445.789JPM Emerging Markets Dividend D (mth) - EUR 28,952.273 17,570.663 12,272.382 34,250.554JPM Emerging Markets Dividend I2 (acc) - EUR* 389,511.000 181.000 389,692.000 -JPM Emerging Markets Dividend T (acc) - EUR 16,177.700 5,695.043 7,000.411 14,872.332JPM Emerging Markets Dividend T (div) - EUR 100,840.895 23,052.781 57,620.982 66,272.694JPM Emerging Markets Dividend X (acc) - EUR 68,824.000 7,339.000 24,776.000 51,387.000JPM Emerging Markets Dividend X (acc) - USD 1,304,232.207 47,186.857 118,874.759 1,232,544.305JPM Emerging Markets Dividend X (dist) - EUR 392,000.000 - - 392,000.000
JPMorgan Funds - Emerging Markets Equity FundJPM Emerging Markets Equity A (acc) - EUR 28,022,262.480 13,879,177.006 13,324,314.715 28,577,124.771JPM Emerging Markets Equity A (acc) - EUR (hedged) 227,615.673 264,987.443 151,765.844 340,837.272JPM Emerging Markets Equity A (acc) - SGD 1,954,134.054 1,129,098.545 549,463.762 2,533,768.837JPM Emerging Markets Equity A (acc) - USD 13,975,288.929 8,064,169.680 3,743,906.516 18,295,552.093JPM Emerging Markets Equity A (dist) - GBP 167,399.137 49,222.936 22,768.908 193,853.165JPM Emerging Markets Equity A (dist) - USD 19,996,595.160 7,145,026.610 6,393,606.995 20,748,014.775JPM Emerging Markets Equity C (acc) - EUR 1,430,522.699 746,020.843 916,834.595 1,259,708.947JPM Emerging Markets Equity C (acc) - EUR (hedged) 108,892.093 135,326.718 90,673.442 153,545.369JPM Emerging Markets Equity C (acc) - USD 10,824,682.218 9,472,746.189 6,275,072.269 14,022,356.138JPM Emerging Markets Equity C (dist) - GBP 203,753.447 82,921.930 45,711.835 240,963.542JPM Emerging Markets Equity C (dist) - USD 467,033.760 451,443.110 99,609.614 818,867.256JPM Emerging Markets Equity C2 (acc) - EUR - 238,005.890 35,768.627 202,237.263JPM Emerging Markets Equity D (acc) - EUR 5,267,167.500 3,500,572.542 2,307,287.049 6,460,452.993JPM Emerging Markets Equity D (acc) - EUR (hedged) 39,801.064 84,711.189 21,980.941 102,531.312JPM Emerging Markets Equity D (acc) - USD 1,271,283.699 500,356.151 332,243.706 1,439,396.144JPM Emerging Markets Equity I (acc) - EUR 23,213,145.449 6,417,411.765 9,006,247.904 20,624,309.310JPM Emerging Markets Equity I (acc) - EUR (hedged) 496,049.047 878,262.563 713,530.772 660,780.838JPM Emerging Markets Equity I (acc) - SGD 26,685,342.534 657,779.734 944,079.032 26,399,043.236JPM Emerging Markets Equity I (acc) - USD 23,394,396.670 13,782,615.158 11,649,476.166 25,527,535.662JPM Emerging Markets Equity I (dist) - EUR 32,585.000 1,315,919.113 739.000 1,347,765.113JPM Emerging Markets Equity I2 (acc) - EUR 163,427.734 2,140,340.138 487,774.540 1,815,993.332JPM Emerging Markets Equity I2 (acc) - USD 6,291,851.249 2,569,493.922 2,454,676.984 6,406,668.187JPM Emerging Markets Equity I2 (dist) - EUR 5,232.251 3,109.332 1,573.000 6,768.583JPM Emerging Markets Equity I2 (dist) - USD 6,137.200 28,383.000 6,236.200 28,284.000JPM Emerging Markets Equity T (acc) - EUR 152,892.205 208,412.544 102,972.225 258,332.524JPM Emerging Markets Equity X (acc) - EUR 1,021,278.178 5,415.000 248,391.000 778,302.178JPM Emerging Markets Equity X (acc) - USD 63,817,787.314 91,567.780 7,135,495.863 56,773,859.231JPM Emerging Markets Equity X (dist) - EUR 28,955,749.722 13,916,795.102 8,600,553.993 34,271,990.831
* Share Class inactive as at the end of the year.
29
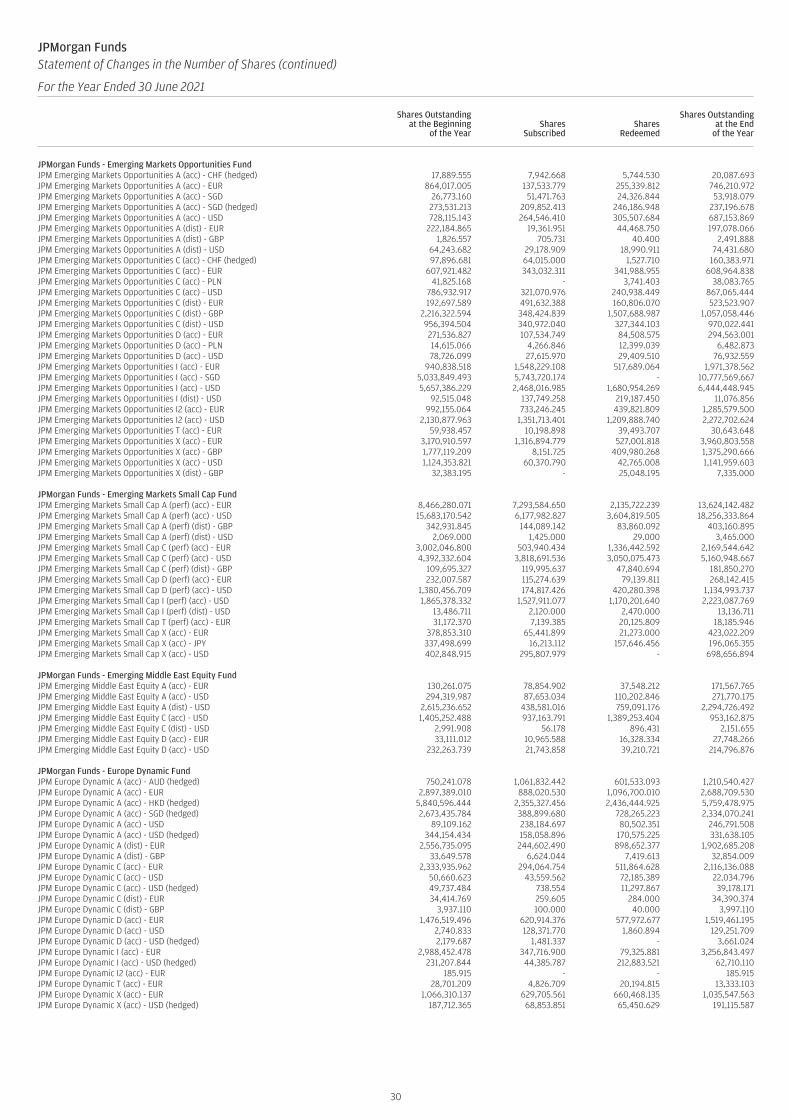
JPMorgan FundsStatement of Changes in the Number of Shares (continued)
For the Year Ended 30 June 2021
Shares Outstandingat the Beginning
of the YearShares
SubscribedShares
Redeemed
Shares Outstandingat the End
of the Year
JPMorgan Funds - Emerging Markets Opportunities FundJPM Emerging Markets Opportunities A (acc) - CHF (hedged) 17,889.555 7,942.668 5,744.530 20,087.693JPM Emerging Markets Opportunities A (acc) - EUR 864,017.005 137,533.779 255,339.812 746,210.972JPM Emerging Markets Opportunities A (acc) - SGD 26,773.160 51,471.763 24,326.844 53,918.079JPM Emerging Markets Opportunities A (acc) - SGD (hedged) 273,531.213 209,852.413 246,186.948 237,196.678JPM Emerging Markets Opportunities A (acc) - USD 728,115.143 264,546.410 305,507.684 687,153.869JPM Emerging Markets Opportunities A (dist) - EUR 222,184.865 19,361.951 44,468.750 197,078.066JPM Emerging Markets Opportunities A (dist) - GBP 1,826.557 705.731 40.400 2,491.888JPM Emerging Markets Opportunities A (dist) - USD 64,243.682 29,178.909 18,990.911 74,431.680JPM Emerging Markets Opportunities C (acc) - CHF (hedged) 97,896.681 64,015.000 1,527.710 160,383.971JPM Emerging Markets Opportunities C (acc) - EUR 607,921.482 343,032.311 341,988.955 608,964.838JPM Emerging Markets Opportunities C (acc) - PLN 41,825.168 - 3,741.403 38,083.765JPM Emerging Markets Opportunities C (acc) - USD 786,932.917 321,070.976 240,938.449 867,065.444JPM Emerging Markets Opportunities C (dist) - EUR 192,697.589 491,632.388 160,806.070 523,523.907JPM Emerging Markets Opportunities C (dist) - GBP 2,216,322.594 348,424.839 1,507,688.987 1,057,058.446JPM Emerging Markets Opportunities C (dist) - USD 956,394.504 340,972.040 327,344.103 970,022.441JPM Emerging Markets Opportunities D (acc) - EUR 271,536.827 107,534.749 84,508.575 294,563.001JPM Emerging Markets Opportunities D (acc) - PLN 14,615.066 4,266.846 12,399.039 6,482.873JPM Emerging Markets Opportunities D (acc) - USD 78,726.099 27,615.970 29,409.510 76,932.559JPM Emerging Markets Opportunities I (acc) - EUR 940,838.518 1,548,229.108 517,689.064 1,971,378.562JPM Emerging Markets Opportunities I (acc) - SGD 5,033,849.493 5,743,720.174 - 10,777,569.667JPM Emerging Markets Opportunities I (acc) - USD 5,657,386.229 2,468,016.985 1,680,954.269 6,444,448.945JPM Emerging Markets Opportunities I (dist) - USD 92,515.048 137,749.258 219,187.450 11,076.856JPM Emerging Markets Opportunities I2 (acc) - EUR 992,155.064 733,246.245 439,821.809 1,285,579.500JPM Emerging Markets Opportunities I2 (acc) - USD 2,130,877.963 1,351,713.401 1,209,888.740 2,272,702.624JPM Emerging Markets Opportunities T (acc) - EUR 59,938.457 10,198.898 39,493.707 30,643.648JPM Emerging Markets Opportunities X (acc) - EUR 3,170,910.597 1,316,894.779 527,001.818 3,960,803.558JPM Emerging Markets Opportunities X (acc) - GBP 1,777,119.209 8,151.725 409,980.268 1,375,290.666JPM Emerging Markets Opportunities X (acc) - USD 1,124,353.821 60,370.790 42,765.008 1,141,959.603JPM Emerging Markets Opportunities X (dist) - GBP 32,383.195 - 25,048.195 7,335.000
JPMorgan Funds - Emerging Markets Small Cap FundJPM Emerging Markets Small Cap A (perf) (acc) - EUR 8,466,280.071 7,293,584.650 2,135,722.239 13,624,142.482JPM Emerging Markets Small Cap A (perf) (acc) - USD 15,683,170.542 6,177,982.827 3,604,819.505 18,256,333.864JPM Emerging Markets Small Cap A (perf) (dist) - GBP 342,931.845 144,089.142 83,860.092 403,160.895JPM Emerging Markets Small Cap A (perf) (dist) - USD 2,069.000 1,425.000 29.000 3,465.000JPM Emerging Markets Small Cap C (perf) (acc) - EUR 3,002,046.800 503,940.434 1,336,442.592 2,169,544.642JPM Emerging Markets Small Cap C (perf) (acc) - USD 4,392,332.604 3,818,691.536 3,050,075.473 5,160,948.667JPM Emerging Markets Small Cap C (perf) (dist) - GBP 109,695.327 119,995.637 47,840.694 181,850.270JPM Emerging Markets Small Cap D (perf) (acc) - EUR 232,007.587 115,274.639 79,139.811 268,142.415JPM Emerging Markets Small Cap D (perf) (acc) - USD 1,380,456.709 174,817.426 420,280.398 1,134,993.737JPM Emerging Markets Small Cap I (perf) (acc) - USD 1,865,378.332 1,527,911.077 1,170,201.640 2,223,087.769JPM Emerging Markets Small Cap I (perf) (dist) - USD 13,486.711 2,120.000 2,470.000 13,136.711JPM Emerging Markets Small Cap T (perf) (acc) - EUR 31,172.370 7,139.385 20,125.809 18,185.946JPM Emerging Markets Small Cap X (acc) - EUR 378,853.310 65,441.899 21,273.000 423,022.209JPM Emerging Markets Small Cap X (acc) - JPY 337,498.699 16,213.112 157,646.456 196,065.355JPM Emerging Markets Small Cap X (acc) - USD 402,848.915 295,807.979 - 698,656.894
JPMorgan Funds - Emerging Middle East Equity FundJPM Emerging Middle East Equity A (acc) - EUR 130,261.075 78,854.902 37,548.212 171,567.765JPM Emerging Middle East Equity A (acc) - USD 294,319.987 87,653.034 110,202.846 271,770.175JPM Emerging Middle East Equity A (dist) - USD 2,615,236.652 438,581.016 759,091.176 2,294,726.492JPM Emerging Middle East Equity C (acc) - USD 1,405,252.488 937,163.791 1,389,253.404 953,162.875JPM Emerging Middle East Equity C (dist) - USD 2,991.908 56.178 896.431 2,151.655JPM Emerging Middle East Equity D (acc) - EUR 33,111.012 10,965.588 16,328.334 27,748.266JPM Emerging Middle East Equity D (acc) - USD 232,263.739 21,743.858 39,210.721 214,796.876
JPMorgan Funds - Europe Dynamic FundJPM Europe Dynamic A (acc) - AUD (hedged) 750,241.078 1,061,832.442 601,533.093 1,210,540.427JPM Europe Dynamic A (acc) - EUR 2,897,389.010 888,020.530 1,096,700.010 2,688,709.530JPM Europe Dynamic A (acc) - HKD (hedged) 5,840,596.444 2,355,327.456 2,436,444.925 5,759,478.975JPM Europe Dynamic A (acc) - SGD (hedged) 2,673,435.784 388,899.680 728,265.223 2,334,070.241JPM Europe Dynamic A (acc) - USD 89,109.162 238,184.697 80,502.351 246,791.508JPM Europe Dynamic A (acc) - USD (hedged) 344,154.434 158,058.896 170,575.225 331,638.105JPM Europe Dynamic A (dist) - EUR 2,556,735.095 244,602.490 898,652.377 1,902,685.208JPM Europe Dynamic A (dist) - GBP 33,649.578 6,624.044 7,419.613 32,854.009JPM Europe Dynamic C (acc) - EUR 2,333,935.962 294,064.754 511,864.628 2,116,136.088JPM Europe Dynamic C (acc) - USD 50,660.623 43,559.562 72,185.389 22,034.796JPM Europe Dynamic C (acc) - USD (hedged) 49,737.484 738.554 11,297.867 39,178.171JPM Europe Dynamic C (dist) - EUR 34,414.769 259.605 284.000 34,390.374JPM Europe Dynamic C (dist) - GBP 3,937.110 100.000 40.000 3,997.110JPM Europe Dynamic D (acc) - EUR 1,476,519.496 620,914.376 577,972.677 1,519,461.195JPM Europe Dynamic D (acc) - USD 2,740.833 128,371.770 1,860.894 129,251.709JPM Europe Dynamic D (acc) - USD (hedged) 2,179.687 1,481.337 - 3,661.024JPM Europe Dynamic I (acc) - EUR 2,988,452.478 347,716.900 79,325.881 3,256,843.497JPM Europe Dynamic I (acc) - USD (hedged) 231,207.844 44,385.787 212,883.521 62,710.110JPM Europe Dynamic I2 (acc) - EUR 185.915 - - 185.915JPM Europe Dynamic T (acc) - EUR 28,701.209 4,826.709 20,194.815 13,333.103JPM Europe Dynamic X (acc) - EUR 1,066,310.137 629,705.561 660,468.135 1,035,547.563JPM Europe Dynamic X (acc) - USD (hedged) 187,712.365 68,853.851 65,450.629 191,115.587
30

JPMorgan FundsStatement of Changes in the Number of Shares (continued)
For the Year Ended 30 June 2021
Shares Outstandingat the Beginning
of the YearShares
SubscribedShares
Redeemed
Shares Outstandingat the End
of the Year
JPMorgan Funds - Europe Equity FundJPM Europe Equity A (acc) - AUD (hedged) 255,282.033 62,523.333 68,256.278 249,549.088JPM Europe Equity A (acc) - EUR 3,321,590.609 1,224,593.285 1,639,323.055 2,906,860.839JPM Europe Equity A (acc) - USD 1,357,047.874 8,359,215.677 2,223,638.857 7,492,624.694JPM Europe Equity A (acc) - USD (hedged) 475,992.208 24,814.954 461,720.356 39,086.806JPM Europe Equity A (dist) - EUR 2,707,741.798 111,047.572 255,993.979 2,562,795.391JPM Europe Equity A (dist) - USD 560,730.907 381,774.676 324,563.630 617,941.953JPM Europe Equity C (acc) - EUR 1,780,718.945 450,722.274 292,350.896 1,939,090.323JPM Europe Equity C (acc) - USD 31,306.917 56,690.959 74,266.222 13,731.654JPM Europe Equity C (acc) - USD (hedged) 13,970.748 9,862.794 11,525.073 12,308.469JPM Europe Equity C (dist) - EUR 27,125.166 1,494.479 1,031.058 27,588.587JPM Europe Equity C (dist) - USD 18,610.756 471.582 739.040 18,343.298JPM Europe Equity D (acc) - EUR 2,904,273.122 490,499.651 849,401.754 2,545,371.019JPM Europe Equity D (acc) - USD 498,244.236 107,691.699 192,998.106 412,937.829JPM Europe Equity D (acc) - USD (hedged) 11,371.493 - 3,231.623 8,139.870JPM Europe Equity I (acc) - EUR 309,183.797 31,479.416 10.427 340,652.786JPM Europe Equity X (acc) - EUR 2,893.937 1,230,002.032 1,224.100 1,231,671.869
JPMorgan Funds - Europe Small Cap FundJPM Europe Small Cap A (acc) - EUR 3,310,984.843 1,049,090.157 2,344,139.369 2,015,935.631JPM Europe Small Cap A (acc) - SEK 127.382 283.087 125.259 285.210JPM Europe Small Cap A (acc) - USD 84,641.737 171,068.274 159,383.529 96,326.482JPM Europe Small Cap A (acc) - USD (hedged) 28,786.809 166,266.043 98,269.678 96,783.174JPM Europe Small Cap A (dist) - EUR 2,353,556.771 176,636.021 473,302.584 2,056,890.208JPM Europe Small Cap A (dist) - GBP 93,060.404 6,742.697 10,063.110 89,739.991JPM Europe Small Cap C (acc) - EUR 3,249,937.068 1,281,169.228 2,773,305.954 1,757,800.342JPM Europe Small Cap C (dist) - EUR 27,098.232 10,677.208 12,052.546 25,722.894JPM Europe Small Cap D (acc) - EUR 1,844,883.891 320,910.680 681,995.137 1,483,799.434JPM Europe Small Cap I (acc) - EUR 87,447.966 260,121.207 34,465.784 313,103.389JPM Europe Small Cap I (dist) - EUR* 50,000.000 - 50,000.000 -JPM Europe Small Cap I2 (acc) - EUR 171,997.904 150,166.457 109,977.246 212,187.115JPM Europe Small Cap X (acc) - EUR 277,021.750 461,599.087 72,434.442 666,186.395JPM Europe Small Cap X (dist) - EUR - 39,270.629 - 39,270.629
JPMorgan Funds - Global Growth Fund (1)JPM Global Growth A (acc) - CHF (hedged) 4,715.734 290.202 64.432 4,941.504JPM Global Growth A (acc) - EUR 74,776.678 23,808.601 16,463.227 82,122.052JPM Global Growth A (acc) - EUR (hedged) 300,144.908 84,045.029 75,055.911 309,134.026JPM Global Growth A (acc) - USD 810,025.008 2,646,176.917 759,569.457 2,696,632.468JPM Global Growth A (dist) - EUR (hedged) 1,755,049.642 55,666.032 50,805.857 1,759,909.817JPM Global Growth A (dist) - USD 1,573,833.605 522,253.818 419,734.620 1,676,352.803JPM Global Growth C (acc) - EUR 328.258 78,422.499 34,204.738 44,546.019JPM Global Growth C (acc) - EUR (hedged) 6,455,961.049 373,145.363 154,173.129 6,674,933.283JPM Global Growth C (acc) - USD 415,851.686 7,050.175 410,557.304 12,344.557JPM Global Growth D (acc) - EUR 40,196.455 19,047.909 8,324.195 50,920.169JPM Global Growth D (acc) - EUR (hedged) 139,434.486 141,234.797 49,626.917 231,042.366JPM Global Growth D (acc) - USD 305,683.332 566,152.526 428,396.749 443,439.109JPM Global Growth I (acc) - JPY 67,268.872 6,891.575 17,142.514 57,017.933JPM Global Growth I (acc) - USD 805,616.277 269.206 70,101.112 735,784.371JPM Global Growth T (acc) - EUR 7,772.462 14,301.210 1,532.681 20,540.991JPM Global Growth X (acc) - EUR 3,007,053.567 - 752,915.048 2,254,138.519JPM Global Growth X (acc) - USD 4,100.449 4,124.098 1,649.466 6,575.081
JPMorgan Funds - Global Healthcare FundJPM Global Healthcare A (acc) - EUR 628,014.418 869,906.300 307,176.993 1,190,743.725JPM Global Healthcare A (acc) - EUR (hedged) 21,956.786 72,443.638 21,785.992 72,614.432JPM Global Healthcare A (acc) - USD 2,303,847.261 984,697.759 780,059.244 2,508,485.776JPM Global Healthcare A (dist) - EUR 244,648.531 451,438.652 41,643.785 654,443.398JPM Global Healthcare A (dist) - GBP 24,760.906 9,259.533 5,515.943 28,504.496JPM Global Healthcare A (dist) - USD 581,819.091 319,717.380 84,857.352 816,679.119JPM Global Healthcare C (acc) - EUR 1,308,871.048 559,000.450 665,245.267 1,202,626.231JPM Global Healthcare C (acc) - USD 960,857.733 400,499.097 339,661.675 1,021,695.155JPM Global Healthcare C (dist) - EUR 60,824.700 65,774.570 52,692.265 73,907.005JPM Global Healthcare C (dist) - GBP 28,248.357 7,501.289 14,380.334 21,369.312JPM Global Healthcare C (dist) - USD 107,312.820 61,884.474 132,090.608 37,106.686JPM Global Healthcare D (acc) - EUR 786,731.096 838,960.720 304,930.545 1,320,761.271JPM Global Healthcare D (acc) - PLN (hedged) 33,821.032 24,899.295 31,911.084 26,809.243JPM Global Healthcare D (acc) - USD 663,237.296 218,688.019 154,279.969 727,645.346JPM Global Healthcare I (acc) - EUR 242,390.272 30,906.034 257,748.250 15,548.056JPM Global Healthcare I (acc) - USD 158,857.940 61,929.318 132,125.121 88,662.137JPM Global Healthcare I2 (acc) - USD 928,896.149 914,743.319 404,497.966 1,439,141.502JPM Global Healthcare T (acc) - EUR 429,291.565 536,856.005 158,589.490 807,558.080JPM Global Healthcare X (acc) - JPY 2,136,737.966 792,488.407 548,469.120 2,380,757.253
(1) This Sub-Fund was renamed from JPMorgan Funds - Global Unconstrained Equity Fund to JPMorgan Funds - Global Growth Fund on 1 April 2021.* Share Class inactive as at the end of the year.
31

JPMorgan FundsStatement of Changes in the Number of Shares (continued)
For the Year Ended 30 June 2021
Shares Outstandingat the Beginning
of the YearShares
SubscribedShares
Redeemed
Shares Outstandingat the End
of the Year
JPMorgan Funds - Global Natural Resources FundJPM Global Natural Resources A (acc) - EUR 7,136,226.077 9,392,384.397 5,537,903.666 10,990,706.808JPM Global Natural Resources A (acc) - GBP 87,487.063 10,296.332 18,725.412 79,057.983JPM Global Natural Resources A (acc) - SGD 414,985.666 598,030.368 485,749.614 527,266.420JPM Global Natural Resources A (acc) - USD 30,463,891.043 25,585,565.259 28,107,733.195 27,941,723.107JPM Global Natural Resources A (dist) - EUR 11,612,974.838 2,443,422.574 4,113,018.394 9,943,379.018JPM Global Natural Resources C (acc) - EUR 2,468,039.950 2,655,841.109 2,723,410.130 2,400,470.929JPM Global Natural Resources C (acc) - GBP* 989.413 - 989.413 -JPM Global Natural Resources C (acc) - USD 3,926,124.462 23,919,997.715 2,679,396.205 25,166,725.972JPM Global Natural Resources C (dist) - EUR 24,250.228 85,899.061 14,428.000 95,721.289JPM Global Natural Resources D (acc) - EUR 6,089,415.949 4,695,321.758 2,652,950.788 8,131,786.919JPM Global Natural Resources D (acc) - USD 184,361.363 268,603.253 113,659.019 339,305.597JPM Global Natural Resources F (acc) - USD 268,535.047 993,156.494 976,897.992 284,793.549JPM Global Natural Resources I (acc) - EUR 6,758.378 407,261.162 59,323.721 354,695.819JPM Global Natural Resources I (acc) - SGD 14,334,417.718 2,218,849.126 3,694,043.867 12,859,222.977JPM Global Natural Resources X (acc) - EUR 2,250.816 2,465.629 1,174.741 3,541.704
JPMorgan Funds - Greater China FundJPM Greater China A (acc) - SGD 147,360.514 781,130.200 155,802.641 772,688.073JPM Greater China A (acc) - USD 2,779,041.812 8,551,477.253 2,725,874.147 8,604,644.918JPM Greater China A (dist) - HKD 2,276,774.780 3,558,403.923 1,704,619.683 4,130,559.020JPM Greater China A (dist) - USD 6,423,706.723 17,294,484.863 10,416,726.477 13,301,465.109JPM Greater China C (acc) - EUR 115,514.072 418,941.301 146,186.648 388,268.725JPM Greater China C (acc) - HKD^ - 1,551.087 774.454 776.633JPM Greater China C (acc) - USD 3,535,515.458 7,074,059.171 4,131,460.424 6,478,114.205JPM Greater China C (dist) - GBP 59,775.623 20,043.624 25,082.457 54,736.790JPM Greater China C (dist) - HKD^ - 1,551.077 774.444 776.633JPM Greater China C (dist) - USD 35,650.052 127,388.673 14,011.291 149,027.434JPM Greater China D (acc) - EUR 223,775.318 680,167.749 205,394.622 698,548.445JPM Greater China D (acc) - USD 892,289.387 1,105,910.255 575,260.138 1,422,939.504JPM Greater China I (acc) - USD 260,067.000 537,686.156 449,769.832 347,983.324JPM Greater China I2 (acc) - EUR 1,635.558 83,884.802 6,438.913 79,081.447JPM Greater China I2 (acc) - USD 11,494.143 1,025,724.567 10,417.335 1,026,801.375JPM Greater China T (acc) - EUR 38,542.821 72,291.514 23,102.716 87,731.619JPM Greater China X (acc) - USD 1,030.976 142,738.828 93,578.349 50,191.455
JPMorgan Funds - Japan Equity FundJPM Japan Equity A (acc) - AUD (hedged) 202,727.142 133,372.929 190,181.521 145,918.550JPM Japan Equity A (acc) - EUR 2,983,539.096 5,950,332.488 3,883,145.068 5,050,726.516JPM Japan Equity A (acc) - EUR (hedged) 66,437.290 92,449.795 44,078.548 114,808.537JPM Japan Equity A (acc) - JPY 3,185,024.965 6,056,425.128 5,459,898.001 3,781,552.092JPM Japan Equity A (acc) - SGD (hedged) 57,949.693 587,360.343 220,466.337 424,843.699JPM Japan Equity A (acc) - USD 4,775,320.994 3,617,476.436 1,778,765.884 6,614,031.546JPM Japan Equity A (acc) - USD (hedged) 609,175.448 864,903.476 824,367.027 649,711.897JPM Japan Equity A (dist) - GBP 38,461.097 863.055 1,333.901 37,990.251JPM Japan Equity A (dist) - GBP (hedged) 8,678.153 4,921.948 4,451.759 9,148.342JPM Japan Equity A (dist) - JPY 922.684 3,928.457 922.674 3,928.467JPM Japan Equity A (dist) - SGD 241,798.722 646,112.561 419,284.401 468,626.882JPM Japan Equity A (dist) - USD 2,831,044.520 2,190,208.928 2,394,017.838 2,627,235.610JPM Japan Equity C (acc) - EUR 358,434.718 283,022.797 242,451.048 399,006.467JPM Japan Equity C (acc) - EUR (hedged) 426,140.813 251,437.341 201,065.160 476,512.994JPM Japan Equity C (acc) - JPY 698,952.839 251,709.881 478,581.520 472,081.200JPM Japan Equity C (acc) - USD 16,794,300.186 6,100,044.553 9,122,227.482 13,772,117.257JPM Japan Equity C (acc) - USD (hedged) 737,322.049 112,620.409 154,494.863 695,447.595JPM Japan Equity C (dist) - GBP 312,722.769 172,518.507 271,453.950 213,787.326JPM Japan Equity C (dist) - JPY 225,200.000 33,029.000 256,014.000 2,215.000JPM Japan Equity C (dist) - USD 218,270.774 67,272.470 153,313.315 132,229.929JPM Japan Equity D (acc) - EUR 668,328.570 1,528,921.575 1,122,106.221 1,075,143.924JPM Japan Equity D (acc) - EUR (hedged) 5,358.220 24,650.853 13,614.064 16,395.009JPM Japan Equity D (acc) - JPY 58,744.802 64,610.397 46,274.960 77,080.239JPM Japan Equity D (acc) - USD 2,200,777.629 1,275,011.638 834,479.186 2,641,310.081JPM Japan Equity I (acc) - EUR 248,951.898 593,358.158 585,172.442 257,137.614JPM Japan Equity I (acc) - EUR (hedged) 103,705.614 103,371.067 87,440.850 119,635.831JPM Japan Equity I (acc) - JPY 62,641.237 - 7,027.130 55,614.107JPM Japan Equity I (acc) - USD 15,129,435.363 3,782,712.716 12,058,040.696 6,854,107.383JPM Japan Equity I (acc) - USD (hedged) - 296,553.070 144,842.910 151,710.160JPM Japan Equity I (dist) - GBP (hedged) - 132,082.000 598.000 131,484.000JPM Japan Equity I2 (acc) - EUR 2,323,102.259 912,269.308 2,120,838.617 1,114,532.950JPM Japan Equity I2 (acc) - EUR (hedged) 149,424.940 238,541.544 135,711.179 252,255.305JPM Japan Equity I2 (acc) - USD - 1,178,255.318 272,727.000 905,528.318JPM Japan Equity J (dist) - USD 1,128,760.541 1,342,114.933 1,107,221.888 1,363,653.586JPM Japan Equity X (acc) - JPY 2,447,971.804 593,224.597 318,076.750 2,723,119.651JPM Japan Equity X (acc) - USD 2,435,168.603 586,026.295 841,478.522 2,179,716.376JPM Japan Equity X (acc) - USD (hedged) 40,777.681 44,536.984 55,378.927 29,935.738
* Share Class inactive as at the end of the year.^ Share Class reactivated during the year.
32

JPMorgan FundsStatement of Changes in the Number of Shares (continued)
For the Year Ended 30 June 2021
Shares Outstandingat the Beginning
of the YearShares
SubscribedShares
Redeemed
Shares Outstandingat the End
of the Year
JPMorgan Funds - Latin America Equity FundJPM Latin America Equity A (acc) - EUR 70,938.119 35,606.908 21,818.965 84,726.062JPM Latin America Equity A (acc) - SGD 4,600.000 - 4,500.000 100.000JPM Latin America Equity A (acc) - USD 3,626,790.420 3,635,626.063 2,424,179.710 4,838,236.773JPM Latin America Equity A (dist) - USD 3,183,053.463 1,537,570.663 1,853,980.032 2,866,644.094JPM Latin America Equity C (acc) - EUR 108,982.612 31,186.675 72,639.177 67,530.110JPM Latin America Equity C (acc) - USD 1,843,244.205 1,859,107.500 913,435.139 2,788,916.566JPM Latin America Equity C (dist) - USD 99,358.384 30,062.712 44,920.928 84,500.168JPM Latin America Equity D (acc) - EUR 32,435.411 30,214.920 17,892.522 44,757.809JPM Latin America Equity D (acc) - USD 417,959.283 174,207.930 178,686.257 413,480.956JPM Latin America Equity I (acc) - JPY 42,855.335 5,436.905 18,046.562 30,245.678JPM Latin America Equity I (acc) - USD 6,652,105.510 2,113,550.736 5,163,118.969 3,602,537.277JPM Latin America Equity I2 (dist) - USD 5,348.368 98,691.739 51,490.368 52,549.739JPM Latin America Equity X (acc) - USD 2,872,960.817 2,100.209 432,538.855 2,442,522.171
JPMorgan Funds - Russia FundJPM Russia A (acc) - USD 4,649,221.087 2,242,100.018 2,688,564.503 4,202,756.602JPM Russia A (dist) - USD 23,924,221.882 23,101,950.657 31,390,644.039 15,635,528.500JPM Russia C (acc) - USD 8,198,275.421 3,288,396.277 3,772,736.609 7,713,935.089JPM Russia C (dist) - USD 1,101.194 25.245 119.000 1,007.439JPM Russia D (acc) - EUR 115,904.185 43,615.325 62,227.305 97,292.205JPM Russia D (acc) - USD 2,687,157.755 316,286.786 869,374.490 2,134,070.051JPM Russia I (acc) - USD 1,023,606.968 143,133.000 60,125.000 1,106,614.968JPM Russia T (acc) - EUR 33,861.622 12,649.917 19,791.845 26,719.694JPM Russia X (acc) - USD 335,938.605 27,126.414 120,463.688 242,601.331
JPMorgan Funds - Thematics - Genetic TherapiesJPM Thematics - Genetic Therapies A (acc) - CHF (hedged) 58,051.172 52,630.657 25,541.078 85,140.751JPM Thematics - Genetic Therapies A (acc) - EUR (hedged) 494,984.693 2,137,753.221 474,315.526 2,158,422.388JPM Thematics - Genetic Therapies A (acc) - GBP (hedged) 12,064.061 28,919.955 7,665.895 33,318.121JPM Thematics - Genetic Therapies A (acc) - HKD (hedged) 1,218,658.618 1,394,856.102 1,360,888.786 1,252,625.934JPM Thematics - Genetic Therapies A (acc) - SGD (hedged) 140,749.774 397,424.836 84,297.696 453,876.914JPM Thematics - Genetic Therapies A (acc) - USD 896,018.218 2,991,854.771 673,849.440 3,214,023.549JPM Thematics - Genetic Therapies A (dist) - CHF (hedged) 29,642.764 20,582.606 8,547.065 41,678.305JPM Thematics - Genetic Therapies A (dist) - EUR (hedged) 11,317.897 80,314.669 19,248.661 72,383.905JPM Thematics - Genetic Therapies A (dist) - GBP (hedged) 269.807 591.752 150.182 711.377JPM Thematics - Genetic Therapies A (dist) - USD 27,955.154 120,487.015 37,417.990 111,024.179JPM Thematics - Genetic Therapies C (acc) - CHF (hedged) 1,940.000 5,016.709 410.000 6,546.709JPM Thematics - Genetic Therapies C (acc) - EUR (hedged) 4,787.766 107,617.584 25,549.041 86,856.309JPM Thematics - Genetic Therapies C (acc) - USD 386,626.775 663,123.099 620,706.860 429,043.014JPM Thematics - Genetic Therapies C (dist) - GBP - 31,361.892 780.683 30,581.209JPM Thematics - Genetic Therapies C (dist) - USD - 3,192.018 367.121 2,824.897JPM Thematics - Genetic Therapies C2 (acc) - CHF (hedged) 280,298.287 169,231.917 49,697.628 399,832.576JPM Thematics - Genetic Therapies C2 (acc) - EUR (hedged) 373,551.838 258,776.357 118,309.083 514,019.112JPM Thematics - Genetic Therapies C2 (acc) - GBP (hedged) 60,272.802 81,277.260 20,858.657 120,691.405JPM Thematics - Genetic Therapies C2 (acc) - HKD (hedged) 506,296.230 102,499.000 2,703.220 606,092.010JPM Thematics - Genetic Therapies C2 (acc) - SGD (hedged) 187,319.948 367,892.739 57,323.417 497,889.270JPM Thematics - Genetic Therapies C2 (acc) - USD 939,920.133 1,057,194.605 315,499.433 1,681,615.305JPM Thematics - Genetic Therapies C2 (dist) - CHF (hedged) 258,122.415 101,329.239 54,171.871 305,279.783JPM Thematics - Genetic Therapies C2 (dist) - EUR (hedged) 24,096.244 18,579.356 19,115.362 23,560.238JPM Thematics - Genetic Therapies C2 (dist) - GBP (hedged) 15,725.257 36,810.399 4,434.500 48,101.156JPM Thematics - Genetic Therapies C2 (dist) - USD 65,081.491 102,427.037 26,378.513 141,130.015JPM Thematics - Genetic Therapies D (acc) - EUR (hedged) 55,606.687 1,901,278.795 204,000.279 1,752,885.203JPM Thematics - Genetic Therapies D (acc) - USD - 6,046.055 423.631 5,622.424JPM Thematics - Genetic Therapies I (acc) - EUR - 753,684.606 118,733.489 634,951.117JPM Thematics - Genetic Therapies I (acc) - EUR (hedged) - 1,084,372.391 576,471.147 507,901.244JPM Thematics - Genetic Therapies I2 (acc) - EUR (hedged) 10.000 293,758.078 64,643.982 229,124.096JPM Thematics - Genetic Therapies I2 (acc) - USD - 641,179.270 564,977.571 76,201.699JPM Thematics - Genetic Therapies I2 (dist) - GBP (hedged) - 10.000 - 10.000JPM Thematics - Genetic Therapies I2 (dist) - USD - 110.000 - 110.000
JPMorgan Funds - US Equity All Cap FundJPM US Equity All Cap A (acc) - AUD (hedged) 393,630.478 309,695.951 83,713.390 619,613.039JPM US Equity All Cap A (acc) - EUR 53,839.309 50,176.794 13,374.282 90,641.821JPM US Equity All Cap A (acc) - EUR (hedged)^ - 10.000 - 10.000JPM US Equity All Cap A (acc) - USD 1,850,593.198 529,186.688 1,065,817.012 1,313,962.874JPM US Equity All Cap C (acc) - EUR 263,939.922 4,572.898 71,933.342 196,579.478JPM US Equity All Cap C (acc) - EUR (hedged) 603,884.122 47,723.620 91,094.632 560,513.110JPM US Equity All Cap C (acc) - USD 390,094.538 251,890.459 317,338.249 324,646.748JPM US Equity All Cap C (dist) - GBP 159,071.074 15,001.196 68,684.388 105,387.882JPM US Equity All Cap I (acc) - EUR 67,846.000 92,569.000 17,697.000 142,718.000JPM US Equity All Cap I (acc) - EUR (hedged) 871,739.118 124,663.960 56,842.870 939,560.208JPM US Equity All Cap I2 (acc) - EUR (hedged) 1,141,641.202 464,562.089 608,277.275 997,926.016JPM US Equity All Cap X (acc) - USD 6,258,252.767 1,023,654.965 2,508,937.674 4,772,970.058
^ Share Class reactivated during the year.
33
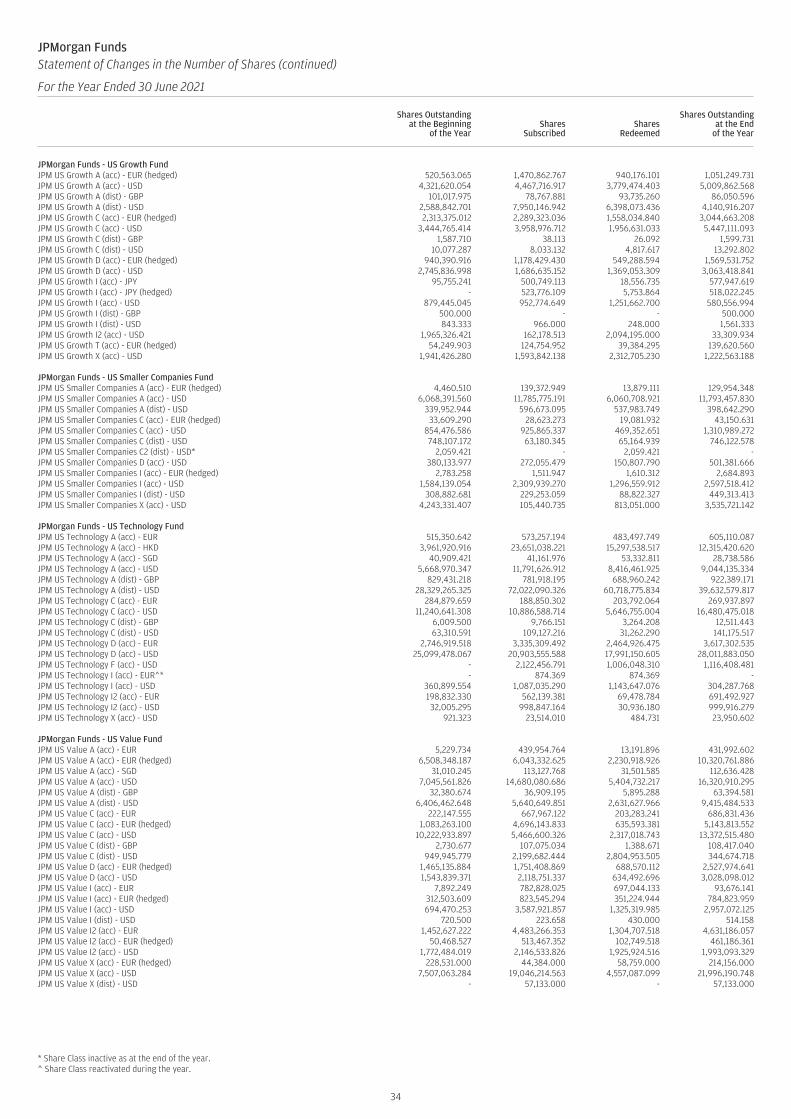
JPMorgan FundsStatement of Changes in the Number of Shares (continued)
For the Year Ended 30 June 2021
Shares Outstandingat the Beginning
of the YearShares
SubscribedShares
Redeemed
Shares Outstandingat the End
of the Year
JPMorgan Funds - US Growth FundJPM US Growth A (acc) - EUR (hedged) 520,563.065 1,470,862.767 940,176.101 1,051,249.731JPM US Growth A (acc) - USD 4,321,620.054 4,467,716.917 3,779,474.403 5,009,862.568JPM US Growth A (dist) - GBP 101,017.975 78,767.881 93,735.260 86,050.596JPM US Growth A (dist) - USD 2,588,842.701 7,950,146.942 6,398,073.436 4,140,916.207JPM US Growth C (acc) - EUR (hedged) 2,313,375.012 2,289,323.036 1,558,034.840 3,044,663.208JPM US Growth C (acc) - USD 3,444,765.414 3,958,976.712 1,956,631.033 5,447,111.093JPM US Growth C (dist) - GBP 1,587.710 38.113 26.092 1,599.731JPM US Growth C (dist) - USD 10,077.287 8,033.132 4,817.617 13,292.802JPM US Growth D (acc) - EUR (hedged) 940,390.916 1,178,429.430 549,288.594 1,569,531.752JPM US Growth D (acc) - USD 2,745,836.998 1,686,635.152 1,369,053.309 3,063,418.841JPM US Growth I (acc) - JPY 95,755.241 500,749.113 18,556.735 577,947.619JPM US Growth I (acc) - JPY (hedged) - 523,776.109 5,753.864 518,022.245JPM US Growth I (acc) - USD 879,445.045 952,774.649 1,251,662.700 580,556.994JPM US Growth I (dist) - GBP 500.000 - - 500.000JPM US Growth I (dist) - USD 843.333 966.000 248.000 1,561.333JPM US Growth I2 (acc) - USD 1,965,326.421 162,178.513 2,094,195.000 33,309.934JPM US Growth T (acc) - EUR (hedged) 54,249.903 124,754.952 39,384.295 139,620.560JPM US Growth X (acc) - USD 1,941,426.280 1,593,842.138 2,312,705.230 1,222,563.188
JPMorgan Funds - US Smaller Companies FundJPM US Smaller Companies A (acc) - EUR (hedged) 4,460.510 139,372.949 13,879.111 129,954.348JPM US Smaller Companies A (acc) - USD 6,068,391.560 11,785,775.191 6,060,708.921 11,793,457.830JPM US Smaller Companies A (dist) - USD 339,952.944 596,673.095 537,983.749 398,642.290JPM US Smaller Companies C (acc) - EUR (hedged) 33,609.290 28,623.273 19,081.932 43,150.631JPM US Smaller Companies C (acc) - USD 854,476.586 925,865.337 469,352.651 1,310,989.272JPM US Smaller Companies C (dist) - USD 748,107.172 63,180.345 65,164.939 746,122.578JPM US Smaller Companies C2 (dist) - USD* 2,059.421 - 2,059.421 -JPM US Smaller Companies D (acc) - USD 380,133.977 272,055.479 150,807.790 501,381.666JPM US Smaller Companies I (acc) - EUR (hedged) 2,783.258 1,511.947 1,610.312 2,684.893JPM US Smaller Companies I (acc) - USD 1,584,139.054 2,309,939.270 1,296,559.912 2,597,518.412JPM US Smaller Companies I (dist) - USD 308,882.681 229,253.059 88,822.327 449,313.413JPM US Smaller Companies X (acc) - USD 4,243,331.407 105,440.735 813,051.000 3,535,721.142
JPMorgan Funds - US Technology FundJPM US Technology A (acc) - EUR 515,350.642 573,257.194 483,497.749 605,110.087JPM US Technology A (acc) - HKD 3,961,920.916 23,651,038.221 15,297,538.517 12,315,420.620JPM US Technology A (acc) - SGD 40,909.421 41,161.976 53,332.811 28,738.586JPM US Technology A (acc) - USD 5,668,970.347 11,791,626.912 8,416,461.925 9,044,135.334JPM US Technology A (dist) - GBP 829,431.218 781,918.195 688,960.242 922,389.171JPM US Technology A (dist) - USD 28,329,265.325 72,022,090.326 60,718,775.834 39,632,579.817JPM US Technology C (acc) - EUR 284,879.659 188,850.302 203,792.064 269,937.897JPM US Technology C (acc) - USD 11,240,641.308 10,886,588.714 5,646,755.004 16,480,475.018JPM US Technology C (dist) - GBP 6,009.500 9,766.151 3,264.208 12,511.443JPM US Technology C (dist) - USD 63,310.591 109,127.216 31,262.290 141,175.517JPM US Technology D (acc) - EUR 2,746,919.518 3,335,309.492 2,464,926.475 3,617,302.535JPM US Technology D (acc) - USD 25,099,478.067 20,903,555.588 17,991,150.605 28,011,883.050JPM US Technology F (acc) - USD - 2,122,456.791 1,006,048.310 1,116,408.481JPM US Technology I (acc) - EUR^* - 874.369 874.369 -JPM US Technology I (acc) - USD 360,899.554 1,087,035.290 1,143,647.076 304,287.768JPM US Technology I2 (acc) - EUR 198,832.330 562,139.381 69,478.784 691,492.927JPM US Technology I2 (acc) - USD 32,005.295 998,847.164 30,936.180 999,916.279JPM US Technology X (acc) - USD 921.323 23,514.010 484.731 23,950.602
JPMorgan Funds - US Value FundJPM US Value A (acc) - EUR 5,229.734 439,954.764 13,191.896 431,992.602JPM US Value A (acc) - EUR (hedged) 6,508,348.187 6,043,332.625 2,230,918.926 10,320,761.886JPM US Value A (acc) - SGD 31,010.245 113,127.768 31,501.585 112,636.428JPM US Value A (acc) - USD 7,045,561.826 14,680,080.686 5,404,732.217 16,320,910.295JPM US Value A (dist) - GBP 32,380.674 36,909.195 5,895.288 63,394.581JPM US Value A (dist) - USD 6,406,462.648 5,640,649.851 2,631,627.966 9,415,484.533JPM US Value C (acc) - EUR 222,147.555 667,967.122 203,283.241 686,831.436JPM US Value C (acc) - EUR (hedged) 1,083,263.100 4,696,143.833 635,593.381 5,143,813.552JPM US Value C (acc) - USD 10,222,933.897 5,466,600.326 2,317,018.743 13,372,515.480JPM US Value C (dist) - GBP 2,730.677 107,075.034 1,388.671 108,417.040JPM US Value C (dist) - USD 949,945.779 2,199,682.444 2,804,953.505 344,674.718JPM US Value D (acc) - EUR (hedged) 1,465,135.884 1,751,408.869 688,570.112 2,527,974.641JPM US Value D (acc) - USD 1,543,839.371 2,118,751.337 634,492.696 3,028,098.012JPM US Value I (acc) - EUR 7,892.249 782,828.025 697,044.133 93,676.141JPM US Value I (acc) - EUR (hedged) 312,503.609 823,545.294 351,224.944 784,823.959JPM US Value I (acc) - USD 694,470.253 3,587,921.857 1,325,319.985 2,957,072.125JPM US Value I (dist) - USD 720.500 223.658 430.000 514.158JPM US Value I2 (acc) - EUR 1,452,627.222 4,483,266.353 1,304,707.518 4,631,186.057JPM US Value I2 (acc) - EUR (hedged) 50,468.527 513,467.352 102,749.518 461,186.361JPM US Value I2 (acc) - USD 1,772,484.019 2,146,533.826 1,925,924.516 1,993,093.329JPM US Value X (acc) - EUR (hedged) 228,531.000 44,384.000 58,759.000 214,156.000JPM US Value X (acc) - USD 7,507,063.284 19,046,214.563 4,557,087.099 21,996,190.748JPM US Value X (dist) - USD - 57,133.000 - 57,133.000
* Share Class inactive as at the end of the year.^ Share Class reactivated during the year.
34

JPMorgan FundsStatement of Changes in the Number of Shares (continued)
For the Year Ended 30 June 2021
Shares Outstandingat the Beginning
of the YearShares
SubscribedShares
Redeemed
Shares Outstandingat the End
of the Year
JPMorgan Funds - Asia Pacific Income FundJPM Asia Pacific Income A (acc) - HKD 10,857,266.782 408,301.272 1,440,903.120 9,824,664.934JPM Asia Pacific Income A (acc) - USD 5,026,777.712 864,346.631 1,637,537.655 4,253,586.688JPM Asia Pacific Income A (dist) - USD 3,691,187.170 1,232,612.532 1,510,025.070 3,413,774.632JPM Asia Pacific Income A (div) - SGD 541,492.604 105,388.253 167,490.295 479,390.562JPM Asia Pacific Income A (irc) - AUD (hedged) 21,779,569.804 13,303,472.911 15,188,964.768 19,894,077.947JPM Asia Pacific Income A (irc) - CAD (hedged) 5,368,355.329 6,349,870.370 3,357,675.788 8,360,549.911JPM Asia Pacific Income A (irc) - EUR (hedged) 1,140,878.161 1,368,947.023 863,868.710 1,645,956.474JPM Asia Pacific Income A (irc) - GBP (hedged) 4,240,067.527 3,145,887.320 2,483,695.514 4,902,259.333JPM Asia Pacific Income A (irc) - NZD (hedged) 4,750,886.623 5,241,721.770 4,079,947.579 5,912,660.814JPM Asia Pacific Income A (irc) - RMB (hedged) 10,219,091.185 14,823,223.060 7,400,785.620 17,641,528.625JPM Asia Pacific Income A (mth) - HKD 170,928,495.132 160,615,727.232 105,166,489.200 226,377,733.164JPM Asia Pacific Income A (mth) - SGD 4,483,003.871 912,446.539 1,422,264.891 3,973,185.519JPM Asia Pacific Income A (mth) - SGD (hedged) 19,832,612.399 8,497,153.900 11,342,986.106 16,986,780.193JPM Asia Pacific Income A (mth) - USD 5,982,745.032 6,594,147.325 6,003,820.144 6,573,072.213JPM Asia Pacific Income C (acc) - HKD 784.160 - - 784.160JPM Asia Pacific Income C (acc) - USD 898,508.988 48,020.852 195,241.547 751,288.293JPM Asia Pacific Income C (dist) - USD 54,271.546 1,921.119 20,275.398 35,917.267JPM Asia Pacific Income C (irc) - AUD (hedged) 110,955.404 85,314.122 50,233.067 146,036.459JPM Asia Pacific Income C (irc) - CAD (hedged)* 27,708.865 1.005 27,709.870 -JPM Asia Pacific Income C (irc) - EUR (hedged) 85,911.609 - 48,130.507 37,781.102JPM Asia Pacific Income C (irc) - GBP (hedged) 1,861.886 3,510.923 - 5,372.809JPM Asia Pacific Income C (irc) - NZD (hedged) 82,492.383 42,401.890 - 124,894.273JPM Asia Pacific Income C (irc) - RMB (hedged) 192,777.160 481,102.849 727.569 673,152.440JPM Asia Pacific Income C (mth) - HKD 468,999.744 340,715.503 45,714.195 764,001.052JPM Asia Pacific Income C (mth) - SGD (hedged) 1,245,603.309 493,659.750 440,568.831 1,298,694.228JPM Asia Pacific Income C (mth) - USD 681,621.837 51,983.416 280,014.847 453,590.406JPM Asia Pacific Income D (acc) - USD 1,109,594.972 130,272.954 289,814.135 950,053.791JPM Asia Pacific Income D (mth) - EUR (hedged) 24,148.532 12,144.443 7,927.365 28,365.610JPM Asia Pacific Income D (mth) - USD 10,038.108 55.398 55.398 10,038.108JPM Asia Pacific Income F (irc) - AUD (hedged) 275,290.723 1,064,607.310 672,832.612 667,065.421JPM Asia Pacific Income F (mth) - USD 114,286.196 763,077.633 381,468.896 495,894.933JPM Asia Pacific Income I (acc) - USD 252,314.254 175,438.420 423,004.025 4,748.649JPM Asia Pacific Income X (acc) - USD 12,724.937 1,369.658 3,885.240 10,209.355
JPMorgan Funds - Aggregate Bond FundJPM Aggregate Bond A (acc) - EUR (hedged) 6,067,779.946 1,386,918.234 1,217,045.625 6,237,652.555JPM Aggregate Bond A (acc) - USD 5,261,237.256 11,509,826.601 4,475,249.589 12,295,814.268JPM Aggregate Bond A (dist) - EUR (hedged) 28,287.528 41,749.650 32,615.207 37,421.971JPM Aggregate Bond C (acc) - EUR (hedged) 1,092,225.980 403,860.093 206,200.725 1,289,885.348JPM Aggregate Bond C (acc) - SEK (hedged) - 856,265.691 10,503.104 845,762.587JPM Aggregate Bond C (acc) - USD 493,111.067 222,843.685 273,581.968 442,372.784JPM Aggregate Bond C (dist) - EUR (hedged) 181,199.750 76,445.148 42,448.747 215,196.151JPM Aggregate Bond C (dist) - GBP (hedged) 24,256.946 15,599.000 21,399.472 18,456.474JPM Aggregate Bond C (dist) - USD 66,980.830 43,995.504 47,299.924 63,676.410JPM Aggregate Bond D (acc) - EUR (hedged) 143,130.250 216,265.450 68,198.598 291,197.102JPM Aggregate Bond D (acc) - USD 84,376.099 45,260.318 33,501.213 96,135.204JPM Aggregate Bond I (acc) - EUR (hedged) 201,525.405 72,882.872 5,728.330 268,679.947JPM Aggregate Bond I (acc) - USD 273,000.069 339,396.389 128,208.579 484,187.879JPM Aggregate Bond I2 (acc) - EUR (hedged) 1,370,174.969 713,054.967 1,488,194.296 595,035.640JPM Aggregate Bond I2 (acc) - USD 2,787,638.470 29,136.142 2,379,217.023 437,557.589JPM Aggregate Bond I2 (dist) - EUR (hedged) 108,109.620 100,641.911 82,720.798 126,030.733JPM Aggregate Bond I2 (dist) - GBP (hedged) 37,684.149 336.458 33,515.108 4,505.499JPM Aggregate Bond I2 (dist) - USD 228,517.541 1,180.073 190,239.246 39,458.368JPM Aggregate Bond X (acc) - CHF (hedged) - 2,394,199.086 - 2,394,199.086JPM Aggregate Bond X (acc) - EUR (hedged)* 727,030.375 - 727,030.375 -JPM Aggregate Bond X (acc) - USD 7,569,172.232 1,828,209.364 3,805,277.842 5,592,103.754
* Share Class inactive as at the end of the year.
35
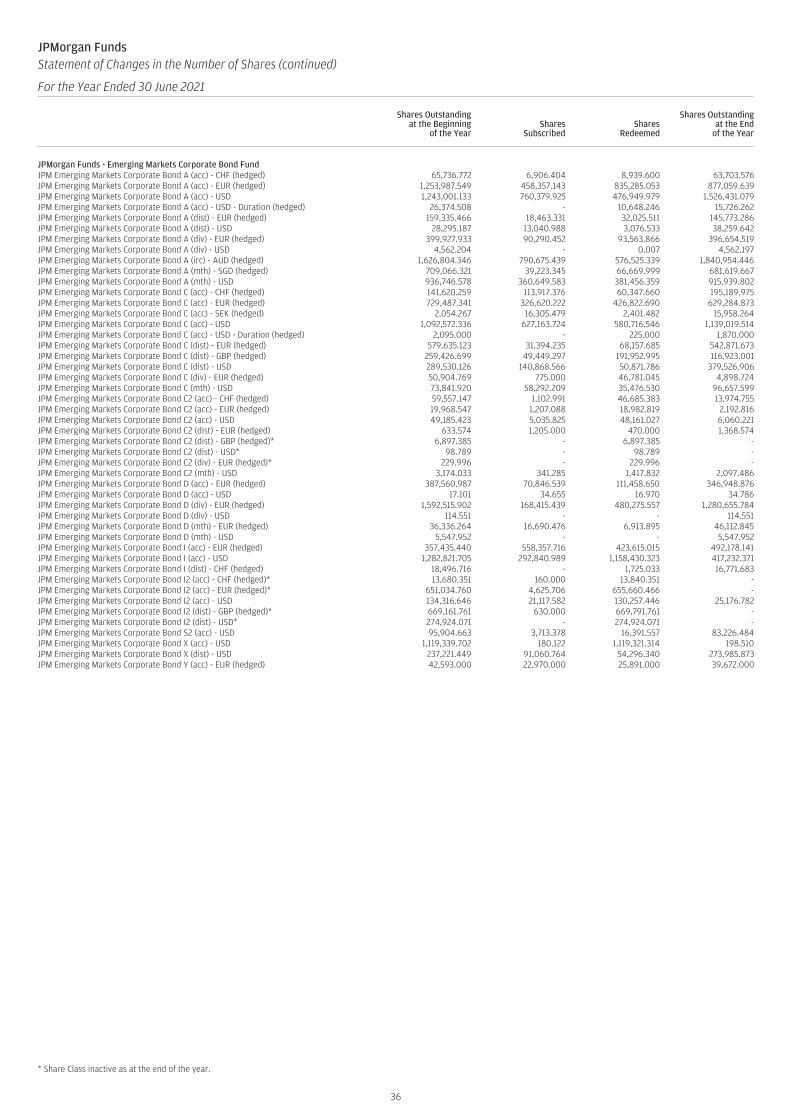
JPMorgan FundsStatement of Changes in the Number of Shares (continued)
For the Year Ended 30 June 2021
Shares Outstandingat the Beginning
of the YearShares
SubscribedShares
Redeemed
Shares Outstandingat the End
of the Year
JPMorgan Funds - Emerging Markets Corporate Bond FundJPM Emerging Markets Corporate Bond A (acc) - CHF (hedged) 65,736.772 6,906.404 8,939.600 63,703.576JPM Emerging Markets Corporate Bond A (acc) - EUR (hedged) 1,253,987.549 458,357.143 835,285.053 877,059.639JPM Emerging Markets Corporate Bond A (acc) - USD 1,243,001.133 760,379.925 476,949.979 1,526,431.079JPM Emerging Markets Corporate Bond A (acc) - USD - Duration (hedged) 26,374.508 - 10,648.246 15,726.262JPM Emerging Markets Corporate Bond A (dist) - EUR (hedged) 159,335.466 18,463.331 32,025.511 145,773.286JPM Emerging Markets Corporate Bond A (dist) - USD 28,295.187 13,040.988 3,076.533 38,259.642JPM Emerging Markets Corporate Bond A (div) - EUR (hedged) 399,927.933 90,290.452 93,563.866 396,654.519JPM Emerging Markets Corporate Bond A (div) - USD 4,562.204 - 0.007 4,562.197JPM Emerging Markets Corporate Bond A (irc) - AUD (hedged) 1,626,804.346 790,675.439 576,525.339 1,840,954.446JPM Emerging Markets Corporate Bond A (mth) - SGD (hedged) 709,066.321 39,223.345 66,669.999 681,619.667JPM Emerging Markets Corporate Bond A (mth) - USD 936,746.578 360,649.583 381,456.359 915,939.802JPM Emerging Markets Corporate Bond C (acc) - CHF (hedged) 141,620.259 113,917.376 60,347.660 195,189.975JPM Emerging Markets Corporate Bond C (acc) - EUR (hedged) 729,487.341 326,620.222 426,822.690 629,284.873JPM Emerging Markets Corporate Bond C (acc) - SEK (hedged) 2,054.267 16,305.479 2,401.482 15,958.264JPM Emerging Markets Corporate Bond C (acc) - USD 1,092,572.336 627,163.724 580,716.546 1,139,019.514JPM Emerging Markets Corporate Bond C (acc) - USD - Duration (hedged) 2,095.000 - 225.000 1,870.000JPM Emerging Markets Corporate Bond C (dist) - EUR (hedged) 579,635.123 31,394.235 68,157.685 542,871.673JPM Emerging Markets Corporate Bond C (dist) - GBP (hedged) 259,426.699 49,449.297 191,952.995 116,923.001JPM Emerging Markets Corporate Bond C (dist) - USD 289,530.126 140,868.566 50,871.786 379,526.906JPM Emerging Markets Corporate Bond C (div) - EUR (hedged) 50,904.769 775.000 46,781.045 4,898.724JPM Emerging Markets Corporate Bond C (mth) - USD 73,841.920 58,292.209 35,476.530 96,657.599JPM Emerging Markets Corporate Bond C2 (acc) - CHF (hedged) 59,557.147 1,102.991 46,685.383 13,974.755JPM Emerging Markets Corporate Bond C2 (acc) - EUR (hedged) 19,968.547 1,207.088 18,982.819 2,192.816JPM Emerging Markets Corporate Bond C2 (acc) - USD 49,185.423 5,035.825 48,161.027 6,060.221JPM Emerging Markets Corporate Bond C2 (dist) - EUR (hedged) 633.574 1,205.000 470.000 1,368.574JPM Emerging Markets Corporate Bond C2 (dist) - GBP (hedged)* 6,897.385 - 6,897.385 -JPM Emerging Markets Corporate Bond C2 (dist) - USD* 98.789 - 98.789 -JPM Emerging Markets Corporate Bond C2 (div) - EUR (hedged)* 229.996 - 229.996 -JPM Emerging Markets Corporate Bond C2 (mth) - USD 3,174.033 341.285 1,417.832 2,097.486JPM Emerging Markets Corporate Bond D (acc) - EUR (hedged) 387,560.987 70,846.539 111,458.650 346,948.876JPM Emerging Markets Corporate Bond D (acc) - USD 17.101 34.655 16.970 34.786JPM Emerging Markets Corporate Bond D (div) - EUR (hedged) 1,592,515.902 168,415.439 480,275.557 1,280,655.784JPM Emerging Markets Corporate Bond D (div) - USD 114.551 - - 114.551JPM Emerging Markets Corporate Bond D (mth) - EUR (hedged) 36,336.264 16,690.476 6,913.895 46,112.845JPM Emerging Markets Corporate Bond D (mth) - USD 5,547.952 - - 5,547.952JPM Emerging Markets Corporate Bond I (acc) - EUR (hedged) 357,435.440 558,357.716 423,615.015 492,178.141JPM Emerging Markets Corporate Bond I (acc) - USD 1,282,821.705 292,840.989 1,158,430.323 417,232.371JPM Emerging Markets Corporate Bond I (dist) - CHF (hedged) 18,496.716 - 1,725.033 16,771.683JPM Emerging Markets Corporate Bond I2 (acc) - CHF (hedged)* 13,680.351 160.000 13,840.351 -JPM Emerging Markets Corporate Bond I2 (acc) - EUR (hedged)* 651,034.760 4,625.706 655,660.466 -JPM Emerging Markets Corporate Bond I2 (acc) - USD 134,316.646 21,117.582 130,257.446 25,176.782JPM Emerging Markets Corporate Bond I2 (dist) - GBP (hedged)* 669,161.761 630.000 669,791.761 -JPM Emerging Markets Corporate Bond I2 (dist) - USD* 274,924.071 - 274,924.071 -JPM Emerging Markets Corporate Bond S2 (acc) - USD 95,904.663 3,713.378 16,391.557 83,226.484JPM Emerging Markets Corporate Bond X (acc) - USD 1,119,339.702 180.122 1,119,321.314 198.510JPM Emerging Markets Corporate Bond X (dist) - USD 237,221.449 91,060.764 54,296.340 273,985.873JPM Emerging Markets Corporate Bond Y (acc) - EUR (hedged) 42,593.000 22,970.000 25,891.000 39,672.000
* Share Class inactive as at the end of the year.
36
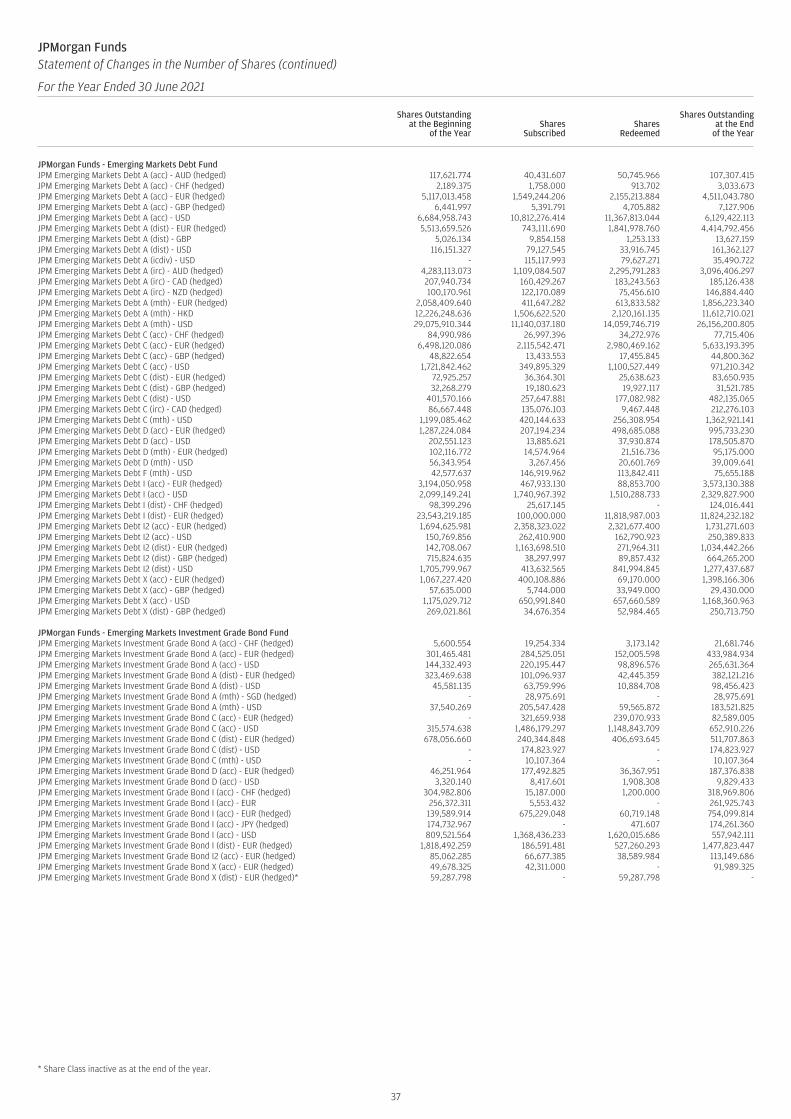
JPMorgan FundsStatement of Changes in the Number of Shares (continued)
For the Year Ended 30 June 2021
Shares Outstandingat the Beginning
of the YearShares
SubscribedShares
Redeemed
Shares Outstandingat the End
of the Year
JPMorgan Funds - Emerging Markets Debt FundJPM Emerging Markets Debt A (acc) - AUD (hedged) 117,621.774 40,431.607 50,745.966 107,307.415JPM Emerging Markets Debt A (acc) - CHF (hedged) 2,189.375 1,758.000 913.702 3,033.673JPM Emerging Markets Debt A (acc) - EUR (hedged) 5,117,013.458 1,549,244.206 2,155,213.884 4,511,043.780JPM Emerging Markets Debt A (acc) - GBP (hedged) 6,441.997 5,391.791 4,705.882 7,127.906JPM Emerging Markets Debt A (acc) - USD 6,684,958.743 10,812,276.414 11,367,813.044 6,129,422.113JPM Emerging Markets Debt A (dist) - EUR (hedged) 5,513,659.526 743,111.690 1,841,978.760 4,414,792.456JPM Emerging Markets Debt A (dist) - GBP 5,026.134 9,854.158 1,253.133 13,627.159JPM Emerging Markets Debt A (dist) - USD 116,151.327 79,127.545 33,916.745 161,362.127JPM Emerging Markets Debt A (icdiv) - USD - 115,117.993 79,627.271 35,490.722JPM Emerging Markets Debt A (irc) - AUD (hedged) 4,283,113.073 1,109,084.507 2,295,791.283 3,096,406.297JPM Emerging Markets Debt A (irc) - CAD (hedged) 207,940.734 160,429.267 183,243.563 185,126.438JPM Emerging Markets Debt A (irc) - NZD (hedged) 100,170.961 122,170.089 75,456.610 146,884.440JPM Emerging Markets Debt A (mth) - EUR (hedged) 2,058,409.640 411,647.282 613,833.582 1,856,223.340JPM Emerging Markets Debt A (mth) - HKD 12,226,248.636 1,506,622.520 2,120,161.135 11,612,710.021JPM Emerging Markets Debt A (mth) - USD 29,075,910.344 11,140,037.180 14,059,746.719 26,156,200.805JPM Emerging Markets Debt C (acc) - CHF (hedged) 84,990.986 26,997.396 34,272.976 77,715.406JPM Emerging Markets Debt C (acc) - EUR (hedged) 6,498,120.086 2,115,542.471 2,980,469.162 5,633,193.395JPM Emerging Markets Debt C (acc) - GBP (hedged) 48,822.654 13,433.553 17,455.845 44,800.362JPM Emerging Markets Debt C (acc) - USD 1,721,842.462 349,895.329 1,100,527.449 971,210.342JPM Emerging Markets Debt C (dist) - EUR (hedged) 72,925.257 36,364.301 25,638.623 83,650.935JPM Emerging Markets Debt C (dist) - GBP (hedged) 32,268.279 19,180.623 19,927.117 31,521.785JPM Emerging Markets Debt C (dist) - USD 401,570.166 257,647.881 177,082.982 482,135.065JPM Emerging Markets Debt C (irc) - CAD (hedged) 86,667.448 135,076.103 9,467.448 212,276.103JPM Emerging Markets Debt C (mth) - USD 1,199,085.462 420,144.633 256,308.954 1,362,921.141JPM Emerging Markets Debt D (acc) - EUR (hedged) 1,287,224.084 207,194.234 498,685.088 995,733.230JPM Emerging Markets Debt D (acc) - USD 202,551.123 13,885.621 37,930.874 178,505.870JPM Emerging Markets Debt D (mth) - EUR (hedged) 102,116.772 14,574.964 21,516.736 95,175.000JPM Emerging Markets Debt D (mth) - USD 56,343.954 3,267.456 20,601.769 39,009.641JPM Emerging Markets Debt F (mth) - USD 42,577.637 146,919.962 113,842.411 75,655.188JPM Emerging Markets Debt I (acc) - EUR (hedged) 3,194,050.958 467,933.130 88,853.700 3,573,130.388JPM Emerging Markets Debt I (acc) - USD 2,099,149.241 1,740,967.392 1,510,288.733 2,329,827.900JPM Emerging Markets Debt I (dist) - CHF (hedged) 98,399.296 25,617.145 - 124,016.441JPM Emerging Markets Debt I (dist) - EUR (hedged) 23,543,219.185 100,000.000 11,818,987.003 11,824,232.182JPM Emerging Markets Debt I2 (acc) - EUR (hedged) 1,694,625.981 2,358,323.022 2,321,677.400 1,731,271.603JPM Emerging Markets Debt I2 (acc) - USD 150,769.856 262,410.900 162,790.923 250,389.833JPM Emerging Markets Debt I2 (dist) - EUR (hedged) 142,708.067 1,163,698.510 271,964.311 1,034,442.266JPM Emerging Markets Debt I2 (dist) - GBP (hedged) 715,824.635 38,297.997 89,857.432 664,265.200JPM Emerging Markets Debt I2 (dist) - USD 1,705,799.967 413,632.565 841,994.845 1,277,437.687JPM Emerging Markets Debt X (acc) - EUR (hedged) 1,067,227.420 400,108.886 69,170.000 1,398,166.306JPM Emerging Markets Debt X (acc) - GBP (hedged) 57,635.000 5,744.000 33,949.000 29,430.000JPM Emerging Markets Debt X (acc) - USD 1,175,029.712 650,991.840 657,660.589 1,168,360.963JPM Emerging Markets Debt X (dist) - GBP (hedged) 269,021.861 34,676.354 52,984.465 250,713.750
JPMorgan Funds - Emerging Markets Investment Grade Bond FundJPM Emerging Markets Investment Grade Bond A (acc) - CHF (hedged) 5,600.554 19,254.334 3,173.142 21,681.746JPM Emerging Markets Investment Grade Bond A (acc) - EUR (hedged) 301,465.481 284,525.051 152,005.598 433,984.934JPM Emerging Markets Investment Grade Bond A (acc) - USD 144,332.493 220,195.447 98,896.576 265,631.364JPM Emerging Markets Investment Grade Bond A (dist) - EUR (hedged) 323,469.638 101,096.937 42,445.359 382,121.216JPM Emerging Markets Investment Grade Bond A (dist) - USD 45,581.135 63,759.996 10,884.708 98,456.423JPM Emerging Markets Investment Grade Bond A (mth) - SGD (hedged) - 28,975.691 - 28,975.691JPM Emerging Markets Investment Grade Bond A (mth) - USD 37,540.269 205,547.428 59,565.872 183,521.825JPM Emerging Markets Investment Grade Bond C (acc) - EUR (hedged) - 321,659.938 239,070.933 82,589.005JPM Emerging Markets Investment Grade Bond C (acc) - USD 315,574.638 1,486,179.297 1,148,843.709 652,910.226JPM Emerging Markets Investment Grade Bond C (dist) - EUR (hedged) 678,056.660 240,344.848 406,693.645 511,707.863JPM Emerging Markets Investment Grade Bond C (dist) - USD - 174,823.927 - 174,823.927JPM Emerging Markets Investment Grade Bond C (mth) - USD - 10,107.364 - 10,107.364JPM Emerging Markets Investment Grade Bond D (acc) - EUR (hedged) 46,251.964 177,492.825 36,367.951 187,376.838JPM Emerging Markets Investment Grade Bond D (acc) - USD 3,320.140 8,417.601 1,908.308 9,829.433JPM Emerging Markets Investment Grade Bond I (acc) - CHF (hedged) 304,982.806 15,187.000 1,200.000 318,969.806JPM Emerging Markets Investment Grade Bond I (acc) - EUR 256,372.311 5,553.432 - 261,925.743JPM Emerging Markets Investment Grade Bond I (acc) - EUR (hedged) 139,589.914 675,229.048 60,719.148 754,099.814JPM Emerging Markets Investment Grade Bond I (acc) - JPY (hedged) 174,732.967 - 471.607 174,261.360JPM Emerging Markets Investment Grade Bond I (acc) - USD 809,521.564 1,368,436.233 1,620,015.686 557,942.111JPM Emerging Markets Investment Grade Bond I (dist) - EUR (hedged) 1,818,492.259 186,591.481 527,260.293 1,477,823.447JPM Emerging Markets Investment Grade Bond I2 (acc) - EUR (hedged) 85,062.285 66,677.385 38,589.984 113,149.686JPM Emerging Markets Investment Grade Bond X (acc) - EUR (hedged) 49,678.325 42,311.000 - 91,989.325JPM Emerging Markets Investment Grade Bond X (dist) - EUR (hedged)* 59,287.798 - 59,287.798 -
* Share Class inactive as at the end of the year.
37
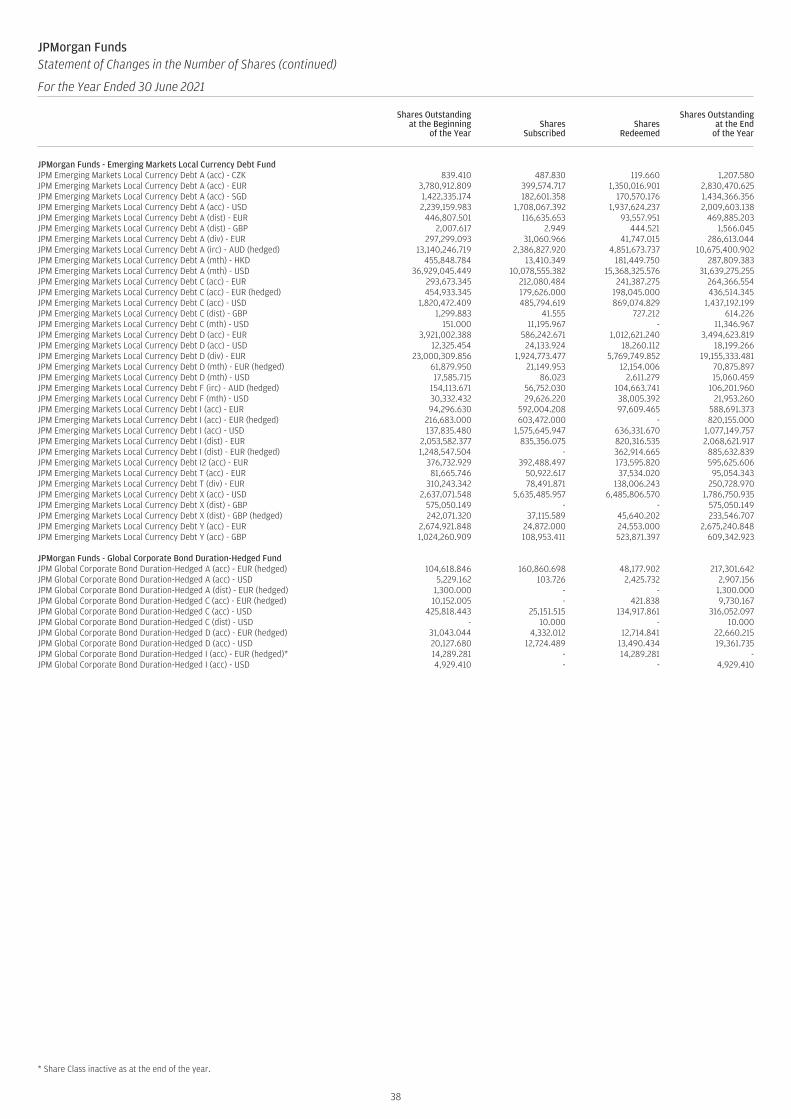
JPMorgan FundsStatement of Changes in the Number of Shares (continued)
For the Year Ended 30 June 2021
Shares Outstandingat the Beginning
of the YearShares
SubscribedShares
Redeemed
Shares Outstandingat the End
of the Year
JPMorgan Funds - Emerging Markets Local Currency Debt FundJPM Emerging Markets Local Currency Debt A (acc) - CZK 839.410 487.830 119.660 1,207.580JPM Emerging Markets Local Currency Debt A (acc) - EUR 3,780,912.809 399,574.717 1,350,016.901 2,830,470.625JPM Emerging Markets Local Currency Debt A (acc) - SGD 1,422,335.174 182,601.358 170,570.176 1,434,366.356JPM Emerging Markets Local Currency Debt A (acc) - USD 2,239,159.983 1,708,067.392 1,937,624.237 2,009,603.138JPM Emerging Markets Local Currency Debt A (dist) - EUR 446,807.501 116,635.653 93,557.951 469,885.203JPM Emerging Markets Local Currency Debt A (dist) - GBP 2,007.617 2.949 444.521 1,566.045JPM Emerging Markets Local Currency Debt A (div) - EUR 297,299.093 31,060.966 41,747.015 286,613.044JPM Emerging Markets Local Currency Debt A (irc) - AUD (hedged) 13,140,246.719 2,386,827.920 4,851,673.737 10,675,400.902JPM Emerging Markets Local Currency Debt A (mth) - HKD 455,848.784 13,410.349 181,449.750 287,809.383JPM Emerging Markets Local Currency Debt A (mth) - USD 36,929,045.449 10,078,555.382 15,368,325.576 31,639,275.255JPM Emerging Markets Local Currency Debt C (acc) - EUR 293,673.345 212,080.484 241,387.275 264,366.554JPM Emerging Markets Local Currency Debt C (acc) - EUR (hedged) 454,933.345 179,626.000 198,045.000 436,514.345JPM Emerging Markets Local Currency Debt C (acc) - USD 1,820,472.409 485,794.619 869,074.829 1,437,192.199JPM Emerging Markets Local Currency Debt C (dist) - GBP 1,299.883 41.555 727.212 614.226JPM Emerging Markets Local Currency Debt C (mth) - USD 151.000 11,195.967 - 11,346.967JPM Emerging Markets Local Currency Debt D (acc) - EUR 3,921,002.388 586,242.671 1,012,621.240 3,494,623.819JPM Emerging Markets Local Currency Debt D (acc) - USD 12,325.454 24,133.924 18,260.112 18,199.266JPM Emerging Markets Local Currency Debt D (div) - EUR 23,000,309.856 1,924,773.477 5,769,749.852 19,155,333.481JPM Emerging Markets Local Currency Debt D (mth) - EUR (hedged) 61,879.950 21,149.953 12,154.006 70,875.897JPM Emerging Markets Local Currency Debt D (mth) - USD 17,585.715 86.023 2,611.279 15,060.459JPM Emerging Markets Local Currency Debt F (irc) - AUD (hedged) 154,113.671 56,752.030 104,663.741 106,201.960JPM Emerging Markets Local Currency Debt F (mth) - USD 30,332.432 29,626.220 38,005.392 21,953.260JPM Emerging Markets Local Currency Debt I (acc) - EUR 94,296.630 592,004.208 97,609.465 588,691.373JPM Emerging Markets Local Currency Debt I (acc) - EUR (hedged) 216,683.000 603,472.000 - 820,155.000JPM Emerging Markets Local Currency Debt I (acc) - USD 137,835.480 1,575,645.947 636,331.670 1,077,149.757JPM Emerging Markets Local Currency Debt I (dist) - EUR 2,053,582.377 835,356.075 820,316.535 2,068,621.917JPM Emerging Markets Local Currency Debt I (dist) - EUR (hedged) 1,248,547.504 - 362,914.665 885,632.839JPM Emerging Markets Local Currency Debt I2 (acc) - EUR 376,732.929 392,488.497 173,595.820 595,625.606JPM Emerging Markets Local Currency Debt T (acc) - EUR 81,665.746 50,922.617 37,534.020 95,054.343JPM Emerging Markets Local Currency Debt T (div) - EUR 310,243.342 78,491.871 138,006.243 250,728.970JPM Emerging Markets Local Currency Debt X (acc) - USD 2,637,071.548 5,635,485.957 6,485,806.570 1,786,750.935JPM Emerging Markets Local Currency Debt X (dist) - GBP 575,050.149 - - 575,050.149JPM Emerging Markets Local Currency Debt X (dist) - GBP (hedged) 242,071.320 37,115.589 45,640.202 233,546.707JPM Emerging Markets Local Currency Debt Y (acc) - EUR 2,674,921.848 24,872.000 24,553.000 2,675,240.848JPM Emerging Markets Local Currency Debt Y (acc) - GBP 1,024,260.909 108,953.411 523,871.397 609,342.923
JPMorgan Funds - Global Corporate Bond Duration-Hedged FundJPM Global Corporate Bond Duration-Hedged A (acc) - EUR (hedged) 104,618.846 160,860.698 48,177.902 217,301.642JPM Global Corporate Bond Duration-Hedged A (acc) - USD 5,229.162 103.726 2,425.732 2,907.156JPM Global Corporate Bond Duration-Hedged A (dist) - EUR (hedged) 1,300.000 - - 1,300.000JPM Global Corporate Bond Duration-Hedged C (acc) - EUR (hedged) 10,152.005 - 421.838 9,730.167JPM Global Corporate Bond Duration-Hedged C (acc) - USD 425,818.443 25,151.515 134,917.861 316,052.097JPM Global Corporate Bond Duration-Hedged C (dist) - USD - 10.000 - 10.000JPM Global Corporate Bond Duration-Hedged D (acc) - EUR (hedged) 31,043.044 4,332.012 12,714.841 22,660.215JPM Global Corporate Bond Duration-Hedged D (acc) - USD 20,127.680 12,724.489 13,490.434 19,361.735JPM Global Corporate Bond Duration-Hedged I (acc) - EUR (hedged)* 14,289.281 - 14,289.281 -JPM Global Corporate Bond Duration-Hedged I (acc) - USD 4,929.410 - - 4,929.410
* Share Class inactive as at the end of the year.
38
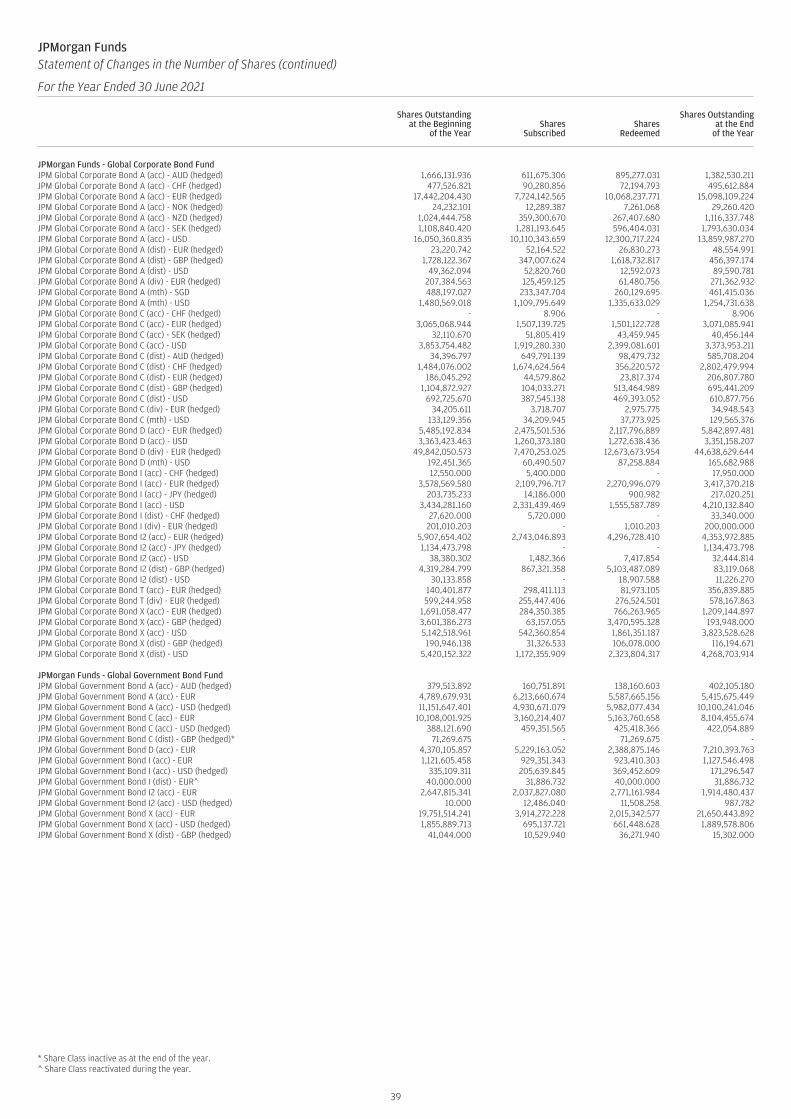
JPMorgan FundsStatement of Changes in the Number of Shares (continued)
For the Year Ended 30 June 2021
Shares Outstandingat the Beginning
of the YearShares
SubscribedShares
Redeemed
Shares Outstandingat the End
of the Year
JPMorgan Funds - Global Corporate Bond FundJPM Global Corporate Bond A (acc) - AUD (hedged) 1,666,131.936 611,675.306 895,277.031 1,382,530.211JPM Global Corporate Bond A (acc) - CHF (hedged) 477,526.821 90,280.856 72,194.793 495,612.884JPM Global Corporate Bond A (acc) - EUR (hedged) 17,442,204.430 7,724,142.565 10,068,237.771 15,098,109.224JPM Global Corporate Bond A (acc) - NOK (hedged) 24,232.101 12,289.387 7,261.068 29,260.420JPM Global Corporate Bond A (acc) - NZD (hedged) 1,024,444.758 359,300.670 267,407.680 1,116,337.748JPM Global Corporate Bond A (acc) - SEK (hedged) 1,108,840.420 1,281,193.645 596,404.031 1,793,630.034JPM Global Corporate Bond A (acc) - USD 16,050,360.835 10,110,343.659 12,300,717.224 13,859,987.270JPM Global Corporate Bond A (dist) - EUR (hedged) 23,220.742 52,164.522 26,830.273 48,554.991JPM Global Corporate Bond A (dist) - GBP (hedged) 1,728,122.367 347,007.624 1,618,732.817 456,397.174JPM Global Corporate Bond A (dist) - USD 49,362.094 52,820.760 12,592.073 89,590.781JPM Global Corporate Bond A (div) - EUR (hedged) 207,384.563 125,459.125 61,480.756 271,362.932JPM Global Corporate Bond A (mth) - SGD 488,197.027 233,347.704 260,129.695 461,415.036JPM Global Corporate Bond A (mth) - USD 1,480,569.018 1,109,795.649 1,335,633.029 1,254,731.638JPM Global Corporate Bond C (acc) - CHF (hedged) - 8.906 - 8.906JPM Global Corporate Bond C (acc) - EUR (hedged) 3,065,068.944 1,507,139.725 1,501,122.728 3,071,085.941JPM Global Corporate Bond C (acc) - SEK (hedged) 32,110.670 51,805.419 43,459.945 40,456.144JPM Global Corporate Bond C (acc) - USD 3,853,754.482 1,919,280.330 2,399,081.601 3,373,953.211JPM Global Corporate Bond C (dist) - AUD (hedged) 34,396.797 649,791.139 98,479.732 585,708.204JPM Global Corporate Bond C (dist) - CHF (hedged) 1,484,076.002 1,674,624.564 356,220.572 2,802,479.994JPM Global Corporate Bond C (dist) - EUR (hedged) 186,045.292 44,579.862 23,817.374 206,807.780JPM Global Corporate Bond C (dist) - GBP (hedged) 1,104,872.927 104,033.271 513,464.989 695,441.209JPM Global Corporate Bond C (dist) - USD 692,725.670 387,545.138 469,393.052 610,877.756JPM Global Corporate Bond C (div) - EUR (hedged) 34,205.611 3,718.707 2,975.775 34,948.543JPM Global Corporate Bond C (mth) - USD 133,129.356 34,209.945 37,773.925 129,565.376JPM Global Corporate Bond D (acc) - EUR (hedged) 5,485,192.834 2,475,501.536 2,117,796.889 5,842,897.481JPM Global Corporate Bond D (acc) - USD 3,363,423.463 1,260,373.180 1,272,638.436 3,351,158.207JPM Global Corporate Bond D (div) - EUR (hedged) 49,842,050.573 7,470,253.025 12,673,673.954 44,638,629.644JPM Global Corporate Bond D (mth) - USD 192,451.365 60,490.507 87,258.884 165,682.988JPM Global Corporate Bond I (acc) - CHF (hedged) 12,550.000 5,400.000 - 17,950.000JPM Global Corporate Bond I (acc) - EUR (hedged) 3,578,569.580 2,109,796.717 2,270,996.079 3,417,370.218JPM Global Corporate Bond I (acc) - JPY (hedged) 203,735.233 14,186.000 900.982 217,020.251JPM Global Corporate Bond I (acc) - USD 3,434,281.160 2,331,439.469 1,555,587.789 4,210,132.840JPM Global Corporate Bond I (dist) - CHF (hedged) 27,620.000 5,720.000 - 33,340.000JPM Global Corporate Bond I (div) - EUR (hedged) 201,010.203 - 1,010.203 200,000.000JPM Global Corporate Bond I2 (acc) - EUR (hedged) 5,907,654.402 2,743,046.893 4,296,728.410 4,353,972.885JPM Global Corporate Bond I2 (acc) - JPY (hedged) 1,134,473.798 - - 1,134,473.798JPM Global Corporate Bond I2 (acc) - USD 38,380.302 1,482.366 7,417.854 32,444.814JPM Global Corporate Bond I2 (dist) - GBP (hedged) 4,319,284.799 867,321.358 5,103,487.089 83,119.068JPM Global Corporate Bond I2 (dist) - USD 30,133.858 - 18,907.588 11,226.270JPM Global Corporate Bond T (acc) - EUR (hedged) 140,401.877 298,411.113 81,973.105 356,839.885JPM Global Corporate Bond T (div) - EUR (hedged) 599,244.958 255,447.406 276,524.501 578,167.863JPM Global Corporate Bond X (acc) - EUR (hedged) 1,691,058.477 284,350.385 766,263.965 1,209,144.897JPM Global Corporate Bond X (acc) - GBP (hedged) 3,601,386.273 63,157.055 3,470,595.328 193,948.000JPM Global Corporate Bond X (acc) - USD 5,142,518.961 542,360.854 1,861,351.187 3,823,528.628JPM Global Corporate Bond X (dist) - GBP (hedged) 190,946.138 31,326.533 106,078.000 116,194.671JPM Global Corporate Bond X (dist) - USD 5,420,152.322 1,172,355.909 2,323,804.317 4,268,703.914
JPMorgan Funds - Global Government Bond FundJPM Global Government Bond A (acc) - AUD (hedged) 379,513.892 160,751.891 138,160.603 402,105.180JPM Global Government Bond A (acc) - EUR 4,789,679.931 6,213,660.674 5,587,665.156 5,415,675.449JPM Global Government Bond A (acc) - USD (hedged) 11,151,647.401 4,930,671.079 5,982,077.434 10,100,241.046JPM Global Government Bond C (acc) - EUR 10,108,001.925 3,160,214.407 5,163,760.658 8,104,455.674JPM Global Government Bond C (acc) - USD (hedged) 388,121.690 459,351.565 425,418.366 422,054.889JPM Global Government Bond C (dist) - GBP (hedged)* 71,269.675 - 71,269.675 -JPM Global Government Bond D (acc) - EUR 4,370,105.857 5,229,163.052 2,388,875.146 7,210,393.763JPM Global Government Bond I (acc) - EUR 1,121,605.458 929,351.343 923,410.303 1,127,546.498JPM Global Government Bond I (acc) - USD (hedged) 335,109.311 205,639.845 369,452.609 171,296.547JPM Global Government Bond I (dist) - EUR^ 40,000.000 31,886.732 40,000.000 31,886.732JPM Global Government Bond I2 (acc) - EUR 2,647,815.341 2,037,827.080 2,771,161.984 1,914,480.437JPM Global Government Bond I2 (acc) - USD (hedged) 10.000 12,486.040 11,508.258 987.782JPM Global Government Bond X (acc) - EUR 19,751,514.241 3,914,272.228 2,015,342.577 21,650,443.892JPM Global Government Bond X (acc) - USD (hedged) 1,855,889.713 695,137.721 661,448.628 1,889,578.806JPM Global Government Bond X (dist) - GBP (hedged) 41,044.000 10,529.940 36,271.940 15,302.000
* Share Class inactive as at the end of the year.^ Share Class reactivated during the year.
39
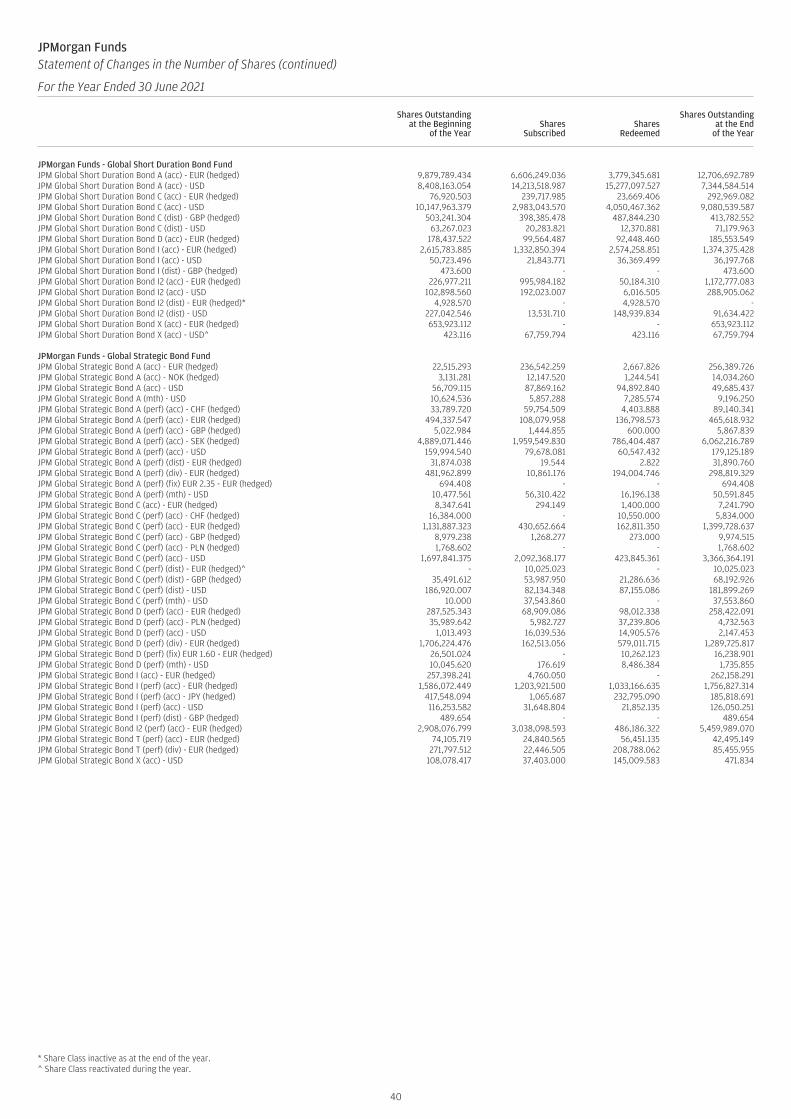
JPMorgan FundsStatement of Changes in the Number of Shares (continued)
For the Year Ended 30 June 2021
Shares Outstandingat the Beginning
of the YearShares
SubscribedShares
Redeemed
Shares Outstandingat the End
of the Year
JPMorgan Funds - Global Short Duration Bond FundJPM Global Short Duration Bond A (acc) - EUR (hedged) 9,879,789.434 6,606,249.036 3,779,345.681 12,706,692.789JPM Global Short Duration Bond A (acc) - USD 8,408,163.054 14,213,518.987 15,277,097.527 7,344,584.514JPM Global Short Duration Bond C (acc) - EUR (hedged) 76,920.503 239,717.985 23,669.406 292,969.082JPM Global Short Duration Bond C (acc) - USD 10,147,963.379 2,983,043.570 4,050,467.362 9,080,539.587JPM Global Short Duration Bond C (dist) - GBP (hedged) 503,241.304 398,385.478 487,844.230 413,782.552JPM Global Short Duration Bond C (dist) - USD 63,267.023 20,283.821 12,370.881 71,179.963JPM Global Short Duration Bond D (acc) - EUR (hedged) 178,437.522 99,564.487 92,448.460 185,553.549JPM Global Short Duration Bond I (acc) - EUR (hedged) 2,615,783.885 1,332,850.394 2,574,258.851 1,374,375.428JPM Global Short Duration Bond I (acc) - USD 50,723.496 21,843.771 36,369.499 36,197.768JPM Global Short Duration Bond I (dist) - GBP (hedged) 473.600 - - 473.600JPM Global Short Duration Bond I2 (acc) - EUR (hedged) 226,977.211 995,984.182 50,184.310 1,172,777.083JPM Global Short Duration Bond I2 (acc) - USD 102,898.560 192,023.007 6,016.505 288,905.062JPM Global Short Duration Bond I2 (dist) - EUR (hedged)* 4,928.570 - 4,928.570 -JPM Global Short Duration Bond I2 (dist) - USD 227,042.546 13,531.710 148,939.834 91,634.422JPM Global Short Duration Bond X (acc) - EUR (hedged) 653,923.112 - - 653,923.112JPM Global Short Duration Bond X (acc) - USD^ 423.116 67,759.794 423.116 67,759.794
JPMorgan Funds - Global Strategic Bond FundJPM Global Strategic Bond A (acc) - EUR (hedged) 22,515.293 236,542.259 2,667.826 256,389.726JPM Global Strategic Bond A (acc) - NOK (hedged) 3,131.281 12,147.520 1,244.541 14,034.260JPM Global Strategic Bond A (acc) - USD 56,709.115 87,869.162 94,892.840 49,685.437JPM Global Strategic Bond A (mth) - USD 10,624.536 5,857.288 7,285.574 9,196.250JPM Global Strategic Bond A (perf) (acc) - CHF (hedged) 33,789.720 59,754.509 4,403.888 89,140.341JPM Global Strategic Bond A (perf) (acc) - EUR (hedged) 494,337.547 108,079.958 136,798.573 465,618.932JPM Global Strategic Bond A (perf) (acc) - GBP (hedged) 5,022.984 1,444.855 600.000 5,867.839JPM Global Strategic Bond A (perf) (acc) - SEK (hedged) 4,889,071.446 1,959,549.830 786,404.487 6,062,216.789JPM Global Strategic Bond A (perf) (acc) - USD 159,994.540 79,678.081 60,547.432 179,125.189JPM Global Strategic Bond A (perf) (dist) - EUR (hedged) 31,874.038 19.544 2.822 31,890.760JPM Global Strategic Bond A (perf) (div) - EUR (hedged) 481,962.899 10,861.176 194,004.746 298,819.329JPM Global Strategic Bond A (perf) (fix) EUR 2.35 - EUR (hedged) 694.408 - - 694.408JPM Global Strategic Bond A (perf) (mth) - USD 10,477.561 56,310.422 16,196.138 50,591.845JPM Global Strategic Bond C (acc) - EUR (hedged) 8,347.641 294.149 1,400.000 7,241.790JPM Global Strategic Bond C (perf) (acc) - CHF (hedged) 16,384.000 - 10,550.000 5,834.000JPM Global Strategic Bond C (perf) (acc) - EUR (hedged) 1,131,887.323 430,652.664 162,811.350 1,399,728.637JPM Global Strategic Bond C (perf) (acc) - GBP (hedged) 8,979.238 1,268.277 273.000 9,974.515JPM Global Strategic Bond C (perf) (acc) - PLN (hedged) 1,768.602 - - 1,768.602JPM Global Strategic Bond C (perf) (acc) - USD 1,697,841.375 2,092,368.177 423,845.361 3,366,364.191JPM Global Strategic Bond C (perf) (dist) - EUR (hedged)^ - 10,025.023 - 10,025.023JPM Global Strategic Bond C (perf) (dist) - GBP (hedged) 35,491.612 53,987.950 21,286.636 68,192.926JPM Global Strategic Bond C (perf) (dist) - USD 186,920.007 82,134.348 87,155.086 181,899.269JPM Global Strategic Bond C (perf) (mth) - USD 10.000 37,543.860 - 37,553.860JPM Global Strategic Bond D (perf) (acc) - EUR (hedged) 287,525.343 68,909.086 98,012.338 258,422.091JPM Global Strategic Bond D (perf) (acc) - PLN (hedged) 35,989.642 5,982.727 37,239.806 4,732.563JPM Global Strategic Bond D (perf) (acc) - USD 1,013.493 16,039.536 14,905.576 2,147.453JPM Global Strategic Bond D (perf) (div) - EUR (hedged) 1,706,224.476 162,513.056 579,011.715 1,289,725.817JPM Global Strategic Bond D (perf) (fix) EUR 1.60 - EUR (hedged) 26,501.024 - 10,262.123 16,238.901JPM Global Strategic Bond D (perf) (mth) - USD 10,045.620 176.619 8,486.384 1,735.855JPM Global Strategic Bond I (acc) - EUR (hedged) 257,398.241 4,760.050 - 262,158.291JPM Global Strategic Bond I (perf) (acc) - EUR (hedged) 1,586,072.449 1,203,921.500 1,033,166.635 1,756,827.314JPM Global Strategic Bond I (perf) (acc) - JPY (hedged) 417,548.094 1,065.687 232,795.090 185,818.691JPM Global Strategic Bond I (perf) (acc) - USD 116,253.582 31,648.804 21,852.135 126,050.251JPM Global Strategic Bond I (perf) (dist) - GBP (hedged) 489.654 - - 489.654JPM Global Strategic Bond I2 (perf) (acc) - EUR (hedged) 2,908,076.799 3,038,098.593 486,186.322 5,459,989.070JPM Global Strategic Bond T (perf) (acc) - EUR (hedged) 74,105.719 24,840.565 56,451.135 42,495.149JPM Global Strategic Bond T (perf) (div) - EUR (hedged) 271,797.512 22,446.505 208,788.062 85,455.955JPM Global Strategic Bond X (acc) - USD 108,078.417 37,403.000 145,009.583 471.834
* Share Class inactive as at the end of the year.^ Share Class reactivated during the year.
40

JPMorgan FundsStatement of Changes in the Number of Shares (continued)
For the Year Ended 30 June 2021
Shares Outstandingat the Beginning
of the YearShares
SubscribedShares
Redeemed
Shares Outstandingat the End
of the Year
JPMorgan Funds - Income FundJPM Income Fund A (acc) - AUD (hedged) 2,168,017.771 371,995.430 662,824.498 1,877,188.703JPM Income Fund A (acc) - CHF (hedged) 1,915.246 1,474.000 - 3,389.246JPM Income Fund A (acc) - EUR (hedged) 2,203,387.775 1,218,255.282 1,375,396.537 2,046,246.520JPM Income Fund A (acc) - GBP (hedged) 49,070.746 8,356.527 7,641.909 49,785.364JPM Income Fund A (acc) - SGD (hedged) 2,282,135.845 695,410.580 681,718.138 2,295,828.287JPM Income Fund A (acc) - USD 4,377,129.070 4,436,707.764 3,459,652.519 5,354,184.315JPM Income Fund A (div) - CHF (hedged) 9.722 2,326.911 - 2,336.633JPM Income Fund A (div) - EUR (hedged) 3,867,144.000 1,118,354.741 1,314,198.271 3,671,300.470JPM Income Fund A (div) - GBP (hedged) 7.853 1,155.289 8.142 1,155.000JPM Income Fund A (div) - USD 1,749,291.029 1,829,562.872 621,136.873 2,957,717.028JPM Income Fund A (mth) - AUD (hedged) 11,517,781.402 8,869,651.765 5,307,871.849 15,079,561.318JPM Income Fund A (mth) - EUR (hedged) 453,254.333 288,641.732 200,605.146 541,290.919JPM Income Fund A (mth) - GBP (hedged) 192,688.329 465,246.601 109,832.147 548,102.783JPM Income Fund A (mth) - HKD 260,591,142.418 130,012,379.053 115,771,808.096 274,831,713.375JPM Income Fund A (mth) - RMB (hedged) 1,427,774.258 14,367,732.678 2,500,723.392 13,294,783.544JPM Income Fund A (mth) - SGD 4,054,252.385 4,691,005.599 3,767,814.357 4,977,443.627JPM Income Fund A (mth) - SGD (hedged) 28,195,028.000 38,672,523.502 24,565,802.627 42,301,748.875JPM Income Fund A (mth) - USD 208,868,850.700 222,510,968.925 146,120,197.898 285,259,621.727JPM Income Fund C (acc) - CHF (hedged) 5,009.722 4,188.000 9.722 9,188.000JPM Income Fund C (acc) - EUR (hedged) 626,612.916 395,841.701 336,144.945 686,309.672JPM Income Fund C (acc) - SGD* 138.840 - 138.840 -JPM Income Fund C (acc) - SGD (hedged) 180,746.396 257,701.936 101,003.540 337,444.792JPM Income Fund C (acc) - USD 3,343,536.252 11,291,073.998 3,125,158.820 11,509,451.430JPM Income Fund C (div) - AUD (hedged) 162.143 24,038.462 - 24,200.605JPM Income Fund C (div) - CHF (hedged) 17,059.782 20,602.523 14,979.781 22,682.524JPM Income Fund C (div) - EUR (hedged) 156,588.686 287,817.322 268,644.518 175,761.490JPM Income Fund C (div) - GBP (hedged) 14,891.702 58,591.437 5,319.720 68,163.419JPM Income Fund C (div) - SGD (hedged) 141.530 1,372,778.192 - 1,372,919.722JPM Income Fund C (div) - USD 3,251,623.083 5,109,650.367 1,232,298.919 7,128,974.531JPM Income Fund C (mth) - AUD (hedged) 227,504.075 1,615,248.370 139,794.366 1,702,958.079JPM Income Fund C (mth) - HKD* 784.565 29.889 814.454 -JPM Income Fund C (mth) - RMB (hedged) 701.501 10,228,646.809 722.468 10,228,625.842JPM Income Fund C (mth) - SGD* 140.089 5.319 145.408 -JPM Income Fund C (mth) - SGD (hedged) 410,026.052 6,419,480.314 148,822.264 6,680,684.102JPM Income Fund C (mth) - USD 1,404,211.759 4,120,955.343 455,070.089 5,070,097.013JPM Income Fund C2 (acc) - EUR (hedged) 10.000 66,431.870 - 66,441.870JPM Income Fund C2 (acc) - USD 10.000 478,818.016 21,579.349 457,248.667JPM Income Fund C2 (div) - GBP (hedged) 20,280.855 25,131.751 1,258.003 44,154.603JPM Income Fund C2 (div) - USD 20,556.870 29,243.991 10.000 49,790.861JPM Income Fund D (acc) - EUR (hedged) 604,599.398 638,086.140 340,308.877 902,376.661JPM Income Fund D (acc) - USD 85,192.101 247,436.866 98,421.437 234,207.530JPM Income Fund D (div) - EUR (hedged) 2,336,168.337 306,335.173 587,845.898 2,054,657.612JPM Income Fund D (div) - USD 26,564.910 27,830.787 37,554.992 16,840.705JPM Income Fund D (mth) - USD 81,738.527 327,970.698 51,864.708 357,844.517JPM Income Fund F (acc) - USD 15,841.621 248,322.448 93,638.923 170,525.146JPM Income Fund F (mth) - USD 5,163,276.452 958,910.931 2,282,088.194 3,840,099.189JPM Income Fund I (acc) - EUR (hedged) 622,797.968 1,057,185.846 140,443.628 1,539,540.186JPM Income Fund I (acc) - JPY (hedged) 799,990.000 - - 799,990.000JPM Income Fund I (acc) - USD 3,007,771.981 3,847,758.876 1,014,528.552 5,841,002.305JPM Income Fund I (div) - EUR (hedged) 36,929.897 98,828.660 254.000 135,504.557JPM Income Fund I (mth) - USD 35,604.888 1,079,922.732 450,279.176 665,248.444JPM Income Fund I2 (acc) - EUR (hedged) 277.224 1,817,962.983 74,386.185 1,743,854.022JPM Income Fund I2 (acc) - USD 10.000 76,717.974 1,335.204 75,392.770JPM Income Fund I2 (div) - GBP (hedged) 10.000 - - 10.000JPM Income Fund T (acc) - EUR (hedged) 581,556.660 27,644.050 486,889.212 122,311.498JPM Income Fund T (div) - EUR (hedged) 444,352.465 402,738.241 53,971.029 793,119.677JPM Income Fund X (acc) - USD 271,498.335 164,202.772 223,844.952 211,856.155JPM Income Fund X (mth) - JPY - 314.137 27.835 286.302JPM Income Fund X (mth) - JPY (hedged) - 1,298.239 535.414 762.825JPM Income Fund X (mth) - USD* 48,437.000 - 48,437.000 -
* Share Class inactive as at the end of the year.
41

JPMorgan FundsStatement of Changes in the Number of Shares (continued)
For the Year Ended 30 June 2021
Shares Outstandingat the Beginning
of the YearShares
SubscribedShares
Redeemed
Shares Outstandingat the End
of the Year
JPMorgan Funds - US Aggregate Bond FundJPM US Aggregate Bond A (acc) - AUD (hedged) 431,374.051 245,723.208 640,677.259 36,420.000JPM US Aggregate Bond A (acc) - EUR (hedged) 1,853,507.551 593,943.233 1,381,027.429 1,066,423.355JPM US Aggregate Bond A (acc) - USD 32,640,718.761 23,793,215.723 26,273,056.767 30,160,877.717JPM US Aggregate Bond A (dist) - USD 7,861,320.512 9,344,101.095 11,270,693.581 5,934,728.026JPM US Aggregate Bond A (div) - USD 35,825.622 107,591.264 111,934.487 31,482.399JPM US Aggregate Bond A (mth) - HKD 2,635,312.379 4,617,318.057 4,164,052.177 3,088,578.259JPM US Aggregate Bond A (mth) - SGD 124,765.219 30,208.550 20,633.331 134,340.438JPM US Aggregate Bond A (mth) - SGD (Hedged) 940,270.170 463,783.928 405,829.555 998,224.543JPM US Aggregate Bond A (mth) - USD 25,930,472.858 27,719,938.426 27,604,248.036 26,046,163.248JPM US Aggregate Bond C (acc) - EUR (hedged) 916,838.306 583,118.443 522,696.586 977,260.163JPM US Aggregate Bond C (acc) - USD 37,757,337.153 13,657,073.976 15,015,936.676 36,398,474.453JPM US Aggregate Bond C (dist) - EUR (hedged) 1.892 6,169.587 950.118 5,221.361JPM US Aggregate Bond C (dist) - USD 156,532.875 351,256.375 215,117.166 292,672.084JPM US Aggregate Bond C (div) - USD 305,539.195 18,984.064 227,846.241 96,677.018JPM US Aggregate Bond C (mth) - USD 786,813.800 613,152.178 642,258.425 757,707.553JPM US Aggregate Bond D (acc) - EUR (hedged) 1,129,078.426 487,668.111 589,116.035 1,027,630.502JPM US Aggregate Bond D (acc) - USD 2,121,096.947 739,128.971 903,030.704 1,957,195.214JPM US Aggregate Bond F (mth) - USD 1,450,308.610 1,150,113.220 1,251,916.386 1,348,505.444JPM US Aggregate Bond I (acc) - EUR (hedged) 3,690,839.373 1,219,046.076 4,044,132.064 865,753.385JPM US Aggregate Bond I (acc) - USD 4,898,214.649 3,855,466.685 3,074,057.504 5,679,623.830JPM US Aggregate Bond I2 (acc) - EUR (hedged) 2,139,637.836 4,030,966.617 1,729,605.947 4,440,998.506JPM US Aggregate Bond I2 (acc) - USD 1,825,199.134 468,191.509 400,298.228 1,893,092.415JPM US Aggregate Bond I2 (dist) - CHF (hedged) - 1,799.320 - 1,799.320JPM US Aggregate Bond I2 (dist) - EUR (hedged) 340,290.384 341,294.204 226,964.395 454,620.193JPM US Aggregate Bond I2 (dist) - GBP (hedged) 41,824.208 3,042.755 8,454.898 36,412.065JPM US Aggregate Bond I2 (dist) - USD 679,179.662 366,606.558 562,544.737 483,241.483JPM US Aggregate Bond X (acc) - EUR (hedged) 1,343,564.294 62,625.000 402,578.891 1,003,610.403JPM US Aggregate Bond X (acc) - USD 4,331,732.495 245,645.377 2,425,798.775 2,151,579.097JPM US Aggregate Bond X (mth) - JPY 127,282.727 108,470.373 23,190.188 212,562.912JPM US Aggregate Bond X (mth) - JPY (hedged) 109,460.494 57,273.464 36,731.882 130,002.076
JPMorgan Funds - USD Money Market VNAV FundJPM USD Money Market VNAV A (acc) - USD 5,610,975.948 4,723,536.966 5,908,780.011 4,425,732.903
The accompanying notes form an integral part of these financial statements.
42
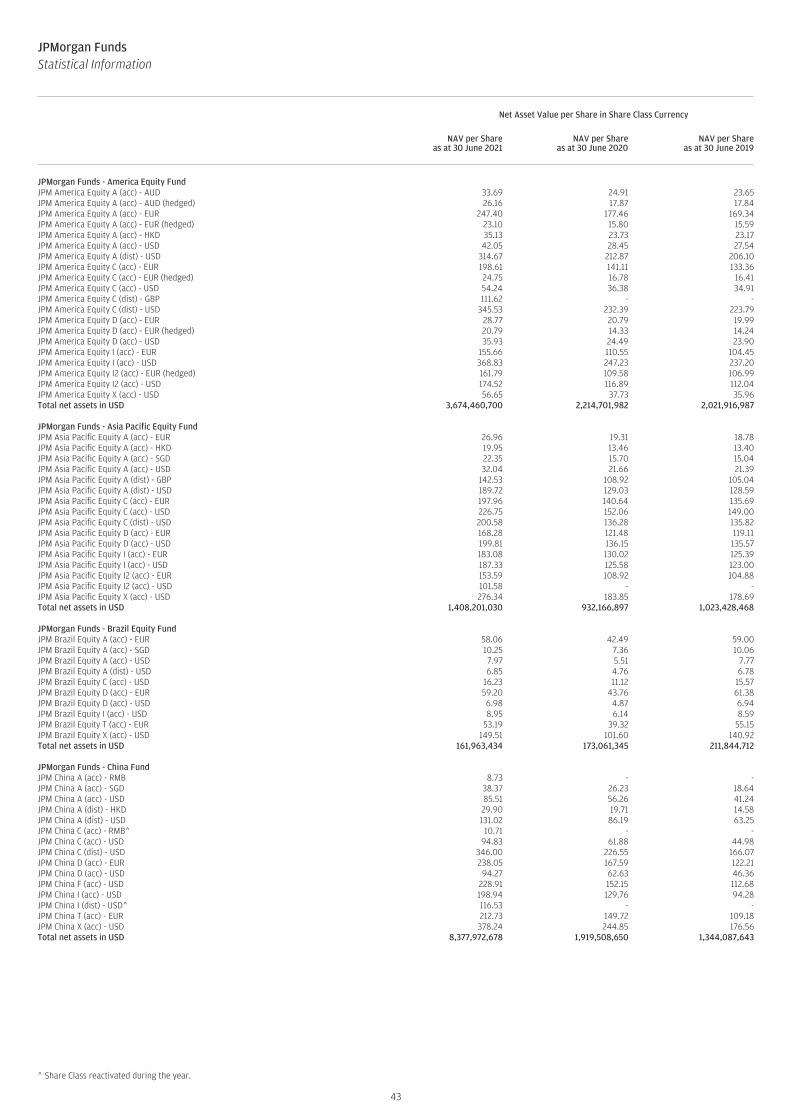
JPMorgan FundsStatistical Information (continued)
Net Asset Value per Share in Share Class Currency
NAV per Shareas at 30 June 2021
NAV per Shareas at 30 June 2020
NAV per Shareas at 30 June 2019
JPMorgan Funds - America Equity FundJPM America Equity A (acc) - AUD 33.69 24.91 23.65JPM America Equity A (acc) - AUD (hedged) 26.16 17.87 17.84JPM America Equity A (acc) - EUR 247.40 177.46 169.34JPM America Equity A (acc) - EUR (hedged) 23.10 15.80 15.59JPM America Equity A (acc) - HKD 35.13 23.73 23.17JPM America Equity A (acc) - USD 42.05 28.45 27.54JPM America Equity A (dist) - USD 314.67 212.87 206.10JPM America Equity C (acc) - EUR 198.61 141.11 133.36JPM America Equity C (acc) - EUR (hedged) 24.75 16.78 16.41JPM America Equity C (acc) - USD 54.24 36.38 34.91JPM America Equity C (dist) - GBP 111.62 - -JPM America Equity C (dist) - USD 345.53 232.39 223.79JPM America Equity D (acc) - EUR 28.77 20.79 19.99JPM America Equity D (acc) - EUR (hedged) 20.79 14.33 14.24JPM America Equity D (acc) - USD 35.93 24.49 23.90JPM America Equity I (acc) - EUR 155.66 110.55 104.45JPM America Equity I (acc) - USD 368.83 247.23 237.20JPM America Equity I2 (acc) - EUR (hedged) 161.79 109.58 106.99JPM America Equity I2 (acc) - USD 174.52 116.89 112.04JPM America Equity X (acc) - USD 56.65 37.73 35.96Total net assets in USD 3,674,460,700 2,214,701,982 2,021,916,987
JPMorgan Funds - Asia Pacific Equity FundJPM Asia Pacific Equity A (acc) - EUR 26.96 19.31 18.78JPM Asia Pacific Equity A (acc) - HKD 19.95 13.46 13.40JPM Asia Pacific Equity A (acc) - SGD 22.35 15.70 15.04JPM Asia Pacific Equity A (acc) - USD 32.04 21.66 21.39JPM Asia Pacific Equity A (dist) - GBP 142.53 108.92 105.04JPM Asia Pacific Equity A (dist) - USD 189.72 129.03 128.59JPM Asia Pacific Equity C (acc) - EUR 197.96 140.64 135.69JPM Asia Pacific Equity C (acc) - USD 226.75 152.06 149.00JPM Asia Pacific Equity C (dist) - USD 200.58 136.28 135.82JPM Asia Pacific Equity D (acc) - EUR 168.28 121.48 119.11JPM Asia Pacific Equity D (acc) - USD 199.81 136.15 135.57JPM Asia Pacific Equity I (acc) - EUR 183.08 130.02 125.39JPM Asia Pacific Equity I (acc) - USD 187.33 125.58 123.00JPM Asia Pacific Equity I2 (acc) - EUR 153.59 108.92 104.88JPM Asia Pacific Equity I2 (acc) - USD 101.58 - -JPM Asia Pacific Equity X (acc) - USD 276.34 183.85 178.69Total net assets in USD 1,408,201,030 932,166,897 1,023,428,468
JPMorgan Funds - Brazil Equity FundJPM Brazil Equity A (acc) - EUR 58.06 42.49 59.00JPM Brazil Equity A (acc) - SGD 10.25 7.36 10.06JPM Brazil Equity A (acc) - USD 7.97 5.51 7.77JPM Brazil Equity A (dist) - USD 6.85 4.76 6.78JPM Brazil Equity C (acc) - USD 16.23 11.12 15.57JPM Brazil Equity D (acc) - EUR 59.20 43.76 61.38JPM Brazil Equity D (acc) - USD 6.98 4.87 6.94JPM Brazil Equity I (acc) - USD 8.95 6.14 8.59JPM Brazil Equity T (acc) - EUR 53.19 39.32 55.15JPM Brazil Equity X (acc) - USD 149.51 101.60 140.92Total net assets in USD 161,963,434 173,061,345 211,844,712
JPMorgan Funds - China FundJPM China A (acc) - RMB 8.73 - -JPM China A (acc) - SGD 38.37 26.23 18.64JPM China A (acc) - USD 85.51 56.26 41.24JPM China A (dist) - HKD 29.90 19.71 14.58JPM China A (dist) - USD 131.02 86.19 63.25JPM China C (acc) - RMB^ 10.71 - -JPM China C (acc) - USD 94.83 61.88 44.98JPM China C (dist) - USD 346.00 226.55 166.07JPM China D (acc) - EUR 238.05 167.59 122.21JPM China D (acc) - USD 94.27 62.63 46.36JPM China F (acc) - USD 228.91 152.15 112.68JPM China I (acc) - USD 198.94 129.76 94.28JPM China I (dist) - USD^ 116.53 - -JPM China T (acc) - EUR 212.73 149.72 109.18JPM China X (acc) - USD 378.24 244.85 176.56Total net assets in USD 8,377,972,678 1,919,508,650 1,344,087,643
^ Share Class reactivated during the year.
43

JPMorgan FundsStatistical Information (continued)
Net Asset Value per Share in Share Class Currency
NAV per Shareas at 30 June 2021
NAV per Shareas at 30 June 2020
NAV per Shareas at 30 June 2019
JPMorgan Funds - Emerging Europe Equity FundJPM Emerging Europe Equity A (acc) - EUR 21.90 17.92 19.53JPM Emerging Europe Equity A (acc) - USD 131.23 101.38 112.22JPM Emerging Europe Equity A (dist) - EUR 43.22 36.40 41.15JPM Emerging Europe Equity A (dist) - USD 131.11 104.20 117.07JPM Emerging Europe Equity C (acc) - EUR 23.58 19.15 20.72JPM Emerging Europe Equity C (acc) - USD 202.17 155.02 170.30JPM Emerging Europe Equity C (dist) - EUR 126.10 106.47 119.96JPM Emerging Europe Equity C (dist) - USD 133.99 106.77 119.74JPM Emerging Europe Equity D (acc) - EUR 33.55 27.74 30.54JPM Emerging Europe Equity D (acc) - USD 134.35 104.83 117.21JPM Emerging Europe Equity I (acc) - EUR 19.25 15.63 16.91JPM Emerging Europe Equity X (acc) - EUR 31.02 24.97 26.77JPM Emerging Europe Equity X (acc) - USD 145.44 110.52 120.32Total net assets in EUR 477,995,493 426,099,377 592,391,323
JPMorgan Funds - Emerging Markets Dividend FundJPM Emerging Markets Dividend A (acc) - CHF (hedged) 106.46 75.03 84.78JPM Emerging Markets Dividend A (acc) - EUR 127.51 93.64 101.43JPM Emerging Markets Dividend A (acc) - USD 151.35 104.91 115.45JPM Emerging Markets Dividend A (dist) - EUR 100.08 74.77 83.15JPM Emerging Markets Dividend A (dist) - GBP 87.96 69.79 76.70JPM Emerging Markets Dividend A (div) - EUR 84.13 64.30 73.14JPM Emerging Markets Dividend A (irc) - AUD (hedged) 9.14 6.64 7.86JPM Emerging Markets Dividend A (irc) - GBP (hedged) 10.94 7.92 9.26JPM Emerging Markets Dividend A (mth) - HKD 10.66 7.65 8.93JPM Emerging Markets Dividend A (mth) - SGD 10.38 7.76 8.69JPM Emerging Markets Dividend A (mth) - SGD (hedged) 9.38 6.77 7.92JPM Emerging Markets Dividend A (mth) - USD 96.56 69.44 80.31JPM Emerging Markets Dividend C (acc) - EUR 132.34 96.36 103.52JPM Emerging Markets Dividend C (acc) - USD 157.79 108.45 118.32JPM Emerging Markets Dividend C (dist) - EUR 107.29 80.18 89.07JPM Emerging Markets Dividend C (div) - EUR 91.56 69.38 78.26JPM Emerging Markets Dividend D (acc) - EUR 119.56 88.45 96.57JPM Emerging Markets Dividend D (div) - EUR 78.86 60.73 69.61JPM Emerging Markets Dividend D (mth) - EUR 111.52 85.69 98.32JPM Emerging Markets Dividend I2 (acc) - EUR* - 86.72 -JPM Emerging Markets Dividend T (acc) - EUR 119.55 88.45 96.56JPM Emerging Markets Dividend T (div) - EUR 78.86 60.73 69.60JPM Emerging Markets Dividend X (acc) - EUR 139.89 101.05 107.69JPM Emerging Markets Dividend X (acc) - USD 174.28 118.83 128.61JPM Emerging Markets Dividend X (dist) - EUR 111.56 83.21 92.43Total net assets in USD 548,830,907 473,889,282 498,137,317
JPMorgan Funds - Emerging Markets Equity FundJPM Emerging Markets Equity A (acc) - EUR 28.83 21.19 20.28JPM Emerging Markets Equity A (acc) - EUR (hedged) 135.73 95.63 95.02JPM Emerging Markets Equity A (acc) - SGD 28.69 20.69 19.51JPM Emerging Markets Equity A (acc) - USD 42.92 29.78 28.95JPM Emerging Markets Equity A (dist) - GBP 69.12 54.00 50.93JPM Emerging Markets Equity A (dist) - USD 57.49 39.90 38.88JPM Emerging Markets Equity C (acc) - EUR 167.29 122.14 116.14JPM Emerging Markets Equity C (acc) - EUR (hedged) 142.03 99.32 97.96JPM Emerging Markets Equity C (acc) - USD 49.29 33.97 32.81JPM Emerging Markets Equity C (dist) - GBP 141.46 109.91 103.19JPM Emerging Markets Equity C (dist) - USD 185.42 128.06 124.02JPM Emerging Markets Equity C2 (acc) - EUR 117.56 - -JPM Emerging Markets Equity D (acc) - EUR 18.71 13.86 13.38JPM Emerging Markets Equity D (acc) - EUR (hedged) 170.01 120.68 120.83JPM Emerging Markets Equity D (acc) - USD 61.09 42.72 41.87JPM Emerging Markets Equity I (acc) - EUR 31.42 22.93 21.79JPM Emerging Markets Equity I (acc) - EUR (hedged) 157.54 110.12 108.57JPM Emerging Markets Equity I (acc) - SGD 22.53 16.12 15.08JPM Emerging Markets Equity I (acc) - USD 33.32 22.96 22.16JPM Emerging Markets Equity I (dist) - EUR 129.45 94.62 -JPM Emerging Markets Equity I2 (acc) - EUR 158.85 115.75 109.86JPM Emerging Markets Equity I2 (acc) - USD 159.37 109.62 105.66JPM Emerging Markets Equity I2 (dist) - EUR 131.64 96.12 -JPM Emerging Markets Equity I2 (dist) - USD 157.63 108.57 106.02JPM Emerging Markets Equity T (acc) - EUR 149.36 110.69 106.86JPM Emerging Markets Equity X (acc) - EUR 191.91 138.86 130.85JPM Emerging Markets Equity X (acc) - USD 62.48 42.68 40.84JPM Emerging Markets Equity X (dist) - EUR 25.47 18.61 17.87Total net assets in USD 13,099,928,373 8,472,286,653 7,748,024,942
* Share Class inactive as at the end of the year.
44
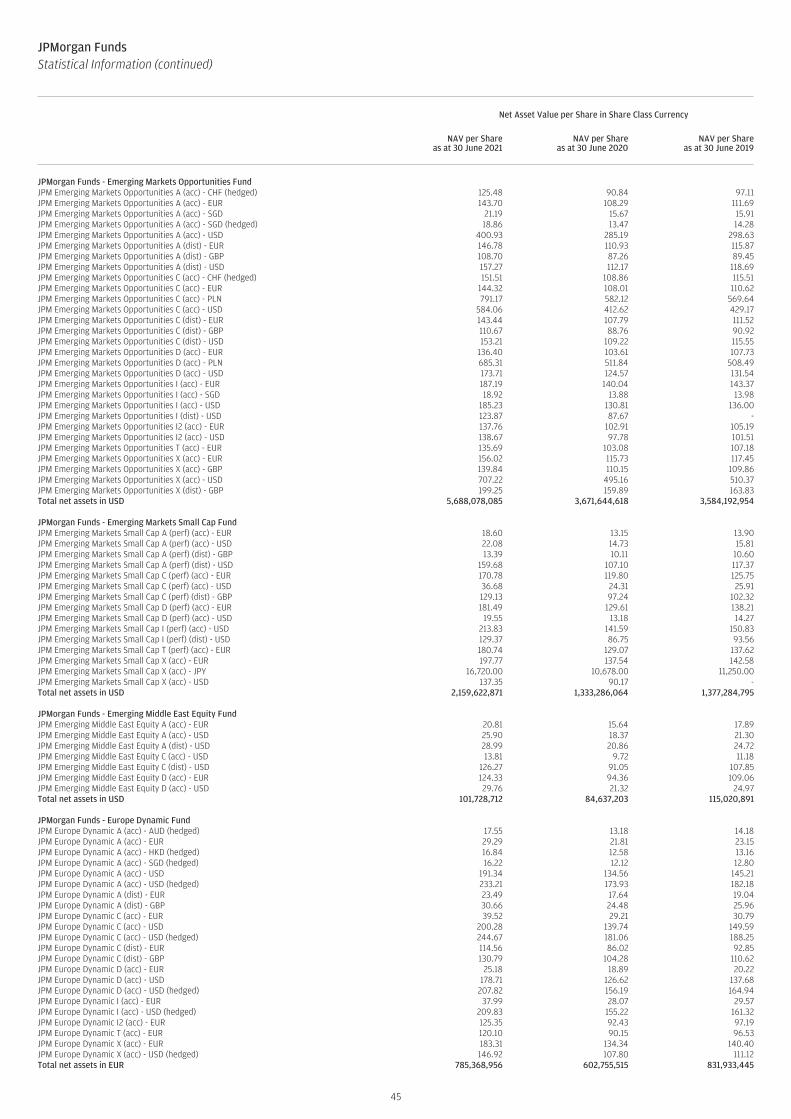
JPMorgan FundsStatistical Information (continued)
Net Asset Value per Share in Share Class Currency
NAV per Shareas at 30 June 2021
NAV per Shareas at 30 June 2020
NAV per Shareas at 30 June 2019
JPMorgan Funds - Emerging Markets Opportunities FundJPM Emerging Markets Opportunities A (acc) - CHF (hedged) 125.48 90.84 97.11JPM Emerging Markets Opportunities A (acc) - EUR 143.70 108.29 111.69JPM Emerging Markets Opportunities A (acc) - SGD 21.19 15.67 15.91JPM Emerging Markets Opportunities A (acc) - SGD (hedged) 18.86 13.47 14.28JPM Emerging Markets Opportunities A (acc) - USD 400.93 285.19 298.63JPM Emerging Markets Opportunities A (dist) - EUR 146.78 110.93 115.87JPM Emerging Markets Opportunities A (dist) - GBP 108.70 87.26 89.45JPM Emerging Markets Opportunities A (dist) - USD 157.27 112.17 118.69JPM Emerging Markets Opportunities C (acc) - CHF (hedged) 151.51 108.86 115.51JPM Emerging Markets Opportunities C (acc) - EUR 144.32 108.01 110.62JPM Emerging Markets Opportunities C (acc) - PLN 791.17 582.12 569.64JPM Emerging Markets Opportunities C (acc) - USD 584.06 412.62 429.17JPM Emerging Markets Opportunities C (dist) - EUR 143.44 107.79 111.52JPM Emerging Markets Opportunities C (dist) - GBP 110.67 88.76 90.92JPM Emerging Markets Opportunities C (dist) - USD 153.21 109.22 115.55JPM Emerging Markets Opportunities D (acc) - EUR 136.40 103.61 107.73JPM Emerging Markets Opportunities D (acc) - PLN 685.31 511.84 508.49JPM Emerging Markets Opportunities D (acc) - USD 173.71 124.57 131.54JPM Emerging Markets Opportunities I (acc) - EUR 187.19 140.04 143.37JPM Emerging Markets Opportunities I (acc) - SGD 18.92 13.88 13.98JPM Emerging Markets Opportunities I (acc) - USD 185.23 130.81 136.00JPM Emerging Markets Opportunities I (dist) - USD 123.87 87.67 -JPM Emerging Markets Opportunities I2 (acc) - EUR 137.76 102.91 105.19JPM Emerging Markets Opportunities I2 (acc) - USD 138.67 97.78 101.51JPM Emerging Markets Opportunities T (acc) - EUR 135.69 103.08 107.18JPM Emerging Markets Opportunities X (acc) - EUR 156.02 115.73 117.45JPM Emerging Markets Opportunities X (acc) - GBP 139.84 110.15 109.86JPM Emerging Markets Opportunities X (acc) - USD 707.22 495.16 510.37JPM Emerging Markets Opportunities X (dist) - GBP 199.25 159.89 163.83Total net assets in USD 5,688,078,085 3,671,644,618 3,584,192,954
JPMorgan Funds - Emerging Markets Small Cap FundJPM Emerging Markets Small Cap A (perf) (acc) - EUR 18.60 13.15 13.90JPM Emerging Markets Small Cap A (perf) (acc) - USD 22.08 14.73 15.81JPM Emerging Markets Small Cap A (perf) (dist) - GBP 13.39 10.11 10.60JPM Emerging Markets Small Cap A (perf) (dist) - USD 159.68 107.10 117.37JPM Emerging Markets Small Cap C (perf) (acc) - EUR 170.78 119.80 125.75JPM Emerging Markets Small Cap C (perf) (acc) - USD 36.68 24.31 25.91JPM Emerging Markets Small Cap C (perf) (dist) - GBP 129.13 97.24 102.32JPM Emerging Markets Small Cap D (perf) (acc) - EUR 181.49 129.61 138.21JPM Emerging Markets Small Cap D (perf) (acc) - USD 19.55 13.18 14.27JPM Emerging Markets Small Cap I (perf) (acc) - USD 213.83 141.59 150.83JPM Emerging Markets Small Cap I (perf) (dist) - USD 129.37 86.75 93.56JPM Emerging Markets Small Cap T (perf) (acc) - EUR 180.74 129.07 137.62JPM Emerging Markets Small Cap X (acc) - EUR 197.77 137.54 142.58JPM Emerging Markets Small Cap X (acc) - JPY 16,720.00 10,678.00 11,250.00JPM Emerging Markets Small Cap X (acc) - USD 137.35 90.17 -Total net assets in USD 2,159,622,871 1,333,286,064 1,377,284,795
JPMorgan Funds - Emerging Middle East Equity FundJPM Emerging Middle East Equity A (acc) - EUR 20.81 15.64 17.89JPM Emerging Middle East Equity A (acc) - USD 25.90 18.37 21.30JPM Emerging Middle East Equity A (dist) - USD 28.99 20.86 24.72JPM Emerging Middle East Equity C (acc) - USD 13.81 9.72 11.18JPM Emerging Middle East Equity C (dist) - USD 126.27 91.05 107.85JPM Emerging Middle East Equity D (acc) - EUR 124.33 94.36 109.06JPM Emerging Middle East Equity D (acc) - USD 29.76 21.32 24.97Total net assets in USD 101,728,712 84,637,203 115,020,891
JPMorgan Funds - Europe Dynamic FundJPM Europe Dynamic A (acc) - AUD (hedged) 17.55 13.18 14.18JPM Europe Dynamic A (acc) - EUR 29.29 21.81 23.15JPM Europe Dynamic A (acc) - HKD (hedged) 16.84 12.58 13.16JPM Europe Dynamic A (acc) - SGD (hedged) 16.22 12.12 12.80JPM Europe Dynamic A (acc) - USD 191.34 134.56 145.21JPM Europe Dynamic A (acc) - USD (hedged) 233.21 173.93 182.18JPM Europe Dynamic A (dist) - EUR 23.49 17.64 19.04JPM Europe Dynamic A (dist) - GBP 30.66 24.48 25.96JPM Europe Dynamic C (acc) - EUR 39.52 29.21 30.79JPM Europe Dynamic C (acc) - USD 200.28 139.74 149.59JPM Europe Dynamic C (acc) - USD (hedged) 244.67 181.06 188.25JPM Europe Dynamic C (dist) - EUR 114.56 86.02 92.85JPM Europe Dynamic C (dist) - GBP 130.79 104.28 110.62JPM Europe Dynamic D (acc) - EUR 25.18 18.89 20.22JPM Europe Dynamic D (acc) - USD 178.71 126.62 137.68JPM Europe Dynamic D (acc) - USD (hedged) 207.82 156.19 164.94JPM Europe Dynamic I (acc) - EUR 37.99 28.07 29.57JPM Europe Dynamic I (acc) - USD (hedged) 209.83 155.22 161.32JPM Europe Dynamic I2 (acc) - EUR 125.35 92.43 97.19JPM Europe Dynamic T (acc) - EUR 120.10 90.15 96.53JPM Europe Dynamic X (acc) - EUR 183.31 134.34 140.40JPM Europe Dynamic X (acc) - USD (hedged) 146.92 107.80 111.12Total net assets in EUR 785,368,956 602,755,515 831,933,445
45
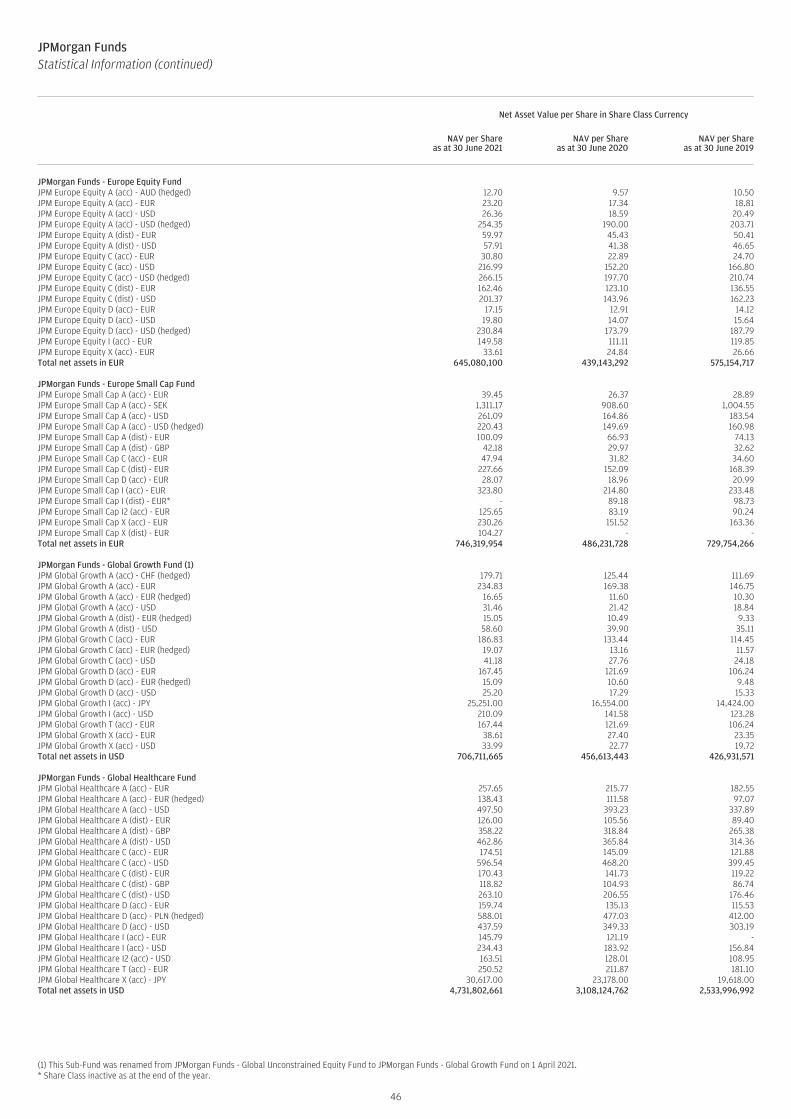
JPMorgan FundsStatistical Information (continued)
Net Asset Value per Share in Share Class Currency
NAV per Shareas at 30 June 2021
NAV per Shareas at 30 June 2020
NAV per Shareas at 30 June 2019
JPMorgan Funds - Europe Equity FundJPM Europe Equity A (acc) - AUD (hedged) 12.70 9.57 10.50JPM Europe Equity A (acc) - EUR 23.20 17.34 18.81JPM Europe Equity A (acc) - USD 26.36 18.59 20.49JPM Europe Equity A (acc) - USD (hedged) 254.35 190.00 203.71JPM Europe Equity A (dist) - EUR 59.97 45.43 50.41JPM Europe Equity A (dist) - USD 57.91 41.38 46.65JPM Europe Equity C (acc) - EUR 30.80 22.89 24.70JPM Europe Equity C (acc) - USD 216.99 152.20 166.80JPM Europe Equity C (acc) - USD (hedged) 266.15 197.70 210.74JPM Europe Equity C (dist) - EUR 162.46 123.10 136.55JPM Europe Equity C (dist) - USD 201.37 143.96 162.23JPM Europe Equity D (acc) - EUR 17.15 12.91 14.12JPM Europe Equity D (acc) - USD 19.80 14.07 15.64JPM Europe Equity D (acc) - USD (hedged) 230.84 173.79 187.79JPM Europe Equity I (acc) - EUR 149.58 111.11 119.85JPM Europe Equity X (acc) - EUR 33.61 24.84 26.66Total net assets in EUR 645,080,100 439,143,292 575,154,717
JPMorgan Funds - Europe Small Cap FundJPM Europe Small Cap A (acc) - EUR 39.45 26.37 28.89JPM Europe Small Cap A (acc) - SEK 1,311.17 908.60 1,004.55JPM Europe Small Cap A (acc) - USD 261.09 164.86 183.54JPM Europe Small Cap A (acc) - USD (hedged) 220.43 149.69 160.98JPM Europe Small Cap A (dist) - EUR 100.09 66.93 74.13JPM Europe Small Cap A (dist) - GBP 42.18 29.97 32.62JPM Europe Small Cap C (acc) - EUR 47.94 31.82 34.60JPM Europe Small Cap C (dist) - EUR 227.66 152.09 168.39JPM Europe Small Cap D (acc) - EUR 28.07 18.96 20.99JPM Europe Small Cap I (acc) - EUR 323.80 214.80 233.48JPM Europe Small Cap I (dist) - EUR* - 89.18 98.73JPM Europe Small Cap I2 (acc) - EUR 125.65 83.19 90.24JPM Europe Small Cap X (acc) - EUR 230.26 151.52 163.36JPM Europe Small Cap X (dist) - EUR 104.27 - -Total net assets in EUR 746,319,954 486,231,728 729,754,266
JPMorgan Funds - Global Growth Fund (1)JPM Global Growth A (acc) - CHF (hedged) 179.71 125.44 111.69JPM Global Growth A (acc) - EUR 234.83 169.38 146.75JPM Global Growth A (acc) - EUR (hedged) 16.65 11.60 10.30JPM Global Growth A (acc) - USD 31.46 21.42 18.84JPM Global Growth A (dist) - EUR (hedged) 15.05 10.49 9.33JPM Global Growth A (dist) - USD 58.60 39.90 35.11JPM Global Growth C (acc) - EUR 186.83 133.44 114.45JPM Global Growth C (acc) - EUR (hedged) 19.07 13.16 11.57JPM Global Growth C (acc) - USD 41.18 27.76 24.18JPM Global Growth D (acc) - EUR 167.45 121.69 106.24JPM Global Growth D (acc) - EUR (hedged) 15.09 10.60 9.48JPM Global Growth D (acc) - USD 25.20 17.29 15.33JPM Global Growth I (acc) - JPY 25,251.00 16,554.00 14,424.00JPM Global Growth I (acc) - USD 210.09 141.58 123.28JPM Global Growth T (acc) - EUR 167.44 121.69 106.24JPM Global Growth X (acc) - EUR 38.61 27.40 23.35JPM Global Growth X (acc) - USD 33.99 22.77 19.72Total net assets in USD 706,711,665 456,613,443 426,931,571
JPMorgan Funds - Global Healthcare FundJPM Global Healthcare A (acc) - EUR 257.65 215.77 182.55JPM Global Healthcare A (acc) - EUR (hedged) 138.43 111.58 97.07JPM Global Healthcare A (acc) - USD 497.50 393.23 337.89JPM Global Healthcare A (dist) - EUR 126.00 105.56 89.40JPM Global Healthcare A (dist) - GBP 358.22 318.84 265.38JPM Global Healthcare A (dist) - USD 462.86 365.84 314.36JPM Global Healthcare C (acc) - EUR 174.51 145.09 121.88JPM Global Healthcare C (acc) - USD 596.54 468.20 399.45JPM Global Healthcare C (dist) - EUR 170.43 141.73 119.22JPM Global Healthcare C (dist) - GBP 118.82 104.93 86.74JPM Global Healthcare C (dist) - USD 263.10 206.55 176.46JPM Global Healthcare D (acc) - EUR 159.74 135.13 115.53JPM Global Healthcare D (acc) - PLN (hedged) 588.01 477.03 412.00JPM Global Healthcare D (acc) - USD 437.59 349.33 303.19JPM Global Healthcare I (acc) - EUR 145.79 121.19 -JPM Global Healthcare I (acc) - USD 234.43 183.92 156.84JPM Global Healthcare I2 (acc) - USD 163.51 128.01 108.95JPM Global Healthcare T (acc) - EUR 250.52 211.87 181.10JPM Global Healthcare X (acc) - JPY 30,617.00 23,178.00 19,618.00Total net assets in USD 4,731,802,661 3,108,124,762 2,533,996,992
(1) This Sub-Fund was renamed from JPMorgan Funds - Global Unconstrained Equity Fund to JPMorgan Funds - Global Growth Fund on 1 April 2021.* Share Class inactive as at the end of the year.
46

JPMorgan FundsStatistical Information (continued)
Net Asset Value per Share in Share Class Currency
NAV per Shareas at 30 June 2021
NAV per Shareas at 30 June 2020
NAV per Shareas at 30 June 2019
JPMorgan Funds - Global Natural Resources FundJPM Global Natural Resources A (acc) - EUR 15.73 11.40 13.74JPM Global Natural Resources A (acc) - GBP 104.03 80.14 94.98JPM Global Natural Resources A (acc) - SGD 14.86 10.57 12.55JPM Global Natural Resources A (acc) - USD 11.43 7.83 9.58JPM Global Natural Resources A (dist) - EUR 12.79 9.50 11.67JPM Global Natural Resources C (acc) - EUR 15.53 11.17 13.36JPM Global Natural Resources C (acc) - GBP* - 90.87 -JPM Global Natural Resources C (acc) - USD 10.02 6.80 8.27JPM Global Natural Resources C (dist) - EUR 109.94 81.78 101.52JPM Global Natural Resources D (acc) - EUR 9.54 6.98 8.50JPM Global Natural Resources D (acc) - USD 7.03 4.86 6.01JPM Global Natural Resources F (acc) - USD 132.63 91.73 113.47JPM Global Natural Resources I (acc) - EUR 127.58 91.78 109.75JPM Global Natural Resources I (acc) - SGD 11.89 8.38 9.87JPM Global Natural Resources X (acc) - EUR 20.10 14.35 17.01Total net assets in EUR 1,096,046,429 611,180,464 815,566,337
JPMorgan Funds - Greater China FundJPM Greater China A (acc) - SGD 49.39 33.93 24.74JPM Greater China A (acc) - USD 73.02 48.28 36.33JPM Greater China A (dist) - HKD 35.91 23.76 18.02JPM Greater China A (dist) - USD 85.32 56.43 42.48JPM Greater China C (acc) - EUR 235.82 163.83 120.36JPM Greater China C (acc) - HKD^ 10.72 - -JPM Greater China C (acc) - USD 85.61 56.14 41.89JPM Greater China C (dist) - GBP 185.16 137.14 -JPM Greater China C (dist) - HKD^ 10.72 - -JPM Greater China C (dist) - USD 287.24 189.19 142.12JPM Greater China D (acc) - EUR 290.56 205.59 153.88JPM Greater China D (acc) - USD 98.80 65.98 50.15JPM Greater China I (acc) - USD 363.55 238.31 177.74JPM Greater China I2 (acc) - EUR 158.11 109.64 92.35JPM Greater China I2 (acc) - USD 242.69 158.85 118.30JPM Greater China T (acc) - EUR 243.01 171.97 128.72JPM Greater China X (acc) - USD 364.97 237.44 175.73Total net assets in USD 3,346,682,085 923,987,306 558,471,741
JPMorgan Funds - Japan Equity FundJPM Japan Equity A (acc) - AUD (hedged) 17.76 13.81 11.64JPM Japan Equity A (acc) - EUR 15.47 13.08 10.89JPM Japan Equity A (acc) - EUR (hedged) 161.42 126.01 107.49JPM Japan Equity A (acc) - JPY 1,820.00 1,413.00 1,196.00JPM Japan Equity A (acc) - SGD (hedged) 18.94 14.67 12.29JPM Japan Equity A (acc) - USD 21.98 17.54 14.83JPM Japan Equity A (acc) - USD (hedged) 242.23 187.37 156.65JPM Japan Equity A (dist) - GBP 20.05 18.02 14.77JPM Japan Equity A (dist) - GBP (hedged) 137.61 106.55 90.73JPM Japan Equity A (dist) - JPY 20,616.00 16,015.00 13,567.00JPM Japan Equity A (dist) - SGD 24.20 20.08 16.49JPM Japan Equity A (dist) - USD 54.99 43.88 37.13JPM Japan Equity C (acc) - EUR 207.00 173.62 143.49JPM Japan Equity C (acc) - EUR (hedged) 141.16 109.26 92.41JPM Japan Equity C (acc) - JPY 20,226.00 15,578.00 13,083.00JPM Japan Equity C (acc) - USD 28.07 22.22 18.65JPM Japan Equity C (acc) - USD (hedged) 262.74 201.65 167.29JPM Japan Equity C (dist) - GBP 174.63 155.68 126.68JPM Japan Equity C (dist) - JPY 14,184.00 10,936.00 9,203.00JPM Japan Equity C (dist) - USD 297.49 235.76 198.28JPM Japan Equity D (acc) - EUR 11.57 9.86 8.28JPM Japan Equity D (acc) - EUR (hedged) 191.46 150.58 129.42JPM Japan Equity D (acc) - JPY 19,911.00 15,583.00 13,300.00JPM Japan Equity D (acc) - USD 16.70 13.43 11.45JPM Japan Equity I (acc) - EUR 172.35 144.49 119.36JPM Japan Equity I (acc) - EUR (hedged) 171.93 133.03 112.46JPM Japan Equity I (acc) - JPY 20,315.00 15,642.00 13,131.00JPM Japan Equity I (acc) - USD 265.46 210.04 176.20JPM Japan Equity I (acc) - USD (hedged) 114.24 - -JPM Japan Equity I (dist) - GBP (hedged) 103.03 - -JPM Japan Equity I2 (acc) - EUR 139.78 117.00 96.51JPM Japan Equity I2 (acc) - EUR (hedged) 139.26 107.59 90.82JPM Japan Equity I2 (acc) - USD 97.87 - -JPM Japan Equity J (dist) - USD 29.26 23.37 19.79JPM Japan Equity X (acc) - JPY 18,637.00 14,240.00 11,863.00JPM Japan Equity X (acc) - USD 30.75 24.16 20.11JPM Japan Equity X (acc) - USD (hedged) 210.27 160.10 131.76Total net assets in JPY 495,349,607,593 574,098,993,593 490,096,435,750
* Share Class inactive as at the end of the year.^ Share Class reactivated during the year.
47
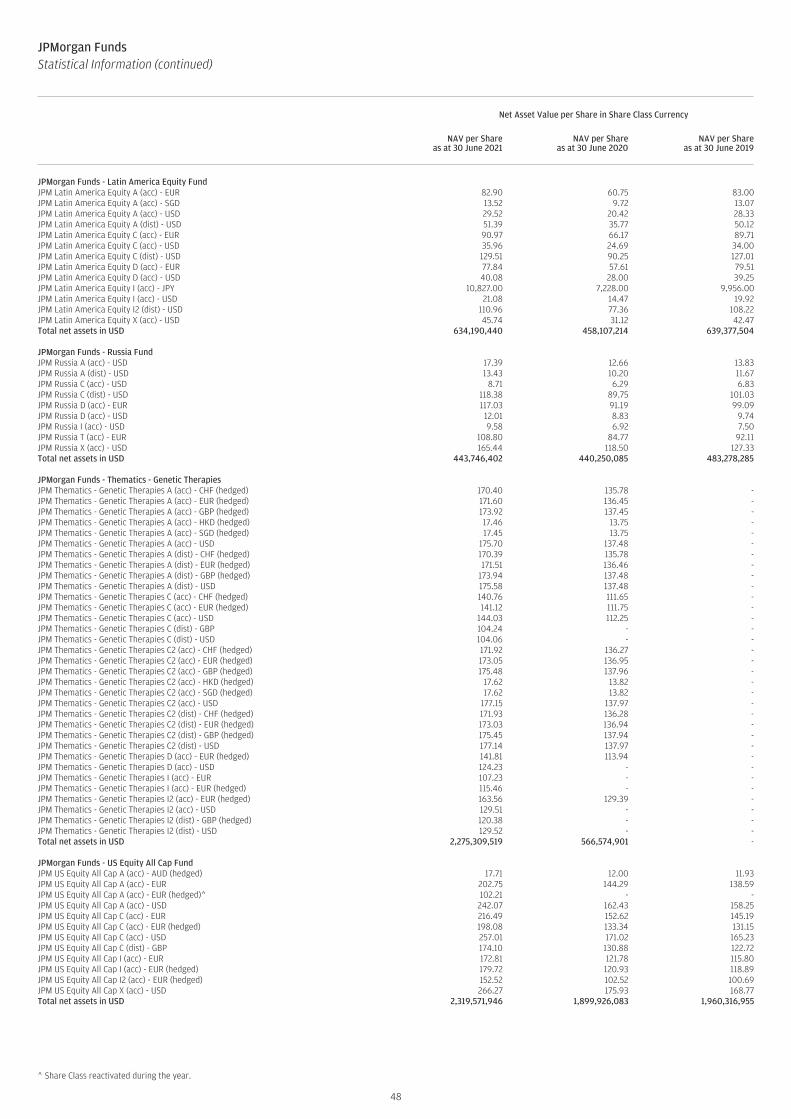
JPMorgan FundsStatistical Information (continued)
Net Asset Value per Share in Share Class Currency
NAV per Shareas at 30 June 2021
NAV per Shareas at 30 June 2020
NAV per Shareas at 30 June 2019
JPMorgan Funds - Latin America Equity FundJPM Latin America Equity A (acc) - EUR 82.90 60.75 83.00JPM Latin America Equity A (acc) - SGD 13.52 9.72 13.07JPM Latin America Equity A (acc) - USD 29.52 20.42 28.33JPM Latin America Equity A (dist) - USD 51.39 35.77 50.12JPM Latin America Equity C (acc) - EUR 90.97 66.17 89.71JPM Latin America Equity C (acc) - USD 35.96 24.69 34.00JPM Latin America Equity C (dist) - USD 129.51 90.25 127.01JPM Latin America Equity D (acc) - EUR 77.84 57.61 79.51JPM Latin America Equity D (acc) - USD 40.08 28.00 39.25JPM Latin America Equity I (acc) - JPY 10,827.00 7,228.00 9,956.00JPM Latin America Equity I (acc) - USD 21.08 14.47 19.92JPM Latin America Equity I2 (dist) - USD 110.96 77.36 108.22JPM Latin America Equity X (acc) - USD 45.74 31.12 42.47Total net assets in USD 634,190,440 458,107,214 639,377,504
JPMorgan Funds - Russia FundJPM Russia A (acc) - USD 17.39 12.66 13.83JPM Russia A (dist) - USD 13.43 10.20 11.67JPM Russia C (acc) - USD 8.71 6.29 6.83JPM Russia C (dist) - USD 118.38 89.75 101.03JPM Russia D (acc) - EUR 117.03 91.19 99.09JPM Russia D (acc) - USD 12.01 8.83 9.74JPM Russia I (acc) - USD 9.58 6.92 7.50JPM Russia T (acc) - EUR 108.80 84.77 92.11JPM Russia X (acc) - USD 165.44 118.50 127.33Total net assets in USD 443,746,402 440,250,085 483,278,285
JPMorgan Funds - Thematics - Genetic TherapiesJPM Thematics - Genetic Therapies A (acc) - CHF (hedged) 170.40 135.78 -JPM Thematics - Genetic Therapies A (acc) - EUR (hedged) 171.60 136.45 -JPM Thematics - Genetic Therapies A (acc) - GBP (hedged) 173.92 137.45 -JPM Thematics - Genetic Therapies A (acc) - HKD (hedged) 17.46 13.75 -JPM Thematics - Genetic Therapies A (acc) - SGD (hedged) 17.45 13.75 -JPM Thematics - Genetic Therapies A (acc) - USD 175.70 137.48 -JPM Thematics - Genetic Therapies A (dist) - CHF (hedged) 170.39 135.78 -JPM Thematics - Genetic Therapies A (dist) - EUR (hedged) 171.51 136.46 -JPM Thematics - Genetic Therapies A (dist) - GBP (hedged) 173.94 137.48 -JPM Thematics - Genetic Therapies A (dist) - USD 175.58 137.48 -JPM Thematics - Genetic Therapies C (acc) - CHF (hedged) 140.76 111.65 -JPM Thematics - Genetic Therapies C (acc) - EUR (hedged) 141.12 111.75 -JPM Thematics - Genetic Therapies C (acc) - USD 144.03 112.25 -JPM Thematics - Genetic Therapies C (dist) - GBP 104.24 - -JPM Thematics - Genetic Therapies C (dist) - USD 104.06 - -JPM Thematics - Genetic Therapies C2 (acc) - CHF (hedged) 171.92 136.27 -JPM Thematics - Genetic Therapies C2 (acc) - EUR (hedged) 173.05 136.95 -JPM Thematics - Genetic Therapies C2 (acc) - GBP (hedged) 175.48 137.96 -JPM Thematics - Genetic Therapies C2 (acc) - HKD (hedged) 17.62 13.82 -JPM Thematics - Genetic Therapies C2 (acc) - SGD (hedged) 17.62 13.82 -JPM Thematics - Genetic Therapies C2 (acc) - USD 177.15 137.97 -JPM Thematics - Genetic Therapies C2 (dist) - CHF (hedged) 171.93 136.28 -JPM Thematics - Genetic Therapies C2 (dist) - EUR (hedged) 173.03 136.94 -JPM Thematics - Genetic Therapies C2 (dist) - GBP (hedged) 175.45 137.94 -JPM Thematics - Genetic Therapies C2 (dist) - USD 177.14 137.97 -JPM Thematics - Genetic Therapies D (acc) - EUR (hedged) 141.81 113.94 -JPM Thematics - Genetic Therapies D (acc) - USD 124.23 - -JPM Thematics - Genetic Therapies I (acc) - EUR 107.23 - -JPM Thematics - Genetic Therapies I (acc) - EUR (hedged) 115.46 - -JPM Thematics - Genetic Therapies I2 (acc) - EUR (hedged) 163.56 129.39 -JPM Thematics - Genetic Therapies I2 (acc) - USD 129.51 - -JPM Thematics - Genetic Therapies I2 (dist) - GBP (hedged) 120.38 - -JPM Thematics - Genetic Therapies I2 (dist) - USD 129.52 - -Total net assets in USD 2,275,309,519 566,574,901 -
JPMorgan Funds - US Equity All Cap FundJPM US Equity All Cap A (acc) - AUD (hedged) 17.71 12.00 11.93JPM US Equity All Cap A (acc) - EUR 202.75 144.29 138.59JPM US Equity All Cap A (acc) - EUR (hedged)^ 102.21 - -JPM US Equity All Cap A (acc) - USD 242.07 162.43 158.25JPM US Equity All Cap C (acc) - EUR 216.49 152.62 145.19JPM US Equity All Cap C (acc) - EUR (hedged) 198.08 133.34 131.15JPM US Equity All Cap C (acc) - USD 257.01 171.02 165.23JPM US Equity All Cap C (dist) - GBP 174.10 130.88 122.72JPM US Equity All Cap I (acc) - EUR 172.81 121.78 115.80JPM US Equity All Cap I (acc) - EUR (hedged) 179.72 120.93 118.89JPM US Equity All Cap I2 (acc) - EUR (hedged) 152.52 102.52 100.69JPM US Equity All Cap X (acc) - USD 266.27 175.93 168.77Total net assets in USD 2,319,571,946 1,899,926,083 1,960,316,955
^ Share Class reactivated during the year.
48

JPMorgan FundsStatistical Information (continued)
Net Asset Value per Share in Share Class Currency
NAV per Shareas at 30 June 2021
NAV per Shareas at 30 June 2020
NAV per Shareas at 30 June 2019
JPMorgan Funds - US Growth FundJPM US Growth A (acc) - EUR (hedged) 31.27 22.34 17.78JPM US Growth A (acc) - USD 60.63 42.79 33.49JPM US Growth A (dist) - GBP 33.13 26.33 19.96JPM US Growth A (dist) - USD 31.89 22.53 17.65JPM US Growth C (acc) - EUR (hedged) 45.06 31.88 25.11JPM US Growth C (acc) - USD 61.20 42.79 33.18JPM US Growth C (dist) - GBP 403.69 317.56 238.28JPM US Growth C (dist) - USD 522.73 365.51 283.41JPM US Growth D (acc) - EUR (hedged) 28.10 20.23 16.21JPM US Growth D (acc) - USD 27.87 19.82 15.63JPM US Growth I (acc) - JPY 51,815.00 35,232.00 27,323.00JPM US Growth I (acc) - JPY (hedged) 10,220.00 - -JPM US Growth I (acc) - USD 415.87 290.66 225.27JPM US Growth I (dist) - GBP 299.99 235.89 176.93JPM US Growth I (dist) - USD 415.34 290.30 225.00JPM US Growth I2 (acc) - USD 234.38 163.63 126.69JPM US Growth T (acc) - EUR (hedged) 298.37 214.73 172.12JPM US Growth X (acc) - USD 72.41 50.31 38.74Total net assets in USD 1,828,024,337 1,289,301,124 437,873,367
JPMorgan Funds - US Smaller Companies FundJPM US Smaller Companies A (acc) - EUR (hedged) 129.85 90.37 97.32JPM US Smaller Companies A (acc) - USD 33.27 22.82 24.16JPM US Smaller Companies A (dist) - USD 329.42 226.03 239.41JPM US Smaller Companies C (acc) - EUR (hedged) 155.68 107.43 114.70JPM US Smaller Companies C (acc) - USD 267.94 182.38 191.64JPM US Smaller Companies C (dist) - USD 235.09 160.23 168.61JPM US Smaller Companies C2 (dist) - USD* - 100.98 -JPM US Smaller Companies D (acc) - USD 41.06 28.47 30.47JPM US Smaller Companies I (acc) - EUR (hedged) 148.87 102.69 109.58JPM US Smaller Companies I (acc) - USD 219.40 149.28 156.79JPM US Smaller Companies I (dist) - USD 211.33 144.04 151.59JPM US Smaller Companies X (acc) - USD 38.50 26.00 27.10Total net assets in USD 1,900,390,401 898,167,958 830,693,538
JPMorgan Funds - US Technology FundJPM US Technology A (acc) - EUR 759.82 503.17 364.88JPM US Technology A (acc) - HKD 26.32 16.43 12.18JPM US Technology A (acc) - SGD 96.02 62.40 44.58JPM US Technology A (acc) - USD 95.51 59.71 43.99JPM US Technology A (dist) - GBP 13.72 9.67 6.91JPM US Technology A (dist) - USD 47.95 29.99 22.10JPM US Technology C (acc) - EUR 415.57 272.83 196.12JPM US Technology C (acc) - USD 92.85 57.53 42.00JPM US Technology C (dist) - GBP 197.72 137.86 -JPM US Technology C (dist) - USD 732.26 453.82 331.31JPM US Technology D (acc) - EUR 68.95 46.12 33.79JPM US Technology D (acc) - USD 11.52 7.27 5.41JPM US Technology F (acc) - USD 119.20 - -JPM US Technology I (acc) - USD 241.02 149.31 108.95JPM US Technology I2 (acc) - EUR 252.85 165.77 119.00JPM US Technology I2 (acc) - USD 256.68 158.85 115.80JPM US Technology X (acc) - USD 571.96 352.01 255.17Total net assets in USD 6,444,771,279 2,683,201,780 1,162,346,330
* Share Class inactive as at the end of the year.
49
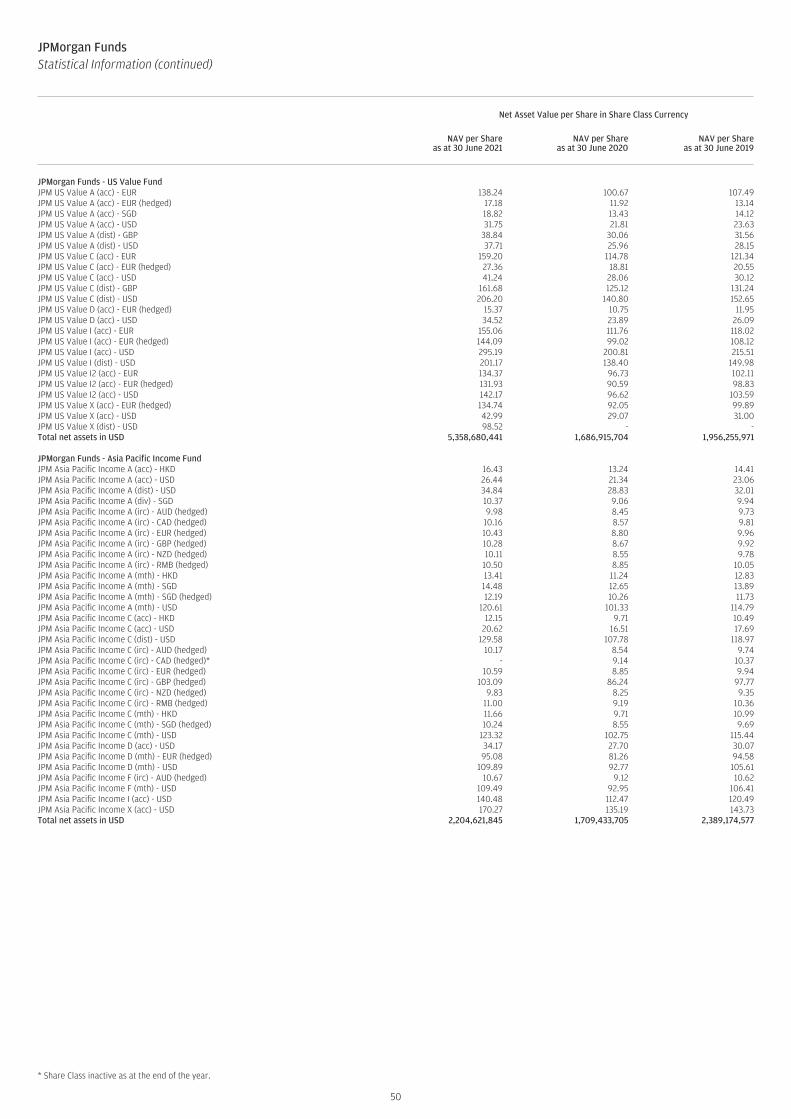
JPMorgan FundsStatistical Information (continued)
Net Asset Value per Share in Share Class Currency
NAV per Shareas at 30 June 2021
NAV per Shareas at 30 June 2020
NAV per Shareas at 30 June 2019
JPMorgan Funds - US Value FundJPM US Value A (acc) - EUR 138.24 100.67 107.49JPM US Value A (acc) - EUR (hedged) 17.18 11.92 13.14JPM US Value A (acc) - SGD 18.82 13.43 14.12JPM US Value A (acc) - USD 31.75 21.81 23.63JPM US Value A (dist) - GBP 38.84 30.06 31.56JPM US Value A (dist) - USD 37.71 25.96 28.15JPM US Value C (acc) - EUR 159.20 114.78 121.34JPM US Value C (acc) - EUR (hedged) 27.36 18.81 20.55JPM US Value C (acc) - USD 41.24 28.06 30.12JPM US Value C (dist) - GBP 161.68 125.12 131.24JPM US Value C (dist) - USD 206.20 140.80 152.65JPM US Value D (acc) - EUR (hedged) 15.37 10.75 11.95JPM US Value D (acc) - USD 34.52 23.89 26.09JPM US Value I (acc) - EUR 155.06 111.76 118.02JPM US Value I (acc) - EUR (hedged) 144.09 99.02 108.12JPM US Value I (acc) - USD 295.19 200.81 215.51JPM US Value I (dist) - USD 201.17 138.40 149.98JPM US Value I2 (acc) - EUR 134.37 96.73 102.11JPM US Value I2 (acc) - EUR (hedged) 131.93 90.59 98.83JPM US Value I2 (acc) - USD 142.17 96.62 103.59JPM US Value X (acc) - EUR (hedged) 134.74 92.05 99.89JPM US Value X (acc) - USD 42.99 29.07 31.00JPM US Value X (dist) - USD 98.52 - -Total net assets in USD 5,358,680,441 1,686,915,704 1,956,255,971
JPMorgan Funds - Asia Pacific Income FundJPM Asia Pacific Income A (acc) - HKD 16.43 13.24 14.41JPM Asia Pacific Income A (acc) - USD 26.44 21.34 23.06JPM Asia Pacific Income A (dist) - USD 34.84 28.83 32.01JPM Asia Pacific Income A (div) - SGD 10.37 9.06 9.94JPM Asia Pacific Income A (irc) - AUD (hedged) 9.98 8.45 9.73JPM Asia Pacific Income A (irc) - CAD (hedged) 10.16 8.57 9.81JPM Asia Pacific Income A (irc) - EUR (hedged) 10.43 8.80 9.96JPM Asia Pacific Income A (irc) - GBP (hedged) 10.28 8.67 9.92JPM Asia Pacific Income A (irc) - NZD (hedged) 10.11 8.55 9.78JPM Asia Pacific Income A (irc) - RMB (hedged) 10.50 8.85 10.05JPM Asia Pacific Income A (mth) - HKD 13.41 11.24 12.83JPM Asia Pacific Income A (mth) - SGD 14.48 12.65 13.89JPM Asia Pacific Income A (mth) - SGD (hedged) 12.19 10.26 11.73JPM Asia Pacific Income A (mth) - USD 120.61 101.33 114.79JPM Asia Pacific Income C (acc) - HKD 12.15 9.71 10.49JPM Asia Pacific Income C (acc) - USD 20.62 16.51 17.69JPM Asia Pacific Income C (dist) - USD 129.58 107.78 118.97JPM Asia Pacific Income C (irc) - AUD (hedged) 10.17 8.54 9.74JPM Asia Pacific Income C (irc) - CAD (hedged)* - 9.14 10.37JPM Asia Pacific Income C (irc) - EUR (hedged) 10.59 8.85 9.94JPM Asia Pacific Income C (irc) - GBP (hedged) 103.09 86.24 97.77JPM Asia Pacific Income C (irc) - NZD (hedged) 9.83 8.25 9.35JPM Asia Pacific Income C (irc) - RMB (hedged) 11.00 9.19 10.36JPM Asia Pacific Income C (mth) - HKD 11.66 9.71 10.99JPM Asia Pacific Income C (mth) - SGD (hedged) 10.24 8.55 9.69JPM Asia Pacific Income C (mth) - USD 123.32 102.75 115.44JPM Asia Pacific Income D (acc) - USD 34.17 27.70 30.07JPM Asia Pacific Income D (mth) - EUR (hedged) 95.08 81.26 94.58JPM Asia Pacific Income D (mth) - USD 109.89 92.77 105.61JPM Asia Pacific Income F (irc) - AUD (hedged) 10.67 9.12 10.62JPM Asia Pacific Income F (mth) - USD 109.49 92.95 106.41JPM Asia Pacific Income I (acc) - USD 140.48 112.47 120.49JPM Asia Pacific Income X (acc) - USD 170.27 135.19 143.73Total net assets in USD 2,204,621,845 1,709,433,705 2,389,174,577
* Share Class inactive as at the end of the year.
50

JPMorgan FundsStatistical Information (continued)
Net Asset Value per Share in Share Class Currency
NAV per Shareas at 30 June 2021
NAV per Shareas at 30 June 2020
NAV per Shareas at 30 June 2019
JPMorgan Funds - Aggregate Bond FundJPM Aggregate Bond A (acc) - EUR (hedged) 9.45 9.26 9.00JPM Aggregate Bond A (acc) - USD 15.82 15.36 14.61JPM Aggregate Bond A (dist) - EUR (hedged) 78.55 77.40 76.53JPM Aggregate Bond C (acc) - EUR (hedged) 91.18 88.94 86.15JPM Aggregate Bond C (acc) - SEK (hedged) 1,007.07 - -JPM Aggregate Bond C (acc) - USD 135.65 131.12 124.23JPM Aggregate Bond C (dist) - EUR (hedged) 81.50 80.58 79.44JPM Aggregate Bond C (dist) - GBP (hedged) 72.22 70.97 68.82JPM Aggregate Bond C (dist) - USD 118.12 115.69 112.56JPM Aggregate Bond D (acc) - EUR (hedged) 83.94 82.54 80.61JPM Aggregate Bond D (acc) - USD 126.48 123.24 117.72JPM Aggregate Bond I (acc) - EUR (hedged) 90.53 88.27 85.47JPM Aggregate Bond I (acc) - USD 136.53 131.92 124.93JPM Aggregate Bond I2 (acc) - EUR (hedged) 108.49 105.63 102.15JPM Aggregate Bond I2 (acc) - USD 116.97 112.87 106.75JPM Aggregate Bond I2 (dist) - EUR (hedged) 103.77 102.49 101.18JPM Aggregate Bond I2 (dist) - GBP (hedged) 107.55 105.21 103.05JPM Aggregate Bond I2 (dist) - USD 111.85 109.64 105.81JPM Aggregate Bond X (acc) - CHF (hedged) 99.56 - -JPM Aggregate Bond X (acc) - EUR (hedged)* - 88.89 85.75JPM Aggregate Bond X (acc) - USD 139.42 134.23 126.64Total net assets in USD 1,920,194,937 2,033,225,200 2,990,963,260
JPMorgan Funds - Emerging Markets Corporate Bond FundJPM Emerging Markets Corporate Bond A (acc) - CHF (hedged) 101.44 93.82 94.61JPM Emerging Markets Corporate Bond A (acc) - EUR (hedged) 122.99 113.41 113.91JPM Emerging Markets Corporate Bond A (acc) - USD 176.72 161.35 158.38JPM Emerging Markets Corporate Bond A (acc) - USD - Duration (hedged) 123.26 109.68 113.41JPM Emerging Markets Corporate Bond A (dist) - EUR (hedged) 72.58 70.03 73.65JPM Emerging Markets Corporate Bond A (dist) - USD 104.89 100.39 103.02JPM Emerging Markets Corporate Bond A (div) - EUR (hedged) 63.34 61.70 65.54JPM Emerging Markets Corporate Bond A (div) - USD 112.26 108.31 -JPM Emerging Markets Corporate Bond A (irc) - AUD (hedged) 8.86 8.56 9.02JPM Emerging Markets Corporate Bond A (mth) - SGD (hedged) 8.90 8.58 8.99JPM Emerging Markets Corporate Bond A (mth) - USD 85.57 82.44 85.57JPM Emerging Markets Corporate Bond C (acc) - CHF (hedged) 109.60 100.76 101.00JPM Emerging Markets Corporate Bond C (acc) - EUR (hedged) 111.85 102.60 102.53JPM Emerging Markets Corporate Bond C (acc) - SEK (hedged) 1,140.85 1,044.00 1,044.61JPM Emerging Markets Corporate Bond C (acc) - USD 178.58 162.16 158.33JPM Emerging Markets Corporate Bond C (acc) - USD - Duration (hedged) 128.81 113.94 117.12JPM Emerging Markets Corporate Bond C (dist) - EUR (hedged) 70.39 68.03 71.70JPM Emerging Markets Corporate Bond C (dist) - GBP (hedged) 58.10 55.73 58.70JPM Emerging Markets Corporate Bond C (dist) - USD 105.65 100.29 102.91JPM Emerging Markets Corporate Bond C (div) - EUR (hedged) 61.31 59.39 62.76JPM Emerging Markets Corporate Bond C (mth) - USD 92.91 89.01 91.88JPM Emerging Markets Corporate Bond C2 (acc) - CHF (hedged) 109.04 100.15 -JPM Emerging Markets Corporate Bond C2 (acc) - EUR (hedged) 109.51 100.36 -JPM Emerging Markets Corporate Bond C2 (acc) - USD 112.51 102.07 -JPM Emerging Markets Corporate Bond C2 (dist) - EUR (hedged) 104.64 100.35 -JPM Emerging Markets Corporate Bond C2 (dist) - GBP (hedged)* - 100.24 -JPM Emerging Markets Corporate Bond C2 (dist) - USD* - 102.08 -JPM Emerging Markets Corporate Bond C2 (div) - EUR (hedged)* - 96.91 -JPM Emerging Markets Corporate Bond C2 (mth) - USD 102.79 98.37 -JPM Emerging Markets Corporate Bond D (acc) - EUR (hedged) 111.99 103.81 104.84JPM Emerging Markets Corporate Bond D (acc) - USD 117.84 108.19 -JPM Emerging Markets Corporate Bond D (div) - EUR (hedged) 60.48 59.19 63.19JPM Emerging Markets Corporate Bond D (div) - USD 111.60 108.20 -JPM Emerging Markets Corporate Bond D (mth) - EUR (hedged) 83.53 81.74 87.38JPM Emerging Markets Corporate Bond D (mth) - USD 111.21 107.72 -JPM Emerging Markets Corporate Bond I (acc) - EUR (hedged) 114.32 104.83 104.72JPM Emerging Markets Corporate Bond I (acc) - USD 137.11 124.46 121.47JPM Emerging Markets Corporate Bond I (dist) - CHF (hedged) 81.88 80.15 84.51JPM Emerging Markets Corporate Bond I2 (acc) - CHF (hedged)* - 99.34 -JPM Emerging Markets Corporate Bond I2 (acc) - EUR (hedged)* - 102.39 102.18JPM Emerging Markets Corporate Bond I2 (acc) - USD 120.46 109.21 106.47JPM Emerging Markets Corporate Bond I2 (dist) - GBP (hedged)* - 102.72 102.39JPM Emerging Markets Corporate Bond I2 (dist) - USD* - 105.25 102.64JPM Emerging Markets Corporate Bond S2 (acc) - USD 119.85 108.52 -JPM Emerging Markets Corporate Bond X (acc) - USD 153.28 138.41 134.37JPM Emerging Markets Corporate Bond X (dist) - USD 108.61 101.69 -JPM Emerging Markets Corporate Bond Y (acc) - EUR (hedged) 100.20 91.41 90.85Total net assets in USD 1,284,878,344 1,652,391,097 2,239,547,064
* Share Class inactive as at the end of the year.
51
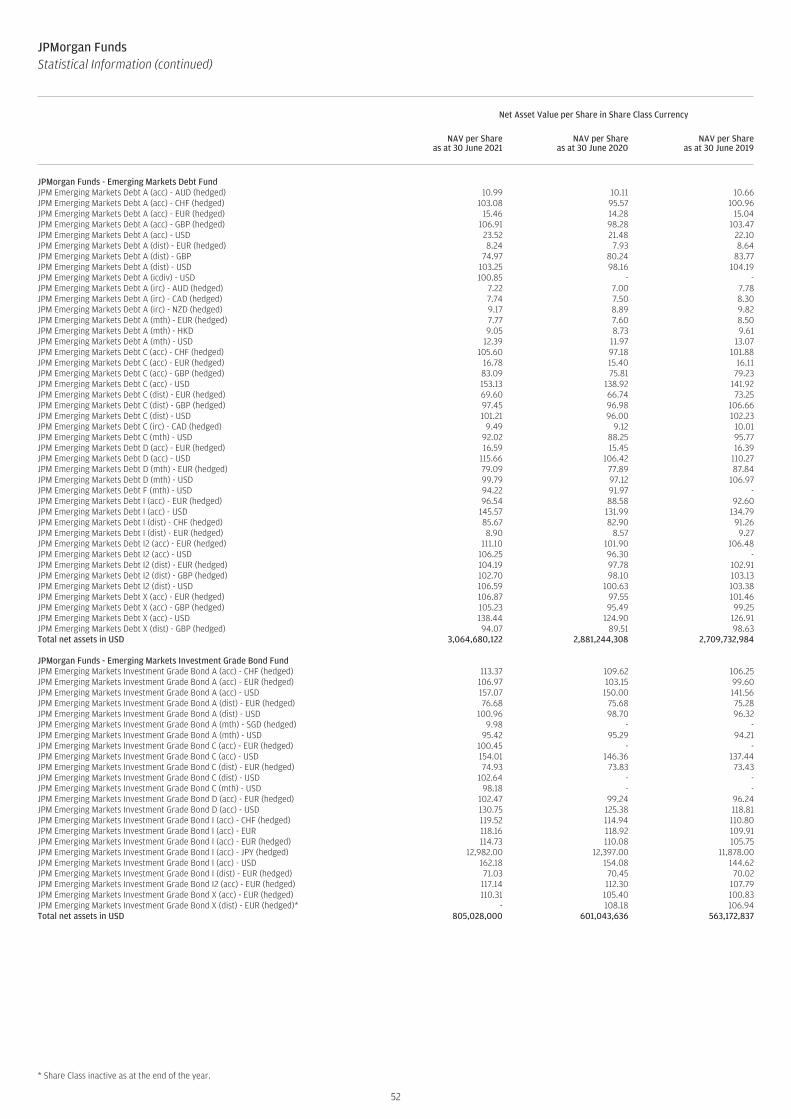
JPMorgan FundsStatistical Information (continued)
Net Asset Value per Share in Share Class Currency
NAV per Shareas at 30 June 2021
NAV per Shareas at 30 June 2020
NAV per Shareas at 30 June 2019
JPMorgan Funds - Emerging Markets Debt FundJPM Emerging Markets Debt A (acc) - AUD (hedged) 10.99 10.11 10.66JPM Emerging Markets Debt A (acc) - CHF (hedged) 103.08 95.57 100.96JPM Emerging Markets Debt A (acc) - EUR (hedged) 15.46 14.28 15.04JPM Emerging Markets Debt A (acc) - GBP (hedged) 106.91 98.28 103.47JPM Emerging Markets Debt A (acc) - USD 23.52 21.48 22.10JPM Emerging Markets Debt A (dist) - EUR (hedged) 8.24 7.93 8.64JPM Emerging Markets Debt A (dist) - GBP 74.97 80.24 83.77JPM Emerging Markets Debt A (dist) - USD 103.25 98.16 104.19JPM Emerging Markets Debt A (icdiv) - USD 100.85 - -JPM Emerging Markets Debt A (irc) - AUD (hedged) 7.22 7.00 7.78JPM Emerging Markets Debt A (irc) - CAD (hedged) 7.74 7.50 8.30JPM Emerging Markets Debt A (irc) - NZD (hedged) 9.17 8.89 9.82JPM Emerging Markets Debt A (mth) - EUR (hedged) 7.77 7.60 8.50JPM Emerging Markets Debt A (mth) - HKD 9.05 8.73 9.61JPM Emerging Markets Debt A (mth) - USD 12.39 11.97 13.07JPM Emerging Markets Debt C (acc) - CHF (hedged) 105.60 97.18 101.88JPM Emerging Markets Debt C (acc) - EUR (hedged) 16.78 15.40 16.11JPM Emerging Markets Debt C (acc) - GBP (hedged) 83.09 75.81 79.23JPM Emerging Markets Debt C (acc) - USD 153.13 138.92 141.92JPM Emerging Markets Debt C (dist) - EUR (hedged) 69.60 66.74 73.25JPM Emerging Markets Debt C (dist) - GBP (hedged) 97.45 96.98 106.66JPM Emerging Markets Debt C (dist) - USD 101.21 96.00 102.23JPM Emerging Markets Debt C (irc) - CAD (hedged) 9.49 9.12 10.01JPM Emerging Markets Debt C (mth) - USD 92.02 88.25 95.77JPM Emerging Markets Debt D (acc) - EUR (hedged) 16.59 15.45 16.39JPM Emerging Markets Debt D (acc) - USD 115.66 106.42 110.27JPM Emerging Markets Debt D (mth) - EUR (hedged) 79.09 77.89 87.84JPM Emerging Markets Debt D (mth) - USD 99.79 97.12 106.97JPM Emerging Markets Debt F (mth) - USD 94.22 91.97 -JPM Emerging Markets Debt I (acc) - EUR (hedged) 96.54 88.58 92.60JPM Emerging Markets Debt I (acc) - USD 145.57 131.99 134.79JPM Emerging Markets Debt I (dist) - CHF (hedged) 85.67 82.90 91.26JPM Emerging Markets Debt I (dist) - EUR (hedged) 8.90 8.57 9.27JPM Emerging Markets Debt I2 (acc) - EUR (hedged) 111.10 101.90 106.48JPM Emerging Markets Debt I2 (acc) - USD 106.25 96.30 -JPM Emerging Markets Debt I2 (dist) - EUR (hedged) 104.19 97.78 102.91JPM Emerging Markets Debt I2 (dist) - GBP (hedged) 102.70 98.10 103.13JPM Emerging Markets Debt I2 (dist) - USD 106.59 100.63 103.38JPM Emerging Markets Debt X (acc) - EUR (hedged) 106.87 97.55 101.46JPM Emerging Markets Debt X (acc) - GBP (hedged) 105.23 95.49 99.25JPM Emerging Markets Debt X (acc) - USD 138.44 124.90 126.91JPM Emerging Markets Debt X (dist) - GBP (hedged) 94.07 89.51 98.63Total net assets in USD 3,064,680,122 2,881,244,308 2,709,732,984
JPMorgan Funds - Emerging Markets Investment Grade Bond FundJPM Emerging Markets Investment Grade Bond A (acc) - CHF (hedged) 113.37 109.62 106.25JPM Emerging Markets Investment Grade Bond A (acc) - EUR (hedged) 106.97 103.15 99.60JPM Emerging Markets Investment Grade Bond A (acc) - USD 157.07 150.00 141.56JPM Emerging Markets Investment Grade Bond A (dist) - EUR (hedged) 76.68 75.68 75.28JPM Emerging Markets Investment Grade Bond A (dist) - USD 100.96 98.70 96.32JPM Emerging Markets Investment Grade Bond A (mth) - SGD (hedged) 9.98 - -JPM Emerging Markets Investment Grade Bond A (mth) - USD 95.42 95.29 94.21JPM Emerging Markets Investment Grade Bond C (acc) - EUR (hedged) 100.45 - -JPM Emerging Markets Investment Grade Bond C (acc) - USD 154.01 146.36 137.44JPM Emerging Markets Investment Grade Bond C (dist) - EUR (hedged) 74.93 73.83 73.43JPM Emerging Markets Investment Grade Bond C (dist) - USD 102.64 - -JPM Emerging Markets Investment Grade Bond C (mth) - USD 98.18 - -JPM Emerging Markets Investment Grade Bond D (acc) - EUR (hedged) 102.47 99.24 96.24JPM Emerging Markets Investment Grade Bond D (acc) - USD 130.75 125.38 118.81JPM Emerging Markets Investment Grade Bond I (acc) - CHF (hedged) 119.52 114.94 110.80JPM Emerging Markets Investment Grade Bond I (acc) - EUR 118.16 118.92 109.91JPM Emerging Markets Investment Grade Bond I (acc) - EUR (hedged) 114.73 110.08 105.75JPM Emerging Markets Investment Grade Bond I (acc) - JPY (hedged) 12,982.00 12,397.00 11,878.00JPM Emerging Markets Investment Grade Bond I (acc) - USD 162.18 154.08 144.62JPM Emerging Markets Investment Grade Bond I (dist) - EUR (hedged) 71.03 70.45 70.02JPM Emerging Markets Investment Grade Bond I2 (acc) - EUR (hedged) 117.14 112.30 107.79JPM Emerging Markets Investment Grade Bond X (acc) - EUR (hedged) 110.31 105.40 100.83JPM Emerging Markets Investment Grade Bond X (dist) - EUR (hedged)* - 108.18 106.94Total net assets in USD 805,028,000 601,043,636 563,172,837
* Share Class inactive as at the end of the year.
52
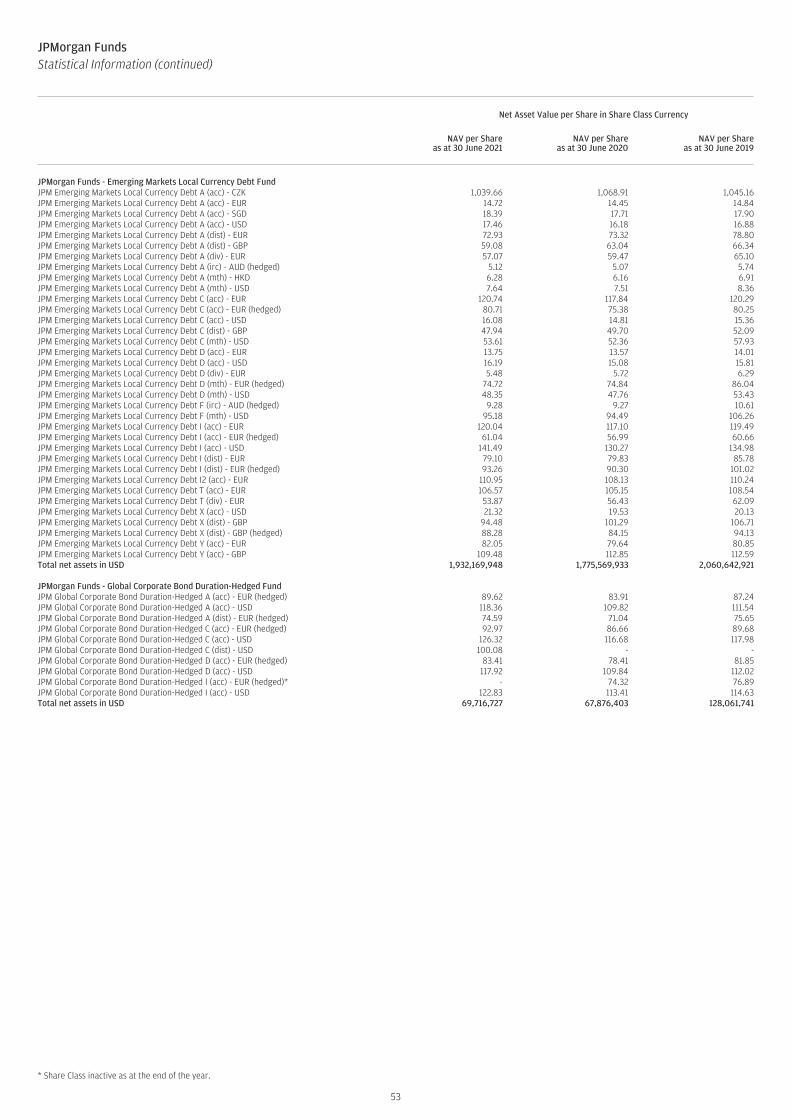
JPMorgan FundsStatistical Information (continued)
Net Asset Value per Share in Share Class Currency
NAV per Shareas at 30 June 2021
NAV per Shareas at 30 June 2020
NAV per Shareas at 30 June 2019
JPMorgan Funds - Emerging Markets Local Currency Debt FundJPM Emerging Markets Local Currency Debt A (acc) - CZK 1,039.66 1,068.91 1,045.16JPM Emerging Markets Local Currency Debt A (acc) - EUR 14.72 14.45 14.84JPM Emerging Markets Local Currency Debt A (acc) - SGD 18.39 17.71 17.90JPM Emerging Markets Local Currency Debt A (acc) - USD 17.46 16.18 16.88JPM Emerging Markets Local Currency Debt A (dist) - EUR 72.93 73.32 78.80JPM Emerging Markets Local Currency Debt A (dist) - GBP 59.08 63.04 66.34JPM Emerging Markets Local Currency Debt A (div) - EUR 57.07 59.47 65.10JPM Emerging Markets Local Currency Debt A (irc) - AUD (hedged) 5.12 5.07 5.74JPM Emerging Markets Local Currency Debt A (mth) - HKD 6.28 6.16 6.91JPM Emerging Markets Local Currency Debt A (mth) - USD 7.64 7.51 8.36JPM Emerging Markets Local Currency Debt C (acc) - EUR 120.74 117.84 120.29JPM Emerging Markets Local Currency Debt C (acc) - EUR (hedged) 80.71 75.38 80.25JPM Emerging Markets Local Currency Debt C (acc) - USD 16.08 14.81 15.36JPM Emerging Markets Local Currency Debt C (dist) - GBP 47.94 49.70 52.09JPM Emerging Markets Local Currency Debt C (mth) - USD 53.61 52.36 57.93JPM Emerging Markets Local Currency Debt D (acc) - EUR 13.75 13.57 14.01JPM Emerging Markets Local Currency Debt D (acc) - USD 16.19 15.08 15.81JPM Emerging Markets Local Currency Debt D (div) - EUR 5.48 5.72 6.29JPM Emerging Markets Local Currency Debt D (mth) - EUR (hedged) 74.72 74.84 86.04JPM Emerging Markets Local Currency Debt D (mth) - USD 48.35 47.76 53.43JPM Emerging Markets Local Currency Debt F (irc) - AUD (hedged) 9.28 9.27 10.61JPM Emerging Markets Local Currency Debt F (mth) - USD 95.18 94.49 106.26JPM Emerging Markets Local Currency Debt I (acc) - EUR 120.04 117.10 119.49JPM Emerging Markets Local Currency Debt I (acc) - EUR (hedged) 61.04 56.99 60.66JPM Emerging Markets Local Currency Debt I (acc) - USD 141.49 130.27 134.98JPM Emerging Markets Local Currency Debt I (dist) - EUR 79.10 79.83 85.78JPM Emerging Markets Local Currency Debt I (dist) - EUR (hedged) 93.26 90.30 101.02JPM Emerging Markets Local Currency Debt I2 (acc) - EUR 110.95 108.13 110.24JPM Emerging Markets Local Currency Debt T (acc) - EUR 106.57 105.15 108.54JPM Emerging Markets Local Currency Debt T (div) - EUR 53.87 56.43 62.09JPM Emerging Markets Local Currency Debt X (acc) - USD 21.32 19.53 20.13JPM Emerging Markets Local Currency Debt X (dist) - GBP 94.48 101.29 106.71JPM Emerging Markets Local Currency Debt X (dist) - GBP (hedged) 88.28 84.15 94.13JPM Emerging Markets Local Currency Debt Y (acc) - EUR 82.05 79.64 80.85JPM Emerging Markets Local Currency Debt Y (acc) - GBP 109.48 112.85 112.59Total net assets in USD 1,932,169,948 1,775,569,933 2,060,642,921
JPMorgan Funds - Global Corporate Bond Duration-Hedged FundJPM Global Corporate Bond Duration-Hedged A (acc) - EUR (hedged) 89.62 83.91 87.24JPM Global Corporate Bond Duration-Hedged A (acc) - USD 118.36 109.82 111.54JPM Global Corporate Bond Duration-Hedged A (dist) - EUR (hedged) 74.59 71.04 75.65JPM Global Corporate Bond Duration-Hedged C (acc) - EUR (hedged) 92.97 86.66 89.68JPM Global Corporate Bond Duration-Hedged C (acc) - USD 126.32 116.68 117.98JPM Global Corporate Bond Duration-Hedged C (dist) - USD 100.08 - -JPM Global Corporate Bond Duration-Hedged D (acc) - EUR (hedged) 83.41 78.41 81.85JPM Global Corporate Bond Duration-Hedged D (acc) - USD 117.92 109.84 112.02JPM Global Corporate Bond Duration-Hedged I (acc) - EUR (hedged)* - 74.32 76.89JPM Global Corporate Bond Duration-Hedged I (acc) - USD 122.83 113.41 114.63Total net assets in USD 69,716,727 67,876,403 128,061,741
* Share Class inactive as at the end of the year.
53

JPMorgan FundsStatistical Information (continued)
Net Asset Value per Share in Share Class Currency
NAV per Shareas at 30 June 2021
NAV per Shareas at 30 June 2020
NAV per Shareas at 30 June 2019
JPMorgan Funds - Global Corporate Bond FundJPM Global Corporate Bond A (acc) - AUD (hedged) 11.71 11.31 10.74JPM Global Corporate Bond A (acc) - CHF (hedged) 113.10 110.20 105.71JPM Global Corporate Bond A (acc) - EUR (hedged) 14.26 13.86 13.24JPM Global Corporate Bond A (acc) - NOK (hedged) 765.72 738.86 700.55JPM Global Corporate Bond A (acc) - NZD (hedged) 11.67 11.25 10.61JPM Global Corporate Bond A (acc) - SEK (hedged) 121.25 117.46 112.11JPM Global Corporate Bond A (acc) - USD 20.24 19.49 18.19JPM Global Corporate Bond A (dist) - EUR (hedged) 84.33 82.73 80.93JPM Global Corporate Bond A (dist) - GBP (hedged) 9.07 8.91 8.70JPM Global Corporate Bond A (dist) - USD 117.98 115.22 110.02JPM Global Corporate Bond A (div) - EUR (hedged) 70.52 70.72 69.75JPM Global Corporate Bond A (mth) - SGD 14.09 14.54 13.57JPM Global Corporate Bond A (mth) - USD 107.09 106.35 102.46JPM Global Corporate Bond C (acc) - CHF (hedged) 99.77 - -JPM Global Corporate Bond C (acc) - EUR (hedged) 109.58 106.02 100.81JPM Global Corporate Bond C (acc) - SEK (hedged) 1,150.22 1,109.26 1,053.98JPM Global Corporate Bond C (acc) - USD 161.86 155.12 144.14JPM Global Corporate Bond C (dist) - AUD (hedged) 10.50 10.10 -JPM Global Corporate Bond C (dist) - CHF (hedged) 96.02 94.85 92.66JPM Global Corporate Bond C (dist) - EUR (hedged) 81.58 80.40 78.86JPM Global Corporate Bond C (dist) - GBP (hedged) 69.29 68.13 66.53JPM Global Corporate Bond C (dist) - USD 119.35 116.83 111.69JPM Global Corporate Bond C (div) - EUR (hedged) 74.25 74.13 72.78JPM Global Corporate Bond C (mth) - USD 108.50 107.25 102.87JPM Global Corporate Bond D (acc) - EUR (hedged) 13.58 13.25 12.71JPM Global Corporate Bond D (acc) - USD 19.31 18.66 17.49JPM Global Corporate Bond D (div) - EUR (hedged) 6.99 7.03 6.97JPM Global Corporate Bond D (mth) - USD 101.48 101.18 97.88JPM Global Corporate Bond I (acc) - CHF (hedged) 112.96 109.52 104.54JPM Global Corporate Bond I (acc) - EUR (hedged) 96.37 93.20 88.59JPM Global Corporate Bond I (acc) - JPY (hedged) 12,003.00 11,561.00 10,970.00JPM Global Corporate Bond I (acc) - USD 143.04 137.04 127.29JPM Global Corporate Bond I (dist) - CHF (hedged) 88.64 87.73 86.37JPM Global Corporate Bond I (div) - EUR (hedged) 102.14 101.93 -JPM Global Corporate Bond I2 (acc) - EUR (hedged) 111.31 107.56 102.16JPM Global Corporate Bond I2 (acc) - JPY (hedged) 11,489.00 11,057.00 10,483.00JPM Global Corporate Bond I2 (acc) - USD 120.25 115.10 106.83JPM Global Corporate Bond I2 (dist) - GBP (hedged) 108.44 106.42 102.32JPM Global Corporate Bond I2 (dist) - USD 111.91 109.53 105.18JPM Global Corporate Bond T (acc) - EUR (hedged) 92.36 90.12 86.43JPM Global Corporate Bond T (div) - EUR (hedged) 68.90 69.36 68.70JPM Global Corporate Bond X (acc) - EUR (hedged) 104.71 100.85 95.46JPM Global Corporate Bond X (acc) - GBP (hedged) 94.98 90.85 85.63JPM Global Corporate Bond X (acc) - USD 139.00 132.61 122.67JPM Global Corporate Bond X (dist) - GBP (hedged) 67.04 66.37 65.59JPM Global Corporate Bond X (dist) - USD 113.64 111.30 105.59Total net assets in USD 5,846,454,879 7,009,827,435 4,456,619,411
JPMorgan Funds - Global Government Bond FundJPM Global Government Bond A (acc) - AUD (hedged) 11.26 11.43 10.77JPM Global Government Bond A (acc) - EUR 13.69 14.00 13.37JPM Global Government Bond A (acc) - USD (hedged) 19.30 19.56 18.29JPM Global Government Bond C (acc) - EUR 14.18 14.47 13.80JPM Global Government Bond C (acc) - USD (hedged) 134.13 135.68 126.58JPM Global Government Bond C (dist) - GBP (hedged)* - 111.38 105.72JPM Global Government Bond D (acc) - EUR 13.36 13.68 13.10JPM Global Government Bond I (acc) - EUR 120.52 122.91 117.17JPM Global Government Bond I (acc) - USD (hedged) 133.13 134.61 125.54JPM Global Government Bond I (dist) - EUR^ 100.18 105.67 100.74JPM Global Government Bond I2 (acc) - EUR 106.90 108.95 103.79JPM Global Government Bond I2 (acc) - USD (hedged) 102.40 103.48 -JPM Global Government Bond X (acc) - EUR 14.69 14.94 14.21JPM Global Government Bond X (acc) - USD (hedged) 135.53 136.69 127.15JPM Global Government Bond X (dist) - GBP (hedged) 109.15 110.29 104.68Total net assets in EUR 1,398,761,669 1,525,412,024 1,557,516,901
* Share Class inactive as at the end of the year.^ Share Class reactivated during the year.
54
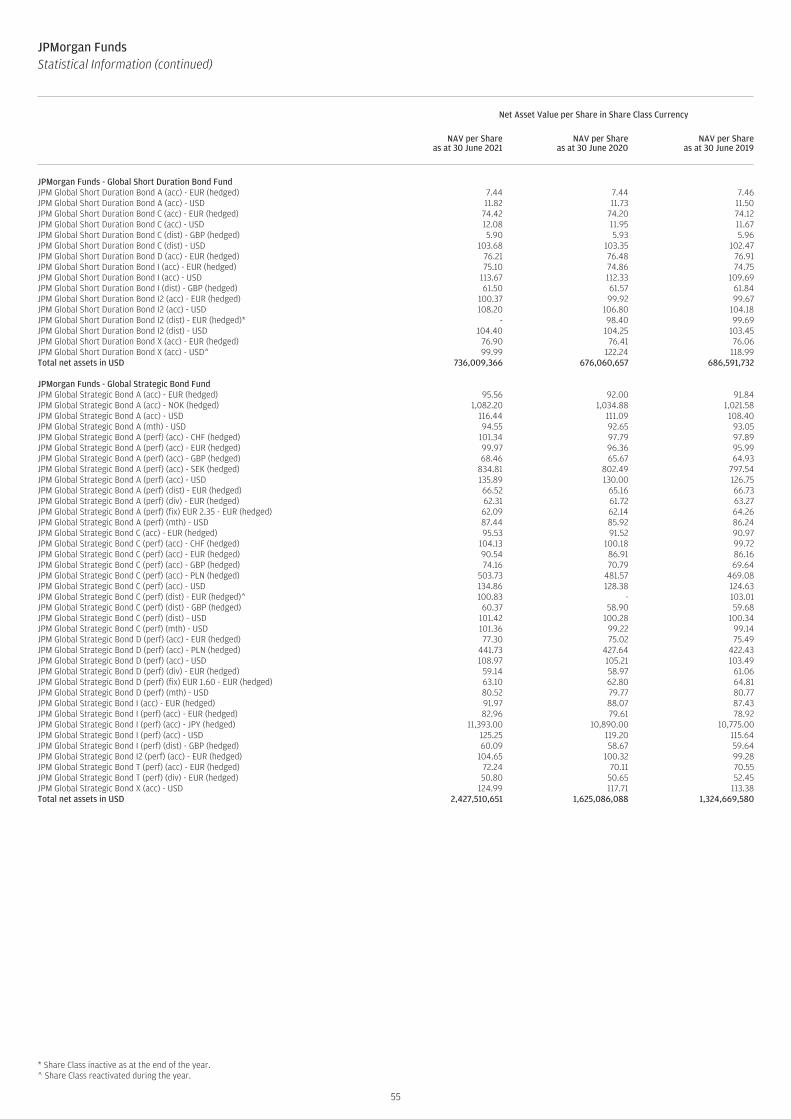
JPMorgan FundsStatistical Information (continued)
Net Asset Value per Share in Share Class Currency
NAV per Shareas at 30 June 2021
NAV per Shareas at 30 June 2020
NAV per Shareas at 30 June 2019
JPMorgan Funds - Global Short Duration Bond FundJPM Global Short Duration Bond A (acc) - EUR (hedged) 7.44 7.44 7.46JPM Global Short Duration Bond A (acc) - USD 11.82 11.73 11.50JPM Global Short Duration Bond C (acc) - EUR (hedged) 74.42 74.20 74.12JPM Global Short Duration Bond C (acc) - USD 12.08 11.95 11.67JPM Global Short Duration Bond C (dist) - GBP (hedged) 5.90 5.93 5.96JPM Global Short Duration Bond C (dist) - USD 103.68 103.35 102.47JPM Global Short Duration Bond D (acc) - EUR (hedged) 76.21 76.48 76.91JPM Global Short Duration Bond I (acc) - EUR (hedged) 75.10 74.86 74.75JPM Global Short Duration Bond I (acc) - USD 113.67 112.33 109.69JPM Global Short Duration Bond I (dist) - GBP (hedged) 61.50 61.57 61.84JPM Global Short Duration Bond I2 (acc) - EUR (hedged) 100.37 99.92 99.67JPM Global Short Duration Bond I2 (acc) - USD 108.20 106.80 104.18JPM Global Short Duration Bond I2 (dist) - EUR (hedged)* - 98.40 99.69JPM Global Short Duration Bond I2 (dist) - USD 104.40 104.25 103.45JPM Global Short Duration Bond X (acc) - EUR (hedged) 76.90 76.41 76.06JPM Global Short Duration Bond X (acc) - USD^ 99.99 122.24 118.99Total net assets in USD 736,009,366 676,060,657 686,591,732
JPMorgan Funds - Global Strategic Bond FundJPM Global Strategic Bond A (acc) - EUR (hedged) 95.56 92.00 91.84JPM Global Strategic Bond A (acc) - NOK (hedged) 1,082.20 1,034.88 1,021.58JPM Global Strategic Bond A (acc) - USD 116.44 111.09 108.40JPM Global Strategic Bond A (mth) - USD 94.55 92.65 93.05JPM Global Strategic Bond A (perf) (acc) - CHF (hedged) 101.34 97.79 97.89JPM Global Strategic Bond A (perf) (acc) - EUR (hedged) 99.97 96.36 95.99JPM Global Strategic Bond A (perf) (acc) - GBP (hedged) 68.46 65.67 64.93JPM Global Strategic Bond A (perf) (acc) - SEK (hedged) 834.81 802.49 797.54JPM Global Strategic Bond A (perf) (acc) - USD 135.89 130.00 126.75JPM Global Strategic Bond A (perf) (dist) - EUR (hedged) 66.52 65.16 66.73JPM Global Strategic Bond A (perf) (div) - EUR (hedged) 62.31 61.72 63.27JPM Global Strategic Bond A (perf) (fix) EUR 2.35 - EUR (hedged) 62.09 62.14 64.26JPM Global Strategic Bond A (perf) (mth) - USD 87.44 85.92 86.24JPM Global Strategic Bond C (acc) - EUR (hedged) 95.53 91.52 90.97JPM Global Strategic Bond C (perf) (acc) - CHF (hedged) 104.13 100.18 99.72JPM Global Strategic Bond C (perf) (acc) - EUR (hedged) 90.54 86.91 86.16JPM Global Strategic Bond C (perf) (acc) - GBP (hedged) 74.16 70.79 69.64JPM Global Strategic Bond C (perf) (acc) - PLN (hedged) 503.73 481.57 469.08JPM Global Strategic Bond C (perf) (acc) - USD 134.86 128.38 124.63JPM Global Strategic Bond C (perf) (dist) - EUR (hedged)^ 100.83 - 103.01JPM Global Strategic Bond C (perf) (dist) - GBP (hedged) 60.37 58.90 59.68JPM Global Strategic Bond C (perf) (dist) - USD 101.42 100.28 100.34JPM Global Strategic Bond C (perf) (mth) - USD 101.36 99.22 99.14JPM Global Strategic Bond D (perf) (acc) - EUR (hedged) 77.30 75.02 75.49JPM Global Strategic Bond D (perf) (acc) - PLN (hedged) 441.73 427.64 422.43JPM Global Strategic Bond D (perf) (acc) - USD 108.97 105.21 103.49JPM Global Strategic Bond D (perf) (div) - EUR (hedged) 59.14 58.97 61.06JPM Global Strategic Bond D (perf) (fix) EUR 1.60 - EUR (hedged) 63.10 62.80 64.81JPM Global Strategic Bond D (perf) (mth) - USD 80.52 79.77 80.77JPM Global Strategic Bond I (acc) - EUR (hedged) 91.97 88.07 87.43JPM Global Strategic Bond I (perf) (acc) - EUR (hedged) 82.96 79.61 78.92JPM Global Strategic Bond I (perf) (acc) - JPY (hedged) 11,393.00 10,890.00 10,775.00JPM Global Strategic Bond I (perf) (acc) - USD 125.25 119.20 115.64JPM Global Strategic Bond I (perf) (dist) - GBP (hedged) 60.09 58.67 59.64JPM Global Strategic Bond I2 (perf) (acc) - EUR (hedged) 104.65 100.32 99.28JPM Global Strategic Bond T (perf) (acc) - EUR (hedged) 72.24 70.11 70.55JPM Global Strategic Bond T (perf) (div) - EUR (hedged) 50.80 50.65 52.45JPM Global Strategic Bond X (acc) - USD 124.99 117.71 113.38Total net assets in USD 2,427,510,651 1,625,086,088 1,324,669,580
* Share Class inactive as at the end of the year.^ Share Class reactivated during the year.
55
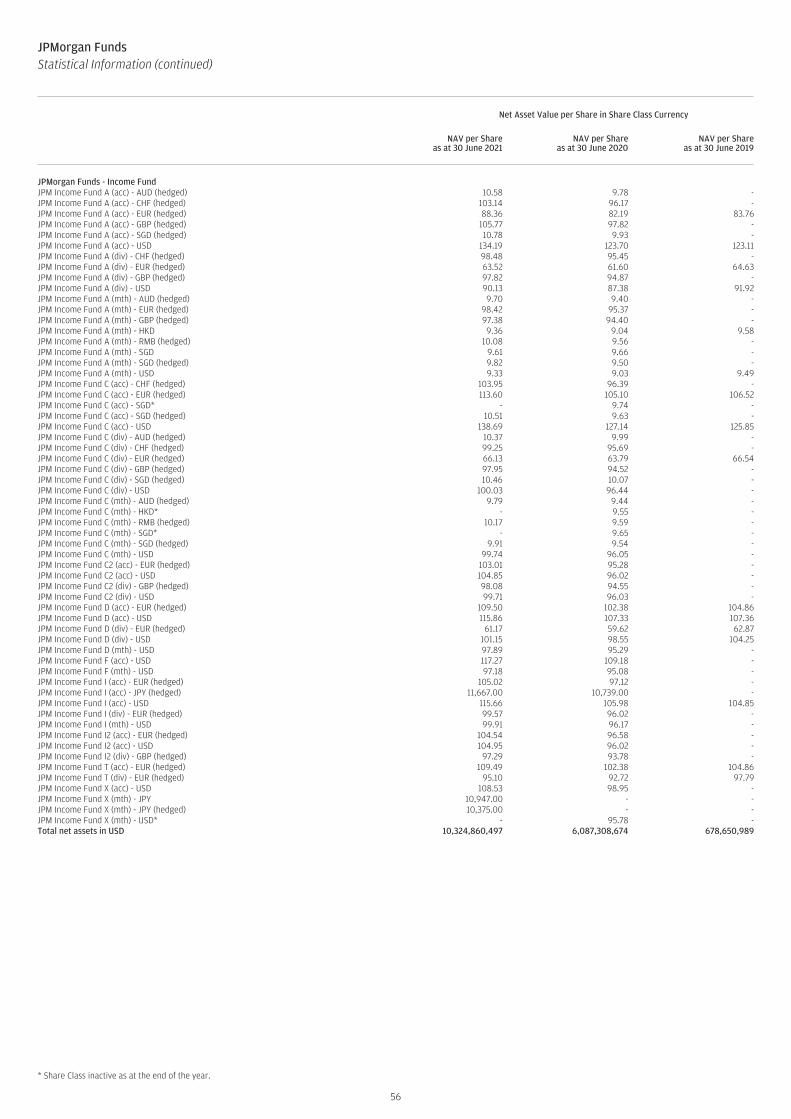
JPMorgan FundsStatistical Information (continued)
Net Asset Value per Share in Share Class Currency
NAV per Shareas at 30 June 2021
NAV per Shareas at 30 June 2020
NAV per Shareas at 30 June 2019
JPMorgan Funds - Income FundJPM Income Fund A (acc) - AUD (hedged) 10.58 9.78 -JPM Income Fund A (acc) - CHF (hedged) 103.14 96.17 -JPM Income Fund A (acc) - EUR (hedged) 88.36 82.19 83.76JPM Income Fund A (acc) - GBP (hedged) 105.77 97.82 -JPM Income Fund A (acc) - SGD (hedged) 10.78 9.93 -JPM Income Fund A (acc) - USD 134.19 123.70 123.11JPM Income Fund A (div) - CHF (hedged) 98.48 95.45 -JPM Income Fund A (div) - EUR (hedged) 63.52 61.60 64.63JPM Income Fund A (div) - GBP (hedged) 97.82 94.87 -JPM Income Fund A (div) - USD 90.13 87.38 91.92JPM Income Fund A (mth) - AUD (hedged) 9.70 9.40 -JPM Income Fund A (mth) - EUR (hedged) 98.42 95.37 -JPM Income Fund A (mth) - GBP (hedged) 97.38 94.40 -JPM Income Fund A (mth) - HKD 9.36 9.04 9.58JPM Income Fund A (mth) - RMB (hedged) 10.08 9.56 -JPM Income Fund A (mth) - SGD 9.61 9.66 -JPM Income Fund A (mth) - SGD (hedged) 9.82 9.50 -JPM Income Fund A (mth) - USD 9.33 9.03 9.49JPM Income Fund C (acc) - CHF (hedged) 103.95 96.39 -JPM Income Fund C (acc) - EUR (hedged) 113.60 105.10 106.52JPM Income Fund C (acc) - SGD* - 9.74 -JPM Income Fund C (acc) - SGD (hedged) 10.51 9.63 -JPM Income Fund C (acc) - USD 138.69 127.14 125.85JPM Income Fund C (div) - AUD (hedged) 10.37 9.99 -JPM Income Fund C (div) - CHF (hedged) 99.25 95.69 -JPM Income Fund C (div) - EUR (hedged) 66.13 63.79 66.54JPM Income Fund C (div) - GBP (hedged) 97.95 94.52 -JPM Income Fund C (div) - SGD (hedged) 10.46 10.07 -JPM Income Fund C (div) - USD 100.03 96.44 -JPM Income Fund C (mth) - AUD (hedged) 9.79 9.44 -JPM Income Fund C (mth) - HKD* - 9.55 -JPM Income Fund C (mth) - RMB (hedged) 10.17 9.59 -JPM Income Fund C (mth) - SGD* - 9.65 -JPM Income Fund C (mth) - SGD (hedged) 9.91 9.54 -JPM Income Fund C (mth) - USD 99.74 96.05 -JPM Income Fund C2 (acc) - EUR (hedged) 103.01 95.28 -JPM Income Fund C2 (acc) - USD 104.85 96.02 -JPM Income Fund C2 (div) - GBP (hedged) 98.08 94.55 -JPM Income Fund C2 (div) - USD 99.71 96.03 -JPM Income Fund D (acc) - EUR (hedged) 109.50 102.38 104.86JPM Income Fund D (acc) - USD 115.86 107.33 107.36JPM Income Fund D (div) - EUR (hedged) 61.17 59.62 62.87JPM Income Fund D (div) - USD 101.15 98.55 104.25JPM Income Fund D (mth) - USD 97.89 95.29 -JPM Income Fund F (acc) - USD 117.27 109.18 -JPM Income Fund F (mth) - USD 97.18 95.08 -JPM Income Fund I (acc) - EUR (hedged) 105.02 97.12 -JPM Income Fund I (acc) - JPY (hedged) 11,667.00 10,739.00 -JPM Income Fund I (acc) - USD 115.66 105.98 104.85JPM Income Fund I (div) - EUR (hedged) 99.57 96.02 -JPM Income Fund I (mth) - USD 99.91 96.17 -JPM Income Fund I2 (acc) - EUR (hedged) 104.54 96.58 -JPM Income Fund I2 (acc) - USD 104.95 96.02 -JPM Income Fund I2 (div) - GBP (hedged) 97.29 93.78 -JPM Income Fund T (acc) - EUR (hedged) 109.49 102.38 104.86JPM Income Fund T (div) - EUR (hedged) 95.10 92.72 97.79JPM Income Fund X (acc) - USD 108.53 98.95 -JPM Income Fund X (mth) - JPY 10,947.00 - -JPM Income Fund X (mth) - JPY (hedged) 10,375.00 - -JPM Income Fund X (mth) - USD* - 95.78 -Total net assets in USD 10,324,860,497 6,087,308,674 678,650,989
* Share Class inactive as at the end of the year.
56
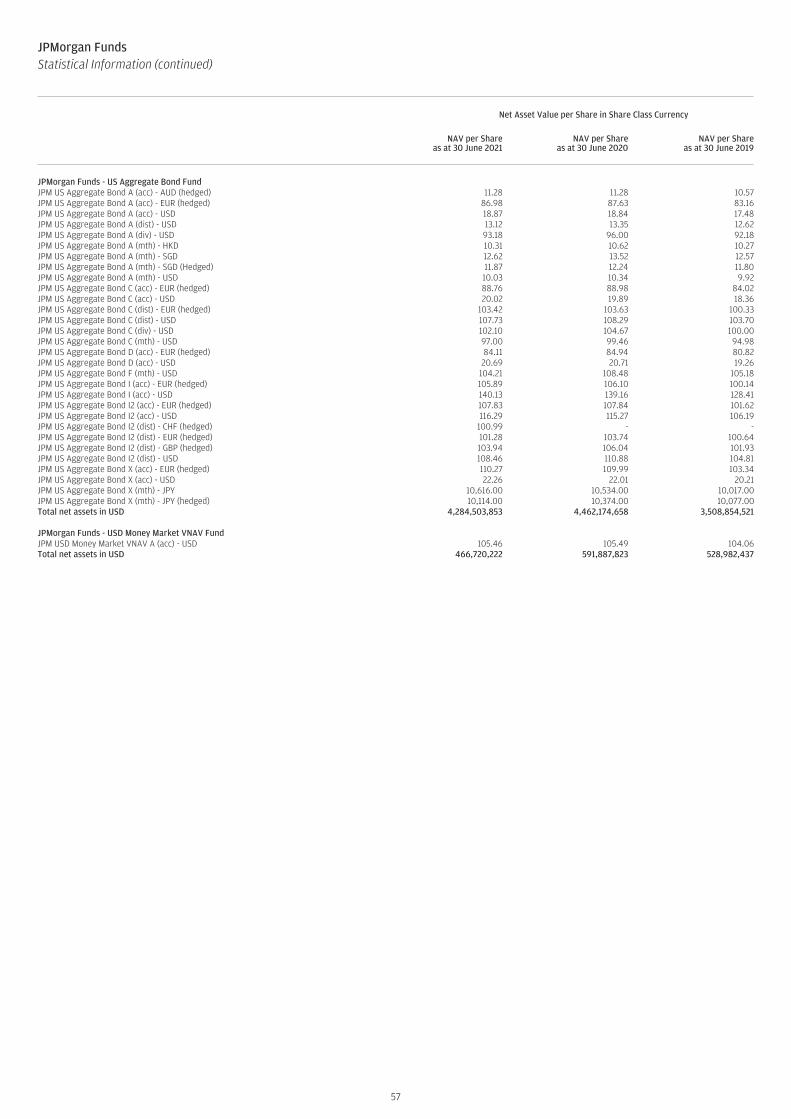
JPMorgan FundsStatistical Information (continued)
Net Asset Value per Share in Share Class Currency
NAV per Shareas at 30 June 2021
NAV per Shareas at 30 June 2020
NAV per Shareas at 30 June 2019
JPMorgan Funds - US Aggregate Bond FundJPM US Aggregate Bond A (acc) - AUD (hedged) 11.28 11.28 10.57JPM US Aggregate Bond A (acc) - EUR (hedged) 86.98 87.63 83.16JPM US Aggregate Bond A (acc) - USD 18.87 18.84 17.48JPM US Aggregate Bond A (dist) - USD 13.12 13.35 12.62JPM US Aggregate Bond A (div) - USD 93.18 96.00 92.18JPM US Aggregate Bond A (mth) - HKD 10.31 10.62 10.27JPM US Aggregate Bond A (mth) - SGD 12.62 13.52 12.57JPM US Aggregate Bond A (mth) - SGD (Hedged) 11.87 12.24 11.80JPM US Aggregate Bond A (mth) - USD 10.03 10.34 9.92JPM US Aggregate Bond C (acc) - EUR (hedged) 88.76 88.98 84.02JPM US Aggregate Bond C (acc) - USD 20.02 19.89 18.36JPM US Aggregate Bond C (dist) - EUR (hedged) 103.42 103.63 100.33JPM US Aggregate Bond C (dist) - USD 107.73 108.29 103.70JPM US Aggregate Bond C (div) - USD 102.10 104.67 100.00JPM US Aggregate Bond C (mth) - USD 97.00 99.46 94.98JPM US Aggregate Bond D (acc) - EUR (hedged) 84.11 84.94 80.82JPM US Aggregate Bond D (acc) - USD 20.69 20.71 19.26JPM US Aggregate Bond F (mth) - USD 104.21 108.48 105.18JPM US Aggregate Bond I (acc) - EUR (hedged) 105.89 106.10 100.14JPM US Aggregate Bond I (acc) - USD 140.13 139.16 128.41JPM US Aggregate Bond I2 (acc) - EUR (hedged) 107.83 107.84 101.62JPM US Aggregate Bond I2 (acc) - USD 116.29 115.27 106.19JPM US Aggregate Bond I2 (dist) - CHF (hedged) 100.99 - -JPM US Aggregate Bond I2 (dist) - EUR (hedged) 101.28 103.74 100.64JPM US Aggregate Bond I2 (dist) - GBP (hedged) 103.94 106.04 101.93JPM US Aggregate Bond I2 (dist) - USD 108.46 110.88 104.81JPM US Aggregate Bond X (acc) - EUR (hedged) 110.27 109.99 103.34JPM US Aggregate Bond X (acc) - USD 22.26 22.01 20.21JPM US Aggregate Bond X (mth) - JPY 10,616.00 10,534.00 10,017.00JPM US Aggregate Bond X (mth) - JPY (hedged) 10,114.00 10,374.00 10,077.00Total net assets in USD 4,284,503,853 4,462,174,658 3,508,854,521
JPMorgan Funds - USD Money Market VNAV FundJPM USD Money Market VNAV A (acc) - USD 105.46 105.49 104.06Total net assets in USD 466,720,222 591,887,823 528,982,437
57

1. OrganisationJPMorgan Funds (the “Fund” or the “SICAV”) is an investment company incorporated on 14 April 1969 under the name Multi-Trust Fund S.A.. The name of theSICAV was changed to Fleming International Fund on 3 July 1984, to Fleming Flagship Fund on 19 October 1988, to Fleming Funds on 2 June 2000, toJPMorgan Fleming Funds on 19 November 2001 and then to JPMorgan Funds on 12 September 2005.
It is organised under Part I of the Luxembourg Law of 17 December 2010 on Undertakings for Collective Investment, as amended, as a Société Anonymequalifying as a Société d’Investissement à Capital Variable (SICAV). As at 30 June 2021, it is comprised of 101 Sub-Funds, each relating to a separateinvestment portfolio consisting of securities, cash and other instruments.
JPMorgan Asset Management (Europe) S.à r.l. was appointed by the SICAV to act as Management Company.
The SICAV is registered with the Registre de Commerce et des Sociétés of Luxembourg, under number B 8478.
Each Sub-Fund may contain A, C, C2, D, F, I, I2, J, K, S1, S2, T, V, X and Y Share Classes. These Share Classes may have differing minimum subscription amounts,minimum holding amounts, currency and/or eligibility requirements, fees and expenses, and dividend policies applicable to them. Certain Share Classesmay charge a Performance Fee and are redenominated by the inclusion of “(perf)” in the name of the Share Class. Within each Sub-Fund, individual ShareClasses may have a currency of denomination that differs from the currency of denomination of the Sub-Fund. The currency of denomination for each ShareClass is indicated by a suffix in the name of the Share Class.
2. Significant Accounting PoliciesThe Financial Statements are prepared in accordance with Luxembourg regulations (under Luxembourg GAAP) relating to Undertakings for CollectiveInvestment under the going concern basis of accounting.
a) Investment ValuationFor all Sub-Funds, except Money Market Funds, transferable securities which are admitted to an official exchange listing or dealt in on another regulatedmarket are valued on the basis of the latest available price prevailing at the time of calculating the net asset value.
If securities are listed or dealt in on several exchanges or markets, the latest available price, or if appropriate, the average price on the principal exchange ormarket will be applied.
Transferable securities not admitted to an official exchange listing nor dealt in on another regulated market are valued at the latest available price. Thosesecurities for which no price is available or for which the latest available price is not representative are valued on the basis of their reasonably foreseeablesales price determined with prudence and in good faith by the Board of Directors. As at 30 June 2021, securities which were fair valued are identified with anasterisk (*) in the Schedule of Investments.
Shares or Units in UCITS or other UCIs are valued at the latest available price or net asset value, as reported or provided by such funds or their agents.
Liquid assets and money market instruments may be valued at nominal values plus any accrued interest or on an amortised cost basis.
Under a Variable NAV Sub-Fund (VNAV), all investments are valued at the latest available price prevailing on the valuation date.
JPMorgan Funds - USD Money Market VNAV Fund qualifies as Variable Net Asset Value Money Market Fund (“VNAV MMF”) under the Money Market Fundregulation (Regulation (EU) 2017/1131).
The assets of VNAV MMF are valued by using mark-to-market prices whenever possible. Where use of mark-to-market prices is not possible or the marketdata are not of sufficient quality, assets of VNAV MMF are valued conservatively by using mark-to-model. The model accurately estimates the value byconsidering the up-to-date factors as trading volume, issue size, market risk, interest rate risk and credit risk of each concerned assets.
For the Money Market Funds (MMFs), securitisations, Asset-Backed Commercial Papers and money market instruments are valued at mark-to-market.Where the value of the assets of the Sub-Funds cannot be calculated following the mark-to-market; a) shares or units in MMFs shall be valued at their lastavailable net asset value as reported by such MMFs; b) the value of any cash on hand or on deposit and accounts receivable, prepaid expenses, cashdividends and interest declared or accrued as aforesaid, and not yet received shall be deemed to be the full amount thereof, unless, however, the same isunlikely to be paid or received in full, in which case the value thereof shall be determined conservatively using mark to model.
The Financial Statements are presented on the basis of the net asset values of the Sub-Funds calculated on 30 June 2021. In accordance with the Prospectus,the net asset values were calculated using the latest exchange rates known at the time of calculation.
In managing the daily priced funds, the Board’s principle is to ensure that portfolios are appropriately valued to give equal treatment to Shareholders and inthis context the Management Company has implemented a Fair Value Committee to address any potential valuation concerns. In line with this, noadjustments were made on 30 June 2021 as the portfolio value at the valuation point represents the same value since closure of the portfolios’ relevantunderlying markets.
b) Swing Pricing AdjustmentTo protect the interests of Shareholders, a Sub-Fund’s NAV may be adjusted to compensate for dilutions that can arise in connection with large flows of cashinto or out of a Sub-Fund.
These adjustments are normally applied on any Valuation Day when the total volume of trading in a Sub-Fund’s Shares (meaning both subscriptions andredemptions) exceeds a certain threshold. The adjustments will seek to reflect the anticipated prices at which the Sub-Fund will be buying and selling assets,as well as estimated transaction costs. The NAV will be adjusted upward when there are large cash net inflows into the Sub-Fund and downward when thereare net large outflows. The SICAV Board has delegated to the Management Company all necessary powers to increase the maximum swing factor applied toSub-Funds from 2% up to a maximum of 5% in exceptional market circumstances caused by the Covid-19 outbreak. The Management Company will promptlynotify the SICAV Board and the CSSF in the event where swing factors increase beyond 2%. During the year, no Sub-Fund has applied a swing factorexceeding 2%. The swing factors typically include the estimated dealing costs, stamp duty and other taxes and market bid/offer spreads. The priceadjustment applicable to a specific Sub-Fund is available on request from the Management Company at its registered office.
The Management Company makes, and periodically reviews, the operational decisions about swing pricing, including the thresholds that trigger it, theextent of the adjustment in each case, and which Sub-Funds will and will not be subject to swing pricing at any given time.
The official Net Asset Value per Share as at year end, disclosed in the Statistical Information section of this report may therefore include a swing pricingadjustment, which would not be recognised in the Combined Statement of Net Assets and in the Combined Statement of Operations and Changes in NetAssets.
During the year, the swing pricing mechanism was applied across all Sub-Funds except for JPMorgan Funds - USD Money Market VNAV Fund, due toProspectus restriction.
As at year end, Swing Pricing adjustments have been applied to the following Sub-Funds: JPMorgan Funds - US Equity All Cap Fund and JPMorgan Funds - USGrowth Fund.
Similarly, in order to protect the interests of Shareholders in a Sub-Fund that is being merged, the Management Company may adjust the final Net AssetValue per Share of the merging Sub-Fund, or make other appropriate adjustments in order to neutralise for the Sub-Fund being merged, the impact of any
JPMorgan FundsNotes to the Financial Statements
As at 30 June 2021
58

pricing adjustment made through the swing pricing mechanism in the absorbing Sub-Fund as a result of cash inflows or outflows in the absorbing Sub-Fundon the merger date.
The Management Company may consider it appropriate not to apply the swing pricing adjustment to the Net Asset Value per Share of a Sub-Fund where it isseeking to attract inflows so that the Sub-Fund reaches a certain size. If a decision is taken in relation to a Sub-Fund the Management Company will pay thedealing and other costs resulting from securities trades to avoid the Sub-Fund suffering dilution of the net asset value. Where this happens shareholders willsubscribe or redeem at a net asset value that will not have been adjusted upwards as would have been the case if the swing pricing mechanism had beenapplied.
c) Realised and Unrealised Gains or Losses on InvestmentsInvestment transactions are accounted for on the trade date (the date the order to buy or sell is executed). For trades into other collective investmentschemes, transactions are accounted for on receipt of the trade confirmation from the underlying transfer agents.
Realised gains or losses on sales of investments are calculated on the average book cost. The associated foreign exchange movement between the date ofpurchase and date of sale of investments is included in realised gains or losses on investments. Unrealised gains or losses on holdings of investments arecalculated on the total book cost and include the associated unrealised gains or losses on foreign exchange.
d) Income RecognitionInterest income is accrued daily and includes the amortisation of premiums and accretion of discounts, where applicable. Bank interest income is recognisedon an accrual basis. Dividend income is accrued on the ex-dividend date. This income is shown net of any withholding taxes and adjusted accordingly whentax reclaims apply. The securities lending income is accounted for on a cash basis on the 16th day of each month following the month that the revenue wasgenerated, net of lending fees paid to the lending agent. An element of the securities lending income will include the proceeds related to the re-investment ofcash collateral, if any.
e) Conversion of Foreign CurrenciesThe books and records of each Sub-Fund are denominated in the base currency of the corresponding Sub-Fund. Amounts denominated in other currenciesare translated into the base currency on the following basis: (i) investment valuations and other assets and liabilities initially expressed in other currenciesare converted each business day into the base currency using currency exchange rates prevailing on each such business day; (ii) purchases and sales offoreign investments, income and expenses are converted into the base currency using currency exchange rates prevailing on the respective dates of suchtransactions.
Net realised and unrealised gains or losses on foreign exchange transactions represent: (i) foreign exchange gains or losses from the sale and holding offoreign currencies and foreign cash equivalents; (ii) gains or losses between trade date and settlement date on securities transactions and forward currencyexchange contracts; and (iii) gains or losses arising from the difference between amounts of dividends and interest recorded and the amounts actuallyreceived.
The resulting gains or losses on translation are included in “Net realised gain/(loss) on currency exchange” in the Combined Statement of Operations andChanges in Net Assets.
f) Forward Currency Exchange ContractsUnrealised gains or losses on outstanding forward currency exchange contracts are valued on the basis of currency exchange rates prevailing at the relevantvaluation date. The changes in such amounts are included in the Combined Statement of Operations and Changes in Net Assets under “Net change inunrealised appreciation/(depreciation) on Forward currency exchange contracts”. When a contract is closed, the Realised Gain/(Loss) is recorded under“Net realised gain/(loss) on Forward currency exchange contracts” in the Combined Statement of Operations and Changes in Net Assets. Unrealised gains orlosses are recorded under “Unrealised gain/(loss) on forward currency exchange contracts” in the Combined Statement of Net Assets.
g) Financial Futures Contracts on Securities and IndicesRegulated financial futures contracts are valued at the exchange quoted settlement price. Initial margin deposits are made upon entering into the contractsand can be either in cash or securities. During the period the contracts are open, changes in the value of the contracts are recognised as unrealised gains orlosses by “marking-to-market” on a daily basis to reflect the market value of the contracts at the end of each business day’s trading. Variation marginpayments are made or received, depending upon whether losses or gains are incurred. The frequency of those margin payments may differ depending onwhere the contract is traded. When a contract is closed, the SICAV records a realised gain or loss equal to the difference between the proceeds from, or costof, the closing transaction and the initial cost of the contract in “Net realised gain/(loss) on Financial futures contracts” in the Combined Statement ofOperations and Changes in Net Assets.
Unrealised gains or losses are recorded under “Unrealised gain/(loss) on financial futures contracts” in the Combined Statement of Net Assets. The changesin such amounts are recorded under “Net change in unrealised appreciation/(depreciation) on Financial futures contracts” in the Combined Statement ofOperations and Changes in Net Assets.
h) Option ContractsThe SICAV writes options on securities, futures and currencies. These options are settled in cash and subject the SICAV to unlimited risk of loss. The SICAV,however, is not subject to credit risk on written options as the counterparty has already performed its obligation by paying the premium at the inception ofthe contract.
Option contracts purchased are recorded as investments; option contracts written or sold are recorded as liabilities. When the exercise of an option results ina cash settlement, the difference between the premium and the settlement proceeds is accounted for as a realised gain or loss. When securities are acquiredor delivered upon exercise of an option, the acquisition cost or sale proceeds are adjusted by the amount of the premium. When an option is closed, thedifference between the premium and the cost to close the position is accounted for as a realised gain or loss. When an option expires, the premium isaccounted for as a realised gain for options written or as a realised loss for options purchased.
For options on futures, where the investment manager is based in the United Kingdom, variation margin payments are made or received daily, dependingupon whether losses or gains are incurred on the underlying financial futures contracts.
The market values are recorded under “Options purchased/written contracts at fair value” in the Combined Statement of Net Assets. The changes inunrealised gains or losses are recorded under “Net change in unrealised appreciation/(depreciation) on Options contracts” in the Combined Statement ofOperations and Changes in Net Assets. When a contract is closed, the Realised Gain/(Loss) is recorded under “Net realised gain/(loss) on Options contracts”in the Combined Statement of Operations and Changes in Net Assets.
i) To Be Announced Securities (“TBA”)TBAs are related to mortgage backed securities issued by government sponsored agencies. These agencies usually pool mortgage loans and sell interests inthe pools created. TBAs relate to future pools of these agencies that are bought and sold for future settlement for which either the interest rate or thematurity date is not yet fixed. TBAs are separately disclosed in the Schedule of Investments.
Certain Sub-Funds may enter into Dollar Rolls, principally using TBAs, in which the Sub-Funds sell mortgage-backed securities for delivery in the currentmonth and simultaneously contract to repurchase similar, but not identical, securities at an agreed-upon price on a fixed date. The Sub-Funds account for
JPMorgan FundsNotes to the Financial Statements (continued)
As at 30 June 2021
59
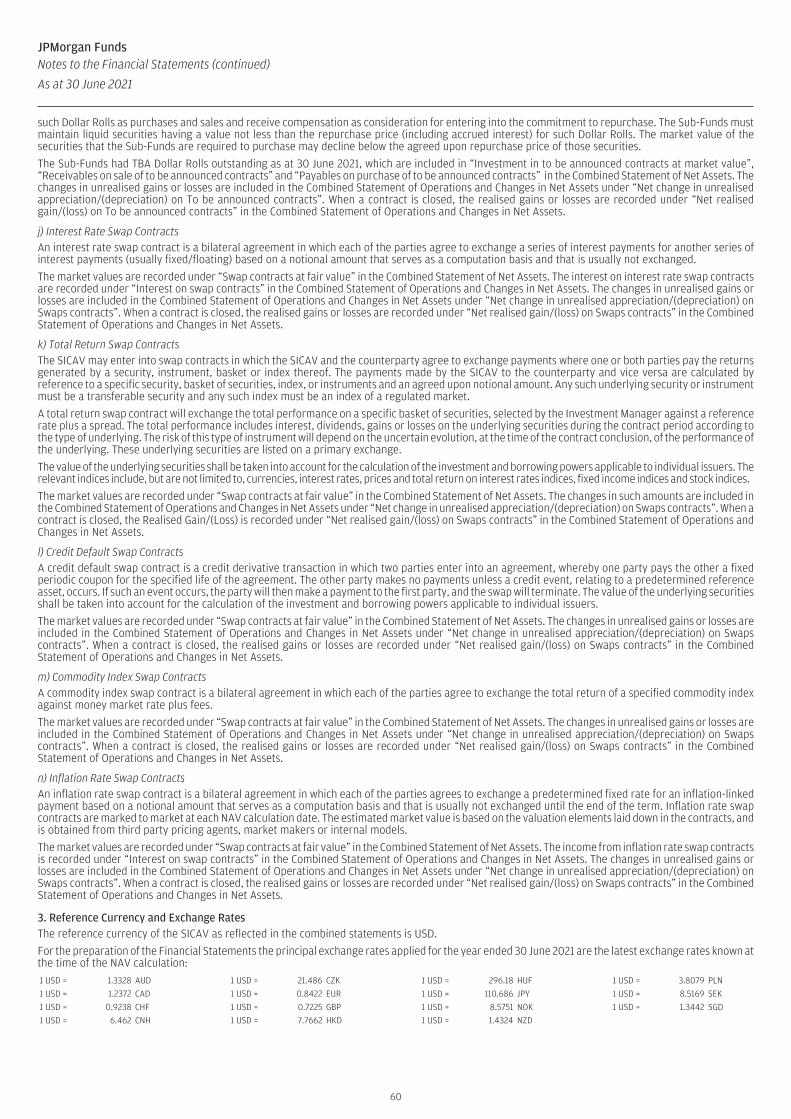
such Dollar Rolls as purchases and sales and receive compensation as consideration for entering into the commitment to repurchase. The Sub-Funds mustmaintain liquid securities having a value not less than the repurchase price (including accrued interest) for such Dollar Rolls. The market value of thesecurities that the Sub-Funds are required to purchase may decline below the agreed upon repurchase price of those securities.
The Sub-Funds had TBA Dollar Rolls outstanding as at 30 June 2021, which are included in “Investment in to be announced contracts at market value”,“Receivables on sale of to be announced contracts” and “Payables on purchase of to be announced contracts” in the Combined Statement of Net Assets. Thechanges in unrealised gains or losses are included in the Combined Statement of Operations and Changes in Net Assets under “Net change in unrealisedappreciation/(depreciation) on To be announced contracts”. When a contract is closed, the realised gains or losses are recorded under “Net realisedgain/(loss) on To be announced contracts” in the Combined Statement of Operations and Changes in Net Assets.
j) Interest Rate Swap ContractsAn interest rate swap contract is a bilateral agreement in which each of the parties agree to exchange a series of interest payments for another series ofinterest payments (usually fixed/floating) based on a notional amount that serves as a computation basis and that is usually not exchanged.
The market values are recorded under “Swap contracts at fair value” in the Combined Statement of Net Assets. The interest on interest rate swap contractsare recorded under “Interest on swap contracts” in the Combined Statement of Operations and Changes in Net Assets. The changes in unrealised gains orlosses are included in the Combined Statement of Operations and Changes in Net Assets under “Net change in unrealised appreciation/(depreciation) onSwaps contracts”. When a contract is closed, the realised gains or losses are recorded under “Net realised gain/(loss) on Swaps contracts” in the CombinedStatement of Operations and Changes in Net Assets.
k) Total Return Swap ContractsThe SICAV may enter into swap contracts in which the SICAV and the counterparty agree to exchange payments where one or both parties pay the returnsgenerated by a security, instrument, basket or index thereof. The payments made by the SICAV to the counterparty and vice versa are calculated byreference to a specific security, basket of securities, index, or instruments and an agreed upon notional amount. Any such underlying security or instrumentmust be a transferable security and any such index must be an index of a regulated market.
A total return swap contract will exchange the total performance on a specific basket of securities, selected by the Investment Manager against a referencerate plus a spread. The total performance includes interest, dividends, gains or losses on the underlying securities during the contract period according tothe type of underlying. The risk of this type of instrument will depend on the uncertain evolution, at the time of the contract conclusion, of the performance ofthe underlying. These underlying securities are listed on a primary exchange.
The value of the underlying securities shall be taken into account for the calculation of the investment and borrowing powers applicable to individual issuers. Therelevant indices include, but are not limited to, currencies, interest rates, prices and total return on interest rates indices, fixed income indices and stock indices.
The market values are recorded under “Swap contracts at fair value” in the Combined Statement of Net Assets. The changes in such amounts are included inthe Combined Statement of Operations and Changes in Net Assets under “Net change in unrealised appreciation/(depreciation) on Swaps contracts”. When acontract is closed, the Realised Gain/(Loss) is recorded under “Net realised gain/(loss) on Swaps contracts” in the Combined Statement of Operations andChanges in Net Assets.
l) Credit Default Swap ContractsA credit default swap contract is a credit derivative transaction in which two parties enter into an agreement, whereby one party pays the other a fixedperiodic coupon for the specified life of the agreement. The other party makes no payments unless a credit event, relating to a predetermined referenceasset, occurs. If such an event occurs, the party will then make a payment to the first party, and the swap will terminate. The value of the underlying securitiesshall be taken into account for the calculation of the investment and borrowing powers applicable to individual issuers.
The market values are recorded under “Swap contracts at fair value” in the Combined Statement of Net Assets. The changes in unrealised gains or losses areincluded in the Combined Statement of Operations and Changes in Net Assets under “Net change in unrealised appreciation/(depreciation) on Swapscontracts”. When a contract is closed, the realised gains or losses are recorded under “Net realised gain/(loss) on Swaps contracts” in the CombinedStatement of Operations and Changes in Net Assets.
m) Commodity Index Swap ContractsA commodity index swap contract is a bilateral agreement in which each of the parties agree to exchange the total return of a specified commodity indexagainst money market rate plus fees.
The market values are recorded under “Swap contracts at fair value” in the Combined Statement of Net Assets. The changes in unrealised gains or losses areincluded in the Combined Statement of Operations and Changes in Net Assets under “Net change in unrealised appreciation/(depreciation) on Swapscontracts”. When a contract is closed, the realised gains or losses are recorded under “Net realised gain/(loss) on Swaps contracts” in the CombinedStatement of Operations and Changes in Net Assets.
n) Inflation Rate Swap ContractsAn inflation rate swap contract is a bilateral agreement in which each of the parties agrees to exchange a predetermined fixed rate for an inflation-linkedpayment based on a notional amount that serves as a computation basis and that is usually not exchanged until the end of the term. Inflation rate swapcontracts are marked to market at each NAV calculation date. The estimated market value is based on the valuation elements laid down in the contracts, andis obtained from third party pricing agents, market makers or internal models.
The market values are recorded under “Swap contracts at fair value” in the Combined Statement of Net Assets. The income from inflation rate swap contractsis recorded under “Interest on swap contracts” in the Combined Statement of Operations and Changes in Net Assets. The changes in unrealised gains orlosses are included in the Combined Statement of Operations and Changes in Net Assets under “Net change in unrealised appreciation/(depreciation) onSwaps contracts”. When a contract is closed, the realised gains or losses are recorded under “Net realised gain/(loss) on Swaps contracts” in the CombinedStatement of Operations and Changes in Net Assets.
3. Reference Currency and Exchange RatesThe reference currency of the SICAV as reflected in the combined statements is USD.
For the preparation of the Financial Statements the principal exchange rates applied for the year ended 30 June 2021 are the latest exchange rates known atthe time of the NAV calculation:1 USD = 1.3328 AUD 1 USD = 21.486 CZK 1 USD = 296.18 HUF 1 USD = 3.8079 PLN
1 USD = 1.2372 CAD 1 USD = 0.8422 EUR 1 USD = 110.686 JPY 1 USD = 8.5169 SEK
1 USD = 0.9238 CHF 1 USD = 0.7225 GBP 1 USD = 8.5751 NOK 1 USD = 1.3442 SGD
1 USD = 6.462 CNH 1 USD = 7.7662 HKD 1 USD = 1.4324 NZD
JPMorgan FundsNotes to the Financial Statements (continued)
As at 30 June 2021
60
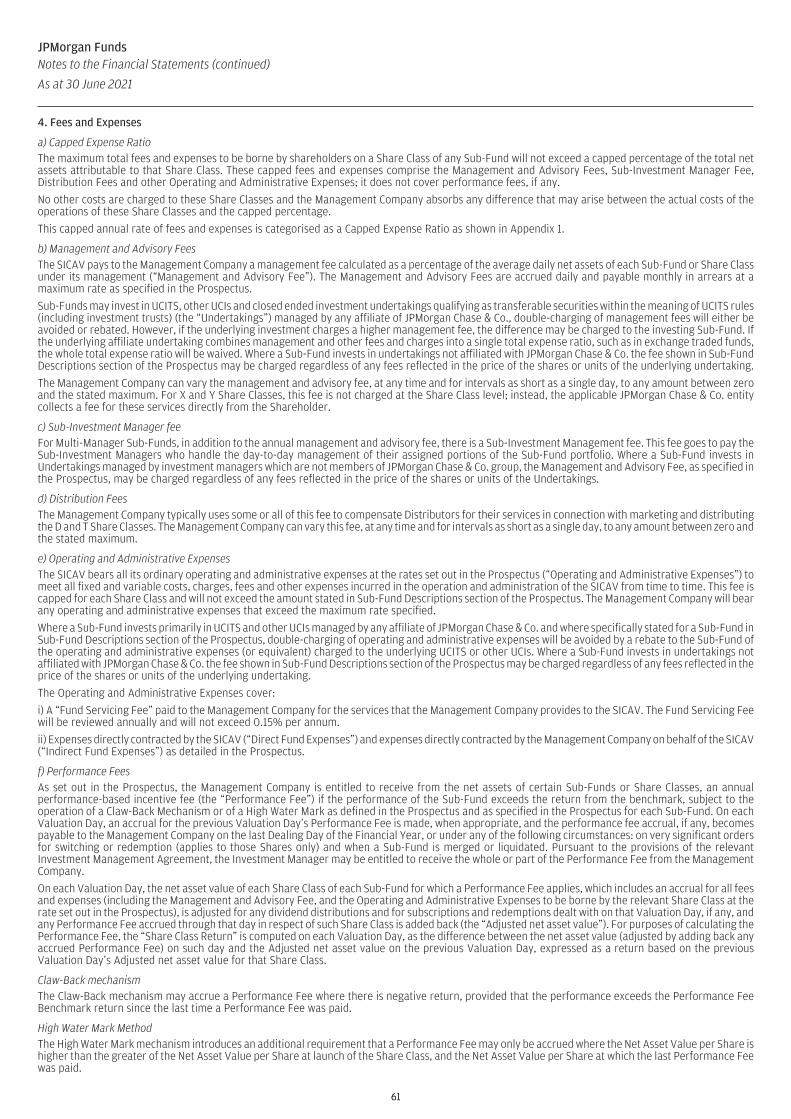
4. Fees and Expenses
a) Capped Expense RatioThe maximum total fees and expenses to be borne by shareholders on a Share Class of any Sub-Fund will not exceed a capped percentage of the total netassets attributable to that Share Class. These capped fees and expenses comprise the Management and Advisory Fees, Sub-Investment Manager Fee,Distribution Fees and other Operating and Administrative Expenses; it does not cover performance fees, if any.
No other costs are charged to these Share Classes and the Management Company absorbs any difference that may arise between the actual costs of theoperations of these Share Classes and the capped percentage.
This capped annual rate of fees and expenses is categorised as a Capped Expense Ratio as shown in Appendix 1.
b) Management and Advisory FeesThe SICAV pays to the Management Company a management fee calculated as a percentage of the average daily net assets of each Sub-Fund or Share Classunder its management (“Management and Advisory Fee”). The Management and Advisory Fees are accrued daily and payable monthly in arrears at amaximum rate as specified in the Prospectus.
Sub-Funds may invest in UCITS, other UCIs and closed ended investment undertakings qualifying as transferable securities within the meaning of UCITS rules(including investment trusts) (the “Undertakings”) managed by any affiliate of JPMorgan Chase & Co., double-charging of management fees will either beavoided or rebated. However, if the underlying investment charges a higher management fee, the difference may be charged to the investing Sub-Fund. Ifthe underlying affiliate undertaking combines management and other fees and charges into a single total expense ratio, such as in exchange traded funds,the whole total expense ratio will be waived. Where a Sub-Fund invests in undertakings not affiliated with JPMorgan Chase & Co. the fee shown in Sub-FundDescriptions section of the Prospectus may be charged regardless of any fees reflected in the price of the shares or units of the underlying undertaking.
The Management Company can vary the management and advisory fee, at any time and for intervals as short as a single day, to any amount between zeroand the stated maximum. For X and Y Share Classes, this fee is not charged at the Share Class level; instead, the applicable JPMorgan Chase & Co. entitycollects a fee for these services directly from the Shareholder.
c) Sub-Investment Manager feeFor Multi-Manager Sub-Funds, in addition to the annual management and advisory fee, there is a Sub-Investment Management fee. This fee goes to pay theSub-Investment Managers who handle the day-to-day management of their assigned portions of the Sub-Fund portfolio. Where a Sub-Fund invests inUndertakings managed by investment managers which are not members of JPMorgan Chase & Co. group, the Management and Advisory Fee, as specified inthe Prospectus, may be charged regardless of any fees reflected in the price of the shares or units of the Undertakings.
d) Distribution FeesThe Management Company typically uses some or all of this fee to compensate Distributors for their services in connection with marketing and distributingthe D and T Share Classes. The Management Company can vary this fee, at any time and for intervals as short as a single day, to any amount between zero andthe stated maximum.
e) Operating and Administrative ExpensesThe SICAV bears all its ordinary operating and administrative expenses at the rates set out in the Prospectus (“Operating and Administrative Expenses”) tomeet all fixed and variable costs, charges, fees and other expenses incurred in the operation and administration of the SICAV from time to time. This fee iscapped for each Share Class and will not exceed the amount stated in Sub-Fund Descriptions section of the Prospectus. The Management Company will bearany operating and administrative expenses that exceed the maximum rate specified.
Where a Sub-Fund invests primarily in UCITS and other UCIs managed by any affiliate of JPMorgan Chase & Co. and where specifically stated for a Sub-Fund inSub-Fund Descriptions section of the Prospectus, double-charging of operating and administrative expenses will be avoided by a rebate to the Sub-Fund ofthe operating and administrative expenses (or equivalent) charged to the underlying UCITS or other UCIs. Where a Sub-Fund invests in undertakings notaffiliated with JPMorgan Chase & Co. the fee shown in Sub-Fund Descriptions section of the Prospectus may be charged regardless of any fees reflected in theprice of the shares or units of the underlying undertaking.
The Operating and Administrative Expenses cover:
i) A “Fund Servicing Fee” paid to the Management Company for the services that the Management Company provides to the SICAV. The Fund Servicing Feewill be reviewed annually and will not exceed 0.15% per annum.
ii) Expenses directly contracted by the SICAV (“Direct Fund Expenses”) and expenses directly contracted by the Management Company on behalf of the SICAV(“Indirect Fund Expenses”) as detailed in the Prospectus.
f) Performance FeesAs set out in the Prospectus, the Management Company is entitled to receive from the net assets of certain Sub-Funds or Share Classes, an annualperformance-based incentive fee (the “Performance Fee”) if the performance of the Sub-Fund exceeds the return from the benchmark, subject to theoperation of a Claw-Back Mechanism or of a High Water Mark as defined in the Prospectus and as specified in the Prospectus for each Sub-Fund. On eachValuation Day, an accrual for the previous Valuation Day’s Performance Fee is made, when appropriate, and the performance fee accrual, if any, becomespayable to the Management Company on the last Dealing Day of the Financial Year, or under any of the following circumstances: on very significant ordersfor switching or redemption (applies to those Shares only) and when a Sub-Fund is merged or liquidated. Pursuant to the provisions of the relevantInvestment Management Agreement, the Investment Manager may be entitled to receive the whole or part of the Performance Fee from the ManagementCompany.
On each Valuation Day, the net asset value of each Share Class of each Sub-Fund for which a Performance Fee applies, which includes an accrual for all feesand expenses (including the Management and Advisory Fee, and the Operating and Administrative Expenses to be borne by the relevant Share Class at therate set out in the Prospectus), is adjusted for any dividend distributions and for subscriptions and redemptions dealt with on that Valuation Day, if any, andany Performance Fee accrued through that day in respect of such Share Class is added back (the “Adjusted net asset value”). For purposes of calculating thePerformance Fee, the “Share Class Return” is computed on each Valuation Day, as the difference between the net asset value (adjusted by adding back anyaccrued Performance Fee) on such day and the Adjusted net asset value on the previous Valuation Day, expressed as a return based on the previousValuation Day’s Adjusted net asset value for that Share Class.
Claw-Back mechanismThe Claw-Back mechanism may accrue a Performance Fee where there is negative return, provided that the performance exceeds the Performance FeeBenchmark return since the last time a Performance Fee was paid.
High Water Mark MethodThe High Water Mark mechanism introduces an additional requirement that a Performance Fee may only be accrued where the Net Asset Value per Share ishigher than the greater of the Net Asset Value per Share at launch of the Share Class, and the Net Asset Value per Share at which the last Performance Feewas paid.
61
JPMorgan FundsNotes to the Financial Statements (continued)
As at 30 June 2021
61

As at 30 June 2021, Performance Fee rates and benchmarks on all Share Classes with the suffix “(perf)” are as follows:
Sub-Fund Applicable
Share Classes
Performance
Fee Rate
Performance Benchmark
Claw-Back Mechanism methodJPMorgan Funds - Emerging Markets Small Cap Fund All 10% MSCI Emerging Markets Small Cap Index (Total Return Net)
High Water Mark methodJPMorgan Funds - Global Strategic Bond Fund Non-hedged 10% ICE Overnight USD LIBOR
JPMorgan Funds - Global Strategic Bond Fund CHF hedged 10% ICE Spot Next CHF LIBOR
JPMorgan Funds - Global Strategic Bond Fund EUR hedged 10% EONIA
JPMorgan Funds - Global Strategic Bond Fund GBP hedged 10% ICE Overnight GBP LIBOR
JPMorgan Funds - Global Strategic Bond Fund JPY hedged 10% ICE Spot Next JPY LIBOR
JPMorgan Funds - Global Strategic Bond Fund PLN hedged 10% ICE Overnight USD LIBOR Hedged to PLN
JPMorgan Funds - Global Strategic Bond Fund SEK hedged 10% STIBOR Tomorrow Next Offered Rate
5. Distribution Policy
Share Classes suffixed “(acc)”Share Classes with the suffix “(acc)” are accumulation Share Classes and will not normally pay dividends.
Distribution Share Classes will normally pay dividends as described below.
Share Classes suffixed “(dist)”It is intended that all those Share Classes with the suffix “(dist)” will, if appropriate, pay reportable income annually and will have “UK Reporting Fund Status”.Payment of dividends on these Share Classes will normally be made in September of each year.
Share Classes suffixed “(div)”Share Classes with the suffix “(div)” will normally pay quarterly dividends which are calculated by the Management Company based on the estimated annualyield of the relevant Sub-Fund’s portfolio which is attributable to that Share Class. The Management Company will review the dividend rate for each ShareClass at least semi-annually, but may adjust the dividend rate more frequently to reflect changes in the portfolio’s expected yield.
Investors should be aware that “(div)” Share Classes give priority to dividends, rather than to capital growth. The expected yield for each Share Class will becalculated gross of both the Management and Advisory Fee and the Operating and Administrative Expenses, and such Share Classes will typically distributemore than the income received. Share Classes with the suffix “(div)” in issue at the dividend record date will be eligible for any dividends which will normallybe paid in the currency of the relevant Share Class.
Share Classes suffixed “(mth)”Share Classes with the suffix “(mth)” will be available to Shareholders subscribing, and remaining subscribed, through specific Asian distribution networksand to other distributors at the sole discretion of the Management Company. Share Classes with the suffix “(mth)” will normally pay dividends on a monthlybasis. The monthly dividend rate per Share will be calculated by the Management Company based on the estimated annual yield of the relevant Sub-Fund’sportfolio which is attributable to that Share Class. The Management Company will review the dividend rate for each Share Class at least semi-annually, butmay adjust the dividend rate more frequently to reflect changes in the portfolio’s expected yield. Investors should be aware that “(mth)” Share Classes givepriority to dividends, rather than to capital growth. The expected yield for each Share Class will be calculated gross of both the Management and AdvisoryFee and the Operating and Administrative Expenses, and such Share Classes will typically distribute more than the income received. Dividend payments forthese Share Classes will normally be made to Shareholders each month and will be paid in the currency of the relevant Share Class. The ManagementCompany reserves the right to fix a minimum amount per Share Class, below which the actual payment of the dividend would not be economically efficientfor the SICAV. These payments will be deferred to the following month or reinvested in further Shares of the same Share Class and not paid directly to theShareholders. The net asset value of “(mth)” Share Classes may fluctuate more than other Share Classes due to more frequent distribution of income.
Share Classes suffixed “(fix)”Share Classes with the suffix “(fix)” will normally pay a quarterly fixed dividend based on a total amount per Share per annum as defined in the Prospectus.Share Classes with the suffix “(fix)” may be closed, liquidated, not pay a dividend or reduce the dividend amount payable if the payment of the dividend isbelieved not to be in the best interests of all Shareholders collectively in the Share Class.
Share Classes suffixed “(irc)”Share Classes with the suffix “(irc)” will normally pay dividends on a monthly basis. The monthly dividend rate per Share will be variable and will be calculatedby the Management Company based on: the estimated gross annual yield of the relevant Sub-Fund’s portfolio attributable to that Share Class, which isrevised at least semi-annually; and the addition or deduction of the estimated interest rate carry depending on whether such carry is positive or negativerespectively. The interest rate carry is calculated using the average daily differential of the one month FX forward rate and the spot rate between these twocurrencies of the preceding calendar month.
Share Classes suffixed “(icdiv)”Share Classes with the suffix “(icdiv)” will pay a dividend that is expected to include a distribution from capital as well as the gains of the Share Class. It sets apredetermined annual percentage of NAV per Share to be paid as a monthly dividend that is not linked to income or capital gains. Payments are likely toexceed the increase in the NAV per share from the net income and realised and/or unrealised capital gains of the Share Class resulting in erosion of theamount invested. The annual percentage is based on prevailing investor demand in the region where the share class is distributed and Sub-Fund levelconsiderations. The percentage may be changed at the discretion of the Management Company. The latest dividend yield of the share class can be found onthe website (www.jpmorganassetmanagement.lu).
This Share Class is available only to investors purchasing and holding Shares through specific Asian distribution networks, and to other investors at thediscretion of the Management Company. Shareholders should be aware that, during periods of negative performance, the dividend will normally continue tobe paid and the value of the investment may fall more rapidly. It may not be possible to maintain the initial / prevailing dividend payment indefinitely and itmay be reduced. If the value of the NAV falls to 1.00 in the Sub-Fund’s Base Currency, the share class will be fully redeemed by the Management Company atthe next practicable opportunity. Investors in these Share Classes may have to pay tax on payments out of capital which may be tax inefficient. Investorsshould consult with their tax advisors.
Other InformationShareholders should note that, where the dividend rate is in excess of the investment income of the Share Class, dividends will be paid out of the capitalattributed to the Share Class, as well as from realised and unrealised capital gains. This may be tax inefficient for Shareholders in certain countries.
JPMorgan FundsNotes to the Financial Statements (continued)
As at 30 June 2021
62

Shareholders should consult their local tax adviser about their own position. Share Classes with the suffix “(div)”, “(fix)” and “(mth)” do not distribute thereportable income in accordance with the United Kingdom tax legislation relating to offshore funds.
Details of the dividends distributed during the year from 1 July 2020 to 30 June 2021 are available on the website:https://am.jpmorgan.com/lu/en/asset-management/adv/products/fund-explorer/sicavs
6. TaxationThe SICAV is not subject to taxation in Luxembourg on its income, profits or gains. The SICAV is not subject to net wealth tax in Luxembourg. The only tax to whichthe SICAV in Luxembourg is subject is the subscription tax (“Taxe d’Abonnement”), up to a rate of 0.05% per annum based on the net asset value attributed toeach Share Class at the end of the relevant quarter, calculated and paid quarterly. A reduced tax rate of 0.01% per annum of the net assets will be applicable toShare Classes as identified in the Appendix. The 0.01% and 0.05% rates described above, as appropriate, are not applicable for the portion of the assets of theSICAV invested in other Luxembourg collective investment undertakings which are themselves already subject to the Taxe d’Abonnement.
No stamp duty, capital duty or other tax is payable in Luxembourg upon the issue of the Shares of the SICAV. No tax is payable on realised or unrealisedcapital appreciation of the assets of the SICAV in the Grand Duchy of Luxembourg. Although the SICAV’s realised capital gains, whether short or long-term,are not expected to become taxable in another country, the shareholders must be aware and recognise that such a possibility is not totally excluded. Theregular income of the SICAV from some of its securities, as well as interest earned on cash deposits in certain countries, may be subject to withholding taxesat varying rates, which normally cannot be recovered.
Dividends, interest and capital gains on security investments held by any Sub-Fund may be subject to non-recoverable withholding tax and Capital Gains Taxof varying rates in the source countries.
7. Statement of Changes in InvestmentsA list, specifying for each investment within each Sub-Fund the total purchases and sales which occurred during the financial year, may be obtained free ofcharge upon request at the registered office of the SICAV. Additional information on investments within each Sub-Fund’s portfolio is available toshareholders at the registered office of the SICAV.
8. Value of Financial Instruments and Associated RisksThe SICAV entered into forward currency exchange contracts, financial futures contracts, options and swaps which, to varying degrees, represent a marketrisk in excess of the amount reflected on the Combined Statement of Net Assets. The amount of the contracts represents the extent of the SICAV’sparticipation in these financial instruments. Market risks associated with such contracts arise due to the possible movements in foreign exchange rates,indices, and security values underlying these instruments. Associated risks are set out in the Prospectus.
In emerging and less developed markets, in which some of the Sub-Funds will invest, the legal, judicial and regulatory infrastructure is still developing andthere is much legal uncertainty both for local market participants and their overseas counterparts. Some markets may carry higher risks for investors whoshould therefore ensure that, before investing, they understand the risks involved and are satisfied that an investment is suitable as part of their portfolio. Insome markets there may be no secure method of delivery against payment which would minimise the exposure to counterparty risk. It may be necessary tomake payment on a purchase or delivery on a sale before receipt of the securities or, as the case may be, sale proceeds.
9. Collateral Received with Respect to Financial Techniques and Financial Derivative InstrumentsAssets received from counterparties in securities lending activities and OTC derivative transactions other than currency forwards constitute collateral.
The SICAV will only enter into transactions with counterparties which the Management Company believes to be creditworthy. Approved counterparties willtypically have a public rating of A- or above. Counterparties will comply with prudential rules considered by the CSSF as equivalent to EU prudential rules. Thecounterparty does not have discretion over the composition or management of a Sub-Fund’s portfolio or over the underlying of financial derivativeinstruments used by a Sub-Fund. Counterparty approval is not required in relation to any investment decision made by a Sub-Fund.
Collateral may be offset against gross counterparty exposure provided it meets a range of standards, including those for liquidity, valuation, issuer credit quality,correlation and diversification. In offsetting collateral its value is reduced by a percentage (a “haircut”) which provides, inter alia, for short term fluctuations in thevalue of the exposure and of the collateral. Collateral levels are maintained to ensure that net counterparty exposure does not exceed the limits per counterparty asset out in the Prospectus. If any, collateral is received in the form of securities and cash. Non-cash collateral received is not sold or pledged.
Collateral received with respect to financial derivative instruments is shown in the Appendix.
10. Securities LendingThe SICAV may lend portions of its securities portfolio to third parties for the purpose of generating additional income or for reducing costs, to the maximumextent allowed by and within the limits set forth in (i) article 11 of the Grand Ducal regulation of 8 February 2008 relating to certain definitions of theLuxembourg Law, (ii) CSSF Circular 08/356 relating to the rules applicable to Undertakings for Collective Investment when they use certain techniques andinstruments relating to transferable securities and money market instruments, (iii) CSSF circular 14/592 relating to ESMA Guidelines on ETFs and otherUCITS issues and (iv) any other applicable laws, regulations, circulars or CSSF positions.
Borrowers of securities lent by participating Sub-Funds are approved by the Management Company after appropriate assessment of such borrowers’ statusand financial standing. 90% of any incremental income earned from securities lending is accrued to the applicable Sub-Fund, whilst the remaining 10%income is paid to J.P. Morgan Bank Luxembourg S.A. for its role as securities lending agent for the SICAV. The income earned from the securities lendingprogram is detailed in the Combined Statement of Operations and Changes in Net Assets.
As at 30 June 2021, the SICAV valuation of securities on loan is USD 2,755,264,611 as detailed below and received collateral with a market value ofUSD 2,893,527,126.
Sub-Fund
Market Value ofSecurities Lent
USDCash Collateral**
USD
Non CashCollateral*
USD
BaseCurrency
Lending Income(Gross)
Base Currency
LendingAgent Fee
Base Currency
LendingIncome (Net)
Base Currency
JPMorgan Funds - America Equity Fund 30,134,352 - 32,021,396 USD 65,622 6,562 59,060
JPMorgan Funds - Asia Pacific Equity Fund 73,136,249 - 77,691,659 USD 205,410 20,541 184,869
JPMorgan Funds - China Fund 155,473,964 11,613,229 153,048,092 USD 2,171,792 217,180 1,954,613
JPMorgan Funds - Emerging Europe Equity Fund 397,253 16,650 411,961 EUR 51,685 5,169 46,516
JPMorgan Funds - Emerging Markets Dividend Fund 13,751,616 5,146,168 9,434,628 USD 68,030 6,803 61,227
JPMorgan Funds - Emerging Markets Equity Fund 256,944,103 39,620,957 228,464,753 USD 1,169,623 116,962 1,052,660
JPMorgan Funds - Emerging Markets Opportunities Fund 120,608,596 29,986,769 97,614,904 USD 306,795 30,679 276,115
JPMorgan Funds - Emerging Markets Small Cap Fund 55,169,053 2,932,034 55,295,894 USD 361,525 36,152 325,373
JPMorgan Funds - Europe Dynamic Fund 50,932,949 - 53,735,384 EUR 221,547 22,154 199,393
JPMorgan Funds - Europe Equity Fund 17,976,852 - 18,919,682 EUR 901,946 90,195 811,751
JPMorgan Funds - Europe Small Cap Fund 62,544,781 2,691,747 63,731,734 EUR 734,294 73,430 660,864
63
JPMorgan FundsNotes to the Financial Statements (continued)
As at 30 June 2021
63
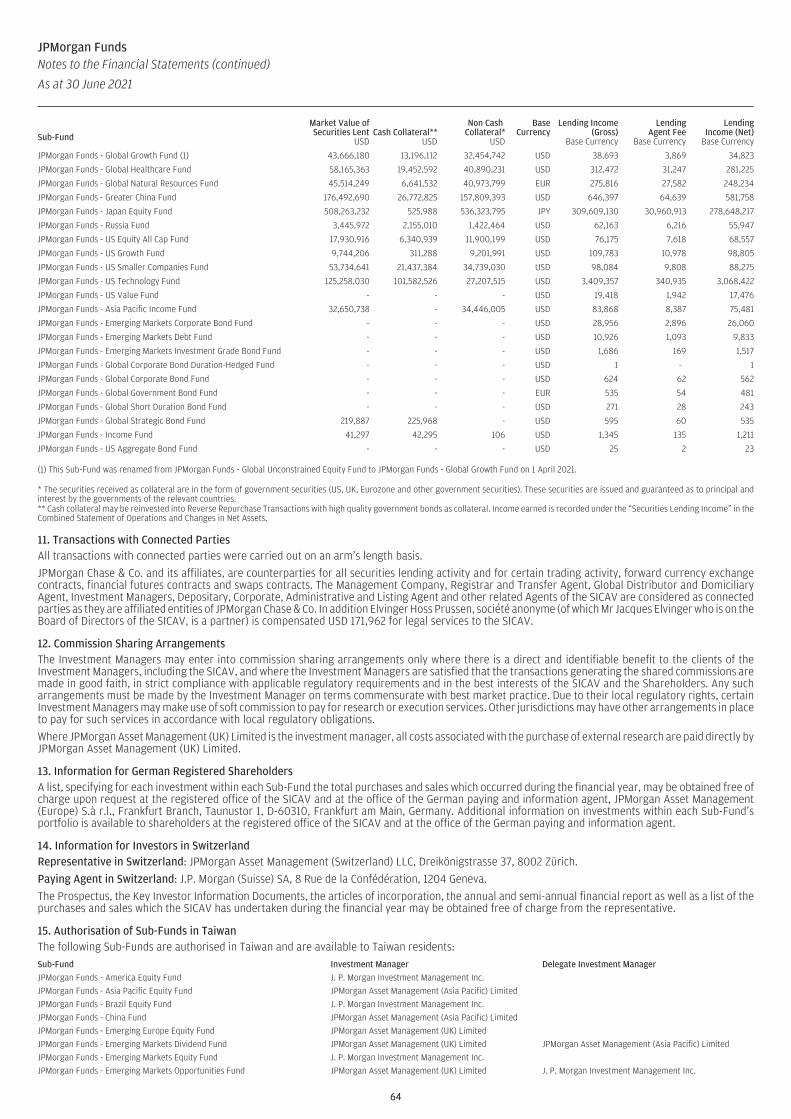
Sub-Fund
Market Value ofSecurities Lent
USDCash Collateral**
USD
Non CashCollateral*
USD
BaseCurrency
Lending Income(Gross)
Base Currency
LendingAgent Fee
Base Currency
LendingIncome (Net)
Base Currency
JPMorgan Funds - Global Growth Fund (1) 43,666,180 13,196,112 32,454,742 USD 38,693 3,869 34,823
JPMorgan Funds - Global Healthcare Fund 58,165,363 19,452,592 40,890,231 USD 312,472 31,247 281,225
JPMorgan Funds - Global Natural Resources Fund 45,514,249 6,641,532 40,973,799 EUR 275,816 27,582 248,234
JPMorgan Funds - Greater China Fund 176,492,690 26,772,825 157,809,393 USD 646,397 64,639 581,758
JPMorgan Funds - Japan Equity Fund 508,263,232 525,988 536,323,795 JPY 309,609,130 30,960,913 278,648,217
JPMorgan Funds - Russia Fund 3,445,972 2,155,010 1,422,464 USD 62,163 6,216 55,947
JPMorgan Funds - US Equity All Cap Fund 17,930,916 6,340,939 11,900,199 USD 76,175 7,618 68,557
JPMorgan Funds - US Growth Fund 9,744,206 311,288 9,201,991 USD 109,783 10,978 98,805
JPMorgan Funds - US Smaller Companies Fund 53,734,641 21,437,384 34,739,030 USD 98,084 9,808 88,275
JPMorgan Funds - US Technology Fund 125,258,030 101,582,526 27,207,515 USD 3,409,357 340,935 3,068,422
JPMorgan Funds - US Value Fund - - - USD 19,418 1,942 17,476
JPMorgan Funds - Asia Pacific Income Fund 32,650,738 - 34,446,005 USD 83,868 8,387 75,481
JPMorgan Funds - Emerging Markets Corporate Bond Fund - - - USD 28,956 2,896 26,060
JPMorgan Funds - Emerging Markets Debt Fund - - - USD 10,926 1,093 9,833
JPMorgan Funds - Emerging Markets Investment Grade Bond Fund - - - USD 1,686 169 1,517
JPMorgan Funds - Global Corporate Bond Duration-Hedged Fund - - - USD 1 - 1
JPMorgan Funds - Global Corporate Bond Fund - - - USD 624 62 562
JPMorgan Funds - Global Government Bond Fund - - - EUR 535 54 481
JPMorgan Funds - Global Short Duration Bond Fund - - - USD 271 28 243
JPMorgan Funds - Global Strategic Bond Fund 219,887 225,968 - USD 595 60 535
JPMorgan Funds - Income Fund 41,297 42,295 106 USD 1,345 135 1,211
JPMorgan Funds - US Aggregate Bond Fund - - - USD 25 2 23
(1) This Sub-Fund was renamed from JPMorgan Funds - Global Unconstrained Equity Fund to JPMorgan Funds - Global Growth Fund on 1 April 2021.
* The securities received as collateral are in the form of government securities (US, UK, Eurozone and other government securities). These securities are issued and guaranteed as to principal andinterest by the governments of the relevant countries.** Cash collateral may be reinvested into Reverse Repurchase Transactions with high quality government bonds as collateral. Income earned is recorded under the “Securities Lending Income” in theCombined Statement of Operations and Changes in Net Assets.
11. Transactions with Connected PartiesAll transactions with connected parties were carried out on an arm’s length basis.
JPMorgan Chase & Co. and its affiliates, are counterparties for all securities lending activity and for certain trading activity, forward currency exchangecontracts, financial futures contracts and swaps contracts. The Management Company, Registrar and Transfer Agent, Global Distributor and DomiciliaryAgent, Investment Managers, Depositary, Corporate, Administrative and Listing Agent and other related Agents of the SICAV are considered as connectedparties as they are affiliated entities of JPMorgan Chase & Co. In addition Elvinger Hoss Prussen, société anonyme (of which Mr Jacques Elvinger who is on theBoard of Directors of the SICAV, is a partner) is compensated USD 171,962 for legal services to the SICAV.
12. Commission Sharing ArrangementsThe Investment Managers may enter into commission sharing arrangements only where there is a direct and identifiable benefit to the clients of theInvestment Managers, including the SICAV, and where the Investment Managers are satisfied that the transactions generating the shared commissions aremade in good faith, in strict compliance with applicable regulatory requirements and in the best interests of the SICAV and the Shareholders. Any sucharrangements must be made by the Investment Manager on terms commensurate with best market practice. Due to their local regulatory rights, certainInvestment Managers may make use of soft commission to pay for research or execution services. Other jurisdictions may have other arrangements in placeto pay for such services in accordance with local regulatory obligations.
Where JPMorgan Asset Management (UK) Limited is the investment manager, all costs associated with the purchase of external research are paid directly byJPMorgan Asset Management (UK) Limited.
13. Information for German Registered ShareholdersA list, specifying for each investment within each Sub-Fund the total purchases and sales which occurred during the financial year, may be obtained free ofcharge upon request at the registered office of the SICAV and at the office of the German paying and information agent, JPMorgan Asset Management(Europe) S.à r.l., Frankfurt Branch, Taunustor 1, D-60310, Frankfurt am Main, Germany. Additional information on investments within each Sub-Fund’sportfolio is available to shareholders at the registered office of the SICAV and at the office of the German paying and information agent.
14. Information for Investors in SwitzerlandRepresentative in Switzerland: JPMorgan Asset Management (Switzerland) LLC, Dreikönigstrasse 37, 8002 Zürich.
Paying Agent in Switzerland: J.P. Morgan (Suisse) SA, 8 Rue de la Confédération, 1204 Geneva.
The Prospectus, the Key Investor Information Documents, the articles of incorporation, the annual and semi-annual financial report as well as a list of thepurchases and sales which the SICAV has undertaken during the financial year may be obtained free of charge from the representative.
15. Authorisation of Sub-Funds in TaiwanThe following Sub-Funds are authorised in Taiwan and are available to Taiwan residents:Sub-Fund Investment Manager Delegate Investment Manager
JPMorgan Funds - America Equity Fund J. P. Morgan Investment Management Inc.
JPMorgan Funds - Asia Pacific Equity Fund JPMorgan Asset Management (Asia Pacific) Limited
JPMorgan Funds - Brazil Equity Fund J. P. Morgan Investment Management Inc.
JPMorgan Funds - China Fund JPMorgan Asset Management (Asia Pacific) Limited
JPMorgan Funds - Emerging Europe Equity Fund JPMorgan Asset Management (UK) Limited
JPMorgan Funds - Emerging Markets Dividend Fund JPMorgan Asset Management (UK) Limited JPMorgan Asset Management (Asia Pacific) Limited
JPMorgan Funds - Emerging Markets Equity Fund J. P. Morgan Investment Management Inc.
JPMorgan Funds - Emerging Markets Opportunities Fund JPMorgan Asset Management (UK) Limited J. P. Morgan Investment Management Inc.
64
JPMorgan FundsNotes to the Financial Statements (continued)
As at 30 June 2021
64

Sub-Fund Investment Manager Delegate Investment Manager
JPMorgan Funds - Emerging Markets Small Cap Fund JPMorgan Asset Management (UK) Limited
JPMorgan Funds - Emerging Middle East Equity Fund JPMorgan Asset Management (UK) Limited
JPMorgan Funds - Europe Dynamic Fund JPMorgan Asset Management (UK) Limited
JPMorgan Funds - Europe Equity Fund JPMorgan Asset Management (UK) Limited
JPMorgan Funds - Europe Small Cap Fund JPMorgan Asset Management (UK) Limited
JPMorgan Funds - Global Growth Fund(1) JPMorgan Asset Management (UK) Limited
JPMorgan Funds - Global Healthcare Fund JPMorgan Asset Management (UK) Limited J. P. Morgan Investment Management Inc.
JPMorgan Funds - Global Natural Resources Fund JPMorgan Asset Management (UK) Limited
JPMorgan Funds - Greater China Fund JPMorgan Asset Management (Asia Pacific) Limited
JPMorgan Funds - Japan Equity Fund JPMorgan Asset Management (Asia Pacific) Limited JPMorgan Asset Management (Japan) Limited
JPMorgan Funds - Latin America Equity Fund J. P. Morgan Investment Management Inc.
JPMorgan Funds - Russia Fund JPMorgan Asset Management (UK) Limited
JPMorgan Funds - Thematics - Genetic Therapies JPMorgan Asset Management (UK) Limited
JPMorgan Funds - US Equity All Cap Fund J. P. Morgan Investment Management Inc.
JPMorgan Funds - US Growth Fund J. P. Morgan Investment Management Inc.
JPMorgan Funds - US Smaller Companies Fund J. P. Morgan Investment Management Inc.
JPMorgan Funds - US Technology Fund J. P. Morgan Investment Management Inc.
JPMorgan Funds - US Value Fund J. P. Morgan Investment Management Inc.
JPMorgan Funds - Asia Pacific Income Fund JPMorgan Asset Management (Asia Pacific) Limited
JPMorgan Funds - Aggregate Bond Fund JPMorgan Asset Management (UK) Limited J. P. Morgan Investment Management Inc.; JPMorganAsset Management (Asia Pacific) Limited
JPMorgan Funds - Emerging Markets Corporate Bond Fund J. P. Morgan Investment Management Inc.
JPMorgan Funds - Emerging Markets Debt Fund J. P. Morgan Investment Management Inc.
JPMorgan Funds - Emerging Markets Investment Grade Bond Fund J. P. Morgan Investment Management Inc
JPMorgan Funds - Emerging Markets Local Currency Debt Fund JPMorgan Asset Management (UK) Limited J. P. Morgan Investment Management Inc.
JPMorgan Funds - Global Corporate Bond Duration-Hedged Fund J. P. Morgan Investment Management Inc.
JPMorgan Funds - Global Corporate Bond Fund
JPMorgan Funds - Global Government Bond Fund JPMorgan Asset Management (UK) Limited
JPMorgan Funds - Global Short Duration Bond Fund JPMorgan Asset Management (UK) Limited J. P. Morgan Investment Management Inc.
JPMorgan Funds - Global Strategic Bond Fund J. P. Morgan Investment Management Inc.
JPMorgan Funds - Income Fund J. P. Morgan Investment Management Inc.
JPMorgan Funds - India Fund JPMorgan Asset Management (Asia Pacific) Limited
JPMorgan Funds - Taiwan Fund JPMorgan Asset Management (Asia Pacific) Limited JPMorgan Asset Management Taiwan Limited
JPMorgan Funds - Total Emerging Markets Income Fund JPMorgan Asset Management (UK) Limited J. P. Morgan Investment Management Inc.
JPMorgan Funds - Euroland Equity Fund JPMorgan Asset Management (UK) Limited
JPMorgan Funds - Europe Dynamic Technologies Fund JPMorgan Asset Management (UK) Limited
JPMorgan Funds - Global Equity Fund JPMorgan Asset Management (UK) Limited
(1) This Sub-Fund was renamed from JPMorgan Funds - Global Unconstrained Equity Fund to JPMorgan Funds - Global Growth Fund on 1 April 2021.Except for the Sub-Funds mentioned above, the other Sub-Funds referred to in this report are not authorised in Taiwan and are not available to the public in Taiwan.
16. Directors’ FeesThe only remuneration paid to Directors is an annual fee including AML Committee Fee. This is waived by Mr Daniel J. Watkins, Mr Massimo Greco and MsMarion Mulvey. The Directors’ fees for the year amounted to USD 505,841 of which USD 102,118 was due to the AML Committee Chairman. The AMLCommittee Directors’ fees for the period amounted to USD 14,132 of which USD 6,006 was due to the Chairman.
17. Transaction CostsFor the year ended 30 June 2021, the SICAV incurred transaction costs which have been defined as brokerage fees included with the “Net realised gain/(loss)for the year” in the Combined Statement of Operations and Changes in Net Assets relating to purchase or sale of transferable securities, derivatives (exceptOTC derivatives), money market instruments or other eligible assets. The SICAV also incurred transaction costs charged by the depositary agent includedwithin “Depositary, corporate, administration and domiciliary agency fees” in the Combined Statement of Operations and Changes in Net Assets relating topurchase and sale of transferable securities as follows:
Sub-Fund Base Currency Depositary Transaction Costs andBrokerage Fees
(in Base Currency)JPMorgan Funds - America Equity Fund USD 790,635JPMorgan Funds - Asia Pacific Equity Fund USD 1,854,589JPMorgan Funds - Brazil Equity Fund USD 274,840JPMorgan Funds - China Fund USD 17,186,897JPMorgan Funds - Emerging Europe Equity Fund EUR 438,162JPMorgan Funds - Emerging Markets Dividend Fund USD 853,845JPMorgan Funds - Emerging Markets Equity Fund USD 7,222,152JPMorgan Funds - Emerging Markets Opportunities Fund USD 6,928,833JPMorgan Funds - Emerging Markets Small Cap Fund USD 3,327,707JPMorgan Funds - Emerging Middle East Equity Fund USD 212,255JPMorgan Funds - Europe Dynamic Fund EUR 2,160,666JPMorgan Funds - Europe Equity Fund EUR 771,469JPMorgan Funds - Europe Small Cap Fund EUR 2,053,033JPMorgan Funds - Global Growth Fund USD 311,209JPMorgan Funds - Global Healthcare Fund USD 661,170JPMorgan Funds - Global Natural Resources Fund EUR 1,516,418JPMorgan Funds - Greater China Fund USD 6,381,188JPMorgan Funds - Japan Equity Fund JPY 231,892,561
JPMorgan FundsNotes to the Financial Statements (continued)
As at 30 June 2021
65

Sub-Fund Base Currency Depositary Transaction Costs andBrokerage Fees
(in Base Currency)JPMorgan Funds - Latin America Equity Fund USD 413,439JPMorgan Funds - Russia Fund USD 483,423JPMorgan Funds - Thematics - Genetic Therapies USD 1,165,447JPMorgan Funds - US Equity All Cap Fund USD 541,986JPMorgan Funds - US Growth Fund USD 326,468JPMorgan Funds - US Smaller Companies Fund USD 525,924JPMorgan Funds - US Technology Fund USD 650,599JPMorgan Funds - US Value Fund USD 672,936JPMorgan Funds - Asia Pacific Income Fund USD 2,698,435JPMorgan Funds - Aggregate Bond Fund USD 205,926JPMorgan Funds - Emerging Markets Corporate Bond Fund USD 49,861JPMorgan Funds - Emerging Markets Debt Fund USD 50,888JPMorgan Funds - Emerging Markets Investment Grade Bond Fund USD 26,229JPMorgan Funds - Emerging Markets Local Currency Debt Fund USD 68,847JPMorgan Funds - Global Corporate Bond Duration-Hedged Fund USD 25,095JPMorgan Funds - Global Corporate Bond Fund USD 535,163JPMorgan Funds - Global Government Bond Fund EUR 176,073JPMorgan Funds - Global Short Duration Bond Fund USD 50,352JPMorgan Funds - Global Strategic Bond Fund USD 118,734JPMorgan Funds - Income Fund USD 66,905JPMorgan Funds - US Aggregate Bond Fund USD 24,197JPMorgan Funds - USD Money Market VNAV Fund USD 12,772
For fixed income securities, transaction costs are not separately identifiable from the purchase price of the security and therefore cannot be disclosed separately.
18. Significant Events during the Year
a) Sub-Fund Name changeThe following Sub-Fund was renamed during the year:
JPMorgan Funds - Global Unconstrained Equity Fund to JPMorgan Funds - Global Growth Fund on 1 April 2021.
b) Investment PolicyWith effect from 29 July 2020, the investment policies for the JPMorgan Funds - Global Corporate Bond Fund and the JPMorgan Funds - Global CorporateBond Duration-Hedged Fund have been amended to remove a restriction to invest in global debt securities issued by local governments, and to allowinvestment in these types of assets up to 5%. This change will broaden the investment universe of the Sub-Funds, permitting the Investment Managers totake advantage of any investment opportunities in debt securities issued by local governments globally. This change will not materially affect how theSub-Funds are currently managed or their risk profile.
With effect from 20 October 2020, the investment policy for the JPMorgan Funds - Emerging Markets Dividend Fund has been amended to allow investmentin China A-Shares through the China-Hong Kong Stock Connect Programmes up to 20%, up from a previous limit of 10%. This provides the InvestmentManager with increased flexibility to gain exposure to China A shares which are growing in prominence in emerging and global indices and provide asignificant and growing investment opportunity. This change will not materially affect the risk profile of the Sub-Fund.
c) Changes to investment restrictionsWith effect from 29 July 2020, the JPMorgan Funds - Emerging Markets Local Currency Debt Fund (the “Sub-Fund”)is registered with the Securities andFutures Commission, the regulatory authority in Hong Kong, and as a result certain investment restrictions are disclosed in the JPMorgan Funds prospectusin respect of the Sub-Fund. The JPMorgan Funds prospectus has been updated to reflect that the Investment Manager may hold up to 20% of the Sub-Fund’snet assets in securities issued or guaranteed by any one country (including any government body or public or local authority) with a credit rating belowinvestment grade. This will provide the Investment Manager with the flexibility to take advantage of opportunities in countries rated below investment gradeand is in line with the current investment policy of the Sub-Fund. There is no impact to the risk profile of the Sub-Fund.
d) Integration of Environmental, Social and Governance factorsWith effect from 29 July 2020, the Sub-Fund Descriptions for the following Sub-Funds have been updated to reflect that Environmental, Social andGovernance factors are integrated into the investment process:
- JPMorgan Funds - America Equity Fund
- JPMorgan Funds - Brazil Equity Fund
- JPMorgan Funds - Emerging Europe Equity Fund
- JPMorgan Funds - Emerging Middle East Equity Fund
- JPMorgan Funds - Global Growth Fund
- JPMorgan Funds - Global Natural Resources Fund
- JPMorgan Funds - Russia Fund
- JPMorgan Funds - Thematics - Genetic Therapies
- JPMorgan Funds - US Equity All Cap Fund
- JPMorgan Funds - US Growth Fund
- JPMorgan Funds - US Smaller Companies Fund
- JPMorgan Funds - US Technology Fund
- JPMorgan Funds - US Value Fund
- JPMorgan Funds - Asia Pacific Income Fund
6666
JPMorgan FundsNotes to the Financial Statements (continued)
As at 30 June 2021

e) Prospectus updatesWith effect from 29 July 2020, for The prospectus of JPMorgan Funds has been updated to clarify and enhance the investment policies of the relevantSub-Funds which are expected to invest in mortgage-backed securities (“MBS”) and/or asset-backed securities (“ABS”), as set out below. For thoseSub-Funds which are expected to invest in MBS/ABS, the investment policies have been updated to indicate a percentage of assets which may be invested inthese securities. In addition, for those Sub-Funds which are expected to invest 20% or more of their assets in MBS/ABS, the investment policies have beenenhanced to include a description of MBS/ABS, underlying assets and any applicable credit quality restrictions. Certain other clarifications of investments inMBS/ABS and covered bonds have been also made for clarity and consistency purposes. For details of the relevant Sub-Funds and the above updates, pleaserefer to the Appendix and the full version of the latest prospectus. These updates reflect how the Sub-Funds are currently being managed and do not affecttheir risk profiles.
f) Changes to Sub-Fund investment policy and global exposure calculation methodWith effect from 14 January 2021, the investment policy for JPMorgan Funds - US Technology Fund has been amended to better reflect current industryterminology. The term ‘telecommunications’ has been replaced with ‘communication services. The ‘telecommunications’ sector no longer exists in the S&PGlobal Industry Classification Standard sector classification as a standalone industry or sector and is now included in the ‘communication services’ sector.The investment policy has also been updated to reflect that investments may include but are not limited to technology, media and communications servicessectors. The technology segment has broadened out considerably in recent years and many new technology companies exist outside the technology sectoras defined by index classifications such as S&P GICs or Russell as well as the traditional TMT (telecom, media, technology) space. There is no change to howthe Sub-Fund is managed and these changes will not materially affect the risk profile of the Sub-Fund.
With effect from 12 May 2021, the investment policies for the below Sub-Fund have been amended to allow investment up to 20% in China A-Shares throughthe China-Hong Kong Stock Connect Programmes.
- JPMorgan Funds - Emerging Markets Small Cap Fund
g) Changes to Sub-Funds Name, Objective, Investment Approach, Benchmark, Investment Exposure, Risk and Investor ProfileWith effect from 1 April 2021, the Name, Objective, Investment Approach, Benchmark, investment exposure, Risk method and Investor Profile of JPMorganFunds - Global Unconstrained Equity Fund will be updated as follows:
Before After
Sub-Fund Name Sub-Fund Name
JPMorgan Funds - Global Unconstrained Equity Fund JPMorgan Funds - Global Growth Fund
Objective Objective
To provide long-term capital growth by investing primarily in an aggressively managed portfolioof companies, globally.
To provide long-term capital growth by investing primarily in a growth style biased portfolio ofcompanies, globally.
Investment Approach Investment Approach
Uses a fundamental bottom-up stock selection process. Uses a fundamental bottom-up stock selection process.
Investment process built on leveraging the insights of a global analyst team to identify attractivelyvalued companies using a quality and growth framework.
Uses a high-conviction approach to finding the best investment ideas with minimal stock, sectorand country constraints
Uses a high-conviction approach to finding the best investment ideas with minimal constraints. Seeks to identify high quality companies with superior and sustainable growth potential.
Benchmark Benchmark
MSCI All Country World Index (Total Return Net) MSCI All Country World Growth Index (Total Return Net)
Main Investment Exposure Main Investment Exposure
At least 67% of assets invested in equities of companies anywhere in the world, includingemerging markets. The SubFund may invest in companies of any size (including smallcapitalisation companies) and focus its investments on specific sectors or markets from time totime.
At least 67% of assets invested in a portfolio of growth style biased equities of companiesanywhere in the world, including emerging markets. The Sub- Fund may invest in companies ofany size (including small capitalisation companies). The Sub-Fund may be concentrated in alimited number of securities, sectors or markets from time to time
Main Risks Main Risks
Investment RisksRisks from the Sub-Fund’s techniques and securities
Investment RisksRisks from the Sub-Fund’s techniques and securities
Techniques Securities Techniques Securities
Concentration Emerging markets Concentration Emerging markets
Hedging Equities, smaller companies Hedging Equities
Style Bias Smaller companies
Investor Profile Investor Profile
Investors who understand the risks of the Sub-Fund, including the risk of capital loss, and: Investors who understand the risks of the Sub-Fund, including the risk of capital loss, and:
- seek long-term capital growth through exposure to global equity markets; - seek long-term capital growth through exposure to global equity markets;
- understand the risks associated with an equity strategy managed with minimal constraints andare willing to accept those risks in search of potential higher returns;
- seek a growth style investment approach;
- are looking to use it as part of an investment portfolio and not as a complete investment plan. - are looking to use it as part of an investment portfolio and not as a complete investment plan.
h) EU Sustainable Finance Disclosure Regulation (SFDR)With effect from 12 May 2021, the prospectus of JPMorgan Funds has been updated to reflect that the Sub-Funds outlined below have been re-categorisedfrom Article 6 to Article 8 under SFDR. The Sub-Funds have been classified as “ESG Promote” (with the exception of JPMorgan Funds - Thematics - GeneticTherapies as “Thematic”) and the Sub-Fund Descriptions have been updated to reflect this categorisation and the following binding criteria:
- At least 51% of assets are invested in companies/issuers with positive environmental and/or social characteristics that follow good governance practices.
- Specific values and norms based exclusions.
These updates clarify how the Sub-Funds are currently being managed and do not affect their risk profiles.
- JPMorgan Funds - Aggregate Bond Fund
- JPMorgan Funds - America Equity Fund
JPMorgan FundsNotes to the Financial Statements (continued)
As at 30 June 2021
67
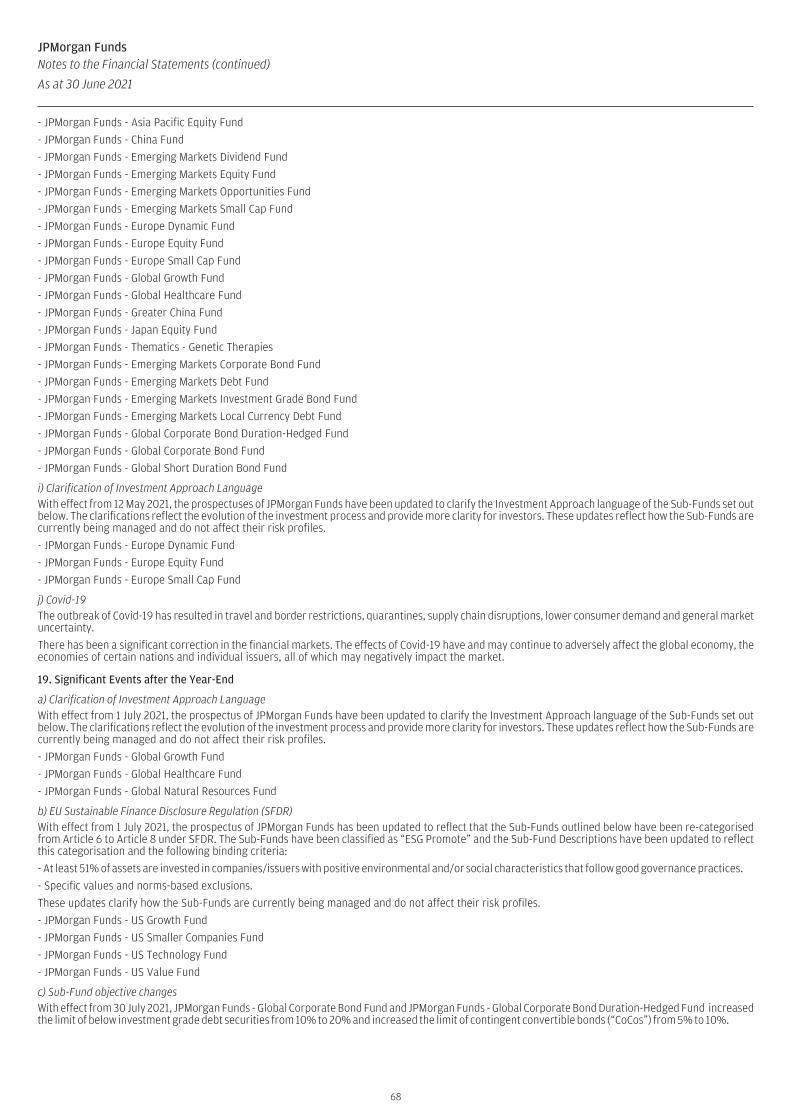
- JPMorgan Funds - Asia Pacific Equity Fund
- JPMorgan Funds - China Fund
- JPMorgan Funds - Emerging Markets Dividend Fund
- JPMorgan Funds - Emerging Markets Equity Fund
- JPMorgan Funds - Emerging Markets Opportunities Fund
- JPMorgan Funds - Emerging Markets Small Cap Fund
- JPMorgan Funds - Europe Dynamic Fund
- JPMorgan Funds - Europe Equity Fund
- JPMorgan Funds - Europe Small Cap Fund
- JPMorgan Funds - Global Growth Fund
- JPMorgan Funds - Global Healthcare Fund
- JPMorgan Funds - Greater China Fund
- JPMorgan Funds - Japan Equity Fund
- JPMorgan Funds - Thematics - Genetic Therapies
- JPMorgan Funds - Emerging Markets Corporate Bond Fund
- JPMorgan Funds - Emerging Markets Debt Fund
- JPMorgan Funds - Emerging Markets Investment Grade Bond Fund
- JPMorgan Funds - Emerging Markets Local Currency Debt Fund
- JPMorgan Funds - Global Corporate Bond Duration-Hedged Fund
- JPMorgan Funds - Global Corporate Bond Fund
- JPMorgan Funds - Global Short Duration Bond Fund
i) Clarification of Investment Approach LanguageWith effect from 12 May 2021, the prospectuses of JPMorgan Funds have been updated to clarify the Investment Approach language of the Sub-Funds set outbelow. The clarifications reflect the evolution of the investment process and provide more clarity for investors. These updates reflect how the Sub-Funds arecurrently being managed and do not affect their risk profiles.
- JPMorgan Funds - Europe Dynamic Fund
- JPMorgan Funds - Europe Equity Fund
- JPMorgan Funds - Europe Small Cap Fund
j) Covid-19The outbreak of Covid-19 has resulted in travel and border restrictions, quarantines, supply chain disruptions, lower consumer demand and general marketuncertainty.
There has been a significant correction in the financial markets. The effects of Covid-19 have and may continue to adversely affect the global economy, theeconomies of certain nations and individual issuers, all of which may negatively impact the market.
19. Significant Events after the Year-End
a) Clarification of Investment Approach LanguageWith effect from 1 July 2021, the prospectus of JPMorgan Funds have been updated to clarify the Investment Approach language of the Sub-Funds set outbelow. The clarifications reflect the evolution of the investment process and provide more clarity for investors. These updates reflect how the Sub-Funds arecurrently being managed and do not affect their risk profiles.
- JPMorgan Funds - Global Growth Fund
- JPMorgan Funds - Global Healthcare Fund
- JPMorgan Funds - Global Natural Resources Fund
b) EU Sustainable Finance Disclosure Regulation (SFDR)With effect from 1 July 2021, the prospectus of JPMorgan Funds has been updated to reflect that the Sub-Funds outlined below have been re-categorisedfrom Article 6 to Article 8 under SFDR. The Sub-Funds have been classified as “ESG Promote” and the Sub-Fund Descriptions have been updated to reflectthis categorisation and the following binding criteria:
- At least 51% of assets are invested in companies/issuers with positive environmental and/or social characteristics that follow good governance practices.
- Specific values and norms-based exclusions.
These updates clarify how the Sub-Funds are currently being managed and do not affect their risk profiles.
- JPMorgan Funds - US Growth Fund
- JPMorgan Funds - US Smaller Companies Fund
- JPMorgan Funds - US Technology Fund
- JPMorgan Funds - US Value Fund
c) Sub-Fund objective changesWith effect from 30 July 2021, JPMorgan Funds - Global Corporate Bond Fund and JPMorgan Funds - Global Corporate Bond Duration-Hedged Fund increasedthe limit of below investment grade debt securities from 10% to 20% and increased the limit of contingent convertible bonds (“CoCos”) from 5% to 10%.
JPMorgan FundsNotes to the Financial Statements (continued)
As at 30 June 2021
68

20. Criteria for preparation of the financial statementsCertain of the Sub-Funds of the Fund are not authorised for offer or distribution in or from Taiwan. Accordingly, no reference is made to these Sub-Funds inthis audited annual report. The attention of the investors is drawn to the fact that certain figures in this audited annual report are expressed on aconsolidated basis and, thus, include the assets of those Sub-Funds which are not registered in Taiwan.
69
JPMorgan FundsNotes to the Financial Statements (continued)
As at 30 June 2021
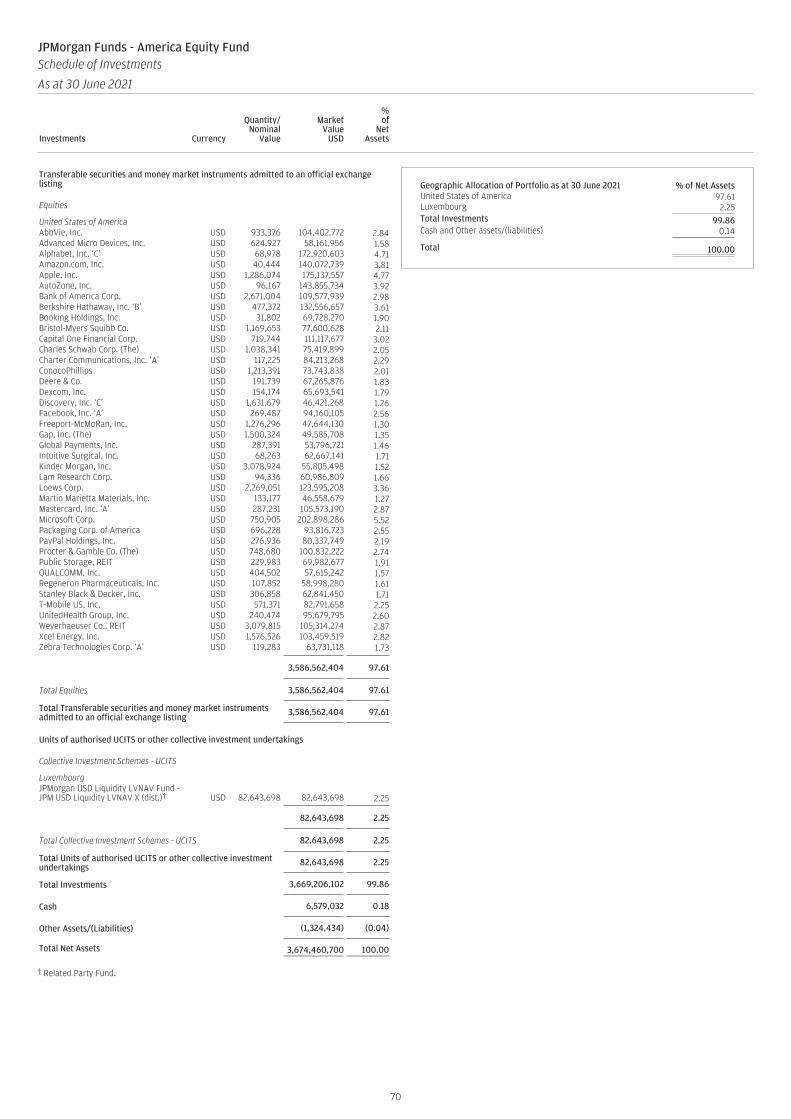
Transferable securities and money market instruments admitted to an official exchangelisting
Equities
United States of AmericaAbbVie, Inc. USD 933,376 104,402,772 2.84Advanced Micro Devices, Inc. USD 624,927 58,161,956 1.58Alphabet, Inc. ‘C’ USD 68,978 172,920,603 4.71Amazon.com, Inc. USD 40,444 140,072,739 3.81Apple, Inc. USD 1,286,074 175,137,557 4.77AutoZone, Inc. USD 96,167 143,855,734 3.92Bank of America Corp. USD 2,671,004 109,577,939 2.98Berkshire Hathaway, Inc. ‘B’ USD 477,372 132,556,657 3.61Booking Holdings, Inc. USD 31,802 69,728,270 1.90Bristol-Myers Squibb Co. USD 1,169,653 77,600,628 2.11Capital One Financial Corp. USD 719,744 111,117,677 3.02Charles Schwab Corp. (The) USD 1,038,341 75,419,899 2.05Charter Communications, Inc. ‘A’ USD 117,225 84,213,268 2.29ConocoPhillips USD 1,213,391 73,743,838 2.01Deere & Co. USD 191,739 67,265,876 1.83Dexcom, Inc. USD 154,174 65,693,541 1.79Discovery, Inc. ‘C’ USD 1,631,679 46,421,268 1.26Facebook, Inc. ‘A’ USD 269,487 94,160,105 2.56Freeport-McMoRan, Inc. USD 1,276,296 47,644,130 1.30Gap, Inc. (The) USD 1,500,324 49,585,708 1.35Global Payments, Inc. USD 287,391 53,796,721 1.46Intuitive Surgical, Inc. USD 68,263 62,667,141 1.71Kinder Morgan, Inc. USD 3,078,924 55,805,498 1.52Lam Research Corp. USD 94,336 60,986,809 1.66Loews Corp. USD 2,269,051 123,595,208 3.36Martin Marietta Materials, Inc. USD 133,177 46,558,679 1.27Mastercard, Inc. ‘A’ USD 287,231 105,573,190 2.87Microsoft Corp. USD 750,905 202,898,286 5.52Packaging Corp. of America USD 696,228 93,816,723 2.55PayPal Holdings, Inc. USD 276,936 80,337,749 2.19Procter & Gamble Co. (The) USD 748,680 100,832,222 2.74Public Storage, REIT USD 229,983 69,982,677 1.91QUALCOMM, Inc. USD 404,502 57,615,242 1.57Regeneron Pharmaceuticals, Inc. USD 107,852 58,998,280 1.61Stanley Black & Decker, Inc. USD 306,858 62,841,450 1.71T-Mobile US, Inc. USD 571,371 82,791,658 2.25UnitedHealth Group, Inc. USD 240,474 95,679,795 2.60Weyerhaeuser Co., REIT USD 3,079,815 105,314,274 2.87Xcel Energy, Inc. USD 1,576,526 103,459,519 2.82Zebra Technologies Corp. ‘A’ USD 119,283 63,731,118 1.73
3,586,562,404 97.61
Total Equities 3,586,562,404 97.61
Total Transferable securities and money market instrumentsadmitted to an official exchange listing 3,586,562,404 97.61
Units of authorised UCITS or other collective investment undertakings
Collective Investment Schemes - UCITS
LuxembourgJPMorgan USD Liquidity LVNAV Fund -JPM USD Liquidity LVNAV X (dist.)† USD 82,643,698 82,643,698 2.25
82,643,698 2.25
Total Collective Investment Schemes - UCITS 82,643,698 2.25
Total Units of authorised UCITS or other collective investmentundertakings 82,643,698 2.25
Total Investments 3,669,206,102 99.86
Cash 6,579,032 0.18
Other Assets/(Liabilities) (1,324,434) (0.04)
Total Net Assets 3,674,460,700 100.00
† Related Party Fund.
Geographic Allocation of Portfolio as at 30 June 2021 % of Net AssetsUnited States of America 97.61Luxembourg 2.25Total Investments 99.86Cash and Other assets/(liabilities) 0.14
Total 100.00
70
JPMorgan Funds - America Equity FundSchedule of Investments
As at 30 June 2021
Investments Currency
Quantity/Nominal
Value
MarketValue
USD
%of
NetAssets Investments Currency
Quantity/Nominal
Value
MarketValue
USD
%of
NetAssets
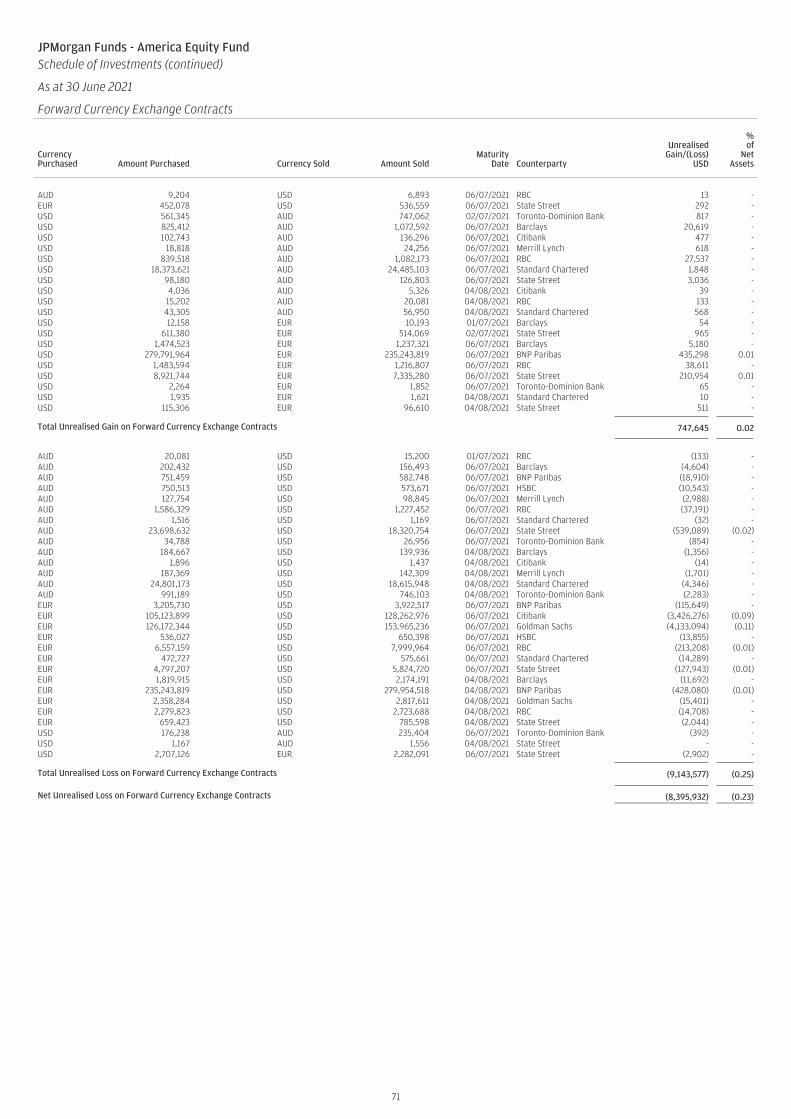
JPMorgan Funds - America Equity FundSchedule of Investments (continued)
As at 30 June 2021
Forward Currency Exchange Contracts (continued)
CurrencyPurchased Amount Purchased Currency Sold Amount Sold
MaturityDate Counterparty
UnrealisedGain/(Loss)
USD
%of
NetAssets
AUD 9,204 USD 6,893 06/07/2021 RBC 13 -EUR 452,078 USD 536,559 06/07/2021 State Street 292 -USD 561,345 AUD 747,062 02/07/2021 Toronto-Dominion Bank 817 -USD 825,412 AUD 1,072,592 06/07/2021 Barclays 20,619 -USD 102,743 AUD 136,296 06/07/2021 Citibank 477 -USD 18,818 AUD 24,256 06/07/2021 Merrill Lynch 618 -USD 839,518 AUD 1,082,173 06/07/2021 RBC 27,537 -USD 18,373,621 AUD 24,485,103 06/07/2021 Standard Chartered 1,848 -USD 98,180 AUD 126,803 06/07/2021 State Street 3,036 -USD 4,036 AUD 5,326 04/08/2021 Citibank 39 -USD 15,202 AUD 20,081 04/08/2021 RBC 133 -USD 43,305 AUD 56,950 04/08/2021 Standard Chartered 568 -USD 12,158 EUR 10,193 01/07/2021 Barclays 54 -USD 611,380 EUR 514,069 02/07/2021 State Street 965 -USD 1,474,523 EUR 1,237,321 06/07/2021 Barclays 5,180 -USD 279,791,964 EUR 235,243,819 06/07/2021 BNP Paribas 435,298 0.01USD 1,483,594 EUR 1,216,807 06/07/2021 RBC 38,611 -USD 8,921,744 EUR 7,335,280 06/07/2021 State Street 210,954 0.01USD 2,264 EUR 1,852 06/07/2021 Toronto-Dominion Bank 65 -USD 1,935 EUR 1,621 04/08/2021 Standard Chartered 10 -USD 115,306 EUR 96,610 04/08/2021 State Street 511 -
Total Unrealised Gain on Forward Currency Exchange Contracts 747,645 0.02
AUD 20,081 USD 15,200 01/07/2021 RBC (133) -AUD 202,432 USD 156,493 06/07/2021 Barclays (4,604) -AUD 751,459 USD 582,748 06/07/2021 BNP Paribas (18,910) -AUD 750,513 USD 573,671 06/07/2021 HSBC (10,543) -AUD 127,754 USD 98,845 06/07/2021 Merrill Lynch (2,988) -AUD 1,586,329 USD 1,227,452 06/07/2021 RBC (37,191) -AUD 1,516 USD 1,169 06/07/2021 Standard Chartered (32) -AUD 23,698,632 USD 18,320,754 06/07/2021 State Street (539,089) (0.02)AUD 34,788 USD 26,956 06/07/2021 Toronto-Dominion Bank (854) -AUD 184,667 USD 139,936 04/08/2021 Barclays (1,356) -AUD 1,896 USD 1,437 04/08/2021 Citibank (14) -AUD 187,369 USD 142,309 04/08/2021 Merrill Lynch (1,701) -AUD 24,801,173 USD 18,615,948 04/08/2021 Standard Chartered (4,346) -AUD 991,189 USD 746,103 04/08/2021 Toronto-Dominion Bank (2,283) -EUR 3,205,730 USD 3,922,517 06/07/2021 BNP Paribas (115,649) -EUR 105,123,899 USD 128,262,976 06/07/2021 Citibank (3,426,276) (0.09)EUR 126,172,344 USD 153,965,236 06/07/2021 Goldman Sachs (4,133,094) (0.11)EUR 536,027 USD 650,398 06/07/2021 HSBC (13,855) -EUR 6,557,159 USD 7,999,964 06/07/2021 RBC (213,208) (0.01)EUR 472,727 USD 575,661 06/07/2021 Standard Chartered (14,289) -EUR 4,797,207 USD 5,824,720 06/07/2021 State Street (127,943) (0.01)EUR 1,819,915 USD 2,174,191 04/08/2021 Barclays (11,692) -EUR 235,243,819 USD 279,954,518 04/08/2021 BNP Paribas (428,080) (0.01)EUR 2,358,284 USD 2,817,611 04/08/2021 Goldman Sachs (15,401) -EUR 2,279,823 USD 2,723,688 04/08/2021 RBC (14,708) -EUR 659,423 USD 785,598 04/08/2021 State Street (2,044) -USD 176,238 AUD 235,404 06/07/2021 Toronto-Dominion Bank (392) -USD 1,167 AUD 1,556 04/08/2021 State Street - -USD 2,707,126 EUR 2,282,091 06/07/2021 State Street (2,902) -
Total Unrealised Loss on Forward Currency Exchange Contracts (9,143,577) (0.25)
Net Unrealised Loss on Forward Currency Exchange Contracts (8,395,932) (0.23)
71
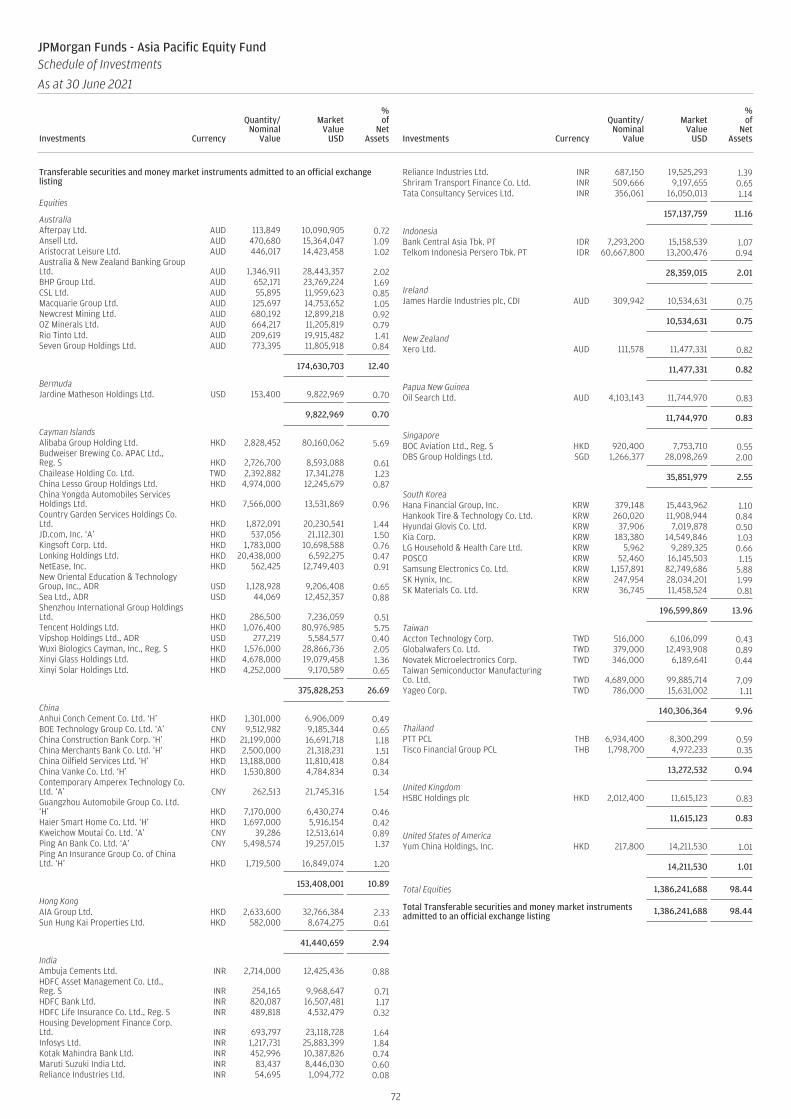
Transferable securities and money market instruments admitted to an official exchangelisting
Equities
AustraliaAfterpay Ltd. AUD 113,849 10,090,905 0.72Ansell Ltd. AUD 470,680 15,364,047 1.09Aristocrat Leisure Ltd. AUD 446,017 14,423,458 1.02Australia & New Zealand Banking GroupLtd. AUD 1,346,911 28,443,357 2.02BHP Group Ltd. AUD 652,171 23,769,224 1.69CSL Ltd. AUD 55,895 11,959,623 0.85Macquarie Group Ltd. AUD 125,697 14,753,652 1.05Newcrest Mining Ltd. AUD 680,192 12,899,218 0.92OZ Minerals Ltd. AUD 664,217 11,205,819 0.79Rio Tinto Ltd. AUD 209,619 19,915,482 1.41Seven Group Holdings Ltd. AUD 773,395 11,805,918 0.84
174,630,703 12.40
BermudaJardine Matheson Holdings Ltd. USD 153,400 9,822,969 0.70
9,822,969 0.70
Cayman IslandsAlibaba Group Holding Ltd. HKD 2,828,452 80,160,062 5.69Budweiser Brewing Co. APAC Ltd.,Reg. S HKD 2,726,700 8,593,088 0.61Chailease Holding Co. Ltd. TWD 2,392,882 17,341,278 1.23China Lesso Group Holdings Ltd. HKD 4,974,000 12,245,679 0.87China Yongda Automobiles ServicesHoldings Ltd. HKD 7,566,000 13,531,869 0.96Country Garden Services Holdings Co.Ltd. HKD 1,872,091 20,230,541 1.44JD.com, Inc. ‘A’ HKD 537,056 21,112,301 1.50Kingsoft Corp. Ltd. HKD 1,783,000 10,698,588 0.76Lonking Holdings Ltd. HKD 20,438,000 6,592,275 0.47NetEase, Inc. HKD 562,425 12,749,403 0.91New Oriental Education & TechnologyGroup, Inc., ADR USD 1,128,928 9,206,408 0.65Sea Ltd., ADR USD 44,069 12,452,357 0.88Shenzhou International Group HoldingsLtd. HKD 286,500 7,236,059 0.51Tencent Holdings Ltd. HKD 1,076,400 80,976,985 5.75Vipshop Holdings Ltd., ADR USD 277,219 5,584,577 0.40Wuxi Biologics Cayman, Inc., Reg. S HKD 1,576,000 28,866,736 2.05Xinyi Glass Holdings Ltd. HKD 4,678,000 19,079,458 1.36Xinyi Solar Holdings Ltd. HKD 4,252,000 9,170,589 0.65
375,828,253 26.69
ChinaAnhui Conch Cement Co. Ltd. ‘H’ HKD 1,301,000 6,906,009 0.49BOE Technology Group Co. Ltd. ‘A’ CNY 9,512,982 9,185,344 0.65China Construction Bank Corp. ‘H’ HKD 21,199,000 16,691,718 1.18China Merchants Bank Co. Ltd. ‘H’ HKD 2,500,000 21,318,231 1.51China Oilfield Services Ltd. ‘H’ HKD 13,188,000 11,810,418 0.84China Vanke Co. Ltd. ‘H’ HKD 1,530,800 4,784,834 0.34Contemporary Amperex Technology Co.Ltd. ‘A’ CNY 262,513 21,745,316 1.54Guangzhou Automobile Group Co. Ltd.‘H’ HKD 7,170,000 6,430,274 0.46Haier Smart Home Co. Ltd. ‘H’ HKD 1,697,000 5,916,154 0.42Kweichow Moutai Co. Ltd. ‘A’ CNY 39,286 12,513,614 0.89Ping An Bank Co. Ltd. ‘A’ CNY 5,498,574 19,257,015 1.37Ping An Insurance Group Co. of ChinaLtd. ‘H’ HKD 1,719,500 16,849,074 1.20
153,408,001 10.89
Hong KongAIA Group Ltd. HKD 2,633,600 32,766,384 2.33Sun Hung Kai Properties Ltd. HKD 582,000 8,674,275 0.61
41,440,659 2.94
IndiaAmbuja Cements Ltd. INR 2,714,000 12,425,436 0.88HDFC Asset Management Co. Ltd.,Reg. S INR 254,165 9,968,647 0.71HDFC Bank Ltd. INR 820,087 16,507,481 1.17HDFC Life Insurance Co. Ltd., Reg. S INR 489,818 4,532,479 0.32Housing Development Finance Corp.Ltd. INR 693,797 23,118,728 1.64Infosys Ltd. INR 1,217,731 25,883,399 1.84Kotak Mahindra Bank Ltd. INR 452,996 10,387,826 0.74Maruti Suzuki India Ltd. INR 83,437 8,446,030 0.60Reliance Industries Ltd. INR 54,695 1,094,772 0.08
Reliance Industries Ltd. INR 687,150 19,525,293 1.39Shriram Transport Finance Co. Ltd. INR 509,666 9,197,655 0.65Tata Consultancy Services Ltd. INR 356,061 16,050,013 1.14
157,137,759 11.16
IndonesiaBank Central Asia Tbk. PT IDR 7,293,200 15,158,539 1.07Telkom Indonesia Persero Tbk. PT IDR 60,667,800 13,200,476 0.94
28,359,015 2.01
IrelandJames Hardie Industries plc, CDI AUD 309,942 10,534,631 0.75
10,534,631 0.75
New ZealandXero Ltd. AUD 111,578 11,477,331 0.82
11,477,331 0.82
Papua New GuineaOil Search Ltd. AUD 4,103,143 11,744,970 0.83
11,744,970 0.83
SingaporeBOC Aviation Ltd., Reg. S HKD 920,400 7,753,710 0.55DBS Group Holdings Ltd. SGD 1,266,377 28,098,269 2.00
35,851,979 2.55
South KoreaHana Financial Group, Inc. KRW 379,148 15,443,962 1.10Hankook Tire & Technology Co. Ltd. KRW 260,020 11,908,944 0.84Hyundai Glovis Co. Ltd. KRW 37,906 7,019,878 0.50Kia Corp. KRW 183,380 14,549,846 1.03LG Household & Health Care Ltd. KRW 5,962 9,289,325 0.66POSCO KRW 52,460 16,145,503 1.15Samsung Electronics Co. Ltd. KRW 1,157,891 82,749,686 5.88SK Hynix, Inc. KRW 247,954 28,034,201 1.99SK Materials Co. Ltd. KRW 36,745 11,458,524 0.81
196,599,869 13.96
TaiwanAccton Technology Corp. TWD 516,000 6,106,099 0.43Globalwafers Co. Ltd. TWD 379,000 12,493,908 0.89Novatek Microelectronics Corp. TWD 346,000 6,189,641 0.44Taiwan Semiconductor ManufacturingCo. Ltd. TWD 4,689,000 99,885,714 7.09Yageo Corp. TWD 786,000 15,631,002 1.11
140,306,364 9.96
ThailandPTT PCL THB 6,934,400 8,300,299 0.59Tisco Financial Group PCL THB 1,798,700 4,972,233 0.35
13,272,532 0.94
United KingdomHSBC Holdings plc HKD 2,012,400 11,615,123 0.83
11,615,123 0.83
United States of AmericaYum China Holdings, Inc. HKD 217,800 14,211,530 1.01
14,211,530 1.01
Total Equities 1,386,241,688 98.44
Total Transferable securities and money market instrumentsadmitted to an official exchange listing 1,386,241,688 98.44
72
JPMorgan Funds - Asia Pacific Equity FundSchedule of Investments
As at 30 June 2021
Investments Currency
Quantity/Nominal
Value
MarketValue
USD
%of
NetAssets Investments Currency
Quantity/Nominal
Value
MarketValue
USD
%of
NetAssets

Units of authorised UCITS or other collective investment undertakings
Collective Investment Schemes - UCITS
LuxembourgJPMorgan USD Liquidity LVNAV Fund -JPM USD Liquidity LVNAV X (dist.)† USD 19,000,000 19,000,000 1.35
19,000,000 1.35
Total Collective Investment Schemes - UCITS 19,000,000 1.35
Total Units of authorised UCITS or other collective investmentundertakings 19,000,000 1.35
Total Investments 1,405,241,688 99.79
Cash 4,258,857 0.30
Other Assets/(Liabilities) (1,299,515) (0.09)
Total Net Assets 1,408,201,030 100.00
† Related Party Fund.
Geographic Allocation of Portfolio as at 30 June 2021 % of Net AssetsCayman Islands 26.69South Korea 13.96Australia 12.40India 11.16China 10.89Taiwan 9.96Hong Kong 2.94Singapore 2.55Indonesia 2.01Luxembourg 1.35United States of America 1.01Thailand 0.94Papua New Guinea 0.83United Kingdom 0.83New Zealand 0.82Ireland 0.75Bermuda 0.70Total Investments 99.79Cash and Other assets/(liabilities) 0.21
Total 100.00
73
JPMorgan Funds - Asia Pacific Equity FundSchedule of Investments (continued)
As at 30 June 2021
Investments Currency
Quantity/Nominal
Value
MarketValue
USD
%of
NetAssets Investments Currency
Quantity/Nominal
Value
MarketValue
USD
%of
NetAssets
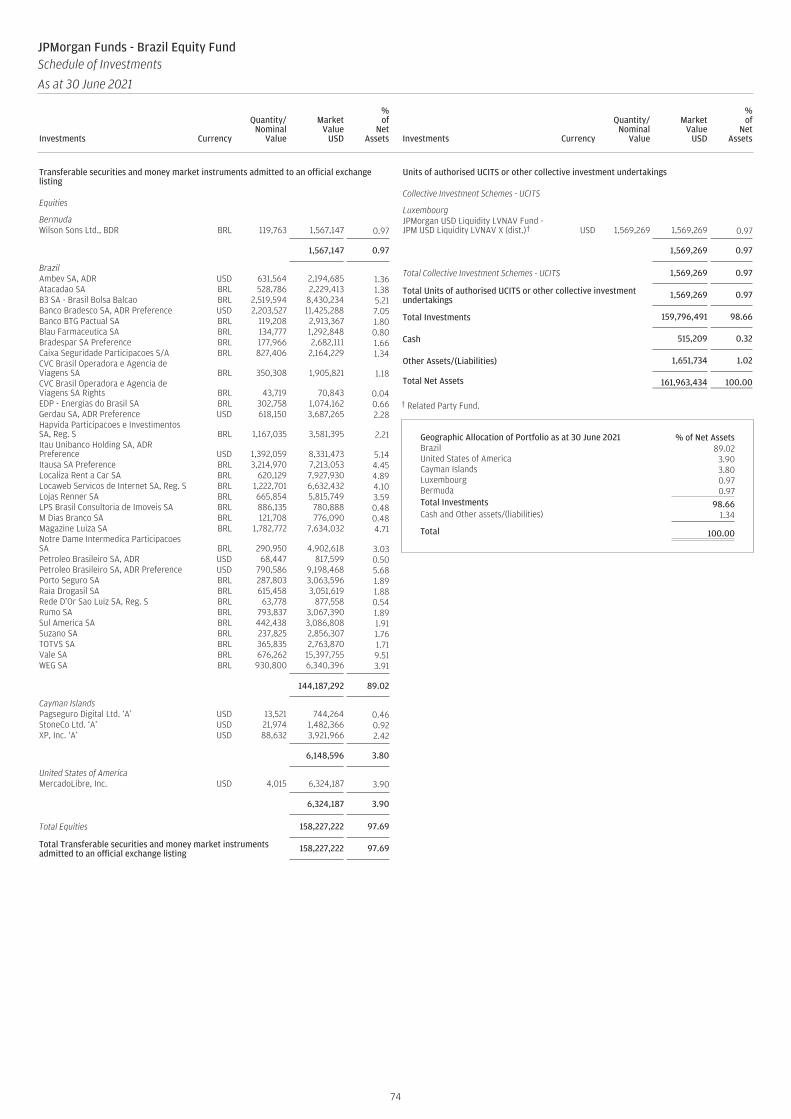
Transferable securities and money market instruments admitted to an official exchangelisting
Equities
BermudaWilson Sons Ltd., BDR BRL 119,763 1,567,147 0.97
1,567,147 0.97
BrazilAmbev SA, ADR USD 631,564 2,194,685 1.36Atacadao SA BRL 528,786 2,229,413 1.38B3 SA - Brasil Bolsa Balcao BRL 2,519,594 8,430,234 5.21Banco Bradesco SA, ADR Preference USD 2,203,527 11,425,288 7.05Banco BTG Pactual SA BRL 119,208 2,913,367 1.80Blau Farmaceutica SA BRL 134,777 1,292,848 0.80Bradespar SA Preference BRL 177,966 2,682,111 1.66Caixa Seguridade Participacoes S/A BRL 827,406 2,164,229 1.34CVC Brasil Operadora e Agencia deViagens SA BRL 350,308 1,905,821 1.18CVC Brasil Operadora e Agencia deViagens SA Rights BRL 43,719 70,843 0.04EDP - Energias do Brasil SA BRL 302,758 1,074,162 0.66Gerdau SA, ADR Preference USD 618,150 3,687,265 2.28Hapvida Participacoes e InvestimentosSA, Reg. S BRL 1,167,035 3,581,395 2.21Itau Unibanco Holding SA, ADRPreference USD 1,392,059 8,331,473 5.14Itausa SA Preference BRL 3,214,970 7,213,053 4.45Localiza Rent a Car SA BRL 620,129 7,927,930 4.89Locaweb Servicos de Internet SA, Reg. S BRL 1,222,701 6,632,432 4.10Lojas Renner SA BRL 665,854 5,815,749 3.59LPS Brasil Consultoria de Imoveis SA BRL 886,135 780,888 0.48M Dias Branco SA BRL 121,708 776,090 0.48Magazine Luiza SA BRL 1,782,772 7,634,032 4.71Notre Dame Intermedica ParticipacoesSA BRL 290,950 4,902,618 3.03Petroleo Brasileiro SA, ADR USD 68,447 817,599 0.50Petroleo Brasileiro SA, ADR Preference USD 790,586 9,198,468 5.68Porto Seguro SA BRL 287,803 3,063,596 1.89Raia Drogasil SA BRL 615,458 3,051,619 1.88Rede D’Or Sao Luiz SA, Reg. S BRL 63,778 877,558 0.54Rumo SA BRL 793,837 3,067,390 1.89Sul America SA BRL 442,438 3,086,808 1.91Suzano SA BRL 237,825 2,856,307 1.76TOTVS SA BRL 365,835 2,763,870 1.71Vale SA BRL 676,262 15,397,755 9.51WEG SA BRL 930,800 6,340,396 3.91
144,187,292 89.02
Cayman IslandsPagseguro Digital Ltd. ‘A’ USD 13,521 744,264 0.46StoneCo Ltd. ‘A’ USD 21,974 1,482,366 0.92XP, Inc. ‘A’ USD 88,632 3,921,966 2.42
6,148,596 3.80
United States of AmericaMercadoLibre, Inc. USD 4,015 6,324,187 3.90
6,324,187 3.90
Total Equities 158,227,222 97.69
Total Transferable securities and money market instrumentsadmitted to an official exchange listing 158,227,222 97.69
Units of authorised UCITS or other collective investment undertakings
Collective Investment Schemes - UCITS
LuxembourgJPMorgan USD Liquidity LVNAV Fund -JPM USD Liquidity LVNAV X (dist.)† USD 1,569,269 1,569,269 0.97
1,569,269 0.97
Total Collective Investment Schemes - UCITS 1,569,269 0.97
Total Units of authorised UCITS or other collective investmentundertakings 1,569,269 0.97
Total Investments 159,796,491 98.66
Cash 515,209 0.32
Other Assets/(Liabilities) 1,651,734 1.02
Total Net Assets 161,963,434 100.00
† Related Party Fund.
Geographic Allocation of Portfolio as at 30 June 2021 % of Net AssetsBrazil 89.02United States of America 3.90Cayman Islands 3.80Luxembourg 0.97Bermuda 0.97Total Investments 98.66Cash and Other assets/(liabilities) 1.34
Total 100.00
74
JPMorgan Funds - Brazil Equity FundSchedule of Investments
As at 30 June 2021
Investments Currency
Quantity/Nominal
Value
MarketValue
USD
%of
NetAssets Investments Currency
Quantity/Nominal
Value
MarketValue
USD
%of
NetAssets
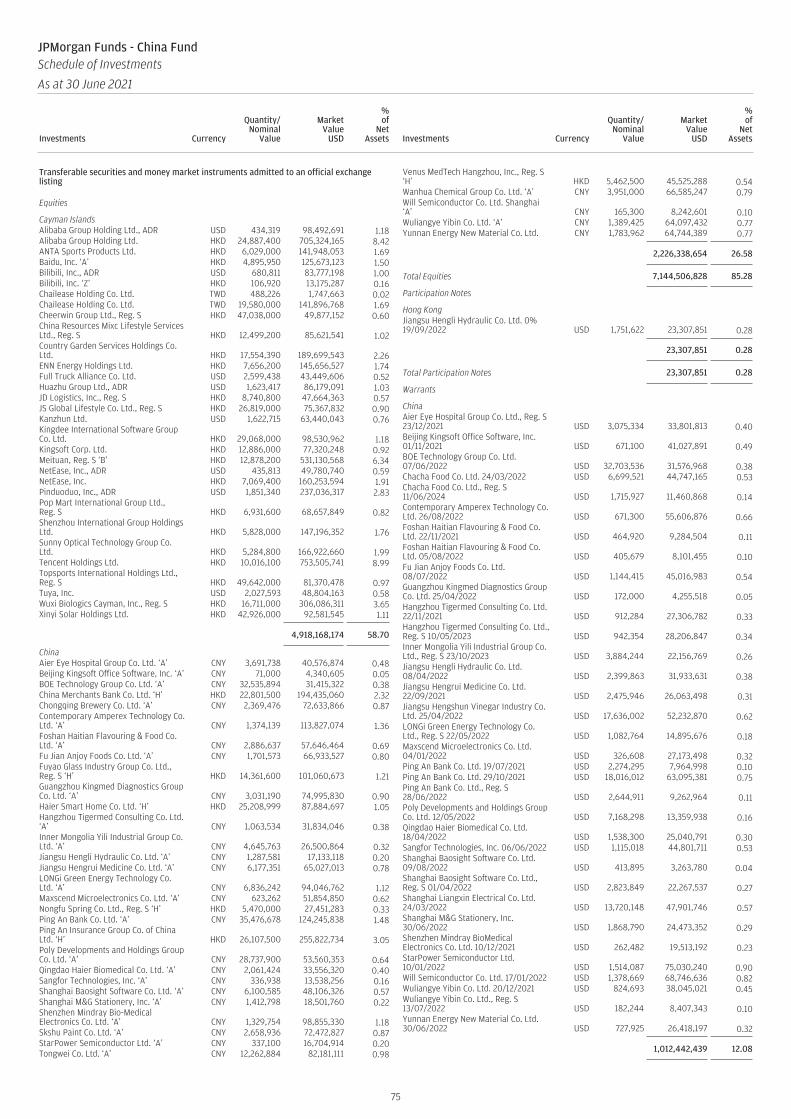
Transferable securities and money market instruments admitted to an official exchangelisting
Equities
Cayman IslandsAlibaba Group Holding Ltd., ADR USD 434,319 98,492,691 1.18Alibaba Group Holding Ltd. HKD 24,887,400 705,324,165 8.42ANTA Sports Products Ltd. HKD 6,029,000 141,948,053 1.69Baidu, Inc. ‘A’ HKD 4,895,950 125,673,123 1.50Bilibili, Inc., ADR USD 680,811 83,777,198 1.00Bilibili, Inc. ‘Z’ HKD 106,920 13,175,287 0.16Chailease Holding Co. Ltd. TWD 488,226 1,747,663 0.02Chailease Holding Co. Ltd. TWD 19,580,000 141,896,768 1.69Cheerwin Group Ltd., Reg. S HKD 47,038,000 49,877,152 0.60China Resources Mixc Lifestyle ServicesLtd., Reg. S HKD 12,499,200 85,621,541 1.02Country Garden Services Holdings Co.Ltd. HKD 17,554,390 189,699,543 2.26ENN Energy Holdings Ltd. HKD 7,656,200 145,656,527 1.74Full Truck Alliance Co. Ltd. USD 2,599,438 43,449,606 0.52Huazhu Group Ltd., ADR USD 1,623,417 86,179,091 1.03JD Logistics, Inc., Reg. S HKD 8,740,800 47,664,363 0.57JS Global Lifestyle Co. Ltd., Reg. S HKD 26,819,000 75,367,832 0.90Kanzhun Ltd. USD 1,622,715 63,440,043 0.76Kingdee International Software GroupCo. Ltd. HKD 29,068,000 98,530,962 1.18Kingsoft Corp. Ltd. HKD 12,886,000 77,320,248 0.92Meituan, Reg. S ‘B’ HKD 12,878,200 531,130,568 6.34NetEase, Inc., ADR USD 435,813 49,780,740 0.59NetEase, Inc. HKD 7,069,400 160,253,594 1.91Pinduoduo, Inc., ADR USD 1,851,340 237,036,317 2.83Pop Mart International Group Ltd.,Reg. S HKD 6,931,600 68,657,849 0.82Shenzhou International Group HoldingsLtd. HKD 5,828,000 147,196,352 1.76Sunny Optical Technology Group Co.Ltd. HKD 5,284,800 166,922,660 1.99Tencent Holdings Ltd. HKD 10,016,100 753,505,741 8.99Topsports International Holdings Ltd.,Reg. S HKD 49,642,000 81,370,478 0.97Tuya, Inc. USD 2,027,593 48,804,163 0.58Wuxi Biologics Cayman, Inc., Reg. S HKD 16,711,000 306,086,311 3.65Xinyi Solar Holdings Ltd. HKD 42,926,000 92,581,545 1.11
4,918,168,174 58.70
ChinaAier Eye Hospital Group Co. Ltd. ‘A’ CNY 3,691,738 40,576,874 0.48Beijing Kingsoft Office Software, Inc. ‘A’ CNY 71,000 4,340,605 0.05BOE Technology Group Co. Ltd. ‘A’ CNY 32,535,894 31,415,322 0.38China Merchants Bank Co. Ltd. ‘H’ HKD 22,801,500 194,435,060 2.32Chongqing Brewery Co. Ltd. ‘A’ CNY 2,369,476 72,633,866 0.87Contemporary Amperex Technology Co.Ltd. ‘A’ CNY 1,374,139 113,827,074 1.36Foshan Haitian Flavouring & Food Co.Ltd. ‘A’ CNY 2,886,637 57,646,464 0.69Fu Jian Anjoy Foods Co. Ltd. ‘A’ CNY 1,701,573 66,933,527 0.80Fuyao Glass Industry Group Co. Ltd.,Reg. S ‘H’ HKD 14,361,600 101,060,673 1.21Guangzhou Kingmed Diagnostics GroupCo. Ltd. ‘A’ CNY 3,031,190 74,995,830 0.90Haier Smart Home Co. Ltd. ‘H’ HKD 25,208,999 87,884,697 1.05Hangzhou Tigermed Consulting Co. Ltd.‘A’ CNY 1,063,534 31,834,046 0.38Inner Mongolia Yili Industrial Group Co.Ltd. ‘A’ CNY 4,645,763 26,500,864 0.32Jiangsu Hengli Hydraulic Co. Ltd. ‘A’ CNY 1,287,581 17,133,118 0.20Jiangsu Hengrui Medicine Co. Ltd. ‘A’ CNY 6,177,351 65,027,013 0.78LONGi Green Energy Technology Co.Ltd. ‘A’ CNY 6,836,242 94,046,762 1.12Maxscend Microelectronics Co. Ltd. ‘A’ CNY 623,262 51,854,850 0.62Nongfu Spring Co. Ltd., Reg. S ‘H’ HKD 5,470,000 27,451,283 0.33Ping An Bank Co. Ltd. ‘A’ CNY 35,476,678 124,245,838 1.48Ping An Insurance Group Co. of ChinaLtd. ‘H’ HKD 26,107,500 255,822,734 3.05Poly Developments and Holdings GroupCo. Ltd. ‘A’ CNY 28,737,900 53,560,353 0.64Qingdao Haier Biomedical Co. Ltd. ‘A’ CNY 2,061,424 33,556,320 0.40Sangfor Technologies, Inc. ‘A’ CNY 336,938 13,538,256 0.16Shanghai Baosight Software Co. Ltd. ‘A’ CNY 6,100,585 48,106,326 0.57Shanghai M&G Stationery, Inc. ‘A’ CNY 1,412,798 18,501,760 0.22Shenzhen Mindray Bio-MedicalElectronics Co. Ltd. ‘A’ CNY 1,329,754 98,855,330 1.18Skshu Paint Co. Ltd. ‘A’ CNY 2,658,936 72,472,827 0.87StarPower Semiconductor Ltd. ‘A’ CNY 337,100 16,704,914 0.20Tongwei Co. Ltd. ‘A’ CNY 12,262,884 82,181,111 0.98
Venus MedTech Hangzhou, Inc., Reg. S‘H’ HKD 5,462,500 45,525,288 0.54Wanhua Chemical Group Co. Ltd. ‘A’ CNY 3,951,000 66,585,247 0.79Will Semiconductor Co. Ltd. Shanghai‘A’ CNY 165,300 8,242,601 0.10Wuliangye Yibin Co. Ltd. ‘A’ CNY 1,389,425 64,097,432 0.77Yunnan Energy New Material Co. Ltd. CNY 1,783,962 64,744,389 0.77
2,226,338,654 26.58
Total Equities 7,144,506,828 85.28
Participation Notes
Hong KongJiangsu Hengli Hydraulic Co. Ltd. 0%19/09/2022 USD 1,751,622 23,307,851 0.28
23,307,851 0.28
Total Participation Notes 23,307,851 0.28
Warrants
ChinaAier Eye Hospital Group Co. Ltd., Reg. S23/12/2021 USD 3,075,334 33,801,813 0.40Beijing Kingsoft Office Software, Inc.01/11/2021 USD 671,100 41,027,891 0.49BOE Technology Group Co. Ltd.07/06/2022 USD 32,703,536 31,576,968 0.38Chacha Food Co. Ltd. 24/03/2022 USD 6,699,521 44,747,165 0.53Chacha Food Co. Ltd., Reg. S11/06/2024 USD 1,715,927 11,460,868 0.14Contemporary Amperex Technology Co.Ltd. 26/08/2022 USD 671,300 55,606,876 0.66Foshan Haitian Flavouring & Food Co.Ltd. 22/11/2021 USD 464,920 9,284,504 0.11Foshan Haitian Flavouring & Food Co.Ltd. 05/08/2022 USD 405,679 8,101,455 0.10Fu Jian Anjoy Foods Co. Ltd.08/07/2022 USD 1,144,415 45,016,983 0.54Guangzhou Kingmed Diagnostics GroupCo. Ltd. 25/04/2022 USD 172,000 4,255,518 0.05Hangzhou Tigermed Consulting Co. Ltd.22/11/2021 USD 912,284 27,306,782 0.33Hangzhou Tigermed Consulting Co. Ltd.,Reg. S 10/05/2023 USD 942,354 28,206,847 0.34Inner Mongolia Yili Industrial Group Co.Ltd., Reg. S 23/10/2023 USD 3,884,244 22,156,769 0.26Jiangsu Hengli Hydraulic Co. Ltd.08/04/2022 USD 2,399,863 31,933,631 0.38Jiangsu Hengrui Medicine Co. Ltd.22/09/2021 USD 2,475,946 26,063,498 0.31Jiangsu Hengshun Vinegar Industry Co.Ltd. 25/04/2022 USD 17,636,002 52,232,870 0.62LONGi Green Energy Technology Co.Ltd., Reg. S 22/05/2022 USD 1,082,764 14,895,676 0.18Maxscend Microelectronics Co. Ltd.04/01/2022 USD 326,608 27,173,498 0.32Ping An Bank Co. Ltd. 19/07/2021 USD 2,274,295 7,964,998 0.10Ping An Bank Co. Ltd. 29/10/2021 USD 18,016,012 63,095,381 0.75Ping An Bank Co. Ltd., Reg. S28/06/2022 USD 2,644,911 9,262,964 0.11Poly Developments and Holdings GroupCo. Ltd. 12/05/2022 USD 7,168,298 13,359,938 0.16Qingdao Haier Biomedical Co. Ltd.18/04/2022 USD 1,538,300 25,040,791 0.30Sangfor Technologies, Inc. 06/06/2022 USD 1,115,018 44,801,711 0.53Shanghai Baosight Software Co. Ltd.09/08/2022 USD 413,895 3,263,780 0.04Shanghai Baosight Software Co. Ltd.,Reg. S 01/04/2022 USD 2,823,849 22,267,537 0.27Shanghai Liangxin Electrical Co. Ltd.24/03/2022 USD 13,720,148 47,901,746 0.57Shanghai M&G Stationery, Inc.30/06/2022 USD 1,868,790 24,473,352 0.29Shenzhen Mindray BioMedicalElectronics Co. Ltd. 10/12/2021 USD 262,482 19,513,192 0.23StarPower Semiconductor Ltd.10/01/2022 USD 1,514,087 75,030,240 0.90Will Semiconductor Co. Ltd. 17/01/2022 USD 1,378,669 68,746,636 0.82Wuliangye Yibin Co. Ltd. 20/12/2021 USD 824,693 38,045,021 0.45Wuliangye Yibin Co. Ltd., Reg. S13/07/2022 USD 182,244 8,407,343 0.10Yunnan Energy New Material Co. Ltd.30/06/2022 USD 727,925 26,418,197 0.32
1,012,442,439 12.08
75
JPMorgan Funds - China FundSchedule of Investments
As at 30 June 2021
Investments Currency
Quantity/Nominal
Value
MarketValue
USD
%of
NetAssets Investments Currency
Quantity/Nominal
Value
MarketValue
USD
%of
NetAssets
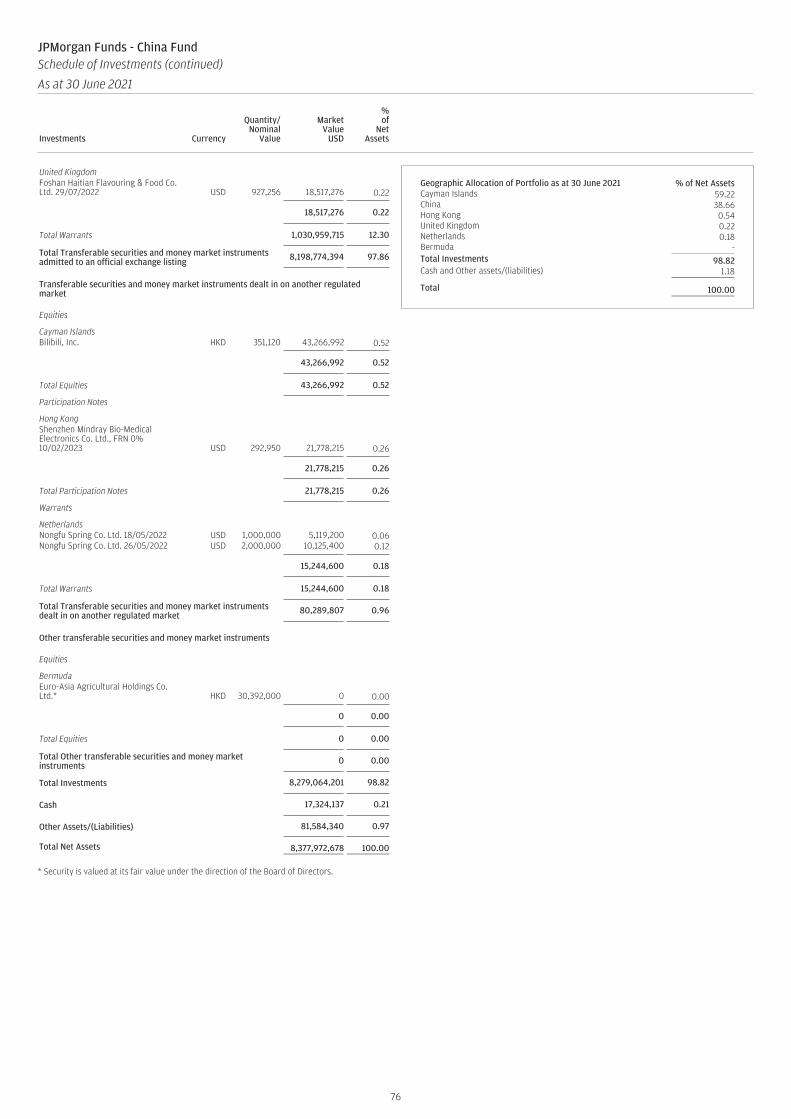
United KingdomFoshan Haitian Flavouring & Food Co.Ltd. 29/07/2022 USD 927,256 18,517,276 0.22
18,517,276 0.22
Total Warrants 1,030,959,715 12.30
Total Transferable securities and money market instrumentsadmitted to an official exchange listing 8,198,774,394 97.86
Transferable securities and money market instruments dealt in on another regulatedmarket
Equities
Cayman IslandsBilibili, Inc. HKD 351,120 43,266,992 0.52
43,266,992 0.52
Total Equities 43,266,992 0.52
Participation Notes
Hong KongShenzhen Mindray Bio-MedicalElectronics Co. Ltd., FRN 0%10/02/2023 USD 292,950 21,778,215 0.26
21,778,215 0.26
Total Participation Notes 21,778,215 0.26
Warrants
NetherlandsNongfu Spring Co. Ltd. 18/05/2022 USD 1,000,000 5,119,200 0.06Nongfu Spring Co. Ltd. 26/05/2022 USD 2,000,000 10,125,400 0.12
15,244,600 0.18
Total Warrants 15,244,600 0.18
Total Transferable securities and money market instrumentsdealt in on another regulated market 80,289,807 0.96
Other transferable securities and money market instruments
Equities
BermudaEuro-Asia Agricultural Holdings Co.Ltd.* HKD 30,392,000 0 0.00
0 0.00
Total Equities 0 0.00
Total Other transferable securities and money marketinstruments 0 0.00
Total Investments 8,279,064,201 98.82
Cash 17,324,137 0.21
Other Assets/(Liabilities) 81,584,340 0.97
Total Net Assets 8,377,972,678 100.00
* Security is valued at its fair value under the direction of the Board of Directors.
Geographic Allocation of Portfolio as at 30 June 2021 % of Net AssetsCayman Islands 59.22China 38.66Hong Kong 0.54United Kingdom 0.22Netherlands 0.18Bermuda -Total Investments 98.82Cash and Other assets/(liabilities) 1.18
Total 100.00
76
JPMorgan Funds - China FundSchedule of Investments (continued)
As at 30 June 2021
Investments Currency
Quantity/Nominal
Value
MarketValue
USD
%of
NetAssets Investments Currency
Quantity/Nominal
Value
MarketValue
USD
%of
NetAssets

Transferable securities and money market instruments admitted to an official exchangelisting
Equities
CyprusQIWI plc, ADR USD 559,728 5,027,285 1.05
5,027,285 1.05
GreeceHellenic TelecommunicationsOrganization SA EUR 688,819 9,757,121 2.04JUMBO SA EUR 468,279 6,680,000 1.40OPAP SA EUR 969,978 12,469,067 2.61
28,906,188 6.05
HungaryOTP Bank Nyrt. HUF 170,323 7,780,257 1.63Richter Gedeon Nyrt. HUF 391,992 8,838,740 1.85
16,618,997 3.48
JerseyPolymetal International plc GBP 253,098 4,605,067 0.96
4,605,067 0.96
KazakhstanHalyk Savings Bank of Kazakhstan JSC,Reg. S, GDR USD 341,654 4,454,030 0.93Kaspi.KZ JSC, Reg. S, GDR USD 89,511 7,673,965 1.61
12,127,995 2.54
LuxembourgAllegro.eu SA, Reg. S PLN 899,444 13,076,180 2.73InPost SA EUR 224,261 3,813,110 0.80
16,889,290 3.53
NetherlandsX5 Retail Group NV, Reg. S, GDR USD 629,260 18,735,989 3.92Yandex NV ‘A’ USD 234,156 13,922,129 2.91
32,658,118 6.83
PolandDino Polska SA, Reg. S PLN 158,946 9,899,024 2.07TEN Square Games SA PLN 130,130 14,185,556 2.97
24,084,580 5.04
RussiaDetsky Mir PJSC, Reg. S USD 3,323,822 5,802,293 1.21Gazprom Neft PJSC USD 1,481,261 7,412,483 1.55Gazprom PJSC, ADR USD 4,197,971 27,034,988 5.66Gazprom PJSC USD 6,453,139 20,905,303 4.37LUKOIL PJSC, ADR USD 348,541 27,148,404 5.68LUKOIL PJSC USD 125,919 9,818,193 2.05MMC Norilsk Nickel PJSC, ADR USD 646,319 18,522,710 3.88MMC Norilsk Nickel PJSC USD 68,411 19,609,835 4.10Moscow Exchange MICEX-RTS PJSC USD 4,000,361 7,836,175 1.64Novatek PJSC, Reg. S, GDR USD 134,231 24,852,778 5.20Novolipetsk Steel PJSC, Reg. S, GDR USD 359,698 9,569,369 2.00Novolipetsk Steel PJSC USD 921,941 2,444,194 0.51Polyus PJSC, Reg. S, GDR USD 83,656 6,751,054 1.41Rosneft Oil Co. PJSC USD 3,603,539 23,643,298 4.95Rostelecom PJSC USD 5,743,455 6,759,754 1.41Sberbank of Russia PJSC, ADR USD 508,002 7,131,759 1.49Sberbank of Russia PJSC USD 9,197,331 32,345,806 6.77Severstal PAO, Reg. S, GDR USD 502,335 9,137,825 1.91Severstal PAO USD 241,467 4,397,648 0.92Sistema PJSFC USD 13,454,421 4,900,928 1.03Surgutneftegas PJSC Preference USD 18,678,721 9,976,156 2.09Tatneft PJSC, ADR USD 100,881 3,720,317 0.78Tatneft PJSC Preference USD 1,093,875 6,346,823 1.33
296,068,093 61.94
TurkeyBIM Birlesik Magazalar A/S TRY 1,189,250 7,214,325 1.51
7,214,325 1.51
United States of AmericaEPAM Systems, Inc. USD 30,311 13,133,780 2.75
13,133,780 2.75
Virgin Islands, BritishFix Price Group Ltd., Reg. S, GDR USD 566,701 4,175,973 0.87
4,175,973 0.87
Total Equities 461,509,691 96.55
Total Transferable securities and money market instrumentsadmitted to an official exchange listing 461,509,691 96.55
Other transferable securities and money market instruments
Equities
PolandgetBACK SA* PLN 3,838,288 85 0.00
85 0.00
Total Equities 85 0.00
Total Other transferable securities and money marketinstruments 85 0.00
Units of authorised UCITS or other collective investment undertakings
Collective Investment Schemes - AIF
United KingdomJPMorgan Russian Securities plc† GBP 591,125 5,091,762 1.07
5,091,762 1.07
Total Collective Investment Schemes - AIF 5,091,762 1.07
Collective Investment Schemes - UCITS
LuxembourgJPMorgan USD Liquidity LVNAV Fund -JPM USD Liquidity LVNAV X (dist.)† USD 11,930,597 10,047,495 2.10
10,047,495 2.10
Total Collective Investment Schemes - UCITS 10,047,495 2.10
Total Units of authorised UCITS or other collective investmentundertakings 15,139,257 3.17
Total Investments 476,649,033 99.72
Cash 523,620 0.11
Other Assets/(Liabilities) 822,840 0.17
Total Net Assets 477,995,493 100.00
* Security is valued at its fair value under the direction of the Board of Directors.† Related Party Fund.
Geographic Allocation of Portfolio as at 30 June 2021 % of Net AssetsRussia 61.94Netherlands 6.83Greece 6.05Luxembourg 5.63Poland 5.04Hungary 3.48United States of America 2.75Kazakhstan 2.54Turkey 1.51United Kingdom 1.07Cyprus 1.05Jersey 0.96Virgin Islands, British 0.87Total Investments 99.72Cash and Other assets/(liabilities) 0.28
Total 100.00
77
JPMorgan Funds - Emerging Europe Equity FundSchedule of Investments
As at 30 June 2021
Investments Currency
Quantity/Nominal
Value
MarketValue
EUR
%of
NetAssets Investments Currency
Quantity/Nominal
Value
MarketValue
EUR
%of
NetAssets

Transferable securities and money market instruments admitted to an official exchangelisting
Equities
BrazilBB Seguridade Participacoes SA BRL 352,595 1,660,802 0.30Itau Unibanco Holding SA Preference BRL 569,598 3,423,604 0.63
5,084,406 0.93
Cayman IslandsChailease Holding Co. Ltd. TWD 428,000 3,101,727 0.57China Resources Land Ltd. HKD 1,506,000 6,103,513 1.11NetEase, Inc. HKD 554,800 12,576,555 2.29Tingyi Cayman Islands Holding Corp. HKD 5,054,000 10,119,401 1.84Topsports International Holdings Ltd.,Reg. S HKD 4,485,000 7,351,569 1.34WH Group Ltd., Reg. S HKD 3,002,500 2,700,465 0.49Xinyi Glass Holdings Ltd. HKD 1,144,000 4,665,862 0.85Xinyi Solar Holdings Ltd. HKD 2,688,000 5,797,400 1.06
52,416,492 9.55
ChileBanco Santander Chile, ADR USD 88,377 1,767,540 0.32
1,767,540 0.32
ChinaChina Construction Bank Corp. ‘H’ HKD 16,246,000 12,791,813 2.33China Life Insurance Co. Ltd. ‘H’ HKD 1,901,000 3,772,020 0.69China Merchants Bank Co. Ltd. ‘H’ HKD 1,967,000 16,773,184 3.06China Pacific Insurance Group Co. Ltd. ‘H’ HKD 2,980,600 9,393,244 1.71China Petroleum & Chemical Corp. ‘H’ HKD 6,264,000 3,173,845 0.58Fuyao Glass Industry Group Co. Ltd.,Reg. S ‘H’ HKD 45,600 320,881 0.06Haier Smart Home Co. Ltd. ‘H’ HKD 2,087,000 7,275,789 1.32Midea Group Co. Ltd. ‘A’ CNH 1,064,020 11,752,465 2.14Ping An Insurance Group Co. of China Ltd.‘H’ HKD 1,596,000 15,638,919 2.85Postal Savings Bank of China Co. Ltd.,Reg. S ‘H’ HKD 12,563,000 8,452,182 1.54
89,344,342 16.28
Hong KongGuangdong Investment Ltd. HKD 2,972,000 4,263,077 0.78Hang Seng Bank Ltd. HKD 221,200 4,413,325 0.80Hong Kong Exchanges & Clearing Ltd. HKD 253,100 15,092,324 2.75
23,768,726 4.33
IndiaInfosys Ltd., ADR USD 1,026,109 21,871,513 3.98Tata Consultancy Services Ltd. INR 528,099 23,804,898 4.34
45,676,411 8.32
IndonesiaBank Rakyat Indonesia Persero Tbk. PT IDR 40,189,000 10,906,463 1.99Telkom Indonesia Persero Tbk. PT IDR 40,188,700 8,744,507 1.59
19,650,970 3.58
MexicoBolsa Mexicana de Valores SAB de CV MXN 882,622 1,911,212 0.35Grupo Financiero Banorte SAB de CV ‘O’ MXN 2,223,370 14,441,083 2.63Kimberly-Clark de Mexico SAB de CV ‘A’ MXN 2,178,973 3,837,774 0.70Wal-Mart de Mexico SAB de CV MXN 5,918,229 19,821,463 3.61
40,011,532 7.29
RussiaAlrosa PJSC USD 2,439,065 4,482,164 0.82LUKOIL PJSC, ADR USD 38,430 3,554,391 0.65Moscow Exchange MICEX-RTS PJSC USD 3,934,261 9,151,082 1.67Sberbank of Russia PJSC USD 3,633,147 15,172,023 2.76Severstal PAO, Reg. S, GDR USD 272,938 5,895,461 1.07
38,255,121 6.97
Saudi ArabiaAl Rajhi Bank SAR 163,606 4,837,988 0.88
4,837,988 0.88
South AfricaAVI Ltd. ZAR 619,165 3,095,608 0.56Bid Corp. Ltd. ZAR 140,394 3,053,197 0.56Mr Price Group Ltd. ZAR 165,817 2,462,964 0.45SPAR Group Ltd. (The) ZAR 142,486 1,818,191 0.33Vodacom Group Ltd. ZAR 435,906 3,956,169 0.72
14,386,129 2.62
South KoreaSamsung Electronics Co. Ltd. KRW 581,917 41,587,204 7.58SK Telecom Co. Ltd., ADR USD 42,363 1,333,799 0.24
42,921,003 7.82
SupranationalHKT Trust & HKT Ltd. HKD 2,065,000 2,810,504 0.51
2,810,504 0.51
TaiwanAccton Technology Corp. TWD 328,000 3,881,396 0.71Advantech Co. Ltd. TWD 623,682 7,715,573 1.41Chicony Electronics Co. Ltd. TWD 335,325 965,435 0.18Delta Electronics, Inc. TWD 295,867 3,214,908 0.58Eclat Textile Co. Ltd. TWD 385,000 9,063,530 1.65MediaTek, Inc. TWD 129,000 4,444,371 0.81Mega Financial Holding Co. Ltd. TWD 1,688,000 1,985,402 0.36Novatek Microelectronics Corp. TWD 199,000 3,559,938 0.65President Chain Store Corp. TWD 494,000 4,646,517 0.85Quanta Computer, Inc. TWD 1,633,000 5,122,873 0.93Realtek Semiconductor Corp. TWD 408,000 7,375,520 1.34Taiwan Semiconductor Manufacturing Co.Ltd. TWD 2,270,000 48,355,848 8.81Vanguard International SemiconductorCorp. TWD 2,470,000 10,465,727 1.91Wiwynn Corp. TWD 179,000 6,385,069 1.16
117,182,107 21.35
ThailandSiam Cement PCL (The) THB 260,808 3,522,454 0.64
3,522,454 0.64
TurkeyBIM Birlesik Magazalar A/S TRY 330,447 2,380,284 0.44
2,380,284 0.44
United States of AmericaYum China Holdings, Inc. HKD 68,400 4,463,125 0.82
4,463,125 0.82
Total Equities 508,479,134 92.65
Total Transferable securities and money market instrumentsadmitted to an official exchange listing 508,479,134 92.65
Transferable securities and money market instruments dealt in on another regulatedmarket
Equities
ChinaFuyao Glass Industry Group Co. Ltd. CNH 53,294 460,570 0.08Huayu Automotive Systems Co. Ltd. ‘A’ CNH 1,186,649 4,823,172 0.88Inner Mongolia Yili Industrial Group Co.Ltd. ‘A’ CNH 2,241,492 12,777,059 2.33Jiangsu Yanghe Brewery Joint-Stock Co.Ltd. ‘A’ CNH 46,424 1,488,233 0.27Joyoung Co. Ltd. ‘A’ CNH 1,323,928 6,657,543 1.21Zhejiang Supor Co. Ltd. ‘A’ CNH 445,800 4,399,705 0.80
30,606,282 5.57
Total Equities 30,606,282 5.57
Total Transferable securities and money market instrumentsdealt in on another regulated market 30,606,282 5.57
78
JPMorgan Funds - Emerging Markets Dividend FundSchedule of Investments
As at 30 June 2021
Investments Currency
Quantity/Nominal
Value
MarketValue
USD
%of
NetAssets Investments Currency
Quantity/Nominal
Value
MarketValue
USD
%of
NetAssets

Units of authorised UCITS or other collective investment undertakings
Collective Investment Schemes - UCITS
LuxembourgJPMorgan USD Liquidity LVNAV Fund -JPM USD Liquidity LVNAV X (dist.)† USD 6,582,081 6,582,081 1.20
6,582,081 1.20
Total Collective Investment Schemes - UCITS 6,582,081 1.20
Total Units of authorised UCITS or other collective investmentundertakings 6,582,081 1.20
Total Investments 545,667,497 99.42
Cash 3,782,441 0.69
Other Assets/(Liabilities) (619,031) (0.11)
Total Net Assets 548,830,907 100.00
† Related Party Fund.
Geographic Allocation of Portfolio as at 30 June 2021 % of Net AssetsChina 21.85Taiwan 21.35Cayman Islands 9.55India 8.32South Korea 7.82Mexico 7.29Russia 6.97Hong Kong 4.33Indonesia 3.58South Africa 2.62Luxembourg 1.20Brazil 0.93Saudi Arabia 0.88United States of America 0.82Thailand 0.64Supranational 0.51Turkey 0.44Chile 0.32Total Investments 99.42Cash and Other assets/(liabilities) 0.58
Total 100.00
79
JPMorgan Funds - Emerging Markets Dividend FundSchedule of Investments (continued)
As at 30 June 2021
Investments Currency
Quantity/Nominal
Value
MarketValue
USD
%of
NetAssets Investments Currency
Quantity/Nominal
Value
MarketValue
USD
%of
NetAssets
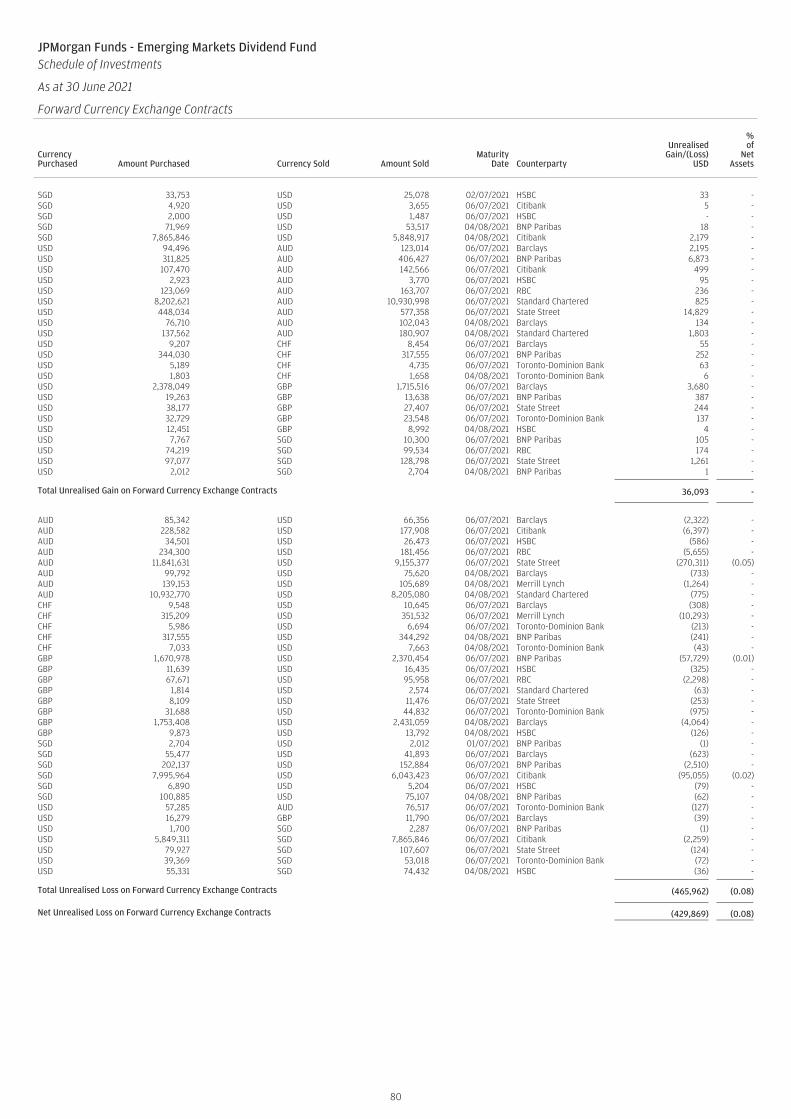
JPMorgan Funds - Emerging Markets Dividend FundSchedule of Investments
As at 30 June 2021
Forward Currency Exchange Contracts (continued)
CurrencyPurchased Amount Purchased Currency Sold Amount Sold
MaturityDate Counterparty
UnrealisedGain/(Loss)
USD
%of
NetAssets
SGD 33,753 USD 25,078 02/07/2021 HSBC 33 -SGD 4,920 USD 3,655 06/07/2021 Citibank 5 -SGD 2,000 USD 1,487 06/07/2021 HSBC - -SGD 71,969 USD 53,517 04/08/2021 BNP Paribas 18 -SGD 7,865,846 USD 5,848,917 04/08/2021 Citibank 2,179 -USD 94,496 AUD 123,014 06/07/2021 Barclays 2,195 -USD 311,825 AUD 406,427 06/07/2021 BNP Paribas 6,873 -USD 107,470 AUD 142,566 06/07/2021 Citibank 499 -USD 2,923 AUD 3,770 06/07/2021 HSBC 95 -USD 123,069 AUD 163,707 06/07/2021 RBC 236 -USD 8,202,621 AUD 10,930,998 06/07/2021 Standard Chartered 825 -USD 448,034 AUD 577,358 06/07/2021 State Street 14,829 -USD 76,710 AUD 102,043 04/08/2021 Barclays 134 -USD 137,562 AUD 180,907 04/08/2021 Standard Chartered 1,803 -USD 9,207 CHF 8,454 06/07/2021 Barclays 55 -USD 344,030 CHF 317,555 06/07/2021 BNP Paribas 252 -USD 5,189 CHF 4,735 06/07/2021 Toronto-Dominion Bank 63 -USD 1,803 CHF 1,658 04/08/2021 Toronto-Dominion Bank 6 -USD 2,378,049 GBP 1,715,516 06/07/2021 Barclays 3,680 -USD 19,263 GBP 13,638 06/07/2021 BNP Paribas 387 -USD 38,177 GBP 27,407 06/07/2021 State Street 244 -USD 32,729 GBP 23,548 06/07/2021 Toronto-Dominion Bank 137 -USD 12,451 GBP 8,992 04/08/2021 HSBC 4 -USD 7,767 SGD 10,300 06/07/2021 BNP Paribas 105 -USD 74,219 SGD 99,534 06/07/2021 RBC 174 -USD 97,077 SGD 128,798 06/07/2021 State Street 1,261 -USD 2,012 SGD 2,704 04/08/2021 BNP Paribas 1 -
Total Unrealised Gain on Forward Currency Exchange Contracts 36,093 -
AUD 85,342 USD 66,356 06/07/2021 Barclays (2,322) -AUD 228,582 USD 177,908 06/07/2021 Citibank (6,397) -AUD 34,501 USD 26,473 06/07/2021 HSBC (586) -AUD 234,300 USD 181,456 06/07/2021 RBC (5,655) -AUD 11,841,631 USD 9,155,377 06/07/2021 State Street (270,311) (0.05)AUD 99,792 USD 75,620 04/08/2021 Barclays (733) -AUD 139,153 USD 105,689 04/08/2021 Merrill Lynch (1,264) -AUD 10,932,770 USD 8,205,080 04/08/2021 Standard Chartered (775) -CHF 9,548 USD 10,645 06/07/2021 Barclays (308) -CHF 315,209 USD 351,532 06/07/2021 Merrill Lynch (10,293) -CHF 5,986 USD 6,694 06/07/2021 Toronto-Dominion Bank (213) -CHF 317,555 USD 344,292 04/08/2021 BNP Paribas (241) -CHF 7,033 USD 7,663 04/08/2021 Toronto-Dominion Bank (43) -GBP 1,670,978 USD 2,370,454 06/07/2021 BNP Paribas (57,729) (0.01)GBP 11,639 USD 16,435 06/07/2021 HSBC (325) -GBP 67,671 USD 95,958 06/07/2021 RBC (2,298) -GBP 1,814 USD 2,574 06/07/2021 Standard Chartered (63) -GBP 8,109 USD 11,476 06/07/2021 State Street (253) -GBP 31,688 USD 44,832 06/07/2021 Toronto-Dominion Bank (975) -GBP 1,753,408 USD 2,431,059 04/08/2021 Barclays (4,064) -GBP 9,873 USD 13,792 04/08/2021 HSBC (126) -SGD 2,704 USD 2,012 01/07/2021 BNP Paribas (1) -SGD 55,477 USD 41,893 06/07/2021 Barclays (623) -SGD 202,137 USD 152,884 06/07/2021 BNP Paribas (2,510) -SGD 7,995,964 USD 6,043,423 06/07/2021 Citibank (95,055) (0.02)SGD 6,890 USD 5,204 06/07/2021 HSBC (79) -SGD 100,885 USD 75,107 04/08/2021 BNP Paribas (62) -USD 57,285 AUD 76,517 06/07/2021 Toronto-Dominion Bank (127) -USD 16,279 GBP 11,790 06/07/2021 Barclays (39) -USD 1,700 SGD 2,287 06/07/2021 BNP Paribas (1) -USD 5,849,311 SGD 7,865,846 06/07/2021 Citibank (2,259) -USD 79,927 SGD 107,607 06/07/2021 State Street (124) -USD 39,369 SGD 53,018 06/07/2021 Toronto-Dominion Bank (72) -USD 55,331 SGD 74,432 04/08/2021 HSBC (36) -
Total Unrealised Loss on Forward Currency Exchange Contracts (465,962) (0.08)
Net Unrealised Loss on Forward Currency Exchange Contracts (429,869) (0.08)
80

Transferable securities and money market instruments admitted to an official exchangelisting
Equities
BermudaChina Gas Holdings Ltd. HKD 42,442,800 129,658,036 0.99
129,658,036 0.99
BrazilB3 SA - Brasil Bolsa Balcao BRL 27,647,028 92,503,360 0.71Localiza Rent a Car SA BRL 4,185,290 53,506,103 0.41Magazine Luiza SA BRL 31,534,750 135,035,374 1.03Raia Drogasil SA BRL 9,573,952 47,470,422 0.36
328,515,259 2.51
Cayman IslandsAlibaba Group Holding Ltd., ADR USD 1,137,766 258,016,885 1.97Alibaba Group Holding Ltd. HKD 6,589,452 186,749,107 1.43Bilibili, Inc., ADR USD 1,280,535 157,576,235 1.20Budweiser Brewing Co. APAC Ltd.,Reg. S HKD 42,457,300 133,802,512 1.02Chailease Holding Co. Ltd. TWD 5,605,000 40,619,580 0.31Dada Nexus Ltd., ADR USD 2,313,417 69,402,510 0.53JD.com, Inc., ADR USD 1,117,740 87,820,832 0.67JD.com, Inc. ‘A’ HKD 4,216,196 165,743,608 1.27JS Global Lifestyle Co. Ltd., Reg. S HKD 33,102,160 93,025,021 0.71KE Holdings, Inc., ADR USD 3,254,969 156,808,132 1.20Kingdee International Software GroupCo. Ltd. HKD 30,711,000 104,100,192 0.79Meituan, Reg. S ‘B’ HKD 10,508,900 433,414,454 3.31NetEase, Inc., ADR USD 988,139 112,870,177 0.86NetEase, Inc. HKD 6,291,400 142,617,402 1.09New Oriental Education & TechnologyGroup, Inc., ADR USD 13,984,822 114,046,223 0.87Pagseguro Digital Ltd. ‘A’ USD 2,672,266 147,094,882 1.12Sands China Ltd. HKD 20,048,400 84,478,962 0.65Sea Ltd., ADR USD 1,623,358 458,704,153 3.50Shenzhou International Group HoldingsLtd. HKD 7,489,100 189,150,344 1.44Silergy Corp. TWD 906,000 122,956,679 0.94Sunny Optical Technology Group Co. Ltd. HKD 6,226,900 196,679,290 1.50Tencent Holdings Ltd. HKD 6,289,800 473,178,224 3.61Wuxi Biologics Cayman, Inc., Reg. S HKD 20,849,000 381,879,809 2.92Xinyi Solar Holdings Ltd. HKD 102,278,000 220,590,208 1.68
4,531,325,421 34.59
ChinaHundsun Technologies, Inc. ‘A’ CNH 6,639,293 95,813,567 0.73Jiangsu Hengli Hydraulic Co. Ltd. ‘A’ CNH 13,693,173 182,077,668 1.39Midea Group Co. Ltd. ‘A’ CNH 8,333,803 92,049,704 0.71Pharmaron Beijing Co. Ltd. ‘A’ CNH 5,225,400 175,469,773 1.34Ping An Insurance Group Co. of ChinaLtd. ‘H’ HKD 8,841,500 86,636,281 0.66Shenzhen Mindray Bio-MedicalElectronics Co. Ltd. ‘A’ CNH 2,010,842 149,381,724 1.14Sichuan Swellfun Co. Ltd. ‘A’ CNH 4,635,500 90,647,626 0.69
872,076,343 6.66
GermanyDelivery Hero SE, Reg. S EUR 1,043,067 137,541,931 1.05
137,541,931 1.05
Hong KongAIA Group Ltd. HKD 19,091,800 237,533,887 1.81Hong Kong Exchanges & Clearing Ltd. HKD 2,507,000 149,492,122 1.14Techtronic Industries Co. Ltd. HKD 16,531,500 288,749,508 2.21
675,775,517 5.16
IndiaAsian Paints Ltd. INR 2,715,992 109,604,013 0.84Britannia Industries Ltd. INR 1,450,152 71,230,768 0.54HDFC Bank Ltd., ADR USD 3,790,131 277,873,454 2.12HDFC Bank Ltd. INR 7,366,720 148,284,252 1.13HDFC Life Insurance Co. Ltd., Reg. S INR 14,600,713 135,106,140 1.03Hindustan Unilever Ltd. INR 2,651,093 88,313,960 0.68Housing Development Finance Corp.Ltd. INR 10,475,072 349,050,713 2.67Kotak Mahindra Bank Ltd. INR 7,958,532 182,500,175 1.39Reliance Industries Ltd. INR 6,782,577 192,726,190 1.47Tata Consultancy Services Ltd. INR 6,041,655 272,337,154 2.08
1,827,026,819 13.95
IndonesiaBank Central Asia Tbk. PT IDR 49,378,300 102,630,243 0.78Bank Rakyat Indonesia Persero Tbk. PT IDR 464,074,730 125,940,280 0.96
228,570,523 1.74
LuxembourgAllegro.eu SA, Reg. S PLN 10,311,239 178,000,813 1.36
178,000,813 1.36
MexicoWal-Mart de Mexico SAB de CV MXN 50,612,861 169,513,709 1.29
169,513,709 1.29
PanamaCopa Holdings SA ‘A’ USD 682,163 51,472,609 0.39
51,472,609 0.39
PortugalJeronimo Martins SGPS SA EUR 5,321,767 97,425,840 0.74
97,425,840 0.74
South AfricaBid Corp. Ltd. ZAR 5,426,620 118,014,592 0.90Capitec Bank Holdings Ltd. ZAR 534,740 63,551,330 0.49
181,565,922 1.39
South KoreaLG Chem Ltd. KRW 121,912 91,657,073 0.70NCSoft Corp. KRW 204,333 148,379,275 1.13Samsung Electronics Co. Ltd., GDR USD 56,108 100,012,510 0.77Samsung Electronics Co. Ltd. KRW 7,496,584 535,749,890 4.09
875,798,748 6.69
TaiwanTaiwan Semiconductor ManufacturingCo. Ltd., ADR USD 784,225 94,483,428 0.72Taiwan Semiconductor ManufacturingCo. Ltd. TWD 36,125,006 769,539,776 5.88
864,023,204 6.60
TurkeyBIM Birlesik Magazalar A/S TRY 4,764,351 34,318,686 0.26
34,318,686 0.26
United KingdomPrudential plc GBP 7,834,271 149,741,061 1.14
149,741,061 1.14
United States of AmericaEPAM Systems, Inc. USD 808,106 415,778,618 3.17MercadoLibre, Inc. USD 204,388 321,939,714 2.46Yum China Holdings, Inc. USD 2,404,217 159,579,904 1.22
897,298,236 6.85
Total Equities 12,229,648,677 93.36
Total Transferable securities and money market instrumentsadmitted to an official exchange listing 12,229,648,677 93.36
Transferable securities and money market instruments dealt in on another regulatedmarket
Bonds
IndiaBritannia Industries Ltd. 5.5%03/06/2024 INR 1,450,152 609,670 0.00
609,670 0.00
Total Bonds 609,670 0.00
81
JPMorgan Funds - Emerging Markets Equity FundSchedule of Investments
As at 30 June 2021
Investments Currency
Quantity/Nominal
Value
MarketValue
USD
%of
NetAssets Investments Currency
Quantity/Nominal
Value
MarketValue
USD
%of
NetAssets
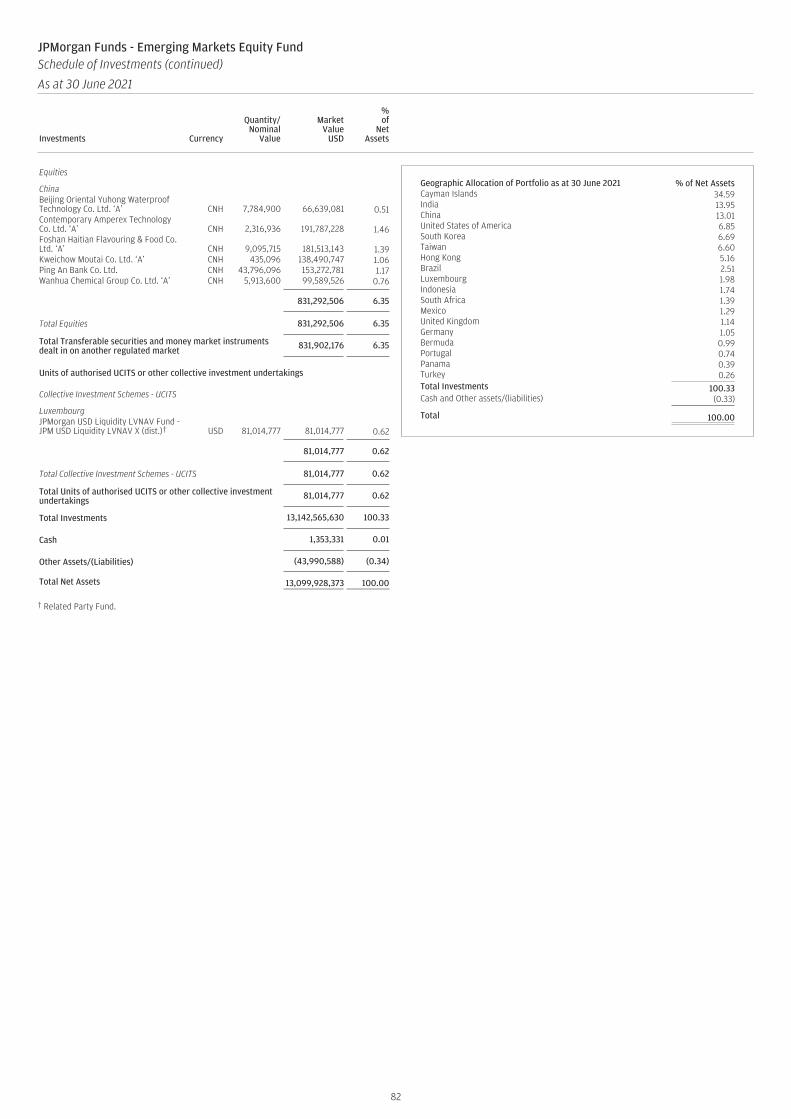
Equities
ChinaBeijing Oriental Yuhong WaterproofTechnology Co. Ltd. ‘A’ CNH 7,784,900 66,639,081 0.51Contemporary Amperex TechnologyCo. Ltd. ‘A’ CNH 2,316,936 191,787,228 1.46Foshan Haitian Flavouring & Food Co.Ltd. ‘A’ CNH 9,095,715 181,513,143 1.39Kweichow Moutai Co. Ltd. ‘A’ CNH 435,096 138,490,747 1.06Ping An Bank Co. Ltd. CNH 43,796,096 153,272,781 1.17Wanhua Chemical Group Co. Ltd. ‘A’ CNH 5,913,600 99,589,526 0.76
831,292,506 6.35
Total Equities 831,292,506 6.35
Total Transferable securities and money market instrumentsdealt in on another regulated market 831,902,176 6.35
Units of authorised UCITS or other collective investment undertakings
Collective Investment Schemes - UCITS
LuxembourgJPMorgan USD Liquidity LVNAV Fund -JPM USD Liquidity LVNAV X (dist.)† USD 81,014,777 81,014,777 0.62
81,014,777 0.62
Total Collective Investment Schemes - UCITS 81,014,777 0.62
Total Units of authorised UCITS or other collective investmentundertakings 81,014,777 0.62
Total Investments 13,142,565,630 100.33
Cash 1,353,331 0.01
Other Assets/(Liabilities) (43,990,588) (0.34)
Total Net Assets 13,099,928,373 100.00
† Related Party Fund.
Geographic Allocation of Portfolio as at 30 June 2021 % of Net AssetsCayman Islands 34.59India 13.95China 13.01United States of America 6.85South Korea 6.69Taiwan 6.60Hong Kong 5.16Brazil 2.51Luxembourg 1.98Indonesia 1.74South Africa 1.39Mexico 1.29United Kingdom 1.14Germany 1.05Bermuda 0.99Portugal 0.74Panama 0.39Turkey 0.26Total Investments 100.33Cash and Other assets/(liabilities) (0.33)
Total 100.00
82
JPMorgan Funds - Emerging Markets Equity FundSchedule of Investments (continued)
As at 30 June 2021
Investments Currency
Quantity/Nominal
Value
MarketValue
USD
%of
NetAssets Investments Currency
Quantity/Nominal
Value
MarketValue
USD
%of
NetAssets
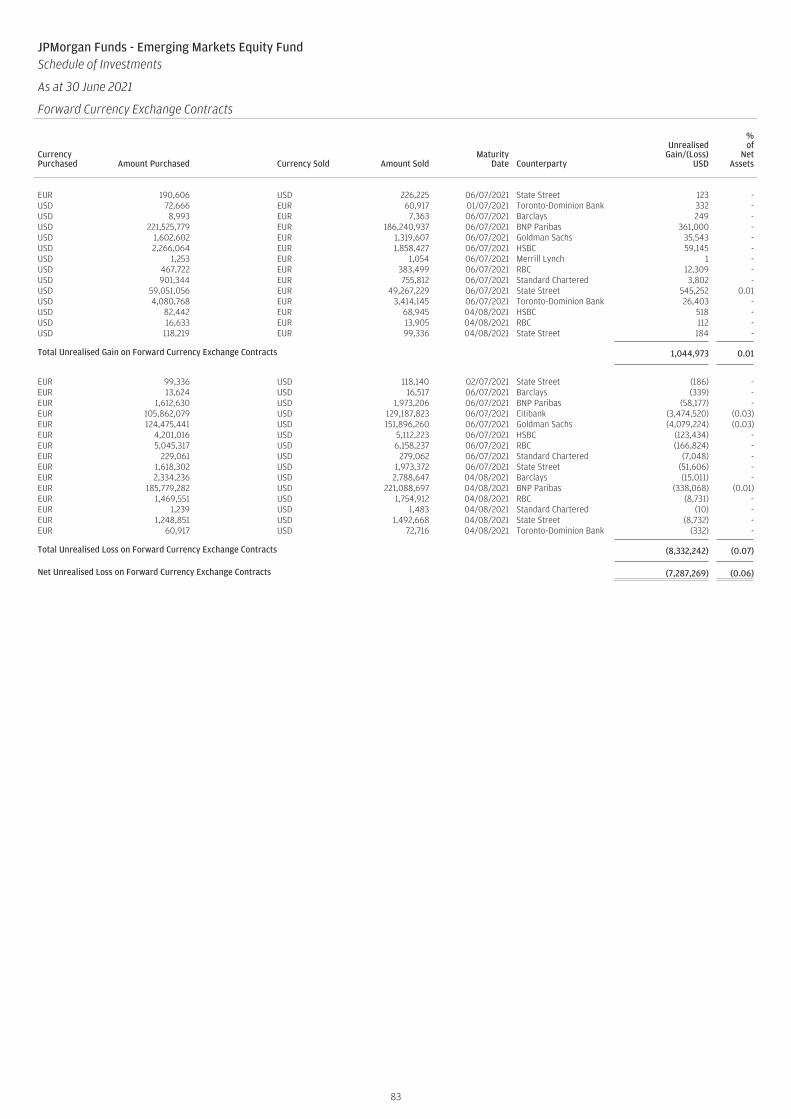
JPMorgan Funds - Emerging Markets Equity FundSchedule of Investments
As at 30 June 2021
Forward Currency Exchange Contracts (continued)
CurrencyPurchased Amount Purchased Currency Sold Amount Sold
MaturityDate Counterparty
UnrealisedGain/(Loss)
USD
%of
NetAssets
EUR 190,606 USD 226,225 06/07/2021 State Street 123 -USD 72,666 EUR 60,917 01/07/2021 Toronto-Dominion Bank 332 -USD 8,993 EUR 7,363 06/07/2021 Barclays 249 -USD 221,525,779 EUR 186,240,937 06/07/2021 BNP Paribas 361,000 -USD 1,602,602 EUR 1,319,607 06/07/2021 Goldman Sachs 35,543 -USD 2,266,064 EUR 1,858,427 06/07/2021 HSBC 59,145 -USD 1,253 EUR 1,054 06/07/2021 Merrill Lynch 1 -USD 467,722 EUR 383,499 06/07/2021 RBC 12,309 -USD 901,344 EUR 755,812 06/07/2021 Standard Chartered 3,802 -USD 59,051,056 EUR 49,267,229 06/07/2021 State Street 545,252 0.01USD 4,080,768 EUR 3,414,145 06/07/2021 Toronto-Dominion Bank 26,403 -USD 82,442 EUR 68,945 04/08/2021 HSBC 518 -USD 16,633 EUR 13,905 04/08/2021 RBC 112 -USD 118,219 EUR 99,336 04/08/2021 State Street 184 -
Total Unrealised Gain on Forward Currency Exchange Contracts 1,044,973 0.01
EUR 99,336 USD 118,140 02/07/2021 State Street (186) -EUR 13,624 USD 16,517 06/07/2021 Barclays (339) -EUR 1,612,630 USD 1,973,206 06/07/2021 BNP Paribas (58,177) -EUR 105,862,079 USD 129,187,823 06/07/2021 Citibank (3,474,520) (0.03)EUR 124,475,441 USD 151,896,260 06/07/2021 Goldman Sachs (4,079,224) (0.03)EUR 4,201,016 USD 5,112,223 06/07/2021 HSBC (123,434) -EUR 5,045,317 USD 6,158,237 06/07/2021 RBC (166,824) -EUR 229,061 USD 279,062 06/07/2021 Standard Chartered (7,048) -EUR 1,618,302 USD 1,973,372 06/07/2021 State Street (51,606) -EUR 2,334,236 USD 2,788,647 04/08/2021 Barclays (15,011) -EUR 185,779,282 USD 221,088,697 04/08/2021 BNP Paribas (338,068) (0.01)EUR 1,469,551 USD 1,754,912 04/08/2021 RBC (8,731) -EUR 1,239 USD 1,483 04/08/2021 Standard Chartered (10) -EUR 1,248,851 USD 1,492,668 04/08/2021 State Street (8,732) -EUR 60,917 USD 72,716 04/08/2021 Toronto-Dominion Bank (332) -
Total Unrealised Loss on Forward Currency Exchange Contracts (8,332,242) (0.07)
Net Unrealised Loss on Forward Currency Exchange Contracts (7,287,269) (0.06)
83
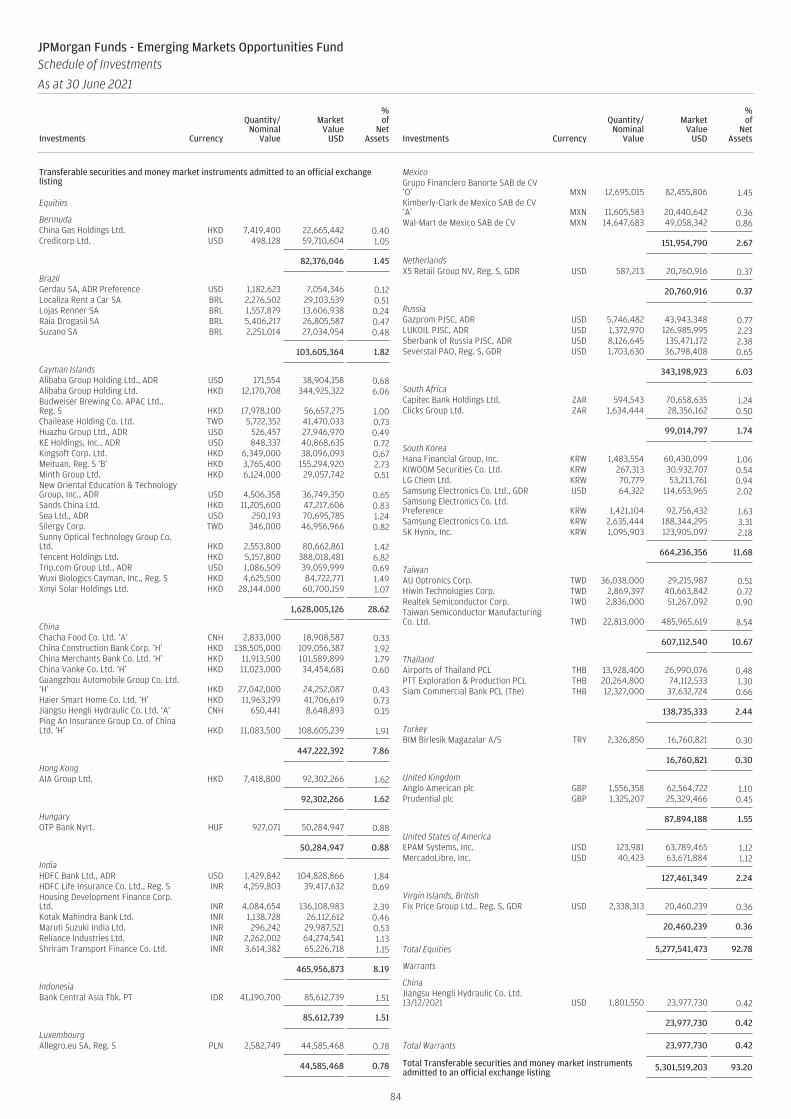
Transferable securities and money market instruments admitted to an official exchangelisting
Equities
BermudaChina Gas Holdings Ltd. HKD 7,419,400 22,665,442 0.40Credicorp Ltd. USD 498,128 59,710,604 1.05
82,376,046 1.45
BrazilGerdau SA, ADR Preference USD 1,182,623 7,054,346 0.12Localiza Rent a Car SA BRL 2,276,502 29,103,539 0.51Lojas Renner SA BRL 1,557,879 13,606,938 0.24Raia Drogasil SA BRL 5,406,217 26,805,587 0.47Suzano SA BRL 2,251,014 27,034,954 0.48
103,605,364 1.82
Cayman IslandsAlibaba Group Holding Ltd., ADR USD 171,554 38,904,158 0.68Alibaba Group Holding Ltd. HKD 12,170,708 344,925,322 6.06Budweiser Brewing Co. APAC Ltd.,Reg. S HKD 17,978,100 56,657,275 1.00Chailease Holding Co. Ltd. TWD 5,722,352 41,470,033 0.73Huazhu Group Ltd., ADR USD 526,457 27,946,970 0.49KE Holdings, Inc., ADR USD 848,337 40,868,635 0.72Kingsoft Corp. Ltd. HKD 6,349,000 38,096,093 0.67Meituan, Reg. S ‘B’ HKD 3,765,400 155,294,920 2.73Minth Group Ltd. HKD 6,124,000 29,057,742 0.51New Oriental Education & TechnologyGroup, Inc., ADR USD 4,506,358 36,749,350 0.65Sands China Ltd. HKD 11,205,600 47,217,606 0.83Sea Ltd., ADR USD 250,193 70,695,785 1.24Silergy Corp. TWD 346,000 46,956,966 0.82Sunny Optical Technology Group Co.Ltd. HKD 2,553,800 80,662,861 1.42Tencent Holdings Ltd. HKD 5,157,800 388,018,481 6.82Trip.com Group Ltd., ADR USD 1,086,509 39,059,999 0.69Wuxi Biologics Cayman, Inc., Reg. S HKD 4,625,500 84,722,771 1.49Xinyi Solar Holdings Ltd. HKD 28,144,000 60,700,159 1.07
1,628,005,126 28.62
ChinaChacha Food Co. Ltd. ‘A’ CNH 2,833,000 18,908,587 0.33China Construction Bank Corp. ‘H’ HKD 138,505,000 109,056,387 1.92China Merchants Bank Co. Ltd. ‘H’ HKD 11,913,500 101,589,899 1.79China Vanke Co. Ltd. ‘H’ HKD 11,023,000 34,454,681 0.60Guangzhou Automobile Group Co. Ltd.‘H’ HKD 27,042,000 24,252,087 0.43Haier Smart Home Co. Ltd. ‘H’ HKD 11,963,199 41,706,619 0.73Jiangsu Hengli Hydraulic Co. Ltd. ‘A’ CNH 650,441 8,648,893 0.15Ping An Insurance Group Co. of ChinaLtd. ‘H’ HKD 11,083,500 108,605,239 1.91
447,222,392 7.86
Hong KongAIA Group Ltd. HKD 7,418,800 92,302,266 1.62
92,302,266 1.62
HungaryOTP Bank Nyrt. HUF 927,071 50,284,947 0.88
50,284,947 0.88
IndiaHDFC Bank Ltd., ADR USD 1,429,842 104,828,866 1.84HDFC Life Insurance Co. Ltd., Reg. S INR 4,259,803 39,417,632 0.69Housing Development Finance Corp.Ltd. INR 4,084,654 136,108,983 2.39Kotak Mahindra Bank Ltd. INR 1,138,728 26,112,612 0.46Maruti Suzuki India Ltd. INR 296,242 29,987,521 0.53Reliance Industries Ltd. INR 2,262,002 64,274,541 1.13Shriram Transport Finance Co. Ltd. INR 3,614,382 65,226,718 1.15
465,956,873 8.19
IndonesiaBank Central Asia Tbk. PT IDR 41,190,700 85,612,739 1.51
85,612,739 1.51
LuxembourgAllegro.eu SA, Reg. S PLN 2,582,749 44,585,468 0.78
44,585,468 0.78
MexicoGrupo Financiero Banorte SAB de CV‘O’ MXN 12,695,015 82,455,806 1.45Kimberly-Clark de Mexico SAB de CV‘A’ MXN 11,605,583 20,440,642 0.36Wal-Mart de Mexico SAB de CV MXN 14,647,683 49,058,342 0.86
151,954,790 2.67
NetherlandsX5 Retail Group NV, Reg. S, GDR USD 587,213 20,760,916 0.37
20,760,916 0.37
RussiaGazprom PJSC, ADR USD 5,746,482 43,943,348 0.77LUKOIL PJSC, ADR USD 1,372,970 126,985,995 2.23Sberbank of Russia PJSC, ADR USD 8,126,645 135,471,172 2.38Severstal PAO, Reg. S, GDR USD 1,703,630 36,798,408 0.65
343,198,923 6.03
South AfricaCapitec Bank Holdings Ltd. ZAR 594,543 70,658,635 1.24Clicks Group Ltd. ZAR 1,634,444 28,356,162 0.50
99,014,797 1.74
South KoreaHana Financial Group, Inc. KRW 1,483,554 60,430,099 1.06KIWOOM Securities Co. Ltd. KRW 267,313 30,932,707 0.54LG Chem Ltd. KRW 70,779 53,213,761 0.94Samsung Electronics Co. Ltd., GDR USD 64,322 114,653,965 2.02Samsung Electronics Co. Ltd.Preference KRW 1,421,104 92,756,432 1.63Samsung Electronics Co. Ltd. KRW 2,635,444 188,344,295 3.31SK Hynix, Inc. KRW 1,095,903 123,905,097 2.18
664,236,356 11.68
TaiwanAU Optronics Corp. TWD 36,038,000 29,215,987 0.51Hiwin Technologies Corp. TWD 2,869,397 40,663,842 0.72Realtek Semiconductor Corp. TWD 2,836,000 51,267,092 0.90Taiwan Semiconductor ManufacturingCo. Ltd. TWD 22,813,000 485,965,619 8.54
607,112,540 10.67
ThailandAirports of Thailand PCL THB 13,928,400 26,990,076 0.48PTT Exploration & Production PCL THB 20,264,800 74,112,533 1.30Siam Commercial Bank PCL (The) THB 12,327,000 37,632,724 0.66
138,735,333 2.44
TurkeyBIM Birlesik Magazalar A/S TRY 2,326,850 16,760,821 0.30
16,760,821 0.30
United KingdomAnglo American plc GBP 1,556,358 62,564,722 1.10Prudential plc GBP 1,325,207 25,329,466 0.45
87,894,188 1.55
United States of AmericaEPAM Systems, Inc. USD 123,981 63,789,465 1.12MercadoLibre, Inc. USD 40,423 63,671,884 1.12
127,461,349 2.24
Virgin Islands, BritishFix Price Group Ltd., Reg. S, GDR USD 2,338,313 20,460,239 0.36
20,460,239 0.36
Total Equities 5,277,541,473 92.78
Warrants
ChinaJiangsu Hengli Hydraulic Co. Ltd.13/12/2021 USD 1,801,550 23,977,730 0.42
23,977,730 0.42
Total Warrants 23,977,730 0.42
Total Transferable securities and money market instrumentsadmitted to an official exchange listing 5,301,519,203 93.20
84
JPMorgan Funds - Emerging Markets Opportunities FundSchedule of Investments
As at 30 June 2021
Investments Currency
Quantity/Nominal
Value
MarketValue
USD
%of
NetAssets Investments Currency
Quantity/Nominal
Value
MarketValue
USD
%of
NetAssets

Transferable securities and money market instruments dealt in on another regulatedmarket
Equities
ChinaBOE Technology Group Co. Ltd. ‘A’ CNH 55,339,860 53,395,857 0.94Contemporary Amperex TechnologyCo. Ltd. ‘A’ CNH 755,201 62,512,692 1.10Han’s Laser Technology Industry GroupCo. Ltd. ‘A’ CNH 5,963,500 37,269,568 0.66Ping An Bank Co. Ltd. CNH 41,647,344 145,752,814 2.56
298,930,931 5.26
Total Equities 298,930,931 5.26
Total Transferable securities and money market instrumentsdealt in on another regulated market 298,930,931 5.26
Other transferable securities and money market instruments
Equities
BermudaPeace Mark (Holdings) Ltd.* HKD 5,104,000 0 0.00
0 0.00
BrazilBanco Nacional SA Preference* BRL 5,100,000 0 0.00
0 0.00
Total Equities 0 0.00
Total Other transferable securities and money marketinstruments 0 0.00
Units of authorised UCITS or other collective investment undertakings
Collective Investment Schemes - UCITS
LuxembourgJPMorgan USD Liquidity LVNAV Fund -JPM USD Liquidity LVNAV X (dist.)† USD 87,304,297 87,304,297 1.53
87,304,297 1.53
Total Collective Investment Schemes - UCITS 87,304,297 1.53
Total Units of authorised UCITS or other collective investmentundertakings 87,304,297 1.53
Total Investments 5,687,754,431 99.99
Cash 2,473,309 0.04
Other Assets/(Liabilities) (2,149,655) (0.03)
Total Net Assets 5,688,078,085 100.00
* Security is valued at its fair value under the direction of the Board of Directors.† Related Party Fund.
Geographic Allocation of Portfolio as at 30 June 2021 % of Net AssetsCayman Islands 28.62China 13.54South Korea 11.68Taiwan 10.67India 8.19Russia 6.03Mexico 2.67Thailand 2.44Luxembourg 2.31United States of America 2.24Brazil 1.82South Africa 1.74Hong Kong 1.62United Kingdom 1.55Indonesia 1.51Bermuda 1.45Hungary 0.88Netherlands 0.37Virgin Islands, British 0.36Turkey 0.30Total Investments 99.99Cash and Other assets/(liabilities) 0.01
Total 100.00
85
JPMorgan Funds - Emerging Markets Opportunities FundSchedule of Investments (continued)
As at 30 June 2021
Investments Currency
Quantity/Nominal
Value
MarketValue
USD
%of
NetAssets Investments Currency
Quantity/Nominal
Value
MarketValue
USD
%of
NetAssets
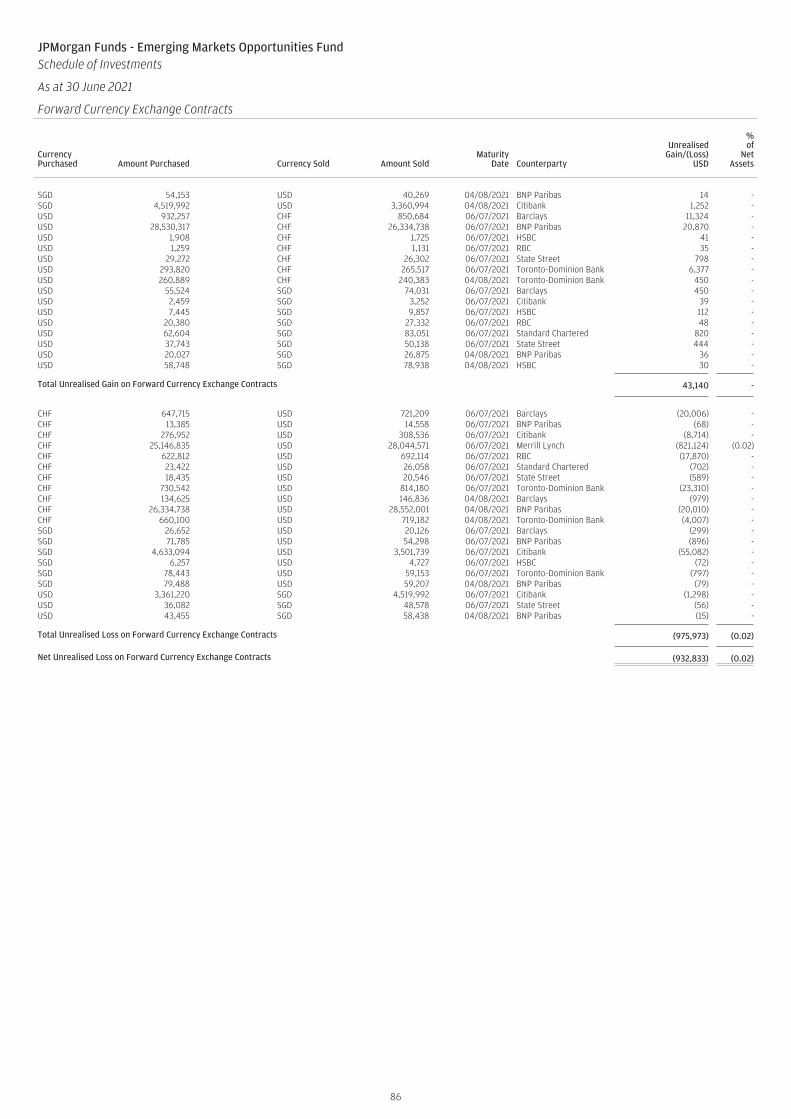
JPMorgan Funds - Emerging Markets Opportunities FundSchedule of Investments
As at 30 June 2021
Forward Currency Exchange Contracts
CurrencyPurchased Amount Purchased Currency Sold Amount Sold
MaturityDate Counterparty
UnrealisedGain/(Loss)
USD
%of
NetAssets
SGD 54,153 USD 40,269 04/08/2021 BNP Paribas 14 -SGD 4,519,992 USD 3,360,994 04/08/2021 Citibank 1,252 -USD 932,257 CHF 850,684 06/07/2021 Barclays 11,324 -USD 28,530,317 CHF 26,334,738 06/07/2021 BNP Paribas 20,870 -USD 1,908 CHF 1,725 06/07/2021 HSBC 41 -USD 1,259 CHF 1,131 06/07/2021 RBC 35 -USD 29,272 CHF 26,302 06/07/2021 State Street 798 -USD 293,820 CHF 265,517 06/07/2021 Toronto-Dominion Bank 6,377 -USD 260,889 CHF 240,383 04/08/2021 Toronto-Dominion Bank 450 -USD 55,524 SGD 74,031 06/07/2021 Barclays 450 -USD 2,459 SGD 3,252 06/07/2021 Citibank 39 -USD 7,445 SGD 9,857 06/07/2021 HSBC 112 -USD 20,380 SGD 27,332 06/07/2021 RBC 48 -USD 62,604 SGD 83,051 06/07/2021 Standard Chartered 820 -USD 37,743 SGD 50,138 06/07/2021 State Street 444 -USD 20,027 SGD 26,875 04/08/2021 BNP Paribas 36 -USD 58,748 SGD 78,938 04/08/2021 HSBC 30 -
Total Unrealised Gain on Forward Currency Exchange Contracts 43,140 -
CHF 647,715 USD 721,209 06/07/2021 Barclays (20,006) -CHF 13,385 USD 14,558 06/07/2021 BNP Paribas (68) -CHF 276,952 USD 308,536 06/07/2021 Citibank (8,714) -CHF 25,146,835 USD 28,044,571 06/07/2021 Merrill Lynch (821,124) (0.02)CHF 622,812 USD 692,114 06/07/2021 RBC (17,870) -CHF 23,422 USD 26,058 06/07/2021 Standard Chartered (702) -CHF 18,435 USD 20,546 06/07/2021 State Street (589) -CHF 730,542 USD 814,180 06/07/2021 Toronto-Dominion Bank (23,310) -CHF 134,625 USD 146,836 04/08/2021 Barclays (979) -CHF 26,334,738 USD 28,552,001 04/08/2021 BNP Paribas (20,010) -CHF 660,100 USD 719,182 04/08/2021 Toronto-Dominion Bank (4,007) -SGD 26,652 USD 20,126 06/07/2021 Barclays (299) -SGD 71,785 USD 54,298 06/07/2021 BNP Paribas (896) -SGD 4,633,094 USD 3,501,739 06/07/2021 Citibank (55,082) -SGD 6,257 USD 4,727 06/07/2021 HSBC (72) -SGD 78,443 USD 59,153 06/07/2021 Toronto-Dominion Bank (797) -SGD 79,488 USD 59,207 04/08/2021 BNP Paribas (79) -USD 3,361,220 SGD 4,519,992 06/07/2021 Citibank (1,298) -USD 36,082 SGD 48,578 06/07/2021 State Street (56) -USD 43,455 SGD 58,438 04/08/2021 BNP Paribas (15) -
Total Unrealised Loss on Forward Currency Exchange Contracts (975,973) (0.02)
Net Unrealised Loss on Forward Currency Exchange Contracts (932,833) (0.02)
86
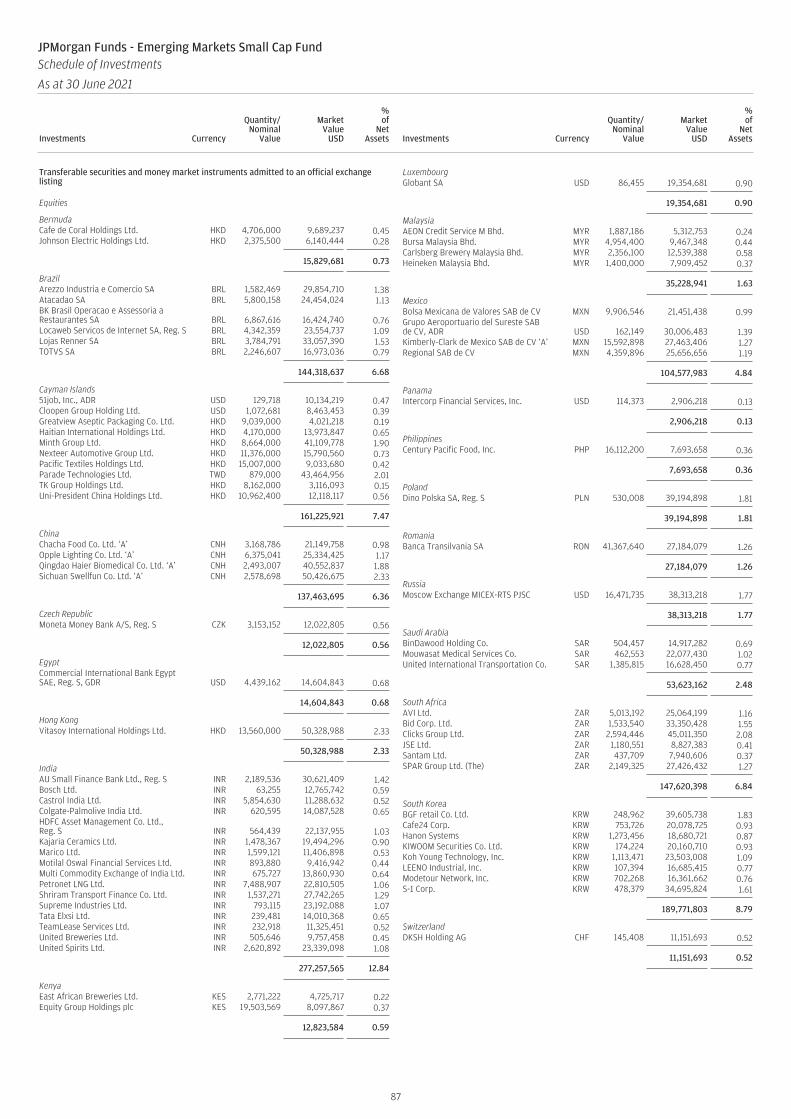
Transferable securities and money market instruments admitted to an official exchangelisting
Equities
BermudaCafe de Coral Holdings Ltd. HKD 4,706,000 9,689,237 0.45Johnson Electric Holdings Ltd. HKD 2,375,500 6,140,444 0.28
15,829,681 0.73
BrazilArezzo Industria e Comercio SA BRL 1,582,469 29,854,710 1.38Atacadao SA BRL 5,800,158 24,454,024 1.13BK Brasil Operacao e Assessoria aRestaurantes SA BRL 6,867,616 16,424,740 0.76Locaweb Servicos de Internet SA, Reg. S BRL 4,342,359 23,554,737 1.09Lojas Renner SA BRL 3,784,791 33,057,390 1.53TOTVS SA BRL 2,246,607 16,973,036 0.79
144,318,637 6.68
Cayman Islands51job, Inc., ADR USD 129,718 10,134,219 0.47Cloopen Group Holding Ltd. USD 1,072,681 8,463,453 0.39Greatview Aseptic Packaging Co. Ltd. HKD 9,039,000 4,021,218 0.19Haitian International Holdings Ltd. HKD 4,170,000 13,973,847 0.65Minth Group Ltd. HKD 8,664,000 41,109,778 1.90Nexteer Automotive Group Ltd. HKD 11,376,000 15,790,560 0.73Pacific Textiles Holdings Ltd. HKD 15,007,000 9,033,680 0.42Parade Technologies Ltd. TWD 879,000 43,464,956 2.01TK Group Holdings Ltd. HKD 8,162,000 3,116,093 0.15Uni-President China Holdings Ltd. HKD 10,962,400 12,118,117 0.56
161,225,921 7.47
ChinaChacha Food Co. Ltd. ‘A’ CNH 3,168,786 21,149,758 0.98Opple Lighting Co. Ltd. ‘A’ CNH 6,375,041 25,334,425 1.17Qingdao Haier Biomedical Co. Ltd. ‘A’ CNH 2,493,007 40,552,837 1.88Sichuan Swellfun Co. Ltd. ‘A’ CNH 2,578,698 50,426,675 2.33
137,463,695 6.36
Czech RepublicMoneta Money Bank A/S, Reg. S CZK 3,153,152 12,022,805 0.56
12,022,805 0.56
EgyptCommercial International Bank EgyptSAE, Reg. S, GDR USD 4,439,162 14,604,843 0.68
14,604,843 0.68
Hong KongVitasoy International Holdings Ltd. HKD 13,560,000 50,328,988 2.33
50,328,988 2.33
IndiaAU Small Finance Bank Ltd., Reg. S INR 2,189,536 30,621,409 1.42Bosch Ltd. INR 63,255 12,765,742 0.59Castrol India Ltd. INR 5,854,630 11,288,632 0.52Colgate-Palmolive India Ltd. INR 620,595 14,087,528 0.65HDFC Asset Management Co. Ltd.,Reg. S INR 564,439 22,137,955 1.03Kajaria Ceramics Ltd. INR 1,478,367 19,494,296 0.90Marico Ltd. INR 1,599,121 11,406,898 0.53Motilal Oswal Financial Services Ltd. INR 893,880 9,416,942 0.44Multi Commodity Exchange of India Ltd. INR 675,727 13,860,930 0.64Petronet LNG Ltd. INR 7,488,907 22,810,505 1.06Shriram Transport Finance Co. Ltd. INR 1,537,271 27,742,265 1.29Supreme Industries Ltd. INR 793,115 23,192,088 1.07Tata Elxsi Ltd. INR 239,481 14,010,368 0.65TeamLease Services Ltd. INR 232,918 11,325,451 0.52United Breweries Ltd. INR 505,646 9,757,458 0.45United Spirits Ltd. INR 2,620,892 23,339,098 1.08
277,257,565 12.84
KenyaEast African Breweries Ltd. KES 2,771,222 4,725,717 0.22Equity Group Holdings plc KES 19,503,569 8,097,867 0.37
12,823,584 0.59
LuxembourgGlobant SA USD 86,455 19,354,681 0.90
19,354,681 0.90
MalaysiaAEON Credit Service M Bhd. MYR 1,887,186 5,312,753 0.24Bursa Malaysia Bhd. MYR 4,954,400 9,467,348 0.44Carlsberg Brewery Malaysia Bhd. MYR 2,356,100 12,539,388 0.58Heineken Malaysia Bhd. MYR 1,400,000 7,909,452 0.37
35,228,941 1.63
MexicoBolsa Mexicana de Valores SAB de CV MXN 9,906,546 21,451,438 0.99Grupo Aeroportuario del Sureste SABde CV, ADR USD 162,149 30,006,483 1.39Kimberly-Clark de Mexico SAB de CV ‘A’ MXN 15,592,898 27,463,406 1.27Regional SAB de CV MXN 4,359,896 25,656,656 1.19
104,577,983 4.84
PanamaIntercorp Financial Services, Inc. USD 114,373 2,906,218 0.13
2,906,218 0.13
PhilippinesCentury Pacific Food, Inc. PHP 16,112,200 7,693,658 0.36
7,693,658 0.36
PolandDino Polska SA, Reg. S PLN 530,008 39,194,898 1.81
39,194,898 1.81
RomaniaBanca Transilvania SA RON 41,367,640 27,184,079 1.26
27,184,079 1.26
RussiaMoscow Exchange MICEX-RTS PJSC USD 16,471,735 38,313,218 1.77
38,313,218 1.77
Saudi ArabiaBinDawood Holding Co. SAR 504,457 14,917,282 0.69Mouwasat Medical Services Co. SAR 462,553 22,077,430 1.02United International Transportation Co. SAR 1,385,815 16,628,450 0.77
53,623,162 2.48
South AfricaAVI Ltd. ZAR 5,013,192 25,064,199 1.16Bid Corp. Ltd. ZAR 1,533,540 33,350,428 1.55Clicks Group Ltd. ZAR 2,594,446 45,011,350 2.08JSE Ltd. ZAR 1,180,551 8,827,383 0.41Santam Ltd. ZAR 437,709 7,940,606 0.37SPAR Group Ltd. (The) ZAR 2,149,325 27,426,432 1.27
147,620,398 6.84
South KoreaBGF retail Co. Ltd. KRW 248,962 39,605,738 1.83Cafe24 Corp. KRW 753,726 20,078,725 0.93Hanon Systems KRW 1,273,456 18,680,721 0.87KIWOOM Securities Co. Ltd. KRW 174,224 20,160,710 0.93Koh Young Technology, Inc. KRW 1,113,471 23,503,008 1.09LEENO Industrial, Inc. KRW 107,394 16,685,415 0.77Modetour Network, Inc. KRW 702,268 16,361,662 0.76S-1 Corp. KRW 478,379 34,695,824 1.61
189,771,803 8.79
SwitzerlandDKSH Holding AG CHF 145,408 11,151,693 0.52
11,151,693 0.52
87
JPMorgan Funds - Emerging Markets Small Cap FundSchedule of Investments
As at 30 June 2021
Investments Currency
Quantity/Nominal
Value
MarketValue
USD
%of
NetAssets Investments Currency
Quantity/Nominal
Value
MarketValue
USD
%of
NetAssets
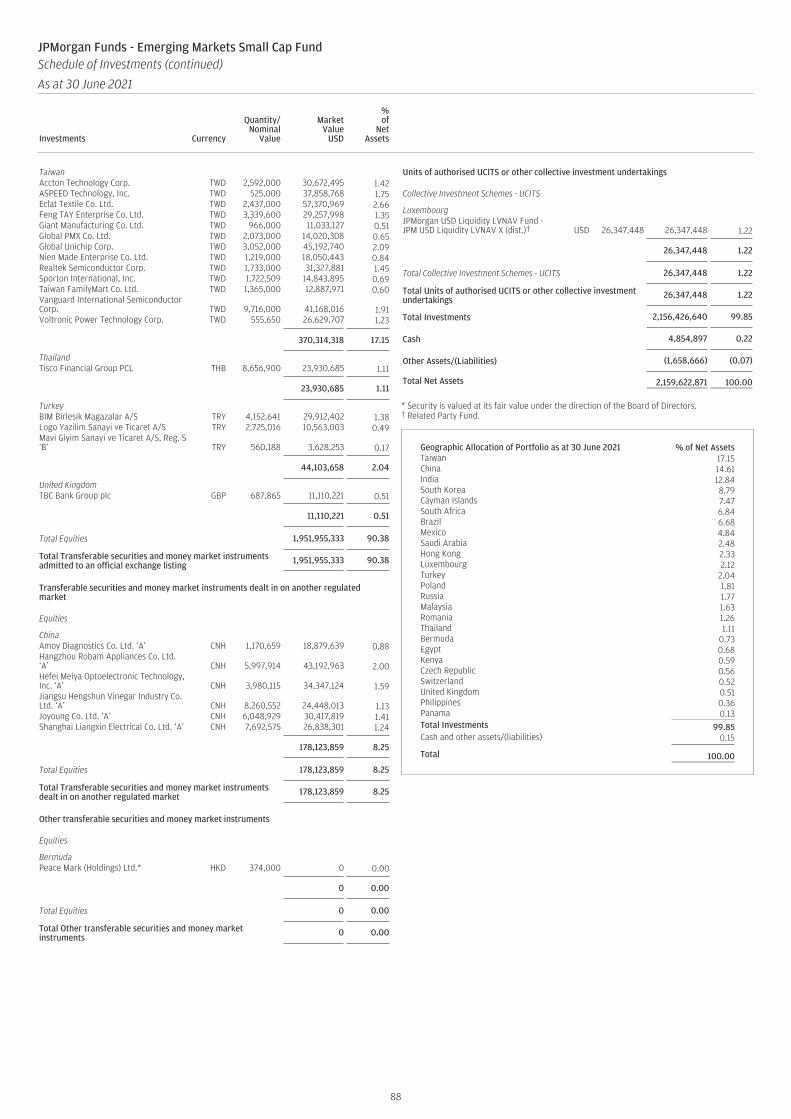
TaiwanAccton Technology Corp. TWD 2,592,000 30,672,495 1.42ASPEED Technology, Inc. TWD 525,000 37,858,768 1.75Eclat Textile Co. Ltd. TWD 2,437,000 57,370,969 2.66Feng TAY Enterprise Co. Ltd. TWD 3,339,600 29,257,998 1.35Giant Manufacturing Co. Ltd. TWD 966,000 11,033,127 0.51Global PMX Co. Ltd. TWD 2,073,000 14,020,308 0.65Global Unichip Corp. TWD 3,052,000 45,192,740 2.09Nien Made Enterprise Co. Ltd. TWD 1,219,000 18,050,443 0.84Realtek Semiconductor Corp. TWD 1,733,000 31,327,881 1.45Sporton International, Inc. TWD 1,722,509 14,843,895 0.69Taiwan FamilyMart Co. Ltd. TWD 1,365,000 12,887,971 0.60Vanguard International SemiconductorCorp. TWD 9,716,000 41,168,016 1.91Voltronic Power Technology Corp. TWD 555,650 26,629,707 1.23
370,314,318 17.15
ThailandTisco Financial Group PCL THB 8,656,900 23,930,685 1.11
23,930,685 1.11
TurkeyBIM Birlesik Magazalar A/S TRY 4,152,641 29,912,402 1.38Logo Yazilim Sanayi ve Ticaret A/S TRY 2,725,016 10,563,003 0.49Mavi Giyim Sanayi ve Ticaret A/S, Reg. S‘B’ TRY 560,188 3,628,253 0.17
44,103,658 2.04
United KingdomTBC Bank Group plc GBP 687,865 11,110,221 0.51
11,110,221 0.51
Total Equities 1,951,955,333 90.38
Total Transferable securities and money market instrumentsadmitted to an official exchange listing 1,951,955,333 90.38
Transferable securities and money market instruments dealt in on another regulatedmarket
Equities
ChinaAmoy Diagnostics Co. Ltd. ‘A’ CNH 1,170,659 18,879,639 0.88Hangzhou Robam Appliances Co. Ltd.‘A’ CNH 5,997,914 43,192,963 2.00Hefei Meiya Optoelectronic Technology,Inc. ‘A’ CNH 3,980,115 34,347,124 1.59Jiangsu Hengshun Vinegar Industry Co.Ltd. ‘A’ CNH 8,260,552 24,448,013 1.13Joyoung Co. Ltd. ‘A’ CNH 6,048,929 30,417,819 1.41Shanghai Liangxin Electrical Co. Ltd. ‘A’ CNH 7,692,575 26,838,301 1.24
178,123,859 8.25
Total Equities 178,123,859 8.25
Total Transferable securities and money market instrumentsdealt in on another regulated market 178,123,859 8.25
Other transferable securities and money market instruments
Equities
BermudaPeace Mark (Holdings) Ltd.* HKD 374,000 0 0.00
0 0.00
Total Equities 0 0.00
Total Other transferable securities and money marketinstruments 0 0.00
Units of authorised UCITS or other collective investment undertakings
Collective Investment Schemes - UCITS
LuxembourgJPMorgan USD Liquidity LVNAV Fund -JPM USD Liquidity LVNAV X (dist.)† USD 26,347,448 26,347,448 1.22
26,347,448 1.22
Total Collective Investment Schemes - UCITS 26,347,448 1.22
Total Units of authorised UCITS or other collective investmentundertakings 26,347,448 1.22
Total Investments 2,156,426,640 99.85
Cash 4,854,897 0.22
Other Assets/(Liabilities) (1,658,666) (0.07)
Total Net Assets 2,159,622,871 100.00
* Security is valued at its fair value under the direction of the Board of Directors.† Related Party Fund.
Geographic Allocation of Portfolio as at 30 June 2021 % of Net AssetsTaiwan 17.15China 14.61India 12.84South Korea 8.79Cayman Islands 7.47South Africa 6.84Brazil 6.68Mexico 4.84Saudi Arabia 2.48Hong Kong 2.33Luxembourg 2.12Turkey 2.04Poland 1.81Russia 1.77Malaysia 1.63Romania 1.26Thailand 1.11Bermuda 0.73Egypt 0.68Kenya 0.59Czech Republic 0.56Switzerland 0.52United Kingdom 0.51Philippines 0.36Panama 0.13Total Investments 99.85Cash and other assets/(liabilities) 0.15
Total 100.00
88
JPMorgan Funds - Emerging Markets Small Cap FundSchedule of Investments (continued)
As at 30 June 2021
Investments Currency
Quantity/Nominal
Value
MarketValue
USD
%of
NetAssets Investments Currency
Quantity/Nominal
Value
MarketValue
USD
%of
NetAssets
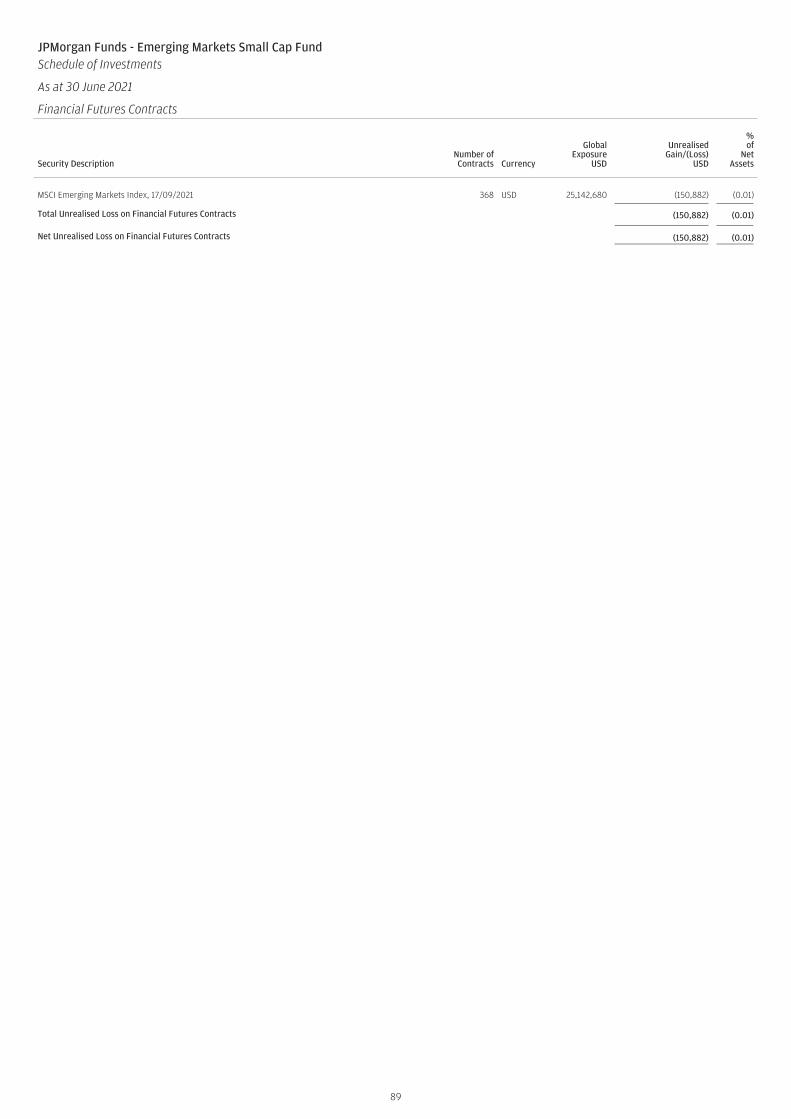
JPMorgan Funds - Emerging Markets Small Cap FundSchedule of Investments
As at 30 June 2021
Financial Futures Contracts
Security DescriptionNumber ofContracts Currency
GlobalExposure
USD
UnrealisedGain/(Loss)
USD
%of
NetAssets
MSCI Emerging Markets Index, 17/09/2021 368 USD 25,142,680 (150,882) (0.01)
Total Unrealised Loss on Financial Futures Contracts (150,882) (0.01)
Net Unrealised Loss on Financial Futures Contracts (150,882) (0.01)
89
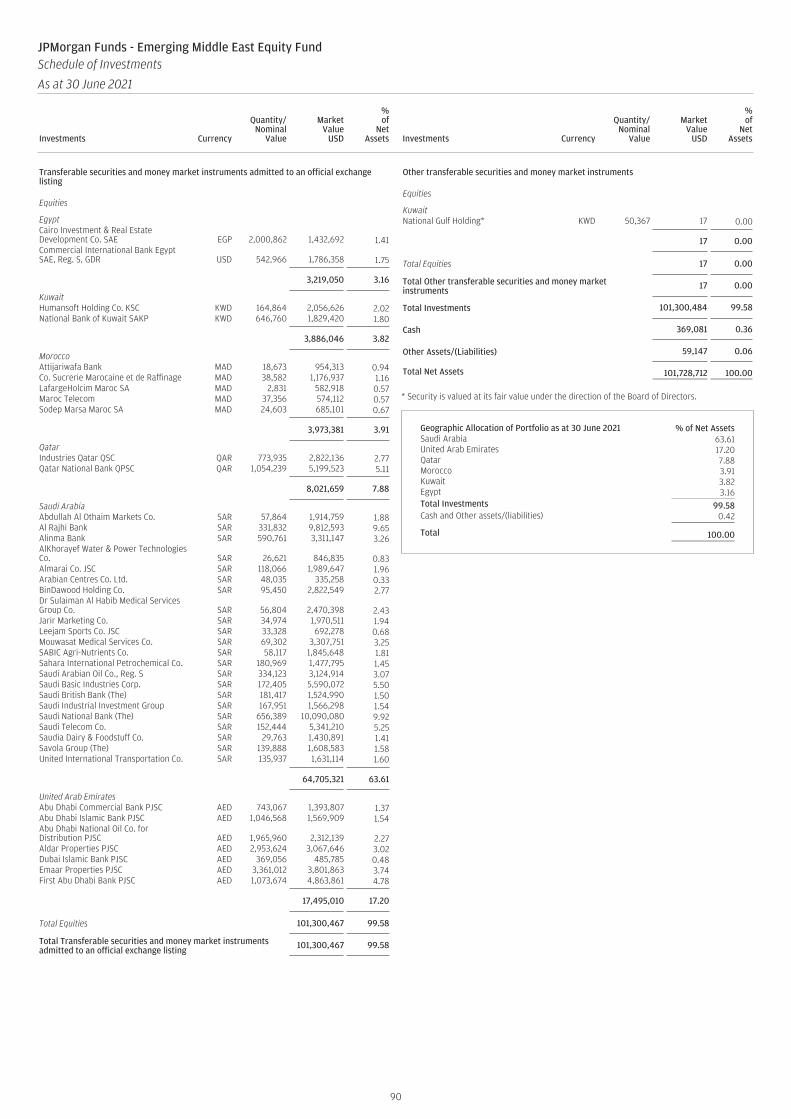
Transferable securities and money market instruments admitted to an official exchangelisting
Equities
EgyptCairo Investment & Real EstateDevelopment Co. SAE EGP 2,000,862 1,432,692 1.41Commercial International Bank EgyptSAE, Reg. S, GDR USD 542,966 1,786,358 1.75
3,219,050 3.16
KuwaitHumansoft Holding Co. KSC KWD 164,864 2,056,626 2.02National Bank of Kuwait SAKP KWD 646,760 1,829,420 1.80
3,886,046 3.82
MoroccoAttijariwafa Bank MAD 18,673 954,313 0.94Co. Sucrerie Marocaine et de Raffinage MAD 38,582 1,176,937 1.16LafargeHolcim Maroc SA MAD 2,831 582,918 0.57Maroc Telecom MAD 37,356 574,112 0.57Sodep Marsa Maroc SA MAD 24,603 685,101 0.67
3,973,381 3.91
QatarIndustries Qatar QSC QAR 773,935 2,822,136 2.77Qatar National Bank QPSC QAR 1,054,239 5,199,523 5.11
8,021,659 7.88
Saudi ArabiaAbdullah Al Othaim Markets Co. SAR 57,864 1,914,759 1.88Al Rajhi Bank SAR 331,832 9,812,593 9.65Alinma Bank SAR 590,761 3,311,147 3.26AlKhorayef Water & Power TechnologiesCo. SAR 26,621 846,835 0.83Almarai Co. JSC SAR 118,066 1,989,647 1.96Arabian Centres Co. Ltd. SAR 48,035 335,258 0.33BinDawood Holding Co. SAR 95,450 2,822,549 2.77Dr Sulaiman Al Habib Medical ServicesGroup Co. SAR 56,804 2,470,398 2.43Jarir Marketing Co. SAR 34,974 1,970,511 1.94Leejam Sports Co. JSC SAR 33,328 692,278 0.68Mouwasat Medical Services Co. SAR 69,302 3,307,751 3.25SABIC Agri-Nutrients Co. SAR 58,117 1,845,648 1.81Sahara International Petrochemical Co. SAR 180,969 1,477,795 1.45Saudi Arabian Oil Co., Reg. S SAR 334,123 3,124,914 3.07Saudi Basic Industries Corp. SAR 172,405 5,590,072 5.50Saudi British Bank (The) SAR 181,417 1,524,990 1.50Saudi Industrial Investment Group SAR 167,951 1,566,298 1.54Saudi National Bank (The) SAR 656,389 10,090,080 9.92Saudi Telecom Co. SAR 152,444 5,341,210 5.25Saudia Dairy & Foodstuff Co. SAR 29,763 1,430,891 1.41Savola Group (The) SAR 139,888 1,608,583 1.58United International Transportation Co. SAR 135,937 1,631,114 1.60
64,705,321 63.61
United Arab EmiratesAbu Dhabi Commercial Bank PJSC AED 743,067 1,393,807 1.37Abu Dhabi Islamic Bank PJSC AED 1,046,568 1,569,909 1.54Abu Dhabi National Oil Co. forDistribution PJSC AED 1,965,960 2,312,139 2.27Aldar Properties PJSC AED 2,953,624 3,067,646 3.02Dubai Islamic Bank PJSC AED 369,056 485,785 0.48Emaar Properties PJSC AED 3,361,012 3,801,863 3.74First Abu Dhabi Bank PJSC AED 1,073,674 4,863,861 4.78
17,495,010 17.20
Total Equities 101,300,467 99.58
Total Transferable securities and money market instrumentsadmitted to an official exchange listing 101,300,467 99.58
Other transferable securities and money market instruments
Equities
KuwaitNational Gulf Holding* KWD 50,367 17 0.00
17 0.00
Total Equities 17 0.00
Total Other transferable securities and money marketinstruments 17 0.00
Total Investments 101,300,484 99.58
Cash 369,081 0.36
Other Assets/(Liabilities) 59,147 0.06
Total Net Assets 101,728,712 100.00
* Security is valued at its fair value under the direction of the Board of Directors.
Geographic Allocation of Portfolio as at 30 June 2021 % of Net AssetsSaudi Arabia 63.61United Arab Emirates 17.20Qatar 7.88Morocco 3.91Kuwait 3.82Egypt 3.16Total Investments 99.58Cash and Other assets/(liabilities) 0.42
Total 100.00
90
JPMorgan Funds - Emerging Middle East Equity FundSchedule of Investments
As at 30 June 2021
Investments Currency
Quantity/Nominal
Value
MarketValue
USD
%of
NetAssets Investments Currency
Quantity/Nominal
Value
MarketValue
USD
%of
NetAssets

Transferable securities and money market instruments admitted to an official exchangelisting
Equities
AustriaErste Group Bank AG EUR 258,942 8,051,801 1.03Wienerberger AG EUR 184,376 6,008,814 0.76
14,060,615 1.79
Belgiumbpost SA EUR 646,387 6,564,060 0.84
6,564,060 0.84
DenmarkPandora A/S DKK 52,892 6,032,377 0.77Royal Unibrew A/S DKK 75,261 8,114,979 1.03
14,147,356 1.80
FinlandCargotec OYJ ‘B’ EUR 130,928 5,686,203 0.72Neste OYJ EUR 113,785 5,929,336 0.76QT Group OYJ EUR 62,002 6,045,195 0.77
17,660,734 2.25
FranceBNP Paribas SA EUR 164,373 8,747,931 1.11Capgemini SE EUR 56,231 9,147,378 1.16Cie Plastic Omnium SA EUR 129,761 3,439,964 0.44Credit Agricole SA EUR 577,885 6,857,761 0.87Eiffage SA EUR 59,759 5,130,908 0.65Kering SA EUR 14,038 10,424,619 1.33La Francaise des Jeux SAEM, Reg. S EUR 182,807 9,062,657 1.15LVMH Moet Hennessy Louis Vuitton SE EUR 32,086 21,515,267 2.74Safran SA EUR 73,355 8,598,673 1.10Schneider Electric SE EUR 135,450 18,111,020 2.31
101,036,178 12.86
GermanyAbout You Holding AG EUR 173,157 4,407,711 0.56Allianz SE EUR 91,335 19,267,118 2.45Daimler AG EUR 145,490 11,000,499 1.40Delivery Hero SE, Reg. S EUR 50,561 5,614,799 0.72Deutsche Boerse AG EUR 54,749 8,075,477 1.03Deutsche Post AG EUR 256,503 14,837,416 1.89Deutsche Telekom AG EUR 716,433 12,822,718 1.63DWS Group GmbH & Co. KGaA, Reg. S EUR 182,644 7,006,224 0.89Eckert & Ziegler Strahlen- undMedizintechnik AG EUR 64,004 6,157,185 0.79HelloFresh SE EUR 76,838 6,308,400 0.80Jungheinrich AG Preference EUR 187,815 7,741,734 0.99Schaeffler AG Preference EUR 707,791 5,524,309 0.70Siemens AG EUR 101,133 13,560,924 1.73VERBIO Vereinigte BioEnergie AG EUR 119,132 5,117,911 0.65Volkswagen AG Preference EUR 45,168 9,590,296 1.22Zalando SE, Reg. S EUR 83,723 8,543,932 1.09
145,576,653 18.54
IrelandAIB Group plc EUR 2,466,370 5,389,018 0.69Bank of Ireland Group plc EUR 1,579,924 7,164,165 0.91Linde plc EUR 25,106 6,117,705 0.78Ryanair Holdings plc EUR 359,481 5,659,130 0.72Smurfit Kappa Group plc EUR 137,365 6,316,730 0.80
30,646,748 3.90
ItalyEnel SpA EUR 1,352,545 10,681,048 1.36Intesa Sanpaolo SpA EUR 4,185,232 9,807,045 1.25
20,488,093 2.61
LuxembourgArcelorMittal SA EUR 158,212 4,144,759 0.53
4,144,759 0.53
NetherlandsAirbus SE EUR 91,335 9,900,714 1.26ASM International NV EUR 35,259 9,803,765 1.25ASML Holding NV EUR 20,072 11,714,019 1.49CNH Industrial NV EUR 666,108 9,258,901 1.18Koninklijke Ahold Delhaize NV EUR 565,899 14,205,480 1.81NN Group NV EUR 204,264 8,150,134 1.04Stellantis NV EUR 537,701 8,930,138 1.13
71,963,151 9.16
NorwayElopak ASA NOK 93,591 247,920 0.03
247,920 0.03
SpainCaixaBank SA EUR 2,683,288 6,975,207 0.89Corp. ACCIONA Energias Renovables SA EUR 101,999 2,726,433 0.35Fluidra SA EUR 217,727 7,331,957 0.93Laboratorios Farmaceuticos Rovi SA EUR 97,720 5,701,962 0.73
22,735,559 2.90
SwedenEvolution AB, Reg. S SEK 40,325 5,530,513 0.71Sinch AB, Reg. S SEK 18,394 265,412 0.03Volvo AB ‘B’ SEK 408,730 8,348,893 1.06
14,144,818 1.80
SwitzerlandHolcim Ltd. CHF 161,987 8,236,960 1.05Interroll Holding AG CHF 1,365 4,572,969 0.58Nestle SA CHF 376,019 39,855,270 5.07Novartis AG CHF 219,151 16,871,411 2.15Roche Holding AG CHF 109,386 34,928,439 4.45Schindler Holding AG CHF 32,035 8,236,811 1.05Siegfried Holding AG CHF 8,903 7,081,253 0.90Sonova Holding AG CHF 26,384 8,333,975 1.06Swissquote Group Holding SA CHF 58,497 7,481,687 0.95Zurich Insurance Group AG CHF 35,854 12,158,748 1.55
147,757,523 18.81
United Kingdom3i Group plc GBP 451,599 6,200,726 0.79Ashtead Group plc GBP 128,034 8,054,193 1.03Barclays plc GBP 2,590,099 5,176,046 0.66BHP Group plc GBP 426,959 10,719,540 1.37BP plc GBP 3,054,783 11,294,261 1.44Centrica plc GBP 6,235,140 3,792,229 0.48Computacenter plc GBP 271,828 8,187,117 1.04Dr. Martens plc GBP 1,040,265 5,411,469 0.69Dunelm Group plc GBP 210,136 3,460,883 0.44Games Workshop Group plc GBP 43,665 5,893,677 0.75Intermediate Capital Group plc GBP 406,042 10,071,331 1.28Lloyds Banking Group plc GBP 24,928,272 13,613,482 1.73Moonpig Group plc GBP 724,441 3,646,956 0.46National Express Group plc GBP 2,786,607 8,776,177 1.12Next plc GBP 112,996 10,367,939 1.32Persimmon plc GBP 208,228 7,178,078 0.91Rio Tinto plc GBP 163,702 11,484,778 1.46Segro plc, REIT GBP 569,496 7,288,486 0.93Spirent Communications plc GBP 1,234,486 3,568,471 0.46Taylor Wimpey plc GBP 4,137,466 7,698,031 0.98
151,883,870 19.34
Total Equities 763,058,037 97.16
Total Transferable securities and money market instrumentsadmitted to an official exchange listing 763,058,037 97.16
91
JPMorgan Funds - Europe Dynamic FundSchedule of Investments
As at 30 June 2021
Investments Currency
Quantity/Nominal
Value
MarketValue
EUR
%of
NetAssets Investments Currency
Quantity/Nominal
Value
MarketValue
EUR
%of
NetAssets
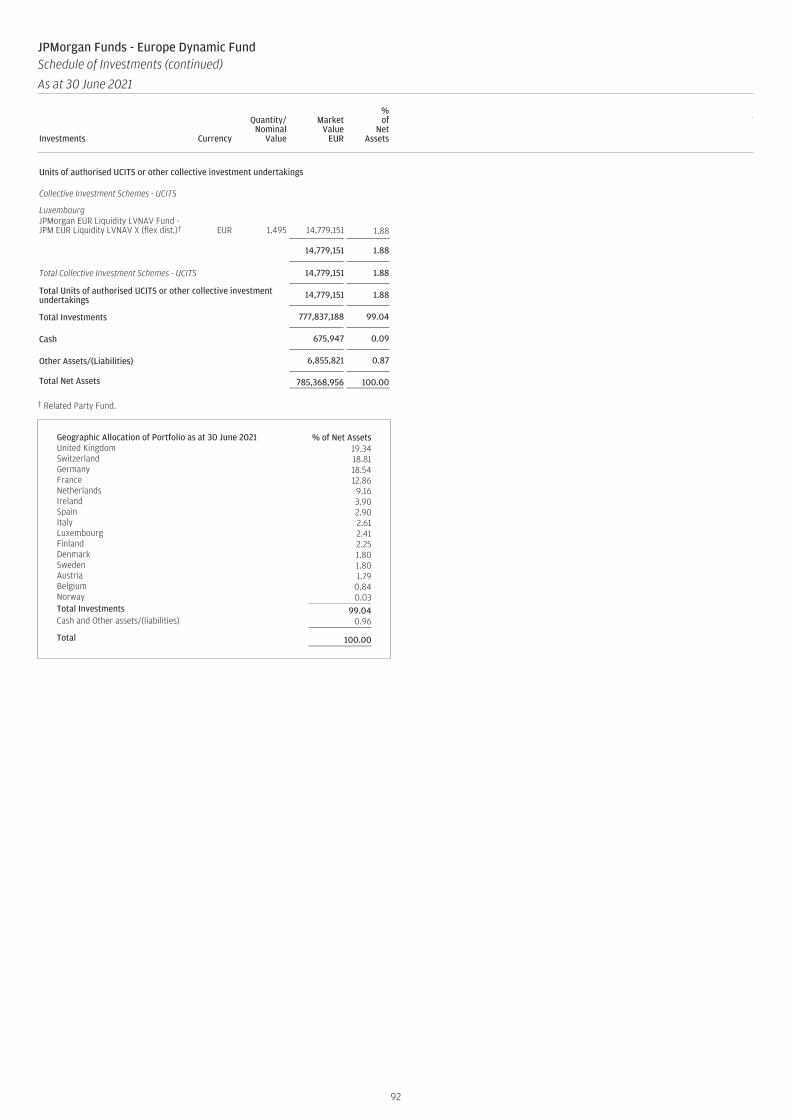
Units of authorised UCITS or other collective investment undertakings
Collective Investment Schemes - UCITS
LuxembourgJPMorgan EUR Liquidity LVNAV Fund -JPM EUR Liquidity LVNAV X (flex dist.)† EUR 1,495 14,779,151 1.88
14,779,151 1.88
Total Collective Investment Schemes - UCITS 14,779,151 1.88
Total Units of authorised UCITS or other collective investmentundertakings 14,779,151 1.88
Total Investments 777,837,188 99.04
Cash 675,947 0.09
Other Assets/(Liabilities) 6,855,821 0.87
Total Net Assets 785,368,956 100.00
† Related Party Fund.
Geographic Allocation of Portfolio as at 30 June 2021 % of Net AssetsUnited Kingdom 19.34Switzerland 18.81Germany 18.54France 12.86Netherlands 9.16Ireland 3.90Spain 2.90Italy 2.61Luxembourg 2.41Finland 2.25Denmark 1.80Sweden 1.80Austria 1.79Belgium 0.84Norway 0.03Total Investments 99.04Cash and Other assets/(liabilities) 0.96
Total 100.00
92
JPMorgan Funds - Europe Dynamic FundSchedule of Investments (continued)
As at 30 June 2021
Investments Currency
Quantity/Nominal
Value
MarketValue
EUR
%of
NetAssets Investments Currency
Quantity/Nominal
Value
MarketValue
EUR
%of
NetAssets

JPMorgan Funds - Europe Dynamic FundSchedule of Investments (continued)
As at 30 June 2021
Forward Currency Exchange Contracts (continued)
CurrencyPurchased Amount Purchased Currency Sold Amount Sold
MaturityDate Counterparty
UnrealisedGain/(Loss)
EUR
%of
NetAssets
AUD 21,105,436 EUR 13,311,033 04/08/2021 RBC 18,079 -CHF 29,521,370 EUR 26,910,350 06/07/2021 BNP Paribas 2,239 -CHF 611,692 EUR 556,575 06/07/2021 RBC 1,063 -DKK 32,267,174 EUR 4,338,986 06/07/2021 Standard Chartered 200 -DKK 8,320,117 EUR 1,118,744 04/08/2021 HSBC 76 -EUR 24,168,655 CHF 26,471,717 06/07/2021 BNP Paribas 36,223 0.01EUR 1,848,455 CHF 2,018,800 06/07/2021 Toronto-Dominion Bank 8,055 -EUR 364,976 CHF 399,985 04/08/2021 Barclays 271 -EUR 27,390,689 GBP 23,491,030 04/08/2021 Standard Chartered 26,447 -EUR 368,490 NOK 3,751,835 06/07/2021 Merrill Lynch 45 -GBP 62,133 AUD 114,214 06/07/2021 RBC 251 -GBP 1,638,880 EUR 1,897,277 06/07/2021 Citibank 12,839 -HKD 1,483,782 CHF 171,258 06/07/2021 HSBC 4,764 -HKD 1,427,097 CHF 167,310 06/07/2021 RBC 2,216 -HKD 410,654 DKK 321,416 06/07/2021 Goldman Sachs 1,304 -HKD 905,719 EUR 95,802 06/07/2021 BNP Paribas 2,406 -HKD 83,986,617 EUR 8,874,501 06/07/2021 HSBC 232,234 0.03HKD 2,663,704 EUR 280,546 06/07/2021 Merrill Lynch 8,282 -HKD 3,429,346 EUR 363,555 06/07/2021 RBC 8,292 -HKD 1,591,883 EUR 172,060 06/07/2021 State Street 549 -HKD 796,357 EUR 85,916 04/08/2021 Barclays 387 -HKD 96,002,299 EUR 10,387,847 04/08/2021 BNP Paribas 16,104 -HKD 1,076,016 EUR 115,970 04/08/2021 Merrill Lynch 640 -HKD 751,953 EUR 81,376 04/08/2021 RBC 114 -HKD 560,177 GBP 51,220 06/07/2021 Barclays 1,044 -HKD 523,987 GBP 47,578 06/07/2021 HSBC 1,364 -HKD 653,648 GBP 59,447 06/07/2021 Standard Chartered 1,591 -HKD 590,336 GBP 54,454 04/08/2021 BNP Paribas 543 -NOK 3,751,835 EUR 368,424 06/07/2021 BNP Paribas 21 -SEK 701,910 AUD 108,660 06/07/2021 State Street 747 -SEK 35,305,919 EUR 3,489,075 06/07/2021 Standard Chartered 1,870 -SEK 2,333,740 SGD 365,476 06/07/2021 HSBC 1,801 -SGD 202,317 CHF 136,701 06/07/2021 Goldman Sachs 2,121 -SGD 235,494 CHF 159,728 06/07/2021 HSBC 1,912 -SGD 242,948 EUR 149,869 06/07/2021 BNP Paribas 2,326 -SGD 900,423 EUR 558,343 06/07/2021 Citibank 5,727 -SGD 37,118,224 EUR 22,987,520 06/07/2021 Goldman Sachs 265,178 0.03SGD 233,743 EUR 145,075 06/07/2021 Merrill Lynch 1,353 -SGD 797,984 EUR 492,196 06/07/2021 RBC 7,700 -SGD 38,278,300 EUR 23,921,139 04/08/2021 HSBC 41,785 0.01SGD 278,013 GBP 149,134 04/08/2021 BNP Paribas 318 -SGD 192,379 USD 143,076 04/08/2021 BNP Paribas 22 -USD 113,587 AUD 150,156 04/08/2021 Barclays 762 -USD 690,766 CHF 634,504 06/07/2021 Barclays 3,255 -USD 716,241 CHF 642,977 06/07/2021 HSBC 16,982 -USD 672,484 CHF 601,641 06/07/2021 Toronto-Dominion Bank 17,819 -USD 2,091,215 CHF 1,924,162 04/08/2021 Barclays 5,478 -USD 579,968 DKK 3,523,200 06/07/2021 Goldman Sachs 14,597 -USD 2,932,093 EUR 2,408,071 06/07/2021 Barclays 61,019 0.01USD 1,009,683 EUR 828,652 06/07/2021 BNP Paribas 21,593 -USD 2,106,378 EUR 1,730,415 06/07/2021 Citibank 43,348 0.01USD 2,110,566 EUR 1,727,394 06/07/2021 HSBC 49,894 0.01USD 111,411,983 EUR 91,417,158 06/07/2021 Merrill Lynch 2,401,904 0.31USD 1,876,902 EUR 1,567,060 06/07/2021 State Street 13,463 -USD 1,311,561 EUR 1,102,024 04/08/2021 Barclays 1,760 -USD 1,273,714 EUR 1,066,044 04/08/2021 Merrill Lynch 5,888 -USD 123,006,360 EUR 103,398,178 04/08/2021 State Street 121,500 0.02USD 2,269,788 GBP 1,636,554 04/08/2021 Barclays 3,818 -USD 66,173 HKD 513,799 06/07/2021 Toronto-Dominion Bank 12 -USD 82,992 HKD 644,475 04/08/2021 Barclays 1 -USD 153,464 SGD 205,894 06/07/2021 Toronto-Dominion Bank 249 -
Total Unrealised Gain on Forward Currency Exchange Contracts 3,503,845 0.44
AUD 142,432 CHF 98,763 06/07/2021 Goldman Sachs (41) -AUD 327,970 CHF 228,145 06/07/2021 RBC (759) -AUD 489,803 EUR 311,037 06/07/2021 Barclays (1,559) -AUD 175,462 EUR 111,373 06/07/2021 BNP Paribas (508) -AUD 205,587 EUR 130,317 06/07/2021 HSBC (418) -AUD 929,600 EUR 589,702 06/07/2021 RBC (2,342) -AUD 18,670,493 EUR 11,821,418 06/07/2021 Standard Chartered (24,621) -AUD 109,540 EUR 69,544 04/08/2021 BNP Paribas (364) -AUD 128,992 EUR 81,670 04/08/2021 State Street (205) -AUD 123,297 GBP 67,743 06/07/2021 RBC (1,050) -AUD 117,632 GBP 63,958 04/08/2021 BNP Paribas (214) -AUD 123,972 GBP 67,591 04/08/2021 State Street (440) -AUD 255,724 USD 196,610 06/07/2021 Barclays (3,987) -AUD 106,088 USD 80,442 04/08/2021 Citibank (699) -CHF 773,382 EUR 709,541 06/07/2021 Barclays (4,502) -CHF 71,629 HKD 620,796 06/07/2021 RBC (2,014) -CHF 209,034 SGD 309,353 06/07/2021 RBC (3,232) -CHF 144,437 SGD 212,676 06/07/2021 State Street (1,557) -DKK 1,964,832 SGD 423,735 04/08/2021 HSBC (1,052) -
93
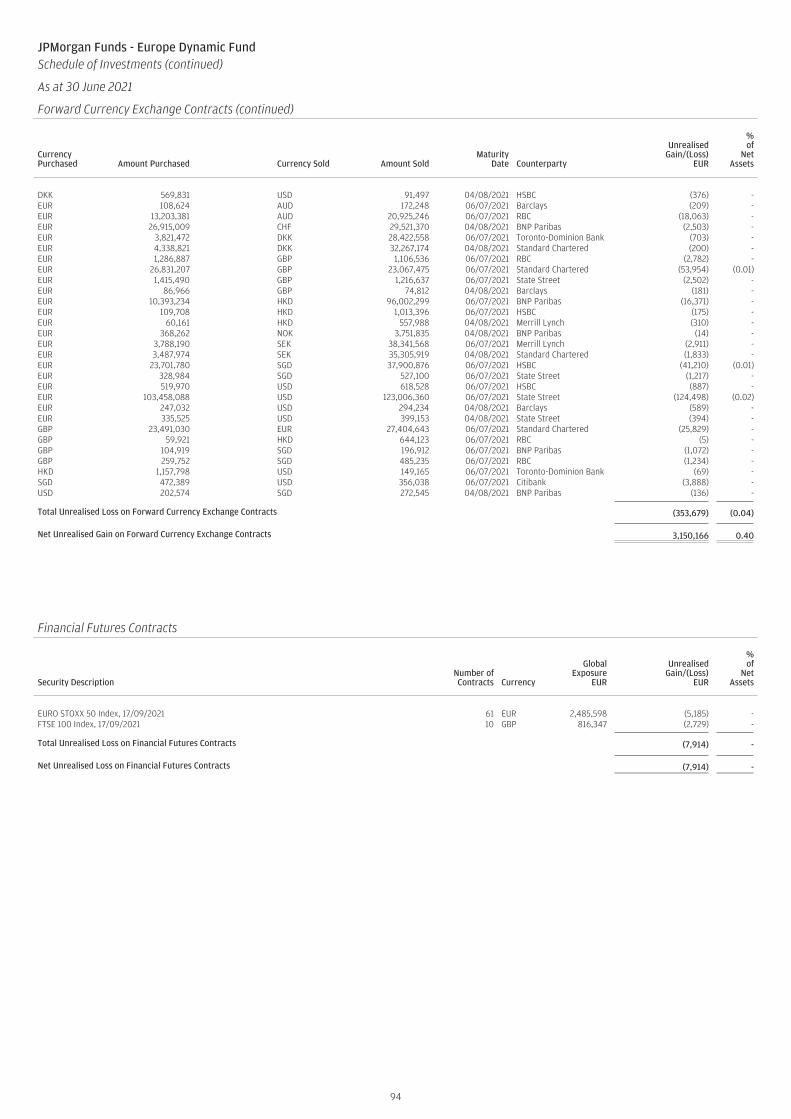
JPMorgan Funds - Europe Dynamic FundSchedule of Investments (continued)
As at 30 June 2021
Forward Currency Exchange Contracts (continued)
CurrencyPurchased Amount Purchased Currency Sold Amount Sold
MaturityDate Counterparty
UnrealisedGain/(Loss)
EUR
%of
NetAssets
DKK 569,831 USD 91,497 04/08/2021 HSBC (376) -EUR 108,624 AUD 172,248 06/07/2021 Barclays (209) -EUR 13,203,381 AUD 20,925,246 06/07/2021 RBC (18,063) -EUR 26,915,009 CHF 29,521,370 04/08/2021 BNP Paribas (2,503) -EUR 3,821,472 DKK 28,422,558 06/07/2021 Toronto-Dominion Bank (703) -EUR 4,338,821 DKK 32,267,174 04/08/2021 Standard Chartered (200) -EUR 1,286,887 GBP 1,106,536 06/07/2021 RBC (2,782) -EUR 26,831,207 GBP 23,067,475 06/07/2021 Standard Chartered (53,954) (0.01)EUR 1,415,490 GBP 1,216,637 06/07/2021 State Street (2,502) -EUR 86,966 GBP 74,812 04/08/2021 Barclays (181) -EUR 10,393,234 HKD 96,002,299 06/07/2021 BNP Paribas (16,371) -EUR 109,708 HKD 1,013,396 06/07/2021 HSBC (175) -EUR 60,161 HKD 557,988 04/08/2021 Merrill Lynch (310) -EUR 368,262 NOK 3,751,835 04/08/2021 BNP Paribas (14) -EUR 3,788,190 SEK 38,341,568 06/07/2021 Merrill Lynch (2,911) -EUR 3,487,974 SEK 35,305,919 04/08/2021 Standard Chartered (1,833) -EUR 23,701,780 SGD 37,900,876 06/07/2021 HSBC (41,210) (0.01)EUR 328,984 SGD 527,100 06/07/2021 State Street (1,217) -EUR 519,970 USD 618,528 06/07/2021 HSBC (887) -EUR 103,458,088 USD 123,006,360 06/07/2021 State Street (124,498) (0.02)EUR 247,032 USD 294,234 04/08/2021 Barclays (589) -EUR 335,525 USD 399,153 04/08/2021 State Street (394) -GBP 23,491,030 EUR 27,404,643 06/07/2021 Standard Chartered (25,829) -GBP 59,921 HKD 644,123 06/07/2021 RBC (5) -GBP 104,919 SGD 196,912 06/07/2021 BNP Paribas (1,072) -GBP 259,752 SGD 485,235 06/07/2021 RBC (1,234) -HKD 1,157,798 USD 149,165 06/07/2021 Toronto-Dominion Bank (69) -SGD 472,389 USD 356,038 06/07/2021 Citibank (3,888) -USD 202,574 SGD 272,545 04/08/2021 BNP Paribas (136) -
Total Unrealised Loss on Forward Currency Exchange Contracts (353,679) (0.04)
Net Unrealised Gain on Forward Currency Exchange Contracts 3,150,166 0.40
JPMorgan Funds - Europe Dynamic FundSchedule of Investments (continued)
As at 30 June 2021
Financial Futures Contracts
Security DescriptionNumber ofContracts Currency
GlobalExposure
EUR
UnrealisedGain/(Loss)
EUR
%of
NetAssets
EURO STOXX 50 Index, 17/09/2021 61 EUR 2,485,598 (5,185) -FTSE 100 Index, 17/09/2021 10 GBP 816,347 (2,729) -
Total Unrealised Loss on Financial Futures Contracts (7,914) -
Net Unrealised Loss on Financial Futures Contracts (7,914) -
94
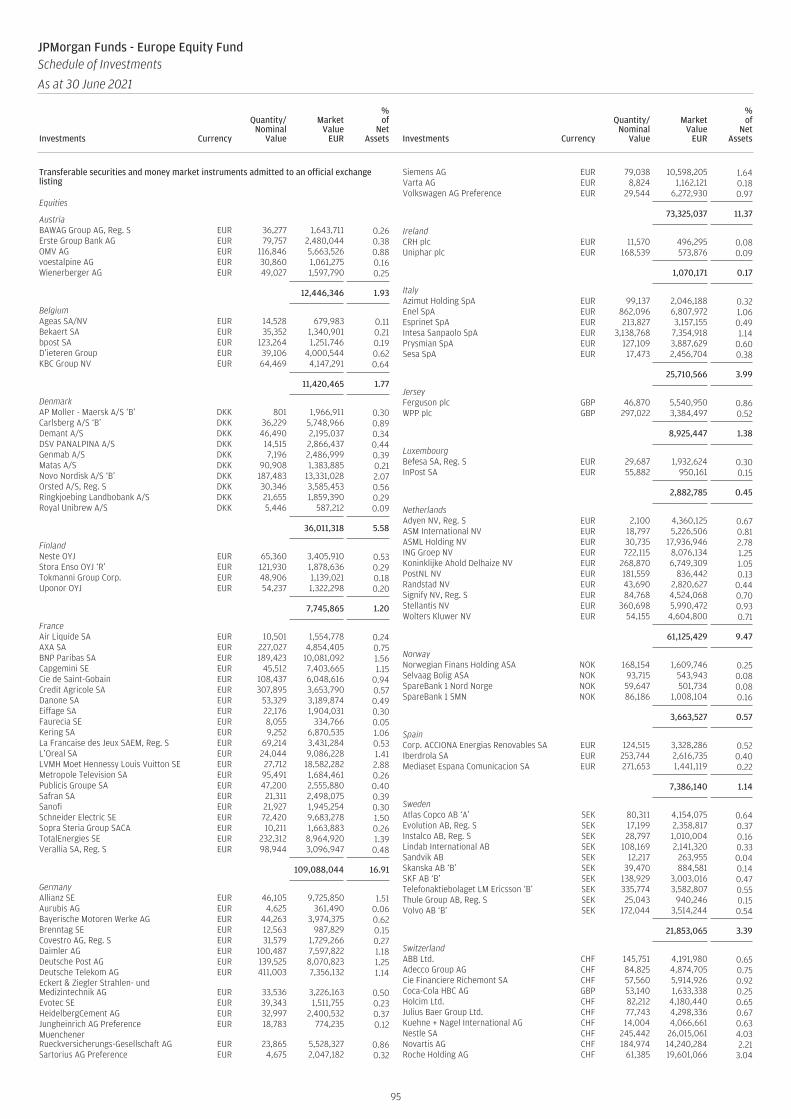
Transferable securities and money market instruments admitted to an official exchangelisting
Equities
AustriaBAWAG Group AG, Reg. S EUR 36,277 1,643,711 0.26Erste Group Bank AG EUR 79,757 2,480,044 0.38OMV AG EUR 116,846 5,663,526 0.88voestalpine AG EUR 30,860 1,061,275 0.16Wienerberger AG EUR 49,027 1,597,790 0.25
12,446,346 1.93
BelgiumAgeas SA/NV EUR 14,528 679,983 0.11Bekaert SA EUR 35,352 1,340,901 0.21bpost SA EUR 123,264 1,251,746 0.19D’ieteren Group EUR 39,106 4,000,544 0.62KBC Group NV EUR 64,469 4,147,291 0.64
11,420,465 1.77
DenmarkAP Moller - Maersk A/S ‘B’ DKK 801 1,966,911 0.30Carlsberg A/S ‘B’ DKK 36,229 5,748,966 0.89Demant A/S DKK 46,490 2,195,037 0.34DSV PANALPINA A/S DKK 14,515 2,866,437 0.44Genmab A/S DKK 7,196 2,486,999 0.39Matas A/S DKK 90,908 1,383,885 0.21Novo Nordisk A/S ‘B’ DKK 187,483 13,331,028 2.07Orsted A/S, Reg. S DKK 30,346 3,585,453 0.56Ringkjoebing Landbobank A/S DKK 21,655 1,859,390 0.29Royal Unibrew A/S DKK 5,446 587,212 0.09
36,011,318 5.58
FinlandNeste OYJ EUR 65,360 3,405,910 0.53Stora Enso OYJ ‘R’ EUR 121,930 1,878,636 0.29Tokmanni Group Corp. EUR 48,906 1,139,021 0.18Uponor OYJ EUR 54,237 1,322,298 0.20
7,745,865 1.20
FranceAir Liquide SA EUR 10,501 1,554,778 0.24AXA SA EUR 227,027 4,854,405 0.75BNP Paribas SA EUR 189,423 10,081,092 1.56Capgemini SE EUR 45,512 7,403,665 1.15Cie de Saint-Gobain EUR 108,437 6,048,616 0.94Credit Agricole SA EUR 307,895 3,653,790 0.57Danone SA EUR 53,329 3,189,874 0.49Eiffage SA EUR 22,176 1,904,031 0.30Faurecia SE EUR 8,055 334,766 0.05Kering SA EUR 9,252 6,870,535 1.06La Francaise des Jeux SAEM, Reg. S EUR 69,214 3,431,284 0.53L’Oreal SA EUR 24,044 9,086,228 1.41LVMH Moet Hennessy Louis Vuitton SE EUR 27,712 18,582,282 2.88Metropole Television SA EUR 95,491 1,684,461 0.26Publicis Groupe SA EUR 47,200 2,555,880 0.40Safran SA EUR 21,311 2,498,075 0.39Sanofi EUR 21,927 1,945,254 0.30Schneider Electric SE EUR 72,420 9,683,278 1.50Sopra Steria Group SACA EUR 10,211 1,663,883 0.26TotalEnergies SE EUR 232,312 8,964,920 1.39Verallia SA, Reg. S EUR 98,944 3,096,947 0.48
109,088,044 16.91
GermanyAllianz SE EUR 46,105 9,725,850 1.51Aurubis AG EUR 4,625 361,490 0.06Bayerische Motoren Werke AG EUR 44,263 3,974,375 0.62Brenntag SE EUR 12,563 987,829 0.15Covestro AG, Reg. S EUR 31,579 1,729,266 0.27Daimler AG EUR 100,487 7,597,822 1.18Deutsche Post AG EUR 139,525 8,070,823 1.25Deutsche Telekom AG EUR 411,003 7,356,132 1.14Eckert & Ziegler Strahlen- undMedizintechnik AG EUR 33,536 3,226,163 0.50Evotec SE EUR 39,343 1,511,755 0.23HeidelbergCement AG EUR 32,997 2,400,532 0.37Jungheinrich AG Preference EUR 18,783 774,235 0.12MuenchenerRueckversicherungs-Gesellschaft AG EUR 23,865 5,528,327 0.86Sartorius AG Preference EUR 4,675 2,047,182 0.32
Siemens AG EUR 79,038 10,598,205 1.64Varta AG EUR 8,824 1,162,121 0.18Volkswagen AG Preference EUR 29,544 6,272,930 0.97
73,325,037 11.37
IrelandCRH plc EUR 11,570 496,295 0.08Uniphar plc EUR 168,539 573,876 0.09
1,070,171 0.17
ItalyAzimut Holding SpA EUR 99,137 2,046,188 0.32Enel SpA EUR 862,096 6,807,972 1.06Esprinet SpA EUR 213,827 3,157,155 0.49Intesa Sanpaolo SpA EUR 3,138,768 7,354,918 1.14Prysmian SpA EUR 127,109 3,887,629 0.60Sesa SpA EUR 17,473 2,456,704 0.38
25,710,566 3.99
JerseyFerguson plc GBP 46,870 5,540,950 0.86WPP plc GBP 297,022 3,384,497 0.52
8,925,447 1.38
LuxembourgBefesa SA, Reg. S EUR 29,687 1,932,624 0.30InPost SA EUR 55,882 950,161 0.15
2,882,785 0.45
NetherlandsAdyen NV, Reg. S EUR 2,100 4,360,125 0.67ASM International NV EUR 18,797 5,226,506 0.81ASML Holding NV EUR 30,735 17,936,946 2.78ING Groep NV EUR 722,115 8,076,134 1.25Koninklijke Ahold Delhaize NV EUR 268,870 6,749,309 1.05PostNL NV EUR 181,559 836,442 0.13Randstad NV EUR 43,690 2,820,627 0.44Signify NV, Reg. S EUR 84,768 4,524,068 0.70Stellantis NV EUR 360,698 5,990,472 0.93Wolters Kluwer NV EUR 54,155 4,604,800 0.71
61,125,429 9.47
NorwayNorwegian Finans Holding ASA NOK 168,154 1,609,746 0.25Selvaag Bolig ASA NOK 93,715 543,943 0.08SpareBank 1 Nord Norge NOK 59,647 501,734 0.08SpareBank 1 SMN NOK 86,186 1,008,104 0.16
3,663,527 0.57
SpainCorp. ACCIONA Energias Renovables SA EUR 124,515 3,328,286 0.52Iberdrola SA EUR 253,744 2,616,735 0.40Mediaset Espana Comunicacion SA EUR 271,653 1,441,119 0.22
7,386,140 1.14
SwedenAtlas Copco AB ‘A’ SEK 80,311 4,154,075 0.64Evolution AB, Reg. S SEK 17,199 2,358,817 0.37Instalco AB, Reg. S SEK 28,797 1,010,004 0.16Lindab International AB SEK 108,169 2,141,320 0.33Sandvik AB SEK 12,217 263,955 0.04Skanska AB ‘B’ SEK 39,470 884,581 0.14SKF AB ‘B’ SEK 138,929 3,003,016 0.47Telefonaktiebolaget LM Ericsson ‘B’ SEK 335,774 3,582,807 0.55Thule Group AB, Reg. S SEK 25,043 940,246 0.15Volvo AB ‘B’ SEK 172,044 3,514,244 0.54
21,853,065 3.39
SwitzerlandABB Ltd. CHF 145,751 4,191,980 0.65Adecco Group AG CHF 84,825 4,874,705 0.75Cie Financiere Richemont SA CHF 57,560 5,914,926 0.92Coca-Cola HBC AG GBP 53,140 1,633,338 0.25Holcim Ltd. CHF 82,212 4,180,440 0.65Julius Baer Group Ltd. CHF 77,743 4,298,336 0.67Kuehne + Nagel International AG CHF 14,004 4,066,661 0.63Nestle SA CHF 245,442 26,015,061 4.03Novartis AG CHF 184,974 14,240,284 2.21Roche Holding AG CHF 61,385 19,601,066 3.04
95
JPMorgan Funds - Europe Equity FundSchedule of Investments
As at 30 June 2021
Investments Currency
Quantity/Nominal
Value
MarketValue
EUR
%of
NetAssets Investments Currency
Quantity/Nominal
Value
MarketValue
EUR
%of
NetAssets
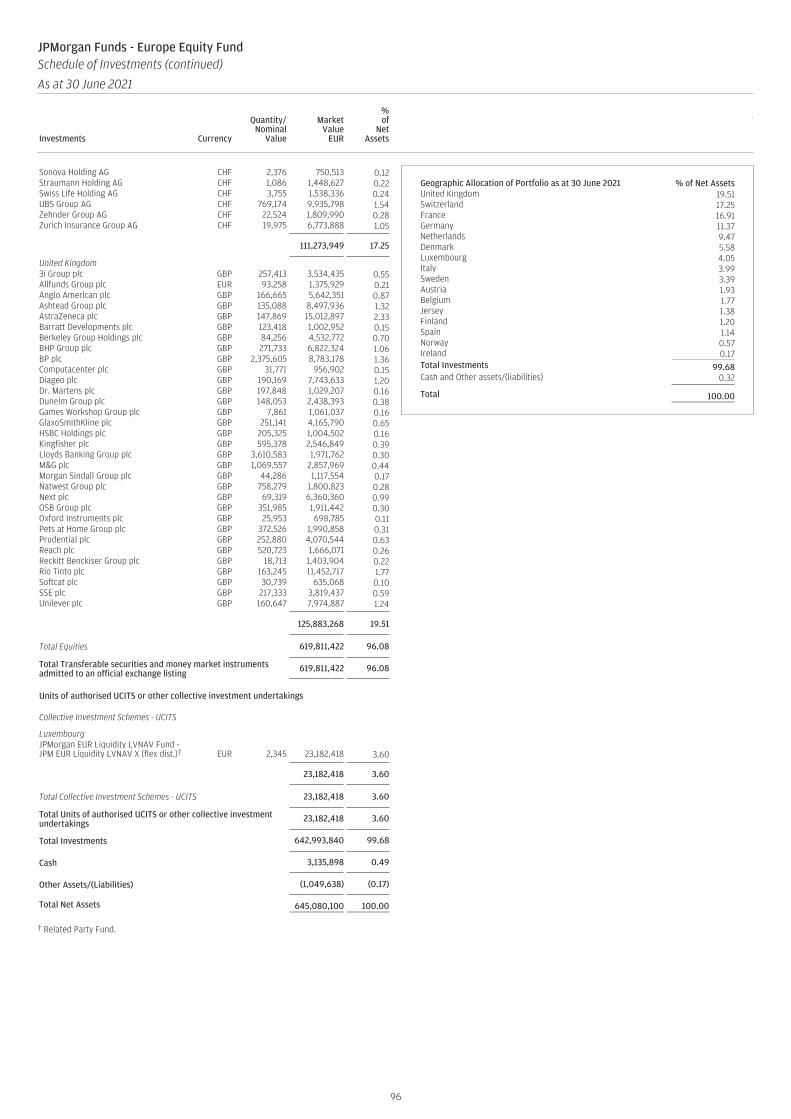
Sonova Holding AG CHF 2,376 750,513 0.12Straumann Holding AG CHF 1,086 1,448,627 0.22Swiss Life Holding AG CHF 3,755 1,538,336 0.24UBS Group AG CHF 769,174 9,935,798 1.54Zehnder Group AG CHF 22,524 1,809,990 0.28Zurich Insurance Group AG CHF 19,975 6,773,888 1.05
111,273,949 17.25
United Kingdom3i Group plc GBP 257,413 3,534,435 0.55Allfunds Group plc EUR 93,258 1,375,929 0.21Anglo American plc GBP 166,665 5,642,351 0.87Ashtead Group plc GBP 135,088 8,497,936 1.32AstraZeneca plc GBP 147,869 15,012,897 2.33Barratt Developments plc GBP 123,418 1,002,952 0.15Berkeley Group Holdings plc GBP 84,256 4,532,772 0.70BHP Group plc GBP 271,733 6,822,324 1.06BP plc GBP 2,375,605 8,783,178 1.36Computacenter plc GBP 31,771 956,902 0.15Diageo plc GBP 190,169 7,743,633 1.20Dr. Martens plc GBP 197,848 1,029,207 0.16Dunelm Group plc GBP 148,053 2,438,393 0.38Games Workshop Group plc GBP 7,861 1,061,037 0.16GlaxoSmithKline plc GBP 251,141 4,165,790 0.65HSBC Holdings plc GBP 205,325 1,004,502 0.16Kingfisher plc GBP 595,378 2,546,849 0.39Lloyds Banking Group plc GBP 3,610,583 1,971,762 0.30M&G plc GBP 1,069,557 2,857,969 0.44Morgan Sindall Group plc GBP 44,286 1,117,554 0.17Natwest Group plc GBP 758,279 1,800,823 0.28Next plc GBP 69,319 6,360,360 0.99OSB Group plc GBP 351,985 1,911,442 0.30Oxford Instruments plc GBP 25,953 698,785 0.11Pets at Home Group plc GBP 372,526 1,990,858 0.31Prudential plc GBP 252,880 4,070,544 0.63Reach plc GBP 520,723 1,666,071 0.26Reckitt Benckiser Group plc GBP 18,713 1,403,904 0.22Rio Tinto plc GBP 163,245 11,452,717 1.77Softcat plc GBP 30,739 635,068 0.10SSE plc GBP 217,333 3,819,437 0.59Unilever plc GBP 160,647 7,974,887 1.24
125,883,268 19.51
Total Equities 619,811,422 96.08
Total Transferable securities and money market instrumentsadmitted to an official exchange listing 619,811,422 96.08
Units of authorised UCITS or other collective investment undertakings
Collective Investment Schemes - UCITS
LuxembourgJPMorgan EUR Liquidity LVNAV Fund -JPM EUR Liquidity LVNAV X (flex dist.)† EUR 2,345 23,182,418 3.60
23,182,418 3.60
Total Collective Investment Schemes - UCITS 23,182,418 3.60
Total Units of authorised UCITS or other collective investmentundertakings 23,182,418 3.60
Total Investments 642,993,840 99.68
Cash 3,135,898 0.49
Other Assets/(Liabilities) (1,049,638) (0.17)
Total Net Assets 645,080,100 100.00
† Related Party Fund.
Geographic Allocation of Portfolio as at 30 June 2021 % of Net AssetsUnited Kingdom 19.51Switzerland 17.25France 16.91Germany 11.37Netherlands 9.47Denmark 5.58Luxembourg 4.05Italy 3.99Sweden 3.39Austria 1.93Belgium 1.77Jersey 1.38Finland 1.20Spain 1.14Norway 0.57Ireland 0.17Total Investments 99.68Cash and Other assets/(liabilities) 0.32
Total 100.00
96
JPMorgan Funds - Europe Equity FundSchedule of Investments (continued)
As at 30 June 2021
Investments Currency
Quantity/Nominal
Value
MarketValue
EUR
%of
NetAssets Investments Currency
Quantity/Nominal
Value
MarketValue
EUR
%of
NetAssets
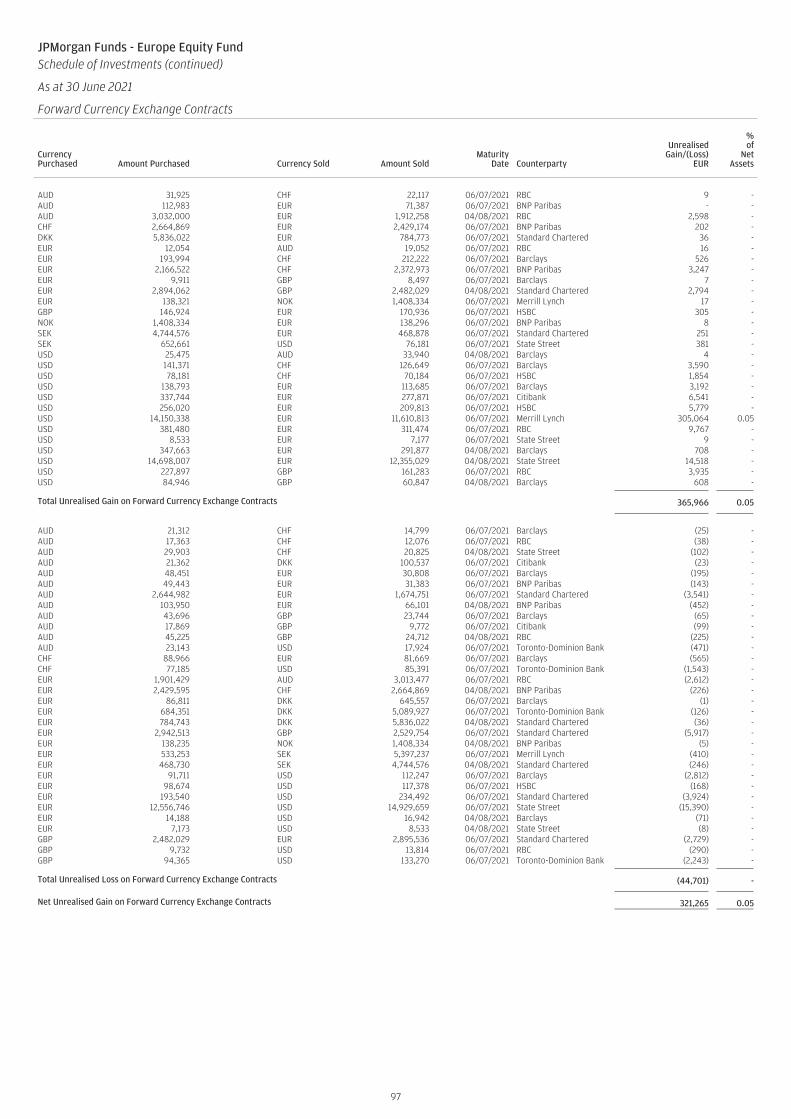
JPMorgan Funds - Europe Equity FundSchedule of Investments (continued)
As at 30 June 2021
Forward Currency Exchange Contracts (continued)
CurrencyPurchased Amount Purchased Currency Sold Amount Sold
MaturityDate Counterparty
UnrealisedGain/(Loss)
EUR
%of
NetAssets
AUD 31,925 CHF 22,117 06/07/2021 RBC 9 -AUD 112,983 EUR 71,387 06/07/2021 BNP Paribas - -AUD 3,032,000 EUR 1,912,258 04/08/2021 RBC 2,598 -CHF 2,664,869 EUR 2,429,174 06/07/2021 BNP Paribas 202 -DKK 5,836,022 EUR 784,773 06/07/2021 Standard Chartered 36 -EUR 12,054 AUD 19,052 06/07/2021 RBC 16 -EUR 193,994 CHF 212,222 06/07/2021 Barclays 526 -EUR 2,166,522 CHF 2,372,973 06/07/2021 BNP Paribas 3,247 -EUR 9,911 GBP 8,497 06/07/2021 Barclays 7 -EUR 2,894,062 GBP 2,482,029 04/08/2021 Standard Chartered 2,794 -EUR 138,321 NOK 1,408,334 06/07/2021 Merrill Lynch 17 -GBP 146,924 EUR 170,936 06/07/2021 HSBC 305 -NOK 1,408,334 EUR 138,296 06/07/2021 BNP Paribas 8 -SEK 4,744,576 EUR 468,878 06/07/2021 Standard Chartered 251 -SEK 652,661 USD 76,181 06/07/2021 State Street 381 -USD 25,475 AUD 33,940 04/08/2021 Barclays 4 -USD 141,371 CHF 126,649 06/07/2021 Barclays 3,590 -USD 78,181 CHF 70,184 06/07/2021 HSBC 1,854 -USD 138,793 EUR 113,685 06/07/2021 Barclays 3,192 -USD 337,744 EUR 277,871 06/07/2021 Citibank 6,541 -USD 256,020 EUR 209,813 06/07/2021 HSBC 5,779 -USD 14,150,338 EUR 11,610,813 06/07/2021 Merrill Lynch 305,064 0.05USD 381,480 EUR 311,474 06/07/2021 RBC 9,767 -USD 8,533 EUR 7,177 06/07/2021 State Street 9 -USD 347,663 EUR 291,877 04/08/2021 Barclays 708 -USD 14,698,007 EUR 12,355,029 04/08/2021 State Street 14,518 -USD 227,897 GBP 161,283 06/07/2021 RBC 3,935 -USD 84,946 GBP 60,847 04/08/2021 Barclays 608 -
Total Unrealised Gain on Forward Currency Exchange Contracts 365,966 0.05
AUD 21,312 CHF 14,799 06/07/2021 Barclays (25) -AUD 17,363 CHF 12,076 06/07/2021 RBC (38) -AUD 29,903 CHF 20,825 04/08/2021 State Street (102) -AUD 21,362 DKK 100,537 06/07/2021 Citibank (23) -AUD 48,451 EUR 30,808 06/07/2021 Barclays (195) -AUD 49,443 EUR 31,383 06/07/2021 BNP Paribas (143) -AUD 2,644,982 EUR 1,674,751 06/07/2021 Standard Chartered (3,541) -AUD 103,950 EUR 66,101 04/08/2021 BNP Paribas (452) -AUD 43,696 GBP 23,744 06/07/2021 Barclays (65) -AUD 17,869 GBP 9,772 06/07/2021 Citibank (99) -AUD 45,225 GBP 24,712 04/08/2021 RBC (225) -AUD 23,143 USD 17,924 06/07/2021 Toronto-Dominion Bank (471) -CHF 88,966 EUR 81,669 06/07/2021 Barclays (565) -CHF 77,185 USD 85,391 06/07/2021 Toronto-Dominion Bank (1,543) -EUR 1,901,429 AUD 3,013,477 06/07/2021 RBC (2,612) -EUR 2,429,595 CHF 2,664,869 04/08/2021 BNP Paribas (226) -EUR 86,811 DKK 645,557 06/07/2021 Barclays (1) -EUR 684,351 DKK 5,089,927 06/07/2021 Toronto-Dominion Bank (126) -EUR 784,743 DKK 5,836,022 04/08/2021 Standard Chartered (36) -EUR 2,942,513 GBP 2,529,754 06/07/2021 Standard Chartered (5,917) -EUR 138,235 NOK 1,408,334 04/08/2021 BNP Paribas (5) -EUR 533,253 SEK 5,397,237 06/07/2021 Merrill Lynch (410) -EUR 468,730 SEK 4,744,576 04/08/2021 Standard Chartered (246) -EUR 91,711 USD 112,247 06/07/2021 Barclays (2,812) -EUR 98,674 USD 117,378 06/07/2021 HSBC (168) -EUR 193,540 USD 234,492 06/07/2021 Standard Chartered (3,924) -EUR 12,556,746 USD 14,929,659 06/07/2021 State Street (15,390) -EUR 14,188 USD 16,942 04/08/2021 Barclays (71) -EUR 7,173 USD 8,533 04/08/2021 State Street (8) -GBP 2,482,029 EUR 2,895,536 06/07/2021 Standard Chartered (2,729) -GBP 9,732 USD 13,814 06/07/2021 RBC (290) -GBP 94,365 USD 133,270 06/07/2021 Toronto-Dominion Bank (2,243) -
Total Unrealised Loss on Forward Currency Exchange Contracts (44,701) -
Net Unrealised Gain on Forward Currency Exchange Contracts 321,265 0.05
97
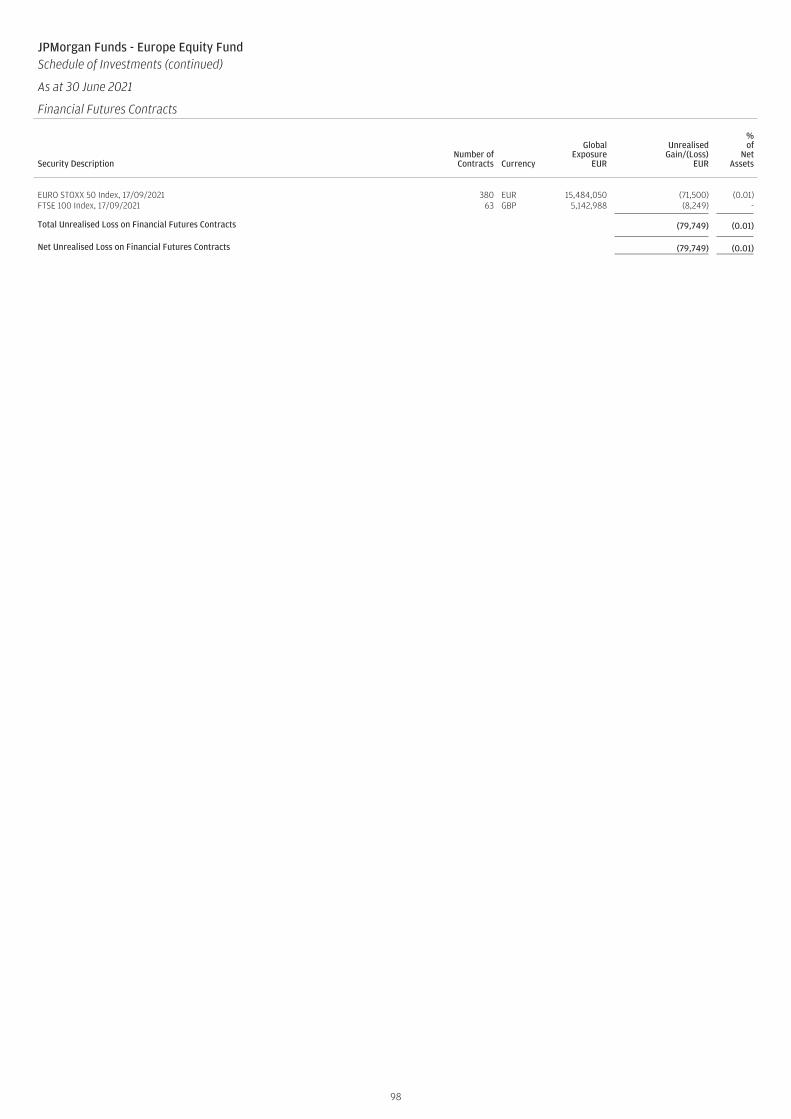
JPMorgan Funds - Europe Equity FundSchedule of Investments (continued)
As at 30 June 2021
Financial Futures Contracts
Security DescriptionNumber ofContracts Currency
GlobalExposure
EUR
UnrealisedGain/(Loss)
EUR
%of
NetAssets
EURO STOXX 50 Index, 17/09/2021 380 EUR 15,484,050 (71,500) (0.01)FTSE 100 Index, 17/09/2021 63 GBP 5,142,988 (8,249) -
Total Unrealised Loss on Financial Futures Contracts (79,749) (0.01)
Net Unrealised Loss on Financial Futures Contracts (79,749) (0.01)
98
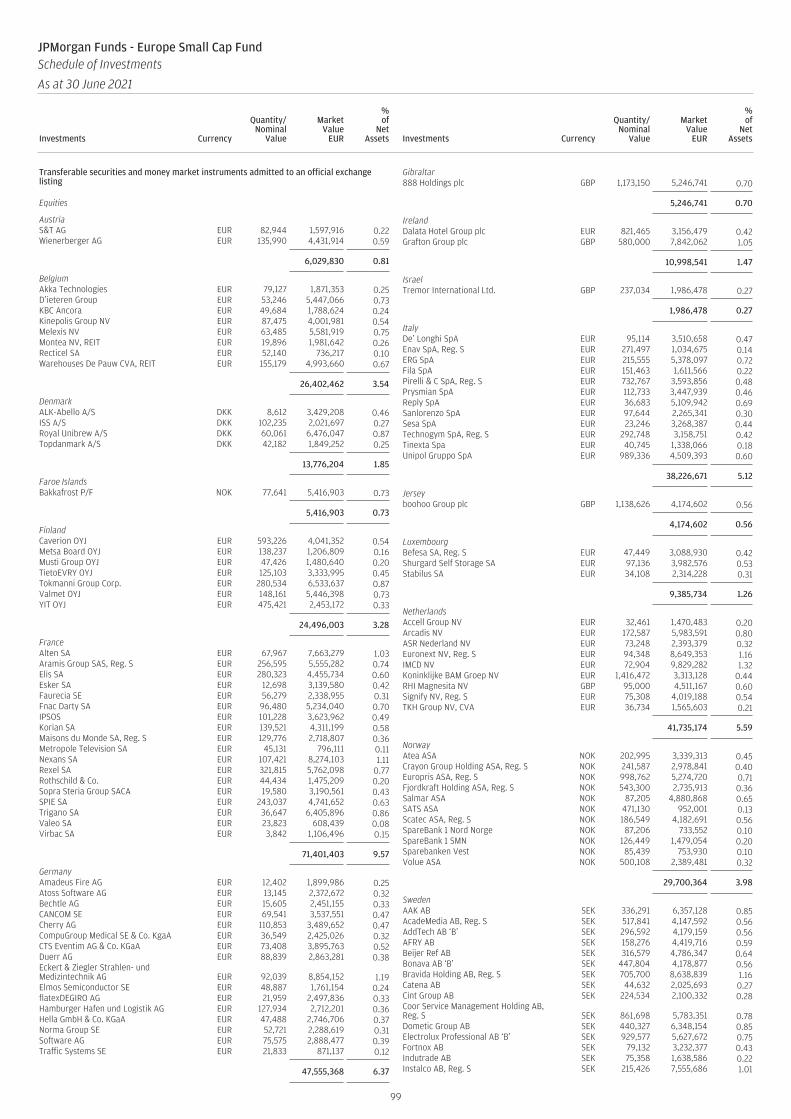
Transferable securities and money market instruments admitted to an official exchangelisting
Equities
AustriaS&T AG EUR 82,944 1,597,916 0.22Wienerberger AG EUR 135,990 4,431,914 0.59
6,029,830 0.81
BelgiumAkka Technologies EUR 79,127 1,871,353 0.25D’ieteren Group EUR 53,246 5,447,066 0.73KBC Ancora EUR 49,684 1,788,624 0.24Kinepolis Group NV EUR 87,475 4,001,981 0.54Melexis NV EUR 63,485 5,581,919 0.75Montea NV, REIT EUR 19,896 1,981,642 0.26Recticel SA EUR 52,140 736,217 0.10Warehouses De Pauw CVA, REIT EUR 155,179 4,993,660 0.67
26,402,462 3.54
DenmarkALK-Abello A/S DKK 8,612 3,429,208 0.46ISS A/S DKK 102,235 2,021,697 0.27Royal Unibrew A/S DKK 60,061 6,476,047 0.87Topdanmark A/S DKK 42,182 1,849,252 0.25
13,776,204 1.85
Faroe IslandsBakkafrost P/F NOK 77,641 5,416,903 0.73
5,416,903 0.73
FinlandCaverion OYJ EUR 593,226 4,041,352 0.54Metsa Board OYJ EUR 138,237 1,206,809 0.16Musti Group OYJ EUR 47,426 1,480,640 0.20TietoEVRY OYJ EUR 125,103 3,333,995 0.45Tokmanni Group Corp. EUR 280,534 6,533,637 0.87Valmet OYJ EUR 148,161 5,446,398 0.73YIT OYJ EUR 475,421 2,453,172 0.33
24,496,003 3.28
FranceAlten SA EUR 67,967 7,663,279 1.03Aramis Group SAS, Reg. S EUR 256,595 5,555,282 0.74Elis SA EUR 280,323 4,455,734 0.60Esker SA EUR 12,698 3,139,580 0.42Faurecia SE EUR 56,279 2,338,955 0.31Fnac Darty SA EUR 96,480 5,234,040 0.70IPSOS EUR 101,228 3,623,962 0.49Korian SA EUR 139,521 4,311,199 0.58Maisons du Monde SA, Reg. S EUR 129,776 2,718,807 0.36Metropole Television SA EUR 45,131 796,111 0.11Nexans SA EUR 107,421 8,274,103 1.11Rexel SA EUR 321,815 5,762,098 0.77Rothschild & Co. EUR 44,434 1,475,209 0.20Sopra Steria Group SACA EUR 19,580 3,190,561 0.43SPIE SA EUR 243,037 4,741,652 0.63Trigano SA EUR 36,647 6,405,896 0.86Valeo SA EUR 23,823 608,439 0.08Virbac SA EUR 3,842 1,106,496 0.15
71,401,403 9.57
GermanyAmadeus Fire AG EUR 12,402 1,899,986 0.25Atoss Software AG EUR 13,145 2,372,672 0.32Bechtle AG EUR 15,605 2,451,155 0.33CANCOM SE EUR 69,541 3,537,551 0.47Cherry AG EUR 110,853 3,489,652 0.47CompuGroup Medical SE & Co. KgaA EUR 36,549 2,425,026 0.32CTS Eventim AG & Co. KGaA EUR 73,408 3,895,763 0.52Duerr AG EUR 88,839 2,863,281 0.38Eckert & Ziegler Strahlen- undMedizintechnik AG EUR 92,039 8,854,152 1.19Elmos Semiconductor SE EUR 48,887 1,761,154 0.24flatexDEGIRO AG EUR 21,959 2,497,836 0.33Hamburger Hafen und Logistik AG EUR 127,934 2,712,201 0.36Hella GmbH & Co. KGaA EUR 47,488 2,746,706 0.37Norma Group SE EUR 52,721 2,288,619 0.31Software AG EUR 75,575 2,888,477 0.39Traffic Systems SE EUR 21,833 871,137 0.12
47,555,368 6.37
Gibraltar888 Holdings plc GBP 1,173,150 5,246,741 0.70
5,246,741 0.70
IrelandDalata Hotel Group plc EUR 821,465 3,156,479 0.42Grafton Group plc GBP 580,000 7,842,062 1.05
10,998,541 1.47
IsraelTremor International Ltd. GBP 237,034 1,986,478 0.27
1,986,478 0.27
ItalyDe’ Longhi SpA EUR 95,114 3,510,658 0.47Enav SpA, Reg. S EUR 271,497 1,034,675 0.14ERG SpA EUR 215,555 5,378,097 0.72Fila SpA EUR 151,463 1,611,566 0.22Pirelli & C SpA, Reg. S EUR 732,767 3,593,856 0.48Prysmian SpA EUR 112,733 3,447,939 0.46Reply SpA EUR 36,683 5,109,942 0.69Sanlorenzo SpA EUR 97,644 2,265,341 0.30Sesa SpA EUR 23,246 3,268,387 0.44Technogym SpA, Reg. S EUR 292,748 3,158,751 0.42Tinexta Spa EUR 40,745 1,338,066 0.18Unipol Gruppo SpA EUR 989,336 4,509,393 0.60
38,226,671 5.12
Jerseyboohoo Group plc GBP 1,138,626 4,174,602 0.56
4,174,602 0.56
LuxembourgBefesa SA, Reg. S EUR 47,449 3,088,930 0.42Shurgard Self Storage SA EUR 97,136 3,982,576 0.53Stabilus SA EUR 34,108 2,314,228 0.31
9,385,734 1.26
NetherlandsAccell Group NV EUR 32,461 1,470,483 0.20Arcadis NV EUR 172,587 5,983,591 0.80ASR Nederland NV EUR 73,248 2,393,379 0.32Euronext NV, Reg. S EUR 94,348 8,649,353 1.16IMCD NV EUR 72,904 9,829,282 1.32Koninklijke BAM Groep NV EUR 1,416,472 3,313,128 0.44RHI Magnesita NV GBP 95,000 4,511,167 0.60Signify NV, Reg. S EUR 75,308 4,019,188 0.54TKH Group NV, CVA EUR 36,734 1,565,603 0.21
41,735,174 5.59
NorwayAtea ASA NOK 202,995 3,339,313 0.45Crayon Group Holding ASA, Reg. S NOK 241,587 2,978,841 0.40Europris ASA, Reg. S NOK 998,762 5,274,720 0.71Fjordkraft Holding ASA, Reg. S NOK 543,300 2,735,913 0.36Salmar ASA NOK 87,205 4,880,868 0.65SATS ASA NOK 471,130 952,001 0.13Scatec ASA, Reg. S NOK 186,549 4,182,691 0.56SpareBank 1 Nord Norge NOK 87,206 733,552 0.10SpareBank 1 SMN NOK 126,449 1,479,054 0.20Sparebanken Vest NOK 85,439 753,930 0.10Volue ASA NOK 500,108 2,389,481 0.32
29,700,364 3.98
SwedenAAK AB SEK 336,291 6,357,128 0.85AcadeMedia AB, Reg. S SEK 517,841 4,147,592 0.56AddTech AB ‘B’ SEK 296,592 4,179,159 0.56AFRY AB SEK 158,276 4,419,716 0.59Beijer Ref AB SEK 316,579 4,786,347 0.64Bonava AB ‘B’ SEK 447,804 4,178,877 0.56Bravida Holding AB, Reg. S SEK 705,700 8,638,839 1.16Catena AB SEK 44,632 2,025,693 0.27Cint Group AB SEK 224,534 2,100,332 0.28Coor Service Management Holding AB,Reg. S SEK 861,698 5,783,351 0.78Dometic Group AB SEK 440,327 6,348,154 0.85Electrolux Professional AB ‘B’ SEK 929,577 5,627,672 0.75Fortnox AB SEK 79,132 3,232,377 0.43Indutrade AB SEK 75,358 1,638,586 0.22Instalco AB, Reg. S SEK 215,426 7,555,686 1.01
99
JPMorgan Funds - Europe Small Cap FundSchedule of Investments
As at 30 June 2021
Investments Currency
Quantity/Nominal
Value
MarketValue
EUR
%of
NetAssets Investments Currency
Quantity/Nominal
Value
MarketValue
EUR
%of
NetAssets
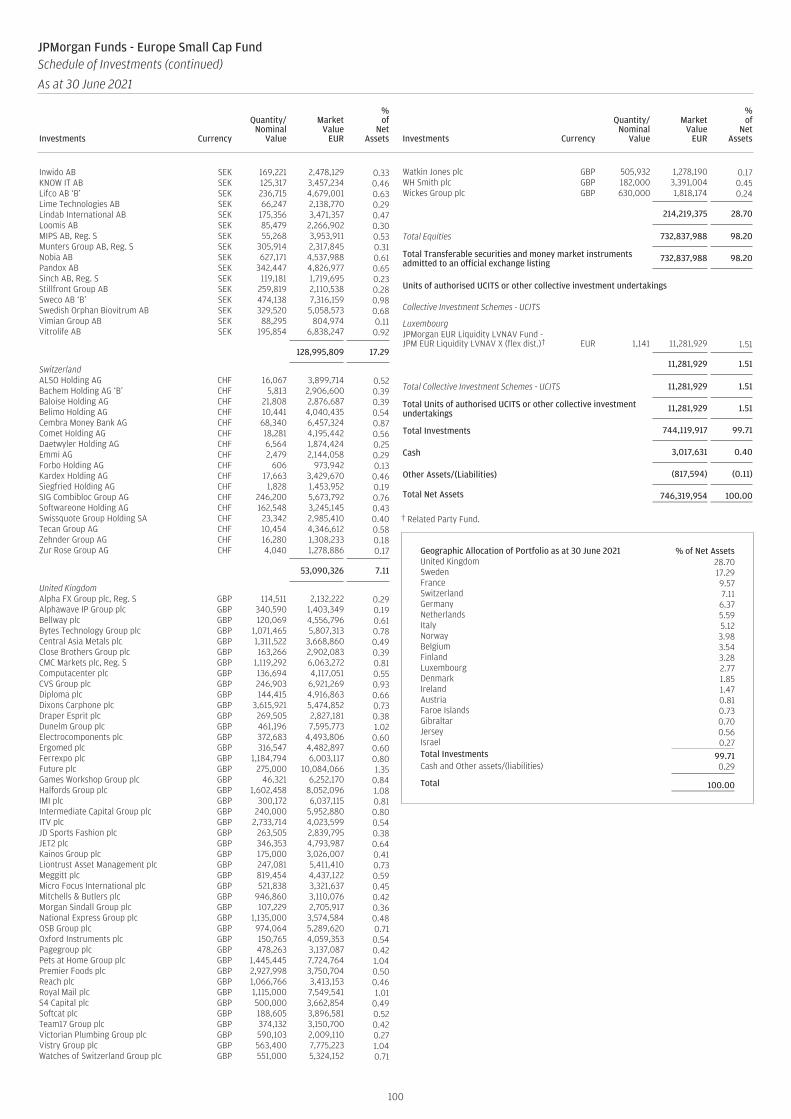
Inwido AB SEK 169,221 2,478,129 0.33KNOW IT AB SEK 125,317 3,457,234 0.46Lifco AB ‘B’ SEK 236,715 4,679,001 0.63Lime Technologies AB SEK 66,247 2,138,770 0.29Lindab International AB SEK 175,356 3,471,357 0.47Loomis AB SEK 85,479 2,266,902 0.30MIPS AB, Reg. S SEK 55,268 3,953,911 0.53Munters Group AB, Reg. S SEK 305,914 2,317,845 0.31Nobia AB SEK 627,171 4,537,988 0.61Pandox AB SEK 342,447 4,826,977 0.65Sinch AB, Reg. S SEK 119,181 1,719,695 0.23Stillfront Group AB SEK 259,819 2,110,538 0.28Sweco AB ‘B’ SEK 474,138 7,316,159 0.98Swedish Orphan Biovitrum AB SEK 329,520 5,058,573 0.68Vimian Group AB SEK 88,295 804,974 0.11Vitrolife AB SEK 195,854 6,838,247 0.92
128,995,809 17.29
SwitzerlandALSO Holding AG CHF 16,067 3,899,714 0.52Bachem Holding AG ‘B’ CHF 5,813 2,906,600 0.39Baloise Holding AG CHF 21,808 2,876,687 0.39Belimo Holding AG CHF 10,441 4,040,435 0.54Cembra Money Bank AG CHF 68,340 6,457,324 0.87Comet Holding AG CHF 18,281 4,195,442 0.56Daetwyler Holding AG CHF 6,564 1,874,424 0.25Emmi AG CHF 2,479 2,144,058 0.29Forbo Holding AG CHF 606 973,942 0.13Kardex Holding AG CHF 17,663 3,429,670 0.46Siegfried Holding AG CHF 1,828 1,453,952 0.19SIG Combibloc Group AG CHF 246,200 5,673,792 0.76Softwareone Holding AG CHF 162,548 3,245,145 0.43Swissquote Group Holding SA CHF 23,342 2,985,410 0.40Tecan Group AG CHF 10,454 4,346,612 0.58Zehnder Group AG CHF 16,280 1,308,233 0.18Zur Rose Group AG CHF 4,040 1,278,886 0.17
53,090,326 7.11
United KingdomAlpha FX Group plc, Reg. S GBP 114,511 2,132,222 0.29Alphawave IP Group plc GBP 340,590 1,403,349 0.19Bellway plc GBP 120,069 4,556,796 0.61Bytes Technology Group plc GBP 1,071,465 5,807,313 0.78Central Asia Metals plc GBP 1,311,522 3,668,860 0.49Close Brothers Group plc GBP 163,266 2,902,083 0.39CMC Markets plc, Reg. S GBP 1,119,292 6,063,272 0.81Computacenter plc GBP 136,694 4,117,051 0.55CVS Group plc GBP 246,903 6,921,269 0.93Diploma plc GBP 144,415 4,916,863 0.66Dixons Carphone plc GBP 3,615,921 5,474,852 0.73Draper Esprit plc GBP 269,505 2,827,181 0.38Dunelm Group plc GBP 461,196 7,595,773 1.02Electrocomponents plc GBP 372,683 4,493,806 0.60Ergomed plc GBP 316,547 4,482,897 0.60Ferrexpo plc GBP 1,184,794 6,003,117 0.80Future plc GBP 275,000 10,084,066 1.35Games Workshop Group plc GBP 46,321 6,252,170 0.84Halfords Group plc GBP 1,602,458 8,052,096 1.08IMI plc GBP 300,172 6,037,115 0.81Intermediate Capital Group plc GBP 240,000 5,952,880 0.80ITV plc GBP 2,733,714 4,023,599 0.54JD Sports Fashion plc GBP 263,505 2,839,795 0.38JET2 plc GBP 346,353 4,793,987 0.64Kainos Group plc GBP 175,000 3,026,007 0.41Liontrust Asset Management plc GBP 247,081 5,411,410 0.73Meggitt plc GBP 819,454 4,437,122 0.59Micro Focus International plc GBP 521,838 3,321,637 0.45Mitchells & Butlers plc GBP 946,860 3,110,076 0.42Morgan Sindall Group plc GBP 107,229 2,705,917 0.36National Express Group plc GBP 1,135,000 3,574,584 0.48OSB Group plc GBP 974,064 5,289,620 0.71Oxford Instruments plc GBP 150,765 4,059,353 0.54Pagegroup plc GBP 478,263 3,137,087 0.42Pets at Home Group plc GBP 1,445,445 7,724,764 1.04Premier Foods plc GBP 2,927,998 3,750,704 0.50Reach plc GBP 1,066,766 3,413,153 0.46Royal Mail plc GBP 1,115,000 7,549,541 1.01S4 Capital plc GBP 500,000 3,662,854 0.49Softcat plc GBP 188,605 3,896,581 0.52Team17 Group plc GBP 374,132 3,150,700 0.42Victorian Plumbing Group plc GBP 590,103 2,009,110 0.27Vistry Group plc GBP 563,400 7,775,223 1.04Watches of Switzerland Group plc GBP 551,000 5,324,152 0.71
Watkin Jones plc GBP 505,932 1,278,190 0.17WH Smith plc GBP 182,000 3,391,004 0.45Wickes Group plc GBP 630,000 1,818,174 0.24
214,219,375 28.70
Total Equities 732,837,988 98.20
Total Transferable securities and money market instrumentsadmitted to an official exchange listing 732,837,988 98.20
Units of authorised UCITS or other collective investment undertakings
Collective Investment Schemes - UCITS
LuxembourgJPMorgan EUR Liquidity LVNAV Fund -JPM EUR Liquidity LVNAV X (flex dist.)† EUR 1,141 11,281,929 1.51
11,281,929 1.51
Total Collective Investment Schemes - UCITS 11,281,929 1.51
Total Units of authorised UCITS or other collective investmentundertakings 11,281,929 1.51
Total Investments 744,119,917 99.71
Cash 3,017,631 0.40
Other Assets/(Liabilities) (817,594) (0.11)
Total Net Assets 746,319,954 100.00
† Related Party Fund.
Geographic Allocation of Portfolio as at 30 June 2021 % of Net AssetsUnited Kingdom 28.70Sweden 17.29France 9.57Switzerland 7.11Germany 6.37Netherlands 5.59Italy 5.12Norway 3.98Belgium 3.54Finland 3.28Luxembourg 2.77Denmark 1.85Ireland 1.47Austria 0.81Faroe Islands 0.73Gibraltar 0.70Jersey 0.56Israel 0.27Total Investments 99.71Cash and Other assets/(liabilities) 0.29
Total 100.00
100
JPMorgan Funds - Europe Small Cap FundSchedule of Investments (continued)
As at 30 June 2021
Investments Currency
Quantity/Nominal
Value
MarketValue
EUR
%of
NetAssets Investments Currency
Quantity/Nominal
Value
MarketValue
EUR
%of
NetAssets
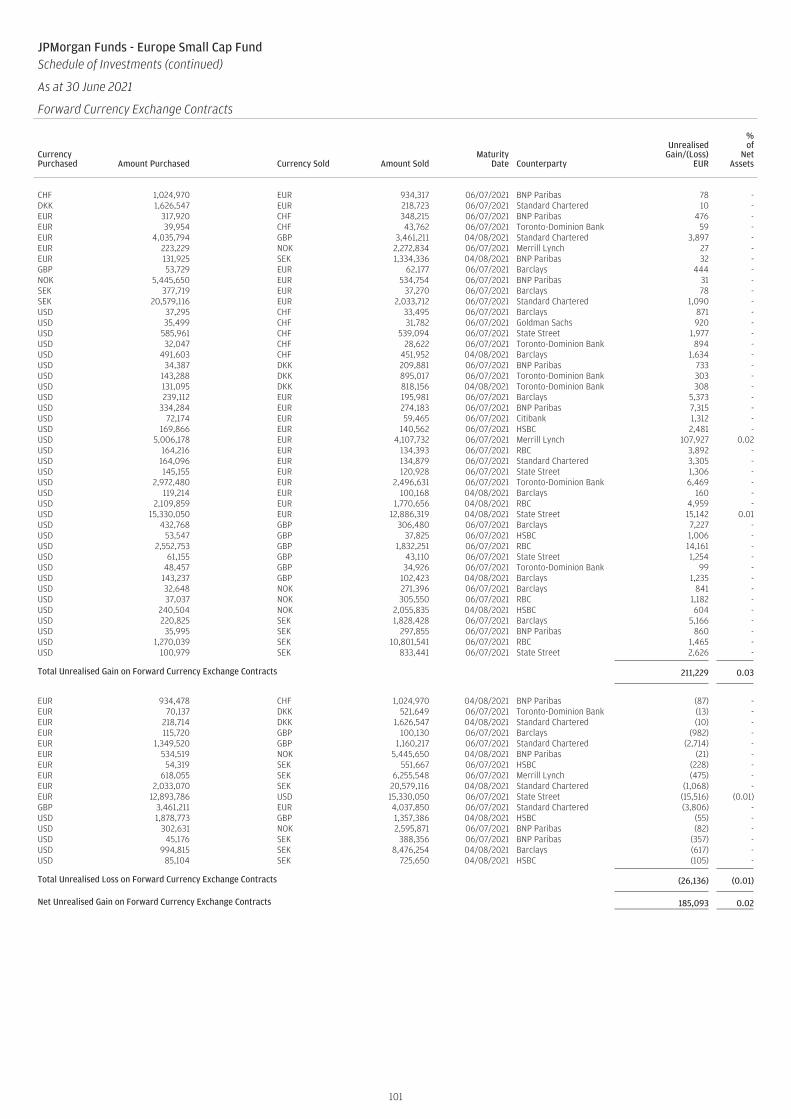
JPMorgan Funds - Europe Small Cap FundSchedule of Investments (continued)
As at 30 June 2021
Forward Currency Exchange Contracts
CurrencyPurchased Amount Purchased Currency Sold Amount Sold
MaturityDate Counterparty
UnrealisedGain/(Loss)
EUR
%of
NetAssets
CHF 1,024,970 EUR 934,317 06/07/2021 BNP Paribas 78 -DKK 1,626,547 EUR 218,723 06/07/2021 Standard Chartered 10 -EUR 317,920 CHF 348,215 06/07/2021 BNP Paribas 476 -EUR 39,954 CHF 43,762 06/07/2021 Toronto-Dominion Bank 59 -EUR 4,035,794 GBP 3,461,211 04/08/2021 Standard Chartered 3,897 -EUR 223,229 NOK 2,272,834 06/07/2021 Merrill Lynch 27 -EUR 131,925 SEK 1,334,336 04/08/2021 BNP Paribas 32 -GBP 53,729 EUR 62,177 06/07/2021 Barclays 444 -NOK 5,445,650 EUR 534,754 06/07/2021 BNP Paribas 31 -SEK 377,719 EUR 37,270 06/07/2021 Barclays 78 -SEK 20,579,116 EUR 2,033,712 06/07/2021 Standard Chartered 1,090 -USD 37,295 CHF 33,495 06/07/2021 Barclays 871 -USD 35,499 CHF 31,782 06/07/2021 Goldman Sachs 920 -USD 585,961 CHF 539,094 06/07/2021 State Street 1,977 -USD 32,047 CHF 28,622 06/07/2021 Toronto-Dominion Bank 894 -USD 491,603 CHF 451,952 04/08/2021 Barclays 1,634 -USD 34,387 DKK 209,881 06/07/2021 BNP Paribas 733 -USD 143,288 DKK 895,017 06/07/2021 Toronto-Dominion Bank 303 -USD 131,095 DKK 818,156 04/08/2021 Toronto-Dominion Bank 308 -USD 239,112 EUR 195,981 06/07/2021 Barclays 5,373 -USD 334,284 EUR 274,183 06/07/2021 BNP Paribas 7,315 -USD 72,174 EUR 59,465 06/07/2021 Citibank 1,312 -USD 169,866 EUR 140,562 06/07/2021 HSBC 2,481 -USD 5,006,178 EUR 4,107,732 06/07/2021 Merrill Lynch 107,927 0.02USD 164,216 EUR 134,393 06/07/2021 RBC 3,892 -USD 164,096 EUR 134,879 06/07/2021 Standard Chartered 3,305 -USD 145,155 EUR 120,928 06/07/2021 State Street 1,306 -USD 2,972,480 EUR 2,496,631 06/07/2021 Toronto-Dominion Bank 6,469 -USD 119,214 EUR 100,168 04/08/2021 Barclays 160 -USD 2,109,859 EUR 1,770,656 04/08/2021 RBC 4,959 -USD 15,330,050 EUR 12,886,319 04/08/2021 State Street 15,142 0.01USD 432,768 GBP 306,480 06/07/2021 Barclays 7,227 -USD 53,547 GBP 37,825 06/07/2021 HSBC 1,006 -USD 2,552,753 GBP 1,832,251 06/07/2021 RBC 14,161 -USD 61,155 GBP 43,110 06/07/2021 State Street 1,254 -USD 48,457 GBP 34,926 06/07/2021 Toronto-Dominion Bank 99 -USD 143,237 GBP 102,423 04/08/2021 Barclays 1,235 -USD 32,648 NOK 271,396 06/07/2021 Barclays 841 -USD 37,037 NOK 305,550 06/07/2021 RBC 1,182 -USD 240,504 NOK 2,055,835 04/08/2021 HSBC 604 -USD 220,825 SEK 1,828,428 06/07/2021 Barclays 5,166 -USD 35,995 SEK 297,855 06/07/2021 BNP Paribas 860 -USD 1,270,039 SEK 10,801,541 06/07/2021 RBC 1,465 -USD 100,979 SEK 833,441 06/07/2021 State Street 2,626 -
Total Unrealised Gain on Forward Currency Exchange Contracts 211,229 0.03
EUR 934,478 CHF 1,024,970 04/08/2021 BNP Paribas (87) -EUR 70,137 DKK 521,649 06/07/2021 Toronto-Dominion Bank (13) -EUR 218,714 DKK 1,626,547 04/08/2021 Standard Chartered (10) -EUR 115,720 GBP 100,130 06/07/2021 Barclays (982) -EUR 1,349,520 GBP 1,160,217 06/07/2021 Standard Chartered (2,714) -EUR 534,519 NOK 5,445,650 04/08/2021 BNP Paribas (21) -EUR 54,319 SEK 551,667 06/07/2021 HSBC (228) -EUR 618,055 SEK 6,255,548 06/07/2021 Merrill Lynch (475) -EUR 2,033,070 SEK 20,579,116 04/08/2021 Standard Chartered (1,068) -EUR 12,893,786 USD 15,330,050 06/07/2021 State Street (15,516) (0.01)GBP 3,461,211 EUR 4,037,850 06/07/2021 Standard Chartered (3,806) -USD 1,878,773 GBP 1,357,386 04/08/2021 HSBC (55) -USD 302,631 NOK 2,595,871 06/07/2021 BNP Paribas (82) -USD 45,176 SEK 388,356 06/07/2021 BNP Paribas (357) -USD 994,815 SEK 8,476,254 04/08/2021 Barclays (617) -USD 85,104 SEK 725,650 04/08/2021 HSBC (105) -
Total Unrealised Loss on Forward Currency Exchange Contracts (26,136) (0.01)
Net Unrealised Gain on Forward Currency Exchange Contracts 185,093 0.02
101
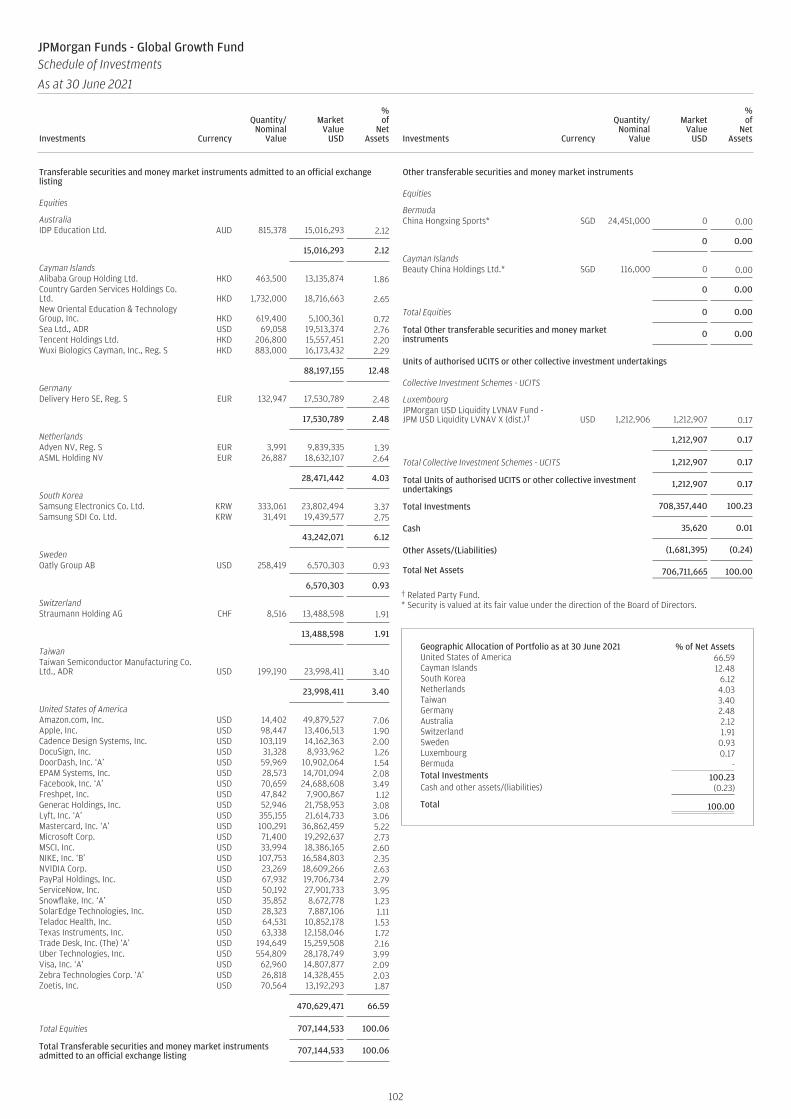
Transferable securities and money market instruments admitted to an official exchangelisting
Equities
AustraliaIDP Education Ltd. AUD 815,378 15,016,293 2.12
15,016,293 2.12
Cayman IslandsAlibaba Group Holding Ltd. HKD 463,500 13,135,874 1.86Country Garden Services Holdings Co.Ltd. HKD 1,732,000 18,716,663 2.65New Oriental Education & TechnologyGroup, Inc. HKD 619,400 5,100,361 0.72Sea Ltd., ADR USD 69,058 19,513,374 2.76Tencent Holdings Ltd. HKD 206,800 15,557,451 2.20Wuxi Biologics Cayman, Inc., Reg. S HKD 883,000 16,173,432 2.29
88,197,155 12.48
GermanyDelivery Hero SE, Reg. S EUR 132,947 17,530,789 2.48
17,530,789 2.48
NetherlandsAdyen NV, Reg. S EUR 3,991 9,839,335 1.39ASML Holding NV EUR 26,887 18,632,107 2.64
28,471,442 4.03
South KoreaSamsung Electronics Co. Ltd. KRW 333,061 23,802,494 3.37Samsung SDI Co. Ltd. KRW 31,491 19,439,577 2.75
43,242,071 6.12
SwedenOatly Group AB USD 258,419 6,570,303 0.93
6,570,303 0.93
SwitzerlandStraumann Holding AG CHF 8,516 13,488,598 1.91
13,488,598 1.91
TaiwanTaiwan Semiconductor Manufacturing Co.Ltd., ADR USD 199,190 23,998,411 3.40
23,998,411 3.40
United States of AmericaAmazon.com, Inc. USD 14,402 49,879,527 7.06Apple, Inc. USD 98,447 13,406,513 1.90Cadence Design Systems, Inc. USD 103,119 14,162,363 2.00DocuSign, Inc. USD 31,328 8,933,962 1.26DoorDash, Inc. ‘A’ USD 59,969 10,902,064 1.54EPAM Systems, Inc. USD 28,573 14,701,094 2.08Facebook, Inc. ‘A’ USD 70,659 24,688,608 3.49Freshpet, Inc. USD 47,842 7,900,867 1.12Generac Holdings, Inc. USD 52,946 21,758,953 3.08Lyft, Inc. ‘A’ USD 355,155 21,614,733 3.06Mastercard, Inc. ‘A’ USD 100,291 36,862,459 5.22Microsoft Corp. USD 71,400 19,292,637 2.73MSCI, Inc. USD 33,994 18,386,165 2.60NIKE, Inc. ‘B’ USD 107,753 16,584,803 2.35NVIDIA Corp. USD 23,269 18,609,266 2.63PayPal Holdings, Inc. USD 67,932 19,706,734 2.79ServiceNow, Inc. USD 50,192 27,901,733 3.95Snowflake, Inc. ‘A’ USD 35,852 8,672,778 1.23SolarEdge Technologies, Inc. USD 28,323 7,887,106 1.11Teladoc Health, Inc. USD 64,531 10,852,178 1.53Texas Instruments, Inc. USD 63,338 12,158,046 1.72Trade Desk, Inc. (The) ‘A’ USD 194,649 15,259,508 2.16Uber Technologies, Inc. USD 554,809 28,178,749 3.99Visa, Inc. ‘A’ USD 62,960 14,807,877 2.09Zebra Technologies Corp. ‘A’ USD 26,818 14,328,455 2.03Zoetis, Inc. USD 70,564 13,192,293 1.87
470,629,471 66.59
Total Equities 707,144,533 100.06
Total Transferable securities and money market instrumentsadmitted to an official exchange listing 707,144,533 100.06
Other transferable securities and money market instruments
Equities
BermudaChina Hongxing Sports* SGD 24,451,000 0 0.00
0 0.00
Cayman IslandsBeauty China Holdings Ltd.* SGD 116,000 0 0.00
0 0.00
Total Equities 0 0.00
Total Other transferable securities and money marketinstruments 0 0.00
Units of authorised UCITS or other collective investment undertakings
Collective Investment Schemes - UCITS
LuxembourgJPMorgan USD Liquidity LVNAV Fund -JPM USD Liquidity LVNAV X (dist.)† USD 1,212,906 1,212,907 0.17
1,212,907 0.17
Total Collective Investment Schemes - UCITS 1,212,907 0.17
Total Units of authorised UCITS or other collective investmentundertakings 1,212,907 0.17
Total Investments 708,357,440 100.23
Cash 35,620 0.01
Other Assets/(Liabilities) (1,681,395) (0.24)
Total Net Assets 706,711,665 100.00
† Related Party Fund.* Security is valued at its fair value under the direction of the Board of Directors.
Geographic Allocation of Portfolio as at 30 June 2021 % of Net AssetsUnited States of America 66.59Cayman Islands 12.48South Korea 6.12Netherlands 4.03Taiwan 3.40Germany 2.48Australia 2.12Switzerland 1.91Sweden 0.93Luxembourg 0.17Bermuda -Total Investments 100.23Cash and other assets/(liabilities) (0.23)
Total 100.00
102
JPMorgan Funds - Global Growth FundSchedule of Investments
As at 30 June 2021
Investments Currency
Quantity/Nominal
Value
MarketValue
USD
%of
NetAssets Investments Currency
Quantity/Nominal
Value
MarketValue
USD
%of
NetAssets

JPMorgan Funds - Global Growth FundSchedule of Investments (continued)
As at 30 June 2021
Forward Currency Exchange Contracts (continued)
CurrencyPurchased Amount Purchased Currency Sold Amount Sold
MaturityDate Counterparty
UnrealisedGain/(Loss)
USD
%of
NetAssets
CHF 4,460 EUR 4,065 09/08/2021 Barclays 2 -HKD 144,226,831 USD 18,570,934 08/07/2021 Goldman Sachs 336 -SEK 12,083,365 USD 1,418,581 08/07/2021 Barclays 257 -SGD 7,024,540 USD 5,223,957 08/07/2021 HSBC 1,693 -USD 4,039,634 AUD 5,231,445 08/07/2021 HSBC 114,314 0.02USD 3,926,073 AUD 5,231,445 09/08/2021 Citibank 159 -USD 10,752 CHF 9,718 08/07/2021 Barclays 231 -USD 893,269 CHF 824,270 08/07/2021 Citibank 883 -USD 4,249,971 CHF 3,810,669 08/07/2021 Goldman Sachs 124,396 0.02USD 4,133,102 CHF 3,810,669 09/08/2021 Citibank 3,943 -USD 1,769,263 EUR 1,460,218 08/07/2021 BNP Paribas 35,153 -USD 172,941,025 EUR 145,465,759 08/07/2021 Standard Chartered 190,319 0.03USD 55,756 EUR 46,869 09/08/2021 Standard Chartered 59 -USD 18,585,079 HKD 144,226,831 08/07/2021 Toronto-Dominion Bank 13,809 -USD 12,059,403 KRW 13,438,154,538 08/07/2021 Goldman Sachs 161,893 0.02USD 11,901,862 KRW 13,438,154,538 09/08/2021 Goldman Sachs 5,722 -USD 4,362,346 SGD 5,771,480 08/07/2021 HSBC 68,865 0.01USD 7,308,153 TWD 201,617,334 08/07/2021 Citibank 82,188 0.01USD 7,244,266 TWD 201,473,897 09/08/2021 J.P. Morgan 3,299 -
Total Unrealised Gain on Forward Currency Exchange Contracts 807,521 0.11
AUD 5,231,445 USD 3,925,521 08/07/2021 Citibank (201) -CHF 6,496 SEK 60,032 08/07/2021 RBC (16) -CHF 4,726 SGD 6,983 08/07/2021 BNP Paribas (79) -CHF 3,810,669 USD 4,129,659 08/07/2021 Citibank (4,084) -CHF 773,400 USD 862,559 08/07/2021 Goldman Sachs (25,247) -CHF 11,594 USD 12,925 08/07/2021 HSBC (374) -CHF 4,915 USD 5,475 08/07/2021 RBC (154) -CHF 4,715 USD 5,259 08/07/2021 State Street (154) -CHF 28,142 USD 31,280 08/07/2021 Toronto-Dominion Bank (812) -CHF 13,982 USD 15,238 09/08/2021 Barclays (88) -CHF 824,270 USD 894,014 09/08/2021 Citibank (853) -CHF 21,712 USD 23,617 09/08/2021 HSBC (90) -EUR 1,186,653 SEK 12,023,333 08/07/2021 State Street (2,556) -EUR 773,327 SGD 1,246,077 08/07/2021 BNP Paribas (8,594) -EUR 3,044,901 USD 3,705,292 08/07/2021 Barclays (89,260) (0.01)EUR 2,425,044 USD 2,949,076 08/07/2021 BNP Paribas (69,168) (0.01)EUR 1,325,193 USD 1,621,901 08/07/2021 Citibank (48,142) (0.01)EUR 1,399,749 USD 1,696,505 08/07/2021 HSBC (34,206) (0.01)EUR 1,869,546 USD 2,278,681 08/07/2021 RBC (58,465) (0.01)EUR 134,901,563 USD 164,604,448 08/07/2021 Standard Chartered (4,399,460) (0.62)EUR 2,373,573 USD 2,836,711 09/08/2021 Barclays (16,046) -EUR 944,997 USD 1,124,779 09/08/2021 BNP Paribas (1,780) -EUR 1,546,668 USD 1,842,389 09/08/2021 HSBC (4,386) -EUR 145,418,890 USD 172,993,947 09/08/2021 Standard Chartered (183,537) (0.03)EUR 1,687,526 USD 2,016,078 09/08/2021 Toronto-Dominion Bank (10,685) -KRW 13,438,154,538 USD 11,903,971 08/07/2021 Goldman Sachs (6,460) -TWD 143,437 USD 5,170 08/07/2021 BNP Paribas (29) -TWD 201,473,897 USD 7,226,389 08/07/2021 Merrill Lynch (5,565) -USD 18,572,156 HKD 144,226,831 09/08/2021 Goldman Sachs (424) -USD 1,418,990 SEK 12,083,365 09/08/2021 Barclays (284) -USD 5,223,511 SGD 7,024,540 10/08/2021 HSBC (1,627) -
Total Unrealised Loss on Forward Currency Exchange Contracts (4,972,826) (0.70)
Net Unrealised Loss on Forward Currency Exchange Contracts (4,165,305) (0.59)
103

Transferable securities and money market instruments admitted to an official exchangelisting
Equities
Cayman IslandsHutchmed China Ltd. HKD 3,322,500 25,839,918 0.55Wuxi Biologics Cayman, Inc., Reg. S HKD 3,163,500 57,944,111 1.22Zai Lab Ltd. HKD 51,900 9,125,323 0.19
92,909,352 1.96
DenmarkGenmab A/S DKK 140,538 57,674,338 1.22Novo Nordisk A/S ‘B’ DKK 1,731,042 146,155,013 3.09
203,829,351 4.31
GermanyMorphoSys AG EUR 54,858 4,267,287 0.09
4,267,287 0.09
IrelandHorizon Therapeutics plc USD 550,501 51,661,766 1.09Jazz Pharmaceuticals plc USD 184,441 32,556,603 0.69Medtronic plc USD 263,182 32,655,623 0.69
116,873,992 2.47
JapanEisai Co. Ltd. JPY 143,000 14,120,937 0.30Kyowa Kirin Co. Ltd. JPY 682,000 24,245,794 0.51
38,366,731 0.81
NetherlandsArgenx SE EUR 133,391 40,413,499 0.86
40,413,499 0.86
SwitzerlandADC Therapeutics SA USD 646,910 15,415,865 0.33Idorsia Ltd. CHF 610,386 16,795,493 0.35Lonza Group AG CHF 101,304 71,891,605 1.52Novartis AG CHF 1,662,194 151,947,656 3.21PolyPeptide Group AG, Reg. S CHF 129,745 11,979,875 0.25Roche Holding AG CHF 516,509 195,839,222 4.14
463,869,716 9.80
United KingdomAstraZeneca plc GBP 1,036,878 125,002,697 2.64Oxford Biomedica plc GBP 449,767 8,179,591 0.18Royalty Pharma plc ‘A’ USD 567,213 23,224,536 0.49
156,406,824 3.31
United States of AmericaAbbott Laboratories USD 623,476 72,161,112 1.52AbbVie, Inc. USD 752,005 84,115,519 1.78Acadia Healthcare Co., Inc. USD 595,010 37,479,680 0.79Agios Pharmaceuticals, Inc. USD 709,619 37,922,039 0.80Alector, Inc. USD 367,751 7,544,412 0.16Alexion Pharmaceuticals, Inc. USD 354,608 65,421,630 1.38Allogene Therapeutics, Inc. USD 231,196 5,799,552 0.12Alnylam Pharmaceuticals, Inc. USD 189,633 31,584,324 0.67Amedisys, Inc. USD 157,529 38,800,968 0.82Amgen, Inc. USD 518,351 125,663,833 2.66Amicus Therapeutics, Inc. USD 2,268,940 22,020,063 0.47Arrowhead Pharmaceuticals, Inc. USD 299,042 24,584,243 0.52Arvinas, Inc. USD 252,806 19,011,011 0.40Atara Biotherapeutics, Inc. USD 1,143,404 17,791,366 0.38Avrobio, Inc. USD 771,752 6,968,921 0.15Becton Dickinson and Co. USD 53,261 13,011,662 0.27Biogen, Inc. USD 167,888 57,985,997 1.23Blueprint Medicines Corp. USD 257,354 22,672,887 0.48Boston Scientific Corp. USD 1,715,464 73,584,828 1.56Bristol-Myers Squibb Co. USD 2,412,192 160,036,878 3.38Catalent, Inc. USD 360,109 38,841,357 0.82Centene Corp. USD 1,815,107 132,475,584 2.80Cigna Corp. USD 614,868 145,849,764 3.08Coherus Biosciences, Inc. USD 892,403 12,422,250 0.26Cooper Cos., Inc. (The) USD 64,952 25,640,776 0.54CVS Health Corp. USD 229,590 19,092,704 0.40Dexcom, Inc. USD 143,555 61,168,786 1.29Eli Lilly & Co. USD 728,676 167,362,304 3.54Evolent Health, Inc. ‘A’ USD 1,516,439 31,693,575 0.67Exact Sciences Corp. USD 415,400 52,182,548 1.10Exelixis, Inc. USD 1,130,579 20,305,199 0.43
FibroGen, Inc. USD 394,154 10,514,058 0.22Gilead Sciences, Inc. USD 342,092 23,364,884 0.49Halozyme Therapeutics, Inc. USD 811,904 36,856,382 0.78Insulet Corp. USD 155,849 43,555,899 0.92Intercept Pharmaceuticals, Inc. USD 128,973 2,659,423 0.06Intuitive Surgical, Inc. USD 118,576 108,855,732 2.30Ionis Pharmaceuticals, Inc. USD 244,354 9,622,661 0.20iRhythm Technologies, Inc. USD 321,597 20,704,415 0.44Johnson & Johnson USD 953,789 156,392,782 3.31Maravai LifeSciences Holdings, Inc. ‘A’ USD 743,115 31,593,534 0.67McKesson Corp. USD 284,001 54,379,092 1.15Merck & Co., Inc. USD 436,365 33,750,651 0.71Natera, Inc. USD 476,809 54,747,209 1.16Neurocrine Biosciences, Inc. USD 171,089 16,520,354 0.35Nevro Corp. USD 230,628 37,985,585 0.80NuVasive, Inc. USD 287,311 19,448,082 0.41Organon & Co. USD 43,636 1,327,407 0.03Outset Medical, Inc. USD 311,133 16,194,473 0.34Personalis, Inc. USD 885,477 22,646,074 0.48Pfizer, Inc. USD 816,197 31,729,658 0.67PMV Pharmaceuticals, Inc. USD 388,603 12,878,303 0.27Regeneron Pharmaceuticals, Inc. USD 175,987 96,270,169 2.03REGENXBIO, Inc. USD 517,989 19,828,619 0.42ResMed, Inc. USD 159,028 39,159,850 0.83Revance Therapeutics, Inc. USD 922,030 26,757,311 0.57Sage Therapeutics, Inc. USD 268,441 15,340,061 0.32Seagen, Inc. USD 149,976 23,528,985 0.50Shockwave Medical, Inc. USD 300,272 57,574,153 1.22Teladoc Health, Inc. USD 261,984 44,057,849 0.93Thermo Fisher Scientific, Inc. USD 351,627 177,698,221 3.76Twist Bioscience Corp. USD 310,123 41,249,460 0.87UnitedHealth Group, Inc. USD 769,245 306,067,201 6.47Veeva Systems, Inc. ‘A’ USD 44,635 14,170,720 0.30Vertex Pharmaceuticals, Inc. USD 256,727 50,603,459 1.07Zimmer Biomet Holdings, Inc. USD 386,744 62,201,971 1.31
3,351,430,459 70.83
Virgin Islands, BritishBiohaven Pharmaceutical Holding Co.Ltd. USD 306,471 29,980,525 0.63
29,980,525 0.63
Total Equities 4,498,347,736 95.07
Total Transferable securities and money market instrumentsadmitted to an official exchange listing 4,498,347,736 95.07
Units of authorised UCITS or other collective investment undertakings
Collective Investment Schemes - UCITS
LuxembourgJPMorgan USD Liquidity LVNAV Fund -JPM USD Liquidity LVNAV X (dist.)† USD 106,631,920 106,631,920 2.25
106,631,920 2.25
Total Collective Investment Schemes - UCITS 106,631,920 2.25
Total Units of authorised UCITS or other collective investmentundertakings 106,631,920 2.25
Total Investments 4,604,979,656 97.32
Cash 126,610,806 2.68
Other Assets/(Liabilities) 212,199 0.00
Total Net Assets 4,731,802,661 100.00
† Related Party Fund.
104
JPMorgan Funds - Global Healthcare FundSchedule of Investments
As at 30 June 2021
Investments Currency
Quantity/Nominal
Value
MarketValue
USD
%of
NetAssets Investments Currency
Quantity/Nominal
Value
MarketValue
USD
%of
NetAssets
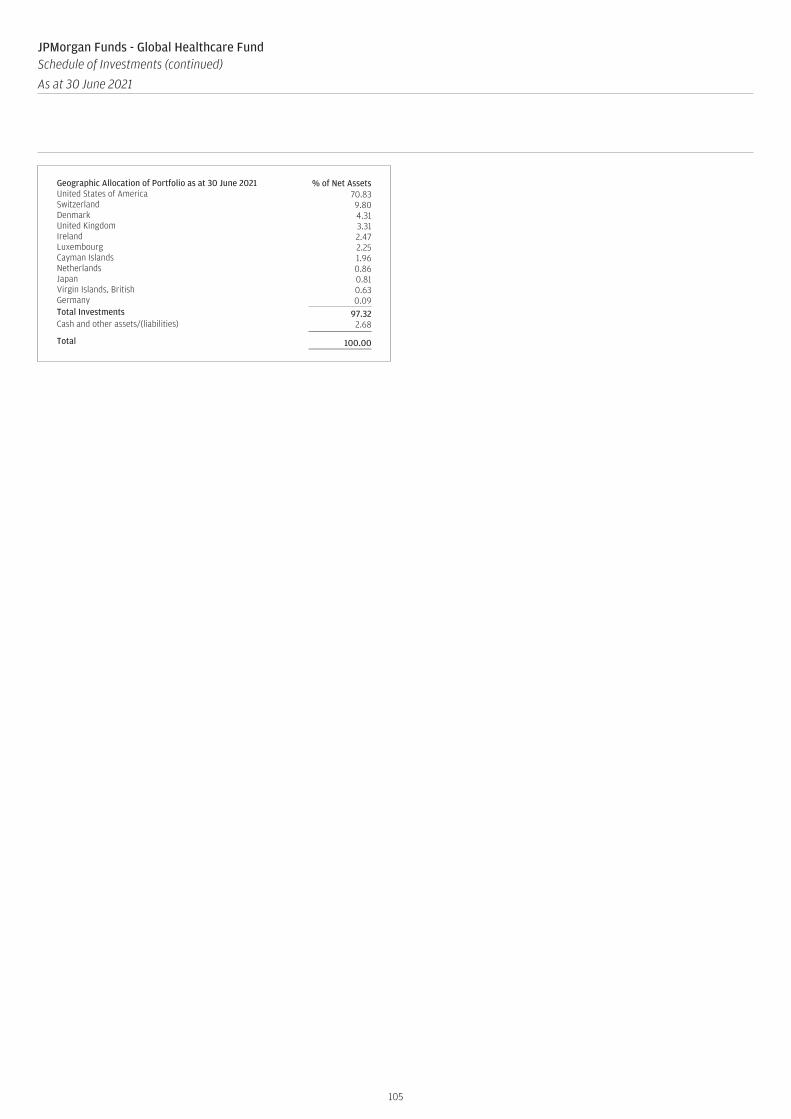
Geographic Allocation of Portfolio as at 30 June 2021 % of Net AssetsUnited States of America 70.83Switzerland 9.80Denmark 4.31United Kingdom 3.31Ireland 2.47Luxembourg 2.25Cayman Islands 1.96Netherlands 0.86Japan 0.81Virgin Islands, British 0.63Germany 0.09Total Investments 97.32Cash and other assets/(liabilities) 2.68
Total 100.00
105
JPMorgan Funds - Global Healthcare FundSchedule of Investments (continued)
As at 30 June 2021
Investments Currency
Quantity/Nominal
Value
MarketValue
USD
%of
NetAssets Investments Currency
Quantity/Nominal
Value
MarketValue
USD
%of
NetAssets

JPMorgan Funds - Global Healthcare FundSchedule of Investments (continued)
As at 30 June 2021
Forward Currency Exchange Contracts (continued)
CurrencyPurchased Amount Purchased Currency Sold Amount Sold
MaturityDate Counterparty
UnrealisedGain/(Loss)
USD
%of
NetAssets
AUD 30,222 PLN 85,755 05/07/2021 HSBC 155 -AUD 30,222 PLN 86,220 04/08/2021 HSBC 33 -CHF 83,614 EUR 76,188 05/07/2021 HSBC 44 -CHF 38,995 PLN 159,752 05/07/2021 HSBC 261 -CHF 19,841 PLN 81,740 04/08/2021 HSBC 27 -EUR 76,710 CHF 83,614 05/07/2021 Barclays 577 -EUR 65,347 DKK 485,950 04/08/2021 HSBC - -EUR 18,893 PLN 84,927 05/07/2021 BNP Paribas 131 -EUR 20,716 PLN 92,929 05/07/2021 HSBC 195 -EUR 39,608 PLN 179,070 04/08/2021 HSBC 31 -HKD 158,927 PLN 75,447 05/07/2021 HSBC 650 -HKD 158,927 PLN 77,791 04/08/2021 HSBC 33 -HKD 1,632,887 USD 210,250 06/07/2021 BNP Paribas 7 -JPY 3,782,723 PLN 126,954 05/07/2021 Barclays 836 -JPY 25,348,196,397 USD 228,674,219 29/07/2021 Merrill Lynch 388,206 0.01PLN 80,437 CHF 19,494 04/08/2021 BNP Paribas 6 -PLN 130,183 JPY 3,782,723 05/07/2021 HSBC 12 -USD 314,160 AUD 406,341 06/07/2021 State Street 9,273 -USD 304,960 AUD 406,341 04/08/2021 Standard Chartered 28 -USD 1,207,242 CHF 1,082,500 06/07/2021 Merrill Lynch 35,350 -USD 90,334,365 CHF 83,032,422 29/07/2021 State Street 388,605 0.01USD 1,173,641 CHF 1,082,500 04/08/2021 BNP Paribas 823 -USD 476,200 DKK 2,901,793 06/07/2021 Toronto-Dominion Bank 12,802 -USD 48,211,400 DKK 300,362,952 29/07/2021 Merrill Lynch 223,632 -USD 464,188 DKK 2,901,793 04/08/2021 Merrill Lynch 525 -USD 134,905 EUR 110,560 06/07/2021 Citibank 3,612 -USD 165,169 EUR 135,352 06/07/2021 Goldman Sachs 4,436 -USD 11,152,577 EUR 9,375,416 06/07/2021 HSBC 19,086 -USD 84,046 EUR 69,368 06/07/2021 Standard Chartered 1,670 -USD 120,067 EUR 100,925 06/07/2021 State Street 217 -USD 292,630 EUR 245,912 04/08/2021 HSBC 426 -USD 544,193 GBP 383,612 06/07/2021 BNP Paribas 13,253 -USD 531,801 GBP 383,612 04/08/2021 Barclays 821 -USD 210,413 HKD 1,632,887 06/07/2021 Toronto-Dominion Bank 156 -USD 17,337,372 HKD 134,574,831 29/07/2021 Goldman Sachs 8,135 -USD 79,041 HKD 613,694 04/08/2021 HSBC 14 -USD 949,129 JPY 104,205,611 06/07/2021 BNP Paribas 7,647 -USD 943,441 JPY 104,205,611 04/08/2021 Goldman Sachs 1,724 -USD 44,518 PLN 164,294 06/07/2021 Citibank 1,372 -USD 263,223 PLN 966,448 06/07/2021 HSBC 9,416 -USD 190,769 PLN 702,713 06/07/2021 Merrill Lynch 6,223 -USD 42,883 PLN 157,893 06/07/2021 State Street 1,418 -USD 4,114,577 PLN 15,632,246 06/07/2021 Toronto-Dominion Bank 9,257 -
Total Unrealised Gain on Forward Currency Exchange Contracts 1,151,125 0.02
AUD 406,341 USD 304,918 06/07/2021 Standard Chartered (31) -AUD 106,464,420 USD 80,620,917 29/07/2021 Merrill Lynch (728,649) (0.02)CHF 1,082,500 USD 1,172,750 06/07/2021 BNP Paribas (858) -DKK 485,950 EUR 65,349 05/07/2021 HSBC - -DKK 2,901,793 USD 463,935 06/07/2021 Merrill Lynch (536) -EUR 76,201 CHF 83,614 04/08/2021 HSBC (45) -EUR 65,348 DKK 485,950 05/07/2021 HSBC (2) -EUR 148,259 USD 181,177 06/07/2021 Barclays (5,117) -EUR 4,023,266 USD 4,909,153 06/07/2021 Citibank (131,445) -EUR 4,925,408 USD 6,010,431 06/07/2021 Goldman Sachs (161,412) -EUR 429,156 USD 516,273 06/07/2021 HSBC (6,642) -EUR 85,285 USD 103,792 06/07/2021 RBC (2,515) -EUR 106,617 USD 129,931 06/07/2021 Standard Chartered (3,322) -EUR 73,630 USD 89,643 06/07/2021 Toronto-Dominion Bank (2,206) -EUR 201,691,345 USD 240,891,025 29/07/2021 Barclays (1,262,830) (0.03)EUR 57,835 USD 69,088 04/08/2021 Barclays (366) -EUR 9,290,543 USD 11,055,514 04/08/2021 HSBC (16,106) -GBP 383,612 USD 531,762 06/07/2021 Barclays (823) -GBP 19,590,806 USD 27,363,539 29/07/2021 Citibank (247,087) -HKD 134,574,831 USD 17,334,317 29/07/2021 BNP Paribas (5,080) -JPY 3,782,723 PLN 130,200 04/08/2021 HSBC (13) -JPY 104,205,611 USD 943,208 06/07/2021 Goldman Sachs (1,726) -PLN 86,219 AUD 30,222 05/07/2021 HSBC (33) -PLN 78,186 CHF 19,154 05/07/2021 Barclays (202) -PLN 81,687 CHF 19,841 05/07/2021 HSBC (27) -PLN 178,985 EUR 39,608 05/07/2021 HSBC (30) -PLN 102,061 HKD 208,556 04/08/2021 HSBC (49) -PLN 198,565 USD 54,072 06/07/2021 Barclays (1,926) -PLN 16,745,879 USD 4,557,059 06/07/2021 HSBC (159,277) -PLN 298,680 USD 81,559 06/07/2021 Merrill Lynch (3,121) -PLN 380,468 USD 103,587 06/07/2021 State Street (3,669) -PLN 108,490 USD 28,661 04/08/2021 Citibank (166) -PLN 129,497 USD 34,309 04/08/2021 HSBC (296) -
106

JPMorgan Funds - Global Healthcare FundSchedule of Investments (continued)
As at 30 June 2021
Forward Currency Exchange Contracts (continued)
CurrencyPurchased Amount Purchased Currency Sold Amount Sold
MaturityDate Counterparty
UnrealisedGain/(Loss)
USD
%of
NetAssets
PLN 252,498 USD 66,628 04/08/2021 Merrill Lynch (309) -PLN 15,632,246 USD 4,115,132 04/08/2021 Toronto-Dominion Bank (9,268) -USD 210,263 HKD 1,632,887 04/08/2021 BNP Paribas (7) -
Total Unrealised Loss on Forward Currency Exchange Contracts (2,755,191) (0.05)
Net Unrealised Loss on Forward Currency Exchange Contracts (1,604,066) (0.03)
107
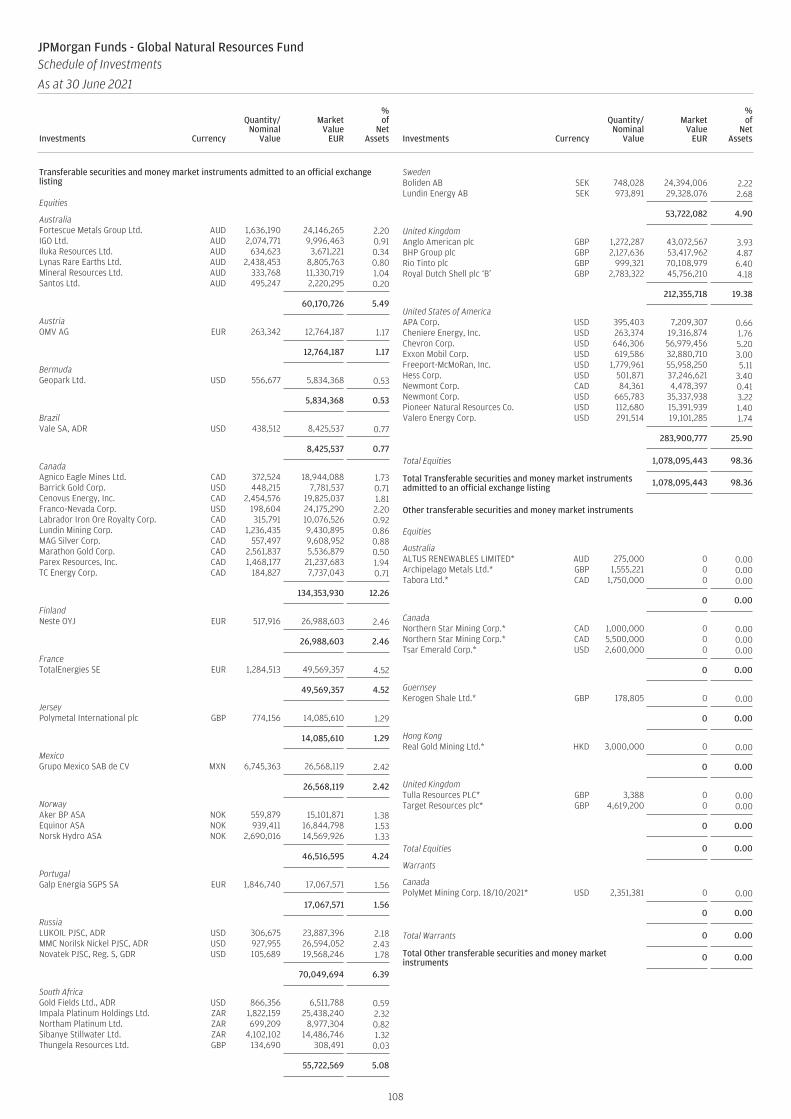
Transferable securities and money market instruments admitted to an official exchangelisting
Equities
AustraliaFortescue Metals Group Ltd. AUD 1,636,190 24,146,265 2.20IGO Ltd. AUD 2,074,771 9,996,463 0.91Iluka Resources Ltd. AUD 634,623 3,671,221 0.34Lynas Rare Earths Ltd. AUD 2,438,453 8,805,763 0.80Mineral Resources Ltd. AUD 333,768 11,330,719 1.04Santos Ltd. AUD 495,247 2,220,295 0.20
60,170,726 5.49
AustriaOMV AG EUR 263,342 12,764,187 1.17
12,764,187 1.17
BermudaGeopark Ltd. USD 556,677 5,834,368 0.53
5,834,368 0.53
BrazilVale SA, ADR USD 438,512 8,425,537 0.77
8,425,537 0.77
CanadaAgnico Eagle Mines Ltd. CAD 372,524 18,944,088 1.73Barrick Gold Corp. USD 448,215 7,781,537 0.71Cenovus Energy, Inc. CAD 2,454,576 19,825,037 1.81Franco-Nevada Corp. USD 198,604 24,175,290 2.20Labrador Iron Ore Royalty Corp. CAD 315,791 10,076,526 0.92Lundin Mining Corp. CAD 1,236,435 9,430,895 0.86MAG Silver Corp. CAD 557,497 9,608,952 0.88Marathon Gold Corp. CAD 2,561,837 5,536,879 0.50Parex Resources, Inc. CAD 1,468,177 21,237,683 1.94TC Energy Corp. CAD 184,827 7,737,043 0.71
134,353,930 12.26
FinlandNeste OYJ EUR 517,916 26,988,603 2.46
26,988,603 2.46
FranceTotalEnergies SE EUR 1,284,513 49,569,357 4.52
49,569,357 4.52
JerseyPolymetal International plc GBP 774,156 14,085,610 1.29
14,085,610 1.29
MexicoGrupo Mexico SAB de CV MXN 6,745,363 26,568,119 2.42
26,568,119 2.42
NorwayAker BP ASA NOK 559,879 15,101,871 1.38Equinor ASA NOK 939,411 16,844,798 1.53Norsk Hydro ASA NOK 2,690,016 14,569,926 1.33
46,516,595 4.24
PortugalGalp Energia SGPS SA EUR 1,846,740 17,067,571 1.56
17,067,571 1.56
RussiaLUKOIL PJSC, ADR USD 306,675 23,887,396 2.18MMC Norilsk Nickel PJSC, ADR USD 927,955 26,594,052 2.43Novatek PJSC, Reg. S, GDR USD 105,689 19,568,246 1.78
70,049,694 6.39
South AfricaGold Fields Ltd., ADR USD 866,356 6,511,788 0.59Impala Platinum Holdings Ltd. ZAR 1,822,159 25,438,240 2.32Northam Platinum Ltd. ZAR 699,209 8,977,304 0.82Sibanye Stillwater Ltd. ZAR 4,102,102 14,486,746 1.32Thungela Resources Ltd. GBP 134,690 308,491 0.03
55,722,569 5.08
SwedenBoliden AB SEK 748,028 24,394,006 2.22Lundin Energy AB SEK 973,891 29,328,076 2.68
53,722,082 4.90
United KingdomAnglo American plc GBP 1,272,287 43,072,567 3.93BHP Group plc GBP 2,127,636 53,417,962 4.87Rio Tinto plc GBP 999,321 70,108,979 6.40Royal Dutch Shell plc ‘B’ GBP 2,783,322 45,756,210 4.18
212,355,718 19.38
United States of AmericaAPA Corp. USD 395,403 7,209,307 0.66Cheniere Energy, Inc. USD 263,374 19,316,874 1.76Chevron Corp. USD 646,306 56,979,456 5.20Exxon Mobil Corp. USD 619,586 32,880,710 3.00Freeport-McMoRan, Inc. USD 1,779,961 55,958,250 5.11Hess Corp. USD 501,871 37,246,621 3.40Newmont Corp. CAD 84,361 4,478,397 0.41Newmont Corp. USD 665,783 35,337,938 3.22Pioneer Natural Resources Co. USD 112,680 15,391,939 1.40Valero Energy Corp. USD 291,514 19,101,285 1.74
283,900,777 25.90
Total Equities 1,078,095,443 98.36
Total Transferable securities and money market instrumentsadmitted to an official exchange listing 1,078,095,443 98.36
Other transferable securities and money market instruments
Equities
AustraliaALTUS RENEWABLES LIMITED* AUD 275,000 0 0.00Archipelago Metals Ltd.* GBP 1,555,221 0 0.00Tabora Ltd.* CAD 1,750,000 0 0.00
0 0.00
CanadaNorthern Star Mining Corp.* CAD 1,000,000 0 0.00Northern Star Mining Corp.* CAD 5,500,000 0 0.00Tsar Emerald Corp.* USD 2,600,000 0 0.00
0 0.00
GuernseyKerogen Shale Ltd.* GBP 178,805 0 0.00
0 0.00
Hong KongReal Gold Mining Ltd.* HKD 3,000,000 0 0.00
0 0.00
United KingdomTulla Resources PLC* GBP 3,388 0 0.00Target Resources plc* GBP 4,619,200 0 0.00
0 0.00
Total Equities 0 0.00
Warrants
CanadaPolyMet Mining Corp. 18/10/2021* USD 2,351,381 0 0.00
0 0.00
Total Warrants 0 0.00
Total Other transferable securities and money marketinstruments 0 0.00
108
JPMorgan Funds - Global Natural Resources FundSchedule of Investments
As at 30 June 2021
Investments Currency
Quantity/Nominal
Value
MarketValue
EUR
%of
NetAssets Investments Currency
Quantity/Nominal
Value
MarketValue
EUR
%of
NetAssets

Units of authorised UCITS or other collective investment undertakings
Collective Investment Schemes - UCITS
LuxembourgJPMorgan EUR Liquidity LVNAV Fund -JPM EUR Liquidity LVNAV X (flex dist.)† EUR 1,969 19,467,921 1.78
19,467,921 1.78
Total Collective Investment Schemes - UCITS 19,467,921 1.78
Total Units of authorised UCITS or other collective investmentundertakings 19,467,921 1.78
Total Investments 1,097,563,364 100.14
Cash 78,457 0.01
Other Assets/(Liabilities) (1,595,392) (0.15)
Total Net Assets 1,096,046,429 100.00
* Security is valued at its fair value under the direction of the Board of Directors.† Related Party Fund.
Geographic Allocation of Portfolio as at 30 June 2021 % of Net AssetsUnited States of America 25.90United Kingdom 19.38Canada 12.26Russia 6.39Australia 5.49South Africa 5.08Sweden 4.90France 4.52Norway 4.24Finland 2.46Mexico 2.42Luxembourg 1.78Portugal 1.56Jersey 1.29Austria 1.17Brazil 0.77Bermuda 0.53Guernsey -Hong Kong -Total Investments 100.14Cash and other assets/(liabilities) (0.14)
Total 100.00
109
JPMorgan Funds - Global Natural Resources FundSchedule of Investments (continued)
As at 30 June 2021
Investments Currency
Quantity/Nominal
Value
MarketValue
EUR
%of
NetAssets Investments Currency
Quantity/Nominal
Value
MarketValue
EUR
%of
NetAssets
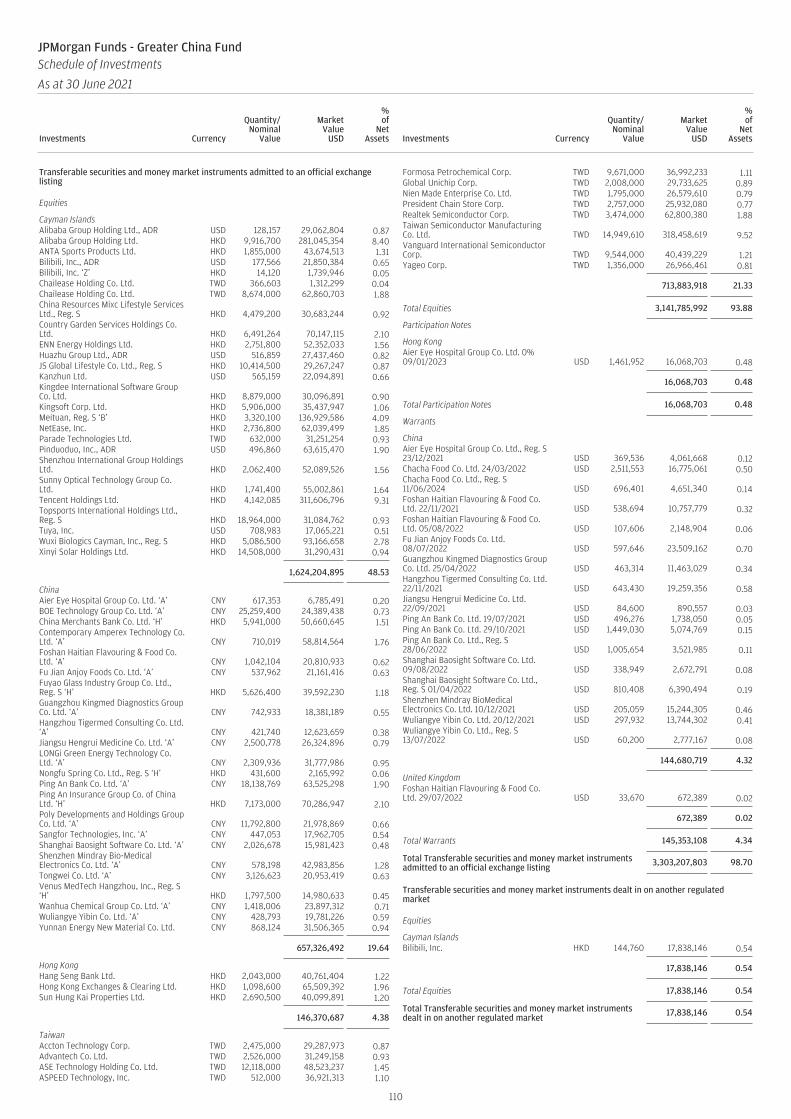
Transferable securities and money market instruments admitted to an official exchangelisting
Equities
Cayman IslandsAlibaba Group Holding Ltd., ADR USD 128,157 29,062,804 0.87Alibaba Group Holding Ltd. HKD 9,916,700 281,045,354 8.40ANTA Sports Products Ltd. HKD 1,855,000 43,674,513 1.31Bilibili, Inc., ADR USD 177,566 21,850,384 0.65Bilibili, Inc. ‘Z’ HKD 14,120 1,739,946 0.05Chailease Holding Co. Ltd. TWD 366,603 1,312,299 0.04Chailease Holding Co. Ltd. TWD 8,674,000 62,860,703 1.88China Resources Mixc Lifestyle ServicesLtd., Reg. S HKD 4,479,200 30,683,244 0.92Country Garden Services Holdings Co.Ltd. HKD 6,491,264 70,147,115 2.10ENN Energy Holdings Ltd. HKD 2,751,800 52,352,033 1.56Huazhu Group Ltd., ADR USD 516,859 27,437,460 0.82JS Global Lifestyle Co. Ltd., Reg. S HKD 10,414,500 29,267,247 0.87Kanzhun Ltd. USD 565,159 22,094,891 0.66Kingdee International Software GroupCo. Ltd. HKD 8,879,000 30,096,891 0.90Kingsoft Corp. Ltd. HKD 5,906,000 35,437,947 1.06Meituan, Reg. S ‘B’ HKD 3,320,100 136,929,586 4.09NetEase, Inc. HKD 2,736,800 62,039,499 1.85Parade Technologies Ltd. TWD 632,000 31,251,254 0.93Pinduoduo, Inc., ADR USD 496,860 63,615,470 1.90Shenzhou International Group HoldingsLtd. HKD 2,062,400 52,089,526 1.56Sunny Optical Technology Group Co.Ltd. HKD 1,741,400 55,002,861 1.64Tencent Holdings Ltd. HKD 4,142,085 311,606,796 9.31Topsports International Holdings Ltd.,Reg. S HKD 18,964,000 31,084,762 0.93Tuya, Inc. USD 708,983 17,065,221 0.51Wuxi Biologics Cayman, Inc., Reg. S HKD 5,086,500 93,166,658 2.78Xinyi Solar Holdings Ltd. HKD 14,508,000 31,290,431 0.94
1,624,204,895 48.53
ChinaAier Eye Hospital Group Co. Ltd. ‘A’ CNY 617,353 6,785,491 0.20BOE Technology Group Co. Ltd. ‘A’ CNY 25,259,400 24,389,438 0.73China Merchants Bank Co. Ltd. ‘H’ HKD 5,941,000 50,660,645 1.51Contemporary Amperex Technology Co.Ltd. ‘A’ CNY 710,019 58,814,564 1.76Foshan Haitian Flavouring & Food Co.Ltd. ‘A’ CNY 1,042,104 20,810,933 0.62Fu Jian Anjoy Foods Co. Ltd. ‘A’ CNY 537,962 21,161,416 0.63Fuyao Glass Industry Group Co. Ltd.,Reg. S ‘H’ HKD 5,626,400 39,592,230 1.18Guangzhou Kingmed Diagnostics GroupCo. Ltd. ‘A’ CNY 742,933 18,381,189 0.55Hangzhou Tigermed Consulting Co. Ltd.‘A’ CNY 421,740 12,623,659 0.38Jiangsu Hengrui Medicine Co. Ltd. ‘A’ CNY 2,500,778 26,324,896 0.79LONGi Green Energy Technology Co.Ltd. ‘A’ CNY 2,309,936 31,777,986 0.95Nongfu Spring Co. Ltd., Reg. S ‘H’ HKD 431,600 2,165,992 0.06Ping An Bank Co. Ltd. ‘A’ CNY 18,138,769 63,525,298 1.90Ping An Insurance Group Co. of ChinaLtd. ‘H’ HKD 7,173,000 70,286,947 2.10Poly Developments and Holdings GroupCo. Ltd. ‘A’ CNY 11,792,800 21,978,869 0.66Sangfor Technologies, Inc. ‘A’ CNY 447,053 17,962,705 0.54Shanghai Baosight Software Co. Ltd. ‘A’ CNY 2,026,678 15,981,423 0.48Shenzhen Mindray Bio-MedicalElectronics Co. Ltd. ‘A’ CNY 578,198 42,983,856 1.28Tongwei Co. Ltd. ‘A’ CNY 3,126,623 20,953,419 0.63Venus MedTech Hangzhou, Inc., Reg. S‘H’ HKD 1,797,500 14,980,633 0.45Wanhua Chemical Group Co. Ltd. ‘A’ CNY 1,418,006 23,897,312 0.71Wuliangye Yibin Co. Ltd. ‘A’ CNY 428,793 19,781,226 0.59Yunnan Energy New Material Co. Ltd. CNY 868,124 31,506,365 0.94
657,326,492 19.64
Hong KongHang Seng Bank Ltd. HKD 2,043,000 40,761,404 1.22Hong Kong Exchanges & Clearing Ltd. HKD 1,098,600 65,509,392 1.96Sun Hung Kai Properties Ltd. HKD 2,690,500 40,099,891 1.20
146,370,687 4.38
TaiwanAccton Technology Corp. TWD 2,475,000 29,287,973 0.87Advantech Co. Ltd. TWD 2,526,000 31,249,158 0.93ASE Technology Holding Co. Ltd. TWD 12,118,000 48,523,237 1.45ASPEED Technology, Inc. TWD 512,000 36,921,313 1.10
Formosa Petrochemical Corp. TWD 9,671,000 36,992,233 1.11Global Unichip Corp. TWD 2,008,000 29,733,625 0.89Nien Made Enterprise Co. Ltd. TWD 1,795,000 26,579,610 0.79President Chain Store Corp. TWD 2,757,000 25,932,080 0.77Realtek Semiconductor Corp. TWD 3,474,000 62,800,380 1.88Taiwan Semiconductor ManufacturingCo. Ltd. TWD 14,949,610 318,458,619 9.52Vanguard International SemiconductorCorp. TWD 9,544,000 40,439,229 1.21Yageo Corp. TWD 1,356,000 26,966,461 0.81
713,883,918 21.33
Total Equities 3,141,785,992 93.88
Participation Notes
Hong KongAier Eye Hospital Group Co. Ltd. 0%09/01/2023 USD 1,461,952 16,068,703 0.48
16,068,703 0.48
Total Participation Notes 16,068,703 0.48
Warrants
ChinaAier Eye Hospital Group Co. Ltd., Reg. S23/12/2021 USD 369,536 4,061,668 0.12Chacha Food Co. Ltd. 24/03/2022 USD 2,511,553 16,775,061 0.50Chacha Food Co. Ltd., Reg. S11/06/2024 USD 696,401 4,651,340 0.14Foshan Haitian Flavouring & Food Co.Ltd. 22/11/2021 USD 538,694 10,757,779 0.32Foshan Haitian Flavouring & Food Co.Ltd. 05/08/2022 USD 107,606 2,148,904 0.06Fu Jian Anjoy Foods Co. Ltd.08/07/2022 USD 597,646 23,509,162 0.70Guangzhou Kingmed Diagnostics GroupCo. Ltd. 25/04/2022 USD 463,314 11,463,029 0.34Hangzhou Tigermed Consulting Co. Ltd.22/11/2021 USD 643,430 19,259,356 0.58Jiangsu Hengrui Medicine Co. Ltd.22/09/2021 USD 84,600 890,557 0.03Ping An Bank Co. Ltd. 19/07/2021 USD 496,276 1,738,050 0.05Ping An Bank Co. Ltd. 29/10/2021 USD 1,449,030 5,074,769 0.15Ping An Bank Co. Ltd., Reg. S28/06/2022 USD 1,005,654 3,521,985 0.11Shanghai Baosight Software Co. Ltd.09/08/2022 USD 338,949 2,672,791 0.08Shanghai Baosight Software Co. Ltd.,Reg. S 01/04/2022 USD 810,408 6,390,494 0.19Shenzhen Mindray BioMedicalElectronics Co. Ltd. 10/12/2021 USD 205,059 15,244,305 0.46Wuliangye Yibin Co. Ltd. 20/12/2021 USD 297,932 13,744,302 0.41Wuliangye Yibin Co. Ltd., Reg. S13/07/2022 USD 60,200 2,777,167 0.08
144,680,719 4.32
United KingdomFoshan Haitian Flavouring & Food Co.Ltd. 29/07/2022 USD 33,670 672,389 0.02
672,389 0.02
Total Warrants 145,353,108 4.34
Total Transferable securities and money market instrumentsadmitted to an official exchange listing 3,303,207,803 98.70
Transferable securities and money market instruments dealt in on another regulatedmarket
Equities
Cayman IslandsBilibili, Inc. HKD 144,760 17,838,146 0.54
17,838,146 0.54
Total Equities 17,838,146 0.54
Total Transferable securities and money market instrumentsdealt in on another regulated market 17,838,146 0.54
110
JPMorgan Funds - Greater China FundSchedule of Investments
As at 30 June 2021
Investments Currency
Quantity/Nominal
Value
MarketValue
USD
%of
NetAssets Investments Currency
Quantity/Nominal
Value
MarketValue
USD
%of
NetAssets
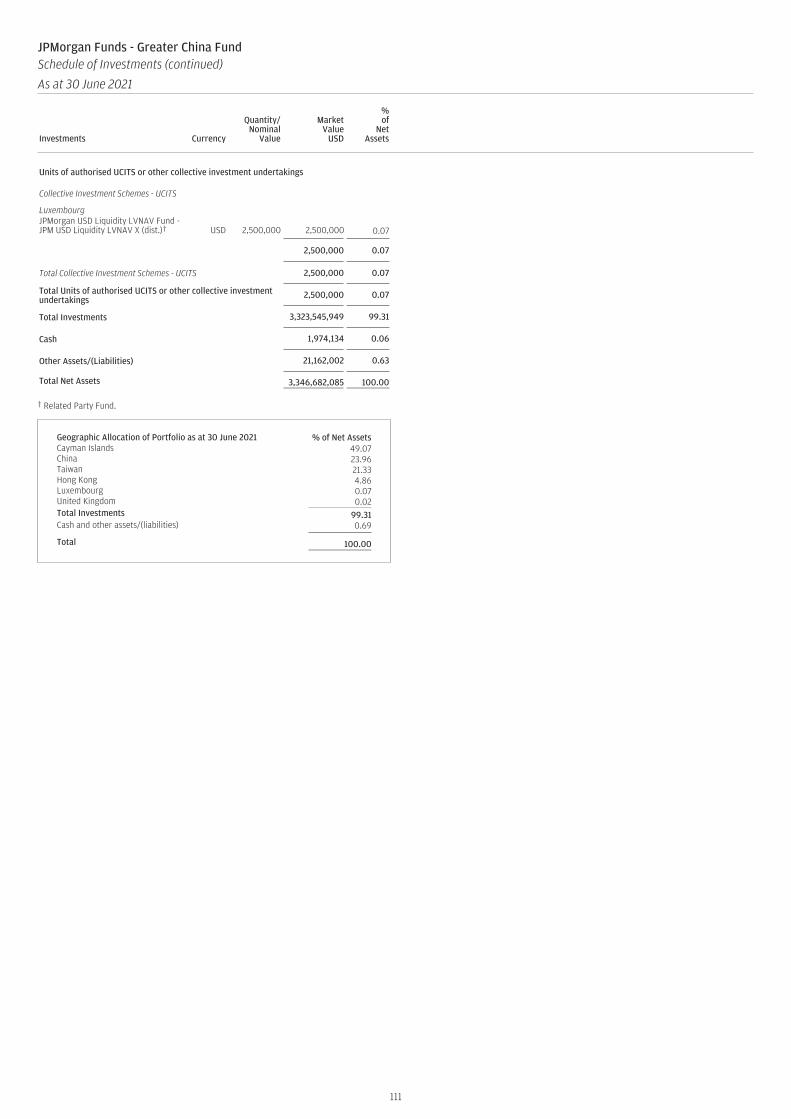
Units of authorised UCITS or other collective investment undertakings
Collective Investment Schemes - UCITS
LuxembourgJPMorgan USD Liquidity LVNAV Fund -JPM USD Liquidity LVNAV X (dist.)† USD 2,500,000 2,500,000 0.07
2,500,000 0.07
Total Collective Investment Schemes - UCITS 2,500,000 0.07
Total Units of authorised UCITS or other collective investmentundertakings 2,500,000 0.07
Total Investments 3,323,545,949 99.31
Cash 1,974,134 0.06
Other Assets/(Liabilities) 21,162,002 0.63
Total Net Assets 3,346,682,085 100.00
† Related Party Fund.
Geographic Allocation of Portfolio as at 30 June 2021 % of Net AssetsCayman Islands 49.07China 23.96Taiwan 21.33Hong Kong 4.86Luxembourg 0.07United Kingdom 0.02Total Investments 99.31Cash and other assets/(liabilities) 0.69
Total 100.00
111
JPMorgan Funds - Greater China FundSchedule of Investments (continued)
As at 30 June 2021
Investments Currency
Quantity/Nominal
Value
MarketValue
USD
%of
NetAssets Investments Currency
Quantity/Nominal
Value
MarketValue
USD
%of
NetAssets
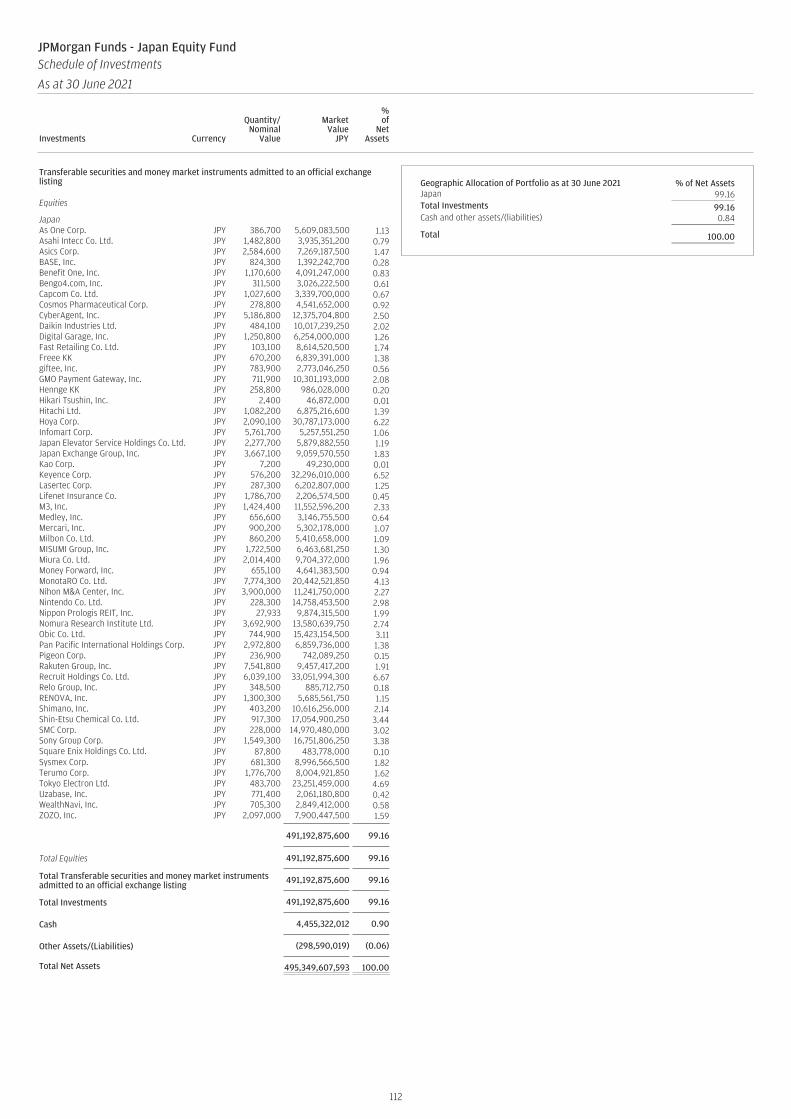
Transferable securities and money market instruments admitted to an official exchangelisting
Equities
JapanAs One Corp. JPY 386,700 5,609,083,500 1.13Asahi Intecc Co. Ltd. JPY 1,482,800 3,935,351,200 0.79Asics Corp. JPY 2,584,600 7,269,187,500 1.47BASE, Inc. JPY 824,300 1,392,242,700 0.28Benefit One, Inc. JPY 1,170,600 4,091,247,000 0.83Bengo4.com, Inc. JPY 311,500 3,026,222,500 0.61Capcom Co. Ltd. JPY 1,027,600 3,339,700,000 0.67Cosmos Pharmaceutical Corp. JPY 278,800 4,541,652,000 0.92CyberAgent, Inc. JPY 5,186,800 12,375,704,800 2.50Daikin Industries Ltd. JPY 484,100 10,017,239,250 2.02Digital Garage, Inc. JPY 1,250,800 6,254,000,000 1.26Fast Retailing Co. Ltd. JPY 103,100 8,614,520,500 1.74Freee KK JPY 670,200 6,839,391,000 1.38giftee, Inc. JPY 783,900 2,773,046,250 0.56GMO Payment Gateway, Inc. JPY 711,900 10,301,193,000 2.08Hennge KK JPY 258,800 986,028,000 0.20Hikari Tsushin, Inc. JPY 2,400 46,872,000 0.01Hitachi Ltd. JPY 1,082,200 6,875,216,600 1.39Hoya Corp. JPY 2,090,100 30,787,173,000 6.22Infomart Corp. JPY 5,761,700 5,257,551,250 1.06Japan Elevator Service Holdings Co. Ltd. JPY 2,277,700 5,879,882,550 1.19Japan Exchange Group, Inc. JPY 3,667,100 9,059,570,550 1.83Kao Corp. JPY 7,200 49,230,000 0.01Keyence Corp. JPY 576,200 32,296,010,000 6.52Lasertec Corp. JPY 287,300 6,202,807,000 1.25Lifenet Insurance Co. JPY 1,786,700 2,206,574,500 0.45M3, Inc. JPY 1,424,400 11,552,596,200 2.33Medley, Inc. JPY 656,600 3,146,755,500 0.64Mercari, Inc. JPY 900,200 5,302,178,000 1.07Milbon Co. Ltd. JPY 860,200 5,410,658,000 1.09MISUMI Group, Inc. JPY 1,722,500 6,463,681,250 1.30Miura Co. Ltd. JPY 2,014,400 9,704,372,000 1.96Money Forward, Inc. JPY 655,100 4,641,383,500 0.94MonotaRO Co. Ltd. JPY 7,774,300 20,442,521,850 4.13Nihon M&A Center, Inc. JPY 3,900,000 11,241,750,000 2.27Nintendo Co. Ltd. JPY 228,300 14,758,453,500 2.98Nippon Prologis REIT, Inc. JPY 27,933 9,874,315,500 1.99Nomura Research Institute Ltd. JPY 3,692,900 13,580,639,750 2.74Obic Co. Ltd. JPY 744,900 15,423,154,500 3.11Pan Pacific International Holdings Corp. JPY 2,972,800 6,859,736,000 1.38Pigeon Corp. JPY 236,900 742,089,250 0.15Rakuten Group, Inc. JPY 7,541,800 9,457,417,200 1.91Recruit Holdings Co. Ltd. JPY 6,039,100 33,051,994,300 6.67Relo Group, Inc. JPY 348,500 885,712,750 0.18RENOVA, Inc. JPY 1,300,300 5,685,561,750 1.15Shimano, Inc. JPY 403,200 10,616,256,000 2.14Shin-Etsu Chemical Co. Ltd. JPY 917,300 17,054,900,250 3.44SMC Corp. JPY 228,000 14,970,480,000 3.02Sony Group Corp. JPY 1,549,300 16,751,806,250 3.38Square Enix Holdings Co. Ltd. JPY 87,800 483,778,000 0.10Sysmex Corp. JPY 681,300 8,996,566,500 1.82Terumo Corp. JPY 1,776,700 8,004,921,850 1.62Tokyo Electron Ltd. JPY 483,700 23,251,459,000 4.69Uzabase, Inc. JPY 771,400 2,061,180,800 0.42WealthNavi, Inc. JPY 705,300 2,849,412,000 0.58ZOZO, Inc. JPY 2,097,000 7,900,447,500 1.59
491,192,875,600 99.16
Total Equities 491,192,875,600 99.16
Total Transferable securities and money market instrumentsadmitted to an official exchange listing 491,192,875,600 99.16
Total Investments 491,192,875,600 99.16
Cash 4,455,322,012 0.90
Other Assets/(Liabilities) (298,590,019) (0.06)
Total Net Assets 495,349,607,593 100.00
Geographic Allocation of Portfolio as at 30 June 2021 % of Net AssetsJapan 99.16Total Investments 99.16Cash and other assets/(liabilities) 0.84
Total 100.00
112
JPMorgan Funds - Japan Equity FundSchedule of Investments
As at 30 June 2021
Investments Currency
Quantity/Nominal
Value
MarketValue
JPY
%of
NetAssets Investments Currency
Quantity/Nominal
Value
MarketValue
JPY
%of
NetAssets
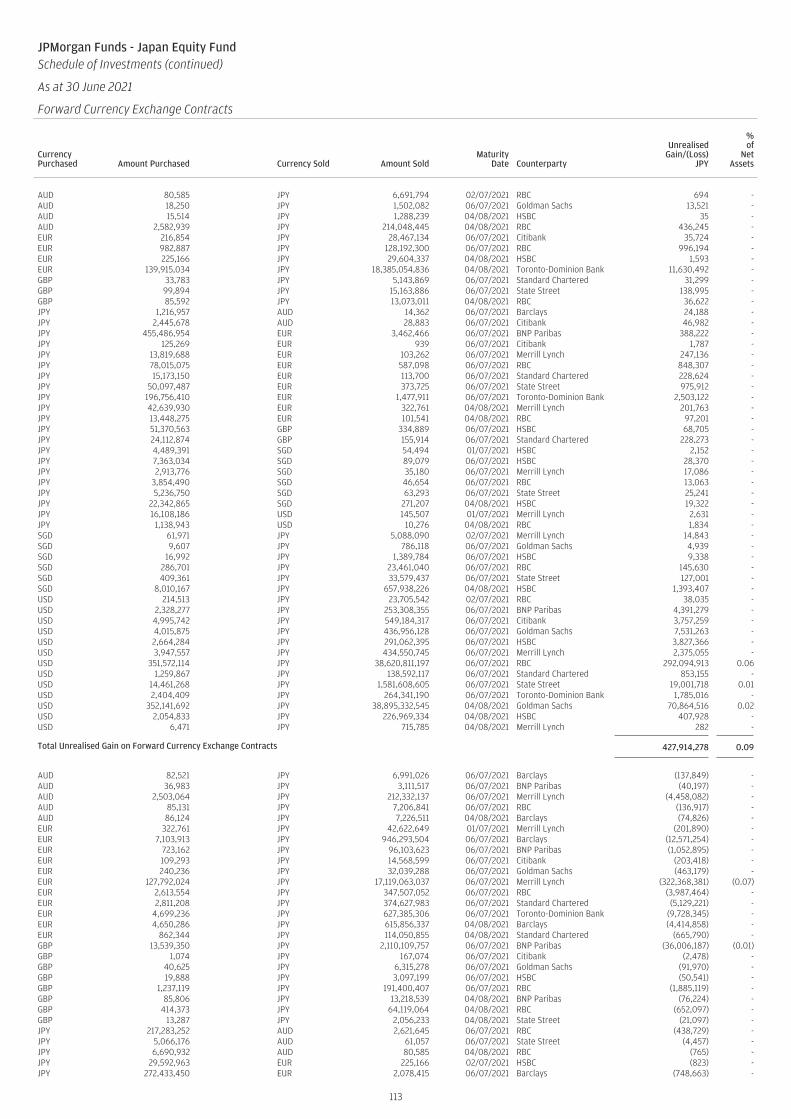
JPMorgan Funds - Japan Equity FundSchedule of Investments (continued)
As at 30 June 2021
Forward Currency Exchange Contracts (continued)
CurrencyPurchased Amount Purchased Currency Sold Amount Sold
MaturityDate Counterparty
UnrealisedGain/(Loss)
JPY
%of
NetAssets
AUD 80,585 JPY 6,691,794 02/07/2021 RBC 694 -AUD 18,250 JPY 1,502,082 06/07/2021 Goldman Sachs 13,521 -AUD 15,514 JPY 1,288,239 04/08/2021 HSBC 35 -AUD 2,582,939 JPY 214,048,445 04/08/2021 RBC 436,245 -EUR 216,854 JPY 28,467,134 06/07/2021 Citibank 35,724 -EUR 982,887 JPY 128,192,300 06/07/2021 RBC 996,194 -EUR 225,166 JPY 29,604,337 04/08/2021 HSBC 1,593 -EUR 139,915,034 JPY 18,385,054,836 04/08/2021 Toronto-Dominion Bank 11,630,492 -GBP 33,783 JPY 5,143,869 06/07/2021 Standard Chartered 31,299 -GBP 99,894 JPY 15,163,886 06/07/2021 State Street 138,995 -GBP 85,592 JPY 13,073,011 04/08/2021 RBC 36,622 -JPY 1,216,957 AUD 14,362 06/07/2021 Barclays 24,188 -JPY 2,445,678 AUD 28,883 06/07/2021 Citibank 46,982 -JPY 455,486,954 EUR 3,462,466 06/07/2021 BNP Paribas 388,222 -JPY 125,269 EUR 939 06/07/2021 Citibank 1,787 -JPY 13,819,688 EUR 103,262 06/07/2021 Merrill Lynch 247,136 -JPY 78,015,075 EUR 587,098 06/07/2021 RBC 848,307 -JPY 15,173,150 EUR 113,700 06/07/2021 Standard Chartered 228,624 -JPY 50,097,487 EUR 373,725 06/07/2021 State Street 975,912 -JPY 196,756,410 EUR 1,477,911 06/07/2021 Toronto-Dominion Bank 2,503,122 -JPY 42,639,930 EUR 322,761 04/08/2021 Merrill Lynch 201,763 -JPY 13,448,275 EUR 101,541 04/08/2021 RBC 97,201 -JPY 51,370,563 GBP 334,889 06/07/2021 HSBC 68,705 -JPY 24,112,874 GBP 155,914 06/07/2021 Standard Chartered 228,273 -JPY 4,489,391 SGD 54,494 01/07/2021 HSBC 2,152 -JPY 7,363,034 SGD 89,079 06/07/2021 HSBC 28,370 -JPY 2,913,776 SGD 35,180 06/07/2021 Merrill Lynch 17,086 -JPY 3,854,490 SGD 46,654 06/07/2021 RBC 13,063 -JPY 5,236,750 SGD 63,293 06/07/2021 State Street 25,241 -JPY 22,342,865 SGD 271,207 04/08/2021 HSBC 19,322 -JPY 16,108,186 USD 145,507 01/07/2021 Merrill Lynch 2,631 -JPY 1,138,943 USD 10,276 04/08/2021 RBC 1,834 -SGD 61,971 JPY 5,088,090 02/07/2021 Merrill Lynch 14,843 -SGD 9,607 JPY 786,118 06/07/2021 Goldman Sachs 4,939 -SGD 16,992 JPY 1,389,784 06/07/2021 HSBC 9,338 -SGD 286,701 JPY 23,461,040 06/07/2021 RBC 145,630 -SGD 409,361 JPY 33,579,437 06/07/2021 State Street 127,001 -SGD 8,010,167 JPY 657,938,226 04/08/2021 HSBC 1,393,407 -USD 214,513 JPY 23,705,542 02/07/2021 RBC 38,035 -USD 2,328,277 JPY 253,308,355 06/07/2021 BNP Paribas 4,391,279 -USD 4,995,742 JPY 549,184,317 06/07/2021 Citibank 3,757,259 -USD 4,015,875 JPY 436,956,128 06/07/2021 Goldman Sachs 7,531,263 -USD 2,664,284 JPY 291,062,395 06/07/2021 HSBC 3,827,366 -USD 3,947,557 JPY 434,550,745 06/07/2021 Merrill Lynch 2,375,055 -USD 351,572,114 JPY 38,620,811,197 06/07/2021 RBC 292,094,913 0.06USD 1,259,867 JPY 138,592,117 06/07/2021 Standard Chartered 853,155 -USD 14,461,268 JPY 1,581,608,605 06/07/2021 State Street 19,001,718 0.01USD 2,404,409 JPY 264,341,190 06/07/2021 Toronto-Dominion Bank 1,785,016 -USD 352,141,692 JPY 38,895,332,545 04/08/2021 Goldman Sachs 70,864,516 0.02USD 2,054,833 JPY 226,969,334 04/08/2021 HSBC 407,928 -USD 6,471 JPY 715,785 04/08/2021 Merrill Lynch 282 -
Total Unrealised Gain on Forward Currency Exchange Contracts 427,914,278 0.09
AUD 82,521 JPY 6,991,026 06/07/2021 Barclays (137,849) -AUD 36,983 JPY 3,111,517 06/07/2021 BNP Paribas (40,197) -AUD 2,503,064 JPY 212,332,137 06/07/2021 Merrill Lynch (4,458,082) -AUD 85,131 JPY 7,206,841 06/07/2021 RBC (136,917) -AUD 86,124 JPY 7,226,511 04/08/2021 Barclays (74,826) -EUR 322,761 JPY 42,622,649 01/07/2021 Merrill Lynch (201,890) -EUR 7,103,913 JPY 946,293,504 06/07/2021 Barclays (12,571,254) -EUR 723,162 JPY 96,103,623 06/07/2021 BNP Paribas (1,052,895) -EUR 109,293 JPY 14,568,599 06/07/2021 Citibank (203,418) -EUR 240,236 JPY 32,039,288 06/07/2021 Goldman Sachs (463,179) -EUR 127,792,024 JPY 17,119,063,037 06/07/2021 Merrill Lynch (322,368,381) (0.07)EUR 2,613,554 JPY 347,507,052 06/07/2021 RBC (3,987,464) -EUR 2,811,208 JPY 374,627,983 06/07/2021 Standard Chartered (5,129,221) -EUR 4,699,236 JPY 627,385,306 06/07/2021 Toronto-Dominion Bank (9,728,345) -EUR 4,650,286 JPY 615,856,337 04/08/2021 Barclays (4,414,858) -EUR 862,344 JPY 114,050,855 04/08/2021 Standard Chartered (665,790) -GBP 13,539,350 JPY 2,110,109,757 06/07/2021 BNP Paribas (36,006,187) (0.01)GBP 1,074 JPY 167,074 06/07/2021 Citibank (2,478) -GBP 40,625 JPY 6,315,278 06/07/2021 Goldman Sachs (91,970) -GBP 19,888 JPY 3,097,199 06/07/2021 HSBC (50,541) -GBP 1,237,119 JPY 191,400,407 06/07/2021 RBC (1,885,119) -GBP 85,806 JPY 13,218,539 04/08/2021 BNP Paribas (76,224) -GBP 414,373 JPY 64,119,064 04/08/2021 RBC (652,097) -GBP 13,287 JPY 2,056,233 04/08/2021 State Street (21,097) -JPY 217,283,252 AUD 2,621,645 06/07/2021 RBC (438,729) -JPY 5,066,176 AUD 61,057 06/07/2021 State Street (4,457) -JPY 6,690,932 AUD 80,585 04/08/2021 RBC (765) -JPY 29,592,963 EUR 225,166 02/07/2021 HSBC (823) -JPY 272,433,450 EUR 2,078,415 06/07/2021 Barclays (748,663) -
113

JPMorgan Funds - Japan Equity FundSchedule of Investments (continued)
As at 30 June 2021
Forward Currency Exchange Contracts (continued)
CurrencyPurchased Amount Purchased Currency Sold Amount Sold
MaturityDate Counterparty
UnrealisedGain/(Loss)
JPY
%of
NetAssets
JPY 1,994,037 EUR 15,250 06/07/2021 BNP Paribas (10,364) -JPY 18,268,995,656 EUR 139,079,601 06/07/2021 Toronto-Dominion Bank (11,312,495) -JPY 133,455 EUR 1,015 04/08/2021 RBC (19) -JPY 32,342,936 GBP 211,765 06/07/2021 RBC (97,476) -JPY 669,173,797 SGD 8,144,828 06/07/2021 HSBC (1,464,101) -JPY 9,439,325 SGD 115,071 06/07/2021 RBC (35,490) -JPY 5,086,268 SGD 61,971 04/08/2021 Merrill Lynch (14,709) -JPY 1,773,517,396 USD 16,217,044 06/07/2021 BNP Paribas (21,426,724) (0.01)JPY 38,673,734,883 USD 350,051,909 06/07/2021 Goldman Sachs (70,910,990) (0.02)JPY 886,849,251 USD 8,035,606 06/07/2021 HSBC (2,552,239) -JPY 614,055,968 USD 5,582,302 06/07/2021 RBC (3,807,534) -JPY 35,419,666 USD 323,103 06/07/2021 Standard Chartered (342,248) -JPY 423,296,614 USD 3,864,772 06/07/2021 State Street (4,466,258) -JPY 391,804,214 USD 3,574,658 06/07/2021 Toronto-Dominion Bank (3,848,090) -JPY 23,698,978 USD 214,513 04/08/2021 RBC (37,923) -SGD 42,302 JPY 3,506,984 06/07/2021 BNP Paribas (23,905) -SGD 1,956 JPY 162,223 06/07/2021 Citibank (1,182) -SGD 7,313,387 JPY 606,827,787 06/07/2021 Goldman Sachs (4,649,986) -SGD 35,032 JPY 2,897,756 06/07/2021 HSBC (13,211) -SGD 147,615 JPY 12,234,087 06/07/2021 Merrill Lynch (79,625) -SGD 231,151 JPY 19,157,661 06/07/2021 RBC (124,872) -SGD 47,112 JPY 3,879,649 04/08/2021 BNP Paribas (1,778) -SGD 1,646 JPY 135,779 04/08/2021 Goldman Sachs (284) -SGD 269,891 JPY 22,244,230 04/08/2021 HSBC (29,036) -SGD 89,243 JPY 7,358,224 04/08/2021 Merrill Lynch (12,434) -USD 1,525,731 JPY 168,874,773 04/08/2021 Merrill Lynch (45,216) -USD 9,365,985 JPY 1,038,606,249 04/08/2021 RBC (2,214,296) -USD 440,358 JPY 48,790,754 04/08/2021 Standard Chartered (62,984) -
Total Unrealised Loss on Forward Currency Exchange Contracts (533,199,185) (0.11)
Net Unrealised Loss on Forward Currency Exchange Contracts (105,284,907) (0.02)
114

Transferable securities and money market instruments admitted to an official exchangelisting
Equities
BermudaCredicorp Ltd. USD 135,577 16,251,615 2.56Wilson Sons Ltd., BDR BRL 294,138 3,848,914 0.61
20,100,529 3.17
BrazilAtacadao SA BRL 863,612 3,641,071 0.58B3 SA - Brasil Bolsa Balcao BRL 8,273,505 27,682,072 4.37Banco Bradesco SA, ADR Preference USD 6,003,561 31,128,464 4.91Banco BTG Pactual SA BRL 192,333 4,700,494 0.74Blau Farmaceutica SA BRL 556,926 5,342,309 0.84Bradespar SA Preference BRL 708,007 10,670,316 1.68Caixa Seguridade Participacoes S/A BRL 2,743,820 7,176,955 1.13CVC Brasil Operadora e Agencia deViagens SA BRL 684,016 3,721,331 0.59CVC Brasil Operadora e Agencia deViagens SA Rights BRL 85,367 138,331 0.02EDP - Energias do Brasil SA BRL 971,100 3,445,387 0.54Gerdau SA, ADR Preference USD 1,098,946 6,555,213 1.03Hapvida Participacoes e InvestimentosSA, Reg. S BRL 2,670,224 8,194,378 1.29Itau Unibanco Holding SA Preference BRL 5,649,755 33,958,207 5.36Itausa SA Preference BRL 5,590,604 12,542,986 1.98Localiza Rent a Car SA BRL 1,627,691 20,808,929 3.28Locaweb Servicos de Internet SA, Reg. S BRL 4,587,740 24,885,784 3.92Lojas Renner SA BRL 2,038,542 17,805,178 2.81LPS Brasil Consultoria de Imoveis SA BRL 1,110,858 978,920 0.16M Dias Branco SA BRL 248,698 1,585,862 0.25Magazine Luiza SA BRL 4,712,865 20,181,022 3.18Notre Dame Intermedica ParticipacoesSA BRL 435,733 7,342,267 1.16Petroleo Brasileiro SA, ADR Preference USD 2,629,943 30,599,387 4.83Porto Seguro SA BRL 611,163 6,505,688 1.03Raia Drogasil SA BRL 2,102,623 10,425,413 1.64Rede D’Or Sao Luiz SA, Reg. S BRL 230,481 3,171,321 0.50Rumo SA BRL 1,385,056 5,351,863 0.84Sul America SA BRL 846,025 5,902,559 0.93Suzano SA BRL 548,959 6,593,065 1.04TOTVS SA BRL 665,895 5,030,813 0.79Vale SA BRL 2,579,549 58,733,545 9.26WEG SA BRL 2,486,030 16,934,267 2.67
401,733,397 63.35
Cayman IslandsPagseguro Digital Ltd. ‘A’ USD 51,181 2,817,258 0.45StoneCo Ltd. ‘A’ USD 64,079 4,322,770 0.68XP, Inc. ‘A’ USD 187,777 8,309,132 1.31
15,449,160 2.44
ChileBanco Santander Chile, ADR USD 447,040 8,940,800 1.41
8,940,800 1.41
LuxembourgGlobant SA USD 87,707 19,634,966 3.10
19,634,966 3.10
MexicoAmerica Movil SAB de CV, ADR ‘L’ USD 472,702 7,163,799 1.13Bolsa Mexicana de Valores SAB de CV MXN 3,117,230 6,749,988 1.06Corp. Inmobiliaria Vesta SAB de CV MXN 3,072,603 5,942,734 0.94Grupo Aeroportuario del Centro NorteSAB de CV MXN 491,284 3,167,809 0.50Grupo Aeroportuario del Pacifico SAB deCV ‘B’ MXN 737,521 7,876,555 1.24Grupo Aeroportuario del Sureste SAB deCV, ADR USD 99,683 18,446,838 2.91Grupo Financiero Banorte SAB de CV ‘O’ MXN 3,681,928 23,914,611 3.77Grupo Mexico SAB de CV MXN 2,503,191 11,707,221 1.85PLA Administradora Industrial S de RL deCV, REIT MXN 1,172,595 1,777,527 0.28Qualitas Controladora SAB de CV MXN 531,104 2,508,416 0.39Regional SAB de CV MXN 1,512,094 8,898,211 1.40Wal-Mart de Mexico SAB de CV MXN 6,871,060 23,012,705 3.63
121,166,414 19.10
PanamaCopa Holdings SA ‘A’ USD 67,043 5,058,730 0.80Intercorp Financial Services, Inc. USD 128,396 3,262,542 0.51
8,321,272 1.31
United States of AmericaFirstCash, Inc. USD 79,965 6,149,708 0.97MercadoLibre, Inc. USD 17,538 27,624,805 4.35
33,774,513 5.32
Total Equities 629,121,051 99.20
Total Transferable securities and money market instrumentsadmitted to an official exchange listing 629,121,051 99.20
Units of authorised UCITS or other collective investment undertakings
Collective Investment Schemes - UCITS
LuxembourgJPMorgan USD Liquidity LVNAV Fund -JPM USD Liquidity LVNAV X (dist.)† USD 3,310,079 3,310,079 0.52
3,310,079 0.52
Total Collective Investment Schemes - UCITS 3,310,079 0.52
Total Units of authorised UCITS or other collective investmentundertakings 3,310,079 0.52
Total Investments 632,431,130 99.72
Cash 1,357,422 0.21
Other Assets/(Liabilities) 401,888 0.07
Total Net Assets 634,190,440 100.00
† Related Party Fund.
Geographic Allocation of Portfolio as at 30 June 2021 % of Net AssetsBrazil 63.35Mexico 19.10United States of America 5.32Luxembourg 3.62Bermuda 3.17Cayman Islands 2.44Chile 1.41Panama 1.31Total Investments 99.72Cash and other assets/(liabilities) 0.28
Total 100.00
115
JPMorgan Funds - Latin America Equity FundSchedule of Investments
As at 30 June 2021
Investments Currency
Quantity/Nominal
Value
MarketValue
USD
%of
NetAssets Investments Currency
Quantity/Nominal
Value
MarketValue
USD
%of
NetAssets

Transferable securities and money market instruments admitted to an official exchangelisting
Equities
CyprusMD Medical Group Investments plc,Reg. S, GDR USD 419,174 4,149,823 0.94QIWI plc, ADR USD 562,539 5,999,478 1.35
10,149,301 2.29
JerseyPolymetal International plc GBP 392,737 8,485,030 1.91
8,485,030 1.91
KazakhstanHalyk Savings Bank of Kazakhstan JSC,Reg. S, GDR USD 661,665 10,242,574 2.31Kaspi.KZ JSC, Reg. S, GDR USD 106,821 10,874,378 2.45
21,116,952 4.76
NetherlandsX5 Retail Group NV, Reg. S, GDR USD 624,382 22,075,026 4.97Yandex NV ‘A’ USD 192,317 13,577,580 3.06
35,652,606 8.03
RussiaAlrosa PJSC USD 4,587,063 8,429,448 1.90Detsky Mir PJSC, Reg. S USD 2,910,772 6,033,572 1.36Gazprom Neft PJSC USD 1,066,829 6,339,154 1.43Gazprom PJSC, ADR USD 1,188,007 9,084,690 2.05Gazprom PJSC USD 9,157,606 35,226,683 7.94Globaltruck Management PJSC RUB 1,014,448 484,612 0.11LUKOIL PJSC, ADR USD 165,845 15,339,004 3.46LUKOIL PJSC USD 183,802 17,017,466 3.84Magnit PJSC USD 131,769 9,582,638 2.16MMC Norilsk Nickel PJSC, ADR USD 239,208 8,140,248 1.83MMC Norilsk Nickel PJSC USD 90,515 30,808,666 6.94Moscow Exchange MICEX-RTS PJSC USD 6,896,012 16,040,108 3.61Novatek PJSC, Reg. S, GDR USD 100,047 21,995,333 4.96Novolipetsk Steel PJSC, Reg. S, GDR USD 590,047 18,639,585 4.20Polyus PJSC, Reg. S, GDR USD 115,318 11,050,347 2.49Rosneft Oil Co. PJSC, Reg. S, GDR USD 1,377,271 10,657,323 2.40Rosneft Oil Co. PJSC USD 2,405,262 18,738,963 4.22Rostelecom PJSC USD 5,759,712 8,049,386 1.81RusHydro PJSC USD 549,811,229 6,544,568 1.47Sberbank of Russia PJSC USD 7,533,037 31,457,964 7.09Severstal PAO, Reg. S, GDR USD 497,267 10,740,967 2.42Severstal PAO USD 447,011 9,666,856 2.18Sistema PJSFC USD 17,388,355 7,521,010 1.69Surgutneftegas PJSC Preference USD 25,799,825 16,362,031 3.69Tatneft PJSC Preference USD 526,922 3,630,274 0.82Tatneft PJSC USD 1,147,465 8,373,830 1.89
345,954,726 77.96
United States of AmericaEPAM Systems, Inc. USD 25,291 13,012,472 2.93
13,012,472 2.93
Virgin Islands, BritishFix Price Group Ltd., Reg. S, GDR USD 592,420 5,183,675 1.17
5,183,675 1.17
Total Equities 439,554,762 99.05
Total Transferable securities and money market instrumentsadmitted to an official exchange listing 439,554,762 99.05
Units of authorised UCITS or other collective investment undertakings
Collective Investment Schemes - UCITS
LuxembourgJPMorgan USD Liquidity LVNAV Fund -JPM USD Liquidity LVNAV X (dist.)† USD 2,386,404 2,386,404 0.54
2,386,404 0.54
Total Collective Investment Schemes - UCITS 2,386,404 0.54
Total Units of authorised UCITS or other collective investmentundertakings 2,386,404 0.54
Total Investments 441,941,166 99.59
Cash 1,503,120 0.34
Other Assets/(Liabilities) 302,116 0.07
Total Net Assets 443,746,402 100.00
† Related Party Fund.
Geographic Allocation of Portfolio as at 30 June 2021 % of Net AssetsRussia 77.96Netherlands 8.03Kazakhstan 4.76United States of America 2.93Cyprus 2.29Jersey 1.91Virgin Islands, British 1.17Luxembourg 0.54Total Investments 99.59Cash and other assets/(liabilities) 0.41
Total 100.00
116
JPMorgan Funds - Russia FundSchedule of Investments
As at 30 June 2021
Investments Currency
Quantity/Nominal
Value
MarketValue
USD
%of
NetAssets Investments Currency
Quantity/Nominal
Value
MarketValue
USD
%of
NetAssets

Transferable securities and money market instruments admitted to an official exchangelisting
Equities
AustraliaCSL Ltd. AUD 138,594 29,654,389 1.31Mesoblast Ltd. AUD 9,694,692 14,384,382 0.63
44,038,771 1.94
BelgiumBiocartis Group NV, Reg. S EUR 304,810 1,464,037 0.06
1,464,037 0.06
Cayman IslandsJW Cayman Therapeutics Co. Ltd.,Reg. S HKD 441,000 1,418,186 0.06Legend Biotech Corp., ADR USD 70,637 2,868,569 0.13MeiraGTx Holdings plc USD 286,126 4,396,326 0.19
8,683,081 0.38
ChinaWuXi AppTec Co. Ltd., Reg. S ‘H’ HKD 1,545,352 36,045,823 1.58
36,045,823 1.58
FranceCellectis SA EUR 307,706 4,762,679 0.21
4,762,679 0.21
GermanyEvotec SE EUR 568,883 25,956,204 1.14Merck KGaA EUR 180,357 34,693,840 1.53
60,650,044 2.67
IsraelGamida Cell Ltd. USD 1,128,294 7,435,458 0.33
7,435,458 0.33
JapanAnGes, Inc. JPY 1,321,800 10,676,049 0.47Astellas Pharma, Inc. JPY 2,720,500 47,547,181 2.09Sumitomo Dainippon Pharma Co. Ltd. JPY 1,265,300 26,635,247 1.17Takara Bio, Inc. JPY 836,400 22,416,391 0.98Takeda Pharmaceutical Co. Ltd. JPY 785,200 26,364,633 1.16
133,639,501 5.87
NetherlandsImmatics NV USD 107,747 1,244,478 0.06ProQR Therapeutics NV USD 1,017,235 6,795,130 0.30uniQure NV USD 981,553 30,128,769 1.32
38,168,377 1.68
NorwayArcticZymes Technologies ASA NOK 558,952 5,995,227 0.26
5,995,227 0.26
SingaporeWaVe Life Sciences Ltd. USD 605,989 3,972,258 0.17
3,972,258 0.17
South KoreaAnterogen Co. Ltd. KRW 203,169 12,074,235 0.53Biosolution Co. Ltd. KRW 142,256 4,006,777 0.18Green Cross Cell Corp. KRW 206,445 7,504,782 0.33Medipost Co. Ltd. KRW 350,069 9,720,610 0.43OliX Pharmaceuticals, Inc. KRW 223,470 8,736,791 0.38Pharmicell Co. Ltd. KRW 941,552 15,145,195 0.67SCM Lifescience Co. Ltd. KRW 247,057 7,095,255 0.31
64,283,645 2.83
SwitzerlandCRISPR Therapeutics AG USD 404,587 60,510,032 2.66Lonza Group AG CHF 46,919 33,296,634 1.46Novartis AG CHF 486,193 44,444,804 1.95Roche Holding AG CHF 124,087 47,048,747 2.07
185,300,217 8.14
TaiwanEver Supreme Bio Technology Co. Ltd. TWD 591,000 8,793,635 0.39
8,793,635 0.39
United KingdomAdaptimmune Therapeutics plc, ADR USD 1,806,376 7,650,002 0.34Autolus Therapeutics plc, ADR USD 741,069 4,753,958 0.21Orchard Therapeutics plc, ADR USD 2,181,349 9,521,588 0.42Oxford Biomedica plc GBP 455,639 8,286,381 0.36
30,211,929 1.33
United States of AmericaAbeona Therapeutics, Inc. USD 1,789,945 2,872,862 0.13Adverum Biotechnologies, Inc. USD 2,302,397 7,931,758 0.35Akouos, Inc. USD 200,465 2,464,717 0.11Allogene Therapeutics, Inc. USD 1,039,841 26,084,412 1.15Allovir, Inc. USD 521,087 10,270,625 0.45Alnylam Pharmaceuticals, Inc. USD 254,233 42,343,777 1.86Amgen, Inc. USD 140,175 33,982,625 1.49Amicus Therapeutics, Inc. USD 1,862,413 18,074,718 0.79Arcturus Therapeutics Holdings, Inc. USD 256,355 8,809,640 0.39Arrowhead Pharmaceuticals, Inc. USD 265,695 21,842,786 0.96Atara Biotherapeutics, Inc. USD 1,373,511 21,371,831 0.94Athersys, Inc. USD 3,731,240 5,205,080 0.23Avrobio, Inc. USD 947,544 8,556,322 0.38Beam Therapeutics, Inc. USD 440,843 50,048,906 2.20Berkeley Lights, Inc. USD 112,305 5,092,470 0.22Biogen, Inc. USD 145,311 50,188,240 2.21BioLife Solutions, Inc. USD 438,428 18,740,605 0.82BioMarin Pharmaceutical, Inc. USD 279,653 23,232,173 1.02Bio-Techne Corp. USD 127,947 57,310,020 2.52Bluebird Bio, Inc. USD 1,106,746 33,523,336 1.47BrainStorm Cell Therapeutics, Inc. USD 627,404 2,374,724 0.10Bristol-Myers Squibb Co. USD 466,248 30,933,224 1.36Brooks Automation, Inc. USD 262,940 24,846,515 1.09Catalent, Inc. USD 285,854 30,832,212 1.35Charles River LaboratoriesInternational, Inc. USD 129,844 47,875,430 2.10Dicerna Pharmaceuticals, Inc. USD 1,064,622 38,853,380 1.71Editas Medicine, Inc. USD 1,057,118 48,463,575 2.13Fate Therapeutics, Inc. USD 373,117 33,110,403 1.46Flexion Therapeutics, Inc. USD 570,146 4,601,078 0.20Fulgent Genetics, Inc. USD 312,697 28,838,481 1.27Generation Bio Co. USD 659,476 17,453,032 0.77Gilead Sciences, Inc. USD 487,039 33,264,764 1.46Homology Medicines, Inc. USD 1,074,732 7,437,145 0.33Illumina, Inc. USD 86,008 40,841,759 1.79ImmunityBio, Inc. USD 516,277 7,465,365 0.33Inovio Pharmaceuticals, Inc. USD 3,298,716 30,496,629 1.34Intellia Therapeutics, Inc. USD 831,556 132,674,760 5.83Invitae Corp. USD 502,852 16,948,627 0.74Ionis Pharmaceuticals, Inc. USD 653,762 25,745,148 1.13Iovance Biotherapeutics, Inc. USD 1,157,172 29,970,755 1.32Krystal Biotech, Inc. USD 402,909 27,391,768 1.20Lineage Cell Therapeutics, Inc. USD 1,905,479 5,678,327 0.25Magenta Therapeutics, Inc. USD 455,897 4,713,975 0.21Moderna, Inc. USD 180,625 43,104,350 1.89Mustang Bio, Inc. USD 1,153,908 3,825,205 0.17Nkarta, Inc. USD 248,539 7,710,922 0.34Passage Bio, Inc. USD 747,809 10,001,945 0.44Pfizer, Inc. USD 651,003 25,307,742 1.11Poseida Therapeutics, Inc. USD 275,520 2,701,474 0.12Precigen, Inc. USD 1,613,415 10,301,655 0.45Precision BioSciences, Inc. USD 494,749 5,697,035 0.25PTC Therapeutics, Inc. USD 386,479 16,193,470 0.71REGENXBIO, Inc. USD 915,762 35,055,369 1.54Repligen Corp. USD 163,913 32,841,609 1.44Replimune Group, Inc. USD 331,272 12,861,635 0.57Rocket Pharmaceuticals, Inc. USD 750,268 32,299,037 1.42Rubius Therapeutics, Inc. USD 466,057 11,043,221 0.49Sangamo Therapeutics, Inc. USD 3,191,965 36,468,200 1.60Sarepta Therapeutics, Inc. USD 603,881 47,308,038 2.08Selecta Biosciences, Inc. USD 1,807,505 7,492,108 0.33Sorrento Therapeutics, Inc. USD 2,353,183 22,649,386 1.00SQZ Biotechnologies Co. USD 173,289 2,410,450 0.11Taysha Gene Therapies, Inc. USD 124,972 2,810,620 0.12TCR2 Therapeutics, Inc. USD 590,543 9,741,007 0.43Translate Bio, Inc. USD 1,217,927 30,795,284 1.35Twist Bioscience Corp. USD 187,683 24,963,716 1.10Ultragenyx Pharmaceutical, Inc. USD 234,883 22,440,722 0.99Vericel Corp. USD 764,432 41,520,124 1.82
117
JPMorgan Funds - Thematics - Genetic TherapiesSchedule of Investments
As at 30 June 2021
Investments Currency
Quantity/Nominal
Value
MarketValue
USD
%of
NetAssets Investments Currency
Quantity/Nominal
Value
MarketValue
USD
%of
NetAssets
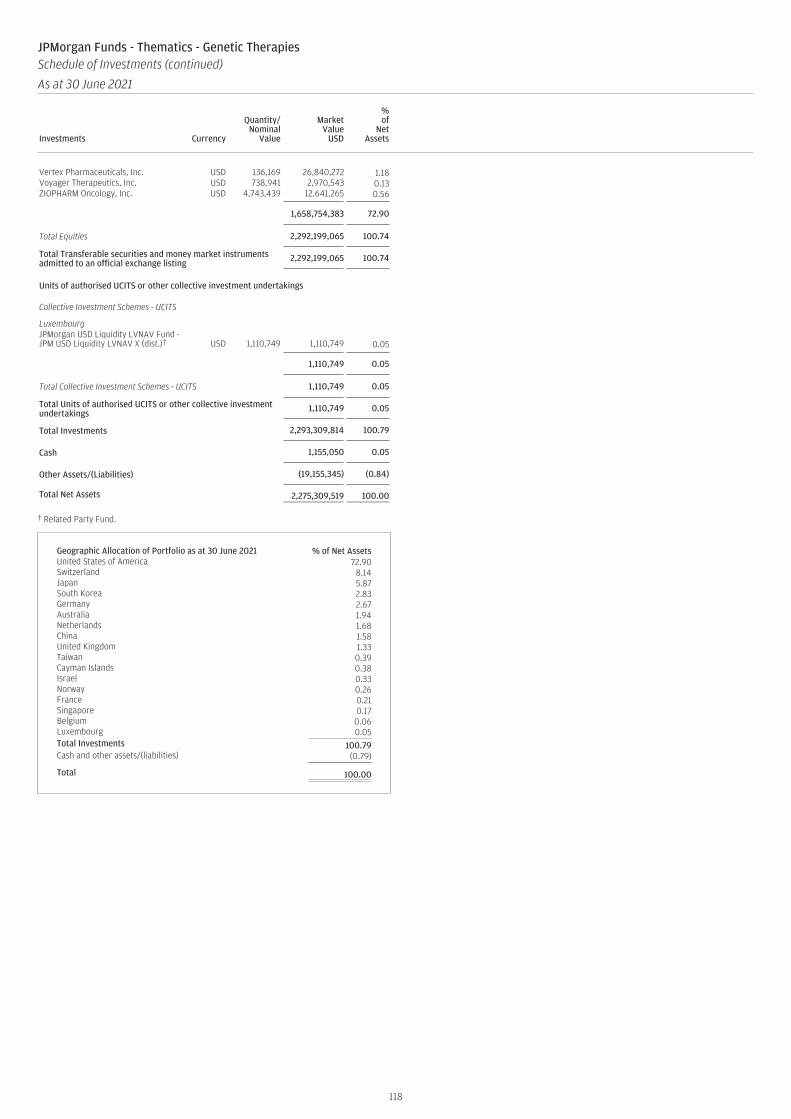
Vertex Pharmaceuticals, Inc. USD 136,169 26,840,272 1.18Voyager Therapeutics, Inc. USD 738,941 2,970,543 0.13ZIOPHARM Oncology, Inc. USD 4,743,439 12,641,265 0.56
1,658,754,383 72.90
Total Equities 2,292,199,065 100.74
Total Transferable securities and money market instrumentsadmitted to an official exchange listing 2,292,199,065 100.74
Units of authorised UCITS or other collective investment undertakings
Collective Investment Schemes - UCITS
LuxembourgJPMorgan USD Liquidity LVNAV Fund -JPM USD Liquidity LVNAV X (dist.)† USD 1,110,749 1,110,749 0.05
1,110,749 0.05
Total Collective Investment Schemes - UCITS 1,110,749 0.05
Total Units of authorised UCITS or other collective investmentundertakings 1,110,749 0.05
Total Investments 2,293,309,814 100.79
Cash 1,155,050 0.05
Other Assets/(Liabilities) (19,155,345) (0.84)
Total Net Assets 2,275,309,519 100.00
† Related Party Fund.
Geographic Allocation of Portfolio as at 30 June 2021 % of Net AssetsUnited States of America 72.90Switzerland 8.14Japan 5.87South Korea 2.83Germany 2.67Australia 1.94Netherlands 1.68China 1.58United Kingdom 1.33Taiwan 0.39Cayman Islands 0.38Israel 0.33Norway 0.26France 0.21Singapore 0.17Belgium 0.06Luxembourg 0.05Total Investments 100.79Cash and other assets/(liabilities) (0.79)
Total 100.00
118
JPMorgan Funds - Thematics - Genetic TherapiesSchedule of Investments (continued)
As at 30 June 2021
Investments Currency
Quantity/Nominal
Value
MarketValue
USD
%of
NetAssets Investments Currency
Quantity/Nominal
Value
MarketValue
USD
%of
NetAssets
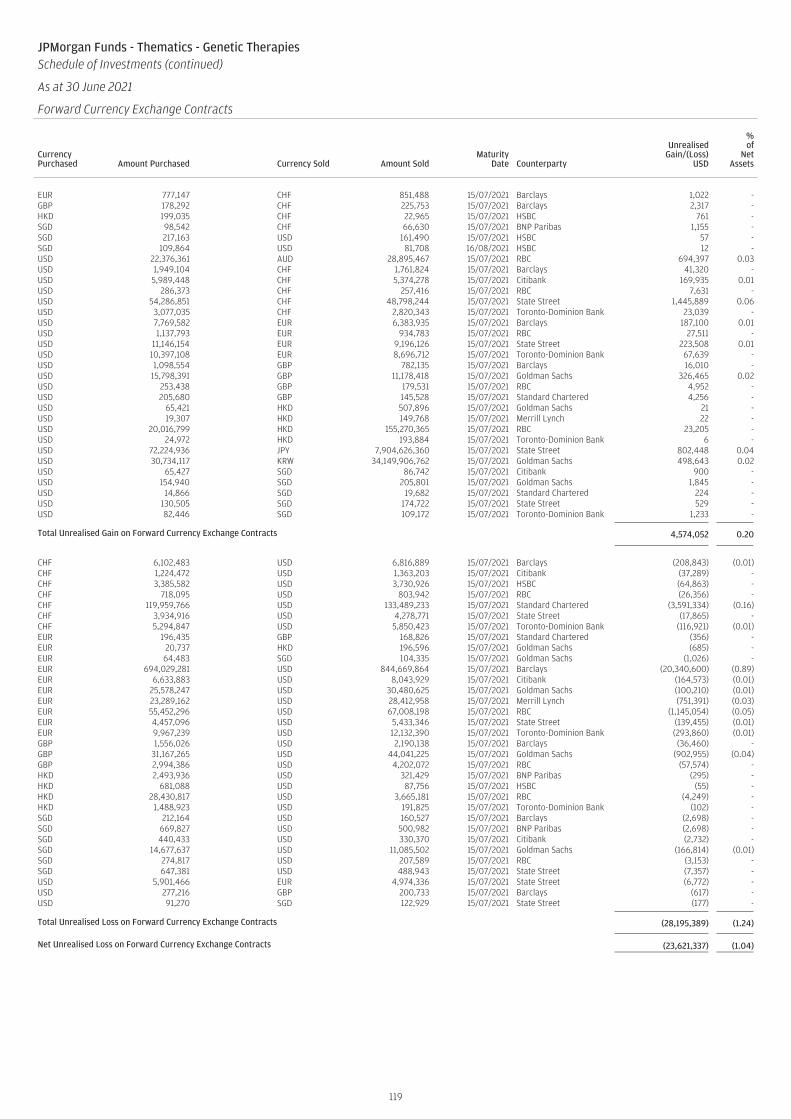
JPMorgan Funds - Thematics - Genetic TherapiesSchedule of Investments (continued)
As at 30 June 2021
Forward Currency Exchange Contracts (continued)
CurrencyPurchased Amount Purchased Currency Sold Amount Sold
MaturityDate Counterparty
UnrealisedGain/(Loss)
USD
%of
NetAssets
EUR 777,147 CHF 851,488 15/07/2021 Barclays 1,022 -GBP 178,292 CHF 225,753 15/07/2021 Barclays 2,317 -HKD 199,035 CHF 22,965 15/07/2021 HSBC 761 -SGD 98,542 CHF 66,630 15/07/2021 BNP Paribas 1,155 -SGD 217,163 USD 161,490 15/07/2021 HSBC 57 -SGD 109,864 USD 81,708 16/08/2021 HSBC 12 -USD 22,376,361 AUD 28,895,467 15/07/2021 RBC 694,397 0.03USD 1,949,104 CHF 1,761,824 15/07/2021 Barclays 41,320 -USD 5,989,448 CHF 5,374,278 15/07/2021 Citibank 169,935 0.01USD 286,373 CHF 257,416 15/07/2021 RBC 7,631 -USD 54,286,851 CHF 48,798,244 15/07/2021 State Street 1,445,889 0.06USD 3,077,035 CHF 2,820,343 15/07/2021 Toronto-Dominion Bank 23,039 -USD 7,769,582 EUR 6,383,935 15/07/2021 Barclays 187,100 0.01USD 1,137,793 EUR 934,783 15/07/2021 RBC 27,511 -USD 11,146,154 EUR 9,196,126 15/07/2021 State Street 223,508 0.01USD 10,397,108 EUR 8,696,712 15/07/2021 Toronto-Dominion Bank 67,639 -USD 1,098,554 GBP 782,135 15/07/2021 Barclays 16,010 -USD 15,798,391 GBP 11,178,418 15/07/2021 Goldman Sachs 326,465 0.02USD 253,438 GBP 179,531 15/07/2021 RBC 4,952 -USD 205,680 GBP 145,528 15/07/2021 Standard Chartered 4,256 -USD 65,421 HKD 507,896 15/07/2021 Goldman Sachs 21 -USD 19,307 HKD 149,768 15/07/2021 Merrill Lynch 22 -USD 20,016,799 HKD 155,270,365 15/07/2021 RBC 23,205 -USD 24,972 HKD 193,884 15/07/2021 Toronto-Dominion Bank 6 -USD 72,224,936 JPY 7,904,626,360 15/07/2021 State Street 802,448 0.04USD 30,734,117 KRW 34,149,906,762 15/07/2021 Goldman Sachs 498,643 0.02USD 65,427 SGD 86,742 15/07/2021 Citibank 900 -USD 154,940 SGD 205,801 15/07/2021 Goldman Sachs 1,845 -USD 14,866 SGD 19,682 15/07/2021 Standard Chartered 224 -USD 130,505 SGD 174,722 15/07/2021 State Street 529 -USD 82,446 SGD 109,172 15/07/2021 Toronto-Dominion Bank 1,233 -
Total Unrealised Gain on Forward Currency Exchange Contracts 4,574,052 0.20
CHF 6,102,483 USD 6,816,889 15/07/2021 Barclays (208,843) (0.01)CHF 1,224,472 USD 1,363,203 15/07/2021 Citibank (37,289) -CHF 3,385,582 USD 3,730,926 15/07/2021 HSBC (64,863) -CHF 718,095 USD 803,942 15/07/2021 RBC (26,356) -CHF 119,959,766 USD 133,489,233 15/07/2021 Standard Chartered (3,591,334) (0.16)CHF 3,934,916 USD 4,278,771 15/07/2021 State Street (17,865) -CHF 5,294,847 USD 5,850,423 15/07/2021 Toronto-Dominion Bank (116,921) (0.01)EUR 196,435 GBP 168,826 15/07/2021 Standard Chartered (356) -EUR 20,737 HKD 196,596 15/07/2021 Goldman Sachs (685) -EUR 64,483 SGD 104,335 15/07/2021 Goldman Sachs (1,026) -EUR 694,029,281 USD 844,669,864 15/07/2021 Barclays (20,340,600) (0.89)EUR 6,633,883 USD 8,043,929 15/07/2021 Citibank (164,573) (0.01)EUR 25,578,247 USD 30,480,625 15/07/2021 Goldman Sachs (100,210) (0.01)EUR 23,289,162 USD 28,412,958 15/07/2021 Merrill Lynch (751,391) (0.03)EUR 55,452,296 USD 67,008,198 15/07/2021 RBC (1,145,054) (0.05)EUR 4,457,096 USD 5,433,346 15/07/2021 State Street (139,455) (0.01)EUR 9,967,239 USD 12,132,390 15/07/2021 Toronto-Dominion Bank (293,860) (0.01)GBP 1,556,026 USD 2,190,138 15/07/2021 Barclays (36,460) -GBP 31,167,265 USD 44,041,225 15/07/2021 Goldman Sachs (902,955) (0.04)GBP 2,994,386 USD 4,202,072 15/07/2021 RBC (57,574) -HKD 2,493,936 USD 321,429 15/07/2021 BNP Paribas (295) -HKD 681,088 USD 87,756 15/07/2021 HSBC (55) -HKD 28,430,817 USD 3,665,181 15/07/2021 RBC (4,249) -HKD 1,488,923 USD 191,825 15/07/2021 Toronto-Dominion Bank (102) -SGD 212,164 USD 160,527 15/07/2021 Barclays (2,698) -SGD 669,827 USD 500,982 15/07/2021 BNP Paribas (2,698) -SGD 440,433 USD 330,370 15/07/2021 Citibank (2,732) -SGD 14,677,637 USD 11,085,502 15/07/2021 Goldman Sachs (166,814) (0.01)SGD 274,817 USD 207,589 15/07/2021 RBC (3,153) -SGD 647,381 USD 488,943 15/07/2021 State Street (7,357) -USD 5,901,466 EUR 4,974,336 15/07/2021 State Street (6,772) -USD 277,216 GBP 200,733 15/07/2021 Barclays (617) -USD 91,270 SGD 122,929 15/07/2021 State Street (177) -
Total Unrealised Loss on Forward Currency Exchange Contracts (28,195,389) (1.24)
Net Unrealised Loss on Forward Currency Exchange Contracts (23,621,337) (1.04)
119
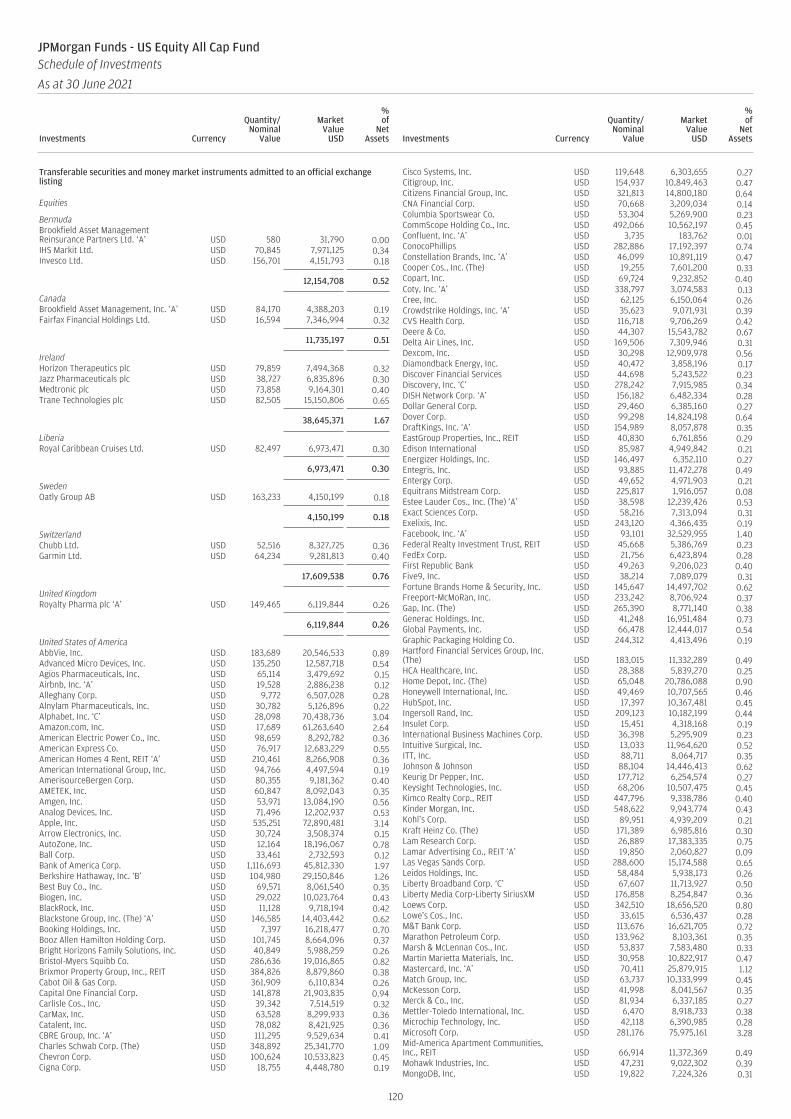
Transferable securities and money market instruments admitted to an official exchangelisting
Equities
BermudaBrookfield Asset ManagementReinsurance Partners Ltd. ‘A’ USD 580 31,790 0.00IHS Markit Ltd. USD 70,845 7,971,125 0.34Invesco Ltd. USD 156,701 4,151,793 0.18
12,154,708 0.52
CanadaBrookfield Asset Management, Inc. ‘A’ USD 84,170 4,388,203 0.19Fairfax Financial Holdings Ltd. USD 16,594 7,346,994 0.32
11,735,197 0.51
IrelandHorizon Therapeutics plc USD 79,859 7,494,368 0.32Jazz Pharmaceuticals plc USD 38,727 6,835,896 0.30Medtronic plc USD 73,858 9,164,301 0.40Trane Technologies plc USD 82,505 15,150,806 0.65
38,645,371 1.67
LiberiaRoyal Caribbean Cruises Ltd. USD 82,497 6,973,471 0.30
6,973,471 0.30
SwedenOatly Group AB USD 163,233 4,150,199 0.18
4,150,199 0.18
SwitzerlandChubb Ltd. USD 52,516 8,327,725 0.36Garmin Ltd. USD 64,234 9,281,813 0.40
17,609,538 0.76
United KingdomRoyalty Pharma plc ‘A’ USD 149,465 6,119,844 0.26
6,119,844 0.26
United States of AmericaAbbVie, Inc. USD 183,689 20,546,533 0.89Advanced Micro Devices, Inc. USD 135,250 12,587,718 0.54Agios Pharmaceuticals, Inc. USD 65,114 3,479,692 0.15Airbnb, Inc. ‘A’ USD 19,528 2,886,238 0.12Alleghany Corp. USD 9,772 6,507,028 0.28Alnylam Pharmaceuticals, Inc. USD 30,782 5,126,896 0.22Alphabet, Inc. ‘C’ USD 28,098 70,438,736 3.04Amazon.com, Inc. USD 17,689 61,263,640 2.64American Electric Power Co., Inc. USD 98,659 8,292,782 0.36American Express Co. USD 76,917 12,683,229 0.55American Homes 4 Rent, REIT ‘A’ USD 210,461 8,266,908 0.36American International Group, Inc. USD 94,766 4,497,594 0.19AmerisourceBergen Corp. USD 80,355 9,181,362 0.40AMETEK, Inc. USD 60,847 8,092,043 0.35Amgen, Inc. USD 53,971 13,084,190 0.56Analog Devices, Inc. USD 71,496 12,202,937 0.53Apple, Inc. USD 535,251 72,890,481 3.14Arrow Electronics, Inc. USD 30,724 3,508,374 0.15AutoZone, Inc. USD 12,164 18,196,067 0.78Ball Corp. USD 33,461 2,732,593 0.12Bank of America Corp. USD 1,116,693 45,812,330 1.97Berkshire Hathaway, Inc. ‘B’ USD 104,980 29,150,846 1.26Best Buy Co., Inc. USD 69,571 8,061,540 0.35Biogen, Inc. USD 29,022 10,023,764 0.43BlackRock, Inc. USD 11,128 9,718,194 0.42Blackstone Group, Inc. (The) ‘A’ USD 146,585 14,403,442 0.62Booking Holdings, Inc. USD 7,397 16,218,477 0.70Booz Allen Hamilton Holding Corp. USD 101,745 8,664,096 0.37Bright Horizons Family Solutions, Inc. USD 40,849 5,988,259 0.26Bristol-Myers Squibb Co. USD 286,636 19,016,865 0.82Brixmor Property Group, Inc., REIT USD 384,826 8,879,860 0.38Cabot Oil & Gas Corp. USD 361,909 6,110,834 0.26Capital One Financial Corp. USD 141,878 21,903,835 0.94Carlisle Cos., Inc. USD 39,342 7,514,519 0.32CarMax, Inc. USD 63,528 8,299,933 0.36Catalent, Inc. USD 78,082 8,421,925 0.36CBRE Group, Inc. ‘A’ USD 111,295 9,529,634 0.41Charles Schwab Corp. (The) USD 348,892 25,341,770 1.09Chevron Corp. USD 100,624 10,533,823 0.45Cigna Corp. USD 18,755 4,448,780 0.19
Cisco Systems, Inc. USD 119,648 6,303,655 0.27Citigroup, Inc. USD 154,937 10,849,463 0.47Citizens Financial Group, Inc. USD 321,813 14,800,180 0.64CNA Financial Corp. USD 70,668 3,209,034 0.14Columbia Sportswear Co. USD 53,304 5,269,900 0.23CommScope Holding Co., Inc. USD 492,066 10,562,197 0.45Confluent, Inc. ‘A’ USD 3,735 183,762 0.01ConocoPhillips USD 282,886 17,192,397 0.74Constellation Brands, Inc. ‘A’ USD 46,099 10,891,119 0.47Cooper Cos., Inc. (The) USD 19,255 7,601,200 0.33Copart, Inc. USD 69,724 9,232,852 0.40Coty, Inc. ‘A’ USD 338,797 3,074,583 0.13Cree, Inc. USD 62,125 6,150,064 0.26Crowdstrike Holdings, Inc. ‘A’ USD 35,623 9,071,931 0.39CVS Health Corp. USD 116,718 9,706,269 0.42Deere & Co. USD 44,307 15,543,782 0.67Delta Air Lines, Inc. USD 169,506 7,309,946 0.31Dexcom, Inc. USD 30,298 12,909,978 0.56Diamondback Energy, Inc. USD 40,472 3,858,196 0.17Discover Financial Services USD 44,698 5,243,522 0.23Discovery, Inc. ‘C’ USD 278,242 7,915,985 0.34DISH Network Corp. ‘A’ USD 156,182 6,482,334 0.28Dollar General Corp. USD 29,460 6,385,160 0.27Dover Corp. USD 99,298 14,824,198 0.64DraftKings, Inc. ‘A’ USD 154,989 8,057,878 0.35EastGroup Properties, Inc., REIT USD 40,830 6,761,856 0.29Edison International USD 85,987 4,949,842 0.21Energizer Holdings, Inc. USD 146,497 6,352,110 0.27Entegris, Inc. USD 93,885 11,472,278 0.49Entergy Corp. USD 49,652 4,971,903 0.21Equitrans Midstream Corp. USD 225,817 1,916,057 0.08Estee Lauder Cos., Inc. (The) ‘A’ USD 38,598 12,239,426 0.53Exact Sciences Corp. USD 58,216 7,313,094 0.31Exelixis, Inc. USD 243,120 4,366,435 0.19Facebook, Inc. ‘A’ USD 93,101 32,529,955 1.40Federal Realty Investment Trust, REIT USD 45,668 5,386,769 0.23FedEx Corp. USD 21,756 6,423,894 0.28First Republic Bank USD 49,263 9,206,023 0.40Five9, Inc. USD 38,214 7,089,079 0.31Fortune Brands Home & Security, Inc. USD 145,647 14,497,702 0.62Freeport-McMoRan, Inc. USD 233,242 8,706,924 0.37Gap, Inc. (The) USD 265,390 8,771,140 0.38Generac Holdings, Inc. USD 41,248 16,951,484 0.73Global Payments, Inc. USD 66,478 12,444,017 0.54Graphic Packaging Holding Co. USD 244,312 4,413,496 0.19Hartford Financial Services Group, Inc.(The) USD 183,015 11,332,289 0.49HCA Healthcare, Inc. USD 28,388 5,839,270 0.25Home Depot, Inc. (The) USD 65,048 20,786,088 0.90Honeywell International, Inc. USD 49,469 10,707,565 0.46HubSpot, Inc. USD 17,397 10,367,481 0.45Ingersoll Rand, Inc. USD 209,123 10,182,199 0.44Insulet Corp. USD 15,451 4,318,168 0.19International Business Machines Corp. USD 36,398 5,295,909 0.23Intuitive Surgical, Inc. USD 13,033 11,964,620 0.52ITT, Inc. USD 88,711 8,064,717 0.35Johnson & Johnson USD 88,104 14,446,413 0.62Keurig Dr Pepper, Inc. USD 177,712 6,254,574 0.27Keysight Technologies, Inc. USD 68,206 10,507,475 0.45Kimco Realty Corp., REIT USD 447,796 9,338,786 0.40Kinder Morgan, Inc. USD 548,622 9,943,774 0.43Kohl’s Corp. USD 89,951 4,939,209 0.21Kraft Heinz Co. (The) USD 171,389 6,985,816 0.30Lam Research Corp. USD 26,889 17,383,335 0.75Lamar Advertising Co., REIT ‘A’ USD 19,850 2,060,827 0.09Las Vegas Sands Corp. USD 288,600 15,174,588 0.65Leidos Holdings, Inc. USD 58,484 5,938,173 0.26Liberty Broadband Corp. ‘C’ USD 67,607 11,713,927 0.50Liberty Media Corp-Liberty SiriusXM USD 176,858 8,254,847 0.36Loews Corp. USD 342,510 18,656,520 0.80Lowe’s Cos., Inc. USD 33,615 6,536,437 0.28M&T Bank Corp. USD 113,676 16,621,705 0.72Marathon Petroleum Corp. USD 133,962 8,103,361 0.35Marsh & McLennan Cos., Inc. USD 53,837 7,583,480 0.33Martin Marietta Materials, Inc. USD 30,958 10,822,917 0.47Mastercard, Inc. ‘A’ USD 70,411 25,879,915 1.12Match Group, Inc. USD 63,737 10,333,999 0.45McKesson Corp. USD 41,998 8,041,567 0.35Merck & Co., Inc. USD 81,934 6,337,185 0.27Mettler-Toledo International, Inc. USD 6,470 8,918,733 0.38Microchip Technology, Inc. USD 42,118 6,390,985 0.28Microsoft Corp. USD 281,176 75,975,161 3.28Mid-America Apartment Communities,Inc., REIT USD 66,914 11,372,369 0.49Mohawk Industries, Inc. USD 47,231 9,022,302 0.39MongoDB, Inc. USD 19,822 7,224,326 0.31
120
JPMorgan Funds - US Equity All Cap FundSchedule of Investments
As at 30 June 2021
Investments Currency
Quantity/Nominal
Value
MarketValue
USD
%of
NetAssets Investments Currency
Quantity/Nominal
Value
MarketValue
USD
%of
NetAssets

Morgan Stanley USD 161,491 14,607,668 0.63Murphy USA, Inc. USD 70,996 9,417,619 0.41National Vision Holdings, Inc. USD 94,567 4,860,271 0.21Newell Brands, Inc. USD 304,611 8,254,958 0.36Nexstar Media Group, Inc. ‘A’ USD 45,551 6,602,617 0.28NextEra Energy, Inc. USD 128,954 9,536,148 0.41NIKE, Inc. ‘B’ USD 130,402 20,070,824 0.86Northern Trust Corp. USD 82,939 9,526,788 0.41NVIDIA Corp. USD 33,817 27,044,977 1.17Old Dominion Freight Line, Inc. USD 34,829 8,874,081 0.38Organon & Co. USD 80,848 2,459,396 0.11Packaging Corp. of America USD 69,737 9,397,061 0.40PayPal Holdings, Inc. USD 76,976 22,330,353 0.96Pfizer, Inc. USD 75,268 2,926,044 0.13PG&E Corp. USD 436,581 4,416,017 0.19Philip Morris International, Inc. USD 76,444 7,533,556 0.32Phillips 66 USD 91,277 7,822,439 0.34PNC Financial Services Group, Inc. (The) USD 81,645 15,606,034 0.67Post Holdings, Inc. USD 96,605 10,444,450 0.45Procter & Gamble Co. (The) USD 81,896 11,029,753 0.48Progressive Corp. (The) USD 149,822 14,739,488 0.64Public Storage, REIT USD 41,967 12,770,348 0.55QUALCOMM, Inc. USD 98,915 14,088,958 0.61Quanta Services, Inc. USD 101,740 9,192,718 0.40Ralph Lauren Corp. USD 56,641 6,618,784 0.28Rayonier, Inc., REIT USD 263,793 9,438,514 0.41Raytheon Technologies Corp. USD 161,323 13,623,727 0.59Regeneron Pharmaceuticals, Inc. USD 30,493 16,680,586 0.72Roku, Inc. USD 33,197 14,623,942 0.63S&P Global, Inc. USD 19,577 8,026,081 0.35ServiceNow, Inc. USD 16,597 9,226,272 0.40Signature Bank USD 24,870 6,085,192 0.26Snap, Inc. ‘A’ USD 113,734 7,788,504 0.34Snowflake, Inc. ‘A’ USD 14,359 3,473,514 0.15SolarEdge Technologies, Inc. USD 39,527 11,007,084 0.47Stanley Black & Decker, Inc. USD 70,272 14,391,003 0.62SYNNEX Corp. USD 47,934 5,882,940 0.25Synopsys, Inc. USD 31,810 8,745,841 0.38Sysco Corp. USD 86,229 6,575,824 0.28T Rowe Price Group, Inc. USD 42,513 8,404,182 0.36Teradyne, Inc. USD 53,374 7,122,760 0.31Tesla, Inc. USD 31,701 21,697,115 0.94Texas Instruments, Inc. USD 56,953 10,932,413 0.47Thermo Fisher Scientific, Inc. USD 17,822 9,006,526 0.39T-Mobile US, Inc. USD 66,098 9,577,600 0.41Tractor Supply Co. USD 51,427 9,644,877 0.42Travelers Cos., Inc. (The) USD 125,348 18,750,807 0.81Truist Financial Corp. USD 259,462 14,435,168 0.62Uber Technologies, Inc. USD 142,524 7,238,794 0.31UiPath, Inc. ‘A’ USD 41,448 2,834,836 0.12UnitedHealth Group, Inc. USD 59,842 23,809,935 1.03US Bancorp USD 198,220 11,268,807 0.49Verizon Communications, Inc. USD 360,848 20,184,033 0.87Viatris, Inc. USD 324,552 4,662,190 0.20Walt Disney Co. (The) USD 68,327 11,902,563 0.51Wells Fargo & Co. USD 477,596 21,441,672 0.92Welltower, Inc., REIT USD 46,933 3,918,906 0.17Westrock Co. USD 159,672 8,393,159 0.36Weyerhaeuser Co., REIT USD 344,217 11,770,500 0.51Williams Cos., Inc. (The) USD 315,874 8,359,605 0.36Xcel Energy, Inc. USD 201,012 13,191,413 0.57Zebra Technologies Corp. ‘A’ USD 21,100 11,273,414 0.49Zillow Group, Inc. ‘C’ USD 49,351 6,026,497 0.26Zscaler, Inc. USD 31,584 6,918,475 0.30
2,182,028,469 94.07
Total Equities 2,279,416,797 98.27
Total Transferable securities and money market instrumentsadmitted to an official exchange listing 2,279,416,797 98.27
Other transferable securities and money market instruments
Equities
United States of AmericaMedia General, Inc., CVR* USD 121,484 0 0.00
0 0.00
Total Equities 0 0.00
Total Other transferable securities and money marketinstruments 0 0.00
Units of authorised UCITS or other collective investment undertakings
Collective Investment Schemes - UCITS
LuxembourgJPMorgan USD Liquidity LVNAV Fund -JPM USD Liquidity LVNAV X (dist.)† USD 55,990,473 55,990,473 2.41
55,990,473 2.41
Total Collective Investment Schemes - UCITS 55,990,473 2.41
Total Units of authorised UCITS or other collective investmentundertakings 55,990,473 2.41
Total Investments 2,335,407,270 100.68
Cash (509,450) (0.02)
Other Assets/(Liabilities) (15,325,874) (0.66)
Total Net Assets 2,319,571,946 100.00
* Security is valued at its fair value under the direction of the Board of Directors.† Related Party Fund.
Geographic Allocation of Portfolio as at 30 June 2021 % of Net AssetsUnited States of America 94.07Luxembourg 2.41Ireland 1.67Switzerland 0.76Bermuda 0.52Canada 0.51Liberia 0.30United Kingdom 0.26Sweden 0.18Total Investments 100.68Cash and other assets/(liabilities) (0.68)
Total 100.00
121
JPMorgan Funds - US Equity All Cap FundSchedule of Investments (continued)
As at 30 June 2021
Investments Currency
Quantity/Nominal
Value
MarketValue
USD
%of
NetAssets Investments Currency
Quantity/Nominal
Value
MarketValue
USD
%of
NetAssets
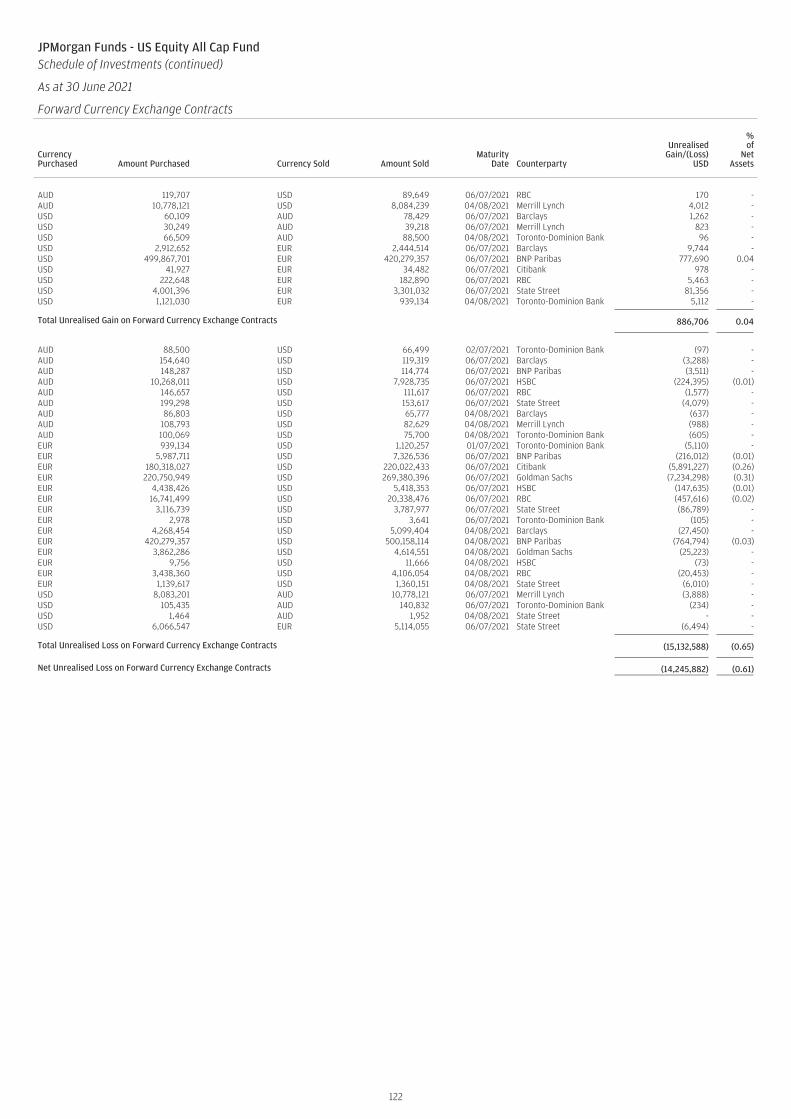
JPMorgan Funds - US Equity All Cap FundSchedule of Investments (continued)
As at 30 June 2021
Forward Currency Exchange Contracts (continued)
CurrencyPurchased Amount Purchased Currency Sold Amount Sold
MaturityDate Counterparty
UnrealisedGain/(Loss)
USD
%of
NetAssets
AUD 119,707 USD 89,649 06/07/2021 RBC 170 -AUD 10,778,121 USD 8,084,239 04/08/2021 Merrill Lynch 4,012 -USD 60,109 AUD 78,429 06/07/2021 Barclays 1,262 -USD 30,249 AUD 39,218 06/07/2021 Merrill Lynch 823 -USD 66,509 AUD 88,500 04/08/2021 Toronto-Dominion Bank 96 -USD 2,912,652 EUR 2,444,514 06/07/2021 Barclays 9,744 -USD 499,867,701 EUR 420,279,357 06/07/2021 BNP Paribas 777,690 0.04USD 41,927 EUR 34,482 06/07/2021 Citibank 978 -USD 222,648 EUR 182,890 06/07/2021 RBC 5,463 -USD 4,001,396 EUR 3,301,032 06/07/2021 State Street 81,356 -USD 1,121,030 EUR 939,134 04/08/2021 Toronto-Dominion Bank 5,112 -
Total Unrealised Gain on Forward Currency Exchange Contracts 886,706 0.04
AUD 88,500 USD 66,499 02/07/2021 Toronto-Dominion Bank (97) -AUD 154,640 USD 119,319 06/07/2021 Barclays (3,288) -AUD 148,287 USD 114,774 06/07/2021 BNP Paribas (3,511) -AUD 10,268,011 USD 7,928,735 06/07/2021 HSBC (224,395) (0.01)AUD 146,657 USD 111,617 06/07/2021 RBC (1,577) -AUD 199,298 USD 153,617 06/07/2021 State Street (4,079) -AUD 86,803 USD 65,777 04/08/2021 Barclays (637) -AUD 108,793 USD 82,629 04/08/2021 Merrill Lynch (988) -AUD 100,069 USD 75,700 04/08/2021 Toronto-Dominion Bank (605) -EUR 939,134 USD 1,120,257 01/07/2021 Toronto-Dominion Bank (5,110) -EUR 5,987,711 USD 7,326,536 06/07/2021 BNP Paribas (216,012) (0.01)EUR 180,318,027 USD 220,022,433 06/07/2021 Citibank (5,891,227) (0.26)EUR 220,750,949 USD 269,380,396 06/07/2021 Goldman Sachs (7,234,298) (0.31)EUR 4,438,426 USD 5,418,353 06/07/2021 HSBC (147,635) (0.01)EUR 16,741,499 USD 20,338,476 06/07/2021 RBC (457,616) (0.02)EUR 3,116,739 USD 3,787,977 06/07/2021 State Street (86,789) -EUR 2,978 USD 3,641 06/07/2021 Toronto-Dominion Bank (105) -EUR 4,268,454 USD 5,099,404 04/08/2021 Barclays (27,450) -EUR 420,279,357 USD 500,158,114 04/08/2021 BNP Paribas (764,794) (0.03)EUR 3,862,286 USD 4,614,551 04/08/2021 Goldman Sachs (25,223) -EUR 9,756 USD 11,666 04/08/2021 HSBC (73) -EUR 3,438,360 USD 4,106,054 04/08/2021 RBC (20,453) -EUR 1,139,617 USD 1,360,151 04/08/2021 State Street (6,010) -USD 8,083,201 AUD 10,778,121 06/07/2021 Merrill Lynch (3,888) -USD 105,435 AUD 140,832 06/07/2021 Toronto-Dominion Bank (234) -USD 1,464 AUD 1,952 04/08/2021 State Street - -USD 6,066,547 EUR 5,114,055 06/07/2021 State Street (6,494) -
Total Unrealised Loss on Forward Currency Exchange Contracts (15,132,588) (0.65)
Net Unrealised Loss on Forward Currency Exchange Contracts (14,245,882) (0.61)
122

Transferable securities and money market instruments admitted to an official exchangelisting
Equities
CanadaShopify, Inc. ‘A’ USD 340 502,607 0.03
502,607 0.03
IrelandTrane Technologies plc USD 52,340 9,611,456 0.52
9,611,456 0.52
LuxembourgSpotify Technology SA USD 17,430 4,738,607 0.26
4,738,607 0.26
NetherlandsASML Holding NV, NYRS USD 38,711 26,821,884 1.47
26,821,884 1.47
United States of AmericaABIOMED, Inc. USD 16,730 5,273,882 0.29Advanced Micro Devices, Inc. USD 205,440 19,120,301 1.05Airbnb, Inc. ‘A’ USD 3,610 533,558 0.03Align Technology, Inc. USD 43,380 26,567,647 1.45Alnylam Pharmaceuticals, Inc. USD 6,400 1,065,952 0.06Alphabet, Inc. ‘C’ USD 43,758 109,696,711 6.00Amazon.com, Inc. USD 16,880 58,461,770 3.20Amphenol Corp. ‘A’ USD 247,650 16,905,827 0.93Apple, Inc. USD 769,990 104,857,238 5.74AutoZone, Inc. USD 10,456 15,641,078 0.86Biogen, Inc. USD 55,920 19,313,929 1.06BioMarin Pharmaceutical, Inc. USD 87,040 7,230,848 0.40Blackstone Group, Inc. (The) ‘A’ USD 366,640 36,026,046 1.97Booking Holdings, Inc. USD 12,469 27,339,218 1.50Boston Beer Co., Inc. (The) ‘A’ USD 12,010 12,508,535 0.68Capital One Financial Corp. USD 29,950 4,623,831 0.25Carvana Co. USD 49,450 14,942,059 0.82Charles Schwab Corp. (The) USD 536,240 38,949,792 2.13Chipotle Mexican Grill, Inc. USD 16,780 25,828,615 1.41Cognizant Technology Solutions Corp.‘A’ USD 88,970 6,126,029 0.34Coinbase Global, Inc. ‘A’ USD 3,025 758,247 0.04Cree, Inc. USD 69,110 6,841,544 0.37Deere & Co. USD 162,538 57,021,581 3.12Dexcom, Inc. USD 25,887 11,030,451 0.60Enphase Energy, Inc. USD 5,336 980,597 0.05Estee Lauder Cos., Inc. (The) ‘A’ USD 87,746 27,824,257 1.52Etsy, Inc. USD 18,260 3,721,023 0.20Exact Sciences Corp. USD 55,390 6,958,092 0.38Facebook, Inc. ‘A’ USD 238,550 83,350,563 4.56FedEx Corp. USD 93,830 27,705,184 1.52Freeport-McMoRan, Inc. USD 727,590 27,160,935 1.49HCA Healthcare, Inc. USD 143,380 29,492,549 1.61HubSpot, Inc. USD 8,270 4,928,382 0.27Intuitive Surgical, Inc. USD 21,180 19,443,770 1.06Lam Research Corp. USD 42,770 27,650,163 1.51Lowe’s Cos., Inc. USD 148,570 28,889,437 1.58MarketAxess Holdings, Inc. USD 18,919 8,846,997 0.48Mastercard, Inc. ‘A’ USD 55,230 20,300,063 1.11Match Group, Inc. USD 120,809 19,587,367 1.07McKesson Corp. USD 149,920 28,705,932 1.57MercadoLibre, Inc. USD 5,410 8,521,507 0.47Microsoft Corp. USD 315,280 85,190,232 4.66Moderna, Inc. USD 38,510 9,190,026 0.50MongoDB, Inc. USD 3,580 1,304,767 0.07Monster Beverage Corp. USD 312,380 28,554,656 1.56Morgan Stanley USD 395,490 35,774,048 1.96MSCI, Inc. USD 15,260 8,253,600 0.45Netflix, Inc. USD 23,970 12,737,898 0.70Norfolk Southern Corp. USD 106,210 28,041,033 1.53NVIDIA Corp. USD 21,330 17,058,561 0.93Oracle Corp. USD 257,120 19,993,651 1.09PayPal Holdings, Inc. USD 210,740 61,134,620 3.34Pinterest, Inc. ‘A’ USD 116,920 9,177,635 0.50QUALCOMM, Inc. USD 113,680 16,192,011 0.89Regeneron Pharmaceuticals, Inc. USD 23,880 13,063,076 0.71Rockwell Automation, Inc. USD 98,612 27,944,176 1.53Roku, Inc. USD 7,620 3,356,762 0.18Seagen, Inc. USD 111,810 17,541,312 0.96Sherwin-Williams Co. (The) USD 56,870 15,515,273 0.85Snap, Inc. ‘A’ USD 665,410 45,567,277 2.49Square, Inc. ‘A’ USD 71,120 17,498,009 0.96
SS&C Technologies Holdings, Inc. USD 256,860 18,654,458 1.02SVB Financial Group USD 43,154 24,114,671 1.32Synopsys, Inc. USD 62,450 17,170,003 0.94Tapestry, Inc. USD 496,660 21,006,235 1.15Tesla, Inc. USD 50,580 34,618,469 1.89Texas Instruments, Inc. USD 138,958 26,673,683 1.46Thermo Fisher Scientific, Inc. USD 7,950 4,017,612 0.22Trade Desk, Inc. (The) ‘A’ USD 12,500 979,938 0.05Twilio, Inc. ‘A’ USD 5,843 2,317,188 0.13Twitter, Inc. USD 129,540 8,913,647 0.49Uber Technologies, Inc. USD 317,080 16,104,493 0.88Verisk Analytics, Inc. USD 48,050 8,371,992 0.46Wayfair, Inc. ‘A’ USD 39,980 12,406,194 0.68Workday, Inc. ‘A’ USD 43,900 10,703,698 0.59Zillow Group, Inc. ‘C’ USD 170,043 20,764,801 1.14
1,700,637,212 93.03
Total Equities 1,742,311,766 95.31
Total Transferable securities and money market instrumentsadmitted to an official exchange listing 1,742,311,766 95.31
Units of authorised UCITS or other collective investment undertakings
Collective Investment Schemes - UCITS
LuxembourgJPMorgan USD Liquidity LVNAV Fund -JPM USD Liquidity LVNAV X (dist.)† USD 90,642,835 90,642,835 4.96
90,642,835 4.96
Total Collective Investment Schemes - UCITS 90,642,835 4.96
Total Units of authorised UCITS or other collective investmentundertakings 90,642,835 4.96
Total Investments 1,832,954,601 100.27
Cash 3,754,187 0.21
Other Assets/(Liabilities) (8,684,451) (0.48)
Total Net Assets 1,828,024,337 100.00
† Related Party Fund.
Geographic Allocation of Portfolio as at 30 June 2021 % of Net AssetsUnited States of America 93.03Luxembourg 5.22Netherlands 1.47Ireland 0.52Canada 0.03Total Investments 100.27Cash and other assets/(liabilities) (0.27)
Total 100.00
123
JPMorgan Funds - US Growth FundSchedule of Investments
As at 30 June 2021
Investments Currency
Quantity/Nominal
Value
MarketValue
USD
%of
NetAssets Investments Currency
Quantity/Nominal
Value
MarketValue
USD
%of
NetAssets
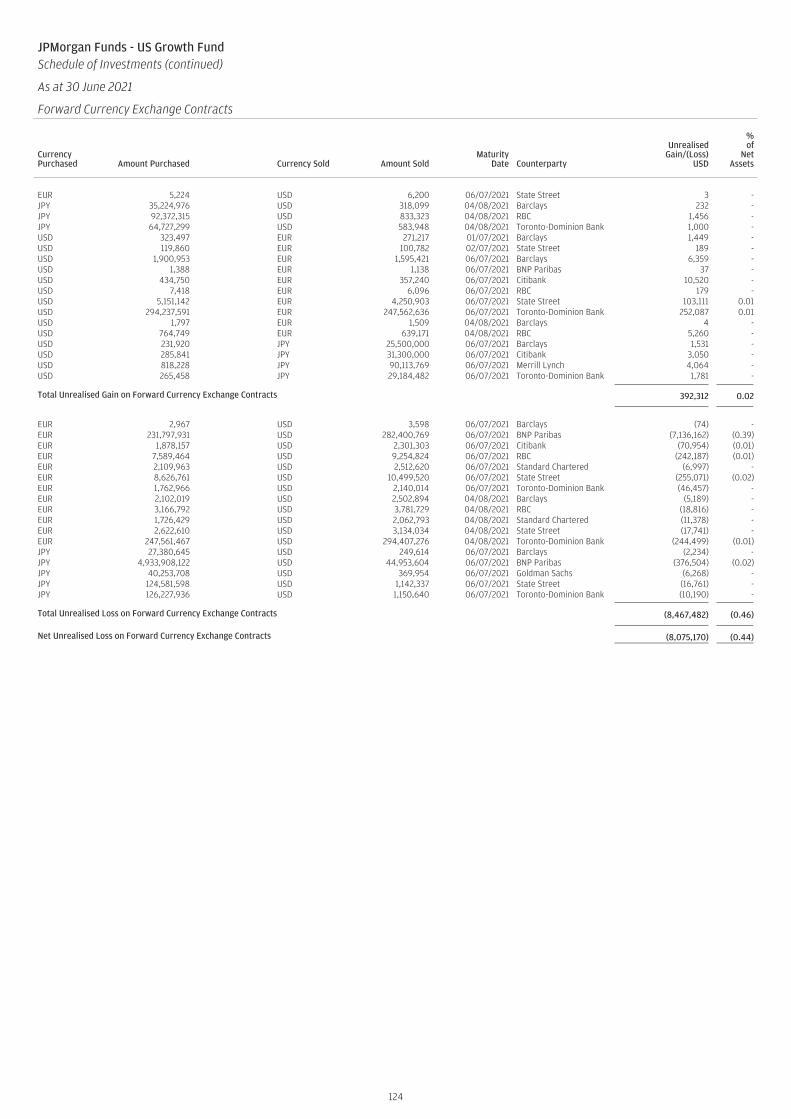
JPMorgan Funds - US Growth FundSchedule of Investments (continued)
As at 30 June 2021
Forward Currency Exchange Contracts
CurrencyPurchased Amount Purchased Currency Sold Amount Sold
MaturityDate Counterparty
UnrealisedGain/(Loss)
USD
%of
NetAssets
EUR 5,224 USD 6,200 06/07/2021 State Street 3 -JPY 35,224,976 USD 318,099 04/08/2021 Barclays 232 -JPY 92,372,315 USD 833,323 04/08/2021 RBC 1,456 -JPY 64,727,299 USD 583,948 04/08/2021 Toronto-Dominion Bank 1,000 -USD 323,497 EUR 271,217 01/07/2021 Barclays 1,449 -USD 119,860 EUR 100,782 02/07/2021 State Street 189 -USD 1,900,953 EUR 1,595,421 06/07/2021 Barclays 6,359 -USD 1,388 EUR 1,138 06/07/2021 BNP Paribas 37 -USD 434,750 EUR 357,240 06/07/2021 Citibank 10,520 -USD 7,418 EUR 6,096 06/07/2021 RBC 179 -USD 5,151,142 EUR 4,250,903 06/07/2021 State Street 103,111 0.01USD 294,237,591 EUR 247,562,636 06/07/2021 Toronto-Dominion Bank 252,087 0.01USD 1,797 EUR 1,509 04/08/2021 Barclays 4 -USD 764,749 EUR 639,171 04/08/2021 RBC 5,260 -USD 231,920 JPY 25,500,000 06/07/2021 Barclays 1,531 -USD 285,841 JPY 31,300,000 06/07/2021 Citibank 3,050 -USD 818,228 JPY 90,113,769 06/07/2021 Merrill Lynch 4,064 -USD 265,458 JPY 29,184,482 06/07/2021 Toronto-Dominion Bank 1,781 -
Total Unrealised Gain on Forward Currency Exchange Contracts 392,312 0.02
EUR 2,967 USD 3,598 06/07/2021 Barclays (74) -EUR 231,797,931 USD 282,400,769 06/07/2021 BNP Paribas (7,136,162) (0.39)EUR 1,878,157 USD 2,301,303 06/07/2021 Citibank (70,954) (0.01)EUR 7,589,464 USD 9,254,824 06/07/2021 RBC (242,187) (0.01)EUR 2,109,963 USD 2,512,620 06/07/2021 Standard Chartered (6,997) -EUR 8,626,761 USD 10,499,520 06/07/2021 State Street (255,071) (0.02)EUR 1,762,966 USD 2,140,014 06/07/2021 Toronto-Dominion Bank (46,457) -EUR 2,102,019 USD 2,502,894 04/08/2021 Barclays (5,189) -EUR 3,166,792 USD 3,781,729 04/08/2021 RBC (18,816) -EUR 1,726,429 USD 2,062,793 04/08/2021 Standard Chartered (11,378) -EUR 2,622,610 USD 3,134,034 04/08/2021 State Street (17,741) -EUR 247,561,467 USD 294,407,276 04/08/2021 Toronto-Dominion Bank (244,499) (0.01)JPY 27,380,645 USD 249,614 06/07/2021 Barclays (2,234) -JPY 4,933,908,122 USD 44,953,604 06/07/2021 BNP Paribas (376,504) (0.02)JPY 40,253,708 USD 369,954 06/07/2021 Goldman Sachs (6,268) -JPY 124,581,598 USD 1,142,337 06/07/2021 State Street (16,761) -JPY 126,227,936 USD 1,150,640 06/07/2021 Toronto-Dominion Bank (10,190) -
Total Unrealised Loss on Forward Currency Exchange Contracts (8,467,482) (0.46)
Net Unrealised Loss on Forward Currency Exchange Contracts (8,075,170) (0.44)
124
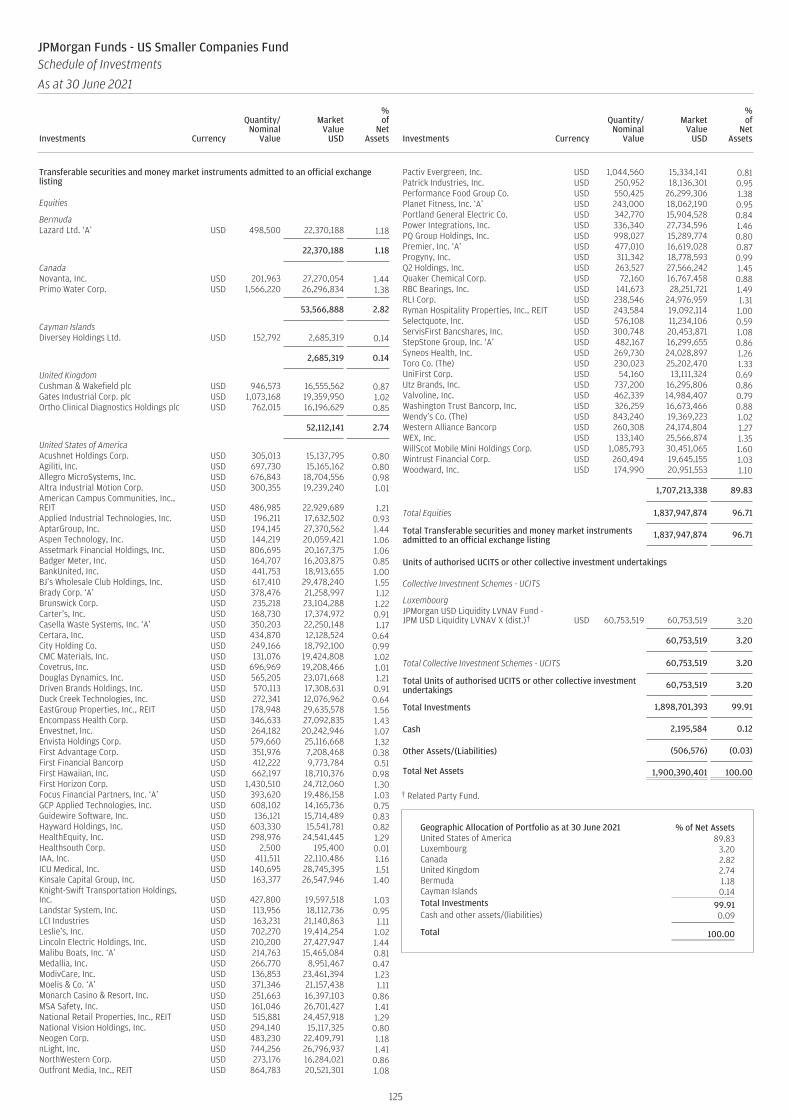
Transferable securities and money market instruments admitted to an official exchangelisting
Equities
BermudaLazard Ltd. ‘A’ USD 498,500 22,370,188 1.18
22,370,188 1.18
CanadaNovanta, Inc. USD 201,963 27,270,054 1.44Primo Water Corp. USD 1,566,220 26,296,834 1.38
53,566,888 2.82
Cayman IslandsDiversey Holdings Ltd. USD 152,792 2,685,319 0.14
2,685,319 0.14
United KingdomCushman & Wakefield plc USD 946,573 16,555,562 0.87Gates Industrial Corp. plc USD 1,073,168 19,359,950 1.02Ortho Clinical Diagnostics Holdings plc USD 762,015 16,196,629 0.85
52,112,141 2.74
United States of AmericaAcushnet Holdings Corp. USD 305,013 15,137,795 0.80Agiliti, Inc. USD 697,730 15,165,162 0.80Allegro MicroSystems, Inc. USD 676,843 18,704,556 0.98Altra Industrial Motion Corp. USD 300,355 19,239,240 1.01American Campus Communities, Inc.,REIT USD 486,985 22,929,689 1.21Applied Industrial Technologies, Inc. USD 196,211 17,632,502 0.93AptarGroup, Inc. USD 194,145 27,370,562 1.44Aspen Technology, Inc. USD 144,219 20,059,421 1.06Assetmark Financial Holdings, Inc. USD 806,695 20,167,375 1.06Badger Meter, Inc. USD 164,707 16,203,875 0.85BankUnited, Inc. USD 441,753 18,913,655 1.00BJ’s Wholesale Club Holdings, Inc. USD 617,410 29,478,240 1.55Brady Corp. ‘A’ USD 378,476 21,258,997 1.12Brunswick Corp. USD 235,218 23,104,288 1.22Carter’s, Inc. USD 168,730 17,374,972 0.91Casella Waste Systems, Inc. ‘A’ USD 350,203 22,250,148 1.17Certara, Inc. USD 434,870 12,128,524 0.64City Holding Co. USD 249,166 18,792,100 0.99CMC Materials, Inc. USD 131,076 19,424,808 1.02Covetrus, Inc. USD 696,969 19,208,466 1.01Douglas Dynamics, Inc. USD 565,205 23,071,668 1.21Driven Brands Holdings, Inc. USD 570,113 17,308,631 0.91Duck Creek Technologies, Inc. USD 272,341 12,076,962 0.64EastGroup Properties, Inc., REIT USD 178,948 29,635,578 1.56Encompass Health Corp. USD 346,633 27,092,835 1.43Envestnet, Inc. USD 264,182 20,242,946 1.07Envista Holdings Corp. USD 579,660 25,116,668 1.32First Advantage Corp. USD 351,976 7,208,468 0.38First Financial Bancorp USD 412,222 9,773,784 0.51First Hawaiian, Inc. USD 662,197 18,710,376 0.98First Horizon Corp. USD 1,430,510 24,712,060 1.30Focus Financial Partners, Inc. ‘A’ USD 393,620 19,486,158 1.03GCP Applied Technologies, Inc. USD 608,102 14,165,736 0.75Guidewire Software, Inc. USD 136,121 15,714,489 0.83Hayward Holdings, Inc. USD 603,330 15,541,781 0.82HealthEquity, Inc. USD 298,976 24,541,445 1.29Healthsouth Corp. USD 2,500 195,400 0.01IAA, Inc. USD 411,511 22,110,486 1.16ICU Medical, Inc. USD 140,695 28,745,395 1.51Kinsale Capital Group, Inc. USD 163,377 26,547,946 1.40Knight-Swift Transportation Holdings,Inc. USD 427,800 19,597,518 1.03Landstar System, Inc. USD 113,956 18,112,736 0.95LCI Industries USD 163,231 21,140,863 1.11Leslie’s, Inc. USD 702,270 19,414,254 1.02Lincoln Electric Holdings, Inc. USD 210,200 27,427,947 1.44Malibu Boats, Inc. ‘A’ USD 214,763 15,465,084 0.81Medallia, Inc. USD 266,770 8,951,467 0.47ModivCare, Inc. USD 136,853 23,461,394 1.23Moelis & Co. ‘A’ USD 371,346 21,157,438 1.11Monarch Casino & Resort, Inc. USD 251,663 16,397,103 0.86MSA Safety, Inc. USD 161,046 26,701,427 1.41National Retail Properties, Inc., REIT USD 515,881 24,457,918 1.29National Vision Holdings, Inc. USD 294,140 15,117,325 0.80Neogen Corp. USD 483,230 22,409,791 1.18nLight, Inc. USD 744,256 26,796,937 1.41NorthWestern Corp. USD 273,176 16,284,021 0.86Outfront Media, Inc., REIT USD 864,783 20,521,301 1.08
Pactiv Evergreen, Inc. USD 1,044,560 15,334,141 0.81Patrick Industries, Inc. USD 250,952 18,136,301 0.95Performance Food Group Co. USD 550,425 26,299,306 1.38Planet Fitness, Inc. ‘A’ USD 243,000 18,062,190 0.95Portland General Electric Co. USD 342,770 15,904,528 0.84Power Integrations, Inc. USD 336,340 27,734,596 1.46PQ Group Holdings, Inc. USD 998,027 15,289,774 0.80Premier, Inc. ‘A’ USD 477,010 16,619,028 0.87Progyny, Inc. USD 311,342 18,778,593 0.99Q2 Holdings, Inc. USD 263,527 27,566,242 1.45Quaker Chemical Corp. USD 72,160 16,767,458 0.88RBC Bearings, Inc. USD 141,673 28,251,721 1.49RLI Corp. USD 238,546 24,976,959 1.31Ryman Hospitality Properties, Inc., REIT USD 243,584 19,092,114 1.00Selectquote, Inc. USD 576,108 11,234,106 0.59ServisFirst Bancshares, Inc. USD 300,748 20,453,871 1.08StepStone Group, Inc. ‘A’ USD 482,167 16,299,655 0.86Syneos Health, Inc. USD 269,730 24,028,897 1.26Toro Co. (The) USD 230,023 25,202,470 1.33UniFirst Corp. USD 54,160 13,111,324 0.69Utz Brands, Inc. USD 737,200 16,295,806 0.86Valvoline, Inc. USD 462,339 14,984,407 0.79Washington Trust Bancorp, Inc. USD 326,259 16,673,466 0.88Wendy’s Co. (The) USD 843,240 19,369,223 1.02Western Alliance Bancorp USD 260,308 24,174,804 1.27WEX, Inc. USD 133,140 25,566,874 1.35WillScot Mobile Mini Holdings Corp. USD 1,085,793 30,451,065 1.60Wintrust Financial Corp. USD 260,494 19,645,155 1.03Woodward, Inc. USD 174,990 20,951,553 1.10
1,707,213,338 89.83
Total Equities 1,837,947,874 96.71
Total Transferable securities and money market instrumentsadmitted to an official exchange listing 1,837,947,874 96.71
Units of authorised UCITS or other collective investment undertakings
Collective Investment Schemes - UCITS
LuxembourgJPMorgan USD Liquidity LVNAV Fund -JPM USD Liquidity LVNAV X (dist.)† USD 60,753,519 60,753,519 3.20
60,753,519 3.20
Total Collective Investment Schemes - UCITS 60,753,519 3.20
Total Units of authorised UCITS or other collective investmentundertakings 60,753,519 3.20
Total Investments 1,898,701,393 99.91
Cash 2,195,584 0.12
Other Assets/(Liabilities) (506,576) (0.03)
Total Net Assets 1,900,390,401 100.00
† Related Party Fund.
Geographic Allocation of Portfolio as at 30 June 2021 % of Net AssetsUnited States of America 89.83Luxembourg 3.20Canada 2.82United Kingdom 2.74Bermuda 1.18Cayman Islands 0.14Total Investments 99.91Cash and other assets/(liabilities) 0.09
Total 100.00
125
JPMorgan Funds - US Smaller Companies FundSchedule of Investments
As at 30 June 2021
Investments Currency
Quantity/Nominal
Value
MarketValue
USD
%of
NetAssets Investments Currency
Quantity/Nominal
Value
MarketValue
USD
%of
NetAssets

JPMorgan Funds - US Smaller Companies FundSchedule of Investments (continued)
As at 30 June 2021
Forward Currency Exchange Contracts
CurrencyPurchased Amount Purchased Currency Sold Amount Sold
MaturityDate Counterparty
UnrealisedGain/(Loss)
USD
%of
NetAssets
USD 113,677 EUR 95,298 01/07/2021 Toronto-Dominion Bank 519 -USD 62,115 EUR 52,228 02/07/2021 State Street 98 -USD 16,173 EUR 13,340 06/07/2021 Barclays 332 -USD 27,985,173 EUR 23,529,407 06/07/2021 BNP Paribas 43,539 -USD 195,620 EUR 160,451 06/07/2021 HSBC 5,081 -USD 379,455 EUR 313,340 06/07/2021 RBC 7,357 -USD 552,805 EUR 455,707 06/07/2021 State Street 11,644 -USD 2,307 EUR 1,887 06/07/2021 Toronto-Dominion Bank 66 -USD 55,312 EUR 46,257 04/08/2021 State Street 348 -
Total Unrealised Gain on Forward Currency Exchange Contracts 68,984 -
EUR 164,799 USD 201,647 06/07/2021 BNP Paribas (5,945) -EUR 10,124,385 USD 12,352,988 06/07/2021 Citibank (330,081) (0.02)EUR 12,100,083 USD 14,765,622 06/07/2021 Goldman Sachs (396,536) (0.02)EUR 154,127 USD 188,113 06/07/2021 Merrill Lynch (5,084) -EUR 915,976 USD 1,110,009 06/07/2021 RBC (22,270) -EUR 1,629,776 USD 1,979,101 06/07/2021 State Street (43,711) -EUR 280,958 USD 335,653 04/08/2021 Barclays (1,807) -EUR 23,529,407 USD 28,001,432 04/08/2021 BNP Paribas (42,817) -EUR 266,476 USD 318,221 04/08/2021 RBC (1,583) -EUR 123,525 USD 147,249 04/08/2021 State Street (472) -EUR 95,298 USD 113,756 04/08/2021 Toronto-Dominion Bank (519) -USD 729,558 EUR 615,013 06/07/2021 State Street (782) -
Total Unrealised Loss on Forward Currency Exchange Contracts (851,607) (0.04)
Net Unrealised Loss on Forward Currency Exchange Contracts (782,623) (0.04)
126
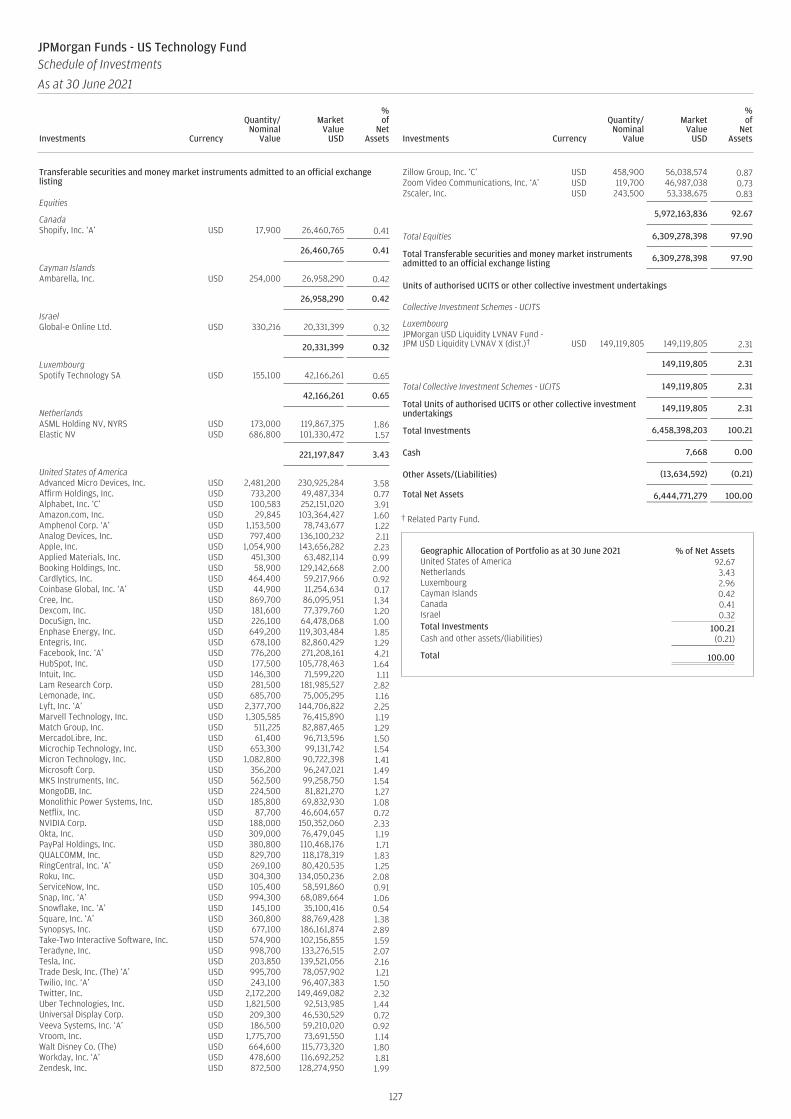
Transferable securities and money market instruments admitted to an official exchangelisting
Equities
CanadaShopify, Inc. ‘A’ USD 17,900 26,460,765 0.41
26,460,765 0.41
Cayman IslandsAmbarella, Inc. USD 254,000 26,958,290 0.42
26,958,290 0.42
IsraelGlobal-e Online Ltd. USD 330,216 20,331,399 0.32
20,331,399 0.32
LuxembourgSpotify Technology SA USD 155,100 42,166,261 0.65
42,166,261 0.65
NetherlandsASML Holding NV, NYRS USD 173,000 119,867,375 1.86Elastic NV USD 686,800 101,330,472 1.57
221,197,847 3.43
United States of AmericaAdvanced Micro Devices, Inc. USD 2,481,200 230,925,284 3.58Affirm Holdings, Inc. USD 733,200 49,487,334 0.77Alphabet, Inc. ‘C’ USD 100,583 252,151,020 3.91Amazon.com, Inc. USD 29,845 103,364,427 1.60Amphenol Corp. ‘A’ USD 1,153,500 78,743,677 1.22Analog Devices, Inc. USD 797,400 136,100,232 2.11Apple, Inc. USD 1,054,900 143,656,282 2.23Applied Materials, Inc. USD 451,300 63,482,114 0.99Booking Holdings, Inc. USD 58,900 129,142,668 2.00Cardlytics, Inc. USD 464,400 59,217,966 0.92Coinbase Global, Inc. ‘A’ USD 44,900 11,254,634 0.17Cree, Inc. USD 869,700 86,095,951 1.34Dexcom, Inc. USD 181,600 77,379,760 1.20DocuSign, Inc. USD 226,100 64,478,068 1.00Enphase Energy, Inc. USD 649,200 119,303,484 1.85Entegris, Inc. USD 678,100 82,860,429 1.29Facebook, Inc. ‘A’ USD 776,200 271,208,161 4.21HubSpot, Inc. USD 177,500 105,778,463 1.64Intuit, Inc. USD 146,300 71,599,220 1.11Lam Research Corp. USD 281,500 181,985,527 2.82Lemonade, Inc. USD 685,700 75,005,295 1.16Lyft, Inc. ‘A’ USD 2,377,700 144,706,822 2.25Marvell Technology, Inc. USD 1,305,585 76,415,890 1.19Match Group, Inc. USD 511,225 82,887,465 1.29MercadoLibre, Inc. USD 61,400 96,713,596 1.50Microchip Technology, Inc. USD 653,300 99,131,742 1.54Micron Technology, Inc. USD 1,082,800 90,722,398 1.41Microsoft Corp. USD 356,200 96,247,021 1.49MKS Instruments, Inc. USD 562,500 99,258,750 1.54MongoDB, Inc. USD 224,500 81,821,270 1.27Monolithic Power Systems, Inc. USD 185,800 69,832,930 1.08Netflix, Inc. USD 87,700 46,604,657 0.72NVIDIA Corp. USD 188,000 150,352,060 2.33Okta, Inc. USD 309,000 76,479,045 1.19PayPal Holdings, Inc. USD 380,800 110,468,176 1.71QUALCOMM, Inc. USD 829,700 118,178,319 1.83RingCentral, Inc. ‘A’ USD 269,100 80,420,535 1.25Roku, Inc. USD 304,300 134,050,236 2.08ServiceNow, Inc. USD 105,400 58,591,860 0.91Snap, Inc. ‘A’ USD 994,300 68,089,664 1.06Snowflake, Inc. ‘A’ USD 145,100 35,100,416 0.54Square, Inc. ‘A’ USD 360,800 88,769,428 1.38Synopsys, Inc. USD 677,100 186,161,874 2.89Take-Two Interactive Software, Inc. USD 574,900 102,156,855 1.59Teradyne, Inc. USD 998,700 133,276,515 2.07Tesla, Inc. USD 203,850 139,521,056 2.16Trade Desk, Inc. (The) ‘A’ USD 995,700 78,057,902 1.21Twilio, Inc. ‘A’ USD 243,100 96,407,383 1.50Twitter, Inc. USD 2,172,200 149,469,082 2.32Uber Technologies, Inc. USD 1,821,500 92,513,985 1.44Universal Display Corp. USD 209,300 46,530,529 0.72Veeva Systems, Inc. ‘A’ USD 186,500 59,210,020 0.92Vroom, Inc. USD 1,775,700 73,691,550 1.14Walt Disney Co. (The) USD 664,600 115,773,320 1.80Workday, Inc. ‘A’ USD 478,600 116,692,252 1.81Zendesk, Inc. USD 872,500 128,274,950 1.99
Zillow Group, Inc. ‘C’ USD 458,900 56,038,574 0.87Zoom Video Communications, Inc. ‘A’ USD 119,700 46,987,038 0.73Zscaler, Inc. USD 243,500 53,338,675 0.83
5,972,163,836 92.67
Total Equities 6,309,278,398 97.90
Total Transferable securities and money market instrumentsadmitted to an official exchange listing 6,309,278,398 97.90
Units of authorised UCITS or other collective investment undertakings
Collective Investment Schemes - UCITS
LuxembourgJPMorgan USD Liquidity LVNAV Fund -JPM USD Liquidity LVNAV X (dist.)† USD 149,119,805 149,119,805 2.31
149,119,805 2.31
Total Collective Investment Schemes - UCITS 149,119,805 2.31
Total Units of authorised UCITS or other collective investmentundertakings 149,119,805 2.31
Total Investments 6,458,398,203 100.21
Cash 7,668 0.00
Other Assets/(Liabilities) (13,634,592) (0.21)
Total Net Assets 6,444,771,279 100.00
† Related Party Fund.
Geographic Allocation of Portfolio as at 30 June 2021 % of Net AssetsUnited States of America 92.67Netherlands 3.43Luxembourg 2.96Cayman Islands 0.42Canada 0.41Israel 0.32Total Investments 100.21Cash and other assets/(liabilities) (0.21)
Total 100.00
127
JPMorgan Funds - US Technology FundSchedule of Investments
As at 30 June 2021
Investments Currency
Quantity/Nominal
Value
MarketValue
USD
%of
NetAssets Investments Currency
Quantity/Nominal
Value
MarketValue
USD
%of
NetAssets
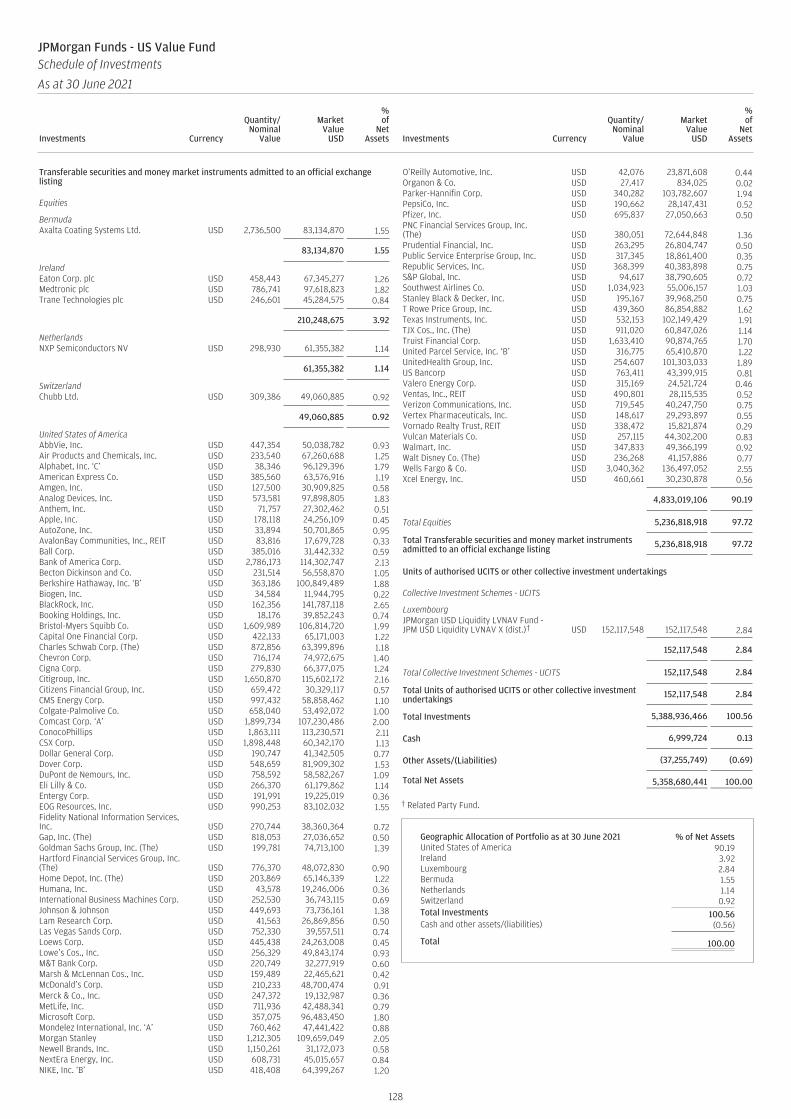
Transferable securities and money market instruments admitted to an official exchangelisting
Equities
BermudaAxalta Coating Systems Ltd. USD 2,736,500 83,134,870 1.55
83,134,870 1.55
IrelandEaton Corp. plc USD 458,443 67,345,277 1.26Medtronic plc USD 786,741 97,618,823 1.82Trane Technologies plc USD 246,601 45,284,575 0.84
210,248,675 3.92
NetherlandsNXP Semiconductors NV USD 298,930 61,355,382 1.14
61,355,382 1.14
SwitzerlandChubb Ltd. USD 309,386 49,060,885 0.92
49,060,885 0.92
United States of AmericaAbbVie, Inc. USD 447,354 50,038,782 0.93Air Products and Chemicals, Inc. USD 233,540 67,260,688 1.25Alphabet, Inc. ‘C’ USD 38,346 96,129,396 1.79American Express Co. USD 385,560 63,576,916 1.19Amgen, Inc. USD 127,500 30,909,825 0.58Analog Devices, Inc. USD 573,581 97,898,805 1.83Anthem, Inc. USD 71,757 27,302,462 0.51Apple, Inc. USD 178,118 24,256,109 0.45AutoZone, Inc. USD 33,894 50,701,865 0.95AvalonBay Communities, Inc., REIT USD 83,816 17,679,728 0.33Ball Corp. USD 385,016 31,442,332 0.59Bank of America Corp. USD 2,786,173 114,302,747 2.13Becton Dickinson and Co. USD 231,514 56,558,870 1.05Berkshire Hathaway, Inc. ‘B’ USD 363,186 100,849,489 1.88Biogen, Inc. USD 34,584 11,944,795 0.22BlackRock, Inc. USD 162,356 141,787,118 2.65Booking Holdings, Inc. USD 18,176 39,852,243 0.74Bristol-Myers Squibb Co. USD 1,609,989 106,814,720 1.99Capital One Financial Corp. USD 422,133 65,171,003 1.22Charles Schwab Corp. (The) USD 872,856 63,399,896 1.18Chevron Corp. USD 716,174 74,972,675 1.40Cigna Corp. USD 279,830 66,377,075 1.24Citigroup, Inc. USD 1,650,870 115,602,172 2.16Citizens Financial Group, Inc. USD 659,472 30,329,117 0.57CMS Energy Corp. USD 997,432 58,858,462 1.10Colgate-Palmolive Co. USD 658,040 53,492,072 1.00Comcast Corp. ‘A’ USD 1,899,734 107,230,486 2.00ConocoPhillips USD 1,863,111 113,230,571 2.11CSX Corp. USD 1,898,448 60,342,170 1.13Dollar General Corp. USD 190,747 41,342,505 0.77Dover Corp. USD 548,659 81,909,302 1.53DuPont de Nemours, Inc. USD 758,592 58,582,267 1.09Eli Lilly & Co. USD 266,370 61,179,862 1.14Entergy Corp. USD 191,991 19,225,019 0.36EOG Resources, Inc. USD 990,253 83,102,032 1.55Fidelity National Information Services,Inc. USD 270,744 38,360,364 0.72Gap, Inc. (The) USD 818,053 27,036,652 0.50Goldman Sachs Group, Inc. (The) USD 199,781 74,713,100 1.39Hartford Financial Services Group, Inc.(The) USD 776,370 48,072,830 0.90Home Depot, Inc. (The) USD 203,869 65,146,339 1.22Humana, Inc. USD 43,578 19,246,006 0.36International Business Machines Corp. USD 252,530 36,743,115 0.69Johnson & Johnson USD 449,693 73,736,161 1.38Lam Research Corp. USD 41,563 26,869,856 0.50Las Vegas Sands Corp. USD 752,330 39,557,511 0.74Loews Corp. USD 445,438 24,263,008 0.45Lowe’s Cos., Inc. USD 256,329 49,843,174 0.93M&T Bank Corp. USD 220,749 32,277,919 0.60Marsh & McLennan Cos., Inc. USD 159,489 22,465,621 0.42McDonald’s Corp. USD 210,233 48,700,474 0.91Merck & Co., Inc. USD 247,372 19,132,987 0.36MetLife, Inc. USD 711,936 42,488,341 0.79Microsoft Corp. USD 357,075 96,483,450 1.80Mondelez International, Inc. ‘A’ USD 760,462 47,441,422 0.88Morgan Stanley USD 1,212,305 109,659,049 2.05Newell Brands, Inc. USD 1,150,261 31,172,073 0.58NextEra Energy, Inc. USD 608,731 45,015,657 0.84NIKE, Inc. ‘B’ USD 418,408 64,399,267 1.20
O’Reilly Automotive, Inc. USD 42,076 23,871,608 0.44Organon & Co. USD 27,417 834,025 0.02Parker-Hannifin Corp. USD 340,282 103,782,607 1.94PepsiCo, Inc. USD 190,662 28,147,431 0.52Pfizer, Inc. USD 695,837 27,050,663 0.50PNC Financial Services Group, Inc.(The) USD 380,051 72,644,848 1.36Prudential Financial, Inc. USD 263,295 26,804,747 0.50Public Service Enterprise Group, Inc. USD 317,345 18,861,400 0.35Republic Services, Inc. USD 368,399 40,383,898 0.75S&P Global, Inc. USD 94,617 38,790,605 0.72Southwest Airlines Co. USD 1,034,923 55,006,157 1.03Stanley Black & Decker, Inc. USD 195,167 39,968,250 0.75T Rowe Price Group, Inc. USD 439,360 86,854,882 1.62Texas Instruments, Inc. USD 532,153 102,149,429 1.91TJX Cos., Inc. (The) USD 911,020 60,847,026 1.14Truist Financial Corp. USD 1,633,410 90,874,765 1.70United Parcel Service, Inc. ‘B’ USD 316,775 65,410,870 1.22UnitedHealth Group, Inc. USD 254,607 101,303,033 1.89US Bancorp USD 763,411 43,399,915 0.81Valero Energy Corp. USD 315,169 24,521,724 0.46Ventas, Inc., REIT USD 490,801 28,115,535 0.52Verizon Communications, Inc. USD 719,545 40,247,750 0.75Vertex Pharmaceuticals, Inc. USD 148,617 29,293,897 0.55Vornado Realty Trust, REIT USD 338,472 15,821,874 0.29Vulcan Materials Co. USD 257,115 44,302,200 0.83Walmart, Inc. USD 347,833 49,366,199 0.92Walt Disney Co. (The) USD 236,268 41,157,886 0.77Wells Fargo & Co. USD 3,040,362 136,497,052 2.55Xcel Energy, Inc. USD 460,661 30,230,878 0.56
4,833,019,106 90.19
Total Equities 5,236,818,918 97.72
Total Transferable securities and money market instrumentsadmitted to an official exchange listing 5,236,818,918 97.72
Units of authorised UCITS or other collective investment undertakings
Collective Investment Schemes - UCITS
LuxembourgJPMorgan USD Liquidity LVNAV Fund -JPM USD Liquidity LVNAV X (dist.)† USD 152,117,548 152,117,548 2.84
152,117,548 2.84
Total Collective Investment Schemes - UCITS 152,117,548 2.84
Total Units of authorised UCITS or other collective investmentundertakings 152,117,548 2.84
Total Investments 5,388,936,466 100.56
Cash 6,999,724 0.13
Other Assets/(Liabilities) (37,255,749) (0.69)
Total Net Assets 5,358,680,441 100.00
† Related Party Fund.
Geographic Allocation of Portfolio as at 30 June 2021 % of Net AssetsUnited States of America 90.19Ireland 3.92Luxembourg 2.84Bermuda 1.55Netherlands 1.14Switzerland 0.92Total Investments 100.56Cash and other assets/(liabilities) (0.56)
Total 100.00
128
JPMorgan Funds - US Value FundSchedule of Investments
As at 30 June 2021
Investments Currency
Quantity/Nominal
Value
MarketValue
USD
%of
NetAssets Investments Currency
Quantity/Nominal
Value
MarketValue
USD
%of
NetAssets
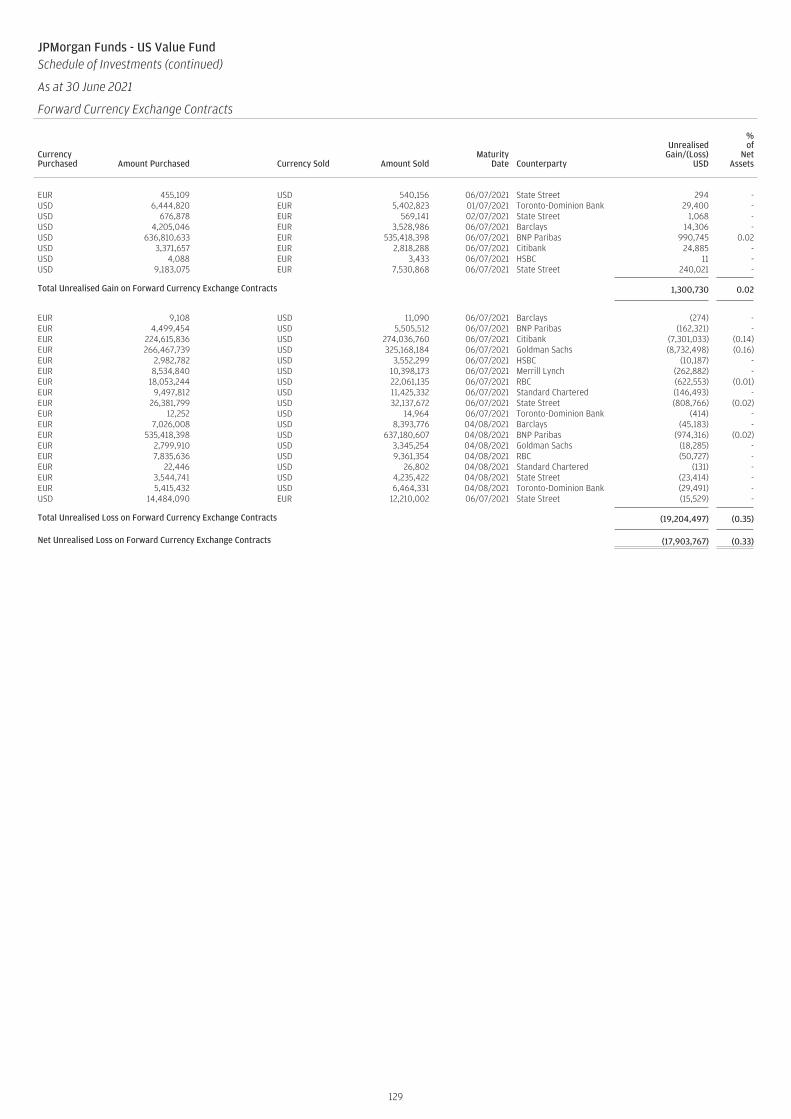
JPMorgan Funds - US Value FundSchedule of Investments (continued)
As at 30 June 2021
Forward Currency Exchange Contracts
CurrencyPurchased Amount Purchased Currency Sold Amount Sold
MaturityDate Counterparty
UnrealisedGain/(Loss)
USD
%of
NetAssets
EUR 455,109 USD 540,156 06/07/2021 State Street 294 -USD 6,444,820 EUR 5,402,823 01/07/2021 Toronto-Dominion Bank 29,400 -USD 676,878 EUR 569,141 02/07/2021 State Street 1,068 -USD 4,205,046 EUR 3,528,986 06/07/2021 Barclays 14,306 -USD 636,810,633 EUR 535,418,398 06/07/2021 BNP Paribas 990,745 0.02USD 3,371,657 EUR 2,818,288 06/07/2021 Citibank 24,885 -USD 4,088 EUR 3,433 06/07/2021 HSBC 11 -USD 9,183,075 EUR 7,530,868 06/07/2021 State Street 240,021 -
Total Unrealised Gain on Forward Currency Exchange Contracts 1,300,730 0.02
EUR 9,108 USD 11,090 06/07/2021 Barclays (274) -EUR 4,499,454 USD 5,505,512 06/07/2021 BNP Paribas (162,321) -EUR 224,615,836 USD 274,036,760 06/07/2021 Citibank (7,301,033) (0.14)EUR 266,467,739 USD 325,168,184 06/07/2021 Goldman Sachs (8,732,498) (0.16)EUR 2,982,782 USD 3,552,299 06/07/2021 HSBC (10,187) -EUR 8,534,840 USD 10,398,173 06/07/2021 Merrill Lynch (262,882) -EUR 18,053,244 USD 22,061,135 06/07/2021 RBC (622,553) (0.01)EUR 9,497,812 USD 11,425,332 06/07/2021 Standard Chartered (146,493) -EUR 26,381,799 USD 32,137,672 06/07/2021 State Street (808,766) (0.02)EUR 12,252 USD 14,964 06/07/2021 Toronto-Dominion Bank (414) -EUR 7,026,008 USD 8,393,776 04/08/2021 Barclays (45,183) -EUR 535,418,398 USD 637,180,607 04/08/2021 BNP Paribas (974,316) (0.02)EUR 2,799,910 USD 3,345,254 04/08/2021 Goldman Sachs (18,285) -EUR 7,835,636 USD 9,361,354 04/08/2021 RBC (50,727) -EUR 22,446 USD 26,802 04/08/2021 Standard Chartered (131) -EUR 3,544,741 USD 4,235,422 04/08/2021 State Street (23,414) -EUR 5,415,432 USD 6,464,331 04/08/2021 Toronto-Dominion Bank (29,491) -USD 14,484,090 EUR 12,210,002 06/07/2021 State Street (15,529) -
Total Unrealised Loss on Forward Currency Exchange Contracts (19,204,497) (0.35)
Net Unrealised Loss on Forward Currency Exchange Contracts (17,903,767) (0.33)
129
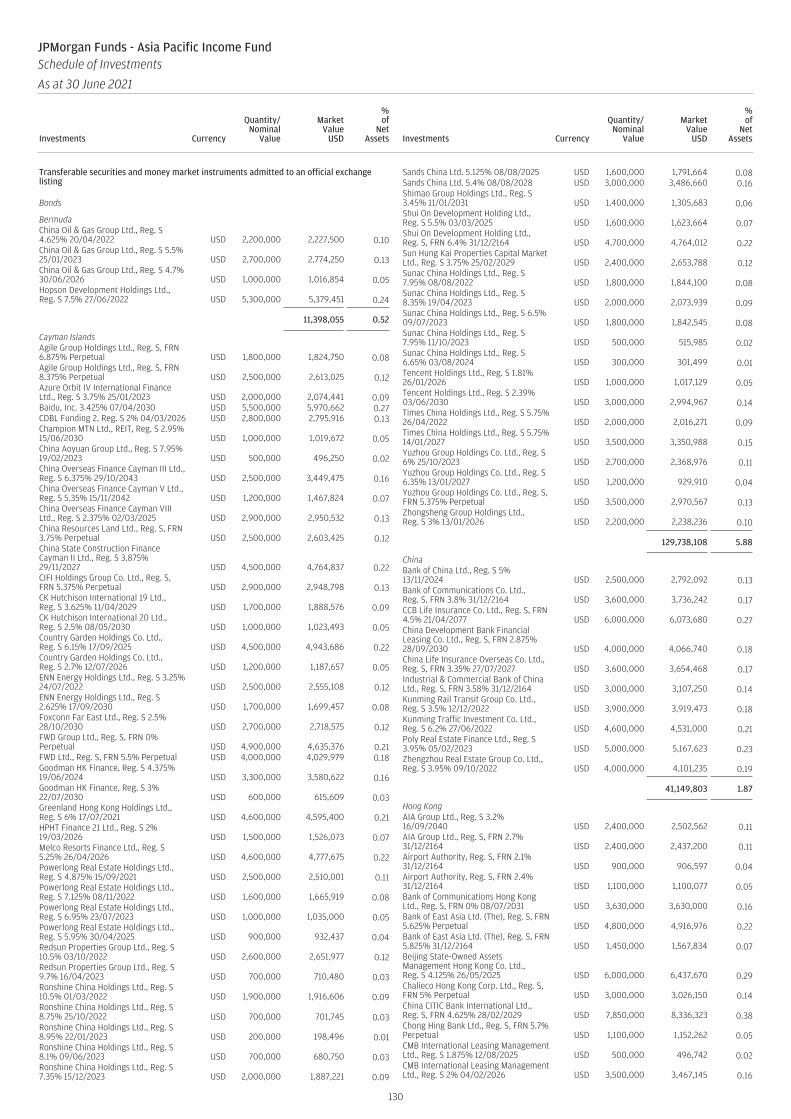
Transferable securities and money market instruments admitted to an official exchangelisting
Bonds
BermudaChina Oil & Gas Group Ltd., Reg. S4.625% 20/04/2022 USD 2,200,000 2,227,500 0.10China Oil & Gas Group Ltd., Reg. S 5.5%25/01/2023 USD 2,700,000 2,774,250 0.13China Oil & Gas Group Ltd., Reg. S 4.7%30/06/2026 USD 1,000,000 1,016,854 0.05Hopson Development Holdings Ltd.,Reg. S 7.5% 27/06/2022 USD 5,300,000 5,379,451 0.24
11,398,055 0.52
Cayman IslandsAgile Group Holdings Ltd., Reg. S, FRN6.875% Perpetual USD 1,800,000 1,824,750 0.08Agile Group Holdings Ltd., Reg. S, FRN8.375% Perpetual USD 2,500,000 2,613,025 0.12Azure Orbit IV International FinanceLtd., Reg. S 3.75% 25/01/2023 USD 2,000,000 2,074,441 0.09Baidu, Inc. 3.425% 07/04/2030 USD 5,500,000 5,970,662 0.27CDBL Funding 2, Reg. S 2% 04/03/2026 USD 2,800,000 2,795,916 0.13Champion MTN Ltd., REIT, Reg. S 2.95%15/06/2030 USD 1,000,000 1,019,672 0.05China Aoyuan Group Ltd., Reg. S 7.95%19/02/2023 USD 500,000 496,250 0.02China Overseas Finance Cayman III Ltd.,Reg. S 6.375% 29/10/2043 USD 2,500,000 3,449,475 0.16China Overseas Finance Cayman V Ltd.,Reg. S 5.35% 15/11/2042 USD 1,200,000 1,467,824 0.07China Overseas Finance Cayman VIIILtd., Reg. S 2.375% 02/03/2025 USD 2,900,000 2,950,532 0.13China Resources Land Ltd., Reg. S, FRN3.75% Perpetual USD 2,500,000 2,603,425 0.12China State Construction FinanceCayman II Ltd., Reg. S 3.875%29/11/2027 USD 4,500,000 4,764,837 0.22CIFI Holdings Group Co. Ltd., Reg. S,FRN 5.375% Perpetual USD 2,900,000 2,948,798 0.13CK Hutchison International 19 Ltd.,Reg. S 3.625% 11/04/2029 USD 1,700,000 1,888,576 0.09CK Hutchison International 20 Ltd.,Reg. S 2.5% 08/05/2030 USD 1,000,000 1,023,493 0.05Country Garden Holdings Co. Ltd.,Reg. S 6.15% 17/09/2025 USD 4,500,000 4,943,686 0.22Country Garden Holdings Co. Ltd.,Reg. S 2.7% 12/07/2026 USD 1,200,000 1,187,657 0.05ENN Energy Holdings Ltd., Reg. S 3.25%24/07/2022 USD 2,500,000 2,555,108 0.12ENN Energy Holdings Ltd., Reg. S2.625% 17/09/2030 USD 1,700,000 1,699,457 0.08Foxconn Far East Ltd., Reg. S 2.5%28/10/2030 USD 2,700,000 2,718,575 0.12FWD Group Ltd., Reg. S, FRN 0%Perpetual USD 4,900,000 4,635,376 0.21FWD Ltd., Reg. S, FRN 5.5% Perpetual USD 4,000,000 4,029,979 0.18Goodman HK Finance, Reg. S 4.375%19/06/2024 USD 3,300,000 3,580,622 0.16Goodman HK Finance, Reg. S 3%22/07/2030 USD 600,000 615,609 0.03Greenland Hong Kong Holdings Ltd.,Reg. S 6% 17/07/2021 USD 4,600,000 4,595,400 0.21HPHT Finance 21 Ltd., Reg. S 2%19/03/2026 USD 1,500,000 1,526,073 0.07Melco Resorts Finance Ltd., Reg. S5.25% 26/04/2026 USD 4,600,000 4,777,675 0.22Powerlong Real Estate Holdings Ltd.,Reg. S 4.875% 15/09/2021 USD 2,500,000 2,510,001 0.11Powerlong Real Estate Holdings Ltd.,Reg. S 7.125% 08/11/2022 USD 1,600,000 1,665,919 0.08Powerlong Real Estate Holdings Ltd.,Reg. S 6.95% 23/07/2023 USD 1,000,000 1,035,000 0.05Powerlong Real Estate Holdings Ltd.,Reg. S 5.95% 30/04/2025 USD 900,000 932,437 0.04Redsun Properties Group Ltd., Reg. S10.5% 03/10/2022 USD 2,600,000 2,651,977 0.12Redsun Properties Group Ltd., Reg. S9.7% 16/04/2023 USD 700,000 710,480 0.03Ronshine China Holdings Ltd., Reg. S10.5% 01/03/2022 USD 1,900,000 1,916,606 0.09Ronshine China Holdings Ltd., Reg. S8.75% 25/10/2022 USD 700,000 701,745 0.03Ronshine China Holdings Ltd., Reg. S8.95% 22/01/2023 USD 200,000 198,496 0.01Ronshine China Holdings Ltd., Reg. S8.1% 09/06/2023 USD 700,000 680,750 0.03Ronshine China Holdings Ltd., Reg. S7.35% 15/12/2023 USD 2,000,000 1,887,221 0.09
Sands China Ltd. 5.125% 08/08/2025 USD 1,600,000 1,791,664 0.08Sands China Ltd. 5.4% 08/08/2028 USD 3,000,000 3,486,660 0.16Shimao Group Holdings Ltd., Reg. S3.45% 11/01/2031 USD 1,400,000 1,305,683 0.06Shui On Development Holding Ltd.,Reg. S 5.5% 03/03/2025 USD 1,600,000 1,623,664 0.07Shui On Development Holding Ltd.,Reg. S, FRN 6.4% 31/12/2164 USD 4,700,000 4,764,012 0.22Sun Hung Kai Properties Capital MarketLtd., Reg. S 3.75% 25/02/2029 USD 2,400,000 2,653,788 0.12Sunac China Holdings Ltd., Reg. S7.95% 08/08/2022 USD 1,800,000 1,844,100 0.08Sunac China Holdings Ltd., Reg. S8.35% 19/04/2023 USD 2,000,000 2,073,939 0.09Sunac China Holdings Ltd., Reg. S 6.5%09/07/2023 USD 1,800,000 1,842,545 0.08Sunac China Holdings Ltd., Reg. S7.95% 11/10/2023 USD 500,000 515,985 0.02Sunac China Holdings Ltd., Reg. S6.65% 03/08/2024 USD 300,000 301,499 0.01Tencent Holdings Ltd., Reg. S 1.81%26/01/2026 USD 1,000,000 1,017,129 0.05Tencent Holdings Ltd., Reg. S 2.39%03/06/2030 USD 3,000,000 2,994,967 0.14Times China Holdings Ltd., Reg. S 5.75%26/04/2022 USD 2,000,000 2,016,271 0.09Times China Holdings Ltd., Reg. S 5.75%14/01/2027 USD 3,500,000 3,350,988 0.15Yuzhou Group Holdings Co. Ltd., Reg. S6% 25/10/2023 USD 2,700,000 2,368,976 0.11Yuzhou Group Holdings Co. Ltd., Reg. S6.35% 13/01/2027 USD 1,200,000 929,910 0.04Yuzhou Group Holdings Co. Ltd., Reg. S,FRN 5.375% Perpetual USD 3,500,000 2,970,567 0.13Zhongsheng Group Holdings Ltd.,Reg. S 3% 13/01/2026 USD 2,200,000 2,238,236 0.10
129,738,108 5.88
ChinaBank of China Ltd., Reg. S 5%13/11/2024 USD 2,500,000 2,792,092 0.13Bank of Communications Co. Ltd.,Reg. S, FRN 3.8% 31/12/2164 USD 3,600,000 3,736,242 0.17CCB Life Insurance Co. Ltd., Reg. S, FRN4.5% 21/04/2077 USD 6,000,000 6,073,680 0.27China Development Bank FinancialLeasing Co. Ltd., Reg. S, FRN 2.875%28/09/2030 USD 4,000,000 4,066,740 0.18China Life Insurance Overseas Co. Ltd.,Reg. S, FRN 3.35% 27/07/2027 USD 3,600,000 3,654,468 0.17Industrial & Commercial Bank of ChinaLtd., Reg. S, FRN 3.58% 31/12/2164 USD 3,000,000 3,107,250 0.14Kunming Rail Transit Group Co. Ltd.,Reg. S 3.5% 12/12/2022 USD 3,900,000 3,919,473 0.18Kunming Traffic Investment Co. Ltd.,Reg. S 6.2% 27/06/2022 USD 4,600,000 4,531,000 0.21Poly Real Estate Finance Ltd., Reg. S3.95% 05/02/2023 USD 5,000,000 5,167,623 0.23Zhengzhou Real Estate Group Co. Ltd.,Reg. S 3.95% 09/10/2022 USD 4,000,000 4,101,235 0.19
41,149,803 1.87
Hong KongAIA Group Ltd., Reg. S 3.2%16/09/2040 USD 2,400,000 2,502,562 0.11AIA Group Ltd., Reg. S, FRN 2.7%31/12/2164 USD 2,400,000 2,437,200 0.11Airport Authority, Reg. S, FRN 2.1%31/12/2164 USD 900,000 906,597 0.04Airport Authority, Reg. S, FRN 2.4%31/12/2164 USD 1,100,000 1,100,077 0.05Bank of Communications Hong KongLtd., Reg. S, FRN 0% 08/07/2031 USD 3,630,000 3,630,000 0.16Bank of East Asia Ltd. (The), Reg. S, FRN5.625% Perpetual USD 4,800,000 4,916,976 0.22Bank of East Asia Ltd. (The), Reg. S, FRN5.825% 31/12/2164 USD 1,450,000 1,567,834 0.07Beijing State-Owned AssetsManagement Hong Kong Co. Ltd.,Reg. S 4.125% 26/05/2025 USD 6,000,000 6,437,670 0.29Chalieco Hong Kong Corp. Ltd., Reg. S,FRN 5% Perpetual USD 3,000,000 3,026,150 0.14China CITIC Bank International Ltd.,Reg. S, FRN 4.625% 28/02/2029 USD 7,850,000 8,336,323 0.38Chong Hing Bank Ltd., Reg. S, FRN 5.7%Perpetual USD 1,100,000 1,152,262 0.05CMB International Leasing ManagementLtd., Reg. S 1.875% 12/08/2025 USD 500,000 496,742 0.02CMB International Leasing ManagementLtd., Reg. S 2% 04/02/2026 USD 3,500,000 3,467,145 0.16
130
JPMorgan Funds - Asia Pacific Income FundSchedule of Investments
As at 30 June 2021
Investments Currency
Quantity/Nominal
Value
MarketValue
USD
%of
NetAssets Investments Currency
Quantity/Nominal
Value
MarketValue
USD
%of
NetAssets

CMB Wing Lung Bank Ltd., Reg. S, FRN3.75% 22/11/2027 USD 3,100,000 3,171,411 0.14CMB Wing Lung Bank Ltd., Reg. S, FRN6.5% Perpetual USD 1,850,000 2,004,865 0.09CNAC HK Finbridge Co. Ltd., Reg. S3.875% 19/06/2029 USD 4,000,000 4,244,220 0.19CNAC HK Finbridge Co. Ltd., Reg. S, FRN3.35% 31/12/2164 USD 6,700,000 6,790,689 0.31GLP China Holdings Ltd., Reg. S 2.95%29/03/2026 USD 4,200,000 4,262,510 0.19HBIS Group Hong Kong Co. Ltd., Reg. S3.75% 18/12/2022 USD 4,200,000 4,189,473 0.19Hero Asia Investment Ltd., Reg. S 1.5%18/11/2023 USD 1,000,000 1,001,527 0.05Hong Kong Red Star MacallineUniversal Home Furnishings Ltd., Reg. S3.375% 21/09/2022 USD 3,090,000 2,840,221 0.13Hongkong International Qingdao Co.Ltd., Reg. S 3.9% 11/11/2022 USD 2,500,000 2,538,750 0.12Hongkong International Qingdao Co.Ltd., Reg. S 4.25% 04/12/2022 USD 4,000,000 4,085,000 0.19ICBCIL Finance Co. Ltd., Reg. S 1.75%25/08/2025 USD 4,600,000 4,622,218 0.21ICBCIL Finance Co. Ltd., Reg. S 3.625%19/05/2026 USD 3,300,000 3,578,702 0.16Lenovo Group Ltd., Reg. S 3.421%02/11/2030 USD 2,200,000 2,303,297 0.11MCC Holding Hong Kong Corp. Ltd.,Reg. S, FRN 2.95% 31/12/2164 USD 2,500,000 2,531,250 0.12MTR Corp. Ltd., Reg. S 1.625%19/08/2030 USD 1,800,000 1,748,763 0.08Shanghai Commercial Bank Ltd., Reg. S,FRN 3.75% 29/11/2027 USD 7,600,000 7,772,140 0.35Vanke Real Estate Hong Kong Co. Ltd.,Reg. S 5.35% 11/03/2024 USD 5,100,000 5,595,649 0.25Vanke Real Estate Hong Kong Co. Ltd.,Reg. S 3.975% 09/11/2027 USD 500,000 538,066 0.03Vanke Real Estate Hong Kong Co. Ltd.,Reg. S 3.5% 12/11/2029 USD 1,300,000 1,349,472 0.06Weichai International Hong KongEnergy Group Co. Ltd., Reg. S, FRN3.75% Perpetual USD 2,400,000 2,444,927 0.11Xiaomi Best Time International Ltd.,Reg. S 3.375% 29/04/2030 USD 4,900,000 5,101,874 0.23Yango Justice International Ltd., Reg. S10.25% 18/03/2022 USD 1,800,000 1,814,152 0.08Yango Justice International Ltd., Reg. S9.25% 15/04/2023 USD 1,900,000 1,885,750 0.09
116,392,464 5.28
IndiaAdani Ports & Special Economic ZoneLtd., Reg. S 3.375% 24/07/2024 USD 3,100,000 3,225,460 0.15Adani Ports & Special Economic ZoneLtd., Reg. S 4.2% 04/08/2027 USD 2,100,000 2,188,358 0.10Adani Transmission Ltd., Reg. S 4%03/08/2026 USD 1,800,000 1,892,998 0.09Adani Transmission Ltd., Reg. S 4.25%21/05/2036 USD 561,000 573,493 0.03Bharat Petroleum Corp. Ltd., Reg. S4.625% 25/10/2022 USD 500,000 521,118 0.02Bharat Petroleum Corp. Ltd., Reg. S 4%08/05/2025 USD 3,800,000 4,036,190 0.18Bharti Airtel Ltd., Reg. S 4.375%10/06/2025 USD 5,100,000 5,574,441 0.25Indian Railway Finance Corp. Ltd.,Reg. S 3.835% 13/12/2027 USD 2,200,000 2,378,235 0.11JSW Steel Ltd., Reg. S 5.25%13/04/2022 USD 500,000 512,815 0.02JSW Steel Ltd., Reg. S 5.95%18/04/2024 USD 300,000 321,394 0.01NTPC Ltd., Reg. S 4.5% 19/03/2028 USD 2,500,000 2,755,397 0.13ReNew Power Synthetic, Reg. S 6.67%12/03/2024 USD 1,500,000 1,578,322 0.07
25,558,221 1.16
IndonesiaAdaro Indonesia PT, Reg. S 4.25%31/10/2024 USD 6,150,000 6,360,638 0.29Bank Mandiri Persero Tbk. PT, Reg. S4.75% 13/05/2025 USD 2,500,000 2,786,875 0.13Bank Rakyat Indonesia Persero Tbk. PT,Reg. S 4.625% 20/07/2023 USD 3,300,000 3,534,986 0.16Bank Rakyat Indonesia Persero Tbk. PT,Reg. S 3.95% 28/03/2024 USD 1,400,000 1,498,254 0.07Bank Tabungan Negara Persero Tbk. PT,Reg. S 4.2% 23/01/2025 USD 1,900,000 1,944,686 0.09Hyundai Motor ManufacturingIndonesia PT, Reg. S 1.75% 06/05/2026 USD 3,200,000 3,213,488 0.15
Indonesia Asahan Aluminium PerseroPT, Reg. S 4.75% 15/05/2025 USD 1,100,000 1,214,598 0.06Indonesia Asahan Aluminium PerseroPT, Reg. S 6.757% 15/11/2048 USD 11,100,000 14,344,641 0.65Indonesia Government Bond 4.75%11/02/2029 USD 3,000,000 3,529,943 0.16Indonesia Government Bond, Reg. S7.75% 17/01/2038 USD 1,600,000 2,424,366 0.11Indonesia Government Bond, Reg. S5.25% 17/01/2042 USD 900,000 1,123,091 0.05Pelabuhan Indonesia III Persero PT,Reg. S 4.5% 02/05/2023 USD 1,500,000 1,596,397 0.07Pertamina Persero PT, Reg. S 2.3%09/02/2031 USD 1,000,000 961,141 0.04Pertamina Persero PT, Reg. S 6.45%30/05/2044 USD 500,000 652,690 0.03Pertamina Persero PT, Reg. S 4.15%25/02/2060 USD 2,000,000 2,014,987 0.09Perusahaan Penerbit SBSN IndonesiaIII, Reg. S 4.325% 28/05/2025 USD 700,000 782,901 0.04Perusahaan Penerbit SBSN IndonesiaIII, Reg. S 2.8% 23/06/2030 USD 1,700,000 1,741,174 0.08Perusahaan Perseroan Persero PTPerusahaan Listrik Negara, Reg. S5.375% 25/01/2029 USD 1,900,000 2,208,930 0.10Perusahaan Perseroan Persero PTPerusahaan Listrik Negara, Reg. S3.875% 17/07/2029 USD 1,700,000 1,802,697 0.08Perusahaan Perseroan Persero PTPerusahaan Listrik Negara, Reg. S5.25% 24/10/2042 USD 2,600,000 2,946,320 0.13Perusahaan Perseroan Persero PTPerusahaan Listrik Negara, Reg. S6.15% 21/05/2048 USD 2,000,000 2,532,320 0.11Perusahaan Perseroan Persero PTPerusahaan Listrik Negara, Reg. S4.375% 05/02/2050 USD 1,600,000 1,642,096 0.07Perusahaan Perseroan Persero PTPerusahaan Listrik Negara, Reg. S 4%30/06/2050 USD 3,200,000 3,157,600 0.14
64,014,819 2.90
Isle of ManGohl Capital Ltd., Reg. S 4.25%24/01/2027 USD 4,700,000 4,936,832 0.22
4,936,832 0.22
JerseyWest China Cement Ltd., Reg. S 4.95%08/07/2026 USD 1,700,000 1,700,000 0.08
1,700,000 0.08
MalaysiaIOI Investment L Bhd., Reg. S 4.375%27/06/2022 USD 5,000,000 5,134,370 0.23Petronas Capital Ltd., Reg. S 3.5%21/04/2030 USD 1,600,000 1,755,840 0.08SSG Resources Ltd., Reg. S 4.25%04/10/2022 USD 2,100,000 2,170,904 0.10TNB Global Ventures Capital Bhd.,Reg. S 4.851% 01/11/2028 USD 2,900,000 3,382,856 0.15
12,443,970 0.56
MauritiusAzure Power Solar Energy Pvt Ltd.,Reg. S 5.65% 24/12/2024 USD 3,000,000 3,190,125 0.14Greenko Mauritius Ltd., Reg. S 6.25%21/02/2023 USD 3,100,000 3,200,725 0.14Greenko Solar Mauritius Ltd., Reg. S5.55% 29/01/2025 USD 800,000 823,827 0.04India Green Energy Holdings, Reg. S5.375% 29/04/2024 USD 950,000 998,687 0.05India Green Power Holdings, Reg. S 4%22/02/2027 USD 2,100,000 2,112,096 0.10UPL Corp. Ltd., Reg. S 4.5%08/03/2028 USD 3,900,000 4,189,708 0.19
14,515,168 0.66
NetherlandsBharti Airtel International NetherlandsBV, Reg. S 5.35% 20/05/2024 USD 1,400,000 1,543,312 0.07Minejesa Capital BV, Reg. S 5.625%10/08/2037 USD 1,200,000 1,303,044 0.06Royal Capital BV, Reg. S, FRN 4.875%Perpetual USD 2,600,000 2,718,300 0.12
5,564,656 0.25
131
JPMorgan Funds - Asia Pacific Income FundSchedule of Investments (continued)
As at 30 June 2021
Investments Currency
Quantity/Nominal
Value
MarketValue
USD
%of
NetAssets Investments Currency
Quantity/Nominal
Value
MarketValue
USD
%of
NetAssets
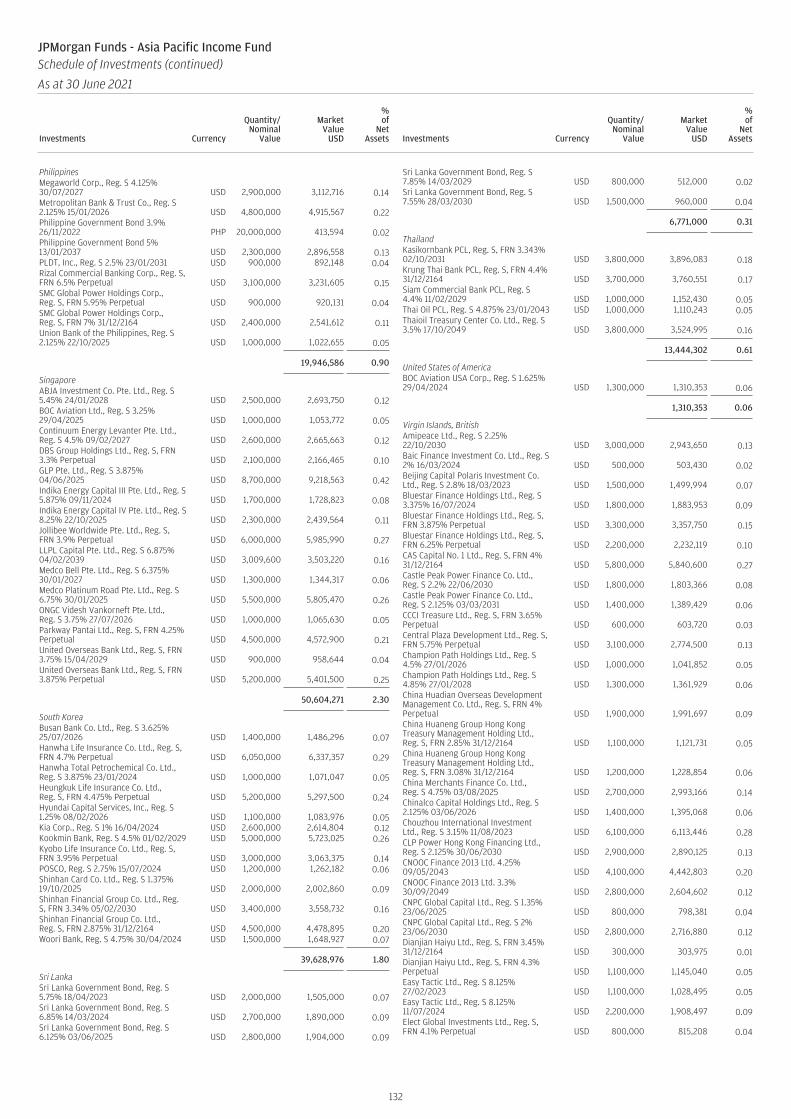
PhilippinesMegaworld Corp., Reg. S 4.125%30/07/2027 USD 2,900,000 3,112,716 0.14Metropolitan Bank & Trust Co., Reg. S2.125% 15/01/2026 USD 4,800,000 4,915,567 0.22Philippine Government Bond 3.9%26/11/2022 PHP 20,000,000 413,594 0.02Philippine Government Bond 5%13/01/2037 USD 2,300,000 2,896,558 0.13PLDT, Inc., Reg. S 2.5% 23/01/2031 USD 900,000 892,148 0.04Rizal Commercial Banking Corp., Reg. S,FRN 6.5% Perpetual USD 3,100,000 3,231,605 0.15SMC Global Power Holdings Corp.,Reg. S, FRN 5.95% Perpetual USD 900,000 920,131 0.04SMC Global Power Holdings Corp.,Reg. S, FRN 7% 31/12/2164 USD 2,400,000 2,541,612 0.11Union Bank of the Philippines, Reg. S2.125% 22/10/2025 USD 1,000,000 1,022,655 0.05
19,946,586 0.90
SingaporeABJA Investment Co. Pte. Ltd., Reg. S5.45% 24/01/2028 USD 2,500,000 2,693,750 0.12BOC Aviation Ltd., Reg. S 3.25%29/04/2025 USD 1,000,000 1,053,772 0.05Continuum Energy Levanter Pte. Ltd.,Reg. S 4.5% 09/02/2027 USD 2,600,000 2,665,663 0.12DBS Group Holdings Ltd., Reg. S, FRN3.3% Perpetual USD 2,100,000 2,166,465 0.10GLP Pte. Ltd., Reg. S 3.875%04/06/2025 USD 8,700,000 9,218,563 0.42Indika Energy Capital III Pte. Ltd., Reg. S5.875% 09/11/2024 USD 1,700,000 1,728,823 0.08Indika Energy Capital IV Pte. Ltd., Reg. S8.25% 22/10/2025 USD 2,300,000 2,439,564 0.11Jollibee Worldwide Pte. Ltd., Reg. S,FRN 3.9% Perpetual USD 6,000,000 5,985,990 0.27LLPL Capital Pte. Ltd., Reg. S 6.875%04/02/2039 USD 3,009,600 3,503,220 0.16Medco Bell Pte. Ltd., Reg. S 6.375%30/01/2027 USD 1,300,000 1,344,317 0.06Medco Platinum Road Pte. Ltd., Reg. S6.75% 30/01/2025 USD 5,500,000 5,805,470 0.26ONGC Videsh Vankorneft Pte. Ltd.,Reg. S 3.75% 27/07/2026 USD 1,000,000 1,065,630 0.05Parkway Pantai Ltd., Reg. S, FRN 4.25%Perpetual USD 4,500,000 4,572,900 0.21United Overseas Bank Ltd., Reg. S, FRN3.75% 15/04/2029 USD 900,000 958,644 0.04United Overseas Bank Ltd., Reg. S, FRN3.875% Perpetual USD 5,200,000 5,401,500 0.25
50,604,271 2.30
South KoreaBusan Bank Co. Ltd., Reg. S 3.625%25/07/2026 USD 1,400,000 1,486,296 0.07Hanwha Life Insurance Co. Ltd., Reg. S,FRN 4.7% Perpetual USD 6,050,000 6,337,357 0.29Hanwha Total Petrochemical Co. Ltd.,Reg. S 3.875% 23/01/2024 USD 1,000,000 1,071,047 0.05Heungkuk Life Insurance Co. Ltd.,Reg. S, FRN 4.475% Perpetual USD 5,200,000 5,297,500 0.24Hyundai Capital Services, Inc., Reg. S1.25% 08/02/2026 USD 1,100,000 1,083,976 0.05Kia Corp., Reg. S 1% 16/04/2024 USD 2,600,000 2,614,804 0.12Kookmin Bank, Reg. S 4.5% 01/02/2029 USD 5,000,000 5,723,025 0.26Kyobo Life Insurance Co. Ltd., Reg. S,FRN 3.95% Perpetual USD 3,000,000 3,063,375 0.14POSCO, Reg. S 2.75% 15/07/2024 USD 1,200,000 1,262,182 0.06Shinhan Card Co. Ltd., Reg. S 1.375%19/10/2025 USD 2,000,000 2,002,860 0.09Shinhan Financial Group Co. Ltd., Reg.S, FRN 3.34% 05/02/2030 USD 3,400,000 3,558,732 0.16Shinhan Financial Group Co. Ltd.,Reg. S, FRN 2.875% 31/12/2164 USD 4,500,000 4,478,895 0.20Woori Bank, Reg. S 4.75% 30/04/2024 USD 1,500,000 1,648,927 0.07
39,628,976 1.80
Sri LankaSri Lanka Government Bond, Reg. S5.75% 18/04/2023 USD 2,000,000 1,505,000 0.07Sri Lanka Government Bond, Reg. S6.85% 14/03/2024 USD 2,700,000 1,890,000 0.09Sri Lanka Government Bond, Reg. S6.125% 03/06/2025 USD 2,800,000 1,904,000 0.09
Sri Lanka Government Bond, Reg. S7.85% 14/03/2029 USD 800,000 512,000 0.02Sri Lanka Government Bond, Reg. S7.55% 28/03/2030 USD 1,500,000 960,000 0.04
6,771,000 0.31
ThailandKasikornbank PCL, Reg. S, FRN 3.343%02/10/2031 USD 3,800,000 3,896,083 0.18Krung Thai Bank PCL, Reg. S, FRN 4.4%31/12/2164 USD 3,700,000 3,760,551 0.17Siam Commercial Bank PCL, Reg. S4.4% 11/02/2029 USD 1,000,000 1,152,430 0.05Thai Oil PCL, Reg. S 4.875% 23/01/2043 USD 1,000,000 1,110,243 0.05Thaioil Treasury Center Co. Ltd., Reg. S3.5% 17/10/2049 USD 3,800,000 3,524,995 0.16
13,444,302 0.61
United States of AmericaBOC Aviation USA Corp., Reg. S 1.625%29/04/2024 USD 1,300,000 1,310,353 0.06
1,310,353 0.06
Virgin Islands, BritishAmipeace Ltd., Reg. S 2.25%22/10/2030 USD 3,000,000 2,943,650 0.13Baic Finance Investment Co. Ltd., Reg. S2% 16/03/2024 USD 500,000 503,430 0.02Beijing Capital Polaris Investment Co.Ltd., Reg. S 2.8% 18/03/2023 USD 1,500,000 1,499,994 0.07Bluestar Finance Holdings Ltd., Reg. S3.375% 16/07/2024 USD 1,800,000 1,883,953 0.09Bluestar Finance Holdings Ltd., Reg. S,FRN 3.875% Perpetual USD 3,300,000 3,357,750 0.15Bluestar Finance Holdings Ltd., Reg. S,FRN 6.25% Perpetual USD 2,200,000 2,232,119 0.10CAS Capital No. 1 Ltd., Reg. S, FRN 4%31/12/2164 USD 5,800,000 5,840,600 0.27Castle Peak Power Finance Co. Ltd.,Reg. S 2.2% 22/06/2030 USD 1,800,000 1,803,366 0.08Castle Peak Power Finance Co. Ltd.,Reg. S 2.125% 03/03/2031 USD 1,400,000 1,389,429 0.06CCCI Treasure Ltd., Reg. S, FRN 3.65%Perpetual USD 600,000 603,720 0.03Central Plaza Development Ltd., Reg. S,FRN 5.75% Perpetual USD 3,100,000 2,774,500 0.13Champion Path Holdings Ltd., Reg. S4.5% 27/01/2026 USD 1,000,000 1,041,852 0.05Champion Path Holdings Ltd., Reg. S4.85% 27/01/2028 USD 1,300,000 1,361,929 0.06China Huadian Overseas DevelopmentManagement Co. Ltd., Reg. S, FRN 4%Perpetual USD 1,900,000 1,991,697 0.09China Huaneng Group Hong KongTreasury Management Holding Ltd.,Reg. S, FRN 2.85% 31/12/2164 USD 1,100,000 1,121,731 0.05China Huaneng Group Hong KongTreasury Management Holding Ltd.,Reg. S, FRN 3.08% 31/12/2164 USD 1,200,000 1,228,854 0.06China Merchants Finance Co. Ltd.,Reg. S 4.75% 03/08/2025 USD 2,700,000 2,993,166 0.14Chinalco Capital Holdings Ltd., Reg. S2.125% 03/06/2026 USD 1,400,000 1,395,068 0.06Chouzhou International InvestmentLtd., Reg. S 3.15% 11/08/2023 USD 6,100,000 6,113,446 0.28CLP Power Hong Kong Financing Ltd.,Reg. S 2.125% 30/06/2030 USD 2,900,000 2,890,125 0.13CNOOC Finance 2013 Ltd. 4.25%09/05/2043 USD 4,100,000 4,442,803 0.20CNOOC Finance 2013 Ltd. 3.3%30/09/2049 USD 2,800,000 2,604,602 0.12CNPC Global Capital Ltd., Reg. S 1.35%23/06/2025 USD 800,000 798,381 0.04CNPC Global Capital Ltd., Reg. S 2%23/06/2030 USD 2,800,000 2,716,880 0.12Dianjian Haiyu Ltd., Reg. S, FRN 3.45%31/12/2164 USD 300,000 303,975 0.01Dianjian Haiyu Ltd., Reg. S, FRN 4.3%Perpetual USD 1,100,000 1,145,040 0.05Easy Tactic Ltd., Reg. S 8.125%27/02/2023 USD 1,100,000 1,028,495 0.05Easy Tactic Ltd., Reg. S 8.125%11/07/2024 USD 2,200,000 1,908,497 0.09Elect Global Investments Ltd., Reg. S,FRN 4.1% Perpetual USD 800,000 815,208 0.04
132
JPMorgan Funds - Asia Pacific Income FundSchedule of Investments (continued)
As at 30 June 2021
Investments Currency
Quantity/Nominal
Value
MarketValue
USD
%of
NetAssets Investments Currency
Quantity/Nominal
Value
MarketValue
USD
%of
NetAssets

ENN Clean Energy InternationalInvestment Ltd., Reg. S 3.375%12/05/2026 USD 1,800,000 1,837,257 0.08Fortune Star BVI Ltd., Reg. S 5.95%29/01/2023 USD 2,000,000 2,057,361 0.09Fortune Star BVI Ltd., Reg. S 6.85%02/07/2024 USD 1,600,000 1,711,640 0.08Fortune Star BVI Ltd., Reg. S 5%18/05/2026 USD 3,600,000 3,659,922 0.17FPC Capital Ltd., Reg. S 5.75%30/05/2025 USD 3,000,000 3,229,259 0.15Franshion Brilliant Ltd., Reg. S, FRN 4%Perpetual USD 1,500,000 1,508,059 0.07Gemstones International Ltd., Reg. S12% 10/03/2023 USD 5,600,000 5,683,586 0.26Greenland Global Investment Ltd.,Reg. S 5.75% 26/09/2022 USD 500,000 446,875 0.02Greenland Global Investment Ltd.,Reg. S 6.25% 16/12/2022 USD 3,500,000 3,357,810 0.15Guangzhou Metro Investment FinanceBVI Ltd., Reg. S 1.507% 17/09/2025 USD 1,800,000 1,766,073 0.08Haitian BVI International InvestmentDevelopment Ltd., Reg. S 2.8%04/11/2023 USD 3,600,000 3,618,065 0.16HKT Capital No. 2 Ltd., Reg. S 3.625%02/04/2025 USD 2,903,000 3,110,630 0.14Hopson Capital International Group Co.Ltd., Reg. S 5.8% 12/01/2022 USD 3,400,000 3,404,088 0.15Huarong Finance 2017 Co. Ltd., Reg. S4.25% 07/11/2027 USD 400,000 280,500 0.01Huarong Finance 2017 Co. Ltd., Reg. S,FRN 4% Perpetual USD 2,700,000 1,684,125 0.08Huarong Finance 2019 Co. Ltd., Reg. S3.875% 13/11/2029 USD 3,751,000 2,606,945 0.12Huarong Finance 2019 Co. Ltd., Reg. S3.375% 24/02/2030 USD 3,900,000 2,684,136 0.12Huarong Finance II Co. Ltd., Reg. S4.625% 03/06/2026 USD 2,000,000 1,410,000 0.06Hysan MTN Ltd., Reg. S 2.875%02/06/2027 USD 3,600,000 3,795,978 0.17Leader Goal International Ltd., Reg. S,FRN 4.25% Perpetual USD 3,100,000 3,173,607 0.14Minmetals Bounteous Finance BVI Ltd.,Reg. S, FRN 3.375% Perpetual USD 1,600,000 1,643,240 0.07New Metro Global Ltd., Reg. S 6.5%20/05/2022 USD 1,300,000 1,326,000 0.06New Metro Global Ltd., Reg. S 4.8%15/12/2024 USD 1,500,000 1,512,801 0.07New Metro Global Ltd., Reg. S 4.5%02/05/2026 USD 2,900,000 2,848,814 0.13NWD MTN Ltd., Reg. S 4.125%18/07/2029 USD 8,000,000 8,375,556 0.38Phoenix Lead Ltd., Reg. S 4.85%31/12/2164 USD 1,000,000 1,024,992 0.05RKPF Overseas 2019 A Ltd., Reg. S 6.7%30/09/2024 USD 3,300,000 3,511,348 0.16RKPF Overseas 2020 A Ltd., Reg. S 5.2%12/01/2026 USD 3,100,000 3,131,742 0.14RongXingDa Development BVI Ltd.,Reg. S 8% 24/04/2022 USD 6,110,000 4,918,550 0.22Shandong Iron And Steel XinhengInternational Co. Ltd., Reg. S 6.85%25/09/2022 USD 2,300,000 2,351,750 0.11Shandong Iron And Steel XinhengInternational Co. Ltd., Reg. S 6.5%05/11/2023 USD 1,500,000 1,548,636 0.07Sinopec Capital 2013 Ltd., Reg. S 4.25%24/04/2043 USD 4,600,000 5,271,561 0.24Sinopec Group Overseas Development2013 Ltd., Reg. S 5.375% 17/10/2043 USD 2,500,000 3,333,335 0.15Sinopec Group Overseas Development2018 Ltd., Reg. S 2.7% 13/05/2030 USD 2,100,000 2,172,190 0.10Sinopec Group Overseas Development2018 Ltd., Reg. S 3.68% 08/08/2049 USD 5,000,000 5,380,377 0.24State Grid Overseas Investment 2014Ltd., Reg. S 4.85% 07/05/2044 USD 1,956,000 2,578,213 0.12Studio City Finance Ltd., Reg. S 6%15/07/2025 USD 2,700,000 2,839,050 0.13Talent Yield International Ltd., Reg. S3.125% 06/05/2031 USD 1,300,000 1,356,850 0.06TSMC Global Ltd., Reg. S 2.25%23/04/2031 USD 1,500,000 1,511,457 0.07Wealth Driven Ltd., Reg. S 5.5%17/08/2023 USD 2,500,000 2,512,500 0.11Yunda Holding Investment Ltd., Reg. S2.25% 19/08/2025 USD 3,900,000 3,847,876 0.18
174,757,014 7.93
Total Bonds 733,874,598 33.29
Equities
AustraliaASX Ltd. AUD 211,212 12,313,466 0.56Australia & New Zealand Banking GroupLtd. AUD 391,869 8,275,283 0.38BHP Group Ltd. AUD 184,152 6,711,660 0.30Brambles Ltd. AUD 2,785,103 23,895,611 1.08Coles Group Ltd. AUD 877,387 11,253,847 0.51Goodman Group, REIT AUD 904,481 14,383,798 0.65Insurance Australia Group Ltd. AUD 3,208,418 12,409,672 0.56Macquarie Group Ltd. AUD 63,286 7,428,178 0.34Medibank Pvt Ltd. AUD 6,445,719 15,258,486 0.69Rio Tinto Ltd. AUD 444,321 42,214,048 1.92Telstra Corp. Ltd. AUD 4,745,242 13,369,311 0.61Transurban Group AUD 1,835,091 19,599,987 0.89Westpac Banking Corp. AUD 777,759 15,064,609 0.68
202,177,956 9.17
BermudaCK Infrastructure Holdings Ltd. HKD 913,000 5,445,972 0.25Kunlun Energy Co. Ltd. HKD 10,366,000 9,543,473 0.43
14,989,445 0.68
Cayman IslandsASM Pacific Technology Ltd. HKD 1,651,700 22,384,246 1.01Chailease Holding Co. Ltd. TWD 1,980,785 14,354,800 0.65China Lesso Group Holdings Ltd. HKD 5,160,000 12,703,599 0.58China Resources Land Ltd. HKD 2,224,000 9,013,422 0.41HKBN Ltd. HKD 3,533,500 4,279,106 0.19NetEase, Inc. HKD 1,007,900 22,847,709 1.04Tingyi Cayman Islands Holding Corp. HKD 5,368,000 10,748,110 0.49Topsports International Holdings Ltd.,Reg. S HKD 4,647,000 7,617,111 0.35WH Group Ltd., Reg. S HKD 12,364,500 11,120,701 0.50Xinyi Glass Holdings Ltd. HKD 3,078,000 12,553,778 0.57
127,622,582 5.79
ChinaChina Construction Bank Corp. ‘H’ HKD 38,892,000 30,622,873 1.39China Life Insurance Co. Ltd. ‘H’ HKD 5,244,000 10,405,298 0.47China Merchants Bank Co. Ltd. ‘H’ HKD 2,948,500 25,142,722 1.14Haier Smart Home Co. Ltd. ‘H’ HKD 7,531,600 26,256,988 1.19Hangzhou Robam Appliances Co. Ltd.‘A’ CNY 433,613 3,124,815 0.14Industrial & Commercial Bank of ChinaLtd. ‘H’ HKD 23,369,000 13,736,310 0.62Inner Mongolia Yili Industrial Group Co.Ltd. ‘A’ CNY 3,830,500 21,850,353 0.99Jiangsu Expressway Co. Ltd. ‘H’ HKD 7,977,000 9,013,136 0.41Joyoung Co. Ltd. ‘A’ CNY 4,228,015 21,276,264 0.96Midea Group Co. Ltd. ‘A’ CNY 1,010,816 11,172,762 0.51Ping An Insurance Group Co. of ChinaLtd. ‘A’ CNY 1,519,040 15,120,063 0.69Ping An Insurance Group Co. of ChinaLtd. ‘H’ HKD 1,588,000 15,560,528 0.71Postal Savings Bank of China Co. Ltd.,Reg. S ‘H’ HKD 28,145,000 18,935,498 0.86
222,217,610 10.08
Hong KongBOC Hong Kong Holdings Ltd. HKD 7,001,000 23,776,161 1.08CLP Holdings Ltd. HKD 2,885,500 28,543,869 1.29CSPC Pharmaceutical Group Ltd. HKD 2,902,000 4,203,772 0.19Guangdong Investment Ltd. HKD 3,938,000 5,648,721 0.26Hong Kong Exchanges & Clearing Ltd. HKD 480,216 28,635,225 1.30
90,807,748 4.12
IndiaInfosys Ltd., ADR USD 2,049,887 43,693,341 1.98Power Grid Corp. of India Ltd. INR 4,049,978 12,649,083 0.58Tata Consultancy Services Ltd. INR 167,389 7,545,324 0.34
63,887,748 2.90
IndonesiaBank Central Asia Tbk. PT IDR 5,491,500 11,413,799 0.52Bank Rakyat Indonesia Persero Tbk. PT IDR 91,780,300 24,907,274 1.13Telkom Indonesia Persero Tbk. PT IDR 88,005,600 19,148,805 0.87
55,469,878 2.52
133
JPMorgan Funds - Asia Pacific Income FundSchedule of Investments (continued)
As at 30 June 2021
Investments Currency
Quantity/Nominal
Value
MarketValue
USD
%of
NetAssets Investments Currency
Quantity/Nominal
Value
MarketValue
USD
%of
NetAssets

SingaporeAIMS APAC REIT SGD 9,661,999 10,602,179 0.48DBS Group Holdings Ltd. SGD 1,865,645 41,394,779 1.88Mapletree Logistics Trust, REIT SGD 10,898,444 16,580,359 0.75Singapore Exchange Ltd. SGD 935,200 7,760,866 0.35United Overseas Bank Ltd. SGD 1,384,000 26,589,644 1.21
102,927,827 4.67
South KoreaBGF retail Co. Ltd. KRW 50,968 8,108,166 0.37Hana Financial Group, Inc. KRW 186,993 7,616,848 0.35Hyundai Motor Co. Preference KRW 91,967 9,339,871 0.42KB Financial Group, Inc. KRW 327,642 16,194,923 0.73Samsung Electronics Co. Ltd.Preference KRW 85,670 5,591,740 0.25Samsung Electronics Co. Ltd. KRW 1,581,868 113,049,571 5.13
159,901,119 7.25
SupranationalHKT Trust & HKT Ltd. HKD 11,711,000 15,938,893 0.72
15,938,893 0.72
TaiwanAccton Technology Corp. TWD 1,231,000 14,567,069 0.66Advantech Co. Ltd. TWD 1,294,486 16,014,092 0.73ASE Technology Holding Co. Ltd. TWD 4,101,000 16,421,340 0.75Catcher Technology Co. Ltd. TWD 380,000 2,474,738 0.11Eclat Textile Co. Ltd. TWD 866,000 20,387,057 0.93President Chain Store Corp. TWD 1,880,000 17,683,102 0.80Realtek Semiconductor Corp. TWD 810,000 14,642,576 0.66Taiwan Semiconductor ManufacturingCo. Ltd. TWD 6,534,000 139,188,154 6.31Vanguard International SemiconductorCorp. TWD 1,439,000 6,097,239 0.28Wiwynn Corp. TWD 446,000 15,909,166 0.72
263,384,533 11.95
ThailandAdvanced Info Service PCL THB 1,906,600 10,184,194 0.46PTT PCL THB 13,574,700 16,248,569 0.74Siam Commercial Bank PCL (The) THB 2,597,300 7,929,218 0.36Tisco Financial Group PCL THB 2,603,800 7,197,809 0.32
41,559,790 1.88
United KingdomBHP Group plc GBP 699,055 20,840,382 0.94
20,840,382 0.94
United States of AmericaYum China Holdings, Inc. HKD 310,250 20,243,926 0.92
20,243,926 0.92
Total Equities 1,401,969,437 63.59
Total Transferable securities and money market instrumentsadmitted to an official exchange listing 2,135,844,035 96.88
Transferable securities and money market instruments dealt in on another regulatedmarket
Bonds
CanadaCNOOC Petroleum North America ULC7.4% 01/05/2028 USD 600,000 774,717 0.04CNOOC Petroleum North America ULC6.4% 15/05/2037 USD 1,900,000 2,491,624 0.11
3,266,341 0.15
Cayman IslandsCK Hutchison Capital Securities 17 Ltd.,Reg. S, FRN 4% Perpetual USD 400,000 407,999 0.02Melco Resorts Finance Ltd., Reg. S5.625% 17/07/2027 USD 500,000 520,316 0.02Tencent Holdings Ltd., Reg. S 2.88%22/04/2031 USD 4,000,000 4,142,163 0.19Tencent Holdings Ltd., Reg. S 3.84%22/04/2051 USD 4,000,000 4,336,129 0.20Yuzhou Group Holdings Co. Ltd., Reg. S8.375% 30/10/2024 USD 1,000,000 893,750 0.04
10,300,357 0.47
Hong KongMCC Holding Hong Kong Corp. Ltd.,Reg. S, FRN 3.5% 31/12/2164 USD 1,000,000 1,017,419 0.05
1,017,419 0.05
NetherlandsGreenko Dutch BV, Reg. S 3.85%29/03/2026 USD 3,400,000 3,493,500 0.16
3,493,500 0.16
PhilippinesPetron Corp., Reg. S, FRN 4.6%Perpetual USD 2,000,000 2,005,000 0.09
2,005,000 0.09
South KoreaShinhan Bank Co. Ltd., Reg. S 3.875%24/03/2026 USD 2,800,000 3,081,745 0.14Shinhan Bank Co. Ltd., Reg. S 3.75%20/09/2027 USD 2,500,000 2,750,281 0.12
5,832,026 0.26
ThailandThaioil Treasury Center Co. Ltd., Reg. S4.625% 20/11/2028 USD 3,000,000 3,431,768 0.15
3,431,768 0.15
Virgin Islands, BritishSinopec Group Overseas Development2012 Ltd., Reg. S 4.875% 17/05/2042 USD 800,000 994,041 0.05Studio City Finance Ltd., Reg. S 5%15/01/2029 USD 900,000 908,550 0.04
1,902,591 0.09
Total Bonds 31,249,002 1.42
Total Transferable securities and money market instrumentsdealt in on another regulated market 31,249,002 1.42
Units of authorised UCITS or other collective investment undertakings
Collective Investment Schemes - UCITS
LuxembourgJPMorgan USD Liquidity LVNAV Fund -JPM USD Liquidity LVNAV X (dist.)† USD 27,390,000 27,390,000 1.24
27,390,000 1.24
Total Collective Investment Schemes - UCITS 27,390,000 1.24
Total Units of authorised UCITS or other collective investmentundertakings 27,390,000 1.24
Total Investments 2,194,483,037 99.54
Cash 10,354,187 0.47
Other Assets/(Liabilities) (215,379) (0.01)
Total Net Assets 2,204,621,845 100.00
† Related Party Fund.
134
JPMorgan Funds - Asia Pacific Income FundSchedule of Investments (continued)
As at 30 June 2021
Investments Currency
Quantity/Nominal
Value
MarketValue
USD
%of
NetAssets Investments Currency
Quantity/Nominal
Value
MarketValue
USD
%of
NetAssets
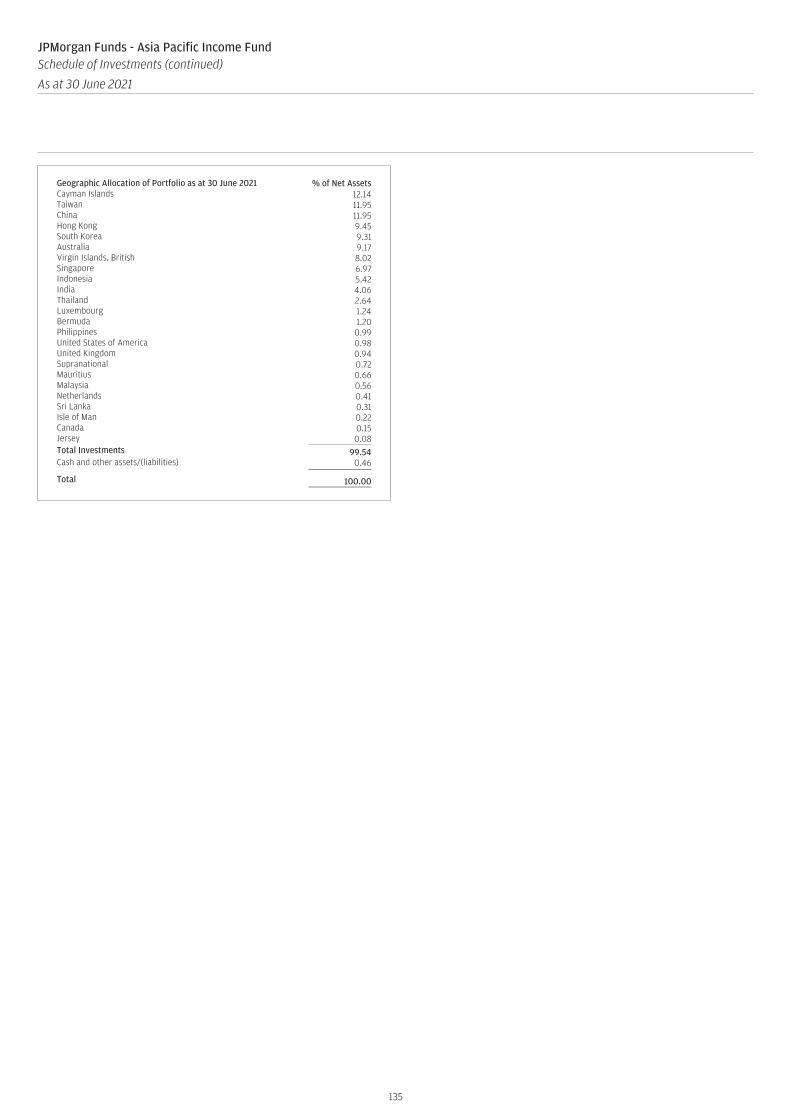
Geographic Allocation of Portfolio as at 30 June 2021 % of Net AssetsCayman Islands 12.14Taiwan 11.95China 11.95Hong Kong 9.45South Korea 9.31Australia 9.17Virgin Islands, British 8.02Singapore 6.97Indonesia 5.42India 4.06Thailand 2.64Luxembourg 1.24Bermuda 1.20Philippines 0.99United States of America 0.98United Kingdom 0.94Supranational 0.72Mauritius 0.66Malaysia 0.56Netherlands 0.41Sri Lanka 0.31Isle of Man 0.22Canada 0.15Jersey 0.08Total Investments 99.54Cash and other assets/(liabilities) 0.46
Total 100.00
135
JPMorgan Funds - Asia Pacific Income FundSchedule of Investments (continued)
As at 30 June 2021
Investments Currency
Quantity/Nominal
Value
MarketValue
USD
%of
NetAssets Investments Currency
Quantity/Nominal
Value
MarketValue
USD
%of
NetAssets
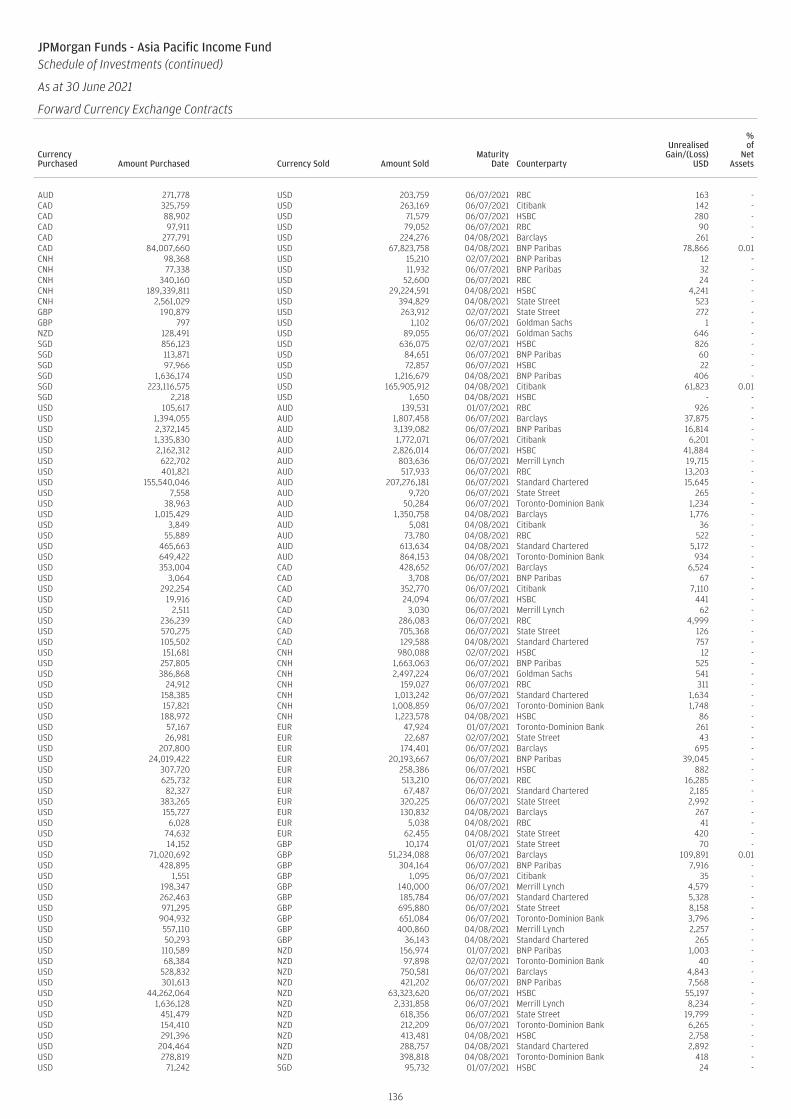
JPMorgan Funds - Asia Pacific Income FundSchedule of Investments (continued)
As at 30 June 2021
Forward Currency Exchange Contracts (continued)
CurrencyPurchased Amount Purchased Currency Sold Amount Sold
MaturityDate Counterparty
UnrealisedGain/(Loss)
USD
%of
NetAssets
AUD 271,778 USD 203,759 06/07/2021 RBC 163 -CAD 325,759 USD 263,169 06/07/2021 Citibank 142 -CAD 88,902 USD 71,579 06/07/2021 HSBC 280 -CAD 97,911 USD 79,052 06/07/2021 RBC 90 -CAD 277,791 USD 224,276 04/08/2021 Barclays 261 -CAD 84,007,660 USD 67,823,758 04/08/2021 BNP Paribas 78,866 0.01CNH 98,368 USD 15,210 02/07/2021 BNP Paribas 12 -CNH 77,338 USD 11,932 06/07/2021 BNP Paribas 32 -CNH 340,160 USD 52,600 06/07/2021 RBC 24 -CNH 189,339,811 USD 29,224,591 04/08/2021 HSBC 4,241 -CNH 2,561,029 USD 394,829 04/08/2021 State Street 523 -GBP 190,879 USD 263,912 02/07/2021 State Street 272 -GBP 797 USD 1,102 06/07/2021 Goldman Sachs 1 -NZD 128,491 USD 89,055 06/07/2021 Goldman Sachs 646 -SGD 856,123 USD 636,075 02/07/2021 HSBC 826 -SGD 113,871 USD 84,651 06/07/2021 BNP Paribas 60 -SGD 97,966 USD 72,857 06/07/2021 HSBC 22 -SGD 1,636,174 USD 1,216,679 04/08/2021 BNP Paribas 406 -SGD 223,116,575 USD 165,905,912 04/08/2021 Citibank 61,823 0.01SGD 2,218 USD 1,650 04/08/2021 HSBC - -USD 105,617 AUD 139,531 01/07/2021 RBC 926 -USD 1,394,055 AUD 1,807,458 06/07/2021 Barclays 37,875 -USD 2,372,145 AUD 3,139,082 06/07/2021 BNP Paribas 16,814 -USD 1,335,830 AUD 1,772,071 06/07/2021 Citibank 6,201 -USD 2,162,312 AUD 2,826,014 06/07/2021 HSBC 41,884 -USD 622,702 AUD 803,636 06/07/2021 Merrill Lynch 19,715 -USD 401,821 AUD 517,933 06/07/2021 RBC 13,203 -USD 155,540,046 AUD 207,276,181 06/07/2021 Standard Chartered 15,645 -USD 7,558 AUD 9,720 06/07/2021 State Street 265 -USD 38,963 AUD 50,284 06/07/2021 Toronto-Dominion Bank 1,234 -USD 1,015,429 AUD 1,350,758 04/08/2021 Barclays 1,776 -USD 3,849 AUD 5,081 04/08/2021 Citibank 36 -USD 55,889 AUD 73,780 04/08/2021 RBC 522 -USD 465,663 AUD 613,634 04/08/2021 Standard Chartered 5,172 -USD 649,422 AUD 864,153 04/08/2021 Toronto-Dominion Bank 934 -USD 353,004 CAD 428,652 06/07/2021 Barclays 6,524 -USD 3,064 CAD 3,708 06/07/2021 BNP Paribas 67 -USD 292,254 CAD 352,770 06/07/2021 Citibank 7,110 -USD 19,916 CAD 24,094 06/07/2021 HSBC 441 -USD 2,511 CAD 3,030 06/07/2021 Merrill Lynch 62 -USD 236,239 CAD 286,083 06/07/2021 RBC 4,999 -USD 570,275 CAD 705,368 06/07/2021 State Street 126 -USD 105,502 CAD 129,588 04/08/2021 Standard Chartered 757 -USD 151,681 CNH 980,088 02/07/2021 HSBC 12 -USD 257,805 CNH 1,663,063 06/07/2021 BNP Paribas 525 -USD 386,868 CNH 2,497,224 06/07/2021 Goldman Sachs 541 -USD 24,912 CNH 159,027 06/07/2021 RBC 311 -USD 158,385 CNH 1,013,242 06/07/2021 Standard Chartered 1,634 -USD 157,821 CNH 1,008,859 06/07/2021 Toronto-Dominion Bank 1,748 -USD 188,972 CNH 1,223,578 04/08/2021 HSBC 86 -USD 57,167 EUR 47,924 01/07/2021 Toronto-Dominion Bank 261 -USD 26,981 EUR 22,687 02/07/2021 State Street 43 -USD 207,800 EUR 174,401 06/07/2021 Barclays 695 -USD 24,019,422 EUR 20,193,667 06/07/2021 BNP Paribas 39,045 -USD 307,720 EUR 258,386 06/07/2021 HSBC 882 -USD 625,732 EUR 513,210 06/07/2021 RBC 16,285 -USD 82,327 EUR 67,487 06/07/2021 Standard Chartered 2,185 -USD 383,265 EUR 320,225 06/07/2021 State Street 2,992 -USD 155,727 EUR 130,832 04/08/2021 Barclays 267 -USD 6,028 EUR 5,038 04/08/2021 RBC 41 -USD 74,632 EUR 62,455 04/08/2021 State Street 420 -USD 14,152 GBP 10,174 01/07/2021 State Street 70 -USD 71,020,692 GBP 51,234,088 06/07/2021 Barclays 109,891 0.01USD 428,895 GBP 304,164 06/07/2021 BNP Paribas 7,916 -USD 1,551 GBP 1,095 06/07/2021 Citibank 35 -USD 198,347 GBP 140,000 06/07/2021 Merrill Lynch 4,579 -USD 262,463 GBP 185,784 06/07/2021 Standard Chartered 5,328 -USD 971,295 GBP 695,880 06/07/2021 State Street 8,158 -USD 904,932 GBP 651,084 06/07/2021 Toronto-Dominion Bank 3,796 -USD 557,110 GBP 400,860 04/08/2021 Merrill Lynch 2,257 -USD 50,293 GBP 36,143 04/08/2021 Standard Chartered 265 -USD 110,589 NZD 156,974 01/07/2021 BNP Paribas 1,003 -USD 68,384 NZD 97,898 02/07/2021 Toronto-Dominion Bank 40 -USD 528,832 NZD 750,581 06/07/2021 Barclays 4,843 -USD 301,613 NZD 421,202 06/07/2021 BNP Paribas 7,568 -USD 44,262,064 NZD 63,323,620 06/07/2021 HSBC 55,197 -USD 1,636,128 NZD 2,331,858 06/07/2021 Merrill Lynch 8,234 -USD 451,479 NZD 618,356 06/07/2021 State Street 19,799 -USD 154,410 NZD 212,209 06/07/2021 Toronto-Dominion Bank 6,265 -USD 291,396 NZD 413,481 04/08/2021 HSBC 2,758 -USD 204,464 NZD 288,757 04/08/2021 Standard Chartered 2,892 -USD 278,819 NZD 398,818 04/08/2021 Toronto-Dominion Bank 418 -USD 71,242 SGD 95,732 01/07/2021 HSBC 24 -
136
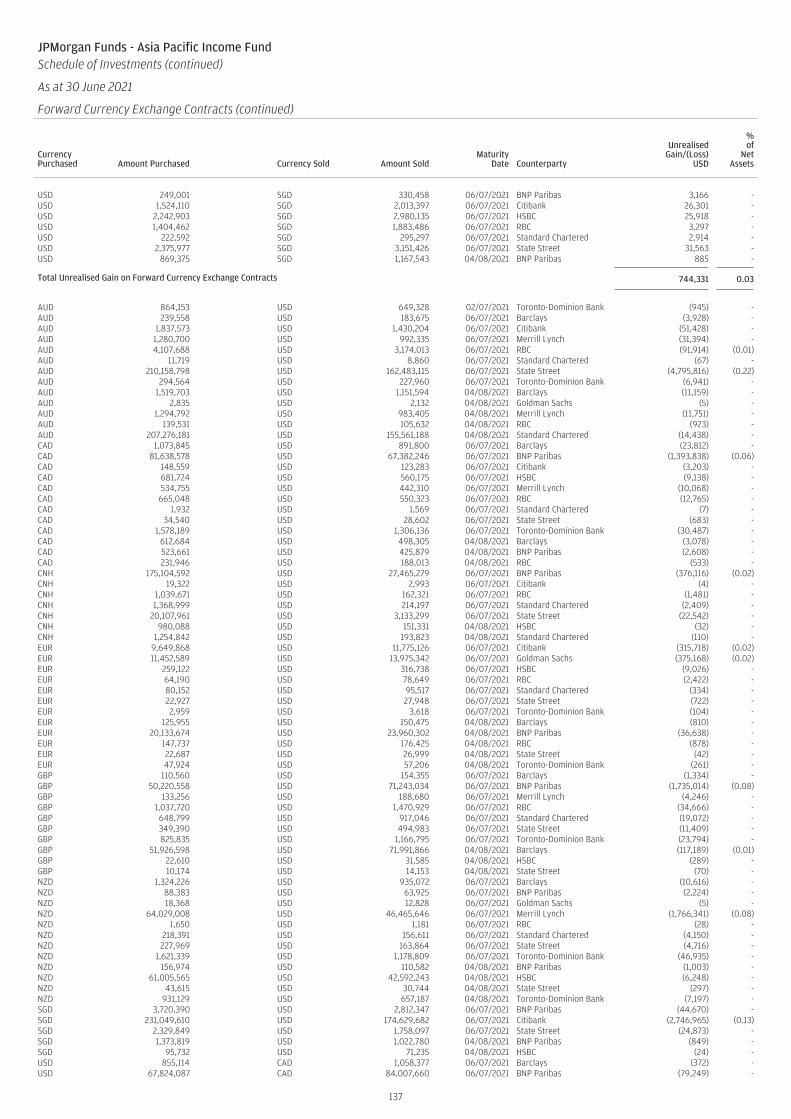
JPMorgan Funds - Asia Pacific Income FundSchedule of Investments (continued)
As at 30 June 2021
Forward Currency Exchange Contracts (continued)
CurrencyPurchased Amount Purchased Currency Sold Amount Sold
MaturityDate Counterparty
UnrealisedGain/(Loss)
USD
%of
NetAssets
USD 249,001 SGD 330,458 06/07/2021 BNP Paribas 3,166 -USD 1,524,110 SGD 2,013,397 06/07/2021 Citibank 26,301 -USD 2,242,903 SGD 2,980,135 06/07/2021 HSBC 25,918 -USD 1,404,462 SGD 1,883,486 06/07/2021 RBC 3,297 -USD 222,592 SGD 295,297 06/07/2021 Standard Chartered 2,914 -USD 2,375,977 SGD 3,151,426 06/07/2021 State Street 31,563 -USD 869,375 SGD 1,167,543 04/08/2021 BNP Paribas 885 -
Total Unrealised Gain on Forward Currency Exchange Contracts 744,331 0.03
AUD 864,153 USD 649,328 02/07/2021 Toronto-Dominion Bank (945) -AUD 239,558 USD 183,675 06/07/2021 Barclays (3,928) -AUD 1,837,573 USD 1,430,204 06/07/2021 Citibank (51,428) -AUD 1,280,700 USD 992,335 06/07/2021 Merrill Lynch (31,394) -AUD 4,107,688 USD 3,174,013 06/07/2021 RBC (91,914) (0.01)AUD 11,719 USD 8,860 06/07/2021 Standard Chartered (67) -AUD 210,158,798 USD 162,483,115 06/07/2021 State Street (4,795,816) (0.22)AUD 294,564 USD 227,960 06/07/2021 Toronto-Dominion Bank (6,941) -AUD 1,519,703 USD 1,151,594 04/08/2021 Barclays (11,159) -AUD 2,835 USD 2,132 04/08/2021 Goldman Sachs (5) -AUD 1,294,792 USD 983,405 04/08/2021 Merrill Lynch (11,751) -AUD 139,531 USD 105,632 04/08/2021 RBC (923) -AUD 207,276,181 USD 155,561,188 04/08/2021 Standard Chartered (14,438) -CAD 1,073,845 USD 891,800 06/07/2021 Barclays (23,812) -CAD 81,638,578 USD 67,382,246 06/07/2021 BNP Paribas (1,393,838) (0.06)CAD 148,559 USD 123,283 06/07/2021 Citibank (3,203) -CAD 681,724 USD 560,175 06/07/2021 HSBC (9,138) -CAD 534,755 USD 442,310 06/07/2021 Merrill Lynch (10,068) -CAD 665,048 USD 550,323 06/07/2021 RBC (12,765) -CAD 1,932 USD 1,569 06/07/2021 Standard Chartered (7) -CAD 34,540 USD 28,602 06/07/2021 State Street (683) -CAD 1,578,189 USD 1,306,136 06/07/2021 Toronto-Dominion Bank (30,487) -CAD 612,684 USD 498,305 04/08/2021 Barclays (3,078) -CAD 523,661 USD 425,879 04/08/2021 BNP Paribas (2,608) -CAD 231,946 USD 188,013 04/08/2021 RBC (533) -CNH 175,104,592 USD 27,465,279 06/07/2021 BNP Paribas (376,116) (0.02)CNH 19,322 USD 2,993 06/07/2021 Citibank (4) -CNH 1,039,671 USD 162,321 06/07/2021 RBC (1,481) -CNH 1,368,999 USD 214,197 06/07/2021 Standard Chartered (2,409) -CNH 20,107,961 USD 3,133,299 06/07/2021 State Street (22,542) -CNH 980,088 USD 151,331 04/08/2021 HSBC (32) -CNH 1,254,842 USD 193,823 04/08/2021 Standard Chartered (110) -EUR 9,649,868 USD 11,775,126 06/07/2021 Citibank (315,718) (0.02)EUR 11,452,589 USD 13,975,342 06/07/2021 Goldman Sachs (375,168) (0.02)EUR 259,122 USD 316,738 06/07/2021 HSBC (9,026) -EUR 64,190 USD 78,649 06/07/2021 RBC (2,422) -EUR 80,152 USD 95,517 06/07/2021 Standard Chartered (334) -EUR 22,927 USD 27,948 06/07/2021 State Street (722) -EUR 2,959 USD 3,618 06/07/2021 Toronto-Dominion Bank (104) -EUR 125,955 USD 150,475 04/08/2021 Barclays (810) -EUR 20,133,674 USD 23,960,302 04/08/2021 BNP Paribas (36,638) -EUR 147,737 USD 176,425 04/08/2021 RBC (878) -EUR 22,687 USD 26,999 04/08/2021 State Street (42) -EUR 47,924 USD 57,206 04/08/2021 Toronto-Dominion Bank (261) -GBP 110,560 USD 154,355 06/07/2021 Barclays (1,334) -GBP 50,220,558 USD 71,243,034 06/07/2021 BNP Paribas (1,735,014) (0.08)GBP 133,256 USD 188,680 06/07/2021 Merrill Lynch (4,246) -GBP 1,037,720 USD 1,470,929 06/07/2021 RBC (34,666) -GBP 648,799 USD 917,046 06/07/2021 Standard Chartered (19,072) -GBP 349,390 USD 494,983 06/07/2021 State Street (11,409) -GBP 825,835 USD 1,166,795 06/07/2021 Toronto-Dominion Bank (23,794) -GBP 51,926,598 USD 71,991,866 04/08/2021 Barclays (117,189) (0.01)GBP 22,610 USD 31,585 04/08/2021 HSBC (289) -GBP 10,174 USD 14,153 04/08/2021 State Street (70) -NZD 1,324,226 USD 935,072 06/07/2021 Barclays (10,616) -NZD 88,383 USD 63,925 06/07/2021 BNP Paribas (2,224) -NZD 18,368 USD 12,828 06/07/2021 Goldman Sachs (5) -NZD 64,029,008 USD 46,465,646 06/07/2021 Merrill Lynch (1,766,341) (0.08)NZD 1,650 USD 1,181 06/07/2021 RBC (28) -NZD 218,391 USD 156,611 06/07/2021 Standard Chartered (4,150) -NZD 227,969 USD 163,864 06/07/2021 State Street (4,716) -NZD 1,621,339 USD 1,178,809 06/07/2021 Toronto-Dominion Bank (46,935) -NZD 156,974 USD 110,582 04/08/2021 BNP Paribas (1,003) -NZD 61,005,565 USD 42,592,243 04/08/2021 HSBC (6,248) -NZD 43,615 USD 30,744 04/08/2021 State Street (297) -NZD 931,129 USD 657,187 04/08/2021 Toronto-Dominion Bank (7,197) -SGD 3,720,390 USD 2,812,347 06/07/2021 BNP Paribas (44,670) -SGD 231,049,610 USD 174,629,682 06/07/2021 Citibank (2,746,965) (0.13)SGD 2,329,849 USD 1,758,097 06/07/2021 State Street (24,873) -SGD 1,373,819 USD 1,022,780 04/08/2021 BNP Paribas (849) -SGD 95,732 USD 71,235 04/08/2021 HSBC (24) -USD 855,114 CAD 1,058,377 06/07/2021 Barclays (372) -USD 67,824,087 CAD 84,007,660 06/07/2021 BNP Paribas (79,249) -
137
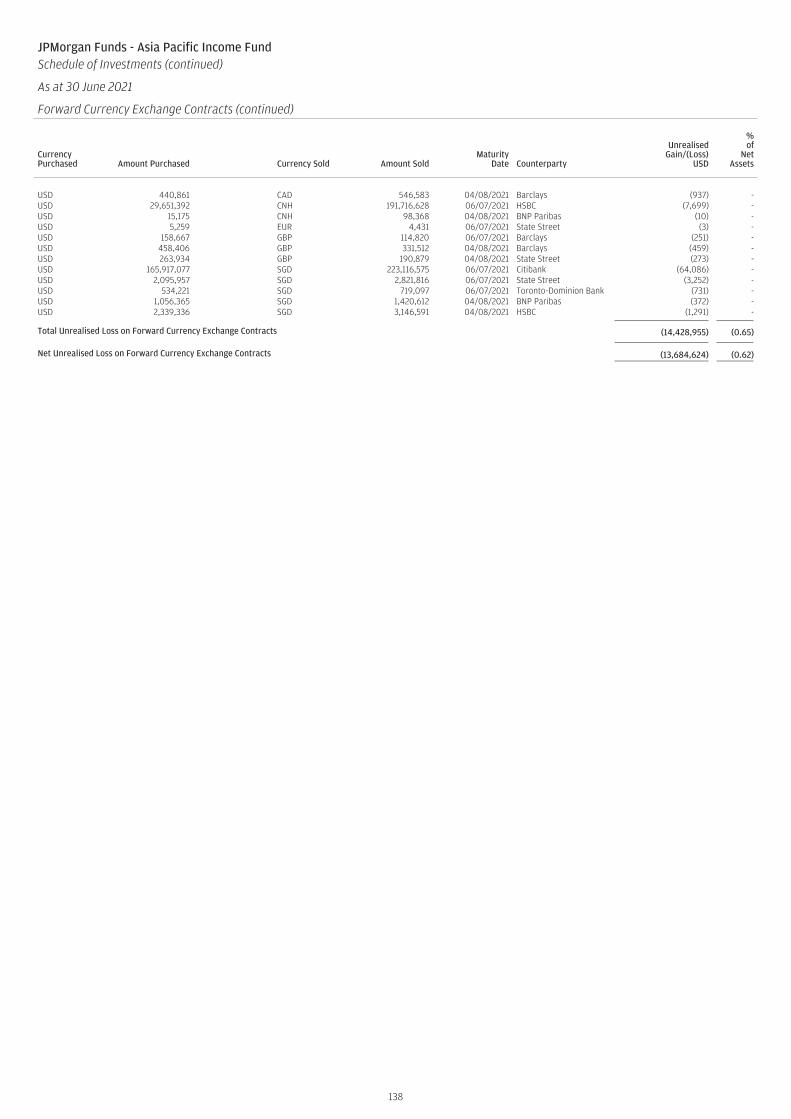
JPMorgan Funds - Asia Pacific Income FundSchedule of Investments (continued)
As at 30 June 2021
Forward Currency Exchange Contracts (continued)
CurrencyPurchased Amount Purchased Currency Sold Amount Sold
MaturityDate Counterparty
UnrealisedGain/(Loss)
USD
%of
NetAssets
USD 440,861 CAD 546,583 04/08/2021 Barclays (937) -USD 29,651,392 CNH 191,716,628 06/07/2021 HSBC (7,699) -USD 15,175 CNH 98,368 04/08/2021 BNP Paribas (10) -USD 5,259 EUR 4,431 06/07/2021 State Street (3) -USD 158,667 GBP 114,820 06/07/2021 Barclays (251) -USD 458,406 GBP 331,512 04/08/2021 Barclays (459) -USD 263,934 GBP 190,879 04/08/2021 State Street (273) -USD 165,917,077 SGD 223,116,575 06/07/2021 Citibank (64,086) -USD 2,095,957 SGD 2,821,816 06/07/2021 State Street (3,252) -USD 534,221 SGD 719,097 06/07/2021 Toronto-Dominion Bank (731) -USD 1,056,365 SGD 1,420,612 04/08/2021 BNP Paribas (372) -USD 2,339,336 SGD 3,146,591 04/08/2021 HSBC (1,291) -
Total Unrealised Loss on Forward Currency Exchange Contracts (14,428,955) (0.65)
Net Unrealised Loss on Forward Currency Exchange Contracts (13,684,624) (0.62)
138
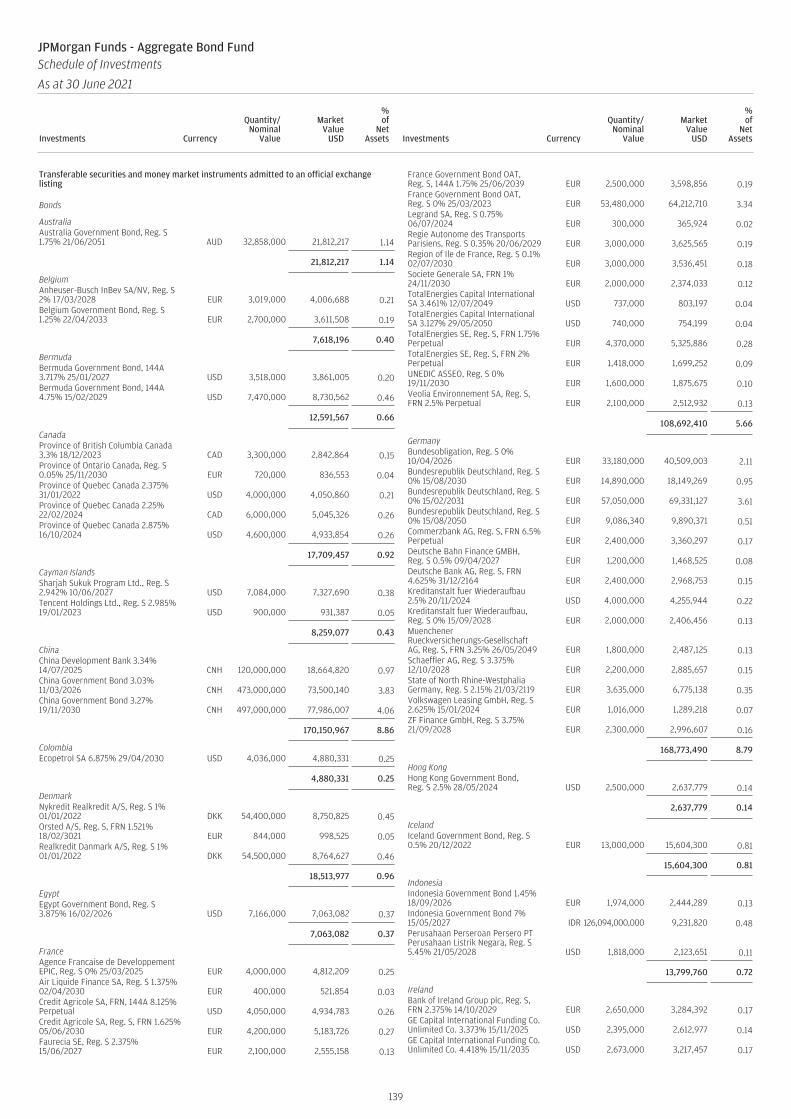
Transferable securities and money market instruments admitted to an official exchangelisting
Bonds
AustraliaAustralia Government Bond, Reg. S1.75% 21/06/2051 AUD 32,858,000 21,812,217 1.14
21,812,217 1.14
BelgiumAnheuser-Busch InBev SA/NV, Reg. S2% 17/03/2028 EUR 3,019,000 4,006,688 0.21Belgium Government Bond, Reg. S1.25% 22/04/2033 EUR 2,700,000 3,611,508 0.19
7,618,196 0.40
BermudaBermuda Government Bond, 144A3.717% 25/01/2027 USD 3,518,000 3,861,005 0.20Bermuda Government Bond, 144A4.75% 15/02/2029 USD 7,470,000 8,730,562 0.46
12,591,567 0.66
CanadaProvince of British Columbia Canada3.3% 18/12/2023 CAD 3,300,000 2,842,864 0.15Province of Ontario Canada, Reg. S0.05% 25/11/2030 EUR 720,000 836,553 0.04Province of Quebec Canada 2.375%31/01/2022 USD 4,000,000 4,050,860 0.21Province of Quebec Canada 2.25%22/02/2024 CAD 6,000,000 5,045,326 0.26Province of Quebec Canada 2.875%16/10/2024 USD 4,600,000 4,933,854 0.26
17,709,457 0.92
Cayman IslandsSharjah Sukuk Program Ltd., Reg. S2.942% 10/06/2027 USD 7,084,000 7,327,690 0.38Tencent Holdings Ltd., Reg. S 2.985%19/01/2023 USD 900,000 931,387 0.05
8,259,077 0.43
ChinaChina Development Bank 3.34%14/07/2025 CNH 120,000,000 18,664,820 0.97China Government Bond 3.03%11/03/2026 CNH 473,000,000 73,500,140 3.83China Government Bond 3.27%19/11/2030 CNH 497,000,000 77,986,007 4.06
170,150,967 8.86
ColombiaEcopetrol SA 6.875% 29/04/2030 USD 4,036,000 4,880,331 0.25
4,880,331 0.25
DenmarkNykredit Realkredit A/S, Reg. S 1%01/01/2022 DKK 54,400,000 8,750,825 0.45Orsted A/S, Reg. S, FRN 1.521%18/02/3021 EUR 844,000 998,525 0.05Realkredit Danmark A/S, Reg. S 1%01/01/2022 DKK 54,500,000 8,764,627 0.46
18,513,977 0.96
EgyptEgypt Government Bond, Reg. S3.875% 16/02/2026 USD 7,166,000 7,063,082 0.37
7,063,082 0.37
FranceAgence Francaise de DeveloppementEPIC, Reg. S 0% 25/03/2025 EUR 4,000,000 4,812,209 0.25Air Liquide Finance SA, Reg. S 1.375%02/04/2030 EUR 400,000 521,854 0.03Credit Agricole SA, FRN, 144A 8.125%Perpetual USD 4,050,000 4,934,783 0.26Credit Agricole SA, Reg. S, FRN 1.625%05/06/2030 EUR 4,200,000 5,183,726 0.27Faurecia SE, Reg. S 2.375%15/06/2027 EUR 2,100,000 2,555,158 0.13
France Government Bond OAT,Reg. S, 144A 1.75% 25/06/2039 EUR 2,500,000 3,598,856 0.19France Government Bond OAT,Reg. S 0% 25/03/2023 EUR 53,480,000 64,212,710 3.34Legrand SA, Reg. S 0.75%06/07/2024 EUR 300,000 365,924 0.02Regie Autonome des TransportsParisiens, Reg. S 0.35% 20/06/2029 EUR 3,000,000 3,625,565 0.19Region of Ile de France, Reg. S 0.1%02/07/2030 EUR 3,000,000 3,536,451 0.18Societe Generale SA, FRN 1%24/11/2030 EUR 2,000,000 2,374,033 0.12TotalEnergies Capital InternationalSA 3.461% 12/07/2049 USD 737,000 803,197 0.04TotalEnergies Capital InternationalSA 3.127% 29/05/2050 USD 740,000 754,199 0.04TotalEnergies SE, Reg. S, FRN 1.75%Perpetual EUR 4,370,000 5,325,886 0.28TotalEnergies SE, Reg. S, FRN 2%Perpetual EUR 1,418,000 1,699,252 0.09UNEDIC ASSEO, Reg. S 0%19/11/2030 EUR 1,600,000 1,875,675 0.10Veolia Environnement SA, Reg. S,FRN 2.5% Perpetual EUR 2,100,000 2,512,932 0.13
108,692,410 5.66
GermanyBundesobligation, Reg. S 0%10/04/2026 EUR 33,180,000 40,509,003 2.11Bundesrepublik Deutschland, Reg. S0% 15/08/2030 EUR 14,890,000 18,149,269 0.95Bundesrepublik Deutschland, Reg. S0% 15/02/2031 EUR 57,050,000 69,331,127 3.61Bundesrepublik Deutschland, Reg. S0% 15/08/2050 EUR 9,086,340 9,890,371 0.51Commerzbank AG, Reg. S, FRN 6.5%Perpetual EUR 2,400,000 3,360,297 0.17Deutsche Bahn Finance GMBH,Reg. S 0.5% 09/04/2027 EUR 1,200,000 1,468,525 0.08Deutsche Bank AG, Reg. S, FRN4.625% 31/12/2164 EUR 2,400,000 2,968,753 0.15Kreditanstalt fuer Wiederaufbau2.5% 20/11/2024 USD 4,000,000 4,255,944 0.22Kreditanstalt fuer Wiederaufbau,Reg. S 0% 15/09/2028 EUR 2,000,000 2,406,456 0.13MuenchenerRueckversicherungs-GesellschaftAG, Reg. S, FRN 3.25% 26/05/2049 EUR 1,800,000 2,487,125 0.13Schaeffler AG, Reg. S 3.375%12/10/2028 EUR 2,200,000 2,885,657 0.15State of North Rhine-WestphaliaGermany, Reg. S 2.15% 21/03/2119 EUR 3,635,000 6,775,138 0.35Volkswagen Leasing GmbH, Reg. S2.625% 15/01/2024 EUR 1,016,000 1,289,218 0.07ZF Finance GmbH, Reg. S 3.75%21/09/2028 EUR 2,300,000 2,996,607 0.16
168,773,490 8.79
Hong KongHong Kong Government Bond,Reg. S 2.5% 28/05/2024 USD 2,500,000 2,637,779 0.14
2,637,779 0.14
IcelandIceland Government Bond, Reg. S0.5% 20/12/2022 EUR 13,000,000 15,604,300 0.81
15,604,300 0.81
IndonesiaIndonesia Government Bond 1.45%18/09/2026 EUR 1,974,000 2,444,289 0.13Indonesia Government Bond 7%15/05/2027 IDR 126,094,000,000 9,231,820 0.48Perusahaan Perseroan Persero PTPerusahaan Listrik Negara, Reg. S5.45% 21/05/2028 USD 1,818,000 2,123,651 0.11
13,799,760 0.72
IrelandBank of Ireland Group plc, Reg. S,FRN 2.375% 14/10/2029 EUR 2,650,000 3,284,392 0.17GE Capital International Funding Co.Unlimited Co. 3.373% 15/11/2025 USD 2,395,000 2,612,977 0.14GE Capital International Funding Co.Unlimited Co. 4.418% 15/11/2035 USD 2,673,000 3,217,457 0.17
139
JPMorgan Funds - Aggregate Bond FundSchedule of Investments
As at 30 June 2021
Investments Currency
Quantity/Nominal
Value
MarketValue
USD
%of
NetAssets Investments Currency
Quantity/Nominal
Value
MarketValue
USD
%of
NetAssets

Glencore Capital Finance DAC, Reg. S1.125% 10/03/2028 EUR 2,300,000 2,778,444 0.14Ireland Government Bond, Reg. S1.35% 18/03/2031 EUR 1,200,000 1,601,294 0.08
13,494,564 0.70
ItalyAutostrade per l’Italia SpA, Reg. S 2%04/12/2028 EUR 2,300,000 2,849,313 0.15Banca Monte dei Paschi di Siena SpA,Reg. S 0.875% 08/10/2027 EUR 2,151,000 2,657,488 0.14Enel SpA, Reg. S, FRN 2.25%Perpetual EUR 1,848,000 2,301,101 0.12Intesa Sanpaolo SpA, Reg. S, FRN5.5% Perpetual EUR 1,140,000 1,492,409 0.08Intesa Sanpaolo SpA, Reg. S, FRN5.875% Perpetual EUR 731,000 987,888 0.05Intesa Sanpaolo SpA, Reg. S, FRN7.75% Perpetual EUR 3,245,000 4,726,909 0.25Italy Buoni Poliennali Del Tesoro,Reg. S, 144A 0.95% 15/09/2027 EUR 34,050,000 41,948,573 2.18Italy Buoni Poliennali Del Tesoro,Reg. S, 144A 0.95% 01/03/2037 EUR 5,816,000 6,564,925 0.34Italy Buoni Poliennali Del Tesoro,Reg. S, 144A 1.8% 01/03/2041 EUR 9,500,000 11,752,359 0.61Italy Buoni Poliennali Del Tesoro,Reg. S 0.6% 15/06/2023 EUR 32,700,000 39,556,674 2.06Italy Buoni Poliennali Del Tesoro,Reg. S 0% 15/04/2024 EUR 31,650,000 37,777,380 1.97Italy Buoni Poliennali Del Tesoro,Reg. S 0.5% 01/02/2026 EUR 4,990,000 6,039,885 0.31Italy Buoni Poliennali Del Tesoro,Reg. S 0.95% 01/08/2030 EUR 5,490,000 6,651,433 0.35Italy Government Bond 0.875%06/05/2024 USD 5,727,000 5,710,841 0.30Italy Government Bond 2.375%17/10/2024 USD 28,501,000 29,645,352 1.54UniCredit SpA, Reg. S, FRN 3.875%Perpetual EUR 2,270,000 2,585,941 0.13UniCredit SpA, Reg. S, FRN 7.5%Perpetual EUR 2,000,000 2,822,037 0.15
206,070,508 10.73
JapanJapan Government Forty Year Bond2.4% 20/03/2048 JPY 1,493,450,000 19,417,838 1.01Japan Government Forty Year Bond2.2% 20/03/2051 JPY 1,816,550,000 23,072,387 1.20Japan Government Forty Year Bond0.9% 20/03/2057 JPY 1,180,800,000 11,233,996 0.59Japan Government Twenty Year Bond0.3% 20/12/2039 JPY 1,800,000,000 15,972,275 0.83Takeda Pharmaceutical Co. Ltd. 1%09/07/2029 EUR 2,985,000 3,663,035 0.19Takeda Pharmaceutical Co. Ltd.1.375% 09/07/2032 EUR 948,000 1,173,191 0.06Takeda Pharmaceutical Co. Ltd. 2%09/07/2040 EUR 1,500,000 1,916,228 0.10
76,448,950 3.98
JerseyGatwick Funding Ltd., Reg. S 5.25%23/01/2026 GBP 809,000 1,237,861 0.06Heathrow Funding Ltd., Reg. S 6.75%03/12/2028 GBP 2,714,000 4,752,298 0.25Heathrow Funding Ltd., Reg. S 6.45%10/12/2031 GBP 1,100,000 2,096,156 0.11Heathrow Funding Ltd., Reg. S1.875% 12/07/2032 EUR 2,812,000 3,541,019 0.18Heathrow Funding Ltd., Reg. S1.875% 14/03/2036 EUR 2,000,000 2,482,373 0.13
14,109,707 0.73
LuxembourgArcelorMittal SA 4.25% 16/07/2029 USD 1,850,000 2,050,180 0.11Medtronic Global Holdings SCA1.125% 07/03/2027 EUR 4,440,000 5,564,661 0.29Medtronic Global Holdings SCA 1%02/07/2031 EUR 2,655,000 3,278,537 0.17
10,893,378 0.57
MexicoPetroleos Mexicanos 6.95%28/01/2060 USD 2,700,000 2,384,937 0.12Petroleos Mexicanos, Reg. S 4.75%26/02/2029 EUR 2,200,000 2,596,062 0.14
4,980,999 0.26
MoroccoMorocco Government Bond, Reg. S2.375% 15/12/2027 USD 1,752,000 1,723,127 0.09Morocco Government Bond, Reg. S2% 30/09/2030 EUR 2,150,000 2,532,848 0.13Morocco Government Bond, Reg. S3% 15/12/2032 USD 1,372,000 1,327,774 0.07
5,583,749 0.29
NetherlandsABN AMRO Bank NV, Reg. S, FRN4.375% Perpetual EUR 3,000,000 3,860,339 0.20Airbus SE, Reg. S 1.375% 09/06/2026 EUR 935,000 1,179,861 0.06Airbus SE, Reg. S 1.625%09/06/2030 EUR 918,000 1,186,358 0.06BNG Bank NV, Reg. S 2.5%23/01/2023 USD 4,000,000 4,139,368 0.21BNG Bank NV, Reg. S 0.05%20/11/2029 EUR 1,700,000 2,033,719 0.11EDP Finance BV, Reg. S 2%22/04/2025 EUR 3,120,000 3,988,278 0.21ING Groep NV, Reg. S, FRN 1.625%26/09/2029 EUR 1,400,000 1,724,929 0.09Linde Finance BV, Reg. S 1%20/04/2028 EUR 300,000 379,158 0.02Swisscom Finance BV, Reg. S 0.375%14/11/2028 EUR 300,000 361,208 0.02TenneT Holding BV, Reg. S 0.125%30/11/2032 EUR 500,000 565,059 0.03Volkswagen International FinanceNV, Reg. S 1.25% 23/09/2032 EUR 900,000 1,118,968 0.06Volkswagen International FinanceNV, Reg. S, FRN 2.5% Perpetual EUR 3,042,000 3,671,909 0.19Volkswagen International FinanceNV, Reg. S, FRN 3.5% Perpetual EUR 1,300,000 1,670,916 0.09Vonovia Finance BV, Reg. S 1%09/07/2030 EUR 2,400,000 2,929,220 0.15WPC Eurobond BV, REIT 1.35%15/04/2028 EUR 1,920,000 2,360,272 0.12
31,169,562 1.62
PhilippinesPhilippine Government Bond 0.25%28/04/2025 EUR 2,474,000 2,952,383 0.15
2,952,383 0.15
RomaniaRomania Government Bond, Reg. S2.625% 02/12/2040 EUR 3,531,000 4,167,204 0.22
4,167,204 0.22
Saudi ArabiaSaudi Government Bond, Reg. S 0%03/03/2024 EUR 6,089,000 7,229,412 0.38
7,229,412 0.38
SingaporeSingapore Airlines Ltd., Reg. S 3%20/07/2026 USD 4,488,000 4,551,947 0.24
4,551,947 0.24
SloveniaSlovenia Government Bond, Reg. S5.25% 18/02/2024 USD 5,800,000 6,519,705 0.34
6,519,705 0.34
South AfricaSouth Africa Government Bond8.875% 28/02/2035 ZAR 106,350,000 6,791,673 0.35
6,791,673 0.35
South KoreaExport-Import Bank of Korea, Reg. S0.829% 27/04/2025 EUR 6,106,000 7,521,928 0.39
7,521,928 0.39
140
JPMorgan Funds - Aggregate Bond FundSchedule of Investments (continued)
As at 30 June 2021
Investments Currency
Quantity/Nominal
Value
MarketValue
USD
%of
NetAssets Investments Currency
Quantity/Nominal
Value
MarketValue
USD
%of
NetAssets
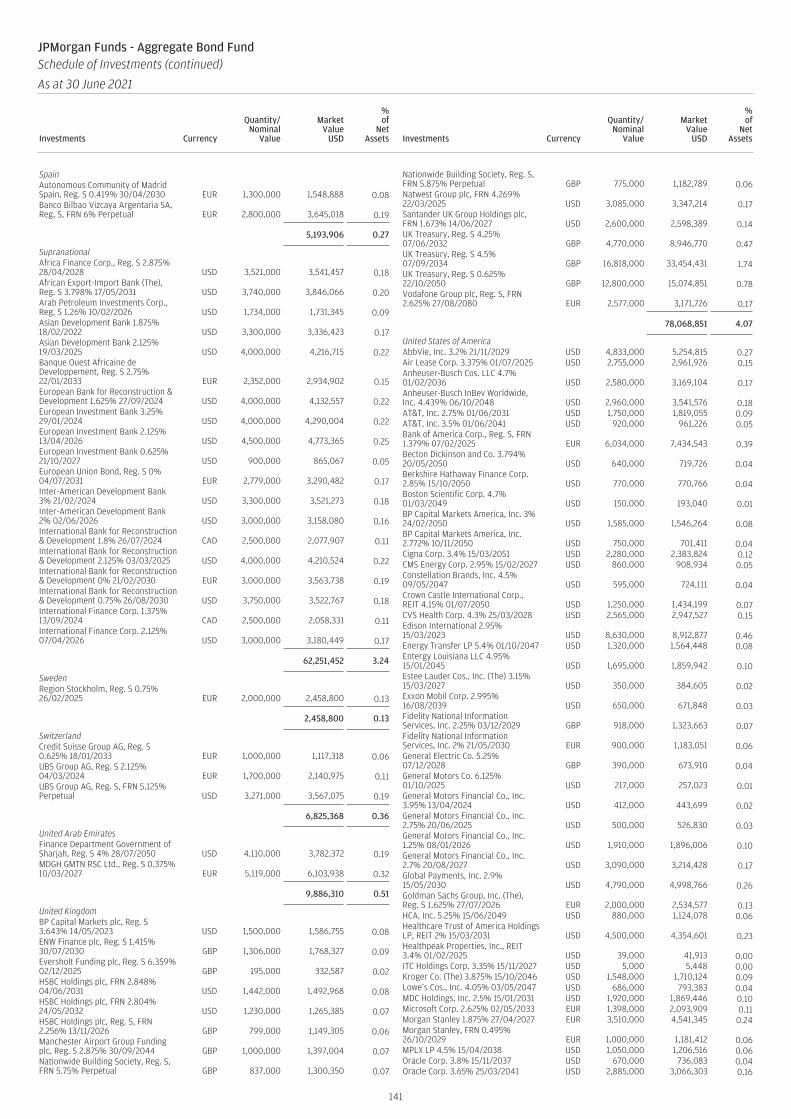
SpainAutonomous Community of MadridSpain, Reg. S 0.419% 30/04/2030 EUR 1,300,000 1,548,888 0.08Banco Bilbao Vizcaya Argentaria SA,Reg. S, FRN 6% Perpetual EUR 2,800,000 3,645,018 0.19
5,193,906 0.27
SupranationalAfrica Finance Corp., Reg. S 2.875%28/04/2028 USD 3,521,000 3,541,457 0.18African Export-Import Bank (The),Reg. S 3.798% 17/05/2031 USD 3,740,000 3,846,066 0.20Arab Petroleum Investments Corp.,Reg. S 1.26% 10/02/2026 USD 1,734,000 1,731,345 0.09Asian Development Bank 1.875%18/02/2022 USD 3,300,000 3,336,423 0.17Asian Development Bank 2.125%19/03/2025 USD 4,000,000 4,216,715 0.22Banque Ouest Africaine deDeveloppement, Reg. S 2.75%22/01/2033 EUR 2,352,000 2,934,902 0.15European Bank for Reconstruction &Development 1.625% 27/09/2024 USD 4,000,000 4,132,557 0.22European Investment Bank 3.25%29/01/2024 USD 4,000,000 4,290,004 0.22European Investment Bank 2.125%13/04/2026 USD 4,500,000 4,773,365 0.25European Investment Bank 0.625%21/10/2027 USD 900,000 865,067 0.05European Union Bond, Reg. S 0%04/07/2031 EUR 2,779,000 3,290,482 0.17Inter-American Development Bank3% 21/02/2024 USD 3,300,000 3,521,273 0.18Inter-American Development Bank2% 02/06/2026 USD 3,000,000 3,158,080 0.16International Bank for Reconstruction& Development 1.8% 26/07/2024 CAD 2,500,000 2,077,907 0.11International Bank for Reconstruction& Development 2.125% 03/03/2025 USD 4,000,000 4,210,524 0.22International Bank for Reconstruction& Development 0% 21/02/2030 EUR 3,000,000 3,563,738 0.19International Bank for Reconstruction& Development 0.75% 26/08/2030 USD 3,750,000 3,522,767 0.18International Finance Corp. 1.375%13/09/2024 CAD 2,500,000 2,058,331 0.11International Finance Corp. 2.125%07/04/2026 USD 3,000,000 3,180,449 0.17
62,251,452 3.24
SwedenRegion Stockholm, Reg. S 0.75%26/02/2025 EUR 2,000,000 2,458,800 0.13
2,458,800 0.13
SwitzerlandCredit Suisse Group AG, Reg. S0.625% 18/01/2033 EUR 1,000,000 1,117,318 0.06UBS Group AG, Reg. S 2.125%04/03/2024 EUR 1,700,000 2,140,975 0.11UBS Group AG, Reg. S, FRN 5.125%Perpetual USD 3,271,000 3,567,075 0.19
6,825,368 0.36
United Arab EmiratesFinance Department Government ofSharjah, Reg. S 4% 28/07/2050 USD 4,110,000 3,782,372 0.19MDGH GMTN RSC Ltd., Reg. S 0.375%10/03/2027 EUR 5,119,000 6,103,938 0.32
9,886,310 0.51
United KingdomBP Capital Markets plc, Reg. S3.643% 14/05/2023 USD 1,500,000 1,586,755 0.08ENW Finance plc, Reg. S 1.415%30/07/2030 GBP 1,306,000 1,768,327 0.09Eversholt Funding plc, Reg. S 6.359%02/12/2025 GBP 195,000 332,587 0.02HSBC Holdings plc, FRN 2.848%04/06/2031 USD 1,442,000 1,492,968 0.08HSBC Holdings plc, FRN 2.804%24/05/2032 USD 1,230,000 1,265,385 0.07HSBC Holdings plc, Reg. S, FRN2.256% 13/11/2026 GBP 799,000 1,149,305 0.06Manchester Airport Group Fundingplc, Reg. S 2.875% 30/09/2044 GBP 1,000,000 1,397,004 0.07Nationwide Building Society, Reg. S,FRN 5.75% Perpetual GBP 837,000 1,300,350 0.07
Nationwide Building Society, Reg. S,FRN 5.875% Perpetual GBP 775,000 1,182,789 0.06Natwest Group plc, FRN 4.269%22/03/2025 USD 3,085,000 3,347,214 0.17Santander UK Group Holdings plc,FRN 1.673% 14/06/2027 USD 2,600,000 2,598,389 0.14UK Treasury, Reg. S 4.25%07/06/2032 GBP 4,770,000 8,946,770 0.47UK Treasury, Reg. S 4.5%07/09/2034 GBP 16,818,000 33,454,431 1.74UK Treasury, Reg. S 0.625%22/10/2050 GBP 12,800,000 15,074,851 0.78Vodafone Group plc, Reg. S, FRN2.625% 27/08/2080 EUR 2,577,000 3,171,726 0.17
78,068,851 4.07
United States of AmericaAbbVie, Inc. 3.2% 21/11/2029 USD 4,833,000 5,254,815 0.27Air Lease Corp. 3.375% 01/07/2025 USD 2,755,000 2,961,926 0.15Anheuser-Busch Cos. LLC 4.7%01/02/2036 USD 2,580,000 3,169,104 0.17Anheuser-Busch InBev Worldwide,Inc. 4.439% 06/10/2048 USD 2,960,000 3,541,576 0.18AT&T, Inc. 2.75% 01/06/2031 USD 1,750,000 1,819,055 0.09AT&T, Inc. 3.5% 01/06/2041 USD 920,000 961,226 0.05Bank of America Corp., Reg. S, FRN1.379% 07/02/2025 EUR 6,034,000 7,434,543 0.39Becton Dickinson and Co. 3.794%20/05/2050 USD 640,000 719,726 0.04Berkshire Hathaway Finance Corp.2.85% 15/10/2050 USD 770,000 770,766 0.04Boston Scientific Corp. 4.7%01/03/2049 USD 150,000 193,040 0.01BP Capital Markets America, Inc. 3%24/02/2050 USD 1,585,000 1,546,264 0.08BP Capital Markets America, Inc.2.772% 10/11/2050 USD 750,000 701,411 0.04Cigna Corp. 3.4% 15/03/2051 USD 2,280,000 2,383,824 0.12CMS Energy Corp. 2.95% 15/02/2027 USD 860,000 908,934 0.05Constellation Brands, Inc. 4.5%09/05/2047 USD 595,000 724,111 0.04Crown Castle International Corp.,REIT 4.15% 01/07/2050 USD 1,250,000 1,434,199 0.07CVS Health Corp. 4.3% 25/03/2028 USD 2,565,000 2,947,527 0.15Edison International 2.95%15/03/2023 USD 8,630,000 8,912,877 0.46Energy Transfer LP 5.4% 01/10/2047 USD 1,320,000 1,564,448 0.08Entergy Louisiana LLC 4.95%15/01/2045 USD 1,695,000 1,859,942 0.10Estee Lauder Cos., Inc. (The) 3.15%15/03/2027 USD 350,000 384,605 0.02Exxon Mobil Corp. 2.995%16/08/2039 USD 650,000 671,848 0.03Fidelity National InformationServices, Inc. 2.25% 03/12/2029 GBP 918,000 1,323,663 0.07Fidelity National InformationServices, Inc. 2% 21/05/2030 EUR 900,000 1,183,051 0.06General Electric Co. 5.25%07/12/2028 GBP 390,000 673,910 0.04General Motors Co. 6.125%01/10/2025 USD 217,000 257,023 0.01General Motors Financial Co., Inc.3.95% 13/04/2024 USD 412,000 443,699 0.02General Motors Financial Co., Inc.2.75% 20/06/2025 USD 500,000 526,830 0.03General Motors Financial Co., Inc.1.25% 08/01/2026 USD 1,910,000 1,896,006 0.10General Motors Financial Co., Inc.2.7% 20/08/2027 USD 3,090,000 3,214,428 0.17Global Payments, Inc. 2.9%15/05/2030 USD 4,790,000 4,998,766 0.26Goldman Sachs Group, Inc. (The),Reg. S 1.625% 27/07/2026 EUR 2,000,000 2,534,577 0.13HCA, Inc. 5.25% 15/06/2049 USD 880,000 1,124,078 0.06Healthcare Trust of America HoldingsLP, REIT 2% 15/03/2031 USD 4,500,000 4,354,601 0.23Healthpeak Properties, Inc., REIT3.4% 01/02/2025 USD 39,000 41,913 0.00ITC Holdings Corp. 3.35% 15/11/2027 USD 5,000 5,448 0.00Kroger Co. (The) 3.875% 15/10/2046 USD 1,548,000 1,710,124 0.09Lowe’s Cos., Inc. 4.05% 03/05/2047 USD 686,000 793,383 0.04MDC Holdings, Inc. 2.5% 15/01/2031 USD 1,920,000 1,869,446 0.10Microsoft Corp. 2.625% 02/05/2033 EUR 1,398,000 2,093,909 0.11Morgan Stanley 1.875% 27/04/2027 EUR 3,510,000 4,541,345 0.24Morgan Stanley, FRN 0.495%26/10/2029 EUR 1,000,000 1,181,412 0.06MPLX LP 4.5% 15/04/2038 USD 1,050,000 1,206,516 0.06Oracle Corp. 3.8% 15/11/2037 USD 670,000 736,083 0.04Oracle Corp. 3.65% 25/03/2041 USD 2,885,000 3,066,303 0.16
141
JPMorgan Funds - Aggregate Bond FundSchedule of Investments (continued)
As at 30 June 2021
Investments Currency
Quantity/Nominal
Value
MarketValue
USD
%of
NetAssets Investments Currency
Quantity/Nominal
Value
MarketValue
USD
%of
NetAssets
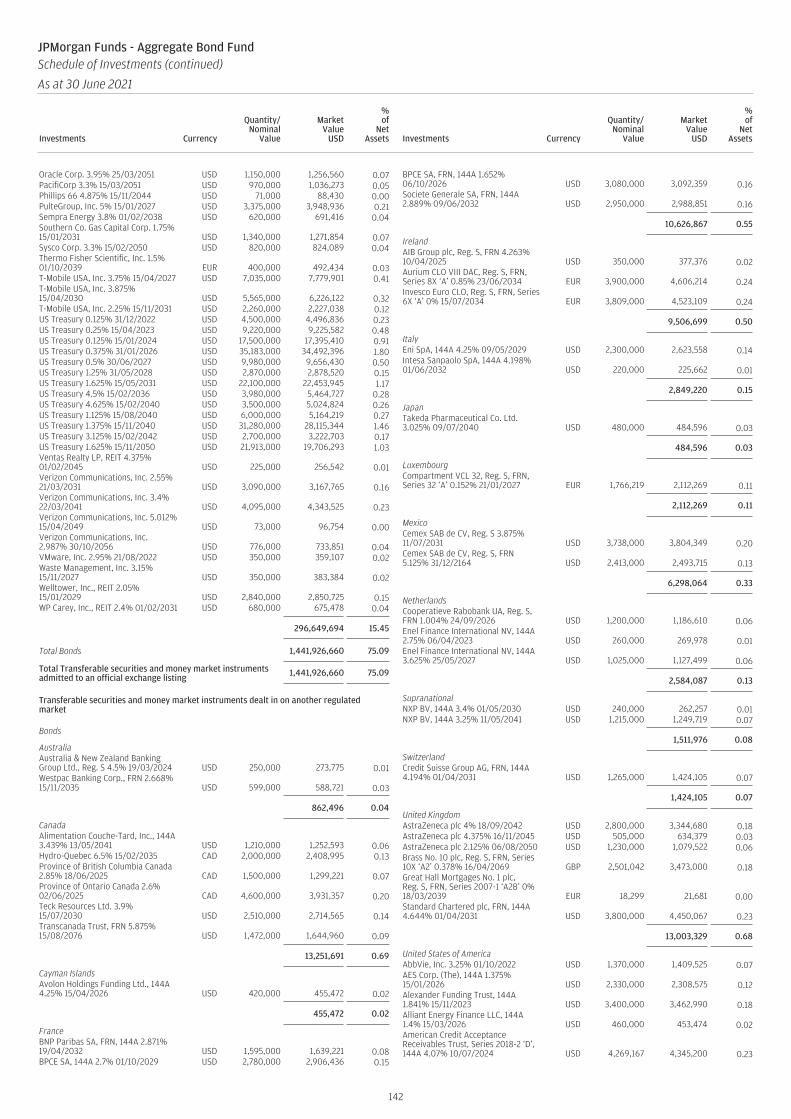
Oracle Corp. 3.95% 25/03/2051 USD 1,150,000 1,256,560 0.07PacifiCorp 3.3% 15/03/2051 USD 970,000 1,036,273 0.05Phillips 66 4.875% 15/11/2044 USD 71,000 88,430 0.00PulteGroup, Inc. 5% 15/01/2027 USD 3,375,000 3,948,936 0.21Sempra Energy 3.8% 01/02/2038 USD 620,000 691,416 0.04Southern Co. Gas Capital Corp. 1.75%15/01/2031 USD 1,340,000 1,271,854 0.07Sysco Corp. 3.3% 15/02/2050 USD 820,000 824,089 0.04Thermo Fisher Scientific, Inc. 1.5%01/10/2039 EUR 400,000 492,434 0.03T-Mobile USA, Inc. 3.75% 15/04/2027 USD 7,035,000 7,779,901 0.41T-Mobile USA, Inc. 3.875%15/04/2030 USD 5,565,000 6,226,122 0.32T-Mobile USA, Inc. 2.25% 15/11/2031 USD 2,260,000 2,227,038 0.12US Treasury 0.125% 31/12/2022 USD 4,500,000 4,496,836 0.23US Treasury 0.25% 15/04/2023 USD 9,220,000 9,225,582 0.48US Treasury 0.125% 15/01/2024 USD 17,500,000 17,395,410 0.91US Treasury 0.375% 31/01/2026 USD 35,183,000 34,492,396 1.80US Treasury 0.5% 30/06/2027 USD 9,980,000 9,656,430 0.50US Treasury 1.25% 31/05/2028 USD 2,870,000 2,878,520 0.15US Treasury 1.625% 15/05/2031 USD 22,100,000 22,453,945 1.17US Treasury 4.5% 15/02/2036 USD 3,980,000 5,464,727 0.28US Treasury 4.625% 15/02/2040 USD 3,500,000 5,024,824 0.26US Treasury 1.125% 15/08/2040 USD 6,000,000 5,164,219 0.27US Treasury 1.375% 15/11/2040 USD 31,280,000 28,115,344 1.46US Treasury 3.125% 15/02/2042 USD 2,700,000 3,222,703 0.17US Treasury 1.625% 15/11/2050 USD 21,913,000 19,706,293 1.03Ventas Realty LP, REIT 4.375%01/02/2045 USD 225,000 256,542 0.01Verizon Communications, Inc. 2.55%21/03/2031 USD 3,090,000 3,167,765 0.16Verizon Communications, Inc. 3.4%22/03/2041 USD 4,095,000 4,343,525 0.23Verizon Communications, Inc. 5.012%15/04/2049 USD 73,000 96,754 0.00Verizon Communications, Inc.2.987% 30/10/2056 USD 776,000 733,851 0.04VMware, Inc. 2.95% 21/08/2022 USD 350,000 359,107 0.02Waste Management, Inc. 3.15%15/11/2027 USD 350,000 383,384 0.02Welltower, Inc., REIT 2.05%15/01/2029 USD 2,840,000 2,850,725 0.15WP Carey, Inc., REIT 2.4% 01/02/2031 USD 680,000 675,478 0.04
296,649,694 15.45
Total Bonds 1,441,926,660 75.09
Total Transferable securities and money market instrumentsadmitted to an official exchange listing 1,441,926,660 75.09
Transferable securities and money market instruments dealt in on another regulatedmarket
Bonds
AustraliaAustralia & New Zealand BankingGroup Ltd., Reg. S 4.5% 19/03/2024 USD 250,000 273,775 0.01Westpac Banking Corp., FRN 2.668%15/11/2035 USD 599,000 588,721 0.03
862,496 0.04
CanadaAlimentation Couche-Tard, Inc., 144A3.439% 13/05/2041 USD 1,210,000 1,252,593 0.06Hydro-Quebec 6.5% 15/02/2035 CAD 2,000,000 2,408,995 0.13Province of British Columbia Canada2.85% 18/06/2025 CAD 1,500,000 1,299,221 0.07Province of Ontario Canada 2.6%02/06/2025 CAD 4,600,000 3,931,357 0.20Teck Resources Ltd. 3.9%15/07/2030 USD 2,510,000 2,714,565 0.14Transcanada Trust, FRN 5.875%15/08/2076 USD 1,472,000 1,644,960 0.09
13,251,691 0.69
Cayman IslandsAvolon Holdings Funding Ltd., 144A4.25% 15/04/2026 USD 420,000 455,472 0.02
455,472 0.02
FranceBNP Paribas SA, FRN, 144A 2.871%19/04/2032 USD 1,595,000 1,639,221 0.08BPCE SA, 144A 2.7% 01/10/2029 USD 2,780,000 2,906,436 0.15
BPCE SA, FRN, 144A 1.652%06/10/2026 USD 3,080,000 3,092,359 0.16Societe Generale SA, FRN, 144A2.889% 09/06/2032 USD 2,950,000 2,988,851 0.16
10,626,867 0.55
IrelandAIB Group plc, Reg. S, FRN 4.263%10/04/2025 USD 350,000 377,376 0.02Aurium CLO VIII DAC, Reg. S, FRN,Series 8X ‘A’ 0.85% 23/06/2034 EUR 3,900,000 4,606,214 0.24Invesco Euro CLO, Reg. S, FRN, Series6X ‘A’ 0% 15/07/2034 EUR 3,809,000 4,523,109 0.24
9,506,699 0.50
ItalyEni SpA, 144A 4.25% 09/05/2029 USD 2,300,000 2,623,558 0.14Intesa Sanpaolo SpA, 144A 4.198%01/06/2032 USD 220,000 225,662 0.01
2,849,220 0.15
JapanTakeda Pharmaceutical Co. Ltd.3.025% 09/07/2040 USD 480,000 484,596 0.03
484,596 0.03
LuxembourgCompartment VCL 32, Reg. S, FRN,Series 32 ‘A’ 0.152% 21/01/2027 EUR 1,766,219 2,112,269 0.11
2,112,269 0.11
MexicoCemex SAB de CV, Reg. S 3.875%11/07/2031 USD 3,738,000 3,804,349 0.20Cemex SAB de CV, Reg. S, FRN5.125% 31/12/2164 USD 2,413,000 2,493,715 0.13
6,298,064 0.33
NetherlandsCooperatieve Rabobank UA, Reg. S,FRN 1.004% 24/09/2026 USD 1,200,000 1,186,610 0.06Enel Finance International NV, 144A2.75% 06/04/2023 USD 260,000 269,978 0.01Enel Finance International NV, 144A3.625% 25/05/2027 USD 1,025,000 1,127,499 0.06
2,584,087 0.13
SupranationalNXP BV, 144A 3.4% 01/05/2030 USD 240,000 262,257 0.01NXP BV, 144A 3.25% 11/05/2041 USD 1,215,000 1,249,719 0.07
1,511,976 0.08
SwitzerlandCredit Suisse Group AG, FRN, 144A4.194% 01/04/2031 USD 1,265,000 1,424,105 0.07
1,424,105 0.07
United KingdomAstraZeneca plc 4% 18/09/2042 USD 2,800,000 3,344,680 0.18AstraZeneca plc 4.375% 16/11/2045 USD 505,000 634,379 0.03AstraZeneca plc 2.125% 06/08/2050 USD 1,230,000 1,079,522 0.06Brass No. 10 plc, Reg. S, FRN, Series10X ‘A2’ 0.378% 16/04/2069 GBP 2,501,042 3,473,000 0.18Great Hall Mortgages No. 1 plc,Reg. S, FRN, Series 2007-1 ‘A2B’ 0%18/03/2039 EUR 18,299 21,681 0.00Standard Chartered plc, FRN, 144A4.644% 01/04/2031 USD 3,800,000 4,450,067 0.23
13,003,329 0.68
United States of AmericaAbbVie, Inc. 3.25% 01/10/2022 USD 1,370,000 1,409,525 0.07AES Corp. (The), 144A 1.375%15/01/2026 USD 2,330,000 2,308,575 0.12Alexander Funding Trust, 144A1.841% 15/11/2023 USD 3,400,000 3,462,990 0.18Alliant Energy Finance LLC, 144A1.4% 15/03/2026 USD 460,000 453,474 0.02American Credit AcceptanceReceivables Trust, Series 2018-2 ‘D’,144A 4.07% 10/07/2024 USD 4,269,167 4,345,200 0.23
142
JPMorgan Funds - Aggregate Bond FundSchedule of Investments (continued)
As at 30 June 2021
Investments Currency
Quantity/Nominal
Value
MarketValue
USD
%of
NetAssets Investments Currency
Quantity/Nominal
Value
MarketValue
USD
%of
NetAssets
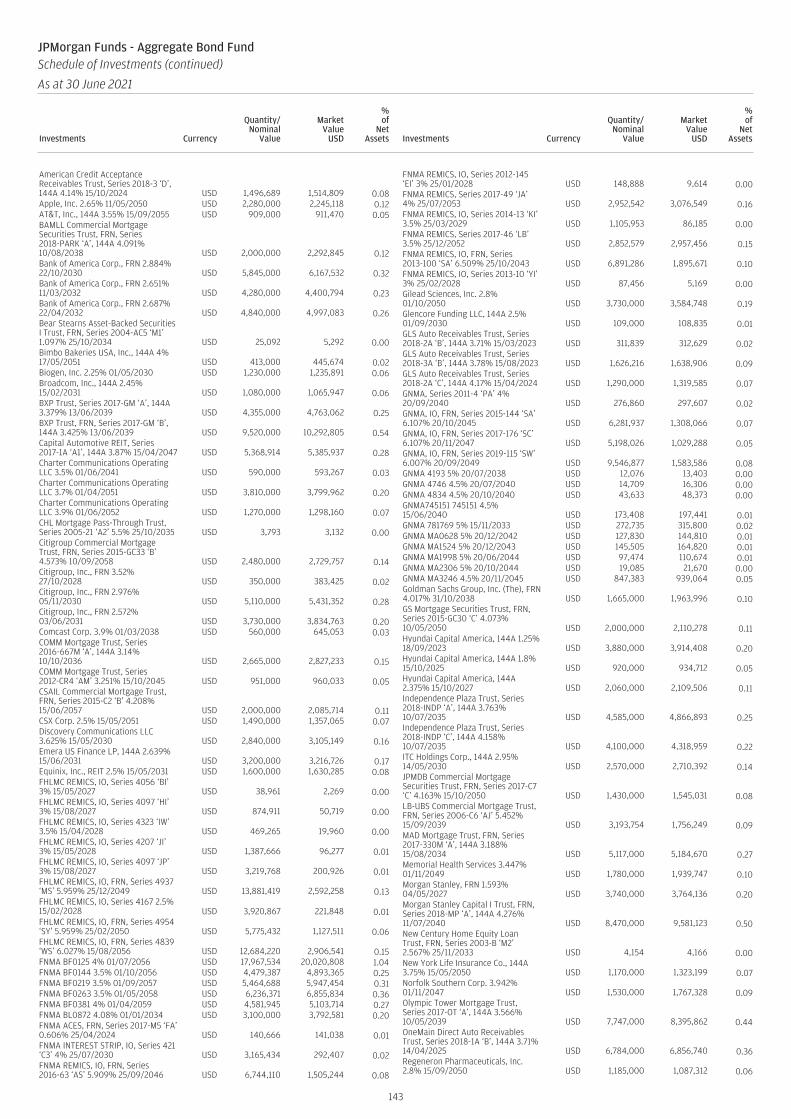
American Credit AcceptanceReceivables Trust, Series 2018-3 ‘D’,144A 4.14% 15/10/2024 USD 1,496,689 1,514,809 0.08Apple, Inc. 2.65% 11/05/2050 USD 2,280,000 2,245,118 0.12AT&T, Inc., 144A 3.55% 15/09/2055 USD 909,000 911,470 0.05BAMLL Commercial MortgageSecurities Trust, FRN, Series2018-PARK ‘A’, 144A 4.091%10/08/2038 USD 2,000,000 2,292,845 0.12Bank of America Corp., FRN 2.884%22/10/2030 USD 5,845,000 6,167,532 0.32Bank of America Corp., FRN 2.651%11/03/2032 USD 4,280,000 4,400,794 0.23Bank of America Corp., FRN 2.687%22/04/2032 USD 4,840,000 4,997,083 0.26Bear Stearns Asset-Backed SecuritiesI Trust, FRN, Series 2004-AC5 ‘M1’1.097% 25/10/2034 USD 25,092 5,292 0.00Bimbo Bakeries USA, Inc., 144A 4%17/05/2051 USD 413,000 445,674 0.02Biogen, Inc. 2.25% 01/05/2030 USD 1,230,000 1,235,891 0.06Broadcom, Inc., 144A 2.45%15/02/2031 USD 1,080,000 1,065,947 0.06BXP Trust, Series 2017-GM ‘A’, 144A3.379% 13/06/2039 USD 4,355,000 4,763,062 0.25BXP Trust, FRN, Series 2017-GM ‘B’,144A 3.425% 13/06/2039 USD 9,520,000 10,292,805 0.54Capital Automotive REIT, Series2017-1A ‘A1’, 144A 3.87% 15/04/2047 USD 5,368,914 5,385,937 0.28Charter Communications OperatingLLC 3.5% 01/06/2041 USD 590,000 593,267 0.03Charter Communications OperatingLLC 3.7% 01/04/2051 USD 3,810,000 3,799,962 0.20Charter Communications OperatingLLC 3.9% 01/06/2052 USD 1,270,000 1,298,160 0.07CHL Mortgage Pass-Through Trust,Series 2005-21 ‘A2’ 5.5% 25/10/2035 USD 3,793 3,132 0.00Citigroup Commercial MortgageTrust, FRN, Series 2015-GC33 ‘B’4.573% 10/09/2058 USD 2,480,000 2,729,757 0.14Citigroup, Inc., FRN 3.52%27/10/2028 USD 350,000 383,425 0.02Citigroup, Inc., FRN 2.976%05/11/2030 USD 5,110,000 5,431,352 0.28Citigroup, Inc., FRN 2.572%03/06/2031 USD 3,730,000 3,834,763 0.20Comcast Corp. 3.9% 01/03/2038 USD 560,000 645,053 0.03COMM Mortgage Trust, Series2016-667M ‘A’, 144A 3.14%10/10/2036 USD 2,665,000 2,827,233 0.15COMM Mortgage Trust, Series2012-CR4 ‘AM’ 3.251% 15/10/2045 USD 951,000 960,033 0.05CSAIL Commercial Mortgage Trust,FRN, Series 2015-C2 ‘B’ 4.208%15/06/2057 USD 2,000,000 2,085,714 0.11CSX Corp. 2.5% 15/05/2051 USD 1,490,000 1,357,065 0.07Discovery Communications LLC3.625% 15/05/2030 USD 2,840,000 3,105,149 0.16Emera US Finance LP, 144A 2.639%15/06/2031 USD 3,200,000 3,216,726 0.17Equinix, Inc., REIT 2.5% 15/05/2031 USD 1,600,000 1,630,285 0.08FHLMC REMICS, IO, Series 4056 ‘BI’3% 15/05/2027 USD 38,961 2,269 0.00FHLMC REMICS, IO, Series 4097 ‘HI’3% 15/08/2027 USD 874,911 50,719 0.00FHLMC REMICS, IO, Series 4323 ‘IW’3.5% 15/04/2028 USD 469,265 19,960 0.00FHLMC REMICS, IO, Series 4207 ‘JI’3% 15/05/2028 USD 1,387,666 96,277 0.01FHLMC REMICS, IO, Series 4097 ‘JP’3% 15/08/2027 USD 3,219,768 200,926 0.01FHLMC REMICS, IO, FRN, Series 4937‘MS’ 5.959% 25/12/2049 USD 13,881,419 2,592,258 0.13FHLMC REMICS, IO, Series 4167 2.5%15/02/2028 USD 3,920,867 221,848 0.01FHLMC REMICS, IO, FRN, Series 4954‘SY’ 5.959% 25/02/2050 USD 5,775,432 1,127,511 0.06FHLMC REMICS, IO, FRN, Series 4839‘WS’ 6.027% 15/08/2056 USD 12,684,220 2,906,541 0.15FNMA BF0125 4% 01/07/2056 USD 17,967,534 20,020,808 1.04FNMA BF0144 3.5% 01/10/2056 USD 4,479,387 4,893,365 0.25FNMA BF0219 3.5% 01/09/2057 USD 5,464,688 5,947,454 0.31FNMA BF0263 3.5% 01/05/2058 USD 6,236,371 6,855,834 0.36FNMA BF0381 4% 01/04/2059 USD 4,581,945 5,103,714 0.27FNMA BL0872 4.08% 01/01/2034 USD 3,100,000 3,792,581 0.20FNMA ACES, FRN, Series 2017-M5 ‘FA’0.606% 25/04/2024 USD 140,666 141,038 0.01FNMA INTEREST STRIP, IO, Series 421‘C3’ 4% 25/07/2030 USD 3,165,434 292,407 0.02FNMA REMICS, IO, FRN, Series2016-63 ‘AS’ 5.909% 25/09/2046 USD 6,744,110 1,505,244 0.08
FNMA REMICS, IO, Series 2012-145‘EI’ 3% 25/01/2028 USD 148,888 9,614 0.00FNMA REMICS, Series 2017-49 ‘JA’4% 25/07/2053 USD 2,952,542 3,076,549 0.16FNMA REMICS, IO, Series 2014-13 ‘KI’3.5% 25/03/2029 USD 1,105,953 86,185 0.00FNMA REMICS, Series 2017-46 ‘LB’3.5% 25/12/2052 USD 2,852,579 2,957,456 0.15FNMA REMICS, IO, FRN, Series2013-100 ‘SA’ 6.509% 25/10/2043 USD 6,891,286 1,895,671 0.10FNMA REMICS, IO, Series 2013-10 ‘YI’3% 25/02/2028 USD 87,456 5,169 0.00Gilead Sciences, Inc. 2.8%01/10/2050 USD 3,730,000 3,584,748 0.19Glencore Funding LLC, 144A 2.5%01/09/2030 USD 109,000 108,835 0.01GLS Auto Receivables Trust, Series2018-2A ‘B’, 144A 3.71% 15/03/2023 USD 311,839 312,629 0.02GLS Auto Receivables Trust, Series2018-3A ‘B’, 144A 3.78% 15/08/2023 USD 1,626,216 1,638,906 0.09GLS Auto Receivables Trust, Series2018-2A ‘C’, 144A 4.17% 15/04/2024 USD 1,290,000 1,319,585 0.07GNMA, Series 2011-4 ‘PA’ 4%20/09/2040 USD 276,860 297,607 0.02GNMA, IO, FRN, Series 2015-144 ‘SA’6.107% 20/10/2045 USD 6,281,937 1,308,066 0.07GNMA, IO, FRN, Series 2017-176 ‘SC’6.107% 20/11/2047 USD 5,198,026 1,029,288 0.05GNMA, IO, FRN, Series 2019-115 ‘SW’6.007% 20/09/2049 USD 9,546,877 1,583,586 0.08GNMA 4193 5% 20/07/2038 USD 12,076 13,403 0.00GNMA 4746 4.5% 20/07/2040 USD 14,709 16,306 0.00GNMA 4834 4.5% 20/10/2040 USD 43,633 48,373 0.00GNMA745151 745151 4.5%15/06/2040 USD 173,408 197,441 0.01GNMA 781769 5% 15/11/2033 USD 272,735 315,800 0.02GNMA MA0628 5% 20/12/2042 USD 127,830 144,810 0.01GNMA MA1524 5% 20/12/2043 USD 145,505 164,820 0.01GNMA MA1998 5% 20/06/2044 USD 97,474 110,674 0.01GNMA MA2306 5% 20/10/2044 USD 19,085 21,670 0.00GNMA MA3246 4.5% 20/11/2045 USD 847,383 939,064 0.05Goldman Sachs Group, Inc. (The), FRN4.017% 31/10/2038 USD 1,665,000 1,963,996 0.10GS Mortgage Securities Trust, FRN,Series 2015-GC30 ‘C’ 4.073%10/05/2050 USD 2,000,000 2,110,278 0.11Hyundai Capital America, 144A 1.25%18/09/2023 USD 3,880,000 3,914,408 0.20Hyundai Capital America, 144A 1.8%15/10/2025 USD 920,000 934,712 0.05Hyundai Capital America, 144A2.375% 15/10/2027 USD 2,060,000 2,109,506 0.11Independence Plaza Trust, Series2018-INDP ‘A’, 144A 3.763%10/07/2035 USD 4,585,000 4,866,893 0.25Independence Plaza Trust, Series2018-INDP ‘C’, 144A 4.158%10/07/2035 USD 4,100,000 4,318,959 0.22ITC Holdings Corp., 144A 2.95%14/05/2030 USD 2,570,000 2,710,392 0.14JPMDB Commercial MortgageSecurities Trust, FRN, Series 2017-C7‘C’ 4.163% 15/10/2050 USD 1,430,000 1,545,031 0.08LB-UBS Commercial Mortgage Trust,FRN, Series 2006-C6 ‘AJ’ 5.452%15/09/2039 USD 3,193,754 1,756,249 0.09MAD Mortgage Trust, FRN, Series2017-330M ‘A’, 144A 3.188%15/08/2034 USD 5,117,000 5,184,670 0.27Memorial Health Services 3.447%01/11/2049 USD 1,780,000 1,939,747 0.10Morgan Stanley, FRN 1.593%04/05/2027 USD 3,740,000 3,764,136 0.20Morgan Stanley Capital I Trust, FRN,Series 2018-MP ‘A’, 144A 4.276%11/07/2040 USD 8,470,000 9,581,123 0.50New Century Home Equity LoanTrust, FRN, Series 2003-B ‘M2’2.567% 25/11/2033 USD 4,154 4,166 0.00New York Life Insurance Co., 144A3.75% 15/05/2050 USD 1,170,000 1,323,199 0.07Norfolk Southern Corp. 3.942%01/11/2047 USD 1,530,000 1,767,328 0.09Olympic Tower Mortgage Trust,Series 2017-OT ‘A’, 144A 3.566%10/05/2039 USD 7,747,000 8,395,862 0.44OneMain Direct Auto ReceivablesTrust, Series 2018-1A ‘B’, 144A 3.71%14/04/2025 USD 6,784,000 6,856,740 0.36Regeneron Pharmaceuticals, Inc.2.8% 15/09/2050 USD 1,185,000 1,087,312 0.06
143
JPMorgan Funds - Aggregate Bond FundSchedule of Investments (continued)
As at 30 June 2021
Investments Currency
Quantity/Nominal
Value
MarketValue
USD
%of
NetAssets Investments Currency
Quantity/Nominal
Value
MarketValue
USD
%of
NetAssets
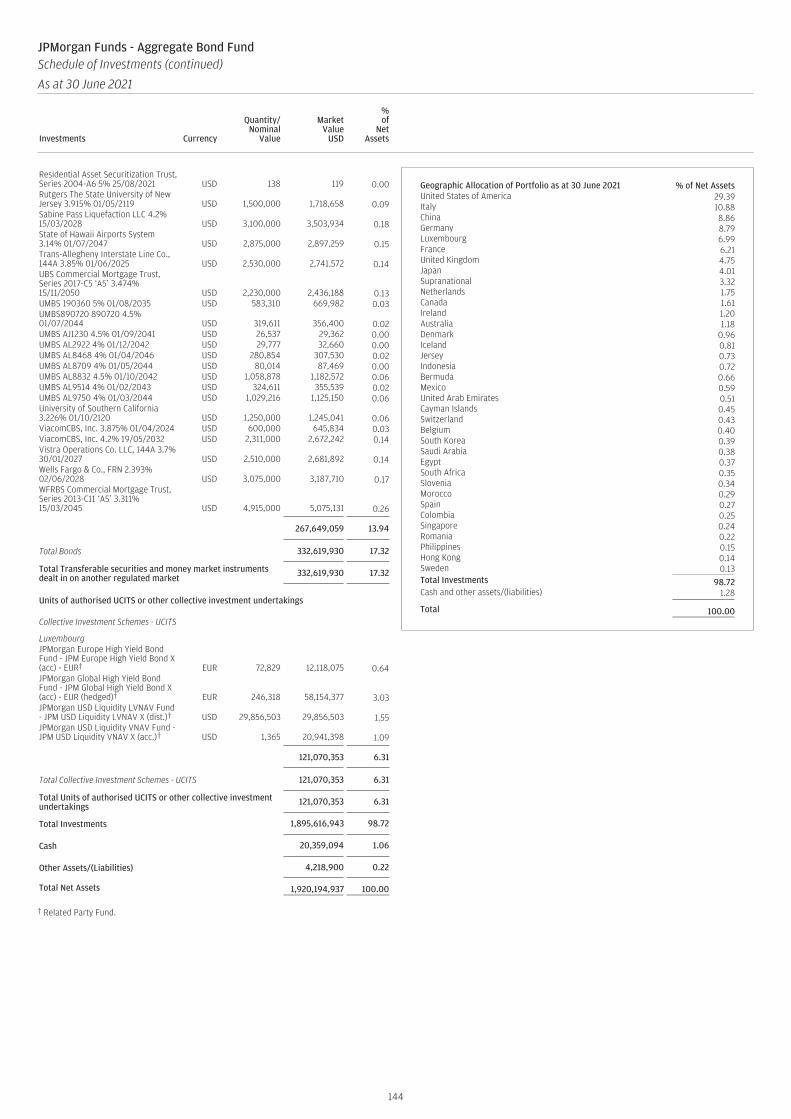
Residential Asset Securitization Trust,Series 2004-A6 5% 25/08/2021 USD 138 119 0.00Rutgers The State University of NewJersey 3.915% 01/05/2119 USD 1,500,000 1,718,658 0.09Sabine Pass Liquefaction LLC 4.2%15/03/2028 USD 3,100,000 3,503,934 0.18State of Hawaii Airports System3.14% 01/07/2047 USD 2,875,000 2,897,259 0.15Trans-Allegheny Interstate Line Co.,144A 3.85% 01/06/2025 USD 2,530,000 2,741,572 0.14UBS Commercial Mortgage Trust,Series 2017-C5 ‘A5’ 3.474%15/11/2050 USD 2,230,000 2,436,188 0.13UMBS 190360 5% 01/08/2035 USD 583,310 669,982 0.03UMBS890720 890720 4.5%01/07/2044 USD 319,611 356,400 0.02UMBS AJ1230 4.5% 01/09/2041 USD 26,537 29,362 0.00UMBS AL2922 4% 01/12/2042 USD 29,777 32,660 0.00UMBS AL8468 4% 01/04/2046 USD 280,854 307,530 0.02UMBS AL8709 4% 01/05/2044 USD 80,014 87,469 0.00UMBS AL8832 4.5% 01/10/2042 USD 1,058,878 1,182,572 0.06UMBS AL9514 4% 01/02/2043 USD 324,611 355,539 0.02UMBS AL9750 4% 01/03/2044 USD 1,029,216 1,125,150 0.06University of Southern California3.226% 01/10/2120 USD 1,250,000 1,245,041 0.06ViacomCBS, Inc. 3.875% 01/04/2024 USD 600,000 645,834 0.03ViacomCBS, Inc. 4.2% 19/05/2032 USD 2,311,000 2,672,242 0.14Vistra Operations Co. LLC, 144A 3.7%30/01/2027 USD 2,510,000 2,681,892 0.14Wells Fargo & Co., FRN 2.393%02/06/2028 USD 3,075,000 3,187,710 0.17WFRBS Commercial Mortgage Trust,Series 2013-C11 ‘AS’ 3.311%15/03/2045 USD 4,915,000 5,075,131 0.26
267,649,059 13.94
Total Bonds 332,619,930 17.32
Total Transferable securities and money market instrumentsdealt in on another regulated market 332,619,930 17.32
Units of authorised UCITS or other collective investment undertakings
Collective Investment Schemes - UCITS
LuxembourgJPMorgan Europe High Yield BondFund - JPM Europe High Yield Bond X(acc) - EUR† EUR 72,829 12,118,075 0.64JPMorgan Global High Yield BondFund - JPM Global High Yield Bond X(acc) - EUR (hedged)† EUR 246,318 58,154,377 3.03JPMorgan USD Liquidity LVNAV Fund- JPM USD Liquidity LVNAV X (dist.)† USD 29,856,503 29,856,503 1.55JPMorgan USD Liquidity VNAV Fund -JPM USD Liquidity VNAV X (acc.)† USD 1,365 20,941,398 1.09
121,070,353 6.31
Total Collective Investment Schemes - UCITS 121,070,353 6.31
Total Units of authorised UCITS or other collective investmentundertakings 121,070,353 6.31
Total Investments 1,895,616,943 98.72
Cash 20,359,094 1.06
Other Assets/(Liabilities) 4,218,900 0.22
Total Net Assets 1,920,194,937 100.00
† Related Party Fund.
Geographic Allocation of Portfolio as at 30 June 2021 % of Net AssetsUnited States of America 29.39Italy 10.88China 8.86Germany 8.79Luxembourg 6.99France 6.21United Kingdom 4.75Japan 4.01Supranational 3.32Netherlands 1.75Canada 1.61Ireland 1.20Australia 1.18Denmark 0.96Iceland 0.81Jersey 0.73Indonesia 0.72Bermuda 0.66Mexico 0.59United Arab Emirates 0.51Cayman Islands 0.45Switzerland 0.43Belgium 0.40South Korea 0.39Saudi Arabia 0.38Egypt 0.37South Africa 0.35Slovenia 0.34Morocco 0.29Spain 0.27Colombia 0.25Singapore 0.24Romania 0.22Philippines 0.15Hong Kong 0.14Sweden 0.13Total Investments 98.72Cash and other assets/(liabilities) 1.28
Total 100.00
144
JPMorgan Funds - Aggregate Bond FundSchedule of Investments (continued)
As at 30 June 2021
Investments Currency
Quantity/Nominal
Value
MarketValue
USD
%of
NetAssets Investments Currency
Quantity/Nominal
Value
MarketValue
USD
%of
NetAssets

JPMorgan Funds - Aggregate Bond FundSchedule of Investments (continued)
As at 30 June 2021
To Be Announced Contracts
Country Security Description CurrencyNominal
Value
MarketValue
USD
UnrealisedGain/(Loss)
USD
%of
NetAssets
United States of America UMBS, 2.00%, 25/07/2051 USD (41,930,000) (42,355,849) 32,760 (2.21)
Total To Be Announced Contracts Short Positions (42,355,849) 32,760 (2.21)
Net To Be Announced Contracts (42,355,849) 32,760 (2.21)
JPMorgan Funds - Aggregate Bond FundSchedule of Investments (continued)
As at 30 June 2021
Forward Currency Exchange Contracts (continued)
CurrencyPurchased Amount Purchased Currency Sold Amount Sold
MaturityDate Counterparty
UnrealisedGain/(Loss)
USD
%of
NetAssets
AUD 19,272,267 CHF 13,298,346 27/07/2021 Citibank 57,220 -BRL 11,962,811 USD 2,354,652 27/07/2021 BNP Paribas 32,443 -CAD 34,744,962 USD 28,031,660 27/07/2021 BNP Paribas 52,444 -CAD 27,061,973 USD 21,718,383 27/07/2021 HSBC 155,617 0.01CHF 13,292,595 SEK 122,565,700 27/07/2021 Citibank 4,131 -CLP 1,747,125,028 USD 2,402,075 27/07/2021 Goldman Sachs 6,933 -EUR 12,179,039 AUD 19,155,923 27/07/2021 Barclays 94,528 0.01EUR 18,253,193 AUD 28,833,474 27/07/2021 HSBC 48,805 -EUR 17,585,474 CHF 19,165,529 27/07/2021 Citibank 132,184 0.01EUR 1,937,385 CZK 49,265,174 27/07/2021 BNP Paribas 9,097 -EUR 875,280 SEK 8,801,378 27/07/2021 BNP Paribas 6,215 -EUR 213,233 USD 253,080 06/07/2021 State Street 138 -JPY 2,403,890,798 EUR 18,253,193 27/07/2021 Citibank 37,115 -KRW 5,455,614,095 USD 4,820,469 27/07/2021 Barclays 9,435 -MXN 50,327,564 EUR 2,039,419 27/07/2021 Barclays 104,947 0.01MXN 138,039,538 USD 6,900,560 27/07/2021 Goldman Sachs 32,928 -MXN 24,364,383 USD 1,185,990 27/07/2021 State Street 37,791 -SEK 30,278,868 EUR 2,983,800 27/07/2021 Barclays 11,142 -SEK 30,382,073 EUR 2,988,496 27/07/2021 Citibank 17,684 -SEK 6,907,031 USD 807,359 06/07/2021 BNP Paribas 3,654 -SEK 2,133,058 USD 247,256 06/07/2021 Standard Chartered 3,205 -SEK 103,323 USD 12,130 06/07/2021 State Street 2 -SEK 835,495,669 USD 98,129,708 04/08/2021 Goldman Sachs 496 -SEK 5,294,968 USD 619,941 04/08/2021 Standard Chartered 1,961 -TRY 21,762,109 USD 2,440,245 27/07/2021 Barclays 35,636 -USD 2,414,552 AUD 3,184,078 27/07/2021 Barclays 25,204 -USD 2,433,122 AUD 3,196,126 27/07/2021 Goldman Sachs 34,732 -USD 10,114,622 AUD 13,454,949 27/07/2021 Standard Chartered 17,960 -USD 386,713 AUD 500,000 27/07/2021 State Street 11,510 -USD 11,942,537 AUD 15,476,203 27/07/2021 Toronto-Dominion Bank 329,115 0.02USD 53,113,730 CAD 64,576,125 27/07/2021 BNP Paribas 917,311 0.05USD 21,709,859 CAD 26,573,519 27/07/2021 Goldman Sachs 230,674 0.01USD 957,222 CAD 1,156,639 27/07/2021 State Street 22,319 -USD 7,149,621 CAD 8,659,023 27/07/2021 Toronto-Dominion Bank 150,595 0.01USD 257,443,539 CHF 237,631,714 06/07/2021 BNP Paribas 188,321 0.01USD 923,321 CHF 839,064 06/07/2021 Toronto-Dominion Bank 14,967 -USD 7,243,959 CHF 6,615,241 27/07/2021 Goldman Sachs 78,320 -USD 5,830,852 CNH 37,649,533 27/07/2021 BNP Paribas 15,417 -USD 171,183,038 CNH 1,100,752,044 27/07/2021 Citibank 1,158,303 0.06USD 7,078,219 COP 26,194,172,363 27/07/2021 BNP Paribas 117,118 0.01USD 2,364,772 COP 8,559,884,269 27/07/2021 Goldman Sachs 89,983 0.01USD 18,014,695 DKK 110,469,040 27/07/2021 HSBC 366,203 0.02USD 1,321,291 EUR 1,107,758 01/07/2021 Barclays 5,918 -USD 828,072 EUR 696,271 02/07/2021 State Street 1,306 -USD 749,983 EUR 630,003 06/07/2021 Barclays 1,841 -USD 97,471 EUR 80,093 06/07/2021 Citibank 2,359 -USD 574,269 EUR 470,066 06/07/2021 Goldman Sachs 16,056 -USD 593,103 EUR 490,364 06/07/2021 RBC 10,787 -USD 383,035,761 EUR 322,151,040 06/07/2021 Standard Chartered 475,058 0.03USD 2,480,041 EUR 2,034,098 06/07/2021 State Street 64,509 -USD 7,138,591 EUR 5,855,960 27/07/2021 Barclays 181,455 0.01USD 99,497,907 EUR 82,311,048 27/07/2021 BNP Paribas 1,708,786 0.09USD 486,169,860 EUR 401,185,195 27/07/2021 Citibank 9,544,320 0.50USD 21,572,987 EUR 17,832,012 27/07/2021 Goldman Sachs 387,778 0.02USD 8,342,657 EUR 7,000,000 27/07/2021 Standard Chartered 26,351 -USD 54,163,358 EUR 44,633,890 27/07/2021 State Street 1,136,346 0.06USD 3,439,721 EUR 2,874,888 04/08/2021 RBC 23,659 -USD 2,517,473 GBP 1,816,095 06/07/2021 Barclays 3,898 -USD 79,707,654 GBP 56,531,053 27/07/2021 Barclays 1,461,092 0.08USD 14,312,632 GBP 10,110,474 27/07/2021 Citibank 318,380 0.02USD 313,735 GBP 222,882 27/07/2021 RBC 5,235 -
145

JPMorgan Funds - Aggregate Bond FundSchedule of Investments (continued)
As at 30 June 2021
Forward Currency Exchange Contracts (continued)
CurrencyPurchased Amount Purchased Currency Sold Amount Sold
MaturityDate Counterparty
UnrealisedGain/(Loss)
USD
%of
NetAssets
USD 303,000 GBP 217,739 27/07/2021 State Street 1,619 -USD 1,021,769 GBP 723,920 27/07/2021 Toronto-Dominion Bank 19,767 -USD 16,908,960 IDR 241,941,851,794 27/07/2021 BNP Paribas 316,346 0.02USD 2,380,283 IDR 33,954,743,935 27/07/2021 Standard Chartered 51,633 -USD 2,382,608 ILS 7,724,782 27/07/2021 BNP Paribas 11,783 -USD 1,112,409 JPY 121,971,578 27/07/2021 Barclays 10,216 -USD 1,108,965 JPY 121,439,795 27/07/2021 BNP Paribas 11,577 -USD 134,791,591 JPY 14,784,245,709 27/07/2021 Citibank 1,194,080 0.06USD 2,372,937 MXN 46,949,744 27/07/2021 BNP Paribas 14,732 -USD 2,382,471 RUB 173,622,609 27/07/2021 Goldman Sachs 9,765 -USD 35,420 SEK 300,000 01/07/2021 State Street 196 -USD 21,924 SEK 183,304 06/07/2021 Barclays 401 -USD 91,490 SEK 756,750 06/07/2021 BNP Paribas 2,633 -USD 98,102,988 SEK 835,495,669 06/07/2021 Goldman Sachs 399 -USD 6,524,733 SEK 54,281,256 27/07/2021 BNP Paribas 149,804 0.01USD 2,383,199 TRY 20,315,582 27/07/2021 Barclays 71,890 -USD 7,366,264 ZAR 100,463,389 27/07/2021 BNP Paribas 330,318 0.02USD 7,726,890 ZAR 109,703,243 27/07/2021 HSBC 43,832 -
Total Unrealised Gain on Forward Currency Exchange Contracts 22,279,928 1.16
AUD 28,908,401 SEK 185,589,909 27/07/2021 Citibank (103,139) (0.01)AUD 351,904 USD 264,177 27/07/2021 RBC (107) -BRL 23,933,127 USD 4,843,629 27/07/2021 Goldman Sachs (67,941) (0.01)BRL 286,857 USD 57,837 27/07/2021 Standard Chartered (597) -CAD 5,757,437 MXN 94,361,512 27/07/2021 Barclays (85,921) (0.01)CAD 8,812,144 USD 7,236,620 27/07/2021 HSBC (113,827) (0.01)CAD 180,794 USD 149,341 27/07/2021 RBC (3,207) -CAD 134,883 USD 111,624 27/07/2021 State Street (2,600) -CHF 19,892,780 EUR 18,186,554 27/07/2021 State Street (58,533) -CHF 6,511,957 JPY 785,059,076 27/07/2021 Toronto-Dominion Bank (40,408) -CHF 236,304,435 USD 263,534,978 06/07/2021 Merrill Lynch (7,716,645) (0.40)CHF 372,680 USD 415,913 06/07/2021 State Street (12,457) -CHF 1,793,663 USD 2,004,030 06/07/2021 Toronto-Dominion Bank (62,247) -CHF 237,631,714 USD 257,639,201 04/08/2021 BNP Paribas (180,558) (0.01)CHF 421,788 USD 459,715 04/08/2021 Toronto-Dominion Bank (2,735) -CLP 3,315,353,805 USD 4,594,830 27/07/2021 Citibank (23,484) -COP 8,917,927,679 USD 2,418,749 27/07/2021 Barclays (48,810) -COP 8,820,855,855 USD 2,389,828 27/07/2021 BNP Paribas (45,686) -CZK 21,105,830 USD 1,006,147 27/07/2021 State Street (23,968) -CZK 179,022,803 USD 8,547,730 27/07/2021 Toronto-Dominion Bank (216,737) (0.01)EUR 1,937,385 TRY 20,830,567 27/07/2021 Barclays (68,202) (0.01)EUR 961,562 USD 1,167,772 06/07/2021 Goldman Sachs (25,899) -EUR 307,013,192 USD 373,127,229 06/07/2021 HSBC (8,543,019) (0.45)EUR 10,972,364 USD 13,381,829 06/07/2021 RBC (351,931) (0.02)EUR 6,695,314 USD 8,129,159 06/07/2021 State Street (178,342) (0.01)EUR 858,363 USD 1,024,180 27/07/2021 Barclays (4,407) -EUR 835,165 USD 994,626 27/07/2021 BNP Paribas (2,413) -EUR 882,482 USD 1,070,865 27/07/2021 Citibank (22,438) -EUR 460,787 USD 561,138 27/07/2021 Merrill Lynch (13,704) -EUR 18,946,242 USD 22,550,674 27/07/2021 Standard Chartered (41,711) -EUR 1,107,758 USD 1,322,205 04/08/2021 Barclays (5,921) -EUR 564,781 USD 674,643 04/08/2021 HSBC (3,547) -EUR 321,035,625 USD 381,929,984 04/08/2021 Standard Chartered (462,172) (0.03)EUR 3,314,531 USD 3,954,845 04/08/2021 State Street (16,381) -GBP 20,448,324 EUR 23,909,429 27/07/2021 HSBC (102,222) (0.01)GBP 9,416 USD 13,321 06/07/2021 Barclays (289) -GBP 1,803,525 USD 2,556,425 06/07/2021 BNP Paribas (60,247) -GBP 3,154 USD 4,452 06/07/2021 RBC (87) -GBP 5,128,433 USD 7,201,741 27/07/2021 Barclays (103,301) (0.01)GBP 910,966 USD 1,271,868 27/07/2021 Standard Chartered (10,968) -GBP 1,815,688 USD 2,517,121 04/08/2021 Barclays (3,919) -HUF 1,355,984,587 EUR 3,907,732 27/07/2021 BNP Paribas (65,469) -ILS 30,065,140 USD 9,266,711 27/07/2021 Citibank (39,373) -INR 398,807,646 USD 5,416,021 27/07/2021 BNP Paribas (65,787) -JPY 3,119,217,481 USD 28,513,437 27/07/2021 HSBC (326,697) (0.02)JPY 20,000,000 USD 182,318 27/07/2021 Merrill Lynch (1,588) -KRW 4,795,282,841 USD 4,286,746 27/07/2021 HSBC (41,439) -MXN 376,234,243 USD 19,047,804 27/07/2021 HSBC (150,208) (0.01)NZD 30,954,490 CAD 26,857,133 27/07/2021 Goldman Sachs (99,648) (0.01)PLN 27,798,441 USD 7,462,378 27/07/2021 Goldman Sachs (161,234) (0.01)RUB 174,374,545 USD 2,407,143 27/07/2021 Citibank (24,161) -RUB 172,613,700 USD 2,372,964 27/07/2021 Goldman Sachs (14,045) -RUB 1,008,909 USD 13,902 27/07/2021 Standard Chartered (114) -SEK 381,403,374 USD 46,002,354 06/07/2021 Barclays (1,218,569) (0.06)SEK 16,516,784 USD 1,987,053 06/07/2021 BNP Paribas (47,678) -SEK 16,630,622 USD 2,011,491 06/07/2021 HSBC (58,749) -SEK 1,640,000 USD 198,472 06/07/2021 Standard Chartered (5,906) -SEK 1,000,000 USD 120,719 06/07/2021 State Street (3,300) -SEK 411,758,803 USD 49,890,351 06/07/2021 Toronto-Dominion Bank (1,542,279) (0.08)SEK 9,858,473 USD 1,163,321 04/08/2021 Barclays (5,429) -SEK 300,000 USD 35,431 04/08/2021 State Street (196) -TRY 21,049,261 USD 2,413,491 27/07/2021 Barclays (18,710) -
146
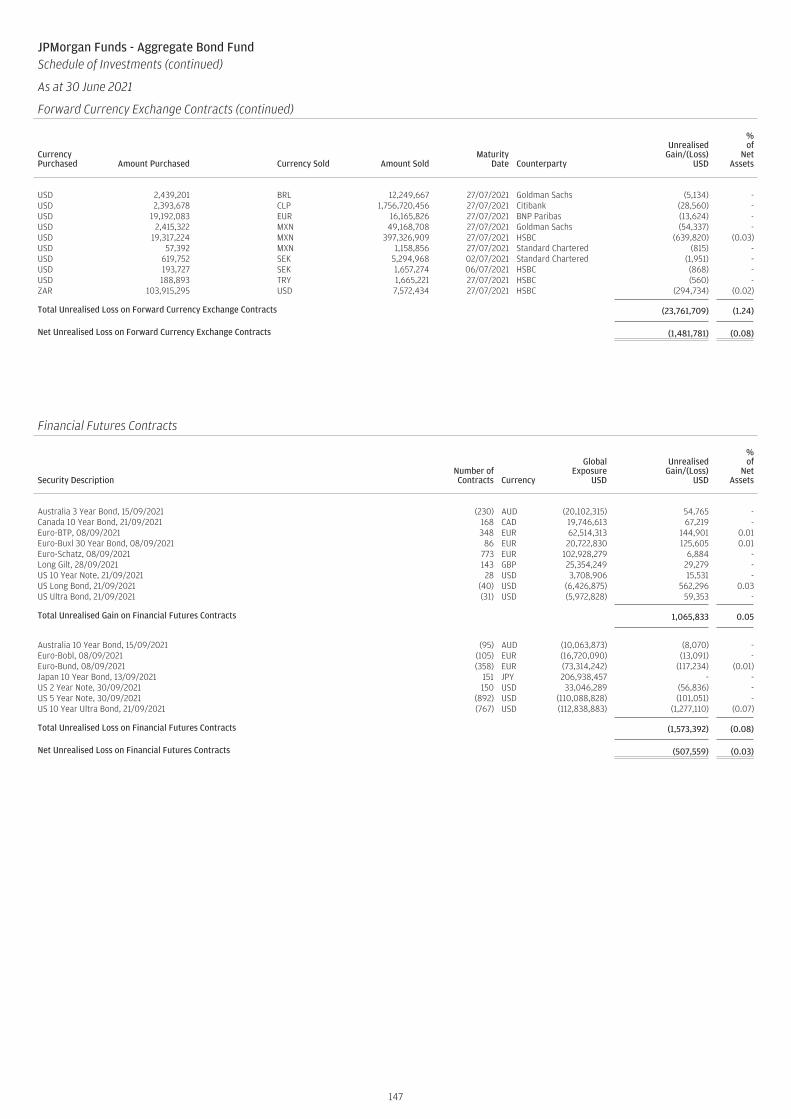
JPMorgan Funds - Aggregate Bond FundSchedule of Investments (continued)
As at 30 June 2021
Forward Currency Exchange Contracts (continued)
CurrencyPurchased Amount Purchased Currency Sold Amount Sold
MaturityDate Counterparty
UnrealisedGain/(Loss)
USD
%of
NetAssets
USD 2,439,201 BRL 12,249,667 27/07/2021 Goldman Sachs (5,134) -USD 2,393,678 CLP 1,756,720,456 27/07/2021 Citibank (28,560) -USD 19,192,083 EUR 16,165,826 27/07/2021 BNP Paribas (13,624) -USD 2,415,322 MXN 49,168,708 27/07/2021 Goldman Sachs (54,337) -USD 19,317,224 MXN 397,326,909 27/07/2021 HSBC (639,820) (0.03)USD 57,392 MXN 1,158,856 27/07/2021 Standard Chartered (815) -USD 619,752 SEK 5,294,968 02/07/2021 Standard Chartered (1,951) -USD 193,727 SEK 1,657,274 06/07/2021 HSBC (868) -USD 188,893 TRY 1,665,221 27/07/2021 HSBC (560) -ZAR 103,915,295 USD 7,572,434 27/07/2021 HSBC (294,734) (0.02)
Total Unrealised Loss on Forward Currency Exchange Contracts (23,761,709) (1.24)
Net Unrealised Loss on Forward Currency Exchange Contracts (1,481,781) (0.08)
JPMorgan Funds - Aggregate Bond FundSchedule of Investments (continued)
As at 30 June 2021
Financial Futures Contracts
Security DescriptionNumber ofContracts Currency
GlobalExposure
USD
UnrealisedGain/(Loss)
USD
%of
NetAssets
Australia 3 Year Bond, 15/09/2021 (230) AUD (20,102,315) 54,765 -Canada 10 Year Bond, 21/09/2021 168 CAD 19,746,613 67,219 -Euro-BTP, 08/09/2021 348 EUR 62,514,313 144,901 0.01Euro-Buxl 30 Year Bond, 08/09/2021 86 EUR 20,722,830 125,605 0.01Euro-Schatz, 08/09/2021 773 EUR 102,928,279 6,884 -Long Gilt, 28/09/2021 143 GBP 25,354,249 29,279 -US 10 Year Note, 21/09/2021 28 USD 3,708,906 15,531 -US Long Bond, 21/09/2021 (40) USD (6,426,875) 562,296 0.03US Ultra Bond, 21/09/2021 (31) USD (5,972,828) 59,353 -
Total Unrealised Gain on Financial Futures Contracts 1,065,833 0.05
Australia 10 Year Bond, 15/09/2021 (95) AUD (10,063,873) (8,070) -Euro-Bobl, 08/09/2021 (105) EUR (16,720,090) (13,091) -Euro-Bund, 08/09/2021 (358) EUR (73,314,242) (117,234) (0.01)Japan 10 Year Bond, 13/09/2021 151 JPY 206,938,457 - -US 2 Year Note, 30/09/2021 150 USD 33,046,289 (56,836) -US 5 Year Note, 30/09/2021 (892) USD (110,088,828) (101,051) -US 10 Year Ultra Bond, 21/09/2021 (767) USD (112,838,883) (1,277,110) (0.07)
Total Unrealised Loss on Financial Futures Contracts (1,573,392) (0.08)
Net Unrealised Loss on Financial Futures Contracts (507,559) (0.03)
147

JPMorgan Funds - Aggregate Bond FundSchedule of Investments (continued)
As at 30 June 2021
Interest Rate Swap Contracts
NominalAmount Currency Counterparty Security Description
MaturityDate
MarketValue
USD
UnrealisedGain/(Loss)
USD
%of
NetAssets
100,000,000 GBP Citigroup Pay fixed 0.432%Receive floating SONIA 1 day 17/09/2024 107,059 107,059 -
2,000,000,000 THB Citigroup Pay fixed 0.755%Receive floating THBFIX 6 month 15/09/2024 10,399 10,399 -
Total Unrealised Gain on Interest Rate Swap Contracts 117,458 117,458 -
175,000,000 GBP Citigroup Pay fixed 0.516%Receive floating SONIA 1 day 17/09/2024 (217,124) (217,124) (0.01)
Total Unrealised Loss on Interest Rate Swap Contracts (217,124) (217,124) (0.01)
Net Unrealised Loss on Interest Rate Swap Contracts (99,666) (99,666) (0.01)
JPMorgan Funds - Aggregate Bond FundSchedule of Investments (continued)
As at 30 June 2021
Inflation Rate Swap Contracts
NominalAmount Currency Counterparty Security Description
MaturityDate
MarketValue
USD
UnrealisedGain/(Loss)
USD
%of
NetAssets
21,000,000 GBP Citigroup Pay floating UKRPI 1 monthReceive fixed 3.693% 15/05/2031 (308,244) (308,244) (0.02)
Total Unrealised Loss on Inflation Rate Swap Contracts (308,244) (308,244) (0.02)
Net Unrealised Loss on Inflation Rate Swap Contracts (308,244) (308,244) (0.02)
148
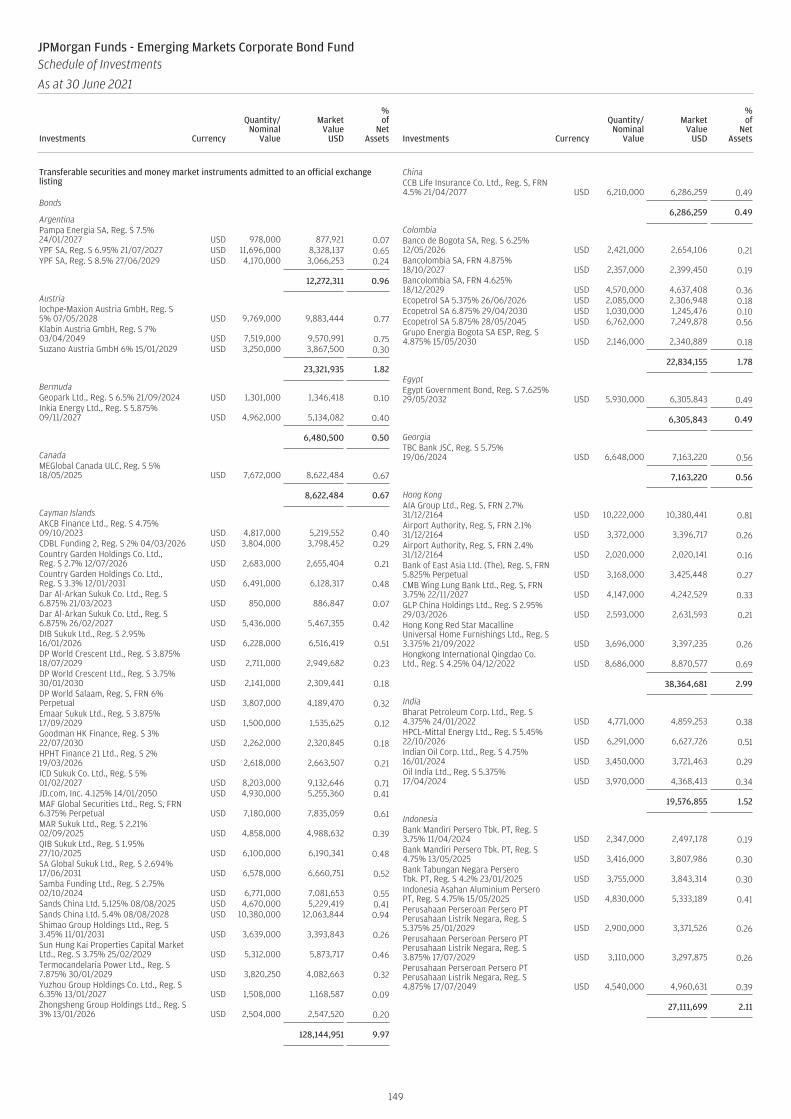
Transferable securities and money market instruments admitted to an official exchangelisting
Bonds
ArgentinaPampa Energia SA, Reg. S 7.5%24/01/2027 USD 978,000 877,921 0.07YPF SA, Reg. S 6.95% 21/07/2027 USD 11,696,000 8,328,137 0.65YPF SA, Reg. S 8.5% 27/06/2029 USD 4,170,000 3,066,253 0.24
12,272,311 0.96
AustriaIochpe-Maxion Austria GmbH, Reg. S5% 07/05/2028 USD 9,769,000 9,883,444 0.77Klabin Austria GmbH, Reg. S 7%03/04/2049 USD 7,519,000 9,570,991 0.75Suzano Austria GmbH 6% 15/01/2029 USD 3,250,000 3,867,500 0.30
23,321,935 1.82
BermudaGeopark Ltd., Reg. S 6.5% 21/09/2024 USD 1,301,000 1,346,418 0.10Inkia Energy Ltd., Reg. S 5.875%09/11/2027 USD 4,962,000 5,134,082 0.40
6,480,500 0.50
CanadaMEGlobal Canada ULC, Reg. S 5%18/05/2025 USD 7,672,000 8,622,484 0.67
8,622,484 0.67
Cayman IslandsAKCB Finance Ltd., Reg. S 4.75%09/10/2023 USD 4,817,000 5,219,552 0.40CDBL Funding 2, Reg. S 2% 04/03/2026 USD 3,804,000 3,798,452 0.29Country Garden Holdings Co. Ltd.,Reg. S 2.7% 12/07/2026 USD 2,683,000 2,655,404 0.21Country Garden Holdings Co. Ltd.,Reg. S 3.3% 12/01/2031 USD 6,491,000 6,128,317 0.48Dar Al-Arkan Sukuk Co. Ltd., Reg. S6.875% 21/03/2023 USD 850,000 886,847 0.07Dar Al-Arkan Sukuk Co. Ltd., Reg. S6.875% 26/02/2027 USD 5,436,000 5,467,355 0.42DIB Sukuk Ltd., Reg. S 2.95%16/01/2026 USD 6,228,000 6,516,419 0.51DP World Crescent Ltd., Reg. S 3.875%18/07/2029 USD 2,711,000 2,949,682 0.23DP World Crescent Ltd., Reg. S 3.75%30/01/2030 USD 2,141,000 2,309,441 0.18DP World Salaam, Reg. S, FRN 6%Perpetual USD 3,807,000 4,189,470 0.32Emaar Sukuk Ltd., Reg. S 3.875%17/09/2029 USD 1,500,000 1,535,625 0.12Goodman HK Finance, Reg. S 3%22/07/2030 USD 2,262,000 2,320,845 0.18HPHT Finance 21 Ltd., Reg. S 2%19/03/2026 USD 2,618,000 2,663,507 0.21ICD Sukuk Co. Ltd., Reg. S 5%01/02/2027 USD 8,203,000 9,132,646 0.71JD.com, Inc. 4.125% 14/01/2050 USD 4,930,000 5,255,360 0.41MAF Global Securities Ltd., Reg. S, FRN6.375% Perpetual USD 7,180,000 7,835,059 0.61MAR Sukuk Ltd., Reg. S 2.21%02/09/2025 USD 4,858,000 4,988,632 0.39QIB Sukuk Ltd., Reg. S 1.95%27/10/2025 USD 6,100,000 6,190,341 0.48SA Global Sukuk Ltd., Reg. S 2.694%17/06/2031 USD 6,578,000 6,660,751 0.52Samba Funding Ltd., Reg. S 2.75%02/10/2024 USD 6,771,000 7,081,653 0.55Sands China Ltd. 5.125% 08/08/2025 USD 4,670,000 5,229,419 0.41Sands China Ltd. 5.4% 08/08/2028 USD 10,380,000 12,063,844 0.94Shimao Group Holdings Ltd., Reg. S3.45% 11/01/2031 USD 3,639,000 3,393,843 0.26Sun Hung Kai Properties Capital MarketLtd., Reg. S 3.75% 25/02/2029 USD 5,312,000 5,873,717 0.46Termocandelaria Power Ltd., Reg. S7.875% 30/01/2029 USD 3,820,250 4,082,663 0.32Yuzhou Group Holdings Co. Ltd., Reg. S6.35% 13/01/2027 USD 1,508,000 1,168,587 0.09Zhongsheng Group Holdings Ltd., Reg. S3% 13/01/2026 USD 2,504,000 2,547,520 0.20
128,144,951 9.97
ChinaCCB Life Insurance Co. Ltd., Reg. S, FRN4.5% 21/04/2077 USD 6,210,000 6,286,259 0.49
6,286,259 0.49
ColombiaBanco de Bogota SA, Reg. S 6.25%12/05/2026 USD 2,421,000 2,654,106 0.21Bancolombia SA, FRN 4.875%18/10/2027 USD 2,357,000 2,399,450 0.19Bancolombia SA, FRN 4.625%18/12/2029 USD 4,570,000 4,637,408 0.36Ecopetrol SA 5.375% 26/06/2026 USD 2,085,000 2,306,948 0.18Ecopetrol SA 6.875% 29/04/2030 USD 1,030,000 1,245,476 0.10Ecopetrol SA 5.875% 28/05/2045 USD 6,762,000 7,249,878 0.56Grupo Energia Bogota SA ESP, Reg. S4.875% 15/05/2030 USD 2,146,000 2,340,889 0.18
22,834,155 1.78
EgyptEgypt Government Bond, Reg. S 7.625%29/05/2032 USD 5,930,000 6,305,843 0.49
6,305,843 0.49
GeorgiaTBC Bank JSC, Reg. S 5.75%19/06/2024 USD 6,648,000 7,163,220 0.56
7,163,220 0.56
Hong KongAIA Group Ltd., Reg. S, FRN 2.7%31/12/2164 USD 10,222,000 10,380,441 0.81Airport Authority, Reg. S, FRN 2.1%31/12/2164 USD 3,372,000 3,396,717 0.26Airport Authority, Reg. S, FRN 2.4%31/12/2164 USD 2,020,000 2,020,141 0.16Bank of East Asia Ltd. (The), Reg. S, FRN5.825% Perpetual USD 3,168,000 3,425,448 0.27CMB Wing Lung Bank Ltd., Reg. S, FRN3.75% 22/11/2027 USD 4,147,000 4,242,529 0.33GLP China Holdings Ltd., Reg. S 2.95%29/03/2026 USD 2,593,000 2,631,593 0.21Hong Kong Red Star MacallineUniversal Home Furnishings Ltd., Reg. S3.375% 21/09/2022 USD 3,696,000 3,397,235 0.26Hongkong International Qingdao Co.Ltd., Reg. S 4.25% 04/12/2022 USD 8,686,000 8,870,577 0.69
38,364,681 2.99
IndiaBharat Petroleum Corp. Ltd., Reg. S4.375% 24/01/2022 USD 4,771,000 4,859,253 0.38HPCL-Mittal Energy Ltd., Reg. S 5.45%22/10/2026 USD 6,291,000 6,627,726 0.51Indian Oil Corp. Ltd., Reg. S 4.75%16/01/2024 USD 3,450,000 3,721,463 0.29Oil India Ltd., Reg. S 5.375%17/04/2024 USD 3,970,000 4,368,413 0.34
19,576,855 1.52
IndonesiaBank Mandiri Persero Tbk. PT, Reg. S3.75% 11/04/2024 USD 2,347,000 2,497,178 0.19Bank Mandiri Persero Tbk. PT, Reg. S4.75% 13/05/2025 USD 3,416,000 3,807,986 0.30Bank Tabungan Negara PerseroTbk. PT, Reg. S 4.2% 23/01/2025 USD 3,755,000 3,843,314 0.30Indonesia Asahan Aluminium PerseroPT, Reg. S 4.75% 15/05/2025 USD 4,830,000 5,333,189 0.41Perusahaan Perseroan Persero PTPerusahaan Listrik Negara, Reg. S5.375% 25/01/2029 USD 2,900,000 3,371,526 0.26Perusahaan Perseroan Persero PTPerusahaan Listrik Negara, Reg. S3.875% 17/07/2029 USD 3,110,000 3,297,875 0.26Perusahaan Perseroan Persero PTPerusahaan Listrik Negara, Reg. S4.875% 17/07/2049 USD 4,540,000 4,960,631 0.39
27,111,699 2.11
149
JPMorgan Funds - Emerging Markets Corporate Bond FundSchedule of Investments
As at 30 June 2021
Investments Currency
Quantity/Nominal
Value
MarketValue
USD
%of
NetAssets Investments Currency
Quantity/Nominal
Value
MarketValue
USD
%of
NetAssets
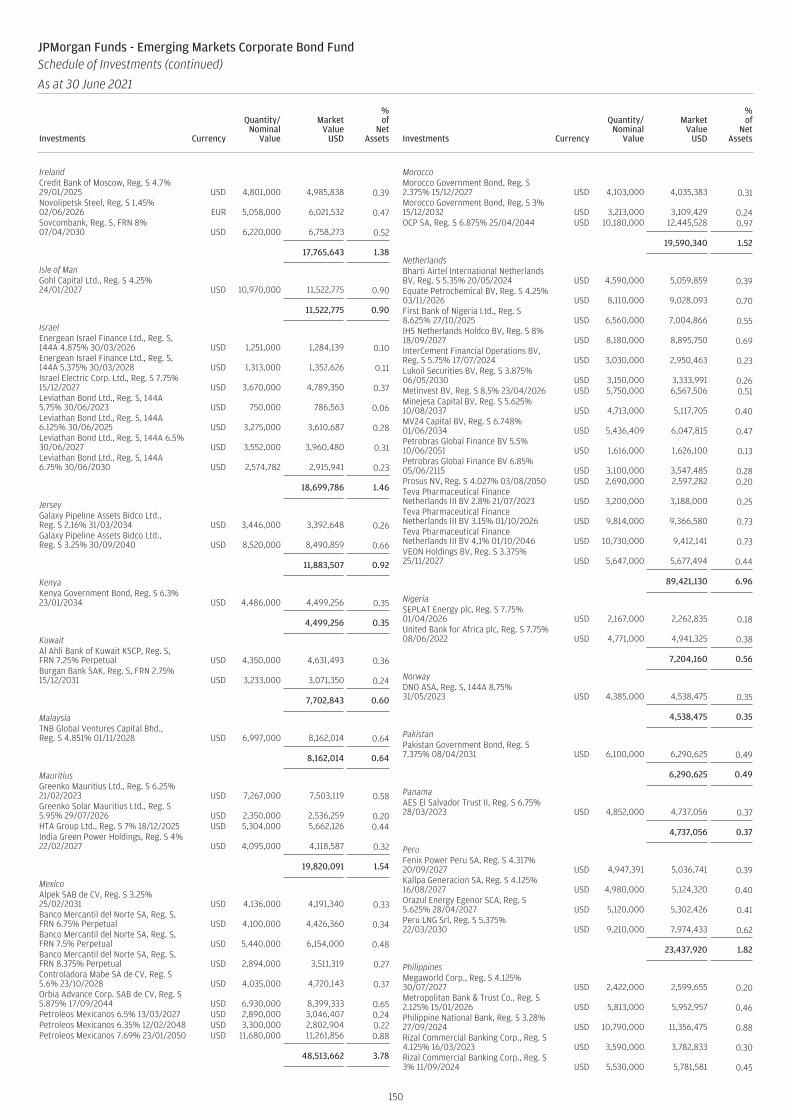
IrelandCredit Bank of Moscow, Reg. S 4.7%29/01/2025 USD 4,801,000 4,985,838 0.39Novolipetsk Steel, Reg. S 1.45%02/06/2026 EUR 5,058,000 6,021,532 0.47Sovcombank, Reg. S, FRN 8%07/04/2030 USD 6,220,000 6,758,273 0.52
17,765,643 1.38
Isle of ManGohl Capital Ltd., Reg. S 4.25%24/01/2027 USD 10,970,000 11,522,775 0.90
11,522,775 0.90
IsraelEnergean Israel Finance Ltd., Reg. S,144A 4.875% 30/03/2026 USD 1,251,000 1,284,139 0.10Energean Israel Finance Ltd., Reg. S,144A 5.375% 30/03/2028 USD 1,313,000 1,352,626 0.11Israel Electric Corp. Ltd., Reg. S 7.75%15/12/2027 USD 3,670,000 4,789,350 0.37Leviathan Bond Ltd., Reg. S, 144A5.75% 30/06/2023 USD 750,000 786,563 0.06Leviathan Bond Ltd., Reg. S, 144A6.125% 30/06/2025 USD 3,275,000 3,610,687 0.28Leviathan Bond Ltd., Reg. S, 144A 6.5%30/06/2027 USD 3,552,000 3,960,480 0.31Leviathan Bond Ltd., Reg. S, 144A6.75% 30/06/2030 USD 2,574,782 2,915,941 0.23
18,699,786 1.46
JerseyGalaxy Pipeline Assets Bidco Ltd.,Reg. S 2.16% 31/03/2034 USD 3,446,000 3,392,648 0.26Galaxy Pipeline Assets Bidco Ltd.,Reg. S 3.25% 30/09/2040 USD 8,520,000 8,490,859 0.66
11,883,507 0.92
KenyaKenya Government Bond, Reg. S 6.3%23/01/2034 USD 4,486,000 4,499,256 0.35
4,499,256 0.35
KuwaitAl Ahli Bank of Kuwait KSCP, Reg. S,FRN 7.25% Perpetual USD 4,350,000 4,631,493 0.36Burgan Bank SAK, Reg. S, FRN 2.75%15/12/2031 USD 3,233,000 3,071,350 0.24
7,702,843 0.60
MalaysiaTNB Global Ventures Capital Bhd.,Reg. S 4.851% 01/11/2028 USD 6,997,000 8,162,014 0.64
8,162,014 0.64
MauritiusGreenko Mauritius Ltd., Reg. S 6.25%21/02/2023 USD 7,267,000 7,503,119 0.58Greenko Solar Mauritius Ltd., Reg. S5.95% 29/07/2026 USD 2,350,000 2,536,259 0.20HTA Group Ltd., Reg. S 7% 18/12/2025 USD 5,304,000 5,662,126 0.44India Green Power Holdings, Reg. S 4%22/02/2027 USD 4,095,000 4,118,587 0.32
19,820,091 1.54
MexicoAlpek SAB de CV, Reg. S 3.25%25/02/2031 USD 4,136,000 4,191,340 0.33Banco Mercantil del Norte SA, Reg. S,FRN 6.75% Perpetual USD 4,100,000 4,426,360 0.34Banco Mercantil del Norte SA, Reg. S,FRN 7.5% Perpetual USD 5,440,000 6,154,000 0.48Banco Mercantil del Norte SA, Reg. S,FRN 8.375% Perpetual USD 2,894,000 3,511,319 0.27Controladora Mabe SA de CV, Reg. S5.6% 23/10/2028 USD 4,035,000 4,720,143 0.37Orbia Advance Corp. SAB de CV, Reg. S5.875% 17/09/2044 USD 6,930,000 8,399,333 0.65Petroleos Mexicanos 6.5% 13/03/2027 USD 2,890,000 3,046,407 0.24Petroleos Mexicanos 6.35% 12/02/2048 USD 3,300,000 2,802,904 0.22Petroleos Mexicanos 7.69% 23/01/2050 USD 11,680,000 11,261,856 0.88
48,513,662 3.78
MoroccoMorocco Government Bond, Reg. S2.375% 15/12/2027 USD 4,103,000 4,035,383 0.31Morocco Government Bond, Reg. S 3%15/12/2032 USD 3,213,000 3,109,429 0.24OCP SA, Reg. S 6.875% 25/04/2044 USD 10,180,000 12,445,528 0.97
19,590,340 1.52
NetherlandsBharti Airtel International NetherlandsBV, Reg. S 5.35% 20/05/2024 USD 4,590,000 5,059,859 0.39Equate Petrochemical BV, Reg. S 4.25%03/11/2026 USD 8,110,000 9,028,093 0.70First Bank of Nigeria Ltd., Reg. S8.625% 27/10/2025 USD 6,560,000 7,004,866 0.55IHS Netherlands Holdco BV, Reg. S 8%18/09/2027 USD 8,180,000 8,895,750 0.69InterCement Financial Operations BV,Reg. S 5.75% 17/07/2024 USD 3,030,000 2,950,463 0.23Lukoil Securities BV, Reg. S 3.875%06/05/2030 USD 3,150,000 3,333,991 0.26Metinvest BV, Reg. S 8.5% 23/04/2026 USD 5,750,000 6,567,506 0.51Minejesa Capital BV, Reg. S 5.625%10/08/2037 USD 4,713,000 5,117,705 0.40MV24 Capital BV, Reg. S 6.748%01/06/2034 USD 5,436,409 6,047,815 0.47Petrobras Global Finance BV 5.5%10/06/2051 USD 1,616,000 1,626,100 0.13Petrobras Global Finance BV 6.85%05/06/2115 USD 3,100,000 3,547,485 0.28Prosus NV, Reg. S 4.027% 03/08/2050 USD 2,690,000 2,597,282 0.20Teva Pharmaceutical FinanceNetherlands III BV 2.8% 21/07/2023 USD 3,200,000 3,188,000 0.25Teva Pharmaceutical FinanceNetherlands III BV 3.15% 01/10/2026 USD 9,814,000 9,366,580 0.73Teva Pharmaceutical FinanceNetherlands III BV 4.1% 01/10/2046 USD 10,730,000 9,412,141 0.73VEON Holdings BV, Reg. S 3.375%25/11/2027 USD 5,647,000 5,677,494 0.44
89,421,130 6.96
NigeriaSEPLAT Energy plc, Reg. S 7.75%01/04/2026 USD 2,167,000 2,262,835 0.18United Bank for Africa plc, Reg. S 7.75%08/06/2022 USD 4,771,000 4,941,325 0.38
7,204,160 0.56
NorwayDNO ASA, Reg. S, 144A 8.75%31/05/2023 USD 4,385,000 4,538,475 0.35
4,538,475 0.35
PakistanPakistan Government Bond, Reg. S7.375% 08/04/2031 USD 6,100,000 6,290,625 0.49
6,290,625 0.49
PanamaAES El Salvador Trust II, Reg. S 6.75%28/03/2023 USD 4,852,000 4,737,056 0.37
4,737,056 0.37
PeruFenix Power Peru SA, Reg. S 4.317%20/09/2027 USD 4,947,391 5,036,741 0.39Kallpa Generacion SA, Reg. S 4.125%16/08/2027 USD 4,980,000 5,124,320 0.40Orazul Energy Egenor SCA, Reg. S5.625% 28/04/2027 USD 5,120,000 5,302,426 0.41Peru LNG Srl, Reg. S 5.375%22/03/2030 USD 9,210,000 7,974,433 0.62
23,437,920 1.82
PhilippinesMegaworld Corp., Reg. S 4.125%30/07/2027 USD 2,422,000 2,599,655 0.20Metropolitan Bank & Trust Co., Reg. S2.125% 15/01/2026 USD 5,813,000 5,952,957 0.46Philippine National Bank, Reg. S 3.28%27/09/2024 USD 10,790,000 11,356,475 0.88Rizal Commercial Banking Corp., Reg. S4.125% 16/03/2023 USD 3,590,000 3,782,833 0.30Rizal Commercial Banking Corp., Reg. S3% 11/09/2024 USD 5,530,000 5,781,581 0.45
150
JPMorgan Funds - Emerging Markets Corporate Bond FundSchedule of Investments (continued)
As at 30 June 2021
Investments Currency
Quantity/Nominal
Value
MarketValue
USD
%of
NetAssets Investments Currency
Quantity/Nominal
Value
MarketValue
USD
%of
NetAssets

Rizal Commercial Banking Corp., Reg. S,FRN 6.5% Perpetual USD 3,420,000 3,565,191 0.28Union Bank of the Philippines, Reg. S2.125% 22/10/2025 USD 3,356,000 3,432,030 0.27
36,470,722 2.84
Saudi ArabiaSaudi Arabian Oil Co., Reg. S 3.25%24/11/2050 USD 7,587,000 7,388,903 0.58
7,388,903 0.58
SingaporeABJA Investment Co. Pte. Ltd., Reg. S5.95% 31/07/2024 USD 3,999,000 4,330,197 0.33LLPL Capital Pte. Ltd., Reg. S 6.875%04/02/2039 USD 7,943,520 9,246,377 0.72Medco Bell Pte. Ltd., Reg. S 6.375%30/01/2027 USD 4,100,000 4,239,769 0.33Medco Oak Tree Pte. Ltd., Reg. S7.375% 14/05/2026 USD 1,959,000 2,146,976 0.17
19,963,319 1.55
South AfricaAbsa Group Ltd., Reg. S, FRN 6.375%Perpetual USD 4,564,000 4,672,897 0.36Eskom Holdings SOC Ltd., Reg. S 7.125%11/02/2025 USD 3,495,000 3,702,788 0.29Standard Bank Group Ltd., Reg. S, FRN5.95% 31/05/2029 USD 5,978,000 6,367,168 0.50
14,742,853 1.15
South KoreaHeungkuk Life Insurance Co. Ltd.,Reg. S, FRN 4.475% Perpetual USD 7,336,000 7,473,550 0.58Hyundai Capital Services, Inc., Reg. S1.25% 08/02/2026 USD 3,412,000 3,362,295 0.26
10,835,845 0.84
SpainAI Candelaria Spain SLU, Reg. S 7.5%15/12/2028 USD 6,035,000 6,781,107 0.53International Airport Finance SA, Reg. S12% 15/03/2033 USD 9,318,363 9,849,509 0.76
16,630,616 1.29
SupranationalAfrica Finance Corp., Reg. S 4.375%17/04/2026 USD 7,570,000 8,266,894 0.64Africa Finance Corp., Reg. S 3.75%30/10/2029 USD 3,506,000 3,684,469 0.29African Export-Import Bank (The), Reg.S 5.25% 11/10/2023 USD 5,260,000 5,708,405 0.44African Export-Import Bank (The),Reg. S 4.125% 20/06/2024 USD 3,471,000 3,716,025 0.29African Export-Import Bank (The),Reg. S 2.634% 17/05/2026 USD 5,040,000 5,113,004 0.40Banque Ouest Africaine deDeveloppement, Reg. S 2.75%22/01/2033 EUR 1,516,000 1,891,714 0.15Eastern & Southern African Trade &Development Bank (The), Reg. S4.875% 23/05/2024 USD 1,572,000 1,655,253 0.13Eastern & Southern African Trade &Development Bank (The), Reg. S 4.125%30/06/2028 USD 5,567,000 5,568,726 0.43
35,604,490 2.77
ThailandBangkok Bank PCL, Reg. S, FRN 5%31/12/2164 USD 4,990,000 5,271,586 0.41Kasikornbank PCL, Reg. S, FRN 3.343%02/10/2031 USD 2,594,000 2,659,589 0.21Krung Thai Bank PCL, Reg. S, FRN 4.4%31/12/2164 USD 4,960,000 5,041,170 0.39
12,972,345 1.01
TurkeyKOC Holding A/S, Reg. S 6.5%11/03/2025 USD 2,380,000 2,572,506 0.20Mersin Uluslararasi Liman IsletmeciligiA/S, Reg. S 5.375% 15/11/2024 USD 6,203,000 6,587,958 0.51Turkcell Iletisim Hizmetleri A/S, Reg. S5.8% 11/04/2028 USD 7,560,000 8,075,214 0.63Turkiye Garanti Bankasi A/S, Reg. S5.25% 13/09/2022 USD 3,456,000 3,573,470 0.28
Turkiye Is Bankasi A/S, Reg. S 6.125%25/04/2024 USD 5,985,000 6,246,844 0.48Turkiye Petrol Rafinerileri A/S, Reg. S4.5% 18/10/2024 USD 2,552,000 2,568,690 0.20Turkiye Sinai Kalkinma Bankasi A/S,Reg. S 5.875% 14/01/2026 USD 995,000 1,003,682 0.08Turkiye Vakiflar Bankasi TAO, Reg. S6.5% 08/01/2026 USD 2,759,000 2,833,286 0.22Yapi ve Kredi Bankasi A/S, Reg. S 8.25%15/10/2024 USD 3,838,000 4,201,631 0.33
37,663,281 2.93
United Arab EmiratesEmirates NBD Bank PJSC, Reg. S, FRN6.125% Perpetual USD 2,030,000 2,193,669 0.17Emirates NBD Bank PJSC, Reg. S, FRN6.125% 31/12/2164 USD 3,861,000 4,256,714 0.33First Abu Dhabi Bank PJSC, Reg. S, FRN4.5% 31/12/2164 USD 4,664,000 4,988,754 0.39Mashreqbank PSC, Reg. S 4.25%26/02/2024 USD 4,219,000 4,530,995 0.35National Central Cooling Co. PJSC,Reg. S 2.5% 21/10/2027 USD 1,528,000 1,522,695 0.12NBK Tier 1 Financing 2 Ltd., Reg. S, FRN4.5% Perpetual USD 5,199,000 5,442,282 0.42Oztel Holdings SPC Ltd., Reg. S 6.625%24/04/2028 USD 8,110,000 9,025,984 0.70Tabreed Sukuk Spc Ltd., Reg. S 5.5%31/10/2025 USD 5,045,000 5,830,128 0.46
37,791,221 2.94
United KingdomGazprom PJSC, Reg. S, FRN 4.599%Perpetual USD 6,657,000 6,953,024 0.54Liquid Telecommunications Financingplc, Reg. S 5.5% 04/09/2026 USD 4,089,000 4,191,225 0.33
11,144,249 0.87
United States of AmericaGUSAP III LP, Reg. S 4.25% 21/01/2030 USD 3,530,000 3,812,400 0.30Kosmos Energy Ltd., Reg. S 7.5%01/03/2028 USD 2,020,000 2,001,598 0.15Sasol Financing USA LLC 6.5%27/09/2028 USD 7,737,000 8,730,895 0.68
14,544,893 1.13
Virgin Islands, BritishCAS Capital No. 1 Ltd., Reg. S, FRN 4%31/12/2164 USD 8,888,000 8,950,216 0.70Champion Path Holdings Ltd., Reg. S4.5% 27/01/2026 USD 1,470,000 1,531,522 0.12Champion Path Holdings Ltd., Reg. S4.85% 27/01/2028 USD 1,794,000 1,879,462 0.15CMHI Finance BVI Co. Ltd., Reg. S, FRN3.5% 31/12/2164 USD 2,560,000 2,626,495 0.20Dianjian Haiyu Ltd., Reg. S, FRN 3.45%31/12/2164 USD 2,932,000 2,970,849 0.23ENN Clean Energy InternationalInvestment Ltd., Reg. S 3.375%12/05/2026 USD 3,956,000 4,037,883 0.31Fortune Star BVI Ltd., Reg. S 6.75%02/07/2023 USD 1,060,000 1,118,300 0.09Fortune Star BVI Ltd., Reg. S 6.85%02/07/2024 USD 716,000 765,085 0.06Fortune Star BVI Ltd., Reg. S 5%18/05/2026 USD 5,050,000 5,134,057 0.40Greenland Global Investment Ltd.,Reg. S 6.25% 16/12/2022 USD 3,736,000 3,584,222 0.28Hongkong Electric Finance Ltd., Reg. S2.25% 09/06/2030 USD 2,770,000 2,778,080 0.22Huarong Finance 2019 Co. Ltd., Reg. S2.125% 30/09/2023 USD 1,769,000 1,349,075 0.10Huarong Finance 2019 Co. Ltd., Reg. S3.875% 13/11/2029 USD 5,820,000 4,044,900 0.31Huarong Finance 2019 Co. Ltd., Reg. S3.625% 30/09/2030 USD 2,570,000 1,779,725 0.14Hysan MTN Ltd., Reg. S 2.875%02/06/2027 USD 2,141,000 2,257,553 0.18New Metro Global Ltd., Reg. S 4.5%02/05/2026 USD 4,110,000 4,037,457 0.31NWD MTN Ltd., Reg. S 4.125%18/07/2029 USD 6,239,000 6,531,887 0.51RKPF Overseas 2020 A Ltd., Reg. S5.2% 12/01/2026 USD 2,529,000 2,554,895 0.20RongXingDa Development BVI Ltd.,Reg. S 8% 24/04/2022 USD 4,272,000 3,438,960 0.27
151
JPMorgan Funds - Emerging Markets Corporate Bond FundSchedule of Investments (continued)
As at 30 June 2021
Investments Currency
Quantity/Nominal
Value
MarketValue
USD
%of
NetAssets Investments Currency
Quantity/Nominal
Value
MarketValue
USD
%of
NetAssets
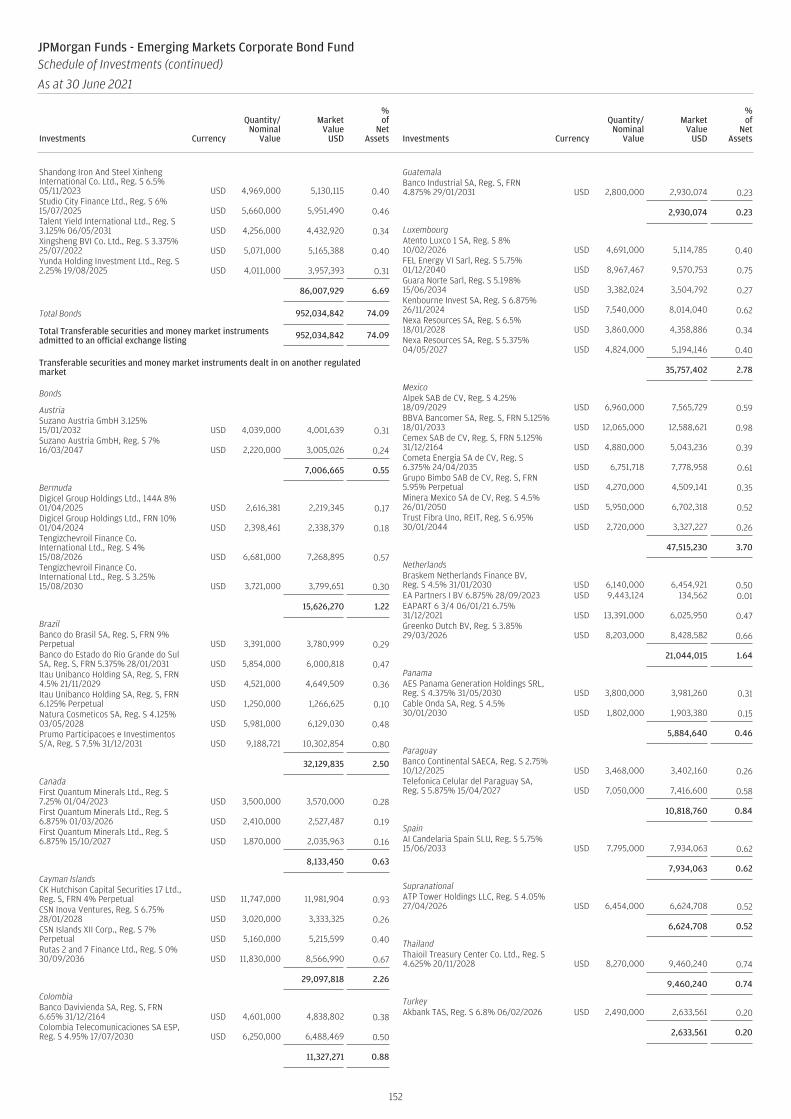
Shandong Iron And Steel XinhengInternational Co. Ltd., Reg. S 6.5%05/11/2023 USD 4,969,000 5,130,115 0.40Studio City Finance Ltd., Reg. S 6%15/07/2025 USD 5,660,000 5,951,490 0.46Talent Yield International Ltd., Reg. S3.125% 06/05/2031 USD 4,256,000 4,432,920 0.34Xingsheng BVI Co. Ltd., Reg. S 3.375%25/07/2022 USD 5,071,000 5,165,388 0.40Yunda Holding Investment Ltd., Reg. S2.25% 19/08/2025 USD 4,011,000 3,957,393 0.31
86,007,929 6.69
Total Bonds 952,034,842 74.09
Total Transferable securities and money market instrumentsadmitted to an official exchange listing 952,034,842 74.09
Transferable securities and money market instruments dealt in on another regulatedmarket
Bonds
AustriaSuzano Austria GmbH 3.125%15/01/2032 USD 4,039,000 4,001,639 0.31Suzano Austria GmbH, Reg. S 7%16/03/2047 USD 2,220,000 3,005,026 0.24
7,006,665 0.55
BermudaDigicel Group Holdings Ltd., 144A 8%01/04/2025 USD 2,616,381 2,219,345 0.17Digicel Group Holdings Ltd., FRN 10%01/04/2024 USD 2,398,461 2,338,379 0.18Tengizchevroil Finance Co.International Ltd., Reg. S 4%15/08/2026 USD 6,681,000 7,268,895 0.57Tengizchevroil Finance Co.International Ltd., Reg. S 3.25%15/08/2030 USD 3,721,000 3,799,651 0.30
15,626,270 1.22
BrazilBanco do Brasil SA, Reg. S, FRN 9%Perpetual USD 3,391,000 3,780,999 0.29Banco do Estado do Rio Grande do SulSA, Reg. S, FRN 5.375% 28/01/2031 USD 5,854,000 6,000,818 0.47Itau Unibanco Holding SA, Reg. S, FRN4.5% 21/11/2029 USD 4,521,000 4,649,509 0.36Itau Unibanco Holding SA, Reg. S, FRN6.125% Perpetual USD 1,250,000 1,266,625 0.10Natura Cosmeticos SA, Reg. S 4.125%03/05/2028 USD 5,981,000 6,129,030 0.48Prumo Participacoes e InvestimentosS/A, Reg. S 7.5% 31/12/2031 USD 9,188,721 10,302,854 0.80
32,129,835 2.50
CanadaFirst Quantum Minerals Ltd., Reg. S7.25% 01/04/2023 USD 3,500,000 3,570,000 0.28First Quantum Minerals Ltd., Reg. S6.875% 01/03/2026 USD 2,410,000 2,527,487 0.19First Quantum Minerals Ltd., Reg. S6.875% 15/10/2027 USD 1,870,000 2,035,963 0.16
8,133,450 0.63
Cayman IslandsCK Hutchison Capital Securities 17 Ltd.,Reg. S, FRN 4% Perpetual USD 11,747,000 11,981,904 0.93CSN Inova Ventures, Reg. S 6.75%28/01/2028 USD 3,020,000 3,333,325 0.26CSN Islands XII Corp., Reg. S 7%Perpetual USD 5,160,000 5,215,599 0.40Rutas 2 and 7 Finance Ltd., Reg. S 0%30/09/2036 USD 11,830,000 8,566,990 0.67
29,097,818 2.26
ColombiaBanco Davivienda SA, Reg. S, FRN6.65% 31/12/2164 USD 4,601,000 4,838,802 0.38Colombia Telecomunicaciones SA ESP,Reg. S 4.95% 17/07/2030 USD 6,250,000 6,488,469 0.50
11,327,271 0.88
GuatemalaBanco Industrial SA, Reg. S, FRN4.875% 29/01/2031 USD 2,800,000 2,930,074 0.23
2,930,074 0.23
LuxembourgAtento Luxco 1 SA, Reg. S 8%10/02/2026 USD 4,691,000 5,114,785 0.40FEL Energy VI Sarl, Reg. S 5.75%01/12/2040 USD 8,967,467 9,570,753 0.75Guara Norte Sarl, Reg. S 5.198%15/06/2034 USD 3,382,024 3,504,792 0.27Kenbourne Invest SA, Reg. S 6.875%26/11/2024 USD 7,540,000 8,014,040 0.62Nexa Resources SA, Reg. S 6.5%18/01/2028 USD 3,860,000 4,358,886 0.34Nexa Resources SA, Reg. S 5.375%04/05/2027 USD 4,824,000 5,194,146 0.40
35,757,402 2.78
MexicoAlpek SAB de CV, Reg. S 4.25%18/09/2029 USD 6,960,000 7,565,729 0.59BBVA Bancomer SA, Reg. S, FRN 5.125%18/01/2033 USD 12,065,000 12,588,621 0.98Cemex SAB de CV, Reg. S, FRN 5.125%31/12/2164 USD 4,880,000 5,043,236 0.39Cometa Energia SA de CV, Reg. S6.375% 24/04/2035 USD 6,751,718 7,778,958 0.61Grupo Bimbo SAB de CV, Reg. S, FRN5.95% Perpetual USD 4,270,000 4,509,141 0.35Minera Mexico SA de CV, Reg. S 4.5%26/01/2050 USD 5,950,000 6,702,318 0.52Trust Fibra Uno, REIT, Reg. S 6.95%30/01/2044 USD 2,720,000 3,327,227 0.26
47,515,230 3.70
NetherlandsBraskem Netherlands Finance BV,Reg. S 4.5% 31/01/2030 USD 6,140,000 6,454,921 0.50EA Partners I BV 6.875% 28/09/2023 USD 9,443,124 134,562 0.01EAPART 6 3/4 06/01/21 6.75%31/12/2021 USD 13,391,000 6,025,950 0.47Greenko Dutch BV, Reg. S 3.85%29/03/2026 USD 8,203,000 8,428,582 0.66
21,044,015 1.64
PanamaAES Panama Generation Holdings SRL,Reg. S 4.375% 31/05/2030 USD 3,800,000 3,981,260 0.31Cable Onda SA, Reg. S 4.5%30/01/2030 USD 1,802,000 1,903,380 0.15
5,884,640 0.46
ParaguayBanco Continental SAECA, Reg. S 2.75%10/12/2025 USD 3,468,000 3,402,160 0.26Telefonica Celular del Paraguay SA,Reg. S 5.875% 15/04/2027 USD 7,050,000 7,416,600 0.58
10,818,760 0.84
SpainAI Candelaria Spain SLU, Reg. S 5.75%15/06/2033 USD 7,795,000 7,934,063 0.62
7,934,063 0.62
SupranationalATP Tower Holdings LLC, Reg. S 4.05%27/04/2026 USD 6,454,000 6,624,708 0.52
6,624,708 0.52
ThailandThaioil Treasury Center Co. Ltd., Reg. S4.625% 20/11/2028 USD 8,270,000 9,460,240 0.74
9,460,240 0.74
TurkeyAkbank TAS, Reg. S 6.8% 06/02/2026 USD 2,490,000 2,633,561 0.20
2,633,561 0.20
152
JPMorgan Funds - Emerging Markets Corporate Bond FundSchedule of Investments (continued)
As at 30 June 2021
Investments Currency
Quantity/Nominal
Value
MarketValue
USD
%of
NetAssets Investments Currency
Quantity/Nominal
Value
MarketValue
USD
%of
NetAssets
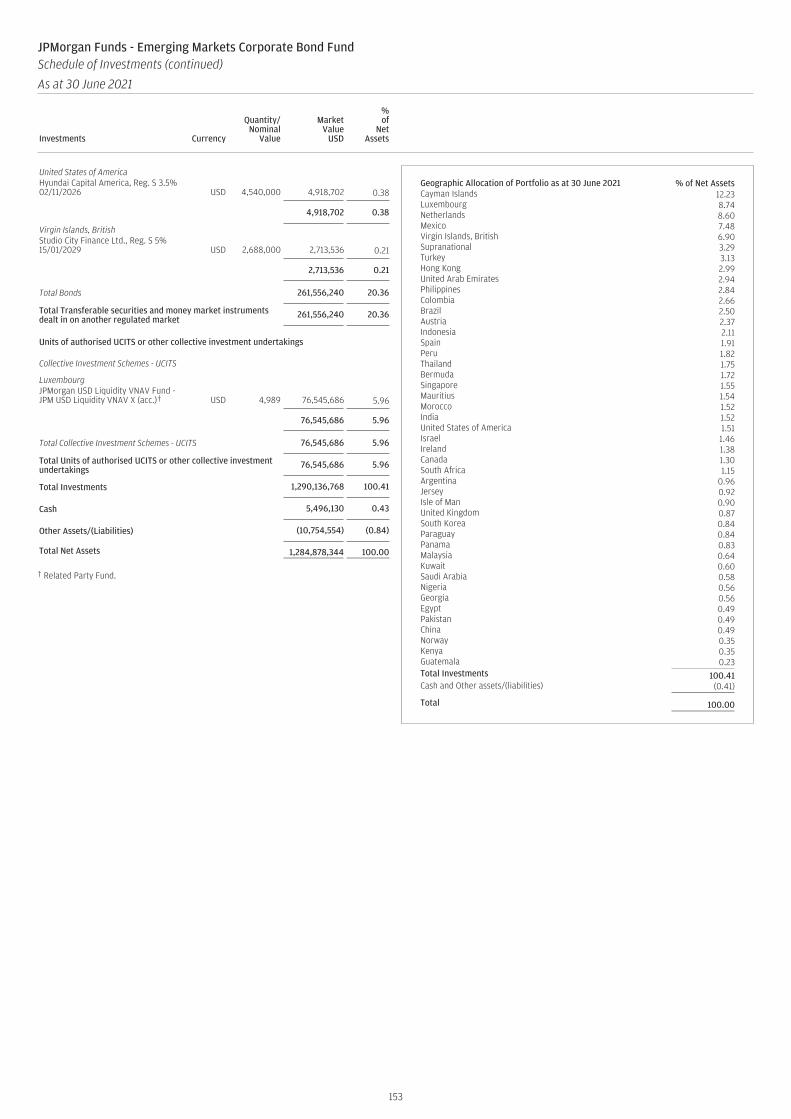
United States of AmericaHyundai Capital America, Reg. S 3.5%02/11/2026 USD 4,540,000 4,918,702 0.38
4,918,702 0.38
Virgin Islands, BritishStudio City Finance Ltd., Reg. S 5%15/01/2029 USD 2,688,000 2,713,536 0.21
2,713,536 0.21
Total Bonds 261,556,240 20.36
Total Transferable securities and money market instrumentsdealt in on another regulated market 261,556,240 20.36
Units of authorised UCITS or other collective investment undertakings
Collective Investment Schemes - UCITS
LuxembourgJPMorgan USD Liquidity VNAV Fund -JPM USD Liquidity VNAV X (acc.)† USD 4,989 76,545,686 5.96
76,545,686 5.96
Total Collective Investment Schemes - UCITS 76,545,686 5.96
Total Units of authorised UCITS or other collective investmentundertakings 76,545,686 5.96
Total Investments 1,290,136,768 100.41
Cash 5,496,130 0.43
Other Assets/(Liabilities) (10,754,554) (0.84)
Total Net Assets 1,284,878,344 100.00
† Related Party Fund.
Geographic Allocation of Portfolio as at 30 June 2021 % of Net AssetsCayman Islands 12.23Luxembourg 8.74Netherlands 8.60Mexico 7.48Virgin Islands, British 6.90Supranational 3.29Turkey 3.13Hong Kong 2.99United Arab Emirates 2.94Philippines 2.84Colombia 2.66Brazil 2.50Austria 2.37Indonesia 2.11Spain 1.91Peru 1.82Thailand 1.75Bermuda 1.72Singapore 1.55Mauritius 1.54Morocco 1.52India 1.52United States of America 1.51Israel 1.46Ireland 1.38Canada 1.30South Africa 1.15Argentina 0.96Jersey 0.92Isle of Man 0.90United Kingdom 0.87South Korea 0.84Paraguay 0.84Panama 0.83Malaysia 0.64Kuwait 0.60Saudi Arabia 0.58Nigeria 0.56Georgia 0.56Egypt 0.49Pakistan 0.49China 0.49Norway 0.35Kenya 0.35Guatemala 0.23Total Investments 100.41Cash and Other assets/(liabilities) (0.41)
Total 100.00
153
JPMorgan Funds - Emerging Markets Corporate Bond FundSchedule of Investments (continued)
As at 30 June 2021
Investments Currency
Quantity/Nominal
Value
MarketValue
USD
%of
NetAssets Investments Currency
Quantity/Nominal
Value
MarketValue
USD
%of
NetAssets

JPMorgan Funds - Emerging Markets Corporate Bond FundSchedule of Investments (continued)
As at 30 June 2021
Forward Currency Exchange Contracts (continued)
CurrencyPurchased Amount Purchased Currency Sold Amount Sold
MaturityDate Counterparty
UnrealisedGain/(Loss)
USD
%of
NetAssets
GBP 12,270 USD 16,965 04/08/2021 HSBC 18 -SEK 6,788,981 USD 797,372 04/08/2021 Goldman Sachs 4 -SEK 11,400,200 USD 1,334,748 04/08/2021 Standard Chartered 4,222 -SGD 6,068,703 USD 4,512,590 04/08/2021 Citibank 1,682 -USD 69,960 AUD 90,961 06/07/2021 Barclays 1,710 -USD 8,427 AUD 11,127 06/07/2021 HSBC 78 -USD 74,253 AUD 95,812 06/07/2021 RBC 2,363 -USD 12,413,462 AUD 16,542,460 06/07/2021 Standard Chartered 1,249 -USD 179,424 AUD 236,504 04/08/2021 RBC 1,944 -USD 32,906,935 CHF 30,374,549 06/07/2021 BNP Paribas 24,072 -USD 88,128 CHF 79,220 06/07/2021 RBC 2,367 -USD 6,633 CHF 6,077 04/08/2021 HSBC 50 -USD 146,675 EUR 123,330 02/07/2021 State Street 231 -USD 23,031 EUR 18,913 06/07/2021 Barclays 572 -USD 518,950,329 EUR 436,317,159 06/07/2021 BNP Paribas 815,113 0.07USD 10,384 EUR 8,558 06/07/2021 HSBC 221 -USD 787,001 EUR 646,082 06/07/2021 RBC 19,765 -USD 139,558 EUR 116,624 06/07/2021 Standard Chartered 1,065 -USD 6,741,987 EUR 5,516,859 06/07/2021 State Street 190,608 0.02USD 1,827,345 EUR 1,501,539 15/07/2021 Goldman Sachs 43,900 -USD 6,188,881 EUR 5,058,000 15/07/2021 State Street 181,270 0.02USD 1,767 EUR 1,483 04/08/2021 Barclays 6 -USD 152,860 EUR 127,759 04/08/2021 RBC 1,051 -USD 73,798 EUR 61,833 04/08/2021 State Street 326 -USD 3,824,936 EUR 3,204,311 04/08/2021 Toronto-Dominion Bank 17,441 -USD 15,664,970 GBP 11,300,656 06/07/2021 Barclays 24,238 -USD 251,628 GBP 177,902 06/07/2021 Merrill Lynch 5,402 -USD 121,963 GBP 85,958 06/07/2021 Standard Chartered 2,992 -USD 137,275 GBP 97,210 06/07/2021 State Street 2,730 -USD 1,213 GBP 876 04/08/2021 RBC - -USD 6,282,267 GBP 4,514,734 04/08/2021 Standard Chartered 33,156 -USD 7,004 SEK 58,279 06/07/2021 Barclays 161 -USD 797,155 SEK 6,788,981 06/07/2021 Goldman Sachs 3 -USD 40,167 SEK 332,687 06/07/2021 State Street 1,103 -USD 207,694 SGD 275,690 06/07/2021 BNP Paribas 2,602 -USD 20,356 SGD 26,973 06/07/2021 State Street 290 -
Total Unrealised Gain on Forward Currency Exchange Contracts 1,384,005 0.11
AUD 25,229 USD 19,607 06/07/2021 BNP Paribas (678) -AUD 57,070 USD 44,031 06/07/2021 HSBC (1,210) -AUD 1,342 USD 1,043 06/07/2021 Merrill Lynch (36) -AUD 16,598,454 USD 12,833,005 06/07/2021 State Street (378,778) (0.03)AUD 70,130 USD 54,191 06/07/2021 Toronto-Dominion Bank (1,571) -AUD 16,542,460 USD 12,415,149 04/08/2021 Standard Chartered (1,152) -CHF 58,936 USD 65,528 06/07/2021 Barclays (1,725) -CHF 21,127 USD 23,526 06/07/2021 Citibank (654) -CHF 60,678 USD 67,880 06/07/2021 Goldman Sachs (2,191) -CHF 54,594 USD 60,751 06/07/2021 HSBC (1,649) -CHF 30,141,764 USD 33,615,150 06/07/2021 Merrill Lynch (984,295) (0.08)CHF 68,781 USD 76,542 06/07/2021 RBC (2,081) -CHF 47,888 USD 53,259 06/07/2021 Toronto-Dominion Bank (1,416) -CHF 30,374,549 USD 32,931,945 04/08/2021 BNP Paribas (23,079) -CHF 344,522 USD 375,252 04/08/2021 HSBC (1,984) -EUR 3,204,311 USD 3,822,299 01/07/2021 Toronto-Dominion Bank (17,436) -EUR 1,006,177 USD 1,221,913 06/07/2021 Barclays (27,058) -EUR 848,694 USD 1,039,731 06/07/2021 BNP Paribas (31,889) -EUR 196,758,400 USD 240,082,828 06/07/2021 Citibank (6,428,355) (0.50)EUR 240,877,765 USD 293,940,969 06/07/2021 Goldman Sachs (7,893,880) (0.62)EUR 947,241 USD 1,155,014 06/07/2021 HSBC (30,146) -EUR 824,722 USD 987,026 06/07/2021 RBC (7,652) -EUR 1,338,485 USD 1,625,342 06/07/2021 Standard Chartered (35,865) (0.01)EUR 22,711 USD 27,061 06/07/2021 State Street (91) -EUR 436,078,121 USD 518,959,608 04/08/2021 BNP Paribas (793,544) (0.06)EUR 412,125 USD 492,802 04/08/2021 HSBC (3,099) -EUR 123,330 USD 146,774 04/08/2021 State Street (228) -GBP 74,961 USD 106,029 06/07/2021 Barclays (2,280) -GBP 11,554,862 USD 16,391,762 06/07/2021 BNP Paribas (399,196) (0.03)GBP 6,700 USD 9,492 06/07/2021 Merrill Lynch (219) -GBP 25,204 USD 35,625 06/07/2021 RBC (741) -GBP 11,300,656 USD 15,666,100 04/08/2021 Barclays (24,193) -SEK 7,040,297 USD 849,194 06/07/2021 Barclays (22,534) -SEK 28,863 USD 3,489 06/07/2021 BNP Paribas (100) -SEK 92,199 USD 11,063 06/07/2021 HSBC (237) -SEK 18,589 USD 2,235 06/07/2021 State Street (52) -SGD 6,314,085 USD 4,772,257 06/07/2021 Citibank (75,075) (0.01)
154
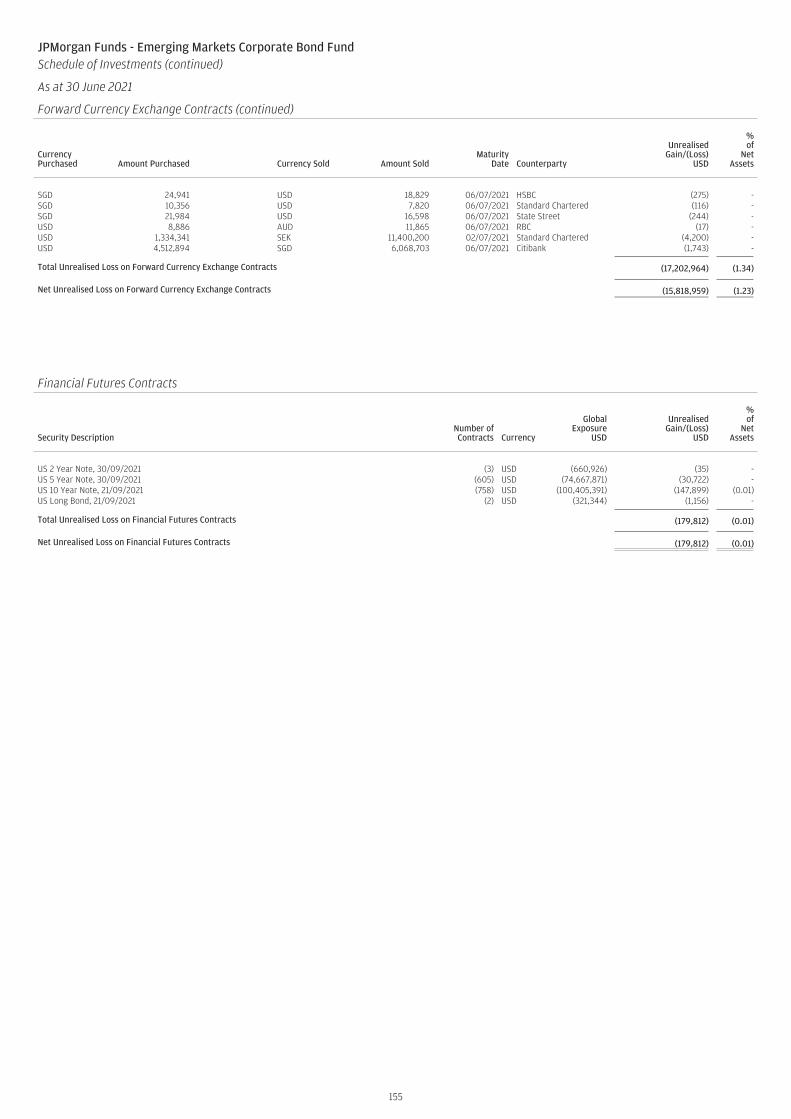
JPMorgan Funds - Emerging Markets Corporate Bond FundSchedule of Investments (continued)
As at 30 June 2021
Forward Currency Exchange Contracts (continued)
CurrencyPurchased Amount Purchased Currency Sold Amount Sold
MaturityDate Counterparty
UnrealisedGain/(Loss)
USD
%of
NetAssets
SGD 24,941 USD 18,829 06/07/2021 HSBC (275) -SGD 10,356 USD 7,820 06/07/2021 Standard Chartered (116) -SGD 21,984 USD 16,598 06/07/2021 State Street (244) -USD 8,886 AUD 11,865 06/07/2021 RBC (17) -USD 1,334,341 SEK 11,400,200 02/07/2021 Standard Chartered (4,200) -USD 4,512,894 SGD 6,068,703 06/07/2021 Citibank (1,743) -
Total Unrealised Loss on Forward Currency Exchange Contracts (17,202,964) (1.34)
Net Unrealised Loss on Forward Currency Exchange Contracts (15,818,959) (1.23)
JPMorgan Funds - Emerging Markets Corporate Bond FundSchedule of Investments (continued)
As at 30 June 2021
Financial Futures Contracts
Security DescriptionNumber ofContracts Currency
GlobalExposure
USD
UnrealisedGain/(Loss)
USD
%of
NetAssets
US 2 Year Note, 30/09/2021 (3) USD (660,926) (35) -US 5 Year Note, 30/09/2021 (605) USD (74,667,871) (30,722) -US 10 Year Note, 21/09/2021 (758) USD (100,405,391) (147,899) (0.01)US Long Bond, 21/09/2021 (2) USD (321,344) (1,156) -
Total Unrealised Loss on Financial Futures Contracts (179,812) (0.01)
Net Unrealised Loss on Financial Futures Contracts (179,812) (0.01)
155
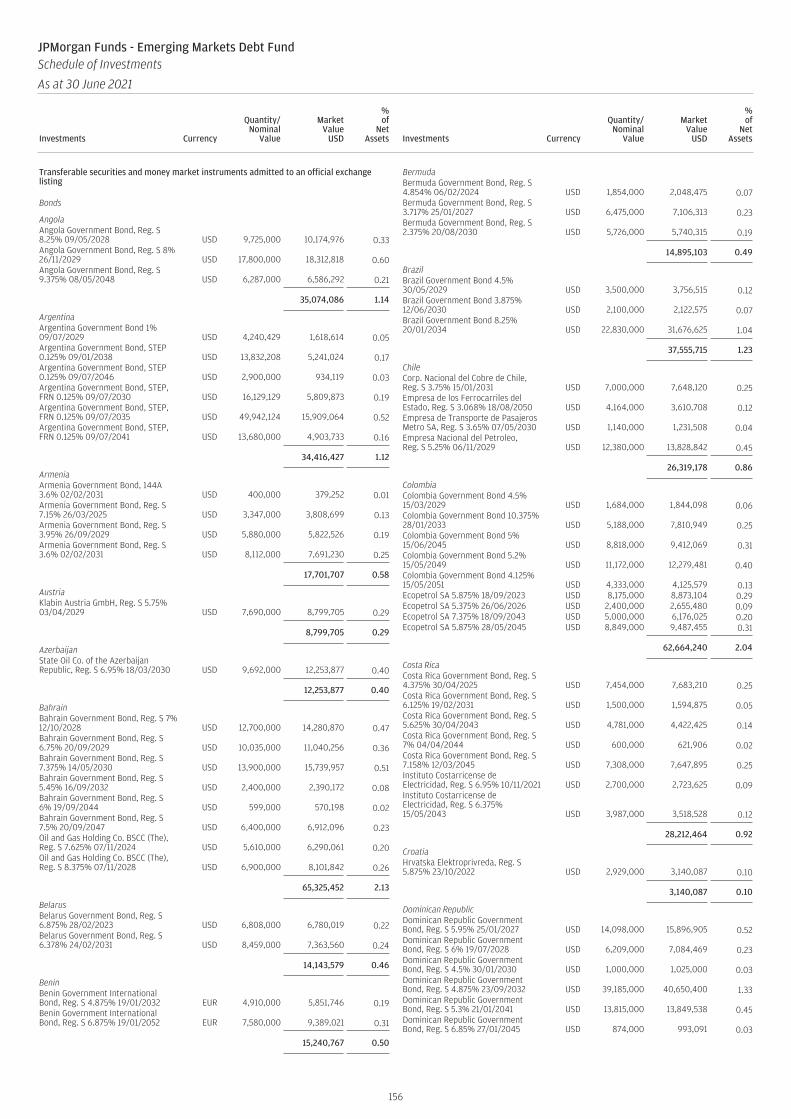
Transferable securities and money market instruments admitted to an official exchangelisting
Bonds
AngolaAngola Government Bond, Reg. S8.25% 09/05/2028 USD 9,725,000 10,174,976 0.33Angola Government Bond, Reg. S 8%26/11/2029 USD 17,800,000 18,312,818 0.60Angola Government Bond, Reg. S9.375% 08/05/2048 USD 6,287,000 6,586,292 0.21
35,074,086 1.14
ArgentinaArgentina Government Bond 1%09/07/2029 USD 4,240,429 1,618,614 0.05Argentina Government Bond, STEP0.125% 09/01/2038 USD 13,832,208 5,241,024 0.17Argentina Government Bond, STEP0.125% 09/07/2046 USD 2,900,000 934,119 0.03Argentina Government Bond, STEP,FRN 0.125% 09/07/2030 USD 16,129,129 5,809,873 0.19Argentina Government Bond, STEP,FRN 0.125% 09/07/2035 USD 49,942,124 15,909,064 0.52Argentina Government Bond, STEP,FRN 0.125% 09/07/2041 USD 13,680,000 4,903,733 0.16
34,416,427 1.12
ArmeniaArmenia Government Bond, 144A3.6% 02/02/2031 USD 400,000 379,252 0.01Armenia Government Bond, Reg. S7.15% 26/03/2025 USD 3,347,000 3,808,699 0.13Armenia Government Bond, Reg. S3.95% 26/09/2029 USD 5,880,000 5,822,526 0.19Armenia Government Bond, Reg. S3.6% 02/02/2031 USD 8,112,000 7,691,230 0.25
17,701,707 0.58
AustriaKlabin Austria GmbH, Reg. S 5.75%03/04/2029 USD 7,690,000 8,799,705 0.29
8,799,705 0.29
AzerbaijanState Oil Co. of the AzerbaijanRepublic, Reg. S 6.95% 18/03/2030 USD 9,692,000 12,253,877 0.40
12,253,877 0.40
BahrainBahrain Government Bond, Reg. S 7%12/10/2028 USD 12,700,000 14,280,870 0.47Bahrain Government Bond, Reg. S6.75% 20/09/2029 USD 10,035,000 11,040,256 0.36Bahrain Government Bond, Reg. S7.375% 14/05/2030 USD 13,900,000 15,739,957 0.51Bahrain Government Bond, Reg. S5.45% 16/09/2032 USD 2,400,000 2,390,172 0.08Bahrain Government Bond, Reg. S6% 19/09/2044 USD 599,000 570,198 0.02Bahrain Government Bond, Reg. S7.5% 20/09/2047 USD 6,400,000 6,912,096 0.23Oil and Gas Holding Co. BSCC (The),Reg. S 7.625% 07/11/2024 USD 5,610,000 6,290,061 0.20Oil and Gas Holding Co. BSCC (The),Reg. S 8.375% 07/11/2028 USD 6,900,000 8,101,842 0.26
65,325,452 2.13
BelarusBelarus Government Bond, Reg. S6.875% 28/02/2023 USD 6,808,000 6,780,019 0.22Belarus Government Bond, Reg. S6.378% 24/02/2031 USD 8,459,000 7,363,560 0.24
14,143,579 0.46
BeninBenin Government InternationalBond, Reg. S 4.875% 19/01/2032 EUR 4,910,000 5,851,746 0.19Benin Government InternationalBond, Reg. S 6.875% 19/01/2052 EUR 7,580,000 9,389,021 0.31
15,240,767 0.50
BermudaBermuda Government Bond, Reg. S4.854% 06/02/2024 USD 1,854,000 2,048,475 0.07Bermuda Government Bond, Reg. S3.717% 25/01/2027 USD 6,475,000 7,106,313 0.23Bermuda Government Bond, Reg. S2.375% 20/08/2030 USD 5,726,000 5,740,315 0.19
14,895,103 0.49
BrazilBrazil Government Bond 4.5%30/05/2029 USD 3,500,000 3,756,515 0.12Brazil Government Bond 3.875%12/06/2030 USD 2,100,000 2,122,575 0.07Brazil Government Bond 8.25%20/01/2034 USD 22,830,000 31,676,625 1.04
37,555,715 1.23
ChileCorp. Nacional del Cobre de Chile,Reg. S 3.75% 15/01/2031 USD 7,000,000 7,648,120 0.25Empresa de los Ferrocarriles delEstado, Reg. S 3.068% 18/08/2050 USD 4,164,000 3,610,708 0.12Empresa de Transporte de PasajerosMetro SA, Reg. S 3.65% 07/05/2030 USD 1,140,000 1,231,508 0.04Empresa Nacional del Petroleo,Reg. S 5.25% 06/11/2029 USD 12,380,000 13,828,842 0.45
26,319,178 0.86
ColombiaColombia Government Bond 4.5%15/03/2029 USD 1,684,000 1,844,098 0.06Colombia Government Bond 10.375%28/01/2033 USD 5,188,000 7,810,949 0.25Colombia Government Bond 5%15/06/2045 USD 8,818,000 9,412,069 0.31Colombia Government Bond 5.2%15/05/2049 USD 11,172,000 12,279,481 0.40Colombia Government Bond 4.125%15/05/2051 USD 4,333,000 4,125,579 0.13Ecopetrol SA 5.875% 18/09/2023 USD 8,175,000 8,873,104 0.29Ecopetrol SA 5.375% 26/06/2026 USD 2,400,000 2,655,480 0.09Ecopetrol SA 7.375% 18/09/2043 USD 5,000,000 6,176,025 0.20Ecopetrol SA 5.875% 28/05/2045 USD 8,849,000 9,487,455 0.31
62,664,240 2.04
Costa RicaCosta Rica Government Bond, Reg. S4.375% 30/04/2025 USD 7,454,000 7,683,210 0.25Costa Rica Government Bond, Reg. S6.125% 19/02/2031 USD 1,500,000 1,594,875 0.05Costa Rica Government Bond, Reg. S5.625% 30/04/2043 USD 4,781,000 4,422,425 0.14Costa Rica Government Bond, Reg. S7% 04/04/2044 USD 600,000 621,906 0.02Costa Rica Government Bond, Reg. S7.158% 12/03/2045 USD 7,308,000 7,647,895 0.25Instituto Costarricense deElectricidad, Reg. S 6.95% 10/11/2021 USD 2,700,000 2,723,625 0.09Instituto Costarricense deElectricidad, Reg. S 6.375%15/05/2043 USD 3,987,000 3,518,528 0.12
28,212,464 0.92
CroatiaHrvatska Elektroprivreda, Reg. S5.875% 23/10/2022 USD 2,929,000 3,140,087 0.10
3,140,087 0.10
Dominican RepublicDominican Republic GovernmentBond, Reg. S 5.95% 25/01/2027 USD 14,098,000 15,896,905 0.52Dominican Republic GovernmentBond, Reg. S 6% 19/07/2028 USD 6,209,000 7,084,469 0.23Dominican Republic GovernmentBond, Reg. S 4.5% 30/01/2030 USD 1,000,000 1,025,000 0.03Dominican Republic GovernmentBond, Reg. S 4.875% 23/09/2032 USD 39,185,000 40,650,400 1.33Dominican Republic GovernmentBond, Reg. S 5.3% 21/01/2041 USD 13,815,000 13,849,538 0.45Dominican Republic GovernmentBond, Reg. S 6.85% 27/01/2045 USD 874,000 993,091 0.03
156
JPMorgan Funds - Emerging Markets Debt FundSchedule of Investments
As at 30 June 2021
Investments Currency
Quantity/Nominal
Value
MarketValue
USD
%of
NetAssets Investments Currency
Quantity/Nominal
Value
MarketValue
USD
%of
NetAssets

Dominican Republic GovernmentBond, Reg. S 6.4% 05/06/2049 USD 7,225,000 7,893,312 0.26Dominican Republic GovernmentBond, Reg. S 5.875% 30/01/2060 USD 18,430,000 18,476,075 0.60
105,868,790 3.45
EcuadorEcuador Government Bond, Reg. S0% 31/07/2030 USD 4,218,759 2,341,453 0.08Ecuador Government Bond, STEP,144A 0.5% 31/07/2040 USD 1,800,000 1,116,018 0.04Ecuador Government Bond, STEP,Reg. S 0.5% 31/07/2030 USD 21,553,080 18,481,982 0.60Ecuador Government Bond, STEP,Reg. S, FRN 0.5% 31/07/2035 USD 16,907,513 11,581,815 0.38Ecuador Government Bond, STEP,Reg. S, FRN 0.5% 31/07/2040 USD 22,444,440 13,915,777 0.45Petroamazonas EP, Reg. S 4.625%06/12/2021 USD 885,000 878,363 0.03
48,315,408 1.58
EgyptEgypt Government Bond, Reg. S 7.5%31/01/2027 USD 17,268,000 19,448,085 0.63Egypt Government Bond, Reg. S6.588% 21/02/2028 USD 9,000,000 9,551,340 0.31Egypt Government Bond, Reg. S 7.6%01/03/2029 USD 4,000,000 4,405,000 0.14Egypt Government Bond, Reg. S5.875% 16/02/2031 USD 8,587,000 8,355,151 0.27Egypt Government Bond, Reg. S7.053% 15/01/2032 USD 6,560,000 6,745,714 0.22Egypt Government Bond, Reg. S 8.5%31/01/2047 USD 14,334,000 14,976,292 0.49Egypt Government Bond, Reg. S7.903% 21/02/2048 USD 7,000,000 6,946,506 0.23Egypt Government Bond, Reg. S8.875% 29/05/2050 USD 6,740,000 7,279,544 0.24Egypt Government Bond, Reg. S8.15% 20/11/2059 USD 11,830,000 11,863,313 0.39
89,570,945 2.92
El SalvadorEl Salvador Government Bond, Reg. S5.875% 30/01/2025 USD 14,920,000 13,912,900 0.45El Salvador Government Bond, Reg. S6.375% 18/01/2027 USD 3,627,000 3,311,487 0.11El Salvador Government Bond, Reg. S8.625% 28/02/2029 USD 7,210,000 7,083,825 0.23
24,308,212 0.79
EthiopiaEthiopia Government Bond, Reg. S6.625% 11/12/2024 USD 20,749,000 19,244,697 0.63
19,244,697 0.63
GabonGabon Government Bond, Reg. S6.95% 16/06/2025 USD 10,050,000 10,916,812 0.36
10,916,812 0.36
GeorgiaGeorgian Railway JSC, Reg. S 4%17/06/2028 USD 7,202,000 7,268,618 0.24
7,268,618 0.24
GhanaGhana Government Bond, Reg. S6.375% 11/02/2027 USD 3,000,000 3,021,597 0.10Ghana Government Bond, Reg. S7.875% 26/03/2027 USD 7,950,000 8,422,071 0.28Ghana Government Bond, Reg. S7.625% 16/05/2029 USD 13,650,000 13,839,326 0.45Ghana Government Bond, Reg. S8.125% 26/03/2032 USD 200,000 203,305 0.01Ghana Government Bond, Reg. S8.625% 07/04/2034 USD 12,234,000 12,659,866 0.41Ghana Government Bond, Reg. S7.875% 11/02/2035 USD 8,076,000 7,980,098 0.26Ghana Government Bond, Reg. S8.627% 16/06/2049 USD 4,200,000 4,057,578 0.13
Ghana Government Bond, Reg. S8.95% 26/03/2051 USD 2,221,000 2,202,010 0.07Ghana Government Bond, Reg. S8.75% 11/03/2061 USD 20,300,000 19,575,391 0.64
71,961,242 2.35
GuatemalaGuatemala Government Bond, Reg. S4.5% 03/05/2026 USD 2,963,000 3,265,996 0.10Guatemala Government Bond, Reg. S4.9% 01/06/2030 USD 7,940,000 8,905,266 0.29Guatemala Government Bond, Reg. S5.375% 24/04/2032 USD 6,580,000 7,601,611 0.25Guatemala Government Bond, Reg. S6.125% 01/06/2050 USD 6,500,000 7,936,565 0.26
27,709,438 0.90
HondurasHonduras Government Bond, Reg. S5.625% 24/06/2030 USD 3,540,000 3,717,000 0.12
3,717,000 0.12
IndiaIndian Railway Finance Corp. Ltd.,Reg. S 3.249% 13/02/2030 USD 4,990,000 5,073,308 0.16Indian Railway Finance Corp. Ltd.,Reg. S 3.95% 13/02/2050 USD 2,100,000 2,064,700 0.07
7,138,008 0.23
IndonesiaHutama Karya Persero PT, Reg. S3.75% 11/05/2030 USD 5,000,000 5,376,915 0.17Indonesia Asahan Aluminium PerseroPT, Reg. S 6.53% 15/11/2028 USD 11,062,000 13,585,851 0.44Indonesia Asahan Aluminium PerseroPT, Reg. S 6.757% 15/11/2048 USD 18,441,000 23,831,489 0.78Indonesia Government Bond, Reg. S6.625% 17/02/2037 USD 14,090,000 19,510,265 0.64Pertamina Persero PT, Reg. S 3.65%30/07/2029 USD 2,000,000 2,142,213 0.07Pertamina Persero PT, Reg. S 3.1%21/01/2030 USD 3,800,000 3,907,669 0.13Pertamina Persero PT, Reg. S 6.45%30/05/2044 USD 2,352,000 3,070,324 0.10Pertamina Persero PT, Reg. S 6.5%07/11/2048 USD 7,300,000 9,713,448 0.32Perusahaan Perseroan Persero PTPerusahaan Listrik Negara, Reg. S4.125% 15/05/2027 USD 6,000,000 6,514,500 0.21Perusahaan Perseroan Persero PTPerusahaan Listrik Negara, Reg. S3.875% 17/07/2029 USD 4,920,000 5,217,217 0.17Perusahaan Perseroan Persero PTPerusahaan Listrik Negara, Reg. S5.25% 15/05/2047 USD 4,000,000 4,511,760 0.15Perusahaan Perseroan Persero PTPerusahaan Listrik Negara, Reg. S6.15% 21/05/2048 USD 4,600,000 5,824,336 0.19Perusahaan Perseroan Persero PTPerusahaan Listrik Negara, Reg. S4.875% 17/07/2049 USD 3,670,000 4,010,026 0.13Perusahaan Perseroan Persero PTPerusahaan Listrik Negara, Reg. S4% 30/06/2050 USD 11,770,000 11,614,047 0.38
118,830,060 3.88
IraqIraq Government Bond, Reg. S6.752% 09/03/2023 USD 8,538,000 8,755,821 0.29Iraq Government Bond, Reg. S 5.8%15/01/2028 USD 36,006,250 34,931,644 1.14
43,687,465 1.43
IrelandVnesheconombank, Reg. S 5.942%21/11/2023 USD 7,621,000 8,368,620 0.27Vnesheconombank, Reg. S 6.8%22/11/2025 USD 3,000,000 3,547,470 0.12
11,916,090 0.39
157
JPMorgan Funds - Emerging Markets Debt FundSchedule of Investments (continued)
As at 30 June 2021
Investments Currency
Quantity/Nominal
Value
MarketValue
USD
%of
NetAssets Investments Currency
Quantity/Nominal
Value
MarketValue
USD
%of
NetAssets
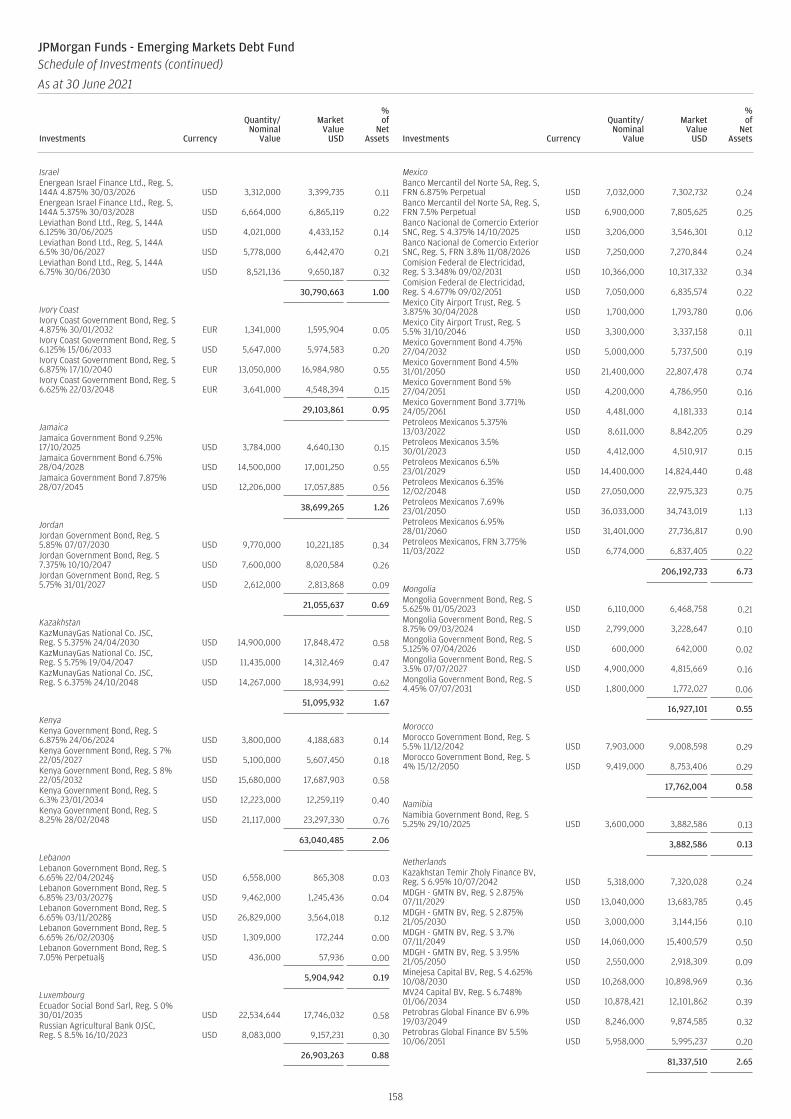
IsraelEnergean Israel Finance Ltd., Reg. S,144A 4.875% 30/03/2026 USD 3,312,000 3,399,735 0.11Energean Israel Finance Ltd., Reg. S,144A 5.375% 30/03/2028 USD 6,664,000 6,865,119 0.22Leviathan Bond Ltd., Reg. S, 144A6.125% 30/06/2025 USD 4,021,000 4,433,152 0.14Leviathan Bond Ltd., Reg. S, 144A6.5% 30/06/2027 USD 5,778,000 6,442,470 0.21Leviathan Bond Ltd., Reg. S, 144A6.75% 30/06/2030 USD 8,521,136 9,650,187 0.32
30,790,663 1.00
Ivory CoastIvory Coast Government Bond, Reg. S4.875% 30/01/2032 EUR 1,341,000 1,595,904 0.05Ivory Coast Government Bond, Reg. S6.125% 15/06/2033 USD 5,647,000 5,974,583 0.20Ivory Coast Government Bond, Reg. S6.875% 17/10/2040 EUR 13,050,000 16,984,980 0.55Ivory Coast Government Bond, Reg. S6.625% 22/03/2048 EUR 3,641,000 4,548,394 0.15
29,103,861 0.95
JamaicaJamaica Government Bond 9.25%17/10/2025 USD 3,784,000 4,640,130 0.15Jamaica Government Bond 6.75%28/04/2028 USD 14,500,000 17,001,250 0.55Jamaica Government Bond 7.875%28/07/2045 USD 12,206,000 17,057,885 0.56
38,699,265 1.26
JordanJordan Government Bond, Reg. S5.85% 07/07/2030 USD 9,770,000 10,221,185 0.34Jordan Government Bond, Reg. S7.375% 10/10/2047 USD 7,600,000 8,020,584 0.26Jordan Government Bond, Reg. S5.75% 31/01/2027 USD 2,612,000 2,813,868 0.09
21,055,637 0.69
KazakhstanKazMunayGas National Co. JSC,Reg. S 5.375% 24/04/2030 USD 14,900,000 17,848,472 0.58KazMunayGas National Co. JSC,Reg. S 5.75% 19/04/2047 USD 11,435,000 14,312,469 0.47KazMunayGas National Co. JSC,Reg. S 6.375% 24/10/2048 USD 14,267,000 18,934,991 0.62
51,095,932 1.67
KenyaKenya Government Bond, Reg. S6.875% 24/06/2024 USD 3,800,000 4,188,683 0.14Kenya Government Bond, Reg. S 7%22/05/2027 USD 5,100,000 5,607,450 0.18Kenya Government Bond, Reg. S 8%22/05/2032 USD 15,680,000 17,687,903 0.58Kenya Government Bond, Reg. S6.3% 23/01/2034 USD 12,223,000 12,259,119 0.40Kenya Government Bond, Reg. S8.25% 28/02/2048 USD 21,117,000 23,297,330 0.76
63,040,485 2.06
LebanonLebanon Government Bond, Reg. S6.65% 22/04/2024§ USD 6,558,000 865,308 0.03Lebanon Government Bond, Reg. S6.85% 23/03/2027§ USD 9,462,000 1,245,436 0.04Lebanon Government Bond, Reg. S6.65% 03/11/2028§ USD 26,829,000 3,564,018 0.12Lebanon Government Bond, Reg. S6.65% 26/02/2030§ USD 1,309,000 172,244 0.00Lebanon Government Bond, Reg. S7.05% Perpetual§ USD 436,000 57,936 0.00
5,904,942 0.19
LuxembourgEcuador Social Bond Sarl, Reg. S 0%30/01/2035 USD 22,534,644 17,746,032 0.58Russian Agricultural Bank OJSC,Reg. S 8.5% 16/10/2023 USD 8,083,000 9,157,231 0.30
26,903,263 0.88
MexicoBanco Mercantil del Norte SA, Reg. S,FRN 6.875% Perpetual USD 7,032,000 7,302,732 0.24Banco Mercantil del Norte SA, Reg. S,FRN 7.5% Perpetual USD 6,900,000 7,805,625 0.25Banco Nacional de Comercio ExteriorSNC, Reg. S 4.375% 14/10/2025 USD 3,206,000 3,546,301 0.12Banco Nacional de Comercio ExteriorSNC, Reg. S, FRN 3.8% 11/08/2026 USD 7,250,000 7,270,844 0.24Comision Federal de Electricidad,Reg. S 3.348% 09/02/2031 USD 10,366,000 10,317,332 0.34Comision Federal de Electricidad,Reg. S 4.677% 09/02/2051 USD 7,050,000 6,835,574 0.22Mexico City Airport Trust, Reg. S3.875% 30/04/2028 USD 1,700,000 1,793,780 0.06Mexico City Airport Trust, Reg. S5.5% 31/10/2046 USD 3,300,000 3,337,158 0.11Mexico Government Bond 4.75%27/04/2032 USD 5,000,000 5,737,500 0.19Mexico Government Bond 4.5%31/01/2050 USD 21,400,000 22,807,478 0.74Mexico Government Bond 5%27/04/2051 USD 4,200,000 4,786,950 0.16Mexico Government Bond 3.771%24/05/2061 USD 4,481,000 4,181,333 0.14Petroleos Mexicanos 5.375%13/03/2022 USD 8,611,000 8,842,205 0.29Petroleos Mexicanos 3.5%30/01/2023 USD 4,412,000 4,510,917 0.15Petroleos Mexicanos 6.5%23/01/2029 USD 14,400,000 14,824,440 0.48Petroleos Mexicanos 6.35%12/02/2048 USD 27,050,000 22,975,323 0.75Petroleos Mexicanos 7.69%23/01/2050 USD 36,033,000 34,743,019 1.13Petroleos Mexicanos 6.95%28/01/2060 USD 31,401,000 27,736,817 0.90Petroleos Mexicanos, FRN 3.775%11/03/2022 USD 6,774,000 6,837,405 0.22
206,192,733 6.73
MongoliaMongolia Government Bond, Reg. S5.625% 01/05/2023 USD 6,110,000 6,468,758 0.21Mongolia Government Bond, Reg. S8.75% 09/03/2024 USD 2,799,000 3,228,647 0.10Mongolia Government Bond, Reg. S5.125% 07/04/2026 USD 600,000 642,000 0.02Mongolia Government Bond, Reg. S3.5% 07/07/2027 USD 4,900,000 4,815,669 0.16Mongolia Government Bond, Reg. S4.45% 07/07/2031 USD 1,800,000 1,772,027 0.06
16,927,101 0.55
MoroccoMorocco Government Bond, Reg. S5.5% 11/12/2042 USD 7,903,000 9,008,598 0.29Morocco Government Bond, Reg. S4% 15/12/2050 USD 9,419,000 8,753,406 0.29
17,762,004 0.58
NamibiaNamibia Government Bond, Reg. S5.25% 29/10/2025 USD 3,600,000 3,882,586 0.13
3,882,586 0.13
NetherlandsKazakhstan Temir Zholy Finance BV,Reg. S 6.95% 10/07/2042 USD 5,318,000 7,320,028 0.24MDGH - GMTN BV, Reg. S 2.875%07/11/2029 USD 13,040,000 13,683,785 0.45MDGH - GMTN BV, Reg. S 2.875%21/05/2030 USD 3,000,000 3,144,156 0.10MDGH - GMTN BV, Reg. S 3.7%07/11/2049 USD 14,060,000 15,400,579 0.50MDGH - GMTN BV, Reg. S 3.95%21/05/2050 USD 2,550,000 2,918,309 0.09Minejesa Capital BV, Reg. S 4.625%10/08/2030 USD 10,268,000 10,898,969 0.36MV24 Capital BV, Reg. S 6.748%01/06/2034 USD 10,878,421 12,101,862 0.39Petrobras Global Finance BV 6.9%19/03/2049 USD 8,246,000 9,874,585 0.32Petrobras Global Finance BV 5.5%10/06/2051 USD 5,958,000 5,995,237 0.20
81,337,510 2.65
158
JPMorgan Funds - Emerging Markets Debt FundSchedule of Investments (continued)
As at 30 June 2021
Investments Currency
Quantity/Nominal
Value
MarketValue
USD
%of
NetAssets Investments Currency
Quantity/Nominal
Value
MarketValue
USD
%of
NetAssets

NigeriaNigeria Government Bond, Reg. S6.5% 28/11/2027 USD 9,086,000 9,657,119 0.31Nigeria Government Bond, Reg. S8.747% 21/01/2031 USD 3,600,000 4,098,096 0.13Nigeria Government Bond, Reg. S7.875% 16/02/2032 USD 8,382,000 9,052,141 0.30Nigeria Government Bond, Reg. S7.696% 23/02/2038 USD 8,835,000 9,079,332 0.30Nigeria Government Bond, Reg. S7.625% 28/11/2047 USD 20,847,000 20,906,581 0.68Nigeria Government Bond, Reg. S9.248% 21/01/2049 USD 6,450,000 7,369,860 0.24
60,163,129 1.96
OmanOman Government Bond, Reg. S4.75% 15/06/2026 USD 20,754,000 21,578,971 0.70Oman Government Bond, Reg. S5.375% 08/03/2027 USD 11,357,000 11,979,875 0.39Oman Government Bond, Reg. S5.625% 17/01/2028 USD 5,391,000 5,677,796 0.19Oman Government Bond, Reg. S6.25% 25/01/2031 USD 19,125,000 20,582,822 0.67Oman Government Bond, Reg. S7.375% 28/10/2032 USD 6,166,000 7,056,636 0.23Oman Government Bond, Reg. S6.75% 17/01/2048 USD 8,019,000 7,999,313 0.26
74,875,413 2.44
PakistanPakistan Government Bond, Reg. S8.25% 15/04/2024 USD 4,452,000 4,869,464 0.16Pakistan Government Bond, Reg. S6% 08/04/2026 USD 5,445,000 5,526,675 0.18Pakistan Government Bond, Reg. S6.875% 05/12/2027 USD 20,663,000 21,519,295 0.70Pakistan Government Bond, Reg. S8.875% 08/04/2051 USD 21,784,000 23,177,762 0.76
55,093,196 1.80
PanamaAeropuerto Internacional deTocumen SA, Reg. S 5.625%18/05/2036 USD 1,500,000 1,625,640 0.05Aeropuerto Internacional deTocumen SA, Reg. S 6% 18/11/2048 USD 8,047,746 8,729,249 0.29Empresa de Transmision Electrica SA,Reg. S 5.125% 02/05/2049 USD 7,640,000 8,386,161 0.27Panama Government Bond 3.75%17/04/2026 USD 13,100,000 14,154,091 0.46Panama Government Bond 9.375%01/04/2029 USD 5,891,000 8,718,798 0.28Panama Government Bond 4.5%16/04/2050 USD 5,000,000 5,702,850 0.19Panama Government Bond 4.5%01/04/2056 USD 7,810,000 8,877,158 0.29
56,193,947 1.83
ParaguayParaguay Government Bond, Reg. S4.7% 27/03/2027 USD 15,920,000 18,117,119 0.59Paraguay Government Bond, Reg. S4.95% 28/04/2031 USD 10,960,000 12,485,084 0.41Paraguay Government Bond, Reg. S2.739% 29/01/2033 USD 10,746,000 10,498,842 0.34Paraguay Government Bond, Reg. S6.1% 11/08/2044 USD 11,312,000 14,111,833 0.46Paraguay Government Bond, Reg. S5.6% 13/03/2048 USD 8,254,000 9,729,403 0.32Paraguay Government Bond, Reg. S5.4% 30/03/2050 USD 20,139,000 23,587,804 0.77
88,530,085 2.89
PeruConsorcio Transmantaro SA, Reg. S4.375% 07/05/2023 USD 4,830,000 5,041,361 0.17Corp. Financiera de Desarrollo SA,Reg. S 4.75% 15/07/2025 USD 3,621,000 3,987,246 0.13Corp. Financiera de Desarrollo SA,Reg. S 2.4% 28/09/2027 USD 4,910,000 4,821,154 0.16Fondo MIVIVIENDA SA, Reg. S 3.5%31/01/2023 USD 8,300,000 8,579,336 0.28Peru Government Bond 8.75%21/11/2033 USD 5,350,000 8,395,488 0.27
Peru LNG Srl, Reg. S 5.375%22/03/2030 USD 11,400,000 9,870,633 0.32Petroleos del Peru SA, Reg. S 4.75%19/06/2032 USD 11,145,000 11,716,181 0.38Petroleos del Peru SA, Reg. S 5.625%19/06/2047 USD 22,115,000 23,392,141 0.76
75,803,540 2.47
QatarQatar Government Bond, Reg. S4.817% 14/03/2049 USD 20,357,000 26,246,077 0.86Qatar Government Bond, Reg. S 4.4%16/04/2050 USD 14,100,000 17,188,957 0.56
43,435,034 1.42
RomaniaRomania Government Bond, Reg. S3.624% 26/05/2030 EUR 4,610,000 6,339,823 0.21Romania Government Bond, Reg. S3% 14/02/2031 USD 7,600,000 7,886,634 0.26Romania Government Bond, Reg. S2.625% 02/12/2040 EUR 2,756,000 3,252,567 0.10Romania Government Bond, Reg. S4.625% 03/04/2049 EUR 15,317,000 23,081,752 0.75Romania Government Bond, Reg. S4% 14/02/2051 USD 3,714,000 3,906,266 0.13
44,467,042 1.45
RussiaRussian Foreign Bond - Eurobond,Reg. S 4.375% 21/03/2029 USD 18,400,000 20,763,296 0.68Russian Foreign Bond - Eurobond,Reg. S 5.1% 28/03/2035 USD 10,000,000 11,904,000 0.39Russian Foreign Bond - Eurobond,Reg. S 5.625% 04/04/2042 USD 10,800,000 13,891,500 0.45Russian Foreign Bond - Eurobond,Reg. S 5.875% 16/09/2043 USD 1,600,000 2,138,672 0.07
48,697,468 1.59
Saudi ArabiaSaudi Arabian Oil Co., Reg. S 3.5%16/04/2029 USD 16,900,000 18,332,275 0.60Saudi Government Bond, Reg. S4.375% 16/04/2029 USD 2,800,000 3,248,000 0.11Saudi Government Bond, Reg. S 4.5%17/04/2030 USD 1,500,000 1,768,582 0.06Saudi Government Bond, Reg. S2.25% 02/02/2033 USD 8,509,000 8,284,771 0.27Saudi Government Bond, Reg. S4.625% 04/10/2047 USD 14,950,000 17,889,020 0.58Saudi Government Bond, Reg. S 5%17/04/2049 USD 4,300,000 5,438,296 0.18Saudi Government Bond, Reg. S5.25% 16/01/2050 USD 6,900,000 9,049,854 0.29Saudi Government Bond, Reg. S 4.5%22/04/2060 USD 4,000,000 4,857,760 0.16Saudi Government Bond, Reg. S3.45% 02/02/2061 USD 9,499,000 9,493,776 0.31
78,362,334 2.56
SenegalSenegal Government Bond, Reg. S6.25% 23/05/2033 USD 5,700,000 6,023,817 0.20Senegal Government Bond, Reg. S6.75% 13/03/2048 USD 9,544,000 9,665,304 0.31
15,689,121 0.51
SerbiaSerbia Government Bond, Reg. S2.125% 01/12/2030 USD 4,637,000 4,404,802 0.14
4,404,802 0.14
South AfricaEskom Holdings SOC Ltd., Reg. S7.125% 11/02/2025 USD 2,400,000 2,542,687 0.08Eskom Holdings SOC Ltd., Reg. S8.45% 10/08/2028 USD 4,102,000 4,646,541 0.15South Africa Government Bond4.875% 14/04/2026 USD 7,600,000 8,270,472 0.27South Africa Government Bond 4.3%12/10/2028 USD 35,803,000 37,075,081 1.21South Africa Government Bond4.85% 30/09/2029 USD 1,400,000 1,488,410 0.05South Africa Government Bond 5%12/10/2046 USD 15,800,000 15,035,248 0.49
159
JPMorgan Funds - Emerging Markets Debt FundSchedule of Investments (continued)
As at 30 June 2021
Investments Currency
Quantity/Nominal
Value
MarketValue
USD
%of
NetAssets Investments Currency
Quantity/Nominal
Value
MarketValue
USD
%of
NetAssets

South Africa Government Bond 5.75%30/09/2049 USD 23,256,000 23,854,307 0.78Transnet SOC Ltd., Reg. S 4%26/07/2022 USD 3,600,000 3,674,124 0.12
96,586,870 3.15
SpainAI Candelaria Spain SLU, Reg. S 7.5%15/12/2028 USD 4,828,000 5,424,886 0.18
5,424,886 0.18
Sri LankaSri Lanka Government Bond, Reg. S6.85% 14/03/2024 USD 5,200,000 3,640,000 0.12Sri Lanka Government Bond, Reg. S6.35% 28/06/2024 USD 3,970,000 2,723,261 0.09Sri Lanka Government Bond, Reg. S6.85% 03/11/2025 USD 7,500,000 5,100,000 0.16Sri Lanka Government Bond, Reg. S6.825% 18/07/2026 USD 6,750,000 4,336,875 0.14Sri Lanka Government Bond, Reg. S6.2% 11/05/2027 USD 15,222,000 9,535,213 0.31Sri Lanka Government Bond, Reg. S6.75% 18/04/2028 USD 3,737,000 2,354,310 0.08Sri Lanka Government Bond, Reg. S7.85% 14/03/2029 USD 2,994,000 1,916,160 0.06Sri Lanka Government Bond, Reg. S7.55% 28/03/2030 USD 14,257,000 9,124,480 0.30
38,730,299 1.26
SupranationalBanque Ouest Africaine deDeveloppement, Reg. S 2.75%22/01/2033 EUR 6,075,000 7,580,581 0.25
7,580,581 0.25
TajikistanTajikistan Government Bond, Reg. S7.125% 14/09/2027 USD 2,280,000 2,110,140 0.07
2,110,140 0.07
Trinidad and TobagoTrinidad & Tobago Government Bond,Reg. S 4.5% 26/06/2030 USD 6,780,000 7,076,625 0.23
7,076,625 0.23
TunisiaBanque Centrale de TunisieInternational Bond, Reg. S 5.75%30/01/2025 USD 15,300,000 14,319,652 0.47
14,319,652 0.47
TurkeyTurkey Government Bond 5.75%22/03/2024 USD 12,271,000 12,755,569 0.42Turkey Government Bond 5.6%14/11/2024 USD 13,900,000 14,318,612 0.47Turkey Government Bond 4.25%14/04/2026 USD 8,300,000 7,999,208 0.26Turkey Government Bond 4.875%16/04/2043 USD 49,350,000 39,462,876 1.29Turkey Government Bond 5.75%11/05/2047 USD 5,224,000 4,478,065 0.14Turkiye Ihracat Kredi Bankasi A/S,Reg. S 8.25% 24/01/2024 USD 1,680,000 1,828,798 0.06
80,843,128 2.64
UkraineUkraine Government Bond, Reg. S7.75% 01/09/2023 USD 15,150,000 16,355,576 0.53Ukraine Government Bond, Reg. S7.75% 01/09/2024 USD 11,600,000 12,684,960 0.41Ukraine Government Bond, Reg. S7.75% 01/09/2025 USD 11,100,000 12,184,470 0.40Ukraine Government Bond, Reg. S7.375% 25/09/2032 USD 19,102,000 20,133,317 0.66Ukraine Government Bond, Reg. S7.253% 15/03/2033 USD 12,764,000 13,322,285 0.44Ukraine Government Bond, Reg. S,FRN 0% 31/05/2040 USD 15,000,000 17,832,090 0.58
92,512,698 3.02
United Arab EmiratesAbu Dhabi Crude Oil Pipeline LLC,Reg. S 4.6% 02/11/2047 USD 5,900,000 6,973,800 0.23Abu Dhabi Government Bond, Reg. S3.125% 30/09/2049 USD 8,610,000 8,803,381 0.29Abu Dhabi Government Bond, Reg. S3.875% 16/04/2050 USD 2,690,000 3,105,301 0.10Abu Dhabi Government Bond, Reg. S3.9% 09/09/2050 USD 2,000,000 1,879,320 0.06DP World plc, Reg. S 6.85%02/07/2037 USD 2,800,000 3,804,290 0.12DP World plc, Reg. S 5.625%25/09/2048 USD 5,000,000 6,267,400 0.20Finance Department Government ofSharjah, 144A 4% 28/07/2050 USD 1,400,000 1,288,399 0.04Finance Department Government ofSharjah, Reg. S 3.625% 10/03/2033 USD 3,570,000 3,614,625 0.12Finance Department Government ofSharjah, Reg. S 4% 28/07/2050 USD 7,160,000 6,614,050 0.22
42,350,566 1.38
United KingdomMARB BondCo plc, Reg. S 3.95%29/01/2031 USD 7,835,000 7,521,600 0.25State Savings Bank of Ukraine, STEP,Reg. S 9.625% 20/03/2025 USD 1,720,000 1,870,500 0.06
9,392,100 0.31
United States of AmericaKazMunayGas National Co. JSC,Reg. S 3.5% 14/04/2033 USD 6,063,000 6,295,152 0.20
6,295,152 0.20
UruguayUruguay Government Bond 7.625%21/03/2036 USD 7,543,610 11,541,799 0.38Uruguay Government Bond 4.975%20/04/2055 USD 6,261,683 8,101,052 0.26
19,642,851 0.64
Venezuela, Bolivarian Republic ofPetroleos de Venezuela SA, Reg. S12.75% 17/02/2022§ USD 2,025,000 91,874 0.00Petroleos de Venezuela SA, Reg. S5.375% 12/04/2027§ USD 7,640,900 353,392 0.01Petroleos de Venezuela SA, Reg. S9.75% 17/05/2035§ USD 1,050,057 47,253 0.00Venezuela Government Bond, Reg. S12.75% 23/08/2022§ USD 4,360,000 446,900 0.02Venezuela Government Bond, Reg. S8.25% 13/10/2024§ USD 8,220,000 863,100 0.03Venezuela Government Bond, Reg. S7.65% 21/04/2025§ USD 4,831,000 495,177 0.02Venezuela Government Bond, Reg. S9.25% 07/05/2028 USD 3,820,000 401,100 0.01
2,698,796 0.09
Virgin Islands, BritishChinalco Capital Holdings Ltd., Reg. S4% 25/08/2021 USD 8,700,000 8,725,014 0.28King Power Capital Ltd., Reg. S5.625% 03/11/2024 USD 1,500,000 1,703,457 0.06Minmetals Bounteous Finance BVILtd., Reg. S 4.2% 27/07/2026 USD 4,600,000 5,069,338 0.17
15,497,809 0.51
ZambiaZambia Government Bond, Reg. S5.375% 20/09/2022 USD 1,718,000 1,088,400 0.03Zambia Government Bond, Reg. S8.5% 14/04/2024 USD 400,000 257,500 0.01Zambia Government Bond, Reg. S8.97% 30/07/2027 USD 10,943,000 6,958,791 0.23
8,304,691 0.27
Total Bonds 2,653,973,109 86.60
Total Transferable securities and money market instrumentsadmitted to an official exchange listing 2,653,973,109 86.60
160
JPMorgan Funds - Emerging Markets Debt FundSchedule of Investments (continued)
As at 30 June 2021
Investments Currency
Quantity/Nominal
Value
MarketValue
USD
%of
NetAssets Investments Currency
Quantity/Nominal
Value
MarketValue
USD
%of
NetAssets
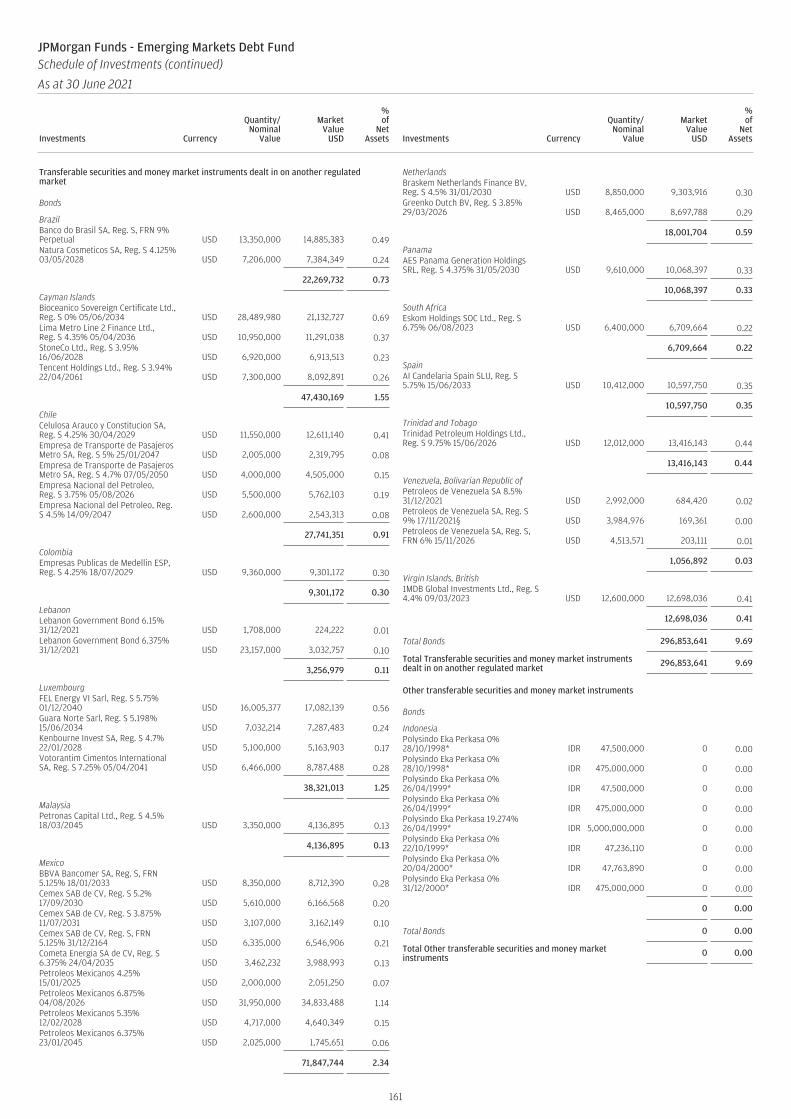
Transferable securities and money market instruments dealt in on another regulatedmarket
Bonds
BrazilBanco do Brasil SA, Reg. S, FRN 9%Perpetual USD 13,350,000 14,885,383 0.49Natura Cosmeticos SA, Reg. S 4.125%03/05/2028 USD 7,206,000 7,384,349 0.24
22,269,732 0.73
Cayman IslandsBioceanico Sovereign Certificate Ltd.,Reg. S 0% 05/06/2034 USD 28,489,980 21,132,727 0.69Lima Metro Line 2 Finance Ltd.,Reg. S 4.35% 05/04/2036 USD 10,950,000 11,291,038 0.37StoneCo Ltd., Reg. S 3.95%16/06/2028 USD 6,920,000 6,913,513 0.23Tencent Holdings Ltd., Reg. S 3.94%22/04/2061 USD 7,300,000 8,092,891 0.26
47,430,169 1.55
ChileCelulosa Arauco y Constitucion SA,Reg. S 4.25% 30/04/2029 USD 11,550,000 12,611,140 0.41Empresa de Transporte de PasajerosMetro SA, Reg. S 5% 25/01/2047 USD 2,005,000 2,319,795 0.08Empresa de Transporte de PasajerosMetro SA, Reg. S 4.7% 07/05/2050 USD 4,000,000 4,505,000 0.15Empresa Nacional del Petroleo,Reg. S 3.75% 05/08/2026 USD 5,500,000 5,762,103 0.19Empresa Nacional del Petroleo, Reg.S 4.5% 14/09/2047 USD 2,600,000 2,543,313 0.08
27,741,351 0.91
ColombiaEmpresas Publicas de Medellin ESP,Reg. S 4.25% 18/07/2029 USD 9,360,000 9,301,172 0.30
9,301,172 0.30
LebanonLebanon Government Bond 6.15%31/12/2021 USD 1,708,000 224,222 0.01Lebanon Government Bond 6.375%31/12/2021 USD 23,157,000 3,032,757 0.10
3,256,979 0.11
LuxembourgFEL Energy VI Sarl, Reg. S 5.75%01/12/2040 USD 16,005,377 17,082,139 0.56Guara Norte Sarl, Reg. S 5.198%15/06/2034 USD 7,032,214 7,287,483 0.24Kenbourne Invest SA, Reg. S 4.7%22/01/2028 USD 5,100,000 5,163,903 0.17Votorantim Cimentos InternationalSA, Reg. S 7.25% 05/04/2041 USD 6,466,000 8,787,488 0.28
38,321,013 1.25
MalaysiaPetronas Capital Ltd., Reg. S 4.5%18/03/2045 USD 3,350,000 4,136,895 0.13
4,136,895 0.13
MexicoBBVA Bancomer SA, Reg. S, FRN5.125% 18/01/2033 USD 8,350,000 8,712,390 0.28Cemex SAB de CV, Reg. S 5.2%17/09/2030 USD 5,610,000 6,166,568 0.20Cemex SAB de CV, Reg. S 3.875%11/07/2031 USD 3,107,000 3,162,149 0.10Cemex SAB de CV, Reg. S, FRN5.125% 31/12/2164 USD 6,335,000 6,546,906 0.21Cometa Energia SA de CV, Reg. S6.375% 24/04/2035 USD 3,462,232 3,988,993 0.13Petroleos Mexicanos 4.25%15/01/2025 USD 2,000,000 2,051,250 0.07Petroleos Mexicanos 6.875%04/08/2026 USD 31,950,000 34,833,488 1.14Petroleos Mexicanos 5.35%12/02/2028 USD 4,717,000 4,640,349 0.15Petroleos Mexicanos 6.375%23/01/2045 USD 2,025,000 1,745,651 0.06
71,847,744 2.34
NetherlandsBraskem Netherlands Finance BV,Reg. S 4.5% 31/01/2030 USD 8,850,000 9,303,916 0.30Greenko Dutch BV, Reg. S 3.85%29/03/2026 USD 8,465,000 8,697,788 0.29
18,001,704 0.59
PanamaAES Panama Generation HoldingsSRL, Reg. S 4.375% 31/05/2030 USD 9,610,000 10,068,397 0.33
10,068,397 0.33
South AfricaEskom Holdings SOC Ltd., Reg. S6.75% 06/08/2023 USD 6,400,000 6,709,664 0.22
6,709,664 0.22
SpainAI Candelaria Spain SLU, Reg. S5.75% 15/06/2033 USD 10,412,000 10,597,750 0.35
10,597,750 0.35
Trinidad and TobagoTrinidad Petroleum Holdings Ltd.,Reg. S 9.75% 15/06/2026 USD 12,012,000 13,416,143 0.44
13,416,143 0.44
Venezuela, Bolivarian Republic ofPetroleos de Venezuela SA 8.5%31/12/2021 USD 2,992,000 684,420 0.02Petroleos de Venezuela SA, Reg. S9% 17/11/2021§ USD 3,984,976 169,361 0.00Petroleos de Venezuela SA, Reg. S,FRN 6% 15/11/2026 USD 4,513,571 203,111 0.01
1,056,892 0.03
Virgin Islands, British1MDB Global Investments Ltd., Reg. S4.4% 09/03/2023 USD 12,600,000 12,698,036 0.41
12,698,036 0.41
Total Bonds 296,853,641 9.69
Total Transferable securities and money market instrumentsdealt in on another regulated market 296,853,641 9.69
Other transferable securities and money market instruments
Bonds
IndonesiaPolysindo Eka Perkasa 0%28/10/1998* IDR 47,500,000 0 0.00Polysindo Eka Perkasa 0%28/10/1998* IDR 475,000,000 0 0.00Polysindo Eka Perkasa 0%26/04/1999* IDR 47,500,000 0 0.00Polysindo Eka Perkasa 0%26/04/1999* IDR 475,000,000 0 0.00Polysindo Eka Perkasa 19.274%26/04/1999* IDR 5,000,000,000 0 0.00Polysindo Eka Perkasa 0%22/10/1999* IDR 47,236,110 0 0.00Polysindo Eka Perkasa 0%20/04/2000* IDR 47,763,890 0 0.00Polysindo Eka Perkasa 0%31/12/2000* IDR 475,000,000 0 0.00
0 0.00
Total Bonds 0 0.00
Total Other transferable securities and money marketinstruments 0 0.00
161
JPMorgan Funds - Emerging Markets Debt FundSchedule of Investments (continued)
As at 30 June 2021
Investments Currency
Quantity/Nominal
Value
MarketValue
USD
%of
NetAssets Investments Currency
Quantity/Nominal
Value
MarketValue
USD
%of
NetAssets
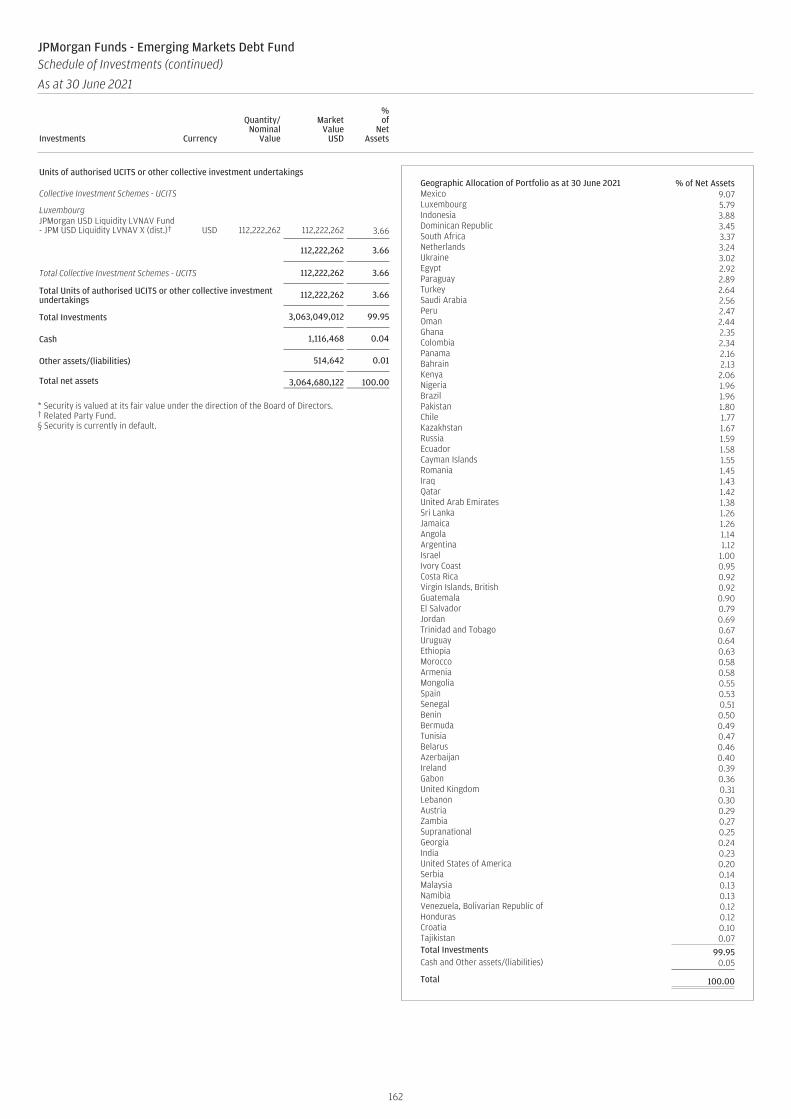
Units of authorised UCITS or other collective investment undertakings
Collective Investment Schemes - UCITS
LuxembourgJPMorgan USD Liquidity LVNAV Fund- JPM USD Liquidity LVNAV X (dist.)† USD 112,222,262 112,222,262 3.66
112,222,262 3.66
Total Collective Investment Schemes - UCITS 112,222,262 3.66
Total Units of authorised UCITS or other collective investmentundertakings 112,222,262 3.66
Total Investments 3,063,049,012 99.95
Cash 1,116,468 0.04
Other assets/(liabilities) 514,642 0.01
Total net assets 3,064,680,122 100.00
* Security is valued at its fair value under the direction of the Board of Directors.† Related Party Fund.§ Security is currently in default.
Geographic Allocation of Portfolio as at 30 June 2021 % of Net AssetsMexico 9.07Luxembourg 5.79Indonesia 3.88Dominican Republic 3.45South Africa 3.37Netherlands 3.24Ukraine 3.02Egypt 2.92Paraguay 2.89Turkey 2.64Saudi Arabia 2.56Peru 2.47Oman 2.44Ghana 2.35Colombia 2.34Panama 2.16Bahrain 2.13Kenya 2.06Nigeria 1.96Brazil 1.96Pakistan 1.80Chile 1.77Kazakhstan 1.67Russia 1.59Ecuador 1.58Cayman Islands 1.55Romania 1.45Iraq 1.43Qatar 1.42United Arab Emirates 1.38Sri Lanka 1.26Jamaica 1.26Angola 1.14Argentina 1.12Israel 1.00Ivory Coast 0.95Costa Rica 0.92Virgin Islands, British 0.92Guatemala 0.90El Salvador 0.79Jordan 0.69Trinidad and Tobago 0.67Uruguay 0.64Ethiopia 0.63Morocco 0.58Armenia 0.58Mongolia 0.55Spain 0.53Senegal 0.51Benin 0.50Bermuda 0.49Tunisia 0.47Belarus 0.46Azerbaijan 0.40Ireland 0.39Gabon 0.36United Kingdom 0.31Lebanon 0.30Austria 0.29Zambia 0.27Supranational 0.25Georgia 0.24India 0.23United States of America 0.20Serbia 0.14Malaysia 0.13Namibia 0.13Venezuela, Bolivarian Republic of 0.12Honduras 0.12Croatia 0.10Tajikistan 0.07Total Investments 99.95Cash and Other assets/(liabilities) 0.05
Total 100.00
162
JPMorgan Funds - Emerging Markets Debt FundSchedule of Investments (continued)
As at 30 June 2021
Investments Currency
Quantity/Nominal
Value
MarketValue
USD
%of
NetAssets Investments Currency
Quantity/Nominal
Value
MarketValue
USD
%of
NetAssets

JPMorgan Funds - Emerging Markets Debt FundSchedule of Investments (continued)
As at 30 June 2021
Forward Currency Exchange Contracts (continued)
CurrencyPurchased Amount Purchased Currency Sold Amount Sold
MaturityDate Counterparty
UnrealisedGain/(Loss)
USD
%of
NetAssets
AUD 76,794 USD 57,468 06/07/2021 BNP Paribas 153 -AUD 1,735 USD 1,300 06/07/2021 RBC 2 -CAD 10,656 USD 8,539 06/07/2021 Barclays 74 -CAD 160,000 USD 129,176 04/08/2021 Barclays 150 -CAD 3,298,970 USD 2,663,430 04/08/2021 BNP Paribas 3,097 -EUR 3,691,506 USD 4,378,776 06/07/2021 Barclays 4,960 -GBP 23,943 USD 33,104 02/07/2021 State Street 34 -GBP 329,657 USD 455,255 06/07/2021 Barclays 1,009 -NZD 4,412 USD 3,066 06/07/2021 Barclays 14 -USD 102,064 AUD 134,308 06/07/2021 Barclays 1,289 -USD 96,723 AUD 125,609 06/07/2021 BNP Paribas 2,475 -USD 9,442 AUD 12,256 06/07/2021 HSBC 246 -USD 89,075 AUD 115,034 06/07/2021 Merrill Lynch 2,762 -USD 168,748 AUD 221,972 06/07/2021 RBC 2,198 -USD 17,763,773 AUD 23,672,406 06/07/2021 Standard Chartered 1,787 -USD 80,042 AUD 103,299 06/07/2021 Toronto-Dominion Bank 2,535 -USD 53,635 AUD 71,040 04/08/2021 Citibank 324 -USD 11,553 AUD 15,219 04/08/2021 Standard Chartered 133 -USD 9,592 AUD 12,764 04/08/2021 Toronto-Dominion Bank 14 -USD 12,431 CAD 15,055 06/07/2021 RBC 262 -USD 14,244 CAD 17,346 06/07/2021 State Street 224 -USD 7,729 CAD 9,517 04/08/2021 HSBC 37 -USD 112,133 CHF 100,709 06/07/2021 Barclays 3,108 -USD 20,897,181 CHF 19,288,567 06/07/2021 BNP Paribas 15,774 -USD 60,715 CHF 55,732 04/08/2021 Toronto-Dominion Bank 333 -USD 2,228,541 EUR 1,868,231 01/07/2021 Toronto-Dominion Bank 10,166 -USD 26,313 EUR 21,556 06/07/2021 Barclays 715 -USD 295,710 EUR 242,093 06/07/2021 BNP Paribas 8,220 -USD 1,365,553,418 EUR 1,148,269,723 06/07/2021 Citibank 1,960,514 0.06USD 7,337,837 EUR 6,051,054 06/07/2021 HSBC 152,091 0.01USD 1,122 EUR 944 06/07/2021 Merrill Lynch 1 -USD 6,547,039 EUR 5,384,556 06/07/2021 RBC 152,773 0.01USD 5,008,393 EUR 4,195,055 06/07/2021 Standard Chartered 26,683 -USD 10,203,962 EUR 8,376,046 06/07/2021 State Street 257,241 0.01USD 85,502,715 EUR 70,556,458 27/07/2021 Citibank 1,678,560 0.05USD 3,972,148 EUR 3,330,562 04/08/2021 BNP Paribas 14,637 -USD 40,400 EUR 33,766 04/08/2021 RBC 278 -USD 1,905,630 EUR 1,601,245 04/08/2021 State Street 2,964 -USD 143,728,100 GBP 103,674,762 06/07/2021 Barclays 236,514 0.01USD 187,928 GBP 132,661 06/07/2021 Merrill Lynch 4,318 -USD 331,074 GBP 236,296 06/07/2021 RBC 4,028 -USD 571,263 GBP 403,596 06/07/2021 Standard Chartered 12,664 -USD 669,310 GBP 472,521 06/07/2021 State Street 15,315 -USD 415,013 GBP 297,155 04/08/2021 Barclays 3,704 -USD 31,998 GBP 23,001 04/08/2021 BNP Paribas 161 -USD 15,811 GBP 11,375 04/08/2021 Merrill Lynch 66 -USD 9,667 NZD 13,494 06/07/2021 Barclays 246 -USD 943,854 NZD 1,351,798 06/07/2021 HSBC 151 -USD 2,801 NZD 3,991 04/08/2021 Toronto-Dominion Bank 15 -
Total Unrealised Gain on Forward Currency Exchange Contracts 4,585,019 0.15
AUD 12,764 USD 9,591 02/07/2021 Toronto-Dominion Bank (14) -AUD 71,838 USD 55,489 06/07/2021 BNP Paribas (1,587) -AUD 52,675 USD 40,985 06/07/2021 Goldman Sachs (1,462) -AUD 98,048 USD 75,969 06/07/2021 HSBC (2,401) -AUD 23,780,211 USD 18,385,542 06/07/2021 State Street (542,666) (0.02)AUD 303,582 USD 234,582 06/07/2021 Toronto-Dominion Bank (6,797) -AUD 23,672,406 USD 17,766,188 04/08/2021 Standard Chartered (1,649) -CAD 28,705 USD 23,737 06/07/2021 Barclays (534) -CAD 3,221,615 USD 2,659,033 06/07/2021 BNP Paribas (55,004) -CAD 7,033 USD 5,829 06/07/2021 Merrill Lynch (145) -CAD 55,465 USD 45,814 06/07/2021 RBC (981) -CAD 11,892 USD 9,848 06/07/2021 State Street (236) -CAD 5,616 USD 4,644 06/07/2021 Toronto-Dominion Bank (105) -CHF 217,482 USD 240,597 06/07/2021 Barclays (5,156) -CHF 50,544 USD 55,943 06/07/2021 BNP Paribas (1,225) -CHF 41,063 USD 45,937 06/07/2021 Goldman Sachs (1,483) -CHF 72,640 USD 80,832 06/07/2021 HSBC (2,194) -CHF 18,861,738 USD 21,035,271 06/07/2021 Merrill Lynch (615,940) (0.02)CHF 145,808 USD 162,500 06/07/2021 Toronto-Dominion Bank (4,651) -CHF 19,204,706 USD 20,821,653 04/08/2021 BNP Paribas (14,592) -EUR 1,601,245 USD 1,904,354 02/07/2021 State Street (3,004) -EUR 2,462,582 USD 3,016,896 06/07/2021 BNP Paribas (92,531) -EUR 505,806,216 USD 617,179,984 06/07/2021 Citibank (16,525,144) (0.54)EUR 624,707,340 USD 762,292,274 06/07/2021 Goldman Sachs (20,440,009) (0.67)EUR 12,159,479 USD 14,779,040 06/07/2021 HSBC (339,419) (0.01)EUR 2,846,024 USD 3,476,689 06/07/2021 RBC (96,980) -EUR 4,385,229 USD 5,314,512 06/07/2021 Standard Chartered (106,966) -EUR 16,482,652 USD 20,124,689 06/07/2021 State Street (551,215) (0.02)EUR 4,362,950 USD 5,291,818 27/07/2021 State Street (108,442) (0.01)EUR 1,068 USD 1,272 04/08/2021 Barclays (3) -EUR 1,147,233,026 USD 1,365,082,826 04/08/2021 Citibank (1,893,082) (0.06)
163

JPMorgan Funds - Emerging Markets Debt FundSchedule of Investments (continued)
As at 30 June 2021
Forward Currency Exchange Contracts (continued)
CurrencyPurchased Amount Purchased Currency Sold Amount Sold
MaturityDate Counterparty
UnrealisedGain/(Loss)
USD
%of
NetAssets
EUR 1,046 USD 1,249 04/08/2021 Standard Chartered (6) -EUR 791,287 USD 945,733 04/08/2021 State Street (5,494) -EUR 1,868,231 USD 2,230,078 04/08/2021 Toronto-Dominion Bank (10,169) -GBP 23,001 USD 31,995 01/07/2021 BNP Paribas (161) -GBP 1,228,461 USD 1,733,238 06/07/2021 Barclays (32,980) -GBP 102,621,405 USD 145,576,708 06/07/2021 BNP Paribas (3,543,027) (0.12)GBP 323,004 USD 457,257 06/07/2021 HSBC (10,202) -GBP 3,197 USD 4,522 06/07/2021 Merrill Lynch (97) -GBP 407,230 USD 575,495 06/07/2021 RBC (11,866) -GBP 19,817 USD 28,080 06/07/2021 State Street (653) -GBP 102,834,118 USD 142,558,938 04/08/2021 Barclays (220,150) (0.01)GBP 2,261 USD 3,145 04/08/2021 RBC (16) -NZD 7,305 USD 5,298 06/07/2021 Barclays (198) -NZD 2,313 USD 1,667 06/07/2021 Citibank (53) -NZD 1,326,886 USD 962,917 06/07/2021 Merrill Lynch (36,604) -NZD 12,261 USD 8,785 06/07/2021 RBC (225) -NZD 1,703 USD 1,212 06/07/2021 Standard Chartered (23) -NZD 6,288 USD 4,555 06/07/2021 State Street (165) -NZD 8,068 USD 5,824 06/07/2021 Toronto-Dominion Bank (192) -NZD 1,351,798 USD 943,784 04/08/2021 HSBC (138) -USD 2,671,209 CAD 3,308,581 06/07/2021 BNP Paribas (3,115) -USD 17,876 GBP 12,936 06/07/2021 Barclays (28) -USD 33,107 GBP 23,943 04/08/2021 State Street (34) -USD 2,751 NZD 3,944 06/07/2021 RBC (2) -
Total Unrealised Loss on Forward Currency Exchange Contracts (45,291,215) (1.48)
Net Unrealised Loss on Forward Currency Exchange Contracts (40,706,196) (1.33)
JPMorgan Funds - Emerging Markets Debt FundSchedule of Investments (continued)
As at 30 June 2021
Financial Futures Contracts
Security DescriptionNumber ofContracts Currency
GlobalExposure
USD
UnrealisedGain/(Loss)
USD
%of
NetAssets
US 5 Year Note, 30/09/2021 (1,367) USD (168,712,363) 411,168 0.02
Total Unrealised Gain on Financial Futures Contracts 411,168 0.02
US 10 Year Note, 21/09/2021 (911) USD (120,671,914) (231,648) (0.01)
Total Unrealised Loss on Financial Futures Contracts (231,648) (0.01)
Net Unrealised Gain on Financial Futures Contracts 179,520 0.01
164
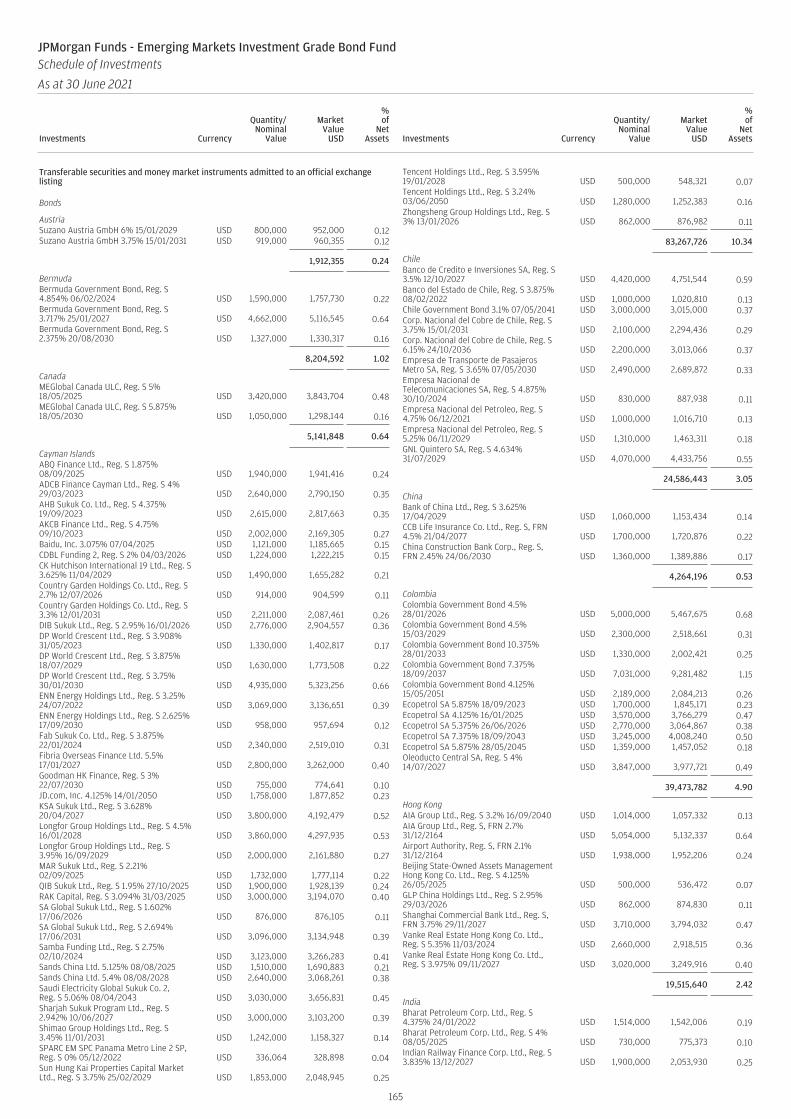
Transferable securities and money market instruments admitted to an official exchangelisting
Bonds
AustriaSuzano Austria GmbH 6% 15/01/2029 USD 800,000 952,000 0.12Suzano Austria GmbH 3.75% 15/01/2031 USD 919,000 960,355 0.12
1,912,355 0.24
BermudaBermuda Government Bond, Reg. S4.854% 06/02/2024 USD 1,590,000 1,757,730 0.22Bermuda Government Bond, Reg. S3.717% 25/01/2027 USD 4,662,000 5,116,545 0.64Bermuda Government Bond, Reg. S2.375% 20/08/2030 USD 1,327,000 1,330,317 0.16
8,204,592 1.02
CanadaMEGlobal Canada ULC, Reg. S 5%18/05/2025 USD 3,420,000 3,843,704 0.48MEGlobal Canada ULC, Reg. S 5.875%18/05/2030 USD 1,050,000 1,298,144 0.16
5,141,848 0.64
Cayman IslandsABQ Finance Ltd., Reg. S 1.875%08/09/2025 USD 1,940,000 1,941,416 0.24ADCB Finance Cayman Ltd., Reg. S 4%29/03/2023 USD 2,640,000 2,790,150 0.35AHB Sukuk Co. Ltd., Reg. S 4.375%19/09/2023 USD 2,615,000 2,817,663 0.35AKCB Finance Ltd., Reg. S 4.75%09/10/2023 USD 2,002,000 2,169,305 0.27Baidu, Inc. 3.075% 07/04/2025 USD 1,121,000 1,185,665 0.15CDBL Funding 2, Reg. S 2% 04/03/2026 USD 1,224,000 1,222,215 0.15CK Hutchison International 19 Ltd., Reg. S3.625% 11/04/2029 USD 1,490,000 1,655,282 0.21Country Garden Holdings Co. Ltd., Reg. S2.7% 12/07/2026 USD 914,000 904,599 0.11Country Garden Holdings Co. Ltd., Reg. S3.3% 12/01/2031 USD 2,211,000 2,087,461 0.26DIB Sukuk Ltd., Reg. S 2.95% 16/01/2026 USD 2,776,000 2,904,557 0.36DP World Crescent Ltd., Reg. S 3.908%31/05/2023 USD 1,330,000 1,402,817 0.17DP World Crescent Ltd., Reg. S 3.875%18/07/2029 USD 1,630,000 1,773,508 0.22DP World Crescent Ltd., Reg. S 3.75%30/01/2030 USD 4,935,000 5,323,256 0.66ENN Energy Holdings Ltd., Reg. S 3.25%24/07/2022 USD 3,069,000 3,136,651 0.39ENN Energy Holdings Ltd., Reg. S 2.625%17/09/2030 USD 958,000 957,694 0.12Fab Sukuk Co. Ltd., Reg. S 3.875%22/01/2024 USD 2,340,000 2,519,010 0.31Fibria Overseas Finance Ltd. 5.5%17/01/2027 USD 2,800,000 3,262,000 0.40Goodman HK Finance, Reg. S 3%22/07/2030 USD 755,000 774,641 0.10JD.com, Inc. 4.125% 14/01/2050 USD 1,758,000 1,877,852 0.23KSA Sukuk Ltd., Reg. S 3.628%20/04/2027 USD 3,800,000 4,192,479 0.52Longfor Group Holdings Ltd., Reg. S 4.5%16/01/2028 USD 3,860,000 4,297,935 0.53Longfor Group Holdings Ltd., Reg. S3.95% 16/09/2029 USD 2,000,000 2,161,880 0.27MAR Sukuk Ltd., Reg. S 2.21%02/09/2025 USD 1,732,000 1,777,114 0.22QIB Sukuk Ltd., Reg. S 1.95% 27/10/2025 USD 1,900,000 1,928,139 0.24RAK Capital, Reg. S 3.094% 31/03/2025 USD 3,000,000 3,194,070 0.40SA Global Sukuk Ltd., Reg. S 1.602%17/06/2026 USD 876,000 876,105 0.11SA Global Sukuk Ltd., Reg. S 2.694%17/06/2031 USD 3,096,000 3,134,948 0.39Samba Funding Ltd., Reg. S 2.75%02/10/2024 USD 3,123,000 3,266,283 0.41Sands China Ltd. 5.125% 08/08/2025 USD 1,510,000 1,690,883 0.21Sands China Ltd. 5.4% 08/08/2028 USD 2,640,000 3,068,261 0.38Saudi Electricity Global Sukuk Co. 2,Reg. S 5.06% 08/04/2043 USD 3,030,000 3,656,831 0.45Sharjah Sukuk Program Ltd., Reg. S2.942% 10/06/2027 USD 3,000,000 3,103,200 0.39Shimao Group Holdings Ltd., Reg. S3.45% 11/01/2031 USD 1,242,000 1,158,327 0.14SPARC EM SPC Panama Metro Line 2 SP,Reg. S 0% 05/12/2022 USD 336,064 328,898 0.04Sun Hung Kai Properties Capital MarketLtd., Reg. S 3.75% 25/02/2029 USD 1,853,000 2,048,945 0.25
Tencent Holdings Ltd., Reg. S 3.595%19/01/2028 USD 500,000 548,321 0.07Tencent Holdings Ltd., Reg. S 3.24%03/06/2050 USD 1,280,000 1,252,383 0.16Zhongsheng Group Holdings Ltd., Reg. S3% 13/01/2026 USD 862,000 876,982 0.11
83,267,726 10.34
ChileBanco de Credito e Inversiones SA, Reg. S3.5% 12/10/2027 USD 4,420,000 4,751,544 0.59Banco del Estado de Chile, Reg. S 3.875%08/02/2022 USD 1,000,000 1,020,810 0.13Chile Government Bond 3.1% 07/05/2041 USD 3,000,000 3,015,000 0.37Corp. Nacional del Cobre de Chile, Reg. S3.75% 15/01/2031 USD 2,100,000 2,294,436 0.29Corp. Nacional del Cobre de Chile, Reg. S6.15% 24/10/2036 USD 2,200,000 3,013,066 0.37Empresa de Transporte de PasajerosMetro SA, Reg. S 3.65% 07/05/2030 USD 2,490,000 2,689,872 0.33Empresa Nacional deTelecomunicaciones SA, Reg. S 4.875%30/10/2024 USD 830,000 887,938 0.11Empresa Nacional del Petroleo, Reg. S4.75% 06/12/2021 USD 1,000,000 1,016,710 0.13Empresa Nacional del Petroleo, Reg. S5.25% 06/11/2029 USD 1,310,000 1,463,311 0.18GNL Quintero SA, Reg. S 4.634%31/07/2029 USD 4,070,000 4,433,756 0.55
24,586,443 3.05
ChinaBank of China Ltd., Reg. S 3.625%17/04/2029 USD 1,060,000 1,153,434 0.14CCB Life Insurance Co. Ltd., Reg. S, FRN4.5% 21/04/2077 USD 1,700,000 1,720,876 0.22China Construction Bank Corp., Reg. S,FRN 2.45% 24/06/2030 USD 1,360,000 1,389,886 0.17
4,264,196 0.53
ColombiaColombia Government Bond 4.5%28/01/2026 USD 5,000,000 5,467,675 0.68Colombia Government Bond 4.5%15/03/2029 USD 2,300,000 2,518,661 0.31Colombia Government Bond 10.375%28/01/2033 USD 1,330,000 2,002,421 0.25Colombia Government Bond 7.375%18/09/2037 USD 7,031,000 9,281,482 1.15Colombia Government Bond 4.125%15/05/2051 USD 2,189,000 2,084,213 0.26Ecopetrol SA 5.875% 18/09/2023 USD 1,700,000 1,845,171 0.23Ecopetrol SA 4.125% 16/01/2025 USD 3,570,000 3,766,279 0.47Ecopetrol SA 5.375% 26/06/2026 USD 2,770,000 3,064,867 0.38Ecopetrol SA 7.375% 18/09/2043 USD 3,245,000 4,008,240 0.50Ecopetrol SA 5.875% 28/05/2045 USD 1,359,000 1,457,052 0.18Oleoducto Central SA, Reg. S 4%14/07/2027 USD 3,847,000 3,977,721 0.49
39,473,782 4.90
Hong KongAIA Group Ltd., Reg. S 3.2% 16/09/2040 USD 1,014,000 1,057,332 0.13AIA Group Ltd., Reg. S, FRN 2.7%31/12/2164 USD 5,054,000 5,132,337 0.64Airport Authority, Reg. S, FRN 2.1%31/12/2164 USD 1,938,000 1,952,206 0.24Beijing State-Owned Assets ManagementHong Kong Co. Ltd., Reg. S 4.125%26/05/2025 USD 500,000 536,472 0.07GLP China Holdings Ltd., Reg. S 2.95%29/03/2026 USD 862,000 874,830 0.11Shanghai Commercial Bank Ltd., Reg. S,FRN 3.75% 29/11/2027 USD 3,710,000 3,794,032 0.47Vanke Real Estate Hong Kong Co. Ltd.,Reg. S 5.35% 11/03/2024 USD 2,660,000 2,918,515 0.36Vanke Real Estate Hong Kong Co. Ltd.,Reg. S 3.975% 09/11/2027 USD 3,020,000 3,249,916 0.40
19,515,640 2.42
IndiaBharat Petroleum Corp. Ltd., Reg. S4.375% 24/01/2022 USD 1,514,000 1,542,006 0.19Bharat Petroleum Corp. Ltd., Reg. S 4%08/05/2025 USD 730,000 775,373 0.10Indian Railway Finance Corp. Ltd., Reg. S3.835% 13/12/2027 USD 1,900,000 2,053,930 0.25
165
JPMorgan Funds - Emerging Markets Investment Grade Bond FundSchedule of Investments
As at 30 June 2021
Investments Currency
Quantity/Nominal
Value
MarketValue
USD
%of
NetAssets Investments Currency
Quantity/Nominal
Value
MarketValue
USD
%of
NetAssets
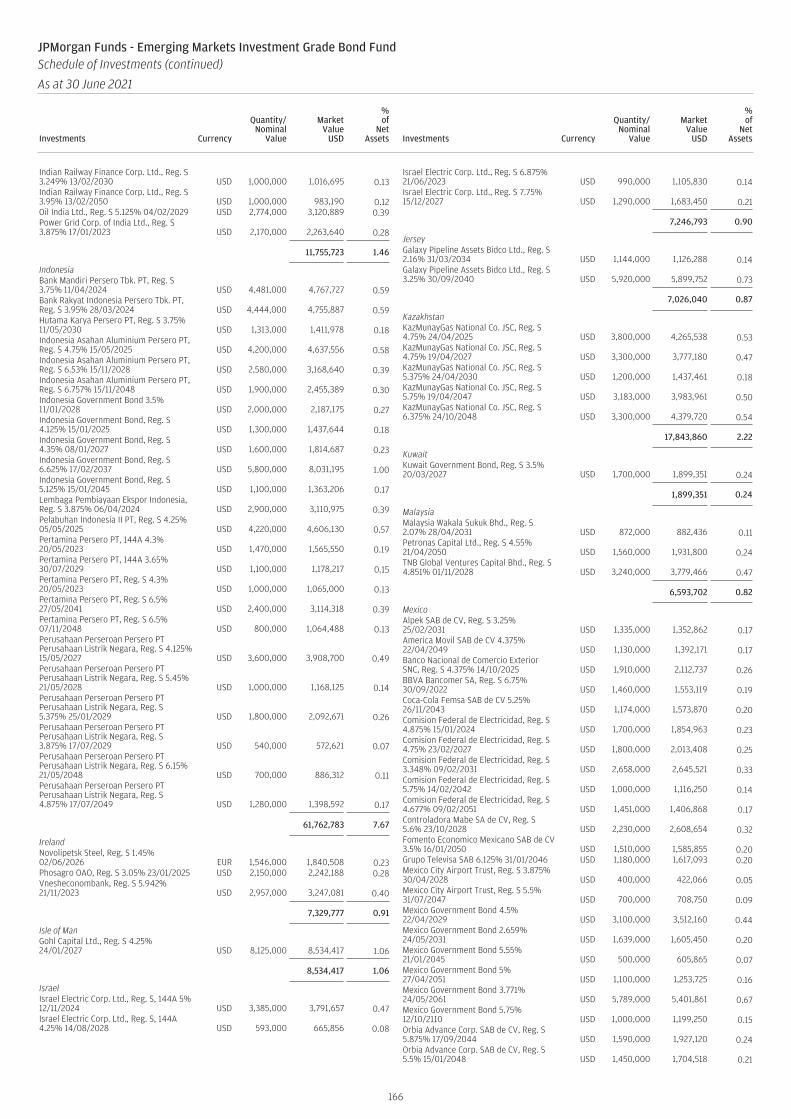
Indian Railway Finance Corp. Ltd., Reg. S3.249% 13/02/2030 USD 1,000,000 1,016,695 0.13Indian Railway Finance Corp. Ltd., Reg. S3.95% 13/02/2050 USD 1,000,000 983,190 0.12Oil India Ltd., Reg. S 5.125% 04/02/2029 USD 2,774,000 3,120,889 0.39Power Grid Corp. of India Ltd., Reg. S3.875% 17/01/2023 USD 2,170,000 2,263,640 0.28
11,755,723 1.46
IndonesiaBank Mandiri Persero Tbk. PT, Reg. S3.75% 11/04/2024 USD 4,481,000 4,767,727 0.59Bank Rakyat Indonesia Persero Tbk. PT,Reg. S 3.95% 28/03/2024 USD 4,444,000 4,755,887 0.59Hutama Karya Persero PT, Reg. S 3.75%11/05/2030 USD 1,313,000 1,411,978 0.18Indonesia Asahan Aluminium Persero PT,Reg. S 4.75% 15/05/2025 USD 4,200,000 4,637,556 0.58Indonesia Asahan Aluminium Persero PT,Reg. S 6.53% 15/11/2028 USD 2,580,000 3,168,640 0.39Indonesia Asahan Aluminium Persero PT,Reg. S 6.757% 15/11/2048 USD 1,900,000 2,455,389 0.30Indonesia Government Bond 3.5%11/01/2028 USD 2,000,000 2,187,175 0.27Indonesia Government Bond, Reg. S4.125% 15/01/2025 USD 1,300,000 1,437,644 0.18Indonesia Government Bond, Reg. S4.35% 08/01/2027 USD 1,600,000 1,814,687 0.23Indonesia Government Bond, Reg. S6.625% 17/02/2037 USD 5,800,000 8,031,195 1.00Indonesia Government Bond, Reg. S5.125% 15/01/2045 USD 1,100,000 1,363,206 0.17Lembaga Pembiayaan Ekspor Indonesia,Reg. S 3.875% 06/04/2024 USD 2,900,000 3,110,975 0.39Pelabuhan Indonesia II PT, Reg. S 4.25%05/05/2025 USD 4,220,000 4,606,130 0.57Pertamina Persero PT, 144A 4.3%20/05/2023 USD 1,470,000 1,565,550 0.19Pertamina Persero PT, 144A 3.65%30/07/2029 USD 1,100,000 1,178,217 0.15Pertamina Persero PT, Reg. S 4.3%20/05/2023 USD 1,000,000 1,065,000 0.13Pertamina Persero PT, Reg. S 6.5%27/05/2041 USD 2,400,000 3,114,318 0.39Pertamina Persero PT, Reg. S 6.5%07/11/2048 USD 800,000 1,064,488 0.13Perusahaan Perseroan Persero PTPerusahaan Listrik Negara, Reg. S 4.125%15/05/2027 USD 3,600,000 3,908,700 0.49Perusahaan Perseroan Persero PTPerusahaan Listrik Negara, Reg. S 5.45%21/05/2028 USD 1,000,000 1,168,125 0.14Perusahaan Perseroan Persero PTPerusahaan Listrik Negara, Reg. S5.375% 25/01/2029 USD 1,800,000 2,092,671 0.26Perusahaan Perseroan Persero PTPerusahaan Listrik Negara, Reg. S3.875% 17/07/2029 USD 540,000 572,621 0.07Perusahaan Perseroan Persero PTPerusahaan Listrik Negara, Reg. S 6.15%21/05/2048 USD 700,000 886,312 0.11Perusahaan Perseroan Persero PTPerusahaan Listrik Negara, Reg. S4.875% 17/07/2049 USD 1,280,000 1,398,592 0.17
61,762,783 7.67
IrelandNovolipetsk Steel, Reg. S 1.45%02/06/2026 EUR 1,546,000 1,840,508 0.23Phosagro OAO, Reg. S 3.05% 23/01/2025 USD 2,150,000 2,242,188 0.28Vnesheconombank, Reg. S 5.942%21/11/2023 USD 2,957,000 3,247,081 0.40
7,329,777 0.91
Isle of ManGohl Capital Ltd., Reg. S 4.25%24/01/2027 USD 8,125,000 8,534,417 1.06
8,534,417 1.06
IsraelIsrael Electric Corp. Ltd., Reg. S, 144A 5%12/11/2024 USD 3,385,000 3,791,657 0.47Israel Electric Corp. Ltd., Reg. S, 144A4.25% 14/08/2028 USD 593,000 665,856 0.08
Israel Electric Corp. Ltd., Reg. S 6.875%21/06/2023 USD 990,000 1,105,830 0.14Israel Electric Corp. Ltd., Reg. S 7.75%15/12/2027 USD 1,290,000 1,683,450 0.21
7,246,793 0.90
JerseyGalaxy Pipeline Assets Bidco Ltd., Reg. S2.16% 31/03/2034 USD 1,144,000 1,126,288 0.14Galaxy Pipeline Assets Bidco Ltd., Reg. S3.25% 30/09/2040 USD 5,920,000 5,899,752 0.73
7,026,040 0.87
KazakhstanKazMunayGas National Co. JSC, Reg. S4.75% 24/04/2025 USD 3,800,000 4,265,538 0.53KazMunayGas National Co. JSC, Reg. S4.75% 19/04/2027 USD 3,300,000 3,777,180 0.47KazMunayGas National Co. JSC, Reg. S5.375% 24/04/2030 USD 1,200,000 1,437,461 0.18KazMunayGas National Co. JSC, Reg. S5.75% 19/04/2047 USD 3,183,000 3,983,961 0.50KazMunayGas National Co. JSC, Reg. S6.375% 24/10/2048 USD 3,300,000 4,379,720 0.54
17,843,860 2.22
KuwaitKuwait Government Bond, Reg. S 3.5%20/03/2027 USD 1,700,000 1,899,351 0.24
1,899,351 0.24
MalaysiaMalaysia Wakala Sukuk Bhd., Reg. S2.07% 28/04/2031 USD 872,000 882,436 0.11Petronas Capital Ltd., Reg. S 4.55%21/04/2050 USD 1,560,000 1,931,800 0.24TNB Global Ventures Capital Bhd., Reg. S4.851% 01/11/2028 USD 3,240,000 3,779,466 0.47
6,593,702 0.82
MexicoAlpek SAB de CV, Reg. S 3.25%25/02/2031 USD 1,335,000 1,352,862 0.17America Movil SAB de CV 4.375%22/04/2049 USD 1,130,000 1,392,171 0.17Banco Nacional de Comercio ExteriorSNC, Reg. S 4.375% 14/10/2025 USD 1,910,000 2,112,737 0.26BBVA Bancomer SA, Reg. S 6.75%30/09/2022 USD 1,460,000 1,553,119 0.19Coca-Cola Femsa SAB de CV 5.25%26/11/2043 USD 1,174,000 1,573,870 0.20Comision Federal de Electricidad, Reg. S4.875% 15/01/2024 USD 1,700,000 1,854,963 0.23Comision Federal de Electricidad, Reg. S4.75% 23/02/2027 USD 1,800,000 2,013,408 0.25Comision Federal de Electricidad, Reg. S3.348% 09/02/2031 USD 2,658,000 2,645,521 0.33Comision Federal de Electricidad, Reg. S5.75% 14/02/2042 USD 1,000,000 1,116,250 0.14Comision Federal de Electricidad, Reg. S4.677% 09/02/2051 USD 1,451,000 1,406,868 0.17Controladora Mabe SA de CV, Reg. S5.6% 23/10/2028 USD 2,230,000 2,608,654 0.32Fomento Economico Mexicano SAB de CV3.5% 16/01/2050 USD 1,510,000 1,585,855 0.20Grupo Televisa SAB 6.125% 31/01/2046 USD 1,180,000 1,617,093 0.20Mexico City Airport Trust, Reg. S 3.875%30/04/2028 USD 400,000 422,066 0.05Mexico City Airport Trust, Reg. S 5.5%31/07/2047 USD 700,000 708,750 0.09Mexico Government Bond 4.5%22/04/2029 USD 3,100,000 3,512,160 0.44Mexico Government Bond 2.659%24/05/2031 USD 1,639,000 1,605,450 0.20Mexico Government Bond 5.55%21/01/2045 USD 500,000 605,865 0.07Mexico Government Bond 5%27/04/2051 USD 1,100,000 1,253,725 0.16Mexico Government Bond 3.771%24/05/2061 USD 5,789,000 5,401,861 0.67Mexico Government Bond 5.75%12/10/2110 USD 1,000,000 1,199,250 0.15Orbia Advance Corp. SAB de CV, Reg. S5.875% 17/09/2044 USD 1,590,000 1,927,120 0.24Orbia Advance Corp. SAB de CV, Reg. S5.5% 15/01/2048 USD 1,450,000 1,704,518 0.21
166
JPMorgan Funds - Emerging Markets Investment Grade Bond FundSchedule of Investments (continued)
As at 30 June 2021
Investments Currency
Quantity/Nominal
Value
MarketValue
USD
%of
NetAssets Investments Currency
Quantity/Nominal
Value
MarketValue
USD
%of
NetAssets
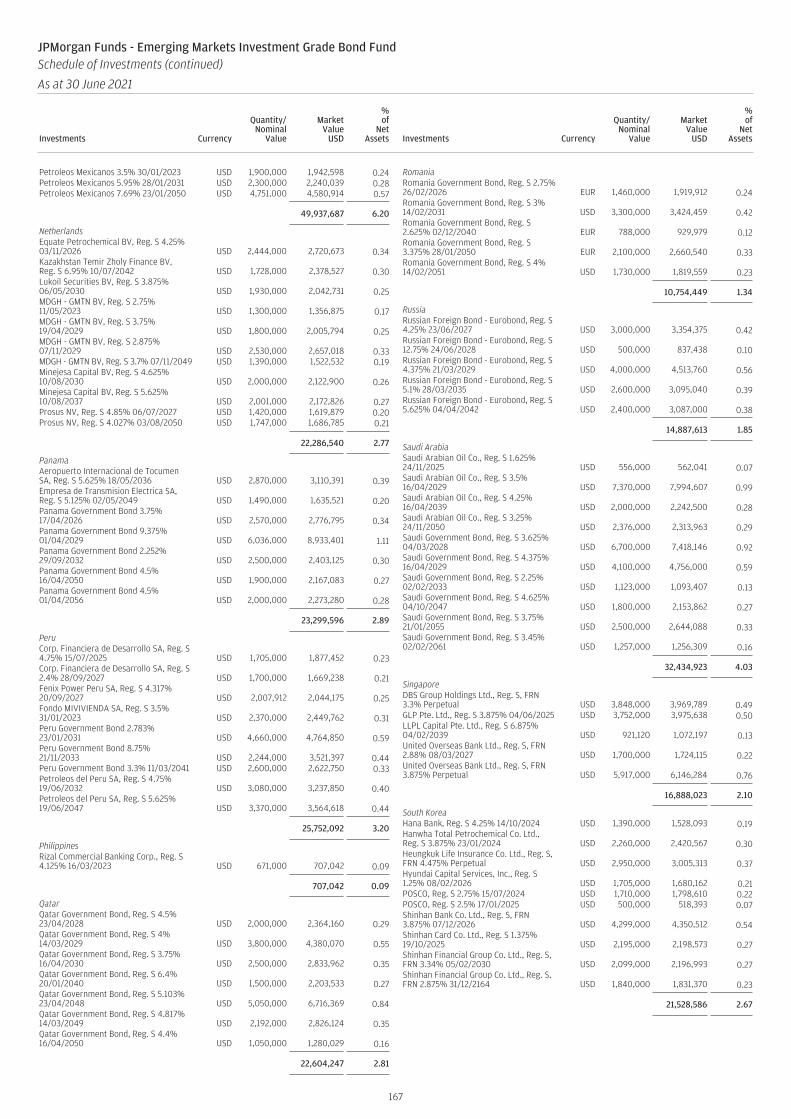
Petroleos Mexicanos 3.5% 30/01/2023 USD 1,900,000 1,942,598 0.24Petroleos Mexicanos 5.95% 28/01/2031 USD 2,300,000 2,240,039 0.28Petroleos Mexicanos 7.69% 23/01/2050 USD 4,751,000 4,580,914 0.57
49,937,687 6.20
NetherlandsEquate Petrochemical BV, Reg. S 4.25%03/11/2026 USD 2,444,000 2,720,673 0.34Kazakhstan Temir Zholy Finance BV,Reg. S 6.95% 10/07/2042 USD 1,728,000 2,378,527 0.30Lukoil Securities BV, Reg. S 3.875%06/05/2030 USD 1,930,000 2,042,731 0.25MDGH - GMTN BV, Reg. S 2.75%11/05/2023 USD 1,300,000 1,356,875 0.17MDGH - GMTN BV, Reg. S 3.75%19/04/2029 USD 1,800,000 2,005,794 0.25MDGH - GMTN BV, Reg. S 2.875%07/11/2029 USD 2,530,000 2,657,018 0.33MDGH - GMTN BV, Reg. S 3.7% 07/11/2049 USD 1,390,000 1,522,532 0.19Minejesa Capital BV, Reg. S 4.625%10/08/2030 USD 2,000,000 2,122,900 0.26Minejesa Capital BV, Reg. S 5.625%10/08/2037 USD 2,001,000 2,172,826 0.27Prosus NV, Reg. S 4.85% 06/07/2027 USD 1,420,000 1,619,879 0.20Prosus NV, Reg. S 4.027% 03/08/2050 USD 1,747,000 1,686,785 0.21
22,286,540 2.77
PanamaAeropuerto Internacional de TocumenSA, Reg. S 5.625% 18/05/2036 USD 2,870,000 3,110,391 0.39Empresa de Transmision Electrica SA,Reg. S 5.125% 02/05/2049 USD 1,490,000 1,635,521 0.20Panama Government Bond 3.75%17/04/2026 USD 2,570,000 2,776,795 0.34Panama Government Bond 9.375%01/04/2029 USD 6,036,000 8,933,401 1.11Panama Government Bond 2.252%29/09/2032 USD 2,500,000 2,403,125 0.30Panama Government Bond 4.5%16/04/2050 USD 1,900,000 2,167,083 0.27Panama Government Bond 4.5%01/04/2056 USD 2,000,000 2,273,280 0.28
23,299,596 2.89
PeruCorp. Financiera de Desarrollo SA, Reg. S4.75% 15/07/2025 USD 1,705,000 1,877,452 0.23Corp. Financiera de Desarrollo SA, Reg. S2.4% 28/09/2027 USD 1,700,000 1,669,238 0.21Fenix Power Peru SA, Reg. S 4.317%20/09/2027 USD 2,007,912 2,044,175 0.25Fondo MIVIVIENDA SA, Reg. S 3.5%31/01/2023 USD 2,370,000 2,449,762 0.31Peru Government Bond 2.783%23/01/2031 USD 4,660,000 4,764,850 0.59Peru Government Bond 8.75%21/11/2033 USD 2,244,000 3,521,397 0.44Peru Government Bond 3.3% 11/03/2041 USD 2,600,000 2,622,750 0.33Petroleos del Peru SA, Reg. S 4.75%19/06/2032 USD 3,080,000 3,237,850 0.40Petroleos del Peru SA, Reg. S 5.625%19/06/2047 USD 3,370,000 3,564,618 0.44
25,752,092 3.20
PhilippinesRizal Commercial Banking Corp., Reg. S4.125% 16/03/2023 USD 671,000 707,042 0.09
707,042 0.09
QatarQatar Government Bond, Reg. S 4.5%23/04/2028 USD 2,000,000 2,364,160 0.29Qatar Government Bond, Reg. S 4%14/03/2029 USD 3,800,000 4,380,070 0.55Qatar Government Bond, Reg. S 3.75%16/04/2030 USD 2,500,000 2,833,962 0.35Qatar Government Bond, Reg. S 6.4%20/01/2040 USD 1,500,000 2,203,533 0.27Qatar Government Bond, Reg. S 5.103%23/04/2048 USD 5,050,000 6,716,369 0.84Qatar Government Bond, Reg. S 4.817%14/03/2049 USD 2,192,000 2,826,124 0.35Qatar Government Bond, Reg. S 4.4%16/04/2050 USD 1,050,000 1,280,029 0.16
22,604,247 2.81
RomaniaRomania Government Bond, Reg. S 2.75%26/02/2026 EUR 1,460,000 1,919,912 0.24Romania Government Bond, Reg. S 3%14/02/2031 USD 3,300,000 3,424,459 0.42Romania Government Bond, Reg. S2.625% 02/12/2040 EUR 788,000 929,979 0.12Romania Government Bond, Reg. S3.375% 28/01/2050 EUR 2,100,000 2,660,540 0.33Romania Government Bond, Reg. S 4%14/02/2051 USD 1,730,000 1,819,559 0.23
10,754,449 1.34
RussiaRussian Foreign Bond - Eurobond, Reg. S4.25% 23/06/2027 USD 3,000,000 3,354,375 0.42Russian Foreign Bond - Eurobond, Reg. S12.75% 24/06/2028 USD 500,000 837,438 0.10Russian Foreign Bond - Eurobond, Reg. S4.375% 21/03/2029 USD 4,000,000 4,513,760 0.56Russian Foreign Bond - Eurobond, Reg. S5.1% 28/03/2035 USD 2,600,000 3,095,040 0.39Russian Foreign Bond - Eurobond, Reg. S5.625% 04/04/2042 USD 2,400,000 3,087,000 0.38
14,887,613 1.85
Saudi ArabiaSaudi Arabian Oil Co., Reg. S 1.625%24/11/2025 USD 556,000 562,041 0.07Saudi Arabian Oil Co., Reg. S 3.5%16/04/2029 USD 7,370,000 7,994,607 0.99Saudi Arabian Oil Co., Reg. S 4.25%16/04/2039 USD 2,000,000 2,242,500 0.28Saudi Arabian Oil Co., Reg. S 3.25%24/11/2050 USD 2,376,000 2,313,963 0.29Saudi Government Bond, Reg. S 3.625%04/03/2028 USD 6,700,000 7,418,146 0.92Saudi Government Bond, Reg. S 4.375%16/04/2029 USD 4,100,000 4,756,000 0.59Saudi Government Bond, Reg. S 2.25%02/02/2033 USD 1,123,000 1,093,407 0.13Saudi Government Bond, Reg. S 4.625%04/10/2047 USD 1,800,000 2,153,862 0.27Saudi Government Bond, Reg. S 3.75%21/01/2055 USD 2,500,000 2,644,088 0.33Saudi Government Bond, Reg. S 3.45%02/02/2061 USD 1,257,000 1,256,309 0.16
32,434,923 4.03
SingaporeDBS Group Holdings Ltd., Reg. S, FRN3.3% Perpetual USD 3,848,000 3,969,789 0.49GLP Pte. Ltd., Reg. S 3.875% 04/06/2025 USD 3,752,000 3,975,638 0.50LLPL Capital Pte. Ltd., Reg. S 6.875%04/02/2039 USD 921,120 1,072,197 0.13United Overseas Bank Ltd., Reg. S, FRN2.88% 08/03/2027 USD 1,700,000 1,724,115 0.22United Overseas Bank Ltd., Reg. S, FRN3.875% Perpetual USD 5,917,000 6,146,284 0.76
16,888,023 2.10
South KoreaHana Bank, Reg. S 4.25% 14/10/2024 USD 1,390,000 1,528,093 0.19Hanwha Total Petrochemical Co. Ltd.,Reg. S 3.875% 23/01/2024 USD 2,260,000 2,420,567 0.30Heungkuk Life Insurance Co. Ltd., Reg. S,FRN 4.475% Perpetual USD 2,950,000 3,005,313 0.37Hyundai Capital Services, Inc., Reg. S1.25% 08/02/2026 USD 1,705,000 1,680,162 0.21POSCO, Reg. S 2.75% 15/07/2024 USD 1,710,000 1,798,610 0.22POSCO, Reg. S 2.5% 17/01/2025 USD 500,000 518,393 0.07Shinhan Bank Co. Ltd., Reg. S, FRN3.875% 07/12/2026 USD 4,299,000 4,350,512 0.54Shinhan Card Co. Ltd., Reg. S 1.375%19/10/2025 USD 2,195,000 2,198,573 0.27Shinhan Financial Group Co. Ltd., Reg. S,FRN 3.34% 05/02/2030 USD 2,099,000 2,196,993 0.27Shinhan Financial Group Co. Ltd., Reg. S,FRN 2.875% 31/12/2164 USD 1,840,000 1,831,370 0.23
21,528,586 2.67
167
JPMorgan Funds - Emerging Markets Investment Grade Bond FundSchedule of Investments (continued)
As at 30 June 2021
Investments Currency
Quantity/Nominal
Value
MarketValue
USD
%of
NetAssets Investments Currency
Quantity/Nominal
Value
MarketValue
USD
%of
NetAssets
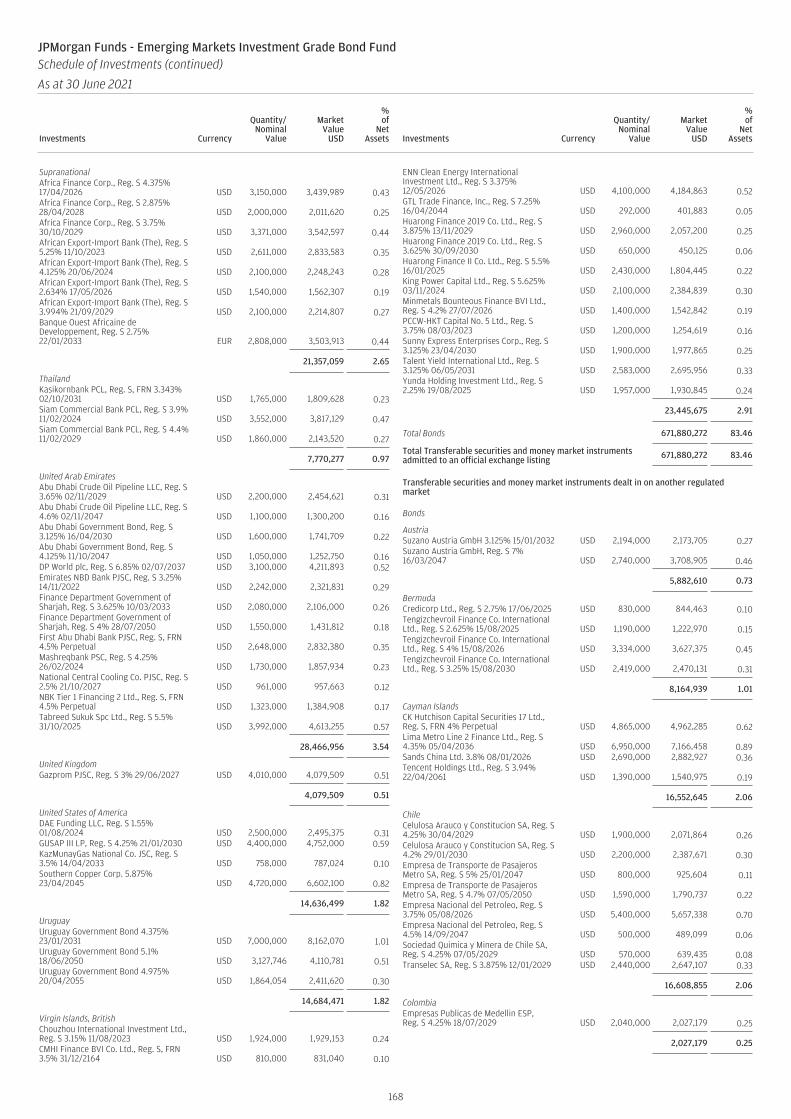
SupranationalAfrica Finance Corp., Reg. S 4.375%17/04/2026 USD 3,150,000 3,439,989 0.43Africa Finance Corp., Reg. S 2.875%28/04/2028 USD 2,000,000 2,011,620 0.25Africa Finance Corp., Reg. S 3.75%30/10/2029 USD 3,371,000 3,542,597 0.44African Export-Import Bank (The), Reg. S5.25% 11/10/2023 USD 2,611,000 2,833,583 0.35African Export-Import Bank (The), Reg. S4.125% 20/06/2024 USD 2,100,000 2,248,243 0.28African Export-Import Bank (The), Reg. S2.634% 17/05/2026 USD 1,540,000 1,562,307 0.19African Export-Import Bank (The), Reg. S3.994% 21/09/2029 USD 2,100,000 2,214,807 0.27Banque Ouest Africaine deDeveloppement, Reg. S 2.75%22/01/2033 EUR 2,808,000 3,503,913 0.44
21,357,059 2.65
ThailandKasikornbank PCL, Reg. S, FRN 3.343%02/10/2031 USD 1,765,000 1,809,628 0.23Siam Commercial Bank PCL, Reg. S 3.9%11/02/2024 USD 3,552,000 3,817,129 0.47Siam Commercial Bank PCL, Reg. S 4.4%11/02/2029 USD 1,860,000 2,143,520 0.27
7,770,277 0.97
United Arab EmiratesAbu Dhabi Crude Oil Pipeline LLC, Reg. S3.65% 02/11/2029 USD 2,200,000 2,454,621 0.31Abu Dhabi Crude Oil Pipeline LLC, Reg. S4.6% 02/11/2047 USD 1,100,000 1,300,200 0.16Abu Dhabi Government Bond, Reg. S3.125% 16/04/2030 USD 1,600,000 1,741,709 0.22Abu Dhabi Government Bond, Reg. S4.125% 11/10/2047 USD 1,050,000 1,252,750 0.16DP World plc, Reg. S 6.85% 02/07/2037 USD 3,100,000 4,211,893 0.52Emirates NBD Bank PJSC, Reg. S 3.25%14/11/2022 USD 2,242,000 2,321,831 0.29Finance Department Government ofSharjah, Reg. S 3.625% 10/03/2033 USD 2,080,000 2,106,000 0.26Finance Department Government ofSharjah, Reg. S 4% 28/07/2050 USD 1,550,000 1,431,812 0.18First Abu Dhabi Bank PJSC, Reg. S, FRN4.5% Perpetual USD 2,648,000 2,832,380 0.35Mashreqbank PSC, Reg. S 4.25%26/02/2024 USD 1,730,000 1,857,934 0.23National Central Cooling Co. PJSC, Reg. S2.5% 21/10/2027 USD 961,000 957,663 0.12NBK Tier 1 Financing 2 Ltd., Reg. S, FRN4.5% Perpetual USD 1,323,000 1,384,908 0.17Tabreed Sukuk Spc Ltd., Reg. S 5.5%31/10/2025 USD 3,992,000 4,613,255 0.57
28,466,956 3.54
United KingdomGazprom PJSC, Reg. S 3% 29/06/2027 USD 4,010,000 4,079,509 0.51
4,079,509 0.51
United States of AmericaDAE Funding LLC, Reg. S 1.55%01/08/2024 USD 2,500,000 2,495,375 0.31GUSAP III LP, Reg. S 4.25% 21/01/2030 USD 4,400,000 4,752,000 0.59KazMunayGas National Co. JSC, Reg. S3.5% 14/04/2033 USD 758,000 787,024 0.10Southern Copper Corp. 5.875%23/04/2045 USD 4,720,000 6,602,100 0.82
14,636,499 1.82
UruguayUruguay Government Bond 4.375%23/01/2031 USD 7,000,000 8,162,070 1.01Uruguay Government Bond 5.1%18/06/2050 USD 3,127,746 4,110,781 0.51Uruguay Government Bond 4.975%20/04/2055 USD 1,864,054 2,411,620 0.30
14,684,471 1.82
Virgin Islands, BritishChouzhou International Investment Ltd.,Reg. S 3.15% 11/08/2023 USD 1,924,000 1,929,153 0.24CMHI Finance BVI Co. Ltd., Reg. S, FRN3.5% 31/12/2164 USD 810,000 831,040 0.10
ENN Clean Energy InternationalInvestment Ltd., Reg. S 3.375%12/05/2026 USD 4,100,000 4,184,863 0.52GTL Trade Finance, Inc., Reg. S 7.25%16/04/2044 USD 292,000 401,883 0.05Huarong Finance 2019 Co. Ltd., Reg. S3.875% 13/11/2029 USD 2,960,000 2,057,200 0.25Huarong Finance 2019 Co. Ltd., Reg. S3.625% 30/09/2030 USD 650,000 450,125 0.06Huarong Finance II Co. Ltd., Reg. S 5.5%16/01/2025 USD 2,430,000 1,804,445 0.22King Power Capital Ltd., Reg. S 5.625%03/11/2024 USD 2,100,000 2,384,839 0.30Minmetals Bounteous Finance BVI Ltd.,Reg. S 4.2% 27/07/2026 USD 1,400,000 1,542,842 0.19PCCW-HKT Capital No. 5 Ltd., Reg. S3.75% 08/03/2023 USD 1,200,000 1,254,619 0.16Sunny Express Enterprises Corp., Reg. S3.125% 23/04/2030 USD 1,900,000 1,977,865 0.25Talent Yield International Ltd., Reg. S3.125% 06/05/2031 USD 2,583,000 2,695,956 0.33Yunda Holding Investment Ltd., Reg. S2.25% 19/08/2025 USD 1,957,000 1,930,845 0.24
23,445,675 2.91
Total Bonds 671,880,272 83.46
Total Transferable securities and money market instrumentsadmitted to an official exchange listing 671,880,272 83.46
Transferable securities and money market instruments dealt in on another regulatedmarket
Bonds
AustriaSuzano Austria GmbH 3.125% 15/01/2032 USD 2,194,000 2,173,705 0.27Suzano Austria GmbH, Reg. S 7%16/03/2047 USD 2,740,000 3,708,905 0.46
5,882,610 0.73
BermudaCredicorp Ltd., Reg. S 2.75% 17/06/2025 USD 830,000 844,463 0.10Tengizchevroil Finance Co. InternationalLtd., Reg. S 2.625% 15/08/2025 USD 1,190,000 1,222,970 0.15Tengizchevroil Finance Co. InternationalLtd., Reg. S 4% 15/08/2026 USD 3,334,000 3,627,375 0.45Tengizchevroil Finance Co. InternationalLtd., Reg. S 3.25% 15/08/2030 USD 2,419,000 2,470,131 0.31
8,164,939 1.01
Cayman IslandsCK Hutchison Capital Securities 17 Ltd.,Reg. S, FRN 4% Perpetual USD 4,865,000 4,962,285 0.62Lima Metro Line 2 Finance Ltd., Reg. S4.35% 05/04/2036 USD 6,950,000 7,166,458 0.89Sands China Ltd. 3.8% 08/01/2026 USD 2,690,000 2,882,927 0.36Tencent Holdings Ltd., Reg. S 3.94%22/04/2061 USD 1,390,000 1,540,975 0.19
16,552,645 2.06
ChileCelulosa Arauco y Constitucion SA, Reg. S4.25% 30/04/2029 USD 1,900,000 2,071,864 0.26Celulosa Arauco y Constitucion SA, Reg. S4.2% 29/01/2030 USD 2,200,000 2,387,671 0.30Empresa de Transporte de PasajerosMetro SA, Reg. S 5% 25/01/2047 USD 800,000 925,604 0.11Empresa de Transporte de PasajerosMetro SA, Reg. S 4.7% 07/05/2050 USD 1,590,000 1,790,737 0.22Empresa Nacional del Petroleo, Reg. S3.75% 05/08/2026 USD 5,400,000 5,657,338 0.70Empresa Nacional del Petroleo, Reg. S4.5% 14/09/2047 USD 500,000 489,099 0.06Sociedad Quimica y Minera de Chile SA,Reg. S 4.25% 07/05/2029 USD 570,000 639,435 0.08Transelec SA, Reg. S 3.875% 12/01/2029 USD 2,440,000 2,647,107 0.33
16,608,855 2.06
ColombiaEmpresas Publicas de Medellin ESP,Reg. S 4.25% 18/07/2029 USD 2,040,000 2,027,179 0.25
2,027,179 0.25
168
JPMorgan Funds - Emerging Markets Investment Grade Bond FundSchedule of Investments (continued)
As at 30 June 2021
Investments Currency
Quantity/Nominal
Value
MarketValue
USD
%of
NetAssets Investments Currency
Quantity/Nominal
Value
MarketValue
USD
%of
NetAssets
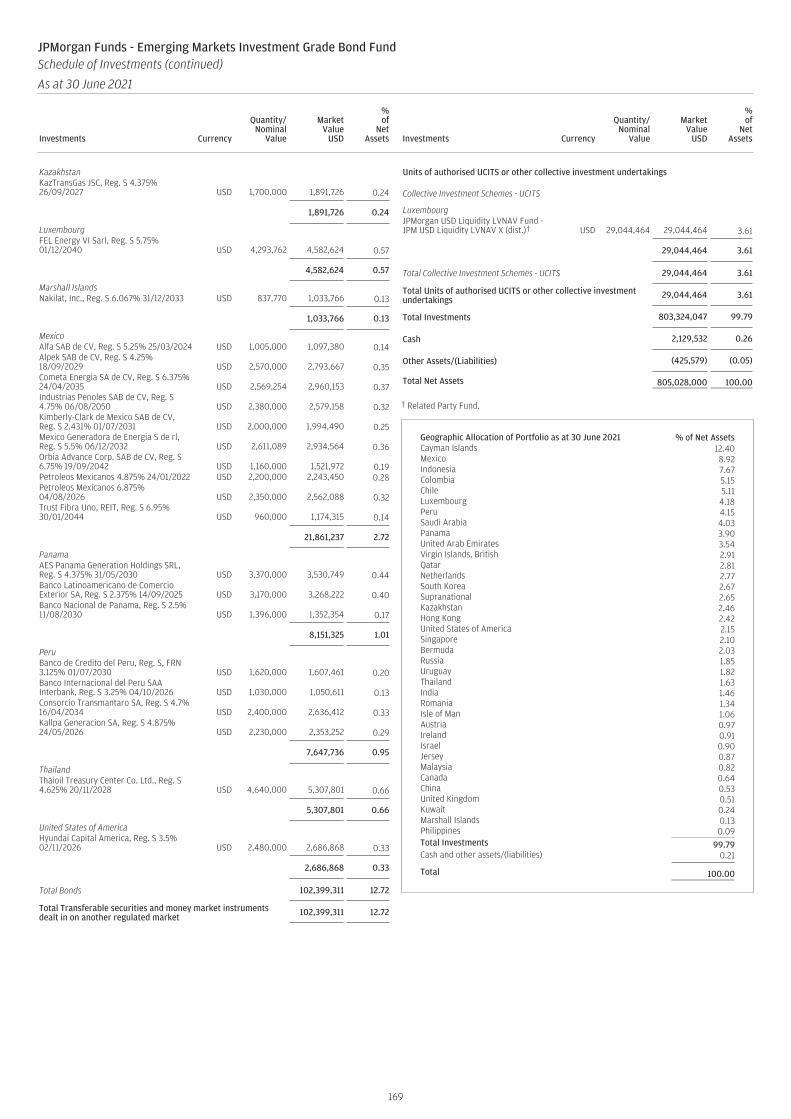
KazakhstanKazTransGas JSC, Reg. S 4.375%26/09/2027 USD 1,700,000 1,891,726 0.24
1,891,726 0.24
LuxembourgFEL Energy VI Sarl, Reg. S 5.75%01/12/2040 USD 4,293,762 4,582,624 0.57
4,582,624 0.57
Marshall IslandsNakilat, Inc., Reg. S 6.067% 31/12/2033 USD 837,770 1,033,766 0.13
1,033,766 0.13
MexicoAlfa SAB de CV, Reg. S 5.25% 25/03/2024 USD 1,005,000 1,097,380 0.14Alpek SAB de CV, Reg. S 4.25%18/09/2029 USD 2,570,000 2,793,667 0.35Cometa Energia SA de CV, Reg. S 6.375%24/04/2035 USD 2,569,254 2,960,153 0.37Industrias Penoles SAB de CV, Reg. S4.75% 06/08/2050 USD 2,380,000 2,579,158 0.32Kimberly-Clark de Mexico SAB de CV,Reg. S 2.431% 01/07/2031 USD 2,000,000 1,994,490 0.25Mexico Generadora de Energia S de rl,Reg. S 5.5% 06/12/2032 USD 2,611,089 2,934,564 0.36Orbia Advance Corp. SAB de CV, Reg. S6.75% 19/09/2042 USD 1,160,000 1,521,972 0.19Petroleos Mexicanos 4.875% 24/01/2022 USD 2,200,000 2,243,450 0.28Petroleos Mexicanos 6.875%04/08/2026 USD 2,350,000 2,562,088 0.32Trust Fibra Uno, REIT, Reg. S 6.95%30/01/2044 USD 960,000 1,174,315 0.14
21,861,237 2.72
PanamaAES Panama Generation Holdings SRL,Reg. S 4.375% 31/05/2030 USD 3,370,000 3,530,749 0.44Banco Latinoamericano de ComercioExterior SA, Reg. S 2.375% 14/09/2025 USD 3,170,000 3,268,222 0.40Banco Nacional de Panama, Reg. S 2.5%11/08/2030 USD 1,396,000 1,352,354 0.17
8,151,325 1.01
PeruBanco de Credito del Peru, Reg. S, FRN3.125% 01/07/2030 USD 1,620,000 1,607,461 0.20Banco Internacional del Peru SAAInterbank, Reg. S 3.25% 04/10/2026 USD 1,030,000 1,050,611 0.13Consorcio Transmantaro SA, Reg. S 4.7%16/04/2034 USD 2,400,000 2,636,412 0.33Kallpa Generacion SA, Reg. S 4.875%24/05/2026 USD 2,230,000 2,353,252 0.29
7,647,736 0.95
ThailandThaioil Treasury Center Co. Ltd., Reg. S4.625% 20/11/2028 USD 4,640,000 5,307,801 0.66
5,307,801 0.66
United States of AmericaHyundai Capital America, Reg. S 3.5%02/11/2026 USD 2,480,000 2,686,868 0.33
2,686,868 0.33
Total Bonds 102,399,311 12.72
Total Transferable securities and money market instrumentsdealt in on another regulated market 102,399,311 12.72
Units of authorised UCITS or other collective investment undertakings
Collective Investment Schemes - UCITS
LuxembourgJPMorgan USD Liquidity LVNAV Fund -JPM USD Liquidity LVNAV X (dist.)† USD 29,044,464 29,044,464 3.61
29,044,464 3.61
Total Collective Investment Schemes - UCITS 29,044,464 3.61
Total Units of authorised UCITS or other collective investmentundertakings 29,044,464 3.61
Total Investments 803,324,047 99.79
Cash 2,129,532 0.26
Other Assets/(Liabilities) (425,579) (0.05)
Total Net Assets 805,028,000 100.00
† Related Party Fund.
Geographic Allocation of Portfolio as at 30 June 2021 % of Net AssetsCayman Islands 12.40Mexico 8.92Indonesia 7.67Colombia 5.15Chile 5.11Luxembourg 4.18Peru 4.15Saudi Arabia 4.03Panama 3.90United Arab Emirates 3.54Virgin Islands, British 2.91Qatar 2.81Netherlands 2.77South Korea 2.67Supranational 2.65Kazakhstan 2.46Hong Kong 2.42United States of America 2.15Singapore 2.10Bermuda 2.03Russia 1.85Uruguay 1.82Thailand 1.63India 1.46Romania 1.34Isle of Man 1.06Austria 0.97Ireland 0.91Israel 0.90Jersey 0.87Malaysia 0.82Canada 0.64China 0.53United Kingdom 0.51Kuwait 0.24Marshall Islands 0.13Philippines 0.09Total Investments 99.79Cash and other assets/(liabilities) 0.21
Total 100.00
169
JPMorgan Funds - Emerging Markets Investment Grade Bond FundSchedule of Investments (continued)
As at 30 June 2021
Investments Currency
Quantity/Nominal
Value
MarketValue
USD
%of
NetAssets Investments Currency
Quantity/Nominal
Value
MarketValue
USD
%of
NetAssets
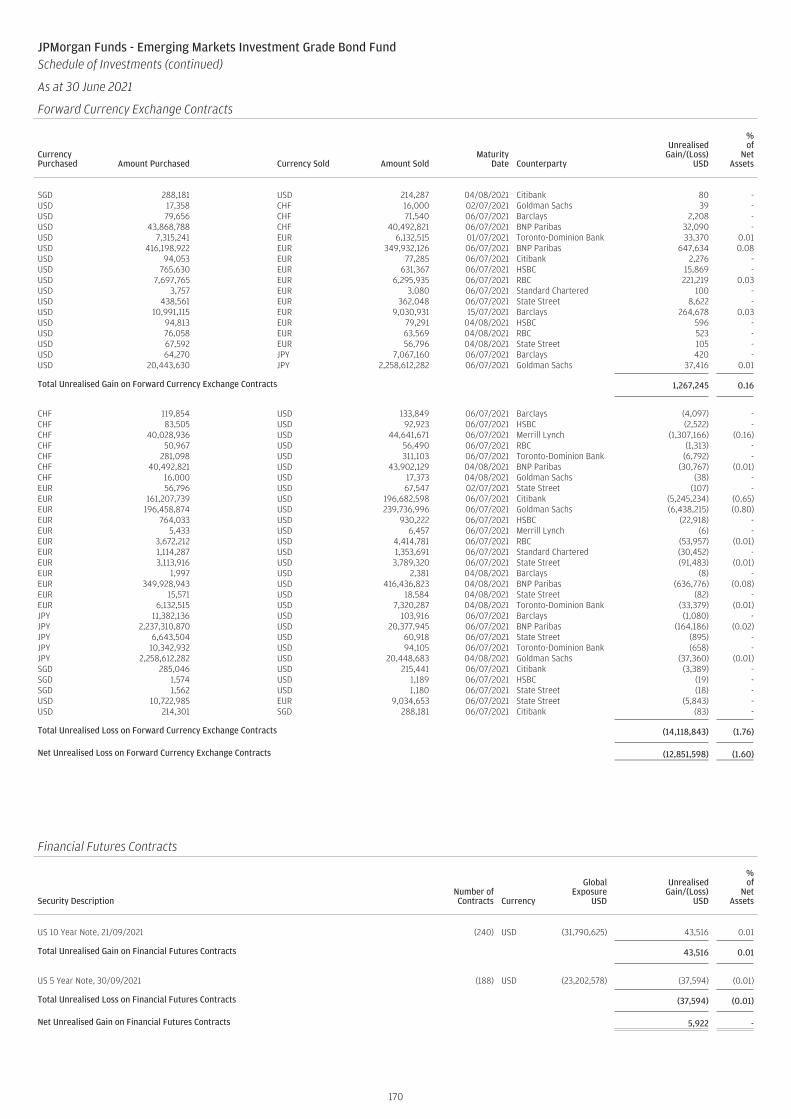
JPMorgan Funds - Emerging Markets Investment Grade Bond FundSchedule of Investments (continued)
As at 30 June 2021
Forward Currency Exchange Contracts
CurrencyPurchased Amount Purchased Currency Sold Amount Sold
MaturityDate Counterparty
UnrealisedGain/(Loss)
USD
%of
NetAssets
SGD 288,181 USD 214,287 04/08/2021 Citibank 80 -USD 17,358 CHF 16,000 02/07/2021 Goldman Sachs 39 -USD 79,656 CHF 71,540 06/07/2021 Barclays 2,208 -USD 43,868,788 CHF 40,492,821 06/07/2021 BNP Paribas 32,090 -USD 7,315,241 EUR 6,132,515 01/07/2021 Toronto-Dominion Bank 33,370 0.01USD 416,198,922 EUR 349,932,126 06/07/2021 BNP Paribas 647,634 0.08USD 94,053 EUR 77,285 06/07/2021 Citibank 2,276 -USD 765,630 EUR 631,367 06/07/2021 HSBC 15,869 -USD 7,697,765 EUR 6,295,935 06/07/2021 RBC 221,219 0.03USD 3,757 EUR 3,080 06/07/2021 Standard Chartered 100 -USD 438,561 EUR 362,048 06/07/2021 State Street 8,622 -USD 10,991,115 EUR 9,030,931 15/07/2021 Barclays 264,678 0.03USD 94,813 EUR 79,291 04/08/2021 HSBC 596 -USD 76,058 EUR 63,569 04/08/2021 RBC 523 -USD 67,592 EUR 56,796 04/08/2021 State Street 105 -USD 64,270 JPY 7,067,160 06/07/2021 Barclays 420 -USD 20,443,630 JPY 2,258,612,282 06/07/2021 Goldman Sachs 37,416 0.01
Total Unrealised Gain on Forward Currency Exchange Contracts 1,267,245 0.16
CHF 119,854 USD 133,849 06/07/2021 Barclays (4,097) -CHF 83,505 USD 92,923 06/07/2021 HSBC (2,522) -CHF 40,028,936 USD 44,641,671 06/07/2021 Merrill Lynch (1,307,166) (0.16)CHF 50,967 USD 56,490 06/07/2021 RBC (1,313) -CHF 281,098 USD 311,103 06/07/2021 Toronto-Dominion Bank (6,792) -CHF 40,492,821 USD 43,902,129 04/08/2021 BNP Paribas (30,767) (0.01)CHF 16,000 USD 17,373 04/08/2021 Goldman Sachs (38) -EUR 56,796 USD 67,547 02/07/2021 State Street (107) -EUR 161,207,739 USD 196,682,598 06/07/2021 Citibank (5,245,234) (0.65)EUR 196,458,874 USD 239,736,996 06/07/2021 Goldman Sachs (6,438,215) (0.80)EUR 764,033 USD 930,222 06/07/2021 HSBC (22,918) -EUR 5,433 USD 6,457 06/07/2021 Merrill Lynch (6) -EUR 3,672,212 USD 4,414,781 06/07/2021 RBC (53,957) (0.01)EUR 1,114,287 USD 1,353,691 06/07/2021 Standard Chartered (30,452) -EUR 3,113,916 USD 3,789,320 06/07/2021 State Street (91,483) (0.01)EUR 1,997 USD 2,381 04/08/2021 Barclays (8) -EUR 349,928,943 USD 416,436,823 04/08/2021 BNP Paribas (636,776) (0.08)EUR 15,571 USD 18,584 04/08/2021 State Street (82) -EUR 6,132,515 USD 7,320,287 04/08/2021 Toronto-Dominion Bank (33,379) (0.01)JPY 11,382,136 USD 103,916 06/07/2021 Barclays (1,080) -JPY 2,237,310,870 USD 20,377,945 06/07/2021 BNP Paribas (164,186) (0.02)JPY 6,643,504 USD 60,918 06/07/2021 State Street (895) -JPY 10,342,932 USD 94,105 06/07/2021 Toronto-Dominion Bank (658) -JPY 2,258,612,282 USD 20,448,683 04/08/2021 Goldman Sachs (37,360) (0.01)SGD 285,046 USD 215,441 06/07/2021 Citibank (3,389) -SGD 1,574 USD 1,189 06/07/2021 HSBC (19) -SGD 1,562 USD 1,180 06/07/2021 State Street (18) -USD 10,722,985 EUR 9,034,653 06/07/2021 State Street (5,843) -USD 214,301 SGD 288,181 06/07/2021 Citibank (83) -
Total Unrealised Loss on Forward Currency Exchange Contracts (14,118,843) (1.76)
Net Unrealised Loss on Forward Currency Exchange Contracts (12,851,598) (1.60)
JPMorgan Funds - Emerging Markets Investment Grade Bond FundSchedule of Investments (continued)
As at 30 June 2021
Financial Futures Contracts
Security DescriptionNumber ofContracts Currency
GlobalExposure
USD
UnrealisedGain/(Loss)
USD
%of
NetAssets
US 10 Year Note, 21/09/2021 (240) USD (31,790,625) 43,516 0.01
Total Unrealised Gain on Financial Futures Contracts 43,516 0.01
US 5 Year Note, 30/09/2021 (188) USD (23,202,578) (37,594) (0.01)
Total Unrealised Loss on Financial Futures Contracts (37,594) (0.01)
Net Unrealised Gain on Financial Futures Contracts 5,922 -
170

Transferable securities and money market instruments admitted to an official exchangelisting
Bonds
BrazilBrazil Government Bond 10%01/01/2027 BRL 38,100 8,121,640 0.42Brazil Government Bond 10%01/01/2029 BRL 11,000 2,352,303 0.12Brazil Notas do Tesouro Nacional10% 01/01/2023 BRL 84 17,474 0.00Brazil Notas do Tesouro Nacional 6%15/08/2028 BRL 21,000 17,250,223 0.90Brazil Notas do Tesouro Nacional 6%15/08/2050 BRL 7,990 7,340,591 0.38Brazil Notas do Tesouro Nacional,FRN 27.19% 15/08/2022 BRL 67,882 51,761,346 2.68Brazil Notas do Tesouro Nacional,FRN 0% 01/01/2025 BRL 158,226 33,540,963 1.74
120,384,540 6.24
ChileBonos de la Tesoreria de la Republicaen pesos 4.5% 01/03/2026 CLP 23,965,000,000 34,660,930 1.80Bonos de la Tesoreria de la Republicaen pesos 5% 01/03/2035 CLP 700,000,000 1,002,264 0.05Bonos de la Tesoreria de la Republicaen pesos, Reg. S, 144A 4.7%01/09/2030 CLP 1,400,000,000 1,967,963 0.10
37,631,157 1.95
ChinaChina Development Bank (The) 3%07/08/2023 CNH 84,000,000 13,031,574 0.68China Government Bond 2.85%04/06/2027 CNH 148,000,000 22,654,431 1.17China Government Bond 3.81%14/09/2050 CNH 34,500,000 5,480,412 0.28
41,166,417 2.13
ColombiaColombia Government Bond 7%04/05/2022 COP 8,670,000,000 2,384,842 0.12Colombia Government Bond 4.375%21/03/2023 COP 19,876,000,000 5,417,148 0.28Colombia Government Bond 7.5%26/08/2026 COP 21,720,000,000 6,128,031 0.32Colombia Government Bond 9.85%28/06/2027 COP 552,000,000 176,037 0.01Colombia Government Bond 5.75%03/11/2027 COP 169,453,000,000 43,378,543 2.24Colombia Government Bond 6%28/04/2028 COP 88,098,400,000 22,602,102 1.17Colombia Government Bond 2.25%18/04/2029 COP 271,762,000 19,470,870 1.01Colombia Government Bond 7%30/06/2032 COP 15,200,000,000 3,983,300 0.21Colombia Government Bond 3%25/03/2033 COP 108,250,000 7,809,783 0.40Colombia Government Bond 6.25%09/07/2036 COP 57,428,000,000 13,490,836 0.70Empresas Publicas de Medellin ESP,Reg. S 8.375% 08/11/2027 COP 41,568,000,000 10,551,781 0.55Patrimonio Autonomo Montes deMaria, Reg. S 4.1% 15/05/2045 COP 72,308,378 5,479,702 0.28
140,872,975 7.29
Czech RepublicCzech Republic Government Bond1.25% 14/02/2025 CZK 308,370,000 14,220,571 0.73Czech Republic Government Bond0.25% 10/02/2027 CZK 209,790,000 9,018,971 0.47Czech Republic Government Bond0.05% 29/11/2029 CZK 97,000,000 3,914,778 0.20Czech Republic Government Bond1.2% 13/03/2031 CZK 107,000,000 4,714,421 0.24Czech Republic Government Bond 2%13/10/2033 CZK 97,000,000 4,595,830 0.24Czech Republic Government Bond,Reg. S 1% 26/06/2026 CZK 60,000,000 2,703,570 0.14Czech Republic Government Bond,Reg. S 2.5% 25/08/2028 CZK 38,330,000 1,873,871 0.10
Czech Republic Government Bond,Reg. S 4.2% 04/12/2036 CZK 56,000,000 3,402,848 0.18Czech Republic Government Bond,Reg. S 4.85% 26/11/2057 CZK 342,490,000 23,989,921 1.24
68,434,781 3.54
Dominican RepublicDominican Republic GovernmentBond, Reg. S 8.9% 15/02/2023 DOP 470,900,000 8,809,052 0.46Dominican Republic GovernmentBond, Reg. S 9.75% 05/06/2026 DOP 224,000,000 4,501,645 0.23
13,310,697 0.69
EgyptEgypt Government Bond 14.313%13/10/2023 EGP 134,900,000 8,644,787 0.45Egypt Government Bond 14.483%06/04/2026 EGP 455,000,000 29,028,593 1.50
37,673,380 1.95
GhanaGhana Government Bond 19.25%18/12/2023 GHS 30,000,000 5,426,490 0.28Ghana Treasury 17.6% 20/02/2023 GHS 48,000,000 8,388,158 0.44
13,814,648 0.72
HungaryHungary Government Bond 1%26/11/2025 HUF 2,129,540,000 6,905,654 0.36Hungary Government Bond 1.5%22/04/2026 HUF 5,940,500,000 19,552,187 1.01Hungary Government Bond 2.25%20/04/2033 HUF 2,107,630,000 6,708,933 0.35Hungary Government Bond 3%25/04/2041 HUF 660,000,000 2,135,897 0.11Hungary Government Bond 4%28/04/2051 HUF 1,017,330,000 3,824,090 0.20
39,126,761 2.03
IndiaIndia Government Bond 7.37%16/04/2023 INR 545,500,000 7,685,134 0.40India Government Bond 5.22%15/06/2025 INR 2,200,000,000 29,241,949 1.51India Government Bond 7.27%08/04/2026 INR 1,030,000,000 14,635,574 0.76India Government Bond 7.26%14/01/2029 INR 345,000,000 4,882,717 0.25
56,445,374 2.92
IndonesiaIndonesia Government Bond 8.375%15/03/2024 IDR 128,340,000,000 9,680,996 0.50Indonesia Government Bond 6.5%15/06/2025 IDR 340,488,000,000 24,676,222 1.28Indonesia Government Bond 8.375%15/09/2026 IDR 536,105,000,000 41,623,192 2.16Indonesia Government Bond 7%15/05/2027 IDR 65,620,000,000 4,804,289 0.25Indonesia Government Bond 9%15/03/2029 IDR 610,634,000,000 48,850,720 2.53Indonesia Government Bond 8.25%15/05/2029 IDR 269,340,000,000 20,739,551 1.07Indonesia Government Bond 10.5%15/08/2030 IDR 84,115,000,000 7,359,714 0.38Indonesia Government Bond 6.5%15/02/2031 IDR 133,000,000,000 9,115,545 0.47Indonesia Government Bond 8.75%15/05/2031 IDR 35,683,000,000 2,843,763 0.15Indonesia Government Bond 8.25%15/06/2032 IDR 3,106,000,000 239,291 0.01Indonesia Government Bond 7.5%15/08/2032 IDR 81,630,000,000 5,950,546 0.31Indonesia Government Bond 8.375%15/03/2034 IDR 190,457,000,000 14,569,566 0.75Indonesia Government Bond 8.25%15/05/2036 IDR 51,370,000,000 3,895,795 0.20Indonesia Government Bond 7.375%15/05/2048 IDR 121,834,000,000 8,640,131 0.45
202,989,321 10.51
171
JPMorgan Funds - Emerging Markets Local Currency Debt FundSchedule of Investments
As at 30 June 2021
Investments Currency
Quantity/Nominal
Value
MarketValue
USD
%of
NetAssets Investments Currency
Quantity/Nominal
Value
MarketValue
USD
%of
NetAssets

IsraelIsrael Government Bond 4.25%31/03/2023 ILS 15,200,000 5,053,141 0.26Israel Government Bond 2.25%28/09/2028 ILS 20,100,000 6,767,051 0.35Israel Government Bond 3.75%31/03/2047 ILS 3,800,000 1,508,794 0.08
13,328,986 0.69
MexicoMexican Bonos 7.5% 03/06/2027 MXN 927,516 4,873,884 0.25Mexican Bonos 7.75% 13/11/2042 MXN 4,117,000 21,484,155 1.11Mexican Bonos, FRN 5.75%05/03/2026 MXN 5,900,000 28,906,946 1.50Mexican Bonos, FRN 8.50%31/05/2029 MXN 890,000 4,944,084 0.26Mexican Bonos, FRN 8.50%18/11/2038 MXN 5,070,000 28,414,706 1.47Mexican Udibonos 2.75% 27/11/2031 MXN 698,474 23,853,680 1.23Mexico Government Bond 6.50%09/06/2022 MXN 136,000 692,309 0.04Mexico Government Bond, FRN8.00% 07/12/2023 MXN 250,000 1,320,239 0.07Mexico Government Bond, FRN27.25% 15/11/2040 MXN 84,102 3,130,281 0.16United Mexican States, FRN 2%09/06/2022 MXN 710,000 24,638,147 1.27United Mexican States, FRN 7.75%23/11/2034 MXN 580,000 3,096,943 0.16
145,355,374 7.52
PeruPeru Government Bond 6.35%12/08/2028 PEN 54,156,000 15,610,158 0.81Peru Government Bond 6.15%12/08/2032 PEN 12,500,000 3,374,738 0.18Peru Government Bond 5.4%12/08/2034 PEN 9,000,000 2,186,807 0.11
21,171,703 1.10
PhilippinesPhilippine Government Bond 5.75%12/04/2025 PHP 6,345,058 143,883 0.01Philippine Government Bond 6.125%24/10/2037 PHP 800,000 18,937 0.00
162,820 0.01
RomaniaRomania Government Bond 4.75%24/02/2025 RON 24,000,000 6,221,607 0.32Romania Government Bond 4.85%22/04/2026 RON 925,000 243,953 0.01Romania Government Bond 3.25%24/06/2026 RON 25,565,000 6,314,369 0.33Romania Government Bond 5.8%26/07/2027 RON 22,340,000 6,288,287 0.32Romania Government Bond 4.15%24/10/2030 RON 30,980,000 7,952,877 0.41Romania Government Bond 4.75%11/10/2034 RON 21,370,000 5,527,131 0.29
32,548,224 1.68
RussiaRussian Federal Bond - OFZ 7.6%20/07/2022 RUB 59,700,000 830,687 0.04Russian Federal Bond - OFZ 7%16/08/2023 RUB 689,064,000 9,504,607 0.49Russian Federal Bond - OFZ 6.5%28/02/2024 RUB 250,800,000 3,422,221 0.18Russian Federal Bond - OFZ 7.1%16/10/2024 RUB 1,108,731,000 15,347,687 0.79Russian Federal Bond - OFZ 7.15%12/11/2025 RUB 1,059,000,000 14,680,696 0.76Russian Federal Bond - OFZ 7.75%16/09/2026 RUB 953,549,000 13,586,326 0.70Russian Federal Bond - OFZ 7.95%07/10/2026 RUB 1,167,000,000 16,737,159 0.87Russian Federal Bond - OFZ 6%06/10/2027 RUB 854,000,000 11,163,517 0.58Russian Federal Bond - OFZ 5.7%17/05/2028 RUB 2,760,000,000 35,387,868 1.83Russian Federal Inflation Linked Bond- OFZ 2.5% 02/02/2028 RUB 100,000,000 1,558,430 0.08Russian Federal Inflation Linked Bond- OFZ 2.5% 17/07/2030 RUB 1,249,000,000 17,688,079 0.92
139,907,277 7.24
SerbiaSerbia Treasury 4.5% 11/01/2026 RSD 683,630,000 7,598,819 0.39Serbia Treasury 5.875% 08/02/2028 RSD 845,930,000 10,302,045 0.53Serbia Treasury 4.5% 20/08/2032 RSD 750,000,000 8,403,773 0.44
26,304,637 1.36
South AfricaSouth Africa Government Bond10.5% 21/12/2026 ZAR 112,404,917 8,982,601 0.46South Africa Government Bond 2.6%31/03/2028 ZAR 136,500,000 19,869,888 1.03South Africa Government Bond 8%31/01/2030 ZAR 403,000,000 26,908,060 1.39South Africa Government Bond 7%28/02/2031 ZAR 363,761,594 21,962,940 1.14South Africa Government Bond8.25% 31/03/2032 ZAR 527,948,374 33,940,333 1.76South Africa Government Bond8.875% 28/02/2035 ZAR 430,060,504 27,464,319 1.42South Africa Government Bond6.25% 31/03/2036 ZAR 230,071,379 11,482,555 0.59South Africa Government Bond 8.5%31/01/2037 ZAR 308,800,993 18,671,018 0.97South Africa Government Bond 9%31/01/2040 ZAR 281,072,170 17,381,187 0.90South Africa Government Bond 6.5%28/02/2041 ZAR 3,965,000 187,441 0.01South Africa Government Bond8.75% 31/01/2044 ZAR 181,438,878 10,838,597 0.56
197,688,939 10.23
TunisiaBanque Centrale de TunisieInternational Bond, Reg. S 5.625%17/02/2024 EUR 2,411,000 2,681,521 0.14Banque Centrale de TunisieInternational Bond, Reg. S 6.375%15/07/2026 EUR 4,480,000 4,932,638 0.25
7,614,159 0.39
TurkeyTurkey Government Bond 9.2%22/09/2021 TRY 151,700,000 17,175,829 0.89Turkey Government Bond 3.95%06/11/2024 TRY 27,497,826 4,028,956 0.21Turkey Government Bond 8%12/03/2025 TRY 20,000,000 1,725,631 0.09Turkey Government Bond 12.6%01/10/2025 TRY 52,000,000 5,141,124 0.26Turkey Government Bond 10.6%11/02/2026 TRY 20,800,000 1,892,174 0.10
29,963,714 1.55
UkraineUkraine Government Bond, Reg. S15.84% 26/02/2025 UAH 200,000,000 8,125,090 0.42
8,125,090 0.42
UruguayUruguay Government Bond 8.25%21/05/2031 UYU 176,000,000 4,139,599 0.21
4,139,599 0.21
Total Bonds 1,398,160,573 72.37
Total Transferable securities and money market instrumentsadmitted to an official exchange listing 1,398,160,573 72.37
Transferable securities and money market instruments dealt in on another regulatedmarket
Bonds
ChinaChina Development Bank 3.3%01/02/2024 CNH 73,000,000 11,387,087 0.59China Development Bank 3.23%10/01/2025 CNH 42,000,000 6,524,374 0.34China Development Bank 3.07%10/03/2030 CNH 58,000,000 8,675,918 0.45China Development Bank SecuritiesCo. Ltd. 3.45% 20/09/2029 CNH 126,200,000 19,440,974 1.00China Government Bond 2.68%21/05/2030 CNH 131,000,000 19,531,238 1.01
65,559,591 3.39
172
JPMorgan Funds - Emerging Markets Local Currency Debt FundSchedule of Investments (continued)
As at 30 June 2021
Investments Currency
Quantity/Nominal
Value
MarketValue
USD
%of
NetAssets Investments Currency
Quantity/Nominal
Value
MarketValue
USD
%of
NetAssets

EgyptEgypt Treasury Bill 0% 31/08/2021 EGP 159,000,000 9,909,658 0.52Egypt Treasury Bill 0% 16/11/2021 EGP 153,600,000 9,317,911 0.48Egypt Treasury Bill 0% 01/02/2022 EGP 157,200,000 9,286,491 0.48
28,514,060 1.48
FranceChina Development Bank 3.42%02/07/2024 CNH 149,000,000 23,328,757 1.21
23,328,757 1.21
KazakhstanKazakhstan Government Bond, Reg. S0% 20/01/2022 KZT 9,542,096,100 21,310,622 1.10
21,310,622 1.10
MalaysiaMalaysia Government Bond 3.48%15/03/2023 MYR 97,800,000 24,152,593 1.25Malaysia Government Bond 4.181%15/07/2024 MYR 25,700,000 6,522,895 0.34Malaysia Government Bond 3.955%15/09/2025 MYR 100,000 25,428 0.00Malaysia Government Bond 4.07%30/09/2026 MYR 36,836,000 9,425,500 0.49Malaysia Government Bond 3.892%15/03/2027 MYR 17,100,000 4,343,344 0.22Malaysia Government Bond 3.502%31/05/2027 MYR 29,400,000 7,310,003 0.38Malaysia Government Bond 3.733%15/06/2028 MYR 96,030,000 24,160,450 1.25Malaysia Government Bond 4.232%30/06/2031 MYR 3,920,000 1,013,402 0.05Malaysia Government Bond 4.127%15/04/2032 MYR 205,000 52,064 0.00Malaysia Government Bond 3.844%15/04/2033 MYR 51,267,000 12,550,053 0.65Malaysia Government Bond 4.642%07/11/2033 MYR 70,800,000 18,528,099 0.96Malaysia Government Bond 3.828%05/07/2034 MYR 113,200,000 27,172,048 1.41Malaysia Government Bond 4.786%31/10/2035 MYR 22,500,000 5,910,893 0.31
141,166,772 7.31
PeruPeru Government Bond, Reg. S 6.35%12/08/2028 PEN 27,600,000 7,954,815 0.41
7,954,815 0.41
ThailandThailand Government Bond 3.85%12/12/2025 THB 201,788,000 7,146,381 0.37Thailand Government Bond 3.58%17/12/2027 THB 4,436,000 157,399 0.01Thailand Government Bond 2.875%17/12/2028 THB 198,043,000 6,836,970 0.35Thailand Government Bond 4.875%22/06/2029 THB 115,059,000 4,505,433 0.23Thailand Government Bond 1.6%17/12/2029 THB 438,000,000 13,696,310 0.71Thailand Government Bond 3.65%20/06/2031 THB 146,900,000 5,365,073 0.28Thailand Government Bond 3.775%25/06/2032 THB 653,712,000 24,235,152 1.25Thailand Government Bond 1.6%17/06/2035 THB 576,300,000 16,842,728 0.87Thailand Government Bond 1.585%17/12/2035 THB 393,000,000 11,376,284 0.59Thailand Government Bond 3.4%17/06/2036 THB 103,600,000 3,685,195 0.19Thailand Government Bond 3.3%17/06/2038 THB 551,000,000 19,421,858 1.01Thailand Government Bond, Reg. S,FRN 1.25% 12/03/2028 THB 655,302,000 21,215,831 1.10
134,484,614 6.96
United KingdomChina Government Bond 1.99%09/04/2025 CNH 131,000,000 19,608,746 1.01
19,608,746 1.01
Total Bonds 441,927,977 22.87
Total Transferable securities and money market instrumentsdealt in on another regulated market 441,927,977 22.87
Units of authorised UCITS or other collective investment undertakings
Collective Investment Schemes - UCITS
LuxembourgJPMorgan USD Liquidity LVNAV Fund- JPM USD Liquidity LVNAV X (dist.)† USD 81,984,076 81,984,076 4.24
81,984,076 4.24
Total Collective Investment Schemes - UCITS 81,984,076 4.24
Total Units of authorised UCITS or other collective investmentundertakings 81,984,076 4.24
Total Investments 1,922,072,626 99.48
Cash 29,535,155 1.53
Other Assets/(Liabilities) (19,437,833) (1.01)
Total Net Assets 1,932,169,948 100.00
† Related Party Fund.
Geographic Allocation of Portfolio as at 30 June 2021 % of Net AssetsIndonesia 10.51South Africa 10.23Mexico 7.52Malaysia 7.31Colombia 7.29Russia 7.24Thailand 6.96Brazil 6.24China 5.52Luxembourg 4.24Czech Republic 3.54Egypt 3.43India 2.92Hungary 2.03Chile 1.95Romania 1.68Turkey 1.55Peru 1.51Serbia 1.36France 1.21Kazakhstan 1.10United Kingdom 1.01Ghana 0.72Israel 0.69Dominican Republic 0.69Ukraine 0.42Tunisia 0.39Uruguay 0.21Philippines 0.01Total Investments 99.48Cash and other assets/(liabilities) 0.52
Total 100.00
173
JPMorgan Funds - Emerging Markets Local Currency Debt FundSchedule of Investments (continued)
As at 30 June 2021
Investments Currency
Quantity/Nominal
Value
MarketValue
USD
%of
NetAssets Investments Currency
Quantity/Nominal
Value
MarketValue
USD
%of
NetAssets
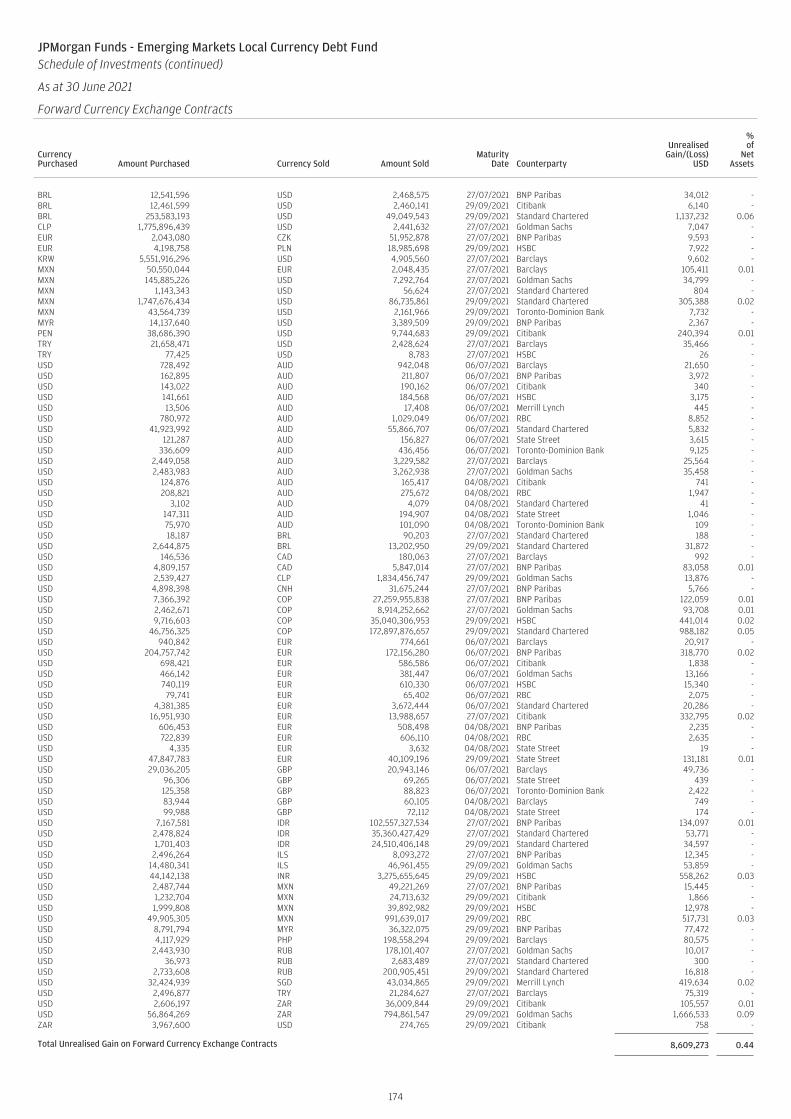
JPMorgan Funds - Emerging Markets Local Currency Debt FundSchedule of Investments (continued)
As at 30 June 2021
Forward Currency Exchange Contracts (continued)
CurrencyPurchased Amount Purchased Currency Sold Amount Sold
MaturityDate Counterparty
UnrealisedGain/(Loss)
USD
%of
NetAssets
BRL 12,541,596 USD 2,468,575 27/07/2021 BNP Paribas 34,012 -BRL 12,461,599 USD 2,460,141 29/09/2021 Citibank 6,140 -BRL 253,583,193 USD 49,049,543 29/09/2021 Standard Chartered 1,137,232 0.06CLP 1,775,896,439 USD 2,441,632 27/07/2021 Goldman Sachs 7,047 -EUR 2,043,080 CZK 51,952,878 27/07/2021 BNP Paribas 9,593 -EUR 4,198,758 PLN 18,985,698 29/09/2021 HSBC 7,922 -KRW 5,551,916,296 USD 4,905,560 27/07/2021 Barclays 9,602 -MXN 50,550,044 EUR 2,048,435 27/07/2021 Barclays 105,411 0.01MXN 145,885,226 USD 7,292,764 27/07/2021 Goldman Sachs 34,799 -MXN 1,143,343 USD 56,624 27/07/2021 Standard Chartered 804 -MXN 1,747,676,434 USD 86,735,861 29/09/2021 Standard Chartered 305,388 0.02MXN 43,564,739 USD 2,161,966 29/09/2021 Toronto-Dominion Bank 7,732 -MYR 14,137,640 USD 3,389,509 29/09/2021 BNP Paribas 2,367 -PEN 38,686,390 USD 9,744,683 29/09/2021 Citibank 240,394 0.01TRY 21,658,471 USD 2,428,624 27/07/2021 Barclays 35,466 -TRY 77,425 USD 8,783 27/07/2021 HSBC 26 -USD 728,492 AUD 942,048 06/07/2021 Barclays 21,650 -USD 162,895 AUD 211,807 06/07/2021 BNP Paribas 3,972 -USD 143,022 AUD 190,162 06/07/2021 Citibank 340 -USD 141,661 AUD 184,568 06/07/2021 HSBC 3,175 -USD 13,506 AUD 17,408 06/07/2021 Merrill Lynch 445 -USD 780,972 AUD 1,029,049 06/07/2021 RBC 8,852 -USD 41,923,992 AUD 55,866,707 06/07/2021 Standard Chartered 5,832 -USD 121,287 AUD 156,827 06/07/2021 State Street 3,615 -USD 336,609 AUD 436,456 06/07/2021 Toronto-Dominion Bank 9,125 -USD 2,449,058 AUD 3,229,582 27/07/2021 Barclays 25,564 -USD 2,483,983 AUD 3,262,938 27/07/2021 Goldman Sachs 35,458 -USD 124,876 AUD 165,417 04/08/2021 Citibank 741 -USD 208,821 AUD 275,672 04/08/2021 RBC 1,947 -USD 3,102 AUD 4,079 04/08/2021 Standard Chartered 41 -USD 147,311 AUD 194,907 04/08/2021 State Street 1,046 -USD 75,970 AUD 101,090 04/08/2021 Toronto-Dominion Bank 109 -USD 18,187 BRL 90,203 27/07/2021 Standard Chartered 188 -USD 2,644,875 BRL 13,202,950 29/09/2021 Standard Chartered 31,872 -USD 146,536 CAD 180,063 27/07/2021 Barclays 992 -USD 4,809,157 CAD 5,847,014 27/07/2021 BNP Paribas 83,058 0.01USD 2,539,427 CLP 1,834,456,747 29/09/2021 Goldman Sachs 13,876 -USD 4,898,398 CNH 31,675,244 27/07/2021 BNP Paribas 5,766 -USD 7,366,392 COP 27,259,955,838 27/07/2021 BNP Paribas 122,059 0.01USD 2,462,671 COP 8,914,252,662 27/07/2021 Goldman Sachs 93,708 0.01USD 9,716,603 COP 35,040,306,953 29/09/2021 HSBC 441,014 0.02USD 46,756,325 COP 172,897,876,657 29/09/2021 Standard Chartered 988,182 0.05USD 940,842 EUR 774,661 06/07/2021 Barclays 20,917 -USD 204,757,742 EUR 172,156,280 06/07/2021 BNP Paribas 318,770 0.02USD 698,421 EUR 586,586 06/07/2021 Citibank 1,838 -USD 466,142 EUR 381,447 06/07/2021 Goldman Sachs 13,166 -USD 740,119 EUR 610,330 06/07/2021 HSBC 15,340 -USD 79,741 EUR 65,402 06/07/2021 RBC 2,075 -USD 4,381,385 EUR 3,672,444 06/07/2021 Standard Chartered 20,286 -USD 16,951,930 EUR 13,988,657 27/07/2021 Citibank 332,795 0.02USD 606,453 EUR 508,498 04/08/2021 BNP Paribas 2,235 -USD 722,839 EUR 606,110 04/08/2021 RBC 2,635 -USD 4,335 EUR 3,632 04/08/2021 State Street 19 -USD 47,847,783 EUR 40,109,196 29/09/2021 State Street 131,181 0.01USD 29,036,205 GBP 20,943,146 06/07/2021 Barclays 49,736 -USD 96,306 GBP 69,265 06/07/2021 State Street 439 -USD 125,358 GBP 88,823 06/07/2021 Toronto-Dominion Bank 2,422 -USD 83,944 GBP 60,105 04/08/2021 Barclays 749 -USD 99,988 GBP 72,112 04/08/2021 State Street 174 -USD 7,167,581 IDR 102,557,327,534 27/07/2021 BNP Paribas 134,097 0.01USD 2,478,824 IDR 35,360,427,429 27/07/2021 Standard Chartered 53,771 -USD 1,701,403 IDR 24,510,406,148 29/09/2021 Standard Chartered 34,597 -USD 2,496,264 ILS 8,093,272 27/07/2021 BNP Paribas 12,345 -USD 14,480,341 ILS 46,961,455 29/09/2021 Goldman Sachs 53,859 -USD 44,142,138 INR 3,275,655,645 29/09/2021 HSBC 558,262 0.03USD 2,487,744 MXN 49,221,269 27/07/2021 BNP Paribas 15,445 -USD 1,232,704 MXN 24,713,632 29/09/2021 Citibank 1,866 -USD 1,999,808 MXN 39,892,982 29/09/2021 HSBC 12,978 -USD 49,905,305 MXN 991,639,017 29/09/2021 RBC 517,731 0.03USD 8,791,794 MYR 36,322,075 29/09/2021 BNP Paribas 77,472 -USD 4,117,929 PHP 198,558,294 29/09/2021 Barclays 80,575 -USD 2,443,930 RUB 178,101,407 27/07/2021 Goldman Sachs 10,017 -USD 36,973 RUB 2,683,489 27/07/2021 Standard Chartered 300 -USD 2,733,608 RUB 200,905,451 29/09/2021 Standard Chartered 16,818 -USD 32,424,939 SGD 43,034,865 29/09/2021 Merrill Lynch 419,634 0.02USD 2,496,877 TRY 21,284,627 27/07/2021 Barclays 75,319 -USD 2,606,197 ZAR 36,009,844 29/09/2021 Citibank 105,557 0.01USD 56,864,269 ZAR 794,861,547 29/09/2021 Goldman Sachs 1,666,533 0.09ZAR 3,967,600 USD 274,765 29/09/2021 Citibank 758 -
Total Unrealised Gain on Forward Currency Exchange Contracts 8,609,273 0.44
174
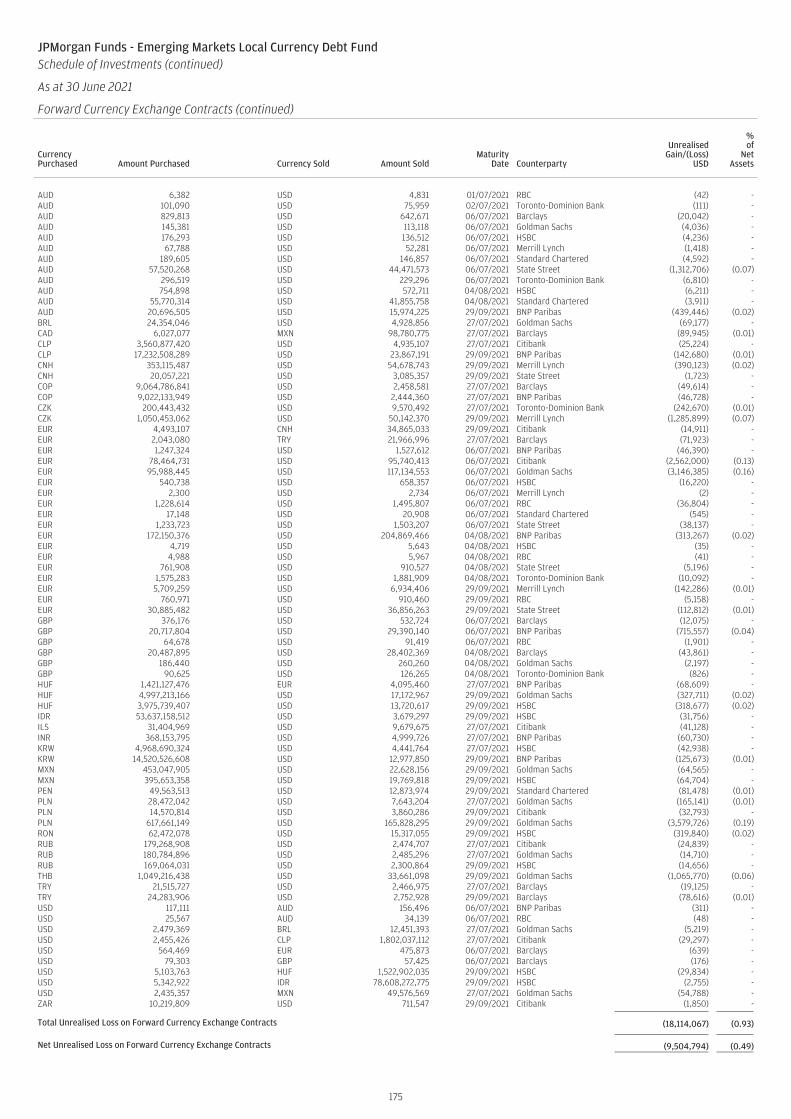
JPMorgan Funds - Emerging Markets Local Currency Debt FundSchedule of Investments (continued)
As at 30 June 2021
Forward Currency Exchange Contracts (continued)
CurrencyPurchased Amount Purchased Currency Sold Amount Sold
MaturityDate Counterparty
UnrealisedGain/(Loss)
USD
%of
NetAssets
AUD 6,382 USD 4,831 01/07/2021 RBC (42) -AUD 101,090 USD 75,959 02/07/2021 Toronto-Dominion Bank (111) -AUD 829,813 USD 642,671 06/07/2021 Barclays (20,042) -AUD 145,381 USD 113,118 06/07/2021 Goldman Sachs (4,036) -AUD 176,293 USD 136,512 06/07/2021 HSBC (4,236) -AUD 67,788 USD 52,281 06/07/2021 Merrill Lynch (1,418) -AUD 189,605 USD 146,857 06/07/2021 Standard Chartered (4,592) -AUD 57,520,268 USD 44,471,573 06/07/2021 State Street (1,312,706) (0.07)AUD 296,519 USD 229,296 06/07/2021 Toronto-Dominion Bank (6,810) -AUD 754,898 USD 572,711 04/08/2021 HSBC (6,211) -AUD 55,770,314 USD 41,855,758 04/08/2021 Standard Chartered (3,911) -AUD 20,696,505 USD 15,974,225 29/09/2021 BNP Paribas (439,446) (0.02)BRL 24,354,046 USD 4,928,856 27/07/2021 Goldman Sachs (69,177) -CAD 6,027,077 MXN 98,780,775 27/07/2021 Barclays (89,945) (0.01)CLP 3,560,877,420 USD 4,935,107 27/07/2021 Citibank (25,224) -CLP 17,232,508,289 USD 23,867,191 29/09/2021 BNP Paribas (142,680) (0.01)CNH 353,115,487 USD 54,678,743 29/09/2021 Merrill Lynch (390,123) (0.02)CNH 20,057,221 USD 3,085,357 29/09/2021 State Street (1,723) -COP 9,064,786,841 USD 2,458,581 27/07/2021 Barclays (49,614) -COP 9,022,133,949 USD 2,444,360 27/07/2021 BNP Paribas (46,728) -CZK 200,443,432 USD 9,570,492 27/07/2021 Toronto-Dominion Bank (242,670) (0.01)CZK 1,050,453,062 USD 50,142,370 29/09/2021 Merrill Lynch (1,285,899) (0.07)EUR 4,493,107 CNH 34,865,033 29/09/2021 Citibank (14,911) -EUR 2,043,080 TRY 21,966,996 27/07/2021 Barclays (71,923) -EUR 1,247,324 USD 1,527,612 06/07/2021 BNP Paribas (46,390) -EUR 78,464,731 USD 95,740,413 06/07/2021 Citibank (2,562,000) (0.13)EUR 95,988,445 USD 117,134,553 06/07/2021 Goldman Sachs (3,146,385) (0.16)EUR 540,738 USD 658,357 06/07/2021 HSBC (16,220) -EUR 2,300 USD 2,734 06/07/2021 Merrill Lynch (2) -EUR 1,228,614 USD 1,495,807 06/07/2021 RBC (36,804) -EUR 17,148 USD 20,908 06/07/2021 Standard Chartered (545) -EUR 1,233,723 USD 1,503,207 06/07/2021 State Street (38,137) -EUR 172,150,376 USD 204,869,466 04/08/2021 BNP Paribas (313,267) (0.02)EUR 4,719 USD 5,643 04/08/2021 HSBC (35) -EUR 4,988 USD 5,967 04/08/2021 RBC (41) -EUR 761,908 USD 910,527 04/08/2021 State Street (5,196) -EUR 1,575,283 USD 1,881,909 04/08/2021 Toronto-Dominion Bank (10,092) -EUR 5,709,259 USD 6,934,406 29/09/2021 Merrill Lynch (142,286) (0.01)EUR 760,971 USD 910,460 29/09/2021 RBC (5,158) -EUR 30,885,482 USD 36,856,263 29/09/2021 State Street (112,812) (0.01)GBP 376,176 USD 532,724 06/07/2021 Barclays (12,075) -GBP 20,717,804 USD 29,390,140 06/07/2021 BNP Paribas (715,557) (0.04)GBP 64,678 USD 91,419 06/07/2021 RBC (1,901) -GBP 20,487,895 USD 28,402,369 04/08/2021 Barclays (43,861) -GBP 186,440 USD 260,260 04/08/2021 Goldman Sachs (2,197) -GBP 90,625 USD 126,265 04/08/2021 Toronto-Dominion Bank (826) -HUF 1,421,127,476 EUR 4,095,460 27/07/2021 BNP Paribas (68,609) -HUF 4,997,213,166 USD 17,172,967 29/09/2021 Goldman Sachs (327,711) (0.02)HUF 3,975,739,407 USD 13,720,617 29/09/2021 HSBC (318,677) (0.02)IDR 53,637,158,512 USD 3,679,297 29/09/2021 HSBC (31,756) -ILS 31,404,969 USD 9,679,675 27/07/2021 Citibank (41,128) -INR 368,153,795 USD 4,999,726 27/07/2021 BNP Paribas (60,730) -KRW 4,968,690,324 USD 4,441,764 27/07/2021 HSBC (42,938) -KRW 14,520,526,608 USD 12,977,850 29/09/2021 BNP Paribas (125,673) (0.01)MXN 453,047,905 USD 22,628,156 29/09/2021 Goldman Sachs (64,565) -MXN 395,653,358 USD 19,769,818 29/09/2021 HSBC (64,704) -PEN 49,563,513 USD 12,873,974 29/09/2021 Standard Chartered (81,478) (0.01)PLN 28,472,042 USD 7,643,204 27/07/2021 Goldman Sachs (165,141) (0.01)PLN 14,570,814 USD 3,860,286 29/09/2021 Citibank (32,793) -PLN 617,661,149 USD 165,828,295 29/09/2021 Goldman Sachs (3,579,726) (0.19)RON 62,472,078 USD 15,317,055 29/09/2021 HSBC (319,840) (0.02)RUB 179,268,908 USD 2,474,707 27/07/2021 Citibank (24,839) -RUB 180,784,896 USD 2,485,296 27/07/2021 Goldman Sachs (14,710) -RUB 169,064,031 USD 2,300,864 29/09/2021 HSBC (14,656) -THB 1,049,216,438 USD 33,661,098 29/09/2021 Goldman Sachs (1,065,770) (0.06)TRY 21,515,727 USD 2,466,975 27/07/2021 Barclays (19,125) -TRY 24,283,906 USD 2,752,928 29/09/2021 Barclays (78,616) (0.01)USD 117,111 AUD 156,496 06/07/2021 BNP Paribas (311) -USD 25,567 AUD 34,139 06/07/2021 RBC (48) -USD 2,479,369 BRL 12,451,393 27/07/2021 Goldman Sachs (5,219) -USD 2,455,426 CLP 1,802,037,112 27/07/2021 Citibank (29,297) -USD 564,469 EUR 475,873 06/07/2021 Barclays (639) -USD 79,303 GBP 57,425 06/07/2021 Barclays (176) -USD 5,103,763 HUF 1,522,902,035 29/09/2021 HSBC (29,834) -USD 5,342,922 IDR 78,608,272,775 29/09/2021 HSBC (2,755) -USD 2,435,357 MXN 49,576,569 27/07/2021 Goldman Sachs (54,788) -ZAR 10,219,809 USD 711,547 29/09/2021 Citibank (1,850) -
Total Unrealised Loss on Forward Currency Exchange Contracts (18,114,067) (0.93)
Net Unrealised Loss on Forward Currency Exchange Contracts (9,504,794) (0.49)
175
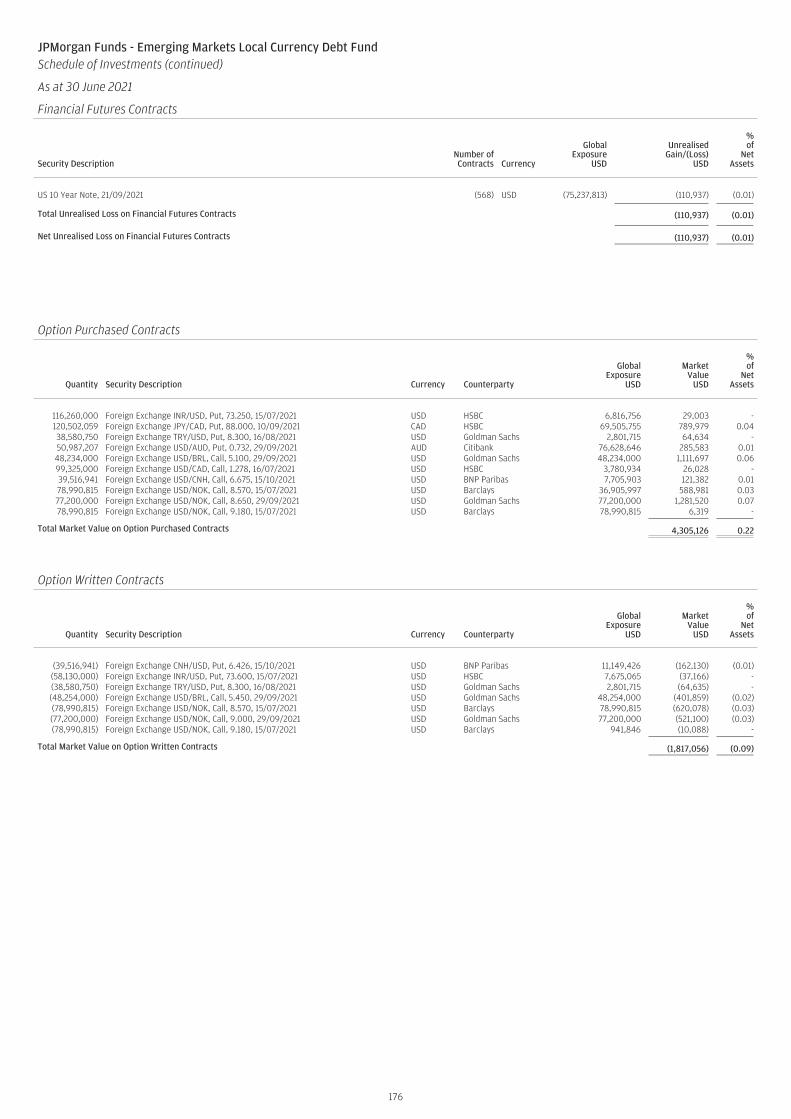
JPMorgan Funds - Emerging Markets Local Currency Debt FundSchedule of Investments (continued)
As at 30 June 2021
Financial Futures Contracts
Security DescriptionNumber ofContracts Currency
GlobalExposure
USD
UnrealisedGain/(Loss)
USD
%of
NetAssets
US 10 Year Note, 21/09/2021 (568) USD (75,237,813) (110,937) (0.01)
Total Unrealised Loss on Financial Futures Contracts (110,937) (0.01)
Net Unrealised Loss on Financial Futures Contracts (110,937) (0.01)
JPMorgan Funds - Emerging Markets Local Currency Debt FundSchedule of Investments (continued)
As at 30 June 2021
Option Purchased Contracts
Quantity Security Description Currency Counterparty
GlobalExposure
USD
MarketValue
USD
%of
NetAssets
116,260,000 Foreign Exchange INR/USD, Put, 73.250, 15/07/2021 USD HSBC 6,816,756 29,003 -120,502,059 Foreign Exchange JPY/CAD, Put, 88.000, 10/09/2021 CAD HSBC 69,505,755 789,979 0.0438,580,750 Foreign Exchange TRY/USD, Put, 8.300, 16/08/2021 USD Goldman Sachs 2,801,715 64,634 -50,987,207 Foreign Exchange USD/AUD, Put, 0.732, 29/09/2021 AUD Citibank 76,628,646 285,583 0.0148,234,000 Foreign Exchange USD/BRL, Call, 5.100, 29/09/2021 USD Goldman Sachs 48,234,000 1,111,697 0.0699,325,000 Foreign Exchange USD/CAD, Call, 1.278, 16/07/2021 USD HSBC 3,780,934 26,028 -39,516,941 Foreign Exchange USD/CNH, Call, 6.675, 15/10/2021 USD BNP Paribas 7,705,903 121,382 0.0178,990,815 Foreign Exchange USD/NOK, Call, 8.570, 15/07/2021 USD Barclays 36,905,997 588,981 0.0377,200,000 Foreign Exchange USD/NOK, Call, 8.650, 29/09/2021 USD Goldman Sachs 77,200,000 1,281,520 0.0778,990,815 Foreign Exchange USD/NOK, Call, 9.180, 15/07/2021 USD Barclays 78,990,815 6,319 -
Total Market Value on Option Purchased Contracts 4,305,126 0.22
Option Written Contracts
Quantity Security Description Currency Counterparty
GlobalExposure
USD
MarketValue
USD
%of
NetAssets
(39,516,941) Foreign Exchange CNH/USD, Put, 6.426, 15/10/2021 USD BNP Paribas 11,149,426 (162,130) (0.01)(58,130,000) Foreign Exchange INR/USD, Put, 73.600, 15/07/2021 USD HSBC 7,675,065 (37,166) -(38,580,750) Foreign Exchange TRY/USD, Put, 8.300, 16/08/2021 USD Goldman Sachs 2,801,715 (64,635) -(48,254,000) Foreign Exchange USD/BRL, Call, 5.450, 29/09/2021 USD Goldman Sachs 48,254,000 (401,859) (0.02)(78,990,815) Foreign Exchange USD/NOK, Call, 8.570, 15/07/2021 USD Barclays 78,990,815 (620,078) (0.03)(77,200,000) Foreign Exchange USD/NOK, Call, 9.000, 29/09/2021 USD Goldman Sachs 77,200,000 (521,100) (0.03)(78,990,815) Foreign Exchange USD/NOK, Call, 9.180, 15/07/2021 USD Barclays 941,846 (10,088) -
Total Market Value on Option Written Contracts (1,817,056) (0.09)
176
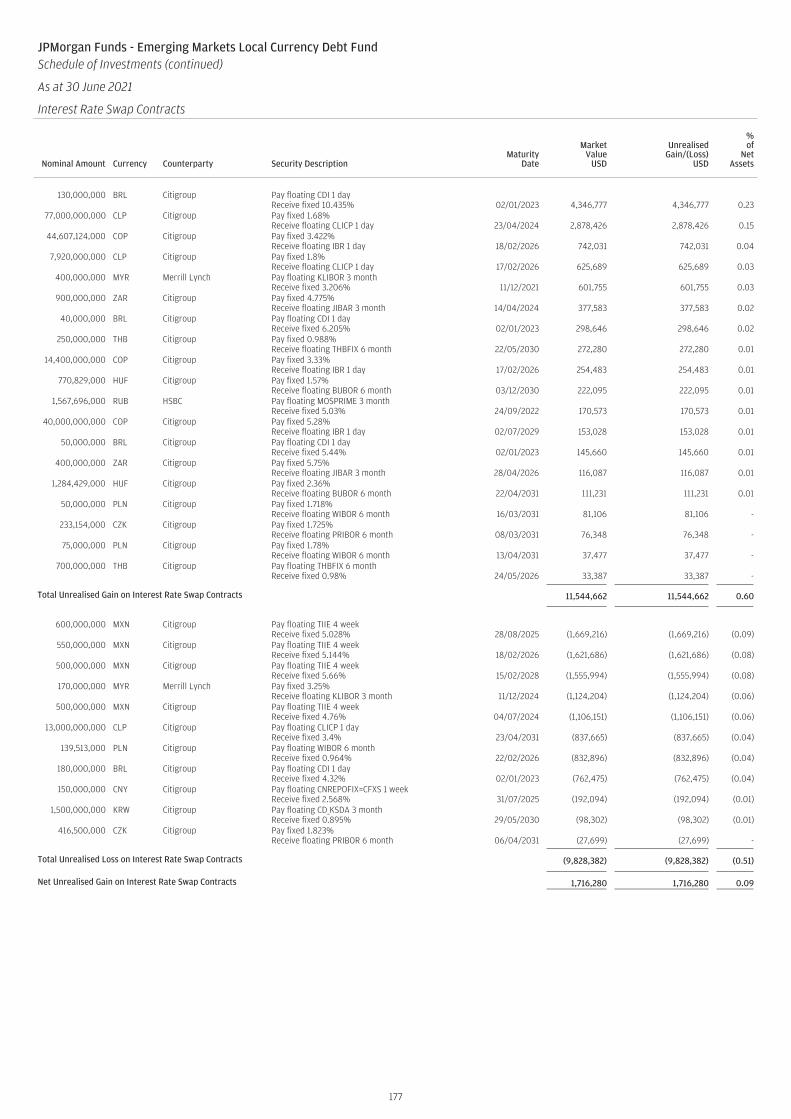
JPMorgan Funds - Emerging Markets Local Currency Debt FundSchedule of Investments (continued)
As at 30 June 2021
Interest Rate Swap Contracts
Nominal Amount Currency Counterparty Security DescriptionMaturity
Date
MarketValue
USD
UnrealisedGain/(Loss)
USD
%of
NetAssets
130,000,000 BRL Citigroup Pay floating CDI 1 dayReceive fixed 10.435% 02/01/2023 4,346,777 4,346,777 0.23
77,000,000,000 CLP Citigroup Pay fixed 1.68%Receive floating CLICP 1 day 23/04/2024 2,878,426 2,878,426 0.15
44,607,124,000 COP Citigroup Pay fixed 3.422%Receive floating IBR 1 day 18/02/2026 742,031 742,031 0.04
7,920,000,000 CLP Citigroup Pay fixed 1.8%Receive floating CLICP 1 day 17/02/2026 625,689 625,689 0.03
400,000,000 MYR Merrill Lynch Pay floating KLIBOR 3 monthReceive fixed 3.206% 11/12/2021 601,755 601,755 0.03
900,000,000 ZAR Citigroup Pay fixed 4.775%Receive floating JIBAR 3 month 14/04/2024 377,583 377,583 0.02
40,000,000 BRL Citigroup Pay floating CDI 1 dayReceive fixed 6.205% 02/01/2023 298,646 298,646 0.02
250,000,000 THB Citigroup Pay fixed 0.988%Receive floating THBFIX 6 month 22/05/2030 272,280 272,280 0.01
14,400,000,000 COP Citigroup Pay fixed 3.33%Receive floating IBR 1 day 17/02/2026 254,483 254,483 0.01
770,829,000 HUF Citigroup Pay fixed 1.57%Receive floating BUBOR 6 month 03/12/2030 222,095 222,095 0.01
1,567,696,000 RUB HSBC Pay floating MOSPRIME 3 monthReceive fixed 5.03% 24/09/2022 170,573 170,573 0.01
40,000,000,000 COP Citigroup Pay fixed 5.28%Receive floating IBR 1 day 02/07/2029 153,028 153,028 0.01
50,000,000 BRL Citigroup Pay floating CDI 1 dayReceive fixed 5.44% 02/01/2023 145,660 145,660 0.01
400,000,000 ZAR Citigroup Pay fixed 5.75%Receive floating JIBAR 3 month 28/04/2026 116,087 116,087 0.01
1,284,429,000 HUF Citigroup Pay fixed 2.36%Receive floating BUBOR 6 month 22/04/2031 111,231 111,231 0.01
50,000,000 PLN Citigroup Pay fixed 1.718%Receive floating WIBOR 6 month 16/03/2031 81,106 81,106 -
233,154,000 CZK Citigroup Pay fixed 1.725%Receive floating PRIBOR 6 month 08/03/2031 76,348 76,348 -
75,000,000 PLN Citigroup Pay fixed 1.78%Receive floating WIBOR 6 month 13/04/2031 37,477 37,477 -
700,000,000 THB Citigroup Pay floating THBFIX 6 monthReceive fixed 0.98% 24/05/2026 33,387 33,387 -
Total Unrealised Gain on Interest Rate Swap Contracts 11,544,662 11,544,662 0.60
600,000,000 MXN Citigroup Pay floating TIIE 4 weekReceive fixed 5.028% 28/08/2025 (1,669,216) (1,669,216) (0.09)
550,000,000 MXN Citigroup Pay floating TIIE 4 weekReceive fixed 5.144% 18/02/2026 (1,621,686) (1,621,686) (0.08)
500,000,000 MXN Citigroup Pay floating TIIE 4 weekReceive fixed 5.66% 15/02/2028 (1,555,994) (1,555,994) (0.08)
170,000,000 MYR Merrill Lynch Pay fixed 3.25%Receive floating KLIBOR 3 month 11/12/2024 (1,124,204) (1,124,204) (0.06)
500,000,000 MXN Citigroup Pay floating TIIE 4 weekReceive fixed 4.76% 04/07/2024 (1,106,151) (1,106,151) (0.06)
13,000,000,000 CLP Citigroup Pay floating CLICP 1 dayReceive fixed 3.4% 23/04/2031 (837,665) (837,665) (0.04)
139,513,000 PLN Citigroup Pay floating WIBOR 6 monthReceive fixed 0.964% 22/02/2026 (832,896) (832,896) (0.04)
180,000,000 BRL Citigroup Pay floating CDI 1 dayReceive fixed 4.32% 02/01/2023 (762,475) (762,475) (0.04)
150,000,000 CNY Citigroup Pay floating CNREPOFIX=CFXS 1 weekReceive fixed 2.568% 31/07/2025 (192,094) (192,094) (0.01)
1,500,000,000 KRW Citigroup Pay floating CD_KSDA 3 monthReceive fixed 0.895% 29/05/2030 (98,302) (98,302) (0.01)
416,500,000 CZK Citigroup Pay fixed 1.823%Receive floating PRIBOR 6 month 06/04/2031 (27,699) (27,699) -
Total Unrealised Loss on Interest Rate Swap Contracts (9,828,382) (9,828,382) (0.51)
Net Unrealised Gain on Interest Rate Swap Contracts 1,716,280 1,716,280 0.09
177
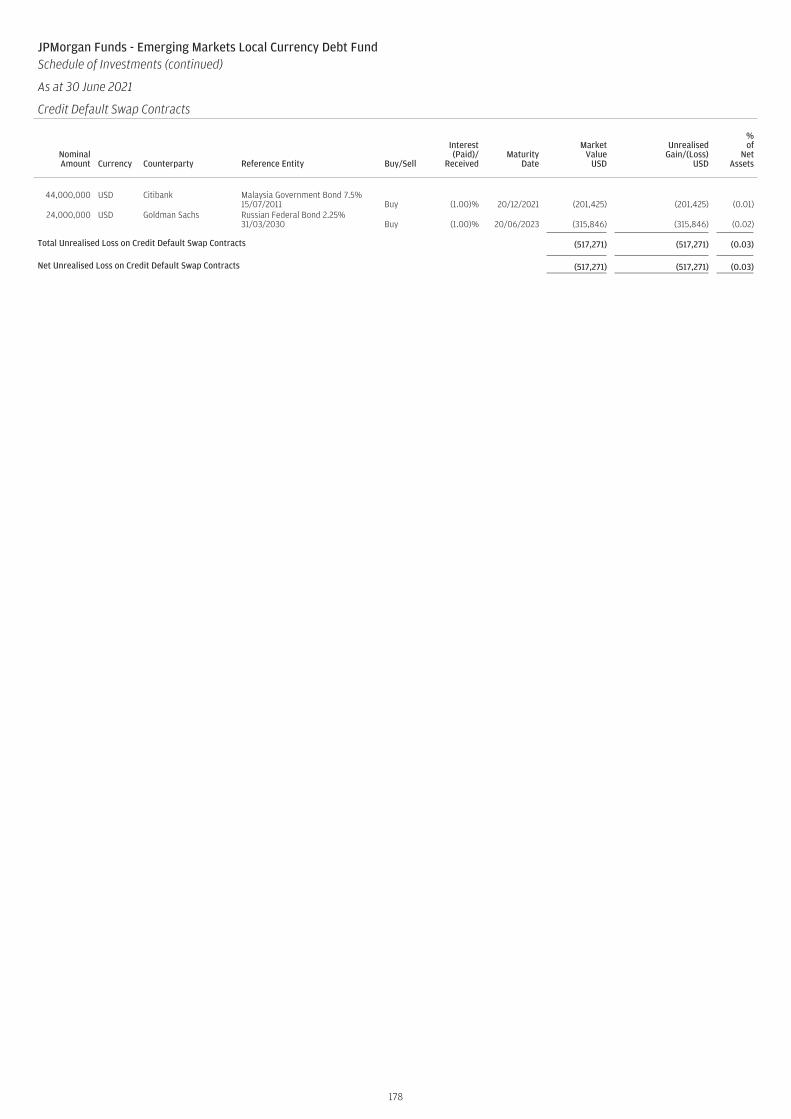
JPMorgan Funds - Emerging Markets Local Currency Debt FundSchedule of Investments (continued)
As at 30 June 2021
Credit Default Swap Contracts
NominalAmount Currency Counterparty Reference Entity Buy/Sell
Interest(Paid)/
ReceivedMaturity
Date
MarketValue
USD
UnrealisedGain/(Loss)
USD
%of
NetAssets
44,000,000 USD Citibank Malaysia Government Bond 7.5%15/07/2011 Buy (1.00)% 20/12/2021 (201,425) (201,425) (0.01)
24,000,000 USD Goldman Sachs Russian Federal Bond 2.25%31/03/2030 Buy (1.00)% 20/06/2023 (315,846) (315,846) (0.02)
Total Unrealised Loss on Credit Default Swap Contracts (517,271) (517,271) (0.03)
Net Unrealised Loss on Credit Default Swap Contracts (517,271) (517,271) (0.03)
178
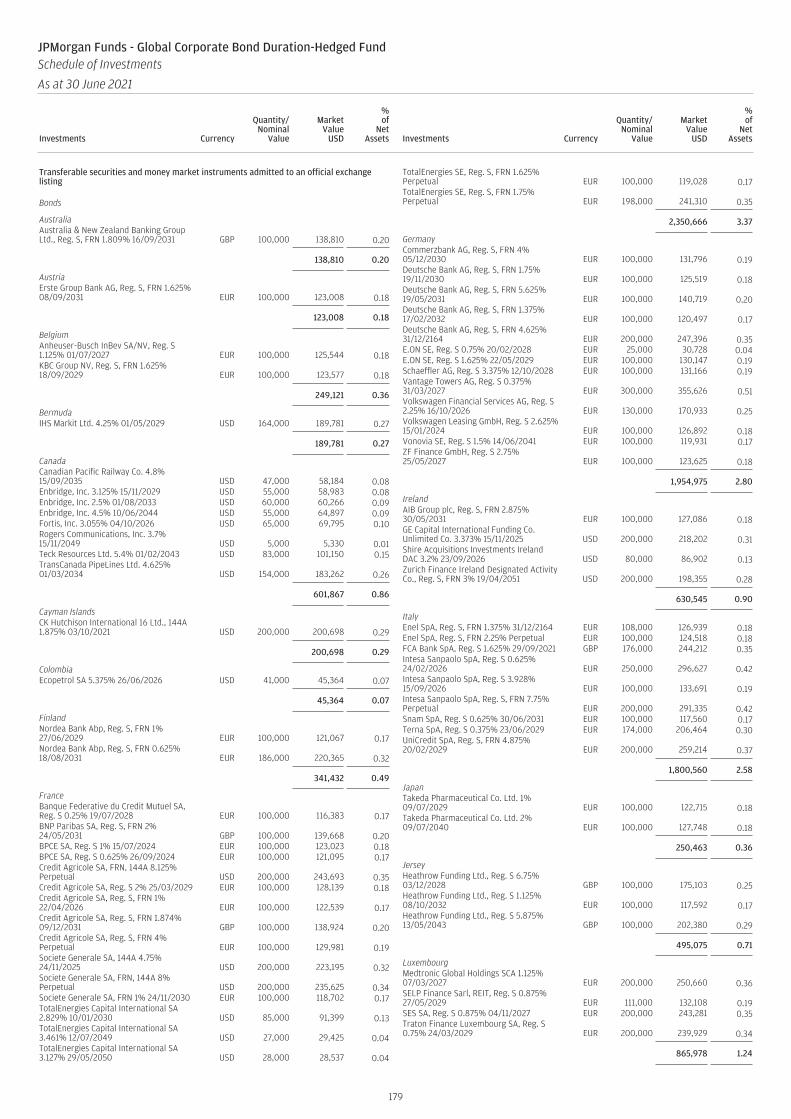
Transferable securities and money market instruments admitted to an official exchangelisting
Bonds
AustraliaAustralia & New Zealand Banking GroupLtd., Reg. S, FRN 1.809% 16/09/2031 GBP 100,000 138,810 0.20
138,810 0.20
AustriaErste Group Bank AG, Reg. S, FRN 1.625%08/09/2031 EUR 100,000 123,008 0.18
123,008 0.18
BelgiumAnheuser-Busch InBev SA/NV, Reg. S1.125% 01/07/2027 EUR 100,000 125,544 0.18KBC Group NV, Reg. S, FRN 1.625%18/09/2029 EUR 100,000 123,577 0.18
249,121 0.36
BermudaIHS Markit Ltd. 4.25% 01/05/2029 USD 164,000 189,781 0.27
189,781 0.27
CanadaCanadian Pacific Railway Co. 4.8%15/09/2035 USD 47,000 58,184 0.08Enbridge, Inc. 3.125% 15/11/2029 USD 55,000 58,983 0.08Enbridge, Inc. 2.5% 01/08/2033 USD 60,000 60,266 0.09Enbridge, Inc. 4.5% 10/06/2044 USD 55,000 64,897 0.09Fortis, Inc. 3.055% 04/10/2026 USD 65,000 69,795 0.10Rogers Communications, Inc. 3.7%15/11/2049 USD 5,000 5,330 0.01Teck Resources Ltd. 5.4% 01/02/2043 USD 83,000 101,150 0.15TransCanada PipeLines Ltd. 4.625%01/03/2034 USD 154,000 183,262 0.26
601,867 0.86
Cayman IslandsCK Hutchison International 16 Ltd., 144A1.875% 03/10/2021 USD 200,000 200,698 0.29
200,698 0.29
ColombiaEcopetrol SA 5.375% 26/06/2026 USD 41,000 45,364 0.07
45,364 0.07
FinlandNordea Bank Abp, Reg. S, FRN 1%27/06/2029 EUR 100,000 121,067 0.17Nordea Bank Abp, Reg. S, FRN 0.625%18/08/2031 EUR 186,000 220,365 0.32
341,432 0.49
FranceBanque Federative du Credit Mutuel SA,Reg. S 0.25% 19/07/2028 EUR 100,000 116,383 0.17BNP Paribas SA, Reg. S, FRN 2%24/05/2031 GBP 100,000 139,668 0.20BPCE SA, Reg. S 1% 15/07/2024 EUR 100,000 123,023 0.18BPCE SA, Reg. S 0.625% 26/09/2024 EUR 100,000 121,095 0.17Credit Agricole SA, FRN, 144A 8.125%Perpetual USD 200,000 243,693 0.35Credit Agricole SA, Reg. S 2% 25/03/2029 EUR 100,000 128,139 0.18Credit Agricole SA, Reg. S, FRN 1%22/04/2026 EUR 100,000 122,539 0.17Credit Agricole SA, Reg. S, FRN 1.874%09/12/2031 GBP 100,000 138,924 0.20Credit Agricole SA, Reg. S, FRN 4%Perpetual EUR 100,000 129,981 0.19Societe Generale SA, 144A 4.75%24/11/2025 USD 200,000 223,195 0.32Societe Generale SA, FRN, 144A 8%Perpetual USD 200,000 235,625 0.34Societe Generale SA, FRN 1% 24/11/2030 EUR 100,000 118,702 0.17TotalEnergies Capital International SA2.829% 10/01/2030 USD 85,000 91,399 0.13TotalEnergies Capital International SA3.461% 12/07/2049 USD 27,000 29,425 0.04TotalEnergies Capital International SA3.127% 29/05/2050 USD 28,000 28,537 0.04
TotalEnergies SE, Reg. S, FRN 1.625%Perpetual EUR 100,000 119,028 0.17TotalEnergies SE, Reg. S, FRN 1.75%Perpetual EUR 198,000 241,310 0.35
2,350,666 3.37
GermanyCommerzbank AG, Reg. S, FRN 4%05/12/2030 EUR 100,000 131,796 0.19Deutsche Bank AG, Reg. S, FRN 1.75%19/11/2030 EUR 100,000 125,519 0.18Deutsche Bank AG, Reg. S, FRN 5.625%19/05/2031 EUR 100,000 140,719 0.20Deutsche Bank AG, Reg. S, FRN 1.375%17/02/2032 EUR 100,000 120,497 0.17Deutsche Bank AG, Reg. S, FRN 4.625%31/12/2164 EUR 200,000 247,396 0.35E.ON SE, Reg. S 0.75% 20/02/2028 EUR 25,000 30,728 0.04E.ON SE, Reg. S 1.625% 22/05/2029 EUR 100,000 130,147 0.19Schaeffler AG, Reg. S 3.375% 12/10/2028 EUR 100,000 131,166 0.19Vantage Towers AG, Reg. S 0.375%31/03/2027 EUR 300,000 355,626 0.51Volkswagen Financial Services AG, Reg. S2.25% 16/10/2026 EUR 130,000 170,933 0.25Volkswagen Leasing GmbH, Reg. S 2.625%15/01/2024 EUR 100,000 126,892 0.18Vonovia SE, Reg. S 1.5% 14/06/2041 EUR 100,000 119,931 0.17ZF Finance GmbH, Reg. S 2.75%25/05/2027 EUR 100,000 123,625 0.18
1,954,975 2.80
IrelandAIB Group plc, Reg. S, FRN 2.875%30/05/2031 EUR 100,000 127,086 0.18GE Capital International Funding Co.Unlimited Co. 3.373% 15/11/2025 USD 200,000 218,202 0.31Shire Acquisitions Investments IrelandDAC 3.2% 23/09/2026 USD 80,000 86,902 0.13Zurich Finance Ireland Designated ActivityCo., Reg. S, FRN 3% 19/04/2051 USD 200,000 198,355 0.28
630,545 0.90
ItalyEnel SpA, Reg. S, FRN 1.375% 31/12/2164 EUR 108,000 126,939 0.18Enel SpA, Reg. S, FRN 2.25% Perpetual EUR 100,000 124,518 0.18FCA Bank SpA, Reg. S 1.625% 29/09/2021 GBP 176,000 244,212 0.35Intesa Sanpaolo SpA, Reg. S 0.625%24/02/2026 EUR 250,000 296,627 0.42Intesa Sanpaolo SpA, Reg. S 3.928%15/09/2026 EUR 100,000 133,691 0.19Intesa Sanpaolo SpA, Reg. S, FRN 7.75%Perpetual EUR 200,000 291,335 0.42Snam SpA, Reg. S 0.625% 30/06/2031 EUR 100,000 117,560 0.17Terna SpA, Reg. S 0.375% 23/06/2029 EUR 174,000 206,464 0.30UniCredit SpA, Reg. S, FRN 4.875%20/02/2029 EUR 200,000 259,214 0.37
1,800,560 2.58
JapanTakeda Pharmaceutical Co. Ltd. 1%09/07/2029 EUR 100,000 122,715 0.18Takeda Pharmaceutical Co. Ltd. 2%09/07/2040 EUR 100,000 127,748 0.18
250,463 0.36
JerseyHeathrow Funding Ltd., Reg. S 6.75%03/12/2028 GBP 100,000 175,103 0.25Heathrow Funding Ltd., Reg. S 1.125%08/10/2032 EUR 100,000 117,592 0.17Heathrow Funding Ltd., Reg. S 5.875%13/05/2043 GBP 100,000 202,380 0.29
495,075 0.71
LuxembourgMedtronic Global Holdings SCA 1.125%07/03/2027 EUR 200,000 250,660 0.36SELP Finance Sarl, REIT, Reg. S 0.875%27/05/2029 EUR 111,000 132,108 0.19SES SA, Reg. S 0.875% 04/11/2027 EUR 200,000 243,281 0.35Traton Finance Luxembourg SA, Reg. S0.75% 24/03/2029 EUR 200,000 239,929 0.34
865,978 1.24
179
JPMorgan Funds - Global Corporate Bond Duration-Hedged FundSchedule of Investments
As at 30 June 2021
Investments Currency
Quantity/Nominal
Value
MarketValue
USD
%of
NetAssets Investments Currency
Quantity/Nominal
Value
MarketValue
USD
%of
NetAssets
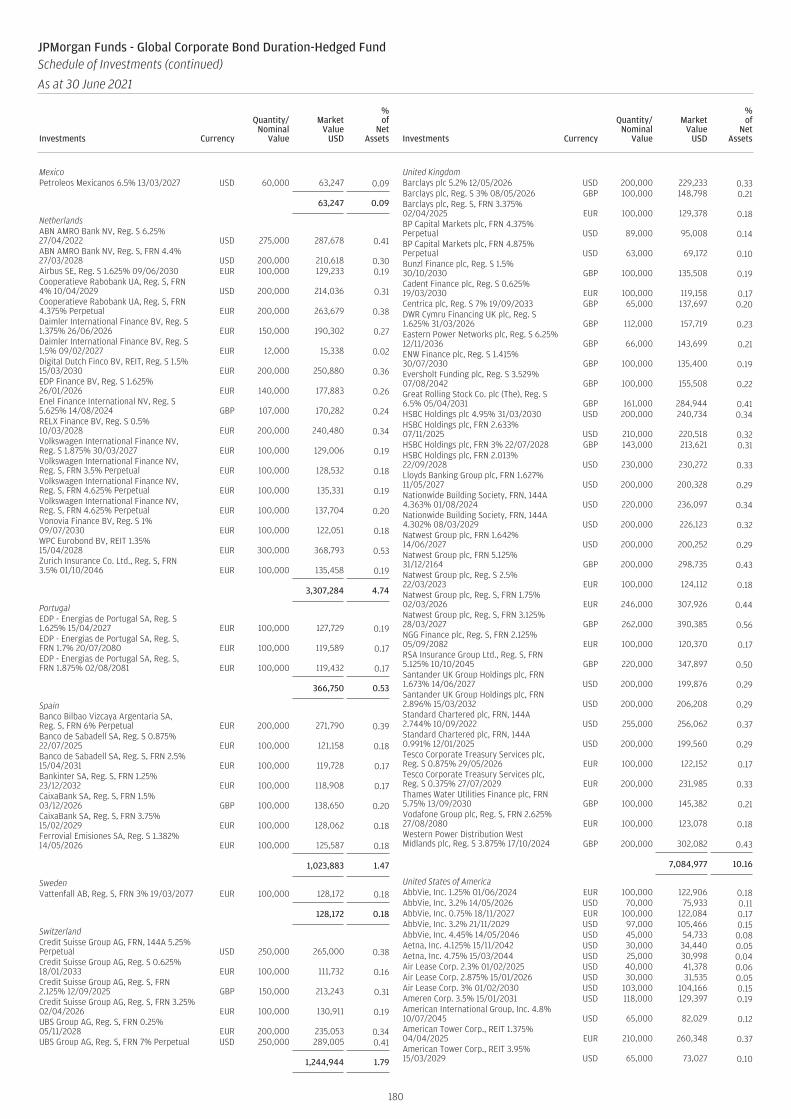
MexicoPetroleos Mexicanos 6.5% 13/03/2027 USD 60,000 63,247 0.09
63,247 0.09
NetherlandsABN AMRO Bank NV, Reg. S 6.25%27/04/2022 USD 275,000 287,678 0.41ABN AMRO Bank NV, Reg. S, FRN 4.4%27/03/2028 USD 200,000 210,618 0.30Airbus SE, Reg. S 1.625% 09/06/2030 EUR 100,000 129,233 0.19Cooperatieve Rabobank UA, Reg. S, FRN4% 10/04/2029 USD 200,000 214,036 0.31Cooperatieve Rabobank UA, Reg. S, FRN4.375% Perpetual EUR 200,000 263,679 0.38Daimler International Finance BV, Reg. S1.375% 26/06/2026 EUR 150,000 190,302 0.27Daimler International Finance BV, Reg. S1.5% 09/02/2027 EUR 12,000 15,338 0.02Digital Dutch Finco BV, REIT, Reg. S 1.5%15/03/2030 EUR 200,000 250,880 0.36EDP Finance BV, Reg. S 1.625%26/01/2026 EUR 140,000 177,883 0.26Enel Finance International NV, Reg. S5.625% 14/08/2024 GBP 107,000 170,282 0.24RELX Finance BV, Reg. S 0.5%10/03/2028 EUR 200,000 240,480 0.34Volkswagen International Finance NV,Reg. S 1.875% 30/03/2027 EUR 100,000 129,006 0.19Volkswagen International Finance NV,Reg. S, FRN 3.5% Perpetual EUR 100,000 128,532 0.18Volkswagen International Finance NV,Reg. S, FRN 4.625% Perpetual EUR 100,000 135,331 0.19Volkswagen International Finance NV,Reg. S, FRN 4.625% Perpetual EUR 100,000 137,704 0.20Vonovia Finance BV, Reg. S 1%09/07/2030 EUR 100,000 122,051 0.18WPC Eurobond BV, REIT 1.35%15/04/2028 EUR 300,000 368,793 0.53Zurich Insurance Co. Ltd., Reg. S, FRN3.5% 01/10/2046 EUR 100,000 135,458 0.19
3,307,284 4.74
PortugalEDP - Energias de Portugal SA, Reg. S1.625% 15/04/2027 EUR 100,000 127,729 0.19EDP - Energias de Portugal SA, Reg. S,FRN 1.7% 20/07/2080 EUR 100,000 119,589 0.17EDP - Energias de Portugal SA, Reg. S,FRN 1.875% 02/08/2081 EUR 100,000 119,432 0.17
366,750 0.53
SpainBanco Bilbao Vizcaya Argentaria SA,Reg. S, FRN 6% Perpetual EUR 200,000 271,790 0.39Banco de Sabadell SA, Reg. S 0.875%22/07/2025 EUR 100,000 121,158 0.18Banco de Sabadell SA, Reg. S, FRN 2.5%15/04/2031 EUR 100,000 119,728 0.17Bankinter SA, Reg. S, FRN 1.25%23/12/2032 EUR 100,000 118,908 0.17CaixaBank SA, Reg. S, FRN 1.5%03/12/2026 GBP 100,000 138,650 0.20CaixaBank SA, Reg. S, FRN 3.75%15/02/2029 EUR 100,000 128,062 0.18Ferrovial Emisiones SA, Reg. S 1.382%14/05/2026 EUR 100,000 125,587 0.18
1,023,883 1.47
SwedenVattenfall AB, Reg. S, FRN 3% 19/03/2077 EUR 100,000 128,172 0.18
128,172 0.18
SwitzerlandCredit Suisse Group AG, FRN, 144A 5.25%Perpetual USD 250,000 265,000 0.38Credit Suisse Group AG, Reg. S 0.625%18/01/2033 EUR 100,000 111,732 0.16Credit Suisse Group AG, Reg. S, FRN2.125% 12/09/2025 GBP 150,000 213,243 0.31Credit Suisse Group AG, Reg. S, FRN 3.25%02/04/2026 EUR 100,000 130,911 0.19UBS Group AG, Reg. S, FRN 0.25%05/11/2028 EUR 200,000 235,053 0.34UBS Group AG, Reg. S, FRN 7% Perpetual USD 250,000 289,005 0.41
1,244,944 1.79
United KingdomBarclays plc 5.2% 12/05/2026 USD 200,000 229,233 0.33Barclays plc, Reg. S 3% 08/05/2026 GBP 100,000 148,798 0.21Barclays plc, Reg. S, FRN 3.375%02/04/2025 EUR 100,000 129,378 0.18BP Capital Markets plc, FRN 4.375%Perpetual USD 89,000 95,008 0.14BP Capital Markets plc, FRN 4.875%Perpetual USD 63,000 69,172 0.10Bunzl Finance plc, Reg. S 1.5%30/10/2030 GBP 100,000 135,508 0.19Cadent Finance plc, Reg. S 0.625%19/03/2030 EUR 100,000 119,158 0.17Centrica plc, Reg. S 7% 19/09/2033 GBP 65,000 137,697 0.20DWR Cymru Financing UK plc, Reg. S1.625% 31/03/2026 GBP 112,000 157,719 0.23Eastern Power Networks plc, Reg. S 6.25%12/11/2036 GBP 66,000 143,699 0.21ENW Finance plc, Reg. S 1.415%30/07/2030 GBP 100,000 135,400 0.19Eversholt Funding plc, Reg. S 3.529%07/08/2042 GBP 100,000 155,508 0.22Great Rolling Stock Co. plc (The), Reg. S6.5% 05/04/2031 GBP 161,000 284,944 0.41HSBC Holdings plc 4.95% 31/03/2030 USD 200,000 240,734 0.34HSBC Holdings plc, FRN 2.633%07/11/2025 USD 210,000 220,518 0.32HSBC Holdings plc, FRN 3% 22/07/2028 GBP 143,000 213,621 0.31HSBC Holdings plc, FRN 2.013%22/09/2028 USD 230,000 230,272 0.33Lloyds Banking Group plc, FRN 1.627%11/05/2027 USD 200,000 200,328 0.29Nationwide Building Society, FRN, 144A4.363% 01/08/2024 USD 220,000 236,097 0.34Nationwide Building Society, FRN, 144A4.302% 08/03/2029 USD 200,000 226,123 0.32Natwest Group plc, FRN 1.642%14/06/2027 USD 200,000 200,252 0.29Natwest Group plc, FRN 5.125%31/12/2164 GBP 200,000 298,735 0.43Natwest Group plc, Reg. S 2.5%22/03/2023 EUR 100,000 124,112 0.18Natwest Group plc, Reg. S, FRN 1.75%02/03/2026 EUR 246,000 307,926 0.44Natwest Group plc, Reg. S, FRN 3.125%28/03/2027 GBP 262,000 390,385 0.56NGG Finance plc, Reg. S, FRN 2.125%05/09/2082 EUR 100,000 120,370 0.17RSA Insurance Group Ltd., Reg. S, FRN5.125% 10/10/2045 GBP 220,000 347,897 0.50Santander UK Group Holdings plc, FRN1.673% 14/06/2027 USD 200,000 199,876 0.29Santander UK Group Holdings plc, FRN2.896% 15/03/2032 USD 200,000 206,208 0.29Standard Chartered plc, FRN, 144A2.744% 10/09/2022 USD 255,000 256,062 0.37Standard Chartered plc, FRN, 144A0.991% 12/01/2025 USD 200,000 199,560 0.29Tesco Corporate Treasury Services plc,Reg. S 0.875% 29/05/2026 EUR 100,000 122,152 0.17Tesco Corporate Treasury Services plc,Reg. S 0.375% 27/07/2029 EUR 200,000 231,985 0.33Thames Water Utilities Finance plc, FRN5.75% 13/09/2030 GBP 100,000 145,382 0.21Vodafone Group plc, Reg. S, FRN 2.625%27/08/2080 EUR 100,000 123,078 0.18Western Power Distribution WestMidlands plc, Reg. S 3.875% 17/10/2024 GBP 200,000 302,082 0.43
7,084,977 10.16
United States of AmericaAbbVie, Inc. 1.25% 01/06/2024 EUR 100,000 122,906 0.18AbbVie, Inc. 3.2% 14/05/2026 USD 70,000 75,933 0.11AbbVie, Inc. 0.75% 18/11/2027 EUR 100,000 122,084 0.17AbbVie, Inc. 3.2% 21/11/2029 USD 97,000 105,466 0.15AbbVie, Inc. 4.45% 14/05/2046 USD 45,000 54,733 0.08Aetna, Inc. 4.125% 15/11/2042 USD 30,000 34,440 0.05Aetna, Inc. 4.75% 15/03/2044 USD 25,000 30,998 0.04Air Lease Corp. 2.3% 01/02/2025 USD 40,000 41,378 0.06Air Lease Corp. 2.875% 15/01/2026 USD 30,000 31,535 0.05Air Lease Corp. 3% 01/02/2030 USD 103,000 104,166 0.15Ameren Corp. 3.5% 15/01/2031 USD 118,000 129,397 0.19American International Group, Inc. 4.8%10/07/2045 USD 65,000 82,029 0.12American Tower Corp., REIT 1.375%04/04/2025 EUR 210,000 260,348 0.37American Tower Corp., REIT 3.95%15/03/2029 USD 65,000 73,027 0.10
180
JPMorgan Funds - Global Corporate Bond Duration-Hedged FundSchedule of Investments (continued)
As at 30 June 2021
Investments Currency
Quantity/Nominal
Value
MarketValue
USD
%of
NetAssets Investments Currency
Quantity/Nominal
Value
MarketValue
USD
%of
NetAssets

American Tower Corp., REIT 0.875%21/05/2029 EUR 152,000 182,002 0.26American Tower Corp., REIT 2.1%15/06/2030 USD 50,000 49,361 0.07Anheuser-Busch Cos. LLC 4.7%01/02/2036 USD 260,000 319,367 0.46Anheuser-Busch InBev Finance, Inc.4.625% 01/02/2044 USD 56,000 68,098 0.10Anheuser-Busch InBev Worldwide, Inc.4.6% 15/04/2048 USD 90,000 110,239 0.16Anheuser-Busch InBev Worldwide, Inc.4.439% 06/10/2048 USD 180,000 215,366 0.31AT&T, Inc. 2.25% 01/02/2032 USD 130,000 127,897 0.18AT&T, Inc. 4.3% 15/12/2042 USD 1,000 1,144 0.00Bank of America Corp. 4.183% 25/11/2027 USD 120,000 134,422 0.19Bank of America Corp., Reg. S, FRN0.583% 24/08/2028 EUR 100,000 119,662 0.17Becton Dickinson and Co. 1.401%24/05/2023 EUR 100,000 121,991 0.17Becton Dickinson and Co. 1.957%11/02/2031 USD 110,000 107,465 0.15Berkshire Hathaway Finance Corp. 2.85%15/10/2050 USD 130,000 130,129 0.19Boston Properties LP, REIT 2.55%01/04/2032 USD 30,000 30,227 0.04Boston Scientific Corp. 2.65% 01/06/2030 USD 60,000 62,013 0.09BP Capital Markets America, Inc. 3%24/02/2050 USD 100,000 97,556 0.14BP Capital Markets America, Inc. 2.772%10/11/2050 USD 80,000 74,817 0.11Bristol-Myers Squibb Co. 2.55%13/11/2050 USD 131,000 125,665 0.18Burlington Northern Santa Fe LLC 4.375%01/09/2042 USD 90,000 112,430 0.16Burlington Northern Santa Fe LLC 4.15%01/04/2045 USD 46,000 56,372 0.08CenterPoint Energy, Inc. 2.95%01/03/2030 USD 9,000 9,520 0.01CenterPoint Energy, Inc. 2.65%01/06/2031 USD 140,000 142,814 0.20CF Industries, Inc. 5.15% 15/03/2034 USD 144,000 174,797 0.25CF Industries, Inc. 4.95% 01/06/2043 USD 25,000 29,586 0.04CF Industries, Inc. 5.375% 15/03/2044 USD 33,000 40,877 0.06Cigna Corp. 4.375% 15/10/2028 USD 40,000 46,615 0.07Cigna Corp. 3.2% 15/03/2040 USD 80,000 83,356 0.12Cigna Corp. 3.4% 15/03/2051 USD 80,000 83,643 0.12Cimarex Energy Co. 3.9% 15/05/2027 USD 30,000 32,962 0.05Citigroup, Inc., Reg. S, FRN 0.5%08/10/2027 EUR 150,000 179,586 0.26Coca-Cola Co. (The) 2.5% 01/06/2040 USD 45,000 44,712 0.06Comcast Corp. 1.5% 20/02/2029 GBP 100,000 139,068 0.20ConocoPhillips Co. 4.15% 15/11/2034 USD 42,000 48,924 0.07Crown Castle International Corp., REIT3.3% 01/07/2030 USD 20,000 21,450 0.03Crown Castle International Corp., REIT2.25% 15/01/2031 USD 50,000 49,441 0.07Crown Castle International Corp., REIT2.9% 01/04/2041 USD 55,000 53,614 0.08Crown Castle International Corp., REIT4.15% 01/07/2050 USD 15,000 17,210 0.02CVS Health Corp. 3.25% 15/08/2029 USD 106,000 115,448 0.17CVS Health Corp. 4.78% 25/03/2038 USD 20,000 24,664 0.04CVS Health Corp. 2.7% 21/08/2040 USD 160,000 155,295 0.22Dana, Inc. 5.625% 15/06/2028 USD 10,000 10,842 0.02Dell International LLC 6.02% 15/06/2026 USD 44,000 52,755 0.08Dominion Energy, Inc. 3.375%01/04/2030 USD 39,000 42,556 0.06Duke Energy Carolinas LLC 2.55%15/04/2031 USD 40,000 41,579 0.06Duke Energy Corp. 2.55% 15/06/2031 USD 69,000 69,906 0.10Duke Energy Corp. 3.5% 15/06/2051 USD 55,000 57,148 0.08Duke Energy Indiana LLC 3.75%15/05/2046 USD 40,000 44,963 0.06Duke Energy Indiana LLC 2.75%01/04/2050 USD 40,000 38,935 0.06Duke Energy Ohio, Inc. 4.3% 01/02/2049 USD 7,000 8,660 0.01Duke Energy Progress LLC 4.1%15/03/2043 USD 45,000 53,639 0.08Edison International 3.125% 15/11/2022 USD 5,000 5,152 0.01Edison International 2.95% 15/03/2023 USD 45,000 46,475 0.07Elanco Animal Health, Inc., FRN 4.912%27/08/2021 USD 85,000 85,609 0.12Encompass Health Corp. 4.75%01/02/2030 USD 15,000 15,977 0.02Energy Transfer LP 4.75% 15/01/2026 USD 125,000 140,894 0.20Energy Transfer LP 3.75% 15/05/2030 USD 51,000 55,456 0.08Energy Transfer LP 5.3% 01/04/2044 USD 28,000 32,422 0.05Energy Transfer LP 5.35% 15/05/2045 USD 16,000 18,573 0.03Entergy Arkansas LLC 4.95% 15/12/2044 USD 66,000 72,264 0.10
Entergy Corp. 2.4% 15/06/2031 USD 90,000 90,005 0.13Entergy Louisiana LLC 4.95% 15/01/2045 USD 82,000 89,979 0.13Enterprise Products Operating LLC 3.2%15/02/2052 USD 70,000 69,420 0.10Essex Portfolio LP, REIT 2.65%01/09/2050 USD 30,000 26,695 0.04Evergy, Inc. 2.9% 15/09/2029 USD 160,000 169,541 0.24Exxon Mobil Corp. 0.524% 26/06/2028 EUR 100,000 120,447 0.17Exxon Mobil Corp. 2.995% 16/08/2039 USD 145,000 149,874 0.21Fidelity National Information Services, Inc.1% 03/12/2028 EUR 100,000 122,263 0.18Fidelity National Information Services, Inc.2.25% 03/12/2029 GBP 100,000 144,190 0.21Fidelity National Information Services, Inc.2% 21/05/2030 EUR 100,000 131,450 0.19Fidelity National Information Services, Inc.3.1% 01/03/2041 USD 30,000 30,841 0.04Fiserv, Inc. 1.625% 01/07/2030 EUR 100,000 127,560 0.18Ford Motor Co. 9% 22/04/2025 USD 30,000 36,938 0.05Ford Motor Credit Co. LLC 3.625%17/06/2031 USD 200,000 203,750 0.29Freeport-McMoRan, Inc. 5% 01/09/2027 USD 30,000 31,736 0.05Freeport-McMoRan, Inc. 4.125%01/03/2028 USD 178,000 185,787 0.27Freeport-McMoRan, Inc. 5.25%01/09/2029 USD 89,000 98,325 0.14Freeport-McMoRan, Inc. 5.45%15/03/2043 USD 90,000 110,445 0.16General Electric Co. 3.45% 01/05/2027 USD 75,000 82,561 0.12General Electric Co. 1.875% 28/05/2027 EUR 200,000 256,399 0.37General Electric Co. 1.5% 17/05/2029 EUR 100,000 125,423 0.18General Motors Co. 5.4% 02/10/2023 USD 30,000 33,047 0.05General Motors Co. 6.125% 01/10/2025 USD 9,000 10,660 0.02General Motors Co. 5.15% 01/04/2038 USD 85,000 103,927 0.15General Motors Financial Co., Inc. 3.95%13/04/2024 USD 16,000 17,231 0.02General Motors Financial Co., Inc. 2.75%20/06/2025 USD 86,000 90,615 0.13Global Payments, Inc. 3.2% 15/08/2029 USD 245,000 262,687 0.38Global Payments, Inc. 2.9% 15/05/2030 USD 10,000 10,436 0.01Goldman Sachs Group, Inc. (The) 3.5%01/04/2025 USD 115,000 124,835 0.18Goldman Sachs Group, Inc. (The) 5.15%22/05/2045 USD 40,000 53,785 0.08Goldman Sachs Group, Inc. (The), Reg. S1.375% 15/05/2024 EUR 200,000 243,812 0.35Goldman Sachs Group, Inc. (The), Reg. S4.25% 29/01/2026 GBP 100,000 157,225 0.23Goldman Sachs Group, Inc. (The), Reg. S1.625% 27/07/2026 EUR 62,000 78,572 0.11Halliburton Co. 4.85% 15/11/2035 USD 30,000 35,381 0.05HCA, Inc. 5% 15/03/2024 USD 230,000 254,368 0.36HCA, Inc. 5.375% 01/09/2026 USD 40,000 46,223 0.07HCA, Inc. 4.5% 15/02/2027 USD 195,000 220,623 0.32HCA, Inc. 5.625% 01/09/2028 USD 40,000 47,550 0.07HCA, Inc. 5.875% 01/02/2029 USD 15,000 18,157 0.03HCA, Inc. 5.25% 15/06/2049 USD 43,000 54,927 0.08HCA, Inc. 3.5% 15/07/2051 USD 60,000 60,203 0.09Healthcare Trust of America Holdings LP,REIT 2% 15/03/2031 USD 140,000 135,476 0.19Healthpeak Properties, Inc., REIT 3%15/01/2030 USD 70,000 74,759 0.11Hess Corp. 5.6% 15/02/2041 USD 25,000 31,269 0.04Hilton Worldwide Finance LLC 4.875%01/04/2027 USD 10,000 10,453 0.01Howmet Aerospace, Inc. 5.9% 01/02/2027 USD 10,000 11,708 0.02Kroger Co. (The) 3.875% 15/10/2046 USD 147,000 162,395 0.23Lennar Corp. 4.75% 29/11/2027 USD 102,000 117,683 0.17Lowe’s Cos., Inc. 1.7% 15/10/2030 USD 205,000 196,714 0.28Lowe’s Cos., Inc. 3.7% 15/04/2046 USD 73,000 80,349 0.12Lumen Technologies, Inc.None 5.8%15/03/2022 USD 55,000 56,811 0.08LYB International Finance III LLC 3.625%01/04/2051 USD 170,000 180,845 0.26Marathon Petroleum Corp. 4.75%15/09/2044 USD 65,000 77,112 0.11McDonald’s Corp. 3.625% 01/09/2049 USD 25,000 27,709 0.04MDC Holdings, Inc. 3.85% 15/01/2030 USD 45,000 48,263 0.07MDC Holdings, Inc. 2.5% 15/01/2031 USD 230,000 223,944 0.32Morgan Stanley, FRN 0.406% 29/10/2027 EUR 100,000 119,139 0.17Morgan Stanley, FRN 1.794% 13/02/2032 USD 90,000 86,544 0.12MPLX LP 1.75% 01/03/2026 USD 155,000 156,812 0.22MPLX LP 4% 15/03/2028 USD 125,000 140,439 0.20MPLX LP 4.5% 15/04/2038 USD 55,000 63,198 0.09Netflix, Inc. 3.625% 15/05/2027 EUR 100,000 136,838 0.20Netflix, Inc., Reg. S 3.875% 15/11/2029 EUR 100,000 143,249 0.21NextEra Energy Capital Holdings, Inc.2.25% 01/06/2030 USD 101,000 101,939 0.15Norfolk Southern Corp. 3.4% 01/11/2049 USD 15,000 16,111 0.02
181
JPMorgan Funds - Global Corporate Bond Duration-Hedged FundSchedule of Investments (continued)
As at 30 June 2021
Investments Currency
Quantity/Nominal
Value
MarketValue
USD
%of
NetAssets Investments Currency
Quantity/Nominal
Value
MarketValue
USD
%of
NetAssets
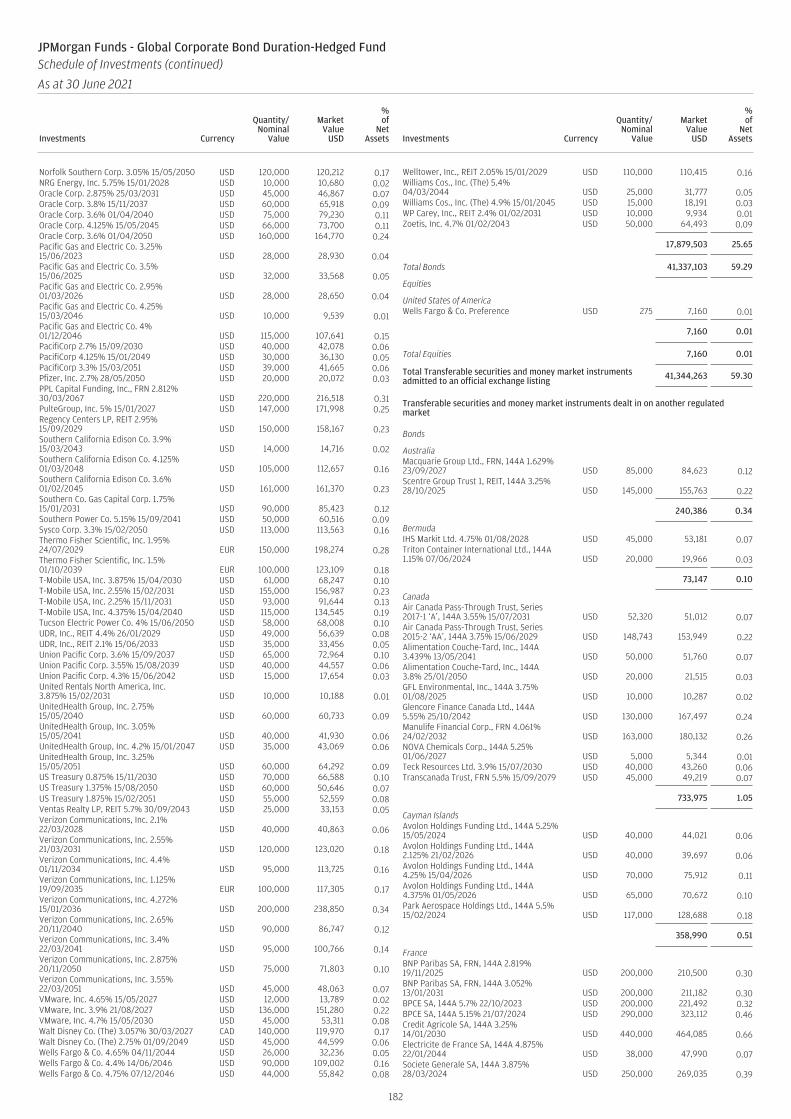
Norfolk Southern Corp. 3.05% 15/05/2050 USD 120,000 120,212 0.17NRG Energy, Inc. 5.75% 15/01/2028 USD 10,000 10,680 0.02Oracle Corp. 2.875% 25/03/2031 USD 45,000 46,867 0.07Oracle Corp. 3.8% 15/11/2037 USD 60,000 65,918 0.09Oracle Corp. 3.6% 01/04/2040 USD 75,000 79,230 0.11Oracle Corp. 4.125% 15/05/2045 USD 66,000 73,700 0.11Oracle Corp. 3.6% 01/04/2050 USD 160,000 164,770 0.24Pacific Gas and Electric Co. 3.25%15/06/2023 USD 28,000 28,930 0.04Pacific Gas and Electric Co. 3.5%15/06/2025 USD 32,000 33,568 0.05Pacific Gas and Electric Co. 2.95%01/03/2026 USD 28,000 28,650 0.04Pacific Gas and Electric Co. 4.25%15/03/2046 USD 10,000 9,539 0.01Pacific Gas and Electric Co. 4%01/12/2046 USD 115,000 107,641 0.15PacifiCorp 2.7% 15/09/2030 USD 40,000 42,078 0.06PacifiCorp 4.125% 15/01/2049 USD 30,000 36,130 0.05PacifiCorp 3.3% 15/03/2051 USD 39,000 41,665 0.06Pfizer, Inc. 2.7% 28/05/2050 USD 20,000 20,072 0.03PPL Capital Funding, Inc., FRN 2.812%30/03/2067 USD 220,000 216,518 0.31PulteGroup, Inc. 5% 15/01/2027 USD 147,000 171,998 0.25Regency Centers LP, REIT 2.95%15/09/2029 USD 150,000 158,167 0.23Southern California Edison Co. 3.9%15/03/2043 USD 14,000 14,716 0.02Southern California Edison Co. 4.125%01/03/2048 USD 105,000 112,657 0.16Southern California Edison Co. 3.6%01/02/2045 USD 161,000 161,370 0.23Southern Co. Gas Capital Corp. 1.75%15/01/2031 USD 90,000 85,423 0.12Southern Power Co. 5.15% 15/09/2041 USD 50,000 60,516 0.09Sysco Corp. 3.3% 15/02/2050 USD 113,000 113,563 0.16Thermo Fisher Scientific, Inc. 1.95%24/07/2029 EUR 150,000 198,274 0.28Thermo Fisher Scientific, Inc. 1.5%01/10/2039 EUR 100,000 123,109 0.18T-Mobile USA, Inc. 3.875% 15/04/2030 USD 61,000 68,247 0.10T-Mobile USA, Inc. 2.55% 15/02/2031 USD 155,000 156,987 0.23T-Mobile USA, Inc. 2.25% 15/11/2031 USD 93,000 91,644 0.13T-Mobile USA, Inc. 4.375% 15/04/2040 USD 115,000 134,545 0.19Tucson Electric Power Co. 4% 15/06/2050 USD 58,000 68,008 0.10UDR, Inc., REIT 4.4% 26/01/2029 USD 49,000 56,639 0.08UDR, Inc., REIT 2.1% 15/06/2033 USD 35,000 33,456 0.05Union Pacific Corp. 3.6% 15/09/2037 USD 65,000 72,964 0.10Union Pacific Corp. 3.55% 15/08/2039 USD 40,000 44,557 0.06Union Pacific Corp. 4.3% 15/06/2042 USD 15,000 17,654 0.03United Rentals North America, Inc.3.875% 15/02/2031 USD 10,000 10,188 0.01UnitedHealth Group, Inc. 2.75%15/05/2040 USD 60,000 60,733 0.09UnitedHealth Group, Inc. 3.05%15/05/2041 USD 40,000 41,930 0.06UnitedHealth Group, Inc. 4.2% 15/01/2047 USD 35,000 43,069 0.06UnitedHealth Group, Inc. 3.25%15/05/2051 USD 60,000 64,292 0.09US Treasury 0.875% 15/11/2030 USD 70,000 66,588 0.10US Treasury 1.375% 15/08/2050 USD 60,000 50,646 0.07US Treasury 1.875% 15/02/2051 USD 55,000 52,559 0.08Ventas Realty LP, REIT 5.7% 30/09/2043 USD 25,000 33,153 0.05Verizon Communications, Inc. 2.1%22/03/2028 USD 40,000 40,863 0.06Verizon Communications, Inc. 2.55%21/03/2031 USD 120,000 123,020 0.18Verizon Communications, Inc. 4.4%01/11/2034 USD 95,000 113,725 0.16Verizon Communications, Inc. 1.125%19/09/2035 EUR 100,000 117,305 0.17Verizon Communications, Inc. 4.272%15/01/2036 USD 200,000 238,850 0.34Verizon Communications, Inc. 2.65%20/11/2040 USD 90,000 86,747 0.12Verizon Communications, Inc. 3.4%22/03/2041 USD 95,000 100,766 0.14Verizon Communications, Inc. 2.875%20/11/2050 USD 75,000 71,803 0.10Verizon Communications, Inc. 3.55%22/03/2051 USD 45,000 48,063 0.07VMware, Inc. 4.65% 15/05/2027 USD 12,000 13,789 0.02VMware, Inc. 3.9% 21/08/2027 USD 136,000 151,280 0.22VMware, Inc. 4.7% 15/05/2030 USD 45,000 53,311 0.08Walt Disney Co. (The) 3.057% 30/03/2027 CAD 140,000 119,970 0.17Walt Disney Co. (The) 2.75% 01/09/2049 USD 45,000 44,599 0.06Wells Fargo & Co. 4.65% 04/11/2044 USD 26,000 32,236 0.05Wells Fargo & Co. 4.4% 14/06/2046 USD 90,000 109,002 0.16Wells Fargo & Co. 4.75% 07/12/2046 USD 44,000 55,842 0.08
Welltower, Inc., REIT 2.05% 15/01/2029 USD 110,000 110,415 0.16Williams Cos., Inc. (The) 5.4%04/03/2044 USD 25,000 31,777 0.05Williams Cos., Inc. (The) 4.9% 15/01/2045 USD 15,000 18,191 0.03WP Carey, Inc., REIT 2.4% 01/02/2031 USD 10,000 9,934 0.01Zoetis, Inc. 4.7% 01/02/2043 USD 50,000 64,493 0.09
17,879,503 25.65
Total Bonds 41,337,103 59.29
Equities
United States of AmericaWells Fargo & Co. Preference USD 275 7,160 0.01
7,160 0.01
Total Equities 7,160 0.01
Total Transferable securities and money market instrumentsadmitted to an official exchange listing 41,344,263 59.30
Transferable securities and money market instruments dealt in on another regulatedmarket
Bonds
AustraliaMacquarie Group Ltd., FRN, 144A 1.629%23/09/2027 USD 85,000 84,623 0.12Scentre Group Trust 1, REIT, 144A 3.25%28/10/2025 USD 145,000 155,763 0.22
240,386 0.34
BermudaIHS Markit Ltd. 4.75% 01/08/2028 USD 45,000 53,181 0.07Triton Container International Ltd., 144A1.15% 07/06/2024 USD 20,000 19,966 0.03
73,147 0.10
CanadaAir Canada Pass-Through Trust, Series2017-1 ‘A’, 144A 3.55% 15/07/2031 USD 52,320 51,012 0.07Air Canada Pass-Through Trust, Series2015-2 ‘AA’, 144A 3.75% 15/06/2029 USD 148,743 153,949 0.22Alimentation Couche-Tard, Inc., 144A3.439% 13/05/2041 USD 50,000 51,760 0.07Alimentation Couche-Tard, Inc., 144A3.8% 25/01/2050 USD 20,000 21,515 0.03GFL Environmental, Inc., 144A 3.75%01/08/2025 USD 10,000 10,287 0.02Glencore Finance Canada Ltd., 144A5.55% 25/10/2042 USD 130,000 167,497 0.24Manulife Financial Corp., FRN 4.061%24/02/2032 USD 163,000 180,132 0.26NOVA Chemicals Corp., 144A 5.25%01/06/2027 USD 5,000 5,344 0.01Teck Resources Ltd. 3.9% 15/07/2030 USD 40,000 43,260 0.06Transcanada Trust, FRN 5.5% 15/09/2079 USD 45,000 49,219 0.07
733,975 1.05
Cayman IslandsAvolon Holdings Funding Ltd., 144A 5.25%15/05/2024 USD 40,000 44,021 0.06Avolon Holdings Funding Ltd., 144A2.125% 21/02/2026 USD 40,000 39,697 0.06Avolon Holdings Funding Ltd., 144A4.25% 15/04/2026 USD 70,000 75,912 0.11Avolon Holdings Funding Ltd., 144A4.375% 01/05/2026 USD 65,000 70,672 0.10Park Aerospace Holdings Ltd., 144A 5.5%15/02/2024 USD 117,000 128,688 0.18
358,990 0.51
FranceBNP Paribas SA, FRN, 144A 2.819%19/11/2025 USD 200,000 210,500 0.30BNP Paribas SA, FRN, 144A 3.052%13/01/2031 USD 200,000 211,182 0.30BPCE SA, 144A 5.7% 22/10/2023 USD 200,000 221,492 0.32BPCE SA, 144A 5.15% 21/07/2024 USD 290,000 323,112 0.46Credit Agricole SA, 144A 3.25%14/01/2030 USD 440,000 464,085 0.66Electricite de France SA, 144A 4.875%22/01/2044 USD 38,000 47,990 0.07Societe Generale SA, 144A 3.875%28/03/2024 USD 250,000 269,035 0.39
182
JPMorgan Funds - Global Corporate Bond Duration-Hedged FundSchedule of Investments (continued)
As at 30 June 2021
Investments Currency
Quantity/Nominal
Value
MarketValue
USD
%of
NetAssets Investments Currency
Quantity/Nominal
Value
MarketValue
USD
%of
NetAssets
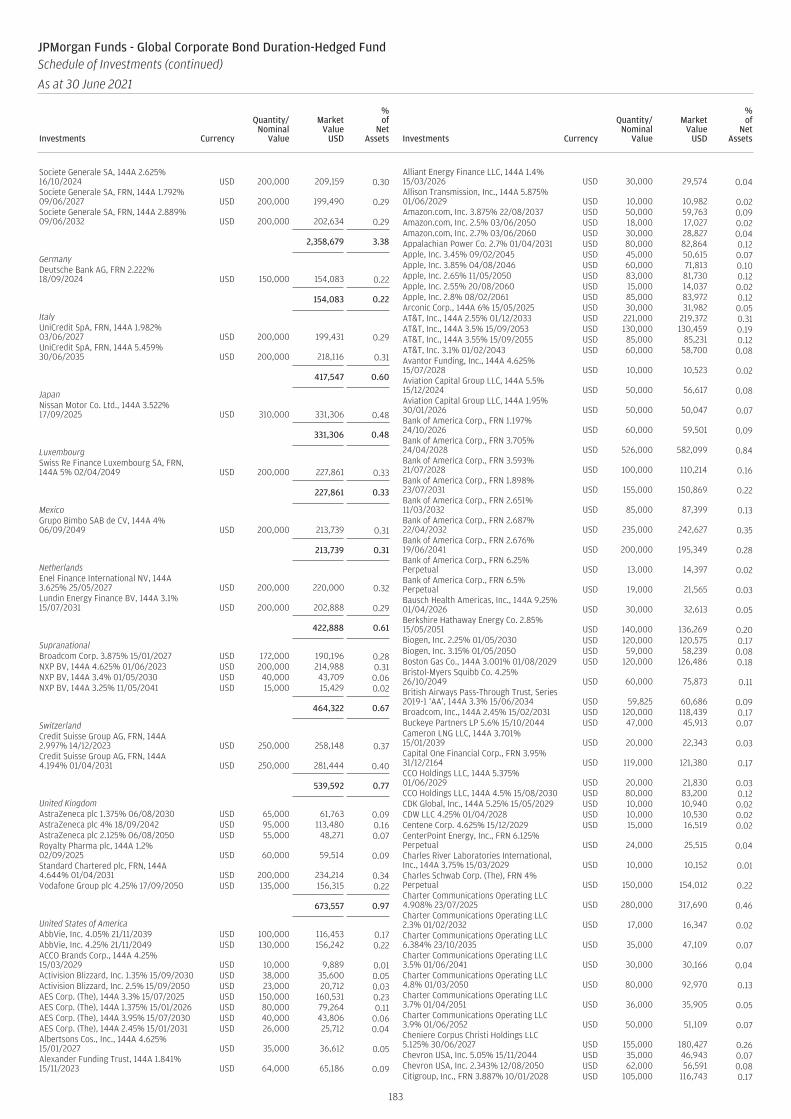
Societe Generale SA, 144A 2.625%16/10/2024 USD 200,000 209,159 0.30Societe Generale SA, FRN, 144A 1.792%09/06/2027 USD 200,000 199,490 0.29Societe Generale SA, FRN, 144A 2.889%09/06/2032 USD 200,000 202,634 0.29
2,358,679 3.38
GermanyDeutsche Bank AG, FRN 2.222%18/09/2024 USD 150,000 154,083 0.22
154,083 0.22
ItalyUniCredit SpA, FRN, 144A 1.982%03/06/2027 USD 200,000 199,431 0.29UniCredit SpA, FRN, 144A 5.459%30/06/2035 USD 200,000 218,116 0.31
417,547 0.60
JapanNissan Motor Co. Ltd., 144A 3.522%17/09/2025 USD 310,000 331,306 0.48
331,306 0.48
LuxembourgSwiss Re Finance Luxembourg SA, FRN,144A 5% 02/04/2049 USD 200,000 227,861 0.33
227,861 0.33
MexicoGrupo Bimbo SAB de CV, 144A 4%06/09/2049 USD 200,000 213,739 0.31
213,739 0.31
NetherlandsEnel Finance International NV, 144A3.625% 25/05/2027 USD 200,000 220,000 0.32Lundin Energy Finance BV, 144A 3.1%15/07/2031 USD 200,000 202,888 0.29
422,888 0.61
SupranationalBroadcom Corp. 3.875% 15/01/2027 USD 172,000 190,196 0.28NXP BV, 144A 4.625% 01/06/2023 USD 200,000 214,988 0.31NXP BV, 144A 3.4% 01/05/2030 USD 40,000 43,709 0.06NXP BV, 144A 3.25% 11/05/2041 USD 15,000 15,429 0.02
464,322 0.67
SwitzerlandCredit Suisse Group AG, FRN, 144A2.997% 14/12/2023 USD 250,000 258,148 0.37Credit Suisse Group AG, FRN, 144A4.194% 01/04/2031 USD 250,000 281,444 0.40
539,592 0.77
United KingdomAstraZeneca plc 1.375% 06/08/2030 USD 65,000 61,763 0.09AstraZeneca plc 4% 18/09/2042 USD 95,000 113,480 0.16AstraZeneca plc 2.125% 06/08/2050 USD 55,000 48,271 0.07Royalty Pharma plc, 144A 1.2%02/09/2025 USD 60,000 59,514 0.09Standard Chartered plc, FRN, 144A4.644% 01/04/2031 USD 200,000 234,214 0.34Vodafone Group plc 4.25% 17/09/2050 USD 135,000 156,315 0.22
673,557 0.97
United States of AmericaAbbVie, Inc. 4.05% 21/11/2039 USD 100,000 116,453 0.17AbbVie, Inc. 4.25% 21/11/2049 USD 130,000 156,242 0.22ACCO Brands Corp., 144A 4.25%15/03/2029 USD 10,000 9,889 0.01Activision Blizzard, Inc. 1.35% 15/09/2030 USD 38,000 35,600 0.05Activision Blizzard, Inc. 2.5% 15/09/2050 USD 23,000 20,712 0.03AES Corp. (The), 144A 3.3% 15/07/2025 USD 150,000 160,531 0.23AES Corp. (The), 144A 1.375% 15/01/2026 USD 80,000 79,264 0.11AES Corp. (The), 144A 3.95% 15/07/2030 USD 40,000 43,806 0.06AES Corp. (The), 144A 2.45% 15/01/2031 USD 26,000 25,712 0.04Albertsons Cos., Inc., 144A 4.625%15/01/2027 USD 35,000 36,612 0.05Alexander Funding Trust, 144A 1.841%15/11/2023 USD 64,000 65,186 0.09
Alliant Energy Finance LLC, 144A 1.4%15/03/2026 USD 30,000 29,574 0.04Allison Transmission, Inc., 144A 5.875%01/06/2029 USD 10,000 10,982 0.02Amazon.com, Inc. 3.875% 22/08/2037 USD 50,000 59,763 0.09Amazon.com, Inc. 2.5% 03/06/2050 USD 18,000 17,027 0.02Amazon.com, Inc. 2.7% 03/06/2060 USD 30,000 28,827 0.04Appalachian Power Co. 2.7% 01/04/2031 USD 80,000 82,864 0.12Apple, Inc. 3.45% 09/02/2045 USD 45,000 50,615 0.07Apple, Inc. 3.85% 04/08/2046 USD 60,000 71,813 0.10Apple, Inc. 2.65% 11/05/2050 USD 83,000 81,730 0.12Apple, Inc. 2.55% 20/08/2060 USD 15,000 14,037 0.02Apple, Inc. 2.8% 08/02/2061 USD 85,000 83,972 0.12Arconic Corp., 144A 6% 15/05/2025 USD 30,000 31,982 0.05AT&T, Inc., 144A 2.55% 01/12/2033 USD 221,000 219,372 0.31AT&T, Inc., 144A 3.5% 15/09/2053 USD 130,000 130,459 0.19AT&T, Inc., 144A 3.55% 15/09/2055 USD 85,000 85,231 0.12AT&T, Inc. 3.1% 01/02/2043 USD 60,000 58,700 0.08Avantor Funding, Inc., 144A 4.625%15/07/2028 USD 10,000 10,523 0.02Aviation Capital Group LLC, 144A 5.5%15/12/2024 USD 50,000 56,617 0.08Aviation Capital Group LLC, 144A 1.95%30/01/2026 USD 50,000 50,047 0.07Bank of America Corp., FRN 1.197%24/10/2026 USD 60,000 59,501 0.09Bank of America Corp., FRN 3.705%24/04/2028 USD 526,000 582,099 0.84Bank of America Corp., FRN 3.593%21/07/2028 USD 100,000 110,214 0.16Bank of America Corp., FRN 1.898%23/07/2031 USD 155,000 150,869 0.22Bank of America Corp., FRN 2.651%11/03/2032 USD 85,000 87,399 0.13Bank of America Corp., FRN 2.687%22/04/2032 USD 235,000 242,627 0.35Bank of America Corp., FRN 2.676%19/06/2041 USD 200,000 195,349 0.28Bank of America Corp., FRN 6.25%Perpetual USD 13,000 14,397 0.02Bank of America Corp., FRN 6.5%Perpetual USD 19,000 21,565 0.03Bausch Health Americas, Inc., 144A 9.25%01/04/2026 USD 30,000 32,613 0.05Berkshire Hathaway Energy Co. 2.85%15/05/2051 USD 140,000 136,269 0.20Biogen, Inc. 2.25% 01/05/2030 USD 120,000 120,575 0.17Biogen, Inc. 3.15% 01/05/2050 USD 59,000 58,239 0.08Boston Gas Co., 144A 3.001% 01/08/2029 USD 120,000 126,486 0.18Bristol-Myers Squibb Co. 4.25%26/10/2049 USD 60,000 75,873 0.11British Airways Pass-Through Trust, Series2019-1 ‘AA’, 144A 3.3% 15/06/2034 USD 59,825 60,686 0.09Broadcom, Inc., 144A 2.45% 15/02/2031 USD 120,000 118,439 0.17Buckeye Partners LP 5.6% 15/10/2044 USD 47,000 45,913 0.07Cameron LNG LLC, 144A 3.701%15/01/2039 USD 20,000 22,343 0.03Capital One Financial Corp., FRN 3.95%31/12/2164 USD 119,000 121,380 0.17CCO Holdings LLC, 144A 5.375%01/06/2029 USD 20,000 21,830 0.03CCO Holdings LLC, 144A 4.5% 15/08/2030 USD 80,000 83,200 0.12CDK Global, Inc., 144A 5.25% 15/05/2029 USD 10,000 10,940 0.02CDW LLC 4.25% 01/04/2028 USD 10,000 10,530 0.02Centene Corp. 4.625% 15/12/2029 USD 15,000 16,519 0.02CenterPoint Energy, Inc., FRN 6.125%Perpetual USD 24,000 25,515 0.04Charles River Laboratories International,Inc., 144A 3.75% 15/03/2029 USD 10,000 10,152 0.01Charles Schwab Corp. (The), FRN 4%Perpetual USD 150,000 154,012 0.22Charter Communications Operating LLC4.908% 23/07/2025 USD 280,000 317,690 0.46Charter Communications Operating LLC2.3% 01/02/2032 USD 17,000 16,347 0.02Charter Communications Operating LLC6.384% 23/10/2035 USD 35,000 47,109 0.07Charter Communications Operating LLC3.5% 01/06/2041 USD 30,000 30,166 0.04Charter Communications Operating LLC4.8% 01/03/2050 USD 80,000 92,970 0.13Charter Communications Operating LLC3.7% 01/04/2051 USD 36,000 35,905 0.05Charter Communications Operating LLC3.9% 01/06/2052 USD 50,000 51,109 0.07Cheniere Corpus Christi Holdings LLC5.125% 30/06/2027 USD 155,000 180,427 0.26Chevron USA, Inc. 5.05% 15/11/2044 USD 35,000 46,943 0.07Chevron USA, Inc. 2.343% 12/08/2050 USD 62,000 56,591 0.08Citigroup, Inc., FRN 3.887% 10/01/2028 USD 105,000 116,743 0.17
183
JPMorgan Funds - Global Corporate Bond Duration-Hedged FundSchedule of Investments (continued)
As at 30 June 2021
Investments Currency
Quantity/Nominal
Value
MarketValue
USD
%of
NetAssets Investments Currency
Quantity/Nominal
Value
MarketValue
USD
%of
NetAssets

Citigroup, Inc., FRN 3.668% 24/07/2028 USD 100,000 110,308 0.16Citigroup, Inc., FRN 3.52% 27/10/2028 USD 45,000 49,297 0.07Citigroup, Inc., FRN 2.976% 05/11/2030 USD 290,000 308,237 0.44Citigroup, Inc., FRN 4.412% 31/03/2031 USD 65,000 75,976 0.11Citigroup, Inc., FRN 2.572% 03/06/2031 USD 85,000 87,387 0.13Citigroup, Inc., FRN 3.875% Perpetual USD 160,000 163,600 0.23Citigroup, Inc., FRN 4% Perpetual USD 124,000 128,495 0.18Citigroup, Inc., FRN 4.7% Perpetual USD 114,000 117,776 0.17Citigroup, Inc., FRN 6.3% Perpetual USD 87,000 93,786 0.13Cleveland Electric Illuminating Co. (The),144A 3.5% 01/04/2028 USD 55,000 58,878 0.08CMS Energy Corp., FRN 4.75%01/06/2050 USD 34,000 37,835 0.05Comcast Corp. 3.2% 15/07/2036 USD 120,000 128,981 0.19Comcast Corp. 3.25% 01/11/2039 USD 65,000 69,248 0.10Comcast Corp. 2.8% 15/01/2051 USD 25,000 24,125 0.03Comcast Corp. 2.45% 15/08/2052 USD 125,000 113,318 0.16ConocoPhillips, Reg. S 3.75% 01/10/2027 USD 107,000 120,415 0.17ConocoPhillips, Reg. S 4.3% 15/08/2028 USD 45,000 52,216 0.08Cottage Health Obligated Group 3.304%01/11/2049 USD 30,000 32,676 0.05Cox Communications, Inc., 144A 3.35%15/09/2026 USD 150,000 163,154 0.23CSX Corp. 2.5% 15/05/2051 USD 73,000 66,487 0.10CVS Pass-Through Trust 6.943%10/01/2030 USD 27,492 33,168 0.05CVS Pass-Through Trust, Series 2013,144A 4.704% 10/01/2036 USD 65,430 74,351 0.11Dell International LLC 4.9% 01/10/2026 USD 182,000 210,199 0.30Dell International LLC 5.3% 01/10/2029 USD 37,000 44,647 0.06Devon Energy Corp., 144A 5.25%15/09/2024 USD 240,000 267,525 0.38Devon Energy Corp., 144A 5.875%15/06/2028 USD 28,000 31,186 0.04Devon Energy Corp., 144A 4.5%15/01/2030 USD 60,000 66,369 0.10Diamondback Energy, Inc. 4.75%31/05/2025 USD 281,000 316,521 0.45Diamondback Energy, Inc. 3.5%01/12/2029 USD 11,000 11,801 0.02Discovery Communications LLC 4.95%15/05/2042 USD 40,000 47,576 0.07Discovery Communications LLC 5.3%15/05/2049 USD 40,000 50,655 0.07Duquesne Light Holdings, Inc., 144A3.616% 01/08/2027 USD 158,000 171,706 0.25Duquesne Light Holdings, Inc., 144A2.775% 07/01/2032 USD 30,000 30,339 0.04Elanco Animal Health, Inc. 5.272%28/08/2023 USD 115,000 123,992 0.18Emera US Finance LP, 144A 2.639%15/06/2031 USD 70,000 70,366 0.10Emera US Finance LP 4.75% 15/06/2046 USD 79,000 94,355 0.14Emergent BioSolutions, Inc., 144A 3.875%15/08/2028 USD 5,000 4,895 0.01Entegris, Inc., 144A 4.375% 15/04/2028 USD 10,000 10,458 0.02Entergy Arkansas LLC 4% 01/06/2028 USD 30,000 34,122 0.05Entergy Mississippi LLC 3.5% 01/06/2051 USD 100,000 111,427 0.16Equinix, Inc., REIT 2.5% 15/05/2031 USD 140,000 142,650 0.20FirstEnergy Transmission LLC, 144A5.45% 15/07/2044 USD 50,000 62,475 0.09Gartner, Inc., 144A 4.5% 01/07/2028 USD 10,000 10,574 0.02GE Capital Funding LLC 4.4% 15/05/2030 USD 200,000 233,508 0.34Gilead Sciences, Inc. 1.65% 01/10/2030 USD 50,000 48,397 0.07Gilead Sciences, Inc. 4% 01/09/2036 USD 140,000 163,052 0.23Gilead Sciences, Inc. 2.6% 01/10/2040 USD 115,000 111,943 0.16Gilead Sciences, Inc. 2.8% 01/10/2050 USD 115,000 110,522 0.16Glencore Funding LLC, 144A 2.5%01/09/2030 USD 40,000 39,939 0.06Goldman Sachs Group, Inc. (The), FRN1.431% 09/03/2027 USD 520,000 519,107 0.74Goldman Sachs Group, Inc. (The), FRN1.542% 10/09/2027 USD 160,000 159,596 0.23Goldman Sachs Group, Inc. (The), FRN3.814% 23/04/2029 USD 55,000 61,541 0.09Goldman Sachs Group, Inc. (The), FRN1.992% 27/01/2032 USD 85,000 82,483 0.12Goldman Sachs Group, Inc. (The), FRN2.615% 22/04/2032 USD 45,000 46,131 0.07Goldman Sachs Group, Inc. (The), FRN4.017% 31/10/2038 USD 25,000 29,489 0.04Gray Oak Pipeline LLC, 144A 2%15/09/2023 USD 300,000 306,012 0.44Gray Oak Pipeline LLC, 144A 2.6%15/10/2025 USD 40,000 41,122 0.06Gray Oak Pipeline LLC, 144A 3.45%15/10/2027 USD 20,000 21,011 0.03Group 1 Automotive, Inc., 144A 4%15/08/2028 USD 5,000 5,063 0.01
Guardian Life Insurance Co. of America(The), 144A 3.7% 22/01/2070 USD 65,000 67,717 0.10Hologic, Inc., 144A 3.25% 15/02/2029 USD 10,000 9,943 0.01Hyundai Capital America, 144A 1.15%10/11/2022 USD 85,000 85,599 0.12Hyundai Capital America, 144A 2.375%10/02/2023 USD 95,000 97,536 0.14Hyundai Capital America, 144A 1.25%18/09/2023 USD 115,000 116,020 0.17Hyundai Capital America, 144A 1.8%15/10/2025 USD 45,000 45,720 0.07Hyundai Capital America, 144A 1.3%08/01/2026 USD 20,000 19,793 0.03Hyundai Capital America, 144A 1.5%15/06/2026 USD 70,000 69,482 0.10Hyundai Capital America, 144A 2.375%15/10/2027 USD 175,000 179,206 0.26Interstate Power and Light Co. 2.3%01/06/2030 USD 30,000 30,480 0.04ITC Holdings Corp., 144A 2.95%14/05/2030 USD 140,000 147,648 0.21Jersey Central Power & Light Co., 144A4.3% 15/01/2026 USD 50,000 55,392 0.08Jersey Central Power & Light Co., 144A2.75% 01/03/2032 USD 79,000 80,195 0.12JetBlue Pass-Through Trust ‘B’ 8%15/11/2027 USD 22,217 25,772 0.04Keurig Dr Pepper, Inc. 4.5% 15/11/2045 USD 28,000 34,156 0.05Keurig Dr Pepper, Inc. 4.42% 15/12/2046 USD 47,000 56,716 0.08Kraft Heinz Foods Co. 4.25% 01/03/2031 USD 75,000 85,403 0.12Kraft Heinz Foods Co. 4.625% 01/10/2039 USD 121,000 141,144 0.20Lamb Weston Holdings, Inc., 144A 4.875%15/05/2028 USD 5,000 5,538 0.01Lennar Corp. 5% 15/06/2027 USD 220,000 254,739 0.37Lumen Technologies, Inc., 144A 4%15/02/2027 USD 15,000 15,318 0.02MasTec, Inc., 144A 4.5% 15/08/2028 USD 5,000 5,273 0.01Memorial Health Services 3.447%01/11/2049 USD 95,000 103,526 0.15MetLife Capital Trust IV, 144A 7.875%15/12/2067 USD 100,000 139,000 0.20Microsoft Corp. 3.45% 08/08/2036 USD 79,000 91,597 0.13Microsoft Corp. 2.921% 17/03/2052 USD 101,000 107,690 0.15Mid-Atlantic Interstate Transmission LLC,144A 4.1% 15/05/2028 USD 20,000 22,487 0.03Moog, Inc., 144A 4.25% 15/12/2027 USD 5,000 5,183 0.01Morgan Stanley, FRN 2.72% 22/07/2025 USD 100,000 105,234 0.15Morgan Stanley, FRN 1.593% 04/05/2027 USD 190,000 191,226 0.27Morgan Stanley, FRN 2.699% 22/01/2031 USD 55,000 57,672 0.08Morgan Stanley, FRN 3.622% 01/04/2031 USD 150,000 167,935 0.24Morgan Stanley, FRN 2.802% 25/01/2052 USD 25,000 24,766 0.04Mosaic Co. (The) 4.05% 15/11/2027 USD 55,000 61,746 0.09Netflix, Inc., 144A 4.875% 15/06/2030 USD 20,000 23,733 0.03Netflix, Inc. 4.875% 15/04/2028 USD 115,000 133,831 0.19New York Life Insurance Co., 144A 3.75%15/05/2050 USD 67,000 75,773 0.11New York Life Insurance Co., 144A 4.45%15/05/2069 USD 25,000 31,466 0.05Nissan Motor Acceptance Corp., 144A 2%09/03/2026 USD 125,000 125,766 0.18Norfolk Southern Corp. 3.95% 01/10/2042 USD 40,000 46,016 0.07Norfolk Southern Corp. 3.942%01/11/2047 USD 45,000 51,980 0.07Northwestern Mutual Life Insurance Co.(The), 144A 3.85% 30/09/2047 USD 40,000 45,972 0.07ON Semiconductor Corp., 144A 3.875%01/09/2028 USD 10,000 10,315 0.01Pacific Gas and Electric Co. 4.55%01/07/2030 USD 40,000 42,845 0.06Pennsylvania Electric Co., 144A 3.6%01/06/2029 USD 50,000 53,526 0.08Pepperdine University 3.301% 01/12/2059 USD 30,000 30,245 0.04PepsiCo, Inc. 3.375% 29/07/2049 USD 70,000 78,760 0.11Pernod Ricard International Finance LLC,144A 1.625% 01/04/2031 USD 150,000 142,516 0.20Plains All American Pipeline LP 4.5%15/12/2026 USD 190,000 212,739 0.31Plains All American Pipeline LP 3.8%15/09/2030 USD 60,000 64,354 0.09Post Holdings, Inc., 144A 5.75%01/03/2027 USD 30,000 31,425 0.05Prime Security Services Borrower LLC,144A 5.75% 15/04/2026 USD 12,000 13,243 0.02Puget Energy, Inc., 144A 2.379%15/06/2028 USD 30,000 30,267 0.04Quicken Loans LLC, 144A 3.625%01/03/2029 USD 10,000 9,895 0.01Regency Centers LP, REIT 3.7%15/06/2030 USD 95,000 105,303 0.15
184
JPMorgan Funds - Global Corporate Bond Duration-Hedged FundSchedule of Investments (continued)
As at 30 June 2021
Investments Currency
Quantity/Nominal
Value
MarketValue
USD
%of
NetAssets Investments Currency
Quantity/Nominal
Value
MarketValue
USD
%of
NetAssets

Regeneron Pharmaceuticals, Inc. 1.75%15/09/2030 USD 90,000 85,645 0.12Regeneron Pharmaceuticals, Inc. 2.8%15/09/2050 USD 50,000 45,878 0.07Sabine Pass Liquefaction LLC 4.2%15/03/2028 USD 280,000 316,484 0.45Sabine Pass Liquefaction LLC 4.5%15/05/2030 USD 60,000 69,170 0.10Schlumberger Holdings Corp., 144A 3.75%01/05/2024 USD 15,000 16,154 0.02Scripps Escrow II, Inc., 144A 3.875%15/01/2029 USD 10,000 9,865 0.01Sensata Technologies, Inc., 144A 4.375%15/02/2030 USD 10,000 10,539 0.02Sirius XM Radio, Inc., 144A 5.5%01/07/2029 USD 10,000 10,887 0.02Smithfield Foods, Inc., 144A 3%15/10/2030 USD 50,000 50,686 0.07Southwestern Electric Power Co. 3.9%01/04/2045 USD 50,000 55,133 0.08Spectrum Brands, Inc., 144A 5%01/10/2029 USD 10,000 10,630 0.02Starbucks Corp. 3.5% 15/11/2050 USD 30,000 32,414 0.05Tenet Healthcare Corp., 144A 4.875%01/01/2026 USD 35,000 36,332 0.05Texas Health Resources 3.372%15/11/2051 USD 55,000 59,124 0.08Time Warner Cable LLC 5.5% 01/09/2041 USD 35,000 43,574 0.06Time Warner Cable LLC 4.5% 15/09/2042 USD 100,000 111,618 0.16Trans-Allegheny Interstate Line Co., 144A3.85% 01/06/2025 USD 116,000 125,701 0.18Truist Financial Corp., FRN 4.95%Perpetual USD 37,000 40,737 0.06Truist Financial Corp., FRN 5.1% Perpetual USD 27,000 30,375 0.04United Airlines Pass-Through Trust, Series2016-1 ‘AA’ 3.1% 07/01/2030 USD 41,581 43,660 0.06United Airlines Pass-Through Trust, Series2019-2 ‘AA’ 2.7% 01/11/2033 USD 38,444 38,656 0.06United Airlines Pass-Through Trust, Series2016-1 ‘B’ 3.65% 07/07/2027 USD 70,590 70,414 0.10United Airlines Pass-Through Trust, Series2016-2 ‘B’ 3.65% 07/04/2027 USD 119,039 119,396 0.17Universal Health Services, Inc., 144A2.65% 15/10/2030 USD 90,000 90,610 0.13VeriSign, Inc. 2.7% 15/06/2031 USD 100,000 101,213 0.15ViacomCBS, Inc. 4.2% 19/05/2032 USD 123,000 142,227 0.20ViacomCBS, Inc., FRN 5.875% 28/02/2057 USD 43,000 43,773 0.06ViacomCBS, Inc., FRN 6.25% 28/02/2057 USD 74,000 84,836 0.12Vistra Operations Co. LLC, 144A 3.55%15/07/2024 USD 210,000 222,110 0.32Vistra Operations Co. LLC, 144A 3.7%30/01/2027 USD 75,000 80,136 0.12Vistra Operations Co. LLC, 144A 4.3%15/07/2029 USD 85,000 92,226 0.13WEA Finance LLC, REIT, 144A 2.875%15/01/2027 USD 115,000 118,649 0.17Wells Fargo & Co., FRN 3.196%17/06/2027 USD 280,000 302,457 0.43Wells Fargo & Co., FRN 2.393%02/06/2028 USD 165,000 171,048 0.25Wells Fargo & Co., FRN 3.068%30/04/2041 USD 100,000 102,733 0.15Wells Fargo & Co., FRN 3.9% Perpetual USD 80,000 82,750 0.12WMG Acquisition Corp., 144A 3%15/02/2031 USD 10,000 9,500 0.01
18,778,306 26.94
Total Bonds 25,988,378 37.28
Total Transferable securities and money market instrumentsdealt in on another regulated market 25,988,378 37.28
Units of authorised UCITS or other collective investment undertakings
Collective Investment Schemes - UCITS
LuxembourgJPMorgan Global High Yield Bond Fund -JPM Global High Yield Bond X (acc) - USD† USD 5 966 0.00
966 0.00
Total Collective Investment Schemes - UCITS 966 0.00
Total Units of authorised UCITS or other collective investmentundertakings 966 0.00
Total Investments 67,333,607 96.58
Cash 2,021,591 2.90
Other Assets/(Liabilities) 361,529 0.52
Total Net Assets 69,716,727 100.00
† Related Party Fund.
Geographic Allocation of Portfolio as at 30 June 2021 % of Net AssetsUnited States of America 52.60United Kingdom 11.13France 6.75Netherlands 5.35Italy 3.18Germany 3.02Switzerland 2.56Canada 1.91Luxembourg 1.57Spain 1.47Ireland 0.90Japan 0.84Cayman Islands 0.80Jersey 0.71Supranational 0.67Australia 0.54Portugal 0.53Finland 0.49Mexico 0.40Bermuda 0.37Belgium 0.36Sweden 0.18Austria 0.18Colombia 0.07Total Investments 96.58Cash and other assets/(liabilities) 3.42
Total 100.00
185
JPMorgan Funds - Global Corporate Bond Duration-Hedged FundSchedule of Investments (continued)
As at 30 June 2021
Investments Currency
Quantity/Nominal
Value
MarketValue
USD
%of
NetAssets Investments Currency
Quantity/Nominal
Value
MarketValue
USD
%of
NetAssets

JPMorgan Funds - Global Corporate Bond Duration-Hedged FundSchedule of Investments (continued)
As at 30 June 2021
Forward Currency Exchange Contracts (continued)
CurrencyPurchased Amount Purchased Currency Sold Amount Sold
MaturityDate Counterparty
UnrealisedGain/(Loss)
USD
%of
NetAssets
CAD 153,792 USD 124,165 06/07/2021 BNP Paribas 145 -EUR 3,182 USD 3,776 06/07/2021 State Street 2 -USD 327,792 CAD 397,144 06/07/2021 BNP Paribas 6,781 0.01USD 53,407 EUR 44,776 01/07/2021 Barclays 239 -USD 14,207 EUR 11,946 02/07/2021 State Street 22 -USD 26,508,044 EUR 22,287,465 06/07/2021 BNP Paribas 41,241 0.06USD 7,759,067 EUR 6,358,895 06/07/2021 Citibank 207,754 0.30USD 9,499,671 EUR 7,784,759 06/07/2021 Goldman Sachs 255,117 0.37USD 46,582 EUR 38,206 06/07/2021 RBC 1,212 -USD 185,351 EUR 151,269 06/07/2021 Standard Chartered 5,717 0.01USD 607,238 EUR 503,068 06/07/2021 State Street 9,834 0.01USD 16,377,643 EUR 13,765,160 04/08/2021 Barclays 21,310 0.03USD 18,065 EUR 15,099 04/08/2021 RBC 124 -USD 120,540 EUR 101,300 04/08/2021 Standard Chartered 172 -USD 127,859 EUR 107,460 04/08/2021 State Street 170 -USD 5,110,900 GBP 3,602,770 06/07/2021 BNP Paribas 124,468 0.18USD 129,202 GBP 92,000 06/07/2021 Citibank 1,868 -USD 118,148 GBP 83,579 06/07/2021 HSBC 2,471 -USD 150,835 GBP 106,126 06/07/2021 RBC 3,951 0.01USD 5,251,055 GBP 3,787,820 04/08/2021 Barclays 8,109 0.01
Total Unrealised Gain on Forward Currency Exchange Contracts 690,707 0.99
CAD 243,352 USD 201,726 06/07/2021 State Street (5,024) (0.01)EUR 13,765,160 USD 16,368,138 06/07/2021 Barclays (21,739) (0.03)EUR 110,000 USD 133,225 06/07/2021 BNP Paribas (2,598) -EUR 9,640,701 USD 11,763,395 06/07/2021 Citibank (314,872) (0.45)EUR 11,763,663 USD 14,355,092 06/07/2021 Goldman Sachs (385,511) (0.55)EUR 120,331 USD 146,510 06/07/2021 HSBC (3,614) (0.01)EUR 351,975 USD 421,972 06/07/2021 RBC (3,994) (0.01)EUR 636,997 USD 770,873 06/07/2021 Standard Chartered (14,427) (0.02)EUR 731,652 USD 893,268 06/07/2021 State Street (24,417) (0.03)EUR 79,062 USD 94,405 04/08/2021 Barclays (460) -EUR 23,002,636 USD 27,378,160 04/08/2021 BNP Paribas (45,476) (0.07)EUR 23,323 USD 27,795 04/08/2021 State Street (82) -GBP 3,787,820 USD 5,250,677 06/07/2021 Barclays (8,124) (0.01)GBP 96,654 USD 134,108 06/07/2021 Toronto-Dominion Bank (333) -GBP 55,637 USD 77,083 04/08/2021 BNP Paribas (73) -GBP 108,433 USD 151,419 04/08/2021 RBC (1,331) -USD 124,164 CAD 153,792 04/08/2021 BNP Paribas (144) -
Total Unrealised Loss on Forward Currency Exchange Contracts (832,219) (1.19)
Net Unrealised Loss on Forward Currency Exchange Contracts (141,512) (0.20)
JPMorgan Funds - Global Corporate Bond Duration-Hedged FundSchedule of Investments (continued)
As at 30 June 2021
Financial Futures Contracts
Security DescriptionNumber ofContracts Currency
GlobalExposure
USD
UnrealisedGain/(Loss)
USD
%of
NetAssets
Canada 10 Year Bond, 21/09/2021 (10) CAD (1,175,394) (1,431) -Euro-Bobl, 08/09/2021 (50) EUR (7,961,948) (6,387) (0.01)Euro-Bund, 08/09/2021 (24) EUR (4,914,921) (11,269) (0.02)Euro-Buxl 30 Year Bond, 08/09/2021 (1) EUR (240,963) (1,460) -Euro-Schatz, 08/09/2021 (12) EUR (1,597,852) (96) -Long Gilt, 28/09/2021 (18) GBP (3,191,444) (2,250) -US 2 Year Note, 30/09/2021 (15) USD (3,304,629) (169) -US 5 Year Note, 30/09/2021 (90) USD (11,107,617) (4,570) (0.01)US 10 Year Note, 21/09/2021 (57) USD (7,550,273) (25,808) (0.04)US 10 Year Ultra Bond, 21/09/2021 (32) USD (4,707,750) (13,854) (0.02)US Long Bond, 21/09/2021 (47) USD (7,551,578) (27,695) (0.04)US Ultra Bond, 21/09/2021 (41) USD (7,899,547) (45,528) (0.06)
Total Unrealised Loss on Financial Futures Contracts (140,517) (0.20)
Net Unrealised Loss on Financial Futures Contracts (140,517) (0.20)
186
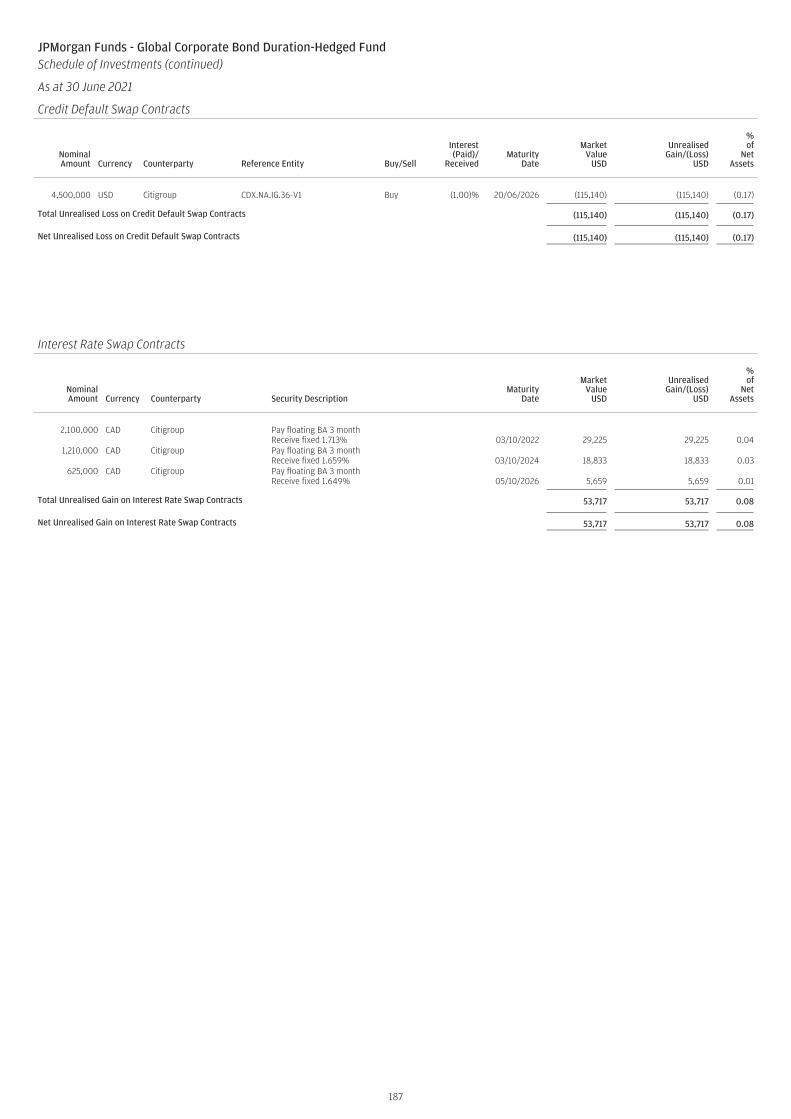
JPMorgan Funds - Global Corporate Bond Duration-Hedged FundSchedule of Investments (continued)
As at 30 June 2021
Credit Default Swap Contracts
NominalAmount Currency Counterparty Reference Entity Buy/Sell
Interest(Paid)/
ReceivedMaturity
Date
MarketValue
USD
UnrealisedGain/(Loss)
USD
%of
NetAssets
4,500,000 USD Citigroup CDX.NA.IG.36-V1 Buy (1.00)% 20/06/2026 (115,140) (115,140) (0.17)
Total Unrealised Loss on Credit Default Swap Contracts (115,140) (115,140) (0.17)
Net Unrealised Loss on Credit Default Swap Contracts (115,140) (115,140) (0.17)
JPMorgan Funds - Global Corporate Bond Duration-Hedged FundSchedule of Investments (continued)
As at 30 June 2021
Interest Rate Swap Contracts
NominalAmount Currency Counterparty Security Description
MaturityDate
MarketValue
USD
UnrealisedGain/(Loss)
USD
%of
NetAssets
2,100,000 CAD Citigroup Pay floating BA 3 monthReceive fixed 1.713% 03/10/2022 29,225 29,225 0.04
1,210,000 CAD Citigroup Pay floating BA 3 monthReceive fixed 1.659% 03/10/2024 18,833 18,833 0.03
625,000 CAD Citigroup Pay floating BA 3 monthReceive fixed 1.649% 05/10/2026 5,659 5,659 0.01
Total Unrealised Gain on Interest Rate Swap Contracts 53,717 53,717 0.08
Net Unrealised Gain on Interest Rate Swap Contracts 53,717 53,717 0.08
187
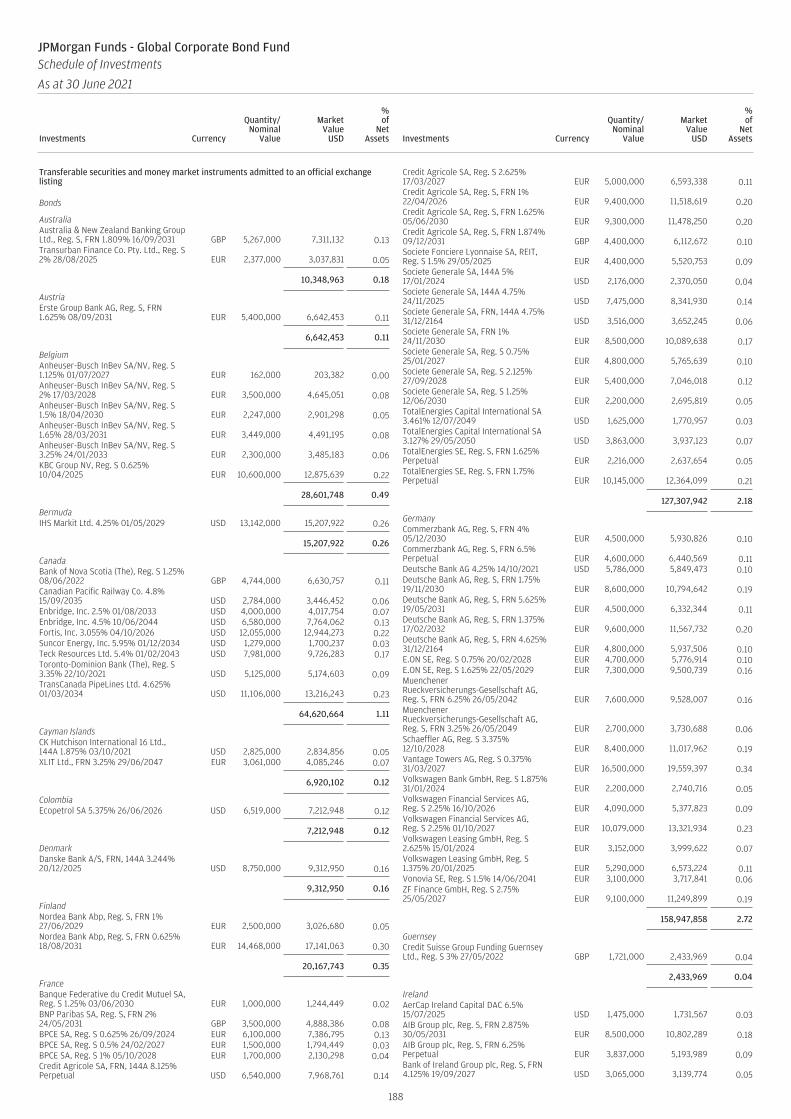
Transferable securities and money market instruments admitted to an official exchangelisting
Bonds
AustraliaAustralia & New Zealand Banking GroupLtd., Reg. S, FRN 1.809% 16/09/2031 GBP 5,267,000 7,311,132 0.13Transurban Finance Co. Pty. Ltd., Reg. S2% 28/08/2025 EUR 2,377,000 3,037,831 0.05
10,348,963 0.18
AustriaErste Group Bank AG, Reg. S, FRN1.625% 08/09/2031 EUR 5,400,000 6,642,453 0.11
6,642,453 0.11
BelgiumAnheuser-Busch InBev SA/NV, Reg. S1.125% 01/07/2027 EUR 162,000 203,382 0.00Anheuser-Busch InBev SA/NV, Reg. S2% 17/03/2028 EUR 3,500,000 4,645,051 0.08Anheuser-Busch InBev SA/NV, Reg. S1.5% 18/04/2030 EUR 2,247,000 2,901,298 0.05Anheuser-Busch InBev SA/NV, Reg. S1.65% 28/03/2031 EUR 3,449,000 4,491,195 0.08Anheuser-Busch InBev SA/NV, Reg. S3.25% 24/01/2033 EUR 2,300,000 3,485,183 0.06KBC Group NV, Reg. S 0.625%10/04/2025 EUR 10,600,000 12,875,639 0.22
28,601,748 0.49
BermudaIHS Markit Ltd. 4.25% 01/05/2029 USD 13,142,000 15,207,922 0.26
15,207,922 0.26
CanadaBank of Nova Scotia (The), Reg. S 1.25%08/06/2022 GBP 4,744,000 6,630,757 0.11Canadian Pacific Railway Co. 4.8%15/09/2035 USD 2,784,000 3,446,452 0.06Enbridge, Inc. 2.5% 01/08/2033 USD 4,000,000 4,017,754 0.07Enbridge, Inc. 4.5% 10/06/2044 USD 6,580,000 7,764,062 0.13Fortis, Inc. 3.055% 04/10/2026 USD 12,055,000 12,944,273 0.22Suncor Energy, Inc. 5.95% 01/12/2034 USD 1,279,000 1,700,237 0.03Teck Resources Ltd. 5.4% 01/02/2043 USD 7,981,000 9,726,283 0.17Toronto-Dominion Bank (The), Reg. S3.35% 22/10/2021 USD 5,125,000 5,174,603 0.09TransCanada PipeLines Ltd. 4.625%01/03/2034 USD 11,106,000 13,216,243 0.23
64,620,664 1.11
Cayman IslandsCK Hutchison International 16 Ltd.,144A 1.875% 03/10/2021 USD 2,825,000 2,834,856 0.05XLIT Ltd., FRN 3.25% 29/06/2047 EUR 3,061,000 4,085,246 0.07
6,920,102 0.12
ColombiaEcopetrol SA 5.375% 26/06/2026 USD 6,519,000 7,212,948 0.12
7,212,948 0.12
DenmarkDanske Bank A/S, FRN, 144A 3.244%20/12/2025 USD 8,750,000 9,312,950 0.16
9,312,950 0.16
FinlandNordea Bank Abp, Reg. S, FRN 1%27/06/2029 EUR 2,500,000 3,026,680 0.05Nordea Bank Abp, Reg. S, FRN 0.625%18/08/2031 EUR 14,468,000 17,141,063 0.30
20,167,743 0.35
FranceBanque Federative du Credit Mutuel SA,Reg. S 1.25% 03/06/2030 EUR 1,000,000 1,244,449 0.02BNP Paribas SA, Reg. S, FRN 2%24/05/2031 GBP 3,500,000 4,888,386 0.08BPCE SA, Reg. S 0.625% 26/09/2024 EUR 6,100,000 7,386,795 0.13BPCE SA, Reg. S 0.5% 24/02/2027 EUR 1,500,000 1,794,449 0.03BPCE SA, Reg. S 1% 05/10/2028 EUR 1,700,000 2,130,298 0.04Credit Agricole SA, FRN, 144A 8.125%Perpetual USD 6,540,000 7,968,761 0.14
Credit Agricole SA, Reg. S 2.625%17/03/2027 EUR 5,000,000 6,593,338 0.11Credit Agricole SA, Reg. S, FRN 1%22/04/2026 EUR 9,400,000 11,518,619 0.20Credit Agricole SA, Reg. S, FRN 1.625%05/06/2030 EUR 9,300,000 11,478,250 0.20Credit Agricole SA, Reg. S, FRN 1.874%09/12/2031 GBP 4,400,000 6,112,672 0.10Societe Fonciere Lyonnaise SA, REIT,Reg. S 1.5% 29/05/2025 EUR 4,400,000 5,520,753 0.09Societe Generale SA, 144A 5%17/01/2024 USD 2,176,000 2,370,050 0.04Societe Generale SA, 144A 4.75%24/11/2025 USD 7,475,000 8,341,930 0.14Societe Generale SA, FRN, 144A 4.75%31/12/2164 USD 3,516,000 3,652,245 0.06Societe Generale SA, FRN 1%24/11/2030 EUR 8,500,000 10,089,638 0.17Societe Generale SA, Reg. S 0.75%25/01/2027 EUR 4,800,000 5,765,639 0.10Societe Generale SA, Reg. S 2.125%27/09/2028 EUR 5,400,000 7,046,018 0.12Societe Generale SA, Reg. S 1.25%12/06/2030 EUR 2,200,000 2,695,819 0.05TotalEnergies Capital International SA3.461% 12/07/2049 USD 1,625,000 1,770,957 0.03TotalEnergies Capital International SA3.127% 29/05/2050 USD 3,863,000 3,937,123 0.07TotalEnergies SE, Reg. S, FRN 1.625%Perpetual EUR 2,216,000 2,637,654 0.05TotalEnergies SE, Reg. S, FRN 1.75%Perpetual EUR 10,145,000 12,364,099 0.21
127,307,942 2.18
GermanyCommerzbank AG, Reg. S, FRN 4%05/12/2030 EUR 4,500,000 5,930,826 0.10Commerzbank AG, Reg. S, FRN 6.5%Perpetual EUR 4,600,000 6,440,569 0.11Deutsche Bank AG 4.25% 14/10/2021 USD 5,786,000 5,849,473 0.10Deutsche Bank AG, Reg. S, FRN 1.75%19/11/2030 EUR 8,600,000 10,794,642 0.19Deutsche Bank AG, Reg. S, FRN 5.625%19/05/2031 EUR 4,500,000 6,332,344 0.11Deutsche Bank AG, Reg. S, FRN 1.375%17/02/2032 EUR 9,600,000 11,567,732 0.20Deutsche Bank AG, Reg. S, FRN 4.625%31/12/2164 EUR 4,800,000 5,937,506 0.10E.ON SE, Reg. S 0.75% 20/02/2028 EUR 4,700,000 5,776,914 0.10E.ON SE, Reg. S 1.625% 22/05/2029 EUR 7,300,000 9,500,739 0.16MuenchenerRueckversicherungs-Gesellschaft AG,Reg. S, FRN 6.25% 26/05/2042 EUR 7,600,000 9,528,007 0.16MuenchenerRueckversicherungs-Gesellschaft AG,Reg. S, FRN 3.25% 26/05/2049 EUR 2,700,000 3,730,688 0.06Schaeffler AG, Reg. S 3.375%12/10/2028 EUR 8,400,000 11,017,962 0.19Vantage Towers AG, Reg. S 0.375%31/03/2027 EUR 16,500,000 19,559,397 0.34Volkswagen Bank GmbH, Reg. S 1.875%31/01/2024 EUR 2,200,000 2,740,716 0.05Volkswagen Financial Services AG,Reg. S 2.25% 16/10/2026 EUR 4,090,000 5,377,823 0.09Volkswagen Financial Services AG,Reg. S 2.25% 01/10/2027 EUR 10,079,000 13,321,934 0.23Volkswagen Leasing GmbH, Reg. S2.625% 15/01/2024 EUR 3,152,000 3,999,622 0.07Volkswagen Leasing GmbH, Reg. S1.375% 20/01/2025 EUR 5,290,000 6,573,224 0.11Vonovia SE, Reg. S 1.5% 14/06/2041 EUR 3,100,000 3,717,841 0.06ZF Finance GmbH, Reg. S 2.75%25/05/2027 EUR 9,100,000 11,249,899 0.19
158,947,858 2.72
GuernseyCredit Suisse Group Funding GuernseyLtd., Reg. S 3% 27/05/2022 GBP 1,721,000 2,433,969 0.04
2,433,969 0.04
IrelandAerCap Ireland Capital DAC 6.5%15/07/2025 USD 1,475,000 1,731,567 0.03AIB Group plc, Reg. S, FRN 2.875%30/05/2031 EUR 8,500,000 10,802,289 0.18AIB Group plc, Reg. S, FRN 6.25%Perpetual EUR 3,837,000 5,193,989 0.09Bank of Ireland Group plc, Reg. S, FRN4.125% 19/09/2027 USD 3,065,000 3,139,774 0.05
188
JPMorgan Funds - Global Corporate Bond FundSchedule of Investments
As at 30 June 2021
Investments Currency
Quantity/Nominal
Value
MarketValue
USD
%of
NetAssets Investments Currency
Quantity/Nominal
Value
MarketValue
USD
%of
NetAssets

GE Capital International Funding Co.Unlimited Co. 3.373% 15/11/2025 USD 17,696,000 19,306,574 0.33GE Capital International Funding Co.Unlimited Co. 4.418% 15/11/2035 USD 20,081,000 24,171,249 0.41GE Capital UK Funding Unlimited Co.,Reg. S 8% 14/01/2039 GBP 700,000 1,697,871 0.03Liberty Mutual Finance Europe DAC,Reg. S 1.75% 27/03/2024 EUR 3,341,000 4,149,304 0.07Shire Acquisitions Investments IrelandDAC 2.875% 23/09/2023 USD 9,784,000 10,241,782 0.18Zurich Finance Ireland DesignatedActivity Co., Reg. S, FRN 1.875%17/09/2050 EUR 3,300,000 4,125,480 0.07Zurich Finance Ireland DesignatedActivity Co., Reg. S, FRN 3% 19/04/2051 USD 6,364,000 6,311,650 0.11
90,871,529 1.55
IsraelIsrael Electric Corp. Ltd., Reg. S, 144A5% 12/11/2024 USD 6,802,000 7,609,738 0.13
7,609,738 0.13
ItalyAssicurazioni Generali SpA, Reg. S, FRN5.5% 27/10/2047 EUR 1,104,000 1,618,265 0.03Assicurazioni Generali SpA, Reg. S, FRN5% 08/06/2048 EUR 2,660,000 3,842,449 0.07Autostrade per l’Italia SpA, Reg. S1.875% 04/11/2025 EUR 2,962,000 3,668,836 0.06Autostrade per l’Italia SpA, Reg. S1.875% 26/09/2029 EUR 3,258,000 3,999,923 0.07Enel SpA, Reg. S, FRN 1.375%31/12/2164 EUR 10,531,000 12,377,734 0.21Enel SpA, Reg. S, FRN 2.25% Perpetual EUR 5,894,000 7,339,117 0.13FCA Bank SpA, Reg. S 1.625%29/09/2021 GBP 1,306,000 1,812,160 0.03Intesa Sanpaolo SpA, Reg. S 0.625%24/02/2026 EUR 19,487,000 23,121,459 0.40Intesa Sanpaolo SpA, Reg. S 3.928%15/09/2026 EUR 5,369,000 7,177,845 0.12Intesa Sanpaolo SpA, Reg. S, FRN 7.75%Perpetual EUR 7,273,000 10,594,394 0.18Snam SpA, Reg. S 0.625% 30/06/2031 EUR 4,446,000 5,226,735 0.09Terna SpA, Reg. S 0.375% 23/06/2029 EUR 14,478,000 17,179,228 0.29UniCredit SpA, Reg. S, FRN 2.2%22/07/2027 EUR 5,300,000 6,695,299 0.11UniCredit SpA, Reg. S, FRN 4.875%20/02/2029 EUR 3,397,000 4,402,754 0.08UniCredit SpA, Reg. S, FRN 2.731%15/01/2032 EUR 4,900,000 5,956,090 0.10UniCredit SpA, Reg. S, FRN 3.875%Perpetual EUR 15,019,000 17,109,360 0.29
132,121,648 2.26
JapanMitsubishi UFJ Financial Group, Inc.2.193% 25/02/2025 USD 6,682,000 6,959,994 0.12Mitsubishi UFJ Financial Group, Inc.1.412% 17/07/2025 USD 8,430,000 8,515,055 0.14Mizuho Financial Group, Inc., FRN1.241% 10/07/2024 USD 3,820,000 3,873,377 0.07Takeda Pharmaceutical Co. Ltd. 1%09/07/2029 EUR 17,339,000 21,277,510 0.36Takeda Pharmaceutical Co. Ltd. 2%09/07/2040 EUR 4,400,000 5,620,936 0.10
46,246,872 0.79
JerseyGatwick Funding Ltd., Reg. S 5.25%23/01/2026 GBP 2,197,000 3,361,656 0.06Gatwick Funding Ltd., Reg. S 2.5%15/04/2032 GBP 1,134,000 1,576,022 0.03Heathrow Funding Ltd., Reg. S 6.75%03/12/2028 GBP 5,617,000 9,835,540 0.17Heathrow Funding Ltd., Reg. S 2.75%13/10/2031 GBP 5,410,000 7,806,153 0.13Heathrow Funding Ltd., Reg. S 1.875%12/07/2032 EUR 2,023,000 2,547,469 0.04Heathrow Funding Ltd., Reg. S 1.125%08/10/2032 EUR 2,200,000 2,587,014 0.04Heathrow Funding Ltd., Reg. S 5.875%13/05/2043 GBP 6,772,000 13,705,187 0.24
41,419,041 0.71
LuxembourgBecton Dickinson Euro Finance Sarl1.208% 04/06/2026 EUR 3,664,000 4,553,889 0.08Hannover Finance Luxembourg SA, FRN5% 30/06/2043 EUR 1,800,000 2,346,979 0.04Medtronic Global Holdings SCA 1.125%07/03/2027 EUR 14,000,000 17,546,228 0.30Medtronic Global Holdings SCA 1%02/07/2031 EUR 1,231,000 1,520,105 0.03SELP Finance Sarl, REIT, Reg. S 1.5%20/11/2025 EUR 5,317,000 6,641,183 0.11SELP Finance Sarl, REIT, Reg. S 0.875%27/05/2029 EUR 8,657,000 10,303,236 0.18SES SA, Reg. S 0.875% 04/11/2027 EUR 16,064,000 19,540,305 0.33Traton Finance Luxembourg SA, Reg. S0.75% 24/03/2029 EUR 11,500,000 13,795,901 0.23
76,247,826 1.30
MexicoAmerica Movil SAB de CV 3.625%22/04/2029 USD 4,470,000 4,938,113 0.09America Movil SAB de CV 4.375%22/04/2049 USD 1,370,000 1,687,854 0.03Fomento Economico Mexicano SAB deCV 3.5% 16/01/2050 USD 7,198,000 7,559,591 0.13Petroleos Mexicanos 6.5% 13/03/2027 USD 5,230,000 5,513,047 0.09
19,698,605 0.34
NetherlandsABN AMRO Bank NV, 144A 4.75%28/07/2025 USD 3,410,000 3,827,316 0.07ABN AMRO Bank NV, Reg. S 6.25%27/04/2022 USD 6,885,000 7,202,398 0.12ABN AMRO Bank NV, Reg. S, FRN 4.4%27/03/2028 USD 5,000,000 5,265,450 0.09ABN AMRO Bank NV, Reg. S, FRN4.375% Perpetual EUR 9,900,000 12,739,119 0.22Airbus SE, Reg. S 1.625% 09/06/2030 EUR 5,564,000 7,190,516 0.12Airbus SE, Reg. S 2.375% 07/04/2032 EUR 2,700,000 3,708,190 0.06Airbus SE, Reg. S 2.375% 09/06/2040 EUR 1,941,000 2,675,396 0.05Cooperatieve Rabobank UA, Reg. S, FRN4.375% Perpetual EUR 5,600,000 7,383,004 0.13Daimler International Finance BV,Reg. S 1.5% 09/02/2027 EUR 966,000 1,234,740 0.02Digital Dutch Finco BV, REIT, Reg. S1.5% 15/03/2030 EUR 13,700,000 17,185,262 0.29E.ON International Finance BV, Reg. S5.625% 06/12/2023 GBP 1,478,000 2,291,049 0.04EDP Finance BV, Reg. S 1.625%26/01/2026 EUR 8,270,000 10,507,798 0.18EDP Finance BV, Reg. S 0.375%16/09/2026 EUR 3,443,000 4,131,488 0.07EDP Finance BV, Reg. S 1.5%22/11/2027 EUR 3,900,000 4,980,083 0.09Enel Finance International NV, Reg. S5.625% 14/08/2024 GBP 783,000 1,246,079 0.02ING Groep NV, FRN 3% 11/04/2028 EUR 6,300,000 7,852,084 0.13ING Groep NV, Reg. S, FRN 1.625%26/09/2029 EUR 2,000,000 2,464,185 0.04ING Groep NV, Reg. S, FRN 2.125%26/05/2031 EUR 3,600,000 4,546,994 0.08RELX Finance BV, Reg. S 0.5%10/03/2028 EUR 7,299,000 8,776,328 0.15Volkswagen Financial Services NV, Reg.S 1.625% 10/02/2024 GBP 2,100,000 2,966,442 0.05Volkswagen International Finance NV,Reg. S 1.875% 30/03/2027 EUR 5,500,000 7,095,319 0.12Volkswagen International Finance NV,Reg. S 2.625% 16/11/2027 EUR 4,100,000 5,548,992 0.10Volkswagen International Finance NV,Reg. S, FRN 3.5% Perpetual EUR 9,200,000 11,824,947 0.20Volkswagen International Finance NV,Reg. S, FRN 4.625% Perpetual EUR 6,800,000 9,363,898 0.16Volkswagen International Finance NV,Reg. S, FRN 4.625% Perpetual EUR 7,800,000 10,555,856 0.18Volkswagen International Finance NV,Reg. S, FRN 5.125% Perpetual EUR 2,098,000 2,739,248 0.05Vonovia Finance BV, Reg. S 1%09/07/2030 EUR 11,700,000 14,279,946 0.24Vonovia Finance BV, Reg. S 1.125%14/09/2034 EUR 4,100,000 4,918,645 0.08WPC Eurobond BV, REIT 2.125%15/04/2027 EUR 14,041,000 18,044,799 0.31WPC Eurobond BV, REIT 1.35%15/04/2028 EUR 14,003,000 17,214,008 0.29
189
JPMorgan Funds - Global Corporate Bond FundSchedule of Investments (continued)
As at 30 June 2021
Investments Currency
Quantity/Nominal
Value
MarketValue
USD
%of
NetAssets Investments Currency
Quantity/Nominal
Value
MarketValue
USD
%of
NetAssets
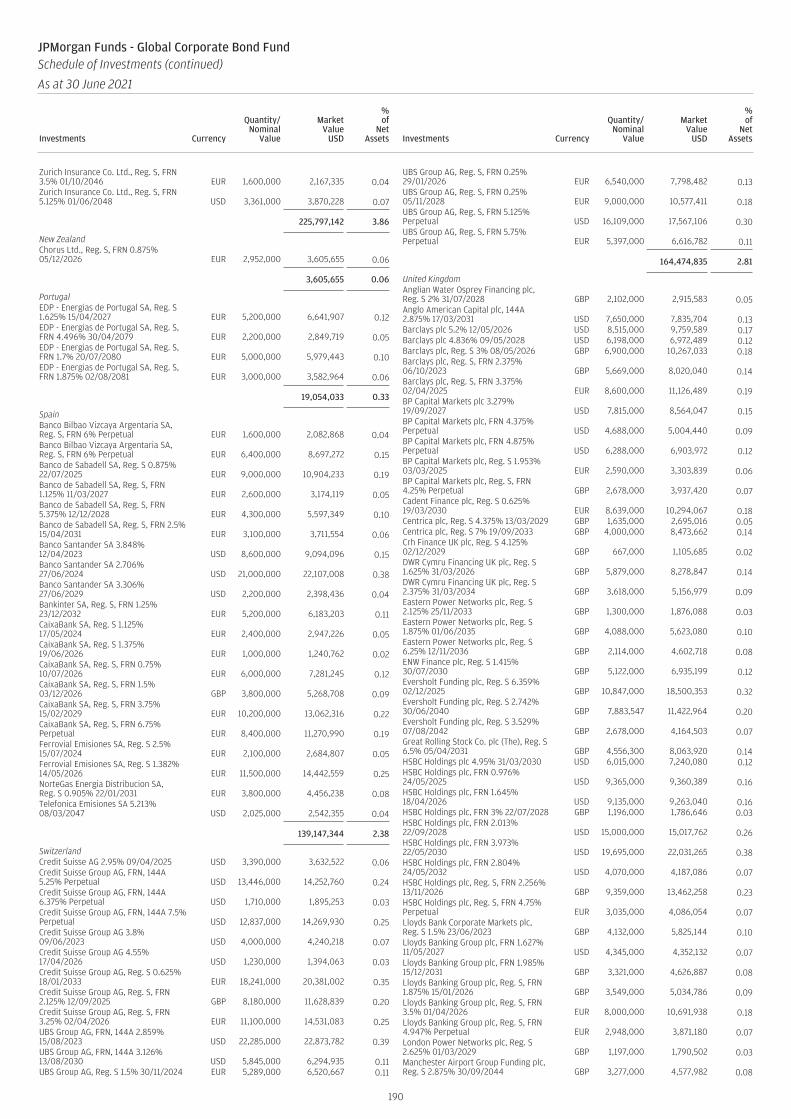
Zurich Insurance Co. Ltd., Reg. S, FRN3.5% 01/10/2046 EUR 1,600,000 2,167,335 0.04Zurich Insurance Co. Ltd., Reg. S, FRN5.125% 01/06/2048 USD 3,361,000 3,870,228 0.07
225,797,142 3.86
New ZealandChorus Ltd., Reg. S, FRN 0.875%05/12/2026 EUR 2,952,000 3,605,655 0.06
3,605,655 0.06
PortugalEDP - Energias de Portugal SA, Reg. S1.625% 15/04/2027 EUR 5,200,000 6,641,907 0.12EDP - Energias de Portugal SA, Reg. S,FRN 4.496% 30/04/2079 EUR 2,200,000 2,849,719 0.05EDP - Energias de Portugal SA, Reg. S,FRN 1.7% 20/07/2080 EUR 5,000,000 5,979,443 0.10EDP - Energias de Portugal SA, Reg. S,FRN 1.875% 02/08/2081 EUR 3,000,000 3,582,964 0.06
19,054,033 0.33
SpainBanco Bilbao Vizcaya Argentaria SA,Reg. S, FRN 6% Perpetual EUR 1,600,000 2,082,868 0.04Banco Bilbao Vizcaya Argentaria SA,Reg. S, FRN 6% Perpetual EUR 6,400,000 8,697,272 0.15Banco de Sabadell SA, Reg. S 0.875%22/07/2025 EUR 9,000,000 10,904,233 0.19Banco de Sabadell SA, Reg. S, FRN1.125% 11/03/2027 EUR 2,600,000 3,174,119 0.05Banco de Sabadell SA, Reg. S, FRN5.375% 12/12/2028 EUR 4,300,000 5,597,349 0.10Banco de Sabadell SA, Reg. S, FRN 2.5%15/04/2031 EUR 3,100,000 3,711,554 0.06Banco Santander SA 3.848%12/04/2023 USD 8,600,000 9,094,096 0.15Banco Santander SA 2.706%27/06/2024 USD 21,000,000 22,107,008 0.38Banco Santander SA 3.306%27/06/2029 USD 2,200,000 2,398,436 0.04Bankinter SA, Reg. S, FRN 1.25%23/12/2032 EUR 5,200,000 6,183,203 0.11CaixaBank SA, Reg. S 1.125%17/05/2024 EUR 2,400,000 2,947,226 0.05CaixaBank SA, Reg. S 1.375%19/06/2026 EUR 1,000,000 1,240,762 0.02CaixaBank SA, Reg. S, FRN 0.75%10/07/2026 EUR 6,000,000 7,281,245 0.12CaixaBank SA, Reg. S, FRN 1.5%03/12/2026 GBP 3,800,000 5,268,708 0.09CaixaBank SA, Reg. S, FRN 3.75%15/02/2029 EUR 10,200,000 13,062,316 0.22CaixaBank SA, Reg. S, FRN 6.75%Perpetual EUR 8,400,000 11,270,990 0.19Ferrovial Emisiones SA, Reg. S 2.5%15/07/2024 EUR 2,100,000 2,684,807 0.05Ferrovial Emisiones SA, Reg. S 1.382%14/05/2026 EUR 11,500,000 14,442,559 0.25NorteGas Energia Distribucion SA,Reg. S 0.905% 22/01/2031 EUR 3,800,000 4,456,238 0.08Telefonica Emisiones SA 5.213%08/03/2047 USD 2,025,000 2,542,355 0.04
139,147,344 2.38
SwitzerlandCredit Suisse AG 2.95% 09/04/2025 USD 3,390,000 3,632,522 0.06Credit Suisse Group AG, FRN, 144A5.25% Perpetual USD 13,446,000 14,252,760 0.24Credit Suisse Group AG, FRN, 144A6.375% Perpetual USD 1,710,000 1,895,253 0.03Credit Suisse Group AG, FRN, 144A 7.5%Perpetual USD 12,837,000 14,269,930 0.25Credit Suisse Group AG 3.8%09/06/2023 USD 4,000,000 4,240,218 0.07Credit Suisse Group AG 4.55%17/04/2026 USD 1,230,000 1,394,063 0.03Credit Suisse Group AG, Reg. S 0.625%18/01/2033 EUR 18,241,000 20,381,002 0.35Credit Suisse Group AG, Reg. S, FRN2.125% 12/09/2025 GBP 8,180,000 11,628,839 0.20Credit Suisse Group AG, Reg. S, FRN3.25% 02/04/2026 EUR 11,100,000 14,531,083 0.25UBS Group AG, FRN, 144A 2.859%15/08/2023 USD 22,285,000 22,873,782 0.39UBS Group AG, FRN, 144A 3.126%13/08/2030 USD 5,845,000 6,294,935 0.11UBS Group AG, Reg. S 1.5% 30/11/2024 EUR 5,289,000 6,520,667 0.11
UBS Group AG, Reg. S, FRN 0.25%29/01/2026 EUR 6,540,000 7,798,482 0.13UBS Group AG, Reg. S, FRN 0.25%05/11/2028 EUR 9,000,000 10,577,411 0.18UBS Group AG, Reg. S, FRN 5.125%Perpetual USD 16,109,000 17,567,106 0.30UBS Group AG, Reg. S, FRN 5.75%Perpetual EUR 5,397,000 6,616,782 0.11
164,474,835 2.81
United KingdomAnglian Water Osprey Financing plc,Reg. S 2% 31/07/2028 GBP 2,102,000 2,915,583 0.05Anglo American Capital plc, 144A2.875% 17/03/2031 USD 7,650,000 7,835,704 0.13Barclays plc 5.2% 12/05/2026 USD 8,515,000 9,759,589 0.17Barclays plc 4.836% 09/05/2028 USD 6,198,000 6,972,489 0.12Barclays plc, Reg. S 3% 08/05/2026 GBP 6,900,000 10,267,033 0.18Barclays plc, Reg. S, FRN 2.375%06/10/2023 GBP 5,669,000 8,020,040 0.14Barclays plc, Reg. S, FRN 3.375%02/04/2025 EUR 8,600,000 11,126,489 0.19BP Capital Markets plc 3.279%19/09/2027 USD 7,815,000 8,564,047 0.15BP Capital Markets plc, FRN 4.375%Perpetual USD 4,688,000 5,004,440 0.09BP Capital Markets plc, FRN 4.875%Perpetual USD 6,288,000 6,903,972 0.12BP Capital Markets plc, Reg. S 1.953%03/03/2025 EUR 2,590,000 3,303,839 0.06BP Capital Markets plc, Reg. S, FRN4.25% Perpetual GBP 2,678,000 3,937,420 0.07Cadent Finance plc, Reg. S 0.625%19/03/2030 EUR 8,639,000 10,294,067 0.18Centrica plc, Reg. S 4.375% 13/03/2029 GBP 1,635,000 2,695,016 0.05Centrica plc, Reg. S 7% 19/09/2033 GBP 4,000,000 8,473,662 0.14Crh Finance UK plc, Reg. S 4.125%02/12/2029 GBP 667,000 1,105,685 0.02DWR Cymru Financing UK plc, Reg. S1.625% 31/03/2026 GBP 5,879,000 8,278,847 0.14DWR Cymru Financing UK plc, Reg. S2.375% 31/03/2034 GBP 3,618,000 5,156,979 0.09Eastern Power Networks plc, Reg. S2.125% 25/11/2033 GBP 1,300,000 1,876,088 0.03Eastern Power Networks plc, Reg. S1.875% 01/06/2035 GBP 4,088,000 5,623,080 0.10Eastern Power Networks plc, Reg. S6.25% 12/11/2036 GBP 2,114,000 4,602,718 0.08ENW Finance plc, Reg. S 1.415%30/07/2030 GBP 5,122,000 6,935,199 0.12Eversholt Funding plc, Reg. S 6.359%02/12/2025 GBP 10,847,000 18,500,353 0.32Eversholt Funding plc, Reg. S 2.742%30/06/2040 GBP 7,883,547 11,422,964 0.20Eversholt Funding plc, Reg. S 3.529%07/08/2042 GBP 2,678,000 4,164,503 0.07Great Rolling Stock Co. plc (The), Reg. S6.5% 05/04/2031 GBP 4,556,300 8,063,920 0.14HSBC Holdings plc 4.95% 31/03/2030 USD 6,015,000 7,240,080 0.12HSBC Holdings plc, FRN 0.976%24/05/2025 USD 9,365,000 9,360,389 0.16HSBC Holdings plc, FRN 1.645%18/04/2026 USD 9,135,000 9,263,040 0.16HSBC Holdings plc, FRN 3% 22/07/2028 GBP 1,196,000 1,786,646 0.03HSBC Holdings plc, FRN 2.013%22/09/2028 USD 15,000,000 15,017,762 0.26HSBC Holdings plc, FRN 3.973%22/05/2030 USD 19,695,000 22,031,265 0.38HSBC Holdings plc, FRN 2.804%24/05/2032 USD 4,070,000 4,187,086 0.07HSBC Holdings plc, Reg. S, FRN 2.256%13/11/2026 GBP 9,359,000 13,462,258 0.23HSBC Holdings plc, Reg. S, FRN 4.75%Perpetual EUR 3,035,000 4,086,054 0.07Lloyds Bank Corporate Markets plc,Reg. S 1.5% 23/06/2023 GBP 4,132,000 5,825,144 0.10Lloyds Banking Group plc, FRN 1.627%11/05/2027 USD 4,345,000 4,352,132 0.07Lloyds Banking Group plc, FRN 1.985%15/12/2031 GBP 3,321,000 4,626,887 0.08Lloyds Banking Group plc, Reg. S, FRN1.875% 15/01/2026 GBP 3,549,000 5,034,786 0.09Lloyds Banking Group plc, Reg. S, FRN3.5% 01/04/2026 EUR 8,000,000 10,691,938 0.18Lloyds Banking Group plc, Reg. S, FRN4.947% Perpetual EUR 2,948,000 3,871,180 0.07London Power Networks plc, Reg. S2.625% 01/03/2029 GBP 1,197,000 1,790,502 0.03Manchester Airport Group Funding plc,Reg. S 2.875% 30/09/2044 GBP 3,277,000 4,577,982 0.08
190
JPMorgan Funds - Global Corporate Bond FundSchedule of Investments (continued)
As at 30 June 2021
Investments Currency
Quantity/Nominal
Value
MarketValue
USD
%of
NetAssets Investments Currency
Quantity/Nominal
Value
MarketValue
USD
%of
NetAssets

National Express Group plc, Reg. S 2.5%11/11/2023 GBP 2,340,000 3,368,812 0.06Nationwide Building Society, 144A 3.9%21/07/2025 USD 3,042,000 3,374,610 0.06Nationwide Building Society, FRN, 144A4.363% 01/08/2024 USD 13,125,000 14,085,359 0.24Nationwide Building Society, FRN, 144A4.302% 08/03/2029 USD 4,780,000 5,404,335 0.09Nationwide Building Society, Reg. S0.25% 22/07/2025 EUR 4,046,000 4,852,245 0.08Nationwide Building Society, Reg. S,FRN 5.75% Perpetual GBP 7,149,000 11,106,578 0.19Nationwide Building Society, Reg. S,FRN 5.875% Perpetual GBP 200,000 305,236 0.00Natwest Group plc, FRN 4.519%25/06/2024 USD 15,770,000 16,939,590 0.29Natwest Group plc, FRN 4.269%22/03/2025 USD 495,000 537,073 0.01Natwest Group plc, FRN 1.642%14/06/2027 USD 7,175,000 7,184,038 0.12Natwest Group plc, FRN 3.073%22/05/2028 USD 14,390,000 15,198,128 0.26Natwest Group plc, FRN 4.445%08/05/2030 USD 1,250,000 1,431,246 0.02Natwest Group plc, FRN 3.032%28/11/2035 USD 5,320,000 5,334,098 0.09Natwest Group plc, FRN 5.125%31/12/2164 GBP 12,140,000 18,133,235 0.31Natwest Group plc, Reg. S 2.5%22/03/2023 EUR 1,588,000 1,970,900 0.03Natwest Group plc, Reg. S, FRN 0.75%15/11/2025 EUR 7,772,000 9,419,633 0.16Natwest Group plc, Reg. S, FRN 1.75%02/03/2026 EUR 5,341,000 6,685,502 0.11Natwest Group plc, Reg. S, FRN 3.125%28/03/2027 GBP 8,936,000 13,314,819 0.23Natwest Group plc, Reg. S, FRN 0.78%26/02/2030 EUR 4,995,000 5,933,734 0.10NGG Finance plc, Reg. S, FRN 2.125%05/09/2082 EUR 8,200,000 9,870,346 0.17Northern Gas Networks Finance plc,Reg. S 4.875% 30/06/2027 GBP 2,563,000 4,290,083 0.07Reckitt Benckiser Treasury Services plc,144A 3% 26/06/2027 USD 4,438,000 4,810,665 0.08RSA Insurance Group Ltd., Reg. S, FRN5.125% 10/10/2045 GBP 6,080,000 9,614,598 0.16Santander UK Group Holdings plc, 144A4.75% 15/09/2025 USD 3,288,000 3,694,621 0.06Santander UK Group Holdings plc, FRN1.673% 14/06/2027 USD 9,200,000 9,194,298 0.16Santander UK Group Holdings plc, FRN2.896% 15/03/2032 USD 5,572,000 5,744,953 0.10Standard Chartered plc, FRN, 144A4.247% 20/01/2023 USD 2,250,000 2,295,565 0.04Standard Chartered plc, FRN, 144A1.319% 14/10/2023 USD 5,865,000 5,919,720 0.10Standard Chartered plc, FRN, 144A0.991% 12/01/2025 USD 7,500,000 7,483,491 0.13Standard Chartered plc, FRN, 144A2.819% 30/01/2026 USD 4,085,000 4,290,764 0.07Standard Chartered plc, FRN, 144A1.456% 14/01/2027 USD 3,885,000 3,848,328 0.07Standard Chartered plc, FRN, 144A2.678% 29/06/2032 USD 13,595,000 13,655,702 0.23Swiss Re Finance UK plc, Reg. S, FRN2.714% 04/06/2052 EUR 3,200,000 4,185,711 0.07Tesco Corporate Treasury Services plc,Reg. S 0.875% 29/05/2026 EUR 5,700,000 6,962,668 0.12Tesco Corporate Treasury Services plc,Reg. S 0.375% 27/07/2029 EUR 15,160,000 17,584,491 0.30Thames Water Utilities Finance plc 6.5%09/02/2032 GBP 2,300,000 4,547,991 0.08Thames Water Utilities Finance plc, FRN5.75% 13/09/2030 GBP 7,700,000 11,194,413 0.19Thames Water Utilities Finance plc,Reg. S 2.625% 24/01/2032 GBP 2,048,000 3,015,391 0.05Vodafone Group plc, Reg. S, FRN2.625% 27/08/2080 EUR 6,387,000 7,861,006 0.13Western Power Distribution EastMidlands plc, Reg. S 1.75% 09/09/2031 GBP 878,000 1,213,324 0.02Western Power Distribution SouthWales plc, Reg. S 1.625% 07/10/2035 GBP 4,230,000 5,528,595 0.09Western Power Distribution WestMidlands plc, Reg. S 3.875% 17/10/2024 GBP 4,968,000 7,503,709 0.13
607,898,461 10.40
United States of AmericaAbbVie, Inc. 1.25% 01/06/2024 EUR 13,230,000 16,260,422 0.28AbbVie, Inc. 3.2% 14/05/2026 USD 5,135,000 5,570,194 0.10AbbVie, Inc. 0.75% 18/11/2027 EUR 4,000,000 4,883,355 0.08
AbbVie, Inc. 2.625% 15/11/2028 EUR 1,550,000 2,124,448 0.04AbbVie, Inc. 3.2% 21/11/2029 USD 3,862,000 4,199,068 0.07AbbVie, Inc. 4.4% 06/11/2042 USD 4,435,000 5,404,721 0.09AbbVie, Inc. 4.45% 14/05/2046 USD 3,720,000 4,524,571 0.08Aetna, Inc. 2.8% 15/06/2023 USD 5,876,000 6,116,926 0.10Aetna, Inc. 3.5% 15/11/2024 USD 4,856,000 5,257,105 0.09Aetna, Inc. 4.125% 15/11/2042 USD 5,253,000 6,030,369 0.10Aetna, Inc. 3.875% 15/08/2047 USD 3,150,000 3,544,970 0.06Air Lease Corp. 3.75% 01/02/2022 USD 3,005,000 3,045,923 0.05Air Lease Corp. 2.3% 01/02/2025 USD 3,800,000 3,930,881 0.07Air Lease Corp. 3.375% 01/07/2025 USD 5,330,000 5,730,332 0.10Air Lease Corp. 2.875% 15/01/2026 USD 3,750,000 3,941,872 0.07Air Lease Corp. 1.875% 15/08/2026 USD 5,340,000 5,347,031 0.09Air Lease Corp. 3% 01/02/2030 USD 6,859,000 6,936,639 0.12Ameren Corp. 3.5% 15/01/2031 USD 13,366,000 14,656,916 0.25American International Group, Inc.1.875% 21/06/2027 EUR 4,061,000 5,211,855 0.09American International Group, Inc.4.8% 10/07/2045 USD 5,430,000 6,852,600 0.12American Tower Corp., REIT 1.375%04/04/2025 EUR 9,959,000 12,346,713 0.21American Tower Corp., REIT 1.95%22/05/2026 EUR 2,102,000 2,694,349 0.05American Tower Corp., REIT 0.5%15/01/2028 EUR 2,400,000 2,826,046 0.05American Tower Corp., REIT 0.875%21/05/2029 EUR 11,834,000 14,169,795 0.24American Tower Corp., REIT 2.1%15/06/2030 USD 5,400,000 5,330,977 0.09Anheuser-Busch Cos. LLC 4.7%01/02/2036 USD 15,080,000 18,523,288 0.32Anheuser-Busch InBev Finance, Inc.4.625% 01/02/2044 USD 2,404,000 2,923,345 0.05Anheuser-Busch InBev Worldwide, Inc.4.375% 15/04/2038 USD 1,910,000 2,286,811 0.04Anheuser-Busch InBev Worldwide, Inc.4.35% 01/06/2040 USD 3,500,000 4,171,201 0.07Anheuser-Busch InBev Worldwide, Inc.4.6% 15/04/2048 USD 7,780,000 9,529,590 0.16Anheuser-Busch InBev Worldwide, Inc.4.439% 06/10/2048 USD 15,512,000 18,559,773 0.32AT&T, Inc. 2.25% 01/02/2032 USD 6,985,000 6,871,995 0.12AT&T, Inc. 3.5% 01/06/2041 USD 2,825,000 2,951,592 0.05Bank of America Corp. 4.183%25/11/2027 USD 15,000,000 16,802,811 0.29Bank of America Corp., Reg. S 2.3%25/07/2025 GBP 4,851,000 7,102,516 0.12Bank of America Corp., Reg. S, FRN0.583% 24/08/2028 EUR 5,000,000 5,983,100 0.10Becton Dickinson and Co. 3.734%15/12/2024 USD 5,387,000 5,869,674 0.10Becton Dickinson and Co. 3.794%20/05/2050 USD 3,420,000 3,846,034 0.07Berkshire Hathaway Finance Corp.2.375% 19/06/2039 GBP 1,372,000 2,049,569 0.03Berkshire Hathaway Finance Corp.4.2% 15/08/2048 USD 5,000 6,191 0.00Berkshire Hathaway Finance Corp.2.85% 15/10/2050 USD 9,010,000 9,018,968 0.15Boston Properties LP, REIT 2.55%01/04/2032 USD 2,650,000 2,670,041 0.05Boston Scientific Corp. 2.65%01/06/2030 USD 2,500,000 2,583,862 0.04BP Capital Markets America, Inc.3.216% 28/11/2023 USD 5,829,000 6,175,584 0.11BP Capital Markets America, Inc. 3%24/02/2050 USD 4,160,000 4,058,335 0.07BP Capital Markets America, Inc.2.772% 10/11/2050 USD 3,980,000 3,722,155 0.06Bristol-Myers Squibb Co. 2.35%13/11/2040 USD 3,780,000 3,629,536 0.06Bristol-Myers Squibb Co. 2.55%13/11/2050 USD 7,500,000 7,194,532 0.12Bunge Ltd. Finance Corp. 3%25/09/2022 USD 6,597,000 6,778,230 0.12Burlington Northern Santa Fe LLC4.15% 01/04/2045 USD 3,259,000 3,993,808 0.07Burlington Northern Santa Fe LLC 3.3%15/09/2051 USD 6,430,000 7,038,880 0.12Campbell Soup Co. 3.95% 15/03/2025 USD 4,542,000 5,011,132 0.09CenterPoint Energy, Inc. 2.65%01/06/2031 USD 11,385,000 11,613,827 0.20CF Industries, Inc. 5.15% 15/03/2034 USD 10,679,000 12,962,864 0.22CF Industries, Inc. 4.95% 01/06/2043 USD 4,320,000 5,112,374 0.09CF Industries, Inc. 5.375% 15/03/2044 USD 2,627,000 3,254,039 0.06Cigna Corp. 3.75% 15/07/2023 USD 2,998,000 3,192,837 0.05Cigna Corp. 3.2% 15/03/2040 USD 9,000,000 9,377,539 0.16Cimarex Energy Co. 3.9% 15/05/2027 USD 3,330,000 3,658,757 0.06Citigroup, Inc. 2.75% 24/01/2024 GBP 1,897,000 2,756,266 0.05Citigroup, Inc. 1.75% 23/10/2026 GBP 4,651,000 6,596,496 0.11
191
JPMorgan Funds - Global Corporate Bond FundSchedule of Investments (continued)
As at 30 June 2021
Investments Currency
Quantity/Nominal
Value
MarketValue
USD
%of
NetAssets Investments Currency
Quantity/Nominal
Value
MarketValue
USD
%of
NetAssets

Citigroup, Inc., Reg. S, FRN 0.5%08/10/2027 EUR 2,847,000 3,408,541 0.06Coca-Cola Co. (The) 2.5% 01/06/2040 USD 3,295,000 3,273,941 0.06ConocoPhillips Co. 4.15% 15/11/2034 USD 900,000 1,048,366 0.02Crown Castle International Corp., REIT2.9% 01/04/2041 USD 5,745,000 5,600,233 0.10CVS Health Corp. 4.78% 25/03/2038 USD 4,035,000 4,976,033 0.09CVS Health Corp. 4.125% 01/04/2040 USD 695,000 809,494 0.01CVS Health Corp. 2.7% 21/08/2040 USD 14,680,000 14,248,360 0.24Dell International LLC 6.02%15/06/2026 USD 1,092,000 1,309,287 0.02Dominion Energy, Inc. 3.375%01/04/2030 USD 6,003,000 6,550,302 0.11Duke Energy Corp. 2.55% 15/06/2031 USD 3,805,000 3,854,963 0.07Duke Energy Corp. 3.5% 15/06/2051 USD 3,195,000 3,319,754 0.06Duke Energy Indiana LLC 3.75%15/05/2046 USD 1,800,000 2,023,320 0.03Duke Energy Indiana LLC 3.25%01/10/2049 USD 4,150,000 4,387,866 0.07Duke Energy Indiana LLC 2.75%01/04/2050 USD 3,280,000 3,192,669 0.05Duke Energy Ohio, Inc. 4.3%01/02/2049 USD 629,000 778,186 0.01Duke Energy Progress LLC 4.1%15/03/2043 USD 3,645,000 4,344,798 0.07Edison International 3.125% 15/11/2022 USD 3,465,000 3,570,067 0.06Edison International 2.95% 15/03/2023 USD 5,867,000 6,059,311 0.10Edison International 4.125%15/03/2028 USD 1,380,000 1,470,168 0.03Elanco Animal Health, Inc., FRN 4.912%27/08/2021 USD 4,675,000 4,708,473 0.08Encompass Health Corp. 4.75%01/02/2030 USD 295,000 314,216 0.01Energy Transfer LP 4.75% 15/01/2026 USD 2,450,000 2,761,514 0.05Energy Transfer LP 4.2% 15/04/2027 USD 4,757,000 5,270,048 0.09Energy Transfer LP 5.25% 15/04/2029 USD 3,000,000 3,547,490 0.06Energy Transfer LP 3.75% 15/05/2030 USD 274,000 297,940 0.00Energy Transfer LP 6.05% 01/06/2041 USD 1,154,000 1,473,391 0.03Energy Transfer LP 5.3% 01/04/2044 USD 6,552,000 7,586,741 0.13Energy Transfer LP 5.35% 15/05/2045 USD 444,000 515,390 0.01Entergy Arkansas LLC 4.95%15/12/2044 USD 4,292,000 4,699,364 0.08Entergy Corp. 2.4% 15/06/2031 USD 5,840,000 5,840,345 0.10Entergy Louisiana LLC 4.95%15/01/2045 USD 7,069,000 7,756,889 0.13Entergy Texas, Inc. 4% 30/03/2029 USD 4,000,000 4,517,884 0.08Entergy Texas, Inc. 3.55% 30/09/2049 USD 3,190,000 3,426,581 0.06Enterprise Products Operating LLC3.2% 15/02/2052 USD 3,530,000 3,500,732 0.06Essex Portfolio LP, REIT 2.65%01/09/2050 USD 2,970,000 2,642,804 0.05Evergy, Inc. 2.9% 15/09/2029 USD 8,950,000 9,483,716 0.16Exxon Mobil Corp. 0.524% 26/06/2028 EUR 8,468,000 10,199,473 0.17Exxon Mobil Corp. 2.995% 16/08/2039 USD 10,131,000 10,471,522 0.18Federal Realty Investment Trust, REIT3.625% 01/08/2046 USD 1,862,000 1,934,226 0.03Fidelity National Information Services,Inc. 1% 03/12/2028 EUR 4,800,000 5,868,609 0.10Fidelity National Information Services,Inc. 2.25% 03/12/2029 GBP 2,593,000 3,738,843 0.06Fidelity National Information Services,Inc. 2% 21/05/2030 EUR 6,700,000 8,807,156 0.15Fidelity National Information Services,Inc. 3.36% 21/05/2031 GBP 2,000,000 3,119,455 0.05Fidelity National Information Services,Inc. 3.1% 01/03/2041 USD 2,670,000 2,744,867 0.05Fiserv, Inc. 1.625% 01/07/2030 EUR 8,000,000 10,204,785 0.17Ford Motor Credit Co. LLC 4.063%01/11/2024 USD 2,500,000 2,660,050 0.05Ford Motor Credit Co. LLC 3.375%13/11/2025 USD 15,979,000 16,550,729 0.28Ford Motor Credit Co. LLC 3.625%17/06/2031 USD 15,320,000 15,607,250 0.27Freeport-McMoRan, Inc. 4.125%01/03/2028 USD 7,845,000 8,188,219 0.14Freeport-McMoRan, Inc. 4.375%01/08/2028 USD 500,000 528,125 0.01Freeport-McMoRan, Inc. 5.25%01/09/2029 USD 15,558,000 17,188,089 0.29Freeport-McMoRan, Inc. 5.4%14/11/2034 USD 1,400,000 1,685,397 0.03Freeport-McMoRan, Inc. 5.45%15/03/2043 USD 7,749,000 9,509,340 0.16General Electric Co. 1.875% 28/05/2027 EUR 10,323,000 13,234,033 0.23General Electric Co. 5.25% 07/12/2028 GBP 1,800,000 3,110,352 0.05General Electric Co. 1.5% 17/05/2029 EUR 4,800,000 6,020,316 0.10General Electric Co. 2.125% 17/05/2037 EUR 4,716,000 6,096,917 0.10General Electric Co., Reg. S 5.375%18/12/2040 GBP 1,500,000 2,939,863 0.05
General Motors Co. 5.4% 02/10/2023 USD 3,100,000 3,414,845 0.06General Motors Co. 6.125% 01/10/2025 USD 901,000 1,067,179 0.02General Motors Co. 5.15% 01/04/2038 USD 4,775,000 5,838,236 0.10General Motors Co. 5.2% 01/04/2045 USD 2,135,000 2,656,965 0.05General Motors Financial Co., Inc.3.95% 13/04/2024 USD 7,183,000 7,735,661 0.13General Motors Financial Co., Inc. 4.3%13/07/2025 USD 2,365,000 2,615,109 0.04General Motors Financial Co., Inc.,Reg. S 2.35% 03/09/2025 GBP 1,600,000 2,305,954 0.04Global Payments, Inc. 4% 01/06/2023 USD 5,130,000 5,450,243 0.09Global Payments, Inc. 2.65%15/02/2025 USD 4,570,000 4,819,483 0.08Global Payments, Inc. 3.2% 15/08/2029 USD 5,100,000 5,468,188 0.09Global Payments, Inc. 2.9% 15/05/2030 USD 2,490,000 2,598,524 0.04Goldman Sachs Group, Inc. (The) 3.5%01/04/2025 USD 10,445,000 11,338,286 0.19Goldman Sachs Group, Inc. (The) 5.15%22/05/2045 USD 2,087,000 2,806,257 0.05Goldman Sachs Group, Inc. (The), Reg. S0.125% 19/08/2024 EUR 6,065,000 7,224,380 0.12Goldman Sachs Group, Inc. (The), Reg. S4.25% 29/01/2026 GBP 11,140,000 17,514,909 0.30Goldman Sachs Group, Inc. (The), Reg. S1.625% 27/07/2026 EUR 3,318,000 4,204,863 0.07Halliburton Co. 4.85% 15/11/2035 USD 4,220,000 4,976,920 0.09HCA, Inc. 4.75% 01/05/2023 USD 4,250,000 4,560,287 0.08HCA, Inc. 5% 15/03/2024 USD 12,230,000 13,525,768 0.23HCA, Inc. 5.375% 01/09/2026 USD 4,725,000 5,460,068 0.09HCA, Inc. 4.5% 15/02/2027 USD 8,190,000 9,266,170 0.16HCA, Inc. 5.625% 01/09/2028 USD 4,450,000 5,289,938 0.09HCA, Inc. 5.875% 01/02/2029 USD 1,580,000 1,912,582 0.03HCA, Inc. 5.25% 15/06/2049 USD 5,975,000 7,632,235 0.13HCA, Inc. 3.5% 15/07/2051 USD 4,490,000 4,505,156 0.08Healthcare Trust of America HoldingsLP, REIT 2% 15/03/2031 USD 5,950,000 5,757,751 0.10Healthpeak Properties, Inc., REIT 3%15/01/2030 USD 5,745,000 6,135,548 0.10Hess Corp. 5.6% 15/02/2041 USD 2,759,000 3,450,817 0.06Hilton Worldwide Finance LLC 4.875%01/04/2027 USD 870,000 909,368 0.02Home Depot, Inc. (The) 3.3%15/04/2040 USD 3,500,000 3,844,452 0.07Home Depot, Inc. (The) 4.25%01/04/2046 USD 3,120,000 3,897,563 0.07Howmet Aerospace, Inc. 5.9%01/02/2027 USD 815,000 954,194 0.02ITC Holdings Corp. 3.65% 15/06/2024 USD 6,559,000 7,041,148 0.12Kraft Heinz Foods Co., Reg. S 1.5%24/05/2024 EUR 1,029,000 1,265,045 0.02Kroger Co. (The) 3.875% 15/10/2046 USD 11,682,000 12,905,467 0.22Lennar Corp. 5.875% 15/11/2024 USD 1,550,000 1,763,528 0.03Lennar Corp. 4.75% 29/11/2027 USD 10,783,000 12,440,886 0.21Lowe’s Cos., Inc. 3.7% 15/04/2046 USD 5,687,000 6,259,507 0.11Lowe’s Cos., Inc. 4.05% 03/05/2047 USD 4,216,000 4,875,948 0.08Lumen Technologies, Inc.None 5.8%15/03/2022 USD 945,000 976,119 0.02LYB International Finance III LLC3.625% 01/04/2051 USD 13,827,000 14,709,059 0.25Magellan Midstream Partners LP 4.2%15/03/2045 USD 1,992,000 2,134,171 0.04Marathon Petroleum Corp. 4.5%01/05/2023 USD 5,080,000 5,419,157 0.09Marathon Petroleum Corp. 4.75%15/09/2044 USD 4,054,000 4,809,447 0.08McDonald’s Corp. 3.625% 01/09/2049 USD 7,210,000 7,991,410 0.14MDC Holdings, Inc. 3.85% 15/01/2030 USD 2,421,000 2,596,535 0.04MDC Holdings, Inc. 2.5% 15/01/2031 USD 18,015,000 17,540,665 0.30Merck & Co., Inc. 3.7% 10/02/2045 USD 1,790,000 2,083,909 0.04Morgan Stanley 3.7% 23/10/2024 USD 7,869,000 8,596,253 0.15Morgan Stanley 2.625% 09/03/2027 GBP 3,936,000 5,848,357 0.10Morgan Stanley, FRN 0.406%29/10/2027 EUR 8,429,000 10,042,197 0.17Morgan Stanley, FRN 1.794%13/02/2032 USD 14,670,000 14,106,650 0.24MPLX LP 4.5% 15/07/2023 USD 2,000,000 2,139,601 0.04MPLX LP 2.65% 15/08/2030 USD 3,250,000 3,290,548 0.06MPLX LP 4.5% 15/04/2038 USD 9,280,000 10,663,307 0.18National Grid North America, Inc.,Reg. S 1% 12/07/2024 EUR 3,700,000 4,527,731 0.08Netflix, Inc. 3.625% 15/05/2027 EUR 6,500,000 8,894,488 0.15Netflix, Inc. 4.625% 15/05/2029 EUR 1,100,000 1,634,681 0.03Netflix, Inc., Reg. S 3.875% 15/11/2029 EUR 6,200,000 8,881,433 0.15Norfolk Southern Corp. 3.05%15/05/2050 USD 6,380,000 6,391,274 0.11NRG Energy, Inc. 5.75% 15/01/2028 USD 430,000 459,251 0.01Oracle Corp. 2.875% 25/03/2031 USD 2,010,000 2,093,398 0.04Oracle Corp. 3.8% 15/11/2037 USD 6,040,000 6,635,731 0.11Oracle Corp. 3.6% 01/04/2040 USD 9,350,000 9,877,350 0.17
192
JPMorgan Funds - Global Corporate Bond FundSchedule of Investments (continued)
As at 30 June 2021
Investments Currency
Quantity/Nominal
Value
MarketValue
USD
%of
NetAssets Investments Currency
Quantity/Nominal
Value
MarketValue
USD
%of
NetAssets
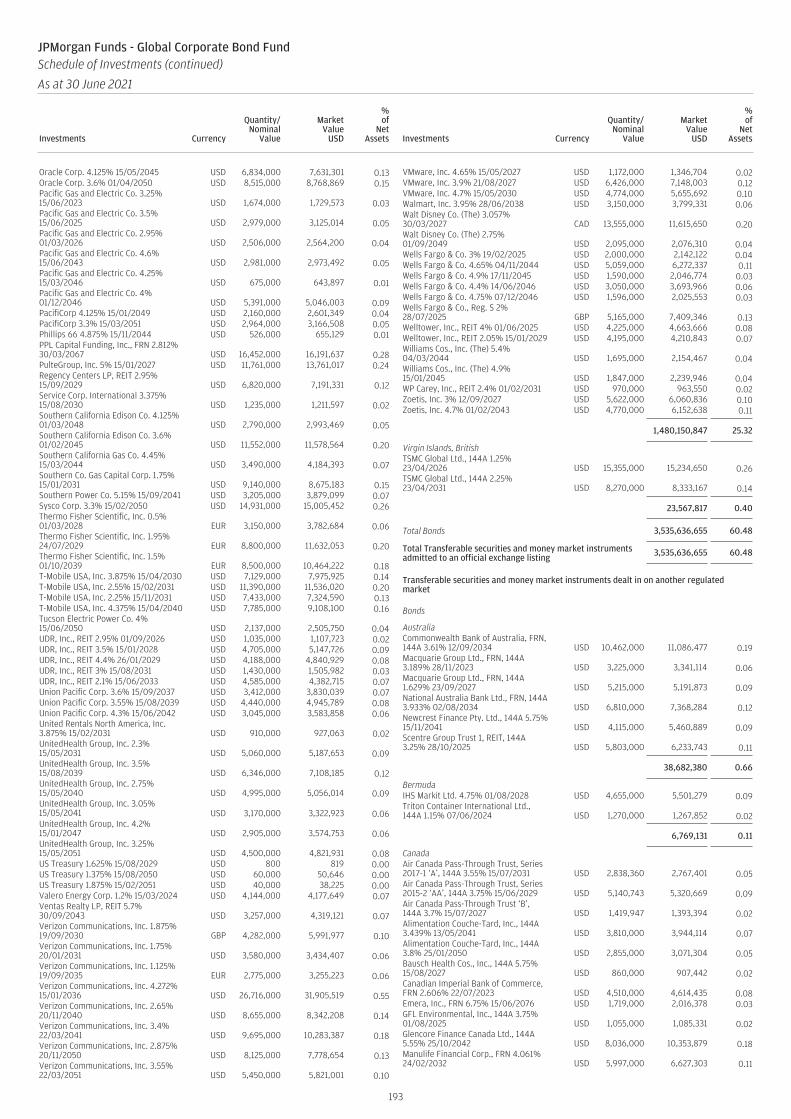
Oracle Corp. 4.125% 15/05/2045 USD 6,834,000 7,631,301 0.13Oracle Corp. 3.6% 01/04/2050 USD 8,515,000 8,768,869 0.15Pacific Gas and Electric Co. 3.25%15/06/2023 USD 1,674,000 1,729,573 0.03Pacific Gas and Electric Co. 3.5%15/06/2025 USD 2,979,000 3,125,014 0.05Pacific Gas and Electric Co. 2.95%01/03/2026 USD 2,506,000 2,564,200 0.04Pacific Gas and Electric Co. 4.6%15/06/2043 USD 2,981,000 2,973,492 0.05Pacific Gas and Electric Co. 4.25%15/03/2046 USD 675,000 643,897 0.01Pacific Gas and Electric Co. 4%01/12/2046 USD 5,391,000 5,046,003 0.09PacifiCorp 4.125% 15/01/2049 USD 2,160,000 2,601,349 0.04PacifiCorp 3.3% 15/03/2051 USD 2,964,000 3,166,508 0.05Phillips 66 4.875% 15/11/2044 USD 526,000 655,129 0.01PPL Capital Funding, Inc., FRN 2.812%30/03/2067 USD 16,452,000 16,191,637 0.28PulteGroup, Inc. 5% 15/01/2027 USD 11,761,000 13,761,017 0.24Regency Centers LP, REIT 2.95%15/09/2029 USD 6,820,000 7,191,331 0.12Service Corp. International 3.375%15/08/2030 USD 1,235,000 1,211,597 0.02Southern California Edison Co. 4.125%01/03/2048 USD 2,790,000 2,993,469 0.05Southern California Edison Co. 3.6%01/02/2045 USD 11,552,000 11,578,564 0.20Southern California Gas Co. 4.45%15/03/2044 USD 3,490,000 4,184,393 0.07Southern Co. Gas Capital Corp. 1.75%15/01/2031 USD 9,140,000 8,675,183 0.15Southern Power Co. 5.15% 15/09/2041 USD 3,205,000 3,879,099 0.07Sysco Corp. 3.3% 15/02/2050 USD 14,931,000 15,005,452 0.26Thermo Fisher Scientific, Inc. 0.5%01/03/2028 EUR 3,150,000 3,782,684 0.06Thermo Fisher Scientific, Inc. 1.95%24/07/2029 EUR 8,800,000 11,632,053 0.20Thermo Fisher Scientific, Inc. 1.5%01/10/2039 EUR 8,500,000 10,464,222 0.18T-Mobile USA, Inc. 3.875% 15/04/2030 USD 7,129,000 7,975,925 0.14T-Mobile USA, Inc. 2.55% 15/02/2031 USD 11,390,000 11,536,020 0.20T-Mobile USA, Inc. 2.25% 15/11/2031 USD 7,433,000 7,324,590 0.13T-Mobile USA, Inc. 4.375% 15/04/2040 USD 7,785,000 9,108,100 0.16Tucson Electric Power Co. 4%15/06/2050 USD 2,137,000 2,505,750 0.04UDR, Inc., REIT 2.95% 01/09/2026 USD 1,035,000 1,107,723 0.02UDR, Inc., REIT 3.5% 15/01/2028 USD 4,705,000 5,147,726 0.09UDR, Inc., REIT 4.4% 26/01/2029 USD 4,188,000 4,840,929 0.08UDR, Inc., REIT 3% 15/08/2031 USD 1,430,000 1,505,982 0.03UDR, Inc., REIT 2.1% 15/06/2033 USD 4,585,000 4,382,715 0.07Union Pacific Corp. 3.6% 15/09/2037 USD 3,412,000 3,830,039 0.07Union Pacific Corp. 3.55% 15/08/2039 USD 4,440,000 4,945,789 0.08Union Pacific Corp. 4.3% 15/06/2042 USD 3,045,000 3,583,858 0.06United Rentals North America, Inc.3.875% 15/02/2031 USD 910,000 927,063 0.02UnitedHealth Group, Inc. 2.3%15/05/2031 USD 5,060,000 5,187,653 0.09UnitedHealth Group, Inc. 3.5%15/08/2039 USD 6,346,000 7,108,185 0.12UnitedHealth Group, Inc. 2.75%15/05/2040 USD 4,995,000 5,056,014 0.09UnitedHealth Group, Inc. 3.05%15/05/2041 USD 3,170,000 3,322,923 0.06UnitedHealth Group, Inc. 4.2%15/01/2047 USD 2,905,000 3,574,753 0.06UnitedHealth Group, Inc. 3.25%15/05/2051 USD 4,500,000 4,821,931 0.08US Treasury 1.625% 15/08/2029 USD 800 819 0.00US Treasury 1.375% 15/08/2050 USD 60,000 50,646 0.00US Treasury 1.875% 15/02/2051 USD 40,000 38,225 0.00Valero Energy Corp. 1.2% 15/03/2024 USD 4,144,000 4,177,649 0.07Ventas Realty LP, REIT 5.7%30/09/2043 USD 3,257,000 4,319,121 0.07Verizon Communications, Inc. 1.875%19/09/2030 GBP 4,282,000 5,991,977 0.10Verizon Communications, Inc. 1.75%20/01/2031 USD 3,580,000 3,434,407 0.06Verizon Communications, Inc. 1.125%19/09/2035 EUR 2,775,000 3,255,223 0.06Verizon Communications, Inc. 4.272%15/01/2036 USD 26,716,000 31,905,519 0.55Verizon Communications, Inc. 2.65%20/11/2040 USD 8,655,000 8,342,208 0.14Verizon Communications, Inc. 3.4%22/03/2041 USD 9,695,000 10,283,387 0.18Verizon Communications, Inc. 2.875%20/11/2050 USD 8,125,000 7,778,654 0.13Verizon Communications, Inc. 3.55%22/03/2051 USD 5,450,000 5,821,001 0.10
VMware, Inc. 4.65% 15/05/2027 USD 1,172,000 1,346,704 0.02VMware, Inc. 3.9% 21/08/2027 USD 6,426,000 7,148,003 0.12VMware, Inc. 4.7% 15/05/2030 USD 4,774,000 5,655,692 0.10Walmart, Inc. 3.95% 28/06/2038 USD 3,150,000 3,799,331 0.06Walt Disney Co. (The) 3.057%30/03/2027 CAD 13,555,000 11,615,650 0.20Walt Disney Co. (The) 2.75%01/09/2049 USD 2,095,000 2,076,310 0.04Wells Fargo & Co. 3% 19/02/2025 USD 2,000,000 2,142,122 0.04Wells Fargo & Co. 4.65% 04/11/2044 USD 5,059,000 6,272,337 0.11Wells Fargo & Co. 4.9% 17/11/2045 USD 1,590,000 2,046,774 0.03Wells Fargo & Co. 4.4% 14/06/2046 USD 3,050,000 3,693,966 0.06Wells Fargo & Co. 4.75% 07/12/2046 USD 1,596,000 2,025,553 0.03Wells Fargo & Co., Reg. S 2%28/07/2025 GBP 5,165,000 7,409,346 0.13Welltower, Inc., REIT 4% 01/06/2025 USD 4,225,000 4,663,666 0.08Welltower, Inc., REIT 2.05% 15/01/2029 USD 4,195,000 4,210,843 0.07Williams Cos., Inc. (The) 5.4%04/03/2044 USD 1,695,000 2,154,467 0.04Williams Cos., Inc. (The) 4.9%15/01/2045 USD 1,847,000 2,239,946 0.04WP Carey, Inc., REIT 2.4% 01/02/2031 USD 970,000 963,550 0.02Zoetis, Inc. 3% 12/09/2027 USD 5,622,000 6,060,836 0.10Zoetis, Inc. 4.7% 01/02/2043 USD 4,770,000 6,152,638 0.11
1,480,150,847 25.32
Virgin Islands, BritishTSMC Global Ltd., 144A 1.25%23/04/2026 USD 15,355,000 15,234,650 0.26TSMC Global Ltd., 144A 2.25%23/04/2031 USD 8,270,000 8,333,167 0.14
23,567,817 0.40
Total Bonds 3,535,636,655 60.48
Total Transferable securities and money market instrumentsadmitted to an official exchange listing 3,535,636,655 60.48
Transferable securities and money market instruments dealt in on another regulatedmarket
Bonds
AustraliaCommonwealth Bank of Australia, FRN,144A 3.61% 12/09/2034 USD 10,462,000 11,086,477 0.19Macquarie Group Ltd., FRN, 144A3.189% 28/11/2023 USD 3,225,000 3,341,114 0.06Macquarie Group Ltd., FRN, 144A1.629% 23/09/2027 USD 5,215,000 5,191,873 0.09National Australia Bank Ltd., FRN, 144A3.933% 02/08/2034 USD 6,810,000 7,368,284 0.12Newcrest Finance Pty. Ltd., 144A 5.75%15/11/2041 USD 4,115,000 5,460,889 0.09Scentre Group Trust 1, REIT, 144A3.25% 28/10/2025 USD 5,803,000 6,233,743 0.11
38,682,380 0.66
BermudaIHS Markit Ltd. 4.75% 01/08/2028 USD 4,655,000 5,501,279 0.09Triton Container International Ltd.,144A 1.15% 07/06/2024 USD 1,270,000 1,267,852 0.02
6,769,131 0.11
CanadaAir Canada Pass-Through Trust, Series2017-1 ‘A’, 144A 3.55% 15/07/2031 USD 2,838,360 2,767,401 0.05Air Canada Pass-Through Trust, Series2015-2 ‘AA’, 144A 3.75% 15/06/2029 USD 5,140,743 5,320,669 0.09Air Canada Pass-Through Trust ‘B’,144A 3.7% 15/07/2027 USD 1,419,947 1,393,394 0.02Alimentation Couche-Tard, Inc., 144A3.439% 13/05/2041 USD 3,810,000 3,944,114 0.07Alimentation Couche-Tard, Inc., 144A3.8% 25/01/2050 USD 2,855,000 3,071,304 0.05Bausch Health Cos., Inc., 144A 5.75%15/08/2027 USD 860,000 907,442 0.02Canadian Imperial Bank of Commerce,FRN 2.606% 22/07/2023 USD 4,510,000 4,614,435 0.08Emera, Inc., FRN 6.75% 15/06/2076 USD 1,719,000 2,016,378 0.03GFL Environmental, Inc., 144A 3.75%01/08/2025 USD 1,055,000 1,085,331 0.02Glencore Finance Canada Ltd., 144A5.55% 25/10/2042 USD 8,036,000 10,353,879 0.18Manulife Financial Corp., FRN 4.061%24/02/2032 USD 5,997,000 6,627,303 0.11
193
JPMorgan Funds - Global Corporate Bond FundSchedule of Investments (continued)
As at 30 June 2021
Investments Currency
Quantity/Nominal
Value
MarketValue
USD
%of
NetAssets Investments Currency
Quantity/Nominal
Value
MarketValue
USD
%of
NetAssets
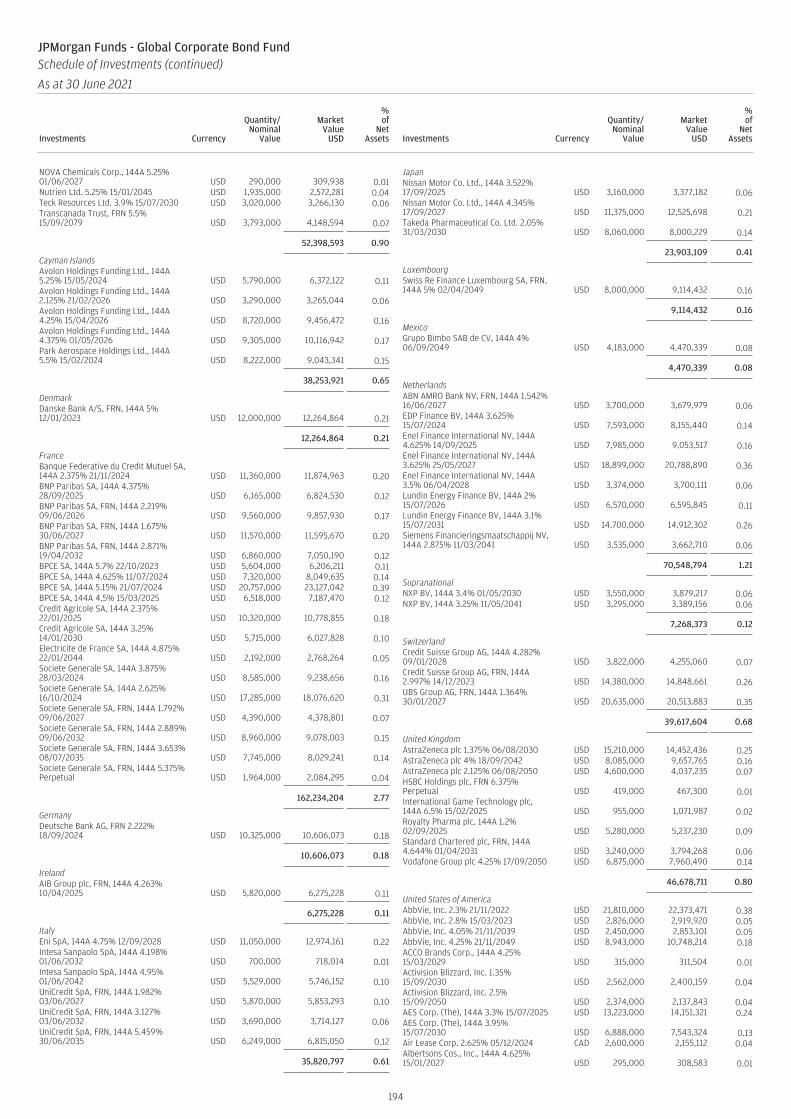
NOVA Chemicals Corp., 144A 5.25%01/06/2027 USD 290,000 309,938 0.01Nutrien Ltd. 5.25% 15/01/2045 USD 1,935,000 2,572,281 0.04Teck Resources Ltd. 3.9% 15/07/2030 USD 3,020,000 3,266,130 0.06Transcanada Trust, FRN 5.5%15/09/2079 USD 3,793,000 4,148,594 0.07
52,398,593 0.90
Cayman IslandsAvolon Holdings Funding Ltd., 144A5.25% 15/05/2024 USD 5,790,000 6,372,122 0.11Avolon Holdings Funding Ltd., 144A2.125% 21/02/2026 USD 3,290,000 3,265,044 0.06Avolon Holdings Funding Ltd., 144A4.25% 15/04/2026 USD 8,720,000 9,456,472 0.16Avolon Holdings Funding Ltd., 144A4.375% 01/05/2026 USD 9,305,000 10,116,942 0.17Park Aerospace Holdings Ltd., 144A5.5% 15/02/2024 USD 8,222,000 9,043,341 0.15
38,253,921 0.65
DenmarkDanske Bank A/S, FRN, 144A 5%12/01/2023 USD 12,000,000 12,264,864 0.21
12,264,864 0.21
FranceBanque Federative du Credit Mutuel SA,144A 2.375% 21/11/2024 USD 11,360,000 11,874,963 0.20BNP Paribas SA, 144A 4.375%28/09/2025 USD 6,165,000 6,824,530 0.12BNP Paribas SA, FRN, 144A 2.219%09/06/2026 USD 9,560,000 9,857,930 0.17BNP Paribas SA, FRN, 144A 1.675%30/06/2027 USD 11,570,000 11,595,670 0.20BNP Paribas SA, FRN, 144A 2.871%19/04/2032 USD 6,860,000 7,050,190 0.12BPCE SA, 144A 5.7% 22/10/2023 USD 5,604,000 6,206,211 0.11BPCE SA, 144A 4.625% 11/07/2024 USD 7,320,000 8,049,635 0.14BPCE SA, 144A 5.15% 21/07/2024 USD 20,757,000 23,127,042 0.39BPCE SA, 144A 4.5% 15/03/2025 USD 6,518,000 7,187,470 0.12Credit Agricole SA, 144A 2.375%22/01/2025 USD 10,320,000 10,778,855 0.18Credit Agricole SA, 144A 3.25%14/01/2030 USD 5,715,000 6,027,828 0.10Electricite de France SA, 144A 4.875%22/01/2044 USD 2,192,000 2,768,264 0.05Societe Generale SA, 144A 3.875%28/03/2024 USD 8,585,000 9,238,656 0.16Societe Generale SA, 144A 2.625%16/10/2024 USD 17,285,000 18,076,620 0.31Societe Generale SA, FRN, 144A 1.792%09/06/2027 USD 4,390,000 4,378,801 0.07Societe Generale SA, FRN, 144A 2.889%09/06/2032 USD 8,960,000 9,078,003 0.15Societe Generale SA, FRN, 144A 3.653%08/07/2035 USD 7,745,000 8,029,241 0.14Societe Generale SA, FRN, 144A 5.375%Perpetual USD 1,964,000 2,084,295 0.04
162,234,204 2.77
GermanyDeutsche Bank AG, FRN 2.222%18/09/2024 USD 10,325,000 10,606,073 0.18
10,606,073 0.18
IrelandAIB Group plc, FRN, 144A 4.263%10/04/2025 USD 5,820,000 6,275,228 0.11
6,275,228 0.11
ItalyEni SpA, 144A 4.75% 12/09/2028 USD 11,050,000 12,974,161 0.22Intesa Sanpaolo SpA, 144A 4.198%01/06/2032 USD 700,000 718,014 0.01Intesa Sanpaolo SpA, 144A 4.95%01/06/2042 USD 5,529,000 5,746,152 0.10UniCredit SpA, FRN, 144A 1.982%03/06/2027 USD 5,870,000 5,853,293 0.10UniCredit SpA, FRN, 144A 3.127%03/06/2032 USD 3,690,000 3,714,127 0.06UniCredit SpA, FRN, 144A 5.459%30/06/2035 USD 6,249,000 6,815,050 0.12
35,820,797 0.61
JapanNissan Motor Co. Ltd., 144A 3.522%17/09/2025 USD 3,160,000 3,377,182 0.06Nissan Motor Co. Ltd., 144A 4.345%17/09/2027 USD 11,375,000 12,525,698 0.21Takeda Pharmaceutical Co. Ltd. 2.05%31/03/2030 USD 8,060,000 8,000,229 0.14
23,903,109 0.41
LuxembourgSwiss Re Finance Luxembourg SA, FRN,144A 5% 02/04/2049 USD 8,000,000 9,114,432 0.16
9,114,432 0.16
MexicoGrupo Bimbo SAB de CV, 144A 4%06/09/2049 USD 4,183,000 4,470,339 0.08
4,470,339 0.08
NetherlandsABN AMRO Bank NV, FRN, 144A 1.542%16/06/2027 USD 3,700,000 3,679,979 0.06EDP Finance BV, 144A 3.625%15/07/2024 USD 7,593,000 8,155,440 0.14Enel Finance International NV, 144A4.625% 14/09/2025 USD 7,985,000 9,053,517 0.16Enel Finance International NV, 144A3.625% 25/05/2027 USD 18,899,000 20,788,890 0.36Enel Finance International NV, 144A3.5% 06/04/2028 USD 3,374,000 3,700,111 0.06Lundin Energy Finance BV, 144A 2%15/07/2026 USD 6,570,000 6,595,845 0.11Lundin Energy Finance BV, 144A 3.1%15/07/2031 USD 14,700,000 14,912,302 0.26Siemens Financieringsmaatschappij NV,144A 2.875% 11/03/2041 USD 3,535,000 3,662,710 0.06
70,548,794 1.21
SupranationalNXP BV, 144A 3.4% 01/05/2030 USD 3,550,000 3,879,217 0.06NXP BV, 144A 3.25% 11/05/2041 USD 3,295,000 3,389,156 0.06
7,268,373 0.12
SwitzerlandCredit Suisse Group AG, 144A 4.282%09/01/2028 USD 3,822,000 4,255,060 0.07Credit Suisse Group AG, FRN, 144A2.997% 14/12/2023 USD 14,380,000 14,848,661 0.26UBS Group AG, FRN, 144A 1.364%30/01/2027 USD 20,635,000 20,513,883 0.35
39,617,604 0.68
United KingdomAstraZeneca plc 1.375% 06/08/2030 USD 15,210,000 14,452,436 0.25AstraZeneca plc 4% 18/09/2042 USD 8,085,000 9,657,765 0.16AstraZeneca plc 2.125% 06/08/2050 USD 4,600,000 4,037,235 0.07HSBC Holdings plc, FRN 6.375%Perpetual USD 419,000 467,300 0.01International Game Technology plc,144A 6.5% 15/02/2025 USD 955,000 1,071,987 0.02Royalty Pharma plc, 144A 1.2%02/09/2025 USD 5,280,000 5,237,230 0.09Standard Chartered plc, FRN, 144A4.644% 01/04/2031 USD 3,240,000 3,794,268 0.06Vodafone Group plc 4.25% 17/09/2050 USD 6,875,000 7,960,490 0.14
46,678,711 0.80
United States of AmericaAbbVie, Inc. 2.3% 21/11/2022 USD 21,810,000 22,373,471 0.38AbbVie, Inc. 2.8% 15/03/2023 USD 2,826,000 2,919,920 0.05AbbVie, Inc. 4.05% 21/11/2039 USD 2,450,000 2,853,101 0.05AbbVie, Inc. 4.25% 21/11/2049 USD 8,943,000 10,748,214 0.18ACCO Brands Corp., 144A 4.25%15/03/2029 USD 315,000 311,504 0.01Activision Blizzard, Inc. 1.35%15/09/2030 USD 2,562,000 2,400,159 0.04Activision Blizzard, Inc. 2.5%15/09/2050 USD 2,374,000 2,137,843 0.04AES Corp. (The), 144A 3.3% 15/07/2025 USD 13,223,000 14,151,321 0.24AES Corp. (The), 144A 3.95%15/07/2030 USD 6,888,000 7,543,324 0.13Air Lease Corp. 2.625% 05/12/2024 CAD 2,600,000 2,155,112 0.04Albertsons Cos., Inc., 144A 4.625%15/01/2027 USD 295,000 308,583 0.01
194
JPMorgan Funds - Global Corporate Bond FundSchedule of Investments (continued)
As at 30 June 2021
Investments Currency
Quantity/Nominal
Value
MarketValue
USD
%of
NetAssets Investments Currency
Quantity/Nominal
Value
MarketValue
USD
%of
NetAssets
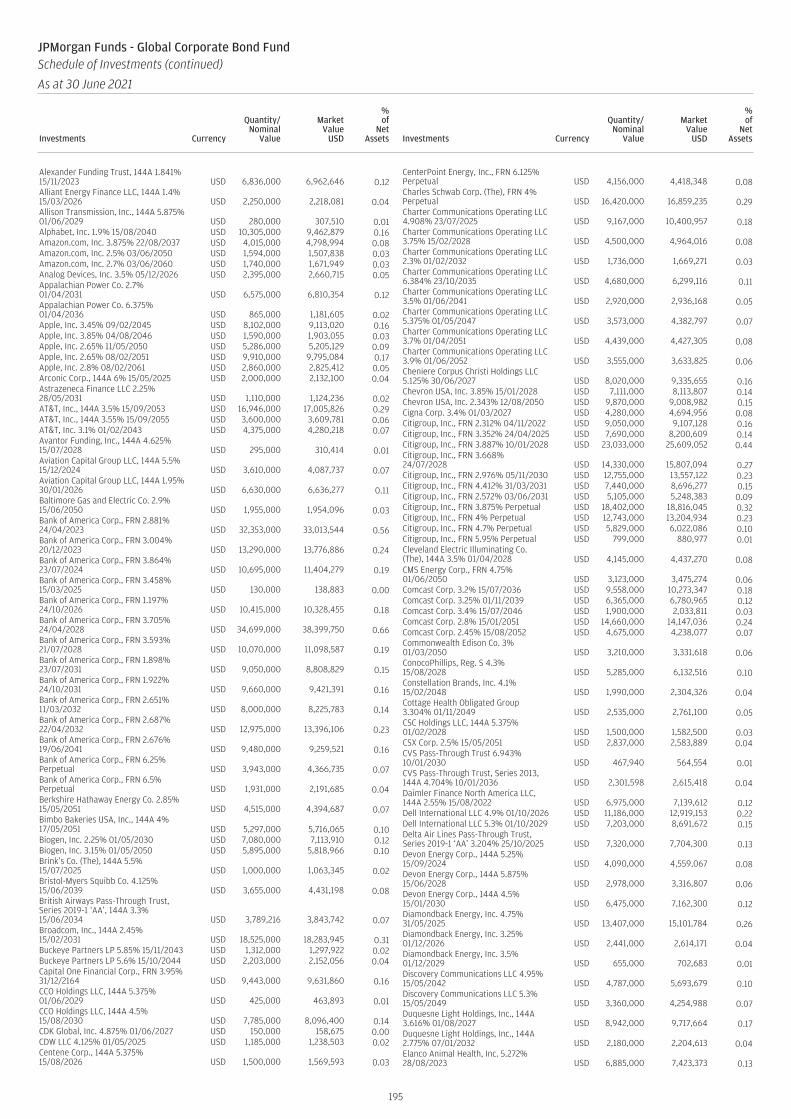
Alexander Funding Trust, 144A 1.841%15/11/2023 USD 6,836,000 6,962,646 0.12Alliant Energy Finance LLC, 144A 1.4%15/03/2026 USD 2,250,000 2,218,081 0.04Allison Transmission, Inc., 144A 5.875%01/06/2029 USD 280,000 307,510 0.01Alphabet, Inc. 1.9% 15/08/2040 USD 10,305,000 9,462,879 0.16Amazon.com, Inc. 3.875% 22/08/2037 USD 4,015,000 4,798,994 0.08Amazon.com, Inc. 2.5% 03/06/2050 USD 1,594,000 1,507,838 0.03Amazon.com, Inc. 2.7% 03/06/2060 USD 1,740,000 1,671,949 0.03Analog Devices, Inc. 3.5% 05/12/2026 USD 2,395,000 2,660,715 0.05Appalachian Power Co. 2.7%01/04/2031 USD 6,575,000 6,810,354 0.12Appalachian Power Co. 6.375%01/04/2036 USD 865,000 1,181,605 0.02Apple, Inc. 3.45% 09/02/2045 USD 8,102,000 9,113,020 0.16Apple, Inc. 3.85% 04/08/2046 USD 1,590,000 1,903,055 0.03Apple, Inc. 2.65% 11/05/2050 USD 5,286,000 5,205,129 0.09Apple, Inc. 2.65% 08/02/2051 USD 9,910,000 9,795,084 0.17Apple, Inc. 2.8% 08/02/2061 USD 2,860,000 2,825,412 0.05Arconic Corp., 144A 6% 15/05/2025 USD 2,000,000 2,132,100 0.04Astrazeneca Finance LLC 2.25%28/05/2031 USD 1,110,000 1,124,236 0.02AT&T, Inc., 144A 3.5% 15/09/2053 USD 16,946,000 17,005,826 0.29AT&T, Inc., 144A 3.55% 15/09/2055 USD 3,600,000 3,609,781 0.06AT&T, Inc. 3.1% 01/02/2043 USD 4,375,000 4,280,218 0.07Avantor Funding, Inc., 144A 4.625%15/07/2028 USD 295,000 310,414 0.01Aviation Capital Group LLC, 144A 5.5%15/12/2024 USD 3,610,000 4,087,737 0.07Aviation Capital Group LLC, 144A 1.95%30/01/2026 USD 6,630,000 6,636,277 0.11Baltimore Gas and Electric Co. 2.9%15/06/2050 USD 1,955,000 1,954,096 0.03Bank of America Corp., FRN 2.881%24/04/2023 USD 32,353,000 33,013,544 0.56Bank of America Corp., FRN 3.004%20/12/2023 USD 13,290,000 13,776,886 0.24Bank of America Corp., FRN 3.864%23/07/2024 USD 10,695,000 11,404,279 0.19Bank of America Corp., FRN 3.458%15/03/2025 USD 130,000 138,883 0.00Bank of America Corp., FRN 1.197%24/10/2026 USD 10,415,000 10,328,455 0.18Bank of America Corp., FRN 3.705%24/04/2028 USD 34,699,000 38,399,750 0.66Bank of America Corp., FRN 3.593%21/07/2028 USD 10,070,000 11,098,587 0.19Bank of America Corp., FRN 1.898%23/07/2031 USD 9,050,000 8,808,829 0.15Bank of America Corp., FRN 1.922%24/10/2031 USD 9,660,000 9,421,391 0.16Bank of America Corp., FRN 2.651%11/03/2032 USD 8,000,000 8,225,783 0.14Bank of America Corp., FRN 2.687%22/04/2032 USD 12,975,000 13,396,106 0.23Bank of America Corp., FRN 2.676%19/06/2041 USD 9,480,000 9,259,521 0.16Bank of America Corp., FRN 6.25%Perpetual USD 3,943,000 4,366,735 0.07Bank of America Corp., FRN 6.5%Perpetual USD 1,931,000 2,191,685 0.04Berkshire Hathaway Energy Co. 2.85%15/05/2051 USD 4,515,000 4,394,687 0.07Bimbo Bakeries USA, Inc., 144A 4%17/05/2051 USD 5,297,000 5,716,065 0.10Biogen, Inc. 2.25% 01/05/2030 USD 7,080,000 7,113,910 0.12Biogen, Inc. 3.15% 01/05/2050 USD 5,895,000 5,818,966 0.10Brink’s Co. (The), 144A 5.5%15/07/2025 USD 1,000,000 1,063,345 0.02Bristol-Myers Squibb Co. 4.125%15/06/2039 USD 3,655,000 4,431,198 0.08British Airways Pass-Through Trust,Series 2019-1 ‘AA’, 144A 3.3%15/06/2034 USD 3,789,216 3,843,742 0.07Broadcom, Inc., 144A 2.45%15/02/2031 USD 18,525,000 18,283,945 0.31Buckeye Partners LP 5.85% 15/11/2043 USD 1,312,000 1,297,922 0.02Buckeye Partners LP 5.6% 15/10/2044 USD 2,203,000 2,152,056 0.04Capital One Financial Corp., FRN 3.95%31/12/2164 USD 9,443,000 9,631,860 0.16CCO Holdings LLC, 144A 5.375%01/06/2029 USD 425,000 463,893 0.01CCO Holdings LLC, 144A 4.5%15/08/2030 USD 7,785,000 8,096,400 0.14CDK Global, Inc. 4.875% 01/06/2027 USD 150,000 158,675 0.00CDW LLC 4.125% 01/05/2025 USD 1,185,000 1,238,503 0.02Centene Corp., 144A 5.375%15/08/2026 USD 1,500,000 1,569,593 0.03
CenterPoint Energy, Inc., FRN 6.125%Perpetual USD 4,156,000 4,418,348 0.08Charles Schwab Corp. (The), FRN 4%Perpetual USD 16,420,000 16,859,235 0.29Charter Communications Operating LLC4.908% 23/07/2025 USD 9,167,000 10,400,957 0.18Charter Communications Operating LLC3.75% 15/02/2028 USD 4,500,000 4,964,016 0.08Charter Communications Operating LLC2.3% 01/02/2032 USD 1,736,000 1,669,271 0.03Charter Communications Operating LLC6.384% 23/10/2035 USD 4,680,000 6,299,116 0.11Charter Communications Operating LLC3.5% 01/06/2041 USD 2,920,000 2,936,168 0.05Charter Communications Operating LLC5.375% 01/05/2047 USD 3,573,000 4,382,797 0.07Charter Communications Operating LLC3.7% 01/04/2051 USD 4,439,000 4,427,305 0.08Charter Communications Operating LLC3.9% 01/06/2052 USD 3,555,000 3,633,825 0.06Cheniere Corpus Christi Holdings LLC5.125% 30/06/2027 USD 8,020,000 9,335,655 0.16Chevron USA, Inc. 3.85% 15/01/2028 USD 7,111,000 8,113,807 0.14Chevron USA, Inc. 2.343% 12/08/2050 USD 9,870,000 9,008,982 0.15Cigna Corp. 3.4% 01/03/2027 USD 4,280,000 4,694,956 0.08Citigroup, Inc., FRN 2.312% 04/11/2022 USD 9,050,000 9,107,128 0.16Citigroup, Inc., FRN 3.352% 24/04/2025 USD 7,690,000 8,200,609 0.14Citigroup, Inc., FRN 3.887% 10/01/2028 USD 23,033,000 25,609,052 0.44Citigroup, Inc., FRN 3.668%24/07/2028 USD 14,330,000 15,807,094 0.27Citigroup, Inc., FRN 2.976% 05/11/2030 USD 12,755,000 13,557,122 0.23Citigroup, Inc., FRN 4.412% 31/03/2031 USD 7,440,000 8,696,277 0.15Citigroup, Inc., FRN 2.572% 03/06/2031 USD 5,105,000 5,248,383 0.09Citigroup, Inc., FRN 3.875% Perpetual USD 18,402,000 18,816,045 0.32Citigroup, Inc., FRN 4% Perpetual USD 12,743,000 13,204,934 0.23Citigroup, Inc., FRN 4.7% Perpetual USD 5,829,000 6,022,086 0.10Citigroup, Inc., FRN 5.95% Perpetual USD 799,000 880,977 0.01Cleveland Electric Illuminating Co.(The), 144A 3.5% 01/04/2028 USD 4,145,000 4,437,270 0.08CMS Energy Corp., FRN 4.75%01/06/2050 USD 3,123,000 3,475,274 0.06Comcast Corp. 3.2% 15/07/2036 USD 9,558,000 10,273,347 0.18Comcast Corp. 3.25% 01/11/2039 USD 6,365,000 6,780,965 0.12Comcast Corp. 3.4% 15/07/2046 USD 1,900,000 2,033,811 0.03Comcast Corp. 2.8% 15/01/2051 USD 14,660,000 14,147,036 0.24Comcast Corp. 2.45% 15/08/2052 USD 4,675,000 4,238,077 0.07Commonwealth Edison Co. 3%01/03/2050 USD 3,210,000 3,331,618 0.06ConocoPhillips, Reg. S 4.3%15/08/2028 USD 5,285,000 6,132,516 0.10Constellation Brands, Inc. 4.1%15/02/2048 USD 1,990,000 2,304,326 0.04Cottage Health Obligated Group3.304% 01/11/2049 USD 2,535,000 2,761,100 0.05CSC Holdings LLC, 144A 5.375%01/02/2028 USD 1,500,000 1,582,500 0.03CSX Corp. 2.5% 15/05/2051 USD 2,837,000 2,583,889 0.04CVS Pass-Through Trust 6.943%10/01/2030 USD 467,940 564,554 0.01CVS Pass-Through Trust, Series 2013,144A 4.704% 10/01/2036 USD 2,301,598 2,615,418 0.04Daimler Finance North America LLC,144A 2.55% 15/08/2022 USD 6,975,000 7,139,612 0.12Dell International LLC 4.9% 01/10/2026 USD 11,186,000 12,919,153 0.22Dell International LLC 5.3% 01/10/2029 USD 7,203,000 8,691,672 0.15Delta Air Lines Pass-Through Trust,Series 2019-1 ‘AA’ 3.204% 25/10/2025 USD 7,320,000 7,704,300 0.13Devon Energy Corp., 144A 5.25%15/09/2024 USD 4,090,000 4,559,067 0.08Devon Energy Corp., 144A 5.875%15/06/2028 USD 2,978,000 3,316,807 0.06Devon Energy Corp., 144A 4.5%15/01/2030 USD 6,475,000 7,162,300 0.12Diamondback Energy, Inc. 4.75%31/05/2025 USD 13,407,000 15,101,784 0.26Diamondback Energy, Inc. 3.25%01/12/2026 USD 2,441,000 2,614,171 0.04Diamondback Energy, Inc. 3.5%01/12/2029 USD 655,000 702,683 0.01Discovery Communications LLC 4.95%15/05/2042 USD 4,787,000 5,693,679 0.10Discovery Communications LLC 5.3%15/05/2049 USD 3,360,000 4,254,988 0.07Duquesne Light Holdings, Inc., 144A3.616% 01/08/2027 USD 8,942,000 9,717,664 0.17Duquesne Light Holdings, Inc., 144A2.775% 07/01/2032 USD 2,180,000 2,204,613 0.04Elanco Animal Health, Inc. 5.272%28/08/2023 USD 6,885,000 7,423,373 0.13
195
JPMorgan Funds - Global Corporate Bond FundSchedule of Investments (continued)
As at 30 June 2021
Investments Currency
Quantity/Nominal
Value
MarketValue
USD
%of
NetAssets Investments Currency
Quantity/Nominal
Value
MarketValue
USD
%of
NetAssets
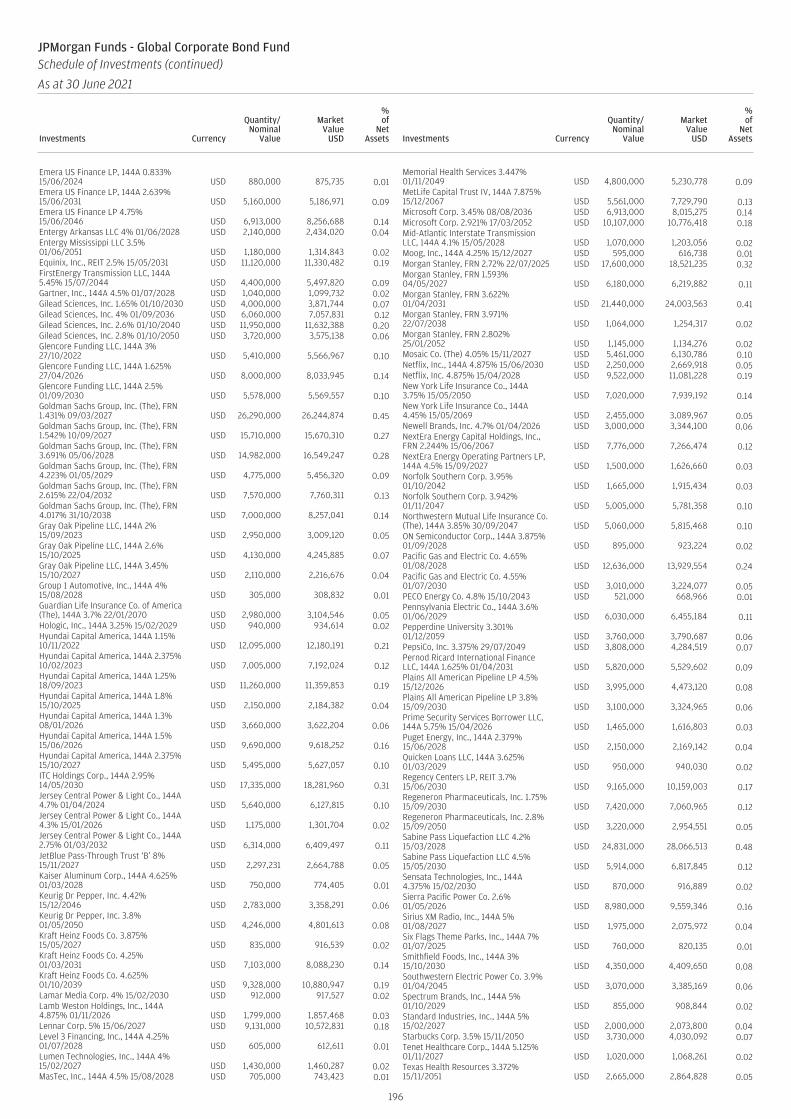
Emera US Finance LP, 144A 0.833%15/06/2024 USD 880,000 875,735 0.01Emera US Finance LP, 144A 2.639%15/06/2031 USD 5,160,000 5,186,971 0.09Emera US Finance LP 4.75%15/06/2046 USD 6,913,000 8,256,688 0.14Entergy Arkansas LLC 4% 01/06/2028 USD 2,140,000 2,434,020 0.04Entergy Mississippi LLC 3.5%01/06/2051 USD 1,180,000 1,314,843 0.02Equinix, Inc., REIT 2.5% 15/05/2031 USD 11,120,000 11,330,482 0.19FirstEnergy Transmission LLC, 144A5.45% 15/07/2044 USD 4,400,000 5,497,820 0.09Gartner, Inc., 144A 4.5% 01/07/2028 USD 1,040,000 1,099,732 0.02Gilead Sciences, Inc. 1.65% 01/10/2030 USD 4,000,000 3,871,744 0.07Gilead Sciences, Inc. 4% 01/09/2036 USD 6,060,000 7,057,831 0.12Gilead Sciences, Inc. 2.6% 01/10/2040 USD 11,950,000 11,632,388 0.20Gilead Sciences, Inc. 2.8% 01/10/2050 USD 3,720,000 3,575,138 0.06Glencore Funding LLC, 144A 3%27/10/2022 USD 5,410,000 5,566,967 0.10Glencore Funding LLC, 144A 1.625%27/04/2026 USD 8,000,000 8,033,945 0.14Glencore Funding LLC, 144A 2.5%01/09/2030 USD 5,578,000 5,569,557 0.10Goldman Sachs Group, Inc. (The), FRN1.431% 09/03/2027 USD 26,290,000 26,244,874 0.45Goldman Sachs Group, Inc. (The), FRN1.542% 10/09/2027 USD 15,710,000 15,670,310 0.27Goldman Sachs Group, Inc. (The), FRN3.691% 05/06/2028 USD 14,982,000 16,549,247 0.28Goldman Sachs Group, Inc. (The), FRN4.223% 01/05/2029 USD 4,775,000 5,456,320 0.09Goldman Sachs Group, Inc. (The), FRN2.615% 22/04/2032 USD 7,570,000 7,760,311 0.13Goldman Sachs Group, Inc. (The), FRN4.017% 31/10/2038 USD 7,000,000 8,257,041 0.14Gray Oak Pipeline LLC, 144A 2%15/09/2023 USD 2,950,000 3,009,120 0.05Gray Oak Pipeline LLC, 144A 2.6%15/10/2025 USD 4,130,000 4,245,885 0.07Gray Oak Pipeline LLC, 144A 3.45%15/10/2027 USD 2,110,000 2,216,676 0.04Group 1 Automotive, Inc., 144A 4%15/08/2028 USD 305,000 308,832 0.01Guardian Life Insurance Co. of America(The), 144A 3.7% 22/01/2070 USD 2,980,000 3,104,546 0.05Hologic, Inc., 144A 3.25% 15/02/2029 USD 940,000 934,614 0.02Hyundai Capital America, 144A 1.15%10/11/2022 USD 12,095,000 12,180,191 0.21Hyundai Capital America, 144A 2.375%10/02/2023 USD 7,005,000 7,192,024 0.12Hyundai Capital America, 144A 1.25%18/09/2023 USD 11,260,000 11,359,853 0.19Hyundai Capital America, 144A 1.8%15/10/2025 USD 2,150,000 2,184,382 0.04Hyundai Capital America, 144A 1.3%08/01/2026 USD 3,660,000 3,622,204 0.06Hyundai Capital America, 144A 1.5%15/06/2026 USD 9,690,000 9,618,252 0.16Hyundai Capital America, 144A 2.375%15/10/2027 USD 5,495,000 5,627,057 0.10ITC Holdings Corp., 144A 2.95%14/05/2030 USD 17,335,000 18,281,960 0.31Jersey Central Power & Light Co., 144A4.7% 01/04/2024 USD 5,640,000 6,127,815 0.10Jersey Central Power & Light Co., 144A4.3% 15/01/2026 USD 1,175,000 1,301,704 0.02Jersey Central Power & Light Co., 144A2.75% 01/03/2032 USD 6,314,000 6,409,497 0.11JetBlue Pass-Through Trust ‘B’ 8%15/11/2027 USD 2,297,231 2,664,788 0.05Kaiser Aluminum Corp., 144A 4.625%01/03/2028 USD 750,000 774,405 0.01Keurig Dr Pepper, Inc. 4.42%15/12/2046 USD 2,783,000 3,358,291 0.06Keurig Dr Pepper, Inc. 3.8%01/05/2050 USD 4,246,000 4,801,613 0.08Kraft Heinz Foods Co. 3.875%15/05/2027 USD 835,000 916,539 0.02Kraft Heinz Foods Co. 4.25%01/03/2031 USD 7,103,000 8,088,230 0.14Kraft Heinz Foods Co. 4.625%01/10/2039 USD 9,328,000 10,880,947 0.19Lamar Media Corp. 4% 15/02/2030 USD 912,000 917,527 0.02Lamb Weston Holdings, Inc., 144A4.875% 01/11/2026 USD 1,799,000 1,857,468 0.03Lennar Corp. 5% 15/06/2027 USD 9,131,000 10,572,831 0.18Level 3 Financing, Inc., 144A 4.25%01/07/2028 USD 605,000 612,611 0.01Lumen Technologies, Inc., 144A 4%15/02/2027 USD 1,430,000 1,460,287 0.02MasTec, Inc., 144A 4.5% 15/08/2028 USD 705,000 743,423 0.01
Memorial Health Services 3.447%01/11/2049 USD 4,800,000 5,230,778 0.09MetLife Capital Trust IV, 144A 7.875%15/12/2067 USD 5,561,000 7,729,790 0.13Microsoft Corp. 3.45% 08/08/2036 USD 6,913,000 8,015,275 0.14Microsoft Corp. 2.921% 17/03/2052 USD 10,107,000 10,776,418 0.18Mid-Atlantic Interstate TransmissionLLC, 144A 4.1% 15/05/2028 USD 1,070,000 1,203,056 0.02Moog, Inc., 144A 4.25% 15/12/2027 USD 595,000 616,738 0.01Morgan Stanley, FRN 2.72% 22/07/2025 USD 17,600,000 18,521,235 0.32Morgan Stanley, FRN 1.593%04/05/2027 USD 6,180,000 6,219,882 0.11Morgan Stanley, FRN 3.622%01/04/2031 USD 21,440,000 24,003,563 0.41Morgan Stanley, FRN 3.971%22/07/2038 USD 1,064,000 1,254,317 0.02Morgan Stanley, FRN 2.802%25/01/2052 USD 1,145,000 1,134,276 0.02Mosaic Co. (The) 4.05% 15/11/2027 USD 5,461,000 6,130,786 0.10Netflix, Inc., 144A 4.875% 15/06/2030 USD 2,250,000 2,669,918 0.05Netflix, Inc. 4.875% 15/04/2028 USD 9,522,000 11,081,228 0.19New York Life Insurance Co., 144A3.75% 15/05/2050 USD 7,020,000 7,939,192 0.14New York Life Insurance Co., 144A4.45% 15/05/2069 USD 2,455,000 3,089,967 0.05Newell Brands, Inc. 4.7% 01/04/2026 USD 3,000,000 3,344,100 0.06NextEra Energy Capital Holdings, Inc.,FRN 2.244% 15/06/2067 USD 7,776,000 7,266,474 0.12NextEra Energy Operating Partners LP,144A 4.5% 15/09/2027 USD 1,500,000 1,626,660 0.03Norfolk Southern Corp. 3.95%01/10/2042 USD 1,665,000 1,915,434 0.03Norfolk Southern Corp. 3.942%01/11/2047 USD 5,005,000 5,781,358 0.10Northwestern Mutual Life Insurance Co.(The), 144A 3.85% 30/09/2047 USD 5,060,000 5,815,468 0.10ON Semiconductor Corp., 144A 3.875%01/09/2028 USD 895,000 923,224 0.02Pacific Gas and Electric Co. 4.65%01/08/2028 USD 12,636,000 13,929,554 0.24Pacific Gas and Electric Co. 4.55%01/07/2030 USD 3,010,000 3,224,077 0.05PECO Energy Co. 4.8% 15/10/2043 USD 521,000 668,966 0.01Pennsylvania Electric Co., 144A 3.6%01/06/2029 USD 6,030,000 6,455,184 0.11Pepperdine University 3.301%01/12/2059 USD 3,760,000 3,790,687 0.06PepsiCo, Inc. 3.375% 29/07/2049 USD 3,808,000 4,284,519 0.07Pernod Ricard International FinanceLLC, 144A 1.625% 01/04/2031 USD 5,820,000 5,529,602 0.09Plains All American Pipeline LP 4.5%15/12/2026 USD 3,995,000 4,473,120 0.08Plains All American Pipeline LP 3.8%15/09/2030 USD 3,100,000 3,324,965 0.06Prime Security Services Borrower LLC,144A 5.75% 15/04/2026 USD 1,465,000 1,616,803 0.03Puget Energy, Inc., 144A 2.379%15/06/2028 USD 2,150,000 2,169,142 0.04Quicken Loans LLC, 144A 3.625%01/03/2029 USD 950,000 940,030 0.02Regency Centers LP, REIT 3.7%15/06/2030 USD 9,165,000 10,159,003 0.17Regeneron Pharmaceuticals, Inc. 1.75%15/09/2030 USD 7,420,000 7,060,965 0.12Regeneron Pharmaceuticals, Inc. 2.8%15/09/2050 USD 3,220,000 2,954,551 0.05Sabine Pass Liquefaction LLC 4.2%15/03/2028 USD 24,831,000 28,066,513 0.48Sabine Pass Liquefaction LLC 4.5%15/05/2030 USD 5,914,000 6,817,845 0.12Sensata Technologies, Inc., 144A4.375% 15/02/2030 USD 870,000 916,889 0.02Sierra Pacific Power Co. 2.6%01/05/2026 USD 8,980,000 9,559,346 0.16Sirius XM Radio, Inc., 144A 5%01/08/2027 USD 1,975,000 2,075,972 0.04Six Flags Theme Parks, Inc., 144A 7%01/07/2025 USD 760,000 820,135 0.01Smithfield Foods, Inc., 144A 3%15/10/2030 USD 4,350,000 4,409,650 0.08Southwestern Electric Power Co. 3.9%01/04/2045 USD 3,070,000 3,385,169 0.06Spectrum Brands, Inc., 144A 5%01/10/2029 USD 855,000 908,844 0.02Standard Industries, Inc., 144A 5%15/02/2027 USD 2,000,000 2,073,800 0.04Starbucks Corp. 3.5% 15/11/2050 USD 3,730,000 4,030,092 0.07Tenet Healthcare Corp., 144A 5.125%01/11/2027 USD 1,020,000 1,068,261 0.02Texas Health Resources 3.372%15/11/2051 USD 2,665,000 2,864,828 0.05
196
JPMorgan Funds - Global Corporate Bond FundSchedule of Investments (continued)
As at 30 June 2021
Investments Currency
Quantity/Nominal
Value
MarketValue
USD
%of
NetAssets Investments Currency
Quantity/Nominal
Value
MarketValue
USD
%of
NetAssets
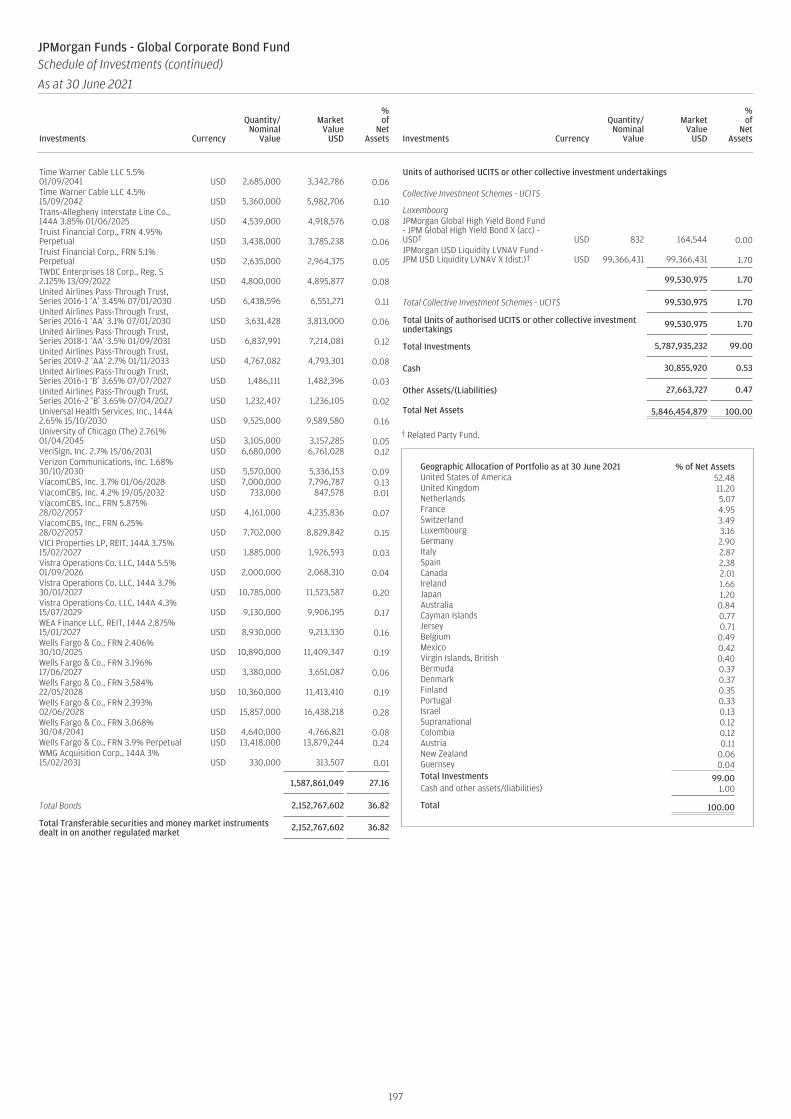
Time Warner Cable LLC 5.5%01/09/2041 USD 2,685,000 3,342,786 0.06Time Warner Cable LLC 4.5%15/09/2042 USD 5,360,000 5,982,706 0.10Trans-Allegheny Interstate Line Co.,144A 3.85% 01/06/2025 USD 4,539,000 4,918,576 0.08Truist Financial Corp., FRN 4.95%Perpetual USD 3,438,000 3,785,238 0.06Truist Financial Corp., FRN 5.1%Perpetual USD 2,635,000 2,964,375 0.05TWDC Enterprises 18 Corp., Reg. S2.125% 13/09/2022 USD 4,800,000 4,895,877 0.08United Airlines Pass-Through Trust,Series 2016-1 ‘A’ 3.45% 07/01/2030 USD 6,438,596 6,551,271 0.11United Airlines Pass-Through Trust,Series 2016-1 ‘AA’ 3.1% 07/01/2030 USD 3,631,428 3,813,000 0.06United Airlines Pass-Through Trust,Series 2018-1 ‘AA’ 3.5% 01/09/2031 USD 6,837,991 7,214,081 0.12United Airlines Pass-Through Trust,Series 2019-2 ‘AA’ 2.7% 01/11/2033 USD 4,767,082 4,793,301 0.08United Airlines Pass-Through Trust,Series 2016-1 ‘B’ 3.65% 07/07/2027 USD 1,486,111 1,482,396 0.03United Airlines Pass-Through Trust,Series 2016-2 ‘B’ 3.65% 07/04/2027 USD 1,232,407 1,236,105 0.02Universal Health Services, Inc., 144A2.65% 15/10/2030 USD 9,525,000 9,589,580 0.16University of Chicago (The) 2.761%01/04/2045 USD 3,105,000 3,157,285 0.05VeriSign, Inc. 2.7% 15/06/2031 USD 6,680,000 6,761,028 0.12Verizon Communications, Inc. 1.68%30/10/2030 USD 5,570,000 5,336,153 0.09ViacomCBS, Inc. 3.7% 01/06/2028 USD 7,000,000 7,796,787 0.13ViacomCBS, Inc. 4.2% 19/05/2032 USD 733,000 847,578 0.01ViacomCBS, Inc., FRN 5.875%28/02/2057 USD 4,161,000 4,235,836 0.07ViacomCBS, Inc., FRN 6.25%28/02/2057 USD 7,702,000 8,829,842 0.15VICI Properties LP, REIT, 144A 3.75%15/02/2027 USD 1,885,000 1,926,593 0.03Vistra Operations Co. LLC, 144A 5.5%01/09/2026 USD 2,000,000 2,068,310 0.04Vistra Operations Co. LLC, 144A 3.7%30/01/2027 USD 10,785,000 11,523,587 0.20Vistra Operations Co. LLC, 144A 4.3%15/07/2029 USD 9,130,000 9,906,195 0.17WEA Finance LLC, REIT, 144A 2.875%15/01/2027 USD 8,930,000 9,213,330 0.16Wells Fargo & Co., FRN 2.406%30/10/2025 USD 10,890,000 11,409,347 0.19Wells Fargo & Co., FRN 3.196%17/06/2027 USD 3,380,000 3,651,087 0.06Wells Fargo & Co., FRN 3.584%22/05/2028 USD 10,360,000 11,413,410 0.19Wells Fargo & Co., FRN 2.393%02/06/2028 USD 15,857,000 16,438,218 0.28Wells Fargo & Co., FRN 3.068%30/04/2041 USD 4,640,000 4,766,821 0.08Wells Fargo & Co., FRN 3.9% Perpetual USD 13,418,000 13,879,244 0.24WMG Acquisition Corp., 144A 3%15/02/2031 USD 330,000 313,507 0.01
1,587,861,049 27.16
Total Bonds 2,152,767,602 36.82
Total Transferable securities and money market instrumentsdealt in on another regulated market 2,152,767,602 36.82
Units of authorised UCITS or other collective investment undertakings
Collective Investment Schemes - UCITS
LuxembourgJPMorgan Global High Yield Bond Fund- JPM Global High Yield Bond X (acc) -USD† USD 832 164,544 0.00JPMorgan USD Liquidity LVNAV Fund -JPM USD Liquidity LVNAV X (dist.)† USD 99,366,431 99,366,431 1.70
99,530,975 1.70
Total Collective Investment Schemes - UCITS 99,530,975 1.70
Total Units of authorised UCITS or other collective investmentundertakings 99,530,975 1.70
Total Investments 5,787,935,232 99.00
Cash 30,855,920 0.53
Other Assets/(Liabilities) 27,663,727 0.47
Total Net Assets 5,846,454,879 100.00
† Related Party Fund.
Geographic Allocation of Portfolio as at 30 June 2021 % of Net AssetsUnited States of America 52.48United Kingdom 11.20Netherlands 5.07France 4.95Switzerland 3.49Luxembourg 3.16Germany 2.90Italy 2.87Spain 2.38Canada 2.01Ireland 1.66Japan 1.20Australia 0.84Cayman Islands 0.77Jersey 0.71Belgium 0.49Mexico 0.42Virgin Islands, British 0.40Bermuda 0.37Denmark 0.37Finland 0.35Portugal 0.33Israel 0.13Supranational 0.12Colombia 0.12Austria 0.11New Zealand 0.06Guernsey 0.04Total Investments 99.00Cash and other assets/(liabilities) 1.00
Total 100.00
197
JPMorgan Funds - Global Corporate Bond FundSchedule of Investments (continued)
As at 30 June 2021
Investments Currency
Quantity/Nominal
Value
MarketValue
USD
%of
NetAssets Investments Currency
Quantity/Nominal
Value
MarketValue
USD
%of
NetAssets
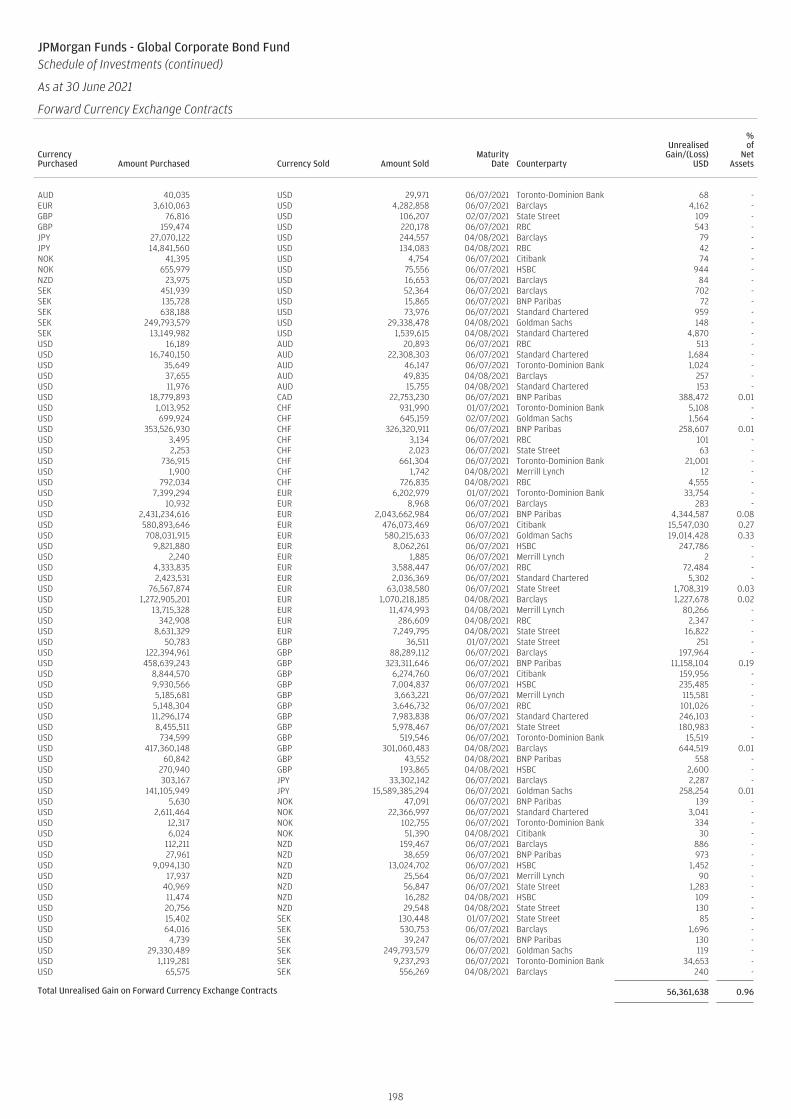
JPMorgan Funds - Global Corporate Bond FundSchedule of Investments (continued)
As at 30 June 2021
Forward Currency Exchange Contracts (continued)
CurrencyPurchased Amount Purchased Currency Sold Amount Sold
MaturityDate Counterparty
UnrealisedGain/(Loss)
USD
%of
NetAssets
AUD 40,035 USD 29,971 06/07/2021 Toronto-Dominion Bank 68 -EUR 3,610,063 USD 4,282,858 06/07/2021 Barclays 4,162 -GBP 76,816 USD 106,207 02/07/2021 State Street 109 -GBP 159,474 USD 220,178 06/07/2021 RBC 543 -JPY 27,070,122 USD 244,557 04/08/2021 Barclays 79 -JPY 14,841,560 USD 134,083 04/08/2021 RBC 42 -NOK 41,395 USD 4,754 06/07/2021 Citibank 74 -NOK 655,979 USD 75,556 06/07/2021 HSBC 944 -NZD 23,975 USD 16,653 06/07/2021 Barclays 84 -SEK 451,939 USD 52,364 06/07/2021 Barclays 702 -SEK 135,728 USD 15,865 06/07/2021 BNP Paribas 72 -SEK 638,188 USD 73,976 06/07/2021 Standard Chartered 959 -SEK 249,793,579 USD 29,338,478 04/08/2021 Goldman Sachs 148 -SEK 13,149,982 USD 1,539,615 04/08/2021 Standard Chartered 4,870 -USD 16,189 AUD 20,893 06/07/2021 RBC 513 -USD 16,740,150 AUD 22,308,303 06/07/2021 Standard Chartered 1,684 -USD 35,649 AUD 46,147 06/07/2021 Toronto-Dominion Bank 1,024 -USD 37,655 AUD 49,835 04/08/2021 Barclays 257 -USD 11,976 AUD 15,755 04/08/2021 Standard Chartered 153 -USD 18,779,893 CAD 22,753,230 06/07/2021 BNP Paribas 388,472 0.01USD 1,013,952 CHF 931,990 01/07/2021 Toronto-Dominion Bank 5,108 -USD 699,924 CHF 645,159 02/07/2021 Goldman Sachs 1,564 -USD 353,526,930 CHF 326,320,911 06/07/2021 BNP Paribas 258,607 0.01USD 3,495 CHF 3,134 06/07/2021 RBC 101 -USD 2,253 CHF 2,023 06/07/2021 State Street 63 -USD 736,915 CHF 661,304 06/07/2021 Toronto-Dominion Bank 21,001 -USD 1,900 CHF 1,742 04/08/2021 Merrill Lynch 12 -USD 792,034 CHF 726,835 04/08/2021 RBC 4,555 -USD 7,399,294 EUR 6,202,979 01/07/2021 Toronto-Dominion Bank 33,754 -USD 10,932 EUR 8,968 06/07/2021 Barclays 283 -USD 2,431,234,616 EUR 2,043,662,984 06/07/2021 BNP Paribas 4,344,587 0.08USD 580,893,646 EUR 476,073,469 06/07/2021 Citibank 15,547,030 0.27USD 708,031,915 EUR 580,215,633 06/07/2021 Goldman Sachs 19,014,428 0.33USD 9,821,880 EUR 8,062,261 06/07/2021 HSBC 247,786 -USD 2,240 EUR 1,885 06/07/2021 Merrill Lynch 2 -USD 4,333,835 EUR 3,588,447 06/07/2021 RBC 72,484 -USD 2,423,531 EUR 2,036,369 06/07/2021 Standard Chartered 5,302 -USD 76,567,874 EUR 63,038,580 06/07/2021 State Street 1,708,319 0.03USD 1,272,905,201 EUR 1,070,218,185 04/08/2021 Barclays 1,227,678 0.02USD 13,715,328 EUR 11,474,993 04/08/2021 Merrill Lynch 80,266 -USD 342,908 EUR 286,609 04/08/2021 RBC 2,347 -USD 8,631,329 EUR 7,249,795 04/08/2021 State Street 16,822 -USD 50,783 GBP 36,511 01/07/2021 State Street 251 -USD 122,394,961 GBP 88,289,112 06/07/2021 Barclays 197,964 -USD 458,639,243 GBP 323,311,646 06/07/2021 BNP Paribas 11,158,104 0.19USD 8,844,570 GBP 6,274,760 06/07/2021 Citibank 159,956 -USD 9,930,566 GBP 7,004,837 06/07/2021 HSBC 235,485 -USD 5,185,681 GBP 3,663,221 06/07/2021 Merrill Lynch 115,581 -USD 5,148,304 GBP 3,646,732 06/07/2021 RBC 101,026 -USD 11,296,174 GBP 7,983,838 06/07/2021 Standard Chartered 246,103 -USD 8,455,511 GBP 5,978,467 06/07/2021 State Street 180,983 -USD 734,599 GBP 519,546 06/07/2021 Toronto-Dominion Bank 15,519 -USD 417,360,148 GBP 301,060,483 04/08/2021 Barclays 644,519 0.01USD 60,842 GBP 43,552 04/08/2021 BNP Paribas 558 -USD 270,940 GBP 193,865 04/08/2021 HSBC 2,600 -USD 303,167 JPY 33,302,142 06/07/2021 Barclays 2,287 -USD 141,105,949 JPY 15,589,385,294 06/07/2021 Goldman Sachs 258,254 0.01USD 5,630 NOK 47,091 06/07/2021 BNP Paribas 139 -USD 2,611,464 NOK 22,366,997 06/07/2021 Standard Chartered 3,041 -USD 12,317 NOK 102,755 06/07/2021 Toronto-Dominion Bank 334 -USD 6,024 NOK 51,390 04/08/2021 Citibank 30 -USD 112,211 NZD 159,467 06/07/2021 Barclays 886 -USD 27,961 NZD 38,659 06/07/2021 BNP Paribas 973 -USD 9,094,130 NZD 13,024,702 06/07/2021 HSBC 1,452 -USD 17,937 NZD 25,564 06/07/2021 Merrill Lynch 90 -USD 40,969 NZD 56,847 06/07/2021 State Street 1,283 -USD 11,474 NZD 16,282 04/08/2021 HSBC 109 -USD 20,756 NZD 29,548 04/08/2021 State Street 130 -USD 15,402 SEK 130,448 01/07/2021 State Street 85 -USD 64,016 SEK 530,753 06/07/2021 Barclays 1,696 -USD 4,739 SEK 39,247 06/07/2021 BNP Paribas 130 -USD 29,330,489 SEK 249,793,579 06/07/2021 Goldman Sachs 119 -USD 1,119,281 SEK 9,237,293 06/07/2021 Toronto-Dominion Bank 34,653 -USD 65,575 SEK 556,269 04/08/2021 Barclays 240 -
Total Unrealised Gain on Forward Currency Exchange Contracts 56,361,638 0.96
198
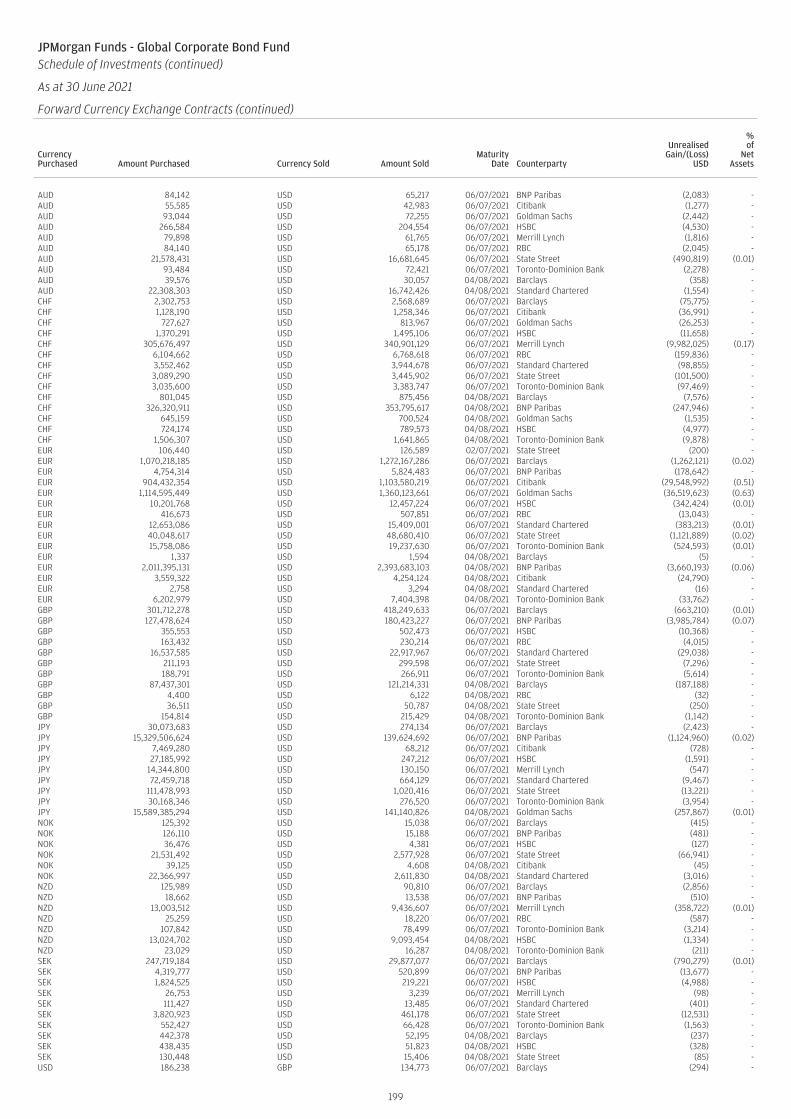
JPMorgan Funds - Global Corporate Bond FundSchedule of Investments (continued)
As at 30 June 2021
Forward Currency Exchange Contracts (continued)
CurrencyPurchased Amount Purchased Currency Sold Amount Sold
MaturityDate Counterparty
UnrealisedGain/(Loss)
USD
%of
NetAssets
AUD 84,142 USD 65,217 06/07/2021 BNP Paribas (2,083) -AUD 55,585 USD 42,983 06/07/2021 Citibank (1,277) -AUD 93,044 USD 72,255 06/07/2021 Goldman Sachs (2,442) -AUD 266,584 USD 204,554 06/07/2021 HSBC (4,530) -AUD 79,898 USD 61,765 06/07/2021 Merrill Lynch (1,816) -AUD 84,140 USD 65,178 06/07/2021 RBC (2,045) -AUD 21,578,431 USD 16,681,645 06/07/2021 State Street (490,819) (0.01)AUD 93,484 USD 72,421 06/07/2021 Toronto-Dominion Bank (2,278) -AUD 39,576 USD 30,057 04/08/2021 Barclays (358) -AUD 22,308,303 USD 16,742,426 04/08/2021 Standard Chartered (1,554) -CHF 2,302,753 USD 2,568,689 06/07/2021 Barclays (75,775) -CHF 1,128,190 USD 1,258,346 06/07/2021 Citibank (36,991) -CHF 727,627 USD 813,967 06/07/2021 Goldman Sachs (26,253) -CHF 1,370,291 USD 1,495,106 06/07/2021 HSBC (11,658) -CHF 305,676,497 USD 340,901,129 06/07/2021 Merrill Lynch (9,982,025) (0.17)CHF 6,104,662 USD 6,768,618 06/07/2021 RBC (159,836) -CHF 3,552,462 USD 3,944,678 06/07/2021 Standard Chartered (98,855) -CHF 3,089,290 USD 3,445,902 06/07/2021 State Street (101,500) -CHF 3,035,600 USD 3,383,747 06/07/2021 Toronto-Dominion Bank (97,469) -CHF 801,045 USD 875,456 04/08/2021 Barclays (7,576) -CHF 326,320,911 USD 353,795,617 04/08/2021 BNP Paribas (247,946) -CHF 645,159 USD 700,524 04/08/2021 Goldman Sachs (1,535) -CHF 724,174 USD 789,573 04/08/2021 HSBC (4,977) -CHF 1,506,307 USD 1,641,865 04/08/2021 Toronto-Dominion Bank (9,878) -EUR 106,440 USD 126,589 02/07/2021 State Street (200) -EUR 1,070,218,185 USD 1,272,167,286 06/07/2021 Barclays (1,262,121) (0.02)EUR 4,754,314 USD 5,824,483 06/07/2021 BNP Paribas (178,642) -EUR 904,432,354 USD 1,103,580,219 06/07/2021 Citibank (29,548,992) (0.51)EUR 1,114,595,449 USD 1,360,123,661 06/07/2021 Goldman Sachs (36,519,623) (0.63)EUR 10,201,768 USD 12,457,224 06/07/2021 HSBC (342,424) (0.01)EUR 416,673 USD 507,851 06/07/2021 RBC (13,043) -EUR 12,653,086 USD 15,409,001 06/07/2021 Standard Chartered (383,213) (0.01)EUR 40,048,617 USD 48,680,410 06/07/2021 State Street (1,121,889) (0.02)EUR 15,758,086 USD 19,237,630 06/07/2021 Toronto-Dominion Bank (524,593) (0.01)EUR 1,337 USD 1,594 04/08/2021 Barclays (5) -EUR 2,011,395,131 USD 2,393,683,103 04/08/2021 BNP Paribas (3,660,193) (0.06)EUR 3,559,322 USD 4,254,124 04/08/2021 Citibank (24,790) -EUR 2,758 USD 3,294 04/08/2021 Standard Chartered (16) -EUR 6,202,979 USD 7,404,398 04/08/2021 Toronto-Dominion Bank (33,762) -GBP 301,712,278 USD 418,249,633 06/07/2021 Barclays (663,210) (0.01)GBP 127,478,624 USD 180,423,227 06/07/2021 BNP Paribas (3,985,784) (0.07)GBP 355,553 USD 502,473 06/07/2021 HSBC (10,368) -GBP 163,432 USD 230,214 06/07/2021 RBC (4,015) -GBP 16,537,585 USD 22,917,967 06/07/2021 Standard Chartered (29,038) -GBP 211,193 USD 299,598 06/07/2021 State Street (7,296) -GBP 188,791 USD 266,911 06/07/2021 Toronto-Dominion Bank (5,614) -GBP 87,437,301 USD 121,214,331 04/08/2021 Barclays (187,188) -GBP 4,400 USD 6,122 04/08/2021 RBC (32) -GBP 36,511 USD 50,787 04/08/2021 State Street (250) -GBP 154,814 USD 215,429 04/08/2021 Toronto-Dominion Bank (1,142) -JPY 30,073,683 USD 274,134 06/07/2021 Barclays (2,423) -JPY 15,329,506,624 USD 139,624,692 06/07/2021 BNP Paribas (1,124,960) (0.02)JPY 7,469,280 USD 68,212 06/07/2021 Citibank (728) -JPY 27,185,992 USD 247,212 06/07/2021 HSBC (1,591) -JPY 14,344,800 USD 130,150 06/07/2021 Merrill Lynch (547) -JPY 72,459,718 USD 664,129 06/07/2021 Standard Chartered (9,467) -JPY 111,478,993 USD 1,020,416 06/07/2021 State Street (13,221) -JPY 30,168,346 USD 276,520 06/07/2021 Toronto-Dominion Bank (3,954) -JPY 15,589,385,294 USD 141,140,826 04/08/2021 Goldman Sachs (257,867) (0.01)NOK 125,392 USD 15,038 06/07/2021 Barclays (415) -NOK 126,110 USD 15,188 06/07/2021 BNP Paribas (481) -NOK 36,476 USD 4,381 06/07/2021 HSBC (127) -NOK 21,531,492 USD 2,577,928 06/07/2021 State Street (66,941) -NOK 39,125 USD 4,608 04/08/2021 Citibank (45) -NOK 22,366,997 USD 2,611,830 04/08/2021 Standard Chartered (3,016) -NZD 125,989 USD 90,810 06/07/2021 Barclays (2,856) -NZD 18,662 USD 13,538 06/07/2021 BNP Paribas (510) -NZD 13,003,512 USD 9,436,607 06/07/2021 Merrill Lynch (358,722) (0.01)NZD 25,259 USD 18,220 06/07/2021 RBC (587) -NZD 107,842 USD 78,499 06/07/2021 Toronto-Dominion Bank (3,214) -NZD 13,024,702 USD 9,093,454 04/08/2021 HSBC (1,334) -NZD 23,029 USD 16,287 04/08/2021 Toronto-Dominion Bank (211) -SEK 247,719,184 USD 29,877,077 06/07/2021 Barclays (790,279) (0.01)SEK 4,319,777 USD 520,899 06/07/2021 BNP Paribas (13,677) -SEK 1,824,525 USD 219,221 06/07/2021 HSBC (4,988) -SEK 26,753 USD 3,239 06/07/2021 Merrill Lynch (98) -SEK 111,427 USD 13,485 06/07/2021 Standard Chartered (401) -SEK 3,820,923 USD 461,178 06/07/2021 State Street (12,531) -SEK 552,427 USD 66,428 06/07/2021 Toronto-Dominion Bank (1,563) -SEK 442,378 USD 52,195 04/08/2021 Barclays (237) -SEK 438,435 USD 51,823 04/08/2021 HSBC (328) -SEK 130,448 USD 15,406 04/08/2021 State Street (85) -USD 186,238 GBP 134,773 06/07/2021 Barclays (294) -
199

JPMorgan Funds - Global Corporate Bond FundSchedule of Investments (continued)
As at 30 June 2021
Forward Currency Exchange Contracts (continued)
CurrencyPurchased Amount Purchased Currency Sold Amount Sold
MaturityDate Counterparty
UnrealisedGain/(Loss)
USD
%of
NetAssets
USD 106,215 GBP 76,816 04/08/2021 State Street (110) -USD 308,804 JPY 34,229,812 04/08/2021 Barclays (534) -USD 1,539,145 SEK 13,149,982 02/07/2021 Standard Chartered (4,844) -
Total Unrealised Loss on Forward Currency Exchange Contracts (92,562,105) (1.58)
Net Unrealised Loss on Forward Currency Exchange Contracts (36,200,467) (0.62)
JPMorgan Funds - Global Corporate Bond FundSchedule of Investments (continued)
As at 30 June 2021
Financial Futures Contracts
Security DescriptionNumber ofContracts Currency
GlobalExposure
USD
UnrealisedGain/(Loss)
USD
%of
NetAssets
Australia 10 Year Bond, 15/09/2021 123 AUD 13,030,067 10,448 -Canada 10 Year Bond, 21/09/2021 1,706 CAD 200,522,156 268,898 0.01Canada 5 Year Bond, 21/09/2021 78 CAD 7,849,114 694 -Euro-BTP, 08/09/2021 518 EUR 93,052,914 322,919 0.01Euro-Buxl 30 Year Bond, 08/09/2021 44 EUR 10,602,378 57,010 -Euro-OAT, 08/09/2021 555 EUR 104,727,859 227,456 -Euro-Schatz, 08/09/2021 1,890 EUR 251,661,640 15,217 -Japan 10 Year Bond Mini, 10/09/2021 244 JPY 33,454,493 26,453 -US 2 Year Note, 30/09/2021 1,034 USD 227,799,086 10,001 -US Long Bond, 21/09/2021 381 USD 61,215,984 146,035 -US Ultra Bond, 21/09/2021 388 USD 74,756,687 478,465 0.01
Total Unrealised Gain on Financial Futures Contracts 1,563,596 0.03
Euro-Bobl, 08/09/2021 (732) EUR (116,562,915) (101,710) -Euro-Bund, 08/09/2021 (428) EUR (87,649,429) (61,947) -Long Gilt, 28/09/2021 (590) GBP (104,608,440) (204,146) (0.01)US 5 Year Note, 30/09/2021 (3,071) USD (379,016,581) (161,433) -US 10 Year Note, 21/09/2021 (610) USD (80,801,172) (202,223) -US 10 Year Ultra Bond, 21/09/2021 (2,324) USD (341,900,344) (815,884) (0.02)
Total Unrealised Loss on Financial Futures Contracts (1,547,343) (0.03)
Net Unrealised Gain on Financial Futures Contracts 16,253 -
JPMorgan Funds - Global Corporate Bond FundSchedule of Investments (continued)
As at 30 June 2021
Interest Rate Swap Contracts
NominalAmount Currency Counterparty Security Description
MaturityDate
MarketValue
USD
UnrealisedGain/(Loss)
USD
%of
NetAssets
89,000,000 CAD Citigroup Pay floating BA 3 monthReceive fixed 1.713% 03/10/2022 1,238,592 1,238,592 0.02
47,800,000 CAD Citigroup Pay floating BA 3 monthReceive fixed 1.659% 03/10/2024 743,995 743,995 0.01
25,000,000 CAD Citigroup Pay floating BA 3 monthReceive fixed 1.649% 05/10/2026 226,354 226,354 0.01
Total Unrealised Gain on Interest Rate Swap Contracts 2,208,941 2,208,941 0.04
Net Unrealised Gain on Interest Rate Swap Contracts 2,208,941 2,208,941 0.04
200
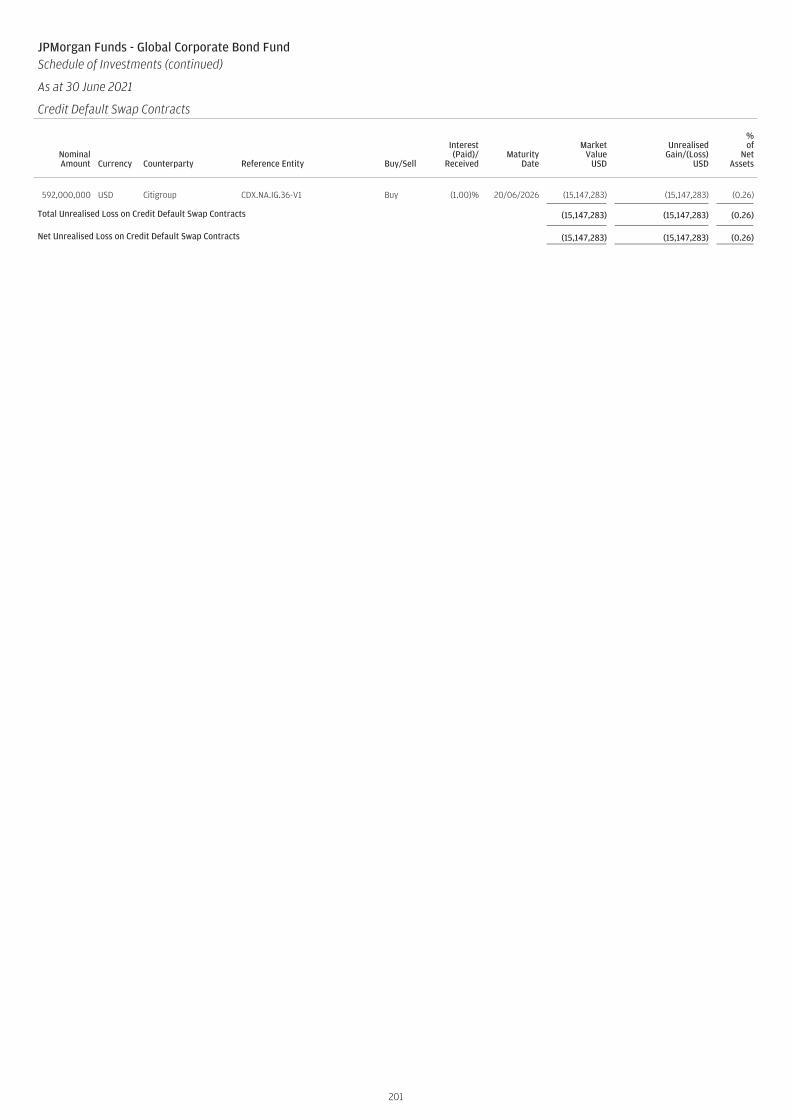
JPMorgan Funds - Global Corporate Bond FundSchedule of Investments (continued)
As at 30 June 2021
Credit Default Swap Contracts
NominalAmount Currency Counterparty Reference Entity Buy/Sell
Interest(Paid)/
ReceivedMaturity
Date
MarketValue
USD
UnrealisedGain/(Loss)
USD
%of
NetAssets
592,000,000 USD Citigroup CDX.NA.IG.36-V1 Buy (1.00)% 20/06/2026 (15,147,283) (15,147,283) (0.26)
Total Unrealised Loss on Credit Default Swap Contracts (15,147,283) (15,147,283) (0.26)
Net Unrealised Loss on Credit Default Swap Contracts (15,147,283) (15,147,283) (0.26)
201
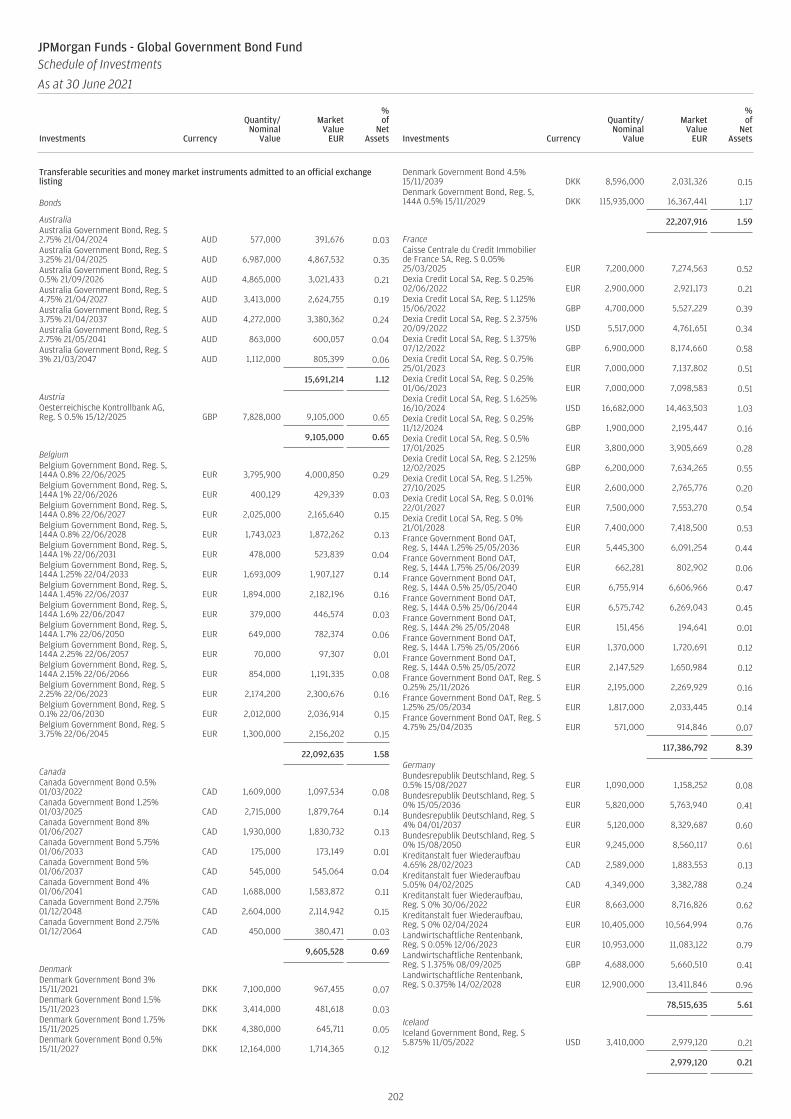
Transferable securities and money market instruments admitted to an official exchangelisting
Bonds
AustraliaAustralia Government Bond, Reg. S2.75% 21/04/2024 AUD 577,000 391,676 0.03Australia Government Bond, Reg. S3.25% 21/04/2025 AUD 6,987,000 4,867,532 0.35Australia Government Bond, Reg. S0.5% 21/09/2026 AUD 4,865,000 3,021,433 0.21Australia Government Bond, Reg. S4.75% 21/04/2027 AUD 3,413,000 2,624,755 0.19Australia Government Bond, Reg. S3.75% 21/04/2037 AUD 4,272,000 3,380,362 0.24Australia Government Bond, Reg. S2.75% 21/05/2041 AUD 863,000 600,057 0.04Australia Government Bond, Reg. S3% 21/03/2047 AUD 1,112,000 805,399 0.06
15,691,214 1.12
AustriaOesterreichische Kontrollbank AG,Reg. S 0.5% 15/12/2025 GBP 7,828,000 9,105,000 0.65
9,105,000 0.65
BelgiumBelgium Government Bond, Reg. S,144A 0.8% 22/06/2025 EUR 3,795,900 4,000,850 0.29Belgium Government Bond, Reg. S,144A 1% 22/06/2026 EUR 400,129 429,339 0.03Belgium Government Bond, Reg. S,144A 0.8% 22/06/2027 EUR 2,025,000 2,165,640 0.15Belgium Government Bond, Reg. S,144A 0.8% 22/06/2028 EUR 1,743,023 1,872,262 0.13Belgium Government Bond, Reg. S,144A 1% 22/06/2031 EUR 478,000 523,839 0.04Belgium Government Bond, Reg. S,144A 1.25% 22/04/2033 EUR 1,693,009 1,907,127 0.14Belgium Government Bond, Reg. S,144A 1.45% 22/06/2037 EUR 1,894,000 2,182,196 0.16Belgium Government Bond, Reg. S,144A 1.6% 22/06/2047 EUR 379,000 446,574 0.03Belgium Government Bond, Reg. S,144A 1.7% 22/06/2050 EUR 649,000 782,374 0.06Belgium Government Bond, Reg. S,144A 2.25% 22/06/2057 EUR 70,000 97,307 0.01Belgium Government Bond, Reg. S,144A 2.15% 22/06/2066 EUR 854,000 1,191,335 0.08Belgium Government Bond, Reg. S2.25% 22/06/2023 EUR 2,174,200 2,300,676 0.16Belgium Government Bond, Reg. S0.1% 22/06/2030 EUR 2,012,000 2,036,914 0.15Belgium Government Bond, Reg. S3.75% 22/06/2045 EUR 1,300,000 2,156,202 0.15
22,092,635 1.58
CanadaCanada Government Bond 0.5%01/03/2022 CAD 1,609,000 1,097,534 0.08Canada Government Bond 1.25%01/03/2025 CAD 2,715,000 1,879,764 0.14Canada Government Bond 8%01/06/2027 CAD 1,930,000 1,830,732 0.13Canada Government Bond 5.75%01/06/2033 CAD 175,000 173,149 0.01Canada Government Bond 5%01/06/2037 CAD 545,000 545,064 0.04Canada Government Bond 4%01/06/2041 CAD 1,688,000 1,583,872 0.11Canada Government Bond 2.75%01/12/2048 CAD 2,604,000 2,114,942 0.15Canada Government Bond 2.75%01/12/2064 CAD 450,000 380,471 0.03
9,605,528 0.69
DenmarkDenmark Government Bond 3%15/11/2021 DKK 7,100,000 967,455 0.07Denmark Government Bond 1.5%15/11/2023 DKK 3,414,000 481,618 0.03Denmark Government Bond 1.75%15/11/2025 DKK 4,380,000 645,711 0.05Denmark Government Bond 0.5%15/11/2027 DKK 12,164,000 1,714,365 0.12
Denmark Government Bond 4.5%15/11/2039 DKK 8,596,000 2,031,326 0.15Denmark Government Bond, Reg. S,144A 0.5% 15/11/2029 DKK 115,935,000 16,367,441 1.17
22,207,916 1.59
FranceCaisse Centrale du Credit Immobilierde France SA, Reg. S 0.05%25/03/2025 EUR 7,200,000 7,274,563 0.52Dexia Credit Local SA, Reg. S 0.25%02/06/2022 EUR 2,900,000 2,921,173 0.21Dexia Credit Local SA, Reg. S 1.125%15/06/2022 GBP 4,700,000 5,527,229 0.39Dexia Credit Local SA, Reg. S 2.375%20/09/2022 USD 5,517,000 4,761,651 0.34Dexia Credit Local SA, Reg. S 1.375%07/12/2022 GBP 6,900,000 8,174,660 0.58Dexia Credit Local SA, Reg. S 0.75%25/01/2023 EUR 7,000,000 7,137,802 0.51Dexia Credit Local SA, Reg. S 0.25%01/06/2023 EUR 7,000,000 7,098,583 0.51Dexia Credit Local SA, Reg. S 1.625%16/10/2024 USD 16,682,000 14,463,503 1.03Dexia Credit Local SA, Reg. S 0.25%11/12/2024 GBP 1,900,000 2,195,447 0.16Dexia Credit Local SA, Reg. S 0.5%17/01/2025 EUR 3,800,000 3,905,669 0.28Dexia Credit Local SA, Reg. S 2.125%12/02/2025 GBP 6,200,000 7,634,265 0.55Dexia Credit Local SA, Reg. S 1.25%27/10/2025 EUR 2,600,000 2,765,776 0.20Dexia Credit Local SA, Reg. S 0.01%22/01/2027 EUR 7,500,000 7,553,270 0.54Dexia Credit Local SA, Reg. S 0%21/01/2028 EUR 7,400,000 7,418,500 0.53France Government Bond OAT,Reg. S, 144A 1.25% 25/05/2036 EUR 5,445,300 6,091,254 0.44France Government Bond OAT,Reg. S, 144A 1.75% 25/06/2039 EUR 662,281 802,902 0.06France Government Bond OAT,Reg. S, 144A 0.5% 25/05/2040 EUR 6,755,914 6,606,966 0.47France Government Bond OAT,Reg. S, 144A 0.5% 25/06/2044 EUR 6,575,742 6,269,043 0.45France Government Bond OAT,Reg. S, 144A 2% 25/05/2048 EUR 151,456 194,641 0.01France Government Bond OAT,Reg. S, 144A 1.75% 25/05/2066 EUR 1,370,000 1,720,691 0.12France Government Bond OAT,Reg. S, 144A 0.5% 25/05/2072 EUR 2,147,529 1,650,984 0.12France Government Bond OAT, Reg. S0.25% 25/11/2026 EUR 2,195,000 2,269,929 0.16France Government Bond OAT, Reg. S1.25% 25/05/2034 EUR 1,817,000 2,033,445 0.14France Government Bond OAT, Reg. S4.75% 25/04/2035 EUR 571,000 914,846 0.07
117,386,792 8.39
GermanyBundesrepublik Deutschland, Reg. S0.5% 15/08/2027 EUR 1,090,000 1,158,252 0.08Bundesrepublik Deutschland, Reg. S0% 15/05/2036 EUR 5,820,000 5,763,940 0.41Bundesrepublik Deutschland, Reg. S4% 04/01/2037 EUR 5,120,000 8,329,687 0.60Bundesrepublik Deutschland, Reg. S0% 15/08/2050 EUR 9,245,000 8,560,117 0.61Kreditanstalt fuer Wiederaufbau4.65% 28/02/2023 CAD 2,589,000 1,883,553 0.13Kreditanstalt fuer Wiederaufbau5.05% 04/02/2025 CAD 4,349,000 3,382,788 0.24Kreditanstalt fuer Wiederaufbau,Reg. S 0% 30/06/2022 EUR 8,663,000 8,716,826 0.62Kreditanstalt fuer Wiederaufbau,Reg. S 0% 02/04/2024 EUR 10,405,000 10,564,994 0.76Landwirtschaftliche Rentenbank,Reg. S 0.05% 12/06/2023 EUR 10,953,000 11,083,122 0.79Landwirtschaftliche Rentenbank,Reg. S 1.375% 08/09/2025 GBP 4,688,000 5,660,510 0.41Landwirtschaftliche Rentenbank,Reg. S 0.375% 14/02/2028 EUR 12,900,000 13,411,846 0.96
78,515,635 5.61
IcelandIceland Government Bond, Reg. S5.875% 11/05/2022 USD 3,410,000 2,979,120 0.21
2,979,120 0.21
202
JPMorgan Funds - Global Government Bond FundSchedule of Investments
As at 30 June 2021
Investments Currency
Quantity/Nominal
Value
MarketValue
EUR
%of
NetAssets Investments Currency
Quantity/Nominal
Value
MarketValue
EUR
%of
NetAssets
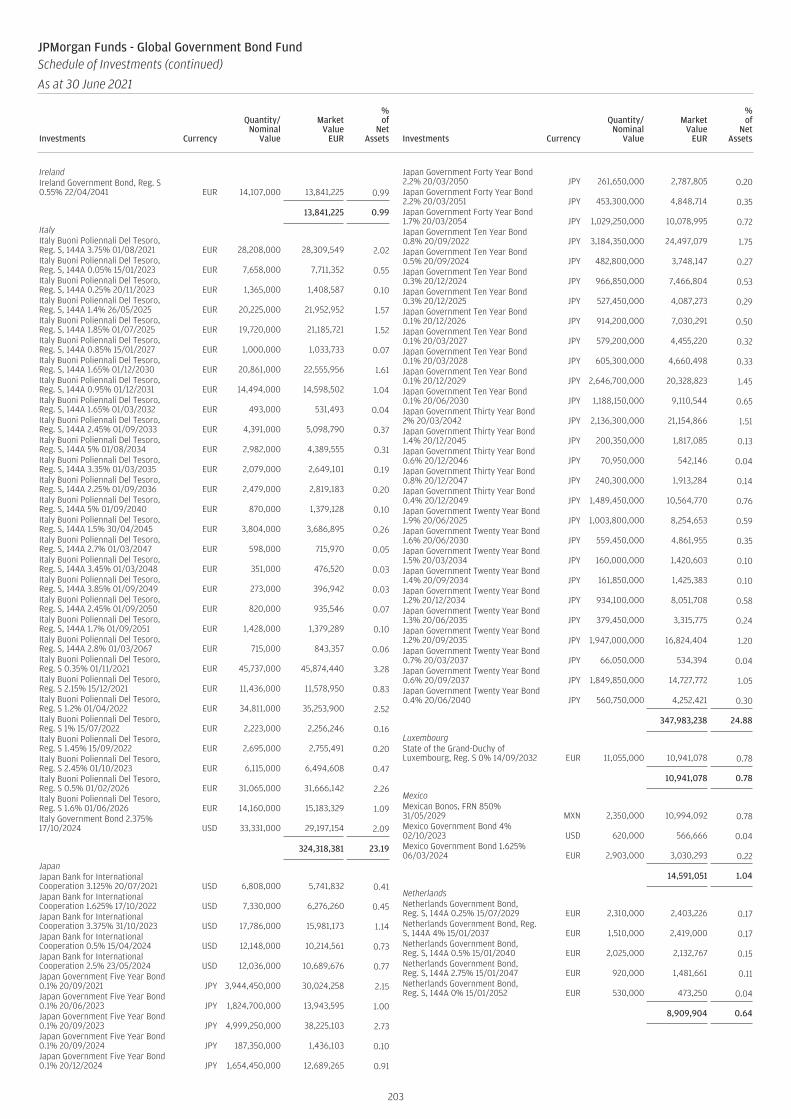
IrelandIreland Government Bond, Reg. S0.55% 22/04/2041 EUR 14,107,000 13,841,225 0.99
13,841,225 0.99
ItalyItaly Buoni Poliennali Del Tesoro,Reg. S, 144A 3.75% 01/08/2021 EUR 28,208,000 28,309,549 2.02Italy Buoni Poliennali Del Tesoro,Reg. S, 144A 0.05% 15/01/2023 EUR 7,658,000 7,711,352 0.55Italy Buoni Poliennali Del Tesoro,Reg. S, 144A 0.25% 20/11/2023 EUR 1,365,000 1,408,587 0.10Italy Buoni Poliennali Del Tesoro,Reg. S, 144A 1.4% 26/05/2025 EUR 20,225,000 21,952,952 1.57Italy Buoni Poliennali Del Tesoro,Reg. S, 144A 1.85% 01/07/2025 EUR 19,720,000 21,185,721 1.52Italy Buoni Poliennali Del Tesoro,Reg. S, 144A 0.85% 15/01/2027 EUR 1,000,000 1,033,733 0.07Italy Buoni Poliennali Del Tesoro,Reg. S, 144A 1.65% 01/12/2030 EUR 20,861,000 22,555,956 1.61Italy Buoni Poliennali Del Tesoro,Reg. S, 144A 0.95% 01/12/2031 EUR 14,494,000 14,598,502 1.04Italy Buoni Poliennali Del Tesoro,Reg. S, 144A 1.65% 01/03/2032 EUR 493,000 531,493 0.04Italy Buoni Poliennali Del Tesoro,Reg. S, 144A 2.45% 01/09/2033 EUR 4,391,000 5,098,790 0.37Italy Buoni Poliennali Del Tesoro,Reg. S, 144A 5% 01/08/2034 EUR 2,982,000 4,389,555 0.31Italy Buoni Poliennali Del Tesoro,Reg. S, 144A 3.35% 01/03/2035 EUR 2,079,000 2,649,101 0.19Italy Buoni Poliennali Del Tesoro,Reg. S, 144A 2.25% 01/09/2036 EUR 2,479,000 2,819,183 0.20Italy Buoni Poliennali Del Tesoro,Reg. S, 144A 5% 01/09/2040 EUR 870,000 1,379,128 0.10Italy Buoni Poliennali Del Tesoro,Reg. S, 144A 1.5% 30/04/2045 EUR 3,804,000 3,686,895 0.26Italy Buoni Poliennali Del Tesoro,Reg. S, 144A 2.7% 01/03/2047 EUR 598,000 715,970 0.05Italy Buoni Poliennali Del Tesoro,Reg. S, 144A 3.45% 01/03/2048 EUR 351,000 476,520 0.03Italy Buoni Poliennali Del Tesoro,Reg. S, 144A 3.85% 01/09/2049 EUR 273,000 396,942 0.03Italy Buoni Poliennali Del Tesoro,Reg. S, 144A 2.45% 01/09/2050 EUR 820,000 935,546 0.07Italy Buoni Poliennali Del Tesoro,Reg. S, 144A 1.7% 01/09/2051 EUR 1,428,000 1,379,289 0.10Italy Buoni Poliennali Del Tesoro,Reg. S, 144A 2.8% 01/03/2067 EUR 715,000 843,357 0.06Italy Buoni Poliennali Del Tesoro,Reg. S 0.35% 01/11/2021 EUR 45,737,000 45,874,440 3.28Italy Buoni Poliennali Del Tesoro,Reg. S 2.15% 15/12/2021 EUR 11,436,000 11,578,950 0.83Italy Buoni Poliennali Del Tesoro,Reg. S 1.2% 01/04/2022 EUR 34,811,000 35,253,900 2.52Italy Buoni Poliennali Del Tesoro,Reg. S 1% 15/07/2022 EUR 2,223,000 2,256,246 0.16Italy Buoni Poliennali Del Tesoro,Reg. S 1.45% 15/09/2022 EUR 2,695,000 2,755,491 0.20Italy Buoni Poliennali Del Tesoro,Reg. S 2.45% 01/10/2023 EUR 6,115,000 6,494,608 0.47Italy Buoni Poliennali Del Tesoro,Reg. S 0.5% 01/02/2026 EUR 31,065,000 31,666,142 2.26Italy Buoni Poliennali Del Tesoro,Reg. S 1.6% 01/06/2026 EUR 14,160,000 15,183,329 1.09Italy Government Bond 2.375%17/10/2024 USD 33,331,000 29,197,154 2.09
324,318,381 23.19
JapanJapan Bank for InternationalCooperation 3.125% 20/07/2021 USD 6,808,000 5,741,832 0.41Japan Bank for InternationalCooperation 1.625% 17/10/2022 USD 7,330,000 6,276,260 0.45Japan Bank for InternationalCooperation 3.375% 31/10/2023 USD 17,786,000 15,981,173 1.14Japan Bank for InternationalCooperation 0.5% 15/04/2024 USD 12,148,000 10,214,561 0.73Japan Bank for InternationalCooperation 2.5% 23/05/2024 USD 12,036,000 10,689,676 0.77Japan Government Five Year Bond0.1% 20/09/2021 JPY 3,944,450,000 30,024,258 2.15Japan Government Five Year Bond0.1% 20/06/2023 JPY 1,824,700,000 13,943,595 1.00Japan Government Five Year Bond0.1% 20/09/2023 JPY 4,999,250,000 38,225,103 2.73Japan Government Five Year Bond0.1% 20/09/2024 JPY 187,350,000 1,436,103 0.10Japan Government Five Year Bond0.1% 20/12/2024 JPY 1,654,450,000 12,689,265 0.91
Japan Government Forty Year Bond2.2% 20/03/2050 JPY 261,650,000 2,787,805 0.20Japan Government Forty Year Bond2.2% 20/03/2051 JPY 453,300,000 4,848,714 0.35Japan Government Forty Year Bond1.7% 20/03/2054 JPY 1,029,250,000 10,078,995 0.72Japan Government Ten Year Bond0.8% 20/09/2022 JPY 3,184,350,000 24,497,079 1.75Japan Government Ten Year Bond0.5% 20/09/2024 JPY 482,800,000 3,748,147 0.27Japan Government Ten Year Bond0.3% 20/12/2024 JPY 966,850,000 7,466,804 0.53Japan Government Ten Year Bond0.3% 20/12/2025 JPY 527,450,000 4,087,273 0.29Japan Government Ten Year Bond0.1% 20/12/2026 JPY 914,200,000 7,030,291 0.50Japan Government Ten Year Bond0.1% 20/03/2027 JPY 579,200,000 4,455,220 0.32Japan Government Ten Year Bond0.1% 20/03/2028 JPY 605,300,000 4,660,498 0.33Japan Government Ten Year Bond0.1% 20/12/2029 JPY 2,646,700,000 20,328,823 1.45Japan Government Ten Year Bond0.1% 20/06/2030 JPY 1,188,150,000 9,110,544 0.65Japan Government Thirty Year Bond2% 20/03/2042 JPY 2,136,300,000 21,154,866 1.51Japan Government Thirty Year Bond1.4% 20/12/2045 JPY 200,350,000 1,817,085 0.13Japan Government Thirty Year Bond0.6% 20/12/2046 JPY 70,950,000 542,146 0.04Japan Government Thirty Year Bond0.8% 20/12/2047 JPY 240,300,000 1,913,284 0.14Japan Government Thirty Year Bond0.4% 20/12/2049 JPY 1,489,450,000 10,564,770 0.76Japan Government Twenty Year Bond1.9% 20/06/2025 JPY 1,003,800,000 8,254,653 0.59Japan Government Twenty Year Bond1.6% 20/06/2030 JPY 559,450,000 4,861,955 0.35Japan Government Twenty Year Bond1.5% 20/03/2034 JPY 160,000,000 1,420,603 0.10Japan Government Twenty Year Bond1.4% 20/09/2034 JPY 161,850,000 1,425,383 0.10Japan Government Twenty Year Bond1.2% 20/12/2034 JPY 934,100,000 8,051,708 0.58Japan Government Twenty Year Bond1.3% 20/06/2035 JPY 379,450,000 3,315,775 0.24Japan Government Twenty Year Bond1.2% 20/09/2035 JPY 1,947,000,000 16,824,404 1.20Japan Government Twenty Year Bond0.7% 20/03/2037 JPY 66,050,000 534,394 0.04Japan Government Twenty Year Bond0.6% 20/09/2037 JPY 1,849,850,000 14,727,772 1.05Japan Government Twenty Year Bond0.4% 20/06/2040 JPY 560,750,000 4,252,421 0.30
347,983,238 24.88
LuxembourgState of the Grand-Duchy ofLuxembourg, Reg. S 0% 14/09/2032 EUR 11,055,000 10,941,078 0.78
10,941,078 0.78
MexicoMexican Bonos, FRN 850%31/05/2029 MXN 2,350,000 10,994,092 0.78Mexico Government Bond 4%02/10/2023 USD 620,000 566,666 0.04Mexico Government Bond 1.625%06/03/2024 EUR 2,903,000 3,030,293 0.22
14,591,051 1.04
NetherlandsNetherlands Government Bond,Reg. S, 144A 0.25% 15/07/2029 EUR 2,310,000 2,403,226 0.17Netherlands Government Bond, Reg.S, 144A 4% 15/01/2037 EUR 1,510,000 2,419,000 0.17Netherlands Government Bond,Reg. S, 144A 0.5% 15/01/2040 EUR 2,025,000 2,132,767 0.15Netherlands Government Bond,Reg. S, 144A 2.75% 15/01/2047 EUR 920,000 1,481,661 0.11Netherlands Government Bond,Reg. S, 144A 0% 15/01/2052 EUR 530,000 473,250 0.04
8,909,904 0.64
203
JPMorgan Funds - Global Government Bond FundSchedule of Investments (continued)
As at 30 June 2021
Investments Currency
Quantity/Nominal
Value
MarketValue
EUR
%of
NetAssets Investments Currency
Quantity/Nominal
Value
MarketValue
EUR
%of
NetAssets

PolandPoland Government Bond, Reg. S0.875% 14/10/2021 EUR 3,438,000 3,450,205 0.25
3,450,205 0.25
PortugalPortugal Government Bond, Reg. S5.125% 15/10/2024 USD 10,426,000 9,974,381 0.71
9,974,381 0.71
SloveniaSlovenia Government Bond, Reg. S0.125% 01/07/2031 EUR 4,254,000 4,249,108 0.30
4,249,108 0.30
South KoreaKorea Government Bond 0%16/09/2025 EUR 7,474,000 7,525,660 0.54Korea Government Bond 2.75%19/01/2027 USD 4,334,000 3,942,880 0.28Korea Government Bond, Reg. S2.125% 10/06/2024 EUR 3,950,000 4,229,139 0.30
15,697,679 1.12
SpainSpain Government Bond 0.4%30/04/2022 EUR 9,496,000 9,573,744 0.69Spain Government Bond 0.35%30/07/2023 EUR 8,575,000 8,725,588 0.62Spain Government Bond, Reg. S,144A 1.6% 30/04/2025 EUR 11,664,000 12,547,378 0.90Spain Government Bond, Reg. S,144A 0.1% 30/04/2031 EUR 8,850,000 8,573,504 0.61Spain Government Bond, Reg. S,144A 0.5% 31/10/2031 EUR 15,155,000 15,168,488 1.09Spain Government Bond, Reg. S,144A 1.85% 30/07/2035 EUR 4,217,000 4,812,434 0.34Spain Government Bond, Reg. S,144A 4.2% 31/01/2037 EUR 1,583,000 2,361,408 0.17Spain Government Bond, Reg. S,144A 1.2% 31/10/2040 EUR 4,512,000 4,573,230 0.33Spain Government Bond, Reg. S,144A 2.7% 31/10/2048 EUR 617,000 807,705 0.06Spain Government Bond, Reg. S,144A 1% 31/10/2050 EUR 1,740,000 1,567,804 0.11Spain Government Bond, Reg. S,144A 3.45% 30/07/2066 EUR 94,000 144,399 0.01Spain Government Bond, Reg. S,144A 1.45% 31/10/2071 EUR 704,000 618,336 0.04
69,474,018 4.97
SupranationalEuropean Union Bond, Reg. S 0%06/07/2026 EUR 20,766,000 21,166,265 1.51European Union Bond, Reg. S 0%04/07/2031 EUR 19,442,500 19,387,361 1.39European Union Bond, Reg. S 0.7%06/07/2051 EUR 3,070,000 3,101,605 0.22
43,655,231 3.12
SwedenSweden Government Bond 3.5%01/06/2022 SEK 3,000,000 307,092 0.02Sweden Government Bond 0.75%12/05/2028 SEK 8,770,000 904,070 0.06Sweden Government Bond 3.5%30/03/2039 SEK 4,170,000 604,732 0.04Sweden Government Bond 1.375%23/06/2071 SEK 31,685,000 3,286,606 0.24Sweden Government Bond, Reg. S,144A 1.5% 13/11/2023 SEK 6,715,000 691,621 0.05Sweden Government Bond, Reg. S 1%12/11/2026 SEK 5,280,000 550,613 0.04
6,344,734 0.45
United KingdomUK Treasury, Reg. S 2.25%07/09/2023 GBP 3,194,485 3,900,865 0.28UK Treasury, Reg. S 5% 07/03/2025 GBP 72,189 98,890 0.01UK Treasury, Reg. S 0.625%07/06/2025 GBP 688,520 814,606 0.06UK Treasury, Reg. S 1.25%22/07/2027 GBP 973,959 1,190,008 0.08UK Treasury, Reg. S 4.25%07/12/2027 GBP 3,186,000 4,603,022 0.33
UK Treasury, Reg. S 1.75%07/09/2037 GBP 4,389,000 5,599,942 0.40UK Treasury, Reg. S 4.75%07/12/2038 GBP 2,321,000 4,270,580 0.30UK Treasury, Reg. S 4.25%07/09/2039 GBP 2,877,000 5,068,312 0.36UK Treasury, Reg. S 3.25%22/01/2044 GBP 1,511,000 2,467,389 0.18UK Treasury, Reg. S 3.5% 22/01/2045 GBP 3,111,000 5,318,797 0.38UK Treasury, Reg. S 4.25%07/12/2046 GBP 2,360,000 4,564,577 0.33UK Treasury, Reg. S 0.625%22/10/2050 GBP 10,468,000 10,382,512 0.74UK Treasury, Reg. S 4% 22/01/2060 GBP 50,000 109,787 0.01UK Treasury, Reg. S 0.5% 22/10/2061 GBP 6,267,524 5,794,534 0.41UK Treasury, Reg. S 2.5% 22/07/2065 GBP 711,000 1,220,834 0.09UK Treasury, Reg. S 3.5%22/07/2068 GBP 478,000 1,043,000 0.07UK Treasury, Reg. S 1.625%22/10/2071 GBP 1,049,190 1,488,443 0.11
57,936,098 4.14
United States of AmericaUS Treasury 0.125% 15/05/2023 USD 33,765,000 28,383,950 2.03US Treasury 0.25% 15/03/2024 USD 11,494,000 9,642,377 0.69US Treasury 1.125% 15/05/2040 USD 10,460,000 7,611,539 0.54US Treasury 1.125% 15/08/2040 USD 6,700,000 4,856,505 0.35US Treasury 1.875% 15/02/2041 USD 43,798,000 36,130,022 2.58US Treasury 2.75% 15/08/2042 USD 6,190,000 5,878,046 0.42US Treasury 2.5% 15/02/2045 USD 9,638,000 8,789,878 0.63US Treasury 2.5% 15/05/2046 USD 7,692,000 7,023,472 0.50US Treasury 2.875% 15/11/2046 USD 16,570,000 16,206,988 1.16US Treasury 3% 15/02/2047 USD 8,057,000 8,064,434 0.58US Treasury 3.125% 15/05/2048 USD 7,185,000 7,385,212 0.53US Treasury 2.375% 15/11/2049 USD 13,173,000 11,822,698 0.84US Treasury 2% 15/02/2050 USD 11,074,000 9,171,274 0.66US Treasury 1.25% 15/05/2050 USD 8,259,000 5,686,324 0.41
166,652,719 11.92
Total Bonds 1,375,602,890 98.34
Total Transferable securities and money market instrumentsadmitted to an official exchange listing 1,375,602,890 98.34
Transferable securities and money market instruments dealt in on another regulatedmarket
Bonds
JapanJapan Government CPI Linked Bond0.1% 10/03/2029 JPY 1,300,500,000 10,196,019 0.73
10,196,019 0.73
Total Bonds 10,196,019 0.73
Total Transferable securities and money market instrumentsdealt in on another regulated market 10,196,019 0.73
Total Investments 1,385,798,909 99.07
Cash 24,299,798 1.74
Other Assets/(Liabilities) (11,337,038) (0.81)
Total Net Assets 1,398,761,669 100.00
204
JPMorgan Funds - Global Government Bond FundSchedule of Investments (continued)
As at 30 June 2021
Investments Currency
Quantity/Nominal
Value
MarketValue
EUR
%of
NetAssets Investments Currency
Quantity/Nominal
Value
MarketValue
EUR
%of
NetAssets

Geographic Allocation of Portfolio as at 30 June 2021 % of Net AssetsJapan 25.61Italy 23.19United States of America 11.92France 8.39Germany 5.61Spain 4.97United Kingdom 4.14Supranational 3.12Denmark 1.59Belgium 1.58South Korea 1.12Australia 1.12Mexico 1.04Ireland 0.99Luxembourg 0.78Portugal 0.71Canada 0.69Austria 0.65Netherlands 0.64Sweden 0.45Slovenia 0.30Poland 0.25Iceland 0.21Total Investments 99.07Cash and other assets/(liabilities) 0.93
Total 100.00
205
JPMorgan Funds - Global Government Bond FundSchedule of Investments (continued)
As at 30 June 2021
Investments Currency
Quantity/Nominal
Value
MarketValue
EUR
%of
NetAssets Investments Currency
Quantity/Nominal
Value
MarketValue
EUR
%of
NetAssets
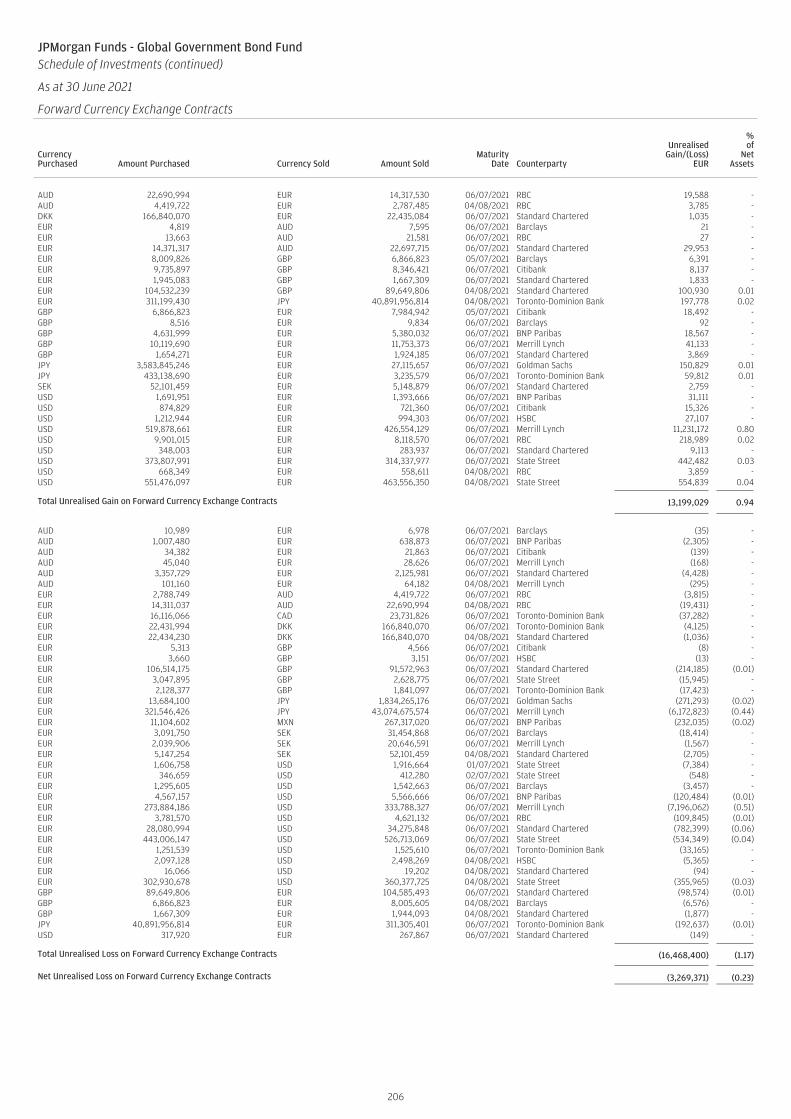
JPMorgan Funds - Global Government Bond FundSchedule of Investments (continued)
As at 30 June 2021
Forward Currency Exchange Contracts (continued)
CurrencyPurchased Amount Purchased Currency Sold Amount Sold
MaturityDate Counterparty
UnrealisedGain/(Loss)
EUR
%of
NetAssets
AUD 22,690,994 EUR 14,317,530 06/07/2021 RBC 19,588 -AUD 4,419,722 EUR 2,787,485 04/08/2021 RBC 3,785 -DKK 166,840,070 EUR 22,435,084 06/07/2021 Standard Chartered 1,035 -EUR 4,819 AUD 7,595 06/07/2021 Barclays 21 -EUR 13,663 AUD 21,581 06/07/2021 RBC 27 -EUR 14,371,317 AUD 22,697,715 06/07/2021 Standard Chartered 29,953 -EUR 8,009,826 GBP 6,866,823 05/07/2021 Barclays 6,391 -EUR 9,735,897 GBP 8,346,421 06/07/2021 Citibank 8,137 -EUR 1,945,083 GBP 1,667,309 06/07/2021 Standard Chartered 1,833 -EUR 104,532,239 GBP 89,649,806 04/08/2021 Standard Chartered 100,930 0.01EUR 311,199,430 JPY 40,891,956,814 04/08/2021 Toronto-Dominion Bank 197,778 0.02GBP 6,866,823 EUR 7,984,942 05/07/2021 Citibank 18,492 -GBP 8,516 EUR 9,834 06/07/2021 Barclays 92 -GBP 4,631,999 EUR 5,380,032 06/07/2021 BNP Paribas 18,567 -GBP 10,119,690 EUR 11,753,373 06/07/2021 Merrill Lynch 41,133 -GBP 1,654,271 EUR 1,924,185 06/07/2021 Standard Chartered 3,869 -JPY 3,583,845,246 EUR 27,115,657 06/07/2021 Goldman Sachs 150,829 0.01JPY 433,138,690 EUR 3,235,579 06/07/2021 Toronto-Dominion Bank 59,812 0.01SEK 52,101,459 EUR 5,148,879 06/07/2021 Standard Chartered 2,759 -USD 1,691,951 EUR 1,393,666 06/07/2021 BNP Paribas 31,111 -USD 874,829 EUR 721,360 06/07/2021 Citibank 15,326 -USD 1,212,944 EUR 994,303 06/07/2021 HSBC 27,107 -USD 519,878,661 EUR 426,554,129 06/07/2021 Merrill Lynch 11,231,172 0.80USD 9,901,015 EUR 8,118,570 06/07/2021 RBC 218,989 0.02USD 348,003 EUR 283,937 06/07/2021 Standard Chartered 9,113 -USD 373,807,991 EUR 314,337,977 06/07/2021 State Street 442,482 0.03USD 668,349 EUR 558,611 04/08/2021 RBC 3,859 -USD 551,476,097 EUR 463,556,350 04/08/2021 State Street 554,839 0.04
Total Unrealised Gain on Forward Currency Exchange Contracts 13,199,029 0.94
AUD 10,989 EUR 6,978 06/07/2021 Barclays (35) -AUD 1,007,480 EUR 638,873 06/07/2021 BNP Paribas (2,305) -AUD 34,382 EUR 21,863 06/07/2021 Citibank (139) -AUD 45,040 EUR 28,626 06/07/2021 Merrill Lynch (168) -AUD 3,357,729 EUR 2,125,981 06/07/2021 Standard Chartered (4,428) -AUD 101,160 EUR 64,182 04/08/2021 Merrill Lynch (295) -EUR 2,788,749 AUD 4,419,722 06/07/2021 RBC (3,815) -EUR 14,311,037 AUD 22,690,994 04/08/2021 RBC (19,431) -EUR 16,116,066 CAD 23,731,826 06/07/2021 Toronto-Dominion Bank (37,282) -EUR 22,431,994 DKK 166,840,070 06/07/2021 Toronto-Dominion Bank (4,125) -EUR 22,434,230 DKK 166,840,070 04/08/2021 Standard Chartered (1,036) -EUR 5,313 GBP 4,566 06/07/2021 Citibank (8) -EUR 3,660 GBP 3,151 06/07/2021 HSBC (13) -EUR 106,514,175 GBP 91,572,963 06/07/2021 Standard Chartered (214,185) (0.01)EUR 3,047,895 GBP 2,628,775 06/07/2021 State Street (15,945) -EUR 2,128,377 GBP 1,841,097 06/07/2021 Toronto-Dominion Bank (17,423) -EUR 13,684,100 JPY 1,834,265,176 06/07/2021 Goldman Sachs (271,293) (0.02)EUR 321,546,426 JPY 43,074,675,574 06/07/2021 Merrill Lynch (6,172,823) (0.44)EUR 11,104,602 MXN 267,317,020 06/07/2021 BNP Paribas (232,035) (0.02)EUR 3,091,750 SEK 31,454,868 06/07/2021 Barclays (18,414) -EUR 2,039,906 SEK 20,646,591 06/07/2021 Merrill Lynch (1,567) -EUR 5,147,254 SEK 52,101,459 04/08/2021 Standard Chartered (2,705) -EUR 1,606,758 USD 1,916,664 01/07/2021 State Street (7,384) -EUR 346,659 USD 412,280 02/07/2021 State Street (548) -EUR 1,295,605 USD 1,542,663 06/07/2021 Barclays (3,457) -EUR 4,567,157 USD 5,566,666 06/07/2021 BNP Paribas (120,484) (0.01)EUR 273,884,186 USD 333,788,327 06/07/2021 Merrill Lynch (7,196,062) (0.51)EUR 3,781,570 USD 4,621,132 06/07/2021 RBC (109,845) (0.01)EUR 28,080,994 USD 34,275,848 06/07/2021 Standard Chartered (782,399) (0.06)EUR 443,006,147 USD 526,713,069 06/07/2021 State Street (534,349) (0.04)EUR 1,251,539 USD 1,525,610 06/07/2021 Toronto-Dominion Bank (33,165) -EUR 2,097,128 USD 2,498,269 04/08/2021 HSBC (5,365) -EUR 16,066 USD 19,202 04/08/2021 Standard Chartered (94) -EUR 302,930,678 USD 360,377,725 04/08/2021 State Street (355,965) (0.03)GBP 89,649,806 EUR 104,585,493 06/07/2021 Standard Chartered (98,574) (0.01)GBP 6,866,823 EUR 8,005,605 04/08/2021 Barclays (6,576) -GBP 1,667,309 EUR 1,944,093 04/08/2021 Standard Chartered (1,877) -JPY 40,891,956,814 EUR 311,305,401 06/07/2021 Toronto-Dominion Bank (192,637) (0.01)USD 317,920 EUR 267,867 06/07/2021 Standard Chartered (149) -
Total Unrealised Loss on Forward Currency Exchange Contracts (16,468,400) (1.17)
Net Unrealised Loss on Forward Currency Exchange Contracts (3,269,371) (0.23)
206

JPMorgan Funds - Global Government Bond FundSchedule of Investments (continued)
As at 30 June 2021
Financial Futures Contracts
Security DescriptionNumber ofContracts Currency
GlobalExposure
EUR
UnrealisedGain/(Loss)
EUR
%of
NetAssets
3 Month Euro Euribor, 18/12/2023 1,425 EUR 357,292,031 53,437 0.01ASX 90 Day Bank Accepted Bill, 08/12/2022 441 AUD 278,323,925 6,855 -ASX 90 Day Bank Accepted Bill, 08/09/2022 441 AUD 278,426,781 6,861 -Australia 10 Year Bond, 15/09/2021 86 AUD 7,672,478 6,152 -Canada 10 Year Bond, 21/09/2021 386 CAD 38,209,055 51,238 -Canada 5 Year Bond, 21/09/2021 51 CAD 4,322,071 190 -US 5 Year Note, 30/09/2021 231 USD 24,009,661 8,924 -US 10 Year Note, 21/09/2021 402 USD 44,844,536 70,254 0.01US 10 Year Ultra Bond, 21/09/2021 30 USD 3,716,895 10,856 -US Long Bond, 21/09/2021 75 USD 10,148,381 36,516 -
Total Unrealised Gain on Financial Futures Contracts 251,283 0.02
Australia 3 Year Bond, 15/09/2021 (627) AUD (46,151,034) (143,042) (0.01)Euro-Bobl, 08/09/2021 (594) EUR (79,658,370) (62,370) (0.01)Euro-Bund, 08/09/2021 (297) EUR (51,222,105) (42,825) -Euro-Buxl 30 Year Bond, 08/09/2021 (115) EUR (23,336,950) (141,450) (0.01)Euro-OAT, 08/09/2021 (25) EUR (3,972,875) (8,625) -Euro-Schatz, 08/09/2021 (182) EUR (20,409,025) (1,365) -Japan 10 Year Bond, 13/09/2021 18 JPY 20,774,589 - -Long Gilt, 28/09/2021 (145) GBP (21,651,020) (24,856) -US 2 Year Note, 30/09/2021 485 USD 89,984,732 (941) -US Ultra Bond, 21/09/2021 (17) USD (2,758,436) (15,883) -
Total Unrealised Loss on Financial Futures Contracts (441,357) (0.03)
Net Unrealised Loss on Financial Futures Contracts (190,074) (0.01)
207

JPMorgan Funds - Global Government Bond FundSchedule of Investments (continued)
As at 30 June 2021
Interest Rate Swap Contracts
NominalAmount Currency Counterparty Security Description
MaturityDate
MarketValue
EUR
UnrealisedGain/(Loss)
EUR
%of
NetAssets
10,000,000 EUR Citigroup Pay fixed 0.454%Receive floating EURIBOR 6 month 16/03/2052 209,192 209,192 0.02
Total Unrealised Gain on Interest Rate Swap Contracts 209,192 209,192 0.02
117,500,000 CAD Citigroup Pay floating BA 3 monthReceive fixed 0.635% 21/09/2023 (484,574) (484,574) (0.04)
116,800,000 CAD Citigroup Pay floating BA 3 monthReceive fixed 0.714% 21/07/2023 (350,814) (350,814) (0.03)
116,000,000 CAD Citigroup Pay floating BA 3 monthReceive fixed 0.691% 17/08/2023 (306,248) (306,248) (0.02)
29,000,000 EUR Citigroup Pay floating EURIBOR 6 monthReceive fixed 0.159% 16/03/2032 (191,210) (191,210) (0.01)
1,000,000 GBP Citigroup Pay floating SONIA 1 dayReceive fixed (0.1)% 22/07/2022 (2,242) (2,242) -
Total Unrealised Loss on Interest Rate Swap Contracts (1,335,088) (1,335,088) (0.10)
Net Unrealised Loss on Interest Rate Swap Contracts (1,125,896) (1,125,896) (0.08)
Inflation Rate Swap Contracts
NominalAmount Currency Counterparty Security Description
MaturityDate
MarketValue
EUR
UnrealisedGain/(Loss)
EUR
%of
NetAssets
25,200,000 EUR Citigroup Pay fixed 1.385%Receive floating HICPXT 1 month 15/03/2026 419,622 419,622 0.03
32,000,000 USD Citigroup Pay fixed 2.477%Receive floating USCPI 1 month 22/03/2031 279,474 279,474 0.02
Total Unrealised Gain on Inflation Rate Swap Contracts 699,096 699,096 0.05
25,200,000 EUR Citigroup Pay floating HICPXT 1 monthReceive fixed 1.435% 15/03/2031 (596,919) (596,919) (0.04)
32,000,000 USD Citigroup Pay floating USCPI 1 monthReceive fixed 2.55% 22/03/2026 (367,013) (367,013) (0.03)
18,500,000 GBP Citigroup Pay floating UKRPI 1 monthReceive fixed 3.728% 15/05/2031 (130,317) (130,317) (0.01)
Total Unrealised Loss on Inflation Rate Swap Contracts (1,094,249) (1,094,249) (0.08)
Net Unrealised Loss on Inflation Rate Swap Contracts (395,153) (395,153) (0.03)
208

Transferable securities and money market instruments admitted to an official exchangelisting
Bonds
AustraliaAustralia & New Zealand BankingGroup Ltd., Reg. S 2.5% 16/01/2024 EUR 1,300,000 1,656,080 0.23New South Wales Treasury Corp. 1%08/02/2024 AUD 7,140,000 5,454,068 0.74Queensland Treasury Corp., Reg. S5.75% 22/07/2024 AUD 5,800,000 5,051,320 0.69Treasury Corp. of Victoria 5.5%17/12/2024 AUD 5,740,000 5,033,738 0.68Westpac Banking Corp., Reg. S 0.5%04/12/2023 EUR 508,000 616,692 0.08Westpac Banking Corp., Reg. S 0.5%17/05/2024 EUR 1,450,000 1,764,229 0.24Westpac Banking Corp., Reg. S 2%16/01/2026 USD 2,215,000 2,310,474 0.31
21,886,601 2.97
CanadaBank of Nova Scotia (The), Reg. S0.75% 14/09/2021 GBP 1,690,000 2,341,785 0.32Canada Government Bond 0.25%01/03/2026 CAD 20,597,000 16,090,887 2.19Province of Ontario Canada, Reg. S0.5% 06/05/2025 EUR 2,373,000 2,899,048 0.39Royal Bank of Canada, Reg. S, FRN0.629% 03/10/2024 GBP 3,000,000 4,202,668 0.57
25,534,388 3.47
Cayman IslandsCK Hutchison International 17 Ltd.,144A 2.875% 05/04/2022 USD 1,960,000 1,994,190 0.27DIB Sukuk Ltd., Reg. S 3.625%06/02/2023 USD 1,000,000 1,042,676 0.14
3,036,866 0.41
ChinaChina Development Bank (The) 3%07/08/2023 CNH 60,000,000 9,308,267 1.26China Development Bank (The) 3.34%14/07/2025 CNH 100,000,000 15,554,017 2.11China Government Bond 3.03%11/03/2026 CNH 194,000,000 30,145,935 4.10
55,008,219 7.47
DenmarkNykredit Realkredit A/S, Reg. S 1%01/01/2022 DKK 23,600,000 3,796,314 0.52Realkredit Danmark A/S, Reg. S 1%01/01/2022 DKK 23,600,000 3,795,325 0.51
7,591,639 1.03
FranceCredit Agricole Home Loan SFH SA,Reg. S 0.125% 16/12/2024 EUR 2,500,000 3,020,247 0.41Credit Mutuel Home Loan SFH SA,Reg. S 0.125% 09/04/2025 EUR 2,700,000 3,263,233 0.44Dexia Credit Local SA, Reg. S 1.375%07/12/2022 GBP 6,000,000 8,440,656 1.15Dexia Credit Local SA, Reg. S 0.75%07/05/2023 USD 2,900,000 2,918,638 0.39Dexia Credit Local SA, Reg. S 1.625%16/10/2024 USD 1,844,000 1,898,413 0.26
19,541,187 2.65
GermanyBundesobligation, Reg. S 0%18/10/2024 EUR 15,330,000 18,606,075 2.53Bundesschatzanweisungen, Reg. S 0%10/03/2023 EUR 15,200,000 18,253,197 2.48FMS Wertmanagement, Reg. S 0.625%08/04/2022 USD 1,400,000 1,404,907 0.19
38,264,179 5.20
IcelandIceland Government Bond, Reg. S 0.5%20/12/2022 EUR 2,750,000 3,300,910 0.45
3,300,910 0.45
IndiaState Bank of India, Reg. S 4.5%28/09/2023 USD 2,720,000 2,915,337 0.40
2,915,337 0.40
IsraelIsrael Electric Corp. Ltd., Reg. S, 144A5% 12/11/2024 USD 1,180,000 1,321,759 0.18
1,321,759 0.18
ItalyFCA Bank SpA, Reg. S 1.625%29/09/2021 GBP 1,700,000 2,358,861 0.32Italy Buoni Poliennali Del Tesoro,Reg. S, 144A 4.5% 01/03/2026 EUR 23,260,000 33,328,316 4.53Italy Buoni Poliennali Del Tesoro,Reg. S 0.6% 15/06/2023 EUR 6,700,000 8,104,884 1.10Italy Buoni Poliennali Del Tesoro,Reg. S 0% 15/04/2024 EUR 12,250,000 14,621,577 1.99Italy Buoni Poliennali Del Tesoro,Reg. S 0% 01/04/2026 EUR 14,890,000 17,597,094 2.39Italy Government Bond 0.875%06/05/2024 USD 3,111,000 3,102,222 0.42Italy Government Bond 2.375%17/10/2024 USD 6,243,000 6,493,664 0.88
85,606,618 11.63
JapanJapan Bank for InternationalCooperation 2.5% 23/05/2024 USD 1,628,000 1,716,885 0.23Japan Government Five Year Bond0.1% 20/12/2022 JPY 425,000,000 3,852,184 0.52Japan Government Five Year Bond0.1% 20/09/2023 JPY 689,000,000 6,255,577 0.85Japan Government Five Year Bond0.1% 20/03/2024 JPY 607,300,000 5,521,351 0.75Japan Government Five Year Bond0.1% 20/06/2024 JPY 771,500,000 7,018,119 0.96Japan Government Five Year Bond0.1% 20/03/2025 JPY 1,786,050,000 16,275,886 2.21Japan Government Five Year Bond0.1% 20/12/2025 JPY 1,405,400,000 12,820,284 1.74Mitsubishi UFJ Financial Group, Inc.2.623% 18/07/2022 USD 2,085,000 2,135,263 0.29Nidec Corp., Reg. S 0.487%27/09/2021 EUR 313,000 372,299 0.05Nomura Holdings, Inc. 1.851%16/07/2025 USD 1,705,000 1,744,502 0.24Sumitomo Mitsui Banking Corp., Reg. S2.014% 07/11/2022 USD 3,000,000 3,068,760 0.42Sumitomo Mitsui Banking Corp., Reg. S0.55% 06/11/2023 EUR 3,410,000 4,129,116 0.56Sumitomo Mitsui Financial Group, Inc.1.474% 08/07/2025 USD 870,000 879,359 0.12
65,789,585 8.94
KuwaitKuwait Government Bond, Reg. S2.75% 20/03/2022 USD 1,520,000 1,547,793 0.21
1,547,793 0.21
NetherlandsING Groep NV 3.15% 29/03/2022 USD 1,420,000 1,450,872 0.20
1,450,872 0.20
New ZealandANZ New Zealand Int’l Ltd., 144A2.875% 25/01/2022 USD 615,000 624,305 0.09ANZ New Zealand Int’l Ltd., Reg. S0.5% 17/01/2024 EUR 4,300,000 5,215,463 0.71BNZ International Funding Ltd., 144A2.1% 14/09/2021 USD 695,000 697,677 0.09BNZ International Funding Ltd., 144A3.375% 01/03/2023 USD 1,490,000 1,563,927 0.21
8,101,372 1.10
PortugalPortugal Obrigacoes do Tesouro OT,Reg. S, 144A 5.65% 15/02/2024 EUR 3,120,000 4,313,593 0.59
4,313,593 0.59
209
JPMorgan Funds - Global Short Duration Bond FundSchedule of Investments
As at 30 June 2021
Investments Currency
Quantity/Nominal
Value
MarketValue
USD
%of
NetAssets Investments Currency
Quantity/Nominal
Value
MarketValue
USD
%of
NetAssets

QatarQatar Government Bond, Reg. S3.875% 23/04/2023 USD 3,100,000 3,294,761 0.45Qatar Government Bond, Reg. S 3.4%16/04/2025 USD 1,770,000 1,929,827 0.26
5,224,588 0.71
Saudi ArabiaSaudi Arabian Oil Co., Reg. S 1.625%24/11/2025 USD 972,000 982,562 0.13Saudi Government Bond, Reg. S2.375% 26/10/2021 USD 1,300,000 1,308,450 0.18Saudi Government Bond, Reg. S2.875% 04/03/2023 USD 5,097,000 5,295,936 0.72Saudi Government Bond, Reg. S 0%03/03/2024 EUR 2,590,000 3,075,082 0.42
10,662,030 1.45
SingaporeSingapore Government Bond 3%01/09/2024 SGD 16,640,000 13,303,830 1.81
13,303,830 1.81
South KoreaExport-Import Bank of Korea 2.375%25/06/2024 USD 2,565,000 2,701,952 0.37Export-Import Bank of Korea, Reg. S0.829% 27/04/2025 EUR 1,441,000 1,775,155 0.24Korea Development Bank (The) 2.125%01/10/2024 USD 1,726,000 1,808,807 0.25Korea East-West Power Co. Ltd., Reg. S1.75% 06/05/2025 USD 1,261,000 1,289,131 0.17Korea Housing Finance Corp., Reg. S0.75% 30/10/2023 EUR 747,000 908,238 0.12
8,483,283 1.15
SpainBanco Bilbao Vizcaya Argentaria SA0.875% 18/09/2023 USD 1,800,000 1,806,721 0.25Banco Santander SA 3.5% 11/04/2022 USD 1,800,000 1,844,415 0.25Banco Santander SA 2.746%28/05/2025 USD 1,400,000 1,476,503 0.20
5,127,639 0.70
SupranationalAfrican Export-Import Bank (The),Reg. S 4.125% 20/06/2024 USD 3,090,000 3,308,129 0.45Asian Development Bank 0.625%07/04/2022 USD 1,819,000 1,825,852 0.25Asian Development Bank 0.625%29/04/2025 USD 4,523,000 4,500,310 0.61Corp. Andina de Fomento 2.375%12/05/2023 USD 3,180,000 3,287,052 0.45
12,921,343 1.76
SwedenSkandinaviska Enskilda Banken AB,Reg. S 0.3% 17/02/2022 EUR 438,000 522,779 0.07Svenska Handelsbanken AB, Reg. S0.5% 21/03/2023 EUR 2,500,000 3,014,546 0.41
3,537,325 0.48
SwitzerlandCredit Suisse AG 2.1% 12/11/2021 USD 1,060,000 1,067,314 0.14UBS Group AG, FRN, 144A 2.859%15/08/2023 USD 1,340,000 1,375,404 0.19
2,442,718 0.33
United Arab EmiratesAbu Dhabi Government Bond, Reg. S2.5% 11/10/2022 USD 3,600,000 3,702,420 0.50Abu Dhabi Government Bond, Reg. S2.5% 16/04/2025 USD 6,080,000 6,467,600 0.88
10,170,020 1.38
United KingdomBank of England Euro Note, Reg. S0.5% 28/04/2023 USD 1,566,000 1,572,750 0.21Barclays plc 3.684% 10/01/2023 USD 1,325,000 1,347,687 0.18Barclays plc, FRN 4.61% 15/02/2023 USD 1,765,000 1,809,878 0.25HSBC Holdings plc, FRN 3.262%13/03/2023 USD 2,140,000 2,183,587 0.30HSBC Holdings plc, FRN 0.976%24/05/2025 USD 720,000 719,646 0.10
HSBC Holdings plc, FRN 1.645%18/04/2026 USD 805,000 816,283 0.11Lloyds Bank plc, Reg. S, FRN 0.62%16/05/2024 GBP 1,429,000 2,000,528 0.27Lloyds Banking Group plc, FRN 0.695%11/05/2024 USD 1,690,000 1,694,844 0.23Lloyds Banking Group plc, FRN 3.87%09/07/2025 USD 1,715,000 1,858,069 0.25Lloyds Banking Group plc, FRN 2.438%05/02/2026 USD 720,000 751,187 0.10National Westminster Bank plc, Reg. S,FRN 0.65% 22/03/2023 GBP 1,000,000 1,395,743 0.19Nationwide Building Society, 144A3.9% 21/07/2025 USD 1,500,000 1,664,009 0.23Nationwide Building Society, FRN,144A 3.622% 26/04/2023 USD 935,000 958,820 0.13Nationwide Building Society, FRN,144A 3.766% 08/03/2024 USD 1,375,000 1,444,057 0.20Natwest Group plc, FRN 3.498%15/05/2023 USD 1,906,000 1,954,932 0.26Natwest Group plc, FRN 2.359%22/05/2024 USD 1,145,000 1,180,116 0.16Reckitt Benckiser Treasury Servicesplc, 144A 2.375% 24/06/2022 USD 1,135,000 1,156,624 0.16ST Engineering RHQ Ltd., Reg. S 1.5%29/04/2025 USD 1,548,000 1,566,793 0.21Standard Chartered plc, FRN, 144A4.247% 20/01/2023 USD 2,310,000 2,356,780 0.32Standard Chartered plc, FRN, 144A1.319% 14/10/2023 USD 1,230,000 1,241,476 0.17TSB Bank plc, Reg. S, FRN 0.422%07/12/2022 GBP 1,427,000 1,982,446 0.27Yorkshire Building Society, Reg. S0.875% 20/03/2023 EUR 554,000 672,753 0.09
32,329,008 4.39
United States of AmericaAir Lease Corp. 2.625% 01/07/2022 USD 830,000 845,976 0.11Air Lease Corp. 3% 15/09/2023 USD 1,340,000 1,401,065 0.19Air Lease Corp. 4.25% 01/02/2024 USD 577,000 626,111 0.09Air Lease Corp. 1.875% 15/08/2026 USD 1,305,000 1,306,718 0.18Ameren Corp. 2.5% 15/09/2024 USD 615,000 648,024 0.09American Express Co. 2.75%20/05/2022 USD 1,305,000 1,331,353 0.18American Tower Corp., REIT 2.25%15/01/2022 USD 1,195,000 1,207,524 0.16American Tower Corp., REIT 1.3%15/09/2025 USD 1,245,000 1,249,124 0.17Campbell Soup Co. 3.65% 15/03/2023 USD 278,000 292,565 0.04Capital One Financial Corp. 3.9%29/01/2024 USD 355,000 383,114 0.05Celanese US Holdings LLC 3.5%08/05/2024 USD 820,000 876,783 0.12CenterPoint Energy, Inc. 1.45%01/06/2026 USD 1,280,000 1,282,694 0.17CVS Health Corp. 3.7% 09/03/2023 USD 223,000 234,696 0.03Dominion Energy, Inc., STEP 2.715%15/08/2021 USD 1,060,000 1,063,122 0.14DuPont de Nemours, Inc. 4.205%15/11/2023 USD 1,260,000 1,365,440 0.19Evergy, Inc. 2.45% 15/09/2024 USD 1,035,000 1,086,807 0.15General Motors Co. 6.125% 01/10/2025 USD 1,500,000 1,776,658 0.24General Motors Financial Co., Inc.1.25% 08/01/2026 USD 1,230,000 1,220,988 0.17Goldman Sachs Group, Inc. (The) 3.5%01/04/2025 USD 2,210,000 2,399,005 0.33ITC Holdings Corp. 2.7% 15/11/2022 USD 1,300,000 1,336,778 0.18NiSource, Inc. 0.95% 15/08/2025 USD 1,390,000 1,378,996 0.19Oracle Corp. 1.65% 25/03/2026 USD 1,855,000 1,882,566 0.26Regions Financial Corp. 3.8%14/08/2023 USD 725,000 773,207 0.10Tennessee Valley Authority 0.75%15/05/2025 USD 4,558,000 4,588,099 0.62US Treasury 0.125% 31/12/2022 USD 6,030,000 6,025,760 0.82US Treasury 0.125% 31/05/2023 USD 2,335,000 2,329,983 0.32US Treasury 0.125% 15/01/2024 USD 765,000 760,428 0.10US Treasury 0.125% 15/02/2024 USD 3,200,000 3,179,500 0.43US Treasury 0.375% 15/04/2024 USD 90,000 89,895 0.01US Treasury 0.25% 15/06/2024 USD 1,677,500 1,667,474 0.23US Treasury 0.375% 31/01/2026 USD 31,540,000 30,920,904 4.20US Treasury 0.75% 30/04/2026 USD 2,135,000 2,124,992 0.29
77,656,349 10.55
Total Bonds 527,069,051 71.61
Total Transferable securities and money market instrumentsadmitted to an official exchange listing 527,069,051 71.61
210
JPMorgan Funds - Global Short Duration Bond FundSchedule of Investments (continued)
As at 30 June 2021
Investments Currency
Quantity/Nominal
Value
MarketValue
USD
%of
NetAssets Investments Currency
Quantity/Nominal
Value
MarketValue
USD
%of
NetAssets

Transferable securities and money market instruments dealt in on another regulatedmarket
Bonds
AustraliaCommonwealth Bank of Australia,Reg. S 3.25% 20/07/2023 USD 1,000,000 1,057,790 0.14Macquarie Bank Ltd., 144A 2.1%17/10/2022 USD 752,000 769,393 0.10Macquarie Group Ltd., FRN, 144A3.189% 28/11/2023 USD 1,365,000 1,414,146 0.19Macquarie Group Ltd., FRN, 144A1.34% 12/01/2027 USD 273,000 270,977 0.04National Australia Bank Ltd. 3.7%04/11/2021 USD 625,000 632,047 0.09
4,144,353 0.56
BermudaTriton Container International Ltd.,144A 1.15% 07/06/2024 USD 635,000 633,926 0.09
633,926 0.09
CanadaCanadian Imperial Bank of Commerce,FRN 2.606% 22/07/2023 USD 2,095,000 2,142,781 0.29Enbridge, Inc. 2.9% 15/07/2022 USD 1,385,000 1,417,699 0.19Federation des Caisses Desjardins duQuebec, Reg. S 1.95% 26/09/2022 USD 4,700,000 4,797,889 0.65HSBC Bank Canada, Reg. S 1.65%10/09/2022 USD 3,500,000 3,559,351 0.49National Bank of Canada, 144A 2.15%07/10/2022 USD 2,500,000 2,555,727 0.35Province of Ontario Canada 3.5%02/06/2024 CAD 7,333,000 6,386,650 0.87Province of Quebec Canada 3.75%01/09/2024 CAD 7,122,000 6,282,035 0.85
27,142,132 3.69
Cayman IslandsAvolon Holdings Funding Ltd., 144A3.625% 01/05/2022 USD 2,605,000 2,665,497 0.36Avolon Holdings Funding Ltd., 144A2.875% 15/02/2025 USD 1,315,000 1,355,097 0.19
4,020,594 0.55
FinlandNordea Bank Abp, 144A 1% 09/06/2023 USD 1,150,000 1,163,663 0.16
1,163,663 0.16
FranceBanque Federative du Credit MutuelSA, 144A 2.125% 21/11/2022 USD 2,890,000 2,960,670 0.40BNP Paribas SA, FRN, 144A 2.819%19/11/2025 USD 1,380,000 1,452,448 0.20BNP Paribas SA, FRN, 144A 2.219%09/06/2026 USD 600,000 618,699 0.09BPCE SA, 144A 4.625% 11/07/2024 USD 1,000,000 1,099,677 0.15BPCE SA, 144A 2.375% 14/01/2025 USD 590,000 614,236 0.08BPCE SA, FRN, 144A 1.652%06/10/2026 USD 690,000 692,769 0.10Credit Agricole SA, 144A 2.375%22/01/2025 USD 1,040,000 1,086,241 0.15Credit Agricole SA, FRN, 144A 1.247%26/01/2027 USD 1,060,000 1,042,821 0.14Societe Generale SA, 144A 4.25%14/09/2023 USD 1,305,000 1,403,600 0.19Societe Generale SA, 144A 2.625%16/10/2024 USD 1,290,000 1,348,669 0.18Societe Generale SA, 144A 2.625%22/01/2025 USD 1,715,000 1,790,854 0.24
14,110,684 1.92
GermanyDeutsche Bank AG 0.898% 28/05/2024 USD 945,000 941,432 0.13
941,432 0.13
IrelandAIB Group plc, 144A 4.75% 12/10/2023 USD 1,370,000 1,487,741 0.20AIB Group plc, FRN, 144A 4.263%10/04/2025 USD 755,000 814,055 0.11Ardmore Securities No. 1 DAC, Reg. S,FRN, Series 1 ‘A’ 0% 15/08/2057 EUR 244,684 292,154 0.04
2,593,950 0.35
ItalyUniCredit SpA, FRN, 144A 1.982%03/06/2027 USD 1,350,000 1,344,781 0.18
1,344,781 0.18
JapanMitsubishi UFJ Financial Group, Inc.,FRN 0.848% 15/09/2024 USD 1,990,000 2,001,147 0.27Mizuho Financial Group, Inc., FRN2.721% 16/07/2023 USD 1,195,000 1,223,585 0.17Mizuho Financial Group, Inc., FRN2.555% 13/09/2025 USD 2,000,000 2,096,662 0.28
5,321,394 0.72
NetherlandsBMW Finance NV, 144A 2.25%12/08/2022 USD 2,100,000 2,145,269 0.29Cooperatieve Rabobank UA 2.75%10/01/2022 USD 1,400,000 1,418,872 0.19Lundin Energy Finance BV, 144A 2%15/07/2026 USD 1,450,000 1,455,704 0.20
5,019,845 0.68
NorwayDNB Bank ASA, 144A 2.15%02/12/2022 USD 2,785,000 2,857,930 0.39
2,857,930 0.39
SwitzerlandCredit Suisse Group AG, FRN, 144A2.193% 05/06/2026 USD 895,000 916,684 0.12Credit Suisse Group AG, FRN, 144A1.305% 02/02/2027 USD 1,440,000 1,411,220 0.19UBS Group AG, FRN, 144A 1.008%30/07/2024 USD 1,510,000 1,521,257 0.21
3,849,161 0.52
United KingdomBavarian Sky UK 3 plc, Reg. S, FRN,Series UK3 ‘A’ 0.67% 20/04/2028 GBP 1,066,011 1,478,427 0.20Brass NO 6 plc, Reg. S, FRN, Series 6‘A’ 0.431% 16/12/2060 GBP 386,000 535,388 0.07Gosforth Funding plc, Reg. S, FRN,Series 2018-1X ‘A1’ 0.637%25/08/2060 USD 381,422 382,185 0.05Gosforth Funding plc, Reg. S, FRN,Series 2017-1X ‘A1A’ 0.66% 19/12/2059 USD 3,452 3,454 0.00Great Hall Mortgages No. 1 plc, Reg. S,FRN, Series 2007-1 ‘A2B’ 0%18/03/2039 EUR 18,299 21,681 0.01Lanark Master Issuer plc, Reg. S, FRN,Series 2020-1X ‘2A’ 0.619%22/12/2069 GBP 974,100 1,358,592 0.19Silverstone Master Issuer plc, Reg. S,FRN, Series 2018-1X ‘1A’ 0.576%21/01/2070 USD 1,120,000 1,122,031 0.15Turbo Finance 8 plc, Reg. S, FRN,Series 8 ‘A’ 0.705% 20/02/2026 GBP 8,194 11,344 0.00
4,913,102 0.67
United States of AmericaAIG Global Funding, 144A 1.9%06/10/2021 USD 1,205,000 1,210,197 0.16Alexander Funding Trust, 144A 1.841%15/11/2023 USD 3,000,000 3,055,579 0.42Athene Global Funding, 144A 1.45%08/01/2026 USD 1,855,000 1,858,216 0.25Bank of America Corp., FRN 3.004%20/12/2023 USD 1,375,000 1,425,374 0.19BBCMS Trust, FRN, Series 2018-CBM‘A’, 144A 1.101% 15/07/2037 USD 2,150,000 2,153,105 0.29BBVA USA 2.875% 29/06/2022 USD 1,115,000 1,142,127 0.16Capital One NA 2.65% 08/08/2022 USD 670,000 685,919 0.09Carmax Auto Owner Trust, Series2018-3 ‘A3’ 3.13% 15/06/2023 USD 547,602 553,444 0.08Citigroup, Inc., FRN 3.142%24/01/2023 USD 1,005,000 1,020,409 0.14Citigroup, Inc., FRN 3.106%08/04/2026 USD 2,500,000 2,677,160 0.36Citizens Bank NA 3.25% 14/02/2022 USD 1,075,000 1,092,337 0.15COMM Mortgage Trust, Series2014-UBS4 ‘A5’ 3.694% 10/08/2047 USD 1,580,000 1,701,977 0.23COMM Mortgage Trust, Series2015-CR23 ‘ASB’ 3.257% 10/05/2048 USD 461,178 481,812 0.07Daimler Finance North America LLC,144A 3.4% 22/02/2022 USD 1,140,000 1,162,193 0.16
211
JPMorgan Funds - Global Short Duration Bond FundSchedule of Investments (continued)
As at 30 June 2021
Investments Currency
Quantity/Nominal
Value
MarketValue
USD
%of
NetAssets Investments Currency
Quantity/Nominal
Value
MarketValue
USD
%of
NetAssets
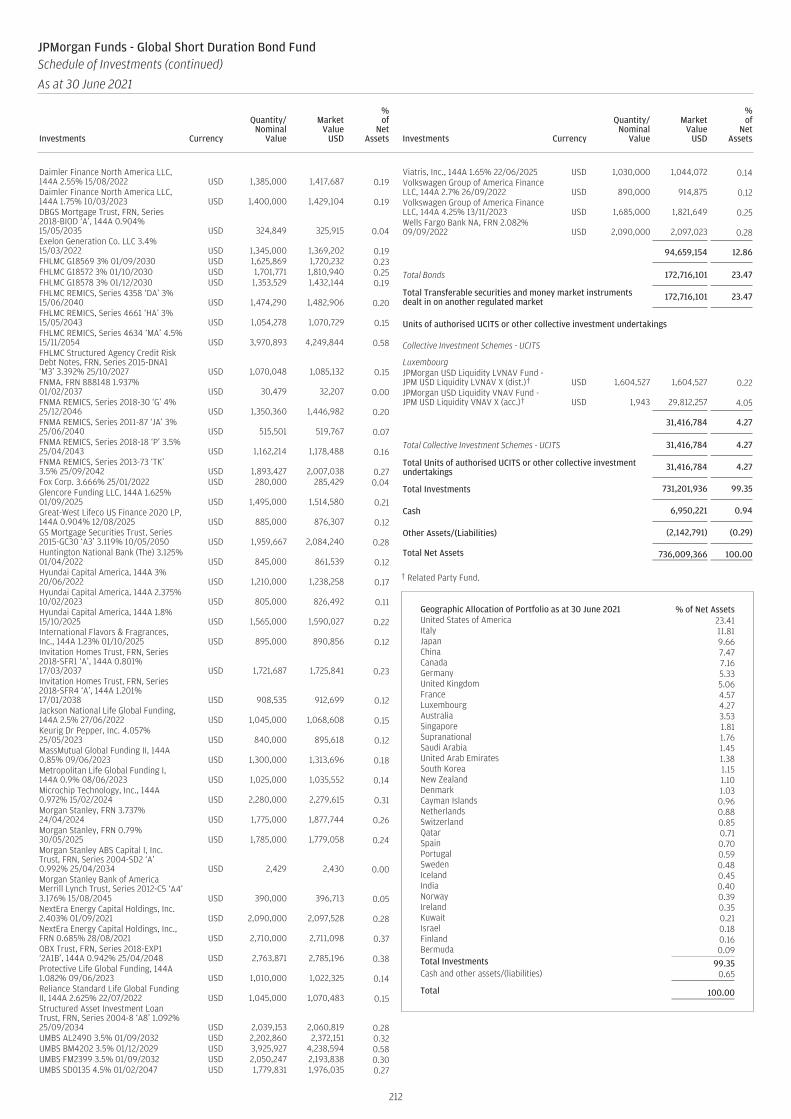
Daimler Finance North America LLC,144A 2.55% 15/08/2022 USD 1,385,000 1,417,687 0.19Daimler Finance North America LLC,144A 1.75% 10/03/2023 USD 1,400,000 1,429,104 0.19DBGS Mortgage Trust, FRN, Series2018-BIOD ‘A’, 144A 0.904%15/05/2035 USD 324,849 325,915 0.04Exelon Generation Co. LLC 3.4%15/03/2022 USD 1,345,000 1,369,202 0.19FHLMC G18569 3% 01/09/2030 USD 1,625,869 1,720,232 0.23FHLMC G18572 3% 01/10/2030 USD 1,701,771 1,810,940 0.25FHLMC G18578 3% 01/12/2030 USD 1,353,529 1,432,144 0.19FHLMC REMICS, Series 4358 ‘DA’ 3%15/06/2040 USD 1,474,290 1,482,906 0.20FHLMC REMICS, Series 4661 ‘HA’ 3%15/05/2043 USD 1,054,278 1,070,729 0.15FHLMC REMICS, Series 4634 ‘MA’ 4.5%15/11/2054 USD 3,970,893 4,249,844 0.58FHLMC Structured Agency Credit RiskDebt Notes, FRN, Series 2015-DNA1‘M3’ 3.392% 25/10/2027 USD 1,070,048 1,085,132 0.15FNMA, FRN 888148 1.937%01/02/2037 USD 30,479 32,207 0.00FNMA REMICS, Series 2018-30 ‘G’ 4%25/12/2046 USD 1,350,360 1,446,982 0.20FNMA REMICS, Series 2011-87 ‘JA’ 3%25/06/2040 USD 515,501 519,767 0.07FNMA REMICS, Series 2018-18 ‘P’ 3.5%25/04/2043 USD 1,162,214 1,178,488 0.16FNMA REMICS, Series 2013-73 ‘TK’3.5% 25/09/2042 USD 1,893,427 2,007,038 0.27Fox Corp. 3.666% 25/01/2022 USD 280,000 285,429 0.04Glencore Funding LLC, 144A 1.625%01/09/2025 USD 1,495,000 1,514,580 0.21Great-West Lifeco US Finance 2020 LP,144A 0.904% 12/08/2025 USD 885,000 876,307 0.12GS Mortgage Securities Trust, Series2015-GC30 ‘A3’ 3.119% 10/05/2050 USD 1,959,667 2,084,240 0.28Huntington National Bank (The) 3.125%01/04/2022 USD 845,000 861,539 0.12Hyundai Capital America, 144A 3%20/06/2022 USD 1,210,000 1,238,258 0.17Hyundai Capital America, 144A 2.375%10/02/2023 USD 805,000 826,492 0.11Hyundai Capital America, 144A 1.8%15/10/2025 USD 1,565,000 1,590,027 0.22International Flavors & Fragrances,Inc., 144A 1.23% 01/10/2025 USD 895,000 890,856 0.12Invitation Homes Trust, FRN, Series2018-SFR1 ‘A’, 144A 0.801%17/03/2037 USD 1,721,687 1,725,841 0.23Invitation Homes Trust, FRN, Series2018-SFR4 ‘A’, 144A 1.201%17/01/2038 USD 908,535 912,699 0.12Jackson National Life Global Funding,144A 2.5% 27/06/2022 USD 1,045,000 1,068,608 0.15Keurig Dr Pepper, Inc. 4.057%25/05/2023 USD 840,000 895,618 0.12MassMutual Global Funding II, 144A0.85% 09/06/2023 USD 1,300,000 1,313,696 0.18Metropolitan Life Global Funding I,144A 0.9% 08/06/2023 USD 1,025,000 1,035,552 0.14Microchip Technology, Inc., 144A0.972% 15/02/2024 USD 2,280,000 2,279,615 0.31Morgan Stanley, FRN 3.737%24/04/2024 USD 1,775,000 1,877,744 0.26Morgan Stanley, FRN 0.79%30/05/2025 USD 1,785,000 1,779,058 0.24Morgan Stanley ABS Capital I, Inc.Trust, FRN, Series 2004-SD2 ‘A’0.992% 25/04/2034 USD 2,429 2,430 0.00Morgan Stanley Bank of AmericaMerrill Lynch Trust, Series 2012-C5 ‘A4’3.176% 15/08/2045 USD 390,000 396,713 0.05NextEra Energy Capital Holdings, Inc.2.403% 01/09/2021 USD 2,090,000 2,097,528 0.28NextEra Energy Capital Holdings, Inc.,FRN 0.685% 28/08/2021 USD 2,710,000 2,711,098 0.37OBX Trust, FRN, Series 2018-EXP1‘2A1B’, 144A 0.942% 25/04/2048 USD 2,763,871 2,785,196 0.38Protective Life Global Funding, 144A1.082% 09/06/2023 USD 1,010,000 1,022,325 0.14Reliance Standard Life Global FundingII, 144A 2.625% 22/07/2022 USD 1,045,000 1,070,483 0.15Structured Asset Investment LoanTrust, FRN, Series 2004-8 ‘A8’ 1.092%25/09/2034 USD 2,039,153 2,060,819 0.28UMBS AL2490 3.5% 01/09/2032 USD 2,202,860 2,372,151 0.32UMBS BM4202 3.5% 01/12/2029 USD 3,925,927 4,238,594 0.58UMBS FM2399 3.5% 01/09/2032 USD 2,050,247 2,193,838 0.30UMBS SD0135 4.5% 01/02/2047 USD 1,779,831 1,976,035 0.27
Viatris, Inc., 144A 1.65% 22/06/2025 USD 1,030,000 1,044,072 0.14Volkswagen Group of America FinanceLLC, 144A 2.7% 26/09/2022 USD 890,000 914,875 0.12Volkswagen Group of America FinanceLLC, 144A 4.25% 13/11/2023 USD 1,685,000 1,821,649 0.25Wells Fargo Bank NA, FRN 2.082%09/09/2022 USD 2,090,000 2,097,023 0.28
94,659,154 12.86
Total Bonds 172,716,101 23.47
Total Transferable securities and money market instrumentsdealt in on another regulated market 172,716,101 23.47
Units of authorised UCITS or other collective investment undertakings
Collective Investment Schemes - UCITS
LuxembourgJPMorgan USD Liquidity LVNAV Fund -JPM USD Liquidity LVNAV X (dist.)† USD 1,604,527 1,604,527 0.22JPMorgan USD Liquidity VNAV Fund -JPM USD Liquidity VNAV X (acc.)† USD 1,943 29,812,257 4.05
31,416,784 4.27
Total Collective Investment Schemes - UCITS 31,416,784 4.27
Total Units of authorised UCITS or other collective investmentundertakings 31,416,784 4.27
Total Investments 731,201,936 99.35
Cash 6,950,221 0.94
Other Assets/(Liabilities) (2,142,791) (0.29)
Total Net Assets 736,009,366 100.00
† Related Party Fund.
Geographic Allocation of Portfolio as at 30 June 2021 % of Net AssetsUnited States of America 23.41Italy 11.81Japan 9.66China 7.47Canada 7.16Germany 5.33United Kingdom 5.06France 4.57Luxembourg 4.27Australia 3.53Singapore 1.81Supranational 1.76Saudi Arabia 1.45United Arab Emirates 1.38South Korea 1.15New Zealand 1.10Denmark 1.03Cayman Islands 0.96Netherlands 0.88Switzerland 0.85Qatar 0.71Spain 0.70Portugal 0.59Sweden 0.48Iceland 0.45India 0.40Norway 0.39Ireland 0.35Kuwait 0.21Israel 0.18Finland 0.16Bermuda 0.09Total Investments 99.35Cash and other assets/(liabilities) 0.65
Total 100.00
212
JPMorgan Funds - Global Short Duration Bond FundSchedule of Investments (continued)
As at 30 June 2021
Investments Currency
Quantity/Nominal
Value
MarketValue
USD
%of
NetAssets Investments Currency
Quantity/Nominal
Value
MarketValue
USD
%of
NetAssets
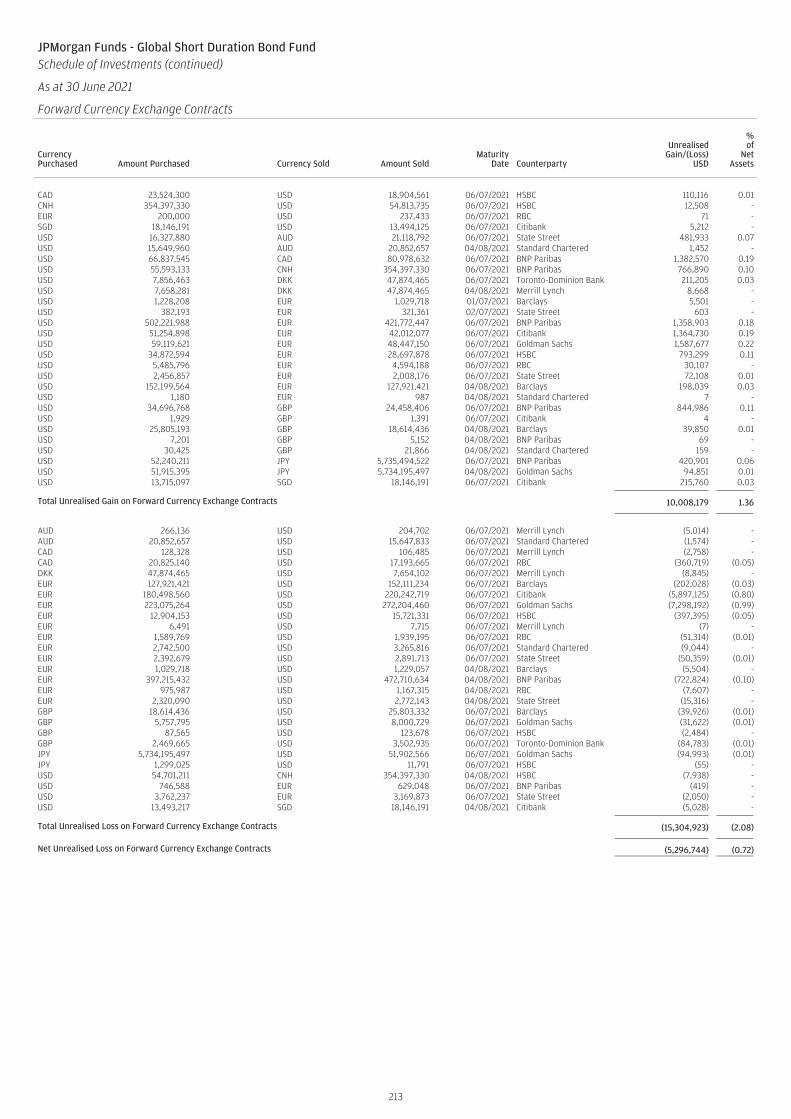
JPMorgan Funds - Global Short Duration Bond FundSchedule of Investments (continued)
As at 30 June 2021
Forward Currency Exchange Contracts (continued)
CurrencyPurchased Amount Purchased Currency Sold Amount Sold
MaturityDate Counterparty
UnrealisedGain/(Loss)
USD
%of
NetAssets
CAD 23,524,300 USD 18,904,561 06/07/2021 HSBC 110,116 0.01CNH 354,397,330 USD 54,813,735 06/07/2021 HSBC 12,508 -EUR 200,000 USD 237,433 06/07/2021 RBC 71 -SGD 18,146,191 USD 13,494,125 06/07/2021 Citibank 5,212 -USD 16,327,880 AUD 21,118,792 06/07/2021 State Street 481,933 0.07USD 15,649,960 AUD 20,852,657 04/08/2021 Standard Chartered 1,452 -USD 66,837,545 CAD 80,978,632 06/07/2021 BNP Paribas 1,382,570 0.19USD 55,593,133 CNH 354,397,330 06/07/2021 BNP Paribas 766,890 0.10USD 7,856,463 DKK 47,874,465 06/07/2021 Toronto-Dominion Bank 211,205 0.03USD 7,658,281 DKK 47,874,465 04/08/2021 Merrill Lynch 8,668 -USD 1,228,208 EUR 1,029,718 01/07/2021 Barclays 5,501 -USD 382,193 EUR 321,361 02/07/2021 State Street 603 -USD 502,221,988 EUR 421,772,447 06/07/2021 BNP Paribas 1,358,903 0.18USD 51,254,898 EUR 42,012,077 06/07/2021 Citibank 1,364,730 0.19USD 59,119,621 EUR 48,447,150 06/07/2021 Goldman Sachs 1,587,677 0.22USD 34,872,594 EUR 28,697,878 06/07/2021 HSBC 793,299 0.11USD 5,485,796 EUR 4,594,188 06/07/2021 RBC 30,107 -USD 2,456,857 EUR 2,008,176 06/07/2021 State Street 72,108 0.01USD 152,199,564 EUR 127,921,421 04/08/2021 Barclays 198,039 0.03USD 1,180 EUR 987 04/08/2021 Standard Chartered 7 -USD 34,696,768 GBP 24,458,406 06/07/2021 BNP Paribas 844,986 0.11USD 1,929 GBP 1,391 06/07/2021 Citibank 4 -USD 25,805,193 GBP 18,614,436 04/08/2021 Barclays 39,850 0.01USD 7,201 GBP 5,152 04/08/2021 BNP Paribas 69 -USD 30,425 GBP 21,866 04/08/2021 Standard Chartered 159 -USD 52,240,211 JPY 5,735,494,522 06/07/2021 BNP Paribas 420,901 0.06USD 51,915,395 JPY 5,734,195,497 04/08/2021 Goldman Sachs 94,851 0.01USD 13,715,097 SGD 18,146,191 06/07/2021 Citibank 215,760 0.03
Total Unrealised Gain on Forward Currency Exchange Contracts 10,008,179 1.36
AUD 266,136 USD 204,702 06/07/2021 Merrill Lynch (5,014) -AUD 20,852,657 USD 15,647,833 06/07/2021 Standard Chartered (1,574) -CAD 128,328 USD 106,485 06/07/2021 Merrill Lynch (2,758) -CAD 20,825,140 USD 17,193,665 06/07/2021 RBC (360,719) (0.05)DKK 47,874,465 USD 7,654,102 06/07/2021 Merrill Lynch (8,845) -EUR 127,921,421 USD 152,111,234 06/07/2021 Barclays (202,028) (0.03)EUR 180,498,560 USD 220,242,719 06/07/2021 Citibank (5,897,125) (0.80)EUR 223,075,264 USD 272,204,460 06/07/2021 Goldman Sachs (7,298,192) (0.99)EUR 12,904,153 USD 15,721,331 06/07/2021 HSBC (397,395) (0.05)EUR 6,491 USD 7,715 06/07/2021 Merrill Lynch (7) -EUR 1,589,769 USD 1,939,195 06/07/2021 RBC (51,314) (0.01)EUR 2,742,500 USD 3,265,816 06/07/2021 Standard Chartered (9,044) -EUR 2,392,679 USD 2,891,713 06/07/2021 State Street (50,359) (0.01)EUR 1,029,718 USD 1,229,057 04/08/2021 Barclays (5,504) -EUR 397,215,432 USD 472,710,634 04/08/2021 BNP Paribas (722,824) (0.10)EUR 975,987 USD 1,167,315 04/08/2021 RBC (7,607) -EUR 2,320,090 USD 2,772,143 04/08/2021 State Street (15,316) -GBP 18,614,436 USD 25,803,332 06/07/2021 Barclays (39,926) (0.01)GBP 5,757,795 USD 8,000,729 06/07/2021 Goldman Sachs (31,622) (0.01)GBP 87,565 USD 123,678 06/07/2021 HSBC (2,484) -GBP 2,469,665 USD 3,502,935 06/07/2021 Toronto-Dominion Bank (84,783) (0.01)JPY 5,734,195,497 USD 51,902,566 06/07/2021 Goldman Sachs (94,993) (0.01)JPY 1,299,025 USD 11,791 06/07/2021 HSBC (55) -USD 54,701,211 CNH 354,397,330 04/08/2021 HSBC (7,938) -USD 746,588 EUR 629,048 06/07/2021 BNP Paribas (419) -USD 3,762,237 EUR 3,169,873 06/07/2021 State Street (2,050) -USD 13,493,217 SGD 18,146,191 04/08/2021 Citibank (5,028) -
Total Unrealised Loss on Forward Currency Exchange Contracts (15,304,923) (2.08)
Net Unrealised Loss on Forward Currency Exchange Contracts (5,296,744) (0.72)
213

JPMorgan Funds - Global Short Duration Bond FundSchedule of Investments (continued)
As at 30 June 2021
Financial Futures Contracts
Security DescriptionNumber ofContracts Currency
GlobalExposure
USD
UnrealisedGain/(Loss)
USD
%of
NetAssets
Euro-Schatz, 08/09/2021 11 EUR 1,464,698 3,019 -US 5 Year Note, 30/09/2021 (1,121) USD (138,351,543) 28,153 -
Total Unrealised Gain on Financial Futures Contracts 31,172 -
Australia 3 Year Bond, 15/09/2021 (406) AUD (35,484,956) (19,880) -Euro-Bobl, 08/09/2021 (415) EUR (66,084,166) (36,583) (0.01)US 2 Year Note, 30/09/2021 149 USD 32,825,980 (163,713) (0.02)
Total Unrealised Loss on Financial Futures Contracts (220,176) (0.03)
Net Unrealised Loss on Financial Futures Contracts (189,004) (0.03)
JPMorgan Funds - Global Short Duration Bond FundSchedule of Investments (continued)
As at 30 June 2021
Interest Rate Swap Contracts
NominalAmount Currency Counterparty Security Description
MaturityDate
MarketValue
USD
UnrealisedGain/(Loss)
USD
%of
NetAssets
40,000,000 GBP Citigroup Pay fixed 0.432%Receive floating SONIA 1 day 17/09/2024 42,823 42,823 0.01
800,000,000 THB Citigroup Pay fixed 0.755%Receive floating THBFIX 6 month 15/09/2024 4,160 4,160 -
Total Unrealised Gain on Interest Rate Swap Contracts 46,983 46,983 0.01
214,750,000 CNY Citigroup Pay fixed 2.858%Receive floating CNREPOFIX=CFXS 1 week 15/09/2024 (119,486) (119,486) (0.02)
Total Unrealised Loss on Interest Rate Swap Contracts (119,486) (119,486) (0.02)
Net Unrealised Gain on Interest Rate Swap Contracts (72,503) (72,503) (0.01)
214

Transferable securities and money market instruments admitted to an official exchangelisting
Bonds
AngolaAngola Government Bond, Reg. S 8%26/11/2029 USD 1,130,000 1,162,555 0.05
1,162,555 0.05
AustraliaAustralia Government Bond, Reg. S5.5% 21/04/2023 AUD 141,912,000 116,909,806 4.82
116,909,806 4.82
Austriaams AG, 144A 7% 31/07/2025 USD 800,000 864,660 0.04ams AG, Reg. S 6% 31/07/2025 EUR 760,000 968,793 0.04Suzano Austria GmbH 6% 15/01/2029 USD 2,300,000 2,737,000 0.11
4,570,453 0.19
BahrainBahrain Government Bond, Reg. S5.45% 16/09/2032 USD 2,406,000 2,396,147 0.10Bahrain Government Bond, Reg. S7.5% 20/09/2047 USD 2,133,000 2,303,672 0.09
4,699,819 0.19
BelgiumAnheuser-Busch InBev SA/NV, Reg. S3.7% 02/04/2040 EUR 3,644,000 5,879,389 0.24KBC Group NV, Reg. S, FRN 4.75%Perpetual EUR 600,000 764,538 0.03Solvay SA, FRN 2.5% Perpetual EUR 1,300,000 1,595,750 0.07
8,239,677 0.34
Cayman IslandsCountry Garden Holdings Co. Ltd.,Reg. S 7.25% 08/04/2026 USD 2,000,000 2,227,102 0.09DIB Sukuk Ltd., Reg. S 2.95%16/01/2026 USD 1,600,000 1,674,096 0.07DP World Crescent Ltd., Reg. S 4.848%26/09/2028 USD 1,510,000 1,741,632 0.07SA Global Sukuk Ltd., Reg. S 2.694%17/06/2031 USD 951,000 962,964 0.04Sharjah Sukuk Program Ltd., Reg. S2.942% 10/06/2027 USD 2,223,000 2,299,471 0.10Vale Overseas Ltd. 3.75% 08/07/2030 USD 1,558,000 1,655,391 0.07
10,560,656 0.44
ChinaChina Government Bond 3.27%19/11/2030 CNH 70,000,000 10,983,945 0.45
10,983,945 0.45
ColombiaColombia Government Bond 3.125%15/04/2031 USD 1,700,000 1,667,139 0.07Colombia Government Bond 7.25%26/10/2050 COP 11,563,200,000 2,833,690 0.12Ecopetrol SA 6.875% 29/04/2030 USD 1,000,000 1,209,200 0.05Ecopetrol SA 7.375% 18/09/2043 USD 1,050,000 1,296,965 0.05Ecopetrol SA 5.875% 28/05/2045 USD 1,480,000 1,586,782 0.06
8,593,776 0.35
Czech RepublicCzech Republic Government Bond 2%13/10/2033 CZK 159,020,000 7,534,318 0.31
7,534,318 0.31
DenmarkDKT Finance ApS, Reg. S 7%17/06/2023 EUR 300,000 363,074 0.02Orsted A/S, Reg. S, FRN 1.521%18/02/3021 EUR 1,077,000 1,274,184 0.05TDC A/S 5% 02/03/2022 EUR 190,000 232,651 0.01
1,869,909 0.08
Dominican RepublicDominican Republic Government Bond,Reg. S 6.875% 29/01/2026 USD 1,840,000 2,141,778 0.09Dominican Republic Government Bond,Reg. S 4.875% 23/09/2032 USD 2,930,000 3,032,550 0.12
Dominican Republic Government Bond,Reg. S 5.3% 21/01/2041 USD 1,616,000 1,620,040 0.07Dominican Republic Government Bond,Reg. S 6.4% 05/06/2049 USD 589,000 643,482 0.03Dominican Republic Government Bond,Reg. S 5.875% 30/01/2060 USD 2,045,000 2,050,113 0.08
9,487,963 0.39
EgyptEgypt Government Bond, Reg. S 5.75%29/05/2024 USD 1,670,000 1,781,776 0.07Egypt Government Bond, Reg. S 7.5%31/01/2027 USD 870,000 979,838 0.04Egypt Government Bond, Reg. S5.875% 16/02/2031 USD 1,647,000 1,602,531 0.07Egypt Government Bond, Reg. S7.625% 29/05/2032 USD 1,920,000 2,041,690 0.09Egypt Government Bond, Reg. S 8.7%01/03/2049 USD 1,900,000 2,012,100 0.08
8,417,935 0.35
EthiopiaEthiopia Government Bond, Reg. S6.625% 11/12/2024 USD 3,754,000 3,481,835 0.14
3,481,835 0.14
FranceAccor SA, Reg. S 2.5% 25/01/2024 EUR 700,000 871,465 0.04Altice France SA, Reg. S 2.125%15/02/2025 EUR 800,000 927,894 0.04AXA SA, Reg. S, FRN 3.375%06/07/2047 EUR 3,400,000 4,623,610 0.19Banijay Entertainment SASU, Reg. S3.5% 01/03/2025 EUR 525,000 630,845 0.03Banijay Group SAS, Reg. S 6.5%01/03/2026 EUR 150,000 184,349 0.01Burger King France SAS, Reg. S 6%01/05/2024 EUR 180,000 217,794 0.01Casino Guichard Perrachon SA, Reg. S1.865% 13/06/2022 EUR 200,000 237,436 0.01Casino Guichard Perrachon SA, Reg. S4.498% 07/03/2024 EUR 700,000 846,779 0.03Casino Guichard Perrachon SA, Reg. S3.58% 07/02/2025 EUR 200,000 231,997 0.01CGG SA, Reg. S 7.75% 01/04/2027 EUR 283,000 349,129 0.01Chrome Bidco SASU, Reg. S 3.5%31/05/2028 EUR 273,000 329,433 0.01CMA CGM SA, Reg. S 5.25% 15/01/2025 EUR 300,000 364,810 0.01Constellium SE, Reg. S 4.25%15/02/2026 EUR 180,000 217,514 0.01Credit Agricole SA, FRN, 144A 8.125%Perpetual USD 1,820,000 2,217,606 0.09Credit Agricole SA, Reg. S, FRN 1.625%05/06/2030 EUR 700,000 863,954 0.04Credit Agricole SA, Reg. S, FRN 4%Perpetual EUR 3,000,000 3,899,417 0.16Crown European Holdings SA, Reg. S2.625% 30/09/2024 EUR 180,000 223,962 0.01Crown European Holdings SA, Reg. S3.375% 15/05/2025 EUR 1,035,000 1,320,195 0.05Electricite de France SA, Reg. S, FRN5% Perpetual EUR 1,200,000 1,603,261 0.07Electricite de France SA, Reg. S, FRN4% Perpetual EUR 300,000 382,021 0.02Elis SA, Reg. S 2.875% 15/02/2026 EUR 1,800,000 2,284,727 0.09Faurecia SE, Reg. S 3.125% 15/06/2026 EUR 660,000 811,616 0.03Faurecia SE, Reg. S 2.375% 15/06/2027 EUR 750,000 912,557 0.04La Financiere Atalian SASU, Reg. S 4%15/05/2024 EUR 250,000 295,697 0.01La Financiere Atalian SASU, Reg. S5.125% 15/05/2025 EUR 610,000 731,425 0.03Loxam SAS, Reg. S 3.25% 14/01/2025 EUR 800,000 959,295 0.04Loxam SAS, Reg. S 3.75% 15/07/2026 EUR 170,000 206,939 0.01Loxam SAS, Reg. S 4.5% 15/04/2027 EUR 200,000 239,840 0.01Orange SA, Reg. S, FRN 1.75%Perpetual EUR 600,000 733,960 0.03Orange SA, Reg. S, FRN 2.375%Perpetual EUR 800,000 999,752 0.04Orano SA, Reg. S 3.125% 20/03/2023 EUR 300,000 371,998 0.02Orano SA, Reg. S 3.375% 23/04/2026 EUR 600,000 773,189 0.03Paprec Holding SA, Reg. S 3.5%01/07/2028 EUR 405,000 480,203 0.02Parts Europe SA, Reg. S 6.5%16/07/2025 EUR 380,000 474,051 0.02Quatrim SASU, Reg. S 5.875%15/01/2024 EUR 470,000 580,884 0.02Renault SA, Reg. S 1.25% 24/06/2025 EUR 400,000 469,080 0.02Renault SA, Reg. S 2% 28/09/2026 EUR 500,000 592,379 0.02
215
JPMorgan Funds - Global Strategic Bond FundSchedule of Investments
As at 30 June 2021
Investments Currency
Quantity/Nominal
Value
MarketValue
USD
%of
NetAssets Investments Currency
Quantity/Nominal
Value
MarketValue
USD
%of
NetAssets
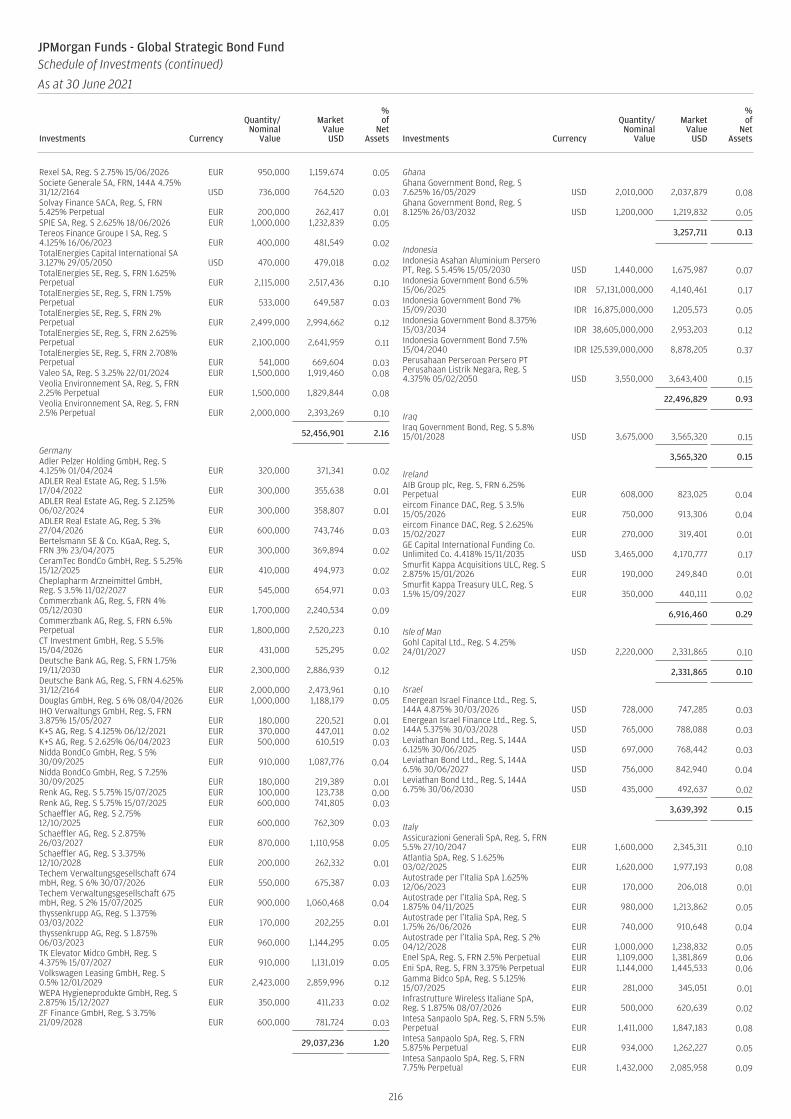
Rexel SA, Reg. S 2.75% 15/06/2026 EUR 950,000 1,159,674 0.05Societe Generale SA, FRN, 144A 4.75%31/12/2164 USD 736,000 764,520 0.03Solvay Finance SACA, Reg. S, FRN5.425% Perpetual EUR 200,000 262,417 0.01SPIE SA, Reg. S 2.625% 18/06/2026 EUR 1,000,000 1,232,839 0.05Tereos Finance Groupe I SA, Reg. S4.125% 16/06/2023 EUR 400,000 481,549 0.02TotalEnergies Capital International SA3.127% 29/05/2050 USD 470,000 479,018 0.02TotalEnergies SE, Reg. S, FRN 1.625%Perpetual EUR 2,115,000 2,517,436 0.10TotalEnergies SE, Reg. S, FRN 1.75%Perpetual EUR 533,000 649,587 0.03TotalEnergies SE, Reg. S, FRN 2%Perpetual EUR 2,499,000 2,994,662 0.12TotalEnergies SE, Reg. S, FRN 2.625%Perpetual EUR 2,100,000 2,641,959 0.11TotalEnergies SE, Reg. S, FRN 2.708%Perpetual EUR 541,000 669,604 0.03Valeo SA, Reg. S 3.25% 22/01/2024 EUR 1,500,000 1,919,460 0.08Veolia Environnement SA, Reg. S, FRN2.25% Perpetual EUR 1,500,000 1,829,844 0.08Veolia Environnement SA, Reg. S, FRN2.5% Perpetual EUR 2,000,000 2,393,269 0.10
52,456,901 2.16
GermanyAdler Pelzer Holding GmbH, Reg. S4.125% 01/04/2024 EUR 320,000 371,341 0.02ADLER Real Estate AG, Reg. S 1.5%17/04/2022 EUR 300,000 355,638 0.01ADLER Real Estate AG, Reg. S 2.125%06/02/2024 EUR 300,000 358,807 0.01ADLER Real Estate AG, Reg. S 3%27/04/2026 EUR 600,000 743,746 0.03Bertelsmann SE & Co. KGaA, Reg. S,FRN 3% 23/04/2075 EUR 300,000 369,894 0.02CeramTec BondCo GmbH, Reg. S 5.25%15/12/2025 EUR 410,000 494,973 0.02Cheplapharm Arzneimittel GmbH,Reg. S 3.5% 11/02/2027 EUR 545,000 654,971 0.03Commerzbank AG, Reg. S, FRN 4%05/12/2030 EUR 1,700,000 2,240,534 0.09Commerzbank AG, Reg. S, FRN 6.5%Perpetual EUR 1,800,000 2,520,223 0.10CT Investment GmbH, Reg. S 5.5%15/04/2026 EUR 431,000 525,295 0.02Deutsche Bank AG, Reg. S, FRN 1.75%19/11/2030 EUR 2,300,000 2,886,939 0.12Deutsche Bank AG, Reg. S, FRN 4.625%31/12/2164 EUR 2,000,000 2,473,961 0.10Douglas GmbH, Reg. S 6% 08/04/2026 EUR 1,000,000 1,188,179 0.05IHO Verwaltungs GmbH, Reg. S, FRN3.875% 15/05/2027 EUR 180,000 220,521 0.01K+S AG, Reg. S 4.125% 06/12/2021 EUR 370,000 447,011 0.02K+S AG, Reg. S 2.625% 06/04/2023 EUR 500,000 610,519 0.03Nidda BondCo GmbH, Reg. S 5%30/09/2025 EUR 910,000 1,087,776 0.04Nidda BondCo GmbH, Reg. S 7.25%30/09/2025 EUR 180,000 219,389 0.01Renk AG, Reg. S 5.75% 15/07/2025 EUR 100,000 123,738 0.00Renk AG, Reg. S 5.75% 15/07/2025 EUR 600,000 741,805 0.03Schaeffler AG, Reg. S 2.75%12/10/2025 EUR 600,000 762,309 0.03Schaeffler AG, Reg. S 2.875%26/03/2027 EUR 870,000 1,110,958 0.05Schaeffler AG, Reg. S 3.375%12/10/2028 EUR 200,000 262,332 0.01Techem Verwaltungsgesellschaft 674mbH, Reg. S 6% 30/07/2026 EUR 550,000 675,387 0.03Techem Verwaltungsgesellschaft 675mbH, Reg. S 2% 15/07/2025 EUR 900,000 1,060,468 0.04thyssenkrupp AG, Reg. S 1.375%03/03/2022 EUR 170,000 202,255 0.01thyssenkrupp AG, Reg. S 1.875%06/03/2023 EUR 960,000 1,144,295 0.05TK Elevator Midco GmbH, Reg. S4.375% 15/07/2027 EUR 910,000 1,131,019 0.05Volkswagen Leasing GmbH, Reg. S0.5% 12/01/2029 EUR 2,423,000 2,859,996 0.12WEPA Hygieneprodukte GmbH, Reg. S2.875% 15/12/2027 EUR 350,000 411,233 0.02ZF Finance GmbH, Reg. S 3.75%21/09/2028 EUR 600,000 781,724 0.03
29,037,236 1.20
GhanaGhana Government Bond, Reg. S7.625% 16/05/2029 USD 2,010,000 2,037,879 0.08Ghana Government Bond, Reg. S8.125% 26/03/2032 USD 1,200,000 1,219,832 0.05
3,257,711 0.13
IndonesiaIndonesia Asahan Aluminium PerseroPT, Reg. S 5.45% 15/05/2030 USD 1,440,000 1,675,987 0.07Indonesia Government Bond 6.5%15/06/2025 IDR 57,131,000,000 4,140,461 0.17Indonesia Government Bond 7%15/09/2030 IDR 16,875,000,000 1,205,573 0.05Indonesia Government Bond 8.375%15/03/2034 IDR 38,605,000,000 2,953,203 0.12Indonesia Government Bond 7.5%15/04/2040 IDR 125,539,000,000 8,878,205 0.37Perusahaan Perseroan Persero PTPerusahaan Listrik Negara, Reg. S4.375% 05/02/2050 USD 3,550,000 3,643,400 0.15
22,496,829 0.93
IraqIraq Government Bond, Reg. S 5.8%15/01/2028 USD 3,675,000 3,565,320 0.15
3,565,320 0.15
IrelandAIB Group plc, Reg. S, FRN 6.25%Perpetual EUR 608,000 823,025 0.04eircom Finance DAC, Reg. S 3.5%15/05/2026 EUR 750,000 913,306 0.04eircom Finance DAC, Reg. S 2.625%15/02/2027 EUR 270,000 319,401 0.01GE Capital International Funding Co.Unlimited Co. 4.418% 15/11/2035 USD 3,465,000 4,170,777 0.17Smurfit Kappa Acquisitions ULC, Reg. S2.875% 15/01/2026 EUR 190,000 249,840 0.01Smurfit Kappa Treasury ULC, Reg. S1.5% 15/09/2027 EUR 350,000 440,111 0.02
6,916,460 0.29
Isle of ManGohl Capital Ltd., Reg. S 4.25%24/01/2027 USD 2,220,000 2,331,865 0.10
2,331,865 0.10
IsraelEnergean Israel Finance Ltd., Reg. S,144A 4.875% 30/03/2026 USD 728,000 747,285 0.03Energean Israel Finance Ltd., Reg. S,144A 5.375% 30/03/2028 USD 765,000 788,088 0.03Leviathan Bond Ltd., Reg. S, 144A6.125% 30/06/2025 USD 697,000 768,442 0.03Leviathan Bond Ltd., Reg. S, 144A6.5% 30/06/2027 USD 756,000 842,940 0.04Leviathan Bond Ltd., Reg. S, 144A6.75% 30/06/2030 USD 435,000 492,637 0.02
3,639,392 0.15
ItalyAssicurazioni Generali SpA, Reg. S, FRN5.5% 27/10/2047 EUR 1,600,000 2,345,311 0.10Atlantia SpA, Reg. S 1.625%03/02/2025 EUR 1,620,000 1,977,193 0.08Autostrade per l’Italia SpA 1.625%12/06/2023 EUR 170,000 206,018 0.01Autostrade per l’Italia SpA, Reg. S1.875% 04/11/2025 EUR 980,000 1,213,862 0.05Autostrade per l’Italia SpA, Reg. S1.75% 26/06/2026 EUR 740,000 910,648 0.04Autostrade per l’Italia SpA, Reg. S 2%04/12/2028 EUR 1,000,000 1,238,832 0.05Enel SpA, Reg. S, FRN 2.5% Perpetual EUR 1,109,000 1,381,869 0.06Eni SpA, Reg. S, FRN 3.375% Perpetual EUR 1,144,000 1,445,533 0.06Gamma Bidco SpA, Reg. S 5.125%15/07/2025 EUR 281,000 345,051 0.01Infrastrutture Wireless Italiane SpA,Reg. S 1.875% 08/07/2026 EUR 500,000 620,639 0.02Intesa Sanpaolo SpA, Reg. S, FRN 5.5%Perpetual EUR 1,411,000 1,847,183 0.08Intesa Sanpaolo SpA, Reg. S, FRN5.875% Perpetual EUR 934,000 1,262,227 0.05Intesa Sanpaolo SpA, Reg. S, FRN7.75% Perpetual EUR 1,432,000 2,085,958 0.09
216
JPMorgan Funds - Global Strategic Bond FundSchedule of Investments (continued)
As at 30 June 2021
Investments Currency
Quantity/Nominal
Value
MarketValue
USD
%of
NetAssets Investments Currency
Quantity/Nominal
Value
MarketValue
USD
%of
NetAssets
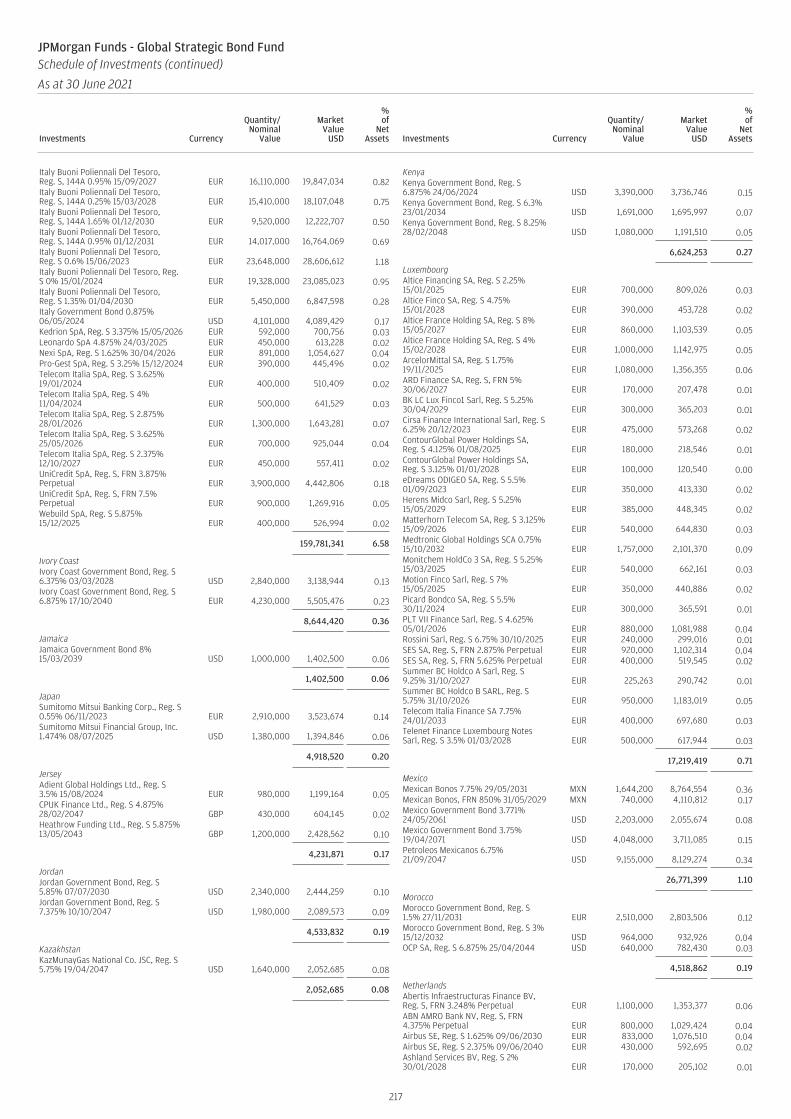
Italy Buoni Poliennali Del Tesoro,Reg. S, 144A 0.95% 15/09/2027 EUR 16,110,000 19,847,034 0.82Italy Buoni Poliennali Del Tesoro,Reg. S, 144A 0.25% 15/03/2028 EUR 15,410,000 18,107,048 0.75Italy Buoni Poliennali Del Tesoro,Reg. S, 144A 1.65% 01/12/2030 EUR 9,520,000 12,222,707 0.50Italy Buoni Poliennali Del Tesoro,Reg. S, 144A 0.95% 01/12/2031 EUR 14,017,000 16,764,069 0.69Italy Buoni Poliennali Del Tesoro,Reg. S 0.6% 15/06/2023 EUR 23,648,000 28,606,612 1.18Italy Buoni Poliennali Del Tesoro, Reg.S 0% 15/01/2024 EUR 19,328,000 23,085,023 0.95Italy Buoni Poliennali Del Tesoro,Reg. S 1.35% 01/04/2030 EUR 5,450,000 6,847,598 0.28Italy Government Bond 0.875%06/05/2024 USD 4,101,000 4,089,429 0.17Kedrion SpA, Reg. S 3.375% 15/05/2026 EUR 592,000 700,756 0.03Leonardo SpA 4.875% 24/03/2025 EUR 450,000 613,228 0.02Nexi SpA, Reg. S 1.625% 30/04/2026 EUR 891,000 1,054,627 0.04Pro-Gest SpA, Reg. S 3.25% 15/12/2024 EUR 390,000 445,496 0.02Telecom Italia SpA, Reg. S 3.625%19/01/2024 EUR 400,000 510,409 0.02Telecom Italia SpA, Reg. S 4%11/04/2024 EUR 500,000 641,529 0.03Telecom Italia SpA, Reg. S 2.875%28/01/2026 EUR 1,300,000 1,643,281 0.07Telecom Italia SpA, Reg. S 3.625%25/05/2026 EUR 700,000 925,044 0.04Telecom Italia SpA, Reg. S 2.375%12/10/2027 EUR 450,000 557,411 0.02UniCredit SpA, Reg. S, FRN 3.875%Perpetual EUR 3,900,000 4,442,806 0.18UniCredit SpA, Reg. S, FRN 7.5%Perpetual EUR 900,000 1,269,916 0.05Webuild SpA, Reg. S 5.875%15/12/2025 EUR 400,000 526,994 0.02
159,781,341 6.58
Ivory CoastIvory Coast Government Bond, Reg. S6.375% 03/03/2028 USD 2,840,000 3,138,944 0.13Ivory Coast Government Bond, Reg. S6.875% 17/10/2040 EUR 4,230,000 5,505,476 0.23
8,644,420 0.36
JamaicaJamaica Government Bond 8%15/03/2039 USD 1,000,000 1,402,500 0.06
1,402,500 0.06
JapanSumitomo Mitsui Banking Corp., Reg. S0.55% 06/11/2023 EUR 2,910,000 3,523,674 0.14Sumitomo Mitsui Financial Group, Inc.1.474% 08/07/2025 USD 1,380,000 1,394,846 0.06
4,918,520 0.20
JerseyAdient Global Holdings Ltd., Reg. S3.5% 15/08/2024 EUR 980,000 1,199,164 0.05CPUK Finance Ltd., Reg. S 4.875%28/02/2047 GBP 430,000 604,145 0.02Heathrow Funding Ltd., Reg. S 5.875%13/05/2043 GBP 1,200,000 2,428,562 0.10
4,231,871 0.17
JordanJordan Government Bond, Reg. S5.85% 07/07/2030 USD 2,340,000 2,444,259 0.10Jordan Government Bond, Reg. S7.375% 10/10/2047 USD 1,980,000 2,089,573 0.09
4,533,832 0.19
KazakhstanKazMunayGas National Co. JSC, Reg. S5.75% 19/04/2047 USD 1,640,000 2,052,685 0.08
2,052,685 0.08
KenyaKenya Government Bond, Reg. S6.875% 24/06/2024 USD 3,390,000 3,736,746 0.15Kenya Government Bond, Reg. S 6.3%23/01/2034 USD 1,691,000 1,695,997 0.07Kenya Government Bond, Reg. S 8.25%28/02/2048 USD 1,080,000 1,191,510 0.05
6,624,253 0.27
LuxembourgAltice Financing SA, Reg. S 2.25%15/01/2025 EUR 700,000 809,026 0.03Altice Finco SA, Reg. S 4.75%15/01/2028 EUR 390,000 453,728 0.02Altice France Holding SA, Reg. S 8%15/05/2027 EUR 860,000 1,103,539 0.05Altice France Holding SA, Reg. S 4%15/02/2028 EUR 1,000,000 1,142,975 0.05ArcelorMittal SA, Reg. S 1.75%19/11/2025 EUR 1,080,000 1,356,355 0.06ARD Finance SA, Reg. S, FRN 5%30/06/2027 EUR 170,000 207,478 0.01BK LC Lux Finco1 Sarl, Reg. S 5.25%30/04/2029 EUR 300,000 365,203 0.01Cirsa Finance International Sarl, Reg. S6.25% 20/12/2023 EUR 475,000 573,268 0.02ContourGlobal Power Holdings SA,Reg. S 4.125% 01/08/2025 EUR 180,000 218,546 0.01ContourGlobal Power Holdings SA,Reg. S 3.125% 01/01/2028 EUR 100,000 120,540 0.00eDreams ODIGEO SA, Reg. S 5.5%01/09/2023 EUR 350,000 413,330 0.02Herens Midco Sarl, Reg. S 5.25%15/05/2029 EUR 385,000 448,345 0.02Matterhorn Telecom SA, Reg. S 3.125%15/09/2026 EUR 540,000 644,830 0.03Medtronic Global Holdings SCA 0.75%15/10/2032 EUR 1,757,000 2,101,370 0.09Monitchem HoldCo 3 SA, Reg. S 5.25%15/03/2025 EUR 540,000 662,161 0.03Motion Finco Sarl, Reg. S 7%15/05/2025 EUR 350,000 440,886 0.02Picard Bondco SA, Reg. S 5.5%30/11/2024 EUR 300,000 365,591 0.01PLT VII Finance Sarl, Reg. S 4.625%05/01/2026 EUR 880,000 1,081,988 0.04Rossini Sarl, Reg. S 6.75% 30/10/2025 EUR 240,000 299,016 0.01SES SA, Reg. S, FRN 2.875% Perpetual EUR 920,000 1,102,314 0.04SES SA, Reg. S, FRN 5.625% Perpetual EUR 400,000 519,545 0.02Summer BC Holdco A Sarl, Reg. S9.25% 31/10/2027 EUR 225,263 290,742 0.01Summer BC Holdco B SARL, Reg. S5.75% 31/10/2026 EUR 950,000 1,183,019 0.05Telecom Italia Finance SA 7.75%24/01/2033 EUR 400,000 697,680 0.03Telenet Finance Luxembourg NotesSarl, Reg. S 3.5% 01/03/2028 EUR 500,000 617,944 0.03
17,219,419 0.71
MexicoMexican Bonos 7.75% 29/05/2031 MXN 1,644,200 8,764,554 0.36Mexican Bonos, FRN 850% 31/05/2029 MXN 740,000 4,110,812 0.17Mexico Government Bond 3.771%24/05/2061 USD 2,203,000 2,055,674 0.08Mexico Government Bond 3.75%19/04/2071 USD 4,048,000 3,711,085 0.15Petroleos Mexicanos 6.75%21/09/2047 USD 9,155,000 8,129,274 0.34
26,771,399 1.10
MoroccoMorocco Government Bond, Reg. S1.5% 27/11/2031 EUR 2,510,000 2,803,506 0.12Morocco Government Bond, Reg. S 3%15/12/2032 USD 964,000 932,926 0.04OCP SA, Reg. S 6.875% 25/04/2044 USD 640,000 782,430 0.03
4,518,862 0.19
NetherlandsAbertis Infraestructuras Finance BV,Reg. S, FRN 3.248% Perpetual EUR 1,100,000 1,353,377 0.06ABN AMRO Bank NV, Reg. S, FRN4.375% Perpetual EUR 800,000 1,029,424 0.04Airbus SE, Reg. S 1.625% 09/06/2030 EUR 833,000 1,076,510 0.04Airbus SE, Reg. S 2.375% 09/06/2040 EUR 430,000 592,695 0.02Ashland Services BV, Reg. S 2%30/01/2028 EUR 170,000 205,102 0.01
217
JPMorgan Funds - Global Strategic Bond FundSchedule of Investments (continued)
As at 30 June 2021
Investments Currency
Quantity/Nominal
Value
MarketValue
USD
%of
NetAssets Investments Currency
Quantity/Nominal
Value
MarketValue
USD
%of
NetAssets
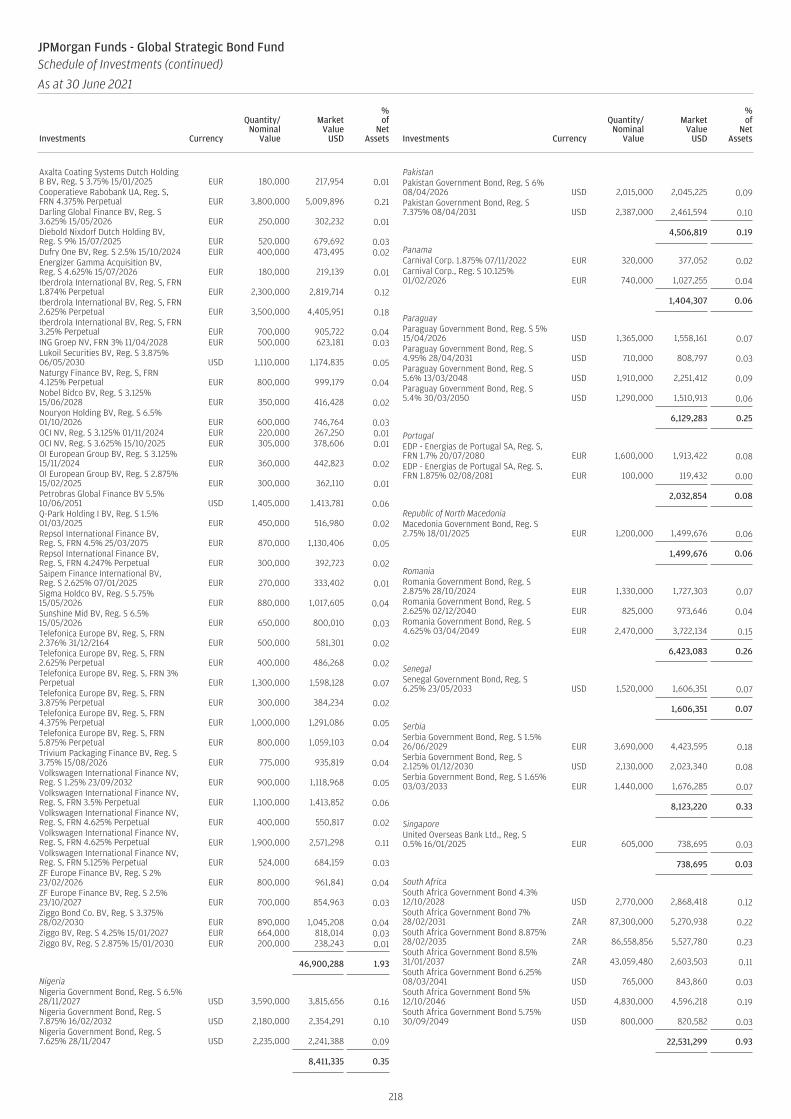
Axalta Coating Systems Dutch HoldingB BV, Reg. S 3.75% 15/01/2025 EUR 180,000 217,954 0.01Cooperatieve Rabobank UA, Reg. S,FRN 4.375% Perpetual EUR 3,800,000 5,009,896 0.21Darling Global Finance BV, Reg. S3.625% 15/05/2026 EUR 250,000 302,232 0.01Diebold Nixdorf Dutch Holding BV,Reg. S 9% 15/07/2025 EUR 520,000 679,692 0.03Dufry One BV, Reg. S 2.5% 15/10/2024 EUR 400,000 473,495 0.02Energizer Gamma Acquisition BV,Reg. S 4.625% 15/07/2026 EUR 180,000 219,139 0.01Iberdrola International BV, Reg. S, FRN1.874% Perpetual EUR 2,300,000 2,819,714 0.12Iberdrola International BV, Reg. S, FRN2.625% Perpetual EUR 3,500,000 4,405,951 0.18Iberdrola International BV, Reg. S, FRN3.25% Perpetual EUR 700,000 905,722 0.04ING Groep NV, FRN 3% 11/04/2028 EUR 500,000 623,181 0.03Lukoil Securities BV, Reg. S 3.875%06/05/2030 USD 1,110,000 1,174,835 0.05Naturgy Finance BV, Reg. S, FRN4.125% Perpetual EUR 800,000 999,179 0.04Nobel Bidco BV, Reg. S 3.125%15/06/2028 EUR 350,000 416,428 0.02Nouryon Holding BV, Reg. S 6.5%01/10/2026 EUR 600,000 746,764 0.03OCI NV, Reg. S 3.125% 01/11/2024 EUR 220,000 267,250 0.01OCI NV, Reg. S 3.625% 15/10/2025 EUR 305,000 378,606 0.01OI European Group BV, Reg. S 3.125%15/11/2024 EUR 360,000 442,823 0.02OI European Group BV, Reg. S 2.875%15/02/2025 EUR 300,000 362,110 0.01Petrobras Global Finance BV 5.5%10/06/2051 USD 1,405,000 1,413,781 0.06Q-Park Holding I BV, Reg. S 1.5%01/03/2025 EUR 450,000 516,980 0.02Repsol International Finance BV,Reg. S, FRN 4.5% 25/03/2075 EUR 870,000 1,130,406 0.05Repsol International Finance BV,Reg. S, FRN 4.247% Perpetual EUR 300,000 392,723 0.02Saipem Finance International BV,Reg. S 2.625% 07/01/2025 EUR 270,000 333,402 0.01Sigma Holdco BV, Reg. S 5.75%15/05/2026 EUR 880,000 1,017,605 0.04Sunshine Mid BV, Reg. S 6.5%15/05/2026 EUR 650,000 800,010 0.03Telefonica Europe BV, Reg. S, FRN2.376% 31/12/2164 EUR 500,000 581,301 0.02Telefonica Europe BV, Reg. S, FRN2.625% Perpetual EUR 400,000 486,268 0.02Telefonica Europe BV, Reg. S, FRN 3%Perpetual EUR 1,300,000 1,598,128 0.07Telefonica Europe BV, Reg. S, FRN3.875% Perpetual EUR 300,000 384,234 0.02Telefonica Europe BV, Reg. S, FRN4.375% Perpetual EUR 1,000,000 1,291,086 0.05Telefonica Europe BV, Reg. S, FRN5.875% Perpetual EUR 800,000 1,059,103 0.04Trivium Packaging Finance BV, Reg. S3.75% 15/08/2026 EUR 775,000 935,819 0.04Volkswagen International Finance NV,Reg. S 1.25% 23/09/2032 EUR 900,000 1,118,968 0.05Volkswagen International Finance NV,Reg. S, FRN 3.5% Perpetual EUR 1,100,000 1,413,852 0.06Volkswagen International Finance NV,Reg. S, FRN 4.625% Perpetual EUR 400,000 550,817 0.02Volkswagen International Finance NV,Reg. S, FRN 4.625% Perpetual EUR 1,900,000 2,571,298 0.11Volkswagen International Finance NV,Reg. S, FRN 5.125% Perpetual EUR 524,000 684,159 0.03ZF Europe Finance BV, Reg. S 2%23/02/2026 EUR 800,000 961,841 0.04ZF Europe Finance BV, Reg. S 2.5%23/10/2027 EUR 700,000 854,963 0.03Ziggo Bond Co. BV, Reg. S 3.375%28/02/2030 EUR 890,000 1,045,208 0.04Ziggo BV, Reg. S 4.25% 15/01/2027 EUR 664,000 818,014 0.03Ziggo BV, Reg. S 2.875% 15/01/2030 EUR 200,000 238,243 0.01
46,900,288 1.93
NigeriaNigeria Government Bond, Reg. S 6.5%28/11/2027 USD 3,590,000 3,815,656 0.16Nigeria Government Bond, Reg. S7.875% 16/02/2032 USD 2,180,000 2,354,291 0.10Nigeria Government Bond, Reg. S7.625% 28/11/2047 USD 2,235,000 2,241,388 0.09
8,411,335 0.35
PakistanPakistan Government Bond, Reg. S 6%08/04/2026 USD 2,015,000 2,045,225 0.09Pakistan Government Bond, Reg. S7.375% 08/04/2031 USD 2,387,000 2,461,594 0.10
4,506,819 0.19
PanamaCarnival Corp. 1.875% 07/11/2022 EUR 320,000 377,052 0.02Carnival Corp., Reg. S 10.125%01/02/2026 EUR 740,000 1,027,255 0.04
1,404,307 0.06
ParaguayParaguay Government Bond, Reg. S 5%15/04/2026 USD 1,365,000 1,558,161 0.07Paraguay Government Bond, Reg. S4.95% 28/04/2031 USD 710,000 808,797 0.03Paraguay Government Bond, Reg. S5.6% 13/03/2048 USD 1,910,000 2,251,412 0.09Paraguay Government Bond, Reg. S5.4% 30/03/2050 USD 1,290,000 1,510,913 0.06
6,129,283 0.25
PortugalEDP - Energias de Portugal SA, Reg. S,FRN 1.7% 20/07/2080 EUR 1,600,000 1,913,422 0.08EDP - Energias de Portugal SA, Reg. S,FRN 1.875% 02/08/2081 EUR 100,000 119,432 0.00
2,032,854 0.08
Republic of North MacedoniaMacedonia Government Bond, Reg. S2.75% 18/01/2025 EUR 1,200,000 1,499,676 0.06
1,499,676 0.06
RomaniaRomania Government Bond, Reg. S2.875% 28/10/2024 EUR 1,330,000 1,727,303 0.07Romania Government Bond, Reg. S2.625% 02/12/2040 EUR 825,000 973,646 0.04Romania Government Bond, Reg. S4.625% 03/04/2049 EUR 2,470,000 3,722,134 0.15
6,423,083 0.26
SenegalSenegal Government Bond, Reg. S6.25% 23/05/2033 USD 1,520,000 1,606,351 0.07
1,606,351 0.07
SerbiaSerbia Government Bond, Reg. S 1.5%26/06/2029 EUR 3,690,000 4,423,595 0.18Serbia Government Bond, Reg. S2.125% 01/12/2030 USD 2,130,000 2,023,340 0.08Serbia Government Bond, Reg. S 1.65%03/03/2033 EUR 1,440,000 1,676,285 0.07
8,123,220 0.33
SingaporeUnited Overseas Bank Ltd., Reg. S0.5% 16/01/2025 EUR 605,000 738,695 0.03
738,695 0.03
South AfricaSouth Africa Government Bond 4.3%12/10/2028 USD 2,770,000 2,868,418 0.12South Africa Government Bond 7%28/02/2031 ZAR 87,300,000 5,270,938 0.22South Africa Government Bond 8.875%28/02/2035 ZAR 86,558,856 5,527,780 0.23South Africa Government Bond 8.5%31/01/2037 ZAR 43,059,480 2,603,503 0.11South Africa Government Bond 6.25%08/03/2041 USD 765,000 843,860 0.03South Africa Government Bond 5%12/10/2046 USD 4,830,000 4,596,218 0.19South Africa Government Bond 5.75%30/09/2049 USD 800,000 820,582 0.03
22,531,299 0.93
218
JPMorgan Funds - Global Strategic Bond FundSchedule of Investments (continued)
As at 30 June 2021
Investments Currency
Quantity/Nominal
Value
MarketValue
USD
%of
NetAssets Investments Currency
Quantity/Nominal
Value
MarketValue
USD
%of
NetAssets
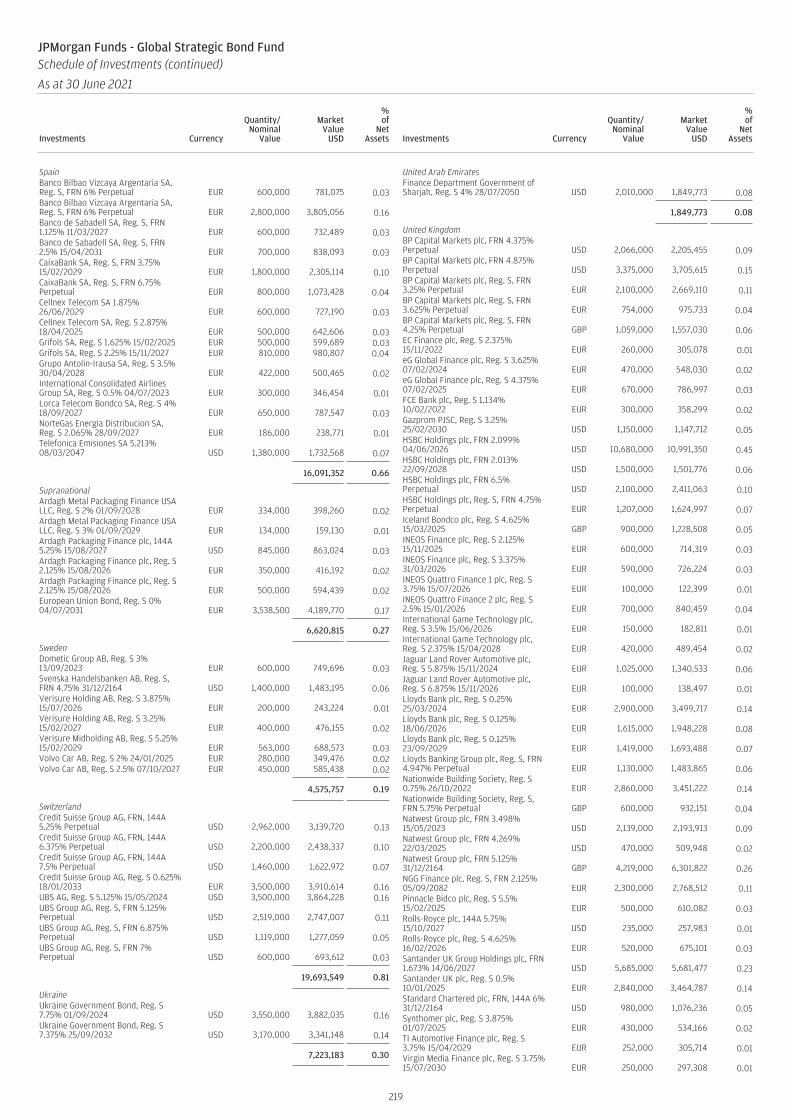
SpainBanco Bilbao Vizcaya Argentaria SA,Reg. S, FRN 6% Perpetual EUR 600,000 781,075 0.03Banco Bilbao Vizcaya Argentaria SA,Reg. S, FRN 6% Perpetual EUR 2,800,000 3,805,056 0.16Banco de Sabadell SA, Reg. S, FRN1.125% 11/03/2027 EUR 600,000 732,489 0.03Banco de Sabadell SA, Reg. S, FRN2.5% 15/04/2031 EUR 700,000 838,093 0.03CaixaBank SA, Reg. S, FRN 3.75%15/02/2029 EUR 1,800,000 2,305,114 0.10CaixaBank SA, Reg. S, FRN 6.75%Perpetual EUR 800,000 1,073,428 0.04Cellnex Telecom SA 1.875%26/06/2029 EUR 600,000 727,190 0.03Cellnex Telecom SA, Reg. S 2.875%18/04/2025 EUR 500,000 642,606 0.03Grifols SA, Reg. S 1.625% 15/02/2025 EUR 500,000 599,689 0.03Grifols SA, Reg. S 2.25% 15/11/2027 EUR 810,000 980,807 0.04Grupo Antolin-Irausa SA, Reg. S 3.5%30/04/2028 EUR 422,000 500,465 0.02International Consolidated AirlinesGroup SA, Reg. S 0.5% 04/07/2023 EUR 300,000 346,454 0.01Lorca Telecom Bondco SA, Reg. S 4%18/09/2027 EUR 650,000 787,547 0.03NorteGas Energia Distribucion SA,Reg. S 2.065% 28/09/2027 EUR 186,000 238,771 0.01Telefonica Emisiones SA 5.213%08/03/2047 USD 1,380,000 1,732,568 0.07
16,091,352 0.66
SupranationalArdagh Metal Packaging Finance USALLC, Reg. S 2% 01/09/2028 EUR 334,000 398,260 0.02Ardagh Metal Packaging Finance USALLC, Reg. S 3% 01/09/2029 EUR 134,000 159,130 0.01Ardagh Packaging Finance plc, 144A5.25% 15/08/2027 USD 845,000 863,024 0.03Ardagh Packaging Finance plc, Reg. S2.125% 15/08/2026 EUR 350,000 416,192 0.02Ardagh Packaging Finance plc, Reg. S2.125% 15/08/2026 EUR 500,000 594,439 0.02European Union Bond, Reg. S 0%04/07/2031 EUR 3,538,500 4,189,770 0.17
6,620,815 0.27
SwedenDometic Group AB, Reg. S 3%13/09/2023 EUR 600,000 749,696 0.03Svenska Handelsbanken AB, Reg. S,FRN 4.75% 31/12/2164 USD 1,400,000 1,483,195 0.06Verisure Holding AB, Reg. S 3.875%15/07/2026 EUR 200,000 243,224 0.01Verisure Holding AB, Reg. S 3.25%15/02/2027 EUR 400,000 476,155 0.02Verisure Midholding AB, Reg. S 5.25%15/02/2029 EUR 563,000 688,573 0.03Volvo Car AB, Reg. S 2% 24/01/2025 EUR 280,000 349,476 0.02Volvo Car AB, Reg. S 2.5% 07/10/2027 EUR 450,000 585,438 0.02
4,575,757 0.19
SwitzerlandCredit Suisse Group AG, FRN, 144A5.25% Perpetual USD 2,962,000 3,139,720 0.13Credit Suisse Group AG, FRN, 144A6.375% Perpetual USD 2,200,000 2,438,337 0.10Credit Suisse Group AG, FRN, 144A7.5% Perpetual USD 1,460,000 1,622,972 0.07Credit Suisse Group AG, Reg. S 0.625%18/01/2033 EUR 3,500,000 3,910,614 0.16UBS AG, Reg. S 5.125% 15/05/2024 USD 3,500,000 3,864,228 0.16UBS Group AG, Reg. S, FRN 5.125%Perpetual USD 2,519,000 2,747,007 0.11UBS Group AG, Reg. S, FRN 6.875%Perpetual USD 1,119,000 1,277,059 0.05UBS Group AG, Reg. S, FRN 7%Perpetual USD 600,000 693,612 0.03
19,693,549 0.81
UkraineUkraine Government Bond, Reg. S7.75% 01/09/2024 USD 3,550,000 3,882,035 0.16Ukraine Government Bond, Reg. S7.375% 25/09/2032 USD 3,170,000 3,341,148 0.14
7,223,183 0.30
United Arab EmiratesFinance Department Government ofSharjah, Reg. S 4% 28/07/2050 USD 2,010,000 1,849,773 0.08
1,849,773 0.08
United KingdomBP Capital Markets plc, FRN 4.375%Perpetual USD 2,066,000 2,205,455 0.09BP Capital Markets plc, FRN 4.875%Perpetual USD 3,375,000 3,705,615 0.15BP Capital Markets plc, Reg. S, FRN3.25% Perpetual EUR 2,100,000 2,669,110 0.11BP Capital Markets plc, Reg. S, FRN3.625% Perpetual EUR 754,000 975,733 0.04BP Capital Markets plc, Reg. S, FRN4.25% Perpetual GBP 1,059,000 1,557,030 0.06EC Finance plc, Reg. S 2.375%15/11/2022 EUR 260,000 305,078 0.01eG Global Finance plc, Reg. S 3.625%07/02/2024 EUR 470,000 548,030 0.02eG Global Finance plc, Reg. S 4.375%07/02/2025 EUR 670,000 786,997 0.03FCE Bank plc, Reg. S 1.134%10/02/2022 EUR 300,000 358,299 0.02Gazprom PJSC, Reg. S 3.25%25/02/2030 USD 1,150,000 1,147,712 0.05HSBC Holdings plc, FRN 2.099%04/06/2026 USD 10,680,000 10,991,350 0.45HSBC Holdings plc, FRN 2.013%22/09/2028 USD 1,500,000 1,501,776 0.06HSBC Holdings plc, FRN 6.5%Perpetual USD 2,100,000 2,411,063 0.10HSBC Holdings plc, Reg. S, FRN 4.75%Perpetual EUR 1,207,000 1,624,997 0.07Iceland Bondco plc, Reg. S 4.625%15/03/2025 GBP 900,000 1,228,508 0.05INEOS Finance plc, Reg. S 2.125%15/11/2025 EUR 600,000 714,319 0.03INEOS Finance plc, Reg. S 3.375%31/03/2026 EUR 590,000 726,224 0.03INEOS Quattro Finance 1 plc, Reg. S3.75% 15/07/2026 EUR 100,000 122,399 0.01INEOS Quattro Finance 2 plc, Reg. S2.5% 15/01/2026 EUR 700,000 840,459 0.04International Game Technology plc,Reg. S 3.5% 15/06/2026 EUR 150,000 182,811 0.01International Game Technology plc,Reg. S 2.375% 15/04/2028 EUR 420,000 489,454 0.02Jaguar Land Rover Automotive plc,Reg. S 5.875% 15/11/2024 EUR 1,025,000 1,340,533 0.06Jaguar Land Rover Automotive plc,Reg. S 6.875% 15/11/2026 EUR 100,000 138,497 0.01Lloyds Bank plc, Reg. S 0.25%25/03/2024 EUR 2,900,000 3,499,717 0.14Lloyds Bank plc, Reg. S 0.125%18/06/2026 EUR 1,615,000 1,948,228 0.08Lloyds Bank plc, Reg. S 0.125%23/09/2029 EUR 1,419,000 1,693,488 0.07Lloyds Banking Group plc, Reg. S, FRN4.947% Perpetual EUR 1,130,000 1,483,865 0.06Nationwide Building Society, Reg. S0.75% 26/10/2022 EUR 2,860,000 3,451,222 0.14Nationwide Building Society, Reg. S,FRN 5.75% Perpetual GBP 600,000 932,151 0.04Natwest Group plc, FRN 3.498%15/05/2023 USD 2,139,000 2,193,913 0.09Natwest Group plc, FRN 4.269%22/03/2025 USD 470,000 509,948 0.02Natwest Group plc, FRN 5.125%31/12/2164 GBP 4,219,000 6,301,822 0.26NGG Finance plc, Reg. S, FRN 2.125%05/09/2082 EUR 2,300,000 2,768,512 0.11Pinnacle Bidco plc, Reg. S 5.5%15/02/2025 EUR 500,000 610,082 0.03Rolls-Royce plc, 144A 5.75%15/10/2027 USD 235,000 257,983 0.01Rolls-Royce plc, Reg. S 4.625%16/02/2026 EUR 520,000 675,101 0.03Santander UK Group Holdings plc, FRN1.673% 14/06/2027 USD 5,685,000 5,681,477 0.23Santander UK plc, Reg. S 0.5%10/01/2025 EUR 2,840,000 3,464,787 0.14Standard Chartered plc, FRN, 144A 6%31/12/2164 USD 980,000 1,076,236 0.05Synthomer plc, Reg. S 3.875%01/07/2025 EUR 430,000 534,166 0.02TI Automotive Finance plc, Reg. S3.75% 15/04/2029 EUR 252,000 305,714 0.01Virgin Media Finance plc, Reg. S 3.75%15/07/2030 EUR 250,000 297,308 0.01
219
JPMorgan Funds - Global Strategic Bond FundSchedule of Investments (continued)
As at 30 June 2021
Investments Currency
Quantity/Nominal
Value
MarketValue
USD
%of
NetAssets Investments Currency
Quantity/Nominal
Value
MarketValue
USD
%of
NetAssets
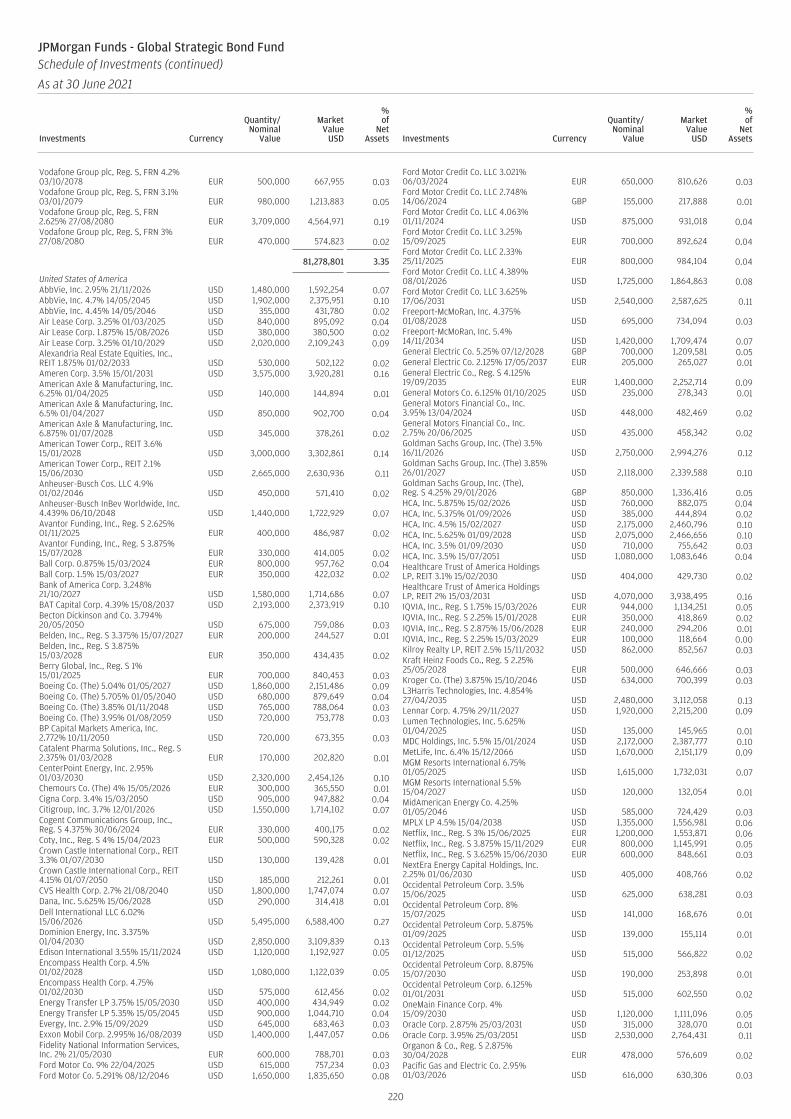
Vodafone Group plc, Reg. S, FRN 4.2%03/10/2078 EUR 500,000 667,955 0.03Vodafone Group plc, Reg. S, FRN 3.1%03/01/2079 EUR 980,000 1,213,883 0.05Vodafone Group plc, Reg. S, FRN2.625% 27/08/2080 EUR 3,709,000 4,564,971 0.19Vodafone Group plc, Reg. S, FRN 3%27/08/2080 EUR 470,000 574,823 0.02
81,278,801 3.35
United States of AmericaAbbVie, Inc. 2.95% 21/11/2026 USD 1,480,000 1,592,254 0.07AbbVie, Inc. 4.7% 14/05/2045 USD 1,902,000 2,375,951 0.10AbbVie, Inc. 4.45% 14/05/2046 USD 355,000 431,780 0.02Air Lease Corp. 3.25% 01/03/2025 USD 840,000 895,092 0.04Air Lease Corp. 1.875% 15/08/2026 USD 380,000 380,500 0.02Air Lease Corp. 3.25% 01/10/2029 USD 2,020,000 2,109,243 0.09Alexandria Real Estate Equities, Inc.,REIT 1.875% 01/02/2033 USD 530,000 502,122 0.02Ameren Corp. 3.5% 15/01/2031 USD 3,575,000 3,920,281 0.16American Axle & Manufacturing, Inc.6.25% 01/04/2025 USD 140,000 144,894 0.01American Axle & Manufacturing, Inc.6.5% 01/04/2027 USD 850,000 902,700 0.04American Axle & Manufacturing, Inc.6.875% 01/07/2028 USD 345,000 378,261 0.02American Tower Corp., REIT 3.6%15/01/2028 USD 3,000,000 3,302,861 0.14American Tower Corp., REIT 2.1%15/06/2030 USD 2,665,000 2,630,936 0.11Anheuser-Busch Cos. LLC 4.9%01/02/2046 USD 450,000 571,410 0.02Anheuser-Busch InBev Worldwide, Inc.4.439% 06/10/2048 USD 1,440,000 1,722,929 0.07Avantor Funding, Inc., Reg. S 2.625%01/11/2025 EUR 400,000 486,987 0.02Avantor Funding, Inc., Reg. S 3.875%15/07/2028 EUR 330,000 414,005 0.02Ball Corp. 0.875% 15/03/2024 EUR 800,000 957,762 0.04Ball Corp. 1.5% 15/03/2027 EUR 350,000 422,032 0.02Bank of America Corp. 3.248%21/10/2027 USD 1,580,000 1,714,686 0.07BAT Capital Corp. 4.39% 15/08/2037 USD 2,193,000 2,373,919 0.10Becton Dickinson and Co. 3.794%20/05/2050 USD 675,000 759,086 0.03Belden, Inc., Reg. S 3.375% 15/07/2027 EUR 200,000 244,527 0.01Belden, Inc., Reg. S 3.875%15/03/2028 EUR 350,000 434,435 0.02Berry Global, Inc., Reg. S 1%15/01/2025 EUR 700,000 840,453 0.03Boeing Co. (The) 5.04% 01/05/2027 USD 1,860,000 2,151,486 0.09Boeing Co. (The) 5.705% 01/05/2040 USD 680,000 879,649 0.04Boeing Co. (The) 3.85% 01/11/2048 USD 765,000 788,064 0.03Boeing Co. (The) 3.95% 01/08/2059 USD 720,000 753,778 0.03BP Capital Markets America, Inc.2.772% 10/11/2050 USD 720,000 673,355 0.03Catalent Pharma Solutions, Inc., Reg. S2.375% 01/03/2028 EUR 170,000 202,820 0.01CenterPoint Energy, Inc. 2.95%01/03/2030 USD 2,320,000 2,454,126 0.10Chemours Co. (The) 4% 15/05/2026 EUR 300,000 365,550 0.01Cigna Corp. 3.4% 15/03/2050 USD 905,000 947,882 0.04Citigroup, Inc. 3.7% 12/01/2026 USD 1,550,000 1,714,102 0.07Cogent Communications Group, Inc.,Reg. S 4.375% 30/06/2024 EUR 330,000 400,175 0.02Coty, Inc., Reg. S 4% 15/04/2023 EUR 500,000 590,328 0.02Crown Castle International Corp., REIT3.3% 01/07/2030 USD 130,000 139,428 0.01Crown Castle International Corp., REIT4.15% 01/07/2050 USD 185,000 212,261 0.01CVS Health Corp. 2.7% 21/08/2040 USD 1,800,000 1,747,074 0.07Dana, Inc. 5.625% 15/06/2028 USD 290,000 314,418 0.01Dell International LLC 6.02%15/06/2026 USD 5,495,000 6,588,400 0.27Dominion Energy, Inc. 3.375%01/04/2030 USD 2,850,000 3,109,839 0.13Edison International 3.55% 15/11/2024 USD 1,120,000 1,192,927 0.05Encompass Health Corp. 4.5%01/02/2028 USD 1,080,000 1,122,039 0.05Encompass Health Corp. 4.75%01/02/2030 USD 575,000 612,456 0.02Energy Transfer LP 3.75% 15/05/2030 USD 400,000 434,949 0.02Energy Transfer LP 5.35% 15/05/2045 USD 900,000 1,044,710 0.04Evergy, Inc. 2.9% 15/09/2029 USD 645,000 683,463 0.03Exxon Mobil Corp. 2.995% 16/08/2039 USD 1,400,000 1,447,057 0.06Fidelity National Information Services,Inc. 2% 21/05/2030 EUR 600,000 788,701 0.03Ford Motor Co. 9% 22/04/2025 USD 615,000 757,234 0.03Ford Motor Co. 5.291% 08/12/2046 USD 1,650,000 1,835,650 0.08
Ford Motor Credit Co. LLC 3.021%06/03/2024 EUR 650,000 810,626 0.03Ford Motor Credit Co. LLC 2.748%14/06/2024 GBP 155,000 217,888 0.01Ford Motor Credit Co. LLC 4.063%01/11/2024 USD 875,000 931,018 0.04Ford Motor Credit Co. LLC 3.25%15/09/2025 EUR 700,000 892,624 0.04Ford Motor Credit Co. LLC 2.33%25/11/2025 EUR 800,000 984,104 0.04Ford Motor Credit Co. LLC 4.389%08/01/2026 USD 1,725,000 1,864,863 0.08Ford Motor Credit Co. LLC 3.625%17/06/2031 USD 2,540,000 2,587,625 0.11Freeport-McMoRan, Inc. 4.375%01/08/2028 USD 695,000 734,094 0.03Freeport-McMoRan, Inc. 5.4%14/11/2034 USD 1,420,000 1,709,474 0.07General Electric Co. 5.25% 07/12/2028 GBP 700,000 1,209,581 0.05General Electric Co. 2.125% 17/05/2037 EUR 205,000 265,027 0.01General Electric Co., Reg. S 4.125%19/09/2035 EUR 1,400,000 2,252,714 0.09General Motors Co. 6.125% 01/10/2025 USD 235,000 278,343 0.01General Motors Financial Co., Inc.3.95% 13/04/2024 USD 448,000 482,469 0.02General Motors Financial Co., Inc.2.75% 20/06/2025 USD 435,000 458,342 0.02Goldman Sachs Group, Inc. (The) 3.5%16/11/2026 USD 2,750,000 2,994,276 0.12Goldman Sachs Group, Inc. (The) 3.85%26/01/2027 USD 2,118,000 2,339,588 0.10Goldman Sachs Group, Inc. (The),Reg. S 4.25% 29/01/2026 GBP 850,000 1,336,416 0.05HCA, Inc. 5.875% 15/02/2026 USD 760,000 882,075 0.04HCA, Inc. 5.375% 01/09/2026 USD 385,000 444,894 0.02HCA, Inc. 4.5% 15/02/2027 USD 2,175,000 2,460,796 0.10HCA, Inc. 5.625% 01/09/2028 USD 2,075,000 2,466,656 0.10HCA, Inc. 3.5% 01/09/2030 USD 710,000 755,642 0.03HCA, Inc. 3.5% 15/07/2051 USD 1,080,000 1,083,646 0.04Healthcare Trust of America HoldingsLP, REIT 3.1% 15/02/2030 USD 404,000 429,730 0.02Healthcare Trust of America HoldingsLP, REIT 2% 15/03/2031 USD 4,070,000 3,938,495 0.16IQVIA, Inc., Reg. S 1.75% 15/03/2026 EUR 944,000 1,134,251 0.05IQVIA, Inc., Reg. S 2.25% 15/01/2028 EUR 350,000 418,869 0.02IQVIA, Inc., Reg. S 2.875% 15/06/2028 EUR 240,000 294,206 0.01IQVIA, Inc., Reg. S 2.25% 15/03/2029 EUR 100,000 118,664 0.00Kilroy Realty LP, REIT 2.5% 15/11/2032 USD 862,000 852,567 0.03Kraft Heinz Foods Co., Reg. S 2.25%25/05/2028 EUR 500,000 646,666 0.03Kroger Co. (The) 3.875% 15/10/2046 USD 634,000 700,399 0.03L3Harris Technologies, Inc. 4.854%27/04/2035 USD 2,480,000 3,112,058 0.13Lennar Corp. 4.75% 29/11/2027 USD 1,920,000 2,215,200 0.09Lumen Technologies, Inc. 5.625%01/04/2025 USD 135,000 145,965 0.01MDC Holdings, Inc. 5.5% 15/01/2024 USD 2,172,000 2,387,777 0.10MetLife, Inc. 6.4% 15/12/2066 USD 1,670,000 2,151,179 0.09MGM Resorts International 6.75%01/05/2025 USD 1,615,000 1,732,031 0.07MGM Resorts International 5.5%15/04/2027 USD 120,000 132,054 0.01MidAmerican Energy Co. 4.25%01/05/2046 USD 585,000 724,429 0.03MPLX LP 4.5% 15/04/2038 USD 1,355,000 1,556,981 0.06Netflix, Inc., Reg. S 3% 15/06/2025 EUR 1,200,000 1,553,871 0.06Netflix, Inc., Reg. S 3.875% 15/11/2029 EUR 800,000 1,145,991 0.05Netflix, Inc., Reg. S 3.625% 15/06/2030 EUR 600,000 848,661 0.03NextEra Energy Capital Holdings, Inc.2.25% 01/06/2030 USD 405,000 408,766 0.02Occidental Petroleum Corp. 3.5%15/06/2025 USD 625,000 638,281 0.03Occidental Petroleum Corp. 8%15/07/2025 USD 141,000 168,676 0.01Occidental Petroleum Corp. 5.875%01/09/2025 USD 139,000 155,114 0.01Occidental Petroleum Corp. 5.5%01/12/2025 USD 515,000 566,822 0.02Occidental Petroleum Corp. 8.875%15/07/2030 USD 190,000 253,898 0.01Occidental Petroleum Corp. 6.125%01/01/2031 USD 515,000 602,550 0.02OneMain Finance Corp. 4%15/09/2030 USD 1,120,000 1,111,096 0.05Oracle Corp. 2.875% 25/03/2031 USD 315,000 328,070 0.01Oracle Corp. 3.95% 25/03/2051 USD 2,530,000 2,764,431 0.11Organon & Co., Reg. S 2.875%30/04/2028 EUR 478,000 576,609 0.02Pacific Gas and Electric Co. 2.95%01/03/2026 USD 616,000 630,306 0.03
220
JPMorgan Funds - Global Strategic Bond FundSchedule of Investments (continued)
As at 30 June 2021
Investments Currency
Quantity/Nominal
Value
MarketValue
USD
%of
NetAssets Investments Currency
Quantity/Nominal
Value
MarketValue
USD
%of
NetAssets

Pacific Gas and Electric Co. 3.3%15/03/2027 USD 1,194,000 1,236,879 0.05Pacific Gas and Electric Co. 4.6%15/06/2043 USD 1,203,000 1,199,970 0.05Pacific Gas and Electric Co. 4.75%15/02/2044 USD 95,000 95,963 0.00Pacific Gas and Electric Co. 4.25%15/03/2046 USD 715,000 682,054 0.03Pacific Gas and Electric Co. 4%01/12/2046 USD 970,000 907,925 0.04Pacific Gas and Electric Co. 3.95%01/12/2047 USD 150,000 138,869 0.01PacifiCorp 2.7% 15/09/2030 USD 1,210,000 1,272,857 0.05PacifiCorp 3.3% 15/03/2051 USD 280,000 299,130 0.01Paysafe Finance plc, Reg. S 3%15/06/2029 EUR 413,000 484,374 0.02PG&E Corp. 5% 01/07/2028 USD 210,000 211,851 0.01PG&E Corp. 5.25% 01/07/2030 USD 130,000 131,697 0.01Philip Morris International, Inc. 2.1%01/05/2030 USD 260,000 259,206 0.01PPL Capital Funding, Inc., FRN 2.812%30/03/2067 USD 1,502,000 1,478,230 0.06Reynolds American, Inc. 4.45%12/06/2025 USD 2,065,000 2,288,645 0.09San Diego Gas & Electric Co. 3.32%15/04/2050 USD 340,000 360,882 0.01Service Corp. International 3.375%15/08/2030 USD 361,000 354,159 0.01Silgan Holdings, Inc. 3.25% 15/03/2025 EUR 350,000 419,427 0.02Silgan Holdings, Inc. 2.25%01/06/2028 EUR 150,000 179,454 0.01SM Energy Co. 6.625% 15/01/2027 USD 210,000 215,145 0.01Southern California Edison Co. 3.9%15/03/2043 USD 284,000 298,528 0.01Southern California Edison Co. 4.125%01/03/2048 USD 1,135,000 1,217,773 0.05Southern California Edison Co. 3.65%01/02/2050 USD 783,000 788,413 0.03Southern Co. Gas Capital Corp. 1.75%15/01/2031 USD 1,102,000 1,045,958 0.04Southwestern Energy Co. 8.375%15/09/2028 USD 650,000 735,378 0.03Spectrum Brands, Inc., Reg. S 4%01/10/2026 EUR 280,000 340,517 0.01Standard Industries, Inc., Reg. S 2.25%21/11/2026 EUR 500,000 591,996 0.02Sysco Corp. 3.3% 15/02/2050 USD 1,010,000 1,015,036 0.04Tenet Healthcare Corp. 4.625%15/07/2024 USD 260,000 264,208 0.01Thermo Fisher Scientific, Inc. 1.5%01/10/2039 EUR 500,000 615,543 0.02T-Mobile USA, Inc. 3.75% 15/04/2027 USD 7,770,000 8,592,726 0.35T-Mobile USA, Inc. 3.875% 15/04/2030 USD 4,366,000 4,884,681 0.20T-Mobile USA, Inc. 2.55% 15/02/2031 USD 2,900,000 2,937,178 0.12T-Mobile USA, Inc. 2.25% 15/11/2031 USD 410,000 404,020 0.02T-Mobile USA, Inc. 4.5% 15/04/2050 USD 1,035,000 1,233,596 0.05UGI International LLC, Reg. S 3.25%01/11/2025 EUR 860,000 1,045,489 0.04United Rentals North America, Inc.4.875% 15/01/2028 USD 590,000 626,315 0.03United Rentals North America, Inc.3.875% 15/02/2031 USD 920,000 937,250 0.04United States Cellular Corp. 6.7%15/12/2033 USD 1,100,000 1,351,515 0.06United States Steel Corp. 6.875%01/03/2029 USD 300,000 321,975 0.01Verizon Communications, Inc. 1.75%20/01/2031 USD 2,730,000 2,618,975 0.11Verizon Communications, Inc. 2.55%21/03/2031 USD 3,055,000 3,131,884 0.13Verizon Communications, Inc. 2.65%20/11/2040 USD 575,000 554,219 0.02Verizon Communications, Inc. 3.4%22/03/2041 USD 2,400,000 2,545,655 0.10Verizon Communications, Inc. 2.875%20/11/2050 USD 2,105,000 2,015,270 0.08Verizon Communications, Inc. 3.55%22/03/2051 USD 1,770,000 1,890,490 0.08Wells Fargo & Co. 4.75% 07/12/2046 USD 1,380,000 1,751,418 0.07WMG Acquisition Corp., Reg. S 3.625%15/10/2026 EUR 320,000 389,939 0.02WP Carey, Inc., REIT 2.4% 01/02/2031 USD 340,000 337,739 0.01ZF North America Capital, Inc., Reg. S2.75% 27/04/2023 EUR 200,000 248,082 0.01
186,296,954 7.67
Virgin Islands, BritishGerdau Trade, Inc., Reg. S 4.875%24/10/2027 USD 2,700,000 3,041,185 0.12Huarong Finance 2017 Co. Ltd., Reg. S4.25% 07/11/2027 USD 2,330,000 1,633,913 0.07
4,675,098 0.19
Total Bonds 999,525,955 41.18
Convertible Bonds
Austriaams AG, Reg. S 2.125% 03/11/2027 EUR 1,300,000 1,526,828 0.06
1,526,828 0.06
United States of AmericaSnap, Inc., 144A 0% 01/05/2027 USD 1,059,000 1,145,596 0.05
1,145,596 0.05
Total Convertible Bonds 2,672,424 0.11
Equities
United States of AmericaiHeartMedia, Inc. ‘A’ USD 9,131 243,798 0.01NMG, Inc. USD 322 40,894 0.00Wells Fargo & Co. Preference USD 9,550 248,634 0.01
533,326 0.02
Total Equities 533,326 0.02
Total Transferable securities and money market instrumentsadmitted to an official exchange listing 1,002,731,705 41.31
Transferable securities and money market instruments dealt in on another regulatedmarket
Bonds
AustraliaWestpac Banking Corp., FRN 4.11%24/07/2034 USD 495,000 542,916 0.02
542,916 0.02
Canada1011778 BC ULC, 144A 3.875%15/01/2028 USD 215,000 218,225 0.011011778 BC ULC, 144A 4% 15/10/2030 USD 1,220,000 1,181,875 0.05Bausch Health Cos., Inc., 144A 6.125%15/04/2025 USD 650,000 666,250 0.03Bausch Health Cos., Inc., 144A 5.5%01/11/2025 USD 750,000 769,688 0.03Bausch Health Cos., Inc., 144A 5%30/01/2028 USD 675,000 641,250 0.02Bausch Health Cos., Inc., 144A 4.875%01/06/2028 USD 870,000 890,053 0.03Bausch Health Cos., Inc., 144A 6.25%15/02/2029 USD 1,675,000 1,654,063 0.07Bausch Health Cos., Inc., 144A 5.25%30/01/2030 USD 1,340,000 1,247,875 0.05Bombardier, Inc., Reg. S 7.875%15/04/2027 USD 170,000 176,589 0.01Clarios Global LP, 144A 6.75%15/05/2025 USD 463,000 494,248 0.02Emera, Inc., FRN 6.75% 15/06/2076 USD 5,588,000 6,554,696 0.27GFL Environmental, Inc., 144A 5.125%15/12/2026 USD 690,000 730,061 0.03GFL Environmental, Inc., 144A 4%01/08/2028 USD 530,000 523,494 0.02Masonite International Corp., 144A5.375% 01/02/2028 USD 390,000 415,656 0.02NOVA Chemicals Corp., 144A 5.25%01/06/2027 USD 203,000 216,956 0.01Transcanada Trust, FRN 5.875%15/08/2076 USD 613,000 685,028 0.03
17,066,007 0.70
Cayman IslandsAvolon Holdings Funding Ltd., 144A5.25% 15/05/2024 USD 900,000 990,485 0.04Avolon Holdings Funding Ltd., 144A3.95% 01/07/2024 USD 1,672,000 1,784,254 0.07Avolon Holdings Funding Ltd., 144A2.125% 21/02/2026 USD 460,000 456,511 0.02Avolon Holdings Funding Ltd., 144A4.25% 15/04/2026 USD 1,310,000 1,420,640 0.06
221
JPMorgan Funds - Global Strategic Bond FundSchedule of Investments (continued)
As at 30 June 2021
Investments Currency
Quantity/Nominal
Value
MarketValue
USD
%of
NetAssets Investments Currency
Quantity/Nominal
Value
MarketValue
USD
%of
NetAssets

Avolon Holdings Funding Ltd., 144A4.375% 01/05/2026 USD 580,000 630,610 0.03CFIP CLO Ltd., FRN, Series 2017-1A ‘A’,144A 1.41% 18/01/2030 USD 1,840,000 1,836,602 0.07Dryden 41 Senior Loan Fund, FRN,Series 2015-41A ‘AR’, 144A 1.154%15/04/2031 USD 2,700,000 2,701,947 0.11GPMT Ltd., FRN, Series 2018-FL1 ‘B’,144A 1.647% 21/11/2035 USD 1,470,000 1,468,373 0.06Hero Funding, Series 2017-3A ‘A1’,144A 3.19% 20/09/2048 USD 877,239 901,101 0.04Magnetite VII Ltd., FRN, Series 2012-7A‘A1R2’, 144A 0.984% 15/01/2028 USD 2,919,016 2,920,671 0.12OCP CLO Ltd., FRN, Series 2017-13A‘A1A’, 144A 1.444% 15/07/2030 USD 1,450,604 1,451,638 0.06Palmer Square Loan Funding Ltd., FRN,Series 2018-5A ‘A1’, 144A 1.038%20/01/2027 USD 6,456,026 6,463,354 0.27
23,026,186 0.95
FranceBPCE SA, 144A 5.7% 22/10/2023 USD 3,645,000 4,036,695 0.17BPCE SA, 144A 5.15% 21/07/2024 USD 1,491,000 1,661,243 0.07Credit Agricole SA, 144A 3.25%04/10/2024 USD 264,000 283,146 0.01Societe Generale SA, FRN, 144A2.889% 09/06/2032 USD 1,260,000 1,276,594 0.05Societe Generale SA, FRN, 144A5.375% Perpetual USD 4,034,000 4,281,083 0.18
11,538,761 0.48
GermanyDeutsche Bank AG, FRN 2.222%18/09/2024 USD 2,250,000 2,311,251 0.10
2,311,251 0.10
IrelandJazz Securities DAC, 144A 4.375%15/01/2029 USD 410,000 425,375 0.02Virgin Media Vendor Financing NotesIII DAC, Reg. S 4.875% 15/07/2028 GBP 200,000 281,782 0.01
707,157 0.03
ItalyEni SpA, 144A 4.25% 09/05/2029 USD 3,200,000 3,650,168 0.15Intesa Sanpaolo SpA, 144A 4.198%01/06/2032 USD 430,000 441,066 0.02Intesa Sanpaolo SpA, 144A 4.95%01/06/2042 USD 1,367,000 1,420,689 0.06UniCredit SpA, FRN, 144A 1.982%03/06/2027 USD 2,127,000 2,120,946 0.09UniCredit SpA, FRN, 144A 3.127%03/06/2032 USD 1,520,000 1,529,938 0.06
9,162,807 0.38
JapanTakeda Pharmaceutical Co. Ltd.3.025% 09/07/2040 USD 740,000 747,086 0.03Takeda Pharmaceutical Co. Ltd. 3.175%09/07/2050 USD 751,000 762,012 0.03
1,509,098 0.06
LebanonLebanon Government Bond 6.375%31/12/2021 USD 1,790,000 234,427 0.01
234,427 0.01
LiberiaRoyal Caribbean Cruises Ltd., 144A11.5% 01/06/2025 USD 180,000 207,664 0.01
207,664 0.01
LuxembourgEndo Luxembourg Finance Co. I Sarl,144A 6.125% 01/04/2029 USD 1,075,000 1,052,156 0.04Guara Norte Sarl, Reg. S 5.198%15/06/2034 USD 1,364,401 1,413,929 0.06Swiss Re Finance Luxembourg SA, FRN,144A 5% 02/04/2049 USD 600,000 683,582 0.03Telecom Italia Capital SA 6.375%15/11/2033 USD 305,000 364,850 0.01Telecom Italia Capital SA 6%30/09/2034 USD 945,000 1,095,491 0.04
Trinseo Materials Operating SCA, 144A5.375% 01/09/2025 USD 200,000 205,366 0.01Trinseo Materials Operating SCA, 144A5.125% 01/04/2029 USD 620,000 634,840 0.03
5,450,214 0.22
MalaysiaMalaysia Government Bond 3.828%05/07/2034 MYR 22,890,000 5,494,419 0.23
5,494,419 0.23
MexicoCemex SAB de CV, Reg. S 3.875%11/07/2031 USD 1,786,000 1,817,701 0.08Cemex SAB de CV, Reg. S, FRN 5.125%31/12/2164 USD 2,373,000 2,452,377 0.10Grupo Bimbo SAB de CV, 144A 4%06/09/2049 USD 770,000 822,893 0.03
5,092,971 0.21
NetherlandsABN AMRO Bank NV, 144A 4.8%18/04/2026 USD 1,200,000 1,363,634 0.06Alcoa Nederland Holding BV, 144A5.5% 15/12/2027 USD 1,245,000 1,347,712 0.05EDP Finance BV, 144A 3.625%15/07/2024 USD 7,823,000 8,402,477 0.34Enel Finance International NV, 144A3.625% 25/05/2027 USD 1,950,000 2,144,999 0.09Enel Finance International NV, 144A3.5% 06/04/2028 USD 2,140,000 2,346,839 0.10Greenko Dutch BV, Reg. S 3.85%29/03/2026 USD 1,382,000 1,420,005 0.06Sensata Technologies BV, 144A 4%15/04/2029 USD 285,000 289,398 0.01
17,315,064 0.71
SpainTDA CAM 4 FTA, Reg. S, FRN, Series 4‘A’ 0% 26/06/2039 EUR 469,687 556,451 0.02
556,451 0.02
SupranationalArdagh Packaging Finance plc, 144A5.25% 15/08/2027 USD 270,000 275,759 0.01Delta Air Lines, Inc., 144A 4.5%20/10/2025 USD 710,000 765,395 0.03NXP BV, 144A 3.25% 11/05/2041 USD 2,580,000 2,653,725 0.11
3,694,879 0.15
SwitzerlandCredit Suisse Group AG, 144A 4.282%09/01/2028 USD 2,550,000 2,838,934 0.12Credit Suisse Group AG, FRN, 144A3.091% 14/05/2032 USD 1,285,000 1,328,773 0.05
4,167,707 0.17
United KingdomHSBC Holdings plc, FRN 6.375%Perpetual USD 222,000 247,591 0.01International Game Technology plc,144A 6.5% 15/02/2025 USD 505,000 566,863 0.02International Game Technology plc,144A 5.25% 15/01/2029 USD 650,000 698,051 0.03Natwest Group plc, FRN 8.625%Perpetual USD 700,000 707,857 0.03RMAC NO 2 plc, Reg. S, FRN, Series2018-2 ‘A’ 1.055% 12/06/2046 GBP 1,267,534 1,761,836 0.07Standard Chartered plc, FRN, 144A4.644% 01/04/2031 USD 3,000,000 3,513,211 0.15Vodafone Group plc 4.875%19/06/2049 USD 2,031,000 2,579,089 0.11Vodafone Group plc 4.25% 17/09/2050 USD 880,000 1,018,943 0.04
11,093,441 0.46
United States of America280 Park Avenue Mortgage Trust, FRN,Series 2017-280P ‘A’, 144A 0.981%15/09/2034 USD 3,680,000 3,689,205 0.15AbbVie, Inc. 4.25% 21/11/2049 USD 510,000 612,947 0.03Acadia Healthcare Co., Inc., 144A 5%15/04/2029 USD 586,000 612,786 0.03ACCO Brands Corp., 144A 4.25%15/03/2029 USD 1,990,000 1,967,911 0.08
222
JPMorgan Funds - Global Strategic Bond FundSchedule of Investments (continued)
As at 30 June 2021
Investments Currency
Quantity/Nominal
Value
MarketValue
USD
%of
NetAssets Investments Currency
Quantity/Nominal
Value
MarketValue
USD
%of
NetAssets

ACE Securities Corp. Home Equity LoanTrust, FRN, Series 2004-FM1 ‘M1’0.992% 25/09/2033 USD 683,369 680,903 0.03Advanced Drainage Systems, Inc., 144A5% 30/09/2027 USD 333,000 346,856 0.01AES Corp. (The), 144A 3.3%15/07/2025 USD 940,000 1,005,993 0.04AES Corp. (The), 144A 3.95%15/07/2030 USD 2,557,000 2,800,273 0.12AES Corp. (The), 144A 2.45%15/01/2031 USD 3,004,000 2,970,775 0.12Albertsons Cos., Inc., 144A 4.625%15/01/2027 USD 770,000 805,454 0.03Albertsons Cos., Inc., 144A 3.5%15/03/2029 USD 850,000 837,250 0.03Alexander Funding Trust, 144A 1.841%15/11/2023 USD 780,000 794,451 0.03Allison Transmission, Inc., 144A 4.75%01/10/2027 USD 330,000 342,915 0.01Allison Transmission, Inc., 144A5.875% 01/06/2029 USD 1,295,000 1,422,234 0.06Allison Transmission, Inc., 144A 3.75%30/01/2031 USD 100,000 98,375 0.00Alternative Loan Trust, Series2004-24CB ‘1A1’ 6% 25/11/2034 USD 390,180 412,643 0.02Alternative Loan Trust, Series2004-28CB ‘2A4’ 5.75% 25/01/2035 USD 648,700 654,177 0.03Alternative Loan Trust, Series2004-28CB ‘3A1’ 6% 25/01/2035 USD 513,032 520,439 0.02Alternative Loan Trust, Series2005-80CB ‘5A1’ 6% 25/02/2036 USD 1,293,341 1,315,539 0.05Alternative Loan Trust, Series2004-25CB ‘A1’ 6% 25/12/2034 USD 1,746,227 1,754,551 0.07Amazon.com, Inc. 2.7% 03/06/2060 USD 615,000 590,948 0.02American Credit AcceptanceReceivables Trust, Series 2018-2 ‘E’,144A 5.16% 10/09/2024 USD 6,150,000 6,382,116 0.26ANGI Group LLC, 144A 3.875%15/08/2028 USD 1,300,000 1,290,549 0.05Antero Midstream Partners LP, 144A5.75% 01/03/2027 USD 315,000 328,780 0.01Antero Midstream Partners LP, 144A5.375% 15/06/2029 USD 425,000 443,596 0.02Antero Resources Corp., 144A 8.375%15/07/2026 USD 584,000 663,570 0.03Antero Resources Corp., 144A 7.625%01/02/2029 USD 80,000 88,904 0.00Apple, Inc. 2.65% 08/02/2051 USD 1,990,000 1,966,924 0.08Applebee’s Funding LLC, Series2019-1A ‘A2II’, 144A 4.723%07/06/2049 USD 3,806,238 4,034,060 0.17Arches Buyer, Inc., 144A 4.25%01/06/2028 USD 620,000 612,358 0.03Arches Buyer, Inc., 144A 6.125%01/12/2028 USD 400,000 412,814 0.02Arconic Corp., 144A 6% 15/05/2025 USD 145,000 154,577 0.01Arconic Corp., 144A 6.125%15/02/2028 USD 1,305,000 1,403,521 0.06Argent Securities, Inc. Asset-BackedPass-Through Certificates Trust, FRN,Series 2004-W7 ‘M2’ 0.992%25/05/2034 USD 288,139 287,101 0.01Asset-Backed Securities Corp. HomeEquity Loan Trust, FRN, Series2004-HE7 ‘M2’ 1.667% 25/10/2034 USD 435,621 451,551 0.02Audacy Capital Corp. 6.75%31/03/2029 USD 460,000 476,231 0.02Avantor Funding, Inc., 144A 4.625%15/07/2028 USD 1,420,000 1,494,195 0.06Avis Budget Car Rental LLC, 144A5.75% 15/07/2027 USD 800,000 840,124 0.03Avis Budget Car Rental LLC, 144A5.375% 01/03/2029 USD 395,000 411,857 0.02BAMLL Re-REMIC Trust, FRN, Series2014-FRR9 ‘F’, 144A 2.429%26/12/2046 USD 1,127,567 1,115,775 0.05BANK, FRN, Series 2018-BN13 ‘C’4.56% 15/08/2061 USD 2,207,000 2,467,228 0.10Bank of America Corp., FRN 3.559%23/04/2027 USD 3,640,000 3,986,678 0.16Bank of America Corp., FRN 1.898%23/07/2031 USD 4,200,000 4,088,075 0.17Bank of America Corp., FRN 1.922%24/10/2031 USD 2,230,000 2,174,917 0.09Bank of America Corp., FRN 2.687%22/04/2032 USD 5,250,000 5,420,390 0.22Bank of America Corp., FRN 2.676%19/06/2041 USD 730,000 713,022 0.03Bank of America Corp., FRN 6.25%Perpetual USD 2,817,000 3,119,729 0.13Bank of America Corp., FRN 6.5%Perpetual USD 594,000 674,190 0.03
Bank of New York Mellon Corp. (The),FRN 4.7% Perpetual USD 553,000 604,152 0.02Benchmark Mortgage Trust, Series2018-B3 ‘A5’ 4.025% 10/04/2051 USD 620,000 706,984 0.03Benchmark Mortgage Trust, IO, FRN,Series 2018-B2 ‘XA’ 0.412%15/02/2051 USD 48,512,822 975,442 0.04Benchmark Mortgage Trust, IO, FRN,Series 2018-B3 ‘XA’ 0.634%10/04/2051 USD 36,203,325 1,076,441 0.04BHMS, FRN, Series 2018-ATLS ‘A’, 144A1.351% 15/07/2035 USD 2,401,000 2,406,276 0.10Bimbo Bakeries USA, Inc., 144A 4%17/05/2051 USD 1,002,000 1,081,272 0.04Biogen, Inc. 2.25% 01/05/2030 USD 2,490,000 2,501,926 0.10Black Knight InfoServ LLC, 144A3.625% 01/09/2028 USD 1,130,000 1,125,740 0.05Blue Racer Midstream LLC, 144A6.625% 15/07/2026 USD 310,000 325,100 0.01Booz Allen Hamilton, Inc., 144A3.875% 01/09/2028 USD 535,000 547,056 0.02Booz Allen Hamilton, Inc., 144A 4%01/07/2029 USD 440,000 450,450 0.02Boyne USA, Inc., 144A 4.75%15/05/2029 USD 825,000 853,557 0.04Braemar Hotels & Resorts Trust, FRN,Series 2018-PRME ‘C’, 144A 1.351%15/06/2035 USD 1,100,000 1,098,992 0.05Brink’s Co. (The), 144A 4.625%15/10/2027 USD 560,000 583,881 0.02Bristol-Myers Squibb Co. 4.25%26/10/2049 USD 600,000 758,733 0.03Buckeye Partners LP, 144A 4.5%01/03/2028 USD 251,000 256,522 0.01BX Commercial Mortgage Trust, FRN,Series 2018-BIOA ‘A’, 144A 0.772%15/03/2037 USD 11,800,000 11,834,272 0.49BX Commercial Mortgage Trust, FRN,Series 2018-IND ‘A’, 144A 0.851%15/11/2035 USD 886,719 888,010 0.04BY Crown Parent LLC, 144A 4.25%31/01/2026 USD 710,000 744,257 0.03California Resources Corp., 144A7.125% 01/02/2026 USD 83,000 87,778 0.00Calpine Corp., 144A 5.25% 01/06/2026 USD 419,000 432,184 0.02Capital One Financial Corp., FRN 3.95%31/12/2164 USD 3,895,000 3,972,900 0.16CCO Holdings LLC, 144A 5.125%01/05/2027 USD 4,835,000 5,070,706 0.21CCO Holdings LLC, 144A 5%01/02/2028 USD 1,435,000 1,507,898 0.06CCO Holdings LLC, 144A 5.375%01/06/2029 USD 385,000 420,232 0.02CCO Holdings LLC, 144A 4.75%01/03/2030 USD 1,735,000 1,832,594 0.08CCO Holdings LLC, 144A 4.25%01/02/2031 USD 2,852,000 2,905,475 0.12CCUBS Commercial Mortgage Trust,FRN, Series 2017-C1 ‘C’ 4.392%15/11/2050 USD 648,000 708,155 0.03CD Mortgage Trust, Series 2017-CD5‘A4’ 3.431% 15/08/2050 USD 1,920,000 2,106,478 0.09CD Mortgage Trust, FRN, Series2016-CD2 ‘C’ 4.022% 10/11/2049 USD 405,000 420,485 0.02CD Mortgage Trust, Series 2017-CD5‘D’, 144A 3.35% 15/08/2050 USD 3,193,000 2,937,913 0.12CD&R Smokey Buyer, Inc., 144A 6.75%15/07/2025 USD 1,120,000 1,207,500 0.05CDK Global, Inc., 144A 5.25%15/05/2029 USD 1,047,000 1,145,408 0.05CDW LLC 4.25% 01/04/2028 USD 350,000 368,555 0.02CDW LLC 3.25% 15/02/2029 USD 865,000 876,894 0.04Cedar Fair LP, 144A 5.5% 01/05/2025 USD 855,000 895,612 0.04Cedar Fair LP 5.25% 15/07/2029 USD 334,000 345,199 0.01Centene Corp. 4.25% 15/12/2027 USD 380,000 400,900 0.02Centene Corp. 4.625% 15/12/2029 USD 700,000 770,889 0.03Central Garden & Pet Co., 144A 4.125%30/04/2031 USD 50,000 50,698 0.00Central Garden & Pet Co. 5.125%01/02/2028 USD 190,000 201,332 0.01Central Garden & Pet Co. 4.125%15/10/2030 USD 1,019,000 1,038,259 0.04CF Industries, Inc., 144A 4.5%01/12/2026 USD 800,000 919,209 0.04Charles Schwab Corp. (The), FRN 4%Perpetual USD 2,090,000 2,145,907 0.09Charles Schwab Corp. (The), FRN 4%Perpetual USD 2,940,000 3,075,643 0.13Charter Communications OperatingLLC 2.8% 01/04/2031 USD 710,000 724,947 0.03
223
JPMorgan Funds - Global Strategic Bond FundSchedule of Investments (continued)
As at 30 June 2021
Investments Currency
Quantity/Nominal
Value
MarketValue
USD
%of
NetAssets Investments Currency
Quantity/Nominal
Value
MarketValue
USD
%of
NetAssets
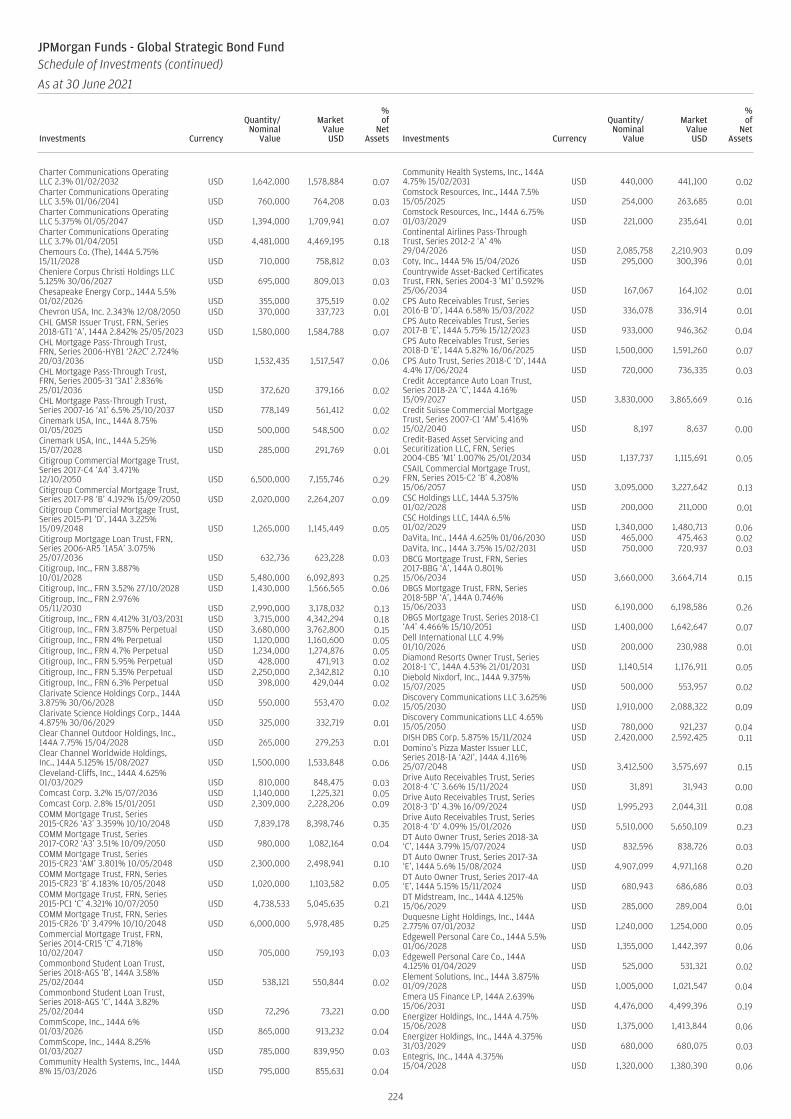
Charter Communications OperatingLLC 2.3% 01/02/2032 USD 1,642,000 1,578,884 0.07Charter Communications OperatingLLC 3.5% 01/06/2041 USD 760,000 764,208 0.03Charter Communications OperatingLLC 5.375% 01/05/2047 USD 1,394,000 1,709,941 0.07Charter Communications OperatingLLC 3.7% 01/04/2051 USD 4,481,000 4,469,195 0.18Chemours Co. (The), 144A 5.75%15/11/2028 USD 710,000 758,812 0.03Cheniere Corpus Christi Holdings LLC5.125% 30/06/2027 USD 695,000 809,013 0.03Chesapeake Energy Corp., 144A 5.5%01/02/2026 USD 355,000 375,519 0.02Chevron USA, Inc. 2.343% 12/08/2050 USD 370,000 337,723 0.01CHL GMSR Issuer Trust, FRN, Series2018-GT1 ‘A’, 144A 2.842% 25/05/2023 USD 1,580,000 1,584,788 0.07CHL Mortgage Pass-Through Trust,FRN, Series 2006-HYB1 ‘2A2C’ 2.724%20/03/2036 USD 1,532,435 1,517,547 0.06CHL Mortgage Pass-Through Trust,FRN, Series 2005-31 ‘3A1’ 2.836%25/01/2036 USD 372,620 379,166 0.02CHL Mortgage Pass-Through Trust,Series 2007-16 ‘A1’ 6.5% 25/10/2037 USD 778,149 561,412 0.02Cinemark USA, Inc., 144A 8.75%01/05/2025 USD 500,000 548,500 0.02Cinemark USA, Inc., 144A 5.25%15/07/2028 USD 285,000 291,769 0.01Citigroup Commercial Mortgage Trust,Series 2017-C4 ‘A4’ 3.471%12/10/2050 USD 6,500,000 7,155,746 0.29Citigroup Commercial Mortgage Trust,Series 2017-P8 ‘B’ 4.192% 15/09/2050 USD 2,020,000 2,264,207 0.09Citigroup Commercial Mortgage Trust,Series 2015-P1 ‘D’, 144A 3.225%15/09/2048 USD 1,265,000 1,145,449 0.05Citigroup Mortgage Loan Trust, FRN,Series 2006-AR5 ‘1A5A’ 3.075%25/07/2036 USD 632,736 623,228 0.03Citigroup, Inc., FRN 3.887%10/01/2028 USD 5,480,000 6,092,893 0.25Citigroup, Inc., FRN 3.52% 27/10/2028 USD 1,430,000 1,566,565 0.06Citigroup, Inc., FRN 2.976%05/11/2030 USD 2,990,000 3,178,032 0.13Citigroup, Inc., FRN 4.412% 31/03/2031 USD 3,715,000 4,342,294 0.18Citigroup, Inc., FRN 3.875% Perpetual USD 3,680,000 3,762,800 0.15Citigroup, Inc., FRN 4% Perpetual USD 1,120,000 1,160,600 0.05Citigroup, Inc., FRN 4.7% Perpetual USD 1,234,000 1,274,876 0.05Citigroup, Inc., FRN 5.95% Perpetual USD 428,000 471,913 0.02Citigroup, Inc., FRN 5.35% Perpetual USD 2,250,000 2,342,812 0.10Citigroup, Inc., FRN 6.3% Perpetual USD 398,000 429,044 0.02Clarivate Science Holdings Corp., 144A3.875% 30/06/2028 USD 550,000 553,470 0.02Clarivate Science Holdings Corp., 144A4.875% 30/06/2029 USD 325,000 332,719 0.01Clear Channel Outdoor Holdings, Inc.,144A 7.75% 15/04/2028 USD 265,000 279,253 0.01Clear Channel Worldwide Holdings,Inc., 144A 5.125% 15/08/2027 USD 1,500,000 1,533,848 0.06Cleveland-Cliffs, Inc., 144A 4.625%01/03/2029 USD 810,000 848,475 0.03Comcast Corp. 3.2% 15/07/2036 USD 1,140,000 1,225,321 0.05Comcast Corp. 2.8% 15/01/2051 USD 2,309,000 2,228,206 0.09COMM Mortgage Trust, Series2015-CR26 ‘A3’ 3.359% 10/10/2048 USD 7,839,178 8,398,746 0.35COMM Mortgage Trust, Series2017-COR2 ‘A3’ 3.51% 10/09/2050 USD 980,000 1,082,164 0.04COMM Mortgage Trust, Series2015-CR23 ‘AM’ 3.801% 10/05/2048 USD 2,300,000 2,498,941 0.10COMM Mortgage Trust, FRN, Series2015-CR23 ‘B’ 4.183% 10/05/2048 USD 1,020,000 1,103,582 0.05COMM Mortgage Trust, FRN, Series2015-PC1 ‘C’ 4.321% 10/07/2050 USD 4,738,533 5,045,635 0.21COMM Mortgage Trust, FRN, Series2015-CR26 ‘D’ 3.479% 10/10/2048 USD 6,000,000 5,978,485 0.25Commercial Mortgage Trust, FRN,Series 2014-CR15 ‘C’ 4.718%10/02/2047 USD 705,000 759,193 0.03Commonbond Student Loan Trust,Series 2018-AGS ‘B’, 144A 3.58%25/02/2044 USD 538,121 550,844 0.02Commonbond Student Loan Trust,Series 2018-AGS ‘C’, 144A 3.82%25/02/2044 USD 72,296 73,221 0.00CommScope, Inc., 144A 6%01/03/2026 USD 865,000 913,232 0.04CommScope, Inc., 144A 8.25%01/03/2027 USD 785,000 839,950 0.03Community Health Systems, Inc., 144A8% 15/03/2026 USD 795,000 855,631 0.04
Community Health Systems, Inc., 144A4.75% 15/02/2031 USD 440,000 441,100 0.02Comstock Resources, Inc., 144A 7.5%15/05/2025 USD 254,000 263,685 0.01Comstock Resources, Inc., 144A 6.75%01/03/2029 USD 221,000 235,641 0.01Continental Airlines Pass-ThroughTrust, Series 2012-2 ‘A’ 4%29/04/2026 USD 2,085,758 2,210,903 0.09Coty, Inc., 144A 5% 15/04/2026 USD 295,000 300,396 0.01Countrywide Asset-Backed CertificatesTrust, FRN, Series 2004-3 ‘M1’ 0.592%25/06/2034 USD 167,067 164,102 0.01CPS Auto Receivables Trust, Series2016-B ‘D’, 144A 6.58% 15/03/2022 USD 336,078 336,914 0.01CPS Auto Receivables Trust, Series2017-B ‘E’, 144A 5.75% 15/12/2023 USD 933,000 946,362 0.04CPS Auto Receivables Trust, Series2018-D ‘E’, 144A 5.82% 16/06/2025 USD 1,500,000 1,591,260 0.07CPS Auto Trust, Series 2018-C ‘D’, 144A4.4% 17/06/2024 USD 720,000 736,335 0.03Credit Acceptance Auto Loan Trust,Series 2018-2A ‘C’, 144A 4.16%15/09/2027 USD 3,830,000 3,865,669 0.16Credit Suisse Commercial MortgageTrust, Series 2007-C1 ‘AM’ 5.416%15/02/2040 USD 8,197 8,637 0.00Credit-Based Asset Servicing andSecuritization LLC, FRN, Series2004-CB5 ‘M1’ 1.007% 25/01/2034 USD 1,137,737 1,115,691 0.05CSAIL Commercial Mortgage Trust,FRN, Series 2015-C2 ‘B’ 4.208%15/06/2057 USD 3,095,000 3,227,642 0.13CSC Holdings LLC, 144A 5.375%01/02/2028 USD 200,000 211,000 0.01CSC Holdings LLC, 144A 6.5%01/02/2029 USD 1,340,000 1,480,713 0.06DaVita, Inc., 144A 4.625% 01/06/2030 USD 465,000 475,463 0.02DaVita, Inc., 144A 3.75% 15/02/2031 USD 750,000 720,937 0.03DBCG Mortgage Trust, FRN, Series2017-BBG ‘A’, 144A 0.801%15/06/2034 USD 3,660,000 3,664,714 0.15DBGS Mortgage Trust, FRN, Series2018-5BP ‘A’, 144A 0.746%15/06/2033 USD 6,190,000 6,198,586 0.26DBGS Mortgage Trust, Series 2018-C1‘A4’ 4.466% 15/10/2051 USD 1,400,000 1,642,647 0.07Dell International LLC 4.9%01/10/2026 USD 200,000 230,988 0.01Diamond Resorts Owner Trust, Series2018-1 ‘C’, 144A 4.53% 21/01/2031 USD 1,140,514 1,176,911 0.05Diebold Nixdorf, Inc., 144A 9.375%15/07/2025 USD 500,000 553,957 0.02Discovery Communications LLC 3.625%15/05/2030 USD 1,910,000 2,088,322 0.09Discovery Communications LLC 4.65%15/05/2050 USD 780,000 921,237 0.04DISH DBS Corp. 5.875% 15/11/2024 USD 2,420,000 2,592,425 0.11Domino’s Pizza Master Issuer LLC,Series 2018-1A ‘A2I’, 144A 4.116%25/07/2048 USD 3,412,500 3,575,697 0.15Drive Auto Receivables Trust, Series2018-4 ‘C’ 3.66% 15/11/2024 USD 31,891 31,943 0.00Drive Auto Receivables Trust, Series2018-3 ‘D’ 4.3% 16/09/2024 USD 1,995,293 2,044,311 0.08Drive Auto Receivables Trust, Series2018-4 ‘D’ 4.09% 15/01/2026 USD 5,510,000 5,650,109 0.23DT Auto Owner Trust, Series 2018-3A‘C’, 144A 3.79% 15/07/2024 USD 832,596 838,726 0.03DT Auto Owner Trust, Series 2017-3A‘E’, 144A 5.6% 15/08/2024 USD 4,907,099 4,971,168 0.20DT Auto Owner Trust, Series 2017-4A‘E’, 144A 5.15% 15/11/2024 USD 680,943 686,686 0.03DT Midstream, Inc., 144A 4.125%15/06/2029 USD 285,000 289,004 0.01Duquesne Light Holdings, Inc., 144A2.775% 07/01/2032 USD 1,240,000 1,254,000 0.05Edgewell Personal Care Co., 144A 5.5%01/06/2028 USD 1,355,000 1,442,397 0.06Edgewell Personal Care Co., 144A4.125% 01/04/2029 USD 525,000 531,321 0.02Element Solutions, Inc., 144A 3.875%01/09/2028 USD 1,005,000 1,021,547 0.04Emera US Finance LP, 144A 2.639%15/06/2031 USD 4,476,000 4,499,396 0.19Energizer Holdings, Inc., 144A 4.75%15/06/2028 USD 1,375,000 1,413,844 0.06Energizer Holdings, Inc., 144A 4.375%31/03/2029 USD 680,000 680,075 0.03Entegris, Inc., 144A 4.375%15/04/2028 USD 1,320,000 1,380,390 0.06
224
JPMorgan Funds - Global Strategic Bond FundSchedule of Investments (continued)
As at 30 June 2021
Investments Currency
Quantity/Nominal
Value
MarketValue
USD
%of
NetAssets Investments Currency
Quantity/Nominal
Value
MarketValue
USD
%of
NetAssets
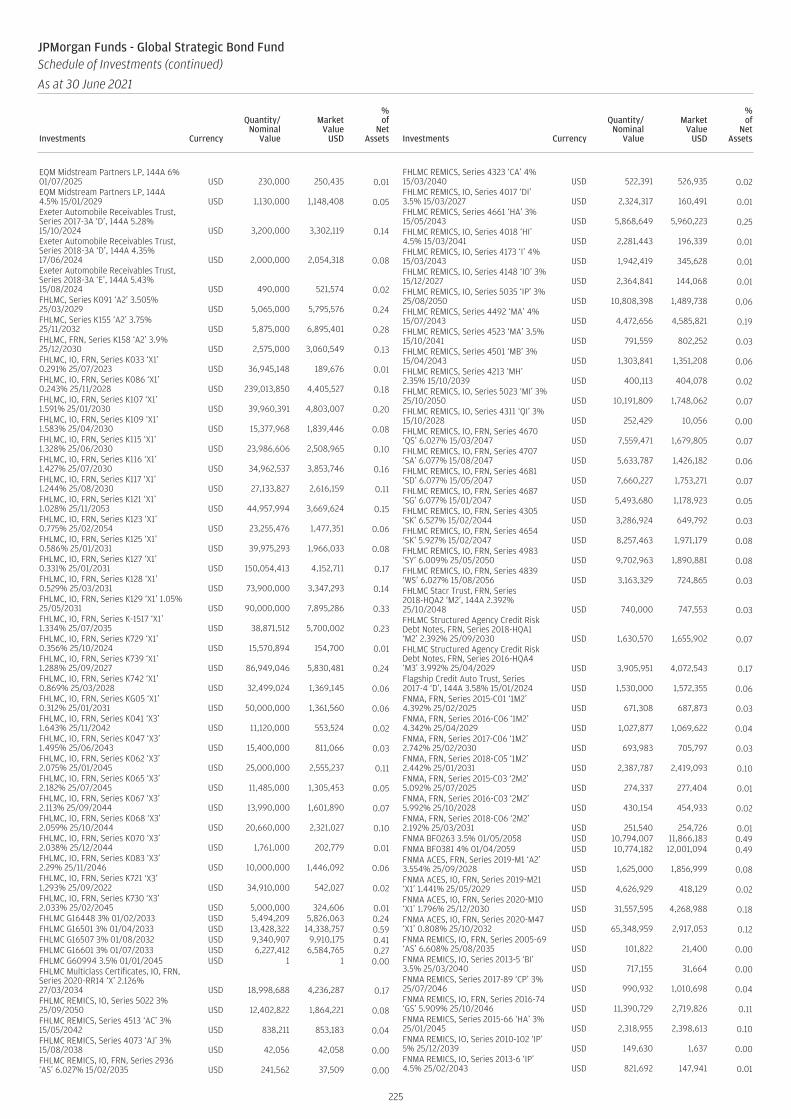
EQM Midstream Partners LP, 144A 6%01/07/2025 USD 230,000 250,435 0.01EQM Midstream Partners LP, 144A4.5% 15/01/2029 USD 1,130,000 1,148,408 0.05Exeter Automobile Receivables Trust,Series 2017-3A ‘D’, 144A 5.28%15/10/2024 USD 3,200,000 3,302,119 0.14Exeter Automobile Receivables Trust,Series 2018-3A ‘D’, 144A 4.35%17/06/2024 USD 2,000,000 2,054,318 0.08Exeter Automobile Receivables Trust,Series 2018-3A ‘E’, 144A 5.43%15/08/2024 USD 490,000 521,574 0.02FHLMC, Series K091 ‘A2’ 3.505%25/03/2029 USD 5,065,000 5,795,576 0.24FHLMC, Series K155 ‘A2’ 3.75%25/11/2032 USD 5,875,000 6,895,401 0.28FHLMC, FRN, Series K158 ‘A2’ 3.9%25/12/2030 USD 2,575,000 3,060,549 0.13FHLMC, IO, FRN, Series K033 ‘X1’0.291% 25/07/2023 USD 36,945,148 189,676 0.01FHLMC, IO, FRN, Series K086 ‘X1’0.243% 25/11/2028 USD 239,013,850 4,405,527 0.18FHLMC, IO, FRN, Series K107 ‘X1’1.591% 25/01/2030 USD 39,960,391 4,803,007 0.20FHLMC, IO, FRN, Series K109 ‘X1’1.583% 25/04/2030 USD 15,377,968 1,839,446 0.08FHLMC, IO, FRN, Series K115 ‘X1’1.328% 25/06/2030 USD 23,986,606 2,508,965 0.10FHLMC, IO, FRN, Series K116 ‘X1’1.427% 25/07/2030 USD 34,962,537 3,853,746 0.16FHLMC, IO, FRN, Series K117 ‘X1’1.244% 25/08/2030 USD 27,133,827 2,616,159 0.11FHLMC, IO, FRN, Series K121 ‘X1’1.028% 25/11/2053 USD 44,957,994 3,669,624 0.15FHLMC, IO, FRN, Series K123 ‘X1’0.775% 25/02/2054 USD 23,255,476 1,477,351 0.06FHLMC, IO, FRN, Series K125 ‘X1’0.586% 25/01/2031 USD 39,975,293 1,966,033 0.08FHLMC, IO, FRN, Series K127 ‘X1’0.331% 25/01/2031 USD 150,054,413 4,152,711 0.17FHLMC, IO, FRN, Series K128 ‘X1’0.529% 25/03/2031 USD 73,900,000 3,347,293 0.14FHLMC, IO, FRN, Series K129 ‘X1’ 1.05%25/05/2031 USD 90,000,000 7,895,286 0.33FHLMC, IO, FRN, Series K-1517 ‘X1’1.334% 25/07/2035 USD 38,871,512 5,700,002 0.23FHLMC, IO, FRN, Series K729 ‘X1’0.356% 25/10/2024 USD 15,570,894 154,700 0.01FHLMC, IO, FRN, Series K739 ‘X1’1.288% 25/09/2027 USD 86,949,046 5,830,481 0.24FHLMC, IO, FRN, Series K742 ‘X1’0.869% 25/03/2028 USD 32,499,024 1,369,145 0.06FHLMC, IO, FRN, Series KG05 ‘X1’0.312% 25/01/2031 USD 50,000,000 1,361,560 0.06FHLMC, IO, FRN, Series K041 ‘X3’1.643% 25/11/2042 USD 11,120,000 553,524 0.02FHLMC, IO, FRN, Series K047 ‘X3’1.495% 25/06/2043 USD 15,400,000 811,066 0.03FHLMC, IO, FRN, Series K062 ‘X3’2.075% 25/01/2045 USD 25,000,000 2,555,237 0.11FHLMC, IO, FRN, Series K065 ‘X3’2.182% 25/07/2045 USD 11,485,000 1,305,453 0.05FHLMC, IO, FRN, Series K067 ‘X3’2.113% 25/09/2044 USD 13,990,000 1,601,890 0.07FHLMC, IO, FRN, Series K068 ‘X3’2.059% 25/10/2044 USD 20,660,000 2,321,027 0.10FHLMC, IO, FRN, Series K070 ‘X3’2.038% 25/12/2044 USD 1,761,000 202,779 0.01FHLMC, IO, FRN, Series K083 ‘X3’2.29% 25/11/2046 USD 10,000,000 1,446,092 0.06FHLMC, IO, FRN, Series K721 ‘X3’1.293% 25/09/2022 USD 34,910,000 542,027 0.02FHLMC, IO, FRN, Series K730 ‘X3’2.033% 25/02/2045 USD 5,000,000 324,606 0.01FHLMC G16448 3% 01/02/2033 USD 5,494,209 5,826,063 0.24FHLMC G16501 3% 01/04/2033 USD 13,428,322 14,338,757 0.59FHLMC G16507 3% 01/08/2032 USD 9,340,907 9,910,175 0.41FHLMC G16601 3% 01/07/2033 USD 6,227,412 6,584,765 0.27FHLMC G60994 3.5% 01/01/2045 USD 1 1 0.00FHLMC Multiclass Certificates, IO, FRN,Series 2020-RR14 ‘X’ 2.126%27/03/2034 USD 18,998,688 4,236,287 0.17FHLMC REMICS, IO, Series 5022 3%25/09/2050 USD 12,402,822 1,864,221 0.08FHLMC REMICS, Series 4513 ‘AC’ 3%15/05/2042 USD 838,211 853,183 0.04FHLMC REMICS, Series 4073 ‘AJ’ 3%15/08/2038 USD 42,056 42,058 0.00FHLMC REMICS, IO, FRN, Series 2936‘AS’ 6.027% 15/02/2035 USD 241,562 37,509 0.00
FHLMC REMICS, Series 4323 ‘CA’ 4%15/03/2040 USD 522,391 526,935 0.02FHLMC REMICS, IO, Series 4017 ‘DI’3.5% 15/03/2027 USD 2,324,317 160,491 0.01FHLMC REMICS, Series 4661 ‘HA’ 3%15/05/2043 USD 5,868,649 5,960,223 0.25FHLMC REMICS, IO, Series 4018 ‘HI’4.5% 15/03/2041 USD 2,281,443 196,339 0.01FHLMC REMICS, IO, Series 4173 ‘I’ 4%15/03/2043 USD 1,942,419 345,628 0.01FHLMC REMICS, IO, Series 4148 ‘IO’ 3%15/12/2027 USD 2,364,841 144,068 0.01FHLMC REMICS, IO, Series 5035 ‘IP’ 3%25/08/2050 USD 10,808,398 1,489,738 0.06FHLMC REMICS, Series 4492 ‘MA’ 4%15/07/2043 USD 4,472,656 4,585,821 0.19FHLMC REMICS, Series 4523 ‘MA’ 3.5%15/10/2041 USD 791,559 802,252 0.03FHLMC REMICS, Series 4501 ‘MB’ 3%15/04/2043 USD 1,303,841 1,351,208 0.06FHLMC REMICS, Series 4213 ‘MH’2.35% 15/10/2039 USD 400,113 404,078 0.02FHLMC REMICS, IO, Series 5023 ‘MI’ 3%25/10/2050 USD 10,191,809 1,748,062 0.07FHLMC REMICS, IO, Series 4311 ‘QI’ 3%15/10/2028 USD 252,429 10,056 0.00FHLMC REMICS, IO, FRN, Series 4670‘QS’ 6.027% 15/03/2047 USD 7,559,471 1,679,805 0.07FHLMC REMICS, IO, FRN, Series 4707‘SA’ 6.077% 15/08/2047 USD 5,633,787 1,426,182 0.06FHLMC REMICS, IO, FRN, Series 4681‘SD’ 6.077% 15/05/2047 USD 7,660,227 1,753,271 0.07FHLMC REMICS, IO, FRN, Series 4687‘SG’ 6.077% 15/01/2047 USD 5,493,680 1,178,923 0.05FHLMC REMICS, IO, FRN, Series 4305‘SK’ 6.527% 15/02/2044 USD 3,286,924 649,792 0.03FHLMC REMICS, IO, FRN, Series 4654‘SK’ 5.927% 15/02/2047 USD 8,257,463 1,971,179 0.08FHLMC REMICS, IO, FRN, Series 4983‘SY’ 6.009% 25/05/2050 USD 9,702,963 1,890,881 0.08FHLMC REMICS, IO, FRN, Series 4839‘WS’ 6.027% 15/08/2056 USD 3,163,329 724,865 0.03FHLMC Stacr Trust, FRN, Series2018-HQA2 ‘M2’, 144A 2.392%25/10/2048 USD 740,000 747,553 0.03FHLMC Structured Agency Credit RiskDebt Notes, FRN, Series 2018-HQA1‘M2’ 2.392% 25/09/2030 USD 1,630,570 1,655,902 0.07FHLMC Structured Agency Credit RiskDebt Notes, FRN, Series 2016-HQA4‘M3’ 3.992% 25/04/2029 USD 3,905,951 4,072,543 0.17Flagship Credit Auto Trust, Series2017-4 ‘D’, 144A 3.58% 15/01/2024 USD 1,530,000 1,572,355 0.06FNMA, FRN, Series 2015-C01 ‘1M2’4.392% 25/02/2025 USD 671,308 687,873 0.03FNMA, FRN, Series 2016-C06 ‘1M2’4.342% 25/04/2029 USD 1,027,877 1,069,622 0.04FNMA, FRN, Series 2017-C06 ‘1M2’2.742% 25/02/2030 USD 693,983 705,797 0.03FNMA, FRN, Series 2018-C05 ‘1M2’2.442% 25/01/2031 USD 2,387,787 2,419,093 0.10FNMA, FRN, Series 2015-C03 ‘2M2’5.092% 25/07/2025 USD 274,337 277,404 0.01FNMA, FRN, Series 2016-C03 ‘2M2’5.992% 25/10/2028 USD 430,154 454,933 0.02FNMA, FRN, Series 2018-C06 ‘2M2’2.192% 25/03/2031 USD 251,540 254,726 0.01FNMA BF0263 3.5% 01/05/2058 USD 10,794,007 11,866,183 0.49FNMA BF0381 4% 01/04/2059 USD 10,774,182 12,001,094 0.49FNMA ACES, FRN, Series 2019-M1 ‘A2’3.554% 25/09/2028 USD 1,625,000 1,856,999 0.08FNMA ACES, IO, FRN, Series 2019-M21‘X1’ 1.441% 25/05/2029 USD 4,626,929 418,129 0.02FNMA ACES, IO, FRN, Series 2020-M10‘X1’ 1.796% 25/12/2030 USD 31,557,595 4,268,988 0.18FNMA ACES, IO, FRN, Series 2020-M47‘X1’ 0.808% 25/10/2032 USD 65,348,959 2,917,053 0.12FNMA REMICS, IO, FRN, Series 2005-69‘AS’ 6.608% 25/08/2035 USD 101,822 21,400 0.00FNMA REMICS, IO, Series 2013-5 ‘BI’3.5% 25/03/2040 USD 717,155 31,664 0.00FNMA REMICS, Series 2017-89 ‘CP’ 3%25/07/2046 USD 990,932 1,010,698 0.04FNMA REMICS, IO, FRN, Series 2016-74‘GS’ 5.909% 25/10/2046 USD 11,390,729 2,719,826 0.11FNMA REMICS, Series 2015-66 ‘HA’ 3%25/01/2045 USD 2,318,955 2,398,613 0.10FNMA REMICS, IO, Series 2010-102 ‘IP’5% 25/12/2039 USD 149,630 1,637 0.00FNMA REMICS, IO, Series 2013-6 ‘IP’4.5% 25/02/2043 USD 821,692 147,941 0.01
225
JPMorgan Funds - Global Strategic Bond FundSchedule of Investments (continued)
As at 30 June 2021
Investments Currency
Quantity/Nominal
Value
MarketValue
USD
%of
NetAssets Investments Currency
Quantity/Nominal
Value
MarketValue
USD
%of
NetAssets
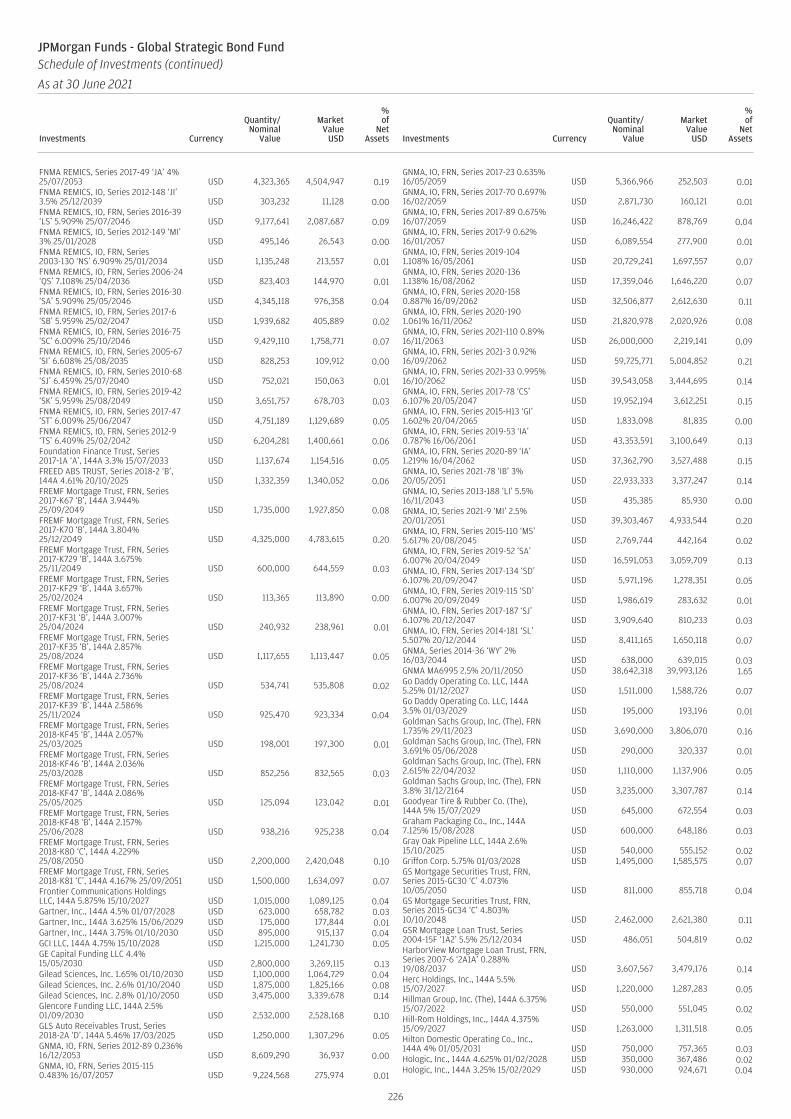
FNMA REMICS, Series 2017-49 ‘JA’ 4%25/07/2053 USD 4,323,365 4,504,947 0.19FNMA REMICS, IO, Series 2012-148 ‘JI’3.5% 25/12/2039 USD 303,232 11,128 0.00FNMA REMICS, IO, FRN, Series 2016-39‘LS’ 5.909% 25/07/2046 USD 9,177,641 2,087,687 0.09FNMA REMICS, IO, Series 2012-149 ‘MI’3% 25/01/2028 USD 495,146 26,543 0.00FNMA REMICS, IO, FRN, Series2003-130 ‘NS’ 6.909% 25/01/2034 USD 1,135,248 213,557 0.01FNMA REMICS, IO, FRN, Series 2006-24‘QS’ 7.108% 25/04/2036 USD 823,403 144,970 0.01FNMA REMICS, IO, FRN, Series 2016-30‘SA’ 5.909% 25/05/2046 USD 4,345,118 976,358 0.04FNMA REMICS, IO, FRN, Series 2017-6‘SB’ 5.959% 25/02/2047 USD 1,939,682 405,889 0.02FNMA REMICS, IO, FRN, Series 2016-75‘SC’ 6.009% 25/10/2046 USD 9,429,110 1,758,771 0.07FNMA REMICS, IO, FRN, Series 2005-67‘SI’ 6.608% 25/08/2035 USD 828,253 109,912 0.00FNMA REMICS, IO, FRN, Series 2010-68‘SJ’ 6.459% 25/07/2040 USD 752,021 150,063 0.01FNMA REMICS, IO, FRN, Series 2019-42‘SK’ 5.959% 25/08/2049 USD 3,651,757 678,703 0.03FNMA REMICS, IO, FRN, Series 2017-47‘ST’ 6.009% 25/06/2047 USD 4,751,189 1,129,689 0.05FNMA REMICS, IO, FRN, Series 2012-9‘TS’ 6.409% 25/02/2042 USD 6,204,281 1,400,661 0.06Foundation Finance Trust, Series2017-1A ‘A’, 144A 3.3% 15/07/2033 USD 1,137,674 1,154,516 0.05FREED ABS TRUST, Series 2018-2 ‘B’,144A 4.61% 20/10/2025 USD 1,332,359 1,340,052 0.06FREMF Mortgage Trust, FRN, Series2017-K67 ‘B’, 144A 3.944%25/09/2049 USD 1,735,000 1,927,850 0.08FREMF Mortgage Trust, FRN, Series2017-K70 ‘B’, 144A 3.804%25/12/2049 USD 4,325,000 4,783,615 0.20FREMF Mortgage Trust, FRN, Series2017-K729 ‘B’, 144A 3.675%25/11/2049 USD 600,000 644,559 0.03FREMF Mortgage Trust, FRN, Series2017-KF29 ‘B’, 144A 3.657%25/02/2024 USD 113,365 113,890 0.00FREMF Mortgage Trust, FRN, Series2017-KF31 ‘B’, 144A 3.007%25/04/2024 USD 240,932 238,961 0.01FREMF Mortgage Trust, FRN, Series2017-KF35 ‘B’, 144A 2.857%25/08/2024 USD 1,117,655 1,113,447 0.05FREMF Mortgage Trust, FRN, Series2017-KF36 ‘B’, 144A 2.736%25/08/2024 USD 534,741 535,808 0.02FREMF Mortgage Trust, FRN, Series2017-KF39 ‘B’, 144A 2.586%25/11/2024 USD 925,470 923,334 0.04FREMF Mortgage Trust, FRN, Series2018-KF45 ‘B’, 144A 2.057%25/03/2025 USD 198,001 197,300 0.01FREMF Mortgage Trust, FRN, Series2018-KF46 ‘B’, 144A 2.036%25/03/2028 USD 852,256 832,565 0.03FREMF Mortgage Trust, FRN, Series2018-KF47 ‘B’, 144A 2.086%25/05/2025 USD 125,094 123,042 0.01FREMF Mortgage Trust, FRN, Series2018-KF48 ‘B’, 144A 2.157%25/06/2028 USD 938,216 925,238 0.04FREMF Mortgage Trust, FRN, Series2018-K80 ‘C’, 144A 4.229%25/08/2050 USD 2,200,000 2,420,048 0.10FREMF Mortgage Trust, FRN, Series2018-K81 ‘C’, 144A 4.167% 25/09/2051 USD 1,500,000 1,634,097 0.07Frontier Communications HoldingsLLC, 144A 5.875% 15/10/2027 USD 1,015,000 1,089,125 0.04Gartner, Inc., 144A 4.5% 01/07/2028 USD 623,000 658,782 0.03Gartner, Inc., 144A 3.625% 15/06/2029 USD 175,000 177,844 0.01Gartner, Inc., 144A 3.75% 01/10/2030 USD 895,000 915,137 0.04GCI LLC, 144A 4.75% 15/10/2028 USD 1,215,000 1,241,730 0.05GE Capital Funding LLC 4.4%15/05/2030 USD 2,800,000 3,269,115 0.13Gilead Sciences, Inc. 1.65% 01/10/2030 USD 1,100,000 1,064,729 0.04Gilead Sciences, Inc. 2.6% 01/10/2040 USD 1,875,000 1,825,166 0.08Gilead Sciences, Inc. 2.8% 01/10/2050 USD 3,475,000 3,339,678 0.14Glencore Funding LLC, 144A 2.5%01/09/2030 USD 2,532,000 2,528,168 0.10GLS Auto Receivables Trust, Series2018-2A ‘D’, 144A 5.46% 17/03/2025 USD 1,250,000 1,307,296 0.05GNMA, IO, FRN, Series 2012-89 0.236%16/12/2053 USD 8,609,290 36,937 0.00GNMA, IO, FRN, Series 2015-1150.483% 16/07/2057 USD 9,224,568 275,974 0.01
GNMA, IO, FRN, Series 2017-23 0.635%16/05/2059 USD 5,366,966 252,503 0.01GNMA, IO, FRN, Series 2017-70 0.697%16/02/2059 USD 2,871,730 160,121 0.01GNMA, IO, FRN, Series 2017-89 0.675%16/07/2059 USD 16,246,422 878,769 0.04GNMA, IO, FRN, Series 2017-9 0.62%16/01/2057 USD 6,089,554 277,900 0.01GNMA, IO, FRN, Series 2019-1041.108% 16/05/2061 USD 20,729,241 1,697,557 0.07GNMA, IO, FRN, Series 2020-1361.138% 16/08/2062 USD 17,359,046 1,646,220 0.07GNMA, IO, FRN, Series 2020-1580.887% 16/09/2062 USD 32,506,877 2,612,630 0.11GNMA, IO, FRN, Series 2020-1901.061% 16/11/2062 USD 21,820,978 2,020,926 0.08GNMA, IO, FRN, Series 2021-110 0.89%16/11/2063 USD 26,000,000 2,219,141 0.09GNMA, IO, FRN, Series 2021-3 0.92%16/09/2062 USD 59,725,771 5,004,852 0.21GNMA, IO, FRN, Series 2021-33 0.995%16/10/2062 USD 39,543,058 3,444,695 0.14GNMA, IO, FRN, Series 2017-78 ‘CS’6.107% 20/05/2047 USD 19,952,194 3,612,251 0.15GNMA, IO, FRN, Series 2015-H13 ‘GI’1.602% 20/04/2065 USD 1,833,098 81,835 0.00GNMA, IO, FRN, Series 2019-53 ‘IA’0.787% 16/06/2061 USD 43,353,591 3,100,649 0.13GNMA, IO, FRN, Series 2020-89 ‘IA’1.219% 16/04/2062 USD 37,362,790 3,527,488 0.15GNMA, IO, Series 2021-78 ‘IB’ 3%20/05/2051 USD 22,933,333 3,377,247 0.14GNMA, IO, Series 2013-188 ‘LI’ 5.5%16/11/2043 USD 435,385 85,930 0.00GNMA, IO, Series 2021-9 ‘MI’ 2.5%20/01/2051 USD 39,303,467 4,933,544 0.20GNMA, IO, FRN, Series 2015-110 ‘MS’5.617% 20/08/2045 USD 2,769,744 442,164 0.02GNMA, IO, FRN, Series 2019-52 ‘SA’6.007% 20/04/2049 USD 16,591,053 3,059,709 0.13GNMA, IO, FRN, Series 2017-134 ‘SD’6.107% 20/09/2047 USD 5,971,196 1,278,351 0.05GNMA, IO, FRN, Series 2019-115 ‘SD’6.007% 20/09/2049 USD 1,986,619 283,632 0.01GNMA, IO, FRN, Series 2017-187 ‘SJ’6.107% 20/12/2047 USD 3,909,640 810,233 0.03GNMA, IO, FRN, Series 2014-181 ‘SL’5.507% 20/12/2044 USD 8,411,165 1,650,118 0.07GNMA, Series 2014-36 ‘WY’ 2%16/03/2044 USD 638,000 639,015 0.03GNMA MA6995 2.5% 20/11/2050 USD 38,642,318 39,993,126 1.65Go Daddy Operating Co. LLC, 144A5.25% 01/12/2027 USD 1,511,000 1,588,726 0.07Go Daddy Operating Co. LLC, 144A3.5% 01/03/2029 USD 195,000 193,196 0.01Goldman Sachs Group, Inc. (The), FRN1.735% 29/11/2023 USD 3,690,000 3,806,070 0.16Goldman Sachs Group, Inc. (The), FRN3.691% 05/06/2028 USD 290,000 320,337 0.01Goldman Sachs Group, Inc. (The), FRN2.615% 22/04/2032 USD 1,110,000 1,137,906 0.05Goldman Sachs Group, Inc. (The), FRN3.8% 31/12/2164 USD 3,235,000 3,307,787 0.14Goodyear Tire & Rubber Co. (The),144A 5% 15/07/2029 USD 645,000 672,554 0.03Graham Packaging Co., Inc., 144A7.125% 15/08/2028 USD 600,000 648,186 0.03Gray Oak Pipeline LLC, 144A 2.6%15/10/2025 USD 540,000 555,152 0.02Griffon Corp. 5.75% 01/03/2028 USD 1,495,000 1,585,575 0.07GS Mortgage Securities Trust, FRN,Series 2015-GC30 ‘C’ 4.073%10/05/2050 USD 811,000 855,718 0.04GS Mortgage Securities Trust, FRN,Series 2015-GC34 ‘C’ 4.803%10/10/2048 USD 2,462,000 2,621,380 0.11GSR Mortgage Loan Trust, Series2004-15F ‘1A2’ 5.5% 25/12/2034 USD 486,051 504,819 0.02HarborView Mortgage Loan Trust, FRN,Series 2007-6 ‘2A1A’ 0.288%19/08/2037 USD 3,607,567 3,479,176 0.14Herc Holdings, Inc., 144A 5.5%15/07/2027 USD 1,220,000 1,287,283 0.05Hillman Group, Inc. (The), 144A 6.375%15/07/2022 USD 550,000 551,045 0.02Hill-Rom Holdings, Inc., 144A 4.375%15/09/2027 USD 1,263,000 1,311,518 0.05Hilton Domestic Operating Co., Inc.,144A 4% 01/05/2031 USD 750,000 757,365 0.03Hologic, Inc., 144A 4.625% 01/02/2028 USD 350,000 367,486 0.02Hologic, Inc., 144A 3.25% 15/02/2029 USD 930,000 924,671 0.04
226
JPMorgan Funds - Global Strategic Bond FundSchedule of Investments (continued)
As at 30 June 2021
Investments Currency
Quantity/Nominal
Value
MarketValue
USD
%of
NetAssets Investments Currency
Quantity/Nominal
Value
MarketValue
USD
%of
NetAssets
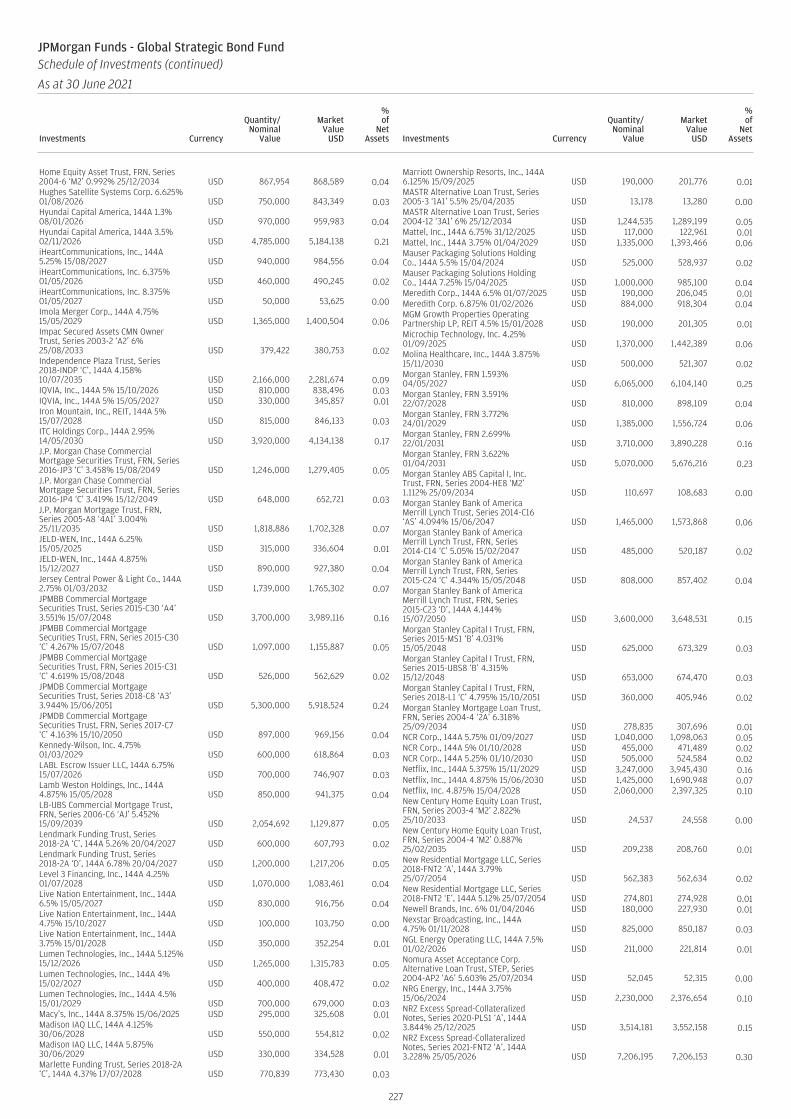
Home Equity Asset Trust, FRN, Series2004-6 ‘M2’ 0.992% 25/12/2034 USD 867,954 868,589 0.04Hughes Satellite Systems Corp. 6.625%01/08/2026 USD 750,000 843,349 0.03Hyundai Capital America, 144A 1.3%08/01/2026 USD 970,000 959,983 0.04Hyundai Capital America, 144A 3.5%02/11/2026 USD 4,785,000 5,184,138 0.21iHeartCommunications, Inc., 144A5.25% 15/08/2027 USD 940,000 984,556 0.04iHeartCommunications, Inc. 6.375%01/05/2026 USD 460,000 490,245 0.02iHeartCommunications, Inc. 8.375%01/05/2027 USD 50,000 53,625 0.00Imola Merger Corp., 144A 4.75%15/05/2029 USD 1,365,000 1,400,504 0.06Impac Secured Assets CMN OwnerTrust, Series 2003-2 ‘A2’ 6%25/08/2033 USD 379,422 380,753 0.02Independence Plaza Trust, Series2018-INDP ‘C’, 144A 4.158%10/07/2035 USD 2,166,000 2,281,674 0.09IQVIA, Inc., 144A 5% 15/10/2026 USD 810,000 838,496 0.03IQVIA, Inc., 144A 5% 15/05/2027 USD 330,000 345,857 0.01Iron Mountain, Inc., REIT, 144A 5%15/07/2028 USD 815,000 846,133 0.03ITC Holdings Corp., 144A 2.95%14/05/2030 USD 3,920,000 4,134,138 0.17J.P. Morgan Chase CommercialMortgage Securities Trust, FRN, Series2016-JP3 ‘C’ 3.458% 15/08/2049 USD 1,246,000 1,279,405 0.05J.P. Morgan Chase CommercialMortgage Securities Trust, FRN, Series2016-JP4 ‘C’ 3.419% 15/12/2049 USD 648,000 652,721 0.03J.P. Morgan Mortgage Trust, FRN,Series 2005-A8 ‘4A1’ 3.004%25/11/2035 USD 1,818,886 1,702,328 0.07JELD-WEN, Inc., 144A 6.25%15/05/2025 USD 315,000 336,604 0.01JELD-WEN, Inc., 144A 4.875%15/12/2027 USD 890,000 927,380 0.04Jersey Central Power & Light Co., 144A2.75% 01/03/2032 USD 1,739,000 1,765,302 0.07JPMBB Commercial MortgageSecurities Trust, Series 2015-C30 ‘A4’3.551% 15/07/2048 USD 3,700,000 3,989,116 0.16JPMBB Commercial MortgageSecurities Trust, FRN, Series 2015-C30‘C’ 4.267% 15/07/2048 USD 1,097,000 1,155,887 0.05JPMBB Commercial MortgageSecurities Trust, FRN, Series 2015-C31‘C’ 4.619% 15/08/2048 USD 526,000 562,629 0.02JPMDB Commercial MortgageSecurities Trust, Series 2018-C8 ‘A3’3.944% 15/06/2051 USD 5,300,000 5,918,524 0.24JPMDB Commercial MortgageSecurities Trust, FRN, Series 2017-C7‘C’ 4.163% 15/10/2050 USD 897,000 969,156 0.04Kennedy-Wilson, Inc. 4.75%01/03/2029 USD 600,000 618,864 0.03LABL Escrow Issuer LLC, 144A 6.75%15/07/2026 USD 700,000 746,907 0.03Lamb Weston Holdings, Inc., 144A4.875% 15/05/2028 USD 850,000 941,375 0.04LB-UBS Commercial Mortgage Trust,FRN, Series 2006-C6 ‘AJ’ 5.452%15/09/2039 USD 2,054,692 1,129,877 0.05Lendmark Funding Trust, Series2018-2A ‘C’, 144A 5.26% 20/04/2027 USD 600,000 607,793 0.02Lendmark Funding Trust, Series2018-2A ‘D’, 144A 6.78% 20/04/2027 USD 1,200,000 1,217,206 0.05Level 3 Financing, Inc., 144A 4.25%01/07/2028 USD 1,070,000 1,083,461 0.04Live Nation Entertainment, Inc., 144A6.5% 15/05/2027 USD 830,000 916,756 0.04Live Nation Entertainment, Inc., 144A4.75% 15/10/2027 USD 100,000 103,750 0.00Live Nation Entertainment, Inc., 144A3.75% 15/01/2028 USD 350,000 352,254 0.01Lumen Technologies, Inc., 144A 5.125%15/12/2026 USD 1,265,000 1,315,783 0.05Lumen Technologies, Inc., 144A 4%15/02/2027 USD 400,000 408,472 0.02Lumen Technologies, Inc., 144A 4.5%15/01/2029 USD 700,000 679,000 0.03Macy’s, Inc., 144A 8.375% 15/06/2025 USD 295,000 325,608 0.01Madison IAQ LLC, 144A 4.125%30/06/2028 USD 550,000 554,812 0.02Madison IAQ LLC, 144A 5.875%30/06/2029 USD 330,000 334,528 0.01Marlette Funding Trust, Series 2018-2A‘C’, 144A 4.37% 17/07/2028 USD 770,839 773,430 0.03
Marriott Ownership Resorts, Inc., 144A6.125% 15/09/2025 USD 190,000 201,776 0.01MASTR Alternative Loan Trust, Series2005-3 ‘1A1’ 5.5% 25/04/2035 USD 13,178 13,280 0.00MASTR Alternative Loan Trust, Series2004-12 ‘3A1’ 6% 25/12/2034 USD 1,244,535 1,289,199 0.05Mattel, Inc., 144A 6.75% 31/12/2025 USD 117,000 122,961 0.01Mattel, Inc., 144A 3.75% 01/04/2029 USD 1,335,000 1,393,466 0.06Mauser Packaging Solutions HoldingCo., 144A 5.5% 15/04/2024 USD 525,000 528,937 0.02Mauser Packaging Solutions HoldingCo., 144A 7.25% 15/04/2025 USD 1,000,000 985,100 0.04Meredith Corp., 144A 6.5% 01/07/2025 USD 190,000 206,045 0.01Meredith Corp. 6.875% 01/02/2026 USD 884,000 918,304 0.04MGM Growth Properties OperatingPartnership LP, REIT 4.5% 15/01/2028 USD 190,000 201,305 0.01Microchip Technology, Inc. 4.25%01/09/2025 USD 1,370,000 1,442,389 0.06Molina Healthcare, Inc., 144A 3.875%15/11/2030 USD 500,000 521,307 0.02Morgan Stanley, FRN 1.593%04/05/2027 USD 6,065,000 6,104,140 0.25Morgan Stanley, FRN 3.591%22/07/2028 USD 810,000 898,109 0.04Morgan Stanley, FRN 3.772%24/01/2029 USD 1,385,000 1,556,724 0.06Morgan Stanley, FRN 2.699%22/01/2031 USD 3,710,000 3,890,228 0.16Morgan Stanley, FRN 3.622%01/04/2031 USD 5,070,000 5,676,216 0.23Morgan Stanley ABS Capital I, Inc.Trust, FRN, Series 2004-HE8 ‘M2’1.112% 25/09/2034 USD 110,697 108,683 0.00Morgan Stanley Bank of AmericaMerrill Lynch Trust, Series 2014-C16‘AS’ 4.094% 15/06/2047 USD 1,465,000 1,573,868 0.06Morgan Stanley Bank of AmericaMerrill Lynch Trust, FRN, Series2014-C14 ‘C’ 5.05% 15/02/2047 USD 485,000 520,187 0.02Morgan Stanley Bank of AmericaMerrill Lynch Trust, FRN, Series2015-C24 ‘C’ 4.344% 15/05/2048 USD 808,000 857,402 0.04Morgan Stanley Bank of AmericaMerrill Lynch Trust, FRN, Series2015-C23 ‘D’, 144A 4.144%15/07/2050 USD 3,600,000 3,648,531 0.15Morgan Stanley Capital I Trust, FRN,Series 2015-MS1 ‘B’ 4.031%15/05/2048 USD 625,000 673,329 0.03Morgan Stanley Capital I Trust, FRN,Series 2015-UBS8 ‘B’ 4.315%15/12/2048 USD 653,000 674,470 0.03Morgan Stanley Capital I Trust, FRN,Series 2018-L1 ‘C’ 4.795% 15/10/2051 USD 360,000 405,946 0.02Morgan Stanley Mortgage Loan Trust,FRN, Series 2004-4 ‘2A’ 6.318%25/09/2034 USD 278,835 307,696 0.01NCR Corp., 144A 5.75% 01/09/2027 USD 1,040,000 1,098,063 0.05NCR Corp., 144A 5% 01/10/2028 USD 455,000 471,489 0.02NCR Corp., 144A 5.25% 01/10/2030 USD 505,000 524,584 0.02Netflix, Inc., 144A 5.375% 15/11/2029 USD 3,247,000 3,945,430 0.16Netflix, Inc., 144A 4.875% 15/06/2030 USD 1,425,000 1,690,948 0.07Netflix, Inc. 4.875% 15/04/2028 USD 2,060,000 2,397,325 0.10New Century Home Equity Loan Trust,FRN, Series 2003-4 ‘M2’ 2.822%25/10/2033 USD 24,537 24,558 0.00New Century Home Equity Loan Trust,FRN, Series 2004-4 ‘M2’ 0.887%25/02/2035 USD 209,238 208,760 0.01New Residential Mortgage LLC, Series2018-FNT2 ‘A’, 144A 3.79%25/07/2054 USD 562,383 562,634 0.02New Residential Mortgage LLC, Series2018-FNT2 ‘E’, 144A 5.12% 25/07/2054 USD 274,801 274,928 0.01Newell Brands, Inc. 6% 01/04/2046 USD 180,000 227,930 0.01Nexstar Broadcasting, Inc., 144A4.75% 01/11/2028 USD 825,000 850,187 0.03NGL Energy Operating LLC, 144A 7.5%01/02/2026 USD 211,000 221,814 0.01Nomura Asset Acceptance Corp.Alternative Loan Trust, STEP, Series2004-AP2 ‘A6’ 5.603% 25/07/2034 USD 52,045 52,315 0.00NRG Energy, Inc., 144A 3.75%15/06/2024 USD 2,230,000 2,376,654 0.10NRZ Excess Spread-CollateralizedNotes, Series 2020-PLS1 ‘A’, 144A3.844% 25/12/2025 USD 3,514,181 3,552,158 0.15NRZ Excess Spread-CollateralizedNotes, Series 2021-FNT2 ‘A’, 144A3.228% 25/05/2026 USD 7,206,195 7,206,153 0.30
227
JPMorgan Funds - Global Strategic Bond FundSchedule of Investments (continued)
As at 30 June 2021
Investments Currency
Quantity/Nominal
Value
MarketValue
USD
%of
NetAssets Investments Currency
Quantity/Nominal
Value
MarketValue
USD
%of
NetAssets

NRZ Excess Spread-CollateralizedNotes, Series 2018-FNT1 ‘D’, 144A4.69% 25/05/2023 USD 964,661 965,720 0.04Nuance Communications, Inc. 5.625%15/12/2026 USD 820,000 858,442 0.04ON Semiconductor Corp., 144A 3.875%01/09/2028 USD 1,574,000 1,623,636 0.07OneMain Direct Auto ReceivablesTrust, Series 2018-1A ‘B’, 144A 3.71%14/04/2025 USD 822,000 830,814 0.03OneMain Direct Auto ReceivablesTrust, Series 2018-1A ‘D’, 144A 4.4%14/01/2028 USD 1,000,000 1,013,668 0.04OneMain Finance Corp. 7.125%15/03/2026 USD 420,000 489,300 0.02Onemain Financial Issuance Trust,Series 2018-1A ‘D’, 144A 4.08%14/03/2029 USD 770,000 789,695 0.03OneMain Financial Issuance Trust,Series 2018-2A ‘A’, 144A 3.57%14/03/2033 USD 3,645,000 3,843,741 0.16Option One Mortgage Loan Trust, FRN,Series 2004-3 ‘M3’ 1.067% 25/11/2034 USD 99,585 98,696 0.00Organon & Co., 144A 4.125%30/04/2028 USD 1,025,000 1,044,219 0.04Outfront Media Capital LLC, 144A6.25% 15/06/2025 USD 370,000 392,346 0.02Owens-Brockway Glass Container, Inc.,144A 6.625% 13/05/2027 USD 850,000 928,200 0.04Pacific Gas and Electric Co. 4.55%01/07/2030 USD 1,080,000 1,156,812 0.05Pacific Gas and Electric Co. 4.95%01/07/2050 USD 312,151 321,933 0.01Performance Food Group, Inc., 144A5.5% 15/10/2027 USD 590,000 621,049 0.03PetSmart, Inc., 144A 4.75%15/02/2028 USD 1,255,000 1,305,200 0.05PetSmart, Inc., 144A 7.75%15/02/2029 USD 250,000 275,937 0.01Photo Holdings Merger Sub, Inc., 144A8.5% 01/10/2026 USD 840,000 922,538 0.04Planet Fitness Master Issuer LLC,Series 2018-1A ‘A2I’, 144A 4.262%05/09/2048 USD 155,600 156,780 0.01Plantronics, Inc., 144A 4.75%01/03/2029 USD 360,000 357,124 0.01PNMAC FMSR ISSUER TRUST, FRN,Series 2018-FT1 ‘A’, 144A 2.442%25/04/2023 USD 1,150,000 1,145,900 0.05Post Holdings, Inc., 144A 5.625%15/01/2028 USD 675,000 717,552 0.03Post Holdings, Inc., 144A 5.5%15/12/2029 USD 310,000 332,765 0.01Presidio Holdings, Inc., 144A 4.875%01/02/2027 USD 1,077,000 1,110,129 0.05Prestige Brands, Inc., 144A 5.125%15/01/2028 USD 1,735,000 1,836,706 0.08Prime Security Services Borrower LLC,144A 5.75% 15/04/2026 USD 385,000 424,894 0.02Prime Security Services Borrower LLC,144A 3.375% 31/08/2027 USD 436,000 423,465 0.02Progress Residential Trust, Series2018-SFR3 ‘E’, 144A 4.873%17/10/2035 USD 2,675,000 2,711,516 0.11PTC, Inc., 144A 4% 15/02/2028 USD 500,000 516,757 0.02Quicken Loans LLC, 144A 5.25%15/01/2028 USD 590,000 621,140 0.03Rain CII Carbon LLC, 144A 7.25%01/04/2025 USD 339,000 351,163 0.01Range Resources Corp., 144A 8.25%15/01/2029 USD 750,000 847,436 0.03RASC Trust, FRN, Series 2005-EMX1‘M1’ 0.737% 25/03/2035 USD 446,069 444,577 0.02Regeneron Pharmaceuticals, Inc. 2.8%15/09/2050 USD 1,430,000 1,312,114 0.05Renaissance Home Equity Loan Trust,FRN, Series 2005-2 ‘AV3’ 0.462%25/08/2035 USD 822,238 796,373 0.03Renaissance Home Equity Loan Trust,STEP, Series 2005-2 ‘M1’ 5.051%25/08/2035 USD 569,745 606,984 0.02Residential Asset Securitization Trust,Series 2004-A6 5% 25/08/2021 USD 238 206 0.00Reynolds Group Issuer, Inc., 144A 4%15/10/2027 USD 920,000 914,250 0.04RHP Hotel Properties LP, REIT, 144A4.5% 15/02/2029 USD 300,000 301,023 0.01RHP Hotel Properties LP, REIT 4.75%15/10/2027 USD 1,395,000 1,432,233 0.06Rite Aid Corp., 144A 7.5% 01/07/2025 USD 570,000 578,573 0.02Rite Aid Corp., 144A 8% 15/11/2026 USD 495,000 503,041 0.02
Sabine Pass Liquefaction LLC 4.5%15/05/2030 USD 5,184,000 5,976,278 0.25Sabre GLBL, Inc., 144A 7.375%01/09/2025 USD 830,000 900,567 0.04Santander Drive Auto ReceivablesTrust, Series 2018-1 ‘E’, 144A 4.37%15/05/2025 USD 2,500,000 2,553,148 0.11Santander Drive Auto ReceivablesTrust, Series 2018-2 ‘E’ 5.02%15/09/2025 USD 5,100,000 5,280,092 0.22Santander Prime Auto Issuance NotesTrust, Series 2018-A ‘F’, 144A 6.8%15/09/2025 USD 191,456 193,963 0.01SART 4.757% 15/06/2025 USD 1,670,449 1,703,858 0.07SBA Communications Corp., REIT, 144A3.125% 01/02/2029 USD 1,100,000 1,061,918 0.04SBA Communications Corp., REIT3.875% 15/02/2027 USD 405,000 416,632 0.02Scotts Miracle-Gro Co. (The), 144A 4%01/04/2031 USD 275,000 274,656 0.01Scotts Miracle-Gro Co. (The) 4.5%15/10/2029 USD 1,220,000 1,274,174 0.05Scripps Escrow II, Inc., 144A 3.875%15/01/2029 USD 1,035,000 1,021,007 0.04Scripps Escrow II, Inc., 144A 5.375%15/01/2031 USD 230,000 229,714 0.01Seasoned Credit Risk Transfer Trust,IO, FRN, Series 2017-3 ‘AIO’ 0%25/07/2056 USD 279,141,760 2,484 0.00Sensata Technologies, Inc., 144A4.375% 15/02/2030 USD 165,000 173,893 0.01Sensata Technologies, Inc., 144A3.75% 15/02/2031 USD 1,400,000 1,387,750 0.06Sequoia Mortgage Trust, FRN, Series2003-8 ‘A1’ 0.739% 20/01/2034 USD 274,223 279,088 0.01Sirius XM Radio, Inc., 144A 4.625%15/07/2024 USD 700,000 718,375 0.03Sirius XM Radio, Inc., 144A 5%01/08/2027 USD 1,300,000 1,366,463 0.06Sirius XM Radio, Inc., 144A 5.5%01/07/2029 USD 430,000 468,162 0.02Six Flags Entertainment Corp., 144A5.5% 15/04/2027 USD 1,285,000 1,329,063 0.05Six Flags Theme Parks, Inc., 144A 7%01/07/2025 USD 190,000 205,034 0.01SoFi Consumer Loan Program Trust,Series 2018-4 ‘D’, 144A 4.76%26/11/2027 USD 2,260,000 2,343,360 0.10Sonic Capital LLC, Series 2018-1A ‘A2’,144A 4.026% 20/02/2048 USD 1,169,000 1,202,012 0.05Spectrum Brands, Inc., 144A 5.5%15/07/2030 USD 1,639,000 1,772,333 0.07Spectrum Brands, Inc., 144A 3.875%15/03/2031 USD 380,000 372,751 0.02Spirit AeroSystems, Inc., 144A 5.5%15/01/2025 USD 500,000 532,775 0.02Springleaf Funding Trust, Series2017-AA ‘C’, 144A 3.86% 15/07/2030 USD 1,800,000 1,804,595 0.07Sprint Capital Corp. 6.875% 15/11/2028 USD 2,410,000 3,099,814 0.13Sprint Capital Corp. 8.75% 15/03/2032 USD 180,000 273,584 0.01Sprint Corp. 7.625% 15/02/2025 USD 170,000 202,087 0.01SPX FLOW, Inc., 144A 5.875%15/08/2026 USD 700,000 725,077 0.03Square, Inc., 144A 2.75% 01/06/2026 USD 315,000 320,109 0.01Square, Inc., 144A 3.5% 01/06/2031 USD 105,000 106,050 0.00SRS Distribution, Inc., 144A 4.625%01/07/2028 USD 545,000 557,944 0.02SRS Distribution, Inc., 144A 6.125%01/07/2029 USD 325,000 335,215 0.01SS&C Technologies, Inc., 144A 5.5%30/09/2027 USD 1,970,000 2,092,731 0.09STACR Trust, FRN, Series 2018-HRP2‘M3’, 144A 2.492% 25/02/2047 USD 3,583,000 3,653,241 0.15Standard Industries, Inc., 144A 4.75%15/01/2028 USD 1,215,000 1,273,320 0.05Staples, Inc., 144A 7.5% 15/04/2026 USD 1,075,000 1,118,016 0.05Stericycle, Inc., 144A 3.875%15/01/2029 USD 400,000 400,606 0.02Summit Materials LLC, 144A 5.25%15/01/2029 USD 200,000 212,282 0.01Sunoco LP, 144A 4.5% 15/05/2029 USD 300,000 306,906 0.01Switch Ltd., 144A 3.75% 15/09/2028 USD 1,310,000 1,328,995 0.05Switch Ltd., 144A 4.125% 15/06/2029 USD 435,000 446,962 0.02Synaptics, Inc., 144A 4% 15/06/2029 USD 1,430,000 1,438,937 0.06Tallgrass Energy Partners LP, 144A7.5% 01/10/2025 USD 1,061,000 1,160,013 0.05Tallgrass Energy Partners LP, 144A 6%31/12/2030 USD 100,000 103,519 0.00Targa Resources Partners LP, 144A 4%15/01/2032 USD 980,000 1,007,048 0.04
228
JPMorgan Funds - Global Strategic Bond FundSchedule of Investments (continued)
As at 30 June 2021
Investments Currency
Quantity/Nominal
Value
MarketValue
USD
%of
NetAssets Investments Currency
Quantity/Nominal
Value
MarketValue
USD
%of
NetAssets
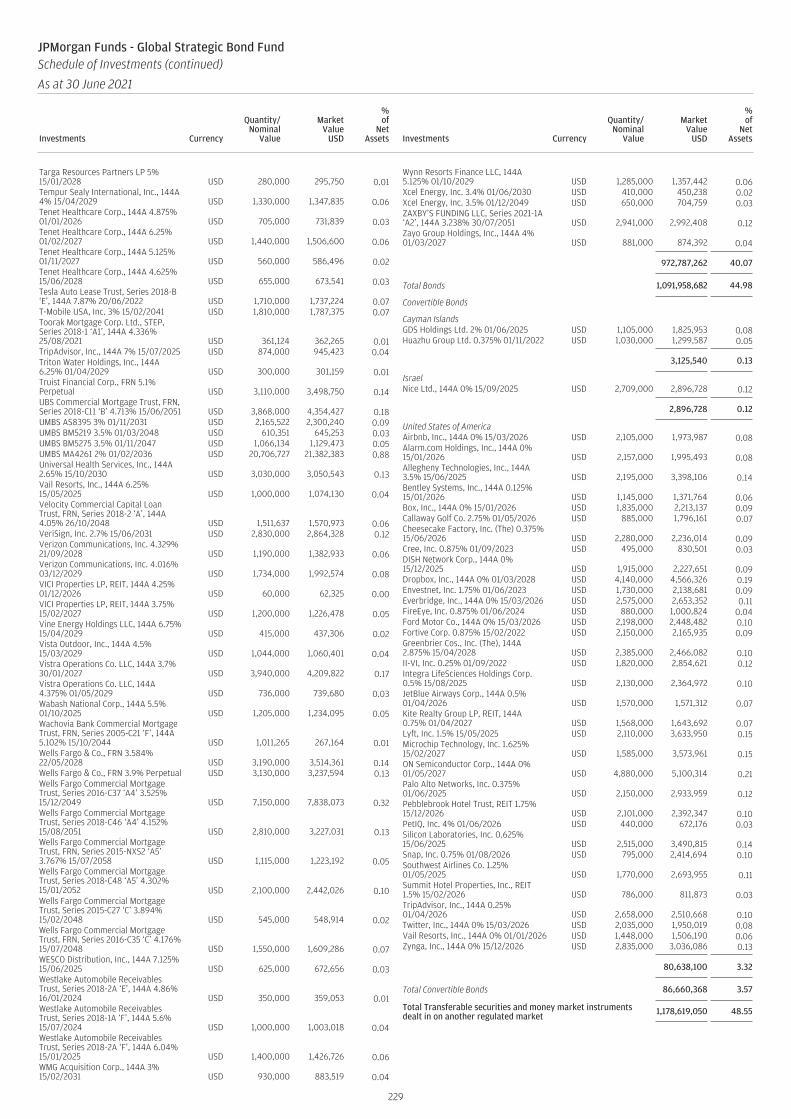
Targa Resources Partners LP 5%15/01/2028 USD 280,000 295,750 0.01Tempur Sealy International, Inc., 144A4% 15/04/2029 USD 1,330,000 1,347,835 0.06Tenet Healthcare Corp., 144A 4.875%01/01/2026 USD 705,000 731,839 0.03Tenet Healthcare Corp., 144A 6.25%01/02/2027 USD 1,440,000 1,506,600 0.06Tenet Healthcare Corp., 144A 5.125%01/11/2027 USD 560,000 586,496 0.02Tenet Healthcare Corp., 144A 4.625%15/06/2028 USD 655,000 673,541 0.03Tesla Auto Lease Trust, Series 2018-B‘E’, 144A 7.87% 20/06/2022 USD 1,710,000 1,737,224 0.07T-Mobile USA, Inc. 3% 15/02/2041 USD 1,810,000 1,787,375 0.07Toorak Mortgage Corp. Ltd., STEP,Series 2018-1 ‘A1’, 144A 4.336%25/08/2021 USD 361,124 362,265 0.01TripAdvisor, Inc., 144A 7% 15/07/2025 USD 874,000 945,423 0.04Triton Water Holdings, Inc., 144A6.25% 01/04/2029 USD 300,000 301,159 0.01Truist Financial Corp., FRN 5.1%Perpetual USD 3,110,000 3,498,750 0.14UBS Commercial Mortgage Trust, FRN,Series 2018-C11 ‘B’ 4.713% 15/06/2051 USD 3,868,000 4,354,427 0.18UMBS AS8395 3% 01/11/2031 USD 2,165,522 2,300,240 0.09UMBS BM5219 3.5% 01/03/2048 USD 610,351 645,253 0.03UMBS BM5275 3.5% 01/11/2047 USD 1,066,134 1,129,473 0.05UMBS MA4261 2% 01/02/2036 USD 20,706,727 21,382,383 0.88Universal Health Services, Inc., 144A2.65% 15/10/2030 USD 3,030,000 3,050,543 0.13Vail Resorts, Inc., 144A 6.25%15/05/2025 USD 1,000,000 1,074,130 0.04Velocity Commercial Capital LoanTrust, FRN, Series 2018-2 ‘A’, 144A4.05% 26/10/2048 USD 1,511,637 1,570,973 0.06VeriSign, Inc. 2.7% 15/06/2031 USD 2,830,000 2,864,328 0.12Verizon Communications, Inc. 4.329%21/09/2028 USD 1,190,000 1,382,933 0.06Verizon Communications, Inc. 4.016%03/12/2029 USD 1,734,000 1,992,574 0.08VICI Properties LP, REIT, 144A 4.25%01/12/2026 USD 60,000 62,325 0.00VICI Properties LP, REIT, 144A 3.75%15/02/2027 USD 1,200,000 1,226,478 0.05Vine Energy Holdings LLC, 144A 6.75%15/04/2029 USD 415,000 437,306 0.02Vista Outdoor, Inc., 144A 4.5%15/03/2029 USD 1,044,000 1,060,401 0.04Vistra Operations Co. LLC, 144A 3.7%30/01/2027 USD 3,940,000 4,209,822 0.17Vistra Operations Co. LLC, 144A4.375% 01/05/2029 USD 736,000 739,680 0.03Wabash National Corp., 144A 5.5%01/10/2025 USD 1,205,000 1,234,095 0.05Wachovia Bank Commercial MortgageTrust, FRN, Series 2005-C21 ‘F’, 144A5.102% 15/10/2044 USD 1,011,265 267,164 0.01Wells Fargo & Co., FRN 3.584%22/05/2028 USD 3,190,000 3,514,361 0.14Wells Fargo & Co., FRN 3.9% Perpetual USD 3,130,000 3,237,594 0.13Wells Fargo Commercial MortgageTrust, Series 2016-C37 ‘A4’ 3.525%15/12/2049 USD 7,150,000 7,838,073 0.32Wells Fargo Commercial MortgageTrust, Series 2018-C46 ‘A4’ 4.152%15/08/2051 USD 2,810,000 3,227,031 0.13Wells Fargo Commercial MortgageTrust, FRN, Series 2015-NXS2 ‘A5’3.767% 15/07/2058 USD 1,115,000 1,223,192 0.05Wells Fargo Commercial MortgageTrust, Series 2018-C48 ‘A5’ 4.302%15/01/2052 USD 2,100,000 2,442,026 0.10Wells Fargo Commercial MortgageTrust, Series 2015-C27 ‘C’ 3.894%15/02/2048 USD 545,000 548,914 0.02Wells Fargo Commercial MortgageTrust, FRN, Series 2016-C35 ‘C’ 4.176%15/07/2048 USD 1,550,000 1,609,286 0.07WESCO Distribution, Inc., 144A 7.125%15/06/2025 USD 625,000 672,656 0.03Westlake Automobile ReceivablesTrust, Series 2018-2A ‘E’, 144A 4.86%16/01/2024 USD 350,000 359,053 0.01Westlake Automobile ReceivablesTrust, Series 2018-1A ‘F’, 144A 5.6%15/07/2024 USD 1,000,000 1,003,018 0.04Westlake Automobile ReceivablesTrust, Series 2018-2A ‘F’, 144A 6.04%15/01/2025 USD 1,400,000 1,426,726 0.06WMG Acquisition Corp., 144A 3%15/02/2031 USD 930,000 883,519 0.04
Wynn Resorts Finance LLC, 144A5.125% 01/10/2029 USD 1,285,000 1,357,442 0.06Xcel Energy, Inc. 3.4% 01/06/2030 USD 410,000 450,238 0.02Xcel Energy, Inc. 3.5% 01/12/2049 USD 650,000 704,759 0.03ZAXBY’S FUNDING LLC, Series 2021-1A‘A2’, 144A 3.238% 30/07/2051 USD 2,941,000 2,992,408 0.12Zayo Group Holdings, Inc., 144A 4%01/03/2027 USD 881,000 874,392 0.04
972,787,262 40.07
Total Bonds 1,091,958,682 44.98
Convertible Bonds
Cayman IslandsGDS Holdings Ltd. 2% 01/06/2025 USD 1,105,000 1,825,953 0.08Huazhu Group Ltd. 0.375% 01/11/2022 USD 1,030,000 1,299,587 0.05
3,125,540 0.13
IsraelNice Ltd., 144A 0% 15/09/2025 USD 2,709,000 2,896,728 0.12
2,896,728 0.12
United States of AmericaAirbnb, Inc., 144A 0% 15/03/2026 USD 2,105,000 1,973,987 0.08Alarm.com Holdings, Inc., 144A 0%15/01/2026 USD 2,157,000 1,995,493 0.08Allegheny Technologies, Inc., 144A3.5% 15/06/2025 USD 2,195,000 3,398,106 0.14Bentley Systems, Inc., 144A 0.125%15/01/2026 USD 1,145,000 1,371,764 0.06Box, Inc., 144A 0% 15/01/2026 USD 1,835,000 2,213,137 0.09Callaway Golf Co. 2.75% 01/05/2026 USD 885,000 1,796,161 0.07Cheesecake Factory, Inc. (The) 0.375%15/06/2026 USD 2,280,000 2,236,014 0.09Cree, Inc. 0.875% 01/09/2023 USD 495,000 830,501 0.03DISH Network Corp., 144A 0%15/12/2025 USD 1,915,000 2,227,651 0.09Dropbox, Inc., 144A 0% 01/03/2028 USD 4,140,000 4,566,326 0.19Envestnet, Inc. 1.75% 01/06/2023 USD 1,730,000 2,138,681 0.09Everbridge, Inc., 144A 0% 15/03/2026 USD 2,575,000 2,653,352 0.11FireEye, Inc. 0.875% 01/06/2024 USD 880,000 1,000,824 0.04Ford Motor Co., 144A 0% 15/03/2026 USD 2,198,000 2,448,482 0.10Fortive Corp. 0.875% 15/02/2022 USD 2,150,000 2,165,935 0.09Greenbrier Cos., Inc. (The), 144A2.875% 15/04/2028 USD 2,385,000 2,466,082 0.10II-VI, Inc. 0.25% 01/09/2022 USD 1,820,000 2,854,621 0.12Integra LifeSciences Holdings Corp.0.5% 15/08/2025 USD 2,130,000 2,364,972 0.10JetBlue Airways Corp., 144A 0.5%01/04/2026 USD 1,570,000 1,571,312 0.07Kite Realty Group LP, REIT, 144A0.75% 01/04/2027 USD 1,568,000 1,643,692 0.07Lyft, Inc. 1.5% 15/05/2025 USD 2,110,000 3,633,950 0.15Microchip Technology, Inc. 1.625%15/02/2027 USD 1,585,000 3,573,961 0.15ON Semiconductor Corp., 144A 0%01/05/2027 USD 4,880,000 5,100,314 0.21Palo Alto Networks, Inc. 0.375%01/06/2025 USD 2,150,000 2,933,959 0.12Pebblebrook Hotel Trust, REIT 1.75%15/12/2026 USD 2,101,000 2,392,347 0.10PetIQ, Inc. 4% 01/06/2026 USD 440,000 672,176 0.03Silicon Laboratories, Inc. 0.625%15/06/2025 USD 2,515,000 3,490,815 0.14Snap, Inc. 0.75% 01/08/2026 USD 795,000 2,414,694 0.10Southwest Airlines Co. 1.25%01/05/2025 USD 1,770,000 2,693,955 0.11Summit Hotel Properties, Inc., REIT1.5% 15/02/2026 USD 786,000 811,873 0.03TripAdvisor, Inc., 144A 0.25%01/04/2026 USD 2,658,000 2,510,668 0.10Twitter, Inc., 144A 0% 15/03/2026 USD 2,035,000 1,950,019 0.08Vail Resorts, Inc., 144A 0% 01/01/2026 USD 1,448,000 1,506,190 0.06Zynga, Inc., 144A 0% 15/12/2026 USD 2,835,000 3,036,086 0.13
80,638,100 3.32
Total Convertible Bonds 86,660,368 3.57
Total Transferable securities and money market instrumentsdealt in on another regulated market 1,178,619,050 48.55
229
JPMorgan Funds - Global Strategic Bond FundSchedule of Investments (continued)
As at 30 June 2021
Investments Currency
Quantity/Nominal
Value
MarketValue
USD
%of
NetAssets Investments Currency
Quantity/Nominal
Value
MarketValue
USD
%of
NetAssets
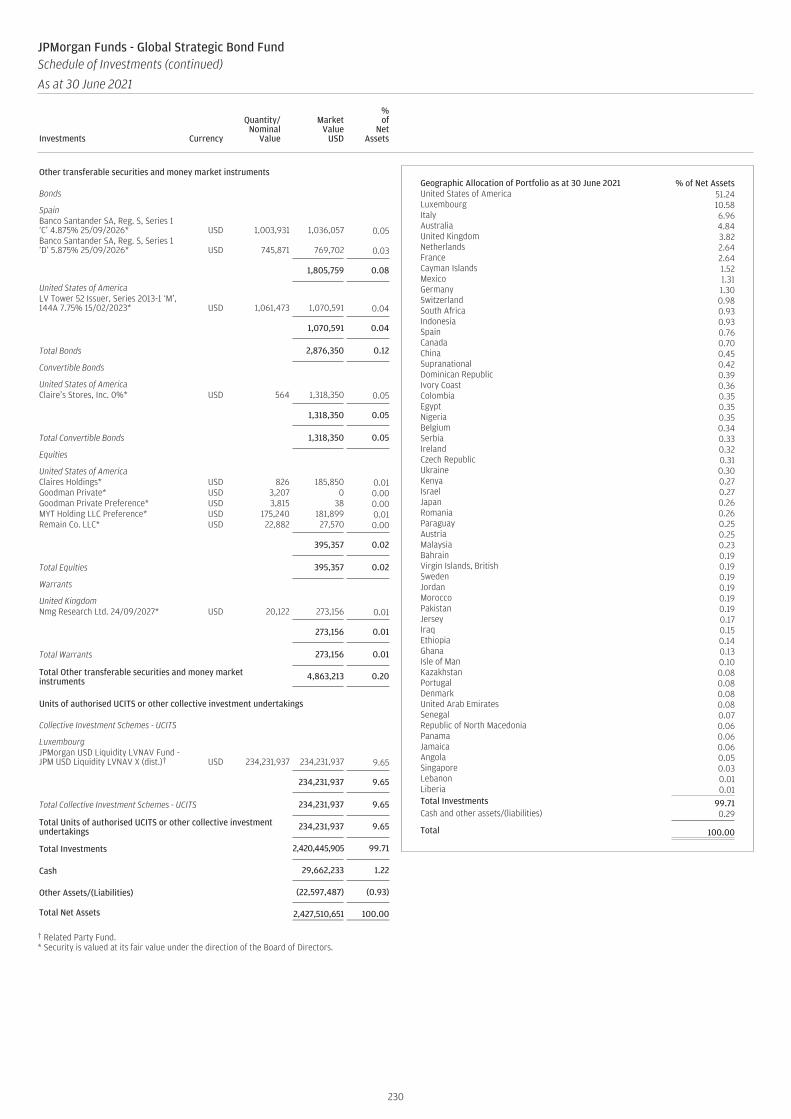
Other transferable securities and money market instruments
Bonds
SpainBanco Santander SA, Reg. S, Series 1‘C’ 4.875% 25/09/2026* USD 1,003,931 1,036,057 0.05Banco Santander SA, Reg. S, Series 1‘D’ 5.875% 25/09/2026* USD 745,871 769,702 0.03
1,805,759 0.08
United States of AmericaLV Tower 52 Issuer, Series 2013-1 ‘M’,144A 7.75% 15/02/2023* USD 1,061,473 1,070,591 0.04
1,070,591 0.04
Total Bonds 2,876,350 0.12
Convertible Bonds
United States of AmericaClaire’s Stores, Inc. 0%* USD 564 1,318,350 0.05
1,318,350 0.05
Total Convertible Bonds 1,318,350 0.05
Equities
United States of AmericaClaires Holdings* USD 826 185,850 0.01Goodman Private* USD 3,207 0 0.00Goodman Private Preference* USD 3,815 38 0.00MYT Holding LLC Preference* USD 175,240 181,899 0.01Remain Co. LLC* USD 22,882 27,570 0.00
395,357 0.02
Total Equities 395,357 0.02
Warrants
United KingdomNmg Research Ltd. 24/09/2027* USD 20,122 273,156 0.01
273,156 0.01
Total Warrants 273,156 0.01
Total Other transferable securities and money marketinstruments 4,863,213 0.20
Units of authorised UCITS or other collective investment undertakings
Collective Investment Schemes - UCITS
LuxembourgJPMorgan USD Liquidity LVNAV Fund -JPM USD Liquidity LVNAV X (dist.)† USD 234,231,937 234,231,937 9.65
234,231,937 9.65
Total Collective Investment Schemes - UCITS 234,231,937 9.65
Total Units of authorised UCITS or other collective investmentundertakings 234,231,937 9.65
Total Investments 2,420,445,905 99.71
Cash 29,662,233 1.22
Other Assets/(Liabilities) (22,597,487) (0.93)
Total Net Assets 2,427,510,651 100.00
† Related Party Fund.* Security is valued at its fair value under the direction of the Board of Directors.
Geographic Allocation of Portfolio as at 30 June 2021 % of Net AssetsUnited States of America 51.24Luxembourg 10.58Italy 6.96Australia 4.84United Kingdom 3.82Netherlands 2.64France 2.64Cayman Islands 1.52Mexico 1.31Germany 1.30Switzerland 0.98South Africa 0.93Indonesia 0.93Spain 0.76Canada 0.70China 0.45Supranational 0.42Dominican Republic 0.39Ivory Coast 0.36Colombia 0.35Egypt 0.35Nigeria 0.35Belgium 0.34Serbia 0.33Ireland 0.32Czech Republic 0.31Ukraine 0.30Kenya 0.27Israel 0.27Japan 0.26Romania 0.26Paraguay 0.25Austria 0.25Malaysia 0.23Bahrain 0.19Virgin Islands, British 0.19Sweden 0.19Jordan 0.19Morocco 0.19Pakistan 0.19Jersey 0.17Iraq 0.15Ethiopia 0.14Ghana 0.13Isle of Man 0.10Kazakhstan 0.08Portugal 0.08Denmark 0.08United Arab Emirates 0.08Senegal 0.07Republic of North Macedonia 0.06Panama 0.06Jamaica 0.06Angola 0.05Singapore 0.03Lebanon 0.01Liberia 0.01Total Investments 99.71Cash and other assets/(liabilities) 0.29
Total 100.00
230
JPMorgan Funds - Global Strategic Bond FundSchedule of Investments (continued)
As at 30 June 2021
Investments Currency
Quantity/Nominal
Value
MarketValue
USD
%of
NetAssets Investments Currency
Quantity/Nominal
Value
MarketValue
USD
%of
NetAssets
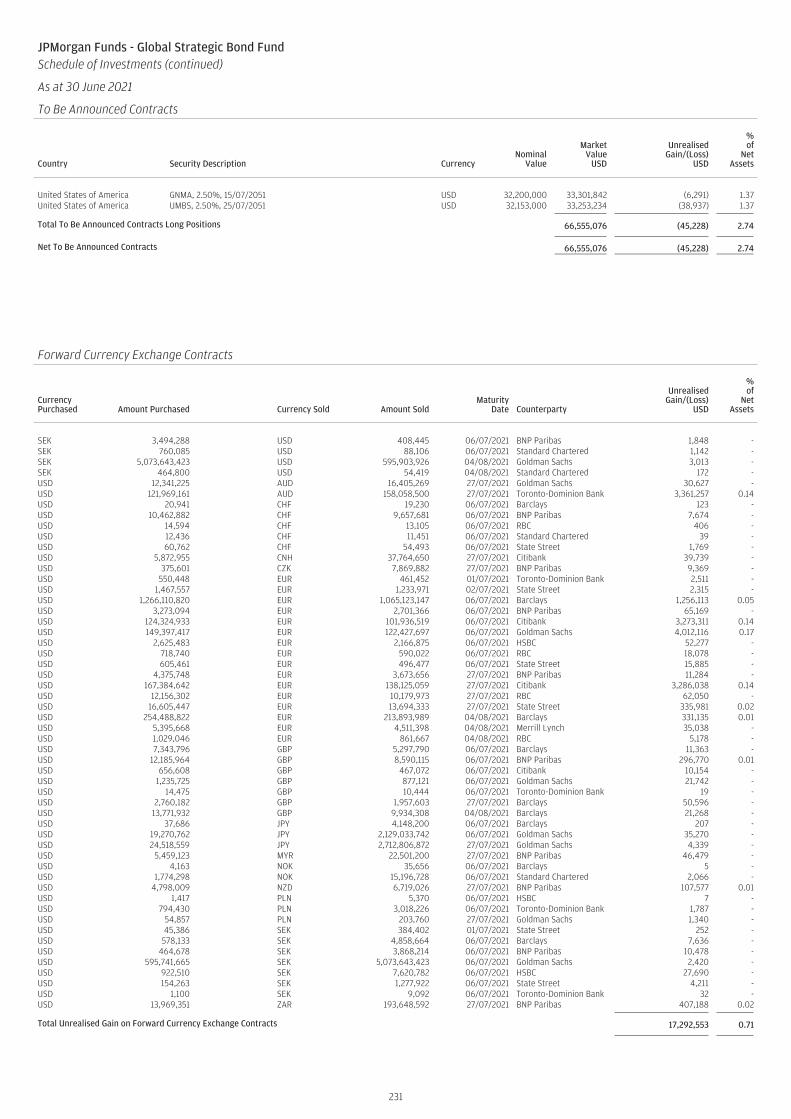
JPMorgan Funds - Global Strategic Bond FundSchedule of Investments (continued)
As at 30 June 2021
To Be Announced Contracts
Country Security Description CurrencyNominal
Value
MarketValue
USD
UnrealisedGain/(Loss)
USD
%of
NetAssets
United States of America GNMA, 2.50%, 15/07/2051 USD 32,200,000 33,301,842 (6,291) 1.37United States of America UMBS, 2.50%, 25/07/2051 USD 32,153,000 33,253,234 (38,937) 1.37
Total To Be Announced Contracts Long Positions 66,555,076 (45,228) 2.74
Net To Be Announced Contracts 66,555,076 (45,228) 2.74
JPMorgan Funds - Global Strategic Bond FundSchedule of Investments (continued)
As at 30 June 2021
Forward Currency Exchange Contracts (continued)
CurrencyPurchased Amount Purchased Currency Sold Amount Sold
MaturityDate Counterparty
UnrealisedGain/(Loss)
USD
%of
NetAssets
SEK 3,494,288 USD 408,445 06/07/2021 BNP Paribas 1,848 -SEK 760,085 USD 88,106 06/07/2021 Standard Chartered 1,142 -SEK 5,073,643,423 USD 595,903,926 04/08/2021 Goldman Sachs 3,013 -SEK 464,800 USD 54,419 04/08/2021 Standard Chartered 172 -USD 12,341,225 AUD 16,405,269 27/07/2021 Goldman Sachs 30,627 -USD 121,969,161 AUD 158,058,500 27/07/2021 Toronto-Dominion Bank 3,361,257 0.14USD 20,941 CHF 19,230 06/07/2021 Barclays 123 -USD 10,462,882 CHF 9,657,681 06/07/2021 BNP Paribas 7,674 -USD 14,594 CHF 13,105 06/07/2021 RBC 406 -USD 12,436 CHF 11,451 06/07/2021 Standard Chartered 39 -USD 60,762 CHF 54,493 06/07/2021 State Street 1,769 -USD 5,872,955 CNH 37,764,650 27/07/2021 Citibank 39,739 -USD 375,601 CZK 7,869,882 27/07/2021 BNP Paribas 9,369 -USD 550,448 EUR 461,452 01/07/2021 Toronto-Dominion Bank 2,511 -USD 1,467,557 EUR 1,233,971 02/07/2021 State Street 2,315 -USD 1,266,110,820 EUR 1,065,123,147 06/07/2021 Barclays 1,256,113 0.05USD 3,273,094 EUR 2,701,366 06/07/2021 BNP Paribas 65,169 -USD 124,324,933 EUR 101,936,519 06/07/2021 Citibank 3,273,311 0.14USD 149,397,417 EUR 122,427,697 06/07/2021 Goldman Sachs 4,012,116 0.17USD 2,625,483 EUR 2,166,875 06/07/2021 HSBC 52,277 -USD 718,740 EUR 590,022 06/07/2021 RBC 18,078 -USD 605,461 EUR 496,477 06/07/2021 State Street 15,885 -USD 4,375,748 EUR 3,673,656 27/07/2021 BNP Paribas 11,284 -USD 167,384,642 EUR 138,125,059 27/07/2021 Citibank 3,286,038 0.14USD 12,156,302 EUR 10,179,973 27/07/2021 RBC 62,050 -USD 16,605,447 EUR 13,694,333 27/07/2021 State Street 335,981 0.02USD 254,488,822 EUR 213,893,989 04/08/2021 Barclays 331,135 0.01USD 5,395,668 EUR 4,511,398 04/08/2021 Merrill Lynch 35,038 -USD 1,029,046 EUR 861,667 04/08/2021 RBC 5,178 -USD 7,343,796 GBP 5,297,790 06/07/2021 Barclays 11,363 -USD 12,185,964 GBP 8,590,115 06/07/2021 BNP Paribas 296,770 0.01USD 656,608 GBP 467,072 06/07/2021 Citibank 10,154 -USD 1,235,725 GBP 877,121 06/07/2021 Goldman Sachs 21,742 -USD 14,475 GBP 10,444 06/07/2021 Toronto-Dominion Bank 19 -USD 2,760,182 GBP 1,957,603 27/07/2021 Barclays 50,596 -USD 13,771,932 GBP 9,934,308 04/08/2021 Barclays 21,268 -USD 37,686 JPY 4,148,200 06/07/2021 Barclays 207 -USD 19,270,762 JPY 2,129,033,742 06/07/2021 Goldman Sachs 35,270 -USD 24,518,559 JPY 2,712,806,872 27/07/2021 Goldman Sachs 4,339 -USD 5,459,123 MYR 22,501,200 27/07/2021 BNP Paribas 46,479 -USD 4,163 NOK 35,656 06/07/2021 Barclays 5 -USD 1,774,298 NOK 15,196,728 06/07/2021 Standard Chartered 2,066 -USD 4,798,009 NZD 6,719,026 27/07/2021 BNP Paribas 107,577 0.01USD 1,417 PLN 5,370 06/07/2021 HSBC 7 -USD 794,430 PLN 3,018,226 06/07/2021 Toronto-Dominion Bank 1,787 -USD 54,857 PLN 203,760 27/07/2021 Goldman Sachs 1,340 -USD 45,386 SEK 384,402 01/07/2021 State Street 252 -USD 578,133 SEK 4,858,664 06/07/2021 Barclays 7,636 -USD 464,678 SEK 3,868,214 06/07/2021 BNP Paribas 10,478 -USD 595,741,665 SEK 5,073,643,423 06/07/2021 Goldman Sachs 2,420 -USD 922,510 SEK 7,620,782 06/07/2021 HSBC 27,690 -USD 154,263 SEK 1,277,922 06/07/2021 State Street 4,211 -USD 1,100 SEK 9,092 06/07/2021 Toronto-Dominion Bank 32 -USD 13,969,351 ZAR 193,648,592 27/07/2021 BNP Paribas 407,188 0.02
Total Unrealised Gain on Forward Currency Exchange Contracts 17,292,553 0.71
231
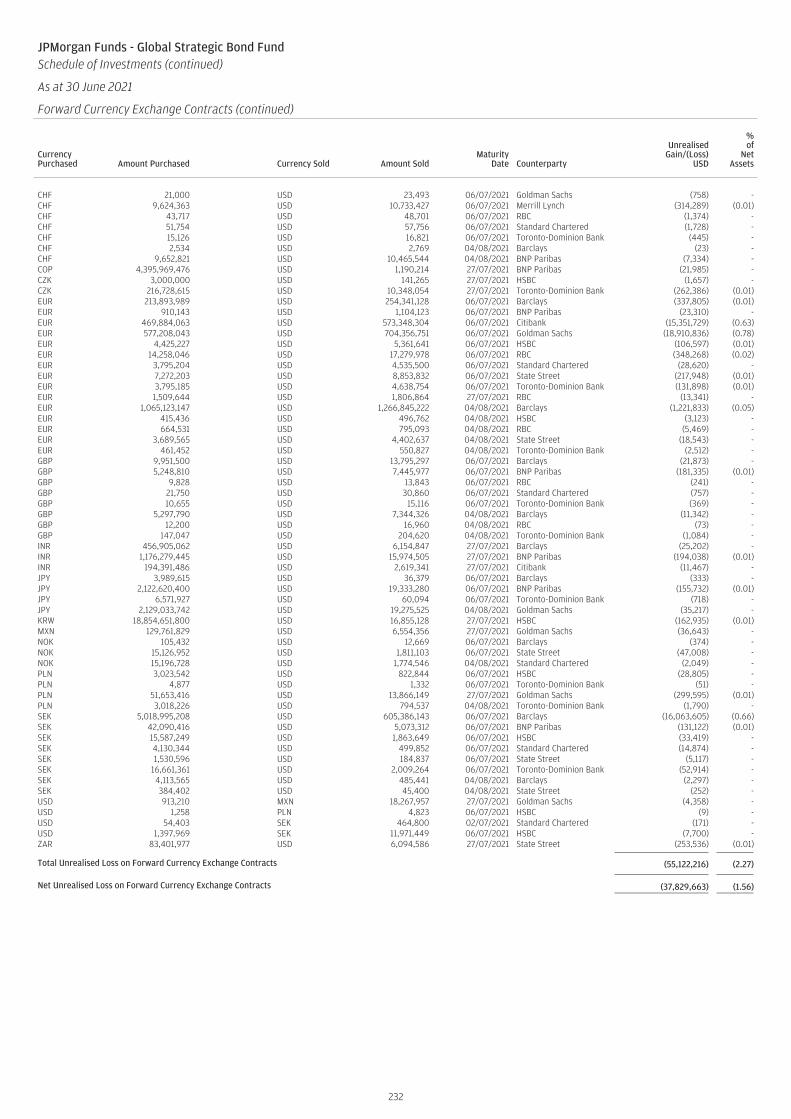
JPMorgan Funds - Global Strategic Bond FundSchedule of Investments (continued)
As at 30 June 2021
Forward Currency Exchange Contracts (continued)
CurrencyPurchased Amount Purchased Currency Sold Amount Sold
MaturityDate Counterparty
UnrealisedGain/(Loss)
USD
%of
NetAssets
CHF 21,000 USD 23,493 06/07/2021 Goldman Sachs (758) -CHF 9,624,363 USD 10,733,427 06/07/2021 Merrill Lynch (314,289) (0.01)CHF 43,717 USD 48,701 06/07/2021 RBC (1,374) -CHF 51,754 USD 57,756 06/07/2021 Standard Chartered (1,728) -CHF 15,126 USD 16,821 06/07/2021 Toronto-Dominion Bank (445) -CHF 2,534 USD 2,769 04/08/2021 Barclays (23) -CHF 9,652,821 USD 10,465,544 04/08/2021 BNP Paribas (7,334) -COP 4,395,969,476 USD 1,190,214 27/07/2021 BNP Paribas (21,985) -CZK 3,000,000 USD 141,265 27/07/2021 HSBC (1,657) -CZK 216,728,615 USD 10,348,054 27/07/2021 Toronto-Dominion Bank (262,386) (0.01)EUR 213,893,989 USD 254,341,128 06/07/2021 Barclays (337,805) (0.01)EUR 910,143 USD 1,104,123 06/07/2021 BNP Paribas (23,310) -EUR 469,884,063 USD 573,348,304 06/07/2021 Citibank (15,351,729) (0.63)EUR 577,208,043 USD 704,356,751 06/07/2021 Goldman Sachs (18,910,836) (0.78)EUR 4,425,227 USD 5,361,641 06/07/2021 HSBC (106,597) (0.01)EUR 14,258,046 USD 17,279,978 06/07/2021 RBC (348,268) (0.02)EUR 3,795,204 USD 4,535,500 06/07/2021 Standard Chartered (28,620) -EUR 7,272,203 USD 8,853,832 06/07/2021 State Street (217,948) (0.01)EUR 3,795,185 USD 4,638,754 06/07/2021 Toronto-Dominion Bank (131,898) (0.01)EUR 1,509,644 USD 1,806,864 27/07/2021 RBC (13,341) -EUR 1,065,123,147 USD 1,266,845,222 04/08/2021 Barclays (1,221,833) (0.05)EUR 415,436 USD 496,762 04/08/2021 HSBC (3,123) -EUR 664,531 USD 795,093 04/08/2021 RBC (5,469) -EUR 3,689,565 USD 4,402,637 04/08/2021 State Street (18,543) -EUR 461,452 USD 550,827 04/08/2021 Toronto-Dominion Bank (2,512) -GBP 9,951,500 USD 13,795,297 06/07/2021 Barclays (21,873) -GBP 5,248,810 USD 7,445,977 06/07/2021 BNP Paribas (181,335) (0.01)GBP 9,828 USD 13,843 06/07/2021 RBC (241) -GBP 21,750 USD 30,860 06/07/2021 Standard Chartered (757) -GBP 10,655 USD 15,116 06/07/2021 Toronto-Dominion Bank (369) -GBP 5,297,790 USD 7,344,326 04/08/2021 Barclays (11,342) -GBP 12,200 USD 16,960 04/08/2021 RBC (73) -GBP 147,047 USD 204,620 04/08/2021 Toronto-Dominion Bank (1,084) -INR 456,905,062 USD 6,154,847 27/07/2021 Barclays (25,202) -INR 1,176,279,445 USD 15,974,505 27/07/2021 BNP Paribas (194,038) (0.01)INR 194,391,486 USD 2,619,341 27/07/2021 Citibank (11,467) -JPY 3,989,615 USD 36,379 06/07/2021 Barclays (333) -JPY 2,122,620,400 USD 19,333,280 06/07/2021 BNP Paribas (155,732) (0.01)JPY 6,571,927 USD 60,094 06/07/2021 Toronto-Dominion Bank (718) -JPY 2,129,033,742 USD 19,275,525 04/08/2021 Goldman Sachs (35,217) -KRW 18,854,651,800 USD 16,855,128 27/07/2021 HSBC (162,935) (0.01)MXN 129,761,829 USD 6,554,356 27/07/2021 Goldman Sachs (36,643) -NOK 105,432 USD 12,669 06/07/2021 Barclays (374) -NOK 15,126,952 USD 1,811,103 06/07/2021 State Street (47,008) -NOK 15,196,728 USD 1,774,546 04/08/2021 Standard Chartered (2,049) -PLN 3,023,542 USD 822,844 06/07/2021 HSBC (28,805) -PLN 4,877 USD 1,332 06/07/2021 Toronto-Dominion Bank (51) -PLN 51,653,416 USD 13,866,149 27/07/2021 Goldman Sachs (299,595) (0.01)PLN 3,018,226 USD 794,537 04/08/2021 Toronto-Dominion Bank (1,790) -SEK 5,018,995,208 USD 605,386,143 06/07/2021 Barclays (16,063,605) (0.66)SEK 42,090,416 USD 5,073,312 06/07/2021 BNP Paribas (131,122) (0.01)SEK 15,587,249 USD 1,863,649 06/07/2021 HSBC (33,419) -SEK 4,130,344 USD 499,852 06/07/2021 Standard Chartered (14,874) -SEK 1,530,596 USD 184,837 06/07/2021 State Street (5,117) -SEK 16,661,361 USD 2,009,264 06/07/2021 Toronto-Dominion Bank (52,914) -SEK 4,113,565 USD 485,441 04/08/2021 Barclays (2,297) -SEK 384,402 USD 45,400 04/08/2021 State Street (252) -USD 913,210 MXN 18,267,957 27/07/2021 Goldman Sachs (4,358) -USD 1,258 PLN 4,823 06/07/2021 HSBC (9) -USD 54,403 SEK 464,800 02/07/2021 Standard Chartered (171) -USD 1,397,969 SEK 11,971,449 06/07/2021 HSBC (7,700) -ZAR 83,401,977 USD 6,094,586 27/07/2021 State Street (253,536) (0.01)
Total Unrealised Loss on Forward Currency Exchange Contracts (55,122,216) (2.27)
Net Unrealised Loss on Forward Currency Exchange Contracts (37,829,663) (1.56)
232
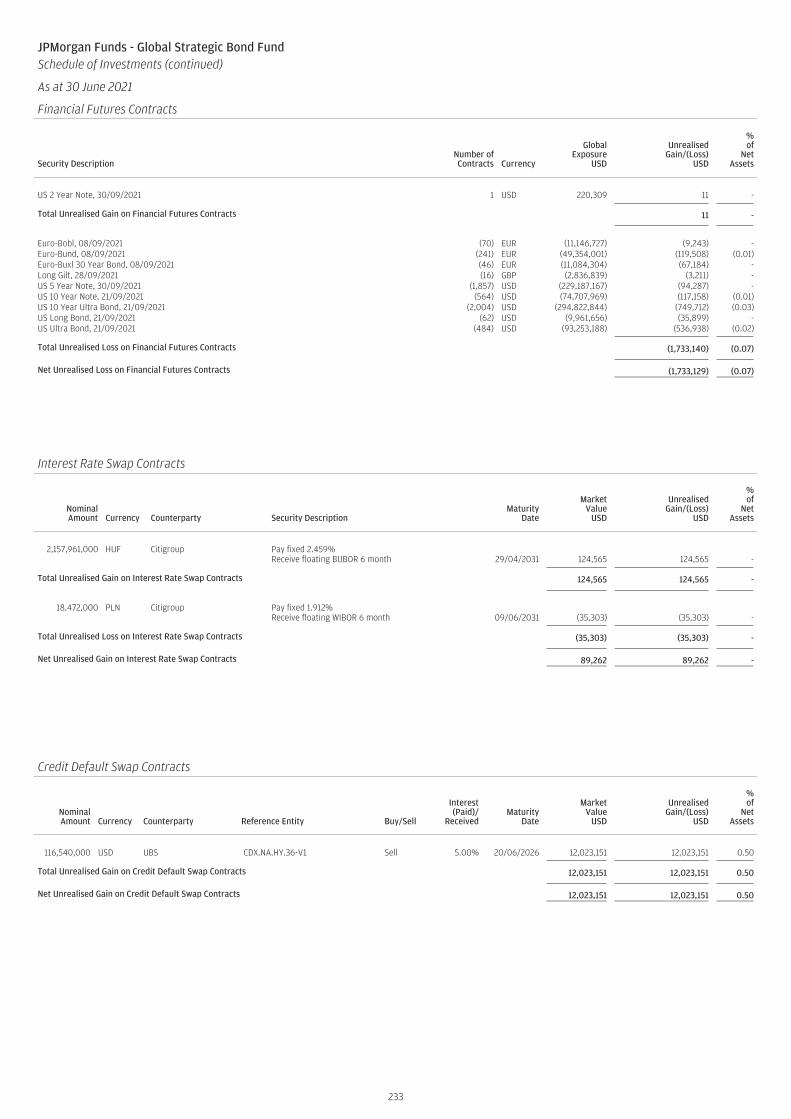
JPMorgan Funds - Global Strategic Bond FundSchedule of Investments (continued)
As at 30 June 2021
Financial Futures Contracts
Security DescriptionNumber ofContracts Currency
GlobalExposure
USD
UnrealisedGain/(Loss)
USD
%of
NetAssets
US 2 Year Note, 30/09/2021 1 USD 220,309 11 -
Total Unrealised Gain on Financial Futures Contracts 11 -
Euro-Bobl, 08/09/2021 (70) EUR (11,146,727) (9,243) -Euro-Bund, 08/09/2021 (241) EUR (49,354,001) (119,508) (0.01)Euro-Buxl 30 Year Bond, 08/09/2021 (46) EUR (11,084,304) (67,184) -Long Gilt, 28/09/2021 (16) GBP (2,836,839) (3,211) -US 5 Year Note, 30/09/2021 (1,857) USD (229,187,167) (94,287) -US 10 Year Note, 21/09/2021 (564) USD (74,707,969) (117,158) (0.01)US 10 Year Ultra Bond, 21/09/2021 (2,004) USD (294,822,844) (749,712) (0.03)US Long Bond, 21/09/2021 (62) USD (9,961,656) (35,899) -US Ultra Bond, 21/09/2021 (484) USD (93,253,188) (536,938) (0.02)
Total Unrealised Loss on Financial Futures Contracts (1,733,140) (0.07)
Net Unrealised Loss on Financial Futures Contracts (1,733,129) (0.07)
JPMorgan Funds - Global Strategic Bond FundSchedule of Investments (continued)
As at 30 June 2021
Interest Rate Swap Contracts
NominalAmount Currency Counterparty Security Description
MaturityDate
MarketValue
USD
UnrealisedGain/(Loss)
USD
%of
NetAssets
2,157,961,000 HUF Citigroup Pay fixed 2.459%Receive floating BUBOR 6 month 29/04/2031 124,565 124,565 -
Total Unrealised Gain on Interest Rate Swap Contracts 124,565 124,565 -
18,472,000 PLN Citigroup Pay fixed 1.912%Receive floating WIBOR 6 month 09/06/2031 (35,303) (35,303) -
Total Unrealised Loss on Interest Rate Swap Contracts (35,303) (35,303) -
Net Unrealised Gain on Interest Rate Swap Contracts 89,262 89,262 -
JPMorgan Funds - Global Strategic Bond FundSchedule of Investments (continued)
As at 30 June 2021
Credit Default Swap Contracts
NominalAmount Currency Counterparty Reference Entity Buy/Sell
Interest(Paid)/
ReceivedMaturity
Date
MarketValue
USD
UnrealisedGain/(Loss)
USD
%of
NetAssets
116,540,000 USD UBS CDX.NA.HY.36-V1 Sell 5.00% 20/06/2026 12,023,151 12,023,151 0.50
Total Unrealised Gain on Credit Default Swap Contracts 12,023,151 12,023,151 0.50
Net Unrealised Gain on Credit Default Swap Contracts 12,023,151 12,023,151 0.50
233

Transferable securities and money market instruments admitted to an official exchangelisting
Bonds
AngolaAngola Government Bond, Reg. S 9.5%12/11/2025 USD 1,000,000 1,097,570 0.01Angola Government Bond, Reg. S 8%26/11/2029 USD 7,610,000 7,829,244 0.08Angola Government Bond, Reg. S9.125% 26/11/2049 USD 6,200,000 6,364,548 0.06
15,291,362 0.15
ArmeniaArmenia Government Bond, Reg. S3.6% 02/02/2031 USD 5,200,000 4,930,276 0.05
4,930,276 0.05
AustriaKlabin Austria GmbH, Reg. S 7%03/04/2049 USD 4,470,000 5,689,897 0.06
5,689,897 0.06
BahrainBahrain Government Bond, Reg. S 7%12/10/2028 USD 1,700,000 1,911,612 0.02Bahrain Government Bond, Reg. S6.75% 20/09/2029 USD 1,800,000 1,980,315 0.02Bahrain Government Bond, Reg. S5.45% 16/09/2032 USD 7,067,000 7,038,061 0.07Oil and Gas Holding Co. BSCC (The),Reg. S 7.625% 07/11/2024 USD 600,000 672,734 0.01Oil and Gas Holding Co. BSCC (The),Reg. S 8.375% 07/11/2028 USD 3,700,000 4,344,466 0.04
15,947,188 0.16
BelarusBelarus Government Bond, Reg. S7.625% 29/06/2027 USD 6,400,000 6,265,408 0.06Development Bank of the Republic ofBelarus JSC, Reg. S 6.75% 02/05/2024 USD 1,370,000 1,251,029 0.01
7,516,437 0.07
CanadaCenovus Energy, Inc. 5.375%15/07/2025 USD 3,104,000 3,553,540 0.03
3,553,540 0.03
Cayman IslandsTermocandelaria Power Ltd., Reg. S7.875% 30/01/2029 USD 3,607,500 3,855,299 0.04
3,855,299 0.04
ColombiaEcopetrol SA 5.875% 28/05/2045 USD 3,960,000 4,245,714 0.04
4,245,714 0.04
Costa RicaCosta Rica Government Bond, Reg. S4.375% 30/04/2025 USD 800,000 824,600 0.01Costa Rica Government Bond, Reg. S6.125% 19/02/2031 USD 8,300,000 8,824,975 0.09Costa Rica Government Bond, Reg. S5.625% 30/04/2043 USD 600,000 555,000 0.00Instituto Costarricense de Electricidad,Reg. S 6.95% 10/11/2021 USD 4,400,000 4,438,500 0.04Instituto Costarricense de Electricidad,Reg. S 6.375% 15/05/2043 USD 1,400,000 1,235,500 0.01
15,878,575 0.15
Dominican RepublicDominican Republic Government Bond,Reg. S 5.3% 21/01/2041 USD 9,683,000 9,707,208 0.09Dominican Republic Government Bond,Reg. S 7.45% 30/04/2044 USD 2,700,000 3,270,375 0.03Dominican Republic Government Bond,Reg. S 5.875% 30/01/2060 USD 14,290,000 14,325,725 0.14
27,303,308 0.26
EgyptEgypt Government Bond, Reg. S 7.5%31/01/2027 USD 2,800,000 3,153,500 0.03Egypt Government Bond, Reg. S5.875% 16/02/2031 USD 4,109,000 3,998,057 0.04Egypt Government Bond, Reg. S7.053% 15/01/2032 USD 11,400,000 11,722,734 0.11Egypt Government Bond, Reg. S8.875% 29/05/2050 USD 9,700,000 10,476,495 0.10
29,350,786 0.28
El SalvadorEl Salvador Government Bond, Reg. S8.625% 28/02/2029 USD 5,000,000 4,912,500 0.05El Salvador Government Bond, Reg. S7.625% 01/02/2041 USD 3,950,000 3,525,375 0.03El Salvador Government Bond, Reg. S7.125% 20/01/2050 USD 8,750,000 7,459,375 0.07
15,897,250 0.15
EthiopiaEthiopia Government Bond, Reg. S6.625% 11/12/2024 USD 7,400,000 6,863,500 0.07
6,863,500 0.07
FinlandNokia OYJ 4.375% 12/06/2027 USD 2,250,000 2,492,055 0.02
2,492,055 0.02
FranceAltice France SA, 144A 7.375%01/05/2026 USD 7,195,000 7,488,196 0.07Altice France SA, 144A 5.5%15/01/2028 USD 3,000,000 3,108,750 0.03Altice France SA, 144A 5.125%15/07/2029 USD 4,734,000 4,757,670 0.05Credit Agricole SA, FRN, 144A 8.125%Perpetual USD 13,224,000 16,112,981 0.16Societe Generale SA, FRN, 144A 4.75%31/12/2164 USD 5,360,000 5,567,700 0.05Societe Generale SA, FRN, 144A 8%Perpetual USD 200,000 235,625 0.00Societe Generale SA, Reg. S, FRN7.375% Perpetual USD 7,500,000 7,585,725 0.07
44,856,647 0.43
GhanaGhana Government Bond, Reg. S 0%07/04/2025 USD 2,720,000 2,168,942 0.02Ghana Government Bond, Reg. S6.375% 11/02/2027 USD 9,500,000 9,568,390 0.09Ghana Government Bond, Reg. S8.625% 07/04/2034 USD 3,474,000 3,594,930 0.04Ghana Government Bond, Reg. S7.875% 11/02/2035 USD 2,000,000 1,976,250 0.02Ghana Government Bond, Reg. S8.875% 07/05/2042 USD 1,300,000 1,315,626 0.01Ghana Government Bond, Reg. S8.95% 26/03/2051 USD 2,400,000 2,379,480 0.03Ghana Government Bond, Reg. S 8.75%11/03/2061 USD 8,810,000 8,495,527 0.08
29,499,145 0.29
IndonesiaIndonesia Asahan Aluminium PerseroPT, Reg. S 6.757% 15/11/2048 USD 6,000,000 7,753,860 0.08
7,753,860 0.08
IraqIraq Government Bond, Reg. S 6.752%09/03/2023 USD 6,200,000 6,358,174 0.06Iraq Government Bond, Reg. S 5.8%15/01/2028 USD 11,200,000 10,865,736 0.11
17,223,910 0.17
IrelandAerCap Ireland Capital DAC 5%01/10/2021 USD 2,163,000 2,186,652 0.02AerCap Ireland Capital DAC 4.5%15/09/2023 USD 2,900,000 3,110,210 0.03Motion Bondco DAC, 144A 6.625%15/11/2027 USD 1,500,000 1,524,690 0.02
6,821,552 0.07
234
JPMorgan Funds - Income FundSchedule of Investments
As at 30 June 2021
Investments Currency
Quantity/Nominal
Value
MarketValue
USD
%of
NetAssets Investments Currency
Quantity/Nominal
Value
MarketValue
USD
%of
NetAssets
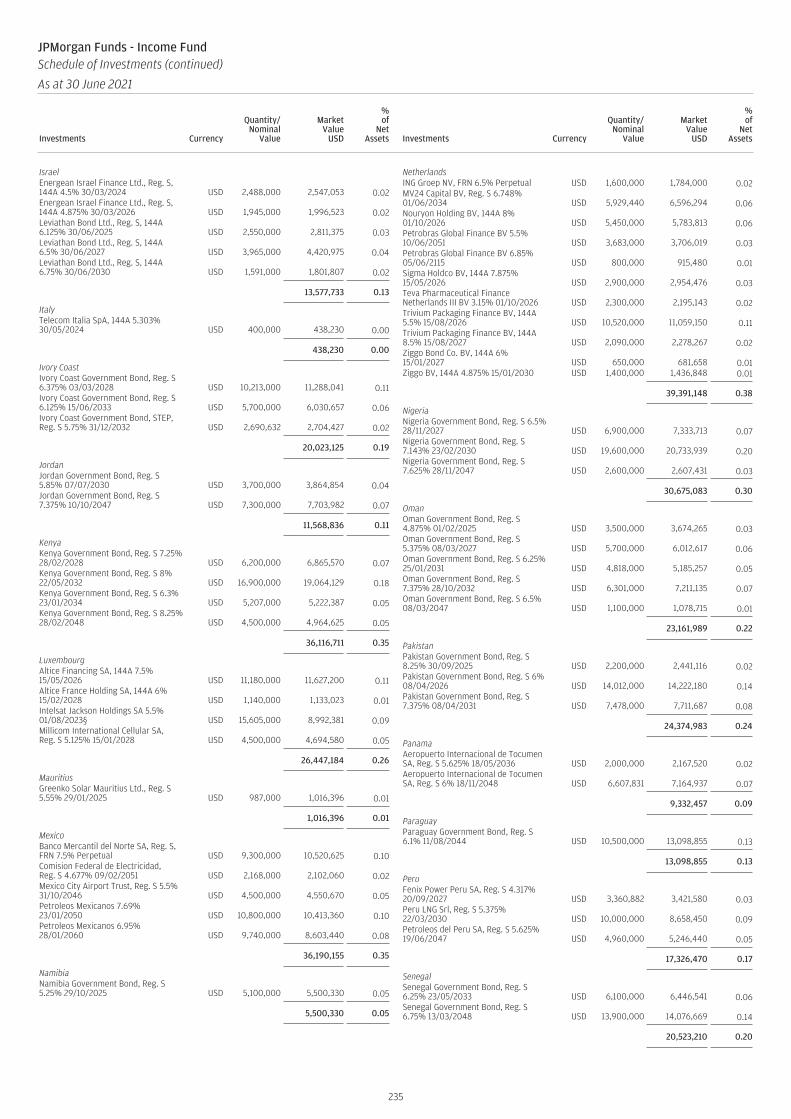
IsraelEnergean Israel Finance Ltd., Reg. S,144A 4.5% 30/03/2024 USD 2,488,000 2,547,053 0.02Energean Israel Finance Ltd., Reg. S,144A 4.875% 30/03/2026 USD 1,945,000 1,996,523 0.02Leviathan Bond Ltd., Reg. S, 144A6.125% 30/06/2025 USD 2,550,000 2,811,375 0.03Leviathan Bond Ltd., Reg. S, 144A6.5% 30/06/2027 USD 3,965,000 4,420,975 0.04Leviathan Bond Ltd., Reg. S, 144A6.75% 30/06/2030 USD 1,591,000 1,801,807 0.02
13,577,733 0.13
ItalyTelecom Italia SpA, 144A 5.303%30/05/2024 USD 400,000 438,230 0.00
438,230 0.00
Ivory CoastIvory Coast Government Bond, Reg. S6.375% 03/03/2028 USD 10,213,000 11,288,041 0.11Ivory Coast Government Bond, Reg. S6.125% 15/06/2033 USD 5,700,000 6,030,657 0.06Ivory Coast Government Bond, STEP,Reg. S 5.75% 31/12/2032 USD 2,690,632 2,704,427 0.02
20,023,125 0.19
JordanJordan Government Bond, Reg. S5.85% 07/07/2030 USD 3,700,000 3,864,854 0.04Jordan Government Bond, Reg. S7.375% 10/10/2047 USD 7,300,000 7,703,982 0.07
11,568,836 0.11
KenyaKenya Government Bond, Reg. S 7.25%28/02/2028 USD 6,200,000 6,865,570 0.07Kenya Government Bond, Reg. S 8%22/05/2032 USD 16,900,000 19,064,129 0.18Kenya Government Bond, Reg. S 6.3%23/01/2034 USD 5,207,000 5,222,387 0.05Kenya Government Bond, Reg. S 8.25%28/02/2048 USD 4,500,000 4,964,625 0.05
36,116,711 0.35
LuxembourgAltice Financing SA, 144A 7.5%15/05/2026 USD 11,180,000 11,627,200 0.11Altice France Holding SA, 144A 6%15/02/2028 USD 1,140,000 1,133,023 0.01Intelsat Jackson Holdings SA 5.5%01/08/2023§ USD 15,605,000 8,992,381 0.09Millicom International Cellular SA,Reg. S 5.125% 15/01/2028 USD 4,500,000 4,694,580 0.05
26,447,184 0.26
MauritiusGreenko Solar Mauritius Ltd., Reg. S5.55% 29/01/2025 USD 987,000 1,016,396 0.01
1,016,396 0.01
MexicoBanco Mercantil del Norte SA, Reg. S,FRN 7.5% Perpetual USD 9,300,000 10,520,625 0.10Comision Federal de Electricidad,Reg. S 4.677% 09/02/2051 USD 2,168,000 2,102,060 0.02Mexico City Airport Trust, Reg. S 5.5%31/10/2046 USD 4,500,000 4,550,670 0.05Petroleos Mexicanos 7.69%23/01/2050 USD 10,800,000 10,413,360 0.10Petroleos Mexicanos 6.95%28/01/2060 USD 9,740,000 8,603,440 0.08
36,190,155 0.35
NamibiaNamibia Government Bond, Reg. S5.25% 29/10/2025 USD 5,100,000 5,500,330 0.05
5,500,330 0.05
NetherlandsING Groep NV, FRN 6.5% Perpetual USD 1,600,000 1,784,000 0.02MV24 Capital BV, Reg. S 6.748%01/06/2034 USD 5,929,440 6,596,294 0.06Nouryon Holding BV, 144A 8%01/10/2026 USD 5,450,000 5,783,813 0.06Petrobras Global Finance BV 5.5%10/06/2051 USD 3,683,000 3,706,019 0.03Petrobras Global Finance BV 6.85%05/06/2115 USD 800,000 915,480 0.01Sigma Holdco BV, 144A 7.875%15/05/2026 USD 2,900,000 2,954,476 0.03Teva Pharmaceutical FinanceNetherlands III BV 3.15% 01/10/2026 USD 2,300,000 2,195,143 0.02Trivium Packaging Finance BV, 144A5.5% 15/08/2026 USD 10,520,000 11,059,150 0.11Trivium Packaging Finance BV, 144A8.5% 15/08/2027 USD 2,090,000 2,278,267 0.02Ziggo Bond Co. BV, 144A 6%15/01/2027 USD 650,000 681,658 0.01Ziggo BV, 144A 4.875% 15/01/2030 USD 1,400,000 1,436,848 0.01
39,391,148 0.38
NigeriaNigeria Government Bond, Reg. S 6.5%28/11/2027 USD 6,900,000 7,333,713 0.07Nigeria Government Bond, Reg. S7.143% 23/02/2030 USD 19,600,000 20,733,939 0.20Nigeria Government Bond, Reg. S7.625% 28/11/2047 USD 2,600,000 2,607,431 0.03
30,675,083 0.30
OmanOman Government Bond, Reg. S4.875% 01/02/2025 USD 3,500,000 3,674,265 0.03Oman Government Bond, Reg. S5.375% 08/03/2027 USD 5,700,000 6,012,617 0.06Oman Government Bond, Reg. S 6.25%25/01/2031 USD 4,818,000 5,185,257 0.05Oman Government Bond, Reg. S7.375% 28/10/2032 USD 6,301,000 7,211,135 0.07Oman Government Bond, Reg. S 6.5%08/03/2047 USD 1,100,000 1,078,715 0.01
23,161,989 0.22
PakistanPakistan Government Bond, Reg. S8.25% 30/09/2025 USD 2,200,000 2,441,116 0.02Pakistan Government Bond, Reg. S 6%08/04/2026 USD 14,012,000 14,222,180 0.14Pakistan Government Bond, Reg. S7.375% 08/04/2031 USD 7,478,000 7,711,687 0.08
24,374,983 0.24
PanamaAeropuerto Internacional de TocumenSA, Reg. S 5.625% 18/05/2036 USD 2,000,000 2,167,520 0.02Aeropuerto Internacional de TocumenSA, Reg. S 6% 18/11/2048 USD 6,607,831 7,164,937 0.07
9,332,457 0.09
ParaguayParaguay Government Bond, Reg. S6.1% 11/08/2044 USD 10,500,000 13,098,855 0.13
13,098,855 0.13
PeruFenix Power Peru SA, Reg. S 4.317%20/09/2027 USD 3,360,882 3,421,580 0.03Peru LNG Srl, Reg. S 5.375%22/03/2030 USD 10,000,000 8,658,450 0.09Petroleos del Peru SA, Reg. S 5.625%19/06/2047 USD 4,960,000 5,246,440 0.05
17,326,470 0.17
SenegalSenegal Government Bond, Reg. S6.25% 23/05/2033 USD 6,100,000 6,446,541 0.06Senegal Government Bond, Reg. S6.75% 13/03/2048 USD 13,900,000 14,076,669 0.14
20,523,210 0.20
235
JPMorgan Funds - Income FundSchedule of Investments (continued)
As at 30 June 2021
Investments Currency
Quantity/Nominal
Value
MarketValue
USD
%of
NetAssets Investments Currency
Quantity/Nominal
Value
MarketValue
USD
%of
NetAssets
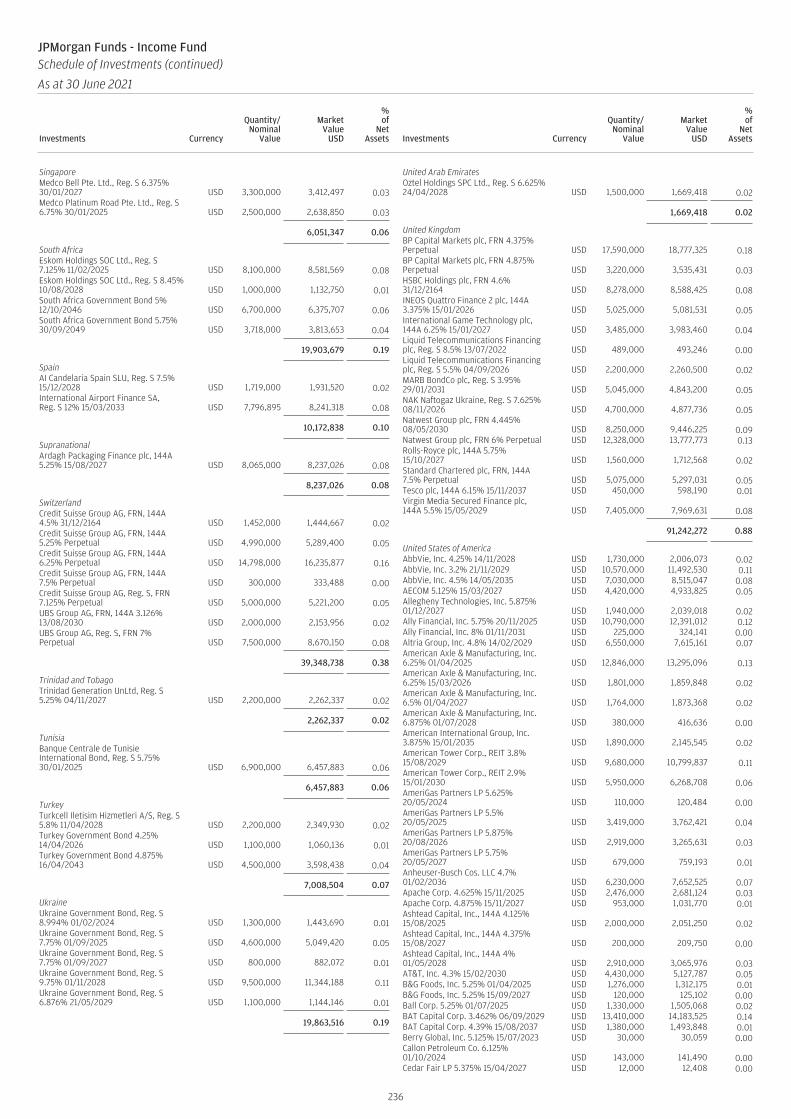
SingaporeMedco Bell Pte. Ltd., Reg. S 6.375%30/01/2027 USD 3,300,000 3,412,497 0.03Medco Platinum Road Pte. Ltd., Reg. S6.75% 30/01/2025 USD 2,500,000 2,638,850 0.03
6,051,347 0.06
South AfricaEskom Holdings SOC Ltd., Reg. S7.125% 11/02/2025 USD 8,100,000 8,581,569 0.08Eskom Holdings SOC Ltd., Reg. S 8.45%10/08/2028 USD 1,000,000 1,132,750 0.01South Africa Government Bond 5%12/10/2046 USD 6,700,000 6,375,707 0.06South Africa Government Bond 5.75%30/09/2049 USD 3,718,000 3,813,653 0.04
19,903,679 0.19
SpainAI Candelaria Spain SLU, Reg. S 7.5%15/12/2028 USD 1,719,000 1,931,520 0.02International Airport Finance SA,Reg. S 12% 15/03/2033 USD 7,796,895 8,241,318 0.08
10,172,838 0.10
SupranationalArdagh Packaging Finance plc, 144A5.25% 15/08/2027 USD 8,065,000 8,237,026 0.08
8,237,026 0.08
SwitzerlandCredit Suisse Group AG, FRN, 144A4.5% 31/12/2164 USD 1,452,000 1,444,667 0.02Credit Suisse Group AG, FRN, 144A5.25% Perpetual USD 4,990,000 5,289,400 0.05Credit Suisse Group AG, FRN, 144A6.25% Perpetual USD 14,798,000 16,235,877 0.16Credit Suisse Group AG, FRN, 144A7.5% Perpetual USD 300,000 333,488 0.00Credit Suisse Group AG, Reg. S, FRN7.125% Perpetual USD 5,000,000 5,221,200 0.05UBS Group AG, FRN, 144A 3.126%13/08/2030 USD 2,000,000 2,153,956 0.02UBS Group AG, Reg. S, FRN 7%Perpetual USD 7,500,000 8,670,150 0.08
39,348,738 0.38
Trinidad and TobagoTrinidad Generation UnLtd, Reg. S5.25% 04/11/2027 USD 2,200,000 2,262,337 0.02
2,262,337 0.02
TunisiaBanque Centrale de TunisieInternational Bond, Reg. S 5.75%30/01/2025 USD 6,900,000 6,457,883 0.06
6,457,883 0.06
TurkeyTurkcell Iletisim Hizmetleri A/S, Reg. S5.8% 11/04/2028 USD 2,200,000 2,349,930 0.02Turkey Government Bond 4.25%14/04/2026 USD 1,100,000 1,060,136 0.01Turkey Government Bond 4.875%16/04/2043 USD 4,500,000 3,598,438 0.04
7,008,504 0.07
UkraineUkraine Government Bond, Reg. S8.994% 01/02/2024 USD 1,300,000 1,443,690 0.01Ukraine Government Bond, Reg. S7.75% 01/09/2025 USD 4,600,000 5,049,420 0.05Ukraine Government Bond, Reg. S7.75% 01/09/2027 USD 800,000 882,072 0.01Ukraine Government Bond, Reg. S9.75% 01/11/2028 USD 9,500,000 11,344,188 0.11Ukraine Government Bond, Reg. S6.876% 21/05/2029 USD 1,100,000 1,144,146 0.01
19,863,516 0.19
United Arab EmiratesOztel Holdings SPC Ltd., Reg. S 6.625%24/04/2028 USD 1,500,000 1,669,418 0.02
1,669,418 0.02
United KingdomBP Capital Markets plc, FRN 4.375%Perpetual USD 17,590,000 18,777,325 0.18BP Capital Markets plc, FRN 4.875%Perpetual USD 3,220,000 3,535,431 0.03HSBC Holdings plc, FRN 4.6%31/12/2164 USD 8,278,000 8,588,425 0.08INEOS Quattro Finance 2 plc, 144A3.375% 15/01/2026 USD 5,025,000 5,081,531 0.05International Game Technology plc,144A 6.25% 15/01/2027 USD 3,485,000 3,983,460 0.04Liquid Telecommunications Financingplc, Reg. S 8.5% 13/07/2022 USD 489,000 493,246 0.00Liquid Telecommunications Financingplc, Reg. S 5.5% 04/09/2026 USD 2,200,000 2,260,500 0.02MARB BondCo plc, Reg. S 3.95%29/01/2031 USD 5,045,000 4,843,200 0.05NAK Naftogaz Ukraine, Reg. S 7.625%08/11/2026 USD 4,700,000 4,877,736 0.05Natwest Group plc, FRN 4.445%08/05/2030 USD 8,250,000 9,446,225 0.09Natwest Group plc, FRN 6% Perpetual USD 12,328,000 13,777,773 0.13Rolls-Royce plc, 144A 5.75%15/10/2027 USD 1,560,000 1,712,568 0.02Standard Chartered plc, FRN, 144A7.5% Perpetual USD 5,075,000 5,297,031 0.05Tesco plc, 144A 6.15% 15/11/2037 USD 450,000 598,190 0.01Virgin Media Secured Finance plc,144A 5.5% 15/05/2029 USD 7,405,000 7,969,631 0.08
91,242,272 0.88
United States of AmericaAbbVie, Inc. 4.25% 14/11/2028 USD 1,730,000 2,006,073 0.02AbbVie, Inc. 3.2% 21/11/2029 USD 10,570,000 11,492,530 0.11AbbVie, Inc. 4.5% 14/05/2035 USD 7,030,000 8,515,047 0.08AECOM 5.125% 15/03/2027 USD 4,420,000 4,933,825 0.05Allegheny Technologies, Inc. 5.875%01/12/2027 USD 1,940,000 2,039,018 0.02Ally Financial, Inc. 5.75% 20/11/2025 USD 10,790,000 12,391,012 0.12Ally Financial, Inc. 8% 01/11/2031 USD 225,000 324,141 0.00Altria Group, Inc. 4.8% 14/02/2029 USD 6,550,000 7,615,161 0.07American Axle & Manufacturing, Inc.6.25% 01/04/2025 USD 12,846,000 13,295,096 0.13American Axle & Manufacturing, Inc.6.25% 15/03/2026 USD 1,801,000 1,859,848 0.02American Axle & Manufacturing, Inc.6.5% 01/04/2027 USD 1,764,000 1,873,368 0.02American Axle & Manufacturing, Inc.6.875% 01/07/2028 USD 380,000 416,636 0.00American International Group, Inc.3.875% 15/01/2035 USD 1,890,000 2,145,545 0.02American Tower Corp., REIT 3.8%15/08/2029 USD 9,680,000 10,799,837 0.11American Tower Corp., REIT 2.9%15/01/2030 USD 5,950,000 6,268,708 0.06AmeriGas Partners LP 5.625%20/05/2024 USD 110,000 120,484 0.00AmeriGas Partners LP 5.5%20/05/2025 USD 3,419,000 3,762,421 0.04AmeriGas Partners LP 5.875%20/08/2026 USD 2,919,000 3,265,631 0.03AmeriGas Partners LP 5.75%20/05/2027 USD 679,000 759,193 0.01Anheuser-Busch Cos. LLC 4.7%01/02/2036 USD 6,230,000 7,652,525 0.07Apache Corp. 4.625% 15/11/2025 USD 2,476,000 2,681,124 0.03Apache Corp. 4.875% 15/11/2027 USD 953,000 1,031,770 0.01Ashtead Capital, Inc., 144A 4.125%15/08/2025 USD 2,000,000 2,051,250 0.02Ashtead Capital, Inc., 144A 4.375%15/08/2027 USD 200,000 209,750 0.00Ashtead Capital, Inc., 144A 4%01/05/2028 USD 2,910,000 3,065,976 0.03AT&T, Inc. 4.3% 15/02/2030 USD 4,430,000 5,127,787 0.05B&G Foods, Inc. 5.25% 01/04/2025 USD 1,276,000 1,312,175 0.01B&G Foods, Inc. 5.25% 15/09/2027 USD 120,000 125,102 0.00Ball Corp. 5.25% 01/07/2025 USD 1,330,000 1,505,068 0.02BAT Capital Corp. 3.462% 06/09/2029 USD 13,410,000 14,183,525 0.14BAT Capital Corp. 4.39% 15/08/2037 USD 1,380,000 1,493,848 0.01Berry Global, Inc. 5.125% 15/07/2023 USD 30,000 30,059 0.00Callon Petroleum Co. 6.125%01/10/2024 USD 143,000 141,490 0.00Cedar Fair LP 5.375% 15/04/2027 USD 12,000 12,408 0.00
236
JPMorgan Funds - Income FundSchedule of Investments (continued)
As at 30 June 2021
Investments Currency
Quantity/Nominal
Value
MarketValue
USD
%of
NetAssets Investments Currency
Quantity/Nominal
Value
MarketValue
USD
%of
NetAssets
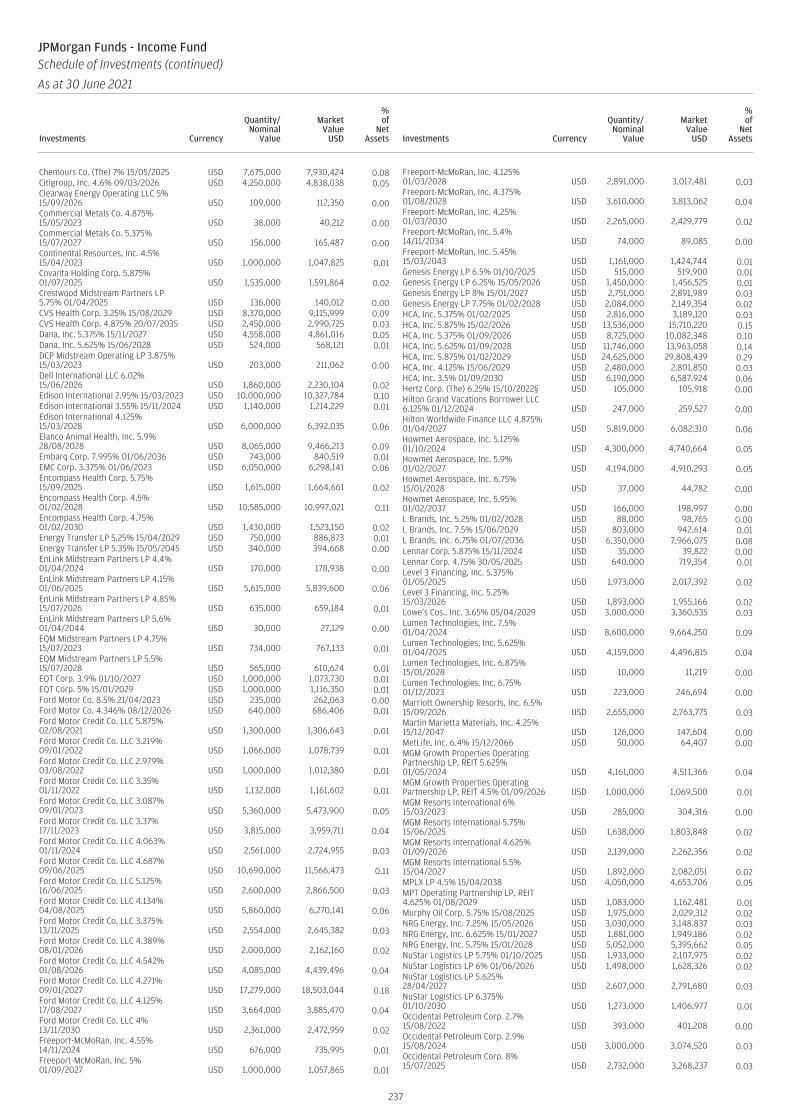
Chemours Co. (The) 7% 15/05/2025 USD 7,675,000 7,930,424 0.08Citigroup, Inc. 4.6% 09/03/2026 USD 4,250,000 4,838,038 0.05Clearway Energy Operating LLC 5%15/09/2026 USD 109,000 112,350 0.00Commercial Metals Co. 4.875%15/05/2023 USD 38,000 40,212 0.00Commercial Metals Co. 5.375%15/07/2027 USD 156,000 165,487 0.00Continental Resources, Inc. 4.5%15/04/2023 USD 1,000,000 1,047,825 0.01Covanta Holding Corp. 5.875%01/07/2025 USD 1,535,000 1,591,864 0.02Crestwood Midstream Partners LP5.75% 01/04/2025 USD 136,000 140,012 0.00CVS Health Corp. 3.25% 15/08/2029 USD 8,370,000 9,115,999 0.09CVS Health Corp. 4.875% 20/07/2035 USD 2,450,000 2,990,725 0.03Dana, Inc. 5.375% 15/11/2027 USD 4,558,000 4,861,016 0.05Dana, Inc. 5.625% 15/06/2028 USD 524,000 568,121 0.01DCP Midstream Operating LP 3.875%15/03/2023 USD 203,000 211,062 0.00Dell International LLC 6.02%15/06/2026 USD 1,860,000 2,230,104 0.02Edison International 2.95% 15/03/2023 USD 10,000,000 10,327,784 0.10Edison International 3.55% 15/11/2024 USD 1,140,000 1,214,229 0.01Edison International 4.125%15/03/2028 USD 6,000,000 6,392,035 0.06Elanco Animal Health, Inc. 5.9%28/08/2028 USD 8,065,000 9,466,213 0.09Embarq Corp. 7.995% 01/06/2036 USD 743,000 840,519 0.01EMC Corp. 3.375% 01/06/2023 USD 6,050,000 6,298,141 0.06Encompass Health Corp. 5.75%15/09/2025 USD 1,615,000 1,664,661 0.02Encompass Health Corp. 4.5%01/02/2028 USD 10,585,000 10,997,021 0.11Encompass Health Corp. 4.75%01/02/2030 USD 1,430,000 1,523,150 0.02Energy Transfer LP 5.25% 15/04/2029 USD 750,000 886,873 0.01Energy Transfer LP 5.35% 15/05/2045 USD 340,000 394,668 0.00EnLink Midstream Partners LP 4.4%01/04/2024 USD 170,000 178,938 0.00EnLink Midstream Partners LP 4.15%01/06/2025 USD 5,615,000 5,839,600 0.06EnLink Midstream Partners LP 4.85%15/07/2026 USD 635,000 659,184 0.01EnLink Midstream Partners LP 5.6%01/04/2044 USD 30,000 27,129 0.00EQM Midstream Partners LP 4.75%15/07/2023 USD 734,000 767,133 0.01EQM Midstream Partners LP 5.5%15/07/2028 USD 565,000 610,624 0.01EQT Corp. 3.9% 01/10/2027 USD 1,000,000 1,073,730 0.01EQT Corp. 5% 15/01/2029 USD 1,000,000 1,116,350 0.01Ford Motor Co. 8.5% 21/04/2023 USD 235,000 262,063 0.00Ford Motor Co. 4.346% 08/12/2026 USD 640,000 686,406 0.01Ford Motor Credit Co. LLC 5.875%02/08/2021 USD 1,300,000 1,306,643 0.01Ford Motor Credit Co. LLC 3.219%09/01/2022 USD 1,066,000 1,078,739 0.01Ford Motor Credit Co. LLC 2.979%03/08/2022 USD 1,000,000 1,012,380 0.01Ford Motor Credit Co. LLC 3.35%01/11/2022 USD 1,132,000 1,161,602 0.01Ford Motor Credit Co. LLC 3.087%09/01/2023 USD 5,360,000 5,473,900 0.05Ford Motor Credit Co. LLC 3.37%17/11/2023 USD 3,815,000 3,959,711 0.04Ford Motor Credit Co. LLC 4.063%01/11/2024 USD 2,561,000 2,724,955 0.03Ford Motor Credit Co. LLC 4.687%09/06/2025 USD 10,690,000 11,566,473 0.11Ford Motor Credit Co. LLC 5.125%16/06/2025 USD 2,600,000 2,866,500 0.03Ford Motor Credit Co. LLC 4.134%04/08/2025 USD 5,860,000 6,270,141 0.06Ford Motor Credit Co. LLC 3.375%13/11/2025 USD 2,554,000 2,645,382 0.03Ford Motor Credit Co. LLC 4.389%08/01/2026 USD 2,000,000 2,162,160 0.02Ford Motor Credit Co. LLC 4.542%01/08/2026 USD 4,085,000 4,439,496 0.04Ford Motor Credit Co. LLC 4.271%09/01/2027 USD 17,279,000 18,503,044 0.18Ford Motor Credit Co. LLC 4.125%17/08/2027 USD 3,664,000 3,885,470 0.04Ford Motor Credit Co. LLC 4%13/11/2030 USD 2,361,000 2,472,959 0.02Freeport-McMoRan, Inc. 4.55%14/11/2024 USD 676,000 735,995 0.01Freeport-McMoRan, Inc. 5%01/09/2027 USD 1,000,000 1,057,865 0.01
Freeport-McMoRan, Inc. 4.125%01/03/2028 USD 2,891,000 3,017,481 0.03Freeport-McMoRan, Inc. 4.375%01/08/2028 USD 3,610,000 3,813,062 0.04Freeport-McMoRan, Inc. 4.25%01/03/2030 USD 2,265,000 2,429,779 0.02Freeport-McMoRan, Inc. 5.4%14/11/2034 USD 74,000 89,085 0.00Freeport-McMoRan, Inc. 5.45%15/03/2043 USD 1,161,000 1,424,744 0.01Genesis Energy LP 6.5% 01/10/2025 USD 515,000 519,900 0.01Genesis Energy LP 6.25% 15/05/2026 USD 1,450,000 1,456,525 0.01Genesis Energy LP 8% 15/01/2027 USD 2,751,000 2,891,989 0.03Genesis Energy LP 7.75% 01/02/2028 USD 2,084,000 2,149,354 0.02HCA, Inc. 5.375% 01/02/2025 USD 2,816,000 3,189,120 0.03HCA, Inc. 5.875% 15/02/2026 USD 13,536,000 15,710,220 0.15HCA, Inc. 5.375% 01/09/2026 USD 8,725,000 10,082,348 0.10HCA, Inc. 5.625% 01/09/2028 USD 11,746,000 13,963,058 0.14HCA, Inc. 5.875% 01/02/2029 USD 24,625,000 29,808,439 0.29HCA, Inc. 4.125% 15/06/2029 USD 2,480,000 2,801,850 0.03HCA, Inc. 3.5% 01/09/2030 USD 6,190,000 6,587,924 0.06Hertz Corp. (The) 6.25% 15/10/2022§ USD 105,000 105,918 0.00Hilton Grand Vacations Borrower LLC6.125% 01/12/2024 USD 247,000 259,527 0.00Hilton Worldwide Finance LLC 4.875%01/04/2027 USD 5,819,000 6,082,310 0.06Howmet Aerospace, Inc. 5.125%01/10/2024 USD 4,300,000 4,740,664 0.05Howmet Aerospace, Inc. 5.9%01/02/2027 USD 4,194,000 4,910,293 0.05Howmet Aerospace, Inc. 6.75%15/01/2028 USD 37,000 44,782 0.00Howmet Aerospace, Inc. 5.95%01/02/2037 USD 166,000 198,997 0.00L Brands, Inc. 5.25% 01/02/2028 USD 88,000 98,765 0.00L Brands, Inc. 7.5% 15/06/2029 USD 803,000 942,614 0.01L Brands, Inc. 6.75% 01/07/2036 USD 6,350,000 7,966,075 0.08Lennar Corp. 5.875% 15/11/2024 USD 35,000 39,822 0.00Lennar Corp. 4.75% 30/05/2025 USD 640,000 719,354 0.01Level 3 Financing, Inc. 5.375%01/05/2025 USD 1,973,000 2,017,392 0.02Level 3 Financing, Inc. 5.25%15/03/2026 USD 1,893,000 1,955,166 0.02Lowe’s Cos., Inc. 3.65% 05/04/2029 USD 3,000,000 3,360,535 0.03Lumen Technologies, Inc. 7.5%01/04/2024 USD 8,600,000 9,664,250 0.09Lumen Technologies, Inc. 5.625%01/04/2025 USD 4,159,000 4,496,815 0.04Lumen Technologies, Inc. 6.875%15/01/2028 USD 10,000 11,219 0.00Lumen Technologies, Inc. 6.75%01/12/2023 USD 223,000 246,694 0.00Marriott Ownership Resorts, Inc. 6.5%15/09/2026 USD 2,655,000 2,763,775 0.03Martin Marietta Materials, Inc. 4.25%15/12/2047 USD 126,000 147,604 0.00MetLife, Inc. 6.4% 15/12/2066 USD 50,000 64,407 0.00MGM Growth Properties OperatingPartnership LP, REIT 5.625%01/05/2024 USD 4,161,000 4,511,366 0.04MGM Growth Properties OperatingPartnership LP, REIT 4.5% 01/09/2026 USD 1,000,000 1,069,500 0.01MGM Resorts International 6%15/03/2023 USD 285,000 304,316 0.00MGM Resorts International 5.75%15/06/2025 USD 1,638,000 1,803,848 0.02MGM Resorts International 4.625%01/09/2026 USD 2,139,000 2,262,356 0.02MGM Resorts International 5.5%15/04/2027 USD 1,892,000 2,082,051 0.02MPLX LP 4.5% 15/04/2038 USD 4,050,000 4,653,706 0.05MPT Operating Partnership LP, REIT4.625% 01/08/2029 USD 1,083,000 1,162,481 0.01Murphy Oil Corp. 5.75% 15/08/2025 USD 1,975,000 2,029,312 0.02NRG Energy, Inc. 7.25% 15/05/2026 USD 3,030,000 3,148,837 0.03NRG Energy, Inc. 6.625% 15/01/2027 USD 1,881,000 1,949,186 0.02NRG Energy, Inc. 5.75% 15/01/2028 USD 5,052,000 5,395,662 0.05NuStar Logistics LP 5.75% 01/10/2025 USD 1,933,000 2,107,975 0.02NuStar Logistics LP 6% 01/06/2026 USD 1,498,000 1,628,326 0.02NuStar Logistics LP 5.625%28/04/2027 USD 2,607,000 2,791,680 0.03NuStar Logistics LP 6.375%01/10/2030 USD 1,273,000 1,406,977 0.01Occidental Petroleum Corp. 2.7%15/08/2022 USD 393,000 401,208 0.00Occidental Petroleum Corp. 2.9%15/08/2024 USD 3,000,000 3,074,520 0.03Occidental Petroleum Corp. 8%15/07/2025 USD 2,732,000 3,268,237 0.03
237
JPMorgan Funds - Income FundSchedule of Investments (continued)
As at 30 June 2021
Investments Currency
Quantity/Nominal
Value
MarketValue
USD
%of
NetAssets Investments Currency
Quantity/Nominal
Value
MarketValue
USD
%of
NetAssets
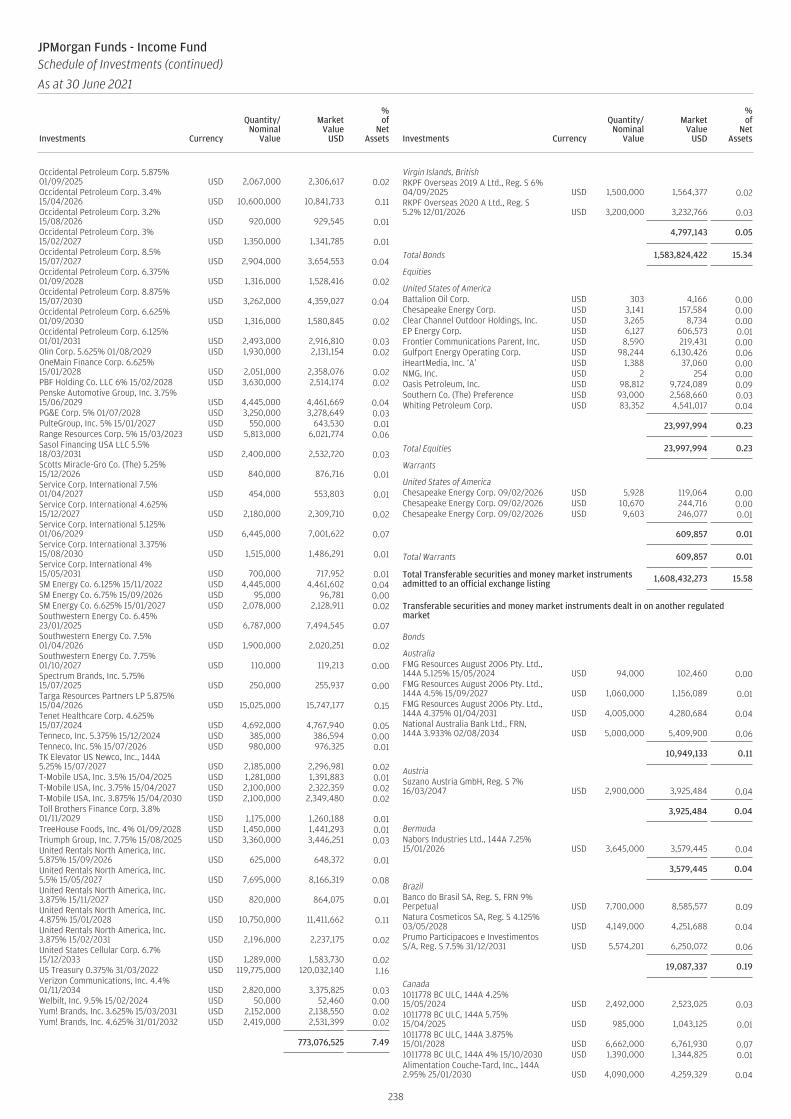
Occidental Petroleum Corp. 5.875%01/09/2025 USD 2,067,000 2,306,617 0.02Occidental Petroleum Corp. 3.4%15/04/2026 USD 10,600,000 10,841,733 0.11Occidental Petroleum Corp. 3.2%15/08/2026 USD 920,000 929,545 0.01Occidental Petroleum Corp. 3%15/02/2027 USD 1,350,000 1,341,785 0.01Occidental Petroleum Corp. 8.5%15/07/2027 USD 2,904,000 3,654,553 0.04Occidental Petroleum Corp. 6.375%01/09/2028 USD 1,316,000 1,528,416 0.02Occidental Petroleum Corp. 8.875%15/07/2030 USD 3,262,000 4,359,027 0.04Occidental Petroleum Corp. 6.625%01/09/2030 USD 1,316,000 1,580,845 0.02Occidental Petroleum Corp. 6.125%01/01/2031 USD 2,493,000 2,916,810 0.03Olin Corp. 5.625% 01/08/2029 USD 1,930,000 2,131,154 0.02OneMain Finance Corp. 6.625%15/01/2028 USD 2,051,000 2,358,076 0.02PBF Holding Co. LLC 6% 15/02/2028 USD 3,630,000 2,514,174 0.02Penske Automotive Group, Inc. 3.75%15/06/2029 USD 4,445,000 4,461,669 0.04PG&E Corp. 5% 01/07/2028 USD 3,250,000 3,278,649 0.03PulteGroup, Inc. 5% 15/01/2027 USD 550,000 643,530 0.01Range Resources Corp. 5% 15/03/2023 USD 5,813,000 6,021,774 0.06Sasol Financing USA LLC 5.5%18/03/2031 USD 2,400,000 2,532,720 0.03Scotts Miracle-Gro Co. (The) 5.25%15/12/2026 USD 840,000 876,716 0.01Service Corp. International 7.5%01/04/2027 USD 454,000 553,803 0.01Service Corp. International 4.625%15/12/2027 USD 2,180,000 2,309,710 0.02Service Corp. International 5.125%01/06/2029 USD 6,445,000 7,001,622 0.07Service Corp. International 3.375%15/08/2030 USD 1,515,000 1,486,291 0.01Service Corp. International 4%15/05/2031 USD 700,000 717,952 0.01SM Energy Co. 6.125% 15/11/2022 USD 4,445,000 4,461,602 0.04SM Energy Co. 6.75% 15/09/2026 USD 95,000 96,781 0.00SM Energy Co. 6.625% 15/01/2027 USD 2,078,000 2,128,911 0.02Southwestern Energy Co. 6.45%23/01/2025 USD 6,787,000 7,494,545 0.07Southwestern Energy Co. 7.5%01/04/2026 USD 1,900,000 2,020,251 0.02Southwestern Energy Co. 7.75%01/10/2027 USD 110,000 119,213 0.00Spectrum Brands, Inc. 5.75%15/07/2025 USD 250,000 255,937 0.00Targa Resources Partners LP 5.875%15/04/2026 USD 15,025,000 15,747,177 0.15Tenet Healthcare Corp. 4.625%15/07/2024 USD 4,692,000 4,767,940 0.05Tenneco, Inc. 5.375% 15/12/2024 USD 385,000 386,594 0.00Tenneco, Inc. 5% 15/07/2026 USD 980,000 976,325 0.01TK Elevator US Newco, Inc., 144A5.25% 15/07/2027 USD 2,185,000 2,296,981 0.02T-Mobile USA, Inc. 3.5% 15/04/2025 USD 1,281,000 1,391,883 0.01T-Mobile USA, Inc. 3.75% 15/04/2027 USD 2,100,000 2,322,359 0.02T-Mobile USA, Inc. 3.875% 15/04/2030 USD 2,100,000 2,349,480 0.02Toll Brothers Finance Corp. 3.8%01/11/2029 USD 1,175,000 1,260,188 0.01TreeHouse Foods, Inc. 4% 01/09/2028 USD 1,450,000 1,441,293 0.01Triumph Group, Inc. 7.75% 15/08/2025 USD 3,360,000 3,446,251 0.03United Rentals North America, Inc.5.875% 15/09/2026 USD 625,000 648,372 0.01United Rentals North America, Inc.5.5% 15/05/2027 USD 7,695,000 8,166,319 0.08United Rentals North America, Inc.3.875% 15/11/2027 USD 820,000 864,075 0.01United Rentals North America, Inc.4.875% 15/01/2028 USD 10,750,000 11,411,662 0.11United Rentals North America, Inc.3.875% 15/02/2031 USD 2,196,000 2,237,175 0.02United States Cellular Corp. 6.7%15/12/2033 USD 1,289,000 1,583,730 0.02US Treasury 0.375% 31/03/2022 USD 119,775,000 120,032,140 1.16Verizon Communications, Inc. 4.4%01/11/2034 USD 2,820,000 3,375,825 0.03Welbilt, Inc. 9.5% 15/02/2024 USD 50,000 52,460 0.00Yum! Brands, Inc. 3.625% 15/03/2031 USD 2,152,000 2,138,550 0.02Yum! Brands, Inc. 4.625% 31/01/2032 USD 2,419,000 2,531,399 0.02
773,076,525 7.49
Virgin Islands, BritishRKPF Overseas 2019 A Ltd., Reg. S 6%04/09/2025 USD 1,500,000 1,564,377 0.02RKPF Overseas 2020 A Ltd., Reg. S5.2% 12/01/2026 USD 3,200,000 3,232,766 0.03
4,797,143 0.05
Total Bonds 1,583,824,422 15.34
Equities
United States of AmericaBattalion Oil Corp. USD 303 4,166 0.00Chesapeake Energy Corp. USD 3,141 157,584 0.00Clear Channel Outdoor Holdings, Inc. USD 3,265 8,734 0.00EP Energy Corp. USD 6,127 606,573 0.01Frontier Communications Parent, Inc. USD 8,590 219,431 0.00Gulfport Energy Operating Corp. USD 98,244 6,130,426 0.06iHeartMedia, Inc. ‘A’ USD 1,388 37,060 0.00NMG, Inc. USD 2 254 0.00Oasis Petroleum, Inc. USD 98,812 9,724,089 0.09Southern Co. (The) Preference USD 93,000 2,568,660 0.03Whiting Petroleum Corp. USD 83,352 4,541,017 0.04
23,997,994 0.23
Total Equities 23,997,994 0.23
Warrants
United States of AmericaChesapeake Energy Corp. 09/02/2026 USD 5,928 119,064 0.00Chesapeake Energy Corp. 09/02/2026 USD 10,670 244,716 0.00Chesapeake Energy Corp. 09/02/2026 USD 9,603 246,077 0.01
609,857 0.01
Total Warrants 609,857 0.01
Total Transferable securities and money market instrumentsadmitted to an official exchange listing 1,608,432,273 15.58
Transferable securities and money market instruments dealt in on another regulatedmarket
Bonds
AustraliaFMG Resources August 2006 Pty. Ltd.,144A 5.125% 15/05/2024 USD 94,000 102,460 0.00FMG Resources August 2006 Pty. Ltd.,144A 4.5% 15/09/2027 USD 1,060,000 1,156,089 0.01FMG Resources August 2006 Pty. Ltd.,144A 4.375% 01/04/2031 USD 4,005,000 4,280,684 0.04National Australia Bank Ltd., FRN,144A 3.933% 02/08/2034 USD 5,000,000 5,409,900 0.06
10,949,133 0.11
AustriaSuzano Austria GmbH, Reg. S 7%16/03/2047 USD 2,900,000 3,925,484 0.04
3,925,484 0.04
BermudaNabors Industries Ltd., 144A 7.25%15/01/2026 USD 3,645,000 3,579,445 0.04
3,579,445 0.04
BrazilBanco do Brasil SA, Reg. S, FRN 9%Perpetual USD 7,700,000 8,585,577 0.09Natura Cosmeticos SA, Reg. S 4.125%03/05/2028 USD 4,149,000 4,251,688 0.04Prumo Participacoes e InvestimentosS/A, Reg. S 7.5% 31/12/2031 USD 5,574,201 6,250,072 0.06
19,087,337 0.19
Canada1011778 BC ULC, 144A 4.25%15/05/2024 USD 2,492,000 2,523,025 0.031011778 BC ULC, 144A 5.75%15/04/2025 USD 985,000 1,043,125 0.011011778 BC ULC, 144A 3.875%15/01/2028 USD 6,662,000 6,761,930 0.071011778 BC ULC, 144A 4% 15/10/2030 USD 1,390,000 1,344,825 0.01Alimentation Couche-Tard, Inc., 144A2.95% 25/01/2030 USD 4,090,000 4,259,329 0.04
238
JPMorgan Funds - Income FundSchedule of Investments (continued)
As at 30 June 2021
Investments Currency
Quantity/Nominal
Value
MarketValue
USD
%of
NetAssets Investments Currency
Quantity/Nominal
Value
MarketValue
USD
%of
NetAssets

Bausch Health Cos., Inc., 144A 6.125%15/04/2025 USD 3,388,000 3,476,397 0.03Bausch Health Cos., Inc., 144A 5.5%01/11/2025 USD 11,875,000 12,186,719 0.12Bausch Health Cos., Inc., 144A 9%15/12/2025 USD 10,822,000 11,620,123 0.11Bausch Health Cos., Inc., 144A 5.75%15/08/2027 USD 6,415,000 6,768,883 0.07Bausch Health Cos., Inc., 144A 7%15/01/2028 USD 4,104,000 4,239,268 0.04Bausch Health Cos., Inc., 144A 5%30/01/2028 USD 10,652,000 10,119,400 0.10Bausch Health Cos., Inc., 144A 4.875%01/06/2028 USD 3,946,000 4,032,023 0.04Bausch Health Cos., Inc., 144A 5%15/02/2029 USD 2,452,000 2,286,539 0.02Bausch Health Cos., Inc., 144A 7.25%30/05/2029 USD 76,000 78,112 0.00Bausch Health Cos., Inc., 144A 5.25%30/01/2030 USD 1,421,000 1,323,306 0.01Bausch Health Cos., Inc., 144A 5.25%15/02/2031 USD 1,966,000 1,842,928 0.02Bombardier, Inc., 144A 6% 15/10/2022 USD 91,000 91,300 0.00Bombardier, Inc., 144A 7.5%01/12/2024 USD 352,000 367,842 0.00Bombardier, Inc., 144A 7.5%15/03/2025 USD 5,044,000 5,168,965 0.05Bombardier, Inc., 144A 7.875%15/04/2027 USD 1,330,000 1,381,551 0.01Emera, Inc., FRN 6.75% 15/06/2076 USD 6,525,000 7,653,792 0.07GFL Environmental, Inc., 144A 3.75%01/08/2025 USD 3,795,000 3,904,106 0.04GFL Environmental, Inc., 144A 5.125%15/12/2026 USD 1,075,000 1,137,414 0.01GFL Environmental, Inc., 144A 4%01/08/2028 USD 2,425,000 2,395,233 0.02GFL Environmental, Inc., 144A 3.5%01/09/2028 USD 3,600,000 3,587,058 0.04Glencore Finance Canada Ltd., 144A6% 15/11/2041 USD 395,000 524,321 0.01Masonite International Corp., 144A5.75% 15/09/2026 USD 1,340,000 1,391,175 0.01Masonite International Corp., 144A5.375% 01/02/2028 USD 4,730,000 5,041,163 0.05MEG Energy Corp., 144A 6.5%15/01/2025 USD 5,284,000 5,475,545 0.05MEG Energy Corp., 144A 7.125%01/02/2027 USD 1,492,000 1,596,746 0.02NOVA Chemicals Corp., 144A 4.875%01/06/2024 USD 4,910,000 5,186,188 0.05NOVA Chemicals Corp., 144A 5%01/05/2025 USD 2,375,000 2,544,337 0.03NOVA Chemicals Corp., 144A 5.25%01/06/2027 USD 10,065,000 10,756,969 0.10NOVA Chemicals Corp., 144A 4.25%15/05/2029 USD 2,490,000 2,514,900 0.02Open Text Corp., 144A 5.875%01/06/2026 USD 265,000 274,044 0.00Open Text Corp., 144A 3.875%15/02/2028 USD 1,565,000 1,583,780 0.02Precision Drilling Corp., 144A 7.125%15/01/2026 USD 2,539,000 2,620,337 0.03Quebecor Media, Inc. 5.75%15/01/2023 USD 150,000 160,362 0.00Transcanada Trust, FRN 5.5%15/09/2079 USD 6,000,000 6,562,500 0.06Videotron Ltd., 144A 5.375%15/06/2024 USD 65,000 71,288 0.00Videotron Ltd., 144A 5.125%15/04/2027 USD 10,115,000 10,599,964 0.10Videotron Ltd., 144A 3.625%15/06/2029 USD 2,733,000 2,770,579 0.03
159,267,391 1.54
Cayman IslandsAvolon Holdings Funding Ltd., 144A3.25% 15/02/2027 USD 8,640,000 8,921,564 0.09Bioceanico Sovereign Certificate Ltd.,Reg. S 0% 05/06/2034 USD 1,672,929 1,240,912 0.01BLUEMOUNTAIN CLO Ltd., FRN, Series2012-2A ‘DR2’, 144A 3.082%20/11/2028 USD 300,000 298,001 0.00Hero Funding, Series 2017-3A ‘A1’,144A 3.19% 20/09/2048 USD 145,073 149,019 0.00HERO Funding II, Series 2016-3B ‘B’,144A 5.24% 20/09/2042 USD 38,150 38,250 0.00HERO Funding II, Series 2016-4B ‘B’,144A 5.75% 20/09/2047 USD 123,659 126,237 0.00Park Aerospace Holdings Ltd., 144A4.5% 15/03/2023 USD 2,146,000 2,256,947 0.02
Park Aerospace Holdings Ltd., 144A5.5% 15/02/2024 USD 5,000,000 5,499,478 0.05Seagate HDD Cayman, 144A 3.125%15/07/2029 USD 2,265,000 2,194,479 0.02StoneCo Ltd., Reg. S 3.95%16/06/2028 USD 4,710,000 4,708,304 0.05Transocean Pontus Ltd., 144A 6.125%01/08/2025 USD 5,760,850 5,811,546 0.06Transocean Poseidon Ltd., 144A6.875% 01/02/2027 USD 214,000 214,310 0.00Transocean Proteus Ltd., 144A 6.25%01/12/2024 USD 130,350 132,019 0.00Transocean, Inc., 144A 11.5%30/01/2027 USD 1,340,000 1,428,849 0.02Voya CLO Ltd., FRN, Series 2016-3A‘CR’, 144A 3.473% 18/10/2031 USD 265,000 257,812 0.00
33,277,727 0.32
ChileCencosud SA, Reg. S 6.625%12/02/2045 USD 6,100,000 7,809,525 0.08
7,809,525 0.08
DenmarkDKT Finance ApS, 144A 9.375%17/06/2023 USD 800,000 819,500 0.01
819,500 0.01
FranceAltice France SA, 144A 8.125%01/02/2027 USD 5,785,000 6,309,989 0.06Altice France SA, 144A 5.125%15/01/2029 USD 360,000 362,073 0.00Constellium SE, 144A 5.875%15/02/2026 USD 500,000 515,000 0.01Constellium SE, 144A 5.625%15/06/2028 USD 250,000 269,064 0.00Constellium SE, 144A 3.75%15/04/2029 USD 1,000,000 991,270 0.01Constellium SE, Reg. S 5.875%15/02/2026 USD 550,000 566,500 0.01Societe Generale SA, FRN, 144A5.375% Perpetual USD 5,000,000 5,306,250 0.05
14,320,146 0.14
GermanyIHO Verwaltungs GmbH, 144A 4.75%15/09/2026 USD 3,455,000 3,540,580 0.03
3,540,580 0.03
GuatemalaBanco Industrial SA, Reg. S, FRN4.875% 29/01/2031 USD 1,400,000 1,465,037 0.01
1,465,037 0.01
IrelandJames Hardie International FinanceDAC, 144A 5% 15/01/2028 USD 1,900,000 2,010,989 0.02Jazz Securities DAC, 144A 4.375%15/01/2029 USD 9,176,000 9,520,100 0.09Smurfit Kappa Treasury Funding DAC7.5% 20/11/2025 USD 400,000 497,506 0.01
12,028,595 0.12
ItalyIntesa Sanpaolo SpA, 144A 4.198%01/06/2032 USD 990,000 1,015,477 0.01Intesa Sanpaolo SpA, 144A 4.95%01/06/2042 USD 5,318,000 5,526,865 0.05UniCredit SpA, FRN, 144A 1.982%03/06/2027 USD 7,630,000 7,608,283 0.08UniCredit SpA, FRN, 144A 5.459%30/06/2035 USD 5,021,000 5,475,815 0.05
19,626,440 0.19
JapanTakeda Pharmaceutical Co. Ltd. 5%26/11/2028 USD 6,220,000 7,493,865 0.07
7,493,865 0.07
239
JPMorgan Funds - Income FundSchedule of Investments (continued)
As at 30 June 2021
Investments Currency
Quantity/Nominal
Value
MarketValue
USD
%of
NetAssets Investments Currency
Quantity/Nominal
Value
MarketValue
USD
%of
NetAssets
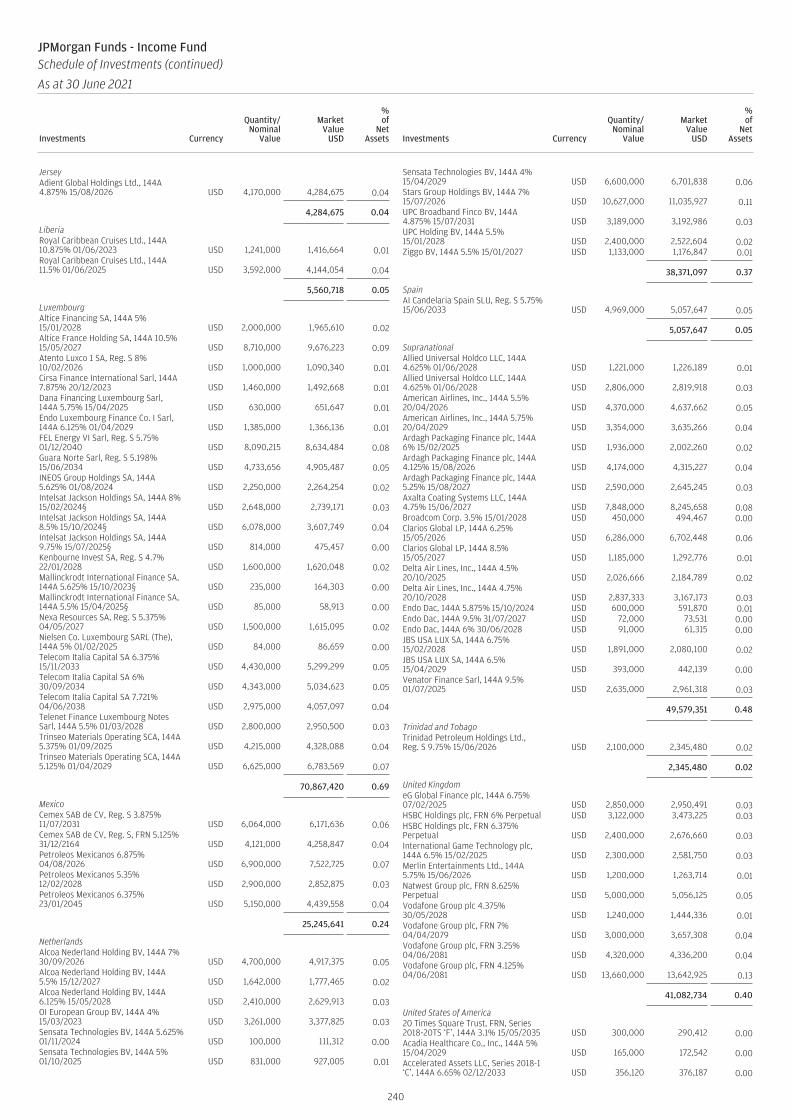
JerseyAdient Global Holdings Ltd., 144A4.875% 15/08/2026 USD 4,170,000 4,284,675 0.04
4,284,675 0.04
LiberiaRoyal Caribbean Cruises Ltd., 144A10.875% 01/06/2023 USD 1,241,000 1,416,664 0.01Royal Caribbean Cruises Ltd., 144A11.5% 01/06/2025 USD 3,592,000 4,144,054 0.04
5,560,718 0.05
LuxembourgAltice Financing SA, 144A 5%15/01/2028 USD 2,000,000 1,965,610 0.02Altice France Holding SA, 144A 10.5%15/05/2027 USD 8,710,000 9,676,223 0.09Atento Luxco 1 SA, Reg. S 8%10/02/2026 USD 1,000,000 1,090,340 0.01Cirsa Finance International Sarl, 144A7.875% 20/12/2023 USD 1,460,000 1,492,668 0.01Dana Financing Luxembourg Sarl,144A 5.75% 15/04/2025 USD 630,000 651,647 0.01Endo Luxembourg Finance Co. I Sarl,144A 6.125% 01/04/2029 USD 1,385,000 1,366,136 0.01FEL Energy VI Sarl, Reg. S 5.75%01/12/2040 USD 8,090,215 8,634,484 0.08Guara Norte Sarl, Reg. S 5.198%15/06/2034 USD 4,733,656 4,905,487 0.05INEOS Group Holdings SA, 144A5.625% 01/08/2024 USD 2,250,000 2,264,254 0.02Intelsat Jackson Holdings SA, 144A 8%15/02/2024§ USD 2,648,000 2,739,171 0.03Intelsat Jackson Holdings SA, 144A8.5% 15/10/2024§ USD 6,078,000 3,607,749 0.04Intelsat Jackson Holdings SA, 144A9.75% 15/07/2025§ USD 814,000 475,457 0.00Kenbourne Invest SA, Reg. S 4.7%22/01/2028 USD 1,600,000 1,620,048 0.02Mallinckrodt International Finance SA,144A 5.625% 15/10/2023§ USD 235,000 164,303 0.00Mallinckrodt International Finance SA,144A 5.5% 15/04/2025§ USD 85,000 58,913 0.00Nexa Resources SA, Reg. S 5.375%04/05/2027 USD 1,500,000 1,615,095 0.02Nielsen Co. Luxembourg SARL (The),144A 5% 01/02/2025 USD 84,000 86,659 0.00Telecom Italia Capital SA 6.375%15/11/2033 USD 4,430,000 5,299,299 0.05Telecom Italia Capital SA 6%30/09/2034 USD 4,343,000 5,034,623 0.05Telecom Italia Capital SA 7.721%04/06/2038 USD 2,975,000 4,057,097 0.04Telenet Finance Luxembourg NotesSarl, 144A 5.5% 01/03/2028 USD 2,800,000 2,950,500 0.03Trinseo Materials Operating SCA, 144A5.375% 01/09/2025 USD 4,215,000 4,328,088 0.04Trinseo Materials Operating SCA, 144A5.125% 01/04/2029 USD 6,625,000 6,783,569 0.07
70,867,420 0.69
MexicoCemex SAB de CV, Reg. S 3.875%11/07/2031 USD 6,064,000 6,171,636 0.06Cemex SAB de CV, Reg. S, FRN 5.125%31/12/2164 USD 4,121,000 4,258,847 0.04Petroleos Mexicanos 6.875%04/08/2026 USD 6,900,000 7,522,725 0.07Petroleos Mexicanos 5.35%12/02/2028 USD 2,900,000 2,852,875 0.03Petroleos Mexicanos 6.375%23/01/2045 USD 5,150,000 4,439,558 0.04
25,245,641 0.24
NetherlandsAlcoa Nederland Holding BV, 144A 7%30/09/2026 USD 4,700,000 4,917,375 0.05Alcoa Nederland Holding BV, 144A5.5% 15/12/2027 USD 1,642,000 1,777,465 0.02Alcoa Nederland Holding BV, 144A6.125% 15/05/2028 USD 2,410,000 2,629,913 0.03OI European Group BV, 144A 4%15/03/2023 USD 3,261,000 3,377,825 0.03Sensata Technologies BV, 144A 5.625%01/11/2024 USD 100,000 111,312 0.00Sensata Technologies BV, 144A 5%01/10/2025 USD 831,000 927,005 0.01
Sensata Technologies BV, 144A 4%15/04/2029 USD 6,600,000 6,701,838 0.06Stars Group Holdings BV, 144A 7%15/07/2026 USD 10,627,000 11,035,927 0.11UPC Broadband Finco BV, 144A4.875% 15/07/2031 USD 3,189,000 3,192,986 0.03UPC Holding BV, 144A 5.5%15/01/2028 USD 2,400,000 2,522,604 0.02Ziggo BV, 144A 5.5% 15/01/2027 USD 1,133,000 1,176,847 0.01
38,371,097 0.37
SpainAI Candelaria Spain SLU, Reg. S 5.75%15/06/2033 USD 4,969,000 5,057,647 0.05
5,057,647 0.05
SupranationalAllied Universal Holdco LLC, 144A4.625% 01/06/2028 USD 1,221,000 1,226,189 0.01Allied Universal Holdco LLC, 144A4.625% 01/06/2028 USD 2,806,000 2,819,918 0.03American Airlines, Inc., 144A 5.5%20/04/2026 USD 4,370,000 4,637,662 0.05American Airlines, Inc., 144A 5.75%20/04/2029 USD 3,354,000 3,635,266 0.04Ardagh Packaging Finance plc, 144A6% 15/02/2025 USD 1,936,000 2,002,260 0.02Ardagh Packaging Finance plc, 144A4.125% 15/08/2026 USD 4,174,000 4,315,227 0.04Ardagh Packaging Finance plc, 144A5.25% 15/08/2027 USD 2,590,000 2,645,245 0.03Axalta Coating Systems LLC, 144A4.75% 15/06/2027 USD 7,848,000 8,245,658 0.08Broadcom Corp. 3.5% 15/01/2028 USD 450,000 494,467 0.00Clarios Global LP, 144A 6.25%15/05/2026 USD 6,286,000 6,702,448 0.06Clarios Global LP, 144A 8.5%15/05/2027 USD 1,185,000 1,292,776 0.01Delta Air Lines, Inc., 144A 4.5%20/10/2025 USD 2,026,666 2,184,789 0.02Delta Air Lines, Inc., 144A 4.75%20/10/2028 USD 2,837,333 3,167,173 0.03Endo Dac, 144A 5.875% 15/10/2024 USD 600,000 591,870 0.01Endo Dac, 144A 9.5% 31/07/2027 USD 72,000 73,531 0.00Endo Dac, 144A 6% 30/06/2028 USD 91,000 61,315 0.00JBS USA LUX SA, 144A 6.75%15/02/2028 USD 1,891,000 2,080,100 0.02JBS USA LUX SA, 144A 6.5%15/04/2029 USD 393,000 442,139 0.00Venator Finance Sarl, 144A 9.5%01/07/2025 USD 2,635,000 2,961,318 0.03
49,579,351 0.48
Trinidad and TobagoTrinidad Petroleum Holdings Ltd.,Reg. S 9.75% 15/06/2026 USD 2,100,000 2,345,480 0.02
2,345,480 0.02
United KingdomeG Global Finance plc, 144A 6.75%07/02/2025 USD 2,850,000 2,950,491 0.03HSBC Holdings plc, FRN 6% Perpetual USD 3,122,000 3,473,225 0.03HSBC Holdings plc, FRN 6.375%Perpetual USD 2,400,000 2,676,660 0.03International Game Technology plc,144A 6.5% 15/02/2025 USD 2,300,000 2,581,750 0.03Merlin Entertainments Ltd., 144A5.75% 15/06/2026 USD 1,200,000 1,263,714 0.01Natwest Group plc, FRN 8.625%Perpetual USD 5,000,000 5,056,125 0.05Vodafone Group plc 4.375%30/05/2028 USD 1,240,000 1,444,336 0.01Vodafone Group plc, FRN 7%04/04/2079 USD 3,000,000 3,657,308 0.04Vodafone Group plc, FRN 3.25%04/06/2081 USD 4,320,000 4,336,200 0.04Vodafone Group plc, FRN 4.125%04/06/2081 USD 13,660,000 13,642,925 0.13
41,082,734 0.40
United States of America20 Times Square Trust, FRN, Series2018-20TS ‘F’, 144A 3.1% 15/05/2035 USD 300,000 290,412 0.00Acadia Healthcare Co., Inc., 144A 5%15/04/2029 USD 165,000 172,542 0.00Accelerated Assets LLC, Series 2018-1‘C’, 144A 6.65% 02/12/2033 USD 356,120 376,187 0.00
240
JPMorgan Funds - Income FundSchedule of Investments (continued)
As at 30 June 2021
Investments Currency
Quantity/Nominal
Value
MarketValue
USD
%of
NetAssets Investments Currency
Quantity/Nominal
Value
MarketValue
USD
%of
NetAssets

ACCO Brands Corp., 144A 4.25%15/03/2029 USD 8,148,000 8,057,557 0.08ACI Worldwide, Inc., 144A 5.75%15/08/2026 USD 315,000 331,341 0.00Adient US LLC, 144A 9% 15/04/2025 USD 2,525,000 2,787,549 0.03Adjustable Rate Mortgage Trust, FRN,Series 2006-2 ‘1A4’ 3.174%25/05/2036 USD 3,620,174 3,534,492 0.03ADT Security Corp. (The), 144A 4.875%15/07/2032 USD 5,569,000 5,888,661 0.06ADT Security Corp. (The) 3.5%15/07/2022 USD 980,000 999,600 0.01ADT Security Corp. (The) 4.125%15/06/2023 USD 262,000 276,083 0.00Advanced Drainage Systems, Inc., 144A5% 30/09/2027 USD 58,000 60,413 0.00Albertsons Cos., Inc., 144A 3.5%15/02/2023 USD 645,000 663,544 0.01Albertsons Cos., Inc., 144A 3.25%15/03/2026 USD 3,420,000 3,488,828 0.03Albertsons Cos., Inc., 144A 7.5%15/03/2026 USD 3,435,000 3,780,424 0.04Albertsons Cos., Inc., 144A 4.625%15/01/2027 USD 13,627,000 14,254,446 0.14Albertsons Cos., Inc., 144A 5.875%15/02/2028 USD 542,000 583,379 0.01Albertsons Cos., Inc., 144A 3.5%15/03/2029 USD 2,950,000 2,905,750 0.03Albertsons Cos., Inc., 144A 4.875%15/02/2030 USD 1,530,000 1,619,918 0.02Albertsons Cos., Inc. 5.75% 15/03/2025 USD 2,013,000 2,062,339 0.02Allied Universal Holdco LLC, 144A6.625% 15/07/2026 USD 4,151,000 4,410,438 0.04Allied Universal Holdco LLC, 144A9.75% 15/07/2027 USD 1,411,000 1,555,628 0.02Allison Transmission, Inc., 144A 4.75%01/10/2027 USD 3,231,000 3,357,445 0.03Allison Transmission, Inc., 144A5.875% 01/06/2029 USD 7,064,000 7,758,038 0.08Allison Transmission, Inc., 144A 3.75%30/01/2031 USD 3,045,000 2,995,519 0.03Alternative Loan Trust, Series2004-30CB 5% 25/08/2021 USD 3,060 3,067 0.00Alternative Loan Trust, Series2004-24CB ‘1A1’ 6% 25/11/2034 USD 18,046 19,085 0.00Alternative Loan Trust, Series2005-64CB ‘1A15’ 5.5% 25/12/2035 USD 278,698 277,211 0.00Alternative Loan Trust, Series2006-41CB ‘2A13’ 5.75% 25/01/2037 USD 379,574 291,677 0.00Alternative Loan Trust, Series2004-18CB ‘5A1’ 6.25% 25/09/2034 USD 26,454 27,475 0.00Alternative Loan Trust, Series2005-23CB ‘A16’ 5.5% 25/07/2035 USD 65,538 63,054 0.00Alternative Loan Trust, Series 2005-J14‘A3’ 5.5% 25/12/2035 USD 189,636 160,108 0.00Alternative Loan Trust, Series2005-23CB ‘A7’ 5.25% 25/07/2035 USD 23,229 22,075 0.00AMC Entertainment Holdings, Inc.,144A 10.5% 24/04/2026 USD 676,000 736,840 0.01AMC Entertainment Holdings, Inc.,144A 12% 15/06/2026 USD 1,992,752 2,042,571 0.02AMC Networks, Inc. 5% 01/04/2024 USD 694,000 704,813 0.01AMC Networks, Inc. 4.75% 01/08/2025 USD 3,040,000 3,115,422 0.03American Credit AcceptanceReceivables Trust, Series 2018-2 ‘E’,144A 5.16% 10/09/2024 USD 540,000 560,381 0.01American Credit AcceptanceReceivables Trust, Series 2018-3 ‘E’,144A 5.17% 15/10/2024 USD 9,225,000 9,550,620 0.09American Credit AcceptanceReceivables Trust, Series 2018-4 ‘E’,144A 5.38% 13/01/2025 USD 7,000,000 7,359,488 0.07American Credit AcceptanceReceivables Trust, Series 2018-1 ‘F’,144A 6.55% 10/12/2024 USD 3,400,000 3,460,132 0.03American Credit AcceptanceReceivables Trust, Series 2018-4 ‘F’,144A 6.94% 13/10/2025 USD 2,600,000 2,724,081 0.03Ameriquest Mortgage Securities, Inc.,FRN, Series 2003-11 ‘M2’ 2.567%25/12/2033 USD 28,017 28,602 0.00Amkor Technology, Inc., 144A 6.625%15/09/2027 USD 391,000 422,085 0.00Angel Oak Mortgage Trust I LLC, FRN,Series 2018-2 ‘B1’, 144A 4.893%27/07/2048 USD 5,000,000 5,077,691 0.05Angel Oak Mortgage Trust I LLC, FRN,Series 2018-3 ‘B1’, 144A 5.039%25/09/2048 USD 2,800,000 2,861,226 0.03Antero Midstream Partners LP, 144A5.75% 01/03/2027 USD 4,037,000 4,213,599 0.04
Antero Midstream Partners LP, 144A5.75% 15/01/2028 USD 2,027,000 2,135,809 0.02Antero Midstream Partners LP, 144A5.375% 15/06/2029 USD 2,559,000 2,670,969 0.03Antero Resources Corp., 144A 8.375%15/07/2026 USD 2,582,000 2,933,798 0.03Antero Resources Corp., 144A 7.625%01/02/2029 USD 865,000 961,275 0.01Apache Corp. 4.375% 15/10/2028 USD 2,370,000 2,524,382 0.02Applebee’s Funding LLC, Series2019-1A ‘A2II’, 144A 4.723%07/06/2049 USD 13,498,000 14,305,923 0.14Aramark Services, Inc., 144A 5%01/04/2025 USD 1,570,000 1,613,253 0.02Aramark Services, Inc., 144A 5%01/02/2028 USD 3,719,000 3,891,004 0.04Archrock Partners LP, 144A 6.875%01/04/2027 USD 3,882,000 4,128,352 0.04Arconic Corp., 144A 6% 15/05/2025 USD 1,455,000 1,551,103 0.02Arconic Corp., 144A 6.125%15/02/2028 USD 7,070,000 7,603,750 0.07Ascend Learning LLC, 144A 6.875%01/08/2025 USD 575,000 588,363 0.01Ascend Learning LLC, 144A 6.875%01/08/2025 USD 695,000 707,392 0.01Ascent Resources Utica Holdings LLC,144A 7% 01/11/2026 USD 2,570,000 2,688,002 0.03Audacy Capital Corp., 144A 6.5%01/05/2027 USD 2,395,000 2,487,734 0.02Avantor Funding, Inc., 144A 4.625%15/07/2028 USD 5,975,000 6,287,194 0.06Aviation Capital Group LLC, 144A 5.5%15/12/2024 USD 2,700,000 3,057,310 0.03Avis Budget Car Rental LLC, 144A5.25% 15/03/2025 USD 2,755,000 2,794,603 0.03Avis Budget Car Rental LLC, 144A5.75% 15/07/2027 USD 2,622,000 2,753,506 0.03Avis Budget Car Rental LLC, 144A4.75% 01/04/2028 USD 3,320,000 3,413,126 0.03Avis Budget Car Rental LLC, 144A5.375% 01/03/2029 USD 3,010,000 3,138,452 0.03Avis Budget Rental Car Funding AESOPLLC, Series 2018-1A ‘A’, 144A 3.7%20/09/2024 USD 26,710,000 28,394,819 0.28Avis Budget Rental Car Funding AESOPLLC, Series 2018-1A ‘B’, 144A 4%20/09/2024 USD 2,000,000 2,117,909 0.02Avis Budget Rental Car Funding AESOPLLC, Series 2018-1A ‘C’, 144A 4.73%20/09/2024 USD 360,000 382,681 0.00Axalta Coating Systems LLC, 144A3.375% 15/02/2029 USD 7,068,000 6,901,443 0.07BAMLL Re-REMIC Trust, FRN, Series2014-FRR9 ‘F’, 144A 2.429%26/12/2046 USD 1,057,094 1,046,039 0.01Banc of America Commercial MortgageTrust, FRN, Series 2007-5 ‘AJ’ 5.822%10/02/2051 USD 232,449 240,184 0.00Banc of America Commercial MortgageTrust, FRN, Series 2007-4 ‘H’, 144A5.869% 10/02/2051 USD 1,383,947 1,404,492 0.01Banc of America Funding Trust, FRN,Series 2007-5 ‘4A1’ 0.462%25/07/2037 USD 233,609 159,742 0.00BANK, FRN, Series 2017-BNK5 ‘C’4.254% 15/06/2060 USD 2,050,000 2,235,782 0.02BANK, FRN, Series 2017-BNK5 ‘D’, 144A3.078% 15/06/2060 USD 2,500,000 2,291,391 0.02BANK, Series 2017-BNK7 ‘D’, 144A2.708% 15/09/2060 USD 4,000,000 3,540,445 0.03BANK, Series 2017-BNK9 ‘D’, 144A2.8% 15/11/2054 USD 10,200,000 9,175,467 0.09BANK, Series 2018-BN10 ‘D’, 144A2.6% 15/02/2061 USD 6,000,000 5,416,672 0.05BANK, Series 2018-BN12 ‘D’, 144A 3%15/05/2061 USD 750,000 661,812 0.01BANK, Series 2018-BN13 ‘D’, 144A 3%15/08/2061 USD 8,064,312 7,321,895 0.07BANK, Series 2018-BN15 ‘E’, 144A 3%15/11/2061 USD 4,118,750 3,392,788 0.03BANK, IO, FRN, Series 2017-BNK7 ‘XB’0.206% 15/09/2060 USD 34,669,000 420,441 0.00BANK, IO, FRN, Series 2017-BNK9 ‘XB’0.18% 15/11/2054 USD 175,182,000 2,269,220 0.02BANK, IO, FRN, Series 2018-BN14 ‘XB’0.081% 15/09/2060 USD 100,000,000 691,640 0.01Bank of America Corp., FRN 2.687%22/04/2032 USD 28,390,000 29,311,403 0.28Bank of America Corp., FRN 6.1%Perpetual USD 385,000 431,995 0.00Bausch Health Americas, Inc., 144A9.25% 01/04/2026 USD 23,863,000 25,941,706 0.25
241
JPMorgan Funds - Income FundSchedule of Investments (continued)
As at 30 June 2021
Investments Currency
Quantity/Nominal
Value
MarketValue
USD
%of
NetAssets Investments Currency
Quantity/Nominal
Value
MarketValue
USD
%of
NetAssets

Bausch Health Americas, Inc., 144A8.5% 31/01/2027 USD 5,851,000 6,362,904 0.06BBCMS Mortgage Trust, FRN, Series2018-TALL ‘E’, 144A 2.538%15/03/2037 USD 17,000,000 16,335,179 0.16Bear Stearns ARM Trust, FRN, Series2006-1 ‘A1’ 2.37% 25/02/2036 USD 109,404 111,219 0.00Bear Stearns Asset-Backed SecuritiesTrust, STEP, Series 2003-AC4 ‘M1’5.658% 25/09/2033 USD 46,126 44,664 0.00Benchmark Mortgage Trust, FRN,Series 2018-B1 ‘C’ 4.114% 15/01/2051 USD 7,250,000 7,919,667 0.08Benchmark Mortgage Trust, FRN,Series 2018-B5 ‘C’ 4.61% 15/07/2051 USD 3,500,000 3,956,093 0.04Benchmark Mortgage Trust, Series2018-B1 ‘D’, 144A 2.75% 15/01/2051 USD 3,000,000 2,693,744 0.03Benchmark Mortgage Trust, Series2018-B8 ‘D’, 144A 3% 15/01/2052 USD 6,000,000 5,571,001 0.05Benchmark Mortgage Trust, IO, FRN,Series 2018-B3 ‘XA’ 0.634%10/04/2051 USD 34,297,371 1,019,771 0.01Berry Global, Inc., 144A 4.875%15/07/2026 USD 6,999,000 7,414,811 0.07Big River Steel LLC, 144A 6.625%31/01/2029 USD 3,360,000 3,724,778 0.04Blue Racer Midstream LLC, 144A7.625% 15/12/2025 USD 2,600,000 2,817,932 0.03BorgWarner, Inc., 144A 5% 01/10/2025 USD 3,450,000 3,966,400 0.04Boyne USA, Inc., 144A 4.75%15/05/2029 USD 2,860,000 2,958,999 0.03Brink’s Co. (The), 144A 4.625%15/10/2027 USD 455,000 474,403 0.00Buckeye Partners LP, 144A 4.125%01/03/2025 USD 2,072,000 2,153,875 0.02Buckeye Partners LP, 144A 4.5%01/03/2028 USD 1,770,000 1,808,940 0.02Buckeye Partners LP 4.15%01/07/2023 USD 3,189,000 3,305,797 0.03Buckeye Partners LP 3.95%01/12/2026 USD 3,881,000 3,960,172 0.04Buckeye Partners LP 4.125%01/12/2027 USD 3,040,000 3,095,115 0.03Buckeye Partners LP 5.6% 15/10/2044 USD 510,000 498,206 0.01Builders FirstSource, Inc., 144A 6.75%01/06/2027 USD 1,117,000 1,199,692 0.01BWX Technologies, Inc., 144A 5.375%15/07/2026 USD 1,855,000 1,906,986 0.02BWX Technologies, Inc., 144A 4.125%30/06/2028 USD 1,030,000 1,050,821 0.01Caesars Resort Collection LLC, 144A5.75% 01/07/2025 USD 2,489,000 2,625,895 0.03Caesars Resort Collection LLC, 144A5.25% 15/10/2025 USD 1,225,000 1,241,844 0.01California Resources Corp., 144A7.125% 01/02/2026 USD 3,449,000 3,647,559 0.04Callon Petroleum Co. 6.25%15/04/2023 USD 1,362,000 1,367,107 0.01Callon Petroleum Co. 6.375%01/07/2026 USD 76,000 72,872 0.00Calpine Corp., 144A 5.25% 01/06/2026 USD 6,268,000 6,465,223 0.06Calpine Corp., 144A 4.5% 15/02/2028 USD 720,000 733,500 0.01Calpine Corp., 144A 4.625%01/02/2029 USD 1,000,000 985,945 0.01CarMax Auto Owner Trust, Series2017-4 ‘C’ 2.7% 16/10/2023 USD 1,000,000 1,009,835 0.01Catalent Pharma Solutions, Inc., 144A5% 15/07/2027 USD 447,000 467,774 0.00Catalent Pharma Solutions, Inc., 144A3.125% 15/02/2029 USD 1,685,000 1,634,762 0.02CCO Holdings LLC, 144A 5.75%15/02/2026 USD 1,935,000 2,008,694 0.02CCO Holdings LLC, 144A 5.5%01/05/2026 USD 5,245,000 5,435,053 0.05CCO Holdings LLC, 144A 5.125%01/05/2027 USD 37,636,000 39,470,755 0.38CCO Holdings LLC, 144A 5%01/02/2028 USD 27,188,000 28,569,150 0.28CCO Holdings LLC, 144A 5.375%01/06/2029 USD 3,039,000 3,317,107 0.03CCO Holdings LLC, 144A 4.75%01/03/2030 USD 9,370,000 9,897,063 0.10CCO Holdings LLC, 144A 4.5%15/08/2030 USD 2,310,000 2,402,400 0.02CCO Holdings LLC, 144A 4.25%01/02/2031 USD 6,701,000 6,826,644 0.07CCO Holdings LLC, 144A 4.5%01/06/2033 USD 6,512,000 6,658,520 0.06CD Mortgage Trust, FRN, Series2016-CD1 ‘C’ 3.631% 10/08/2049 USD 3,000,000 3,000,947 0.03CD Mortgage Trust, FRN, Series2016-CD2 ‘C’ 4.022% 10/11/2049 USD 3,500,000 3,633,823 0.04
CD Mortgage Trust, FRN, Series2017-CD6 ‘C’ 4.266% 13/11/2050 USD 1,644,827 1,773,191 0.02CD Mortgage Trust, Series 2017-CD3‘D’, 144A 3.25% 10/02/2050 USD 8,800,000 7,206,778 0.07CD Mortgage Trust, Series 2017-CD4‘D’, 144A 3.3% 10/05/2050 USD 1,350,000 1,270,230 0.01CD Mortgage Trust, Series 2017-CD5‘D’, 144A 3.35% 15/08/2050 USD 5,000,000 4,600,553 0.04CD Mortgage Trust, FRN, Series2018-CD7 ‘D’, 144A 3.101% 15/08/2051 USD 6,390,000 6,078,022 0.06CDK Global, Inc., 144A 5.25%15/05/2029 USD 2,506,000 2,741,539 0.03CDK Global, Inc. 4.875% 01/06/2027 USD 2,040,000 2,157,983 0.02CDW LLC 5.5% 01/12/2024 USD 310,000 345,976 0.00CDW LLC 4.125% 01/05/2025 USD 239,000 249,791 0.00CDW LLC 4.25% 01/04/2028 USD 10,029,000 10,560,687 0.10CDW LLC 3.25% 15/02/2029 USD 1,000,000 1,013,750 0.01Cedar Fair LP, 144A 5.5% 01/05/2025 USD 3,249,000 3,403,327 0.03Cedar Fair LP 5.25% 15/07/2029 USD 3,789,000 3,916,045 0.04Centene Corp., 144A 5.375%01/06/2026 USD 14,165,000 14,784,719 0.14Centene Corp. 4.25% 15/12/2027 USD 6,002,000 6,332,110 0.06Centene Corp. 4.625% 15/12/2029 USD 5,423,000 5,972,187 0.06Centene Corp. 3.375% 15/02/2030 USD 5,130,000 5,361,389 0.05Central Garden & Pet Co. 5.125%01/02/2028 USD 7,990,000 8,466,524 0.08Central Garden & Pet Co. 4.125%15/10/2030 USD 1,410,000 1,436,649 0.01CFCRE Commercial Mortgage Trust,Series 2016-C6 ‘B’ 3.804% 10/11/2049 USD 7,000,000 7,525,963 0.07CFCRE Commercial Mortgage Trust,FRN, Series 2016-C6 ‘C’ 4.201%10/11/2049 USD 3,200,000 3,391,920 0.03CFCRE Commercial Mortgage Trust,FRN, Series 2016-C6 ‘D’, 144A 4.201%10/11/2049 USD 1,900,000 1,703,905 0.02CGMS Commercial Mortgage Trust,Series 2017-B1 ‘D’, 144A 3%15/08/2050 USD 13,076,250 12,019,158 0.12Charles Schwab Corp. (The), FRN 4%Perpetual USD 13,350,000 13,707,112 0.13Charles Schwab Corp. (The), FRN 4%Perpetual USD 27,500,000 28,768,768 0.28Charter Communications OperatingLLC 5.375% 01/04/2038 USD 4,320,000 5,351,081 0.05Chase Funding Trust, STEP, Series2003-6 ‘1A7’ 4.973% 25/11/2034 USD 46,583 49,096 0.00Chemours Co. (The), 144A 5.75%15/11/2028 USD 5,800,000 6,198,750 0.06Cheniere Energy Partners LP, 144A 4%01/03/2031 USD 1,749,000 1,823,332 0.02Cheniere Energy Partners LP 5.625%01/10/2026 USD 2,518,000 2,618,720 0.03Cheniere Energy Partners LP 4.5%01/10/2029 USD 3,042,000 3,266,347 0.03Cheniere Energy, Inc. 4.625%15/10/2028 USD 8,740,000 9,203,395 0.09Chevron USA, Inc. 3.25% 15/10/2029 USD 16,830,000 18,669,378 0.18CHL GMSR Issuer Trust, FRN, Series2018-GT1 ‘A’, 144A 2.842% 25/05/2023 USD 5,760,000 5,777,454 0.06CHL GMSR Issuer Trust, FRN, Series2018-GT1 ‘B’, 144A 3.592% 25/05/2023 USD 4,392,000 4,435,770 0.04CHL Mortgage Pass-Through Trust,FRN, Series 2004-HYB6 ‘A3’ 2.766%20/11/2034 USD 124,984 129,197 0.00Cincinnati Bell, Inc., 144A 7%15/07/2024 USD 1,360,000 1,396,713 0.01Cincinnati Bell, Inc., 144A 8%15/10/2025 USD 161,000 169,579 0.00Citigroup Commercial Mortgage Trust,FRN, Series 2013-GC17 ‘C’ 5.109%10/11/2046 USD 3,149,000 3,305,828 0.03Citigroup Commercial Mortgage Trust,FRN, Series 2014-GC23 ‘C’ 4.43%10/07/2047 USD 3,000,000 3,206,753 0.03Citigroup Commercial Mortgage Trust,FRN, Series 2015-GC27 ‘C’ 4.42%10/02/2048 USD 5,000,000 5,303,607 0.05Citigroup Commercial Mortgage Trust,FRN, Series 2016-C2 ‘C’ 4.031%10/08/2049 USD 3,720,000 3,802,000 0.04Citigroup Commercial Mortgage Trust,FRN, Series 2016-P4 ‘C’ 3.971%10/07/2049 USD 9,909,432 10,376,935 0.10Citigroup Commercial Mortgage Trust,FRN, Series 2012-GC8 ‘D’, 144A4.876% 10/09/2045 USD 1,050,000 925,750 0.01Citigroup Commercial Mortgage Trust,Series 2014-GC25 ‘D’, 144A 3.548%10/10/2047 USD 6,000,000 6,017,647 0.06
242
JPMorgan Funds - Income FundSchedule of Investments (continued)
As at 30 June 2021
Investments Currency
Quantity/Nominal
Value
MarketValue
USD
%of
NetAssets Investments Currency
Quantity/Nominal
Value
MarketValue
USD
%of
NetAssets
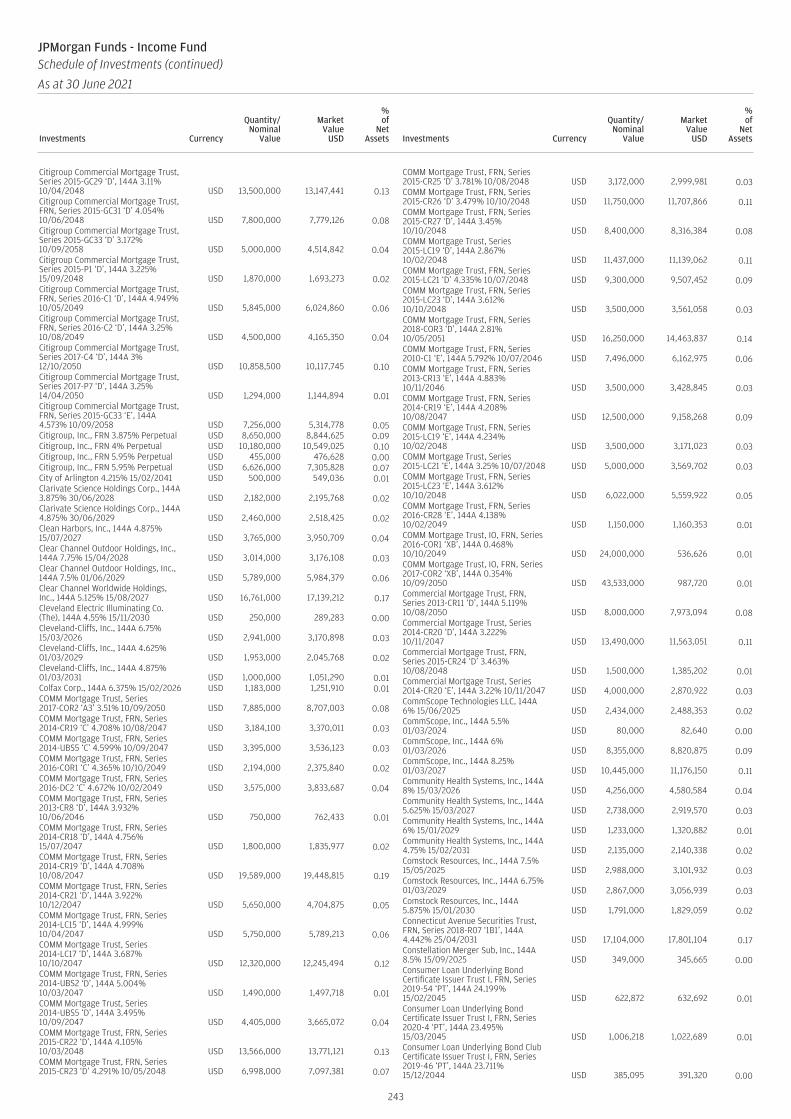
Citigroup Commercial Mortgage Trust,Series 2015-GC29 ‘D’, 144A 3.11%10/04/2048 USD 13,500,000 13,147,441 0.13Citigroup Commercial Mortgage Trust,FRN, Series 2015-GC31 ‘D’ 4.054%10/06/2048 USD 7,800,000 7,779,126 0.08Citigroup Commercial Mortgage Trust,Series 2015-GC33 ‘D’ 3.172%10/09/2058 USD 5,000,000 4,514,842 0.04Citigroup Commercial Mortgage Trust,Series 2015-P1 ‘D’, 144A 3.225%15/09/2048 USD 1,870,000 1,693,273 0.02Citigroup Commercial Mortgage Trust,FRN, Series 2016-C1 ‘D’, 144A 4.949%10/05/2049 USD 5,845,000 6,024,860 0.06Citigroup Commercial Mortgage Trust,FRN, Series 2016-C2 ‘D’, 144A 3.25%10/08/2049 USD 4,500,000 4,165,350 0.04Citigroup Commercial Mortgage Trust,Series 2017-C4 ‘D’, 144A 3%12/10/2050 USD 10,858,500 10,117,745 0.10Citigroup Commercial Mortgage Trust,Series 2017-P7 ‘D’, 144A 3.25%14/04/2050 USD 1,294,000 1,144,894 0.01Citigroup Commercial Mortgage Trust,FRN, Series 2015-GC33 ‘E’, 144A4.573% 10/09/2058 USD 7,256,000 5,314,778 0.05Citigroup, Inc., FRN 3.875% Perpetual USD 8,650,000 8,844,625 0.09Citigroup, Inc., FRN 4% Perpetual USD 10,180,000 10,549,025 0.10Citigroup, Inc., FRN 5.95% Perpetual USD 455,000 476,628 0.00Citigroup, Inc., FRN 5.95% Perpetual USD 6,626,000 7,305,828 0.07City of Arlington 4.215% 15/02/2041 USD 500,000 549,036 0.01Clarivate Science Holdings Corp., 144A3.875% 30/06/2028 USD 2,182,000 2,195,768 0.02Clarivate Science Holdings Corp., 144A4.875% 30/06/2029 USD 2,460,000 2,518,425 0.02Clean Harbors, Inc., 144A 4.875%15/07/2027 USD 3,765,000 3,950,709 0.04Clear Channel Outdoor Holdings, Inc.,144A 7.75% 15/04/2028 USD 3,014,000 3,176,108 0.03Clear Channel Outdoor Holdings, Inc.,144A 7.5% 01/06/2029 USD 5,789,000 5,984,379 0.06Clear Channel Worldwide Holdings,Inc., 144A 5.125% 15/08/2027 USD 16,761,000 17,139,212 0.17Cleveland Electric Illuminating Co.(The), 144A 4.55% 15/11/2030 USD 250,000 289,283 0.00Cleveland-Cliffs, Inc., 144A 6.75%15/03/2026 USD 2,941,000 3,170,898 0.03Cleveland-Cliffs, Inc., 144A 4.625%01/03/2029 USD 1,953,000 2,045,768 0.02Cleveland-Cliffs, Inc., 144A 4.875%01/03/2031 USD 1,000,000 1,051,290 0.01Colfax Corp., 144A 6.375% 15/02/2026 USD 1,183,000 1,251,910 0.01COMM Mortgage Trust, Series2017-COR2 ‘A3’ 3.51% 10/09/2050 USD 7,885,000 8,707,003 0.08COMM Mortgage Trust, FRN, Series2014-CR19 ‘C’ 4.708% 10/08/2047 USD 3,184,100 3,370,011 0.03COMM Mortgage Trust, FRN, Series2014-UBS5 ‘C’ 4.599% 10/09/2047 USD 3,395,000 3,536,123 0.03COMM Mortgage Trust, FRN, Series2016-COR1 ‘C’ 4.365% 10/10/2049 USD 2,194,000 2,375,840 0.02COMM Mortgage Trust, FRN, Series2016-DC2 ‘C’ 4.672% 10/02/2049 USD 3,575,000 3,833,687 0.04COMM Mortgage Trust, FRN, Series2013-CR8 ‘D’, 144A 3.932%10/06/2046 USD 750,000 762,433 0.01COMM Mortgage Trust, FRN, Series2014-CR18 ‘D’, 144A 4.756%15/07/2047 USD 1,800,000 1,835,977 0.02COMM Mortgage Trust, FRN, Series2014-CR19 ‘D’, 144A 4.708%10/08/2047 USD 19,589,000 19,448,815 0.19COMM Mortgage Trust, FRN, Series2014-CR21 ‘D’, 144A 3.922%10/12/2047 USD 5,650,000 4,704,875 0.05COMM Mortgage Trust, FRN, Series2014-LC15 ‘D’, 144A 4.999%10/04/2047 USD 5,750,000 5,789,213 0.06COMM Mortgage Trust, Series2014-LC17 ‘D’, 144A 3.687%10/10/2047 USD 12,320,000 12,245,494 0.12COMM Mortgage Trust, FRN, Series2014-UBS2 ‘D’, 144A 5.004%10/03/2047 USD 1,490,000 1,497,718 0.01COMM Mortgage Trust, Series2014-UBS5 ‘D’, 144A 3.495%10/09/2047 USD 4,405,000 3,665,072 0.04COMM Mortgage Trust, FRN, Series2015-CR22 ‘D’, 144A 4.105%10/03/2048 USD 13,566,000 13,771,121 0.13COMM Mortgage Trust, FRN, Series2015-CR23 ‘D’ 4.291% 10/05/2048 USD 6,998,000 7,097,381 0.07
COMM Mortgage Trust, FRN, Series2015-CR25 ‘D’ 3.781% 10/08/2048 USD 3,172,000 2,999,981 0.03COMM Mortgage Trust, FRN, Series2015-CR26 ‘D’ 3.479% 10/10/2048 USD 11,750,000 11,707,866 0.11COMM Mortgage Trust, FRN, Series2015-CR27 ‘D’, 144A 3.45%10/10/2048 USD 8,400,000 8,316,384 0.08COMM Mortgage Trust, Series2015-LC19 ‘D’, 144A 2.867%10/02/2048 USD 11,437,000 11,139,062 0.11COMM Mortgage Trust, FRN, Series2015-LC21 ‘D’ 4.335% 10/07/2048 USD 9,300,000 9,507,452 0.09COMM Mortgage Trust, FRN, Series2015-LC23 ‘D’, 144A 3.612%10/10/2048 USD 3,500,000 3,561,058 0.03COMM Mortgage Trust, FRN, Series2018-COR3 ‘D’, 144A 2.81%10/05/2051 USD 16,250,000 14,463,837 0.14COMM Mortgage Trust, FRN, Series2010-C1 ‘E’, 144A 5.792% 10/07/2046 USD 7,496,000 6,162,975 0.06COMM Mortgage Trust, FRN, Series2013-CR13 ‘E’, 144A 4.883%10/11/2046 USD 3,500,000 3,428,845 0.03COMM Mortgage Trust, FRN, Series2014-CR19 ‘E’, 144A 4.208%10/08/2047 USD 12,500,000 9,158,268 0.09COMM Mortgage Trust, FRN, Series2015-LC19 ‘E’, 144A 4.234%10/02/2048 USD 3,500,000 3,171,023 0.03COMM Mortgage Trust, Series2015-LC21 ‘E’, 144A 3.25% 10/07/2048 USD 5,000,000 3,569,702 0.03COMM Mortgage Trust, FRN, Series2015-LC23 ‘E’, 144A 3.612%10/10/2048 USD 6,022,000 5,559,922 0.05COMM Mortgage Trust, FRN, Series2016-CR28 ‘E’, 144A 4.138%10/02/2049 USD 1,150,000 1,160,353 0.01COMM Mortgage Trust, IO, FRN, Series2016-COR1 ‘XB’, 144A 0.468%10/10/2049 USD 24,000,000 536,626 0.01COMM Mortgage Trust, IO, FRN, Series2017-COR2 ‘XB’, 144A 0.354%10/09/2050 USD 43,533,000 987,720 0.01Commercial Mortgage Trust, FRN,Series 2013-CR11 ‘D’, 144A 5.119%10/08/2050 USD 8,000,000 7,973,094 0.08Commercial Mortgage Trust, Series2014-CR20 ‘D’, 144A 3.222%10/11/2047 USD 13,490,000 11,563,051 0.11Commercial Mortgage Trust, FRN,Series 2015-CR24 ‘D’ 3.463%10/08/2048 USD 1,500,000 1,385,202 0.01Commercial Mortgage Trust, Series2014-CR20 ‘E’, 144A 3.22% 10/11/2047 USD 4,000,000 2,870,922 0.03CommScope Technologies LLC, 144A6% 15/06/2025 USD 2,434,000 2,488,353 0.02CommScope, Inc., 144A 5.5%01/03/2024 USD 80,000 82,640 0.00CommScope, Inc., 144A 6%01/03/2026 USD 8,355,000 8,820,875 0.09CommScope, Inc., 144A 8.25%01/03/2027 USD 10,445,000 11,176,150 0.11Community Health Systems, Inc., 144A8% 15/03/2026 USD 4,256,000 4,580,584 0.04Community Health Systems, Inc., 144A5.625% 15/03/2027 USD 2,738,000 2,919,570 0.03Community Health Systems, Inc., 144A6% 15/01/2029 USD 1,233,000 1,320,882 0.01Community Health Systems, Inc., 144A4.75% 15/02/2031 USD 2,135,000 2,140,338 0.02Comstock Resources, Inc., 144A 7.5%15/05/2025 USD 2,988,000 3,101,932 0.03Comstock Resources, Inc., 144A 6.75%01/03/2029 USD 2,867,000 3,056,939 0.03Comstock Resources, Inc., 144A5.875% 15/01/2030 USD 1,791,000 1,829,059 0.02Connecticut Avenue Securities Trust,FRN, Series 2018-R07 ‘1B1’, 144A4.442% 25/04/2031 USD 17,104,000 17,801,104 0.17Constellation Merger Sub, Inc., 144A8.5% 15/09/2025 USD 349,000 345,665 0.00Consumer Loan Underlying BondCertificate Issuer Trust I, FRN, Series2019-54 ‘PT’, 144A 24.199%15/02/2045 USD 622,872 632,692 0.01Consumer Loan Underlying BondCertificate Issuer Trust I, FRN, Series2020-4 ‘PT’, 144A 23.495%15/03/2045 USD 1,006,218 1,022,689 0.01Consumer Loan Underlying Bond ClubCertificate Issuer Trust I, FRN, Series2019-46 ‘PT’, 144A 23.711%15/12/2044 USD 385,095 391,320 0.00
243
JPMorgan Funds - Income FundSchedule of Investments (continued)
As at 30 June 2021
Investments Currency
Quantity/Nominal
Value
MarketValue
USD
%of
NetAssets Investments Currency
Quantity/Nominal
Value
MarketValue
USD
%of
NetAssets

Consumer Loan Underlying Bond ClubCertificate Issuer Trust I, FRN, Series2020-8 ‘PT’, 144A 23.959%17/04/2045 USD 565,751 575,006 0.01Consumer Loan Underlying Bond ClubCertificate Issuer Trust I, FRN, Series2020-9 ‘PT’, 144A 8.263% 15/04/2045 USD 14,180,073 14,108,934 0.14Consumer Loan Underlying BondCredit Trust, Series 2018-P2 ‘C’, 144A5.21% 15/10/2025 USD 5,965,388 6,070,824 0.06Continental Resources, Inc., 144A5.75% 15/01/2031 USD 3,487,000 4,179,972 0.04Cooper-Standard Automotive, Inc.,144A 13% 01/06/2024 USD 305,000 345,844 0.00Cooper-Standard Automotive, Inc.,144A 5.625% 15/11/2026 USD 504,000 470,739 0.00County of Sarasota 3.72% 01/10/2047 USD 160,000 168,934 0.00CPS Auto Receivables Trust, Series2016-B ‘D’, 144A 6.58% 15/03/2022 USD 331,929 332,755 0.00CPS Auto Receivables Trust, Series2016-C ‘D’, 144A 5.92% 15/06/2022 USD 59,626 59,773 0.00CPS Auto Receivables Trust, Series2017-D ‘E’, 144A 5.3% 17/06/2024 USD 3,000,000 3,112,699 0.03Credit Acceptance Auto Loan Trust,Series 2018-2A ‘C’, 144A 4.16%15/09/2027 USD 280,000 282,608 0.00Credit Suisse Commercial MortgageTrust, Series 2007-C1 ‘AM’ 5.416%15/02/2040 USD 250 263 0.00Crestwood Midstream Partners LP,144A 5.625% 01/05/2027 USD 5,190,000 5,348,035 0.05Crown Americas LLC 4.75%01/02/2026 USD 472,000 490,316 0.01CSAIL Commercial Mortgage Trust,FRN, Series 2015-C2 ‘B’ 4.208%15/06/2057 USD 13,500,000 14,078,569 0.14CSAIL Commercial Mortgage Trust,FRN, Series 2018-CX11 ‘C’ 4.789%15/04/2051 USD 4,000,000 4,289,876 0.04CSAIL Commercial Mortgage Trust,FRN, Series 2016-C5 ‘D’, 144A 3.629%15/11/2048 USD 750,000 658,193 0.01CSAIL Commercial Mortgage Trust,FRN, Series 2015-C4 ‘E’ 3.562%15/11/2048 USD 5,000,000 4,993,997 0.05CSC Holdings LLC, 144A 5.5%15/04/2027 USD 2,525,000 2,644,710 0.03CSC Holdings LLC, 144A 5.375%01/02/2028 USD 3,333,000 3,516,315 0.03CSC Holdings LLC, 144A 6.5%01/02/2029 USD 16,770,000 18,531,018 0.18CSC Holdings LLC, 144A 4.5%15/11/2031 USD 4,991,000 5,009,716 0.05CSC Holdings LLC 6.75% 15/11/2021 USD 47,000 47,936 0.00CSC Holdings LLC 5.875% 15/09/2022 USD 137,000 144,197 0.00CSC Holdings LLC 5.25% 01/06/2024 USD 516,000 559,860 0.01CSFB Mortgage-Backed Pass-ThroughCertificates Trust, FRN, Series 2005-4‘2A5’ 0.642% 25/06/2035 USD 33,445 25,557 0.00CVR Partners LP, 144A 9.25%15/06/2023 USD 158,000 158,711 0.00CWABS, Inc. Trust, FRN, Series 2004-4‘M1’ 0.812% 25/07/2034 USD 1,672,072 1,655,939 0.02Darling Ingredients, Inc., 144A 5.25%15/04/2027 USD 1,605,000 1,684,512 0.02DaVita, Inc., 144A 4.625% 01/06/2030 USD 6,082,000 6,218,845 0.06DaVita, Inc., 144A 3.75% 15/02/2031 USD 6,043,000 5,808,834 0.06DBGS Mortgage Trust, Series 2018-C1‘A4’ 4.466% 15/10/2051 USD 3,097,500 3,634,357 0.04DBGS Mortgage Trust, FRN, Series2018-C1 ‘D’, 144A 2.885% 15/10/2051 USD 3,318,000 3,104,115 0.03DBJPM 16-C3 Mortgage Trust, FRN,Series 2016-C3 ‘D’, 144A 3.489%10/08/2049 USD 10,448,000 8,905,477 0.09DBJPM 17-C6 Mortgage Trust, FRN,Series 2017-C6 ‘D’, 144A 3.22%10/06/2050 USD 5,200,000 4,893,763 0.05DBJPM Mortgage Trust, FRN, Series2016-C3 ‘E’, 144A 4.239% 10/08/2049 USD 1,250,000 931,355 0.01DCP Midstream LP, FRN 7.375%Perpetual USD 120,000 117,900 0.00DCP Midstream Operating LP, 144A6.75% 15/09/2037 USD 62,000 74,865 0.00DCP Midstream Operating LP 5.375%15/07/2025 USD 5,295,000 5,897,306 0.06Dell International LLC, 144A 7.125%15/06/2024 USD 174,000 178,242 0.00Dell International LLC 8.35%15/07/2046 USD 120,000 197,100 0.00Devon Energy Corp., 144A 8.25%01/08/2023 USD 1,908,000 2,174,550 0.02
Devon Energy Corp., 144A 5.875%15/06/2028 USD 648,000 721,723 0.01Devon Energy Corp., 144A 4.5%15/01/2030 USD 305,000 337,375 0.00Diamond Resorts Owner Trust, Series2018-1 ‘D’, 144A 5.9% 21/01/2031 USD 304,543 309,408 0.00Diamond Sports Group LLC, 144A5.375% 15/08/2026 USD 5,153,000 3,317,501 0.03Discovery Communications LLC 4.95%15/05/2042 USD 3,450,000 4,103,445 0.04DISH DBS Corp. 5.875% 15/07/2022 USD 1,604,000 1,672,170 0.02DISH DBS Corp. 5% 15/03/2023 USD 2,617,000 2,737,670 0.03DISH DBS Corp. 5.875% 15/11/2024 USD 41,495,000 44,451,519 0.43DISH DBS Corp. 7.75% 01/07/2026 USD 9,720,000 11,007,900 0.11Dole Food Co., Inc., 144A 7.25%15/06/2025 USD 338,000 346,097 0.00Domino’s Pizza Master Issuer LLC,Series 2018-1A ‘A2I’, 144A 4.116%25/07/2048 USD 5,879,250 6,160,416 0.06Domino’s Pizza Master Issuer LLC,Series 2021-1A ‘A2II’, 144A 3.151%25/04/2051 USD 8,800,000 9,203,157 0.09Downstream Development Authority ofthe Quapaw Tribe of Oklahoma, 144A10.5% 15/02/2023 USD 456,000 477,341 0.00Drive Auto Receivables Trust, Series2018-3 ‘D’ 4.3% 16/09/2024 USD 717,058 734,674 0.01Driven Brands Funding LLC, Series2018-1A ‘A2’, 144A 4.739%20/04/2048 USD 4,083,700 4,361,015 0.04Driven Brands Funding LLC, Series2019-1A ‘A2’, 144A 4.641%20/04/2049 USD 12,298,905 13,289,948 0.13Driven Brands Funding LLC, Series2019-2A ‘A2’, 144A 3.981%20/10/2049 USD 1,669,575 1,772,842 0.02Driven Brands Funding LLC, Series2020-1A ‘A2’, 144A 3.786%20/07/2050 USD 9,686,800 10,172,970 0.10Driven Brands Funding LLC, Series2020-2A ‘A2’, 144A 3.237% 20/01/2051 USD 6,982,500 7,199,990 0.07DT Auto Owner Trust, Series 2017-4A‘E’, 144A 5.15% 15/11/2024 USD 5,826,323 5,875,456 0.06DT Auto Owner Trust, Series 2018-1A‘E’, 144A 5.42% 17/03/2025 USD 635,000 645,483 0.01DT Auto Owner Trust, Series 2018-2A‘E’, 144A 5.54% 16/06/2025 USD 15,210,000 15,831,452 0.15DT Auto Owner Trust, Series 2018-3A‘E’, 144A 5.33% 17/11/2025 USD 5,000,000 5,231,989 0.05DT Midstream, Inc., 144A 4.125%15/06/2029 USD 2,616,000 2,652,755 0.03DT Midstream, Inc., 144A 4.375%15/06/2031 USD 1,307,000 1,331,506 0.01Dun & Bradstreet Corp. (The), 144A6.875% 15/08/2026 USD 157,000 166,969 0.00Duquesne Light Holdings, Inc., 144A2.775% 07/01/2032 USD 5,670,000 5,734,015 0.06Dycom Industries, Inc., 144A 4.5%15/04/2029 USD 1,140,000 1,148,601 0.01Edgewell Personal Care Co., 144A 5.5%01/06/2028 USD 9,290,000 9,889,205 0.10Edgewell Personal Care Co., 144A4.125% 01/04/2029 USD 90,000 91,084 0.00Element Solutions, Inc., 144A 3.875%01/09/2028 USD 6,465,000 6,571,446 0.06Emergent BioSolutions, Inc., 144A3.875% 15/08/2028 USD 2,572,000 2,517,962 0.02Encino Acquisition Partners HoldingsLLC, 144A 8.5% 01/05/2028 USD 4,950,000 5,055,187 0.05Energizer Holdings, Inc., 144A 4.75%15/06/2028 USD 6,568,000 6,753,546 0.07Energizer Holdings, Inc., 144A 4.375%31/03/2029 USD 8,101,000 8,101,891 0.08Energy Transfer LP, FRN 6.625%Perpetual USD 94,000 92,943 0.00Energy Transfer LP, FRN 7.125%31/12/2164 USD 2,423,000 2,501,747 0.02EnLink Midstream Partners LP, FRN6% Perpetual USD 245,000 189,228 0.00Entegris, Inc., 144A 4.375%15/04/2028 USD 3,090,000 3,231,368 0.03Entegris, Inc., 144A 3.625%01/05/2029 USD 1,305,000 1,324,575 0.01Envision Healthcare Corp., 144A 8.75%15/10/2026 USD 621,000 436,327 0.00EQM Midstream Partners LP, 144A 6%01/07/2025 USD 5,823,000 6,340,374 0.06EQM Midstream Partners LP, 144A6.5% 01/07/2027 USD 235,000 262,711 0.00EQM Midstream Partners LP, 144A4.5% 15/01/2029 USD 2,148,000 2,182,991 0.02
244
JPMorgan Funds - Income FundSchedule of Investments (continued)
As at 30 June 2021
Investments Currency
Quantity/Nominal
Value
MarketValue
USD
%of
NetAssets Investments Currency
Quantity/Nominal
Value
MarketValue
USD
%of
NetAssets
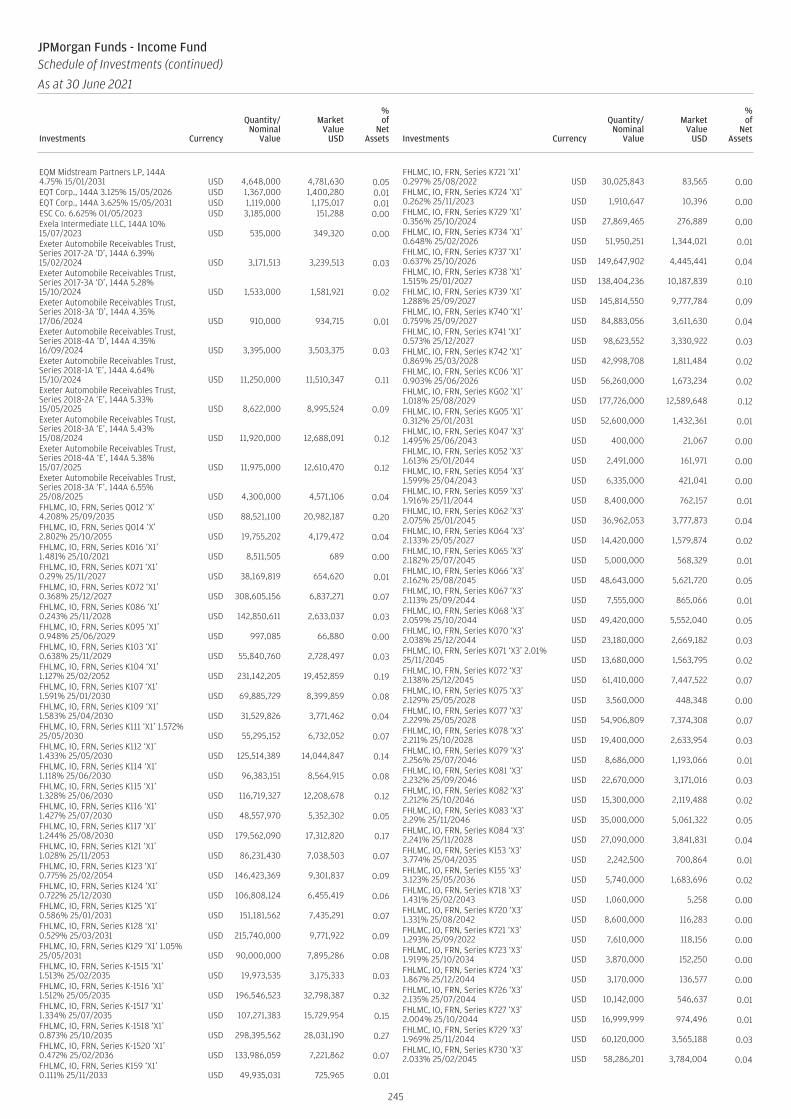
EQM Midstream Partners LP, 144A4.75% 15/01/2031 USD 4,648,000 4,781,630 0.05EQT Corp., 144A 3.125% 15/05/2026 USD 1,367,000 1,400,280 0.01EQT Corp., 144A 3.625% 15/05/2031 USD 1,119,000 1,175,017 0.01ESC Co. 6.625% 01/05/2023 USD 3,185,000 151,288 0.00Exela Intermediate LLC, 144A 10%15/07/2023 USD 535,000 349,320 0.00Exeter Automobile Receivables Trust,Series 2017-2A ‘D’, 144A 6.39%15/02/2024 USD 3,171,513 3,239,513 0.03Exeter Automobile Receivables Trust,Series 2017-3A ‘D’, 144A 5.28%15/10/2024 USD 1,533,000 1,581,921 0.02Exeter Automobile Receivables Trust,Series 2018-3A ‘D’, 144A 4.35%17/06/2024 USD 910,000 934,715 0.01Exeter Automobile Receivables Trust,Series 2018-4A ‘D’, 144A 4.35%16/09/2024 USD 3,395,000 3,503,375 0.03Exeter Automobile Receivables Trust,Series 2018-1A ‘E’, 144A 4.64%15/10/2024 USD 11,250,000 11,510,347 0.11Exeter Automobile Receivables Trust,Series 2018-2A ‘E’, 144A 5.33%15/05/2025 USD 8,622,000 8,995,524 0.09Exeter Automobile Receivables Trust,Series 2018-3A ‘E’, 144A 5.43%15/08/2024 USD 11,920,000 12,688,091 0.12Exeter Automobile Receivables Trust,Series 2018-4A ‘E’, 144A 5.38%15/07/2025 USD 11,975,000 12,610,470 0.12Exeter Automobile Receivables Trust,Series 2018-3A ‘F’, 144A 6.55%25/08/2025 USD 4,300,000 4,571,106 0.04FHLMC, IO, FRN, Series Q012 ‘X’4.208% 25/09/2035 USD 88,521,100 20,982,187 0.20FHLMC, IO, FRN, Series Q014 ‘X’2.802% 25/10/2055 USD 19,755,202 4,179,472 0.04FHLMC, IO, FRN, Series K016 ‘X1’1.481% 25/10/2021 USD 8,511,505 689 0.00FHLMC, IO, FRN, Series K071 ‘X1’0.29% 25/11/2027 USD 38,169,819 654,620 0.01FHLMC, IO, FRN, Series K072 ‘X1’0.368% 25/12/2027 USD 308,605,156 6,837,271 0.07FHLMC, IO, FRN, Series K086 ‘X1’0.243% 25/11/2028 USD 142,850,611 2,633,037 0.03FHLMC, IO, FRN, Series K095 ‘X1’0.948% 25/06/2029 USD 997,085 66,880 0.00FHLMC, IO, FRN, Series K103 ‘X1’0.638% 25/11/2029 USD 55,840,760 2,728,497 0.03FHLMC, IO, FRN, Series K104 ‘X1’1.127% 25/02/2052 USD 231,142,205 19,452,859 0.19FHLMC, IO, FRN, Series K107 ‘X1’1.591% 25/01/2030 USD 69,885,729 8,399,859 0.08FHLMC, IO, FRN, Series K109 ‘X1’1.583% 25/04/2030 USD 31,529,826 3,771,462 0.04FHLMC, IO, FRN, Series K111 ‘X1’ 1.572%25/05/2030 USD 55,295,152 6,732,052 0.07FHLMC, IO, FRN, Series K112 ‘X1’1.433% 25/05/2030 USD 125,514,389 14,044,847 0.14FHLMC, IO, FRN, Series K114 ‘X1’1.118% 25/06/2030 USD 96,383,151 8,564,915 0.08FHLMC, IO, FRN, Series K115 ‘X1’1.328% 25/06/2030 USD 116,719,327 12,208,678 0.12FHLMC, IO, FRN, Series K116 ‘X1’1.427% 25/07/2030 USD 48,557,970 5,352,302 0.05FHLMC, IO, FRN, Series K117 ‘X1’1.244% 25/08/2030 USD 179,562,090 17,312,820 0.17FHLMC, IO, FRN, Series K121 ‘X1’1.028% 25/11/2053 USD 86,231,430 7,038,503 0.07FHLMC, IO, FRN, Series K123 ‘X1’0.775% 25/02/2054 USD 146,423,369 9,301,837 0.09FHLMC, IO, FRN, Series K124 ‘X1’0.722% 25/12/2030 USD 106,808,124 6,455,419 0.06FHLMC, IO, FRN, Series K125 ‘X1’0.586% 25/01/2031 USD 151,181,562 7,435,291 0.07FHLMC, IO, FRN, Series K128 ‘X1’0.529% 25/03/2031 USD 215,740,000 9,771,922 0.09FHLMC, IO, FRN, Series K129 ‘X1’ 1.05%25/05/2031 USD 90,000,000 7,895,286 0.08FHLMC, IO, FRN, Series K-1515 ‘X1’1.513% 25/02/2035 USD 19,973,535 3,175,333 0.03FHLMC, IO, FRN, Series K-1516 ‘X1’1.512% 25/05/2035 USD 196,546,523 32,798,387 0.32FHLMC, IO, FRN, Series K-1517 ‘X1’1.334% 25/07/2035 USD 107,271,383 15,729,954 0.15FHLMC, IO, FRN, Series K-1518 ‘X1’0.873% 25/10/2035 USD 298,395,562 28,031,190 0.27FHLMC, IO, FRN, Series K-1520 ‘X1’0.472% 25/02/2036 USD 133,986,059 7,221,862 0.07FHLMC, IO, FRN, Series K159 ‘X1’0.111% 25/11/2033 USD 49,935,031 725,965 0.01
FHLMC, IO, FRN, Series K721 ‘X1’0.297% 25/08/2022 USD 30,025,843 83,565 0.00FHLMC, IO, FRN, Series K724 ‘X1’0.262% 25/11/2023 USD 1,910,647 10,396 0.00FHLMC, IO, FRN, Series K729 ‘X1’0.356% 25/10/2024 USD 27,869,465 276,889 0.00FHLMC, IO, FRN, Series K734 ‘X1’0.648% 25/02/2026 USD 51,950,251 1,344,021 0.01FHLMC, IO, FRN, Series K737 ‘X1’0.637% 25/10/2026 USD 149,647,902 4,445,441 0.04FHLMC, IO, FRN, Series K738 ‘X1’1.515% 25/01/2027 USD 138,404,236 10,187,839 0.10FHLMC, IO, FRN, Series K739 ‘X1’1.288% 25/09/2027 USD 145,814,550 9,777,784 0.09FHLMC, IO, FRN, Series K740 ‘X1’0.759% 25/09/2027 USD 84,883,056 3,611,630 0.04FHLMC, IO, FRN, Series K741 ‘X1’0.573% 25/12/2027 USD 98,623,552 3,330,922 0.03FHLMC, IO, FRN, Series K742 ‘X1’0.869% 25/03/2028 USD 42,998,708 1,811,484 0.02FHLMC, IO, FRN, Series KC06 ‘X1’0.903% 25/06/2026 USD 56,260,000 1,673,234 0.02FHLMC, IO, FRN, Series KG02 ‘X1’1.018% 25/08/2029 USD 177,726,000 12,589,648 0.12FHLMC, IO, FRN, Series KG05 ‘X1’0.312% 25/01/2031 USD 52,600,000 1,432,361 0.01FHLMC, IO, FRN, Series K047 ‘X3’1.495% 25/06/2043 USD 400,000 21,067 0.00FHLMC, IO, FRN, Series K052 ‘X3’1.613% 25/01/2044 USD 2,491,000 161,971 0.00FHLMC, IO, FRN, Series K054 ‘X3’1.599% 25/04/2043 USD 6,335,000 421,041 0.00FHLMC, IO, FRN, Series K059 ‘X3’1.916% 25/11/2044 USD 8,400,000 762,157 0.01FHLMC, IO, FRN, Series K062 ‘X3’2.075% 25/01/2045 USD 36,962,053 3,777,873 0.04FHLMC, IO, FRN, Series K064 ‘X3’2.133% 25/05/2027 USD 14,420,000 1,579,874 0.02FHLMC, IO, FRN, Series K065 ‘X3’2.182% 25/07/2045 USD 5,000,000 568,329 0.01FHLMC, IO, FRN, Series K066 ‘X3’2.162% 25/08/2045 USD 48,643,000 5,621,720 0.05FHLMC, IO, FRN, Series K067 ‘X3’2.113% 25/09/2044 USD 7,555,000 865,066 0.01FHLMC, IO, FRN, Series K068 ‘X3’2.059% 25/10/2044 USD 49,420,000 5,552,040 0.05FHLMC, IO, FRN, Series K070 ‘X3’2.038% 25/12/2044 USD 23,180,000 2,669,182 0.03FHLMC, IO, FRN, Series K071 ‘X3’ 2.01%25/11/2045 USD 13,680,000 1,563,795 0.02FHLMC, IO, FRN, Series K072 ‘X3’2.138% 25/12/2045 USD 61,410,000 7,447,522 0.07FHLMC, IO, FRN, Series K075 ‘X3’2.129% 25/05/2028 USD 3,560,000 448,348 0.00FHLMC, IO, FRN, Series K077 ‘X3’2.229% 25/05/2028 USD 54,906,809 7,374,308 0.07FHLMC, IO, FRN, Series K078 ‘X3’2.211% 25/10/2028 USD 19,400,000 2,633,954 0.03FHLMC, IO, FRN, Series K079 ‘X3’2.256% 25/07/2046 USD 8,686,000 1,193,066 0.01FHLMC, IO, FRN, Series K081 ‘X3’2.232% 25/09/2046 USD 22,670,000 3,171,016 0.03FHLMC, IO, FRN, Series K082 ‘X3’2.212% 25/10/2046 USD 15,300,000 2,119,488 0.02FHLMC, IO, FRN, Series K083 ‘X3’2.29% 25/11/2046 USD 35,000,000 5,061,322 0.05FHLMC, IO, FRN, Series K084 ‘X3’2.241% 25/11/2028 USD 27,090,000 3,841,831 0.04FHLMC, IO, FRN, Series K153 ‘X3’3.774% 25/04/2035 USD 2,242,500 700,864 0.01FHLMC, IO, FRN, Series K155 ‘X3’3.123% 25/05/2036 USD 5,740,000 1,683,696 0.02FHLMC, IO, FRN, Series K718 ‘X3’1.431% 25/02/2043 USD 1,060,000 5,258 0.00FHLMC, IO, FRN, Series K720 ‘X3’1.331% 25/08/2042 USD 8,600,000 116,283 0.00FHLMC, IO, FRN, Series K721 ‘X3’1.293% 25/09/2022 USD 7,610,000 118,156 0.00FHLMC, IO, FRN, Series K723 ‘X3’1.919% 25/10/2034 USD 3,870,000 152,250 0.00FHLMC, IO, FRN, Series K724 ‘X3’1.867% 25/12/2044 USD 3,170,000 136,577 0.00FHLMC, IO, FRN, Series K726 ‘X3’2.135% 25/07/2044 USD 10,142,000 546,637 0.01FHLMC, IO, FRN, Series K727 ‘X3’2.004% 25/10/2044 USD 16,999,999 974,496 0.01FHLMC, IO, FRN, Series K729 ‘X3’1.969% 25/11/2044 USD 60,120,000 3,565,188 0.03FHLMC, IO, FRN, Series K730 ‘X3’2.033% 25/02/2045 USD 58,286,201 3,784,004 0.04
245
JPMorgan Funds - Income FundSchedule of Investments (continued)
As at 30 June 2021
Investments Currency
Quantity/Nominal
Value
MarketValue
USD
%of
NetAssets Investments Currency
Quantity/Nominal
Value
MarketValue
USD
%of
NetAssets
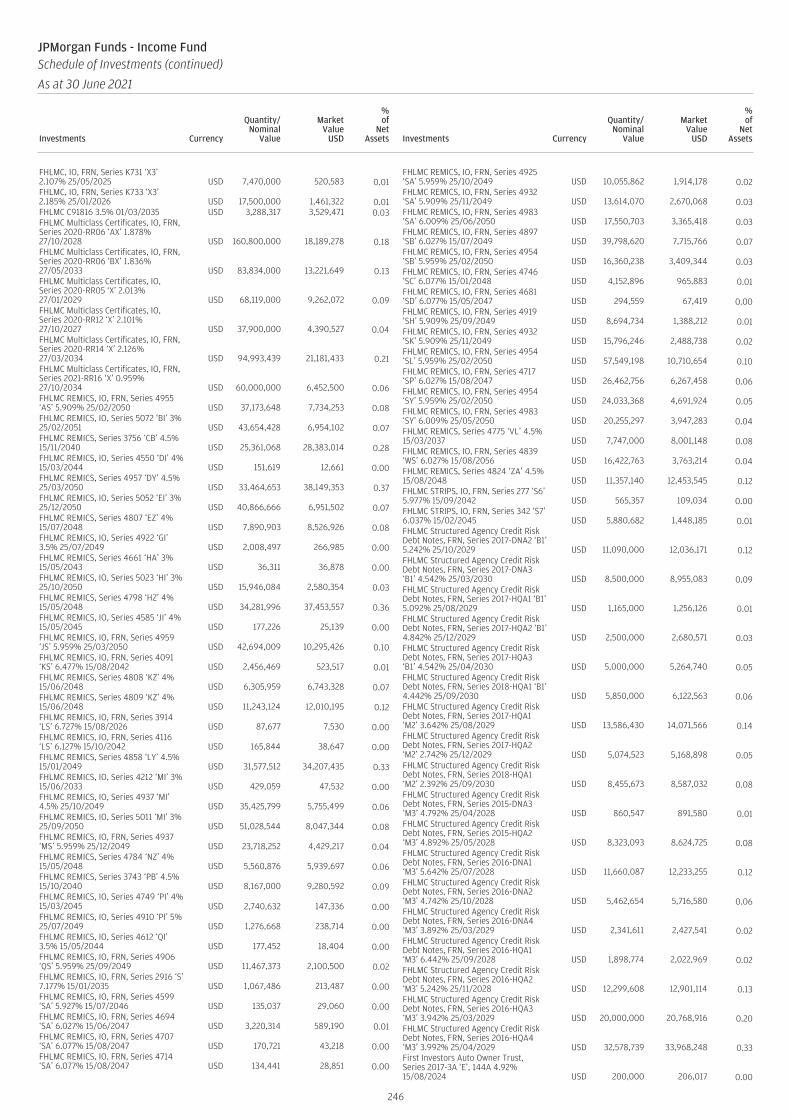
FHLMC, IO, FRN, Series K731 ‘X3’2.107% 25/05/2025 USD 7,470,000 520,583 0.01FHLMC, IO, FRN, Series K733 ‘X3’2.185% 25/01/2026 USD 17,500,000 1,461,322 0.01FHLMC C91816 3.5% 01/03/2035 USD 3,288,317 3,529,471 0.03FHLMC Multiclass Certificates, IO, FRN,Series 2020-RR06 ‘AX’ 1.878%27/10/2028 USD 160,800,000 18,189,278 0.18FHLMC Multiclass Certificates, IO, FRN,Series 2020-RR06 ‘BX’ 1.836%27/05/2033 USD 83,834,000 13,221,649 0.13FHLMC Multiclass Certificates, IO,Series 2020-RR05 ‘X’ 2.013%27/01/2029 USD 68,119,000 9,262,072 0.09FHLMC Multiclass Certificates, IO,Series 2020-RR12 ‘X’ 2.101%27/10/2027 USD 37,900,000 4,390,527 0.04FHLMC Multiclass Certificates, IO, FRN,Series 2020-RR14 ‘X’ 2.126%27/03/2034 USD 94,993,439 21,181,433 0.21FHLMC Multiclass Certificates, IO, FRN,Series 2021-RR16 ‘X’ 0.959%27/10/2034 USD 60,000,000 6,452,500 0.06FHLMC REMICS, IO, FRN, Series 4955‘AS’ 5.909% 25/02/2050 USD 37,173,648 7,734,253 0.08FHLMC REMICS, IO, Series 5072 ‘BI’ 3%25/02/2051 USD 43,654,428 6,954,102 0.07FHLMC REMICS, Series 3756 ‘CB’ 4.5%15/11/2040 USD 25,361,068 28,383,014 0.28FHLMC REMICS, IO, Series 4550 ‘DI’ 4%15/03/2044 USD 151,619 12,661 0.00FHLMC REMICS, Series 4957 ‘DY’ 4.5%25/03/2050 USD 33,464,653 38,149,353 0.37FHLMC REMICS, IO, Series 5052 ‘EI’ 3%25/12/2050 USD 40,866,666 6,951,502 0.07FHLMC REMICS, Series 4807 ‘EZ’ 4%15/07/2048 USD 7,890,903 8,526,926 0.08FHLMC REMICS, IO, Series 4922 ‘GI’3.5% 25/07/2049 USD 2,008,497 266,985 0.00FHLMC REMICS, Series 4661 ‘HA’ 3%15/05/2043 USD 36,311 36,878 0.00FHLMC REMICS, IO, Series 5023 ‘HI’ 3%25/10/2050 USD 15,946,084 2,580,354 0.03FHLMC REMICS, Series 4798 ‘HZ’ 4%15/05/2048 USD 34,281,996 37,453,557 0.36FHLMC REMICS, IO, Series 4585 ‘JI’ 4%15/05/2045 USD 177,226 25,139 0.00FHLMC REMICS, IO, FRN, Series 4959‘JS’ 5.959% 25/03/2050 USD 42,694,009 10,295,426 0.10FHLMC REMICS, IO, FRN, Series 4091‘KS’ 6.477% 15/08/2042 USD 2,456,469 523,517 0.01FHLMC REMICS, Series 4808 ‘KZ’ 4%15/06/2048 USD 6,305,959 6,743,328 0.07FHLMC REMICS, Series 4809 ‘KZ’ 4%15/06/2048 USD 11,243,124 12,010,195 0.12FHLMC REMICS, IO, FRN, Series 3914‘LS’ 6.727% 15/08/2026 USD 87,677 7,530 0.00FHLMC REMICS, IO, FRN, Series 4116‘LS’ 6.127% 15/10/2042 USD 165,844 38,647 0.00FHLMC REMICS, Series 4858 ‘LY’ 4.5%15/01/2049 USD 31,577,512 34,207,435 0.33FHLMC REMICS, IO, Series 4212 ‘MI’ 3%15/06/2033 USD 429,059 47,532 0.00FHLMC REMICS, IO, Series 4937 ‘MI’4.5% 25/10/2049 USD 35,425,799 5,755,499 0.06FHLMC REMICS, IO, Series 5011 ‘MI’ 3%25/09/2050 USD 51,028,544 8,047,344 0.08FHLMC REMICS, IO, FRN, Series 4937‘MS’ 5.959% 25/12/2049 USD 23,718,252 4,429,217 0.04FHLMC REMICS, Series 4784 ‘NZ’ 4%15/05/2048 USD 5,560,876 5,939,697 0.06FHLMC REMICS, Series 3743 ‘PB’ 4.5%15/10/2040 USD 8,167,000 9,280,592 0.09FHLMC REMICS, IO, Series 4749 ‘PI’ 4%15/03/2045 USD 2,740,632 147,336 0.00FHLMC REMICS, IO, Series 4910 ‘PI’ 5%25/07/2049 USD 1,276,668 238,714 0.00FHLMC REMICS, IO, Series 4612 ‘QI’3.5% 15/05/2044 USD 177,452 18,404 0.00FHLMC REMICS, IO, FRN, Series 4906‘QS’ 5.959% 25/09/2049 USD 11,467,373 2,100,500 0.02FHLMC REMICS, IO, FRN, Series 2916 ‘S’7.177% 15/01/2035 USD 1,067,486 213,487 0.00FHLMC REMICS, IO, FRN, Series 4599‘SA’ 5.927% 15/07/2046 USD 135,037 29,060 0.00FHLMC REMICS, IO, FRN, Series 4694‘SA’ 6.027% 15/06/2047 USD 3,220,314 589,190 0.01FHLMC REMICS, IO, FRN, Series 4707‘SA’ 6.077% 15/08/2047 USD 170,721 43,218 0.00FHLMC REMICS, IO, FRN, Series 4714‘SA’ 6.077% 15/08/2047 USD 134,441 28,851 0.00
FHLMC REMICS, IO, FRN, Series 4925‘SA’ 5.959% 25/10/2049 USD 10,055,862 1,914,178 0.02FHLMC REMICS, IO, FRN, Series 4932‘SA’ 5.909% 25/11/2049 USD 13,614,070 2,670,068 0.03FHLMC REMICS, IO, FRN, Series 4983‘SA’ 6.009% 25/06/2050 USD 17,550,703 3,365,418 0.03FHLMC REMICS, IO, FRN, Series 4897‘SB’ 6.027% 15/07/2049 USD 39,798,620 7,715,766 0.07FHLMC REMICS, IO, FRN, Series 4954‘SB’ 5.959% 25/02/2050 USD 16,360,238 3,409,344 0.03FHLMC REMICS, IO, FRN, Series 4746‘SC’ 6.077% 15/01/2048 USD 4,152,896 965,883 0.01FHLMC REMICS, IO, FRN, Series 4681‘SD’ 6.077% 15/05/2047 USD 294,559 67,419 0.00FHLMC REMICS, IO, FRN, Series 4919‘SH’ 5.909% 25/09/2049 USD 8,694,734 1,388,212 0.01FHLMC REMICS, IO, FRN, Series 4932‘SK’ 5.909% 25/11/2049 USD 15,796,246 2,488,738 0.02FHLMC REMICS, IO, FRN, Series 4954‘SL’ 5.959% 25/02/2050 USD 57,549,198 10,710,654 0.10FHLMC REMICS, IO, FRN, Series 4717‘SP’ 6.027% 15/08/2047 USD 26,462,756 6,267,458 0.06FHLMC REMICS, IO, FRN, Series 4954‘SY’ 5.959% 25/02/2050 USD 24,033,368 4,691,924 0.05FHLMC REMICS, IO, FRN, Series 4983‘SY’ 6.009% 25/05/2050 USD 20,255,297 3,947,283 0.04FHLMC REMICS, Series 4775 ‘VL’ 4.5%15/03/2037 USD 7,747,000 8,001,148 0.08FHLMC REMICS, IO, FRN, Series 4839‘WS’ 6.027% 15/08/2056 USD 16,422,763 3,763,214 0.04FHLMC REMICS, Series 4824 ‘ZA’ 4.5%15/08/2048 USD 11,357,140 12,453,545 0.12FHLMC STRIPS, IO, FRN, Series 277 ‘S6’5.977% 15/09/2042 USD 565,357 109,034 0.00FHLMC STRIPS, IO, FRN, Series 342 ‘S7’6.037% 15/02/2045 USD 5,880,682 1,448,185 0.01FHLMC Structured Agency Credit RiskDebt Notes, FRN, Series 2017-DNA2 ‘B1’5.242% 25/10/2029 USD 11,090,000 12,036,171 0.12FHLMC Structured Agency Credit RiskDebt Notes, FRN, Series 2017-DNA3‘B1’ 4.542% 25/03/2030 USD 8,500,000 8,955,083 0.09FHLMC Structured Agency Credit RiskDebt Notes, FRN, Series 2017-HQA1 ‘B1’5.092% 25/08/2029 USD 1,165,000 1,256,126 0.01FHLMC Structured Agency Credit RiskDebt Notes, FRN, Series 2017-HQA2 ‘B1’4.842% 25/12/2029 USD 2,500,000 2,680,571 0.03FHLMC Structured Agency Credit RiskDebt Notes, FRN, Series 2017-HQA3‘B1’ 4.542% 25/04/2030 USD 5,000,000 5,264,740 0.05FHLMC Structured Agency Credit RiskDebt Notes, FRN, Series 2018-HQA1 ‘B1’4.442% 25/09/2030 USD 5,850,000 6,122,563 0.06FHLMC Structured Agency Credit RiskDebt Notes, FRN, Series 2017-HQA1‘M2’ 3.642% 25/08/2029 USD 13,586,430 14,071,566 0.14FHLMC Structured Agency Credit RiskDebt Notes, FRN, Series 2017-HQA2‘M2’ 2.742% 25/12/2029 USD 5,074,523 5,168,898 0.05FHLMC Structured Agency Credit RiskDebt Notes, FRN, Series 2018-HQA1‘M2’ 2.392% 25/09/2030 USD 8,455,673 8,587,032 0.08FHLMC Structured Agency Credit RiskDebt Notes, FRN, Series 2015-DNA3‘M3’ 4.792% 25/04/2028 USD 860,547 891,580 0.01FHLMC Structured Agency Credit RiskDebt Notes, FRN, Series 2015-HQA2‘M3’ 4.892% 25/05/2028 USD 8,323,093 8,624,725 0.08FHLMC Structured Agency Credit RiskDebt Notes, FRN, Series 2016-DNA1‘M3’ 5.642% 25/07/2028 USD 11,660,087 12,233,255 0.12FHLMC Structured Agency Credit RiskDebt Notes, FRN, Series 2016-DNA2‘M3’ 4.742% 25/10/2028 USD 5,462,654 5,716,580 0.06FHLMC Structured Agency Credit RiskDebt Notes, FRN, Series 2016-DNA4‘M3’ 3.892% 25/03/2029 USD 2,341,611 2,427,541 0.02FHLMC Structured Agency Credit RiskDebt Notes, FRN, Series 2016-HQA1‘M3’ 6.442% 25/09/2028 USD 1,898,774 2,022,969 0.02FHLMC Structured Agency Credit RiskDebt Notes, FRN, Series 2016-HQA2‘M3’ 5.242% 25/11/2028 USD 12,299,608 12,901,114 0.13FHLMC Structured Agency Credit RiskDebt Notes, FRN, Series 2016-HQA3‘M3’ 3.942% 25/03/2029 USD 20,000,000 20,768,916 0.20FHLMC Structured Agency Credit RiskDebt Notes, FRN, Series 2016-HQA4‘M3’ 3.992% 25/04/2029 USD 32,578,739 33,968,248 0.33First Investors Auto Owner Trust,Series 2017-3A ‘E’, 144A 4.92%15/08/2024 USD 200,000 206,017 0.00
246
JPMorgan Funds - Income FundSchedule of Investments (continued)
As at 30 June 2021
Investments Currency
Quantity/Nominal
Value
MarketValue
USD
%of
NetAssets Investments Currency
Quantity/Nominal
Value
MarketValue
USD
%of
NetAssets
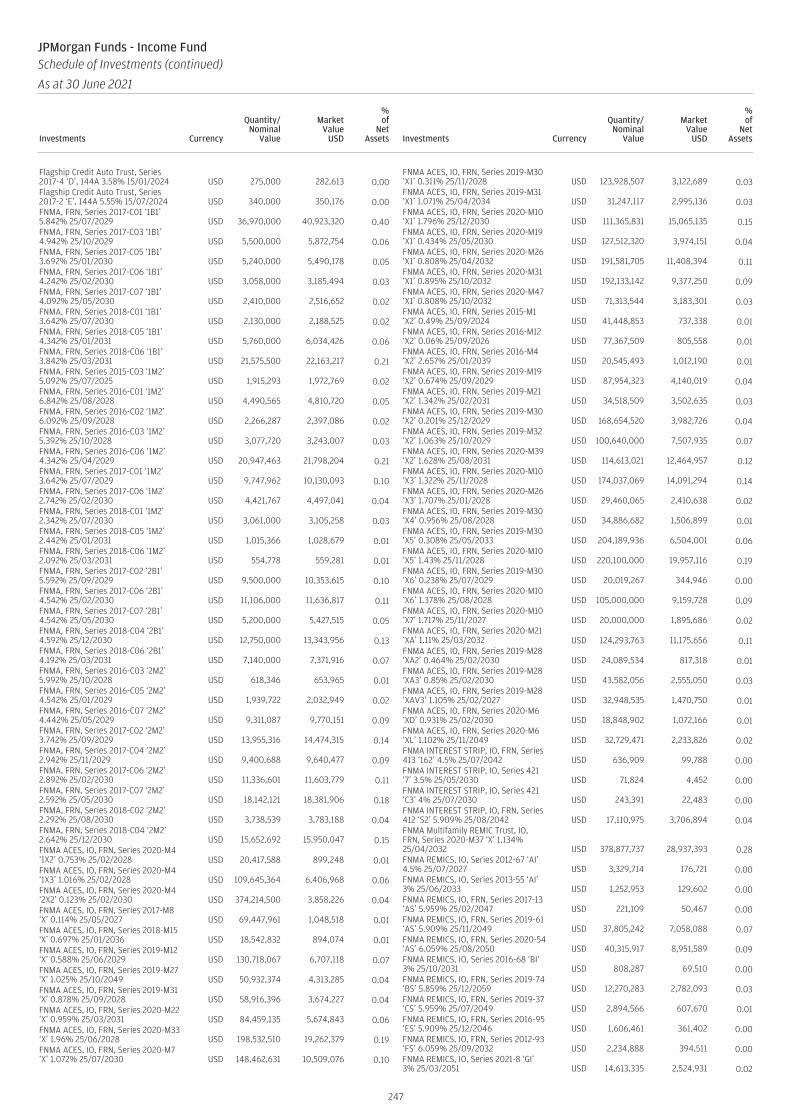
Flagship Credit Auto Trust, Series2017-4 ‘D’, 144A 3.58% 15/01/2024 USD 275,000 282,613 0.00Flagship Credit Auto Trust, Series2017-2 ‘E’, 144A 5.55% 15/07/2024 USD 340,000 350,176 0.00FNMA, FRN, Series 2017-C01 ‘1B1’5.842% 25/07/2029 USD 36,970,000 40,923,320 0.40FNMA, FRN, Series 2017-C03 ‘1B1’4.942% 25/10/2029 USD 5,500,000 5,872,754 0.06FNMA, FRN, Series 2017-C05 ‘1B1’3.692% 25/01/2030 USD 5,240,000 5,490,178 0.05FNMA, FRN, Series 2017-C06 ‘1B1’4.242% 25/02/2030 USD 3,058,000 3,185,494 0.03FNMA, FRN, Series 2017-C07 ‘1B1’4.092% 25/05/2030 USD 2,410,000 2,516,652 0.02FNMA, FRN, Series 2018-C01 ‘1B1’3.642% 25/07/2030 USD 2,130,000 2,188,525 0.02FNMA, FRN, Series 2018-C05 ‘1B1’4.342% 25/01/2031 USD 5,760,000 6,034,426 0.06FNMA, FRN, Series 2018-C06 ‘1B1’3.842% 25/03/2031 USD 21,575,500 22,163,217 0.21FNMA, FRN, Series 2015-C03 ‘1M2’5.092% 25/07/2025 USD 1,915,293 1,972,769 0.02FNMA, FRN, Series 2016-C01 ‘1M2’6.842% 25/08/2028 USD 4,490,565 4,810,720 0.05FNMA, FRN, Series 2016-C02 ‘1M2’6.092% 25/09/2028 USD 2,266,287 2,397,086 0.02FNMA, FRN, Series 2016-C03 ‘1M2’5.392% 25/10/2028 USD 3,077,720 3,243,007 0.03FNMA, FRN, Series 2016-C06 ‘1M2’4.342% 25/04/2029 USD 20,947,463 21,798,204 0.21FNMA, FRN, Series 2017-C01 ‘1M2’3.642% 25/07/2029 USD 9,747,962 10,130,093 0.10FNMA, FRN, Series 2017-C06 ‘1M2’2.742% 25/02/2030 USD 4,421,767 4,497,041 0.04FNMA, FRN, Series 2018-C01 ‘1M2’2.342% 25/07/2030 USD 3,061,000 3,105,258 0.03FNMA, FRN, Series 2018-C05 ‘1M2’2.442% 25/01/2031 USD 1,015,366 1,028,679 0.01FNMA, FRN, Series 2018-C06 ‘1M2’2.092% 25/03/2031 USD 554,778 559,281 0.01FNMA, FRN, Series 2017-C02 ‘2B1’5.592% 25/09/2029 USD 9,500,000 10,353,615 0.10FNMA, FRN, Series 2017-C06 ‘2B1’4.542% 25/02/2030 USD 11,106,000 11,636,817 0.11FNMA, FRN, Series 2017-C07 ‘2B1’4.542% 25/05/2030 USD 5,200,000 5,427,515 0.05FNMA, FRN, Series 2018-C04 ‘2B1’4.592% 25/12/2030 USD 12,750,000 13,343,956 0.13FNMA, FRN, Series 2018-C06 ‘2B1’4.192% 25/03/2031 USD 7,140,000 7,371,916 0.07FNMA, FRN, Series 2016-C03 ‘2M2’5.992% 25/10/2028 USD 618,346 653,965 0.01FNMA, FRN, Series 2016-C05 ‘2M2’4.542% 25/01/2029 USD 1,939,722 2,032,949 0.02FNMA, FRN, Series 2016-C07 ‘2M2’4.442% 25/05/2029 USD 9,311,087 9,770,151 0.09FNMA, FRN, Series 2017-C02 ‘2M2’3.742% 25/09/2029 USD 13,955,316 14,474,315 0.14FNMA, FRN, Series 2017-C04 ‘2M2’2.942% 25/11/2029 USD 9,400,688 9,640,477 0.09FNMA, FRN, Series 2017-C06 ‘2M2’2.892% 25/02/2030 USD 11,336,601 11,603,779 0.11FNMA, FRN, Series 2017-C07 ‘2M2’2.592% 25/05/2030 USD 18,142,121 18,381,906 0.18FNMA, FRN, Series 2018-C02 ‘2M2’2.292% 25/08/2030 USD 3,738,539 3,783,188 0.04FNMA, FRN, Series 2018-C04 ‘2M2’2.642% 25/12/2030 USD 15,652,692 15,950,047 0.15FNMA ACES, IO, FRN, Series 2020-M4‘1X2’ 0.753% 25/02/2028 USD 20,417,588 899,248 0.01FNMA ACES, IO, FRN, Series 2020-M4‘1X3’ 1.016% 25/02/2028 USD 109,645,364 6,406,968 0.06FNMA ACES, IO, FRN, Series 2020-M4‘2X2’ 0.123% 25/02/2030 USD 374,214,500 3,858,226 0.04FNMA ACES, IO, FRN, Series 2017-M8‘X’ 0.114% 25/05/2027 USD 69,447,961 1,048,518 0.01FNMA ACES, IO, FRN, Series 2018-M15‘X’ 0.697% 25/01/2036 USD 18,542,832 894,074 0.01FNMA ACES, IO, FRN, Series 2019-M12‘X’ 0.588% 25/06/2029 USD 130,718,067 6,707,118 0.07FNMA ACES, IO, FRN, Series 2019-M27‘X’ 1.025% 25/10/2049 USD 50,932,374 4,313,285 0.04FNMA ACES, IO, FRN, Series 2019-M31‘X’ 0.878% 25/09/2028 USD 58,916,396 3,674,227 0.04FNMA ACES, IO, FRN, Series 2020-M22‘X’ 0.959% 25/03/2031 USD 84,459,135 5,674,843 0.06FNMA ACES, IO, FRN, Series 2020-M33‘X’ 1.96% 25/06/2028 USD 198,532,510 19,262,379 0.19FNMA ACES, IO, FRN, Series 2020-M7‘X’ 1.072% 25/07/2030 USD 148,462,631 10,509,076 0.10
FNMA ACES, IO, FRN, Series 2019-M30‘X1’ 0.311% 25/11/2028 USD 123,928,507 3,122,689 0.03FNMA ACES, IO, FRN, Series 2019-M31‘X1’ 1.071% 25/04/2034 USD 31,247,117 2,995,136 0.03FNMA ACES, IO, FRN, Series 2020-M10‘X1’ 1.796% 25/12/2030 USD 111,365,831 15,065,135 0.15FNMA ACES, IO, FRN, Series 2020-M19‘X1’ 0.434% 25/05/2030 USD 127,512,320 3,974,151 0.04FNMA ACES, IO, FRN, Series 2020-M26‘X1’ 0.808% 25/04/2032 USD 191,581,705 11,408,394 0.11FNMA ACES, IO, FRN, Series 2020-M31‘X1’ 0.895% 25/10/2032 USD 192,133,142 9,377,250 0.09FNMA ACES, IO, FRN, Series 2020-M47‘X1’ 0.808% 25/10/2032 USD 71,313,544 3,183,301 0.03FNMA ACES, IO, FRN, Series 2015-M1‘X2’ 0.49% 25/09/2024 USD 41,448,853 737,338 0.01FNMA ACES, IO, FRN, Series 2016-M12‘X2’ 0.06% 25/09/2026 USD 77,367,509 805,558 0.01FNMA ACES, IO, FRN, Series 2016-M4‘X2’ 2.657% 25/01/2039 USD 20,545,493 1,012,190 0.01FNMA ACES, IO, FRN, Series 2019-M19‘X2’ 0.674% 25/09/2029 USD 87,954,323 4,140,019 0.04FNMA ACES, IO, FRN, Series 2019-M21‘X2’ 1.342% 25/02/2031 USD 34,518,509 3,502,635 0.03FNMA ACES, IO, FRN, Series 2019-M30‘X2’ 0.201% 25/12/2029 USD 168,654,520 3,982,726 0.04FNMA ACES, IO, FRN, Series 2019-M32‘X2’ 1.063% 25/10/2029 USD 100,640,000 7,507,935 0.07FNMA ACES, IO, FRN, Series 2020-M39‘X2’ 1.628% 25/08/2031 USD 114,613,021 12,464,957 0.12FNMA ACES, IO, FRN, Series 2020-M10‘X3’ 1.322% 25/11/2028 USD 174,037,069 14,091,294 0.14FNMA ACES, IO, FRN, Series 2020-M26‘X3’ 1.707% 25/01/2028 USD 29,460,065 2,410,638 0.02FNMA ACES, IO, FRN, Series 2019-M30‘X4’ 0.956% 25/08/2028 USD 34,886,682 1,506,899 0.01FNMA ACES, IO, FRN, Series 2019-M30‘X5’ 0.308% 25/05/2033 USD 204,189,936 6,504,001 0.06FNMA ACES, IO, FRN, Series 2020-M10‘X5’ 1.43% 25/11/2028 USD 220,100,000 19,957,116 0.19FNMA ACES, IO, FRN, Series 2019-M30‘X6’ 0.238% 25/07/2029 USD 20,019,267 344,946 0.00FNMA ACES, IO, FRN, Series 2020-M10‘X6’ 1.378% 25/08/2028 USD 105,000,000 9,159,728 0.09FNMA ACES, IO, FRN, Series 2020-M10‘X7’ 1.717% 25/11/2027 USD 20,000,000 1,895,686 0.02FNMA ACES, IO, FRN, Series 2020-M21‘XA’ 1.11% 25/03/2032 USD 124,293,763 11,175,656 0.11FNMA ACES, IO, FRN, Series 2019-M28‘XA2’ 0.464% 25/02/2030 USD 24,089,534 817,318 0.01FNMA ACES, IO, FRN, Series 2019-M28‘XA3’ 0.85% 25/02/2030 USD 43,582,056 2,555,050 0.03FNMA ACES, IO, FRN, Series 2019-M28‘XAV3’ 1.105% 25/02/2027 USD 32,948,535 1,470,750 0.01FNMA ACES, IO, FRN, Series 2020-M6‘XD’ 0.931% 25/02/2030 USD 18,848,902 1,072,166 0.01FNMA ACES, IO, FRN, Series 2020-M6‘XL’ 1.102% 25/11/2049 USD 32,729,471 2,233,826 0.02FNMA INTEREST STRIP, IO, FRN, Series413 ‘162’ 4.5% 25/07/2042 USD 636,909 99,788 0.00FNMA INTEREST STRIP, IO, Series 421‘7’ 3.5% 25/05/2030 USD 71,824 4,452 0.00FNMA INTEREST STRIP, IO, Series 421‘C3’ 4% 25/07/2030 USD 243,391 22,483 0.00FNMA INTEREST STRIP, IO, FRN, Series412 ‘S2’ 5.909% 25/08/2042 USD 17,110,975 3,706,894 0.04FNMA Multifamily REMIC Trust, IO,FRN, Series 2020-M37 ‘X’ 1.134%25/04/2032 USD 378,877,737 28,937,393 0.28FNMA REMICS, IO, Series 2012-67 ‘AI’4.5% 25/07/2027 USD 3,329,714 176,721 0.00FNMA REMICS, IO, Series 2013-55 ‘AI’3% 25/06/2033 USD 1,252,953 129,602 0.00FNMA REMICS, IO, FRN, Series 2017-13‘AS’ 5.959% 25/02/2047 USD 221,109 50,467 0.00FNMA REMICS, IO, FRN, Series 2019-61‘AS’ 5.909% 25/11/2049 USD 37,805,242 7,058,088 0.07FNMA REMICS, IO, FRN, Series 2020-54‘AS’ 6.059% 25/08/2050 USD 40,315,917 8,951,589 0.09FNMA REMICS, IO, Series 2016-68 ‘BI’3% 25/10/2031 USD 808,287 69,510 0.00FNMA REMICS, IO, FRN, Series 2019-74‘BS’ 5.859% 25/12/2059 USD 12,270,283 2,782,093 0.03FNMA REMICS, IO, FRN, Series 2019-37‘CS’ 5.959% 25/07/2049 USD 2,894,566 607,670 0.01FNMA REMICS, IO, FRN, Series 2016-95‘ES’ 5.909% 25/12/2046 USD 1,606,461 361,402 0.00FNMA REMICS, IO, FRN, Series 2012-93‘FS’ 6.059% 25/09/2032 USD 2,234,888 394,511 0.00FNMA REMICS, IO, Series 2021-8 ‘GI’3% 25/03/2051 USD 14,613,335 2,524,931 0.02
247
JPMorgan Funds - Income FundSchedule of Investments (continued)
As at 30 June 2021
Investments Currency
Quantity/Nominal
Value
MarketValue
USD
%of
NetAssets Investments Currency
Quantity/Nominal
Value
MarketValue
USD
%of
NetAssets

FNMA REMICS, Series 2015-66 ‘HA’ 3%25/01/2045 USD 25,966 26,858 0.00FNMA REMICS, IO, FRN, Series 2012-133‘HS’ 6.059% 25/12/2042 USD 208,248 52,754 0.00FNMA REMICS, IO, Series 2020-100 ‘IA’3% 25/01/2051 USD 117,048,681 19,076,922 0.19FNMA REMICS, IO, FRN, Series 2017-66‘JS’ 6.009% 25/09/2057 USD 7,821,842 1,627,043 0.02FNMA REMICS, IO, Series 2014-13 ‘KI’3.5% 25/03/2029 USD 65,163 5,078 0.00FNMA REMICS, IO, Series 2016-6 ‘KI’4% 25/02/2044 USD 181,587 21,133 0.00FNMA REMICS, IO, FRN, Series 2018-83‘KS’ 6.059% 25/11/2048 USD 14,827,965 3,542,755 0.03FNMA REMICS, Series 2005-117 ‘LD’5.5% 25/01/2036 USD 10,240,000 12,129,850 0.12FNMA REMICS, IO, FRN, Series 2006-42‘LI’ 6.469% 25/06/2036 USD 1,258,879 251,026 0.00FNMA REMICS, IO, Series 2016-43 ‘MI’4% 25/10/2045 USD 153,471 24,082 0.00FNMA REMICS, IO, FRN, Series 2011-87‘MS’ 6.409% 25/09/2041 USD 10,214,372 2,235,203 0.02FNMA REMICS, IO, FRN, Series 2013-118‘MS’ 5.959% 25/12/2043 USD 2,253,156 428,964 0.00FNMA REMICS, Series 2010-139 ‘NB’4.5% 25/12/2040 USD 3,000,000 3,484,683 0.03FNMA REMICS, IO, FRN, Series 2012-133‘NS’ 6.059% 25/12/2042 USD 1,775,690 358,784 0.00FNMA REMICS, IO, FRN, Series 2017-97‘NS’ 6.109% 25/12/2047 USD 39,723,706 8,398,465 0.08FNMA REMICS, IO, Series 2019-32 ‘PI’5% 25/10/2048 USD 779,869 124,738 0.00FNMA REMICS, IO, FRN, Series 2014-25‘PS’ 6.009% 25/05/2044 USD 1,562,129 292,455 0.00FNMA REMICS, IO, Series 2019-47 ‘QI’4.5% 25/06/2049 USD 1,617,897 270,208 0.00FNMA REMICS, IO, FRN, Series 2015-35‘SA’ 5.509% 25/06/2045 USD 4,308,948 734,952 0.01FNMA REMICS, IO, FRN, Series 2016-30‘SA’ 5.909% 25/05/2046 USD 296,153 66,546 0.00FNMA REMICS, IO, FRN, Series 2017-16‘SA’ 5.959% 25/03/2047 USD 17,815,305 4,195,736 0.04FNMA REMICS, IO, FRN, Series 2017-57‘SA’ 6.009% 25/08/2057 USD 152,317 35,886 0.00FNMA REMICS, IO, FRN, Series 2017-70‘SA’ 6.059% 25/09/2047 USD 1,803,714 384,237 0.00FNMA REMICS, IO, FRN, Series 2017-75‘SA’ 6.009% 25/09/2057 USD 13,649,931 3,040,974 0.03FNMA REMICS, IO, FRN, Series 2017-6‘SB’ 5.959% 25/02/2047 USD 40,410 8,456 0.00FNMA REMICS, IO, FRN, Series 2016-75‘SC’ 6.009% 25/10/2046 USD 5,184,960 967,128 0.01FNMA REMICS, IO, FRN, Series 2017-112‘SC’ 6.059% 25/01/2048 USD 2,263,708 420,928 0.00FNMA REMICS, IO, FRN, Series 2018-73‘SC’ 6.109% 25/10/2048 USD 3,117,943 605,209 0.01FNMA REMICS, IO, FRN, Series 2011-79‘SD’ 5.808% 25/08/2041 USD 2,421,946 449,963 0.00FNMA REMICS, IO, FRN, Series2012-130 ‘SD’ 4.92% 25/12/2042 USD 47,449,952 7,474,269 0.07FNMA REMICS, IO, FRN, Series 2018-27‘SE’ 6.109% 25/05/2048 USD 1,833,061 402,683 0.00FNMA REMICS, IO, FRN, Series 2017-69‘SH’ 6.109% 25/09/2047 USD 1,309,354 290,183 0.00FNMA REMICS, IO, FRN, Series 2019-42‘SK’ 5.959% 25/08/2049 USD 7,666,704 1,424,907 0.01FNMA REMICS, IO, FRN, Series 2016-25‘SL’ 5.909% 25/05/2046 USD 487,645 103,769 0.00FNMA REMICS, IO, FRN, Series 2017-16‘SM’ 5.959% 25/03/2047 USD 2,738,057 608,467 0.01FNMA REMICS, IO, FRN, Series 2017-81‘SM’ 6.109% 25/10/2047 USD 22,628,815 5,458,206 0.05FNMA REMICS, IO, FRN, Series 2018-67‘SN’ 6.109% 25/09/2048 USD 4,770,011 969,956 0.01FNMA REMICS, IO, FRN, Series 2017-90‘SP’ 6.059% 25/11/2047 USD 1,841,974 441,623 0.00FNMA REMICS, IO, FRN, Series 2019-62‘SP’ 5.959% 25/11/2049 USD 10,987,363 2,450,932 0.02FNMA REMICS, IO, FRN, Series 2016-56‘ST’ 5.909% 25/08/2046 USD 4,360,374 992,167 0.01FNMA REMICS, IO, FRN, Series 2016-61‘ST’ 5.909% 25/09/2046 USD 120,396 28,336 0.00FNMA REMICS, IO, FRN, Series 2017-39‘ST’ 6.009% 25/05/2047 USD 632,854 132,764 0.00FNMA REMICS, IO, FRN, Series 2017-47‘ST’ 6.009% 25/06/2047 USD 295,922 70,361 0.00FNMA REMICS, IO, FRN, Series 2017-50‘ST’ 6.009% 25/07/2057 USD 13,349,818 3,124,941 0.03FNMA REMICS, Series 2014-19 ‘VK’4.5% 25/04/2034 USD 8,900,000 9,249,120 0.09
FNMA REMICS, Series 2012-6 ‘ZE’ 4%25/02/2042 USD 14,589,819 16,054,435 0.16FORT CRE LLC, FRN, Series 2018-1A‘A2’, 144A 1.796% 16/11/2035 USD 4,000,000 3,996,572 0.04Foundation Finance Trust, Series2017-1A ‘A’, 144A 3.3% 15/07/2033 USD 1,185,077 1,202,621 0.01FREED ABS TRUST, Series 2018-2 ‘C’,144A 5.88% 20/10/2025 USD 6,000,000 6,079,266 0.06FREMF Mortgage Trust, FRN, Series2015-K51 ‘B’, 144A 3.954% 25/10/2048 USD 4,835,000 5,314,102 0.05FREMF Mortgage Trust, FRN, Series2016-KF24 ‘B’, 144A 5.107%25/10/2026 USD 52,824 54,139 0.00FREMF Mortgage Trust, FRN, Series2017-K67 ‘B’, 144A 3.944%25/09/2049 USD 20,000 22,223 0.00FREMF Mortgage Trust, FRN, Series2017-K70 ‘B’, 144A 3.804%25/12/2049 USD 295,000 326,281 0.00FREMF Mortgage Trust, FRN, Series2017-K71 ‘B’, 144A 3.753% 25/11/2050 USD 350,000 385,833 0.00FREMF Mortgage Trust, FRN, Series2017-K725 ‘B’, 144A 3.879%25/02/2050 USD 2,330,000 2,500,234 0.02FREMF Mortgage Trust, FRN, Series2017-K728 ‘B’, 144A 3.647%25/11/2050 USD 100,000 107,138 0.00FREMF Mortgage Trust, FRN, Series2017-KF29 ‘B’, 144A 3.657%25/02/2024 USD 117,022 117,564 0.00FREMF Mortgage Trust, FRN, Series2017-KF32 ‘B’, 144A 2.636%25/05/2024 USD 311,995 312,549 0.00FREMF Mortgage Trust, FRN, Series2017-KF33 ‘B’, 144A 2.657%25/06/2027 USD 205,169 204,316 0.00FREMF Mortgage Trust, FRN, Series2017-KF35 ‘B’, 144A 2.857%25/08/2024 USD 92,616 92,268 0.00FREMF Mortgage Trust, FRN, Series2017-KF37 ‘B’, 144A 2.857%25/06/2027 USD 5,141,618 5,195,941 0.05FREMF Mortgage Trust, FRN, Series2017-KF38 ‘B’, 144A 2.607%25/09/2024 USD 488,931 489,878 0.00FREMF Mortgage Trust, FRN, Series2017-KF39 ‘B’, 144A 2.586%25/11/2024 USD 3,412,087 3,404,213 0.03FREMF Mortgage Trust, FRN, Series2017-KF40 ‘B’, 144A 2.807%25/11/2027 USD 160,429 158,857 0.00FREMF Mortgage Trust, FRN, Series2017-KF41 ‘B’, 144A 2.607%25/11/2024 USD 222,610 221,330 0.00FREMF Mortgage Trust, FRN, Series2017-KS09 ‘B’, 144A 4.389%25/10/2027 USD 17,719,000 17,608,286 0.17FREMF Mortgage Trust, FRN, Series2018-K155 ‘B’, 144A 4.163%25/04/2033 USD 2,768,500 2,994,358 0.03FREMF Mortgage Trust, FRN, Series2018-K156 ‘B’, 144A 4.068%25/07/2036 USD 4,127,835 3,850,653 0.04FREMF Mortgage Trust, FRN, Series2018-K157 ‘B’, 144A 4.307%25/08/2033 USD 7,500,000 8,092,327 0.08FREMF Mortgage Trust, FRN, Series2018-K158 ‘B’, 144A 4.269%25/10/2033 USD 5,205,000 4,925,705 0.05FREMF Mortgage Trust, FRN, Series2018-KC02 ‘B’, 144A 4.086%25/07/2025 USD 16,820,000 17,325,579 0.17FREMF Mortgage Trust, FRN, Series2018-KF42 ‘B’, 144A 2.307%25/12/2024 USD 700,236 689,751 0.01FREMF Mortgage Trust, FRN, Series2018-KF49 ‘B’, 144A 1.986%25/06/2025 USD 223,898 220,463 0.00FREMF Mortgage Trust, FRN, Series2018-KF51 ‘B’, 144A 1.957%25/08/2025 USD 2,193,178 2,158,028 0.02FREMF Mortgage Trust, FRN, Series2018-KF52 ‘B’ 2.036% 25/09/2028 USD 6,019,492 5,837,687 0.06FREMF Mortgage Trust, FRN, Series2018-KF53 ‘B’ 2.157% 25/10/2025 USD 3,026,997 3,012,333 0.03FREMF Mortgage Trust, FRN, Series2018-KF55 ‘B’, 144A 2.407%25/11/2025 USD 13,354,379 13,339,445 0.13FREMF Mortgage Trust, FRN, Series2018-KF56 ‘B’, 144A 2.557%25/11/2028 USD 9,779,531 9,818,346 0.10
248
JPMorgan Funds - Income FundSchedule of Investments (continued)
As at 30 June 2021
Investments Currency
Quantity/Nominal
Value
MarketValue
USD
%of
NetAssets Investments Currency
Quantity/Nominal
Value
MarketValue
USD
%of
NetAssets
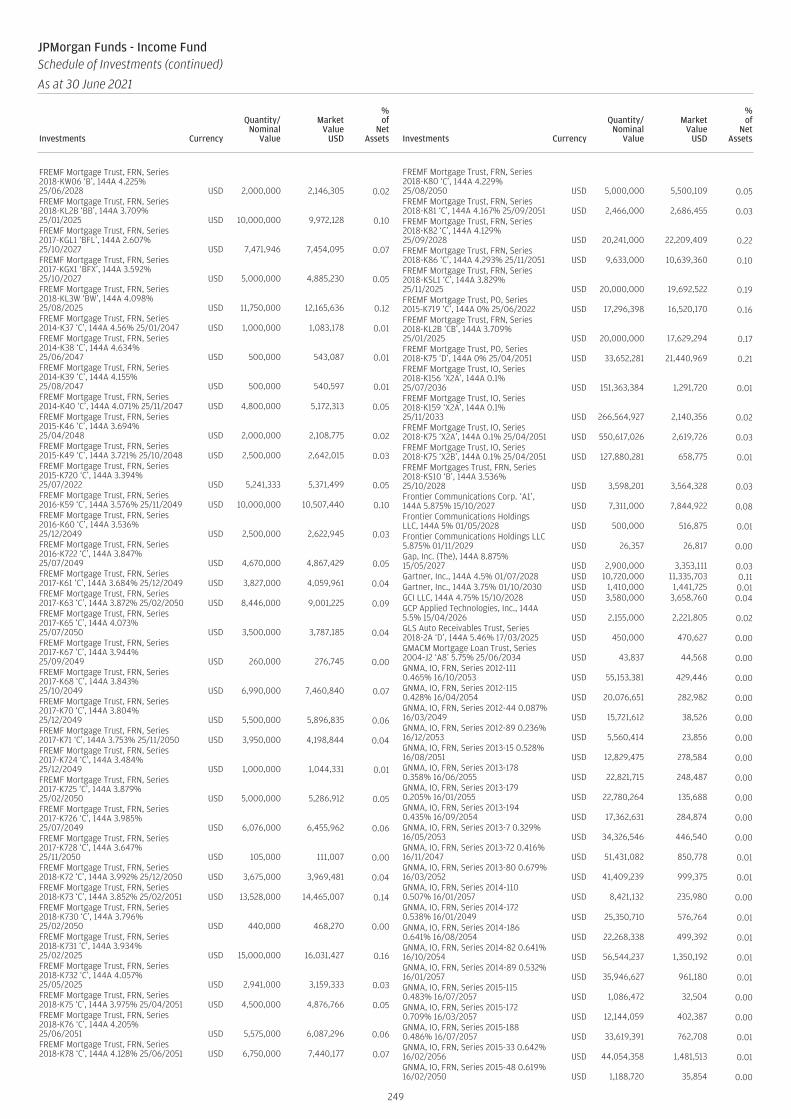
FREMF Mortgage Trust, FRN, Series2018-KW06 ‘B’, 144A 4.225%25/06/2028 USD 2,000,000 2,146,305 0.02FREMF Mortgage Trust, FRN, Series2018-KL2B ‘BB’, 144A 3.709%25/01/2025 USD 10,000,000 9,972,128 0.10FREMF Mortgage Trust, FRN, Series2017-KGL1 ‘BFL’, 144A 2.607%25/10/2027 USD 7,471,946 7,454,095 0.07FREMF Mortgage Trust, FRN, Series2017-KGX1 ‘BFX’, 144A 3.592%25/10/2027 USD 5,000,000 4,885,230 0.05FREMF Mortgage Trust, FRN, Series2018-KL3W ‘BW’, 144A 4.098%25/08/2025 USD 11,750,000 12,165,636 0.12FREMF Mortgage Trust, FRN, Series2014-K37 ‘C’, 144A 4.56% 25/01/2047 USD 1,000,000 1,083,178 0.01FREMF Mortgage Trust, FRN, Series2014-K38 ‘C’, 144A 4.634%25/06/2047 USD 500,000 543,087 0.01FREMF Mortgage Trust, FRN, Series2014-K39 ‘C’, 144A 4.155%25/08/2047 USD 500,000 540,597 0.01FREMF Mortgage Trust, FRN, Series2014-K40 ‘C’, 144A 4.071% 25/11/2047 USD 4,800,000 5,172,313 0.05FREMF Mortgage Trust, FRN, Series2015-K46 ‘C’, 144A 3.694%25/04/2048 USD 2,000,000 2,108,775 0.02FREMF Mortgage Trust, FRN, Series2015-K49 ‘C’, 144A 3.721% 25/10/2048 USD 2,500,000 2,642,015 0.03FREMF Mortgage Trust, FRN, Series2015-K720 ‘C’, 144A 3.394%25/07/2022 USD 5,241,333 5,371,499 0.05FREMF Mortgage Trust, FRN, Series2016-K59 ‘C’, 144A 3.576% 25/11/2049 USD 10,000,000 10,507,440 0.10FREMF Mortgage Trust, FRN, Series2016-K60 ‘C’, 144A 3.536%25/12/2049 USD 2,500,000 2,622,945 0.03FREMF Mortgage Trust, FRN, Series2016-K722 ‘C’, 144A 3.847%25/07/2049 USD 4,670,000 4,867,429 0.05FREMF Mortgage Trust, FRN, Series2017-K61 ‘C’, 144A 3.684% 25/12/2049 USD 3,827,000 4,059,961 0.04FREMF Mortgage Trust, FRN, Series2017-K63 ‘C’, 144A 3.872% 25/02/2050 USD 8,446,000 9,001,225 0.09FREMF Mortgage Trust, FRN, Series2017-K65 ‘C’, 144A 4.073%25/07/2050 USD 3,500,000 3,787,185 0.04FREMF Mortgage Trust, FRN, Series2017-K67 ‘C’, 144A 3.944%25/09/2049 USD 260,000 276,745 0.00FREMF Mortgage Trust, FRN, Series2017-K68 ‘C’, 144A 3.843%25/10/2049 USD 6,990,000 7,460,840 0.07FREMF Mortgage Trust, FRN, Series2017-K70 ‘C’, 144A 3.804%25/12/2049 USD 5,500,000 5,896,835 0.06FREMF Mortgage Trust, FRN, Series2017-K71 ‘C’, 144A 3.753% 25/11/2050 USD 3,950,000 4,198,844 0.04FREMF Mortgage Trust, FRN, Series2017-K724 ‘C’, 144A 3.484%25/12/2049 USD 1,000,000 1,044,331 0.01FREMF Mortgage Trust, FRN, Series2017-K725 ‘C’, 144A 3.879%25/02/2050 USD 5,000,000 5,286,912 0.05FREMF Mortgage Trust, FRN, Series2017-K726 ‘C’, 144A 3.985%25/07/2049 USD 6,076,000 6,455,962 0.06FREMF Mortgage Trust, FRN, Series2017-K728 ‘C’, 144A 3.647%25/11/2050 USD 105,000 111,007 0.00FREMF Mortgage Trust, FRN, Series2018-K72 ‘C’, 144A 3.992% 25/12/2050 USD 3,675,000 3,969,481 0.04FREMF Mortgage Trust, FRN, Series2018-K73 ‘C’, 144A 3.852% 25/02/2051 USD 13,528,000 14,465,007 0.14FREMF Mortgage Trust, FRN, Series2018-K730 ‘C’, 144A 3.796%25/02/2050 USD 440,000 468,270 0.00FREMF Mortgage Trust, FRN, Series2018-K731 ‘C’, 144A 3.934%25/02/2025 USD 15,000,000 16,031,427 0.16FREMF Mortgage Trust, FRN, Series2018-K732 ‘C’, 144A 4.057%25/05/2025 USD 2,941,000 3,159,333 0.03FREMF Mortgage Trust, FRN, Series2018-K75 ‘C’, 144A 3.975% 25/04/2051 USD 4,500,000 4,876,766 0.05FREMF Mortgage Trust, FRN, Series2018-K76 ‘C’, 144A 4.205%25/06/2051 USD 5,575,000 6,087,296 0.06FREMF Mortgage Trust, FRN, Series2018-K78 ‘C’, 144A 4.128% 25/06/2051 USD 6,750,000 7,440,177 0.07
FREMF Mortgage Trust, FRN, Series2018-K80 ‘C’, 144A 4.229%25/08/2050 USD 5,000,000 5,500,109 0.05FREMF Mortgage Trust, FRN, Series2018-K81 ‘C’, 144A 4.167% 25/09/2051 USD 2,466,000 2,686,455 0.03FREMF Mortgage Trust, FRN, Series2018-K82 ‘C’, 144A 4.129%25/09/2028 USD 20,241,000 22,209,409 0.22FREMF Mortgage Trust, FRN, Series2018-K86 ‘C’, 144A 4.293% 25/11/2051 USD 9,633,000 10,639,360 0.10FREMF Mortgage Trust, FRN, Series2018-KSL1 ‘C’, 144A 3.829%25/11/2025 USD 20,000,000 19,692,522 0.19FREMF Mortgage Trust, PO, Series2015-K719 ‘C’, 144A 0% 25/06/2022 USD 17,296,398 16,520,170 0.16FREMF Mortgage Trust, FRN, Series2018-KL2B ‘CB’, 144A 3.709%25/01/2025 USD 20,000,000 17,629,294 0.17FREMF Mortgage Trust, PO, Series2018-K75 ‘D’, 144A 0% 25/04/2051 USD 33,652,281 21,440,969 0.21FREMF Mortgage Trust, IO, Series2018-K156 ‘X2A’, 144A 0.1%25/07/2036 USD 151,363,384 1,291,720 0.01FREMF Mortgage Trust, IO, Series2018-K159 ‘X2A’, 144A 0.1%25/11/2033 USD 266,564,927 2,140,356 0.02FREMF Mortgage Trust, IO, Series2018-K75 ‘X2A’, 144A 0.1% 25/04/2051 USD 550,617,026 2,619,726 0.03FREMF Mortgage Trust, IO, Series2018-K75 ‘X2B’, 144A 0.1% 25/04/2051 USD 127,880,281 658,775 0.01FREMF Mortgages Trust, FRN, Series2018-KS10 ‘B’, 144A 3.536%25/10/2028 USD 3,598,201 3,564,328 0.03Frontier Communications Corp. ‘A1’,144A 5.875% 15/10/2027 USD 7,311,000 7,844,922 0.08Frontier Communications HoldingsLLC, 144A 5% 01/05/2028 USD 500,000 516,875 0.01Frontier Communications Holdings LLC5.875% 01/11/2029 USD 26,357 26,817 0.00Gap, Inc. (The), 144A 8.875%15/05/2027 USD 2,900,000 3,353,111 0.03Gartner, Inc., 144A 4.5% 01/07/2028 USD 10,720,000 11,335,703 0.11Gartner, Inc., 144A 3.75% 01/10/2030 USD 1,410,000 1,441,725 0.01GCI LLC, 144A 4.75% 15/10/2028 USD 3,580,000 3,658,760 0.04GCP Applied Technologies, Inc., 144A5.5% 15/04/2026 USD 2,155,000 2,221,805 0.02GLS Auto Receivables Trust, Series2018-2A ‘D’, 144A 5.46% 17/03/2025 USD 450,000 470,627 0.00GMACM Mortgage Loan Trust, Series2004-J2 ‘A8’ 5.75% 25/06/2034 USD 43,837 44,568 0.00GNMA, IO, FRN, Series 2012-1110.465% 16/10/2053 USD 55,153,381 429,446 0.00GNMA, IO, FRN, Series 2012-1150.428% 16/04/2054 USD 20,076,651 282,982 0.00GNMA, IO, FRN, Series 2012-44 0.087%16/03/2049 USD 15,721,612 38,526 0.00GNMA, IO, FRN, Series 2012-89 0.236%16/12/2053 USD 5,560,414 23,856 0.00GNMA, IO, FRN, Series 2013-15 0.528%16/08/2051 USD 12,829,475 278,584 0.00GNMA, IO, FRN, Series 2013-1780.358% 16/06/2055 USD 22,821,715 248,487 0.00GNMA, IO, FRN, Series 2013-1790.205% 16/01/2055 USD 22,780,264 135,688 0.00GNMA, IO, FRN, Series 2013-1940.435% 16/09/2054 USD 17,362,631 284,874 0.00GNMA, IO, FRN, Series 2013-7 0.329%16/05/2053 USD 34,326,546 446,540 0.00GNMA, IO, FRN, Series 2013-72 0.416%16/11/2047 USD 51,431,082 850,778 0.01GNMA, IO, FRN, Series 2013-80 0.679%16/03/2052 USD 41,409,239 999,375 0.01GNMA, IO, FRN, Series 2014-1100.507% 16/01/2057 USD 8,421,132 235,980 0.00GNMA, IO, FRN, Series 2014-1720.538% 16/01/2049 USD 25,350,710 576,764 0.01GNMA, IO, FRN, Series 2014-1860.641% 16/08/2054 USD 22,268,338 499,392 0.01GNMA, IO, FRN, Series 2014-82 0.641%16/10/2054 USD 56,544,237 1,350,192 0.01GNMA, IO, FRN, Series 2014-89 0.532%16/01/2057 USD 35,946,627 961,180 0.01GNMA, IO, FRN, Series 2015-1150.483% 16/07/2057 USD 1,086,472 32,504 0.00GNMA, IO, FRN, Series 2015-1720.709% 16/03/2057 USD 12,144,059 402,387 0.00GNMA, IO, FRN, Series 2015-1880.486% 16/07/2057 USD 33,619,391 762,708 0.01GNMA, IO, FRN, Series 2015-33 0.642%16/02/2056 USD 44,054,358 1,481,513 0.01GNMA, IO, FRN, Series 2015-48 0.619%16/02/2050 USD 1,188,720 35,854 0.00
249
JPMorgan Funds - Income FundSchedule of Investments (continued)
As at 30 June 2021
Investments Currency
Quantity/Nominal
Value
MarketValue
USD
%of
NetAssets Investments Currency
Quantity/Nominal
Value
MarketValue
USD
%of
NetAssets

GNMA, IO, FRN, Series 2015-59 0.912%16/06/2056 USD 8,497,969 322,662 0.00GNMA, IO, FRN, Series 2015-86 0.55%16/05/2052 USD 23,420,852 598,686 0.01GNMA, IO, FRN, Series 2015-93 0.628%16/11/2054 USD 14,412,097 337,014 0.00GNMA, IO, FRN, Series 2016-102 0.71%16/10/2055 USD 45,325,262 1,579,694 0.02GNMA, IO, FRN, Series 2016-1050.814% 16/10/2057 USD 60,681,436 2,540,355 0.02GNMA, IO, FRN, Series 2016-1190.905% 16/04/2058 USD 140,044,586 6,563,778 0.06GNMA, IO, FRN, Series 2016-13 0.813%16/04/2057 USD 23,808,400 954,710 0.01GNMA, IO, FRN, Series 2016-1300.863% 16/03/2058 USD 41,165,349 1,969,309 0.02GNMA, IO, FRN, Series 2016-1420.921% 16/09/2058 USD 58,765,449 3,325,037 0.03GNMA, IO, FRN, Series 2016-151 1.018%16/06/2058 USD 38,912,375 2,226,002 0.02GNMA, IO, FRN, Series 2016-1550.765% 16/02/2058 USD 43,874,524 2,149,722 0.02GNMA, IO, FRN, Series 2016-1570.892% 16/11/2057 USD 16,806,053 934,823 0.01GNMA, IO, FRN, Series 2016-1650.807% 16/12/2057 USD 66,582,365 3,454,346 0.03GNMA, IO, FRN, Series 2016-1750.748% 16/09/2058 USD 141,926,756 6,772,418 0.07GNMA, IO, FRN, Series 2016-1770.583% 16/01/2057 USD 34,884,634 1,293,013 0.01GNMA, IO, FRN, Series 2016-400.666% 16/07/2057 USD 25,778,021 883,485 0.01GNMA, IO, FRN, Series 2016-56 0.906%16/11/2057 USD 72,894,053 3,618,475 0.04GNMA, IO, FRN, Series 2016-87 0.932%16/08/2058 USD 50,670,582 2,538,682 0.02GNMA, IO, FRN, Series 2016-92 0.806%16/04/2058 USD 356,057 15,806 0.00GNMA, IO, FRN, Series 2016-94 0.878%16/12/2057 USD 11,006,316 498,039 0.01GNMA, IO, FRN, Series 2016-96 0.882%16/12/2057 USD 21,140,854 1,075,296 0.01GNMA, IO, FRN, Series 2016-97 0.968%16/07/2056 USD 26,542,428 1,499,076 0.01GNMA, IO, FRN, Series 2017-1050.634% 16/05/2059 USD 25,008,299 1,454,730 0.01GNMA, IO, FRN, Series 2017-1460.619% 16/09/2057 USD 57,053,851 2,537,949 0.02GNMA, IO, FRN, Series 2017-1480.595% 16/07/2059 USD 19,273,977 906,067 0.01GNMA, IO, FRN, Series 2017-1510.707% 16/09/2057 USD 9,755,843 504,862 0.01GNMA, IO, FRN, Series 2017-157 0.57%16/12/2059 USD 19,117,292 1,002,864 0.01GNMA, IO, FRN, Series 2017-16 0.52%16/09/2058 USD 33,943,308 1,375,958 0.01GNMA, IO, FRN, Series 2017-1710.686% 16/09/2059 USD 2,454,299 129,327 0.00GNMA, IO, FRN, Series 2017-173 0.97%16/09/2057 USD 13,086,929 753,276 0.01GNMA, IO, FRN, Series 2017-23 0.635%16/05/2059 USD 15,623,317 735,040 0.01GNMA, IO, FRN, Series 2017-3 0.842%16/09/2058 USD 61,129,621 3,178,429 0.03GNMA, IO, FRN, Series 2017-35 0.665%16/05/2059 USD 19,631,328 1,004,535 0.01GNMA, IO, FRN, Series 2017-41 0.684%16/07/2058 USD 15,571,279 710,858 0.01GNMA, IO, FRN, Series 2017-51 0.821%16/05/2059 USD 5,428,489 303,980 0.00GNMA, IO, FRN, Series 2017-54 0.581%16/12/2058 USD 16,979,729 833,530 0.01GNMA, IO, FRN, Series 2017-69 0.833%16/07/2059 USD 6,134,205 336,004 0.00GNMA, IO, FRN, Series 2017-70 0.697%16/02/2059 USD 8,630,146 481,196 0.00GNMA, IO, FRN, Series 2017-72 0.615%16/04/2057 USD 45,217,614 2,295,567 0.02GNMA, IO, FRN, Series 2017-76 0.889%16/12/2056 USD 13,731,967 765,219 0.01GNMA, IO, FRN, Series 2017-81 0.655%16/12/2058 USD 6,279,847 276,710 0.00GNMA, IO, FRN, Series 2017-86 0.771%16/05/2059 USD 16,416,737 887,959 0.01GNMA, IO, FRN, Series 2017-89 0.675%16/07/2059 USD 36,446,139 1,971,372 0.02GNMA, IO, FRN, Series 2018-1060.622% 16/04/2060 USD 21,893,657 1,302,254 0.01GNMA, IO, FRN, Series 2018-1190.709% 16/05/2060 USD 10,776,775 692,444 0.01
GNMA, IO, FRN, Series 2018-25 0.559%16/02/2060 USD 56,848,442 2,679,210 0.03GNMA, IO, FRN, Series 2018-4 0.587%16/10/2059 USD 7,229,903 378,975 0.00GNMA, IO, FRN, Series 2018-45 0.602%16/03/2059 USD 17,168,819 878,261 0.01GNMA, IO, FRN, Series 2018-57 0.408%16/10/2059 USD 59,241,210 2,829,775 0.03GNMA, IO, FRN, Series 2018-85 0.48%16/07/2060 USD 13,390,516 756,540 0.01GNMA, IO, FRN, Series 2018-9 0.521%16/01/2060 USD 132,953,333 6,367,667 0.06GNMA, IO, FRN, Series 2018-98 0.427%16/08/2060 USD 64,006,957 2,989,144 0.03GNMA, IO, FRN, Series 2019-114 1.16%16/02/2061 USD 60,575,408 5,070,616 0.05GNMA, IO, FRN, Series 2019-1300.876% 16/01/2062 USD 26,829,550 2,314,360 0.02GNMA, IO, FRN, Series 2019-1350.778% 16/02/2060 USD 36,576,314 2,311,012 0.02GNMA, IO, FRN, Series 2019-1440.853% 16/01/2062 USD 18,709,550 1,534,192 0.02GNMA, IO, FRN, Series 2019-155 0.65%16/07/2061 USD 149,710,544 9,333,165 0.09GNMA, IO, FRN, Series 2019-32 0.591%16/05/2061 USD 93,336,900 5,955,949 0.06GNMA, IO, FRN, Series 2019-67 0.858%16/02/2060 USD 33,655,623 2,317,816 0.02GNMA, IO, FRN, Series 2019-79 0.803%16/02/2061 USD 41,672,903 3,102,306 0.03GNMA, IO, FRN, Series 2019-9 0.692%16/08/2060 USD 38,185,777 2,441,954 0.02GNMA, IO, FRN, Series 2020-1080.934% 16/06/2062 USD 35,782,483 2,818,132 0.03GNMA, IO, FRN, Series 2020-1101.098% 16/03/2062 USD 213,558,560 18,086,958 0.18GNMA, IO, FRN, Series 2020-1110.987% 15/09/2062 USD 113,429,050 9,035,588 0.09GNMA, IO, FRN, Series 2020-1140.925% 16/09/2062 USD 220,807,408 18,115,029 0.18GNMA, IO, FRN, Series 2020-118 0.99%16/06/2062 USD 188,808,493 15,811,616 0.15GNMA, IO, FRN, Series 2020-120 0.85%16/05/2062 USD 85,223,839 6,824,589 0.07GNMA, IO, FRN, Series 2020-1210.943% 16/08/2060 USD 29,502,515 2,457,247 0.02GNMA, IO, FRN, Series 2020-124 1.1%16/12/2061 USD 53,520,137 4,643,640 0.05GNMA, IO, FRN, Series 2020-1280.983% 16/10/2062 USD 181,041,176 15,616,648 0.15GNMA, IO, FRN, Series 2020-1361.138% 16/08/2062 USD 73,555,281 6,975,508 0.07GNMA, IO, FRN, Series 2020-14 0.722%16/02/2062 USD 108,661,680 7,479,683 0.07GNMA, IO, FRN, Series 2020-1431.146% 16/03/2062 USD 98,308,003 8,889,875 0.09GNMA, IO, FRN, Series 2020-1450.729% 16/03/2063 USD 18,456,356 1,297,893 0.01GNMA, IO, FRN, Series 2020-1470.968% 16/06/2062 USD 394,762,154 33,867,198 0.33GNMA, IO, FRN, Series 2020-1500.983% 16/12/2062 USD 158,043,188 13,519,820 0.13GNMA, IO, FRN, Series 2020-1580.887% 16/09/2062 USD 147,271,264 11,836,427 0.11GNMA, IO, FRN, Series 2020-1591.084% 16/10/2062 USD 78,180,562 7,044,350 0.07GNMA, IO, FRN, Series 2020-1611.054% 16/08/2062 USD 73,670,050 6,536,412 0.06GNMA, IO, FRN, Series 2020-1690.931% 16/07/2062 USD 266,447,817 21,722,638 0.21GNMA, IO, FRN, Series 2020-1721.193% 16/09/2062 USD 61,794,072 5,987,265 0.06GNMA, IO, FRN, Series 2020-1901.061% 16/11/2062 USD 89,267,639 8,267,424 0.08GNMA, IO, FRN, Series 2020-1920.995% 16/09/2062 USD 108,436,889 9,209,751 0.09GNMA, IO, FRN, Series 2020-1950.967% 16/12/2062 USD 9,905,081 865,278 0.01GNMA, IO, FRN, Series 2020-2 0.776%16/03/2062 USD 124,826,976 8,162,523 0.08GNMA, IO, FRN, Series 2020-23 0.738%16/04/2062 USD 201,250,228 14,423,765 0.14GNMA, IO, FRN, Series 2020-270.844% 16/03/2062 USD 83,089,289 5,952,201 0.06GNMA, IO, FRN, Series 2020-280.867% 16/11/2061 USD 19,810,841 1,516,409 0.01GNMA, IO, FRN, Series 2020-380.895% 16/04/2062 USD 147,690,893 11,179,447 0.11GNMA, IO, FRN, Series 2020-40 1.158%16/01/2062 USD 20,034,136 1,773,480 0.02
250
JPMorgan Funds - Income FundSchedule of Investments (continued)
As at 30 June 2021
Investments Currency
Quantity/Nominal
Value
MarketValue
USD
%of
NetAssets Investments Currency
Quantity/Nominal
Value
MarketValue
USD
%of
NetAssets

GNMA, IO, FRN, Series 2020-50 0.717%16/06/2062 USD 80,870,678 5,737,354 0.06GNMA, IO, FRN, Series 2020-54 0.98%16/04/2062 USD 186,213,723 14,845,591 0.14GNMA, IO, FRN, Series 2020-560.958% 16/11/2061 USD 66,724,724 5,019,134 0.05GNMA, IO, FRN, Series 2020-700.934% 16/04/2062 USD 90,672,185 6,863,223 0.07GNMA, IO, FRN, Series 2020-72 1.153%16/05/2062 USD 253,043,499 22,907,092 0.22GNMA, IO, FRN, Series 2020-73 1.274%16/03/2062 USD 24,241,498 2,214,994 0.02GNMA, IO, FRN, Series 2020-94 1.173%16/03/2062 USD 17,400,105 1,505,748 0.01GNMA, IO, FRN, Series 2021-10 1%16/05/2063 USD 30,787,187 2,777,679 0.03GNMA, IO, FRN, Series 2021-11 1.022%16/12/2062 USD 59,540,387 5,483,446 0.05GNMA, IO, FRN, Series 2021-110 0.89%16/11/2063 USD 26,000,000 2,219,141 0.02GNMA, IO, FRN, Series 2021-22 0.989%16/05/2063 USD 104,001,058 9,225,320 0.09GNMA, IO, FRN, Series 2021-3 0.92%16/09/2062 USD 225,910,661 18,930,681 0.18GNMA, IO, FRN, Series 2021-33 0.995%16/10/2062 USD 141,366,431 12,314,783 0.12GNMA, IO, FRN, Series 2021-35 1.014%16/12/2062 USD 83,495,656 7,904,567 0.08GNMA, IO, FRN, Series 2021-40 0.843%16/02/2063 USD 47,789,618 3,820,985 0.04GNMA, IO, FRN, Series 2021-71 0.897%16/10/2062 USD 142,607,951 11,738,716 0.11GNMA, IO, FRN, Series 2021-80 0.91%16/12/2062 USD 51,936,490 4,506,714 0.04GNMA, IO, FRN, Series 2021-88 0.91%16/09/2062 USD 304,554,812 26,786,860 0.26GNMA 2.5% 20/03/2051 USD 344,956,056 357,214,828 3.46GNMA, FRN 0% 16/04/2061 USD 56,828,769 11,942,711 0.12GNMA, FRN 0% 16/02/2063 USD 108,000,000 29,293,078 0.28GNMA, IO, Series 3 ‘23’ 1.4%16/09/2045 USD 14,743,161 1,368,062 0.01GNMA, IO, FRN, Series 2016-147 ‘AS’6.007% 20/10/2046 USD 3,837,359 806,551 0.01GNMA, IO, FRN, Series 2017-80 ‘AS’6.107% 20/05/2047 USD 2,227,119 430,590 0.00GNMA, IO, FRN, Series 2018-46 ‘AS’6.107% 20/03/2048 USD 8,739,630 1,822,746 0.02GNMA, IO, FRN, Series 2020-112 ‘AS’6.157% 20/08/2050 USD 51,911,157 11,553,487 0.11GNMA, IO, FRN, Series 2018-63 ‘BS’6.107% 20/04/2048 USD 5,404,678 1,134,565 0.01GNMA, IO, Series 2021-91 ‘CI’ 3%20/05/2051 USD 18,217,410 2,731,421 0.03GNMA, IO, FRN, Series 2018-6 ‘CS’6.107% 20/01/2048 USD 3,035,826 676,576 0.01GNMA, IO, FRN, Series 2019-145 ‘CS’5.957% 20/11/2049 USD 30,402,584 6,189,881 0.06GNMA, IO, FRN, Series 2012-88 ‘DI’0.557% 16/08/2046 USD 59,476,063 877,623 0.01GNMA, IO, FRN, Series 2017-161 ‘DS’6.157% 20/10/2047 USD 1,407,796 283,297 0.00GNMA, IO, FRN, Series 2018-65 ‘DS’6.107% 20/05/2048 USD 3,221,639 635,665 0.01GNMA, IO, FRN, Series 2018-92 ‘DS’6.107% 20/07/2048 USD 25,510,862 3,999,394 0.04GNMA, IO, FRN, Series 2019-120 ‘DS’5.957% 20/09/2049 USD 7,686,077 1,524,621 0.02GNMA, IO, FRN, Series 2017-120 ‘ES’6.107% 20/08/2047 USD 4,009,181 836,713 0.01GNMA, IO, FRN, Series 2015-H13 ‘GI’1.602% 20/04/2065 USD 1,273,097 56,835 0.00GNMA, IO, FRN, Series 2019-56 ‘GS’6.057% 20/05/2049 USD 4,535,632 678,938 0.01GNMA, IO, FRN, Series 2019-97 ‘GS’6.007% 20/08/2049 USD 31,256,818 5,547,735 0.05GNMA, IO, FRN, Series 2016-89 ‘HS’5.957% 20/07/2046 USD 9,017,670 1,736,920 0.02GNMA, IO, FRN, Series 2017-163 ‘HS’6.107% 20/11/2047 USD 4,319,400 796,005 0.01GNMA, IO, FRN, Series 2018-148 ‘HS’6.107% 20/11/2045 USD 36,911,911 6,794,926 0.07GNMA, IO, FRN, Series 2019-53 ‘IA’0.787% 16/06/2061 USD 6,259,251 447,662 0.00GNMA, IO, FRN, Series 2020-69 ‘IA’1.331% 16/04/2062 USD 22,167,503 2,108,407 0.02GNMA, IO, FRN, Series 2020-89 ‘IA’1.219% 16/04/2062 USD 196,154,650 18,519,314 0.18GNMA, IO, Series 2021-23 ‘IA’ 2.5%20/02/2051 USD 95,798,840 12,792,843 0.12GNMA, IO, FRN, Series 2014-130 ‘IB’0.4% 16/08/2054 USD 487,804 8,386 0.00
GNMA, IO, FRN, Series 2020-143 ‘IB’0.896% 16/03/2062 USD 45,512,964 3,493,871 0.03GNMA, IO, FRN, Series 2020-106 ‘IC’0.824% 16/06/2062 USD 274,208,436 20,628,728 0.20GNMA, IO, Series 2021-81 ‘IC’ 3%20/05/2051 USD 39,714,542 6,210,346 0.06GNMA, IO, FRN, Series 2014-124 ‘IE’0.613% 16/05/2054 USD 8,820,813 202,771 0.00GNMA, IO, Series 2019-152 ‘IN’ 3.5%20/12/2049 USD 619,142 159,678 0.00GNMA, IO, FRN, Series 2020-91 ‘IU’1.161% 16/05/2062 USD 266,589,202 22,560,245 0.22GNMA, IO, Series 2019-132 ‘KI’ 3.5%20/03/2047 USD 1,656,706 75,188 0.00GNMA, IO, Series 2021-91 ‘KI’ 3%20/05/2051 USD 38,397,849 5,891,006 0.06GNMA, IO, FRN, Series 2017-107 ‘KS’6.107% 20/07/2047 USD 3,027,120 559,046 0.01GNMA, IO, FRN, Series 2017-141 ‘KS’6.107% 20/09/2047 USD 5,410,537 1,099,375 0.01GNMA, IO, FRN, Series 2017-155 ‘KS’6.107% 20/10/2047 USD 3,884,251 712,236 0.01GNMA, IO, FRN, Series 2019-153 ‘KS’5.957% 20/12/2049 USD 17,417,453 2,109,266 0.02GNMA, IO, FRN, Series 2019-89 ‘KS’6.007% 20/07/2049 USD 8,839,105 1,306,779 0.01GNMA, IO, FRN, Series 2019-43 ‘LS’5.957% 20/04/2049 USD 2,805,382 569,388 0.01GNMA, IO, FRN, Series 2020-11 ‘LS’5.957% 20/01/2050 USD 41,332,695 6,871,350 0.07GNMA, IO, Series 2012-39 ‘MI’ 4%16/03/2042 USD 337,873 57,643 0.00GNMA, IO, Series 2021-9 ‘MI’ 2.5%20/01/2051 USD 206,343,201 25,901,107 0.25GNMA, IO, FRN, Series 2015-110 ‘MS’5.617% 20/08/2045 USD 2,199,359 351,107 0.00GNMA, IO, FRN, Series 2018-112 ‘MS’6.107% 20/08/2048 USD 35,587,448 6,697,074 0.07GNMA, IO, Series 2019-152 ‘NI’ 3.5%20/08/2047 USD 1,126,735 61,435 0.00GNMA, IO, FRN, Series 2016-120 ‘NS’6.007% 20/09/2046 USD 4,067,565 895,029 0.01GNMA, IO, FRN, Series 2016-146 ‘NS’6.007% 20/10/2046 USD 4,332,760 1,000,175 0.01GNMA, IO, FRN, Series 2016-71 ‘QI’0.93% 16/11/2057 USD 63,194,472 3,252,444 0.03GNMA, IO, FRN, Series 2019-159 ‘QS’5.957% 20/12/2049 USD 30,418,419 5,331,184 0.05GNMA, IO, FRN, Series 2019-138 ‘S’5.957% 20/11/2049 USD 24,577,532 4,084,633 0.04GNMA, IO, FRN, Series 2016-111 ‘SA’6.007% 20/08/2046 USD 3,365,303 741,400 0.01GNMA, IO, FRN, Series 2016-120 ‘SA’6.007% 20/09/2046 USD 7,129,540 1,374,761 0.01GNMA, IO, FRN, Series 2017-68 ‘SA’6.057% 20/05/2047 USD 2,137,193 427,873 0.00GNMA, IO, FRN, Series 2017-85 ‘SA’6.057% 20/06/2047 USD 7,465,371 1,340,131 0.01GNMA, IO, FRN, Series 2019-115 ‘SA’5.957% 20/09/2049 USD 6,171,937 1,059,754 0.01GNMA, IO, FRN, Series 2019-117 ‘SA’6.007% 20/09/2049 USD 9,627,959 1,911,007 0.02GNMA, IO, FRN, Series 2019-71 ‘SA’6.057% 20/06/2049 USD 17,028,480 3,197,313 0.03GNMA, IO, FRN, Series 2020-101 ‘SA’6.107% 20/07/2050 USD 89,275,448 18,854,109 0.18GNMA, IO, FRN, Series 2016-49 ‘SB’5.957% 20/04/2046 USD 2,667,988 505,368 0.01GNMA, IO, FRN, Series 2017-134 ‘SB’6.107% 20/09/2047 USD 3,002,481 505,987 0.01GNMA, IO, FRN, Series 2018-63 ‘SB’6.107% 20/04/2048 USD 2,681,624 496,564 0.01GNMA, IO, FRN, Series 2019-49 ‘SB’5.447% 20/04/2049 USD 5,572,633 802,128 0.01GNMA, IO, FRN, Series 2020-33 ‘SB’5.957% 20/03/2050 USD 26,837,684 5,414,339 0.05GNMA, IO, FRN, Series 2019-103 ‘SC’5.957% 20/08/2049 USD 13,076,679 2,360,307 0.02GNMA, IO, FRN, Series 2017-134 ‘SD’6.107% 20/09/2047 USD 5,010,198 1,072,614 0.01GNMA, IO, FRN, Series 2017-180 ‘SD’6.107% 20/12/2047 USD 3,673,057 661,453 0.01GNMA, IO, FRN, Series 2018-147 ‘SD’6.057% 20/10/2048 USD 4,205,808 748,311 0.01GNMA, IO, FRN, Series 2017-93 ‘SE’6.107% 20/06/2047 USD 4,948,545 969,634 0.01GNMA, IO, FRN, Series 2020-84 ‘SE’6.057% 20/06/2050 USD 31,029,736 7,094,555 0.07GNMA, IO, FRN, Series 2018-36 ‘SG’6.107% 20/03/2048 USD 1,869,120 405,554 0.00
251
JPMorgan Funds - Income FundSchedule of Investments (continued)
As at 30 June 2021
Investments Currency
Quantity/Nominal
Value
MarketValue
USD
%of
NetAssets Investments Currency
Quantity/Nominal
Value
MarketValue
USD
%of
NetAssets

GNMA, IO, FRN, Series 2019-1 ‘SG’5.957% 20/01/2049 USD 14,618,862 2,875,093 0.03GNMA, IO, FRN, Series 2019-158 ‘SG’5.957% 20/12/2049 USD 10,644,995 1,758,210 0.02GNMA, IO, FRN, Series 2019-98 ‘SG’5.957% 20/08/2049 USD 17,033,516 2,943,117 0.03GNMA, IO, FRN, Series 2020-140 ‘SG’6.257% 20/09/2050 USD 74,506,519 16,613,061 0.16GNMA, IO, FRN, Series 2019-42 ‘SJ’5.957% 20/04/2049 USD 4,293,694 663,701 0.01GNMA, IO, FRN, Series 2019-99 ‘SJ’5.957% 20/08/2049 USD 48,305,575 8,445,660 0.08GNMA, IO, FRN, Series 2020-101 ‘SJ’6.107% 20/07/2050 USD 63,089,132 12,460,280 0.12GNMA, IO, FRN, Series 2019-153 ‘SK’5.957% 20/12/2049 USD 19,673,136 3,376,410 0.03GNMA, IO, FRN, Series 2019-71 ‘SK’6.057% 20/06/2049 USD 9,794,431 1,737,202 0.02GNMA, IO, FRN, Series 2017-36 ‘SL’6.125% 16/03/2047 USD 4,571,750 887,840 0.01GNMA, IO, FRN, Series 2016-108 ‘SM’6.007% 20/08/2046 USD 1,947,277 414,398 0.00GNMA, IO, FRN, Series 2019-98 ‘SN’5.907% 20/08/2049 USD 15,484,275 2,998,189 0.03GNMA, IO, FRN, Series 2019-65 ‘ST’5.957% 20/05/2049 USD 8,614,870 1,269,518 0.01GNMA, IO, FRN, Series 2018-125 ‘SU’6.107% 20/09/2048 USD 18,331,644 3,768,513 0.04GNMA, IO, FRN, Series 2019-115 ‘SW’6.007% 20/09/2049 USD 14,334,844 2,377,789 0.02GNMA, IO, FRN, Series 2019-138 ‘SW’5.957% 20/10/2049 USD 23,801,897 4,550,235 0.04GNMA, IO, FRN, Series 2020-86 ‘TS’5.507% 20/06/2050 USD 16,671,964 3,113,374 0.03GNMA, IO, FRN, Series 2019-115 ‘US’5.957% 20/09/2049 USD 7,974,806 1,265,817 0.01GNMA, Series 2009-92 ‘ZA’ 5.5%16/10/2039 USD 5,082,627 6,192,162 0.06GNMA 784847 4.5% 20/11/2049 USD 7,479,631 8,184,415 0.08GNMA BF2605 5.5% 20/05/2048 USD 359,992 407,340 0.00GNMA BH2761 4.5% 20/09/2048 USD 945,866 1,048,974 0.01GNMA BH5219 4.5% 20/10/2048 USD 245,293 272,023 0.00GNMA BI9909 4.5% 20/10/2048 USD 432,752 479,949 0.00GNMA BJ0977 4.5% 20/10/2048 USD 184,623 202,284 0.00GNMA BJ4027 4.5% 20/09/2048 USD 200,564 221,397 0.00GNMA BJ4052 4.5% 20/09/2048 USD 215,268 237,957 0.00GNMA BJ4126 4.5% 20/10/2048 USD 228,127 248,673 0.00GNMA BJ4168 4.5% 20/10/2048 USD 358,590 396,720 0.00GNMA BJ4297 4.5% 20/10/2048 USD 220,640 242,147 0.00GNMA BJ4354 4.5% 20/10/2048 USD 308,380 340,509 0.00GNMA BJ4396 4.5% 20/10/2048 USD 462,501 512,562 0.01GNMA BJ9835 4.5% 20/01/2049 USD 547,656 610,927 0.01GNMA BJ9839 4.375% 20/04/2049 USD 291,583 327,625 0.00GNMA BJ9846 4.5% 20/07/2049 USD 683,738 763,938 0.01GNMA BJ9850 4.5% 20/08/2049 USD 357,137 399,584 0.00GNMA BJ9854 4.5% 20/09/2049 USD 462,452 517,171 0.01GNMA BJ9863 4.5% 20/11/2049 USD 897,427 1,003,238 0.01GNMA BL9253 4.5% 20/06/2049 USD 144,734 156,230 0.00GNMA BM5450 4.5% 20/07/2049 USD 299,647 328,720 0.00GNMA BN2462 4.5% 20/06/2048 USD 53,330 57,038 0.00GNMA BN2463 4.5% 20/06/2049 USD 54,230 58,711 0.00GNMA BQ8922 4.5% 20/12/2049 USD 723,103 830,112 0.01GNMA MA6995 2.5% 20/11/2050 USD 198,182,513 205,110,319 1.99GNMA Multifamily REMIC Pass-ThroughCertificates Trust 0% 16/12/2062 USD 94,271,754 24,766,684 0.24Go Daddy Operating Co. LLC, 144A5.25% 01/12/2027 USD 273,000 287,043 0.00Goldman Sachs Group, Inc. (The), FRN5% Perpetual USD 5,340,000 5,420,634 0.05Goodgreen Trust, Series 2017-R1 5%20/10/2051 USD 234,190 236,609 0.00Goodyear Tire & Rubber Co. (The),144A 5% 15/07/2029 USD 2,088,000 2,177,199 0.02Goodyear Tire & Rubber Co. (The),144A 5.25% 15/07/2031 USD 900,000 939,015 0.01Goodyear Tire & Rubber Co. (The) 5%31/05/2026 USD 3,838,000 3,946,075 0.04Goodyear Tire & Rubber Co. (The)5.25% 30/04/2031 USD 6,063,000 6,320,678 0.06Gray Television, Inc., 144A 5.875%15/07/2026 USD 1,930,000 1,992,725 0.02Gray Television, Inc., 144A 7%15/05/2027 USD 3,847,000 4,172,110 0.04Greif, Inc., 144A 6.5% 01/03/2027 USD 2,854,000 3,019,789 0.03Group 1 Automotive, Inc., 144A 4%15/08/2028 USD 455,000 460,717 0.00GS Mortgage Securities Trust, Series2017-GS5 ‘A4’ 3.674% 10/03/2050 USD 500,000 558,932 0.01GS Mortgage Securities Trust, Series2017-GS8 ‘A4’ 3.469% 10/11/2050 USD 1,300,000 1,435,074 0.01
GS Mortgage Securities Trust, FRN,Series 2016-GS3 ‘C’ 4.005%10/10/2049 USD 5,250,000 5,302,219 0.05GS Mortgage Securities Trust, FRN,Series 2017-GS8 ‘C’ 4.336%10/11/2050 USD 2,000,000 2,181,512 0.02GS Mortgage Securities Trust, FRN,Series 2012-GCJ9 ‘D’, 144A 4.738%10/11/2045 USD 280,000 283,068 0.00GS Mortgage Securities Trust, FRN,Series 2013-GC12 ‘D’, 144A 4.452%10/06/2046 USD 4,555,000 4,515,159 0.04GS Mortgage Securities Trust, FRN,Series 2015-GC28 ‘D’, 144A 4.319%10/02/2048 USD 5,673,615 5,781,738 0.06GS Mortgage Securities Trust, Series2015-GC30 ‘D’ 3.384% 10/05/2050 USD 7,525,000 7,470,592 0.07GS Mortgage Securities Trust, Series2015-GC32 ‘D’ 3.345% 10/07/2048 USD 13,564,225 12,996,467 0.13GS Mortgage Securities Trust, Series2015-GC34 ‘D’ 2.979% 10/10/2048 USD 23,190,000 21,031,973 0.20GS Mortgage Securities Trust, FRN,Series 2017-GS5 ‘D’, 144A 3.509%10/03/2050 USD 6,530,000 6,400,421 0.06GS Mortgage Securities Trust, Series2017-GS6 ‘D’, 144A 3.243%10/05/2050 USD 3,998,000 3,902,590 0.04GS Mortgage Securities Trust, Series2013-GC12 ‘E’, 144A 3.25% 10/06/2046 USD 1,950,000 1,763,617 0.02GS Mortgage Securities Trust, FRN,Series 2015-GC32 ‘E’, 144A 4.422%10/07/2048 USD 5,563,000 4,517,357 0.04GSMSC Pass-Through Trust, FRN,Series 2008-2R ‘2A1’, 144A 7.5%25/10/2036 USD 170,996 71,697 0.00Gulfport Energy Operating Corp. 8%17/05/2026 USD 2,616,277 2,812,999 0.03Hanesbrands, Inc., 144A 4.625%15/05/2024 USD 15,000 15,919 0.00Hanesbrands, Inc., 144A 4.875%15/05/2026 USD 3,756,000 4,061,175 0.04HarborView Mortgage Loan Trust, FRN,Series 2006-14 ‘1A1A’ 0.277%25/01/2047 USD 4,124,586 4,087,664 0.04Herc Holdings, Inc., 144A 5.5%15/07/2027 USD 6,139,000 6,477,566 0.06Hertz Corp. (The), 144A 5.5%15/10/2024§ USD 7,725,000 7,795,722 0.08Hertz Corp. (The), 144A 7.125%01/08/2026§ USD 3,200,000 3,437,616 0.03Hertz Corp. (The), 144A 6%15/01/2028§ USD 670,000 721,587 0.01Hertz Corp. (The), 144A 7.625%01/06/2022§ USD 2,205,000 2,468,497 0.02Hess Midstream Operations LP, 144A5.625% 15/02/2026 USD 2,250,000 2,345,625 0.02Hexion, Inc., 144A 7.875% 15/07/2027 USD 3,340,000 3,607,551 0.04Hilcorp Energy I LP, 144A 6.25%01/11/2028 USD 120,000 127,531 0.00Hillman Group, Inc. (The), 144A 6.375%15/07/2022 USD 55,000 55,104 0.00Hill-Rom Holdings, Inc., 144A 4.375%15/09/2027 USD 2,010,000 2,087,214 0.02Hilton Domestic Operating Co., Inc.,144A 5.375% 01/05/2025 USD 760,000 802,195 0.01Hilton Domestic Operating Co., Inc.,144A 5.75% 01/05/2028 USD 1,000,000 1,083,280 0.01Hilton Domestic Operating Co., Inc.,144A 3.75% 01/05/2029 USD 4,218,000 4,256,046 0.04Hilton Domestic Operating Co., Inc.,144A 4% 01/05/2031 USD 597,000 602,863 0.01Hilton Domestic Operating Co., Inc.4.875% 15/01/2030 USD 900,000 962,550 0.01Holly Energy Partners LP, 144A 5%01/02/2028 USD 75,000 76,838 0.00Hologic, Inc., 144A 4.625% 01/02/2028 USD 1,320,000 1,385,947 0.01Hologic, Inc., 144A 3.25% 15/02/2029 USD 9,300,000 9,246,711 0.09Hughes Satellite Systems Corp. 5.25%01/08/2026 USD 2,560,000 2,872,320 0.03Hughes Satellite Systems Corp. 6.625%01/08/2026 USD 2,079,000 2,337,763 0.02Icahn Enterprises LP 6.75%01/02/2024 USD 170,000 173,925 0.00Icahn Enterprises LP 4.75%15/09/2024 USD 1,500,000 1,567,583 0.02Icahn Enterprises LP 6.25%15/05/2026 USD 3,222,000 3,420,379 0.03iHeartCommunications, Inc., 144A5.25% 15/08/2027 USD 10,358,000 10,848,969 0.11iHeartCommunications, Inc. 6.375%01/05/2026 USD 5,652,851 6,024,526 0.06
252
JPMorgan Funds - Income FundSchedule of Investments (continued)
As at 30 June 2021
Investments Currency
Quantity/Nominal
Value
MarketValue
USD
%of
NetAssets Investments Currency
Quantity/Nominal
Value
MarketValue
USD
%of
NetAssets
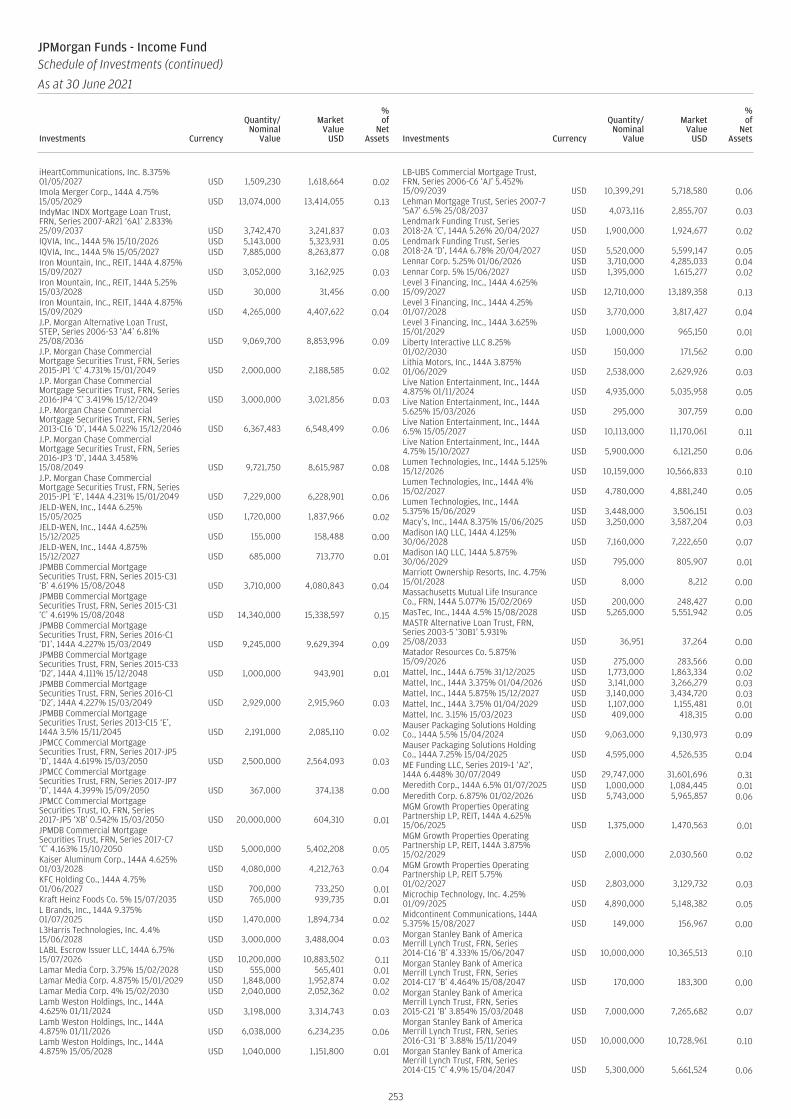
iHeartCommunications, Inc. 8.375%01/05/2027 USD 1,509,230 1,618,664 0.02Imola Merger Corp., 144A 4.75%15/05/2029 USD 13,074,000 13,414,055 0.13IndyMac INDX Mortgage Loan Trust,FRN, Series 2007-AR21 ‘6A1’ 2.833%25/09/2037 USD 3,742,470 3,241,837 0.03IQVIA, Inc., 144A 5% 15/10/2026 USD 5,143,000 5,323,931 0.05IQVIA, Inc., 144A 5% 15/05/2027 USD 7,885,000 8,263,877 0.08Iron Mountain, Inc., REIT, 144A 4.875%15/09/2027 USD 3,052,000 3,162,925 0.03Iron Mountain, Inc., REIT, 144A 5.25%15/03/2028 USD 30,000 31,456 0.00Iron Mountain, Inc., REIT, 144A 4.875%15/09/2029 USD 4,265,000 4,407,622 0.04J.P. Morgan Alternative Loan Trust,STEP, Series 2006-S3 ‘A4’ 6.81%25/08/2036 USD 9,069,700 8,853,996 0.09J.P. Morgan Chase CommercialMortgage Securities Trust, FRN, Series2015-JP1 ‘C’ 4.731% 15/01/2049 USD 2,000,000 2,188,585 0.02J.P. Morgan Chase CommercialMortgage Securities Trust, FRN, Series2016-JP4 ‘C’ 3.419% 15/12/2049 USD 3,000,000 3,021,856 0.03J.P. Morgan Chase CommercialMortgage Securities Trust, FRN, Series2013-C16 ‘D’, 144A 5.022% 15/12/2046 USD 6,367,483 6,548,499 0.06J.P. Morgan Chase CommercialMortgage Securities Trust, FRN, Series2016-JP3 ‘D’, 144A 3.458%15/08/2049 USD 9,721,750 8,615,987 0.08J.P. Morgan Chase CommercialMortgage Securities Trust, FRN, Series2015-JP1 ‘E’, 144A 4.231% 15/01/2049 USD 7,229,000 6,228,901 0.06JELD-WEN, Inc., 144A 6.25%15/05/2025 USD 1,720,000 1,837,966 0.02JELD-WEN, Inc., 144A 4.625%15/12/2025 USD 155,000 158,488 0.00JELD-WEN, Inc., 144A 4.875%15/12/2027 USD 685,000 713,770 0.01JPMBB Commercial MortgageSecurities Trust, FRN, Series 2015-C31‘B’ 4.619% 15/08/2048 USD 3,710,000 4,080,843 0.04JPMBB Commercial MortgageSecurities Trust, FRN, Series 2015-C31‘C’ 4.619% 15/08/2048 USD 14,340,000 15,338,597 0.15JPMBB Commercial MortgageSecurities Trust, FRN, Series 2016-C1‘D1’, 144A 4.227% 15/03/2049 USD 9,245,000 9,629,394 0.09JPMBB Commercial MortgageSecurities Trust, FRN, Series 2015-C33‘D2’, 144A 4.111% 15/12/2048 USD 1,000,000 943,901 0.01JPMBB Commercial MortgageSecurities Trust, FRN, Series 2016-C1‘D2’, 144A 4.227% 15/03/2049 USD 2,929,000 2,915,960 0.03JPMBB Commercial MortgageSecurities Trust, Series 2013-C15 ‘E’,144A 3.5% 15/11/2045 USD 2,191,000 2,085,110 0.02JPMCC Commercial MortgageSecurities Trust, FRN, Series 2017-JP5‘D’, 144A 4.619% 15/03/2050 USD 2,500,000 2,564,093 0.03JPMCC Commercial MortgageSecurities Trust, FRN, Series 2017-JP7‘D’, 144A 4.399% 15/09/2050 USD 367,000 374,138 0.00JPMCC Commercial MortgageSecurities Trust, IO, FRN, Series2017-JP5 ‘XB’ 0.542% 15/03/2050 USD 20,000,000 604,310 0.01JPMDB Commercial MortgageSecurities Trust, FRN, Series 2017-C7‘C’ 4.163% 15/10/2050 USD 5,000,000 5,402,208 0.05Kaiser Aluminum Corp., 144A 4.625%01/03/2028 USD 4,080,000 4,212,763 0.04KFC Holding Co., 144A 4.75%01/06/2027 USD 700,000 733,250 0.01Kraft Heinz Foods Co. 5% 15/07/2035 USD 765,000 939,735 0.01L Brands, Inc., 144A 9.375%01/07/2025 USD 1,470,000 1,894,734 0.02L3Harris Technologies, Inc. 4.4%15/06/2028 USD 3,000,000 3,488,004 0.03LABL Escrow Issuer LLC, 144A 6.75%15/07/2026 USD 10,200,000 10,883,502 0.11Lamar Media Corp. 3.75% 15/02/2028 USD 555,000 565,401 0.01Lamar Media Corp. 4.875% 15/01/2029 USD 1,848,000 1,952,874 0.02Lamar Media Corp. 4% 15/02/2030 USD 2,040,000 2,052,362 0.02Lamb Weston Holdings, Inc., 144A4.625% 01/11/2024 USD 3,198,000 3,314,743 0.03Lamb Weston Holdings, Inc., 144A4.875% 01/11/2026 USD 6,038,000 6,234,235 0.06Lamb Weston Holdings, Inc., 144A4.875% 15/05/2028 USD 1,040,000 1,151,800 0.01
LB-UBS Commercial Mortgage Trust,FRN, Series 2006-C6 ‘AJ’ 5.452%15/09/2039 USD 10,399,291 5,718,580 0.06Lehman Mortgage Trust, Series 2007-7‘5A7’ 6.5% 25/08/2037 USD 4,073,116 2,855,707 0.03Lendmark Funding Trust, Series2018-2A ‘C’, 144A 5.26% 20/04/2027 USD 1,900,000 1,924,677 0.02Lendmark Funding Trust, Series2018-2A ‘D’, 144A 6.78% 20/04/2027 USD 5,520,000 5,599,147 0.05Lennar Corp. 5.25% 01/06/2026 USD 3,710,000 4,285,033 0.04Lennar Corp. 5% 15/06/2027 USD 1,395,000 1,615,277 0.02Level 3 Financing, Inc., 144A 4.625%15/09/2027 USD 12,710,000 13,189,358 0.13Level 3 Financing, Inc., 144A 4.25%01/07/2028 USD 3,770,000 3,817,427 0.04Level 3 Financing, Inc., 144A 3.625%15/01/2029 USD 1,000,000 965,150 0.01Liberty Interactive LLC 8.25%01/02/2030 USD 150,000 171,562 0.00Lithia Motors, Inc., 144A 3.875%01/06/2029 USD 2,538,000 2,629,926 0.03Live Nation Entertainment, Inc., 144A4.875% 01/11/2024 USD 4,935,000 5,035,958 0.05Live Nation Entertainment, Inc., 144A5.625% 15/03/2026 USD 295,000 307,759 0.00Live Nation Entertainment, Inc., 144A6.5% 15/05/2027 USD 10,113,000 11,170,061 0.11Live Nation Entertainment, Inc., 144A4.75% 15/10/2027 USD 5,900,000 6,121,250 0.06Lumen Technologies, Inc., 144A 5.125%15/12/2026 USD 10,159,000 10,566,833 0.10Lumen Technologies, Inc., 144A 4%15/02/2027 USD 4,780,000 4,881,240 0.05Lumen Technologies, Inc., 144A5.375% 15/06/2029 USD 3,448,000 3,506,151 0.03Macy’s, Inc., 144A 8.375% 15/06/2025 USD 3,250,000 3,587,204 0.03Madison IAQ LLC, 144A 4.125%30/06/2028 USD 7,160,000 7,222,650 0.07Madison IAQ LLC, 144A 5.875%30/06/2029 USD 795,000 805,907 0.01Marriott Ownership Resorts, Inc. 4.75%15/01/2028 USD 8,000 8,212 0.00Massachusetts Mutual Life InsuranceCo., FRN, 144A 5.077% 15/02/2069 USD 200,000 248,427 0.00MasTec, Inc., 144A 4.5% 15/08/2028 USD 5,265,000 5,551,942 0.05MASTR Alternative Loan Trust, FRN,Series 2003-5 ‘30B1’ 5.931%25/08/2033 USD 36,951 37,264 0.00Matador Resources Co. 5.875%15/09/2026 USD 275,000 283,566 0.00Mattel, Inc., 144A 6.75% 31/12/2025 USD 1,773,000 1,863,334 0.02Mattel, Inc., 144A 3.375% 01/04/2026 USD 3,141,000 3,266,279 0.03Mattel, Inc., 144A 5.875% 15/12/2027 USD 3,140,000 3,434,720 0.03Mattel, Inc., 144A 3.75% 01/04/2029 USD 1,107,000 1,155,481 0.01Mattel, Inc. 3.15% 15/03/2023 USD 409,000 418,315 0.00Mauser Packaging Solutions HoldingCo., 144A 5.5% 15/04/2024 USD 9,063,000 9,130,973 0.09Mauser Packaging Solutions HoldingCo., 144A 7.25% 15/04/2025 USD 4,595,000 4,526,535 0.04ME Funding LLC, Series 2019-1 ‘A2’,144A 6.448% 30/07/2049 USD 29,747,000 31,601,696 0.31Meredith Corp., 144A 6.5% 01/07/2025 USD 1,000,000 1,084,445 0.01Meredith Corp. 6.875% 01/02/2026 USD 5,743,000 5,965,857 0.06MGM Growth Properties OperatingPartnership LP, REIT, 144A 4.625%15/06/2025 USD 1,375,000 1,470,563 0.01MGM Growth Properties OperatingPartnership LP, REIT, 144A 3.875%15/02/2029 USD 2,000,000 2,030,560 0.02MGM Growth Properties OperatingPartnership LP, REIT 5.75%01/02/2027 USD 2,803,000 3,129,732 0.03Microchip Technology, Inc. 4.25%01/09/2025 USD 4,890,000 5,148,382 0.05Midcontinent Communications, 144A5.375% 15/08/2027 USD 149,000 156,967 0.00Morgan Stanley Bank of AmericaMerrill Lynch Trust, FRN, Series2014-C16 ‘B’ 4.333% 15/06/2047 USD 10,000,000 10,365,513 0.10Morgan Stanley Bank of AmericaMerrill Lynch Trust, FRN, Series2014-C17 ‘B’ 4.464% 15/08/2047 USD 170,000 183,300 0.00Morgan Stanley Bank of AmericaMerrill Lynch Trust, FRN, Series2015-C21 ‘B’ 3.854% 15/03/2048 USD 7,000,000 7,265,682 0.07Morgan Stanley Bank of AmericaMerrill Lynch Trust, FRN, Series2016-C31 ‘B’ 3.88% 15/11/2049 USD 10,000,000 10,728,961 0.10Morgan Stanley Bank of AmericaMerrill Lynch Trust, FRN, Series2014-C15 ‘C’ 4.9% 15/04/2047 USD 5,300,000 5,661,524 0.06
253
JPMorgan Funds - Income FundSchedule of Investments (continued)
As at 30 June 2021
Investments Currency
Quantity/Nominal
Value
MarketValue
USD
%of
NetAssets Investments Currency
Quantity/Nominal
Value
MarketValue
USD
%of
NetAssets
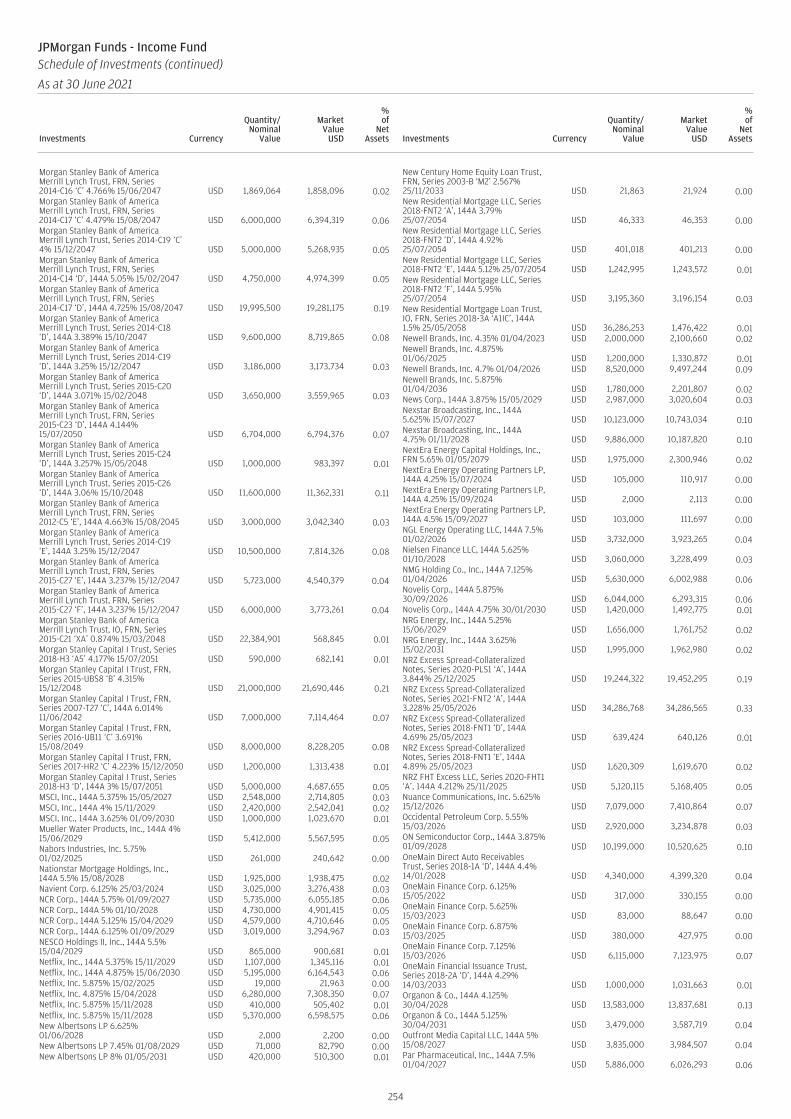
Morgan Stanley Bank of AmericaMerrill Lynch Trust, FRN, Series2014-C16 ‘C’ 4.766% 15/06/2047 USD 1,869,064 1,858,096 0.02Morgan Stanley Bank of AmericaMerrill Lynch Trust, FRN, Series2014-C17 ‘C’ 4.479% 15/08/2047 USD 6,000,000 6,394,319 0.06Morgan Stanley Bank of AmericaMerrill Lynch Trust, Series 2014-C19 ‘C’4% 15/12/2047 USD 5,000,000 5,268,935 0.05Morgan Stanley Bank of AmericaMerrill Lynch Trust, FRN, Series2014-C14 ‘D’, 144A 5.05% 15/02/2047 USD 4,750,000 4,974,399 0.05Morgan Stanley Bank of AmericaMerrill Lynch Trust, FRN, Series2014-C17 ‘D’, 144A 4.725% 15/08/2047 USD 19,995,500 19,281,175 0.19Morgan Stanley Bank of AmericaMerrill Lynch Trust, Series 2014-C18‘D’, 144A 3.389% 15/10/2047 USD 9,600,000 8,719,865 0.08Morgan Stanley Bank of AmericaMerrill Lynch Trust, Series 2014-C19‘D’, 144A 3.25% 15/12/2047 USD 3,186,000 3,173,734 0.03Morgan Stanley Bank of AmericaMerrill Lynch Trust, Series 2015-C20‘D’, 144A 3.071% 15/02/2048 USD 3,650,000 3,559,965 0.03Morgan Stanley Bank of AmericaMerrill Lynch Trust, FRN, Series2015-C23 ‘D’, 144A 4.144%15/07/2050 USD 6,704,000 6,794,376 0.07Morgan Stanley Bank of AmericaMerrill Lynch Trust, Series 2015-C24‘D’, 144A 3.257% 15/05/2048 USD 1,000,000 983,397 0.01Morgan Stanley Bank of AmericaMerrill Lynch Trust, Series 2015-C26‘D’, 144A 3.06% 15/10/2048 USD 11,600,000 11,362,331 0.11Morgan Stanley Bank of AmericaMerrill Lynch Trust, FRN, Series2012-C5 ‘E’, 144A 4.663% 15/08/2045 USD 3,000,000 3,042,340 0.03Morgan Stanley Bank of AmericaMerrill Lynch Trust, Series 2014-C19‘E’, 144A 3.25% 15/12/2047 USD 10,500,000 7,814,326 0.08Morgan Stanley Bank of AmericaMerrill Lynch Trust, FRN, Series2015-C27 ‘E’, 144A 3.237% 15/12/2047 USD 5,723,000 4,540,379 0.04Morgan Stanley Bank of AmericaMerrill Lynch Trust, FRN, Series2015-C27 ‘F’, 144A 3.237% 15/12/2047 USD 6,000,000 3,773,261 0.04Morgan Stanley Bank of AmericaMerrill Lynch Trust, IO, FRN, Series2015-C21 ‘XA’ 0.874% 15/03/2048 USD 22,384,901 568,845 0.01Morgan Stanley Capital I Trust, Series2018-H3 ‘A5’ 4.177% 15/07/2051 USD 590,000 682,141 0.01Morgan Stanley Capital I Trust, FRN,Series 2015-UBS8 ‘B’ 4.315%15/12/2048 USD 21,000,000 21,690,446 0.21Morgan Stanley Capital I Trust, FRN,Series 2007-T27 ‘C’, 144A 6.014%11/06/2042 USD 7,000,000 7,114,464 0.07Morgan Stanley Capital I Trust, FRN,Series 2016-UB11 ‘C’ 3.691%15/08/2049 USD 8,000,000 8,228,205 0.08Morgan Stanley Capital I Trust, FRN,Series 2017-HR2 ‘C’ 4.223% 15/12/2050 USD 1,200,000 1,313,438 0.01Morgan Stanley Capital I Trust, Series2018-H3 ‘D’, 144A 3% 15/07/2051 USD 5,000,000 4,687,655 0.05MSCI, Inc., 144A 5.375% 15/05/2027 USD 2,548,000 2,714,805 0.03MSCI, Inc., 144A 4% 15/11/2029 USD 2,420,000 2,542,041 0.02MSCI, Inc., 144A 3.625% 01/09/2030 USD 1,000,000 1,023,670 0.01Mueller Water Products, Inc., 144A 4%15/06/2029 USD 5,412,000 5,567,595 0.05Nabors Industries, Inc. 5.75%01/02/2025 USD 261,000 240,642 0.00Nationstar Mortgage Holdings, Inc.,144A 5.5% 15/08/2028 USD 1,925,000 1,938,475 0.02Navient Corp. 6.125% 25/03/2024 USD 3,025,000 3,276,438 0.03NCR Corp., 144A 5.75% 01/09/2027 USD 5,735,000 6,055,185 0.06NCR Corp., 144A 5% 01/10/2028 USD 4,730,000 4,901,415 0.05NCR Corp., 144A 5.125% 15/04/2029 USD 4,579,000 4,710,646 0.05NCR Corp., 144A 6.125% 01/09/2029 USD 3,019,000 3,294,967 0.03NESCO Holdings II, Inc., 144A 5.5%15/04/2029 USD 865,000 900,681 0.01Netflix, Inc., 144A 5.375% 15/11/2029 USD 1,107,000 1,345,116 0.01Netflix, Inc., 144A 4.875% 15/06/2030 USD 5,195,000 6,164,543 0.06Netflix, Inc. 5.875% 15/02/2025 USD 19,000 21,963 0.00Netflix, Inc. 4.875% 15/04/2028 USD 6,280,000 7,308,350 0.07Netflix, Inc. 5.875% 15/11/2028 USD 410,000 505,402 0.01Netflix, Inc. 5.875% 15/11/2028 USD 5,370,000 6,598,575 0.06New Albertsons LP 6.625%01/06/2028 USD 2,000 2,200 0.00New Albertsons LP 7.45% 01/08/2029 USD 71,000 82,790 0.00New Albertsons LP 8% 01/05/2031 USD 420,000 510,300 0.01
New Century Home Equity Loan Trust,FRN, Series 2003-B ‘M2’ 2.567%25/11/2033 USD 21,863 21,924 0.00New Residential Mortgage LLC, Series2018-FNT2 ‘A’, 144A 3.79%25/07/2054 USD 46,333 46,353 0.00New Residential Mortgage LLC, Series2018-FNT2 ‘D’, 144A 4.92%25/07/2054 USD 401,018 401,213 0.00New Residential Mortgage LLC, Series2018-FNT2 ‘E’, 144A 5.12% 25/07/2054 USD 1,242,995 1,243,572 0.01New Residential Mortgage LLC, Series2018-FNT2 ‘F’, 144A 5.95%25/07/2054 USD 3,195,360 3,196,154 0.03New Residential Mortgage Loan Trust,IO, FRN, Series 2018-3A ‘A1IC’, 144A1.5% 25/05/2058 USD 36,286,253 1,476,422 0.01Newell Brands, Inc. 4.35% 01/04/2023 USD 2,000,000 2,100,660 0.02Newell Brands, Inc. 4.875%01/06/2025 USD 1,200,000 1,330,872 0.01Newell Brands, Inc. 4.7% 01/04/2026 USD 8,520,000 9,497,244 0.09Newell Brands, Inc. 5.875%01/04/2036 USD 1,780,000 2,201,807 0.02News Corp., 144A 3.875% 15/05/2029 USD 2,987,000 3,020,604 0.03Nexstar Broadcasting, Inc., 144A5.625% 15/07/2027 USD 10,123,000 10,743,034 0.10Nexstar Broadcasting, Inc., 144A4.75% 01/11/2028 USD 9,886,000 10,187,820 0.10NextEra Energy Capital Holdings, Inc.,FRN 5.65% 01/05/2079 USD 1,975,000 2,300,946 0.02NextEra Energy Operating Partners LP,144A 4.25% 15/07/2024 USD 105,000 110,917 0.00NextEra Energy Operating Partners LP,144A 4.25% 15/09/2024 USD 2,000 2,113 0.00NextEra Energy Operating Partners LP,144A 4.5% 15/09/2027 USD 103,000 111,697 0.00NGL Energy Operating LLC, 144A 7.5%01/02/2026 USD 3,732,000 3,923,265 0.04Nielsen Finance LLC, 144A 5.625%01/10/2028 USD 3,060,000 3,228,499 0.03NMG Holding Co., Inc., 144A 7.125%01/04/2026 USD 5,630,000 6,002,988 0.06Novelis Corp., 144A 5.875%30/09/2026 USD 6,044,000 6,293,315 0.06Novelis Corp., 144A 4.75% 30/01/2030 USD 1,420,000 1,492,775 0.01NRG Energy, Inc., 144A 5.25%15/06/2029 USD 1,656,000 1,761,752 0.02NRG Energy, Inc., 144A 3.625%15/02/2031 USD 1,995,000 1,962,980 0.02NRZ Excess Spread-CollateralizedNotes, Series 2020-PLS1 ‘A’, 144A3.844% 25/12/2025 USD 19,244,322 19,452,295 0.19NRZ Excess Spread-CollateralizedNotes, Series 2021-FNT2 ‘A’, 144A3.228% 25/05/2026 USD 34,286,768 34,286,565 0.33NRZ Excess Spread-CollateralizedNotes, Series 2018-FNT1 ‘D’, 144A4.69% 25/05/2023 USD 639,424 640,126 0.01NRZ Excess Spread-CollateralizedNotes, Series 2018-FNT1 ‘E’, 144A4.89% 25/05/2023 USD 1,620,309 1,619,670 0.02NRZ FHT Excess LLC, Series 2020-FHT1‘A’, 144A 4.212% 25/11/2025 USD 5,120,115 5,168,405 0.05Nuance Communications, Inc. 5.625%15/12/2026 USD 7,079,000 7,410,864 0.07Occidental Petroleum Corp. 5.55%15/03/2026 USD 2,920,000 3,234,878 0.03ON Semiconductor Corp., 144A 3.875%01/09/2028 USD 10,199,000 10,520,625 0.10OneMain Direct Auto ReceivablesTrust, Series 2018-1A ‘D’, 144A 4.4%14/01/2028 USD 4,340,000 4,399,320 0.04OneMain Finance Corp. 6.125%15/05/2022 USD 317,000 330,155 0.00OneMain Finance Corp. 5.625%15/03/2023 USD 83,000 88,647 0.00OneMain Finance Corp. 6.875%15/03/2025 USD 380,000 427,975 0.00OneMain Finance Corp. 7.125%15/03/2026 USD 6,115,000 7,123,975 0.07OneMain Financial Issuance Trust,Series 2018-2A ‘D’, 144A 4.29%14/03/2033 USD 1,000,000 1,031,663 0.01Organon & Co., 144A 4.125%30/04/2028 USD 13,583,000 13,837,681 0.13Organon & Co., 144A 5.125%30/04/2031 USD 3,479,000 3,587,719 0.04Outfront Media Capital LLC, 144A 5%15/08/2027 USD 3,835,000 3,984,507 0.04Par Pharmaceutical, Inc., 144A 7.5%01/04/2027 USD 5,886,000 6,026,293 0.06
254
JPMorgan Funds - Income FundSchedule of Investments (continued)
As at 30 June 2021
Investments Currency
Quantity/Nominal
Value
MarketValue
USD
%of
NetAssets Investments Currency
Quantity/Nominal
Value
MarketValue
USD
%of
NetAssets
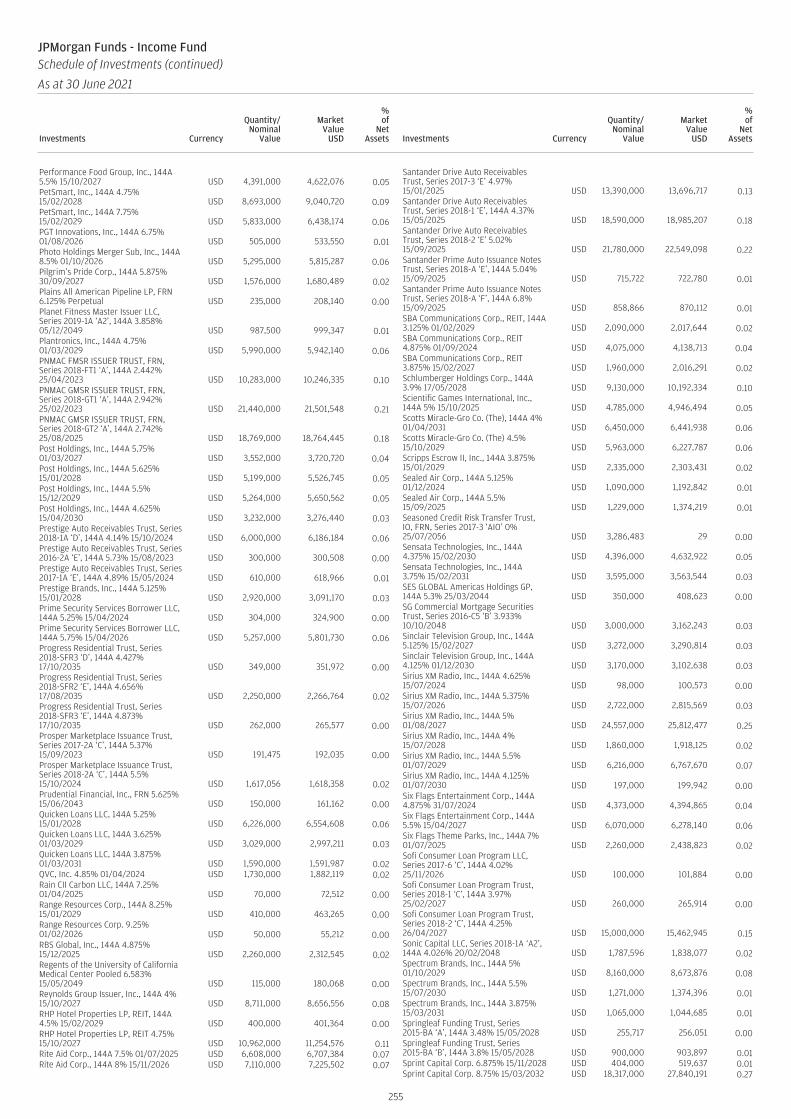
Performance Food Group, Inc., 144A5.5% 15/10/2027 USD 4,391,000 4,622,076 0.05PetSmart, Inc., 144A 4.75%15/02/2028 USD 8,693,000 9,040,720 0.09PetSmart, Inc., 144A 7.75%15/02/2029 USD 5,833,000 6,438,174 0.06PGT Innovations, Inc., 144A 6.75%01/08/2026 USD 505,000 533,550 0.01Photo Holdings Merger Sub, Inc., 144A8.5% 01/10/2026 USD 5,295,000 5,815,287 0.06Pilgrim’s Pride Corp., 144A 5.875%30/09/2027 USD 1,576,000 1,680,489 0.02Plains All American Pipeline LP, FRN6.125% Perpetual USD 235,000 208,140 0.00Planet Fitness Master Issuer LLC,Series 2019-1A ‘A2’, 144A 3.858%05/12/2049 USD 987,500 999,347 0.01Plantronics, Inc., 144A 4.75%01/03/2029 USD 5,990,000 5,942,140 0.06PNMAC FMSR ISSUER TRUST, FRN,Series 2018-FT1 ‘A’, 144A 2.442%25/04/2023 USD 10,283,000 10,246,335 0.10PNMAC GMSR ISSUER TRUST, FRN,Series 2018-GT1 ‘A’, 144A 2.942%25/02/2023 USD 21,440,000 21,501,548 0.21PNMAC GMSR ISSUER TRUST, FRN,Series 2018-GT2 ‘A’, 144A 2.742%25/08/2025 USD 18,769,000 18,764,445 0.18Post Holdings, Inc., 144A 5.75%01/03/2027 USD 3,552,000 3,720,720 0.04Post Holdings, Inc., 144A 5.625%15/01/2028 USD 5,199,000 5,526,745 0.05Post Holdings, Inc., 144A 5.5%15/12/2029 USD 5,264,000 5,650,562 0.05Post Holdings, Inc., 144A 4.625%15/04/2030 USD 3,232,000 3,276,440 0.03Prestige Auto Receivables Trust, Series2018-1A ‘D’, 144A 4.14% 15/10/2024 USD 6,000,000 6,186,184 0.06Prestige Auto Receivables Trust, Series2016-2A ‘E’, 144A 5.73% 15/08/2023 USD 300,000 300,508 0.00Prestige Auto Receivables Trust, Series2017-1A ‘E’, 144A 4.89% 15/05/2024 USD 610,000 618,966 0.01Prestige Brands, Inc., 144A 5.125%15/01/2028 USD 2,920,000 3,091,170 0.03Prime Security Services Borrower LLC,144A 5.25% 15/04/2024 USD 304,000 324,900 0.00Prime Security Services Borrower LLC,144A 5.75% 15/04/2026 USD 5,257,000 5,801,730 0.06Progress Residential Trust, Series2018-SFR3 ‘D’, 144A 4.427%17/10/2035 USD 349,000 351,972 0.00Progress Residential Trust, Series2018-SFR2 ‘E’, 144A 4.656%17/08/2035 USD 2,250,000 2,266,764 0.02Progress Residential Trust, Series2018-SFR3 ‘E’, 144A 4.873%17/10/2035 USD 262,000 265,577 0.00Prosper Marketplace Issuance Trust,Series 2017-2A ‘C’, 144A 5.37%15/09/2023 USD 191,475 192,035 0.00Prosper Marketplace Issuance Trust,Series 2018-2A ‘C’, 144A 5.5%15/10/2024 USD 1,617,056 1,618,358 0.02Prudential Financial, Inc., FRN 5.625%15/06/2043 USD 150,000 161,162 0.00Quicken Loans LLC, 144A 5.25%15/01/2028 USD 6,226,000 6,554,608 0.06Quicken Loans LLC, 144A 3.625%01/03/2029 USD 3,029,000 2,997,211 0.03Quicken Loans LLC, 144A 3.875%01/03/2031 USD 1,590,000 1,591,987 0.02QVC, Inc. 4.85% 01/04/2024 USD 1,730,000 1,882,119 0.02Rain CII Carbon LLC, 144A 7.25%01/04/2025 USD 70,000 72,512 0.00Range Resources Corp., 144A 8.25%15/01/2029 USD 410,000 463,265 0.00Range Resources Corp. 9.25%01/02/2026 USD 50,000 55,212 0.00RBS Global, Inc., 144A 4.875%15/12/2025 USD 2,260,000 2,312,545 0.02Regents of the University of CaliforniaMedical Center Pooled 6.583%15/05/2049 USD 115,000 180,068 0.00Reynolds Group Issuer, Inc., 144A 4%15/10/2027 USD 8,711,000 8,656,556 0.08RHP Hotel Properties LP, REIT, 144A4.5% 15/02/2029 USD 400,000 401,364 0.00RHP Hotel Properties LP, REIT 4.75%15/10/2027 USD 10,962,000 11,254,576 0.11Rite Aid Corp., 144A 7.5% 01/07/2025 USD 6,608,000 6,707,384 0.07Rite Aid Corp., 144A 8% 15/11/2026 USD 7,110,000 7,225,502 0.07
Santander Drive Auto ReceivablesTrust, Series 2017-3 ‘E’ 4.97%15/01/2025 USD 13,390,000 13,696,717 0.13Santander Drive Auto ReceivablesTrust, Series 2018-1 ‘E’, 144A 4.37%15/05/2025 USD 18,590,000 18,985,207 0.18Santander Drive Auto ReceivablesTrust, Series 2018-2 ‘E’ 5.02%15/09/2025 USD 21,780,000 22,549,098 0.22Santander Prime Auto Issuance NotesTrust, Series 2018-A ‘E’, 144A 5.04%15/09/2025 USD 715,722 722,780 0.01Santander Prime Auto Issuance NotesTrust, Series 2018-A ‘F’, 144A 6.8%15/09/2025 USD 858,866 870,112 0.01SBA Communications Corp., REIT, 144A3.125% 01/02/2029 USD 2,090,000 2,017,644 0.02SBA Communications Corp., REIT4.875% 01/09/2024 USD 4,075,000 4,138,713 0.04SBA Communications Corp., REIT3.875% 15/02/2027 USD 1,960,000 2,016,291 0.02Schlumberger Holdings Corp., 144A3.9% 17/05/2028 USD 9,130,000 10,192,334 0.10Scientific Games International, Inc.,144A 5% 15/10/2025 USD 4,785,000 4,946,494 0.05Scotts Miracle-Gro Co. (The), 144A 4%01/04/2031 USD 6,450,000 6,441,938 0.06Scotts Miracle-Gro Co. (The) 4.5%15/10/2029 USD 5,963,000 6,227,787 0.06Scripps Escrow II, Inc., 144A 3.875%15/01/2029 USD 2,335,000 2,303,431 0.02Sealed Air Corp., 144A 5.125%01/12/2024 USD 1,090,000 1,192,842 0.01Sealed Air Corp., 144A 5.5%15/09/2025 USD 1,229,000 1,374,219 0.01Seasoned Credit Risk Transfer Trust,IO, FRN, Series 2017-3 ‘AIO’ 0%25/07/2056 USD 3,286,483 29 0.00Sensata Technologies, Inc., 144A4.375% 15/02/2030 USD 4,396,000 4,632,922 0.05Sensata Technologies, Inc., 144A3.75% 15/02/2031 USD 3,595,000 3,563,544 0.03SES GLOBAL Americas Holdings GP,144A 5.3% 25/03/2044 USD 350,000 408,623 0.00SG Commercial Mortgage SecuritiesTrust, Series 2016-C5 ‘B’ 3.933%10/10/2048 USD 3,000,000 3,162,243 0.03Sinclair Television Group, Inc., 144A5.125% 15/02/2027 USD 3,272,000 3,290,814 0.03Sinclair Television Group, Inc., 144A4.125% 01/12/2030 USD 3,170,000 3,102,638 0.03Sirius XM Radio, Inc., 144A 4.625%15/07/2024 USD 98,000 100,573 0.00Sirius XM Radio, Inc., 144A 5.375%15/07/2026 USD 2,722,000 2,815,569 0.03Sirius XM Radio, Inc., 144A 5%01/08/2027 USD 24,557,000 25,812,477 0.25Sirius XM Radio, Inc., 144A 4%15/07/2028 USD 1,860,000 1,918,125 0.02Sirius XM Radio, Inc., 144A 5.5%01/07/2029 USD 6,216,000 6,767,670 0.07Sirius XM Radio, Inc., 144A 4.125%01/07/2030 USD 197,000 199,942 0.00Six Flags Entertainment Corp., 144A4.875% 31/07/2024 USD 4,373,000 4,394,865 0.04Six Flags Entertainment Corp., 144A5.5% 15/04/2027 USD 6,070,000 6,278,140 0.06Six Flags Theme Parks, Inc., 144A 7%01/07/2025 USD 2,260,000 2,438,823 0.02Sofi Consumer Loan Program LLC,Series 2017-6 ‘C’, 144A 4.02%25/11/2026 USD 100,000 101,884 0.00Sofi Consumer Loan Program Trust,Series 2018-1 ‘C’, 144A 3.97%25/02/2027 USD 260,000 265,914 0.00Sofi Consumer Loan Program Trust,Series 2018-2 ‘C’, 144A 4.25%26/04/2027 USD 15,000,000 15,462,945 0.15Sonic Capital LLC, Series 2018-1A ‘A2’,144A 4.026% 20/02/2048 USD 1,787,596 1,838,077 0.02Spectrum Brands, Inc., 144A 5%01/10/2029 USD 8,160,000 8,673,876 0.08Spectrum Brands, Inc., 144A 5.5%15/07/2030 USD 1,271,000 1,374,396 0.01Spectrum Brands, Inc., 144A 3.875%15/03/2031 USD 1,065,000 1,044,685 0.01Springleaf Funding Trust, Series2015-BA ‘A’, 144A 3.48% 15/05/2028 USD 255,717 256,051 0.00Springleaf Funding Trust, Series2015-BA ‘B’, 144A 3.8% 15/05/2028 USD 900,000 903,897 0.01Sprint Capital Corp. 6.875% 15/11/2028 USD 404,000 519,637 0.01Sprint Capital Corp. 8.75% 15/03/2032 USD 18,317,000 27,840,191 0.27
255
JPMorgan Funds - Income FundSchedule of Investments (continued)
As at 30 June 2021
Investments Currency
Quantity/Nominal
Value
MarketValue
USD
%of
NetAssets Investments Currency
Quantity/Nominal
Value
MarketValue
USD
%of
NetAssets

Sprint Communications, Inc. 11.5%15/11/2021 USD 1,775,000 1,841,101 0.02Sprint Corp. 7.875% 15/09/2023 USD 5,528,000 6,292,799 0.06Sprint Corp. 7.125% 15/06/2024 USD 4,304,000 4,975,067 0.05Sprint Corp. 7.625% 15/02/2025 USD 4,251,000 5,053,376 0.05Sprint Corp. 7.625% 01/03/2026 USD 30,482,000 37,223,704 0.36Sprint Corp. 7.25% 15/09/2021 USD 110,000 111,604 0.00SPX FLOW, Inc., 144A 5.875%15/08/2026 USD 2,240,000 2,320,248 0.02Square, Inc., 144A 2.75% 01/06/2026 USD 3,829,000 3,891,106 0.04Square, Inc., 144A 3.5% 01/06/2031 USD 3,895,000 3,933,950 0.04SRS Distribution, Inc., 144A 4.625%01/07/2028 USD 3,130,000 3,204,337 0.03SRS Distribution, Inc., 144A 6.125%01/07/2029 USD 785,000 809,673 0.01SS&C Technologies, Inc., 144A 5.5%30/09/2027 USD 8,897,000 9,451,283 0.09STACR Trust, FRN, Series 2018-DNA3‘B1’, 144A 3.992% 25/09/2048 USD 2,700,000 2,794,785 0.03STACR Trust, FRN, Series 2018-HRP1‘B1’, 144A 3.842% 25/04/2043 USD 2,170,000 2,233,911 0.02STACR Trust, FRN, Series 2018-DNA3‘M2’, 144A 2.192% 25/09/2048 USD 5,000,000 5,070,118 0.05STACR Trust, FRN, Series 2018-HRP1‘M2’, 144A 1.742% 25/04/2043 USD 1,887,215 1,890,496 0.02STACR Trust, FRN, Series 2018-HRP2‘M3’, 144A 2.492% 25/02/2047 USD 20,990,000 21,401,488 0.21Standard Industries, Inc., 144A 5%15/02/2027 USD 500,000 518,450 0.01Standard Industries, Inc., 144A 4.75%15/01/2028 USD 9,242,000 9,685,616 0.09Standard Industries, Inc., 144A 4.375%15/07/2030 USD 225,000 231,290 0.00Standard Industries, Inc., 144A 3.375%15/01/2031 USD 1,364,000 1,304,461 0.01Staples, Inc., 144A 7.5% 15/04/2026 USD 9,135,000 9,500,537 0.09Staples, Inc., 144A 10.75% 15/04/2027 USD 4,518,000 4,621,575 0.05Station Casinos LLC, 144A 5%01/10/2025 USD 1,732,000 1,763,159 0.02Station Casinos LLC, 144A 4.5%15/02/2028 USD 1,095,000 1,113,013 0.01Stericycle, Inc., 144A 5.375%15/07/2024 USD 180,000 185,082 0.00Stericycle, Inc., 144A 3.875%15/01/2029 USD 4,929,000 4,936,467 0.05Structured Adjustable Rate MortgageLoan Trust, FRN, Series 2007-9 ‘1A1’1.706% 25/10/2037 USD 2,288,097 2,327,791 0.02Structured Asset MortgageInvestments II Trust, FRN, Series2007-AR7 ‘1A1’ 0.942% 25/05/2047 USD 8,205,593 7,282,105 0.07Summit Materials LLC, 144A 5.125%01/06/2025 USD 175,000 176,829 0.00Summit Materials LLC, 144A 6.5%15/03/2027 USD 1,265,000 1,332,893 0.01Summit Materials LLC, 144A 5.25%15/01/2029 USD 1,470,000 1,560,273 0.02Sunoco LP, 144A 4.5% 15/05/2029 USD 1,470,000 1,503,839 0.01Sunoco LP 6% 15/04/2027 USD 1,250,000 1,308,281 0.01Switch Ltd., 144A 3.75% 15/09/2028 USD 1,343,000 1,362,474 0.01Switch Ltd., 144A 4.125% 15/06/2029 USD 1,360,000 1,397,400 0.01Tallgrass Energy Partners LP, 144A5.5% 15/09/2024 USD 3,883,000 3,952,894 0.04Tallgrass Energy Partners LP, 144A7.5% 01/10/2025 USD 4,959,000 5,421,774 0.05Tallgrass Energy Partners LP, 144A 6%01/03/2027 USD 2,450,000 2,519,213 0.02Tallgrass Energy Partners LP, 144A5.5% 15/01/2028 USD 509,000 516,055 0.01Targa Resources Partners LP, 144A4.875% 01/02/2031 USD 2,177,000 2,354,132 0.02Targa Resources Partners LP, 144A 4%15/01/2032 USD 1,673,000 1,719,175 0.02Targa Resources Partners LP 5.375%01/02/2027 USD 1,910,000 1,998,395 0.02Targa Resources Partners LP 6.5%15/07/2027 USD 2,659,000 2,893,364 0.03Targa Resources Partners LP 5%15/01/2028 USD 2,928,000 3,092,700 0.03Targa Resources Partners LP 6.875%15/01/2029 USD 1,060,000 1,196,348 0.01Targa Resources Partners LP 5.5%01/03/2030 USD 3,195,000 3,510,858 0.03Team Health Holdings, Inc., 144A6.375% 01/02/2025 USD 547,000 521,253 0.01TEGNA, Inc. 4.625% 15/03/2028 USD 1,580,000 1,641,225 0.02TEGNA, Inc. 5% 15/09/2029 USD 2,980,000 3,112,789 0.03Teleflex, Inc., 144A 4.25% 01/06/2028 USD 1,000,000 1,044,070 0.01Tempur Sealy International, Inc., 144A4% 15/04/2029 USD 6,390,000 6,475,690 0.06
Tenet Healthcare Corp., 144A 4.625%01/09/2024 USD 346,000 355,342 0.00Tenet Healthcare Corp., 144A 4.875%01/01/2026 USD 12,414,000 12,886,601 0.13Tenet Healthcare Corp., 144A 6.25%01/02/2027 USD 9,090,000 9,510,413 0.09Tenet Healthcare Corp., 144A 5.125%01/11/2027 USD 10,800,000 11,311,002 0.11Tenet Healthcare Corp., 144A 4.625%15/06/2028 USD 4,869,000 5,006,826 0.05Tenet Healthcare Corp., 144A 4.25%01/06/2029 USD 2,590,000 2,622,375 0.03Tenneco, Inc., 144A 7.875%15/01/2029 USD 1,519,000 1,710,417 0.02Tenneco, Inc., 144A 5.125%15/04/2029 USD 675,000 694,450 0.01TerraForm Power Operating LLC, 144A4.25% 31/01/2023 USD 124,000 127,428 0.00TerraForm Power Operating LLC, 144A5% 31/01/2028 USD 84,000 88,875 0.00Tesla Auto Lease Trust, Series 2018-B‘E’, 144A 7.87% 20/06/2022 USD 1,000,000 1,015,920 0.01T-Mobile USA, Inc. 4.5% 01/02/2026 USD 1,186,000 1,217,654 0.01T-Mobile USA, Inc. 2.25% 15/02/2026 USD 1,676,000 1,690,665 0.02T-Mobile USA, Inc. 4.75% 01/02/2028 USD 12,266,000 13,169,253 0.13Toorak Mortgage Corp. Ltd., STEP,Series 2018-1 ‘A1’, 144A 4.336%25/08/2021 USD 160,176 160,682 0.00Travel + Leisure Co. 6% 01/04/2027 USD 616,000 681,810 0.01TriMas Corp., 144A 4.125% 15/04/2029 USD 360,000 364,381 0.00Triton Water Holdings, Inc., 144A6.25% 01/04/2029 USD 3,990,000 4,005,421 0.04Triumph Group, Inc., 144A 8.875%01/06/2024 USD 866,000 964,512 0.01Triumph Group, Inc., 144A 6.25%15/09/2024 USD 420,000 427,879 0.00UBS Commercial Mortgage Trust, FRN,Series 2018-C11 ‘B’ 4.713% 15/06/2051 USD 2,500,000 2,814,392 0.03UBS Commercial Mortgage Trust,Series 2017-C1 ‘C’ 4.44% 15/06/2050 USD 5,235,000 5,220,971 0.05UBS Commercial Mortgage Trust, FRN,Series 2017-C2 ‘C’ 4.295% 15/08/2050 USD 7,250,000 7,712,820 0.07UBS Commercial Mortgage Trust, FRN,Series 2017-C5 ‘C’ 4.312% 15/11/2050 USD 4,000,000 4,238,943 0.04UBS Commercial Mortgage Trust, IO,FRN, Series 2018-C10 ‘XB’ 0.335%15/05/2051 USD 112,302,000 2,488,758 0.02UBS Commercial Mortgage Trust, IO,FRN, Series 2018-C11 ‘XB’ 0.251%15/06/2051 USD 43,441,000 953,669 0.01UBS-Barclays Commercial MortgageTrust, FRN, Series 2012-C3 ‘D’, 144A5.031% 10/08/2049 USD 4,827,000 4,948,031 0.05UMBS BM5088 5.5% 01/10/2038 USD 3,323,530 3,754,723 0.04UMBS MA3972 4.5% 01/03/2050 USD 4,115,372 4,443,918 0.04United Airlines, Inc., 144A 4.375%15/04/2026 USD 3,333,000 3,457,988 0.03Univision Communications, Inc., 144A4.5% 01/05/2029 USD 1,880,000 1,894,457 0.02US Auto Funding LLC, Series 2018-1A‘B’, 144A 7.5% 15/07/2023 USD 828,987 845,036 0.01Vail Resorts, Inc., 144A 6.25%15/05/2025 USD 4,306,000 4,625,204 0.05Velocity Commercial Capital LoanTrust, FRN, Series 2018-2 ‘A’, 144A4.05% 26/10/2048 USD 2,762,127 2,870,548 0.03Verizon Communications, Inc. 4.016%03/12/2029 USD 1,160,000 1,332,979 0.01Veros Automobile Receivables Trust,Series 2018-1 ‘D’, 144A 5.74%15/08/2025 USD 1,000,000 1,006,828 0.01ViacomCBS, Inc., FRN 5.875%28/02/2057 USD 236,000 240,244 0.00ViacomCBS, Inc., FRN 6.25%28/02/2057 USD 1,427,000 1,635,963 0.02VICI Properties LP, REIT, 144A 3.5%15/02/2025 USD 555,000 569,294 0.01VICI Properties LP, REIT, 144A 4.25%01/12/2026 USD 6,315,000 6,559,706 0.06VICI Properties LP, REIT, 144A 3.75%15/02/2027 USD 6,190,000 6,326,582 0.06VICI Properties LP, REIT, 144A 4.625%01/12/2029 USD 2,567,000 2,726,154 0.03VICI Properties LP, REIT, 144A 4.125%15/08/2030 USD 4,695,000 4,834,254 0.05Vine Energy Holdings LLC, 144A 6.75%15/04/2029 USD 4,050,000 4,267,688 0.04Vista Outdoor, Inc., 144A 4.5%15/03/2029 USD 3,836,000 3,896,264 0.04Vistra Operations Co. LLC, 144A 5.5%01/09/2026 USD 205,000 212,002 0.00
256
JPMorgan Funds - Income FundSchedule of Investments (continued)
As at 30 June 2021
Investments Currency
Quantity/Nominal
Value
MarketValue
USD
%of
NetAssets Investments Currency
Quantity/Nominal
Value
MarketValue
USD
%of
NetAssets
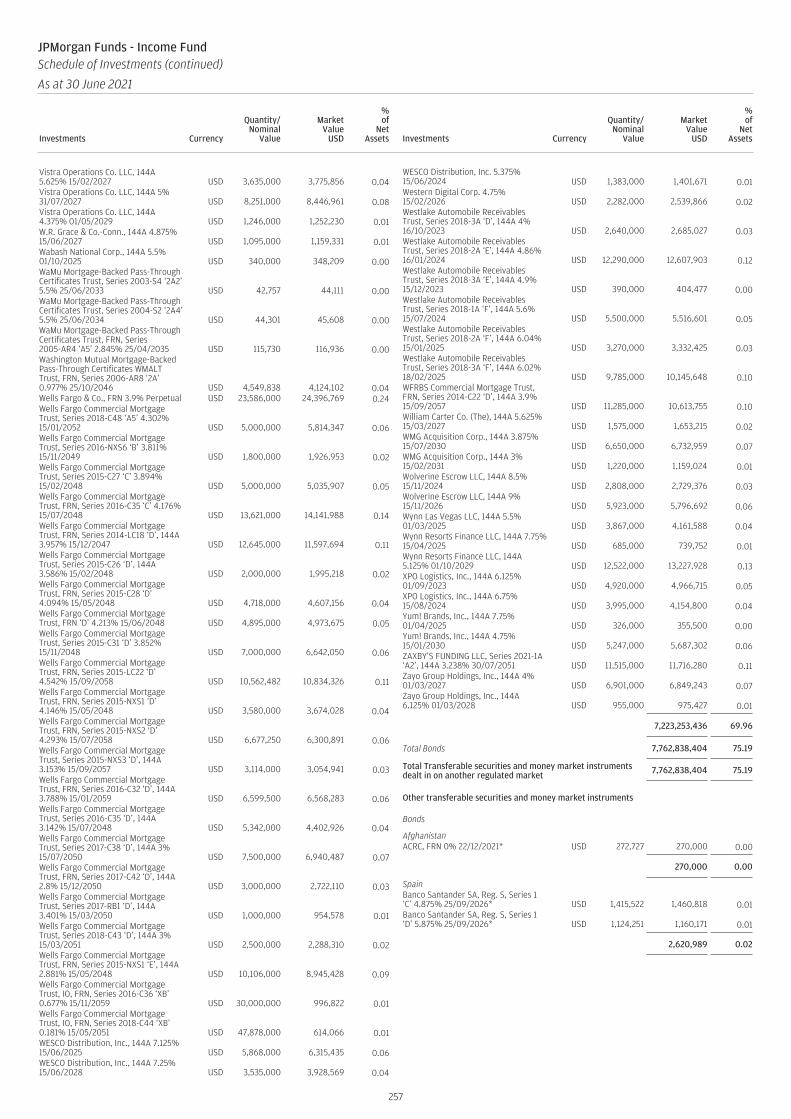
Vistra Operations Co. LLC, 144A5.625% 15/02/2027 USD 3,635,000 3,775,856 0.04Vistra Operations Co. LLC, 144A 5%31/07/2027 USD 8,251,000 8,446,961 0.08Vistra Operations Co. LLC, 144A4.375% 01/05/2029 USD 1,246,000 1,252,230 0.01W.R. Grace & Co.-Conn., 144A 4.875%15/06/2027 USD 1,095,000 1,159,331 0.01Wabash National Corp., 144A 5.5%01/10/2025 USD 340,000 348,209 0.00WaMu Mortgage-Backed Pass-ThroughCertificates Trust, Series 2003-S4 ‘2A2’5.5% 25/06/2033 USD 42,757 44,111 0.00WaMu Mortgage-Backed Pass-ThroughCertificates Trust, Series 2004-S2 ‘2A4’5.5% 25/06/2034 USD 44,301 45,608 0.00WaMu Mortgage-Backed Pass-ThroughCertificates Trust, FRN, Series2005-AR4 ‘A5’ 2.845% 25/04/2035 USD 115,730 116,936 0.00Washington Mutual Mortgage-BackedPass-Through Certificates WMALTTrust, FRN, Series 2006-AR8 ‘2A’0.977% 25/10/2046 USD 4,549,838 4,124,102 0.04Wells Fargo & Co., FRN 3.9% Perpetual USD 23,586,000 24,396,769 0.24Wells Fargo Commercial MortgageTrust, Series 2018-C48 ‘A5’ 4.302%15/01/2052 USD 5,000,000 5,814,347 0.06Wells Fargo Commercial MortgageTrust, Series 2016-NXS6 ‘B’ 3.811%15/11/2049 USD 1,800,000 1,926,953 0.02Wells Fargo Commercial MortgageTrust, Series 2015-C27 ‘C’ 3.894%15/02/2048 USD 5,000,000 5,035,907 0.05Wells Fargo Commercial MortgageTrust, FRN, Series 2016-C35 ‘C’ 4.176%15/07/2048 USD 13,621,000 14,141,988 0.14Wells Fargo Commercial MortgageTrust, FRN, Series 2014-LC18 ‘D’, 144A3.957% 15/12/2047 USD 12,645,000 11,597,694 0.11Wells Fargo Commercial MortgageTrust, Series 2015-C26 ‘D’, 144A3.586% 15/02/2048 USD 2,000,000 1,995,218 0.02Wells Fargo Commercial MortgageTrust, FRN, Series 2015-C28 ‘D’4.094% 15/05/2048 USD 4,718,000 4,607,156 0.04Wells Fargo Commercial MortgageTrust, FRN ‘D’ 4.213% 15/06/2048 USD 4,895,000 4,973,675 0.05Wells Fargo Commercial MortgageTrust, Series 2015-C31 ‘D’ 3.852%15/11/2048 USD 7,000,000 6,642,050 0.06Wells Fargo Commercial MortgageTrust, FRN, Series 2015-LC22 ‘D’4.542% 15/09/2058 USD 10,562,482 10,834,326 0.11Wells Fargo Commercial MortgageTrust, FRN, Series 2015-NXS1 ‘D’4.146% 15/05/2048 USD 3,580,000 3,674,028 0.04Wells Fargo Commercial MortgageTrust, FRN, Series 2015-NXS2 ‘D’4.293% 15/07/2058 USD 6,677,250 6,300,891 0.06Wells Fargo Commercial MortgageTrust, Series 2015-NXS3 ‘D’, 144A3.153% 15/09/2057 USD 3,114,000 3,054,941 0.03Wells Fargo Commercial MortgageTrust, FRN, Series 2016-C32 ‘D’, 144A3.788% 15/01/2059 USD 6,599,500 6,568,283 0.06Wells Fargo Commercial MortgageTrust, Series 2016-C35 ‘D’, 144A3.142% 15/07/2048 USD 5,342,000 4,402,926 0.04Wells Fargo Commercial MortgageTrust, Series 2017-C38 ‘D’, 144A 3%15/07/2050 USD 7,500,000 6,940,487 0.07Wells Fargo Commercial MortgageTrust, FRN, Series 2017-C42 ‘D’, 144A2.8% 15/12/2050 USD 3,000,000 2,722,110 0.03Wells Fargo Commercial MortgageTrust, Series 2017-RB1 ‘D’, 144A3.401% 15/03/2050 USD 1,000,000 954,578 0.01Wells Fargo Commercial MortgageTrust, Series 2018-C43 ‘D’, 144A 3%15/03/2051 USD 2,500,000 2,288,310 0.02Wells Fargo Commercial MortgageTrust, FRN, Series 2015-NXS1 ‘E’, 144A2.881% 15/05/2048 USD 10,106,000 8,945,428 0.09Wells Fargo Commercial MortgageTrust, IO, FRN, Series 2016-C36 ‘XB’0.677% 15/11/2059 USD 30,000,000 996,822 0.01Wells Fargo Commercial MortgageTrust, IO, FRN, Series 2018-C44 ‘XB’0.181% 15/05/2051 USD 47,878,000 614,066 0.01WESCO Distribution, Inc., 144A 7.125%15/06/2025 USD 5,868,000 6,315,435 0.06WESCO Distribution, Inc., 144A 7.25%15/06/2028 USD 3,535,000 3,928,569 0.04
WESCO Distribution, Inc. 5.375%15/06/2024 USD 1,383,000 1,401,671 0.01Western Digital Corp. 4.75%15/02/2026 USD 2,282,000 2,539,866 0.02Westlake Automobile ReceivablesTrust, Series 2018-3A ‘D’, 144A 4%16/10/2023 USD 2,640,000 2,685,027 0.03Westlake Automobile ReceivablesTrust, Series 2018-2A ‘E’, 144A 4.86%16/01/2024 USD 12,290,000 12,607,903 0.12Westlake Automobile ReceivablesTrust, Series 2018-3A ‘E’, 144A 4.9%15/12/2023 USD 390,000 404,477 0.00Westlake Automobile ReceivablesTrust, Series 2018-1A ‘F’, 144A 5.6%15/07/2024 USD 5,500,000 5,516,601 0.05Westlake Automobile ReceivablesTrust, Series 2018-2A ‘F’, 144A 6.04%15/01/2025 USD 3,270,000 3,332,425 0.03Westlake Automobile ReceivablesTrust, Series 2018-3A ‘F’, 144A 6.02%18/02/2025 USD 9,785,000 10,145,648 0.10WFRBS Commercial Mortgage Trust,FRN, Series 2014-C22 ‘D’, 144A 3.9%15/09/2057 USD 11,285,000 10,613,755 0.10William Carter Co. (The), 144A 5.625%15/03/2027 USD 1,575,000 1,653,215 0.02WMG Acquisition Corp., 144A 3.875%15/07/2030 USD 6,650,000 6,732,959 0.07WMG Acquisition Corp., 144A 3%15/02/2031 USD 1,220,000 1,159,024 0.01Wolverine Escrow LLC, 144A 8.5%15/11/2024 USD 2,808,000 2,729,376 0.03Wolverine Escrow LLC, 144A 9%15/11/2026 USD 5,923,000 5,796,692 0.06Wynn Las Vegas LLC, 144A 5.5%01/03/2025 USD 3,867,000 4,161,588 0.04Wynn Resorts Finance LLC, 144A 7.75%15/04/2025 USD 685,000 739,752 0.01Wynn Resorts Finance LLC, 144A5.125% 01/10/2029 USD 12,522,000 13,227,928 0.13XPO Logistics, Inc., 144A 6.125%01/09/2023 USD 4,920,000 4,966,715 0.05XPO Logistics, Inc., 144A 6.75%15/08/2024 USD 3,995,000 4,154,800 0.04Yum! Brands, Inc., 144A 7.75%01/04/2025 USD 326,000 355,500 0.00Yum! Brands, Inc., 144A 4.75%15/01/2030 USD 5,247,000 5,687,302 0.06ZAXBY’S FUNDING LLC, Series 2021-1A‘A2’, 144A 3.238% 30/07/2051 USD 11,515,000 11,716,280 0.11Zayo Group Holdings, Inc., 144A 4%01/03/2027 USD 6,901,000 6,849,243 0.07Zayo Group Holdings, Inc., 144A6.125% 01/03/2028 USD 955,000 975,427 0.01
7,223,253,436 69.96
Total Bonds 7,762,838,404 75.19
Total Transferable securities and money market instrumentsdealt in on another regulated market 7,762,838,404 75.19
Other transferable securities and money market instruments
Bonds
AfghanistanACRC, FRN 0% 22/12/2021* USD 272,727 270,000 0.00
270,000 0.00
SpainBanco Santander SA, Reg. S, Series 1‘C’ 4.875% 25/09/2026* USD 1,415,522 1,460,818 0.01Banco Santander SA, Reg. S, Series 1‘D’ 5.875% 25/09/2026* USD 1,124,251 1,160,171 0.01
2,620,989 0.02
257
JPMorgan Funds - Income FundSchedule of Investments (continued)
As at 30 June 2021
Investments Currency
Quantity/Nominal
Value
MarketValue
USD
%of
NetAssets Investments Currency
Quantity/Nominal
Value
MarketValue
USD
%of
NetAssets
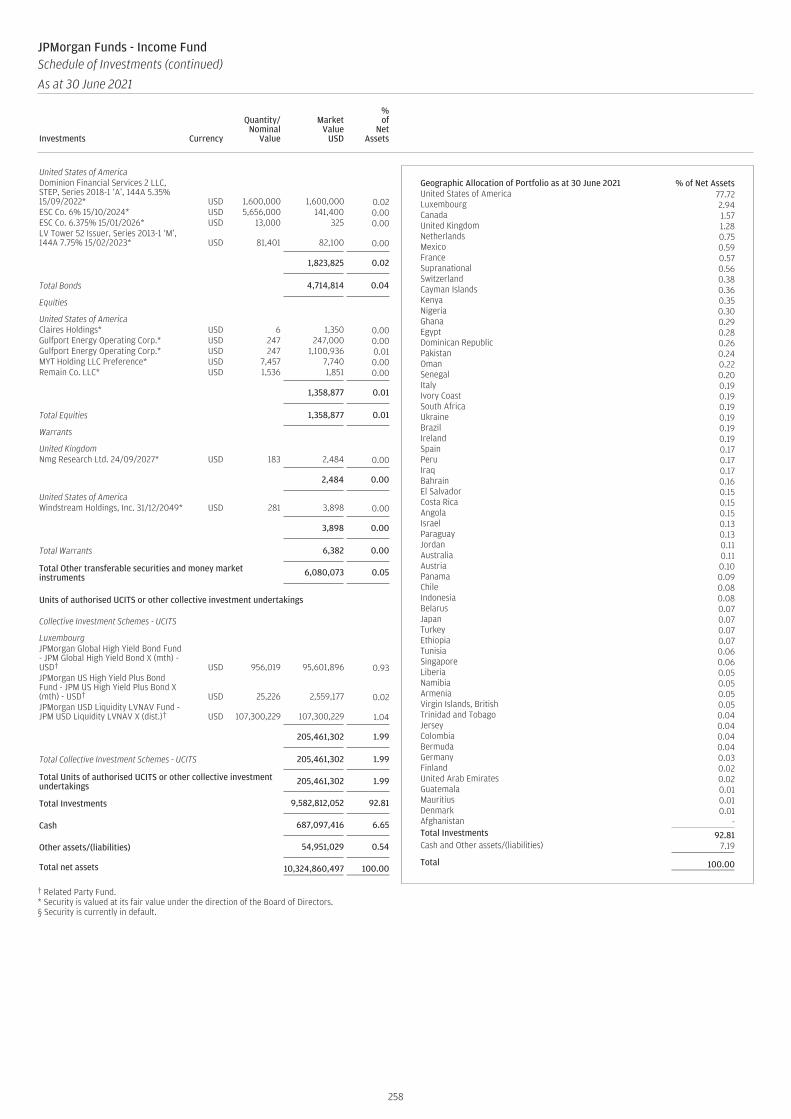
United States of AmericaDominion Financial Services 2 LLC,STEP, Series 2018-1 ‘A’, 144A 5.35%15/09/2022* USD 1,600,000 1,600,000 0.02ESC Co. 6% 15/10/2024* USD 5,656,000 141,400 0.00ESC Co. 6.375% 15/01/2026* USD 13,000 325 0.00LV Tower 52 Issuer, Series 2013-1 ‘M’,144A 7.75% 15/02/2023* USD 81,401 82,100 0.00
1,823,825 0.02
Total Bonds 4,714,814 0.04
Equities
United States of AmericaClaires Holdings* USD 6 1,350 0.00Gulfport Energy Operating Corp.* USD 247 247,000 0.00Gulfport Energy Operating Corp.* USD 247 1,100,936 0.01MYT Holding LLC Preference* USD 7,457 7,740 0.00Remain Co. LLC* USD 1,536 1,851 0.00
1,358,877 0.01
Total Equities 1,358,877 0.01
Warrants
United KingdomNmg Research Ltd. 24/09/2027* USD 183 2,484 0.00
2,484 0.00
United States of AmericaWindstream Holdings, Inc. 31/12/2049* USD 281 3,898 0.00
3,898 0.00
Total Warrants 6,382 0.00
Total Other transferable securities and money marketinstruments 6,080,073 0.05
Units of authorised UCITS or other collective investment undertakings
Collective Investment Schemes - UCITS
LuxembourgJPMorgan Global High Yield Bond Fund- JPM Global High Yield Bond X (mth) -USD† USD 956,019 95,601,896 0.93JPMorgan US High Yield Plus BondFund - JPM US High Yield Plus Bond X(mth) - USD† USD 25,226 2,559,177 0.02JPMorgan USD Liquidity LVNAV Fund -JPM USD Liquidity LVNAV X (dist.)† USD 107,300,229 107,300,229 1.04
205,461,302 1.99
Total Collective Investment Schemes - UCITS 205,461,302 1.99
Total Units of authorised UCITS or other collective investmentundertakings 205,461,302 1.99
Total Investments 9,582,812,052 92.81
Cash 687,097,416 6.65
Other assets/(liabilities) 54,951,029 0.54
Total net assets 10,324,860,497 100.00
† Related Party Fund.* Security is valued at its fair value under the direction of the Board of Directors.§ Security is currently in default.
Geographic Allocation of Portfolio as at 30 June 2021 % of Net AssetsUnited States of America 77.72Luxembourg 2.94Canada 1.57United Kingdom 1.28Netherlands 0.75Mexico 0.59France 0.57Supranational 0.56Switzerland 0.38Cayman Islands 0.36Kenya 0.35Nigeria 0.30Ghana 0.29Egypt 0.28Dominican Republic 0.26Pakistan 0.24Oman 0.22Senegal 0.20Italy 0.19Ivory Coast 0.19South Africa 0.19Ukraine 0.19Brazil 0.19Ireland 0.19Spain 0.17Peru 0.17Iraq 0.17Bahrain 0.16El Salvador 0.15Costa Rica 0.15Angola 0.15Israel 0.13Paraguay 0.13Jordan 0.11Australia 0.11Austria 0.10Panama 0.09Chile 0.08Indonesia 0.08Belarus 0.07Japan 0.07Turkey 0.07Ethiopia 0.07Tunisia 0.06Singapore 0.06Liberia 0.05Namibia 0.05Armenia 0.05Virgin Islands, British 0.05Trinidad and Tobago 0.04Jersey 0.04Colombia 0.04Bermuda 0.04Germany 0.03Finland 0.02United Arab Emirates 0.02Guatemala 0.01Mauritius 0.01Denmark 0.01Afghanistan -Total Investments 92.81Cash and Other assets/(liabilities) 7.19
Total 100.00
258
JPMorgan Funds - Income FundSchedule of Investments (continued)
As at 30 June 2021
Investments Currency
Quantity/Nominal
Value
MarketValue
USD
%of
NetAssets Investments Currency
Quantity/Nominal
Value
MarketValue
USD
%of
NetAssets
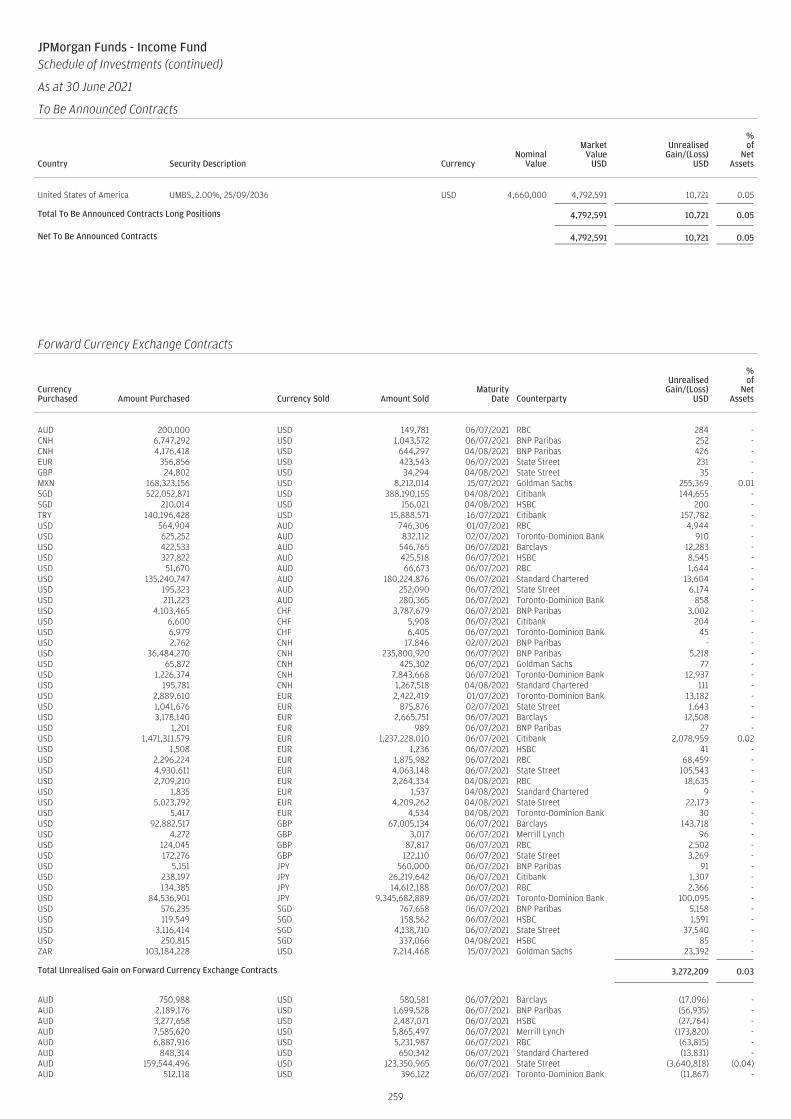
JPMorgan Funds - Income FundSchedule of Investments (continued)
As at 30 June 2021
To Be Announced Contracts
Country Security Description CurrencyNominal
Value
MarketValue
USD
UnrealisedGain/(Loss)
USD
%of
NetAssets
United States of America UMBS, 2.00%, 25/09/2036 USD 4,660,000 4,792,591 10,721 0.05
Total To Be Announced Contracts Long Positions 4,792,591 10,721 0.05
Net To Be Announced Contracts 4,792,591 10,721 0.05
JPMorgan Funds - Income FundSchedule of Investments (continued)
As at 30 June 2021
Forward Currency Exchange Contracts (continued)
CurrencyPurchased Amount Purchased Currency Sold Amount Sold
MaturityDate Counterparty
UnrealisedGain/(Loss)
USD
%of
NetAssets
AUD 200,000 USD 149,781 06/07/2021 RBC 284 -CNH 6,747,292 USD 1,043,572 06/07/2021 BNP Paribas 252 -CNH 4,176,418 USD 644,297 04/08/2021 BNP Paribas 426 -EUR 356,856 USD 423,543 06/07/2021 State Street 231 -GBP 24,802 USD 34,294 04/08/2021 State Street 35 -MXN 168,323,156 USD 8,212,014 15/07/2021 Goldman Sachs 255,369 0.01SGD 522,052,871 USD 388,190,155 04/08/2021 Citibank 144,655 -SGD 210,014 USD 156,021 04/08/2021 HSBC 200 -TRY 140,196,428 USD 15,888,571 16/07/2021 Citibank 157,782 -USD 564,904 AUD 746,306 01/07/2021 RBC 4,944 -USD 625,252 AUD 832,112 02/07/2021 Toronto-Dominion Bank 910 -USD 422,533 AUD 546,765 06/07/2021 Barclays 12,283 -USD 327,822 AUD 425,518 06/07/2021 HSBC 8,545 -USD 51,670 AUD 66,673 06/07/2021 RBC 1,644 -USD 135,240,747 AUD 180,224,876 06/07/2021 Standard Chartered 13,604 -USD 195,323 AUD 252,090 06/07/2021 State Street 6,174 -USD 211,223 AUD 280,365 06/07/2021 Toronto-Dominion Bank 858 -USD 4,103,465 CHF 3,787,679 06/07/2021 BNP Paribas 3,002 -USD 6,600 CHF 5,908 06/07/2021 Citibank 204 -USD 6,979 CHF 6,405 06/07/2021 Toronto-Dominion Bank 45 -USD 2,762 CNH 17,846 02/07/2021 BNP Paribas - -USD 36,484,270 CNH 235,800,920 06/07/2021 BNP Paribas 5,218 -USD 65,872 CNH 425,302 06/07/2021 Goldman Sachs 77 -USD 1,226,374 CNH 7,843,668 06/07/2021 Toronto-Dominion Bank 12,937 -USD 195,781 CNH 1,267,518 04/08/2021 Standard Chartered 111 -USD 2,889,610 EUR 2,422,419 01/07/2021 Toronto-Dominion Bank 13,182 -USD 1,041,676 EUR 875,876 02/07/2021 State Street 1,643 -USD 3,178,140 EUR 2,665,751 06/07/2021 Barclays 12,508 -USD 1,201 EUR 989 06/07/2021 BNP Paribas 27 -USD 1,471,311,579 EUR 1,237,228,010 06/07/2021 Citibank 2,078,959 0.02USD 1,508 EUR 1,236 06/07/2021 HSBC 41 -USD 2,296,224 EUR 1,875,982 06/07/2021 RBC 68,459 -USD 4,930,611 EUR 4,063,148 06/07/2021 State Street 105,543 -USD 2,709,210 EUR 2,264,334 04/08/2021 RBC 18,635 -USD 1,835 EUR 1,537 04/08/2021 Standard Chartered 9 -USD 5,023,792 EUR 4,209,262 04/08/2021 State Street 22,173 -USD 5,417 EUR 4,534 04/08/2021 Toronto-Dominion Bank 30 -USD 92,882,517 GBP 67,005,134 06/07/2021 Barclays 143,718 -USD 4,272 GBP 3,017 06/07/2021 Merrill Lynch 96 -USD 124,045 GBP 87,817 06/07/2021 RBC 2,502 -USD 172,276 GBP 122,110 06/07/2021 State Street 3,269 -USD 5,151 JPY 560,000 06/07/2021 BNP Paribas 91 -USD 238,197 JPY 26,219,642 06/07/2021 Citibank 1,307 -USD 134,385 JPY 14,612,188 06/07/2021 RBC 2,366 -USD 84,536,901 JPY 9,345,682,889 06/07/2021 Toronto-Dominion Bank 100,095 -USD 576,235 SGD 767,658 06/07/2021 BNP Paribas 5,158 -USD 119,549 SGD 158,562 06/07/2021 HSBC 1,591 -USD 3,116,414 SGD 4,138,710 06/07/2021 State Street 37,540 -USD 250,815 SGD 337,066 04/08/2021 HSBC 85 -ZAR 103,184,228 USD 7,214,468 15/07/2021 Goldman Sachs 23,392 -
Total Unrealised Gain on Forward Currency Exchange Contracts 3,272,209 0.03
AUD 750,988 USD 580,581 06/07/2021 Barclays (17,096) -AUD 2,189,176 USD 1,699,528 06/07/2021 BNP Paribas (56,935) -AUD 3,277,658 USD 2,487,071 06/07/2021 HSBC (27,764) -AUD 7,585,620 USD 5,865,497 06/07/2021 Merrill Lynch (173,820) -AUD 6,887,916 USD 5,231,987 06/07/2021 RBC (63,815) -AUD 848,314 USD 650,342 06/07/2021 Standard Chartered (13,831) -AUD 159,544,496 USD 123,350,965 06/07/2021 State Street (3,640,818) (0.04)AUD 512,118 USD 396,122 06/07/2021 Toronto-Dominion Bank (11,867) -
259
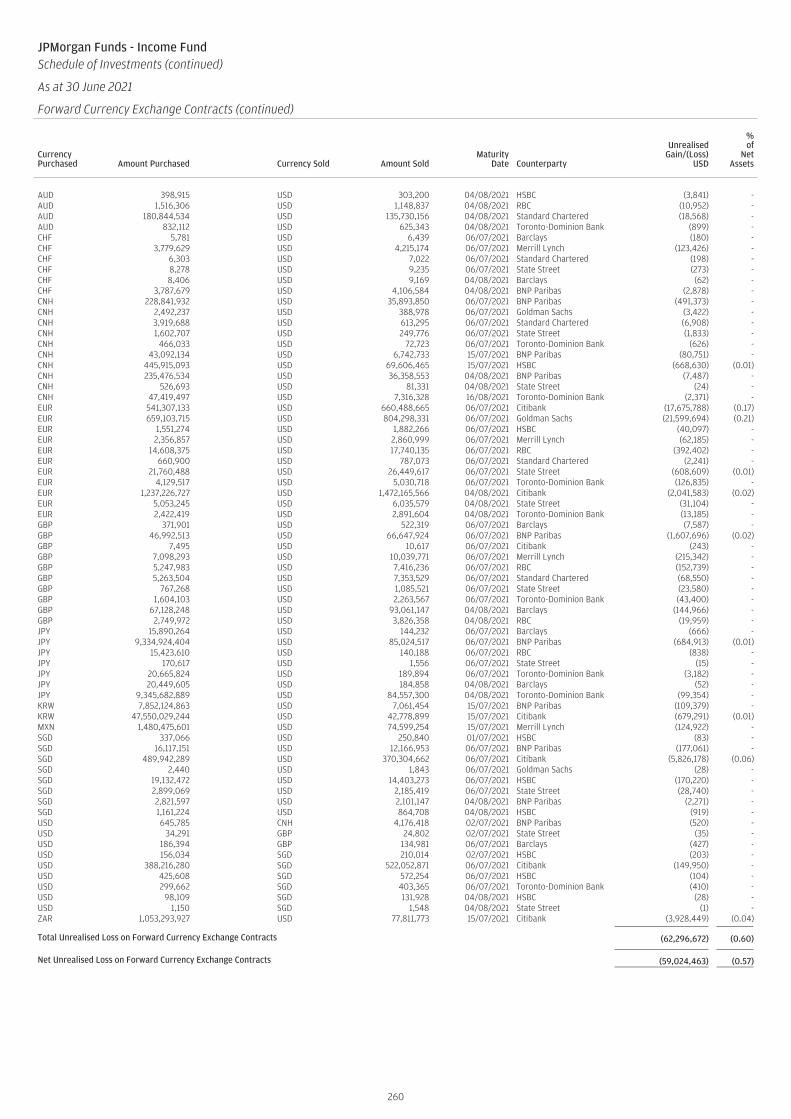
JPMorgan Funds - Income FundSchedule of Investments (continued)
As at 30 June 2021
Forward Currency Exchange Contracts (continued)
CurrencyPurchased Amount Purchased Currency Sold Amount Sold
MaturityDate Counterparty
UnrealisedGain/(Loss)
USD
%of
NetAssets
AUD 398,915 USD 303,200 04/08/2021 HSBC (3,841) -AUD 1,516,306 USD 1,148,837 04/08/2021 RBC (10,952) -AUD 180,844,534 USD 135,730,156 04/08/2021 Standard Chartered (18,568) -AUD 832,112 USD 625,343 04/08/2021 Toronto-Dominion Bank (899) -CHF 5,781 USD 6,439 06/07/2021 Barclays (180) -CHF 3,779,629 USD 4,215,174 06/07/2021 Merrill Lynch (123,426) -CHF 6,303 USD 7,022 06/07/2021 Standard Chartered (198) -CHF 8,278 USD 9,235 06/07/2021 State Street (273) -CHF 8,406 USD 9,169 04/08/2021 Barclays (62) -CHF 3,787,679 USD 4,106,584 04/08/2021 BNP Paribas (2,878) -CNH 228,841,932 USD 35,893,850 06/07/2021 BNP Paribas (491,373) -CNH 2,492,237 USD 388,978 06/07/2021 Goldman Sachs (3,422) -CNH 3,919,688 USD 613,295 06/07/2021 Standard Chartered (6,908) -CNH 1,602,707 USD 249,776 06/07/2021 State Street (1,833) -CNH 466,033 USD 72,723 06/07/2021 Toronto-Dominion Bank (626) -CNH 43,092,134 USD 6,742,733 15/07/2021 BNP Paribas (80,751) -CNH 445,915,093 USD 69,606,465 15/07/2021 HSBC (668,630) (0.01)CNH 235,476,534 USD 36,358,553 04/08/2021 BNP Paribas (7,487) -CNH 526,693 USD 81,331 04/08/2021 State Street (24) -CNH 47,419,497 USD 7,316,328 16/08/2021 Toronto-Dominion Bank (2,371) -EUR 541,307,133 USD 660,488,665 06/07/2021 Citibank (17,675,788) (0.17)EUR 659,103,715 USD 804,298,331 06/07/2021 Goldman Sachs (21,599,694) (0.21)EUR 1,551,274 USD 1,882,266 06/07/2021 HSBC (40,097) -EUR 2,356,857 USD 2,860,999 06/07/2021 Merrill Lynch (62,185) -EUR 14,608,375 USD 17,740,135 06/07/2021 RBC (392,402) -EUR 660,900 USD 787,073 06/07/2021 Standard Chartered (2,241) -EUR 21,760,488 USD 26,449,617 06/07/2021 State Street (608,609) (0.01)EUR 4,129,517 USD 5,030,718 06/07/2021 Toronto-Dominion Bank (126,835) -EUR 1,237,226,727 USD 1,472,165,566 04/08/2021 Citibank (2,041,583) (0.02)EUR 5,053,245 USD 6,035,579 04/08/2021 State Street (31,104) -EUR 2,422,419 USD 2,891,604 04/08/2021 Toronto-Dominion Bank (13,185) -GBP 371,901 USD 522,319 06/07/2021 Barclays (7,587) -GBP 46,992,513 USD 66,647,924 06/07/2021 BNP Paribas (1,607,696) (0.02)GBP 7,495 USD 10,617 06/07/2021 Citibank (243) -GBP 7,098,293 USD 10,039,771 06/07/2021 Merrill Lynch (215,342) -GBP 5,247,983 USD 7,416,236 06/07/2021 RBC (152,739) -GBP 5,263,504 USD 7,353,529 06/07/2021 Standard Chartered (68,550) -GBP 767,268 USD 1,085,521 06/07/2021 State Street (23,580) -GBP 1,604,103 USD 2,263,567 06/07/2021 Toronto-Dominion Bank (43,400) -GBP 67,128,248 USD 93,061,147 04/08/2021 Barclays (144,966) -GBP 2,749,972 USD 3,826,358 04/08/2021 RBC (19,959) -JPY 15,890,264 USD 144,232 06/07/2021 Barclays (666) -JPY 9,334,924,404 USD 85,024,517 06/07/2021 BNP Paribas (684,913) (0.01)JPY 15,423,610 USD 140,188 06/07/2021 RBC (838) -JPY 170,617 USD 1,556 06/07/2021 State Street (15) -JPY 20,665,824 USD 189,894 06/07/2021 Toronto-Dominion Bank (3,182) -JPY 20,449,605 USD 184,858 04/08/2021 Barclays (52) -JPY 9,345,682,889 USD 84,557,300 04/08/2021 Toronto-Dominion Bank (99,354) -KRW 7,852,124,863 USD 7,061,454 15/07/2021 BNP Paribas (109,379) -KRW 47,550,029,244 USD 42,778,899 15/07/2021 Citibank (679,291) (0.01)MXN 1,480,475,601 USD 74,599,254 15/07/2021 Merrill Lynch (124,922) -SGD 337,066 USD 250,840 01/07/2021 HSBC (83) -SGD 16,117,151 USD 12,166,953 06/07/2021 BNP Paribas (177,061) -SGD 489,942,289 USD 370,304,662 06/07/2021 Citibank (5,826,178) (0.06)SGD 2,440 USD 1,843 06/07/2021 Goldman Sachs (28) -SGD 19,132,472 USD 14,403,273 06/07/2021 HSBC (170,220) -SGD 2,899,069 USD 2,185,419 06/07/2021 State Street (28,740) -SGD 2,821,597 USD 2,101,147 04/08/2021 BNP Paribas (2,271) -SGD 1,161,224 USD 864,708 04/08/2021 HSBC (919) -USD 645,785 CNH 4,176,418 02/07/2021 BNP Paribas (520) -USD 34,291 GBP 24,802 02/07/2021 State Street (35) -USD 186,394 GBP 134,981 06/07/2021 Barclays (427) -USD 156,034 SGD 210,014 02/07/2021 HSBC (203) -USD 388,216,280 SGD 522,052,871 06/07/2021 Citibank (149,950) -USD 425,608 SGD 572,254 06/07/2021 HSBC (104) -USD 299,662 SGD 403,365 06/07/2021 Toronto-Dominion Bank (410) -USD 98,109 SGD 131,928 04/08/2021 HSBC (28) -USD 1,150 SGD 1,548 04/08/2021 State Street (1) -ZAR 1,053,293,927 USD 77,811,773 15/07/2021 Citibank (3,928,449) (0.04)
Total Unrealised Loss on Forward Currency Exchange Contracts (62,296,672) (0.60)
Net Unrealised Loss on Forward Currency Exchange Contracts (59,024,463) (0.57)
260

JPMorgan Funds - Income FundSchedule of Investments (continued)
As at 30 June 2021
Financial Futures Contracts
Security DescriptionNumber ofContracts Currency
GlobalExposure
USD
UnrealisedGain/(Loss)
USD
%of
NetAssets
US 2 Year Note, 30/09/2021 (2,389) USD (526,317,231) 867,682 0.01
Total Unrealised Gain on Financial Futures Contracts 867,682 0.01
US 5 Year Note, 30/09/2021 273 USD 33,693,105 (85,262) -US 10 Year Note, 21/09/2021 (7,963) USD (1,054,786,445) (5,847,824) (0.06)US 10 Year Ultra Bond, 21/09/2021 (3,322) USD (488,723,297) (6,674,336) (0.06)US Long Bond, 21/09/2021 (76) USD (12,211,062) (248,781) -US Ultra Bond, 21/09/2021 (2,671) USD (514,626,578) (20,242,874) (0.20)
Total Unrealised Loss on Financial Futures Contracts (33,099,077) (0.32)
Net Unrealised Loss on Financial Futures Contracts (32,231,395) (0.31)
JPMorgan Funds - Income FundSchedule of Investments (continued)
As at 30 June 2021
Credit Default Swap Contracts
NominalAmount Currency Counterparty Reference Entity Buy/Sell
Interest(Paid)/
ReceivedMaturity
Date
MarketValue
USD
UnrealisedGain/(Loss)
USD
%of
NetAssets
215,000,000 USD Citigroup CDX.NA.HY.36-V1 Sell 5.00% 20/06/2026 22,181,032 (185,801) 0.2180,500,000 USD Morgan Stanley CMBX.NA.BBB- Sell 3.00% 18/11/2054 (2,721,037) (2,721,037) (0.03)
106,483,000 USD Morgan Stanley CMBX.NA.BBB- Sell 3.00% 17/08/2061 (3,825,156) (3,825,156) (0.03)22,500,000 USD Merrill Lynch CMBX.NA.BBB- Sell 3.00% 17/08/2061 (808,259) (808,259) –32,500,000 USD Citigroup CMBX.NA.BBB- Sell 3.00% 17/08/2061 (1,167,487) (1,167,487) (0.02)17,500,000 USD Citigroup CMBX.NA.BBB- Sell 3.00% 17/09/2058 (1,351,348) (1,351,348) (0.01)5,000,000 USD Merrill Lynch CMBX.NA.BBB- Sell 3.00% 17/09/2058 (386,099) (386,099) –
57,500,000 USD Morgan Stanley CMBX.NA.BBB- Sell 3.00% 17/09/2058 (4,440,141) (4,440,141) (0.05)
Total Unrealised Loss on Credit Default Swap Contracts 7,481,505 (14,885,328) 0.07
Net Unrealised Loss on Credit Default Swap Contracts 7,481,505 (14,885,328) 0.07
261
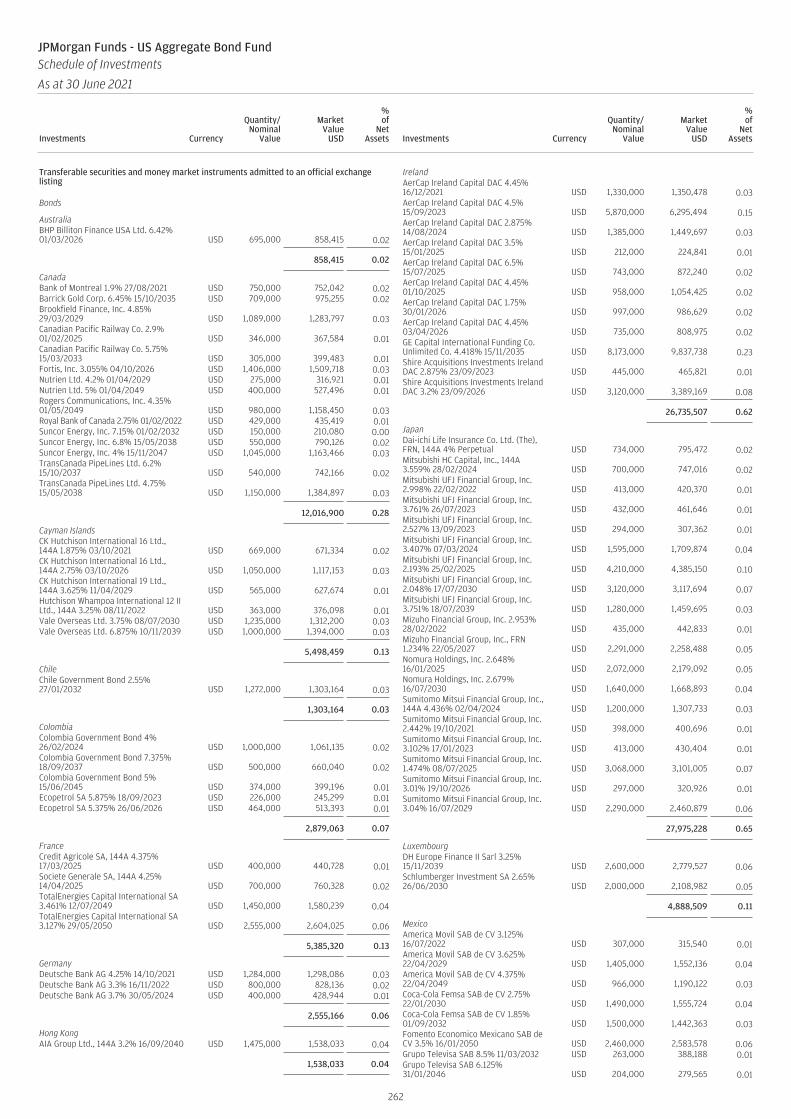
Transferable securities and money market instruments admitted to an official exchangelisting
Bonds
AustraliaBHP Billiton Finance USA Ltd. 6.42%01/03/2026 USD 695,000 858,415 0.02
858,415 0.02
CanadaBank of Montreal 1.9% 27/08/2021 USD 750,000 752,042 0.02Barrick Gold Corp. 6.45% 15/10/2035 USD 709,000 975,255 0.02Brookfield Finance, Inc. 4.85%29/03/2029 USD 1,089,000 1,283,797 0.03Canadian Pacific Railway Co. 2.9%01/02/2025 USD 346,000 367,584 0.01Canadian Pacific Railway Co. 5.75%15/03/2033 USD 305,000 399,483 0.01Fortis, Inc. 3.055% 04/10/2026 USD 1,406,000 1,509,718 0.03Nutrien Ltd. 4.2% 01/04/2029 USD 275,000 316,921 0.01Nutrien Ltd. 5% 01/04/2049 USD 400,000 527,496 0.01Rogers Communications, Inc. 4.35%01/05/2049 USD 980,000 1,158,450 0.03Royal Bank of Canada 2.75% 01/02/2022 USD 429,000 435,419 0.01Suncor Energy, Inc. 7.15% 01/02/2032 USD 150,000 210,080 0.00Suncor Energy, Inc. 6.8% 15/05/2038 USD 550,000 790,126 0.02Suncor Energy, Inc. 4% 15/11/2047 USD 1,045,000 1,163,466 0.03TransCanada PipeLines Ltd. 6.2%15/10/2037 USD 540,000 742,166 0.02TransCanada PipeLines Ltd. 4.75%15/05/2038 USD 1,150,000 1,384,897 0.03
12,016,900 0.28
Cayman IslandsCK Hutchison International 16 Ltd.,144A 1.875% 03/10/2021 USD 669,000 671,334 0.02CK Hutchison International 16 Ltd.,144A 2.75% 03/10/2026 USD 1,050,000 1,117,153 0.03CK Hutchison International 19 Ltd.,144A 3.625% 11/04/2029 USD 565,000 627,674 0.01Hutchison Whampoa International 12 IILtd., 144A 3.25% 08/11/2022 USD 363,000 376,098 0.01Vale Overseas Ltd. 3.75% 08/07/2030 USD 1,235,000 1,312,200 0.03Vale Overseas Ltd. 6.875% 10/11/2039 USD 1,000,000 1,394,000 0.03
5,498,459 0.13
ChileChile Government Bond 2.55%27/01/2032 USD 1,272,000 1,303,164 0.03
1,303,164 0.03
ColombiaColombia Government Bond 4%26/02/2024 USD 1,000,000 1,061,135 0.02Colombia Government Bond 7.375%18/09/2037 USD 500,000 660,040 0.02Colombia Government Bond 5%15/06/2045 USD 374,000 399,196 0.01Ecopetrol SA 5.875% 18/09/2023 USD 226,000 245,299 0.01Ecopetrol SA 5.375% 26/06/2026 USD 464,000 513,393 0.01
2,879,063 0.07
FranceCredit Agricole SA, 144A 4.375%17/03/2025 USD 400,000 440,728 0.01Societe Generale SA, 144A 4.25%14/04/2025 USD 700,000 760,328 0.02TotalEnergies Capital International SA3.461% 12/07/2049 USD 1,450,000 1,580,239 0.04TotalEnergies Capital International SA3.127% 29/05/2050 USD 2,555,000 2,604,025 0.06
5,385,320 0.13
GermanyDeutsche Bank AG 4.25% 14/10/2021 USD 1,284,000 1,298,086 0.03Deutsche Bank AG 3.3% 16/11/2022 USD 800,000 828,136 0.02Deutsche Bank AG 3.7% 30/05/2024 USD 400,000 428,944 0.01
2,555,166 0.06
Hong KongAIA Group Ltd., 144A 3.2% 16/09/2040 USD 1,475,000 1,538,033 0.04
1,538,033 0.04
IrelandAerCap Ireland Capital DAC 4.45%16/12/2021 USD 1,330,000 1,350,478 0.03AerCap Ireland Capital DAC 4.5%15/09/2023 USD 5,870,000 6,295,494 0.15AerCap Ireland Capital DAC 2.875%14/08/2024 USD 1,385,000 1,449,697 0.03AerCap Ireland Capital DAC 3.5%15/01/2025 USD 212,000 224,841 0.01AerCap Ireland Capital DAC 6.5%15/07/2025 USD 743,000 872,240 0.02AerCap Ireland Capital DAC 4.45%01/10/2025 USD 958,000 1,054,425 0.02AerCap Ireland Capital DAC 1.75%30/01/2026 USD 997,000 986,629 0.02AerCap Ireland Capital DAC 4.45%03/04/2026 USD 735,000 808,975 0.02GE Capital International Funding Co.Unlimited Co. 4.418% 15/11/2035 USD 8,173,000 9,837,738 0.23Shire Acquisitions Investments IrelandDAC 2.875% 23/09/2023 USD 445,000 465,821 0.01Shire Acquisitions Investments IrelandDAC 3.2% 23/09/2026 USD 3,120,000 3,389,169 0.08
26,735,507 0.62
JapanDai-ichi Life Insurance Co. Ltd. (The),FRN, 144A 4% Perpetual USD 734,000 795,472 0.02Mitsubishi HC Capital, Inc., 144A3.559% 28/02/2024 USD 700,000 747,016 0.02Mitsubishi UFJ Financial Group, Inc.2.998% 22/02/2022 USD 413,000 420,370 0.01Mitsubishi UFJ Financial Group, Inc.3.761% 26/07/2023 USD 432,000 461,646 0.01Mitsubishi UFJ Financial Group, Inc.2.527% 13/09/2023 USD 294,000 307,362 0.01Mitsubishi UFJ Financial Group, Inc.3.407% 07/03/2024 USD 1,595,000 1,709,874 0.04Mitsubishi UFJ Financial Group, Inc.2.193% 25/02/2025 USD 4,210,000 4,385,150 0.10Mitsubishi UFJ Financial Group, Inc.2.048% 17/07/2030 USD 3,120,000 3,117,694 0.07Mitsubishi UFJ Financial Group, Inc.3.751% 18/07/2039 USD 1,280,000 1,459,695 0.03Mizuho Financial Group, Inc. 2.953%28/02/2022 USD 435,000 442,833 0.01Mizuho Financial Group, Inc., FRN1.234% 22/05/2027 USD 2,291,000 2,258,488 0.05Nomura Holdings, Inc. 2.648%16/01/2025 USD 2,072,000 2,179,092 0.05Nomura Holdings, Inc. 2.679%16/07/2030 USD 1,640,000 1,668,893 0.04Sumitomo Mitsui Financial Group, Inc.,144A 4.436% 02/04/2024 USD 1,200,000 1,307,733 0.03Sumitomo Mitsui Financial Group, Inc.2.442% 19/10/2021 USD 398,000 400,696 0.01Sumitomo Mitsui Financial Group, Inc.3.102% 17/01/2023 USD 413,000 430,404 0.01Sumitomo Mitsui Financial Group, Inc.1.474% 08/07/2025 USD 3,068,000 3,101,005 0.07Sumitomo Mitsui Financial Group, Inc.3.01% 19/10/2026 USD 297,000 320,926 0.01Sumitomo Mitsui Financial Group, Inc.3.04% 16/07/2029 USD 2,290,000 2,460,879 0.06
27,975,228 0.65
LuxembourgDH Europe Finance II Sarl 3.25%15/11/2039 USD 2,600,000 2,779,527 0.06Schlumberger Investment SA 2.65%26/06/2030 USD 2,000,000 2,108,982 0.05
4,888,509 0.11
MexicoAmerica Movil SAB de CV 3.125%16/07/2022 USD 307,000 315,540 0.01America Movil SAB de CV 3.625%22/04/2029 USD 1,405,000 1,552,136 0.04America Movil SAB de CV 4.375%22/04/2049 USD 966,000 1,190,122 0.03Coca-Cola Femsa SAB de CV 2.75%22/01/2030 USD 1,490,000 1,555,724 0.04Coca-Cola Femsa SAB de CV 1.85%01/09/2032 USD 1,500,000 1,442,363 0.03Fomento Economico Mexicano SAB deCV 3.5% 16/01/2050 USD 2,460,000 2,583,578 0.06Grupo Televisa SAB 8.5% 11/03/2032 USD 263,000 388,188 0.01Grupo Televisa SAB 6.125%31/01/2046 USD 204,000 279,565 0.01
262
JPMorgan Funds - US Aggregate Bond FundSchedule of Investments
As at 30 June 2021
Investments Currency
Quantity/Nominal
Value
MarketValue
USD
%of
NetAssets Investments Currency
Quantity/Nominal
Value
MarketValue
USD
%of
NetAssets
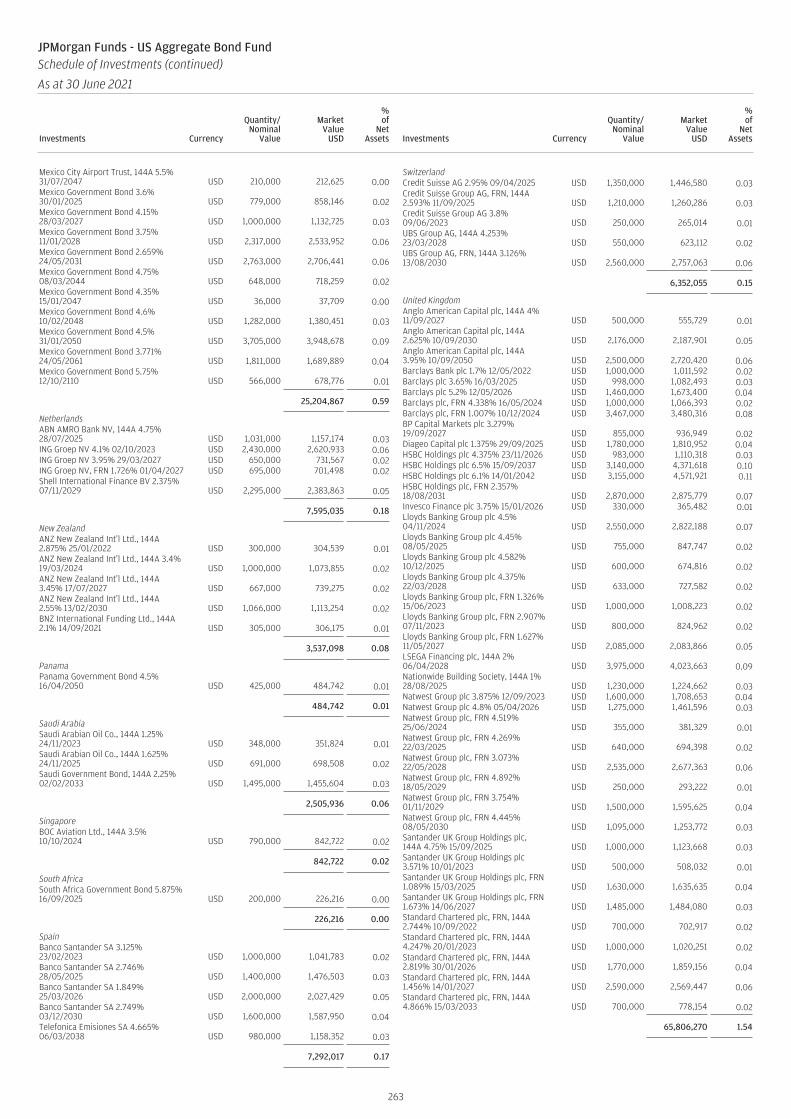
Mexico City Airport Trust, 144A 5.5%31/07/2047 USD 210,000 212,625 0.00Mexico Government Bond 3.6%30/01/2025 USD 779,000 858,146 0.02Mexico Government Bond 4.15%28/03/2027 USD 1,000,000 1,132,725 0.03Mexico Government Bond 3.75%11/01/2028 USD 2,317,000 2,533,952 0.06Mexico Government Bond 2.659%24/05/2031 USD 2,763,000 2,706,441 0.06Mexico Government Bond 4.75%08/03/2044 USD 648,000 718,259 0.02Mexico Government Bond 4.35%15/01/2047 USD 36,000 37,709 0.00Mexico Government Bond 4.6%10/02/2048 USD 1,282,000 1,380,451 0.03Mexico Government Bond 4.5%31/01/2050 USD 3,705,000 3,948,678 0.09Mexico Government Bond 3.771%24/05/2061 USD 1,811,000 1,689,889 0.04Mexico Government Bond 5.75%12/10/2110 USD 566,000 678,776 0.01
25,204,867 0.59
NetherlandsABN AMRO Bank NV, 144A 4.75%28/07/2025 USD 1,031,000 1,157,174 0.03ING Groep NV 4.1% 02/10/2023 USD 2,430,000 2,620,933 0.06ING Groep NV 3.95% 29/03/2027 USD 650,000 731,567 0.02ING Groep NV, FRN 1.726% 01/04/2027 USD 695,000 701,498 0.02Shell International Finance BV 2.375%07/11/2029 USD 2,295,000 2,383,863 0.05
7,595,035 0.18
New ZealandANZ New Zealand Int’l Ltd., 144A2.875% 25/01/2022 USD 300,000 304,539 0.01ANZ New Zealand Int’l Ltd., 144A 3.4%19/03/2024 USD 1,000,000 1,073,855 0.02ANZ New Zealand Int’l Ltd., 144A3.45% 17/07/2027 USD 667,000 739,275 0.02ANZ New Zealand Int’l Ltd., 144A2.55% 13/02/2030 USD 1,066,000 1,113,254 0.02BNZ International Funding Ltd., 144A2.1% 14/09/2021 USD 305,000 306,175 0.01
3,537,098 0.08
PanamaPanama Government Bond 4.5%16/04/2050 USD 425,000 484,742 0.01
484,742 0.01
Saudi ArabiaSaudi Arabian Oil Co., 144A 1.25%24/11/2023 USD 348,000 351,824 0.01Saudi Arabian Oil Co., 144A 1.625%24/11/2025 USD 691,000 698,508 0.02Saudi Government Bond, 144A 2.25%02/02/2033 USD 1,495,000 1,455,604 0.03
2,505,936 0.06
SingaporeBOC Aviation Ltd., 144A 3.5%10/10/2024 USD 790,000 842,722 0.02
842,722 0.02
South AfricaSouth Africa Government Bond 5.875%16/09/2025 USD 200,000 226,216 0.00
226,216 0.00
SpainBanco Santander SA 3.125%23/02/2023 USD 1,000,000 1,041,783 0.02Banco Santander SA 2.746%28/05/2025 USD 1,400,000 1,476,503 0.03Banco Santander SA 1.849%25/03/2026 USD 2,000,000 2,027,429 0.05Banco Santander SA 2.749%03/12/2030 USD 1,600,000 1,587,950 0.04Telefonica Emisiones SA 4.665%06/03/2038 USD 980,000 1,158,352 0.03
7,292,017 0.17
SwitzerlandCredit Suisse AG 2.95% 09/04/2025 USD 1,350,000 1,446,580 0.03Credit Suisse Group AG, FRN, 144A2.593% 11/09/2025 USD 1,210,000 1,260,286 0.03Credit Suisse Group AG 3.8%09/06/2023 USD 250,000 265,014 0.01UBS Group AG, 144A 4.253%23/03/2028 USD 550,000 623,112 0.02UBS Group AG, FRN, 144A 3.126%13/08/2030 USD 2,560,000 2,757,063 0.06
6,352,055 0.15
United KingdomAnglo American Capital plc, 144A 4%11/09/2027 USD 500,000 555,729 0.01Anglo American Capital plc, 144A2.625% 10/09/2030 USD 2,176,000 2,187,901 0.05Anglo American Capital plc, 144A3.95% 10/09/2050 USD 2,500,000 2,720,420 0.06Barclays Bank plc 1.7% 12/05/2022 USD 1,000,000 1,011,592 0.02Barclays plc 3.65% 16/03/2025 USD 998,000 1,082,493 0.03Barclays plc 5.2% 12/05/2026 USD 1,460,000 1,673,400 0.04Barclays plc, FRN 4.338% 16/05/2024 USD 1,000,000 1,066,393 0.02Barclays plc, FRN 1.007% 10/12/2024 USD 3,467,000 3,480,316 0.08BP Capital Markets plc 3.279%19/09/2027 USD 855,000 936,949 0.02Diageo Capital plc 1.375% 29/09/2025 USD 1,780,000 1,810,952 0.04HSBC Holdings plc 4.375% 23/11/2026 USD 983,000 1,110,318 0.03HSBC Holdings plc 6.5% 15/09/2037 USD 3,140,000 4,371,618 0.10HSBC Holdings plc 6.1% 14/01/2042 USD 3,155,000 4,571,921 0.11HSBC Holdings plc, FRN 2.357%18/08/2031 USD 2,870,000 2,875,779 0.07Invesco Finance plc 3.75% 15/01/2026 USD 330,000 365,482 0.01Lloyds Banking Group plc 4.5%04/11/2024 USD 2,550,000 2,822,188 0.07Lloyds Banking Group plc 4.45%08/05/2025 USD 755,000 847,747 0.02Lloyds Banking Group plc 4.582%10/12/2025 USD 600,000 674,816 0.02Lloyds Banking Group plc 4.375%22/03/2028 USD 633,000 727,582 0.02Lloyds Banking Group plc, FRN 1.326%15/06/2023 USD 1,000,000 1,008,223 0.02Lloyds Banking Group plc, FRN 2.907%07/11/2023 USD 800,000 824,962 0.02Lloyds Banking Group plc, FRN 1.627%11/05/2027 USD 2,085,000 2,083,866 0.05LSEGA Financing plc, 144A 2%06/04/2028 USD 3,975,000 4,023,663 0.09Nationwide Building Society, 144A 1%28/08/2025 USD 1,230,000 1,224,662 0.03Natwest Group plc 3.875% 12/09/2023 USD 1,600,000 1,708,653 0.04Natwest Group plc 4.8% 05/04/2026 USD 1,275,000 1,461,596 0.03Natwest Group plc, FRN 4.519%25/06/2024 USD 355,000 381,329 0.01Natwest Group plc, FRN 4.269%22/03/2025 USD 640,000 694,398 0.02Natwest Group plc, FRN 3.073%22/05/2028 USD 2,535,000 2,677,363 0.06Natwest Group plc, FRN 4.892%18/05/2029 USD 250,000 293,222 0.01Natwest Group plc, FRN 3.754%01/11/2029 USD 1,500,000 1,595,625 0.04Natwest Group plc, FRN 4.445%08/05/2030 USD 1,095,000 1,253,772 0.03Santander UK Group Holdings plc,144A 4.75% 15/09/2025 USD 1,000,000 1,123,668 0.03Santander UK Group Holdings plc3.571% 10/01/2023 USD 500,000 508,032 0.01Santander UK Group Holdings plc, FRN1.089% 15/03/2025 USD 1,630,000 1,635,635 0.04Santander UK Group Holdings plc, FRN1.673% 14/06/2027 USD 1,485,000 1,484,080 0.03Standard Chartered plc, FRN, 144A2.744% 10/09/2022 USD 700,000 702,917 0.02Standard Chartered plc, FRN, 144A4.247% 20/01/2023 USD 1,000,000 1,020,251 0.02Standard Chartered plc, FRN, 144A2.819% 30/01/2026 USD 1,770,000 1,859,156 0.04Standard Chartered plc, FRN, 144A1.456% 14/01/2027 USD 2,590,000 2,569,447 0.06Standard Chartered plc, FRN, 144A4.866% 15/03/2033 USD 700,000 778,154 0.02
65,806,270 1.54
263
JPMorgan Funds - US Aggregate Bond FundSchedule of Investments (continued)
As at 30 June 2021
Investments Currency
Quantity/Nominal
Value
MarketValue
USD
%of
NetAssets Investments Currency
Quantity/Nominal
Value
MarketValue
USD
%of
NetAssets
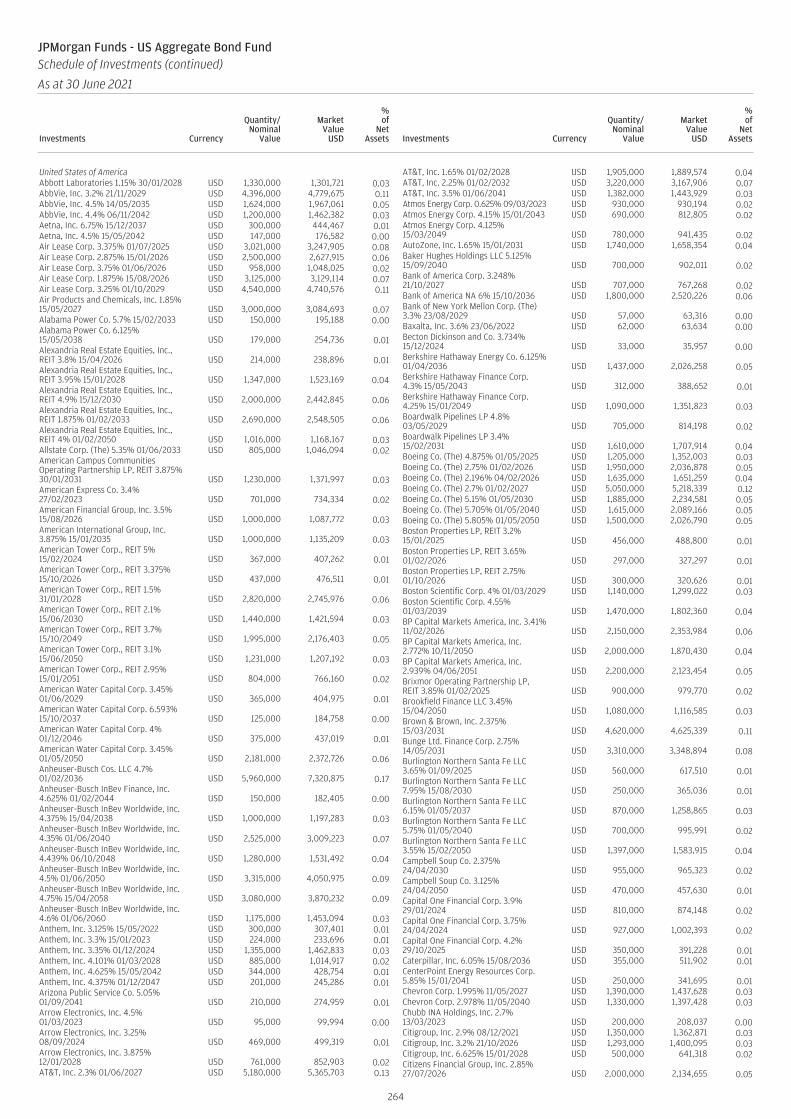
United States of AmericaAbbott Laboratories 1.15% 30/01/2028 USD 1,330,000 1,301,721 0.03AbbVie, Inc. 3.2% 21/11/2029 USD 4,396,000 4,779,675 0.11AbbVie, Inc. 4.5% 14/05/2035 USD 1,624,000 1,967,061 0.05AbbVie, Inc. 4.4% 06/11/2042 USD 1,200,000 1,462,382 0.03Aetna, Inc. 6.75% 15/12/2037 USD 300,000 444,467 0.01Aetna, Inc. 4.5% 15/05/2042 USD 147,000 176,582 0.00Air Lease Corp. 3.375% 01/07/2025 USD 3,021,000 3,247,905 0.08Air Lease Corp. 2.875% 15/01/2026 USD 2,500,000 2,627,915 0.06Air Lease Corp. 3.75% 01/06/2026 USD 958,000 1,048,025 0.02Air Lease Corp. 1.875% 15/08/2026 USD 3,125,000 3,129,114 0.07Air Lease Corp. 3.25% 01/10/2029 USD 4,540,000 4,740,576 0.11Air Products and Chemicals, Inc. 1.85%15/05/2027 USD 3,000,000 3,084,693 0.07Alabama Power Co. 5.7% 15/02/2033 USD 150,000 195,188 0.00Alabama Power Co. 6.125%15/05/2038 USD 179,000 254,736 0.01Alexandria Real Estate Equities, Inc.,REIT 3.8% 15/04/2026 USD 214,000 238,896 0.01Alexandria Real Estate Equities, Inc.,REIT 3.95% 15/01/2028 USD 1,347,000 1,523,169 0.04Alexandria Real Estate Equities, Inc.,REIT 4.9% 15/12/2030 USD 2,000,000 2,442,845 0.06Alexandria Real Estate Equities, Inc.,REIT 1.875% 01/02/2033 USD 2,690,000 2,548,505 0.06Alexandria Real Estate Equities, Inc.,REIT 4% 01/02/2050 USD 1,016,000 1,168,167 0.03Allstate Corp. (The) 5.35% 01/06/2033 USD 805,000 1,046,094 0.02American Campus CommunitiesOperating Partnership LP, REIT 3.875%30/01/2031 USD 1,230,000 1,371,997 0.03American Express Co. 3.4%27/02/2023 USD 701,000 734,334 0.02American Financial Group, Inc. 3.5%15/08/2026 USD 1,000,000 1,087,772 0.03American International Group, Inc.3.875% 15/01/2035 USD 1,000,000 1,135,209 0.03American Tower Corp., REIT 5%15/02/2024 USD 367,000 407,262 0.01American Tower Corp., REIT 3.375%15/10/2026 USD 437,000 476,511 0.01American Tower Corp., REIT 1.5%31/01/2028 USD 2,820,000 2,745,976 0.06American Tower Corp., REIT 2.1%15/06/2030 USD 1,440,000 1,421,594 0.03American Tower Corp., REIT 3.7%15/10/2049 USD 1,995,000 2,176,403 0.05American Tower Corp., REIT 3.1%15/06/2050 USD 1,231,000 1,207,192 0.03American Tower Corp., REIT 2.95%15/01/2051 USD 804,000 766,160 0.02American Water Capital Corp. 3.45%01/06/2029 USD 365,000 404,975 0.01American Water Capital Corp. 6.593%15/10/2037 USD 125,000 184,758 0.00American Water Capital Corp. 4%01/12/2046 USD 375,000 437,019 0.01American Water Capital Corp. 3.45%01/05/2050 USD 2,181,000 2,372,726 0.06Anheuser-Busch Cos. LLC 4.7%01/02/2036 USD 5,960,000 7,320,875 0.17Anheuser-Busch InBev Finance, Inc.4.625% 01/02/2044 USD 150,000 182,405 0.00Anheuser-Busch InBev Worldwide, Inc.4.375% 15/04/2038 USD 1,000,000 1,197,283 0.03Anheuser-Busch InBev Worldwide, Inc.4.35% 01/06/2040 USD 2,525,000 3,009,223 0.07Anheuser-Busch InBev Worldwide, Inc.4.439% 06/10/2048 USD 1,280,000 1,531,492 0.04Anheuser-Busch InBev Worldwide, Inc.4.5% 01/06/2050 USD 3,315,000 4,050,975 0.09Anheuser-Busch InBev Worldwide, Inc.4.75% 15/04/2058 USD 3,080,000 3,870,232 0.09Anheuser-Busch InBev Worldwide, Inc.4.6% 01/06/2060 USD 1,175,000 1,453,094 0.03Anthem, Inc. 3.125% 15/05/2022 USD 300,000 307,401 0.01Anthem, Inc. 3.3% 15/01/2023 USD 224,000 233,696 0.01Anthem, Inc. 3.35% 01/12/2024 USD 1,355,000 1,462,833 0.03Anthem, Inc. 4.101% 01/03/2028 USD 885,000 1,014,917 0.02Anthem, Inc. 4.625% 15/05/2042 USD 344,000 428,754 0.01Anthem, Inc. 4.375% 01/12/2047 USD 201,000 245,286 0.01Arizona Public Service Co. 5.05%01/09/2041 USD 210,000 274,959 0.01Arrow Electronics, Inc. 4.5%01/03/2023 USD 95,000 99,994 0.00Arrow Electronics, Inc. 3.25%08/09/2024 USD 469,000 499,319 0.01Arrow Electronics, Inc. 3.875%12/01/2028 USD 761,000 852,903 0.02AT&T, Inc. 2.3% 01/06/2027 USD 5,180,000 5,365,703 0.13
AT&T, Inc. 1.65% 01/02/2028 USD 1,905,000 1,889,574 0.04AT&T, Inc. 2.25% 01/02/2032 USD 3,220,000 3,167,906 0.07AT&T, Inc. 3.5% 01/06/2041 USD 1,382,000 1,443,929 0.03Atmos Energy Corp. 0.625% 09/03/2023 USD 930,000 930,194 0.02Atmos Energy Corp. 4.15% 15/01/2043 USD 690,000 812,805 0.02Atmos Energy Corp. 4.125%15/03/2049 USD 780,000 941,435 0.02AutoZone, Inc. 1.65% 15/01/2031 USD 1,740,000 1,658,354 0.04Baker Hughes Holdings LLC 5.125%15/09/2040 USD 700,000 902,011 0.02Bank of America Corp. 3.248%21/10/2027 USD 707,000 767,268 0.02Bank of America NA 6% 15/10/2036 USD 1,800,000 2,520,226 0.06Bank of New York Mellon Corp. (The)3.3% 23/08/2029 USD 57,000 63,316 0.00Baxalta, Inc. 3.6% 23/06/2022 USD 62,000 63,634 0.00Becton Dickinson and Co. 3.734%15/12/2024 USD 33,000 35,957 0.00Berkshire Hathaway Energy Co. 6.125%01/04/2036 USD 1,437,000 2,026,258 0.05Berkshire Hathaway Finance Corp.4.3% 15/05/2043 USD 312,000 388,652 0.01Berkshire Hathaway Finance Corp.4.25% 15/01/2049 USD 1,090,000 1,351,823 0.03Boardwalk Pipelines LP 4.8%03/05/2029 USD 705,000 814,198 0.02Boardwalk Pipelines LP 3.4%15/02/2031 USD 1,610,000 1,707,914 0.04Boeing Co. (The) 4.875% 01/05/2025 USD 1,205,000 1,352,003 0.03Boeing Co. (The) 2.75% 01/02/2026 USD 1,950,000 2,036,878 0.05Boeing Co. (The) 2.196% 04/02/2026 USD 1,635,000 1,651,259 0.04Boeing Co. (The) 2.7% 01/02/2027 USD 5,050,000 5,218,339 0.12Boeing Co. (The) 5.15% 01/05/2030 USD 1,885,000 2,234,581 0.05Boeing Co. (The) 5.705% 01/05/2040 USD 1,615,000 2,089,166 0.05Boeing Co. (The) 5.805% 01/05/2050 USD 1,500,000 2,026,790 0.05Boston Properties LP, REIT 3.2%15/01/2025 USD 456,000 488,800 0.01Boston Properties LP, REIT 3.65%01/02/2026 USD 297,000 327,297 0.01Boston Properties LP, REIT 2.75%01/10/2026 USD 300,000 320,626 0.01Boston Scientific Corp. 4% 01/03/2029 USD 1,140,000 1,299,022 0.03Boston Scientific Corp. 4.55%01/03/2039 USD 1,470,000 1,802,360 0.04BP Capital Markets America, Inc. 3.41%11/02/2026 USD 2,150,000 2,353,984 0.06BP Capital Markets America, Inc.2.772% 10/11/2050 USD 2,000,000 1,870,430 0.04BP Capital Markets America, Inc.2.939% 04/06/2051 USD 2,200,000 2,123,454 0.05Brixmor Operating Partnership LP,REIT 3.85% 01/02/2025 USD 900,000 979,770 0.02Brookfield Finance LLC 3.45%15/04/2050 USD 1,080,000 1,116,585 0.03Brown & Brown, Inc. 2.375%15/03/2031 USD 4,620,000 4,625,339 0.11Bunge Ltd. Finance Corp. 2.75%14/05/2031 USD 3,310,000 3,348,894 0.08Burlington Northern Santa Fe LLC3.65% 01/09/2025 USD 560,000 617,510 0.01Burlington Northern Santa Fe LLC7.95% 15/08/2030 USD 250,000 365,036 0.01Burlington Northern Santa Fe LLC6.15% 01/05/2037 USD 870,000 1,258,865 0.03Burlington Northern Santa Fe LLC5.75% 01/05/2040 USD 700,000 995,991 0.02Burlington Northern Santa Fe LLC3.55% 15/02/2050 USD 1,397,000 1,583,915 0.04Campbell Soup Co. 2.375%24/04/2030 USD 955,000 965,323 0.02Campbell Soup Co. 3.125%24/04/2050 USD 470,000 457,630 0.01Capital One Financial Corp. 3.9%29/01/2024 USD 810,000 874,148 0.02Capital One Financial Corp. 3.75%24/04/2024 USD 927,000 1,002,393 0.02Capital One Financial Corp. 4.2%29/10/2025 USD 350,000 391,228 0.01Caterpillar, Inc. 6.05% 15/08/2036 USD 355,000 511,902 0.01CenterPoint Energy Resources Corp.5.85% 15/01/2041 USD 250,000 341,695 0.01Chevron Corp. 1.995% 11/05/2027 USD 1,390,000 1,437,628 0.03Chevron Corp. 2.978% 11/05/2040 USD 1,330,000 1,397,428 0.03Chubb INA Holdings, Inc. 2.7%13/03/2023 USD 200,000 208,037 0.00Citigroup, Inc. 2.9% 08/12/2021 USD 1,350,000 1,362,871 0.03Citigroup, Inc. 3.2% 21/10/2026 USD 1,293,000 1,400,095 0.03Citigroup, Inc. 6.625% 15/01/2028 USD 500,000 641,318 0.02Citizens Financial Group, Inc. 2.85%27/07/2026 USD 2,000,000 2,134,655 0.05
264
JPMorgan Funds - US Aggregate Bond FundSchedule of Investments (continued)
As at 30 June 2021
Investments Currency
Quantity/Nominal
Value
MarketValue
USD
%of
NetAssets Investments Currency
Quantity/Nominal
Value
MarketValue
USD
%of
NetAssets
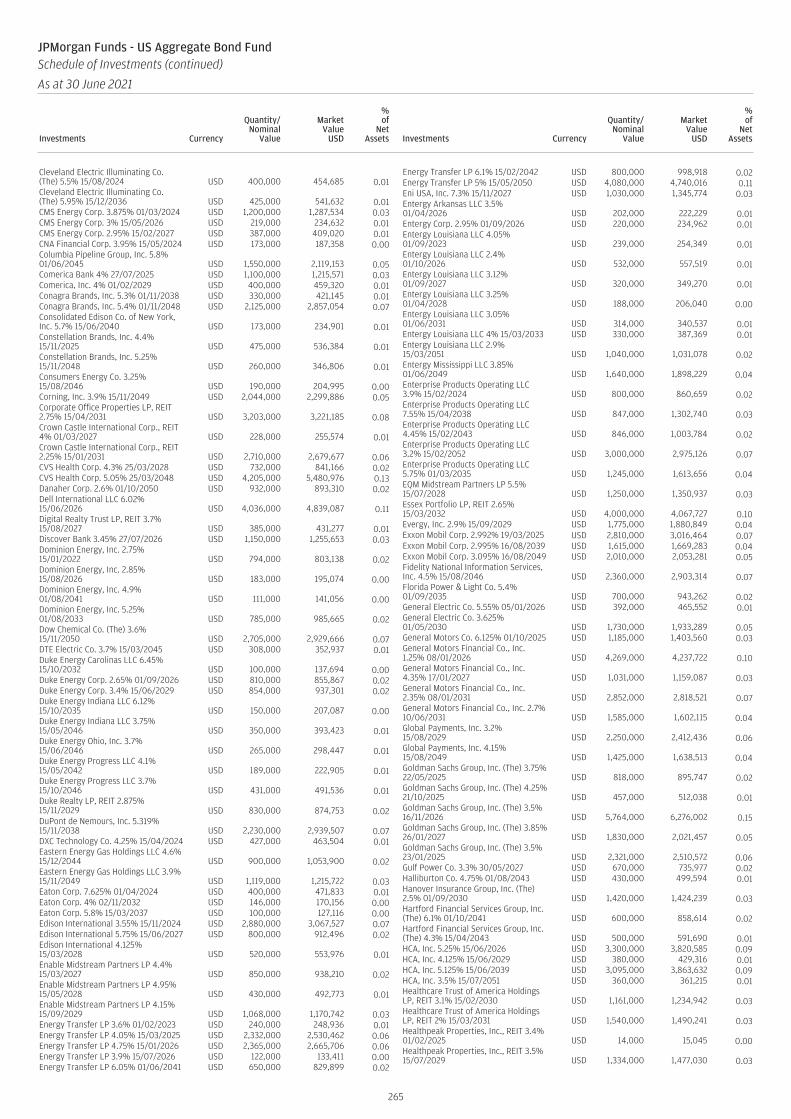
Cleveland Electric Illuminating Co.(The) 5.5% 15/08/2024 USD 400,000 454,685 0.01Cleveland Electric Illuminating Co.(The) 5.95% 15/12/2036 USD 425,000 541,632 0.01CMS Energy Corp. 3.875% 01/03/2024 USD 1,200,000 1,287,534 0.03CMS Energy Corp. 3% 15/05/2026 USD 219,000 234,632 0.01CMS Energy Corp. 2.95% 15/02/2027 USD 387,000 409,020 0.01CNA Financial Corp. 3.95% 15/05/2024 USD 173,000 187,358 0.00Columbia Pipeline Group, Inc. 5.8%01/06/2045 USD 1,550,000 2,119,153 0.05Comerica Bank 4% 27/07/2025 USD 1,100,000 1,215,571 0.03Comerica, Inc. 4% 01/02/2029 USD 400,000 459,320 0.01Conagra Brands, Inc. 5.3% 01/11/2038 USD 330,000 421,145 0.01Conagra Brands, Inc. 5.4% 01/11/2048 USD 2,125,000 2,857,054 0.07Consolidated Edison Co. of New York,Inc. 5.7% 15/06/2040 USD 173,000 234,901 0.01Constellation Brands, Inc. 4.4%15/11/2025 USD 475,000 536,384 0.01Constellation Brands, Inc. 5.25%15/11/2048 USD 260,000 346,806 0.01Consumers Energy Co. 3.25%15/08/2046 USD 190,000 204,995 0.00Corning, Inc. 3.9% 15/11/2049 USD 2,044,000 2,299,886 0.05Corporate Office Properties LP, REIT2.75% 15/04/2031 USD 3,203,000 3,221,185 0.08Crown Castle International Corp., REIT4% 01/03/2027 USD 228,000 255,574 0.01Crown Castle International Corp., REIT2.25% 15/01/2031 USD 2,710,000 2,679,677 0.06CVS Health Corp. 4.3% 25/03/2028 USD 732,000 841,166 0.02CVS Health Corp. 5.05% 25/03/2048 USD 4,205,000 5,480,976 0.13Danaher Corp. 2.6% 01/10/2050 USD 932,000 893,310 0.02Dell International LLC 6.02%15/06/2026 USD 4,036,000 4,839,087 0.11Digital Realty Trust LP, REIT 3.7%15/08/2027 USD 385,000 431,277 0.01Discover Bank 3.45% 27/07/2026 USD 1,150,000 1,255,653 0.03Dominion Energy, Inc. 2.75%15/01/2022 USD 794,000 803,138 0.02Dominion Energy, Inc. 2.85%15/08/2026 USD 183,000 195,074 0.00Dominion Energy, Inc. 4.9%01/08/2041 USD 111,000 141,056 0.00Dominion Energy, Inc. 5.25%01/08/2033 USD 785,000 985,665 0.02Dow Chemical Co. (The) 3.6%15/11/2050 USD 2,705,000 2,929,666 0.07DTE Electric Co. 3.7% 15/03/2045 USD 308,000 352,937 0.01Duke Energy Carolinas LLC 6.45%15/10/2032 USD 100,000 137,694 0.00Duke Energy Corp. 2.65% 01/09/2026 USD 810,000 855,867 0.02Duke Energy Corp. 3.4% 15/06/2029 USD 854,000 937,301 0.02Duke Energy Indiana LLC 6.12%15/10/2035 USD 150,000 207,087 0.00Duke Energy Indiana LLC 3.75%15/05/2046 USD 350,000 393,423 0.01Duke Energy Ohio, Inc. 3.7%15/06/2046 USD 265,000 298,447 0.01Duke Energy Progress LLC 4.1%15/05/2042 USD 189,000 222,905 0.01Duke Energy Progress LLC 3.7%15/10/2046 USD 431,000 491,536 0.01Duke Realty LP, REIT 2.875%15/11/2029 USD 830,000 874,753 0.02DuPont de Nemours, Inc. 5.319%15/11/2038 USD 2,230,000 2,939,507 0.07DXC Technology Co. 4.25% 15/04/2024 USD 427,000 463,504 0.01Eastern Energy Gas Holdings LLC 4.6%15/12/2044 USD 900,000 1,053,900 0.02Eastern Energy Gas Holdings LLC 3.9%15/11/2049 USD 1,119,000 1,215,722 0.03Eaton Corp. 7.625% 01/04/2024 USD 400,000 471,833 0.01Eaton Corp. 4% 02/11/2032 USD 146,000 170,156 0.00Eaton Corp. 5.8% 15/03/2037 USD 100,000 127,116 0.00Edison International 3.55% 15/11/2024 USD 2,880,000 3,067,527 0.07Edison International 5.75% 15/06/2027 USD 800,000 912,496 0.02Edison International 4.125%15/03/2028 USD 520,000 553,976 0.01Enable Midstream Partners LP 4.4%15/03/2027 USD 850,000 938,210 0.02Enable Midstream Partners LP 4.95%15/05/2028 USD 430,000 492,773 0.01Enable Midstream Partners LP 4.15%15/09/2029 USD 1,068,000 1,170,742 0.03Energy Transfer LP 3.6% 01/02/2023 USD 240,000 248,936 0.01Energy Transfer LP 4.05% 15/03/2025 USD 2,332,000 2,530,462 0.06Energy Transfer LP 4.75% 15/01/2026 USD 2,365,000 2,665,706 0.06Energy Transfer LP 3.9% 15/07/2026 USD 122,000 133,411 0.00Energy Transfer LP 6.05% 01/06/2041 USD 650,000 829,899 0.02
Energy Transfer LP 6.1% 15/02/2042 USD 800,000 998,918 0.02Energy Transfer LP 5% 15/05/2050 USD 4,080,000 4,740,016 0.11Eni USA, Inc. 7.3% 15/11/2027 USD 1,030,000 1,345,774 0.03Entergy Arkansas LLC 3.5%01/04/2026 USD 202,000 222,229 0.01Entergy Corp. 2.95% 01/09/2026 USD 220,000 234,962 0.01Entergy Louisiana LLC 4.05%01/09/2023 USD 239,000 254,349 0.01Entergy Louisiana LLC 2.4%01/10/2026 USD 532,000 557,519 0.01Entergy Louisiana LLC 3.12%01/09/2027 USD 320,000 349,270 0.01Entergy Louisiana LLC 3.25%01/04/2028 USD 188,000 206,040 0.00Entergy Louisiana LLC 3.05%01/06/2031 USD 314,000 340,537 0.01Entergy Louisiana LLC 4% 15/03/2033 USD 330,000 387,369 0.01Entergy Louisiana LLC 2.9%15/03/2051 USD 1,040,000 1,031,078 0.02Entergy Mississippi LLC 3.85%01/06/2049 USD 1,640,000 1,898,229 0.04Enterprise Products Operating LLC3.9% 15/02/2024 USD 800,000 860,659 0.02Enterprise Products Operating LLC7.55% 15/04/2038 USD 847,000 1,302,740 0.03Enterprise Products Operating LLC4.45% 15/02/2043 USD 846,000 1,003,784 0.02Enterprise Products Operating LLC3.2% 15/02/2052 USD 3,000,000 2,975,126 0.07Enterprise Products Operating LLC5.75% 01/03/2035 USD 1,245,000 1,613,656 0.04EQM Midstream Partners LP 5.5%15/07/2028 USD 1,250,000 1,350,937 0.03Essex Portfolio LP, REIT 2.65%15/03/2032 USD 4,000,000 4,067,727 0.10Evergy, Inc. 2.9% 15/09/2029 USD 1,775,000 1,880,849 0.04Exxon Mobil Corp. 2.992% 19/03/2025 USD 2,810,000 3,016,464 0.07Exxon Mobil Corp. 2.995% 16/08/2039 USD 1,615,000 1,669,283 0.04Exxon Mobil Corp. 3.095% 16/08/2049 USD 2,010,000 2,053,281 0.05Fidelity National Information Services,Inc. 4.5% 15/08/2046 USD 2,360,000 2,903,314 0.07Florida Power & Light Co. 5.4%01/09/2035 USD 700,000 943,262 0.02General Electric Co. 5.55% 05/01/2026 USD 392,000 465,552 0.01General Electric Co. 3.625%01/05/2030 USD 1,730,000 1,933,289 0.05General Motors Co. 6.125% 01/10/2025 USD 1,185,000 1,403,560 0.03General Motors Financial Co., Inc.1.25% 08/01/2026 USD 4,269,000 4,237,722 0.10General Motors Financial Co., Inc.4.35% 17/01/2027 USD 1,031,000 1,159,087 0.03General Motors Financial Co., Inc.2.35% 08/01/2031 USD 2,852,000 2,818,521 0.07General Motors Financial Co., Inc. 2.7%10/06/2031 USD 1,585,000 1,602,115 0.04Global Payments, Inc. 3.2%15/08/2029 USD 2,250,000 2,412,436 0.06Global Payments, Inc. 4.15%15/08/2049 USD 1,425,000 1,638,513 0.04Goldman Sachs Group, Inc. (The) 3.75%22/05/2025 USD 818,000 895,747 0.02Goldman Sachs Group, Inc. (The) 4.25%21/10/2025 USD 457,000 512,038 0.01Goldman Sachs Group, Inc. (The) 3.5%16/11/2026 USD 5,764,000 6,276,002 0.15Goldman Sachs Group, Inc. (The) 3.85%26/01/2027 USD 1,830,000 2,021,457 0.05Goldman Sachs Group, Inc. (The) 3.5%23/01/2025 USD 2,321,000 2,510,572 0.06Gulf Power Co. 3.3% 30/05/2027 USD 670,000 735,977 0.02Halliburton Co. 4.75% 01/08/2043 USD 430,000 499,594 0.01Hanover Insurance Group, Inc. (The)2.5% 01/09/2030 USD 1,420,000 1,424,239 0.03Hartford Financial Services Group, Inc.(The) 6.1% 01/10/2041 USD 600,000 858,614 0.02Hartford Financial Services Group, Inc.(The) 4.3% 15/04/2043 USD 500,000 591,690 0.01HCA, Inc. 5.25% 15/06/2026 USD 3,300,000 3,820,585 0.09HCA, Inc. 4.125% 15/06/2029 USD 380,000 429,316 0.01HCA, Inc. 5.125% 15/06/2039 USD 3,095,000 3,863,632 0.09HCA, Inc. 3.5% 15/07/2051 USD 360,000 361,215 0.01Healthcare Trust of America HoldingsLP, REIT 3.1% 15/02/2030 USD 1,161,000 1,234,942 0.03Healthcare Trust of America HoldingsLP, REIT 2% 15/03/2031 USD 1,540,000 1,490,241 0.03Healthpeak Properties, Inc., REIT 3.4%01/02/2025 USD 14,000 15,045 0.00Healthpeak Properties, Inc., REIT 3.5%15/07/2029 USD 1,334,000 1,477,030 0.03
265
JPMorgan Funds - US Aggregate Bond FundSchedule of Investments (continued)
As at 30 June 2021
Investments Currency
Quantity/Nominal
Value
MarketValue
USD
%of
NetAssets Investments Currency
Quantity/Nominal
Value
MarketValue
USD
%of
NetAssets

Hess Corp. 6% 15/01/2040 USD 287,000 369,036 0.01HollyFrontier Corp. 2.625% 01/10/2023 USD 2,365,000 2,446,465 0.06HollyFrontier Corp. 5.875%01/04/2026 USD 1,960,000 2,267,162 0.05HP, Inc. 3% 17/06/2027 USD 1,445,000 1,547,319 0.04Illinois Tool Works, Inc. 2.65%15/11/2026 USD 900,000 966,126 0.02International Flavors & Fragrances,Inc. 4.45% 26/09/2028 USD 368,000 426,300 0.01International Flavors & Fragrances,Inc. 5% 26/09/2048 USD 452,000 580,500 0.01International Lease Finance Corp.8.625% 15/01/2022 USD 2,200,000 2,294,139 0.05International Lease Finance Corp.5.875% 15/08/2022 USD 623,000 659,318 0.02International Paper Co. 8.7%15/06/2038 USD 850,000 1,422,797 0.03Jersey Central Power & Light Co. 6.15%01/06/2037 USD 320,000 415,096 0.01Kinder Morgan, Inc. 2% 15/02/2031 USD 1,370,000 1,318,444 0.03Kinder Morgan, Inc. 3.25% 01/08/2050 USD 1,540,000 1,505,837 0.04Kohl’s Corp. 3.375% 01/05/2031 USD 2,000,000 2,072,792 0.05Kroger Co. (The) 2.2% 01/05/2030 USD 3,500,000 3,524,255 0.08Kroger Co. (The) 5.4% 15/07/2040 USD 114,000 149,676 0.00Kroger Co. (The) 3.95% 15/01/2050 USD 1,220,000 1,394,260 0.03L3Harris Technologies, Inc. 3.832%27/04/2025 USD 700,000 767,355 0.02L3Harris Technologies, Inc. 1.8%15/01/2031 USD 2,090,000 2,037,252 0.05Legg Mason, Inc. 3.95% 15/07/2024 USD 350,000 383,362 0.01Lennar Corp. 4.5% 30/04/2024 USD 1,220,000 1,335,900 0.03Life Storage LP, REIT 4% 15/06/2029 USD 1,373,000 1,539,715 0.04Life Storage LP, REIT 2.2% 15/10/2030 USD 2,940,000 2,900,466 0.07Lincoln National Corp. 4.2%15/03/2022 USD 541,000 555,562 0.01Lincoln National Corp. 4% 01/09/2023 USD 1,042,000 1,118,756 0.03Lowe’s Cos., Inc. 2.5% 15/04/2026 USD 550,000 583,890 0.01Lowe’s Cos., Inc. 3.65% 05/04/2029 USD 1,150,000 1,288,205 0.03Lowe’s Cos., Inc. 1.7% 15/10/2030 USD 3,000,000 2,878,743 0.07LYB International Finance III LLC 1.25%01/10/2025 USD 780,000 779,617 0.02Magellan Midstream Partners LP 3.2%15/03/2025 USD 171,000 181,096 0.00Magellan Midstream Partners LP 6.4%01/05/2037 USD 235,000 304,412 0.01Marathon Oil Corp. 6.8% 15/03/2032 USD 241,000 318,262 0.01Marathon Petroleum Corp. 4.5%01/05/2023 USD 2,009,000 2,143,127 0.05Marathon Petroleum Corp. 4.7%01/05/2025 USD 1,209,000 1,363,015 0.03Markel Corp. 5% 05/04/2046 USD 1,000,000 1,289,221 0.03Martin Marietta Materials, Inc. 3.45%01/06/2027 USD 666,000 728,658 0.02Masco Corp. 2% 01/10/2030 USD 840,000 821,554 0.02Masco Corp. 6.5% 15/08/2032 USD 1,000,000 1,333,681 0.03McDonald’s Corp. 4.7% 09/12/2035 USD 547,000 679,952 0.02McDonald’s Corp. 6.3% 15/10/2037 USD 179,000 258,003 0.01MDC Holdings, Inc. 2.5% 15/01/2031 USD 2,210,000 2,151,811 0.05MetLife, Inc. 4.368% 15/09/2023 USD 400,000 433,059 0.01MetLife, Inc. 6.5% 15/12/2032 USD 616,000 875,860 0.02Mid-America Apartments LP, REIT 4%15/11/2025 USD 930,000 1,033,867 0.02Mid-America Apartments LP, REIT 1.7%15/02/2031 USD 1,470,000 1,399,346 0.03Morgan Stanley 5.5% 28/07/2021 USD 950,000 953,665 0.02Morgan Stanley 2.625% 17/11/2021 USD 1,730,000 1,745,717 0.04Morgan Stanley 3.875% 29/04/2024 USD 2,697,000 2,932,508 0.07Morgan Stanley 4% 23/07/2025 USD 3,125,000 3,477,342 0.08Morgan Stanley 3.875% 27/01/2026 USD 270,000 301,912 0.01Morgan Stanley 3.125% 27/07/2026 USD 1,056,000 1,145,229 0.03Morgan Stanley 3.625% 20/01/2027 USD 945,000 1,049,562 0.02Morgan Stanley 4.3% 27/01/2045 USD 1,125,000 1,397,032 0.03Morgan Stanley, FRN 1.794%13/02/2032 USD 2,080,000 2,000,125 0.05MPLX LP 4.875% 01/12/2024 USD 1,284,000 1,438,300 0.03MPLX LP 4.8% 15/02/2029 USD 362,000 425,453 0.01MPLX LP 5.2% 01/03/2047 USD 323,000 398,486 0.01National Retail Properties, Inc., REIT4% 15/11/2025 USD 583,000 645,048 0.02National Retail Properties, Inc., REIT3.6% 15/12/2026 USD 1,000,000 1,093,555 0.03Nevada Power Co. 3.7% 01/05/2029 USD 1,600,000 1,799,658 0.04Nevada Power Co. 6.65% 01/04/2036 USD 200,000 292,384 0.01Nevada Power Co. 5.375% 15/09/2040 USD 365,000 478,501 0.01NiSource, Inc. 2.95% 01/09/2029 USD 615,000 651,424 0.02NiSource, Inc. 1.7% 15/02/2031 USD 1,830,000 1,734,041 0.04NiSource, Inc. 5.8% 01/02/2042 USD 628,000 853,060 0.02
Norfolk Southern Corp. 2.903%15/02/2023 USD 42,000 43,493 0.00OGE Energy Corp. 0.703% 26/05/2023 USD 1,180,000 1,179,408 0.03Ohio Edison Co. 6.875% 15/07/2036 USD 350,000 497,590 0.01Oklahoma Gas and Electric Co. 0.553%26/05/2023 USD 1,425,000 1,425,182 0.03ONE Gas, Inc. 2% 15/05/2030 USD 2,060,000 2,028,764 0.05ONEOK Partners LP 3.375%01/10/2022 USD 76,000 78,092 0.00ONEOK Partners LP 5% 15/09/2023 USD 169,000 182,475 0.00ONEOK Partners LP 6.65% 01/10/2036 USD 910,000 1,220,368 0.03ONEOK, Inc. 7.5% 01/09/2023 USD 2,741,000 3,088,101 0.07ONEOK, Inc. 2.2% 15/09/2025 USD 2,750,000 2,829,604 0.07ONEOK, Inc. 3.4% 01/09/2029 USD 980,000 1,045,706 0.02Oracle Corp. 2.95% 15/05/2025 USD 1,500,000 1,598,753 0.04Oracle Corp. 2.3% 25/03/2028 USD 2,875,000 2,953,564 0.07Oracle Corp. 3.9% 15/05/2035 USD 1,175,000 1,312,816 0.03Oracle Corp. 3.85% 15/07/2036 USD 1,335,000 1,473,018 0.03Oracle Corp. 3.6% 01/04/2040 USD 1,800,000 1,901,522 0.04Oracle Corp. 4% 15/07/2046 USD 1,070,000 1,167,773 0.03Oracle Corp. 4.375% 15/05/2055 USD 940,000 1,095,668 0.03Pacific Gas and Electric Co. 1.75%16/06/2022 USD 5,015,000 5,012,730 0.12Pacific Gas and Electric Co. 1.367%10/03/2023 USD 2,415,000 2,415,136 0.06Pacific Gas and Electric Co. 2.95%01/03/2026 USD 970,000 992,528 0.02Pacific Gas and Electric Co. 3.75%15/08/2042 USD 451,000 411,798 0.01Pacific Gas and Electric Co. 4.3%15/03/2045 USD 770,000 740,773 0.02Pacific Gas and Electric Co. 4%01/12/2046 USD 1,500,000 1,404,008 0.03PacifiCorp 4.15% 15/02/2050 USD 1,600,000 1,943,656 0.05Packaging Corp. of America 4.05%15/12/2049 USD 1,565,000 1,851,792 0.04Parker-Hannifin Corp. 4.1%01/03/2047 USD 416,000 494,907 0.01Phillips 66 4.875% 15/11/2044 USD 85,000 105,867 0.00Phillips 66 Partners LP 3.605%15/02/2025 USD 700,000 754,800 0.02Phillips 66 Partners LP 3.55%01/10/2026 USD 147,000 159,966 0.00Phillips 66 Partners LP 3.15%15/12/2029 USD 1,130,000 1,189,950 0.03Phillips 66 Partners LP 4.9%01/10/2046 USD 306,000 364,590 0.01Pioneer Natural Resources Co. 1.9%15/08/2030 USD 2,580,000 2,486,375 0.06PNC Bank NA 3.25% 01/06/2025 USD 750,000 815,757 0.02PPG Industries, Inc. 1.2% 15/03/2026 USD 1,275,000 1,273,004 0.03Precision Castparts Corp. 3.25%15/06/2025 USD 332,000 360,473 0.01Precision Castparts Corp. 4.2%15/06/2035 USD 250,000 294,147 0.01Precision Castparts Corp. 4.375%15/06/2045 USD 250,000 302,159 0.01Progress Energy, Inc. 3.15%01/04/2022 USD 350,000 355,028 0.01Progress Energy, Inc. 7% 30/10/2031 USD 300,000 416,225 0.01Prologis LP, REIT 2.125% 15/10/2050 USD 525,000 449,834 0.01Quest Diagnostics, Inc. 2.8%30/06/2031 USD 955,000 999,117 0.02Qwest Corp. 6.75% 01/12/2021 USD 444,000 454,822 0.01Raytheon Technologies Corp. 4.5%01/06/2042 USD 800,000 998,338 0.02Raytheon Technologies Corp. 4.15%15/05/2045 USD 395,000 472,083 0.01Raytheon Technologies Corp. 3.75%01/11/2046 USD 2,800,000 3,169,267 0.07Realty Income Corp., REIT 3.875%15/04/2025 USD 255,000 281,919 0.01Realty Income Corp., REIT 3.25%15/01/2031 USD 1,480,000 1,613,539 0.04Regency Centers LP, REIT 2.95%15/09/2029 USD 1,305,000 1,376,054 0.03Regions Financial Corp. 3.8%14/08/2023 USD 1,160,000 1,237,132 0.03Reliance Steel & Aluminum Co. 2.15%15/08/2030 USD 3,330,000 3,291,354 0.08Republic Services, Inc. 1.45%15/02/2031 USD 2,120,000 1,988,338 0.05Roper Technologies, Inc. 1.4%15/09/2027 USD 3,420,000 3,367,826 0.08Roper Technologies, Inc. 4.2%15/09/2028 USD 450,000 517,423 0.01Safehold Operating Partnership LP,REIT 2.8% 15/06/2031 USD 5,000,000 5,007,307 0.12
266
JPMorgan Funds - US Aggregate Bond FundSchedule of Investments (continued)
As at 30 June 2021
Investments Currency
Quantity/Nominal
Value
MarketValue
USD
%of
NetAssets Investments Currency
Quantity/Nominal
Value
MarketValue
USD
%of
NetAssets

San Diego Gas & Electric Co. 6.125%15/09/2037 USD 150,000 208,046 0.00San Diego Gas & Electric Co. 3.95%15/11/2041 USD 218,000 245,058 0.01Sherwin-Williams Co. (The) 4.55%01/08/2045 USD 1,821,000 2,266,693 0.05Simon Property Group LP, REIT 3.25%13/09/2049 USD 1,518,000 1,530,951 0.04SITE Centers Corp., REIT 3.625%01/02/2025 USD 345,000 364,897 0.01Southern California Edison Co. 3.65%01/03/2028 USD 800,000 880,252 0.02Southern California Edison Co. 6%15/01/2034 USD 150,000 194,786 0.00Southern California Edison Co. 5.55%15/01/2036 USD 530,000 661,429 0.02Southern California Edison Co. 4.05%15/03/2042 USD 900,000 970,767 0.02Southern California Gas Co. 2.55%01/02/2030 USD 2,260,000 2,339,558 0.05Southern Co. (The) 3.25% 01/07/2026 USD 258,000 279,950 0.01Southern Co. Gas Capital Corp. 2.45%01/10/2023 USD 153,000 159,018 0.00Southern Co. Gas Capital Corp. 5.875%15/03/2041 USD 550,000 762,457 0.02Southern Co. Gas Capital Corp. 4.4%01/06/2043 USD 167,000 198,554 0.00Southern Co. Gas Capital Corp. 3.95%01/10/2046 USD 188,000 209,627 0.00Southern Natural Gas Co. LLC 8%01/03/2032 USD 624,000 892,970 0.02Southern Power Co. 5.15% 15/09/2041 USD 871,000 1,054,195 0.02SouthTrust Bank 7.69% 15/05/2025 USD 250,000 304,382 0.01Southwest Gas Corp. 3.8% 29/09/2046 USD 442,000 480,408 0.01TC PipeLines LP 3.9% 25/05/2027 USD 457,000 504,027 0.01Tennessee Valley Authority 5.88%01/04/2036 USD 2,548,000 3,793,499 0.09Tennessee Valley Authority 4.625%15/09/2060 USD 433,000 638,244 0.01Tennessee Valley Authority 4.25%15/09/2065 USD 438,000 616,287 0.01T-Mobile USA, Inc. 1.5% 15/02/2026 USD 4,510,000 4,543,487 0.11T-Mobile USA, Inc. 3.75% 15/04/2027 USD 4,600,000 5,087,071 0.12T-Mobile USA, Inc. 2.05% 15/02/2028 USD 3,460,000 3,512,886 0.08T-Mobile USA, Inc. 3.875% 15/04/2030 USD 8,485,000 9,493,018 0.22Toledo Edison Co. (The) 6.15%15/05/2037 USD 600,000 824,534 0.02Truist Bank 3.3% 15/05/2026 USD 950,000 1,042,054 0.02Truist Financial Corp. 2.7% 27/01/2022 USD 355,000 359,414 0.01Truist Financial Corp. 4% 01/05/2025 USD 408,000 454,088 0.01Tyson Foods, Inc. 4.875% 15/08/2034 USD 390,000 485,044 0.01UDR, Inc., REIT 2.95% 01/09/2026 USD 276,000 295,393 0.01UDR, Inc., REIT 3.5% 01/07/2027 USD 1,383,000 1,531,192 0.04UDR, Inc., REIT 3% 15/08/2031 USD 460,000 484,442 0.01UDR, Inc., REIT 2.1% 01/08/2032 USD 1,520,000 1,464,425 0.03Union Carbide Corp. 7.75% 01/10/2096 USD 650,000 1,082,830 0.03Union Electric Co. 2.95% 15/06/2027 USD 715,000 774,391 0.02Union Pacific Corp. 3.95% 15/08/2059 USD 900,000 1,045,566 0.02UnitedHealth Group, Inc. 4.625%15/07/2035 USD 396,000 501,630 0.01UnitedHealth Group, Inc. 3.5%15/08/2039 USD 1,495,000 1,674,557 0.04US Bancorp 3.375% 05/02/2024 USD 1,200,000 1,285,542 0.03US Treasury 2% 31/10/2021 USD 14,600,000 14,694,360 0.34US Treasury 1.75% 30/11/2021 USD 15,000,000 15,105,783 0.35US Treasury 2% 31/12/2021 USD 20,000,000 20,191,908 0.47US Treasury 2.5% 15/01/2022 USD 81,200,000 82,264,793 1.92US Treasury 1.75% 28/02/2022 USD 9,300,000 9,402,395 0.22US Treasury 1.875% 30/04/2022 USD 69,800,000 70,833,577 1.65US Treasury 1.75% 15/05/2022 USD 20,000,000 20,290,726 0.47US Treasury 1.625% 31/08/2022 USD 5,000,000 5,087,891 0.12US Treasury 1.75% 30/09/2022 USD 10,000,000 10,202,539 0.24US Treasury 1.875% 30/09/2022 USD 10,000,000 10,217,773 0.24US Treasury 1.5% 28/02/2023 USD 42,000,000 42,913,008 1.00US Treasury 1.75% 15/05/2023 USD 24,636,000 25,335,624 0.59US Treasury 2.75% 31/05/2023 USD 880,000 922,350 0.02US Treasury 1.375% 30/06/2023 USD 10,000,000 10,225,781 0.24US Treasury 1.375% 31/08/2023 USD 10,000,000 10,237,500 0.24US Treasury 1.625% 31/10/2023 USD 11,000,000 11,336,016 0.26US Treasury 2.125% 29/02/2024 USD 17,730,000 18,550,705 0.43US Treasury 2.5% 15/05/2024 USD 369,000 390,960 0.01US Treasury 2% 30/06/2024 USD 1,068,000 1,117,145 0.03US Treasury 1.75% 31/12/2024 USD 22,019,000 22,919,543 0.54US Treasury 2.875% 31/05/2025 USD 46,008,000 49,965,407 1.17US Treasury 2% 15/08/2025 USD 10,000,000 10,527,344 0.25US Treasury 1.625% 15/02/2026 USD 639,100 662,767 0.02US Treasury 0.5% 28/02/2026 USD 36,325,000 35,790,058 0.84US Treasury 1.75% 31/12/2026 USD 20,466,000 21,339,802 0.50
US Treasury 0.5% 30/04/2027 USD 25,000,000 24,257,812 0.57US Treasury 0.375% 30/09/2027 USD 13,990,000 13,368,101 0.31US Treasury 1.25% 31/03/2028 USD 18,725,000 18,806,190 0.44US Treasury 1.25% 30/04/2028 USD 42,760,000 42,913,669 1.00US Treasury 2.875% 15/05/2028 USD 7,360,400 8,179,676 0.19US Treasury 1.625% 15/08/2029 USD 775,000 792,922 0.02US Treasury 1.75% 15/11/2029 USD 2,410,000 2,488,419 0.06US Treasury 1.625% 15/05/2031 USD 2,965,000 3,012,486 0.07US Treasury 4.375% 15/02/2038 USD 1,830,000 2,519,467 0.06US Treasury 1.125% 15/05/2040 USD 3,105,000 2,682,914 0.06US Treasury 3.875% 15/08/2040 USD 1,250,000 1,644,141 0.04US Treasury 4.25% 15/11/2040 USD 6,500,000 8,967,715 0.21US Treasury 4.75% 15/02/2041 USD 3,000,000 4,400,742 0.10US Treasury 2.75% 15/11/2042 USD 27,800,000 31,332,555 0.73US Treasury 3.125% 15/02/2043 USD 7,800,000 9,325,570 0.22US Treasury 3.625% 15/08/2043 USD 22,000,000 28,350,781 0.66US Treasury 3.625% 15/02/2044 USD 9,348,000 12,090,689 0.28US Treasury 3% 15/11/2044 USD 634,000 747,006 0.02US Treasury 2.25% 15/08/2046 USD 2,450,000 2,534,889 0.06US Treasury 3% 15/02/2048 USD 1,330,000 1,586,129 0.04US Treasury 2.875% 15/05/2049 USD 23,296,000 27,301,820 0.64US Treasury 2.25% 15/08/2049 USD 1,880,000 1,949,545 0.05US Treasury 2.375% 15/11/2049 USD 10,005,000 10,662,360 0.25US Treasury 2% 15/02/2050 USD 10,484,000 10,309,949 0.24US Treasury 1.25% 15/05/2050 USD 12,240,000 10,006,678 0.23US Treasury 1.375% 15/08/2050 USD 1,655,000 1,396,988 0.03US Treasury 1.625% 15/11/2050 USD 14,815,000 13,323,083 0.31US Treasury 1.875% 15/02/2051 USD 34,355,000 32,830,497 0.77US Treasury 2.375% 15/05/2051 USD 510,000 545,302 0.01US Treasury Inflation Indexed 0.125%15/01/2022 USD 5,360,000 6,461,033 0.15US Treasury Inflation Indexed 1.75%15/01/2028 USD 1,500,000 2,312,103 0.05US Treasury Inflation Indexed 3.03%15/01/2029 USD 1,000,000 1,601,529 0.04US Treasury STRIP Coupon 0%15/11/2023 USD 3,287,000 3,261,830 0.08Valero Energy Corp. 2.7% 15/04/2023 USD 1,460,000 1,514,399 0.04Valero Energy Corp. 1.2% 15/03/2024 USD 2,320,000 2,338,838 0.05Valero Energy Corp. 2.15% 15/09/2027 USD 2,090,000 2,126,744 0.05Valero Energy Corp. 7.5% 15/04/2032 USD 251,000 353,470 0.01Ventas Realty LP, REIT 3.75%01/05/2024 USD 300,000 322,286 0.01Ventas Realty LP, REIT 4.125%15/01/2026 USD 43,000 48,174 0.00Ventas Realty LP, REIT 3.25%15/10/2026 USD 108,000 117,256 0.00Ventas Realty LP, REIT 3.85%01/04/2027 USD 369,000 413,623 0.01VEREIT Operating Partnership LP, REIT4.875% 01/06/2026 USD 1,500,000 1,727,205 0.04Verizon Communications, Inc. 2.1%22/03/2028 USD 1,545,000 1,578,350 0.04Verizon Communications, Inc. 3.15%22/03/2030 USD 2,915,000 3,149,259 0.07Verizon Communications, Inc. 4.5%10/08/2033 USD 1,290,000 1,545,010 0.04Verizon Communications, Inc. 4.4%01/11/2034 USD 3,033,000 3,630,808 0.08Verizon Communications, Inc. 4.272%15/01/2036 USD 1,500,000 1,791,371 0.04Verizon Communications, Inc. 2.65%20/11/2040 USD 2,481,000 2,391,336 0.06Verizon Communications, Inc. 4.862%21/08/2046 USD 3,047,000 3,942,813 0.09Verizon Communications, Inc. 4.672%15/03/2055 USD 700,000 915,460 0.02Verizon Communications, Inc. 2.987%30/10/2056 USD 1,091,000 1,031,742 0.02Virginia Electric and Power Co. 6%15/05/2037 USD 200,000 277,920 0.01Virginia Electric and Power Co. 3.8%15/09/2047 USD 700,000 811,663 0.02VMware, Inc. 2.95% 21/08/2022 USD 1,944,000 1,994,583 0.05Wells Fargo & Co. 3.55% 29/09/2025 USD 750,000 824,779 0.02Wells Fargo & Co. 4.1% 03/06/2026 USD 317,000 357,126 0.01Wells Fargo & Co. 5.375% 02/11/2043 USD 284,000 379,429 0.01Wells Fargo & Co. 5.606% 15/01/2044 USD 2,640,000 3,632,992 0.08Wells Fargo & Co. 4.9% 17/11/2045 USD 359,000 462,133 0.01Wells Fargo & Co. 4.75% 07/12/2046 USD 478,000 606,651 0.01Welltower, Inc., REIT 2.7% 15/02/2027 USD 412,000 437,326 0.01Welltower, Inc., REIT 4.95%01/09/2048 USD 1,372,000 1,757,190 0.04Williams Cos., Inc. (The) 4.85%01/03/2048 USD 676,000 827,736 0.02WP Carey, Inc., REIT 4.25% 01/10/2026 USD 4,400,000 4,949,129 0.12WP Carey, Inc., REIT 2.4% 01/02/2031 USD 1,975,000 1,961,867 0.05WP Carey, Inc., REIT 2.25% 01/04/2033 USD 3,000,000 2,881,492 0.07
267
JPMorgan Funds - US Aggregate Bond FundSchedule of Investments (continued)
As at 30 June 2021
Investments Currency
Quantity/Nominal
Value
MarketValue
USD
%of
NetAssets Investments Currency
Quantity/Nominal
Value
MarketValue
USD
%of
NetAssets

WRKCo, Inc. 3.9% 01/06/2028 USD 315,000 357,149 0.01Xylem, Inc. 3.25% 01/11/2026 USD 166,000 181,855 0.00Zimmer Biomet Holdings, Inc. 3.7%19/03/2023 USD 349,000 366,998 0.01Zoetis, Inc. 2% 15/05/2030 USD 1,630,000 1,625,718 0.04
1,438,642,190 33.58
Virgin Islands, BritishChina Southern Power GridInternational Finance BVI Co. Ltd.,144A 3.5% 08/05/2027 USD 1,751,000 1,922,020 0.04
1,922,020 0.04
Total Bonds 1,652,044,932 38.56
Total Transferable securities and money market instrumentsadmitted to an official exchange listing 1,652,044,932 38.56
Transferable securities and money market instruments dealt in on another regulatedmarket
Bonds
AustraliaAPT Pipelines Ltd., 144A 4.25%15/07/2027 USD 895,000 1,012,394 0.02Australia & New Zealand BankingGroup Ltd., 144A 4.4% 19/05/2026 USD 200,000 225,680 0.01Commonwealth Bank of Australia,144A 2.5% 18/09/2022 USD 600,000 615,684 0.01GAIF Bond Issuer Pty. Ltd., REIT, 144A3.4% 30/09/2026 USD 826,000 902,058 0.02Macquarie Bank Ltd., FRN, 144A3.052% 03/03/2036 USD 1,565,000 1,559,210 0.04Macquarie Group Ltd., FRN, 144A5.033% 15/01/2030 USD 4,000,000 4,753,071 0.11National Australia Bank Ltd., 144A2.332% 21/08/2030 USD 1,660,000 1,613,024 0.04National Australia Bank Ltd., 144A2.648% 14/01/2041 USD 765,000 719,305 0.02National Australia Bank Ltd., FRN,144A 3.933% 02/08/2034 USD 1,795,000 1,942,154 0.05National Australia Bank Ltd. 3.375%14/01/2026 USD 1,337,000 1,474,897 0.04National Australia Bank Ltd. 2.5%12/07/2026 USD 500,000 532,167 0.01Newcrest Finance Pty. Ltd., 144A3.25% 13/05/2030 USD 955,000 1,027,752 0.02Scentre Group Trust 1, REIT, 144A 3.5%12/02/2025 USD 1,700,000 1,834,201 0.04Scentre Group Trust 2, REIT, FRN, 144A4.75% 24/09/2080 USD 4,055,000 4,333,781 0.10Sydney Airport Finance Co. Pty. Ltd.,144A 3.375% 30/04/2025 USD 1,200,000 1,284,616 0.03Westpac Banking Corp. 4.421%24/07/2039 USD 865,000 1,025,714 0.02Westpac Banking Corp., FRN 4.322%23/11/2031 USD 1,950,000 2,167,273 0.05
27,022,981 0.63
BermudaTriton Container International Ltd.,144A 1.15% 07/06/2024 USD 2,005,000 2,001,609 0.05
2,001,609 0.05
CanadaAir Canada Pass-Through Trust, Series2013-1 ‘A’, 144A 4.125% 15/11/2026 USD 642,292 663,167 0.02Air Canada Pass-Through Trust, Series2015-1 ‘A’, 144A 3.6% 15/09/2028 USD 371,561 378,993 0.01Air Canada Pass-Through Trust, Series2017-1 ‘A’, 144A 3.55% 15/07/2031 USD 2,186,976 2,132,302 0.05Air Canada Pass-Through Trust, Series2017-2 ‘AA’, 144A 3.3% 15/07/2031 USD 714,168 725,323 0.02Alimentation Couche-Tard, Inc., 144A2.95% 25/01/2030 USD 875,000 911,822 0.02Alimentation Couche-Tard, Inc., 144A3.439% 13/05/2041 USD 1,190,000 1,231,889 0.03Alimentation Couche-Tard, Inc., 144A3.8% 25/01/2050 USD 2,525,000 2,716,302 0.06Alimentation Couche-Tard, Inc., 144A3.625% 13/05/2051 USD 1,325,000 1,388,770 0.03Bank of Montreal 3.3% 05/02/2024 USD 1,200,000 1,285,537 0.03Bank of Montreal 1.85% 01/05/2025 USD 1,950,000 2,017,610 0.05Bank of Montreal, FRN 3.803%15/12/2032 USD 433,000 477,883 0.01
Bank of Nova Scotia (The) 2.2%03/02/2025 USD 2,727,000 2,847,204 0.07Bank of Nova Scotia (The) 4.5%16/12/2025 USD 365,000 413,929 0.01Brookfield Finance, Inc. 3.9%25/01/2028 USD 422,000 471,614 0.01Brookfield Finance, Inc. 4.7%20/09/2047 USD 335,000 408,173 0.01Canadian Imperial Bank of Commerce3.1% 02/04/2024 USD 500,000 531,605 0.01Cenovus Energy, Inc. 3.95%15/04/2022 USD 300,000 305,402 0.01Glencore Finance Canada Ltd., 144A4.95% 15/11/2021 USD 2,155,000 2,190,549 0.05Manulife Financial Corp., FRN 4.061%24/02/2032 USD 1,700,000 1,878,675 0.04Nutrien Ltd. 4% 15/12/2026 USD 850,000 958,396 0.02Nutrien Ltd. 4.125% 15/03/2035 USD 500,000 572,285 0.01Nutrien Ltd. 6.125% 15/01/2041 USD 125,000 179,196 0.00Ontario Teachers’ Cadillac FairviewProperties Trust, 144A 3.125%20/03/2022 USD 772,000 786,445 0.02Ontario Teachers’ Cadillac FairviewProperties Trust, 144A 3.875%20/03/2027 USD 804,000 887,765 0.02Province of Quebec Canada 6.35%30/01/2026 USD 270,000 329,169 0.01Royal Bank of Canada 3.7%05/10/2023 USD 1,500,000 1,610,401 0.04Royal Bank of Canada 4.65%27/01/2026 USD 400,000 458,703 0.01Schlumberger Finance Canada Ltd.1.4% 17/09/2025 USD 2,950,000 2,989,922 0.07Toronto-Dominion Bank (The) 3.25%11/03/2024 USD 1,245,000 1,334,576 0.03
33,083,607 0.77
Cayman IslandsAvolon Holdings Funding Ltd., 144A5.5% 15/01/2023 USD 3,965,000 4,212,238 0.10Avolon Holdings Funding Ltd., 144A5.25% 15/05/2024 USD 2,915,000 3,208,072 0.07Avolon Holdings Funding Ltd., 144A2.875% 15/02/2025 USD 1,898,000 1,955,874 0.05Avolon Holdings Funding Ltd., 144A5.5% 15/01/2026 USD 4,015,000 4,558,014 0.11Avolon Holdings Funding Ltd., 144A2.125% 21/02/2026 USD 1,380,000 1,369,532 0.03Avolon Holdings Funding Ltd., 144A4.25% 15/04/2026 USD 1,830,000 1,984,558 0.05Avolon Holdings Funding Ltd., 144A4.375% 01/05/2026 USD 605,000 657,791 0.02Colony American Finance Ltd., Series2016-2 ‘A’, 144A 2.554% 15/11/2048 USD 323,974 323,997 0.01HERO Funding II, Series 2016-3B ‘B’,144A 5.24% 20/09/2042 USD 1,008,256 1,010,890 0.02HERO Funding II, Series 2016-4B ‘B’,144A 5.75% 20/09/2047 USD 1,236,591 1,262,369 0.03HERO Funding Trust, Series 2017-1A‘A2’, 144A 4.46% 20/09/2047 USD 2,654,004 2,798,445 0.06Hutchison Whampoa International 11Ltd., 144A 4.625% 13/01/2022 USD 300,000 306,796 0.01Hutchison Whampoa International 14Ltd., 144A 3.625% 31/10/2024 USD 550,000 599,409 0.01Park Aerospace Holdings Ltd., 144A5.25% 15/08/2022 USD 9,950,000 10,413,037 0.24Park Aerospace Holdings Ltd., 144A4.5% 15/03/2023 USD 860,000 904,462 0.02Park Aerospace Holdings Ltd., 144A5.5% 15/02/2024 USD 2,625,000 2,887,226 0.07Renew, Series 2017-1A ‘A’, 144A 3.67%20/09/2052 USD 1,138,666 1,199,150 0.03
39,651,860 0.93
ChinaIndustrial & Commercial Bank of ChinaLtd. 2.452% 20/10/2021 USD 1,000,000 1,005,233 0.02
1,005,233 0.02
DenmarkDanske Bank A/S, 144A 2%08/09/2021 USD 429,000 430,343 0.01Danske Bank A/S, 144A 2.7%02/03/2022 USD 550,000 558,814 0.01Danske Bank A/S, FRN, 144A 1.171%08/12/2023 USD 5,034,000 5,060,188 0.12
6,049,345 0.14
268
JPMorgan Funds - US Aggregate Bond FundSchedule of Investments (continued)
As at 30 June 2021
Investments Currency
Quantity/Nominal
Value
MarketValue
USD
%of
NetAssets Investments Currency
Quantity/Nominal
Value
MarketValue
USD
%of
NetAssets
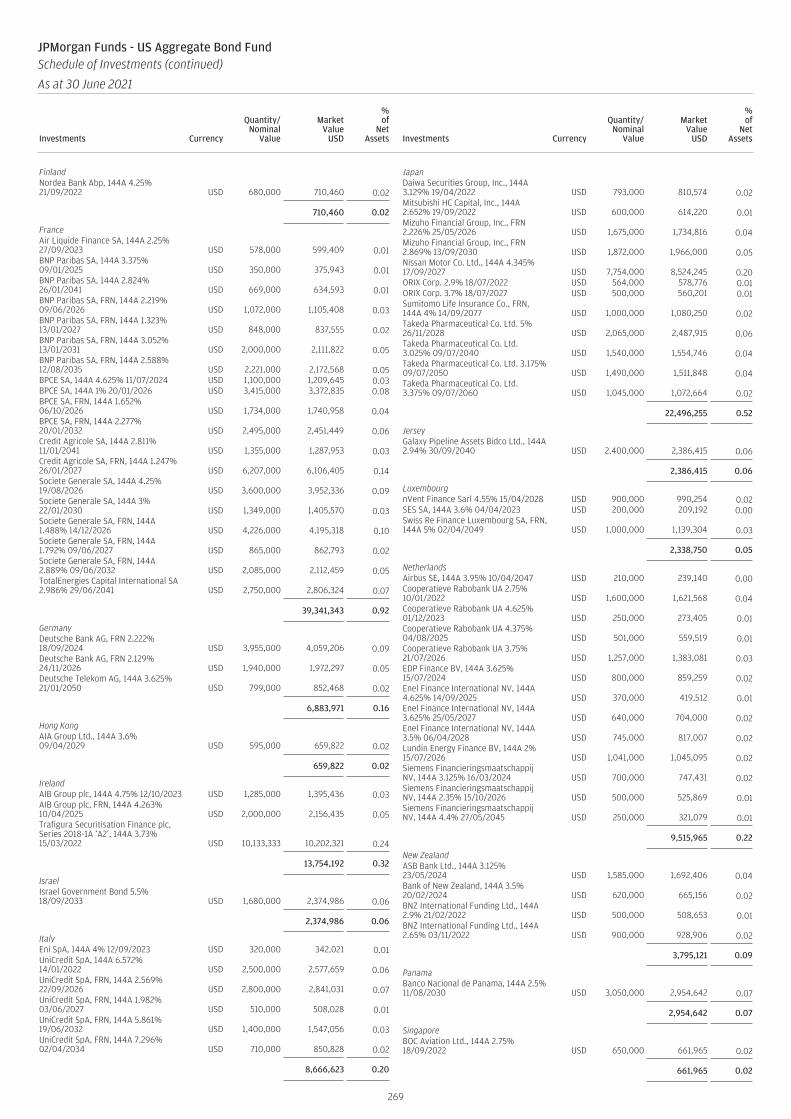
FinlandNordea Bank Abp, 144A 4.25%21/09/2022 USD 680,000 710,460 0.02
710,460 0.02
FranceAir Liquide Finance SA, 144A 2.25%27/09/2023 USD 578,000 599,409 0.01BNP Paribas SA, 144A 3.375%09/01/2025 USD 350,000 375,943 0.01BNP Paribas SA, 144A 2.824%26/01/2041 USD 669,000 634,593 0.01BNP Paribas SA, FRN, 144A 2.219%09/06/2026 USD 1,072,000 1,105,408 0.03BNP Paribas SA, FRN, 144A 1.323%13/01/2027 USD 848,000 837,555 0.02BNP Paribas SA, FRN, 144A 3.052%13/01/2031 USD 2,000,000 2,111,822 0.05BNP Paribas SA, FRN, 144A 2.588%12/08/2035 USD 2,221,000 2,172,568 0.05BPCE SA, 144A 4.625% 11/07/2024 USD 1,100,000 1,209,645 0.03BPCE SA, 144A 1% 20/01/2026 USD 3,415,000 3,372,835 0.08BPCE SA, FRN, 144A 1.652%06/10/2026 USD 1,734,000 1,740,958 0.04BPCE SA, FRN, 144A 2.277%20/01/2032 USD 2,495,000 2,451,449 0.06Credit Agricole SA, 144A 2.811%11/01/2041 USD 1,355,000 1,287,953 0.03Credit Agricole SA, FRN, 144A 1.247%26/01/2027 USD 6,207,000 6,106,405 0.14Societe Generale SA, 144A 4.25%19/08/2026 USD 3,600,000 3,952,336 0.09Societe Generale SA, 144A 3%22/01/2030 USD 1,349,000 1,405,570 0.03Societe Generale SA, FRN, 144A1.488% 14/12/2026 USD 4,226,000 4,195,318 0.10Societe Generale SA, FRN, 144A1.792% 09/06/2027 USD 865,000 862,793 0.02Societe Generale SA, FRN, 144A2.889% 09/06/2032 USD 2,085,000 2,112,459 0.05TotalEnergies Capital International SA2.986% 29/06/2041 USD 2,750,000 2,806,324 0.07
39,341,343 0.92
GermanyDeutsche Bank AG, FRN 2.222%18/09/2024 USD 3,955,000 4,059,206 0.09Deutsche Bank AG, FRN 2.129%24/11/2026 USD 1,940,000 1,972,297 0.05Deutsche Telekom AG, 144A 3.625%21/01/2050 USD 799,000 852,468 0.02
6,883,971 0.16
Hong KongAIA Group Ltd., 144A 3.6%09/04/2029 USD 595,000 659,822 0.02
659,822 0.02
IrelandAIB Group plc, 144A 4.75% 12/10/2023 USD 1,285,000 1,395,436 0.03AIB Group plc, FRN, 144A 4.263%10/04/2025 USD 2,000,000 2,156,435 0.05Trafigura Securitisation Finance plc,Series 2018-1A ‘A2’, 144A 3.73%15/03/2022 USD 10,133,333 10,202,321 0.24
13,754,192 0.32
IsraelIsrael Government Bond 5.5%18/09/2033 USD 1,680,000 2,374,986 0.06
2,374,986 0.06
ItalyEni SpA, 144A 4% 12/09/2023 USD 320,000 342,021 0.01UniCredit SpA, 144A 6.572%14/01/2022 USD 2,500,000 2,577,659 0.06UniCredit SpA, FRN, 144A 2.569%22/09/2026 USD 2,800,000 2,841,031 0.07UniCredit SpA, FRN, 144A 1.982%03/06/2027 USD 510,000 508,028 0.01UniCredit SpA, FRN, 144A 5.861%19/06/2032 USD 1,400,000 1,547,056 0.03UniCredit SpA, FRN, 144A 7.296%02/04/2034 USD 710,000 850,828 0.02
8,666,623 0.20
JapanDaiwa Securities Group, Inc., 144A3.129% 19/04/2022 USD 793,000 810,574 0.02Mitsubishi HC Capital, Inc., 144A2.652% 19/09/2022 USD 600,000 614,220 0.01Mizuho Financial Group, Inc., FRN2.226% 25/05/2026 USD 1,675,000 1,734,816 0.04Mizuho Financial Group, Inc., FRN2.869% 13/09/2030 USD 1,872,000 1,966,000 0.05Nissan Motor Co. Ltd., 144A 4.345%17/09/2027 USD 7,754,000 8,524,245 0.20ORIX Corp. 2.9% 18/07/2022 USD 564,000 578,776 0.01ORIX Corp. 3.7% 18/07/2027 USD 500,000 560,201 0.01Sumitomo Life Insurance Co., FRN,144A 4% 14/09/2077 USD 1,000,000 1,080,250 0.02Takeda Pharmaceutical Co. Ltd. 5%26/11/2028 USD 2,065,000 2,487,915 0.06Takeda Pharmaceutical Co. Ltd.3.025% 09/07/2040 USD 1,540,000 1,554,746 0.04Takeda Pharmaceutical Co. Ltd. 3.175%09/07/2050 USD 1,490,000 1,511,848 0.04Takeda Pharmaceutical Co. Ltd.3.375% 09/07/2060 USD 1,045,000 1,072,664 0.02
22,496,255 0.52
JerseyGalaxy Pipeline Assets Bidco Ltd., 144A2.94% 30/09/2040 USD 2,400,000 2,386,415 0.06
2,386,415 0.06
LuxembourgnVent Finance Sarl 4.55% 15/04/2028 USD 900,000 990,254 0.02SES SA, 144A 3.6% 04/04/2023 USD 200,000 209,192 0.00Swiss Re Finance Luxembourg SA, FRN,144A 5% 02/04/2049 USD 1,000,000 1,139,304 0.03
2,338,750 0.05
NetherlandsAirbus SE, 144A 3.95% 10/04/2047 USD 210,000 239,140 0.00Cooperatieve Rabobank UA 2.75%10/01/2022 USD 1,600,000 1,621,568 0.04Cooperatieve Rabobank UA 4.625%01/12/2023 USD 250,000 273,405 0.01Cooperatieve Rabobank UA 4.375%04/08/2025 USD 501,000 559,519 0.01Cooperatieve Rabobank UA 3.75%21/07/2026 USD 1,257,000 1,383,081 0.03EDP Finance BV, 144A 3.625%15/07/2024 USD 800,000 859,259 0.02Enel Finance International NV, 144A4.625% 14/09/2025 USD 370,000 419,512 0.01Enel Finance International NV, 144A3.625% 25/05/2027 USD 640,000 704,000 0.02Enel Finance International NV, 144A3.5% 06/04/2028 USD 745,000 817,007 0.02Lundin Energy Finance BV, 144A 2%15/07/2026 USD 1,041,000 1,045,095 0.02Siemens FinancieringsmaatschappijNV, 144A 3.125% 16/03/2024 USD 700,000 747,431 0.02Siemens FinancieringsmaatschappijNV, 144A 2.35% 15/10/2026 USD 500,000 525,869 0.01Siemens FinancieringsmaatschappijNV, 144A 4.4% 27/05/2045 USD 250,000 321,079 0.01
9,515,965 0.22
New ZealandASB Bank Ltd., 144A 3.125%23/05/2024 USD 1,585,000 1,692,406 0.04Bank of New Zealand, 144A 3.5%20/02/2024 USD 620,000 665,156 0.02BNZ International Funding Ltd., 144A2.9% 21/02/2022 USD 500,000 508,653 0.01BNZ International Funding Ltd., 144A2.65% 03/11/2022 USD 900,000 928,906 0.02
3,795,121 0.09
PanamaBanco Nacional de Panama, 144A 2.5%11/08/2030 USD 3,050,000 2,954,642 0.07
2,954,642 0.07
SingaporeBOC Aviation Ltd., 144A 2.75%18/09/2022 USD 650,000 661,965 0.02
661,965 0.02
269
JPMorgan Funds - US Aggregate Bond FundSchedule of Investments (continued)
As at 30 June 2021
Investments Currency
Quantity/Nominal
Value
MarketValue
USD
%of
NetAssets Investments Currency
Quantity/Nominal
Value
MarketValue
USD
%of
NetAssets

SupranationalBroadcom Corp. 3.875% 15/01/2027 USD 200,000 221,158 0.01NXP BV, 144A 2.5% 11/05/2031 USD 2,975,000 3,024,394 0.07NXP BV, 144A 3.25% 11/05/2041 USD 3,060,000 3,147,441 0.07
6,392,993 0.15
SwedenSwedbank AB, 144A 2.8% 14/03/2022 USD 500,000 508,827 0.01
508,827 0.01
SwitzerlandCredit Suisse Group AG, 144A 3.574%09/01/2023 USD 1,808,000 1,836,774 0.04Credit Suisse Group AG, 144A 4.282%09/01/2028 USD 594,000 661,305 0.01Credit Suisse Group AG, FRN, 144A2.193% 05/06/2026 USD 1,070,000 1,095,924 0.03Credit Suisse Group AG, FRN, 144A1.305% 02/02/2027 USD 4,635,000 4,542,364 0.11Credit Suisse Group AG, FRN, 144A3.091% 14/05/2032 USD 1,860,000 1,917,014 0.04UBS Group AG, 144A 4.125%24/09/2025 USD 2,295,000 2,560,943 0.06UBS Group AG, FRN, 144A 1.364%30/01/2027 USD 2,000,000 1,988,261 0.05
14,602,585 0.34
United KingdomAstraZeneca plc 6.45% 15/09/2037 USD 520,000 777,802 0.02AstraZeneca plc 4% 18/09/2042 USD 430,000 513,647 0.01AstraZeneca plc 2.125% 06/08/2050 USD 1,210,000 1,061,968 0.02BAE Systems plc, 144A 1.9%15/02/2031 USD 2,613,000 2,520,982 0.06BAE Systems plc, 144A 3% 15/09/2050 USD 1,272,000 1,248,026 0.03Royalty Pharma plc, 144A 0.75%02/09/2023 USD 2,360,000 2,367,169 0.05Royalty Pharma plc, 144A 1.2%02/09/2025 USD 2,515,000 2,495,209 0.06Royalty Pharma plc, 144A 1.75%02/09/2027 USD 2,515,000 2,477,568 0.06Royalty Pharma plc, 144A 3.3%02/09/2040 USD 1,930,000 1,930,376 0.04Royalty Pharma plc, 144A 3.55%02/09/2050 USD 1,985,000 1,986,117 0.05Vodafone Group plc 5.25%30/05/2048 USD 683,000 900,371 0.02Vodafone Group plc 4.875%19/06/2049 USD 2,550,000 3,238,148 0.08
21,517,383 0.50
United States of America7-Eleven, Inc., 144A 1.3% 10/02/2028 USD 1,234,000 1,191,745 0.037-Eleven, Inc., 144A 2.5% 10/02/2041 USD 1,258,000 1,171,515 0.03AbbVie, Inc. 2.8% 15/03/2023 USD 1,100,000 1,136,558 0.03AbbVie, Inc. 3.85% 15/06/2024 USD 801,000 868,945 0.02AbbVie, Inc. 4.55% 15/03/2035 USD 500,000 606,610 0.01AbbVie, Inc. 4.05% 21/11/2039 USD 2,729,000 3,178,005 0.07AbbVie, Inc. 4.25% 21/11/2049 USD 1,560,000 1,874,898 0.04ABFC Trust, STEP, Series 2005-AQ1 ‘A4’4.594% 25/01/2034 USD 9,660 9,666 0.00Advocate Health & Hospitals Corp.2.211% 15/06/2030 USD 1,300,000 1,319,725 0.03AEP Transmission Co. LLC 4%01/12/2046 USD 467,000 551,842 0.01AEP Transmission Co. LLC 3.8%15/06/2049 USD 615,000 711,524 0.02AIG Global Funding, 144A 1.9%06/10/2021 USD 800,000 803,450 0.02AIG SunAmerica Global Financing X,144A 6.9% 15/03/2032 USD 650,000 929,043 0.02Air Lease Corp. 3.875% 03/07/2023 USD 925,000 982,325 0.02Alexander Funding Trust, 144A 1.841%15/11/2023 USD 2,000,000 2,037,053 0.05Alternative Loan Trust, Series2005-54CB ‘1A11’ 5.5% 25/11/2035 USD 148,249 140,209 0.00Alternative Loan Trust, Series2005-28CB ‘1A4’ 5.5% 25/08/2035 USD 121,969 121,935 0.00Alternative Loan Trust, Series2004-2CB ‘1A9’ 5.75% 25/03/2034 USD 367,205 369,808 0.01Alternative Loan Trust, Series2004-28CB ‘3A1’ 6% 25/01/2035 USD 25,652 26,022 0.00Alternative Loan Trust, IO, FRN, Series2005-20CB ‘3A8’ 4.658% 25/07/2035 USD 513,943 70,237 0.00Amazon.com, Inc. 3.875% 22/08/2037 USD 1,000,000 1,195,266 0.03American Airlines Pass-Through Trust,Series 2014-1 ‘A’ 3.7% 01/04/2028 USD 1,627,380 1,655,859 0.04
American Airlines Pass-Through Trust,Series 2016-2 ‘AA’ 3.2% 15/12/2029 USD 472,200 482,824 0.01American Airlines Pass-Through Trust,Series 2016-3 ‘AA’ 3% 15/04/2030 USD 1,559,802 1,590,998 0.04American Airlines Pass-Through Trust,Series 2017-1 ‘AA’ 3.65% 15/08/2030 USD 1,759,730 1,847,716 0.04American Airlines Pass-Through Trust,Series 2019-1 ‘AA’ 3.15% 15/08/2033 USD 2,175,478 2,229,865 0.05American Credit AcceptanceReceivables Trust, Series 2018-1 ‘D’,144A 3.93% 10/04/2024 USD 1,233,667 1,242,993 0.03American Homes 4 Rent, Series2015-SFR1 ‘A’, 144A 3.467%17/04/2052 USD 6,393,250 6,789,379 0.16American Homes 4 Rent, Series2015-SFR1 ‘D’, 144A 4.407%17/04/2052 USD 6,418,000 6,828,554 0.16American Homes 4 Rent, Series2015-SFR1 ‘E’, 144A 5.639%17/04/2052 USD 650,000 713,001 0.02American Homes 4 Rent Trust, Series2014-SFR2 ‘A’, 144A 3.786%17/10/2036 USD 5,744,400 6,112,793 0.14American Homes 4 Rent Trust, Series2014-SFR3 ‘A’, 144A 3.678%17/12/2036 USD 5,811,598 6,194,160 0.15American Homes 4 Rent Trust, Series2015-SFR2 ‘A’, 144A 3.732%17/10/2052 USD 1,424,834 1,533,522 0.04American Homes 4 Rent Trust, Series2014-SFR3 ‘B’, 144A 4.201%17/12/2036 USD 750,000 799,442 0.02American Homes 4 Rent Trust, Series2014-SFR2 ‘C’, 144A 4.705%17/10/2036 USD 1,300,000 1,397,438 0.03American Homes 4 Rent Trust, Series2014-SFR3 ‘C’, 144A 4.596%17/12/2036 USD 500,000 537,769 0.01American Homes 4 Rent Trust, Series2015-SFR2 ‘C’, 144A 4.691%17/10/2052 USD 1,893,000 2,059,267 0.05American Homes 4 Rent Trust, Series2014-SFR3 ‘D’, 144A 5.04% 17/12/2036 USD 523,000 564,821 0.01American Homes 4 Rent Trust, Series2015-SFR2 ‘D’, 144A 5.036%17/10/2052 USD 4,103,000 4,486,196 0.11American Homes 4 Rent Trust, Series2014-SFR2 ‘E’, 144A 6.231%17/10/2036 USD 3,350,000 3,685,128 0.09American Homes 4 Rent Trust, Series2014-SFR3 ‘E’, 144A 6.418%17/12/2036 USD 875,000 959,971 0.02American Homes 4 Rent Trust, Series2015-SFR2 ‘E’, 144A 6.07% 17/10/2052 USD 2,800,000 3,148,351 0.07American Municipal Power, Inc. ‘B’7.499% 15/02/2050 USD 715,000 1,166,835 0.03American Tower Corp., REIT 1.875%15/10/2030 USD 2,740,000 2,648,547 0.06American Tower Trust #1, REIT, 144A3.07% 15/03/2048 USD 1,950,000 1,959,501 0.05AmeriCredit Automobile ReceivablesTrust, Series 2017-1 ‘C’ 2.71%18/08/2022 USD 24,164 24,191 0.00AmeriCredit Automobile ReceivablesTrust, Series 2017-1 ‘D’ 3.13%18/01/2023 USD 1,372,000 1,382,878 0.03AmeriCredit Automobile ReceivablesTrust, Series 2017-2 ‘D’ 3.42%18/04/2023 USD 10,400,000 10,552,655 0.25AmeriCredit Automobile ReceivablesTrust, Series 2017-3 ‘D’ 3.18%18/07/2023 USD 12,425,000 12,666,900 0.30AmeriCredit Automobile ReceivablesTrust, Series 2017-4 ‘D’ 3.08%18/12/2023 USD 11,550,000 11,799,124 0.28Amgen, Inc. 2.2% 21/02/2027 USD 1,190,000 1,235,922 0.03Amgen, Inc. 3.15% 21/02/2040 USD 625,000 650,630 0.02Analog Devices, Inc. 3.125%05/12/2023 USD 611,000 646,542 0.02Analog Devices, Inc. 4.5% 05/12/2036 USD 803,000 948,493 0.02Appalachian Power Co. 4.5%01/03/2049 USD 380,000 465,731 0.01Apple, Inc. 3.25% 23/02/2026 USD 266,000 292,202 0.01Apple, Inc. 2.45% 04/08/2026 USD 1,259,000 1,340,724 0.03Apple, Inc. 3% 20/06/2027 USD 1,350,000 1,485,355 0.04Apple, Inc. 3.45% 09/02/2045 USD 792,000 890,831 0.02Apple, Inc. 3.85% 04/08/2046 USD 879,000 1,052,066 0.03Ascension Health 2.532% 15/11/2029 USD 1,770,000 1,866,842 0.04Assurant, Inc. 4.2% 27/09/2023 USD 910,000 976,466 0.02AT&T, Inc., 144A 3.5% 15/09/2053 USD 3,168,000 3,179,184 0.07AT&T, Inc., 144A 3.55% 15/09/2055 USD 309,000 309,840 0.01AT&T, Inc., 144A 3.8% 01/12/2057 USD 246,000 258,601 0.01
270
JPMorgan Funds - US Aggregate Bond FundSchedule of Investments (continued)
As at 30 June 2021
Investments Currency
Quantity/Nominal
Value
MarketValue
USD
%of
NetAssets Investments Currency
Quantity/Nominal
Value
MarketValue
USD
%of
NetAssets

AT&T, Inc. 3.1% 01/02/2043 USD 4,835,000 4,730,253 0.11Athene Global Funding, 144A 0.95%08/01/2024 USD 3,665,000 3,675,025 0.09Athene Global Funding, 144A 2.75%25/06/2024 USD 1,885,000 1,977,897 0.05Athene Global Funding, 144A 1.45%08/01/2026 USD 2,770,000 2,774,802 0.07Athene Global Funding, 144A 2.95%12/11/2026 USD 4,250,000 4,531,815 0.11Aviation Capital Group LLC, 144A2.875% 20/01/2022 USD 1,200,000 1,212,493 0.03Aviation Capital Group LLC, 144A3.875% 01/05/2023 USD 750,000 785,957 0.02Aviation Capital Group LLC, 144A 5.5%15/12/2024 USD 2,094,000 2,371,114 0.06Avis Budget Rental Car Funding AESOPLLC, Series 2018-2A ‘A’, 144A 4%20/03/2025 USD 7,000,000 7,566,580 0.18Baltimore Gas and Electric Co. 2.8%15/08/2022 USD 619,000 632,289 0.02Baltimore Gas and Electric Co. 3.5%15/08/2046 USD 385,000 425,024 0.01Baltimore Gas and Electric Co. 3.2%15/09/2049 USD 885,000 929,811 0.02Baltimore Gas and Electric Co. 2.9%15/06/2050 USD 1,000,000 1,001,962 0.02BAMLL Re-REMIC Trust, FRN, Series2016-FR13 ‘A’, 144A 1.549%27/08/2045 USD 7,475,000 7,393,194 0.17Banc of America Funding Trust, FRN,Series 2004-C ‘1A1’ 3.233%20/12/2034 USD 23,789 24,701 0.00Banc of America Funding Trust, Series2004-2 ‘1CB1’ 5.75% 20/09/2034 USD 41,575 44,904 0.00Banc of America Funding Trust, Series2005-6 ‘2A7’ 5.5% 25/10/2035 USD 75,972 76,749 0.00Banc of America Funding Trust, PO,Series 2004-2 ‘30PO’ 0% 20/09/2034 USD 8,335 7,012 0.00Banc of America Funding Trust, PO,Series 2005-7 ‘30PO’ 0% 25/11/2035 USD 16,370 15,747 0.00Banc of America Funding Trust, FRN,Series 2005-E ‘4A1’ 2.971%20/03/2035 USD 1,675 1,677 0.00Bank of America Corp., FRN 3.864%23/07/2024 USD 300,000 319,896 0.01Bank of America Corp., FRN 3.458%15/03/2025 USD 500,000 534,165 0.01Bank of America Corp., FRN 3.093%01/10/2025 USD 635,000 676,835 0.02Bank of America Corp., FRN 3.366%23/01/2026 USD 1,000,000 1,078,690 0.03Bank of America Corp., FRN 1.658%11/03/2027 USD 2,510,000 2,533,578 0.06Bank of America Corp., FRN 1.734%22/07/2027 USD 829,000 836,231 0.02Bank of America Corp., FRN 3.705%24/04/2028 USD 3,600,000 3,983,951 0.09Bank of America Corp., FRN 3.419%20/12/2028 USD 3,165,000 3,449,287 0.08Bank of America Corp., FRN 3.97%05/03/2029 USD 1,500,000 1,690,800 0.04Bank of America Corp., FRN 2.496%13/02/2031 USD 7,205,000 7,384,000 0.17Bank of America Corp., FRN 2.592%29/04/2031 USD 3,045,000 3,138,167 0.07Bank of America Corp., FRN 1.898%23/07/2031 USD 1,675,000 1,630,363 0.04Bank of America Corp., FRN 2.687%22/04/2032 USD 2,635,000 2,720,519 0.06Bank of America Corp., FRN 2.676%19/06/2041 USD 9,751,000 9,524,218 0.22BB-UBS Trust, Series 2012-SHOW ‘A’,144A 3.43% 05/11/2036 USD 3,850,000 4,082,552 0.10BBVA USA 2.5% 27/08/2024 USD 1,750,000 1,842,920 0.04Bear Stearns ARM Trust, FRN, Series2004-2 ‘14A’ 2.699% 25/05/2034 USD 28,265 27,925 0.00Bear Stearns ARM Trust, FRN, Series2003-7 ‘3A’ 2.186% 25/10/2033 USD 3,822 3,803 0.00Bear Stearns ARM Trust, FRN, Series2003-4 ‘3A1’ 2.475% 25/07/2033 USD 38,957 40,751 0.00Bear Stearns ARM Trust, FRN, Series2006-1 ‘A1’ 2.37% 25/02/2036 USD 54,702 55,610 0.00Bear Stearns Commercial MortgageSecurities Trust, IO, FRN, Series2005-PWR8 ‘X1’, 144A 0.716%11/06/2041 USD 4,853 6 0.00Bear Stearns Commercial MortgageSecurities Trust, IO, FRN, Series2007-T26 ‘X1’, 144A 0.006%12/01/2045 USD 8,270,318 1,337 0.00Biogen, Inc. 2.25% 01/05/2030 USD 2,872,000 2,885,755 0.07Biogen, Inc. 3.15% 01/05/2050 USD 600,000 592,261 0.01
Blackstone Secured Lending Fund,144A 3.65% 14/07/2023 USD 1,860,000 1,939,538 0.05Boeing Co. (The) 3.25% 01/03/2028 USD 2,043,000 2,148,205 0.05Bon Secours Mercy Health, Inc. 3.205%01/06/2050 USD 1,980,000 2,054,331 0.05Boston Gas Co., 144A 4.487%15/02/2042 USD 149,000 176,286 0.00Brambles USA, Inc., 144A 4.125%23/10/2025 USD 500,000 552,651 0.01Bristol-Myers Squibb Co. 3.9%20/02/2028 USD 1,000,000 1,143,816 0.03Bristol-Myers Squibb Co. 4.125%15/06/2039 USD 936,000 1,134,775 0.03Bristol-Myers Squibb Co. 5%15/08/2045 USD 971,000 1,332,315 0.03Bristol-Myers Squibb Co. 4.55%20/02/2048 USD 1,000,000 1,298,975 0.03British Airways Pass-Through Trust,Series 2013-1 ‘A’, 144A 4.125%20/03/2033 USD 1,576,437 1,602,584 0.04British Airways Pass-Through Trust,Series 2018-1 ‘AA’, 144A 3.8%20/03/2033 USD 664,781 696,452 0.02British Airways Pass-Through Trust,Series 2019-1 ‘AA’, 144A 3.3%15/06/2034 USD 1,172,370 1,189,240 0.03Broadcom, Inc., 144A 2.45%15/02/2031 USD 4,373,000 4,316,097 0.10Broadcom, Inc. 4.25% 15/04/2026 USD 3,010,000 3,376,570 0.08Broadcom, Inc. 4.11% 15/09/2028 USD 2,218,000 2,498,127 0.06Broadcom, Inc. 4.15% 15/11/2030 USD 1,500,000 1,686,681 0.04Brooklyn Union Gas Co. (The), 144A3.865% 04/03/2029 USD 785,000 866,263 0.02Brooklyn Union Gas Co. (The), 144A4.273% 15/03/2048 USD 760,000 871,563 0.02Buckeye Partners LP 5.85% 15/11/2043 USD 450,000 445,171 0.01BXG Receivables Note Trust, Series2018-A ‘C’, 144A 4.44% 02/02/2034 USD 3,287,548 3,444,843 0.08Cameron LNG LLC, 144A 3.302%15/01/2035 USD 2,200,000 2,366,192 0.06Capital One Financial Corp., FRN 3.95%31/12/2164 USD 2,035,000 2,075,700 0.05Cargill, Inc., 144A 3.25% 01/03/2023 USD 350,000 367,000 0.01Cargill, Inc., 144A 2.125% 23/04/2030 USD 2,800,000 2,841,225 0.07Carmax Auto Owner Trust, Series2018-4 ‘A3’ 3.36% 15/09/2023 USD 1,345,452 1,364,003 0.03CarMax Auto Owner Trust, Series2017-4 ‘C’ 2.7% 16/10/2023 USD 2,560,000 2,585,178 0.06CD Commercial Mortgage Trust, IO,FRN, Series 2007-CD4 ‘XC’, 144A1.379% 11/12/2049 USD 28,560 846 0.00Charles Schwab Corp. (The), FRN 4%Perpetual USD 2,430,000 2,495,002 0.06Charles Schwab Corp. (The), FRN 4%Perpetual USD 2,895,000 3,028,567 0.07Charter Communications OperatingLLC 3.75% 15/02/2028 USD 2,280,000 2,515,102 0.06Charter Communications OperatingLLC 6.384% 23/10/2035 USD 275,000 370,140 0.01Charter Communications OperatingLLC 5.375% 01/04/2038 USD 400,000 495,470 0.01Charter Communications OperatingLLC 3.5% 01/06/2041 USD 1,345,000 1,352,447 0.03Charter Communications OperatingLLC 4.8% 01/03/2050 USD 2,585,000 3,004,087 0.07Charter Communications OperatingLLC 3.7% 01/04/2051 USD 2,570,000 2,563,229 0.06Charter Communications OperatingLLC 6.834% 23/10/2055 USD 350,000 516,247 0.01Chase Funding Trust, STEP, Series2003-4 ‘1A5’ 5.064% 25/05/2033 USD 126,608 130,138 0.00Chase Funding Trust, STEP, Series2003-6 ‘1A7’ 4.973% 25/11/2034 USD 74,534 78,554 0.00Chase Mortgage Finance Trust, FRN,Series 2007-A1 ‘1A3’ 2.556%25/02/2037 USD 235,319 238,896 0.01Chase Mortgage Finance Trust, FRN,Series 2007-A1 ‘2A1’ 2.791%25/02/2037 USD 23,270 23,578 0.00Chase Mortgage Finance Trust, FRN,Series 2007-A2 ‘2A1’ 2.76%25/06/2035 USD 95,045 96,734 0.00Chase Mortgage Finance Trust, FRN,Series 2007-A1 ‘7A1’ 3.036%25/02/2037 USD 19,393 19,918 0.00Chase Mortgage Finance Trust, FRN,Series 2007-A1 ‘9A1’ 2.826%25/02/2037 USD 20,448 20,822 0.00Cheniere Corpus Christi Holdings LLC5.125% 30/06/2027 USD 420,000 488,900 0.01
271
JPMorgan Funds - US Aggregate Bond FundSchedule of Investments (continued)
As at 30 June 2021
Investments Currency
Quantity/Nominal
Value
MarketValue
USD
%of
NetAssets Investments Currency
Quantity/Nominal
Value
MarketValue
USD
%of
NetAssets
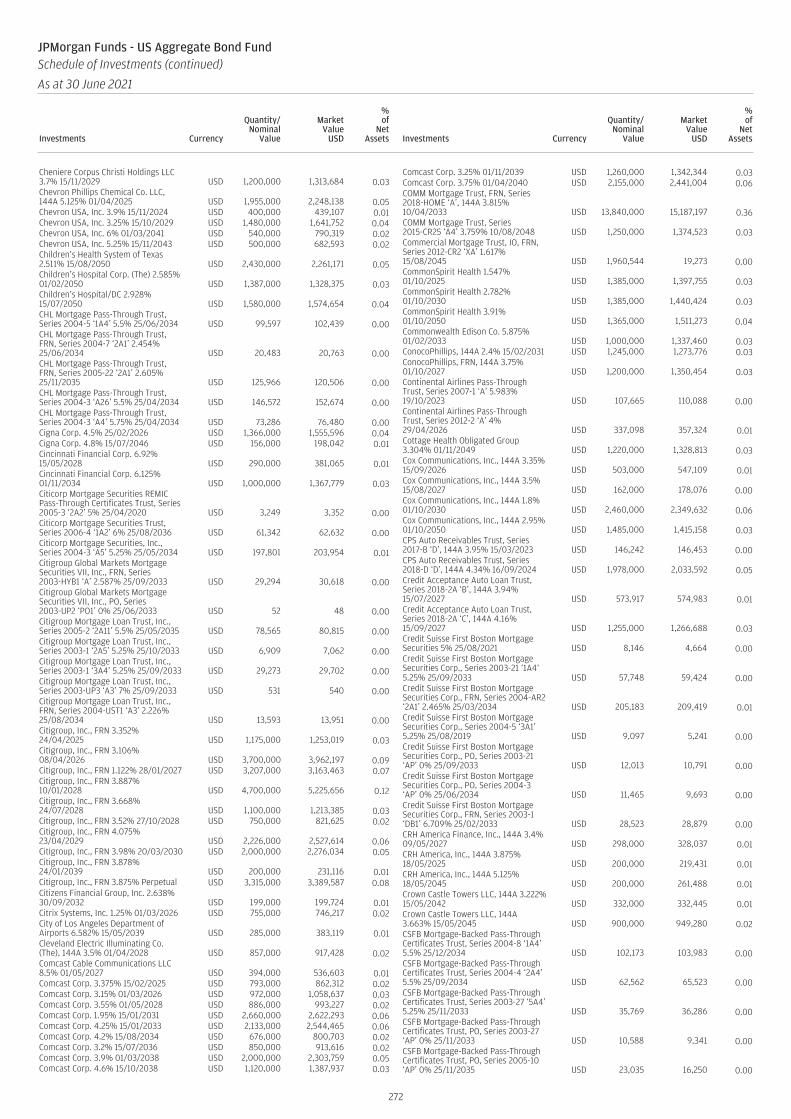
Cheniere Corpus Christi Holdings LLC3.7% 15/11/2029 USD 1,200,000 1,313,684 0.03Chevron Phillips Chemical Co. LLC,144A 5.125% 01/04/2025 USD 1,955,000 2,248,138 0.05Chevron USA, Inc. 3.9% 15/11/2024 USD 400,000 439,107 0.01Chevron USA, Inc. 3.25% 15/10/2029 USD 1,480,000 1,641,752 0.04Chevron USA, Inc. 6% 01/03/2041 USD 540,000 790,319 0.02Chevron USA, Inc. 5.25% 15/11/2043 USD 500,000 682,593 0.02Children’s Health System of Texas2.511% 15/08/2050 USD 2,430,000 2,261,171 0.05Children’s Hospital Corp. (The) 2.585%01/02/2050 USD 1,387,000 1,328,375 0.03Children’s Hospital/DC 2.928%15/07/2050 USD 1,580,000 1,574,654 0.04CHL Mortgage Pass-Through Trust,Series 2004-5 ‘1A4’ 5.5% 25/06/2034 USD 99,597 102,439 0.00CHL Mortgage Pass-Through Trust,FRN, Series 2004-7 ‘2A1’ 2.454%25/06/2034 USD 20,483 20,763 0.00CHL Mortgage Pass-Through Trust,FRN, Series 2005-22 ‘2A1’ 2.605%25/11/2035 USD 125,966 120,506 0.00CHL Mortgage Pass-Through Trust,Series 2004-3 ‘A26’ 5.5% 25/04/2034 USD 146,572 152,674 0.00CHL Mortgage Pass-Through Trust,Series 2004-3 ‘A4’ 5.75% 25/04/2034 USD 73,286 76,480 0.00Cigna Corp. 4.5% 25/02/2026 USD 1,366,000 1,555,596 0.04Cigna Corp. 4.8% 15/07/2046 USD 156,000 198,042 0.01Cincinnati Financial Corp. 6.92%15/05/2028 USD 290,000 381,065 0.01Cincinnati Financial Corp. 6.125%01/11/2034 USD 1,000,000 1,367,779 0.03Citicorp Mortgage Securities REMICPass-Through Certificates Trust, Series2005-3 ‘2A2’ 5% 25/04/2020 USD 3,249 3,352 0.00Citicorp Mortgage Securities Trust,Series 2006-4 ‘1A2’ 6% 25/08/2036 USD 61,342 62,632 0.00Citicorp Mortgage Securities, Inc.,Series 2004-3 ‘A5’ 5.25% 25/05/2034 USD 197,801 203,954 0.01Citigroup Global Markets MortgageSecurities VII, Inc., FRN, Series2003-HYB1 ‘A’ 2.587% 25/09/2033 USD 29,294 30,618 0.00Citigroup Global Markets MortgageSecurities VII, Inc., PO, Series2003-UP2 ‘PO1’ 0% 25/06/2033 USD 52 48 0.00Citigroup Mortgage Loan Trust, Inc.,Series 2005-2 ‘2A11’ 5.5% 25/05/2035 USD 78,565 80,815 0.00Citigroup Mortgage Loan Trust, Inc.,Series 2003-1 ‘2A5’ 5.25% 25/10/2033 USD 6,909 7,062 0.00Citigroup Mortgage Loan Trust, Inc.,Series 2003-1 ‘3A4’ 5.25% 25/09/2033 USD 29,273 29,702 0.00Citigroup Mortgage Loan Trust, Inc.,Series 2003-UP3 ‘A3’ 7% 25/09/2033 USD 531 540 0.00Citigroup Mortgage Loan Trust, Inc.,FRN, Series 2004-UST1 ‘A3’ 2.226%25/08/2034 USD 13,593 13,951 0.00Citigroup, Inc., FRN 3.352%24/04/2025 USD 1,175,000 1,253,019 0.03Citigroup, Inc., FRN 3.106%08/04/2026 USD 3,700,000 3,962,197 0.09Citigroup, Inc., FRN 1.122% 28/01/2027 USD 3,207,000 3,163,463 0.07Citigroup, Inc., FRN 3.887%10/01/2028 USD 4,700,000 5,225,656 0.12Citigroup, Inc., FRN 3.668%24/07/2028 USD 1,100,000 1,213,385 0.03Citigroup, Inc., FRN 3.52% 27/10/2028 USD 750,000 821,625 0.02Citigroup, Inc., FRN 4.075%23/04/2029 USD 2,226,000 2,527,614 0.06Citigroup, Inc., FRN 3.98% 20/03/2030 USD 2,000,000 2,276,034 0.05Citigroup, Inc., FRN 3.878%24/01/2039 USD 200,000 231,116 0.01Citigroup, Inc., FRN 3.875% Perpetual USD 3,315,000 3,389,587 0.08Citizens Financial Group, Inc. 2.638%30/09/2032 USD 199,000 199,724 0.01Citrix Systems, Inc. 1.25% 01/03/2026 USD 755,000 746,217 0.02City of Los Angeles Department ofAirports 6.582% 15/05/2039 USD 285,000 383,119 0.01Cleveland Electric Illuminating Co.(The), 144A 3.5% 01/04/2028 USD 857,000 917,428 0.02Comcast Cable Communications LLC8.5% 01/05/2027 USD 394,000 536,603 0.01Comcast Corp. 3.375% 15/02/2025 USD 793,000 862,312 0.02Comcast Corp. 3.15% 01/03/2026 USD 972,000 1,058,637 0.03Comcast Corp. 3.55% 01/05/2028 USD 886,000 993,227 0.02Comcast Corp. 1.95% 15/01/2031 USD 2,660,000 2,622,293 0.06Comcast Corp. 4.25% 15/01/2033 USD 2,133,000 2,544,465 0.06Comcast Corp. 4.2% 15/08/2034 USD 676,000 800,703 0.02Comcast Corp. 3.2% 15/07/2036 USD 850,000 913,616 0.02Comcast Corp. 3.9% 01/03/2038 USD 2,000,000 2,303,759 0.05Comcast Corp. 4.6% 15/10/2038 USD 1,120,000 1,387,937 0.03
Comcast Corp. 3.25% 01/11/2039 USD 1,260,000 1,342,344 0.03Comcast Corp. 3.75% 01/04/2040 USD 2,155,000 2,441,004 0.06COMM Mortgage Trust, FRN, Series2018-HOME ‘A’, 144A 3.815%10/04/2033 USD 13,840,000 15,187,197 0.36COMM Mortgage Trust, Series2015-CR25 ‘A4’ 3.759% 10/08/2048 USD 1,250,000 1,374,523 0.03Commercial Mortgage Trust, IO, FRN,Series 2012-CR2 ‘XA’ 1.617%15/08/2045 USD 1,960,544 19,273 0.00CommonSpirit Health 1.547%01/10/2025 USD 1,385,000 1,397,755 0.03CommonSpirit Health 2.782%01/10/2030 USD 1,385,000 1,440,424 0.03CommonSpirit Health 3.91%01/10/2050 USD 1,365,000 1,511,273 0.04Commonwealth Edison Co. 5.875%01/02/2033 USD 1,000,000 1,337,460 0.03ConocoPhillips, 144A 2.4% 15/02/2031 USD 1,245,000 1,273,776 0.03ConocoPhillips, FRN, 144A 3.75%01/10/2027 USD 1,200,000 1,350,454 0.03Continental Airlines Pass-ThroughTrust, Series 2007-1 ‘A’ 5.983%19/10/2023 USD 107,665 110,088 0.00Continental Airlines Pass-ThroughTrust, Series 2012-2 ‘A’ 4%29/04/2026 USD 337,098 357,324 0.01Cottage Health Obligated Group3.304% 01/11/2049 USD 1,220,000 1,328,813 0.03Cox Communications, Inc., 144A 3.35%15/09/2026 USD 503,000 547,109 0.01Cox Communications, Inc., 144A 3.5%15/08/2027 USD 162,000 178,076 0.00Cox Communications, Inc., 144A 1.8%01/10/2030 USD 2,460,000 2,349,632 0.06Cox Communications, Inc., 144A 2.95%01/10/2050 USD 1,485,000 1,415,158 0.03CPS Auto Receivables Trust, Series2017-B ‘D’, 144A 3.95% 15/03/2023 USD 146,242 146,453 0.00CPS Auto Receivables Trust, Series2018-D ‘D’, 144A 4.34% 16/09/2024 USD 1,978,000 2,033,592 0.05Credit Acceptance Auto Loan Trust,Series 2018-2A ‘B’, 144A 3.94%15/07/2027 USD 573,917 574,983 0.01Credit Acceptance Auto Loan Trust,Series 2018-2A ‘C’, 144A 4.16%15/09/2027 USD 1,255,000 1,266,688 0.03Credit Suisse First Boston MortgageSecurities 5% 25/08/2021 USD 8,146 4,664 0.00Credit Suisse First Boston MortgageSecurities Corp., Series 2003-21 ‘1A4’5.25% 25/09/2033 USD 57,748 59,424 0.00Credit Suisse First Boston MortgageSecurities Corp., FRN, Series 2004-AR2‘2A1’ 2.465% 25/03/2034 USD 205,183 209,419 0.01Credit Suisse First Boston MortgageSecurities Corp., Series 2004-5 ‘3A1’5.25% 25/08/2019 USD 9,097 5,241 0.00Credit Suisse First Boston MortgageSecurities Corp., PO, Series 2003-21‘AP’ 0% 25/09/2033 USD 12,013 10,791 0.00Credit Suisse First Boston MortgageSecurities Corp., PO, Series 2004-3‘AP’ 0% 25/06/2034 USD 11,465 9,693 0.00Credit Suisse First Boston MortgageSecurities Corp., FRN, Series 2003-1‘DB1’ 6.709% 25/02/2033 USD 28,523 28,879 0.00CRH America Finance, Inc., 144A 3.4%09/05/2027 USD 298,000 328,037 0.01CRH America, Inc., 144A 3.875%18/05/2025 USD 200,000 219,431 0.01CRH America, Inc., 144A 5.125%18/05/2045 USD 200,000 261,488 0.01Crown Castle Towers LLC, 144A 3.222%15/05/2042 USD 332,000 332,445 0.01Crown Castle Towers LLC, 144A3.663% 15/05/2045 USD 900,000 949,280 0.02CSFB Mortgage-Backed Pass-ThroughCertificates Trust, Series 2004-8 ‘1A4’5.5% 25/12/2034 USD 102,173 103,983 0.00CSFB Mortgage-Backed Pass-ThroughCertificates Trust, Series 2004-4 ‘2A4’5.5% 25/09/2034 USD 62,562 65,523 0.00CSFB Mortgage-Backed Pass-ThroughCertificates Trust, Series 2003-27 ‘5A4’5.25% 25/11/2033 USD 35,769 36,286 0.00CSFB Mortgage-Backed Pass-ThroughCertificates Trust, PO, Series 2003-27‘AP’ 0% 25/11/2033 USD 10,588 9,341 0.00CSFB Mortgage-Backed Pass-ThroughCertificates Trust, PO, Series 2005-10‘AP’ 0% 25/11/2035 USD 23,035 16,250 0.00
272
JPMorgan Funds - US Aggregate Bond FundSchedule of Investments (continued)
As at 30 June 2021
Investments Currency
Quantity/Nominal
Value
MarketValue
USD
%of
NetAssets Investments Currency
Quantity/Nominal
Value
MarketValue
USD
%of
NetAssets
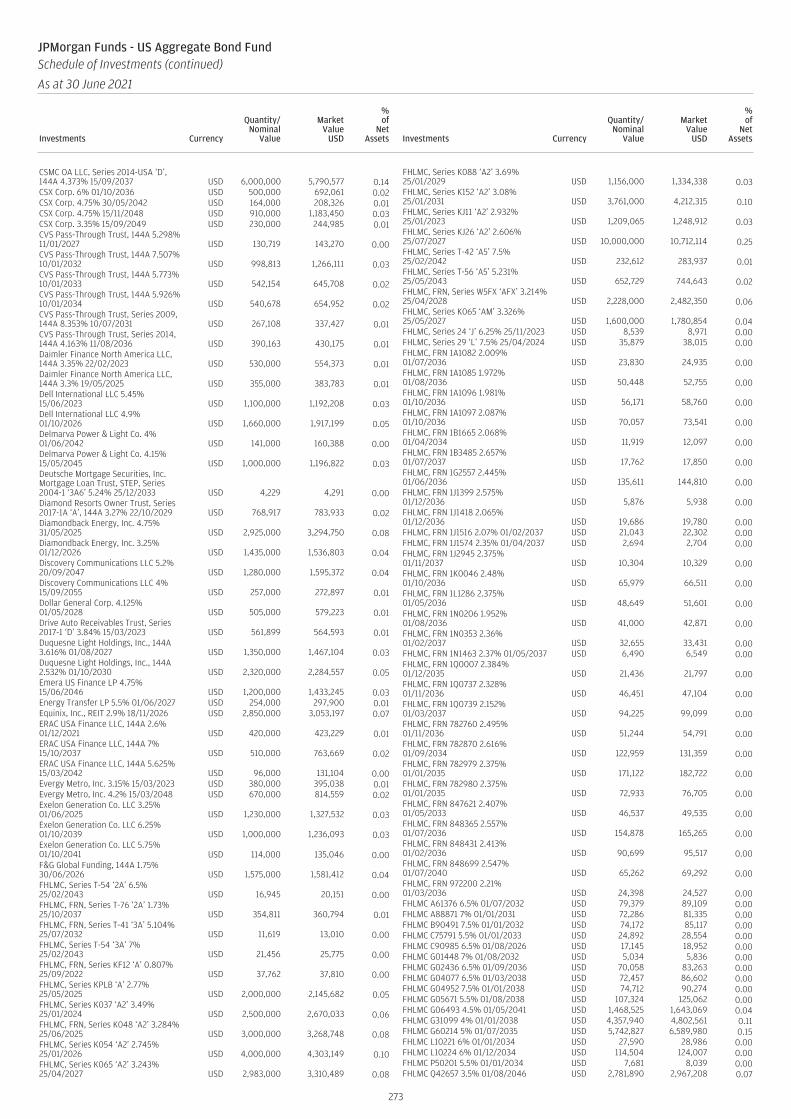
CSMC OA LLC, Series 2014-USA ‘D’,144A 4.373% 15/09/2037 USD 6,000,000 5,790,577 0.14CSX Corp. 6% 01/10/2036 USD 500,000 692,061 0.02CSX Corp. 4.75% 30/05/2042 USD 164,000 208,326 0.01CSX Corp. 4.75% 15/11/2048 USD 910,000 1,183,450 0.03CSX Corp. 3.35% 15/09/2049 USD 230,000 244,985 0.01CVS Pass-Through Trust, 144A 5.298%11/01/2027 USD 130,719 143,270 0.00CVS Pass-Through Trust, 144A 7.507%10/01/2032 USD 998,813 1,266,111 0.03CVS Pass-Through Trust, 144A 5.773%10/01/2033 USD 542,154 645,708 0.02CVS Pass-Through Trust, 144A 5.926%10/01/2034 USD 540,678 654,952 0.02CVS Pass-Through Trust, Series 2009,144A 8.353% 10/07/2031 USD 267,108 337,427 0.01CVS Pass-Through Trust, Series 2014,144A 4.163% 11/08/2036 USD 390,163 430,175 0.01Daimler Finance North America LLC,144A 3.35% 22/02/2023 USD 530,000 554,373 0.01Daimler Finance North America LLC,144A 3.3% 19/05/2025 USD 355,000 383,783 0.01Dell International LLC 5.45%15/06/2023 USD 1,100,000 1,192,208 0.03Dell International LLC 4.9%01/10/2026 USD 1,660,000 1,917,199 0.05Delmarva Power & Light Co. 4%01/06/2042 USD 141,000 160,388 0.00Delmarva Power & Light Co. 4.15%15/05/2045 USD 1,000,000 1,196,822 0.03Deutsche Mortgage Securities, Inc.Mortgage Loan Trust, STEP, Series2004-1 ‘3A6’ 5.24% 25/12/2033 USD 4,229 4,291 0.00Diamond Resorts Owner Trust, Series2017-1A ‘A’, 144A 3.27% 22/10/2029 USD 768,917 783,933 0.02Diamondback Energy, Inc. 4.75%31/05/2025 USD 2,925,000 3,294,750 0.08Diamondback Energy, Inc. 3.25%01/12/2026 USD 1,435,000 1,536,803 0.04Discovery Communications LLC 5.2%20/09/2047 USD 1,280,000 1,595,372 0.04Discovery Communications LLC 4%15/09/2055 USD 257,000 272,897 0.01Dollar General Corp. 4.125%01/05/2028 USD 505,000 579,223 0.01Drive Auto Receivables Trust, Series2017-1 ‘D’ 3.84% 15/03/2023 USD 561,899 564,593 0.01Duquesne Light Holdings, Inc., 144A3.616% 01/08/2027 USD 1,350,000 1,467,104 0.03Duquesne Light Holdings, Inc., 144A2.532% 01/10/2030 USD 2,320,000 2,284,557 0.05Emera US Finance LP 4.75%15/06/2046 USD 1,200,000 1,433,245 0.03Energy Transfer LP 5.5% 01/06/2027 USD 254,000 297,900 0.01Equinix, Inc., REIT 2.9% 18/11/2026 USD 2,850,000 3,053,197 0.07ERAC USA Finance LLC, 144A 2.6%01/12/2021 USD 420,000 423,229 0.01ERAC USA Finance LLC, 144A 7%15/10/2037 USD 510,000 763,669 0.02ERAC USA Finance LLC, 144A 5.625%15/03/2042 USD 96,000 131,104 0.00Evergy Metro, Inc. 3.15% 15/03/2023 USD 380,000 395,038 0.01Evergy Metro, Inc. 4.2% 15/03/2048 USD 670,000 814,559 0.02Exelon Generation Co. LLC 3.25%01/06/2025 USD 1,230,000 1,327,532 0.03Exelon Generation Co. LLC 6.25%01/10/2039 USD 1,000,000 1,236,093 0.03Exelon Generation Co. LLC 5.75%01/10/2041 USD 114,000 135,046 0.00F&G Global Funding, 144A 1.75%30/06/2026 USD 1,575,000 1,581,412 0.04FHLMC, Series T-54 ‘2A’ 6.5%25/02/2043 USD 16,945 20,151 0.00FHLMC, FRN, Series T-76 ‘2A’ 1.73%25/10/2037 USD 354,811 360,794 0.01FHLMC, FRN, Series T-41 ‘3A’ 5.104%25/07/2032 USD 11,619 13,010 0.00FHLMC, Series T-54 ‘3A’ 7%25/02/2043 USD 21,456 25,775 0.00FHLMC, FRN, Series KF12 ‘A’ 0.807%25/09/2022 USD 37,762 37,810 0.00FHLMC, Series KPLB ‘A’ 2.77%25/05/2025 USD 2,000,000 2,145,682 0.05FHLMC, Series K037 ‘A2’ 3.49%25/01/2024 USD 2,500,000 2,670,033 0.06FHLMC, FRN, Series K048 ‘A2’ 3.284%25/06/2025 USD 3,000,000 3,268,748 0.08FHLMC, Series K054 ‘A2’ 2.745%25/01/2026 USD 4,000,000 4,303,149 0.10FHLMC, Series K065 ‘A2’ 3.243%25/04/2027 USD 2,983,000 3,310,489 0.08
FHLMC, Series K088 ‘A2’ 3.69%25/01/2029 USD 1,156,000 1,334,338 0.03FHLMC, Series K152 ‘A2’ 3.08%25/01/2031 USD 3,761,000 4,212,315 0.10FHLMC, Series KJ11 ‘A2’ 2.932%25/01/2023 USD 1,209,065 1,248,912 0.03FHLMC, Series KJ26 ‘A2’ 2.606%25/07/2027 USD 10,000,000 10,712,114 0.25FHLMC, Series T-42 ‘A5’ 7.5%25/02/2042 USD 232,612 283,937 0.01FHLMC, Series T-56 ‘A5’ 5.231%25/05/2043 USD 652,729 744,643 0.02FHLMC, FRN, Series W5FX ‘AFX’ 3.214%25/04/2028 USD 2,228,000 2,482,350 0.06FHLMC, Series K065 ‘AM’ 3.326%25/05/2027 USD 1,600,000 1,780,854 0.04FHLMC, Series 24 ‘J’ 6.25% 25/11/2023 USD 8,539 8,971 0.00FHLMC, Series 29 ‘L’ 7.5% 25/04/2024 USD 35,879 38,015 0.00FHLMC, FRN 1A1082 2.009%01/07/2036 USD 23,830 24,935 0.00FHLMC, FRN 1A1085 1.972%01/08/2036 USD 50,448 52,755 0.00FHLMC, FRN 1A1096 1.981%01/10/2036 USD 56,171 58,760 0.00FHLMC, FRN 1A1097 2.087%01/10/2036 USD 70,057 73,541 0.00FHLMC, FRN 1B1665 2.068%01/04/2034 USD 11,919 12,097 0.00FHLMC, FRN 1B3485 2.657%01/07/2037 USD 17,762 17,850 0.00FHLMC, FRN 1G2557 2.445%01/06/2036 USD 135,611 144,810 0.00FHLMC, FRN 1J1399 2.575%01/12/2036 USD 5,876 5,938 0.00FHLMC, FRN 1J1418 2.065%01/12/2036 USD 19,686 19,780 0.00FHLMC, FRN 1J1516 2.07% 01/02/2037 USD 21,043 22,302 0.00FHLMC, FRN 1J1574 2.35% 01/04/2037 USD 2,694 2,704 0.00FHLMC, FRN 1J2945 2.375%01/11/2037 USD 10,304 10,329 0.00FHLMC, FRN 1K0046 2.48%01/10/2036 USD 65,979 66,511 0.00FHLMC, FRN 1L1286 2.375%01/05/2036 USD 48,649 51,601 0.00FHLMC, FRN 1N0206 1.952%01/08/2036 USD 41,000 42,871 0.00FHLMC, FRN 1N0353 2.36%01/02/2037 USD 32,655 33,431 0.00FHLMC, FRN 1N1463 2.37% 01/05/2037 USD 6,490 6,549 0.00FHLMC, FRN 1Q0007 2.384%01/12/2035 USD 21,436 21,797 0.00FHLMC, FRN 1Q0737 2.328%01/11/2036 USD 46,451 47,104 0.00FHLMC, FRN 1Q0739 2.152%01/03/2037 USD 94,225 99,099 0.00FHLMC, FRN 782760 2.495%01/11/2036 USD 51,244 54,791 0.00FHLMC, FRN 782870 2.616%01/09/2034 USD 122,959 131,359 0.00FHLMC, FRN 782979 2.375%01/01/2035 USD 171,122 182,722 0.00FHLMC, FRN 782980 2.375%01/01/2035 USD 72,933 76,705 0.00FHLMC, FRN 847621 2.407%01/05/2033 USD 46,537 49,535 0.00FHLMC, FRN 848365 2.557%01/07/2036 USD 154,878 165,265 0.00FHLMC, FRN 848431 2.413%01/02/2036 USD 90,699 95,517 0.00FHLMC, FRN 848699 2.547%01/07/2040 USD 65,262 69,292 0.00FHLMC, FRN 972200 2.21%01/03/2036 USD 24,398 24,527 0.00FHLMC A61376 6.5% 01/07/2032 USD 79,379 89,109 0.00FHLMC A88871 7% 01/01/2031 USD 72,286 81,335 0.00FHLMC B90491 7.5% 01/01/2032 USD 74,172 85,117 0.00FHLMC C75791 5.5% 01/01/2033 USD 24,892 28,554 0.00FHLMC C90985 6.5% 01/08/2026 USD 17,145 18,952 0.00FHLMC G01448 7% 01/08/2032 USD 5,034 5,836 0.00FHLMC G02436 6.5% 01/09/2036 USD 70,058 83,263 0.00FHLMC G04077 6.5% 01/03/2038 USD 72,457 86,602 0.00FHLMC G04952 7.5% 01/01/2038 USD 74,712 90,274 0.00FHLMC G05671 5.5% 01/08/2038 USD 107,324 125,062 0.00FHLMC G06493 4.5% 01/05/2041 USD 1,468,525 1,643,069 0.04FHLMC G31099 4% 01/01/2038 USD 4,357,940 4,802,561 0.11FHLMC G60214 5% 01/07/2035 USD 5,742,827 6,589,980 0.15FHLMC L10221 6% 01/01/2034 USD 27,590 28,986 0.00FHLMC L10224 6% 01/12/2034 USD 114,504 124,007 0.00FHLMC P50201 5.5% 01/01/2034 USD 7,681 8,039 0.00FHLMC Q42657 3.5% 01/08/2046 USD 2,781,890 2,967,208 0.07
273
JPMorgan Funds - US Aggregate Bond FundSchedule of Investments (continued)
As at 30 June 2021
Investments Currency
Quantity/Nominal
Value
MarketValue
USD
%of
NetAssets Investments Currency
Quantity/Nominal
Value
MarketValue
USD
%of
NetAssets

FHLMC Q49329 4.5% 01/07/2047 USD 1,130,784 1,235,059 0.03FHLMC Q52834 4% 01/12/2047 USD 3,209,101 3,435,095 0.08FHLMC U63546 5% 01/11/2043 USD 47,361 52,528 0.00FHLMC U69030 4.5% 01/01/2046 USD 2,965,272 3,272,044 0.08FHLMC U90673 4% 01/01/2043 USD 479,849 529,834 0.01FHLMC U90690 3.5% 01/06/2042 USD 1,418,719 1,534,297 0.04FHLMC U90975 4% 01/06/2042 USD 1,219,784 1,345,693 0.03FHLMC U91253 4% 01/04/2043 USD 2,530,579 2,791,969 0.07FHLMC U91305 3.5% 01/04/2043 USD 537,002 576,586 0.01FHLMC U91484 4% 01/05/2043 USD 3,405,683 3,759,810 0.09FHLMC U93007 3.5% 01/07/2045 USD 674,230 729,340 0.02FHLMC U93024 3.5% 01/08/2045 USD 864,698 935,303 0.02FHLMC U93089 3.5% 01/12/2035 USD 608,540 649,115 0.02FHLMC U93090 3.5% 01/11/2045 USD 908,947 979,470 0.02FHLMC U93143 3.5% 01/04/2046 USD 752,711 811,138 0.02FHLMC U93154 3.5% 01/05/2046 USD 501,434 542,301 0.01FHLMC U99051 3.5% 01/06/2043 USD 1,715,693 1,844,362 0.04FHLMC U99134 4% 01/01/2046 USD 1,676,041 1,849,522 0.04FHLMC V85515 4% 01/03/2049 USD 636,784 679,577 0.02FHLMC Z40024 5.5% 01/04/2036 USD 32,775 37,429 0.00FHLMC Pool RE0011 2.5% 01/12/2049 USD 5,522,470 5,691,886 0.13FHLMC REMICS, Series 2619 ‘AE’ 5%15/05/2023 USD 83,360 85,657 0.00FHLMC REMICS, IO, STEP, Series 3422‘AI’ 0.25% 15/01/2038 USD 244,875 1,734 0.00FHLMC REMICS, PO, Series 3607 ‘AO’0% 15/04/2036 USD 32,295 29,482 0.00FHLMC REMICS, Series 3181 ‘AZ’ 6.5%15/07/2036 USD 237,064 282,925 0.01FHLMC REMICS, Series 3453 ‘B’ 5.5%15/05/2038 USD 15,413 17,734 0.00FHLMC REMICS, Series 3957 ‘B’ 4%15/11/2041 USD 102,209 112,575 0.00FHLMC REMICS, Series 2694 ‘BA’ 4%15/06/2031 USD 6,512 6,771 0.00FHLMC REMICS, Series 3143 ‘BC’ 5.5%15/02/2036 USD 119,659 139,123 0.00FHLMC REMICS, FRN, Series 3966 ‘BF’0.573% 15/10/2040 USD 88,562 88,889 0.00FHLMC REMICS, PO, Series 3607 ‘BO’0% 15/04/2036 USD 24,221 22,716 0.00FHLMC REMICS, PO, Series 3621 ‘BO’0% 15/01/2040 USD 58,105 54,283 0.00FHLMC REMICS, FRN, Series 3632 ‘BS’17.257% 15/02/2040 USD 145,029 211,125 0.01FHLMC REMICS, Series 3501 ‘CB’ 5.5%15/01/2039 USD 180,887 208,583 0.01FHLMC REMICS, IO, FRN, Series 3260‘CS’ 6.067% 15/01/2037 USD 27,990 5,525 0.00FHLMC REMICS, FRN, Series 3688 ‘CU’6.604% 15/11/2021 USD 609 611 0.00FHLMC REMICS, Series 3684 ‘CY’ 4.5%15/06/2025 USD 397,501 420,235 0.01FHLMC REMICS, Series 3928 ‘D’ 4%15/09/2041 USD 2,165,967 2,350,602 0.06FHLMC REMICS, Series 4900 ‘D’ 3%25/07/2049 USD 2,998,254 3,141,543 0.07FHLMC REMICS, IO, Series 3219 ‘DI’ 6%15/04/2036 USD 30,833 6,445 0.00FHLMC REMICS, FRN, Series 3051 ‘DP’27.707% 15/10/2025 USD 10,784 14,380 0.00FHLMC REMICS, Series 3704 ‘DT’ 7.5%15/11/2036 USD 162,891 198,801 0.01FHLMC REMICS, Series 4818 ‘DZ’ 4%15/06/2048 USD 6,798,545 7,274,048 0.17FHLMC REMICS, IO, Series 3795 ‘EI’ 5%15/10/2039 USD 192,735 10,509 0.00FHLMC REMICS, PO, Series 3117 ‘EO’0% 15/02/2036 USD 14,764 13,735 0.00FHLMC REMICS, PO, Series 3153 ‘EO’0% 15/05/2036 USD 73,120 66,875 0.00FHLMC REMICS, PO, Series 4280 ‘EO’0% 15/12/2043 USD 697,409 589,474 0.01FHLMC REMICS, Series 3704 ‘ET’ 7.5%15/12/2036 USD 149,467 184,327 0.00FHLMC REMICS, Series 2388 ‘EZ’ 8.5%15/06/2031 USD 16,556 20,198 0.00FHLMC REMICS, FRN, Series 270 ‘F1’0.573% 15/08/2042 USD 429,083 436,351 0.01FHLMC REMICS, FRN, Series 3549 ‘FA’1.273% 15/07/2039 USD 18,413 18,800 0.00FHLMC REMICS, FRN, Series 2388 ‘FB’0.673% 15/01/2029 USD 20,992 21,164 0.00FHLMC REMICS, FRN, Series 4085 ‘FB’0.473% 15/01/2039 USD 75,876 75,976 0.00FHLMC REMICS, FRN, Series 4048 ‘FJ’0.515% 15/07/2037 USD 906,971 907,397 0.02FHLMC REMICS, FRN, Series 3275 ‘FL’0.513% 15/02/2037 USD 10,797 10,910 0.00
FHLMC REMICS, Series 2544 ‘HC’ 6%15/12/2032 USD 26,813 32,072 0.00FHLMC REMICS, IO, FRN, Series 3202‘HI’ 6.577% 15/08/2036 USD 310,510 64,698 0.00FHLMC REMICS, Series 2483 ‘HZ’ 4.5%15/08/2032 USD 488,358 552,861 0.01FHLMC REMICS, IO, Series 3714 ‘IP’ 5%15/08/2040 USD 148,528 14,487 0.00FHLMC REMICS, Series 1621 ‘J’ 6.4%15/11/2023 USD 44,284 46,343 0.00FHLMC REMICS, Series 2033 ‘J’ 5.6%15/06/2023 USD 8,595 8,920 0.00FHLMC REMICS, PO, Series 3316 ‘JO’0% 15/05/2037 USD 9,596 9,052 0.00FHLMC REMICS, PO, Series 3393 ‘JO’0% 15/09/2032 USD 380,828 354,479 0.01FHLMC REMICS, Series 1578 ‘K’ 6.9%15/09/2023 USD 5,220 5,485 0.00FHLMC REMICS, Series 2283 ‘K’ 6.5%15/12/2023 USD 6,504 6,851 0.00FHLMC REMICS, PO, Series 3288 ‘LO’0% 15/03/2037 USD 76,173 68,063 0.00FHLMC REMICS, IO, FRN, Series 3802‘LS’ 1.944% 15/01/2040 USD 227,029 10,530 0.00FHLMC REMICS, Series 2484 ‘LZ’ 6.5%15/07/2032 USD 12,822 15,306 0.00FHLMC REMICS, Series 3461 ‘LZ’ 6%15/06/2038 USD 29,970 35,153 0.00FHLMC REMICS, Series 2575 ‘ME’ 6%15/02/2033 USD 31,366 36,330 0.00FHLMC REMICS, PO, Series 3152 ‘MO’0% 15/03/2036 USD 145,408 136,329 0.00FHLMC REMICS, PO, Series 3171 ‘MO’0% 15/06/2036 USD 22,609 21,934 0.00FHLMC REMICS, Series 3966 ‘NA’ 4%15/12/2041 USD 908,827 1,009,790 0.02FHLMC REMICS, Series 2410 ‘NG’ 6.5%15/02/2032 USD 6,777 7,940 0.00FHLMC REMICS, Series 3047 ‘OD’ 5.5%15/10/2035 USD 152,138 169,874 0.00FHLMC REMICS, Series 3064 ‘OE’ 5.5%15/11/2035 USD 305,938 351,726 0.01FHLMC REMICS, PO, Series 3117 ‘OG’0% 15/02/2036 USD 44,734 42,109 0.00FHLMC REMICS, PO, Series 3122 ‘OH’0% 15/03/2036 USD 46,355 43,215 0.00FHLMC REMICS, PO, Series 3117 ‘OK’0% 15/02/2036 USD 17,298 16,105 0.00FHLMC REMICS, Series 2720 ‘PC’ 5%15/12/2023 USD 13,208 13,735 0.00FHLMC REMICS, Series 2165 ‘PE’ 6%15/06/2029 USD 122,898 139,035 0.00FHLMC REMICS, Series 2110 ‘PG’ 6%15/01/2029 USD 31,673 35,764 0.00FHLMC REMICS, Series 2075 ‘PH’ 6.5%15/08/2028 USD 7,464 8,469 0.00FHLMC REMICS, IO, FRN, Series 3424‘PI’ 6.727% 15/04/2038 USD 66,554 15,844 0.00FHLMC REMICS, PO, Series 3134 ‘PO’0% 15/03/2036 USD 3,624 3,455 0.00FHLMC REMICS, PO, Series 3138 ‘PO’0% 15/04/2036 USD 14,508 13,431 0.00FHLMC REMICS, PO, Series 3151 ‘PO’0% 15/05/2036 USD 68,657 64,123 0.00FHLMC REMICS, PO, Series 3200 ‘PO’0% 15/08/2036 USD 60,482 56,542 0.00FHLMC REMICS, PO, Series 3607 ‘PO’0% 15/05/2037 USD 162,844 148,740 0.00FHLMC REMICS, PO, Series 3611 ‘PO’0% 15/07/2034 USD 19,069 17,953 0.00FHLMC REMICS, PO, Series 3621 ‘PO’0% 15/01/2040 USD 94,181 87,473 0.00FHLMC REMICS, Series 3614 ‘QB’ 4%15/12/2024 USD 791,090 826,873 0.02FHLMC REMICS, Series 2172 ‘QC’ 7%15/07/2029 USD 56,364 65,612 0.00FHLMC REMICS, FRN, Series 3852 ‘QN’5.5% 15/05/2041 USD 199,649 217,608 0.01FHLMC REMICS, PO, Series 3671 ‘QO’0% 15/12/2036 USD 152,003 139,151 0.00FHLMC REMICS, FRN, Series 2671 ‘S’14.625% 15/09/2033 USD 12,189 16,224 0.00FHLMC REMICS, FRN, Series 2967 ‘S’33.424% 15/04/2025 USD 17,174 21,395 0.00FHLMC REMICS, IO, FRN, Series 3194‘SA’ 7.027% 15/07/2036 USD 7,533 1,538 0.00FHLMC REMICS, IO, FRN, Series 3387‘SA’ 6.347% 15/11/2037 USD 113,838 20,976 0.00FHLMC REMICS, IO, FRN, Series 3511‘SA’ 5.927% 15/02/2039 USD 80,473 15,187 0.00
274
JPMorgan Funds - US Aggregate Bond FundSchedule of Investments (continued)
As at 30 June 2021
Investments Currency
Quantity/Nominal
Value
MarketValue
USD
%of
NetAssets Investments Currency
Quantity/Nominal
Value
MarketValue
USD
%of
NetAssets
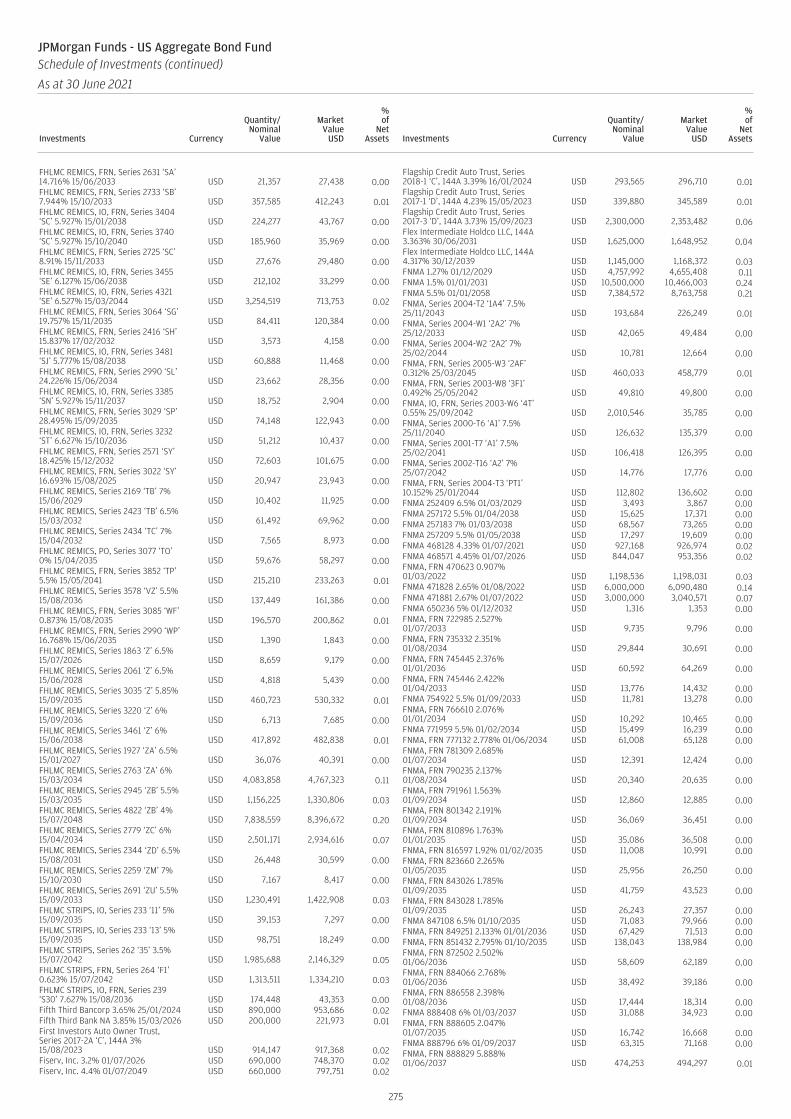
FHLMC REMICS, FRN, Series 2631 ‘SA’14.716% 15/06/2033 USD 21,357 27,438 0.00FHLMC REMICS, FRN, Series 2733 ‘SB’7.944% 15/10/2033 USD 357,585 412,243 0.01FHLMC REMICS, IO, FRN, Series 3404‘SC’ 5.927% 15/01/2038 USD 224,277 43,767 0.00FHLMC REMICS, IO, FRN, Series 3740‘SC’ 5.927% 15/10/2040 USD 185,960 35,969 0.00FHLMC REMICS, FRN, Series 2725 ‘SC’8.91% 15/11/2033 USD 27,676 29,480 0.00FHLMC REMICS, IO, FRN, Series 3455‘SE’ 6.127% 15/06/2038 USD 212,102 33,299 0.00FHLMC REMICS, IO, FRN, Series 4321‘SE’ 6.527% 15/03/2044 USD 3,254,519 713,753 0.02FHLMC REMICS, FRN, Series 3064 ‘SG’19.757% 15/11/2035 USD 84,411 120,384 0.00FHLMC REMICS, FRN, Series 2416 ‘SH’15.837% 17/02/2032 USD 3,573 4,158 0.00FHLMC REMICS, IO, FRN, Series 3481‘SJ’ 5.777% 15/08/2038 USD 60,888 11,468 0.00FHLMC REMICS, FRN, Series 2990 ‘SL’24.226% 15/06/2034 USD 23,662 28,356 0.00FHLMC REMICS, IO, FRN, Series 3385‘SN’ 5.927% 15/11/2037 USD 18,752 2,904 0.00FHLMC REMICS, FRN, Series 3029 ‘SP’28.495% 15/09/2035 USD 74,148 122,943 0.00FHLMC REMICS, IO, FRN, Series 3232‘ST’ 6.627% 15/10/2036 USD 51,212 10,437 0.00FHLMC REMICS, FRN, Series 2571 ‘SY’18.425% 15/12/2032 USD 72,603 101,675 0.00FHLMC REMICS, FRN, Series 3022 ‘SY’16.693% 15/08/2025 USD 20,947 23,943 0.00FHLMC REMICS, Series 2169 ‘TB’ 7%15/06/2029 USD 10,402 11,925 0.00FHLMC REMICS, Series 2423 ‘TB’ 6.5%15/03/2032 USD 61,492 69,962 0.00FHLMC REMICS, Series 2434 ‘TC’ 7%15/04/2032 USD 7,565 8,973 0.00FHLMC REMICS, PO, Series 3077 ‘TO’0% 15/04/2035 USD 59,676 58,297 0.00FHLMC REMICS, FRN, Series 3852 ‘TP’5.5% 15/05/2041 USD 215,210 233,263 0.01FHLMC REMICS, Series 3578 ‘VZ’ 5.5%15/08/2036 USD 137,449 161,386 0.00FHLMC REMICS, FRN, Series 3085 ‘WF’0.873% 15/08/2035 USD 196,570 200,862 0.01FHLMC REMICS, FRN, Series 2990 ‘WP’16.768% 15/06/2035 USD 1,390 1,843 0.00FHLMC REMICS, Series 1863 ‘Z’ 6.5%15/07/2026 USD 8,659 9,179 0.00FHLMC REMICS, Series 2061 ‘Z’ 6.5%15/06/2028 USD 4,818 5,439 0.00FHLMC REMICS, Series 3035 ‘Z’ 5.85%15/09/2035 USD 460,723 530,332 0.01FHLMC REMICS, Series 3220 ‘Z’ 6%15/09/2036 USD 6,713 7,685 0.00FHLMC REMICS, Series 3461 ‘Z’ 6%15/06/2038 USD 417,892 482,838 0.01FHLMC REMICS, Series 1927 ‘ZA’ 6.5%15/01/2027 USD 36,076 40,391 0.00FHLMC REMICS, Series 2763 ‘ZA’ 6%15/03/2034 USD 4,083,858 4,767,323 0.11FHLMC REMICS, Series 2945 ‘ZB’ 5.5%15/03/2035 USD 1,156,225 1,330,806 0.03FHLMC REMICS, Series 4822 ‘ZB’ 4%15/07/2048 USD 7,838,559 8,396,672 0.20FHLMC REMICS, Series 2779 ‘ZC’ 6%15/04/2034 USD 2,501,171 2,934,616 0.07FHLMC REMICS, Series 2344 ‘ZD’ 6.5%15/08/2031 USD 26,448 30,599 0.00FHLMC REMICS, Series 2259 ‘ZM’ 7%15/10/2030 USD 7,167 8,417 0.00FHLMC REMICS, Series 2691 ‘ZU’ 5.5%15/09/2033 USD 1,230,491 1,422,908 0.03FHLMC STRIPS, IO, Series 233 ‘11’ 5%15/09/2035 USD 39,153 7,297 0.00FHLMC STRIPS, IO, Series 233 ‘13’ 5%15/09/2035 USD 98,751 18,249 0.00FHLMC STRIPS, Series 262 ‘35’ 3.5%15/07/2042 USD 1,985,688 2,146,329 0.05FHLMC STRIPS, FRN, Series 264 ‘F1’0.623% 15/07/2042 USD 1,313,511 1,334,210 0.03FHLMC STRIPS, IO, FRN, Series 239‘S30’ 7.627% 15/08/2036 USD 174,448 43,353 0.00Fifth Third Bancorp 3.65% 25/01/2024 USD 890,000 953,686 0.02Fifth Third Bank NA 3.85% 15/03/2026 USD 200,000 221,973 0.01First Investors Auto Owner Trust,Series 2017-2A ‘C’, 144A 3%15/08/2023 USD 914,147 917,368 0.02Fiserv, Inc. 3.2% 01/07/2026 USD 690,000 748,370 0.02Fiserv, Inc. 4.4% 01/07/2049 USD 660,000 797,751 0.02
Flagship Credit Auto Trust, Series2018-1 ‘C’, 144A 3.39% 16/01/2024 USD 293,565 296,710 0.01Flagship Credit Auto Trust, Series2017-1 ‘D’, 144A 4.23% 15/05/2023 USD 339,880 345,589 0.01Flagship Credit Auto Trust, Series2017-3 ‘D’, 144A 3.73% 15/09/2023 USD 2,300,000 2,353,482 0.06Flex Intermediate Holdco LLC, 144A3.363% 30/06/2031 USD 1,625,000 1,648,952 0.04Flex Intermediate Holdco LLC, 144A4.317% 30/12/2039 USD 1,145,000 1,168,372 0.03FNMA 1.27% 01/12/2029 USD 4,757,992 4,655,408 0.11FNMA 1.5% 01/01/2031 USD 10,500,000 10,466,003 0.24FNMA 5.5% 01/01/2058 USD 7,384,572 8,763,758 0.21FNMA, Series 2004-T2 ‘1A4’ 7.5%25/11/2043 USD 193,684 226,249 0.01FNMA, Series 2004-W1 ‘2A2’ 7%25/12/2033 USD 42,065 49,484 0.00FNMA, Series 2004-W2 ‘2A2’ 7%25/02/2044 USD 10,781 12,664 0.00FNMA, FRN, Series 2005-W3 ‘2AF’0.312% 25/03/2045 USD 460,033 458,779 0.01FNMA, FRN, Series 2003-W8 ‘3F1’0.492% 25/05/2042 USD 49,810 49,800 0.00FNMA, IO, FRN, Series 2003-W6 ‘4T’0.55% 25/09/2042 USD 2,010,546 35,785 0.00FNMA, Series 2000-T6 ‘A1’ 7.5%25/11/2040 USD 126,632 135,379 0.00FNMA, Series 2001-T7 ‘A1’ 7.5%25/02/2041 USD 106,418 126,395 0.00FNMA, Series 2002-T16 ‘A2’ 7%25/07/2042 USD 14,776 17,776 0.00FNMA, FRN, Series 2004-T3 ‘PT1’10.152% 25/01/2044 USD 112,802 136,602 0.00FNMA 252409 6.5% 01/03/2029 USD 3,493 3,867 0.00FNMA 257172 5.5% 01/04/2038 USD 15,625 17,371 0.00FNMA 257183 7% 01/03/2038 USD 68,567 73,265 0.00FNMA 257209 5.5% 01/05/2038 USD 17,297 19,609 0.00FNMA 468128 4.33% 01/07/2021 USD 927,168 926,974 0.02FNMA 468571 4.45% 01/07/2026 USD 844,047 953,356 0.02FNMA, FRN 470623 0.907%01/03/2022 USD 1,198,536 1,198,031 0.03FNMA 471828 2.65% 01/08/2022 USD 6,000,000 6,090,480 0.14FNMA 471881 2.67% 01/07/2022 USD 3,000,000 3,040,571 0.07FNMA 650236 5% 01/12/2032 USD 1,316 1,353 0.00FNMA, FRN 722985 2.527%01/07/2033 USD 9,735 9,796 0.00FNMA, FRN 735332 2.351%01/08/2034 USD 29,844 30,691 0.00FNMA, FRN 745445 2.376%01/01/2036 USD 60,592 64,269 0.00FNMA, FRN 745446 2.422%01/04/2033 USD 13,776 14,432 0.00FNMA 754922 5.5% 01/09/2033 USD 11,781 13,278 0.00FNMA, FRN 766610 2.076%01/01/2034 USD 10,292 10,465 0.00FNMA 771959 5.5% 01/02/2034 USD 15,499 16,239 0.00FNMA, FRN 777132 2.778% 01/06/2034 USD 61,008 65,128 0.00FNMA, FRN 781309 2.685%01/07/2034 USD 12,391 12,424 0.00FNMA, FRN 790235 2.137%01/08/2034 USD 20,340 20,635 0.00FNMA, FRN 791961 1.563%01/09/2034 USD 12,860 12,885 0.00FNMA, FRN 801342 2.191%01/09/2034 USD 36,069 36,451 0.00FNMA, FRN 810896 1.763%01/01/2035 USD 35,086 36,508 0.00FNMA, FRN 816597 1.92% 01/02/2035 USD 11,008 10,991 0.00FNMA, FRN 823660 2.265%01/05/2035 USD 25,956 26,250 0.00FNMA, FRN 843026 1.785%01/09/2035 USD 41,759 43,523 0.00FNMA, FRN 843028 1.785%01/09/2035 USD 26,243 27,357 0.00FNMA 847108 6.5% 01/10/2035 USD 71,083 79,966 0.00FNMA, FRN 849251 2.133% 01/01/2036 USD 67,429 71,513 0.00FNMA, FRN 851432 2.795% 01/10/2035 USD 138,043 138,984 0.00FNMA, FRN 872502 2.502%01/06/2036 USD 58,609 62,189 0.00FNMA, FRN 884066 2.768%01/06/2036 USD 38,492 39,186 0.00FNMA, FRN 886558 2.398%01/08/2036 USD 17,444 18,314 0.00FNMA 888408 6% 01/03/2037 USD 31,088 34,923 0.00FNMA, FRN 888605 2.047%01/07/2035 USD 16,742 16,668 0.00FNMA 888796 6% 01/09/2037 USD 63,315 71,168 0.00FNMA, FRN 888829 5.888%01/06/2037 USD 474,253 494,297 0.01
275
JPMorgan Funds - US Aggregate Bond FundSchedule of Investments (continued)
As at 30 June 2021
Investments Currency
Quantity/Nominal
Value
MarketValue
USD
%of
NetAssets Investments Currency
Quantity/Nominal
Value
MarketValue
USD
%of
NetAssets
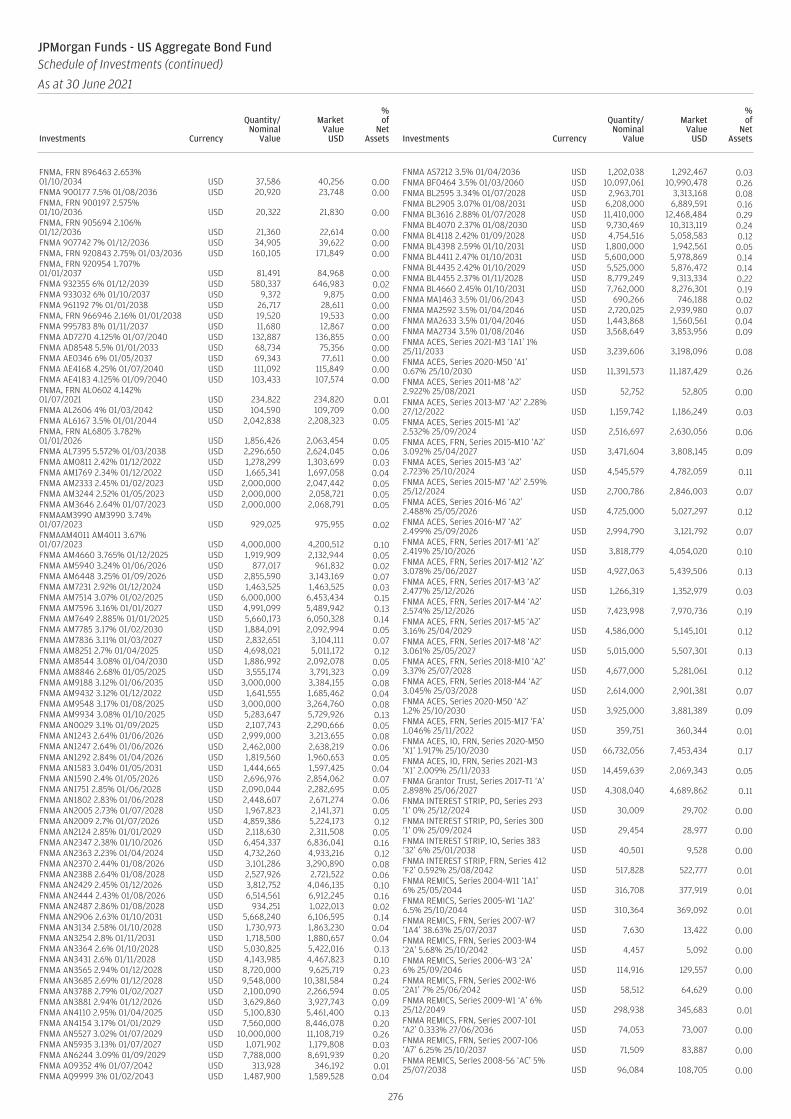
FNMA, FRN 896463 2.653%01/10/2034 USD 37,586 40,256 0.00FNMA 900177 7.5% 01/08/2036 USD 20,920 23,748 0.00FNMA, FRN 900197 2.575%01/10/2036 USD 20,322 21,830 0.00FNMA, FRN 905694 2.106%01/12/2036 USD 21,360 22,614 0.00FNMA 907742 7% 01/12/2036 USD 34,905 39,622 0.00FNMA, FRN 920843 2.75% 01/03/2036 USD 160,105 171,849 0.00FNMA, FRN 920954 1.707%01/01/2037 USD 81,491 84,968 0.00FNMA 932355 6% 01/12/2039 USD 580,337 646,983 0.02FNMA 933032 6% 01/10/2037 USD 9,372 9,875 0.00FNMA 961192 7% 01/01/2038 USD 26,717 28,611 0.00FNMA, FRN 966946 2.16% 01/01/2038 USD 19,520 19,533 0.00FNMA 995783 8% 01/11/2037 USD 11,680 12,867 0.00FNMA AD7270 4.125% 01/07/2040 USD 132,887 136,855 0.00FNMA AD8548 5.5% 01/01/2033 USD 68,734 75,356 0.00FNMA AE0346 6% 01/05/2037 USD 69,343 77,611 0.00FNMA AE4168 4.25% 01/07/2040 USD 111,092 115,849 0.00FNMA AE4183 4.125% 01/09/2040 USD 103,433 107,574 0.00FNMA, FRN AL0602 4.142%01/07/2021 USD 234,822 234,820 0.01FNMA AL2606 4% 01/03/2042 USD 104,590 109,709 0.00FNMA AL6167 3.5% 01/01/2044 USD 2,042,838 2,208,323 0.05FNMA, FRN AL6805 3.782%01/01/2026 USD 1,856,426 2,063,454 0.05FNMA AL7395 5.572% 01/03/2038 USD 2,296,650 2,624,045 0.06FNMA AM0811 2.42% 01/12/2022 USD 1,278,299 1,303,699 0.03FNMA AM1769 2.34% 01/12/2022 USD 1,665,341 1,697,058 0.04FNMA AM2333 2.45% 01/02/2023 USD 2,000,000 2,047,442 0.05FNMA AM3244 2.52% 01/05/2023 USD 2,000,000 2,058,721 0.05FNMA AM3646 2.64% 01/07/2023 USD 2,000,000 2,068,791 0.05FNMAAM3990 AM3990 3.74%01/07/2023 USD 929,025 975,955 0.02FNMAAM4011 AM4011 3.67%01/07/2023 USD 4,000,000 4,200,512 0.10FNMA AM4660 3.765% 01/12/2025 USD 1,919,909 2,132,944 0.05FNMA AM5940 3.24% 01/06/2026 USD 877,017 961,832 0.02FNMA AM6448 3.25% 01/09/2026 USD 2,855,590 3,143,169 0.07FNMA AM7231 2.92% 01/12/2024 USD 1,463,525 1,463,525 0.03FNMA AM7514 3.07% 01/02/2025 USD 6,000,000 6,453,434 0.15FNMA AM7596 3.16% 01/01/2027 USD 4,991,099 5,489,942 0.13FNMA AM7649 2.885% 01/01/2025 USD 5,660,173 6,050,328 0.14FNMA AM7785 3.17% 01/02/2030 USD 1,884,091 2,092,994 0.05FNMA AM7836 3.11% 01/03/2027 USD 2,832,651 3,104,111 0.07FNMA AM8251 2.7% 01/04/2025 USD 4,698,021 5,011,172 0.12FNMA AM8544 3.08% 01/04/2030 USD 1,886,992 2,092,078 0.05FNMA AM8846 2.68% 01/05/2025 USD 3,555,174 3,791,323 0.09FNMA AM9188 3.12% 01/06/2035 USD 3,000,000 3,384,155 0.08FNMA AM9432 3.12% 01/12/2022 USD 1,641,555 1,685,462 0.04FNMA AM9548 3.17% 01/08/2025 USD 3,000,000 3,264,760 0.08FNMA AM9934 3.08% 01/10/2025 USD 5,283,647 5,729,926 0.13FNMA AN0029 3.1% 01/09/2025 USD 2,107,743 2,290,666 0.05FNMA AN1243 2.64% 01/06/2026 USD 2,999,000 3,213,655 0.08FNMA AN1247 2.64% 01/06/2026 USD 2,462,000 2,638,219 0.06FNMA AN1292 2.84% 01/04/2026 USD 1,819,560 1,960,653 0.05FNMA AN1583 3.04% 01/05/2031 USD 1,444,665 1,597,425 0.04FNMA AN1590 2.4% 01/05/2026 USD 2,696,976 2,854,062 0.07FNMA AN1751 2.85% 01/06/2028 USD 2,090,044 2,282,695 0.05FNMA AN1802 2.83% 01/06/2028 USD 2,448,607 2,671,274 0.06FNMA AN2005 2.73% 01/07/2028 USD 1,967,823 2,141,371 0.05FNMA AN2009 2.7% 01/07/2026 USD 4,859,386 5,224,173 0.12FNMA AN2124 2.85% 01/01/2029 USD 2,118,630 2,311,508 0.05FNMA AN2347 2.38% 01/10/2026 USD 6,454,337 6,836,041 0.16FNMA AN2363 2.23% 01/04/2024 USD 4,732,260 4,933,216 0.12FNMA AN2370 2.44% 01/08/2026 USD 3,101,286 3,290,890 0.08FNMA AN2388 2.64% 01/08/2028 USD 2,527,926 2,721,522 0.06FNMA AN2429 2.45% 01/12/2026 USD 3,812,752 4,046,135 0.10FNMA AN2444 2.43% 01/08/2026 USD 6,514,561 6,912,245 0.16FNMA AN2487 2.86% 01/08/2028 USD 934,251 1,022,013 0.02FNMA AN2906 2.63% 01/10/2031 USD 5,668,240 6,106,595 0.14FNMA AN3134 2.58% 01/10/2028 USD 1,730,973 1,863,230 0.04FNMA AN3254 2.8% 01/11/2031 USD 1,718,500 1,880,657 0.04FNMA AN3364 2.6% 01/10/2028 USD 5,030,825 5,422,016 0.13FNMA AN3431 2.6% 01/11/2028 USD 4,143,985 4,467,823 0.10FNMA AN3565 2.94% 01/12/2028 USD 8,720,000 9,625,719 0.23FNMA AN3685 2.69% 01/12/2028 USD 9,548,000 10,381,584 0.24FNMA AN3788 2.79% 01/02/2027 USD 2,100,090 2,266,594 0.05FNMA AN3881 2.94% 01/12/2026 USD 3,629,860 3,927,743 0.09FNMA AN4110 2.95% 01/04/2025 USD 5,100,830 5,461,400 0.13FNMA AN4154 3.17% 01/01/2029 USD 7,560,000 8,446,078 0.20FNMA AN5527 3.02% 01/07/2029 USD 10,000,000 11,108,719 0.26FNMA AN5935 3.13% 01/07/2027 USD 1,071,902 1,179,808 0.03FNMA AN6244 3.09% 01/09/2029 USD 7,788,000 8,691,939 0.20FNMA AO9352 4% 01/07/2042 USD 313,928 346,192 0.01FNMA AQ9999 3% 01/02/2043 USD 1,487,900 1,589,528 0.04
FNMA AS7212 3.5% 01/04/2036 USD 1,202,038 1,292,467 0.03FNMA BF0464 3.5% 01/03/2060 USD 10,097,061 10,990,478 0.26FNMA BL2595 3.34% 01/07/2028 USD 2,963,701 3,313,168 0.08FNMA BL2905 3.07% 01/08/2031 USD 6,208,000 6,889,591 0.16FNMA BL3616 2.88% 01/07/2028 USD 11,410,000 12,468,484 0.29FNMA BL4070 2.37% 01/08/2030 USD 9,730,469 10,313,119 0.24FNMA BL4118 2.42% 01/09/2028 USD 4,754,516 5,058,583 0.12FNMA BL4398 2.59% 01/10/2031 USD 1,800,000 1,942,561 0.05FNMA BL4411 2.47% 01/10/2031 USD 5,600,000 5,978,869 0.14FNMA BL4435 2.42% 01/10/2029 USD 5,525,000 5,876,472 0.14FNMA BL4455 2.37% 01/11/2028 USD 8,779,249 9,313,334 0.22FNMA BL4660 2.45% 01/10/2031 USD 7,762,000 8,276,301 0.19FNMA MA1463 3.5% 01/06/2043 USD 690,266 746,188 0.02FNMA MA2592 3.5% 01/04/2046 USD 2,720,025 2,939,980 0.07FNMA MA2633 3.5% 01/04/2046 USD 1,443,868 1,560,561 0.04FNMA MA2734 3.5% 01/08/2046 USD 3,568,649 3,853,956 0.09FNMA ACES, Series 2021-M3 ‘1A1’ 1%25/11/2033 USD 3,239,606 3,198,096 0.08FNMA ACES, Series 2020-M50 ‘A1’0.67% 25/10/2030 USD 11,391,573 11,187,429 0.26FNMA ACES, Series 2011-M8 ‘A2’2.922% 25/08/2021 USD 52,752 52,805 0.00FNMA ACES, Series 2013-M7 ‘A2’ 2.28%27/12/2022 USD 1,159,742 1,186,249 0.03FNMA ACES, Series 2015-M1 ‘A2’2.532% 25/09/2024 USD 2,516,697 2,630,056 0.06FNMA ACES, FRN, Series 2015-M10 ‘A2’3.092% 25/04/2027 USD 3,471,604 3,808,145 0.09FNMA ACES, Series 2015-M3 ‘A2’2.723% 25/10/2024 USD 4,545,579 4,782,059 0.11FNMA ACES, Series 2015-M7 ‘A2’ 2.59%25/12/2024 USD 2,700,786 2,846,003 0.07FNMA ACES, Series 2016-M6 ‘A2’2.488% 25/05/2026 USD 4,725,000 5,027,297 0.12FNMA ACES, Series 2016-M7 ‘A2’2.499% 25/09/2026 USD 2,994,790 3,121,792 0.07FNMA ACES, FRN, Series 2017-M1 ‘A2’2.419% 25/10/2026 USD 3,818,779 4,054,020 0.10FNMA ACES, FRN, Series 2017-M12 ‘A2’3.078% 25/06/2027 USD 4,927,063 5,439,506 0.13FNMA ACES, FRN, Series 2017-M3 ‘A2’2.477% 25/12/2026 USD 1,266,319 1,352,979 0.03FNMA ACES, FRN, Series 2017-M4 ‘A2’2.574% 25/12/2026 USD 7,423,998 7,970,736 0.19FNMA ACES, FRN, Series 2017-M5 ‘A2’3.16% 25/04/2029 USD 4,586,000 5,145,101 0.12FNMA ACES, FRN, Series 2017-M8 ‘A2’3.061% 25/05/2027 USD 5,015,000 5,507,301 0.13FNMA ACES, FRN, Series 2018-M10 ‘A2’3.37% 25/07/2028 USD 4,677,000 5,281,061 0.12FNMA ACES, FRN, Series 2018-M4 ‘A2’3.045% 25/03/2028 USD 2,614,000 2,901,381 0.07FNMA ACES, Series 2020-M50 ‘A2’1.2% 25/10/2030 USD 3,925,000 3,881,389 0.09FNMA ACES, FRN, Series 2015-M17 ‘FA’1.046% 25/11/2022 USD 359,751 360,344 0.01FNMA ACES, IO, FRN, Series 2020-M50‘X1’ 1.917% 25/10/2030 USD 66,732,056 7,453,434 0.17FNMA ACES, IO, FRN, Series 2021-M3‘X1’ 2.009% 25/11/2033 USD 14,459,639 2,069,343 0.05FNMA Grantor Trust, Series 2017-T1 ‘A’2.898% 25/06/2027 USD 4,308,040 4,689,862 0.11FNMA INTEREST STRIP, PO, Series 293‘1’ 0% 25/12/2024 USD 30,009 29,702 0.00FNMA INTEREST STRIP, PO, Series 300‘1’ 0% 25/09/2024 USD 29,454 28,977 0.00FNMA INTEREST STRIP, IO, Series 383‘32’ 6% 25/01/2038 USD 40,501 9,528 0.00FNMA INTEREST STRIP, FRN, Series 412‘F2’ 0.592% 25/08/2042 USD 517,828 522,777 0.01FNMA REMICS, Series 2004-W11 ‘1A1’6% 25/05/2044 USD 316,708 377,919 0.01FNMA REMICS, Series 2005-W1 ‘1A2’6.5% 25/10/2044 USD 310,364 369,092 0.01FNMA REMICS, FRN, Series 2007-W7‘1A4’ 38.63% 25/07/2037 USD 7,630 13,422 0.00FNMA REMICS, FRN, Series 2003-W4‘2A’ 5.68% 25/10/2042 USD 4,457 5,092 0.00FNMA REMICS, Series 2006-W3 ‘2A’6% 25/09/2046 USD 114,916 129,557 0.00FNMA REMICS, FRN, Series 2002-W6‘2A1’ 7% 25/06/2042 USD 58,512 64,629 0.00FNMA REMICS, Series 2009-W1 ‘A’ 6%25/12/2049 USD 298,938 345,683 0.01FNMA REMICS, FRN, Series 2007-101‘A2’ 0.333% 27/06/2036 USD 74,053 73,007 0.00FNMA REMICS, FRN, Series 2007-106‘A7’ 6.25% 25/10/2037 USD 71,509 83,887 0.00FNMA REMICS, Series 2008-56 ‘AC’ 5%25/07/2038 USD 96,084 108,705 0.00
276
JPMorgan Funds - US Aggregate Bond FundSchedule of Investments (continued)
As at 30 June 2021
Investments Currency
Quantity/Nominal
Value
MarketValue
USD
%of
NetAssets Investments Currency
Quantity/Nominal
Value
MarketValue
USD
%of
NetAssets
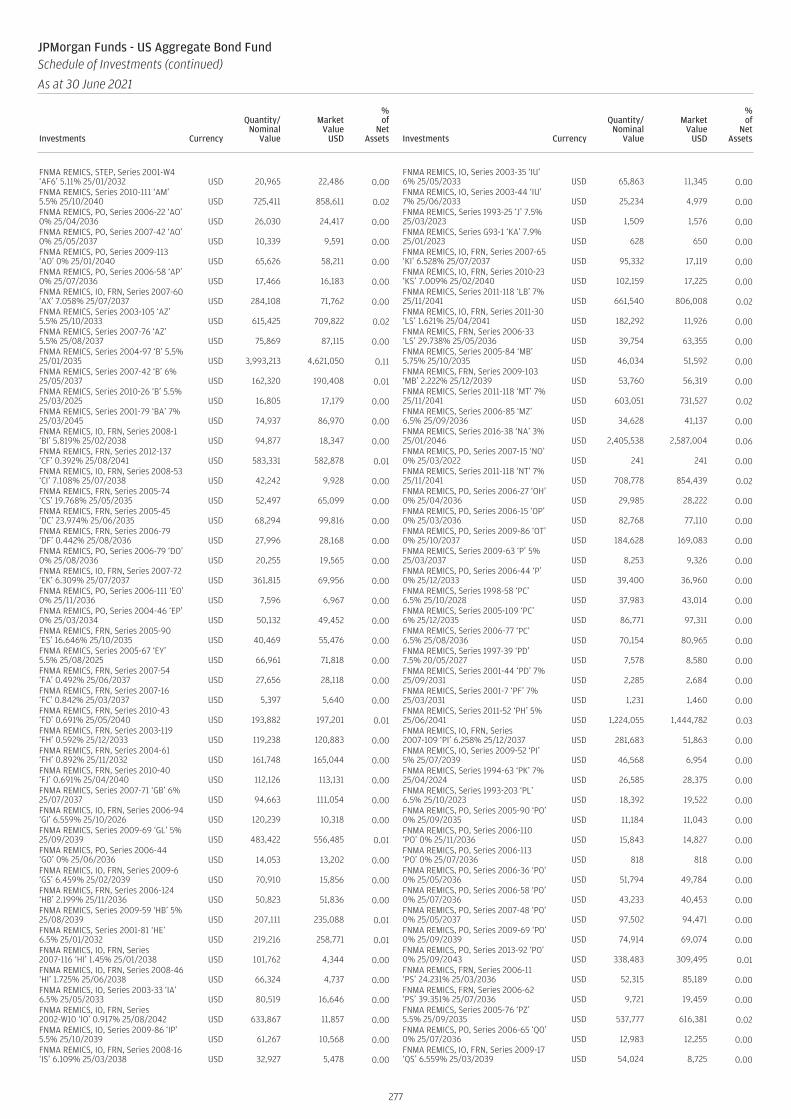
FNMA REMICS, STEP, Series 2001-W4‘AF6’ 5.11% 25/01/2032 USD 20,965 22,486 0.00FNMA REMICS, Series 2010-111 ‘AM’5.5% 25/10/2040 USD 725,411 858,611 0.02FNMA REMICS, PO, Series 2006-22 ‘AO’0% 25/04/2036 USD 26,030 24,417 0.00FNMA REMICS, PO, Series 2007-42 ‘AO’0% 25/05/2037 USD 10,339 9,591 0.00FNMA REMICS, PO, Series 2009-113‘AO’ 0% 25/01/2040 USD 65,626 58,211 0.00FNMA REMICS, PO, Series 2006-58 ‘AP’0% 25/07/2036 USD 17,466 16,183 0.00FNMA REMICS, IO, FRN, Series 2007-60‘AX’ 7.058% 25/07/2037 USD 284,108 71,762 0.00FNMA REMICS, Series 2003-105 ‘AZ’5.5% 25/10/2033 USD 615,425 709,822 0.02FNMA REMICS, Series 2007-76 ‘AZ’5.5% 25/08/2037 USD 75,869 87,115 0.00FNMA REMICS, Series 2004-97 ‘B’ 5.5%25/01/2035 USD 3,993,213 4,621,050 0.11FNMA REMICS, Series 2007-42 ‘B’ 6%25/05/2037 USD 162,320 190,408 0.01FNMA REMICS, Series 2010-26 ‘B’ 5.5%25/03/2025 USD 16,805 17,179 0.00FNMA REMICS, Series 2001-79 ‘BA’ 7%25/03/2045 USD 74,937 86,970 0.00FNMA REMICS, IO, FRN, Series 2008-1‘BI’ 5.819% 25/02/2038 USD 94,877 18,347 0.00FNMA REMICS, FRN, Series 2012-137‘CF’ 0.392% 25/08/2041 USD 583,331 582,878 0.01FNMA REMICS, IO, FRN, Series 2008-53‘CI’ 7.108% 25/07/2038 USD 42,242 9,928 0.00FNMA REMICS, FRN, Series 2005-74‘CS’ 19.768% 25/05/2035 USD 52,497 65,099 0.00FNMA REMICS, FRN, Series 2005-45‘DC’ 23.974% 25/06/2035 USD 68,294 99,816 0.00FNMA REMICS, FRN, Series 2006-79‘DF’ 0.442% 25/08/2036 USD 27,996 28,168 0.00FNMA REMICS, PO, Series 2006-79 ‘DO’0% 25/08/2036 USD 20,255 19,565 0.00FNMA REMICS, IO, FRN, Series 2007-72‘EK’ 6.309% 25/07/2037 USD 361,815 69,956 0.00FNMA REMICS, PO, Series 2006-111 ‘EO’0% 25/11/2036 USD 7,596 6,967 0.00FNMA REMICS, PO, Series 2004-46 ‘EP’0% 25/03/2034 USD 50,132 49,452 0.00FNMA REMICS, FRN, Series 2005-90‘ES’ 16.646% 25/10/2035 USD 40,469 55,476 0.00FNMA REMICS, Series 2005-67 ‘EY’5.5% 25/08/2025 USD 66,961 71,818 0.00FNMA REMICS, FRN, Series 2007-54‘FA’ 0.492% 25/06/2037 USD 27,656 28,118 0.00FNMA REMICS, FRN, Series 2007-16‘FC’ 0.842% 25/03/2037 USD 5,397 5,640 0.00FNMA REMICS, FRN, Series 2010-43‘FD’ 0.691% 25/05/2040 USD 193,882 197,201 0.01FNMA REMICS, FRN, Series 2003-119‘FH’ 0.592% 25/12/2033 USD 119,238 120,883 0.00FNMA REMICS, FRN, Series 2004-61‘FH’ 0.892% 25/11/2032 USD 161,748 165,044 0.00FNMA REMICS, FRN, Series 2010-40‘FJ’ 0.691% 25/04/2040 USD 112,126 113,131 0.00FNMA REMICS, Series 2007-71 ‘GB’ 6%25/07/2037 USD 94,663 111,054 0.00FNMA REMICS, IO, FRN, Series 2006-94‘GI’ 6.559% 25/10/2026 USD 120,239 10,318 0.00FNMA REMICS, Series 2009-69 ‘GL’ 5%25/09/2039 USD 483,422 556,485 0.01FNMA REMICS, PO, Series 2006-44‘GO’ 0% 25/06/2036 USD 14,053 13,202 0.00FNMA REMICS, IO, FRN, Series 2009-6‘GS’ 6.459% 25/02/2039 USD 70,910 15,856 0.00FNMA REMICS, FRN, Series 2006-124‘HB’ 2.199% 25/11/2036 USD 50,823 51,836 0.00FNMA REMICS, Series 2009-59 ‘HB’ 5%25/08/2039 USD 207,111 235,088 0.01FNMA REMICS, Series 2001-81 ‘HE’6.5% 25/01/2032 USD 219,216 258,771 0.01FNMA REMICS, IO, FRN, Series2007-116 ‘HI’ 1.45% 25/01/2038 USD 101,762 4,344 0.00FNMA REMICS, IO, FRN, Series 2008-46‘HI’ 1.725% 25/06/2038 USD 66,324 4,737 0.00FNMA REMICS, IO, Series 2003-33 ‘IA’6.5% 25/05/2033 USD 80,519 16,646 0.00FNMA REMICS, IO, FRN, Series2002-W10 ‘IO’ 0.917% 25/08/2042 USD 633,867 11,857 0.00FNMA REMICS, IO, Series 2009-86 ‘IP’5.5% 25/10/2039 USD 61,267 10,568 0.00FNMA REMICS, IO, FRN, Series 2008-16‘IS’ 6.109% 25/03/2038 USD 32,927 5,478 0.00
FNMA REMICS, IO, Series 2003-35 ‘IU’6% 25/05/2033 USD 65,863 11,345 0.00FNMA REMICS, IO, Series 2003-44 ‘IU’7% 25/06/2033 USD 25,234 4,979 0.00FNMA REMICS, Series 1993-25 ‘J’ 7.5%25/03/2023 USD 1,509 1,576 0.00FNMA REMICS, Series G93-1 ‘KA’ 7.9%25/01/2023 USD 628 650 0.00FNMA REMICS, IO, FRN, Series 2007-65‘KI’ 6.528% 25/07/2037 USD 95,332 17,119 0.00FNMA REMICS, IO, FRN, Series 2010-23‘KS’ 7.009% 25/02/2040 USD 102,159 17,225 0.00FNMA REMICS, Series 2011-118 ‘LB’ 7%25/11/2041 USD 661,540 806,008 0.02FNMA REMICS, IO, FRN, Series 2011-30‘LS’ 1.621% 25/04/2041 USD 182,292 11,926 0.00FNMA REMICS, FRN, Series 2006-33‘LS’ 29.738% 25/05/2036 USD 39,754 63,355 0.00FNMA REMICS, Series 2005-84 ‘MB’5.75% 25/10/2035 USD 46,034 51,592 0.00FNMA REMICS, FRN, Series 2009-103‘MB’ 2.222% 25/12/2039 USD 53,760 56,319 0.00FNMA REMICS, Series 2011-118 ‘MT’ 7%25/11/2041 USD 603,051 731,527 0.02FNMA REMICS, Series 2006-85 ‘MZ’6.5% 25/09/2036 USD 34,628 41,137 0.00FNMA REMICS, Series 2016-38 ‘NA’ 3%25/01/2046 USD 2,405,538 2,587,004 0.06FNMA REMICS, PO, Series 2007-15 ‘NO’0% 25/03/2022 USD 241 241 0.00FNMA REMICS, Series 2011-118 ‘NT’ 7%25/11/2041 USD 708,778 854,439 0.02FNMA REMICS, PO, Series 2006-27 ‘OH’0% 25/04/2036 USD 29,985 28,222 0.00FNMA REMICS, PO, Series 2006-15 ‘OP’0% 25/03/2036 USD 82,768 77,110 0.00FNMA REMICS, PO, Series 2009-86 ‘OT’0% 25/10/2037 USD 184,628 169,083 0.00FNMA REMICS, Series 2009-63 ‘P’ 5%25/03/2037 USD 8,253 9,326 0.00FNMA REMICS, PO, Series 2006-44 ‘P’0% 25/12/2033 USD 39,400 36,960 0.00FNMA REMICS, Series 1998-58 ‘PC’6.5% 25/10/2028 USD 37,983 43,014 0.00FNMA REMICS, Series 2005-109 ‘PC’6% 25/12/2035 USD 86,771 97,311 0.00FNMA REMICS, Series 2006-77 ‘PC’6.5% 25/08/2036 USD 70,154 80,965 0.00FNMA REMICS, Series 1997-39 ‘PD’7.5% 20/05/2027 USD 7,578 8,580 0.00FNMA REMICS, Series 2001-44 ‘PD’ 7%25/09/2031 USD 2,285 2,684 0.00FNMA REMICS, Series 2001-7 ‘PF’ 7%25/03/2031 USD 1,231 1,460 0.00FNMA REMICS, Series 2011-52 ‘PH’ 5%25/06/2041 USD 1,224,055 1,444,782 0.03FNMA REMICS, IO, FRN, Series2007-109 ‘PI’ 6.258% 25/12/2037 USD 281,683 51,863 0.00FNMA REMICS, IO, Series 2009-52 ‘PI’5% 25/07/2039 USD 46,568 6,954 0.00FNMA REMICS, Series 1994-63 ‘PK’ 7%25/04/2024 USD 26,585 28,375 0.00FNMA REMICS, Series 1993-203 ‘PL’6.5% 25/10/2023 USD 18,392 19,522 0.00FNMA REMICS, PO, Series 2005-90 ‘PO’0% 25/09/2035 USD 11,184 11,043 0.00FNMA REMICS, PO, Series 2006-110‘PO’ 0% 25/11/2036 USD 15,843 14,827 0.00FNMA REMICS, PO, Series 2006-113‘PO’ 0% 25/07/2036 USD 818 818 0.00FNMA REMICS, PO, Series 2006-36 ‘PO’0% 25/05/2036 USD 51,794 49,784 0.00FNMA REMICS, PO, Series 2006-58 ‘PO’0% 25/07/2036 USD 43,233 40,453 0.00FNMA REMICS, PO, Series 2007-48 ‘PO’0% 25/05/2037 USD 97,502 94,471 0.00FNMA REMICS, PO, Series 2009-69 ‘PO’0% 25/09/2039 USD 74,914 69,074 0.00FNMA REMICS, PO, Series 2013-92 ‘PO’0% 25/09/2043 USD 338,483 309,495 0.01FNMA REMICS, FRN, Series 2006-11‘PS’ 24.231% 25/03/2036 USD 52,315 85,189 0.00FNMA REMICS, FRN, Series 2006-62‘PS’ 39.351% 25/07/2036 USD 9,721 19,459 0.00FNMA REMICS, Series 2005-76 ‘PZ’5.5% 25/09/2035 USD 537,777 616,381 0.02FNMA REMICS, PO, Series 2006-65 ‘QO’0% 25/07/2036 USD 12,983 12,255 0.00FNMA REMICS, IO, FRN, Series 2009-17‘QS’ 6.559% 25/03/2039 USD 54,024 8,725 0.00
277
JPMorgan Funds - US Aggregate Bond FundSchedule of Investments (continued)
As at 30 June 2021
Investments Currency
Quantity/Nominal
Value
MarketValue
USD
%of
NetAssets Investments Currency
Quantity/Nominal
Value
MarketValue
USD
%of
NetAssets

FNMA REMICS, FRN, Series 2008-28‘QS’ 20.426% 25/04/2038 USD 38,852 55,436 0.00FNMA REMICS, IO, FRN, Series 2005-56‘S’ 6.618% 25/07/2035 USD 55,710 11,096 0.00FNMA REMICS, IO, FRN, Series 1996-4‘SA’ 8.408% 25/02/2024 USD 21,069 1,800 0.00FNMA REMICS, IO, FRN, Series2007-108 ‘SA’ 6.269% 25/12/2037 USD 12,597 1,795 0.00FNMA REMICS, IO, FRN, Series 2008-80‘SA’ 5.758% 25/09/2038 USD 66,597 12,080 0.00FNMA REMICS, IO, FRN, Series2010-125 ‘SA’ 4.349% 25/11/2040 USD 272,670 33,746 0.00FNMA REMICS, IO, FRN, Series 2010-68‘SA’ 4.908% 25/07/2040 USD 269,688 37,227 0.00FNMA REMICS, FRN, Series 2004-25‘SA’ 19.273% 25/04/2034 USD 3,971 5,662 0.00FNMA REMICS, IO, FRN, Series2003-116 ‘SB’ 7.508% 25/11/2033 USD 19,608 3,773 0.00FNMA REMICS, IO, FRN, Series 2008-81‘SB’ 5.758% 25/09/2038 USD 100,769 16,780 0.00FNMA REMICS, IO, FRN, Series 2010-35‘SB’ 6.329% 25/04/2040 USD 77,526 12,485 0.00FNMA REMICS, FRN, Series 2005-122‘SC’ 22.78% 25/06/2035 USD 60,480 65,456 0.00FNMA REMICS, FRN, Series 2010-49‘SC’ 12.477% 25/03/2040 USD 167,747 215,269 0.01FNMA REMICS, FRN, Series 2007-1 ‘SD’38.451% 25/02/2037 USD 20,326 60,582 0.00FNMA REMICS, FRN, Series 2002-5 ‘SE’15.416% 25/02/2032 USD 16,760 20,718 0.00FNMA REMICS, IO, FRN, Series 2007-7‘SG’ 6.409% 25/08/2036 USD 84,673 23,134 0.00FNMA REMICS, FRN, Series 2006-95‘SG’ 25.834% 25/10/2036 USD 21,917 36,018 0.00FNMA REMICS, FRN, Series 2007-29‘SG’ 22.361% 25/04/2037 USD 24,596 38,381 0.00FNMA REMICS, IO, FRN, Series 2007-53‘SH’ 6.009% 25/06/2037 USD 72,133 11,158 0.00FNMA REMICS, FRN, Series 2004-61‘SH’ 23.622% 25/11/2032 USD 20,218 30,071 0.00FNMA REMICS, FRN, Series G93-17 ‘SH’30.02% 25/04/2023 USD 3,218 3,705 0.00FNMA REMICS, IO, FRN, Series 2008-47‘SI’ 6.409% 25/06/2023 USD 230 2 0.00FNMA REMICS, IO, FRN, Series 1997-50‘SK’ 6.909% 25/05/2023 USD 16,974 707 0.00FNMA REMICS, FRN, Series 2004-46‘SK’ 16.248% 25/05/2034 USD 46,397 61,215 0.00FNMA REMICS, FRN, Series 2005-74‘SK’ 19.878% 25/05/2035 USD 52,497 65,384 0.00FNMA REMICS, FRN, Series 2007-85‘SL’ 15.921% 25/09/2037 USD 16,351 21,859 0.00FNMA REMICS, FRN, Series 2008-18‘SP’ 13.817% 25/03/2038 USD 14,978 17,972 0.00FNMA REMICS, IO, FRN, Series2009-112 ‘ST’ 6.158% 25/01/2040 USD 107,318 19,410 0.00FNMA REMICS, FRN, Series 2005-75‘SV’ 23.834% 25/09/2035 USD 53,880 77,767 0.00FNMA REMICS, FRN, Series 2004-74‘SW’ 15.335% 25/11/2031 USD 27,133 34,800 0.00FNMA REMICS, FRN, Series 2003-52‘SX’ 22.676% 25/10/2031 USD 6,298 9,106 0.00FNMA REMICS, PO, Series 2006-72 ‘TO’0% 25/08/2036 USD 16,564 15,223 0.00FNMA REMICS, FRN, Series 2005-56‘TP’ 17.876% 25/08/2033 USD 26,489 32,610 0.00FNMA REMICS, Series 2009-79 ‘UA’ 7%25/03/2038 USD 13,670 15,713 0.00FNMA REMICS, IO, FRN, Series 2006-53‘US’ 6.489% 25/06/2036 USD 105,410 20,274 0.00FNMA REMICS, IO, FRN, Series2012-134 ‘US’ 6.109% 25/01/2042 USD 3,442,531 373,084 0.01FNMA REMICS, IO, FRN, Series 2007-88‘VI’ 6.449% 25/09/2037 USD 186,086 40,158 0.00FNMA REMICS, Series 2004-50 ‘VZ’5.5% 25/07/2034 USD 640,187 728,801 0.02FNMA REMICS, FRN, Series 2010-1 ‘WA’6.209% 25/02/2040 USD 98,903 112,641 0.00FNMA REMICS, FRN, Series 2010-61‘WA’ 6.016% 25/06/2040 USD 98,588 114,116 0.00FNMA REMICS, FRN, Series 2011-43‘WA’ 5.817% 25/05/2051 USD 125,778 146,006 0.00FNMA REMICS, Series 2006-53 ‘WE’ 6%25/06/2036 USD 586,736 686,175 0.02FNMA REMICS, IO, FRN, Series 2006-8‘WN’ 6.608% 25/03/2036 USD 825,377 173,177 0.00FNMA REMICS, PO, Series 2006-8 ‘WQ’0% 25/03/2036 USD 225,103 203,652 0.01FNMA REMICS, IO, FRN, Series 2009-84‘WS’ 5.808% 25/10/2039 USD 29,155 4,615 0.00
FNMA REMICS, Series 2005-84 ‘XH’5.75% 25/10/2035 USD 501,625 567,361 0.01FNMA REMICS, IO, FRN, Series 2008-10‘XI’ 6.139% 25/03/2038 USD 30,248 5,623 0.00FNMA REMICS, Series 2005-84 ‘XM’5.75% 25/10/2035 USD 34,522 39,046 0.00FNMA REMICS, IO, FRN, Series 2007-92‘YS’ 5.689% 25/06/2037 USD 171,313 31,925 0.00FNMA REMICS, Series 1992-69 ‘Z’ 8%25/05/2022 USD 8,519 8,716 0.00FNMA REMICS, Series 1993-141 ‘Z’ 7%25/08/2023 USD 28,723 30,085 0.00FNMA REMICS, Series 1993-99 ‘Z’ 7%25/07/2023 USD 22,848 23,936 0.00FNMA REMICS, Series 1996-48 ‘Z’ 7%25/11/2026 USD 48,341 52,289 0.00FNMA REMICS, Series 2002-30 ‘Z’ 6%25/05/2032 USD 104,616 121,872 0.00FNMA REMICS, Series G92-43 ‘Z’ 7.5%25/07/2022 USD 282 283 0.00FNMA REMICS, Series G92-61 ‘Z’ 7%25/10/2022 USD 7,204 7,382 0.00FNMA REMICS, Series 1998-44 ‘ZA’6.5% 20/07/2028 USD 294,438 329,243 0.01FNMA REMICS, Series 2002-50 ‘ZA’ 6%25/05/2031 USD 134,865 152,442 0.00FNMA REMICS, Series 2011-39 ‘ZA’ 6%25/11/2032 USD 290,606 336,096 0.01FNMA REMICS, Series 2011-47 ‘ZA’5.5% 25/07/2038 USD 261,084 302,808 0.01FNMA REMICS, Series 1992-145 ‘ZB’8% 25/08/2022 USD 5,844 6,019 0.00FNMA REMICS, FRN, Series 1993-136‘ZB’ 6% 25/07/2023 USD 20,627 21,610 0.00FNMA REMICS, Series 1998-36 ‘ZB’ 6%18/07/2028 USD 1,248 1,392 0.00FNMA REMICS, Series 2007-76 ‘ZG’ 6%25/08/2037 USD 110,610 129,949 0.00Ford Credit Auto Owner Trust, Series2018-B ‘A3’ 3.24% 15/04/2023 USD 1,425,272 1,437,372 0.03Ford Foundation (The) 2.815%01/06/2070 USD 825,000 826,627 0.02FORT CRE LLC, FRN, Series 2018-1A‘A2’, 144A 1.796% 16/11/2035 USD 6,000,000 5,994,858 0.14FORT CRE LLC, FRN, Series 2018-1A ‘D’,144A 3.526% 21/12/2023 USD 10,000,000 9,639,493 0.23Foundation Finance Trust, Series2017-1A ‘A’, 144A 3.3% 15/07/2033 USD 2,895,380 2,938,242 0.07FREMF Mortgage Trust, FRN, Series2015-K44 ‘B’, 144A 3.68% 25/01/2048 USD 13,563,000 14,650,526 0.34FREMF Mortgage Trust, FRN, Series2015-K45 ‘B’, 144A 3.589%25/04/2048 USD 8,250,000 8,908,563 0.21FREMF Mortgage Trust, FRN, Series2015-K48 ‘B’, 144A 3.641%25/08/2048 USD 11,935,000 12,968,165 0.30FREMF Mortgage Trust, FRN, Series2015-K51 ‘B’, 144A 3.954% 25/10/2048 USD 7,149,000 7,857,397 0.18FREMF Mortgage Trust, FRN, Series2015-K721 ‘B’, 144A 3.557%25/11/2047 USD 2,665,000 2,750,602 0.06FREMF Mortgage Trust, FRN, Series2016-K55 ‘B’, 144A 4.163%25/04/2049 USD 5,000,000 5,575,821 0.13FREMF Mortgage Trust, FRN, Series2016-K58 ‘B’, 144A 3.738%25/09/2049 USD 6,000,000 6,597,161 0.15FREMF Mortgage Trust, FRN, Series2016-K59 ‘B’, 144A 3.576% 25/11/2049 USD 6,179,000 6,725,547 0.16FREMF Mortgage Trust, FRN, Series2016-K722 ‘B’, 144A 3.847%25/07/2049 USD 4,050,000 4,265,331 0.10FREMF Mortgage Trust, FRN, Series2017-K725 ‘B’, 144A 3.879%25/02/2050 USD 6,606,000 7,088,647 0.17FREMF Mortgage Trust, FRN, Series2017-K728 ‘B’, 144A 3.647%25/11/2050 USD 6,000,000 6,428,309 0.15FREMF Mortgage Trust, FRN, Series2018-K157 ‘B’, 144A 4.307%25/08/2033 USD 5,150,000 5,556,732 0.13FREMF Mortgage Trust, FRN, Series2018-K732 ‘B’, 144A 4.057%25/05/2025 USD 4,910,000 5,365,564 0.13FREMF Mortgage Trust, FRN, Series2018-KF52 ‘B’ 2.036% 25/09/2028 USD 2,561,486 2,484,122 0.06FREMF Mortgage Trust, FRN, Series2018-KSL1 ‘B’, 144A 3.829%25/11/2025 USD 10,000,000 10,270,441 0.24FREMF Mortgage Trust, FRN, Series2018-KW07 ‘B’, 144A 4.081%25/10/2031 USD 5,516,000 5,848,433 0.14
278
JPMorgan Funds - US Aggregate Bond FundSchedule of Investments (continued)
As at 30 June 2021
Investments Currency
Quantity/Nominal
Value
MarketValue
USD
%of
NetAssets Investments Currency
Quantity/Nominal
Value
MarketValue
USD
%of
NetAssets
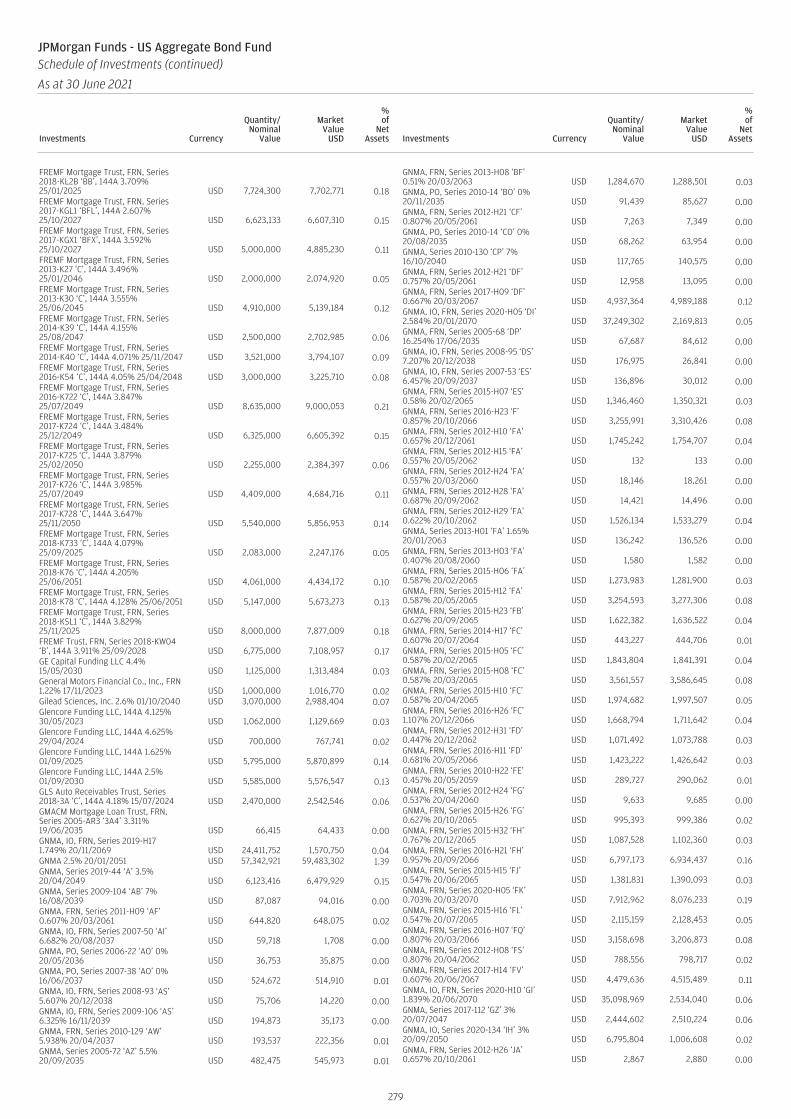
FREMF Mortgage Trust, FRN, Series2018-KL2B ‘BB’, 144A 3.709%25/01/2025 USD 7,724,300 7,702,771 0.18FREMF Mortgage Trust, FRN, Series2017-KGL1 ‘BFL’, 144A 2.607%25/10/2027 USD 6,623,133 6,607,310 0.15FREMF Mortgage Trust, FRN, Series2017-KGX1 ‘BFX’, 144A 3.592%25/10/2027 USD 5,000,000 4,885,230 0.11FREMF Mortgage Trust, FRN, Series2013-K27 ‘C’, 144A 3.496%25/01/2046 USD 2,000,000 2,074,920 0.05FREMF Mortgage Trust, FRN, Series2013-K30 ‘C’, 144A 3.555%25/06/2045 USD 4,910,000 5,139,184 0.12FREMF Mortgage Trust, FRN, Series2014-K39 ‘C’, 144A 4.155%25/08/2047 USD 2,500,000 2,702,985 0.06FREMF Mortgage Trust, FRN, Series2014-K40 ‘C’, 144A 4.071% 25/11/2047 USD 3,521,000 3,794,107 0.09FREMF Mortgage Trust, FRN, Series2016-K54 ‘C’, 144A 4.05% 25/04/2048 USD 3,000,000 3,225,710 0.08FREMF Mortgage Trust, FRN, Series2016-K722 ‘C’, 144A 3.847%25/07/2049 USD 8,635,000 9,000,053 0.21FREMF Mortgage Trust, FRN, Series2017-K724 ‘C’, 144A 3.484%25/12/2049 USD 6,325,000 6,605,392 0.15FREMF Mortgage Trust, FRN, Series2017-K725 ‘C’, 144A 3.879%25/02/2050 USD 2,255,000 2,384,397 0.06FREMF Mortgage Trust, FRN, Series2017-K726 ‘C’, 144A 3.985%25/07/2049 USD 4,409,000 4,684,716 0.11FREMF Mortgage Trust, FRN, Series2017-K728 ‘C’, 144A 3.647%25/11/2050 USD 5,540,000 5,856,953 0.14FREMF Mortgage Trust, FRN, Series2018-K733 ‘C’, 144A 4.079%25/09/2025 USD 2,083,000 2,247,176 0.05FREMF Mortgage Trust, FRN, Series2018-K76 ‘C’, 144A 4.205%25/06/2051 USD 4,061,000 4,434,172 0.10FREMF Mortgage Trust, FRN, Series2018-K78 ‘C’, 144A 4.128% 25/06/2051 USD 5,147,000 5,673,273 0.13FREMF Mortgage Trust, FRN, Series2018-KSL1 ‘C’, 144A 3.829%25/11/2025 USD 8,000,000 7,877,009 0.18FREMF Trust, FRN, Series 2018-KW04‘B’, 144A 3.911% 25/09/2028 USD 6,775,000 7,108,957 0.17GE Capital Funding LLC 4.4%15/05/2030 USD 1,125,000 1,313,484 0.03General Motors Financial Co., Inc., FRN1.22% 17/11/2023 USD 1,000,000 1,016,770 0.02Gilead Sciences, Inc. 2.6% 01/10/2040 USD 3,070,000 2,988,404 0.07Glencore Funding LLC, 144A 4.125%30/05/2023 USD 1,062,000 1,129,669 0.03Glencore Funding LLC, 144A 4.625%29/04/2024 USD 700,000 767,741 0.02Glencore Funding LLC, 144A 1.625%01/09/2025 USD 5,795,000 5,870,899 0.14Glencore Funding LLC, 144A 2.5%01/09/2030 USD 5,585,000 5,576,547 0.13GLS Auto Receivables Trust, Series2018-3A ‘C’, 144A 4.18% 15/07/2024 USD 2,470,000 2,542,546 0.06GMACM Mortgage Loan Trust, FRN,Series 2005-AR3 ‘3A4’ 3.311%19/06/2035 USD 66,415 64,433 0.00GNMA, IO, FRN, Series 2019-H171.749% 20/11/2069 USD 24,411,752 1,570,750 0.04GNMA 2.5% 20/01/2051 USD 57,342,921 59,483,302 1.39GNMA, Series 2019-44 ‘A’ 3.5%20/04/2049 USD 6,123,416 6,479,929 0.15GNMA, Series 2009-104 ‘AB’ 7%16/08/2039 USD 87,087 94,016 0.00GNMA, FRN, Series 2011-H09 ‘AF’0.607% 20/03/2061 USD 644,820 648,075 0.02GNMA, IO, FRN, Series 2007-50 ‘AI’6.682% 20/08/2037 USD 59,718 1,708 0.00GNMA, PO, Series 2006-22 ‘AO’ 0%20/05/2036 USD 36,753 35,875 0.00GNMA, PO, Series 2007-38 ‘AO’ 0%16/06/2037 USD 524,672 514,910 0.01GNMA, IO, FRN, Series 2008-93 ‘AS’5.607% 20/12/2038 USD 75,706 14,220 0.00GNMA, IO, FRN, Series 2009-106 ‘AS’6.325% 16/11/2039 USD 194,873 35,173 0.00GNMA, FRN, Series 2010-129 ‘AW’5.938% 20/04/2037 USD 193,537 222,356 0.01GNMA, Series 2005-72 ‘AZ’ 5.5%20/09/2035 USD 482,475 545,973 0.01
GNMA, FRN, Series 2013-H08 ‘BF’0.51% 20/03/2063 USD 1,284,670 1,288,501 0.03GNMA, PO, Series 2010-14 ‘BO’ 0%20/11/2035 USD 91,439 85,627 0.00GNMA, FRN, Series 2012-H21 ‘CF’0.807% 20/05/2061 USD 7,263 7,349 0.00GNMA, PO, Series 2010-14 ‘CO’ 0%20/08/2035 USD 68,262 63,954 0.00GNMA, Series 2010-130 ‘CP’ 7%16/10/2040 USD 117,765 140,575 0.00GNMA, FRN, Series 2012-H21 ‘DF’0.757% 20/05/2061 USD 12,958 13,095 0.00GNMA, FRN, Series 2017-H09 ‘DF’0.667% 20/03/2067 USD 4,937,364 4,989,188 0.12GNMA, IO, FRN, Series 2020-H05 ‘DI’2.584% 20/01/2070 USD 37,249,302 2,169,813 0.05GNMA, FRN, Series 2005-68 ‘DP’16.254% 17/06/2035 USD 67,687 84,612 0.00GNMA, IO, FRN, Series 2008-95 ‘DS’7.207% 20/12/2038 USD 176,975 26,841 0.00GNMA, IO, FRN, Series 2007-53 ‘ES’6.457% 20/09/2037 USD 136,896 30,012 0.00GNMA, FRN, Series 2015-H07 ‘ES’0.58% 20/02/2065 USD 1,346,460 1,350,321 0.03GNMA, FRN, Series 2016-H23 ‘F’0.857% 20/10/2066 USD 3,255,991 3,310,426 0.08GNMA, FRN, Series 2012-H10 ‘FA’0.657% 20/12/2061 USD 1,745,242 1,754,707 0.04GNMA, FRN, Series 2012-H15 ‘FA’0.557% 20/05/2062 USD 132 133 0.00GNMA, FRN, Series 2012-H24 ‘FA’0.557% 20/03/2060 USD 18,146 18,261 0.00GNMA, FRN, Series 2012-H28 ‘FA’0.687% 20/09/2062 USD 14,421 14,496 0.00GNMA, FRN, Series 2012-H29 ‘FA’0.622% 20/10/2062 USD 1,526,134 1,533,279 0.04GNMA, Series 2013-H01 ‘FA’ 1.65%20/01/2063 USD 136,242 136,526 0.00GNMA, FRN, Series 2013-H03 ‘FA’0.407% 20/08/2060 USD 1,580 1,582 0.00GNMA, FRN, Series 2015-H06 ‘FA’0.587% 20/02/2065 USD 1,273,983 1,281,900 0.03GNMA, FRN, Series 2015-H12 ‘FA’0.587% 20/05/2065 USD 3,254,593 3,277,306 0.08GNMA, FRN, Series 2015-H23 ‘FB’0.627% 20/09/2065 USD 1,622,382 1,636,522 0.04GNMA, FRN, Series 2014-H17 ‘FC’0.607% 20/07/2064 USD 443,227 444,706 0.01GNMA, FRN, Series 2015-H05 ‘FC’0.587% 20/02/2065 USD 1,843,804 1,841,391 0.04GNMA, FRN, Series 2015-H08 ‘FC’0.587% 20/03/2065 USD 3,561,557 3,586,645 0.08GNMA, FRN, Series 2015-H10 ‘FC’0.587% 20/04/2065 USD 1,974,682 1,997,507 0.05GNMA, FRN, Series 2016-H26 ‘FC’1.107% 20/12/2066 USD 1,668,794 1,711,642 0.04GNMA, FRN, Series 2012-H31 ‘FD’0.447% 20/12/2062 USD 1,071,492 1,073,788 0.03GNMA, FRN, Series 2016-H11 ‘FD’0.681% 20/05/2066 USD 1,423,222 1,426,642 0.03GNMA, FRN, Series 2010-H22 ‘FE’0.457% 20/05/2059 USD 289,727 290,062 0.01GNMA, FRN, Series 2012-H24 ‘FG’0.537% 20/04/2060 USD 9,633 9,685 0.00GNMA, FRN, Series 2015-H26 ‘FG’0.627% 20/10/2065 USD 995,393 999,386 0.02GNMA, FRN, Series 2015-H32 ‘FH’0.767% 20/12/2065 USD 1,087,528 1,102,360 0.03GNMA, FRN, Series 2016-H21 ‘FH’0.957% 20/09/2066 USD 6,797,173 6,934,437 0.16GNMA, FRN, Series 2015-H15 ‘FJ’0.547% 20/06/2065 USD 1,381,831 1,390,093 0.03GNMA, FRN, Series 2020-H05 ‘FK’0.703% 20/03/2070 USD 7,912,962 8,076,233 0.19GNMA, FRN, Series 2015-H16 ‘FL’0.547% 20/07/2065 USD 2,115,159 2,128,453 0.05GNMA, FRN, Series 2016-H07 ‘FQ’0.807% 20/03/2066 USD 3,158,698 3,206,873 0.08GNMA, FRN, Series 2012-H08 ‘FS’0.807% 20/04/2062 USD 788,556 798,717 0.02GNMA, FRN, Series 2017-H14 ‘FV’0.607% 20/06/2067 USD 4,479,636 4,515,489 0.11GNMA, IO, FRN, Series 2020-H10 ‘GI’1.839% 20/06/2070 USD 35,098,969 2,534,040 0.06GNMA, Series 2017-112 ‘GZ’ 3%20/07/2047 USD 2,444,602 2,510,224 0.06GNMA, IO, Series 2020-134 ‘IH’ 3%20/09/2050 USD 6,795,804 1,006,608 0.02GNMA, FRN, Series 2012-H26 ‘JA’0.657% 20/10/2061 USD 2,867 2,880 0.00
279
JPMorgan Funds - US Aggregate Bond FundSchedule of Investments (continued)
As at 30 June 2021
Investments Currency
Quantity/Nominal
Value
MarketValue
USD
%of
NetAssets Investments Currency
Quantity/Nominal
Value
MarketValue
USD
%of
NetAssets
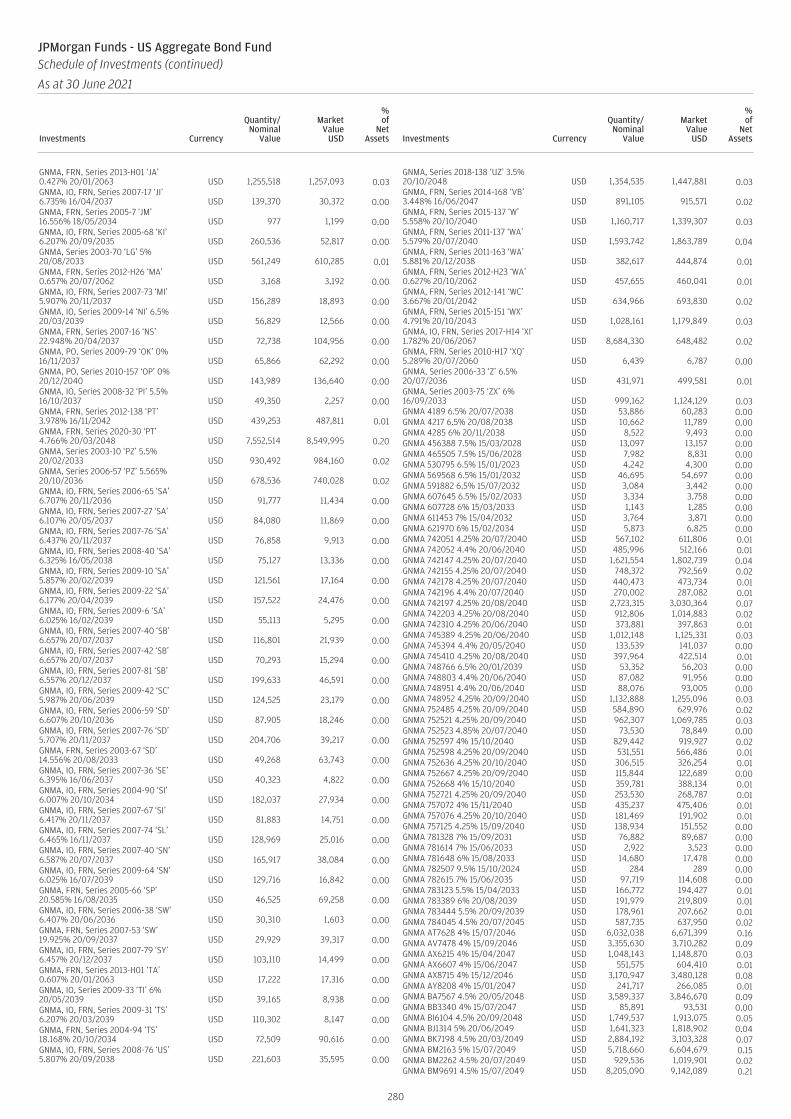
GNMA, FRN, Series 2013-H01 ‘JA’0.427% 20/01/2063 USD 1,255,518 1,257,093 0.03GNMA, IO, FRN, Series 2007-17 ‘JI’6.735% 16/04/2037 USD 139,370 30,372 0.00GNMA, FRN, Series 2005-7 ‘JM’16.556% 18/05/2034 USD 977 1,199 0.00GNMA, IO, FRN, Series 2005-68 ‘KI’6.207% 20/09/2035 USD 260,536 52,817 0.00GNMA, Series 2003-70 ‘LG’ 5%20/08/2033 USD 561,249 610,285 0.01GNMA, FRN, Series 2012-H26 ‘MA’0.657% 20/07/2062 USD 3,168 3,192 0.00GNMA, IO, FRN, Series 2007-73 ‘MI’5.907% 20/11/2037 USD 156,289 18,893 0.00GNMA, IO, Series 2009-14 ‘NI’ 6.5%20/03/2039 USD 56,829 12,566 0.00GNMA, FRN, Series 2007-16 ‘NS’22.948% 20/04/2037 USD 72,738 104,956 0.00GNMA, PO, Series 2009-79 ‘OK’ 0%16/11/2037 USD 65,866 62,292 0.00GNMA, PO, Series 2010-157 ‘OP’ 0%20/12/2040 USD 143,989 136,640 0.00GNMA, IO, Series 2008-32 ‘PI’ 5.5%16/10/2037 USD 49,350 2,257 0.00GNMA, FRN, Series 2012-138 ‘PT’3.978% 16/11/2042 USD 439,253 487,811 0.01GNMA, FRN, Series 2020-30 ‘PT’4.766% 20/03/2048 USD 7,552,514 8,549,995 0.20GNMA, Series 2003-10 ‘PZ’ 5.5%20/02/2033 USD 930,492 984,160 0.02GNMA, Series 2006-57 ‘PZ’ 5.565%20/10/2036 USD 678,536 740,028 0.02GNMA, IO, FRN, Series 2006-65 ‘SA’6.707% 20/11/2036 USD 91,777 11,434 0.00GNMA, IO, FRN, Series 2007-27 ‘SA’6.107% 20/05/2037 USD 84,080 11,869 0.00GNMA, IO, FRN, Series 2007-76 ‘SA’6.437% 20/11/2037 USD 76,858 9,913 0.00GNMA, IO, FRN, Series 2008-40 ‘SA’6.325% 16/05/2038 USD 75,127 13,336 0.00GNMA, IO, FRN, Series 2009-10 ‘SA’5.857% 20/02/2039 USD 121,561 17,164 0.00GNMA, IO, FRN, Series 2009-22 ‘SA’6.177% 20/04/2039 USD 157,522 24,476 0.00GNMA, IO, FRN, Series 2009-6 ‘SA’6.025% 16/02/2039 USD 55,113 5,295 0.00GNMA, IO, FRN, Series 2007-40 ‘SB’6.657% 20/07/2037 USD 116,801 21,939 0.00GNMA, IO, FRN, Series 2007-42 ‘SB’6.657% 20/07/2037 USD 70,293 15,294 0.00GNMA, IO, FRN, Series 2007-81 ‘SB’6.557% 20/12/2037 USD 199,633 46,591 0.00GNMA, IO, FRN, Series 2009-42 ‘SC’5.987% 20/06/2039 USD 124,525 23,179 0.00GNMA, IO, FRN, Series 2006-59 ‘SD’6.607% 20/10/2036 USD 87,905 18,246 0.00GNMA, IO, FRN, Series 2007-76 ‘SD’5.707% 20/11/2037 USD 204,706 39,217 0.00GNMA, FRN, Series 2003-67 ‘SD’14.556% 20/08/2033 USD 49,268 63,743 0.00GNMA, IO, FRN, Series 2007-36 ‘SE’6.395% 16/06/2037 USD 40,323 4,822 0.00GNMA, IO, FRN, Series 2004-90 ‘SI’6.007% 20/10/2034 USD 182,037 27,934 0.00GNMA, IO, FRN, Series 2007-67 ‘SI’6.417% 20/11/2037 USD 81,883 14,751 0.00GNMA, IO, FRN, Series 2007-74 ‘SL’6.465% 16/11/2037 USD 128,969 25,016 0.00GNMA, IO, FRN, Series 2007-40 ‘SN’6.587% 20/07/2037 USD 165,917 38,084 0.00GNMA, IO, FRN, Series 2009-64 ‘SN’6.025% 16/07/2039 USD 129,716 16,842 0.00GNMA, FRN, Series 2005-66 ‘SP’20.585% 16/08/2035 USD 46,525 69,258 0.00GNMA, IO, FRN, Series 2006-38 ‘SW’6.407% 20/06/2036 USD 30,310 1,603 0.00GNMA, FRN, Series 2007-53 ‘SW’19.925% 20/09/2037 USD 29,929 39,317 0.00GNMA, IO, FRN, Series 2007-79 ‘SY’6.457% 20/12/2037 USD 103,110 14,499 0.00GNMA, FRN, Series 2013-H01 ‘TA’0.607% 20/01/2063 USD 17,222 17,316 0.00GNMA, IO, Series 2009-33 ‘TI’ 6%20/05/2039 USD 39,165 8,938 0.00GNMA, IO, FRN, Series 2009-31 ‘TS’6.207% 20/03/2039 USD 110,302 8,147 0.00GNMA, FRN, Series 2004-94 ‘TS’18.168% 20/10/2034 USD 72,509 90,616 0.00GNMA, IO, FRN, Series 2008-76 ‘US’5.807% 20/09/2038 USD 221,603 35,595 0.00
GNMA, Series 2018-138 ‘UZ’ 3.5%20/10/2048 USD 1,354,535 1,447,881 0.03GNMA, FRN, Series 2014-168 ‘VB’3.448% 16/06/2047 USD 891,105 915,571 0.02GNMA, FRN, Series 2015-137 ‘W’5.558% 20/10/2040 USD 1,160,717 1,339,307 0.03GNMA, FRN, Series 2011-137 ‘WA’5.579% 20/07/2040 USD 1,593,742 1,863,789 0.04GNMA, FRN, Series 2011-163 ‘WA’5.881% 20/12/2038 USD 382,617 444,874 0.01GNMA, FRN, Series 2012-H23 ‘WA’0.627% 20/10/2062 USD 457,655 460,041 0.01GNMA, FRN, Series 2012-141 ‘WC’3.667% 20/01/2042 USD 634,966 693,830 0.02GNMA, FRN, Series 2015-151 ‘WX’4.791% 20/10/2043 USD 1,028,161 1,179,849 0.03GNMA, IO, FRN, Series 2017-H14 ‘XI’1.782% 20/06/2067 USD 8,684,330 648,482 0.02GNMA, FRN, Series 2010-H17 ‘XQ’5.289% 20/07/2060 USD 6,439 6,787 0.00GNMA, Series 2006-33 ‘Z’ 6.5%20/07/2036 USD 431,971 499,581 0.01GNMA, Series 2003-75 ‘ZX’ 6%16/09/2033 USD 999,162 1,124,129 0.03GNMA 4189 6.5% 20/07/2038 USD 53,886 60,283 0.00GNMA 4217 6.5% 20/08/2038 USD 10,662 11,789 0.00GNMA 4285 6% 20/11/2038 USD 8,522 9,493 0.00GNMA 456388 7.5% 15/03/2028 USD 13,097 13,157 0.00GNMA 465505 7.5% 15/06/2028 USD 7,982 8,831 0.00GNMA 530795 6.5% 15/01/2023 USD 4,242 4,300 0.00GNMA 569568 6.5% 15/01/2032 USD 46,695 54,697 0.00GNMA 591882 6.5% 15/07/2032 USD 3,084 3,442 0.00GNMA 607645 6.5% 15/02/2033 USD 3,334 3,758 0.00GNMA 607728 6% 15/03/2033 USD 1,143 1,285 0.00GNMA 611453 7% 15/04/2032 USD 3,764 3,871 0.00GNMA 621970 6% 15/02/2034 USD 5,873 6,825 0.00GNMA 742051 4.25% 20/07/2040 USD 567,102 611,806 0.01GNMA 742052 4.4% 20/06/2040 USD 485,996 512,166 0.01GNMA 742147 4.25% 20/07/2040 USD 1,621,554 1,802,739 0.04GNMA 742155 4.25% 20/07/2040 USD 748,372 792,569 0.02GNMA 742178 4.25% 20/07/2040 USD 440,473 473,734 0.01GNMA 742196 4.4% 20/07/2040 USD 270,002 287,082 0.01GNMA 742197 4.25% 20/08/2040 USD 2,723,315 3,030,364 0.07GNMA 742203 4.25% 20/08/2040 USD 912,806 1,014,883 0.02GNMA 742310 4.25% 20/06/2040 USD 373,881 397,863 0.01GNMA 745389 4.25% 20/06/2040 USD 1,012,148 1,125,331 0.03GNMA 745394 4.4% 20/05/2040 USD 133,539 141,037 0.00GNMA 745410 4.25% 20/08/2040 USD 397,964 422,514 0.01GNMA 748766 6.5% 20/01/2039 USD 53,352 56,203 0.00GNMA 748803 4.4% 20/06/2040 USD 87,082 91,956 0.00GNMA 748951 4.4% 20/06/2040 USD 88,076 93,005 0.00GNMA 748952 4.25% 20/09/2040 USD 1,132,888 1,255,096 0.03GNMA 752485 4.25% 20/09/2040 USD 584,890 629,976 0.02GNMA 752521 4.25% 20/09/2040 USD 962,307 1,069,785 0.03GNMA 752523 4.85% 20/07/2040 USD 73,530 78,849 0.00GNMA 752597 4% 15/10/2040 USD 829,442 919,927 0.02GNMA 752598 4.25% 20/09/2040 USD 531,551 566,486 0.01GNMA 752636 4.25% 20/10/2040 USD 306,515 326,254 0.01GNMA 752667 4.25% 20/09/2040 USD 115,844 122,689 0.00GNMA 752668 4% 15/10/2040 USD 359,781 388,134 0.01GNMA 752721 4.25% 20/09/2040 USD 253,530 268,787 0.01GNMA 757072 4% 15/11/2040 USD 435,237 475,406 0.01GNMA 757076 4.25% 20/10/2040 USD 181,469 191,902 0.01GNMA 757125 4.25% 15/09/2040 USD 138,934 151,552 0.00GNMA 781328 7% 15/09/2031 USD 76,882 89,687 0.00GNMA 781614 7% 15/06/2033 USD 2,922 3,523 0.00GNMA 781648 6% 15/08/2033 USD 14,680 17,478 0.00GNMA 782507 9.5% 15/10/2024 USD 284 289 0.00GNMA 782615 7% 15/06/2035 USD 97,719 114,608 0.00GNMA 783123 5.5% 15/04/2033 USD 166,772 194,427 0.01GNMA 783389 6% 20/08/2039 USD 191,979 219,809 0.01GNMA 783444 5.5% 20/09/2039 USD 178,961 207,662 0.01GNMA 784045 4.5% 20/07/2045 USD 587,735 637,950 0.02GNMA AT7628 4% 15/07/2046 USD 6,032,038 6,671,399 0.16GNMA AV7478 4% 15/09/2046 USD 3,355,630 3,710,282 0.09GNMA AX6215 4% 15/04/2047 USD 1,048,143 1,148,870 0.03GNMA AX6607 4% 15/06/2047 USD 551,575 604,410 0.01GNMA AX8715 4% 15/12/2046 USD 3,170,947 3,480,128 0.08GNMA AY8208 4% 15/01/2047 USD 241,717 266,085 0.01GNMA BA7567 4.5% 20/05/2048 USD 3,589,337 3,846,670 0.09GNMA BB3340 4% 15/07/2047 USD 85,891 93,531 0.00GNMA BI6104 4.5% 20/09/2048 USD 1,749,537 1,913,075 0.05GNMA BJ1314 5% 20/06/2049 USD 1,641,323 1,818,902 0.04GNMA BK7198 4.5% 20/03/2049 USD 2,884,192 3,103,328 0.07GNMA BM2163 5% 15/07/2049 USD 5,718,660 6,604,679 0.15GNMA BM2262 4.5% 20/07/2049 USD 929,536 1,019,901 0.02GNMA BM9691 4.5% 15/07/2049 USD 8,205,090 9,142,089 0.21
280
JPMorgan Funds - US Aggregate Bond FundSchedule of Investments (continued)
As at 30 June 2021
Investments Currency
Quantity/Nominal
Value
MarketValue
USD
%of
NetAssets Investments Currency
Quantity/Nominal
Value
MarketValue
USD
%of
NetAssets

GNMA BM9692 4.5% 20/07/2049 USD 9,683,764 10,432,891 0.24GNMA BM9701 4.5% 20/08/2049 USD 7,704,836 8,279,159 0.19GNMA BM9713 4.5% 20/09/2049 USD 5,302,106 5,710,801 0.13GNMA BM9734 4% 20/10/2049 USD 6,600,310 7,104,787 0.17GNMA BN3949 5.5% 20/07/2049 USD 4,328,081 4,882,583 0.11GNMA BO3248 4.5% 20/08/2049 USD 8,180,380 8,979,761 0.21GNMA BO8204 4.5% 20/09/2049 USD 4,901,917 5,275,420 0.12GNMA BP7143 4.5% 20/09/2049 USD 3,108,569 3,409,992 0.08GNMA BS7412 4.5% 15/04/2050 USD 4,018,377 4,519,228 0.11GNMA BS7592 4.5% 20/03/2050 USD 1,840,936 2,019,191 0.05GNMA BT8093 3.5% 20/04/2050 USD 15,109,675 16,211,240 0.38GNMA BU7638 2.5% 20/09/2050 USD 7,271,613 7,598,866 0.18GNMA BU7669 3% 20/07/2050 USD 7,562,646 7,889,427 0.18GNMA MA7052 2.5% 20/12/2050 USD 23,161,597 23,979,298 0.56GNMA REMICS, FRN, Series 2013-H07‘HA’ 0.517% 20/03/2063 USD 587,635 589,642 0.01Gold Key Resorts LLC, Series 2014-A‘A’, 144A 3.22% 17/03/2031 USD 50,771 51,414 0.00Golden Bear LLC, Series 2016-R ‘R’,144A 5.65% 20/09/2047 USD 1,283,169 1,286,689 0.03Goldman Sachs Group, Inc. (The), FRN3.272% 29/09/2025 USD 1,773,000 1,899,884 0.05Goldman Sachs Group, Inc. (The), FRN1.431% 09/03/2027 USD 5,790,000 5,780,062 0.14Goldman Sachs Group, Inc. (The), FRN1.934% 28/10/2027 USD 1,200,000 1,271,258 0.03Goldman Sachs Group, Inc. (The), FRN3.691% 05/06/2028 USD 4,090,000 4,517,850 0.11Goldman Sachs Group, Inc. (The), FRN4.223% 01/05/2029 USD 3,605,000 4,119,379 0.10Goldman Sachs Group, Inc. (The), FRN4.411% 23/04/2039 USD 2,300,000 2,804,975 0.07Goodgreen Trust, Series 2017-1A ‘A’,144A 3.74% 15/10/2052 USD 892,591 945,769 0.02Goodgreen Trust, Series 2017-2A ‘A’,144A 3.26% 15/10/2053 USD 2,625,181 2,745,195 0.06Goodman US Finance Three LLC, REIT,144A 3.7% 15/03/2028 USD 431,000 467,706 0.01Graphic Packaging International LLC,144A 1.512% 15/04/2026 USD 2,710,000 2,697,789 0.06Gray Oak Pipeline LLC, 144A 2%15/09/2023 USD 1,355,000 1,382,155 0.03Gray Oak Pipeline LLC, 144A 2.6%15/10/2025 USD 3,150,000 3,238,387 0.08GSMPS Mortgage Loan Trust, FRN,Series 2004-4 ‘1AF’, 144A 0.492%25/06/2034 USD 75,780 68,814 0.00GSMPS Mortgage Loan Trust, FRN,Series 2005-RP1 ‘1AF’, 144A 0.442%25/01/2035 USD 29,287 26,984 0.00GSMPS Mortgage Loan Trust, FRN,Series 2005-RP2 ‘1AF’, 144A 0.442%25/03/2035 USD 120,880 113,290 0.00GSMPS Mortgage Loan Trust, IO, FRN,Series 2006-RP2 ‘1AS2’, 144A 5.946%25/04/2036 USD 540,970 83,345 0.00GSR Mortgage Loan Trust, Series2003-7F ‘1A4’ 5.25% 25/06/2033 USD 171,534 176,626 0.00GSR Mortgage Loan Trust, Series2004-6F ‘3A4’ 6.5% 25/05/2034 USD 72,262 78,189 0.00GTP Acquisition Partners I LLC, 144A3.482% 15/06/2050 USD 225,000 235,688 0.01Guardian Life Global Funding, 144A2.5% 08/05/2022 USD 720,000 733,993 0.02Guardian Life Insurance Co. of America(The), 144A 4.85% 24/01/2077 USD 250,000 321,274 0.01Hackensack Meridian Health, Inc.2.875% 01/09/2050 USD 2,000,000 1,981,691 0.05Hartford HealthCare Corp. 3.447%01/07/2054 USD 2,680,000 2,830,080 0.07Headlands Residential LLC, STEP,Series 2017-RPL1 ‘A’, 144A 3.875%25/11/2024 USD 5,715,000 5,829,126 0.14Headlands Residential LLC, STEP,Series 2018-RPL1 ‘A’, 144A 3.875%25/08/2024 USD 5,540,000 5,584,866 0.13HERO Funding Trust, Series 2016-3A‘A1’, 144A 3.08% 20/09/2042 USD 367,153 379,996 0.01HERO Funding Trust, Series 2016-4A‘A1’, 144A 3.57% 20/09/2047 USD 1,684,129 1,741,114 0.04Hilton Grand Vacations Trust, Series2017-AA ‘A’, 144A 2.66% 26/12/2028 USD 730,027 747,881 0.02Hyundai Capital America, 144A 1.15%10/11/2022 USD 3,763,000 3,789,505 0.09Hyundai Capital America, 144A 1.8%15/10/2025 USD 1,340,000 1,361,429 0.03Hyundai Capital America, 144A 1.3%08/01/2026 USD 1,005,000 994,621 0.02Hyundai Capital America, 144A 1.5%15/06/2026 USD 1,005,000 997,559 0.02
Hyundai Capital America, 144A 3%10/02/2027 USD 605,000 641,745 0.02Hyundai Capital America, 144A 2.375%15/10/2027 USD 1,330,000 1,361,963 0.03Hyundai Capital America, 144A 1.8%10/01/2028 USD 1,940,000 1,926,188 0.05Impac Secured Assets CMN OwnerTrust, Series 2003-2 ‘A1’ 5.5%25/08/2033 USD 31,619 31,091 0.00Independence Plaza Trust, Series2018-INDP ‘A’, 144A 3.763%10/07/2035 USD 3,660,000 3,885,023 0.09IndyMac INDX Mortgage Loan Trust,FRN, Series 2004-AR7 ‘A1’ 0.972%25/09/2034 USD 2,758 2,623 0.00Intact US Holdings, Inc. 4.6%09/11/2022 USD 1,000,000 1,048,574 0.03International Flavors & Fragrances,Inc., 144A 1.832% 15/10/2027 USD 1,995,000 1,993,881 0.05International Flavors & Fragrances,Inc., 144A 3.268% 15/11/2040 USD 1,140,000 1,174,155 0.03International Flavors & Fragrances,Inc., 144A 3.468% 01/12/2050 USD 885,000 924,819 0.02ITC Holdings Corp., 144A 2.95%14/05/2030 USD 910,000 959,711 0.02J.P. Morgan Chase CommercialMortgage Securities Trust, IO, FRN,Series 2006-LDP8 ‘X’ 0.297%15/05/2045 USD 31,893 35 0.00J.P. Morgan Mortgage Trust, FRN,Series 2004-A4 ‘1A1’ 2.888%25/09/2034 USD 6,929 6,836 0.00J.P. Morgan Mortgage Trust, FRN,Series 2004-A3 ‘4A1’ 2.671%25/07/2034 USD 3,448 3,569 0.00J.P. Morgan Mortgage Trust, FRN,Series 2006-A2 ‘4A1’ 2.742%25/08/2034 USD 26,113 27,495 0.00J.P. Morgan Mortgage Trust, FRN,Series 2006-A2 ‘5A3’ 2.516%25/11/2033 USD 70,450 71,239 0.00J.P. Morgan Resecuritization Trust,FRN, Series 2009-7 ‘17A1’, 144A5.234% 27/07/2037 USD 6,298 6,304 0.00Jackson National Life Global Funding,144A 2.5% 27/06/2022 USD 710,000 726,040 0.02Jackson National Life Global Funding,144A 3.25% 30/01/2024 USD 173,000 184,422 0.00Jackson National Life Global Funding,144A 3.05% 29/04/2026 USD 1,034,000 1,112,475 0.03JB Hunt Transport Services, Inc. 3.85%15/03/2024 USD 1,200,000 1,287,308 0.03JB Hunt Transport Services, Inc.3.875% 01/03/2026 USD 860,000 956,746 0.02Jersey Central Power & Light Co., 144A4.3% 15/01/2026 USD 460,000 509,603 0.01John Sevier Combined CycleGeneration LLC 4.626% 15/01/2042 USD 315,475 382,193 0.01Keurig Dr Pepper, Inc. 3.13%15/12/2023 USD 560,000 594,420 0.01Keurig Dr Pepper, Inc. 4.417%25/05/2025 USD 336,000 377,456 0.01Keurig Dr Pepper, Inc. 3.43%15/06/2027 USD 450,000 497,187 0.01Keurig Dr Pepper, Inc. 3.2%01/05/2030 USD 1,500,000 1,624,035 0.04Keurig Dr Pepper, Inc. 4.985%25/05/2038 USD 484,000 618,283 0.02Keurig Dr Pepper, Inc. 4.42%15/12/2046 USD 500,000 603,358 0.01KeyBank NA 3.18% 15/10/2027 USD 650,000 666,900 0.02KeySpan Gas East Corp., 144A 2.742%15/08/2026 USD 448,000 470,635 0.01LB-UBS Commercial Mortgage Trust,IO, FRN, Series 2006-C1 ‘XCL’, 144A0.367% 15/02/2041 USD 772,307 1,513 0.00Lehman Mortgage Trust, Series 2008-2‘1A6’ 6% 25/03/2038 USD 246,017 132,980 0.00Leidos, Inc. 3.625% 15/05/2025 USD 5,000,000 5,457,300 0.13Leidos, Inc. 2.3% 15/02/2031 USD 1,190,000 1,164,058 0.03Lendmark Funding Trust, Series2018-2A ‘B’, 144A 4.48% 20/04/2027 USD 6,000,000 6,069,904 0.14Liberty Mutual Group, Inc., 144A4.569% 01/02/2029 USD 258,000 302,154 0.01Liberty Mutual Group, Inc., 144A3.951% 15/10/2050 USD 1,120,000 1,244,392 0.03Liberty Mutual Insurance Co., 144A8.5% 15/05/2025 USD 400,000 492,993 0.01Massachusetts Electric Co., 144A4.004% 15/08/2046 USD 483,000 542,817 0.01MassMutual Global Funding II, 144A2.75% 22/06/2024 USD 1,000,000 1,061,121 0.03
281
JPMorgan Funds - US Aggregate Bond FundSchedule of Investments (continued)
As at 30 June 2021
Investments Currency
Quantity/Nominal
Value
MarketValue
USD
%of
NetAssets Investments Currency
Quantity/Nominal
Value
MarketValue
USD
%of
NetAssets
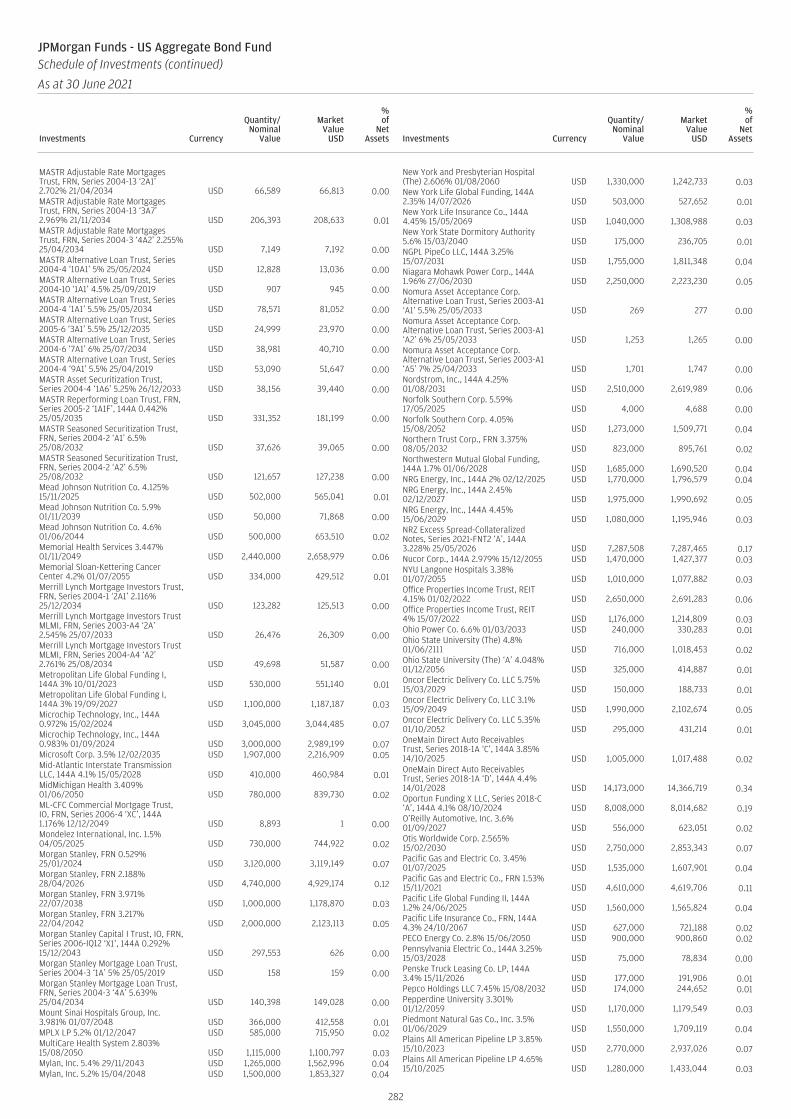
MASTR Adjustable Rate MortgagesTrust, FRN, Series 2004-13 ‘2A1’2.702% 21/04/2034 USD 66,589 66,813 0.00MASTR Adjustable Rate MortgagesTrust, FRN, Series 2004-13 ‘3A7’2.969% 21/11/2034 USD 206,393 208,633 0.01MASTR Adjustable Rate MortgagesTrust, FRN, Series 2004-3 ‘4A2’ 2.255%25/04/2034 USD 7,149 7,192 0.00MASTR Alternative Loan Trust, Series2004-4 ‘10A1’ 5% 25/05/2024 USD 12,828 13,036 0.00MASTR Alternative Loan Trust, Series2004-10 ‘1A1’ 4.5% 25/09/2019 USD 907 945 0.00MASTR Alternative Loan Trust, Series2004-4 ‘1A1’ 5.5% 25/05/2034 USD 78,571 81,052 0.00MASTR Alternative Loan Trust, Series2005-6 ‘3A1’ 5.5% 25/12/2035 USD 24,999 23,970 0.00MASTR Alternative Loan Trust, Series2004-6 ‘7A1’ 6% 25/07/2034 USD 38,981 40,710 0.00MASTR Alternative Loan Trust, Series2004-4 ‘9A1’ 5.5% 25/04/2019 USD 53,090 51,647 0.00MASTR Asset Securitization Trust,Series 2004-4 ‘1A6’ 5.25% 26/12/2033 USD 38,156 39,440 0.00MASTR Reperforming Loan Trust, FRN,Series 2005-2 ‘1A1F’, 144A 0.442%25/05/2035 USD 331,352 181,199 0.00MASTR Seasoned Securitization Trust,FRN, Series 2004-2 ‘A1’ 6.5%25/08/2032 USD 37,626 39,065 0.00MASTR Seasoned Securitization Trust,FRN, Series 2004-2 ‘A2’ 6.5%25/08/2032 USD 121,657 127,238 0.00Mead Johnson Nutrition Co. 4.125%15/11/2025 USD 502,000 565,041 0.01Mead Johnson Nutrition Co. 5.9%01/11/2039 USD 50,000 71,868 0.00Mead Johnson Nutrition Co. 4.6%01/06/2044 USD 500,000 653,510 0.02Memorial Health Services 3.447%01/11/2049 USD 2,440,000 2,658,979 0.06Memorial Sloan-Kettering CancerCenter 4.2% 01/07/2055 USD 334,000 429,512 0.01Merrill Lynch Mortgage Investors Trust,FRN, Series 2004-1 ‘2A1’ 2.116%25/12/2034 USD 123,282 125,513 0.00Merrill Lynch Mortgage Investors TrustMLMI, FRN, Series 2003-A4 ‘2A’2.545% 25/07/2033 USD 26,476 26,309 0.00Merrill Lynch Mortgage Investors TrustMLMI, FRN, Series 2004-A4 ‘A2’2.761% 25/08/2034 USD 49,698 51,587 0.00Metropolitan Life Global Funding I,144A 3% 10/01/2023 USD 530,000 551,140 0.01Metropolitan Life Global Funding I,144A 3% 19/09/2027 USD 1,100,000 1,187,187 0.03Microchip Technology, Inc., 144A0.972% 15/02/2024 USD 3,045,000 3,044,485 0.07Microchip Technology, Inc., 144A0.983% 01/09/2024 USD 3,000,000 2,989,199 0.07Microsoft Corp. 3.5% 12/02/2035 USD 1,907,000 2,216,909 0.05Mid-Atlantic Interstate TransmissionLLC, 144A 4.1% 15/05/2028 USD 410,000 460,984 0.01MidMichigan Health 3.409%01/06/2050 USD 780,000 839,730 0.02ML-CFC Commercial Mortgage Trust,IO, FRN, Series 2006-4 ‘XC’, 144A1.176% 12/12/2049 USD 8,893 1 0.00Mondelez International, Inc. 1.5%04/05/2025 USD 730,000 744,922 0.02Morgan Stanley, FRN 0.529%25/01/2024 USD 3,120,000 3,119,149 0.07Morgan Stanley, FRN 2.188%28/04/2026 USD 4,740,000 4,929,174 0.12Morgan Stanley, FRN 3.971%22/07/2038 USD 1,000,000 1,178,870 0.03Morgan Stanley, FRN 3.217%22/04/2042 USD 2,000,000 2,123,113 0.05Morgan Stanley Capital I Trust, IO, FRN,Series 2006-IQ12 ‘X1’, 144A 0.292%15/12/2043 USD 297,553 626 0.00Morgan Stanley Mortgage Loan Trust,Series 2004-3 ‘1A’ 5% 25/05/2019 USD 158 159 0.00Morgan Stanley Mortgage Loan Trust,FRN, Series 2004-3 ‘4A’ 5.639%25/04/2034 USD 140,398 149,028 0.00Mount Sinai Hospitals Group, Inc.3.981% 01/07/2048 USD 366,000 412,558 0.01MPLX LP 5.2% 01/12/2047 USD 585,000 715,950 0.02MultiCare Health System 2.803%15/08/2050 USD 1,115,000 1,100,797 0.03Mylan, Inc. 5.4% 29/11/2043 USD 1,265,000 1,562,996 0.04Mylan, Inc. 5.2% 15/04/2048 USD 1,500,000 1,853,327 0.04
New York and Presbyterian Hospital(The) 2.606% 01/08/2060 USD 1,330,000 1,242,733 0.03New York Life Global Funding, 144A2.35% 14/07/2026 USD 503,000 527,652 0.01New York Life Insurance Co., 144A4.45% 15/05/2069 USD 1,040,000 1,308,988 0.03New York State Dormitory Authority5.6% 15/03/2040 USD 175,000 236,705 0.01NGPL PipeCo LLC, 144A 3.25%15/07/2031 USD 1,755,000 1,811,348 0.04Niagara Mohawk Power Corp., 144A1.96% 27/06/2030 USD 2,250,000 2,223,230 0.05Nomura Asset Acceptance Corp.Alternative Loan Trust, Series 2003-A1‘A1’ 5.5% 25/05/2033 USD 269 277 0.00Nomura Asset Acceptance Corp.Alternative Loan Trust, Series 2003-A1‘A2’ 6% 25/05/2033 USD 1,253 1,265 0.00Nomura Asset Acceptance Corp.Alternative Loan Trust, Series 2003-A1‘A5’ 7% 25/04/2033 USD 1,701 1,747 0.00Nordstrom, Inc., 144A 4.25%01/08/2031 USD 2,510,000 2,619,989 0.06Norfolk Southern Corp. 5.59%17/05/2025 USD 4,000 4,688 0.00Norfolk Southern Corp. 4.05%15/08/2052 USD 1,273,000 1,509,771 0.04Northern Trust Corp., FRN 3.375%08/05/2032 USD 823,000 895,761 0.02Northwestern Mutual Global Funding,144A 1.7% 01/06/2028 USD 1,685,000 1,690,520 0.04NRG Energy, Inc., 144A 2% 02/12/2025 USD 1,770,000 1,796,579 0.04NRG Energy, Inc., 144A 2.45%02/12/2027 USD 1,975,000 1,990,692 0.05NRG Energy, Inc., 144A 4.45%15/06/2029 USD 1,080,000 1,195,946 0.03NRZ Excess Spread-CollateralizedNotes, Series 2021-FNT2 ‘A’, 144A3.228% 25/05/2026 USD 7,287,508 7,287,465 0.17Nucor Corp., 144A 2.979% 15/12/2055 USD 1,470,000 1,427,377 0.03NYU Langone Hospitals 3.38%01/07/2055 USD 1,010,000 1,077,882 0.03Office Properties Income Trust, REIT4.15% 01/02/2022 USD 2,650,000 2,691,283 0.06Office Properties Income Trust, REIT4% 15/07/2022 USD 1,176,000 1,214,809 0.03Ohio Power Co. 6.6% 01/03/2033 USD 240,000 330,283 0.01Ohio State University (The) 4.8%01/06/2111 USD 716,000 1,018,453 0.02Ohio State University (The) ‘A’ 4.048%01/12/2056 USD 325,000 414,887 0.01Oncor Electric Delivery Co. LLC 5.75%15/03/2029 USD 150,000 188,733 0.01Oncor Electric Delivery Co. LLC 3.1%15/09/2049 USD 1,990,000 2,102,674 0.05Oncor Electric Delivery Co. LLC 5.35%01/10/2052 USD 295,000 431,214 0.01OneMain Direct Auto ReceivablesTrust, Series 2018-1A ‘C’, 144A 3.85%14/10/2025 USD 1,005,000 1,017,488 0.02OneMain Direct Auto ReceivablesTrust, Series 2018-1A ‘D’, 144A 4.4%14/01/2028 USD 14,173,000 14,366,719 0.34Oportun Funding X LLC, Series 2018-C‘A’, 144A 4.1% 08/10/2024 USD 8,008,000 8,014,682 0.19O’Reilly Automotive, Inc. 3.6%01/09/2027 USD 556,000 623,051 0.02Otis Worldwide Corp. 2.565%15/02/2030 USD 2,750,000 2,853,343 0.07Pacific Gas and Electric Co. 3.45%01/07/2025 USD 1,535,000 1,607,901 0.04Pacific Gas and Electric Co., FRN 1.53%15/11/2021 USD 4,610,000 4,619,706 0.11Pacific Life Global Funding II, 144A1.2% 24/06/2025 USD 1,560,000 1,565,824 0.04Pacific Life Insurance Co., FRN, 144A4.3% 24/10/2067 USD 627,000 721,188 0.02PECO Energy Co. 2.8% 15/06/2050 USD 900,000 900,860 0.02Pennsylvania Electric Co., 144A 3.25%15/03/2028 USD 75,000 78,834 0.00Penske Truck Leasing Co. LP, 144A3.4% 15/11/2026 USD 177,000 191,906 0.01Pepco Holdings LLC 7.45% 15/08/2032 USD 174,000 244,652 0.01Pepperdine University 3.301%01/12/2059 USD 1,170,000 1,179,549 0.03Piedmont Natural Gas Co., Inc. 3.5%01/06/2029 USD 1,550,000 1,709,119 0.04Plains All American Pipeline LP 3.85%15/10/2023 USD 2,770,000 2,937,026 0.07Plains All American Pipeline LP 4.65%15/10/2025 USD 1,280,000 1,433,044 0.03
282
JPMorgan Funds - US Aggregate Bond FundSchedule of Investments (continued)
As at 30 June 2021
Investments Currency
Quantity/Nominal
Value
MarketValue
USD
%of
NetAssets Investments Currency
Quantity/Nominal
Value
MarketValue
USD
%of
NetAssets

Plains All American Pipeline LP 5.15%01/06/2042 USD 1,455,000 1,636,249 0.04Plains All American Pipeline LP 4.7%15/06/2044 USD 1,110,000 1,181,395 0.03Port Authority of New York & NewJersey 5.647% 01/11/2040 USD 285,000 402,166 0.01Port Authority of New York & NewJersey 5.647% 01/11/2040 USD 650,000 917,300 0.02Port Authority of New York & NewJersey 4.458% 01/10/2062 USD 1,330,000 1,770,796 0.04Potomac Electric Power Co. 6.5%15/11/2037 USD 200,000 295,163 0.01Prestige Auto Receivables Trust, Series2016-2A ‘D’, 144A 3.91% 15/11/2022 USD 1,542,942 1,545,169 0.04Principal Life Global Funding II, 144A2.375% 21/11/2021 USD 950,000 958,042 0.02Progress Residential Trust, Series2018-SFR3 ‘D’, 144A 4.427%17/10/2035 USD 8,372,000 8,443,291 0.20Progress Residential Trust, Series2018-SFR3 ‘E’, 144A 4.873%17/10/2035 USD 4,458,000 4,518,855 0.11Progressive Corp. (The), FRN 5.375%Perpetual USD 690,000 724,500 0.02Providence St Joseph Health ObligatedGroup 2.746% 01/10/2026 USD 280,000 300,013 0.01Prudential Insurance Co. of America(The), 144A 8.3% 01/07/2025 USD 1,350,000 1,698,204 0.04Public Service Co. of Colorado 6.5%01/08/2038 USD 135,000 203,262 0.01Public Service Co. of Oklahoma 6.625%15/11/2037 USD 300,000 429,136 0.01RALI Trust, Series 2003-QS14 ‘A1’ 5%25/07/2018 USD 571 516 0.00RAMP Trust, Series 2004-SL2 ‘A3’ 7%25/10/2031 USD 133,305 140,739 0.00Raytheon Technologies Corp. 3.2%15/03/2024 USD 420,000 446,629 0.01Raytheon Technologies Corp. 4.35%15/04/2047 USD 166,000 205,042 0.01Regeneron Pharmaceuticals, Inc. 1.75%15/09/2030 USD 3,100,000 2,949,999 0.07Regents of the University of CaliforniaMedical Center Pooled 3.706%15/05/2120 USD 2,540,000 2,752,553 0.06Reliance Standard Life Global FundingII, 144A 3.85% 19/09/2023 USD 300,000 321,071 0.01RFMSI Trust, FRN, Series 2005-SA4‘1A1’ 2.923% 25/09/2035 USD 13,119 11,834 0.00Sabine Pass Liquefaction LLC 5.625%01/03/2025 USD 2,000,000 2,287,749 0.05Santander Drive Auto ReceivablesTrust, Series 2017-3 ‘E’ 4.97%15/01/2025 USD 12,000,000 12,274,877 0.29SCE Recovery Funding LLC 2.51%15/11/2043 USD 1,140,000 1,090,276 0.03Schlumberger Holdings Corp., 144A3.75% 01/05/2024 USD 640,000 689,231 0.02Schlumberger Holdings Corp., 144A3.9% 17/05/2028 USD 455,000 507,942 0.01Seasoned Credit Risk Transfer Trust,Series 2018-4 ‘MA’ 3.5% 25/03/2058 USD 3,670,923 3,861,318 0.09Seasoned Credit Risk Transfer Trust,Series 2018-4 ‘MZ’ 3.5% 25/03/2058 USD 7,354,446 8,511,130 0.20Seasoned Loans StructuredTransaction, Series 2018-1 ‘A1’ 3.5%25/06/2028 USD 3,467,415 3,632,866 0.09Securitized Asset-Backed ReceivablesLLC Trust, STEP, Series 2006-CB1 ‘AF2’3.06% 25/01/2036 USD 31,105 31,336 0.00Sequoia Mortgage Trust, FRN, Series10 ‘1A’ 0.899% 20/10/2027 USD 81,166 82,141 0.00Sequoia Mortgage Trust, FRN, Series2003-1 ‘1A’ 0.859% 20/04/2033 USD 76,079 77,195 0.00Sequoia Mortgage Trust, FRN, Series2004-12 ‘A3’ 0.58% 20/01/2035 USD 57,014 55,427 0.00Sierra Timeshare Receivables FundingLLC, Series 2018-3A ‘A’, 144A 3.69%20/09/2035 USD 997,584 1,042,740 0.03Smithfield Foods, Inc., 144A 5.2%01/04/2029 USD 1,600,000 1,864,113 0.04SoFi Professional Loan Program LLC,Series 2016-C ‘A2B’, 144A 2.36%27/12/2032 USD 82,859 83,662 0.00Southern Natural Gas Co. LLC, 144A4.8% 15/03/2047 USD 407,000 503,855 0.01Southwestern Electric Power Co. 2.75%01/10/2026 USD 500,000 531,237 0.01Southwestern Public Service Co. 4.5%15/08/2041 USD 250,000 309,763 0.01
Spirit Airlines Pass Through Trust,Series 2017-1AA ‘AA’ 3.375%15/08/2031 USD 641,899 656,342 0.02Spruce ABS Trust, Series 2016-E1 ‘B’,144A 6.9% 15/06/2028 USD 952,937 999,173 0.02Starbucks Corp. 2.55% 15/11/2030 USD 1,640,000 1,701,628 0.04State of Texas 5% 01/04/2025 USD 536,000 555,571 0.01Steel Dynamics, Inc. 1.65% 15/10/2027 USD 1,519,000 1,517,683 0.04Steel Dynamics, Inc. 3.45%15/04/2030 USD 1,424,000 1,552,916 0.04Structured Asset MortgageInvestments II Trust, FRN, Series2004-AR5 ‘1A1’ 0.758% 19/10/2034 USD 145,879 143,614 0.00Structured Asset MortgageInvestments II Trust, FRN, Series2005-AR5 ‘A3’ 0.597% 19/07/2035 USD 206,689 209,747 0.01Structured Asset Securities Corp.Mortgage Pass-Through CertificatesTrust, FRN, Series 2003-34A ‘3A3’2.764% 25/11/2033 USD 106,713 108,642 0.00Structured Asset Securities Corp.Mortgage Pass-Through CertificatesTrust, STEP, Series 2004-6XS ‘A5B’6.05% 25/03/2034 USD 84,256 85,224 0.00Structured Asset Securities Corp.Pass-Through Certificates Trust, Series2002-AL1 ‘A3’ 3.45% 25/02/2032 USD 49,039 46,839 0.00Synchrony Card Issuance Trust, Series2018-A1 ‘A’ 3.38% 15/09/2024 USD 5,000,000 5,033,224 0.12Teachers Insurance & AnnuityAssociation of America, 144A 4.9%15/09/2044 USD 400,000 521,225 0.01Teachers Insurance & AnnuityAssociation of America, 144A 4.27%15/05/2047 USD 800,000 959,881 0.02Tennessee Gas Pipeline Co. LLC, 144A2.9% 01/03/2030 USD 1,535,000 1,594,331 0.04Tesla Auto Lease Trust, Series 2018-B‘A’, 144A 3.71% 20/08/2021 USD 32,651 32,717 0.00Texas Eastern Transmission LP, 144A2.8% 15/10/2022 USD 554,000 565,637 0.01Texas Eastern Transmission LP, 144A3.5% 15/01/2028 USD 90,000 98,004 0.00Texas Health Resources 2.328%15/11/2050 USD 1,260,000 1,138,755 0.03Texas Health Resources 4.33%15/11/2055 USD 700,000 917,410 0.02Time Warner Cable LLC 6.55%01/05/2037 USD 400,000 543,942 0.01Time Warner Cable LLC 6.75%15/06/2039 USD 1,560,000 2,190,956 0.05Tri-State Generation and TransmissionAssociation, Inc. 4.25% 01/06/2046 USD 202,000 217,993 0.01UMBS 254305 6.5% 01/05/2022 USD 2,443 2,738 0.00UMBS 255052 4% 01/11/2023 USD 8,120 8,649 0.00UMBS 255843 5.5% 01/09/2035 USD 50,457 58,557 0.00UMBS 256648 7.5% 01/01/2022 USD 2,631 2,639 0.00UMBS 257055 6.5% 01/12/2027 USD 26,991 30,431 0.00UMBS 257510 7% 01/12/2038 USD 71,095 85,704 0.00UMBS 357639 5.5% 01/11/2034 USD 2,165 2,510 0.00UMBS 555791 6.5% 01/12/2022 USD 323 362 0.00UMBS 598559 6.5% 01/08/2031 USD 4,099 4,839 0.00UMBS 602589 7% 01/09/2031 USD 16,927 19,210 0.00UMBS 622534 3% 01/09/2031 USD 113,243 118,365 0.00UMBS 622542 5.5% 01/09/2031 USD 145,029 165,500 0.00UMBS 674349 6% 01/03/2033 USD 1,682 1,894 0.00UMBS 689977 8% 01/03/2027 USD 8,502 9,316 0.00UMBS 695533 8% 01/06/2027 USD 4,531 4,991 0.00UMBS 725704 6% 01/08/2034 USD 3,419 3,942 0.00UMBS 745148 5% 01/01/2036 USD 41,540 47,744 0.00UMBS 745418 5.5% 01/04/2036 USD 54,273 62,982 0.00UMBS 755973 8% 01/11/2028 USD 17,358 19,785 0.00UMBS 755994 8% 01/10/2028 USD 4,613 5,038 0.00UMBS 775902 8.5% 01/04/2030 USD 33,827 37,539 0.00UMBS 788150 6% 01/03/2032 USD 22,175 24,967 0.00UMBS 870770 6.5% 01/07/2036 USD 24,207 27,953 0.00UMBS 888892 7.5% 01/11/2037 USD 85,855 100,866 0.00UMBS 889519 5.5% 01/12/2035 USD 63,342 73,510 0.00UMBS 889573 6.5% 01/03/2023 USD 22,602 23,205 0.00UMBS 889757 5% 01/02/2038 USD 47,324 55,063 0.00UMBS 924857 8.5% 01/09/2037 USD 16,284 16,497 0.00UMBS 929560 7% 01/06/2038 USD 60,521 73,380 0.00UMBS 945870 6.5% 01/08/2037 USD 34,358 40,756 0.00UMBS 946338 7% 01/09/2037 USD 58,908 68,631 0.00UMBS 960150 6% 01/11/2037 USD 53,350 61,955 0.00UMBS 976871 6.5% 01/08/2036 USD 172,131 197,913 0.01UMBS 995149 6.5% 01/10/2038 USD 93,231 108,638 0.00UMBS 995456 6.5% 01/02/2024 USD 38,239 39,548 0.00UMBS 995505 8% 01/01/2038 USD 51,776 60,898 0.00
283
JPMorgan Funds - US Aggregate Bond FundSchedule of Investments (continued)
As at 30 June 2021
Investments Currency
Quantity/Nominal
Value
MarketValue
USD
%of
NetAssets Investments Currency
Quantity/Nominal
Value
MarketValue
USD
%of
NetAssets

UMBS AA0922 6% 01/09/2036 USD 106,373 124,892 0.00UMBS AA1019 6% 01/11/2036 USD 86,320 102,601 0.00UMBS AB9551 3% 01/06/2043 USD 2,042,508 2,183,186 0.05UMBS AC3407 5.5% 01/10/2039 USD 65,889 73,973 0.00UMBS AD0133 5% 01/08/2024 USD 29,310 30,574 0.00UMBS AD0364 5% 01/05/2023 USD 7,667 7,987 0.00UMBS AD0753 7% 01/01/2039 USD 73,947 89,891 0.00UMBS AD0755 7% 01/06/2035 USD 3,985,028 4,708,165 0.11UMBS BH4683 4% 01/06/2047 USD 2,292,045 2,514,321 0.06UMBS BH4684 4% 01/06/2047 USD 2,807,769 3,071,821 0.07UMBS BH4685 4% 01/06/2047 USD 2,860,663 3,129,517 0.07UMBS BH7663 4% 01/10/2047 USD 5,179,541 5,622,333 0.13UMBS BK0319 4.5% 01/03/2049 USD 1,286,770 1,402,799 0.03UMBS BK8753 4.5% 01/06/2049 USD 3,975,360 4,337,363 0.10UMBS BK9929 4.5% 01/09/2048 USD 9,352,841 10,242,234 0.24UMBS BM1213 4% 01/04/2047 USD 5,210,352 5,648,071 0.13UMBS BM3254 4% 01/01/2038 USD 3,370,535 3,723,552 0.09UMBS BM3566 4% 01/02/2038 USD 4,194,071 4,611,061 0.11UMBS BM5430 5% 01/01/2049 USD 4,919,401 5,527,774 0.13UMBS BN5899 5% 01/02/2049 USD 1,555,644 1,712,958 0.04UMBS BN9169 4.5% 01/04/2049 USD 1,496,311 1,633,397 0.04UMBS BO2504 5% 01/08/2049 USD 1,143,536 1,289,814 0.03UMBS BO3950 5% 01/08/2049 USD 1,193,125 1,340,206 0.03UMBS BO3951 5% 01/08/2049 USD 602,532 680,677 0.02UMBS BO4194 5% 01/09/2049 USD 683,775 773,789 0.02UMBS BO4199 5% 01/08/2049 USD 1,141,193 1,294,062 0.03UMBS BO4200 5% 01/08/2049 USD 2,890,559 3,260,938 0.08UMBS BO4201 5% 01/08/2049 USD 3,047,322 3,424,582 0.08UMBS BO4202 5% 01/08/2049 USD 2,470,057 2,786,690 0.07UMBS BO4203 5% 01/08/2049 USD 2,619,558 2,962,124 0.07UMBS BO5594 4% 01/09/2049 USD 3,121,809 3,349,845 0.08UMBS BO5625 3.5% 01/08/2049 USD 8,609,393 9,239,534 0.22UMBS BO6078 3.5% 01/10/2049 USD 4,065,969 4,285,454 0.10UMBS BO6817 3.5% 01/10/2049 USD 4,347,803 4,580,426 0.11UMBS BQ1623 3% 01/08/2050 USD 4,378,094 4,628,013 0.11UMBS CA1234 4% 01/02/2038 USD 1,351,076 1,488,482 0.04UMBS CA1238 4% 01/02/2038 USD 1,372,428 1,520,986 0.04UMBS CA5729 3% 01/05/2050 USD 10,848,406 11,338,820 0.27UMBS FM1219 4% 01/07/2049 USD 1,785,416 1,905,799 0.05UMBS FM1758 3.5% 01/09/2049 USD 3,591,972 3,798,049 0.09UMBS MA0406 4.5% 01/05/2030 USD 123,430 134,317 0.00UMBS MA0948 5% 01/11/2031 USD 163,963 183,443 0.00UMBS QA9332 2.5% 01/05/2050 USD 5,252,289 5,434,733 0.13UMBS QB1061 3.5% 01/06/2050 USD 897,302 970,682 0.02UMBS RA2008 4% 01/01/2050 USD 5,669,892 6,137,688 0.14United Airlines Pass-Through Trust,Series 2013-1 ‘A’ 4.3% 15/02/2027 USD 1,014,790 1,070,603 0.03United Airlines Pass-Through Trust,Series 2014-1 ‘A’ 4% 11/10/2027 USD 651,467 688,926 0.02United Airlines Pass-Through Trust,Series 2014-2 ‘A’ 3.75% 03/03/2028 USD 483,315 509,897 0.01United Airlines Pass-Through Trust,Series 2016-2 ‘A’ 3.1% 07/04/2030 USD 2,355,301 2,361,190 0.06United Airlines Pass-Through Trust,Series 2018-1 ‘A’ 3.7% 01/09/2031 USD 3,153,957 3,256,461 0.08United Airlines Pass-Through Trust,Series 2019-1 ‘A’ 4.55% 25/02/2033 USD 1,264,980 1,385,153 0.03United Airlines Pass-Through Trust,Series 2016-2 ‘AA’ 2.875% 07/04/2030 USD 1,092,077 1,122,110 0.03United Airlines Pass-Through Trust,Series 2018-1 ‘AA’ 3.5% 01/09/2031 USD 1,641,471 1,731,752 0.04United Airlines Pass-Through Trust,Series 2019-1 ‘AA’ 4.15% 25/02/2033 USD 1,415,537 1,557,091 0.04United Airlines Pass-Through Trust,Series 2019-2 ‘AA’ 2.7% 01/11/2033 USD 2,243,220 2,255,557 0.05United Airlines Pass-Through Trust,Series 2016-1 ‘B’ 3.65% 07/07/2027 USD 1,490,569 1,486,843 0.04United Airlines Pass-Through Trust,Series 2018-1 ‘B’ 4.6% 01/09/2027 USD 312,647 322,026 0.01Universal Health Services, Inc., 144A2.65% 15/10/2030 USD 1,770,000 1,782,001 0.04University of Southern California3.226% 01/10/2120 USD 1,090,000 1,085,676 0.03US Auto Funding LLC, Series 2018-1A‘A’, 144A 5.5% 15/07/2023 USD 392,329 396,271 0.01US Treasury STRIP Coupon 0%15/02/2022 USD 4,420,000 4,418,661 0.10US Treasury STRIP Coupon 0%15/05/2022 USD 12,905,000 12,897,941 0.30US Treasury STRIP Coupon 0%15/08/2022 USD 3,460,000 3,456,024 0.08US Treasury STRIP Coupon 0%15/11/2022 USD 16,400,000 16,362,316 0.38US Treasury STRIP Coupon 0%15/02/2023 USD 15,076,000 15,027,437 0.35US Treasury STRIP Coupon 0%15/08/2023 USD 11,765,000 11,697,759 0.27
US Treasury STRIP Coupon 0%15/02/2024 USD 7,713,000 7,637,472 0.18US Treasury STRIP Coupon 0%15/05/2024 USD 4,150,000 4,098,269 0.10US Treasury STRIP Coupon 0%15/05/2026 USD 1,000,000 955,636 0.02US Treasury STRIP Coupon 0%15/08/2026 USD 100,000 95,009 0.00US Treasury STRIP Coupon 0%15/08/2033 USD 1,600,000 1,288,747 0.03US Treasury STRIP Coupon 0%15/11/2033 USD 3,920,000 3,139,295 0.07US Treasury STRIP Coupon 0%15/11/2034 USD 3,600,000 2,812,045 0.07US Treasury STRIP Coupon 0%15/02/2035 USD 1,515,000 1,176,777 0.03US Treasury STRIP Coupon 0%15/05/2035 USD 2,600,000 2,007,033 0.05US Treasury STRIP Coupon 0%15/11/2043 USD 10,000,000 6,123,747 0.14Utah Acquisition Sub, Inc. 3.95%15/06/2026 USD 1,215,000 1,339,905 0.03Vendee Mortgage Trust, Series 1998-2‘1G’ 6.75% 15/06/2028 USD 143,065 163,655 0.00Vendee Mortgage Trust, Series 1998-1‘2E’ 7% 15/03/2028 USD 18,512 20,537 0.00Verizon Communications, Inc. 1.68%30/10/2030 USD 585,000 560,440 0.01Verizon Owner Trust, Series 2018-A‘A1A’ 3.23% 20/04/2023 USD 1,387,920 1,398,423 0.03Veros Automobile Receivables Trust,Series 2018-1 ‘C’, 144A 4.65%15/02/2024 USD 1,623,698 1,630,926 0.04ViacomCBS, Inc. 3.7% 15/08/2024 USD 176,000 190,302 0.01ViacomCBS, Inc. 4% 15/01/2026 USD 750,000 834,557 0.02ViacomCBS, Inc. 2.9% 15/01/2027 USD 198,000 210,557 0.01ViacomCBS, Inc. 4.85% 01/07/2042 USD 150,000 184,582 0.00ViacomCBS, Inc. 5.85% 01/09/2043 USD 945,000 1,299,892 0.03Viatris, Inc., 144A 3.85% 22/06/2040 USD 1,326,000 1,414,944 0.03VNDO Trust, Series 2016-350P ‘A’,144A 3.805% 10/01/2035 USD 5,294,000 5,845,024 0.14Volkswagen Group of America FinanceLLC, 144A 1.625% 24/11/2027 USD 1,760,000 1,743,399 0.04Walt Disney Co. (The) 8.875%26/04/2023 USD 300,000 345,122 0.01Walt Disney Co. (The) 9.5% 15/07/2024 USD 480,000 606,508 0.01Walt Disney Co. (The) 7.7% 30/10/2025 USD 170,000 215,518 0.01Walt Disney Co. (The) 7.625%30/11/2028 USD 200,000 277,357 0.01Walt Disney Co. (The) 6.4% 15/12/2035 USD 382,000 561,171 0.01WaMu Mortgage-Backed Pass-ThroughCertificates Trust, Series 2003-S3 ‘1A4’5.5% 25/06/2033 USD 74,683 76,473 0.00WaMu Mortgage-Backed Pass-ThroughCertificates Trust, Series 2004-S3 ‘1A5’5% 25/07/2034 USD 26,042 26,300 0.00WaMu Mortgage-Backed Pass-ThroughCertificates Trust, FRN, Series2003-AR9 ‘1A6’ 2.745% 25/09/2033 USD 112,229 114,322 0.00WaMu Mortgage-Backed Pass-ThroughCertificates Trust, Series 2004-S2 ‘2A4’5.5% 25/06/2034 USD 80,547 82,924 0.00WaMu Mortgage-Backed Pass-ThroughCertificates Trust, Series 2004-S3 ‘3A2’6% 25/07/2034 USD 157,149 160,075 0.00WaMu Mortgage-Backed Pass-ThroughCertificates Trust, FRN, Series2003-AR8 ‘A’ 2.914% 25/08/2033 USD 9,040 9,348 0.00WaMu Mortgage-Backed Pass-ThroughCertificates Trust, Series 2004-RS2‘A4’ 5% 25/11/2033 USD 116,156 119,503 0.00WaMu Mortgage-Backed Pass-ThroughCertificates Trust, Series 2003-S1 ‘A5’5.5% 25/04/2033 USD 68,695 70,676 0.00WaMu Mortgage-Backed Pass-ThroughCertificates Trust, FRN, Series2003-AR11 ‘A6’ 2.815% 25/10/2033 USD 167,764 169,853 0.00WaMu Mortgage-Backed Pass-ThroughCertificates Trust, FRN, Series2003-AR5 ‘A7’ 2.579% 25/06/2033 USD 101,474 103,489 0.00WaMu Mortgage-Backed Pass-ThroughCertificates Trust, FRN, Series2003-AR7 ‘A7’ 2.687% 25/08/2033 USD 15,062 15,429 0.00Washington Mutual Mortgage-BackedPass-Through Certificates WMALTTrust, Series 2005-4 ‘CB7’ 5.5%25/06/2035 USD 99,380 100,190 0.00Washington Mutual Mortgage-BackedPass-Through Certificates WMALTTrust, IO, Series 2005-3 ‘CX’ 5.5%25/05/2035 USD 359,542 63,074 0.00
284
JPMorgan Funds - US Aggregate Bond FundSchedule of Investments (continued)
As at 30 June 2021
Investments Currency
Quantity/Nominal
Value
MarketValue
USD
%of
NetAssets Investments Currency
Quantity/Nominal
Value
MarketValue
USD
%of
NetAssets

Wells Fargo & Co., FRN 3.196%17/06/2027 USD 7,064,000 7,630,556 0.18Wells Fargo & Co., FRN 3.068%30/04/2041 USD 4,290,000 4,407,255 0.10Wells Fargo & Co., FRN 3.9%31/12/2164 USD 2,190,000 2,265,281 0.05Westgate Resorts LLC, Series 2017-1A‘A’, 144A 3.05% 20/12/2030 USD 356,529 356,349 0.01World Financial Network Credit CardMaster Trust, Series 2018-C ‘A’ 3.55%15/08/2025 USD 2,600,000 2,625,391 0.06WRKCo, Inc. 3.75% 15/03/2025 USD 800,000 874,806 0.02Xilinx, Inc. 2.375% 01/06/2030 USD 1,700,000 1,730,316 0.04Yale-New Haven Health Services Corp.2.496% 01/07/2050 USD 1,710,000 1,574,781 0.04
2,237,097,737 52.21
Total Bonds 2,505,474,670 58.48
Commercial Papers
United States of AmericaResolution Funding Corp. 0%15/01/2030 USD 4,000,000 3,480,130 0.08Resolution Funding Corp. 0%15/04/2030 USD 200,000 172,875 0.00Tennessee Valley Authority 0%01/11/2025 USD 1,150,000 1,106,096 0.03Tennessee Valley Authority 0%15/03/2032 USD 800,000 663,719 0.02Tennessee Valley Authority 0%15/06/2035 USD 2,000,000 1,471,624 0.03
6,894,444 0.16
Total Commercial Papers 6,894,444 0.16
Total Transferable securities and money market instrumentsdealt in on another regulated market 2,512,369,114 58.64
Other transferable securities and money market instruments
Bonds
United States of AmericaCamillo 1-A-1 Issuer LLC, Series2018-SFR1 ‘A’ 5.25% 05/06/2028* USD 4,311,978 4,435,947 0.10Camillo LLC, Series 2016-SFR 1 5%05/12/2023* USD 4,262,151 4,374,033 0.10LV Tower 52 Issuer, Series 2013-1 ‘A’,144A 5.75% 15/02/2023* USD 1,753,328 1,768,389 0.04LV Tower 52 Issuer, Series 2013-1 ‘M’,144A 7.75% 15/02/2023* USD 387,470 390,799 0.01
10,969,168 0.25
Total Bonds 10,969,168 0.25
Total Other transferable securities and money marketinstruments 10,969,168 0.25
Units of authorised UCITS or other collective investment undertakings
Collective Investment Schemes - UCITS
LuxembourgJPMorgan USD Liquidity LVNAV Fund -JPM USD Liquidity LVNAV X (dist.)† USD 130,078,781 130,078,780 3.04
130,078,780 3.04
Total Collective Investment Schemes - UCITS 130,078,780 3.04
Total Units of authorised UCITS or other collective investmentundertakings 130,078,780 3.04
Total Investments 4,305,461,994 100.49
Cash (1,422,943) (0.03)
Other Assets/(Liabilities) (19,535,198) (0.46)
Total Net Assets 4,284,503,853 100.00
* Security is valued at its fair value under the direction of the Board of Directors.† Related Party Fund.
Geographic Allocation of Portfolio as at 30 June 2021 % of Net AssetsUnited States of America 86.20Luxembourg 3.20United Kingdom 2.04Japan 1.17Cayman Islands 1.06Canada 1.05France 1.05Ireland 0.94Australia 0.65Mexico 0.59Switzerland 0.49Netherlands 0.40Germany 0.22Italy 0.20New Zealand 0.17Spain 0.17Supranational 0.15Denmark 0.14Panama 0.08Colombia 0.07Saudi Arabia 0.06Jersey 0.06Israel 0.06Hong Kong 0.06Bermuda 0.05Virgin Islands, British 0.04Singapore 0.04Chile 0.03China 0.02Finland 0.02Sweden 0.01South Africa -Total Investments 100.49Cash and other assets/(liabilities) (0.49)
Total 100.00
285
JPMorgan Funds - US Aggregate Bond FundSchedule of Investments (continued)
As at 30 June 2021
Investments Currency
Quantity/Nominal
Value
MarketValue
USD
%of
NetAssets Investments Currency
Quantity/Nominal
Value
MarketValue
USD
%of
NetAssets
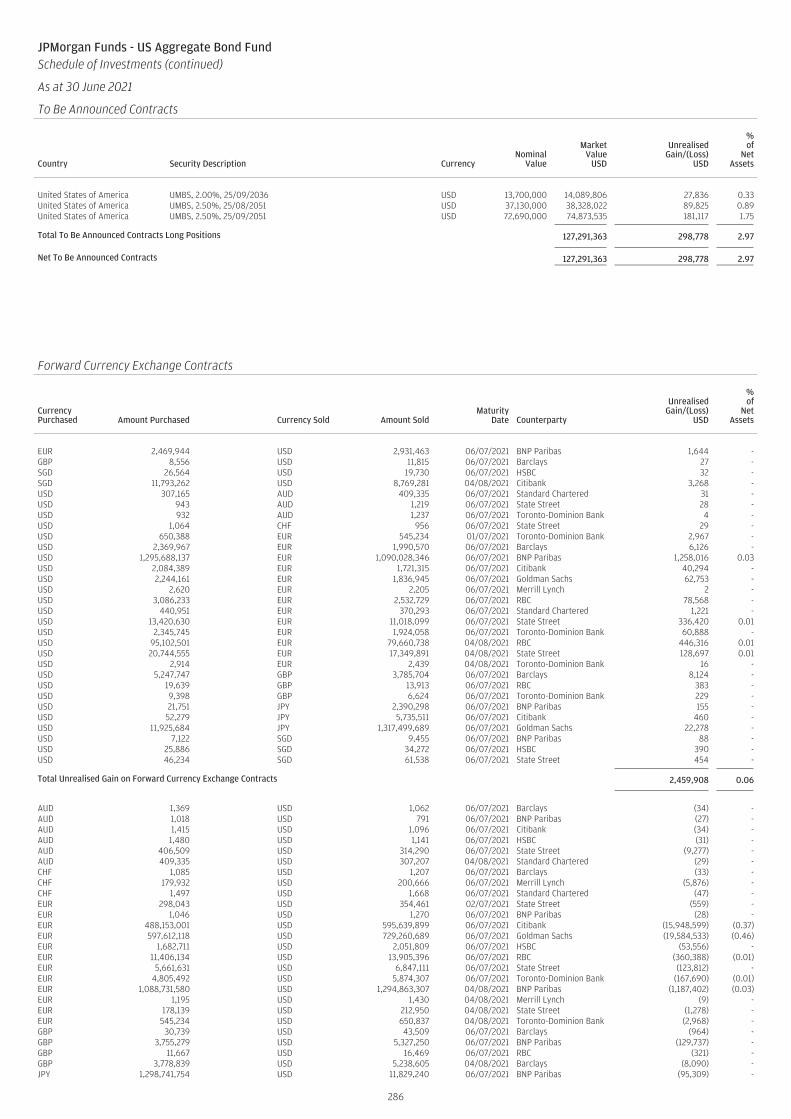
JPMorgan Funds - US Aggregate Bond FundSchedule of Investments (continued)
As at 30 June 2021
To Be Announced Contracts
Country Security Description CurrencyNominal
Value
MarketValue
USD
UnrealisedGain/(Loss)
USD
%of
NetAssets
United States of America UMBS, 2.00%, 25/09/2036 USD 13,700,000 14,089,806 27,836 0.33United States of America UMBS, 2.50%, 25/08/2051 USD 37,130,000 38,328,022 89,825 0.89United States of America UMBS, 2.50%, 25/09/2051 USD 72,690,000 74,873,535 181,117 1.75
Total To Be Announced Contracts Long Positions 127,291,363 298,778 2.97
Net To Be Announced Contracts 127,291,363 298,778 2.97
JPMorgan Funds - US Aggregate Bond FundSchedule of Investments (continued)
As at 30 June 2021
Forward Currency Exchange Contracts (continued)
CurrencyPurchased Amount Purchased Currency Sold Amount Sold
MaturityDate Counterparty
UnrealisedGain/(Loss)
USD
%of
NetAssets
EUR 2,469,944 USD 2,931,463 06/07/2021 BNP Paribas 1,644 -GBP 8,556 USD 11,815 06/07/2021 Barclays 27 -SGD 26,564 USD 19,730 06/07/2021 HSBC 32 -SGD 11,793,262 USD 8,769,281 04/08/2021 Citibank 3,268 -USD 307,165 AUD 409,335 06/07/2021 Standard Chartered 31 -USD 943 AUD 1,219 06/07/2021 State Street 28 -USD 932 AUD 1,237 06/07/2021 Toronto-Dominion Bank 4 -USD 1,064 CHF 956 06/07/2021 State Street 29 -USD 650,388 EUR 545,234 01/07/2021 Toronto-Dominion Bank 2,967 -USD 2,369,967 EUR 1,990,570 06/07/2021 Barclays 6,126 -USD 1,295,688,137 EUR 1,090,028,346 06/07/2021 BNP Paribas 1,258,016 0.03USD 2,084,389 EUR 1,721,315 06/07/2021 Citibank 40,294 -USD 2,244,161 EUR 1,836,945 06/07/2021 Goldman Sachs 62,753 -USD 2,620 EUR 2,205 06/07/2021 Merrill Lynch 2 -USD 3,086,233 EUR 2,532,729 06/07/2021 RBC 78,568 -USD 440,951 EUR 370,293 06/07/2021 Standard Chartered 1,221 -USD 13,420,630 EUR 11,018,099 06/07/2021 State Street 336,420 0.01USD 2,345,745 EUR 1,924,058 06/07/2021 Toronto-Dominion Bank 60,888 -USD 95,102,501 EUR 79,660,738 04/08/2021 RBC 446,316 0.01USD 20,744,555 EUR 17,349,891 04/08/2021 State Street 128,697 0.01USD 2,914 EUR 2,439 04/08/2021 Toronto-Dominion Bank 16 -USD 5,247,747 GBP 3,785,704 06/07/2021 Barclays 8,124 -USD 19,639 GBP 13,913 06/07/2021 RBC 383 -USD 9,398 GBP 6,624 06/07/2021 Toronto-Dominion Bank 229 -USD 21,751 JPY 2,390,298 06/07/2021 BNP Paribas 155 -USD 52,279 JPY 5,735,511 06/07/2021 Citibank 460 -USD 11,925,684 JPY 1,317,499,689 06/07/2021 Goldman Sachs 22,278 -USD 7,122 SGD 9,455 06/07/2021 BNP Paribas 88 -USD 25,886 SGD 34,272 06/07/2021 HSBC 390 -USD 46,234 SGD 61,538 06/07/2021 State Street 454 -
Total Unrealised Gain on Forward Currency Exchange Contracts 2,459,908 0.06
AUD 1,369 USD 1,062 06/07/2021 Barclays (34) -AUD 1,018 USD 791 06/07/2021 BNP Paribas (27) -AUD 1,415 USD 1,096 06/07/2021 Citibank (34) -AUD 1,480 USD 1,141 06/07/2021 HSBC (31) -AUD 406,509 USD 314,290 06/07/2021 State Street (9,277) -AUD 409,335 USD 307,207 04/08/2021 Standard Chartered (29) -CHF 1,085 USD 1,207 06/07/2021 Barclays (33) -CHF 179,932 USD 200,666 06/07/2021 Merrill Lynch (5,876) -CHF 1,497 USD 1,668 06/07/2021 Standard Chartered (47) -EUR 298,043 USD 354,461 02/07/2021 State Street (559) -EUR 1,046 USD 1,270 06/07/2021 BNP Paribas (28) -EUR 488,153,001 USD 595,639,899 06/07/2021 Citibank (15,948,599) (0.37)EUR 597,612,118 USD 729,260,689 06/07/2021 Goldman Sachs (19,584,533) (0.46)EUR 1,682,711 USD 2,051,809 06/07/2021 HSBC (53,556) -EUR 11,406,134 USD 13,905,396 06/07/2021 RBC (360,388) (0.01)EUR 5,661,631 USD 6,847,111 06/07/2021 State Street (123,812) -EUR 4,805,492 USD 5,874,307 06/07/2021 Toronto-Dominion Bank (167,690) (0.01)EUR 1,088,731,580 USD 1,294,863,307 04/08/2021 BNP Paribas (1,187,402) (0.03)EUR 1,195 USD 1,430 04/08/2021 Merrill Lynch (9) -EUR 178,139 USD 212,950 04/08/2021 State Street (1,278) -EUR 545,234 USD 650,837 04/08/2021 Toronto-Dominion Bank (2,968) -GBP 30,739 USD 43,509 06/07/2021 Barclays (964) -GBP 3,755,279 USD 5,327,250 06/07/2021 BNP Paribas (129,737) -GBP 11,667 USD 16,469 06/07/2021 RBC (321) -GBP 3,778,839 USD 5,238,605 04/08/2021 Barclays (8,090) -JPY 1,298,741,754 USD 11,829,240 06/07/2021 BNP Paribas (95,309) -
286

JPMorgan Funds - US Aggregate Bond FundSchedule of Investments (continued)
As at 30 June 2021
Forward Currency Exchange Contracts (continued)
CurrencyPurchased Amount Purchased Currency Sold Amount Sold
MaturityDate Counterparty
UnrealisedGain/(Loss)
USD
%of
NetAssets
JPY 9,200,000 USD 84,511 06/07/2021 HSBC (1,390) -JPY 2,826,295 USD 25,822 06/07/2021 State Street (287) -JPY 14,857,449 USD 136,060 06/07/2021 Toronto-Dominion Bank (1,825) -JPY 1,312,599,689 USD 11,883,817 04/08/2021 Goldman Sachs (21,712) -SGD 11,738,803 USD 8,872,321 06/07/2021 Citibank (139,575) (0.01)SGD 5,439 USD 4,109 06/07/2021 HSBC (63) -SGD 18,869 USD 14,246 06/07/2021 RBC (209) -SGD 78,983 USD 59,631 06/07/2021 State Street (874) -SGD 29,870 USD 22,565 06/07/2021 Toronto-Dominion Bank (344) -SGD 32,670 USD 24,308 04/08/2021 BNP Paribas (6) -SGD 16,830 USD 12,542 04/08/2021 HSBC (23) -USD 436,198 EUR 367,519 06/07/2021 State Street (238) -USD 8,769,871 SGD 11,793,262 06/07/2021 Citibank (3,387) -
Total Unrealised Loss on Forward Currency Exchange Contracts (37,850,564) (0.89)
Net Unrealised Loss on Forward Currency Exchange Contracts (35,390,656) (0.83)
287
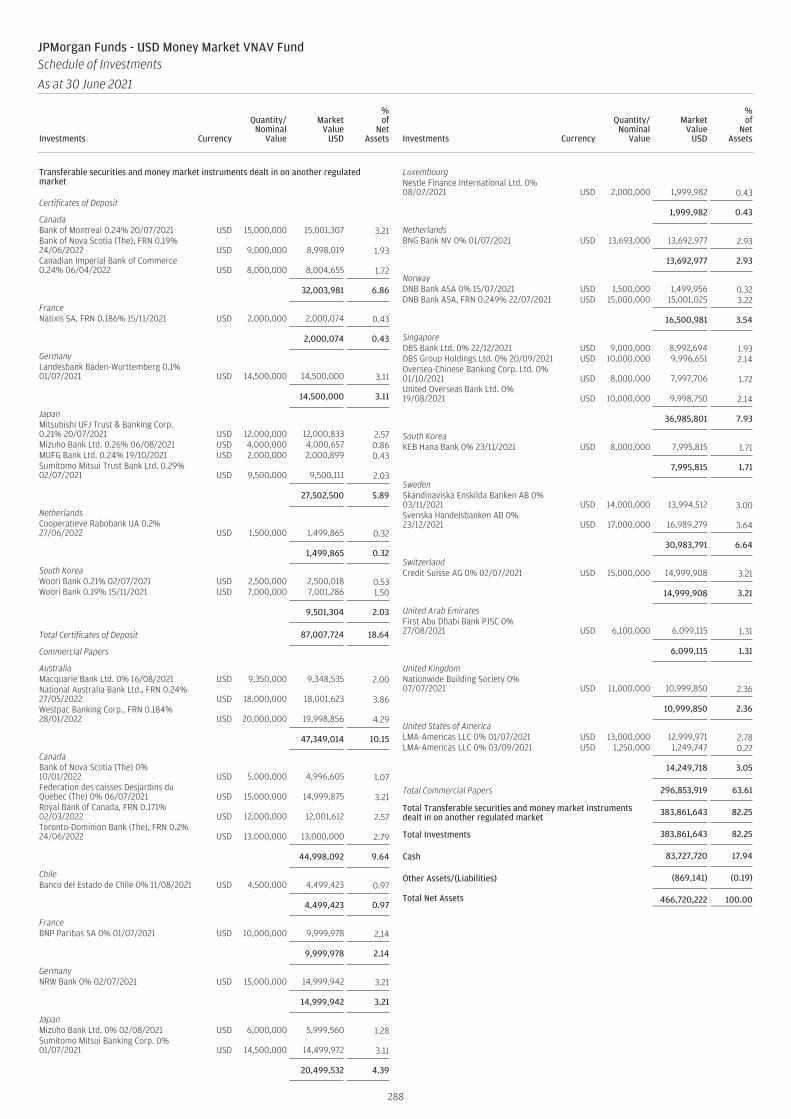
Transferable securities and money market instruments dealt in on another regulatedmarket
Certificates of Deposit
CanadaBank of Montreal 0.24% 20/07/2021 USD 15,000,000 15,001,307 3.21Bank of Nova Scotia (The), FRN 0.19%24/06/2022 USD 9,000,000 8,998,019 1.93Canadian Imperial Bank of Commerce0.24% 06/04/2022 USD 8,000,000 8,004,655 1.72
32,003,981 6.86
FranceNatixis SA, FRN 0.186% 15/11/2021 USD 2,000,000 2,000,074 0.43
2,000,074 0.43
GermanyLandesbank Baden-Wurttemberg 0.1%01/07/2021 USD 14,500,000 14,500,000 3.11
14,500,000 3.11
JapanMitsubishi UFJ Trust & Banking Corp.0.21% 20/07/2021 USD 12,000,000 12,000,833 2.57Mizuho Bank Ltd. 0.26% 06/08/2021 USD 4,000,000 4,000,657 0.86MUFG Bank Ltd. 0.24% 19/10/2021 USD 2,000,000 2,000,899 0.43Sumitomo Mitsui Trust Bank Ltd. 0.29%02/07/2021 USD 9,500,000 9,500,111 2.03
27,502,500 5.89
NetherlandsCooperatieve Rabobank UA 0.2%27/06/2022 USD 1,500,000 1,499,865 0.32
1,499,865 0.32
South KoreaWoori Bank 0.21% 02/07/2021 USD 2,500,000 2,500,018 0.53Woori Bank 0.19% 15/11/2021 USD 7,000,000 7,001,286 1.50
9,501,304 2.03
Total Certificates of Deposit 87,007,724 18.64
Commercial Papers
AustraliaMacquarie Bank Ltd. 0% 16/08/2021 USD 9,350,000 9,348,535 2.00National Australia Bank Ltd., FRN 0.24%27/05/2022 USD 18,000,000 18,001,623 3.86Westpac Banking Corp., FRN 0.184%28/01/2022 USD 20,000,000 19,998,856 4.29
47,349,014 10.15
CanadaBank of Nova Scotia (The) 0%10/01/2022 USD 5,000,000 4,996,605 1.07Federation des caisses Desjardins duQuebec (The) 0% 06/07/2021 USD 15,000,000 14,999,875 3.21Royal Bank of Canada, FRN 0.171%02/03/2022 USD 12,000,000 12,001,612 2.57Toronto-Dominion Bank (The), FRN 0.2%24/06/2022 USD 13,000,000 13,000,000 2.79
44,998,092 9.64
ChileBanco del Estado de Chile 0% 11/08/2021 USD 4,500,000 4,499,423 0.97
4,499,423 0.97
FranceBNP Paribas SA 0% 01/07/2021 USD 10,000,000 9,999,978 2.14
9,999,978 2.14
GermanyNRW Bank 0% 02/07/2021 USD 15,000,000 14,999,942 3.21
14,999,942 3.21
JapanMizuho Bank Ltd. 0% 02/08/2021 USD 6,000,000 5,999,560 1.28Sumitomo Mitsui Banking Corp. 0%01/07/2021 USD 14,500,000 14,499,972 3.11
20,499,532 4.39
LuxembourgNestle Finance International Ltd. 0%08/07/2021 USD 2,000,000 1,999,982 0.43
1,999,982 0.43
NetherlandsBNG Bank NV 0% 01/07/2021 USD 13,693,000 13,692,977 2.93
13,692,977 2.93
NorwayDNB Bank ASA 0% 15/07/2021 USD 1,500,000 1,499,956 0.32DNB Bank ASA, FRN 0.249% 22/07/2021 USD 15,000,000 15,001,025 3.22
16,500,981 3.54
SingaporeDBS Bank Ltd. 0% 22/12/2021 USD 9,000,000 8,992,694 1.93DBS Group Holdings Ltd. 0% 20/09/2021 USD 10,000,000 9,996,651 2.14Oversea-Chinese Banking Corp. Ltd. 0%01/10/2021 USD 8,000,000 7,997,706 1.72United Overseas Bank Ltd. 0%19/08/2021 USD 10,000,000 9,998,750 2.14
36,985,801 7.93
South KoreaKEB Hana Bank 0% 23/11/2021 USD 8,000,000 7,995,815 1.71
7,995,815 1.71
SwedenSkandinaviska Enskilda Banken AB 0%03/11/2021 USD 14,000,000 13,994,512 3.00Svenska Handelsbanken AB 0%23/12/2021 USD 17,000,000 16,989,279 3.64
30,983,791 6.64
SwitzerlandCredit Suisse AG 0% 02/07/2021 USD 15,000,000 14,999,908 3.21
14,999,908 3.21
United Arab EmiratesFirst Abu Dhabi Bank PJSC 0%27/08/2021 USD 6,100,000 6,099,115 1.31
6,099,115 1.31
United KingdomNationwide Building Society 0%07/07/2021 USD 11,000,000 10,999,850 2.36
10,999,850 2.36
United States of AmericaLMA-Americas LLC 0% 01/07/2021 USD 13,000,000 12,999,971 2.78LMA-Americas LLC 0% 03/09/2021 USD 1,250,000 1,249,747 0.27
14,249,718 3.05
Total Commercial Papers 296,853,919 63.61
Total Transferable securities and money market instrumentsdealt in on another regulated market 383,861,643 82.25
Total Investments 383,861,643 82.25
Cash 83,727,720 17.94
Other Assets/(Liabilities) (869,141) (0.19)
Total Net Assets 466,720,222 100.00
288
JPMorgan Funds - USD Money Market VNAV FundSchedule of Investments
As at 30 June 2021
Investments Currency
Quantity/Nominal
Value
MarketValue
USD
%of
NetAssets Investments Currency
Quantity/Nominal
Value
MarketValue
USD
%of
NetAssets
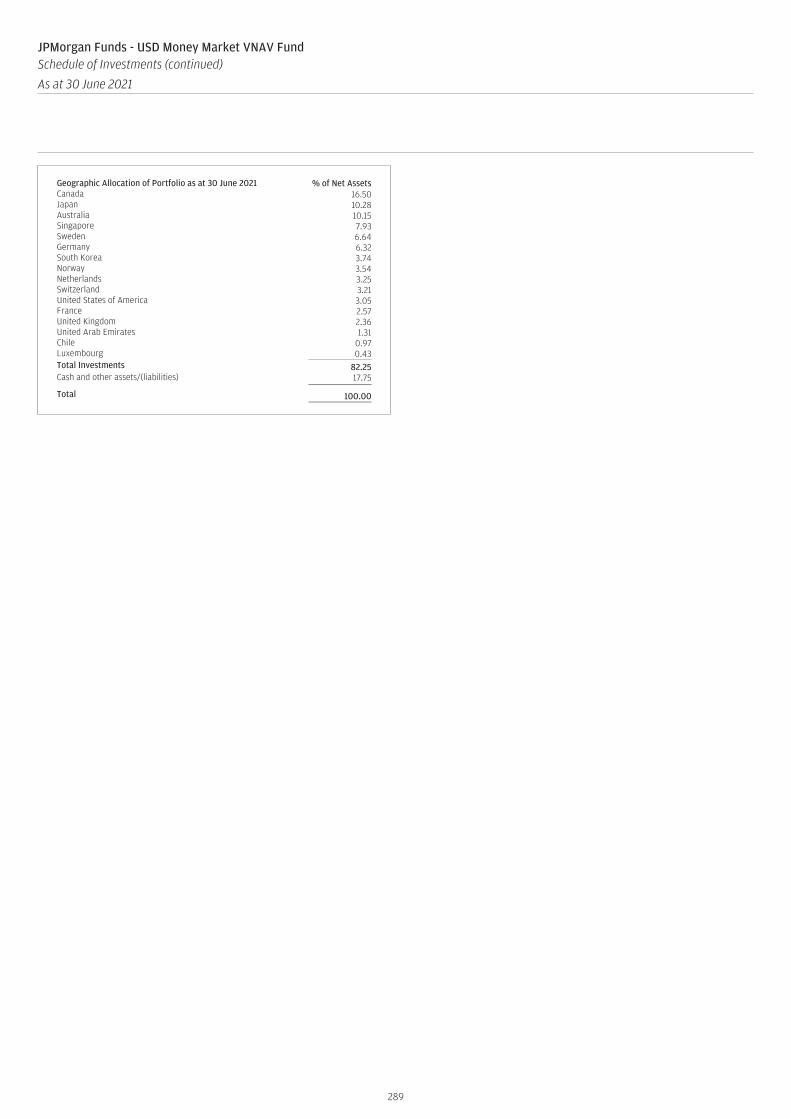
Geographic Allocation of Portfolio as at 30 June 2021 % of Net AssetsCanada 16.50Japan 10.28Australia 10.15Singapore 7.93Sweden 6.64Germany 6.32South Korea 3.74Norway 3.54Netherlands 3.25Switzerland 3.21United States of America 3.05France 2.57United Kingdom 2.36United Arab Emirates 1.31Chile 0.97Luxembourg 0.43Total Investments 82.25Cash and other assets/(liabilities) 17.75
Total 100.00
289
JPMorgan Funds - USD Money Market VNAV FundSchedule of Investments (continued)
As at 30 June 2021
Investments Currency
Quantity/Nominal
Value
MarketValue
USD
%of
NetAssets Investments Currency
Quantity/Nominal
Value
MarketValue
USD
%of
NetAssets

1. Total Expense Ratios (continued)For the
yearended
30 Jun 21+
For theyear
ended30 Jun 21 (a)
For theyear
ended30 Jun 21 (b)
For theyear
ended30 Jun 21 (c)
For theyear
ended30 Jun 20+
For theyear
ended30 Jun 19+
CappedExpense
Ratio30 Jun 21+
InceptionDate
JPMorgan Funds - America Equity FundJPM America Equity A (acc) - AUD 1.80% 1.80% 1.80% 1.80% 1.80% 1.80% 1.80% 22-Jul-13JPM America Equity A (acc) - AUD (hedged) 1.80% 1.80% 1.80% 1.80% 1.80% 1.80% 1.80% 04-Nov-13JPM America Equity A (acc) - EUR 1.80% 1.80% 1.80% 1.80% 1.80% 1.80% 1.80% 07-May-13JPM America Equity A (acc) - EUR (hedged) 1.73% 1.73% 1.73% 1.73% 1.73% 1.73% 1.80% 15-Mar-07JPM America Equity A (acc) - HKD 1.80% 1.80% 1.80% 1.80% 1.80% 1.80% 1.80% 06-Feb-13JPM America Equity A (acc) - USD 1.71% 1.71% 1.71% 1.71% 1.69% 1.69% 1.80% 01-Apr-05JPM America Equity A (dist) - USD 1.71% 1.71% 1.71% 1.71% 1.70% 1.70% 1.80% 16-Nov-88JPM America Equity C (acc) - EUR 0.85% 0.85% 0.85% 0.85% 0.84% 0.84% 0.85% 16-Oct-15JPM America Equity C (acc) - EUR (hedged) 0.84% 0.84% 0.84% 0.84% 0.85% 0.84% 0.85% 28-Jan-08JPM America Equity C (acc) - USD 0.84% 0.84% 0.84% 0.84% 0.84% 0.84% 0.85% 26-Aug-04JPM America Equity C (dist) - GBP 0.85% 0.85% 0.85% 0.85% - - 0.85% 02-Feb-21JPM America Equity C (dist) - USD 0.84% 0.84% 0.84% 0.84% 0.84% 0.84% 0.85% 26-Sep-12JPM America Equity D (acc) - EUR 2.55% 2.55% 2.55% 2.55% 2.55% 2.55% 2.55% 08-May-06JPM America Equity D (acc) - EUR (hedged) 2.49% 2.49% 2.49% 2.49% 2.47% 2.48% 2.55% 15-Mar-07JPM America Equity D (acc) - USD 2.48% 2.48% 2.48% 2.48% 2.48% 2.48% 2.55% 13-Oct-00JPM America Equity I (acc) - EUR 0.81% 0.81% 0.81% 0.81% 0.81% 0.81% 0.81% 17-Sep-18JPM America Equity I (acc) - USD 0.79% 0.79% 0.79% 0.79% 0.80% 0.80% 0.81% 26-Oct-12JPM America Equity I2 (acc) - EUR (hedged) 0.71% 0.71% 0.71% 0.71% 0.71% 0.71% 0.71% 18-Dec-17JPM America Equity I2 (acc) - USD 0.71% 0.71% 0.71% 0.71% 0.71% 0.71% 0.71% 18-Dec-17JPM America Equity X (acc) - USD 0.15% 0.15% 0.15% 0.15% 0.15% 0.15% 0.15% 24-Nov-04
JPMorgan Funds - Asia Pacific Equity FundJPM Asia Pacific Equity A (acc) - EUR 1.76% 1.76% 1.76% 1.76% 1.76% 1.79% 1.80% 09-Sep-09JPM Asia Pacific Equity A (acc) - HKD 1.80% 1.80% 1.80% 1.80% 1.80% 1.80% 1.80% 19-Dec-14JPM Asia Pacific Equity A (acc) - SGD 1.80% 1.80% 1.80% 1.80% 1.80% 1.80% 1.80% 12-Sep-13JPM Asia Pacific Equity A (acc) - USD 1.76% 1.76% 1.76% 1.76% 1.74% 1.75% 1.80% 09-Sep-09JPM Asia Pacific Equity A (dist) - GBP 1.80% 1.80% 1.80% 1.80% 1.80% 1.80% 1.80% 13-Sep-13JPM Asia Pacific Equity A (dist) - USD 1.76% 1.76% 1.76% 1.76% 1.77% 1.77% 1.80% 07-Apr-11JPM Asia Pacific Equity C (acc) - EUR 0.95% 0.95% 0.95% 0.95% 0.95% 0.95% 0.95% 19-Apr-11JPM Asia Pacific Equity C (acc) - USD 0.95% 0.95% 0.95% 0.95% 0.95% 0.95% 0.95% 13-Sep-13JPM Asia Pacific Equity C (dist) - USD 0.95% 0.95% 0.95% 0.95% 0.95% 0.95% 0.95% 13-Sep-13JPM Asia Pacific Equity D (acc) - EUR 2.55% 2.55% 2.55% 2.55% 2.55% 2.55% 2.55% 13-Sep-13JPM Asia Pacific Equity D (acc) - USD 2.55% 2.55% 2.55% 2.55% 2.55% 2.55% 2.55% 13-Sep-13JPM Asia Pacific Equity I (acc) - EUR 0.91% 0.91% 0.91% 0.91% 0.91% 0.91% 0.91% 09-Jan-17JPM Asia Pacific Equity I (acc) - USD 0.91% 0.91% 0.91% 0.91% 0.91% 0.91% 0.91% 14-Apr-15JPM Asia Pacific Equity I2 (acc) - EUR 0.76% 0.76% 0.76% 0.76% 0.76% 0.76% 0.76% 24-May-19JPM Asia Pacific Equity I2 (acc) - USD 0.76% 0.76% 0.76% 0.76% - - 0.76% 11-May-21JPM Asia Pacific Equity X (acc) - USD 0.15% 0.15% 0.15% 0.15% 0.15% 0.15% 0.15% 02-Dec-10
JPMorgan Funds - Brazil Equity FundJPM Brazil Equity A (acc) - EUR 1.80% 1.80% 1.80% 1.80% 1.80% 1.80% 1.80% 28-Mar-11JPM Brazil Equity A (acc) - SGD 1.80% 1.80% 1.80% 1.80% 1.80% 1.80% 1.80% 09-Aug-10JPM Brazil Equity A (acc) - USD 1.80% 1.80% 1.80% 1.80% 1.80% 1.80% 1.80% 18-Oct-07JPM Brazil Equity A (dist) - USD 1.80% 1.80% 1.80% 1.80% 1.80% 1.80% 1.80% 24-Nov-09JPM Brazil Equity C (acc) - USD 1.05% 1.05% 1.05% 1.05% 1.05% 1.05% 1.05% 19-Mar-08JPM Brazil Equity D (acc) - EUR 2.80% 2.79% 2.80% 2.79% 2.80% 2.80% 2.80% 13-Jul-10JPM Brazil Equity D (acc) - USD 2.80% 2.79% 2.80% 2.79% 2.80% 2.80% 2.80% 18-Oct-07JPM Brazil Equity I (acc) - USD 1.01% 1.01% 1.01% 1.01% 1.01% 1.01% 1.01% 18-Oct-07JPM Brazil Equity T (acc) - EUR 2.80% 2.79% 2.80% 2.79% 2.80% 2.80% 2.80% 21-Feb-11JPM Brazil Equity X (acc) - USD 0.15% 0.15% 0.15% 0.15% 0.15% 0.15% 0.15% 17-Jan-17
+ Expense ratios are calculated in accordance with the guidelines dated 16 May 2008 issued by the Swiss Funds & Asset Management Association. The Total Expense Ratio (“TER”) represents the totaloperating costs as a percentage of the Sub-Fund’s average daily net assets. The total operating cost comprises investment management and advisory fees, custodian fees, taxe d’abonnement and otherexpenses, as summarised in the Combined Statement of Operations and Changes in Net Assets. Overdraft interest and Performance Fees are excluded from the calculation.
The capped expense ratios and total expense ratios for some Share Classes may have changed over the previous two periods. All details concerning these changes have been disclosed in previousperiods’ Financial Statements.
(a) These figures include Fee Waivers on Management and Advisory Fees or Operating and Administrative expenses, where applicable.(b) These figures include Performance Fees, where applicable.(c) These figures include i) Fee Waivers on Management and Advisory Fees or Operating and Administrative expenses and ii) Performance Fees, where applicable.
290
JPMorgan FundsAppendix - Unaudited Additional Disclosures
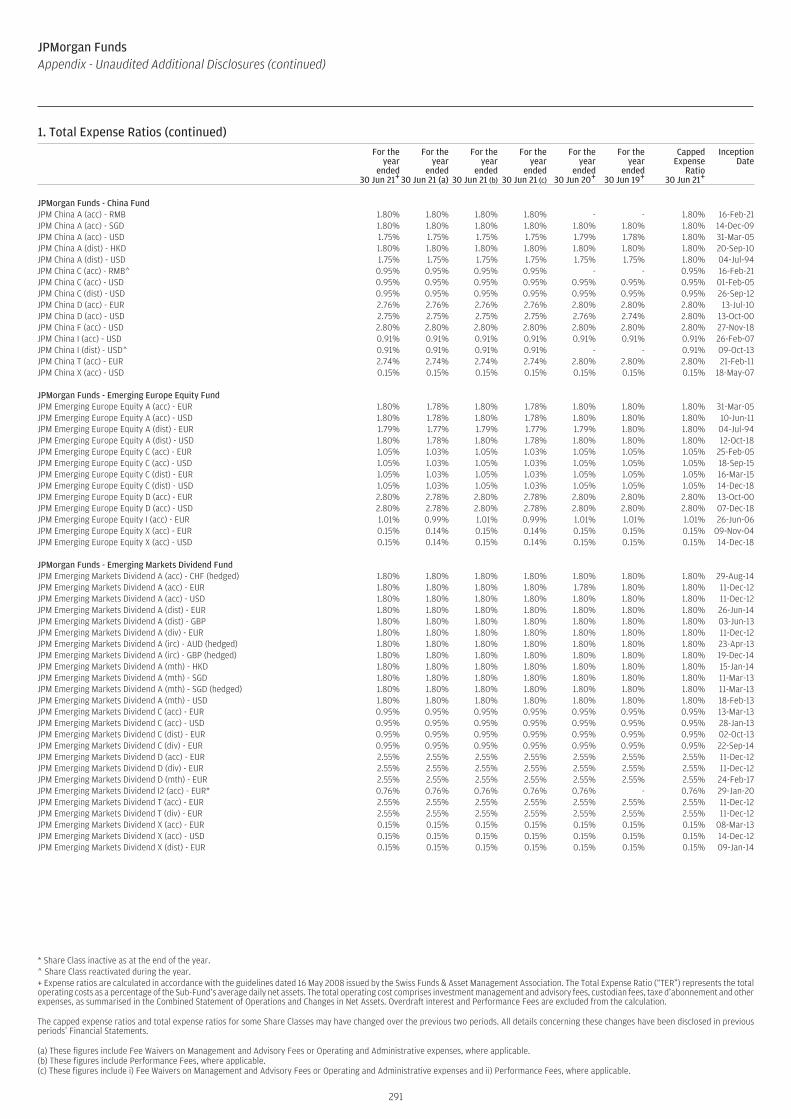
1. Total Expense Ratios (continued)For the
yearended
30 Jun 21+
For theyear
ended30 Jun 21 (a)
For theyear
ended30 Jun 21 (b)
For theyear
ended30 Jun 21 (c)
For theyear
ended30 Jun 20+
For theyear
ended30 Jun 19+
CappedExpense
Ratio30 Jun 21+
InceptionDate
JPMorgan Funds - China FundJPM China A (acc) - RMB 1.80% 1.80% 1.80% 1.80% - - 1.80% 16-Feb-21JPM China A (acc) - SGD 1.80% 1.80% 1.80% 1.80% 1.80% 1.80% 1.80% 14-Dec-09JPM China A (acc) - USD 1.75% 1.75% 1.75% 1.75% 1.79% 1.78% 1.80% 31-Mar-05JPM China A (dist) - HKD 1.80% 1.80% 1.80% 1.80% 1.80% 1.80% 1.80% 20-Sep-10JPM China A (dist) - USD 1.75% 1.75% 1.75% 1.75% 1.75% 1.75% 1.80% 04-Jul-94JPM China C (acc) - RMB^ 0.95% 0.95% 0.95% 0.95% - - 0.95% 16-Feb-21JPM China C (acc) - USD 0.95% 0.95% 0.95% 0.95% 0.95% 0.95% 0.95% 01-Feb-05JPM China C (dist) - USD 0.95% 0.95% 0.95% 0.95% 0.95% 0.95% 0.95% 26-Sep-12JPM China D (acc) - EUR 2.76% 2.76% 2.76% 2.76% 2.80% 2.80% 2.80% 13-Jul-10JPM China D (acc) - USD 2.75% 2.75% 2.75% 2.75% 2.76% 2.74% 2.80% 13-Oct-00JPM China F (acc) - USD 2.80% 2.80% 2.80% 2.80% 2.80% 2.80% 2.80% 27-Nov-18JPM China I (acc) - USD 0.91% 0.91% 0.91% 0.91% 0.91% 0.91% 0.91% 26-Feb-07JPM China I (dist) - USD^ 0.91% 0.91% 0.91% 0.91% - - 0.91% 09-Oct-13JPM China T (acc) - EUR 2.74% 2.74% 2.74% 2.74% 2.80% 2.80% 2.80% 21-Feb-11JPM China X (acc) - USD 0.15% 0.15% 0.15% 0.15% 0.15% 0.15% 0.15% 18-May-07
JPMorgan Funds - Emerging Europe Equity FundJPM Emerging Europe Equity A (acc) - EUR 1.80% 1.78% 1.80% 1.78% 1.80% 1.80% 1.80% 31-Mar-05JPM Emerging Europe Equity A (acc) - USD 1.80% 1.78% 1.80% 1.78% 1.80% 1.80% 1.80% 10-Jun-11JPM Emerging Europe Equity A (dist) - EUR 1.79% 1.77% 1.79% 1.77% 1.79% 1.80% 1.80% 04-Jul-94JPM Emerging Europe Equity A (dist) - USD 1.80% 1.78% 1.80% 1.78% 1.80% 1.80% 1.80% 12-Oct-18JPM Emerging Europe Equity C (acc) - EUR 1.05% 1.03% 1.05% 1.03% 1.05% 1.05% 1.05% 25-Feb-05JPM Emerging Europe Equity C (acc) - USD 1.05% 1.03% 1.05% 1.03% 1.05% 1.05% 1.05% 18-Sep-15JPM Emerging Europe Equity C (dist) - EUR 1.05% 1.03% 1.05% 1.03% 1.05% 1.05% 1.05% 16-Mar-15JPM Emerging Europe Equity C (dist) - USD 1.05% 1.03% 1.05% 1.03% 1.05% 1.05% 1.05% 14-Dec-18JPM Emerging Europe Equity D (acc) - EUR 2.80% 2.78% 2.80% 2.78% 2.80% 2.80% 2.80% 13-Oct-00JPM Emerging Europe Equity D (acc) - USD 2.80% 2.78% 2.80% 2.78% 2.80% 2.80% 2.80% 07-Dec-18JPM Emerging Europe Equity I (acc) - EUR 1.01% 0.99% 1.01% 0.99% 1.01% 1.01% 1.01% 26-Jun-06JPM Emerging Europe Equity X (acc) - EUR 0.15% 0.14% 0.15% 0.14% 0.15% 0.15% 0.15% 09-Nov-04JPM Emerging Europe Equity X (acc) - USD 0.15% 0.14% 0.15% 0.14% 0.15% 0.15% 0.15% 14-Dec-18
JPMorgan Funds - Emerging Markets Dividend FundJPM Emerging Markets Dividend A (acc) - CHF (hedged) 1.80% 1.80% 1.80% 1.80% 1.80% 1.80% 1.80% 29-Aug-14JPM Emerging Markets Dividend A (acc) - EUR 1.80% 1.80% 1.80% 1.80% 1.78% 1.80% 1.80% 11-Dec-12JPM Emerging Markets Dividend A (acc) - USD 1.80% 1.80% 1.80% 1.80% 1.80% 1.80% 1.80% 11-Dec-12JPM Emerging Markets Dividend A (dist) - EUR 1.80% 1.80% 1.80% 1.80% 1.80% 1.80% 1.80% 26-Jun-14JPM Emerging Markets Dividend A (dist) - GBP 1.80% 1.80% 1.80% 1.80% 1.80% 1.80% 1.80% 03-Jun-13JPM Emerging Markets Dividend A (div) - EUR 1.80% 1.80% 1.80% 1.80% 1.80% 1.80% 1.80% 11-Dec-12JPM Emerging Markets Dividend A (irc) - AUD (hedged) 1.80% 1.80% 1.80% 1.80% 1.80% 1.80% 1.80% 23-Apr-13JPM Emerging Markets Dividend A (irc) - GBP (hedged) 1.80% 1.80% 1.80% 1.80% 1.80% 1.80% 1.80% 19-Dec-14JPM Emerging Markets Dividend A (mth) - HKD 1.80% 1.80% 1.80% 1.80% 1.80% 1.80% 1.80% 15-Jan-14JPM Emerging Markets Dividend A (mth) - SGD 1.80% 1.80% 1.80% 1.80% 1.80% 1.80% 1.80% 11-Mar-13JPM Emerging Markets Dividend A (mth) - SGD (hedged) 1.80% 1.80% 1.80% 1.80% 1.80% 1.80% 1.80% 11-Mar-13JPM Emerging Markets Dividend A (mth) - USD 1.80% 1.80% 1.80% 1.80% 1.80% 1.80% 1.80% 18-Feb-13JPM Emerging Markets Dividend C (acc) - EUR 0.95% 0.95% 0.95% 0.95% 0.95% 0.95% 0.95% 13-Mar-13JPM Emerging Markets Dividend C (acc) - USD 0.95% 0.95% 0.95% 0.95% 0.95% 0.95% 0.95% 28-Jan-13JPM Emerging Markets Dividend C (dist) - EUR 0.95% 0.95% 0.95% 0.95% 0.95% 0.95% 0.95% 02-Oct-13JPM Emerging Markets Dividend C (div) - EUR 0.95% 0.95% 0.95% 0.95% 0.95% 0.95% 0.95% 22-Sep-14JPM Emerging Markets Dividend D (acc) - EUR 2.55% 2.55% 2.55% 2.55% 2.55% 2.55% 2.55% 11-Dec-12JPM Emerging Markets Dividend D (div) - EUR 2.55% 2.55% 2.55% 2.55% 2.55% 2.55% 2.55% 11-Dec-12JPM Emerging Markets Dividend D (mth) - EUR 2.55% 2.55% 2.55% 2.55% 2.55% 2.55% 2.55% 24-Feb-17JPM Emerging Markets Dividend I2 (acc) - EUR* 0.76% 0.76% 0.76% 0.76% 0.76% - 0.76% 29-Jan-20JPM Emerging Markets Dividend T (acc) - EUR 2.55% 2.55% 2.55% 2.55% 2.55% 2.55% 2.55% 11-Dec-12JPM Emerging Markets Dividend T (div) - EUR 2.55% 2.55% 2.55% 2.55% 2.55% 2.55% 2.55% 11-Dec-12JPM Emerging Markets Dividend X (acc) - EUR 0.15% 0.15% 0.15% 0.15% 0.15% 0.15% 0.15% 08-Mar-13JPM Emerging Markets Dividend X (acc) - USD 0.15% 0.15% 0.15% 0.15% 0.15% 0.15% 0.15% 14-Dec-12JPM Emerging Markets Dividend X (dist) - EUR 0.15% 0.15% 0.15% 0.15% 0.15% 0.15% 0.15% 09-Jan-14
* Share Class inactive as at the end of the year.^ Share Class reactivated during the year.+ Expense ratios are calculated in accordance with the guidelines dated 16 May 2008 issued by the Swiss Funds & Asset Management Association. The Total Expense Ratio (“TER”) represents the totaloperating costs as a percentage of the Sub-Fund’s average daily net assets. The total operating cost comprises investment management and advisory fees, custodian fees, taxe d’abonnement and otherexpenses, as summarised in the Combined Statement of Operations and Changes in Net Assets. Overdraft interest and Performance Fees are excluded from the calculation.
The capped expense ratios and total expense ratios for some Share Classes may have changed over the previous two periods. All details concerning these changes have been disclosed in previousperiods’ Financial Statements.
(a) These figures include Fee Waivers on Management and Advisory Fees or Operating and Administrative expenses, where applicable.(b) These figures include Performance Fees, where applicable.(c) These figures include i) Fee Waivers on Management and Advisory Fees or Operating and Administrative expenses and ii) Performance Fees, where applicable.
291
JPMorgan FundsAppendix - Unaudited Additional Disclosures (continued)
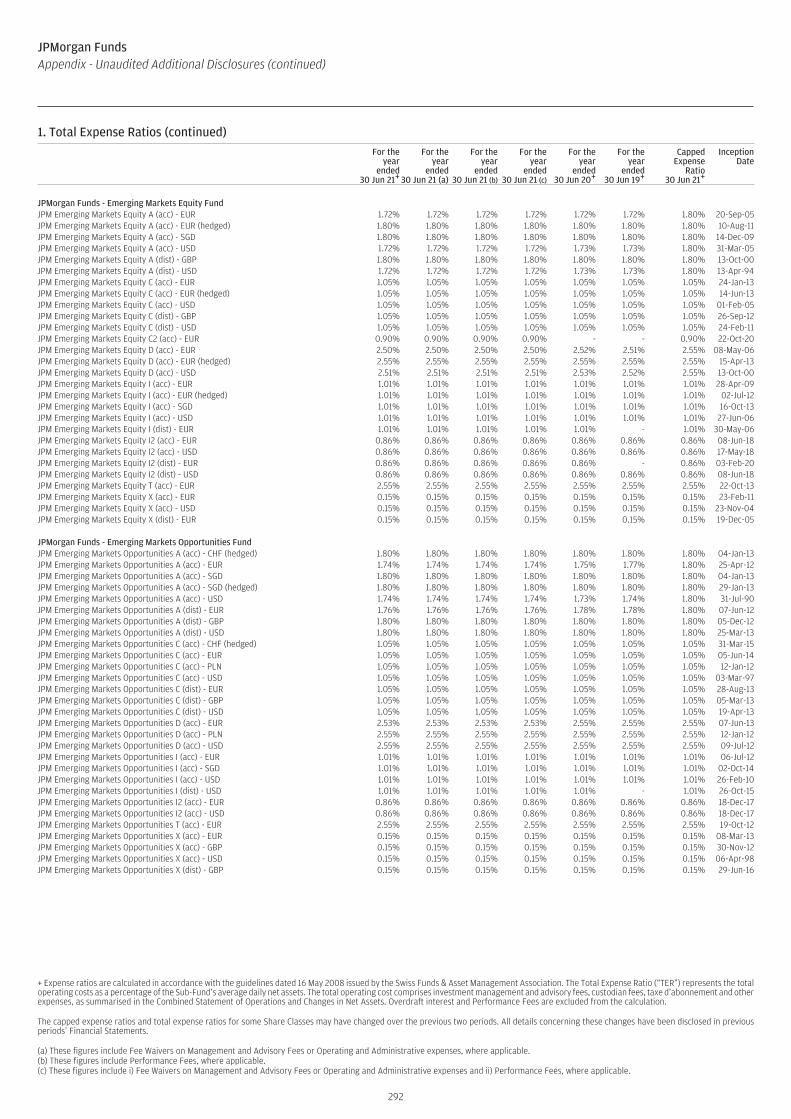
1. Total Expense Ratios (continued)For the
yearended
30 Jun 21+
For theyear
ended30 Jun 21 (a)
For theyear
ended30 Jun 21 (b)
For theyear
ended30 Jun 21 (c)
For theyear
ended30 Jun 20+
For theyear
ended30 Jun 19+
CappedExpense
Ratio30 Jun 21+
InceptionDate
JPMorgan Funds - Emerging Markets Equity FundJPM Emerging Markets Equity A (acc) - EUR 1.72% 1.72% 1.72% 1.72% 1.72% 1.72% 1.80% 20-Sep-05JPM Emerging Markets Equity A (acc) - EUR (hedged) 1.80% 1.80% 1.80% 1.80% 1.80% 1.80% 1.80% 10-Aug-11JPM Emerging Markets Equity A (acc) - SGD 1.80% 1.80% 1.80% 1.80% 1.80% 1.80% 1.80% 14-Dec-09JPM Emerging Markets Equity A (acc) - USD 1.72% 1.72% 1.72% 1.72% 1.73% 1.73% 1.80% 31-Mar-05JPM Emerging Markets Equity A (dist) - GBP 1.80% 1.80% 1.80% 1.80% 1.80% 1.80% 1.80% 13-Oct-00JPM Emerging Markets Equity A (dist) - USD 1.72% 1.72% 1.72% 1.72% 1.73% 1.73% 1.80% 13-Apr-94JPM Emerging Markets Equity C (acc) - EUR 1.05% 1.05% 1.05% 1.05% 1.05% 1.05% 1.05% 24-Jan-13JPM Emerging Markets Equity C (acc) - EUR (hedged) 1.05% 1.05% 1.05% 1.05% 1.05% 1.05% 1.05% 14-Jun-13JPM Emerging Markets Equity C (acc) - USD 1.05% 1.05% 1.05% 1.05% 1.05% 1.05% 1.05% 01-Feb-05JPM Emerging Markets Equity C (dist) - GBP 1.05% 1.05% 1.05% 1.05% 1.05% 1.05% 1.05% 26-Sep-12JPM Emerging Markets Equity C (dist) - USD 1.05% 1.05% 1.05% 1.05% 1.05% 1.05% 1.05% 24-Feb-11JPM Emerging Markets Equity C2 (acc) - EUR 0.90% 0.90% 0.90% 0.90% - - 0.90% 22-Oct-20JPM Emerging Markets Equity D (acc) - EUR 2.50% 2.50% 2.50% 2.50% 2.52% 2.51% 2.55% 08-May-06JPM Emerging Markets Equity D (acc) - EUR (hedged) 2.55% 2.55% 2.55% 2.55% 2.55% 2.55% 2.55% 15-Apr-13JPM Emerging Markets Equity D (acc) - USD 2.51% 2.51% 2.51% 2.51% 2.53% 2.52% 2.55% 13-Oct-00JPM Emerging Markets Equity I (acc) - EUR 1.01% 1.01% 1.01% 1.01% 1.01% 1.01% 1.01% 28-Apr-09JPM Emerging Markets Equity I (acc) - EUR (hedged) 1.01% 1.01% 1.01% 1.01% 1.01% 1.01% 1.01% 02-Jul-12JPM Emerging Markets Equity I (acc) - SGD 1.01% 1.01% 1.01% 1.01% 1.01% 1.01% 1.01% 16-Oct-13JPM Emerging Markets Equity I (acc) - USD 1.01% 1.01% 1.01% 1.01% 1.01% 1.01% 1.01% 27-Jun-06JPM Emerging Markets Equity I (dist) - EUR 1.01% 1.01% 1.01% 1.01% 1.01% - 1.01% 30-May-06JPM Emerging Markets Equity I2 (acc) - EUR 0.86% 0.86% 0.86% 0.86% 0.86% 0.86% 0.86% 08-Jun-18JPM Emerging Markets Equity I2 (acc) - USD 0.86% 0.86% 0.86% 0.86% 0.86% 0.86% 0.86% 17-May-18JPM Emerging Markets Equity I2 (dist) - EUR 0.86% 0.86% 0.86% 0.86% 0.86% - 0.86% 03-Feb-20JPM Emerging Markets Equity I2 (dist) - USD 0.86% 0.86% 0.86% 0.86% 0.86% 0.86% 0.86% 08-Jun-18JPM Emerging Markets Equity T (acc) - EUR 2.55% 2.55% 2.55% 2.55% 2.55% 2.55% 2.55% 22-Oct-13JPM Emerging Markets Equity X (acc) - EUR 0.15% 0.15% 0.15% 0.15% 0.15% 0.15% 0.15% 23-Feb-11JPM Emerging Markets Equity X (acc) - USD 0.15% 0.15% 0.15% 0.15% 0.15% 0.15% 0.15% 23-Nov-04JPM Emerging Markets Equity X (dist) - EUR 0.15% 0.15% 0.15% 0.15% 0.15% 0.15% 0.15% 19-Dec-05
JPMorgan Funds - Emerging Markets Opportunities FundJPM Emerging Markets Opportunities A (acc) - CHF (hedged) 1.80% 1.80% 1.80% 1.80% 1.80% 1.80% 1.80% 04-Jan-13JPM Emerging Markets Opportunities A (acc) - EUR 1.74% 1.74% 1.74% 1.74% 1.75% 1.77% 1.80% 25-Apr-12JPM Emerging Markets Opportunities A (acc) - SGD 1.80% 1.80% 1.80% 1.80% 1.80% 1.80% 1.80% 04-Jan-13JPM Emerging Markets Opportunities A (acc) - SGD (hedged) 1.80% 1.80% 1.80% 1.80% 1.80% 1.80% 1.80% 29-Jan-13JPM Emerging Markets Opportunities A (acc) - USD 1.74% 1.74% 1.74% 1.74% 1.73% 1.74% 1.80% 31-Jul-90JPM Emerging Markets Opportunities A (dist) - EUR 1.76% 1.76% 1.76% 1.76% 1.78% 1.78% 1.80% 07-Jun-12JPM Emerging Markets Opportunities A (dist) - GBP 1.80% 1.80% 1.80% 1.80% 1.80% 1.80% 1.80% 05-Dec-12JPM Emerging Markets Opportunities A (dist) - USD 1.80% 1.80% 1.80% 1.80% 1.80% 1.80% 1.80% 25-Mar-13JPM Emerging Markets Opportunities C (acc) - CHF (hedged) 1.05% 1.05% 1.05% 1.05% 1.05% 1.05% 1.05% 31-Mar-15JPM Emerging Markets Opportunities C (acc) - EUR 1.05% 1.05% 1.05% 1.05% 1.05% 1.05% 1.05% 05-Jun-14JPM Emerging Markets Opportunities C (acc) - PLN 1.05% 1.05% 1.05% 1.05% 1.05% 1.05% 1.05% 12-Jan-12JPM Emerging Markets Opportunities C (acc) - USD 1.05% 1.05% 1.05% 1.05% 1.05% 1.05% 1.05% 03-Mar-97JPM Emerging Markets Opportunities C (dist) - EUR 1.05% 1.05% 1.05% 1.05% 1.05% 1.05% 1.05% 28-Aug-13JPM Emerging Markets Opportunities C (dist) - GBP 1.05% 1.05% 1.05% 1.05% 1.05% 1.05% 1.05% 05-Mar-13JPM Emerging Markets Opportunities C (dist) - USD 1.05% 1.05% 1.05% 1.05% 1.05% 1.05% 1.05% 19-Apr-13JPM Emerging Markets Opportunities D (acc) - EUR 2.53% 2.53% 2.53% 2.53% 2.55% 2.55% 2.55% 07-Jun-13JPM Emerging Markets Opportunities D (acc) - PLN 2.55% 2.55% 2.55% 2.55% 2.55% 2.55% 2.55% 12-Jan-12JPM Emerging Markets Opportunities D (acc) - USD 2.55% 2.55% 2.55% 2.55% 2.55% 2.55% 2.55% 09-Jul-12JPM Emerging Markets Opportunities I (acc) - EUR 1.01% 1.01% 1.01% 1.01% 1.01% 1.01% 1.01% 06-Jul-12JPM Emerging Markets Opportunities I (acc) - SGD 1.01% 1.01% 1.01% 1.01% 1.01% 1.01% 1.01% 02-Oct-14JPM Emerging Markets Opportunities I (acc) - USD 1.01% 1.01% 1.01% 1.01% 1.01% 1.01% 1.01% 26-Feb-10JPM Emerging Markets Opportunities I (dist) - USD 1.01% 1.01% 1.01% 1.01% 1.01% - 1.01% 26-Oct-15JPM Emerging Markets Opportunities I2 (acc) - EUR 0.86% 0.86% 0.86% 0.86% 0.86% 0.86% 0.86% 18-Dec-17JPM Emerging Markets Opportunities I2 (acc) - USD 0.86% 0.86% 0.86% 0.86% 0.86% 0.86% 0.86% 18-Dec-17JPM Emerging Markets Opportunities T (acc) - EUR 2.55% 2.55% 2.55% 2.55% 2.55% 2.55% 2.55% 19-Oct-12JPM Emerging Markets Opportunities X (acc) - EUR 0.15% 0.15% 0.15% 0.15% 0.15% 0.15% 0.15% 08-Mar-13JPM Emerging Markets Opportunities X (acc) - GBP 0.15% 0.15% 0.15% 0.15% 0.15% 0.15% 0.15% 30-Nov-12JPM Emerging Markets Opportunities X (acc) - USD 0.15% 0.15% 0.15% 0.15% 0.15% 0.15% 0.15% 06-Apr-98JPM Emerging Markets Opportunities X (dist) - GBP 0.15% 0.15% 0.15% 0.15% 0.15% 0.15% 0.15% 29-Jun-16
+ Expense ratios are calculated in accordance with the guidelines dated 16 May 2008 issued by the Swiss Funds & Asset Management Association. The Total Expense Ratio (“TER”) represents the totaloperating costs as a percentage of the Sub-Fund’s average daily net assets. The total operating cost comprises investment management and advisory fees, custodian fees, taxe d’abonnement and otherexpenses, as summarised in the Combined Statement of Operations and Changes in Net Assets. Overdraft interest and Performance Fees are excluded from the calculation.
The capped expense ratios and total expense ratios for some Share Classes may have changed over the previous two periods. All details concerning these changes have been disclosed in previousperiods’ Financial Statements.
(a) These figures include Fee Waivers on Management and Advisory Fees or Operating and Administrative expenses, where applicable.(b) These figures include Performance Fees, where applicable.(c) These figures include i) Fee Waivers on Management and Advisory Fees or Operating and Administrative expenses and ii) Performance Fees, where applicable.
292
JPMorgan FundsAppendix - Unaudited Additional Disclosures (continued)

1. Total Expense Ratios (continued)For the
yearended
30 Jun 21+
For theyear
ended30 Jun 21 (a)
For theyear
ended30 Jun 21 (b)
For theyear
ended30 Jun 21 (c)
For theyear
ended30 Jun 20+
For theyear
ended30 Jun 19+
CappedExpense
Ratio30 Jun 21+
InceptionDate
JPMorgan Funds - Emerging Markets Small Cap FundJPM Emerging Markets Small Cap A (perf) (acc) - EUR 1.79% 1.79% 1.79% 1.79% 1.80% 1.77% 1.80% 15-Nov-07JPM Emerging Markets Small Cap A (perf) (acc) - USD 1.78% 1.78% 1.78% 1.78% 1.77% 1.77% 1.80% 15-Nov-07JPM Emerging Markets Small Cap A (perf) (dist) - GBP 1.80% 1.80% 1.80% 1.80% 1.80% 1.80% 1.80% 15-Nov-07JPM Emerging Markets Small Cap A (perf) (dist) - USD 1.80% 1.80% 1.80% 1.80% 1.80% 1.80% 1.80% 16-Feb-17JPM Emerging Markets Small Cap C (perf) (acc) - EUR 1.05% 1.05% 1.05% 1.05% 1.05% 1.05% 1.05% 06-Jul-11JPM Emerging Markets Small Cap C (perf) (acc) - USD 1.05% 1.05% 1.05% 1.05% 1.05% 1.05% 1.05% 07-Dec-07JPM Emerging Markets Small Cap C (perf) (dist) - GBP 1.05% 1.05% 1.05% 1.05% 1.05% 1.05% 1.05% 09-Oct-14JPM Emerging Markets Small Cap D (perf) (acc) - EUR 2.80% 2.80% 2.80% 2.80% 2.80% 2.80% 2.80% 11-Jun-10JPM Emerging Markets Small Cap D (perf) (acc) - USD 2.80% 2.80% 2.80% 2.80% 2.80% 2.80% 2.80% 15-Nov-07JPM Emerging Markets Small Cap I (perf) (acc) - USD 1.01% 1.01% 1.01% 1.01% 1.01% 1.01% 1.01% 09-Mar-11JPM Emerging Markets Small Cap I (perf) (dist) - USD 1.01% 1.01% 1.01% 1.01% 1.01% 1.01% 1.01% 16-Feb-18JPM Emerging Markets Small Cap T (perf) (acc) - EUR 2.80% 2.80% 2.80% 2.80% 2.80% 2.80% 2.80% 04-Jul-12JPM Emerging Markets Small Cap X (acc) - EUR 0.15% 0.15% 0.15% 0.15% 0.15% 0.15% 0.15% 08-Mar-13JPM Emerging Markets Small Cap X (acc) - JPY 0.15% 0.15% 0.15% 0.15% 0.15% 0.15% 0.15% 12-Jun-17JPM Emerging Markets Small Cap X (acc) - USD 0.15% 0.15% 0.15% 0.15% 0.15% - 0.15% 21-Feb-20
JPMorgan Funds - Emerging Middle East Equity FundJPM Emerging Middle East Equity A (acc) - EUR 1.80% 1.80% 1.80% 1.80% 1.80% 1.80% 1.80% 10-Dec-08JPM Emerging Middle East Equity A (acc) - USD 1.80% 1.80% 1.80% 1.80% 1.80% 1.80% 1.80% 31-Mar-05JPM Emerging Middle East Equity A (dist) - USD 1.80% 1.80% 1.80% 1.80% 1.80% 1.80% 1.80% 18-May-98JPM Emerging Middle East Equity C (acc) - USD 1.05% 1.05% 1.05% 1.05% 1.05% 1.05% 1.05% 21-Jan-08JPM Emerging Middle East Equity C (dist) - USD 1.05% 1.05% 1.05% 1.05% 1.05% 1.05% 1.05% 30-Jul-13JPM Emerging Middle East Equity D (acc) - EUR 2.80% 2.80% 2.80% 2.80% 2.80% 2.80% 2.80% 13-Jul-10JPM Emerging Middle East Equity D (acc) - USD 2.80% 2.80% 2.80% 2.80% 2.80% 2.80% 2.80% 13-Oct-00
JPMorgan Funds - Europe Dynamic FundJPM Europe Dynamic A (acc) - AUD (hedged) 1.80% 1.80% 1.80% 1.80% 1.80% 1.80% 1.80% 22-Nov-13JPM Europe Dynamic A (acc) - EUR 1.74% 1.74% 1.74% 1.74% 1.72% 1.69% 1.80% 31-Mar-05JPM Europe Dynamic A (acc) - HKD (hedged) 1.80% 1.80% 1.80% 1.80% 1.80% 1.80% 1.80% 22-Nov-13JPM Europe Dynamic A (acc) - SGD (hedged) 1.80% 1.80% 1.80% 1.80% 1.80% 1.79% 1.80% 19-May-14JPM Europe Dynamic A (acc) - USD 1.80% 1.80% 1.80% 1.80% 1.80% 1.80% 1.80% 23-Oct-13JPM Europe Dynamic A (acc) - USD (hedged) 1.78% 1.78% 1.78% 1.78% 1.74% 1.73% 1.80% 22-Nov-13JPM Europe Dynamic A (dist) - EUR 1.77% 1.77% 1.77% 1.77% 1.77% 1.74% 1.80% 08-Dec-00JPM Europe Dynamic A (dist) - GBP 1.80% 1.80% 1.80% 1.80% 1.80% 1.80% 1.80% 08-Dec-00JPM Europe Dynamic C (acc) - EUR 1.00% 1.00% 1.00% 1.00% 1.00% 1.00% 1.00% 26-Aug-04JPM Europe Dynamic C (acc) - USD 1.00% 1.00% 1.00% 1.00% 1.00% 1.00% 1.00% 03-Dec-13JPM Europe Dynamic C (acc) - USD (hedged) 1.00% 1.00% 1.00% 1.00% 1.00% 1.00% 1.00% 15-Apr-14JPM Europe Dynamic C (dist) - EUR 1.00% 1.00% 1.00% 1.00% 1.00% 1.00% 1.00% 16-Mar-15JPM Europe Dynamic C (dist) - GBP 1.00% 1.00% 1.00% 1.00% 1.00% 1.00% 1.00% 01-Oct-13JPM Europe Dynamic D (acc) - EUR 2.52% 2.52% 2.52% 2.52% 2.52% 2.50% 2.55% 08-Dec-00JPM Europe Dynamic D (acc) - USD 2.55% 2.55% 2.55% 2.55% 2.55% 2.55% 2.55% 01-Oct-04JPM Europe Dynamic D (acc) - USD (hedged) 2.55% 2.55% 2.55% 2.55% 2.55% 2.55% 2.55% 14-May-14JPM Europe Dynamic I (acc) - EUR 0.96% 0.96% 0.96% 0.96% 0.96% 0.96% 0.96% 12-Jul-06JPM Europe Dynamic I (acc) - USD (hedged) 0.96% 0.96% 0.96% 0.96% 0.96% 0.96% 0.96% 28-Nov-14JPM Europe Dynamic I2 (acc) - EUR 0.76% 0.76% 0.76% 0.76% 0.76% 0.76% 0.76% 18-Dec-17JPM Europe Dynamic T (acc) - EUR 2.55% 2.55% 2.55% 2.55% 2.55% 2.55% 2.55% 16-Feb-11JPM Europe Dynamic X (acc) - EUR 0.15% 0.15% 0.15% 0.15% 0.15% 0.15% 0.15% 25-Oct-04JPM Europe Dynamic X (acc) - USD (hedged) 0.15% 0.15% 0.15% 0.15% 0.15% 0.15% 0.15% 03-Mar-17
+ Expense ratios are calculated in accordance with the guidelines dated 16 May 2008 issued by the Swiss Funds & Asset Management Association. The Total Expense Ratio (“TER”) represents the totaloperating costs as a percentage of the Sub-Fund’s average daily net assets. The total operating cost comprises investment management and advisory fees, custodian fees, taxe d’abonnement and otherexpenses, as summarised in the Combined Statement of Operations and Changes in Net Assets. Overdraft interest and Performance Fees are excluded from the calculation.
The capped expense ratios and total expense ratios for some Share Classes may have changed over the previous two periods. All details concerning these changes have been disclosed in previousperiods’ Financial Statements.
(a) These figures include Fee Waivers on Management and Advisory Fees or Operating and Administrative expenses, where applicable.(b) These figures include Performance Fees, where applicable.(c) These figures include i) Fee Waivers on Management and Advisory Fees or Operating and Administrative expenses and ii) Performance Fees, where applicable.
293
JPMorgan FundsAppendix - Unaudited Additional Disclosures (continued)

294
1. Total Expense Ratios (continued)For the
yearended
30 Jun 21+
For theyear
ended30 Jun 21 (a)
For theyear
ended30 Jun 21 (b)
For theyear
ended30 Jun 21 (c)
For theyear
ended30 Jun 20+
For theyear
ended30 Jun 19+
CappedExpense
Ratio30 Jun 21+
InceptionDate
JPMorgan Funds - Europe Equity FundJPM Europe Equity A (acc) - AUD (hedged) 1.30% 1.30% 1.30% 1.30% 1.30% 1.30% 1.30% 11-Oct-17JPM Europe Equity A (acc) - EUR 1.24% 1.24% 1.24% 1.24% 1.24% 1.24% 1.30% 31-Mar-05JPM Europe Equity A (acc) - USD 1.24% 1.24% 1.24% 1.24% 1.27% 1.25% 1.30% 13-Oct-00JPM Europe Equity A (acc) - USD (hedged) 1.26% 1.26% 1.26% 1.26% 1.28% 1.30% 1.30% 11-Apr-14JPM Europe Equity A (dist) - EUR 1.24% 1.24% 1.24% 1.24% 1.24% 1.23% 1.30% 01-Dec-88JPM Europe Equity A (dist) - USD 1.30% 1.30% 1.30% 1.30% 1.30% 1.30% 1.30% 01-Jun-01JPM Europe Equity C (acc) - EUR 0.70% 0.70% 0.70% 0.70% 0.70% 0.70% 0.70% 26-Aug-04JPM Europe Equity C (acc) - USD 0.70% 0.70% 0.70% 0.70% 0.70% 0.70% 0.70% 03-Dec-13JPM Europe Equity C (acc) - USD (hedged) 0.70% 0.70% 0.70% 0.70% 0.70% 0.70% 0.70% 11-Apr-14JPM Europe Equity C (dist) - EUR 0.70% 0.70% 0.70% 0.70% 0.70% 0.70% 0.70% 24-Jul-13JPM Europe Equity C (dist) - USD 0.70% 0.70% 0.70% 0.70% 0.70% 0.70% 0.70% 15-Mar-13JPM Europe Equity D (acc) - EUR 2.00% 2.00% 2.00% 2.00% 2.01% 2.00% 2.05% 13-Oct-00JPM Europe Equity D (acc) - USD 2.05% 2.05% 2.05% 2.05% 2.05% 2.05% 2.05% 27-Jun-06JPM Europe Equity D (acc) - USD (hedged) 2.05% 2.05% 2.05% 2.05% 2.05% 2.05% 2.05% 16-May-14JPM Europe Equity I (acc) - EUR 0.66% 0.66% 0.66% 0.66% 0.66% 0.66% 0.66% 28-Jun-06JPM Europe Equity X (acc) - EUR 0.15% 0.15% 0.15% 0.15% 0.15% 0.15% 0.15% 14-Sep-04
JPMorgan Funds - Europe Small Cap FundJPM Europe Small Cap A (acc) - EUR 1.73% 1.73% 1.73% 1.73% 1.74% 1.71% 1.80% 31-Mar-05JPM Europe Small Cap A (acc) - SEK 1.80% 1.80% 1.80% 1.80% 1.80% 1.80% 1.80% 22-Dec-17JPM Europe Small Cap A (acc) - USD 1.80% 1.80% 1.80% 1.80% 1.80% 1.80% 1.80% 29-Oct-13JPM Europe Small Cap A (acc) - USD (hedged) 1.80% 1.80% 1.80% 1.80% 1.80% 1.80% 1.80% 14-Oct-15JPM Europe Small Cap A (dist) - EUR 1.74% 1.74% 1.74% 1.74% 1.74% 1.73% 1.80% 18-Apr-94JPM Europe Small Cap A (dist) - GBP 1.80% 1.80% 1.80% 1.80% 1.80% 1.80% 1.80% 13-Oct-00JPM Europe Small Cap C (acc) - EUR 1.00% 1.00% 1.00% 1.00% 1.00% 1.00% 1.00% 26-Aug-04JPM Europe Small Cap C (dist) - EUR 1.00% 1.00% 1.00% 1.00% 1.00% 1.00% 1.00% 24-Jul-13JPM Europe Small Cap D (acc) - EUR 2.76% 2.76% 2.76% 2.76% 2.75% 2.74% 2.80% 13-Oct-00JPM Europe Small Cap I (acc) - EUR 0.96% 0.96% 0.96% 0.96% 0.96% 0.96% 0.96% 27-Jun-06JPM Europe Small Cap I (dist) - EUR* 0.96% 0.96% 0.96% 0.96% 0.96% 0.96% 0.96% 09-Mar-11JPM Europe Small Cap I2 (acc) - EUR 0.76% 0.76% 0.76% 0.76% 0.76% 0.76% 0.76% 08-Jun-18JPM Europe Small Cap X (acc) - EUR 0.15% 0.15% 0.15% 0.15% 0.15% 0.15% 0.15% 24-Nov-04JPM Europe Small Cap X (dist) - EUR 0.15% 0.15% 0.15% 0.15% - - 0.15% 06-May-21
JPMorgan Funds - Global Growth Fund (1)JPM Global Growth A (acc) - CHF (hedged) 1.80% 1.80% 1.80% 1.80% 1.80% 1.80% 1.80% 27-Mar-15JPM Global Growth A (acc) - EUR 1.79% 1.79% 1.79% 1.79% 1.80% 1.80% 1.80% 14-Jun-11JPM Global Growth A (acc) - EUR (hedged) 1.80% 1.80% 1.80% 1.80% 1.80% 1.80% 1.80% 17-Jul-08JPM Global Growth A (acc) - USD 1.78% 1.78% 1.78% 1.78% 1.80% 1.80% 1.80% 31-Mar-05JPM Global Growth A (dist) - EUR (hedged) 1.76% 1.76% 1.76% 1.76% 1.79% 1.79% 1.80% 17-Jul-08JPM Global Growth A (dist) - USD 1.78% 1.78% 1.78% 1.78% 1.78% 1.79% 1.80% 16-Nov-88JPM Global Growth C (acc) - EUR 0.80% 0.80% 0.80% 0.80% 0.80% 0.80% 0.80% 27-Mar-15JPM Global Growth C (acc) - EUR (hedged) 0.80% 0.80% 0.80% 0.80% 0.80% 0.80% 0.80% 17-Jul-08JPM Global Growth C (acc) - USD 0.80% 0.80% 0.80% 0.80% 0.80% 0.80% 0.80% 13-Sep-04JPM Global Growth D (acc) - EUR 2.55% 2.55% 2.55% 2.55% 2.55% 2.55% 2.55% 27-Mar-15JPM Global Growth D (acc) - EUR (hedged) 2.55% 2.55% 2.55% 2.55% 2.55% 2.55% 2.55% 17-Jul-08JPM Global Growth D (acc) - USD 2.55% 2.55% 2.55% 2.55% 2.55% 2.55% 2.55% 13-Oct-00JPM Global Growth I (acc) - JPY 0.76% 0.76% 0.76% 0.76% 0.76% 0.76% 0.76% 30-Jun-14JPM Global Growth I (acc) - USD 0.76% 0.76% 0.76% 0.76% 0.76% 0.76% 0.76% 11-Jun-15JPM Global Growth T (acc) - EUR 2.55% 2.55% 2.55% 2.55% 2.55% 2.55% 2.55% 27-Mar-15JPM Global Growth X (acc) - EUR 0.15% 0.15% 0.15% 0.15% 0.15% 0.15% 0.15% 25-Jun-09JPM Global Growth X (acc) - USD 0.15% 0.15% 0.15% 0.15% 0.15% 0.15% 0.15% 21-Mar-06
(1) This Sub-Fund was renamed from JPMorgan Funds - Global Unconstrained Equity Fund to JPMorgan Funds - Global Growth Fund on 1 April 2021.* Share Class inactive as at the end of the year.+ Expense ratios are calculated in accordance with the guidelines dated 16 May 2008 issued by the Swiss Funds & Asset Management Association. The Total Expense Ratio (“TER”) represents the totaloperating costs as a percentage of the Sub-Fund’s average daily net assets. The total operating cost comprises investment management and advisory fees, custodian fees, taxe d’abonnement and otherexpenses, as summarised in the Combined Statement of Operations and Changes in Net Assets. Overdraft interest and Performance Fees are excluded from the calculation.
The capped expense ratios and total expense ratios for some Share Classes may have changed over the previous two periods. All details concerning these changes have been disclosed in previousperiods’ Financial Statements.
(a) These figures include Fee Waivers on Management and Advisory Fees or Operating and Administrative expenses, where applicable.(b) These figures include Performance Fees, where applicable.(c) These figures include i) Fee Waivers on Management and Advisory Fees or Operating and Administrative expenses and ii) Performance Fees, where applicable.
JPMorgan FundsAppendix - Unaudited Additional Disclosures (continued)
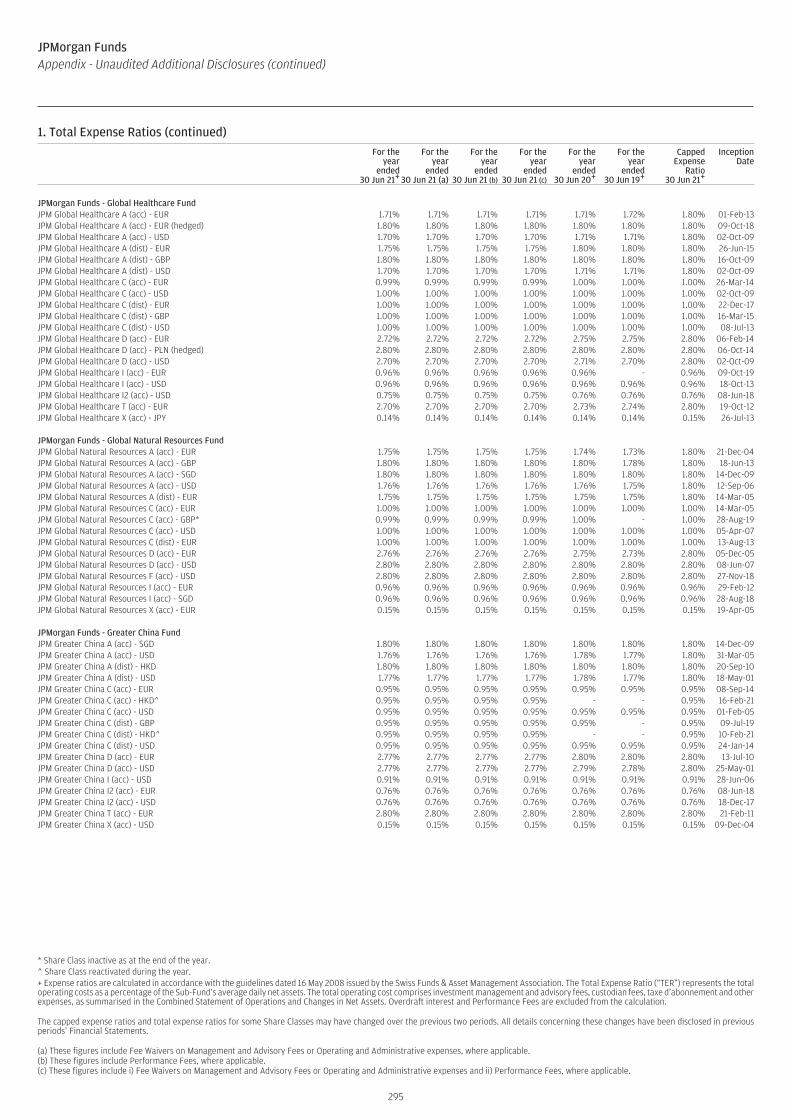
1. Total Expense Ratios (continued)For the
yearended
30 Jun 21+
For theyear
ended30 Jun 21 (a)
For theyear
ended30 Jun 21 (b)
For theyear
ended30 Jun 21 (c)
For theyear
ended30 Jun 20+
For theyear
ended30 Jun 19+
CappedExpense
Ratio30 Jun 21+
InceptionDate
JPMorgan Funds - Global Healthcare FundJPM Global Healthcare A (acc) - EUR 1.71% 1.71% 1.71% 1.71% 1.71% 1.72% 1.80% 01-Feb-13JPM Global Healthcare A (acc) - EUR (hedged) 1.80% 1.80% 1.80% 1.80% 1.80% 1.80% 1.80% 09-Oct-18JPM Global Healthcare A (acc) - USD 1.70% 1.70% 1.70% 1.70% 1.71% 1.71% 1.80% 02-Oct-09JPM Global Healthcare A (dist) - EUR 1.75% 1.75% 1.75% 1.75% 1.80% 1.80% 1.80% 26-Jun-15JPM Global Healthcare A (dist) - GBP 1.80% 1.80% 1.80% 1.80% 1.80% 1.80% 1.80% 16-Oct-09JPM Global Healthcare A (dist) - USD 1.70% 1.70% 1.70% 1.70% 1.71% 1.71% 1.80% 02-Oct-09JPM Global Healthcare C (acc) - EUR 0.99% 0.99% 0.99% 0.99% 1.00% 1.00% 1.00% 26-Mar-14JPM Global Healthcare C (acc) - USD 1.00% 1.00% 1.00% 1.00% 1.00% 1.00% 1.00% 02-Oct-09JPM Global Healthcare C (dist) - EUR 1.00% 1.00% 1.00% 1.00% 1.00% 1.00% 1.00% 22-Dec-17JPM Global Healthcare C (dist) - GBP 1.00% 1.00% 1.00% 1.00% 1.00% 1.00% 1.00% 16-Mar-15JPM Global Healthcare C (dist) - USD 1.00% 1.00% 1.00% 1.00% 1.00% 1.00% 1.00% 08-Jul-13JPM Global Healthcare D (acc) - EUR 2.72% 2.72% 2.72% 2.72% 2.75% 2.75% 2.80% 06-Feb-14JPM Global Healthcare D (acc) - PLN (hedged) 2.80% 2.80% 2.80% 2.80% 2.80% 2.80% 2.80% 06-Oct-14JPM Global Healthcare D (acc) - USD 2.70% 2.70% 2.70% 2.70% 2.71% 2.70% 2.80% 02-Oct-09JPM Global Healthcare I (acc) - EUR 0.96% 0.96% 0.96% 0.96% 0.96% - 0.96% 09-Oct-19JPM Global Healthcare I (acc) - USD 0.96% 0.96% 0.96% 0.96% 0.96% 0.96% 0.96% 18-Oct-13JPM Global Healthcare I2 (acc) - USD 0.75% 0.75% 0.75% 0.75% 0.76% 0.76% 0.76% 08-Jun-18JPM Global Healthcare T (acc) - EUR 2.70% 2.70% 2.70% 2.70% 2.73% 2.74% 2.80% 19-Oct-12JPM Global Healthcare X (acc) - JPY 0.14% 0.14% 0.14% 0.14% 0.14% 0.14% 0.15% 26-Jul-13
JPMorgan Funds - Global Natural Resources FundJPM Global Natural Resources A (acc) - EUR 1.75% 1.75% 1.75% 1.75% 1.74% 1.73% 1.80% 21-Dec-04JPM Global Natural Resources A (acc) - GBP 1.80% 1.80% 1.80% 1.80% 1.80% 1.78% 1.80% 18-Jun-13JPM Global Natural Resources A (acc) - SGD 1.80% 1.80% 1.80% 1.80% 1.80% 1.80% 1.80% 14-Dec-09JPM Global Natural Resources A (acc) - USD 1.76% 1.76% 1.76% 1.76% 1.76% 1.75% 1.80% 12-Sep-06JPM Global Natural Resources A (dist) - EUR 1.75% 1.75% 1.75% 1.75% 1.75% 1.75% 1.80% 14-Mar-05JPM Global Natural Resources C (acc) - EUR 1.00% 1.00% 1.00% 1.00% 1.00% 1.00% 1.00% 14-Mar-05JPM Global Natural Resources C (acc) - GBP* 0.99% 0.99% 0.99% 0.99% 1.00% - 1.00% 28-Aug-19JPM Global Natural Resources C (acc) - USD 1.00% 1.00% 1.00% 1.00% 1.00% 1.00% 1.00% 05-Apr-07JPM Global Natural Resources C (dist) - EUR 1.00% 1.00% 1.00% 1.00% 1.00% 1.00% 1.00% 13-Aug-13JPM Global Natural Resources D (acc) - EUR 2.76% 2.76% 2.76% 2.76% 2.75% 2.73% 2.80% 05-Dec-05JPM Global Natural Resources D (acc) - USD 2.80% 2.80% 2.80% 2.80% 2.80% 2.80% 2.80% 08-Jun-07JPM Global Natural Resources F (acc) - USD 2.80% 2.80% 2.80% 2.80% 2.80% 2.80% 2.80% 27-Nov-18JPM Global Natural Resources I (acc) - EUR 0.96% 0.96% 0.96% 0.96% 0.96% 0.96% 0.96% 29-Feb-12JPM Global Natural Resources I (acc) - SGD 0.96% 0.96% 0.96% 0.96% 0.96% 0.96% 0.96% 28-Aug-18JPM Global Natural Resources X (acc) - EUR 0.15% 0.15% 0.15% 0.15% 0.15% 0.15% 0.15% 19-Apr-05
JPMorgan Funds - Greater China FundJPM Greater China A (acc) - SGD 1.80% 1.80% 1.80% 1.80% 1.80% 1.80% 1.80% 14-Dec-09JPM Greater China A (acc) - USD 1.76% 1.76% 1.76% 1.76% 1.78% 1.77% 1.80% 31-Mar-05JPM Greater China A (dist) - HKD 1.80% 1.80% 1.80% 1.80% 1.80% 1.80% 1.80% 20-Sep-10JPM Greater China A (dist) - USD 1.77% 1.77% 1.77% 1.77% 1.78% 1.77% 1.80% 18-May-01JPM Greater China C (acc) - EUR 0.95% 0.95% 0.95% 0.95% 0.95% 0.95% 0.95% 08-Sep-14JPM Greater China C (acc) - HKD^ 0.95% 0.95% 0.95% 0.95% - - 0.95% 16-Feb-21JPM Greater China C (acc) - USD 0.95% 0.95% 0.95% 0.95% 0.95% 0.95% 0.95% 01-Feb-05JPM Greater China C (dist) - GBP 0.95% 0.95% 0.95% 0.95% 0.95% - 0.95% 09-Jul-19JPM Greater China C (dist) - HKD^ 0.95% 0.95% 0.95% 0.95% - - 0.95% 10-Feb-21JPM Greater China C (dist) - USD 0.95% 0.95% 0.95% 0.95% 0.95% 0.95% 0.95% 24-Jan-14JPM Greater China D (acc) - EUR 2.77% 2.77% 2.77% 2.77% 2.80% 2.80% 2.80% 13-Jul-10JPM Greater China D (acc) - USD 2.77% 2.77% 2.77% 2.77% 2.79% 2.78% 2.80% 25-May-01JPM Greater China I (acc) - USD 0.91% 0.91% 0.91% 0.91% 0.91% 0.91% 0.91% 28-Jun-06JPM Greater China I2 (acc) - EUR 0.76% 0.76% 0.76% 0.76% 0.76% 0.76% 0.76% 08-Jun-18JPM Greater China I2 (acc) - USD 0.76% 0.76% 0.76% 0.76% 0.76% 0.76% 0.76% 18-Dec-17JPM Greater China T (acc) - EUR 2.80% 2.80% 2.80% 2.80% 2.80% 2.80% 2.80% 21-Feb-11JPM Greater China X (acc) - USD 0.15% 0.15% 0.15% 0.15% 0.15% 0.15% 0.15% 09-Dec-04
* Share Class inactive as at the end of the year.^ Share Class reactivated during the year.+ Expense ratios are calculated in accordance with the guidelines dated 16 May 2008 issued by the Swiss Funds & Asset Management Association. The Total Expense Ratio (“TER”) represents the totaloperating costs as a percentage of the Sub-Fund’s average daily net assets. The total operating cost comprises investment management and advisory fees, custodian fees, taxe d’abonnement and otherexpenses, as summarised in the Combined Statement of Operations and Changes in Net Assets. Overdraft interest and Performance Fees are excluded from the calculation.
The capped expense ratios and total expense ratios for some Share Classes may have changed over the previous two periods. All details concerning these changes have been disclosed in previousperiods’ Financial Statements.
(a) These figures include Fee Waivers on Management and Advisory Fees or Operating and Administrative expenses, where applicable.(b) These figures include Performance Fees, where applicable.(c) These figures include i) Fee Waivers on Management and Advisory Fees or Operating and Administrative expenses and ii) Performance Fees, where applicable.
295
JPMorgan FundsAppendix - Unaudited Additional Disclosures (continued)
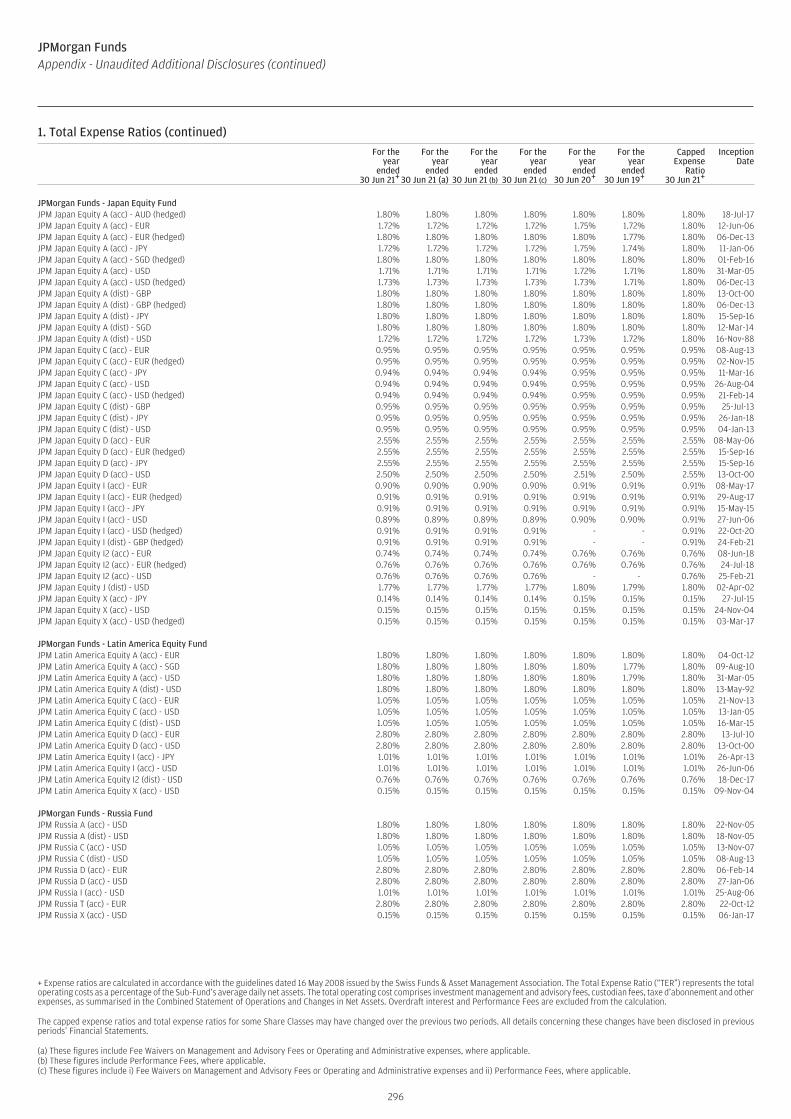
1. Total Expense Ratios (continued)For the
yearended
30 Jun 21+
For theyear
ended30 Jun 21 (a)
For theyear
ended30 Jun 21 (b)
For theyear
ended30 Jun 21 (c)
For theyear
ended30 Jun 20+
For theyear
ended30 Jun 19+
CappedExpense
Ratio30 Jun 21+
InceptionDate
JPMorgan Funds - Japan Equity FundJPM Japan Equity A (acc) - AUD (hedged) 1.80% 1.80% 1.80% 1.80% 1.80% 1.80% 1.80% 18-Jul-17JPM Japan Equity A (acc) - EUR 1.72% 1.72% 1.72% 1.72% 1.75% 1.72% 1.80% 12-Jun-06JPM Japan Equity A (acc) - EUR (hedged) 1.80% 1.80% 1.80% 1.80% 1.80% 1.77% 1.80% 06-Dec-13JPM Japan Equity A (acc) - JPY 1.72% 1.72% 1.72% 1.72% 1.75% 1.74% 1.80% 11-Jan-06JPM Japan Equity A (acc) - SGD (hedged) 1.80% 1.80% 1.80% 1.80% 1.80% 1.80% 1.80% 01-Feb-16JPM Japan Equity A (acc) - USD 1.71% 1.71% 1.71% 1.71% 1.72% 1.71% 1.80% 31-Mar-05JPM Japan Equity A (acc) - USD (hedged) 1.73% 1.73% 1.73% 1.73% 1.73% 1.71% 1.80% 06-Dec-13JPM Japan Equity A (dist) - GBP 1.80% 1.80% 1.80% 1.80% 1.80% 1.80% 1.80% 13-Oct-00JPM Japan Equity A (dist) - GBP (hedged) 1.80% 1.80% 1.80% 1.80% 1.80% 1.80% 1.80% 06-Dec-13JPM Japan Equity A (dist) - JPY 1.80% 1.80% 1.80% 1.80% 1.80% 1.80% 1.80% 15-Sep-16JPM Japan Equity A (dist) - SGD 1.80% 1.80% 1.80% 1.80% 1.80% 1.80% 1.80% 12-Mar-14JPM Japan Equity A (dist) - USD 1.72% 1.72% 1.72% 1.72% 1.73% 1.72% 1.80% 16-Nov-88JPM Japan Equity C (acc) - EUR 0.95% 0.95% 0.95% 0.95% 0.95% 0.95% 0.95% 08-Aug-13JPM Japan Equity C (acc) - EUR (hedged) 0.95% 0.95% 0.95% 0.95% 0.95% 0.95% 0.95% 02-Nov-15JPM Japan Equity C (acc) - JPY 0.94% 0.94% 0.94% 0.94% 0.95% 0.95% 0.95% 11-Mar-16JPM Japan Equity C (acc) - USD 0.94% 0.94% 0.94% 0.94% 0.95% 0.95% 0.95% 26-Aug-04JPM Japan Equity C (acc) - USD (hedged) 0.94% 0.94% 0.94% 0.94% 0.95% 0.95% 0.95% 21-Feb-14JPM Japan Equity C (dist) - GBP 0.95% 0.95% 0.95% 0.95% 0.95% 0.95% 0.95% 25-Jul-13JPM Japan Equity C (dist) - JPY 0.95% 0.95% 0.95% 0.95% 0.95% 0.95% 0.95% 26-Jan-18JPM Japan Equity C (dist) - USD 0.95% 0.95% 0.95% 0.95% 0.95% 0.95% 0.95% 04-Jan-13JPM Japan Equity D (acc) - EUR 2.55% 2.55% 2.55% 2.55% 2.55% 2.55% 2.55% 08-May-06JPM Japan Equity D (acc) - EUR (hedged) 2.55% 2.55% 2.55% 2.55% 2.55% 2.55% 2.55% 15-Sep-16JPM Japan Equity D (acc) - JPY 2.55% 2.55% 2.55% 2.55% 2.55% 2.55% 2.55% 15-Sep-16JPM Japan Equity D (acc) - USD 2.50% 2.50% 2.50% 2.50% 2.51% 2.50% 2.55% 13-Oct-00JPM Japan Equity I (acc) - EUR 0.90% 0.90% 0.90% 0.90% 0.91% 0.91% 0.91% 08-May-17JPM Japan Equity I (acc) - EUR (hedged) 0.91% 0.91% 0.91% 0.91% 0.91% 0.91% 0.91% 29-Aug-17JPM Japan Equity I (acc) - JPY 0.91% 0.91% 0.91% 0.91% 0.91% 0.91% 0.91% 15-May-15JPM Japan Equity I (acc) - USD 0.89% 0.89% 0.89% 0.89% 0.90% 0.90% 0.91% 27-Jun-06JPM Japan Equity I (acc) - USD (hedged) 0.91% 0.91% 0.91% 0.91% - - 0.91% 22-Oct-20JPM Japan Equity I (dist) - GBP (hedged) 0.91% 0.91% 0.91% 0.91% - - 0.91% 24-Feb-21JPM Japan Equity I2 (acc) - EUR 0.74% 0.74% 0.74% 0.74% 0.76% 0.76% 0.76% 08-Jun-18JPM Japan Equity I2 (acc) - EUR (hedged) 0.76% 0.76% 0.76% 0.76% 0.76% 0.76% 0.76% 24-Jul-18JPM Japan Equity I2 (acc) - USD 0.76% 0.76% 0.76% 0.76% - - 0.76% 25-Feb-21JPM Japan Equity J (dist) - USD 1.77% 1.77% 1.77% 1.77% 1.80% 1.79% 1.80% 02-Apr-02JPM Japan Equity X (acc) - JPY 0.14% 0.14% 0.14% 0.14% 0.15% 0.15% 0.15% 27-Jul-15JPM Japan Equity X (acc) - USD 0.15% 0.15% 0.15% 0.15% 0.15% 0.15% 0.15% 24-Nov-04JPM Japan Equity X (acc) - USD (hedged) 0.15% 0.15% 0.15% 0.15% 0.15% 0.15% 0.15% 03-Mar-17
JPMorgan Funds - Latin America Equity FundJPM Latin America Equity A (acc) - EUR 1.80% 1.80% 1.80% 1.80% 1.80% 1.80% 1.80% 04-Oct-12JPM Latin America Equity A (acc) - SGD 1.80% 1.80% 1.80% 1.80% 1.80% 1.77% 1.80% 09-Aug-10JPM Latin America Equity A (acc) - USD 1.80% 1.80% 1.80% 1.80% 1.80% 1.79% 1.80% 31-Mar-05JPM Latin America Equity A (dist) - USD 1.80% 1.80% 1.80% 1.80% 1.80% 1.80% 1.80% 13-May-92JPM Latin America Equity C (acc) - EUR 1.05% 1.05% 1.05% 1.05% 1.05% 1.05% 1.05% 21-Nov-13JPM Latin America Equity C (acc) - USD 1.05% 1.05% 1.05% 1.05% 1.05% 1.05% 1.05% 13-Jan-05JPM Latin America Equity C (dist) - USD 1.05% 1.05% 1.05% 1.05% 1.05% 1.05% 1.05% 16-Mar-15JPM Latin America Equity D (acc) - EUR 2.80% 2.80% 2.80% 2.80% 2.80% 2.80% 2.80% 13-Jul-10JPM Latin America Equity D (acc) - USD 2.80% 2.80% 2.80% 2.80% 2.80% 2.80% 2.80% 13-Oct-00JPM Latin America Equity I (acc) - JPY 1.01% 1.01% 1.01% 1.01% 1.01% 1.01% 1.01% 26-Apr-13JPM Latin America Equity I (acc) - USD 1.01% 1.01% 1.01% 1.01% 1.01% 1.01% 1.01% 26-Jun-06JPM Latin America Equity I2 (dist) - USD 0.76% 0.76% 0.76% 0.76% 0.76% 0.76% 0.76% 18-Dec-17JPM Latin America Equity X (acc) - USD 0.15% 0.15% 0.15% 0.15% 0.15% 0.15% 0.15% 09-Nov-04
JPMorgan Funds - Russia FundJPM Russia A (acc) - USD 1.80% 1.80% 1.80% 1.80% 1.80% 1.80% 1.80% 22-Nov-05JPM Russia A (dist) - USD 1.80% 1.80% 1.80% 1.80% 1.80% 1.80% 1.80% 18-Nov-05JPM Russia C (acc) - USD 1.05% 1.05% 1.05% 1.05% 1.05% 1.05% 1.05% 13-Nov-07JPM Russia C (dist) - USD 1.05% 1.05% 1.05% 1.05% 1.05% 1.05% 1.05% 08-Aug-13JPM Russia D (acc) - EUR 2.80% 2.80% 2.80% 2.80% 2.80% 2.80% 2.80% 06-Feb-14JPM Russia D (acc) - USD 2.80% 2.80% 2.80% 2.80% 2.80% 2.80% 2.80% 27-Jan-06JPM Russia I (acc) - USD 1.01% 1.01% 1.01% 1.01% 1.01% 1.01% 1.01% 25-Aug-06JPM Russia T (acc) - EUR 2.80% 2.80% 2.80% 2.80% 2.80% 2.80% 2.80% 22-Oct-12JPM Russia X (acc) - USD 0.15% 0.15% 0.15% 0.15% 0.15% 0.15% 0.15% 06-Jan-17
+ Expense ratios are calculated in accordance with the guidelines dated 16 May 2008 issued by the Swiss Funds & Asset Management Association. The Total Expense Ratio (“TER”) represents the totaloperating costs as a percentage of the Sub-Fund’s average daily net assets. The total operating cost comprises investment management and advisory fees, custodian fees, taxe d’abonnement and otherexpenses, as summarised in the Combined Statement of Operations and Changes in Net Assets. Overdraft interest and Performance Fees are excluded from the calculation.
The capped expense ratios and total expense ratios for some Share Classes may have changed over the previous two periods. All details concerning these changes have been disclosed in previousperiods’ Financial Statements.
(a) These figures include Fee Waivers on Management and Advisory Fees or Operating and Administrative expenses, where applicable.(b) These figures include Performance Fees, where applicable.(c) These figures include i) Fee Waivers on Management and Advisory Fees or Operating and Administrative expenses and ii) Performance Fees, where applicable.
296
JPMorgan FundsAppendix - Unaudited Additional Disclosures (continued)
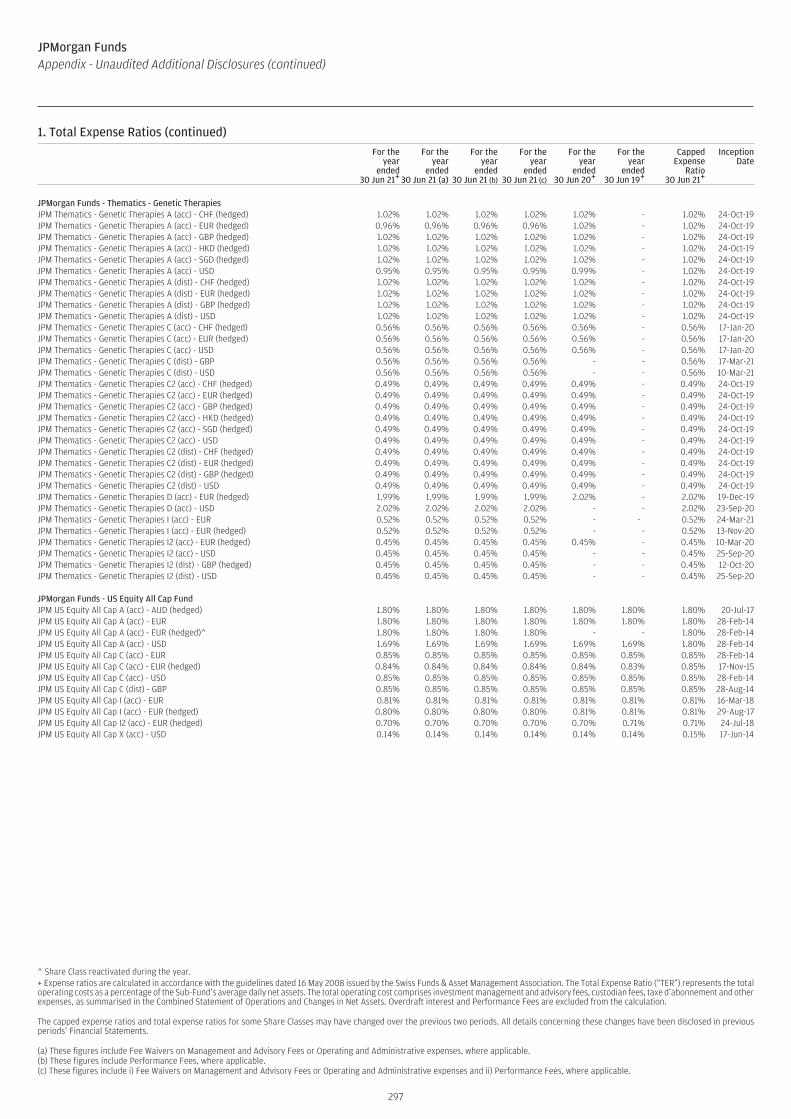
1. Total Expense Ratios (continued)For the
yearended
30 Jun 21+
For theyear
ended30 Jun 21 (a)
For theyear
ended30 Jun 21 (b)
For theyear
ended30 Jun 21 (c)
For theyear
ended30 Jun 20+
For theyear
ended30 Jun 19+
CappedExpense
Ratio30 Jun 21+
InceptionDate
JPMorgan Funds - Thematics - Genetic TherapiesJPM Thematics - Genetic Therapies A (acc) - CHF (hedged) 1.02% 1.02% 1.02% 1.02% 1.02% - 1.02% 24-Oct-19JPM Thematics - Genetic Therapies A (acc) - EUR (hedged) 0.96% 0.96% 0.96% 0.96% 1.02% - 1.02% 24-Oct-19JPM Thematics - Genetic Therapies A (acc) - GBP (hedged) 1.02% 1.02% 1.02% 1.02% 1.02% - 1.02% 24-Oct-19JPM Thematics - Genetic Therapies A (acc) - HKD (hedged) 1.02% 1.02% 1.02% 1.02% 1.02% - 1.02% 24-Oct-19JPM Thematics - Genetic Therapies A (acc) - SGD (hedged) 1.02% 1.02% 1.02% 1.02% 1.02% - 1.02% 24-Oct-19JPM Thematics - Genetic Therapies A (acc) - USD 0.95% 0.95% 0.95% 0.95% 0.99% - 1.02% 24-Oct-19JPM Thematics - Genetic Therapies A (dist) - CHF (hedged) 1.02% 1.02% 1.02% 1.02% 1.02% - 1.02% 24-Oct-19JPM Thematics - Genetic Therapies A (dist) - EUR (hedged) 1.02% 1.02% 1.02% 1.02% 1.02% - 1.02% 24-Oct-19JPM Thematics - Genetic Therapies A (dist) - GBP (hedged) 1.02% 1.02% 1.02% 1.02% 1.02% - 1.02% 24-Oct-19JPM Thematics - Genetic Therapies A (dist) - USD 1.02% 1.02% 1.02% 1.02% 1.02% - 1.02% 24-Oct-19JPM Thematics - Genetic Therapies C (acc) - CHF (hedged) 0.56% 0.56% 0.56% 0.56% 0.56% - 0.56% 17-Jan-20JPM Thematics - Genetic Therapies C (acc) - EUR (hedged) 0.56% 0.56% 0.56% 0.56% 0.56% - 0.56% 17-Jan-20JPM Thematics - Genetic Therapies C (acc) - USD 0.56% 0.56% 0.56% 0.56% 0.56% - 0.56% 17-Jan-20JPM Thematics - Genetic Therapies C (dist) - GBP 0.56% 0.56% 0.56% 0.56% - - 0.56% 17-Mar-21JPM Thematics - Genetic Therapies C (dist) - USD 0.56% 0.56% 0.56% 0.56% - - 0.56% 10-Mar-21JPM Thematics - Genetic Therapies C2 (acc) - CHF (hedged) 0.49% 0.49% 0.49% 0.49% 0.49% - 0.49% 24-Oct-19JPM Thematics - Genetic Therapies C2 (acc) - EUR (hedged) 0.49% 0.49% 0.49% 0.49% 0.49% - 0.49% 24-Oct-19JPM Thematics - Genetic Therapies C2 (acc) - GBP (hedged) 0.49% 0.49% 0.49% 0.49% 0.49% - 0.49% 24-Oct-19JPM Thematics - Genetic Therapies C2 (acc) - HKD (hedged) 0.49% 0.49% 0.49% 0.49% 0.49% - 0.49% 24-Oct-19JPM Thematics - Genetic Therapies C2 (acc) - SGD (hedged) 0.49% 0.49% 0.49% 0.49% 0.49% - 0.49% 24-Oct-19JPM Thematics - Genetic Therapies C2 (acc) - USD 0.49% 0.49% 0.49% 0.49% 0.49% - 0.49% 24-Oct-19JPM Thematics - Genetic Therapies C2 (dist) - CHF (hedged) 0.49% 0.49% 0.49% 0.49% 0.49% - 0.49% 24-Oct-19JPM Thematics - Genetic Therapies C2 (dist) - EUR (hedged) 0.49% 0.49% 0.49% 0.49% 0.49% - 0.49% 24-Oct-19JPM Thematics - Genetic Therapies C2 (dist) - GBP (hedged) 0.49% 0.49% 0.49% 0.49% 0.49% - 0.49% 24-Oct-19JPM Thematics - Genetic Therapies C2 (dist) - USD 0.49% 0.49% 0.49% 0.49% 0.49% - 0.49% 24-Oct-19JPM Thematics - Genetic Therapies D (acc) - EUR (hedged) 1.99% 1.99% 1.99% 1.99% 2.02% - 2.02% 19-Dec-19JPM Thematics - Genetic Therapies D (acc) - USD 2.02% 2.02% 2.02% 2.02% - - 2.02% 23-Sep-20JPM Thematics - Genetic Therapies I (acc) - EUR 0.52% 0.52% 0.52% 0.52% - - 0.52% 24-Mar-21JPM Thematics - Genetic Therapies I (acc) - EUR (hedged) 0.52% 0.52% 0.52% 0.52% - - 0.52% 13-Nov-20JPM Thematics - Genetic Therapies I2 (acc) - EUR (hedged) 0.45% 0.45% 0.45% 0.45% 0.45% - 0.45% 10-Mar-20JPM Thematics - Genetic Therapies I2 (acc) - USD 0.45% 0.45% 0.45% 0.45% - - 0.45% 25-Sep-20JPM Thematics - Genetic Therapies I2 (dist) - GBP (hedged) 0.45% 0.45% 0.45% 0.45% - - 0.45% 12-Oct-20JPM Thematics - Genetic Therapies I2 (dist) - USD 0.45% 0.45% 0.45% 0.45% - - 0.45% 25-Sep-20
JPMorgan Funds - US Equity All Cap FundJPM US Equity All Cap A (acc) - AUD (hedged) 1.80% 1.80% 1.80% 1.80% 1.80% 1.80% 1.80% 20-Jul-17JPM US Equity All Cap A (acc) - EUR 1.80% 1.80% 1.80% 1.80% 1.80% 1.80% 1.80% 28-Feb-14JPM US Equity All Cap A (acc) - EUR (hedged)^ 1.80% 1.80% 1.80% 1.80% - - 1.80% 28-Feb-14JPM US Equity All Cap A (acc) - USD 1.69% 1.69% 1.69% 1.69% 1.69% 1.69% 1.80% 28-Feb-14JPM US Equity All Cap C (acc) - EUR 0.85% 0.85% 0.85% 0.85% 0.85% 0.85% 0.85% 28-Feb-14JPM US Equity All Cap C (acc) - EUR (hedged) 0.84% 0.84% 0.84% 0.84% 0.84% 0.83% 0.85% 17-Nov-15JPM US Equity All Cap C (acc) - USD 0.85% 0.85% 0.85% 0.85% 0.85% 0.85% 0.85% 28-Feb-14JPM US Equity All Cap C (dist) - GBP 0.85% 0.85% 0.85% 0.85% 0.85% 0.85% 0.85% 28-Aug-14JPM US Equity All Cap I (acc) - EUR 0.81% 0.81% 0.81% 0.81% 0.81% 0.81% 0.81% 16-Mar-18JPM US Equity All Cap I (acc) - EUR (hedged) 0.80% 0.80% 0.80% 0.80% 0.81% 0.81% 0.81% 29-Aug-17JPM US Equity All Cap I2 (acc) - EUR (hedged) 0.70% 0.70% 0.70% 0.70% 0.70% 0.71% 0.71% 24-Jul-18JPM US Equity All Cap X (acc) - USD 0.14% 0.14% 0.14% 0.14% 0.14% 0.14% 0.15% 17-Jun-14
^ Share Class reactivated during the year.+ Expense ratios are calculated in accordance with the guidelines dated 16 May 2008 issued by the Swiss Funds & Asset Management Association. The Total Expense Ratio (“TER”) represents the totaloperating costs as a percentage of the Sub-Fund’s average daily net assets. The total operating cost comprises investment management and advisory fees, custodian fees, taxe d’abonnement and otherexpenses, as summarised in the Combined Statement of Operations and Changes in Net Assets. Overdraft interest and Performance Fees are excluded from the calculation.
The capped expense ratios and total expense ratios for some Share Classes may have changed over the previous two periods. All details concerning these changes have been disclosed in previousperiods’ Financial Statements.
(a) These figures include Fee Waivers on Management and Advisory Fees or Operating and Administrative expenses, where applicable.(b) These figures include Performance Fees, where applicable.(c) These figures include i) Fee Waivers on Management and Advisory Fees or Operating and Administrative expenses and ii) Performance Fees, where applicable.
297
JPMorgan FundsAppendix - Unaudited Additional Disclosures (continued)

1. Total Expense Ratios (continued)For the
yearended
30 Jun 21+
For theyear
ended30 Jun 21 (a)
For theyear
ended30 Jun 21 (b)
For theyear
ended30 Jun 21 (c)
For theyear
ended30 Jun 20+
For theyear
ended30 Jun 19+
CappedExpense
Ratio30 Jun 21+
InceptionDate
JPMorgan Funds - US Growth FundJPM US Growth A (acc) - EUR (hedged) 1.78% 1.78% 1.78% 1.78% 1.80% 1.80% 1.80% 15-Mar-07JPM US Growth A (acc) - USD 1.72% 1.72% 1.72% 1.72% 1.74% 1.73% 1.80% 31-Mar-05JPM US Growth A (dist) - GBP 1.80% 1.80% 1.80% 1.80% 1.80% 1.80% 1.80% 20-Oct-00JPM US Growth A (dist) - USD 1.79% 1.79% 1.79% 1.79% 1.80% 1.80% 1.80% 20-Oct-00JPM US Growth C (acc) - EUR (hedged) 0.80% 0.80% 0.80% 0.80% 0.80% 0.80% 0.80% 06-Dec-07JPM US Growth C (acc) - USD 0.80% 0.80% 0.80% 0.80% 0.80% 0.80% 0.80% 08-Mar-06JPM US Growth C (dist) - GBP 0.80% 0.80% 0.80% 0.80% 0.80% 0.80% 0.80% 21-Jan-11JPM US Growth C (dist) - USD 0.80% 0.80% 0.80% 0.80% 0.80% 0.80% 0.80% 14-Jul-11JPM US Growth D (acc) - EUR (hedged) 2.52% 2.52% 2.52% 2.52% 2.55% 2.55% 2.55% 15-Mar-07JPM US Growth D (acc) - USD 2.49% 2.49% 2.49% 2.49% 2.53% 2.54% 2.55% 20-Oct-00JPM US Growth I (acc) - JPY 0.76% 0.76% 0.76% 0.76% 0.76% 0.76% 0.76% 26-Apr-13JPM US Growth I (acc) - JPY (hedged) 0.76% 0.76% 0.76% 0.76% - - 0.76% 25-Jan-21JPM US Growth I (acc) - USD 0.76% 0.76% 0.76% 0.76% 0.76% 0.76% 0.76% 03-Oct-13JPM US Growth I (dist) - GBP 0.76% 0.76% 0.76% 0.76% 0.76% 0.76% 0.76% 10-Oct-13JPM US Growth I (dist) - USD 0.76% 0.76% 0.76% 0.76% 0.76% 0.76% 0.76% 10-Oct-13JPM US Growth I2 (acc) - USD 0.65% 0.65% 0.65% 0.65% 0.66% 0.66% 0.66% 18-Dec-17JPM US Growth T (acc) - EUR (hedged) 2.50% 2.50% 2.50% 2.50% 2.54% 2.55% 2.55% 22-Oct-12JPM US Growth X (acc) - USD 0.15% 0.15% 0.15% 0.15% 0.15% 0.15% 0.15% 22-Sep-05
JPMorgan Funds - US Smaller Companies FundJPM US Smaller Companies A (acc) - EUR (hedged) 1.80% 1.80% 1.80% 1.80% 1.80% 1.80% 1.80% 28-Feb-17JPM US Smaller Companies A (acc) - USD 1.72% 1.72% 1.72% 1.72% 1.71% 1.70% 1.80% 31-Mar-05JPM US Smaller Companies A (dist) - USD 1.74% 1.74% 1.74% 1.74% 1.74% 1.73% 1.80% 16-Nov-88JPM US Smaller Companies C (acc) - EUR (hedged) 0.95% 0.95% 0.95% 0.95% 0.95% 0.95% 0.95% 22-Dec-16JPM US Smaller Companies C (acc) - USD 0.95% 0.95% 0.95% 0.95% 0.95% 0.94% 0.95% 12-Apr-13JPM US Smaller Companies C (dist) - USD 0.94% 0.94% 0.94% 0.94% 0.95% 0.95% 0.95% 10-Oct-13JPM US Smaller Companies C2 (dist) - USD* 0.80% 0.80% 0.80% 0.80% 0.80% - 0.80% 26-Jun-20JPM US Smaller Companies D (acc) - USD 2.80% 2.80% 2.80% 2.80% 2.80% 2.80% 2.80% 13-Oct-00JPM US Smaller Companies I (acc) - EUR (hedged) 0.91% 0.91% 0.91% 0.91% 0.91% 0.91% 0.91% 05-Jun-14JPM US Smaller Companies I (acc) - USD 0.90% 0.90% 0.90% 0.90% 0.91% 0.91% 0.91% 31-Mar-14JPM US Smaller Companies I (dist) - USD 0.91% 0.91% 0.91% 0.91% 0.91% 0.91% 0.91% 31-Mar-14JPM US Smaller Companies X (acc) - USD 0.15% 0.15% 0.15% 0.15% 0.15% 0.15% 0.15% 09-Dec-04
JPMorgan Funds - US Technology FundJPM US Technology A (acc) - EUR 1.71% 1.71% 1.71% 1.71% 1.73% 1.75% 1.80% 11-Jun-10JPM US Technology A (acc) - HKD 1.80% 1.80% 1.80% 1.80% 1.80% 1.80% 1.80% 31-Oct-18JPM US Technology A (acc) - SGD 1.80% 1.80% 1.80% 1.80% 1.80% 1.80% 1.80% 18-Jan-12JPM US Technology A (acc) - USD 1.72% 1.72% 1.72% 1.72% 1.75% 1.74% 1.80% 31-Mar-05JPM US Technology A (dist) - GBP 1.80% 1.80% 1.80% 1.80% 1.80% 1.80% 1.80% 13-Oct-00JPM US Technology A (dist) - USD 1.73% 1.73% 1.73% 1.73% 1.75% 1.75% 1.80% 05-Dec-97JPM US Technology C (acc) - EUR 0.84% 0.84% 0.84% 0.84% 0.85% 0.85% 0.85% 16-Oct-15JPM US Technology C (acc) - USD 0.83% 0.83% 0.83% 0.83% 0.84% 0.85% 0.85% 20-Jun-08JPM US Technology C (dist) - GBP 0.85% 0.85% 0.85% 0.85% 0.85% - 0.85% 24-Sep-19JPM US Technology C (dist) - USD 0.85% 0.85% 0.85% 0.85% 0.85% 0.85% 0.85% 13-Dec-12JPM US Technology D (acc) - EUR 2.71% 2.71% 2.71% 2.71% 2.75% 2.80% 2.80% 11-Dec-09JPM US Technology D (acc) - USD 2.71% 2.71% 2.71% 2.71% 2.74% 2.75% 2.80% 13-Oct-00JPM US Technology F (acc) - USD 2.80% 2.80% 2.80% 2.80% - - 2.80% 25-Nov-20JPM US Technology I (acc) - EUR^* 0.81% 0.81% 0.81% 0.81% - - 0.81% 11-Oct-13JPM US Technology I (acc) - USD 0.80% 0.80% 0.80% 0.80% 0.81% 0.81% 0.81% 20-Sep-07JPM US Technology I2 (acc) - EUR 0.70% 0.70% 0.70% 0.70% 0.71% 0.71% 0.71% 25-Jan-19JPM US Technology I2 (acc) - USD 0.71% 0.71% 0.71% 0.71% 0.71% 0.71% 0.71% 08-Jun-18JPM US Technology X (acc) - USD 0.15% 0.15% 0.15% 0.15% 0.15% 0.15% 0.15% 08-Oct-07
* Share Class inactive as at the end of the year.^ Share Class reactivated during the year.+ Expense ratios are calculated in accordance with the guidelines dated 16 May 2008 issued by the Swiss Funds & Asset Management Association. The Total Expense Ratio (“TER”) represents the totaloperating costs as a percentage of the Sub-Fund’s average daily net assets. The total operating cost comprises investment management and advisory fees, custodian fees, taxe d’abonnement and otherexpenses, as summarised in the Combined Statement of Operations and Changes in Net Assets. Overdraft interest and Performance Fees are excluded from the calculation.
The capped expense ratios and total expense ratios for some Share Classes may have changed over the previous two periods. All details concerning these changes have been disclosed in previousperiods’ Financial Statements.
(a) These figures include Fee Waivers on Management and Advisory Fees or Operating and Administrative expenses, where applicable.(b) These figures include Performance Fees, where applicable.(c) These figures include i) Fee Waivers on Management and Advisory Fees or Operating and Administrative expenses and ii) Performance Fees, where applicable.
298
JPMorgan FundsAppendix - Unaudited Additional Disclosures (continued)

1. Total Expense Ratios (continued)For the
yearended
30 Jun 21+
For theyear
ended30 Jun 21 (a)
For theyear
ended30 Jun 21 (b)
For theyear
ended30 Jun 21 (c)
For theyear
ended30 Jun 20+
For theyear
ended30 Jun 19+
CappedExpense
Ratio30 Jun 21+
InceptionDate
JPMorgan Funds - US Value FundJPM US Value A (acc) - EUR 1.80% 1.80% 1.80% 1.80% 1.80% 1.80% 1.80% 09-Apr-15JPM US Value A (acc) - EUR (hedged) 1.71% 1.71% 1.71% 1.71% 1.72% 1.71% 1.80% 13-Nov-06JPM US Value A (acc) - SGD 1.80% 1.80% 1.80% 1.80% 1.80% 1.80% 1.80% 11-Jun-14JPM US Value A (acc) - USD 1.72% 1.72% 1.72% 1.72% 1.70% 1.69% 1.80% 31-Mar-05JPM US Value A (dist) - GBP 1.80% 1.80% 1.80% 1.80% 1.80% 1.80% 1.80% 20-Oct-00JPM US Value A (dist) - USD 1.72% 1.72% 1.72% 1.72% 1.70% 1.69% 1.80% 20-Oct-00JPM US Value C (acc) - EUR 0.80% 0.80% 0.80% 0.80% 0.80% 0.80% 0.80% 13-Aug-14JPM US Value C (acc) - EUR (hedged) 0.80% 0.80% 0.80% 0.80% 0.80% 0.80% 0.80% 07-Jan-09JPM US Value C (acc) - USD 0.79% 0.79% 0.79% 0.79% 0.78% 0.78% 0.80% 01-Sep-04JPM US Value C (dist) - GBP 0.80% 0.80% 0.80% 0.80% 0.80% 0.80% 0.80% 30-Jan-13JPM US Value C (dist) - USD 0.77% 0.77% 0.77% 0.77% 0.79% 0.79% 0.80% 12-Jun-13JPM US Value D (acc) - EUR (hedged) 2.51% 2.51% 2.51% 2.51% 2.50% 2.48% 2.55% 13-Nov-06JPM US Value D (acc) - USD 2.49% 2.49% 2.49% 2.49% 2.47% 2.46% 2.55% 20-Oct-00JPM US Value I (acc) - EUR 0.76% 0.76% 0.76% 0.76% 0.76% 0.75% 0.76% 23-Aug-17JPM US Value I (acc) - EUR (hedged) 0.76% 0.76% 0.76% 0.76% 0.76% 0.76% 0.76% 11-Oct-13JPM US Value I (acc) - USD 0.76% 0.76% 0.76% 0.76% 0.76% 0.76% 0.76% 05-May-11JPM US Value I (dist) - USD 0.76% 0.76% 0.76% 0.76% 0.76% 0.76% 0.76% 10-Oct-13JPM US Value I2 (acc) - EUR 0.65% 0.65% 0.65% 0.65% 0.65% 0.66% 0.66% 16-Aug-18JPM US Value I2 (acc) - EUR (hedged) 0.66% 0.66% 0.66% 0.66% 0.66% 0.66% 0.66% 18-Dec-17JPM US Value I2 (acc) - USD 0.66% 0.66% 0.66% 0.66% 0.66% 0.66% 0.66% 18-Dec-17JPM US Value X (acc) - EUR (hedged) 0.15% 0.15% 0.15% 0.15% 0.15% 0.15% 0.15% 17-Nov-11JPM US Value X (acc) - USD 0.15% 0.15% 0.15% 0.15% 0.14% 0.15% 0.15% 24-Nov-04JPM US Value X (dist) - USD 0.15% 0.15% 0.15% 0.15% - - 0.15% 02-Jun-21
JPMorgan Funds - Asia Pacific Income FundJPM Asia Pacific Income A (acc) - HKD 1.80% 1.80% 1.80% 1.80% 1.80% 1.80% 1.80% 06-Feb-13JPM Asia Pacific Income A (acc) - USD 1.78% 1.78% 1.78% 1.78% 1.78% 1.77% 1.80% 31-Mar-05JPM Asia Pacific Income A (dist) - USD 1.79% 1.79% 1.79% 1.79% 1.79% 1.79% 1.80% 15-Jun-01JPM Asia Pacific Income A (div) - SGD 1.80% 1.80% 1.80% 1.80% 1.80% 1.80% 1.80% 28-Sep-17JPM Asia Pacific Income A (irc) - AUD (hedged) 1.78% 1.78% 1.78% 1.78% 1.78% 1.78% 1.80% 07-Oct-13JPM Asia Pacific Income A (irc) - CAD (hedged) 1.80% 1.80% 1.80% 1.80% 1.80% 1.80% 1.80% 07-Oct-13JPM Asia Pacific Income A (irc) - EUR (hedged) 1.80% 1.80% 1.80% 1.80% 1.80% 1.80% 1.80% 27-Nov-13JPM Asia Pacific Income A (irc) - GBP (hedged) 1.80% 1.80% 1.80% 1.80% 1.80% 1.80% 1.80% 27-Nov-13JPM Asia Pacific Income A (irc) - NZD (hedged) 1.80% 1.80% 1.80% 1.80% 1.80% 1.80% 1.80% 27-Nov-13JPM Asia Pacific Income A (irc) - RMB (hedged) 1.80% 1.80% 1.80% 1.80% 1.80% 1.80% 1.80% 17-Mar-14JPM Asia Pacific Income A (mth) - HKD 1.78% 1.78% 1.78% 1.78% 1.78% 1.78% 1.80% 25-May-12JPM Asia Pacific Income A (mth) - SGD 1.80% 1.80% 1.80% 1.80% 1.80% 1.80% 1.80% 19-Sep-12JPM Asia Pacific Income A (mth) - SGD (hedged) 1.78% 1.78% 1.78% 1.78% 1.78% 1.78% 1.80% 14-Mar-13JPM Asia Pacific Income A (mth) - USD 1.77% 1.77% 1.77% 1.77% 1.77% 1.77% 1.80% 25-May-12JPM Asia Pacific Income C (acc) - HKD 0.95% 0.95% 0.95% 0.95% 0.95% 0.95% 0.95% 21-Sep-15JPM Asia Pacific Income C (acc) - USD 0.95% 0.95% 0.95% 0.95% 0.95% 0.95% 0.95% 10-Sep-07JPM Asia Pacific Income C (dist) - USD 0.95% 0.95% 0.95% 0.95% 0.95% 0.95% 0.95% 26-Sep-12JPM Asia Pacific Income C (irc) - AUD (hedged) 0.95% 0.95% 0.95% 0.95% 0.95% 0.95% 0.95% 25-Sep-15JPM Asia Pacific Income C (irc) - CAD (hedged)* 0.95% 0.95% 0.95% 0.95% 0.95% 0.95% 0.95% 25-Sep-15JPM Asia Pacific Income C (irc) - EUR (hedged) 0.95% 0.95% 0.95% 0.95% 0.95% 0.95% 0.95% 25-Sep-15JPM Asia Pacific Income C (irc) - GBP (hedged) 0.95% 0.95% 0.95% 0.95% 0.95% 0.95% 0.95% 25-Sep-15JPM Asia Pacific Income C (irc) - NZD (hedged) 0.95% 0.95% 0.95% 0.95% 0.95% 0.95% 0.95% 25-Sep-15JPM Asia Pacific Income C (irc) - RMB (hedged) 0.95% 0.95% 0.95% 0.95% 0.95% 0.95% 0.95% 25-Sep-15JPM Asia Pacific Income C (mth) - HKD 0.95% 0.95% 0.95% 0.95% 0.95% 0.95% 0.95% 05-Oct-15JPM Asia Pacific Income C (mth) - SGD (hedged) 0.95% 0.95% 0.95% 0.95% 0.95% 0.95% 0.95% 05-Oct-15JPM Asia Pacific Income C (mth) - USD 0.95% 0.95% 0.95% 0.95% 0.95% 0.95% 0.95% 05-Jul-12JPM Asia Pacific Income D (acc) - USD 2.23% 2.23% 2.23% 2.23% 2.24% 2.24% 2.25% 22-Jun-01JPM Asia Pacific Income D (mth) - EUR (hedged) 2.25% 2.25% 2.25% 2.25% 2.25% 2.25% 2.25% 23-Feb-17JPM Asia Pacific Income D (mth) - USD 2.25% 2.25% 2.25% 2.25% 2.25% 2.25% 2.25% 05-Jul-12JPM Asia Pacific Income F (irc) - AUD (hedged) 2.80% 2.80% 2.80% 2.80% 2.80% 2.80% 2.80% 27-Nov-18JPM Asia Pacific Income F (mth) - USD 2.80% 2.80% 2.80% 2.80% 2.80% 2.80% 2.80% 27-Nov-18JPM Asia Pacific Income I (acc) - USD 0.91% 0.91% 0.91% 0.91% 0.91% 0.91% 0.91% 05-Jun-15JPM Asia Pacific Income X (acc) - USD 0.15% 0.15% 0.15% 0.15% 0.15% 0.15% 0.15% 04-Feb-13
* Share Class inactive as at the end of the year.+ Expense ratios are calculated in accordance with the guidelines dated 16 May 2008 issued by the Swiss Funds & Asset Management Association. The Total Expense Ratio (“TER”) represents the totaloperating costs as a percentage of the Sub-Fund’s average daily net assets. The total operating cost comprises investment management and advisory fees, custodian fees, taxe d’abonnement and otherexpenses, as summarised in the Combined Statement of Operations and Changes in Net Assets. Overdraft interest and Performance Fees are excluded from the calculation.
The capped expense ratios and total expense ratios for some Share Classes may have changed over the previous two periods. All details concerning these changes have been disclosed in previousperiods’ Financial Statements.
(a) These figures include Fee Waivers on Management and Advisory Fees or Operating and Administrative expenses, where applicable.(b) These figures include Performance Fees, where applicable.(c) These figures include i) Fee Waivers on Management and Advisory Fees or Operating and Administrative expenses and ii) Performance Fees, where applicable.
299
JPMorgan FundsAppendix - Unaudited Additional Disclosures (continued)

1. Total Expense Ratios (continued)For the
yearended
30 Jun 21+
For theyear
ended30 Jun 21 (a)
For theyear
ended30 Jun 21 (b)
For theyear
ended30 Jun 21 (c)
For theyear
ended30 Jun 20+
For theyear
ended30 Jun 19+
CappedExpense
Ratio30 Jun 21+
InceptionDate
JPMorgan Funds - Aggregate Bond FundJPM Aggregate Bond A (acc) - EUR (hedged) 0.90% 0.90% 0.90% 0.90% 0.90% 1.00% 0.90% 09-Nov-09JPM Aggregate Bond A (acc) - USD 0.90% 0.90% 0.90% 0.90% 0.90% 1.00% 0.90% 09-Nov-09JPM Aggregate Bond A (dist) - EUR (hedged) 0.90% 0.90% 0.90% 0.90% 0.90% 1.00% 0.90% 19-Nov-13JPM Aggregate Bond C (acc) - EUR (hedged) 0.50% 0.50% 0.50% 0.50% 0.50% 0.55% 0.50% 18-Jan-13JPM Aggregate Bond C (acc) - SEK (hedged) 0.50% 0.50% 0.50% 0.50% - - 0.50% 20-May-21JPM Aggregate Bond C (acc) - USD 0.50% 0.50% 0.50% 0.50% 0.50% 0.55% 0.50% 18-Jan-13JPM Aggregate Bond C (dist) - EUR (hedged) 0.50% 0.50% 0.50% 0.50% 0.50% 0.55% 0.50% 23-Sep-11JPM Aggregate Bond C (dist) - GBP (hedged) 0.50% 0.50% 0.50% 0.50% 0.50% 0.55% 0.50% 31-Jan-13JPM Aggregate Bond C (dist) - USD 0.50% 0.50% 0.50% 0.50% 0.50% 0.55% 0.50% 25-Jan-13JPM Aggregate Bond D (acc) - EUR (hedged) 1.30% 1.30% 1.30% 1.30% 1.30% 1.40% 1.30% 19-Nov-13JPM Aggregate Bond D (acc) - USD 1.30% 1.30% 1.30% 1.30% 1.30% 1.40% 1.30% 19-Nov-13JPM Aggregate Bond I (acc) - EUR (hedged) 0.46% 0.46% 0.46% 0.46% 0.46% 0.51% 0.46% 09-Oct-13JPM Aggregate Bond I (acc) - USD 0.46% 0.46% 0.46% 0.46% 0.46% 0.51% 0.46% 09-Oct-13JPM Aggregate Bond I2 (acc) - EUR (hedged) 0.32% 0.32% 0.32% 0.32% 0.32% 0.43% 0.32% 18-Dec-17JPM Aggregate Bond I2 (acc) - USD 0.32% 0.32% 0.32% 0.32% 0.32% 0.43% 0.32% 18-Dec-17JPM Aggregate Bond I2 (dist) - EUR (hedged) 0.32% 0.32% 0.32% 0.32% 0.32% 0.43% 0.32% 18-Dec-17JPM Aggregate Bond I2 (dist) - GBP (hedged) 0.32% 0.32% 0.32% 0.32% 0.32% 0.43% 0.32% 18-Dec-17JPM Aggregate Bond I2 (dist) - USD 0.32% 0.32% 0.32% 0.32% 0.32% 0.43% 0.32% 18-Dec-17JPM Aggregate Bond X (acc) - CHF (hedged) 0.10% 0.10% 0.10% 0.10% - - 0.10% 02-Feb-21JPM Aggregate Bond X (acc) - EUR (hedged)* 0.10% 0.10% 0.10% 0.10% 0.10% 0.10% 0.10% 22-Jan-14JPM Aggregate Bond X (acc) - USD 0.10% 0.10% 0.10% 0.10% 0.10% 0.10% 0.10% 19-Nov-13
* Share Class inactive as at the end of the year.+ Expense ratios are calculated in accordance with the guidelines dated 16 May 2008 issued by the Swiss Funds & Asset Management Association. The Total Expense Ratio (“TER”) represents the totaloperating costs as a percentage of the Sub-Fund’s average daily net assets. The total operating cost comprises investment management and advisory fees, custodian fees, taxe d’abonnement and otherexpenses, as summarised in the Combined Statement of Operations and Changes in Net Assets. Overdraft interest and Performance Fees are excluded from the calculation.
The capped expense ratios and total expense ratios for some Share Classes may have changed over the previous two periods. All details concerning these changes have been disclosed in previousperiods’ Financial Statements.
(a) These figures include Fee Waivers on Management and Advisory Fees or Operating and Administrative expenses, where applicable.(b) These figures include Performance Fees, where applicable.(c) These figures include i) Fee Waivers on Management and Advisory Fees or Operating and Administrative expenses and ii) Performance Fees, where applicable.
300
JPMorgan FundsAppendix - Unaudited Additional Disclosures (continued)
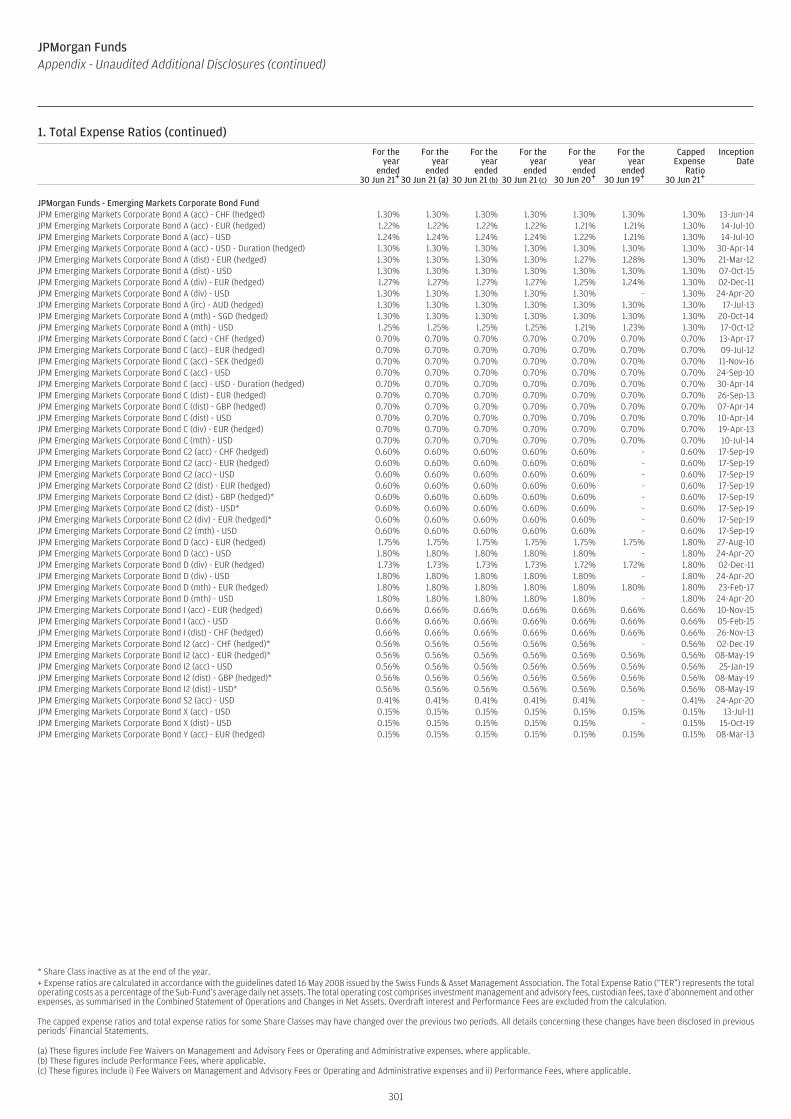
1. Total Expense Ratios (continued)For the
yearended
30 Jun 21+
For theyear
ended30 Jun 21 (a)
For theyear
ended30 Jun 21 (b)
For theyear
ended30 Jun 21 (c)
For theyear
ended30 Jun 20+
For theyear
ended30 Jun 19+
CappedExpense
Ratio30 Jun 21+
InceptionDate
JPMorgan Funds - Emerging Markets Corporate Bond FundJPM Emerging Markets Corporate Bond A (acc) - CHF (hedged) 1.30% 1.30% 1.30% 1.30% 1.30% 1.30% 1.30% 13-Jun-14JPM Emerging Markets Corporate Bond A (acc) - EUR (hedged) 1.22% 1.22% 1.22% 1.22% 1.21% 1.21% 1.30% 14-Jul-10JPM Emerging Markets Corporate Bond A (acc) - USD 1.24% 1.24% 1.24% 1.24% 1.22% 1.21% 1.30% 14-Jul-10JPM Emerging Markets Corporate Bond A (acc) - USD - Duration (hedged) 1.30% 1.30% 1.30% 1.30% 1.30% 1.30% 1.30% 30-Apr-14JPM Emerging Markets Corporate Bond A (dist) - EUR (hedged) 1.30% 1.30% 1.30% 1.30% 1.27% 1.28% 1.30% 21-Mar-12JPM Emerging Markets Corporate Bond A (dist) - USD 1.30% 1.30% 1.30% 1.30% 1.30% 1.30% 1.30% 07-Oct-15JPM Emerging Markets Corporate Bond A (div) - EUR (hedged) 1.27% 1.27% 1.27% 1.27% 1.25% 1.24% 1.30% 02-Dec-11JPM Emerging Markets Corporate Bond A (div) - USD 1.30% 1.30% 1.30% 1.30% 1.30% - 1.30% 24-Apr-20JPM Emerging Markets Corporate Bond A (irc) - AUD (hedged) 1.30% 1.30% 1.30% 1.30% 1.30% 1.30% 1.30% 17-Jul-13JPM Emerging Markets Corporate Bond A (mth) - SGD (hedged) 1.30% 1.30% 1.30% 1.30% 1.30% 1.30% 1.30% 20-Oct-14JPM Emerging Markets Corporate Bond A (mth) - USD 1.25% 1.25% 1.25% 1.25% 1.21% 1.23% 1.30% 17-Oct-12JPM Emerging Markets Corporate Bond C (acc) - CHF (hedged) 0.70% 0.70% 0.70% 0.70% 0.70% 0.70% 0.70% 13-Apr-17JPM Emerging Markets Corporate Bond C (acc) - EUR (hedged) 0.70% 0.70% 0.70% 0.70% 0.70% 0.70% 0.70% 09-Jul-12JPM Emerging Markets Corporate Bond C (acc) - SEK (hedged) 0.70% 0.70% 0.70% 0.70% 0.70% 0.70% 0.70% 11-Nov-16JPM Emerging Markets Corporate Bond C (acc) - USD 0.70% 0.70% 0.70% 0.70% 0.70% 0.70% 0.70% 24-Sep-10JPM Emerging Markets Corporate Bond C (acc) - USD - Duration (hedged) 0.70% 0.70% 0.70% 0.70% 0.70% 0.70% 0.70% 30-Apr-14JPM Emerging Markets Corporate Bond C (dist) - EUR (hedged) 0.70% 0.70% 0.70% 0.70% 0.70% 0.70% 0.70% 26-Sep-13JPM Emerging Markets Corporate Bond C (dist) - GBP (hedged) 0.70% 0.70% 0.70% 0.70% 0.70% 0.70% 0.70% 07-Apr-14JPM Emerging Markets Corporate Bond C (dist) - USD 0.70% 0.70% 0.70% 0.70% 0.70% 0.70% 0.70% 10-Apr-14JPM Emerging Markets Corporate Bond C (div) - EUR (hedged) 0.70% 0.70% 0.70% 0.70% 0.70% 0.70% 0.70% 19-Apr-13JPM Emerging Markets Corporate Bond C (mth) - USD 0.70% 0.70% 0.70% 0.70% 0.70% 0.70% 0.70% 10-Jul-14JPM Emerging Markets Corporate Bond C2 (acc) - CHF (hedged) 0.60% 0.60% 0.60% 0.60% 0.60% - 0.60% 17-Sep-19JPM Emerging Markets Corporate Bond C2 (acc) - EUR (hedged) 0.60% 0.60% 0.60% 0.60% 0.60% - 0.60% 17-Sep-19JPM Emerging Markets Corporate Bond C2 (acc) - USD 0.60% 0.60% 0.60% 0.60% 0.60% - 0.60% 17-Sep-19JPM Emerging Markets Corporate Bond C2 (dist) - EUR (hedged) 0.60% 0.60% 0.60% 0.60% 0.60% - 0.60% 17-Sep-19JPM Emerging Markets Corporate Bond C2 (dist) - GBP (hedged)* 0.60% 0.60% 0.60% 0.60% 0.60% - 0.60% 17-Sep-19JPM Emerging Markets Corporate Bond C2 (dist) - USD* 0.60% 0.60% 0.60% 0.60% 0.60% - 0.60% 17-Sep-19JPM Emerging Markets Corporate Bond C2 (div) - EUR (hedged)* 0.60% 0.60% 0.60% 0.60% 0.60% - 0.60% 17-Sep-19JPM Emerging Markets Corporate Bond C2 (mth) - USD 0.60% 0.60% 0.60% 0.60% 0.60% - 0.60% 17-Sep-19JPM Emerging Markets Corporate Bond D (acc) - EUR (hedged) 1.75% 1.75% 1.75% 1.75% 1.75% 1.75% 1.80% 27-Aug-10JPM Emerging Markets Corporate Bond D (acc) - USD 1.80% 1.80% 1.80% 1.80% 1.80% - 1.80% 24-Apr-20JPM Emerging Markets Corporate Bond D (div) - EUR (hedged) 1.73% 1.73% 1.73% 1.73% 1.72% 1.72% 1.80% 02-Dec-11JPM Emerging Markets Corporate Bond D (div) - USD 1.80% 1.80% 1.80% 1.80% 1.80% - 1.80% 24-Apr-20JPM Emerging Markets Corporate Bond D (mth) - EUR (hedged) 1.80% 1.80% 1.80% 1.80% 1.80% 1.80% 1.80% 23-Feb-17JPM Emerging Markets Corporate Bond D (mth) - USD 1.80% 1.80% 1.80% 1.80% 1.80% - 1.80% 24-Apr-20JPM Emerging Markets Corporate Bond I (acc) - EUR (hedged) 0.66% 0.66% 0.66% 0.66% 0.66% 0.66% 0.66% 10-Nov-15JPM Emerging Markets Corporate Bond I (acc) - USD 0.66% 0.66% 0.66% 0.66% 0.66% 0.66% 0.66% 05-Feb-15JPM Emerging Markets Corporate Bond I (dist) - CHF (hedged) 0.66% 0.66% 0.66% 0.66% 0.66% 0.66% 0.66% 26-Nov-13JPM Emerging Markets Corporate Bond I2 (acc) - CHF (hedged)* 0.56% 0.56% 0.56% 0.56% 0.56% - 0.56% 02-Dec-19JPM Emerging Markets Corporate Bond I2 (acc) - EUR (hedged)* 0.56% 0.56% 0.56% 0.56% 0.56% 0.56% 0.56% 08-May-19JPM Emerging Markets Corporate Bond I2 (acc) - USD 0.56% 0.56% 0.56% 0.56% 0.56% 0.56% 0.56% 25-Jan-19JPM Emerging Markets Corporate Bond I2 (dist) - GBP (hedged)* 0.56% 0.56% 0.56% 0.56% 0.56% 0.56% 0.56% 08-May-19JPM Emerging Markets Corporate Bond I2 (dist) - USD* 0.56% 0.56% 0.56% 0.56% 0.56% 0.56% 0.56% 08-May-19JPM Emerging Markets Corporate Bond S2 (acc) - USD 0.41% 0.41% 0.41% 0.41% 0.41% - 0.41% 24-Apr-20JPM Emerging Markets Corporate Bond X (acc) - USD 0.15% 0.15% 0.15% 0.15% 0.15% 0.15% 0.15% 13-Jul-11JPM Emerging Markets Corporate Bond X (dist) - USD 0.15% 0.15% 0.15% 0.15% 0.15% - 0.15% 15-Oct-19JPM Emerging Markets Corporate Bond Y (acc) - EUR (hedged) 0.15% 0.15% 0.15% 0.15% 0.15% 0.15% 0.15% 08-Mar-13
* Share Class inactive as at the end of the year.+ Expense ratios are calculated in accordance with the guidelines dated 16 May 2008 issued by the Swiss Funds & Asset Management Association. The Total Expense Ratio (“TER”) represents the totaloperating costs as a percentage of the Sub-Fund’s average daily net assets. The total operating cost comprises investment management and advisory fees, custodian fees, taxe d’abonnement and otherexpenses, as summarised in the Combined Statement of Operations and Changes in Net Assets. Overdraft interest and Performance Fees are excluded from the calculation.
The capped expense ratios and total expense ratios for some Share Classes may have changed over the previous two periods. All details concerning these changes have been disclosed in previousperiods’ Financial Statements.
(a) These figures include Fee Waivers on Management and Advisory Fees or Operating and Administrative expenses, where applicable.(b) These figures include Performance Fees, where applicable.(c) These figures include i) Fee Waivers on Management and Advisory Fees or Operating and Administrative expenses and ii) Performance Fees, where applicable.
301
JPMorgan FundsAppendix - Unaudited Additional Disclosures (continued)
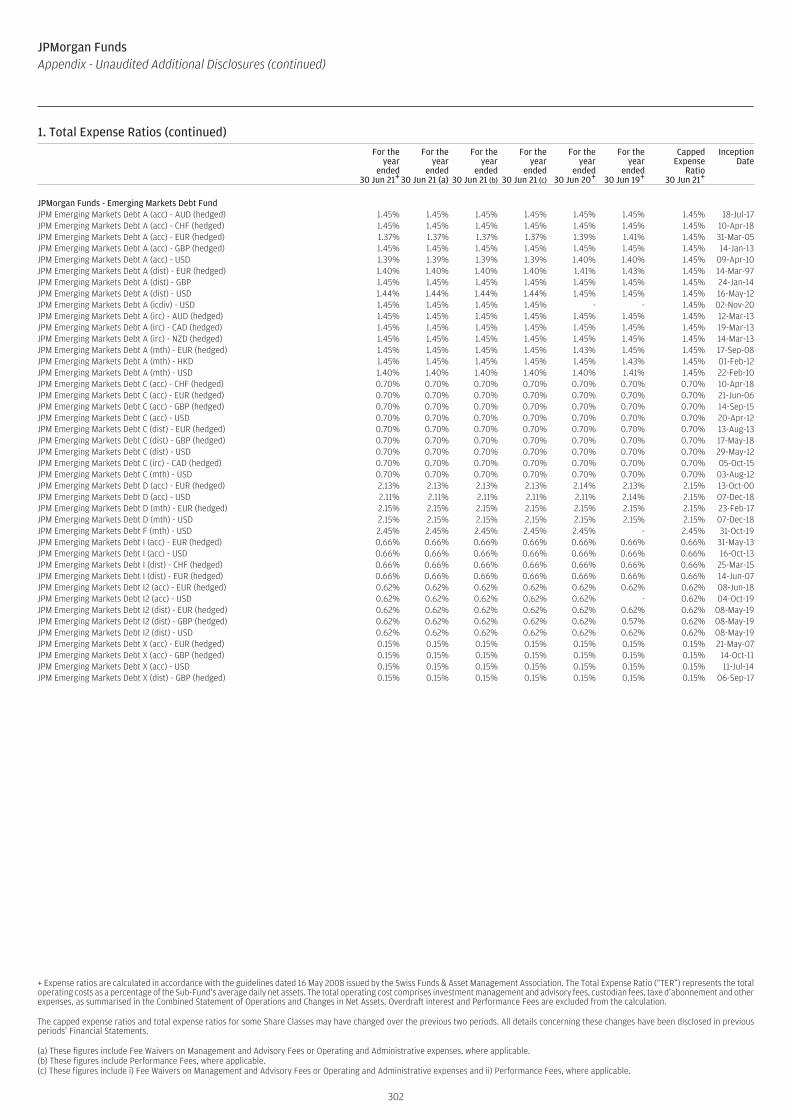
1. Total Expense Ratios (continued)For the
yearended
30 Jun 21+
For theyear
ended30 Jun 21 (a)
For theyear
ended30 Jun 21 (b)
For theyear
ended30 Jun 21 (c)
For theyear
ended30 Jun 20+
For theyear
ended30 Jun 19+
CappedExpense
Ratio30 Jun 21+
InceptionDate
JPMorgan Funds - Emerging Markets Debt FundJPM Emerging Markets Debt A (acc) - AUD (hedged) 1.45% 1.45% 1.45% 1.45% 1.45% 1.45% 1.45% 18-Jul-17JPM Emerging Markets Debt A (acc) - CHF (hedged) 1.45% 1.45% 1.45% 1.45% 1.45% 1.45% 1.45% 10-Apr-18JPM Emerging Markets Debt A (acc) - EUR (hedged) 1.37% 1.37% 1.37% 1.37% 1.39% 1.41% 1.45% 31-Mar-05JPM Emerging Markets Debt A (acc) - GBP (hedged) 1.45% 1.45% 1.45% 1.45% 1.45% 1.45% 1.45% 14-Jan-13JPM Emerging Markets Debt A (acc) - USD 1.39% 1.39% 1.39% 1.39% 1.40% 1.40% 1.45% 09-Apr-10JPM Emerging Markets Debt A (dist) - EUR (hedged) 1.40% 1.40% 1.40% 1.40% 1.41% 1.43% 1.45% 14-Mar-97JPM Emerging Markets Debt A (dist) - GBP 1.45% 1.45% 1.45% 1.45% 1.45% 1.45% 1.45% 24-Jan-14JPM Emerging Markets Debt A (dist) - USD 1.44% 1.44% 1.44% 1.44% 1.45% 1.45% 1.45% 16-May-12JPM Emerging Markets Debt A (icdiv) - USD 1.45% 1.45% 1.45% 1.45% - - 1.45% 02-Nov-20JPM Emerging Markets Debt A (irc) - AUD (hedged) 1.45% 1.45% 1.45% 1.45% 1.45% 1.45% 1.45% 12-Mar-13JPM Emerging Markets Debt A (irc) - CAD (hedged) 1.45% 1.45% 1.45% 1.45% 1.45% 1.45% 1.45% 19-Mar-13JPM Emerging Markets Debt A (irc) - NZD (hedged) 1.45% 1.45% 1.45% 1.45% 1.45% 1.45% 1.45% 14-Mar-13JPM Emerging Markets Debt A (mth) - EUR (hedged) 1.45% 1.45% 1.45% 1.45% 1.43% 1.45% 1.45% 17-Sep-08JPM Emerging Markets Debt A (mth) - HKD 1.45% 1.45% 1.45% 1.45% 1.45% 1.43% 1.45% 01-Feb-12JPM Emerging Markets Debt A (mth) - USD 1.40% 1.40% 1.40% 1.40% 1.40% 1.41% 1.45% 22-Feb-10JPM Emerging Markets Debt C (acc) - CHF (hedged) 0.70% 0.70% 0.70% 0.70% 0.70% 0.70% 0.70% 10-Apr-18JPM Emerging Markets Debt C (acc) - EUR (hedged) 0.70% 0.70% 0.70% 0.70% 0.70% 0.70% 0.70% 21-Jun-06JPM Emerging Markets Debt C (acc) - GBP (hedged) 0.70% 0.70% 0.70% 0.70% 0.70% 0.70% 0.70% 14-Sep-15JPM Emerging Markets Debt C (acc) - USD 0.70% 0.70% 0.70% 0.70% 0.70% 0.70% 0.70% 20-Apr-12JPM Emerging Markets Debt C (dist) - EUR (hedged) 0.70% 0.70% 0.70% 0.70% 0.70% 0.70% 0.70% 13-Aug-13JPM Emerging Markets Debt C (dist) - GBP (hedged) 0.70% 0.70% 0.70% 0.70% 0.70% 0.70% 0.70% 17-May-18JPM Emerging Markets Debt C (dist) - USD 0.70% 0.70% 0.70% 0.70% 0.70% 0.70% 0.70% 29-May-12JPM Emerging Markets Debt C (irc) - CAD (hedged) 0.70% 0.70% 0.70% 0.70% 0.70% 0.70% 0.70% 05-Oct-15JPM Emerging Markets Debt C (mth) - USD 0.70% 0.70% 0.70% 0.70% 0.70% 0.70% 0.70% 03-Aug-12JPM Emerging Markets Debt D (acc) - EUR (hedged) 2.13% 2.13% 2.13% 2.13% 2.14% 2.13% 2.15% 13-Oct-00JPM Emerging Markets Debt D (acc) - USD 2.11% 2.11% 2.11% 2.11% 2.11% 2.14% 2.15% 07-Dec-18JPM Emerging Markets Debt D (mth) - EUR (hedged) 2.15% 2.15% 2.15% 2.15% 2.15% 2.15% 2.15% 23-Feb-17JPM Emerging Markets Debt D (mth) - USD 2.15% 2.15% 2.15% 2.15% 2.15% 2.15% 2.15% 07-Dec-18JPM Emerging Markets Debt F (mth) - USD 2.45% 2.45% 2.45% 2.45% 2.45% - 2.45% 31-Oct-19JPM Emerging Markets Debt I (acc) - EUR (hedged) 0.66% 0.66% 0.66% 0.66% 0.66% 0.66% 0.66% 31-May-13JPM Emerging Markets Debt I (acc) - USD 0.66% 0.66% 0.66% 0.66% 0.66% 0.66% 0.66% 16-Oct-13JPM Emerging Markets Debt I (dist) - CHF (hedged) 0.66% 0.66% 0.66% 0.66% 0.66% 0.66% 0.66% 25-Mar-15JPM Emerging Markets Debt I (dist) - EUR (hedged) 0.66% 0.66% 0.66% 0.66% 0.66% 0.66% 0.66% 14-Jun-07JPM Emerging Markets Debt I2 (acc) - EUR (hedged) 0.62% 0.62% 0.62% 0.62% 0.62% 0.62% 0.62% 08-Jun-18JPM Emerging Markets Debt I2 (acc) - USD 0.62% 0.62% 0.62% 0.62% 0.62% - 0.62% 04-Oct-19JPM Emerging Markets Debt I2 (dist) - EUR (hedged) 0.62% 0.62% 0.62% 0.62% 0.62% 0.62% 0.62% 08-May-19JPM Emerging Markets Debt I2 (dist) - GBP (hedged) 0.62% 0.62% 0.62% 0.62% 0.62% 0.57% 0.62% 08-May-19JPM Emerging Markets Debt I2 (dist) - USD 0.62% 0.62% 0.62% 0.62% 0.62% 0.62% 0.62% 08-May-19JPM Emerging Markets Debt X (acc) - EUR (hedged) 0.15% 0.15% 0.15% 0.15% 0.15% 0.15% 0.15% 21-May-07JPM Emerging Markets Debt X (acc) - GBP (hedged) 0.15% 0.15% 0.15% 0.15% 0.15% 0.15% 0.15% 14-Oct-11JPM Emerging Markets Debt X (acc) - USD 0.15% 0.15% 0.15% 0.15% 0.15% 0.15% 0.15% 11-Jul-14JPM Emerging Markets Debt X (dist) - GBP (hedged) 0.15% 0.15% 0.15% 0.15% 0.15% 0.15% 0.15% 06-Sep-17
+ Expense ratios are calculated in accordance with the guidelines dated 16 May 2008 issued by the Swiss Funds & Asset Management Association. The Total Expense Ratio (“TER”) represents the totaloperating costs as a percentage of the Sub-Fund’s average daily net assets. The total operating cost comprises investment management and advisory fees, custodian fees, taxe d’abonnement and otherexpenses, as summarised in the Combined Statement of Operations and Changes in Net Assets. Overdraft interest and Performance Fees are excluded from the calculation.
The capped expense ratios and total expense ratios for some Share Classes may have changed over the previous two periods. All details concerning these changes have been disclosed in previousperiods’ Financial Statements.
(a) These figures include Fee Waivers on Management and Advisory Fees or Operating and Administrative expenses, where applicable.(b) These figures include Performance Fees, where applicable.(c) These figures include i) Fee Waivers on Management and Advisory Fees or Operating and Administrative expenses and ii) Performance Fees, where applicable.
302
JPMorgan FundsAppendix - Unaudited Additional Disclosures (continued)

1. Total Expense Ratios (continued)For the
yearended
30 Jun 21+
For theyear
ended30 Jun 21 (a)
For theyear
ended30 Jun 21 (b)
For theyear
ended30 Jun 21 (c)
For theyear
ended30 Jun 20+
For theyear
ended30 Jun 19+
CappedExpense
Ratio30 Jun 21+
InceptionDate
JPMorgan Funds - Emerging Markets Investment Grade Bond FundJPM Emerging Markets Investment Grade Bond A (acc) - CHF (hedged) 1.10% 1.10% 1.10% 1.10% 1.10% 1.10% 1.10% 09-Feb-12JPM Emerging Markets Investment Grade Bond A (acc) - EUR (hedged) 1.06% 1.06% 1.06% 1.06% 1.07% 1.10% 1.10% 29-Nov-10JPM Emerging Markets Investment Grade Bond A (acc) - USD 1.08% 1.08% 1.08% 1.08% 1.10% 1.10% 1.10% 29-Nov-10JPM Emerging Markets Investment Grade Bond A (dist) - EUR (hedged) 1.07% 1.07% 1.07% 1.07% 1.08% 1.08% 1.10% 29-Nov-10JPM Emerging Markets Investment Grade Bond A (dist) - USD 1.10% 1.10% 1.10% 1.10% 1.10% 1.10% 1.10% 08-Oct-12JPM Emerging Markets Investment Grade Bond A (mth) - SGD (hedged) 1.10% 1.10% 1.10% 1.10% - - 1.10% 06-Jul-20JPM Emerging Markets Investment Grade Bond A (mth) - USD 1.10% 1.10% 1.10% 1.10% 1.10% 1.10% 1.10% 15-Jan-14JPM Emerging Markets Investment Grade Bond C (acc) - EUR (hedged) 0.60% 0.60% 0.60% 0.60% - - 0.60% 07-Sep-20JPM Emerging Markets Investment Grade Bond C (acc) - USD 0.60% 0.60% 0.60% 0.60% 0.60% 0.60% 0.60% 11-Nov-11JPM Emerging Markets Investment Grade Bond C (dist) - EUR (hedged) 0.60% 0.60% 0.60% 0.60% 0.60% 0.60% 0.60% 08-Feb-11JPM Emerging Markets Investment Grade Bond C (dist) - USD 0.60% 0.60% 0.60% 0.60% - - 0.60% 20-Jul-20JPM Emerging Markets Investment Grade Bond C (mth) - USD 0.60% 0.60% 0.60% 0.60% - - 0.60% 09-Oct-20JPM Emerging Markets Investment Grade Bond D (acc) - EUR (hedged) 1.50% 1.50% 1.50% 1.50% 1.50% 1.50% 1.50% 29-Nov-10JPM Emerging Markets Investment Grade Bond D (acc) - USD 1.50% 1.50% 1.50% 1.50% 1.50% 1.50% 1.50% 17-Jul-12JPM Emerging Markets Investment Grade Bond I (acc) - CHF (hedged) 0.56% 0.56% 0.56% 0.56% 0.56% 0.56% 0.56% 11-Nov-11JPM Emerging Markets Investment Grade Bond I (acc) - EUR 0.56% 0.56% 0.56% 0.56% 0.56% 0.56% 0.56% 03-Sep-12JPM Emerging Markets Investment Grade Bond I (acc) - EUR (hedged) 0.56% 0.56% 0.56% 0.56% 0.56% 0.56% 0.56% 01-Mar-17JPM Emerging Markets Investment Grade Bond I (acc) - JPY (hedged) 0.56% 0.56% 0.56% 0.56% 0.56% 0.56% 0.56% 01-Aug-13JPM Emerging Markets Investment Grade Bond I (acc) - USD 0.56% 0.56% 0.56% 0.56% 0.56% 0.56% 0.56% 30-Sep-11JPM Emerging Markets Investment Grade Bond I (dist) - EUR (hedged) 0.56% 0.56% 0.56% 0.56% 0.56% 0.56% 0.56% 21-Mar-13JPM Emerging Markets Investment Grade Bond I2 (acc) - EUR (hedged) 0.48% 0.48% 0.48% 0.48% 0.48% 0.48% 0.48% 08-Jun-18JPM Emerging Markets Investment Grade Bond X (acc) - EUR (hedged) 0.15% 0.15% 0.15% 0.15% 0.15% 0.15% 0.15% 24-Feb-12JPM Emerging Markets Investment Grade Bond X (dist) - EUR (hedged)* 0.15% 0.15% 0.15% 0.15% 0.15% 0.15% 0.15% 06-Jan-14
JPMorgan Funds - Emerging Markets Local Currency Debt FundJPM Emerging Markets Local Currency Debt A (acc) - CZK 1.30% 1.30% 1.30% 1.30% 1.30% 1.30% 1.30% 16-Feb-18JPM Emerging Markets Local Currency Debt A (acc) - EUR 1.30% 1.30% 1.30% 1.30% 1.30% 1.30% 1.30% 24-Jan-08JPM Emerging Markets Local Currency Debt A (acc) - SGD 1.30% 1.30% 1.30% 1.30% 1.30% 1.30% 1.30% 21-Sep-11JPM Emerging Markets Local Currency Debt A (acc) - USD 1.30% 1.30% 1.30% 1.30% 1.30% 1.30% 1.30% 24-Jan-08JPM Emerging Markets Local Currency Debt A (dist) - EUR 1.30% 1.30% 1.30% 1.30% 1.30% 1.30% 1.30% 27-Dec-10JPM Emerging Markets Local Currency Debt A (dist) - GBP 1.30% 1.30% 1.30% 1.30% 1.30% 1.30% 1.30% 13-Aug-10JPM Emerging Markets Local Currency Debt A (div) - EUR 1.30% 1.30% 1.30% 1.30% 1.30% 1.30% 1.30% 23-May-12JPM Emerging Markets Local Currency Debt A (irc) - AUD (hedged) 1.30% 1.30% 1.30% 1.30% 1.30% 1.30% 1.30% 17-Jul-13JPM Emerging Markets Local Currency Debt A (mth) - HKD 1.30% 1.30% 1.30% 1.30% 1.30% 1.30% 1.30% 17-Oct-14JPM Emerging Markets Local Currency Debt A (mth) - USD 1.30% 1.30% 1.30% 1.30% 1.30% 1.30% 1.30% 20-Nov-09JPM Emerging Markets Local Currency Debt C (acc) - EUR 0.70% 0.70% 0.70% 0.70% 0.70% 0.70% 0.70% 01-Oct-10JPM Emerging Markets Local Currency Debt C (acc) - EUR (hedged) 0.70% 0.70% 0.70% 0.70% 0.70% 0.70% 0.70% 20-Jan-15JPM Emerging Markets Local Currency Debt C (acc) - USD 0.70% 0.70% 0.70% 0.70% 0.70% 0.70% 0.70% 09-Mar-10JPM Emerging Markets Local Currency Debt C (dist) - GBP 0.70% 0.70% 0.70% 0.70% 0.70% 0.70% 0.70% 26-Sep-12JPM Emerging Markets Local Currency Debt C (mth) - USD 0.70% 0.70% 0.70% 0.70% 0.70% 0.70% 0.70% 19-Jul-12JPM Emerging Markets Local Currency Debt D (acc) - EUR 1.80% 1.80% 1.80% 1.80% 1.80% 1.80% 1.80% 24-Jan-08JPM Emerging Markets Local Currency Debt D (acc) - USD 1.80% 1.80% 1.80% 1.80% 1.80% 1.80% 1.80% 24-Jan-08JPM Emerging Markets Local Currency Debt D (div) - EUR 1.80% 1.80% 1.80% 1.80% 1.80% 1.80% 1.80% 19-Apr-10JPM Emerging Markets Local Currency Debt D (mth) - EUR (hedged) 1.80% 1.80% 1.80% 1.80% 1.80% 1.80% 1.80% 24-Feb-17JPM Emerging Markets Local Currency Debt D (mth) - USD 1.80% 1.80% 1.80% 1.80% 1.80% 1.80% 1.80% 19-Jul-12JPM Emerging Markets Local Currency Debt F (irc) - AUD (hedged) 2.30% 2.30% 2.30% 2.30% 2.30% 2.30% 2.30% 27-Nov-18JPM Emerging Markets Local Currency Debt F (mth) - USD 2.30% 2.30% 2.30% 2.30% 2.30% 2.30% 2.30% 27-Nov-18JPM Emerging Markets Local Currency Debt I (acc) - EUR 0.66% 0.66% 0.66% 0.66% 0.66% 0.66% 0.66% 26-Oct-10JPM Emerging Markets Local Currency Debt I (acc) - EUR (hedged) 0.66% 0.66% 0.66% 0.66% 0.66% 0.66% 0.66% 15-Apr-13JPM Emerging Markets Local Currency Debt I (acc) - USD 0.66% 0.66% 0.66% 0.66% 0.66% 0.66% 0.66% 10-Aug-11JPM Emerging Markets Local Currency Debt I (dist) - EUR 0.66% 0.66% 0.66% 0.66% 0.66% 0.66% 0.66% 24-Nov-11JPM Emerging Markets Local Currency Debt I (dist) - EUR (hedged) 0.66% 0.66% 0.66% 0.66% 0.66% 0.66% 0.66% 24-May-18JPM Emerging Markets Local Currency Debt I2 (acc) - EUR 0.56% 0.56% 0.56% 0.56% 0.56% 0.56% 0.56% 08-Jun-18JPM Emerging Markets Local Currency Debt T (acc) - EUR 1.80% 1.80% 1.80% 1.80% 1.80% 1.80% 1.80% 03-Jun-11JPM Emerging Markets Local Currency Debt T (div) - EUR 1.80% 1.80% 1.80% 1.80% 1.80% 1.80% 1.80% 21-Feb-11JPM Emerging Markets Local Currency Debt X (acc) - USD 0.15% 0.15% 0.15% 0.15% 0.15% 0.15% 0.15% 01-Jul-08JPM Emerging Markets Local Currency Debt X (dist) - GBP 0.15% 0.15% 0.15% 0.15% 0.15% 0.15% 0.15% 02-Dec-16JPM Emerging Markets Local Currency Debt X (dist) - GBP (hedged) 0.15% 0.15% 0.15% 0.15% 0.15% 0.15% 0.15% 17-Aug-17JPM Emerging Markets Local Currency Debt Y (acc) - EUR 0.15% 0.15% 0.15% 0.15% 0.15% 0.15% 0.15% 08-Mar-13JPM Emerging Markets Local Currency Debt Y (acc) - GBP 0.15% 0.15% 0.15% 0.15% 0.15% 0.15% 0.15% 14-Oct-11
* Share Class inactive as at the end of the year.+ Expense ratios are calculated in accordance with the guidelines dated 16 May 2008 issued by the Swiss Funds & Asset Management Association. The Total Expense Ratio (“TER”) represents the totaloperating costs as a percentage of the Sub-Fund’s average daily net assets. The total operating cost comprises investment management and advisory fees, custodian fees, taxe d’abonnement and otherexpenses, as summarised in the Combined Statement of Operations and Changes in Net Assets. Overdraft interest and Performance Fees are excluded from the calculation.
The capped expense ratios and total expense ratios for some Share Classes may have changed over the previous two periods. All details concerning these changes have been disclosed in previousperiods’ Financial Statements.
(a) These figures include Fee Waivers on Management and Advisory Fees or Operating and Administrative expenses, where applicable.(b) These figures include Performance Fees, where applicable.(c) These figures include i) Fee Waivers on Management and Advisory Fees or Operating and Administrative expenses and ii) Performance Fees, where applicable.
303
JPMorgan FundsAppendix - Unaudited Additional Disclosures (continued)
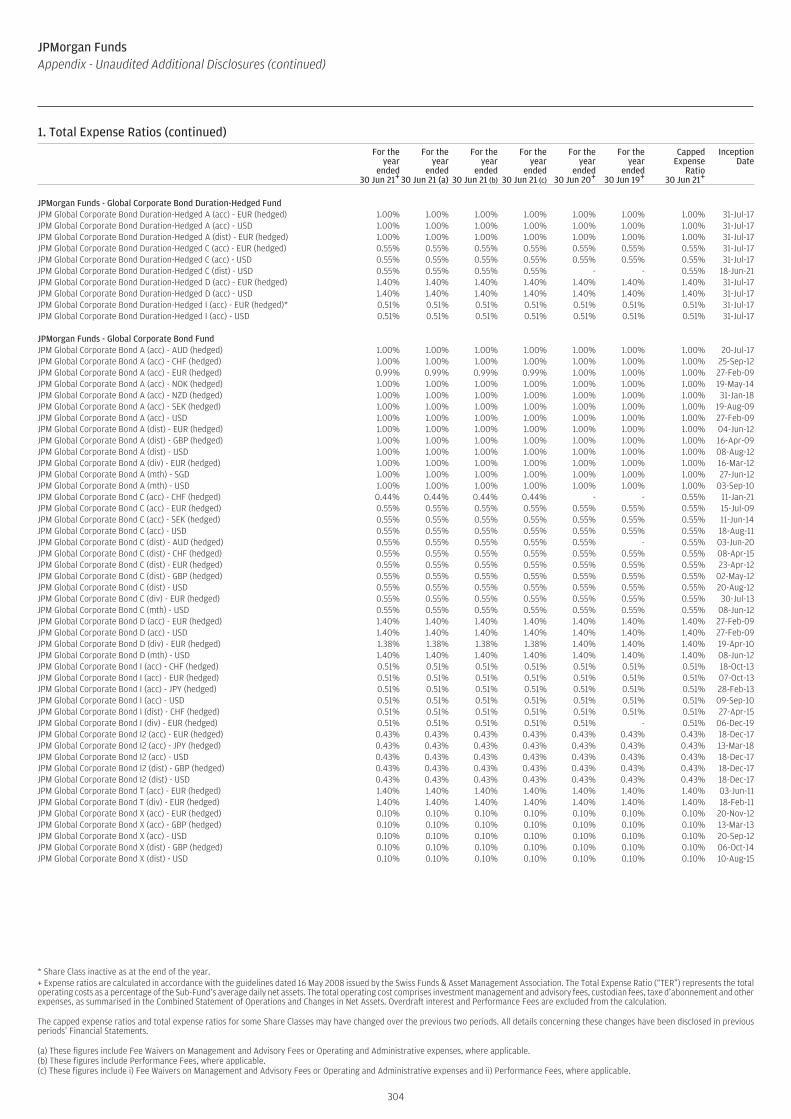
1. Total Expense Ratios (continued)For the
yearended
30 Jun 21+
For theyear
ended30 Jun 21 (a)
For theyear
ended30 Jun 21 (b)
For theyear
ended30 Jun 21 (c)
For theyear
ended30 Jun 20+
For theyear
ended30 Jun 19+
CappedExpense
Ratio30 Jun 21+
InceptionDate
JPMorgan Funds - Global Corporate Bond Duration-Hedged FundJPM Global Corporate Bond Duration-Hedged A (acc) - EUR (hedged) 1.00% 1.00% 1.00% 1.00% 1.00% 1.00% 1.00% 31-Jul-17JPM Global Corporate Bond Duration-Hedged A (acc) - USD 1.00% 1.00% 1.00% 1.00% 1.00% 1.00% 1.00% 31-Jul-17JPM Global Corporate Bond Duration-Hedged A (dist) - EUR (hedged) 1.00% 1.00% 1.00% 1.00% 1.00% 1.00% 1.00% 31-Jul-17JPM Global Corporate Bond Duration-Hedged C (acc) - EUR (hedged) 0.55% 0.55% 0.55% 0.55% 0.55% 0.55% 0.55% 31-Jul-17JPM Global Corporate Bond Duration-Hedged C (acc) - USD 0.55% 0.55% 0.55% 0.55% 0.55% 0.55% 0.55% 31-Jul-17JPM Global Corporate Bond Duration-Hedged C (dist) - USD 0.55% 0.55% 0.55% 0.55% - - 0.55% 18-Jun-21JPM Global Corporate Bond Duration-Hedged D (acc) - EUR (hedged) 1.40% 1.40% 1.40% 1.40% 1.40% 1.40% 1.40% 31-Jul-17JPM Global Corporate Bond Duration-Hedged D (acc) - USD 1.40% 1.40% 1.40% 1.40% 1.40% 1.40% 1.40% 31-Jul-17JPM Global Corporate Bond Duration-Hedged I (acc) - EUR (hedged)* 0.51% 0.51% 0.51% 0.51% 0.51% 0.51% 0.51% 31-Jul-17JPM Global Corporate Bond Duration-Hedged I (acc) - USD 0.51% 0.51% 0.51% 0.51% 0.51% 0.51% 0.51% 31-Jul-17
JPMorgan Funds - Global Corporate Bond FundJPM Global Corporate Bond A (acc) - AUD (hedged) 1.00% 1.00% 1.00% 1.00% 1.00% 1.00% 1.00% 20-Jul-17JPM Global Corporate Bond A (acc) - CHF (hedged) 1.00% 1.00% 1.00% 1.00% 1.00% 1.00% 1.00% 25-Sep-12JPM Global Corporate Bond A (acc) - EUR (hedged) 0.99% 0.99% 0.99% 0.99% 1.00% 1.00% 1.00% 27-Feb-09JPM Global Corporate Bond A (acc) - NOK (hedged) 1.00% 1.00% 1.00% 1.00% 1.00% 1.00% 1.00% 19-May-14JPM Global Corporate Bond A (acc) - NZD (hedged) 1.00% 1.00% 1.00% 1.00% 1.00% 1.00% 1.00% 31-Jan-18JPM Global Corporate Bond A (acc) - SEK (hedged) 1.00% 1.00% 1.00% 1.00% 1.00% 1.00% 1.00% 19-Aug-09JPM Global Corporate Bond A (acc) - USD 1.00% 1.00% 1.00% 1.00% 1.00% 1.00% 1.00% 27-Feb-09JPM Global Corporate Bond A (dist) - EUR (hedged) 1.00% 1.00% 1.00% 1.00% 1.00% 1.00% 1.00% 04-Jun-12JPM Global Corporate Bond A (dist) - GBP (hedged) 1.00% 1.00% 1.00% 1.00% 1.00% 1.00% 1.00% 16-Apr-09JPM Global Corporate Bond A (dist) - USD 1.00% 1.00% 1.00% 1.00% 1.00% 1.00% 1.00% 08-Aug-12JPM Global Corporate Bond A (div) - EUR (hedged) 1.00% 1.00% 1.00% 1.00% 1.00% 1.00% 1.00% 16-Mar-12JPM Global Corporate Bond A (mth) - SGD 1.00% 1.00% 1.00% 1.00% 1.00% 1.00% 1.00% 27-Jun-12JPM Global Corporate Bond A (mth) - USD 1.00% 1.00% 1.00% 1.00% 1.00% 1.00% 1.00% 03-Sep-10JPM Global Corporate Bond C (acc) - CHF (hedged) 0.44% 0.44% 0.44% 0.44% - - 0.55% 11-Jan-21JPM Global Corporate Bond C (acc) - EUR (hedged) 0.55% 0.55% 0.55% 0.55% 0.55% 0.55% 0.55% 15-Jul-09JPM Global Corporate Bond C (acc) - SEK (hedged) 0.55% 0.55% 0.55% 0.55% 0.55% 0.55% 0.55% 11-Jun-14JPM Global Corporate Bond C (acc) - USD 0.55% 0.55% 0.55% 0.55% 0.55% 0.55% 0.55% 18-Aug-11JPM Global Corporate Bond C (dist) - AUD (hedged) 0.55% 0.55% 0.55% 0.55% 0.55% - 0.55% 03-Jun-20JPM Global Corporate Bond C (dist) - CHF (hedged) 0.55% 0.55% 0.55% 0.55% 0.55% 0.55% 0.55% 08-Apr-15JPM Global Corporate Bond C (dist) - EUR (hedged) 0.55% 0.55% 0.55% 0.55% 0.55% 0.55% 0.55% 23-Apr-12JPM Global Corporate Bond C (dist) - GBP (hedged) 0.55% 0.55% 0.55% 0.55% 0.55% 0.55% 0.55% 02-May-12JPM Global Corporate Bond C (dist) - USD 0.55% 0.55% 0.55% 0.55% 0.55% 0.55% 0.55% 20-Aug-12JPM Global Corporate Bond C (div) - EUR (hedged) 0.55% 0.55% 0.55% 0.55% 0.55% 0.55% 0.55% 30-Jul-13JPM Global Corporate Bond C (mth) - USD 0.55% 0.55% 0.55% 0.55% 0.55% 0.55% 0.55% 08-Jun-12JPM Global Corporate Bond D (acc) - EUR (hedged) 1.40% 1.40% 1.40% 1.40% 1.40% 1.40% 1.40% 27-Feb-09JPM Global Corporate Bond D (acc) - USD 1.40% 1.40% 1.40% 1.40% 1.40% 1.40% 1.40% 27-Feb-09JPM Global Corporate Bond D (div) - EUR (hedged) 1.38% 1.38% 1.38% 1.38% 1.40% 1.40% 1.40% 19-Apr-10JPM Global Corporate Bond D (mth) - USD 1.40% 1.40% 1.40% 1.40% 1.40% 1.40% 1.40% 08-Jun-12JPM Global Corporate Bond I (acc) - CHF (hedged) 0.51% 0.51% 0.51% 0.51% 0.51% 0.51% 0.51% 18-Oct-13JPM Global Corporate Bond I (acc) - EUR (hedged) 0.51% 0.51% 0.51% 0.51% 0.51% 0.51% 0.51% 07-Oct-13JPM Global Corporate Bond I (acc) - JPY (hedged) 0.51% 0.51% 0.51% 0.51% 0.51% 0.51% 0.51% 28-Feb-13JPM Global Corporate Bond I (acc) - USD 0.51% 0.51% 0.51% 0.51% 0.51% 0.51% 0.51% 09-Sep-10JPM Global Corporate Bond I (dist) - CHF (hedged) 0.51% 0.51% 0.51% 0.51% 0.51% 0.51% 0.51% 27-Apr-15JPM Global Corporate Bond I (div) - EUR (hedged) 0.51% 0.51% 0.51% 0.51% 0.51% - 0.51% 06-Dec-19JPM Global Corporate Bond I2 (acc) - EUR (hedged) 0.43% 0.43% 0.43% 0.43% 0.43% 0.43% 0.43% 18-Dec-17JPM Global Corporate Bond I2 (acc) - JPY (hedged) 0.43% 0.43% 0.43% 0.43% 0.43% 0.43% 0.43% 13-Mar-18JPM Global Corporate Bond I2 (acc) - USD 0.43% 0.43% 0.43% 0.43% 0.43% 0.43% 0.43% 18-Dec-17JPM Global Corporate Bond I2 (dist) - GBP (hedged) 0.43% 0.43% 0.43% 0.43% 0.43% 0.43% 0.43% 18-Dec-17JPM Global Corporate Bond I2 (dist) - USD 0.43% 0.43% 0.43% 0.43% 0.43% 0.43% 0.43% 18-Dec-17JPM Global Corporate Bond T (acc) - EUR (hedged) 1.40% 1.40% 1.40% 1.40% 1.40% 1.40% 1.40% 03-Jun-11JPM Global Corporate Bond T (div) - EUR (hedged) 1.40% 1.40% 1.40% 1.40% 1.40% 1.40% 1.40% 18-Feb-11JPM Global Corporate Bond X (acc) - EUR (hedged) 0.10% 0.10% 0.10% 0.10% 0.10% 0.10% 0.10% 20-Nov-12JPM Global Corporate Bond X (acc) - GBP (hedged) 0.10% 0.10% 0.10% 0.10% 0.10% 0.10% 0.10% 13-Mar-13JPM Global Corporate Bond X (acc) - USD 0.10% 0.10% 0.10% 0.10% 0.10% 0.10% 0.10% 20-Sep-12JPM Global Corporate Bond X (dist) - GBP (hedged) 0.10% 0.10% 0.10% 0.10% 0.10% 0.10% 0.10% 06-Oct-14JPM Global Corporate Bond X (dist) - USD 0.10% 0.10% 0.10% 0.10% 0.10% 0.10% 0.10% 10-Aug-15
* Share Class inactive as at the end of the year.+ Expense ratios are calculated in accordance with the guidelines dated 16 May 2008 issued by the Swiss Funds & Asset Management Association. The Total Expense Ratio (“TER”) represents the totaloperating costs as a percentage of the Sub-Fund’s average daily net assets. The total operating cost comprises investment management and advisory fees, custodian fees, taxe d’abonnement and otherexpenses, as summarised in the Combined Statement of Operations and Changes in Net Assets. Overdraft interest and Performance Fees are excluded from the calculation.
The capped expense ratios and total expense ratios for some Share Classes may have changed over the previous two periods. All details concerning these changes have been disclosed in previousperiods’ Financial Statements.
(a) These figures include Fee Waivers on Management and Advisory Fees or Operating and Administrative expenses, where applicable.(b) These figures include Performance Fees, where applicable.(c) These figures include i) Fee Waivers on Management and Advisory Fees or Operating and Administrative expenses and ii) Performance Fees, where applicable.
304
JPMorgan FundsAppendix - Unaudited Additional Disclosures (continued)

1. Total Expense Ratios (continued)For the
yearended
30 Jun 21+
For theyear
ended30 Jun 21 (a)
For theyear
ended30 Jun 21 (b)
For theyear
ended30 Jun 21 (c)
For theyear
ended30 Jun 20+
For theyear
ended30 Jun 19+
CappedExpense
Ratio30 Jun 21+
InceptionDate
JPMorgan Funds - Global Government Bond FundJPM Global Government Bond A (acc) - AUD (hedged) 0.60% 0.60% 0.60% 0.60% 0.60% 0.60% 0.60% 01-Dec-17JPM Global Government Bond A (acc) - EUR 0.60% 0.60% 0.60% 0.60% 0.60% 0.60% 0.60% 20-Feb-09JPM Global Government Bond A (acc) - USD (hedged) 0.60% 0.60% 0.60% 0.60% 0.60% 0.60% 0.60% 20-Feb-09JPM Global Government Bond C (acc) - EUR 0.40% 0.40% 0.40% 0.40% 0.40% 0.40% 0.40% 26-Feb-09JPM Global Government Bond C (acc) - USD (hedged) 0.40% 0.40% 0.40% 0.40% 0.40% 0.40% 0.40% 23-Oct-15JPM Global Government Bond C (dist) - GBP (hedged)* 0.40% 0.40% 0.40% 0.40% 0.40% 0.40% 0.40% 29-Jan-13JPM Global Government Bond D (acc) - EUR 0.80% 0.80% 0.80% 0.80% 0.80% 0.80% 0.80% 20-Feb-09JPM Global Government Bond I (acc) - EUR 0.36% 0.36% 0.36% 0.36% 0.36% 0.36% 0.36% 04-Oct-13JPM Global Government Bond I (acc) - USD (hedged) 0.36% 0.36% 0.36% 0.36% 0.36% 0.36% 0.36% 15-Oct-13JPM Global Government Bond I (dist) - EUR^ 0.36% 0.36% 0.36% 0.36% 0.36% 0.36% 0.36% 10-Jun-19JPM Global Government Bond I2 (acc) - EUR 0.29% 0.29% 0.29% 0.29% 0.29% 0.29% 0.29% 18-Dec-17JPM Global Government Bond I2 (acc) - USD (hedged) 0.29% 0.29% 0.29% 0.29% 0.29% - 0.29% 18-Dec-17JPM Global Government Bond X (acc) - EUR 0.10% 0.10% 0.10% 0.10% 0.10% 0.10% 0.10% 04-Mar-09JPM Global Government Bond X (acc) - USD (hedged) 0.10% 0.10% 0.10% 0.10% 0.10% 0.10% 0.10% 30-Mar-16JPM Global Government Bond X (dist) - GBP (hedged) 0.10% 0.10% 0.10% 0.10% 0.10% 0.10% 0.10% 25-May-16
JPMorgan Funds - Global Short Duration Bond FundJPM Global Short Duration Bond A (acc) - EUR (hedged) 0.80% 0.80% 0.80% 0.80% 0.80% 0.80% 0.80% 21-Jul-09JPM Global Short Duration Bond A (acc) - USD 0.80% 0.80% 0.80% 0.80% 0.80% 0.80% 0.80% 21-Jul-09JPM Global Short Duration Bond C (acc) - EUR (hedged) 0.45% 0.45% 0.45% 0.45% 0.45% 0.45% 0.45% 19-Apr-11JPM Global Short Duration Bond C (acc) - USD 0.45% 0.45% 0.45% 0.45% 0.45% 0.45% 0.45% 07-May-10JPM Global Short Duration Bond C (dist) - GBP (hedged) 0.45% 0.45% 0.45% 0.45% 0.45% 0.45% 0.45% 28-Oct-09JPM Global Short Duration Bond C (dist) - USD 0.45% 0.45% 0.45% 0.45% 0.45% 0.45% 0.45% 17-Jun-13JPM Global Short Duration Bond D (acc) - EUR (hedged) 1.10% 1.10% 1.10% 1.10% 1.10% 1.10% 1.10% 28-Dec-10JPM Global Short Duration Bond I (acc) - EUR (hedged) 0.41% 0.41% 0.41% 0.41% 0.41% 0.41% 0.41% 16-Oct-13JPM Global Short Duration Bond I (acc) - USD 0.41% 0.41% 0.41% 0.41% 0.41% 0.41% 0.41% 07-Oct-13JPM Global Short Duration Bond I (dist) - GBP (hedged) 0.41% 0.41% 0.41% 0.41% 0.41% 0.41% 0.41% 16-Oct-13JPM Global Short Duration Bond I2 (acc) - EUR (hedged) 0.29% 0.29% 0.29% 0.29% 0.29% 0.35% 0.29% 18-Dec-17JPM Global Short Duration Bond I2 (acc) - USD 0.29% 0.29% 0.29% 0.29% 0.29% 0.35% 0.29% 18-Dec-17JPM Global Short Duration Bond I2 (dist) - EUR (hedged)* 0.29% 0.29% 0.29% 0.29% 0.29% 0.35% 0.29% 18-Dec-17JPM Global Short Duration Bond I2 (dist) - USD 0.29% 0.29% 0.29% 0.29% 0.29% 0.35% 0.29% 18-Dec-17JPM Global Short Duration Bond X (acc) - EUR (hedged) 0.10% 0.10% 0.10% 0.10% 0.10% 0.10% 0.10% 05-Aug-11JPM Global Short Duration Bond X (acc) - USD^ 0.10% 0.10% 0.10% 0.10% 0.10% 0.10% 0.10% 30-Sep-10
* Share Class inactive as at the end of the year.^ Share Class reactivated during the year.+ Expense ratios are calculated in accordance with the guidelines dated 16 May 2008 issued by the Swiss Funds & Asset Management Association. The Total Expense Ratio (“TER”) represents the totaloperating costs as a percentage of the Sub-Fund’s average daily net assets. The total operating cost comprises investment management and advisory fees, custodian fees, taxe d’abonnement and otherexpenses, as summarised in the Combined Statement of Operations and Changes in Net Assets. Overdraft interest and Performance Fees are excluded from the calculation.
The capped expense ratios and total expense ratios for some Share Classes may have changed over the previous two periods. All details concerning these changes have been disclosed in previousperiods’ Financial Statements.
(a) These figures include Fee Waivers on Management and Advisory Fees or Operating and Administrative expenses, where applicable.(b) These figures include Performance Fees, where applicable.(c) These figures include i) Fee Waivers on Management and Advisory Fees or Operating and Administrative expenses and ii) Performance Fees, where applicable.
305
JPMorgan FundsAppendix - Unaudited Additional Disclosures (continued)
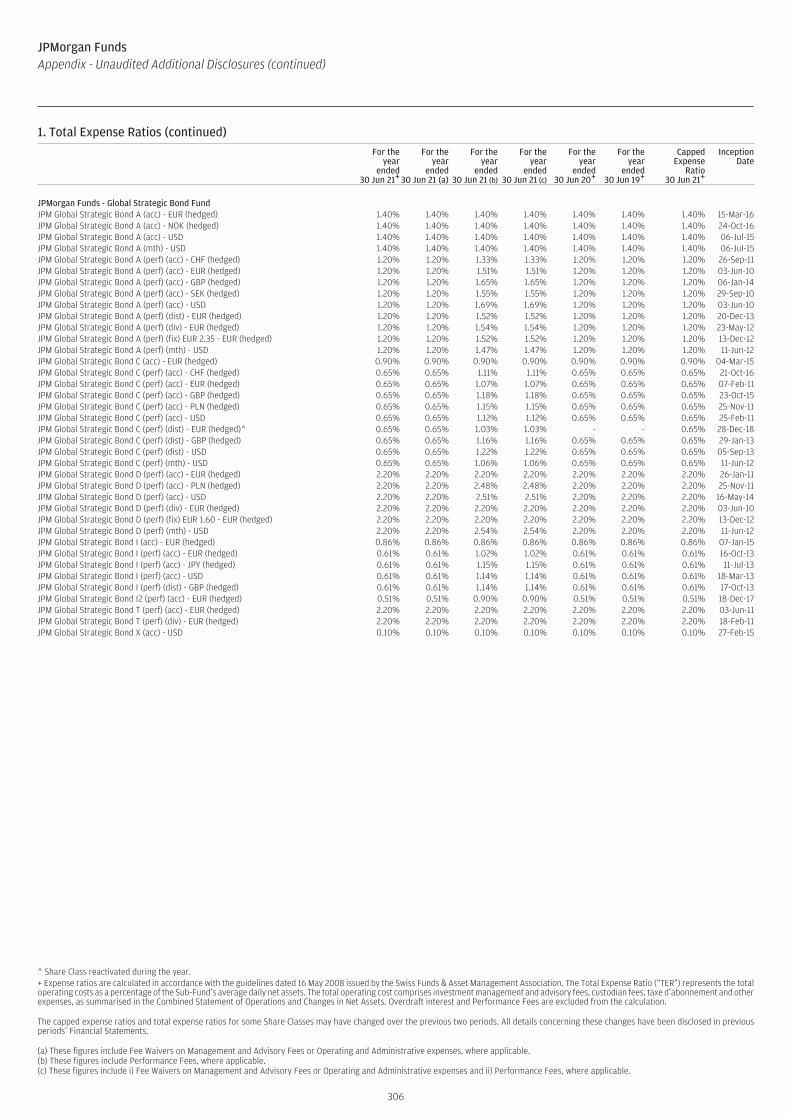
1. Total Expense Ratios (continued)For the
yearended
30 Jun 21+
For theyear
ended30 Jun 21 (a)
For theyear
ended30 Jun 21 (b)
For theyear
ended30 Jun 21 (c)
For theyear
ended30 Jun 20+
For theyear
ended30 Jun 19+
CappedExpense
Ratio30 Jun 21+
InceptionDate
JPMorgan Funds - Global Strategic Bond FundJPM Global Strategic Bond A (acc) - EUR (hedged) 1.40% 1.40% 1.40% 1.40% 1.40% 1.40% 1.40% 15-Mar-16JPM Global Strategic Bond A (acc) - NOK (hedged) 1.40% 1.40% 1.40% 1.40% 1.40% 1.40% 1.40% 24-Oct-16JPM Global Strategic Bond A (acc) - USD 1.40% 1.40% 1.40% 1.40% 1.40% 1.40% 1.40% 06-Jul-15JPM Global Strategic Bond A (mth) - USD 1.40% 1.40% 1.40% 1.40% 1.40% 1.40% 1.40% 06-Jul-15JPM Global Strategic Bond A (perf) (acc) - CHF (hedged) 1.20% 1.20% 1.33% 1.33% 1.20% 1.20% 1.20% 26-Sep-11JPM Global Strategic Bond A (perf) (acc) - EUR (hedged) 1.20% 1.20% 1.51% 1.51% 1.20% 1.20% 1.20% 03-Jun-10JPM Global Strategic Bond A (perf) (acc) - GBP (hedged) 1.20% 1.20% 1.65% 1.65% 1.20% 1.20% 1.20% 06-Jan-14JPM Global Strategic Bond A (perf) (acc) - SEK (hedged) 1.20% 1.20% 1.55% 1.55% 1.20% 1.20% 1.20% 29-Sep-10JPM Global Strategic Bond A (perf) (acc) - USD 1.20% 1.20% 1.69% 1.69% 1.20% 1.20% 1.20% 03-Jun-10JPM Global Strategic Bond A (perf) (dist) - EUR (hedged) 1.20% 1.20% 1.52% 1.52% 1.20% 1.20% 1.20% 20-Dec-13JPM Global Strategic Bond A (perf) (div) - EUR (hedged) 1.20% 1.20% 1.54% 1.54% 1.20% 1.20% 1.20% 23-May-12JPM Global Strategic Bond A (perf) (fix) EUR 2.35 - EUR (hedged) 1.20% 1.20% 1.52% 1.52% 1.20% 1.20% 1.20% 13-Dec-12JPM Global Strategic Bond A (perf) (mth) - USD 1.20% 1.20% 1.47% 1.47% 1.20% 1.20% 1.20% 11-Jun-12JPM Global Strategic Bond C (acc) - EUR (hedged) 0.90% 0.90% 0.90% 0.90% 0.90% 0.90% 0.90% 04-Mar-15JPM Global Strategic Bond C (perf) (acc) - CHF (hedged) 0.65% 0.65% 1.11% 1.11% 0.65% 0.65% 0.65% 21-Oct-16JPM Global Strategic Bond C (perf) (acc) - EUR (hedged) 0.65% 0.65% 1.07% 1.07% 0.65% 0.65% 0.65% 07-Feb-11JPM Global Strategic Bond C (perf) (acc) - GBP (hedged) 0.65% 0.65% 1.18% 1.18% 0.65% 0.65% 0.65% 23-Oct-15JPM Global Strategic Bond C (perf) (acc) - PLN (hedged) 0.65% 0.65% 1.15% 1.15% 0.65% 0.65% 0.65% 25-Nov-11JPM Global Strategic Bond C (perf) (acc) - USD 0.65% 0.65% 1.12% 1.12% 0.65% 0.65% 0.65% 25-Feb-11JPM Global Strategic Bond C (perf) (dist) - EUR (hedged)^ 0.65% 0.65% 1.03% 1.03% - - 0.65% 28-Dec-18JPM Global Strategic Bond C (perf) (dist) - GBP (hedged) 0.65% 0.65% 1.16% 1.16% 0.65% 0.65% 0.65% 29-Jan-13JPM Global Strategic Bond C (perf) (dist) - USD 0.65% 0.65% 1.22% 1.22% 0.65% 0.65% 0.65% 05-Sep-13JPM Global Strategic Bond C (perf) (mth) - USD 0.65% 0.65% 1.06% 1.06% 0.65% 0.65% 0.65% 11-Jun-12JPM Global Strategic Bond D (perf) (acc) - EUR (hedged) 2.20% 2.20% 2.20% 2.20% 2.20% 2.20% 2.20% 26-Jan-11JPM Global Strategic Bond D (perf) (acc) - PLN (hedged) 2.20% 2.20% 2.48% 2.48% 2.20% 2.20% 2.20% 25-Nov-11JPM Global Strategic Bond D (perf) (acc) - USD 2.20% 2.20% 2.51% 2.51% 2.20% 2.20% 2.20% 16-May-14JPM Global Strategic Bond D (perf) (div) - EUR (hedged) 2.20% 2.20% 2.20% 2.20% 2.20% 2.20% 2.20% 03-Jun-10JPM Global Strategic Bond D (perf) (fix) EUR 1.60 - EUR (hedged) 2.20% 2.20% 2.20% 2.20% 2.20% 2.20% 2.20% 13-Dec-12JPM Global Strategic Bond D (perf) (mth) - USD 2.20% 2.20% 2.54% 2.54% 2.20% 2.20% 2.20% 11-Jun-12JPM Global Strategic Bond I (acc) - EUR (hedged) 0.86% 0.86% 0.86% 0.86% 0.86% 0.86% 0.86% 07-Jan-15JPM Global Strategic Bond I (perf) (acc) - EUR (hedged) 0.61% 0.61% 1.02% 1.02% 0.61% 0.61% 0.61% 16-Oct-13JPM Global Strategic Bond I (perf) (acc) - JPY (hedged) 0.61% 0.61% 1.15% 1.15% 0.61% 0.61% 0.61% 11-Jul-13JPM Global Strategic Bond I (perf) (acc) - USD 0.61% 0.61% 1.14% 1.14% 0.61% 0.61% 0.61% 18-Mar-13JPM Global Strategic Bond I (perf) (dist) - GBP (hedged) 0.61% 0.61% 1.14% 1.14% 0.61% 0.61% 0.61% 17-Oct-13JPM Global Strategic Bond I2 (perf) (acc) - EUR (hedged) 0.51% 0.51% 0.90% 0.90% 0.51% 0.51% 0.51% 18-Dec-17JPM Global Strategic Bond T (perf) (acc) - EUR (hedged) 2.20% 2.20% 2.20% 2.20% 2.20% 2.20% 2.20% 03-Jun-11JPM Global Strategic Bond T (perf) (div) - EUR (hedged) 2.20% 2.20% 2.20% 2.20% 2.20% 2.20% 2.20% 18-Feb-11JPM Global Strategic Bond X (acc) - USD 0.10% 0.10% 0.10% 0.10% 0.10% 0.10% 0.10% 27-Feb-15
^ Share Class reactivated during the year.+ Expense ratios are calculated in accordance with the guidelines dated 16 May 2008 issued by the Swiss Funds & Asset Management Association. The Total Expense Ratio (“TER”) represents the totaloperating costs as a percentage of the Sub-Fund’s average daily net assets. The total operating cost comprises investment management and advisory fees, custodian fees, taxe d’abonnement and otherexpenses, as summarised in the Combined Statement of Operations and Changes in Net Assets. Overdraft interest and Performance Fees are excluded from the calculation.
The capped expense ratios and total expense ratios for some Share Classes may have changed over the previous two periods. All details concerning these changes have been disclosed in previousperiods’ Financial Statements.
(a) These figures include Fee Waivers on Management and Advisory Fees or Operating and Administrative expenses, where applicable.(b) These figures include Performance Fees, where applicable.(c) These figures include i) Fee Waivers on Management and Advisory Fees or Operating and Administrative expenses and ii) Performance Fees, where applicable.
306
JPMorgan FundsAppendix - Unaudited Additional Disclosures (continued)
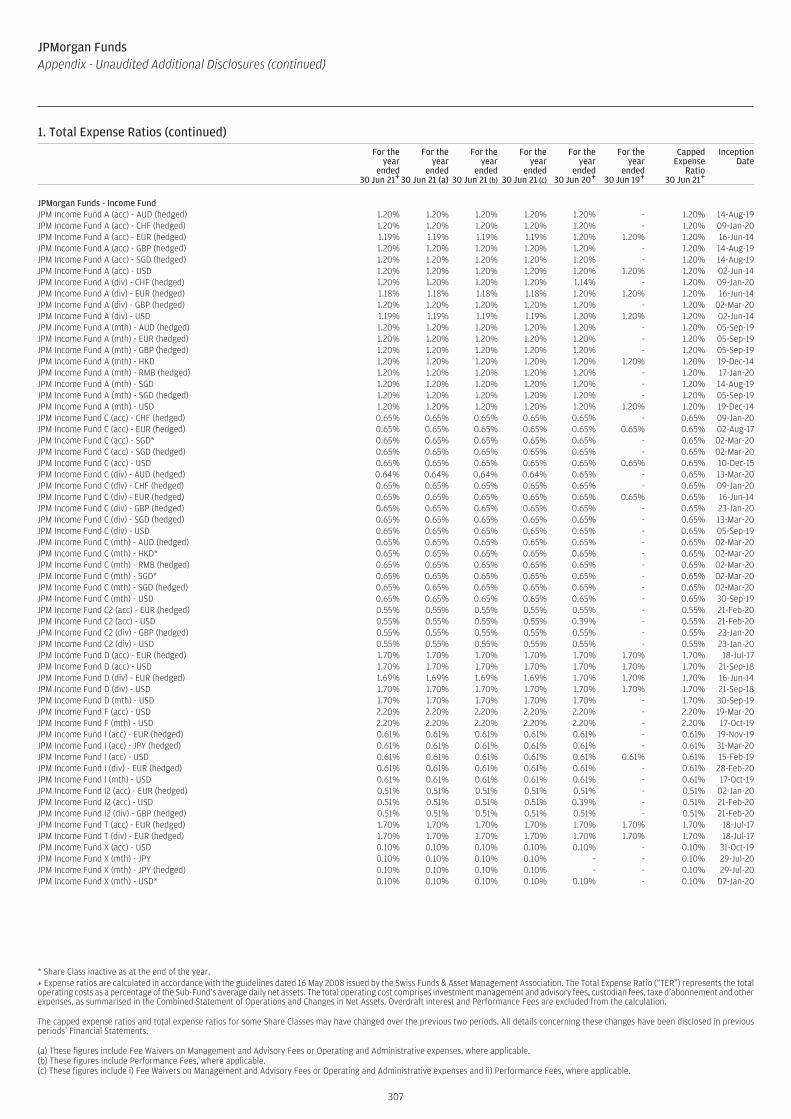
1. Total Expense Ratios (continued)For the
yearended
30 Jun 21+
For theyear
ended30 Jun 21 (a)
For theyear
ended30 Jun 21 (b)
For theyear
ended30 Jun 21 (c)
For theyear
ended30 Jun 20+
For theyear
ended30 Jun 19+
CappedExpense
Ratio30 Jun 21+
InceptionDate
JPMorgan Funds - Income FundJPM Income Fund A (acc) - AUD (hedged) 1.20% 1.20% 1.20% 1.20% 1.20% - 1.20% 14-Aug-19JPM Income Fund A (acc) - CHF (hedged) 1.20% 1.20% 1.20% 1.20% 1.20% - 1.20% 09-Jan-20JPM Income Fund A (acc) - EUR (hedged) 1.19% 1.19% 1.19% 1.19% 1.20% 1.20% 1.20% 16-Jun-14JPM Income Fund A (acc) - GBP (hedged) 1.20% 1.20% 1.20% 1.20% 1.20% - 1.20% 14-Aug-19JPM Income Fund A (acc) - SGD (hedged) 1.20% 1.20% 1.20% 1.20% 1.20% - 1.20% 14-Aug-19JPM Income Fund A (acc) - USD 1.20% 1.20% 1.20% 1.20% 1.20% 1.20% 1.20% 02-Jun-14JPM Income Fund A (div) - CHF (hedged) 1.20% 1.20% 1.20% 1.20% 1.14% - 1.20% 09-Jan-20JPM Income Fund A (div) - EUR (hedged) 1.18% 1.18% 1.18% 1.18% 1.20% 1.20% 1.20% 16-Jun-14JPM Income Fund A (div) - GBP (hedged) 1.20% 1.20% 1.20% 1.20% 1.20% - 1.20% 02-Mar-20JPM Income Fund A (div) - USD 1.19% 1.19% 1.19% 1.19% 1.20% 1.20% 1.20% 02-Jun-14JPM Income Fund A (mth) - AUD (hedged) 1.20% 1.20% 1.20% 1.20% 1.20% - 1.20% 05-Sep-19JPM Income Fund A (mth) - EUR (hedged) 1.20% 1.20% 1.20% 1.20% 1.20% - 1.20% 05-Sep-19JPM Income Fund A (mth) - GBP (hedged) 1.20% 1.20% 1.20% 1.20% 1.20% - 1.20% 05-Sep-19JPM Income Fund A (mth) - HKD 1.20% 1.20% 1.20% 1.20% 1.20% 1.20% 1.20% 19-Dec-14JPM Income Fund A (mth) - RMB (hedged) 1.20% 1.20% 1.20% 1.20% 1.20% - 1.20% 17-Jan-20JPM Income Fund A (mth) - SGD 1.20% 1.20% 1.20% 1.20% 1.20% - 1.20% 14-Aug-19JPM Income Fund A (mth) - SGD (hedged) 1.20% 1.20% 1.20% 1.20% 1.20% - 1.20% 05-Sep-19JPM Income Fund A (mth) - USD 1.20% 1.20% 1.20% 1.20% 1.20% 1.20% 1.20% 19-Dec-14JPM Income Fund C (acc) - CHF (hedged) 0.65% 0.65% 0.65% 0.65% 0.65% - 0.65% 09-Jan-20JPM Income Fund C (acc) - EUR (hedged) 0.65% 0.65% 0.65% 0.65% 0.65% 0.65% 0.65% 02-Aug-17JPM Income Fund C (acc) - SGD* 0.65% 0.65% 0.65% 0.65% 0.65% - 0.65% 02-Mar-20JPM Income Fund C (acc) - SGD (hedged) 0.65% 0.65% 0.65% 0.65% 0.65% - 0.65% 02-Mar-20JPM Income Fund C (acc) - USD 0.65% 0.65% 0.65% 0.65% 0.65% 0.65% 0.65% 10-Dec-15JPM Income Fund C (div) - AUD (hedged) 0.64% 0.64% 0.64% 0.64% 0.65% - 0.65% 13-Mar-20JPM Income Fund C (div) - CHF (hedged) 0.65% 0.65% 0.65% 0.65% 0.65% - 0.65% 09-Jan-20JPM Income Fund C (div) - EUR (hedged) 0.65% 0.65% 0.65% 0.65% 0.65% 0.65% 0.65% 16-Jun-14JPM Income Fund C (div) - GBP (hedged) 0.65% 0.65% 0.65% 0.65% 0.65% - 0.65% 23-Jan-20JPM Income Fund C (div) - SGD (hedged) 0.65% 0.65% 0.65% 0.65% 0.65% - 0.65% 13-Mar-20JPM Income Fund C (div) - USD 0.65% 0.65% 0.65% 0.65% 0.65% - 0.65% 05-Sep-19JPM Income Fund C (mth) - AUD (hedged) 0.65% 0.65% 0.65% 0.65% 0.65% - 0.65% 02-Mar-20JPM Income Fund C (mth) - HKD* 0.65% 0.65% 0.65% 0.65% 0.65% - 0.65% 02-Mar-20JPM Income Fund C (mth) - RMB (hedged) 0.65% 0.65% 0.65% 0.65% 0.65% - 0.65% 02-Mar-20JPM Income Fund C (mth) - SGD* 0.65% 0.65% 0.65% 0.65% 0.65% - 0.65% 02-Mar-20JPM Income Fund C (mth) - SGD (hedged) 0.65% 0.65% 0.65% 0.65% 0.65% - 0.65% 02-Mar-20JPM Income Fund C (mth) - USD 0.65% 0.65% 0.65% 0.65% 0.65% - 0.65% 30-Sep-19JPM Income Fund C2 (acc) - EUR (hedged) 0.55% 0.55% 0.55% 0.55% 0.55% - 0.55% 21-Feb-20JPM Income Fund C2 (acc) - USD 0.55% 0.55% 0.55% 0.55% 0.39% - 0.55% 21-Feb-20JPM Income Fund C2 (div) - GBP (hedged) 0.55% 0.55% 0.55% 0.55% 0.55% - 0.55% 23-Jan-20JPM Income Fund C2 (div) - USD 0.55% 0.55% 0.55% 0.55% 0.55% - 0.55% 23-Jan-20JPM Income Fund D (acc) - EUR (hedged) 1.70% 1.70% 1.70% 1.70% 1.70% 1.70% 1.70% 18-Jul-17JPM Income Fund D (acc) - USD 1.70% 1.70% 1.70% 1.70% 1.70% 1.70% 1.70% 21-Sep-18JPM Income Fund D (div) - EUR (hedged) 1.69% 1.69% 1.69% 1.69% 1.70% 1.70% 1.70% 16-Jun-14JPM Income Fund D (div) - USD 1.70% 1.70% 1.70% 1.70% 1.70% 1.70% 1.70% 21-Sep-18JPM Income Fund D (mth) - USD 1.70% 1.70% 1.70% 1.70% 1.70% - 1.70% 30-Sep-19JPM Income Fund F (acc) - USD 2.20% 2.20% 2.20% 2.20% 2.20% - 2.20% 19-Mar-20JPM Income Fund F (mth) - USD 2.20% 2.20% 2.20% 2.20% 2.20% - 2.20% 17-Oct-19JPM Income Fund I (acc) - EUR (hedged) 0.61% 0.61% 0.61% 0.61% 0.61% - 0.61% 19-Nov-19JPM Income Fund I (acc) - JPY (hedged) 0.61% 0.61% 0.61% 0.61% 0.61% - 0.61% 31-Mar-20JPM Income Fund I (acc) - USD 0.61% 0.61% 0.61% 0.61% 0.61% 0.61% 0.61% 15-Feb-19JPM Income Fund I (div) - EUR (hedged) 0.61% 0.61% 0.61% 0.61% 0.61% - 0.61% 28-Feb-20JPM Income Fund I (mth) - USD 0.61% 0.61% 0.61% 0.61% 0.61% - 0.61% 17-Oct-19JPM Income Fund I2 (acc) - EUR (hedged) 0.51% 0.51% 0.51% 0.51% 0.51% - 0.51% 02-Jan-20JPM Income Fund I2 (acc) - USD 0.51% 0.51% 0.51% 0.51% 0.39% - 0.51% 21-Feb-20JPM Income Fund I2 (div) - GBP (hedged) 0.51% 0.51% 0.51% 0.51% 0.51% - 0.51% 21-Feb-20JPM Income Fund T (acc) - EUR (hedged) 1.70% 1.70% 1.70% 1.70% 1.70% 1.70% 1.70% 18-Jul-17JPM Income Fund T (div) - EUR (hedged) 1.70% 1.70% 1.70% 1.70% 1.70% 1.70% 1.70% 18-Jul-17JPM Income Fund X (acc) - USD 0.10% 0.10% 0.10% 0.10% 0.10% - 0.10% 31-Oct-19JPM Income Fund X (mth) - JPY 0.10% 0.10% 0.10% 0.10% - - 0.10% 29-Jul-20JPM Income Fund X (mth) - JPY (hedged) 0.10% 0.10% 0.10% 0.10% - - 0.10% 29-Jul-20JPM Income Fund X (mth) - USD* 0.10% 0.10% 0.10% 0.10% 0.10% - 0.10% 07-Jan-20
* Share Class inactive as at the end of the year.+ Expense ratios are calculated in accordance with the guidelines dated 16 May 2008 issued by the Swiss Funds & Asset Management Association. The Total Expense Ratio (“TER”) represents the totaloperating costs as a percentage of the Sub-Fund’s average daily net assets. The total operating cost comprises investment management and advisory fees, custodian fees, taxe d’abonnement and otherexpenses, as summarised in the Combined Statement of Operations and Changes in Net Assets. Overdraft interest and Performance Fees are excluded from the calculation.
The capped expense ratios and total expense ratios for some Share Classes may have changed over the previous two periods. All details concerning these changes have been disclosed in previousperiods’ Financial Statements.
(a) These figures include Fee Waivers on Management and Advisory Fees or Operating and Administrative expenses, where applicable.(b) These figures include Performance Fees, where applicable.(c) These figures include i) Fee Waivers on Management and Advisory Fees or Operating and Administrative expenses and ii) Performance Fees, where applicable.
307
JPMorgan FundsAppendix - Unaudited Additional Disclosures (continued)

1. Total Expense Ratios (continued)For the
yearended
30 Jun 21+
For theyear
ended30 Jun 21 (a)
For theyear
ended30 Jun 21 (b)
For theyear
ended30 Jun 21 (c)
For theyear
ended30 Jun 20+
For theyear
ended30 Jun 19+
CappedExpense
Ratio30 Jun 21+
InceptionDate
JPMorgan Funds - US Aggregate Bond FundJPM US Aggregate Bond A (acc) - AUD (hedged) 1.10% 1.10% 1.10% 1.10% 1.10% 1.10% 1.10% 20-Jul-17JPM US Aggregate Bond A (acc) - EUR (hedged) 1.09% 1.09% 1.09% 1.09% 1.10% 1.10% 1.10% 03-Oct-11JPM US Aggregate Bond A (acc) - USD 1.10% 1.10% 1.10% 1.10% 1.10% 1.10% 1.10% 31-Mar-05JPM US Aggregate Bond A (dist) - USD 1.10% 1.10% 1.10% 1.10% 1.10% 1.10% 1.10% 15-Sep-00JPM US Aggregate Bond A (div) - USD 1.10% 1.10% 1.10% 1.10% 1.10% 1.10% 1.10% 30-Apr-12JPM US Aggregate Bond A (mth) - HKD 1.10% 1.10% 1.10% 1.10% 1.10% 1.10% 1.10% 12-Sep-12JPM US Aggregate Bond A (mth) - SGD 1.10% 1.10% 1.10% 1.10% 1.10% 1.10% 1.10% 18-Jan-12JPM US Aggregate Bond A (mth) - SGD (Hedged) 1.10% 1.10% 1.10% 1.10% 1.10% 1.10% 1.10% 18-Jan-12JPM US Aggregate Bond A (mth) - USD 1.10% 1.10% 1.10% 1.10% 1.10% 1.10% 1.10% 06-Apr-10JPM US Aggregate Bond C (acc) - EUR (hedged) 0.60% 0.60% 0.60% 0.60% 0.60% 0.60% 0.60% 02-Nov-12JPM US Aggregate Bond C (acc) - USD 0.60% 0.60% 0.60% 0.60% 0.60% 0.60% 0.60% 13-Jul-05JPM US Aggregate Bond C (dist) - EUR (hedged) 0.60% 0.60% 0.60% 0.60% 0.60% 0.60% 0.60% 21-Mar-17JPM US Aggregate Bond C (dist) - USD 0.60% 0.60% 0.60% 0.60% 0.60% 0.60% 0.60% 08-Jan-15JPM US Aggregate Bond C (div) - USD 0.60% 0.60% 0.60% 0.60% 0.60% 0.60% 0.60% 18-Sep-15JPM US Aggregate Bond C (mth) - USD 0.60% 0.60% 0.60% 0.60% 0.60% 0.60% 0.60% 08-Jun-12JPM US Aggregate Bond D (acc) - EUR (hedged) 1.35% 1.35% 1.35% 1.35% 1.35% 1.35% 1.35% 02-Nov-10JPM US Aggregate Bond D (acc) - USD 1.35% 1.35% 1.35% 1.35% 1.35% 1.35% 1.35% 13-Oct-00JPM US Aggregate Bond F (mth) - USD 2.10% 2.10% 2.10% 2.10% 2.10% 2.10% 2.10% 27-Nov-18JPM US Aggregate Bond I (acc) - EUR (hedged) 0.56% 0.56% 0.56% 0.56% 0.56% 0.56% 0.56% 05-Oct-16JPM US Aggregate Bond I (acc) - USD 0.56% 0.56% 0.56% 0.56% 0.56% 0.56% 0.56% 17-Jun-11JPM US Aggregate Bond I2 (acc) - EUR (hedged) 0.37% 0.37% 0.37% 0.37% 0.37% 0.47% 0.37% 18-Dec-17JPM US Aggregate Bond I2 (acc) - USD 0.37% 0.37% 0.37% 0.37% 0.37% 0.47% 0.37% 18-Dec-17JPM US Aggregate Bond I2 (dist) - CHF (hedged) 0.37% 0.37% 0.37% 0.37% - - 0.37% 19-May-21JPM US Aggregate Bond I2 (dist) - EUR (hedged) 0.37% 0.37% 0.37% 0.37% 0.37% 0.47% 0.37% 18-Dec-17JPM US Aggregate Bond I2 (dist) - GBP (hedged) 0.37% 0.37% 0.37% 0.37% 0.37% 0.47% 0.37% 18-Dec-17JPM US Aggregate Bond I2 (dist) - USD 0.37% 0.37% 0.37% 0.37% 0.37% 0.47% 0.37% 18-Dec-17JPM US Aggregate Bond X (acc) - EUR (hedged) 0.10% 0.10% 0.10% 0.10% 0.10% 0.10% 0.10% 03-Jun-13JPM US Aggregate Bond X (acc) - USD 0.10% 0.10% 0.10% 0.10% 0.10% 0.10% 0.10% 30-Mar-05JPM US Aggregate Bond X (mth) - JPY 0.10% 0.10% 0.10% 0.10% 0.10% 0.10% 0.10% 10-Jun-19JPM US Aggregate Bond X (mth) - JPY (hedged) 0.10% 0.10% 0.10% 0.10% 0.10% 0.10% 0.10% 10-Jun-19
JPMorgan Funds - USD Money Market VNAV FundJPM USD Money Market VNAV A (acc) - USD 0.45% 0.23% 0.45% 0.23% 0.45% 0.45% 0.45% 06-Jun-14
+ Expense ratios are calculated in accordance with the guidelines dated 16 May 2008 issued by the Swiss Funds & Asset Management Association. The Total Expense Ratio (“TER”) represents the totaloperating costs as a percentage of the Sub-Fund’s average daily net assets. The total operating cost comprises investment management and advisory fees, custodian fees, taxe d’abonnement and otherexpenses, as summarised in the Combined Statement of Operations and Changes in Net Assets. Overdraft interest and Performance Fees are excluded from the calculation.
The capped expense ratios and total expense ratios for some Share Classes may have changed over the previous two periods. All details concerning these changes have been disclosed in previousperiods’ Financial Statements.
(a) These figures include Fee Waivers on Management and Advisory Fees or Operating and Administrative expenses, where applicable.(b) These figures include Performance Fees, where applicable.(c) These figures include i) Fee Waivers on Management and Advisory Fees or Operating and Administrative expenses and ii) Performance Fees, where applicable.
308
JPMorgan FundsAppendix - Unaudited Additional Disclosures (continued)
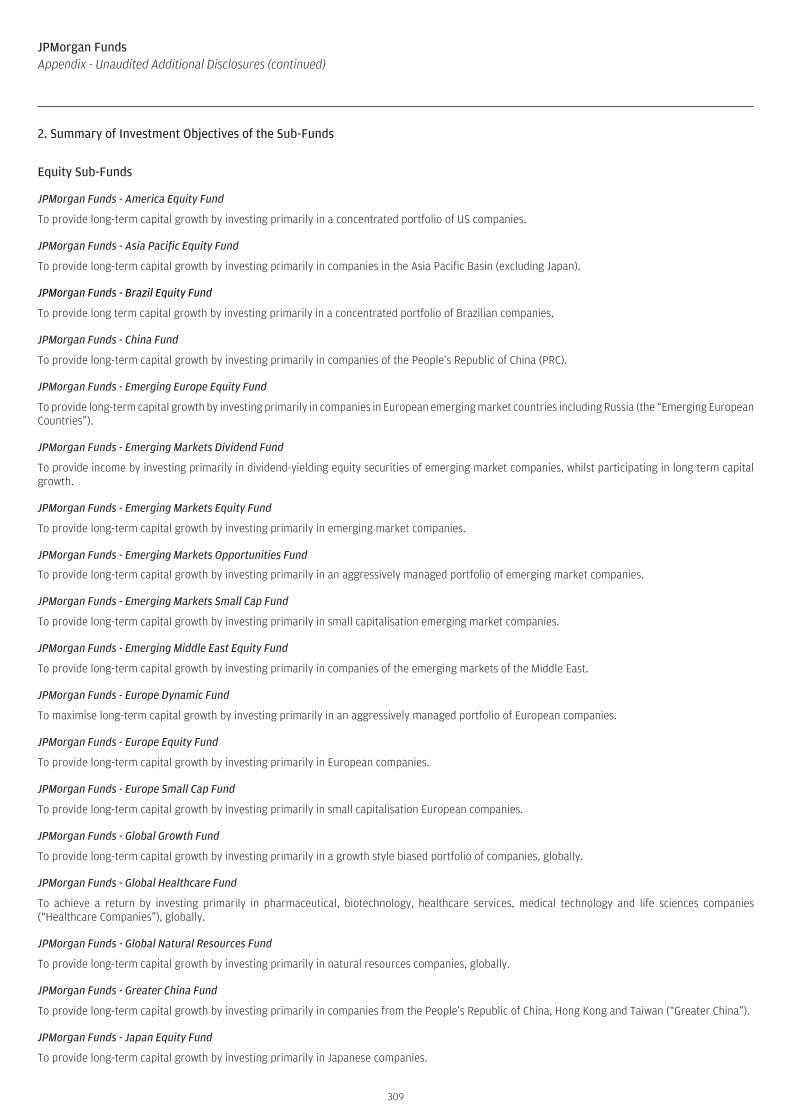
Equity Sub-Funds
JPMorgan Funds - America Equity Fund
To provide long-term capital growth by investing primarily in a concentrated portfolio of US companies.
JPMorgan Funds - Asia Pacific Equity Fund
To provide long-term capital growth by investing primarily in companies in the Asia Pacific Basin (excluding Japan).
JPMorgan Funds - Brazil Equity Fund
To provide long term capital growth by investing primarily in a concentrated portfolio of Brazilian companies.
JPMorgan Funds - China Fund
To provide long-term capital growth by investing primarily in companies of the People’s Republic of China (PRC).
JPMorgan Funds - Emerging Europe Equity Fund
To provide long-term capital growth by investing primarily in companies in European emerging market countries including Russia (the “Emerging EuropeanCountries”).
JPMorgan Funds - Emerging Markets Dividend Fund
To provide income by investing primarily in dividend-yielding equity securities of emerging market companies, whilst participating in long term capitalgrowth.
JPMorgan Funds - Emerging Markets Equity Fund
To provide long-term capital growth by investing primarily in emerging market companies.
JPMorgan Funds - Emerging Markets Opportunities Fund
To provide long-term capital growth by investing primarily in an aggressively managed portfolio of emerging market companies.
JPMorgan Funds - Emerging Markets Small Cap Fund
To provide long-term capital growth by investing primarily in small capitalisation emerging market companies.
JPMorgan Funds - Emerging Middle East Equity Fund
To provide long-term capital growth by investing primarily in companies of the emerging markets of the Middle East.
JPMorgan Funds - Europe Dynamic Fund
To maximise long-term capital growth by investing primarily in an aggressively managed portfolio of European companies.
JPMorgan Funds - Europe Equity Fund
To provide long-term capital growth by investing primarily in European companies.
JPMorgan Funds - Europe Small Cap Fund
To provide long-term capital growth by investing primarily in small capitalisation European companies.
JPMorgan Funds - Global Growth Fund
To provide long-term capital growth by investing primarily in a growth style biased portfolio of companies, globally.
JPMorgan Funds - Global Healthcare Fund
To achieve a return by investing primarily in pharmaceutical, biotechnology, healthcare services, medical technology and life sciences companies(“Healthcare Companies”), globally.
JPMorgan Funds - Global Natural Resources Fund
To provide long-term capital growth by investing primarily in natural resources companies, globally.
JPMorgan Funds - Greater China Fund
To provide long-term capital growth by investing primarily in companies from the People’s Republic of China, Hong Kong and Taiwan (“Greater China”).
JPMorgan Funds - Japan Equity Fund
To provide long-term capital growth by investing primarily in Japanese companies.
309
JPMorgan FundsAppendix - Unaudited Additional Disclosures (continued)
2. Summary of Investment Objectives of the Sub-Funds

JPMorgan Funds - Latin America Equity Fund
To provide long-term capital growth by investing primarily in Latin American companies.
JPMorgan Funds - Russia Fund
To provide long-term capital growth by investing primarily in a concentrated portfolio of Russian companies.
JPMorgan Funds - Thematics - Genetic Therapies Fund
To achieve a return by investing in companies with exposure to the theme of genetic therapies, globally.
JPMorgan Funds - US Equity All Cap Fund
To provide long-term capital growth by investing primarily in a portfolio of US companies across all market capitalisations.
JPMorgan Funds - US Growth Fund
To provide long-term capital growth by investing primarily in a growth style biased portfolio of US companies.
JPMorgan Funds - US Smaller Companies Fund
To provide long-term capital growth by investing primarily in small and micro capitalisation US companies.
JPMorgan Funds - US Technology Fund
To provide long-term capital growth by investing primarily in technology, media and telecommunications related US companies.
JPMorgan Funds - US Value Fund
To provide long-term capital growth by investing primarily in a value style biased portfolio of US companies.
Balanced and Mixed Asset Sub-Funds
JPMorgan Funds - Asia Pacific Income Fund
To provide income and long term capital growth by investing primarily in income generating securities of countries in the Asia Pacific region (excludingJapan).
Bond Sub-Funds
JPMorgan Funds - Aggregate Bond Fund
To achieve a return in excess of global bond markets by investing primarily in global investment grade debt securities, using derivatives where appropriate.
JPMorgan Funds - Emerging Markets Corporate Bond Fund
To achieve a return in excess of corporate bond markets of emerging market countries by investing primarily in emerging market corporate debt securities,using derivatives where appropriate.
JPMorgan Funds - Emerging Markets Debt Fund
To achieve a return in excess of the bond markets of emerging countries by investing primarily in emerging market debt securities, including corporatesecurities and securities issued in local currencies, using derivatives where appropriate.
JPMorgan Funds - Emerging Markets Investment Grade Bond Fund
To achieve a return in excess of investment grade bond markets of emerging countries by investing primarily in emerging market investment grade USDdenominated debt securities.
JPMorgan Funds - Emerging Markets Local Currency Debt Fund
To achieve a return in excess of government bond markets of emerging markets countries by investing primarily in emerging market local currency debtsecurities, using derivatives where appropriate.
JPMorgan Funds - Global Corporate Bond Duration-Hedged Fund
To achieve a return in excess of the benchmark by investing primarily in global investment grade corporate debt securities and hedging interest rate risks,using derivatives where appropriate.
JPMorgan Funds - Global Corporate Bond Fund
To achieve a return in excess of global corporate bond markets by investing primarily in global investment grade corporate debt securities, using derivativeswhere appropriate.
310
JPMorgan FundsAppendix - Unaudited Additional Disclosures (continued)
2. Summary of Investment Objectives of the Sub-Funds (continued)
JPMorgan Funds - Global Government Bond Fund
To achieve a return in line with the benchmark by investing primarily in global government debt securities.
JPMorgan Funds - Global Short Duration Bond Fund
To achieve a return in excess of global short duration bond markets by investing primarily in global investment grade short-term debt securities, usingderivatives where appropriate.
JPMorgan Funds - Global Strategic Bond Fund
To achieve a return in excess of its benchmark by exploiting investment opportunities in, amongst others, the debt and currency markets, using derivativeswhere appropriate.
JPMorgan Funds - Income Fund
To provide income by investing primarily in debt securities.
JPMorgan Funds - US Aggregate Bond Fund
To achieve a return in excess of US bond markets by investing primarily in US investment grade debt securities.
Money Market Sub-Funds
JPMorgan Funds - USD Money Market VNAV Fund
To achieve a return in the Sub-Fund’s Base Currency in line with prevailing money market rates whilst aiming to preserve capital consistent with such ratesand to maintain a high degree of liquidity, by investing in USD-denominated short-term Money Market Instruments, eligible securitisations, Asset-BackedCommercial Paper, deposits with credit institutions and reverse repurchase transactions.
311
JPMorgan FundsAppendix - Unaudited Additional Disclosures (continued)
2. Summary of Investment Objectives of the Sub-Funds (continued)

PerformanceReturns for periods greater than one year are annualised. SICAV performance includes reinvestment of income and is net of all expenses.Past performance is no indication of current or future performance.The performance data does not take into account the commissions and costs incurred on the issue and redemption of units.
Volatility
The standard deviation (D) of the price is calculated on a daily basis throughout the SICAV’s financial year.The details below relate to the year from 1 July 2020 to 30 June 2021.
If D is equal to or less than 0.1 then volatility will be Low.If D is greater than 0.1 but less or equal to 1.0 then volatility will be Medium.If D is greater than 1.0 but less than or equal to 2.4 then volatility will be High.If D is greater than 2.4 then volatility will be Very High.
Share Class 3 Months 6 Months 9 Months 1 Year 2 Years 3 Years Volatility
JPMorgan Funds - America Equity FundJPM America Equity A (acc) - AUD 9.63% 19.26% 26.04% 35.25% 21.23% 20.48% MediumJPM America Equity A (acc) - AUD (hedged) 7.79% 15.45% 31.39% 46.39% 23.32% 18.85% MediumJPM America Equity A (acc) - EUR 6.67% 19.58% 30.44% 39.41% 23.05% 20.23% MediumJPM America Equity A (acc) - EUR (hedged) 7.64% 15.27% 31.32% 46.20% 24.09% 18.17% MediumJPM America Equity A (acc) - HKD 7.83% 15.94% 32.77% 48.04% 25.81% 20.75% MediumJPM America Equity A (acc) - USD 7.96% 15.78% 32.52% 47.80% 26.34% 21.46% MediumJPM America Equity A (dist) - USD 7.96% 15.78% 32.52% 47.83% 26.34% 21.45% MediumJPM America Equity C (acc) - EUR 6.92% 20.14% 31.37% 40.75% 24.46% 21.79% MediumJPM America Equity C (acc) - EUR (hedged) 7.89% 15.76% 32.21% 47.50% 25.41% 19.59% MediumJPM America Equity C (acc) - USD 8.18% 16.27% 33.37% 49.09% 27.69% 22.89% MediumJPM America Equity C (dist) - GBP 7.73% - - - - - MediumJPM America Equity C (dist) - USD 8.19% 16.28% 33.38% 49.02% 27.54% 22.76% MediumJPM America Equity D (acc) - EUR 6.48% 19.13% 29.71% 38.38% 21.96% 19.04% MediumJPM America Equity D (acc) - EUR (hedged) 7.44% 14.80% 30.59% 45.08% 23.00% 17.03% MediumJPM America Equity D (acc) - USD 7.77% 15.35% 31.76% 46.71% 25.17% 20.18% MediumJPM America Equity I (acc) - EUR 6.94% 20.17% 31.41% 40.81% 24.51% - MediumJPM America Equity I (acc) - USD 8.20% 16.31% 33.43% 49.18% 27.75% 22.96% MediumJPM America Equity I2 (acc) - EUR (hedged) 7.90% 15.84% 32.33% 47.65% 25.61% 19.80% MediumJPM America Equity I2 (acc) - USD 8.22% 16.35% 33.51% 49.30% 27.88% 23.11% MediumJPM America Equity X (acc) - USD 8.38% 16.68% 34.08% 50.15% 28.77% 24.08% Medium
JPMorgan Funds - Asia Pacific Equity FundJPM Asia Pacific Equity A (acc) - EUR 0.52% 9.95% 29.18% 39.62% 21.78% 14.09% MediumJPM Asia Pacific Equity A (acc) - HKD 1.58% 6.57% 31.34% 48.22% 24.44% 14.51% MediumJPM Asia Pacific Equity A (acc) - SGD 1.68% 8.28% 28.82% 42.36% 24.30% 14.30% MediumJPM Asia Pacific Equity A (acc) - USD 1.68% 6.41% 31.10% 47.92% 24.89% 15.06% MediumJPM Asia Pacific Equity A (dist) - GBP 1.26% 4.99% 21.77% 31.32% 18.51% 12.37% MediumJPM Asia Pacific Equity A (dist) - USD 1.70% 6.41% 31.13% 47.70% 24.53% 14.70% MediumJPM Asia Pacific Equity C (acc) - EUR 0.71% 10.39% 29.95% 40.76% 22.95% 15.26% MediumJPM Asia Pacific Equity C (acc) - USD 1.91% 6.84% 31.93% 49.12% 26.09% 16.23% MediumJPM Asia Pacific Equity C (dist) - USD 1.91% 6.84% 31.93% 48.65% 25.40% 15.52% MediumJPM Asia Pacific Equity D (acc) - EUR 0.31% 9.52% 28.41% 38.52% 20.64% 12.99% MediumJPM Asia Pacific Equity D (acc) - USD 1.50% 5.99% 30.36% 46.76% 23.69% 13.91% MediumJPM Asia Pacific Equity I (acc) - EUR 0.73% 10.42% 29.99% 40.81% 23.00% 15.32% MediumJPM Asia Pacific Equity I (acc) - USD 1.92% 6.86% 31.97% 49.17% 26.15% 16.29% MediumJPM Asia Pacific Equity I2 (acc) - EUR 0.76% 10.50% 30.13% 41.01% 23.22% - MediumJPM Asia Pacific Equity I2 (acc) - USD+ - - - - - - MediumJPM Asia Pacific Equity X (acc) - USD 2.11% 7.26% 32.72% 50.31% 27.32% 17.43% Medium
JPMorgan Funds - Brazil Equity FundJPM Brazil Equity A (acc) - EUR 20.93% 10.40% 41.51% 36.64% -0.80% 14.49% HighJPM Brazil Equity A (acc) - SGD 22.32% 8.24% 41.18% 39.27% 0.94% 14.72% HighJPM Brazil Equity A (acc) - USD 22.43% 6.55% 43.60% 44.65% 1.29% 15.41% HighJPM Brazil Equity A (dist) - USD 22.32% 6.70% 43.61% 44.54% 1.25% 15.11% HighJPM Brazil Equity C (acc) - USD 22.68% 7.13% 44.65% 45.95% 2.12% 16.57% HighJPM Brazil Equity D (acc) - EUR 20.64% 9.85% 40.48% 35.28% -1.78% 13.08% HighJPM Brazil Equity D (acc) - USD 22.03% 6.08% 42.74% 43.33% 0.29% 14.05% HighJPM Brazil Equity I (acc) - USD 22.60% 7.06% 44.59% 45.77% 2.10% 16.56% HighJPM Brazil Equity T (acc) - EUR 20.64% 9.85% 40.45% 35.27% -1.78% 13.08% HighJPM Brazil Equity X (acc) - USD 22.87% 7.49% 45.45% 47.16% 3.05% 17.92% High
+ No data is applicable for these Share Classes as they were launched or reactivated less than 3 months before the year end.
312
JPMorgan FundsAppendix - Unaudited Additional Disclosures (continued)
3. Performance and Volatility

Share Class 3 Months 6 Months 9 Months 1 Year 2 Years 3 Years Volatility
JPMorgan Funds - China FundJPM China A (acc) - RMB 7.38% - - - - - HighJPM China A (acc) - SGD 9.04% 7.75% 29.32% 46.28% 52.92% 31.07% HighJPM China A (acc) - USD 9.05% 5.89% 31.70% 51.99% 53.67% 32.04% HighJPM China A (dist) - HKD 8.93% 6.07% 31.95% 52.11% 52.88% 31.02% HighJPM China A (dist) - USD 9.05% 5.90% 31.70% 52.02% 53.65% 32.04% HighJPM China C (acc) - RMB^ 7.64% - - - - - HighJPM China C (acc) - USD 9.26% 6.32% 32.50% 53.25% 55.41% 33.69% HighJPM China C (dist) - USD 9.27% 6.32% 32.50% 53.11% 54.87% 33.07% HighJPM China D (acc) - EUR 7.52% 8.88% 28.75% 42.04% 47.39% 28.85% HighJPM China D (acc) - USD 8.78% 5.38% 30.73% 50.52% 51.67% 30.16% HighJPM China F (acc) - USD 8.77% 5.35% 30.68% 50.45% 51.58% - HighJPM China I (acc) - USD 9.28% 6.35% 32.54% 53.31% 55.50% - HighJPM China I (dist) - USD^ 9.27% 6.34% - - - - HighJPM China T (acc) - EUR 7.52% 8.90% 28.77% 42.09% 47.42% 28.87% HighJPM China X (acc) - USD 9.49% 6.75% 33.29% 54.48% 57.11% 35.32% High
JPMorgan Funds - Emerging Europe Equity FundJPM Emerging Europe Equity A (acc) - EUR 10.66% 18.25% 27.92% 22.21% 6.07% 10.75% MediumJPM Emerging Europe Equity A (acc) - USD 11.94% 14.44% 29.85% 29.44% 8.47% 11.62% MediumJPM Emerging Europe Equity A (dist) - EUR 10.62% 18.25% 27.91% 21.51% 5.55% 10.06% MediumJPM Emerging Europe Equity A (dist) - USD 11.94% 14.44% 29.85% 28.71% 8.00% - MediumJPM Emerging Europe Equity C (acc) - EUR 10.86% 18.67% 28.64% 23.13% 6.90% 11.76% MediumJPM Emerging Europe Equity C (acc) - USD 12.15% 14.86% 30.58% 30.42% 9.36% 12.64% MediumJPM Emerging Europe Equity C (dist) - EUR 10.84% 18.68% 28.62% 22.16% 6.22% 10.79% MediumJPM Emerging Europe Equity C (dist) - USD 12.14% 14.86% 30.59% 29.41% 8.69% - MediumJPM Emerging Europe Equity D (acc) - EUR 10.33% 17.64% 26.94% 20.94% 4.93% 9.43% MediumJPM Emerging Europe Equity D (acc) - USD 11.66% 13.88% 28.90% 28.16% 7.31% - MediumJPM Emerging Europe Equity I (acc) - EUR 10.82% 18.68% 28.68% 23.16% 6.92% 11.76% MediumJPM Emerging Europe Equity X (acc) - EUR 11.10% 19.22% 29.52% 24.23% 7.94% 12.99% MediumJPM Emerging Europe Equity X (acc) - USD 12.40% 15.37% 31.47% 31.60% 10.44% - Medium
JPMorgan Funds - Emerging Markets Dividend FundJPM Emerging Markets Dividend A (acc) - CHF (hedged) 2.17% 6.03% 32.05% 41.89% 12.79% 10.15% MediumJPM Emerging Markets Dividend A (acc) - EUR 1.40% 10.32% 31.64% 36.17% 12.86% 12.78% MediumJPM Emerging Markets Dividend A (acc) - USD 2.59% 6.76% 33.63% 44.27% 15.55% 13.68% MediumJPM Emerging Markets Dividend A (dist) - EUR 1.40% 10.32% 31.63% 35.62% 12.25% 12.04% MediumJPM Emerging Markets Dividend A (dist) - GBP 2.17% 5.37% 24.15% 27.81% 9.71% 10.70% MediumJPM Emerging Markets Dividend A (div) - EUR 1.37% 10.27% 31.34% 35.54% 11.94% 11.57% MediumJPM Emerging Markets Dividend A (irc) - AUD (hedged) 2.43% 6.49% 32.33% 42.00% 11.91% 10.06% MediumJPM Emerging Markets Dividend A (irc) - GBP (hedged) 2.36% 6.54% 32.64% 42.41% 12.65% 10.29% MediumJPM Emerging Markets Dividend A (mth) - HKD 2.44% 6.81% 33.57% 43.95% 13.98% 11.71% MediumJPM Emerging Markets Dividend A (mth) - SGD 2.67% 8.72% 31.07% 38.29% 14.09% 11.69% MediumJPM Emerging Markets Dividend A (mth) - SGD (hedged) 2.55% 6.72% 33.02% 43.18% 13.50% 11.15% MediumJPM Emerging Markets Dividend A (mth) - USD 2.59% 6.74% 33.41% 43.65% 14.42% 12.24% MediumJPM Emerging Markets Dividend C (acc) - EUR 1.61% 10.78% 32.47% 37.34% 13.92% 13.95% MediumJPM Emerging Markets Dividend C (acc) - USD 2.81% 7.21% 34.48% 45.50% 16.68% 14.89% MediumJPM Emerging Markets Dividend C (dist) - EUR 1.61% 10.78% 32.47% 36.56% 13.11% 12.89% MediumJPM Emerging Markets Dividend C (div) - EUR 1.57% 10.72% 32.17% 36.68% 12.96% 12.67% MediumJPM Emerging Markets Dividend D (acc) - EUR 1.21% 9.91% 30.91% 35.17% 11.90% 11.74% MediumJPM Emerging Markets Dividend D (div) - EUR 1.17% 9.85% 30.61% 34.55% 11.04% 10.63% MediumJPM Emerging Markets Dividend D (mth) - EUR 1.19% 9.86% 30.63% 34.57% 11.01% 10.58% MediumJPM Emerging Markets Dividend I2 (acc) - EUR* - - - - - - MediumJPM Emerging Markets Dividend T (acc) - EUR 1.21% 9.91% 30.90% 35.16% 11.90% 11.74% MediumJPM Emerging Markets Dividend T (div) - EUR 1.18% 9.86% 30.61% 34.55% 11.05% 10.63% MediumJPM Emerging Markets Dividend X (acc) - EUR 1.81% 11.22% 33.27% 38.44% 14.95% 15.10% MediumJPM Emerging Markets Dividend X (acc) - USD 3.01% 7.64% 35.30% 46.66% 17.76% 16.07% MediumJPM Emerging Markets Dividend X (dist) - EUR 1.82% 11.23% 33.27% 37.34% 13.86% 13.68% Medium
* Share Class inactive as at the end of the year.^ Share Class reactivated during the year.
313
JPMorgan FundsAppendix - Unaudited Additional Disclosures (continued)
3. Performance and Volatility (continued)
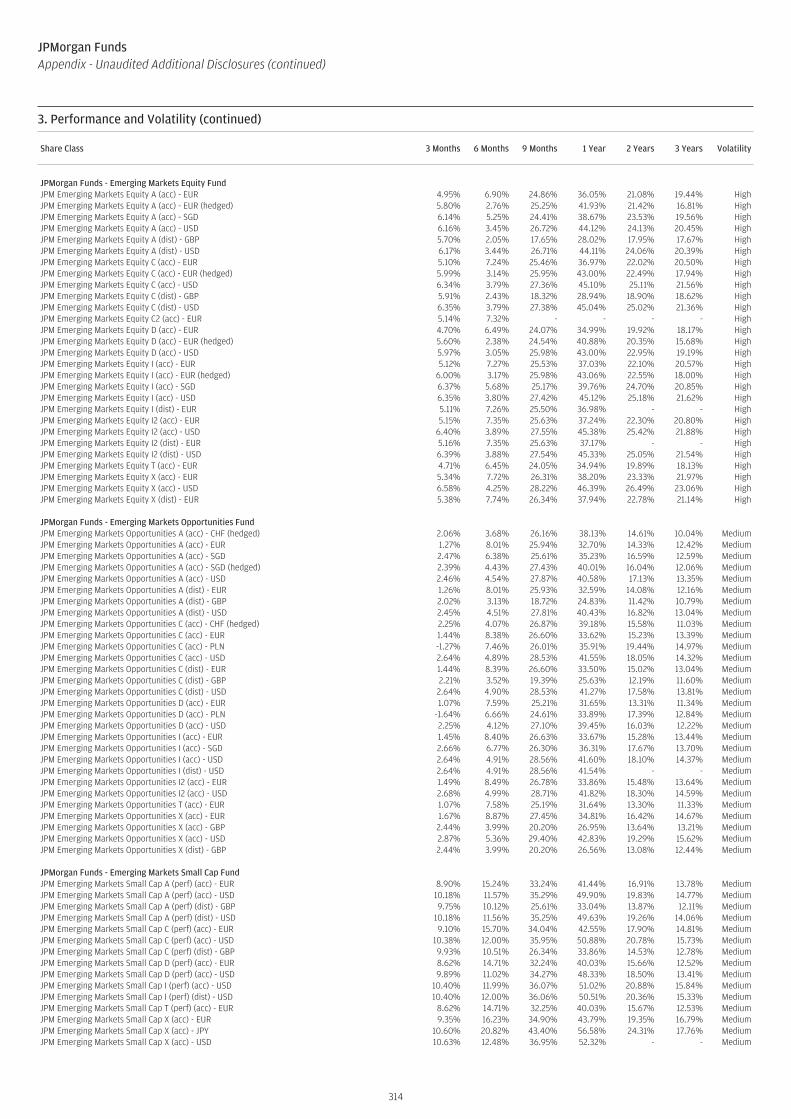
Share Class 3 Months 6 Months 9 Months 1 Year 2 Years 3 Years Volatility
JPMorgan Funds - Emerging Markets Equity FundJPM Emerging Markets Equity A (acc) - EUR 4.95% 6.90% 24.86% 36.05% 21.08% 19.44% HighJPM Emerging Markets Equity A (acc) - EUR (hedged) 5.80% 2.76% 25.25% 41.93% 21.42% 16.81% HighJPM Emerging Markets Equity A (acc) - SGD 6.14% 5.25% 24.41% 38.67% 23.53% 19.56% HighJPM Emerging Markets Equity A (acc) - USD 6.16% 3.45% 26.72% 44.12% 24.13% 20.45% HighJPM Emerging Markets Equity A (dist) - GBP 5.70% 2.05% 17.65% 28.02% 17.95% 17.67% HighJPM Emerging Markets Equity A (dist) - USD 6.17% 3.44% 26.71% 44.11% 24.06% 20.39% HighJPM Emerging Markets Equity C (acc) - EUR 5.10% 7.24% 25.46% 36.97% 22.02% 20.50% HighJPM Emerging Markets Equity C (acc) - EUR (hedged) 5.99% 3.14% 25.95% 43.00% 22.49% 17.94% HighJPM Emerging Markets Equity C (acc) - USD 6.34% 3.79% 27.36% 45.10% 25.11% 21.56% HighJPM Emerging Markets Equity C (dist) - GBP 5.91% 2.43% 18.32% 28.94% 18.90% 18.62% HighJPM Emerging Markets Equity C (dist) - USD 6.35% 3.79% 27.38% 45.04% 25.02% 21.36% HighJPM Emerging Markets Equity C2 (acc) - EUR 5.14% 7.32% - - - - HighJPM Emerging Markets Equity D (acc) - EUR 4.70% 6.49% 24.07% 34.99% 19.92% 18.17% HighJPM Emerging Markets Equity D (acc) - EUR (hedged) 5.60% 2.38% 24.54% 40.88% 20.35% 15.68% HighJPM Emerging Markets Equity D (acc) - USD 5.97% 3.05% 25.98% 43.00% 22.95% 19.19% HighJPM Emerging Markets Equity I (acc) - EUR 5.12% 7.27% 25.53% 37.03% 22.10% 20.57% HighJPM Emerging Markets Equity I (acc) - EUR (hedged) 6.00% 3.17% 25.98% 43.06% 22.55% 18.00% HighJPM Emerging Markets Equity I (acc) - SGD 6.37% 5.68% 25.17% 39.76% 24.70% 20.85% HighJPM Emerging Markets Equity I (acc) - USD 6.35% 3.80% 27.42% 45.12% 25.18% 21.62% HighJPM Emerging Markets Equity I (dist) - EUR 5.11% 7.26% 25.50% 36.98% - - HighJPM Emerging Markets Equity I2 (acc) - EUR 5.15% 7.35% 25.63% 37.24% 22.30% 20.80% HighJPM Emerging Markets Equity I2 (acc) - USD 6.40% 3.89% 27.55% 45.38% 25.42% 21.88% HighJPM Emerging Markets Equity I2 (dist) - EUR 5.16% 7.35% 25.63% 37.17% - - HighJPM Emerging Markets Equity I2 (dist) - USD 6.39% 3.88% 27.54% 45.33% 25.05% 21.54% HighJPM Emerging Markets Equity T (acc) - EUR 4.71% 6.45% 24.05% 34.94% 19.89% 18.13% HighJPM Emerging Markets Equity X (acc) - EUR 5.34% 7.72% 26.31% 38.20% 23.33% 21.97% HighJPM Emerging Markets Equity X (acc) - USD 6.58% 4.25% 28.22% 46.39% 26.49% 23.06% HighJPM Emerging Markets Equity X (dist) - EUR 5.38% 7.74% 26.34% 37.94% 22.78% 21.14% High
JPMorgan Funds - Emerging Markets Opportunities FundJPM Emerging Markets Opportunities A (acc) - CHF (hedged) 2.06% 3.68% 26.16% 38.13% 14.61% 10.04% MediumJPM Emerging Markets Opportunities A (acc) - EUR 1.27% 8.01% 25.94% 32.70% 14.33% 12.42% MediumJPM Emerging Markets Opportunities A (acc) - SGD 2.47% 6.38% 25.61% 35.23% 16.59% 12.59% MediumJPM Emerging Markets Opportunities A (acc) - SGD (hedged) 2.39% 4.43% 27.43% 40.01% 16.04% 12.06% MediumJPM Emerging Markets Opportunities A (acc) - USD 2.46% 4.54% 27.87% 40.58% 17.13% 13.35% MediumJPM Emerging Markets Opportunities A (dist) - EUR 1.26% 8.01% 25.93% 32.59% 14.08% 12.16% MediumJPM Emerging Markets Opportunities A (dist) - GBP 2.02% 3.13% 18.72% 24.83% 11.42% 10.79% MediumJPM Emerging Markets Opportunities A (dist) - USD 2.45% 4.51% 27.81% 40.43% 16.82% 13.04% MediumJPM Emerging Markets Opportunities C (acc) - CHF (hedged) 2.25% 4.07% 26.87% 39.18% 15.58% 11.03% MediumJPM Emerging Markets Opportunities C (acc) - EUR 1.44% 8.38% 26.60% 33.62% 15.23% 13.39% MediumJPM Emerging Markets Opportunities C (acc) - PLN -1.27% 7.46% 26.01% 35.91% 19.44% 14.97% MediumJPM Emerging Markets Opportunities C (acc) - USD 2.64% 4.89% 28.53% 41.55% 18.05% 14.32% MediumJPM Emerging Markets Opportunities C (dist) - EUR 1.44% 8.39% 26.60% 33.50% 15.02% 13.04% MediumJPM Emerging Markets Opportunities C (dist) - GBP 2.21% 3.52% 19.39% 25.63% 12.19% 11.60% MediumJPM Emerging Markets Opportunities C (dist) - USD 2.64% 4.90% 28.53% 41.27% 17.58% 13.81% MediumJPM Emerging Markets Opportunities D (acc) - EUR 1.07% 7.59% 25.21% 31.65% 13.31% 11.34% MediumJPM Emerging Markets Opportunities D (acc) - PLN -1.64% 6.66% 24.61% 33.89% 17.39% 12.84% MediumJPM Emerging Markets Opportunities D (acc) - USD 2.25% 4.12% 27.10% 39.45% 16.03% 12.22% MediumJPM Emerging Markets Opportunities I (acc) - EUR 1.45% 8.40% 26.63% 33.67% 15.28% 13.44% MediumJPM Emerging Markets Opportunities I (acc) - SGD 2.66% 6.77% 26.30% 36.31% 17.67% 13.70% MediumJPM Emerging Markets Opportunities I (acc) - USD 2.64% 4.91% 28.56% 41.60% 18.10% 14.37% MediumJPM Emerging Markets Opportunities I (dist) - USD 2.64% 4.91% 28.56% 41.54% - - MediumJPM Emerging Markets Opportunities I2 (acc) - EUR 1.49% 8.49% 26.78% 33.86% 15.48% 13.64% MediumJPM Emerging Markets Opportunities I2 (acc) - USD 2.68% 4.99% 28.71% 41.82% 18.30% 14.59% MediumJPM Emerging Markets Opportunities T (acc) - EUR 1.07% 7.58% 25.19% 31.64% 13.30% 11.33% MediumJPM Emerging Markets Opportunities X (acc) - EUR 1.67% 8.87% 27.45% 34.81% 16.42% 14.67% MediumJPM Emerging Markets Opportunities X (acc) - GBP 2.44% 3.99% 20.20% 26.95% 13.64% 13.21% MediumJPM Emerging Markets Opportunities X (acc) - USD 2.87% 5.36% 29.40% 42.83% 19.29% 15.62% MediumJPM Emerging Markets Opportunities X (dist) - GBP 2.44% 3.99% 20.20% 26.56% 13.08% 12.44% Medium
JPMorgan Funds - Emerging Markets Small Cap FundJPM Emerging Markets Small Cap A (perf) (acc) - EUR 8.90% 15.24% 33.24% 41.44% 16.91% 13.78% MediumJPM Emerging Markets Small Cap A (perf) (acc) - USD 10.18% 11.57% 35.29% 49.90% 19.83% 14.77% MediumJPM Emerging Markets Small Cap A (perf) (dist) - GBP 9.75% 10.12% 25.61% 33.04% 13.87% 12.11% MediumJPM Emerging Markets Small Cap A (perf) (dist) - USD 10.18% 11.56% 35.25% 49.63% 19.26% 14.06% MediumJPM Emerging Markets Small Cap C (perf) (acc) - EUR 9.10% 15.70% 34.04% 42.55% 17.90% 14.81% MediumJPM Emerging Markets Small Cap C (perf) (acc) - USD 10.38% 12.00% 35.95% 50.88% 20.78% 15.73% MediumJPM Emerging Markets Small Cap C (perf) (dist) - GBP 9.93% 10.51% 26.34% 33.86% 14.53% 12.78% MediumJPM Emerging Markets Small Cap D (perf) (acc) - EUR 8.62% 14.71% 32.24% 40.03% 15.66% 12.52% MediumJPM Emerging Markets Small Cap D (perf) (acc) - USD 9.89% 11.02% 34.27% 48.33% 18.50% 13.41% MediumJPM Emerging Markets Small Cap I (perf) (acc) - USD 10.40% 11.99% 36.07% 51.02% 20.88% 15.84% MediumJPM Emerging Markets Small Cap I (perf) (dist) - USD 10.40% 12.00% 36.06% 50.51% 20.36% 15.33% MediumJPM Emerging Markets Small Cap T (perf) (acc) - EUR 8.62% 14.71% 32.25% 40.03% 15.67% 12.53% MediumJPM Emerging Markets Small Cap X (acc) - EUR 9.35% 16.23% 34.90% 43.79% 19.35% 16.79% MediumJPM Emerging Markets Small Cap X (acc) - JPY 10.60% 20.82% 43.40% 56.58% 24.31% 17.76% MediumJPM Emerging Markets Small Cap X (acc) - USD 10.63% 12.48% 36.95% 52.32% - - Medium
314
JPMorgan FundsAppendix - Unaudited Additional Disclosures (continued)
3. Performance and Volatility (continued)

Share Class 3 Months 6 Months 9 Months 1 Year 2 Years 3 Years Volatility
JPMorgan Funds - Emerging Middle East Equity FundJPM Emerging Middle East Equity A (acc) - EUR 7.43% 23.43% 26.50% 33.06% 8.16% 9.25% MediumJPM Emerging Middle East Equity A (acc) - USD 8.73% 19.46% 28.47% 40.99% 10.80% 10.36% MediumJPM Emerging Middle East Equity A (dist) - USD 8.74% 19.45% 28.44% 40.56% 10.32% 9.85% MediumJPM Emerging Middle East Equity C (acc) - USD 9.00% 19.88% 29.19% 42.08% 11.76% 11.36% MediumJPM Emerging Middle East Equity C (dist) - USD 8.95% 19.90% 29.19% 41.27% 10.99% 10.56% MediumJPM Emerging Middle East Equity D (acc) - EUR 7.20% 22.82% 25.59% 31.76% 7.00% 7.99% MediumJPM Emerging Middle East Equity D (acc) - USD 8.45% 18.85% 27.51% 39.59% 9.59% 9.06% Medium
JPMorgan Funds - Europe Dynamic FundJPM Europe Dynamic A (acc) - AUD (hedged) 5.91% 16.15% 32.45% 33.16% 11.88% 7.40% MediumJPM Europe Dynamic A (acc) - EUR 5.85% 16.93% 34.11% 34.30% 13.26% 7.64% MediumJPM Europe Dynamic A (acc) - HKD (hedged) 6.05% 16.22% 33.33% 33.86% 13.98% 8.81% MediumJPM Europe Dynamic A (acc) - SGD (hedged) 6.01% 16.36% 33.28% 33.83% 13.36% 8.35% MediumJPM Europe Dynamic A (acc) - USD 7.09% 12.88% 36.11% 42.20% 15.88% 8.34% MediumJPM Europe Dynamic A (acc) - USD (hedged) 6.07% 16.31% 33.44% 34.08% 14.01% 9.21% MediumJPM Europe Dynamic A (dist) - EUR 5.86% 16.92% 34.08% 34.01% 12.87% 7.27% MediumJPM Europe Dynamic A (dist) - GBP 6.64% 10.97% 26.43% 26.18% 10.25% 6.07% MediumJPM Europe Dynamic C (acc) - EUR 6.04% 17.37% 34.88% 35.30% 14.18% 8.53% MediumJPM Europe Dynamic C (acc) - USD 7.29% 13.33% 36.92% 43.32% 16.94% 9.35% MediumJPM Europe Dynamic C (acc) - USD (hedged) 6.27% 16.76% 34.22% 35.13% 14.99% 10.17% MediumJPM Europe Dynamic C (dist) - EUR 6.04% 17.37% 34.86% 34.78% 13.60% 8.01% MediumJPM Europe Dynamic C (dist) - GBP 6.85% 11.40% 27.19% 27.02% 11.04% 6.84% MediumJPM Europe Dynamic D (acc) - EUR 5.67% 16.52% 33.37% 33.30% 12.27% 6.67% MediumJPM Europe Dynamic D (acc) - USD 6.88% 12.46% 35.35% 41.14% 14.90% 7.41% MediumJPM Europe Dynamic D (acc) - USD (hedged) 5.86% 15.86% 32.67% 33.06% 13.00% 8.19% MediumJPM Europe Dynamic I (acc) - EUR 6.06% 17.40% 34.91% 35.34% 14.24% 8.57% MediumJPM Europe Dynamic I (acc) - USD (hedged) 6.29% 16.78% 34.26% 35.18% 15.04% 10.22% MediumJPM Europe Dynamic I2 (acc) - EUR 6.10% 17.50% 35.10% 35.62% 14.49% 8.82% MediumJPM Europe Dynamic T (acc) - EUR 5.63% 16.45% 33.31% 33.22% 12.21% 6.61% MediumJPM Europe Dynamic X (acc) - EUR 6.27% 17.86% 35.71% 36.45% 15.28% 9.60% MediumJPM Europe Dynamic X (acc) - USD (hedged) 6.50% 17.25% 35.07% 36.29% 16.11% 11.30% Medium
JPMorgan Funds - Europe Equity FundJPM Europe Equity A (acc) - AUD (hedged) 7.45% 17.38% 29.86% 32.71% 10.48% 8.46% MediumJPM Europe Equity A (acc) - EUR 7.26% 18.19% 31.44% 33.79% 11.67% 8.54% MediumJPM Europe Equity A (acc) - USD 8.57% 14.16% 33.47% 41.80% 14.32% 9.34% MediumJPM Europe Equity A (acc) - USD (hedged) 7.52% 17.46% 30.62% 33.87% 12.43% 10.12% MediumJPM Europe Equity A (dist) - EUR 7.30% 18.21% 31.46% 33.44% 11.23% 8.08% MediumJPM Europe Equity A (dist) - USD 8.57% 14.13% 33.40% 41.32% 13.73% 8.77% MediumJPM Europe Equity C (acc) - EUR 7.43% 18.51% 31.96% 34.56% 12.35% 9.23% MediumJPM Europe Equity C (acc) - USD 8.72% 14.46% 34.00% 42.57% 15.04% 10.08% MediumJPM Europe Equity C (acc) - USD (hedged) 7.70% 17.86% 31.28% 34.62% 13.15% 10.88% MediumJPM Europe Equity C (dist) - EUR 7.45% 18.54% 32.00% 33.98% 11.74% 8.61% MediumJPM Europe Equity C (dist) - USD 8.71% 14.47% 34.01% 41.94% 14.30% 9.36% MediumJPM Europe Equity D (acc) - EUR 7.12% 17.79% 30.72% 32.84% 10.73% 7.59% MediumJPM Europe Equity D (acc) - USD 8.37% 13.73% 32.71% 40.72% 13.30% 8.36% MediumJPM Europe Equity D (acc) - USD (hedged) 7.34% 17.07% 29.96% 32.83% 11.46% 9.12% MediumJPM Europe Equity I (acc) - EUR 7.46% 18.55% 32.02% 34.62% 12.40% 9.28% MediumJPM Europe Equity X (acc) - EUR 7.59% 18.85% 32.53% 35.31% 13.03% 9.94% Medium
JPMorgan Funds - Europe Small Cap FundJPM Europe Small Cap A (acc) - EUR 7.32% 16.68% 34.92% 49.60% 18.28% 8.43% MediumJPM Europe Small Cap A (acc) - SEK 5.95% 17.42% 29.33% 44.31% 15.26% 6.96% MediumJPM Europe Small Cap A (acc) - USD 8.57% 12.65% 36.90% 58.37% 21.13% 9.15% MediumJPM Europe Small Cap A (acc) - USD (hedged) 7.73% 15.25% 32.41% 47.26% 18.47% 9.88% MediumJPM Europe Small Cap A (dist) - EUR 7.31% 16.68% 34.89% 49.56% 18.06% 8.24% MediumJPM Europe Small Cap A (dist) - GBP 8.10% 10.71% 27.16% 40.77% 15.17% 6.94% MediumJPM Europe Small Cap C (acc) - EUR 7.51% 17.13% 35.65% 50.66% 19.28% 9.34% MediumJPM Europe Small Cap C (dist) - EUR 7.51% 17.12% 35.65% 50.40% 18.80% 8.94% MediumJPM Europe Small Cap D (acc) - EUR 7.01% 16.09% 33.86% 48.05% 16.87% 7.15% MediumJPM Europe Small Cap I (acc) - EUR 7.52% 17.14% 35.69% 50.74% 19.34% 9.39% MediumJPM Europe Small Cap I (dist) - EUR* - - - - - - MediumJPM Europe Small Cap I2 (acc) - EUR 7.57% 17.25% 35.88% 51.04% 19.62% 9.65% MediumJPM Europe Small Cap X (acc) - EUR 7.74% 17.62% 36.52% 51.97% 20.48% 10.44% MediumJPM Europe Small Cap X (dist) - EUR+ - - - - - - Medium
* Share Class inactive as at the end of the year.+ No data is applicable for these Share Classes as they were launched or reactivated less than 3 months before the year end.
315
JPMorgan FundsAppendix - Unaudited Additional Disclosures (continued)
3. Performance and Volatility (continued)

Share Class 3 Months 6 Months 9 Months 1 Year 2 Years 3 Years Volatility
JPMorgan Funds - Global Growth Fund (1)JPM Global Growth A (acc) - CHF (hedged) 10.18% 14.08% 28.96% 43.26% 30.45% 21.06% MediumJPM Global Growth A (acc) - EUR 9.12% 17.20% 28.48% 38.64% 30.01% 23.59% MediumJPM Global Growth A (acc) - EUR (hedged) 10.19% 14.28% 29.17% 43.53% 30.83% 21.45% MediumJPM Global Growth A (acc) - USD 10.42% 13.45% 30.43% 46.87% 33.49% 24.73% MediumJPM Global Growth A (dist) - EUR (hedged) 10.18% 14.27% 29.18% 43.57% 30.76% 21.42% MediumJPM Global Growth A (dist) - USD 10.42% 13.43% 30.45% 46.89% 33.48% 24.73% MediumJPM Global Growth C (acc) - EUR 9.39% 17.77% 29.42% 40.01% 31.62% 25.31% MediumJPM Global Growth C (acc) - EUR (hedged) 10.49% 14.81% 30.08% 44.91% 32.41% 23.12% MediumJPM Global Growth C (acc) - USD 10.70% 14.01% 31.40% 48.34% 35.15% 26.48% MediumJPM Global Growth D (acc) - EUR 8.91% 16.75% 27.75% 37.60% 28.81% 22.31% MediumJPM Global Growth D (acc) - EUR (hedged) 9.99% 13.80% 28.43% 42.36% 29.59% 20.23% MediumJPM Global Growth D (acc) - USD 10.19% 13.00% 29.70% 45.75% 32.19% 23.42% MediumJPM Global Growth I (acc) - JPY 10.64% 22.45% 37.62% 52.54% 37.53% 26.51% MediumJPM Global Growth I (acc) - USD 10.69% 14.00% 31.44% 48.39% 35.21% 26.55% MediumJPM Global Growth T (acc) - EUR 8.91% 16.76% 27.75% 37.60% 28.80% 22.31% MediumJPM Global Growth X (acc) - EUR 9.56% 18.15% 30.04% 40.91% 32.68% 26.47% MediumJPM Global Growth X (acc) - USD 10.86% 14.33% 32.00% 49.28% 36.18% 27.61% Medium
JPMorgan Funds - Global Healthcare FundJPM Global Healthcare A (acc) - EUR 6.98% 10.90% 15.62% 19.41% 20.57% 18.34% MediumJPM Global Healthcare A (acc) - EUR (hedged) 7.82% 8.17% 16.42% 24.06% 21.30% - MediumJPM Global Healthcare A (acc) - USD 8.25% 7.33% 17.39% 26.52% 23.62% 19.38% MediumJPM Global Healthcare A (dist) - EUR 6.97% 10.89% 15.60% 19.37% 20.48% 18.23% MediumJPM Global Healthcare A (dist) - GBP 7.77% 5.88% 8.97% 12.35% 17.50% 16.64% MediumJPM Global Healthcare A (dist) - USD 8.25% 7.33% 17.40% 26.52% 23.62% 19.38% MediumJPM Global Healthcare C (acc) - EUR 7.17% 11.29% 16.25% 20.28% 21.59% 19.47% MediumJPM Global Healthcare C (acc) - USD 8.44% 7.70% 18.01% 27.41% 24.67% 20.51% MediumJPM Global Healthcare C (dist) - EUR 7.17% 11.29% 16.24% 20.26% 21.55% 19.42% MediumJPM Global Healthcare C (dist) - GBP 7.99% 6.30% 9.62% 13.26% 18.57% 17.84% MediumJPM Global Healthcare C (dist) - USD 8.44% 7.70% 18.01% 27.41% 24.63% 20.48% MediumJPM Global Healthcare D (acc) - EUR 6.71% 10.34% 14.75% 18.21% 19.13% 16.77% MediumJPM Global Healthcare D (acc) - PLN (hedged) 7.63% 7.88% 15.70% 23.26% 21.36% 17.27% MediumJPM Global Healthcare D (acc) - USD 7.98% 6.80% 16.52% 25.27% 22.16% 17.83% MediumJPM Global Healthcare I (acc) - EUR 7.17% 11.30% 16.26% 20.30% - - MediumJPM Global Healthcare I (acc) - USD 8.45% 7.72% 18.05% 27.46% 24.74% 20.57% MediumJPM Global Healthcare I2 (acc) - USD 8.51% 7.84% 18.24% 27.73% 25.04% 20.90% MediumJPM Global Healthcare T (acc) - EUR 6.72% 10.36% 14.78% 18.24% 19.17% 16.80% MediumJPM Global Healthcare X (acc) - JPY 8.62% 16.18% 24.36% 32.10% 28.03% 21.88% Medium
JPMorgan Funds - Global Natural Resources FundJPM Global Natural Resources A (acc) - EUR 5.01% 21.66% 40.70% 37.98% 7.24% 3.59% HighJPM Global Natural Resources A (acc) - GBP 5.76% 16.17% 32.62% 29.81% 4.76% 2.40% HighJPM Global Natural Resources A (acc) - SGD 6.22% 19.74% 40.32% 40.59% 9.20% 3.71% HighJPM Global Natural Resources A (acc) - USD 6.23% 17.71% 42.88% 45.98% 9.66% 4.28% HighJPM Global Natural Resources A (dist) - EUR 5.01% 21.69% 40.70% 37.16% 6.73% 3.22% HighJPM Global Natural Resources C (acc) - EUR 5.22% 22.09% 41.57% 39.03% 8.12% 4.42% HighJPM Global Natural Resources C (acc) - GBP* - - - - - - HighJPM Global Natural Resources C (acc) - USD 6.48% 18.16% 43.76% 47.35% 10.58% 5.15% HighJPM Global Natural Resources C (dist) - EUR 5.18% 22.11% 41.47% 37.81% 7.27% 3.79% HighJPM Global Natural Resources D (acc) - EUR 4.72% 21.07% 39.68% 36.68% 6.12% 2.48% HighJPM Global Natural Resources D (acc) - USD 5.87% 17.17% 41.73% 44.65% 8.49% 3.11% HighJPM Global Natural Resources F (acc) - USD 5.94% 17.13% 41.71% 44.59% 8.44% - HighJPM Global Natural Resources I (acc) - EUR 5.19% 22.14% 41.52% 39.01% 8.12% 4.45% HighJPM Global Natural Resources I (acc) - SGD 6.45% 20.34% 41.21% 41.89% 10.23% - HighJPM Global Natural Resources X (acc) - EUR 5.40% 22.64% 42.35% 40.07% 9.08% 5.39% High
(1) This Sub-Fund was renamed from JPMorgan Funds - Global Unconstrained Equity Fund to JPMorgan Funds - Global Growth Fund on 1 April 2021.* Share Class inactive as at the end of the year.
316
JPMorgan FundsAppendix - Unaudited Additional Disclosures (continued)
3. Performance and Volatility (continued)
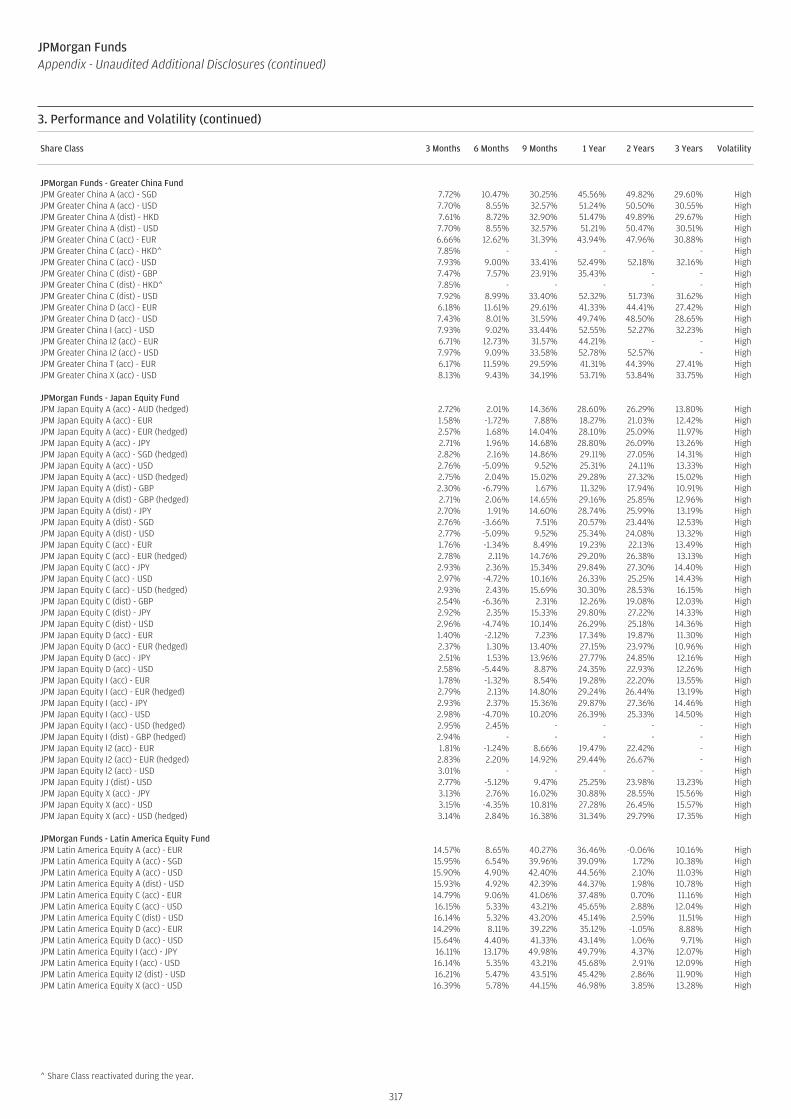
Share Class 3 Months 6 Months 9 Months 1 Year 2 Years 3 Years Volatility
JPMorgan Funds - Greater China FundJPM Greater China A (acc) - SGD 7.72% 10.47% 30.25% 45.56% 49.82% 29.60% HighJPM Greater China A (acc) - USD 7.70% 8.55% 32.57% 51.24% 50.50% 30.55% HighJPM Greater China A (dist) - HKD 7.61% 8.72% 32.90% 51.47% 49.89% 29.67% HighJPM Greater China A (dist) - USD 7.70% 8.55% 32.57% 51.21% 50.47% 30.51% HighJPM Greater China C (acc) - EUR 6.66% 12.62% 31.39% 43.94% 47.96% 30.88% HighJPM Greater China C (acc) - HKD^ 7.85% - - - - - HighJPM Greater China C (acc) - USD 7.93% 9.00% 33.41% 52.49% 52.18% 32.16% HighJPM Greater China C (dist) - GBP 7.47% 7.57% 23.91% 35.43% - - HighJPM Greater China C (dist) - HKD^ 7.85% - - - - - HighJPM Greater China C (dist) - USD 7.92% 8.99% 33.40% 52.32% 51.73% 31.62% HighJPM Greater China D (acc) - EUR 6.18% 11.61% 29.61% 41.33% 44.41% 27.42% HighJPM Greater China D (acc) - USD 7.43% 8.01% 31.59% 49.74% 48.50% 28.65% HighJPM Greater China I (acc) - USD 7.93% 9.02% 33.44% 52.55% 52.27% 32.23% HighJPM Greater China I2 (acc) - EUR 6.71% 12.73% 31.57% 44.21% - - HighJPM Greater China I2 (acc) - USD 7.97% 9.09% 33.58% 52.78% 52.57% - HighJPM Greater China T (acc) - EUR 6.17% 11.59% 29.59% 41.31% 44.39% 27.41% HighJPM Greater China X (acc) - USD 8.13% 9.43% 34.19% 53.71% 53.84% 33.75% High
JPMorgan Funds - Japan Equity FundJPM Japan Equity A (acc) - AUD (hedged) 2.72% 2.01% 14.36% 28.60% 26.29% 13.80% HighJPM Japan Equity A (acc) - EUR 1.58% -1.72% 7.88% 18.27% 21.03% 12.42% HighJPM Japan Equity A (acc) - EUR (hedged) 2.57% 1.68% 14.04% 28.10% 25.09% 11.97% HighJPM Japan Equity A (acc) - JPY 2.71% 1.96% 14.68% 28.80% 26.09% 13.26% HighJPM Japan Equity A (acc) - SGD (hedged) 2.82% 2.16% 14.86% 29.11% 27.05% 14.31% HighJPM Japan Equity A (acc) - USD 2.76% -5.09% 9.52% 25.31% 24.11% 13.33% HighJPM Japan Equity A (acc) - USD (hedged) 2.75% 2.04% 15.02% 29.28% 27.32% 15.02% HighJPM Japan Equity A (dist) - GBP 2.30% -6.79% 1.67% 11.32% 17.94% 10.91% HighJPM Japan Equity A (dist) - GBP (hedged) 2.71% 2.06% 14.65% 29.16% 25.85% 12.96% HighJPM Japan Equity A (dist) - JPY 2.70% 1.91% 14.60% 28.74% 25.99% 13.19% HighJPM Japan Equity A (dist) - SGD 2.76% -3.66% 7.51% 20.57% 23.44% 12.53% HighJPM Japan Equity A (dist) - USD 2.77% -5.09% 9.52% 25.34% 24.08% 13.32% HighJPM Japan Equity C (acc) - EUR 1.76% -1.34% 8.49% 19.23% 22.13% 13.49% HighJPM Japan Equity C (acc) - EUR (hedged) 2.78% 2.11% 14.76% 29.20% 26.38% 13.13% HighJPM Japan Equity C (acc) - JPY 2.93% 2.36% 15.34% 29.84% 27.30% 14.40% HighJPM Japan Equity C (acc) - USD 2.97% -4.72% 10.16% 26.33% 25.25% 14.43% HighJPM Japan Equity C (acc) - USD (hedged) 2.93% 2.43% 15.69% 30.30% 28.53% 16.15% HighJPM Japan Equity C (dist) - GBP 2.54% -6.36% 2.31% 12.26% 19.08% 12.03% HighJPM Japan Equity C (dist) - JPY 2.92% 2.35% 15.33% 29.80% 27.22% 14.33% HighJPM Japan Equity C (dist) - USD 2.96% -4.74% 10.14% 26.29% 25.18% 14.36% HighJPM Japan Equity D (acc) - EUR 1.40% -2.12% 7.23% 17.34% 19.87% 11.30% HighJPM Japan Equity D (acc) - EUR (hedged) 2.37% 1.30% 13.40% 27.15% 23.97% 10.96% HighJPM Japan Equity D (acc) - JPY 2.51% 1.53% 13.96% 27.77% 24.85% 12.16% HighJPM Japan Equity D (acc) - USD 2.58% -5.44% 8.87% 24.35% 22.93% 12.26% HighJPM Japan Equity I (acc) - EUR 1.78% -1.32% 8.54% 19.28% 22.20% 13.55% HighJPM Japan Equity I (acc) - EUR (hedged) 2.79% 2.13% 14.80% 29.24% 26.44% 13.19% HighJPM Japan Equity I (acc) - JPY 2.93% 2.37% 15.36% 29.87% 27.36% 14.46% HighJPM Japan Equity I (acc) - USD 2.98% -4.70% 10.20% 26.39% 25.33% 14.50% HighJPM Japan Equity I (acc) - USD (hedged) 2.95% 2.45% - - - - HighJPM Japan Equity I (dist) - GBP (hedged) 2.94% - - - - - HighJPM Japan Equity I2 (acc) - EUR 1.81% -1.24% 8.66% 19.47% 22.42% - HighJPM Japan Equity I2 (acc) - EUR (hedged) 2.83% 2.20% 14.92% 29.44% 26.67% - HighJPM Japan Equity I2 (acc) - USD 3.01% - - - - - HighJPM Japan Equity J (dist) - USD 2.77% -5.12% 9.47% 25.25% 23.98% 13.23% HighJPM Japan Equity X (acc) - JPY 3.13% 2.76% 16.02% 30.88% 28.55% 15.56% HighJPM Japan Equity X (acc) - USD 3.15% -4.35% 10.81% 27.28% 26.45% 15.57% HighJPM Japan Equity X (acc) - USD (hedged) 3.14% 2.84% 16.38% 31.34% 29.79% 17.35% High
JPMorgan Funds - Latin America Equity FundJPM Latin America Equity A (acc) - EUR 14.57% 8.65% 40.27% 36.46% -0.06% 10.16% HighJPM Latin America Equity A (acc) - SGD 15.95% 6.54% 39.96% 39.09% 1.72% 10.38% HighJPM Latin America Equity A (acc) - USD 15.90% 4.90% 42.40% 44.56% 2.10% 11.03% HighJPM Latin America Equity A (dist) - USD 15.93% 4.92% 42.39% 44.37% 1.98% 10.78% HighJPM Latin America Equity C (acc) - EUR 14.79% 9.06% 41.06% 37.48% 0.70% 11.16% HighJPM Latin America Equity C (acc) - USD 16.15% 5.33% 43.21% 45.65% 2.88% 12.04% HighJPM Latin America Equity C (dist) - USD 16.14% 5.32% 43.20% 45.14% 2.59% 11.51% HighJPM Latin America Equity D (acc) - EUR 14.29% 8.11% 39.22% 35.12% -1.05% 8.88% HighJPM Latin America Equity D (acc) - USD 15.64% 4.40% 41.33% 43.14% 1.06% 9.71% HighJPM Latin America Equity I (acc) - JPY 16.11% 13.17% 49.98% 49.79% 4.37% 12.07% HighJPM Latin America Equity I (acc) - USD 16.14% 5.35% 43.21% 45.68% 2.91% 12.09% HighJPM Latin America Equity I2 (dist) - USD 16.21% 5.47% 43.51% 45.42% 2.86% 11.90% HighJPM Latin America Equity X (acc) - USD 16.39% 5.78% 44.15% 46.98% 3.85% 13.28% High
^ Share Class reactivated during the year.
317
JPMorgan FundsAppendix - Unaudited Additional Disclosures (continued)
3. Performance and Volatility (continued)

Share Class 3 Months 6 Months 9 Months 1 Year 2 Years 3 Years Volatility
JPMorgan Funds - Russia FundJPM Russia A (acc) - USD 11.90% 17.58% 34.29% 37.36% 12.87% 17.12% MediumJPM Russia A (dist) - USD 11.92% 17.60% 34.30% 35.98% 11.65% 15.63% MediumJPM Russia C (acc) - USD 12.10% 18.02% 35.04% 38.47% 13.76% 18.33% MediumJPM Russia C (dist) - USD 12.12% 18.05% 35.06% 36.84% 12.59% 16.88% MediumJPM Russia D (acc) - EUR 10.33% 20.92% 31.32% 28.34% 9.05% 14.68% MediumJPM Russia D (acc) - USD 11.72% 17.06% 33.44% 36.01% 11.65% 15.67% MediumJPM Russia I (acc) - USD 12.18% 18.13% 35.12% 38.44% 13.87% 18.34% MediumJPM Russia T (acc) - EUR 10.34% 20.93% 31.32% 28.35% 9.06% 14.69% MediumJPM Russia X (acc) - USD 12.38% 18.59% 35.99% 39.61% 14.97% 19.69% Medium
JPMorgan Funds - Thematics - Genetic TherapiesJPM Thematics - Genetic Therapies A (acc) - CHF (hedged) 9.03% 2.71% 24.66% 25.50% - - HighJPM Thematics - Genetic Therapies A (acc) - EUR (hedged) 9.02% 2.98% 24.90% 25.76% - - HighJPM Thematics - Genetic Therapies A (acc) - GBP (hedged) 9.06% 3.29% 25.44% 26.53% - - HighJPM Thematics - Genetic Therapies A (acc) - HKD (hedged) 9.06% 3.13% 25.61% 26.98% - - HighJPM Thematics - Genetic Therapies A (acc) - SGD (hedged) 9.20% 3.32% 25.72% 26.91% - - HighJPM Thematics - Genetic Therapies A (acc) - USD 9.28% 2.10% 25.68% 27.80% - - HighJPM Thematics - Genetic Therapies A (dist) - CHF (hedged) 9.03% 2.71% 24.66% 25.50% - - HighJPM Thematics - Genetic Therapies A (dist) - EUR (hedged) 9.00% 2.95% 24.85% 25.69% - - HighJPM Thematics - Genetic Therapies A (dist) - GBP (hedged) 9.07% 3.29% 25.44% 26.53% - - HighJPM Thematics - Genetic Therapies A (dist) - USD 9.25% 2.06% 25.62% 27.72% - - HighJPM Thematics - Genetic Therapies C (acc) - CHF (hedged) 9.15% 2.94% 25.09% 26.07% - - HighJPM Thematics - Genetic Therapies C (acc) - EUR (hedged) 9.12% 3.19% 25.28% 26.28% - - HighJPM Thematics - Genetic Therapies C (acc) - USD 9.39% 2.30% 26.07% 28.31% - - HighJPM Thematics - Genetic Therapies C (dist) - GBP 8.92% - - - - - HighJPM Thematics - Genetic Therapies C (dist) - USD 9.38% - - - - - HighJPM Thematics - Genetic Therapies C2 (acc) - CHF (hedged) 9.17% 2.98% 25.16% 26.16% - - HighJPM Thematics - Genetic Therapies C2 (acc) - EUR (hedged) 9.15% 3.22% 25.34% 26.36% - - HighJPM Thematics - Genetic Therapies C2 (acc) - GBP (hedged) 9.20% 3.56% 25.94% 27.20% - - HighJPM Thematics - Genetic Therapies C2 (acc) - HKD (hedged) 9.24% 3.40% 26.04% 27.50% - - HighJPM Thematics - Genetic Therapies C2 (acc) - SGD (hedged) 9.31% 3.59% 26.22% 27.50% - - HighJPM Thematics - Genetic Therapies C2 (acc) - USD 9.40% 2.33% 26.12% 28.40% - - HighJPM Thematics - Genetic Therapies C2 (dist) - CHF (hedged) 9.18% 2.98% 25.16% 26.17% - - HighJPM Thematics - Genetic Therapies C2 (dist) - EUR (hedged) 9.15% 3.22% 25.35% 26.36% - - HighJPM Thematics - Genetic Therapies C2 (dist) - GBP (hedged) 9.21% 3.57% 25.94% 27.20% - - HighJPM Thematics - Genetic Therapies C2 (dist) - USD 9.40% 2.33% 26.12% 28.40% - - HighJPM Thematics - Genetic Therapies D (acc) - EUR (hedged) 8.75% 2.46% 23.94% 24.46% - - HighJPM Thematics - Genetic Therapies D (acc) - USD 8.98% 1.54% 24.67% - - - HighJPM Thematics - Genetic Therapies I (acc) - EUR 8.12% - - - - - HighJPM Thematics - Genetic Therapies I (acc) - EUR (hedged) 9.13% 3.20% - - - - HighJPM Thematics - Genetic Therapies I2 (acc) - EUR (hedged) 9.16% 3.24% 25.38% 26.41% - - HighJPM Thematics - Genetic Therapies I2 (acc) - USD 9.41% 2.36% 26.18% - - - HighJPM Thematics - Genetic Therapies I2 (dist) - GBP (hedged) 9.21% 3.57% - - - - HighJPM Thematics - Genetic Therapies I2 (dist) - USD 9.43% 2.35% 26.19% - - - High
JPMorgan Funds - US Equity All Cap FundJPM US Equity All Cap A (acc) - AUD (hedged) 7.01% 16.21% 34.27% 47.58% 24.22% 18.77% MediumJPM US Equity All Cap A (acc) - EUR 5.91% 20.38% 33.30% 40.52% 23.15% 19.60% MediumJPM US Equity All Cap A (acc) - EUR (hedged)^+ - - - - - - MediumJPM US Equity All Cap A (acc) - USD 7.18% 16.56% 35.43% 49.03% 26.48% 20.84% MediumJPM US Equity All Cap C (acc) - EUR 6.15% 20.95% 34.25% 41.85% 24.55% 21.13% MediumJPM US Equity All Cap C (acc) - EUR (hedged) 7.08% 16.50% 35.04% 48.55% 25.52% 18.96% MediumJPM US Equity All Cap C (acc) - USD 7.41% 17.06% 36.29% 50.28% 27.77% 22.21% MediumJPM US Equity All Cap C (dist) - GBP 6.96% 15.53% 26.60% 33.46% 21.32% 19.36% MediumJPM US Equity All Cap I (acc) - EUR 6.17% 20.97% 34.28% 41.90% 24.62% 21.19% MediumJPM US Equity All Cap I (acc) - EUR (hedged) 7.10% 16.53% 35.08% 48.61% 25.58% 19.01% MediumJPM US Equity All Cap I2 (acc) - EUR (hedged) 7.12% 16.59% 35.18% 48.77% 25.74% - MediumJPM US Equity All Cap X (acc) - USD 7.60% 17.47% 37.02% 51.35% 28.89% 23.40% Medium
^ Share Class reactivated during the year.+ No data is applicable for these Share Classes as they were launched or reactivated less than 3 months before the year end.
318
JPMorgan FundsAppendix - Unaudited Additional Disclosures (continued)
3. Performance and Volatility (continued)

Share Class 3 Months 6 Months 9 Months 1 Year 2 Years 3 Years Volatility
JPMorgan Funds - US Growth FundJPM US Growth A (acc) - EUR (hedged) 7.94% 8.05% 19.31% 39.97% 37.94% 29.95% HighJPM US Growth A (acc) - USD 8.29% 8.71% 20.54% 41.69% 40.52% 34.01% HighJPM US Growth A (dist) - GBP 7.81% 7.25% 11.93% 25.86% 33.04% 30.52% HighJPM US Growth A (dist) - USD 8.29% 8.69% 20.48% 41.59% 40.40% 33.84% HighJPM US Growth C (acc) - EUR (hedged) 8.19% 8.58% 20.16% 41.34% 39.73% 31.89% HighJPM US Growth C (acc) - USD 8.51% 9.21% 21.38% 43.02% 42.22% 35.89% HighJPM US Growth C (dist) - GBP 8.07% 7.79% 12.74% 27.13% 34.71% 32.49% HighJPM US Growth C (dist) - USD 8.52% 9.21% 21.37% 43.02% 42.23% 35.90% HighJPM US Growth D (acc) - EUR (hedged) 7.75% 7.66% 18.62% 38.90% 36.67% 28.57% HighJPM US Growth D (acc) - USD 8.07% 8.32% 19.87% 40.62% 39.16% 32.41% HighJPM US Growth I (acc) - JPY 8.49% 17.33% 27.12% 47.07% 44.82% 35.95% HighJPM US Growth I (acc) - JPY (hedged) 8.50% - - - - - HighJPM US Growth I (acc) - USD 8.53% 9.24% 21.41% 43.08% 42.30% 35.99% HighJPM US Growth I (dist) - GBP 8.09% 7.81% 12.78% 27.18% 34.78% 32.57% HighJPM US Growth I (dist) - USD 8.53% 9.24% 21.41% 43.08% 42.30% 35.99% HighJPM US Growth I2 (acc) - USD 8.54% 9.24% 21.52% 43.24% 42.50% 36.21% HighJPM US Growth T (acc) - EUR (hedged) 7.74% 7.68% 18.65% 38.95% 36.67% 28.58% HighJPM US Growth X (acc) - USD 8.69% 9.56% 21.94% 43.93% 43.46% 37.28% High
JPMorgan Funds - US Smaller Companies FundJPM US Smaller Companies A (acc) - EUR (hedged) 2.39% 9.92% 37.16% 43.69% 16.71% 9.72% HighJPM US Smaller Companies A (acc) - USD 2.81% 10.64% 38.74% 45.79% 18.85% 12.55% HighJPM US Smaller Companies A (dist) - USD 2.79% 10.61% 38.72% 45.75% 18.80% 12.51% HighJPM US Smaller Companies C (acc) - EUR (hedged) 2.62% 10.39% 38.04% 44.91% 17.86% 10.83% HighJPM US Smaller Companies C (acc) - USD 2.99% 11.05% 39.54% 46.91% 19.91% 13.61% HighJPM US Smaller Companies C (dist) - USD 2.99% 11.05% 39.54% 46.86% 19.85% 13.56% HighJPM US Smaller Companies C2 (dist) - USD* - - - - - - HighJPM US Smaller Companies D (acc) - USD 2.52% 10.05% 37.65% 44.22% 17.38% 11.08% HighJPM US Smaller Companies I (acc) - EUR (hedged) 2.62% 10.40% 38.07% 44.97% 17.93% 10.89% HighJPM US Smaller Companies I (acc) - USD 3.00% 11.07% 39.59% 46.97% 19.97% 13.66% HighJPM US Smaller Companies I (dist) - USD 3.00% 11.07% 39.57% 46.90% 19.89% 13.60% HighJPM US Smaller Companies X (acc) - USD 3.19% 11.50% 40.41% 48.08% 21.03% 14.75% High
JPMorgan Funds - US Technology FundJPM US Technology A (acc) - EUR 9.31% 11.78% 34.87% 51.01% 54.12% 50.22% HighJPM US Technology A (acc) - HKD 10.45% 8.31% 37.15% 60.19% 58.05% - HighJPM US Technology A (acc) - SGD 10.60% 10.05% 34.44% 53.88% 57.69% 50.48% HighJPM US Technology A (acc) - USD 10.60% 8.18% 36.91% 59.96% 58.56% 51.86% HighJPM US Technology A (dist) - GBP 10.11% 6.69% 27.04% 41.99% 49.42% 47.36% HighJPM US Technology A (dist) - USD 10.59% 8.17% 36.88% 59.92% 58.53% 51.78% HighJPM US Technology C (acc) - EUR 9.54% 12.26% 35.75% 52.32% 55.95% 52.46% HighJPM US Technology C (acc) - USD 10.84% 8.66% 37.84% 61.39% 60.54% 54.17% HighJPM US Technology C (dist) - GBP 10.37% 7.22% 28.01% 43.43% - - HighJPM US Technology C (dist) - USD 10.83% 8.64% 37.81% 61.36% 60.51% 54.15% HighJPM US Technology D (acc) - EUR 9.05% 11.23% 33.86% 49.50% 52.03% 47.68% HighJPM US Technology D (acc) - USD 10.34% 7.66% 36.01% 58.46% 56.47% 49.43% HighJPM US Technology F (acc) - USD 10.30% 7.60% - - - - HighJPM US Technology I (acc) - EUR^* - - - - - - HighJPM US Technology I (acc) - USD 10.84% 8.67% 37.85% 61.42% 60.61% - HighJPM US Technology I2 (acc) - EUR 9.58% 12.34% 35.89% 52.53% 56.24% - HighJPM US Technology I2 (acc) - USD 10.87% 8.72% 37.96% 61.59% 60.83% 54.48% HighJPM US Technology X (acc) - USD 11.03% 9.02% 38.53% 62.48% 62.07% 56.01% High
* Share Class inactive as at the end of the year.^ Share Class reactivated during the year.
319
JPMorgan FundsAppendix - Unaudited Additional Disclosures (continued)
3. Performance and Volatility (continued)
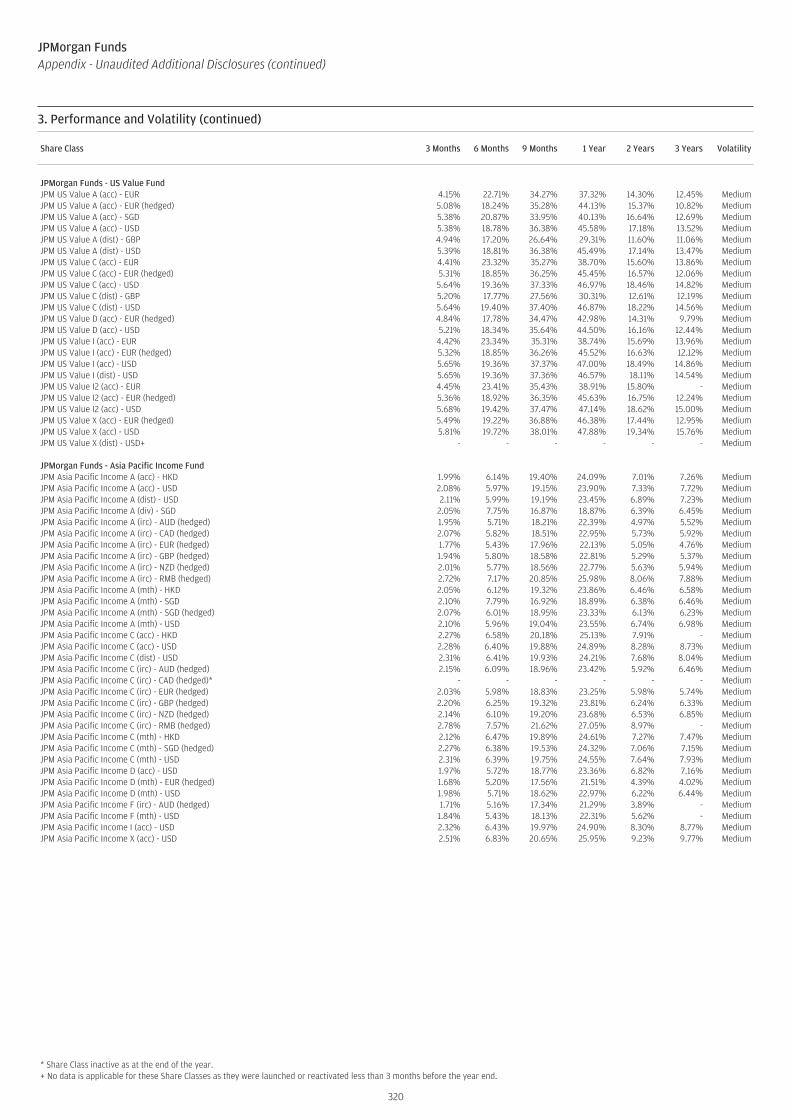
Share Class 3 Months 6 Months 9 Months 1 Year 2 Years 3 Years Volatility
JPMorgan Funds - US Value FundJPM US Value A (acc) - EUR 4.15% 22.71% 34.27% 37.32% 14.30% 12.45% MediumJPM US Value A (acc) - EUR (hedged) 5.08% 18.24% 35.28% 44.13% 15.37% 10.82% MediumJPM US Value A (acc) - SGD 5.38% 20.87% 33.95% 40.13% 16.64% 12.69% MediumJPM US Value A (acc) - USD 5.38% 18.78% 36.38% 45.58% 17.18% 13.52% MediumJPM US Value A (dist) - GBP 4.94% 17.20% 26.64% 29.31% 11.60% 11.06% MediumJPM US Value A (dist) - USD 5.39% 18.81% 36.38% 45.49% 17.14% 13.47% MediumJPM US Value C (acc) - EUR 4.41% 23.32% 35.27% 38.70% 15.60% 13.86% MediumJPM US Value C (acc) - EUR (hedged) 5.31% 18.85% 36.25% 45.45% 16.57% 12.06% MediumJPM US Value C (acc) - USD 5.64% 19.36% 37.33% 46.97% 18.46% 14.82% MediumJPM US Value C (dist) - GBP 5.20% 17.77% 27.56% 30.31% 12.61% 12.19% MediumJPM US Value C (dist) - USD 5.64% 19.40% 37.40% 46.87% 18.22% 14.56% MediumJPM US Value D (acc) - EUR (hedged) 4.84% 17.78% 34.47% 42.98% 14.31% 9.79% MediumJPM US Value D (acc) - USD 5.21% 18.34% 35.64% 44.50% 16.16% 12.44% MediumJPM US Value I (acc) - EUR 4.42% 23.34% 35.31% 38.74% 15.69% 13.96% MediumJPM US Value I (acc) - EUR (hedged) 5.32% 18.85% 36.26% 45.52% 16.63% 12.12% MediumJPM US Value I (acc) - USD 5.65% 19.36% 37.37% 47.00% 18.49% 14.86% MediumJPM US Value I (dist) - USD 5.65% 19.36% 37.36% 46.57% 18.11% 14.54% MediumJPM US Value I2 (acc) - EUR 4.45% 23.41% 35.43% 38.91% 15.80% - MediumJPM US Value I2 (acc) - EUR (hedged) 5.36% 18.92% 36.35% 45.63% 16.75% 12.24% MediumJPM US Value I2 (acc) - USD 5.68% 19.42% 37.47% 47.14% 18.62% 15.00% MediumJPM US Value X (acc) - EUR (hedged) 5.49% 19.22% 36.88% 46.38% 17.44% 12.95% MediumJPM US Value X (acc) - USD 5.81% 19.72% 38.01% 47.88% 19.34% 15.76% MediumJPM US Value X (dist) - USD+ - - - - - - Medium
JPMorgan Funds - Asia Pacific Income FundJPM Asia Pacific Income A (acc) - HKD 1.99% 6.14% 19.40% 24.09% 7.01% 7.26% MediumJPM Asia Pacific Income A (acc) - USD 2.08% 5.97% 19.15% 23.90% 7.33% 7.72% MediumJPM Asia Pacific Income A (dist) - USD 2.11% 5.99% 19.19% 23.45% 6.89% 7.23% MediumJPM Asia Pacific Income A (div) - SGD 2.05% 7.75% 16.87% 18.87% 6.39% 6.45% MediumJPM Asia Pacific Income A (irc) - AUD (hedged) 1.95% 5.71% 18.21% 22.39% 4.97% 5.52% MediumJPM Asia Pacific Income A (irc) - CAD (hedged) 2.07% 5.82% 18.51% 22.95% 5.73% 5.92% MediumJPM Asia Pacific Income A (irc) - EUR (hedged) 1.77% 5.43% 17.96% 22.13% 5.05% 4.76% MediumJPM Asia Pacific Income A (irc) - GBP (hedged) 1.94% 5.80% 18.58% 22.81% 5.29% 5.37% MediumJPM Asia Pacific Income A (irc) - NZD (hedged) 2.01% 5.77% 18.56% 22.77% 5.63% 5.94% MediumJPM Asia Pacific Income A (irc) - RMB (hedged) 2.72% 7.17% 20.85% 25.98% 8.06% 7.88% MediumJPM Asia Pacific Income A (mth) - HKD 2.05% 6.12% 19.32% 23.86% 6.46% 6.58% MediumJPM Asia Pacific Income A (mth) - SGD 2.10% 7.79% 16.92% 18.89% 6.38% 6.46% MediumJPM Asia Pacific Income A (mth) - SGD (hedged) 2.07% 6.01% 18.95% 23.33% 6.13% 6.23% MediumJPM Asia Pacific Income A (mth) - USD 2.10% 5.96% 19.04% 23.55% 6.74% 6.98% MediumJPM Asia Pacific Income C (acc) - HKD 2.27% 6.58% 20.18% 25.13% 7.91% - MediumJPM Asia Pacific Income C (acc) - USD 2.28% 6.40% 19.88% 24.89% 8.28% 8.73% MediumJPM Asia Pacific Income C (dist) - USD 2.31% 6.41% 19.93% 24.21% 7.68% 8.04% MediumJPM Asia Pacific Income C (irc) - AUD (hedged) 2.15% 6.09% 18.96% 23.42% 5.92% 6.46% MediumJPM Asia Pacific Income C (irc) - CAD (hedged)* - - - - - - MediumJPM Asia Pacific Income C (irc) - EUR (hedged) 2.03% 5.98% 18.83% 23.25% 5.98% 5.74% MediumJPM Asia Pacific Income C (irc) - GBP (hedged) 2.20% 6.25% 19.32% 23.81% 6.24% 6.33% MediumJPM Asia Pacific Income C (irc) - NZD (hedged) 2.14% 6.10% 19.20% 23.68% 6.53% 6.85% MediumJPM Asia Pacific Income C (irc) - RMB (hedged) 2.78% 7.57% 21.62% 27.05% 8.97% - MediumJPM Asia Pacific Income C (mth) - HKD 2.12% 6.47% 19.89% 24.61% 7.27% 7.47% MediumJPM Asia Pacific Income C (mth) - SGD (hedged) 2.27% 6.38% 19.53% 24.32% 7.06% 7.15% MediumJPM Asia Pacific Income C (mth) - USD 2.31% 6.39% 19.75% 24.55% 7.64% 7.93% MediumJPM Asia Pacific Income D (acc) - USD 1.97% 5.72% 18.77% 23.36% 6.82% 7.16% MediumJPM Asia Pacific Income D (mth) - EUR (hedged) 1.68% 5.20% 17.56% 21.51% 4.39% 4.02% MediumJPM Asia Pacific Income D (mth) - USD 1.98% 5.71% 18.62% 22.97% 6.22% 6.44% MediumJPM Asia Pacific Income F (irc) - AUD (hedged) 1.71% 5.16% 17.34% 21.29% 3.89% - MediumJPM Asia Pacific Income F (mth) - USD 1.84% 5.43% 18.13% 22.31% 5.62% - MediumJPM Asia Pacific Income I (acc) - USD 2.32% 6.43% 19.97% 24.90% 8.30% 8.77% MediumJPM Asia Pacific Income X (acc) - USD 2.51% 6.83% 20.65% 25.95% 9.23% 9.77% Medium
* Share Class inactive as at the end of the year.+ No data is applicable for these Share Classes as they were launched or reactivated less than 3 months before the year end.
320
JPMorgan FundsAppendix - Unaudited Additional Disclosures (continued)
3. Performance and Volatility (continued)
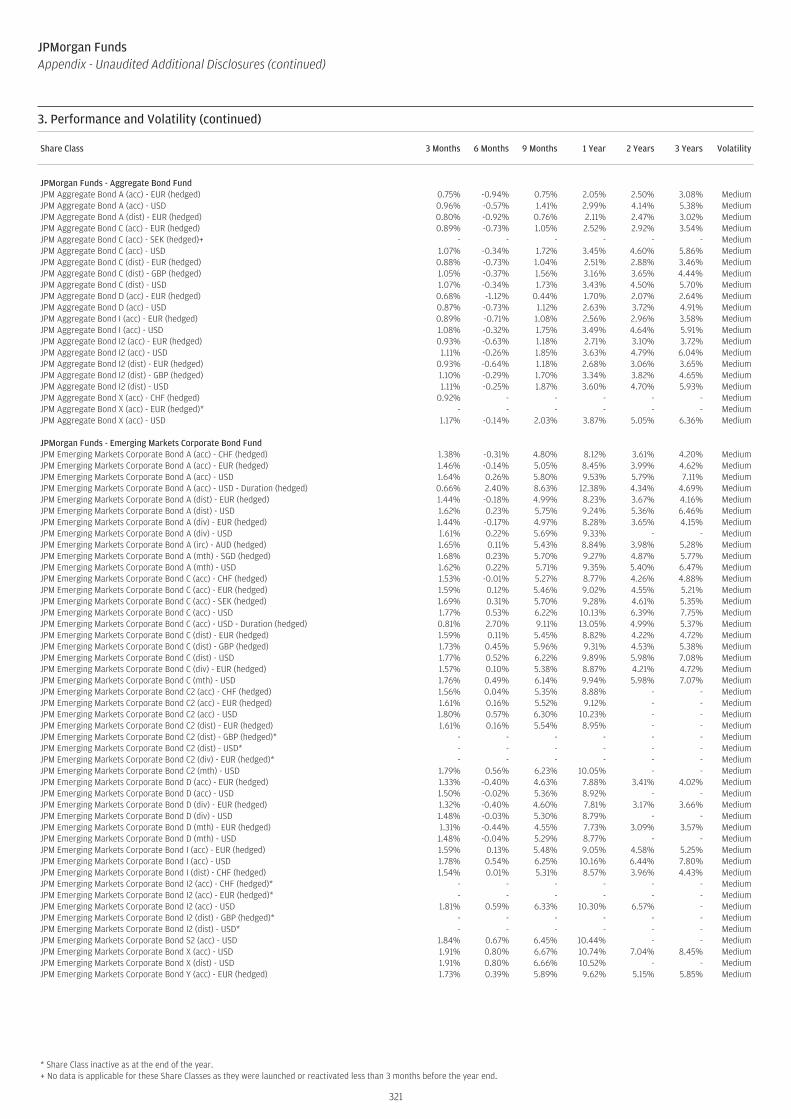
Share Class 3 Months 6 Months 9 Months 1 Year 2 Years 3 Years Volatility
JPMorgan Funds - Aggregate Bond FundJPM Aggregate Bond A (acc) - EUR (hedged) 0.75% -0.94% 0.75% 2.05% 2.50% 3.08% MediumJPM Aggregate Bond A (acc) - USD 0.96% -0.57% 1.41% 2.99% 4.14% 5.38% MediumJPM Aggregate Bond A (dist) - EUR (hedged) 0.80% -0.92% 0.76% 2.11% 2.47% 3.02% MediumJPM Aggregate Bond C (acc) - EUR (hedged) 0.89% -0.73% 1.05% 2.52% 2.92% 3.54% MediumJPM Aggregate Bond C (acc) - SEK (hedged)+ - - - - - - MediumJPM Aggregate Bond C (acc) - USD 1.07% -0.34% 1.72% 3.45% 4.60% 5.86% MediumJPM Aggregate Bond C (dist) - EUR (hedged) 0.88% -0.73% 1.04% 2.51% 2.88% 3.46% MediumJPM Aggregate Bond C (dist) - GBP (hedged) 1.05% -0.37% 1.56% 3.16% 3.65% 4.44% MediumJPM Aggregate Bond C (dist) - USD 1.07% -0.34% 1.73% 3.43% 4.50% 5.70% MediumJPM Aggregate Bond D (acc) - EUR (hedged) 0.68% -1.12% 0.44% 1.70% 2.07% 2.64% MediumJPM Aggregate Bond D (acc) - USD 0.87% -0.73% 1.12% 2.63% 3.72% 4.91% MediumJPM Aggregate Bond I (acc) - EUR (hedged) 0.89% -0.71% 1.08% 2.56% 2.96% 3.58% MediumJPM Aggregate Bond I (acc) - USD 1.08% -0.32% 1.75% 3.49% 4.64% 5.91% MediumJPM Aggregate Bond I2 (acc) - EUR (hedged) 0.93% -0.63% 1.18% 2.71% 3.10% 3.72% MediumJPM Aggregate Bond I2 (acc) - USD 1.11% -0.26% 1.85% 3.63% 4.79% 6.04% MediumJPM Aggregate Bond I2 (dist) - EUR (hedged) 0.93% -0.64% 1.18% 2.68% 3.06% 3.65% MediumJPM Aggregate Bond I2 (dist) - GBP (hedged) 1.10% -0.29% 1.70% 3.34% 3.82% 4.65% MediumJPM Aggregate Bond I2 (dist) - USD 1.11% -0.25% 1.87% 3.60% 4.70% 5.93% MediumJPM Aggregate Bond X (acc) - CHF (hedged) 0.92% - - - - - MediumJPM Aggregate Bond X (acc) - EUR (hedged)* - - - - - - MediumJPM Aggregate Bond X (acc) - USD 1.17% -0.14% 2.03% 3.87% 5.05% 6.36% Medium
JPMorgan Funds - Emerging Markets Corporate Bond FundJPM Emerging Markets Corporate Bond A (acc) - CHF (hedged) 1.38% -0.31% 4.80% 8.12% 3.61% 4.20% MediumJPM Emerging Markets Corporate Bond A (acc) - EUR (hedged) 1.46% -0.14% 5.05% 8.45% 3.99% 4.62% MediumJPM Emerging Markets Corporate Bond A (acc) - USD 1.64% 0.26% 5.80% 9.53% 5.79% 7.11% MediumJPM Emerging Markets Corporate Bond A (acc) - USD - Duration (hedged) 0.66% 2.40% 8.63% 12.38% 4.34% 4.69% MediumJPM Emerging Markets Corporate Bond A (dist) - EUR (hedged) 1.44% -0.18% 4.99% 8.23% 3.67% 4.16% MediumJPM Emerging Markets Corporate Bond A (dist) - USD 1.62% 0.23% 5.75% 9.24% 5.36% 6.46% MediumJPM Emerging Markets Corporate Bond A (div) - EUR (hedged) 1.44% -0.17% 4.97% 8.28% 3.65% 4.15% MediumJPM Emerging Markets Corporate Bond A (div) - USD 1.61% 0.22% 5.69% 9.33% - - MediumJPM Emerging Markets Corporate Bond A (irc) - AUD (hedged) 1.65% 0.11% 5.43% 8.84% 3.98% 5.28% MediumJPM Emerging Markets Corporate Bond A (mth) - SGD (hedged) 1.68% 0.23% 5.70% 9.27% 4.87% 5.77% MediumJPM Emerging Markets Corporate Bond A (mth) - USD 1.62% 0.22% 5.71% 9.35% 5.40% 6.47% MediumJPM Emerging Markets Corporate Bond C (acc) - CHF (hedged) 1.53% -0.01% 5.27% 8.77% 4.26% 4.88% MediumJPM Emerging Markets Corporate Bond C (acc) - EUR (hedged) 1.59% 0.12% 5.46% 9.02% 4.55% 5.21% MediumJPM Emerging Markets Corporate Bond C (acc) - SEK (hedged) 1.69% 0.31% 5.70% 9.28% 4.61% 5.35% MediumJPM Emerging Markets Corporate Bond C (acc) - USD 1.77% 0.53% 6.22% 10.13% 6.39% 7.75% MediumJPM Emerging Markets Corporate Bond C (acc) - USD - Duration (hedged) 0.81% 2.70% 9.11% 13.05% 4.99% 5.37% MediumJPM Emerging Markets Corporate Bond C (dist) - EUR (hedged) 1.59% 0.11% 5.45% 8.82% 4.22% 4.72% MediumJPM Emerging Markets Corporate Bond C (dist) - GBP (hedged) 1.73% 0.45% 5.96% 9.31% 4.53% 5.38% MediumJPM Emerging Markets Corporate Bond C (dist) - USD 1.77% 0.52% 6.22% 9.89% 5.98% 7.08% MediumJPM Emerging Markets Corporate Bond C (div) - EUR (hedged) 1.57% 0.10% 5.38% 8.87% 4.21% 4.72% MediumJPM Emerging Markets Corporate Bond C (mth) - USD 1.76% 0.49% 6.14% 9.94% 5.98% 7.07% MediumJPM Emerging Markets Corporate Bond C2 (acc) - CHF (hedged) 1.56% 0.04% 5.35% 8.88% - - MediumJPM Emerging Markets Corporate Bond C2 (acc) - EUR (hedged) 1.61% 0.16% 5.52% 9.12% - - MediumJPM Emerging Markets Corporate Bond C2 (acc) - USD 1.80% 0.57% 6.30% 10.23% - - MediumJPM Emerging Markets Corporate Bond C2 (dist) - EUR (hedged) 1.61% 0.16% 5.54% 8.95% - - MediumJPM Emerging Markets Corporate Bond C2 (dist) - GBP (hedged)* - - - - - - MediumJPM Emerging Markets Corporate Bond C2 (dist) - USD* - - - - - - MediumJPM Emerging Markets Corporate Bond C2 (div) - EUR (hedged)* - - - - - - MediumJPM Emerging Markets Corporate Bond C2 (mth) - USD 1.79% 0.56% 6.23% 10.05% - - MediumJPM Emerging Markets Corporate Bond D (acc) - EUR (hedged) 1.33% -0.40% 4.63% 7.88% 3.41% 4.02% MediumJPM Emerging Markets Corporate Bond D (acc) - USD 1.50% -0.02% 5.36% 8.92% - - MediumJPM Emerging Markets Corporate Bond D (div) - EUR (hedged) 1.32% -0.40% 4.60% 7.81% 3.17% 3.66% MediumJPM Emerging Markets Corporate Bond D (div) - USD 1.48% -0.03% 5.30% 8.79% - - MediumJPM Emerging Markets Corporate Bond D (mth) - EUR (hedged) 1.31% -0.44% 4.55% 7.73% 3.09% 3.57% MediumJPM Emerging Markets Corporate Bond D (mth) - USD 1.48% -0.04% 5.29% 8.77% - - MediumJPM Emerging Markets Corporate Bond I (acc) - EUR (hedged) 1.59% 0.13% 5.48% 9.05% 4.58% 5.25% MediumJPM Emerging Markets Corporate Bond I (acc) - USD 1.78% 0.54% 6.25% 10.16% 6.44% 7.80% MediumJPM Emerging Markets Corporate Bond I (dist) - CHF (hedged) 1.54% 0.01% 5.31% 8.57% 3.96% 4.43% MediumJPM Emerging Markets Corporate Bond I2 (acc) - CHF (hedged)* - - - - - - MediumJPM Emerging Markets Corporate Bond I2 (acc) - EUR (hedged)* - - - - - - MediumJPM Emerging Markets Corporate Bond I2 (acc) - USD 1.81% 0.59% 6.33% 10.30% 6.57% - MediumJPM Emerging Markets Corporate Bond I2 (dist) - GBP (hedged)* - - - - - - MediumJPM Emerging Markets Corporate Bond I2 (dist) - USD* - - - - - - MediumJPM Emerging Markets Corporate Bond S2 (acc) - USD 1.84% 0.67% 6.45% 10.44% - - MediumJPM Emerging Markets Corporate Bond X (acc) - USD 1.91% 0.80% 6.67% 10.74% 7.04% 8.45% MediumJPM Emerging Markets Corporate Bond X (dist) - USD 1.91% 0.80% 6.66% 10.52% - - MediumJPM Emerging Markets Corporate Bond Y (acc) - EUR (hedged) 1.73% 0.39% 5.89% 9.62% 5.15% 5.85% Medium
* Share Class inactive as at the end of the year.+ No data is applicable for these Share Classes as they were launched or reactivated less than 3 months before the year end.
321
JPMorgan FundsAppendix - Unaudited Additional Disclosures (continued)
3. Performance and Volatility (continued)
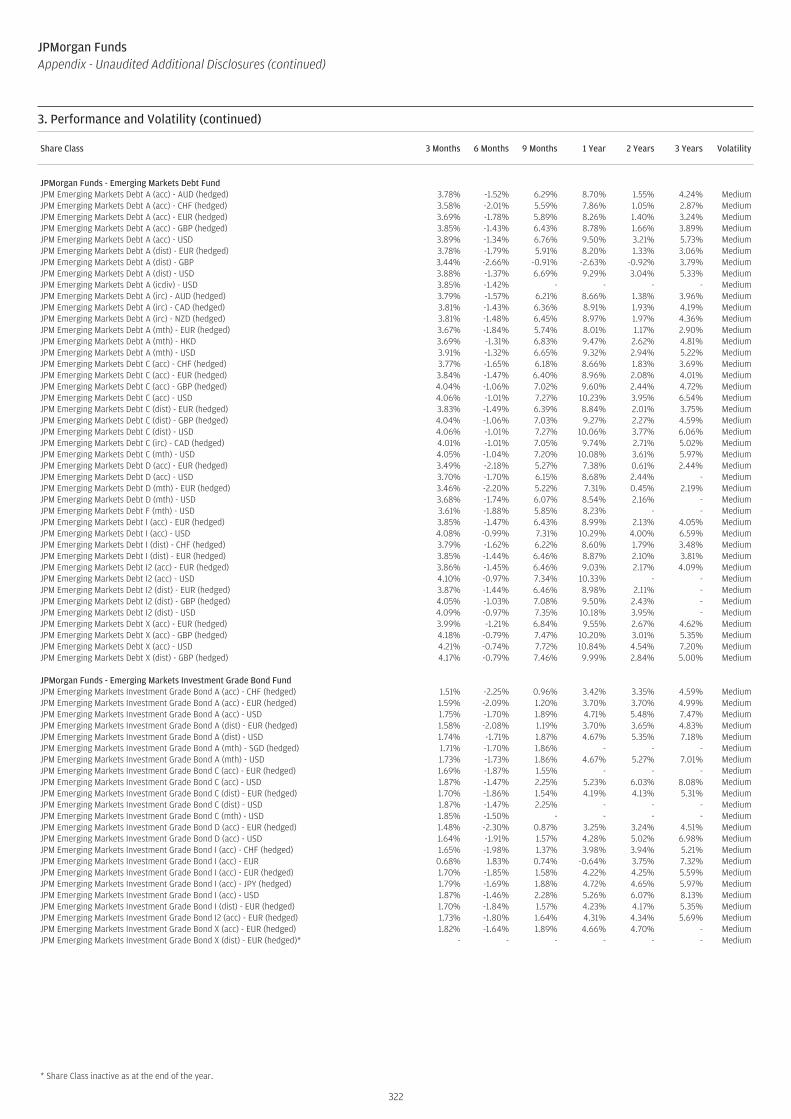
Share Class 3 Months 6 Months 9 Months 1 Year 2 Years 3 Years Volatility
JPMorgan Funds - Emerging Markets Debt FundJPM Emerging Markets Debt A (acc) - AUD (hedged) 3.78% -1.52% 6.29% 8.70% 1.55% 4.24% MediumJPM Emerging Markets Debt A (acc) - CHF (hedged) 3.58% -2.01% 5.59% 7.86% 1.05% 2.87% MediumJPM Emerging Markets Debt A (acc) - EUR (hedged) 3.69% -1.78% 5.89% 8.26% 1.40% 3.24% MediumJPM Emerging Markets Debt A (acc) - GBP (hedged) 3.85% -1.43% 6.43% 8.78% 1.66% 3.89% MediumJPM Emerging Markets Debt A (acc) - USD 3.89% -1.34% 6.76% 9.50% 3.21% 5.73% MediumJPM Emerging Markets Debt A (dist) - EUR (hedged) 3.78% -1.79% 5.91% 8.20% 1.33% 3.06% MediumJPM Emerging Markets Debt A (dist) - GBP 3.44% -2.66% -0.91% -2.63% -0.92% 3.79% MediumJPM Emerging Markets Debt A (dist) - USD 3.88% -1.37% 6.69% 9.29% 3.04% 5.33% MediumJPM Emerging Markets Debt A (icdiv) - USD 3.85% -1.42% - - - - MediumJPM Emerging Markets Debt A (irc) - AUD (hedged) 3.79% -1.57% 6.21% 8.66% 1.38% 3.96% MediumJPM Emerging Markets Debt A (irc) - CAD (hedged) 3.81% -1.43% 6.36% 8.91% 1.93% 4.19% MediumJPM Emerging Markets Debt A (irc) - NZD (hedged) 3.81% -1.48% 6.45% 8.97% 1.97% 4.36% MediumJPM Emerging Markets Debt A (mth) - EUR (hedged) 3.67% -1.84% 5.74% 8.01% 1.17% 2.90% MediumJPM Emerging Markets Debt A (mth) - HKD 3.69% -1.31% 6.83% 9.47% 2.62% 4.81% MediumJPM Emerging Markets Debt A (mth) - USD 3.91% -1.32% 6.65% 9.32% 2.94% 5.22% MediumJPM Emerging Markets Debt C (acc) - CHF (hedged) 3.77% -1.65% 6.18% 8.66% 1.83% 3.69% MediumJPM Emerging Markets Debt C (acc) - EUR (hedged) 3.84% -1.47% 6.40% 8.96% 2.08% 4.01% MediumJPM Emerging Markets Debt C (acc) - GBP (hedged) 4.04% -1.06% 7.02% 9.60% 2.44% 4.72% MediumJPM Emerging Markets Debt C (acc) - USD 4.06% -1.01% 7.27% 10.23% 3.95% 6.54% MediumJPM Emerging Markets Debt C (dist) - EUR (hedged) 3.83% -1.49% 6.39% 8.84% 2.01% 3.75% MediumJPM Emerging Markets Debt C (dist) - GBP (hedged) 4.04% -1.06% 7.03% 9.27% 2.27% 4.59% MediumJPM Emerging Markets Debt C (dist) - USD 4.06% -1.01% 7.27% 10.06% 3.77% 6.06% MediumJPM Emerging Markets Debt C (irc) - CAD (hedged) 4.01% -1.01% 7.05% 9.74% 2.71% 5.02% MediumJPM Emerging Markets Debt C (mth) - USD 4.05% -1.04% 7.20% 10.08% 3.61% 5.97% MediumJPM Emerging Markets Debt D (acc) - EUR (hedged) 3.49% -2.18% 5.27% 7.38% 0.61% 2.44% MediumJPM Emerging Markets Debt D (acc) - USD 3.70% -1.70% 6.15% 8.68% 2.44% - MediumJPM Emerging Markets Debt D (mth) - EUR (hedged) 3.46% -2.20% 5.22% 7.31% 0.45% 2.19% MediumJPM Emerging Markets Debt D (mth) - USD 3.68% -1.74% 6.07% 8.54% 2.16% - MediumJPM Emerging Markets Debt F (mth) - USD 3.61% -1.88% 5.85% 8.23% - - MediumJPM Emerging Markets Debt I (acc) - EUR (hedged) 3.85% -1.47% 6.43% 8.99% 2.13% 4.05% MediumJPM Emerging Markets Debt I (acc) - USD 4.08% -0.99% 7.31% 10.29% 4.00% 6.59% MediumJPM Emerging Markets Debt I (dist) - CHF (hedged) 3.79% -1.62% 6.22% 8.60% 1.79% 3.48% MediumJPM Emerging Markets Debt I (dist) - EUR (hedged) 3.85% -1.44% 6.46% 8.87% 2.10% 3.81% MediumJPM Emerging Markets Debt I2 (acc) - EUR (hedged) 3.86% -1.45% 6.46% 9.03% 2.17% 4.09% MediumJPM Emerging Markets Debt I2 (acc) - USD 4.10% -0.97% 7.34% 10.33% - - MediumJPM Emerging Markets Debt I2 (dist) - EUR (hedged) 3.87% -1.44% 6.46% 8.98% 2.11% - MediumJPM Emerging Markets Debt I2 (dist) - GBP (hedged) 4.05% -1.03% 7.08% 9.50% 2.43% - MediumJPM Emerging Markets Debt I2 (dist) - USD 4.09% -0.97% 7.35% 10.18% 3.95% - MediumJPM Emerging Markets Debt X (acc) - EUR (hedged) 3.99% -1.21% 6.84% 9.55% 2.67% 4.62% MediumJPM Emerging Markets Debt X (acc) - GBP (hedged) 4.18% -0.79% 7.47% 10.20% 3.01% 5.35% MediumJPM Emerging Markets Debt X (acc) - USD 4.21% -0.74% 7.72% 10.84% 4.54% 7.20% MediumJPM Emerging Markets Debt X (dist) - GBP (hedged) 4.17% -0.79% 7.46% 9.99% 2.84% 5.00% Medium
JPMorgan Funds - Emerging Markets Investment Grade Bond FundJPM Emerging Markets Investment Grade Bond A (acc) - CHF (hedged) 1.51% -2.25% 0.96% 3.42% 3.35% 4.59% MediumJPM Emerging Markets Investment Grade Bond A (acc) - EUR (hedged) 1.59% -2.09% 1.20% 3.70% 3.70% 4.99% MediumJPM Emerging Markets Investment Grade Bond A (acc) - USD 1.75% -1.70% 1.89% 4.71% 5.48% 7.47% MediumJPM Emerging Markets Investment Grade Bond A (dist) - EUR (hedged) 1.58% -2.08% 1.19% 3.70% 3.65% 4.83% MediumJPM Emerging Markets Investment Grade Bond A (dist) - USD 1.74% -1.71% 1.87% 4.67% 5.35% 7.18% MediumJPM Emerging Markets Investment Grade Bond A (mth) - SGD (hedged) 1.71% -1.70% 1.86% - - - MediumJPM Emerging Markets Investment Grade Bond A (mth) - USD 1.73% -1.73% 1.86% 4.67% 5.27% 7.01% MediumJPM Emerging Markets Investment Grade Bond C (acc) - EUR (hedged) 1.69% -1.87% 1.55% - - - MediumJPM Emerging Markets Investment Grade Bond C (acc) - USD 1.87% -1.47% 2.25% 5.23% 6.03% 8.08% MediumJPM Emerging Markets Investment Grade Bond C (dist) - EUR (hedged) 1.70% -1.86% 1.54% 4.19% 4.13% 5.31% MediumJPM Emerging Markets Investment Grade Bond C (dist) - USD 1.87% -1.47% 2.25% - - - MediumJPM Emerging Markets Investment Grade Bond C (mth) - USD 1.85% -1.50% - - - - MediumJPM Emerging Markets Investment Grade Bond D (acc) - EUR (hedged) 1.48% -2.30% 0.87% 3.25% 3.24% 4.51% MediumJPM Emerging Markets Investment Grade Bond D (acc) - USD 1.64% -1.91% 1.57% 4.28% 5.02% 6.98% MediumJPM Emerging Markets Investment Grade Bond I (acc) - CHF (hedged) 1.65% -1.98% 1.37% 3.98% 3.94% 5.21% MediumJPM Emerging Markets Investment Grade Bond I (acc) - EUR 0.68% 1.83% 0.74% -0.64% 3.75% 7.32% MediumJPM Emerging Markets Investment Grade Bond I (acc) - EUR (hedged) 1.70% -1.85% 1.58% 4.22% 4.25% 5.59% MediumJPM Emerging Markets Investment Grade Bond I (acc) - JPY (hedged) 1.79% -1.69% 1.88% 4.72% 4.65% 5.97% MediumJPM Emerging Markets Investment Grade Bond I (acc) - USD 1.87% -1.46% 2.28% 5.26% 6.07% 8.13% MediumJPM Emerging Markets Investment Grade Bond I (dist) - EUR (hedged) 1.70% -1.84% 1.57% 4.23% 4.17% 5.35% MediumJPM Emerging Markets Investment Grade Bond I2 (acc) - EUR (hedged) 1.73% -1.80% 1.64% 4.31% 4.34% 5.69% MediumJPM Emerging Markets Investment Grade Bond X (acc) - EUR (hedged) 1.82% -1.64% 1.89% 4.66% 4.70% - MediumJPM Emerging Markets Investment Grade Bond X (dist) - EUR (hedged)* - - - - - - Medium
* Share Class inactive as at the end of the year.
322
JPMorgan FundsAppendix - Unaudited Additional Disclosures (continued)
3. Performance and Volatility (continued)
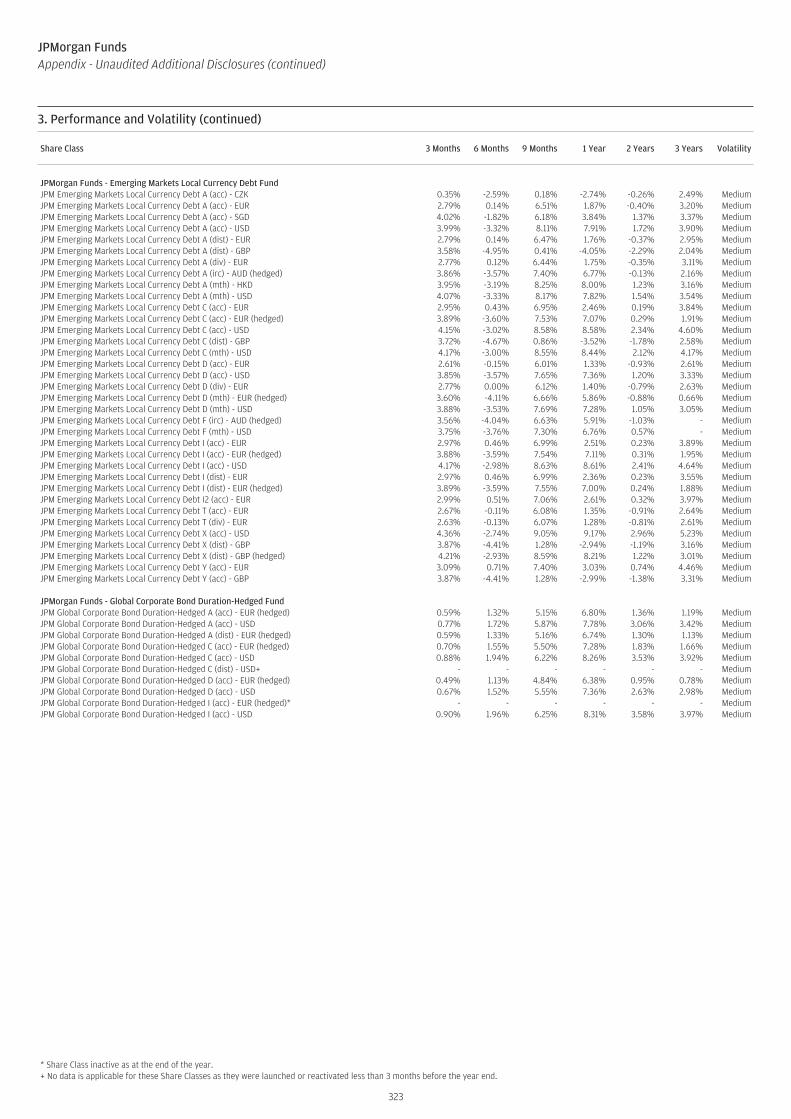
Share Class 3 Months 6 Months 9 Months 1 Year 2 Years 3 Years Volatility
JPMorgan Funds - Emerging Markets Local Currency Debt FundJPM Emerging Markets Local Currency Debt A (acc) - CZK 0.35% -2.59% 0.18% -2.74% -0.26% 2.49% MediumJPM Emerging Markets Local Currency Debt A (acc) - EUR 2.79% 0.14% 6.51% 1.87% -0.40% 3.20% MediumJPM Emerging Markets Local Currency Debt A (acc) - SGD 4.02% -1.82% 6.18% 3.84% 1.37% 3.37% MediumJPM Emerging Markets Local Currency Debt A (acc) - USD 3.99% -3.32% 8.11% 7.91% 1.72% 3.90% MediumJPM Emerging Markets Local Currency Debt A (dist) - EUR 2.79% 0.14% 6.47% 1.76% -0.37% 2.95% MediumJPM Emerging Markets Local Currency Debt A (dist) - GBP 3.58% -4.95% 0.41% -4.05% -2.29% 2.04% MediumJPM Emerging Markets Local Currency Debt A (div) - EUR 2.77% 0.12% 6.44% 1.75% -0.35% 3.11% MediumJPM Emerging Markets Local Currency Debt A (irc) - AUD (hedged) 3.86% -3.57% 7.40% 6.77% -0.13% 2.16% MediumJPM Emerging Markets Local Currency Debt A (mth) - HKD 3.95% -3.19% 8.25% 8.00% 1.23% 3.16% MediumJPM Emerging Markets Local Currency Debt A (mth) - USD 4.07% -3.33% 8.17% 7.82% 1.54% 3.54% MediumJPM Emerging Markets Local Currency Debt C (acc) - EUR 2.95% 0.43% 6.95% 2.46% 0.19% 3.84% MediumJPM Emerging Markets Local Currency Debt C (acc) - EUR (hedged) 3.89% -3.60% 7.53% 7.07% 0.29% 1.91% MediumJPM Emerging Markets Local Currency Debt C (acc) - USD 4.15% -3.02% 8.58% 8.58% 2.34% 4.60% MediumJPM Emerging Markets Local Currency Debt C (dist) - GBP 3.72% -4.67% 0.86% -3.52% -1.78% 2.58% MediumJPM Emerging Markets Local Currency Debt C (mth) - USD 4.17% -3.00% 8.55% 8.44% 2.12% 4.17% MediumJPM Emerging Markets Local Currency Debt D (acc) - EUR 2.61% -0.15% 6.01% 1.33% -0.93% 2.61% MediumJPM Emerging Markets Local Currency Debt D (acc) - USD 3.85% -3.57% 7.65% 7.36% 1.20% 3.33% MediumJPM Emerging Markets Local Currency Debt D (div) - EUR 2.77% 0.00% 6.12% 1.40% -0.79% 2.63% MediumJPM Emerging Markets Local Currency Debt D (mth) - EUR (hedged) 3.60% -4.11% 6.66% 5.86% -0.88% 0.66% MediumJPM Emerging Markets Local Currency Debt D (mth) - USD 3.88% -3.53% 7.69% 7.28% 1.05% 3.05% MediumJPM Emerging Markets Local Currency Debt F (irc) - AUD (hedged) 3.56% -4.04% 6.63% 5.91% -1.03% - MediumJPM Emerging Markets Local Currency Debt F (mth) - USD 3.75% -3.76% 7.30% 6.76% 0.57% - MediumJPM Emerging Markets Local Currency Debt I (acc) - EUR 2.97% 0.46% 6.99% 2.51% 0.23% 3.89% MediumJPM Emerging Markets Local Currency Debt I (acc) - EUR (hedged) 3.88% -3.59% 7.54% 7.11% 0.31% 1.95% MediumJPM Emerging Markets Local Currency Debt I (acc) - USD 4.17% -2.98% 8.63% 8.61% 2.41% 4.64% MediumJPM Emerging Markets Local Currency Debt I (dist) - EUR 2.97% 0.46% 6.99% 2.36% 0.23% 3.55% MediumJPM Emerging Markets Local Currency Debt I (dist) - EUR (hedged) 3.89% -3.59% 7.55% 7.00% 0.24% 1.88% MediumJPM Emerging Markets Local Currency Debt I2 (acc) - EUR 2.99% 0.51% 7.06% 2.61% 0.32% 3.97% MediumJPM Emerging Markets Local Currency Debt T (acc) - EUR 2.67% -0.11% 6.08% 1.35% -0.91% 2.64% MediumJPM Emerging Markets Local Currency Debt T (div) - EUR 2.63% -0.13% 6.07% 1.28% -0.81% 2.61% MediumJPM Emerging Markets Local Currency Debt X (acc) - USD 4.36% -2.74% 9.05% 9.17% 2.96% 5.23% MediumJPM Emerging Markets Local Currency Debt X (dist) - GBP 3.87% -4.41% 1.28% -2.94% -1.19% 3.16% MediumJPM Emerging Markets Local Currency Debt X (dist) - GBP (hedged) 4.21% -2.93% 8.59% 8.21% 1.22% 3.01% MediumJPM Emerging Markets Local Currency Debt Y (acc) - EUR 3.09% 0.71% 7.40% 3.03% 0.74% 4.46% MediumJPM Emerging Markets Local Currency Debt Y (acc) - GBP 3.87% -4.41% 1.28% -2.99% -1.38% 3.31% Medium
JPMorgan Funds - Global Corporate Bond Duration-Hedged FundJPM Global Corporate Bond Duration-Hedged A (acc) - EUR (hedged) 0.59% 1.32% 5.15% 6.80% 1.36% 1.19% MediumJPM Global Corporate Bond Duration-Hedged A (acc) - USD 0.77% 1.72% 5.87% 7.78% 3.06% 3.42% MediumJPM Global Corporate Bond Duration-Hedged A (dist) - EUR (hedged) 0.59% 1.33% 5.16% 6.74% 1.30% 1.13% MediumJPM Global Corporate Bond Duration-Hedged C (acc) - EUR (hedged) 0.70% 1.55% 5.50% 7.28% 1.83% 1.66% MediumJPM Global Corporate Bond Duration-Hedged C (acc) - USD 0.88% 1.94% 6.22% 8.26% 3.53% 3.92% MediumJPM Global Corporate Bond Duration-Hedged C (dist) - USD+ - - - - - - MediumJPM Global Corporate Bond Duration-Hedged D (acc) - EUR (hedged) 0.49% 1.13% 4.84% 6.38% 0.95% 0.78% MediumJPM Global Corporate Bond Duration-Hedged D (acc) - USD 0.67% 1.52% 5.55% 7.36% 2.63% 2.98% MediumJPM Global Corporate Bond Duration-Hedged I (acc) - EUR (hedged)* - - - - - - MediumJPM Global Corporate Bond Duration-Hedged I (acc) - USD 0.90% 1.96% 6.25% 8.31% 3.58% 3.97% Medium
* Share Class inactive as at the end of the year.+ No data is applicable for these Share Classes as they were launched or reactivated less than 3 months before the year end.
323
JPMorgan FundsAppendix - Unaudited Additional Disclosures (continued)
3. Performance and Volatility (continued)

Share Class 3 Months 6 Months 9 Months 1 Year 2 Years 3 Years Volatility
JPMorgan Funds - Global Corporate Bond FundJPM Global Corporate Bond A (acc) - AUD (hedged) 2.27% -0.85% 2.09% 3.54% 4.52% 6.01% MediumJPM Global Corporate Bond A (acc) - CHF (hedged) 2.09% -1.38% 1.39% 2.63% 3.50% 4.13% MediumJPM Global Corporate Bond A (acc) - EUR (hedged) 2.15% -1.25% 1.64% 2.89% 3.85% 4.54% MediumJPM Global Corporate Bond A (acc) - NOK (hedged) 2.33% -0.77% 2.24% 3.64% 4.65% 5.63% MediumJPM Global Corporate Bond A (acc) - NZD (hedged) 2.37% -0.77% 2.28% 3.73% 5.00% 6.36% MediumJPM Global Corporate Bond A (acc) - SEK (hedged) 2.24% -1.02% 1.87% 3.23% 4.08% 4.71% MediumJPM Global Corporate Bond A (acc) - USD 2.27% -0.88% 2.27% 3.85% 5.63% 6.97% MediumJPM Global Corporate Bond A (dist) - EUR (hedged) 2.14% -1.23% 1.59% 2.89% 3.81% 4.29% MediumJPM Global Corporate Bond A (dist) - GBP (hedged) 2.25% -0.87% 2.14% 3.48% 4.31% 5.24% MediumJPM Global Corporate Bond A (dist) - USD 2.32% -0.84% 2.29% 3.84% 5.53% 6.74% MediumJPM Global Corporate Bond A (div) - EUR (hedged) 2.13% -1.24% 1.58% 2.88% 3.76% 4.32% MediumJPM Global Corporate Bond A (mth) - SGD 2.32% 0.88% 0.45% -0.04% 5.18% 6.14% MediumJPM Global Corporate Bond A (mth) - USD 2.30% -0.86% 2.27% 3.83% 5.49% 6.65% MediumJPM Global Corporate Bond C (acc) - CHF (hedged) 2.24% - - - - - MediumJPM Global Corporate Bond C (acc) - EUR (hedged) 2.26% -1.01% 1.93% 3.36% 4.35% 5.05% MediumJPM Global Corporate Bond C (acc) - SEK (hedged) 2.36% -0.80% 2.22% 3.69% 4.57% 5.22% MediumJPM Global Corporate Bond C (acc) - USD 2.42% -0.62% 2.64% 4.35% 6.15% 7.52% MediumJPM Global Corporate Bond C (dist) - AUD (hedged) 2.44% -0.66% 2.44% 4.06% - - MediumJPM Global Corporate Bond C (dist) - CHF (hedged) 2.19% -1.16% 1.73% 3.07% 3.90% 4.48% MediumJPM Global Corporate Bond C (dist) - EUR (hedged) 2.26% -1.01% 1.94% 3.35% 4.25% 4.80% MediumJPM Global Corporate Bond C (dist) - GBP (hedged) 2.42% -0.63% 2.48% 3.98% 4.80% 5.62% MediumJPM Global Corporate Bond C (dist) - USD 2.43% -0.62% 2.64% 4.29% 5.99% 7.22% MediumJPM Global Corporate Bond C (div) - EUR (hedged) 2.24% -1.02% 1.92% 3.35% 4.24% 4.80% MediumJPM Global Corporate Bond C (mth) - USD 2.42% -0.64% 2.61% 4.30% 5.98% 7.16% MediumJPM Global Corporate Bond D (acc) - EUR (hedged) 2.03% -1.38% 1.34% 2.49% 3.42% 4.08% MediumJPM Global Corporate Bond D (acc) - USD 2.22% -1.03% 2.01% 3.48% 5.20% 6.50% MediumJPM Global Corporate Bond D (div) - EUR (hedged) 2.03% -1.39% 1.27% 2.56% 3.37% 3.88% MediumJPM Global Corporate Bond D (mth) - USD 2.20% -1.05% 1.97% 3.43% 5.06% 6.19% MediumJPM Global Corporate Bond I (acc) - CHF (hedged) 2.21% -1.13% 1.77% 3.14% 4.03% 4.69% MediumJPM Global Corporate Bond I (acc) - EUR (hedged) 2.26% -0.99% 1.96% 3.40% 4.39% 5.09% MediumJPM Global Corporate Bond I (acc) - JPY (hedged) 2.35% -0.83% 2.26% 3.82% 4.71% 5.38% MediumJPM Global Corporate Bond I (acc) - USD 2.43% -0.60% 2.66% 4.38% 6.19% 7.57% MediumJPM Global Corporate Bond I (dist) - CHF (hedged) 2.20% -1.14% 1.76% 3.10% 3.92% 4.49% MediumJPM Global Corporate Bond I (div) - EUR (hedged) 2.25% -1.00% 1.94% 3.38% - - MediumJPM Global Corporate Bond I2 (acc) - EUR (hedged) 2.29% -0.95% 2.03% 3.49% 4.48% 5.18% MediumJPM Global Corporate Bond I2 (acc) - JPY (hedged) 2.37% -0.79% 2.32% 3.91% 4.80% 5.48% MediumJPM Global Corporate Bond I2 (acc) - USD 2.46% -0.55% 2.73% 4.47% 6.28% 7.68% MediumJPM Global Corporate Bond I2 (dist) - GBP (hedged) 2.46% -0.57% 2.57% 4.11% 4.99% 5.94% MediumJPM Global Corporate Bond I2 (dist) - USD 2.45% -0.56% 2.73% 4.41% 6.09% 7.42% MediumJPM Global Corporate Bond T (acc) - EUR (hedged) 2.04% -1.42% 1.28% 2.49% 3.43% 4.08% MediumJPM Global Corporate Bond T (div) - EUR (hedged) 2.03% -1.42% 1.28% 2.49% 3.35% 3.89% MediumJPM Global Corporate Bond X (acc) - EUR (hedged) 2.38% -0.78% 2.29% 3.83% 4.84% 5.57% MediumJPM Global Corporate Bond X (acc) - GBP (hedged) 2.55% -0.41% 2.83% 4.55% 5.46% 6.50% MediumJPM Global Corporate Bond X (acc) - USD 2.55% -0.39% 2.99% 4.82% 6.66% 8.08% MediumJPM Global Corporate Bond X (dist) - GBP (hedged) 2.54% -0.40% 2.82% 4.40% 5.21% 6.11% MediumJPM Global Corporate Bond X (dist) - USD 2.54% -0.40% 2.98% 4.73% 6.48% 7.80% Medium
JPMorgan Funds - Global Government Bond FundJPM Global Government Bond A (acc) - AUD (hedged) 0.63% -2.34% -2.43% -1.49% 2.27% 3.94% MediumJPM Global Government Bond A (acc) - EUR 0.44% -2.70% -2.98% -2.21% 1.20% 2.26% MediumJPM Global Government Bond A (acc) - USD (hedged) 0.68% -2.33% -2.33% -1.33% 2.76% 4.47% MediumJPM Global Government Bond C (acc) - EUR 0.50% -2.61% -2.81% -2.00% 1.38% 2.47% MediumJPM Global Government Bond C (acc) - USD (hedged) 0.71% -2.24% -2.17% -1.14% 2.98% 4.69% MediumJPM Global Government Bond C (dist) - GBP (hedged)* - - - - - - MediumJPM Global Government Bond D (acc) - EUR 0.45% -2.77% -3.05% -2.34% 0.99% 2.04% MediumJPM Global Government Bond I (acc) - EUR 0.55% -2.59% -2.76% -1.94% 1.43% 2.52% MediumJPM Global Government Bond I (acc) - USD (hedged) 0.72% -2.22% -2.15% -1.10% 3.02% 4.73% MediumJPM Global Government Bond I (dist) - EUR^+ - - - - - - MediumJPM Global Government Bond I2 (acc) - EUR 0.56% -2.55% -2.71% -1.88% 1.50% 2.59% MediumJPM Global Government Bond I2 (acc) - USD (hedged) 0.73% -2.19% -2.09% -1.04% - - MediumJPM Global Government Bond X (acc) - EUR 0.62% -2.46% -2.59% -1.67% 1.69% 2.80% MediumJPM Global Government Bond X (acc) - USD (hedged) 0.78% -2.09% -1.96% -0.85% 3.30% 5.03% MediumJPM Global Government Bond X (dist) - GBP (hedged) 0.78% -2.11% -2.05% -1.02% 2.59% 3.87% Medium
* Share Class inactive as at the end of the year.^ Share Class reactivated during the year.+ No data is applicable for these Share Classes as they were launched or reactivated less than 3 months before the year end.
324
JPMorgan FundsAppendix - Unaudited Additional Disclosures (continued)
3. Performance and Volatility (continued)

Share Class 3 Months 6 Months 9 Months 1 Year 2 Years 3 Years Volatility
JPMorgan Funds - Global Short Duration Bond FundJPM Global Short Duration Bond A (acc) - EUR (hedged) 0.13% -0.27% -0.13% - -0.13% - MediumJPM Global Short Duration Bond A (acc) - USD 0.25% - 0.42% 0.77% 1.39% 2.10% MediumJPM Global Short Duration Bond C (acc) - EUR (hedged) 0.17% -0.15% 0.09% 0.30% 0.20% 0.36% MediumJPM Global Short Duration Bond C (acc) - USD 0.33% 0.25% 0.67% 1.09% 1.76% 2.46% MediumJPM Global Short Duration Bond C (dist) - GBP (hedged) 0.34% 0.17% 0.51% 1.01% 1.01% 1.29% MediumJPM Global Short Duration Bond C (dist) - USD 0.37% 0.25% 0.74% 1.14% 1.75% 2.42% MediumJPM Global Short Duration Bond D (acc) - EUR (hedged) 0.01% -0.47% -0.39% -0.35% -0.46% -0.29% MediumJPM Global Short Duration Bond I (acc) - EUR (hedged) 0.17% -0.13% 0.11% 0.32% 0.23% 0.40% MediumJPM Global Short Duration Bond I (acc) - USD 0.38% 0.26% 0.77% 1.19% 1.81% 2.51% MediumJPM Global Short Duration Bond I (dist) - GBP (hedged) 0.36% 0.20% 0.61% 0.97% 1.02% 1.35% MediumJPM Global Short Duration Bond I2 (acc) - EUR (hedged) 0.21% -0.07% 0.20% 0.45% 0.35% 0.49% MediumJPM Global Short Duration Bond I2 (acc) - USD 0.40% 0.32% 0.86% 1.31% 1.93% 2.61% MediumJPM Global Short Duration Bond I2 (dist) - EUR (hedged)* - - - - - - MediumJPM Global Short Duration Bond I2 (dist) - USD 0.40% 0.33% 0.85% 1.29% 1.89% 2.57% MediumJPM Global Short Duration Bond X (acc) - EUR (hedged) 0.26% 0.03% 0.35% 0.64% 0.55% 0.71% MediumJPM Global Short Duration Bond X (acc) - USD^+ - - - - - - Medium
JPMorgan Funds - Global Strategic Bond FundJPM Global Strategic Bond A (acc) - EUR (hedged) 0.76% -0.08% 2.66% 3.87% 2.03% 1.36% MediumJPM Global Strategic Bond A (acc) - NOK (hedged) 0.92% 0.31% 3.26% 4.57% 2.97% 2.51% MediumJPM Global Strategic Bond A (acc) - USD 0.94% 0.33% 3.37% 4.82% 3.71% 3.59% MediumJPM Global Strategic Bond A (mth) - USD 0.95% 0.33% 3.36% 4.78% 3.60% 3.42% MediumJPM Global Strategic Bond A (perf) (acc) - CHF (hedged) 0.67% -0.10% 2.46% 3.63% 1.76% 1.14% MediumJPM Global Strategic Bond A (perf) (acc) - EUR (hedged) 0.72% 0.02% 2.54% 3.75% 2.07% 1.46% MediumJPM Global Strategic Bond A (perf) (acc) - GBP (hedged) 0.85% 0.32% 2.99% 4.25% 2.72% 2.33% MediumJPM Global Strategic Bond A (perf) (acc) - SEK (hedged) 0.79% 0.18% 2.79% 4.03% 2.34% 1.67% MediumJPM Global Strategic Bond A (perf) (acc) - USD 0.90% 0.40% 3.18% 4.53% 3.61% 3.57% MediumJPM Global Strategic Bond A (perf) (dist) - EUR (hedged) 0.70% - 2.53% 3.71% 2.01% 1.39% MediumJPM Global Strategic Bond A (perf) (div) - EUR (hedged) 0.71% - 2.52% 3.71% 2.00% 1.37% MediumJPM Global Strategic Bond A (perf) (fix) EUR 2.35 - EUR (hedged) 0.70% 0.01% 2.51% 3.70% 1.97% 1.34% MediumJPM Global Strategic Bond A (perf) (mth) - USD 0.88% 0.39% 3.18% 4.49% 3.49% 3.39% MediumJPM Global Strategic Bond C (acc) - EUR (hedged) 0.89% 0.16% 3.05% 4.38% 2.51% 1.86% MediumJPM Global Strategic Bond C (perf) (acc) - CHF (hedged) 0.77% 0.15% 2.74% 3.94% 2.21% 1.63% MediumJPM Global Strategic Bond C (perf) (acc) - EUR (hedged) 0.84% 0.27% 2.92% 4.18% 2.54% 1.97% MediumJPM Global Strategic Bond C (perf) (acc) - GBP (hedged) 0.98% 0.56% 3.37% 4.76% 3.25% 2.85% MediumJPM Global Strategic Bond C (perf) (acc) - PLN (hedged) 0.90% 0.42% 3.21% 4.60% 3.69% 3.47% MediumJPM Global Strategic Bond C (perf) (acc) - USD 1.01% 0.63% 3.56% 5.05% 4.10% 4.08% MediumJPM Global Strategic Bond C (perf) (dist) - EUR (hedged)^ 0.85% - - - - - MediumJPM Global Strategic Bond C (perf) (dist) - GBP (hedged) 0.99% 0.57% 3.37% 4.69% 3.20% 2.76% MediumJPM Global Strategic Bond C (perf) (dist) - USD 1.01% 0.65% 3.57% 4.91% 3.97% 3.88% MediumJPM Global Strategic Bond C (perf) (mth) - USD 1.01% 0.53% 3.43% 4.88% 3.92% 3.89% MediumJPM Global Strategic Bond D (perf) (acc) - EUR (hedged) 0.56% -0.48% 2.06% 3.04% 1.20% 0.54% MediumJPM Global Strategic Bond D (perf) (acc) - PLN (hedged) 0.56% -0.29% 2.17% 3.29% 2.28% 2.00% MediumJPM Global Strategic Bond D (perf) (acc) - USD 0.65% -0.16% 2.39% 3.57% 2.65% 2.57% MediumJPM Global Strategic Bond D (perf) (div) - EUR (hedged) 0.56% -0.48% 2.06% 3.04% 1.15% 0.48% MediumJPM Global Strategic Bond D (perf) (fix) EUR 1.60 - EUR (hedged) 0.55% -0.48% 2.05% 3.03% 1.15% 0.49% MediumJPM Global Strategic Bond D (perf) (mth) - USD 0.67% -0.06% 2.45% 3.66% 2.62% 2.48% MediumJPM Global Strategic Bond I (acc) - EUR (hedged) 0.90% 0.19% 3.08% 4.43% 2.60% 1.93% MediumJPM Global Strategic Bond I (perf) (acc) - EUR (hedged) 0.85% 0.29% 2.95% 4.21% 2.56% 2.00% MediumJPM Global Strategic Bond I (perf) (acc) - JPY (hedged) 0.95% 0.47% 3.27% 4.62% 2.87% 2.29% MediumJPM Global Strategic Bond I (perf) (acc) - USD 1.02% 0.64% 3.58% 5.08% 4.16% 4.14% MediumJPM Global Strategic Bond I (perf) (dist) - GBP (hedged) 0.99% 0.59% 3.39% 4.70% 3.14% 2.73% MediumJPM Global Strategic Bond I2 (perf) (acc) - EUR (hedged) 0.87% 0.34% 3.03% 4.32% 2.70% 2.13% MediumJPM Global Strategic Bond T (perf) (acc) - EUR (hedged) 0.56% -0.48% 2.06% 3.04% 1.20% 0.54% MediumJPM Global Strategic Bond T (perf) (div) - EUR (hedged) 0.55% -0.48% 2.05% 3.02% 1.14% 0.48% MediumJPM Global Strategic Bond X (acc) - USD 1.28% 0.98% 4.38% 6.18% 5.12% 5.06% Medium
* Share Class inactive as at the end of the year.^ Share Class reactivated during the year.+ No data is applicable for these Share Classes as they were launched or reactivated less than 3 months before the year end.
325
JPMorgan FundsAppendix - Unaudited Additional Disclosures (continued)
3. Performance and Volatility (continued)

Share Class 3 Months 6 Months 9 Months 1 Year 2 Years 3 Years Volatility
JPMorgan Funds - Income FundJPM Income Fund A (acc) - AUD (hedged) 1.44% 2.72% 6.01% 8.18% - - MediumJPM Income Fund A (acc) - CHF (hedged) 1.16% 2.26% 5.31% 7.25% - - MediumJPM Income Fund A (acc) - EUR (hedged) 1.23% 2.39% 5.50% 7.51% 2.75% 3.95% MediumJPM Income Fund A (acc) - GBP (hedged) 1.39% 2.69% 5.98% 8.13% - - MediumJPM Income Fund A (acc) - SGD (hedged) 1.51% 2.86% 6.21% 8.56% - - MediumJPM Income Fund A (acc) - USD 1.42% 2.78% 6.20% 8.48% 4.50% 6.36% MediumJPM Income Fund A (div) - CHF (hedged) 1.16% 2.22% 5.24% 7.16% - - MediumJPM Income Fund A (div) - EUR (hedged) 1.22% 2.36% 5.41% 7.35% 2.58% 3.73% MediumJPM Income Fund A (div) - GBP (hedged) 1.38% 2.64% 5.90% 7.97% - - MediumJPM Income Fund A (div) - USD 1.42% 2.76% 6.10% 8.30% 4.18% 5.81% MediumJPM Income Fund A (mth) - AUD (hedged) 1.42% 2.62% 5.91% 7.99% - - MediumJPM Income Fund A (mth) - EUR (hedged) 1.21% 2.35% 5.41% 7.36% - - MediumJPM Income Fund A (mth) - GBP (hedged) 1.38% 2.65% 5.88% 7.93% - - MediumJPM Income Fund A (mth) - HKD 1.37% 2.97% 6.41% 8.60% 3.90% 5.50% MediumJPM Income Fund A (mth) - RMB (hedged) 1.97% 3.95% 7.69% 10.47% - - MediumJPM Income Fund A (mth) - SGD 1.45% 4.54% 4.28% 4.30% - - MediumJPM Income Fund A (mth) - SGD (hedged) 1.47% 2.84% 6.16% 8.35% - - MediumJPM Income Fund A (mth) - USD 1.48% 2.76% 6.20% 8.38% 4.23% 5.85% MediumJPM Income Fund C (acc) - CHF (hedged) 1.31% 2.55% 5.75% 7.84% - - MediumJPM Income Fund C (acc) - EUR (hedged) 1.37% 2.66% 5.92% 8.09% 3.32% 4.57% MediumJPM Income Fund C (acc) - SGD* - - - - - - MediumJPM Income Fund C (acc) - SGD (hedged) 1.64% 3.14% 6.70% 9.14% - - MediumJPM Income Fund C (acc) - USD 1.56% 3.06% 6.64% 9.08% 5.10% 7.01% MediumJPM Income Fund C (div) - AUD (hedged) 1.55% 3.02% 6.35% 8.61% - - MediumJPM Income Fund C (div) - CHF (hedged) 1.31% 2.54% 5.69% 7.71% - - MediumJPM Income Fund C (div) - EUR (hedged) 1.35% 2.62% 5.83% 7.92% 3.13% 4.31% MediumJPM Income Fund C (div) - GBP (hedged) 1.53% 2.93% 6.30% 8.51% - - MediumJPM Income Fund C (div) - SGD (hedged) 1.54% 3.08% 6.59% 8.84% - - MediumJPM Income Fund C (div) - USD 1.56% 3.03% 6.51% 8.87% - - MediumJPM Income Fund C (mth) - AUD (hedged) 1.53% 2.85% 6.23% 8.53% - - MediumJPM Income Fund C (mth) - HKD* - - - - - - MediumJPM Income Fund C (mth) - RMB (hedged) 2.15% 4.24% 8.29% 11.09% - - MediumJPM Income Fund C (mth) - SGD* - - - - - - MediumJPM Income Fund C (mth) - SGD (hedged) 1.57% 3.05% 6.57% 8.87% - - MediumJPM Income Fund C (mth) - USD 1.56% 3.03% 6.53% 8.88% - - MediumJPM Income Fund C2 (acc) - EUR (hedged) 1.38% 2.67% 5.94% 8.11% - - MediumJPM Income Fund C2 (acc) - USD 1.59% 3.12% 6.71% 9.20% - - MediumJPM Income Fund C2 (div) - GBP (hedged) 1.55% 2.98% 6.37% 8.61% - - MediumJPM Income Fund C2 (div) - USD 1.58% 3.08% 6.59% 8.98% - - MediumJPM Income Fund D (acc) - EUR (hedged) 1.10% 2.13% 5.10% 6.95% 2.21% 3.39% MediumJPM Income Fund D (acc) - USD 1.29% 2.53% 5.80% 7.95% 3.96% - MediumJPM Income Fund D (div) - EUR (hedged) 1.10% 2.10% 5.02% 6.83% 2.07% 3.20% MediumJPM Income Fund D (div) - USD 1.30% 2.50% 5.71% 7.77% 3.66% - MediumJPM Income Fund D (mth) - USD 1.30% 2.50% 5.71% 7.77% - - MediumJPM Income Fund F (acc) - USD 1.17% 2.29% 5.41% 7.41% - - MediumJPM Income Fund F (mth) - USD 1.17% 2.25% 5.32% 7.25% - - MediumJPM Income Fund I (acc) - EUR (hedged) 1.37% 2.68% 5.95% 8.13% - - MediumJPM Income Fund I (acc) - JPY (hedged) 1.49% 2.90% 6.31% 8.64% - - MediumJPM Income Fund I (acc) - USD 1.58% 3.09% 6.68% 9.13% 5.15% - MediumJPM Income Fund I (div) - EUR (hedged) 1.36% 2.64% 5.85% 7.96% - - MediumJPM Income Fund I (mth) - USD 1.57% 3.05% 6.56% 8.92% - - MediumJPM Income Fund I2 (acc) - EUR (hedged) 1.40% 2.73% 6.02% 8.24% - - MediumJPM Income Fund I2 (acc) - USD 1.60% 3.14% 6.75% 9.30% - - MediumJPM Income Fund I2 (div) - GBP (hedged) 1.55% 2.99% 6.38% 8.62% - - MediumJPM Income Fund T (acc) - EUR (hedged) 1.10% 2.11% 5.08% 6.94% 2.21% 3.39% MediumJPM Income Fund T (div) - EUR (hedged) 1.09% 2.10% 5.02% 6.82% 2.06% 3.19% MediumJPM Income Fund X (acc) - USD 1.71% 3.34% 7.07% 9.68% - - MediumJPM Income Fund X (mth) - JPY 1.64% 10.89% 11.84% - - - MediumJPM Income Fund X (mth) - JPY (hedged) 1.61% 3.13% 6.62% - - - MediumJPM Income Fund X (mth) - USD* - - - - - - Medium
* Share Class inactive as at the end of the year.
326
JPMorgan FundsAppendix - Unaudited Additional Disclosures (continued)
3. Performance and Volatility (continued)
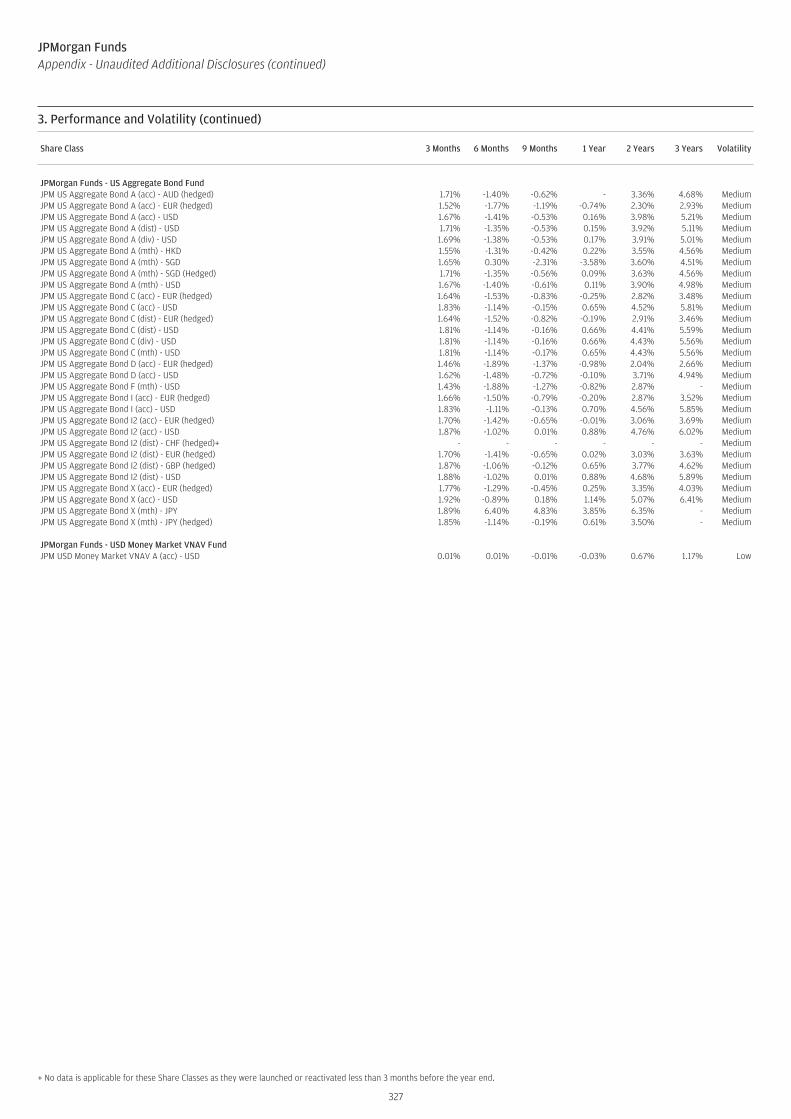
Share Class 3 Months 6 Months 9 Months 1 Year 2 Years 3 Years Volatility
JPMorgan Funds - US Aggregate Bond FundJPM US Aggregate Bond A (acc) - AUD (hedged) 1.71% -1.40% -0.62% - 3.36% 4.68% MediumJPM US Aggregate Bond A (acc) - EUR (hedged) 1.52% -1.77% -1.19% -0.74% 2.30% 2.93% MediumJPM US Aggregate Bond A (acc) - USD 1.67% -1.41% -0.53% 0.16% 3.98% 5.21% MediumJPM US Aggregate Bond A (dist) - USD 1.71% -1.35% -0.53% 0.15% 3.92% 5.11% MediumJPM US Aggregate Bond A (div) - USD 1.69% -1.38% -0.53% 0.17% 3.91% 5.01% MediumJPM US Aggregate Bond A (mth) - HKD 1.55% -1.31% -0.42% 0.22% 3.55% 4.56% MediumJPM US Aggregate Bond A (mth) - SGD 1.65% 0.30% -2.31% -3.58% 3.60% 4.51% MediumJPM US Aggregate Bond A (mth) - SGD (Hedged) 1.71% -1.35% -0.56% 0.09% 3.63% 4.56% MediumJPM US Aggregate Bond A (mth) - USD 1.67% -1.40% -0.61% 0.11% 3.90% 4.98% MediumJPM US Aggregate Bond C (acc) - EUR (hedged) 1.64% -1.53% -0.83% -0.25% 2.82% 3.48% MediumJPM US Aggregate Bond C (acc) - USD 1.83% -1.14% -0.15% 0.65% 4.52% 5.81% MediumJPM US Aggregate Bond C (dist) - EUR (hedged) 1.64% -1.52% -0.82% -0.19% 2.91% 3.46% MediumJPM US Aggregate Bond C (dist) - USD 1.81% -1.14% -0.16% 0.66% 4.41% 5.59% MediumJPM US Aggregate Bond C (div) - USD 1.81% -1.14% -0.16% 0.66% 4.43% 5.56% MediumJPM US Aggregate Bond C (mth) - USD 1.81% -1.14% -0.17% 0.65% 4.43% 5.56% MediumJPM US Aggregate Bond D (acc) - EUR (hedged) 1.46% -1.89% -1.37% -0.98% 2.04% 2.66% MediumJPM US Aggregate Bond D (acc) - USD 1.62% -1.48% -0.72% -0.10% 3.71% 4.94% MediumJPM US Aggregate Bond F (mth) - USD 1.43% -1.88% -1.27% -0.82% 2.87% - MediumJPM US Aggregate Bond I (acc) - EUR (hedged) 1.66% -1.50% -0.79% -0.20% 2.87% 3.52% MediumJPM US Aggregate Bond I (acc) - USD 1.83% -1.11% -0.13% 0.70% 4.56% 5.85% MediumJPM US Aggregate Bond I2 (acc) - EUR (hedged) 1.70% -1.42% -0.65% -0.01% 3.06% 3.69% MediumJPM US Aggregate Bond I2 (acc) - USD 1.87% -1.02% 0.01% 0.88% 4.76% 6.02% MediumJPM US Aggregate Bond I2 (dist) - CHF (hedged)+ - - - - - - MediumJPM US Aggregate Bond I2 (dist) - EUR (hedged) 1.70% -1.41% -0.65% 0.02% 3.03% 3.63% MediumJPM US Aggregate Bond I2 (dist) - GBP (hedged) 1.87% -1.06% -0.12% 0.65% 3.77% 4.62% MediumJPM US Aggregate Bond I2 (dist) - USD 1.88% -1.02% 0.01% 0.88% 4.68% 5.89% MediumJPM US Aggregate Bond X (acc) - EUR (hedged) 1.77% -1.29% -0.45% 0.25% 3.35% 4.03% MediumJPM US Aggregate Bond X (acc) - USD 1.92% -0.89% 0.18% 1.14% 5.07% 6.41% MediumJPM US Aggregate Bond X (mth) - JPY 1.89% 6.40% 4.83% 3.85% 6.35% - MediumJPM US Aggregate Bond X (mth) - JPY (hedged) 1.85% -1.14% -0.19% 0.61% 3.50% - Medium
JPMorgan Funds - USD Money Market VNAV FundJPM USD Money Market VNAV A (acc) - USD 0.01% 0.01% -0.01% -0.03% 0.67% 1.17% Low
+ No data is applicable for these Share Classes as they were launched or reactivated less than 3 months before the year end.
327
JPMorgan FundsAppendix - Unaudited Additional Disclosures (continued)
3. Performance and Volatility (continued)

Basis for Bank Interest RatesThe rates are based on JPMorgan Chase Treasury rates and consequently may change on a daily basis. The bank interest amount is posted to each of theSICAV’s bank accounts on a monthly basis on the first business day of the subsequent month based on the bank balances from the prior month.
5. Sub-Fund Share Classes Taxe d’Abonnement RatesThe following Sub-Fund Share Classes are subject to an asset based tax of at the rates below:
Sub-Funds Share Classes Rate per annum (%)
Money Market Sub-Funds A, C, D 0.01
All other Sub-Funds I, I2, K, S1, S2, V, X, Y 0.01
A, C, C2, D, F, J, T 0.05
6. Portfolio Turnover Ratio
The Portfolio Turnover Ratio is an indicator of the relevance of the additional costs incurred by a fund when buying and selling investments according to its investment policy.The Portfolio Turnover Ratio is calculated in accordance with the CSSF Circular 03/122 covering the year from 1 July 2020 to 30 June 2021, as outlined below:
(Total securities’ purchases and sales - total subscriptions and redemptions of Sub-Fund shares)
Average net Sub-Fund assets in Sub-Fund currency
The Portfolio Turnover Ratio is expressed as a percentage and in the case the outcome of the calculation is negative, a zero value has been published.
Sub-Fund Portfolio Turnover Ratio (%)JPMorgan Funds - America Equity Fund 43.04JPMorgan Funds - Asia Pacific Equity Fund -JPMorgan Funds - Brazil Equity Fund -JPMorgan Funds - China Fund -JPMorgan Funds - Emerging Europe Equity Fund 93.54JPMorgan Funds - Emerging Markets Dividend Fund 37.34JPMorgan Funds - Emerging Markets Equity Fund -JPMorgan Funds - Emerging Markets Opportunities Fund 22.16JPMorgan Funds - Emerging Markets Small Cap Fund 26.04JPMorgan Funds - Emerging Middle East Equity Fund 6.95JPMorgan Funds - Europe Dynamic Fund 179.42JPMorgan Funds - Europe Equity Fund -JPMorgan Funds - Europe Small Cap Fund 81.80JPMorgan Funds - Global Growth Fund (1) 108.85JPMorgan Funds - Global Healthcare Fund -JPMorgan Funds - Global Natural Resources Fund -JPMorgan Funds - Greater China Fund -JPMorgan Funds - Japan Equity Fund -JPMorgan Funds - Latin America Equity Fund -JPMorgan Funds - Russia Fund -JPMorgan Funds - Thematics - Genetic Therapies Fund -JPMorgan Funds - US Equity All Cap Fund 50.86JPMorgan Funds - US Growth Fund -JPMorgan Funds - US Smaller Companies Fund -JPMorgan Funds - US Technology Fund -JPMorgan Funds - US Value Fund -JPMorgan Funds - Asia Pacific Income Fund -JPMorgan Funds - Aggregate Bond Fund 187.73JPMorgan Funds - Emerging Markets Corporate Bond Fund 29.02JPMorgan Funds - Emerging Markets Debt Fund 5.53JPMorgan Funds - Emerging Markets Investment Grade Bond Fund -JPMorgan Funds - Emerging Markets Local Currency Debt Fund 54.31JPMorgan Funds - Global Corporate Bond Duration-Hedged Fund 111.91JPMorgan Funds - Global Corporate Bond Fund 54.02JPMorgan Funds - Global Government Bond Fund 94.17JPMorgan Funds - Global Short Duration Bond Fund 10.31JPMorgan Funds - Global Strategic Bond Fund 106.37JPMorgan Funds - Income Fund -JPMorgan Funds - US Aggregate Bond Fund -JPMorgan Funds - USD Money Market VNAV Fund -
(1) This Sub-Fund was renamed from JPMorgan Funds - Global Unconstrained Equity Fund to JPMorgan Funds - Global Growth Fund on 1 April 2021.
328
JPMorgan FundsAppendix - Unaudited Additional Disclosures (continued)
4. Interest Rate Received/(Charged) on Bank Accounts
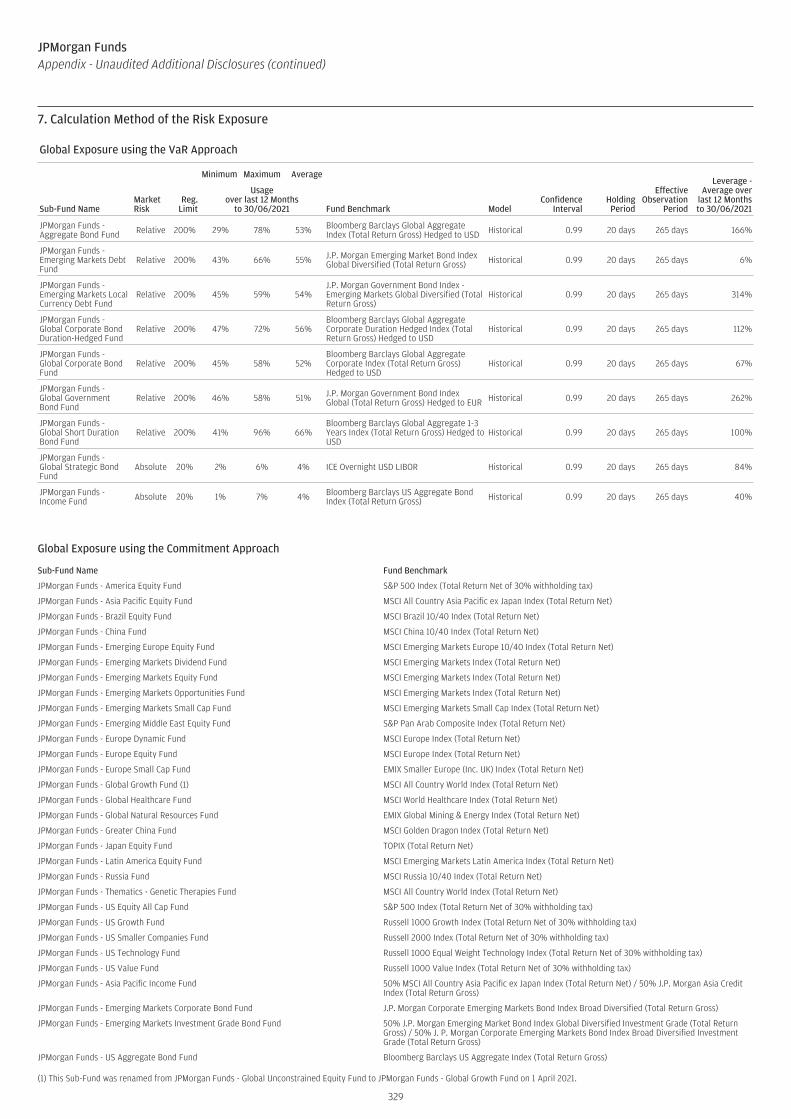
Global Exposure using the VaR Approach (continued)
MarketRisk
Minimum Maximum Average
ConfidenceInterval
HoldingPeriod
EffectiveObservation
Period
Leverage -Average over
last 12 Monthsto 30/06/2021Sub-Fund Name
Reg.Limit
Usageover last 12 Months
to 30/06/2021 Fund Benchmark Model
JPMorgan Funds -Aggregate Bond Fund Relative 200% 29% 78% 53% Bloomberg Barclays Global Aggregate
Index (Total Return Gross) Hedged to USD Historical 0.99 20 days 265 days 166%
JPMorgan Funds -Emerging Markets DebtFund
Relative 200% 43% 66% 55% J.P. Morgan Emerging Market Bond IndexGlobal Diversified (Total Return Gross) Historical 0.99 20 days 265 days 6%
JPMorgan Funds -Emerging Markets LocalCurrency Debt Fund
Relative 200% 45% 59% 54%J.P. Morgan Government Bond Index -Emerging Markets Global Diversified (TotalReturn Gross)
Historical 0.99 20 days 265 days 314%
JPMorgan Funds -Global Corporate BondDuration-Hedged Fund
Relative 200% 47% 72% 56%Bloomberg Barclays Global AggregateCorporate Duration Hedged Index (TotalReturn Gross) Hedged to USD
Historical 0.99 20 days 265 days 112%
JPMorgan Funds -Global Corporate BondFund
Relative 200% 45% 58% 52%Bloomberg Barclays Global AggregateCorporate Index (Total Return Gross)Hedged to USD
Historical 0.99 20 days 265 days 67%
JPMorgan Funds -Global GovernmentBond Fund
Relative 200% 46% 58% 51% J.P. Morgan Government Bond IndexGlobal (Total Return Gross) Hedged to EUR Historical 0.99 20 days 265 days 262%
JPMorgan Funds -Global Short DurationBond Fund
Relative 200% 41% 96% 66%Bloomberg Barclays Global Aggregate 1-3Years Index (Total Return Gross) Hedged toUSD
Historical 0.99 20 days 265 days 100%
JPMorgan Funds -Global Strategic BondFund
Absolute 20% 2% 6% 4% ICE Overnight USD LIBOR Historical 0.99 20 days 265 days 84%
JPMorgan Funds -Income Fund Absolute 20% 1% 7% 4% Bloomberg Barclays US Aggregate Bond
Index (Total Return Gross) Historical 0.99 20 days 265 days 40%
Global Exposure using the Commitment Approach
Sub-Fund Name Fund Benchmark
JPMorgan Funds - America Equity Fund S&P 500 Index (Total Return Net of 30% withholding tax)
JPMorgan Funds - Asia Pacific Equity Fund MSCI All Country Asia Pacific ex Japan Index (Total Return Net)
JPMorgan Funds - Brazil Equity Fund MSCI Brazil 10/40 Index (Total Return Net)
JPMorgan Funds - China Fund MSCI China 10/40 Index (Total Return Net)
JPMorgan Funds - Emerging Europe Equity Fund MSCI Emerging Markets Europe 10/40 Index (Total Return Net)
JPMorgan Funds - Emerging Markets Dividend Fund MSCI Emerging Markets Index (Total Return Net)
JPMorgan Funds - Emerging Markets Equity Fund MSCI Emerging Markets Index (Total Return Net)
JPMorgan Funds - Emerging Markets Opportunities Fund MSCI Emerging Markets Index (Total Return Net)
JPMorgan Funds - Emerging Markets Small Cap Fund MSCI Emerging Markets Small Cap Index (Total Return Net)
JPMorgan Funds - Emerging Middle East Equity Fund S&P Pan Arab Composite Index (Total Return Net)
JPMorgan Funds - Europe Dynamic Fund MSCI Europe Index (Total Return Net)
JPMorgan Funds - Europe Equity Fund MSCI Europe Index (Total Return Net)
JPMorgan Funds - Europe Small Cap Fund EMIX Smaller Europe (Inc. UK) Index (Total Return Net)
JPMorgan Funds - Global Growth Fund (1) MSCI All Country World Index (Total Return Net)
JPMorgan Funds - Global Healthcare Fund MSCI World Healthcare Index (Total Return Net)
JPMorgan Funds - Global Natural Resources Fund EMIX Global Mining & Energy Index (Total Return Net)
JPMorgan Funds - Greater China Fund MSCI Golden Dragon Index (Total Return Net)
JPMorgan Funds - Japan Equity Fund TOPIX (Total Return Net)
JPMorgan Funds - Latin America Equity Fund MSCI Emerging Markets Latin America Index (Total Return Net)
JPMorgan Funds - Russia Fund MSCI Russia 10/40 Index (Total Return Net)
JPMorgan Funds - Thematics - Genetic Therapies Fund MSCI All Country World Index (Total Return Net)
JPMorgan Funds - US Equity All Cap Fund S&P 500 Index (Total Return Net of 30% withholding tax)
JPMorgan Funds - US Growth Fund Russell 1000 Growth Index (Total Return Net of 30% withholding tax)
JPMorgan Funds - US Smaller Companies Fund Russell 2000 Index (Total Return Net of 30% withholding tax)
JPMorgan Funds - US Technology Fund Russell 1000 Equal Weight Technology Index (Total Return Net of 30% withholding tax)
JPMorgan Funds - US Value Fund Russell 1000 Value Index (Total Return Net of 30% withholding tax)
JPMorgan Funds - Asia Pacific Income Fund 50% MSCI All Country Asia Pacific ex Japan Index (Total Return Net) / 50% J.P. Morgan Asia CreditIndex (Total Return Gross)
JPMorgan Funds - Emerging Markets Corporate Bond Fund J.P. Morgan Corporate Emerging Markets Bond Index Broad Diversified (Total Return Gross)
JPMorgan Funds - Emerging Markets Investment Grade Bond Fund 50% J.P. Morgan Emerging Market Bond Index Global Diversified Investment Grade (Total ReturnGross) / 50% J. P. Morgan Corporate Emerging Markets Bond Index Broad Diversified InvestmentGrade (Total Return Gross)
JPMorgan Funds - US Aggregate Bond Fund Bloomberg Barclays US Aggregate Index (Total Return Gross)
(1) This Sub-Fund was renamed from JPMorgan Funds - Global Unconstrained Equity Fund to JPMorgan Funds - Global Growth Fund on 1 April 2021.
329
JPMorgan FundsAppendix - Unaudited Additional Disclosures (continued)
7. Calculation Method of the Risk Exposure
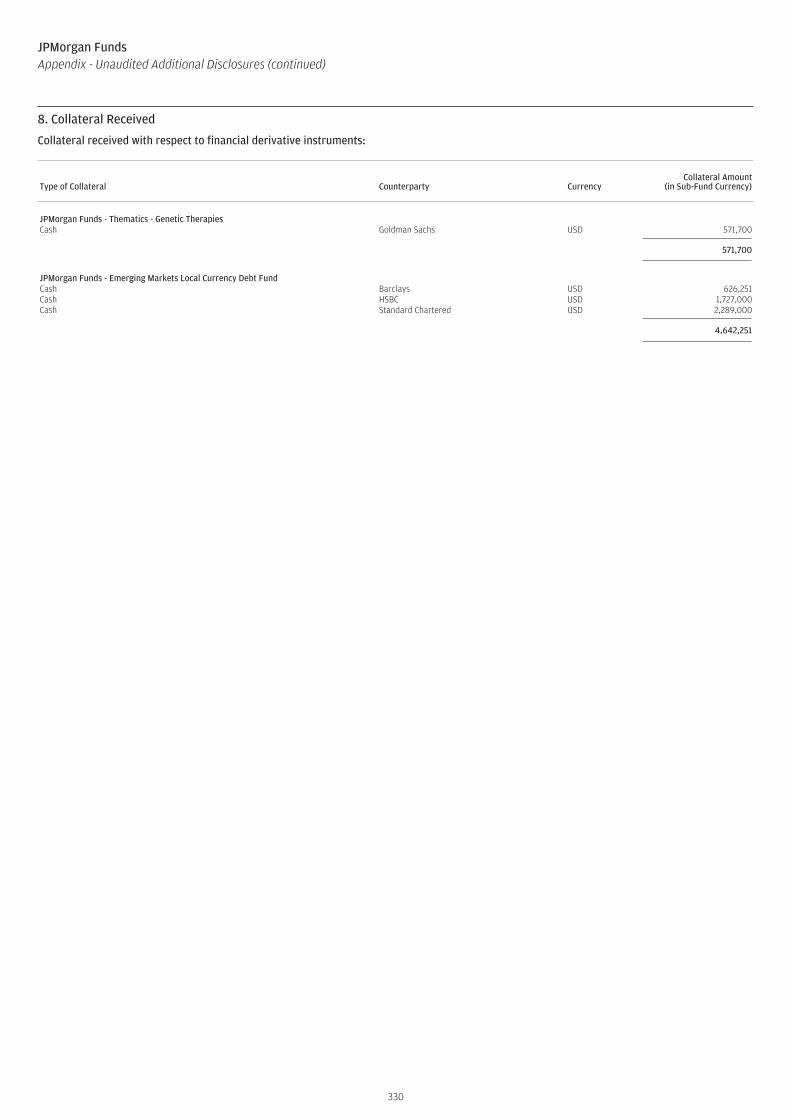
Collateral received with respect to financial derivative instruments:
Type of Collateral Counterparty CurrencyCollateral Amount
(in Sub-Fund Currency)
JPMorgan Funds - Thematics - Genetic TherapiesCash Goldman Sachs USD 571,700
571,700
JPMorgan Funds - Emerging Markets Local Currency Debt FundCash Barclays USD 626,251Cash HSBC USD 1,727,000Cash Standard Chartered USD 2,289,000
4,642,251
330
JPMorgan FundsAppendix - Unaudited Additional Disclosures (continued)
8. Collateral Received
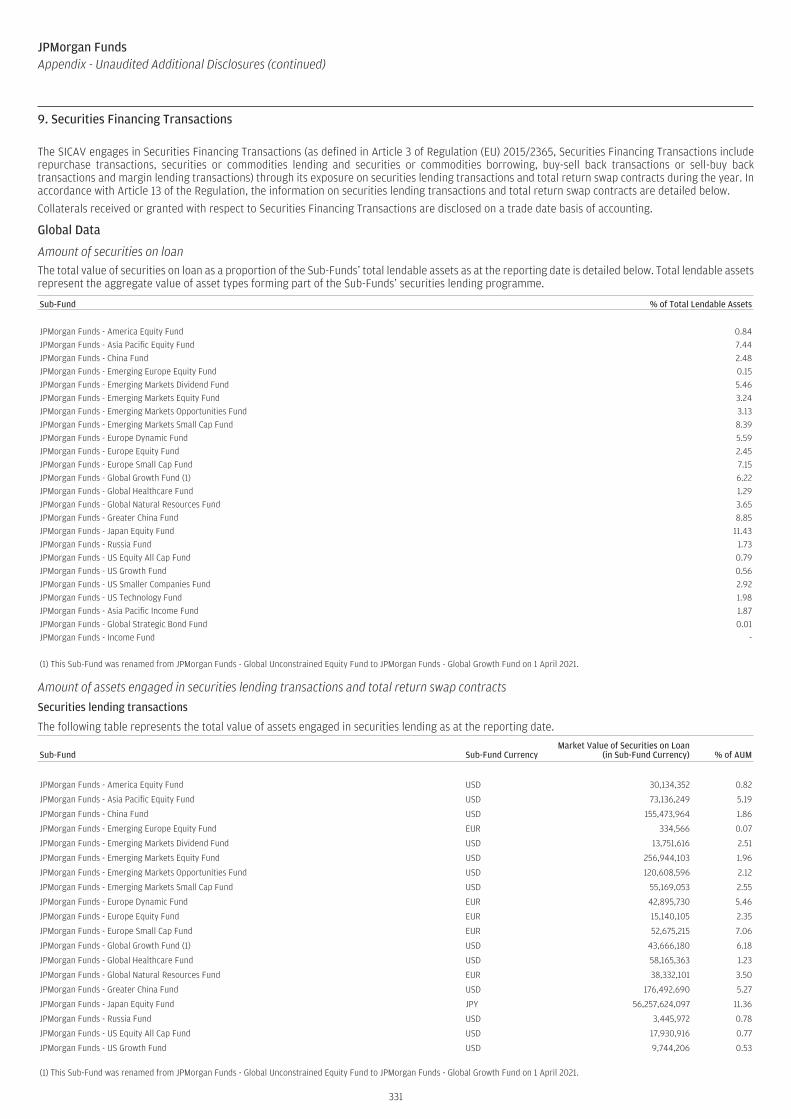
The SICAV engages in Securities Financing Transactions (as defined in Article 3 of Regulation (EU) 2015/2365, Securities Financing Transactions includerepurchase transactions, securities or commodities lending and securities or commodities borrowing, buy-sell back transactions or sell-buy backtransactions and margin lending transactions) through its exposure on securities lending transactions and total return swap contracts during the year. Inaccordance with Article 13 of the Regulation, the information on securities lending transactions and total return swap contracts are detailed below.
Collaterals received or granted with respect to Securities Financing Transactions are disclosed on a trade date basis of accounting.
Global Data
Amount of securities on loanThe total value of securities on loan as a proportion of the Sub-Funds’ total lendable assets as at the reporting date is detailed below. Total lendable assetsrepresent the aggregate value of asset types forming part of the Sub-Funds’ securities lending programme.
Sub-Fund % of Total Lendable Assets
JPMorgan Funds - America Equity Fund 0.84
JPMorgan Funds - Asia Pacific Equity Fund 7.44
JPMorgan Funds - China Fund 2.48
JPMorgan Funds - Emerging Europe Equity Fund 0.15
JPMorgan Funds - Emerging Markets Dividend Fund 5.46
JPMorgan Funds - Emerging Markets Equity Fund 3.24
JPMorgan Funds - Emerging Markets Opportunities Fund 3.13
JPMorgan Funds - Emerging Markets Small Cap Fund 8.39
JPMorgan Funds - Europe Dynamic Fund 5.59
JPMorgan Funds - Europe Equity Fund 2.45
JPMorgan Funds - Europe Small Cap Fund 7.15
JPMorgan Funds - Global Growth Fund (1) 6.22
JPMorgan Funds - Global Healthcare Fund 1.29
JPMorgan Funds - Global Natural Resources Fund 3.65
JPMorgan Funds - Greater China Fund 8.85
JPMorgan Funds - Japan Equity Fund 11.43
JPMorgan Funds - Russia Fund 1.73
JPMorgan Funds - US Equity All Cap Fund 0.79
JPMorgan Funds - US Growth Fund 0.56
JPMorgan Funds - US Smaller Companies Fund 2.92
JPMorgan Funds - US Technology Fund 1.98
JPMorgan Funds - Asia Pacific Income Fund 1.87
JPMorgan Funds - Global Strategic Bond Fund 0.01
JPMorgan Funds - Income Fund -
(1) This Sub-Fund was renamed from JPMorgan Funds - Global Unconstrained Equity Fund to JPMorgan Funds - Global Growth Fund on 1 April 2021.
Amount of assets engaged in securities lending transactions and total return swap contracts
Securities lending transactions
The following table represents the total value of assets engaged in securities lending as at the reporting date.
Sub-Fund Sub-Fund CurrencyMarket Value of Securities on Loan
(in Sub-Fund Currency) % of AUM
JPMorgan Funds - America Equity Fund USD 30,134,352 0.82
JPMorgan Funds - Asia Pacific Equity Fund USD 73,136,249 5.19
JPMorgan Funds - China Fund USD 155,473,964 1.86
JPMorgan Funds - Emerging Europe Equity Fund EUR 334,566 0.07
JPMorgan Funds - Emerging Markets Dividend Fund USD 13,751,616 2.51
JPMorgan Funds - Emerging Markets Equity Fund USD 256,944,103 1.96
JPMorgan Funds - Emerging Markets Opportunities Fund USD 120,608,596 2.12
JPMorgan Funds - Emerging Markets Small Cap Fund USD 55,169,053 2.55
JPMorgan Funds - Europe Dynamic Fund EUR 42,895,730 5.46
JPMorgan Funds - Europe Equity Fund EUR 15,140,105 2.35
JPMorgan Funds - Europe Small Cap Fund EUR 52,675,215 7.06
JPMorgan Funds - Global Growth Fund (1) USD 43,666,180 6.18
JPMorgan Funds - Global Healthcare Fund USD 58,165,363 1.23
JPMorgan Funds - Global Natural Resources Fund EUR 38,332,101 3.50
JPMorgan Funds - Greater China Fund USD 176,492,690 5.27
JPMorgan Funds - Japan Equity Fund JPY 56,257,624,097 11.36
JPMorgan Funds - Russia Fund USD 3,445,972 0.78
JPMorgan Funds - US Equity All Cap Fund USD 17,930,916 0.77
JPMorgan Funds - US Growth Fund USD 9,744,206 0.53
(1) This Sub-Fund was renamed from JPMorgan Funds - Global Unconstrained Equity Fund to JPMorgan Funds - Global Growth Fund on 1 April 2021.
331
JPMorgan FundsAppendix - Unaudited Additional Disclosures (continued)
9. Securities Financing Transactions
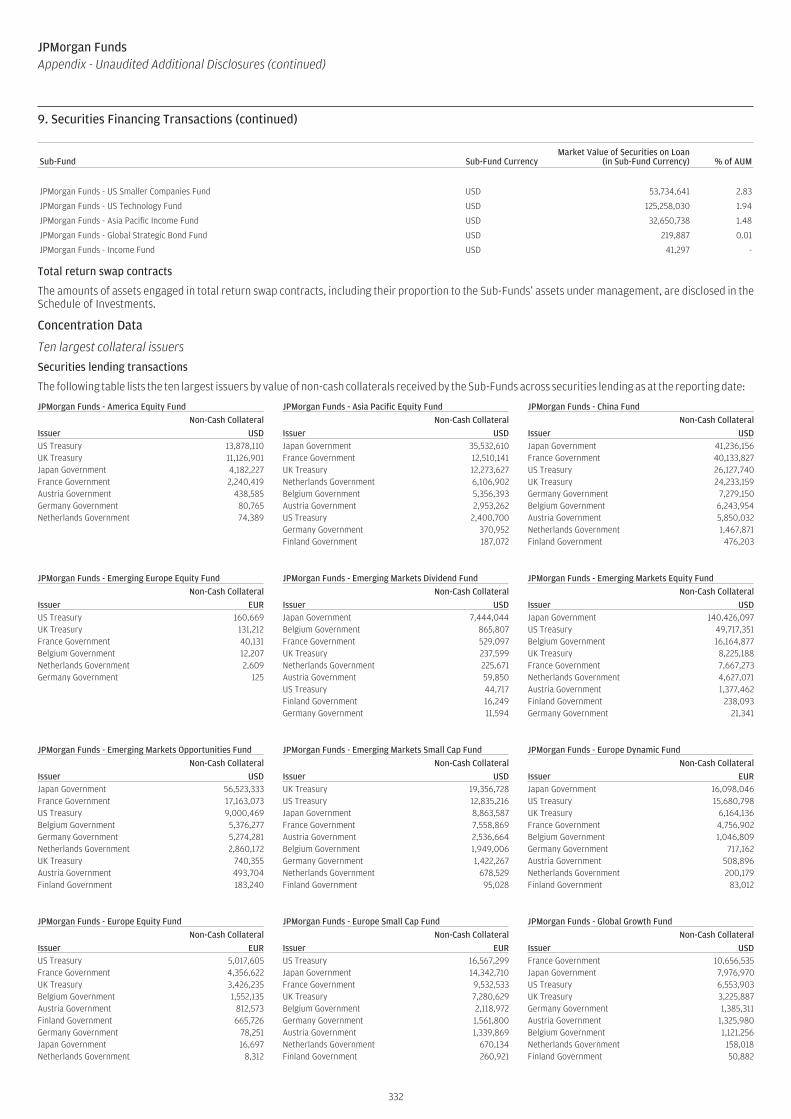
Sub-Fund Sub-Fund CurrencyMarket Value of Securities on Loan
(in Sub-Fund Currency) % of AUM
JPMorgan Funds - US Smaller Companies Fund USD 53,734,641 2.83
JPMorgan Funds - US Technology Fund USD 125,258,030 1.94
JPMorgan Funds - Asia Pacific Income Fund USD 32,650,738 1.48
JPMorgan Funds - Global Strategic Bond Fund USD 219,887 0.01
JPMorgan Funds - Income Fund USD 41,297 -
Total return swap contracts
The amounts of assets engaged in total return swap contracts, including their proportion to the Sub-Funds’ assets under management, are disclosed in theSchedule of Investments.
Concentration Data
Ten largest collateral issuers
Securities lending transactions
The following table lists the ten largest issuers by value of non-cash collaterals received by the Sub-Funds across securities lending as at the reporting date:
JPMorgan Funds - America Equity Fund JPMorgan Funds - Asia Pacific Equity Fund JPMorgan Funds - China Fund
Non-Cash Collateral Non-Cash Collateral Non-Cash Collateral
Issuer USD Issuer USD Issuer USDUS Treasury 13,878,110 Japan Government 35,532,610 Japan Government 41,236,156UK Treasury 11,126,901 France Government 12,510,141 France Government 40,133,827Japan Government 4,182,227 UK Treasury 12,273,627 US Treasury 26,127,740France Government 2,240,419 Netherlands Government 6,106,902 UK Treasury 24,233,159Austria Government 438,585 Belgium Government 5,356,393 Germany Government 7,279,150Germany Government 80,765 Austria Government 2,953,262 Belgium Government 6,243,954Netherlands Government 74,389 US Treasury 2,400,700 Austria Government 5,850,032
Germany Government 370,952 Netherlands Government 1,467,871Finland Government 187,072 Finland Government 476,203
JPMorgan Funds - Emerging Europe Equity Fund JPMorgan Funds - Emerging Markets Dividend Fund JPMorgan Funds - Emerging Markets Equity Fund
Non-Cash Collateral Non-Cash Collateral Non-Cash Collateral
Issuer EUR Issuer USD Issuer USDUS Treasury 160,669 Japan Government 7,444,044 Japan Government 140,426,097UK Treasury 131,212 Belgium Government 865,807 US Treasury 49,717,351France Government 40,131 France Government 529,097 Belgium Government 16,164,877Belgium Government 12,207 UK Treasury 237,599 UK Treasury 8,225,188Netherlands Government 2,609 Netherlands Government 225,671 France Government 7,667,273Germany Government 125 Austria Government 59,850 Netherlands Government 4,627,071
US Treasury 44,717 Austria Government 1,377,462Finland Government 16,249 Finland Government 238,093Germany Government 11,594 Germany Government 21,341
JPMorgan Funds - Emerging Markets Opportunities Fund JPMorgan Funds - Emerging Markets Small Cap Fund JPMorgan Funds - Europe Dynamic Fund
Non-Cash Collateral Non-Cash Collateral Non-Cash Collateral
Issuer USD Issuer USD Issuer EURJapan Government 56,523,333 UK Treasury 19,356,728 Japan Government 16,098,046France Government 17,163,073 US Treasury 12,835,216 US Treasury 15,680,798US Treasury 9,000,469 Japan Government 8,863,587 UK Treasury 6,164,136Belgium Government 5,376,277 France Government 7,558,869 France Government 4,756,902Germany Government 5,274,281 Austria Government 2,536,664 Belgium Government 1,046,809Netherlands Government 2,860,172 Belgium Government 1,949,006 Germany Government 717,162UK Treasury 740,355 Germany Government 1,422,267 Austria Government 508,896Austria Government 493,704 Netherlands Government 678,529 Netherlands Government 200,179Finland Government 183,240 Finland Government 95,028 Finland Government 83,012
JPMorgan Funds - Europe Equity Fund JPMorgan Funds - Europe Small Cap Fund JPMorgan Funds - Global Growth Fund
Non-Cash Collateral Non-Cash Collateral Non-Cash Collateral
Issuer EUR Issuer EUR Issuer USDUS Treasury 5,017,605 US Treasury 16,567,299 France Government 10,656,535France Government 4,356,622 Japan Government 14,342,710 Japan Government 7,976,970UK Treasury 3,426,235 France Government 9,532,533 US Treasury 6,553,903Belgium Government 1,552,135 UK Treasury 7,280,629 UK Treasury 3,225,887Austria Government 812,573 Belgium Government 2,118,972 Germany Government 1,385,311Finland Government 665,726 Germany Government 1,561,800 Austria Government 1,325,980Germany Government 78,251 Austria Government 1,339,869 Belgium Government 1,121,256Japan Government 16,697 Netherlands Government 670,134 Netherlands Government 158,018Netherlands Government 8,312 Finland Government 260,921 Finland Government 50,882
332
JPMorgan FundsAppendix - Unaudited Additional Disclosures (continued)
9. Securities Financing Transactions (continued)
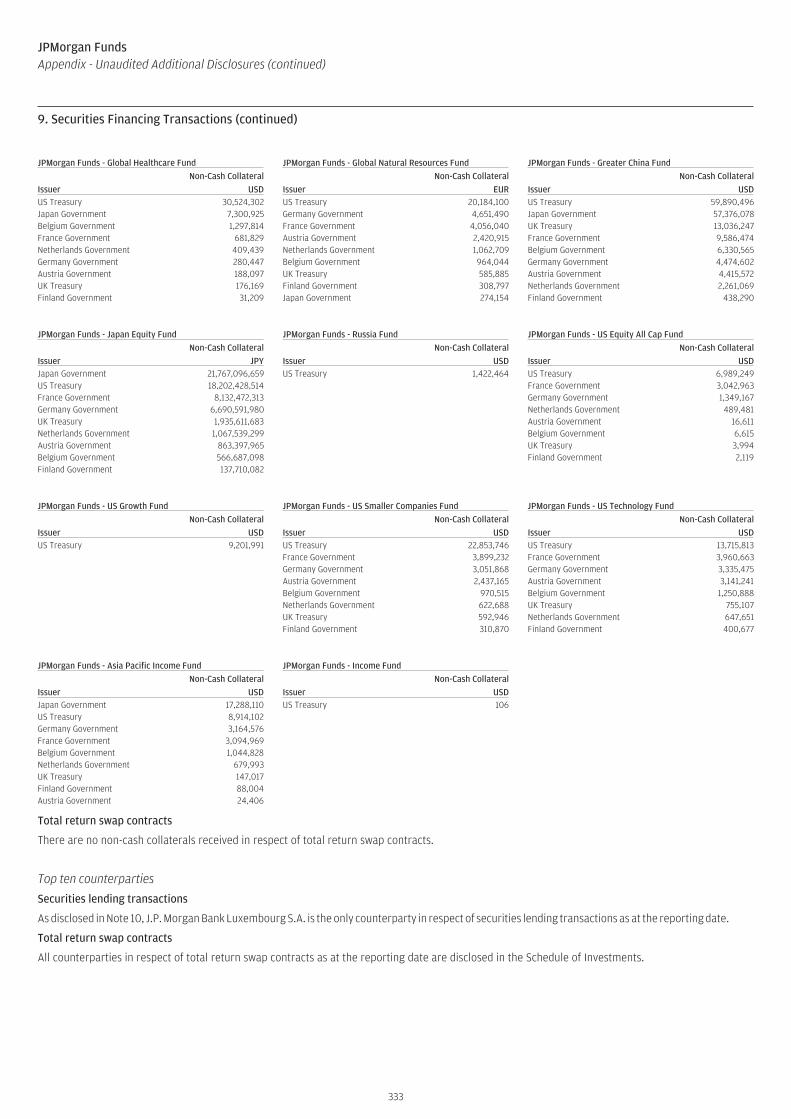
JPMorgan Funds - Global Healthcare Fund JPMorgan Funds - Global Natural Resources Fund JPMorgan Funds - Greater China Fund
Non-Cash Collateral Non-Cash Collateral Non-Cash Collateral
Issuer USD Issuer EUR Issuer USDUS Treasury 30,524,302 US Treasury 20,184,100 US Treasury 59,890,496Japan Government 7,300,925 Germany Government 4,651,490 Japan Government 57,376,078Belgium Government 1,297,814 France Government 4,056,040 UK Treasury 13,036,247France Government 681,829 Austria Government 2,420,915 France Government 9,586,474Netherlands Government 409,439 Netherlands Government 1,062,709 Belgium Government 6,330,565Germany Government 280,447 Belgium Government 964,044 Germany Government 4,474,602Austria Government 188,097 UK Treasury 585,885 Austria Government 4,415,572UK Treasury 176,169 Finland Government 308,797 Netherlands Government 2,261,069Finland Government 31,209 Japan Government 274,154 Finland Government 438,290
JPMorgan Funds - Japan Equity Fund JPMorgan Funds - Russia Fund JPMorgan Funds - US Equity All Cap Fund
Non-Cash Collateral Non-Cash Collateral Non-Cash Collateral
Issuer JPY Issuer USD Issuer USDJapan Government 21,767,096,659 US Treasury 1,422,464 US Treasury 6,989,249US Treasury 18,202,428,514 France Government 3,042,963France Government 8,132,472,313 Germany Government 1,349,167Germany Government 6,690,591,980 Netherlands Government 489,481UK Treasury 1,935,611,683 Austria Government 16,611Netherlands Government 1,067,539,299 Belgium Government 6,615Austria Government 863,397,965 UK Treasury 3,994Belgium Government 566,687,098 Finland Government 2,119Finland Government 137,710,082
JPMorgan Funds - US Growth Fund JPMorgan Funds - US Smaller Companies Fund JPMorgan Funds - US Technology Fund
Non-Cash Collateral Non-Cash Collateral Non-Cash Collateral
Issuer USD Issuer USD Issuer USDUS Treasury 9,201,991 US Treasury 22,853,746 US Treasury 13,715,813
France Government 3,899,232 France Government 3,960,663Germany Government 3,051,868 Germany Government 3,335,475Austria Government 2,437,165 Austria Government 3,141,241Belgium Government 970,515 Belgium Government 1,250,888Netherlands Government 622,688 UK Treasury 755,107UK Treasury 592,946 Netherlands Government 647,651Finland Government 310,870 Finland Government 400,677
JPMorgan Funds - Asia Pacific Income Fund JPMorgan Funds - Income Fund
Non-Cash Collateral Non-Cash Collateral
Issuer USD Issuer USDJapan Government 17,288,110 US Treasury 106US Treasury 8,914,102Germany Government 3,164,576France Government 3,094,969Belgium Government 1,044,828Netherlands Government 679,993UK Treasury 147,017Finland Government 88,004Austria Government 24,406
Total return swap contracts
There are no non-cash collaterals received in respect of total return swap contracts.
Top ten counterparties
Securities lending transactions
As disclosed in Note 10, J.P. Morgan Bank Luxembourg S.A. is the only counterparty in respect of securities lending transactions as at the reporting date.
Total return swap contracts
All counterparties in respect of total return swap contracts as at the reporting date are disclosed in the Schedule of Investments.
333
JPMorgan FundsAppendix - Unaudited Additional Disclosures (continued)
9. Securities Financing Transactions (continued)
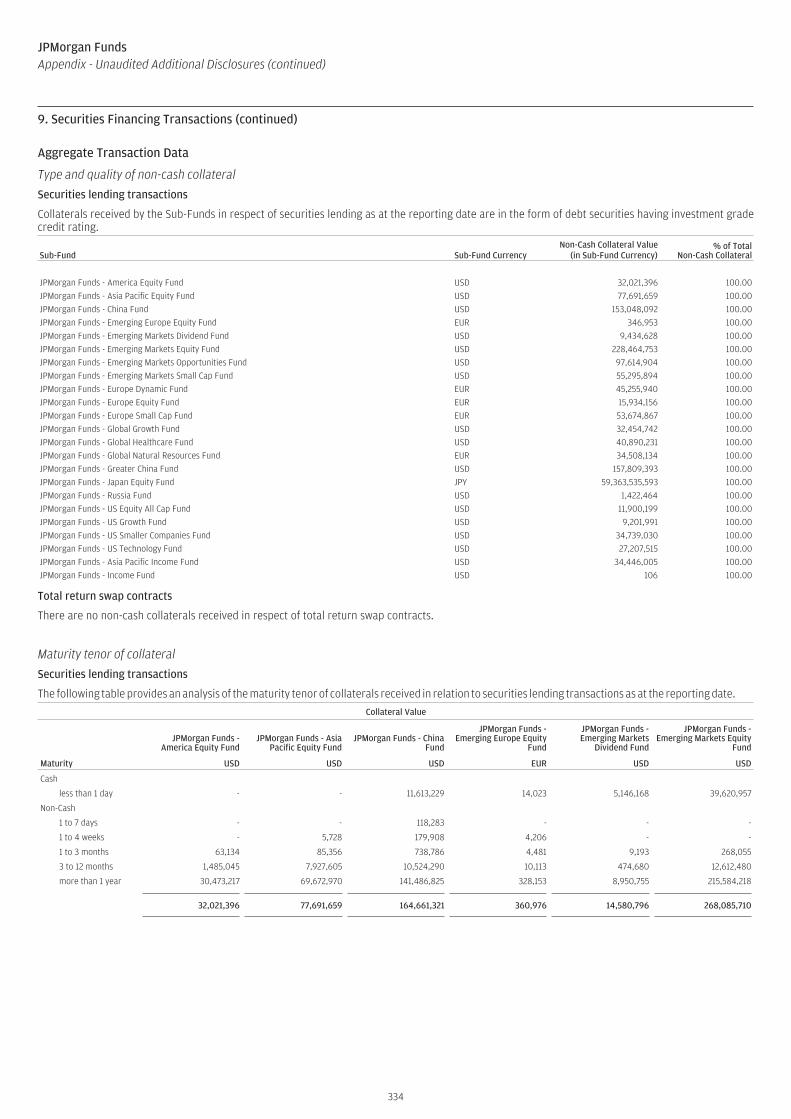
Aggregate Transaction Data
Type and quality of non-cash collateral
Securities lending transactions
Collaterals received by the Sub-Funds in respect of securities lending as at the reporting date are in the form of debt securities having investment gradecredit rating.
Sub-Fund Sub-Fund CurrencyNon-Cash Collateral Value
(in Sub-Fund Currency)% of Total
Non-Cash Collateral
JPMorgan Funds - America Equity Fund USD 32,021,396 100.00
JPMorgan Funds - Asia Pacific Equity Fund USD 77,691,659 100.00
JPMorgan Funds - China Fund USD 153,048,092 100.00
JPMorgan Funds - Emerging Europe Equity Fund EUR 346,953 100.00
JPMorgan Funds - Emerging Markets Dividend Fund USD 9,434,628 100.00
JPMorgan Funds - Emerging Markets Equity Fund USD 228,464,753 100.00
JPMorgan Funds - Emerging Markets Opportunities Fund USD 97,614,904 100.00
JPMorgan Funds - Emerging Markets Small Cap Fund USD 55,295,894 100.00
JPMorgan Funds - Europe Dynamic Fund EUR 45,255,940 100.00
JPMorgan Funds - Europe Equity Fund EUR 15,934,156 100.00
JPMorgan Funds - Europe Small Cap Fund EUR 53,674,867 100.00
JPMorgan Funds - Global Growth Fund USD 32,454,742 100.00
JPMorgan Funds - Global Healthcare Fund USD 40,890,231 100.00
JPMorgan Funds - Global Natural Resources Fund EUR 34,508,134 100.00
JPMorgan Funds - Greater China Fund USD 157,809,393 100.00
JPMorgan Funds - Japan Equity Fund JPY 59,363,535,593 100.00
JPMorgan Funds - Russia Fund USD 1,422,464 100.00
JPMorgan Funds - US Equity All Cap Fund USD 11,900,199 100.00
JPMorgan Funds - US Growth Fund USD 9,201,991 100.00
JPMorgan Funds - US Smaller Companies Fund USD 34,739,030 100.00
JPMorgan Funds - US Technology Fund USD 27,207,515 100.00
JPMorgan Funds - Asia Pacific Income Fund USD 34,446,005 100.00
JPMorgan Funds - Income Fund USD 106 100.00
Total return swap contracts
There are no non-cash collaterals received in respect of total return swap contracts.
Maturity tenor of collateral
Securities lending transactions
The following table provides an analysis of the maturity tenor of collaterals received in relation to securities lending transactions as at the reporting date.
Collateral Value
JPMorgan Funds -America Equity Fund
JPMorgan Funds - AsiaPacific Equity Fund
JPMorgan Funds - ChinaFund
JPMorgan Funds -Emerging Europe Equity
Fund
JPMorgan Funds -Emerging Markets
Dividend Fund
JPMorgan Funds -Emerging Markets Equity
Fund
Maturity USD USD USD EUR USD USD
Cash
less than 1 day - - 11,613,229 14,023 5,146,168 39,620,957
Non-Cash
1 to 7 days - - 118,283 - - -
1 to 4 weeks - 5,728 179,908 4,206 - -
1 to 3 months 63,134 85,356 738,786 4,481 9,193 268,055
3 to 12 months 1,485,045 7,927,605 10,524,290 10,113 474,680 12,612,480
more than 1 year 30,473,217 69,672,970 141,486,825 328,153 8,950,755 215,584,218
32,021,396 77,691,659 164,661,321 360,976 14,580,796 268,085,710
334
JPMorgan FundsAppendix - Unaudited Additional Disclosures (continued)
9. Securities Financing Transactions (continued)
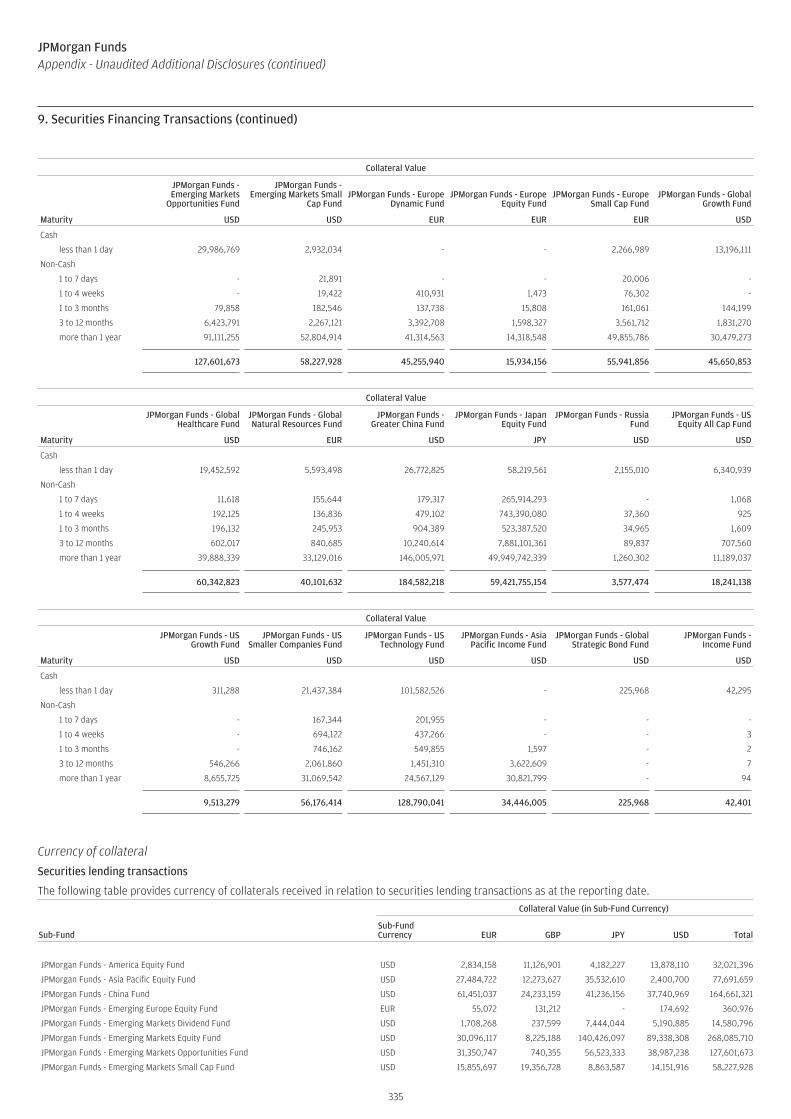
Collateral Value
JPMorgan Funds -Emerging Markets
Opportunities Fund
JPMorgan Funds -Emerging Markets Small
Cap FundJPMorgan Funds - Europe
Dynamic FundJPMorgan Funds - Europe
Equity FundJPMorgan Funds - Europe
Small Cap FundJPMorgan Funds - Global
Growth Fund
Maturity USD USD EUR EUR EUR USD
Cash
less than 1 day 29,986,769 2,932,034 - - 2,266,989 13,196,111
Non-Cash
1 to 7 days - 21,891 - - 20,006 -
1 to 4 weeks - 19,422 410,931 1,473 76,302 -
1 to 3 months 79,858 182,546 137,738 15,808 161,061 144,199
3 to 12 months 6,423,791 2,267,121 3,392,708 1,598,327 3,561,712 1,831,270
more than 1 year 91,111,255 52,804,914 41,314,563 14,318,548 49,855,786 30,479,273
127,601,673 58,227,928 45,255,940 15,934,156 55,941,856 45,650,853
Collateral Value
JPMorgan Funds - GlobalHealthcare Fund
JPMorgan Funds - GlobalNatural Resources Fund
JPMorgan Funds -Greater China Fund
JPMorgan Funds - JapanEquity Fund
JPMorgan Funds - RussiaFund
JPMorgan Funds - USEquity All Cap Fund
Maturity USD EUR USD JPY USD USD
Cash
less than 1 day 19,452,592 5,593,498 26,772,825 58,219,561 2,155,010 6,340,939
Non-Cash
1 to 7 days 11,618 155,644 179,317 265,914,293 - 1,068
1 to 4 weeks 192,125 136,836 479,102 743,390,080 37,360 925
1 to 3 months 196,132 245,953 904,389 523,387,520 34,965 1,609
3 to 12 months 602,017 840,685 10,240,614 7,881,101,361 89,837 707,560
more than 1 year 39,888,339 33,129,016 146,005,971 49,949,742,339 1,260,302 11,189,037
60,342,823 40,101,632 184,582,218 59,421,755,154 3,577,474 18,241,138
Collateral Value
JPMorgan Funds - USGrowth Fund
JPMorgan Funds - USSmaller Companies Fund
JPMorgan Funds - USTechnology Fund
JPMorgan Funds - AsiaPacific Income Fund
JPMorgan Funds - GlobalStrategic Bond Fund
JPMorgan Funds -Income Fund
Maturity USD USD USD USD USD USD
Cash
less than 1 day 311,288 21,437,384 101,582,526 - 225,968 42,295
Non-Cash
1 to 7 days - 167,344 201,955 - - -
1 to 4 weeks - 694,122 437,266 - - 3
1 to 3 months - 746,162 549,855 1,597 - 2
3 to 12 months 546,266 2,061,860 1,451,310 3,622,609 - 7
more than 1 year 8,655,725 31,069,542 24,567,129 30,821,799 - 94
9,513,279 56,176,414 128,790,041 34,446,005 225,968 42,401
Currency of collateral
Securities lending transactions
The following table provides currency of collaterals received in relation to securities lending transactions as at the reporting date.
Collateral Value (in Sub-Fund Currency)
Sub-FundSub-FundCurrency EUR GBP JPY USD Total
JPMorgan Funds - America Equity Fund USD 2,834,158 11,126,901 4,182,227 13,878,110 32,021,396
JPMorgan Funds - Asia Pacific Equity Fund USD 27,484,722 12,273,627 35,532,610 2,400,700 77,691,659
JPMorgan Funds - China Fund USD 61,451,037 24,233,159 41,236,156 37,740,969 164,661,321
JPMorgan Funds - Emerging Europe Equity Fund EUR 55,072 131,212 - 174,692 360,976
JPMorgan Funds - Emerging Markets Dividend Fund USD 1,708,268 237,599 7,444,044 5,190,885 14,580,796
JPMorgan Funds - Emerging Markets Equity Fund USD 30,096,117 8,225,188 140,426,097 89,338,308 268,085,710
JPMorgan Funds - Emerging Markets Opportunities Fund USD 31,350,747 740,355 56,523,333 38,987,238 127,601,673
JPMorgan Funds - Emerging Markets Small Cap Fund USD 15,855,697 19,356,728 8,863,587 14,151,916 58,227,928
335
JPMorgan FundsAppendix - Unaudited Additional Disclosures (continued)
9. Securities Financing Transactions (continued)
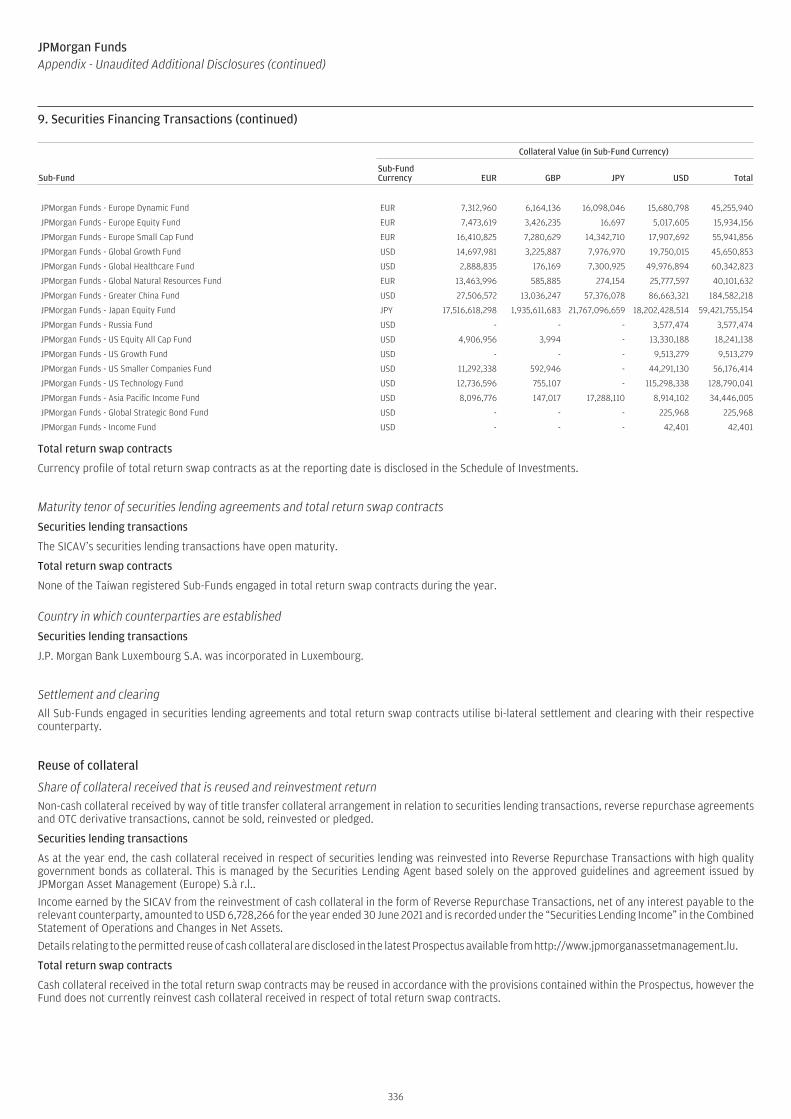
Collateral Value (in Sub-Fund Currency)
Sub-FundSub-FundCurrency EUR GBP JPY USD Total
JPMorgan Funds - Europe Dynamic Fund EUR 7,312,960 6,164,136 16,098,046 15,680,798 45,255,940
JPMorgan Funds - Europe Equity Fund EUR 7,473,619 3,426,235 16,697 5,017,605 15,934,156
JPMorgan Funds - Europe Small Cap Fund EUR 16,410,825 7,280,629 14,342,710 17,907,692 55,941,856
JPMorgan Funds - Global Growth Fund USD 14,697,981 3,225,887 7,976,970 19,750,015 45,650,853
JPMorgan Funds - Global Healthcare Fund USD 2,888,835 176,169 7,300,925 49,976,894 60,342,823
JPMorgan Funds - Global Natural Resources Fund EUR 13,463,996 585,885 274,154 25,777,597 40,101,632
JPMorgan Funds - Greater China Fund USD 27,506,572 13,036,247 57,376,078 86,663,321 184,582,218
JPMorgan Funds - Japan Equity Fund JPY 17,516,618,298 1,935,611,683 21,767,096,659 18,202,428,514 59,421,755,154
JPMorgan Funds - Russia Fund USD - - - 3,577,474 3,577,474
JPMorgan Funds - US Equity All Cap Fund USD 4,906,956 3,994 - 13,330,188 18,241,138
JPMorgan Funds - US Growth Fund USD - - - 9,513,279 9,513,279
JPMorgan Funds - US Smaller Companies Fund USD 11,292,338 592,946 - 44,291,130 56,176,414
JPMorgan Funds - US Technology Fund USD 12,736,596 755,107 - 115,298,338 128,790,041
JPMorgan Funds - Asia Pacific Income Fund USD 8,096,776 147,017 17,288,110 8,914,102 34,446,005
JPMorgan Funds - Global Strategic Bond Fund USD - - - 225,968 225,968
JPMorgan Funds - Income Fund USD - - - 42,401 42,401
Total return swap contracts
Currency profile of total return swap contracts as at the reporting date is disclosed in the Schedule of Investments.
Maturity tenor of securities lending agreements and total return swap contracts
Securities lending transactions
The SICAV’s securities lending transactions have open maturity.
Total return swap contracts
None of the Taiwan registered Sub-Funds engaged in total return swap contracts during the year.
Country in which counterparties are established
Securities lending transactions
J.P. Morgan Bank Luxembourg S.A. was incorporated in Luxembourg.
Settlement and clearingAll Sub-Funds engaged in securities lending agreements and total return swap contracts utilise bi-lateral settlement and clearing with their respectivecounterparty.
Reuse of collateral
Share of collateral received that is reused and reinvestment returnNon-cash collateral received by way of title transfer collateral arrangement in relation to securities lending transactions, reverse repurchase agreementsand OTC derivative transactions, cannot be sold, reinvested or pledged.
Securities lending transactions
As at the year end, the cash collateral received in respect of securities lending was reinvested into Reverse Repurchase Transactions with high qualitygovernment bonds as collateral. This is managed by the Securities Lending Agent based solely on the approved guidelines and agreement issued byJPMorgan Asset Management (Europe) S.à r.l..
Income earned by the SICAV from the reinvestment of cash collateral in the form of Reverse Repurchase Transactions, net of any interest payable to therelevant counterparty, amounted to USD 6,728,266 for the year ended 30 June 2021 and is recorded under the “Securities Lending Income” in the CombinedStatement of Operations and Changes in Net Assets.
Details relating to the permitted reuse of cash collateral are disclosed in the latest Prospectus available from http://www.jpmorganassetmanagement.lu.
Total return swap contracts
Cash collateral received in the total return swap contracts may be reused in accordance with the provisions contained within the Prospectus, however theFund does not currently reinvest cash collateral received in respect of total return swap contracts.
336
JPMorgan FundsAppendix - Unaudited Additional Disclosures (continued)
9. Securities Financing Transactions (continued)

Safekeeping of Collateral
Collateral received
Securities lending transactions
The following tables provide an analysis of collateral received held at each custodian as at the reporting date:
Sub-Fund Custodian Sub-Fund CurrencyCollateral Value
(in Sub-Fund Currency)
JPMorgan Funds - America Equity Fund JPMorgan Bank Luxembourg S.A. USD 32,021,396
JPMorgan Funds - Asia Pacific Equity Fund JPMorgan Bank Luxembourg S.A. USD 77,691,659
JPMorgan Funds - China Fund JPMorgan Bank Luxembourg S.A. USD 164,661,321
JPMorgan Funds - Emerging Europe Equity Fund JPMorgan Bank Luxembourg S.A. EUR 360,976
JPMorgan Funds - Emerging Markets Dividend Fund JPMorgan Bank Luxembourg S.A. USD 14,580,796
JPMorgan Funds - Emerging Markets Equity Fund JPMorgan Bank Luxembourg S.A. USD 268,085,710
JPMorgan Funds - Emerging Markets Opportunities Fund JPMorgan Bank Luxembourg S.A. USD 127,601,673
JPMorgan Funds - Emerging Markets Small Cap Fund JPMorgan Bank Luxembourg S.A. USD 58,227,928
JPMorgan Funds - Europe Dynamic Fund JPMorgan Bank Luxembourg S.A. EUR 45,255,940
JPMorgan Funds - Europe Equity Fund JPMorgan Bank Luxembourg S.A. EUR 15,934,156
JPMorgan Funds - Europe Small Cap Fund JPMorgan Bank Luxembourg S.A. EUR 55,941,856
JPMorgan Funds - Global Growth Fund JPMorgan Bank Luxembourg S.A. USD 45,650,853
JPMorgan Funds - Global Healthcare Fund JPMorgan Bank Luxembourg S.A. USD 60,342,823
JPMorgan Funds - Global Natural Resources Fund JPMorgan Bank Luxembourg S.A. EUR 40,101,632
JPMorgan Funds - Greater China Fund JPMorgan Bank Luxembourg S.A. USD 184,582,218
JPMorgan Funds - Japan Equity Fund JPMorgan Bank Luxembourg S.A. JPY 59,421,755,154
JPMorgan Funds - Russia Fund JPMorgan Bank Luxembourg S.A. USD 3,577,474
JPMorgan Funds - US Equity All Cap Fund JPMorgan Bank Luxembourg S.A. USD 18,241,138
JPMorgan Funds - US Growth Fund JPMorgan Bank Luxembourg S.A. USD 9,513,279
JPMorgan Funds - US Smaller Companies Fund JPMorgan Bank Luxembourg S.A. USD 56,176,414
JPMorgan Funds - US Technology Fund JPMorgan Bank Luxembourg S.A. USD 128,790,041
JPMorgan Funds - Asia Pacific Income Fund JPMorgan Bank Luxembourg S.A. USD 34,446,005
JPMorgan Funds - Global Strategic Bond Fund JPMorgan Bank Luxembourg S.A. USD 225,968
JPMorgan Funds - Income Fund JPMorgan Bank Luxembourg S.A. USD 42,401
Collateral granted
Securities lending transactions
As at the reporting date, there was no collateral granted with respect to securities lending transactions.
Total return swap contracts
As at the reporting date, there was no collateral granted with respect to total return swap contracts.
Return and cost
Securities lending transactions
The total income earned from securities lending transactions is split between the relevant Sub-Funds and the securities lending agent. Detail of this split isdisclosed in Note 10 to the Financial Statements.
Total return swap contracts
All returns from total return swap contracts will accrue to the Sub-Funds and are not subject to any returns sharing arrangements with the InvestmentManager or any other third parties.
337
JPMorgan FundsAppendix - Unaudited Additional Disclosures (continued)
9. Securities Financing Transactions (continued)

Sub-Fund Name
Lowest Grossderivative
exposure over last12 months to30/06/2021
Highest Grossderivative
exposure over last12 months to30/06/2021
Average Grossderivative
exposure over last12 months to30/06/2021
Lowest Netderivative
exposure over last12 months to30/06/2021
Highest Netderivative
exposure over last12 months to30/06/2021
Average Netderivative
exposure over last12 months to30/06/2021
JPMorgan Funds - America Equity Fund 0.00 0.00 0.00 0.00 0.00 0.00
JPMorgan Funds - Asia Pacific Equity Fund 0.00 0.09 0.00 0.00 0.09 0.00
JPMorgan Funds - Brazil Equity Fund 0.00 0.16 0.02 0.00 0.16 0.02
JPMorgan Funds - China Fund 0.00 31.10 10.03 0.00 31.10 9.94
JPMorgan Funds - Emerging Europe Equity Fund 0.00 0.00 0.00 0.00 0.00 0.00
JPMorgan Funds - Emerging Markets Dividend Fund 0.00 0.30 0.00 0.00 0.00 0.00
JPMorgan Funds - Emerging Markets Equity Fund 0.00 0.10 0.00 0.00 0.00 0.00
JPMorgan Funds - Emerging Markets Opportunities Fund 0.00 3.90 0.69 0.00 3.00 0.64
JPMorgan Funds - Emerging Middle East Equity Fund 0.00 0.10 0.00 0.00 0.00 0.00
JPMorgan Funds - Europe Dynamic Fund 0.00 5.60 0.77 0.00 2.70 0.40
JPMorgan Funds - Europe Equity Fund 0.00 9.70 1.48 0.00 3.20 0.62
JPMorgan Funds - Europe Small Cap Fund 0.00 0.47 0.02 0.00 0.47 0.02
JPMorgan Funds - Global Growth Fund (1) 0.00 0.01 0.00 0.00 0.00 0.00
JPMorgan Funds - Global Natural Resources Fund 0.00 1.20 0.34 0.00 1.20 0.34
JPMorgan Funds - Greater China Fund 0.00 17.02 7.42 0.00 17.02 7.39
JPMorgan Funds - Japan Equity Fund 0.00 0.00 0.00 0.00 0.00 0.00
JPMorgan Funds - Latin America Equity Fund 0.00 0.10 0.00 0.00 0.10 0.00
JPMorgan Funds - Russia Fund 0.00 0.00 0.00 0.00 0.00 0.00
JPMorgan Funds - US Growth Fund 0.00 0.00 0.00 0.00 0.00 0.00
JPMorgan Funds - US Technology Fund 0.00 0.00 0.00 0.00 0.00 0.00
JPMorgan Funds - US Value Fund 0.00 0.00 0.00 0.00 0.00 0.00
JPMorgan Funds - Asia Pacific Income Fund 0.00 0.20 0.07 0.00 0.20 0.07
JPMorgan Funds - Emerging Markets Debt Fund 2.51 11.34 5.11 0.56 2.23 1.16
JPMorgan Funds - Emerging Markets Investment Grade Bond Fund 1.32 7.70 2.80 0.00 1.25 0.38
JPMorgan Funds - Emerging Markets Local Currency Debt Fund 2.51 18.30 8.00 0.56 2.23 1.16
JPMorgan Funds - Global Government Bond Fund 120.18 492.65 264.51 22.24 236.70 65.06
JPMorgan Funds - Income Fund 26.34 55.50 39.83 11.90 21.50 15.62
JPMorgan Funds - US Aggregate Bond Fund 3.30 9.94 5.04 3.30 9.94 5.06
JPMorgan Funds - USD Money Market VNAV Fund 0.00 0.00 0.00 0.00 0.00 0.00
(1) This Sub-Fund was renamed from JPMorgan Funds - Global Unconstrained Equity Fund to JPMorgan Funds - Global Growth Fund on 1 April 2021.
338
JPMorgan FundsAppendix - Unaudited Additional Disclosures (continued)
10. Exposure arising from financial derivative instruments
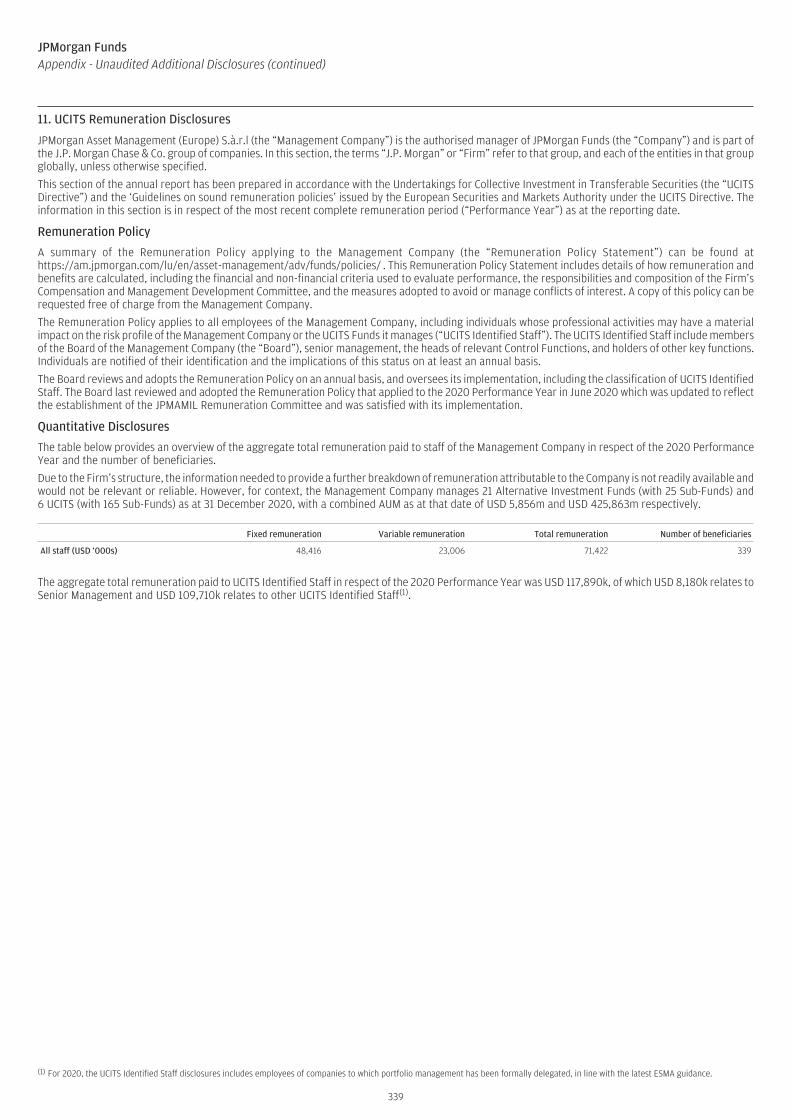
JPMorgan Asset Management (Europe) S.à.r.l (the “Management Company”) is the authorised manager of JPMorgan Funds (the “Company”) and is part ofthe J.P. Morgan Chase & Co. group of companies. In this section, the terms “J.P. Morgan” or “Firm” refer to that group, and each of the entities in that groupglobally, unless otherwise specified.
This section of the annual report has been prepared in accordance with the Undertakings for Collective Investment in Transferable Securities (the “UCITSDirective”) and the ‘Guidelines on sound remuneration policies’ issued by the European Securities and Markets Authority under the UCITS Directive. Theinformation in this section is in respect of the most recent complete remuneration period (“Performance Year”) as at the reporting date.
Remuneration Policy
A summary of the Remuneration Policy applying to the Management Company (the “Remuneration Policy Statement”) can be found athttps://am.jpmorgan.com/lu/en/asset-management/adv/funds/policies/ . This Remuneration Policy Statement includes details of how remuneration andbenefits are calculated, including the financial and non-financial criteria used to evaluate performance, the responsibilities and composition of the Firm’sCompensation and Management Development Committee, and the measures adopted to avoid or manage conflicts of interest. A copy of this policy can berequested free of charge from the Management Company.
The Remuneration Policy applies to all employees of the Management Company, including individuals whose professional activities may have a materialimpact on the risk profile of the Management Company or the UCITS Funds it manages (“UCITS Identified Staff”). The UCITS Identified Staff include membersof the Board of the Management Company (the “Board”), senior management, the heads of relevant Control Functions, and holders of other key functions.Individuals are notified of their identification and the implications of this status on at least an annual basis.
The Board reviews and adopts the Remuneration Policy on an annual basis, and oversees its implementation, including the classification of UCITS IdentifiedStaff. The Board last reviewed and adopted the Remuneration Policy that applied to the 2020 Performance Year in June 2020 which was updated to reflectthe establishment of the JPMAMIL Remuneration Committee and was satisfied with its implementation.
Quantitative Disclosures
The table below provides an overview of the aggregate total remuneration paid to staff of the Management Company in respect of the 2020 PerformanceYear and the number of beneficiaries.
Due to the Firm’s structure, the information needed to provide a further breakdown of remuneration attributable to the Company is not readily available andwould not be relevant or reliable. However, for context, the Management Company manages 21 Alternative Investment Funds (with 25 Sub-Funds) and6 UCITS (with 165 Sub-Funds) as at 31 December 2020, with a combined AUM as at that date of USD 5,856m and USD 425,863m respectively.
Fixed remuneration Variable remuneration Total remuneration Number of beneficiaries
All staff (USD ‘000s) 48,416 23,006 71,422 339
The aggregate total remuneration paid to UCITS Identified Staff in respect of the 2020 Performance Year was USD 117,890k, of which USD 8,180k relates toSenior Management and USD 109,710k relates to other UCITS Identified Staff(1).
(1) For 2020, the UCITS Identified Staff disclosures includes employees of companies to which portfolio management has been formally delegated, in line with the latest ESMA guidance.
339
JPMorgan FundsAppendix - Unaudited Additional Disclosures (continued)
11. UCITS Remuneration Disclosures

Language Disclaimer Annual
NEXT STEPS
Telephone:+886 2 8726 8686+886 800 045 333
Homepage:www.jpmorgan.com/tw/am/
Address:JPMorgan Asset Management (Taiwan) Limited20F, 1 Songzhi Road,Xinyi District,Taipei City 110,Taiwan (R.O.C.)
TW JPMF 06/21