
managements-discussion-analysis-2020.pdf - JPMorgan Chase
114
FIVE-YEAR SUMMARY OF CONSOLIDATED FINANCIAL HIGHLIGHTS (unaudited) As of or for the year ended December 31, (in millions, except per share, ratio, headcount data and where otherwise noted) 2020 2019 2018 2017 2016 Selected income statement data Total net revenue (a) $ 119,543 $ 115,399 $ 108,783 $ 100,460 $ 96,275 Total noninterest expense (a) 66,656 65,269 63,148 59,270 56,378 Pre-provision profit (b) 52,887 50,130 45,635 41,190 39,897 Provision for credit losses 17,480 5,585 4,871 5,290 5,361 Income before income tax expense 35,407 44,545 40,764 35,900 34,536 Income tax expense 6,276 8,114 8,290 11,459 9,803 Net income $ 29,131 $ 36,431 $ 32,474 $ 24,441 (h) $ 24,733 Earnings per share data Net income: Basic $ 8.89 $ 10.75 $ 9.04 $ 6.35 $ 6.24 Diluted 8.88 10.72 9.00 6.31 6.19 Average shares: Basic 3,082.4 3,221.5 3,396.4 3,551.6 3,658.8 Diluted 3,087.4 3,230.4 3,414.0 3,576.8 3,690.0 Market and per common share data Market capitalization $ 387,492 $ 429,913 $ 319,780 $ 366,301 $ 307,295 Common shares at period-end 3,049.4 3,084.0 3,275.8 3,425.3 3,561.2 Book value per share 81.75 75.98 70.35 67.04 64.06 Tangible book value per share (“TBVPS”) (b) 66.11 60.98 56.33 53.56 51.44 Cash dividends declared per share 3.60 3.40 2.72 2.12 1.88 Selected ratios and metrics Return on common equity (“ROE”) (c) 12 % 15 % 13 % 10 % 10 % Return on tangible common equity (“ROTCE”) (b)(c) 14 19 17 12 13 Return on assets (“ROA”) (b) 0.91 1.33 1.24 0.96 1.00 Overhead ratio 56 57 58 59 59 Loans-to-deposits ratio (d) 47 64 69 66 67 Firm Liquidity coverage ratio (“LCR”) (average) (e) 110 116 113 119 NA JPMorgan Chase Bank, N.A. LCR (average) (e) 160 116 111 108 NA Common equity tier 1 (“CET1”) capital ratio (f)(g) 13.1 12.4 12.0 12.2 12.3 Tier 1 capital ratio (f)(g) 15.0 14.1 13.7 13.9 14.0 Total capital ratio (f)(g) 17.3 16.0 15.5 15.9 15.5 Tier 1 leverage ratio (f)(g) 7.0 7.9 8.1 8.3 8.4 Supplementary leverage ratio (“SLR”) (f)(g) 6.9 % 6.3 % 6.4 % 6.5 % 6.5 % Selected balance sheet data (period-end) Trading assets (d) $ 503,126 $ 369,687 $ 378,551 $ 349,053 $ 342,436 Investment securities, net of allowance for credit losses 589,999 398,239 261,828 249,958 289,059 Loans (d) 1,012,853 997,620 1,015,760 959,429 922,831 Total assets 3,386,071 2,687,379 2,622,532 2,533,600 2,490,972 Deposits 2,144,257 1,562,431 1,470,666 1,443,982 1,375,179 Long-term debt 281,685 291,498 282,031 284,080 295,245 Common stockholders’ equity 249,291 234,337 230,447 229,625 228,122 Total stockholders’ equity 279,354 261,330 256,515 255,693 254,190 Headcount 255,351 256,981 256,105 252,539 243,355 Credit quality metrics Allowances for loan losses and lending-related commitments $ 30,737 $ 14,314 $ 14,500 $ 14,672 $ 14,854 Allowance for loan losses to total retained loans 2.95 % 1.39 % 1.39 % 1.47 % 1.55 % Nonperforming assets (d) $ 10,906 $ 5,054 $ 5,901 $ 7,119 $ 7,754 Net charge-offs 5,259 5,629 4,856 5,387 4,692 Net charge-off rate 0.55 % 0.60 % 0.52 % 0.60 % (i) 0.54 % Effective January 1, 2020, the Firm adopted the Financial Instruments – Credit Losses (“CECL”) accounting guidance. Refer to Note 1 for further information. (a) In the second quarter of 2020, the Firm reclassified certain spend-based credit card reward costs from marketing expense to be a reduction of card income, with no effect on net income. Prior-period amounts have been revised to conform with the current presentation. (b) Pre-provision profit, TBVPS and ROTCE are each non-GAAP financial measures. Tangible common equity (“TCE”) is also a non-GAAP financial measure. Refer to Explanation and Reconciliation of the Firm’s Use of Non-GAAP Financial Measures on pages 62–64 for a further discussion of these measures. (c) Quarterly ratios are based upon annualized amounts. (d) In the third quarter of 2020, the Firm reclassified certain fair value option elected lending-related positions from trading assets to loans and other assets. Prior- period amounts have been revised to conform with the current presentation. (e) For the years ended December 31, 2020, 2019, 2018 and 2017, the percentage represents average LCR for the three months ended December 31, 2020, 2019, 2018 and 2017. The U.S. LCR public disclosure requirements for the Firm became effective in 2017. Refer to Liquidity Risk Management on pages 102–108 for additional information on the LCR results. (f) As of December 31, 2020, the capital metrics reflect the relief provided by the Federal Reserve Board in response to the COVID-19 pandemic, including the CECL capital transition provisions that became effective in the first quarter of 2020. As of December 31, 2020, the SLR reflects the temporary exclusions of U.S. Treasury securities and deposits at Federal Reserve Banks that became effective in the second quarter of 2020. Refer to Regulatory Developments Relating to the COVID-19 Pandemic on pages 52-53 and Capital Risk Management on pages 91-101 for additional information. (g) The Basel III capital rules became fully phased-in effective January 1, 2019, and for the SLR became fully phased-in effective January 1, 2018. Prior to these dates, the required capital metrics were subject to the transitional rules. As of December 31, 2018, the risk-based capital metrics were the same on a fully phased-in and transitional basis. Refer to Capital Risk Management on pages 91-101 for additional information on these capital metrics. (h) In December 2017, the Tax Cuts and Jobs Act (“TCJA”) was signed into law. The Firm’s results for the year ended December 31, 2017 included a $2.4 billion decrease to net income as a result of the enactment of the TCJA. (i) Excluding net charge-offs of $467 million related to the student loan portfolio sale, the net charge-off rate for the year ended December 31, 2017 would have been 0.55%. Financial 44 JPMorgan Chase & Co./2020 Form 10-K
-
Upload
khangminh22 -
Category
Documents
-
view
1 -
download
0
Transcript of managements-discussion-analysis-2020.pdf - JPMorgan Chase

FIVE-YEAR SUMMARY OF CONSOLIDATED FINANCIAL HIGHLIGHTS (unaudited)As of or for the year ended December 31,(in millions, except per share, ratio, headcount data and where otherwise noted) 2020 2019 2018 2017 2016Selected income statement dataTotal net revenue(a) $ 119,543 $ 115,399 $ 108,783 $ 100,460 $ 96,275 Total noninterest expense(a) 66,656 65,269 63,148 59,270 56,378 Pre-provision profit(b) 52,887 50,130 45,635 41,190 39,897 Provision for credit losses 17,480 5,585 4,871 5,290 5,361 Income before income tax expense 35,407 44,545 40,764 35,900 34,536 Income tax expense 6,276 8,114 8,290 11,459 9,803
Net income $ 29,131 $ 36,431 $ 32,474 $ 24,441 (h) $ 24,733 Earnings per share dataNet income: Basic $ 8.89 $ 10.75 $ 9.04 $ 6.35 $ 6.24
Diluted 8.88 10.72 9.00 6.31 6.19 Average shares: Basic 3,082.4 3,221.5 3,396.4 3,551.6 3,658.8
Diluted 3,087.4 3,230.4 3,414.0 3,576.8 3,690.0 Market and per common share dataMarket capitalization $ 387,492 $ 429,913 $ 319,780 $ 366,301 $ 307,295 Common shares at period-end 3,049.4 3,084.0 3,275.8 3,425.3 3,561.2 Book value per share 81.75 75.98 70.35 67.04 64.06 Tangible book value per share (“TBVPS”)(b) 66.11 60.98 56.33 53.56 51.44 Cash dividends declared per share 3.60 3.40 2.72 2.12 1.88 Selected ratios and metricsReturn on common equity (“ROE”)(c) 12 % 15 % 13 % 10 % 10 %Return on tangible common equity (“ROTCE”)(b)(c) 14 19 17 12 13 Return on assets (“ROA”)(b) 0.91 1.33 1.24 0.96 1.00 Overhead ratio 56 57 58 59 59 Loans-to-deposits ratio(d) 47 64 69 66 67 Firm Liquidity coverage ratio (“LCR”) (average)(e) 110 116 113 119 NAJPMorgan Chase Bank, N.A. LCR (average)(e) 160 116 111 108 NACommon equity tier 1 (“CET1”) capital ratio(f)(g) 13.1 12.4 12.0 12.2 12.3 Tier 1 capital ratio(f)(g) 15.0 14.1 13.7 13.9 14.0 Total capital ratio(f)(g) 17.3 16.0 15.5 15.9 15.5 Tier 1 leverage ratio(f)(g) 7.0 7.9 8.1 8.3 8.4 Supplementary leverage ratio (“SLR”)(f)(g) 6.9 % 6.3 % 6.4 % 6.5 % 6.5 %Selected balance sheet data (period-end)Trading assets(d) $ 503,126 $ 369,687 $ 378,551 $ 349,053 $ 342,436 Investment securities, net of allowance for credit losses 589,999 398,239 261,828 249,958 289,059 Loans(d) 1,012,853 997,620 1,015,760 959,429 922,831 Total assets 3,386,071 2,687,379 2,622,532 2,533,600 2,490,972 Deposits 2,144,257 1,562,431 1,470,666 1,443,982 1,375,179 Long-term debt 281,685 291,498 282,031 284,080 295,245 Common stockholders’ equity 249,291 234,337 230,447 229,625 228,122 Total stockholders’ equity 279,354 261,330 256,515 255,693 254,190 Headcount 255,351 256,981 256,105 252,539 243,355 Credit quality metrics
Allowances for loan losses and lending-related commitments $ 30,737 $ 14,314 $ 14,500 $ 14,672 $ 14,854 Allowance for loan losses to total retained loans 2.95 % 1.39 % 1.39 % 1.47 % 1.55 %Nonperforming assets(d) $ 10,906 $ 5,054 $ 5,901 $ 7,119 $ 7,754 Net charge-offs 5,259 5,629 4,856 5,387 4,692 Net charge-off rate 0.55 % 0.60 % 0.52 % 0.60 % (i) 0.54 %
Effective January 1, 2020, the Firm adopted the Financial Instruments – Credit Losses (“CECL”) accounting guidance. Refer to Note 1 for further information.(a) In the second quarter of 2020, the Firm reclassified certain spend-based credit card reward costs from marketing expense to be a reduction of card income, with
no effect on net income. Prior-period amounts have been revised to conform with the current presentation.(b) Pre-provision profit, TBVPS and ROTCE are each non-GAAP financial measures. Tangible common equity (“TCE”) is also a non-GAAP financial measure. Refer to
Explanation and Reconciliation of the Firm’s Use of Non-GAAP Financial Measures on pages 62–64 for a further discussion of these measures.(c) Quarterly ratios are based upon annualized amounts.(d) In the third quarter of 2020, the Firm reclassified certain fair value option elected lending-related positions from trading assets to loans and other assets. Prior-
period amounts have been revised to conform with the current presentation.(e) For the years ended December 31, 2020, 2019, 2018 and 2017, the percentage represents average LCR for the three months ended December 31, 2020, 2019,
2018 and 2017. The U.S. LCR public disclosure requirements for the Firm became effective in 2017. Refer to Liquidity Risk Management on pages 102–108 for additional information on the LCR results.
(f) As of December 31, 2020, the capital metrics reflect the relief provided by the Federal Reserve Board in response to the COVID-19 pandemic, including the CECL capital transition provisions that became effective in the first quarter of 2020. As of December 31, 2020, the SLR reflects the temporary exclusions of U.S. Treasury securities and deposits at Federal Reserve Banks that became effective in the second quarter of 2020. Refer to Regulatory Developments Relating to the COVID-19 Pandemic on pages 52-53 and Capital Risk Management on pages 91-101 for additional information.
(g) The Basel III capital rules became fully phased-in effective January 1, 2019, and for the SLR became fully phased-in effective January 1, 2018. Prior to these dates, the required capital metrics were subject to the transitional rules. As of December 31, 2018, the risk-based capital metrics were the same on a fully phased-in and transitional basis. Refer to Capital Risk Management on pages 91-101 for additional information on these capital metrics.
(h) In December 2017, the Tax Cuts and Jobs Act (“TCJA”) was signed into law. The Firm’s results for the year ended December 31, 2017 included a $2.4 billion decrease to net income as a result of the enactment of the TCJA.
(i) Excluding net charge-offs of $467 million related to the student loan portfolio sale, the net charge-off rate for the year ended December 31, 2017 would have been 0.55%.
Financial
44 JPMorgan Chase & Co./2020 Form 10-K

FIVE-YEAR STOCK PERFORMANCEThe following table and graph compare the five-year cumulative total return for JPMorgan Chase & Co. (“JPMorgan Chase” or the “Firm”) common stock with the cumulative return of the S&P 500 Index, the KBW Bank Index and the S&P Financials Index. The S&P 500 Index is a commonly referenced equity benchmark in the United States of America (“U.S.”), consisting of leading companies from different economic sectors. The KBW Bank Index seeks to reflect the performance of banks and thrifts that are publicly traded in the U.S. and is composed of leading national money center and regional banks and thrifts. The S&P Financials Index is an index of financial companies, all of which are components of the S&P 500. The Firm is a component of all three industry indices.
The following table and graph assume simultaneous investments of $100 on December 31, 2015, in JPMorgan Chase common stock and in each of the above indices. The comparison assumes that all dividends were reinvested.
December 31,(in dollars) 2015 2016 2017 2018 2019 2020
JPMorgan Chase $ 100.00 $ 134.57 $ 170.54 $ 159.20 $ 234.46 $ 221.52
KBW Bank Index 100.00 128.51 152.41 125.42 170.72 153.12
S&P Financials Index 100.00 122.75 149.92 130.37 172.21 169.19
S&P 500 Index 100.00 111.95 136.38 130.39 171.44 202.96
December 31,(in dollars)
JPMorgan Chase & Co./2020 Form 10-K 45

The following is Management’s discussion and analysis of the financial condition and results of operations (“MD&A”) of JPMorgan Chase for the year ended December 31, 2020. The MD&A is included in both JPMorgan Chase’s Annual Report for the year ended December 31, 2020 (“Annual Report”) and its Annual Report on Form 10-K for the year ended December 31, 2020 (“2020 Form 10-K”) filed with the Securities and Exchange Commission (“SEC”). Refer to the Glossary of terms and acronyms on pages 305-311 for definitions of terms and acronyms used throughout the Annual Report and the 2020 Form 10-K.
The MD&A contains statements that are forward-looking within the meaning of the Private Securities Litigation Reform Act of 1995. These statements are based on the current beliefs and expectations of JPMorgan Chase’s management and are subject to significant risks and uncertainties. Refer to Forward-looking Statements on page 157) and Part 1, Item 1A: Risk factors in the 2020 Form 10-K on pages 8-32 for a discussion of certain of those risks and uncertainties and the factors that could cause JPMorgan Chase’s actual results to differ materially because of those risks and uncertainties.
INTRODUCTION
JPMorgan Chase & Co. (NYSE: JPM), a financial holding company incorporated under Delaware law in 1968, is a leading financial services firm based in the United States of America (“U.S.”), and has operations worldwide; JPMorgan Chase had $3.4 trillion in assets and $279.4 billion in stockholders’ equity as of December 31, 2020. The Firm is a leader in investment banking, financial services for consumers and small businesses, commercial banking, financial transaction processing and asset management. Under the J.P. Morgan and Chase brands, the Firm serves millions of customers in the U.S. and globally many of the world’s most prominent corporate, institutional and government clients.
JPMorgan Chase’s principal bank subsidiary is JPMorgan Chase Bank, National Association (“JPMorgan Chase Bank, N.A.”), a national banking association with U.S. branches in 38 states and Washington, D.C. as of December 31, 2020. JPMorgan Chase’s principal nonbank subsidiary is J.P. Morgan Securities LLC (“J.P. Morgan Securities”), a U.S. broker-dealer. The bank and non-bank subsidiaries of JPMorgan Chase operate nationally as well as through overseas branches and subsidiaries, representative offices and subsidiary foreign banks. The Firm’s principal operating subsidiary outside the U.S. is J.P. Morgan Securities plc, a U.K.-based subsidiary of JPMorgan Chase Bank, N.A.
For management reporting purposes, the Firm’s activities are organized into four major reportable business segments, as well as a Corporate segment. The Firm’s consumer business is the Consumer & Community Banking (“CCB”) segment. The Firm’s wholesale business segments are the Corporate & Investment Bank (“CIB”), Commercial Banking (“CB”), and Asset & Wealth Management (“AWM”). Refer to Business Segment Results on pages 65–84, and Note 32 for a description of the Firm’s business segments, and the products and services they provide to their respective client bases.
Management’s discussion and analysis
46 JPMorgan Chase & Co./2020 Form 10-K

EXECUTIVE OVERVIEW
This executive overview of the MD&A highlights selected information and does not contain all of the information that is important to readers of this 2020 Form 10-K. For a complete description of the trends and uncertainties, as well as the risks and critical accounting estimates, affecting the Firm and its various LOBs, this 2020 Form 10-K should be read in its entirety.
Effective January 1, 2020, the Firm adopted the CECL accounting guidance. Refer to Note 1 for further information.
Financial performance of JPMorgan Chase
Year ended December 31,(in millions, except per share data and ratios) 2020 2019 Change
Selected income statement data
Total net revenue(a) $ 119,543 $ 115,399 4 %
Total noninterest expense(a) 66,656 65,269 2
Pre-provision profit 52,887 50,130 5
Provision for credit losses 17,480 5,585 213
Net income 29,131 36,431 (20)
Diluted earnings per share 8.88 10.72 (17)
Selected ratios and metrics
Return on common equity 12 % 15 %
Return on tangible common equity 14 19
Book value per share $ 81.75 $ 75.98 8
Tangible book value per share 66.11 60.98 8
Capital ratios(b)
CET1 13.1 % 12.4 %
Tier 1 capital 15.0 14.1
Total capital 17.3 16.0
(a) In the second quarter of 2020, the Firm reclassified certain spend-based credit card reward costs from marketing expense to be a reduction of card income, with no effect on net income. Prior-period amounts have been revised to conform with the current presentation.
(b) As of December 31, 2020, the capital metrics reflect the relief provided by the Federal Reserve Board in response to the COVID-19 pandemic, including the CECL capital transition provisions that became effective in the first quarter of 2020. Refer to Regulatory Developments relating to the COVID-19 Pandemic on pages 52-53 and Capital Risk Management on pages 91-101 for additional information.
Comparisons noted in the sections below are for the full year of 2020 versus the full year of 2019, unless otherwise specified.Firmwide overviewJPMorgan Chase reported net income of $29.1 billion for 2020, or $8.88 per share, on net revenue of $119.5 billion. The Firm reported ROE of 12% and ROTCE of 14%. The Firm's results for 2020 included net additions to the allowance for credit losses of $12.2 billion and Firmwide legal expense of $1.1 billion. • The Firm had net income of $29.1 billion, down 20%.• Total net revenue was up 4%. Noninterest revenue was
$65.0 billion, up 12%, driven by higher CIB Markets revenue, Investment Banking fees and net production revenue in Home Lending. Net interest income was $54.6 billion, down 5%, driven by the impact of lower rates,
predominantly offset by higher net interest income in CIB Markets as well as balance sheet growth.
• Noninterest expense was $66.7 billion, up 2%, driven by higher volume- and revenue-related expense, legal expense and continued investments in the businesses, partially offset by lower structural expense.
• The provision for credit losses was $17.5 billion, up $11.9 billion from the prior year, driven by net additions to the allowance for credit losses of $12.2 billion due to the deterioration and increased uncertainty in the macroeconomic environment as a result of the impact of the COVID-19 pandemic.
• The total allowance for credit losses was $30.8 billion at December 31, 2020. The Firm had an allowance for loan losses to retained loans coverage ratio of 2.95%, compared with 1.39% in the prior year; the increase from the prior year was driven by the additions to the allowance for credit losses and the adoption of CECL.
• The Firm’s nonperforming assets totaled $10.9 billion at December 31, 2020, an increase of $5.9 billion from the prior year, primarily reflecting client credit deterioration across multiple industries in the wholesale portfolio; and in the consumer portfolio, loans placed on nonaccrual status related to the impact of the COVID-19 pandemic, as well as the adoption of CECL, as the purchased credit deteriorated loans in the mortgage portfolio became subject to nonaccrual loan treatment. In the fourth quarter of 2020, nonperforming assets decreased $556 million from the prior quarter, reflecting some credit improvement in the wholesale portfolio. The consumer portfolio remained relatively flat, as the increase in loans placed on nonaccrual status in Home Lending related to the impact of the COVID-19 pandemic was predominantly offset by lower loans at fair value in CIB, largely due to sales.
• Firmwide average loans of $1.0 trillion were up 1%, driven by higher loan balances in AWM and CIB, as well as loans originated under the Small Business Administration’s (“SBA”) Paycheck Protection Program (“PPP”), predominantly offset by lower loan balances in Home Lending and Card.
• Firmwide average deposits of $1.9 trillion were up 25%, reflecting significant inflows across the Firm, primarily driven by the impact of the COVID-19 pandemic and the related effect of certain government actions.
• As of December 31, 2020, the Firm had average eligible High Quality Liquid Assets (“HQLA”) of approximately $697 billion and unencumbered marketable securities with a fair value of approximately $740 billion, resulting in approximately $1.4 trillion of liquidity sources. Refer to Liquidity Risk Management on pages 102–108 for additional information.
JPMorgan Chase & Co./2020 Form 10-K 47

Selected capital-related metrics • The Firm’s CET1 capital was $205 billion, and the
Standardized and Advanced CET1 ratios were 13.1% and 13.8%, respectively.
• The Firm’s SLR was 6.9%. The SLR reflects the temporary exclusions of U.S. Treasury securities and deposits at Federal Reserve Banks, as required by the Federal Reserve’s interim final rule issued on April 1, 2020. The Firm’s SLR excluding the temporary relief was 5.8%.
• The Firm grew TBVPS, ending 2020 at $66.11, up 8% versus the prior year.
Pre-provision profit, ROTCE and TBVPS are non-GAAP financial measures. Refer to Explanation and Reconciliation of the Firm’s Use of Non-GAAP Financial Measures on pages 62–64, and Capital Risk Management on pages 91-101 for a further discussion of each of these measures.
Business segment highlightsSelected business metrics for each of the Firm’s four LOBs are presented below for the full year of 2020.
CCBROE
15%
• Average deposits up 22%; client investment assets up 17%
• Average loans down 6%; debit and credit card sales volume down 3%
• Active mobile customers up 10%
CIBROE
20%
• $9.5 billion of Global Investment Banking fees, up 25%
• #1 ranking for Global Investment Banking fees with 9.2% wallet share for the year
• Total Markets revenue of $29.5 billion, up 41%, with Fixed Income Markets up 45% and Equity Markets up 33%
CBROE
11%
• Gross Investment Banking revenue of $3.3 billion, up 22%
• Average deposits up 38%; average loans up 5%
AWMROE
28%
• Assets under management (AUM) of $2.7 trillion, up 17%
• Average deposits up 20%; average loans up 13%
Refer to the Business Segment Results on pages 65–66 for a detailed discussion of results by business segment.
Credit provided and capital raisedJPMorgan Chase continues to support consumers, businesses and communities around the globe. The Firm provided new and renewed credit and raised capital for wholesale and consumer clients during 2020, consisting of:
$2.3 trillionTotal credit provided and capital raised (including loans and commitments)(a)
$226billion
Credit for consumers
$18billion
Credit for U.S. small businesses
$865 billion
Credit for corporations
$1.1 trillion
Capital raised for corporate clients and non-U.S. government entities
$103 billion
Credit and capital raised for nonprofit and U.S. government entities(b)
$28 billionLoans under the Small Business Administration’s Paycheck ProtectionProgram
(a) Excludes loans under the SBA’s PPP.(b) Includes states, municipalities, hospitals and universities.
Management’s discussion and analysis
48 JPMorgan Chase & Co./2020 Form 10-K

Recent events• On January 27, 2021, JPMorgan Chase announced that it
will launch a digital retail bank in the U.K. this year, and on February 23, 2021, JPMorgan Chase announced that it will appoint Sanoke Viswanathan, head of International Consumer, to the Operating Committee.
• On December 31, 2020, JPMorgan Chase acquired the Global Loyalty business (“cxLoyalty”) of cxLoyalty Group Holdings, Inc. This includes cxLoyalty’s technology platforms, full-service travel agency, and gift card and merchandise services.
• On December 31, 2020, JPMorgan Chase acquired 55ip, a financial technology company and leading provider of automated tax-smart investment strategies.
• On December 18, 2020, JPMorgan Chase received the results of the 2020 Comprehensive Capital Analysis and Review (“CCAR”) Round 2 stress test from the Federal Reserve. The Firm’s Stress Capital Buffer (“SCB”) requirement remained at 3.3%. The Federal Reserve also announced that all large banks, including the Firm, could resume share repurchases commencing in the first quarter of 2021, subject to certain restrictions. The Firm's Board of Directors has authorized a new common share repurchase program for up to $30 billion. The Firm expects to repurchase up to $4.5 billion of common stock in the first quarter of 2021 and, subject to approval by the Board of Directors, maintain the quarterly common stock dividend of $0.90 per share.
• On December 18, 2020, JPMorgan Chase announced the retirement of Lee Raymond, the Firm’s Lead Independent Director. Stephen B. Burke has succeeded Mr. Raymond as Lead Independent Director effective January 1, 2021.
• On December 7, 2020, Phebe N. Novakovic became a member of the Firm's Board of Directors. Ms. Novakovic is Chairman and Chief Executive Officer of General Dynamics Corporation.
2021 outlookThese current expectations are forward-looking statements within the meaning of the Private Securities Litigation Reform Act of 1995. Such forward-looking statements are based on the current beliefs and expectations of JPMorgan Chase’s management and are subject to significant risks and uncertainties. Refer to Forward-Looking Statements on page 157, and the Risk Factors section on pages 8-32 of the Firm’s 2020 Form 10-K, for a further discussion of certain of those risks and uncertainties and the other factors that could cause JPMorgan Chase’s actual results to differ materially because of those risks and uncertainties. There is no assurance that actual results in 2021 will be in line with the outlook set forth below, and the Firm does not undertake to update any forward-looking statements.
JPMorgan Chase’s current outlook for 2021 should be viewed against the backdrop of the global and U.S. economies, the COVID-19 pandemic, financial markets activity, the geopolitical environment, the competitive environment, client and customer activity levels, and regulatory and legislative developments in the U.S. and other countries where the Firm does business. Each of these factors will affect the performance of the Firm and its LOBs. The Firm will continue to make appropriate adjustments to its businesses and operations in response to ongoing developments in the business, economic, regulatory and legal environments in which it operates. The outlook information contained in this Form 10-K supersedes all outlook information included in the Firm’s periodic reports furnished or filed with the SEC prior to the date of this Form 10-K.
Full-year 2021• Management expects net interest income, on a managed
basis, to be approximately $55 billion, market dependent.
• Management expects adjusted expense to be approximately $69 billion, which includes accelerated contributions to the Firm’s Foundation in the form of equity investments, as well as higher revenue-related expense.
First-quarter 2021• Management expects net interest income, on a managed
basis, to be approximately $13 billion, market dependent.
• Investment banking fees are expected to be flat when compared with the fourth quarter of 2020, depending on market conditions.
Fourth-quarter 2021• Management expects net interest income, on a managed
basis, to be in excess of $14 billion, market dependent.
Net interest income, on a managed basis, and adjusted expense are non-GAAP financial measures. Refer to Explanation and Reconciliation of the Firm’s Use of Non-GAAP Financial Measures on pages 62-64.
JPMorgan Chase & Co./2020 Form 10-K 49
Business DevelopmentsCOVID-19 PandemicIn response to the COVID-19 pandemic the Firm invoked resiliency plans to allow its businesses to remain operational, utilizing disaster recovery sites and implementing alternative work arrangements globally.
Additionally, the Firm implemented strategies and procedures designed to help it respond to increased market volatility, client demand for credit and liquidity, distress in certain industries and the ongoing impacts to consumers and businesses.
Throughout 2020, the Firm remained focused on serving its clients, customers and communities, as well as the well-being of its employees, during the pandemic. The Firm continues to actively monitor the health and safety situations at local and regional levels, and will continue to adapt as these situations evolve.
Supporting clients and customersThe Firm has supported its clients and customers during the challenging conditions caused by the COVID-19 pandemic by providing assistance, primarily in the form of payment deferrals on loans and extending credit, including through its participation in the Small Business Association’s (“SBA”) PPP.
Refer to Credit Portfolio on page 112 for information on assistance granted to customers and clients. Refer to Consumer Credit portfolio on page 116 and Wholesale Credit Portfolio on page 122 for information on retained loans under payment deferral.
The Firm has gradually re-opened its branches since April 2020, with nearly 90% of its branches returning to full service as of December 31, 2020. Additionally, the Firm continues to provide a wide range of banking services that are accessible to clients and customers through mobile and other digital channels.
Protecting and supporting employeesIn response to the COVID-19 pandemic, the Firm implemented alternative work arrangements, with the vast majority of its global workforce working from home since the onset of the pandemic and continuing into the first quarter of 2021. The Firm also provided additional benefits to employees during the COVID-19 pandemic.
Supporting communitiesSince March, the Firm has committed $250 million to help address humanitarian needs and long-term economic challenges posed by the COVID-19 pandemic on the communities in which the Firm operates. As of December 31, 2020, over 75% of this commitment has been funded.
Departure of the U.K. from the EUThe U.K.’s departure from the EU, which is commonly referred to as “Brexit,” was completed on December 31, 2020. The U.K. and the EU have entered into a Trade and Cooperation Agreement which delineates many significant aspects of the future relationship between the U.K. and the EU. However, the agreement contained very limited provisions relating to cross-border financial services, and the U.K. and the EU are expected to engage in further negotiations concerning financial services.
The Firm has executed and continues to execute on its Firmwide Brexit Implementation program, which encompasses a strategic implementation plan across all impacted businesses and functions, including an ongoing assessment of political, legal and regulatory and other implementation risks. A key focus of the program has been to ensure continuity of service to the Firm’s EU clients in the following areas: regulatory and legal entities; clients; and business and operations.
Regulatory and legal entitiesThe Firm’s legal entities in Germany, Luxembourg and Ireland are now licensed to provide and are providing services to the Firm’s EU clients, including through a branch network covering locations such as Paris, Madrid and Milan. Subject to limited exceptions, the Firm’s U.K.-based legal entities are no longer permitted to transact business from the U.K. with EU clients.
ClientsAgreements covering substantially all of the Firm’s EU client activity have been re-documented to EU legal entities to facilitate continuation of service. The Firm continues to actively engage with those clients that have not completed re-documentation or required operational changes.
Business and operationsThe COVID-19 pandemic introduced additional risk to the Firm’s Brexit Implementation program, particularly in relation to staff relocations. As a result, the Firm has worked closely with regulators and employees to ensure that critical staff are relocated in a safe and timely manner so that the Firm can meet its regulatory commitments and continue serving its clients. Further relocations are planned for 2021, and the Firm’s longer-term EU staffing strategy will be developed over time in cooperation with its regulators and as the post-Brexit market landscape evolves in order to ensure that the Firm maintains operational resilience and effective client coverage.
Management’s discussion and analysis
50 JPMorgan Chase & Co./2020 Form 10-K

Interbank Offered Rate (“IBOR”) transition JPMorgan Chase and other market participants continue to make progress in preparing for the discontinuation of the London Interbank Offered Rate (“LIBOR”) and other IBORs to comply with the International Organization of Securities Commission’s standards for transaction-based benchmark rates.
On November 30, 2020, ICE Benchmark Administration, the administrator of LIBOR, announced a public consultation on its proposal to cease the publication of the principal tenors of U.S. dollar LIBOR (i.e., overnight, one-month, three-month, six-month and 12-month LIBOR) immediately following a final publication on June 30, 2023. The Federal Reserve, the OCC and the FDIC also released guidance encouraging market participants to cease dealing in new U.S. dollar LIBOR contracts from the end of 2021. There has been no change in the scheduled cessation of U.K. sterling, Japanese yen, Swiss franc and Euro LIBOR, or the remaining tenors of U.S. dollar LIBOR, from December 31, 2021.
The Firm continues to work towards reducing its exposure to IBOR-referencing contracts, including derivatives, bilateral and syndicated loans, securities, and debt and preferred stock issuances, to meet the industry milestones and recommendations published by National Working Groups (“NWG”), including the Alternative Reference Rates Committee (the “ARRC”) in the U.S.
On October 23, 2020, the International Swaps and Derivatives Association, Inc. (“ISDA”) published a new supplement to the ISDA 2006 definitions and the related 2020 IBOR Fallbacks Protocol (the “Protocol”). These publications are intended to facilitate the incorporation of robust rate fallback provisions into both legacy and new derivative contracts with effect from January 25, 2021. The Firm’s client-facing legal entities have agreed to adhere to the Protocol, in accordance with recommendations from multiple industry working groups, including the ARRC. ISDA further announced that bilateral templates have been made available for use with counterparties who choose not to adhere to the Protocol.
As a key objective of the ARRC’s transition plan to encourage adoption of the Secured Overnight Financing Rate (“SOFR”), counterparty clearing houses, clearing house members and other impacted market participants successfully executed the discounting and price alignment interest (“PAI”) switch from federal funds to SOFR on October 16, 2020. The industry completed a similar switch from EONIA to €STR on July 27, 2020.
On March 12, 2020 and January 7, 2021, the Financial Accounting Standards Board (“FASB”) issued accounting standards updates providing optional expedients and exceptions for applying generally accepted accounting principles to contracts and hedge accounting relationships affected by reference rate reform. These optional expedients are intended to simplify the operational impact of applying U.S. GAAP to transactions impacted by reference rate reform. The Firm elected to apply certain of these expedients beginning in the third quarter of 2020. On
August 27, 2020, the International Accounting Standards Board (“IASB”) issued guidance that provides similar relief for entities reporting under International Financial Reporting Standards ("IFRS"). Refer to Accounting and Reporting Developments on page 156 for additional information. The Firm continues to monitor the transition relief being considered by the U.S. Treasury Department regarding the tax implications of reference rate reform.
The Firm’s initiatives in connection with LIBOR transition include:
• continuing to reduce its overall exposure to LIBOR
• implementing rate fallback provisions developed by NWGs in new LIBOR contracts, where appropriate
• continuing to educate and inform clients on LIBOR transition and the necessity to prepare for the cessation of LIBOR
• assisting clients with discontinuing their issuance or use of LIBOR-linked products within the timelines specified by NWGs
• supporting clients in their efforts to remediate contracts linked to LIBOR, including contracts to which the Firm is a party, which it manages or for which it acts as agent
• offering products linked to alternative reference rates (“ARRs”) across its businesses, and
• planning for the implementation of rate fallback mechanisms across products based on the conventions recommended by NWGs to prepare for transition to ARRs upon the cessation of various IBORs.
The Firm is on schedule to implement necessary changes to operational and risk management systems in order to transition away from IBORs, including by aiming to meet proposed deadlines set by NWGs for the cessation of new contracts referencing these benchmarks. The Firm continues to engage with and remains committed to NWGs in devising solutions to unresolved issues relating to IBOR transition.
The Firm continues to engage with market participants, NWGs and regulators to address market-wide challenges associated with LIBOR transition, including efforts to:
• improve liquidity in ARRs
• develop and introduce forward-looking term rates linked to ARRs, and
• support legislative proposals in the U.S., the U.K. and the EU that aim to resolve concerns involving “tough legacy” contracts (i.e. contracts that do not provide for automatic conversion to another rate or that are difficult to amend in order to add rate fallback provisions).
Resolution of these challenges should provide more certainty and help to provide a framework for market participants in transitioning away from IBORs.
JPMorgan Chase & Co./2020 Form 10-K 51

Regulatory Developments Relating to the COVID-19 Pandemic Since March 2020, the U.S. government as well as central banks and banking authorities around the world have taken and continue to take actions to help individuals, households and businesses that have been adversely affected by the economic disruption caused by the COVID-19 pandemic. The CARES Act and the Consolidated Appropriations Act, which were signed into law on March 27, 2020 and December 27, 2020, respectively, provide, among other things, funding to support loan facilities to assist consumers and businesses. Set forth below is a summary as of the date of this Form 10-K of U.S. government actions currently impacting the Firm and U.S. government programs in which the Firm is participating. The Firm will continue to assess ongoing developments in government actions in response to the COVID-19 pandemic.
U.S. government actions
Eligible retained income definition. On March 17, 2020, the Office of the Comptroller of the Currency (“OCC”), the Board of Governors of the Federal Reserve System (“Federal Reserve”), and the Federal Deposit Insurance Corporation (“FDIC”), collectively the “federal banking agencies,” issued an interim final rule (issued as final on August 26, 2020) that revised the definition of “eligible retained income” in the regulatory capital rules that apply to all U.S. banking organizations. On March 23, 2020, the Federal Reserve issued an interim final rule (issued as final on August 26, 2020) that revised the definition of “eligible retained income” for purposes of the total loss-absorbing capacity (“TLAC”) buffer requirements that apply to global systemically important banking organizations. The revised definition of eligible retained income makes any automatic limitations on payout distributions that could apply under the agencies’ capital rules or TLAC rule take effect on a more graduated basis in the event that a banking organization’s capital, leverage and TLAC ratios were to decline below regulatory requirements (including buffers). The March 17, 2020 interim final rule was issued, in conjunction with an interagency statement encouraging banking organizations to use their capital and liquidity buffers, to further support banking organizations’ abilities to lend to households and businesses affected by the COVID-19 pandemic.
Reserve requirements. On March 24, 2020, the Federal Reserve issued an interim final rule (issued as final on December 22, 2020) reducing reserve requirement ratios for all depository institutions to zero percent, effective March 26, 2020, an action intended to free up liquidity in the banking system to support lending to households and businesses.
Refer to Note 26 for additional information on the reduction to the reserve requirement.
Regulatory Capital - Current Expected Credit Losses (“CECL”) transition delay. On March 31, 2020, the federal banking agencies issued an interim final rule (issued as final on August 26, 2020) that provided banking organizations with the option to delay the effects of CECL on regulatory capital for two years, followed by a three-year transition period (“CECL capital transition provisions”). The Firm elected to apply the CECL capital transition provisions.
Supplementary leverage ratio (“SLR”) temporary revision. On April 1, 2020, the Federal Reserve issued an interim final rule that requires, on a temporary basis, the calculation of total leverage exposure for purposes of calculating the SLR for bank holding companies (“BHC”), to exclude the on-balance sheet amounts of U.S. Treasury securities and deposits at Federal Reserve Banks. These exclusions became effective April 1, 2020, and will remain in effect through March 31, 2021.
Refer to Capital Risk Management on pages 91-101 and Note 27 for additional information on the CECL capital transition provisions, the impact to the Firm’s capital metrics and the Firm’s SLR.
Loan modifications. On April 7, 2020, the federal banking agencies along with the National Credit Union Administration, and the Consumer Financial Protection Bureau, in consultation with the state financial regulators, issued an interagency statement revising a March 22, 2020 interagency statement on loan modifications and the reporting for financial institutions working with customers affected by the COVID-19 pandemic (the “IA Statement”). The IA Statement reconfirmed that efforts to work with borrowers where the loans are prudently underwritten, and not considered past due or carried on nonaccrual status, should not result in the loans automatically being considered modified in a troubled debt restructuring (“TDR”) for accounting and financial reporting purposes, or for purposes of their respective risk-based capital rules, which would otherwise require financial institutions subject to the capital rules to hold more capital. The IA Statement also clarified the interaction between its previous guidance and Section 4013 of the CARES Act, as extended by Section 541 of the Consolidated Appropriations Act, which provides certain financial institutions with the option to suspend the application of accounting guidance for TDRs for a limited period of time for loan modifications made to address the effects of the COVID-19 pandemic.
The Firm has granted various forms of assistance to customers and clients impacted by the COVID-19 pandemic, including payment deferrals and covenant modifications. The majority of the Firm’s COVID-19 related loan modifications have not been considered TDRs because:
• they represent short-term or other insignificant modifications, whether under the Firm’s regular loan modification assessments or the IA Statement guidance, or
• the Firm has elected to apply the option to suspend the application of accounting guidance for TDRs as provided by
Management’s discussion and analysis
52 JPMorgan Chase & Co./2020 Form 10-K

the CARES Act and extended by the Consolidated Appropriations Act.
To the extent that certain modifications do not meet any of the above criteria, the Firm accounts for them as TDRs. Refer to Credit Portfolio on pages 112-113 and Note 12 for additional information on the Firm’s loan modification activities.
PPP. Beginning April 3, 2020, the PPP, established by the CARES Act and administered by the SBA, authorized eligible lenders to provide nonrecourse loans to eligible borrowers until August 8, 2020 to provide an incentive for these businesses to keep their workers on their payroll. As part of the Consolidated Appropriations Act, additional funding was provided for new PPP loans beginning in early January 2021. This program was designed to target smaller businesses as well as to simplify the loan forgiveness process for loans under $150,000. As of February 19, 2021, the Firm has funded approximately $5 billion under this extension of the program.
U.S. government facilities. Beginning in March 2020, the Federal Reserve announced a suite of facilities using its emergency lending powers under section 13(3) of the Federal Reserve Act to support the flow of credit to individuals, households and businesses adversely affected by the COVID-19 pandemic and to support the broader economy.
The Firm has participated and is participating in the PPP and certain of the other government facilities and programs, as needed, to assist its clients and customers or to support the broader economy. Refer to Capital Risk Management on pages 91-101, Liquidity Risk Management on pages 102–108, Credit Portfolio on pages 112-113, Note 12 and Note 27 for additional information on the Firm’s participation in the PPP and other government facilities and programs.
JPMorgan Chase & Co./2020 Form 10-K 53

CONSOLIDATED RESULTS OF OPERATIONS
This section provides a comparative discussion of JPMorgan Chase’s Consolidated Results of Operations on a reported basis for the two-year period ended December 31, 2020, unless otherwise specified. Refer to Consolidated Results of Operations on pages 48-51 of the Firm’s Annual Report on Form 10-K for the year ended December 31, 2019 (the “2019 Form 10-K”) for a discussion of the 2019 versus 2018 results. Factors that relate primarily to a single business segment are discussed in more detail within that business segment’s results. Refer to pages 152-155 for a discussion of the Critical Accounting Estimates Used by the Firm that affect the Consolidated Results of Operations.
RevenueYear ended December 31,(in millions) 2020 2019 2018
Investment banking fees $ 9,486 $ 7,501 $ 7,550
Principal transactions 18,021 14,018 12,059
Lending- and deposit-related fees(a) 6,511 6,626 6,377 Asset management, administration
and commissions(a) 18,177 16,908 16,793
Investment securities gains/(losses) 802 258 (395)
Mortgage fees and related income 3,091 2,036 1,254
Card income(b) 4,435 5,076 4,743
Other income(c) 4,457 5,731 5,343
Noninterest revenue 64,980 58,154 53,724
Net interest income 54,563 57,245 55,059
Total net revenue $ 119,543 $ 115,399 $ 108,783
(a) In the first quarter of 2020, the Firm reclassified certain fees from asset management, administration and commissions to lending- and deposit-related fees. Prior-period amounts have been revised to conform with the current presentation.
(b) In the second quarter of 2020, the Firm reclassified certain spend-based credit card reward costs from marketing expense to be a reduction of card income, with no effect on net income. Prior-period amounts have been revised to conform with the current presentation.
(c) Included operating lease income of $5.5 billion for each of the years ended December 31, 2020 and 2019, and $4.5 billion for the year ended December 31, 2018.
2020 compared with 2019Investment banking fees increased, driven by CIB, reflecting:
• higher equity underwriting fees predominantly in follow-on offerings and convertible securities markets due to increased industry-wide fees
• higher debt underwriting fees in investment-grade and high-yield bonds driven by increased industry-wide fees and wallet share gains. The increased activity resulted in part from clients seeking liquidity in the first half of the year as a result of the COVID-19 pandemic.
Refer to CIB segment results on pages 71–76 and Note 6 for additional information.
Principal transactions revenue increased, predominantly in CIB, reflecting higher revenue in Fixed Income Markets, driven by strong performance in Currencies & Emerging Markets, Rates, and Credit.
The increase in principal transactions revenue also reflected higher net valuations on several legacy equity investments in Corporate, compared with net losses in the prior year.
Principal transactions revenue in CIB may in certain cases have offsets across other revenue lines, including net interest income. The Firm assesses the performance of its CIB Markets business on a total revenue basis.
Refer to CIB and Corporate segment results on pages 71–76 and pages 83–84, respectively, and Note 6 for additional information.
Lending- and deposit-related fees decreased as a result of lower deposit-related fees in CCB, reflecting lower transaction activity and the impact of fee refunds related to the COVID-19 pandemic, predominantly offset by higher cash management fees in CIB and CB, as well as higher lending-related fees, particularly loan commitment fees in CIB.
Refer to CCB, CIB and CB segment results on pages 67–70, pages 71–76 and pages 77–79, respectively, and Note 6 for additional information.
Asset management, administration and commissions revenue increased driven by:
• higher asset management fees in AWM as a result of net inflows into liquidity and long term products, and higher performance fees; and in CCB related to a higher level of investment assets
• higher brokerage commissions in CIB and AWM on higher client-driven volume,
partially offset by
• lower volume of annuity sales in CCB.
Refer to CCB, CIB and AWM segment results on pages 67–70, pages 71–76 and pages 80–82, respectively, and Note 6 for additional information.
Investment securities gains/(losses) increased due to the repositioning of the investment securities portfolio, including sales of U.S. GSE and government agency mortgage-backed securities, particularly in the first and third quarters of 2020. Refer to Corporate segment results on pages 83–84 and Note 10 for additional information.
Mortgage fees and related income increased due to higher net mortgage production revenue reflecting higher mortgage production volumes and margins; the prior year included gains on sales of certain loans.
Refer to CCB segment results on pages 67–70, Note 6 and 15 for further information.
Management’s discussion and analysis
54 JPMorgan Chase & Co./2020 Form 10-K

Card income decreased due to:
• lower net interchange income reflecting lower credit card sales volumes and debit card transactions as a result of the impact of the COVID-19 pandemic, largely offset by lower acquisition costs and higher annual fees in CCB, and
• lower merchant processing fees in CIB predominantly driven by a reporting reclassification of certain expenses to be a reduction of revenue in Merchant Services. Refer to CCB and CIB segment results on pages 67–70 and pages 71–76, respectively, and Note 6 for further information.
Other income decreased reflecting:
• Increased amortization on higher levels of alternative energy investments in CIB. The increased amortization was more than offset by lower income tax expense from the associated tax credits
• lower net valuation gains on certain investments in AWM
• net losses on certain equity investments in CIB, compared with net gains in the prior year
• higher costs associated with using forward contracts to hedge certain non-U.S. dollar-denominated net investment exposures, and
• higher losses related to the early termination of certain of the Firm's long-term debt in Treasury and CIO,
partially offset by
• a net increase from a gain on an equity investment.
Net interest income decreased due to the impact of lower rates, predominantly offset by higher net interest income in CIB Markets, as well as balance sheet growth.
The Firm’s average interest-earning assets were $2.8 trillion, up $434 billion, and the yield was 2.34%, down 127 basis points (“bps”), primarily due to lower rates. The net yield on these assets, on an FTE basis, was 1.98%, a decrease of 48 bps. The net yield excluding CIB Markets was 2.30%, down 97 bps.
Net yield excluding CIB Markets is a non-GAAP financial measure. Refer to the Consolidated average balance sheets, interest and rates schedule on pages 300–304 for further details; and the Explanation and Reconciliation of the Firm’s Use of Non-GAAP Financial Measures on pages 62–64 for a further discussion of Net interest yield excluding CIB Markets.
Provision for credit lossesYear ended December 31,
(in millions) 2020 2019 2018
Consumer, excluding credit card $ 1,016 $ (378) $ (119)
Credit card 10,886 5,348 4,818
Total consumer 11,902 4,970 4,699
Wholesale 5,510 615 172
Investment securities 68 NA NA
Total provision for credit losses $ 17,480 $ 5,585 $ 4,871
Effective January 1, 2020, the Firm adopted the CECL accounting guidance. In conjunction with the adoption of CECL, the Firm reclassified risk-rated loans and lending-related commitments from the consumer, excluding credit card portfolio segment to the wholesale portfolio segment, to align with the methodology applied when determining the allowance. Prior-period amounts have been revised to conform with the current presentation. Refer to Note 1 for further information.
2020 compared with 2019The provision for credit losses increased in consumer and wholesale primarily driven by the deterioration and uncertainty in the macroeconomic environment, in particular in the first half of 2020, as a result of the impact of the COVID-19 pandemic.
The increase in consumer reflected:
• net additions of $7.4 billion to the allowance for credit losses, consisting of $6.6 billion for Card, $520 million for Auto, $252 million for Business Banking,
partially offset by
• lower net charge-offs largely in Card, reflecting lower charge-offs and higher recoveries, primarily benefiting from payment assistance and government stimulus.
The prior year included a $244 million net reduction in the allowance for credit losses.
The increase in wholesale reflected a net addition of $4.7 billion to the allowance for credit losses across the LOBs, impacting multiple industries.
The investment securities provision for credit losses relates to the HTM portfolio, which became subject tothe CECL accounting guidance beginning on January 1, 2020.
Refer to the segment discussions of CCB on pages 67–70, CIB on pages 71–76, CB on pages 77–79, AWM on pages 80–82, the Allowance for Credit Losses on pages 132-133, and Notes 1, 10 and 13 for further discussion of the credit portfolio and the allowance for credit losses.
JPMorgan Chase & Co./2020 Form 10-K 55

Noninterest expenseYear ended December 31,
(in millions) 2020 2019 2018
Compensation expense $ 34,988 $ 34,155 $ 33,117
Noncompensation expense:
Occupancy 4,449 4,322 3,952 Technology, communications and
equipment 10,338 9,821 8,802
Professional and outside services 8,464 8,533 8,502
Marketing(a) 2,476 3,351 3,044
Other(b)(c) 5,941 5,087 5,731
Total noncompensation expense 31,668 31,114 30,031
Total noninterest expense $ 66,656 $ 65,269 $ 63,148
(a) In the second quarter of 2020, the Firm reclassified certain spend-based credit card reward costs from marketing expense to be a reduction of card income, with no effect on net income. Prior-period amounts have been revised to conform with the current presentation.
(b) Included Firmwide legal expense of $1.1 billion, $239 million and $72 million for the years ended December 31, 2020, 2019 and 2018, respectively.
(c) Included FDIC-related expense of $717 million, $457 million and $1.2 billion for the years ended December 31, 2020, 2019 and 2018, respectively.
2020 compared with 2019Compensation expense increased driven by higher volume-and revenue-related expense, predominantly in CIB and CCB, as well as the impact of investments in the businesses.
Noncompensation expense increased as a result of:• higher legal expense predominantly in CIB and AWM
• higher volume-related expense, in particular brokerage expense in CIB and depreciation from growth in auto lease assets in CCB
• higher investments in the businesses, including technology and real estate,
• an impairment on a legacy investment in Corporate, and
• higher FDIC-related expense,
partially offset by
• lower marketing expense as a result of lower investments in marketing campaigns and lower travel-related benefits in CCB, and
• lower structural expense, including lower travel and entertainment across the businesses, and payment processing costs, partially offset by higher contributions to the Firm’s Foundation.
Income tax expense
Year ended December 31,(in millions, except rate) 2020 2019 2018
Income before income tax expense $ 35,407 $ 44,545 $ 40,764
Income tax expense 6,276 8,114 8,290
Effective tax rate 17.7 % 18.2 % 20.3 %
2020 compared with 2019The effective tax rate decreased, with the current year rate reflecting the impact of a lower level of pre-tax income and changes in the mix of income and expenses subject to U.S. federal, and state and local taxes, as well as other tax adjustments. The prior year included the effect of $1.1 billion of tax benefits related to the resolution of certain tax audits. Refer to Note 25 for further information.
Management’s discussion and analysis
56 JPMorgan Chase & Co./2020 Form 10-K

CONSOLIDATED BALANCE SHEETS AND CASH FLOWS ANALYSIS
Effective January 1, 2020, the Firm adopted the CECL accounting guidance. Refer to Note 1 for further information.
Consolidated balance sheets analysisThe following is a discussion of the significant changes between December 31, 2020 and 2019.
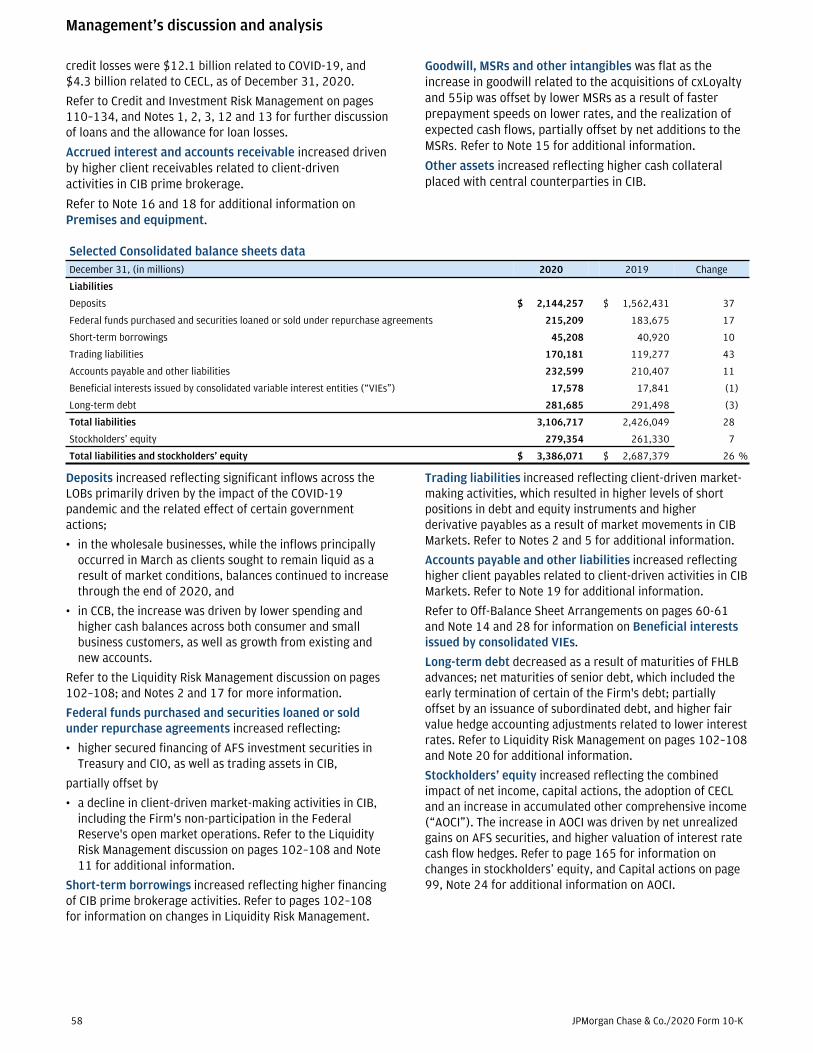
Selected Consolidated balance sheets dataDecember 31, (in millions) 2020 2019 Change
Assets
Cash and due from banks $ 24,874 $ 21,704 15 %
Deposits with banks 502,735 241,927 108
Federal funds sold and securities purchased under resale agreements 296,284 249,157 19
Securities borrowed 160,635 139,758 15
Trading assets(a) 503,126 369,687 36
Available-for-sale securities 388,178 350,699 11
Held-to-maturity securities, net of allowance for credit losses 201,821 47,540 325
Investment securities, net of allowance for credit losses 589,999 398,239 48
Loans(a) 1,012,853 997,620 2
Allowance for loan losses (28,328) (13,123) 116
Loans, net of allowance for loan losses 984,525 984,497 —
Accrued interest and accounts receivable 90,503 72,861 24
Premises and equipment 27,109 25,813 5
Goodwill, MSRs and other intangible assets 53,428 53,341 —
Other assets(a) 152,853 130,395 17
Total assets $ 3,386,071 $ 2,687,379 26 %
(a) In the third quarter of 2020, the Firm reclassified certain fair value option elected lending-related positions from trading assets to loans and other assets. Prior-period amounts have been revised to conform with the current presentation.
Cash and due from banks and deposits with banks increased primarily as a result of significant deposit inflows, which also funded asset growth across the Firm, including investment securities and securities purchased under resale agreements. Deposits with banks reflect the Firm’s placements of its excess cash with various central banks, including the Federal Reserve Banks.
Federal funds sold and securities purchased under resale agreements increased as a result of higher deployment of cash in Treasury and CIO, as well as the impact of client activity and higher demand for securities to cover short positions in CIB. Refer to Liquidity Risk Management on pages 102–108 and Note 11 for additional information.
Securities borrowed increased driven by client-driven activities in CIB. Refer to Liquidity Risk Management on pages 102–108 and Note 11 for additional information.
Trading assets remained elevated at the end of 2020, due to stronger client-driven market-making activities in debt and equity instruments and higher derivative receivables as a result of market movements in CIB Markets. Refer to Notes 2 and 5 for additional information.
Investment securities increased, reflecting net purchases of U.S. Treasuries and U.S. GSE and government agency MBS in the available-for-sale (“AFS”) portfolio, driven by interest rate risk management activities and cash deployment. AFS securities of $164 billion were transferred to the held-to-maturity (“HTM”) portfolio, resulting in a decrease in AFS and a comparable increase in HTM securities. The transfers were executed for capital management purposes. Refer to
Corporate segment results on pages 83–84, Investment Portfolio Risk Management on page 134 and Notes 2 and 10 for additional information on investment securities.
Loans increased, reflecting:
• growth in wholesale loans and mortgages in AWM and the impact of PPP loans in CBB and CB, as well as higher wholesale loans related to client-driven activities in CIB Markets
largely offset by
• lower loans in Home Lending primarily due to net paydowns; and lower loans in Card due to the decline in sales volumes that began in March as a result of the impact of the COVID-19 pandemic.
The allowance for loan losses increased primarily reflecting the deterioration and uncertainty in the macroeconomic environment, in particular in the first half of 2020, as a result of the impact of the COVID-19 pandemic, consisting of:• a net $7.4 billion addition in consumer, predominantly in
the credit card portfolio, and
• a net $3.6 billion addition in wholesale, across the LOBs, impacting multiple industries.
The adoption of CECL on January 1, 2020, resulted in a $4.2 billion addition to the allowance for loan losses.
There were also additions to the allowance for lending-related commitments, which is included in other liabilities on the consolidated balance sheets, of $1.1 billion related to the impact of the COVID-19 pandemic, and $98 million related to the adoption of CECL. Total additions to the allowance for
JPMorgan Chase & Co./2020 Form 10-K 57
credit losses were $12.1 billion related to COVID-19, and $4.3 billion related to CECL, as of December 31, 2020.
Refer to Credit and Investment Risk Management on pages 110–134, and Notes 1, 2, 3, 12 and 13 for further discussion of loans and the allowance for loan losses.
Accrued interest and accounts receivable increased driven by higher client receivables related to client-driven activities in CIB prime brokerage.
Refer to Note 16 and 18 for additional information on Premises and equipment.
Goodwill, MSRs and other intangibles was flat as the increase in goodwill related to the acquisitions of cxLoyalty and 55ip was offset by lower MSRs as a result of faster prepayment speeds on lower rates, and the realization of expected cash flows, partially offset by net additions to the MSRs. Refer to Note 15 for additional information.
Other assets increased reflecting higher cash collateral placed with central counterparties in CIB.
Selected Consolidated balance sheets dataDecember 31, (in millions) 2020 2019 Change
Liabilities
Deposits $ 2,144,257 $ 1,562,431 37
Federal funds purchased and securities loaned or sold under repurchase agreements 215,209 183,675 17
Short-term borrowings 45,208 40,920 10
Trading liabilities 170,181 119,277 43
Accounts payable and other liabilities 232,599 210,407 11
Beneficial interests issued by consolidated variable interest entities (“VIEs”) 17,578 17,841 (1)
Long-term debt 281,685 291,498 (3)
Total liabilities 3,106,717 2,426,049 28
Stockholders’ equity 279,354 261,330 7
Total liabilities and stockholders’ equity $ 3,386,071 $ 2,687,379 26 %
Deposits increased reflecting significant inflows across the LOBs primarily driven by the impact of the COVID-19 pandemic and the related effect of certain government actions;
• in the wholesale businesses, while the inflows principally occurred in March as clients sought to remain liquid as a result of market conditions, balances continued to increase through the end of 2020, and
• in CCB, the increase was driven by lower spending and higher cash balances across both consumer and small business customers, as well as growth from existing and new accounts.
Refer to the Liquidity Risk Management discussion on pages 102–108; and Notes 2 and 17 for more information.
Federal funds purchased and securities loaned or sold under repurchase agreements increased reflecting:
• higher secured financing of AFS investment securities in Treasury and CIO, as well as trading assets in CIB,
partially offset by
• a decline in client-driven market-making activities in CIB, including the Firm's non-participation in the Federal Reserve's open market operations. Refer to the Liquidity Risk Management discussion on pages 102–108 and Note 11 for additional information.
Short-term borrowings increased reflecting higher financing of CIB prime brokerage activities. Refer to pages 102–108 for information on changes in Liquidity Risk Management.
Trading liabilities increased reflecting client-driven market-making activities, which resulted in higher levels of short positions in debt and equity instruments and higher derivative payables as a result of market movements in CIB Markets. Refer to Notes 2 and 5 for additional information.
Accounts payable and other liabilities increased reflecting higher client payables related to client-driven activities in CIB Markets. Refer to Note 19 for additional information.
Refer to Off-Balance Sheet Arrangements on pages 60-61 and Note 14 and 28 for information on Beneficial interests issued by consolidated VIEs.
Long-term debt decreased as a result of maturities of FHLB advances; net maturities of senior debt, which included the early termination of certain of the Firm's debt; partially offset by an issuance of subordinated debt, and higher fair value hedge accounting adjustments related to lower interest rates. Refer to Liquidity Risk Management on pages 102–108 and Note 20 for additional information.
Stockholders’ equity increased reflecting the combined impact of net income, capital actions, the adoption of CECL and an increase in accumulated other comprehensive income (“AOCI”). The increase in AOCI was driven by net unrealized gains on AFS securities, and higher valuation of interest rate cash flow hedges. Refer to page 165 for information on changes in stockholders’ equity, and Capital actions on page 99, Note 24 for additional information on AOCI.
Management’s discussion and analysis
58 JPMorgan Chase & Co./2020 Form 10-K

Consolidated cash flows analysisThe following is a discussion of cash flow activities during the years ended December 31, 2020 and 2019. Refer to Consolidated cash flows analysis on page 54 of the Firm’s 2019 Form 10-K for a discussion of the 2018 activities.
(in millions)
Year ended December 31,
2020 2019 2018
Net cash provided by/(used in)
Operating activities(a) $ (79,910) $ 4,092 $ 15,614
Investing activities(a) (261,912) (52,059) (199,420)
Financing activities 596,645 32,987 34,158
Effect of exchange rate changes on cash 9,155 (182) (2,863)
Net increase/(decrease) in cash and due from banks and deposits with banks $ 263,978 $ (15,162) $ (152,511)
(a) In the third quarter of 2020, the Firm reclassified certain fair value option elected lending-related positions from trading assets to loans and other assets. Prior-period amounts have been revised to conform with the current presentation.
Operating activities JPMorgan Chase’s operating assets and liabilities primarily support the Firm’s lending and capital markets activities. These assets and liabilities can vary significantly in the normal course of business due to the amount and timing of cash flows, which are affected by client-driven and risk management activities and market conditions. The Firm believes that cash flows from operations, available cash and other liquidity sources, and its capacity to generate cash through secured and unsecured sources, are sufficient to meet its operating liquidity needs.
• In 2020, cash used primarily reflected higher trading assets, other assets, and securities borrowed, partially offset by higher trading liabilities and net income excluding noncash adjustments.
• In 2019, cash provided primarily reflected net income excluding noncash adjustments, lower trading assets, and net proceeds of sales, securitizations, and paydowns of loans held-for-sale, partially offset by higher securities borrowed, an increase in other assets and a decrease in trading liabilities.
Investing activitiesThe Firm’s investing activities predominantly include originating held-for-investment loans and investing in the investment securities portfolio, and other short-term instruments.
• In 2020, cash used primarily reflected net purchases of investment securities, higher net originations of loans, and higher securities purchased under resale agreements.
• In 2019, cash used reflected net purchases of investment securities, partially offset by lower securities purchased under resale agreements, and net proceeds from sales and securitizations of loans held-for-investment.
Financing activitiesThe Firm’s financing activities include acquiring customer deposits and issuing long-term debt, as well as preferred stock.
• In 2020, cash provided reflected higher deposits and an increase in securities loaned or sold under repurchase agreements, partially offset by net payments of long-term borrowings.
• In 2019, cash provided reflected higher deposits, partially offset by a decrease in short-term borrowings and net payments of long-term borrowings.
• For both periods, cash was used for repurchases of common stock and cash dividends on common and preferred stock. On March 15, 2020, in response to the economic disruptions caused by the COVID-19 pandemic, the Firm temporarily suspended repurchases of its common stock. Subsequently, the Federal Reserve directed all large banks, including the Firm, to discontinue net share repurchases through the end of 2020.
* * *
Refer to Consolidated Balance Sheets Analysis on pages 57-58, Capital Risk Management on pages 91-101, and Liquidity Risk Management on pages 102–108 for a further discussion of the activities affecting the Firm’s cash flows.
JPMorgan Chase & Co./2020 Form 10-K 59

OFF-BALANCE SHEET ARRANGEMENTS AND CONTRACTUAL CASH OBLIGATIONS
In the normal course of business, the Firm enters into various off-balance sheet arrangements and contractual obligations that may require future cash payments. Certain obligations are recognized on-balance sheet, while others are disclosed as off-balance sheet under accounting principles generally accepted in the U.S. (“U.S. GAAP”).
Special-purpose entitiesThe Firm has several types of off–balance sheet arrangements, including through nonconsolidated special-purpose entities (“SPEs”), which are a type of VIE, and through lending-related financial instruments (e.g., commitments and guarantees).
The Firm holds capital, as appropriate, against all SPE-related transactions and related exposures, such as derivative contracts and lending-related commitments and guarantees.
The Firm has no commitments to issue its own stock to support any SPE transaction, and its policies require that transactions with SPEs be conducted at arm’s length and reflect market pricing. Consistent with this policy, no JPMorgan Chase employee is permitted to invest in SPEs with which the Firm is involved where such investment would violate the Firm’s Code of Conduct.
The table below provides an index of where in this 2020 Form 10-K discussions of the Firm’s various off-balance sheet arrangements can be found. Refer to Note 1 for additional information about the Firm’s consolidation policies.
Type of off-balance sheet arrangement Location of disclosure Page references
Special-purpose entities: variable interests and other obligations, including contingent obligations, arising from variable interests in nonconsolidated VIEs
Refer to Note 14 253-260
Off-balance sheet lending-related financial instruments, guarantees, and other commitments
Refer to Note 28 283-288
Management’s discussion and analysis
60 JPMorgan Chase & Co./2020 Form 10-K

Contractual cash obligationsThe accompanying table summarizes, by remaining maturity, JPMorgan Chase’s significant contractual cash obligations at December 31, 2020. The contractual cash obligations included in the table below reflect the minimum contractual obligation under legally enforceable contracts with terms that are both fixed and determinable. Excluded from the table are certain liabilities with variable cash flows and/or no obligation to return a stated amount of principal at maturity.
The carrying amount of on-balance sheet obligations on the Consolidated balance sheets may differ from the minimum contractual amount of the obligations reported below. Refer to Note 28 for a discussion of mortgage repurchase liabilities and other obligations.
Contractual cash obligations
By remaining maturity at December 31,(in millions)
2020 2019
2021 2022-2023 2024-2025 After 2025 Total Total
On-balance sheet obligations
Deposits(a) $ 2,134,256 $ 4,321 $ 2,931 $ 1,637 $ 2,143,145 $ 1,558,040
Federal funds purchased and securities loaned or sold under repurchase agreements 214,881 118 9 189 215,197 183,675
Short-term borrowings(a) 28,514 — — — 28,514 35,107
Beneficial interests issued by consolidated VIEs 14,976 2,400 — 223 17,599 17,874
Long-term debt(a) 22,461 42,084 42,180 123,477 230,202 250,415
Operating leases(b) 1,606 2,705 2,070 3,602 9,983 10,090
Other(c) 8,694 2,237 2,008 2,592 15,531 15,568
Total on-balance sheet obligations 2,425,388 53,865 49,198 131,720 2,660,171 2,070,769
Off-balance sheet obligations
Unsettled resale and securities borrowed agreements(d) 95,084 1,764 — — 96,848 117,951
Contractual interest payments(e) 6,071 10,450 8,128 29,719 54,368 54,681
Equity investment commitments 286 — — — 286 539
Contractual purchases and capital expenditures 1,968 942 225 198 3,333 2,929
Obligations under co-brand programs 333 530 240 79 1,182 1,548
Total off-balance sheet obligations 103,742 13,686 8,593 29,996 156,017 177,648
Total contractual cash obligations $ 2,529,130 $ 67,551 $ 57,791 $ 161,716 $ 2,816,188 $ 2,248,417
(a) Excludes structured notes on which the Firm is not obligated to return a stated amount of principal at the maturity of the notes, but is obligated to return an amount based on the performance of the structured notes.
(b) Includes noncancelable operating leases for premises and equipment used primarily for business purposes. Excludes the benefit of noncancelable sublease rentals of $593 million and $846 million at December 31, 2020 and 2019, respectively. Refer to Note 18 for further information on operating leases.
(c) Primarily includes dividends declared on preferred and common stock, deferred annuity contracts, pension and other postretirement employee benefit obligations, insurance liabilities and income taxes payable associated with the deemed repatriation under the TCJA.
(d) Refer to unsettled resale and securities borrowed agreements in Note 28 for further information.(e) Includes accrued interest and future contractual interest obligations. Excludes interest related to structured notes for which the Firm’s payment obligation
is based on the performance of certain benchmarks.
JPMorgan Chase & Co./2020 Form 10-K 61

EXPLANATION AND RECONCILIATION OF THE FIRM’S USE OF NON-GAAP FINANCIAL MEASURES
Non-GAAP financial measuresThe Firm prepares its Consolidated Financial Statements in accordance with U.S. GAAP; these financial statements appear on pages 162-166. That presentation, which is referred to as “reported” basis, provides the reader with an understanding of the Firm’s results that can be tracked consistently from year-to-year and enables a comparison of the Firm’s performance with the U.S. GAAP financial statements of other companies.
In addition to analyzing the Firm’s results on a reported basis, management reviews Firmwide results, including the overhead ratio, on a “managed” basis; these Firmwide managed basis results are non-GAAP financial measures. The Firm also reviews the results of the LOBs on a managed basis. The Firm’s definition of managed basis starts, in each case, with the reported U.S. GAAP results and includes certain reclassifications to present total net revenue for the Firm (and each of the reportable business segments) on an FTE basis. Accordingly, revenue from investments that receive tax credits and tax-exempt securities is presented in the managed results on a basis comparable to taxable investments and securities. These financial measures allow
management to assess the comparability of revenue from year-to-year arising from both taxable and tax-exempt sources. The corresponding income tax impact related to tax-exempt items is recorded within income tax expense. These adjustments have no impact on net income as reported by the Firm as a whole or by the LOBs.
Management also uses certain non-GAAP financial measures at the Firm and business-segment level, because these other non-GAAP financial measures provide information to investors about the underlying operational performance and trends of the Firm or of the particular business segment, as the case may be, and, therefore, facilitate a comparison of the Firm or the business segment with the performance of its relevant competitors. Refer to Business Segment Results on pages 65–84 for additional information on these non-GAAP measures. Non-GAAP financial measures used by the Firm may not be comparable to similarly named non-GAAP financial measures used by other companies.
The following summary table provides a reconciliation from the Firm’s reported U.S. GAAP results to managed basis.2020 2019 2018
Year ended December 31, (in millions, except ratios) Reported
Fully taxable-equivalent
adjustments(b)Managed
basis Reported
Fully taxable-equivalent
adjustments(b)Managed
basis Reported
Fully taxable-equivalent
adjustments(b)Managed
basis
Other income $ 4,457 $ 2,968 $ 7,425 $ 5,731 $ 2,534 $ 8,265 $ 5,343 $ 1,877 $ 7,220
Total noninterest revenue(a) 64,980 2,968 67,948 58,154 2,534 60,688 53,724 1,877 55,601
Net interest income 54,563 418 54,981 57,245 531 57,776 55,059 628 55,687
Total net revenue 119,543 3,386 122,929 115,399 3,065 118,464 108,783 2,505 111,288
Total noninterest expense(a) 66,656 NA 66,656 65,269 NA 65,269 63,148 NA 63,148
Pre-provision profit 52,887 3,386 56,273 50,130 3,065 53,195 45,635 2,505 48,140
Provision for credit losses 17,480 NA 17,480 5,585 NA 5,585 4,871 NA 4,871
Income before income tax expense 35,407 3,386 38,793 44,545 3,065 47,610 40,764 2,505 43,269
Income tax expense 6,276 3,386 9,662 8,114 3,065 11,179 8,290 2,505 10,795
Net income $ 29,131 NA $ 29,131 $ 36,431 NA $ 36,431 $ 32,474 NA $ 32,474
Overhead ratio 56 % NM 54 % 57 % NM 55 % 58 % NM 57 %
(a) In the second quarter of 2020, the Firm reclassified certain spend-based credit card reward costs from marketing expense to be a reduction of card income, with no effect on net income. Prior-period amounts have been revised to conform with the current presentation.
(b) Predominantly recognized in CIB, CB and Corporate.
Management’s discussion and analysis
62 JPMorgan Chase & Co./2020 Form 10-K

Net interest income and net yield excluding CIB MarketsIn addition to reviewing net interest income and the net yield on a managed basis, management also reviews these metrics excluding CIB Markets, as shown below; these metrics, which exclude CIB Markets, are non-GAAP financial measures. Management reviews these metrics to assess the performance of the Firm’s lending, investing (including asset-liability management) and deposit-raising activities. The resulting metrics that exclude CIB Markets are referred to as non-markets-related net interest income and net yield. CIB Markets consists of Fixed Income Markets and Equity Markets. Management believes that disclosure of non-markets-related net interest income and net yield provides investors and analysts with other measures by which to analyze the non-markets-related business trends of the Firm and provides a comparable measure to other financial institutions that are primarily focused on lending, investing and deposit-raising activities.
Year ended December 31, (in millions, except rates) 2020 2019 2018
Net interest income – reported $ 54,563 $ 57,245 $ 55,059
Fully taxable-equivalent adjustments 418 531 628
Net interest income – managed basis(a) $ 54,981 $ 57,776 $ 55,687
Less: CIB Markets net interest income(b) 8,374 3,120 3,087
Net interest income excluding CIB Markets(a) $ 46,607 $ 54,656 $ 52,600
Average interest-earning assets(c) $ 2,779,710 $ 2,345,279 $ 2,212,657
Less: Average CIB Markets interest-earning assets(b)(c) 751,131 672,417 593,104
Average interest-earning assets excluding CIB Markets $ 2,028,579 $ 1,672,862 $ 1,619,553
Net yield on average interest-earning assets – managed basis 1.98 % 2.46 % 2.52 %
Net yield on average CIB Markets interest-earning assets(b) 1.11 0.46 0.52
Net yield on average interest-earning assets excluding CIB Markets 2.30 % 3.27 % 3.25 %
(a) Interest includes the effect of related hedges. Taxable-equivalent amounts are used where applicable.
(b) Refer to pages 74-75 for further information on CIB Markets.(c) In the third quarter of 2020, the Firm reclassified certain fair value
option elected lending-related positions from trading assets to loans. Prior-period amounts have been revised to conform with the current presentation.
Calculation of certain U.S. GAAP and non-GAAP financial measures
Certain U.S. GAAP and non-GAAP financial measures are calculated as follows:
Book value per share (“BVPS”)Common stockholders’ equity at period-end /Common shares at period-end
Overhead ratioTotal noninterest expense / Total net revenue
Pre-provision profitTotal net revenue – Total noninterest expense
Return on assets (“ROA”)Reported net income / Total average assets
Return on common equity (“ROE”)Net income* / Average common stockholders’ equity
Return on tangible common equity (“ROTCE”)Net income* / Average tangible common equity
Tangible book value per share (“TBVPS”)Tangible common equity at period-end / Common shares at period-end
* Represents net income applicable to common equity
In addition, the Firm reviews other non-GAAP financial measures which include:
• Adjusted expense, which is noninterest expense excluding Firmwide legal expense
• Allowance for loan losses to period-end loans retained excluding trade finance and conduits
• Pre-provision profit, which represents total net revenue less total noninterest expense.
Management believes that these measures help investors understand the effect of these items on reported results and provide an alternate presentation of the Firm’s performance.
JPMorgan Chase & Co./2020 Form 10-K 63

Tangible common equity, ROTCE and TBVPSTangible common equity (“TCE”), ROTCE and TBVPS are each non-GAAP financial measures. TCE represents the Firm’s common stockholders’ equity (i.e., total stockholders’ equity less preferred stock) less goodwill and identifiable intangible assets (other than MSRs), net of related deferred tax liabilities. ROTCE measures the Firm’s net income applicable to common equity as a percentage of average TCE. TBVPS represents the Firm’s TCE at period-end divided by common shares at period-end. TCE, ROTCE and TBVPS are utilized by the Firm, as well as investors and analysts, in assessing the Firm’s use of equity.
The following summary table provides a reconciliation from the Firm’s common stockholders’ equity to TCE.
Period-end Average
Dec 31,2020
Dec 31,2019
Year ended December 31,
(in millions, except per share and ratio data) 2020 2019 2018
Common stockholders’ equity $ 249,291 $ 234,337 $ 236,865 $ 232,907 $ 229,222
Less: Goodwill 49,248 47,823 47,820 47,620 47,491
Less: Other intangible assets 904 819 781 789 807
Add: Certain deferred tax liabilities(a) 2,453 2,381 2,399 2,328 2,231
Tangible common equity $ 201,592 $ 188,076 $ 190,663 $ 186,826 $ 183,155
Return on tangible common equity NA NA 14 % 19 % 17 %
Tangible book value per share $ 66.11 $ 60.98 NA NA NA
(a) Represents deferred tax liabilities related to tax-deductible goodwill and to identifiable intangibles created in nontaxable transactions, which are netted against goodwill and other intangibles when calculating TCE.
Management’s discussion and analysis
64 JPMorgan Chase & Co./2020 Form 10-K

BUSINESS SEGMENT RESULTS
The Firm is managed on an LOB basis. There are four major reportable business segments – Consumer & Community Banking, Corporate & Investment Bank, Commercial Banking and Asset & Wealth Management. In addition, there is a Corporate segment.
The business segments are determined based on the products and services provided, or the type of customer served, and they reflect the manner in which financial information is currently evaluated by the Firm’s Operating Committee. Segment results are presented on a managed basis. Refer to Explanation and Reconciliation of the Firm’s use of Non-GAAP Financial Measures, on pages 62–64 for a definition of managed basis.
JPMorgan Chase
Consumer Businesses Wholesale Businesses
Consumer & Community Banking Corporate & Investment Bank Commercial Banking
Asset & Wealth Management
Consumer & Business Banking Home Lending Card & Auto Banking Markets &
Securities Services
• Middle Market Banking
• Asset Management
• Consumer Banking
• J.P. Morgan Wealth Management
• Business Banking
• Home Lending Production
• Home Lending Servicing
• Real Estate Portfolios
• Credit Card• Auto
• Investment Banking
• Wholesale Payments
• Lending
• Fixed Income Markets
• Corporate Client Banking
• Wealth Management
• Equity Markets
• Securities Services
• Credit Adjustments & Other
• Commercial Real Estate Banking
Business segment changesIn the fourth quarter of 2020, the Firm transferred certain assets, liabilities, revenue, expense and headcount associated with certain wealth management clients from AWM to the J.P. Morgan Wealth Management business unit within CCB. Prior-period amounts have been revised to conform with the current presentation, including the transfer of approximately 1,650 technology and support staff during the second and third quarters of 2020. Ultra-high-net-worth and certain high-net-worth client relationships remained in AWM.
In the first quarter of 2020, the Firm began reporting a Wholesale Payments business unit within CIB following a realignment of the Firm’s wholesale payments businesses. The Wholesale Payments business comprises:
• Merchant Services, which was realigned from CCB to CIB• Treasury Services and Trade Finance in CIB. Trade Finance
was previously reported in Lending in CIB.
In connection with the alignment of Wholesale Payments, the assets, liabilities and headcount associated with the Merchant Services business were realigned to CIB from CCB, and the revenue and expenses of the Merchant Services business are reported across CCB, CIB and CB based primarily on client relationships. In the fourth quarter of 2020, payment processing-only clients along with the associated revenue and expenses were realigned to CIB’s Wholesale Payments business from CCB and CB. Payment processing-only clients are those that only use payment services offered by Merchant Services, and in general do not currently utilize other services offered by the Firm. Prior-period amounts have been revised
to reflect this realignment and revised allocation methodology.
Description of business segment reporting methodology Results of the business segments are intended to present each segment as if it were a stand-alone business. The management reporting process that derives business segment results includes the allocation of certain income and expense items. The Firm also assesses the level of capital required for each LOB on at least an annual basis. The Firm periodically assesses the assumptions, methodologies and reporting classifications used for segment reporting, and further refinements may be implemented in future periods.
Revenue sharing When business segments join efforts to sell products and services to the Firm’s clients, the participating business segments may agree to share revenue from those transactions. Revenue is generally recognized in the segment responsible for the related product or service, with allocations to the other segment(s) involved in the transaction. The segment results reflect these revenue-sharing agreements.
Expense AllocationWhere business segments use services provided by corporate support units, or another business segment, the costs of those services are allocated to the respective business segments. The expense is generally allocated based on the actual cost and use of services provided. In contrast, certain costs and investments related to corporate support units, technology and operations not currently utilized by any LOB, are not
JPMorgan Chase & Co./2020 Form 10-K 65

allocated to the business segments and are retained in Corporate. Expense retained in Corporate generally includes parent company costs that would not be incurred if the segments were stand-alone businesses; and other items not aligned with a particular business segment.
Funds transfer pricing Funds transfer pricing is the process by which the Firm allocates interest income and expense to each business segment and transfers the primary interest rate risk and liquidity risk exposures to Treasury and CIO within Corporate. The funds transfer pricing process considers the interest rate risk, liquidity risk and regulatory requirements on a product-by-product basis within each business segment.
Debt expense and preferred stock dividend allocationAs part of the funds transfer pricing process, almost all of the cost of the credit spread component of outstanding unsecured long-term debt and preferred stock dividends is allocated to the reportable business segments, while the balance of the cost is retained in Corporate. The methodology to allocate the
cost of unsecured long-term debt and preferred stock dividends to the business segments is aligned with the Firm’s process to allocate capital. The allocated cost of unsecured long-term debt is included in a business segment’s net interest income, and net income is reduced by preferred stock dividends to arrive at a business segment’s net income applicable to common equity.
Business segment capital allocation The amount of capital assigned to each business is referred to as equity. As of January 1, 2021, the Firm has changed its line of business capital allocations primarily as a result of changes in exposures for each LOB and an increase in the relative risk weighting toward Standardized RWA. The assumptions and methodologies used to allocate capital are periodically assessed and as a result, the capital allocated to the LOBs may change from time to time. Refer to Line of business equity on page 98 for additional information on business segment capital allocation.
Segment Results – Managed BasisThe following tables summarize the Firm’s results by segment for the periods indicated.
Year ended December 31, Consumer & Community Banking(a) Corporate & Investment Bank Commercial Banking
(in millions, except ratios) 2020 2019 2018 2020 2019 2018 2020 2019 2018
Total net revenue $ 51,268 $ 55,133 $ 51,271 $ 49,284 $ 39,265 $ 37,382 $ 9,313 $ 9,264 $ 9,336
Total noninterest expense 27,990 28,276 27,168 23,538 22,444 21,876 3,798 3,735 3,627
Pre-provision profit/(loss) 23,278 26,857 24,103 25,746 16,821 15,506 5,515 5,529 5,709
Provision for credit losses 12,312 4,954 4,754 2,726 277 (60) 2,113 296 129
Net income/(loss) 8,217 16,541 14,707 17,094 11,954 11,799 2,578 3,958 4,264
Return on equity (“ROE”) 15 % 31 % 28 % 20 % 14 % 16 % 11 % 17 % 20 %
Year ended December 31, Asset & Wealth Management Corporate Total(a)
(in millions, except ratios) 2020 2019 2018 2020 2019 2018 2020 2019 2018
Total net revenue $ 14,240 $ 13,591 $ 13,427 $ (1,176) $ 1,211 $ (128) $ 122,929 $ 118,464 $ 111,288
Total noninterest expense 9,957 9,747 9,575 1,373 1,067 902 66,656 65,269 63,148
Pre-provision profit/(loss) 4,283 3,844 3,852 (2,549) 144 (1,030) 56,273 53,195 48,140
Provision for credit losses 263 59 52 66 (1) (4) 17,480 5,585 4,871
Net income/(loss) 2,992 2,867 2,945 (1,750) 1,111 (1,241) 29,131 36,431 32,474
Return on equity (“ROE”) 28 % 26 % 32 % NM NM NM 12 % 15 % 13 %
(a) In the second quarter of 2020, the Firm reclassified certain spend-based credit card reward costs from marketing expense to be a reduction of card income, with no effect on net income. Prior-period amounts have been revised to conform with the current presentation.
The following sections provide a comparative discussion of the Firm’s results by segment as of or for the years ended December 31, 2020 and 2019.
Management’s discussion and analysis
66 JPMorgan Chase & Co./2020 Form 10-K

CONSUMER & COMMUNITY BANKING
Consumer & Community Banking offers services to consumers and businesses through bank branches, ATMs, digital (including mobile and online) and telephone banking. CCB is organized into Consumer & Business Banking (including Consumer Banking, J.P. Morgan Wealth Management and Business Banking), Home Lending (including Home Lending Production, Home Lending Servicing and Real Estate Portfolios) and Card & Auto. Consumer & Business Banking offers deposit and investment products, payments and services to consumers, and lending, deposit, and cash management and payment solutions to small businesses. Home Lending includes mortgage origination and servicing activities, as well as portfolios consisting of residential mortgages and home equity loans. Card & Auto issues credit cards to consumers and small businesses and originates and services auto loans and leases.
Selected income statement dataYear ended December 31,(in millions, except ratios) 2020 2019 2018Revenue
Lending- and deposit-related fees(a) $ 3,166 $ 3,938 $ 3,787
Asset management, administration and commissions(a) 2,780 2,808 2,592
Mortgage fees and related income 3,079 2,035 1,252
Card income(b) 3,068 3,412 3,108 All other income 5,647 5,603 4,599 Noninterest revenue 17,740 17,796 15,338 Net interest income 33,528 37,337 35,933 Total net revenue 51,268 55,133 51,271
Provision for credit losses 12,312 4,954 4,754
Noninterest expenseCompensation expense 11,014 10,815 10,580 Noncompensation expense(b)(c) 16,976 17,461 16,588 Total noninterest expense 27,990 28,276 27,168
Income before income tax expense 10,966 21,903 19,349
Income tax expense 2,749 5,362 4,642 Net income $ 8,217 $ 16,541 $ 14,707
Revenue by line of businessConsumer & Business Banking $ 22,955 $ 27,376 $ 25,607 Home Lending 6,018 5,179 5,484 Card & Auto(b) 22,295 22,578 20,180
Mortgage fees and related income details:
Net production revenue 2,629 1,618 268 Net mortgage servicing revenue(d) 450 417 984
Mortgage fees and related income $ 3,079 $ 2,035 $ 1,252
Financial ratiosReturn on equity 15 % 31 % 28 %Overhead ratio 55 51 53
In the first quarter of 2020, the Merchant Services business was realigned from CCB to CIB as part of the Firm’s Wholesale Payments business. In the fourth quarter of 2020, payment processing-only clients along with the associated revenue and expenses were realigned to CIB’s Wholesale Payments business from CCB and CB. Prior-period amounts have been revised to conform with the current presentation.
In the fourth quarter of 2020, the Firm realigned certain wealth management clients from AWM to CCB. Prior-period amounts have been revised to conform with the current presentation, including an increase to net revenue of $725 million and $649 million for the years ended December 31, 2019 and 2018, respectively. Ultra-high-net-worth and certain high-net-worth client relationships remained in AWM.
(a) In the first quarter of 2020, the Firm reclassified certain fees from asset management, administration and commissions to lending- and deposit-related fees. Prior-period amounts have been revised to conform with the current presentation.
(b) In the second quarter of 2020, the Firm reclassified certain spend-based credit card reward costs from marketing expense to be a reduction of card income, with no effect on net income. Prior-period amounts have been revised to conform with the current presentation.
(c) Included depreciation expense on leased assets of $4.2 billion, $4.0 billion and $3.4 billion for the years ended December 31, 2020, 2019 and 2018, respectively.
(d) Included MSR risk management results of $(18) million, $(165) million and $(111) million for the years ended December 31, 2020, 2019 and 2018, respectively.
JPMorgan Chase & Co./2020 Form 10-K 67

2020 compared with 2019Net income was $8.2 billion, a decrease of 50%, largely driven by an increase in the provision for credit losses.
Net revenue was $51.3 billion, a decrease of 7%.
Net interest income was $33.5 billion, down 10%, driven by:
• the impact of deposit margin compression in CBB, spread compression and lower loans in Home Lending, predominantly due to paydowns and prior year loan sales, and lower loans in Card due to the decline in sales volume as a result of the COVID-19 pandemic,
partially offset by
• growth in deposits in CBB, and loan margin expansion in Card, the prior year included charges for the unwind of the internal funding from Treasury and CIO associated with the sales of certain mortgage loans.
Noninterest revenue was $17.7 billion, flat, reflecting:
• lower deposit-related fees due to lower transaction activity and the impact of fee refunds related to the COVID-19 pandemic,
• lower card income due to lower net interchange income reflecting lower credit card sales volumes and debit card transactions as a result of the impact of the COVID-19 pandemic, largely offset by lower acquisition costs and higher annual fees, and
• lower asset management, administration and commissions due to a lower volume of annuity sales offset by a higher level of investment assets,
offset by
• higher net mortgage production revenue reflecting higher mortgage production volumes and margins; the prior year included gains on the sales of certain mortgage loans.
Refer to Note 15 for further information regarding changes in the value of the MSR asset and related hedges, and mortgage fees and related income.
Noninterest expense was $28.0 billion, relatively flat, reflecting:
• lower marketing expense as a result of lower investments in marketing campaigns and lower travel-related benefits, and
• lower structural expenses,
offset by
• investments in the business, higher volume-related compensation, and higher depreciation on auto lease assets.
The provision for credit losses was $12.3 billion, an increase of $7.4 billion from the prior year, driven by:
• additions to the allowance for credit losses as a result of the impact of the COVID-19 pandemic, consisting of: $6.6 billion for Card, $649 million for CBB, and $560 million for Auto,
partially offset by
• lower net charge-offs largely in Card, reflecting lower charge-offs and higher recoveries primarily benefiting from payment assistance and government stimulus.
The prior year included a $300 million net reduction in theallowance for credit losses.
Refer to Credit and Investment Risk Management on pages 110–134 and Allowance for Credit Losses on pages 132-133 for further discussions of the credit portfolios and the allowance for credit losses.
Management’s discussion and analysis
68 JPMorgan Chase & Co./2020 Form 10-K

Selected metrics
As of or for the year ended December 31,
(in millions, except headcount) 2020 2019 2018Selected balance sheet data
(period-end)Total assets $ 496,705 $ 541,367 $ 560,177 Loans:
Consumer & Business Banking 48,810 (d) 29,585 28,450 Home Lending(a)(b) 182,121 213,445 247,721 Card 144,216 168,924 156,632 Auto 66,432 61,522 63,573
Total loans 441,579 473,476 496,376 Deposits 958,706 723,418 684,124 Equity 52,000 52,000 51,000 Selected balance sheet data
(average)Total assets $ 501,584 $ 543,127 $ 548,637 Loans:
Consumer & Business Banking 43,064 28,859 27,890 Home Lending(a)(c) 197,148 230,662 250,373 Card 146,633 156,325 145,652 Auto 61,476 61,862 64,675
Total loans 448,321 477,708 488,590 Deposits 851,390 698,378 675,537 Equity 52,000 52,000 51,000
Headcount 122,894 125,756 127,826
In the first quarter of 2020, the Merchant Services business was realigned from CCB to CIB as part of the Firm’s Wholesale Payments business. In the fourth quarter of 2020, payment processing-only clients along with the associated revenue and expenses were realigned to CIB’s Wholesale Payments business from CCB and CB. Prior-period amounts have been revised to conform with the current presentation, including a decrease to period-end assets of $6.6 billion and $6.2 billion and headcount of 4,022 and 4,092, as of December 31, 2019 and 2018, respectively.
In the fourth quarter of 2020, the Firm realigned certain wealth management clients from AWM to CCB. Prior-period amounts have been revised to conform with the current presentation, including an increase to headcount of 2,641 and 2,400 as of December 31, 2019 and 2018, respectively.
(a) In the third quarter of 2020, the Firm reclassified certain fair value option elected lending-related positions from trading assets to loans. Prior-period amounts have been revised to conform with the current presentation.
(b) At December 31, 2020, 2019 and 2018, Home Lending loans held-for-sale and loans at fair value were $9.7 billion, $16.6 billion and $7.9 billion, respectively.
(c) Average Home Lending loans held-for sale and loans at fair value were $11.1 billion, $14.1 billion and $9.0 billion, respectively, for the years ended December 31, 2020, 2019 and 2018.
(d) At December 31, 2020 included $19.2 billion of loans in Business Banking under the PPP. Refer to Credit Portfolio on pages 112-113 for a further discussion of the PPP.
Selected metricsAs of or for the year ended December 31,(in millions, except ratio data) 2020 2019 2018Credit data and quality statistics
Nonaccrual loans(a)(b)(c) $ 5,675 (f) $ 3,027 $ 3,349
Net charge-offs/(recoveries)Consumer & Business Banking 263 298 246 Home Lending (169) (98) (294) Card 4,286 4,848 4,518 Auto 123 206 243
Total net charge-offs/(recoveries) $ 4,503 $ 5,254 $ 4,713
Net charge-off/(recovery) rateConsumer & Business Banking 0.61 % (g) 1.03 % 0.88 %Home Lending (0.09) (0.05) (0.12) Card 2.93 3.10 3.10 Auto 0.20 0.33 0.38
Total net charge-off/(recovery) rate 1.03 % 1.13 % 0.98 %
30+ day delinquency rate Home Lending(d)(e) 1.15 % (h) 1.58 % 1.63 %Card 1.68 (h) 1.87 1.83 Auto 0.69 (h) 0.94 0.93
90+ day delinquency rate - Card 0.92 % (h) 0.95 % 0.92 %
Allowance for loan lossesConsumer & Business Banking $ 1,372 $ 750 $ 796
Home Lending 1,813 1,890 2,791
Card 17,800 5,683 5,184
Auto 1,042 465 464
Total allowance for loan losses $ 22,027 $ 8,788 $ 9,235
Effective January 1, 2020, the Firm adopted the CECL accounting guidance. The adoption resulted in a change in the accounting for PCI loans, which are considered purchased credit deteriorated (“PCD”) loans under CECL. Refer to Note 1 for further information.
In the fourth quarter of 2020, the Firm realigned certain wealth management clients from AWM to CCB. Prior-period amounts have been revised to conform with the current presentation.
(a) At December 31, 2020, nonaccrual loans included $1.6 billion of PCD loans. Prior to the adoption of CECL, nonaccrual loans excluded PCI loans as the Firm recognized interest income on each pool of PCI loans as each of the pools was performing.
(b) At December 31, 2020, 2019 and 2018, nonaccrual loans excluded mortgage loans 90 or more days past due and insured by U.S. government agencies of $558 million, $963 million and $2.6 billion, respectively. These amounts have been excluded based upon the government guarantee. Prior-period amounts of mortgage loans 90 or more days past due and insured by U.S. government agencies excluded from nonaccrual loans have been revised to conform with the current presentation; refer to footnote (c) for additional information.
(c) In the third quarter of 2020, the Firm reclassified certain fair value option elected lending-related positions from trading assets to loans. Prior-period amounts have been revised to conform with the current presentation.
(d) At December 31, 2020, the 30+ day delinquency rates included PCD loans. The rates prior to January 1, 2020 were revised to include the impact of PCI loans.
(e) At December 31, 2020, 2019 and 2018, excluded mortgage loans insured by U.S. government agencies of $744 million, $1.7 billion and $4.1 billion, respectively, that are 30 or more days past due. These amounts have been excluded based upon the government guarantee. Prior-period amounts of mortgage loans 30 or more days past due and insured by U.S. government agencies excluded from 30+ day delinquency rate have been revised to conform with the current presentation; refer to footnote (c) for additional information.
JPMorgan Chase & Co./2020 Form 10-K 69

(f) Generally excludes loans under payment deferral programs offered in response to the COVID-19 pandemic. Refer to Consumer Credit Portfolio on pages 114-116 for further information on consumer payment assistance activity. Includes loans to customers that have exited COVID-19 payment deferral programs and are 90 or more days past due, predominantly all of which were also at least 150 days past due and therefore considered collateral-dependent. Collateral-dependent loans are charged down to the lower of amortized cost or fair value of the underlying collateral less costs to sell.
(g) At December 31, 2020, included $19.2 billion of loans in Business Banking under the PPP. Given that PPP loans are guaranteed by the SBA, the Firm does not expect to realize material credit losses on these loans. Refer to Credit Portfolio on pages 112-113 for a further discussion of the PPP.
(h) At December 31, 2020, the principal balance of loans in Home Lending, Card and Auto under payment deferral programs offered in response to the COVID-19 pandemic were $9.1 billion, $264 million and $376 million, respectively. Loans that are performing according to their modified terms are generally not considered delinquent. Refer to Consumer Credit Portfolio on pages 114-116 for further information on consumer payment assistance activity.
Selected metricsAs of or for the year ended December 31,(in billions, except ratios and where otherwise noted) 2020 2019 2018Business MetricsCCB households (in millions) 63.4 62.6 61.7 Number of branches 4,908 4,976 5,036 Active digital customers (in thousands)(a) 55,274 52,453 49,254 Active mobile customers
(in thousands)(b) 40,899 37,315 33,260 Debit and credit card
sales volume $ 1,081.2 $ 1,114.4 $ 1,016.9
Consumer & Business BankingAverage deposits $ 832.5 $ 683.7 $ 661.7 Deposit margin 1.58 % 2.48 % 2.38 %Business banking
origination volume $ 26.6 (f) $ 6.6 $ 6.7 Client investment assets 590.2 501.4 399.7 Number of client advisors 4,417 4,196 3,929
Home LendingMortgage origination volume
by channelRetail $ 72.9 $ 51.0 $ 38.3 Correspondent 40.9 54.2 41.1
Total mortgage origination volume(c) $ 113.8 $ 105.2 $ 79.4
Total loans serviced (period-end) $ 626.3 $ 761.4 $ 789.8
Third-party mortgage loans serviced (period-end) 447.3 520.8 519.6
MSR carrying value(period-end) 3.3 4.7 6.1
Ratio of MSR carrying value (period-end) to third-party mortgage loans serviced (period-end) 0.74 % 0.90 % 1.17 %
MSR revenue multiple(d) 2.55x 2.65x 3.34x
Credit CardCredit card sales volume,
excluding commercial card $ 702.7 $ 762.8 $ 692.4 New accounts opened
(in millions) 5.4 $ 7.8 7.8 Net revenue rate(e) 10.92 % 10.48 % 10.17 %
AutoLoan and lease
origination volume $ 38.4 $ 34.0 $ 31.8 Average auto
operating lease assets 22.0 21.6 18.8
In the fourth quarter of 2020, the Firm realigned certain wealth management clients from AWM to CCB. Prior-period amounts have been revised to conform with the current presentation, including an increase to client investment assets of $143.3 billion and $117.3 billion as of December 31, 2019 and 2018, respectively.
(a) Users of all web and/or mobile platforms who have logged in within the past 90 days.
(b) Users of all mobile platforms who have logged in within the past 90 days.(c) Firmwide mortgage origination volume was $133.4 billion, $115.9 billion
and $86.9 billion for the years ended December 31, 2020, 2019 and 2018, respectively.
(d) Represents the ratio of MSR carrying value (period-end) to third-party mortgage loans serviced (period-end) divided by the ratio of loan servicing-related revenue to third-party mortgage loans serviced (average).
(e) In the second quarter of 2020, the Firm reclassified certain spend-based credit card reward costs from marketing expense to be a reduction of card income, with no effect on net income. Prior-period amounts have been revised to conform with the current presentation.
(f) Included $21.9 billion of origination volume under the PPP for the year ended December 31, 2020. Refer to Credit Portfolio on pages 112-113 for a further discussion of the PPP.
Management’s discussion and analysis
70 JPMorgan Chase & Co./2020 Form 10-K

CORPORATE & INVESTMENT BANK
The Corporate & Investment Bank, which consists of Banking and Markets & Securities Services, offers a broad suite of investment banking, market-making, prime brokerage, and treasury and securities products and services to a global client base of corporations, investors, financial institutions, merchants, government and municipal entities. Banking offers a full range of investment banking products and services in all major capital markets, including advising on corporate strategy and structure, capital-raising in equity and debt markets, as well as loan origination and syndication. Banking also includes Wholesale Payments, which provides payments services enabling clients to manage payments and receipts globally, and cross-border financing. Markets & Securities Services includes Markets, a global market-maker across products, including cash and derivative instruments, which also offers sophisticated risk management solutions, prime brokerage, and research. Markets & Securities Services also includes Securities Services, a leading global custodian which provides custody, fund accounting and administration, and securities lending products principally for asset managers, insurance companies and public and private investment funds.
Selected income statement dataYear ended December 31,
(in millions) 2020 2019 2018
Revenue
Investment banking fees $ 9,477 $ 7,575 $ 7,473
Principal transactions 17,560 14,399 12,262
Lending- and deposit-related fees(a) 2,070 1,668 1,633
Asset management, administration and commissions(a) 4,721 4,400 4,361
All other income 1,292 2,018 2,125
Noninterest revenue 35,120 30,060 27,854
Net interest income 14,164 9,205 9,528
Total net revenue(b) 49,284 39,265 37,382
Provision for credit losses 2,726 277 (60)
Noninterest expense
Compensation expense 11,612 11,180 10,776
Noncompensation expense 11,926 11,264 11,100
Total noninterest expense 23,538 22,444 21,876
Income before income tax expense 23,020 16,544 15,566
Income tax expense 5,926 4,590 3,767
Net income $ 17,094 $ 11,954 $ 11,799
In the first quarter of 2020, the Merchant Services business was realigned from CCB to CIB as part of the Firm’s Wholesale Payments business. In the fourth quarter of 2020, payment processing-only clients along with the associated revenue and expenses were realigned to CIB’s Wholesale Payments business from CCB and CB. Prior-period amounts have been revised to conform with the current presentation.
(a) In the first quarter of 2020, the Firm reclassified certain fees from asset management, administration and commissions to lending- and deposit-related fees. Prior-period amounts have been revised to conform with the current presentation.
(b) Includes tax-equivalent adjustments, predominantly due to income tax credits related to alternative energy investments; income tax credits and amortization of the cost of investments in affordable housing projects; and tax-exempt income from municipal bonds of $2.8 billion, $2.3 billion and $1.7 billion for the years ended December 31, 2020, 2019 and 2018, respectively.
Selected income statement dataYear ended December 31,
(in millions, except ratios) 2020 2019 2018
Financial ratios
Return on equity 20 % 14 % 16 %
Overhead ratio 48 57 59
Compensation expense aspercentage of total net revenue 24 28 29
Revenue by business
Investment Banking $ 8,871 $ 7,215 $ 6,987
Wholesale Payments 5,560 5,842 5,930
Lending 1,146 1,021 999
Total Banking 15,577 14,078 13,916
Fixed Income Markets 20,878 14,418 12,706
Equity Markets 8,605 6,494 6,888
Securities Services 4,253 4,154 4,245
Credit Adjustments & Other(a) (29) 121 (373)
Total Markets & Securities Services 33,707 25,187 23,466
Total net revenue $ 49,284 $ 39,265 $ 37,382
In the first quarter of 2020, the Merchant Services business was realigned from CCB to CIB as part of the Firm’s Wholesale Payments business. In the fourth quarter of 2020, payment processing-only clients along with the associated revenue and expenses were realigned to CIB’s Wholesale Payments business from CCB and CB. Prior-period amounts have been revised to conform with the current presentation.
(a) Includes credit valuation adjustments (“CVA”) managed centrally within CIB and funding valuation adjustments (“FVA”) on derivatives and certain components of fair value option elected liabilities, which are primarily reported in principal transactions revenue. Results are presented net of associated hedging activities and net of CVA and FVA amounts allocated to Fixed Income Markets and Equity Markets. Refer to Notes 2, 3 and 24 for additional information.
JPMorgan Chase & Co./2020 Form 10-K 71

2020 compared with 2019
Net income was $17.1 billion, up 43%.
Net revenue was $49.3 billion, up 26%.
Banking revenue was $15.6 billion, up 11%.
• Investment Banking revenue was $8.9 billion, up 23%, driven by higher Investment Banking fees, up 25%, reflecting higher equity and debt underwriting fees. The Firm maintained its #1 ranking for Global Investment Banking fees with overall share gains, according to Dealogic.
– Equity underwriting fees were $2.8 billion, up 66%, predominantly in follow-on offerings and convertible securities markets due to increased industry-wide fees.
– Debt underwriting fees were $4.4 billion, up 23%, driven by increased industry-wide fees and wallet share gains in investment grade and high yield bonds. The increased activity resulted in part from clients seeking liquidity in the first half of the year as a result of the COVID-19 pandemic.
– Advisory fees of $2.4 billion were flat, reflecting an increase in wallet share, despite a decrease in industry-wide fees.
• Wholesale Payments revenue was $5.6 billion, down 5%, driven by deposit margin compression and a reporting reclassification for certain expenses which are now reported as a reduction of revenue in Merchant Services, largely offset by higher deposit balances.
• Lending revenue was $1.1 billion, up 12%, predominantly driven by higher net interest income reflecting higher yields on new loans and higher loan balances, as well as higher loan commitment fees, largely offset by fair value losses on hedges of accrual loans.
Markets & Securities Services revenue was $33.7 billion, up 34%. Markets revenue was $29.5 billion, up 41%.
• Fixed Income Markets revenue was $20.9 billion, up 45%, driven by strong client activity across products primarily in Rates, Credit, Currencies & Emerging Markets, and Securitized Products.
• Equity Markets revenue was $8.6 billion, up 33%, driven by strong client activity across products.
• Securities Services revenue was $4.3 billion, up 2%, driven by deposit balance and fee growth largely offset by deposit margin compression.
The provision for credit losses was $2.7 billion, compared with $277 million in the prior year. The increase was driven by net additions to the allowance for credit losses as a result of the impact of the COVID-19 pandemic across multiple industries.
Noninterest expense was $23.5 billion, up 5%, driven by higher volume- and revenue-related expense and legal expense.
Management’s discussion and analysis
72 JPMorgan Chase & Co./2020 Form 10-K

Selected metrics
As of or for the year ended December 31,(in millions, except headcount) 2020 2019 2018
Selected balance sheet data (period-end)
Assets $ 1,097,219 $ 914,705 $ 909,292
Loans:
Loans retained(a) 133,296 121,733 129,389
Loans held-for-sale and loans at fair value(b)(c) 39,588 34,317 36,407
Total loans 172,884 156,050 165,796
Equity 80,000 80,000 70,000
Selected balance sheet data (average)
Assets $ 1,122,939 $ 993,508 $ 930,126
Trading assets-debt and equity instruments(c) 422,237 376,182 321,280
Trading assets-derivative receivables 72,065 48,196 60,552
Loans:
Loans retained(a) 135,676 122,371 114,417
Loans held-for-sale and loans at fair value(b)(c) 33,792 32,884 30,317
Total loans 169,468 155,255 144,734
Equity 80,000 80,000 70,000
Headcount 61,733 60,013 58,572
In the first quarter of 2020, the Merchant Services business was realigned from CCB to CIB as part of the Firm’s Wholesale Payments business. In the fourth quarter of 2020, payment processing-only clients along with the associated revenue and expenses were realigned to CIB’s Wholesale Payments business from CCB and CB. Prior-period amounts have been revised to conform with the current presentation, including an increase to period-end assets of $6.6 billion and $6.2 billion and headcount of 4,022 and 4,092, as of December 31, 2019 and 2018, respectively.
(a) Loans retained includes credit portfolio loans, loans held by consolidated Firm-administered multi-seller conduits, trade finance loans, mortgage-related secured lending, other held-for-investment loans and overdrafts
(b) Loans held-for-sale and loans at fair value primarily reflect lending-related positions originated and purchased in CIB Markets, including loans held for securitization.
(c) In the third quarter of 2020, the Firm reclassified certain fair value option elected lending-related positions from trading assets to loans and other assets. Prior-period amounts have been revised to conform with the current presentation.
Selected metrics
As of or for the year ended December 31, (in millions, except ratios) 2020 2019 2018
Credit data and quality statistics
Net charge-offs/(recoveries) $ 370 $ 183 $ 93
Nonperforming assets:
Nonaccrual loans:
Nonaccrual loans retained(a) 1,008 308 443
Nonaccrual loans held-for-sale and loans at fair value(b)(c) 1,662 644 921
Total nonaccrual loans 2,670 952 1,364
Derivative receivables 56 30 60
Assets acquired in loan satisfactions 85 70 57
Total nonperforming assets 2,811 1,052 1,481
Allowance for credit losses:
Allowance for loan losses 2,366 1,202 1,199
Allowance for lending-related commitments 1,534 848 754
Total allowance for credit losses 3,900 2,050 1,953
Net charge-off/(recovery) rate(d) 0.27 % 0.15 % 0.08 %
Allowance for loan losses to period-end loans retained 1.77 0.99 0.93
Allowance for loan losses to period-end loans retained, excluding trade finance and conduits(e) 2.54 1.31 1.24
Allowance for loan losses to nonaccrual loans retained(a) 235 390 271
Nonaccrual loans to total period-end loans(b) 1.54 0.61 0.82
(a) Allowance for loan losses of $278 million, $110 million and $174 million were held against these nonaccrual loans at December 31, 2020, 2019 and 2018, respectively.
(b) In the third quarter of 2020, the Firm reclassified certain fair value option elected lending-related positions from trading assets to loans. Prior-period amounts have been revised to conform with the current presentation.
(c) At December 31, 2020, 2019 and 2018, nonaccrual loans excluded mortgage loans 90 or more days past due and insured by U.S. government agencies of $316 million, $127 million and $155 million, respectively. These amounts have been excluded based upon the government guarantee.
(d) Loans held-for-sale and loans at fair value were excluded when calculating the net charge-off/(recovery) rate.
(e) Management uses allowance for loan losses to period-end loans retained, excluding trade finance and conduits, a non-GAAP financial measure, to provide a more meaningful assessment of CIB’s allowance coverage ratio.
JPMorgan Chase & Co./2020 Form 10-K 73

Investment banking feesYear ended December 31,
(in millions) 2020 2019 2018
Advisory $ 2,368 $ 2,377 $ 2,509
Equity underwriting 2,758 1,666 1,684
Debt underwriting(a) 4,351 3,532 3,280
Total investment banking fees $ 9,477 $ 7,575 $ 7,473
(a) Represents long-term debt and loan syndications.
League table results – wallet share2020 2019 2018
Year ended December 31, Rank Share Rank Share Rank ShareBased on fees(a)
M&A(b)
Global # 2 9.3 % # 2 8.9 % # 2 8.6 %U.S. 2 9.7 2 9.2 2 8.8
Equity and equity-related(c)
Global 2 8.6 1 9.3 1 9.0 U.S. 2 11.1 2 13.2 1 12.3
Long-term debt(d)
Global 1 8.9 1 7.8 1 7.2 U.S. 1 12.8 1 12.0 1 11.4
Loan syndicationsGlobal 1 11.1 1 10.1 1 10.1 U.S. 1 11.5 1 12.5 1 12.3
Global investment banking fees(e) # 1 9.2 % # 1 8.9 % # 1 8.6 %
(a) Source: Dealogic as of January 4, 2021. Reflects the ranking of revenue wallet and market share.(b) Global M&A excludes any withdrawn transactions. U.S. M&A revenue wallet represents wallet from client parents based in the U.S.(c) Global equity and equity-related ranking includes rights offerings and Chinese A-Shares.(d) Long-term debt rankings include investment-grade, high-yield, supranationals, sovereigns, agencies, covered bonds, asset-backed securities (“ABS”) and
mortgage-backed securities (“MBS”); and exclude money market, short-term debt, and U.S. municipal securities.(e) Global investment banking fees exclude money market, short-term debt and shelf securities.
Markets revenueThe following table summarizes select income statement data for the Markets businesses. Markets consists of Fixed Income Markets and Equity Markets. Markets revenue comprises principal transactions, fees, commissions and other income, as well as net interest income. The Firm assesses its Markets business performance on a total revenue basis, as offsets may occur across revenue line items. For example, securities that generate net interest income may be risk-managed by derivatives that are recorded in principal transactions revenue. Refer to Notes 6 and 7 for a description of the composition of these income statement line items.
Principal transactions reflects revenue on financial instruments and commodities transactions that arise from client-driven market-making activity. Principal transactions revenue includes amounts recognized upon executing new transactions with market participants, as well as “inventory-related revenue”, which is revenue recognized from gains and losses on derivatives and other instruments that the Firm has been holding in anticipation of, or in response to, client demand, and changes in the fair value of instruments used by the Firm to actively manage the risk exposure arising from such inventory. Principal transactions revenue recognized upon executing new transactions with market participants is driven by many factors including the level of client activity, the bid-offer spread (which is the difference
between the price at which a market participant is willing and able to sell an instrument to the Firm and the price at which another market participant is willing and able to buy it from the Firm, and vice versa), market liquidity and volatility. These factors are interrelated and sensitive to the same factors that drive inventory-related revenue, which include general market conditions, such as interest rates, foreign exchange rates, credit spreads, and equity and commodity prices, as well as other macroeconomic conditions.
Management’s discussion and analysis
74 JPMorgan Chase & Co./2020 Form 10-K

For the periods presented below, the predominant source of principal transactions revenue was the amount recognized upon executing new transactions.
2020 2019 2018
Year ended December 31, (in millions, except where otherwise noted)
Fixed Income Markets
Equity Markets
Total Markets
Fixed Income Markets
Equity Markets
Total Markets
Fixed Income Markets
Equity Markets
Total Markets
Principal transactions $ 11,857 $ 6,087 $ 17,944 $ 8,786 $ 5,739 $ 14,525 $ 7,560 $ 5,566 $ 13,126 Lending- and deposit-related fees 226 10 236 198 7 205 197 6 203 Asset management,
administration and commissions 411 2,087 2,498 407 1,775 2,182 410 1,794 2,204 All other income 493 (62) 431 872 8 880 952 22 974
Noninterest revenue 12,987 8,122 21,109 10,263 7,529 17,792 9,119 7,388 16,507 Net interest income 7,891 483 8,374 4,155 (1,035) 3,120 3,587 (500) 3,087
Total net revenue $ 20,878 $ 8,605 $ 29,483 $ 14,418 $ 6,494 $ 20,912 $ 12,706 $ 6,888 $ 19,594
Loss days(a) 4 1 5
(a) Loss days represent the number of days for which CIB Markets, which consists of Fixed Income Markets and Equity Markets, posted losses to total net revenue. The loss days determined under this measure differ from the measure used to determine backtesting gains and losses. Daily backtesting gains and losses include positions in the Firm’s Risk Management value-at-risk (“VaR”) measure and exclude select components of total net revenue, which may more than offset backtesting gains or losses on a particular day. For more information on daily backtesting gains and losses, refer to the VaR discussion on pages 137–139.
Selected metricsAs of or for the year ended December 31, (in millions, except where otherwise noted) 2020 2019 2018
Assets under custody (“AUC”) by asset class (period-end) (in billions):
Fixed Income $ 15,840 $ 13,498 $ 12,440
Equity 11,489 10,100 8,078
Other(a) 3,651 3,233 2,699
Total AUC $ 30,980 $ 26,831 $ 23,217
Merchant processing volume (in billions)(b) $ 1,597.3 $ 1,511.5 $ 1,366.1
Client deposits and other third party liabilities (average)(c) $ 610,555 $ 464,795 $ 434,422
In the first quarter of 2020, the Merchant Services business was realigned from CCB to CIB as part of the Firm’s Wholesale Payments business. Prior-period amounts have been revised to conform with the current presentation.
(a) Consists of mutual funds, unit investment trusts, currencies, annuities, insurance contracts, options and other contracts.(b) Represents total merchant processing volume across CIB, CCB and CB.(c) Client deposits and other third-party liabilities pertain to the Wholesale Payments and Securities Services businesses.
JPMorgan Chase & Co./2020 Form 10-K 75

International metricsAs of or for the year ended December 31, (in millions, except where otherwise noted) 2020 2019(c) 2018(c)
Total net revenue(a)
Europe/Middle East/Africa $ 13,872 $ 11,905 $ 12,422
Asia-Pacific 7,524 5,319 5,077
Latin America/Caribbean 1,931 1,543 1,473
Total international net revenue 23,327 18,767 18,972
North America 25,957 20,498 18,410
Total net revenue $ 49,284 $ 39,265 $ 37,382
Loans retained (period-end)(a)
Europe/Middle East/Africa $ 27,659 $ 26,067 $ 23,648
Asia-Pacific 12,802 14,759 17,101
Latin America/Caribbean 5,425 6,173 6,515
Total international loans 45,886 46,999 47,264
North America 87,410 74,734 82,125
Total loans retained $ 133,296 $ 121,733 $ 129,389
Client deposits and other third-party liabilities (average)(b)
Europe/Middle East/Africa $ 211,592 $ 174,477 $ 162,846
Asia-Pacific 124,145 90,364 82,867
Latin America/Caribbean 37,664 29,024 26,668
Total international $ 373,401 $ 293,865 $ 272,381
North America 237,154 170,930 162,041
Total client deposits and other third-party liabilities $ 610,555 $ 464,795 $ 434,422
AUC (period-end)(b)
(in billions)
North America $ 20,028 $ 16,855 $ 14,359
All other regions 10,952 9,976 8,858
Total AUC $ 30,980 $ 26,831 $ 23,217
In the first quarter of 2020, the Merchant Services business was realigned from CCB to CIB as part of the Firm’s Wholesale Payments business. In the fourth quarter of 2020, payment processing-only clients along with the associated revenue and expenses were realigned to CIB’s Wholesale Payments business from CCB and CB. Prior-period amounts have been revised to conform with the current presentation.
(a) Total net revenue and loans retained (excluding loans held-for-sale and loans at fair value) are based on the location of the trading desk, booking location, or domicile of the client, as applicable.
(b) Client deposits and other third-party liabilities pertaining to the Wholesale Payments and Securities Services businesses, and AUC, are based on the domicile of the client.
(c) Prior-period amounts have been revised to conform with the current presentation.
Management’s discussion and analysis
76 JPMorgan Chase & Co./2020 Form 10-K

COMMERCIAL BANKING
Commercial Banking provides comprehensive financial solutions, including lending, wholesale payments, investment banking and asset management products across three primary client segments: Middle Market Banking, Corporate Client Banking and Commercial Real Estate Banking. Other includes amounts not aligned with a primary client segment.
Middle Market Banking covers small and midsized companies, local governments and nonprofit clients.
Corporate Client Banking covers large corporations.
Commercial Real Estate Banking covers investors, developers, and owners of multifamily, office, retail, industrial and affordable housing properties.
Selected income statement dataYear ended December 31,(in millions) 2020 2019 2018
Revenue
Lending- and deposit-related fees(a) $ 1,187 $ 941 $ 896
All other income(a) 1,880 1,769 1,724
Noninterest revenue 3,067 2,710 2,620
Net interest income 6,246 6,554 6,716
Total net revenue(b) 9,313 9,264 9,336
Provision for credit losses 2,113 296 129
Noninterest expense
Compensation expense 1,854 1,785 1,694
Noncompensation expense 1,944 1,950 1,933
Total noninterest expense 3,798 3,735 3,627
Income before income tax expense 3,402 5,233 5,580
Income tax expense 824 1,275 1,316
Net income $ 2,578 $ 3,958 $ 4,264
In the first quarter of 2020, the Merchant Services business was realigned from CCB to CIB as part of the Firm’s Wholesale Payments business. In conjunction with this realignment, treasury services product revenue has been renamed wholesale payments. In the fourth quarter of 2020, payment processing-only clients along with the associated revenue and expenses were realigned to CIB’s Wholesale Payments business from CCB and CB. Prior-period revenue and expense amounts have been revised to conform with the current presentation.
(a) In the first quarter of 2020, the Firm reclassified certain fees from asset management, administration and commissions (which are included in all other income) to lending and deposit-related fees. Prior period amounts have been revised to conform with the current period presentation.
(b) Total net revenue included tax-equivalent adjustments from income tax credits related to equity investments in designated community development entities and in entities established for rehabilitation of historic properties, as well as tax-exempt income related to municipal financing activities of $351 million, $460 million and $444 million for the years ended December 31, 2020, 2019 and 2018, respectively.
2020 compared with 2019 Net income was $2.6 billion, a decrease of 35%, driven by an increase in the provision for credit losses.
Net revenue was $9.3 billion, flat compared to the prior year. Net interest income was $6.2 billion, a decrease of 5%, driven by deposit margin compression, predominantly offset by higher deposit balances and lending revenue. Noninterest revenue was $3.1 billion, an increase of 13%, driven by higher deposit-related fees, particularly cash management fees, higher investment banking revenue, and a gain on a strategic investment. The increase was partially offset by a $56 million markdown of a held-for-sale position and lower card income, primarily due to lower volumes as a result of the COVID-19 pandemic.
Noninterest expense was $3.8 billion, an increase of 2%, driven by higher compensation expense.
The provision for credit losses was $2.1 billion, compared to $296 million in the prior year. The increase was driven by net additions to the allowance for credit losses as a result of the impact of the COVID-19 pandemic across multiple industries.
JPMorgan Chase & Co./2020 Form 10-K 77
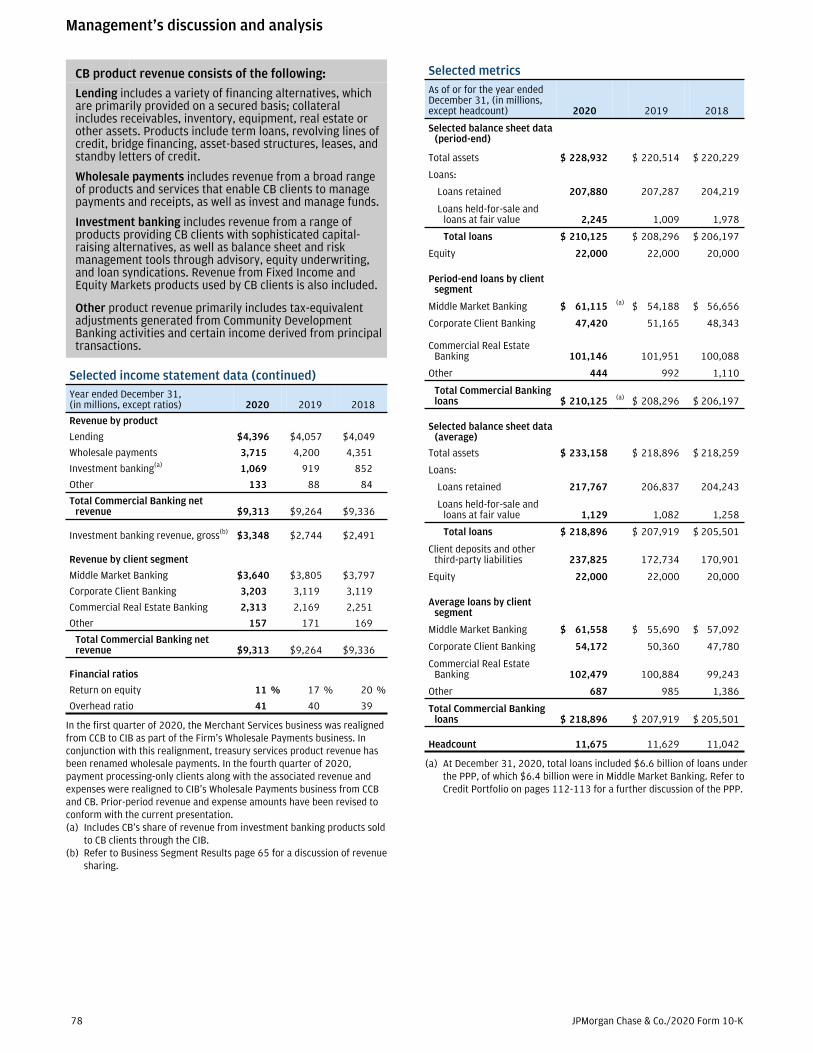
CB product revenue consists of the following:
Lending includes a variety of financing alternatives, which are primarily provided on a secured basis; collateral includes receivables, inventory, equipment, real estate or other assets. Products include term loans, revolving lines of credit, bridge financing, asset-based structures, leases, and standby letters of credit.
Wholesale payments includes revenue from a broad range of products and services that enable CB clients to manage payments and receipts, as well as invest and manage funds.
Investment banking includes revenue from a range of products providing CB clients with sophisticated capital-raising alternatives, as well as balance sheet and risk management tools through advisory, equity underwriting, and loan syndications. Revenue from Fixed Income and Equity Markets products used by CB clients is also included.
Other product revenue primarily includes tax-equivalent adjustments generated from Community Development Banking activities and certain income derived from principal transactions.
Selected income statement data (continued)Year ended December 31,(in millions, except ratios) 2020 2019 2018
Revenue by product
Lending $ 4,396 $ 4,057 $ 4,049
Wholesale payments 3,715 4,200 4,351
Investment banking(a) 1,069 919 852
Other 133 88 84
Total Commercial Banking net revenue $ 9,313 $ 9,264 $ 9,336
Investment banking revenue, gross(b) $ 3,348 $ 2,744 $ 2,491
Revenue by client segment
Middle Market Banking $ 3,640 $ 3,805 $ 3,797
Corporate Client Banking 3,203 3,119 3,119
Commercial Real Estate Banking 2,313 2,169 2,251
Other 157 171 169
Total Commercial Banking net revenue $ 9,313 $ 9,264 $ 9,336
Financial ratios
Return on equity 11 % 17 % 20 %
Overhead ratio 41 40 39
In the first quarter of 2020, the Merchant Services business was realigned from CCB to CIB as part of the Firm’s Wholesale Payments business. In conjunction with this realignment, treasury services product revenue has been renamed wholesale payments. In the fourth quarter of 2020, payment processing-only clients along with the associated revenue and expenses were realigned to CIB’s Wholesale Payments business from CCB and CB. Prior-period revenue and expense amounts have been revised to conform with the current presentation.(a) Includes CB’s share of revenue from investment banking products sold
to CB clients through the CIB.(b) Refer to Business Segment Results page 65 for a discussion of revenue
sharing.
Selected metricsAs of or for the year ended December 31, (in millions, except headcount) 2020 2019 2018
Selected balance sheet data (period-end)
Total assets $ 228,932 $ 220,514 $ 220,229
Loans:
Loans retained 207,880 207,287 204,219
Loans held-for-sale and loans at fair value 2,245 1,009 1,978
Total loans $ 210,125 $ 208,296 $ 206,197
Equity 22,000 22,000 20,000
Period-end loans by client segment
Middle Market Banking $ 61,115 (a) $ 54,188 $ 56,656
Corporate Client Banking 47,420 51,165 48,343
Commercial Real Estate Banking 101,146 101,951 100,088
Other 444 992 1,110
Total Commercial Banking loans $ 210,125 (a) $ 208,296 $ 206,197
Selected balance sheet data (average)
Total assets $ 233,158 $ 218,896 $ 218,259
Loans:
Loans retained 217,767 206,837 204,243
Loans held-for-sale and loans at fair value 1,129 1,082 1,258
Total loans $ 218,896 $ 207,919 $ 205,501
Client deposits and other third-party liabilities 237,825 172,734 170,901
Equity 22,000 22,000 20,000
Average loans by client segment
Middle Market Banking $ 61,558 $ 55,690 $ 57,092
Corporate Client Banking 54,172 50,360 47,780
Commercial Real Estate Banking 102,479 100,884 99,243
Other 687 985 1,386
Total Commercial Banking loans $ 218,896 $ 207,919 $ 205,501
Headcount 11,675 11,629 11,042
(a) At December 31, 2020, total loans included $6.6 billion of loans under the PPP, of which $6.4 billion were in Middle Market Banking. Refer to Credit Portfolio on pages 112-113 for a further discussion of the PPP.
Management’s discussion and analysis
78 JPMorgan Chase & Co./2020 Form 10-K

Selected metricsAs of or for the year ended December 31, (in millions, except ratios) 2020 2019 2018
Credit data and quality statistics
Net charge-offs/(recoveries) $ 401 $ 160 $ 53
Nonperforming assets
Nonaccrual loans:
Nonaccrual loans retained(a) 1,286 498 511
Nonaccrual loans held-for-sale and loans at fair value 120 — —
Total nonaccrual loans 1,406 498 511
Assets acquired in loan satisfactions 24 25 2
Total nonperforming assets 1,430 523 513
Allowance for credit losses:
Allowance for loan losses 3,335 2,780 2,682
Allowance for lending-related commitments 651 293 254
Total allowance for credit losses 3,986 3,073 2,936
Net charge-off/(recovery) rate(b) 0.18 % 0.08 % 0.03 %
Allowance for loan losses to period-end loans retained 1.60 1.34 1.31
Allowance for loan losses to nonaccrual loans retained(a) 259 558 525
Nonaccrual loans to period-end total loans 0.67 0.24 0.25
(a) Allowance for loan losses of $273 million, $114 million and $92 million was held against nonaccrual loans retained at December 31, 2020, 2019 and 2018, respectively.
(b) Loans held-for-sale and loans at fair value were excluded when calculating the net charge-off/(recovery) rate.
JPMorgan Chase & Co./2020 Form 10-K 79

ASSET & WEALTH MANAGEMENT
Asset & Wealth Management, with client assets of $3.7 trillion, is a global leader in investment and wealth management.
Asset Management Offers multi-asset investment management solutions across equities, fixed income, alternatives and money market funds to institutional and retail investors providing for a broad range of clients’ investment needs.
Wealth ManagementProvides retirement products and services, brokerage, custody, trusts and estates, loans, mortgages, deposits and investment management to high net worth clients.
The majority of AWM’s client assets are in actively managed portfolios.
Selected income statement dataYear ended December 31,(in millions, except ratios and headcount) 2020 2019 2018
Revenue
Asset management, administration and commissions $ 10,610 $ 9,818 $ 9,808
All other income 212 418 244
Noninterest revenue 10,822 10,236 10,052
Net interest income 3,418 3,355 3,375
Total net revenue 14,240 13,591 13,427
Provision for credit losses 263 59 52
Noninterest expense
Compensation expense 4,959 5,028 4,888
Noncompensation expense 4,998 4,719 4,687
Total noninterest expense 9,957 9,747 9,575
Income before income tax expense 4,020 3,785 3,800
Income tax expense 1,028 918 855
Net income $ 2,992 $ 2,867 $ 2,945
Revenue by line of business
Asset Management $ 7,654 $ 7,254 $ 7,163
Wealth Management 6,586 6,337 6,264
Total net revenue $ 14,240 $ 13,591 $ 13,427
Financial ratios
Return on common equity 28 % 26 % 32 %
Overhead ratio 70 72 71
Pre-tax margin ratio:
Asset Management 29 26 26
Wealth Management 27 30 30
Asset & Wealth Management 28 28 28
In the fourth quarter of 2020, the Firm realigned certain wealth management clients from AWM to CCB. Prior-period amounts have been revised to conform with the current presentation, including a decrease to net revenue of $725 million and $649 million for the years ended December 31, 2019 and 2018, respectively. Effective in the first quarter of 2021, the Wealth Management business was renamed Global Private Bank.
2020 compared with 2019 Net income was $3.0 billion, an increase of 4%.
Net revenue was $14.2 billion, an increase of 5%. Net interest income was $3.4 billion, up 2%, driven by higher deposit and loan balances as well as loan margin expansion, offset by deposit margin compression. Noninterest revenue was $10.8 billion, up 6%, predominantly driven by higher asset management fees as a result of net inflows into liquidity and long term products, higher performance fees and increased brokerage commissions on higher client-driven volume, partially offset by lower net investment valuation gains.
Revenue from Asset Management was $7.7 billion, up 6%, predominantly driven by higher asset management fees as a result of net inflows into liquidity products as well as higher performance fees, partially offset by lower net investment valuation gains.
Revenue from Wealth Management was $6.6 billion, up 4%, predominantly driven by higher deposit and loan balances, increased brokerage commissions and asset management fees, largely offset by deposit margin compression.
The provision for credit losses was $263 million, driven by additions to the allowance for credit losses, predominantly as a result of the impact of the COVID-19 pandemic.
Noninterest expense was $10.0 billion, an increase of 2%, driven by legal expense, volume- and revenue-related expense as well as investments in the business, partially offset by lower structural expense.
Management’s discussion and analysis
80 JPMorgan Chase & Co./2020 Form 10-K

AWM’s client segments consist of the following:
Private Banking clients include high- and ultra-high-net-worth individuals, families, money managers and business owners.
Institutional clients include both corporate and public institutions, endowments, foundations, nonprofit organizations and governments worldwide.
Retail clients include financial intermediaries and individual investors.
Asset Management has two high-level measures of its overall fund performance.• Percentage of mutual fund assets under management in funds
rated 4- or 5-star: Mutual fund rating services rank funds based on their risk-adjusted performance over various periods. A 5-star rating is the best rating and represents the top 10% of industry-wide ranked funds. A 4-star rating represents the next 22.5% of industry-wide ranked funds. A 3-star rating represents the next 35% of industry-wide ranked funds. A 2-star rating represents the next 22.5% of industry-wide ranked funds. A 1-star rating is the worst rating and represents the bottom 10% of industry-wide ranked funds. The “overall Morningstar rating” is derived from a weighted average of the performance associated with a fund’s three-, five- and ten-year (if applicable) Morningstar Rating metrics. For U.S. domiciled funds, separate star ratings are given at the individual share class level. The Nomura “star rating” is based on three-year risk-adjusted performance only. Funds with fewer than three years of history are not rated and hence excluded from this analysis. All ratings, the assigned peer categories and the asset values used to derive this analysis are sourced from these fund rating providers mentioned in footnote (a). The data providers re-denominate the asset values into U.S. dollars. This % of AUM is based on star ratings at the share class level for U.S. domiciled funds, and at a “primary share class” level to represent the star rating of all other funds except for Japan where Nomura provides ratings at the fund level. The “primary share class”, as defined by Morningstar, denotes the share class recommended as being the best proxy for the portfolio and in most cases will be the most retail version (based upon annual management charge, minimum investment, currency and other factors). The performance data could have been different if all funds/accounts would have been included. Past performance is not indicative of future results.
• Percentage of mutual fund assets under management in funds ranked in the 1st or 2nd quartile (one, three and five years): All quartile rankings, the assigned peer categories and the asset values used to derive this analysis are sourced from the fund ranking providers mentioned in footnote (b). Quartile rankings are done on the net-of-fee absolute return of each fund. The data providers re-denominate the asset values into U.S. dollars. This % of AUM is based on fund performance and associated peer rankings at the share class level for U.S. domiciled funds and at the “primary share class” level or fund level for all other funds. The “primary share class”, as defined by Morningstar, denotes the share class recommended as being the best proxy for the portfolio and in most cases will be the most retail version (based upon annual management charge, minimum investment, currency and other factors). Where peer group rankings given for a fund are in more than one “primary share class” territory both rankings are included to reflect local market competitiveness. The performance data could have been different if all funds/accounts would have been included. Past performance is not indicative of future results.
Selected metricsAs of or for the year ended
December 31, (in millions, except ranking
data and ratios) 2020 2019 2018
% of JPM mutual fund assets rated as 4- or 5-star(a) 55 % 61 % 58 %
% of JPM mutual fund assets ranked in 1st or 2nd quartile:(b)
1 year 55 59 68
3 years 69 77 73
5 years 68 75 85
Selected balance sheet data (period-end)(c)
Total assets $ 203,384 $ 173,175 $ 161,047
Loans 186,608 158,149 145,794
Deposits 198,755 142,740 133,276
Equity 10,500 10,500 9,000
Selected balance sheet data (average)(c)
Total assets $ 181,432 $ 161,863 $ 151,632
Loans 166,311 147,404 136,929
Deposits 161,955 135,265 132,123
Equity 10,500 10,500 9,000
Headcount 20,683 21,550 21,520
Number of Wealth Management client advisors 2,462 2,419 2,385
Credit data and quality statistics(c)
Net charge-offs/(recoveries) $ (14) $ 29 $ —
Nonaccrual loans 785 115 263
Allowance for credit losses:
Allowance for loan losses 598 350 326
Allowance for lending-related commitments 38 19 16
Total allowance for credit losses 636 369 342
Net charge-off/(recovery) rate (0.01) % 0.02 % — %
Allowance for loan losses to period-end loans 0.32 0.22 0.22
Allowance for loan losses to nonaccrual loans 76 304 124
Nonaccrual loans to period-end loans 0.42 0.07 0.18
In the fourth quarter of 2020, the Firm realigned certain wealth management clients from AWM to CCB. Prior-period amounts have been revised to conform with the current presentation, including a decrease to headcount of 2,641 and 2,400 as of December 31, 2019 and 2018, respectively.
(a) Represents the Nomura “star rating” for Japan domiciled funds and Morningstar for all other domiciled funds. Includes only Asset Management retail open-ended mutual funds that have a rating. Excludes money market funds, Undiscovered Managers Fund, and Brazil domiciled funds.
(b) Quartile ranking sourced from Lipper, Morningstar and Nomura based on country of domicile. Includes only Asset Management retail open-ended mutual funds that are ranked by the aforementioned sources. Excludes money market funds, Undiscovered Managers Fund, and Brazil domiciled funds.
(c) Loans, deposits and related credit data and quality statistics relate to the Wealth Management business.
JPMorgan Chase & Co./2020 Form 10-K 81

Client assets2020 compared with 2019Client assets were $3.7 trillion, an increase of 18%. Assets under management were $2.7 trillion, an increase of 17% driven by the impact of higher market levels and net inflows into both long-term and liquidity products.
Client assetsDecember 31, (in billions) 2020 2019 2018
Assets by asset class
Liquidity $ 641 $ 539 $ 477
Fixed income 671 591 455
Equity 595 463 376
Multi-asset 656 596 515
Alternatives 153 139 135
Total assets under management 2,716 2,328 1,958
Custody/brokerage/administration/deposits 936 761 661
Total client assets $ 3,652 $ 3,089 $ 2,619
Assets by client segment
Private Banking $ 689 $ 628 $ 518
Institutional 1,273 1,081 930
Retail 754 619 510
Total assets under management $ 2,716 $ 2,328 $ 1,958
Private Banking $ 1,581 $ 1,359 $ 1,155
Institutional 1,311 1,106 950
Retail 760 624 514
Total client assets $ 3,652 $ 3,089 $ 2,619
Client assets (continued)Year ended December 31,(in billions) 2020 2019 2018
Assets under management rollforward
Beginning balance $ 2,328 $ 1,958 $ 2,010
Net asset flows:
Liquidity 104 61 30
Fixed income 48 104 (4)
Equity 33 (11) —
Multi-asset 5 2 17
Alternatives 6 2 5
Market/performance/other impacts 192 212 (100)
Ending balance, December 31 $ 2,716 $ 2,328 $ 1,958
Client assets rollforward
Beginning balance $ 3,089 $ 2,619 $ 2,685
Net asset flows 276 176 74
Market/performance/other impacts 287 294 (140)
Ending balance, December 31 $ 3,652 $ 3,089 $ 2,619
In the fourth quarter of 2020, the Firm realigned certain wealth management clients from AWM to CCB. Prior-period amounts have been revised to conform with the current presentation, including a decrease to client assets of $137 billion and $114 billion as of December 31, 2019 and 2018, respectively.
International metricsYear ended December 31,(in billions, except where otherwise noted) 2020 2019 2018
Total net revenue (in millions)(a)
Europe/Middle East/Africa(b) $ 2,956 $ 2,869 $ 2,850
Asia-Pacific(b) 1,665 1,509 1,538
Latin America/Caribbean(b) 782 724 755
Total international net revenue 5,403 5,102 5,143
North America 8,837 8,489 8,284
Total net revenue $ 14,240 $ 13,591 $ 13,427
Assets under management
Europe/Middle East/Africa(b) $ 517 $ 428 $ 366
Asia-Pacific(b) 224 192 163
Latin America/Caribbean(b) 70 62 51
Total international assets under management 811 682 580
North America 1,905 1,646 1,378
Total assets under management $ 2,716 $ 2,328 $ 1,958
Client assets
Europe/Middle East/Africa(b) $ 622 $ 520 $ 440
Asia-Pacific(b) 330 272 226
Latin America/Caribbean(b) 166 147 125
Total international client assets 1,118 939 791
North America 2,534 2,150 1,828
Total client assets $ 3,652 $ 3,089 $ 2,619
In the fourth quarter of 2020, the Firm realigned certain wealth management clients from AWM to CCB. Prior-period amounts have been revised to conform with the current presentation, including a decrease to net revenue of $725 million and $649 million for the years ended December 31, 2019 and 2018, respectively, and client assets of $137 billion and $114 billion as of December 31, 2019 and 2018, respectively.
(a) Regional revenue is based on the domicile of the client.(b) The prior period amounts have been revised to conform with the
current period presentation.
Management’s discussion and analysis
82 JPMorgan Chase & Co./2020 Form 10-K

CORPORATE
The Corporate segment consists of Treasury and Chief Investment Office and Other Corporate, which includes corporate staff functions and expense that is centrally managed. Treasury and CIO is predominantly responsible for measuring, monitoring, reporting and managing the Firm’s liquidity, funding, capital, structural interest rate and foreign exchange risks. The major Other Corporate functions include Real Estate, Technology, Legal, Corporate Finance, Human Resources, Internal Audit, Risk Management, Compliance, Control Management, Corporate Responsibility and various Other Corporate groups.
Selected income statement and balance sheet dataYear ended December 31,(in millions, except headcount) 2020 2019 2018RevenuePrincipal transactions $ 245 $ (461) $ (426)
Investment securities gains/(losses) 795 258 (395) All other income 159 89 558 Noninterest revenue 1,199 (114) (263) Net interest income (2,375) 1,325 135 Total net revenue(a) (1,176) 1,211 (128)
Provision for credit losses 66 (1) (4)
Noninterest expense 1,373 1,067 902
Income/(loss) before income tax expense/(benefit) (2,615) 145 (1,026)
Income tax expense/(benefit) (865) (966) 215 Net income/(loss) $ (1,750) $ 1,111 $ (1,241) Total net revenueTreasury and CIO (1,368) 2,032 510 Other Corporate 192 (821) (638) Total net revenue $ (1,176) $ 1,211 $ (128) Net income/(loss)Treasury and CIO (1,403) 1,394 (69) Other Corporate (347) (283) (1,172) Total net income/(loss) $ (1,750) $ 1,111 $ (1,241)
Total assets (period-end) $ 1,359,831 $ 837,618 $ 771,787 Loans (period-end) 1,657 1,649 1,597 Headcount 38,366 38,033 37,145
(a) Included tax-equivalent adjustments, driven by tax-exempt income from municipal bonds, of $241 million, $314 million and $382 million for the years ended December 31, 2020, 2019 and 2018, respectively.
2020 compared with 2019Net income was a loss of $1.8 billion compared with income of $1.1 billion in the prior year.
Net revenue was a loss of $1.2 billion, compared with revenue of $1.2 billion in the prior year, driven by lower net interest income partially offset by higher noninterest revenue. The decrease in net interest income was predominantly driven by lower rates, including the impact of faster prepayments on mortgage-backed securities, as well as limited opportunities to deploy funds in response to significant deposit growth across the LOBs.
Noninterest revenue increased reflecting higher net valuations on certain legacy equity investments and higher net investment securities gains due to the repositioning of the investment securities portfolio.
Noninterest expense of $1.4 billion was up $305 million driven by an impairment on a legacy investment.
The provision for credit losses relates to the HTM portfolio, which became subject to the CECL accounting guidance beginning on January 1, 2020.
Refer to Note 10 and Note 13 for additional information on the investment securities portfolio and the allowance for credit losses.
The current period income tax benefit was predominantly driven by a lower level of pre-tax income and changes in the level and mix of income and expenses subject to U.S. federal, and state and local taxes. The prior period included $1.1 billion of tax benefits related to the resolution of certain tax audits.
JPMorgan Chase & Co./2020 Form 10-K 83

Treasury and CIO overview Treasury and CIO is predominantly responsible for measuring, monitoring, reporting and managing the Firm’s liquidity, funding, capital, structural interest rate and foreign exchange risks. The risks managed by Treasury and CIO arise from the activities undertaken by the Firm’s four major reportable business segments to serve their respective client bases, which generate both on- and off-balance sheet assets and liabilities.
Treasury and CIO seek to achieve the Firm’s asset-liability management objectives generally by investing in high-quality securities that are managed for the longer-term as part of the Firm’s investment securities portfolio. Treasury and CIO also use derivatives to meet the Firm’s asset-liability management objectives. Refer to Note 5 for further information on derivatives. In addition, Treasury and CIO manage the Firm’s cash position primarily through deposits at central banks and investments in short-term instruments. Refer to Liquidity Risk Management on pages 102–108 for further information on liquidity and funding risk. Refer to Market Risk Management on pages 135–142 for information on interest rate, foreign exchange and other risks.
The investment securities portfolio primarily consists of U.S. GSE and government agency and nonagency mortgage-backed securities, U.S. and non-U.S. government securities, obligations of U.S. states and municipalities, other ABS and corporate debt securities. At December 31, 2020, the investment securities portfolio was $587.9 billion, and the average credit rating of the securities comprising the portfolio was AA+ (based upon external ratings where available and, where not available, based primarily upon internal risk ratings). Refer to Note 10 for further information on the Firm’s investment securities portfolio and internal risk ratings.
Selected income statement and balance sheet dataAs of or for the year ended December 31, (in millions) 2020 2019 2018
Investment securities gains/(losses) $ 795 $ 258 $ (395)
Available-for-sale securities (average) $ 413,367 $ 283,205 $ 203,449
Held-to-maturity securities (average) 94,569 34,939 31,747
Investment securities portfolio (average) $ 507,936 $ 318,144 $ 235,196
Available-for-sale securities (period-end) $ 386,065 $ 348,876 $ 228,681
Held-to-maturity securities, net of allowance for credit losses (period–end)(a)(b) 201,821 47,540 31,434
Investment securities portfolio, net of allowance for credit losses (period–end)(a) $ 587,886 $ 396,416 $ 260,115
(a) At December 31, 2020, the allowance for credit losses on HTM securities was $78 million.
(b) During 2020, the Firm transferred $164.2 billion of investment securities from AFS to HTM for capital management purposes.
Refer to Note 10 for further information.
Management’s discussion and analysis
84 JPMorgan Chase & Co./2020 Form 10-K

FIRMWIDE RISK MANAGEMENT
Risk is an inherent part of JPMorgan Chase’s business activities. When the Firm extends a consumer or wholesale loan, advises customers and clients on their investment decisions, makes markets in securities, or offers other products or services, the Firm takes on some degree of risk. The Firm’s overall objective is to manage its businesses, and the associated risks, in a manner that balances serving the interests of its clients, customers and investors and protects the safety and soundness of the Firm.
The Firm believes that effective risk management requires, among other things:
• Acceptance of responsibility, including identification and escalation of risks by all individuals within the Firm;
• Ownership of risk identification, assessment, data and management within each of the LOBs and Corporate; and
• Firmwide structures for risk governance.
The Firm follows a disciplined and balanced compensation framework with strong internal governance and independent oversight by the Board of Directors (the “Board”). The impact of risk and control issues is carefully considered in the Firm’s performance evaluation and incentive compensation processes.
Risk governance and oversight frameworkThe Firm’s risk management governance and oversight framework involves understanding drivers of risks, types of risks, and impacts of risks.
Drivers of Risks are factors that cause a risk to exist. Drivers of risks include the economic environment, regulatory and government policy, competitor and market evolution, business decisions, process and judgment error, deliberate wrongdoing, dysfunctional markets, and natural disasters.
Types of Risks are categories by which risks manifest themselves. Risks are generally categorized in the following four risk types:
• Strategic risk is the risk to earnings, capital, liquidity or reputation associated with poorly designed or failed business plans or inadequate response to changes in the operating environment.
• Credit and investment risk is the risk associated with the default or change in credit profile of a client, counterparty or customer; or loss of principal or a reduction in expected returns on investments, including
consumer credit risk, wholesale credit risk, and investment portfolio risk.
• Market risk is the risk associated with the effect of changes in market factors, such as interest and foreign exchange rates, equity and commodity prices, credit spreads or implied volatilities, on the value of assets and liabilities held for both the short and long term.
• Operational risk is the risk associated with an adverse outcome resulting from inadequate or failed internal processes or systems; human factors; or external events impacting the Firm’s processes or systems. It includes compliance, conduct, legal, and estimations and model risk.
Impacts of Risks are consequences of risks, both quantitative and qualitative. There may be many consequences of risks manifesting, including quantitative impacts such as a reduction in earnings and capital, liquidity outflows, and fines or penalties, or qualitative impacts such as reputation damage, loss of clients and customers, and regulatory and enforcement actions.
The Firm’s risk governance and oversight framework is managed on a Firmwide basis. The Firm has an Independent Risk Management (“IRM”) function, which consists of the Risk Management and Compliance organizations. The Chief Executive Officer (“CEO”) appoints, subject to approval by the Risk Committee of the Board (“Board Risk Committee”), the Firm’s Chief Risk Officer (“CRO”) to lead the IRM organization and manage the risk governance structure of the Firm. The framework is subject to approval by the Board Risk Committee in the form of the Risk Governance and Oversight Policy. The Firm’s CRO oversees and delegates authorities to LOB CROs, Firmwide Risk Executives (“FREs”), and the Firm’s Chief Compliance Officer (“CCO”), who each establish Risk Management and Compliance organizations, set the Firm’s risk governance policies and standards, and define and oversee the implementation of the Firm’s risk governance. The LOB CROs are responsible for risks that arise in their LOBs, while FREs oversee risk areas that span across the individual LOBs, functions and regions.
Three lines of defenseThe Firm relies upon each of its LOBs and Corporate areas giving rise to risk to operate within the parameters identified by the IRM function, and within its own management-identified risk and control standards. Each LOB and Treasury & CIO, including their aligned Operations, Technology and Control Management, are the Firm’s “first line of defense” and own the identification of risks, as well as the design and execution of controls to manage those risks. The first line of defense is responsible for adherence to applicable laws, rules and regulations and for the implementation of the risk management structure (which may include policy, standards, limits, thresholds and controls) established by IRM.
JPMorgan Chase & Co./2020 Form 10-K 85

The IRM function is independent of the businesses and is the Firm’s “second line of defense.” The IRM function independently assesses and challenges the first line of defense risk management practices. IRM is also responsible for its own adherence to applicable laws, rules and regulations and for the implementation of policies and standards established by IRM with respect to its own processes.
Internal Audit is an independent function that provides objective assessment on the adequacy and effectiveness of Firmwide processes, controls, governance and risk management as the “third line of defense.” The Internal Audit Function is headed by the General Auditor, who reports to the Audit Committee and administratively to the CEO.
In addition, there are other functions that contribute to the Firmwide control environment but are not considered part of a particular line of defense, including Finance, Human Resources and Legal.
Risk identification and ownershipEach LOB and Corporate area owns the ongoing identification of risks, as well as the design and execution of controls, inclusive of IRM-specified controls, to manage those risks. To support this activity, the Firm has a formal Risk Identification framework designed to facilitate their responsibility to identify material risks inherent to the Firm, catalog them in a central repository and review the most material risks on a regular basis. The IRM function reviews and challenges the LOB and Corporate’s identified risks, maintains the central repository and provides the consolidated Firmwide results to the Firmwide Risk Committee (“FRC”) and Board Risk Committee.
Risk appetiteThe Firm’s overall appetite for risk is governed by a “Risk Appetite” framework. The framework and the Firm’s risk appetite are set and approved by the Firm’s CEO, Chief Financial Officer (“CFO”) and CRO. Quantitative parameters and qualitative factors are used to monitor and measure the Firm’s capacity to take risk consistent with its stated risk appetite. Qualitative factors have been established to assess select operational risks, and impact to the Firm’s reputation. Risk Appetite results are reported to the Board Risk Committee.
Management’s discussion and analysis
86 JPMorgan Chase & Co./2020 Form 10-K

Risk governance and oversight structureThe independent status of the IRM function is supported by a governance structure that provides for escalation of risk issues to senior management, the FRC, and the Board of Directors, as appropriate.
The chart below illustrates the committees of the Board of Directors and key senior management-level committees in the Firm’s risk governance structure. In addition, there are other committees, forums and paths of escalation that support the oversight of risk which are not shown in the chart below or described in this Form 10-K.
The Firm’s Operating Committee, which consists of the Firm’s CEO, CRO, CFO, General Counsel, CEOs of the LOBs and other senior executives, is accountable to and may refer matters to the Firm’s Board of Directors. The Operating Committee is responsible for escalating to the Board the information necessary to facilitate the Board’s exercise of its duties.
Board oversightThe Firm’s Board of Directors provides oversight of risk. The Board Risk Committee is the principal committee that oversees risk matters. The Audit Committee oversees the control environment, and the Compensation & Management Development Committee oversees compensation and other management-related matters. Each committee of the Board oversees reputational risks and conduct risks within its scope of responsibility.
The JPMorgan Chase Bank, N.A. Board of Directors is responsible for the oversight of management of the bank. The JPMorgan Chase Bank, N.A. Board accomplishes this function acting directly and through the principal standing committees of the Firm’s Board of Directors. Risk and control oversight on behalf of JPMorgan Chase Bank N.A. is primarily the responsibility of the Risk Committee and the Audit Committee, respectively, and, with respect to
compensation and other management-related matters, the Compensation & Management Development Committee.
The Board Risk Committee assists the Board in its oversight of management’s responsibility to implement a global risk management framework reasonably designed to identify, assess and manage the Firm’s risks. The Board Risk Committee’s responsibilities include approval of applicable primary risk policies and review of certain associated frameworks, analysis and reporting established by management. Breaches in risk appetite and parameters, issues that may have a material adverse impact on the Firm, including capital and liquidity issues, and other significant risk-related matters are escalated to the Board Risk Committee, as appropriate.
The Audit Committee assists the Board in its oversight of management’s responsibility to ensure that there is an effective system of controls reasonably designed to safeguard the Firm’s assets and income, ensure the integrity of the Firm’s financial statements, and maintain compliance with the Firm’s ethical standards, policies, plans and procedures, and with laws and regulations. It also assists the Board in its oversight of the Firm’s independent registered public accounting firm’s qualifications, independence and performance, and of the performance of the Firm’s Internal Audit function.
JPMorgan Chase & Co./2020 Form 10-K 87

The Compensation & Management Development Committee (“CMDC”) assists the Board in its oversight of the Firm’s compensation principles and practices. The CMDC reviews and approves the Firm’s compensation and qualified benefits programs. The Committee reviews the performance of Operating Committee members against their goals, and approves their compensation awards. In addition, the CEO’s award is subject to ratification by the independent directors of the Board. The CMDC also reviews the development of and succession for key executives, and provides oversight of the Firm’s culture, including reviewing updates from management regarding significant conduct issues and any related employee actions, including compensation actions.
The Public Responsibility Committee assists the Board in its oversight of the Firm's positions and practices on public responsibility matters such as community investment, fair lending, sustainability, consumer practices and other public policy issues that reflect the Firm's values and character and could impact the Firm's reputation among its stakeholders. The Committee also provides guidance on these matters to management and the Board, as appropriate.
The Corporate Governance & Nominating Committee exercises general oversight with respect to the governance of the Board of Directors. It reviews the qualifications of and recommends to the Board of Directors proposed nominees for election to the Board. The Committee evaluates and recommends to the Board corporate governance practices applicable to the Firm. It also appraises the framework for assessing the Board’s performance and self-evaluation.
Management oversightThe Firm’s senior management-level committees that are primarily responsible for key risk-related functions include:
The Firmwide Risk Committee (“FRC”) is the Firm’s highest management-level risk committee. It provides oversight of the risks inherent in the Firm’s businesses and serves as an escalation point for risk topics and issues raised by underlying committees and/or FRC members.
The Firmwide Control Committee (“FCC”) is an escalation committee for senior management to review and discuss the Firmwide operational risk environment including identified issues, operational risk metrics and significant events that have been escalated.
Line of Business and Regional Risk Committees are responsible for providing oversight of the governance, limits, and controls that are in place through the scope of their activities. These committees review the ways in which the particular LOB or the business operating in a particular region could be exposed to adverse outcomes with a focus on identifying, accepting, escalating and/or requiring remediation of matters brought to these committees.
Line of Business and Corporate Function Control Committees oversee the operational risk and control environment of their respective business or function, inclusive of Operational Risk, Compliance and Conduct Risks. As part of that mandate, they are responsible for reviewing indicators of elevated or emerging risks and other data that may impact the level of operating risk in a business or function, addressing key operational risk issues, focusing on processes with control concerns and overseeing control remediation.
The Asset and Liability Committee (“ALCO”) is responsible for overseeing the Firm’s asset and liability management (“ALM”) activities and the management of liquidity risk, balance sheet, interest rate risk, and capital risk.
The Firmwide Valuation Governance Forum (“VGF”) is composed of senior finance and risk executives and is responsible for overseeing the management of risks arising from valuation activities conducted across the Firm.
Management’s discussion and analysis
88 JPMorgan Chase & Co./2020 Form 10-K

Risk governance and oversight functionsThe Firm manages its risk through risk governance and oversight functions. The scope of a particular function may include one or more drivers, types and/or impacts of risk. For example, Country Risk Management oversees country risk which may be a driver of risk or an aggregation of exposures that could give rise to multiple risk types such as credit or market risk.
The following sections discuss the risk governance and oversight functions in place to manage the risks inherent in the Firms business activities.
Risk governance and oversight functions PageStrategic Risk 90Capital risk 91-101Liquidity risk 102-108Reputation risk 109Consumer Credit Risk 114-120Wholesale credit risk 121-131Investment portfolio risk 134Market risk 135-142Country risk 143-144Operational risk 145-151Compliance Risk 148Conduct risk 149Legal risk 150Estimations and Model risk 151
JPMorgan Chase & Co./2020 Form 10-K 89

STRATEGIC RISK MANAGEMENT
Strategic risk is the risk to earnings, capital, liquidity or reputation associated with poorly designed or failed business plans or inadequate response to changes in the operating environment.
Management and oversightThe Operating Committee and the senior leadership of each LOB and Corporate are responsible for managing the Firm’s most significant strategic risks. Strategic risks are overseen by IRM through participation in relevant business reviews, LOB and Corporate senior management meetings, risk and control committees and other relevant governance forums and ongoing discussions. The Board of Directors oversees management’s strategic decisions, and the Board Risk Committee oversees IRM and the Firm’s risk management framework.
In the process of developing business plans and strategic initiatives, LOB and Corporate senior management identify the associated risks that are incorporated into the Firmwide Risk Identification process and monitored and assessed as part of the Firmwide Risk Appetite framework.
In addition, IRM conducts a qualitative assessment of the LOB and Corporate strategic initiatives to assess their impact on the risk profile of the Firm.
The Firm’s strategic planning process, which includes the development and execution of strategic initiatives, is one component of managing the Firm’s strategic risk. Guided by the Firm’s How We Do Business Principles (the “Principles”), the Operating Committee and senior management teams in each LOB and Corporate review and update the strategic plan periodically. The process includes evaluating the high-level strategic framework and performance against prior-year initiatives, assessing the operating environment, refining existing strategies and developing new strategies.
These strategic initiatives, along with IRM’s assessment, are incorporated in the Firm’s budget and provided to the Board for review.
The Firm’s balance sheet strategy, which focuses on risk-adjusted returns, strong capital and robust liquidity, is also a component in the management of strategic risk. Refer to Capital Risk Management on pages 91-101 for further information on capital risk. Refer to Liquidity Risk Management on pages 102–108 for further information on liquidity risk. Refer to Reputation Risk Management on page 109 for further information on reputation risk.
Management’s discussion and analysis
90 JPMorgan Chase & Co./2020 Form 10-K

CAPITAL RISK MANAGEMENT
Capital risk is the risk the Firm has an insufficient level or composition of capital to support the Firm’s business activities and associated risks during normal economic environments and under stressed conditions.
A strong capital position is essential to the Firm’s business strategy and competitive position. Maintaining a strong balance sheet to manage through economic volatility is considered a strategic imperative of the Firm’s Board of Directors, CEO and Operating Committee. The Firm’s fortress balance sheet philosophy focuses on risk-adjusted returns, strong capital and robust liquidity. The Firm’s capital risk management strategy focuses on maintaining long-term stability to enable the Firm to build and invest in market-leading businesses, including in highly stressed environments. Senior management considers the implications on the Firm’s capital prior to making any significant decisions that could impact future business activities. In addition to considering the Firm’s earnings outlook, senior management evaluates all sources and uses of capital with a view to ensuring the Firm’s capital strength.
Capital management oversightThe Firm has a Capital Management Oversight function whose primary objective is to provide independent oversight of capital risk across the Firm.
Capital Management Oversight’s responsibilities include:
• Defining, monitoring and reporting capital risk metrics;
• Establishing, calibrating and monitoring capital risk limits and indicators, including capital risk appetite;
• Developing a process to classify, monitor and report capital limit breaches; and
• Performing an independent assessment of the Firm’s capital management activities, including changes made to the Contingency Capital Plan described below.
In addition, the Basel Independent Review function (“BIR”), which is a part of the IRM function, conducts independent assessments of the Firm’s regulatory capital framework. These assessments are intended to ensure compliance with the applicable regulatory capital rules in support of senior management’s responsibility for managing capital and for the Board Risk Committee’s oversight of management in executing that responsibility.
Capital managementTreasury & CIO is responsible for capital management.
The primary objectives of the Firm’s capital management are to:
• Maintain sufficient capital in order to continue to build and invest in the Firm’s businesses through the cycle and in stressed environments;
• Retain flexibility to take advantage of future investment opportunities;
• Promote the Firm’s ability to serve as a source of strength to its subsidiaries;
• Ensure the Firm operates above the minimum regulatory capital ratios as well as maintain “well-capitalized” status for the Firm and its insured depository institution (“IDI”) subsidiaries at all times under applicable regulatory capital requirements;
• Meet capital distribution objectives; and
• Maintain sufficient capital resources to operate throughout a resolution period in accordance with the Firm’s preferred resolution strategy.
The Firm addresses these objectives through establishing internal minimum capital requirements and a strong capital governance framework. The internal minimum capital levels consider the Firm’s regulatory capital requirements as well as an internal assessment of capital adequacy, in normal economic cycles and in stress events, when setting its minimum capital levels.
Capital management is intended to be flexible in order to react to a range of potential events.
The current capital governance framework requires regular monitoring of the Firm’s capital position and follows prescribed escalation protocols, both at the Firm and material legal entity levels.
GovernanceCommittees responsible for overseeing the Firm’s capital management include the Capital Governance Committee, the Treasurer Committee and the Firmwide ALCO. Oversight of capital management is governed through the CIO, Treasury and Corporate (“CTC”) Risk Committee. In addition, the Board Risk Committee periodically reviews the Firm’s capital risk tolerance. Refer to Firmwide Risk Management on pages 85-89 for additional discussion on the Board Risk Committee and the ALCO.
Capital planning and stress testing
Comprehensive Capital Analysis and Review The Federal Reserve requires large BHCs, including the Firm, to submit at least annually a capital plan that has been reviewed and approved by the Board of Directors. The Federal Reserve uses CCAR and other stress testing processes to ensure that large BHCs have sufficient capital during periods of economic and financial stress, and have robust, forward-looking capital assessment and planning processes in place that address each BHC’s unique risks to enable it to absorb losses under certain stress scenarios. Through CCAR, the Federal Reserve evaluates each BHC’s capital adequacy and internal capital adequacy assessment processes (“ICAAP”), as well as its plans to make capital distributions, such as dividend payments or stock repurchases. The Federal Reserve uses results under the severely adverse scenario from its supervisory stress test to determine each firm’s SCB requirement for the coming
JPMorgan Chase & Co./2020 Form 10-K 91

year. Refer to Key Regulatory Developments on pages 93–94 for additional information.
On June 29, 2020, the Firm announced that it had completed the 2020 CCAR stress test process. On August 10, 2020, the Federal Reserve affirmed the Firm's SCB requirement of 3.3% and the Firm's minimum Standardized CET1 capital ratio of 11.3% (up from 10.5%). The SCB requirement became effective on October 1, 2020.
In June 2020, the Federal Reserve determined that changes in financial markets or the macroeconomic outlook due to the COVID-19 pandemic could have a material effect on a firm’s risk profile and financial condition and therefore required all large bank holding companies, including the Firm, to update and resubmit their capital plans by November 2, 2020. On December 18, 2020, the Federal Reserve released its results from the 2020 CCAR Round 2 stress test, which showed that large banks had strong levels of capital and announced that it would allow all large banks, including the Firm, to resume share repurchases commencing in the first quarter of 2021, subject to certain restrictions for at least the first quarter of 2021 given considerable economic uncertainty remained. The Federal Reserve has stated that due to uncertainty about future economic conditions and the ultimate path of the current recovery, the SCB will not be reset at this time. The Federal Reserve will notify firms by March 31, 2021 whether a revised SCB requirement based on the 2020 CCAR Round 2 stress test will be recalculated ahead of the 2021 annual CCAR assessment.
Refer to Capital actions on page 99 for information on actions taken by the Firm’s Board of Directors following the 2020 CCAR results.
Internal Capital Adequacy Assessment Process Annually, the Firm prepares the ICAAP, which informs the Board of Directors of the ongoing assessment of the Firm’s processes for managing the sources and uses of capital as well as compliance with supervisory expectations for capital planning and capital adequacy. The Firm’s ICAAP integrates stress testing protocols with capital planning.
The CCAR and other stress testing processes assess the potential impact of alternative economic and business scenarios on the Firm’s earnings and capital. Economic scenarios, and the parameters underlying those scenarios, are defined centrally and applied uniformly across the businesses. These scenarios are articulated in terms of macroeconomic factors, which are key drivers of business results; global market shocks, which generate short-term but severe trading losses; and idiosyncratic operational risk events. The scenarios are intended to capture and stress key vulnerabilities and idiosyncratic risks facing the Firm. However, when defining a broad range of scenarios, actual events can be worse. Accordingly, management considers additional stresses outside these scenarios, as necessary. These results are reviewed by management and the Board of Directors.
Contingency capital planThe Firm’s contingency capital plan establishes the capital management framework for the Firm and specifies the principles underlying the Firm’s approach towards capital management in normal economic conditions and during stress. The contingency capital plan defines how the Firm calibrates its targeted capital levels and meets minimum capital requirements, monitors the ongoing appropriateness of planned capital distributions, and sets out the capital contingency actions that are expected to be taken or considered at various levels of capital depletion during a period of stress.
Regulatory capitalThe Federal Reserve establishes capital requirements, including well-capitalized standards, for the consolidated financial holding company. The OCC establishes similar minimum capital requirements and standards for the Firm’s IDI subsidiaries, including JPMorgan Chase Bank, N.A. The U.S. capital requirements generally follow the Capital Accord of the Basel Committee, as amended from time to time.
Basel III OverviewThe capital rules under Basel III establish minimum capital ratios and overall capital adequacy standards for large and internationally active U.S. BHCs and banks, including the Firm and its IDI subsidiaries, including JPMorgan Chase Bank, N.A. The minimum amount of regulatory capital that must be held by BHCs and banks is determined by calculating risk-weighted assets (“RWA”), which are on-balance sheet assets and off-balance sheet exposures, weighted according to risk. Two comprehensive approaches are prescribed for calculating RWA: a standardized approach (“Basel III Standardized”), and an advanced approach (“Basel III Advanced”). For each of the risk-based capital ratios, the capital adequacy of the Firm is evaluated against the lower of the Standardized or Advanced approaches compared to their respective minimum capital ratios.
Basel III establishes capital requirements for calculating credit risk RWA and market risk RWA, and in the case of Basel III Advanced, operational risk RWA. Key differences in the calculation of credit risk RWA between the Standardized and Advanced approaches are that for Basel III Advanced, credit risk RWA is based on risk-sensitive approaches which largely rely on the use of internal credit models and parameters, whereas for Basel III Standardized, credit risk RWA is generally based on supervisory risk-weightings which vary primarily by counterparty type and asset class. Market risk RWA is calculated on a generally consistent basis between Basel III Standardized and Basel III Advanced. In addition to the RWA calculated under these approaches, the Firm may supplement such amounts to incorporate management judgment and feedback from its regulators.
Basel III also includes a requirement for Advanced Approach banking organizations, including the Firm, to
Management’s discussion and analysis
92 JPMorgan Chase & Co./2020 Form 10-K

calculate the SLR. Refer to SLR on page 98 for additional information.
COVID-19 PandemicThe Firm has been impacted by market events as a result of the COVID-19 pandemic, but remains well-capitalized. However, the continuation or further deterioration of the current macroeconomic environment could result in impacts to the Firm’s capital and leverage.
Key Regulatory Developments
Current Expected Credit Losses. Effective January 1, 2020, the Firm adopted the Financial Instruments – Credit Losses guidance under U.S. GAAP. As permitted under the U.S. capital rules issued by the federal banking agencies in 2019, the Firm initially elected to phase-in the January 1, 2020 (“day 1”) CECL adoption impact to retained earnings of $2.7 billion to CET1 capital, at 25% per year in each of 2020 to 2023. As part of their response to the impact of the COVID-19 pandemic, on March 31, 2020, the federal banking agencies issued an interim final rule (issued as final on August 26, 2020) that provided the option to delay the effects of CECL on regulatory capital for two years, followed by a three-year transition period (“CECL capital transition provisions”).
The final rule provides a uniform approach for estimating the effects of CECL compared to the legacy incurred loss model during the first two years of the transition period (the “day 2” transition amount), whereby the Firm may exclude from CET1 capital 25% of the change in the allowance for credit losses (excluding allowances on PCD loans). The cumulative day 2 transition amount as at December 31, 2021 that is not recognized in CET1 capital, as well as the $2.7 billion day 1 impact, will be phased into CET1 capital at 25% per year beginning January 1, 2022. The Firm has elected to apply the CECL capital transition provisions, and accordingly, for the year ended December 31, 2020, the capital metrics of the Firm exclude $5.7 billion, which is the $2.7 billion day 1 impact to retained earnings and 25% of the $12.2 billion increase in the allowance for credit losses (excluding allowances on PCD loans).
The impacts of the CECL capital transition provisions have also been incorporated into Tier 2 capital, adjusted average assets, and total leverage exposure. Refer to Note 1 for further information on the CECL accounting guidance.
Money Market Mutual Fund Liquidity Facility ("MMLF"). The Federal Reserve established the MMLF facility on March 18, 2020, authorized through at least March 31, 2021, to enhance the liquidity and functioning of money markets. Under the MMLF, the Federal Reserve Bank of Boston (“FRBB”) makes nonrecourse advances to participating financial institutions to purchase certain types of assets from eligible money market mutual fund clients. These assets, which are reflected in other assets on the Firm’s Consolidated balance sheets, are pledged to the FRBB as collateral. On March 23, 2020, the federal banking agencies issued an interim final rule (issued as final on
September 29, 2020) to neutralize the effects of purchasing assets through the program on risk-based and leverage-based capital ratios. As of December 31, 2020, the Firm excluded assets purchased from money market mutual fund clients pursuant to nonrecourse advances provided under the MMLF in the amount of $187 million from its RWA and $358 million from adjusted three month average assets and total leverage exposure.
Supplementary leverage ratio temporary revision. On April 1, 2020, the Federal Reserve issued an interim final rule that requires, on a temporary basis, the calculation of total leverage exposure for purposes of calculating the SLR for bank holding companies, to exclude the on-balance sheet amounts of U.S. Treasury securities and deposits at Federal Reserve Banks. These exclusions became effective April 1, 2020, and will remain in effect through March 31, 2021.
On June 1, 2020, the Federal Reserve, OCC and FDIC issued an interim final rule that provides IDI subsidiaries with an option to apply this temporary exclusion subject to certain restrictions. As of December 31, 2020, JPMorgan Chase Bank, N.A. has not elected to apply this exclusion.
Paycheck Protection Program. On April 13, 2020, the federal banking agencies issued an interim final rule (issued as final on September 29, 2020) to neutralize the regulatory capital effects of participating in the PPP on risk-based capital ratios by applying a zero percent risk weight to loans originated under the program. Given that PPP loans are guaranteed by the SBA, the Firm does not expect to realize material credit losses on these loans. As of December 31, 2020, the Firm had approximately $27 billion of loans under the program.
The rule also provides that if a PPP loan is pledged as collateral for a non-recourse loan under the Federal Reserve’s Paycheck Protection Program Lending (“PPPL”) Facility, the PPP loan can be excluded from leverage-based capital ratios. As of December 31, 2020, the Firm had not participated in the PPPL Facility.
Refer to Regulatory Developments Relating to the COVID-19 Pandemic on pages 52-53 for additional information on regulatory actions and significant financing programs that the U.S. government and regulators have introduced to address the effects of the COVID-19 pandemic.
Stress Capital Buffer. On March 4, 2020, the Federal Reserve issued the final rule introducing the SCB framework for the Basel III Standardized approach that is designed to more closely integrate the results of the quantitative assessment in the annual CCAR with the ongoing minimum capital requirements for BHCs under the U.S. Basel III rules. The final rule replaces the fixed 2.5% CET1 capital conservation buffer in the Standardized approach with a dynamic institution-specific SCB. The final rule does not apply to the U.S. Basel III Advanced approach capital requirements. The SCB requirement for BHCs will be effective on October 1 of each year and is expected to remain in effect until September 30 of the following year.
JPMorgan Chase & Co./2020 Form 10-K 93

TLAC Holdings rule. On October 20, 2020, the federal banking agencies issued a final rule prescribing the regulatory capital treatment for holdings of TLAC debt instruments by certain large banking organizations, such as the Firm and JPMorgan Chase Bank, N.A. This rule expands the scope of the existing capital deductions rule around the
holdings of capital instruments of financial institutions to also include TLAC debt instruments issued by systemically important banking organizations. The final rule will become effective on April 1, 2021 and is not expected to have a material impact on the Firm’s risk-based capital metrics.
Risk-based Capital Regulatory Minimums
The following chart presents the Firm’s Basel III minimum CET1 capital ratio under the Basel III rules currently in effect.
The Firm’s Basel III Standardized risk-based ratios are currently more binding than the Basel III Advanced risk-based ratios.
All banking institutions are currently required to have a minimum CET1 capital ratio of 4.5% of risk-weighted assets.
Certain banking organizations, including the Firm, are required to hold additional levels of capital to serve as a “capital conservation buffer”. The capital conservation buffer incorporates a global systemically important bank (“GSIB”) surcharge, a discretionary countercyclical capital buffer and a fixed capital conservation buffer of 2.5% for Advanced regulatory capital requirements and a variable SCB requirement, floored at 2.5%, for Standardized regulatory capital requirements.
Under the Federal Reserve’s GSIB rule, the Firm is required to assess its GSIB surcharge on an annual basis under two separately prescribed methods based on data for the previous fiscal year-end, and is subject to the higher of the two. The first (“Method 1”), reflects the GSIB surcharge as prescribed by the Basel Committee’s assessment methodology, and is calculated across five criteria: size, cross-jurisdictional activity, interconnectedness, complexity and substitutability. The second (“Method 2”), modifies the Method 1 requirements to include a measure of short-term wholesale funding in place of substitutability, and introduces a GSIB score “multiplication factor”.
Management’s discussion and analysis
94 JPMorgan Chase & Co./2020 Form 10-K

The following table presents the Firm’s effective GSIB surcharge for the years ended December 31, 2020 and 2019.
2020 2019
Fully Phased-In:
Method 1 2.50 % 2.50 %
Method 2 3.50 % 3.50 %
The Firm’s effective regulatory minimum GSIB surcharge calculated under Method 2 remains unchanged at 3.5% for 2021. On November 11, 2020, the Financial Stability Board (“FSB”) released its annual GSIB list, which published the Firm’s Method 1 GSIB surcharge of 2.0% (down from 2.5%) effective January 1, 2021, based upon data as of December 31, 2019.
The Firm’s estimated Method 2 surcharge calculated using data as of December 31, 2020 is 4.0%. Accordingly, based on the GSIB rule currently in effect, the Firm’s effective regulatory minimum GSIB surcharge is expected to increase to 4.0% on January 1, 2023 unless the Firm’s Method 2 GSIB surcharge calculation based upon data as of December 31, 2021 is lower.
The U.S. federal regulatory capital standards include a framework for setting a discretionary countercyclical capital buffer taking into account the macro financial environment in which large, internationally active banks function. As of December 31, 2020, the U.S. countercyclical capital buffer remained at 0%. The Federal Reserve will continue to review the buffer at least annually. The buffer can be increased if the Federal Reserve, FDIC and OCC determine that systemic risks are meaningfully above normal and can be calibrated up to an additional 2.5% of RWA subject to a 12-month implementation period.
Failure to maintain regulatory capital equal to or in excess of the risk-based regulatory capital minimum plus the capital conservation buffer (inclusive of the GSIB surcharge) and any countercyclical buffer will result in limitations to the amount of capital that the Firm may distribute, such as through dividends and common share repurchases, as well as certain executive discretionary bonus payments.
The Firm has a target Basel III CET1 capital ratio of 12%. However, the Firm may remain above that level in order to satisfy leverage-based capital requirements if deposits continue to grow due to actions taken by the Federal Reserve and the U.S. government in response to the COVID-19 pandemic.
Total Loss-Absorbing CapacityThe Federal Reserve’s TLAC rule requires the U.S. GSIB top-tier holding companies, including the Firm, to maintain minimum levels of external TLAC and eligible long-term debt (“eligible LTD”). Refer to TLAC on page 100 for additional information.
Leverage-based Capital Regulatory MinimumsSupplementary leverage ratioBanking organizations subject to the Basel III Advanced approach are currently required to have a minimum SLR of
3.0%. Certain banking organizations, including the Firm, are also required to hold an additional 2.0% leverage buffer.
The SLR is defined as Tier 1 capital under Basel III divided by the Firm’s total leverage exposure. Total leverage exposure is calculated by taking the Firm’s total average on-balance sheet assets, less amounts permitted to be deducted for Tier 1 capital, and adding certain off-balance sheet exposures, such as undrawn commitments and derivatives potential future exposure.
Failure to maintain an SLR equal to or greater than the regulatory minimum will result in limitations on the amount of capital that the Firm may distribute such as through dividends and common share repurchases.
Other regulatory capitalIn addition to meeting the capital ratio requirements of Basel III, the Firm and its IDI subsidiaries also must maintain minimum capital and leverage ratios in order to be “well-capitalized” under the regulations issued by the Federal Reserve and the Prompt Corrective Action (“PCA”) requirements of the FDIC Improvement Act (“FDICIA”), respectively. Refer to Note 27 for additional information.
Additional information regarding the Firm’s capital ratios, as well as the U.S. federal regulatory capital standards to which the Firm is subject, is presented in Note 27. Refer to the Firm’s Pillar 3 Regulatory Capital Disclosures reports, which are available on the Firm’s website, for further information on the Firm’s Basel III measures.
JPMorgan Chase & Co./2020 Form 10-K 95

The following table presents the Firm’s risk-based and leverage-based capital metrics under both the Basel III Standardized and Advanced approaches.
Standardized Advanced
(in millions, except ratios)December 31,
2020(c)(d)December 31,
2019Minimum
capital ratios(e)December 31,
2020(c)(d)December 31,
2019Minimum
capital ratios(e)
Risk-based capital metrics:
CET1 capital $ 205,078 $ 187,753 $ 205,078 $ 187,753
Tier 1 capital 234,844 214,432 234,844 214,432
Total capital 269,923 242,589 257,228 232,112
Risk-weighted assets 1,560,609 1,515,869 1,484,431 1,397,878
CET1 capital ratio 13.1 % 12.4 % 11.3 % 13.8 % 13.4 % 10.5 %
Tier 1 capital ratio 15.0 14.1 12.8 15.8 15.3 12.0
Total capital ratio 17.3 16.0 14.8 17.3 16.6 14.0
Leverage-based capital metrics:
Adjusted average assets(a) $ 3,353,319 $ 2,730,239 $ 3,353,319 $ 2,730,239
Tier 1 leverage ratio 7.0 % 7.9 % 4.0 % 7.0 % 7.9 % 4.0 %
Total leverage exposure(b) NA NA $ 3,401,542 $ 3,423,431
SLR(b) NA NA NA 6.9 % 6.3 % 5.0 %
(a) Adjusted average assets, for purposes of calculating the leverage ratios, includes total quarterly average assets adjusted for on-balance sheet assets that are subject to deduction from Tier 1 capital, predominantly goodwill and other intangible assets.
(b) As of December 31, 2020, total leverage exposure for purposes of calculating the SLR excludes U.S. Treasury securities and deposits at Federal Reserve Banks, as provided by the interim final rule issued by the Federal Reserve on April 1, 2020.
(c) As of December 31, 2020, the capital metrics reflect the CECL capital transition provisions.(d) As of December 31, 2020, the capital metrics reflect the exclusion of assets purchased from money market mutual fund clients pursuant to nonrecourse
advances provided under the MMLF. Additionally, loans originated under the PPP receive a zero percent risk weight.(e) Represents minimum requirements and regulatory buffers applicable to the Firm. For the period ended December 31, 2019, the CET1, Tier 1, Total, Tier 1
leverage and SLR minimum capital ratios applicable to the Firm were 10.5%, 12.0%, 14.0%, 4.0% and 5.0%, respectively. Refer to Note 27 for additional information.
Management’s discussion and analysis
96 JPMorgan Chase & Co./2020 Form 10-K

Capital components The following table presents reconciliations of total stockholders’ equity to Basel III CET1 capital, Tier 1 capital and Total capital as of December 31, 2020 and 2019.
(in millions)December 31,
2020December 31,
2019
Total stockholders’ equity $ 279,354 $ 261,330
Less: Preferred stock 30,063 26,993
Common stockholders’ equity 249,291 234,337
Add:
Certain deferred tax liabilities(a) 2,453 2,381
Less:
Goodwill 49,248 47,823
Other intangible assets 904 819
Other CET1 capital adjustments(b) (3,486) 323
Standardized/Advanced CET1 capital 205,078 187,753
Preferred stock 30,063 26,993
Less: Other Tier 1 adjustments 297 314
Standardized/Advanced Tier 1 capital $ 234,844 $ 214,432
Long-term debt and other instruments qualifying as Tier 2 capital $ 16,645 $ 13,733
Qualifying allowance for credit losses(c) 18,372 14,314
Other 62 110
Standardized Tier 2 capital $ 35,079 $ 28,157
Standardized Total capital $ 269,923 $ 242,589
Adjustment in qualifying allowance for credit losses for Advanced Tier 2 capital(d) (12,695) (10,477)
Advanced Tier 2 capital $ 22,384 $ 17,680
Advanced Total capital $ 257,228 $ 232,112
(a) Represents deferred tax liabilities related to tax-deductible goodwill and to identifiable intangibles created in nontaxable transactions, which are netted against goodwill and other intangibles when calculating CET1 capital.
(b) As of December 31, 2020, the impact of the CECL capital transition provision was an increase in CET1 capital of $5.7 billion.
(c) Represents the allowance for credit losses eligible for inclusion in Tier 2 capital up to 1.25% of credit risk RWA, including the impact of the CECL capital transition provision with any excess deducted from RWA.
(d) Represents an adjustment to qualifying allowance for credit losses for the excess of eligible credit reserves over expected credit losses up to 0.6% of credit risk RWA, including the impact of the CECL capital transition provision with any excess deducted from RWA.
Capital rollforward The following table presents the changes in Basel III CET1 capital, Tier 1 capital and Tier 2 capital for the year ended December 31, 2020.
Year Ended December 31, (in millions) 2020
Standardized/Advanced CET1 capital at December 31, 2019 $ 187,753
Net income applicable to common equity 27,548
Dividends declared on common stock (11,119)
Net purchase of treasury stock (5,135)
Changes in additional paid-in capital (128)
Changes related to AOCI 6,417
Adjustment related to AOCI(a) (1,829)
Changes related to other CET1 capital adjustments(b) 1,571
Change in Standardized/Advanced CET1 capital 17,325
Standardized/Advanced CET1 capital at December 31, 2020 $ 205,078
Standardized/Advanced Tier 1 capital at December 31, 2019 $ 214,432
Change in CET1 capital(b) 17,325
Net issuance of noncumulative perpetual preferred stock 3,070
Other 17
Change in Standardized/Advanced Tier 1 capital 20,412
Standardized/Advanced Tier 1 capital at December 31, 2020 $ 234,844
Standardized Tier 2 capital at December 31, 2019 $ 28,157
Change in long-term debt and other instruments qualifying as Tier 2 2,912
Change in qualifying allowance for credit losses(b) 4,058
Other (48)
Change in Standardized Tier 2 capital 6,922
Standardized Tier 2 capital at December 31, 2020 $ 35,079
Standardized Total capital at December 31, 2020 $ 269,923
Advanced Tier 2 capital at December 31, 2019 $ 17,680
Change in long-term debt and other instruments qualifying as Tier 2 2,912
Change in qualifying allowance for credit losses(b) 1,840
Other (48)
Change in Advanced Tier 2 capital 4,704
Advanced Tier 2 capital at December 31, 2020 $ 22,384
Advanced Total capital at December 31, 2020 $ 257,228
(a) Includes cash flow hedges and DVA related to structured notes recorded in AOCI.
(b) Includes the impact of the CECL capital transition provisions.
JPMorgan Chase & Co./2020 Form 10-K 97

RWA rollforward The following table presents changes in the components of RWA under Basel III Standardized and Advanced approaches for the year ended December 31, 2020. The amounts in the rollforward categories are estimates, based on the predominant driver of the change.
Standardized Advanced
Year ended December 31, 2020(in millions)
Credit risk RWA
Market risk RWA Total RWA
Credit risk RWA
Market risk RWA
Operational risk RWA Total RWA
December 31, 2019 $ 1,440,220 $ 75,649 $ 1,515,869 $ 932,948 $ 75,652 $ 389,278 $ 1,397,878
Model & data changes(a) (800) (16,320) (17,120) (6,100) (16,320) — (22,420)
Portfolio runoff(b) (4,450) — (4,450) (4,000) — — (4,000)
Movement in portfolio levels(c) 29,249 37,061 66,310 79,482 37,578 (4,087) 112,973
Changes in RWA 23,999 20,741 44,740 69,382 21,258 (4,087) 86,553
December 31, 2020 $ 1,464,219 $ 96,390 $ 1,560,609 $ 1,002,330 $ 96,910 $ 385,191 $ 1,484,431
(a) Model & data changes refer to material movements in levels of RWA as a result of revised methodologies and/or treatment per regulatory guidance (exclusive of rule changes).
(b) Portfolio runoff for credit risk RWA primarily reflects reduced risk from position rolloffs in legacy portfolios in Home Lending.(c) Movement in portfolio levels (inclusive of rule changes) refers to: changes in book size, composition, credit quality, and market movements for credit risk
RWA; changes in position and market movements for market risk RWA; updates to cumulative losses for operational risk RWA; and deductions to credit risk RWA for excess eligible credit reserves not eligible for inclusion in Tier 2 capital.
Supplementary leverage ratio The following table presents the components of the Firm’s SLR.
Three months ended(in millions, except ratio)
December 31,2020
December 31,2019
Tier 1 capital $ 234,844 214,432
Total average assets 3,399,818 2,777,270
Less: Regulatory capital adjustments(a) 46,499 47,031
Total adjusted average assets(b) 3,353,319 2,730,239
Add: Off-balance sheet exposures(c) 729,978 693,192
Less: Exclusion for U.S. Treasuries and Federal Reserve Bank deposits 681,755 —
Total leverage exposure $ 3,401,542 $ 3,423,431
SLR 6.9 % 6.3 %
(a) For purposes of calculating the SLR, includes total quarterly average assets adjusted for on-balance sheet assets that are subject to deduction from Tier 1 capital, predominantly goodwill and other intangible assets. As of December 31, 2020, includes adjustments for the CECL capital transition provisions and the exclusion of average assets purchased from money market mutual fund clients pursuant to nonrecourse advances provided under the MMLF.
(b) Adjusted average assets used for the calculation of Tier 1 leverage ratio.
(c) Off-balance sheet exposures are calculated as the average of the three month-end spot balances during the reporting quarter.
Refer to Note 27 for JPMorgan Chase Bank, N.A.’s SLR.
Line of business equity Each business segment is allocated capital by taking into consideration a variety of factors including capital levels of similarly rated peers and applicable regulatory capital requirements. ROE is measured and internal targets for expected returns are established as key measures of a business segment’s performance.
The Firm’s allocation methodology incorporates Basel III Standardized RWA, Basel III Advanced RWA, the GSIB surcharge, and a simulation of capital in a severe stress environment. As of January 1, 2021, the Firm has changed its line of business capital allocations primarily as a result of changes in exposures for each LOB and an increase in the relative risk weighting toward Standardized RWA. The assumptions and methodologies used to allocate capital are periodically assessed and as a result, the capital allocated to the LOBs may change from time to time. The following table presents the capital allocated to each business segment.
Line of business equity (Allocated capital)December 31,
(in billions)January 1,
2021 2020 2019
Consumer & Community Banking $ 50.0 $ 52.0 $ 52.0
Corporate & Investment Bank 83.0 80.0 80.0
Commercial Banking 24.0 22.0 22.0
Asset & Wealth Management 14.0 10.5 10.5
Corporate 78.3 84.8 69.8
Total common stockholders’ equity $ 249.3 $ 249.3 $ 234.3
Management’s discussion and analysis
98 JPMorgan Chase & Co./2020 Form 10-K

Capital actions
Common stock dividends The Firm’s common stock dividends are planned as part of the Capital Management governance framework in line with the Firm’s capital management objectives.
The Firm’s quarterly common stock dividend is currently $0.90 per share. The Firm’s dividends are subject to the Board of Directors’ approval on a quarterly basis.
Refer to Note 21 and Note 26 for information regarding dividend restrictions.
The following table shows the common dividend payout ratio based on net income applicable to common equity.
Year ended December 31, 2020 2019 2018
Common dividend payout ratio 40 % 31 % 30 %
Common stockOn March 15, 2020, in response to the economic disruptions caused by the COVID-19 pandemic, the Firm temporarily suspended repurchases of its common stock. Subsequently, the Federal Reserve directed all large banks, including the Firm, to discontinue net share repurchases through the end of 2020. On December 18, 2020, the Federal Reserve announced that all large banks, including the Firm, could resume share repurchases commencing in the first quarter of 2021. As directed by the Federal Reserve, total net repurchases and common stock dividends in the first quarter of 2021 are restricted and cannot exceed the average of the Firm’s net income for the four preceding calendar quarters. The Firm's Board of Directors has authorized a new common share repurchase program for up to $30 billion.
The following table sets forth the Firm’s repurchases of common stock for the years ended December 31, 2020, 2019 and 2018.
Year ended December 31, (in millions) 2020 2019 2018
Total number of shares of common stock repurchased 50.0 213.0 181.5
Aggregate purchase price of common stock repurchases $ 6,397 $ 24,121 $ 19,983
The authorization to repurchase common shares is utilized at management’s discretion, and the timing of purchases and the exact amount of common shares that may be repurchased is subject to various factors, including market conditions; legal and regulatory considerations affecting the amount and timing of repurchase activity; the Firm’s capital position (taking into account goodwill and intangibles); internal capital generation; and alternative investment opportunities. The repurchase program does not include specific price targets or timetables; may be suspended by management at any time; and may be executed through open market purchases or privately negotiated transactions, or utilizing Rule 10b5-1 plans, which are written trading plans that the Firm may enter into from time to time under Rule 10b5-1 of the Securities Exchange Act of 1934 and which allow the Firm to repurchase its common shares during periods when it may otherwise not be repurchasing common shares — for example, during internal trading blackout periods.
Refer to Part II, Item 5: Market for Registrant’s Common Equity, Related Stockholder Matters and Issuer Purchases of Equity Securities on page 34 of the 2020 Form 10-K for additional information regarding repurchases of the Firm’s equity securities.
Preferred stock Preferred stock dividends declared were $1.6 billion for the year ended December 31, 2020.
The Firm has not issued or redeemed any preferred stock since the first quarter of 2020. Refer to Note 21 for additional information on the Firm’s preferred stock, including the issuance and redemption of preferred stock.
Subordinated DebtOn May 13, 2020, the Firm issued $3.0 billion of fixed-to-floating rate subordinated notes due 2031. Refer to Long-term funding and issuance on page 107 and Note 20 for additional information.
JPMorgan Chase & Co./2020 Form 10-K 99
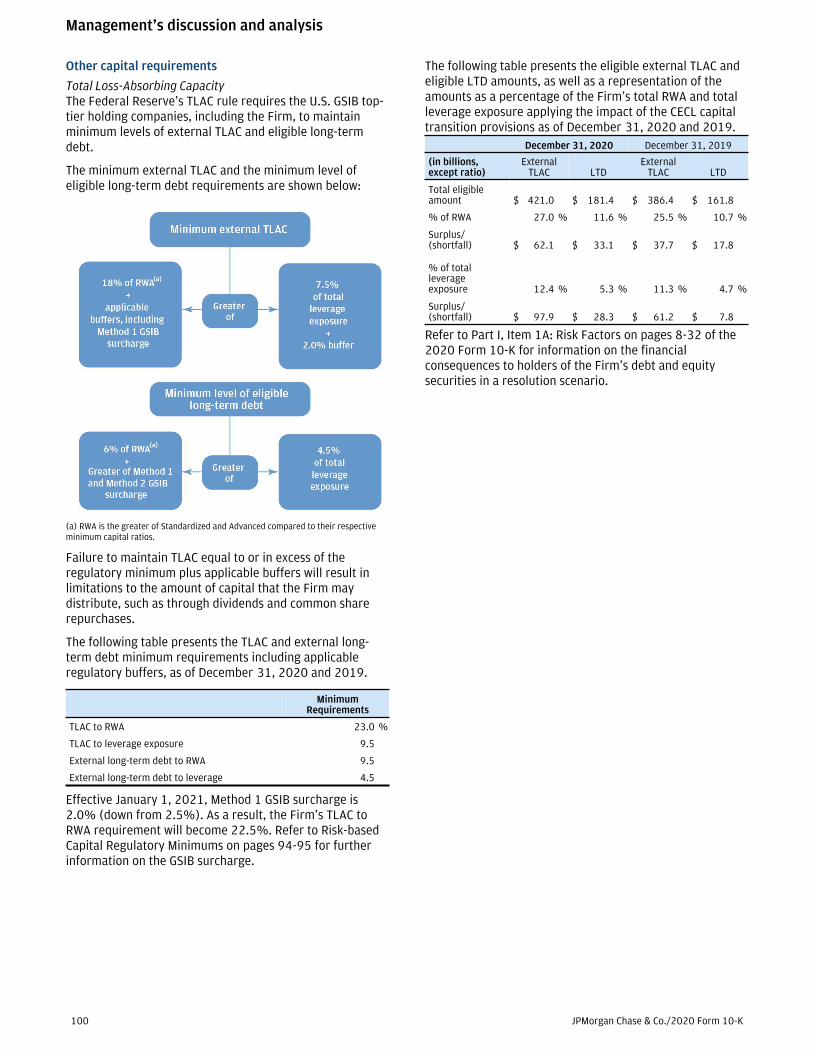
Other capital requirements
Total Loss-Absorbing CapacityThe Federal Reserve’s TLAC rule requires the U.S. GSIB top-tier holding companies, including the Firm, to maintain minimum levels of external TLAC and eligible long-term debt.
The minimum external TLAC and the minimum level of eligible long-term debt requirements are shown below:
(a) RWA is the greater of Standardized and Advanced compared to their respective minimum capital ratios.
Failure to maintain TLAC equal to or in excess of the regulatory minimum plus applicable buffers will result in limitations to the amount of capital that the Firm may distribute, such as through dividends and common share repurchases.
The following table presents the TLAC and external long-term debt minimum requirements including applicable regulatory buffers, as of December 31, 2020 and 2019.
Minimum Requirements
TLAC to RWA 23.0 %
TLAC to leverage exposure 9.5
External long-term debt to RWA 9.5
External long-term debt to leverage 4.5
Effective January 1, 2021, Method 1 GSIB surcharge is 2.0% (down from 2.5%). As a result, the Firm’s TLAC to RWA requirement will become 22.5%. Refer to Risk-based Capital Regulatory Minimums on pages 94-95 for further information on the GSIB surcharge.
The following table presents the eligible external TLAC and eligible LTD amounts, as well as a representation of the amounts as a percentage of the Firm’s total RWA and total leverage exposure applying the impact of the CECL capital transition provisions as of December 31, 2020 and 2019.
December 31, 2020 December 31, 2019
(in billions, except ratio)
External TLAC LTD
External TLAC LTD
Total eligible amount $ 421.0 $ 181.4 $ 386.4 $ 161.8
% of RWA 27.0 % 11.6 % 25.5 % 10.7 %
Surplus/(shortfall) $ 62.1 $ 33.1 $ 37.7 $ 17.8
% of total leverage exposure 12.4 % 5.3 % 11.3 % 4.7 %
Surplus/(shortfall) $ 97.9 $ 28.3 $ 61.2 $ 7.8
Refer to Part I, Item 1A: Risk Factors on pages 8-32 of the 2020 Form 10-K for information on the financial consequences to holders of the Firm’s debt and equity securities in a resolution scenario.
Management’s discussion and analysis
100 JPMorgan Chase & Co./2020 Form 10-K

Broker-dealer regulatory capital
J.P. Morgan SecuritiesJPMorgan Chase’s principal U.S. broker-dealer subsidiary is J.P. Morgan Securities. J.P. Morgan Securities is subject to Rule 15c3-1 under the Securities Exchange Act of 1934 (the “Net Capital Rule”). J.P. Morgan Securities is also registered as a futures commission merchant and is subject to regulatory capital requirements, including those imposed by the SEC, Commodity Futures Trading Commission (“CFTC”), Financial Industry Regulatory Authority (“FINRA”) and the National Futures Association (“NFA”).
J.P. Morgan Securities has elected to compute its minimum net capital requirements in accordance with the “Alternative Net Capital Requirements” of the Net Capital Rule.
The following table presents J.P. Morgan Securities’ net capital:
December 31, 2020
(in millions) Actual(a) Minimum
Net Capital $ 27,651 $ 5,024
(a) Net capital reflects the exclusion of assets purchased from money market mutual fund clients pursuant to nonrecourse advances provided under the MMLF.
In addition to its alternative minimum net capital requirements, J.P. Morgan Securities is required to hold “tentative net capital” in excess of $1.0 billion and is also required to notify the SEC in the event that its tentative net capital is less than $5.0 billion. Tentative net capital is net capital before deducting market and credit risk charges as defined by the Net Capital Rule. As of December 31, 2020, J.P. Morgan Securities maintained tentative net capital in excess of the minimum and notification requirements.
J.P. Morgan Securities plcJ.P. Morgan Securities plc is a wholly-owned subsidiary of JPMorgan Chase Bank, N.A. and has authority to engage in banking, investment banking and broker-dealer activities. J.P. Morgan Securities plc is jointly regulated by the U.K. Prudential Regulation Authority (“PRA”) and the Financial Conduct Authority (“FCA”). J.P. Morgan Securities plc is subject to the European Union Capital Requirements Regulation and the PRA capital rules, each of which implement Basel III and thereby subject J.P. Morgan Securities plc to its requirements. Effective January 1, 2021, J.P. Morgan Securities plc is subject to the amended EU Capital Requirement Regulation, as adopted in the U.K.
The Bank of England requires, on a transitional basis, that U.K. banks, including U.K. regulated subsidiaries of overseas groups, maintain a minimum requirement for own funds and eligible liabilities (“MREL”). As of December 31, 2020, J.P. Morgan Securities plc was compliant with the requirements of the MREL rule.
The following table presents J.P. Morgan Securities plc’s capital metrics:
December 31, 2020
(in millions, except ratios) Estimated Minimum ratios
Total capital $ 55,156
CET1 ratio 17.9 % 4.5 %
Total capital ratio 22.8 % 8.0 %
JPMorgan Chase & Co./2020 Form 10-K 101

LIQUIDITY RISK MANAGEMENT
Liquidity risk is the risk that the Firm will be unable to meet its contractual and contingent financial obligations as they arise or that it does not have the appropriate amount, composition and tenor of funding and liquidity to support its assets and liabilities.
Liquidity risk oversightThe Firm has a Liquidity Risk Oversight function whose primary objective is to provide oversight of liquidity risk across the Firm. Liquidity Risk Oversight’s responsibilities include:
• Defining, monitoring and reporting liquidity risk metrics;
• Establishing and monitoring limits and indicators, including liquidity risk appetite;
• Developing a process to classify, monitor and report limit breaches;
• Performing an independent review of liquidity risk management processes;
• Monitoring and reporting internal Firmwide and legal entity liquidity stress tests as well as regulatory defined liquidity stress tests;
• Approving or escalating for review new or updated liquidity stress assumptions; and
• Monitoring liquidity positions, balance sheet variances and funding activities;
Liquidity management The primary objectives of the Firm’s liquidity management are to:
• Ensure that the Firm’s core businesses and material legal entities are able to operate in support of client needs and meet contractual and contingent financial obligations through normal economic cycles as well as during stress events, and
• Manage an optimal funding mix and availability of liquidity sources.
As part of the Firm’s overall liquidity management strategy, the Firm manages liquidity and funding using a centralized, global approach in order to:
• Optimize liquidity sources and uses;
• Monitor exposures;
• Identify constraints on the transfer of liquidity between the Firm’s legal entities; and
• Maintain the appropriate amount of surplus liquidity at a Firmwide and legal entity level, where relevant.
In the context of the Firm’s liquidity management, Treasury and CIO is responsible for:
• Analyzing and understanding the liquidity characteristics of the assets and liabilities of the Firm, LOBs and legal entities, taking into account legal, regulatory, and operational restrictions;
• Developing internal liquidity stress testing assumptions;
• Defining and monitoring Firmwide and legal entity-specific liquidity strategies, policies, reporting and contingency funding plans;
• Managing liquidity within the Firm’s approved liquidity risk appetite tolerances and limits;
• Managing compliance with regulatory requirements related to funding and liquidity risk; and
• Setting transfer pricing in accordance with underlying liquidity characteristics of balance sheet assets and liabilities as well as certain off-balance sheet items.
GovernanceCommittees responsible for liquidity governance include the Firmwide ALCO as well as LOB and regional ALCOs, the Treasurer Committee, and the CTC Risk Committee. In addition, the Board Risk Committee reviews and recommends to the Board of Directors, for formal approval, the Firm’s liquidity risk tolerances, liquidity strategy, and liquidity policy. Refer to Firmwide Risk Management on pages 85-89 for further discussion of ALCO and other risk-related committees.
Internal stress testingLiquidity stress tests are intended to ensure that the Firm has sufficient liquidity under a variety of adverse scenarios, including scenarios analyzed as part of the Firm’s resolution and recovery planning. Stress scenarios are produced for JPMorgan Chase & Co. (“Parent Company”) and the Firm’s material legal entities on a regular basis, and other stress tests are performed in response to specific market events or concerns. Liquidity stress tests assume all of the Firm’s contractual financial obligations are met and take into consideration:
• Varying levels of access to unsecured and secured funding markets,
• Estimated non-contractual and contingent cash outflows, and
• Potential impediments to the availability and transferability of liquidity between jurisdictions and material legal entities such as regulatory, legal or other restrictions.
Liquidity outflow assumptions are modeled across a range of time horizons and currency dimensions and contemplate both market and idiosyncratic stresses.
Results of stress tests are considered in the formulation of the Firm’s funding plan and assessment of its liquidity position. The Parent Company acts as a source of funding for the Firm through equity and long-term debt issuances, and its intermediate holding company, JPMorgan Chase Holdings LLC (the “IHC”) provides funding support to the ongoing operations of the Parent Company and its subsidiaries. The Firm maintains liquidity at the Parent Company, IHC, and operating subsidiaries at levels sufficient to comply with liquidity risk tolerances and minimum liquidity requirements, and to manage through periods of
Management’s discussion and analysis
102 JPMorgan Chase & Co./2020 Form 10-K
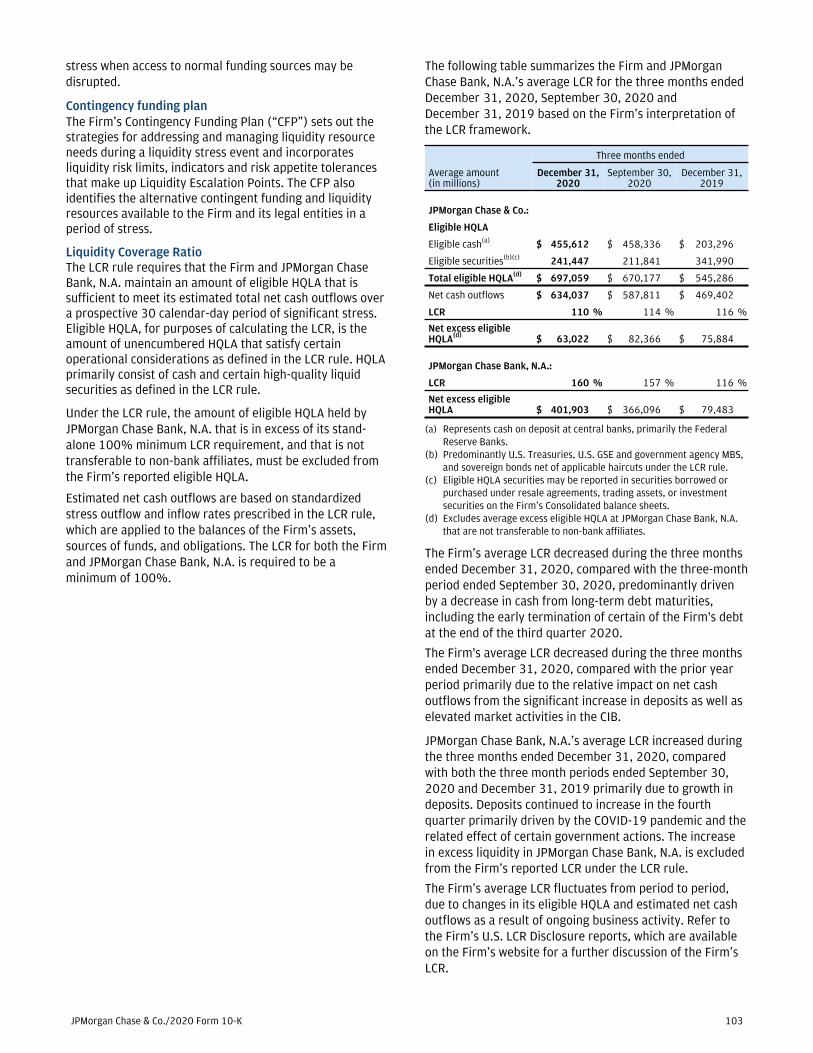
stress when access to normal funding sources may be disrupted.
Contingency funding planThe Firm’s Contingency Funding Plan (“CFP”) sets out the strategies for addressing and managing liquidity resource needs during a liquidity stress event and incorporates liquidity risk limits, indicators and risk appetite tolerances that make up Liquidity Escalation Points. The CFP also identifies the alternative contingent funding and liquidity resources available to the Firm and its legal entities in a period of stress.
Liquidity Coverage RatioThe LCR rule requires that the Firm and JPMorgan Chase Bank, N.A. maintain an amount of eligible HQLA that is sufficient to meet its estimated total net cash outflows over a prospective 30 calendar-day period of significant stress. Eligible HQLA, for purposes of calculating the LCR, is the amount of unencumbered HQLA that satisfy certain operational considerations as defined in the LCR rule. HQLA primarily consist of cash and certain high-quality liquid securities as defined in the LCR rule.
Under the LCR rule, the amount of eligible HQLA held by JPMorgan Chase Bank, N.A. that is in excess of its stand-alone 100% minimum LCR requirement, and that is not transferable to non-bank affiliates, must be excluded from the Firm’s reported eligible HQLA.
Estimated net cash outflows are based on standardized stress outflow and inflow rates prescribed in the LCR rule, which are applied to the balances of the Firm’s assets, sources of funds, and obligations. The LCR for both the Firm and JPMorgan Chase Bank, N.A. is required to be a minimum of 100%.
The following table summarizes the Firm and JPMorgan Chase Bank, N.A.’s average LCR for the three months ended December 31, 2020, September 30, 2020 and December 31, 2019 based on the Firm’s interpretation of the LCR framework.
Three months ended
Average amount(in millions)
December 31, 2020
September 30, 2020
December 31,2019
JPMorgan Chase & Co.:
Eligible HQLA
Eligible cash(a) $ 455,612 $ 458,336 $ 203,296
Eligible securities(b)(c) 241,447 211,841 341,990
Total eligible HQLA(d) $ 697,059 $ 670,177 $ 545,286
Net cash outflows $ 634,037 $ 587,811 $ 469,402
LCR 110 % 114 % 116 %
Net excess eligible HQLA(d) $ 63,022 $ 82,366 $ 75,884
JPMorgan Chase Bank, N.A.:
LCR 160 % 157 % 116 %
Net excess eligible HQLA $ 401,903 $ 366,096 $ 79,483
(a) Represents cash on deposit at central banks, primarily the Federal Reserve Banks.
(b) Predominantly U.S. Treasuries, U.S. GSE and government agency MBS, and sovereign bonds net of applicable haircuts under the LCR rule.
(c) Eligible HQLA securities may be reported in securities borrowed or purchased under resale agreements, trading assets, or investment securities on the Firm’s Consolidated balance sheets.
(d) Excludes average excess eligible HQLA at JPMorgan Chase Bank, N.A. that are not transferable to non-bank affiliates.
The Firm’s average LCR decreased during the three months ended December 31, 2020, compared with the three-month period ended September 30, 2020, predominantly driven by a decrease in cash from long-term debt maturities, including the early termination of certain of the Firm's debt at the end of the third quarter 2020.
The Firm's average LCR decreased during the three months ended December 31, 2020, compared with the prior year period primarily due to the relative impact on net cash outflows from the significant increase in deposits as well as elevated market activities in the CIB.
JPMorgan Chase Bank, N.A.’s average LCR increased during the three months ended December 31, 2020, compared with both the three month periods ended September 30, 2020 and December 31, 2019 primarily due to growth in deposits. Deposits continued to increase in the fourth quarter primarily driven by the COVID-19 pandemic and the related effect of certain government actions. The increase in excess liquidity in JPMorgan Chase Bank, N.A. is excluded from the Firm’s reported LCR under the LCR rule.
The Firm’s average LCR fluctuates from period to period, due to changes in its eligible HQLA and estimated net cash outflows as a result of ongoing business activity. Refer to the Firm’s U.S. LCR Disclosure reports, which are available on the Firm’s website for a further discussion of the Firm’s LCR.
JPMorgan Chase & Co./2020 Form 10-K 103

Other liquidity sourcesIn addition to the assets reported in the Firm’s eligible HQLA above, the Firm had unencumbered marketable securities, such as equity and debt securities, that the Firm believes would be available to raise liquidity. This includes securities included as part of the excess eligible HQLA at JPMorgan Chase Bank, N.A. that are not transferable to non-bank affiliates. The fair value of these securities was approximately $740 billion and $315 billion as of December 31, 2020 and 2019, respectively, although the amount of liquidity that could be raised would be dependent on prevailing market conditions. The fair value increased compared to December 31, 2019, due to an increase in excess eligible HQLA at JPMorgan Chase Bank, N.A. which was primarily a result of increased deposits.
The Firm also had available borrowing capacity at FHLBs and the discount window at the Federal Reserve Bank as a result of collateral pledged by the Firm to such banks of approximately $307 billion and $322 billion as of December 31, 2020 and 2019, respectively. This borrowing capacity excludes the benefit of cash and securities reported in the Firm’s eligible HQLA or other unencumbered securities that are currently pledged at the Federal Reserve Bank discount window and other central banks. Available borrowing capacity decreased from December 31, 2019 primarily due to lower pledged credit card receivable balances driven by the COVID-19 pandemic and a decrease in pledged mortgage collateral as a result of paydown and maturity activity. Although available, the Firm does not view this borrowing capacity at the Federal Reserve Bank discount window and the other central banks as a primary source of liquidity.
NSFRThe net stable funding ratio (“NSFR”) is a liquidity requirement for large banking organizations that is intended to measure the adequacy of “available” and “required” amounts of stable funding over a one-year horizon. On October 20, 2020, the federal banking agencies issued a final NSFR rule under which large banking organizations such as the Firm will be required to maintain an NSFR of at least 100% on an ongoing basis. The final NSFR rule will become effective on July 1, 2021, and the Firm will be required to publicly disclose its quarterly average NSFR semi-annually beginning in 2023.
As of December 31, 2020 the Firm estimates that it was compliant with the 100% minimum NSFR based on its current understanding of the final rule.
Management’s discussion and analysis
104 JPMorgan Chase & Co./2020 Form 10-K
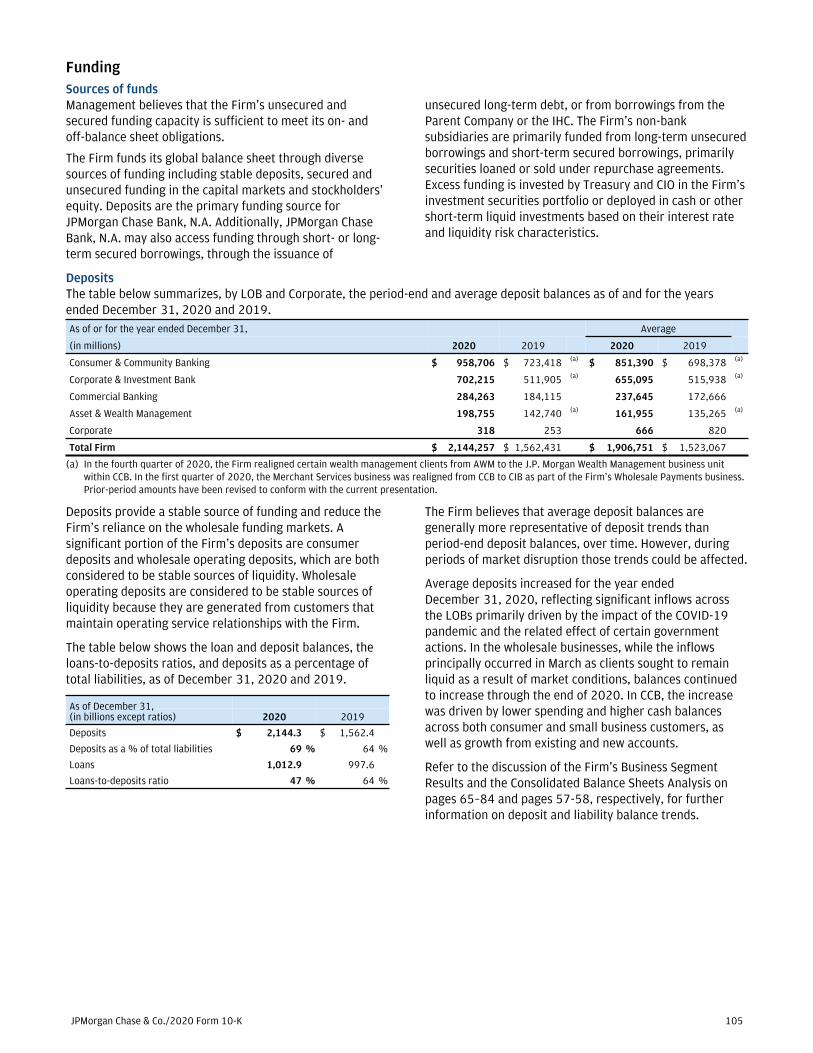
FundingSources of fundsManagement believes that the Firm’s unsecured and secured funding capacity is sufficient to meet its on- and off-balance sheet obligations.
The Firm funds its global balance sheet through diverse sources of funding including stable deposits, secured and unsecured funding in the capital markets and stockholders’ equity. Deposits are the primary funding source for JPMorgan Chase Bank, N.A. Additionally, JPMorgan Chase Bank, N.A. may also access funding through short- or long-term secured borrowings, through the issuance of
unsecured long-term debt, or from borrowings from the Parent Company or the IHC. The Firm’s non-bank subsidiaries are primarily funded from long-term unsecured borrowings and short-term secured borrowings, primarily securities loaned or sold under repurchase agreements. Excess funding is invested by Treasury and CIO in the Firm’s investment securities portfolio or deployed in cash or other short-term liquid investments based on their interest rate and liquidity risk characteristics.
DepositsThe table below summarizes, by LOB and Corporate, the period-end and average deposit balances as of and for the years ended December 31, 2020 and 2019.As of or for the year ended December 31, Average
(in millions) 2020 2019 2020 2019
Consumer & Community Banking $ 958,706 $ 723,418 (a) $ 851,390 $ 698,378 (a)
Corporate & Investment Bank 702,215 511,905 (a) 655,095 515,938 (a)
Commercial Banking 284,263 184,115 237,645 172,666
Asset & Wealth Management 198,755 142,740 (a) 161,955 135,265 (a)
Corporate 318 253 666 820
Total Firm $ 2,144,257 $ 1,562,431 $ 1,906,751 $ 1,523,067
(a) In the fourth quarter of 2020, the Firm realigned certain wealth management clients from AWM to the J.P. Morgan Wealth Management business unit within CCB. In the first quarter of 2020, the Merchant Services business was realigned from CCB to CIB as part of the Firm’s Wholesale Payments business. Prior-period amounts have been revised to conform with the current presentation.
Deposits provide a stable source of funding and reduce the Firm’s reliance on the wholesale funding markets. A significant portion of the Firm’s deposits are consumer deposits and wholesale operating deposits, which are both considered to be stable sources of liquidity. Wholesale operating deposits are considered to be stable sources of liquidity because they are generated from customers that maintain operating service relationships with the Firm.
The table below shows the loan and deposit balances, the loans-to-deposits ratios, and deposits as a percentage of total liabilities, as of December 31, 2020 and 2019.
As of December 31, (in billions except ratios) 2020 2019
Deposits $ 2,144.3 $ 1,562.4
Deposits as a % of total liabilities 69 % 64 %
Loans 1,012.9 997.6
Loans-to-deposits ratio 47 % 64 %
The Firm believes that average deposit balances are generally more representative of deposit trends than period-end deposit balances, over time. However, during periods of market disruption those trends could be affected.
Average deposits increased for the year ended December 31, 2020, reflecting significant inflows across the LOBs primarily driven by the impact of the COVID-19 pandemic and the related effect of certain government actions. In the wholesale businesses, while the inflows principally occurred in March as clients sought to remain liquid as a result of market conditions, balances continued to increase through the end of 2020. In CCB, the increase was driven by lower spending and higher cash balances across both consumer and small business customers, as well as growth from existing and new accounts.
Refer to the discussion of the Firm’s Business Segment Results and the Consolidated Balance Sheets Analysis on pages 65–84 and pages 57-58, respectively, for further information on deposit and liability balance trends.
JPMorgan Chase & Co./2020 Form 10-K 105

The following table summarizes short-term and long-term funding, excluding deposits, as of December 31, 2020 and 2019, and average balances for the years ended December 31, 2020 and 2019. Refer to the Consolidated Balance Sheets Analysis on pages 57-58 and Note 20 for additional information.
Sources of funds (excluding deposits)As of or for the year ended December 31, Average(in millions) 2020 2019 2020 2019Commercial paper $ 12,031 $ 14,754 $ 12,129 $ 22,977 Other borrowed funds 8,510 7,544 9,198 10,369 Total short-term unsecured funding $ 20,541 $ 22,298 $ 21,327 $ 33,346
Securities sold under agreements to repurchase(a) $ 207,877 $ 175,709 $ 246,354 $ 217,807 Securities loaned(a) 4,886 5,983 6,536 8,816 Other borrowed funds(b) 24,667 18,622 23,812 26,050 Obligations of Firm-administered multi-seller conduits(c) 10,523 9,223 11,430 10,929
Total short-term secured funding $ 247,953 $ 209,537 $ 288,132 $ 263,602
Senior notes $ 166,089 $ 166,185 $ 171,509 $ 168,546
Subordinated debt 21,608 17,591 20,789 17,387
Structured notes(d) 75,325 74,724 73,056 65,487
Total long-term unsecured funding $ 263,022 $ 258,500 $ 265,354 $ 251,420
Credit card securitization(c) $ 4,943 $ 6,461 $ 5,520 $ 9,707
FHLB advances 14,123 28,635 27,076 34,143
Other long-term secured funding(e) 4,540 4,363 4,460 4,643
Total long-term secured funding $ 23,606 $ 39,459 $ 37,056 $ 48,493
Preferred stock(f) $ 30,063 $ 26,993 $ 29,899 $ 27,511
Common stockholders’ equity(f) $ 249,291 $ 234,337 $ 236,865 $ 232,907
(a) Primarily consists of short-term securities loaned or sold under agreements to repurchase.(b) Effective March 2020, includes nonrecourse advances provided under the MMLF.(c) Included in beneficial interests issued by consolidated variable interest entities on the Firm’s Consolidated balance sheets.(d) Includes certain TLAC-eligible long-term unsecured debt issued by the Parent Company.(e) Includes long-term structured notes which are secured.(f) Refer to Capital Risk Management on pages 91-101, Consolidated statements of changes in stockholders’ equity on page 165, Note 21 and Note 22 for
additional information on preferred stock and common stockholders’ equity.
Short-term funding The Firm’s sources of short-term secured funding primarily consist of securities loaned or sold under agreements to repurchase. These instruments are secured predominantly by high-quality securities collateral, including government-issued debt and U.S. GSE and government agency MBS. Securities sold under agreements to repurchase increased at December 31, 2020, compared with December 31, 2019, reflecting higher secured financing of AFS investment securities in Treasury and CIO, as well as trading assets in CIB, partially offset by a decline in client-driven market-making activities in CIB, including the Firm's non-participation in the Federal Reserve's open market operations.
The balances associated with securities loaned or sold under agreements to repurchase fluctuate over time due to investment and financing activities of clients, the Firm’s demand for financing, the ongoing management of the mix of the Firm’s liabilities, including its secured and unsecured financing (for both the investment securities and market-making portfolios), and other market and portfolio factors.
As of December 31, 2020, the Firm participated in the MMLF government facility. The secured nonrecourse advances under the MMLF are included in other borrowed funds. Refer to Capital Risk Management on pages 91-101 for additional information on the MMLF.
The Primary Dealer Credit Facility ("PDCF") was established by the Federal Reserve on March 20, 2020. Under the PDCF, the Federal Reserve Bank of New York (“FRBNY”) provides collateralized financing on a term basis to primary dealers. These financing transactions were reported as securities sold under agreements to repurchase. The Firm participated in the PDCF in the first quarter of 2020, and ceased its participation in May 2020 as the secured financing market normalized.
The Firm’s sources of short-term unsecured funding consist of other borrowed funds and issuance of wholesale commercial paper. The decrease in short-term unsecured funding at December 31, 2020, from December 31, 2019 and for the average year ended December 31, 2020 compared to the prior year period, was due to lower net commercial paper issuance primarily for short-term liquidity management.
Management’s discussion and analysis
106 JPMorgan Chase & Co./2020 Form 10-K

Long-term funding and issuanceLong-term funding provides an additional source of stable funding and liquidity for the Firm. The Firm’s long-term funding plan is driven primarily by expected client activity, liquidity considerations, and regulatory requirements, including TLAC. Long-term funding objectives include maintaining diversification, maximizing market access and optimizing funding costs. The Firm evaluates various funding markets, tenors and currencies in creating its optimal long-term funding plan.
The significant majority of the Firm’s long-term unsecured funding is issued by the Parent Company to provide flexibility in support of both bank and non-bank subsidiary funding needs. The Parent Company advances substantially all net funding proceeds to its subsidiary, the IHC. The IHC does not issue debt to external counterparties. The following table summarizes long-term unsecured issuance and maturities or redemptions for the years ended December 31, 2020 and 2019. Refer to Note 20 for additional information on long-term debt.
Long-term unsecured fundingYear ended December 31, 2020 2019 2020 2019
(Notional in millions) Parent Company Subsidiaries
Issuance
Senior notes issued in the U.S. market $ 25,500 $ 14,000 $ 60 $ 1,750
Senior notes issued in non-U.S. markets 1,355 5,867 — —
Total senior notes 26,855 19,867 60 1,750
Subordinated debt 3,000 — — —
Structured notes(a) 7,596 5,844 24,185 33,563
Total long-term unsecured funding – issuance $ 37,451 $ 25,711 $ 24,245 $ 35,313
Maturities/redemptions
Senior notes $ 28,719 $ 18,098 $ 7,701 $ 5,367
Subordinated debt 135 183 — —
Structured notes 5,340 2,944 30,002 19,271
Total long-term unsecured funding – maturities/redemptions $ 34,194 $ 21,225 $ 37,703 $ 24,638
(a) Includes certain TLAC-eligible long-term unsecured debt issued by the Parent Company.
The Firm can also raise secured long-term funding through securitization of consumer credit card loans and through FHLB advances. The following table summarizes the securitization issuance and FHLB advances and their respective maturities or redemptions for the years ended December 31, 2020 and 2019.
Long-term secured fundingYear ended December 31, Issuance Maturities/Redemptions
(in millions) 2020 2019 2020 2019
Credit card securitization $ 1,000 $ — $ 2,525 $ 6,975
FHLB advances 15,000 — 29,509 15,817
Other long-term secured funding(a) 1,130 204 1,048 927
Total long-term secured funding $ 17,130 $ 204 $ 33,082 $ 23,719
(a) Includes long-term structured notes which are secured.
The Firm’s wholesale businesses also securitize loans for client-driven transactions; those client-driven loan securitizations are not considered to be a source of funding for the Firm and are not included in the table above. Refer to Note 14 for a further description of client-driven loan securitizations.
JPMorgan Chase & Co./2020 Form 10-K 107

Credit ratingsThe cost and availability of financing are influenced by credit ratings. Reductions in these ratings could have an adverse effect on the Firm’s access to liquidity sources, increase the cost of funds, trigger additional collateral or funding requirements and decrease the number of investors and counterparties willing to lend to the Firm. The nature and magnitude of the impact of ratings downgrades depends on numerous contractual and behavioral factors,
which the Firm believes are incorporated in its liquidity risk and stress testing metrics. The Firm believes that it maintains sufficient liquidity to withstand a potential decrease in funding capacity due to ratings downgrades.
Additionally, the Firm’s funding requirements for VIEs and other third-party commitments may be adversely affected by a decline in credit ratings.
The credit ratings of the Parent Company and the Firm’s principal bank and non-bank subsidiaries as of December 31, 2020 were as follows:
JPMorgan Chase & Co. JPMorgan Chase Bank, N.A.J.P. Morgan Securities LLCJ.P. Morgan Securities plc
December 31, 2020Long-term
issuerShort-term
issuer OutlookLong-term
issuerShort-term
issuer OutlookLong-term
issuerShort-term
issuer Outlook
Moody’s Investors Service A2 P-1 Stable Aa2 P-1 Stable Aa3 P-1 Stable
Standard & Poor’s A- A-2 Stable A+ A-1 Stable A+ A-1 Stable
Fitch Ratings(a) AA- F1+ Negative AA F1+ Negative AA F1+ Negative
(a) On April 18, 2020, Fitch affirmed the credit ratings of the Parent Company and the Firm’s principal bank and non-bank subsidiaries but revised the outlook on the credit ratings from stable to negative given expectations that credit fundamentals will deteriorate as a result of the COVID-19 pandemic.
JPMorgan Chase’s unsecured debt does not contain requirements that would call for an acceleration of payments, maturities or changes in the structure of the existing debt, provide any limitations on future borrowings or require additional collateral, based on unfavorable changes in the Firm’s credit ratings, financial ratios, earnings, or stock price.
Critical factors in maintaining high credit ratings include a stable and diverse earnings stream, strong capital and liquidity ratios, strong credit quality and risk management controls, and diverse funding sources. Rating agencies continue to evaluate economic and geopolitical trends, regulatory developments, future profitability, risk management practices, and litigation matters, as well as their broader ratings methodologies. Changes in any of these factors could lead to changes in the Firm’s credit ratings.
Management’s discussion and analysis
108 JPMorgan Chase & Co./2020 Form 10-K

REPUTATION RISK MANAGEMENT
Reputation risk is the risk that an action or inaction may negatively impact perception of the Firm’s integrity and reduce confidence in the Firm’s competence by various constituents, including clients, counterparties, customers, investors, regulators, employees, communities or the broader public.
Organization and management Reputation Risk Management establishes the governance framework for managing reputation risk across the Firm. As reputation risk is inherently challenging to identify, manage, and quantify, a reputation risk management function is critical.
The Firm’s reputation risk management function includes the following activities:• Maintaining a Firmwide Reputation Risk Governance
policy and standards consistent with the reputation risk framework
• Managing the governance infrastructure and processes that support consistent identification, escalation, management and monitoring of reputation risk issues Firmwide
• Providing guidance to LOB Reputation Risk Offices (“RRO”), as appropriate
The types of events that give rise to reputation risk are wide-ranging and could be introduced in various ways, including by the Firm’s employees and the clients, customers and counterparties the Firm does business with. These events could result in financial losses, litigation and regulatory fines, as well as other damages to the Firm.
Governance and oversightThe Reputation Risk Governance policy establishes the principles for managing reputation risk for the Firm. It is the responsibility of employees in each LOB and Corporate to consider the reputation of the Firm when deciding whether to offer a new product, engage in a transaction or client relationship, enter a new jurisdiction, initiate a business process or other matters. Sustainability, social responsibility and environmental impacts are important considerations in assessing the Firm’s reputation risk, and are a component of the Firm’s reputation risk governance.
Reputation risk issues deemed material are escalated as appropriate.
JPMorgan Chase & Co./2020 Form 10-K 109

CREDIT AND INVESTMENT RISK MANAGEMENT
Credit and investment risk is the risk associated with the default or change in credit profile of a client, counterparty or customer; or loss of principal or a reduction in expected returns on investments, including consumer credit risk, wholesale credit risk, and investment portfolio risk.
Credit risk managementCredit risk is the risk associated with the default or change in credit profile of a client, counterparty or customer. The Firm provides credit to a variety of customers, ranging from large corporate and institutional clients to individual consumers and small businesses. In its consumer businesses, the Firm is exposed to credit risk primarily through its home lending, credit card, auto, and business banking businesses. In its wholesale businesses, the Firm is exposed to credit risk through its underwriting, lending, market-making, and hedging activities with and for clients and counterparties, as well as through its operating services activities (such as cash management and clearing activities), and securities financing activities. The Firm is also exposed to credit risk through its investment securities portfolio and cash placed with banks.
Credit Risk Management monitors, measures and manages credit risk throughout the Firm and defines credit risk policies and procedures. The Firm’s credit risk management governance includes the following activities:
• Maintaining a credit risk policy framework
• Monitoring, measuring and managing credit risk across all portfolio segments, including transaction and exposure approval
• Setting industry and geographic concentration limits, as appropriate, and establishing underwriting guidelines
• Assigning and managing credit authorities in connection with the approval of credit exposure
• Managing criticized exposures and delinquent loans and
• Estimating credit losses and ensuring appropriate credit risk-based capital management
Risk identification and measurementThe Credit Risk Management function monitors, measures, manages and limits credit risk across the Firm’s businesses. To measure credit risk, the Firm employs several methodologies for estimating the likelihood of obligor or counterparty default. Methodologies for measuring credit risk vary depending on several factors, including type of asset (e.g., consumer versus wholesale), risk measurement parameters (e.g., delinquency status and borrower’s credit score versus wholesale risk-rating) and risk management and collection processes (e.g., retail collection center versus centrally managed workout groups). Credit risk measurement is based on the probability of default of an obligor or counterparty, the loss severity given a default event and the exposure at default.
Based on these factors and the methodology and estimates described in Note 13 and Note 10, the Firm estimates credit losses for its exposures. The allowance for loan losses reflects credit losses related to the consumer and wholesale held-for-investment loan portfolios, the allowance for lending-related commitments reflects credit losses related to the Firm’s lending-related commitments and the allowance for investment securities reflects the credit losses related to the Firm’s HTM and AFS securities. Refer to Note 13, Note 10 and Critical Accounting Estimates used by the Firm on pages 152-155 for further information.
In addition, potential and unexpected credit losses are reflected in the allocation of credit risk capital and represent the potential volatility of actual losses relative to the established allowances for loan losses and lending-related commitments. The analyses for these losses include stress testing that considers alternative economic scenarios as described in the Stress testing section below.
Stress testingStress testing is important in measuring and managing credit risk in the Firm’s credit portfolio. The stress testing process assesses the potential impact of alternative economic and business scenarios on estimated credit losses for the Firm. Economic scenarios and the underlying parameters are defined centrally, articulated in terms of macroeconomic factors and applied across the businesses. The stress test results may indicate credit migration, changes in delinquency trends and potential losses in the credit portfolio. In addition to the periodic stress testing processes, management also considers additional stresses outside these scenarios, including industry and country- specific stress scenarios, as necessary. The Firm uses stress testing to inform decisions on setting risk appetite both at a Firm and LOB level, as well as to assess the impact of stress on individual counterparties.
Management’s discussion and analysis
110 JPMorgan Chase & Co./2020 Form 10-K

Risk monitoring and managementThe Firm has developed policies and practices that are designed to preserve the independence and integrity of the approval and decision-making process of extending credit to ensure credit risks are assessed accurately, approved properly, monitored regularly and managed actively at both the transaction and portfolio levels. The policy framework establishes credit approval authorities, concentration limits, risk-rating methodologies, portfolio review parameters and guidelines for management of distressed exposures. In addition, certain models, assumptions and inputs used in evaluating and monitoring credit risk are independently validated by groups that are separate from the LOBs.
Consumer credit risk is monitored for delinquency and other trends, including any concentrations at the portfolio level, as certain of these trends can be modified through changes in underwriting policies and portfolio guidelines. Consumer Risk Management evaluates delinquency and other trends against business expectations, current and forecasted economic conditions, and industry benchmarks. Historical and forecasted economic performance and trends are incorporated into the modeling of estimated consumer credit losses and are part of the monitoring of the credit risk profile of the portfolio.
Wholesale credit risk is monitored regularly at an aggregate portfolio, industry, and individual client and counterparty level with established concentration limits that are reviewed and revised periodically as deemed appropriate by management. Industry and counterparty limits, as measured in terms of exposure and economic risk appetite, are subject to stress-based loss constraints. Wrong-way risk is the risk that exposure to a counterparty is positively correlated with the impact of a default by the same counterparty, which could cause exposure to increase at the same time as the counterparty’s capacity to meet its obligations is decreasing.
Management of the Firm’s wholesale credit risk exposure is accomplished through a number of means, including:
• Loan underwriting and credit approval process
• Loan syndications and participations
• Loan sales and securitizations
• Credit derivatives
• Master netting agreements, and
• Collateral and other risk-reduction techniques
In addition to Credit Risk Management, an independent Credit Review function is responsible for:
• Independently validating or changing the risk grades assigned to exposures in the Firm’s wholesale credit portfolio, and assessing the timeliness of risk grade changes initiated by responsible business units; and
• Evaluating the effectiveness of business units’ credit management processes, including the adequacy of credit analyses and risk grading/LGD rationales, proper monitoring and management of credit exposures, and compliance with applicable grading policies and underwriting guidelines.
Refer to Note 12 for further discussion of consumer and wholesale loans.
Risk reportingTo enable monitoring of credit risk and effective decision-making, aggregate credit exposure, credit quality forecasts, concentration levels and risk profile changes are reported regularly to senior members of Credit Risk Management. Detailed portfolio reporting of industry, clients, counterparties and customers, product and geography are prepared, and the appropriateness of the allowance for credit losses is reviewed by senior management at least on a quarterly basis. Through the risk reporting and governance structure, credit risk trends and limit exceptions are provided regularly to, and discussed with, risk committees, senior management and the Board of Directors.
JPMorgan Chase & Co./2020 Form 10-K 111

CREDIT PORTFOLIO
Effective January 1, 2020, the Firm adopted the CECL accounting guidance. The adoption resulted in a change in the accounting for PCI loans, which are considered PCD loans under CECL. In conjunction with the adoption of CECL, the Firm reclassified risk-rated loans and lending-related commitments from the consumer, excluding credit card portfolio segment to the wholesale portfolio segment, to align with the methodology applied when determining the allowance. Prior-period amounts have been revised to conform with the current presentation. Refer to Note 1 for further information.
The Firm has provided various forms of assistance to customers and clients impacted by the COVID-19 pandemic, including payment deferrals and covenant modifications. The majority of the Firm’s COVID-19 related loan modifications have not been considered troubled debt restructurings (“TDRs”) because:
• they represent short-term or other insignificant modifications, whether under the Firm’s regular loan modification assessments or the IA Statement guidance, or
• the Firm has elected to apply the option to suspend the application of accounting guidance for TDRs provided by the CARES Act and extended by the Consolidated Appropriations Act.
To the extent that certain modifications do not meet any of the above criteria, the Firm accounts for them as TDRs. The Firm considers expected losses of principal and accrued interest associated with all COVID-19 related loan modifications in its allowance for credit losses. Refer to Business Developments on pages 50-51 for more information on customer and client assistance granted. Refer to Notes 12 and 13 for further information on the Firm’s accounting policies on loan modifications and the allowance for credit losses.
The effectiveness of the Firm’s actions in helping borrowers recover and in mitigating the Firm’s credit losses remains uncertain in light of the unpredictable nature and duration of the COVID-19 pandemic. Assistance provided in response to the COVID-19 pandemic could delay the recognition of delinquencies, nonaccrual status, and net charge-offs for those customers and clients who would have otherwise moved into past due or nonaccrual status. Refer to Consumer Credit Portfolio on pages 114-120 and Wholesale Credit Portfolio on pages 121-131 for information on loan modifications as of December 31, 2020.
In the following tables, reported loans include loans retained (i.e., held-for-investment); loans held-for-sale; and certain loans accounted for at fair value. The following tables do not include loans which the Firm accounts for at fair value and classifies as trading assets; refer to Notes 2 and 3 for further information regarding these loans. Refer to Notes 12, 28, and 5 for additional information on the Firm’s loans, lending-related commitments and derivative receivables, including the Firm’s accounting policies.
Refer to Note 10 for information regarding the credit risk inherent in the Firm’s investment securities portfolio; and refer to Note 11 for information regarding credit risk inherent in the securities financing portfolio. Refer to Consumer Credit Portfolio on pages 114-120 and Note 12 for further discussions of the consumer credit environment and consumer loans. Refer to Wholesale Credit Portfolio on pages 121-131 and Note 12 for further discussions of the wholesale credit environment and wholesale loans.
Management’s discussion and analysis
112 JPMorgan Chase & Co./2020 Form 10-K

Total credit portfolio
December 31,(in millions)
Credit exposure Nonperforming(f)(g)
2020 2019 2020 2019
Loans retained $ 960,506 $ 945,601 $ 8,782 $ 3,983
Loans held-for-sale 7,873 7,064 284 7
Loans at fair value (a) 44,474 44,955 1,507 647
Total loans – reported 1,012,853 997,620 10,573 4,637
Derivative receivables 79,630 49,766 56 30
Receivables from customers(b) 47,710 33,706 — —
Total credit-related assets 1,140,193 1,081,092 10,629 4,667
Assets acquired in loan satisfactions
Real estate owned NA NA 256 344
Other NA NA 21 43
Total assets acquired in loan satisfactions NA NA 277 387
Lending-related commitments(a) 1,165,688 1,108,399 577 474
Total credit portfolio $ 2,305,881 $ 2,189,491 $ 11,483 $ 5,528
Credit derivatives used in credit portfolio management activities(c)(d) $ (22,239) $ (18,530) $ — $ —
Liquid securities and other cash collateral held against derivatives(e) (14,806) (13,052) NA NA
Year ended December 31,(in millions, except ratios) 2020 2019
Net charge-offs $ 5,259 $ 5,629
Average retained loans 958,303 941,919
Net charge-off rates 0.55 % 0.60 %
(a) In the third quarter of 2020, the Firm reclassified certain fair value option elected lending-related positions from trading assets to loans, which resulted in a corresponding reclassification of certain off-balance sheet commitments. Prior-period amounts have been revised to conform with the current presentation.
(b) Receivables from customers reflect held-for-investment margin loans to brokerage clients in CIB, CCB and AWM; these are reported within accrued interest and accounts receivable on the Consolidated balance sheets.
(c) Represents the net notional amount of protection purchased and sold through credit derivatives used to manage both performing and nonperforming wholesale credit exposures; these derivatives do not qualify for hedge accounting under U.S. GAAP. Refer to Credit derivatives on page 131 and Note 5 for additional information.
(d) Prior-period amount has been revised to conform with the current presentation.
(e) In the fourth quarter of 2020, the Firm refined its approach for disclosing additional collateral held by the Firm that may be used as security when the fair value of the client’s exposure is in the Firm’s favor. Prior-period amounts have been revised to conform with the current presentation.
(f) At December 31, 2020 and 2019, nonperforming assets excluded mortgage loans 90 or more days past due and insured by U.S. government agencies of $874 million and $1.1 billion, respectively, and real estate owned (“REO”) insured by U.S. government agencies of $9 million and $41 million, respectively. Prior-period amount of mortgage loans 90 or more days past due and insured by U.S. government agencies excluded from nonperforming assets has been revised to conform with the current presentation; refer to footnote (a) for additional information. These amounts have been excluded based upon the government guarantee. In addition, the Firm’s policy is generally to exempt credit card loans from being placed on nonaccrual status as permitted by regulatory guidance.
(g) At December 31, 2020, nonperforming loans included $1.6 billion of PCD loans on nonaccrual status. Prior to the adoption of CECL, nonaccrual loans excluded PCI loans as the Firm recognized interest income on each pool of PCI loans as each of the pools was performing.
Paycheck Protection ProgramThe PPP, established by the CARES Act and implemented by the SBA, provided the Firm with delegated authority to process and originate PPP loans. When certain criteria are met, PPP loans are subject to forgiveness and the Firm will receive payment of the forgiveness amount from the SBA. PPP loans have a contractual term of two or five years and provide borrowers with an automatic payment deferral of principal and interest. Given that PPP loans are guaranteed by the SBA, the Firm does not expect to realize material credit losses on these loans. PPP processing fees are deferred and accreted into interest income over the contractual life of the loans, but may be accelerated upon forgiveness or prepayment. The impact on interest income related to PPP loans was not material for the year ended December 31, 2020.
The Firm was in the early stages of the PPP loan forgiveness process at December 31, 2020.
At December 31, 2020, the Firm had approximately $27 billion of loans under the PPP, of which $19 billion are in the consumer portfolio and $8 billion are in the wholesale portfolio.
JPMorgan Chase & Co./2020 Form 10-K 113

CONSUMER CREDIT PORTFOLIO
The Firm’s retained consumer portfolio consists primarily of residential real estate loans, credit card loans, scored auto and business banking loans, as well as associated lending-related commitments. The Firm’s focus is on serving primarily the prime segment of the consumer credit market. Originated mortgage loans are retained in the residential real estate portfolio, securitized or sold to U.S. government agencies and U.S. government-sponsored enterprises; other types of consumer loans are typically retained on the balance sheet. Refer to Note 12 for further information on the consumer loan portfolio. Refer to Note 28 for further information on lending-related commitments.
In 2020, the allowance for credit losses increased, reflecting the deterioration in and uncertainty around the future macroeconomic environment as a result of the impact of the COVID-19 pandemic. Net charge-offs for the year ended December 31, 2020 decreased when compared to December 31, 2019, benefiting from payment assistance and government stimulus. The potential for increased infection rates and related lock downs, as well as the duration and effectiveness of government and other consumer relief measures remains uncertain which could have a longer term impact on delinquency rates and net charge-offs.
Management’s discussion and analysis
114 JPMorgan Chase & Co./2020 Form 10-K

The following table presents consumer credit-related information with respect to the scored credit portfolio held in CCB, AWM, CIB and Corporate.
Consumer credit portfolio
As of or for the year ended December 31,(in millions, except ratios)
Credit exposure Nonaccrual loans(j)(k)(l)Net charge-offs/
(recoveries)Net charge-off/
(recovery) rate(m)
2020 2019 2020 2019 2020 2019 2020 2019
Consumer, excluding credit card
Residential real estate(a) $ 225,302 $ 243,317 $ 5,313 $ 2,780 $ (164) $ (92) (0.07) % (0.04) %
Auto and other(b)(c)(d) 76,825 51,682 151 $ 146 338 $ 456 0.51 (d) 0.88
Total loans - retained 302,127 294,999 5,464 2,926 174 364 0.06 0.12
Loans held-for-sale 1,305 3,002 — 2 NA NA NA NA
Loans at fair value(e)(f) 15,147 19,816 1,003 438 NA NA NA NA
Total consumer, excluding credit card loans 318,579 317,817 6,467 3,366 174 364 0.06 0.12
Lending-related commitments(g) 57,319 40,169
Total consumer exposure, excluding credit card 375,898 357,986
Credit Card
Loans retained(h) 143,432 168,924 NA NA 4,286 4,848 2.93 3.10
Loans held-for-sale 784 — NA NA NA NA NA NA
Total credit card loans 144,216 168,924 NA NA 4,286 4,848 2.93 3.10
Lending-related commitments(g)(i) 658,506 650,720
Total credit card exposure(i) 802,722 819,644
Total consumer credit portfolio(i) $ 1,178,620 $ 1,177,630 $ 6,467 $ 3,366 $ 4,460 $ 5,212 0.99 % 1.11 %
(a) Includes scored mortgage and home equity loans held in CCB and AWM, and scored mortgage loans held in Corporate.(b) At December 31, 2020 and 2019, excluded operating lease assets of $20.6 billion and $22.8 billion, respectively. These operating lease assets are included
in other assets on the Firm’s Consolidated balance sheets. Refer to Note 18 for further information.(c) Includes scored auto and business banking loans and overdrafts.(d) At December 31, 2020, included $19.2 billion of loans in Business Banking under the PPP. Given that PPP loans are guaranteed by the SBA, the Firm does
not expect to realize material credit losses on these loans. Refer to Credit Portfolio on pages 112-113 for a further discussion of the PPP.(e) In the third quarter of 2020, the Firm reclassified certain fair value option elected lending-related positions from trading assets to loans. Prior-period
amounts have been revised to conform with the current presentation.(f) Includes scored mortgage loans held in CCB and CIB.(g) Credit card, home equity and certain business banking lending-related commitments represent the total available lines of credit for these products. The Firm
has not experienced, and does not anticipate, that all available lines of credit would be used at the same time. For credit card commitments, and if certain conditions are met, home equity commitments and certain business banking commitments, the Firm can reduce or cancel these lines of credit by providing the borrower notice or, in some cases as permitted by law, without notice. Refer to Note 28 for further information.
(h) Includes billed interest and fees.(i) Also includes commercial card lending-related commitments primarily in CB and CIB.(j) At December 31, 2020 and 2019, nonaccrual loans excluded mortgage loans 90 or more days past due and insured by U.S. government agencies of $874
million and $1.1 billion, respectively. Prior-period amount of mortgage loans 90 or more days past due and insured by U.S. government agencies excluded from nonaccrual loans has been revised to conform with the current presentation; refer to footnote (e) for additional information. These amounts have been excluded from nonaccrual loans based upon the government guarantee. In addition, the Firm’s policy is generally to exempt credit card loans from being placed on nonaccrual status, as permitted by regulatory guidance.
(k) At December 31, 2020, nonaccrual loans included $1.6 billion of PCD loans. Prior to the adoption of CECL, nonaccrual loans excluded PCI loans as the Firm recognized interest income on each pool of PCI loans as each of the pools was performing.
(l) Generally excludes loans under payment deferral programs offered in response to the COVID-19 pandemic. Includes loans to customers that have exited COVID-19 payment deferral programs and are 90 or more days past due, predominantly all of which were also at least 150 days past due and therefore considered collateral-dependent. Collateral-dependent loans are charged down to the lower of amortized cost or fair value of the underlying collateral less costs to sell.
(m) Average consumer loans held-for-sale and loans at fair value were $18.3 billion and $20.4 billion for the years ended December 31, 2020 and 2019, respectively. Prior-period amounts have been revised to conform with the current presentation; refer to footnote (e) for additional information. These amounts were excluded when calculating net charge-off/(recovery) rates.
JPMorgan Chase & Co./2020 Form 10-K 115
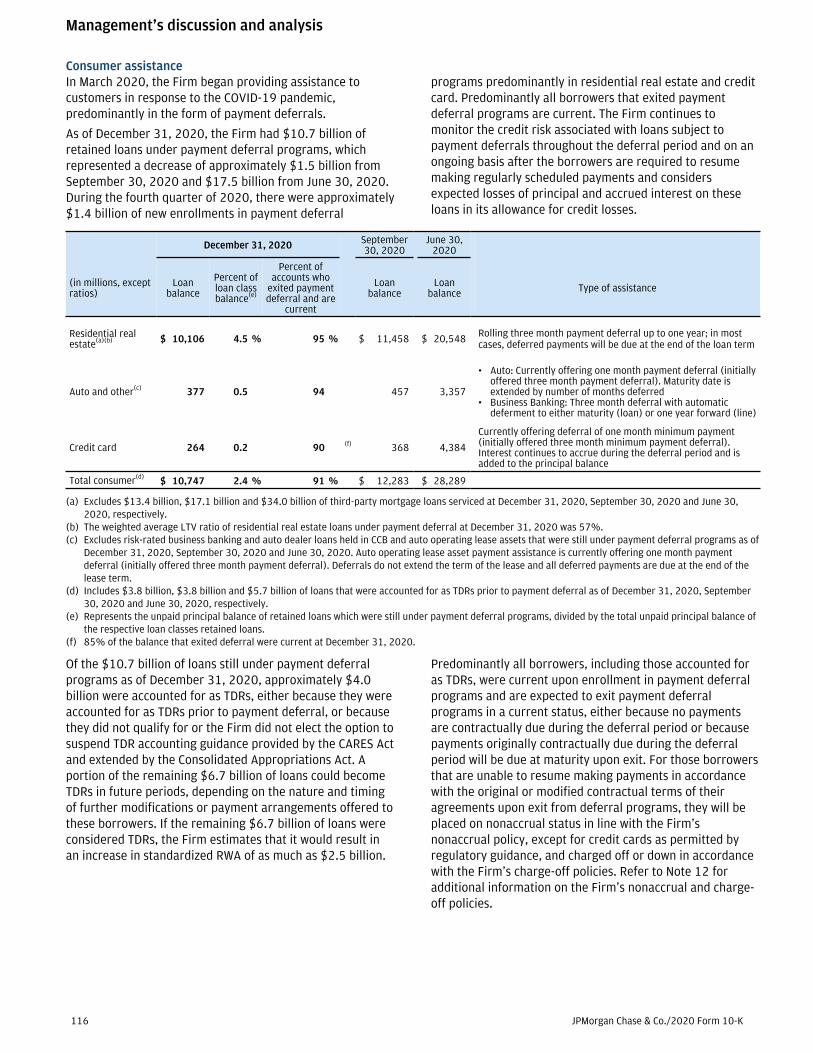
Consumer assistanceIn March 2020, the Firm began providing assistance to customers in response to the COVID-19 pandemic, predominantly in the form of payment deferrals.
As of December 31, 2020, the Firm had $10.7 billion of retained loans under payment deferral programs, which represented a decrease of approximately $1.5 billion from September 30, 2020 and $17.5 billion from June 30, 2020. During the fourth quarter of 2020, there were approximately $1.4 billion of new enrollments in payment deferral
programs predominantly in residential real estate and credit card. Predominantly all borrowers that exited payment deferral programs are current. The Firm continues to monitor the credit risk associated with loans subject to payment deferrals throughout the deferral period and on an ongoing basis after the borrowers are required to resume making regularly scheduled payments and considers expected losses of principal and accrued interest on these loans in its allowance for credit losses.
December 31, 2020 September 30, 2020
June 30, 2020
(in millions, except ratios)
Loan balance
Percent of loan class balance(e)
Percent of accounts who
exited payment deferral and are
current
Loan balance
Loan balance Type of assistance
Residential real estate(a)(b) $ 10,106 4.5 % 95 % $ 11,458 $ 20,548 Rolling three month payment deferral up to one year; in most
cases, deferred payments will be due at the end of the loan term
Auto and other(c) 377 0.5 94 457 3,357
• Auto: Currently offering one month payment deferral (initially offered three month payment deferral). Maturity date is extended by number of months deferred
• Business Banking: Three month deferral with automatic deferment to either maturity (loan) or one year forward (line)
Credit card 264 0.2 90 (f) 368 4,384
Currently offering deferral of one month minimum payment (initially offered three month minimum payment deferral). Interest continues to accrue during the deferral period and is added to the principal balance
Total consumer(d) $ 10,747 2.4 % 91 % $ 12,283 $ 28,289
(a) Excludes $13.4 billion, $17.1 billion and $34.0 billion of third-party mortgage loans serviced at December 31, 2020, September 30, 2020 and June 30, 2020, respectively.
(b) The weighted average LTV ratio of residential real estate loans under payment deferral at December 31, 2020 was 57%.(c) Excludes risk-rated business banking and auto dealer loans held in CCB and auto operating lease assets that were still under payment deferral programs as of
December 31, 2020, September 30, 2020 and June 30, 2020. Auto operating lease asset payment assistance is currently offering one month payment deferral (initially offered three month payment deferral). Deferrals do not extend the term of the lease and all deferred payments are due at the end of the lease term.
(d) Includes $3.8 billion, $3.8 billion and $5.7 billion of loans that were accounted for as TDRs prior to payment deferral as of December 31, 2020, September 30, 2020 and June 30, 2020, respectively.
(e) Represents the unpaid principal balance of retained loans which were still under payment deferral programs, divided by the total unpaid principal balance of the respective loan classes retained loans.
(f) 85% of the balance that exited deferral were current at December 31, 2020.
Of the $10.7 billion of loans still under payment deferral programs as of December 31, 2020, approximately $4.0 billion were accounted for as TDRs, either because they were accounted for as TDRs prior to payment deferral, or because they did not qualify for or the Firm did not elect the option to suspend TDR accounting guidance provided by the CARES Act and extended by the Consolidated Appropriations Act. A portion of the remaining $6.7 billion of loans could become TDRs in future periods, depending on the nature and timing of further modifications or payment arrangements offered to these borrowers. If the remaining $6.7 billion of loans were considered TDRs, the Firm estimates that it would result in an increase in standardized RWA of as much as $2.5 billion.
Predominantly all borrowers, including those accounted for as TDRs, were current upon enrollment in payment deferral programs and are expected to exit payment deferral programs in a current status, either because no payments are contractually due during the deferral period or because payments originally contractually due during the deferral period will be due at maturity upon exit. For those borrowers that are unable to resume making payments in accordance with the original or modified contractual terms of their agreements upon exit from deferral programs, they will be placed on nonaccrual status in line with the Firm’s nonaccrual policy, except for credit cards as permitted by regulatory guidance, and charged off or down in accordance with the Firm’s charge-off policies. Refer to Note 12 for additional information on the Firm’s nonaccrual and charge-off policies.
Management’s discussion and analysis
116 JPMorgan Chase & Co./2020 Form 10-K

Consumer, excluding credit cardPortfolio analysisLoan balances were flat from December 31, 2019 as PPP loan originations in Business Banking were offset by lower residential real estate loans, reflecting paydowns.
The following discussions provide information concerning individual loan products. Refer to Note 12 for further information about this portfolio, including information about delinquencies, loan modifications and other credit quality indicators.
Residential real estate: The residential real estate portfolio, including loans held-for-sale and loans at fair value, predominantly consists of prime mortgage loans and home equity lines of credit. The portfolio decreased from December 31, 2019 driven by paydowns largely offset by originations of prime mortgage loans that have been retained on the balance sheet. The 30+ delinquency rate decreased to 0.98% at December 31, 2020, from 1.35% at December 31, 2019, primarily due to payment assistance and government stimulus. Nonaccrual loans increased from December 31, 2019 due primarily to loans placed on nonaccrual status related to the impact of the COVID-19 pandemic as well as the adoption of CECL, as PCD loans became subject to nonaccrual treatment. Net recoveries for the year ended December 31, 2020 were higher when compared with the prior year as the current year benefited from a recovery on a loan sale.
The carrying value of home equity lines of credit outstanding was $23.7 billion at December 31, 2020. This amount included $8.6 billion of HELOCs that have recast from interest-only to fully amortizing payments or have been modified and $7.7 billion of interest-only balloon HELOCs, which primarily mature after 2030. The Firm manages the risk of HELOCs during their revolving period by closing or reducing the undrawn line to the extent permitted by law when borrowers are exhibiting a material deterioration in their credit risk profile.
At December 31, 2020 and 2019, the carrying value of interest-only residential mortgage loans were $25.6 billion and $22.5 billion, respectively. These loans have an interest-only payment period generally followed by an adjustable-rate or fixed-rate fully amortizing payment period to maturity and are typically originated as higher-balance loans to higher-income borrowers, predominantly in AWM. The net charge-off rate for the year ended December 31, 2020 was consistent with the rate of the broader residential mortgage portfolio as the performance of this portfolio is generally in line with the performance of the broader residential mortgage portfolio.
The following table provides a summary of the Firm’sresidential mortgage portfolio insured and/or guaranteedby U.S. government agencies, predominantly loans held-for-sale and loans at fair value. The Firm monitors its exposure to certain potential unrecoverable claim payments related to government-insured loans and considers this exposure in estimating the allowance for loan losses.
(in millions)December 31,
2020December 31,
2019
Current $ 669 $ 1,432
30-89 days past due 235 704
90 or more days past due 874 1,090
Total government guaranteed loans(a) $ 1,778 $ 3,226
(a) In the third quarter of 2020, the Firm reclassified certain fair value option elected lending-related positions from trading assets to loans. Prior-period amounts have been revised to conform with the current presentation.
Geographic composition and current estimated loan-to-value ratio of residential real estate loansAt December 31, 2020, $146.6 billion, or 65% of the total retained residential real estate loan portfolio, excluding mortgage loans insured by U.S. government agencies, were concentrated in California, New York, Florida, Texas and Illinois, compared with $157.9 billion, or 65%, at December 31, 2019.
Average current estimated loan-to-value (“LTV”) ratios have declined consistent with recent improvements in home prices, customer pay-downs, and charge-offs or liquidations of higher LTV loans.
Refer to Note 12 for information on the geographic composition and current estimated LTVs of the Firm’s residential real estate loans.
JPMorgan Chase & Co./2020 Form 10-K 117

Modified residential real estate loansThe following table presents information relating to modified retained residential real estate loans for which concessions have been granted to borrowers experiencing financial difficulty, which include both TDRs and modified loans accounted for as PCI loans prior to the adoption of CECL. The following table does not include loans with short-term or other insignificant modifications that are not considered concessions and, therefore, are not TDRs, or loans for which the Firm has elected to apply the option to suspend the application of accounting guidance for TDRs as provided by the CARES Act and extended by the Consolidated Appropriations Act. Refer to Note 12 for further information on modifications for the years ended December 31, 2020 and 2019.
(in millions)December 31,
2020December 31,
2019
Retained loans(a) $ 15,406 5,926
PCI loans NA 12,372 (d)
Nonaccrual retained loans(b)(c) $ 3,899 2,332
(a) At December 31, 2020 and 2019, $7 million and $14 million, respectively, of loans modified subsequent to repurchase from Ginnie Mae in accordance with the standards of the appropriate government agency (i.e., Federal Housing Administration (“FHA”), U.S. Department of Veterans Affairs (“VA”), Rural Housing Service of the U.S. Department of Agriculture (“RHS”)) are not included in the table above. When such loans perform subsequent to modification in accordance with Ginnie Mae guidelines, they are generally sold back into Ginnie Mae loan pools. Modified loans that do not re-perform become subject to foreclosure. Refer to Note 14 for additional information about sales of loans in securitization transactions with Ginnie Mae.
(b) At December 31, 2020 and 2019, nonaccrual loans included $3.0 billion and $1.9 billion, respectively, of TDRs for which the borrowers were less than 90 days past due. Refer to Note 12 for additional information about loans modified in a TDR that are on nonaccrual status.
(c) At December 31, 2020, nonaccrual loans included $1.3 billion of PCD loans. Prior to the adoption of CECL, nonaccrual loans excluded PCI loans as the Firm recognized interest income on each pool of PCI loans as each of the pools was performing.
(d) Amount represents the unpaid principal balance of modified PCI loans at December 31, 2019, which were moved to retained loans upon the adoption of CECL.
Auto and other: The auto and other loan portfolio predominantly consists of prime-quality scored auto and business banking loans, as well as overdrafts. The portfolio increased when compared with December 31, 2019, predominantly due to PPP loan originations of $21.9 billion in Business Banking of which $19.2 billion remained outstanding at December 31, 2020 as well as from growth in the auto portfolio from loan originations, partially offset by paydowns and charge-offs or liquidation of delinquent loans. The 30+ delinquency rate decreased to 0.60% at December 31, 2020, from 1.31% at December 31, 2019, primarily due to payment assistance and government stimulus, as well as PPP loan originations as these loans are all considered current. The scored auto portfolio net charge-off rates were 0.25% and 0.44% for the years ended December 31, 2020 and 2019, respectively. Auto charge-offs for the year ended December 31, 2020
benefited from payment assistance programs and high vehicle collateral values.
Nonperforming assetsThe following table presents information as of December 31, 2020 and 2019, about consumer, excluding credit card, nonperforming assets.
Nonperforming assets(a)
December 31, (in millions) 2020 2019
Nonaccrual loans
Residential real estate(b)(c)(d) $ 6,316 $ 3,220
Auto and other 151 146
Total nonaccrual loans 6,467 3,366
Assets acquired in loan satisfactions
Real estate owned(e) 131 229
Other 21 24
Total assets acquired in loan satisfactions 152 253
Total nonperforming assets $ 6,619 $ 3,619
(a) At December 31, 2020 and 2019, nonperforming assets excluded mortgage loans 90 or more days past due and insured by U.S. government agencies of $874 million and $1.1 billion, respectively, and REO insured by U.S. government agencies of $9 million and $41 million, respectively. Prior-period amount of mortgage loans 90 or more days past due and insured by U.S. government agencies excluded from nonperforming assets has been revised to conform with the current presentation; refer to footnote (b) for additional information. These amounts have been excluded based upon the government guarantee.
(b) In the third quarter of 2020, the Firm reclassified certain fair value option elected lending-related positions from trading assets to loans. Prior-period amounts have been revised to conform with the current presentation.
(c) Generally excludes loans under payment deferral programs offered in response to the COVID-19 pandemic. Includes loans to customers that have exited COVID-19 payment deferral programs and are 90 or more days past due, predominantly all of which were also at least 150 days past due and therefore considered collateral-dependent. Collateral-dependent loans are charged down to the lower of amortized cost or fair value of the underlying collateral less costs to sell.
(d) At December 31, 2020, nonaccrual loans included $1.6 billion of PCD loans. Prior to the adoption of CECL, nonaccrual loans excluded PCI loans as the Firm recognized interest income on each pool of PCI loans as each of the pools was performing.
(e) Prior-period amount has been revised to conform with the current presentation.
Management’s discussion and analysis
118 JPMorgan Chase & Co./2020 Form 10-K

Nonaccrual loansThe following table presents changes in consumer, excluding credit card, nonaccrual loans for the years ended December 31, 2020 and 2019.
Nonaccrual loan activity(a)
Year ended December 31,(in millions) 2020 2019Beginning balance $ 3,366 $ 3,853 Additions:
PCD loans, upon adoption of CECL 708 NAOther additions 5,184 (c) 2,174
Total additions 5,892 2,174 Reductions:
Principal payments and other(b) 983 1,167 Charge-offs 390 371 Returned to performing status 1,024 751 Foreclosures and other liquidations 394 372
Total reductions 2,791 2,661 Net changes 3,101 (487)
Ending balance $ 6,467 $ 3,366
(a) In the third quarter of 2020, the Firm reclassified certain fair value option elected lending-related positions from trading assets to loans. Prior-period amounts have been revised to conform with the current presentation.
(b) Other reductions includes loan sales.(c) Includes loans to customers that have exited COVID-19 payment
deferral programs and are 90 or more days past due, predominantly all of which were also at least 150 days past due and therefore considered collateral-dependent. Collateral-dependent loans are charged down to the lower of amortized cost or fair value of the underlying collateral less costs to sell.
Active and suspended foreclosure: Refer to Note 12 for information on loans that were in the process of active or suspended foreclosure.
Refer to Note 12 for further information about the consumer credit portfolio, including information about delinquencies, loan modifications and other credit quality indicators.
Purchased credit deteriorated (“PCD”) loansThe following tables provide credit-related information for PCD loans, which were accounted for as PCI loans prior to the adoption of CECL. PCI loans are considered PCD loans under CECL and are subject to the Firm’s nonaccrual and charge-off policies. PCD loans are now reported in the consumer, excluding credit card portfolio’s residential real estate class. Refer to Note 1 for further information.
(in millions, except ratios)December 31,
2020December 31,
2019
Loan delinquency(a)
Current $ 16,036 $ 18,571
30-149 days past due 432 970
150 or more days past due(b) 573 822
Total PCD loans $ 17,041 $ 20,363
% of 30+ days past due to total retained PCD loans 5.90 % 8.80 %
Nonaccrual loans(c) $ 1,609 NA
(in millions, except ratios)Twelve months ended
December 31, 2020
Net charge-offs $ 74
Net charge-off rate 0.39 %
(a) At December 31, 2020, loans under payment deferral programs offered in response to the COVID-19 pandemic which are still within their deferral period and performing according to their modified terms are generally not considered delinquent.
(b) Includes loans to customers that have exited COVID-19 payment deferral programs and are 150 or more days past due and therefore considered collateral-dependent. Collateral dependent loans are charged down to the lower of amortized cost or fair value of the underlying collateral less costs to sell.
(c) Includes loans to customers that have exited COVID-19 payment deferral programs and are 90 or more days past due, predominantly all of which were also at least 150 days past due and therefore considered collateral-dependent.
JPMorgan Chase & Co./2020 Form 10-K 119

Credit cardTotal credit card loans decreased from December 31, 2019 reflecting a decline in sales volume that began in March as a result of the impact of the COVID-19 pandemic. The December 31, 2020 30+ and 90+ day delinquency rates of 1.68% and 0.92%, respectively, decreased compared to the December 31, 2019 30+ and 90+ day delinquency rates of 1.87% and 0.95%, respectively. The delinquency rates were positively impacted by borrowers who received payment assistance and government stimulus. Net charge-offs decreased for the year ended December 31, 2020 compared with the prior year reflecting lower charge-offs and higher recoveries primarily benefiting from payment assistance and government stimulus.
Consistent with the Firm’s policy, all credit card loans typically remain on accrual status until charged off. However, the Firm’s allowance for loan losses includes the estimated uncollectible portion of accrued and billed interest and fee income. Refer to Note 12 for further information about this portfolio, including information about delinquencies.
Geographic and FICO composition of credit card loansAt December 31, 2020, $65.0 billion, or 45% of the total retained credit card loan portfolio, was concentrated in California, Texas, New York, Florida and Illinois, compared with $77.5 billion, or 46%, at December 31, 2019. Refer to Note 12 for additional information on the geographic and FICO composition of the Firm’s credit card loans.
Modifications of credit card loansAt December 31, 2020, the Firm had $1.4 billion of credit card loans outstanding that have been modified in TDRs, which does not include loans with short-term or other insignificant modifications that are not considered TDRs, compared to $1.5 billion at December 31, 2019. Refer to Note 12 for additional information about loan modification programs for borrowers.
Management’s discussion and analysis
120 JPMorgan Chase & Co./2020 Form 10-K

WHOLESALE CREDIT PORTFOLIO
In its wholesale businesses, the Firm is exposed to credit risk primarily through its underwriting, lending, market-making, and hedging activities with and for clients and counterparties, as well as through various operating services (such as cash management and clearing activities), securities financing activities and cash placed with banks. A portion of the loans originated or acquired by the Firm’s wholesale businesses is generally retained on the balance sheet. The Firm distributes a significant percentage of the loans that it originates into the market as part of its syndicated loan business and to manage portfolio concentrations and credit risk. The wholesale portfolio is actively managed, in part by conducting ongoing, in-depth reviews of client credit quality and transaction structure inclusive of collateral where applicable, and of industry, product and client concentrations. Refer to the industry discussion on pages 123-127 for further information.
The Firm’s wholesale credit portfolio includes exposure held in CIB, CB, AWM and Corporate, as well as risk-rated business banking and auto dealer exposures held in CCB for which the wholesale methodology is applied when determining the allowance for credit losses.
In 2020, the impacts of the COVID-19 pandemic resulted in broad-based credit deterioration and an increase in the allowance for credit losses. As of December 31, 2020, the investment-grade percentage of the portfolio decreased from 74% to 71%, and criticized exposure increased $26.5 billion from $15.1 billion to $41.6 billion. The increase in criticized exposure was largely driven by downgrades in Consumer & Retail, Oil & Gas and Real Estate, and to a lesser extent, net portfolio activity in Technology, Media & Telecommunications. The continuation or worsening of the effects of the COVID-19 pandemic on the macroeconomic environment could result in further impacts to credit quality metrics, including investment-grade percentages, as well as to criticized and nonperforming exposures and charge-offs.
As of December 31, 2020 retained loans were up $33.3 billion predominantly driven by AWM and CIB, and lending-related commitments were up $32.4 billion, predominantly driven by CIB and CB.
Wholesale credit portfolio
December 31,(in millions)
Credit exposure Nonperforming(f)
2020 2019 2020 2019
Loans retained $ 514,947 $ 481,678 $ 3,318 $ 1,057
Loans held-for-sale 5,784 4,062 284 5
Loans at fair value (a) 29,327 25,139 504 209
Loans – reported 550,058 510,879 4,106 1,271
Derivative receivables 79,630 49,766 56 30
Receivables from customers(b) 47,710 33,706 — —
Total wholesale credit-related assets 677,398 594,351 4,162 1,301
Assets acquired in loan satisfactions
Real estate owned (c) NA NA 125 115
Other NA NA — 19
Total assets acquired in loan satisfactions NA NA 125 134
Lending-related commitments (a) 449,863 417,510 577 474
Total wholesale credit portfolio $ 1,127,261 $ 1,011,861 $ 4,864 $ 1,909
Credit derivatives used in credit portfolio management activities(c)(d) $ (22,239) $ (18,530) $ — $ —
Liquid securities and other cash collateral held against derivatives(e) (14,806) (13,052) NA NA
(a) In the third quarter of 2020, the Firm reclassified certain fair value option elected lending-related positions from trading assets to loans, which resulted in a corresponding reclassification of certain off-balance sheet commitments. Prior-period amounts have been revised to conform with the current presentation.
(b) Receivables from customers reflect held-for-investment margin loans to brokerage clients in CIB, CCB and AWM; these are reported within accrued interest and accounts receivable on the Consolidated balance sheets.
(c) Prior-period amounts have been revised to conform with the current presentation.
(d) Represents the net notional amount of protection purchased and sold through credit derivatives used to manage both performing and nonperforming wholesale credit exposures; these derivatives do not qualify for hedge accounting under U.S. GAAP. Refer to Credit derivatives on page 131 and Note 5 for additional information.
(e) In the fourth quarter of 2020, the Firm refined its approach for disclosing additional collateral held by the Firm that may be used as security when the fair value of the client’s exposure is in the Firm’s favor. Prior-period amounts have been revised to conform with the current presentation.
(f) Loans that were modified in response to the COVID-19 pandemic continue to be risk-rated in accordance with the Firm’s overall credit risk management framework. As of December 31, 2020, predominantly all of these loans were considered performing.
JPMorgan Chase & Co./2020 Form 10-K 121

Wholesale assistance In March 2020, the Firm began providing assistance to clients in response to the COVID-19 pandemic, predominantly in the form of payment deferrals and covenant modifications.
As of December 31, 2020, the Firm had approximately $1.6 billion of retained loans still under payment deferral, which has decreased approximately $4.6 billion from the third quarter, and $15.1 billion from the second quarter. Predominantly all clients that exited deferral are current or
have paid down their loans, and the Firm has not experienced significant new payment deferral requests. The Firm continues to monitor the credit risk associated with loans subject to deferrals throughout the deferral period and on an ongoing basis after the borrowers are required to resume making regularly scheduled payments and considers expected losses of principal and accrued interest on these loans in its allowance for credit losses.
(in millions, except ratios) December 31, 2020 September 30, 2020 June 30, 2020
Industry Loan balancePercent of total
industry loan balance(a)
IG percentage of loan balance in payment
deferral Loan balance Loan balanceReal Estate $ 550 0.46 % 36 % $ 4,385 $ 5,211
Individuals and Individual Entities 402 0.37 4 691 809
Transportation 394 5.99 92 346 294 Consumer & Retail 82 0.21 2 413 690 Automotive 22 0.13 — 15 8,827 Industrials 19 0.09 — 91 335 Healthcare 7 0.04 — 100 300 All Other industries 147 0.08 99 233 309 Total wholesale $ 1,623 0.32 % 45 % $ 6,274 $ 16,775
(a) Represents the balance of the retained loans which were still under payment deferral, divided by the respective industry total retained loans balance.
In addition, the Firm granted assistance in the form of covenant modifications. These types of assistance, both payment deferrals and covenant modifications, are generally not reported as TDRs, either because the modifications were insignificant or they qualified for the option to suspend the application of accounting guidance for TDRs as provided by the CARES Act and extended by the Consolidated Appropriations Act. A portion of the $1.6 billion of loans under payment deferral as December 31,
2020 could become TDRs in future periods, depending on the nature and timing of further modifications or payment arrangements offered to these borrowers. If the $1.6 billion of loans under payment deferral were considered TDRs, the Firm estimates that it would result in an increase in standardized RWA of as much as $500 million. Loans under assistance continue to be risk-rated in accordance with the Firm’s overall credit risk management framework. As of December 31, 2020, predominantly all of these loans were considered performing.
Wholesale credit exposure – maturity and ratings profileThe following tables present the maturity and internal risk ratings profiles of the wholesale credit portfolio as of December 31, 2020 and 2019. The Firm generally considers internal ratings with qualitative characteristics equivalent to BBB-/Baa3 or higher as investment grade, and takes into consideration collateral and structural support when determining the internal risk rating for each credit facility. Refer to Note 12 for further information on internal risk ratings.
Maturity profile(g) Ratings profile
1 year or less
1 year through 5 years
After 5 years Total Total
Total % of IG
December 31, 2020(in millions, except ratios)
Investment-grade
Noninvestment-grade
Loans retained $ 183,969 $ 197,905 $ 133,073 $ 514,947 $ 379,273 $ 135,674 $ 514,947 74 %
Derivative receivables 79,630 79,630
Less: Liquid securities and other cash collateral held against derivatives(b) (14,806) (14,806)
Total derivative receivables, net of collateral 18,456 17,599 28,769 64,824 38,941 25,883 64,824 60
Lending-related commitments(c) 116,950 315,179 17,734 449,863 312,694 137,169 449,863 70
Subtotal 319,375 530,683 179,576 1,029,634 730,908 298,726 1,029,634 71
Loans held-for-sale and loans at fair value(c)(d) 35,111 35,111
Receivables from customers 47,710 47,710
Total exposure – net of liquid securities and other cash collateral held against derivatives $ 1,112,455 $ 1,112,455
Credit derivatives used in credit portfolio management activities(e)(f) $ (6,190) $ (13,223) $ (2,826) $ (22,239) $ (17,860) $ (4,379) $ (22,239) 80 %
Management’s discussion and analysis
122 JPMorgan Chase & Co./2020 Form 10-K

Maturity profile(g) Ratings profile
1 year or less
1 year through 5 years
After 5 years Total Total
Total % of IG
December 31, 2019(in millions, except ratios)
Investment-grade
Noninvestment-grade
Loans retained(a) $ 159,006 $ 186,256 $ 136,416 $ 481,678 $ 363,444 $ 118,234 $ 481,678 75 %
Derivative receivables 49,766 49,766
Less: Liquid securities and other cash collateral held against derivatives(b) (13,052) (13,052)
Total derivative receivables, net of collateral 7,136 7,569 22,009 36,714 29,416 7,298 36,714 80
Lending-related commitments(a)(c) 87,577 312,939 16,994 417,510 296,702 120,808 417,510 71
Subtotal 253,719 506,764 175,419 935,902 689,562 246,340 935,902 74
Loans held-for-sale and loans at fair value(c)(d) 29,201 29,201
Receivables from customers 33,706 33,706
Total exposure – net of liquid securities and other cash collateral held against derivatives $ 998,809 $ 998,809
Credit derivatives used in credit portfolio management activities(a)(e)(f) $ (5,412) $ (10,031) $ (3,087) $ (18,530) $ (16,724) $ (1,806) $ (18,530) 90 %
(a) Prior-period amounts have been revised to conform with the current presentation.(b) In the fourth quarter of 2020, the Firm refined its approach for disclosing additional collateral held by the Firm that may be used as security when the fair
value of the client’s exposure is in the Firm’s favor. Prior-period amounts have been revised to conform with the current presentation.(c) In the third quarter of 2020, the Firm reclassified certain fair value option elected lending-related positions from trading assets to loans, which resulted in
a corresponding reclassification of certain off-balance sheet commitments. Prior-period amounts have been revised to conform with the current presentation.
(d) Represents loans held-for-sale, primarily related to syndicated loans and loans transferred from the retained portfolio, and loans at fair value.(e) These derivatives do not qualify for hedge accounting under U.S. GAAP.(f) The notional amounts are presented on a net basis by underlying reference entity and the ratings profile shown is based on the ratings of the reference
entity on which protection has been purchased. Predominantly all of the credit derivatives entered into by the Firm where it has purchased protection used in credit portfolio management activities are executed with investment-grade counterparties.
(g) The maturity profile of retained loans, lending-related commitments and derivative receivables is generally based on remaining contractual maturity. Derivative contracts that are in a receivable position at December 31, 2020, may become payable prior to maturity based on their cash flow profile or changes in market conditions.
Wholesale credit exposure – industry exposuresThe Firm focuses on the management and diversification of its industry exposures, and pays particular attention to industries with actual or potential credit concerns.
Exposures deemed criticized align with the U.S. banking regulators’ definition of criticized exposures, which consist of the special mention, substandard and doubtful categories. Total criticized exposure excluding loans held-for-sale and loans at fair value, was $41.6 billion at December 31, 2020, compared with $15.1 billion at December 31, 2019, representing approximately 4.0% and 1.5% of total wholesale credit exposure, respectively. The increase in total criticized exposure was largely driven by downgrades in Consumer & Retail, Oil & Gas and Real Estate due to impacts from the COVID-19 pandemic, and to a lesser extent, net portfolio activity in Technology, Media & Telecommunications. Predominantly all of the $41.6 billion was performing and largely undrawn.
JPMorgan Chase & Co./2020 Form 10-K 123

The table below summarizes by industry the Firm’s exposures as of December 31, 2020 and 2019. The industry of risk category is generally based on the client or counterparty’s primary business activity. Refer to Note 4 for additional information on industry concentrations.
Wholesale credit exposure – industries(a)
Selected metrics
30 days or more past due and accruingloans(h)
Net charge-offs/
(recoveries)
Credit derivative hedges(i)
Liquid securities and other cash collateral held
against derivative
receivables(k)
Noninvestment-grade
Creditexposure(f)(g)
Investment- grade(g) Noncriticized(g)
Criticized performing
Criticized nonperforming
As of or for the year ended December 31, 2020(in millions)
Real Estate $ 148,498 $ 116,124 $ 27,576 $ 4,294 $ 504 $ 374 $ 94 $ (110) $ —
Individuals and Individual Entities(b) 122,870 107,266 14,688 227 689 1,570 (17) — —
Consumer & Retail 108,437 57,580 41,624 8,852 381 203 55 (381) (5)
Technology, Media & Telecommunications 72,150 36,435 27,770 7,738 207 10 73 (934) (56)
Asset Managers 66,573 57,582 8,885 85 21 19 1 — (4,685)
Industrials 66,470 37,512 26,881 1,852 225 278 70 (658) (61)
Healthcare 60,118 44,901 13,356 1,684 177 96 104 (378) (191)
Banks & Finance Cos 54,032 35,115 17,820 1,045 52 20 13 (555) (1,648)
Automotive 43,331 25,548 15,575 2,149 59 152 22 (434) —
Oil & Gas 39,159 18,456 14,969 4,952 782 11 249 (238) (4)
State & Municipal Govt(c) 38,286 37,705 574 2 5 41 — — (41)
Utilities 30,124 22,451 7,048 571 54 14 (7) (402) (1)
Chemicals & Plastics 17,176 10,622 5,703 822 29 6 — (83) —
Central Govt 17,025 16,652 373 — — — — (8,364) (982)
Transportation 16,232 7,549 6,340 2,137 206 30 117 (83) (26)
Metals & Mining 15,542 5,958 8,699 704 181 8 16 (141) (13)
Insurance 13,141 10,177 2,960 3 1 7 — — (1,771)
Securities Firms 8,048 6,116 1,927 1 4 — 18 (49) (3,423)
Financial Markets Infrastructure 6,515 6,449 66 — — — — — (10)
All other(d) 100,713 84,650 15,185 504 374 83 (9) (9,429) (1,889)
Subtotal $ 1,044,440 $ 744,848 $ 258,019 $ 37,622 $ 3,951 $ 2,922 $ 799 $ (22,239) $ (14,806)
Loans held-for-sale and loans at fair value 35,111
Receivables from customers 47,710
Total(e) $ 1,127,261
Management’s discussion and analysis
124 JPMorgan Chase & Co./2020 Form 10-K

Selected metrics
30 days or more past due and accruing
loans
Net charge-offs/
(recoveries)
Credit derivative hedges(i)
Liquid securities and other cash collateral held
against derivative
receivables(k)
Noninvestment-grade
Creditexposure(f)(g)
Investment- grade(g) Noncriticized(g)
Criticized performing
Criticized nonperforming
As of or for the year ended December 31, 2019(in millions)
Real Estate $ 150,919 $ 121,625 $ 27,779 $ 1,457 $ 58 $ 104 $ 13 $ (100) $ —
Individuals and Individual Entities(b) 105,027 93,181 11,617 192 37 388 33 — (287)
Consumer & Retail 106,986 58,704 45,806 2,261 215 118 124 (235) (5)
Technology, Media & Telecommunications 60,033 35,878 21,066 2,953 136 27 27 (658) (13)
Asset Managers 54,304 47,569 6,716 6 13 18 — — (4,410)
Industrials 62,483 39,434 21,673 1,157 219 172 48 (746) (1)
Healthcare 50,824 36,988 12,544 1,141 151 108 14 (405) (144)
Banks & Finance Cos 50,786 34,941 15,031 808 6 — — (834) (1,419)
Automotive 35,118 24,255 10,246 615 2 8 1 (194) —
Oil & Gas 41,641 22,244 17,823 995 579 — 98 (429) (6)
State & Municipal Govt(c) 30,095 29,586 509 — — 33 7 — (16)
Utilities 34,843 22,213 12,316 301 13 2 39 (414) (34)
Chemicals & Plastics 17,499 12,033 5,243 221 2 5 — (10) (13)
Central Govt 14,865 14,524 341 — — — — (9,018) (850)
Transportation 14,497 8,734 5,336 353 74 30 8 (37) (37)
Metals & Mining 15,586 7,095 7,789 661 41 2 (1) (33) (2)
Insurance 12,348 9,458 2,867 19 4 3 — (36) (1,790)
Securities Firms 7,381 6,010 1,344 27 — — — (48) (3,088)
Financial Markets Infrastructure 4,121 3,969 152 — — — — — (4)
All other(d) 79,598 73,453 5,722 412 11 4 4 (5,333) (j) (933)
Subtotal $ 948,954 $ 701,894 $ 231,920 $ 13,579 $ 1,561 $ 1,022 $ 415 $ (18,530) $ (13,052)
Loans held-for-sale and loans at fair value 29,201
Receivables from customers 33,706
Total(e) $ 1,011,861
(a) The industry rankings presented in the table as of December 31, 2019, are based on the industry rankings of the corresponding exposures at December 31, 2020, not actual rankings of such exposures at December 31, 2019.
(b) Individuals and Individual Entities predominantly consists of Wealth Management clients within AWM and includes exposure to personal investment companies and personal and testamentary trusts.
(c) In addition to the credit risk exposure to states and municipal governments (both U.S. and non-U.S.) at December 31, 2020 and 2019, noted above, the Firm held: $7.2 billion and $6.5 billion, respectively, of trading assets; $20.4 billion and $29.8 billion, respectively, of AFS securities; and $12.8 billion and $4.8 billion, respectively, of HTM securities, issued by U.S. state and municipal governments. Refer to Note 2 and Note 10 for further information.
(d) All other includes: SPEs and Private education and civic organizations, representing approximately 92% and 8%, respectively, at December 31, 2020 and 90% and 10%, respectively, at December 31, 2019 .
(e) Excludes cash placed with banks of $516.9 billion and $254.0 billion, at December 31, 2020 and 2019, respectively, which is predominantly placed with various central banks, primarily Federal Reserve Banks.
(f) Credit exposure is net of risk participations and excludes the benefit of credit derivatives used in credit portfolio management activities held against derivative receivables or loans and liquid securities and other cash collateral held against derivative receivables.
(g) In the third quarter of 2020, the Firm reclassified certain fair value option elected lending-related positions from trading assets to loans, which resulted in a corresponding reclassification of certain off-balance sheet commitments. Prior-period amounts have been revised to conform with the current presentation.
(h) Generally excludes loans under payment deferral programs offered in response to the COVID-19 pandemic. (i) Represents the net notional amounts of protection purchased and sold through credit derivatives used to manage the credit exposures; these derivatives
do not qualify for hedge accounting under U.S. GAAP. The All other category includes purchased credit protection on certain credit indices.(j) Prior-period amount has been revised to conform with the current presentation.(k) In the fourth quarter of 2020, the Firm refined its approach for disclosing additional collateral held by the Firm that may be used as security when the fair
value of the client’s exposure is in the Firm’s favor. Prior-period amounts have been revised to conform with the current presentation.
JPMorgan Chase & Co./2020 Form 10-K 125

Presented below is additional detail on certain of the Firm’s largest industry exposures and/or certain industries which present potential heightened credit concerns.
Real EstateReal Estate exposure was $148.5 billion as of December 31, 2020, of which $85.6 billion was multifamily lending as shown in the table below. During the year ended December 31, 2020, the following changes were primarily driven by impacts from the COVID-19 pandemic:
• the investment-grade portion of the Real Estate portfolio decreased from 81% to 78%.• the drawn percentage of this portfolio increased from 78% to 80%• criticized exposure increased by $3.3 billion from $1.5 billion to $4.8 billion
December 31, 2020
(in millions, except ratios)
Loans and Lending-related Commitments(d)
Derivative Receivables
Credit exposure
% Investment-
grade % Drawn(e)
Multifamily(a) $ 85,368 $ 183 $ 85,551 85 % 92 %
Office 16,372 475 16,847 76 70
Other Income Producing Properties(b) 13,435 421 13,856 76 55
Retail 10,573 199 10,772 60 69
Services and Non Income Producing 9,242 22 9,264 62 47
Industrial 9,039 69 9,108 76 73
Lodging 3,084 16 3,100 24 57
Total Real Estate Exposure(c) 147,113 1,385 148,498 78 80
December 31, 2019
(in millions, except ratios)
Loans and Lending-related Commitments(d)
Derivative Receivables
Credit exposure
% Investment-grade % Drawn(e)
Multifamily(a) $ 86,381 $ 58 $ 86,439 91 % 92 %
Office 15,734 231 15,965 80 70
Other Income Producing Properties(b) 14,372 181 14,553 48 45
Retail 11,347 87 11,434 83 68
Services and Non Income Producing 9,922 19 9,941 57 47
Industrial 8,842 24 8,866 74 75
Lodging 3,702 19 3,721 51 38
Total Real Estate Exposure 150,300 619 150,919 81 78
(a) Multifamily exposure is largely in California.(b) Other Income Producing Properties consists of clients with diversified property types or other property types outside of multifamily, office, retail,
industrial and lodging with less material exposures.(c) Real Estate exposure is approximately 80% secured; unsecured exposure is approximately 78% investment-grade.(d) In the third quarter of 2020, the Firm reclassified certain fair value option elected lending-related positions from trading assets to loans, which resulted in
a corresponding reclassification of certain off-balance sheet commitments. Prior-period amounts have been revised to conform with the current presentation.
(e) Represents drawn exposure as a percentage of credit exposure.
Management’s discussion and analysis
126 JPMorgan Chase & Co./2020 Form 10-K

Consumer & RetailConsumer & Retail exposure was $108.4 billion as of December 31, 2020, and predominantly included Retail, Food and Beverage, and Business and Consumer Services as shown in the table below. During the year ended December 31, 2020, the following changes were primarily driven by impacts from the COVID-19 pandemic:
• the investment-grade portion of the Consumer & Retail portfolio decreased from 55% to 53%• the drawn percentage of this portfolio increased from 35% to 36%• criticized exposure increased by $6.7 billion from $2.5 billion to $9.2 billion
December 31, 2020
(in millions, except ratios)
Loans and Lending-related Commitments
Derivative Receivables
Credit exposure
% Investment-
grade % Drawn(d)
Retail(a) $ 32,486 $ 887 $ 33,373 52 % 33 %
Food and Beverage 28,012 897 28,909 62 33
Business and Consumer Services 24,760 599 25,359 52 41
Consumer Hard Goods 12,937 178 13,115 59 36
Leisure(b) 7,440 241 7,681 18 43
Total Consumer & Retail(c) 105,635 2,802 108,437 53 36
December 31, 2019
(in millions, except ratios)
Loans and Lending-related Commitments
Derivative Receivables
Credit exposure
% Investment-grade % Drawn(d)
Retail(a) $ 29,290 $ 294 $ 29,584 54 % 37 %
Food and Beverage 27,956 625 28,581 67 36
Business and Consumer Services 24,242 249 24,491 51 37
Consumer Hard Goods 13,144 109 13,253 65 35
Leisure(b) 10,930 147 11,077 21 19
Total Consumer & Retail 105,562 1,424 106,986 55 35
(a) Retail consists of Home Improvement & Specialty Retailers, Restaurants, Supermarkets, Discount & Drug Stores, Specialty Apparel and Department Stores.(b) Leisure consists of Gaming, Arts & Culture, Travel Services and Sports & Recreation. As of December 31, 2020 approximately 75% of the noninvestment-
grade Leisure portfolio is secured.(c) Approximately 80% of the noninvestment-grade portfolio is secured.(d) Represents drawn exposure as a percent of credit exposure.
Oil & GasOil & Gas exposure was $39.2 billion as of December 31, 2020, including $19.3 billion of Exploration & Production and Oil field Services as shown in the table below. During the year ended December 31, 2020, the following changes were driven by lower oil prices and impacts from the COVID-19 pandemic:
• the investment-grade portion of the Oil & Gas portfolio decreased from 53% to 47% • criticized exposure increased by $4.1 billion from $1.6 billion to $5.7 billion
December 31, 2020
(in millions, except ratios)
Loans and Lending-related Commitments
Derivative Receivables
Credit exposure
% Investment-
grade % Drawn(c)
Exploration & Production ("E&P") and Oil field Services $ 18,228 $ 1,048 $ 19,276 32 % 37 %
Other Oil & Gas(a) 19,288 595 19,883 62 21
Total Oil & Gas(b) 37,516 1,643 39,159 47 29
December 31, 2019
(in millions, except ratios)
Loans and Lending-related Commitments
Derivative Receivables
Credit exposure
% Investment-grade % Drawn(c)
Exploration & Production ("E&P") and Oil field Services $ 22,543 $ 646 $ 23,189 38 % 38 %
Other Oil & Gas(a) 18,246 206 18,452 73 23
Total Oil & Gas(b) 40,789 852 41,641 53 31
(a) Other Oil & Gas includes Integrated Oil & Gas companies, Midstream/Oil Pipeline companies and refineries.(b) Secured lending was $13.2 billion and $15.7 billion at December 31, 2020 and 2019, respectively, approximately half of which is reserve-based lending
to the Exploration & Production sub-sector; unsecured exposure is largely investment-grade.(c) Represents drawn exposure as a percent of credit exposure.
JPMorgan Chase & Co./2020 Form 10-K 127

LoansIn its wholesale businesses, the Firm provides loans to a variety of clients, ranging from large corporate and institutional clients to high-net-worth individuals. Refer to Note 12 for a further discussion on loans, including information about delinquencies, loan modifications and other credit quality indicators.
The following table presents the change in the nonaccrual loan portfolio for the years ended December 31, 2020 and 2019. The increase was driven by downgrades across multiple industries on client credit deterioration, with the largest concentration in Real Estate, predominantly within retail and lodging.
Wholesale nonaccrual loan activity
Year ended December 31, (in millions) 2020 2019
Beginning balance $ 1,271 $ 1,587
Additions(a) 6,753 2,552
Reductions:
Paydowns and other 2,290 1,585
Gross charge-offs 922 425
Returned to performing status 569 652
Sales 137 206
Total reductions 3,918 2,868
Net changes 2,835 (316)
Ending balance $ 4,106 $ 1,271
(a) In the third quarter of 2020, the Firm reclassified certain fair value option elected lending-related positions from trading assets to loans. Prior-period amounts have been revised to conform with the current presentation.
The following table presents net charge-offs/recoveries, which are defined as gross charge-offs less recoveries, for the years ended December 31, 2020 and 2019. The amounts in the table below do not include gains or losses from sales of nonaccrual loans.
Wholesale net charge-offs/(recoveries)Year ended December 31,(in millions, except ratios) 2020 2019
Loans – reported
Average loans retained $ 509,907 $ 472,628
Gross charge-offs 954 472
Gross recoveries collected (155) (57)
Net charge-offs/(recoveries) 799 415
Net charge-off/(recovery) rate 0.16 % 0.09 %
Management’s discussion and analysis
128 JPMorgan Chase & Co./2020 Form 10-K

Lending-related commitmentsThe Firm uses lending-related financial instruments, such as commitments (including revolving credit facilities) and guarantees, to address the financing needs of its clients. The contractual amounts of these financial instruments represent the maximum possible credit risk should the clients draw down on these commitments or when the Firm fulfills its obligations under these guarantees, and the clients subsequently fail to perform according to the terms of these contracts. Most of these commitments and guarantees have historically been refinanced, extended, cancelled, or expired without being drawn upon or a default occurring. As a result, the Firm does not believe that the total contractual amount of these wholesale lending-related commitments is representative of the Firm’s expected future credit exposure or funding requirements. Refer to Note 28 for further information on wholesale lending-related commitments.
Receivables from CustomersReceivables from customers reflect held-for-investment margin loans to brokerage clients in CIB, CCB and AWM that are collateralized by assets maintained in the clients’ brokerage accounts (e.g., cash on deposit, liquid and readily marketable debt or equity securities). Because of this collateralization, no allowance for credit losses is generally held against these receivables. To manage its credit risk the Firm establishes margin requirements and monitors the required margin levels on an ongoing basis, and requires clients to deposit additional cash or other collateral, or to reduce positions, when appropriate. These receivables are reported within accrued interest and accounts receivable on the Firm’s Consolidated balance sheets.
Clearing servicesThe Firm provides clearing services for clients entering into certain securities and derivative contracts. Through the provision of these services the Firm is exposed to the risk of non-performance by its clients and may be required to share in losses incurred by CCPs. Where possible, the Firm seeks to mitigate its credit risk to its clients through the collection of adequate margin at inception and throughout the life of the transactions and can also cease the provision of clearing services if clients do not adhere to their obligations under the clearing agreement. Refer to Note 28 for a further discussion of clearing services.
Derivative contractsDerivatives enable clients and counterparties to manage risks including credit risk and risks arising from fluctuations in interest rates, foreign exchange, equities, and commodities. The Firm makes markets in derivatives in order to meet these needs and uses derivatives to manage certain risks associated with net open risk positions from its market-making activities, including the counterparty credit risk arising from derivative receivables. The Firm also uses derivative instruments to manage its own credit risk and other market risk exposure. The nature of the counterparty and the settlement mechanism of the derivative affect the credit risk to which the Firm is exposed. For OTC derivatives the Firm is exposed to
the credit risk of the derivative counterparty. For exchange-traded derivatives (“ETD”), such as futures and options, and cleared over-the-counter (“OTC-cleared”) derivatives, the Firm can also be exposed to the credit risk of the relevant CCP. Where possible, the Firm seeks to mitigate its credit risk exposures arising from derivative contracts through the use of legally enforceable master netting arrangements and collateral agreements. The percentage of the Firm’s over-the-counter derivative transactions subject to collateral agreements — excluding foreign exchange spot trades, which are not typically covered by collateral agreements due to their short maturity and centrally cleared trades that are settled daily — was approximately 88% and 90% at December 31, 2020 and 2019, respectively. Refer to Note 5 for additional information on the Firm’s use of collateral agreements. Refer to Note 5 for a further discussion of derivative contracts, counterparties and settlement types.
The fair value of derivative receivables reported on the Consolidated balance sheets were $79.6 billion and $49.8 billion at December 31, 2020 and 2019, respectively, with increases in CIB resulting from market movements. Derivative receivables represent the fair value of the derivative contracts after giving effect to legally enforceable master netting agreements and the related cash collateral held by the Firm. In addition, the Firm held liquid securities and other cash collateral that the Firm believes is legally enforceable and may be used as security when the fair value of the client’s exposure is in the Firm’s favor. Liquid securities represents high quality liquid assets as defined in the LCR rule. In management’s view, the appropriate measure of current credit risk should also take into consideration other collateral, which generally represents securities that do not qualify as high quality liquid assets under the LCR rule, but that the Firm believes is legally enforceable. The collateral amounts for each counterparty are limited to the net derivative receivables for the counterparty. The following tables summarize the net derivative receivables and the internal ratings profile for the periods presented.
Derivative receivablesDecember 31, (in millions) 2020 2019
Total, net of cash collateral $ 79,630 $ 49,766
Liquid securities and other cash collateral held against derivative receivables(a) (14,806) (13,052)
Total, net of liquid securities and other cash collateral $ 64,824 $ 36,714
Other collateralheld against derivative receivables(a) (6,022) (1,837)
Total, net of collateral $ 58,802 $ 34,877
(a) In the fourth quarter of 2020, the Firm refined its approach for disclosing additional collateral held by the Firm that may be used as security when the fair value of the client’s exposure is in the Firm’s favor. Prior-period amounts have been revised to conform with the current presentation.
JPMorgan Chase & Co./2020 Form 10-K 129

Ratings profile of derivative receivables
2020(a) 2019(a)
December 31,(in millions, except ratios)
Exposure net of collateral
% of exposure net of collateral
Exposure net of collateral
% of exposure net of collateral
Investment-grade $ 37,013 63 % $ 27,851 80 %
Noninvestment-grade 21,789 37 7,026 20
Total $ 58,802 100 % $ 34,877 100 %
(a) In the fourth quarter of 2020, the Firm refined its approach for disclosing additional collateral held by the Firm that may be used as security when the fair value of the client’s exposure is in the Firm’s favor. Prior-period amounts have been revised to conform with the current presentation.
The Firm also holds additional collateral (primarily cash, G7 government securities, other liquid government agency and guaranteed securities, and corporate debt and equity securities) delivered by clients at the initiation of transactions, as well as collateral related to contracts that have a non-daily call frequency and collateral that the Firm has agreed to return but has not yet settled as of the reporting date. Although this collateral does not reduce the balances and is not included in the table above, it is available as security against potential exposure that could arise should the fair value of the client’s derivative contracts move in the Firm’s favor. Refer to Note 5 for additional information on the Firm’s use of collateral agreements.
While useful as a current view of credit exposure, the net fair value of the derivative receivables does not capture the potential future variability of that credit exposure. To capture the potential future variability of credit exposure, the Firm calculates, on a client-by-client basis, three measures of potential derivatives-related credit loss: Peak, Derivative Risk Equivalent (“DRE”), and Average exposure (“AVG”). These measures all incorporate netting and collateral benefits, where applicable.
Peak represents a conservative measure of potential derivative exposure, including the benefit of collateral, to a counterparty calculated in a manner that is broadly equivalent to a 97.5% confidence level over the life of the transaction. Peak is the primary measure used by the Firm for setting credit limits for derivative contracts, senior management reporting and derivatives exposure management.
DRE exposure is a measure that expresses the risk of derivative exposure, including the benefit of collateral, on a basis intended to be equivalent to the risk of loan exposures. DRE is a less extreme measure of potential credit loss than Peak and is used as an input for aggregating derivative credit risk exposures with loans and other credit risk.
Finally, AVG is a measure of the expected fair value of the Firm’s derivative exposure, including the benefit of collateral, at future time periods. AVG over the total life of the derivative contract is used as the primary metric for pricing purposes and is used to calculate credit risk capital and CVA, as further described below.
The fair value of the Firm’s derivative receivables incorporates CVA to reflect the credit quality of counterparties. CVA is based on the Firm’s AVG to a counterparty and the counterparty’s credit spread in the credit derivatives market. The Firm believes that active risk management is essential to controlling the dynamic credit risk in the derivatives portfolio. In addition, the Firm’s risk management process takes into consideration the potential impact of wrong-way risk, which is broadly defined as the risk that exposure to a counterparty is positively correlated with the impact of a default by the same counterparty, which could cause exposure to increase at the same time as the counterparty’s capacity to meet its obligations is decreasing. Many factors may influence the nature and magnitude of these correlations over time. To the extent that these correlations are identified, the Firm may adjust the CVA associated with a particular counterparty’s AVG. The Firm risk manages exposure to changes in CVA by entering into credit derivative contracts, as well as interest rate, foreign exchange, equity and commodity derivative contracts.
The below graph shows exposure profiles to the Firm’s current derivatives portfolio over the next 10 years as calculated by the Peak, DRE and AVG metrics. The three measures generally show that exposure will decline after the first year, if no new trades are added to the portfolio.
Exposure profile of derivatives measuresDecember 31, 2020(in billions)
Management’s discussion and analysis
130 JPMorgan Chase & Co./2020 Form 10-K

Credit derivativesThe Firm uses credit derivatives for two primary purposes: first, in its capacity as a market-maker, and second, as an end-user, to manage the Firm’s own credit risk associated with various exposures.
Credit portfolio management activitiesIncluded in the Firm’s end-user activities are credit derivatives used to mitigate the credit risk associated with traditional lending activities (loans and lending-related commitments) and derivatives counterparty exposure in the Firm’s wholesale businesses (collectively, “credit portfolio management activities”). Information on credit portfolio management activities is provided in the table below.
The Firm also uses credit derivatives as an end-user to manage other exposures, including credit risk arising from certain securities held in the Firm’s market-making businesses. These credit derivatives are not included in credit portfolio management activities.
Credit derivatives used in credit portfolio management activities
Notional amount of protection
purchased and sold(b)
December 31, (in millions) 2020 2019
Credit derivatives used to manage:
Loans and lending-related commitments $ 3,877 $ 2,047
Derivative receivables (a) 18,362 16,483
Credit derivatives used in credit portfolio management activities $ 22,239 $ 18,530
(a) Prior-period amount has been revised to conform with the current presentation.
(b) Amounts are presented net, considering the Firm’s net protection purchased or sold with respect to each underlying reference entity or index.
The credit derivatives used in credit portfolio management activities do not qualify for hedge accounting under U.S. GAAP; these derivatives are reported at fair value, with gains and losses recognized in principal transactions revenue. In contrast, the loans and lending-related commitments being risk-managed are accounted for on an accrual basis. This asymmetry in accounting treatment, between loans and lending-related commitments and the credit derivatives used in credit portfolio management activities, causes earnings volatility that is not representative, in the Firm’s view, of the true changes in value of the Firm’s overall credit exposure.
The effectiveness of credit default swaps (“CDS”) as a hedge against the Firm’s exposures may vary depending on a number of factors, including the named reference entity (i.e., the Firm may experience losses on specific exposures that are different than the named reference entities in the purchased CDS); the contractual terms of the CDS (which may have a defined credit event that does not align with an actual loss realized by the Firm); and the maturity of the Firm’s CDS protection (which in some cases may be shorter than the Firm’s exposures). However, the Firm generally seeks to purchase credit protection with a maturity date that is the same or similar to the maturity date of the exposure for which the protection was purchased, and remaining differences in maturity are actively monitored and managed by the Firm. Refer to Credit derivatives in Note 5 for a detailed description of credit derivatives.
JPMorgan Chase & Co./2020 Form 10-K 131

ALLOWANCE FOR CREDIT LOSSES
Effective January 1, 2020, the Firm adopted the CECL accounting guidance. The adoption of this guidance established a single allowance framework for all financial assets measured at amortized cost and certain off-balance sheet credit exposures. This framework requires that management’s estimate reflects credit losses over the instrument’s remaining expected life and considers expected future changes in macroeconomic conditions. Refer to Note 1 for further information.
The Firm’s allowance for credit losses comprises:
• the allowance for loan losses, which covers the Firm’s retained loan portfolios (scored and risk-rated) and is presented separately on the Consolidated balance sheets,
• the allowance for lending-related commitments, which is presented on the Consolidated balance sheets in accounts payable and other liabilities, and
• the allowance for credit losses on investment securities, which covers the Firm’s HTM and AFS securities and is recognized within Investment Securities on the Consolidated balance sheets.
The allowance for credit losses increased compared with December 31, 2019, primarily reflecting the deterioration and uncertainty in the macroeconomic environment, in particular in the first half of 2020, as a result of the impact of the COVID-19 pandemic, consisting of:
• a net $7.4 billion addition in consumer, predominantly in the credit card portfolio, and
• a net $4.7 billion addition in wholesale, across the LOBs, impacting multiple industries.
The adoption of CECL on January 1, 2020, resulted in a $4.3 billion addition to the allowance for credit losses.
Discussion of changes in the allowance during 2020The increase in the allowance for loan losses and lending-related commitments was primarily driven by an increase in the provision for credit losses, reflecting the deterioration in and uncertainty around the future macroeconomic environment as a result of the impact of the COVID-19 pandemic.
As of December 31, 2020, the Firm’s central case reflected U.S. unemployment rates of approximately 7% through the second quarter of 2021 and remaining above 5% until the second half of 2022. This compared with relatively low levels of unemployment of approximately 4% throughout 2020 and 2021 in the Firm’s January 1, 2020 central case.
Further, while the Firm’s January 1, 2020 central case U.S. GDP forecast reflected a 1.7% expansion in 2020, actual U.S. GDP contracted approximately 2.5% in 2020. As of December 31, 2020, the Firm’s central case assumptions reflect a return to pre-pandemic GDP levels in the fourth quarter of 2021.
Due to elevated uncertainty in the near term outlook, driven by the potential for increased infection rates and related lock downs resulting from the pandemic, as well as the
prospect that government and other consumer relief measures set to expire may not be extended, the Firm has placed significant weighting on its adverse scenarios. These scenarios incorporate more punitive macroeconomic factors than the central case assumptions, resulting in weighted average U.S. unemployment rates remaining elevated throughout 2021 and 2022, ending the fourth quarter of 2022 at approximately 6%, and in U.S. GDP ending 2022 approximately 0.9% higher than fourth quarter 2019 actual pre-pandemic levels.
The Firm’s central case assumptions reflected U.S. unemployment rates and U.S. real GDP as follows:
Assumptions at January 1, 2020
2Q20 4Q20(b) 2Q21
U.S. unemployment rate(a) 3.7 % 3.8 % 4.0 %
Cumulative change in U.S. real GDP from 12/31/2019 0.9 % 1.7 % 2.4 %
Assumptions at December 31, 2020
2Q21 4Q21 2Q22
U.S. unemployment rate(a) 6.8 % 5.7 % 5.1 %
Cumulative change in U.S. real GDP from 12/31/2019 (1.9) % 0.6 % 2.0 %
(a) Reflects quarterly average of forecasted U.S. unemployment rate.(b) 4Q20 actual U.S. unemployment rate (quarterly average) was 6.8%.
4Q20 actual cumulative change in U.S. real GDP from 4Q19 was (2.5%).
Subsequent changes to this forecast and related estimateswill be reflected in the provision for credit losses in futureperiods. Refer to Note 13 and Note 10 for a description of the policies, methodologies and judgments used to determine the Firm’s allowances for credit losses on loans, lending-related commitments, and investment securities.
Refer to Critical Accounting Estimates Used by the Firm on pages 152-155 for further information on the allowance for credit losses and related management judgments.
Refer to Consumer Credit Portfolio on pages 114-120, Wholesale Credit Portfolio on pages 121-131 and Note 12 for additional information on the consumer and wholesale credit portfolios.
Management’s discussion and analysis
132 JPMorgan Chase & Co./2020 Form 10-K

The adoption of the CECL accounting guidance resulted in a change in the accounting for PCI loans, which are considered PCD loans under CECL. In conjunction with the adoption of CECL, the Firm reclassified risk-rated loans and lending-related commitments from the consumer, excluding credit card portfolio segment to the wholesale portfolio segment, to align with the methodology applied when determining the allowance. Prior-period amounts have been revised to conform with the current presentation. Refer to Note 1 for further information.
Allowance for credit losses and related information2020(d) 2019
Year ended December 31, Consumer, excluding
credit card Credit card Wholesale Total
Consumer, excluding
credit card Credit card Wholesale Total(in millions, except ratios)
Allowance for loan losses
Beginning balance at January 1, $ 2,538 $ 5,683 $ 4,902 $ 13,123 $ 3,434 $ 5,184 $ 4,827 $ 13,445
Cumulative effect of a change in accounting principle 297 5,517 (1,642) 4,172 NA NA NA NA
Gross charge-offs 805 5,077 954 6,836 902 5,436 472 6,810
Gross recoveries collected (631) (791) (155) (1,577) (536) (588) (57) (1,181)
Net charge-offs 174 4,286 799 5,259 366 4,848 415 5,629
Write-offs of PCI loans(a) NA NA NA NA 151 — — 151
Provision for loan losses 974 10,886 4,431 16,291 (378) 5,348 479 5,449
Other 1 — — 1 (1) (1) 11 9
Ending balance at December 31, $ 3,636 $ 17,800 $ 6,892 $ 28,328 $ 2,538 $ 5,683 $ 4,902 $ 13,123
Allowance for lending-related commitments
Beginning balance at January 1, $ 12 $ — $ 1,179 $ 1,191 $ 12 $ — $ 1,043 $ 1,055
Cumulative effect of a change in accounting principle 133 — (35) 98 NA NA NA NA
Provision for lending-related commitments 42 — 1,079 1,121 — — 136 136
Other — — (1) (1) — — — —
Ending balance at December 31, $ 187 $ — $ 2,222 $ 2,409 $ 12 $ — $ 1,179 $ 1,191
Impairment methodology
Asset-specific(b) $ (7) $ 633 $ 682 $ 1,308 $ 75 $ 477 $ 295 $ 847
Portfolio-based 3,643 17,167 6,210 27,020 1,476 5,206 4,607 11,289
PCI NA NA NA NA 987 — — 987
Total allowance for loan losses $ 3,636 $ 17,800 $ 6,892 $ 28,328 $ 2,538 $ 5,683 $ 4,902 $ 13,123
Impairment methodology
Asset-specific $ — $ — $ 114 $ 114 $ — $ — $ 102 $ 102
Portfolio-based 187 — 2,108 2,295 12 — 1,077 1,089
Total allowance for lending-related commitments $ 187 $ — $ 2,222 $ 2,409 $ 12 $ — $ 1,179 $ 1,191
Total allowance for credit losses $ 3,823 $ 17,800 $ 9,114 $ 30,737 $ 2,550 $ 5,683 $ 6,081 $ 14,314
Memo:
Retained loans, end of period $ 302,127 $ 143,432 $ 514,947 $ 960,506 $ 294,999 $ 168,924 $ 481,678 $ 945,601
Retained loans, average 302,005 146,391 509,907 958,303 312,972 156,319 472,628 941,919
Credit ratios
Allowance for loan losses to retained loans 1.20 % 12.41 % 1.34 % 2.95 % 0.86 % 3.36 % 1.02 % 1.39 %
Allowance for loan losses to retained nonaccrual loans(c) 67 NM 208 323 87 NM 464 329
Allowance for loan losses to retained nonaccrual loans excluding credit card 67 NM 208 120 87 NM 464 187
Net charge-off rates 0.06 2.93 0.16 0.55 0.12 3.10 0.09 0.60
(a) Prior to the adoption of CECL, write-offs of PCI loans were recorded against the allowance for loan losses when actual losses for a pool exceeded estimated losses that were recorded as purchase accounting adjustments at the time of acquisition. A write-off of a PCI loan was recognized when the underlying loan was removed from a pool.
(b) Includes modified PCD loans and loans that have been modified or are reasonably expected to be modified in a TDR. Also includes risk-rated loans that have been placed on nonaccrual status for the wholesale portfolio segment. The asset-specific credit card allowance for loan losses modified or reasonably expected to be modified in a TDR is calculated based on the loans’ original contractual interest rates and does not consider any incremental penalty rates.
(c) The Firm’s policy is generally to exempt credit card loans from being placed on nonaccrual status as permitted by regulatory guidance.(d) Excludes HTM securities, which had an allowance for credit losses of $78 million and a provision for credit losses of $68 million as of and for the year
ended December 31, 2020.
JPMorgan Chase & Co./2020 Form 10-K 133

INVESTMENT PORTFOLIO RISK MANAGEMENT
Investment portfolio risk is the risk associated with the loss of principal or a reduction in expected returns on investments arising from the investment securities portfolio or from principal investments. The investment securities portfolio is predominantly held by Treasury and CIO in connection with the Firm's balance sheet or asset-liability management objectives. Principal investments are predominantly privately-held non-traded financial instruments and are managed in the LOBs and Corporate. Investments are typically intended to be held over extended periods and, accordingly, the Firm has no expectation for short-term realized gains with respect to these investments.
Investment securities risk Investment securities risk includes the exposure associated with a default in the payment of principal and interest. This risk is mitigated given that the investment securities portfolio held by Treasury and CIO is predominantly invested in high-quality securities. At December 31, 2020, the Treasury and CIO investment securities portfolio, net of allowance for credit losses, was $587.9 billion, and the average credit rating of the securities comprising the portfolio was AA+ (based upon external ratings where available and where not available, based primarily upon internal risk ratings). Refer to Corporate segment results on pages 83–84 and Note 10 for further information on the investment securities portfolio and internal risk ratings. Refer to Market Risk Management on pages 135–142 for further information on the market risk inherent in the portfolio. Refer to Liquidity Risk Management on pages 102–108 for further information on related liquidity risk.
Governance and oversightInvestment securities risks are governed by the Firm’s Risk Appetite framework, and reviewed at the CTC Risk Committee with regular updates to the Board Risk Committee.
The Firm’s independent control functions are responsible for reviewing the appropriateness of the carrying value of investment securities in accordance with relevant policies. Approved levels for investment securities are established for each risk category, including capital and credit risks.
Principal investment risk Principal investments are typically privately held non-traded financial instruments representing ownership or other forms of junior capital and span multiple asset classes. These investments are made by dedicated investing businesses or as part of a broader business strategy. In general, principal investments include tax-oriented investments and investments made to enhance or accelerate the Firm’s business strategies. The Firm’s investments will continue to evolve in line with its strategies, including the Firm’s commitment to support underserved communities and minority-owned businesses. The Firm’s principal investments are managed by the LOBs and Corporate and are reflected within their respective financial results. The aggregate carrying values of the principal investment portfolios have not been significantly affected by recent market events as a result of the COVID-19 pandemic. However, the duration and severity of adverse macroeconomic conditions could subject certain principal investments to impairments, write-downs, or other negative impacts.
As of December 31, 2020 and 2019, the aggregate carrying values of the principal investment portfolios were $27.5 billion and $24.2 billion, respectively, which included tax-oriented investments (e.g., alternative energy and affordable housing investments) of $21.3 billion and $18.2 billion, respectively, and private equity, various debt and equity instruments, and real assets of $6.2 billion and $6.0 billion, respectively.
Governance and oversightThe Firm’s approach to managing principal risk is consistent with the Firm’s risk governance structure. A Firmwide risk policy framework exists for all principal investing activities and includes approval by executives who are independent from the investing businesses, as appropriate.
The Firm’s independent control functions are responsible for reviewing the appropriateness of the carrying value of investments in accordance with relevant policies. As part of the risk governance structure, approved levels for investments are established and monitored for each relevant business or segment in order to manage the overall size of the portfolios. The Firm also conducts stress testing on these portfolios using specific scenarios that estimate losses based on significant market moves and/or other risk events.
Management’s discussion and analysis
134 JPMorgan Chase & Co./2020 Form 10-K

MARKET RISK MANAGEMENT
Market risk is the risk associated with the effect of changes in market factors, such as interest and foreign exchange rates, equity and commodity prices, credit spreads or implied volatilities, on the value of assets and liabilities held for both the short and long term.
Market Risk ManagementMarket Risk Management monitors market risks throughout the Firm and defines market risk policies and procedures.
Market Risk Management seeks to manage risk, facilitate efficient risk/return decisions, reduce volatility in operating performance and provide transparency into the Firm’s market risk profile for senior management, the Board of Directors and regulators. Market Risk Management is responsible for the following functions:
• Maintaining a market risk policy framework
• Independently measuring, monitoring and controlling LOB, Corporate, and Firmwide market risk
• Defining, approving and monitoring of limits
• Performing stress testing and qualitative risk assessments
Risk measurementMeasures used to capture market risk There is no single measure to capture market risk and therefore Market Risk Management uses various metrics, both statistical and nonstatistical, to assess risk including:
• Value-at-risk (VaR)
• Stress testing
• Profit and loss drawdowns
• Earnings-at-risk
• Other sensitivity-based measures
Risk monitoring and control Market risk exposure is managed primarily through a series of limits set in the context of the market environment and business strategy. In setting limits, Market Risk Management takes into consideration factors such as market volatility, product liquidity, accommodation of client business, and management experience. Market Risk Management maintains different levels of limits. Firm level limits include VaR and stress limits. Similarly, LOB and Corporate limits include VaR and stress limits and may be supplemented by certain nonstatistical risk measures such as profit and loss drawdowns. Limits may also be set within the LOBs and Corporate, as well as at the legal entity level.
Market Risk Management sets limits and regularly reviews and updates them as appropriate. Senior management is responsible for reviewing and approving certain of these risk limits on an ongoing basis. Limits that have not been reviewed within specified time periods by Market Risk Management are reported to senior management. The LOBs and Corporate are responsible for adhering to established limits against which exposures are monitored and reported.
Limit breaches are required to be reported in a timely manner to limit approvers, which include Market Risk Management and senior management. In the event of a breach, Market Risk Management consults with appropriate members of the Firm to determine the suitable course of action required to return the applicable positions to compliance, which may include a reduction in risk in order to remedy the breach or granting a temporary increase in limits to accommodate an expected increase in client activity and/or market volatility. Certain Firm, Corporate or LOB-level limit breaches are escalated as appropriate.
COVID-19 Pandemic Market Risk Management continues to actively monitor the impact of the COVID-19 pandemic on market risk exposures by leveraging existing risk measures and controls.
Models used to measure market risk are inherently imprecise and are limited in their ability to measure certain risks or to predict losses. This imprecision may be heightened when sudden or severe shifts in market conditions occur, such as those observed at the onset of the COVID-19 pandemic. For additional discussion on model uncertainty refer to Estimations and Model Risk Management on page 151.
Market Risk Management periodically reviews the Firm’s existing market risk measures to identify opportunities for enhancement, and to the extent appropriate, will calibrate those measures accordingly over time. This is increasingly important in periods of sustained, heightened market volatility.
JPMorgan Chase & Co./2020 Form 10-K 135

The following table summarizes the predominant business activities and related market risks, as well as positions which give rise to market risk and certain measures used to capture those risks, for each LOB and Corporate.
In addition to the predominant business activities, each LOB and Corporate may engage in principal investing activities. To the extent principal investments are deemed market risk sensitive, they are reflected in relevant risk measures and captured in the table below. Refer to Investment Portfolio Risk Management on page 134 for additional discussion on principal investments.
LOBs and Corporate
Predominant business activities
Related market risks Positions included in Risk Management VaR
Positions included in earnings-at-risk
Positions included in other sensitivity-based measures
CCB • Services mortgage loans
• Originates loans and takes deposits
• Risk from changes in the probability of newly originated mortgage commitments closing
• Interest rate risk and prepayment risk
• Mortgage commitments, classified as derivatives
• Warehouse loans that are fair value option elected, classified as loans – debt instruments
• MSRs• Hedges of mortgage
commitments, warehouse loans and MSRs, classified as derivatives
• Interest-only and mortgage-backed securities, classified as trading assets debt instruments, and related hedges, classified as derivatives
• Fair value option elected liabilities(a)
• Retained loan portfolio• Deposits
• Fair value option elected liabilities DVA(a)
CIB • Makes markets and services clients across fixed income, foreign exchange, equities and commodities
• Originates loans and takes deposits
• Risk of loss from adverse movements in market prices and implied volatilities across interest rate, foreign exchange, credit, commodity and equity instruments
• Basis and correlation risk from changes in the way asset values move relative to one another
• Interest rate risk and prepayment risk
• Trading assets/liabilities – debt and marketable equity instruments, and derivatives, including hedges of the retained loan portfolio
• Certain securities purchased, loaned or sold under resale agreements and securities borrowed
• Fair value option elected liabilities(a)
• Derivative CVA and associated hedges
• Marketable equity investments
• Retained loan portfolio• Deposits
• Privately held equity and other investments measured at fair value; and certain asset-backed fair value option elected loans
• Derivatives FVA and fair value option elected liabilities DVA(a)
CB • Originates loans and takes deposits
• Interest rate risk and prepayment risk
• Marketable equity investments(b)
• Retained loan portfolio• Deposits
AWM • Provides initial capital investments in products such as mutual funds and capital invested alongside third-party investors
• Originates loans and takes deposits
• Risk from adverse movements in market factors (e.g., market prices, rates and credit spreads)
• Interest rate risk and prepayment risk
• Debt securities held in advance of distribution to clients, classified as trading assets - debt instruments(b)
• Retained loan portfolio• Deposits
• Initial seed capital investments and related hedges, classified as derivatives
• Certain deferred compensation and related hedges, classified as derivatives
• Capital invested alongside third-party investors, typically in privately distributed collective vehicles managed by AWM (i.e., co-investments)
Corporate • Manages the Firm’s liquidity, funding, capital, structural interest rate and foreign exchange risks
• Structural interest rate risk from the Firm’s traditional banking activities
• Structural non-USD foreign exchange risks
• Derivative positions measured at fair value through noninterest revenue in earnings
• Marketable equity investments
• Deposits with banks• Investment securities
portfolio and related interest rate hedges
• Long-term debt and related interest rate hedges
• Privately held equity and other investments measured at fair value
• Foreign exchange exposure related to Firm-issued non-USD long-term debt (“LTD”) and related hedges
(a) Reflects structured notes in Risk Management VaR and the DVA on structured notes in other sensitivity-based measures.(b) The AWM and CB contributions to Firmwide average VaR were not material for the year ended December 31, 2020 and 2019.
Management’s discussion and analysis
136 JPMorgan Chase & Co./2020 Form 10-K

Value-at-riskJPMorgan Chase utilizes VaR, a statistical risk measure, to estimate the potential loss from adverse market moves in the current market environment. The Firm has a single VaR framework used as a basis for calculating Risk Management VaR and Regulatory VaR.
The framework is employed across the Firm using historical simulation based on data for the previous 12 months. The framework’s approach assumes that historical changes in market values are representative of the distribution of potential outcomes in the immediate future. The Firm believes the use of Risk Management VaR provides a daily measure of risk that is closely aligned to risk management decisions made by the LOBs and Corporate and, along with other market risk measures, provides the appropriate information needed to respond to risk events.
The Firm’s Risk Management VaR is calculated assuming a one-day holding period and an expected tail-loss methodology which approximates a 95% confidence level. Risk Management VaR provides a consistent framework to measure risk profiles and levels of diversification across product types and is used for aggregating risks and monitoring limits across businesses. VaR results are reported to senior management, the Board of Directors and regulators.
Under the Firm’s Risk Management VaR methodology, assuming current changes in market values are consistent with the historical changes used in the simulation, the Firm would expect to incur VaR “backtesting exceptions,” defined as losses greater than that predicted by VaR estimates, an average of five times every 100 trading days. The number of VaR backtesting exceptions observed can differ from the statistically expected number of backtesting exceptions if the current level of market volatility is materially different from the level of market volatility during the 12 months of historical data used in the VaR calculation.
Underlying the overall VaR model framework are individual VaR models that simulate historical market returns for individual risk factors and/or product types. To capture material market risks as part of the Firm’s risk management framework, comprehensive VaR model calculations are performed daily for businesses whose activities give rise to market risk. These VaR models are granular and incorporate numerous risk factors and inputs to simulate daily changes in market values over the historical period; inputs are selected based on the risk profile of each portfolio, as sensitivities and historical time series used to generate daily market values may be different across product types or risk management systems. The VaR model results across all portfolios are aggregated at the Firm level.
As VaR is based on historical data, it is an imperfect measure of market risk exposure and potential future losses. In addition, based on their reliance on available historical data, limited time horizons, and other factors, VaR measures are inherently limited in their ability to measure certain risks and to predict losses, particularly those associated with market illiquidity and sudden or severe shifts in market conditions.
For certain products, specific risk parameters are not captured in VaR due to the lack of liquidity and availability of appropriate historical data. The Firm uses proxies to estimate the VaR for these and other products when daily time series are not available. It is likely that using an actual price-based time series for these products, if available, would affect the VaR results presented. The Firm therefore considers other nonstatistical measures such as stress testing, in addition to VaR, to capture and manage its market risk positions.
The daily market data used in VaR models may be different than the independent third-party data collected for VCG price testing in its monthly valuation process. For example, in cases where market prices are not observable, or where proxies are used in VaR historical time series, the data sources may differ. Refer to Valuation process in Note 2 for further information on the Firm’s valuation process. As VaR model calculations require daily data and a consistent source for valuation, it may not be practical to use the data collected in the VCG monthly valuation process for VaR model calculations.
The Firm’s VaR model calculations are periodically evaluated and enhanced in response to changes in the composition of the Firm’s portfolios, changes in market conditions, improvements in the Firm’s modeling techniques and measurements, and other factors. Such changes may affect historical comparisons of VaR results. Refer to Estimations and Model Risk Management on page 151 for information regarding model reviews and approvals.
The Firm calculates separately a daily aggregated VaR in accordance with regulatory rules (“Regulatory VaR”), which is used to derive the Firm’s regulatory VaR-based capital requirements under Basel III. This Regulatory VaR model framework currently assumes a ten business-day holding period and an expected tail loss methodology which approximates a 99% confidence level. Regulatory VaR is applied to “covered” positions as defined by Basel III, which may be different than the positions included in the Firm’s Risk Management VaR. For example, credit derivative hedges of accrual loans are included in the Firm’s Risk Management VaR, while Regulatory VaR excludes these credit derivative hedges. In addition, in contrast to the Firm’s Risk Management VaR, Regulatory VaR currently excludes the diversification benefit for certain VaR models.
JPMorgan Chase & Co./2020 Form 10-K 137

Refer to JPMorgan Chase’s Basel III Pillar 3 Regulatory Capital Disclosures reports, which are available on the Firm’s website, for additional information on Regulatory VaR and the other components of market risk regulatory capital for the Firm (e.g., VaR-based measure, stressed VaR-based measure and the respective backtesting).
The table below shows the results of the Firm’s Risk Management VaR measure using a 95% confidence level. VaR can vary significantly as positions change, market volatility fluctuates, and diversification benefits change.
Total VaRAs of or for the year ended December 31, 2020 2019
(in millions) Avg. Min Max Avg. Min Max
CIB trading VaR by risk type
Fixed income $ 98 $ 35 $ 156 $ 40 $ 31 $ 50
Foreign exchange 10 4 18 7 4 15
Equities 24 13 41 20 13 31
Commodities and other 28 7 47 8 6 12
Diversification benefit to CIB trading VaR (67) (a) NM (b) NM (b) (33) (a) NM (b) NM (b)
CIB trading VaR 93 32 (b) 160 (b) 42 29 (b) 61 (b)
Credit portfolio VaR 16 3 28 5 3 7
Diversification benefit to CIB VaR (17) (a) NM (b) NM (b) (5) (a) NM (b) NM (b)
CIB VaR 92 31 (b) 162 (b) 42 29 (b) 63 (b)
CCB VaR 5 1 12 5 1 11
Corporate and other LOB VaR 19 9 82 (c) 10 9 13
Diversification benefit to other VaR (4) (a) NM (b) NM (b) (4) (a) NM (b) NM (b)
Other VaR 20 10 (b) 82 (b) 11 8 (b) 17 (b)
Diversification benefit to CIB and other VaR (17) (a) NM (b) NM (b) (10) (a) NM (b) NM (b)
Total VaR $ 95 $ 32 (b) $ 164 (b) $ 43 $ 30 (b) $ 65 (b)
(a) Diversification benefit represents the difference between the portfolio VaR and the sum of its individual components. This reflects the non-additive nature of VaR due to imperfect correlation across LOBs, Corporate, and risk types.
(b) The maximum and minimum VaR for each portfolio may have occurred on different trading days than the components and consequently diversification benefit is not meaningful.
(c) Maximum Corporate and other LOB VaR was higher than the prior year, due to increases in the fourth quarter of 2020 driven by a private equity position that became publicly traded at the end of the third quarter of 2020.
Generally, average VaR and maximum VaR across risk types and LOBs were higher due to increased volatility that occurred at the onset of the COVID-19 pandemic, which remains in the one-year historical look-back period. As a result average total VaR increased by $52 million for the year-ended December 31, 2020 when compared with the prior year driven by the fixed income and commodities risk types.
Effective January 1, 2020, the Firm refined the scope of VaR to exclude positions related to the risk management of interest rate exposure from changes in the Firm’s own credit spread on fair value option elected liabilities, and included these positions in other sensitivity-based measures. Additionally, effective July 1, 2020, the Firm refined the scope of VaR to exclude certain asset-backed fair value option elected loans, and included them in other sensitivity-based measures to more effectively measure the risk from these loans. In the absence of these refinements, the average Total VaR and each of the components would have been higher by the amounts reported in the following table:
(in millions)
Amount by which reported average VaR would have been higher for the year ended
December 31, 2020
CIB fixed income VaR $ 9
CIB trading VaR 7
CIB VaR 9
Total VaR 8
Management’s discussion and analysis
138 JPMorgan Chase & Co./2020 Form 10-K

VaR backtestingThe Firm performs daily VaR model backtesting, which compares the daily Risk Management VaR results with the daily gains and losses that are utilized for VaR backtesting purposes. The gains and losses in the chart below do not reflect the Firm’s revenue results as they exclude select components of total net revenue, such as those associated with the execution of new transactions (i.e., intraday client-driven trading and intraday risk management activities), fees, commissions, certain valuation adjustments and net interest income. These excluded components of total net revenue may more than offset backtesting gains and losses on a particular day. The definition of backtesting gains and losses above is consistent with the requirements for backtesting under Basel III capital rules.
The following chart compares Firmwide daily backtesting gains and losses with the Firm’s Risk Management VaR for the year ended December 31, 2020. The results in the chart below differ from the results of backtesting disclosed in the Market Risk section of the Firm’s Basel III Pillar 3 Regulatory Capital Disclosures reports, which are based on Regulatory VaR applied to the Firm’s covered positions.
For the year ended December 31, 2020, the Firm posted backtesting gains on 162 of the 260 days, and observed 10 VaR backtesting exceptions, which were predominantly driven by volatility at the onset of the COVID-19 pandemic that was materially higher than the levels realized in the historical data used for the VaR calculation. Firmwide backtesting loss days can differ from the loss days for which Fixed Income Markets and Equity Markets posted losses, as disclosed in CIB Markets revenue, as the population of positions which compose each metric are different and due to the exclusion of select components of total net revenue in backtesting gains and losses as described above. For more information on CIB Markets revenue, refer to pages 74-75.
Daily Risk Management VaR Backtesting ResultsYear ended December 31, 2020
Backtesting Gains and Losses
Risk Management VaR (1-day, 95% Confidence level)
$ m
illio
ns
-550
-500
-450
-400
-350
-300
-250
-200
-150
-100
-50
0
50
100
150
200
250
300
350
First Quarter2020
Second Quarter2020
Third Quarter2020
Fourth Quarter2020
JPMorgan Chase & Co./2020 Form 10-K 139
Other risk measures Stress testing Along with VaR, stress testing is an important tool used to assess risk. While VaR reflects the risk of loss due to adverse changes in markets using recent historical market behavior, stress testing reflects the risk of loss from hypothetical changes in the value of market risk sensitive positions applied simultaneously. Stress testing measures the Firm’s vulnerability to losses under a range of stressed but possible economic and market scenarios. The results are used to understand the exposures responsible for those potential losses and are measured against limits.
The Firm’s stress framework covers market risk sensitive positions in the LOBs and Corporate. The framework is used to calculate multiple magnitudes of potential stress for both market rallies and market sell-offs, assuming significant changes in market factors such as credit spreads, equity prices, interest rates, currency rates and commodity prices, and combines them in multiple ways to capture an array of hypothetical economic and market scenarios.
The Firm generates a number of scenarios that focus on tail events in specific asset classes and geographies, including how the event may impact multiple market factors simultaneously. Scenarios also incorporate specific idiosyncratic risks and stress basis risk between different products. The flexibility in the stress framework allows the Firm to construct new scenarios that can test the outcomes against possible future stress events. Stress testing results are reported on a regular basis to senior management of the Firm, as appropriate.
Stress scenarios are governed by an overall stress framework and are subject to the standards outlined in the Firm’s policies related to model risk management. Significant changes to the framework are reviewed as appropriate.
The Firm’s stress testing framework is utilized in calculating the Firm’s CCAR and other stress test results, which are reported to the Board of Directors. In addition, stress testing results are incorporated into the Firm’s Risk Appetite framework, and are reported periodically to the Board Risk Committee.
Profit and loss drawdowns Profit and loss drawdowns are used to highlight trading losses above certain levels of risk tolerance. A profit and loss drawdown is a decline in revenue from its year-to-date peak level.
Earnings-at-risk The effect of interest rate exposure on the Firm’s reported net income is important as interest rate risk represents one of the Firm’s significant market risks. Interest rate risk arises not only from trading activities but also from the Firm’s traditional banking activities, which include extension of loans and credit facilities, taking deposits and issuing debt as well as from the investment securities portfolio. Refer to the table on page 136 for a summary by
LOB and Corporate, identifying positions included in earnings-at-risk.
The CTC Risk Committee establishes the Firm’s structural interest rate risk policy and related limits, which are subject to approval by the Board Risk Committee. Treasury and CIO, working in partnership with the LOBs, calculates the Firm’s structural interest rate risk profile and reviews it with senior management, including the CTC Risk Committee. In addition, oversight of structural interest rate risk is managed through a dedicated risk function reporting to the CTC CRO. This risk function is responsible for providing independent oversight and governance around assumptions and establishing and monitoring limits for structural interest rate risk. The Firm manages structural interest rate risk generally through its investment securities portfolio and interest rate derivatives.
Structural interest rate risk can occur due to a variety of factors, including:
• Differences in timing among the maturity or repricing of assets, liabilities and off-balance sheet instruments
• Differences in the amounts of assets, liabilities and off-balance sheet instruments that are maturing or repricing at the same time
• Differences in the amounts by which short-term and long-term market interest rates change (for example, changes in the slope of the yield curve)
• The impact of changes in the maturity of various assets, liabilities or off-balance sheet instruments as interest rates change
The Firm manages interest rate exposure related to its assets and liabilities on a consolidated, Firmwide basis. Business units transfer their interest rate risk to Treasury and CIO through funds transfer pricing, which takes into account the elements of interest rate exposure that can be risk-managed in financial markets. These elements include asset and liability balances and contractual rates of interest, contractual principal payment schedules, expected prepayment experience, interest rate reset dates and maturities, rate indices used for repricing, and any interest rate ceilings or floors for adjustable rate products.
One way the Firm evaluates its structural interest rate risk is through earnings-at-risk. Earnings-at-risk estimates the Firm’s interest rate exposure for a given interest rate scenario. It is presented as a sensitivity to a baseline, which includes net interest income and certain interest rate sensitive fees. The baseline uses market interest rates and in the case of deposits, pricing assumptions. The Firm conducts simulations of changes to this baseline for interest rate-sensitive assets and liabilities denominated in U.S. dollars and other currencies (“non-U.S. dollar” currencies). These simulations primarily include retained loans, deposits, deposits with banks, investment securities, long-term debt and any related interest rate hedges, and funds transfer pricing of positions in risk management VaR and other sensitivity-based measures as described on page 136.
Management’s discussion and analysis
140 JPMorgan Chase & Co./2020 Form 10-K

Earnings-at-risk scenarios estimate the potential change to a net interest income baseline, over the following 12 months utilizing multiple assumptions. These scenarios include a parallel shift involving changes to both short-term and long-term rates by an equal amount; a steeper yield curve involving holding short-term rates constant and increasing long-term rates; and a flatter yield curve involving increasing short-term rates and holding long-term rates constant. These scenarios consider many different factors, including:
• The impact on exposures as a result of instantaneous changes in interest rates from baseline rates.
• Forecasted balance sheet, as well as modeled prepayment and reinvestment behavior, but do not include assumptions about actions that could be taken by the Firm or its clients and customers in response to any such instantaneous rate changes. Mortgage prepayment assumptions are based on the interest rates used in the scenarios compared with underlying contractual rates, the time since origination, and other factors which are updated periodically based on historical experience.
• The pricing sensitivity of deposits, known as deposit betas, represent the amount by which deposit rates paid could change upon a given change in market interest rates over the cycle. The deposit rates paid in these scenarios may differ from actual deposit rates paid, due to repricing lags and other factors.
The Firm’s earnings-at-risk scenarios are periodically evaluated and enhanced in response to changes in the composition of the Firm’s balance sheet, changes in market conditions, improvements in the Firm’s simulation and other factors. While a relevant measure of the Firm’s interest rate exposure, the earnings at risk analysis does not represent a forecast of the Firm’s net interest income (Refer to Outlook on page 49 for additional information).
The Firm’s U.S. dollar sensitivities are presented in the table below.
December 31,(in billions) 2020 2019
Parallel shift:
+100 bps shift in rates $ 6.9 $ 0.3
Steeper yield curve:
+100 bps shift in long-term rates 2.4 1.2
Flatter yield curve:
+100 bps shift in short-term rates 4.5 (0.9)
The change in the Firm’s U.S. dollar sensitivities as of December 31, 2020 compared to December 31, 2019 reflected updates to the Firm’s baseline for lower short-term and long-term rates as well as the impact of changes in the Firm’s balance sheet. In addition, during the fourth quarter of 2020 as part of the Firm’s continuous evaluation and periodic enhancement to its earnings-at-risk calculations, the Firm updated the deposit rates paid betas for consumer deposit products based upon observed pricing during the most recent economic cycle. In the absence of this update, the Firm’s U.S. dollar sensitivities as of December 31, 2020 would have been lower by $2.0 billion to the +100bps shift in short-term and parallel rate scenarios.
The Firm’s sensitivity to rates is primarily a result of assets repricing at a faster pace than deposits.
Based upon current and implied market rates as of December 31, 2020, scenarios reflecting lower rates could result in negative interest rates. The U.S. has never experienced an interest rate environment where the Federal Reserve has a negative interest rate policy. While the impact of negative interest rates on the Firm's earnings-at-risk would vary by scenario, a parallel shift downward of up to 100bps would negatively impact net interest income. In a negative interest rate environment, the modeling assumptions used for certain assets and liabilities require additional management judgment and therefore, the actual outcomes may differ from these assumptions.
The Firm’s non-U.S. dollar sensitivities are presented in the table below.
December 31,(in billions) 2020 2019
Parallel shift:
+100 bps shift in rates $ 0.9 $ 0.5
Flatter yield curve:
+100 bps shift in short-term rates 0.8 0.5
The results of the non-U.S. dollar interest rate scenario involving a steeper yield curve with long-term rates rising by 100 basis points and short-term rates staying at current levels were not material to the Firm’s earnings-at-risk at December 31, 2020 and 2019.
JPMorgan Chase & Co./2020 Form 10-K 141

Non-U.S. dollar foreign exchange risk Non-U.S. dollar FX risk is the risk that changes in foreign exchange rates affect the value of the Firm’s assets or liabilities or future results. The Firm has structural non-U.S. dollar FX exposures arising from capital investments, forecasted expense and revenue, the investment securities portfolio and non-U.S. dollar-denominated debt issuance. Treasury and CIO, working in partnership with the LOBs, primarily manage these risks on behalf of the Firm. Treasury and CIO may hedge certain of these risks using derivatives.
Other sensitivity-based measuresThe Firm quantifies the market risk of certain debt and equity and funding activities by assessing the potential impact on net revenue, other comprehensive income (“OCI”) and noninterest expense due to changes in relevant market variables. Refer to the table Predominant business activities that give rise to market risk on page 136 for additional information on the positions captured in other sensitivity-based measures.
The table below represents the potential impact to net revenue, OCI or noninterest expense for market risk sensitive instruments that are not included in VaR or earnings-at-risk. Where appropriate, instruments used for hedging purposes are reported net of the positions being hedged. The sensitivities disclosed in the table below may not be representative of the actual gain or loss that would have been realized at December 31, 2020 and 2019, as the movement in market parameters across maturities may vary and are not intended to imply management’s expectation of future changes in these sensitivities.
Year ended December 31,Gain/(loss) (in millions)
Activity Description Sensitivity measure 2020 2019
Debt and equity(a)
Asset Management activities Consists of seed capital and related hedges; fund co-investments(b); and certain deferred compensation and related hedges(c)
10% decline in market value
$ (48) $ (68)
Other debt and equity Consists of certain asset-backed fair value option elected loans, privately held equity and other investments held at fair value(b)
10% decline in market value
(919) (867) (e)
Funding activities
Non-USD LTD cross-currency basis Represents the basis risk on derivatives used to hedge the foreign exchange risk on the non-USD LTD(d)
1 basis point parallel tightening of cross currency basis
(16) (17)
Non-USD LTD hedges foreign currency (“FX”) exposure
Primarily represents the foreign exchange revaluation on the fair value of the derivative hedges(d)
10% depreciation of currency
13 15
Derivatives – funding spread risk Impact of changes in the spread related to derivatives FVA(b)
1 basis point parallel increase in spread
(4) (5)
Fair value option elected liabilities –funding spread risk
Impact of changes in the spread related to fair value option elected liabilities DVA(d)
1 basis point parallel increase in spread
33 29
Fair value option elected liabilities –interest rate sensitivity
Interest rate sensitivity on fair value option liabilities resulting from a change in the Firm’s own credit spread(d)
1 basis point parallel increase in spread
(3) (2)
Interest rate sensitivity related to risk management of changes in the Firm’s own credit spread on fair value option liabilities(b)
1 basis point parallel increase in spread
3 2
(a) Excludes equity securities without readily determinable fair values that are measured under the measurement alternative. Refer to Note 2 for additional information.
(b) Impact recognized through net revenue.(c) In the second quarter of 2020, the Firm refined the approach for risk management of certain deferred compensation, which is recognized through
noninterest expense. As a result, certain deferred compensation and related hedges are now included in other sensitivity-based measures.(d) Impact recognized through OCI.(e) Prior-period amount has been revised to conform with the current presentation. In the absence of the scope refinement, Other debt and equity would have
been $(203) million and $(192) million for the periods ending December 31, 2020 and 2019, respectively. Refer to Total VaR on page 138 for additional information.
Management’s discussion and analysis
142 JPMorgan Chase & Co./2020 Form 10-K

COUNTRY RISK MANAGEMENT
The Firm, through its LOBs and Corporate, may be exposed to country risk resulting from financial, economic, political or other significant developments which adversely affect the value of the Firm’s exposures related to a particular country or set of countries. The Country Risk Management group actively monitors the various portfolios which may be impacted by these developments and measures the extent to which the Firm’s exposures are diversified given the Firm’s strategy and risk tolerance relative to a country.
Organization and managementCountry Risk Management is an independent risk management function that assesses, manages and monitors country risk originated across the Firm.
The Firm’s country risk management function includes the following activities:
• Maintaining policies, procedures and standards consistent with a comprehensive country risk framework
• Assigning sovereign ratings, assessing country risks and establishing risk tolerance relative to a country
• Measuring and monitoring country risk exposure and stress across the Firm
• Managing and approving country limits and reporting trends and limit breaches to senior management
• Developing surveillance tools, such as signaling models and ratings indicators, for early identification of potential country risk concerns
• Providing country risk scenario analysis
Sources and measurementThe Firm is exposed to country risk through its lending and deposits, investing, and market-making activities, whether cross-border or locally funded. Country exposure includes activity with both government and private-sector entities in a country.
Under the Firm’s internal country risk management approach, attribution of exposure to an individual country is based on the country where the largest proportion of the assets of the counterparty, issuer, obligor or guarantor are located or where the largest proportion of its revenue is derived, which may be different than the domicile (i.e. legal residence) or country of incorporation.
Individual country exposures reflect an aggregation of the Firm’s risk to an immediate default, with zero recovery, of the counterparties, issuers, obligors or guarantors attributed to that country. Activities which result in contingent or indirect exposure to a country are not included in the country exposure measure (for example, providing clearing services or secondary exposure to collateral on securities financing receivables).
Assumptions are sometimes required in determining the measurement and allocation of country exposure, particularly in the case of certain non-linear or index products, or where the nature of the counterparty, issuer,
obligor or guarantor is not suitable for attribution to an individual country. The use of different measurement approaches or assumptions could affect the amount of reported country exposure.
Under the Firm’s internal country risk measurement framework:
• Lending exposures are measured at the total committed amount (funded and unfunded), net of the allowance for credit losses and eligible cash and marketable securities collateral received
• Deposits are measured as the cash balances placed with central and commercial banks
• Securities financing exposures are measured at their receivable balance, net of eligible collateral received
• Debt and equity securities are measured at the fair value of all positions, including both long and short positions
• Counterparty exposure on derivative receivables is measured at the derivative’s fair value, net of the fair value of the eligible collateral received
• Credit derivatives protection purchased and sold is reported based on the underlying reference entity and is measured at the notional amount of protection purchased or sold, net of the fair value of the recognized derivative receivable or payable. Credit derivatives protection purchased and sold in the Firm’s market-making activities is measured on a net basis, as such activities often result in selling and purchasing protection related to the same underlying reference entity; this reflects the manner in which the Firm manages these exposures
The Firm’s internal country risk reporting differs from the reporting provided under the FFIEC bank regulatory requirements. Refer to Cross-border outstandings on page 318 of the 2020 Form 10-K for further information on the FFIEC’s reporting methodology.
JPMorgan Chase & Co./2020 Form 10-K 143

Stress testingStress testing is an important component of the Firm’s country risk management framework, which aims to estimate and limit losses arising from a country crisis by measuring the impact of adverse asset price movements to a country based on market shocks combined with counterparty specific assumptions. Country Risk Management periodically designs and runs tailored stress scenarios to test vulnerabilities to individual countries or sets of countries in response to specific or potential market events, sector performance concerns, sovereign actions and geopolitical risks. These tailored stress results are used to inform potential risk reduction across the Firm, as necessary.
COVID-19 PandemicCountry Risk Management continues to monitor the impact of the COVID-19 pandemic, leveraging existing stress testing, exposure reporting and controls, as well as tailored analysis, to assess the extent to which individual countries may be adversely impacted.
Risk reportingCountry exposure and stress are measured and reported regularly, and used by Country Risk Management to identify trends, and monitor high usages and breaches against limits.
For country risk management purposes, the Firm may report exposure to jurisdictions that are not fully autonomous, including Special Administrative Regions (“SAR”) and dependent territories, separately from the independent sovereign states with which they are associated.
The following table presents the Firm’s top 20 exposures by country (excluding the U.S.) as of December 31, 2020, and their comparative exposures as of December 31, 2019. The selection of countries represents the Firm’s largest total exposures by individual country, based on the Firm’s internal country risk management approach, and does not represent the Firm’s view of any actual or potentially adverse credit conditions. Country exposures may fluctuate from period to period due to client activity and market flows.
The overall increase in top 20 exposures was largely driven by client activity and growth in client deposits, relative to the period ending December 31, 2019. This resulted in an increase in cash placements with the central banks of Germany and the United Kingdom.
Top 20 country exposures (excluding the U.S.)(a)
December 31, (in billions) 2020 2019(f)
Lending and
deposits(c)Trading and investing(d) Other(e)
Total exposure
Total exposure
Germany $ 120.8 $ 5.8 $ 0.6 $ 127.2 $ 51.6
United Kingdom 57.2 9.4 1.8 68.4 42.4
Japan 36.7 8.6 0.3 45.6 43.8
China 9.7 9.9 1.6 21.2 19.2
France 13.4 4.6 0.8 18.8 18.1
Switzerland 14.7 0.5 3.5 18.7 18.3
Australia 9.9 5.7 0.3 15.9 11.7
Canada 13.4 0.9 0.2 14.5 13.2
Luxembourg 11.1 1.3 — 12.4 12.9
Brazil 4.2 6.6 — 10.8 7.2
India 3.9 5.1 1.5 10.5 11.3
South Korea 5.4 4.3 0.4 10.1 6.4
Italy 4.7 4.7 0.3 9.7 6.8
Singapore 4.0 2.7 2.0 8.7 6.8
Netherlands(b) 5.4 0.1 2.2 7.7 5.8
Hong Kong SAR 3.7 1.9 0.6 6.2 5.1
Spain 4.1 1.6 0.1 5.8 5.8
Saudi Arabia 4.9 0.9 — 5.8 5.2
Mexico 3.9 1.0 — 4.9 4.7
Sweden 5.4 (1.1) — 4.3 1.1
(a) Country exposures presented in the table reflect 90% and 87% of total Firmwide non-U.S. exposure, where exposure is attributed to an individual country, at December 31, 2020 and 2019, respectively.
(b) In the fourth quarter of 2020, Country Risk Management determined that the exposure for certain commodities contracts corresponds to an EU-wide risk and should not be attributed to the individual country of registration, previously the Netherlands. As such, the exposure is no longer included and the prior-period amount has been revised to conform with the current presentation.
(c) Lending and deposits includes loans and accrued interest receivable, lending-related commitments (net of eligible collateral and the allowance for credit losses), deposits with banks (including central banks), acceptances, other monetary assets, and issued letters of credit net of participations. Excludes intra-day and operating exposures, such as those from settlement and clearing activities.
(d) Includes market-making inventory, Investment securities, and counterparty exposure on derivative and securities financings net of eligible collateral and hedging. Includes exposure from single reference entity (“single-name”), index and other multiple reference entity transactions for which one or more of the underlying reference entities is in a country listed in the above table.
(e) Predominantly includes physical commodity inventory. (f) The country rankings presented in the table as of December 31, 2019,
are based on the country rankings of the corresponding exposures at December 31, 2020, not actual rankings of such exposures at December 31, 2019.
Management’s discussion and analysis
144 JPMorgan Chase & Co./2020 Form 10-K

OPERATIONAL RISK MANAGEMENT
Operational risk is the risk of an adverse outcome resulting from inadequate or failed internal processes or systems; human factors; or external events impacting the Firm’s processes or systems; Operational Risk includes compliance, conduct, legal, and estimations and model risk. Operational risk is inherent in the Firm’s activities and can manifest itself in various ways, including fraudulent acts, business interruptions, cyber attacks, inappropriate employee behavior, failure to comply with applicable laws and regulations or failure of vendors to perform in accordance with their agreements. Operational Risk Management attempts to manage operational risk at appropriate levels in light of the Firm’s financial position, the characteristics of its businesses, and the markets and regulatory environments in which it operates.
Operational Risk Management FrameworkThe Firm’s Compliance, Conduct, and Operational Risk (“CCOR”) Management Framework is designed to enable the Firm to govern, identify, measure, monitor and test, manage and report on the Firm’s operational risk.
Operational Risk GovernanceThe LOBs and Corporate are responsible for the management of operational risk. The Control Management Organization, which consists of control managers within each LOB and Corporate, is responsible for the day-to-day execution of the CCOR Framework and the evaluation of the effectiveness of their control environments to determine where targeted remediation efforts may be required.
The Firm’s Global Chief Compliance Officer (“CCO”) and FRE for Operational Risk is responsible for defining the CCOR Management Framework and establishing minimum standards for its execution. Operational Risk Officers (“OROs”) report to both the LOB CROs and to the FRE for Operational Risk, and are independent of the respective businesses or functions they oversee.
The Firm’s CCOR Management policy establishes the CCOR Management Framework for the Firm. The CCOR Management Framework is articulated in the Risk Governance and Oversight Policy which is reviewed and approved by the Board Risk Committee periodically.
Operational Risk identificationThe Firm utilizes a structured risk and control self-assessment process that is executed by the LOBs and Corporate. As part of this process, the LOBs and Corporate evaluate the effectiveness of their control environment to assess where controls have failed, and to determine where remediation efforts may be required. The Firm’s Operational Risk and Compliance organization (“Operational Risk and Compliance”) provides oversight of these activities and may also perform independent assessments of significant operational risk events and areas of concentrated or emerging risk.
Operational Risk MeasurementOperational Risk and Compliance performs independent risk assessments of the Firm’s operational risks, which includes assessing the effectiveness of the control environment and reporting the results to senior management.
In addition, operational risk measurement includes operational risk-based capital and operational risk loss projections under both baseline and stressed conditions.
The primary component of the operational risk capital estimate is the Loss Distribution Approach (“LDA”) statistical model, which simulates the frequency and severity of future operational risk loss projections based on historical data. The LDA model is used to estimate an aggregate operational risk loss over a one-year time horizon, at a 99.9% confidence level. The LDA model incorporates actual internal operational risk losses in the quarter following the period in which those losses were realized, and the calculation generally continues to reflect such losses even after the issues or business activities giving rise to the losses have been remediated or reduced.
As required under the Basel III capital framework, the Firm’s operational risk-based capital methodology, which uses the Advanced Measurement Approach (“AMA”), incorporates internal and external losses as well as management’s view of tail risk captured through operational risk scenario analysis, and evaluation of key business environment and internal control metrics. The Firm does not reflect the impact of insurance in its AMA estimate of operational risk capital.
The Firm considers the impact of stressed economic conditions on operational risk losses and develops a forward looking view of material operational risk events that may occur in a stressed environment. The Firm’s operational risk stress testing framework is utilized in calculating results for the Firm’s CCAR and other stress testing processes.
Refer to Capital Risk Management section, on pages 91-101 for information related to operational risk RWA, and CCAR.
Operational Risk Monitoring and testingThe results of risk assessments performed by Operational Risk and Compliance are leveraged as one of the key criteria in the independent monitoring and testing of the LOBs and Corporate’s compliance with laws and regulation. Through monitoring and testing, Operational Risk and Compliance independently identify areas of operational risk and tests the effectiveness of controls within the LOBs and Corporate.
Management of Operational RiskThe operational risk areas or issues identified through monitoring and testing are escalated to the LOBs and Corporate to be remediated through action plans, as needed, to mitigate operational risk. Operational Risk and
JPMorgan Chase & Co./2020 Form 10-K 145

Compliance may advise the LOBs and Corporate in the development and implementation of action plans.
Operational Risk ReportingEscalation of risks is a fundamental expectation for employees at the Firm. Risks identified by Operational Risk and Compliance are escalated to the appropriate LOB and Corporate Control Committees, as needed. Operational Risk and Compliance has established standards to ensure that consistent operational risk reporting and operational risk reports are produced on a Firmwide basis as well as by the LOBs and Corporate. Reporting includes the evaluation of key risk indicators and key performance indicators against established thresholds as well as the assessment of different types of operational risk against stated risk appetite. The standards reinforce escalation protocols to senior management and to the Board of Directors.
COVID-19 PandemicUnder the CCOR Management Framework, Operational Risk and Compliance monitors and assesses COVID-19 related legal and regulatory developments associated with the Firm’s financial products and services offered to clients and customers as part of the existing change management process. The Firm will continue to review and assess the impact of the pandemic on operational risk and implement adequate measures as needed.
Subcategories and examples of operational risksOperational risk can manifest itself in various ways. Operational risk subcategories such as Compliance risk, Conduct risk, Legal risk, and Estimations and Model risk as well as other operational risks, can lead to losses which are captured through the Firm’s operational risk measurement processes. Refer to pages 148, 149, 150 and 151, respectively for more information on Compliance, Conduct, Legal, and Estimations and Model risk. Details on other select examples of operational risks are provided below.
Cybersecurity risk Cybersecurity risk is the risk of the Firm’s exposure to harm or loss resulting from misuse or abuse of technology by malicious actors. Cybersecurity risk is an important and continuously evolving focus for the Firm. Significant resources are devoted to protecting and enhancing the security of computer systems, software, networks and other technology assets. The Firm’s security efforts are designed to protect against, among other things, cybersecurity attacks by unauthorized parties attempting to obtain access to confidential information, destroy data, disrupt or degrade service, sabotage systems or cause other damage.
Ongoing business expansions may expose the Firm to potential new threats as well as expanded regulatory scrutiny including the introduction of new cybersecurity requirements. The Firm continues to make significant investments in enhancing its cyber defense capabilities and to strengthen its partnerships with the appropriate government and law enforcement agencies and other businesses in order to understand the full spectrum of cybersecurity risks in the operating environment, enhance defenses and improve resiliency against cybersecurity
threats. The Firm actively participates in discussions of cybersecurity risks with law enforcement, government officials, peer and industry groups, and has significantly increased efforts to educate employees and certain clients on the topic of cybersecurity risks.
Third parties with which the Firm does business or that facilitate the Firm’s business activities (e.g., vendors, supply chain, exchanges, clearing houses, central depositories, and financial intermediaries) are also sources of cybersecurity risk to the Firm. Third party cybersecurity incidents such as system breakdowns or failures, misconduct by the employees of such parties, or cyberattacks could affect their ability to deliver a product or service to the Firm or result in lost or compromised information of the Firm or its clients. Clients are also sources of cybersecurity risk to the Firm, particularly when their activities and systems are beyond the Firm’s own security and control systems. As a result, the Firm engages in regular and ongoing discussions with certain vendors and clients regarding cybersecurity risks and opportunities to improve security. However, where cybersecurity incidents occur as a result of client failures to maintain the security of their own systems and processes, clients are responsible for losses incurred.
To protect the confidentiality, integrity and availability of the Firm’s infrastructure, resources and information, the Firm maintains a cybersecurity program designed to prevent, detect, and respond to cyberattacks. The Audit Committee is updated periodically on the Firm’s Information Security Program, recommended changes, cybersecurity policies and practices, ongoing efforts to improve security, as well as its efforts regarding significant cybersecurity events. In addition, the Firm has a cybersecurity incident response plan (“IRP”) designed to enable the Firm to respond to attempted cybersecurity incidents, coordinate such responses with law enforcement and other government agencies, and notify clients and customers, as applicable. Among other key focus areas, the IRP is designed to mitigate the risk of insider trading connected to a cybersecurity incident, and includes various escalation points. Due to the impact of COVID-19, the Firm increased the use of remote access and also video conferencing solutions provided by third parties to facilitate remote work. As a result the Firm took additional precautionary measures to mitigate cybersecurity risks.
The Cybersecurity and Technology Control functions are responsible for governance and oversight of the Firm’s Information Security Program. In partnership with the Firm’s LOBs and Corporate, the Cybersecurity and Technology Control organization identifies information security risk issues and oversees programs for the technological protection of the Firm’s information resources including applications, infrastructure as well as confidential and personal information related to the Firm’s customers. The Cybersecurity and Technology organization consists of business aligned information security managers that are supported within the organization by the following products that execute the Information Security Program for the Firm:• Cyber Defense & Fraud
Management’s discussion and analysis
146 JPMorgan Chase & Co./2020 Form 10-K

• Data Management, Protection & Privacy
• Identity & Access Management
• Governance & Controls
• Production Management & Resiliency
• Software & Platform Enablement
The Global Cybersecurity and Technology Control governance structure is designed to identify, escalate, and mitigate information security risks. This structure uses key governance forums to disseminate information and monitor technology efforts. These forums are established at multiple levels throughout the Firm and include representatives from each LOB and Corporate. Reports containing overviews of key technology risks and efforts to enhance related controls are produced for these forums, and are reviewed by management at multiple levels. The forums are used to escalate information security risks or other matters as appropriate.
The IRM function provides oversight of the activities designed to identify, assess, measure, and mitigate cybersecurity risk.
The Firm’s Security Awareness Program includes training that reinforces the Firm's Information Technology Risk and Security Management policies, standards and practices, as well as the expectation that employees comply with these policies. The Security Awareness Program engages personnel through training on how to identify potential cybersecurity risks and protect the Firm’s resources and information. This training is mandatory for all employees globally on a periodic basis, and it is supplemented by Firmwide testing initiatives, including periodic phishing tests. Finally, the Firm’s Global Privacy Program requires all employees to take periodic awareness training on data privacy. This privacy-focused training includes information about confidentiality and security, as well as responding to unauthorized access to or use of information.
Business and technology resiliency risk Business disruptions can occur due to forces beyond the Firm’s control such as the spread of infectious diseases or pandemics, severe weather, power or telecommunications loss, accidents, failure of a third party to provide expected services, cyberattack, flooding, transit strikes, terrorism, health emergencies. The safety of the Firm’s employees and customers is of the highest priority. The Firmwide resiliency program is intended to enable the Firm to recover its critical business functions and supporting assets (i.e., staff, technology and facilities) in the event of a business interruption. The program includes governance, awareness training, and testing of recovery strategies, as well as strategic and tactical initiatives to identify, assess, and manage business interruption and public safety risks. The strength and proficiency of the Firmwide resiliency program has played an integral role in maintaining the Firm’s business operations during and after various events.
Payment fraud riskPayment fraud risk is the risk of external and internal parties unlawfully obtaining personal monetary benefit through misdirected or otherwise improper payment. The risk of payment fraud remains at a heightened level across the industry, particularly during the current COVID-19 pandemic due to the use of contingent forms of payment authentication methods, scams involving the pandemic being perpetrated including an increase in the level of fraud attempts against consumers. The complexities of these incidents and the strategies used by perpetrators continue to evolve. The Firm employs various controls for managing payment fraud risk as well as providing employee and client education and awareness trainings. The Firm’s monitoring of customer behavior to detect new fraud strategies is periodically evaluated and enhanced in an effort to mitigate these fraud risks.
Third-party outsourcing riskThe Firm‘s Third-Party Oversight (“TPO”) and Inter-affiliates Oversight (“IAO”) framework assist the LOBs and Corporate in selecting, documenting, onboarding, monitoring and managing their supplier relationships including services provided by affiliates. The objectives of the TPO framework are to hold suppliers to a high level of operational performance and to mitigate key risks including data loss and business disruption. The Corporate Third-Party Oversight group is responsible for Firmwide training, monitoring, reporting and standards.
InsuranceOne of the ways in which operational risk may be mitigated is through insurance maintained by the Firm. The Firm purchases insurance from commercial insurers and maintains a wholly-owned captive insurer, Park Assurance Company. Insurance may also be required by third parties with whom the Firm does business.
JPMorgan Chase & Co./2020 Form 10-K 147

COMPLIANCE RISK MANAGEMENT
Compliance risk, a subcategory of operational risk, is the risk of failing to comply with laws, rules, regulations or codes of conduct and standards of self-regulatory organizations.
OverviewEach LOB and Corporate hold primary ownership of and accountability for managing compliance risk. The Firm’s Operational Risk and Compliance Organization (“Operational Risk and Compliance”), which is independent of the LOBs and Corporate, provides independent review, monitoring and oversight of business operations with a focus on compliance with the laws, rules, and regulations applicable to the delivery of the Firm’s products and services to clients and customers.
These compliance risks relate to a wide variety of laws, rules and regulations depending on the LOB and the jurisdiction, and include risks related to financial products and services, relationships and interactions with clients and customers, and employee activities. For example, compliance risks include those associated with anti-money laundering compliance, trading activities, market conduct, and complying with the laws, rules, and regulations related to the offering of products and services across jurisdictional borders. Compliance risk is also inherent in the Firm’s fiduciary activities, including the failure to exercise the applicable standard of care (such as the duties of loyalty or care), to act in the best interest of clients and customers or to treat clients and customers fairly.
Other functions provide oversight of significant regulatory obligations that are specific to their respective areas of responsibility.
Operational Risk and Compliance implements policies and standards designed to govern, identify, measure, monitor and test, manage, and report on compliance risk.
Governance and oversightOperational Risk and Compliance is led by the Firm’s Global CCO and FRE for Operational Risk.
The Firm maintains oversight and coordination of its compliance risk through the implementation of the CCOR Risk Management Framework. The Firm’s CCO also provides regular updates to the Audit Committee and the Board Risk Committee. In certain Special Purpose Committees of the Board have previously been established to oversee the Firm’s compliance with regulatory Consent Orders.
Code of ConductThe Firm has a Code of Conduct (the “Code”) that sets forth the Firm’s expectation that employees will conduct themselves with integrity at all times and provides the principles that govern employee conduct with clients, customers, shareholders and one another, as well as with the markets and communities in which the Firm does business. The Code requires employees to promptly report any potential or actual violation of the Code, any internal Firm policy, or any law or regulation applicable to the Firm’s business. It also requires employees to report any illegal conduct, or conduct that violates the underlying principles of the Code, by any of the Firm’s employees, clients, customers, suppliers, contract workers, business partners, or agents. All newly hired employees are assigned Code training and current employees are periodically assigned Code training on an ongoing basis. Employees are required to affirm their compliance with the Code periodically.
Employees can report any potential or actual violations of the Code through the JPMC Conduct Hotline by phone or the internet. The Hotline is anonymous, except in certain non-U.S. jurisdictions where laws prohibit anonymous reporting, and is available at all times globally, with translation services. It is administered by an outside service provider. The Code prohibits retaliation against anyone who raises an issue or concern in good faith. Periodically, the Audit Committee receives reports on the Code of Conduct program.
Management’s discussion and analysis
148 JPMorgan Chase & Co./2020 Form 10-K

CONDUCT RISK MANAGEMENT
Conduct risk, a subcategory of operational risk, is the risk that any action or inaction by an employee or employees could lead to unfair client or customer outcomes, impact the integrity of the markets in which the Firm operates, or compromise the Firm’s reputation.
OverviewEach LOB and Corporate is accountable for identifying and managing its conduct risk to provide appropriate engagement, ownership and sustainability of a culture consistent with the Firm’s How We Do Business Principles (the “Principles”). The Principles serve as a guide for how employees are expected to conduct themselves. With the Principles serving as a guide, the Firm’s Code sets out the Firm’s expectations for each employee and provides information and resources to help employees conduct business ethically and in compliance with the laws everywhere the Firm operates. Refer to Compliance Risk Management on page 148 for further discussion of the Code.
Governance and oversightThe Conduct Risk Program is governed by the CCOR Management policy, which establishes the framework for governance, identification, measurement, monitoring and testing, management and reporting conduct risk in the Firm.
The Firm has a senior committee that provides oversight of the Firm’s conduct initiatives to develop a more holistic view of conduct risks and to connect key programs across the Firm in order to identify opportunities and emerging areas of focus. This committee is responsible for setting overall program direction for strategic enhancements to the Firm's employee conduct framework and review the consolidated Firmwide Conduct Risk Appetite Assessment.
Conduct risk management encompasses various aspects of people management practices throughout the employee life cycle, including recruiting, onboarding, training and development, performance management, promotion and compensation processes. Each LOB, Treasury and CIO, and designated corporate functions completes an assessment of conduct risk periodically, reviews metrics and issues which may involve conduct risk, and provides business conduct training as appropriate.
JPMorgan Chase & Co./2020 Form 10-K 149

LEGAL RISK MANAGEMENT
Legal risk, a subcategory of operational risk, is the risk of loss primarily caused by the actual or alleged failure to meet legal obligations that arise from the rule of law in jurisdictions in which the Firm operates, agreements with clients and customers, and products and services offered by the Firm.
OverviewThe global Legal function (“Legal”) provides legal services and advice to the Firm. Legal is responsible for managing the Firm’s exposure to legal risk by:
• managing actual and potential litigation and enforcement matters, including internal reviews and investigations related to such matters
• advising on products and services, including contract negotiation and documentation
• advising on offering and marketing documents and new business initiatives
• managing dispute resolution
• interpreting existing laws, rules and regulations, and advising on changes to them
• advising on advocacy in connection with contemplated and proposed laws, rules and regulations, and
• providing legal advice to the LOBs, Corporate, functions and the Board.
Legal selects, engages and manages outside counsel for the Firm on all matters in which outside counsel is engaged. In addition, Legal advises the Firm’s Conflicts Office which reviews the Firm’s wholesale transactions that may have the potential to create conflicts of interest for the Firm.
Governance and oversightThe Firm’s General Counsel reports to the CEO and is a member of the Operating Committee, the Firmwide Risk Committee and the Firmwide Control Committee. The Firm’s General Counsel and other members of Legal report on significant legal matters to the Firm’s Board of Directors and to the Audit Committee. Legal serves on and advises various committees and advises the Firm’s LOBs and Corporate on potential reputation risk issues.
Management’s discussion and analysis
150 JPMorgan Chase & Co./2020 Form 10-K

ESTIMATIONS AND MODEL RISK MANAGEMENT
Estimations and Model risk, a subcategory of operational risk, is the potential for adverse consequences from decisions based on incorrect or misused estimation outputs.
The Firm uses models and other analytical and judgment-based estimations across various businesses and functions. The estimation methods are of varying levels of sophistication and are used for many purposes, such as the valuation of positions and measurement of risk, assessing regulatory capital requirements, conducting stress testing, and making business decisions. A dedicated independent function, Model Risk Governance and Review (“MRGR”), defines and governs the Firm’s policies relating to the management of model risk and risks associated with certain analytical and judgment-based estimations, such as those used in risk management, budget forecasting and capital planning and analysis.
The governance of analytical and judgment-based estimations within MRGR’s scope follows a consistent approach to the approach used for models, which is described in detail below.
Model risks are owned by the users of the models within the Firm based on the specific purposes of such models. Users and developers of models are responsible for developing, implementing and testing their models, as well as referring models to the MRGR for review and approval. Once models have been approved, model users and developers are responsible for maintaining a robust operating environment, and must monitor and evaluate the performance of the models on an ongoing basis. Model users and developers may seek to enhance models in response to changes in the portfolios and in product and market developments, as well as to capture improvements in available modeling techniques and systems capabilities.
Models are tiered based on an internal standard according to their complexity, the exposure associated with the model and the Firm’s reliance on the model. This tiering is subject to the approval of the MRGR. In its review of a model, the MRGR considers whether the model is suitable for the specific purposes for which it will be used. When reviewing a model, the MRGR analyzes and challenges the model methodology and the reasonableness of model assumptions, and may perform or require additional testing, including back-testing of model outcomes. Model reviews are approved by the appropriate level of management within the MRGR based on the relevant model tier.
Under the Firm’s Estimations and Model Risk Management Policy, the MRGR reviews and approves new models, as well as material changes to existing models, prior to implementation in the operating environment. In certain circumstances exceptions may be granted to the Firm’s policy to allow a model to be used prior to review or approval. The MRGR may also require the user to take appropriate actions to mitigate the model risk if it is to be used in the interim. These actions will depend on the model and may include, for example, limitation of trading activity.
While models are inherently imprecise, the degree of imprecision or uncertainty can be heightened by the market or economic environment. This is particularly true when the current and forecasted environment is significantly different from the historical macroeconomic environments upon which the models were trained, as the Firm has experienced during the COVID-19 pandemic. This uncertainty may necessitate a greater degree of judgment and analytics to inform adjustments to model outputs than in typical periods.
Refer to Critical Accounting Estimates Used by the Firm on pages 152-155 and Note 2 for a summary of model-based valuations and other valuation techniques.
JPMorgan Chase & Co./2020 Form 10-K 151

CRITICAL ACCOUNTING ESTIMATES USED BY THE FIRM
JPMorgan Chase’s accounting policies and use of estimates are integral to understanding its reported results. The Firm’s most complex accounting estimates require management’s judgment to ascertain the appropriate carrying value of assets and liabilities. The Firm has established policies and control procedures intended to ensure that estimation methods, including any judgments made as part of such methods, are well-controlled, independently reviewed and applied consistently from period to period. The methods used and judgments made reflect, among other factors, the nature of the assets or liabilities and the related business and risk management strategies, which may vary across the Firm’s businesses and portfolios. In addition, the policies and procedures are intended to ensure that the process for changing methodologies occurs in an appropriate manner. The Firm believes its estimates for determining the carrying value of its assets and liabilities are appropriate. The following is a brief description of the Firm’s critical accounting estimates involving significant judgments.
Allowance for credit lossesThe Firm’s allowance for credit losses represents management’s estimate of expected credit losses over the remaining expected life of the Firm’s financial assets measured at amortized cost and certain off-balance sheet lending-related commitments. The allowance for credit losses comprises:
• The allowance for loan losses, which covers the Firm’s retained loan portfolios (scored and risk-rated),
• The allowance for lending-related commitments, and
• The allowance for credit losses on investment securities, which covers the Firm’s HTM and AFS securities.
The allowance for credit losses involves significant judgment on a number of matters including development and weighting of macroeconomic forecasts, incorporation of historical loss experience, assessment of risk characteristics, assignment of risk ratings, valuation of collateral, and the determination of remaining expected life. Refer to Note 10 and Note 13 for further information on these judgments as well as the Firm’s policies and methodologies used to determine the Firm’s allowance for credit losses.
One of the most significant judgments involved in estimating the Firm’s allowance for credit losses relates to the macroeconomic forecasts used to estimate credit losses over the eight-quarter forecast period within the Firm’s methodology. The eight-quarter forecast incorporates hundreds of macroeconomic variables (“MEVs”) that are relevant for exposures across the Firm, with modeled credit losses being driven primarily by a subset of less than twenty variables. The specific variables that have the greatest effect on the modeled losses of each portfolio vary by portfolio and geography.
• Key MEVs for the consumer portfolio include U.S. unemployment, house price index (“HPI”) and U.S. real gross domestic product (“GDP”).
• Key MEVs for the wholesale portfolio include U.S. real GDP, U.S. unemployment, U.S. equity prices, corporate credit spreads, oil prices, commercial real estate prices and HPI.
Changes in the Firm’s assumptions and forecasts of economic conditions could significantly affect its estimate of expected credit losses in the portfolio at the balance sheet date or lead to significant changes in the estimate from one reporting period to the next.
The COVID-19 pandemic has resulted in a weak labor market and weak overall economic conditions that will continue to affect borrowers across the Firm’s consumer and wholesale lending portfolios. Significant judgment is required to estimate the severity and duration of the current economic downturn, as well as its potential impact on borrower defaults and loss severities. In particular, macroeconomic conditions and forecasts regarding the duration and severity of the economic downturn caused by the COVID-19 pandemic have been rapidly changing and remain highly uncertain. It is difficult to predict exactly how borrower behavior will be impacted by these changes in economic conditions. The effectiveness of government support, customer assistance and enhanced unemployment benefits should act as mitigants to credit losses, but the extent of the mitigation impact remains uncertain.
It is difficult to estimate how potential changes in any one factor or input might affect the overall allowance for credit losses because management considers a wide variety of factors and inputs in estimating the allowance for credit losses. Changes in the factors and inputs considered may not occur at the same rate and may not be consistent across all geographies or product types, and changes in factors and inputs may be directionally inconsistent, such that improvement in one factor or input may offset deterioration in others.
To consider the impact of a hypothetical alternate macroeconomic forecast, the Firm compared the modeled credit losses determined using its central and relative adverse macroeconomic scenarios, which are two of the five scenarios considered in estimating the allowances for loan losses and lending-related commitments. The central and relative adverse scenarios each included a full suite of MEVs, but differed in the levels, paths and peaks/troughs of those variables over the eight-quarter forecast period.
For example, compared to the Firm’s central scenario described on page 132 and in Note 13, the Firm’s relative adverse scenario assumes a significantly elevated U.S. unemployment rate throughout 2021, averaging 3.0% higher over the eight-quarter forecast, with a peak difference of approximately 4.0% in the second quarter of 2021; lower U.S. real GDP with a slower recovery,
Management’s discussion and analysis
152 JPMorgan Chase & Co./2020 Form 10-K

remaining nearly 2.6% lower at the end of the eight-quarter forecast, with a peak difference of nearly 4.1% in the third quarter of 2021; and a 10.1% further deterioration in the national HPI with a trough in the first quarter of 2022.
This analysis is not intended to estimate expected future changes in the allowance for credit losses, for a number of reasons, including:
• the Firm has placed significant weight on its adverse scenarios in estimating its allowance for credit losses as of December 31, 2020, and accordingly, the existing allowance already reflects credit losses beyond those estimated under the central scenario
• the impacts of changes in many MEVs are both interrelated and nonlinear, so the results of this analysis cannot be simply extrapolated for more severe changes in macroeconomic variables
• the COVID-19 pandemic has stressed many MEVs at a speed and to degrees not seen in recent history, adding significantly higher degrees of uncertainty around modeled credit loss estimations
• significant changes in the expected severity and duration of the economic downturn caused by the COVID-19 pandemic, the effects of government support and customer assistance, and the speed of the subsequent recovery could significantly affect the Firm’s estimate of expected credit losses irrespective of the estimated sensitivities described below.
Without considering the additional weight the Firm has placed on its adverse scenarios or any other offsetting or correlated effects in other qualitative components of the Firm’s allowance for credit losses for the lending exposures noted below, the difference between the modeled estimates under the Firm’s relative adverse and central scenarios at December 31, 2020 would result in the following:
• An increase of approximately $700 million for residential real estate loans and lending-related commitments
• An increase of approximately $5.1 billion for credit card loans
• An increase of approximately $2.8 billion for wholesale loans and lending-related commitments
This analysis relates only to the modeled credit loss estimates and is not intended to estimate changes in the overall allowance for credit losses as it does not reflect any potential changes in other adjustments to the quantitative calculation, which would also be influenced by the judgment management applies to the modeled lifetime loss estimates to reflect the uncertainty and imprecision of these modeled lifetime loss estimates based on then-current circumstances and conditions.
Recognizing that forecasts of macroeconomic conditions are inherently uncertain, particularly in light of the recent economic conditions, the Firm believes that its process to consider the available information and associated risks and
uncertainties is appropriately governed and that its estimates of expected credit losses were reasonable and appropriate for the period ended December 31, 2020.
Fair value JPMorgan Chase carries a portion of its assets and liabilities at fair value. The majority of such assets and liabilities are measured at fair value on a recurring basis, including, derivatives and structured note products. Certain assets and liabilities are measured at fair value on a nonrecurring basis, including certain mortgage, home equity and other loans, where the carrying value is based on the fair value of the underlying collateral.
Assets measured at fair value The following table includes the Firm’s assets measured at fair value and the portion of such assets that are classified within level 3 of the valuation hierarchy. Refer to Note 2 for further information.
December 31, 2020(in billions, except ratios)
Total assets at fair value
Total level 3 assets
Federal Funds sold and securities purchased under resale agreements $ 238.0 $ —
Securities borrowed 53.0 —
Trading assets:
Trading debt and equity instruments $ 423.5 $ 2.6
Derivative receivables(a) 79.6 7.7
Total trading assets 503.1 10.3
AFS securities 388.2 —
Loans 44.5 2.3
MSRs 3.3 3.3
Other 304.1 0.5 Total assets measured at fair value on
a recurring basis 1,243.2 16.4 Total assets measured at fair value on a
nonrecurring basis 3.6 2.0
Total assets measured at fair value $ 1,246.8 $ 18.4
Total Firm assets $ 3,386.1
Level 3 assets at fair value as a percentage of total Firm assets(a) 0.5%
Level 3 assets at fair value as a percentage of total Firm assets at fair value(a) 1.5%
(a) For purposes of the table above, the derivative receivables total reflects the impact of netting adjustments; however, the $7.7 billion of derivative receivables classified as level 3 does not reflect the netting adjustment as such netting is not relevant to a presentation based on the transparency of inputs to the valuation of an asset. The level 3 balances would be reduced if netting were applied, including the netting benefit associated with cash collateral.
ValuationDetails of the Firm’s processes for determining fair value are set out in Note 2. Estimating fair value requires the application of judgment. The type and level of judgment required is largely dependent on the amount of observable market information available to the Firm. For instruments valued using internally developed valuation models and other valuation techniques that use significant unobservable inputs and are therefore classified within level 3 of the valuation hierarchy, judgments used to estimate fair value are more significant than those required when estimating the fair value of instruments classified within levels 1 and 2.
JPMorgan Chase & Co./2020 Form 10-K 153

In arriving at an estimate of fair value for an instrument within level 3, management must first determine the appropriate valuation model or other valuation technique to use. Second, the lack of observability of certain significant inputs requires management to assess all relevant empirical data in deriving valuation inputs including, for example, transaction details, yield curves, interest rates, prepayment speed, default rates, volatilities, correlations, prices (such as commodity, equity or debt prices), valuations of comparable instruments, foreign exchange rates and credit curves. Refer to Note 2 for a further discussion of the valuation of level 3 instruments, including unobservable inputs used.
For instruments classified in levels 2 and 3, management judgment must be applied to assess the appropriate level of valuation adjustments to reflect counterparty credit quality, the Firm’s creditworthiness, market funding rates, liquidity considerations, unobservable parameters, and for portfolios that meet specified criteria, the size of the net open risk position. The judgments made are typically affected by the type of product and its specific contractual terms, and the level of liquidity for the product or within the market as a whole. In periods of heightened market volatility and uncertainty judgments are further affected by the wider variation of reasonable valuation estimates, particularly for positions that are less liquid. Refer to Note 2 for a further discussion of valuation adjustments applied by the Firm.
Imprecision in estimating unobservable market inputs or other factors can affect the amount of gain or loss recorded for a particular position. Furthermore, while the Firm believes its valuation methods are appropriate and consistent with those of other market participants, the methods and assumptions used reflect management judgment and may vary across the Firm’s businesses and portfolios.
The Firm uses various methodologies and assumptions in the determination of fair value. The use of methodologies or assumptions different than those used by the Firm could result in a different estimate of fair value at the reporting date. Refer to Note 2 for a detailed discussion of the Firm’s valuation process and hierarchy, and its determination of fair value for individual financial instruments.
Goodwill impairment Under U.S. GAAP, goodwill must be allocated to reporting units and tested for impairment at least annually. The Firm’s process and methodology used to conduct goodwill impairment testing is described in Note 15.
Management applies significant judgment when testing goodwill for impairment. The goodwill associated with each business combination is allocated to the related reporting units for goodwill impairment testing.
For the year ended December 31, 2020, the Firm reviewed current economic conditions, including the potential impacts of the COVID-19 pandemic on business performance, estimated market cost of equity, as well as actual business results and projections of business
performance for all its reporting units. The Firm has concluded that the goodwill allocated to its reporting units was not impaired as of December 31, 2020. The fair values of these reporting units exceeded their carrying values by at least 15% and did not indicate a significant risk of goodwill impairment based on current projections and valuations.
The projections for all of the Firm’s reporting units are consistent with management’s current business outlook assumptions in the short term, and the Firm’s best estimates of long-term growth and return on equity in the longer term. Where possible, the Firm uses third-party and peer data to benchmark its assumptions and estimates.
Refer to Note 15 for additional information on goodwill, including the goodwill impairment assessment as of December 31, 2020.
Credit card rewards liabilityJPMorgan Chase offers credit cards with various rewards programs which allow cardholders to earn rewards points based on their account activity and the terms and conditions of the rewards program. Generally, there are no limits on the points that an eligible cardholder can earn, nor do the points expire, and the points can be redeemed for a variety of rewards, including cash (predominantly in the form of account credits), gift cards and travel. The Firm maintains a rewards liability which represents the estimated cost of rewards points earned and expected to be redeemed by cardholders. The liability is accrued as the cardholder earns the benefit and is reduced when the cardholder redeems points. This liability was $7.7 billion and $6.4 billion at December 31, 2020 and 2019, respectively, and is recorded in accounts payable and other liabilities on the Consolidated balance sheets.
The rewards liability is sensitive to redemption rate (“RR”) and cost per point (“CPP”) assumptions. The RR assumption is used to estimate the number of points earned by customers that will be redeemed over the life of the account. The CPP assumption is used to estimate the cost of future point redemptions. These assumptions are evaluated periodically considering historical actuals and cardholder redemption behavior and updates to them will impact the rewards liability. As of December 31, 2020, a combined increase of 25 basis points in RR and 1 basis point in CPP would increase the rewards liability by approximately $215 million.
Income taxes JPMorgan Chase is subject to the income tax laws of the various jurisdictions in which it operates, including U.S. federal, state and local, and non-U.S. jurisdictions. These laws are often complex and may be subject to different interpretations. To determine the financial statement impact of accounting for income taxes, including the provision for income tax expense and unrecognized tax benefits, JPMorgan Chase must make assumptions and judgments about how to interpret and apply these complex tax laws to numerous transactions and business events, as well as make judgments regarding the timing of when
Management’s discussion and analysis
154 JPMorgan Chase & Co./2020 Form 10-K

certain items may affect taxable income in the U.S. and non-U.S. tax jurisdictions.
JPMorgan Chase’s interpretations of tax laws around the world are subject to review and examination by the various taxing authorities in the jurisdictions where the Firm operates, and disputes may occur regarding its view on a tax position. These disputes over interpretations with the various taxing authorities may be settled by audit, administrative appeals or adjudication in the court systems of the tax jurisdictions in which the Firm operates. JPMorgan Chase regularly reviews whether it may be assessed additional income taxes as a result of the resolution of these matters, and the Firm records additional reserves as appropriate. In addition, the Firm may revise its estimate of income taxes due to changes in income tax laws, legal interpretations, and business strategies. It is possible that revisions in the Firm’s estimate of income taxes may materially affect the Firm’s results of operations in any reporting period.
The Firm’s provision for income taxes is composed of current and deferred taxes. Deferred taxes arise from differences between assets and liabilities measured for financial reporting versus income tax return purposes. Deferred tax assets are recognized if, in management’s judgment, their realizability is determined to be more likely than not. The Firm has also recognized deferred tax assets in connection with certain tax attributes, including net operating loss (“NOL”) carryforwards and foreign tax credit (“FTC”) carryforwards. The Firm performs regular reviews to ascertain whether its deferred tax assets are realizable. These reviews include management’s estimates and assumptions regarding future taxable income, which also incorporates various tax planning strategies, including strategies that may be available to utilize NOLs before they expire. In connection with these reviews, if it is determined that a deferred tax asset is not realizable, a valuation allowance is established. The valuation allowance may be reversed in a subsequent reporting period if the Firm determines that, based on revised estimates of future taxable income or changes in tax planning strategies, it is more likely than not that all or part of the deferred tax asset will become realizable. As of December 31, 2020, management has determined it is more likely than not that the Firm will realize its deferred tax assets, net of the existing valuation allowance.
The Firm adjusts its unrecognized tax benefits as necessary when additional information becomes available. Uncertain tax positions that meet the more-likely-than-not recognition threshold are measured to determine the amount of benefit to recognize. An uncertain tax position is measured at the largest amount of benefit that management believes is more likely than not to be realized upon settlement. It is possible that the reassessment of JPMorgan Chase’s unrecognized tax benefits may have a material impact on its effective income tax rate in the period in which the reassessment occurs.
Refer to Note 25 for additional information on income taxes.
Litigation reserves Refer to Note 30 for a description of the significant estimates and judgments associated with establishing litigation reserves.
JPMorgan Chase & Co./2020 Form 10-K 155

ACCOUNTING AND REPORTING DEVELOPMENTS
Financial Accounting Standards Board (“FASB”) Standards Adopted since January 1, 2020
Standard Summary of guidance Effects on financial statements
Financial Instruments - Credit Losses (“CECL”)
Issued June 2016
• Establishes a single allowance framework for all financial assets measured at amortized cost and certain off-balance sheet credit exposures. This framework requires that management’s estimate reflects credit losses over the instrument’s remaining expected life and considers expected future changes in macroeconomic conditions.
• Eliminates existing guidance for PCI loans, and requires recognition of the nonaccretable difference as an increase to the allowance for expected credit losses on financial assets purchased with more than insignificant credit deterioration since origination, with a corresponding increase in the amortized cost of the related loans.
• Requires inclusion of expected recoveries, limited to the cumulative amount of prior writeoffs, when estimating the allowance for credit losses for in scope financial assets (including collateral-dependent assets).
• Amends existing impairment guidance for AFS securities to incorporate an allowance, which will allow for reversals of credit impairments in the event that the credit of an issuer improves.
• Requires a cumulative-effect adjustment to retained earnings as of the beginning of the reporting period of adoption.
• Adopted January 1, 2020.
• Refer to Note 1 for further information.
Goodwill
Issued January 2017
• Requires recognition of an impairment loss when the estimated fair value of a reporting unit falls below its carrying value.
• Eliminates the requirement that an impairment loss be recognized only if the estimated implied fair value of the goodwill is below its carrying value.
• Adopted January 1, 2020.
• No impact upon adoption as the guidance was applied prospectively.
• Refer to Note 15 for further information.
Reference RateReform
Issued March2020 and updated January 2021
• Provides optional expedients and exceptions to current accounting guidance when financial instruments, hedge accounting relationships, and other transactions are amended due to reference rate reform.
• Provides an election to account for certain contract amendments related to reference rate reform as modifications rather than extinguishments without the requirement to assess the significance of the amendments.
• Allows for changes in critical terms of a hedge accounting relationship without automatic termination of that relationship. Provides various practical expedients and elections designed to allow hedge accounting to continue uninterrupted during the transition period.
• Provides a one-time election to transfer securities out of the held-to-maturity classification if certain criteria are met.
• The January 2021 update provides an election to account for derivatives modified to change the rate used for discounting, margining, or contract price alignment (collectively “discounting transition”) as modifications.
• Issued and effective March 12, 2020. The January 7, 2021 update was effective when issued.
• The Firm elected to apply certain of the practical expedients related to contract modifications and hedge accounting relationships, and discounting transition beginning in the third quarter of 2020. The discounting transition election was applied retrospectively. The main purpose of the practical expedients is to ease the administrative burden of accounting for contracts impacted by reference rate reform, and these elections did not have a material impact on the Consolidated Financial Statements.
Management’s discussion and analysis
156 JPMorgan Chase & Co./2020 Form 10-K

FORWARD-LOOKING STATEMENTS
From time to time, the Firm has made and will make forward-looking statements. These statements can be identified by the fact that they do not relate strictly to historical or current facts. Forward-looking statements often use words such as “anticipate,” “target,” “expect,” “estimate,” “intend,” “plan,” “goal,” “believe,” or other words of similar meaning. Forward-looking statements provide JPMorgan Chase’s current expectations or forecasts of future events, circumstances, results or aspirations. JPMorgan Chase’s disclosures in this 2020 Form 10-K contain forward-looking statements within the meaning of the Private Securities Litigation Reform Act of 1995. The Firm also may make forward-looking statements in its other documents filed or furnished with the SEC. In addition, the Firm’s senior management may make forward-looking statements orally to investors, analysts, representatives of the media and others.
All forward-looking statements are, by their nature, subject to risks and uncertainties, many of which are beyond the Firm’s control. JPMorgan Chase’s actual future results may differ materially from those set forth in its forward-looking statements. While there is no assurance that any list of risks and uncertainties or risk factors is complete, below are certain factors which could cause actual results to differ from those in the forward-looking statements:
• Economic, financial, reputational and other impacts of the COVID-19 pandemic;
• Local, regional and global business, economic and political conditions and geopolitical events;
• Changes in laws and regulatory requirements, including capital and liquidity requirements affecting the Firm’s businesses, and the ability of the Firm to address those requirements;
• Heightened regulatory and governmental oversight and scrutiny of JPMorgan Chase’s business practices, including dealings with retail customers;
• Changes in trade, monetary and fiscal policies and laws;• Changes in income tax laws and regulations;• Securities and capital markets behavior, including changes
in market liquidity and volatility;• Changes in investor sentiment or consumer spending or
savings behavior;• Ability of the Firm to manage effectively its capital and
liquidity;• Changes in credit ratings assigned to the Firm or its
subsidiaries;• Damage to the Firm’s reputation;• Ability of the Firm to appropriately address social,
environmental and sustainability concerns that may arise, including from its business activities;
• Ability of the Firm to deal effectively with an economic slowdown or other economic or market disruption, including, but not limited to, in the interest rate environment;
• Technology changes instituted by the Firm, its counterparties or competitors;
• The effectiveness of the Firm’s control agenda;• Ability of the Firm to develop or discontinue products and
services, and the extent to which products or services previously sold by the Firm require the Firm to incur liabilities or absorb losses not contemplated at their initiation or origination;
• Acceptance of the Firm’s new and existing products and services by the marketplace and the ability of the Firm to innovate and to increase market share;
• Ability of the Firm to attract and retain qualified and diverse employees;
• Ability of the Firm to control expenses;
• Competitive pressures;
• Changes in the credit quality of the Firm’s clients, customers and counterparties;
• Adequacy of the Firm’s risk management framework, disclosure controls and procedures and internal control over financial reporting;
• Adverse judicial or regulatory proceedings;
• Changes in applicable accounting policies, including the introduction of new accounting standards;
• Ability of the Firm to determine accurate values of certain assets and liabilities;
• Occurrence of natural or man-made disasters or calamities, including health emergencies, the spread of infectious diseases, pandemics or outbreaks of hostilities, or the effects of climate change, and the Firm’s ability to deal effectively with disruptions caused by the foregoing;
• Ability of the Firm to maintain the security of its financial, accounting, technology, data processing and other operational systems and facilities;
• Ability of the Firm to withstand disruptions that may be caused by any failure of its operational systems or those of third parties;
• Ability of the Firm to effectively defend itself against cyber attacks and other attempts by unauthorized parties to access information of the Firm or its customers or to disrupt the Firm’s systems; and
• The other risks and uncertainties detailed in Part I, Item 1A: Risk Factors in JPMorgan Chase’s 2020 Form 10-K.
Any forward-looking statements made by or on behalf of the Firm speak only as of the date they are made, and JPMorgan Chase does not undertake to update any forward-looking statements. The reader should, however, consult any further disclosures of a forward-looking nature the Firm may make in any subsequent Form 10-Ks, Quarterly Reports on Form 10-Qs, or Current Reports on Form 8-K.
JPMorgan Chase & Co./2020 Form 10-K 157


![[Review] I. Hadot, Athenian and Alexandrian Neoplatonism and the Harmonization of Aristotle and Plato, translated by M. Chase, Brill, Leiden – Boston 2015 (Studies in Platonism,](https://static.fdokumen.com/doc/165x107/6339a22a749ef70165006f5a/review-i-hadot-athenian-and-alexandrian-neoplatonism-and-the-harmonization-of.jpg)