JPMorgan Funds - cnyes.cool
312
Audited Annual Report – 30 June 2016 JPMorgan Funds SICAV Range
-
Upload
khangminh22 -
Category
Documents
-
view
0 -
download
0
Transcript of JPMorgan Funds - cnyes.cool
Audited Annual Report – 30 June 2016
JPMorgan FundsSICAV Range
This report is an abridged version of the audited annual report established in conformity with the Luxembourg Law of 17 December 2010 on Undertakings for Collective Investment. The full version is available on request from the Company’s registered office in Luxembourg or the Singapore Representative*.
This report does not constitute an offer or sale or invitation for subscription or purchase of shares, which must be accompanied with the relevant current Singapore prospectus (which is not valid without the relevant current Luxembourg prospectus) and the relevant product highlights sheets. These documents are available free of charge on request from appointed Singapore distributors or the Singapore Representative.
Certain of the sub-funds of the Fund are not authorised for offer or distribution in or to Singapore. Accordingly, no reference is made to these sub-funds in this audited annual report. The attention of the investors is drawn to the fact that certain figures in this audited annual report are expressed on a consolidated basis and, thus, include the assets of those sub-funds which are not authorised for offer or distribution in or to Singapore.
* The Singapore Representative is JPMorgan Asset Management (Singapore) Limited, 168 Robinson Road, 17th Floor, Capital Tower, Singapore 068912, telephone number: (65) 6882 1328.
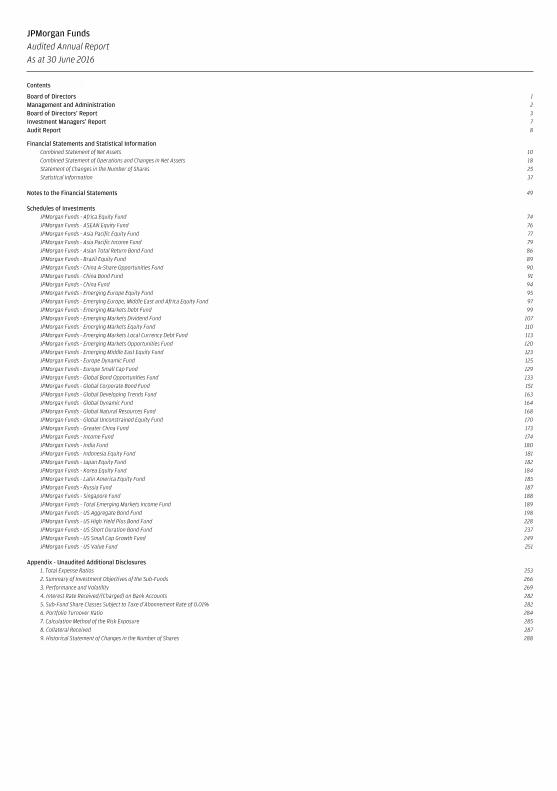
JPMorgan FundsAudited Annual ReportAs at 30 June 2016
Contents (continued)
Board of Directors 1
Management and Administration 2
Board of Directors’ Report 3
Investment Managers’ Report 7
Audit Report 8
Financial Statements and Statistical InformationCombined Statement of Net Assets 10Combined Statement of Operations and Changes in Net Assets 18Statement of Changes in the Number of Shares 25Statistical Information 37
Notes to the Financial Statements 49
Schedules of InvestmentsJPMorgan Funds - Africa Equity Fund 74JPMorgan Funds - ASEAN Equity Fund 76JPMorgan Funds - Asia Pacific Equity Fund 77JPMorgan Funds - Asia Pacific Income Fund 79JPMorgan Funds - Asian Total Return Bond Fund 86JPMorgan Funds - Brazil Equity Fund 89JPMorgan Funds - China A-Share Opportunities Fund 90JPMorgan Funds - China Bond Fund 91JPMorgan Funds - China Fund 94JPMorgan Funds - Emerging Europe Equity Fund 95JPMorgan Funds - Emerging Europe, Middle East and Africa Equity Fund 97JPMorgan Funds - Emerging Markets Debt Fund 99JPMorgan Funds - Emerging Markets Dividend Fund 107JPMorgan Funds - Emerging Markets Equity Fund 110JPMorgan Funds - Emerging Markets Local Currency Debt Fund 113JPMorgan Funds - Emerging Markets Opportunities Fund 120JPMorgan Funds - Emerging Middle East Equity Fund 123JPMorgan Funds - Europe Dynamic Fund 125JPMorgan Funds - Europe Small Cap Fund 129JPMorgan Funds - Global Bond Opportunities Fund 133JPMorgan Funds - Global Corporate Bond Fund 151JPMorgan Funds - Global Developing Trends Fund 163JPMorgan Funds - Global Dynamic Fund 164JPMorgan Funds - Global Natural Resources Fund 168JPMorgan Funds - Global Unconstrained Equity Fund 170JPMorgan Funds - Greater China Fund 173JPMorgan Funds - Income Fund 174JPMorgan Funds - India Fund 180JPMorgan Funds - Indonesia Equity Fund 181JPMorgan Funds - Japan Equity Fund 182JPMorgan Funds - Korea Equity Fund 184JPMorgan Funds - Latin America Equity Fund 185JPMorgan Funds - Russia Fund 187JPMorgan Funds - Singapore Fund 188JPMorgan Funds - Total Emerging Markets Income Fund 189JPMorgan Funds - US Aggregate Bond Fund 198JPMorgan Funds - US High Yield Plus Bond Fund 228JPMorgan Funds - US Short Duration Bond Fund 237JPMorgan Funds - US Small Cap Growth Fund 249JPMorgan Funds - US Value Fund 251
Appendix - Unaudited Additional Disclosures1. Total Expense Ratios 2532. Summary of Investment Objectives of the Sub-Funds 2663. Performance and Volatility 2694. Interest Rate Received/(Charged) on Bank Accounts 2825. Sub-Fund Share Classes Subject to Taxe d’Abonnement Rate of 0.01% 2826. Portfolio Turnover Ratio 2847. Calculation Method of the Risk Exposure 2858. Collateral Received 2879. Historical Statement of Changes in the Number of Shares 288
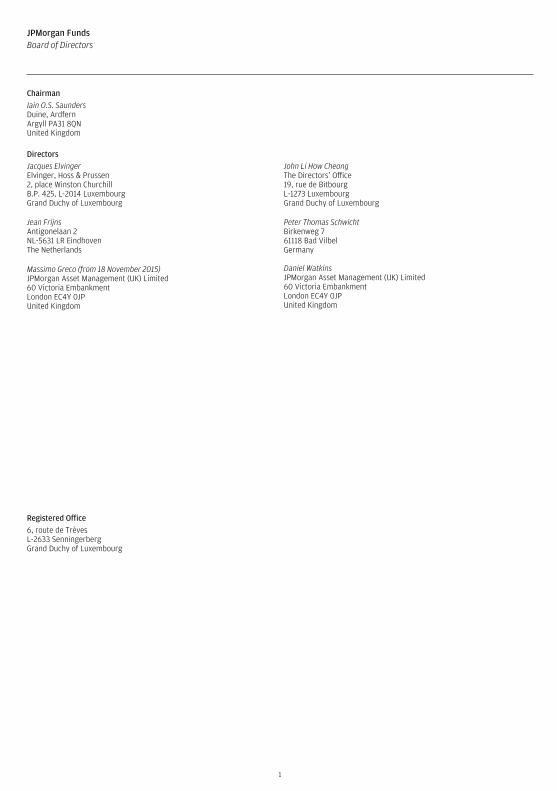
JPMorgan FundsBoard of Directors
Chairman
Iain O.S. SaundersDuine, ArdfernArgyll PA31 8QNUnited Kingdom
Directors
Jacques ElvingerElvinger, Hoss & Prussen2, place Winston ChurchillB.P. 425, L-2014 LuxembourgGrand Duchy of Luxembourg
Jean FrijnsAntigonelaan 2NL-5631 LR EindhovenThe Netherlands
Massimo Greco (from 18 November 2015)JPMorgan Asset Management (UK) Limited60 Victoria EmbankmentLondon EC4Y 0JPUnited Kingdom
Registered Office
6, route de TrèvesL-2633 SenningerbergGrand Duchy of Luxembourg
John Li How CheongThe Directors’ Office19, rue de BitbourgL-1273 LuxembourgGrand Duchy of Luxembourg
Peter Thomas SchwichtBirkenweg 761118 Bad VilbelGermany
Daniel WatkinsJPMorgan Asset Management (UK) Limited60 Victoria EmbankmentLondon EC4Y 0JPUnited Kingdom
1
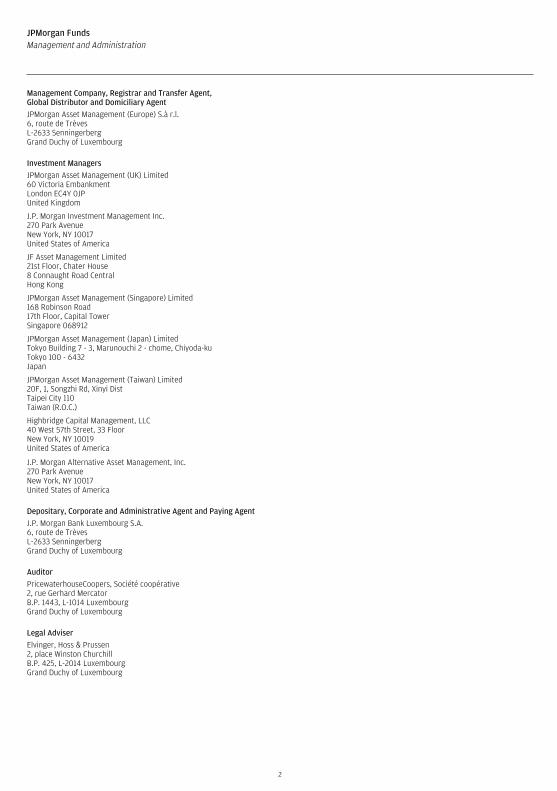
JPMorgan FundsManagement and Administration
Management Company, Registrar and Transfer Agent,Global Distributor and Domiciliary Agent
JPMorgan Asset Management (Europe) S.à r.l.6, route de TrèvesL-2633 SenningerbergGrand Duchy of Luxembourg
Investment Managers
JPMorgan Asset Management (UK) Limited60 Victoria EmbankmentLondon EC4Y 0JPUnited Kingdom
J.P. Morgan Investment Management Inc.270 Park AvenueNew York, NY 10017United States of America
JF Asset Management Limited21st Floor, Chater House8 Connaught Road CentralHong Kong
JPMorgan Asset Management (Singapore) Limited168 Robinson Road17th Floor, Capital TowerSingapore 068912
JPMorgan Asset Management (Japan) LimitedTokyo Building 7 - 3, Marunouchi 2 - chome, Chiyoda-kuTokyo 100 - 6432Japan
JPMorgan Asset Management (Taiwan) Limited20F, 1, Songzhi Rd, Xinyi DistTaipei City 110Taiwan (R.O.C.)
Highbridge Capital Management, LLC40 West 57th Street, 33 FloorNew York, NY 10019United States of America
J.P. Morgan Alternative Asset Management, Inc.270 Park AvenueNew York, NY 10017United States of America
Depositary, Corporate and Administrative Agent and Paying Agent
J.P. Morgan Bank Luxembourg S.A.6, route de TrèvesL-2633 SenningerbergGrand Duchy of Luxembourg
Auditor
PricewaterhouseCoopers, Société coopérative2, rue Gerhard MercatorB.P. 1443, L-1014 LuxembourgGrand Duchy of Luxembourg
Legal Adviser
Elvinger, Hoss & Prussen2, place Winston ChurchillB.P. 425, L-2014 LuxembourgGrand Duchy of Luxembourg
2
ChairmanIain O.S. SaundersIndependent Director and Chairman. A member of the Board since November 1996.
Mr Saunders graduated in Economics from Bristol University and joined Robert Fleming in 1970. He held several senior positions with the group in HongKong, Japan and the US, before returning to the UK in 1988. He was appointed Deputy Chairman of Fleming Asset Management and retired in 2001 followingthe merger of the Robert Fleming group with JP Morgan. Mr Saunders is currently Chairman of several JPMorgan managed Luxembourg-domiciledinvestment funds and MB Asia Select Fund.
Jacques ElvingerIndependent Director. A member of the Board since January 2009.
Mr Elvinger became a member of the Luxembourg Bar in 1984 and has been a partner of the Luxembourg law firm Elvinger Hoss Prussen since 1987. MrElvinger practices general corporate and banking law and specializes in the field of investment and pension funds. He is a member of the High Committee forthe Development of the Financial Sector instituted by the Luxembourg Government. He is also a member of the Advisory Committees to the LuxembourgCommission for the Supervision of the Financial Sector in the area of investment funds, pension funds and investment companies in risk capital. He is amember of the Board of Directors of the Association of the Luxembourg Fund Industry (ALFI) and is currently chairman of ALFI’s Regulatory Board. MrElvinger currently holds a number of board mandates with Luxembourg investment funds including several JPMorgan managed Luxembourg-domiciledinvestment funds.
Jean FrijnsIndependent Director. A member of the Board since September 2005.
Mr Frijns studied Econometrics, attained a doctorate in Economics from the University of Tilburg and was a lecturer at the Northern Illinois University. Hejoined the Dutch Central Planning Bureau (CPB), the economic think-tank of the Dutch government in 1980 and, in 1983, was appointed as deputy director ofthe CPB. Mr Frijns has held various posts including Chief Investment Strategist of ABP, a Dutch pension fund, a professorship in Investments from VrijeUniversiteit (Amsterdam) and, since 2005 has served as Chairman of the Monitoring Committee on Corporate Governance. Mr Frijns currently holds anumber of professional and board mandates with European organisations including several JPMorgan managed Luxembourg-domiciled investment funds.
Massimo GrecoConnected Director. A member of the Board since November 2015
Mr Greco, managing director, is responsible for JPMorgan Asset Management’s Global Funds business in Continental Europe, based in London. Mr Greco hasbeen a JPMorgan employee since 1992, he took on his current responsibilities in 2012. In 1998 Mr Greco moved to Head the Investment Managementbusiness in Italy. Before that, he worked for Goldman Sachs International in the London Capital Markets team from 1986 to 1992. Mr Greco began his careerwith the Investment Bank as Head of Sales for Credit and Rates in Italy. Mr Greco holds a degree in Economics from the University of Turin and an MBA (Majorin Finance) from the Anderson Graduate School of Management at UCLA.
John Li How CheongIndependent Director. A member of the Board since June 2012.
During the last 29 years Mr Li worked essentially in the financial sector auditing and advising clients including banks, investment funds and insurancecompanies. Clients were from Europe, US, Japan and Asia offering Mr Li an extensive experience in dealing with international companies. Mr Li was a Partnerat KPMG Luxembourg for more than 20 years during which he was Managing Partner for 8 years before taking on the role of Chairman of the SupervisoryBoard for 3 years. Mr Li was also a member of the Investment Management Practice. Mr Li is a board member of the Institut Luxembourgeois desAdministrateurs. Mr Li currently holds a number of board mandates with financial institutions including several JPMorgan managed Luxembourg-domiciledinvestment funds.
Peter Thomas SchwichtIndependent Director. A member of the Board since June 2012.
Mr Schwicht obtained a Business Economics degree from the University of Mannheim in Germany after having studied business, tax and accounting inHamburg, Norway and the USA and was an employee of JPMorgan Asset Management from 1987 until October 2014. Prior to his retirement Mr Schwicht wasthe Chief Executive of Investment Management – EMEA, JPMorgan Asset Management He had previously held positions as the Head of the ContinentalEurope Institutional business and the Investment Management Country Head for Institutional and Retail business in Germany where he first developed thebusiness and then went on to expand this throughout Continental Europe. Mr Schwicht is currently a Director of several JPMorgan managedLuxembourg-domiciled investment funds.
Daniel WatkinsConnected Director. A member of the Board since December 2014.
Mr Watkins is the Deputy CEO of JPMorgan Asset Management’s IM Europe and Global Head of IM Client Services and Business Platform. Mr Watkins has beenan employee since 1997 and oversees the business infrastructure of Investment Management in Europe and Asia including client services, fundadministration, product development, and RFP. Mr Watkins also performs the role of Deputy CEO of GIM EMEA, acting as a director of all the regulated legalentities across the region. Mr Watkins has held a number of positions at JPMorgan namely; Head of Europe COO and Global IM Operations, Head of theEuropean Operations Team, Head of the European Transfer Agency, Head of Luxembourg Operations, manager of European Transfer Agency and LondonInvestment Operations; and manager of the Flemings Investment Operations Teams. Mr Watkins obtained a BA in Economics and Politics from the Universityof York and is a qualified Financial Advisor. Mr Watkins is currently a Director of several JPMorgan managed Luxembourg-domiciled investment funds.
The Board of Directors (the “Board”) is pleased to present the Audited Annual Report for the year ended 30 June 2016.
3
JPMorgan FundsBoard of Directors’ Report
Structure of the FundThe Fund is a variable capital investment company, organised as a “Société Anonyme”, under the laws of the Grand Duchy of Luxembourg. The Board hasappointed JPMorgan Asset Management (Europe) S.à r.l. (JPMAM) as Management Company of the Fund. The Fund is organised as an “umbrella” with anumber of Sub-Funds each of which has its own investment objective, policies and restrictions.
The objective of the Fund is to place the money available to it in transferable securities and other permitted assets of any kind, in accordance with the Fund’sProspectus, with the purpose of spreading investment risks and affording shareholders the results of the management of their portfolios.
The Fund qualifies as an Undertaking for Collective Investment in Transferable Securities (UCITS) under the EC Directive 2009/65/EC of 13 July 2009 and issubject to the Luxembourg law of 17 December 2010 on undertakings for collective investment. The Fund may therefore be offered for sale in EuropeanUnion Member States, subject to notification in countries other than the Grand Duchy of Luxembourg. In addition, applications to register the Fund and itsSub-Funds may be made in other countries.
As at the year end the Fund had 119 Sub-Funds. All of the Sub-Funds and Share Classes are registered for offer and distribution in the Grand Duchy ofLuxembourg and a number of the Sub-Funds and Share Classes are registered for distribution in the following jurisdictions:
Austria, Bahrain, Belgium, Chile, Cyprus, Czech Republic, Denmark, Estonia, Finland, France, Germany, Greece, Hong Kong, Hungary, Iceland, Ireland, Italy,Jersey, Korea, Liechtenstein, Macau, The Netherlands, The Netherlands Antilles, Norway, Peru, Poland, Portugal, Singapore, Slovakia, Spain, Sweden,Switzerland, Taiwan and the United Kingdom.
Role and Responsibility of the BoardThe responsibility of the Board is governed exclusively by Luxembourg law. With respect to the annual accounts of the Fund, the duties of the Directors aregoverned by the law of 10 December 2010 on, inter alia, the accounting and annual accounts of undertakings for collective investment and by the law of 17December 2010 relating to undertakings for collective investment.
A management agreement between the Fund and JPMorgan Asset Management (Europe) S.à r.l. sets out the matters over which the Management Companyhas authority under Chapter 15 of the Law of 17 December 2010. This includes management of the Fund’s assets and the provision of administration,registration, domiciliation agent and marketing services. All other matters are reserved for approval by the Board and a schedule setting out such mattersfor clarity is in place between the Board and the Management Company. The matters reserved for the Board include determination of each Sub-Fund’sinvestment objective and policies, investment restrictions and powers, amendments to the Prospectus, reviewing and approving key investment andfinancial data, including the annual accounts, as well as the appointment of, and review of the services provided by, the Management Company, Auditor andDepositary.
Prior to each Board meeting the Directors receive detailed and timely information allowing them to be prepared for the items under discussion during themeeting. For each quarterly meeting the Board requests, and receives, reports from, amongst others, the Management Company, the investment managers,risk management as well as proposals for changes to existing Sub-Funds or proposals to launch new ones as appropriate. Senior representatives of each ofthese functions attend Board meetings by invitation to enable the Directors to question the reports presented to it.
The Directors take decisions in the interests of the Fund and its shareholders as a whole and refrain from taking part in any deliberation or decision whichcreates a conflict of interest between their personal interests and those of the Fund and its shareholders. The subject of conflicts of interest is documented inthe Prospectus and the Management Company’s policy on conflicts of interest is available for inspection on the website:
http://www.jpmorganassetmanagement.lu/ENG/Document_Library
The Board can take independent professional advice if necessary and at the Fund’s expense.
Board Composition
The Board is chaired by Mr. Saunders and consists of five Independent Directors and two Connected Directors. The Board defines a Connected Director assomeone who is employed by JPMorgan Chase & Co or any of its affiliates. All Board meetings require a majority of Independent Directors to be in attendanceand as such the Board acts independently from the Management Company. The Board as a whole has a breadth of investment knowledge, financial skills, aswell as legal and other experience relevant to the Fund’s business.
The Board has agreed that a proposal will be put to shareholders to appoint Directors on a rotational basis and believes that this is of benefit to shareholdersas it will ensure that there is always continuity of Directors. In order to facilitate this proposal it is necessary that the Articles of Incorporation be altered; thedecision to amend them is subject to a shareholder vote at an Extraordinary General Meeting and it is anticipated that this meeting will take place during2017.
The Board does not limit the number of years of Directors’ service and it does take into account the nature and requirements of the fund industry and of theFund’s business when making recommendation to shareholders that Directors be elected. The terms of each Director’s appointment are set out in a contractfor services and these are available at the Fund’s registered office for inspection.
Change to the Composition of the Board
At the Annual General Meeting (“AGM”) held on 18 November 2015 the shareholders appointed Mr Massimo Greco as Director with effect from the date of theAGM.
Board Remuneration
The Board believes that the remuneration of its members should reflect the responsibilities and experience of the Board as a whole and be fair andappropriate given the size, complexity and investment objectives of the Fund.
The remuneration is reviewed on an annual basis. The Chairman is currently paid EUR 76,222.15 per annum and the other Directors EUR 60,952.86 perannum apart from the Connected Directors who have agreed to waive their remuneration.
Board Meetings and Committees
The Board meets quarterly but if necessary additional meetings will be arranged.
Given the scope and nature of the business of the Fund, the Board does not currently consider it necessary to have a formal Audit or RemunerationCommittee or indeed any other standing committees. However, this is kept under review.
All Board related matters are therefore currently approved by the Board or, where there are specific matters that need further consideration, aSub-Committee of the Board could be formed for this specific purpose. Such circumstances could be where the Board requests some amendments to theProspectus and where it is not appropriate to wait till the next quarterly Board meeting for this to be approved. These Sub-Committee meetings are usuallyformed of a minimum of two Directors.
4
JPMorgan FundsBoard of Directors’ Report (continued)
There were six Board meetings held during the year. Four of these were quarterly Board meetings where, amongst other matters, the agenda included thoseitems highlighted under the section above called ‘Role and Responsibility of the Board’ and two were ad hoc Board meetings. There were two Sub-Committeemeetings held during the year.
In addition to the Board meeting where the Auditors present the report on the audit of the Fund accounts, the Independent Directors also meet with themannually without the Connected Directors being in attendance.
Internal Control
Investment management and all administrative services are provided by the Management Company and custody of assets is provided by J.P. Morgan BankLuxembourg S.A. The Board’s system of internal control therefore mainly comprises monitoring the services provided by the Management Company and theDepositary, including the operational and compliance controls established by them to meet the Fund’s obligations to shareholders as set out in theProspectus, Articles of Incorporation as well as all relevant regulations. The Management Company formally reports to the Board on a quarterly basis on thevarious activities it is responsible for and in addition shall inform the Board without delay of any material administrative or accounting matters.
Corporate Governance and ALFI Code of Conduct
The Board is responsible for ensuring that a high level of corporate governance is met and considers that the Fund has complied with the best practices in theLuxembourg funds industry.
In particular the Board has adopted the ALFI Code of Conduct (the “Code”) which sets out principles of good governance. These principles are set out below:
1. The Board should ensure that high standards of corporate governance are applied at all times;
2. The Board should have good professional standing and appropriate experience and ensure that it is collectively competent to fulfil its responsibilities;
3. The Board should act fairly and independently in the best interests of the investors;
4. The Board should act with due care and diligence in the performance of their duties;
5. The Board should ensure compliance with all applicable laws and regulations and with the Fund’s constitutional documents;
6. The Board should ensure that investors are properly informed, are fairly and equitably treated, and receive the benefits and services to which they areentitled;
7. The Board should ensure that an effective risk management process and appropriate internal controls are in place;
8. The Board should identify and manage fairly and effectively, to the best of its ability, any actual, potential or apparent conflict of interest and ensureappropriate disclosure;
9. The Board should ensure that shareholder rights are exercised in a considered way and in the best interests of the Fund;
10. The Board should ensure that the remuneration of the Board members is reasonable and fair and adequately disclosed.
The Board considers that the Fund has been in compliance with the principles of the Code in all material aspects throughout the financial year ended 30 June2016. The Board undertakes an annual review of ongoing compliance with the principles of the Code.
Proxy Voting Policy
The Board delegates responsibility for proxy voting to the Management Company. The Management Company manages the voting rights of the sharesentrusted in a prudent and diligent manner, based exclusively on the reasonable judgement of what will best serve the financial interests of clients. So far asis practicable, the Management Company will vote at all of the meetings called by companies in which they are invested.
A copy of the proxy voting policy is available from the Fund’s registered office upon request or on the website:
https://am.jpmorgan.com/uk/institutional/corporate-governance
Directors and Officers Indemnity InsurancePricewaterhouseCoopers, Société coopérative, has been the Fund’s Auditor since February 2006. The provision of audit services was put to competitivetender in 2016 and as a result the Board decided that, subject to any other influencing factor, PwC should continue to be proposed to Shareholders as Auditoruntil the time when the Board will reconsider who should provide audit services.
Independent AuditorPricewaterhouseCoopers, Société coopérative, has been the Fund’s Auditor since February 2006. The provision of audit services was put to competitivetender in 2016 and as a result the Board decided that, subject to any other influencing factor, PwC should continue to be proposed to Shareholders as Auditoruntil the time when the Board will reconsider who should provide audit services.
Annual General MeetingThe next Annual General Meeting of the SICAV will be held on 16 November 2016 at the Registered Office of the SICAV to consider matters relating to the yearending on 30 June 2016. At this meeting shareholders will, amongst other matters, be requested to consider the usual matters at such meetings including:
1. the adoption of the financial statements and approval of the allocation of the results;
2. the approval of Directors’ fees;
3. the election of the Directors, all of whom wish to stand for election;
4. the election of the Auditor;
No special business is being proposed by the Board.
One of the resolutions proposed in the AGM is to discharge the Directors of their duties for the fiscal year in question. The discharge only relates toinformation explicitly provided for in the annual accounts and is valid as long as the annual accounts do not contain any omission or incorrect statementconcealing the real financial situation of the SICAV.
5
JPMorgan FundsBoard of Directors’ Report (continued)
Events during the YearWith effect from 1 July 2015, changes have been made to the Operating & Administrative Expenses (“O&A”) across all Sub-Funds as set out below:
- For those Share Classes where the O&A is currently set at a fixed rate, the O&A rate has been replaced with capped O&A rates that have been set at eitherthe current fixed rate or a lower rate based on an analysis of the actual direct expenses of the Share Classes. With a capped O&A rate, the Share Classes willpay the actual expenses incurred by the Sub-Fund until the cap is reached.
- Share Classes that currently have a capped O&A will not be impacted by this change and, in some instances, may experience a reduction in the maximumO&A expense cap.
- The “Fund Servicing Fee” has been capped and it is more explicitly defined as a component of the O&A Expenses that is paid to the Management Companyfor the services that the Management Company provides. This Fund Servicing Fee has been capped at 0.15% of the NAV and will be reviewed annually.
Board of Directors
Luxembourg, 13 October 2016
6
JPMorgan FundsBoard of Directors’ Report (continued)

JPMorgan FundsInvestment Managers’ Report
Market Review
Global financial markets were broadly supported in the year under review by positive (albeit relatively modest) global economic growth and by furtherstimulus from central banks. Equities had a challenging year, while bond markets did well, with the Barclays Global Aggregate Index up 8.2% and the BofAMerrill Lynch Global High Yield Index up 9.1% (all performance in local currency terms, total return gross, 30 June 2015 - 30 June 2016, source: FactSet).
Global stock markets delivered small negative returns in the 12-month period ending 30 June 2016. The MSCI World Index (representing global developedmarkets) fell 2.1%, outperforming emerging market stocks, which were down 7.4%. Markets performed strongly at the start of the review period, with manystock indices hitting record highs in the summer of 2015, supported by strong US growth and signs of a recovery in Europe. However, markets experiencedsignificantly volatility later in 2015 and particularly at the start of 2016, as investors began to worry that China’s economic slowdown may be having a greaterimpact on the global economy than had previously been expected. This led investors to reassess their expectations for global growth and monetary policy in2016. However, these fears started to ebb when we saw more stimulus from the European Central Bank (ECB) and dovish noises from the Federal Reserve(Fed). The end of the period saw the surprise announcement of the UK’s decision to leave the European Union. Global stocks fell heavily in the immediateaftermath of the result, compounding losses suffered ahead of the ballot.
Bond markets performed well in an environment of continued central bank easing, low inflation and lacklustre economic growth. The ECB pushed rates torecord lows and introduced a negative deposit rate, while also expanding asset purchases to include corporate bonds. As a result, a large portion of theEuropean bond market is now offering negative yields (in other words, investors are prepared to suffer a small loss in return for the safety these bonds aredeemed to provide). Continued low default rates, central bank buying and solid corporate profits supported credit, both investment grade and high yield,while emerging debt markets saw inflows return as the less hawkish Fed relieved the pressure on emerging market currencies.
Outlook
We had hoped to move into the second half of 2016 with uncertainties around the UK’s relationship with Europe removed. Instead, they have intensified, withthe Brexit vote bringing volatility to markets, a sharp fall in the pound and a new British Prime Minister. We expect the Brexit decision to cut UK growth, pushup inflation and leave a cloud of uncertainty hanging over the country for years.
The key points of focus for the rest of the year will be politics, the Fed and the strength of recovery in the eurozone and the US. The US presidential election iscoming into view, and investors and policy makers will also be watching to see how the Brexit vote is affecting either support for populist parties or the paceof the eurozone recovery. Though the dollar has risen recently, the weakening of the US currency, coupled with a stronger oil price, were striking andwelcome developments in the first part of 2016. It would be costly for the global economy and especially for emerging markets if the dollar rose markedly inthe second half of the year. But the most important focus will be growth in US productivity and profits. Both of these need to strengthen in the second half of2016 for fears of recession to subside.
Investment Managers
13 October 2016
The information contained in this report is historical and not necessarily indicative of future performance.
7

We have audited the accompanying financial statements of JPMorgan Funds and of each of its Sub-Funds, which comprise the Combined Statement of NetAssets and the Schedule of Investments as at 30 June 2016 and the Combined Statement of Operations and Changes in Net Assets for the year then ended,and a summary of significant accounting policies and other explanatory notes to the financial statements.
Responsibility of the Board of Directors of the SICAV for the financial statementsThe Board of Directors of the SICAV is responsible for the preparation and fair presentation of these financial statements in accordance with Luxembourglegal and regulatory requirements relating to the preparation of the financial statements and for such internal control as the Board of Directors of the SICAVdetermines is necessary to enable the preparation of financial statements that are free from material misstatement, whether due to fraud or error.
Responsibility of the “Réviseur d’entreprises agréé”Our responsibility is to express an opinion on these financial statements based on our audit. We conducted our audit in accordance with InternationalStandards on Auditing as adopted for Luxembourg by the “Commission de Surveillance du Secteur Financier”. Those standards require that we comply withethical requirements and plan and perform the audit to obtain reasonable assurance about whether the financial statements are free from materialmisstatement.
An audit involves performing procedures to obtain audit evidence about the amounts and disclosures in the financial statements. The procedures selecteddepend on the judgment of the “Réviseur d’entreprises agréé”, including the assessment of the risks of material misstatement of the financial statements,whether due to fraud or error. In making those risk assessments, the “Réviseur d’entreprises agréé” considers internal control relevant to the entity’spreparation and fair presentation of the financial statements in order to design audit procedures that are appropriate in the circumstances, but not for thepurpose of expressing an opinion on the effectiveness of the entity’s internal control. An audit also includes evaluating the appropriateness of accountingpolicies used and the reasonableness of accounting estimates made by the Board of Directors of the SICAV, as well as evaluating the overall presentation ofthe financial statements.
We believe that the audit evidence we have obtained is sufficient and appropriate to provide a basis for our audit opinion.
OpinionIn our opinion, the financial statements give a true and fair view of the financial position of JPMorgan Funds and of each of its Sub-Funds as of 30 June 2016,and of the results of their operations and changes in their net assets for the year then ended in accordance with Luxembourg legal and regulatoryrequirements relating to the preparation of the financial statements.
Other mattersSupplementary information included in the annual report has been reviewed in the context of our mandate but has not been subject to specific auditprocedures carried out in accordance with the standards described above. Consequently, we express no opinion on such information. However, we have noobservation to make concerning such information in the context of the financial statements taken as a whole.
PricewaterhouseCoopers, Société coopérative Luxembourg, 13 October 2016
Represented by
Régis Malcourant
PricewaterhouseCoopers, Société coopérative, 2 rue Gerhard Mercator, B.P. 1443, L-1014 LuxembourgT: +352 494848 1, F: +352 494848 2900, www.pwc.lu
Cabinet de révision agréé. Expert-comptable (autorisation gouvernementale n° 10028256)R.C.S. Luxembourg B 65 477 - TVA LU25482518
8
Audit Report
To the Shareholders ofJPMorgan Funds

This page has been left blank intentionally
9
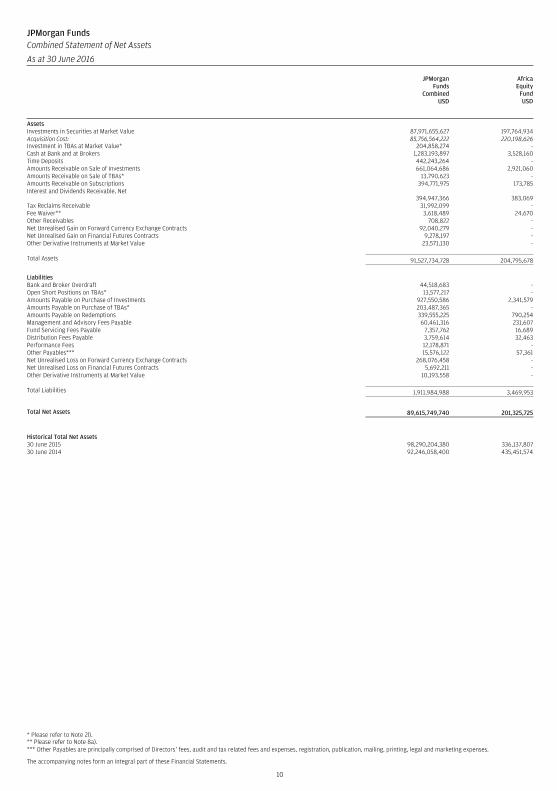
JPMorgan FundsCombined Statement of Net Assets
As at 30 June 2016
JPMorganFunds
CombinedUSD
AfricaEquity
FundUSD
AssetsInvestments in Securities at Market Value 87,971,655,627 197,764,934Acquisition Cost: 85,756,564,222 220,198,626Investment in TBAs at Market Value* 204,858,274 -Cash at Bank and at Brokers 1,283,193,897 3,528,160Time Deposits 442,243,264 -Amounts Receivable on Sale of Investments 661,064,686 2,921,060Amounts Receivable on Sale of TBAs* 13,790,623 -Amounts Receivable on Subscriptions 394,771,975 173,785Interest and Dividends Receivable, Net
394,947,366 383,069Tax Reclaims Receivable 31,992,099 -Fee Waiver** 3,618,489 24,670Other Receivables 708,822 -Net Unrealised Gain on Forward Currency Exchange Contracts 92,040,279 -Net Unrealised Gain on Financial Futures Contracts 9,278,197 -Other Derivative Instruments at Market Value 23,571,130 -
Total Assets 91,527,734,728 204,795,678
LiabilitiesBank and Broker Overdraft 44,518,683 -Open Short Positions on TBAs* 13,577,217 -Amounts Payable on Purchase of Investments 927,550,586 2,341,579Amounts Payable on Purchase of TBAs* 203,487,365 -Amounts Payable on Redemptions 339,555,225 790,254Management and Advisory Fees Payable 60,461,316 231,607Fund Servicing Fees Payable 7,357,762 16,689Distribution Fees Payable 3,759,614 32,463Performance Fees 12,178,871 -Other Payables*** 15,576,122 57,361Net Unrealised Loss on Forward Currency Exchange Contracts 268,076,458 -Net Unrealised Loss on Financial Futures Contracts 5,692,211 -Other Derivative Instruments at Market Value 10,193,558 -
Total Liabilities 1,911,984,988 3,469,953
Total Net Assets 89,615,749,740 201,325,725
Historical Total Net Assets30 June 2015 98,290,204,380 336,137,80730 June 2014 92,246,058,400 435,451,574
* Please refer to Note 2l).** Please refer to Note 8a).*** Other Payables are principally comprised of Directors’ fees, audit and tax related fees and expenses, registration, publication, mailing, printing, legal and marketing expenses.
The accompanying notes form an integral part of these Financial Statements.
10
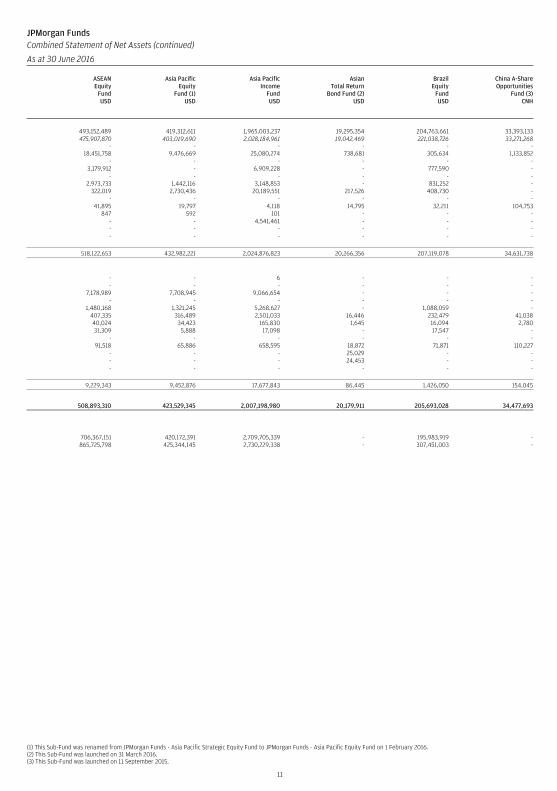
JPMorgan FundsCombined Statement of Net Assets (continued)
As at 30 June 2016
ASEANEquity
FundUSD
Asia PacificEquity
Fund (1)USD
Asia PacificIncome
FundUSD
AsianTotal Return
Bond Fund (2)USD
BrazilEquity
FundUSD
China A-ShareOpportunities
Fund (3)CNH
493,152,489 419,312,611 1,965,003,237 19,295,354 204,763,661 33,393,133475,907,870 403,019,690 2,028,184,961 19,042,469 221,038,726 33,271,268
- - - - - -18,451,758 9,476,669 25,080,274 738,681 305,634 1,133,852
- - - - - -3,179,912 - 6,909,228 - 777,590 -
- - - - - -2,973,733 1,442,116 3,148,853 - 831,252 -
322,019 2,730,436 20,189,551 217,526 408,730 -- - - - - -
41,895 19,797 4,118 14,795 32,211 104,753847 592 101 - - -
- - 4,541,461 - - -- - - - - -- - - - - -
518,122,653 432,982,221 2,024,876,823 20,266,356 207,119,078 34,631,738
- - 6 - - -- - - - - -
7,178,989 7,708,945 9,066,654 - - -- - - - - -
1,480,168 1,321,245 5,268,627 - 1,088,059 -407,335 316,489 2,501,033 16,446 232,479 41,03840,024 34,423 165,830 1,645 16,094 2,78031,309 5,888 17,098 - 17,547 -
- - - - - -91,518 65,886 658,595 18,872 71,871 110,227
- - - 25,029 - -- - - 24,453 - -- - - - - -
9,229,343 9,452,876 17,677,843 86,445 1,426,050 154,045
508,893,310 423,529,345 2,007,198,980 20,179,911 205,693,028 34,477,693
706,367,151 420,172,391 2,709,705,339 - 195,983,919 -865,725,798 425,344,145 2,730,229,338 - 307,451,003 -
(1) This Sub-Fund was renamed from JPMorgan Funds - Asia Pacific Strategic Equity Fund to JPMorgan Funds - Asia Pacific Equity Fund on 1 February 2016.(2) This Sub-Fund was launched on 31 March 2016.(3) This Sub-Fund was launched on 11 September 2015.
11
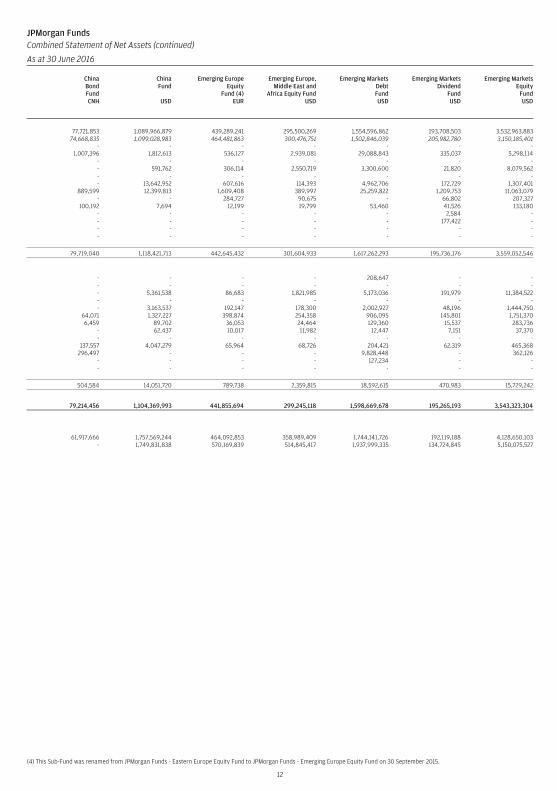
JPMorgan FundsCombined Statement of Net Assets (continued)
As at 30 June 2016
ChinaBondFundCNH
ChinaFund
USD
Emerging EuropeEquity
Fund (4)EUR
Emerging Europe,Middle East and
Africa Equity FundUSD
Emerging MarketsDebtFundUSD
Emerging MarketsDividend
FundUSD
Emerging MarketsEquity
FundUSD
77,721,853 1,089,966,879 439,289,241 295,500,269 1,554,596,862 193,708,503 3,532,963,88374,668,835 1,099,028,983 464,481,863 300,476,751 1,502,846,039 205,982,780 3,150,185,401
- - - - - - -1,007,396 1,812,613 536,127 2,939,081 29,088,843 335,037 5,298,114
- - - - - - -- 591,762 306,114 2,550,719 3,300,600 21,820 8,079,562- - - - - - -- 13,642,952 607,616 114,393 4,962,706 172,729 1,307,401
889,599 12,399,813 1,609,408 389,997 25,259,822 1,209,753 11,063,079- - 284,727 90,675 - 66,802 207,327
100,192 7,694 12,199 19,799 53,460 41,526 133,180- - - - - 2,584 -- - - - - 177,422 -- - - - - - -- - - - - - -
79,719,040 1,118,421,713 442,645,432 301,604,933 1,617,262,293 195,736,176 3,559,052,546
- - - - 208,647 - -- - - - - - -- 5,361,538 86,683 1,821,985 5,173,036 191,979 11,384,522- - - - - - -- 3,163,537 192,147 178,300 2,002,927 48,196 1,444,750
64,071 1,327,227 398,874 254,358 906,095 145,801 1,751,3706,459 89,702 36,053 24,464 129,360 15,537 283,736
- 62,437 10,017 11,982 12,447 7,151 37,370- - - - - - -
137,557 4,047,279 65,964 68,726 204,421 62,319 465,368296,497 - - - 9,828,448 - 362,126
- - - - 127,234 - -- - - - - - -
504,584 14,051,720 789,738 2,359,815 18,592,615 470,983 15,729,242
79,214,456 1,104,369,993 441,855,694 299,245,118 1,598,669,678 195,265,193 3,543,323,304
61,917,666 1,757,569,244 464,092,853 358,989,409 1,744,141,726 192,119,188 4,128,650,103- 1,749,831,838 570,169,839 514,845,417 1,937,999,335 134,724,845 5,150,075,527
(4) This Sub-Fund was renamed from JPMorgan Funds - Eastern Europe Equity Fund to JPMorgan Funds - Emerging Europe Equity Fund on 30 September 2015.
12
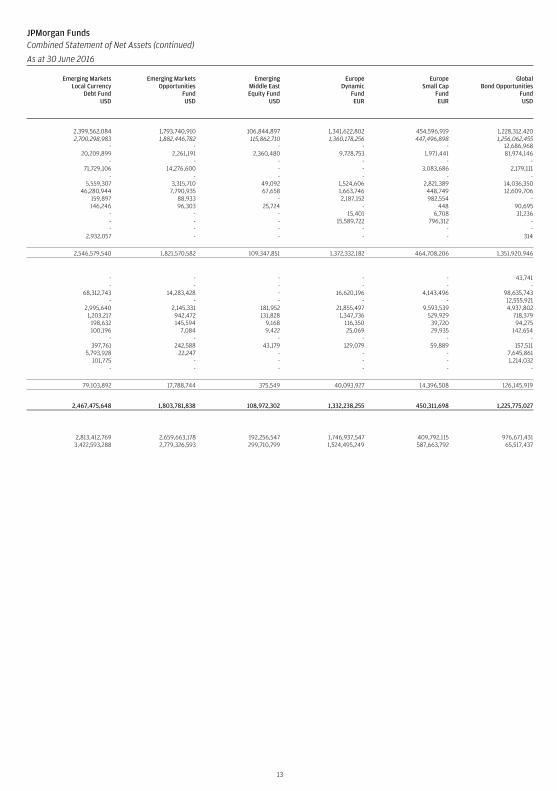
JPMorgan FundsCombined Statement of Net Assets (continued)
As at 30 June 2016
Emerging MarketsLocal Currency
Debt FundUSD
Emerging MarketsOpportunities
FundUSD
EmergingMiddle EastEquity Fund
USD
EuropeDynamic
FundEUR
EuropeSmall Cap
FundEUR
GlobalBond Opportunities
FundUSD
2,399,562,084 1,793,740,910 106,844,897 1,341,622,802 454,596,919 1,228,312,4202,700,298,983 1,882,446,782 115,862,710 1,360,178,256 447,496,898 1,256,062,455
- - - - - 12,686,96820,209,899 2,261,191 2,360,480 9,728,753 1,971,441 81,974,146
- - - - - -71,729,106 14,276,600 - - 3,083,686 2,179,111
- - - - - -5,559,307 3,315,710 49,092 1,524,606 2,821,389 14,036,350
46,280,944 7,790,935 67,658 1,663,746 448,749 12,609,706159,897 88,933 - 2,187,152 982,554 -146,246 96,303 25,724 - 448 90,695
- - - 15,401 6,708 31,236- - - 15,589,722 796,312 -- - - - - -
2,932,057 - - - - 314
2,546,579,540 1,821,570,582 109,347,851 1,372,332,182 464,708,206 1,351,920,946
- - - - - 43,741- - - - - -
68,312,743 14,283,428 - 16,620,196 4,143,496 98,635,743- - - - - 12,555,921
2,995,640 2,145,331 181,952 21,855,497 9,593,539 4,937,8021,203,217 942,472 131,828 1,347,736 529,929 718,379
198,632 145,594 9,168 116,350 39,720 94,275100,196 7,084 9,422 25,069 29,935 142,654
- - - - - -397,761 242,588 43,179 129,079 59,889 157,511
5,793,928 22,247 - - - 7,645,861101,775 - - - - 1,214,032
- - - - - -
79,103,892 17,788,744 375,549 40,093,927 14,396,508 126,145,919
2,467,475,648 1,803,781,838 108,972,302 1,332,238,255 450,311,698 1,225,775,027
2,813,412,769 2,659,663,178 192,256,547 1,746,937,547 409,792,115 976,671,4313,422,593,288 2,779,326,593 299,710,799 1,524,495,249 587,663,792 65,517,437
13
JPMorgan FundsCombined Statement of Net Assets (continued)
As at 30 June 2016
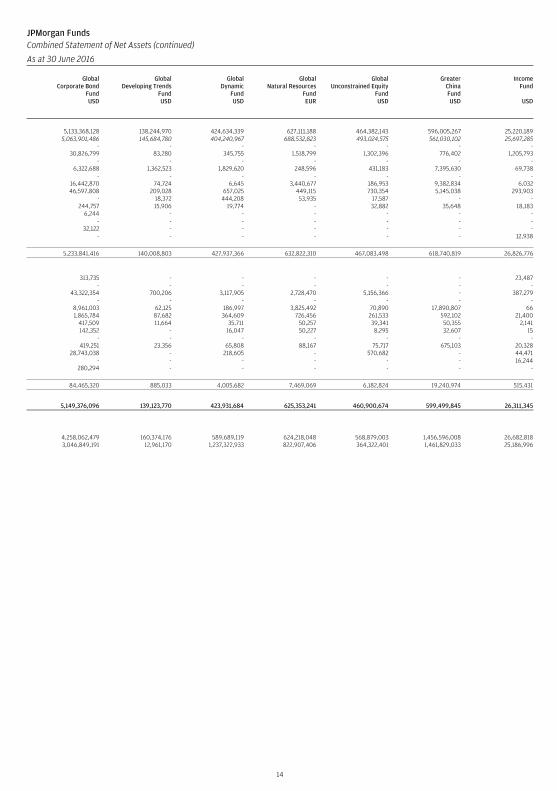
GlobalCorporate Bond
FundUSD
GlobalDeveloping Trends
FundUSD
GlobalDynamic
FundUSD
GlobalNatural Resources
FundEUR
GlobalUnconstrained Equity
FundUSD
GreaterChinaFundUSD
IncomeFund
USD
5,133,368,128 138,244,970 424,634,339 627,111,188 464,382,143 596,005,267 25,220,1895,063,901,486 145,684,780 404,240,967 688,532,823 493,024,575 561,030,102 25,697,285
- - - - - - -30,826,799 83,280 345,755 1,518,799 1,302,396 776,402 1,205,793
- - - - - - -6,322,688 1,362,523 1,829,620 248,596 431,183 7,395,630 69,738
- - - - - - -16,442,870 74,724 6,645 3,440,677 186,953 9,382,834 6,03246,597,808 209,028 657,025 449,115 730,354 5,145,038 293,903
- 18,372 444,208 53,935 17,587 - -244,757 15,906 19,774 - 32,882 35,648 18,183
6,244 - - - - - -- - - - - - -
32,122 - - - - - -- - - - - - 12,938
5,233,841,416 140,008,803 427,937,366 632,822,310 467,083,498 618,740,819 26,826,776
313,735 - - - - - 23,487- - - - - - -
43,322,354 700,206 3,117,905 2,728,470 5,156,366 - 387,279- - - - - - -
8,961,003 62,125 186,997 3,825,492 70,890 17,890,807 661,865,784 87,682 364,609 726,456 261,533 592,102 21,400
417,509 11,664 35,711 50,257 39,341 50,355 2,141142,352 - 16,047 50,227 8,295 32,607 15
- - - - - - -419,251 23,356 65,808 88,167 75,717 675,103 20,328
28,743,038 - 218,605 - 570,682 - 44,471- - - - - - 16,244
280,294 - - - - - -
84,465,320 885,033 4,005,682 7,469,069 6,182,824 19,240,974 515,431
5,149,376,096 139,123,770 423,931,684 625,353,241 460,900,674 599,499,845 26,311,345
4,258,062,479 160,374,176 589,689,119 624,218,048 568,879,003 1,456,596,008 26,682,8183,046,849,191 12,961,170 1,237,322,933 822,907,406 364,322,401 1,461,829,033 25,186,996
14
JPMorgan FundsCombined Statement of Net Assets (continued)
As at 30 June 2016
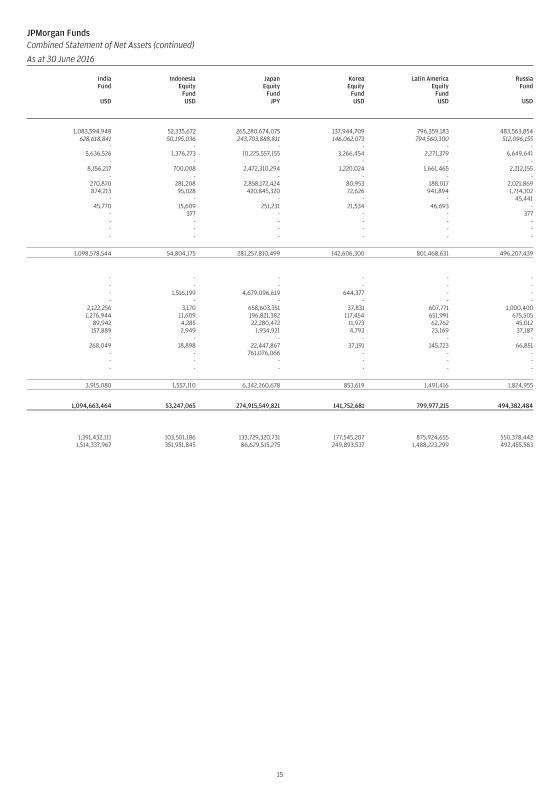
IndiaFund
USD
IndonesiaEquity
FundUSD
JapanEquity
FundJPY
KoreaEquity
FundUSD
Latin AmericaEquity
FundUSD
RussiaFund
USD
1,083,594,948 52,335,672 265,280,674,075 137,944,709 796,359,183 483,563,854628,618,841 50,195,036 243,703,888,811 146,062,073 794,560,300 512,096,155
- - - - - -5,636,526 1,376,273 10,225,557,155 3,266,454 2,271,379 6,649,641
- - - - - -8,156,217 700,008 2,472,310,294 1,220,024 1,661,465 2,212,155
- - - - - -270,870 281,208 2,858,172,424 80,953 188,017 2,021,869874,213 95,028 420,845,320 72,626 941,894 1,714,102
- - - - - 45,44145,770 15,609 251,231 21,534 46,693 -
- 377 - - - 377- - - - - -- - - - - -- - - - - -
1,098,578,544 54,804,175 281,257,810,499 142,606,300 801,468,631 496,207,439
- - - - - -- - - - - -- 1,516,199 4,679,096,619 644,377 - -- - - - - -
2,122,256 3,170 658,603,351 37,831 607,771 1,000,4001,276,944 11,609 196,821,382 117,454 651,991 675,505
89,942 4,285 22,280,472 11,973 62,762 45,012157,889 2,949 1,934,921 4,793 23,169 37,187
- - - - - -268,049 18,898 22,447,867 37,191 145,723 66,851
- - 761,076,066 - - -- - - - - -- - - - - -
3,915,080 1,557,110 6,342,260,678 853,619 1,491,416 1,824,955
1,094,663,464 53,247,065 274,915,549,821 141,752,681 799,977,215 494,382,484
1,391,432,111 103,501,186 133,729,320,731 177,545,207 875,924,655 550,378,4421,514,337,967 351,951,845 86,629,515,275 249,893,537 1,488,223,299 492,455,583
15
JPMorgan FundsCombined Statement of Net Assets (continued)
As at 30 June 2016
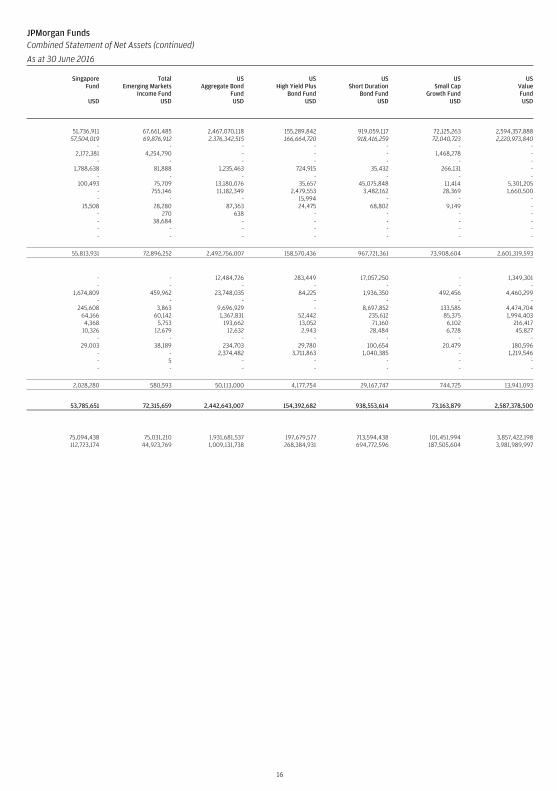
SingaporeFund
USD
TotalEmerging Markets
Income FundUSD
USAggregate Bond
FundUSD
USHigh Yield Plus
Bond FundUSD
USShort Duration
Bond FundUSD
USSmall Cap
Growth FundUSD
USValueFundUSD
51,736,911 67,661,485 2,467,070,118 155,289,842 919,059,117 72,125,263 2,594,357,88857,504,019 69,876,912 2,376,342,515 166,664,720 918,416,259 72,040,723 2,220,973,840
- - - - - - -2,172,381 4,254,790 - - - 1,468,278 -
- - - - - - -1,788,638 81,888 1,235,463 724,915 35,432 266,131 -
- - - - - - -100,493 75,709 13,180,076 35,657 45,075,848 11,414 5,301,205
- 755,146 11,182,349 2,479,553 3,482,162 28,369 1,660,500- - - 15,994 - - -
15,508 28,280 87,363 24,475 68,802 9,149 -- 270 638 - - - -- 38,684 - - - - -- - - - - - -- - - - - - -
55,813,931 72,896,252 2,492,756,007 158,570,436 967,721,361 73,908,604 2,601,319,593
- - 12,484,726 283,449 17,057,250 - 1,349,301- - - - - - -
1,674,809 459,962 23,748,035 84,225 1,936,350 492,456 4,460,299- - - - - - -
245,608 3,863 9,696,929 - 8,697,852 133,585 4,474,70464,166 60,142 1,367,831 52,442 235,612 85,375 1,994,4034,368 5,753 193,662 13,052 71,160 6,102 216,417
10,326 12,679 12,632 2,943 28,484 6,728 45,827- - - - - - -
29,003 38,189 234,703 29,780 100,654 20,479 180,596- - 2,374,482 3,711,863 1,040,385 - 1,219,546- 5 - - - - -- - - - - - -
2,028,280 580,593 50,113,000 4,177,754 29,167,747 744,725 13,941,093
53,785,651 72,315,659 2,442,643,007 154,392,682 938,553,614 73,163,879 2,587,378,500
75,094,438 75,031,210 1,931,681,537 197,679,577 713,594,438 101,451,994 3,857,422,198112,723,174 44,923,769 1,009,131,738 268,384,931 694,772,596 187,505,604 3,981,989,997
16

This page has been left blank intentionally
17
JPMorgan FundsCombined Statement of Operations and Changes in Net Assets
For the Year Ended 30 June 2016
JPMorganFunds
CombinedUSD
AfricaEquity
FundUSD
ASEANEquity
FundUSD
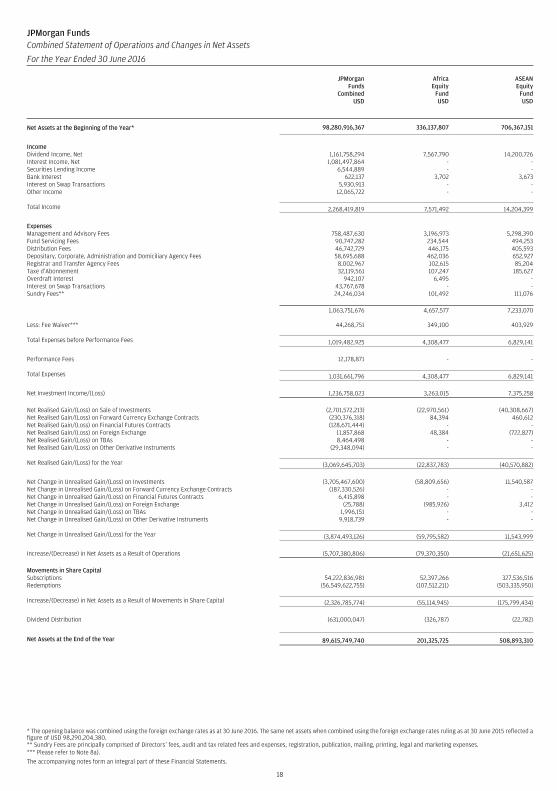
Net Assets at the Beginning of the Year* 98,280,916,367 336,137,807 706,367,151
IncomeDividend Income, Net 1,161,758,294 7,567,790 14,200,726Interest Income, Net 1,081,497,864 - -Securities Lending Income 6,544,889 - -Bank Interest 622,137 3,702 3,673Interest on Swap Transactions 5,930,913 - -Other Income 12,065,722 - -
Total Income 2,268,419,819 7,571,492 14,204,399
ExpensesManagement and Advisory Fees 758,487,630 3,196,973 5,298,390Fund Servicing Fees 90,747,282 234,544 494,253Distribution Fees 46,742,729 446,175 405,593Depositary, Corporate, Administration and Domiciliary Agency Fees 58,695,688 462,036 652,927Registrar and Transfer Agency Fees 8,002,967 102,615 85,204Taxe d’Abonnement 32,119,561 107,247 185,627Overdraft Interest 942,107 6,495 -Interest on Swap Transactions 43,767,678 - -Sundry Fees** 24,246,034 101,492 111,076
1,063,751,676 4,657,577 7,233,070
Less: Fee Waiver*** 44,268,751 349,100 403,929
Total Expenses before Performance Fees 1,019,482,925 4,308,477 6,829,141
Performance Fees 12,178,871 - -
Total Expenses 1,031,661,796 4,308,477 6,829,141
Net Investment Income/(Loss) 1,236,758,023 3,263,015 7,375,258
Net Realised Gain/(Loss) on Sale of Investments (2,701,572,213) (22,970,561) (40,308,667)Net Realised Gain/(Loss) on Forward Currency Exchange Contracts (230,376,318) 84,394 460,612Net Realised Gain/(Loss) on Financial Futures Contracts (128,671,444) - -Net Realised Gain/(Loss) on Foreign Exchange 11,857,868 48,384 (722,827)Net Realised Gain/(Loss) on TBAs 8,464,498 - -Net Realised Gain/(Loss) on Other Derivative Instruments (29,348,094) - -
Net Realised Gain/(Loss) for the Year (3,069,645,703) (22,837,783) (40,570,882)
Net Change in Unrealised Gain/(Loss) on Investments (3,705,467,600) (58,809,656) 11,540,587Net Change in Unrealised Gain/(Loss) on Forward Currency Exchange Contracts (187,330,526) - -Net Change in Unrealised Gain/(Loss) on Financial Futures Contracts 6,415,898 - -Net Change in Unrealised Gain/(Loss) on Foreign Exchange (25,788) (985,926) 3,412Net Change in Unrealised Gain/(Loss) on TBAs 1,996,151 - -Net Change in Unrealised Gain/(Loss) on Other Derivative Instruments 9,918,739 - -
Net Change in Unrealised Gain/(Loss) for the Year (3,874,493,126) (59,795,582) 11,543,999
Increase/(Decrease) in Net Assets as a Result of Operations (5,707,380,806) (79,370,350) (21,651,625)
Movements in Share CapitalSubscriptions 54,222,836,981 52,397,266 327,536,516Redemptions (56,549,622,755) (107,512,211) (503,335,950)
Increase/(Decrease) in Net Assets as a Result of Movements in Share Capital (2,326,785,774) (55,114,945) (175,799,434)
Dividend Distribution (631,000,047) (326,787) (22,782)
Net Assets at the End of the Year 89,615,749,740 201,325,725 508,893,310
* The opening balance was combined using the foreign exchange rates as at 30 June 2016. The same net assets when combined using the foreign exchange rates ruling as at 30 June 2015 reflected afigure of USD 98,290,204,380.** Sundry Fees are principally comprised of Directors’ fees, audit and tax related fees and expenses, registration, publication, mailing, printing, legal and marketing expenses.*** Please refer to Note 8a).The accompanying notes form an integral part of these Financial Statements.
18
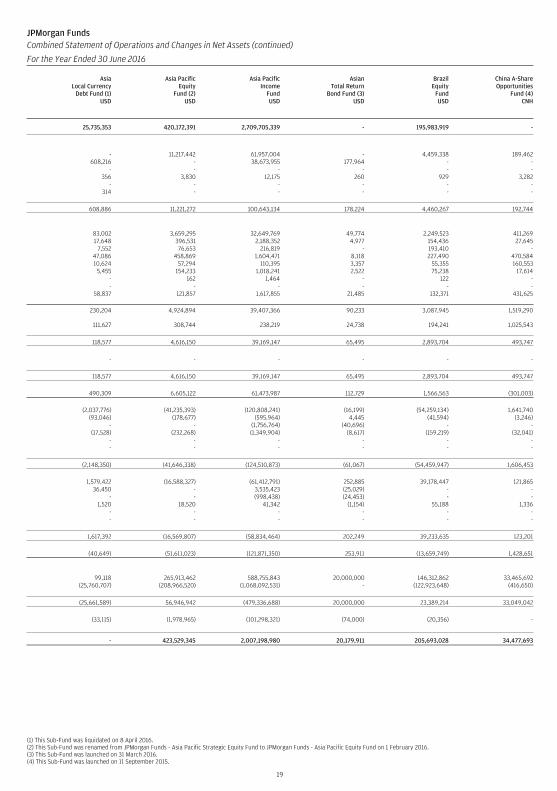
JPMorgan FundsCombined Statement of Operations and Changes in Net Assets (continued)
For the Year Ended 30 June 2016
AsiaLocal Currency
Debt Fund (1)USD
Asia PacificEquity
Fund (2)USD
Asia PacificIncome
FundUSD
AsianTotal Return
Bond Fund (3)USD
BrazilEquity
FundUSD
China A-ShareOpportunities
Fund (4)CNH
25,735,353 420,172,391 2,709,705,339 - 195,983,919 -
- 11,217,442 61,957,004 - 4,459,338 189,462608,216 - 38,673,955 177,964 - -
- - - - - -356 3,830 12,175 260 929 3,282
- - - - - -314 - - - - -
608,886 11,221,272 100,643,134 178,224 4,460,267 192,744
83,002 3,659,295 32,649,769 49,774 2,249,523 411,26917,648 396,531 2,188,352 4,977 154,436 27,645
7,552 76,653 216,819 - 193,410 -47,086 458,869 1,604,471 8,118 227,490 470,58410,624 57,294 110,395 3,357 55,355 160,553
5,455 154,233 1,018,241 2,522 75,238 17,614- 162 1,464 - 122 -- - - - - -
58,837 121,857 1,617,855 21,485 132,371 431,625
230,204 4,924,894 39,407,366 90,233 3,087,945 1,519,290
111,627 308,744 238,219 24,738 194,241 1,025,543
118,577 4,616,150 39,169,147 65,495 2,893,704 493,747
- - - - - -
118,577 4,616,150 39,169,147 65,495 2,893,704 493,747
490,309 6,605,122 61,473,987 112,729 1,566,563 (301,003)
(2,037,776) (41,235,393) (120,808,241) (16,199) (54,259,134) 1,641,740(93,046) (178,677) (595,964) 4,445 (41,594) (3,246)
- - (1,756,764) (40,696) - -(17,528) (232,268) (1,349,904) (8,617) (159,219) (32,041)
- - - - - -- - - - - -
(2,148,350) (41,646,338) (124,510,873) (61,067) (54,459,947) 1,606,453
1,579,422 (16,588,327) (61,412,791) 252,885 39,178,447 121,86536,450 - 3,535,423 (25,029) - -
- - (998,438) (24,453) - -1,520 18,520 41,342 (1,154) 55,188 1,336
- - - - - -- - - - - -
1,617,392 (16,569,807) (58,834,464) 202,249 39,233,635 123,201
(40,649) (51,611,023) (121,871,350) 253,911 (13,659,749) 1,428,651
99,118 265,913,462 588,755,843 20,000,000 146,312,862 33,465,692(25,760,707) (208,966,520) (1,068,092,531) - (122,923,648) (416,650)
(25,661,589) 56,946,942 (479,336,688) 20,000,000 23,389,214 33,049,042
(33,115) (1,978,965) (101,298,321) (74,000) (20,356) -
- 423,529,345 2,007,198,980 20,179,911 205,693,028 34,477,693
(1) This Sub-Fund was liquidated on 8 April 2016.(2) This Sub-Fund was renamed from JPMorgan Funds - Asia Pacific Strategic Equity Fund to JPMorgan Funds - Asia Pacific Equity Fund on 1 February 2016.(3) This Sub-Fund was launched on 31 March 2016.(4) This Sub-Fund was launched on 11 September 2015.
19
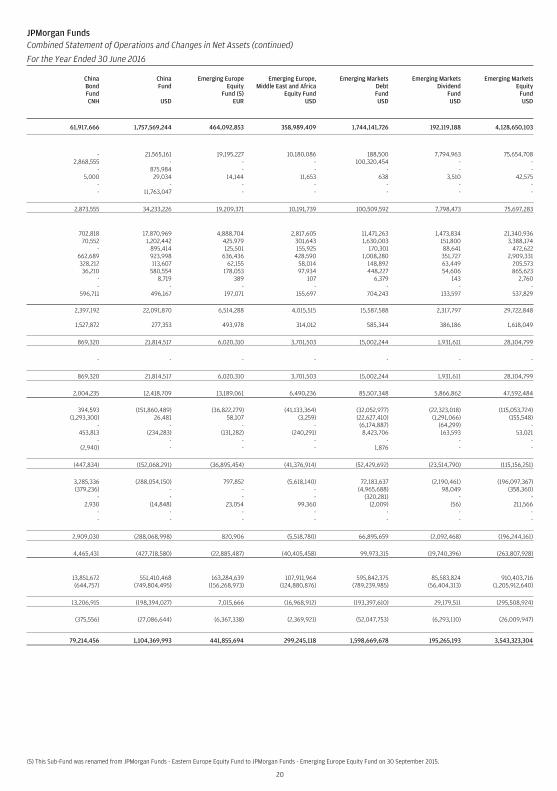
JPMorgan FundsCombined Statement of Operations and Changes in Net Assets (continued)
For the Year Ended 30 June 2016
ChinaBondFundCNH
ChinaFund
USD
Emerging EuropeEquity
Fund (5)EUR
Emerging Europe,Middle East and Africa
Equity FundUSD
Emerging MarketsDebtFundUSD
Emerging MarketsDividend
FundUSD
Emerging MarketsEquity
FundUSD
61,917,666 1,757,569,244 464,092,853 358,989,409 1,744,141,726 192,119,188 4,128,650,103
- 21,565,161 19,195,227 10,180,086 188,500 7,794,963 75,654,7082,868,555 - - - 100,320,454 - -
- 875,984 - - - - -5,000 29,034 14,144 11,653 638 3,510 42,575
- - - - - - -- 11,763,047 - - - - -
2,873,555 34,233,226 19,209,371 10,191,739 100,509,592 7,798,473 75,697,283
702,818 17,870,969 4,888,704 2,817,605 11,471,263 1,473,834 21,340,93670,552 1,202,442 425,979 301,643 1,630,003 151,800 3,388,174
- 895,414 125,501 155,925 170,301 88,641 472,622662,689 923,998 636,436 428,590 1,008,280 351,727 2,909,331328,212 113,607 62,155 58,014 148,892 63,449 205,57336,210 580,554 178,053 97,934 448,227 54,606 865,623
- 8,719 389 107 6,379 143 2,760- - - - - - -
596,711 496,167 197,071 155,697 704,243 133,597 537,829
2,397,192 22,091,870 6,514,288 4,015,515 15,587,588 2,317,797 29,722,848
1,527,872 277,353 493,978 314,012 585,344 386,186 1,618,049
869,320 21,814,517 6,020,310 3,701,503 15,002,244 1,931,611 28,104,799
- - - - - - -
869,320 21,814,517 6,020,310 3,701,503 15,002,244 1,931,611 28,104,799
2,004,235 12,418,709 13,189,061 6,490,236 85,507,348 5,866,862 47,592,484
394,593 (151,860,489) (36,822,279) (41,133,364) (32,052,977) (22,323,018) (115,053,724)(1,293,300) 26,481 58,107 (3,259) (22,627,410) (1,291,066) (155,548)
- - - - (6,174,887) (64,299) -453,813 (234,283) (131,282) (240,291) 8,423,706 163,593 53,021
- - - - - - -(2,940) - - - 1,876 - -
(447,834) (152,068,291) (36,895,454) (41,376,914) (52,429,692) (23,514,790) (115,156,251)
3,285,336 (288,054,150) 797,852 (5,618,140) 72,183,637 (2,190,461) (196,097,367)(379,236) - - - (4,965,688) 98,049 (358,360)
- - - - (320,281) - -2,930 (14,848) 23,054 99,360 (2,009) (56) 211,566
- - - - - - -- - - - - - -
2,909,030 (288,068,998) 820,906 (5,518,780) 66,895,659 (2,092,468) (196,244,161)
4,465,431 (427,718,580) (22,885,487) (40,405,458) 99,973,315 (19,740,396) (263,807,928)
13,851,672 551,410,468 163,284,639 107,911,964 595,842,375 85,583,824 910,403,716(644,757) (749,804,495) (156,268,973) (124,880,876) (789,239,985) (56,404,313) (1,205,912,640)
13,206,915 (198,394,027) 7,015,666 (16,968,912) (193,397,610) 29,179,511 (295,508,924)
(375,556) (27,086,644) (6,367,338) (2,369,921) (52,047,753) (6,293,110) (26,009,947)
79,214,456 1,104,369,993 441,855,694 299,245,118 1,598,669,678 195,265,193 3,543,323,304
(5) This Sub-Fund was renamed from JPMorgan Funds - Eastern Europe Equity Fund to JPMorgan Funds - Emerging Europe Equity Fund on 30 September 2015.
20
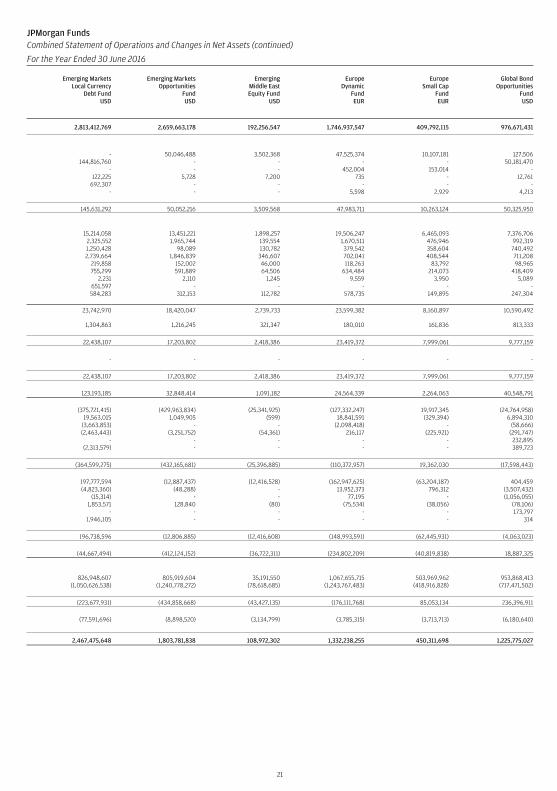
JPMorgan FundsCombined Statement of Operations and Changes in Net Assets (continued)
For the Year Ended 30 June 2016
Emerging MarketsLocal Currency
Debt FundUSD
Emerging MarketsOpportunities
FundUSD
EmergingMiddle EastEquity Fund
USD
EuropeDynamic
FundEUR
EuropeSmall Cap
FundEUR
Global BondOpportunities
FundUSD
2,813,412,769 2,659,663,178 192,256,547 1,746,937,547 409,792,115 976,671,431
- 50,046,488 3,502,368 47,525,374 10,107,181 127,506144,816,760 - - - - 50,181,470
- - - 452,004 153,014 -122,225 5,728 7,200 735 - 12,761
692,307 - - - - -- - - 5,598 2,929 4,213
145,631,292 50,052,216 3,509,568 47,983,711 10,263,124 50,325,950
15,214,058 13,451,221 1,898,257 19,506,247 6,465,093 7,376,7062,325,552 1,965,744 139,554 1,670,511 476,946 992,3191,250,428 98,089 130,782 379,542 358,604 740,4922,739,664 1,846,839 346,607 702,041 408,544 711,208
219,858 152,002 46,000 118,263 83,792 98,965755,299 591,889 64,506 634,484 214,073 418,409
2,231 2,110 1,245 9,559 3,950 5,089651,597 - - - - -584,283 312,153 112,782 578,735 149,895 247,304
23,742,970 18,420,047 2,739,733 23,599,382 8,160,897 10,590,492
1,304,863 1,216,245 321,347 180,010 161,836 813,333
22,438,107 17,203,802 2,418,386 23,419,372 7,999,061 9,777,159
- - - - - -
22,438,107 17,203,802 2,418,386 23,419,372 7,999,061 9,777,159
123,193,185 32,848,414 1,091,182 24,564,339 2,264,063 40,548,791
(375,721,415) (429,963,834) (25,341,925) (127,332,247) 19,917,345 (24,764,958)19,563,015 1,049,905 (599) 18,841,591 (329,394) 6,894,310
(3,663,853) - - (2,098,418) - (58,666)(2,463,443) (3,251,752) (54,361) 216,117 (225,921) (291,747)
- - - - - 232,895(2,313,579) - - - - 389,723
(364,599,275) (432,165,681) (25,396,885) (110,372,957) 19,362,030 (17,598,443)
197,777,594 (12,887,437) (12,416,528) (162,947,625) (63,204,187) 404,459(4,823,360) (48,288) - 13,952,373 796,312 (3,507,432)
(15,314) - - 77,195 - (1,056,055)1,853,571 128,840 (80) (75,534) (38,056) (78,106)
- - - - - 173,7971,946,105 - - - - 314
196,738,596 (12,806,885) (12,416,608) (148,993,591) (62,445,931) (4,063,023)
(44,667,494) (412,124,152) (36,722,311) (234,802,209) (40,819,838) 18,887,325
826,948,607 805,919,604 35,191,550 1,067,655,715 503,969,962 953,868,413(1,050,626,538) (1,240,778,272) (78,618,685) (1,243,767,483) (418,916,828) (717,471,502)
(223,677,931) (434,858,668) (43,427,135) (176,111,768) 85,053,134 236,396,911
(77,591,696) (8,898,520) (3,134,799) (3,785,315) (3,713,713) (6,180,640)
2,467,475,648 1,803,781,838 108,972,302 1,332,238,255 450,311,698 1,225,775,027
21
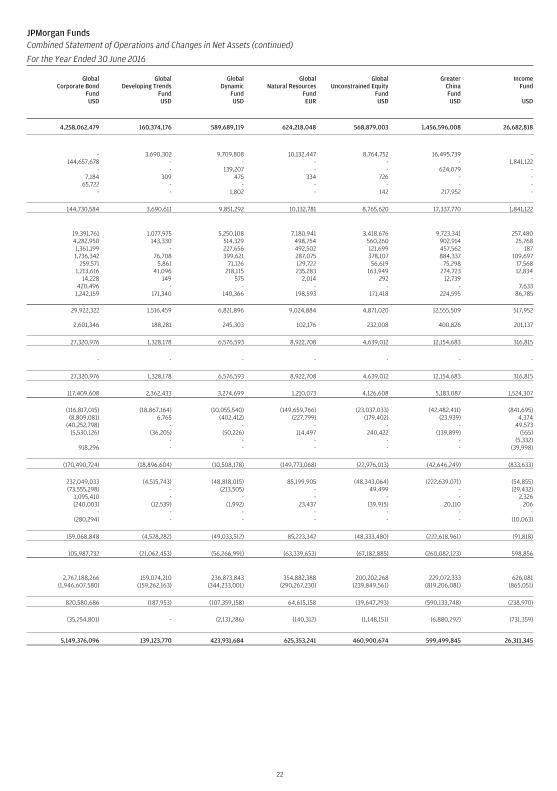
JPMorgan FundsCombined Statement of Operations and Changes in Net Assets (continued)
For the Year Ended 30 June 2016
GlobalCorporate Bond
FundUSD
GlobalDeveloping Trends
FundUSD
GlobalDynamic
FundUSD
GlobalNatural Resources
FundEUR
GlobalUnconstrained Equity
FundUSD
GreaterChinaFundUSD
IncomeFund
USD
4,258,062,479 160,374,176 589,689,119 624,218,048 568,879,003 1,456,596,008 26,682,818
- 3,690,302 9,709,808 10,132,447 8,764,752 16,495,739 -144,657,678 - - - - - 1,841,122
- - 139,207 - - 624,079 -7,184 309 475 334 726 - -
65,722 - - - - - -- - 1,802 - 142 217,952 -
144,730,584 3,690,611 9,851,292 10,132,781 8,765,620 17,337,770 1,841,122
19,391,761 1,077,975 5,250,108 7,180,941 3,418,676 9,723,341 257,4804,282,950 143,330 514,329 498,754 560,260 902,914 25,7681,361,199 - 227,656 492,502 121,699 457,562 1871,736,342 76,708 399,621 287,075 378,107 884,337 109,697
259,571 5,861 71,126 129,722 56,619 75,298 17,5681,213,616 41,096 218,115 235,283 163,949 274,723 12,834
14,228 149 575 2,014 292 12,739 -420,496 - - - - - 7,633
1,242,159 171,340 140,366 198,593 171,418 224,595 86,785
29,922,322 1,516,459 6,821,896 9,024,884 4,871,020 12,555,509 517,952
2,601,346 188,281 245,303 102,176 232,008 400,826 201,137
27,320,976 1,328,178 6,576,593 8,922,708 4,639,012 12,154,683 316,815
- - - - - - -
27,320,976 1,328,178 6,576,593 8,922,708 4,639,012 12,154,683 316,815
117,409,608 2,362,433 3,274,699 1,210,073 4,126,608 5,183,087 1,524,307
(116,817,015) (18,867,164) (10,055,540) (149,659,766) (23,037,033) (42,482,411) (841,695)(8,809,081) 6,765 (402,412) (227,799) (179,402) (23,939) 4,374
(40,252,798) - - - - - 49,573(5,530,126) (36,205) (50,226) 114,497 240,422 (139,899) (555)
- - - - - - (5,332)918,296 - - - - - (39,998)
(170,490,724) (18,896,604) (10,508,178) (149,773,068) (22,976,013) (42,646,249) (833,633)
232,049,033 (4,515,743) (48,818,015) 85,199,905 (48,343,064) (222,639,071) (54,855)(73,555,298) - (213,505) - 49,499 - (29,432)
1,095,410 - - - - - 2,326(240,003) (12,539) (1,992) 23,437 (39,915) 20,110 206
- - - - - - -(280,294) - - - - - (10,063)
159,068,848 (4,528,282) (49,033,512) 85,223,342 (48,333,480) (222,618,961) (91,818)
105,987,732 (21,062,453) (56,266,991) (63,339,653) (67,182,885) (260,082,123) 598,856
2,767,188,266 159,074,210 236,873,843 354,882,388 200,202,268 229,072,333 626,081(1,946,607,580) (159,262,163) (344,233,001) (290,267,230) (239,849,561) (819,206,081) (865,051)
820,580,686 (187,953) (107,359,158) 64,615,158 (39,647,293) (590,133,748) (238,970)
(35,254,801) - (2,131,286) (140,312) (1,148,151) (6,880,292) (731,359)
5,149,376,096 139,123,770 423,931,684 625,353,241 460,900,674 599,499,845 26,311,345
22
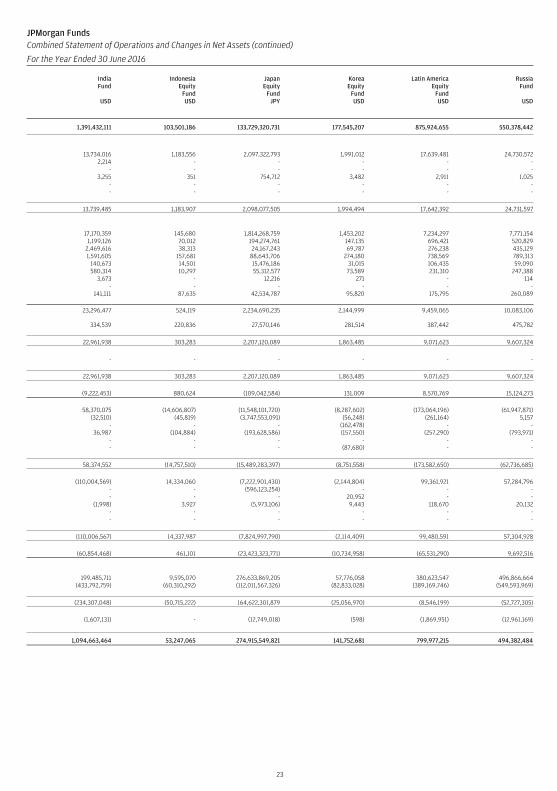
JPMorgan FundsCombined Statement of Operations and Changes in Net Assets (continued)
For the Year Ended 30 June 2016
IndiaFund
USD
IndonesiaEquity
FundUSD
JapanEquity
FundJPY
KoreaEquity
FundUSD
Latin AmericaEquity
FundUSD
RussiaFund
USD
1,391,432,111 103,501,186 133,729,320,731 177,545,207 875,924,655 550,378,442
13,734,016 1,183,556 2,097,322,793 1,991,012 17,639,481 24,730,5722,214 - - - - -
- - - - - -3,255 351 754,712 3,482 2,911 1,025
- - - - - -- - - - - -
13,739,485 1,183,907 2,098,077,505 1,994,494 17,642,392 24,731,597
17,170,359 145,680 1,814,268,759 1,453,202 7,234,297 7,771,1541,199,126 70,012 194,274,761 147,135 696,421 520,829
2,469,616 38,313 24,167,243 69,787 276,238 435,1291,591,605 157,681 88,643,706 274,180 738,569 789,313
140,673 14,501 15,476,186 31,015 106,435 59,090580,314 10,297 55,312,577 73,589 231,310 247,388
3,673 - 12,216 271 - 114- - - - - -
141,111 87,635 42,534,787 95,820 175,795 260,089
23,296,477 524,119 2,234,690,235 2,144,999 9,459,065 10,083,106
334,539 220,836 27,570,146 281,514 387,442 475,782
22,961,938 303,283 2,207,120,089 1,863,485 9,071,623 9,607,324
- - - - - -
22,961,938 303,283 2,207,120,089 1,863,485 9,071,623 9,607,324
(9,222,453) 880,624 (109,042,584) 131,009 8,570,769 15,124,273
58,370,075 (14,606,807) (11,548,101,720) (8,287,602) (173,064,196) (61,947,871)(32,510) (45,819) (3,747,553,091) (56,248) (261,164) 5,157
- - - (162,478) - -36,987 (104,884) (193,628,586) (157,550) (257,290) (793,971)
- - - - - -- - - (87,680) - -
58,374,552 (14,757,510) (15,489,283,397) (8,751,558) (173,582,650) (62,736,685)
(110,004,569) 14,334,060 (7,222,901,430) (2,144,804) 99,361,921 57,284,796- - (596,123,254) - - -- - - 20,952 - -
(1,998) 3,927 (5,973,106) 9,443 118,670 20,132- - - - - -- - - - - -
(110,006,567) 14,337,987 (7,824,997,790) (2,114,409) 99,480,591 57,304,928
(60,854,468) 461,101 (23,423,323,771) (10,734,958) (65,531,290) 9,692,516
199,485,711 9,595,070 276,633,869,205 57,776,058 380,623,547 496,866,664(433,792,759) (60,310,292) (112,011,567,326) (82,833,028) (389,169,746) (549,593,969)
(234,307,048) (50,715,222) 164,622,301,879 (25,056,970) (8,546,199) (52,727,305)
(1,607,131) - (12,749,018) (598) (1,869,951) (12,961,169)
1,094,663,464 53,247,065 274,915,549,821 141,752,681 799,977,215 494,382,484
23
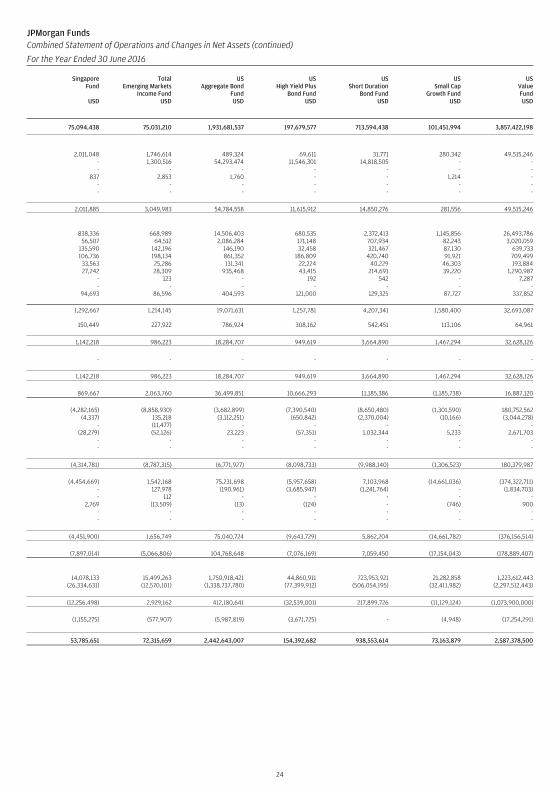
JPMorgan FundsCombined Statement of Operations and Changes in Net Assets (continued)
For the Year Ended 30 June 2016
SingaporeFund
USD
TotalEmerging Markets
Income FundUSD
USAggregate Bond
FundUSD
USHigh Yield Plus
Bond FundUSD
USShort Duration
Bond FundUSD
USSmall Cap
Growth FundUSD
USValueFundUSD
75,094,438 75,031,210 1,931,681,537 197,679,577 713,594,438 101,451,994 3,857,422,198
2,011,048 1,746,614 489,324 69,611 31,771 280,342 49,515,246- 1,300,516 54,293,474 11,546,301 14,818,505 - -- - - - - - -
837 2,853 1,760 - - 1,214 -- - - - - - -- - - - - - -
2,011,885 3,049,983 54,784,558 11,615,912 14,850,276 281,556 49,515,246
838,336 668,989 14,506,403 680,535 2,372,413 1,145,856 26,493,78656,507 64,512 2,086,284 171,148 707,934 82,243 3,020,059
135,590 142,196 146,190 32,458 321,467 87,130 639,733106,736 198,134 861,352 186,809 420,740 91,921 709,49933,563 25,286 131,341 22,224 40,229 46,303 193,88427,242 28,309 935,468 43,415 214,691 39,220 1,290,987
- 123 - 192 542 - 7,287- - - - - - -
94,693 86,596 404,593 121,000 129,325 87,727 337,852
1,292,667 1,214,145 19,071,631 1,257,781 4,207,341 1,580,400 32,693,087
150,449 227,922 786,924 308,162 542,451 113,106 64,961
1,142,218 986,223 18,284,707 949,619 3,664,890 1,467,294 32,628,126
- - - - - - -
1,142,218 986,223 18,284,707 949,619 3,664,890 1,467,294 32,628,126
869,667 2,063,760 36,499,851 10,666,293 11,185,386 (1,185,738) 16,887,120
(4,282,165) (8,858,930) (3,682,899) (7,390,540) (8,650,480) (1,301,590) 180,752,562(4,337) 135,218 (3,112,251) (650,842) (2,370,004) (10,166) (3,044,278)
- (11,477) - - - - -(28,279) (52,126) 23,223 (57,351) 1,032,344 5,233 2,671,703
- - - - - - -- - - - - - -
(4,314,781) (8,787,315) (6,771,927) (8,098,733) (9,988,140) (1,306,523) 180,379,987
(4,454,669) 1,542,168 75,231,698 (5,957,658) 7,103,968 (14,661,036) (374,322,711)- 127,978 (190,961) (3,685,947) (1,241,764) - (1,834,703)- 112 - - - - -
2,769 (13,509) (13) (124) - (746) 900- - - - - - -- - - - - - -
(4,451,900) 1,656,749 75,040,724 (9,643,729) 5,862,204 (14,661,782) (376,156,514)
(7,897,014) (5,066,806) 104,768,648 (7,076,169) 7,059,450 (17,154,043) (178,889,407)
14,078,133 15,499,263 1,750,918,421 44,860,911 723,953,921 21,282,858 1,223,612,443(26,334,631) (12,570,101) (1,338,737,780) (77,399,912) (506,054,195) (32,411,982) (2,297,512,443)
(12,256,498) 2,929,162 412,180,641 (32,539,001) 217,899,726 (11,129,124) (1,073,900,000)
(1,155,275) (577,907) (5,987,819) (3,671,725) - (4,948) (17,254,291)
53,785,651 72,315,659 2,442,643,007 154,392,682 938,553,614 73,163,879 2,587,378,500
24
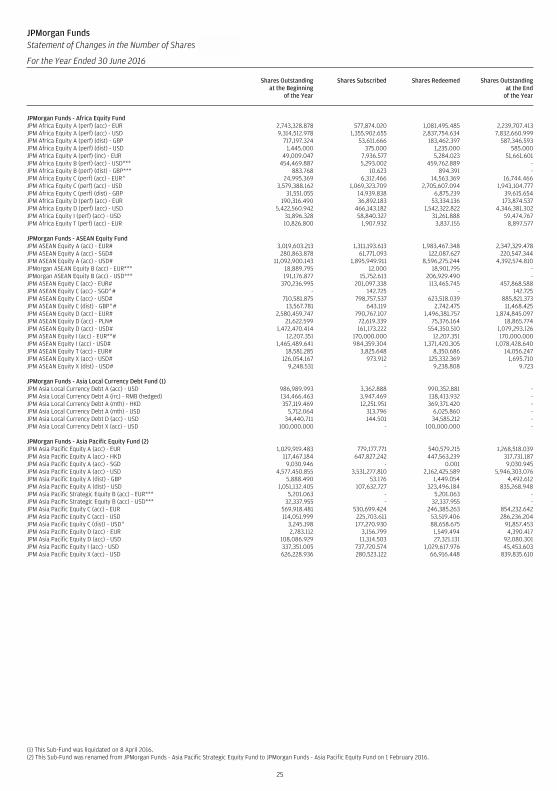
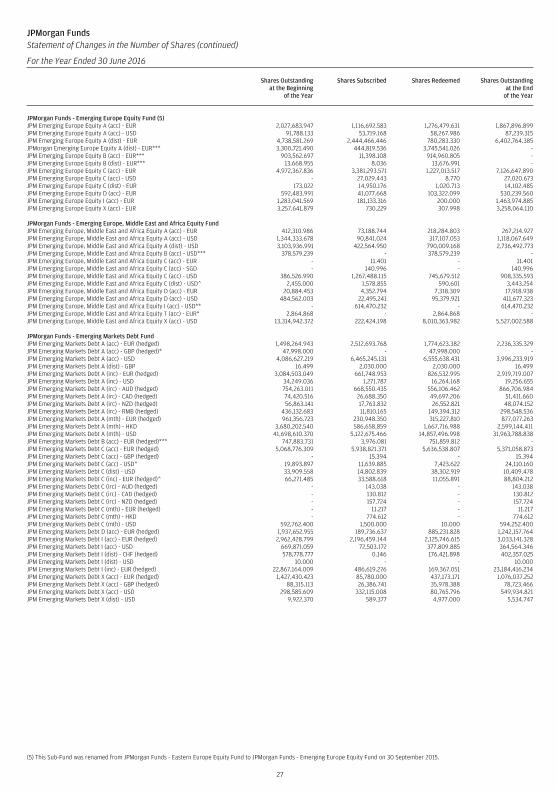
JPMorgan FundsStatement of Changes in the Number of Shares (continued)
For the Year Ended 30 June 2016
Shares Outstandingat the Beginning
of the Year
Shares Subscribed Shares Redeemed Shares Outstandingat the End
of the Year
JPMorgan Funds - Africa Equity FundJPM Africa Equity A (perf) (acc) - EUR 2,743,328.878 577,874.020 1,081,495.485 2,239,707.413JPM Africa Equity A (perf) (acc) - USD 9,314,512.978 1,355,902.655 2,837,754.634 7,832,660.999JPM Africa Equity A (perf) (dist) - GBP 717,197.324 53,611.666 183,462.397 587,346.593JPM Africa Equity A (perf) (dist) - USD 1,445.000 375.000 1,235.000 585.000JPM Africa Equity A (perf) (inc) - EUR 49,009.047 7,936.577 5,284.023 51,661.601JPM Africa Equity B (perf) (acc) - USD*** 454,469.887 5,293.002 459,762.889 -JPM Africa Equity B (perf) (dist) - GBP*** 883.768 10.623 894.391 -JPM Africa Equity C (perf) (acc) - EUR^ 24,995.369 6,312.466 14,563.369 16,744.466JPM Africa Equity C (perf) (acc) - USD 3,579,388.162 1,069,323.709 2,705,607.094 1,943,104.777JPM Africa Equity C (perf) (dist) - GBP 31,551.055 14,939.838 6,875.239 39,615.654JPM Africa Equity D (perf) (acc) - EUR 190,316.490 36,892.183 53,334.136 173,874.537JPM Africa Equity D (perf) (acc) - USD 5,422,560.942 466,143.182 1,542,322.822 4,346,381.302JPM Africa Equity I (perf) (acc) - USD 31,896.328 58,840.327 31,261.888 59,474.767JPM Africa Equity T (perf) (acc) - EUR 10,826.800 1,907.932 3,837.155 8,897.577
JPMorgan Funds - ASEAN Equity FundJPM ASEAN Equity A (acc) - EUR# 3,019,603.213 1,311,193.613 1,983,467.348 2,347,329.478JPM ASEAN Equity A (acc) - SGD# 280,863.878 61,771.093 122,087.627 220,547.344JPM ASEAN Equity A (acc) - USD# 11,092,900.143 1,895,949.911 8,596,275.244 4,392,574.810JPMorgan ASEAN Equity B (acc) - EUR*** 18,889.795 12.000 18,901.795 -JPMorgan ASEAN Equity B (acc) - USD*** 191,176.877 15,752.613 206,929.490 -JPM ASEAN Equity C (acc) - EUR# 370,236.995 201,097.338 113,465.745 457,868.588JPM ASEAN Equity C (acc) - SGD^# - 142.725 - 142.725JPM ASEAN Equity C (acc) - USD# 710,581.875 798,757.537 623,518.039 885,821.373JPM ASEAN Equity C (dist) - GBP^# 13,567.781 643.119 2,742.475 11,468.425JPM ASEAN Equity D (acc) - EUR# 2,580,459.747 790,767.107 1,496,381.757 1,874,845.097JPM ASEAN Equity D (acc) - PLN# 21,622.599 72,619.339 75,376.164 18,865.774JPM ASEAN Equity D (acc) - USD# 1,472,470.414 161,173.222 554,350.510 1,079,293.126JPM ASEAN Equity I (acc) - EUR**# 12,207.351 170,000.000 12,207.351 170,000.000JPM ASEAN Equity I (acc) - USD# 1,465,489.641 984,359.304 1,371,420.305 1,078,428.640JPM ASEAN Equity T (acc) - EUR# 18,581.285 3,825.648 8,350.686 14,056.247JPM ASEAN Equity X (acc) - USD# 126,054.167 973.912 125,332.369 1,695.710JPM ASEAN Equity X (dist) - USD# 9,248.531 - 9,238.808 9.723
JPMorgan Funds - Asia Local Currency Debt Fund (1)JPM Asia Local Currency Debt A (acc) - USD 986,989.993 3,362.888 990,352.881 -JPM Asia Local Currency Debt A (irc) - RMB (hedged) 134,466.463 3,947.469 138,413.932 -JPM Asia Local Currency Debt A (mth) - HKD 357,119.469 12,251.951 369,371.420 -JPM Asia Local Currency Debt A (mth) - USD 5,712.064 313.796 6,025.860 -JPM Asia Local Currency Debt D (acc) - USD 34,440.711 144.501 34,585.212 -JPM Asia Local Currency Debt X (acc) - USD 100,000.000 - 100,000.000 -
JPMorgan Funds - Asia Pacific Equity Fund (2)JPM Asia Pacific Equity A (acc) - EUR 1,029,919.483 779,177.771 540,579.215 1,268,518.039JPM Asia Pacific Equity A (acc) - HKD 117,467.184 647,827.242 447,563.239 317,731.187JPM Asia Pacific Equity A (acc) - SGD 9,030.946 - 0.001 9,030.945JPM Asia Pacific Equity A (acc) - USD 4,577,450.855 3,531,277.810 2,162,425.589 5,946,303.076JPM Asia Pacific Equity A (dist) - GBP 5,888.490 53.176 1,449.054 4,492.612JPM Asia Pacific Equity A (dist) - USD 1,051,132.405 107,632.727 323,496.184 835,268.948JPM Asia Pacific Strategic Equity B (acc) - EUR*** 5,201.063 - 5,201.063 -JPM Asia Pacific Strategic Equity B (acc) - USD*** 32,337.955 - 32,337.955 -JPM Asia Pacific Equity C (acc) - EUR 569,918.481 530,699.424 246,385.263 854,232.642JPM Asia Pacific Equity C (acc) - USD 114,051.999 225,703.611 53,519.406 286,236.204JPM Asia Pacific Equity C (dist) - USD^ 3,245.198 177,270.930 88,658.675 91,857.453JPM Asia Pacific Equity D (acc) - EUR 2,783.112 3,156.799 1,549.494 4,390.417JPM Asia Pacific Equity D (acc) - USD 108,086.929 11,314.503 27,321.131 92,080.301JPM Asia Pacific Equity I (acc) - USD 337,351.005 737,720.574 1,029,617.976 45,453.603JPM Asia Pacific Equity X (acc) - USD 626,228.936 280,523.122 66,916.448 839,835.610
(1) This Sub-Fund was liquidated on 8 April 2016.(2) This Sub-Fund was renamed from JPMorgan Funds - Asia Pacific Strategic Equity Fund to JPMorgan Funds - Asia Pacific Equity Fund on 1 February 2016.
25
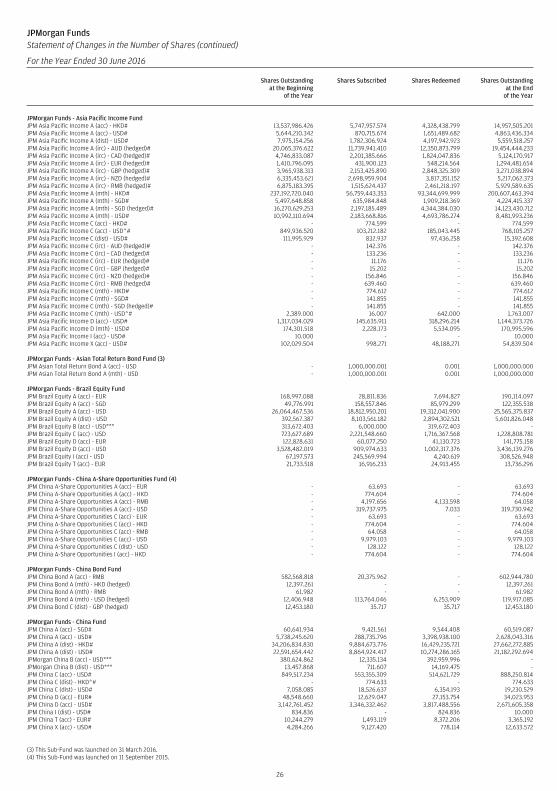
JPMorgan FundsStatement of Changes in the Number of Shares (continued)
For the Year Ended 30 June 2016
Shares Outstandingat the Beginning
of the Year
Shares Subscribed Shares Redeemed Shares Outstandingat the End
of the Year
JPMorgan Funds - Asia Pacific Income FundJPM Asia Pacific Income A (acc) - HKD# 13,537,986.426 5,747,957.574 4,328,438.799 14,957,505.201JPM Asia Pacific Income A (acc) - USD# 5,644,210.342 870,715.674 1,651,489.682 4,863,436.334JPM Asia Pacific Income A (dist) - USD# 7,975,154.256 1,782,306.924 4,197,942.923 5,559,518.257JPM Asia Pacific Income A (irc) - AUD (hedged)# 20,065,376.622 11,739,941.410 12,350,873.799 19,454,444.233JPM Asia Pacific Income A (irc) - CAD (hedged)# 4,746,833.087 2,201,385.666 1,824,047.836 5,124,170.917JPM Asia Pacific Income A (irc) - EUR (hedged)# 1,410,796.095 431,900.123 548,214.564 1,294,481.654JPM Asia Pacific Income A (irc) - GBP (hedged)# 3,965,938.313 2,153,425.890 2,848,325.309 3,271,038.894JPM Asia Pacific Income A (irc) - NZD (hedged)# 6,335,453.621 2,698,959.904 3,817,351.152 5,217,062.373JPM Asia Pacific Income A (irc) - RMB (hedged)# 6,875,183.395 1,515,624.437 2,461,218.197 5,929,589.635JPM Asia Pacific Income A (mth) - HKD# 237,192,720.040 56,759,443.353 93,344,699.999 200,607,463.394JPM Asia Pacific Income A (mth) - SGD# 5,497,648.858 635,984.848 1,909,218.369 4,224,415.337JPM Asia Pacific Income A (mth) - SGD (hedged)# 16,270,629.253 2,197,185.489 4,344,384.030 14,123,430.712JPM Asia Pacific Income A (mth) - USD# 10,992,110.694 2,183,668.816 4,693,786.274 8,481,993.236JPM Asia Pacific Income C (acc) - HKD# - 774.599 - 774.599JPM Asia Pacific Income C (acc) - USD^# 849,936.520 103,212.182 185,043.445 768,105.257JPM Asia Pacific Income C (dist) - USD# 111,995.929 832.937 97,436.258 15,392.608JPM Asia Pacific Income C (irc) - AUD (hedged)# - 142.376 - 142.376JPM Asia Pacific Income C (irc) - CAD (hedged)# - 133.236 - 133.236JPM Asia Pacific Income C (irc) - EUR (hedged)# - 11.176 - 11.176JPM Asia Pacific Income C (irc) - GBP (hedged)# - 15.202 - 15.202JPM Asia Pacific Income C (irc) - NZD (hedged)# - 156.846 - 156.846JPM Asia Pacific Income C (irc) - RMB (hedged)# - 639.460 - 639.460JPM Asia Pacific Income C (mth) - HKD# - 774.612 - 774.612JPM Asia Pacific Income C (mth) - SGD# - 141.855 - 141.855JPM Asia Pacific Income C (mth) - SGD (hedged)# - 141.855 - 141.855JPM Asia Pacific Income C (mth) - USD^# 2,389.000 16.007 642.000 1,763.007JPM Asia Pacific Income D (acc) - USD# 1,317,034.029 145,635.911 318,296.214 1,144,373.726JPM Asia Pacific Income D (mth) - USD# 174,301.518 2,228.173 5,534.095 170,995.596JPM Asia Pacific Income I (acc) - USD# 10.000 - - 10.000JPM Asia Pacific Income X (acc) - USD# 102,029.504 998.271 48,188.271 54,839.504
JPMorgan Funds - Asian Total Return Bond Fund (3)JPM Asian Total Return Bond A (acc) - USD - 1,000,000.001 0.001 1,000,000.000JPM Asian Total Return Bond A (mth) - USD - 1,000,000.001 0.001 1,000,000.000
JPMorgan Funds - Brazil Equity FundJPM Brazil Equity A (acc) - EUR 168,997.088 28,811.836 7,694.827 190,114.097JPM Brazil Equity A (acc) - SGD 49,776.991 158,557.846 85,979.299 122,355.538JPM Brazil Equity A (acc) - USD 26,064,467.536 18,812,950.201 19,312,041.900 25,565,375.837JPM Brazil Equity A (dist) - USD 392,567.387 8,103,561.182 2,894,302.521 5,601,826.048JPM Brazil Equity B (acc) - USD*** 313,672.403 6,000.000 319,672.403 -JPM Brazil Equity C (acc) - USD 723,627.689 2,221,548.660 1,716,367.568 1,228,808.781JPM Brazil Equity D (acc) - EUR 122,828.631 60,077.250 41,130.723 141,775.158JPM Brazil Equity D (acc) - USD 3,528,482.019 909,974.633 1,002,317.376 3,436,139.276JPM Brazil Equity I (acc) - USD 67,197.573 245,569.994 4,240.619 308,526.948JPM Brazil Equity T (acc) - EUR 21,733.518 16,916.233 24,913.455 13,736.296
JPMorgan Funds - China A-Share Opportunities Fund (4)JPM China A-Share Opportunities A (acc) - EUR - 63.693 - 63.693JPM China A-Share Opportunities A (acc) - HKD - 774.604 - 774.604JPM China A-Share Opportunities A (acc) - RMB - 4,197.656 4,133.598 64.058JPM China A-Share Opportunities A (acc) - USD - 319,737.975 7.033 319,730.942JPM China A-Share Opportunities C (acc) - EUR - 63.693 - 63.693JPM China A-Share Opportunities C (acc) - HKD - 774.604 - 774.604JPM China A-Share Opportunities C (acc) - RMB - 64.058 - 64.058JPM China A-Share Opportunities C (acc) - USD - 9,979.103 - 9,979.103JPM China A-Share Opportunities C (dist) - USD - 128.122 - 128.122JPM China A-Share Opportunities I (acc) - HKD - 774.604 - 774.604
JPMorgan Funds - China Bond FundJPM China Bond A (acc) - RMB 582,568.818 20,375.962 - 602,944.780JPM China Bond A (mth) - HKD (hedged) 12,397.261 - - 12,397.261JPM China Bond A (mth) - RMB 61.982 - - 61.982JPM China Bond A (mth) - USD (hedged) 12,406.948 113,764.046 6,253.909 119,917.085JPM China Bond C (dist) - GBP (hedged) 12,453.180 35.717 35.717 12,453.180
JPMorgan Funds - China FundJPM China A (acc) - SGD# 60,641.934 9,421.561 9,544.408 60,519.087JPM China A (acc) - USD# 5,738,245.620 288,735.796 3,398,938.100 2,628,043.316JPM China A (dist) - HKD# 34,206,834.830 9,884,673.776 16,429,235.721 27,662,272.885JPM China A (dist) - USD# 22,591,654.442 8,864,924.417 10,274,286.165 21,182,292.694JPMorgan China B (acc) - USD*** 380,624.862 12,335.134 392,959.996 -JPMorgan China B (dist) - USD*** 13,457.868 711.607 14,169.475 -JPM China C (acc) - USD# 849,517.234 553,355.309 514,621.729 888,250.814JPM China C (dist) - HKD^# - 774.633 - 774.633JPM China C (dist) - USD# 7,058.085 18,526.637 6,354.193 19,230.529JPM China D (acc) - EUR# 48,548.660 12,629.047 27,153.754 34,023.953JPM China D (acc) - USD# 3,142,761.452 3,346,332.462 3,817,488.556 2,671,605.358JPM China I (dist) - USD# 834.836 - 824.836 10.000JPM China T (acc) - EUR# 10,244.279 1,493.119 8,372.206 3,365.192JPM China X (acc) - USD# 4,284.266 9,127.420 778.114 12,633.572
(3) This Sub-Fund was launched on 31 March 2016.(4) This Sub-Fund was launched on 11 September 2015.
26
JPMorgan FundsStatement of Changes in the Number of Shares (continued)
For the Year Ended 30 June 2016
Shares Outstandingat the Beginning
of the Year
Shares Subscribed Shares Redeemed Shares Outstandingat the End
of the Year
JPMorgan Funds - Emerging Europe Equity Fund (5)JPM Emerging Europe Equity A (acc) - EUR 2,027,683.947 1,116,692.583 1,276,479.631 1,867,896.899JPM Emerging Europe Equity A (acc) - USD 91,788.133 53,719.168 58,267.986 87,239.315JPM Emerging Europe Equity A (dist) - EUR 4,738,581.269 2,444,466.446 780,283.330 6,402,764.385JPMorgan Emerging Europe Equity A (dist) - EUR*** 3,300,721.490 444,819.536 3,745,541.026 -JPM Emerging Europe Equity B (acc) - EUR*** 903,562.697 11,398.108 914,960.805 -JPM Emerging Europe Equity B (dist) - EUR*** 13,668.955 8.036 13,676.991 -JPM Emerging Europe Equity C (acc) - EUR 4,972,367.836 3,381,293.571 1,227,013.517 7,126,647.890JPM Emerging Europe Equity C (acc) - USD - 27,029.443 8.770 27,020.673JPM Emerging Europe Equity C (dist) - EUR 173.022 14,950.176 1,020.713 14,102.485JPM Emerging Europe Equity D (acc) - EUR 592,483.991 41,077.668 103,322.099 530,239.560JPM Emerging Europe Equity I (acc) - EUR 1,283,041.569 181,133.316 200.000 1,463,974.885JPM Emerging Europe Equity X (acc) - EUR 3,257,641.879 730.229 307.998 3,258,064.110
JPMorgan Funds - Emerging Europe, Middle East and Africa Equity FundJPM Emerging Europe, Middle East and Africa Equity A (acc) - EUR 412,310.986 73,188.744 218,284.803 267,214.927JPM Emerging Europe, Middle East and Africa Equity A (acc) - USD 1,344,333.678 90,841.024 317,107.053 1,118,067.649JPM Emerging Europe, Middle East and Africa Equity A (dist) - USD 3,103,936.991 422,564.950 790,009.168 2,736,492.773JPM Emerging Europe, Middle East and Africa Equity B (acc) - USD*** 378,579.239 - 378,579.239 -JPM Emerging Europe, Middle East and Africa Equity C (acc) - EUR - 11.401 - 11.401JPM Emerging Europe, Middle East and Africa Equity C (acc) - SGD - 140.996 - 140.996JPM Emerging Europe, Middle East and Africa Equity C (acc) - USD 386,526.990 1,267,488.115 745,679.512 908,335.593JPM Emerging Europe, Middle East and Africa Equity C (dist) - USD^ 2,455.000 1,578.855 590.601 3,443.254JPM Emerging Europe, Middle East and Africa Equity D (acc) - EUR 20,884.453 4,352.794 7,318.309 17,918.938JPM Emerging Europe, Middle East and Africa Equity D (acc) - USD 484,562.003 22,495.241 95,379.921 411,677.323JPM Emerging Europe, Middle East and Africa Equity I (acc) - USD** - 614,470.232 - 614,470.232JPM Emerging Europe, Middle East and Africa Equity T (acc) - EUR* 2,864.868 - 2,864.868 -JPM Emerging Europe, Middle East and Africa Equity X (acc) - USD 13,314,942.372 222,424.198 8,010,363.982 5,527,002.588
JPMorgan Funds - Emerging Markets Debt FundJPM Emerging Markets Debt A (acc) - EUR (hedged) 1,498,264.943 2,512,693.768 1,774,623.382 2,236,335.329JPM Emerging Markets Debt A (acc) - GBP (hedged)* 47,998.000 - 47,998.000 -JPM Emerging Markets Debt A (acc) - USD 4,086,627.219 6,465,245.131 6,555,638.431 3,996,233.919JPM Emerging Markets Debt A (dist) - GBP 16.499 2,030.000 2,030.000 16.499JPM Emerging Markets Debt A (inc) - EUR (hedged) 3,084,503.049 661,748.953 826,532.995 2,919,719.007JPM Emerging Markets Debt A (inc) - USD 34,249.036 1,271.787 16,264.168 19,256.655JPM Emerging Markets Debt A (irc) - AUD (hedged) 754,263.011 668,550.435 556,106.462 866,706.984JPM Emerging Markets Debt A (irc) - CAD (hedged) 74,420.516 26,688.350 49,697.206 51,411.660JPM Emerging Markets Debt A (irc) - NZD (hedged) 56,863.141 17,763.832 26,552.821 48,074.152JPM Emerging Markets Debt A (irc) - RMB (hedged) 436,132.683 11,810.165 149,394.312 298,548.536JPM Emerging Markets Debt A (mth) - EUR (hedged) 961,356.723 230,948.350 315,227.810 877,077.263JPM Emerging Markets Debt A (mth) - HKD 3,680,202.540 586,658.859 1,667,716.988 2,599,144.411JPM Emerging Markets Debt A (mth) - USD 41,698,610.370 5,122,675.466 14,857,496.998 31,963,788.838JPM Emerging Markets Debt B (acc) - EUR (hedged)*** 747,883.731 3,976.081 751,859.812 -JPM Emerging Markets Debt C (acc) - EUR (hedged) 5,068,776.309 5,938,821.371 5,636,538.807 5,371,058.873JPM Emerging Markets Debt C (acc) - GBP (hedged) - 15.394 - 15.394JPM Emerging Markets Debt C (acc) - USD^ 19,893.897 11,639.885 7,423.622 24,110.160JPM Emerging Markets Debt C (dist) - USD 33,909.558 14,802.839 38,302.919 10,409.478JPM Emerging Markets Debt C (inc) - EUR (hedged)^ 66,271.485 33,588.618 11,055.891 88,804.212JPM Emerging Markets Debt C (irc) - AUD (hedged) - 143.038 - 143.038JPM Emerging Markets Debt C (irc) - CAD (hedged) - 130.812 - 130.812JPM Emerging Markets Debt C (irc) - NZD (hedged) - 157.724 - 157.724JPM Emerging Markets Debt C (mth) - EUR (hedged) - 11.217 - 11.217JPM Emerging Markets Debt C (mth) - HKD - 774.612 - 774.612JPM Emerging Markets Debt C (mth) - USD 592,762.400 1,500.000 10.000 594,252.400JPM Emerging Markets Debt D (acc) - EUR (hedged) 1,937,652.955 189,736.637 885,231.828 1,242,157.764JPM Emerging Markets Debt I (acc) - EUR (hedged) 2,962,428.799 2,196,459.144 2,125,746.615 3,033,141.328JPM Emerging Markets Debt I (acc) - USD 669,871.059 72,503.172 377,809.885 364,564.346JPM Emerging Markets Debt I (dist) - CHF (hedged) 578,778.777 0.146 176,421.898 402,357.025JPM Emerging Markets Debt I (dist) - USD 10.000 - - 10.000JPM Emerging Markets Debt I (inc) - EUR (hedged) 22,867,164.009 486,619.276 169,367.051 23,184,416.234JPM Emerging Markets Debt X (acc) - EUR (hedged) 1,427,430.423 85,780.000 437,173.171 1,076,037.252JPM Emerging Markets Debt X (acc) - GBP (hedged) 88,315.113 26,386.741 35,978.388 78,723.466JPM Emerging Markets Debt X (acc) - USD 298,585.609 332,115.008 80,765.796 549,934.821JPM Emerging Markets Debt X (dist) - USD 9,922.370 589.377 4,977.000 5,534.747
(5) This Sub-Fund was renamed from JPMorgan Funds - Eastern Europe Equity Fund to JPMorgan Funds - Emerging Europe Equity Fund on 30 September 2015.
27
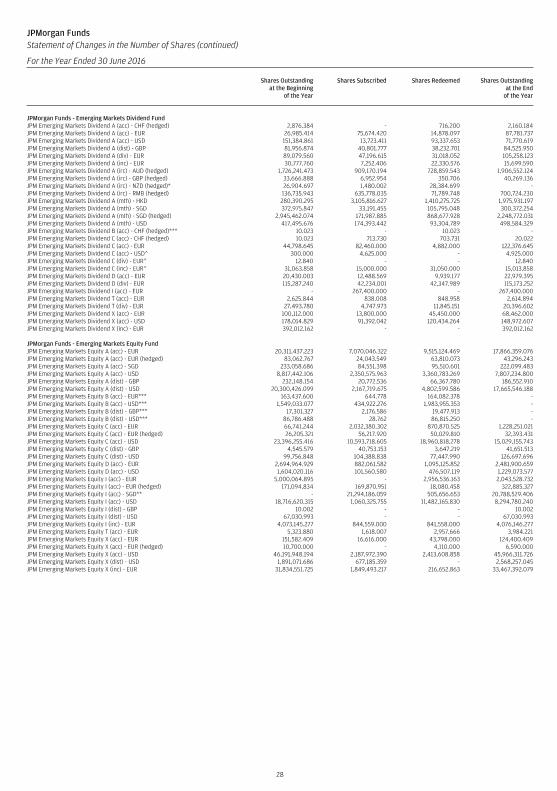
JPMorgan FundsStatement of Changes in the Number of Shares (continued)
For the Year Ended 30 June 2016
Shares Outstandingat the Beginning
of the Year
Shares Subscribed Shares Redeemed Shares Outstandingat the End
of the Year
JPMorgan Funds - Emerging Markets Dividend FundJPM Emerging Markets Dividend A (acc) - CHF (hedged) 2,876.384 - 716.200 2,160.184JPM Emerging Markets Dividend A (acc) - EUR 26,985.414 75,674.420 14,878.097 87,781.737JPM Emerging Markets Dividend A (acc) - USD 151,384.861 13,723.411 93,337.653 71,770.619JPM Emerging Markets Dividend A (dist) - GBP 81,956.874 40,801.777 38,232.701 84,525.950JPM Emerging Markets Dividend A (div) - EUR 89,079.560 47,196.615 31,018.052 105,258.123JPM Emerging Markets Dividend A (inc) - EUR 30,777.760 7,252.406 22,330.576 15,699.590JPM Emerging Markets Dividend A (irc) - AUD (hedged) 1,726,241.473 909,170.194 728,859.543 1,906,552.124JPM Emerging Markets Dividend A (irc) - GBP (hedged) 33,666.888 6,952.954 350.706 40,269.136JPM Emerging Markets Dividend A (irc) - NZD (hedged)* 26,904.697 1,480.002 28,384.699 -JPM Emerging Markets Dividend A (irc) - RMB (hedged) 136,735.943 635,778.035 71,789.748 700,724.230JPM Emerging Markets Dividend A (mth) - HKD 280,390.295 3,105,816.627 1,410,275.725 1,975,931.197JPM Emerging Markets Dividend A (mth) - SGD 372,975.847 33,191.455 105,795.048 300,372.254JPM Emerging Markets Dividend A (mth) - SGD (hedged) 2,945,462.074 171,987.885 868,677.928 2,248,772.031JPM Emerging Markets Dividend A (mth) - USD 417,495.676 174,393.442 93,304.789 498,584.329JPM Emerging Markets Dividend B (acc) - CHF (hedged)*** 10.023 - 10.023 -JPM Emerging Markets Dividend C (acc) - CHF (hedged) 10.023 713.730 703.731 20.022JPM Emerging Markets Dividend C (acc) - EUR 44,798.645 82,460.000 4,882.000 122,376.645JPM Emerging Markets Dividend C (acc) - USD^ 300.000 4,625.000 - 4,925.000JPM Emerging Markets Dividend C (div) - EUR^ 12.840 - - 12.840JPM Emerging Markets Dividend C (inc) - EUR^ 31,063.858 15,000.000 31,050.000 15,013.858JPM Emerging Markets Dividend D (acc) - EUR 20,430.003 12,488.569 9,939.177 22,979.395JPM Emerging Markets Dividend D (div) - EUR 115,287.240 42,234.001 42,347.989 115,173.252JPM Emerging Markets Dividend I (acc) - EUR - 267,400.000 - 267,400.000JPM Emerging Markets Dividend T (acc) - EUR 2,625.844 838.008 848.958 2,614.894JPM Emerging Markets Dividend T (div) - EUR 27,493.780 4,747.973 11,845.151 20,396.602JPM Emerging Markets Dividend X (acc) - EUR 100,112.000 13,800.000 45,450.000 68,462.000JPM Emerging Markets Dividend X (acc) - USD 178,014.829 91,392.042 120,434.264 148,972.607JPM Emerging Markets Dividend X (inc) - EUR 392,012.162 - - 392,012.162
JPMorgan Funds - Emerging Markets Equity FundJPM Emerging Markets Equity A (acc) - EUR 20,311,437.223 7,070,046.322 9,515,124.469 17,866,359.076JPM Emerging Markets Equity A (acc) - EUR (hedged) 83,062.767 24,043.549 63,810.073 43,296.243JPM Emerging Markets Equity A (acc) - SGD 233,058.686 84,551.398 95,510.601 222,099.483JPM Emerging Markets Equity A (acc) - USD 8,817,442.106 2,350,575.963 3,360,783.269 7,807,234.800JPM Emerging Markets Equity A (dist) - GBP 232,148.154 20,772.536 66,367.780 186,552.910JPM Emerging Markets Equity A (dist) - USD 20,300,426.099 2,167,719.675 4,802,599.586 17,665,546.188JPM Emerging Markets Equity B (acc) - EUR*** 163,437.600 644.778 164,082.378 -JPM Emerging Markets Equity B (acc) - USD*** 1,549,033.077 434,922.276 1,983,955.353 -JPM Emerging Markets Equity B (dist) - GBP*** 17,301.327 2,176.586 19,477.913 -JPM Emerging Markets Equity B (dist) - USD*** 86,786.488 28.762 86,815.250 -JPM Emerging Markets Equity C (acc) - EUR 66,741.244 2,032,380.302 870,870.525 1,228,251.021JPM Emerging Markets Equity C (acc) - EUR (hedged) 26,205.321 56,217.920 50,029.810 32,393.431JPM Emerging Markets Equity C (acc) - USD 23,396,255.416 10,593,718.605 18,960,818.278 15,029,155.743JPM Emerging Markets Equity C (dist) - GBP 4,545.579 40,753.153 3,647.219 41,651.513JPM Emerging Markets Equity C (dist) - USD 99,756.848 104,388.838 77,447.990 126,697.696JPM Emerging Markets Equity D (acc) - EUR 2,694,964.929 882,061.582 1,095,125.852 2,481,900.659JPM Emerging Markets Equity D (acc) - USD 1,604,020.116 101,560.580 476,507.119 1,229,073.577JPM Emerging Markets Equity I (acc) - EUR 5,000,064.895 - 2,956,536.163 2,043,528.732JPM Emerging Markets Equity I (acc) - EUR (hedged) 171,094.834 169,870.951 18,080.458 322,885.327JPM Emerging Markets Equity I (acc) - SGD** - 21,294,186.059 505,656.653 20,788,529.406JPM Emerging Markets Equity I (acc) - USD 18,716,620.315 1,060,325.755 11,482,165.830 8,294,780.240JPM Emerging Markets Equity I (dist) - GBP 10.002 - - 10.002JPM Emerging Markets Equity I (dist) - USD 67,030.993 - - 67,030.993JPM Emerging Markets Equity I (inc) - EUR 4,073,145.277 844,559.000 841,558.000 4,076,146.277JPM Emerging Markets Equity T (acc) - EUR 5,323.880 1,618.007 2,957.666 3,984.221JPM Emerging Markets Equity X (acc) - EUR 151,582.409 16,616.000 43,798.000 124,400.409JPM Emerging Markets Equity X (acc) - EUR (hedged) 10,700.000 - 4,110.000 6,590.000JPM Emerging Markets Equity X (acc) - USD 46,191,948.194 2,187,972.390 2,413,608.858 45,966,311.726JPM Emerging Markets Equity X (dist) - USD 1,891,071.686 677,185.359 - 2,568,257.045JPM Emerging Markets Equity X (inc) - EUR 31,834,551.725 1,849,493.217 216,652.863 33,467,392.079
28
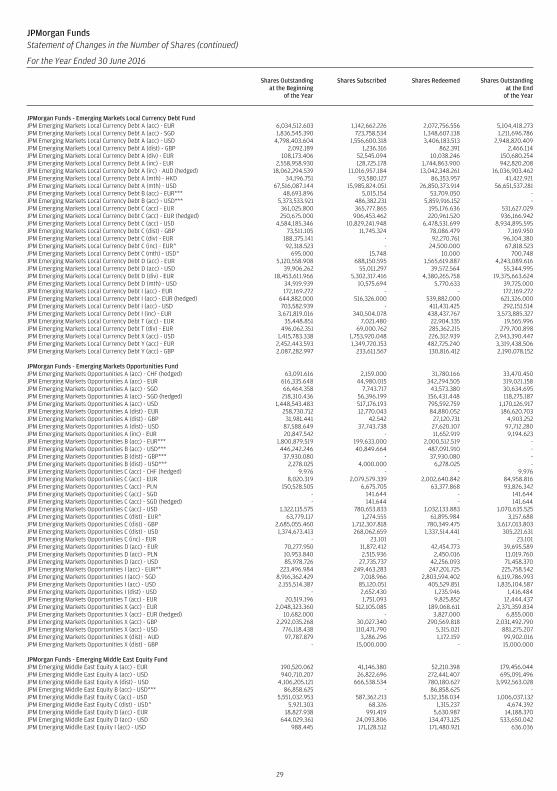
JPMorgan FundsStatement of Changes in the Number of Shares (continued)
For the Year Ended 30 June 2016
Shares Outstandingat the Beginning
of the Year
Shares Subscribed Shares Redeemed Shares Outstandingat the End
of the Year
JPMorgan Funds - Emerging Markets Local Currency Debt FundJPM Emerging Markets Local Currency Debt A (acc) - EUR 6,034,512.603 1,142,662.226 2,072,756.556 5,104,418.273JPM Emerging Markets Local Currency Debt A (acc) - SGD 1,836,545.390 723,758.534 1,348,607.138 1,211,696.786JPM Emerging Markets Local Currency Debt A (acc) - USD 4,798,403.604 1,556,600.318 3,406,183.513 2,948,820.409JPM Emerging Markets Local Currency Debt A (dist) - GBP 2,092.189 1,236.316 862.391 2,466.114JPM Emerging Markets Local Currency Debt A (div) - EUR 108,173.406 52,545.094 10,038.246 150,680.254JPM Emerging Markets Local Currency Debt A (inc) - EUR 2,558,958.930 128,725.178 1,744,863.900 942,820.208JPM Emerging Markets Local Currency Debt A (irc) - AUD (hedged) 18,062,294.539 11,016,957.184 13,042,348.261 16,036,903.462JPM Emerging Markets Local Currency Debt A (mth) - HKD 34,196.751 93,580.127 86,353.957 41,422.921JPM Emerging Markets Local Currency Debt A (mth) - USD 67,516,087.144 15,985,824.051 26,850,373.914 56,651,537.281JPM Emerging Markets Local Currency Debt B (acc) - EUR*** 48,693.896 5,015.154 53,709.050 -JPM Emerging Markets Local Currency Debt B (acc) - USD*** 5,373,533.921 486,382.231 5,859,916.152 -JPM Emerging Markets Local Currency Debt C (acc) - EUR 361,025.800 365,777.865 195,176.636 531,627.029JPM Emerging Markets Local Currency Debt C (acc) - EUR (hedged) 250,675.000 906,453.462 220,961.520 936,166.942JPM Emerging Markets Local Currency Debt C (acc) - USD 4,584,185.346 10,829,241.948 6,478,531.699 8,934,895.595JPM Emerging Markets Local Currency Debt C (dist) - GBP 73,511.105 11,745.324 78,086.479 7,169.950JPM Emerging Markets Local Currency Debt C (div) - EUR 188,375.141 - 92,270.761 96,104.380JPM Emerging Markets Local Currency Debt C (inc) - EUR^ 92,318.523 - 24,500.000 67,818.523JPM Emerging Markets Local Currency Debt C (mth) - USD^ 695.000 15.748 10.000 700.748JPM Emerging Markets Local Currency Debt D (acc) - EUR 5,120,558.908 688,150.595 1,565,619.887 4,243,089.616JPM Emerging Markets Local Currency Debt D (acc) - USD 39,906.262 55,011.297 39,572.564 55,344.995JPM Emerging Markets Local Currency Debt D (div) - EUR 18,453,611.966 5,302,317.416 4,380,265.758 19,375,663.624JPM Emerging Markets Local Currency Debt D (mth) - USD 34,919.939 10,575.694 5,770.633 39,725.000JPM Emerging Markets Local Currency Debt I (acc) - EUR 172,169.272 - - 172,169.272JPM Emerging Markets Local Currency Debt I (acc) - EUR (hedged) 644,882.000 516,326.000 539,882.000 621,326.000JPM Emerging Markets Local Currency Debt I (acc) - USD 703,582.939 - 411,431.425 292,151.514JPM Emerging Markets Local Currency Debt I (inc) - EUR 3,671,819.016 340,504.078 438,437.767 3,573,885.327JPM Emerging Markets Local Currency Debt T (acc) - EUR 35,448.851 7,021.480 22,904.335 19,565.996JPM Emerging Markets Local Currency Debt T (div) - EUR 496,062.351 69,000.762 285,362.215 279,700.898JPM Emerging Markets Local Currency Debt X (acc) - USD 1,415,783.338 1,753,920.048 226,312.939 2,943,390.447JPM Emerging Markets Local Currency Debt Y (acc) - EUR 2,452,443.593 1,349,720.153 482,725.240 3,319,438.506JPM Emerging Markets Local Currency Debt Y (acc) - GBP 2,087,282.997 233,611.567 130,816.412 2,190,078.152
JPMorgan Funds - Emerging Markets Opportunities FundJPM Emerging Markets Opportunities A (acc) - CHF (hedged) 63,091.616 2,159.000 31,780.166 33,470.450JPM Emerging Markets Opportunities A (acc) - EUR 616,335.648 44,980.015 342,294.505 319,021.158JPM Emerging Markets Opportunities A (acc) - SGD 66,464.358 7,743.717 43,573.380 30,634.695JPM Emerging Markets Opportunities A (acc) - SGD (hedged) 218,310.436 56,396.199 156,431.448 118,275.187JPM Emerging Markets Opportunities A (acc) - USD 1,448,543.483 517,176.193 795,592.759 1,170,126.917JPM Emerging Markets Opportunities A (dist) - EUR 258,730.712 12,770.043 84,880.052 186,620.703JPM Emerging Markets Opportunities A (dist) - GBP 31,981.441 42.542 27,120.731 4,903.252JPM Emerging Markets Opportunities A (dist) - USD 87,588.649 37,743.738 27,620.107 97,712.280JPM Emerging Markets Opportunities A (inc) - EUR 20,847.542 - 11,652.919 9,194.623JPM Emerging Markets Opportunities B (acc) - EUR*** 1,800,879.519 199,633.000 2,000,512.519 -JPM Emerging Markets Opportunities B (acc) - USD*** 446,242.246 40,849.664 487,091.910 -JPM Emerging Markets Opportunities B (dist) - GBP*** 37,930.080 - 37,930.080 -JPM Emerging Markets Opportunities B (dist) - USD*** 2,278.025 4,000.000 6,278.025 -JPM Emerging Markets Opportunities C (acc) - CHF (hedged) 9.976 - - 9.976JPM Emerging Markets Opportunities C (acc) - EUR 8,020.319 2,079,579.339 2,002,640.842 84,958.816JPM Emerging Markets Opportunities C (acc) - PLN 150,528.505 6,675.705 63,377.868 93,826.342JPM Emerging Markets Opportunities C (acc) - SGD - 141.644 - 141.644JPM Emerging Markets Opportunities C (acc) - SGD (hedged) - 141.644 - 141.644JPM Emerging Markets Opportunities C (acc) - USD 1,322,115.575 780,653.833 1,032,133.883 1,070,635.525JPM Emerging Markets Opportunities C (dist) - EUR^ 63,779.117 1,274.555 61,895.984 3,157.688JPM Emerging Markets Opportunities C (dist) - GBP 2,685,055.460 1,712,307.818 780,349.475 3,617,013.803JPM Emerging Markets Opportunities C (dist) - USD 1,374,673.413 268,062.659 1,337,514.441 305,221.631JPM Emerging Markets Opportunities C (inc) - EUR - 23.101 - 23.101JPM Emerging Markets Opportunities D (acc) - EUR 70,277.950 11,872.412 42,454.773 39,695.589JPM Emerging Markets Opportunities D (acc) - PLN 10,953.840 2,515.936 2,450.016 11,019.760JPM Emerging Markets Opportunities D (acc) - USD 85,978.726 27,735.737 42,256.093 71,458.370JPM Emerging Markets Opportunities I (acc) - EUR** 223,496.984 249,463.283 247,201.725 225,758.542JPM Emerging Markets Opportunities I (acc) - SGD 8,916,362.429 7,018.966 2,803,594.402 6,119,786.993JPM Emerging Markets Opportunities I (acc) - USD 2,155,514.387 85,120.051 405,529.851 1,835,104.587JPM Emerging Markets Opportunities I (dist) - USD - 2,652.430 1,235.946 1,416.484JPM Emerging Markets Opportunities T (acc) - EUR 20,519.196 1,751.093 9,825.852 12,444.437JPM Emerging Markets Opportunities X (acc) - EUR 2,048,323.360 512,105.085 189,068.611 2,371,359.834JPM Emerging Markets Opportunities X (acc) - EUR (hedged) 10,682.000 - 3,827.000 6,855.000JPM Emerging Markets Opportunities X (acc) - GBP 2,292,035.268 30,027.340 290,569.818 2,031,492.790JPM Emerging Markets Opportunities X (acc) - USD 776,118.438 110,471.790 5,315.021 881,275.207JPM Emerging Markets Opportunities X (dist) - AUD 97,787.879 3,286.296 1,172.159 99,902.016JPM Emerging Markets Opportunities X (dist) - GBP - 15,000.000 - 15,000.000
JPMorgan Funds - Emerging Middle East Equity FundJPM Emerging Middle East Equity A (acc) - EUR 190,520.062 41,146.380 52,210.398 179,456.044JPM Emerging Middle East Equity A (acc) - USD 940,710.207 26,822.696 272,441.407 695,091.496JPM Emerging Middle East Equity A (dist) - USD 4,106,205.121 666,538.534 780,180.627 3,992,563.028JPM Emerging Middle East Equity B (acc) - USD*** 86,858.625 - 86,858.625 -JPM Emerging Middle East Equity C (acc) - USD 5,551,032.953 587,362.213 5,132,358.034 1,006,037.132JPM Emerging Middle East Equity C (dist) - USD^ 5,921.303 68.326 1,315.237 4,674.392JPM Emerging Middle East Equity D (acc) - EUR 18,827.938 991.419 5,630.987 14,188.370JPM Emerging Middle East Equity D (acc) - USD 644,029.361 24,093.806 134,473.125 533,650.042JPM Emerging Middle East Equity I (acc) - USD 988.445 171,128.512 171,480.921 636.036
29
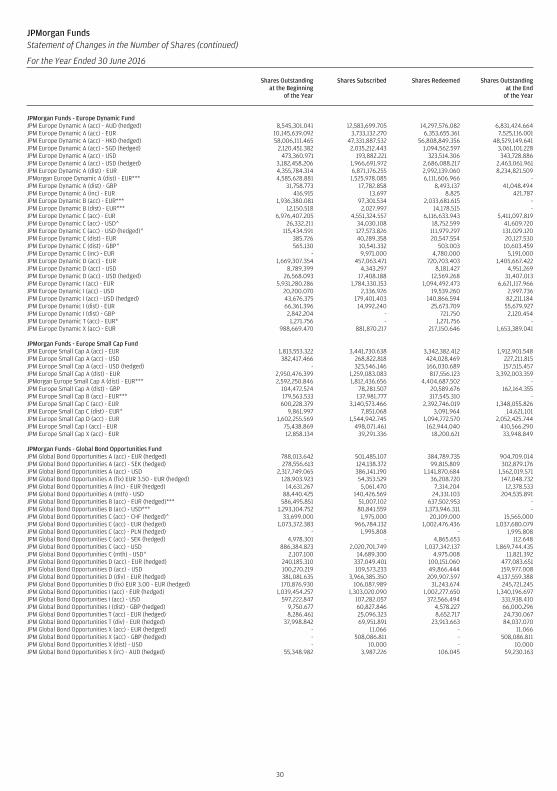
JPMorgan FundsStatement of Changes in the Number of Shares (continued)
For the Year Ended 30 June 2016
Shares Outstandingat the Beginning
of the Year
Shares Subscribed Shares Redeemed Shares Outstandingat the End
of the Year
JPMorgan Funds - Europe Dynamic FundJPM Europe Dynamic A (acc) - AUD (hedged) 8,545,301.041 12,583,699.705 14,297,576.082 6,831,424.664JPM Europe Dynamic A (acc) - EUR 10,145,639.092 3,733,132.270 6,353,655.361 7,525,116.001JPM Europe Dynamic A (acc) - HKD (hedged) 58,006,111.465 47,331,887.532 56,808,849.356 48,529,149.641JPM Europe Dynamic A (acc) - SGD (hedged) 2,120,451.382 2,035,212.443 1,094,562.597 3,061,101.228JPM Europe Dynamic A (acc) - USD 473,360.971 193,882.221 323,514.306 343,728.886JPM Europe Dynamic A (acc) - USD (hedged) 3,182,458.206 1,966,691.972 2,686,088.217 2,463,061.961JPM Europe Dynamic A (dist) - EUR 4,355,784.314 6,871,176.255 2,992,139.060 8,234,821.509JPMorgan Europe Dynamic A (dist) - EUR*** 4,585,628.881 1,525,978.085 6,111,606.966 -JPM Europe Dynamic A (dist) - GBP 31,758.773 17,782.858 8,493.137 41,048.494JPM Europe Dynamic A (inc) - EUR 416.915 13.697 8.825 421.787JPM Europe Dynamic B (acc) - EUR*** 1,936,380.081 97,301.534 2,033,681.615 -JPM Europe Dynamic B (dist) - EUR*** 12,150.518 2,027.997 14,178.515 -JPM Europe Dynamic C (acc) - EUR 6,976,407.205 4,551,324.557 6,116,633.943 5,411,097.819JPM Europe Dynamic C (acc) - USD^ 26,332.211 34,030.108 18,752.599 41,609.720JPM Europe Dynamic C (acc) - USD (hedged)^ 115,434.591 127,573.826 111,979.297 131,029.120JPM Europe Dynamic C (dist) - EUR 385.726 40,289.358 20,547.554 20,127.530JPM Europe Dynamic C (dist) - GBP^ 565.130 10,541.332 503.003 10,603.459JPM Europe Dynamic C (inc) - EUR - 9,971.000 4,780.000 5,191.000JPM Europe Dynamic D (acc) - EUR 1,669,307.354 457,063.471 720,703.403 1,405,667.422JPM Europe Dynamic D (acc) - USD 8,789.399 4,343.297 8,181.427 4,951.269JPM Europe Dynamic D (acc) - USD (hedged) 26,568.093 17,408.188 12,569.268 31,407.013JPM Europe Dynamic I (acc) - EUR 5,931,280.286 1,784,330.153 1,094,492.473 6,621,117.966JPM Europe Dynamic I (acc) - USD 20,200.070 2,336.926 19,539.260 2,997.736JPM Europe Dynamic I (acc) - USD (hedged) 43,676.375 179,401.403 140,866.594 82,211.184JPM Europe Dynamic I (dist) - EUR 66,361.396 14,992.240 25,673.709 55,679.927JPM Europe Dynamic I (dist) - GBP 2,842.204 - 721.750 2,120.454JPM Europe Dynamic T (acc) - EUR* 1,271.756 - 1,271.756 -JPM Europe Dynamic X (acc) - EUR 988,669.470 881,870.217 217,150.646 1,653,389.041
JPMorgan Funds - Europe Small Cap FundJPM Europe Small Cap A (acc) - EUR 1,813,553.322 3,441,730.638 3,342,382.412 1,912,901.548JPM Europe Small Cap A (acc) - USD 382,417.466 268,822.818 424,028.469 227,211.815JPM Europe Small Cap A (acc) - USD (hedged) - 323,546.146 166,030.689 157,515.457JPM Europe Small Cap A (dist) - EUR 2,950,476.399 1,259,083.083 817,556.123 3,392,003.359JPMorgan Europe Small Cap A (dist) - EUR*** 2,592,250.846 1,812,436.656 4,404,687.502 -JPM Europe Small Cap A (dist) - GBP 104,472.524 78,281.507 20,589.676 162,164.355JPM Europe Small Cap B (acc) - EUR*** 179,563.533 137,981.777 317,545.310 -JPM Europe Small Cap C (acc) - EUR 600,228.379 3,140,573.466 2,392,746.019 1,348,055.826JPM Europe Small Cap C (dist) - EUR^ 9,861.997 7,851.068 3,091.964 14,621.101JPM Europe Small Cap D (acc) - EUR 1,602,255.569 1,544,942.745 1,094,772.570 2,052,425.744JPM Europe Small Cap I (acc) - EUR 75,438.869 498,071.461 162,944.040 410,566.290JPM Europe Small Cap X (acc) - EUR 12,858.134 39,291.336 18,200.621 33,948.849
JPMorgan Funds - Global Bond Opportunities FundJPM Global Bond Opportunities A (acc) - EUR (hedged) 788,013.642 501,485.107 384,789.735 904,709.014JPM Global Bond Opportunities A (acc) - SEK (hedged) 278,556.613 124,138.372 99,815.809 302,879.176JPM Global Bond Opportunities A (acc) - USD 2,317,749.065 386,141.190 1,141,870.684 1,562,019.571JPM Global Bond Opportunities A (fix) EUR 3.50 - EUR (hedged) 128,903.923 54,353.529 36,208.720 147,048.732JPM Global Bond Opportunities A (inc) - EUR (hedged) 14,631.267 5,061.470 7,314.204 12,378.533JPM Global Bond Opportunities A (mth) - USD 88,440.425 140,426.569 24,331.103 204,535.891JPM Global Bond Opportunities B (acc) - EUR (hedged)*** 586,495.851 51,007.102 637,502.953 -JPM Global Bond Opportunities B (acc) - USD*** 1,293,104.752 80,841.559 1,373,946.311 -JPM Global Bond Opportunities C (acc) - CHF (hedged)^ 33,699.000 1,975.000 20,109.000 15,565.000JPM Global Bond Opportunities C (acc) - EUR (hedged) 1,073,372.383 966,784.132 1,002,476.436 1,037,680.079JPM Global Bond Opportunities C (acc) - PLN (hedged) - 1,995.808 - 1,995.808JPM Global Bond Opportunities C (acc) - SEK (hedged) 4,978.301 - 4,865.653 112.648JPM Global Bond Opportunities C (acc) - USD 886,384.823 2,020,701.749 1,037,342.137 1,869,744.435JPM Global Bond Opportunities C (mth) - USD^ 2,107.100 14,689.300 4,975.008 11,821.392JPM Global Bond Opportunities D (acc) - EUR (hedged) 240,185.310 337,049.401 100,151.060 477,083.651JPM Global Bond Opportunities D (acc) - USD 100,270.219 109,573.233 49,866.444 159,977.008JPM Global Bond Opportunities D (div) - EUR (hedged) 381,081.635 3,966,385.350 209,907.597 4,137,559.388JPM Global Bond Opportunities D (fix) EUR 3.00 - EUR (hedged) 170,876.930 106,087.989 31,243.674 245,721.245JPM Global Bond Opportunities I (acc) - EUR (hedged) 1,039,454.257 1,303,020.090 1,002,277.650 1,340,196.697JPM Global Bond Opportunities I (acc) - USD 597,222.847 107,282.057 372,566.494 331,938.410JPM Global Bond Opportunities I (dist) - GBP (hedged) 9,750.677 60,827.846 4,578.227 66,000.296JPM Global Bond Opportunities T (acc) - EUR (hedged) 8,286.461 25,096.323 8,652.717 24,730.067JPM Global Bond Opportunities T (div) - EUR (hedged) 37,998.842 69,951.891 23,913.663 84,037.070JPM Global Bond Opportunities X (acc) - EUR (hedged) - 11.066 - 11.066JPM Global Bond Opportunities X (acc) - GBP (hedged) - 508,086.811 - 508,086.811JPM Global Bond Opportunities X (dist) - USD - 10.000 - 10.000JPM Global Bond Opportunities X (irc) - AUD (hedged) 55,348.982 3,987.226 106.045 59,230.163
30
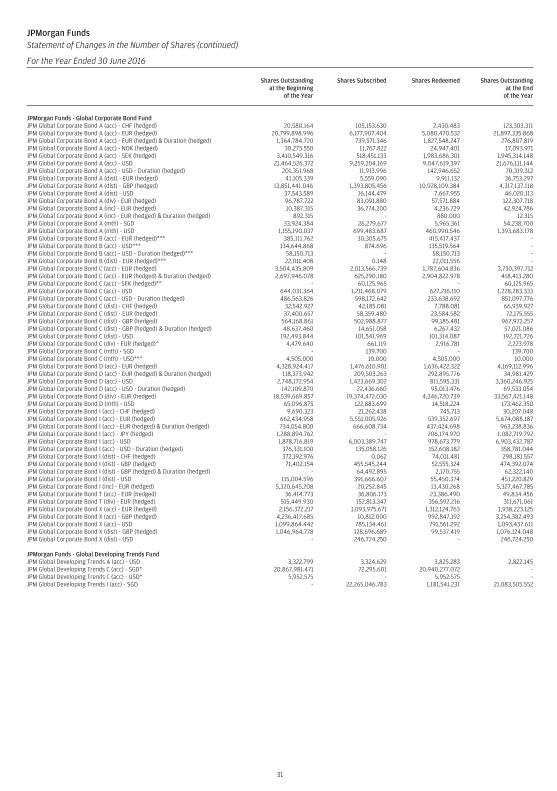
JPMorgan FundsStatement of Changes in the Number of Shares (continued)
For the Year Ended 30 June 2016
Shares Outstandingat the Beginning
of the Year
Shares Subscribed Shares Redeemed Shares Outstandingat the End
of the Year
JPMorgan Funds - Global Corporate Bond FundJPM Global Corporate Bond A (acc) - CHF (hedged) 20,580.164 105,153.630 2,430.483 123,303.311JPM Global Corporate Bond A (acc) - EUR (hedged) 20,799,898.996 6,177,907.404 5,080,470.532 21,897,335.868JPM Global Corporate Bond A (acc) - EUR (hedged) & Duration (hedged) 1,364,784.720 739,571.346 1,827,548.247 276,807.819JPM Global Corporate Bond A (acc) - NOK (hedged) 30,273.550 11,767.822 24,947.401 17,093.971JPM Global Corporate Bond A (acc) - SEK (hedged) 3,410,549.316 518,451.133 1,983,686.301 1,945,314.148JPM Global Corporate Bond A (acc) - USD 21,464,526.372 9,259,204.169 9,047,619.397 21,676,111.144JPM Global Corporate Bond A (acc) - USD - Duration (hedged) 201,351.968 11,913.996 142,946.652 70,319.312JPM Global Corporate Bond A (dist) - EUR (hedged) 41,105.339 5,559.090 9,911.132 36,753.297JPM Global Corporate Bond A (dist) - GBP (hedged) 13,851,441.046 1,393,805.456 10,928,109.384 4,317,137.118JPM Global Corporate Bond A (dist) - USD 37,543.589 16,144.479 7,667.955 46,020.113JPM Global Corporate Bond A (div) - EUR (hedged) 96,787.722 83,091.880 57,571.884 122,307.718JPM Global Corporate Bond A (inc) - EUR (hedged) 10,387.315 36,774.200 4,236.729 42,924.786JPM Global Corporate Bond A (inc) - EUR (hedged) & Duration (hedged) 892.315 - 880.000 12.315JPM Global Corporate Bond A (mth) - SGD 33,924.384 26,279.677 5,965.361 54,238.700JPM Global Corporate Bond A (mth) - USD 1,155,190.037 699,483.687 460,990.546 1,393,683.178JPM Global Corporate Bond B (acc) - EUR (hedged)*** 385,111.762 30,305.675 415,417.437 -JPM Global Corporate Bond B (acc) - USD*** 134,644.868 874.696 135,519.564 -JPM Global Corporate Bond B (acc) - USD - Duration (hedged)*** 58,150.713 - 58,150.713 -JPM Global Corporate Bond B (dist) - EUR (hedged)*** 22,011.408 0.148 22,011.556 -JPM Global Corporate Bond C (acc) - EUR (hedged) 3,504,435.809 2,013,566.739 1,787,604.836 3,730,397.712JPM Global Corporate Bond C (acc) - EUR (hedged) & Duration (hedged) 2,697,946.078 625,290.180 2,904,822.978 418,413.280JPM Global Corporate Bond C (acc) - SEK (hedged)** - 60,125.965 - 60,125.965JPM Global Corporate Bond C (acc) - USD 644,031.364 1,211,468.079 627,216.110 1,228,283.333JPM Global Corporate Bond C (acc) - USD - Duration (hedged) 486,563.826 598,172.642 233,638.692 851,097.776JPM Global Corporate Bond C (dist) - CHF (hedged) 32,542.927 42,185.081 7,788.081 66,939.927JPM Global Corporate Bond C (dist) - EUR (hedged) 37,400.657 58,359.480 23,584.582 72,175.555JPM Global Corporate Bond C (dist) - GBP (hedged) 564,168.861 502,988.877 99,185.481 967,972.257JPM Global Corporate Bond C (dist) - GBP (hedged) & Duration (hedged) 48,637.460 14,651.058 6,267.432 57,021.086JPM Global Corporate Bond C (dist) - USD 192,493.844 101,541.969 101,314.087 192,721.726JPM Global Corporate Bond C (div) - EUR (hedged)^ 4,479.640 661.119 2,916.781 2,223.978JPM Global Corporate Bond C (mth) - SGD - 139.700 - 139.700JPM Global Corporate Bond C (mth) - USD**^ 4,505.000 10.000 4,505.000 10.000JPM Global Corporate Bond D (acc) - EUR (hedged) 4,328,924.417 1,476,610.901 1,636,422.322 4,169,112.996JPM Global Corporate Bond D (acc) - EUR (hedged) & Duration (hedged) 118,373.942 209,503.263 292,895.776 34,981.429JPM Global Corporate Bond D (acc) - USD 2,748,172.954 1,423,669.302 811,595.331 3,360,246.925JPM Global Corporate Bond D (acc) - USD - Duration (hedged) 142,109.870 22,436.660 95,013.476 69,533.054JPM Global Corporate Bond D (div) - EUR (hedged) 18,539,669.857 19,374,472.030 4,346,720.739 33,567,421.148JPM Global Corporate Bond D (mth) - USD 65,096.875 122,883.699 14,518.224 173,462.350JPM Global Corporate Bond I (acc) - CHF (hedged) 9,690.323 21,262.438 745.713 30,207.048JPM Global Corporate Bond I (acc) - EUR (hedged) 662,434.958 5,551,005.926 539,352.697 5,674,088.187JPM Global Corporate Bond I (acc) - EUR (hedged) & Duration (hedged) 734,054.800 666,608.734 437,424.698 963,238.836JPM Global Corporate Bond I (acc) - JPY (hedged) 1,288,894.762 - 206,174.970 1,082,719.792JPM Global Corporate Bond I (acc) - USD 1,878,716.819 6,003,389.747 978,673.779 6,903,432.787JPM Global Corporate Bond I (acc) - USD - Duration (hedged) 376,331.100 135,058.126 152,608.182 358,781.044JPM Global Corporate Bond I (dist) - CHF (hedged) 372,192.976 0.062 74,011.481 298,181.557JPM Global Corporate Bond I (dist) - GBP (hedged) 71,402.154 455,545.244 52,555.324 474,392.074JPM Global Corporate Bond I (dist) - GBP (hedged) & Duration (hedged) - 64,492.895 2,170.755 62,322.140JPM Global Corporate Bond I (dist) - USD 115,004.596 391,666.607 55,450.374 451,220.829JPM Global Corporate Bond I (inc) - EUR (hedged) 5,320,645.208 20,252.845 13,430.268 5,327,467.785JPM Global Corporate Bond T (acc) - EUR (hedged) 36,414.773 36,806.173 23,386.490 49,834.456JPM Global Corporate Bond T (div) - EUR (hedged) 515,449.930 152,813.347 356,592.216 311,671.061JPM Global Corporate Bond X (acc) - EUR (hedged) 2,156,372.217 1,093,975.671 1,312,124.763 1,938,223.125JPM Global Corporate Bond X (acc) - GBP (hedged) 4,236,417.685 10,812.000 992,847.192 3,254,382.493JPM Global Corporate Bond X (acc) - USD 1,099,864.442 785,134.461 791,561.292 1,093,437.611JPM Global Corporate Bond X (dist) - GBP (hedged) 1,046,964.778 128,696.689 99,537.419 1,076,124.048JPM Global Corporate Bond X (dist) - USD - 246,724.250 - 246,724.250
JPMorgan Funds - Global Developing Trends FundJPM Global Developing Trends A (acc) - USD 3,322.799 3,324.629 3,825.283 2,822.145JPM Global Developing Trends C (acc) - SGD* 20,867,981.471 72,295.601 20,940,277.072 -JPM Global Developing Trends C (acc) - USD* 5,952.575 - 5,952.575 -JPM Global Developing Trends I (acc) - SGD - 22,265,046.783 1,181,541.231 21,083,505.552
31
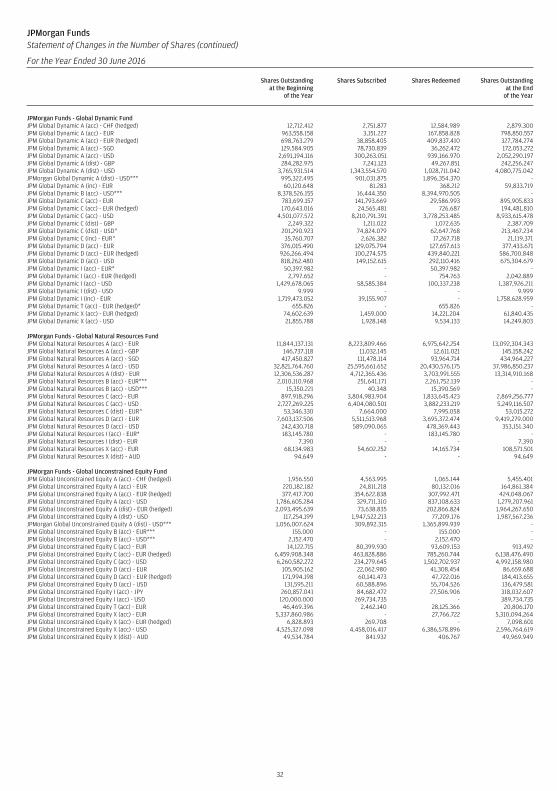
JPMorgan FundsStatement of Changes in the Number of Shares (continued)
For the Year Ended 30 June 2016
Shares Outstandingat the Beginning
of the Year
Shares Subscribed Shares Redeemed Shares Outstandingat the End
of the Year
JPMorgan Funds - Global Dynamic FundJPM Global Dynamic A (acc) - CHF (hedged) 12,712.412 2,751.877 12,584.989 2,879.300JPM Global Dynamic A (acc) - EUR 963,558.158 3,151.227 167,858.828 798,850.557JPM Global Dynamic A (acc) - EUR (hedged) 698,763.279 38,858.405 409,837.410 327,784.274JPM Global Dynamic A (acc) - SGD 129,584.905 78,730.839 36,262.472 172,053.272JPM Global Dynamic A (acc) - USD 2,691,194.116 300,263.051 939,166.970 2,052,290.197JPM Global Dynamic A (dist) - GBP 284,282.975 7,241.123 49,267.851 242,256.247JPM Global Dynamic A (dist) - USD 3,765,931.514 1,343,554.570 1,028,711.042 4,080,775.042JPMorgan Global Dynamic A (dist) - USD*** 995,322.495 901,031.875 1,896,354.370 -JPM Global Dynamic A (inc) - EUR 60,120.648 81.283 368.212 59,833.719JPM Global Dynamic B (acc) - USD*** 8,378,526.155 16,444.350 8,394,970.505 -JPM Global Dynamic C (acc) - EUR 783,699.157 141,793.669 29,586.993 895,905.833JPM Global Dynamic C (acc) - EUR (hedged) 170,643.016 24,565.481 726.687 194,481.810JPM Global Dynamic C (acc) - USD 4,501,077.572 8,210,791.391 3,778,253.485 8,933,615.478JPM Global Dynamic C (dist) - GBP 2,249.322 1,211.022 1,072.635 2,387.709JPM Global Dynamic C (dist) - USD^ 201,290.923 74,824.079 62,647.768 213,467.234JPM Global Dynamic C (inc) - EUR^ 35,760.707 2,626.382 17,267.718 21,119.371JPM Global Dynamic D (acc) - EUR 376,015.490 129,075.794 127,657.613 377,433.671JPM Global Dynamic D (acc) - EUR (hedged) 926,266.494 100,274.575 439,840.221 586,700.848JPM Global Dynamic D (acc) - USD 818,262.480 149,152.615 292,110.416 675,304.679JPM Global Dynamic I (acc) - EUR* 50,397.982 - 50,397.982 -JPM Global Dynamic I (acc) - EUR (hedged) 2,797.652 - 754.763 2,042.889JPM Global Dynamic I (acc) - USD 1,429,678.065 58,585.384 100,337.238 1,387,926.211JPM Global Dynamic I (dist) - USD 9.999 - - 9.999JPM Global Dynamic I (inc) - EUR 1,719,473.052 39,155.907 - 1,758,628.959JPM Global Dynamic T (acc) - EUR (hedged)* 655.826 - 655.826 -JPM Global Dynamic X (acc) - EUR (hedged) 74,602.639 1,459.000 14,221.204 61,840.435JPM Global Dynamic X (acc) - USD 21,855.788 1,928.148 9,534.133 14,249.803
JPMorgan Funds - Global Natural Resources FundJPM Global Natural Resources A (acc) - EUR 11,844,137.131 8,223,809.466 6,975,642.254 13,092,304.343JPM Global Natural Resources A (acc) - GBP 146,737.118 11,032.145 12,611.021 145,158.242JPM Global Natural Resources A (acc) - SGD 417,450.827 111,478.114 93,964.714 434,964.227JPM Global Natural Resources A (acc) - USD 32,821,764.760 25,595,661.652 20,430,576.175 37,986,850.237JPM Global Natural Resources A (dist) - EUR 12,306,536.287 4,712,365.436 3,703,991.555 13,314,910.168JPM Global Natural Resources B (acc) - EUR*** 2,010,110.968 251,641.171 2,261,752.139 -JPM Global Natural Resources B (acc) - USD*** 15,350.221 40.348 15,390.569 -JPM Global Natural Resources C (acc) - EUR 897,918.296 3,804,983.904 1,833,645.423 2,869,256.777JPM Global Natural Resources C (acc) - USD 2,727,269.225 6,404,080.501 3,882,233.219 5,249,116.507JPM Global Natural Resources C (dist) - EUR^ 53,346.330 7,664.000 7,995.058 53,015.272JPM Global Natural Resources D (acc) - EUR 7,603,137.506 5,511,513.968 3,695,372.474 9,419,279.000JPM Global Natural Resources D (acc) - USD 242,430.718 589,090.065 478,369.443 353,151.340JPM Global Natural Resources I (acc) - EUR* 183,145.780 - 183,145.780 -JPM Global Natural Resources I (dist) - EUR 7.390 - - 7.390JPM Global Natural Resources X (acc) - EUR 68,134.983 54,602.252 14,165.734 108,571.501JPM Global Natural Resources X (dist) - AUD 94.649 - - 94.649
JPMorgan Funds - Global Unconstrained Equity FundJPM Global Unconstrained Equity A (acc) - CHF (hedged) 1,956.550 4,563.995 1,065.144 5,455.401JPM Global Unconstrained Equity A (acc) - EUR 220,182.182 24,811.218 80,132.016 164,861.384JPM Global Unconstrained Equity A (acc) - EUR (hedged) 377,417.700 354,622.838 307,992.471 424,048.067JPM Global Unconstrained Equity A (acc) - USD 1,786,605.284 329,711.310 837,108.633 1,279,207.961JPM Global Unconstrained Equity A (dist) - EUR (hedged) 2,093,495.639 73,638.835 202,866.824 1,964,267.650JPM Global Unconstrained Equity A (dist) - USD 117,254.199 1,947,522.213 77,209.176 1,987,567.236JPMorgan Global Unconstrained Equity A (dist) - USD*** 1,056,007.624 309,892.315 1,365,899.939 -JPM Global Unconstrained Equity B (acc) - EUR*** 155.000 - 155.000 -JPM Global Unconstrained Equity B (acc) - USD*** 2,152.470 - 2,152.470 -JPM Global Unconstrained Equity C (acc) - EUR 14,122.715 80,399.930 93,609.153 913.492JPM Global Unconstrained Equity C (acc) - EUR (hedged) 6,459,908.348 463,828.886 785,260.744 6,138,476.490JPM Global Unconstrained Equity C (acc) - USD 6,260,582.272 234,279.645 1,502,702.937 4,992,158.980JPM Global Unconstrained Equity D (acc) - EUR 105,905.162 22,062.980 41,308.454 86,659.688JPM Global Unconstrained Equity D (acc) - EUR (hedged) 171,994.198 60,141.473 47,722.016 184,413.655JPM Global Unconstrained Equity D (acc) - USD 131,595.211 60,588.896 55,704.526 136,479.581JPM Global Unconstrained Equity I (acc) - JPY 260,857.041 84,682.472 27,506.906 318,032.607JPM Global Unconstrained Equity I (acc) - USD 120,000.000 269,734.735 - 389,734.735JPM Global Unconstrained Equity T (acc) - EUR 46,469.396 2,462.140 28,125.366 20,806.170JPM Global Unconstrained Equity X (acc) - EUR 5,337,860.986 - 27,766.722 5,310,094.264JPM Global Unconstrained Equity X (acc) - EUR (hedged) 6,828.893 269.708 - 7,098.601JPM Global Unconstrained Equity X (acc) - USD 4,525,327.098 4,458,016.417 6,386,578.896 2,596,764.619JPM Global Unconstrained Equity X (dist) - AUD 49,534.784 841.932 406.767 49,969.949
32
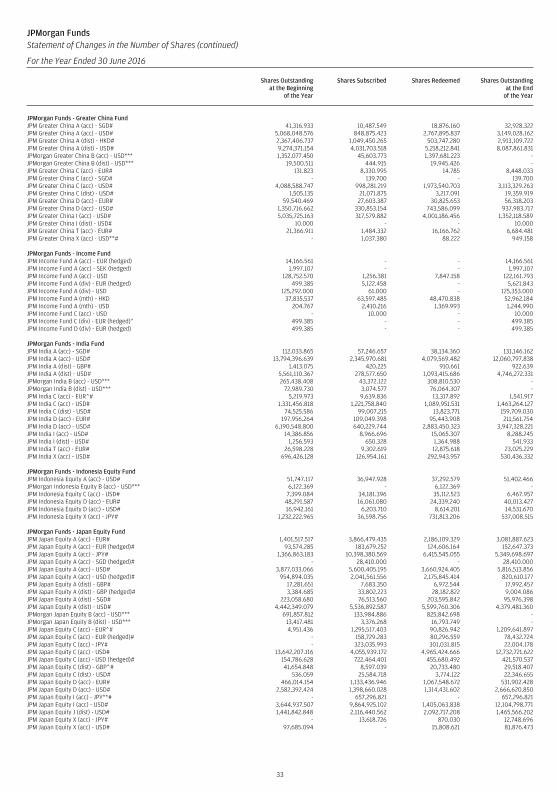
JPMorgan FundsStatement of Changes in the Number of Shares (continued)
For the Year Ended 30 June 2016
Shares Outstandingat the Beginning
of the Year
Shares Subscribed Shares Redeemed Shares Outstandingat the End
of the Year
JPMorgan Funds - Greater China FundJPM Greater China A (acc) - SGD# 41,316.933 10,487.549 18,876.160 32,928.322JPM Greater China A (acc) - USD# 5,068,048.576 848,875.423 2,767,895.837 3,149,028.162JPM Greater China A (dist) - HKD# 2,367,406.737 1,049,450.265 503,747.280 2,913,109.722JPM Greater China A (dist) - USD# 9,274,371.154 4,031,703.518 5,218,212.841 8,087,861.831JPMorgan Greater China B (acc) - USD*** 1,352,077.450 45,603.773 1,397,681.223 -JPMorgan Greater China B (dist) - USD*** 19,500.511 444.915 19,945.426 -JPM Greater China C (acc) - EUR# 131.823 8,330.995 14.785 8,448.033JPM Greater China C (acc) - SGD# - 139.700 - 139.700JPM Greater China C (acc) - USD# 4,088,588.747 998,281.219 1,973,540.703 3,113,329.263JPM Greater China C (dist) - USD# 1,505.135 21,071.875 3,217.091 19,359.919JPM Greater China D (acc) - EUR# 59,540.469 27,603.387 30,825.653 56,318.203JPM Greater China D (acc) - USD# 1,350,716.662 330,853.154 743,586.099 937,983.717JPM Greater China I (acc) - USD# 5,035,725.163 317,579.882 4,001,186.456 1,352,118.589JPM Greater China I (dist) - USD# 10.000 - - 10.000JPM Greater China T (acc) - EUR# 21,366.911 1,484.332 16,166.762 6,684.481JPM Greater China X (acc) - USD**# - 1,037.380 88.222 949.158
JPMorgan Funds - Income FundJPM Income Fund A (acc) - EUR (hedged) 14,166.561 - - 14,166.561JPM Income Fund A (acc) - SEK (hedged) 1,997.107 - - 1,997.107JPM Income Fund A (acc) - USD 128,752.570 1,256.381 7,847.158 122,161.793JPM Income Fund A (div) - EUR (hedged) 499.385 5,122.458 - 5,621.843JPM Income Fund A (div) - USD 125,292.000 61.000 - 125,353.000JPM Income Fund A (mth) - HKD 37,835.537 63,597.485 48,470.838 52,962.184JPM Income Fund A (mth) - USD 204.767 2,410.216 1,369.993 1,244.990JPM Income Fund C (acc) - USD - 10.000 - 10.000JPM Income Fund C (div) - EUR (hedged)^ 499.385 - - 499.385JPM Income Fund D (div) - EUR (hedged) 499.385 - - 499.385
JPMorgan Funds - India FundJPM India A (acc) - SGD# 112,033.865 57,246.657 38,134.360 131,146.162JPM India A (acc) - USD# 13,794,396.639 2,345,970.681 4,079,569.482 12,060,797.838JPM India A (dist) - GBP# 1,413.075 420.225 910.661 922.639JPM India A (dist) - USD# 5,561,110.367 278,577.650 1,093,415.686 4,746,272.331JPMorgan India B (acc) - USD*** 265,438.408 43,372.122 308,810.530 -JPMorgan India B (dist) - USD*** 72,989.730 3,074.577 76,064.307 -JPM India C (acc) - EUR^# 5,219.973 9,639.836 13,317.892 1,541.917JPM India C (acc) - USD# 1,331,456.818 1,221,758.840 1,089,951.531 1,463,264.127JPM India C (dist) - USD# 74,525.586 99,007.215 13,823.771 159,709.030JPM India D (acc) - EUR# 197,956.264 109,049.398 95,443.908 211,561.754JPM India D (acc) - USD# 6,190,548.800 640,229.744 2,883,450.323 3,947,328.221JPM India I (acc) - USD# 14,386.856 8,966.696 15,065.307 8,288.245JPM India I (dist) - USD# 1,256.593 650.328 1,364.988 541.933JPM India T (acc) - EUR# 26,598.228 9,302.619 12,875.618 23,025.229JPM India X (acc) - USD# 696,426.128 126,954.161 292,943.957 530,436.332
JPMorgan Funds - Indonesia Equity FundJPM Indonesia Equity A (acc) - USD# 51,747.117 36,947.928 37,292.579 51,402.466JPMorgan Indonesia Equity B (acc) - USD*** 6,122.369 - 6,122.369 -JPM Indonesia Equity C (acc) - USD# 7,399.084 34,181.396 35,112.523 6,467.957JPM Indonesia Equity D (acc) - EUR# 48,291.587 16,061.080 24,339.240 40,013.427JPM Indonesia Equity D (acc) - USD# 16,942.161 6,203.710 8,614.201 14,531.670JPM Indonesia Equity X (acc) - JPY# 1,232,222.965 36,598.756 731,813.206 537,008.515
JPMorgan Funds - Japan Equity FundJPM Japan Equity A (acc) - EUR# 1,401,517.517 3,866,479.435 2,186,109.329 3,081,887.623JPM Japan Equity A (acc) - EUR (hedged)# 93,574.285 183,679.252 124,606.164 152,647.373JPM Japan Equity A (acc) - JPY# 1,366,863.183 10,398,380.569 6,415,545.055 5,349,698.697JPM Japan Equity A (acc) - SGD (hedged)# - 28,410.000 - 28,410.000JPM Japan Equity A (acc) - USD# 3,877,033.066 5,600,405.195 3,660,924.405 5,816,513.856JPM Japan Equity A (acc) - USD (hedged)# 954,894.035 2,041,561.556 2,175,845.414 820,610.177JPM Japan Equity A (dist) - GBP# 17,281.651 7,683.350 6,972.544 17,992.457JPM Japan Equity A (dist) - GBP (hedged)# 3,384.685 33,802.223 28,182.822 9,004.086JPM Japan Equity A (dist) - SGD# 223,058.680 76,513.560 203,595.842 95,976.398JPM Japan Equity A (dist) - USD# 4,442,349.079 5,536,892.587 5,599,760.306 4,379,481.360JPMorgan Japan Equity B (acc) - USD*** 691,857.812 133,984.886 825,842.698 -JPMorgan Japan Equity B (dist) - USD*** 13,417.481 3,376.268 16,793.749 -JPM Japan Equity C (acc) - EUR^# 4,951.436 1,295,517.403 90,826.942 1,209,641.897JPM Japan Equity C (acc) - EUR (hedged)# - 158,729.283 80,296.559 78,432.724JPM Japan Equity C (acc) - JPY# - 323,035.993 301,031.815 22,004.178JPM Japan Equity C (acc) - USD# 13,642,207.116 4,055,939.172 4,965,424.666 12,732,721.622JPM Japan Equity C (acc) - USD (hedged)# 154,786.628 722,464.401 455,680.492 421,570.537JPM Japan Equity C (dist) - GBP^# 41,654.848 8,597.039 20,733.480 29,518.407JPM Japan Equity C (dist) - USD# 536.059 25,584.718 3,774.122 22,346.655JPM Japan Equity D (acc) - EUR# 466,014.154 1,133,436.946 1,067,548.672 531,902.428JPM Japan Equity D (acc) - USD# 2,582,392.424 1,398,660.028 1,314,431.602 2,666,620.850JPM Japan Equity I (acc) - JPY**# - 657,296.821 - 657,296.821JPM Japan Equity I (acc) - USD# 3,644,937.507 9,864,925.102 1,405,063.838 12,104,798.771JPM Japan Equity J (dist) - USD# 1,441,842.848 2,116,440.562 2,092,717.208 1,465,566.202JPM Japan Equity X (acc) - JPY# - 13,618.726 870.030 12,748.696JPM Japan Equity X (acc) - USD# 97,685.094 - 15,808.621 81,876.473
33
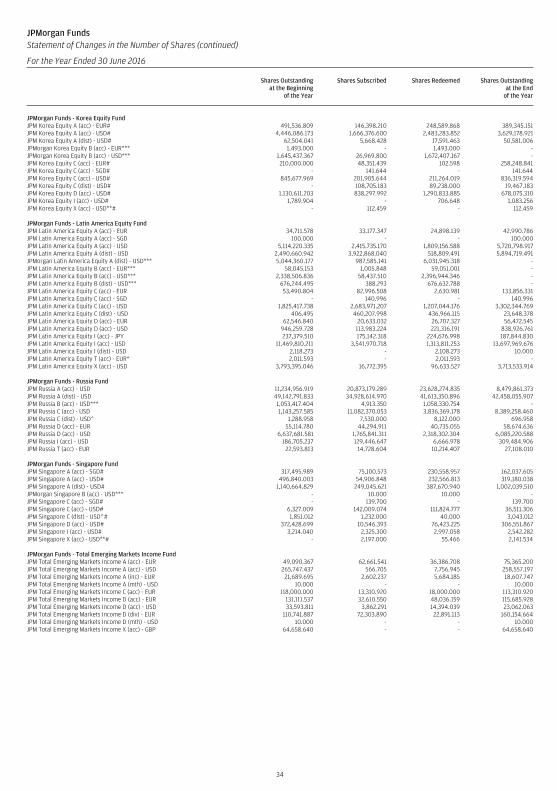
JPMorgan FundsStatement of Changes in the Number of Shares (continued)
For the Year Ended 30 June 2016
Shares Outstandingat the Beginning
of the Year
Shares Subscribed Shares Redeemed Shares Outstandingat the End
of the Year
JPMorgan Funds - Korea Equity FundJPM Korea Equity A (acc) - EUR# 491,536.809 146,398.210 248,589.868 389,345.151JPM Korea Equity A (acc) - USD# 4,446,086.173 1,666,376.600 2,483,283.852 3,629,178.921JPM Korea Equity A (dist) - USD# 62,504.041 5,668.428 17,591.463 50,581.006JPMorgan Korea Equity B (acc) - EUR*** 1,493.000 - 1,493.000 -JPMorgan Korea Equity B (acc) - USD*** 1,645,437.367 26,969.800 1,672,407.167 -JPM Korea Equity C (acc) - EUR# 210,000.000 48,351.439 102.598 258,248.841JPM Korea Equity C (acc) - SGD# - 141.644 - 141.644JPM Korea Equity C (acc) - USD# 845,677.969 201,905.644 211,264.019 836,319.594JPM Korea Equity C (dist) - USD# - 108,705.183 89,238.000 19,467.183JPM Korea Equity D (acc) - USD# 1,130,611.203 838,297.992 1,290,833.885 678,075.310JPM Korea Equity I (acc) - USD# 1,789.904 - 706.648 1,083.256JPM Korea Equity X (acc) - USD**# - 112.459 - 112.459
JPMorgan Funds - Latin America Equity FundJPM Latin America Equity A (acc) - EUR 34,711.578 33,177.347 24,898.139 42,990.786JPM Latin America Equity A (acc) - SGD 100.000 - - 100.000JPM Latin America Equity A (acc) - USD 5,114,220.335 2,415,735.170 1,809,156.588 5,720,798.917JPM Latin America Equity A (dist) - USD 2,490,660.942 3,922,868.040 518,809.491 5,894,719.491JPMorgan Latin America Equity A (dist) - USD*** 5,044,360.177 987,585.141 6,031,945.318 -JPM Latin America Equity B (acc) - EUR*** 58,045.153 1,005.848 59,051.001 -JPM Latin America Equity B (acc) - USD*** 2,338,506.836 58,437.510 2,396,944.346 -JPM Latin America Equity B (dist) - USD*** 676,244.495 388.293 676,632.788 -JPM Latin America Equity C (acc) - EUR 53,490.804 82,996.508 2,630.981 133,856.331JPM Latin America Equity C (acc) - SGD - 140.996 - 140.996JPM Latin America Equity C (acc) - USD 1,825,417.738 2,683,971.207 1,207,044.176 3,302,344.769JPM Latin America Equity C (dist) - USD 406.495 460,207.998 436,966.115 23,648.378JPM Latin America Equity D (acc) - EUR 62,546.840 20,633.032 26,707.327 56,472.545JPM Latin America Equity D (acc) - USD 946,259.728 113,983.224 221,316.191 838,926.761JPM Latin America Equity I (acc) - JPY 237,379.510 175,142.318 224,676.998 187,844.830JPM Latin America Equity I (acc) - USD 11,469,810.211 3,541,970.718 1,313,811.253 13,697,969.676JPM Latin America Equity I (dist) - USD 2,118.273 - 2,108.273 10.000JPM Latin America Equity T (acc) - EUR* 2,011.593 - 2,011.593 -JPM Latin America Equity X (acc) - USD 3,793,395.046 16,772.395 96,633.527 3,713,533.914
JPMorgan Funds - Russia FundJPM Russia A (acc) - USD 11,234,956.919 20,873,179.289 23,628,274.835 8,479,861.373JPM Russia A (dist) - USD 49,142,791.833 34,928,614.970 41,613,350.896 42,458,055.907JPM Russia B (acc) - USD*** 1,053,417.404 4,913.350 1,058,330.754 -JPM Russia C (acc) - USD 1,143,257.585 11,082,370.053 3,836,369.178 8,389,258.460JPM Russia C (dist) - USD^ 1,288.958 7,530.000 8,122.000 696.958JPM Russia D (acc) - EUR 55,114.780 44,294.911 40,735.055 58,674.636JPM Russia D (acc) - USD 6,637,681.581 1,765,841.311 2,318,302.304 6,085,220.588JPM Russia I (acc) - USD 186,705.237 129,446.647 6,666.978 309,484.906JPM Russia T (acc) - EUR 22,593.813 14,728.604 10,214.407 27,108.010
JPMorgan Funds - Singapore FundJPM Singapore A (acc) - SGD# 317,495.989 75,100.573 230,558.957 162,037.605JPM Singapore A (acc) - USD# 496,840.003 54,906.848 232,566.813 319,180.038JPM Singapore A (dist) - USD# 1,140,664.829 249,045.621 387,670.940 1,002,039.510JPMorgan Singapore B (acc) - USD*** - 10.000 10.000 -JPM Singapore C (acc) - SGD# - 139.700 - 139.700JPM Singapore C (acc) - USD# 6,327.009 142,009.074 111,824.777 36,511.306JPM Singapore C (dist) - USD^# 1,851.012 1,232.000 40.000 3,043.012JPM Singapore D (acc) - USD# 372,428.699 10,546.393 76,423.225 306,551.867JPM Singapore I (acc) - USD# 3,214.040 2,325.300 2,997.058 2,542.282JPM Singapore X (acc) - USD**# - 2,197.000 55.466 2,141.534
JPMorgan Funds - Total Emerging Markets Income FundJPM Total Emerging Markets Income A (acc) - EUR 49,090.367 62,661.541 36,386.708 75,365.200JPM Total Emerging Markets Income A (acc) - USD 265,747.437 566.705 7,756.945 258,557.197JPM Total Emerging Markets Income A (inc) - EUR 21,689.695 2,602.237 5,684.185 18,607.747JPM Total Emerging Markets Income A (mth) - USD 10.000 - - 10.000JPM Total Emerging Markets Income C (acc) - EUR 118,000.000 13,310.920 18,000.000 113,310.920JPM Total Emerging Markets Income D (acc) - EUR 131,111.537 32,610.550 48,036.159 115,685.928JPM Total Emerging Markets Income D (acc) - USD 33,593.811 3,862.291 14,394.039 23,062.063JPM Total Emerging Markets Income D (div) - EUR 110,741.887 72,303.890 22,891.113 160,154.664JPM Total Emerging Markets Income D (mth) - USD 10.000 - - 10.000JPM Total Emerging Markets Income X (acc) - GBP 64,658.640 - - 64,658.640
34
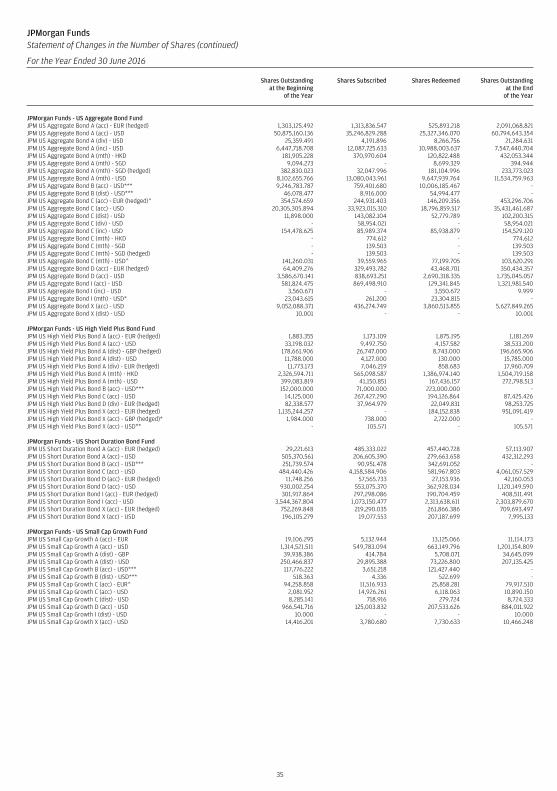
JPMorgan FundsStatement of Changes in the Number of Shares (continued)
For the Year Ended 30 June 2016
Shares Outstandingat the Beginning
of the Year
Shares Subscribed Shares Redeemed Shares Outstandingat the End
of the Year
JPMorgan Funds - US Aggregate Bond FundJPM US Aggregate Bond A (acc) - EUR (hedged) 1,303,125.492 1,313,836.547 525,893.218 2,091,068.821JPM US Aggregate Bond A (acc) - USD 50,875,160.136 35,246,829.288 25,327,346.070 60,794,643.354JPM US Aggregate Bond A (div) - USD 25,359.491 4,191.896 8,266.756 21,284.631JPM US Aggregate Bond A (inc) - USD 6,447,718.708 12,087,725.633 10,988,003.637 7,547,440.704JPM US Aggregate Bond A (mth) - HKD 181,905.228 370,970.604 120,822.488 432,053.344JPM US Aggregate Bond A (mth) - SGD 9,094.273 - 8,699.329 394.944JPM US Aggregate Bond A (mth) - SGD (hedged) 382,830.023 32,047.996 181,104.996 233,773.023JPM US Aggregate Bond A (mth) - USD 8,102,655.766 13,080,043.961 9,647,939.764 11,534,759.963JPM US Aggregate Bond B (acc) - USD*** 9,246,783.787 759,401.680 10,006,185.467 -JPM US Aggregate Bond B (dist) - USD*** 46,078.477 8,916.000 54,994.477 -JPM US Aggregate Bond C (acc) - EUR (hedged)^ 354,574.659 244,931.403 146,209.356 453,296.706JPM US Aggregate Bond C (acc) - USD 20,305,305.894 33,923,015.310 18,796,859.517 35,431,461.687JPM US Aggregate Bond C (dist) - USD 11,898.000 143,082.104 52,779.789 102,200.315JPM US Aggregate Bond C (div) - USD - 58,954.021 - 58,954.021JPM US Aggregate Bond C (inc) - USD 154,478.625 85,989.374 85,938.879 154,529.120JPM US Aggregate Bond C (mth) - HKD - 774.612 - 774.612JPM US Aggregate Bond C (mth) - SGD - 139.503 - 139.503JPM US Aggregate Bond C (mth) - SGD (hedged) - 139.503 - 139.503JPM US Aggregate Bond C (mth) - USD^ 141,260.031 39,559.965 77,199.705 103,620.291JPM US Aggregate Bond D (acc) - EUR (hedged) 64,409.276 329,493.782 43,468.701 350,434.357JPM US Aggregate Bond D (acc) - USD 3,586,670.141 838,693.251 2,690,318.335 1,735,045.057JPM US Aggregate Bond I (acc) - USD 581,824.475 869,498.910 129,341.845 1,321,981.540JPM US Aggregate Bond I (inc) - USD 3,560.671 - 3,550.672 9.999JPM US Aggregate Bond I (mth) - USD* 23,043.615 261.200 23,304.815 -JPM US Aggregate Bond X (acc) - USD 9,052,088.371 436,274.749 3,860,513.855 5,627,849.265JPM US Aggregate Bond X (dist) - USD 10.001 - - 10.001
JPMorgan Funds - US High Yield Plus Bond FundJPM US High Yield Plus Bond A (acc) - EUR (hedged) 1,883.355 1,173.109 1,875.195 1,181.269JPM US High Yield Plus Bond A (acc) - USD 33,198.032 9,492.750 4,157.582 38,533.200JPM US High Yield Plus Bond A (dist) - GBP (hedged) 178,661.906 26,747.000 8,743.000 196,665.906JPM US High Yield Plus Bond A (dist) - USD 11,788.000 4,127.000 130.000 15,785.000JPM US High Yield Plus Bond A (div) - EUR (hedged) 11,773.173 7,046.219 858.683 17,960.709JPM US High Yield Plus Bond A (mth) - HKD 2,326,594.711 565,098.587 1,386,974.140 1,504,719.158JPM US High Yield Plus Bond A (mth) - USD 399,083.819 41,150.851 167,436.157 272,798.513JPM US High Yield Plus Bond B (acc) - USD*** 152,000.000 71,000.000 223,000.000 -JPM US High Yield Plus Bond C (acc) - USD 14,125.000 267,427.290 194,126.864 87,425.426JPM US High Yield Plus Bond D (div) - EUR (hedged) 82,338.577 37,964.979 22,049.831 98,253.725JPM US High Yield Plus Bond X (acc) - EUR (hedged) 1,135,244.257 - 184,152.838 951,091.419JPM US High Yield Plus Bond X (acc) - GBP (hedged)* 1,984.000 738.000 2,722.000 -JPM US High Yield Plus Bond X (acc) - USD** - 105.571 - 105.571
JPMorgan Funds - US Short Duration Bond FundJPM US Short Duration Bond A (acc) - EUR (hedged) 29,221.613 485,333.022 457,440.728 57,113.907JPM US Short Duration Bond A (acc) - USD 505,370.561 206,605.390 279,663.658 432,312.293JPM US Short Duration Bond B (acc) - USD*** 251,739.574 90,951.478 342,691.052 -JPM US Short Duration Bond C (acc) - USD 484,440.426 4,158,584.906 581,967.803 4,061,057.529JPM US Short Duration Bond D (acc) - EUR (hedged) 11,748.256 57,565.733 27,153.936 42,160.053JPM US Short Duration Bond D (acc) - USD 930,002.254 553,075.370 362,928.034 1,120,149.590JPM US Short Duration Bond I (acc) - EUR (hedged) 301,917.864 297,298.086 190,704.459 408,511.491JPM US Short Duration Bond I (acc) - USD 3,544,367.804 1,073,150.477 2,313,638.611 2,303,879.670JPM US Short Duration Bond X (acc) - EUR (hedged) 752,269.848 219,290.035 261,866.386 709,693.497JPM US Short Duration Bond X (acc) - USD 196,105.279 19,077.553 207,187.699 7,995.133
JPMorgan Funds - US Small Cap Growth FundJPM US Small Cap Growth A (acc) - EUR 19,106.295 5,132.944 13,125.066 11,114.173JPM US Small Cap Growth A (acc) - USD 1,314,521.511 549,783.094 663,149.796 1,201,154.809JPM US Small Cap Growth A (dist) - GBP 39,938.386 414.784 5,708.071 34,645.099JPM US Small Cap Growth A (dist) - USD 250,466.837 29,895.388 73,226.800 207,135.425JPM US Small Cap Growth B (acc) - USD*** 117,776.222 3,651.218 121,427.440 -JPM US Small Cap Growth B (dist) - USD*** 518.363 4.336 522.699 -JPM US Small Cap Growth C (acc) - EUR^ 94,258.858 11,516.933 25,858.281 79,917.510JPM US Small Cap Growth C (acc) - USD 2,081.952 14,926.261 6,118.063 10,890.150JPM US Small Cap Growth C (dist) - USD 8,285.141 718.916 279.724 8,724.333JPM US Small Cap Growth D (acc) - USD 966,541.716 125,003.832 207,533.626 884,011.922JPM US Small Cap Growth I (dist) - USD 10.000 - - 10.000JPM US Small Cap Growth X (acc) - USD 14,416.201 3,780.680 7,730.633 10,466.248
35
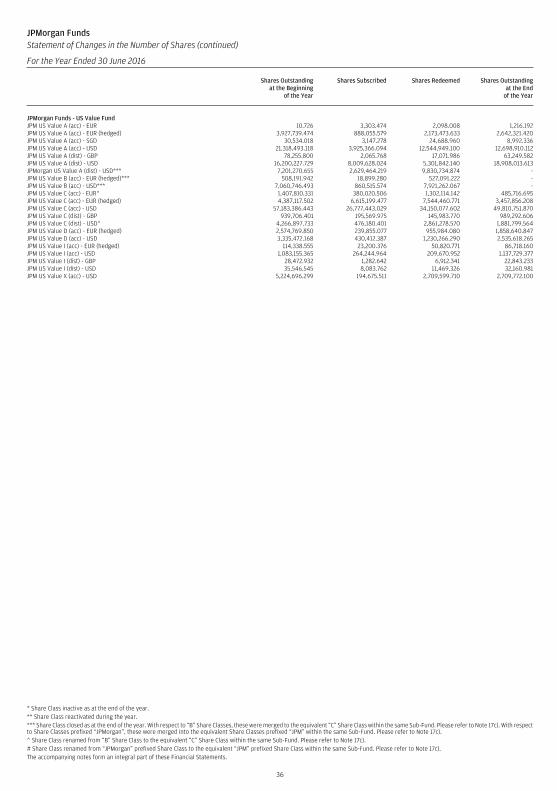
JPMorgan FundsStatement of Changes in the Number of Shares (continued)
For the Year Ended 30 June 2016
Shares Outstandingat the Beginning
of the Year
Shares Subscribed Shares Redeemed Shares Outstandingat the End
of the Year
JPMorgan Funds - US Value FundJPM US Value A (acc) - EUR 10.726 3,303.474 2,098.008 1,216.192JPM US Value A (acc) - EUR (hedged) 3,927,739.474 888,055.579 2,173,473.633 2,642,321.420JPM US Value A (acc) - SGD 30,534.018 3,147.278 24,688.960 8,992.336JPM US Value A (acc) - USD 21,318,493.118 3,925,366.094 12,544,949.100 12,698,910.112JPM US Value A (dist) - GBP 78,255.800 2,065.768 17,071.986 63,249.582JPM US Value A (dist) - USD 16,200,227.729 8,009,628.024 5,301,842.140 18,908,013.613JPMorgan US Value A (dist) - USD*** 7,201,270.655 2,629,464.219 9,830,734.874 -JPM US Value B (acc) - EUR (hedged)*** 508,191.942 18,899.280 527,091.222 -JPM US Value B (acc) - USD*** 7,060,746.493 860,515.574 7,921,262.067 -JPM US Value C (acc) - EUR^ 1,407,810.331 380,020.506 1,302,114.142 485,716.695JPM US Value C (acc) - EUR (hedged) 4,387,117.502 6,615,199.477 7,544,460.771 3,457,856.208JPM US Value C (acc) - USD 57,183,386.443 26,777,443.029 34,150,077.602 49,810,751.870JPM US Value C (dist) - GBP 939,706.401 195,569.975 145,983.770 989,292.606JPM US Value C (dist) - USD^ 4,266,897.733 476,180.401 2,861,278.570 1,881,799.564JPM US Value D (acc) - EUR (hedged) 2,574,769.850 239,855.077 955,984.080 1,858,640.847JPM US Value D (acc) - USD 3,335,472.168 430,412.387 1,230,266.290 2,535,618.265JPM US Value I (acc) - EUR (hedged) 114,338.555 23,200.376 50,820.771 86,718.160JPM US Value I (acc) - USD 1,083,155.365 264,244.964 209,670.952 1,137,729.377JPM US Value I (dist) - GBP 28,472.932 1,282.642 6,912.341 22,843.233JPM US Value I (dist) - USD 35,546.545 8,083.762 11,469.326 32,160.981JPM US Value X (acc) - USD 5,224,696.299 194,675.511 2,709,599.710 2,709,772.100
* Share Class inactive as at the end of the year.** Share Class reactivated during the year.*** Share Class closed as at the end of the year. With respect to “B” Share Classes, these were merged to the equivalent “C” Share Class within the same Sub-Fund. Please refer to Note 17c). With respectto Share Classes prefixed “JPMorgan”, these were merged into the equivalent Share Classes prefixed “JPM” within the same Sub-Fund. Please refer to Note 17c).^ Share Class renamed from “B” Share Class to the equivalent “C” Share Class within the same Sub-Fund. Please refer to Note 17c).# Share Class renamed from “JPMorgan” prefixed Share Class to the equivalent “JPM” prefixed Share Class within the same Sub-Fund. Please refer to Note 17c).The accompanying notes form an integral part of these Financial Statements.
36
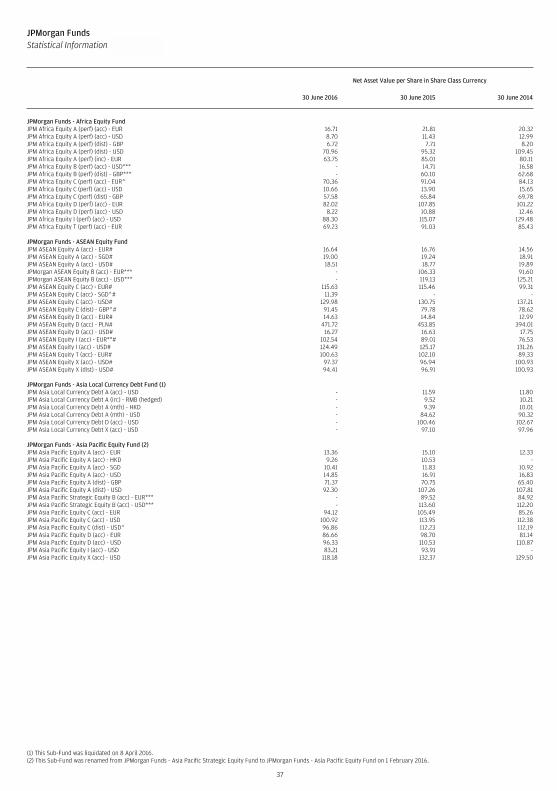
JPMorgan FundsStatistical Information (continued)
Net Asset Value per Share in Share Class Currency
30 June 2016 30 June 2015 30 June 2014
JPMorgan Funds - Africa Equity FundJPM Africa Equity A (perf) (acc) - EUR 16.71 21.81 20.32JPM Africa Equity A (perf) (acc) - USD 8.70 11.43 12.99JPM Africa Equity A (perf) (dist) - GBP 6.72 7.71 8.20JPM Africa Equity A (perf) (dist) - USD 70.96 95.32 109.45JPM Africa Equity A (perf) (inc) - EUR 63.75 85.01 80.11JPM Africa Equity B (perf) (acc) - USD*** - 14.71 16.58JPM Africa Equity B (perf) (dist) - GBP*** - 60.10 62.68JPM Africa Equity C (perf) (acc) - EUR^ 70.36 91.04 84.13JPM Africa Equity C (perf) (acc) - USD 10.66 13.90 15.65JPM Africa Equity C (perf) (dist) - GBP 57.58 65.84 69.78JPM Africa Equity D (perf) (acc) - EUR 82.02 107.85 101.22JPM Africa Equity D (perf) (acc) - USD 8.22 10.88 12.46JPM Africa Equity I (perf) (acc) - USD 88.30 115.07 129.48JPM Africa Equity T (perf) (acc) - EUR 69.23 91.03 85.43
JPMorgan Funds - ASEAN Equity FundJPM ASEAN Equity A (acc) - EUR# 16.64 16.76 14.56JPM ASEAN Equity A (acc) - SGD# 19.00 19.24 18.91JPM ASEAN Equity A (acc) - USD# 18.51 18.77 19.89JPMorgan ASEAN Equity B (acc) - EUR*** - 106.33 91.60JPMorgan ASEAN Equity B (acc) - USD*** - 119.13 125.21JPM ASEAN Equity C (acc) - EUR# 115.63 115.46 99.31JPM ASEAN Equity C (acc) - SGD^# 11.39 - -JPM ASEAN Equity C (acc) - USD# 129.98 130.75 137.21JPM ASEAN Equity C (dist) - GBP^# 91.45 79.78 78.62JPM ASEAN Equity D (acc) - EUR# 14.63 14.84 12.99JPM ASEAN Equity D (acc) - PLN# 471.72 453.85 394.01JPM ASEAN Equity D (acc) - USD# 16.27 16.63 17.75JPM ASEAN Equity I (acc) - EUR**# 102.54 89.01 76.53JPM ASEAN Equity I (acc) - USD# 124.49 125.17 131.26JPM ASEAN Equity T (acc) - EUR# 100.63 102.10 89.33JPM ASEAN Equity X (acc) - USD# 97.37 96.94 100.93JPM ASEAN Equity X (dist) - USD# 94.41 96.91 100.93
JPMorgan Funds - Asia Local Currency Debt Fund (1)JPM Asia Local Currency Debt A (acc) - USD - 11.59 11.80JPM Asia Local Currency Debt A (irc) - RMB (hedged) - 9.52 10.21JPM Asia Local Currency Debt A (mth) - HKD - 9.39 10.01JPM Asia Local Currency Debt A (mth) - USD - 84.62 90.32JPM Asia Local Currency Debt D (acc) - USD - 100.46 102.67JPM Asia Local Currency Debt X (acc) - USD - 97.10 97.96
JPMorgan Funds - Asia Pacific Equity Fund (2)JPM Asia Pacific Equity A (acc) - EUR 13.36 15.10 12.33JPM Asia Pacific Equity A (acc) - HKD 9.26 10.53 -JPM Asia Pacific Equity A (acc) - SGD 10.41 11.83 10.92JPM Asia Pacific Equity A (acc) - USD 14.85 16.91 16.83JPM Asia Pacific Equity A (dist) - GBP 71.37 70.75 65.40JPM Asia Pacific Equity A (dist) - USD 92.30 107.26 107.81JPM Asia Pacific Strategic Equity B (acc) - EUR*** - 89.52 84.92JPM Asia Pacific Strategic Equity B (acc) - USD*** - 113.60 112.20JPM Asia Pacific Equity C (acc) - EUR 94.12 105.49 85.26JPM Asia Pacific Equity C (acc) - USD 100.92 113.95 112.38JPM Asia Pacific Equity C (dist) - USD^ 96.86 112.23 112.19JPM Asia Pacific Equity D (acc) - EUR 86.66 98.70 81.14JPM Asia Pacific Equity D (acc) - USD 96.33 110.53 110.87JPM Asia Pacific Equity I (acc) - USD 83.21 93.91 -JPM Asia Pacific Equity X (acc) - USD 118.18 132.37 129.50
(1) This Sub-Fund was liquidated on 8 April 2016.(2) This Sub-Fund was renamed from JPMorgan Funds - Asia Pacific Strategic Equity Fund to JPMorgan Funds - Asia Pacific Equity Fund on 1 February 2016.
37
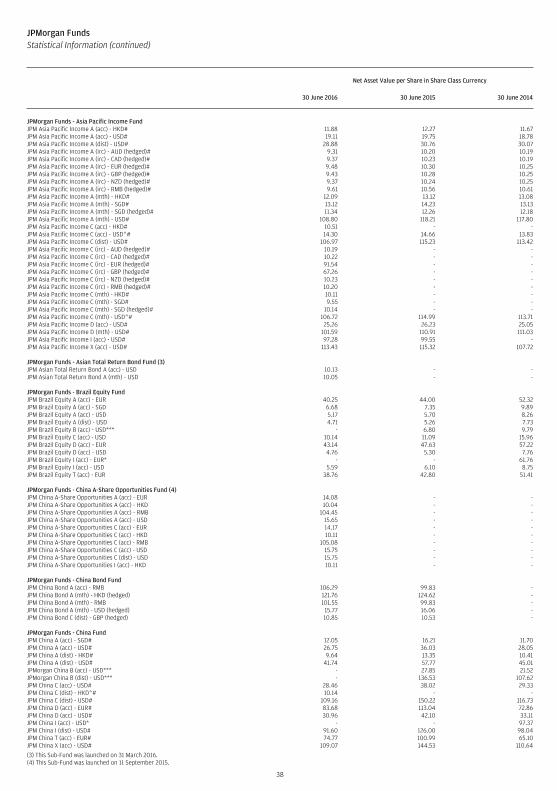
JPMorgan FundsStatistical Information (continued)
Net Asset Value per Share in Share Class Currency
30 June 2016 30 June 2015 30 June 2014
JPMorgan Funds - Asia Pacific Income FundJPM Asia Pacific Income A (acc) - HKD# 11.88 12.27 11.67JPM Asia Pacific Income A (acc) - USD# 19.11 19.75 18.78JPM Asia Pacific Income A (dist) - USD# 28.88 30.76 30.07JPM Asia Pacific Income A (irc) - AUD (hedged)# 9.31 10.20 10.19JPM Asia Pacific Income A (irc) - CAD (hedged)# 9.37 10.23 10.19JPM Asia Pacific Income A (irc) - EUR (hedged)# 9.48 10.30 10.25JPM Asia Pacific Income A (irc) - GBP (hedged)# 9.43 10.28 10.25JPM Asia Pacific Income A (irc) - NZD (hedged)# 9.37 10.24 10.25JPM Asia Pacific Income A (irc) - RMB (hedged)# 9.61 10.56 10.61JPM Asia Pacific Income A (mth) - HKD# 12.09 13.12 13.08JPM Asia Pacific Income A (mth) - SGD# 13.12 14.23 13.13JPM Asia Pacific Income A (mth) - SGD (hedged)# 11.34 12.26 12.18JPM Asia Pacific Income A (mth) - USD# 108.80 118.21 117.80JPM Asia Pacific Income C (acc) - HKD# 10.51 - -JPM Asia Pacific Income C (acc) - USD^# 14.30 14.66 13.83JPM Asia Pacific Income C (dist) - USD# 106.97 115.23 113.42JPM Asia Pacific Income C (irc) - AUD (hedged)# 10.19 - -JPM Asia Pacific Income C (irc) - CAD (hedged)# 10.22 - -JPM Asia Pacific Income C (irc) - EUR (hedged)# 91.54 - -JPM Asia Pacific Income C (irc) - GBP (hedged)# 67.26 - -JPM Asia Pacific Income C (irc) - NZD (hedged)# 10.23 - -JPM Asia Pacific Income C (irc) - RMB (hedged)# 10.20 - -JPM Asia Pacific Income C (mth) - HKD# 10.11 - -JPM Asia Pacific Income C (mth) - SGD# 9.55 - -JPM Asia Pacific Income C (mth) - SGD (hedged)# 10.14 - -JPM Asia Pacific Income C (mth) - USD^# 106.72 114.99 113.71JPM Asia Pacific Income D (acc) - USD# 25.26 26.23 25.05JPM Asia Pacific Income D (mth) - USD# 101.59 110.91 111.03JPM Asia Pacific Income I (acc) - USD# 97.28 99.55 -JPM Asia Pacific Income X (acc) - USD# 113.43 115.32 107.72
JPMorgan Funds - Asian Total Return Bond Fund (3)JPM Asian Total Return Bond A (acc) - USD 10.13 - -JPM Asian Total Return Bond A (mth) - USD 10.05 - -
JPMorgan Funds - Brazil Equity FundJPM Brazil Equity A (acc) - EUR 40.25 44.00 52.32JPM Brazil Equity A (acc) - SGD 6.68 7.35 9.89JPM Brazil Equity A (acc) - USD 5.17 5.70 8.26JPM Brazil Equity A (dist) - USD 4.71 5.26 7.73JPM Brazil Equity B (acc) - USD*** - 6.80 9.79JPM Brazil Equity C (acc) - USD 10.14 11.09 15.96JPM Brazil Equity D (acc) - EUR 43.14 47.63 57.22JPM Brazil Equity D (acc) - USD 4.76 5.30 7.76JPM Brazil Equity I (acc) - EUR* - - 61.76JPM Brazil Equity I (acc) - USD 5.59 6.10 8.75JPM Brazil Equity T (acc) - EUR 38.76 42.80 51.41
JPMorgan Funds - China A-Share Opportunities Fund (4)JPM China A-Share Opportunities A (acc) - EUR 14.08 - -JPM China A-Share Opportunities A (acc) - HKD 10.04 - -JPM China A-Share Opportunities A (acc) - RMB 104.45 - -JPM China A-Share Opportunities A (acc) - USD 15.65 - -JPM China A-Share Opportunities C (acc) - EUR 14.17 - -JPM China A-Share Opportunities C (acc) - HKD 10.11 - -JPM China A-Share Opportunities C (acc) - RMB 105.08 - -JPM China A-Share Opportunities C (acc) - USD 15.75 - -JPM China A-Share Opportunities C (dist) - USD 15.75 - -JPM China A-Share Opportunities I (acc) - HKD 10.11 - -
JPMorgan Funds - China Bond FundJPM China Bond A (acc) - RMB 106.29 99.83 -JPM China Bond A (mth) - HKD (hedged) 121.76 124.62 -JPM China Bond A (mth) - RMB 101.55 99.83 -JPM China Bond A (mth) - USD (hedged) 15.77 16.06 -JPM China Bond C (dist) - GBP (hedged) 10.85 10.53 -
JPMorgan Funds - China FundJPM China A (acc) - SGD# 12.05 16.21 11.70JPM China A (acc) - USD# 26.75 36.03 28.05JPM China A (dist) - HKD# 9.64 13.35 10.41JPM China A (dist) - USD# 41.74 57.77 45.01JPMorgan China B (acc) - USD*** - 27.85 21.52JPMorgan China B (dist) - USD*** - 136.53 107.62JPM China C (acc) - USD# 28.46 38.02 29.33JPM China C (dist) - HKD^# 10.14 - -JPM China C (dist) - USD# 109.16 150.22 116.73JPM China D (acc) - EUR# 83.68 113.04 72.86JPM China D (acc) - USD# 30.96 42.10 33.11JPM China I (acc) - USD* - - 97.37JPM China I (dist) - USD# 91.60 126.00 98.04JPM China T (acc) - EUR# 74.77 100.99 65.10JPM China X (acc) - USD# 109.07 144.53 110.64
(3) This Sub-Fund was launched on 31 March 2016.(4) This Sub-Fund was launched on 11 September 2015.
38
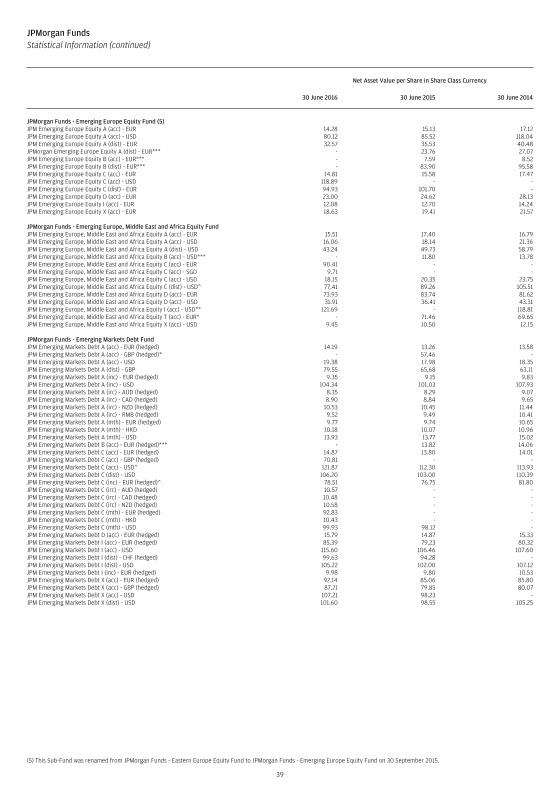
JPMorgan FundsStatistical Information (continued)
Net Asset Value per Share in Share Class Currency
30 June 2016 30 June 2015 30 June 2014
JPMorgan Funds - Emerging Europe Equity Fund (5)JPM Emerging Europe Equity A (acc) - EUR 14.28 15.13 17.12JPM Emerging Europe Equity A (acc) - USD 80.12 85.52 118.04JPM Emerging Europe Equity A (dist) - EUR 32.57 35.53 40.48JPMorgan Emerging Europe Equity A (dist) - EUR*** - 23.76 27.07JPM Emerging Europe Equity B (acc) - EUR*** - 7.59 8.52JPM Emerging Europe Equity B (dist) - EUR*** - 83.90 95.58JPM Emerging Europe Equity C (acc) - EUR 14.81 15.58 17.47JPM Emerging Europe Equity C (acc) - USD 118.89 - -JPM Emerging Europe Equity C (dist) - EUR 94.93 101.70 -JPM Emerging Europe Equity D (acc) - EUR 23.00 24.62 28.13JPM Emerging Europe Equity I (acc) - EUR 12.08 12.70 14.24JPM Emerging Europe Equity X (acc) - EUR 18.63 19.41 21.57
JPMorgan Funds - Emerging Europe, Middle East and Africa Equity FundJPM Emerging Europe, Middle East and Africa Equity A (acc) - EUR 15.51 17.40 16.79JPM Emerging Europe, Middle East and Africa Equity A (acc) - USD 16.06 18.14 21.36JPM Emerging Europe, Middle East and Africa Equity A (dist) - USD 43.24 49.73 58.79JPM Emerging Europe, Middle East and Africa Equity B (acc) - USD*** - 11.80 13.78JPM Emerging Europe, Middle East and Africa Equity C (acc) - EUR 90.41 - -JPM Emerging Europe, Middle East and Africa Equity C (acc) - SGD 9.71 - -JPM Emerging Europe, Middle East and Africa Equity C (acc) - USD 18.15 20.35 23.75JPM Emerging Europe, Middle East and Africa Equity C (dist) - USD^ 77.41 89.26 105.51JPM Emerging Europe, Middle East and Africa Equity D (acc) - EUR 73.93 83.74 81.62JPM Emerging Europe, Middle East and Africa Equity D (acc) - USD 31.91 36.41 43.31JPM Emerging Europe, Middle East and Africa Equity I (acc) - USD** 121.69 - 118.81JPM Emerging Europe, Middle East and Africa Equity T (acc) - EUR* - 71.46 69.65JPM Emerging Europe, Middle East and Africa Equity X (acc) - USD 9.45 10.50 12.15
JPMorgan Funds - Emerging Markets Debt FundJPM Emerging Markets Debt A (acc) - EUR (hedged) 14.19 13.26 13.58JPM Emerging Markets Debt A (acc) - GBP (hedged)* - 57.46 -JPM Emerging Markets Debt A (acc) - USD 19.38 17.98 18.35JPM Emerging Markets Debt A (dist) - GBP 79.55 65.68 63.11JPM Emerging Markets Debt A (inc) - EUR (hedged) 9.35 9.15 9.83JPM Emerging Markets Debt A (inc) - USD 104.34 101.03 107.93JPM Emerging Markets Debt A (irc) - AUD (hedged) 8.35 8.29 9.07JPM Emerging Markets Debt A (irc) - CAD (hedged) 8.90 8.84 9.65JPM Emerging Markets Debt A (irc) - NZD (hedged) 10.53 10.45 11.44JPM Emerging Markets Debt A (irc) - RMB (hedged) 9.52 9.49 10.41JPM Emerging Markets Debt A (mth) - EUR (hedged) 9.77 9.74 10.65JPM Emerging Markets Debt A (mth) - HKD 10.18 10.07 10.96JPM Emerging Markets Debt A (mth) - USD 13.93 13.77 15.02JPM Emerging Markets Debt B (acc) - EUR (hedged)*** - 13.82 14.06JPM Emerging Markets Debt C (acc) - EUR (hedged) 14.87 13.80 14.01JPM Emerging Markets Debt C (acc) - GBP (hedged) 70.81 - -JPM Emerging Markets Debt C (acc) - USD^ 121.87 112.30 113.93JPM Emerging Markets Debt C (dist) - USD 106.20 103.00 110.39JPM Emerging Markets Debt C (inc) - EUR (hedged)^ 78.51 76.75 81.80JPM Emerging Markets Debt C (irc) - AUD (hedged) 10.57 - -JPM Emerging Markets Debt C (irc) - CAD (hedged) 10.48 - -JPM Emerging Markets Debt C (irc) - NZD (hedged) 10.58 - -JPM Emerging Markets Debt C (mth) - EUR (hedged) 92.83 - -JPM Emerging Markets Debt C (mth) - HKD 10.43 - -JPM Emerging Markets Debt C (mth) - USD 99.93 98.12 -JPM Emerging Markets Debt D (acc) - EUR (hedged) 15.79 14.87 15.33JPM Emerging Markets Debt I (acc) - EUR (hedged) 85.39 79.23 80.32JPM Emerging Markets Debt I (acc) - USD 115.60 106.46 107.60JPM Emerging Markets Debt I (dist) - CHF (hedged) 99.63 94.28 -JPM Emerging Markets Debt I (dist) - USD 105.22 102.00 107.12JPM Emerging Markets Debt I (inc) - EUR (hedged) 9.98 9.80 10.53JPM Emerging Markets Debt X (acc) - EUR (hedged) 92.14 85.06 85.80JPM Emerging Markets Debt X (acc) - GBP (hedged) 87.21 79.85 80.07JPM Emerging Markets Debt X (acc) - USD 107.21 98.23 -JPM Emerging Markets Debt X (dist) - USD 101.60 98.55 105.25
(5) This Sub-Fund was renamed from JPMorgan Funds - Eastern Europe Equity Fund to JPMorgan Funds - Emerging Europe Equity Fund on 30 September 2015.
39
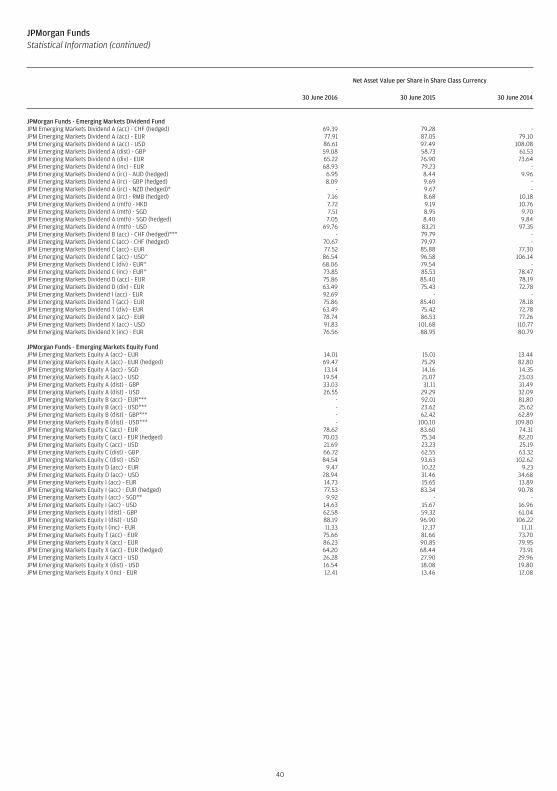
JPMorgan FundsStatistical Information (continued)
Net Asset Value per Share in Share Class Currency
30 June 2016 30 June 2015 30 June 2014
JPMorgan Funds - Emerging Markets Dividend FundJPM Emerging Markets Dividend A (acc) - CHF (hedged) 69.39 79.28 -JPM Emerging Markets Dividend A (acc) - EUR 77.91 87.05 79.10JPM Emerging Markets Dividend A (acc) - USD 86.61 97.49 108.08JPM Emerging Markets Dividend A (dist) - GBP 59.08 58.73 61.53JPM Emerging Markets Dividend A (div) - EUR 65.22 76.90 73.64JPM Emerging Markets Dividend A (inc) - EUR 68.93 79.23 -JPM Emerging Markets Dividend A (irc) - AUD (hedged) 6.95 8.44 9.96JPM Emerging Markets Dividend A (irc) - GBP (hedged) 8.09 9.69 -JPM Emerging Markets Dividend A (irc) - NZD (hedged)* - 9.67 -JPM Emerging Markets Dividend A (irc) - RMB (hedged) 7.16 8.68 10.18JPM Emerging Markets Dividend A (mth) - HKD 7.72 9.19 10.76JPM Emerging Markets Dividend A (mth) - SGD 7.51 8.95 9.70JPM Emerging Markets Dividend A (mth) - SGD (hedged) 7.05 8.40 9.84JPM Emerging Markets Dividend A (mth) - USD 69.76 83.21 97.35JPM Emerging Markets Dividend B (acc) - CHF (hedged)*** - 79.79 -JPM Emerging Markets Dividend C (acc) - CHF (hedged) 70.67 79.97 -JPM Emerging Markets Dividend C (acc) - EUR 77.52 85.88 77.30JPM Emerging Markets Dividend C (acc) - USD^ 86.54 96.58 106.14JPM Emerging Markets Dividend C (div) - EUR^ 68.06 79.54 -JPM Emerging Markets Dividend C (inc) - EUR^ 73.85 85.53 78.47JPM Emerging Markets Dividend D (acc) - EUR 75.86 85.40 78.19JPM Emerging Markets Dividend D (div) - EUR 63.49 75.43 72.78JPM Emerging Markets Dividend I (acc) - EUR 92.69 - -JPM Emerging Markets Dividend T (acc) - EUR 75.86 85.40 78.18JPM Emerging Markets Dividend T (div) - EUR 63.49 75.42 72.78JPM Emerging Markets Dividend X (acc) - EUR 78.74 86.53 77.26JPM Emerging Markets Dividend X (acc) - USD 91.83 101.68 110.77JPM Emerging Markets Dividend X (inc) - EUR 76.56 88.95 80.79
JPMorgan Funds - Emerging Markets Equity FundJPM Emerging Markets Equity A (acc) - EUR 14.01 15.01 13.44JPM Emerging Markets Equity A (acc) - EUR (hedged) 69.47 75.29 82.80JPM Emerging Markets Equity A (acc) - SGD 13.14 14.16 14.35JPM Emerging Markets Equity A (acc) - USD 19.54 21.07 23.03JPM Emerging Markets Equity A (dist) - GBP 33.03 31.11 31.49JPM Emerging Markets Equity A (dist) - USD 26.55 29.29 32.09JPM Emerging Markets Equity B (acc) - EUR*** - 92.01 81.80JPM Emerging Markets Equity B (acc) - USD*** - 23.62 25.62JPM Emerging Markets Equity B (dist) - GBP*** - 62.42 62.89JPM Emerging Markets Equity B (dist) - USD*** - 100.10 109.80JPM Emerging Markets Equity C (acc) - EUR 78.62 83.60 74.31JPM Emerging Markets Equity C (acc) - EUR (hedged) 70.03 75.34 82.20JPM Emerging Markets Equity C (acc) - USD 21.69 23.23 25.19JPM Emerging Markets Equity C (dist) - GBP 66.72 62.55 63.32JPM Emerging Markets Equity C (dist) - USD 84.54 93.63 102.62JPM Emerging Markets Equity D (acc) - EUR 9.47 10.22 9.23JPM Emerging Markets Equity D (acc) - USD 28.94 31.46 34.68JPM Emerging Markets Equity I (acc) - EUR 14.73 15.65 13.89JPM Emerging Markets Equity I (acc) - EUR (hedged) 77.53 83.34 90.78JPM Emerging Markets Equity I (acc) - SGD** 9.92 - -JPM Emerging Markets Equity I (acc) - USD 14.63 15.67 16.96JPM Emerging Markets Equity I (dist) - GBP 62.58 59.32 61.04JPM Emerging Markets Equity I (dist) - USD 88.19 96.90 106.22JPM Emerging Markets Equity I (inc) - EUR 11.33 12.37 11.11JPM Emerging Markets Equity T (acc) - EUR 75.66 81.66 73.70JPM Emerging Markets Equity X (acc) - EUR 86.23 90.85 79.95JPM Emerging Markets Equity X (acc) - EUR (hedged) 64.20 68.44 73.91JPM Emerging Markets Equity X (acc) - USD 26.28 27.90 29.96JPM Emerging Markets Equity X (dist) - USD 16.54 18.08 19.80JPM Emerging Markets Equity X (inc) - EUR 12.41 13.46 12.08
40
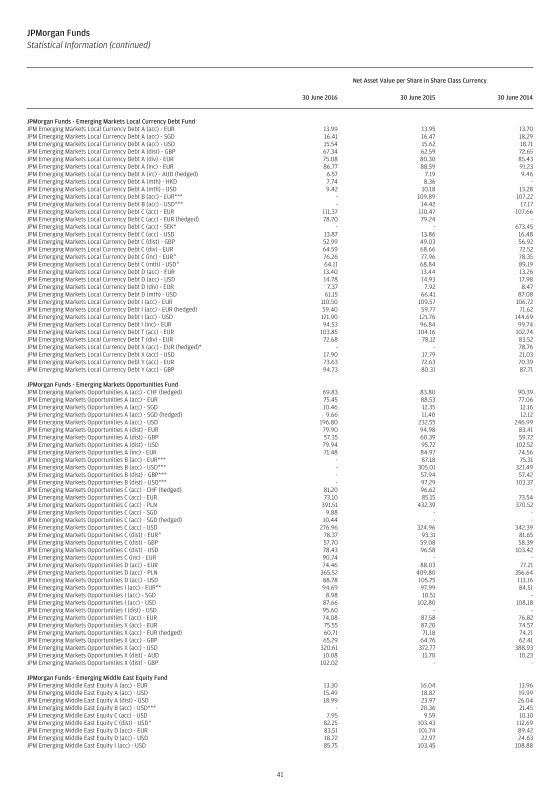
JPMorgan FundsStatistical Information (continued)
Net Asset Value per Share in Share Class Currency
30 June 2016 30 June 2015 30 June 2014
JPMorgan Funds - Emerging Markets Local Currency Debt FundJPM Emerging Markets Local Currency Debt A (acc) - EUR 13.99 13.95 13.70JPM Emerging Markets Local Currency Debt A (acc) - SGD 16.41 16.47 18.29JPM Emerging Markets Local Currency Debt A (acc) - USD 15.54 15.62 18.71JPM Emerging Markets Local Currency Debt A (dist) - GBP 67.34 62.59 72.65JPM Emerging Markets Local Currency Debt A (div) - EUR 75.08 80.30 85.43JPM Emerging Markets Local Currency Debt A (inc) - EUR 86.77 88.59 91.23JPM Emerging Markets Local Currency Debt A (irc) - AUD (hedged) 6.57 7.19 9.46JPM Emerging Markets Local Currency Debt A (mth) - HKD 7.74 8.36 -JPM Emerging Markets Local Currency Debt A (mth) - USD 9.42 10.18 13.28JPM Emerging Markets Local Currency Debt B (acc) - EUR*** - 109.89 107.22JPM Emerging Markets Local Currency Debt B (acc) - USD*** - 14.42 17.17JPM Emerging Markets Local Currency Debt C (acc) - EUR 111.37 110.47 107.66JPM Emerging Markets Local Currency Debt C (acc) - EUR (hedged) 78.70 79.24 -JPM Emerging Markets Local Currency Debt C (acc) - SEK* - - 673.45JPM Emerging Markets Local Currency Debt C (acc) - USD 13.87 13.86 16.48JPM Emerging Markets Local Currency Debt C (dist) - GBP 52.99 49.03 56.92JPM Emerging Markets Local Currency Debt C (div) - EUR 64.59 68.66 72.52JPM Emerging Markets Local Currency Debt C (inc) - EUR^ 76.26 77.96 78.35JPM Emerging Markets Local Currency Debt C (mth) - USD^ 64.11 68.84 89.19JPM Emerging Markets Local Currency Debt D (acc) - EUR 13.40 13.44 13.26JPM Emerging Markets Local Currency Debt D (acc) - USD 14.78 14.93 17.98JPM Emerging Markets Local Currency Debt D (div) - EUR 7.37 7.92 8.47JPM Emerging Markets Local Currency Debt D (mth) - USD 61.15 66.41 87.08JPM Emerging Markets Local Currency Debt I (acc) - EUR 110.50 109.57 106.72JPM Emerging Markets Local Currency Debt I (acc) - EUR (hedged) 59.40 59.77 71.62JPM Emerging Markets Local Currency Debt I (acc) - USD 121.90 121.76 144.69JPM Emerging Markets Local Currency Debt I (inc) - EUR 94.53 96.84 99.74JPM Emerging Markets Local Currency Debt T (acc) - EUR 103.85 104.16 102.74JPM Emerging Markets Local Currency Debt T (div) - EUR 72.68 78.12 83.52JPM Emerging Markets Local Currency Debt X (acc) - EUR (hedged)* - - 78.76JPM Emerging Markets Local Currency Debt X (acc) - USD 17.90 17.79 21.03JPM Emerging Markets Local Currency Debt Y (acc) - EUR 73.63 72.63 70.39JPM Emerging Markets Local Currency Debt Y (acc) - GBP 94.73 80.31 87.71
JPMorgan Funds - Emerging Markets Opportunities FundJPM Emerging Markets Opportunities A (acc) - CHF (hedged) 69.83 83.80 90.39JPM Emerging Markets Opportunities A (acc) - EUR 75.45 88.53 77.06JPM Emerging Markets Opportunities A (acc) - SGD 10.46 12.35 12.16JPM Emerging Markets Opportunities A (acc) - SGD (hedged) 9.66 11.40 12.12JPM Emerging Markets Opportunities A (acc) - USD 196.80 232.55 246.99JPM Emerging Markets Opportunities A (dist) - EUR 79.90 94.98 83.41JPM Emerging Markets Opportunities A (dist) - GBP 57.35 60.39 59.72JPM Emerging Markets Opportunities A (dist) - USD 79.94 95.72 102.52JPM Emerging Markets Opportunities A (inc) - EUR 71.48 84.97 74.56JPM Emerging Markets Opportunities B (acc) - EUR*** - 87.18 75.31JPM Emerging Markets Opportunities B (acc) - USD*** - 305.01 321.49JPM Emerging Markets Opportunities B (dist) - GBP*** - 57.94 57.42JPM Emerging Markets Opportunities B (dist) - USD*** - 97.29 103.37JPM Emerging Markets Opportunities C (acc) - CHF (hedged) 81.20 96.62 -JPM Emerging Markets Opportunities C (acc) - EUR 73.10 85.15 73.54JPM Emerging Markets Opportunities C (acc) - PLN 391.51 432.39 370.52JPM Emerging Markets Opportunities C (acc) - SGD 9.88 - -JPM Emerging Markets Opportunities C (acc) - SGD (hedged) 10.44 - -JPM Emerging Markets Opportunities C (acc) - USD 276.96 324.96 342.39JPM Emerging Markets Opportunities C (dist) - EUR^ 78.37 93.31 81.65JPM Emerging Markets Opportunities C (dist) - GBP 57.70 59.08 58.39JPM Emerging Markets Opportunities C (dist) - USD 78.43 96.58 103.42JPM Emerging Markets Opportunities C (inc) - EUR 90.74 - -JPM Emerging Markets Opportunities D (acc) - EUR 74.46 88.03 77.21JPM Emerging Markets Opportunities D (acc) - PLN 365.52 409.80 356.64JPM Emerging Markets Opportunities D (acc) - USD 88.78 105.75 113.16JPM Emerging Markets Opportunities I (acc) - EUR** 94.69 97.99 84.51JPM Emerging Markets Opportunities I (acc) - SGD 8.98 10.51 -JPM Emerging Markets Opportunities I (acc) - USD 87.66 102.80 108.18JPM Emerging Markets Opportunities I (dist) - USD 95.60 - -JPM Emerging Markets Opportunities T (acc) - EUR 74.08 87.58 76.82JPM Emerging Markets Opportunities X (acc) - EUR 75.55 87.20 74.57JPM Emerging Markets Opportunities X (acc) - EUR (hedged) 60.71 71.18 74.21JPM Emerging Markets Opportunities X (acc) - GBP 65.29 64.76 62.41JPM Emerging Markets Opportunities X (acc) - USD 320.61 372.77 388.93JPM Emerging Markets Opportunities X (dist) - AUD 10.08 11.70 10.23JPM Emerging Markets Opportunities X (dist) - GBP 102.02 - -
JPMorgan Funds - Emerging Middle East Equity FundJPM Emerging Middle East Equity A (acc) - EUR 13.30 16.04 13.96JPM Emerging Middle East Equity A (acc) - USD 15.49 18.82 19.99JPM Emerging Middle East Equity A (dist) - USD 18.99 23.97 26.04JPM Emerging Middle East Equity B (acc) - USD*** - 20.36 21.45JPM Emerging Middle East Equity C (acc) - USD 7.95 9.59 10.10JPM Emerging Middle East Equity C (dist) - USD^ 82.25 103.43 112.69JPM Emerging Middle East Equity D (acc) - EUR 83.51 101.74 89.42JPM Emerging Middle East Equity D (acc) - USD 18.72 22.97 24.63JPM Emerging Middle East Equity I (acc) - USD 85.75 103.45 108.88
41
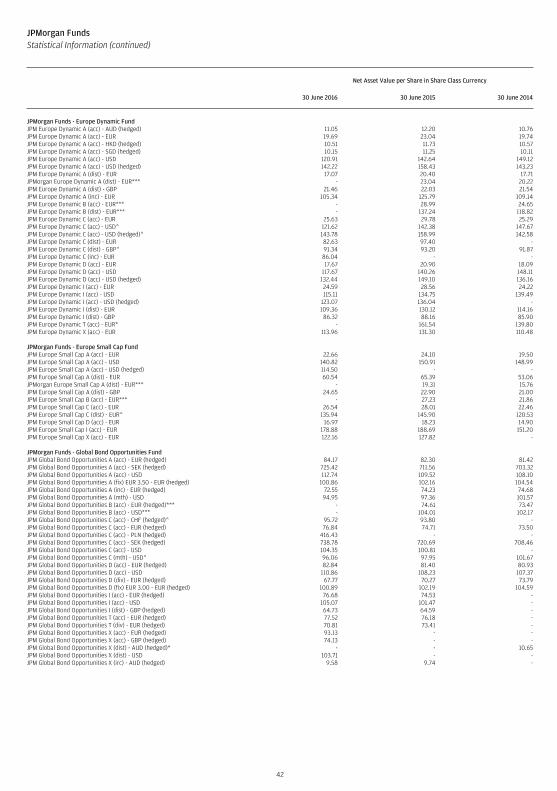
JPMorgan FundsStatistical Information (continued)
Net Asset Value per Share in Share Class Currency
30 June 2016 30 June 2015 30 June 2014
JPMorgan Funds - Europe Dynamic FundJPM Europe Dynamic A (acc) - AUD (hedged) 11.05 12.20 10.76JPM Europe Dynamic A (acc) - EUR 19.69 23.04 19.74JPM Europe Dynamic A (acc) - HKD (hedged) 10.51 11.73 10.57JPM Europe Dynamic A (acc) - SGD (hedged) 10.15 11.25 10.11JPM Europe Dynamic A (acc) - USD 120.91 142.64 149.12JPM Europe Dynamic A (acc) - USD (hedged) 142.22 158.43 143.23JPM Europe Dynamic A (dist) - EUR 17.07 20.40 17.71JPMorgan Europe Dynamic A (dist) - EUR*** - 23.04 20.22JPM Europe Dynamic A (dist) - GBP 21.46 22.03 21.54JPM Europe Dynamic A (inc) - EUR 105.34 125.79 109.14JPM Europe Dynamic B (acc) - EUR*** - 28.99 24.65JPM Europe Dynamic B (dist) - EUR*** - 137.24 118.82JPM Europe Dynamic C (acc) - EUR 25.63 29.78 25.29JPM Europe Dynamic C (acc) - USD^ 121.62 142.38 147.67JPM Europe Dynamic C (acc) - USD (hedged)^ 143.78 158.99 142.58JPM Europe Dynamic C (dist) - EUR 82.63 97.40 -JPM Europe Dynamic C (dist) - GBP^ 91.34 93.20 91.87JPM Europe Dynamic C (inc) - EUR 86.04 - -JPM Europe Dynamic D (acc) - EUR 17.67 20.90 18.09JPM Europe Dynamic D (acc) - USD 117.67 140.26 148.11JPM Europe Dynamic D (acc) - USD (hedged) 132.44 149.10 136.16JPM Europe Dynamic I (acc) - EUR 24.59 28.56 24.22JPM Europe Dynamic I (acc) - USD 115.11 134.75 139.49JPM Europe Dynamic I (acc) - USD (hedged) 123.07 136.04 -JPM Europe Dynamic I (dist) - EUR 109.36 130.12 114.16JPM Europe Dynamic I (dist) - GBP 86.32 88.16 85.90JPM Europe Dynamic T (acc) - EUR* - 161.54 139.80JPM Europe Dynamic X (acc) - EUR 113.96 131.30 110.48
JPMorgan Funds - Europe Small Cap FundJPM Europe Small Cap A (acc) - EUR 22.66 24.10 19.50JPM Europe Small Cap A (acc) - USD 140.82 150.91 148.99JPM Europe Small Cap A (acc) - USD (hedged) 114.50 - -JPM Europe Small Cap A (dist) - EUR 60.54 65.39 53.06JPMorgan Europe Small Cap A (dist) - EUR*** - 19.31 15.76JPM Europe Small Cap A (dist) - GBP 24.65 22.90 21.00JPM Europe Small Cap B (acc) - EUR*** - 27.23 21.86JPM Europe Small Cap C (acc) - EUR 26.54 28.01 22.46JPM Europe Small Cap C (dist) - EUR^ 135.94 145.90 120.53JPM Europe Small Cap D (acc) - EUR 16.97 18.23 14.90JPM Europe Small Cap I (acc) - EUR 178.88 188.69 151.20JPM Europe Small Cap X (acc) - EUR 122.16 127.82 -
JPMorgan Funds - Global Bond Opportunities FundJPM Global Bond Opportunities A (acc) - EUR (hedged) 84.17 82.30 81.42JPM Global Bond Opportunities A (acc) - SEK (hedged) 725.42 711.56 703.32JPM Global Bond Opportunities A (acc) - USD 112.74 109.52 108.10JPM Global Bond Opportunities A (fix) EUR 3.50 - EUR (hedged) 100.86 102.16 104.54JPM Global Bond Opportunities A (inc) - EUR (hedged) 72.55 74.23 74.68JPM Global Bond Opportunities A (mth) - USD 94.95 97.36 101.57JPM Global Bond Opportunities B (acc) - EUR (hedged)*** - 74.61 73.47JPM Global Bond Opportunities B (acc) - USD*** - 104.01 102.17JPM Global Bond Opportunities C (acc) - CHF (hedged)^ 95.72 93.80 -JPM Global Bond Opportunities C (acc) - EUR (hedged) 76.84 74.71 73.50JPM Global Bond Opportunities C (acc) - PLN (hedged) 416.43 - -JPM Global Bond Opportunities C (acc) - SEK (hedged) 738.78 720.69 708.46JPM Global Bond Opportunities C (acc) - USD 104.35 100.81 -JPM Global Bond Opportunities C (mth) - USD^ 96.06 97.95 101.67JPM Global Bond Opportunities D (acc) - EUR (hedged) 82.84 81.40 80.93JPM Global Bond Opportunities D (acc) - USD 110.86 108.23 107.37JPM Global Bond Opportunities D (div) - EUR (hedged) 67.77 70.27 73.79JPM Global Bond Opportunities D (fix) EUR 3.00 - EUR (hedged) 100.89 102.19 104.59JPM Global Bond Opportunities I (acc) - EUR (hedged) 76.68 74.53 -JPM Global Bond Opportunities I (acc) - USD 105.07 101.47 -JPM Global Bond Opportunities I (dist) - GBP (hedged) 64.73 64.59 -JPM Global Bond Opportunities T (acc) - EUR (hedged) 77.52 76.18 -JPM Global Bond Opportunities T (div) - EUR (hedged) 70.81 73.41 -JPM Global Bond Opportunities X (acc) - EUR (hedged) 93.13 - -JPM Global Bond Opportunities X (acc) - GBP (hedged) 74.13 - -JPM Global Bond Opportunities X (dist) - AUD (hedged)* - - 10.65JPM Global Bond Opportunities X (dist) - USD 103.71 - -JPM Global Bond Opportunities X (irc) - AUD (hedged) 9.58 9.74 -
42
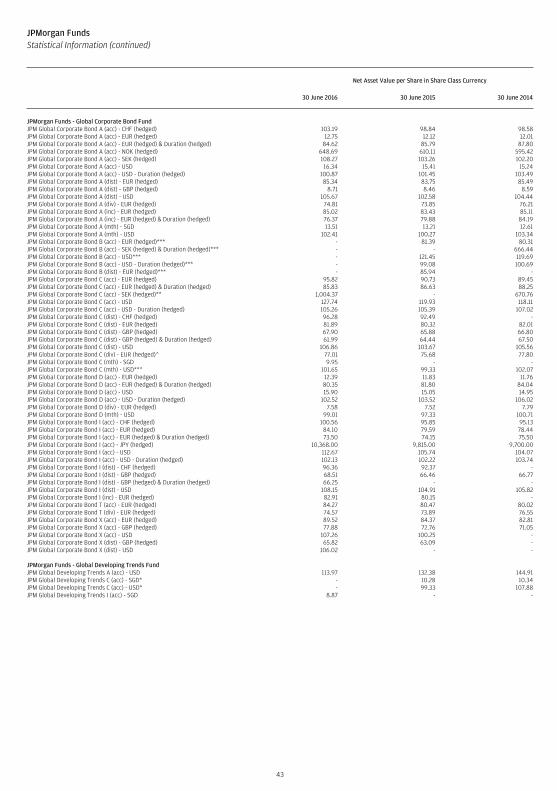
JPMorgan FundsStatistical Information (continued)
Net Asset Value per Share in Share Class Currency
30 June 2016 30 June 2015 30 June 2014
JPMorgan Funds - Global Corporate Bond FundJPM Global Corporate Bond A (acc) - CHF (hedged) 103.19 98.84 98.58JPM Global Corporate Bond A (acc) - EUR (hedged) 12.75 12.12 12.01JPM Global Corporate Bond A (acc) - EUR (hedged) & Duration (hedged) 84.62 85.79 87.80JPM Global Corporate Bond A (acc) - NOK (hedged) 648.69 610.11 595.42JPM Global Corporate Bond A (acc) - SEK (hedged) 108.27 103.26 102.20JPM Global Corporate Bond A (acc) - USD 16.34 15.41 15.24JPM Global Corporate Bond A (acc) - USD - Duration (hedged) 100.87 101.45 103.49JPM Global Corporate Bond A (dist) - EUR (hedged) 85.34 83.75 85.49JPM Global Corporate Bond A (dist) - GBP (hedged) 8.71 8.46 8.59JPM Global Corporate Bond A (dist) - USD 105.67 102.58 104.44JPM Global Corporate Bond A (div) - EUR (hedged) 74.81 73.85 76.21JPM Global Corporate Bond A (inc) - EUR (hedged) 85.02 83.43 85.11JPM Global Corporate Bond A (inc) - EUR (hedged) & Duration (hedged) 76.37 79.88 84.19JPM Global Corporate Bond A (mth) - SGD 13.51 13.21 12.61JPM Global Corporate Bond A (mth) - USD 102.41 100.27 103.34JPM Global Corporate Bond B (acc) - EUR (hedged)*** - 81.39 80.31JPM Global Corporate Bond B (acc) - SEK (hedged) & Duration (hedged)*** - - 666.44JPM Global Corporate Bond B (acc) - USD*** - 121.45 119.69JPM Global Corporate Bond B (acc) - USD - Duration (hedged)*** - 99.08 100.69JPM Global Corporate Bond B (dist) - EUR (hedged)*** - 85.94 -JPM Global Corporate Bond C (acc) - EUR (hedged) 95.82 90.73 89.45JPM Global Corporate Bond C (acc) - EUR (hedged) & Duration (hedged) 85.83 86.63 88.25JPM Global Corporate Bond C (acc) - SEK (hedged)** 1,004.37 - 670.76JPM Global Corporate Bond C (acc) - USD 127.74 119.93 118.11JPM Global Corporate Bond C (acc) - USD - Duration (hedged) 105.26 105.39 107.02JPM Global Corporate Bond C (dist) - CHF (hedged) 96.28 92.49 -JPM Global Corporate Bond C (dist) - EUR (hedged) 81.89 80.32 82.01JPM Global Corporate Bond C (dist) - GBP (hedged) 67.90 65.88 66.80JPM Global Corporate Bond C (dist) - GBP (hedged) & Duration (hedged) 61.99 64.44 67.50JPM Global Corporate Bond C (dist) - USD 106.86 103.67 105.56JPM Global Corporate Bond C (div) - EUR (hedged)^ 77.01 75.68 77.80JPM Global Corporate Bond C (mth) - SGD 9.95 - -JPM Global Corporate Bond C (mth) - USD**^ 101.65 99.33 102.07JPM Global Corporate Bond D (acc) - EUR (hedged) 12.39 11.83 11.76JPM Global Corporate Bond D (acc) - EUR (hedged) & Duration (hedged) 80.35 81.80 84.04JPM Global Corporate Bond D (acc) - USD 15.90 15.05 14.95JPM Global Corporate Bond D (acc) - USD - Duration (hedged) 102.52 103.52 106.02JPM Global Corporate Bond D (div) - EUR (hedged) 7.58 7.52 7.79JPM Global Corporate Bond D (mth) - USD 99.01 97.33 100.71JPM Global Corporate Bond I (acc) - CHF (hedged) 100.56 95.85 95.13JPM Global Corporate Bond I (acc) - EUR (hedged) 84.10 79.59 78.44JPM Global Corporate Bond I (acc) - EUR (hedged) & Duration (hedged) 73.50 74.15 75.50JPM Global Corporate Bond I (acc) - JPY (hedged) 10,368.00 9,815.00 9,700.00JPM Global Corporate Bond I (acc) - USD 112.67 105.74 104.07JPM Global Corporate Bond I (acc) - USD - Duration (hedged) 102.13 102.22 103.74JPM Global Corporate Bond I (dist) - CHF (hedged) 96.36 92.37 -JPM Global Corporate Bond I (dist) - GBP (hedged) 68.51 66.46 66.77JPM Global Corporate Bond I (dist) - GBP (hedged) & Duration (hedged) 66.25 - -JPM Global Corporate Bond I (dist) - USD 108.15 104.91 105.82JPM Global Corporate Bond I (inc) - EUR (hedged) 82.91 80.15 -JPM Global Corporate Bond T (acc) - EUR (hedged) 84.27 80.47 80.02JPM Global Corporate Bond T (div) - EUR (hedged) 74.57 73.89 76.55JPM Global Corporate Bond X (acc) - EUR (hedged) 89.52 84.37 82.81JPM Global Corporate Bond X (acc) - GBP (hedged) 77.88 72.76 71.05JPM Global Corporate Bond X (acc) - USD 107.26 100.25 -JPM Global Corporate Bond X (dist) - GBP (hedged) 65.82 63.09 -JPM Global Corporate Bond X (dist) - USD 106.02 - -
JPMorgan Funds - Global Developing Trends FundJPM Global Developing Trends A (acc) - USD 113.97 132.38 144.91JPM Global Developing Trends C (acc) - SGD* - 10.28 10.34JPM Global Developing Trends C (acc) - USD* - 99.33 107.88JPM Global Developing Trends I (acc) - SGD 8.87 - -
43
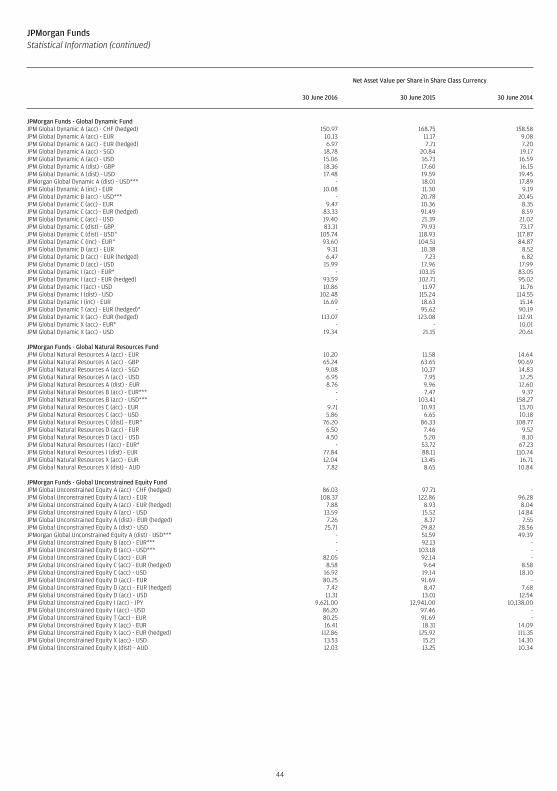
JPMorgan FundsStatistical Information (continued)
Net Asset Value per Share in Share Class Currency
30 June 2016 30 June 2015 30 June 2014
JPMorgan Funds - Global Dynamic FundJPM Global Dynamic A (acc) - CHF (hedged) 150.97 168.75 158.58JPM Global Dynamic A (acc) - EUR 10.13 11.17 9.08JPM Global Dynamic A (acc) - EUR (hedged) 6.97 7.71 7.20JPM Global Dynamic A (acc) - SGD 18.78 20.84 19.17JPM Global Dynamic A (acc) - USD 15.06 16.73 16.59JPM Global Dynamic A (dist) - GBP 18.36 17.60 16.15JPM Global Dynamic A (dist) - USD 17.48 19.59 19.45JPMorgan Global Dynamic A (dist) - USD*** - 18.01 17.89JPM Global Dynamic A (inc) - EUR 10.08 11.30 9.19JPM Global Dynamic B (acc) - USD*** - 20.78 20.45JPM Global Dynamic C (acc) - EUR 9.47 10.36 8.35JPM Global Dynamic C (acc) - EUR (hedged) 83.33 91.49 8.59JPM Global Dynamic C (acc) - USD 19.40 21.39 21.02JPM Global Dynamic C (dist) - GBP 83.31 79.93 73.17JPM Global Dynamic C (dist) - USD^ 105.74 118.93 117.87JPM Global Dynamic C (inc) - EUR^ 93.60 104.51 84.87JPM Global Dynamic D (acc) - EUR 9.31 10.38 8.52JPM Global Dynamic D (acc) - EUR (hedged) 6.47 7.23 6.82JPM Global Dynamic D (acc) - USD 15.99 17.96 17.99JPM Global Dynamic I (acc) - EUR* - 103.15 83.05JPM Global Dynamic I (acc) - EUR (hedged) 93.59 102.71 95.02JPM Global Dynamic I (acc) - USD 10.86 11.97 11.76JPM Global Dynamic I (dist) - USD 102.48 115.24 114.55JPM Global Dynamic I (inc) - EUR 16.69 18.63 15.14JPM Global Dynamic T (acc) - EUR (hedged)* - 95.62 90.19JPM Global Dynamic X (acc) - EUR (hedged) 113.07 123.08 112.91JPM Global Dynamic X (acc) - EUR* - - 10.01JPM Global Dynamic X (acc) - USD 19.34 21.15 20.61
JPMorgan Funds - Global Natural Resources FundJPM Global Natural Resources A (acc) - EUR 10.20 11.58 14.64JPM Global Natural Resources A (acc) - GBP 65.24 63.65 90.69JPM Global Natural Resources A (acc) - SGD 9.08 10.37 14.83JPM Global Natural Resources A (acc) - USD 6.95 7.95 12.25JPM Global Natural Resources A (dist) - EUR 8.76 9.96 12.60JPM Global Natural Resources B (acc) - EUR*** - 7.47 9.37JPM Global Natural Resources B (acc) - USD*** - 103.41 158.27JPM Global Natural Resources C (acc) - EUR 9.71 10.93 13.70JPM Global Natural Resources C (acc) - USD 5.86 6.65 10.18JPM Global Natural Resources C (dist) - EUR^ 76.20 86.33 108.77JPM Global Natural Resources D (acc) - EUR 6.50 7.46 9.52JPM Global Natural Resources D (acc) - USD 4.50 5.20 8.10JPM Global Natural Resources I (acc) - EUR* - 53.72 67.23JPM Global Natural Resources I (dist) - EUR 77.84 88.11 110.74JPM Global Natural Resources X (acc) - EUR 12.04 13.45 16.71JPM Global Natural Resources X (dist) - AUD 7.82 8.65 10.84
JPMorgan Funds - Global Unconstrained Equity FundJPM Global Unconstrained Equity A (acc) - CHF (hedged) 86.03 97.71 -JPM Global Unconstrained Equity A (acc) - EUR 108.37 122.86 96.28JPM Global Unconstrained Equity A (acc) - EUR (hedged) 7.88 8.93 8.04JPM Global Unconstrained Equity A (acc) - USD 13.59 15.52 14.84JPM Global Unconstrained Equity A (dist) - EUR (hedged) 7.26 8.37 7.55JPM Global Unconstrained Equity A (dist) - USD 25.71 29.82 28.56JPMorgan Global Unconstrained Equity A (dist) - USD*** - 51.59 49.39JPM Global Unconstrained Equity B (acc) - EUR*** - 92.13 -JPM Global Unconstrained Equity B (acc) - USD*** - 103.18 -JPM Global Unconstrained Equity C (acc) - EUR 82.05 92.14 -JPM Global Unconstrained Equity C (acc) - EUR (hedged) 8.58 9.64 8.58JPM Global Unconstrained Equity C (acc) - USD 16.92 19.14 18.10JPM Global Unconstrained Equity D (acc) - EUR 80.25 91.69 -JPM Global Unconstrained Equity D (acc) - EUR (hedged) 7.42 8.47 7.68JPM Global Unconstrained Equity D (acc) - USD 11.31 13.01 12.54JPM Global Unconstrained Equity I (acc) - JPY 9,621.00 12,941.00 10,138.00JPM Global Unconstrained Equity I (acc) - USD 86.20 97.46 -JPM Global Unconstrained Equity T (acc) - EUR 80.25 91.69 -JPM Global Unconstrained Equity X (acc) - EUR 16.41 18.31 14.09JPM Global Unconstrained Equity X (acc) - EUR (hedged) 112.86 125.92 111.35JPM Global Unconstrained Equity X (acc) - USD 13.53 15.21 14.30JPM Global Unconstrained Equity X (dist) - AUD 12.03 13.25 10.34
44

JPMorgan FundsStatistical Information (continued)
Net Asset Value per Share in Share Class Currency
30 June 2016 30 June 2015 30 June 2014
JPMorgan Funds - Greater China FundJPM Greater China A (acc) - SGD# 16.48 20.32 16.37JPM Greater China A (acc) - USD# 24.28 29.97 26.03JPM Greater China A (dist) - HKD# 12.25 15.50 13.55JPM Greater China A (dist) - USD# 28.92 36.63 31.96JPMorgan Greater China B (acc) - USD*** - 27.48 23.69JPMorgan Greater China B (dist) - USD*** - 131.49 114.72JPM Greater China C (acc) - EUR# 80.37 97.66 -JPM Greater China C (acc) - SGD# 8.86 - -JPM Greater China C (acc) - USD# 27.31 33.44 28.79JPM Greater China C (dist) - USD# 95.65 120.46 104.83JPM Greater China D (acc) - EUR# 108.59 134.43 96.67JPM Greater China D (acc) - USD# 34.55 43.09 37.81JPM Greater China I (acc) - USD# 115.75 141.63 121.76JPM Greater China I (dist) - USD# 97.64 122.90 107.11JPM Greater China T (acc) - EUR# 90.84 112.45 80.87JPM Greater China X (acc) - USD**# 111.88 - -
JPMorgan Funds - Income FundJPM Income Fund A (acc) - EUR (hedged) 75.90 74.61 74.19JPM Income Fund A (acc) - SEK (hedged) 681.88 672.54 667.97JPM Income Fund A (acc) - USD 104.11 101.61 100.75JPM Income Fund A (div) - EUR (hedged) 67.90 70.92 74.19JPM Income Fund A (div) - USD 93.01 96.45 100.75JPM Income Fund A (mth) - HKD 9.59 9.93 -JPM Income Fund A (mth) - USD 9.58 9.93 -JPM Income Fund C (acc) - USD 104.66 - -JPM Income Fund C (div) - EUR (hedged)^ 68.65 71.28 74.21JPM Income Fund D (div) - EUR (hedged) 67.16 70.54 74.18
JPMorgan Funds - India FundJPM India A (acc) - SGD# 17.48 17.92 14.75JPM India A (acc) - USD# 29.32 30.10 26.71JPM India A (dist) - GBP# 104.57 91.96 75.39JPM India A (dist) - USD# 85.94 88.53 78.57JPMorgan India B (acc) - USD*** - 41.43 36.47JPMorgan India B (dist) - USD*** - 141.55 124.65JPM India C (acc) - EUR^# 129.34 130.72 94.34JPM India C (acc) - USD# 32.59 33.18 29.18JPM India C (dist) - USD# 117.82 121.11 108.13JPM India D (acc) - EUR# 103.01 105.85 77.60JPM India D (acc) - USD# 54.84 56.76 50.77JPM India I (acc) - USD# 140.55 143.03 125.65JPM India I (dist) - USD# 129.86 138.93 122.06JPM India T (acc) - EUR# 96.96 99.63 73.04JPM India X (acc) - USD# 38.11 38.49 33.48
JPMorgan Funds - Indonesia Equity FundJPM Indonesia Equity A (acc) - USD# 94.19 89.56 99.12JPMorgan Indonesia Equity B (acc) - USD*** - 68.49 75.19JPM Indonesia Equity C (acc) - USD# 75.21 70.90 77.73JPM Indonesia Equity D (acc) - EUR# 80.58 76.63 70.04JPM Indonesia Equity D (acc) - USD# 91.19 87.36 97.42JPM Indonesia Equity X (acc) - JPY# 8,232.00 9,160.00 8,258.00
JPMorgan Funds - Japan Equity FundJPM Japan Equity A (acc) - EUR# 9.27 8.54 6.01JPM Japan Equity A (acc) - EUR (hedged)# 87.87 96.88 69.17JPM Japan Equity A (acc) - JPY# 949.00 1,047.00 745.00JPM Japan Equity A (acc) - SGD (hedged)# 9.50 - -JPM Japan Equity A (acc) - USD# 12.32 11.43 9.81JPM Japan Equity A (acc) - USD (hedged)# 118.95 132.61 94.59JPM Japan Equity A (dist) - GBP# 11.66 9.24 7.34JPM Japan Equity A (dist) - GBP (hedged)# 72.39 81.05 57.86JPM Japan Equity A (dist) - SGD# 13.71 12.71 10.13JPM Japan Equity A (dist) - USD# 30.89 28.67 24.64JPMorgan Japan Equity B (acc) - USD*** - 13.58 11.57JPMorgan Japan Equity B (dist) - USD*** - 123.79 105.60JPM Japan Equity C (acc) - EUR^# 119.23 108.88 76.02JPM Japan Equity C (acc) - EUR (hedged)# 73.69 - -JPM Japan Equity C (acc) - JPY# 10,127.00 - -JPM Japan Equity C (acc) - USD# 15.14 13.93 11.85JPM Japan Equity C (acc) - USD (hedged)# 124.10 137.26 96.98JPM Japan Equity C (dist) - GBP^# 98.69 77.51 61.09JPM Japan Equity C (dist) - USD# 163.45 150.55 128.38JPM Japan Equity D (acc) - EUR# 7.22 6.70 4.75JPM Japan Equity D (acc) - USD# 9.74 9.10 7.87JPM Japan Equity I (acc) - JPY**# 10,152.00 - -JPM Japan Equity I (acc) - USD# 142.80 131.32 111.58JPM Japan Equity J (dist) - USD# 16.51 15.33 13.17JPM Japan Equity X (acc) - JPY# 8,967.00 - -JPM Japan Equity X (acc) - USD# 15.93 14.54 12.27
45
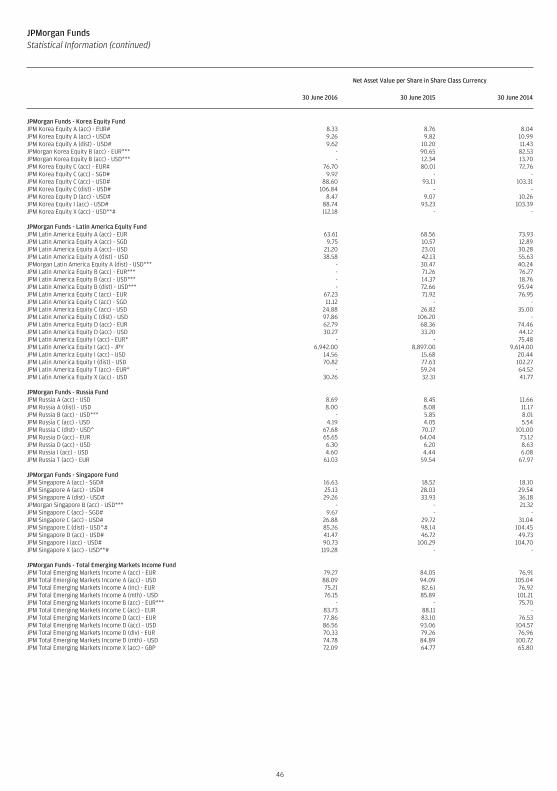
JPMorgan FundsStatistical Information (continued)
Net Asset Value per Share in Share Class Currency
30 June 2016 30 June 2015 30 June 2014
JPMorgan Funds - Korea Equity FundJPM Korea Equity A (acc) - EUR# 8.33 8.76 8.04JPM Korea Equity A (acc) - USD# 9.26 9.82 10.99JPM Korea Equity A (dist) - USD# 9.62 10.20 11.43JPMorgan Korea Equity B (acc) - EUR*** - 90.65 82.53JPMorgan Korea Equity B (acc) - USD*** - 12.34 13.70JPM Korea Equity C (acc) - EUR# 76.70 80.01 72.76JPM Korea Equity C (acc) - SGD# 9.92 - -JPM Korea Equity C (acc) - USD# 88.60 93.11 103.31JPM Korea Equity C (dist) - USD# 106.84 - -JPM Korea Equity D (acc) - USD# 8.47 9.07 10.26JPM Korea Equity I (acc) - USD# 88.74 93.23 103.39JPM Korea Equity X (acc) - USD**# 112.18 - -
JPMorgan Funds - Latin America Equity FundJPM Latin America Equity A (acc) - EUR 63.61 68.56 73.93JPM Latin America Equity A (acc) - SGD 9.75 10.57 12.89JPM Latin America Equity A (acc) - USD 21.20 23.01 30.28JPM Latin America Equity A (dist) - USD 38.58 42.13 55.63JPMorgan Latin America Equity A (dist) - USD*** - 30.47 40.24JPM Latin America Equity B (acc) - EUR*** - 71.26 76.27JPM Latin America Equity B (acc) - USD*** - 14.37 18.76JPM Latin America Equity B (dist) - USD*** - 72.66 95.94JPM Latin America Equity C (acc) - EUR 67.23 71.92 76.95JPM Latin America Equity C (acc) - SGD 11.12 - -JPM Latin America Equity C (acc) - USD 24.88 26.82 35.00JPM Latin America Equity C (dist) - USD 97.86 106.20 -JPM Latin America Equity D (acc) - EUR 62.79 68.36 74.46JPM Latin America Equity D (acc) - USD 30.27 33.20 44.12JPM Latin America Equity I (acc) - EUR* - - 75.48JPM Latin America Equity I (acc) - JPY 6,942.00 8,897.00 9,614.00JPM Latin America Equity I (acc) - USD 14.56 15.68 20.44JPM Latin America Equity I (dist) - USD 70.82 77.63 102.27JPM Latin America Equity T (acc) - EUR* - 59.24 64.52JPM Latin America Equity X (acc) - USD 30.26 32.31 41.77
JPMorgan Funds - Russia FundJPM Russia A (acc) - USD 8.69 8.45 11.66JPM Russia A (dist) - USD 8.00 8.08 11.17JPM Russia B (acc) - USD*** - 5.85 8.01JPM Russia C (acc) - USD 4.19 4.05 5.54JPM Russia C (dist) - USD^ 67.68 70.17 101.00JPM Russia D (acc) - EUR 65.65 64.04 73.12JPM Russia D (acc) - USD 6.30 6.20 8.63JPM Russia I (acc) - USD 4.60 4.44 6.08JPM Russia T (acc) - EUR 61.03 59.54 67.97
JPMorgan Funds - Singapore FundJPM Singapore A (acc) - SGD# 16.63 18.52 18.10JPM Singapore A (acc) - USD# 25.13 28.03 29.54JPM Singapore A (dist) - USD# 29.26 33.93 36.18JPMorgan Singapore B (acc) - USD*** - - 21.32JPM Singapore C (acc) - SGD# 9.67 - -JPM Singapore C (acc) - USD# 26.88 29.72 31.04JPM Singapore C (dist) - USD^# 85.26 98.14 104.45JPM Singapore D (acc) - USD# 41.47 46.72 49.73JPM Singapore I (acc) - USD# 90.73 100.29 104.70JPM Singapore X (acc) - USD**# 119.28 - -
JPMorgan Funds - Total Emerging Markets Income FundJPM Total Emerging Markets Income A (acc) - EUR 79.27 84.05 76.91JPM Total Emerging Markets Income A (acc) - USD 88.09 94.09 105.04JPM Total Emerging Markets Income A (inc) - EUR 75.21 82.61 76.92JPM Total Emerging Markets Income A (mth) - USD 76.15 85.89 101.21JPM Total Emerging Markets Income B (acc) - EUR*** - - 75.70JPM Total Emerging Markets Income C (acc) - EUR 83.73 88.11 -JPM Total Emerging Markets Income D (acc) - EUR 77.86 83.10 76.53JPM Total Emerging Markets Income D (acc) - USD 86.56 93.06 104.57JPM Total Emerging Markets Income D (div) - EUR 70.33 79.26 76.96JPM Total Emerging Markets Income D (mth) - USD 74.78 84.89 100.72JPM Total Emerging Markets Income X (acc) - GBP 72.09 64.77 65.80
46
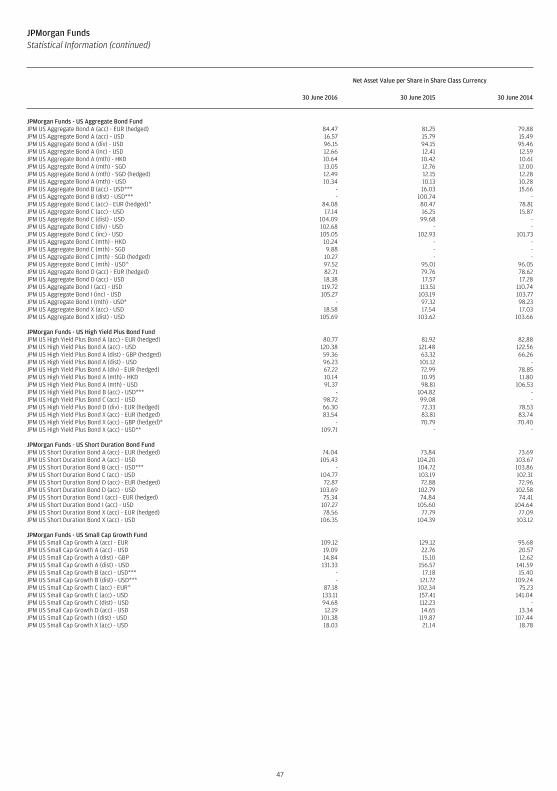
JPMorgan FundsStatistical Information (continued)
Net Asset Value per Share in Share Class Currency
30 June 2016 30 June 2015 30 June 2014
JPMorgan Funds - US Aggregate Bond FundJPM US Aggregate Bond A (acc) - EUR (hedged) 84.47 81.25 79.88JPM US Aggregate Bond A (acc) - USD 16.57 15.79 15.49JPM US Aggregate Bond A (div) - USD 96.15 94.15 95.46JPM US Aggregate Bond A (inc) - USD 12.66 12.41 12.59JPM US Aggregate Bond A (mth) - HKD 10.64 10.42 10.61JPM US Aggregate Bond A (mth) - SGD 13.05 12.76 12.00JPM US Aggregate Bond A (mth) - SGD (hedged) 12.49 12.15 12.28JPM US Aggregate Bond A (mth) - USD 10.34 10.13 10.28JPM US Aggregate Bond B (acc) - USD*** - 16.03 15.66JPM US Aggregate Bond B (dist) - USD*** - 100.74 -JPM US Aggregate Bond C (acc) - EUR (hedged)^ 84.08 80.47 78.81JPM US Aggregate Bond C (acc) - USD 17.14 16.25 15.87JPM US Aggregate Bond C (dist) - USD 104.09 99.68 -JPM US Aggregate Bond C (div) - USD 102.68 - -JPM US Aggregate Bond C (inc) - USD 105.05 102.93 101.73JPM US Aggregate Bond C (mth) - HKD 10.24 - -JPM US Aggregate Bond C (mth) - SGD 9.88 - -JPM US Aggregate Bond C (mth) - SGD (hedged) 10.27 - -JPM US Aggregate Bond C (mth) - USD^ 97.52 95.01 96.05JPM US Aggregate Bond D (acc) - EUR (hedged) 82.71 79.76 78.62JPM US Aggregate Bond D (acc) - USD 18.38 17.57 17.28JPM US Aggregate Bond I (acc) - USD 119.72 113.51 110.74JPM US Aggregate Bond I (inc) - USD 105.27 103.19 103.77JPM US Aggregate Bond I (mth) - USD* - 97.32 98.23JPM US Aggregate Bond X (acc) - USD 18.58 17.54 17.03JPM US Aggregate Bond X (dist) - USD 105.69 103.62 103.66
JPMorgan Funds - US High Yield Plus Bond FundJPM US High Yield Plus Bond A (acc) - EUR (hedged) 80.77 81.92 82.88JPM US High Yield Plus Bond A (acc) - USD 120.38 121.48 122.56JPM US High Yield Plus Bond A (dist) - GBP (hedged) 59.36 63.32 66.26JPM US High Yield Plus Bond A (dist) - USD 96.23 101.12 -JPM US High Yield Plus Bond A (div) - EUR (hedged) 67.22 72.99 78.85JPM US High Yield Plus Bond A (mth) - HKD 10.14 10.95 11.80JPM US High Yield Plus Bond A (mth) - USD 91.37 98.81 106.53JPM US High Yield Plus Bond B (acc) - USD*** - 104.82 -JPM US High Yield Plus Bond C (acc) - USD 98.72 99.08 -JPM US High Yield Plus Bond D (div) - EUR (hedged) 66.30 72.33 78.53JPM US High Yield Plus Bond X (acc) - EUR (hedged) 83.54 83.81 83.74JPM US High Yield Plus Bond X (acc) - GBP (hedged)* - 70.79 70.40JPM US High Yield Plus Bond X (acc) - USD** 109.71 - -
JPMorgan Funds - US Short Duration Bond FundJPM US Short Duration Bond A (acc) - EUR (hedged) 74.04 73.84 73.69JPM US Short Duration Bond A (acc) - USD 105.43 104.20 103.67JPM US Short Duration Bond B (acc) - USD*** - 104.72 103.86JPM US Short Duration Bond C (acc) - USD 104.77 103.19 102.31JPM US Short Duration Bond D (acc) - EUR (hedged) 72.87 72.88 72.96JPM US Short Duration Bond D (acc) - USD 103.69 102.79 102.58JPM US Short Duration Bond I (acc) - EUR (hedged) 75.34 74.84 74.41JPM US Short Duration Bond I (acc) - USD 107.27 105.60 104.64JPM US Short Duration Bond X (acc) - EUR (hedged) 78.56 77.79 77.09JPM US Short Duration Bond X (acc) - USD 106.35 104.39 103.12
JPMorgan Funds - US Small Cap Growth FundJPM US Small Cap Growth A (acc) - EUR 109.12 129.12 95.68JPM US Small Cap Growth A (acc) - USD 19.09 22.76 20.57JPM US Small Cap Growth A (dist) - GBP 14.84 15.10 12.62JPM US Small Cap Growth A (dist) - USD 131.33 156.57 141.59JPM US Small Cap Growth B (acc) - USD*** - 17.18 15.40JPM US Small Cap Growth B (dist) - USD*** - 121.72 109.24JPM US Small Cap Growth C (acc) - EUR^ 87.18 102.34 75.23JPM US Small Cap Growth C (acc) - USD 133.11 157.41 141.04JPM US Small Cap Growth C (dist) - USD 94.68 112.23 -JPM US Small Cap Growth D (acc) - USD 12.19 14.65 13.34JPM US Small Cap Growth I (dist) - USD 101.38 119.87 107.44JPM US Small Cap Growth X (acc) - USD 18.03 21.14 18.78
47
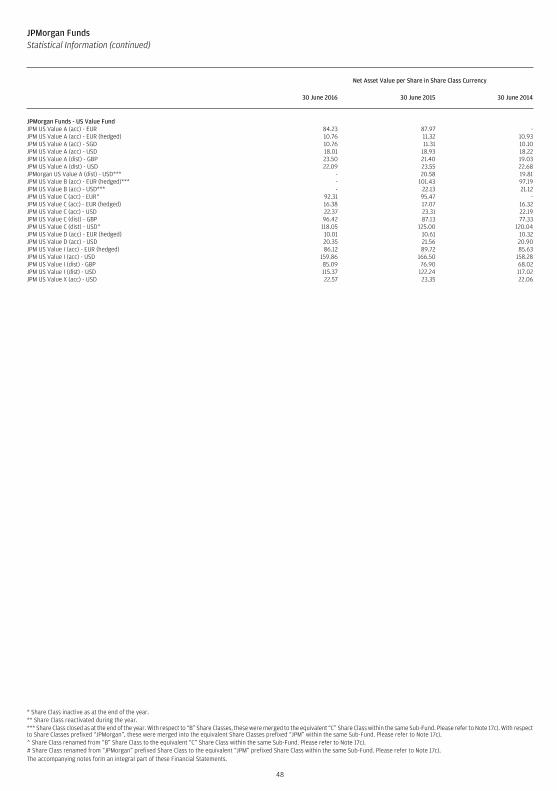
JPMorgan FundsStatistical Information (continued)
Net Asset Value per Share in Share Class Currency
30 June 2016 30 June 2015 30 June 2014
JPMorgan Funds - US Value FundJPM US Value A (acc) - EUR 84.23 87.97 -JPM US Value A (acc) - EUR (hedged) 10.76 11.32 10.93JPM US Value A (acc) - SGD 10.76 11.31 10.10JPM US Value A (acc) - USD 18.01 18.93 18.22JPM US Value A (dist) - GBP 23.50 21.40 19.03JPM US Value A (dist) - USD 22.09 23.55 22.68JPMorgan US Value A (dist) - USD*** - 20.58 19.81JPM US Value B (acc) - EUR (hedged)*** - 101.43 97.19JPM US Value B (acc) - USD*** - 22.13 21.12JPM US Value C (acc) - EUR^ 92.31 95.47 -JPM US Value C (acc) - EUR (hedged) 16.38 17.07 16.32JPM US Value C (acc) - USD 22.37 23.31 22.19JPM US Value C (dist) - GBP 96.42 87.13 77.33JPM US Value C (dist) - USD^ 118.05 125.00 120.04JPM US Value D (acc) - EUR (hedged) 10.01 10.61 10.32JPM US Value D (acc) - USD 20.35 21.56 20.90JPM US Value I (acc) - EUR (hedged) 86.12 89.72 85.63JPM US Value I (acc) - USD 159.86 166.50 158.28JPM US Value I (dist) - GBP 85.09 76.90 68.02JPM US Value I (dist) - USD 115.37 122.24 117.02JPM US Value X (acc) - USD 22.57 23.35 22.06
* Share Class inactive as at the end of the year.** Share Class reactivated during the year.*** Share Class closed as at the end of the year. With respect to “B” Share Classes, these were merged to the equivalent “C” Share Class within the same Sub-Fund. Please refer to Note 17c). With respectto Share Classes prefixed “JPMorgan”, these were merged into the equivalent Share Classes prefixed “JPM” within the same Sub-Fund. Please refer to Note 17c).^ Share Class renamed from “B” Share Class to the equivalent “C” Share Class within the same Sub-Fund. Please refer to Note 17c).# Share Class renamed from “JPMorgan” prefixed Share Class to the equivalent “JPM” prefixed Share Class within the same Sub-Fund. Please refer to Note 17c).The accompanying notes form an integral part of these Financial Statements.
48
1. OrganisationJPMorgan Funds (the “Fund” or the “SICAV”) is an investment company incorporated on 14 April 1969 under the name Multi Trust Fund S.A.. The name of theSICAV was changed to Fleming International Fund on 3 July 1984, to Fleming Flagship Fund on 19 October 1988, to Fleming Funds on 2 June 2000, toJPMorgan Fleming Funds on 19 November 2001 and then to JPMorgan Funds on 12 September 2005.
It is organised under Part I of the Luxembourg Law of 17 December 2010, as amended, on Undertakings for Collective Investment, as amended, as a SociétéAnonyme qualifying as a “Société d’Investissement à Capital Variable” (SICAV). As at 30 June 2016, it comprises 119 Sub-Funds, each relating to a separateinvestment portfolio consisting of securities, cash and other instruments. The law of 10 May 2016 transposing UCITS V into Luxembourg law was published inthe Mémorial A, on 12 May 2016 and entered into force on 1 June 2016. The new law implements Directive 2014/91/EU on undertakings for collectiveinvestment in transferable securities as regards depositary functions, remuneration policies and sanctions, and also introduces a number of changes to theLuxembourg Legislation applicable to investment funds other than UCITS.
On 12 September 2005, JPMorgan Asset Management (Europe) S.à r.l. was appointed by the SICAV to act as Management Company. The Articles ofIncorporation were also modified so the SICAV complies with UCITS III regulations. From 1 July 2011, JPMorgan Asset Management (Europe) S.à r.l. is acting asa Chapter 15 Management Company under the Luxembourg Law of 17 December 2010 and complies with UCITS IV regulations.
The SICAV is registered with the Registre de Commerce et des Sociétés of Luxembourg, under number B 8478.
Each Sub-Fund may contain A, C, D, I, J, P, S, T, X and Y Share Classes. In addition, the JPMorgan Funds - Sterling Managed Reserves (see Note 18a)) maycontain K Share Classes. These Share Classes may differ in the minimum subscription amount, minimum holding amount, currency and/or eligibilityrequirements, the fees and expenses, and the dividend policy applicable to them. Certain Share Classes may charge a Performance Fee and areredenominated by the inclusion of “(perf)” in the name of the Share Class.
Within each Sub-Fund, individual Share Class may have a currency of denomination that differs from the currency of denomination of the Sub-Fund. Thecurrency of denomination for each Share Class is indicated by a suffix on the name of the Share Class.
2. Significant Accounting PoliciesThe Financial Statements are prepared in accordance with Luxembourg regulations (under Lux GAAP) relating to Undertakings for Collective Investment.
a) Investment ValuationTransferable securities which are admitted to an official exchange listing or dealt in on another regulated market are valued on the basis of the latestavailable price prevailing at the time of calculating the net asset value.
If securities are listed or dealt in on several exchanges or markets, the latest available price, or if appropriate, the average price on the principal exchange ormarket will be applied.
Transferable securities not admitted to an official exchange listing nor dealt in on another regulated market are valued at the latest available price. Thosesecurities for which no price is available or for which the latest available price is not representative are valued on the basis of their reasonably foreseeablesales price determined with prudence and in good faith by the Board of Directors.
Securities issued by any open-ended investment funds are valued at the latest available price or net asset value, as reported or provided by such funds ortheir agents.
Liquid assets and money market instruments may be valued at nominal values plus any accrued interest or on an amortised cost basis.
The Financial Statements are presented on the basis of the net asset values of the Sub-Funds calculated on 30 June 2016. In accordance with the Prospectus,the net asset values were calculated using the latest exchange rates known at the time of calculation.
In managing the daily priced funds, the Board’s principle is to ensure that portfolios are appropriately valued to give equal treatment to Shareholders and inthis context the Management Company has implemented a Fair Value Committee (FVC) to address any potential valuation concerns. In line with this, noadjustments were made on 30 June 2016 as the portfolio value at the valuation point represents the same value since closure of the portfolios’ relevantunderlying markets.
b) Swing Pricing AdjustmentA Sub-Fund may suffer dilution of the Net Asset Value per Share due to investors buying or selling Shares in a Sub-Fund at a price that does not reflect thedealing and other costs that arise when security trades are undertaken by the Investment Manager to accommodate cash inflows or outflows.
In order to counter this impact, a Swing Pricing mechanism may be adopted to protect the interests of Shareholders of the SICAV. If on any Valuation Day, theaggregate net transactions in Shares of a Sub-Fund exceed a pre-determined threshold, as determined and reviewed for each Sub-Fund on a periodic basisby the Management Company, the Net Asset Value per Share may be adjusted upwards or downwards to reflect net inflows and net outflows respectively.The net inflows and net outflows will be determined by the Management Company based on the latest available information at the time of calculation of theNet Asset Value per Share. The Swing Pricing mechanism may be applied across all Sub-Funds with the exception of the money market Sub-Funds. Theextent of the price adjustment will be set by the Management Company to reflect dealing and other costs. Such adjustment may vary from Sub-Fund toSub-Fund and will not exceed 2% of the original Net Asset Value per Share. The price adjustment applicable to a specific Sub-Fund is available on requestfrom the Management Company at its registered office.
The official Net Asset Value per Share as at year end, disclosed in the Statistical Information section of this report may therefore include a Swing Pricingadjustment, which would not be recognised in the Combined Statement of Net Assets or in the Combined Statement of Operations and Changes in Net Assets.As at year end, a Swing Pricing adjustment has been applied to the following Sub-Funds: JPMorgan Funds - Asia Pacific Equity Fund, JPMorgan Funds -Europe Small Cap Fund and JPMorgan Funds - US Short Duration Bond Fund.
The Management Company may consider it appropriate not to apply the swing price adjustment to the Net Asset Value per Share of a Sub-Fund where it isseeking to attract inflows so that the Sub-Fund reaches a certain size. If a decision is taken in relation to a Sub-Fund the Management Company will pay thedealing and other costs resulting from securities trades to avoid the Sub-Fund suffering dilution of the Net Asset Value. Where this happens shareholders willsubscribe or redeem at a Net Asset Value that will not have been adjusted upwards as would have been the case if the swing pricing mechanism had beenapplied.
The Management Company has determined to apply this mechanism to the following Sub-Fund until such time that the Sub-Fund reaches a certain size(“AUM target”) or for a specific period of time (“End of Waiver Period”) whichever comes first. See Note 17j) and 18b).Sub-Fund Effective Date AUM Target End of Waiver Period
JPMorgan Funds - Total Emerging Markets Income Fund 20 April 2015 USD 250 million 31 December 2015
c) Realised and Unrealised Gains and Losses on InvestmentsInvestment transactions are accounted for on the trade date (the date the order to buy or sell is executed). For trades into other collective investmentschemes, transactions are accounted for on receipt of the trade confirmation from the underlying transfer agents.
49
JPMorgan FundsNotes to the Financial Statements
As at 30 June 2016
Realised gains and losses on sales of investments are calculated on the average book cost. The associated foreign exchange movement between the date ofpurchase and date of sale of investments is included in realised gains and losses on investments. Unrealised gains and losses on holdings of investments arecalculated on the total book cost and include the associated unrealised gains and losses on foreign exchange.
d) Income RecognitionInterest income is accrued daily and includes the amortisation of premiums and accretion of discounts, where applicable. Bank interest income is recognisedon an accrual basis. Dividend income is accrued on the ex-dividend date. This income is shown net of any withholding taxes and adjusted accordingly whentax reclaims apply.
e) Conversion of Foreign CurrenciesThe books and records of each Sub-Fund are denominated in the base currency of the corresponding Sub-Fund. Amounts denominated in other currenciesare translated into the base currency on the following basis: (i) investment valuations and other assets and liabilities initially expressed in other currenciesare converted each business day into the base currency using currency exchange rates prevailing on each such business day; (ii) purchases and sales offoreign investments, income and expenses are converted into the base currency using currency exchange rates prevailing on the respective dates of suchtransactions.
Net realised and unrealised gains or losses on foreign exchange transactions represent: (i) foreign exchange gains and losses from the sale and holding offoreign currencies and foreign cash equivalents; (ii) gains and losses between trade date and settlement date on securities transactions and forwardcurrency exchange contracts; and (iii) gains and losses arising from the difference between amounts of dividends and interest recorded and the amountsactually received.
The resulting gains and losses on translation are included in “Net Realised Gain/(Loss) on Foreign Exchange” in the Combined Statement of Operations andChanges in Net Assets.
The reference currency of the Combined Statements is USD.
The principal exchange rates applied as at 30 June 2016 are as follows:
1 USD = 1.344773020 AUD;1 USD = 1.298500000 CAD;1 USD = 0.974770000 CHF;1 USD = 6.669700000 CNH;1 USD = 0.899571840 EUR;1 USD = 0.744186070 GBP;1 USD = 7.758900000 HKD;1 USD = 284.940000000 HUF;1 USD = 102.780000000 JPY;1 USD = 8.374890000 NOK;1 USD = 1.407202750 NZD;1 USD = 3.973800000 PLN;1 USD = 8.485060000 SEK;1 USD = 1.347710000 SGD.
f) Forward Currency Exchange ContractsUnrealised gains or losses on outstanding forward currency exchange contracts are valued on the basis of currency exchange rates prevailing at the relevantvaluation date. The changes in such amounts are included in “Net Change in Unrealised Gain/(Loss) on Forward Currency Exchange Contracts” in theCombined Statement of Operations and Changes in Net Assets. Unrealised gains or losses are recorded under “Net Unrealised Net Gain/(Loss) on ForwardCurrency Exchange Contracts” in the Combined Statement of Net Assets.
g) Financial Futures Contracts on Securities and IndicesRegulated financial futures contracts are valued at the exchange quoted settlement price. Initial margin deposits are made upon entering into the contractsand can be either in cash or securities. During the period the contracts are open, changes in the value of the contracts are recognised as unrealised gains andlosses by “marking-to-market” to reflect the market value of the contracts at the end of each business day’s trading. Variation margin payments are made orreceived, depending upon whether losses or gains are incurred. The frequency of those margin payments may differ depending on where the contract istraded. When a contract is closed, the SICAV records a realised gain or loss equal to the difference between the proceeds from, or cost of, the closingtransaction and the initial cost of the contract in “Net Realised Gain/(Loss) on Financial Futures Contracts” in the Combined Statement of Operations andChanges in Net Assets.
Unrealised gains or losses are recorded under “Net Unrealised Gain/(Loss) on Financial Futures Contracts” in the Combined Statement of Net Assets.
Daily margin calls are recorded under “Net Realised Gain/(Loss) on Financial Futures Contracts” in the Combined Statement of Operations and Changes inNet Assets.
h) Option ContractsThe SICAV writes options on securities, futures and currencies. These options are settled in cash and subject the SICAV to unlimited risk of loss. The SICAV,however, is not subject to credit risk on written options as the counterparty has already performed its obligation by paying the premium at the inception ofthe contract.
Options purchased are recorded as investments; options written or sold are recorded as liabilities. When the exercise of an option results in a cashsettlement, the difference between the premium and the settlement proceeds is accounted for as a realised gain or loss. When securities are acquired ordelivered upon exercise of an option, the acquisition cost or sale proceeds are adjusted by the amount of the premium. When an option is closed, thedifference between the premium and the cost to close the position is accounted for as a realised gain or loss. When an option expires, the premium isaccounted for as a realised gain for options written or as a realised loss for options purchased.
For options on futures, where the investment manager is based in the United Kingdom, variation margin payments are made or received daily, dependingupon whether losses or gains are incurred on the underlying futures contracts.
i) Total Return SwapsThe SICAV may enter into swap contracts in which the SICAV and the counterparty agree to exchange payments where one or both parties pay the returnsgenerated by a security, instrument, basket or index thereof. The payments made by the SICAV to the counterparty and vice versa are calculated byreference to a specific security, on a basket of securities, index, or instruments and an agreed upon notional amount. Any such underlying security orinstrument must be a transferable security and any such index must be an index of a regulated market.
50
JPMorgan FundsNotes to the Financial Statements (continued)
As at 30 June 2016
A Total Return Swap will exchange the total performance on a specific basket of securities, selected by the Investment Manager against a reference rate plusa spread. The total performance will include interests, dividends, gains and losses on the underlying securities during the contract period according to thetype of underlying. The risk of this type of instrument will depend on the uncertain evolution, at the time of the contract conclusion, of the performance of theunderlying. These underlying securities are listed on a primary exchange.
The value of the underlying securities shall be taken into account for the calculation of the investment and borrowing powers applicable to individual issuers.The relevant indices include, but are not limited to, currencies, interest rates, prices and total return on interest rates indices, fixed income indices and stockindices.
The market values are recorded under “Other Derivative Instruments at Market Value” in the Combined Statement of Net Assets. The changes in suchamounts are included in the Combined Statement of Operations and Changes in Net Assets under “Net Change in Unrealised Gain/(Loss) on Other DerivativeInstruments”. When a contract is closed, the Realised Gain/(Loss) is recorded under “Net Realised Gain/(Loss) on Other Derivative Instruments” in theCombined Statement of Operations and Changes in Net Assets.
j) Interest Rate SwapsAn interest rate swap is a bilateral agreement in which each of the parties agree to exchange a series of interest payments for another series of interestpayments (usually fixed/floating) based on a notional amount that serves as a computation basis and that is usually not exchanged.
The market values are recorded under “Other Derivative Instruments at Market Value” in the Combined Statement of Net Assets. The interests on interestrate swaps are recorded under “Interest on Swap Transactions” in the Combined Statement of Operations and Changes in Net Assets. The changes inunrealised gains or losses are included in the Combined Statement of Operations and Changes in Net Assets under “Net Change in Unrealised Gain/(Loss) onOther Derivative Instruments”. When a contract is closed, the realised gains or losses are recorded under “Net Realised Gain/(Loss) on Other DerivativeInstruments” in the Combined Statement of Operations and Changes in Net Assets.
k) Credit Default SwapsA Credit Default Swap is a credit derivative transaction in which two parties enter into an agreement, whereby one party pays the other a fixed periodiccoupon for the specified life of the agreement. The other party makes no payments unless a credit event, relating to a predetermined reference asset,occurs. If such an event occurs, the party will then make a payment to the first party, and the swap will terminate. The value of the underlying securities shallbe taken into account for the calculation of the investment and borrowing powers applicable to individual issuers.
The market values are recorded under “Other Derivative Instruments at Market Value” in the Combined Statement of Net Assets. The changes in unrealisedgains or losses are included in the Combined Statement of Operations and Changes in Net Assets under “Net Change in Unrealised Gain/(Loss) on OtherDerivative Instruments”. When a contract is closed, the realised gains or losses are recorded under “Net Realised Gain/(Loss) on Other DerivativeInstruments” in the Combined Statement of Operations and Changes in Net Assets.
l) To Be Announced Securities (“TBA”)TBAs are related to mortgage backed securities issued by government sponsored agencies. These agencies usually pool mortgage loans and sell interests inthe pools created. TBAs relate to future pools of these agencies that are bought and sold for future settlement for which either the interest rate or thematurity date is not yet fixed. TBAs are separately disclosed in the Schedule of Investments.
The Sub-Funds may enter into Dollar Rolls, principally using TBAs, in which the Sub-Funds sell mortgage-backed securities for delivery in the current monthand simultaneously contract to repurchase similar, but not identical, securities at an agreed-upon price on a fixed date. The Sub-Funds account for suchDollar Rolls as purchases and sales and receive compensation as consideration for entering into the commitment to repurchase. The Sub-Funds mustmaintain liquid securities having a value not less than the repurchase price (including accrued interest) for such Dollar Rolls. The market value of thesecurities that the Sub-Funds are required to purchase may decline below the agreed upon repurchase price of those securities.
The Sub-Funds had TBA Dollar Rolls outstanding as of 30 June 2016, which are included in “Amounts Receivable on Sale of TBAs” and “Amounts Payable onPurchase of TBAs” in the Combined Statement of Net Assets.
m) Commodity Index SwapsA Commodity Index Swap is a bilateral agreement in which each of the parties agree to exchange the total return of a specified commodity index againstmoney market rate plus fees.
The market values are recorded under “Other Derivative Instruments at Market Value” in the Combined Statement of Net Assets. The changes in unrealisedgains or losses are included in the Combined Statement of Operations and Changes in Net Assets under “Net Change in Unrealised Gain/(Loss) on OtherDerivative Instruments”. When a contract is closed, the realised gains or losses are recorded under “Net Realised Gain/(Loss) on Other DerivativeInstruments” in the Combined Statement of Operations and Changes in Net Assets.
n) Consolidation of Mauritian SubsidiaryAll income, expenses, receivables, payables and investments of JPMorgan SICAV Investment Company (Mauritius) Limited (the “Subsidiary”), awholly-owned subsidiary of JPMorgan Funds - India Fund, are consolidated into the Combined Statement of Net Assets and the Combined Statement ofOperations and Changes in Net Assets of JPMorgan Funds - India Fund. Securities owned by the Subsidiary are individually disclosed in the Schedule ofInvestments of JPMorgan Funds - India Fund. Intercompany balances are eliminated on consolidation.
The use of the Mauritius Subsidiary and the tax treatment it is afforded, is based on the law and practice currently in force in the relevant countries, asunderstood by the Board of Directors. It is subject to any future changes and such changes may adversely affect the returns of the Sub-Fund. This includesany circumstances where the India/Mauritius Double Taxation Treaty may not be applied or ceases to be applied, resulting from, inter alia, any future rulingby the Indian tax authorities. Should the treaty not be applied, or cease to be applied, interest on securities listed on an Indian stock exchange would besubject to tax at a maximum rate of 20%. Capital gains on disposal of such investments would be subject to tax at rates of 0% to 15% from 1 April 2011 inrespect of listed securities depending on the length of time the relevant investment has been held.
The Subsidiary received tax assessments from the Mauritius Revenue Authority (“MRA”) in respect of the treatment of capital gains in the income taxcomputation and subsequently objected to these by appealing to the Mauritius Assessment Review Committee (“ARC”). On 11 September 2014 the ARC ruledin favour of the MRA for the tax assessments for the periods before 2009. As a result a sum of MUR 18,615,727 (USD 610,352) was paid to the MRA for the taxassessments and interest for the periods before 2009. The Subsidiary has lodged an appeal against the decision of the ARC with the Supreme Court ofMauritius. As at 30 June 2016, the tax provision amounts to USD 995,305.
3. Value of Financial Instruments and Associated RisksThe SICAV entered into forward currency exchange contracts, financial futures contracts, options and swaps which, to varying degrees, represent a marketrisk in excess of the amount reflected on the Combined Statement of Net Assets. The amount of the contracts represents the extent of the SICAV’sparticipation in these financial instruments. Market risks associated with such contracts arise due to the possible movements in foreign exchange rates,indices, and security values underlying these instruments.
Investment in fixed income securities is subject to interest rate, sector, security and credit risks. High yield bonds are lower-rated securities and will usuallyoffer higher yields to compensate for the reduced creditworthiness or increased risk of default that these securities carry.
51
JPMorgan FundsNotes to the Financial Statements (continued)
As at 30 June 2016
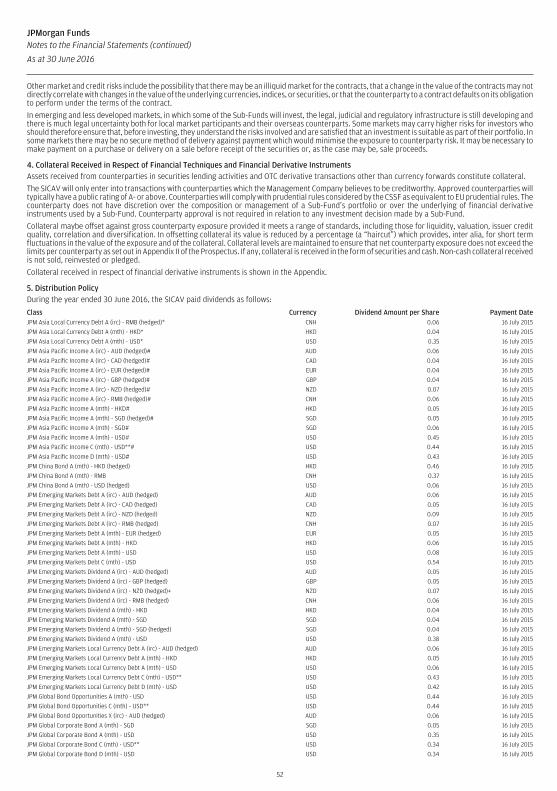
Other market and credit risks include the possibility that there may be an illiquid market for the contracts, that a change in the value of the contracts may notdirectly correlate with changes in the value of the underlying currencies, indices, or securities, or that the counterparty to a contract defaults on its obligationto perform under the terms of the contract.
In emerging and less developed markets, in which some of the Sub-Funds will invest, the legal, judicial and regulatory infrastructure is still developing andthere is much legal uncertainty both for local market participants and their overseas counterparts. Some markets may carry higher risks for investors whoshould therefore ensure that, before investing, they understand the risks involved and are satisfied that an investment is suitable as part of their portfolio. Insome markets there may be no secure method of delivery against payment which would minimise the exposure to counterparty risk. It may be necessary tomake payment on a purchase or delivery on a sale before receipt of the securities or, as the case may be, sale proceeds.
4. Collateral Received in Respect of Financial Techniques and Financial Derivative InstrumentsAssets received from counterparties in securities lending activities and OTC derivative transactions other than currency forwards constitute collateral.
The SICAV will only enter into transactions with counterparties which the Management Company believes to be creditworthy. Approved counterparties willtypically have a public rating of A- or above. Counterparties will comply with prudential rules considered by the CSSF as equivalent to EU prudential rules. Thecounterparty does not have discretion over the composition or management of a Sub-Fund’s portfolio or over the underlying of financial derivativeinstruments used by a Sub-Fund. Counterparty approval is not required in relation to any investment decision made by a Sub-Fund.
Collateral maybe offset against gross counterparty exposure provided it meets a range of standards, including those for liquidity, valuation, issuer creditquality, correlation and diversification. In offsetting collateral its value is reduced by a percentage (a “haircut”) which provides, inter alia, for short termfluctuations in the value of the exposure and of the collateral. Collateral levels are maintained to ensure that net counterparty exposure does not exceed thelimits per counterparty as set out in Appendix II of the Prospectus. If any, collateral is received in the form of securities and cash. Non-cash collateral receivedis not sold, reinvested or pledged.
Collateral received in respect of financial derivative instruments is shown in the Appendix.
5. Distribution PolicyDuring the year ended 30 June 2016, the SICAV paid dividends as follows:
Class Currency Dividend Amount per Share Payment DateJPM Asia Local Currency Debt A (irc) - RMB (hedged)* CNH 0.06 16 July 2015
JPM Asia Local Currency Debt A (mth) - HKD* HKD 0.04 16 July 2015
JPM Asia Local Currency Debt A (mth) - USD* USD 0.35 16 July 2015
JPM Asia Pacific Income A (irc) - AUD (hedged)# AUD 0.06 16 July 2015
JPM Asia Pacific Income A (irc) - CAD (hedged)# CAD 0.04 16 July 2015
JPM Asia Pacific Income A (irc) - EUR (hedged)# EUR 0.04 16 July 2015
JPM Asia Pacific Income A (irc) - GBP (hedged)# GBP 0.04 16 July 2015
JPM Asia Pacific Income A (irc) - NZD (hedged)# NZD 0.07 16 July 2015
JPM Asia Pacific Income A (irc) - RMB (hedged)# CNH 0.06 16 July 2015
JPM Asia Pacific Income A (mth) - HKD# HKD 0.05 16 July 2015
JPM Asia Pacific Income A (mth) - SGD (hedged)# SGD 0.05 16 July 2015
JPM Asia Pacific Income A (mth) - SGD# SGD 0.06 16 July 2015
JPM Asia Pacific Income A (mth) - USD# USD 0.45 16 July 2015
JPM Asia Pacific Income C (mth) - USD**# USD 0.44 16 July 2015
JPM Asia Pacific Income D (mth) - USD# USD 0.43 16 July 2015
JPM China Bond A (mth) - HKD (hedged) HKD 0.46 16 July 2015
JPM China Bond A (mth) - RMB CNH 0.37 16 July 2015
JPM China Bond A (mth) - USD (hedged) USD 0.06 16 July 2015
JPM Emerging Markets Debt A (irc) - AUD (hedged) AUD 0.06 16 July 2015
JPM Emerging Markets Debt A (irc) - CAD (hedged) CAD 0.05 16 July 2015
JPM Emerging Markets Debt A (irc) - NZD (hedged) NZD 0.09 16 July 2015
JPM Emerging Markets Debt A (irc) - RMB (hedged) CNH 0.07 16 July 2015
JPM Emerging Markets Debt A (mth) - EUR (hedged) EUR 0.05 16 July 2015
JPM Emerging Markets Debt A (mth) - HKD HKD 0.06 16 July 2015
JPM Emerging Markets Debt A (mth) - USD USD 0.08 16 July 2015
JPM Emerging Markets Debt C (mth) - USD USD 0.54 16 July 2015
JPM Emerging Markets Dividend A (irc) - AUD (hedged) AUD 0.05 16 July 2015
JPM Emerging Markets Dividend A (irc) - GBP (hedged) GBP 0.05 16 July 2015
JPM Emerging Markets Dividend A (irc) - NZD (hedged)+ NZD 0.07 16 July 2015
JPM Emerging Markets Dividend A (irc) - RMB (hedged) CNH 0.06 16 July 2015
JPM Emerging Markets Dividend A (mth) - HKD HKD 0.04 16 July 2015
JPM Emerging Markets Dividend A (mth) - SGD SGD 0.04 16 July 2015
JPM Emerging Markets Dividend A (mth) - SGD (hedged) SGD 0.04 16 July 2015
JPM Emerging Markets Dividend A (mth) - USD USD 0.38 16 July 2015
JPM Emerging Markets Local Currency Debt A (irc) - AUD (hedged) AUD 0.06 16 July 2015
JPM Emerging Markets Local Currency Debt A (mth) - HKD HKD 0.05 16 July 2015
JPM Emerging Markets Local Currency Debt A (mth) - USD USD 0.06 16 July 2015
JPM Emerging Markets Local Currency Debt C (mth) - USD** USD 0.43 16 July 2015
JPM Emerging Markets Local Currency Debt D (mth) - USD USD 0.42 16 July 2015
JPM Global Bond Opportunities A (mth) - USD USD 0.44 16 July 2015
JPM Global Bond Opportunities C (mth) - USD** USD 0.44 16 July 2015
JPM Global Bond Opportunities X (irc) - AUD (hedged) AUD 0.06 16 July 2015
JPM Global Corporate Bond A (mth) - SGD SGD 0.05 16 July 2015
JPM Global Corporate Bond A (mth) - USD USD 0.35 16 July 2015
JPM Global Corporate Bond C (mth) - USD** USD 0.34 16 July 2015
JPM Global Corporate Bond D (mth) - USD USD 0.34 16 July 2015
52
JPMorgan FundsNotes to the Financial Statements (continued)
As at 30 June 2016
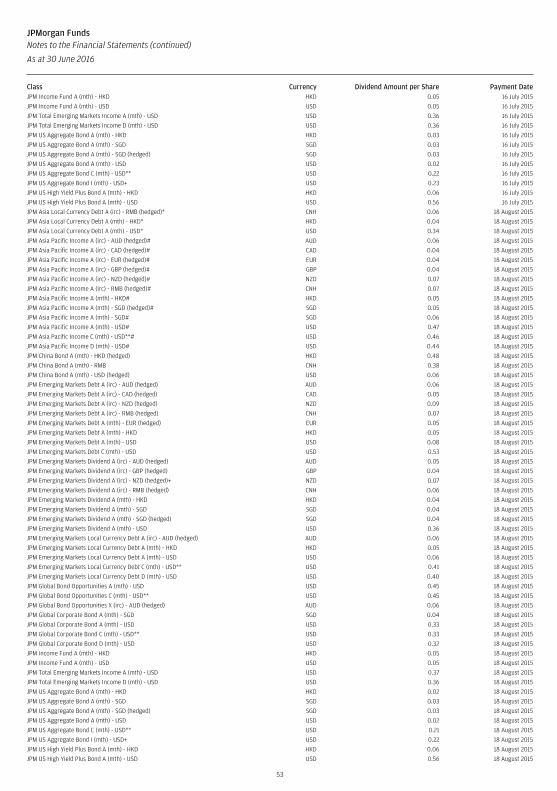
Class Currency Dividend Amount per Share Payment DateJPM Income Fund A (mth) - HKD HKD 0.05 16 July 2015
JPM Income Fund A (mth) - USD USD 0.05 16 July 2015
JPM Total Emerging Markets Income A (mth) - USD USD 0.36 16 July 2015
JPM Total Emerging Markets Income D (mth) - USD USD 0.36 16 July 2015
JPM US Aggregate Bond A (mth) - HKD HKD 0.03 16 July 2015
JPM US Aggregate Bond A (mth) - SGD SGD 0.03 16 July 2015
JPM US Aggregate Bond A (mth) - SGD (hedged) SGD 0.03 16 July 2015
JPM US Aggregate Bond A (mth) - USD USD 0.02 16 July 2015
JPM US Aggregate Bond C (mth) - USD** USD 0.22 16 July 2015
JPM US Aggregate Bond I (mth) - USD+ USD 0.23 16 July 2015
JPM US High Yield Plus Bond A (mth) - HKD HKD 0.06 16 July 2015
JPM US High Yield Plus Bond A (mth) - USD USD 0.56 16 July 2015
JPM Asia Local Currency Debt A (irc) - RMB (hedged)* CNH 0.06 18 August 2015
JPM Asia Local Currency Debt A (mth) - HKD* HKD 0.04 18 August 2015
JPM Asia Local Currency Debt A (mth) - USD* USD 0.34 18 August 2015
JPM Asia Pacific Income A (irc) - AUD (hedged)# AUD 0.06 18 August 2015
JPM Asia Pacific Income A (irc) - CAD (hedged)# CAD 0.04 18 August 2015
JPM Asia Pacific Income A (irc) - EUR (hedged)# EUR 0.04 18 August 2015
JPM Asia Pacific Income A (irc) - GBP (hedged)# GBP 0.04 18 August 2015
JPM Asia Pacific Income A (irc) - NZD (hedged)# NZD 0.07 18 August 2015
JPM Asia Pacific Income A (irc) - RMB (hedged)# CNH 0.07 18 August 2015
JPM Asia Pacific Income A (mth) - HKD# HKD 0.05 18 August 2015
JPM Asia Pacific Income A (mth) - SGD (hedged)# SGD 0.05 18 August 2015
JPM Asia Pacific Income A (mth) - SGD# SGD 0.06 18 August 2015
JPM Asia Pacific Income A (mth) - USD# USD 0.47 18 August 2015
JPM Asia Pacific Income C (mth) - USD**# USD 0.46 18 August 2015
JPM Asia Pacific Income D (mth) - USD# USD 0.44 18 August 2015
JPM China Bond A (mth) - HKD (hedged) HKD 0.48 18 August 2015
JPM China Bond A (mth) - RMB CNH 0.38 18 August 2015
JPM China Bond A (mth) - USD (hedged) USD 0.06 18 August 2015
JPM Emerging Markets Debt A (irc) - AUD (hedged) AUD 0.06 18 August 2015
JPM Emerging Markets Debt A (irc) - CAD (hedged) CAD 0.05 18 August 2015
JPM Emerging Markets Debt A (irc) - NZD (hedged) NZD 0.09 18 August 2015
JPM Emerging Markets Debt A (irc) - RMB (hedged) CNH 0.07 18 August 2015
JPM Emerging Markets Debt A (mth) - EUR (hedged) EUR 0.05 18 August 2015
JPM Emerging Markets Debt A (mth) - HKD HKD 0.05 18 August 2015
JPM Emerging Markets Debt A (mth) - USD USD 0.08 18 August 2015
JPM Emerging Markets Debt C (mth) - USD USD 0.53 18 August 2015
JPM Emerging Markets Dividend A (irc) - AUD (hedged) AUD 0.05 18 August 2015
JPM Emerging Markets Dividend A (irc) - GBP (hedged) GBP 0.04 18 August 2015
JPM Emerging Markets Dividend A (irc) - NZD (hedged)+ NZD 0.07 18 August 2015
JPM Emerging Markets Dividend A (irc) - RMB (hedged) CNH 0.06 18 August 2015
JPM Emerging Markets Dividend A (mth) - HKD HKD 0.04 18 August 2015
JPM Emerging Markets Dividend A (mth) - SGD SGD 0.04 18 August 2015
JPM Emerging Markets Dividend A (mth) - SGD (hedged) SGD 0.04 18 August 2015
JPM Emerging Markets Dividend A (mth) - USD USD 0.36 18 August 2015
JPM Emerging Markets Local Currency Debt A (irc) - AUD (hedged) AUD 0.06 18 August 2015
JPM Emerging Markets Local Currency Debt A (mth) - HKD HKD 0.05 18 August 2015
JPM Emerging Markets Local Currency Debt A (mth) - USD USD 0.06 18 August 2015
JPM Emerging Markets Local Currency Debt C (mth) - USD** USD 0.41 18 August 2015
JPM Emerging Markets Local Currency Debt D (mth) - USD USD 0.40 18 August 2015
JPM Global Bond Opportunities A (mth) - USD USD 0.45 18 August 2015
JPM Global Bond Opportunities C (mth) - USD** USD 0.45 18 August 2015
JPM Global Bond Opportunities X (irc) - AUD (hedged) AUD 0.06 18 August 2015
JPM Global Corporate Bond A (mth) - SGD SGD 0.04 18 August 2015
JPM Global Corporate Bond A (mth) - USD USD 0.33 18 August 2015
JPM Global Corporate Bond C (mth) - USD** USD 0.33 18 August 2015
JPM Global Corporate Bond D (mth) - USD USD 0.32 18 August 2015
JPM Income Fund A (mth) - HKD HKD 0.05 18 August 2015
JPM Income Fund A (mth) - USD USD 0.05 18 August 2015
JPM Total Emerging Markets Income A (mth) - USD USD 0.37 18 August 2015
JPM Total Emerging Markets Income D (mth) - USD USD 0.36 18 August 2015
JPM US Aggregate Bond A (mth) - HKD HKD 0.02 18 August 2015
JPM US Aggregate Bond A (mth) - SGD SGD 0.03 18 August 2015
JPM US Aggregate Bond A (mth) - SGD (hedged) SGD 0.03 18 August 2015
JPM US Aggregate Bond A (mth) - USD USD 0.02 18 August 2015
JPM US Aggregate Bond C (mth) - USD** USD 0.21 18 August 2015
JPM US Aggregate Bond I (mth) - USD+ USD 0.22 18 August 2015
JPM US High Yield Plus Bond A (mth) - HKD HKD 0.06 18 August 2015
JPM US High Yield Plus Bond A (mth) - USD USD 0.56 18 August 2015
53
JPMorgan FundsNotes to the Financial Statements (continued)
As at 30 June 2016
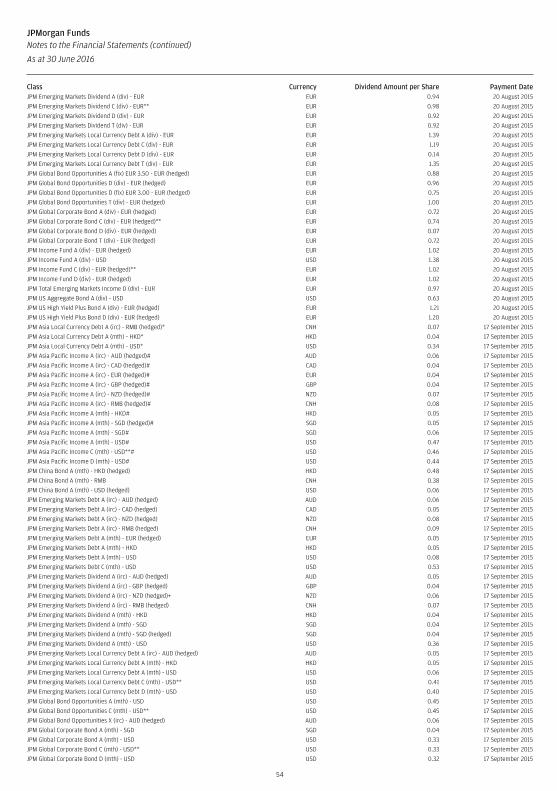
Class Currency Dividend Amount per Share Payment DateJPM Emerging Markets Dividend A (div) - EUR EUR 0.94 20 August 2015
JPM Emerging Markets Dividend C (div) - EUR** EUR 0.98 20 August 2015
JPM Emerging Markets Dividend D (div) - EUR EUR 0.92 20 August 2015
JPM Emerging Markets Dividend T (div) - EUR EUR 0.92 20 August 2015
JPM Emerging Markets Local Currency Debt A (div) - EUR EUR 1.39 20 August 2015
JPM Emerging Markets Local Currency Debt C (div) - EUR EUR 1.19 20 August 2015
JPM Emerging Markets Local Currency Debt D (div) - EUR EUR 0.14 20 August 2015
JPM Emerging Markets Local Currency Debt T (div) - EUR EUR 1.35 20 August 2015
JPM Global Bond Opportunities A (fix) EUR 3.50 - EUR (hedged) EUR 0.88 20 August 2015
JPM Global Bond Opportunities D (div) - EUR (hedged) EUR 0.96 20 August 2015
JPM Global Bond Opportunities D (fix) EUR 3.00 - EUR (hedged) EUR 0.75 20 August 2015
JPM Global Bond Opportunities T (div) - EUR (hedged) EUR 1.00 20 August 2015
JPM Global Corporate Bond A (div) - EUR (hedged) EUR 0.72 20 August 2015
JPM Global Corporate Bond C (div) - EUR (hedged)** EUR 0.74 20 August 2015
JPM Global Corporate Bond D (div) - EUR (hedged) EUR 0.07 20 August 2015
JPM Global Corporate Bond T (div) - EUR (hedged) EUR 0.72 20 August 2015
JPM Income Fund A (div) - EUR (hedged) EUR 1.02 20 August 2015
JPM Income Fund A (div) - USD USD 1.38 20 August 2015
JPM Income Fund C (div) - EUR (hedged)** EUR 1.02 20 August 2015
JPM Income Fund D (div) - EUR (hedged) EUR 1.02 20 August 2015
JPM Total Emerging Markets Income D (div) - EUR EUR 0.97 20 August 2015
JPM US Aggregate Bond A (div) - USD USD 0.63 20 August 2015
JPM US High Yield Plus Bond A (div) - EUR (hedged) EUR 1.21 20 August 2015
JPM US High Yield Plus Bond D (div) - EUR (hedged) EUR 1.20 20 August 2015
JPM Asia Local Currency Debt A (irc) - RMB (hedged)* CNH 0.07 17 September 2015
JPM Asia Local Currency Debt A (mth) - HKD* HKD 0.04 17 September 2015
JPM Asia Local Currency Debt A (mth) - USD* USD 0.34 17 September 2015
JPM Asia Pacific Income A (irc) - AUD (hedged)# AUD 0.06 17 September 2015
JPM Asia Pacific Income A (irc) - CAD (hedged)# CAD 0.04 17 September 2015
JPM Asia Pacific Income A (irc) - EUR (hedged)# EUR 0.04 17 September 2015
JPM Asia Pacific Income A (irc) - GBP (hedged)# GBP 0.04 17 September 2015
JPM Asia Pacific Income A (irc) - NZD (hedged)# NZD 0.07 17 September 2015
JPM Asia Pacific Income A (irc) - RMB (hedged)# CNH 0.08 17 September 2015
JPM Asia Pacific Income A (mth) - HKD# HKD 0.05 17 September 2015
JPM Asia Pacific Income A (mth) - SGD (hedged)# SGD 0.05 17 September 2015
JPM Asia Pacific Income A (mth) - SGD# SGD 0.06 17 September 2015
JPM Asia Pacific Income A (mth) - USD# USD 0.47 17 September 2015
JPM Asia Pacific Income C (mth) - USD**# USD 0.46 17 September 2015
JPM Asia Pacific Income D (mth) - USD# USD 0.44 17 September 2015
JPM China Bond A (mth) - HKD (hedged) HKD 0.48 17 September 2015
JPM China Bond A (mth) - RMB CNH 0.38 17 September 2015
JPM China Bond A (mth) - USD (hedged) USD 0.06 17 September 2015
JPM Emerging Markets Debt A (irc) - AUD (hedged) AUD 0.06 17 September 2015
JPM Emerging Markets Debt A (irc) - CAD (hedged) CAD 0.05 17 September 2015
JPM Emerging Markets Debt A (irc) - NZD (hedged) NZD 0.08 17 September 2015
JPM Emerging Markets Debt A (irc) - RMB (hedged) CNH 0.09 17 September 2015
JPM Emerging Markets Debt A (mth) - EUR (hedged) EUR 0.05 17 September 2015
JPM Emerging Markets Debt A (mth) - HKD HKD 0.05 17 September 2015
JPM Emerging Markets Debt A (mth) - USD USD 0.08 17 September 2015
JPM Emerging Markets Debt C (mth) - USD USD 0.53 17 September 2015
JPM Emerging Markets Dividend A (irc) - AUD (hedged) AUD 0.05 17 September 2015
JPM Emerging Markets Dividend A (irc) - GBP (hedged) GBP 0.04 17 September 2015
JPM Emerging Markets Dividend A (irc) - NZD (hedged)+ NZD 0.06 17 September 2015
JPM Emerging Markets Dividend A (irc) - RMB (hedged) CNH 0.07 17 September 2015
JPM Emerging Markets Dividend A (mth) - HKD HKD 0.04 17 September 2015
JPM Emerging Markets Dividend A (mth) - SGD SGD 0.04 17 September 2015
JPM Emerging Markets Dividend A (mth) - SGD (hedged) SGD 0.04 17 September 2015
JPM Emerging Markets Dividend A (mth) - USD USD 0.36 17 September 2015
JPM Emerging Markets Local Currency Debt A (irc) - AUD (hedged) AUD 0.05 17 September 2015
JPM Emerging Markets Local Currency Debt A (mth) - HKD HKD 0.05 17 September 2015
JPM Emerging Markets Local Currency Debt A (mth) - USD USD 0.06 17 September 2015
JPM Emerging Markets Local Currency Debt C (mth) - USD** USD 0.41 17 September 2015
JPM Emerging Markets Local Currency Debt D (mth) - USD USD 0.40 17 September 2015
JPM Global Bond Opportunities A (mth) - USD USD 0.45 17 September 2015
JPM Global Bond Opportunities C (mth) - USD** USD 0.45 17 September 2015
JPM Global Bond Opportunities X (irc) - AUD (hedged) AUD 0.06 17 September 2015
JPM Global Corporate Bond A (mth) - SGD SGD 0.04 17 September 2015
JPM Global Corporate Bond A (mth) - USD USD 0.33 17 September 2015
JPM Global Corporate Bond C (mth) - USD** USD 0.33 17 September 2015
JPM Global Corporate Bond D (mth) - USD USD 0.32 17 September 2015
54
JPMorgan FundsNotes to the Financial Statements (continued)
As at 30 June 2016
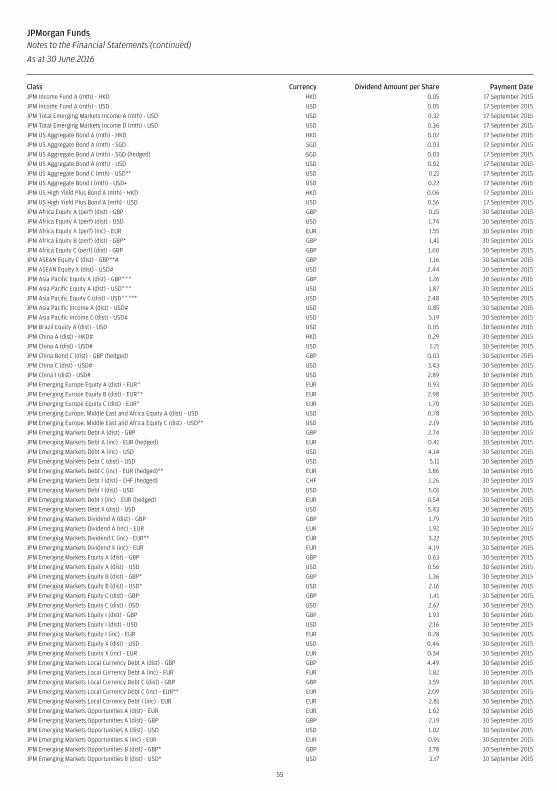
Class Currency Dividend Amount per Share Payment DateJPM Income Fund A (mth) - HKD HKD 0.05 17 September 2015
JPM Income Fund A (mth) - USD USD 0.05 17 September 2015
JPM Total Emerging Markets Income A (mth) - USD USD 0.37 17 September 2015
JPM Total Emerging Markets Income D (mth) - USD USD 0.36 17 September 2015
JPM US Aggregate Bond A (mth) - HKD HKD 0.02 17 September 2015
JPM US Aggregate Bond A (mth) - SGD SGD 0.03 17 September 2015
JPM US Aggregate Bond A (mth) - SGD (hedged) SGD 0.03 17 September 2015
JPM US Aggregate Bond A (mth) - USD USD 0.02 17 September 2015
JPM US Aggregate Bond C (mth) - USD** USD 0.21 17 September 2015
JPM US Aggregate Bond I (mth) - USD+ USD 0.22 17 September 2015
JPM US High Yield Plus Bond A (mth) - HKD HKD 0.06 17 September 2015
JPM US High Yield Plus Bond A (mth) - USD USD 0.56 17 September 2015
JPM Africa Equity A (perf) (dist) - GBP GBP 0.15 30 September 2015
JPM Africa Equity A (perf) (dist) - USD USD 1.74 30 September 2015
JPM Africa Equity A (perf) (inc) - EUR EUR 1.55 30 September 2015
JPM Africa Equity B (perf) (dist) - GBP* GBP 1.41 30 September 2015
JPM Africa Equity C (perf) (dist) - GBP GBP 1.60 30 September 2015
JPM ASEAN Equity C (dist) - GBP**# GBP 1.16 30 September 2015
JPM ASEAN Equity X (dist) - USD# USD 2.44 30 September 2015
JPM Asia Pacific Equity A (dist) - GBP^^^ GBP 1.26 30 September 2015
JPM Asia Pacific Equity A (dist) - USD^^^ USD 1.87 30 September 2015
JPM Asia Pacific Equity C (dist) - USD^^^** USD 2.48 30 September 2015
JPM Asia Pacific Income A (dist) - USD# USD 0.85 30 September 2015
JPM Asia Pacific Income C (dist) - USD# USD 5.19 30 September 2015
JPM Brazil Equity A (dist) - USD USD 0.05 30 September 2015
JPM China A (dist) - HKD# HKD 0.29 30 September 2015
JPM China A (dist) - USD# USD 1.21 30 September 2015
JPM China Bond C (dist) - GBP (hedged) GBP 0.03 30 September 2015
JPM China C (dist) - USD# USD 3.43 30 September 2015
JPM China I (dist) - USD# USD 2.89 30 September 2015
JPM Emerging Europe Equity A (dist) - EUR^ EUR 0.93 30 September 2015
JPM Emerging Europe Equity B (dist) - EUR^* EUR 2.98 30 September 2015
JPM Emerging Europe Equity C (dist) - EUR^ EUR 1.70 30 September 2015
JPM Emerging Europe, Middle East and Africa Equity A (dist) - USD USD 0.78 30 September 2015
JPM Emerging Europe, Middle East and Africa Equity C (dist) - USD** USD 2.19 30 September 2015
JPM Emerging Markets Debt A (dist) - GBP GBP 2.74 30 September 2015
JPM Emerging Markets Debt A (inc) - EUR (hedged) EUR 0.41 30 September 2015
JPM Emerging Markets Debt A (inc) - USD USD 4.14 30 September 2015
JPM Emerging Markets Debt C (dist) - USD USD 5.11 30 September 2015
JPM Emerging Markets Debt C (inc) - EUR (hedged)** EUR 3.86 30 September 2015
JPM Emerging Markets Debt I (dist) - CHF (hedged) CHF 1.26 30 September 2015
JPM Emerging Markets Debt I (dist) - USD USD 5.01 30 September 2015
JPM Emerging Markets Debt I (inc) - EUR (hedged) EUR 0.54 30 September 2015
JPM Emerging Markets Debt X (dist) - USD USD 5.43 30 September 2015
JPM Emerging Markets Dividend A (dist) - GBP GBP 1.79 30 September 2015
JPM Emerging Markets Dividend A (inc) - EUR EUR 1.92 30 September 2015
JPM Emerging Markets Dividend C (inc) - EUR** EUR 3.22 30 September 2015
JPM Emerging Markets Dividend X (inc) - EUR EUR 4.19 30 September 2015
JPM Emerging Markets Equity A (dist) - GBP GBP 0.63 30 September 2015
JPM Emerging Markets Equity A (dist) - USD USD 0.56 30 September 2015
JPM Emerging Markets Equity B (dist) - GBP* GBP 1.36 30 September 2015
JPM Emerging Markets Equity B (dist) - USD* USD 2.16 30 September 2015
JPM Emerging Markets Equity C (dist) - GBP GBP 1.41 30 September 2015
JPM Emerging Markets Equity C (dist) - USD USD 2.67 30 September 2015
JPM Emerging Markets Equity I (dist) - GBP GBP 1.93 30 September 2015
JPM Emerging Markets Equity I (dist) - USD USD 2.16 30 September 2015
JPM Emerging Markets Equity I (inc) - EUR EUR 0.28 30 September 2015
JPM Emerging Markets Equity X (dist) - USD USD 0.46 30 September 2015
JPM Emerging Markets Equity X (inc) - EUR EUR 0.34 30 September 2015
JPM Emerging Markets Local Currency Debt A (dist) - GBP GBP 4.49 30 September 2015
JPM Emerging Markets Local Currency Debt A (inc) - EUR EUR 1.82 30 September 2015
JPM Emerging Markets Local Currency Debt C (dist) - GBP GBP 3.59 30 September 2015
JPM Emerging Markets Local Currency Debt C (inc) - EUR** EUR 2.09 30 September 2015
JPM Emerging Markets Local Currency Debt I (inc) - EUR EUR 2.81 30 September 2015
JPM Emerging Markets Opportunities A (dist) - EUR EUR 1.02 30 September 2015
JPM Emerging Markets Opportunities A (dist) - GBP GBP 2.19 30 September 2015
JPM Emerging Markets Opportunities A (dist) - USD USD 1.02 30 September 2015
JPM Emerging Markets Opportunities A (inc) - EUR EUR 0.91 30 September 2015
JPM Emerging Markets Opportunities B (dist) - GBP* GBP 3.78 30 September 2015
JPM Emerging Markets Opportunities B (dist) - USD* USD 3.17 30 September 2015
55
JPMorgan FundsNotes to the Financial Statements (continued)
As at 30 June 2016
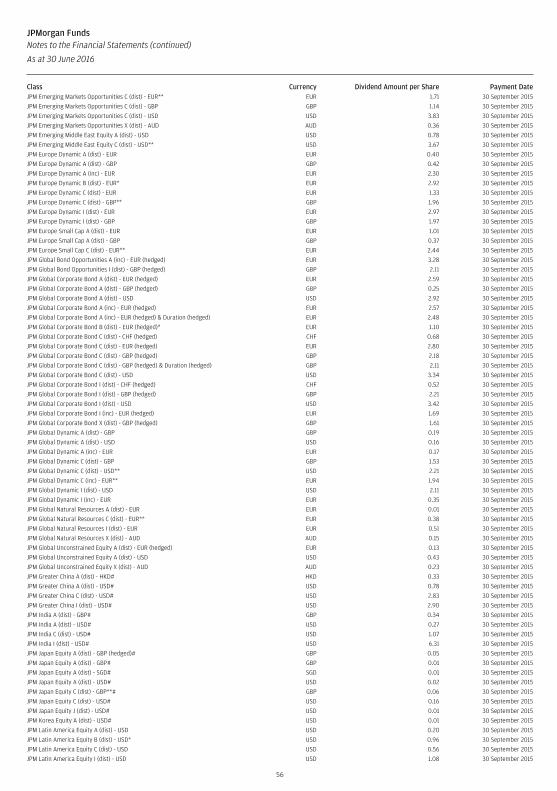
Class Currency Dividend Amount per Share Payment DateJPM Emerging Markets Opportunities C (dist) - EUR** EUR 1.71 30 September 2015
JPM Emerging Markets Opportunities C (dist) - GBP GBP 1.14 30 September 2015
JPM Emerging Markets Opportunities C (dist) - USD USD 3.83 30 September 2015
JPM Emerging Markets Opportunities X (dist) - AUD AUD 0.36 30 September 2015
JPM Emerging Middle East Equity A (dist) - USD USD 0.78 30 September 2015
JPM Emerging Middle East Equity C (dist) - USD** USD 3.67 30 September 2015
JPM Europe Dynamic A (dist) - EUR EUR 0.40 30 September 2015
JPM Europe Dynamic A (dist) - GBP GBP 0.42 30 September 2015
JPM Europe Dynamic A (inc) - EUR EUR 2.30 30 September 2015
JPM Europe Dynamic B (dist) - EUR* EUR 2.92 30 September 2015
JPM Europe Dynamic C (dist) - EUR EUR 1.33 30 September 2015
JPM Europe Dynamic C (dist) - GBP** GBP 1.96 30 September 2015
JPM Europe Dynamic I (dist) - EUR EUR 2.97 30 September 2015
JPM Europe Dynamic I (dist) - GBP GBP 1.97 30 September 2015
JPM Europe Small Cap A (dist) - EUR EUR 1.01 30 September 2015
JPM Europe Small Cap A (dist) - GBP GBP 0.37 30 September 2015
JPM Europe Small Cap C (dist) - EUR** EUR 2.44 30 September 2015
JPM Global Bond Opportunities A (inc) - EUR (hedged) EUR 3.28 30 September 2015
JPM Global Bond Opportunities I (dist) - GBP (hedged) GBP 2.11 30 September 2015
JPM Global Corporate Bond A (dist) - EUR (hedged) EUR 2.59 30 September 2015
JPM Global Corporate Bond A (dist) - GBP (hedged) GBP 0.25 30 September 2015
JPM Global Corporate Bond A (dist) - USD USD 2.92 30 September 2015
JPM Global Corporate Bond A (inc) - EUR (hedged) EUR 2.57 30 September 2015
JPM Global Corporate Bond A (inc) - EUR (hedged) & Duration (hedged) EUR 2.48 30 September 2015
JPM Global Corporate Bond B (dist) - EUR (hedged)* EUR 1.10 30 September 2015
JPM Global Corporate Bond C (dist) - CHF (hedged) CHF 0.68 30 September 2015
JPM Global Corporate Bond C (dist) - EUR (hedged) EUR 2.80 30 September 2015
JPM Global Corporate Bond C (dist) - GBP (hedged) GBP 2.18 30 September 2015
JPM Global Corporate Bond C (dist) - GBP (hedged) & Duration (hedged) GBP 2.11 30 September 2015
JPM Global Corporate Bond C (dist) - USD USD 3.34 30 September 2015
JPM Global Corporate Bond I (dist) - CHF (hedged) CHF 0.52 30 September 2015
JPM Global Corporate Bond I (dist) - GBP (hedged) GBP 2.21 30 September 2015
JPM Global Corporate Bond I (dist) - USD USD 3.42 30 September 2015
JPM Global Corporate Bond I (inc) - EUR (hedged) EUR 1.69 30 September 2015
JPM Global Corporate Bond X (dist) - GBP (hedged) GBP 1.61 30 September 2015
JPM Global Dynamic A (dist) - GBP GBP 0.19 30 September 2015
JPM Global Dynamic A (dist) - USD USD 0.16 30 September 2015
JPM Global Dynamic A (inc) - EUR EUR 0.17 30 September 2015
JPM Global Dynamic C (dist) - GBP GBP 1.53 30 September 2015
JPM Global Dynamic C (dist) - USD** USD 2.21 30 September 2015
JPM Global Dynamic C (inc) - EUR** EUR 1.94 30 September 2015
JPM Global Dynamic I (dist) - USD USD 2.11 30 September 2015
JPM Global Dynamic I (inc) - EUR EUR 0.35 30 September 2015
JPM Global Natural Resources A (dist) - EUR EUR 0.01 30 September 2015
JPM Global Natural Resources C (dist) - EUR** EUR 0.38 30 September 2015
JPM Global Natural Resources I (dist) - EUR EUR 0.51 30 September 2015
JPM Global Natural Resources X (dist) - AUD AUD 0.15 30 September 2015
JPM Global Unconstrained Equity A (dist) - EUR (hedged) EUR 0.13 30 September 2015
JPM Global Unconstrained Equity A (dist) - USD USD 0.43 30 September 2015
JPM Global Unconstrained Equity X (dist) - AUD AUD 0.23 30 September 2015
JPM Greater China A (dist) - HKD# HKD 0.33 30 September 2015
JPM Greater China A (dist) - USD# USD 0.78 30 September 2015
JPM Greater China C (dist) - USD# USD 2.83 30 September 2015
JPM Greater China I (dist) - USD# USD 2.90 30 September 2015
JPM India A (dist) - GBP# GBP 0.34 30 September 2015
JPM India A (dist) - USD# USD 0.27 30 September 2015
JPM India C (dist) - USD# USD 1.07 30 September 2015
JPM India I (dist) - USD# USD 6.31 30 September 2015
JPM Japan Equity A (dist) - GBP (hedged)# GBP 0.05 30 September 2015
JPM Japan Equity A (dist) - GBP# GBP 0.01 30 September 2015
JPM Japan Equity A (dist) - SGD# SGD 0.01 30 September 2015
JPM Japan Equity A (dist) - USD# USD 0.02 30 September 2015
JPM Japan Equity C (dist) - GBP**# GBP 0.06 30 September 2015
JPM Japan Equity C (dist) - USD# USD 0.16 30 September 2015
JPM Japan Equity J (dist) - USD# USD 0.01 30 September 2015
JPM Korea Equity A (dist) - USD# USD 0.01 30 September 2015
JPM Latin America Equity A (dist) - USD USD 0.20 30 September 2015
JPM Latin America Equity B (dist) - USD* USD 0.96 30 September 2015
JPM Latin America Equity C (dist) - USD USD 0.56 30 September 2015
JPM Latin America Equity I (dist) - USD USD 1.08 30 September 2015
56
JPMorgan FundsNotes to the Financial Statements (continued)
As at 30 June 2016
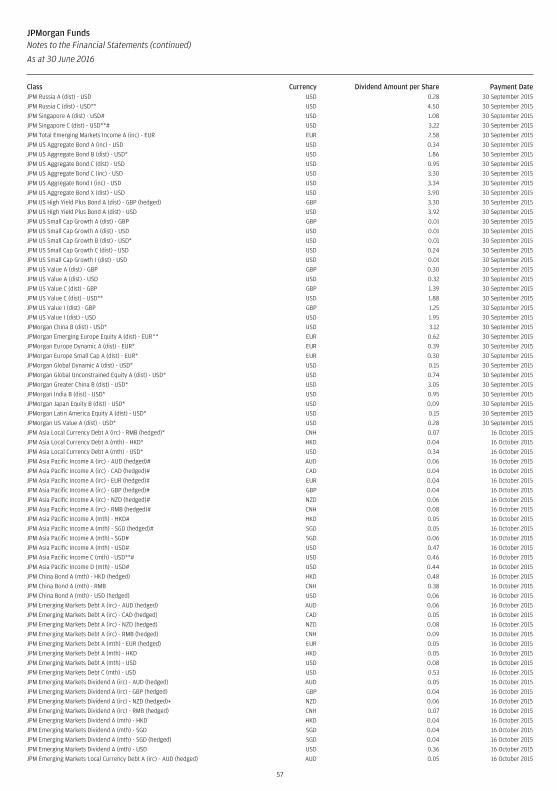
Class Currency Dividend Amount per Share Payment DateJPM Russia A (dist) - USD USD 0.28 30 September 2015
JPM Russia C (dist) - USD** USD 4.50 30 September 2015
JPM Singapore A (dist) - USD# USD 1.08 30 September 2015
JPM Singapore C (dist) - USD**# USD 3.22 30 September 2015
JPM Total Emerging Markets Income A (inc) - EUR EUR 2.58 30 September 2015
JPM US Aggregate Bond A (inc) - USD USD 0.34 30 September 2015
JPM US Aggregate Bond B (dist) - USD* USD 1.86 30 September 2015
JPM US Aggregate Bond C (dist) - USD USD 0.95 30 September 2015
JPM US Aggregate Bond C (inc) - USD USD 3.30 30 September 2015
JPM US Aggregate Bond I (inc) - USD USD 3.34 30 September 2015
JPM US Aggregate Bond X (dist) - USD USD 3.90 30 September 2015
JPM US High Yield Plus Bond A (dist) - GBP (hedged) GBP 3.30 30 September 2015
JPM US High Yield Plus Bond A (dist) - USD USD 3.92 30 September 2015
JPM US Small Cap Growth A (dist) - GBP GBP 0.01 30 September 2015
JPM US Small Cap Growth A (dist) - USD USD 0.01 30 September 2015
JPM US Small Cap Growth B (dist) - USD* USD 0.01 30 September 2015
JPM US Small Cap Growth C (dist) - USD USD 0.24 30 September 2015
JPM US Small Cap Growth I (dist) - USD USD 0.01 30 September 2015
JPM US Value A (dist) - GBP GBP 0.30 30 September 2015
JPM US Value A (dist) - USD USD 0.32 30 September 2015
JPM US Value C (dist) - GBP GBP 1.39 30 September 2015
JPM US Value C (dist) - USD** USD 1.88 30 September 2015
JPM US Value I (dist) - GBP GBP 1.25 30 September 2015
JPM US Value I (dist) - USD USD 1.95 30 September 2015
JPMorgan China B (dist) - USD* USD 3.12 30 September 2015
JPMorgan Emerging Europe Equity A (dist) - EUR^* EUR 0.62 30 September 2015
JPMorgan Europe Dynamic A (dist) - EUR* EUR 0.39 30 September 2015
JPMorgan Europe Small Cap A (dist) - EUR* EUR 0.30 30 September 2015
JPMorgan Global Dynamic A (dist) - USD* USD 0.15 30 September 2015
JPMorgan Global Unconstrained Equity A (dist) - USD* USD 0.74 30 September 2015
JPMorgan Greater China B (dist) - USD* USD 3.05 30 September 2015
JPMorgan India B (dist) - USD* USD 0.95 30 September 2015
JPMorgan Japan Equity B (dist) - USD* USD 0.09 30 September 2015
JPMorgan Latin America Equity A (dist) - USD* USD 0.15 30 September 2015
JPMorgan US Value A (dist) - USD* USD 0.28 30 September 2015
JPM Asia Local Currency Debt A (irc) - RMB (hedged)* CNH 0.07 16 October 2015
JPM Asia Local Currency Debt A (mth) - HKD* HKD 0.04 16 October 2015
JPM Asia Local Currency Debt A (mth) - USD* USD 0.34 16 October 2015
JPM Asia Pacific Income A (irc) - AUD (hedged)# AUD 0.06 16 October 2015
JPM Asia Pacific Income A (irc) - CAD (hedged)# CAD 0.04 16 October 2015
JPM Asia Pacific Income A (irc) - EUR (hedged)# EUR 0.04 16 October 2015
JPM Asia Pacific Income A (irc) - GBP (hedged)# GBP 0.04 16 October 2015
JPM Asia Pacific Income A (irc) - NZD (hedged)# NZD 0.06 16 October 2015
JPM Asia Pacific Income A (irc) - RMB (hedged)# CNH 0.08 16 October 2015
JPM Asia Pacific Income A (mth) - HKD# HKD 0.05 16 October 2015
JPM Asia Pacific Income A (mth) - SGD (hedged)# SGD 0.05 16 October 2015
JPM Asia Pacific Income A (mth) - SGD# SGD 0.06 16 October 2015
JPM Asia Pacific Income A (mth) - USD# USD 0.47 16 October 2015
JPM Asia Pacific Income C (mth) - USD**# USD 0.46 16 October 2015
JPM Asia Pacific Income D (mth) - USD# USD 0.44 16 October 2015
JPM China Bond A (mth) - HKD (hedged) HKD 0.48 16 October 2015
JPM China Bond A (mth) - RMB CNH 0.38 16 October 2015
JPM China Bond A (mth) - USD (hedged) USD 0.06 16 October 2015
JPM Emerging Markets Debt A (irc) - AUD (hedged) AUD 0.06 16 October 2015
JPM Emerging Markets Debt A (irc) - CAD (hedged) CAD 0.05 16 October 2015
JPM Emerging Markets Debt A (irc) - NZD (hedged) NZD 0.08 16 October 2015
JPM Emerging Markets Debt A (irc) - RMB (hedged) CNH 0.09 16 October 2015
JPM Emerging Markets Debt A (mth) - EUR (hedged) EUR 0.05 16 October 2015
JPM Emerging Markets Debt A (mth) - HKD HKD 0.05 16 October 2015
JPM Emerging Markets Debt A (mth) - USD USD 0.08 16 October 2015
JPM Emerging Markets Debt C (mth) - USD USD 0.53 16 October 2015
JPM Emerging Markets Dividend A (irc) - AUD (hedged) AUD 0.05 16 October 2015
JPM Emerging Markets Dividend A (irc) - GBP (hedged) GBP 0.04 16 October 2015
JPM Emerging Markets Dividend A (irc) - NZD (hedged)+ NZD 0.06 16 October 2015
JPM Emerging Markets Dividend A (irc) - RMB (hedged) CNH 0.07 16 October 2015
JPM Emerging Markets Dividend A (mth) - HKD HKD 0.04 16 October 2015
JPM Emerging Markets Dividend A (mth) - SGD SGD 0.04 16 October 2015
JPM Emerging Markets Dividend A (mth) - SGD (hedged) SGD 0.04 16 October 2015
JPM Emerging Markets Dividend A (mth) - USD USD 0.36 16 October 2015
JPM Emerging Markets Local Currency Debt A (irc) - AUD (hedged) AUD 0.05 16 October 2015
57
JPMorgan FundsNotes to the Financial Statements (continued)
As at 30 June 2016
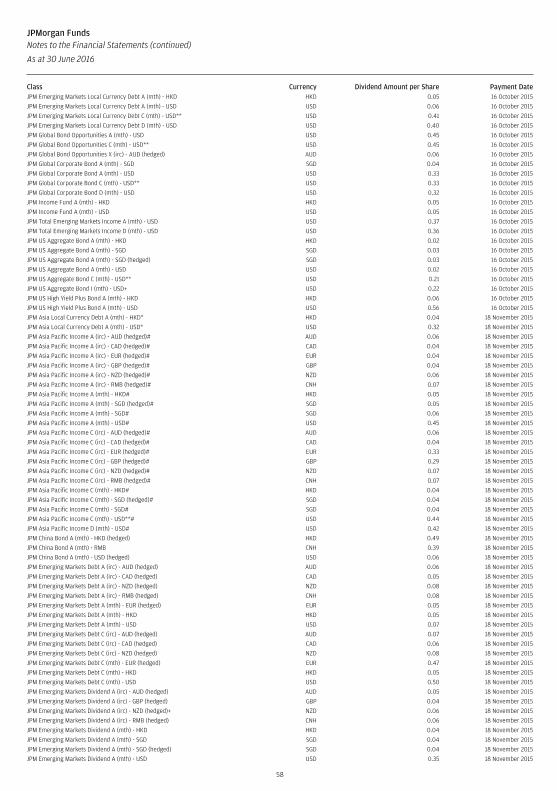
Class Currency Dividend Amount per Share Payment DateJPM Emerging Markets Local Currency Debt A (mth) - HKD HKD 0.05 16 October 2015
JPM Emerging Markets Local Currency Debt A (mth) - USD USD 0.06 16 October 2015
JPM Emerging Markets Local Currency Debt C (mth) - USD** USD 0.41 16 October 2015
JPM Emerging Markets Local Currency Debt D (mth) - USD USD 0.40 16 October 2015
JPM Global Bond Opportunities A (mth) - USD USD 0.45 16 October 2015
JPM Global Bond Opportunities C (mth) - USD** USD 0.45 16 October 2015
JPM Global Bond Opportunities X (irc) - AUD (hedged) AUD 0.06 16 October 2015
JPM Global Corporate Bond A (mth) - SGD SGD 0.04 16 October 2015
JPM Global Corporate Bond A (mth) - USD USD 0.33 16 October 2015
JPM Global Corporate Bond C (mth) - USD** USD 0.33 16 October 2015
JPM Global Corporate Bond D (mth) - USD USD 0.32 16 October 2015
JPM Income Fund A (mth) - HKD HKD 0.05 16 October 2015
JPM Income Fund A (mth) - USD USD 0.05 16 October 2015
JPM Total Emerging Markets Income A (mth) - USD USD 0.37 16 October 2015
JPM Total Emerging Markets Income D (mth) - USD USD 0.36 16 October 2015
JPM US Aggregate Bond A (mth) - HKD HKD 0.02 16 October 2015
JPM US Aggregate Bond A (mth) - SGD SGD 0.03 16 October 2015
JPM US Aggregate Bond A (mth) - SGD (hedged) SGD 0.03 16 October 2015
JPM US Aggregate Bond A (mth) - USD USD 0.02 16 October 2015
JPM US Aggregate Bond C (mth) - USD** USD 0.21 16 October 2015
JPM US Aggregate Bond I (mth) - USD+ USD 0.22 16 October 2015
JPM US High Yield Plus Bond A (mth) - HKD HKD 0.06 16 October 2015
JPM US High Yield Plus Bond A (mth) - USD USD 0.56 16 October 2015
JPM Asia Local Currency Debt A (mth) - HKD* HKD 0.04 18 November 2015
JPM Asia Local Currency Debt A (mth) - USD* USD 0.32 18 November 2015
JPM Asia Pacific Income A (irc) - AUD (hedged)# AUD 0.06 18 November 2015
JPM Asia Pacific Income A (irc) - CAD (hedged)# CAD 0.04 18 November 2015
JPM Asia Pacific Income A (irc) - EUR (hedged)# EUR 0.04 18 November 2015
JPM Asia Pacific Income A (irc) - GBP (hedged)# GBP 0.04 18 November 2015
JPM Asia Pacific Income A (irc) - NZD (hedged)# NZD 0.06 18 November 2015
JPM Asia Pacific Income A (irc) - RMB (hedged)# CNH 0.07 18 November 2015
JPM Asia Pacific Income A (mth) - HKD# HKD 0.05 18 November 2015
JPM Asia Pacific Income A (mth) - SGD (hedged)# SGD 0.05 18 November 2015
JPM Asia Pacific Income A (mth) - SGD# SGD 0.06 18 November 2015
JPM Asia Pacific Income A (mth) - USD# USD 0.45 18 November 2015
JPM Asia Pacific Income C (irc) - AUD (hedged)# AUD 0.06 18 November 2015
JPM Asia Pacific Income C (irc) - CAD (hedged)# CAD 0.04 18 November 2015
JPM Asia Pacific Income C (irc) - EUR (hedged)# EUR 0.33 18 November 2015
JPM Asia Pacific Income C (irc) - GBP (hedged)# GBP 0.29 18 November 2015
JPM Asia Pacific Income C (irc) - NZD (hedged)# NZD 0.07 18 November 2015
JPM Asia Pacific Income C (irc) - RMB (hedged)# CNH 0.07 18 November 2015
JPM Asia Pacific Income C (mth) - HKD# HKD 0.04 18 November 2015
JPM Asia Pacific Income C (mth) - SGD (hedged)# SGD 0.04 18 November 2015
JPM Asia Pacific Income C (mth) - SGD# SGD 0.04 18 November 2015
JPM Asia Pacific Income C (mth) - USD**# USD 0.44 18 November 2015
JPM Asia Pacific Income D (mth) - USD# USD 0.42 18 November 2015
JPM China Bond A (mth) - HKD (hedged) HKD 0.49 18 November 2015
JPM China Bond A (mth) - RMB CNH 0.39 18 November 2015
JPM China Bond A (mth) - USD (hedged) USD 0.06 18 November 2015
JPM Emerging Markets Debt A (irc) - AUD (hedged) AUD 0.06 18 November 2015
JPM Emerging Markets Debt A (irc) - CAD (hedged) CAD 0.05 18 November 2015
JPM Emerging Markets Debt A (irc) - NZD (hedged) NZD 0.08 18 November 2015
JPM Emerging Markets Debt A (irc) - RMB (hedged) CNH 0.08 18 November 2015
JPM Emerging Markets Debt A (mth) - EUR (hedged) EUR 0.05 18 November 2015
JPM Emerging Markets Debt A (mth) - HKD HKD 0.05 18 November 2015
JPM Emerging Markets Debt A (mth) - USD USD 0.07 18 November 2015
JPM Emerging Markets Debt C (irc) - AUD (hedged) AUD 0.07 18 November 2015
JPM Emerging Markets Debt C (irc) - CAD (hedged) CAD 0.06 18 November 2015
JPM Emerging Markets Debt C (irc) - NZD (hedged) NZD 0.08 18 November 2015
JPM Emerging Markets Debt C (mth) - EUR (hedged) EUR 0.47 18 November 2015
JPM Emerging Markets Debt C (mth) - HKD HKD 0.05 18 November 2015
JPM Emerging Markets Debt C (mth) - USD USD 0.50 18 November 2015
JPM Emerging Markets Dividend A (irc) - AUD (hedged) AUD 0.05 18 November 2015
JPM Emerging Markets Dividend A (irc) - GBP (hedged) GBP 0.04 18 November 2015
JPM Emerging Markets Dividend A (irc) - NZD (hedged)+ NZD 0.06 18 November 2015
JPM Emerging Markets Dividend A (irc) - RMB (hedged) CNH 0.06 18 November 2015
JPM Emerging Markets Dividend A (mth) - HKD HKD 0.04 18 November 2015
JPM Emerging Markets Dividend A (mth) - SGD SGD 0.04 18 November 2015
JPM Emerging Markets Dividend A (mth) - SGD (hedged) SGD 0.04 18 November 2015
JPM Emerging Markets Dividend A (mth) - USD USD 0.35 18 November 2015
58
JPMorgan FundsNotes to the Financial Statements (continued)
As at 30 June 2016

Class Currency Dividend Amount per Share Payment DateJPM Emerging Markets Local Currency Debt A (irc) - AUD (hedged) AUD 0.05 18 November 2015
JPM Emerging Markets Local Currency Debt A (mth) - HKD HKD 0.05 18 November 2015
JPM Emerging Markets Local Currency Debt A (mth) - USD USD 0.06 18 November 2015
JPM Emerging Markets Local Currency Debt C (mth) - USD** USD 0.37 18 November 2015
JPM Emerging Markets Local Currency Debt D (mth) - USD USD 0.36 18 November 2015
JPM Global Bond Opportunities A (mth) - USD USD 0.43 18 November 2015
JPM Global Bond Opportunities C (mth) - USD** USD 0.43 18 November 2015
JPM Global Bond Opportunities X (irc) - AUD (hedged) AUD 0.06 18 November 2015
JPM Global Corporate Bond A (mth) - SGD SGD 0.04 18 November 2015
JPM Global Corporate Bond A (mth) - USD USD 0.31 18 November 2015
JPM Global Corporate Bond C (mth) - USD** USD 0.31 18 November 2015
JPM Global Corporate Bond D (mth) - USD USD 0.30 18 November 2015
JPM Income Fund A (mth) - HKD HKD 0.05 18 November 2015
JPM Income Fund A (mth) - USD USD 0.05 18 November 2015
JPM Total Emerging Markets Income A (mth) - USD USD 0.37 18 November 2015
JPM Total Emerging Markets Income D (mth) - USD USD 0.37 18 November 2015
JPM US Aggregate Bond A (mth) - HKD HKD 0.02 18 November 2015
JPM US Aggregate Bond A (mth) - SGD SGD 0.03 18 November 2015
JPM US Aggregate Bond A (mth) - SGD (hedged) SGD 0.03 18 November 2015
JPM US Aggregate Bond A (mth) - USD USD 0.02 18 November 2015
JPM US Aggregate Bond C (mth) - HKD HKD 0.02 18 November 2015
JPM US Aggregate Bond C (mth) - SGD SGD 0.02 18 November 2015
JPM US Aggregate Bond C (mth) - SGD (hedged) SGD 0.02 18 November 2015
JPM US Aggregate Bond C (mth) - USD** USD 0.21 18 November 2015
JPM US Aggregate Bond I (mth) - USD+ USD 0.21 18 November 2015
JPM US High Yield Plus Bond A (mth) - HKD HKD 0.06 18 November 2015
JPM US High Yield Plus Bond A (mth) - USD USD 0.52 18 November 2015
JPM Emerging Markets Dividend A (div) - EUR EUR 0.99 20 November 2015
JPM Emerging Markets Dividend C (div) - EUR** EUR 1.03 20 November 2015
JPM Emerging Markets Dividend D (div) - EUR EUR 0.97 20 November 2015
JPM Emerging Markets Dividend T (div) - EUR EUR 0.97 20 November 2015
JPM Emerging Markets Local Currency Debt A (div) - EUR EUR 1.33 20 November 2015
JPM Emerging Markets Local Currency Debt C (div) - EUR EUR 1.14 20 November 2015
JPM Emerging Markets Local Currency Debt D (div) - EUR EUR 0.13 20 November 2015
JPM Emerging Markets Local Currency Debt T (div) - EUR EUR 1.29 20 November 2015
JPM Global Bond Opportunities A (fix) EUR 3.50 - EUR (hedged) EUR 0.88 20 November 2015
JPM Global Bond Opportunities D (div) - EUR (hedged) EUR 0.92 20 November 2015
JPM Global Bond Opportunities D (fix) EUR 3.00 - EUR (hedged) EUR 0.75 20 November 2015
JPM Global Bond Opportunities T (div) - EUR (hedged) EUR 0.96 20 November 2015
JPM Global Corporate Bond A (div) - EUR (hedged) EUR 0.68 20 November 2015
JPM Global Corporate Bond C (div) - EUR (hedged)** EUR 0.69 20 November 2015
JPM Global Corporate Bond D (div) - EUR (hedged) EUR 0.07 20 November 2015
JPM Global Corporate Bond T (div) - EUR (hedged) EUR 0.68 20 November 2015
JPM Income Fund A (div) - EUR (hedged) EUR 1.02 20 November 2015
JPM Income Fund A (div) - USD USD 1.38 20 November 2015
JPM Income Fund C (div) - EUR (hedged)** EUR 1.02 20 November 2015
JPM Income Fund D (div) - EUR (hedged) EUR 1.02 20 November 2015
JPM Total Emerging Markets Income D (div) - EUR EUR 1.05 20 November 2015
JPM US Aggregate Bond A (div) - USD USD 0.61 20 November 2015
JPM US Aggregate Bond C (div) - USD USD 0.37 20 November 2015
JPM US High Yield Plus Bond A (div) - EUR (hedged) EUR 1.15 20 November 2015
JPM US High Yield Plus Bond D (div) - EUR (hedged) EUR 1.13 20 November 2015
JPM Asia Local Currency Debt A (mth) - HKD* HKD 0.04 16 December 2015
JPM Asia Local Currency Debt A (mth) - USD* USD 0.32 16 December 2015
JPM Asia Pacific Income A (irc) - AUD (hedged)# AUD 0.06 16 December 2015
JPM Asia Pacific Income A (irc) - CAD (hedged)# CAD 0.04 16 December 2015
JPM Asia Pacific Income A (irc) - EUR (hedged)# EUR 0.03 16 December 2015
JPM Asia Pacific Income A (irc) - GBP (hedged)# GBP 0.04 16 December 2015
JPM Asia Pacific Income A (irc) - NZD (hedged)# NZD 0.06 16 December 2015
JPM Asia Pacific Income A (irc) - RMB (hedged)# CNH 0.07 16 December 2015
JPM Asia Pacific Income A (mth) - HKD# HKD 0.05 16 December 2015
JPM Asia Pacific Income A (mth) - SGD (hedged)# SGD 0.05 16 December 2015
JPM Asia Pacific Income A (mth) - SGD# SGD 0.06 16 December 2015
JPM Asia Pacific Income A (mth) - USD# USD 0.45 16 December 2015
JPM Asia Pacific Income C (irc) - AUD (hedged)# AUD 0.06 16 December 2015
JPM Asia Pacific Income C (irc) - CAD (hedged)# CAD 0.04 16 December 2015
JPM Asia Pacific Income C (irc) - EUR (hedged)# EUR 0.32 16 December 2015
JPM Asia Pacific Income C (irc) - GBP (hedged)# GBP 0.28 16 December 2015
JPM Asia Pacific Income C (irc) - NZD (hedged)# NZD 0.07 16 December 2015
JPM Asia Pacific Income C (irc) - RMB (hedged)# CNH 0.07 16 December 2015
59
JPMorgan FundsNotes to the Financial Statements (continued)
As at 30 June 2016
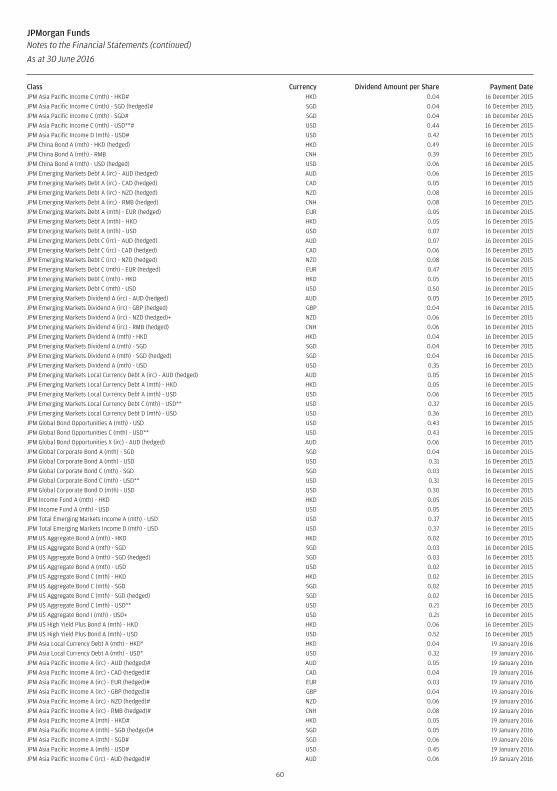
Class Currency Dividend Amount per Share Payment DateJPM Asia Pacific Income C (mth) - HKD# HKD 0.04 16 December 2015
JPM Asia Pacific Income C (mth) - SGD (hedged)# SGD 0.04 16 December 2015
JPM Asia Pacific Income C (mth) - SGD# SGD 0.04 16 December 2015
JPM Asia Pacific Income C (mth) - USD**# USD 0.44 16 December 2015
JPM Asia Pacific Income D (mth) - USD# USD 0.42 16 December 2015
JPM China Bond A (mth) - HKD (hedged) HKD 0.49 16 December 2015
JPM China Bond A (mth) - RMB CNH 0.39 16 December 2015
JPM China Bond A (mth) - USD (hedged) USD 0.06 16 December 2015
JPM Emerging Markets Debt A (irc) - AUD (hedged) AUD 0.06 16 December 2015
JPM Emerging Markets Debt A (irc) - CAD (hedged) CAD 0.05 16 December 2015
JPM Emerging Markets Debt A (irc) - NZD (hedged) NZD 0.08 16 December 2015
JPM Emerging Markets Debt A (irc) - RMB (hedged) CNH 0.08 16 December 2015
JPM Emerging Markets Debt A (mth) - EUR (hedged) EUR 0.05 16 December 2015
JPM Emerging Markets Debt A (mth) - HKD HKD 0.05 16 December 2015
JPM Emerging Markets Debt A (mth) - USD USD 0.07 16 December 2015
JPM Emerging Markets Debt C (irc) - AUD (hedged) AUD 0.07 16 December 2015
JPM Emerging Markets Debt C (irc) - CAD (hedged) CAD 0.06 16 December 2015
JPM Emerging Markets Debt C (irc) - NZD (hedged) NZD 0.08 16 December 2015
JPM Emerging Markets Debt C (mth) - EUR (hedged) EUR 0.47 16 December 2015
JPM Emerging Markets Debt C (mth) - HKD HKD 0.05 16 December 2015
JPM Emerging Markets Debt C (mth) - USD USD 0.50 16 December 2015
JPM Emerging Markets Dividend A (irc) - AUD (hedged) AUD 0.05 16 December 2015
JPM Emerging Markets Dividend A (irc) - GBP (hedged) GBP 0.04 16 December 2015
JPM Emerging Markets Dividend A (irc) - NZD (hedged)+ NZD 0.06 16 December 2015
JPM Emerging Markets Dividend A (irc) - RMB (hedged) CNH 0.06 16 December 2015
JPM Emerging Markets Dividend A (mth) - HKD HKD 0.04 16 December 2015
JPM Emerging Markets Dividend A (mth) - SGD SGD 0.04 16 December 2015
JPM Emerging Markets Dividend A (mth) - SGD (hedged) SGD 0.04 16 December 2015
JPM Emerging Markets Dividend A (mth) - USD USD 0.35 16 December 2015
JPM Emerging Markets Local Currency Debt A (irc) - AUD (hedged) AUD 0.05 16 December 2015
JPM Emerging Markets Local Currency Debt A (mth) - HKD HKD 0.05 16 December 2015
JPM Emerging Markets Local Currency Debt A (mth) - USD USD 0.06 16 December 2015
JPM Emerging Markets Local Currency Debt C (mth) - USD** USD 0.37 16 December 2015
JPM Emerging Markets Local Currency Debt D (mth) - USD USD 0.36 16 December 2015
JPM Global Bond Opportunities A (mth) - USD USD 0.43 16 December 2015
JPM Global Bond Opportunities C (mth) - USD** USD 0.43 16 December 2015
JPM Global Bond Opportunities X (irc) - AUD (hedged) AUD 0.06 16 December 2015
JPM Global Corporate Bond A (mth) - SGD SGD 0.04 16 December 2015
JPM Global Corporate Bond A (mth) - USD USD 0.31 16 December 2015
JPM Global Corporate Bond C (mth) - SGD SGD 0.03 16 December 2015
JPM Global Corporate Bond C (mth) - USD** USD 0.31 16 December 2015
JPM Global Corporate Bond D (mth) - USD USD 0.30 16 December 2015
JPM Income Fund A (mth) - HKD HKD 0.05 16 December 2015
JPM Income Fund A (mth) - USD USD 0.05 16 December 2015
JPM Total Emerging Markets Income A (mth) - USD USD 0.37 16 December 2015
JPM Total Emerging Markets Income D (mth) - USD USD 0.37 16 December 2015
JPM US Aggregate Bond A (mth) - HKD HKD 0.02 16 December 2015
JPM US Aggregate Bond A (mth) - SGD SGD 0.03 16 December 2015
JPM US Aggregate Bond A (mth) - SGD (hedged) SGD 0.03 16 December 2015
JPM US Aggregate Bond A (mth) - USD USD 0.02 16 December 2015
JPM US Aggregate Bond C (mth) - HKD HKD 0.02 16 December 2015
JPM US Aggregate Bond C (mth) - SGD SGD 0.02 16 December 2015
JPM US Aggregate Bond C (mth) - SGD (hedged) SGD 0.02 16 December 2015
JPM US Aggregate Bond C (mth) - USD** USD 0.21 16 December 2015
JPM US Aggregate Bond I (mth) - USD+ USD 0.21 16 December 2015
JPM US High Yield Plus Bond A (mth) - HKD HKD 0.06 16 December 2015
JPM US High Yield Plus Bond A (mth) - USD USD 0.52 16 December 2015
JPM Asia Local Currency Debt A (mth) - HKD* HKD 0.04 19 January 2016
JPM Asia Local Currency Debt A (mth) - USD* USD 0.32 19 January 2016
JPM Asia Pacific Income A (irc) - AUD (hedged)# AUD 0.05 19 January 2016
JPM Asia Pacific Income A (irc) - CAD (hedged)# CAD 0.04 19 January 2016
JPM Asia Pacific Income A (irc) - EUR (hedged)# EUR 0.03 19 January 2016
JPM Asia Pacific Income A (irc) - GBP (hedged)# GBP 0.04 19 January 2016
JPM Asia Pacific Income A (irc) - NZD (hedged)# NZD 0.06 19 January 2016
JPM Asia Pacific Income A (irc) - RMB (hedged)# CNH 0.08 19 January 2016
JPM Asia Pacific Income A (mth) - HKD# HKD 0.05 19 January 2016
JPM Asia Pacific Income A (mth) - SGD (hedged)# SGD 0.05 19 January 2016
JPM Asia Pacific Income A (mth) - SGD# SGD 0.06 19 January 2016
JPM Asia Pacific Income A (mth) - USD# USD 0.45 19 January 2016
JPM Asia Pacific Income C (irc) - AUD (hedged)# AUD 0.06 19 January 2016
60
JPMorgan FundsNotes to the Financial Statements (continued)
As at 30 June 2016
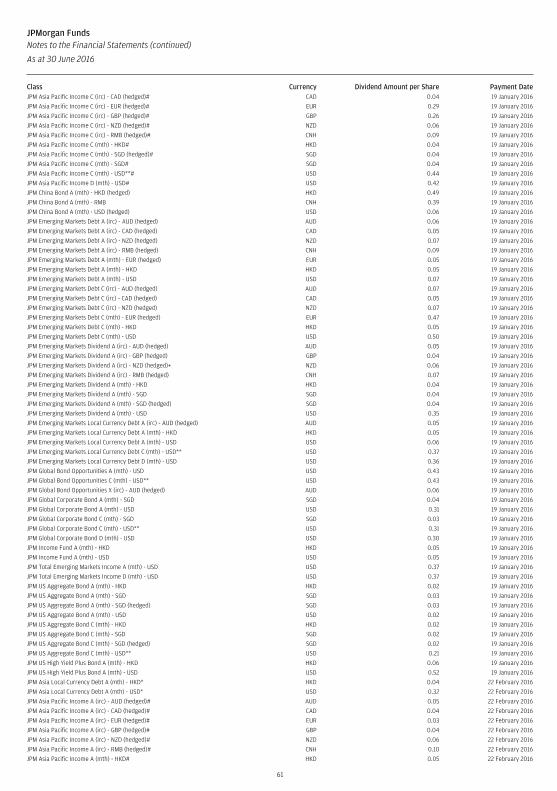
Class Currency Dividend Amount per Share Payment DateJPM Asia Pacific Income C (irc) - CAD (hedged)# CAD 0.04 19 January 2016
JPM Asia Pacific Income C (irc) - EUR (hedged)# EUR 0.29 19 January 2016
JPM Asia Pacific Income C (irc) - GBP (hedged)# GBP 0.26 19 January 2016
JPM Asia Pacific Income C (irc) - NZD (hedged)# NZD 0.06 19 January 2016
JPM Asia Pacific Income C (irc) - RMB (hedged)# CNH 0.09 19 January 2016
JPM Asia Pacific Income C (mth) - HKD# HKD 0.04 19 January 2016
JPM Asia Pacific Income C (mth) - SGD (hedged)# SGD 0.04 19 January 2016
JPM Asia Pacific Income C (mth) - SGD# SGD 0.04 19 January 2016
JPM Asia Pacific Income C (mth) - USD**# USD 0.44 19 January 2016
JPM Asia Pacific Income D (mth) - USD# USD 0.42 19 January 2016
JPM China Bond A (mth) - HKD (hedged) HKD 0.49 19 January 2016
JPM China Bond A (mth) - RMB CNH 0.39 19 January 2016
JPM China Bond A (mth) - USD (hedged) USD 0.06 19 January 2016
JPM Emerging Markets Debt A (irc) - AUD (hedged) AUD 0.06 19 January 2016
JPM Emerging Markets Debt A (irc) - CAD (hedged) CAD 0.05 19 January 2016
JPM Emerging Markets Debt A (irc) - NZD (hedged) NZD 0.07 19 January 2016
JPM Emerging Markets Debt A (irc) - RMB (hedged) CNH 0.09 19 January 2016
JPM Emerging Markets Debt A (mth) - EUR (hedged) EUR 0.05 19 January 2016
JPM Emerging Markets Debt A (mth) - HKD HKD 0.05 19 January 2016
JPM Emerging Markets Debt A (mth) - USD USD 0.07 19 January 2016
JPM Emerging Markets Debt C (irc) - AUD (hedged) AUD 0.07 19 January 2016
JPM Emerging Markets Debt C (irc) - CAD (hedged) CAD 0.05 19 January 2016
JPM Emerging Markets Debt C (irc) - NZD (hedged) NZD 0.07 19 January 2016
JPM Emerging Markets Debt C (mth) - EUR (hedged) EUR 0.47 19 January 2016
JPM Emerging Markets Debt C (mth) - HKD HKD 0.05 19 January 2016
JPM Emerging Markets Debt C (mth) - USD USD 0.50 19 January 2016
JPM Emerging Markets Dividend A (irc) - AUD (hedged) AUD 0.05 19 January 2016
JPM Emerging Markets Dividend A (irc) - GBP (hedged) GBP 0.04 19 January 2016
JPM Emerging Markets Dividend A (irc) - NZD (hedged)+ NZD 0.06 19 January 2016
JPM Emerging Markets Dividend A (irc) - RMB (hedged) CNH 0.07 19 January 2016
JPM Emerging Markets Dividend A (mth) - HKD HKD 0.04 19 January 2016
JPM Emerging Markets Dividend A (mth) - SGD SGD 0.04 19 January 2016
JPM Emerging Markets Dividend A (mth) - SGD (hedged) SGD 0.04 19 January 2016
JPM Emerging Markets Dividend A (mth) - USD USD 0.35 19 January 2016
JPM Emerging Markets Local Currency Debt A (irc) - AUD (hedged) AUD 0.05 19 January 2016
JPM Emerging Markets Local Currency Debt A (mth) - HKD HKD 0.05 19 January 2016
JPM Emerging Markets Local Currency Debt A (mth) - USD USD 0.06 19 January 2016
JPM Emerging Markets Local Currency Debt C (mth) - USD** USD 0.37 19 January 2016
JPM Emerging Markets Local Currency Debt D (mth) - USD USD 0.36 19 January 2016
JPM Global Bond Opportunities A (mth) - USD USD 0.43 19 January 2016
JPM Global Bond Opportunities C (mth) - USD** USD 0.43 19 January 2016
JPM Global Bond Opportunities X (irc) - AUD (hedged) AUD 0.06 19 January 2016
JPM Global Corporate Bond A (mth) - SGD SGD 0.04 19 January 2016
JPM Global Corporate Bond A (mth) - USD USD 0.31 19 January 2016
JPM Global Corporate Bond C (mth) - SGD SGD 0.03 19 January 2016
JPM Global Corporate Bond C (mth) - USD** USD 0.31 19 January 2016
JPM Global Corporate Bond D (mth) - USD USD 0.30 19 January 2016
JPM Income Fund A (mth) - HKD HKD 0.05 19 January 2016
JPM Income Fund A (mth) - USD USD 0.05 19 January 2016
JPM Total Emerging Markets Income A (mth) - USD USD 0.37 19 January 2016
JPM Total Emerging Markets Income D (mth) - USD USD 0.37 19 January 2016
JPM US Aggregate Bond A (mth) - HKD HKD 0.02 19 January 2016
JPM US Aggregate Bond A (mth) - SGD SGD 0.03 19 January 2016
JPM US Aggregate Bond A (mth) - SGD (hedged) SGD 0.03 19 January 2016
JPM US Aggregate Bond A (mth) - USD USD 0.02 19 January 2016
JPM US Aggregate Bond C (mth) - HKD HKD 0.02 19 January 2016
JPM US Aggregate Bond C (mth) - SGD SGD 0.02 19 January 2016
JPM US Aggregate Bond C (mth) - SGD (hedged) SGD 0.02 19 January 2016
JPM US Aggregate Bond C (mth) - USD** USD 0.21 19 January 2016
JPM US High Yield Plus Bond A (mth) - HKD HKD 0.06 19 January 2016
JPM US High Yield Plus Bond A (mth) - USD USD 0.52 19 January 2016
JPM Asia Local Currency Debt A (mth) - HKD* HKD 0.04 22 February 2016
JPM Asia Local Currency Debt A (mth) - USD* USD 0.32 22 February 2016
JPM Asia Pacific Income A (irc) - AUD (hedged)# AUD 0.05 22 February 2016
JPM Asia Pacific Income A (irc) - CAD (hedged)# CAD 0.04 22 February 2016
JPM Asia Pacific Income A (irc) - EUR (hedged)# EUR 0.03 22 February 2016
JPM Asia Pacific Income A (irc) - GBP (hedged)# GBP 0.04 22 February 2016
JPM Asia Pacific Income A (irc) - NZD (hedged)# NZD 0.06 22 February 2016
JPM Asia Pacific Income A (irc) - RMB (hedged)# CNH 0.10 22 February 2016
JPM Asia Pacific Income A (mth) - HKD# HKD 0.05 22 February 2016
61
JPMorgan FundsNotes to the Financial Statements (continued)
As at 30 June 2016
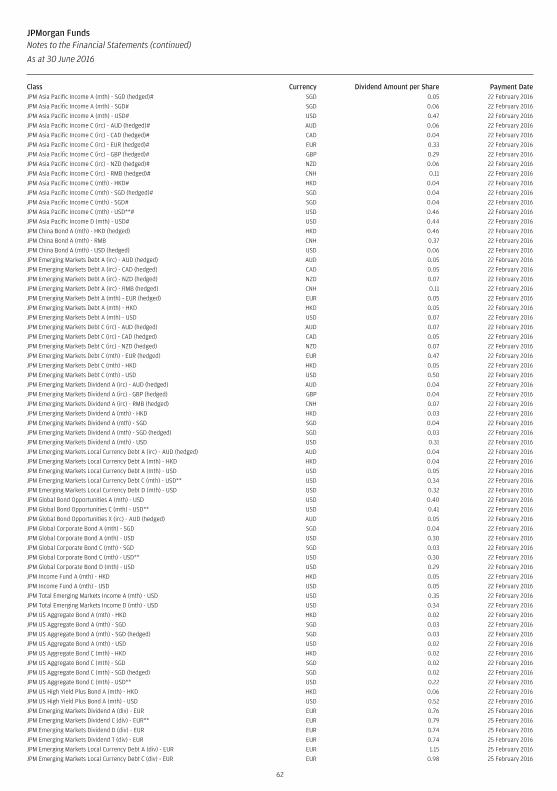
Class Currency Dividend Amount per Share Payment DateJPM Asia Pacific Income A (mth) - SGD (hedged)# SGD 0.05 22 February 2016
JPM Asia Pacific Income A (mth) - SGD# SGD 0.06 22 February 2016
JPM Asia Pacific Income A (mth) - USD# USD 0.47 22 February 2016
JPM Asia Pacific Income C (irc) - AUD (hedged)# AUD 0.06 22 February 2016
JPM Asia Pacific Income C (irc) - CAD (hedged)# CAD 0.04 22 February 2016
JPM Asia Pacific Income C (irc) - EUR (hedged)# EUR 0.33 22 February 2016
JPM Asia Pacific Income C (irc) - GBP (hedged)# GBP 0.29 22 February 2016
JPM Asia Pacific Income C (irc) - NZD (hedged)# NZD 0.06 22 February 2016
JPM Asia Pacific Income C (irc) - RMB (hedged)# CNH 0.11 22 February 2016
JPM Asia Pacific Income C (mth) - HKD# HKD 0.04 22 February 2016
JPM Asia Pacific Income C (mth) - SGD (hedged)# SGD 0.04 22 February 2016
JPM Asia Pacific Income C (mth) - SGD# SGD 0.04 22 February 2016
JPM Asia Pacific Income C (mth) - USD**# USD 0.46 22 February 2016
JPM Asia Pacific Income D (mth) - USD# USD 0.44 22 February 2016
JPM China Bond A (mth) - HKD (hedged) HKD 0.46 22 February 2016
JPM China Bond A (mth) - RMB CNH 0.37 22 February 2016
JPM China Bond A (mth) - USD (hedged) USD 0.06 22 February 2016
JPM Emerging Markets Debt A (irc) - AUD (hedged) AUD 0.05 22 February 2016
JPM Emerging Markets Debt A (irc) - CAD (hedged) CAD 0.05 22 February 2016
JPM Emerging Markets Debt A (irc) - NZD (hedged) NZD 0.07 22 February 2016
JPM Emerging Markets Debt A (irc) - RMB (hedged) CNH 0.11 22 February 2016
JPM Emerging Markets Debt A (mth) - EUR (hedged) EUR 0.05 22 February 2016
JPM Emerging Markets Debt A (mth) - HKD HKD 0.05 22 February 2016
JPM Emerging Markets Debt A (mth) - USD USD 0.07 22 February 2016
JPM Emerging Markets Debt C (irc) - AUD (hedged) AUD 0.07 22 February 2016
JPM Emerging Markets Debt C (irc) - CAD (hedged) CAD 0.05 22 February 2016
JPM Emerging Markets Debt C (irc) - NZD (hedged) NZD 0.07 22 February 2016
JPM Emerging Markets Debt C (mth) - EUR (hedged) EUR 0.47 22 February 2016
JPM Emerging Markets Debt C (mth) - HKD HKD 0.05 22 February 2016
JPM Emerging Markets Debt C (mth) - USD USD 0.50 22 February 2016
JPM Emerging Markets Dividend A (irc) - AUD (hedged) AUD 0.04 22 February 2016
JPM Emerging Markets Dividend A (irc) - GBP (hedged) GBP 0.04 22 February 2016
JPM Emerging Markets Dividend A (irc) - RMB (hedged) CNH 0.07 22 February 2016
JPM Emerging Markets Dividend A (mth) - HKD HKD 0.03 22 February 2016
JPM Emerging Markets Dividend A (mth) - SGD SGD 0.04 22 February 2016
JPM Emerging Markets Dividend A (mth) - SGD (hedged) SGD 0.03 22 February 2016
JPM Emerging Markets Dividend A (mth) - USD USD 0.31 22 February 2016
JPM Emerging Markets Local Currency Debt A (irc) - AUD (hedged) AUD 0.04 22 February 2016
JPM Emerging Markets Local Currency Debt A (mth) - HKD HKD 0.04 22 February 2016
JPM Emerging Markets Local Currency Debt A (mth) - USD USD 0.05 22 February 2016
JPM Emerging Markets Local Currency Debt C (mth) - USD** USD 0.34 22 February 2016
JPM Emerging Markets Local Currency Debt D (mth) - USD USD 0.32 22 February 2016
JPM Global Bond Opportunities A (mth) - USD USD 0.40 22 February 2016
JPM Global Bond Opportunities C (mth) - USD** USD 0.41 22 February 2016
JPM Global Bond Opportunities X (irc) - AUD (hedged) AUD 0.05 22 February 2016
JPM Global Corporate Bond A (mth) - SGD SGD 0.04 22 February 2016
JPM Global Corporate Bond A (mth) - USD USD 0.30 22 February 2016
JPM Global Corporate Bond C (mth) - SGD SGD 0.03 22 February 2016
JPM Global Corporate Bond C (mth) - USD** USD 0.30 22 February 2016
JPM Global Corporate Bond D (mth) - USD USD 0.29 22 February 2016
JPM Income Fund A (mth) - HKD HKD 0.05 22 February 2016
JPM Income Fund A (mth) - USD USD 0.05 22 February 2016
JPM Total Emerging Markets Income A (mth) - USD USD 0.35 22 February 2016
JPM Total Emerging Markets Income D (mth) - USD USD 0.34 22 February 2016
JPM US Aggregate Bond A (mth) - HKD HKD 0.02 22 February 2016
JPM US Aggregate Bond A (mth) - SGD SGD 0.03 22 February 2016
JPM US Aggregate Bond A (mth) - SGD (hedged) SGD 0.03 22 February 2016
JPM US Aggregate Bond A (mth) - USD USD 0.02 22 February 2016
JPM US Aggregate Bond C (mth) - HKD HKD 0.02 22 February 2016
JPM US Aggregate Bond C (mth) - SGD SGD 0.02 22 February 2016
JPM US Aggregate Bond C (mth) - SGD (hedged) SGD 0.02 22 February 2016
JPM US Aggregate Bond C (mth) - USD** USD 0.22 22 February 2016
JPM US High Yield Plus Bond A (mth) - HKD HKD 0.06 22 February 2016
JPM US High Yield Plus Bond A (mth) - USD USD 0.52 22 February 2016
JPM Emerging Markets Dividend A (div) - EUR EUR 0.76 25 February 2016
JPM Emerging Markets Dividend C (div) - EUR** EUR 0.79 25 February 2016
JPM Emerging Markets Dividend D (div) - EUR EUR 0.74 25 February 2016
JPM Emerging Markets Dividend T (div) - EUR EUR 0.74 25 February 2016
JPM Emerging Markets Local Currency Debt A (div) - EUR EUR 1.15 25 February 2016
JPM Emerging Markets Local Currency Debt C (div) - EUR EUR 0.98 25 February 2016
62
JPMorgan FundsNotes to the Financial Statements (continued)
As at 30 June 2016
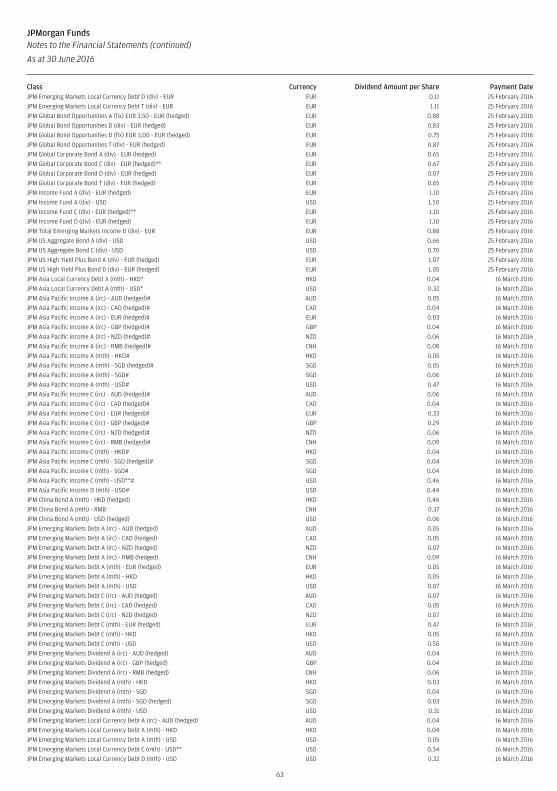
Class Currency Dividend Amount per Share Payment DateJPM Emerging Markets Local Currency Debt D (div) - EUR EUR 0.11 25 February 2016
JPM Emerging Markets Local Currency Debt T (div) - EUR EUR 1.11 25 February 2016
JPM Global Bond Opportunities A (fix) EUR 3.50 - EUR (hedged) EUR 0.88 25 February 2016
JPM Global Bond Opportunities D (div) - EUR (hedged) EUR 0.83 25 February 2016
JPM Global Bond Opportunities D (fix) EUR 3.00 - EUR (hedged) EUR 0.75 25 February 2016
JPM Global Bond Opportunities T (div) - EUR (hedged) EUR 0.87 25 February 2016
JPM Global Corporate Bond A (div) - EUR (hedged) EUR 0.65 25 February 2016
JPM Global Corporate Bond C (div) - EUR (hedged)** EUR 0.67 25 February 2016
JPM Global Corporate Bond D (div) - EUR (hedged) EUR 0.07 25 February 2016
JPM Global Corporate Bond T (div) - EUR (hedged) EUR 0.65 25 February 2016
JPM Income Fund A (div) - EUR (hedged) EUR 1.10 25 February 2016
JPM Income Fund A (div) - USD USD 1.50 25 February 2016
JPM Income Fund C (div) - EUR (hedged)** EUR 1.10 25 February 2016
JPM Income Fund D (div) - EUR (hedged) EUR 1.10 25 February 2016
JPM Total Emerging Markets Income D (div) - EUR EUR 0.88 25 February 2016
JPM US Aggregate Bond A (div) - USD USD 0.66 25 February 2016
JPM US Aggregate Bond C (div) - USD USD 0.70 25 February 2016
JPM US High Yield Plus Bond A (div) - EUR (hedged) EUR 1.07 25 February 2016
JPM US High Yield Plus Bond D (div) - EUR (hedged) EUR 1.05 25 February 2016
JPM Asia Local Currency Debt A (mth) - HKD* HKD 0.04 16 March 2016
JPM Asia Local Currency Debt A (mth) - USD* USD 0.32 16 March 2016
JPM Asia Pacific Income A (irc) - AUD (hedged)# AUD 0.05 16 March 2016
JPM Asia Pacific Income A (irc) - CAD (hedged)# CAD 0.04 16 March 2016
JPM Asia Pacific Income A (irc) - EUR (hedged)# EUR 0.03 16 March 2016
JPM Asia Pacific Income A (irc) - GBP (hedged)# GBP 0.04 16 March 2016
JPM Asia Pacific Income A (irc) - NZD (hedged)# NZD 0.06 16 March 2016
JPM Asia Pacific Income A (irc) - RMB (hedged)# CNH 0.08 16 March 2016
JPM Asia Pacific Income A (mth) - HKD# HKD 0.05 16 March 2016
JPM Asia Pacific Income A (mth) - SGD (hedged)# SGD 0.05 16 March 2016
JPM Asia Pacific Income A (mth) - SGD# SGD 0.06 16 March 2016
JPM Asia Pacific Income A (mth) - USD# USD 0.47 16 March 2016
JPM Asia Pacific Income C (irc) - AUD (hedged)# AUD 0.06 16 March 2016
JPM Asia Pacific Income C (irc) - CAD (hedged)# CAD 0.04 16 March 2016
JPM Asia Pacific Income C (irc) - EUR (hedged)# EUR 0.33 16 March 2016
JPM Asia Pacific Income C (irc) - GBP (hedged)# GBP 0.29 16 March 2016
JPM Asia Pacific Income C (irc) - NZD (hedged)# NZD 0.06 16 March 2016
JPM Asia Pacific Income C (irc) - RMB (hedged)# CNH 0.09 16 March 2016
JPM Asia Pacific Income C (mth) - HKD# HKD 0.04 16 March 2016
JPM Asia Pacific Income C (mth) - SGD (hedged)# SGD 0.04 16 March 2016
JPM Asia Pacific Income C (mth) - SGD# SGD 0.04 16 March 2016
JPM Asia Pacific Income C (mth) - USD**# USD 0.46 16 March 2016
JPM Asia Pacific Income D (mth) - USD# USD 0.44 16 March 2016
JPM China Bond A (mth) - HKD (hedged) HKD 0.46 16 March 2016
JPM China Bond A (mth) - RMB CNH 0.37 16 March 2016
JPM China Bond A (mth) - USD (hedged) USD 0.06 16 March 2016
JPM Emerging Markets Debt A (irc) - AUD (hedged) AUD 0.05 16 March 2016
JPM Emerging Markets Debt A (irc) - CAD (hedged) CAD 0.05 16 March 2016
JPM Emerging Markets Debt A (irc) - NZD (hedged) NZD 0.07 16 March 2016
JPM Emerging Markets Debt A (irc) - RMB (hedged) CNH 0.09 16 March 2016
JPM Emerging Markets Debt A (mth) - EUR (hedged) EUR 0.05 16 March 2016
JPM Emerging Markets Debt A (mth) - HKD HKD 0.05 16 March 2016
JPM Emerging Markets Debt A (mth) - USD USD 0.07 16 March 2016
JPM Emerging Markets Debt C (irc) - AUD (hedged) AUD 0.07 16 March 2016
JPM Emerging Markets Debt C (irc) - CAD (hedged) CAD 0.05 16 March 2016
JPM Emerging Markets Debt C (irc) - NZD (hedged) NZD 0.07 16 March 2016
JPM Emerging Markets Debt C (mth) - EUR (hedged) EUR 0.47 16 March 2016
JPM Emerging Markets Debt C (mth) - HKD HKD 0.05 16 March 2016
JPM Emerging Markets Debt C (mth) - USD USD 0.50 16 March 2016
JPM Emerging Markets Dividend A (irc) - AUD (hedged) AUD 0.04 16 March 2016
JPM Emerging Markets Dividend A (irc) - GBP (hedged) GBP 0.04 16 March 2016
JPM Emerging Markets Dividend A (irc) - RMB (hedged) CNH 0.06 16 March 2016
JPM Emerging Markets Dividend A (mth) - HKD HKD 0.03 16 March 2016
JPM Emerging Markets Dividend A (mth) - SGD SGD 0.04 16 March 2016
JPM Emerging Markets Dividend A (mth) - SGD (hedged) SGD 0.03 16 March 2016
JPM Emerging Markets Dividend A (mth) - USD USD 0.31 16 March 2016
JPM Emerging Markets Local Currency Debt A (irc) - AUD (hedged) AUD 0.04 16 March 2016
JPM Emerging Markets Local Currency Debt A (mth) - HKD HKD 0.04 16 March 2016
JPM Emerging Markets Local Currency Debt A (mth) - USD USD 0.05 16 March 2016
JPM Emerging Markets Local Currency Debt C (mth) - USD** USD 0.34 16 March 2016
JPM Emerging Markets Local Currency Debt D (mth) - USD USD 0.32 16 March 2016
63
JPMorgan FundsNotes to the Financial Statements (continued)
As at 30 June 2016
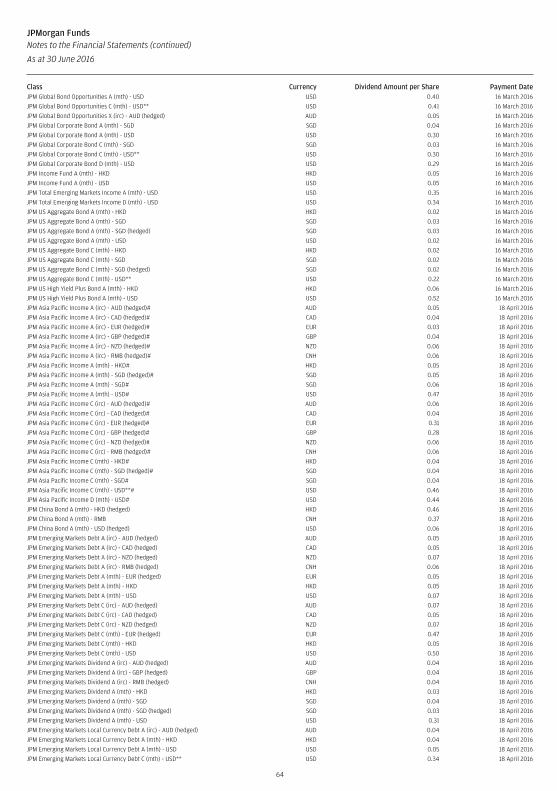
Class Currency Dividend Amount per Share Payment DateJPM Global Bond Opportunities A (mth) - USD USD 0.40 16 March 2016
JPM Global Bond Opportunities C (mth) - USD** USD 0.41 16 March 2016
JPM Global Bond Opportunities X (irc) - AUD (hedged) AUD 0.05 16 March 2016
JPM Global Corporate Bond A (mth) - SGD SGD 0.04 16 March 2016
JPM Global Corporate Bond A (mth) - USD USD 0.30 16 March 2016
JPM Global Corporate Bond C (mth) - SGD SGD 0.03 16 March 2016
JPM Global Corporate Bond C (mth) - USD** USD 0.30 16 March 2016
JPM Global Corporate Bond D (mth) - USD USD 0.29 16 March 2016
JPM Income Fund A (mth) - HKD HKD 0.05 16 March 2016
JPM Income Fund A (mth) - USD USD 0.05 16 March 2016
JPM Total Emerging Markets Income A (mth) - USD USD 0.35 16 March 2016
JPM Total Emerging Markets Income D (mth) - USD USD 0.34 16 March 2016
JPM US Aggregate Bond A (mth) - HKD HKD 0.02 16 March 2016
JPM US Aggregate Bond A (mth) - SGD SGD 0.03 16 March 2016
JPM US Aggregate Bond A (mth) - SGD (hedged) SGD 0.03 16 March 2016
JPM US Aggregate Bond A (mth) - USD USD 0.02 16 March 2016
JPM US Aggregate Bond C (mth) - HKD HKD 0.02 16 March 2016
JPM US Aggregate Bond C (mth) - SGD SGD 0.02 16 March 2016
JPM US Aggregate Bond C (mth) - SGD (hedged) SGD 0.02 16 March 2016
JPM US Aggregate Bond C (mth) - USD** USD 0.22 16 March 2016
JPM US High Yield Plus Bond A (mth) - HKD HKD 0.06 16 March 2016
JPM US High Yield Plus Bond A (mth) - USD USD 0.52 16 March 2016
JPM Asia Pacific Income A (irc) - AUD (hedged)# AUD 0.05 18 April 2016
JPM Asia Pacific Income A (irc) - CAD (hedged)# CAD 0.04 18 April 2016
JPM Asia Pacific Income A (irc) - EUR (hedged)# EUR 0.03 18 April 2016
JPM Asia Pacific Income A (irc) - GBP (hedged)# GBP 0.04 18 April 2016
JPM Asia Pacific Income A (irc) - NZD (hedged)# NZD 0.06 18 April 2016
JPM Asia Pacific Income A (irc) - RMB (hedged)# CNH 0.06 18 April 2016
JPM Asia Pacific Income A (mth) - HKD# HKD 0.05 18 April 2016
JPM Asia Pacific Income A (mth) - SGD (hedged)# SGD 0.05 18 April 2016
JPM Asia Pacific Income A (mth) - SGD# SGD 0.06 18 April 2016
JPM Asia Pacific Income A (mth) - USD# USD 0.47 18 April 2016
JPM Asia Pacific Income C (irc) - AUD (hedged)# AUD 0.06 18 April 2016
JPM Asia Pacific Income C (irc) - CAD (hedged)# CAD 0.04 18 April 2016
JPM Asia Pacific Income C (irc) - EUR (hedged)# EUR 0.31 18 April 2016
JPM Asia Pacific Income C (irc) - GBP (hedged)# GBP 0.28 18 April 2016
JPM Asia Pacific Income C (irc) - NZD (hedged)# NZD 0.06 18 April 2016
JPM Asia Pacific Income C (irc) - RMB (hedged)# CNH 0.06 18 April 2016
JPM Asia Pacific Income C (mth) - HKD# HKD 0.04 18 April 2016
JPM Asia Pacific Income C (mth) - SGD (hedged)# SGD 0.04 18 April 2016
JPM Asia Pacific Income C (mth) - SGD# SGD 0.04 18 April 2016
JPM Asia Pacific Income C (mth) - USD**# USD 0.46 18 April 2016
JPM Asia Pacific Income D (mth) - USD# USD 0.44 18 April 2016
JPM China Bond A (mth) - HKD (hedged) HKD 0.46 18 April 2016
JPM China Bond A (mth) - RMB CNH 0.37 18 April 2016
JPM China Bond A (mth) - USD (hedged) USD 0.06 18 April 2016
JPM Emerging Markets Debt A (irc) - AUD (hedged) AUD 0.05 18 April 2016
JPM Emerging Markets Debt A (irc) - CAD (hedged) CAD 0.05 18 April 2016
JPM Emerging Markets Debt A (irc) - NZD (hedged) NZD 0.07 18 April 2016
JPM Emerging Markets Debt A (irc) - RMB (hedged) CNH 0.06 18 April 2016
JPM Emerging Markets Debt A (mth) - EUR (hedged) EUR 0.05 18 April 2016
JPM Emerging Markets Debt A (mth) - HKD HKD 0.05 18 April 2016
JPM Emerging Markets Debt A (mth) - USD USD 0.07 18 April 2016
JPM Emerging Markets Debt C (irc) - AUD (hedged) AUD 0.07 18 April 2016
JPM Emerging Markets Debt C (irc) - CAD (hedged) CAD 0.05 18 April 2016
JPM Emerging Markets Debt C (irc) - NZD (hedged) NZD 0.07 18 April 2016
JPM Emerging Markets Debt C (mth) - EUR (hedged) EUR 0.47 18 April 2016
JPM Emerging Markets Debt C (mth) - HKD HKD 0.05 18 April 2016
JPM Emerging Markets Debt C (mth) - USD USD 0.50 18 April 2016
JPM Emerging Markets Dividend A (irc) - AUD (hedged) AUD 0.04 18 April 2016
JPM Emerging Markets Dividend A (irc) - GBP (hedged) GBP 0.04 18 April 2016
JPM Emerging Markets Dividend A (irc) - RMB (hedged) CNH 0.04 18 April 2016
JPM Emerging Markets Dividend A (mth) - HKD HKD 0.03 18 April 2016
JPM Emerging Markets Dividend A (mth) - SGD SGD 0.04 18 April 2016
JPM Emerging Markets Dividend A (mth) - SGD (hedged) SGD 0.03 18 April 2016
JPM Emerging Markets Dividend A (mth) - USD USD 0.31 18 April 2016
JPM Emerging Markets Local Currency Debt A (irc) - AUD (hedged) AUD 0.04 18 April 2016
JPM Emerging Markets Local Currency Debt A (mth) - HKD HKD 0.04 18 April 2016
JPM Emerging Markets Local Currency Debt A (mth) - USD USD 0.05 18 April 2016
JPM Emerging Markets Local Currency Debt C (mth) - USD** USD 0.34 18 April 2016
64
JPMorgan FundsNotes to the Financial Statements (continued)
As at 30 June 2016
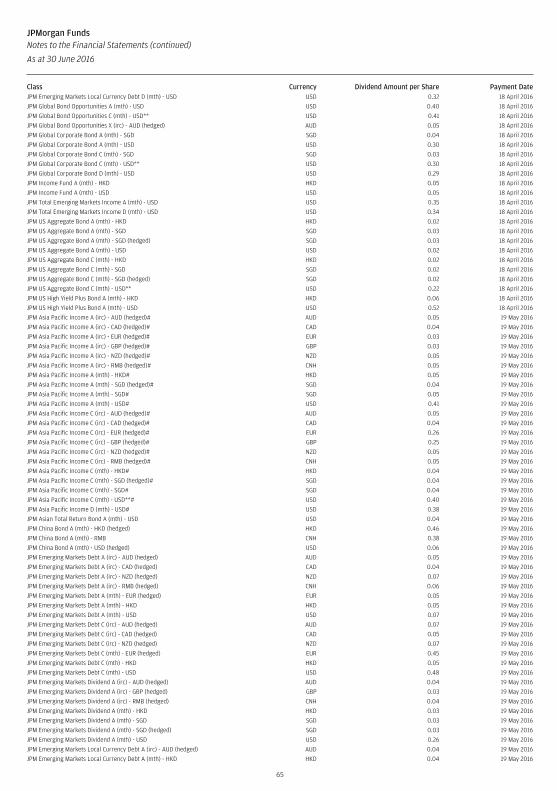
Class Currency Dividend Amount per Share Payment DateJPM Emerging Markets Local Currency Debt D (mth) - USD USD 0.32 18 April 2016
JPM Global Bond Opportunities A (mth) - USD USD 0.40 18 April 2016
JPM Global Bond Opportunities C (mth) - USD** USD 0.41 18 April 2016
JPM Global Bond Opportunities X (irc) - AUD (hedged) AUD 0.05 18 April 2016
JPM Global Corporate Bond A (mth) - SGD SGD 0.04 18 April 2016
JPM Global Corporate Bond A (mth) - USD USD 0.30 18 April 2016
JPM Global Corporate Bond C (mth) - SGD SGD 0.03 18 April 2016
JPM Global Corporate Bond C (mth) - USD** USD 0.30 18 April 2016
JPM Global Corporate Bond D (mth) - USD USD 0.29 18 April 2016
JPM Income Fund A (mth) - HKD HKD 0.05 18 April 2016
JPM Income Fund A (mth) - USD USD 0.05 18 April 2016
JPM Total Emerging Markets Income A (mth) - USD USD 0.35 18 April 2016
JPM Total Emerging Markets Income D (mth) - USD USD 0.34 18 April 2016
JPM US Aggregate Bond A (mth) - HKD HKD 0.02 18 April 2016
JPM US Aggregate Bond A (mth) - SGD SGD 0.03 18 April 2016
JPM US Aggregate Bond A (mth) - SGD (hedged) SGD 0.03 18 April 2016
JPM US Aggregate Bond A (mth) - USD USD 0.02 18 April 2016
JPM US Aggregate Bond C (mth) - HKD HKD 0.02 18 April 2016
JPM US Aggregate Bond C (mth) - SGD SGD 0.02 18 April 2016
JPM US Aggregate Bond C (mth) - SGD (hedged) SGD 0.02 18 April 2016
JPM US Aggregate Bond C (mth) - USD** USD 0.22 18 April 2016
JPM US High Yield Plus Bond A (mth) - HKD HKD 0.06 18 April 2016
JPM US High Yield Plus Bond A (mth) - USD USD 0.52 18 April 2016
JPM Asia Pacific Income A (irc) - AUD (hedged)# AUD 0.05 19 May 2016
JPM Asia Pacific Income A (irc) - CAD (hedged)# CAD 0.04 19 May 2016
JPM Asia Pacific Income A (irc) - EUR (hedged)# EUR 0.03 19 May 2016
JPM Asia Pacific Income A (irc) - GBP (hedged)# GBP 0.03 19 May 2016
JPM Asia Pacific Income A (irc) - NZD (hedged)# NZD 0.05 19 May 2016
JPM Asia Pacific Income A (irc) - RMB (hedged)# CNH 0.05 19 May 2016
JPM Asia Pacific Income A (mth) - HKD# HKD 0.05 19 May 2016
JPM Asia Pacific Income A (mth) - SGD (hedged)# SGD 0.04 19 May 2016
JPM Asia Pacific Income A (mth) - SGD# SGD 0.05 19 May 2016
JPM Asia Pacific Income A (mth) - USD# USD 0.41 19 May 2016
JPM Asia Pacific Income C (irc) - AUD (hedged)# AUD 0.05 19 May 2016
JPM Asia Pacific Income C (irc) - CAD (hedged)# CAD 0.04 19 May 2016
JPM Asia Pacific Income C (irc) - EUR (hedged)# EUR 0.26 19 May 2016
JPM Asia Pacific Income C (irc) - GBP (hedged)# GBP 0.25 19 May 2016
JPM Asia Pacific Income C (irc) - NZD (hedged)# NZD 0.05 19 May 2016
JPM Asia Pacific Income C (irc) - RMB (hedged)# CNH 0.05 19 May 2016
JPM Asia Pacific Income C (mth) - HKD# HKD 0.04 19 May 2016
JPM Asia Pacific Income C (mth) - SGD (hedged)# SGD 0.04 19 May 2016
JPM Asia Pacific Income C (mth) - SGD# SGD 0.04 19 May 2016
JPM Asia Pacific Income C (mth) - USD**# USD 0.40 19 May 2016
JPM Asia Pacific Income D (mth) - USD# USD 0.38 19 May 2016
JPM Asian Total Return Bond A (mth) - USD USD 0.04 19 May 2016
JPM China Bond A (mth) - HKD (hedged) HKD 0.46 19 May 2016
JPM China Bond A (mth) - RMB CNH 0.38 19 May 2016
JPM China Bond A (mth) - USD (hedged) USD 0.06 19 May 2016
JPM Emerging Markets Debt A (irc) - AUD (hedged) AUD 0.05 19 May 2016
JPM Emerging Markets Debt A (irc) - CAD (hedged) CAD 0.04 19 May 2016
JPM Emerging Markets Debt A (irc) - NZD (hedged) NZD 0.07 19 May 2016
JPM Emerging Markets Debt A (irc) - RMB (hedged) CNH 0.06 19 May 2016
JPM Emerging Markets Debt A (mth) - EUR (hedged) EUR 0.05 19 May 2016
JPM Emerging Markets Debt A (mth) - HKD HKD 0.05 19 May 2016
JPM Emerging Markets Debt A (mth) - USD USD 0.07 19 May 2016
JPM Emerging Markets Debt C (irc) - AUD (hedged) AUD 0.07 19 May 2016
JPM Emerging Markets Debt C (irc) - CAD (hedged) CAD 0.05 19 May 2016
JPM Emerging Markets Debt C (irc) - NZD (hedged) NZD 0.07 19 May 2016
JPM Emerging Markets Debt C (mth) - EUR (hedged) EUR 0.45 19 May 2016
JPM Emerging Markets Debt C (mth) - HKD HKD 0.05 19 May 2016
JPM Emerging Markets Debt C (mth) - USD USD 0.48 19 May 2016
JPM Emerging Markets Dividend A (irc) - AUD (hedged) AUD 0.04 19 May 2016
JPM Emerging Markets Dividend A (irc) - GBP (hedged) GBP 0.03 19 May 2016
JPM Emerging Markets Dividend A (irc) - RMB (hedged) CNH 0.04 19 May 2016
JPM Emerging Markets Dividend A (mth) - HKD HKD 0.03 19 May 2016
JPM Emerging Markets Dividend A (mth) - SGD SGD 0.03 19 May 2016
JPM Emerging Markets Dividend A (mth) - SGD (hedged) SGD 0.03 19 May 2016
JPM Emerging Markets Dividend A (mth) - USD USD 0.26 19 May 2016
JPM Emerging Markets Local Currency Debt A (irc) - AUD (hedged) AUD 0.04 19 May 2016
JPM Emerging Markets Local Currency Debt A (mth) - HKD HKD 0.04 19 May 2016
65
JPMorgan FundsNotes to the Financial Statements (continued)
As at 30 June 2016
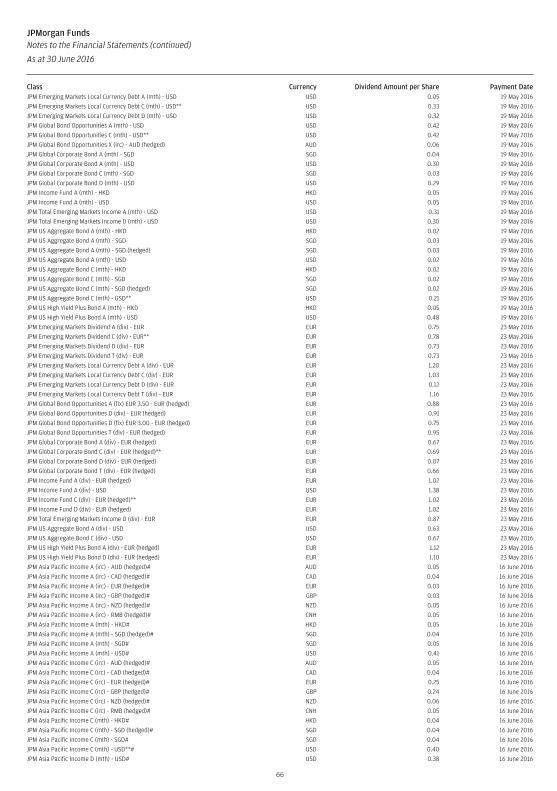
Class Currency Dividend Amount per Share Payment DateJPM Emerging Markets Local Currency Debt A (mth) - USD USD 0.05 19 May 2016
JPM Emerging Markets Local Currency Debt C (mth) - USD** USD 0.33 19 May 2016
JPM Emerging Markets Local Currency Debt D (mth) - USD USD 0.32 19 May 2016
JPM Global Bond Opportunities A (mth) - USD USD 0.42 19 May 2016
JPM Global Bond Opportunities C (mth) - USD** USD 0.42 19 May 2016
JPM Global Bond Opportunities X (irc) - AUD (hedged) AUD 0.06 19 May 2016
JPM Global Corporate Bond A (mth) - SGD SGD 0.04 19 May 2016
JPM Global Corporate Bond A (mth) - USD USD 0.30 19 May 2016
JPM Global Corporate Bond C (mth) - SGD SGD 0.03 19 May 2016
JPM Global Corporate Bond D (mth) - USD USD 0.29 19 May 2016
JPM Income Fund A (mth) - HKD HKD 0.05 19 May 2016
JPM Income Fund A (mth) - USD USD 0.05 19 May 2016
JPM Total Emerging Markets Income A (mth) - USD USD 0.31 19 May 2016
JPM Total Emerging Markets Income D (mth) - USD USD 0.30 19 May 2016
JPM US Aggregate Bond A (mth) - HKD HKD 0.02 19 May 2016
JPM US Aggregate Bond A (mth) - SGD SGD 0.03 19 May 2016
JPM US Aggregate Bond A (mth) - SGD (hedged) SGD 0.03 19 May 2016
JPM US Aggregate Bond A (mth) - USD USD 0.02 19 May 2016
JPM US Aggregate Bond C (mth) - HKD HKD 0.02 19 May 2016
JPM US Aggregate Bond C (mth) - SGD SGD 0.02 19 May 2016
JPM US Aggregate Bond C (mth) - SGD (hedged) SGD 0.02 19 May 2016
JPM US Aggregate Bond C (mth) - USD** USD 0.21 19 May 2016
JPM US High Yield Plus Bond A (mth) - HKD HKD 0.05 19 May 2016
JPM US High Yield Plus Bond A (mth) - USD USD 0.48 19 May 2016
JPM Emerging Markets Dividend A (div) - EUR EUR 0.75 23 May 2016
JPM Emerging Markets Dividend C (div) - EUR** EUR 0.78 23 May 2016
JPM Emerging Markets Dividend D (div) - EUR EUR 0.73 23 May 2016
JPM Emerging Markets Dividend T (div) - EUR EUR 0.73 23 May 2016
JPM Emerging Markets Local Currency Debt A (div) - EUR EUR 1.20 23 May 2016
JPM Emerging Markets Local Currency Debt C (div) - EUR EUR 1.03 23 May 2016
JPM Emerging Markets Local Currency Debt D (div) - EUR EUR 0.12 23 May 2016
JPM Emerging Markets Local Currency Debt T (div) - EUR EUR 1.16 23 May 2016
JPM Global Bond Opportunities A (fix) EUR 3.50 - EUR (hedged) EUR 0.88 23 May 2016
JPM Global Bond Opportunities D (div) - EUR (hedged) EUR 0.91 23 May 2016
JPM Global Bond Opportunities D (fix) EUR 3.00 - EUR (hedged) EUR 0.75 23 May 2016
JPM Global Bond Opportunities T (div) - EUR (hedged) EUR 0.95 23 May 2016
JPM Global Corporate Bond A (div) - EUR (hedged) EUR 0.67 23 May 2016
JPM Global Corporate Bond C (div) - EUR (hedged)** EUR 0.69 23 May 2016
JPM Global Corporate Bond D (div) - EUR (hedged) EUR 0.07 23 May 2016
JPM Global Corporate Bond T (div) - EUR (hedged) EUR 0.66 23 May 2016
JPM Income Fund A (div) - EUR (hedged) EUR 1.02 23 May 2016
JPM Income Fund A (div) - USD USD 1.38 23 May 2016
JPM Income Fund C (div) - EUR (hedged)** EUR 1.02 23 May 2016
JPM Income Fund D (div) - EUR (hedged) EUR 1.02 23 May 2016
JPM Total Emerging Markets Income D (div) - EUR EUR 0.87 23 May 2016
JPM US Aggregate Bond A (div) - USD USD 0.63 23 May 2016
JPM US Aggregate Bond C (div) - USD USD 0.67 23 May 2016
JPM US High Yield Plus Bond A (div) - EUR (hedged) EUR 1.12 23 May 2016
JPM US High Yield Plus Bond D (div) - EUR (hedged) EUR 1.10 23 May 2016
JPM Asia Pacific Income A (irc) - AUD (hedged)# AUD 0.05 16 June 2016
JPM Asia Pacific Income A (irc) - CAD (hedged)# CAD 0.04 16 June 2016
JPM Asia Pacific Income A (irc) - EUR (hedged)# EUR 0.03 16 June 2016
JPM Asia Pacific Income A (irc) - GBP (hedged)# GBP 0.03 16 June 2016
JPM Asia Pacific Income A (irc) - NZD (hedged)# NZD 0.05 16 June 2016
JPM Asia Pacific Income A (irc) - RMB (hedged)# CNH 0.05 16 June 2016
JPM Asia Pacific Income A (mth) - HKD# HKD 0.05 16 June 2016
JPM Asia Pacific Income A (mth) - SGD (hedged)# SGD 0.04 16 June 2016
JPM Asia Pacific Income A (mth) - SGD# SGD 0.05 16 June 2016
JPM Asia Pacific Income A (mth) - USD# USD 0.41 16 June 2016
JPM Asia Pacific Income C (irc) - AUD (hedged)# AUD 0.05 16 June 2016
JPM Asia Pacific Income C (irc) - CAD (hedged)# CAD 0.04 16 June 2016
JPM Asia Pacific Income C (irc) - EUR (hedged)# EUR 0.25 16 June 2016
JPM Asia Pacific Income C (irc) - GBP (hedged)# GBP 0.24 16 June 2016
JPM Asia Pacific Income C (irc) - NZD (hedged)# NZD 0.06 16 June 2016
JPM Asia Pacific Income C (irc) - RMB (hedged)# CNH 0.05 16 June 2016
JPM Asia Pacific Income C (mth) - HKD# HKD 0.04 16 June 2016
JPM Asia Pacific Income C (mth) - SGD (hedged)# SGD 0.04 16 June 2016
JPM Asia Pacific Income C (mth) - SGD# SGD 0.04 16 June 2016
JPM Asia Pacific Income C (mth) - USD**# USD 0.40 16 June 2016
JPM Asia Pacific Income D (mth) - USD# USD 0.38 16 June 2016
66
JPMorgan FundsNotes to the Financial Statements (continued)
As at 30 June 2016
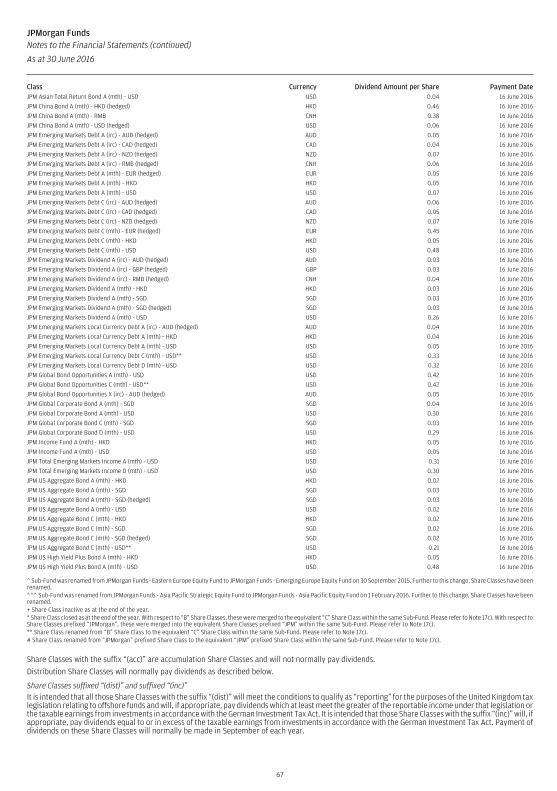
Class Currency Dividend Amount per Share Payment DateJPM Asian Total Return Bond A (mth) - USD USD 0.04 16 June 2016
JPM China Bond A (mth) - HKD (hedged) HKD 0.46 16 June 2016
JPM China Bond A (mth) - RMB CNH 0.38 16 June 2016
JPM China Bond A (mth) - USD (hedged) USD 0.06 16 June 2016
JPM Emerging Markets Debt A (irc) - AUD (hedged) AUD 0.05 16 June 2016
JPM Emerging Markets Debt A (irc) - CAD (hedged) CAD 0.04 16 June 2016
JPM Emerging Markets Debt A (irc) - NZD (hedged) NZD 0.07 16 June 2016
JPM Emerging Markets Debt A (irc) - RMB (hedged) CNH 0.06 16 June 2016
JPM Emerging Markets Debt A (mth) - EUR (hedged) EUR 0.05 16 June 2016
JPM Emerging Markets Debt A (mth) - HKD HKD 0.05 16 June 2016
JPM Emerging Markets Debt A (mth) - USD USD 0.07 16 June 2016
JPM Emerging Markets Debt C (irc) - AUD (hedged) AUD 0.06 16 June 2016
JPM Emerging Markets Debt C (irc) - CAD (hedged) CAD 0.05 16 June 2016
JPM Emerging Markets Debt C (irc) - NZD (hedged) NZD 0.07 16 June 2016
JPM Emerging Markets Debt C (mth) - EUR (hedged) EUR 0.45 16 June 2016
JPM Emerging Markets Debt C (mth) - HKD HKD 0.05 16 June 2016
JPM Emerging Markets Debt C (mth) - USD USD 0.48 16 June 2016
JPM Emerging Markets Dividend A (irc) - AUD (hedged) AUD 0.03 16 June 2016
JPM Emerging Markets Dividend A (irc) - GBP (hedged) GBP 0.03 16 June 2016
JPM Emerging Markets Dividend A (irc) - RMB (hedged) CNH 0.04 16 June 2016
JPM Emerging Markets Dividend A (mth) - HKD HKD 0.03 16 June 2016
JPM Emerging Markets Dividend A (mth) - SGD SGD 0.03 16 June 2016
JPM Emerging Markets Dividend A (mth) - SGD (hedged) SGD 0.03 16 June 2016
JPM Emerging Markets Dividend A (mth) - USD USD 0.26 16 June 2016
JPM Emerging Markets Local Currency Debt A (irc) - AUD (hedged) AUD 0.04 16 June 2016
JPM Emerging Markets Local Currency Debt A (mth) - HKD HKD 0.04 16 June 2016
JPM Emerging Markets Local Currency Debt A (mth) - USD USD 0.05 16 June 2016
JPM Emerging Markets Local Currency Debt C (mth) - USD** USD 0.33 16 June 2016
JPM Emerging Markets Local Currency Debt D (mth) - USD USD 0.32 16 June 2016
JPM Global Bond Opportunities A (mth) - USD USD 0.42 16 June 2016
JPM Global Bond Opportunities C (mth) - USD** USD 0.42 16 June 2016
JPM Global Bond Opportunities X (irc) - AUD (hedged) AUD 0.05 16 June 2016
JPM Global Corporate Bond A (mth) - SGD SGD 0.04 16 June 2016
JPM Global Corporate Bond A (mth) - USD USD 0.30 16 June 2016
JPM Global Corporate Bond C (mth) - SGD SGD 0.03 16 June 2016
JPM Global Corporate Bond D (mth) - USD USD 0.29 16 June 2016
JPM Income Fund A (mth) - HKD HKD 0.05 16 June 2016
JPM Income Fund A (mth) - USD USD 0.05 16 June 2016
JPM Total Emerging Markets Income A (mth) - USD USD 0.31 16 June 2016
JPM Total Emerging Markets Income D (mth) - USD USD 0.30 16 June 2016
JPM US Aggregate Bond A (mth) - HKD HKD 0.02 16 June 2016
JPM US Aggregate Bond A (mth) - SGD SGD 0.03 16 June 2016
JPM US Aggregate Bond A (mth) - SGD (hedged) SGD 0.03 16 June 2016
JPM US Aggregate Bond A (mth) - USD USD 0.02 16 June 2016
JPM US Aggregate Bond C (mth) - HKD HKD 0.02 16 June 2016
JPM US Aggregate Bond C (mth) - SGD SGD 0.02 16 June 2016
JPM US Aggregate Bond C (mth) - SGD (hedged) SGD 0.02 16 June 2016
JPM US Aggregate Bond C (mth) - USD** USD 0.21 16 June 2016
JPM US High Yield Plus Bond A (mth) - HKD HKD 0.05 16 June 2016
JPM US High Yield Plus Bond A (mth) - USD USD 0.48 16 June 2016
^ Sub-Fund was renamed from JPMorgan Funds - Eastern Europe Equity Fund to JPMorgan Funds - Emerging Europe Equity Fund on 30 September 2015. Further to this change, Share Classes have beenrenamed.^^^ Sub-Fund was renamed from JPMorgan Funds - Asia Pacific Strategic Equity Fund to JPMorgan Funds - Asia Pacific Equity Fund on 1 February 2016. Further to this change, Share Classes have beenrenamed.+ Share Class inactive as at the end of the year.* Share Class closed as at the end of the year. With respect to “B” Share Classes, these were merged to the equivalent “C” Share Class within the same Sub-Fund. Please refer to Note 17c). With respect toShare Classes prefixed “JPMorgan”, these were merged into the equivalent Share Classes prefixed “JPM” within the same Sub-Fund. Please refer to Note 17c).** Share Class renamed from “B” Share Class to the equivalent “C” Share Class within the same Sub-Fund. Please refer to Note 17c).# Share Class renamed from “JPMorgan” prefixed Share Class to the equivalent “JPM” prefixed Share Class within the same Sub-Fund. Please refer to Note 17c).
Share Classes with the suffix “(acc)” are accumulation Share Classes and will not normally pay dividends.
Distribution Share Classes will normally pay dividends as described below.
Share Classes suffixed “(dist)” and suffixed “(inc)”It is intended that all those Share Classes with the suffix “(dist)” will meet the conditions to qualify as “reporting” for the purposes of the United Kingdom taxlegislation relating to offshore funds and will, if appropriate, pay dividends which at least meet the greater of the reportable income under that legislation orthe taxable earnings from investments in accordance with the German Investment Tax Act. It is intended that those Share Classes with the suffix “(inc)” will, ifappropriate, pay dividends equal to or in excess of the taxable earnings from investments in accordance with the German Investment Tax Act. Payment ofdividends on these Share Classes will normally be made in September of each year.
67
JPMorgan FundsNotes to the Financial Statements (continued)
As at 30 June 2016
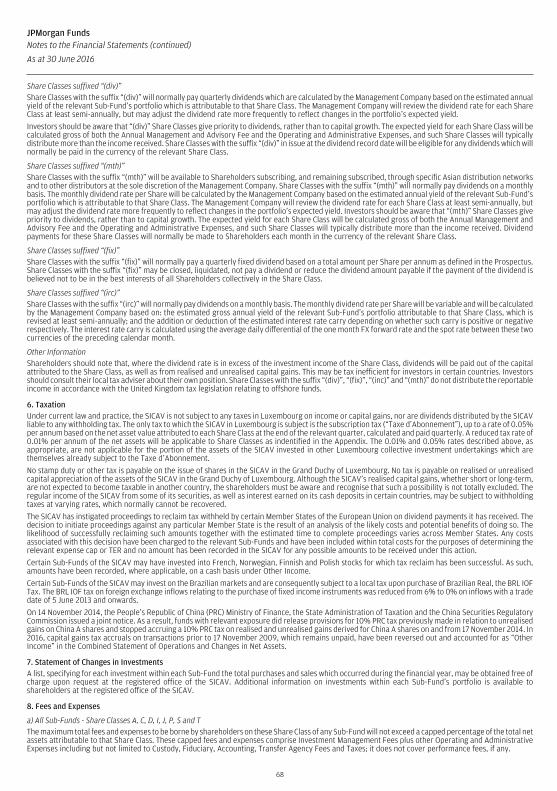
Share Classes suffixed “(div)”Share Classes with the suffix “(div)” will normally pay quarterly dividends which are calculated by the Management Company based on the estimated annualyield of the relevant Sub-Fund’s portfolio which is attributable to that Share Class. The Management Company will review the dividend rate for each ShareClass at least semi-annually, but may adjust the dividend rate more frequently to reflect changes in the portfolio’s expected yield.
Investors should be aware that “(div)” Share Classes give priority to dividends, rather than to capital growth. The expected yield for each Share Class will becalculated gross of both the Annual Management and Advisory Fee and the Operating and Administrative Expenses, and such Share Classes will typicallydistribute more than the income received. Share Classes with the suffix “(div)” in issue at the dividend record date will be eligible for any dividends which willnormally be paid in the currency of the relevant Share Class.
Share Classes suffixed “(mth)”Share Classes with the suffix “(mth)” will be available to Shareholders subscribing, and remaining subscribed, through specific Asian distribution networksand to other distributors at the sole discretion of the Management Company. Share Classes with the suffix “(mth)” will normally pay dividends on a monthlybasis. The monthly dividend rate per Share will be calculated by the Management Company based on the estimated annual yield of the relevant Sub-Fund’sportfolio which is attributable to that Share Class. The Management Company will review the dividend rate for each Share Class at least semi-annually, butmay adjust the dividend rate more frequently to reflect changes in the portfolio’s expected yield. Investors should be aware that “(mth)” Share Classes givepriority to dividends, rather than to capital growth. The expected yield for each Share Class will be calculated gross of both the Annual Management andAdvisory Fee and the Operating and Administrative Expenses, and such Share Classes will typically distribute more than the income received. Dividendpayments for these Share Classes will normally be made to Shareholders each month in the currency of the relevant Share Class.
Share Classes suffixed “(fix)”Share Classes with the suffix “(fix)” will normally pay a quarterly fixed dividend based on a total amount per Share per annum as defined in the Prospectus.Share Classes with the suffix “(fix)” may be closed, liquidated, not pay a dividend or reduce the dividend amount payable if the payment of the dividend isbelieved not to be in the best interests of all Shareholders collectively in the Share Class.
Share Classes suffixed “(irc)”Share Classes with the suffix “(irc)” will normally pay dividends on a monthly basis. The monthly dividend rate per Share will be variable and will be calculatedby the Management Company based on: the estimated gross annual yield of the relevant Sub-Fund’s portfolio attributable to that Share Class, which isrevised at least semi-annually; and the addition or deduction of the estimated interest rate carry depending on whether such carry is positive or negativerespectively. The interest rate carry is calculated using the average daily differential of the one month FX forward rate and the spot rate between these twocurrencies of the preceding calendar month.
Other InformationShareholders should note that, where the dividend rate is in excess of the investment income of the Share Class, dividends will be paid out of the capitalattributed to the Share Class, as well as from realised and unrealised capital gains. This may be tax inefficient for investors in certain countries. Investorsshould consult their local tax adviser about their own position. Share Classes with the suffix “(div)”, “(fix)”, “(inc)” and “(mth)” do not distribute the reportableincome in accordance with the United Kingdom tax legislation relating to offshore funds.
6. TaxationUnder current law and practice, the SICAV is not subject to any taxes in Luxembourg on income or capital gains, nor are dividends distributed by the SICAVliable to any withholding tax. The only tax to which the SICAV in Luxembourg is subject is the subscription tax (“Taxe d’Abonnement”), up to a rate of 0.05%per annum based on the net asset value attributed to each Share Class at the end of the relevant quarter, calculated and paid quarterly. A reduced tax rate of0.01% per annum of the net assets will be applicable to Share Classes as indentified in the Appendix. The 0.01% and 0.05% rates described above, asappropriate, are not applicable for the portion of the assets of the SICAV invested in other Luxembourg collective investment undertakings which arethemselves already subject to the Taxe d’Abonnement.
No stamp duty or other tax is payable on the issue of shares in the SICAV in the Grand Duchy of Luxembourg. No tax is payable on realised or unrealisedcapital appreciation of the assets of the SICAV in the Grand Duchy of Luxembourg. Although the SICAV’s realised capital gains, whether short or long-term,are not expected to become taxable in another country, the shareholders must be aware and recognise that such a possibility is not totally excluded. Theregular income of the SICAV from some of its securities, as well as interest earned on its cash deposits in certain countries, may be subject to withholdingtaxes at varying rates, which normally cannot be recovered.
The SICAV has instigated proceedings to reclaim tax withheld by certain Member States of the European Union on dividend payments it has received. Thedecision to initiate proceedings against any particular Member State is the result of an analysis of the likely costs and potential benefits of doing so. Thelikelihood of successfully reclaiming such amounts together with the estimated time to complete proceedings varies across Member States. Any costsassociated with this decision have been charged to the relevant Sub-Funds and have been included within total costs for the purposes of determining therelevant expense cap or TER and no amount has been recorded in the SICAV for any possible amounts to be received under this action.
Certain Sub-Funds of the SICAV may have invested into French, Norwegian, Finnish and Polish stocks for which tax reclaim has been successful. As such,amounts have been recorded, where applicable, on a cash basis under Other Income.
Certain Sub-Funds of the SICAV may invest on the Brazilian markets and are consequently subject to a local tax upon purchase of Brazilian Real, the BRL IOFTax. The BRL IOF tax on foreign exchange inflows relating to the purchase of fixed income instruments was reduced from 6% to 0% on inflows with a tradedate of 5 June 2013 and onwards.
On 14 November 2014, the People’s Republic of China (PRC) Ministry of Finance, the State Administration of Taxation and the China Securities RegulatoryCommission issued a joint notice. As a result, funds with relevant exposure did release provisions for 10% PRC tax previously made in relation to unrealisedgains on China A shares and stopped accruing a 10% PRC tax on realised and unrealised gains derived for China A shares on and from 17 November 2014. In2016, capital gains tax accruals on transactions prior to 17 November 2009, which remains unpaid, have been reversed out and accounted for as “OtherIncome” in the Combined Statement of Operations and Changes in Net Assets.
7. Statement of Changes in InvestmentsA list, specifying for each investment within each Sub-Fund the total purchases and sales which occurred during the financial year, may be obtained free ofcharge upon request at the registered office of the SICAV. Additional information on investments within each Sub-Fund’s portfolio is available toshareholders at the registered office of the SICAV.
8. Fees and Expenses
a) All Sub-Funds - Share Classes A, C, D, I, J, P, S and TThe maximum total fees and expenses to be borne by shareholders on these Share Class of any Sub-Fund will not exceed a capped percentage of the total netassets attributable to that Share Class. These capped fees and expenses comprise Investment Management Fees plus other Operating and AdministrativeExpenses including but not limited to Custody, Fiduciary, Accounting, Transfer Agency Fees and Taxes; it does not cover performance fees, if any.
68
JPMorgan FundsNotes to the Financial Statements (continued)
As at 30 June 2016
No other costs are charged to these Share Classes and the Management Company absorbs any difference that may arise between the actual costs of theoperations of these Share Classes and the capped percentage. To the extent that actual operating costs exceed the capped percentage, the amount borne bythe Management Company will be separately disclosed as a “Fee Waiver’’ in the Combined Statement of Net Assets and the Combined Statement ofOperations and Changes in Net Assets.
This capped annual rate of fees and expenses is categorised as a Capped Expense Ratio. The capped annual rates of fees for each Share Class are shown in theAppendix.
b) All Sub-Funds - Share Classes X and YThe Annual Management Fee that would normally be payable in respect of the X Share Classes and Y Share Classes are administratively levied and collectedby the Global Distributor directly from the shareholder or through the relevant JPMorgan Chase & Co entity.
The maximum Operating and Administrative Expenses to be borne by the Class X and Class Y shareholders of any Sub-Fund will not exceed a cappedpercentage of the total net assets attributable to that Class, as set out in the Appendix.
Sub-Funds may invest in UCITS and other UCIs managed by the Management Company, the Investment Manager or any other member of JPMorgan Chase &Co. The avoidance of a double-charge of the Annual Management and Advisory Fee on such assets is achieved by either a) excluding the assets from the netassets on which the Annual Management and Advisory Fee is calculated; or b) investing in UCITS or UCIs via classes that do not accrue an AnnualManagement and Advisory Fee or other equivalent fees payable to the relevant Investment Manager’s group; or c) the Annual Management and AdvisoryFee being netted off by a rebate to the SICAV or Sub-Fund of the Annual Management and Advisory Fee (or equivalent) charged to the underlying UCITS orUCIs; or d) charging only the difference between the Annual Management and Advisory Fee of the SICAV or Sub-Fund and the Annual Management andAdvisory Fee (or equivalent) charged to the underlying UCITS or UCIs.
The Management Company may decide from time to time, in order to protect the interests of the SICAV’s shareholders, to reduce the fees payable to theManagement Company.
The Operating and Administrative Expenses cover:
(i) A “Fund Servicing Fee” paid to the Management Company for the services that the Management Company provides to the SICAV. The Fund Servicing Feewill be reviewed annually and will not exceed 0.15% per annum.
(ii) Expenses directly contracted by the SICAV (“Direct Fund Expenses”) and expenses directly contracted by the Management Company on behalf of theSICAV (“Indirect Fund Expenses”):
i. Direct Fund Expenses include but are not limited to the custodian fees, Depositary fees, auditing fees and expenses, the Luxembourg taxe d’Abonnement,Directors’ fees (no fees will be paid to Directors who are also directors or employees of JPMorgan Chase & Co.) and reasonable out-of-pocket expensesincurred by the Directors.
ii. Indirect Fund Expenses include but are not limited to formation expenses such as organisation and registration costs; accounting expenses covering fundaccounting and administrative services; transfer agency expenses covering registrar and transfer agency services; the Administrative Agent and DomiciliaryAgent services; the fees and reasonable out-of-pocket expenses of the paying agents and representatives; legal fees and expenses; ongoing registration,listing and quotation fees, including translation expenses; the cost of publication of the Share prices and postage, telephone, facsimile transmission andother electronic means of communication; and the costs and expenses of preparing, printing and distributing the Prospectus, Key Investor InformationDocuments or any offering document, financial reports and other documents made available to Shareholders.
Operating and Administrative Expenses do not include Transaction Fees and Extraordinary Expenses.
Expenses related to the formation of new Sub-Funds may be amortised over a period not exceeding five years, as permitted by Luxembourg Law.The Management Company will bear any Operating and Administrative Expenses which exceed the maximum rate specified in Appendix III – Sub-FundDetails of the Prospectus. At its discretion, the Management Company may on a temporary basis meet the Direct and/or Indirect Fund Expenses on aSub-Fund’s behalf and/or waive all or part of the Fund Servicing Fee.
c) Performance FeesPursuant to the Investment Management Agreement, as set out in Appendix V - Calculation of Performance Fees to the Prospectus, the Investment Manageris entitled to receive from the net assets of certain Sub-Funds or Share Classes, an annual performance-based incentive fee (the “Performance Fee”) if theperformance of the Sub-Fund exceeds the return from the benchmark, subject to the operation of a Claw-Back Mechanism or of a High Water Mark as definedin Appendix V - Calculation of Performance Fees of the Prospectus and as specified in Appendix III - Sub-Fund Details of the Prospectus for each Sub-Fund. Oneach Valuation Day, an accrual for the previous Valuation Day’s Performance Fee is made, when appropriate, and the final Performance Fee is payableannually. Pursuant to the provisions of the relevant Investment Management Agreement, the Investment Manager may be entitled to receive theperformance Fee from the Management Company.
On each Valuation Day, the net asset value of each Share Class of each Sub-Fund for which a Performance Fee applies, which includes an accrual for all feesand expenses (including the Annual Management and Advisory Fee, and the Operating and Administrative Expenses to be borne by the relevant Share Classat the rate set out in the Appendix to the Prospectus), is adjusted for any dividend distributions and for subscriptions and redemptions dealt with on thatValuation Day, if any, and any Performance Fee accrued through that day in respect of such Share Class is added back (the “Adjusted net asset value”). Forpurposes of calculating the Performance Fee, the “Share Class Return” is computed on each Valuation Day, as the difference between the net asset value(adjusted by adding back any accrued Performance Fee) on such day and the Adjusted net asset value on the previous Valuation Day, expressed as a returnbased on the previous Valuation Day’s Adjusted net asset value for that Share Class.
High Water Mark MethodIf the Share Class Return exceeds the Benchmark Return and the cumulative Share Class Return exceeds the High Water Mark Return (as set out in theAppendix to the Prospectus), the Performance Fee accrual is increased by the Performance Fee Rate multiplied by the Excess Return multiplied by theprevious Valuation Day’s Adjusted net asset value for that Share Class. If the Share Class Return does not exceed the Benchmark Return, the PerformanceFee accrual is reduced (but not below zero) by the Performance Fee Rate multiplied by the negative Excess Return multiplied by the previous Valuation Day’sAdjusted net asset value for that Share Class. Following a period of negative Excess Return whereby the Performance Fee accrual has been reduced to zero,no new Performance Fee is accrued until such time as the cumulative Share Class Return exceeds the greater of the High Water Mark Return and thecumulative Benchmark Return since the beginning of the Fund accounting period. The Performance Fee accrued on any Valuation Day is reflected in the NetAsset Value per Share on the basis of which subscriptions and redemptions may be accepted.
Claw-Back mechanismThe purpose of the Claw-Back Mechanism is to ensure that the Management Company will only become entitled to a Performance Fee when it outperformsthe cumulative Benchmark Return (as defined in Appendix V - Calculation of Performance Fees of the Prospectus) accrued since the last Valuation Day of thelast period in which a Performance Fee was paid.
69
JPMorgan FundsNotes to the Financial Statements (continued)
As at 30 June 2016
As at 30 June 2016, Performance Fee rates and benchmarks on all Share Classes with suffix of “(perf)” are as follows:
Sub-Fund Applicable
Share Classes
Performance
Fee Rate
Performance Benchmark
Claw-Back mechanism method
JPMorgan Funds - Africa Equity Fund All 10% MSCI Emerging and Frontier Markets Africa Index (Total Return Net)
d) Distribution FeeThe SICAV pays to the Management Company a distribution fee (the “Distribution Fee”) in respect of Shares of D and T Share Classes. The Distribution Feerate payable for each Share Class is stated in the Fees and Expenses section of Appendix III - Sub-Fund Details of the Prospectus. The Management Companymay, at its absolute discretion and from time to time (which in certain circumstances may be daily) decide to vary such rate between the maximum and 0.0%.The Management Company may pay all or part of the Distribution Fee to certain Distributors for the services provided by them in relation to the distributionof the D and T Share Classes.
9. Transactions with Connected PartiesAll transactions with connected parties were carried out on an arm’s length basis.
JPMorgan Chase & Co. and its affiliates are counterparties for all securities lending activity and for certain forward currency exchange contracts and financialfutures contracts. The Management Company, Registrar, Global Distributor, Transfer and Domiciliary Agent, Advisory Company, Investment Managers,Depositary, Corporate, Administrative and Paying Agent and other related Agents of the SICAV are considered as connected parties as they are affiliatedentities of JPMorgan Chase & Co. In addition Elvinger, Hoss & Prussen (of which Mr Jacques Elvinger, who is on the Board of the Directors of the SICAV, is apartner) is compensated for legal services to the SICAV.
10. Commission Sharing ArrangementsThe Investment Managers may enter into commission sharing arrangements only where there is a direct and identifiable benefit to the clients of theInvestment Managers, including the SICAV, and where the Investment Managers are satisfied that the transactions generating the shared commissions aremade in good faith, in strict compliance with applicable regulatory requirements and in the best interests of the SICAV and the Shareholders. Any sucharrangements must be made by the Investment Manager on terms commensurate with best market practice. Due to their local regulatory rights, certainInvestment Managers may make use of soft commission to pay for research or execution services. Other jurisdictions may have other arrangements in placeto pay for such services in accordance with local regulatory obligations.
11. Securities LendingThe SICAV may lend portions of its securities portfolio to third parties for the purpose of generating additional income or for reducing costs, to the maximumextent allowed by and within the limits set forth in (i) article 11 of the Grand Ducal regulation of 8 February 2008 relating to certain definitions of theLuxembourg Law, (ii) CSSF Circular 08/356 relating to the rules applicable to Undertakings for Collective Investment when they use certain techniques andinstruments relating to transferable securities and money market instruments and (iii) any other applicable laws, regulations, circulars or CSSF positions. Asignificant proportion of the income generated from the securities lending program is credited to participating Sub-Funds, with a portion of the incomebeing paid to JPMorgan Chase Bank, N.A. for its role as securities lending agent for the SICAV. Borrowers of securities lent by participating Sub-Funds areapproved by the Management Company after appropriate assessment of such borrowers’ status and financial standing. The Management Company waivesthe incremental income previously received from the portion of income generated from the securities lending program, for its oversight of the program;hence, 85% of any incremental income earned from the securities lending is accrued to the applicable Sub-Fund, whilst the remaining 15% income is paid tothe securities lending agent which arranges the transaction. The income earned from the securities lending program is detailed in the Combined Statementof Operations and Changes in Net Assets.
As at 30 June 2016, the SICAV valuation of securities on loan is USD 506,032,647, as detailed below and received collateral with a market value of USD556,628,124.
Sub-Fund Market ValueUSD
Cash CollateralUSD
Non CashCollateral*
USD
BaseCurrency
Lending Income(Gross)
Base Currency
LendingAgent Fee
Base Currency
LendingIncome (Net)
Base Currency
JPMorgan Funds - China Fund 78,282,330 9,084,460 74,002,631 USD 1,030,569 154,585 875,984
JPMorgan Funds - Europe Dynamic Fund 70,854,646 18,941,475 55,813,687 EUR 531,769 79,765 452,004
JPMorgan Funds - Europe Small Cap Fund 25,488,653 8,094,124 18,660,980 EUR 180,016 27,002 153,014
JPMorgan Funds - Global Dynamic Fund 11,793,248 4,898,319 7,667,876 USD 163,772 24,565 139,207
JPMorgan Funds - Greater China Fund 22,749,232 575,600 23,468,298 USD 734,210 110,131 624,079
* The securities received as collateral are in the form of government securities (US, UK, and some Eurozone). These securities are issued and guaranteed as to principal and interest by the US and theEurozone government with minimum ratings of AAA and AA-, respectively.
12. Information for Swiss Registered ShareholdersJ.P. Morgan (Suisse) S.A. was authorised by the Swiss Financial Market Supervisory Authority (FINMA) as Swiss representative of the SICAV and acts also aspaying agent. The current Prospectus, the current Key Investor Information Documents, the articles, the annual and semi-annual reports of the SICAV, aswell as a list of the purchases and sales which the SICAV has undertaken during the financial year may be obtained, on simple request and free of charge, atthe head office of the Swiss representative of the SICAV, J.P. Morgan (Suisse) S.A., 8, rue de la Confédération, CH-1211 Geneva, Switzerland.
Payments/compensations (trailer fees) can be paid out from the management fee for the distribution/marketing of the investment fund to distributors.Reimbursements/rebates can be granted out of the management fee to institutional investors who hold the Sub-Fund shares for the economic benefit ofthird parties.
13. Information for German Registered ShareholdersA list, specifying for each investment within each Sub-Fund the total purchases and sales which occurred during the financial year, may be obtained free ofcharge upon request at the registered office of the SICAV and at the office of the German paying and information agent, J.P. Morgan AG, Taunustor 1, D-60311Frankfurt am Main. Additional information on investments within each Sub-Fund’s portfolio is available to shareholders at the registered office of the SICAVand at the office of the German paying and information agent.
70
JPMorgan FundsNotes to the Financial Statements (continued)
As at 30 June 2016
14. Authorisation of Sub-Funds in SingaporeThe following Sub-Funds are authorised in Singapore and available to Singapore Residents:
JPMorgan Funds - Africa Equity Fund JPMorgan Funds - Global Corporate Bond Fund
JPMorgan Funds - ASEAN Equity Fund JPMorgan Funds - Global Developing Trends Fund
JPMorgan Funds - Asia Pacific Equity Fund JPMorgan Funds - Global Dynamic Fund
JPMorgan Funds - Asia Pacific Income Fund JPMorgan Funds - Global Natural Resources Fund
JPMorgan Funds - Asian Total Return Bond Fund JPMorgan Funds - Global Unconstrained Equity Fund
JPMorgan Funds - Brazil Equity Fund JPMorgan Funds - Greater China Fund
JPMorgan Funds - China A-Share Opportunities Fund JPMorgan Funds - Income Fund
JPMorgan Funds - China Bond Fund JPMorgan Funds - India Fund
JPMorgan Funds - China Fund JPMorgan Funds - Indonesia Equity Fund
JPMorgan Funds - Emerging Europe Equity Fund JPMorgan Funds - Japan Equity Fund
JPMorgan Funds - Emerging Europe, Middle East and Africa Equity Fund JPMorgan Funds - Korea Equity Fund
JPMorgan Funds - Emerging Markets Debt Fund JPMorgan Funds - Latin America Equity Fund
JPMorgan Funds - Emerging Markets Dividend Fund JPMorgan Funds - Russia Fund
JPMorgan Funds - Emerging Markets Equity Fund JPMorgan Funds - Singapore Fund
JPMorgan Funds - Emerging Markets Local Currency Debt Fund JPMorgan Funds - Total Emerging Markets Income Fund
JPMorgan Funds - Emerging Markets Opportunities Fund JPMorgan Funds - US Aggregate Bond Fund
JPMorgan Funds - Emerging Middle East Equity Fund JPMorgan Funds - US High Yield Plus Bond Fund
JPMorgan Funds - Europe Dynamic Fund JPMorgan Funds - US Short Duration Bond Fund
JPMorgan Funds - Europe Small Cap Fund JPMorgan Funds - US Small Cap Growth Fund
JPMorgan Funds - Global Bond Opportunities Fund JPMorgan Funds - US Value Fund
15. Directors’ FeesThe only remuneration paid to Directors is an annual fee. This is waived by Mr Daniel Watkins and Mr Massimo Greco.
The total Directors’ fees for the year amounted to EUR 320,034 of which EUR 76,222 was due to the Chairman.
16. Transaction CostsFor the year ended 30 June 2016, the SICAV incurred transaction costs which have been defined as brokerage fees relating to purchase or sale oftransferable securities, derivatives (except OTC derivatives), money market instruments or other eligible assets. The SICAV also incurred transaction costscharged by the custodian agent and relating to purchase and sale of transferable securities as follows:
Sub-Fund Base Currency Custodian Transaction Costsand Brokerage Fees
(Base Currency)
JPMorgan Funds - Africa Equity Fund USD 483,910
JPMorgan Funds - ASEAN Equity Fund USD 1,462,159
JPMorgan Funds - Asia Local Currency Debt Fund USD 59,719
JPMorgan Funds - Asia Pacific Equity Fund USD 1,478,970
JPMorgan Funds - Asia Pacific Income Fund USD 3,525,036
JPMorgan Funds - Asian Total Return Bond Fund USD 2,619
JPMorgan Funds - Brazil Equity Fund USD 437,814
JPMorgan Funds - China A-Share Opportunities Fund CNH 178,567
JPMorgan Funds - China Bond Fund CNH 257,715
JPMorgan Funds - China Fund USD 4,697,560
JPMorgan Funds - Emerging Europe Equity Fund EUR 788,678
JPMorgan Funds - Emerging Europe, Middle East and Africa Equity Fund USD 608,500
JPMorgan Funds - Emerging Markets Debt Fund USD 52,570
JPMorgan Funds - Emerging Markets Dividend Fund USD 344,106
JPMorgan Funds - Emerging Markets Equity Fund USD 3,489,141
JPMorgan Funds - Emerging Markets Local Currency Debt Fund USD 144,828
JPMorgan Funds - Emerging Markets Opportunities Fund USD 5,754,228
JPMorgan Funds - Emerging Middle East Equity Fund USD 349,295
JPMorgan Funds - Europe Dynamic Fund EUR 7,678,617
JPMorgan Funds - Europe Small Cap Fund EUR 2,691,694
JPMorgan Funds - Global Bond Opportunities Fund USD 116,096
JPMorgan Funds - Global Corporate Bond Fund USD 397,725
JPMorgan Funds - Global Developing Trends Fund USD 220,121
JPMorgan Funds - Global Dynamic Fund USD 507,236
JPMorgan Funds - Global Natural Resources Fund EUR 651,571
JPMorgan Funds - Global Unconstrained Equity Fund USD 1,176,404
JPMorgan Funds - Greater China Fund USD 3,277,796
JPMorgan Funds - Income Fund USD 11,756
JPMorgan Funds - India Fund USD 1,322,416
JPMorgan Funds - Indonesia Equity Fund USD 356,594
JPMorgan Funds - Japan Equity Fund JPY 154,459,593
JPMorgan Funds - Korea Equity Fund USD 1,166,063
JPMorgan Funds - Latin America Equity Fund USD 1,130,212
JPMorgan Funds - Russia Fund USD 967,944
71
JPMorgan FundsNotes to the Financial Statements (continued)
As at 30 June 2016
Sub-Fund Base Currency Custodian Transaction Costsand Brokerage Fees
(Base Currency)
JPMorgan Funds - Singapore Fund USD 98,606
JPMorgan Funds - Total Emerging Markets Income Fund USD 147,823
JPMorgan Funds - US Aggregate Bond Fund USD 28,710
JPMorgan Funds - US High Yield Plus Bond Fund USD 17,098
JPMorgan Funds - US Short Duration Bond Fund USD 11,610
JPMorgan Funds - US Small Cap Growth Fund USD 57,448
JPMorgan Funds - US Value Fund USD 819,761
For fixed income securities, transaction costs are not separately identifiable from the purchase price of the security and therefore cannot be disclosed separately.
17. Significant Events during the YearThe Board agreed the following corporate actions and other significant amendments relating to Sub-Funds during the year:
a) Sub-Fund launchesDuring the year, the following Sub-Funds were launched:
JPMorgan Funds - China A-Share Opportunities Fund on 11 September 2015;
JPMorgan Funds - Asian Total Return Bond Fund on 31 March 2016.
b) Sub-Fund liquidationsDuring the year, the following Sub-Fund was liquidated:
JPMorgan Funds - Asia Local Currency Debt Fund on 8 April 2016.
c) Share Class merger and name changeWith effect from October 2015, the “B” Share Class was merged into the equivalent “C” Share Class within the same Sub-Fund or, where a corresponding “B”Share Class within the same Sub-Fund has not been launched, the “B” Share Class was renamed to the equivalent “C” Share Class with Share Class identifiersretained. The Management Company has decided, for the purpose of this merger, to waive its right to receive the performance fee accrual in the “B” ShareClasses merging as at the merger date.
With effect from 20 May 2016 and 27 May 2016, certain Share Classes prefixed “JPMorgan” were merged into equivalent Share Classes prefixed “JPM”. Theremaining Share Classes prefixed “JPMorgan” were renamed “JPM” on 31 May 2016. The Management Company has decided, for the purpose of this merger,to waive its right to receive the performance fee accrual in the “JPMorgan” Share Classes merging as at the merger date.
d) Changes to Sub-Fund names, investment objective, investment policy, risk profile and benchmarkWith effect from 30 September 2015, JPMorgan Funds - Eastern Europe Equity Fund was renamed JPMorgan Funds - Emerging Europe Equity Fund. Furtherto this change, Share Class names have been renamed. The investment objective, investment policy and investor profile were clarified to better reflect theSub-Fund’s current investment universe.
With effect from 1 February 2016, JPMorgan Funds - Asia Pacific Strategic Equity Fund was renamed JPMorgan Funds - Asia Pacific Equity Fund. Further tothis change, Share Classes have been renamed.
e) Change to the Sub-Fund and hedged Share Class benchmarksWith effect from 27 August 2015, the Sub-Fund and hedged Share Class benchmarks for JPMorgan Funds - Global Bond Opportunities Fund changed asfollows:
Old Sub-Fund Benchmark New Sub-Fund Benchmark
Barclays Multiverse Index (Total Return Gross) Barclays Multiverse Index (Total Return Gross) Hedged to USD
Old Hedged Share Class Benchmark New Hedged Share Class Benchmark
Barclays Multiverse Index (Total Return Gross) in AUD for the AUD Hedged Share Classes Barclays Multiverse Index (Total Return Gross) Hedged to AUD for the AUD Hedged Share Classes
Barclays Multiverse Index (Total Return Gross) in CHF for the CHF Hedged Share Classes Barclays Multiverse Index (Total Return Gross) Hedged to CHF for the CHF Hedged Share Classes
Barclays Multiverse Index (Total Return Gross) in EUR for the EUR Hedged Share Classes Barclays Multiverse Index (Total Return Gross) Hedged to EUR for the EUR Hedged Share Classes
Barclays Multiverse Index (Total Return Gross) in GBP for the GBP Hedged Share Classes Barclays Multiverse Index (Total Return Gross) Hedged to GBP for the GBP Hedged Share Classes
Barclays Multiverse Index (Total Return Gross) in SEK for the SEK Hedged Share Classes Barclays Multiverse Index (Total Return Gross) Hedged to SEK for the SEK Hedged Share Classes
With effect from 4 January 2016, the Sub-Fund benchmark for JPMorgan Funds - Global Natural Resources Fund changed from Euromoney Global Gold,Mining& Energy Index (Total Return Net) to Euromoney Global Mining & Energy Index (Total Return Net).
f) Changes to operating and administrative expensesWith effect from 1 July 2015, changes have been made to the Operating & Administrative Expenses (“O&A”) across all Sub-Funds as set out below:
For those Share Classes where the O&A is currently set at a fixed rate, the O&A rate has been replaced with capped O&A rates that have been set at either thecurrent fixed rate or a lower rate based on an analysis of the actual direct expenses of the Share Classes. With a capped O&A rate, the Share Classes will paythe actual expenses incurred by the Sub-Fund until the cap is reached.
Share Classes that currently have a capped O&A will not be impacted by this change and, in some instances, may experience a reduction in the maximum O&Aexpense cap.
The “Fund Servicing Fee” has been capped and it is more explicitly defined as a component of the O&A Expenses that is paid to the Management Company forthe services that the Management Company provides.
This Fund Servicing Fee has been capped at 0.15% of the NAV and will be reviewed annually.
g) Annual management and advisory fee rate reduction and waiverWith effect from 7 April 2016, the Management Company decided to waive the Management Fees of JPMorgan Funds - Asia Local Currency Debt Fund.
h) Swing waiver mechanismWith effect from 1 January 2016, the following Sub-Fund was removed from the swing waiver mechanism having reached the end of the waiver period:
- JPMorgan Funds - Total Emerging Markets Income Fund.
72
JPMorgan FundsNotes to the Financial Statements (continued)
As at 30 June 2016

18. Events after the Year-End
a) Change to the Sub-Fund benchmarkWith effect from 1 July 2016, the benchmark for JPMorgan Funds - Singapore Fund changed from MSCI Singapore 10/40 Index (Total Return Net) to FTSE STAll Share Index (Total Return Net).
b) Swing waiver mechanismThe Management Company has decided to include JPMorgan Funds - Income Fund in the scope of the swing waiver mechanism with an AUM target ofUSD 250 million or by 31 December 2016 whichever comes first.
73
JPMorgan FundsNotes to the Financial Statements (continued)
As at 30 June 2016
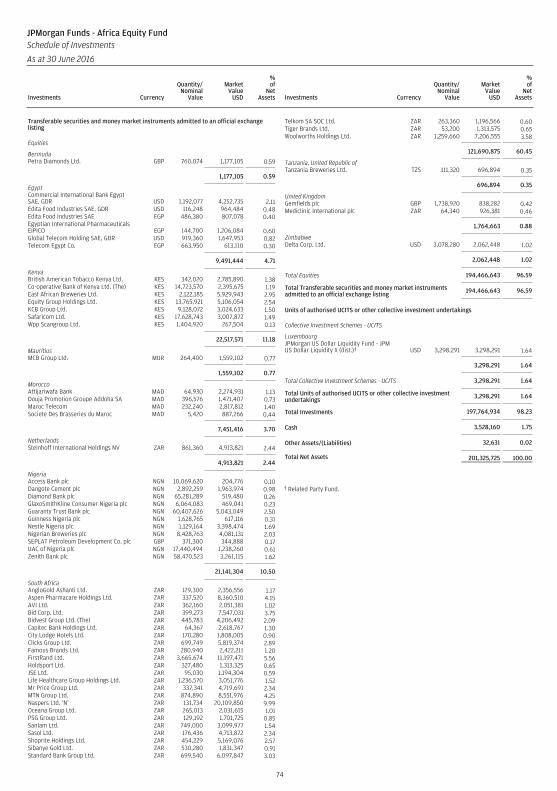
Transferable securities and money market instruments admitted to an official exchangelisting
Equities
BermudaPetra Diamonds Ltd. GBP 760,074 1,177,105 0.59
1,177,105 0.59
EgyptCommercial International Bank EgyptSAE, GDR USD 1,192,077 4,252,735 2.11Edita Food Industries SAE, GDR USD 116,248 964,484 0.48Edita Food Industries SAE EGP 486,380 807,078 0.40Egyptian International PharmaceuticalsEIPICO EGP 144,700 1,206,084 0.60Global Telecom Holding SAE, GDR USD 919,360 1,647,953 0.82Telecom Egypt Co. EGP 663,950 613,110 0.30
9,491,444 4.71
KenyaBritish American Tobacco Kenya Ltd. KES 342,020 2,785,890 1.38Co-operative Bank of Kenya Ltd. (The) KES 14,723,570 2,395,675 1.19East African Breweries Ltd. KES 2,122,185 5,929,943 2.95Equity Group Holdings Ltd. KES 13,765,921 5,106,054 2.54KCB Group Ltd. KES 9,128,072 3,024,633 1.50Safaricom Ltd. KES 17,628,743 3,007,872 1.49Wpp Scangroup Ltd. KES 1,404,920 267,504 0.13
22,517,571 11.18
MauritiusMCB Group Ltd. MUR 264,400 1,559,102 0.77
1,559,102 0.77
MoroccoAttijariwafa Bank MAD 64,930 2,274,931 1.13Douja Promotion Groupe Addoha SA MAD 396,576 1,471,407 0.73Maroc Telecom MAD 232,240 2,817,812 1.40Societe Des Brasseries du Maroc MAD 5,420 887,266 0.44
7,451,416 3.70
NetherlandsSteinhoff International Holdings NV ZAR 861,360 4,913,821 2.44
4,913,821 2.44
NigeriaAccess Bank plc NGN 10,069,620 204,776 0.10Dangote Cement plc NGN 2,892,259 1,963,974 0.98Diamond Bank plc NGN 65,281,289 519,480 0.26GlaxoSmithKline Consumer Nigeria plc NGN 6,064,083 469,041 0.23Guaranty Trust Bank plc NGN 60,407,626 5,043,049 2.50Guinness Nigeria plc NGN 1,628,765 617,116 0.31Nestle Nigeria plc NGN 1,129,164 3,398,474 1.69Nigerian Breweries plc NGN 8,428,763 4,081,131 2.03SEPLAT Petroleum Development Co. plc GBP 371,300 344,888 0.17UAC of Nigeria plc NGN 17,440,494 1,238,260 0.61Zenith Bank plc NGN 58,470,523 3,261,115 1.62
21,141,304 10.50
South AfricaAngloGold Ashanti Ltd. ZAR 129,300 2,356,556 1.17Aspen Pharmacare Holdings Ltd. ZAR 337,520 8,360,510 4.15AVI Ltd. ZAR 362,160 2,051,381 1.02Bid Corp. Ltd. ZAR 399,273 7,547,031 3.75Bidvest Group Ltd. (The) ZAR 445,783 4,206,492 2.09Capitec Bank Holdings Ltd. ZAR 64,367 2,618,767 1.30City Lodge Hotels Ltd. ZAR 170,280 1,808,005 0.90Clicks Group Ltd. ZAR 699,749 5,819,374 2.89Famous Brands Ltd. ZAR 280,940 2,422,211 1.20FirstRand Ltd. ZAR 3,665,674 11,197,471 5.56Holdsport Ltd. ZAR 327,480 1,313,325 0.65JSE Ltd. ZAR 95,030 1,194,304 0.59Life Healthcare Group Holdings Ltd. ZAR 1,236,570 3,051,776 1.52Mr Price Group Ltd. ZAR 337,341 4,719,691 2.34MTN Group Ltd. ZAR 874,890 8,551,976 4.25Naspers Ltd. ‘N’ ZAR 131,734 20,109,850 9.99Oceana Group Ltd. ZAR 265,013 2,031,615 1.01PSG Group Ltd. ZAR 129,192 1,701,725 0.85Sanlam Ltd. ZAR 749,000 3,099,977 1.54Sasol Ltd. ZAR 176,436 4,713,872 2.34Shoprite Holdings Ltd. ZAR 454,229 5,169,076 2.57Sibanye Gold Ltd. ZAR 530,280 1,831,347 0.91Standard Bank Group Ltd. ZAR 699,540 6,097,847 3.03
Telkom SA SOC Ltd. ZAR 263,360 1,196,566 0.60Tiger Brands Ltd. ZAR 53,200 1,313,575 0.65Woolworths Holdings Ltd. ZAR 1,259,660 7,206,555 3.58
121,690,875 60.45
Tanzania, United Republic ofTanzania Breweries Ltd. TZS 111,320 696,894 0.35
696,894 0.35
United KingdomGemfields plc GBP 1,738,920 838,282 0.42Mediclinic International plc ZAR 64,340 926,381 0.46
1,764,663 0.88
ZimbabweDelta Corp. Ltd. USD 3,078,280 2,062,448 1.02
2,062,448 1.02
Total Equities 194,466,643 96.59
Total Transferable securities and money market instrumentsadmitted to an official exchange listing 194,466,643 96.59
Units of authorised UCITS or other collective investment undertakings
Collective Investment Schemes - UCITS
LuxembourgJPMorgan US Dollar Liquidity Fund - JPMUS Dollar Liquidity X (dist.)† USD 3,298,291 3,298,291 1.64
3,298,291 1.64
Total Collective Investment Schemes - UCITS 3,298,291 1.64
Total Units of authorised UCITS or other collective investmentundertakings 3,298,291 1.64
Total Investments 197,764,934 98.23
Cash 3,528,160 1.75
Other Assets/(Liabilities) 32,631 0.02
Total Net Assets 201,325,725 100.00
† Related Party Fund.
74
JPMorgan Funds - Africa Equity FundSchedule of Investments
As at 30 June 2016
Investments Currency
Quantity/Nominal
Value
MarketValue
USD
%of
NetAssets Investments Currency
Quantity/Nominal
Value
MarketValue
USD
%of
NetAssets
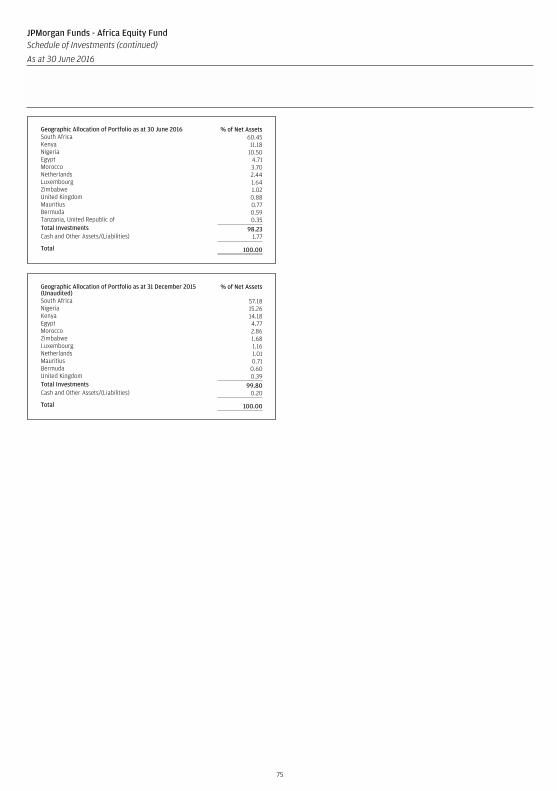
Geographic Allocation of Portfolio as at 30 June 2016 % of Net AssetsSouth Africa 60.45Kenya 11.18Nigeria 10.50Egypt 4.71Morocco 3.70Netherlands 2.44Luxembourg 1.64Zimbabwe 1.02United Kingdom 0.88Mauritius 0.77Bermuda 0.59Tanzania, United Republic of 0.35Total Investments 98.23Cash and Other Assets/(Liabilities) 1.77
Total 100.00
Geographic Allocation of Portfolio as at 31 December 2015(Unaudited)
% of Net Assets
South Africa 57.18Nigeria 15.26Kenya 14.18Egypt 4.77Morocco 2.86Zimbabwe 1.68Luxembourg 1.16Netherlands 1.01Mauritius 0.71Bermuda 0.60United Kingdom 0.39Total Investments 99.80Cash and Other Assets/(Liabilities) 0.20
Total 100.00
75
JPMorgan Funds - Africa Equity FundSchedule of Investments (continued)
As at 30 June 2016
Investments Currency
Quantity/Nominal
Value
MarketValue
USD
%of
NetAssets Investments Currency
Quantity/Nominal
Value
MarketValue
USD
%of
NetAssets
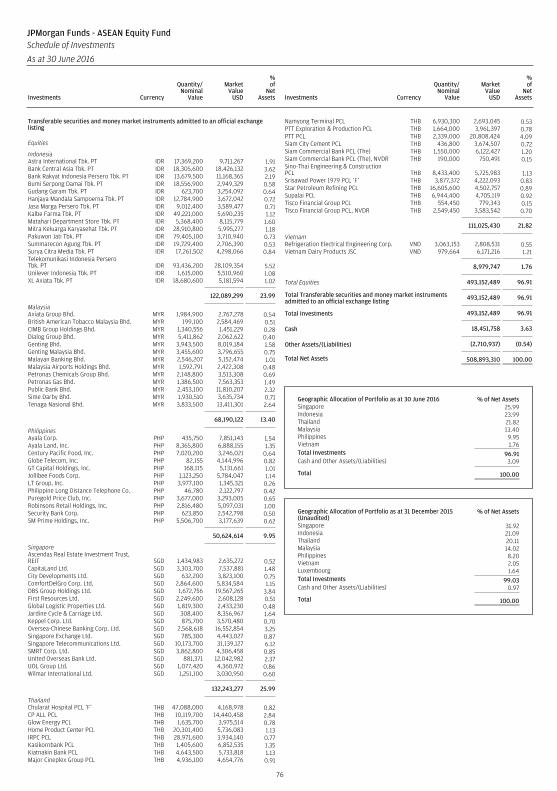
Transferable securities and money market instruments admitted to an official exchangelisting
Equities
IndonesiaAstra International Tbk. PT IDR 17,369,200 9,711,267 1.91Bank Central Asia Tbk. PT IDR 18,305,600 18,426,132 3.62Bank Rakyat Indonesia Persero Tbk. PT IDR 13,679,500 11,168,365 2.19Bumi Serpong Damai Tbk. PT IDR 18,556,900 2,949,329 0.58Gudang Garam Tbk. PT IDR 623,700 3,254,092 0.64Hanjaya Mandala Sampoerna Tbk. PT IDR 12,784,900 3,672,042 0.72Jasa Marga Persero Tbk. PT IDR 9,012,400 3,589,477 0.71Kalbe Farma Tbk. PT IDR 49,221,000 5,690,235 1.12Matahari Department Store Tbk. PT IDR 5,368,400 8,115,779 1.60Mitra Keluarga Karyasehat Tbk. PT IDR 28,910,800 5,995,277 1.18Pakuwon Jati Tbk. PT IDR 79,405,100 3,710,940 0.73Summarecon Agung Tbk. PT IDR 19,729,400 2,706,390 0.53Surya Citra Media Tbk. PT IDR 17,261,502 4,298,066 0.84Telekomunikasi Indonesia PerseroTbk. PT IDR 93,436,200 28,109,354 5.52Unilever Indonesia Tbk. PT IDR 1,615,000 5,510,960 1.08XL Axiata Tbk. PT IDR 18,680,600 5,181,594 1.02
122,089,299 23.99
MalaysiaAxiata Group Bhd. MYR 1,984,900 2,767,278 0.54British American Tobacco Malaysia Bhd. MYR 199,100 2,584,469 0.51CIMB Group Holdings Bhd. MYR 1,340,556 1,451,229 0.28Dialog Group Bhd. MYR 5,411,862 2,062,622 0.40Genting Bhd. MYR 3,943,500 8,019,184 1.58Genting Malaysia Bhd. MYR 3,455,600 3,796,655 0.75Malayan Banking Bhd. MYR 2,546,207 5,152,474 1.01Malaysia Airports Holdings Bhd. MYR 1,592,791 2,422,308 0.48Petronas Chemicals Group Bhd. MYR 2,148,800 3,513,308 0.69Petronas Gas Bhd. MYR 1,386,500 7,563,353 1.49Public Bank Bhd. MYR 2,453,100 11,810,207 2.32Sime Darby Bhd. MYR 1,930,510 3,635,734 0.71Tenaga Nasional Bhd. MYR 3,833,500 13,411,301 2.64
68,190,122 13.40
PhilippinesAyala Corp. PHP 435,750 7,851,143 1.54Ayala Land, Inc. PHP 8,365,800 6,888,155 1.35Century Pacific Food, Inc. PHP 7,020,200 3,246,021 0.64Globe Telecom, Inc. PHP 82,155 4,144,996 0.82GT Capital Holdings, Inc. PHP 168,115 5,131,661 1.01Jollibee Foods Corp. PHP 1,123,250 5,784,047 1.14LT Group, Inc. PHP 3,977,100 1,345,321 0.26Philippine Long Distance Telephone Co. PHP 46,780 2,122,797 0.42Puregold Price Club, Inc. PHP 3,677,000 3,293,005 0.65Robinsons Retail Holdings, Inc. PHP 2,816,480 5,097,031 1.00Security Bank Corp. PHP 623,850 2,542,798 0.50SM Prime Holdings, Inc. PHP 5,506,700 3,177,639 0.62
50,624,614 9.95
SingaporeAscendas Real Estate Investment Trust,REIT SGD 1,434,983 2,635,272 0.52CapitaLand Ltd. SGD 3,303,700 7,537,881 1.48City Developments Ltd. SGD 632,200 3,823,100 0.75ComfortDelGro Corp. Ltd. SGD 2,864,600 5,834,584 1.15DBS Group Holdings Ltd. SGD 1,672,756 19,567,265 3.84First Resources Ltd. SGD 2,249,600 2,608,128 0.51Global Logistic Properties Ltd. SGD 1,819,300 2,433,230 0.48Jardine Cycle & Carriage Ltd. SGD 308,400 8,356,967 1.64Keppel Corp. Ltd. SGD 875,700 3,570,480 0.70Oversea-Chinese Banking Corp. Ltd. SGD 2,568,618 16,552,854 3.25Singapore Exchange Ltd. SGD 785,300 4,443,027 0.87Singapore Telecommunications Ltd. SGD 10,173,700 31,139,127 6.12SMRT Corp. Ltd. SGD 3,862,800 4,306,458 0.85United Overseas Bank Ltd. SGD 881,371 12,042,982 2.37UOL Group Ltd. SGD 1,077,420 4,360,972 0.86Wilmar International Ltd. SGD 1,251,100 3,030,950 0.60
132,243,277 25.99
ThailandChularat Hospital PCL ‘F’ THB 47,088,000 4,168,978 0.82CP ALL PCL THB 10,119,700 14,440,458 2.84Glow Energy PCL THB 1,635,700 3,975,514 0.78Home Product Center PCL THB 20,301,400 5,736,083 1.13IRPC PCL THB 28,971,600 3,934,140 0.77Kasikornbank PCL THB 1,405,600 6,852,535 1.35Kiatnakin Bank PCL THB 4,643,500 5,733,818 1.13Major Cineplex Group PCL THB 4,936,100 4,654,776 0.91
Namyong Terminal PCL THB 6,930,300 2,693,045 0.53PTT Exploration & Production PCL THB 1,664,000 3,961,397 0.78PTT PCL THB 2,339,000 20,808,424 4.09Siam City Cement PCL THB 436,800 3,674,507 0.72Siam Commercial Bank PCL (The) THB 1,550,000 6,122,427 1.20Siam Commercial Bank PCL (The), NVDR THB 190,000 750,491 0.15Sino-Thai Engineering & ConstructionPCL THB 8,433,400 5,725,983 1.13Srisawad Power 1979 PCL ‘F’ THB 3,877,372 4,222,093 0.83Star Petroleum Refining PCL THB 16,605,600 4,502,757 0.89Supalai PCL THB 6,944,400 4,705,119 0.92Tisco Financial Group PCL THB 554,450 779,343 0.15Tisco Financial Group PCL, NVDR THB 2,549,450 3,583,542 0.70
111,025,430 21.82
VietnamRefrigeration Electrical Engineering Corp. VND 3,063,153 2,808,531 0.55Vietnam Dairy Products JSC VND 979,664 6,171,216 1.21
8,979,747 1.76
Total Equities 493,152,489 96.91
Total Transferable securities and money market instrumentsadmitted to an official exchange listing 493,152,489 96.91
Total Investments 493,152,489 96.91
Cash 18,451,758 3.63
Other Assets/(Liabilities) (2,710,937) (0.54)
Total Net Assets 508,893,310 100.00
Geographic Allocation of Portfolio as at 30 June 2016 % of Net AssetsSingapore 25.99Indonesia 23.99Thailand 21.82Malaysia 13.40Philippines 9.95Vietnam 1.76Total Investments 96.91Cash and Other Assets/(Liabilities) 3.09
Total 100.00
Geographic Allocation of Portfolio as at 31 December 2015(Unaudited)
% of Net Assets
Singapore 31.92Indonesia 21.09Thailand 20.11Malaysia 14.02Philippines 8.20Vietnam 2.05Luxembourg 1.64Total Investments 99.03Cash and Other Assets/(Liabilities) 0.97
Total 100.00
76
JPMorgan Funds - ASEAN Equity FundSchedule of Investments
As at 30 June 2016
Investments Currency
Quantity/Nominal
Value
MarketValue
USD
%of
NetAssets Investments Currency
Quantity/Nominal
Value
MarketValue
USD
%of
NetAssets
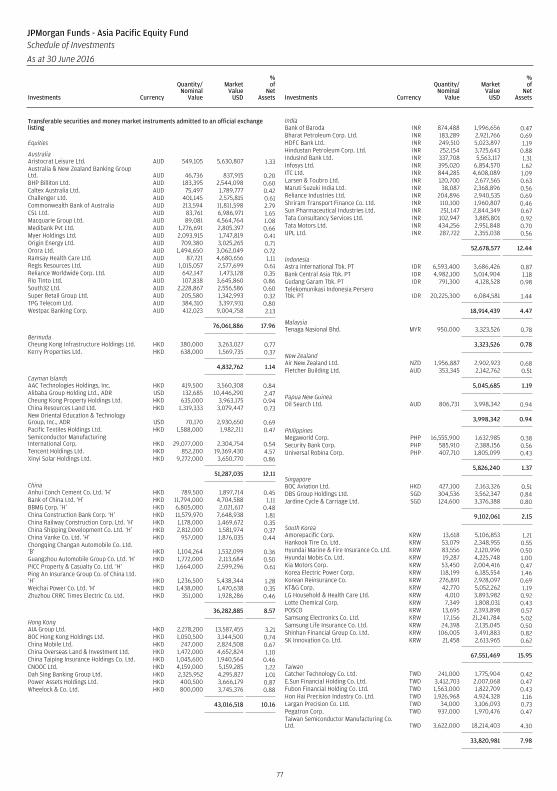
Transferable securities and money market instruments admitted to an official exchangelisting
Equities
AustraliaAristocrat Leisure Ltd. AUD 549,105 5,630,807 1.33Australia & New Zealand Banking GroupLtd. AUD 46,736 837,915 0.20BHP Billiton Ltd. AUD 183,395 2,544,098 0.60Caltex Australia Ltd. AUD 75,497 1,789,777 0.42Challenger Ltd. AUD 401,145 2,575,815 0.61Commonwealth Bank of Australia AUD 213,594 11,811,598 2.79CSL Ltd. AUD 83,761 6,986,971 1.65Macquarie Group Ltd. AUD 89,081 4,564,764 1.08Medibank Pvt Ltd. AUD 1,276,691 2,805,397 0.66Myer Holdings Ltd. AUD 2,093,915 1,747,819 0.41Origin Energy Ltd. AUD 709,380 3,025,265 0.71Orora Ltd. AUD 1,494,650 3,062,049 0.72Ramsay Health Care Ltd. AUD 87,721 4,680,656 1.11Regis Resources Ltd. AUD 1,015,057 2,577,699 0.61Reliance Worldwide Corp. Ltd. AUD 642,147 1,473,128 0.35Rio Tinto Ltd. AUD 107,838 3,645,860 0.86South32 Ltd. AUD 2,228,867 2,556,586 0.60Super Retail Group Ltd. AUD 205,580 1,342,993 0.32TPG Telecom Ltd. AUD 384,310 3,397,931 0.80Westpac Banking Corp. AUD 412,023 9,004,758 2.13
76,061,886 17.96
BermudaCheung Kong Infrastructure Holdings Ltd. HKD 380,000 3,263,027 0.77Kerry Properties Ltd. HKD 638,000 1,569,735 0.37
4,832,762 1.14
Cayman IslandsAAC Technologies Holdings, Inc. HKD 419,500 3,560,308 0.84Alibaba Group Holding Ltd., ADR USD 132,685 10,446,290 2.47Cheung Kong Property Holdings Ltd. HKD 635,000 3,963,175 0.94China Resources Land Ltd. HKD 1,319,333 3,079,447 0.73New Oriental Education & TechnologyGroup, Inc., ADR USD 70,170 2,930,650 0.69Pacific Textiles Holdings Ltd. HKD 1,588,000 1,982,211 0.47Semiconductor ManufacturingInternational Corp. HKD 29,077,000 2,304,754 0.54Tencent Holdings Ltd. HKD 852,200 19,369,430 4.57Xinyi Solar Holdings Ltd. HKD 9,272,000 3,650,770 0.86
51,287,035 12.11
ChinaAnhui Conch Cement Co. Ltd. ‘H’ HKD 789,500 1,897,714 0.45Bank of China Ltd. ‘H’ HKD 11,794,000 4,704,588 1.11BBMG Corp. ‘H’ HKD 6,805,000 2,021,617 0.48China Construction Bank Corp. ‘H’ HKD 11,579,970 7,648,938 1.81China Railway Construction Corp. Ltd. ‘H’ HKD 1,178,000 1,469,672 0.35China Shipping Development Co. Ltd. ‘H’ HKD 2,812,000 1,581,974 0.37China Vanke Co. Ltd. ‘H’ HKD 957,000 1,876,035 0.44Chongqing Changan Automobile Co. Ltd.‘B’ HKD 1,104,264 1,532,099 0.36Guangzhou Automobile Group Co. Ltd. ‘H’ HKD 1,772,000 2,113,684 0.50PICC Property & Casualty Co. Ltd. ‘H’ HKD 1,664,000 2,599,296 0.61Ping An Insurance Group Co. of China Ltd.‘H’ HKD 1,236,500 5,438,344 1.28Weichai Power Co. Ltd. ‘H’ HKD 1,438,000 1,470,638 0.35Zhuzhou CRRC Times Electric Co. Ltd. HKD 351,000 1,928,286 0.46
36,282,885 8.57
Hong KongAIA Group Ltd. HKD 2,278,200 13,587,455 3.21BOC Hong Kong Holdings Ltd. HKD 1,050,500 3,144,500 0.74China Mobile Ltd. HKD 247,000 2,824,508 0.67China Overseas Land & Investment Ltd. HKD 1,472,000 4,652,824 1.10China Taiping Insurance Holdings Co. Ltd. HKD 1,045,600 1,940,564 0.46CNOOC Ltd. HKD 4,159,000 5,159,285 1.22Dah Sing Banking Group Ltd. HKD 2,325,952 4,295,827 1.01Power Assets Holdings Ltd. HKD 400,500 3,666,179 0.87Wheelock & Co. Ltd. HKD 800,000 3,745,376 0.88
43,016,518 10.16
IndiaBank of Baroda INR 874,488 1,996,656 0.47Bharat Petroleum Corp. Ltd. INR 183,289 2,921,766 0.69HDFC Bank Ltd. INR 249,510 5,023,897 1.19Hindustan Petroleum Corp. Ltd. INR 252,154 3,725,643 0.88IndusInd Bank Ltd. INR 337,708 5,563,117 1.31Infosys Ltd. INR 395,020 6,854,570 1.62ITC Ltd. INR 844,285 4,608,089 1.09Larsen & Toubro Ltd. INR 120,700 2,677,565 0.63Maruti Suzuki India Ltd. INR 38,087 2,368,896 0.56Reliance Industries Ltd. INR 204,896 2,940,535 0.69Shriram Transport Finance Co. Ltd. INR 110,100 1,960,807 0.46Sun Pharmaceutical Industries Ltd. INR 251,147 2,844,349 0.67Tata Consultancy Services Ltd. INR 102,947 3,885,801 0.92Tata Motors Ltd. INR 434,256 2,951,848 0.70UPL Ltd. INR 287,722 2,355,038 0.56
52,678,577 12.44
IndonesiaAstra International Tbk. PT IDR 6,593,400 3,686,426 0.87Bank Central Asia Tbk. PT IDR 4,982,100 5,014,904 1.18Gudang Garam Tbk. PT IDR 791,300 4,128,528 0.98Telekomunikasi Indonesia PerseroTbk. PT IDR 20,225,300 6,084,581 1.44
18,914,439 4.47
MalaysiaTenaga Nasional Bhd. MYR 950,000 3,323,526 0.78
3,323,526 0.78
New ZealandAir New Zealand Ltd. NZD 1,956,887 2,902,923 0.68Fletcher Building Ltd. AUD 353,345 2,142,762 0.51
5,045,685 1.19
Papua New GuineaOil Search Ltd. AUD 806,731 3,998,342 0.94
3,998,342 0.94
PhilippinesMegaworld Corp. PHP 16,555,900 1,632,985 0.38Security Bank Corp. PHP 585,910 2,388,156 0.56Universal Robina Corp. PHP 407,710 1,805,099 0.43
5,826,240 1.37
SingaporeBOC Aviation Ltd. HKD 427,100 2,163,326 0.51DBS Group Holdings Ltd. SGD 304,536 3,562,347 0.84Jardine Cycle & Carriage Ltd. SGD 124,600 3,376,388 0.80
9,102,061 2.15
South KoreaAmorepacific Corp. KRW 13,618 5,106,853 1.21Hankook Tire Co. Ltd. KRW 53,079 2,348,955 0.55Hyundai Marine & Fire Insurance Co. Ltd. KRW 83,556 2,120,996 0.50Hyundai Mobis Co. Ltd. KRW 19,287 4,225,748 1.00Kia Motors Corp. KRW 53,450 2,004,416 0.47Korea Electric Power Corp. KRW 118,199 6,185,554 1.46Korean Reinsurance Co. KRW 276,891 2,928,097 0.69KT&G Corp. KRW 42,770 5,052,262 1.19LG Household & Health Care Ltd. KRW 4,010 3,893,982 0.92Lotte Chemical Corp. KRW 7,349 1,808,031 0.43POSCO KRW 13,695 2,393,898 0.57Samsung Electronics Co. Ltd. KRW 17,156 21,241,784 5.02Samsung Life Insurance Co. Ltd. KRW 24,398 2,135,045 0.50Shinhan Financial Group Co. Ltd. KRW 106,005 3,491,883 0.82SK Innovation Co. Ltd. KRW 21,458 2,613,965 0.62
67,551,469 15.95
TaiwanCatcher Technology Co. Ltd. TWD 241,000 1,775,904 0.42E.Sun Financial Holding Co. Ltd. TWD 3,412,703 2,007,068 0.47Fubon Financial Holding Co. Ltd. TWD 1,563,000 1,822,709 0.43Hon Hai Precision Industry Co. Ltd. TWD 1,926,968 4,924,328 1.16Largan Precision Co. Ltd. TWD 34,000 3,106,093 0.73Pegatron Corp. TWD 937,000 1,970,476 0.47Taiwan Semiconductor Manufacturing Co.Ltd. TWD 3,622,000 18,214,403 4.30
33,820,981 7.98
77
JPMorgan Funds - Asia Pacific Equity FundSchedule of Investments
As at 30 June 2016
Investments Currency
Quantity/Nominal
Value
MarketValue
USD
%of
NetAssets Investments Currency
Quantity/Nominal
Value
MarketValue
USD
%of
NetAssets
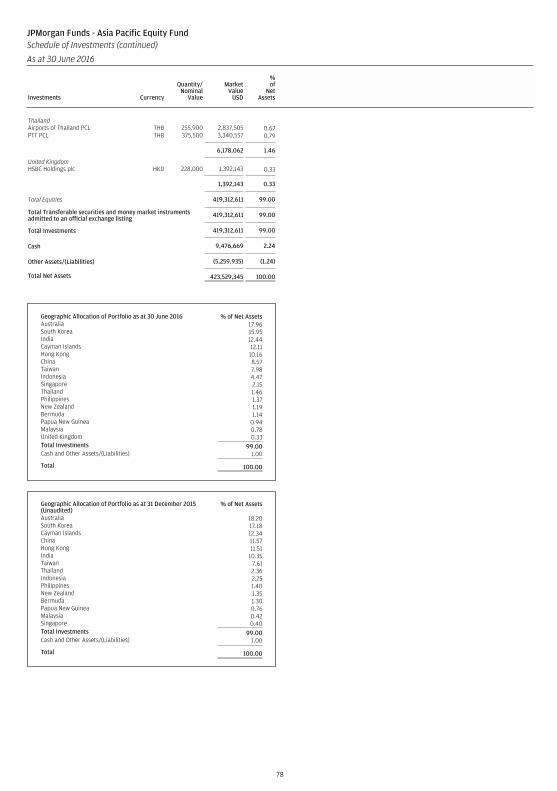
ThailandAirports of Thailand PCL THB 255,900 2,837,505 0.67PTT PCL THB 375,500 3,340,557 0.79
6,178,062 1.46
United KingdomHSBC Holdings plc HKD 228,000 1,392,143 0.33
1,392,143 0.33
Total Equities 419,312,611 99.00
Total Transferable securities and money market instrumentsadmitted to an official exchange listing 419,312,611 99.00
Total Investments 419,312,611 99.00
Cash 9,476,669 2.24
Other Assets/(Liabilities) (5,259,935) (1.24)
Total Net Assets 423,529,345 100.00
Geographic Allocation of Portfolio as at 30 June 2016 % of Net AssetsAustralia 17.96South Korea 15.95India 12.44Cayman Islands 12.11Hong Kong 10.16China 8.57Taiwan 7.98Indonesia 4.47Singapore 2.15Thailand 1.46Philippines 1.37New Zealand 1.19Bermuda 1.14Papua New Guinea 0.94Malaysia 0.78United Kingdom 0.33Total Investments 99.00Cash and Other Assets/(Liabilities) 1.00
Total 100.00
Geographic Allocation of Portfolio as at 31 December 2015(Unaudited)
% of Net Assets
Australia 18.20South Korea 17.18Cayman Islands 12.34China 11.57Hong Kong 11.51India 10.35Taiwan 7.61Thailand 2.36Indonesia 2.25Philippines 1.40New Zealand 1.35Bermuda 1.30Papua New Guinea 0.76Malaysia 0.42Singapore 0.40Total Investments 99.00Cash and Other Assets/(Liabilities) 1.00
Total 100.00
78
JPMorgan Funds - Asia Pacific Equity FundSchedule of Investments (continued)
As at 30 June 2016
Investments Currency
Quantity/Nominal
Value
MarketValue
USD
%of
NetAssets Investments Currency
Quantity/Nominal
Value
MarketValue
USD
%of
NetAssets
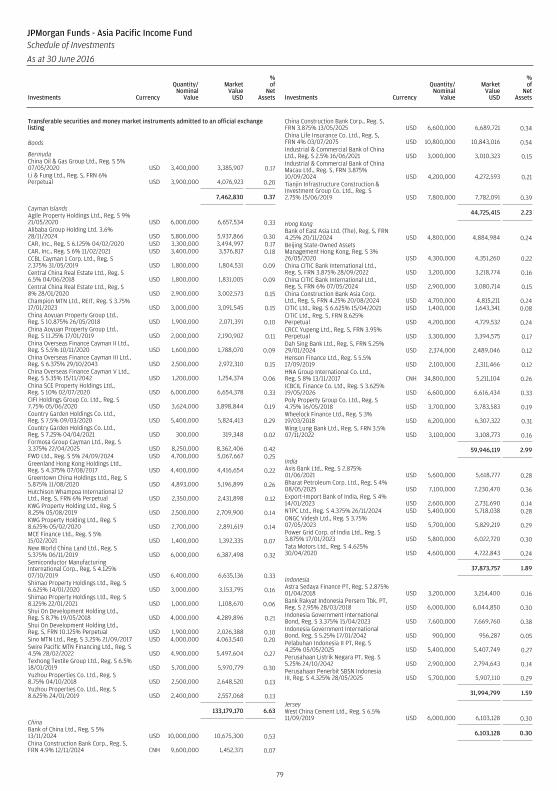
Transferable securities and money market instruments admitted to an official exchangelisting
Bonds
BermudaChina Oil & Gas Group Ltd., Reg. S 5%07/05/2020 USD 3,400,000 3,385,907 0.17Li & Fung Ltd., Reg. S, FRN 6%Perpetual USD 3,900,000 4,076,923 0.20
7,462,830 0.37
Cayman IslandsAgile Property Holdings Ltd., Reg. S 9%21/05/2020 USD 6,000,000 6,657,534 0.33Alibaba Group Holding Ltd. 3.6%28/11/2024 USD 5,800,000 5,937,866 0.30CAR, Inc., Reg. S 6.125% 04/02/2020 USD 3,300,000 3,494,997 0.17CAR, Inc., Reg. S 6% 11/02/2021 USD 3,400,000 3,576,817 0.18CCBL Cayman 1 Corp. Ltd., Reg. S2.375% 31/05/2019 USD 1,800,000 1,804,531 0.09Central China Real Estate Ltd., Reg. S6.5% 04/06/2018 USD 1,800,000 1,831,005 0.09Central China Real Estate Ltd., Reg. S8% 28/01/2020 USD 2,900,000 3,002,573 0.15Champion MTN Ltd., REIT, Reg. S 3.75%17/01/2023 USD 3,000,000 3,091,545 0.15China Aoyuan Property Group Ltd.,Reg. S 10.875% 26/05/2018 USD 1,900,000 2,071,391 0.10China Aoyuan Property Group Ltd.,Reg. S 11.25% 17/01/2019 USD 2,000,000 2,190,902 0.11China Overseas Finance Cayman II Ltd.,Reg. S 5.5% 10/11/2020 USD 1,600,000 1,788,070 0.09China Overseas Finance Cayman III Ltd.,Reg. S 6.375% 29/10/2043 USD 2,500,000 2,972,310 0.15China Overseas Finance Cayman V Ltd.,Reg. S 5.35% 15/11/2042 USD 1,200,000 1,254,374 0.06China SCE Property Holdings Ltd.,Reg. S 10% 02/07/2020 USD 6,000,000 6,654,378 0.33CIFI Holdings Group Co. Ltd., Reg. S7.75% 05/06/2020 USD 3,624,000 3,898,844 0.19Country Garden Holdings Co. Ltd.,Reg. S 7.5% 09/03/2020 USD 5,400,000 5,824,413 0.29Country Garden Holdings Co. Ltd.,Reg. S 7.25% 04/04/2021 USD 300,000 319,348 0.02Formosa Group Cayman Ltd., Reg. S3.375% 22/04/2025 USD 8,250,000 8,362,406 0.42FWD Ltd., Reg. S 5% 24/09/2024 USD 4,700,000 5,067,667 0.25Greenland Hong Kong Holdings Ltd.,Reg. S 4.375% 07/08/2017 USD 4,400,000 4,416,654 0.22Greentown China Holdings Ltd., Reg. S5.875% 11/08/2020 USD 4,893,000 5,196,899 0.26Hutchison Whampoa International 12Ltd., Reg. S, FRN 6% Perpetual USD 2,350,000 2,431,898 0.12KWG Property Holding Ltd., Reg. S8.25% 05/08/2019 USD 2,500,000 2,709,900 0.14KWG Property Holding Ltd., Reg. S8.625% 05/02/2020 USD 2,700,000 2,891,619 0.14MCE Finance Ltd., Reg. S 5%15/02/2021 USD 1,400,000 1,392,335 0.07New World China Land Ltd., Reg. S5.375% 06/11/2019 USD 6,000,000 6,387,498 0.32Semiconductor ManufacturingInternational Corp., Reg. S 4.125%07/10/2019 USD 6,400,000 6,635,136 0.33Shimao Property Holdings Ltd., Reg. S6.625% 14/01/2020 USD 3,000,000 3,153,795 0.16Shimao Property Holdings Ltd., Reg. S8.125% 22/01/2021 USD 1,000,000 1,108,670 0.06Shui On Development Holding Ltd.,Reg. S 8.7% 19/05/2018 USD 4,000,000 4,289,896 0.21Shui On Development Holding Ltd.,Reg. S, FRN 10.125% Perpetual USD 1,900,000 2,026,388 0.10Sino MTN Ltd., Reg. S 3.25% 21/09/2017 USD 4,000,000 4,063,540 0.20Swire Pacific MTN Financing Ltd., Reg. S4.5% 28/02/2022 USD 4,900,000 5,497,604 0.27Texhong Textile Group Ltd., Reg. S 6.5%18/01/2019 USD 5,700,000 5,970,779 0.30Yuzhou Properties Co. Ltd., Reg. S8.75% 04/10/2018 USD 2,500,000 2,648,520 0.13Yuzhou Properties Co. Ltd., Reg. S8.625% 24/01/2019 USD 2,400,000 2,557,068 0.13
133,179,170 6.63
ChinaBank of China Ltd., Reg. S 5%13/11/2024 USD 10,000,000 10,675,300 0.53China Construction Bank Corp., Reg. S,FRN 4.9% 12/11/2024 CNH 9,600,000 1,452,371 0.07
China Construction Bank Corp., Reg. S,FRN 3.875% 13/05/2025 USD 6,600,000 6,689,721 0.34China Life Insurance Co. Ltd., Reg. S,FRN 4% 03/07/2075 USD 10,800,000 10,843,016 0.54Industrial & Commercial Bank of ChinaLtd., Reg. S 2.5% 16/06/2021 USD 3,000,000 3,010,323 0.15Industrial & Commercial Bank of ChinaMacau Ltd., Reg. S, FRN 3.875%10/09/2024 USD 4,200,000 4,272,593 0.21Tianjin Infrastructure Construction &Investment Group Co. Ltd., Reg. S2.75% 15/06/2019 USD 7,800,000 7,782,091 0.39
44,725,415 2.23
Hong KongBank of East Asia Ltd. (The), Reg. S, FRN4.25% 20/11/2024 USD 4,800,000 4,884,984 0.24Beijing State-Owned AssetsManagement Hong Kong, Reg. S 3%26/05/2020 USD 4,300,000 4,351,260 0.22China CITIC Bank International Ltd.,Reg. S, FRN 3.875% 28/09/2022 USD 3,200,000 3,218,774 0.16China CITIC Bank International Ltd.,Reg. S, FRN 6% 07/05/2024 USD 2,900,000 3,080,714 0.15China Construction Bank Asia Corp.Ltd., Reg. S, FRN 4.25% 20/08/2024 USD 4,700,000 4,815,211 0.24CITIC Ltd., Reg. S 6.625% 15/04/2021 USD 1,400,000 1,643,341 0.08CITIC Ltd., Reg. S, FRN 8.625%Perpetual USD 4,200,000 4,729,532 0.24CRCC Yupeng Ltd., Reg. S, FRN 3.95%Perpetual USD 3,300,000 3,394,575 0.17Dah Sing Bank Ltd., Reg. S, FRN 5.25%29/01/2024 USD 2,374,000 2,489,046 0.12Henson Finance Ltd., Reg. S 5.5%17/09/2019 USD 2,100,000 2,311,466 0.12HNA Group International Co. Ltd.,Reg. S 8% 13/11/2017 CNH 34,800,000 5,211,104 0.26ICBCIL Finance Co. Ltd., Reg. S 3.625%19/05/2026 USD 6,600,000 6,616,434 0.33Poly Property Group Co. Ltd., Reg. S4.75% 16/05/2018 USD 3,700,000 3,783,583 0.19Wheelock Finance Ltd., Reg. S 3%19/03/2018 USD 6,200,000 6,307,322 0.31Wing Lung Bank Ltd., Reg. S, FRN 3.5%07/11/2022 USD 3,100,000 3,108,773 0.16
59,946,119 2.99
IndiaAxis Bank Ltd., Reg. S 2.875%01/06/2021 USD 5,600,000 5,618,777 0.28Bharat Petroleum Corp. Ltd., Reg. S 4%08/05/2025 USD 7,100,000 7,230,470 0.36Export-Import Bank of India, Reg. S 4%14/01/2023 USD 2,600,000 2,731,690 0.14NTPC Ltd., Reg. S 4.375% 26/11/2024 USD 5,400,000 5,718,038 0.28ONGC Videsh Ltd., Reg. S 3.75%07/05/2023 USD 5,700,000 5,829,219 0.29Power Grid Corp. of India Ltd., Reg. S3.875% 17/01/2023 USD 5,800,000 6,022,720 0.30Tata Motors Ltd., Reg. S 4.625%30/04/2020 USD 4,600,000 4,722,843 0.24
37,873,757 1.89
IndonesiaAstra Sedaya Finance PT, Reg. S 2.875%01/04/2018 USD 3,200,000 3,214,400 0.16Bank Rakyat Indonesia Persero Tbk. PT,Reg. S 2.95% 28/03/2018 USD 6,000,000 6,044,850 0.30Indonesia Government InternationalBond, Reg. S 3.375% 15/04/2023 USD 7,600,000 7,669,760 0.38Indonesia Government InternationalBond, Reg. S 5.25% 17/01/2042 USD 900,000 956,287 0.05Pelabuhan Indonesia II PT, Reg. S4.25% 05/05/2025 USD 5,400,000 5,407,749 0.27Perusahaan Listrik Negara PT, Reg. S5.25% 24/10/2042 USD 2,900,000 2,794,643 0.14Perusahaan Penerbit SBSN IndonesiaIII, Reg. S 4.325% 28/05/2025 USD 5,700,000 5,907,110 0.29
31,994,799 1.59
JerseyWest China Cement Ltd., Reg. S 6.5%11/09/2019 USD 6,000,000 6,103,128 0.30
6,103,128 0.30
79
JPMorgan Funds - Asia Pacific Income FundSchedule of Investments
As at 30 June 2016
Investments Currency
Quantity/Nominal
Value
MarketValue
USD
%of
NetAssets Investments Currency
Quantity/Nominal
Value
MarketValue
USD
%of
NetAssets
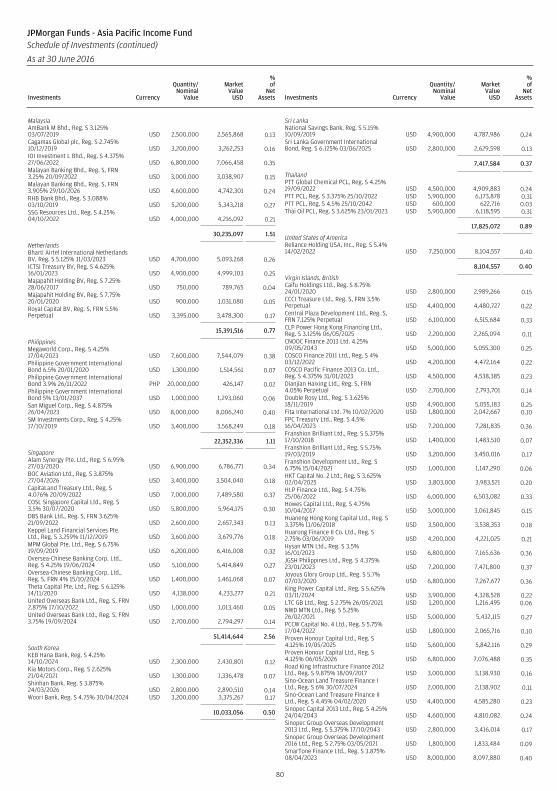
MalaysiaAmBank M Bhd., Reg. S 3.125%03/07/2019 USD 2,500,000 2,565,868 0.13Cagamas Global plc, Reg. S 2.745%10/12/2019 USD 3,200,000 3,262,253 0.16IOI Investment L Bhd., Reg. S 4.375%27/06/2022 USD 6,800,000 7,066,458 0.35Malayan Banking Bhd., Reg. S, FRN3.25% 20/09/2022 USD 3,000,000 3,038,907 0.15Malayan Banking Bhd., Reg. S, FRN3.905% 29/10/2026 USD 4,600,000 4,742,301 0.24RHB Bank Bhd., Reg. S 3.088%03/10/2019 USD 5,200,000 5,343,218 0.27SSG Resources Ltd., Reg. S 4.25%04/10/2022 USD 4,000,000 4,216,092 0.21
30,235,097 1.51
NetherlandsBharti Airtel International NetherlandsBV, Reg. S 5.125% 11/03/2023 USD 4,700,000 5,093,268 0.26ICTSI Treasury BV, Reg. S 4.625%16/01/2023 USD 4,900,000 4,999,103 0.25Majapahit Holding BV, Reg. S 7.25%28/06/2017 USD 750,000 789,765 0.04Majapahit Holding BV, Reg. S 7.75%20/01/2020 USD 900,000 1,031,080 0.05Royal Capital BV, Reg. S, FRN 5.5%Perpetual USD 3,395,000 3,478,300 0.17
15,391,516 0.77
PhilippinesMegaworld Corp., Reg. S 4.25%17/04/2023 USD 7,600,000 7,544,079 0.38Philippine Government InternationalBond 6.5% 20/01/2020 USD 1,300,000 1,514,561 0.07Philippine Government InternationalBond 3.9% 26/11/2022 PHP 20,000,000 426,147 0.02Philippine Government InternationalBond 5% 13/01/2037 USD 1,000,000 1,293,060 0.06San Miguel Corp., Reg. S 4.875%26/04/2023 USD 8,000,000 8,006,240 0.40SM Investments Corp., Reg. S 4.25%17/10/2019 USD 3,400,000 3,568,249 0.18
22,352,336 1.11
SingaporeAlam Synergy Pte. Ltd., Reg. S 6.95%27/03/2020 USD 6,900,000 6,786,771 0.34BOC Aviation Ltd., Reg. S 3.875%27/04/2026 USD 3,400,000 3,504,040 0.18CapitaLand Treasury Ltd., Reg. S4.076% 20/09/2022 USD 7,000,000 7,489,580 0.37COSL Singapore Capital Ltd., Reg. S3.5% 30/07/2020 USD 5,800,000 5,964,175 0.30DBS Bank Ltd., Reg. S, FRN 3.625%21/09/2022 USD 2,600,000 2,657,343 0.13Keppel Land Financial Services Pte.Ltd., Reg. S 3.259% 11/12/2019 USD 3,600,000 3,679,776 0.18MPM Global Pte. Ltd., Reg. S 6.75%19/09/2019 USD 6,200,000 6,416,008 0.32Oversea-Chinese Banking Corp. Ltd.,Reg. S 4.25% 19/06/2024 USD 5,100,000 5,414,849 0.27Oversea-Chinese Banking Corp. Ltd.,Reg. S, FRN 4% 15/10/2024 USD 1,400,000 1,461,068 0.07Theta Capital Pte. Ltd., Reg. S 6.125%14/11/2020 USD 4,138,000 4,233,277 0.21United Overseas Bank Ltd., Reg. S, FRN2.875% 17/10/2022 USD 1,000,000 1,013,460 0.05United Overseas Bank Ltd., Reg. S, FRN3.75% 19/09/2024 USD 2,700,000 2,794,297 0.14
51,414,644 2.56
South KoreaKEB Hana Bank, Reg. S 4.25%14/10/2024 USD 2,300,000 2,430,801 0.12Kia Motors Corp., Reg. S 2.625%21/04/2021 USD 1,300,000 1,336,478 0.07Shinhan Bank, Reg. S 3.875%24/03/2026 USD 2,800,000 2,890,510 0.14Woori Bank, Reg. S 4.75% 30/04/2024 USD 3,200,000 3,375,267 0.17
10,033,056 0.50
Sri LankaNational Savings Bank, Reg. S 5.15%10/09/2019 USD 4,900,000 4,787,986 0.24Sri Lanka Government InternationalBond, Reg. S 6.125% 03/06/2025 USD 2,800,000 2,629,598 0.13
7,417,584 0.37
ThailandPTT Global Chemical PCL, Reg. S 4.25%19/09/2022 USD 4,500,000 4,909,883 0.24PTT PCL, Reg. S 3.375% 25/10/2022 USD 5,900,000 6,173,878 0.31PTT PCL, Reg. S 4.5% 25/10/2042 USD 600,000 622,716 0.03Thai Oil PCL, Reg. S 3.625% 23/01/2023 USD 5,900,000 6,118,595 0.31
17,825,072 0.89
United States of AmericaReliance Holding USA, Inc., Reg. S 5.4%14/02/2022 USD 7,250,000 8,104,557 0.40
8,104,557 0.40
Virgin Islands, BritishCaifu Holdings Ltd., Reg. S 8.75%24/01/2020 USD 2,800,000 2,989,266 0.15CCCI Treasure Ltd., Reg. S, FRN 3.5%Perpetual USD 4,400,000 4,480,727 0.22Central Plaza Development Ltd., Reg. S,FRN 7.125% Perpetual USD 6,100,000 6,515,684 0.33CLP Power Hong Kong Financing Ltd.,Reg. S 3.125% 06/05/2025 USD 2,200,000 2,265,094 0.11CNOOC Finance 2013 Ltd. 4.25%09/05/2043 USD 5,000,000 5,055,300 0.25COSCO Finance 2011 Ltd., Reg. S 4%03/12/2022 USD 4,200,000 4,472,164 0.22COSCO Pacific Finance 2013 Co. Ltd.,Reg. S 4.375% 31/01/2023 USD 4,500,000 4,538,385 0.23Dianjian Haixing Ltd., Reg. S, FRN4.05% Perpetual USD 2,700,000 2,793,701 0.14Double Rosy Ltd., Reg. S 3.625%18/11/2019 USD 4,900,000 5,055,183 0.25Fita International Ltd. 7% 10/02/2020 USD 1,800,000 2,042,667 0.10FPC Treasury Ltd., Reg. S 4.5%16/04/2023 USD 7,200,000 7,281,835 0.36Franshion Brilliant Ltd., Reg. S 5.375%17/10/2018 USD 1,400,000 1,483,510 0.07Franshion Brilliant Ltd., Reg. S 5.75%19/03/2019 USD 3,200,000 3,450,016 0.17Franshion Development Ltd., Reg. S6.75% 15/04/2021 USD 1,000,000 1,147,290 0.06HKT Capital No. 2 Ltd., Reg. S 3.625%02/04/2025 USD 3,803,000 3,983,521 0.20HLP Finance Ltd., Reg. S 4.75%25/06/2022 USD 6,000,000 6,503,082 0.33Howes Capital Ltd., Reg. S 4.75%10/04/2017 USD 3,000,000 3,061,845 0.15Huaneng Hong Kong Capital Ltd., Reg. S3.375% 11/06/2018 USD 3,500,000 3,538,353 0.18Huarong Finance II Co. Ltd., Reg. S2.75% 03/06/2019 USD 4,200,000 4,221,025 0.21Hysan MTN Ltd., Reg. S 3.5%16/01/2023 USD 6,800,000 7,165,636 0.36JGSH Philippines Ltd., Reg. S 4.375%23/01/2023 USD 7,200,000 7,471,800 0.37Joyous Glory Group Ltd., Reg. S 5.7%07/03/2020 USD 6,800,000 7,267,677 0.36King Power Capital Ltd., Reg. S 5.625%03/11/2024 USD 3,900,000 4,328,528 0.22LTC GB Ltd., Reg. S 2.75% 26/05/2021 USD 1,200,000 1,216,495 0.06NWD MTN Ltd., Reg. S 5.25%26/02/2021 USD 5,000,000 5,432,115 0.27PCCW Capital No. 4 Ltd., Reg. S 5.75%17/04/2022 USD 1,800,000 2,065,716 0.10Proven Honour Capital Ltd., Reg. S4.125% 19/05/2025 USD 5,600,000 5,842,116 0.29Proven Honour Capital Ltd., Reg. S4.125% 06/05/2026 USD 6,800,000 7,076,488 0.35Road King Infrastructure Finance 2012Ltd., Reg. S 9.875% 18/09/2017 USD 3,000,000 3,138,930 0.16Sino-Ocean Land Treasure Finance ILtd., Reg. S 6% 30/07/2024 USD 2,000,000 2,138,902 0.11Sino-Ocean Land Treasure Finance IILtd., Reg. S 4.45% 04/02/2020 USD 4,400,000 4,585,280 0.23Sinopec Capital 2013 Ltd., Reg. S 4.25%24/04/2043 USD 4,600,000 4,810,082 0.24Sinopec Group Overseas Development2013 Ltd., Reg. S 5.375% 17/10/2043 USD 2,800,000 3,416,014 0.17Sinopec Group Overseas Development2016 Ltd., Reg. S 2.75% 03/05/2021 USD 1,800,000 1,833,484 0.09SmarTone Finance Ltd., Reg. S 3.875%08/04/2023 USD 8,000,000 8,097,880 0.40
80
JPMorgan Funds - Asia Pacific Income FundSchedule of Investments (continued)
As at 30 June 2016
Investments Currency
Quantity/Nominal
Value
MarketValue
USD
%of
NetAssets Investments Currency
Quantity/Nominal
Value
MarketValue
USD
%of
NetAssets
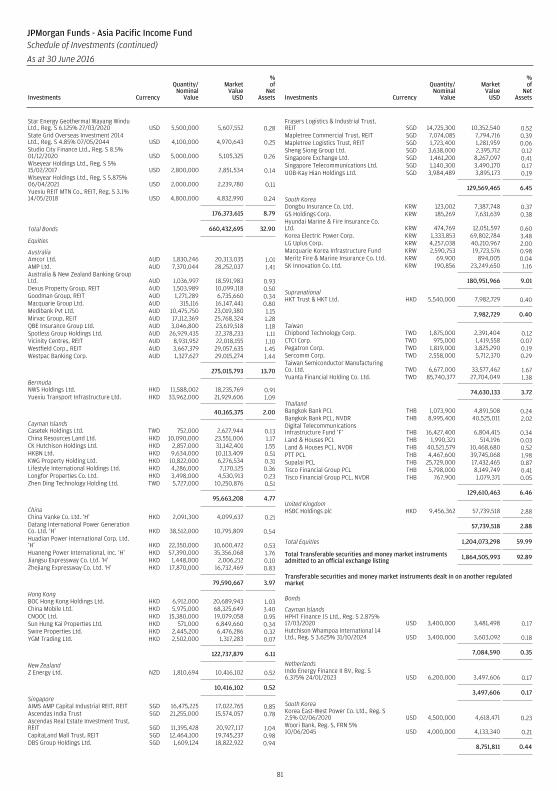
Star Energy Geothermal Wayang WinduLtd., Reg. S 6.125% 27/03/2020 USD 5,500,000 5,607,552 0.28State Grid Overseas Investment 2014Ltd., Reg. S 4.85% 07/05/2044 USD 4,100,000 4,970,643 0.25Studio City Finance Ltd., Reg. S 8.5%01/12/2020 USD 5,000,000 5,105,325 0.26Wiseyear Holdings Ltd., Reg. S 5%15/02/2017 USD 2,800,000 2,851,534 0.14Wiseyear Holdings Ltd., Reg. S 5.875%06/04/2021 USD 2,000,000 2,239,780 0.11Yuexiu REIT MTN Co., REIT, Reg. S 3.1%14/05/2018 USD 4,800,000 4,832,990 0.24
176,373,615 8.79
Total Bonds 660,432,695 32.90
Equities
AustraliaAmcor Ltd. AUD 1,830,246 20,313,035 1.01AMP Ltd. AUD 7,370,044 28,252,037 1.41Australia & New Zealand Banking GroupLtd. AUD 1,036,997 18,591,983 0.93Dexus Property Group, REIT AUD 1,503,989 10,099,118 0.50Goodman Group, REIT AUD 1,271,289 6,735,660 0.34Macquarie Group Ltd. AUD 315,116 16,147,441 0.80Medibank Pvt Ltd. AUD 10,475,750 23,019,380 1.15Mirvac Group, REIT AUD 17,112,369 25,768,324 1.28QBE Insurance Group Ltd. AUD 3,046,800 23,619,518 1.18Spotless Group Holdings Ltd. AUD 26,929,435 22,378,233 1.11Vicinity Centres, REIT AUD 8,931,952 22,018,155 1.10Westfield Corp., REIT AUD 3,667,379 29,057,635 1.45Westpac Banking Corp. AUD 1,327,627 29,015,274 1.44
275,015,793 13.70
BermudaNWS Holdings Ltd. HKD 11,588,002 18,235,769 0.91Yuexiu Transport Infrastructure Ltd. HKD 33,962,000 21,929,606 1.09
40,165,375 2.00
Cayman IslandsCasetek Holdings Ltd. TWD 752,000 2,627,944 0.13China Resources Land Ltd. HKD 10,090,000 23,551,006 1.17CK Hutchison Holdings Ltd. HKD 2,857,000 31,142,401 1.55HKBN Ltd. HKD 9,634,000 10,113,409 0.51KWG Property Holding Ltd. HKD 10,822,000 6,276,534 0.31Lifestyle International Holdings Ltd. HKD 4,286,000 7,170,125 0.36Longfor Properties Co. Ltd. HKD 3,498,000 4,530,913 0.23Zhen Ding Technology Holding Ltd. TWD 5,727,000 10,250,876 0.51
95,663,208 4.77
ChinaChina Vanke Co. Ltd. ‘H’ HKD 2,091,300 4,099,637 0.21Datang International Power GenerationCo. Ltd. ‘H’ HKD 38,512,000 10,795,809 0.54Huadian Power International Corp. Ltd.‘H’ HKD 22,350,000 10,600,472 0.53Huaneng Power International, Inc. ‘H’ HKD 57,390,000 35,356,068 1.76Jiangsu Expressway Co. Ltd. ‘H’ HKD 1,448,000 2,006,212 0.10Zhejiang Expressway Co. Ltd. ‘H’ HKD 17,870,000 16,732,469 0.83
79,590,667 3.97
Hong KongBOC Hong Kong Holdings Ltd. HKD 6,912,000 20,689,943 1.03China Mobile Ltd. HKD 5,975,000 68,325,649 3.40CNOOC Ltd. HKD 15,380,000 19,079,058 0.95Sun Hung Kai Properties Ltd. HKD 571,000 6,849,660 0.34Swire Properties Ltd. HKD 2,445,200 6,476,286 0.32YGM Trading Ltd. HKD 2,502,000 1,317,283 0.07
122,737,879 6.11
New ZealandZ Energy Ltd. NZD 1,810,694 10,416,102 0.52
10,416,102 0.52
SingaporeAIMS AMP Capital Industrial REIT, REIT SGD 16,475,225 17,022,765 0.85Ascendas India Trust SGD 21,255,000 15,574,057 0.78Ascendas Real Estate Investment Trust,REIT SGD 11,395,428 20,927,117 1.04CapitaLand Mall Trust, REIT SGD 12,464,100 19,745,237 0.98DBS Group Holdings Ltd. SGD 1,609,124 18,822,922 0.94
Frasers Logistics & Industrial Trust,REIT SGD 14,725,300 10,352,540 0.52Mapletree Commercial Trust, REIT SGD 7,074,085 7,794,716 0.39Mapletree Logistics Trust, REIT SGD 1,723,400 1,281,959 0.06Sheng Siong Group Ltd. SGD 3,638,000 2,395,712 0.12Singapore Exchange Ltd. SGD 1,461,200 8,267,097 0.41Singapore Telecommunications Ltd. SGD 1,140,300 3,490,170 0.17UOB-Kay Hian Holdings Ltd. SGD 3,984,489 3,895,173 0.19
129,569,465 6.45
South KoreaDongbu Insurance Co. Ltd. KRW 123,002 7,387,748 0.37GS Holdings Corp. KRW 185,269 7,631,639 0.38Hyundai Marine & Fire Insurance Co.Ltd. KRW 474,769 12,051,597 0.60Korea Electric Power Corp. KRW 1,333,853 69,802,784 3.48LG Uplus Corp. KRW 4,257,038 40,210,967 2.00Macquarie Korea Infrastructure Fund KRW 2,590,753 19,723,576 0.98Meritz Fire & Marine Insurance Co. Ltd. KRW 69,900 894,005 0.04SK Innovation Co. Ltd. KRW 190,856 23,249,650 1.16
180,951,966 9.01
SupranationalHKT Trust & HKT Ltd. HKD 5,540,000 7,982,729 0.40
7,982,729 0.40
TaiwanChipbond Technology Corp. TWD 1,875,000 2,391,404 0.12CTCI Corp. TWD 975,000 1,419,558 0.07Pegatron Corp. TWD 1,819,000 3,825,290 0.19Sercomm Corp. TWD 2,558,000 5,712,370 0.29Taiwan Semiconductor ManufacturingCo. Ltd. TWD 6,677,000 33,577,462 1.67Yuanta Financial Holding Co. Ltd. TWD 85,740,377 27,704,049 1.38
74,630,133 3.72
ThailandBangkok Bank PCL THB 1,073,900 4,891,508 0.24Bangkok Bank PCL, NVDR THB 8,995,400 40,525,011 2.02Digital TelecommunicationsInfrastructure Fund ‘F’ THB 16,427,400 6,804,415 0.34Land & Houses PCL THB 1,990,321 514,196 0.03Land & Houses PCL, NVDR THB 40,521,579 10,468,680 0.52PTT PCL THB 4,467,600 39,745,068 1.98Supalai PCL THB 25,729,000 17,432,465 0.87Tisco Financial Group PCL THB 5,798,000 8,149,749 0.41Tisco Financial Group PCL, NVDR THB 767,900 1,079,371 0.05
129,610,463 6.46
United KingdomHSBC Holdings plc HKD 9,456,362 57,739,518 2.88
57,739,518 2.88
Total Equities 1,204,073,298 59.99
Total Transferable securities and money market instrumentsadmitted to an official exchange listing 1,864,505,993 92.89
Transferable securities and money market instruments dealt in on another regulatedmarket
Bonds
Cayman IslandsHPHT Finance 15 Ltd., Reg. S 2.875%17/03/2020 USD 3,400,000 3,481,498 0.17Hutchison Whampoa International 14Ltd., Reg. S 3.625% 31/10/2024 USD 3,400,000 3,603,092 0.18
7,084,590 0.35
NetherlandsIndo Energy Finance II BV, Reg. S6.375% 24/01/2023 USD 6,200,000 3,497,606 0.17
3,497,606 0.17
South KoreaKorea East-West Power Co. Ltd., Reg. S2.5% 02/06/2020 USD 4,500,000 4,618,471 0.23Woori Bank, Reg. S, FRN 5%10/06/2045 USD 4,000,000 4,133,340 0.21
8,751,811 0.44
81
JPMorgan Funds - Asia Pacific Income FundSchedule of Investments (continued)
As at 30 June 2016
Investments Currency
Quantity/Nominal
Value
MarketValue
USD
%of
NetAssets Investments Currency
Quantity/Nominal
Value
MarketValue
USD
%of
NetAssets
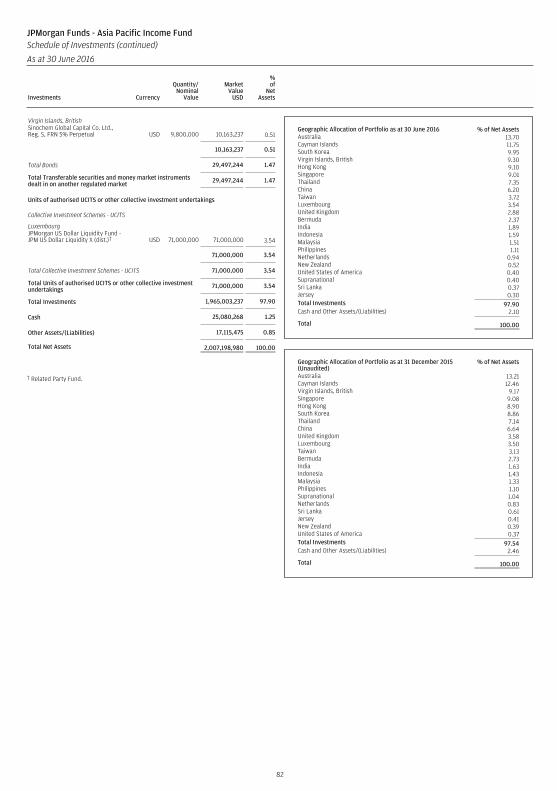
Virgin Islands, BritishSinochem Global Capital Co. Ltd.,Reg. S, FRN 5% Perpetual USD 9,800,000 10,163,237 0.51
10,163,237 0.51
Total Bonds 29,497,244 1.47
Total Transferable securities and money market instrumentsdealt in on another regulated market 29,497,244 1.47
Units of authorised UCITS or other collective investment undertakings
Collective Investment Schemes - UCITS
LuxembourgJPMorgan US Dollar Liquidity Fund -JPM US Dollar Liquidity X (dist.)† USD 71,000,000 71,000,000 3.54
71,000,000 3.54
Total Collective Investment Schemes - UCITS 71,000,000 3.54
Total Units of authorised UCITS or other collective investmentundertakings 71,000,000 3.54
Total Investments 1,965,003,237 97.90
Cash 25,080,268 1.25
Other Assets/(Liabilities) 17,115,475 0.85
Total Net Assets 2,007,198,980 100.00
† Related Party Fund.
Geographic Allocation of Portfolio as at 30 June 2016 % of Net AssetsAustralia 13.70Cayman Islands 11.75South Korea 9.95Virgin Islands, British 9.30Hong Kong 9.10Singapore 9.01Thailand 7.35China 6.20Taiwan 3.72Luxembourg 3.54United Kingdom 2.88Bermuda 2.37India 1.89Indonesia 1.59Malaysia 1.51Philippines 1.11Netherlands 0.94New Zealand 0.52United States of America 0.40Supranational 0.40Sri Lanka 0.37Jersey 0.30Total Investments 97.90Cash and Other Assets/(Liabilities) 2.10
Total 100.00
Geographic Allocation of Portfolio as at 31 December 2015(Unaudited)
% of Net Assets
Australia 13.21Cayman Islands 12.46Virgin Islands, British 9.17Singapore 9.08Hong Kong 8.90South Korea 8.86Thailand 7.14China 6.64United Kingdom 3.58Luxembourg 3.50Taiwan 3.13Bermuda 2.73India 1.63Indonesia 1.43Malaysia 1.33Philippines 1.10Supranational 1.04Netherlands 0.83Sri Lanka 0.61Jersey 0.41New Zealand 0.39United States of America 0.37Total Investments 97.54Cash and Other Assets/(Liabilities) 2.46
Total 100.00
82
JPMorgan Funds - Asia Pacific Income FundSchedule of Investments (continued)
As at 30 June 2016
Investments Currency
Quantity/Nominal
Value
MarketValue
USD
%of
NetAssets Investments Currency
Quantity/Nominal
Value
MarketValue
USD
%of
NetAssets
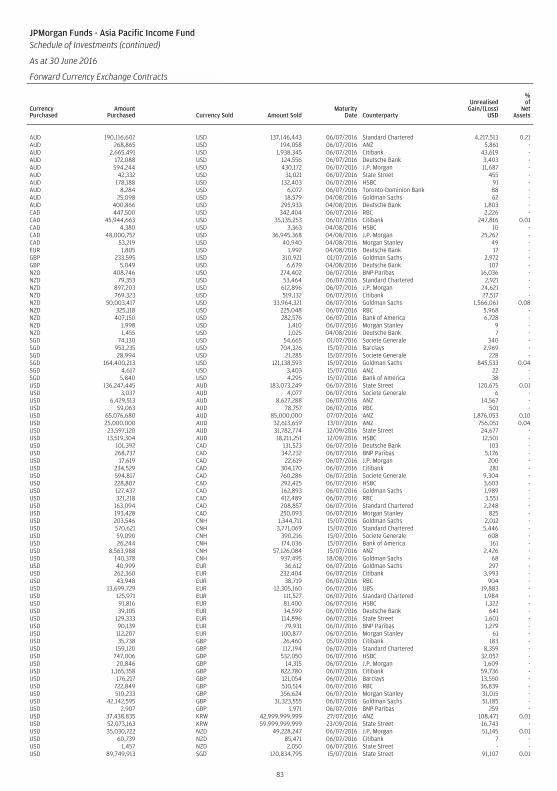
JPMorgan Funds - Asia Pacific Income FundSchedule of Investments (continued)
As at 30 June 2016
Forward Currency Exchange Contracts (continued)
CurrencyPurchased
AmountPurchased Currency Sold Amount Sold
MaturityDate Counterparty
UnrealisedGain/(Loss)
USD
%of
NetAssets
AUD 190,116,602 USD 137,146,443 06/07/2016 Standard Chartered 4,217,513 0.21AUD 268,865 USD 194,058 06/07/2016 ANZ 5,861 -AUD 2,665,491 USD 1,938,345 06/07/2016 Citibank 43,619 -AUD 172,088 USD 124,556 06/07/2016 Deutsche Bank 3,403 -AUD 594,244 USD 430,172 06/07/2016 J.P. Morgan 11,687 -AUD 42,332 USD 31,021 06/07/2016 State Street 455 -AUD 178,188 USD 132,403 06/07/2016 HSBC 91 -AUD 8,284 USD 6,072 06/07/2016 Toronto-Dominion Bank 88 -AUD 25,098 USD 18,579 04/08/2016 Goldman Sachs 62 -AUD 400,866 USD 295,933 04/08/2016 Deutsche Bank 1,803 -CAD 447,500 USD 342,404 06/07/2016 RBC 2,226 -CAD 45,944,663 USD 35,135,253 06/07/2016 Citibank 247,816 0.01CAD 4,380 USD 3,363 04/08/2016 HSBC 10 -CAD 48,000,752 USD 36,945,368 04/08/2016 J.P. Morgan 25,262 -CAD 53,219 USD 40,940 04/08/2016 Morgan Stanley 49 -EUR 1,805 USD 1,992 04/08/2016 Deutsche Bank 17 -GBP 233,595 USD 310,921 01/07/2016 Goldman Sachs 2,972 -GBP 5,049 USD 6,679 04/08/2016 Deutsche Bank 107 -NZD 408,746 USD 274,402 06/07/2016 BNP Paribas 16,036 -NZD 79,353 USD 53,464 06/07/2016 Standard Chartered 2,921 -NZD 897,203 USD 612,896 06/07/2016 J.P. Morgan 24,621 -NZD 769,323 USD 519,132 06/07/2016 Citibank 27,517 -NZD 50,003,417 USD 33,964,321 06/07/2016 Goldman Sachs 1,566,061 0.08NZD 325,118 USD 225,048 06/07/2016 RBC 5,968 -NZD 407,150 USD 282,576 06/07/2016 Bank of America 6,728 -NZD 1,998 USD 1,410 06/07/2016 Morgan Stanley 9 -NZD 1,455 USD 1,025 04/08/2016 Deutsche Bank 7 -SGD 74,130 USD 54,665 01/07/2016 Societe Generale 340 -SGD 953,235 USD 704,326 15/07/2016 Barclays 2,969 -SGD 28,994 USD 21,285 15/07/2016 Societe Generale 228 -SGD 164,400,213 USD 121,138,593 15/07/2016 Goldman Sachs 845,533 0.04SGD 4,617 USD 3,403 15/07/2016 ANZ 22 -SGD 5,840 USD 4,295 15/07/2016 Bank of America 38 -USD 136,247,445 AUD 183,073,249 06/07/2016 State Street 120,675 0.01USD 3,037 AUD 4,077 06/07/2016 Societe Generale 6 -USD 6,429,513 AUD 8,627,288 06/07/2016 ANZ 14,567 -USD 59,063 AUD 78,757 06/07/2016 RBC 501 -USD 65,076,680 AUD 85,000,000 07/07/2016 ANZ 1,876,053 0.10USD 25,000,000 AUD 32,613,659 13/07/2016 ANZ 756,051 0.04USD 23,597,120 AUD 31,782,774 12/09/2016 State Street 24,677 -USD 13,519,304 AUD 18,211,251 12/09/2016 HSBC 12,501 -USD 101,392 CAD 131,523 06/07/2016 Deutsche Bank 103 -USD 268,737 CAD 342,232 06/07/2016 BNP Paribas 5,176 -USD 17,619 CAD 22,619 06/07/2016 J.P. Morgan 200 -USD 234,529 CAD 304,170 06/07/2016 Citibank 281 -USD 594,817 CAD 760,286 06/07/2016 Societe Generale 9,304 -USD 228,807 CAD 292,425 06/07/2016 HSBC 3,603 -USD 127,437 CAD 162,893 06/07/2016 Goldman Sachs 1,989 -USD 321,218 CAD 412,489 06/07/2016 RBC 3,551 -USD 163,094 CAD 208,857 06/07/2016 Standard Chartered 2,248 -USD 193,428 CAD 250,093 06/07/2016 Morgan Stanley 825 -USD 203,546 CNH 1,344,711 15/07/2016 Goldman Sachs 2,012 -USD 570,621 CNH 3,771,069 15/07/2016 Standard Chartered 5,446 -USD 59,090 CNH 390,216 15/07/2016 Societe Generale 608 -USD 26,244 CNH 174,036 15/07/2016 Bank of America 161 -USD 8,563,988 CNH 57,126,084 15/07/2016 ANZ 2,426 -USD 140,378 CNH 937,495 18/08/2016 Goldman Sachs 68 -USD 40,999 EUR 36,612 06/07/2016 Goldman Sachs 297 -USD 262,360 EUR 232,404 06/07/2016 Citibank 3,993 -USD 43,948 EUR 38,719 06/07/2016 RBC 904 -USD 13,699,729 EUR 12,305,160 06/07/2016 UBS 19,883 -USD 125,971 EUR 111,527 06/07/2016 Standard Chartered 1,984 -USD 91,816 EUR 81,400 06/07/2016 HSBC 1,322 -USD 39,105 EUR 34,599 06/07/2016 Deutsche Bank 641 -USD 129,333 EUR 114,896 06/07/2016 State Street 1,601 -USD 90,139 EUR 79,931 06/07/2016 BNP Paribas 1,279 -USD 112,207 EUR 100,877 06/07/2016 Morgan Stanley 61 -USD 35,738 GBP 26,460 05/07/2016 Citibank 183 -USD 159,120 GBP 112,194 06/07/2016 Standard Chartered 8,359 -USD 747,006 GBP 532,050 06/07/2016 HSBC 32,057 -USD 20,846 GBP 14,315 06/07/2016 J.P. Morgan 1,609 -USD 1,165,358 GBP 822,780 06/07/2016 Citibank 59,736 -USD 176,217 GBP 121,054 06/07/2016 Barclays 13,550 -USD 722,849 GBP 510,514 06/07/2016 RBC 36,839 -USD 510,233 GBP 356,624 06/07/2016 Morgan Stanley 31,015 -USD 42,142,595 GBP 31,323,555 06/07/2016 Goldman Sachs 51,185 -USD 2,907 GBP 1,971 06/07/2016 BNP Paribas 259 -USD 37,438,835 KRW 42,999,999,999 27/07/2016 ANZ 108,471 0.01USD 52,073,163 KRW 59,999,999,999 23/09/2016 State Street 16,743 -USD 35,030,722 NZD 49,228,247 06/07/2016 J.P. Morgan 51,145 0.01USD 60,739 NZD 85,471 06/07/2016 Citibank 7 -USD 1,457 NZD 2,050 06/07/2016 State Street - -USD 89,749,913 SGD 120,834,795 15/07/2016 State Street 91,107 0.01
83

JPMorgan Funds - Asia Pacific Income FundSchedule of Investments (continued)
As at 30 June 2016
Forward Currency Exchange Contracts (continued)
CurrencyPurchased
AmountPurchased Currency Sold Amount Sold
MaturityDate Counterparty
UnrealisedGain/(Loss)
USD
%of
NetAssets
USD 144,290 SGD 194,426 15/07/2016 HSBC 27 -USD 3,728 SGD 5,015 15/07/2016 Societe Generale 7 -USD 21,817 SGD 29,242 15/07/2016 Standard Chartered 119 -USD 373,823 SGD 503,634 15/07/2016 Goldman Sachs 129 -
Total Unrealised Gain on Forward Currency Exchange Contracts 10,439,583 0.52
AUD 174,836 USD 130,913 06/07/2016 ANZ (911) -AUD 610,054 USD 455,268 06/07/2016 Citibank (1,654) -AUD 2,204,582 USD 1,649,807 06/07/2016 Goldman Sachs (10,558) -AUD 1,092,998 USD 813,144 06/07/2016 HSBC (429) -AUD 2,115,206 USD 1,585,173 06/07/2016 RBC (12,381) -AUD 181,096,001 USD 134,632,362 04/08/2016 State Street (126,608) (0.01)AUD 1,711,659 USD 1,273,140 04/08/2016 Citibank (1,837) -CAD 378,658 USD 291,791 06/07/2016 Bank of America (177) -CAD 1,086,812 USD 848,296 06/07/2016 RBC (11,316) -CAD 2,158 USD 1,670 06/07/2016 Citibank (8) -CAD 274,323 USD 214,620 06/07/2016 Morgan Stanley (3,357) -CAD 126,159 USD 98,681 06/07/2016 Goldman Sachs (1,523) -CAD 266,945 USD 209,682 06/07/2016 Barclays (4,101) -CAD 1,559 USD 1,226 06/07/2016 J.P. Morgan (25) -CAD 300,120 USD 231,971 06/07/2016 HSBC (842) -CAD 9,852 USD 7,690 06/07/2016 BNP Paribas (103) -CAD 2,578,269 USD 2,009,152 06/07/2016 Standard Chartered (23,566) -CAD 466,786 USD 360,654 04/08/2016 Citibank (1,131) -CNH 899,133 USD 136,658 15/07/2016 Societe Generale (1,903) -CNH 1,530,285 USD 231,934 15/07/2016 Goldman Sachs (2,588) -CNH 294,118 USD 44,594 15/07/2016 Standard Chartered (514) -CNH 60,082,581 USD 9,100,719 15/07/2016 BNP Paribas (96,062) (0.01)CNH 57,126,084 USD 8,553,986 18/08/2016 ANZ (4,270) -CNH 572,844 USD 85,797 18/08/2016 Bank of America (63) -EUR 164,911 USD 185,616 06/07/2016 RBC (2,281) -EUR 3,900 USD 4,369 06/07/2016 ANZ (33) -EUR 121,238 USD 135,079 06/07/2016 Societe Generale (297) -EUR 81,009 USD 90,482 06/07/2016 Deutsche Bank (423) -EUR 12,486,239 USD 14,000,283 06/07/2016 Morgan Stanley (119,128) (0.01)EUR 278,827 USD 316,581 06/07/2016 Standard Chartered (6,605) -EUR 12,283,563 USD 13,689,429 04/08/2016 UBS (18,637) -EUR 122,025 USD 136,127 04/08/2016 Morgan Stanley (321) -GBP 250,474 USD 368,248 06/07/2016 Citibank (31,671) -GBP 297,499 USD 434,559 06/07/2016 HSBC (34,792) -GBP 31,954,973 USD 46,146,087 06/07/2016 Deutsche Bank (3,206,201) (0.16)GBP 1,142 USD 1,649 06/07/2016 State Street (115) -GBP 520,915 USD 750,940 06/07/2016 Societe Generale (50,954) -GBP 81,853 USD 118,971 06/07/2016 Bank of America (8,980) -GBP 204,806 USD 301,417 06/07/2016 Goldman Sachs (26,207) -GBP 185,506 USD 270,548 06/07/2016 Standard Chartered (21,272) -GBP 296,363 USD 426,231 06/07/2016 ANZ (27,990) -GBP 1,527 USD 2,164 06/07/2016 Morgan Stanley (112) -GBP 26,460 USD 35,746 04/08/2016 Citibank (182) -GBP 31,217,158 USD 41,995,226 04/08/2016 Goldman Sachs (37,057) -GBP 316,840 USD 426,269 04/08/2016 RBC (413) -NZD 778,767 USD 557,719 06/07/2016 RBC (4,359) -NZD 49,228,246 USD 34,978,589 04/08/2016 J.P. Morgan (52,840) -NZD 452,460 USD 321,474 04/08/2016 State Street (469) -SGD 384,996 USD 286,605 15/07/2016 ANZ (940) -SGD 1,821,857 USD 1,358,351 15/07/2016 RBC (6,542) -SGD 815,631 USD 610,679 15/07/2016 Standard Chartered (5,486) -SGD 1,581,719 USD 1,175,062 15/07/2016 State Street (1,434) -USD 153,728 AUD 209,085 01/07/2016 Deutsche Bank (1,752) -USD 142,553 AUD 191,781 05/07/2016 Deutsche Bank (54) -USD 390,031 AUD 527,873 06/07/2016 State Street (2,476) -USD 198,541 AUD 275,028 06/07/2016 Societe Generale (5,960) -USD 3,204 AUD 4,363 06/07/2016 Goldman Sachs (40) -USD 124,976 AUD 170,928 06/07/2016 ANZ (2,119) -USD 1,282,110 AUD 1,735,175 06/07/2016 Deutsche Bank (8,105) -USD 1,164,970 AUD 1,575,457 06/07/2016 RBC (6,483) -USD 1,266,158 AUD 1,723,276 06/07/2016 UBS (15,209) -USD 875,136 AUD 1,189,583 06/07/2016 Citibank (9,396) -USD 929,426 AUD 1,258,715 06/07/2016 Standard Chartered (6,510) -USD 2,107,870 AUD 2,842,109 04/08/2016 State Street (3,055) -USD 32,389 AUD 44,157 04/08/2016 ANZ (408) -USD 40,345,097 AUD 55,368,134 12/08/2016 State Street (766,556) (0.04)USD 20,776,470 AUD 28,600,000 01/09/2016 State Street (443,930) (0.02)USD 17,232,900 AUD 23,250,000 20/09/2016 ANZ (5,964) -USD 40,936 CAD 53,219 05/07/2016 Morgan Stanley (49) -USD 53,087 CAD 69,041 06/07/2016 BNP Paribas (83) -USD 36,993,491 CAD 48,068,015 06/07/2016 J.P. Morgan (24,820) -USD 29,421 CAD 38,520 06/07/2016 Citibank (244) -USD 252,783 CAD 329,182 06/07/2016 Societe Generale (728) -USD 18,981 CAD 24,672 06/07/2016 RBC (19) -USD 597,137 CAD 777,461 04/08/2016 Citibank (1,670) -USD 223,972 EUR 202,402 04/08/2016 BNP Paribas (1,288) -
84
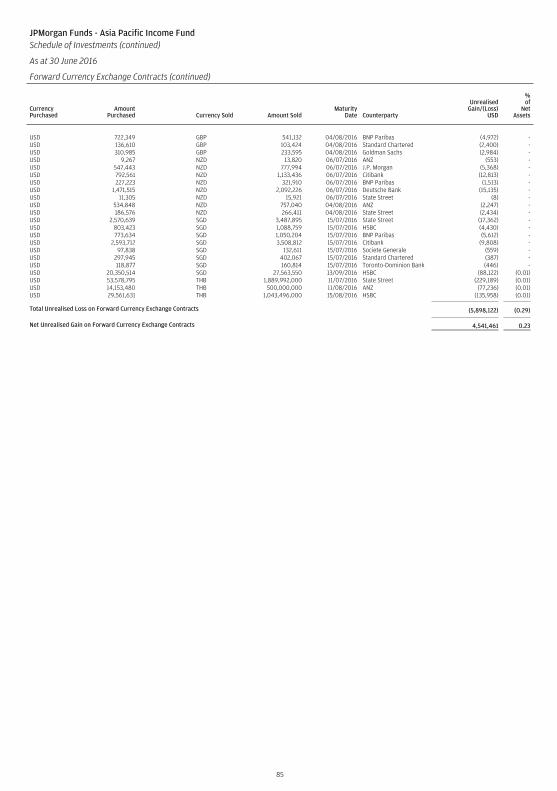
JPMorgan Funds - Asia Pacific Income FundSchedule of Investments (continued)
As at 30 June 2016
Forward Currency Exchange Contracts (continued)
CurrencyPurchased
AmountPurchased Currency Sold Amount Sold
MaturityDate Counterparty
UnrealisedGain/(Loss)
USD
%of
NetAssets
USD 722,349 GBP 541,132 04/08/2016 BNP Paribas (4,972) -USD 136,610 GBP 103,424 04/08/2016 Standard Chartered (2,400) -USD 310,985 GBP 233,595 04/08/2016 Goldman Sachs (2,984) -USD 9,267 NZD 13,820 06/07/2016 ANZ (553) -USD 547,443 NZD 777,994 06/07/2016 J.P. Morgan (5,368) -USD 792,561 NZD 1,133,436 06/07/2016 Citibank (12,813) -USD 227,223 NZD 321,910 06/07/2016 BNP Paribas (1,513) -USD 1,471,515 NZD 2,092,226 06/07/2016 Deutsche Bank (15,135) -USD 11,305 NZD 15,921 06/07/2016 State Street (8) -USD 534,848 NZD 757,040 04/08/2016 ANZ (2,247) -USD 186,576 NZD 266,411 04/08/2016 State Street (2,434) -USD 2,570,639 SGD 3,487,895 15/07/2016 State Street (17,362) -USD 803,423 SGD 1,088,759 15/07/2016 HSBC (4,430) -USD 773,634 SGD 1,050,204 15/07/2016 BNP Paribas (5,612) -USD 2,593,712 SGD 3,508,812 15/07/2016 Citibank (9,808) -USD 97,838 SGD 132,611 15/07/2016 Societe Generale (559) -USD 297,945 SGD 402,067 15/07/2016 Standard Chartered (387) -USD 118,877 SGD 160,814 15/07/2016 Toronto-Dominion Bank (446) -USD 20,350,514 SGD 27,563,550 13/09/2016 HSBC (88,122) (0.01)USD 53,578,795 THB 1,889,992,000 11/07/2016 State Street (229,189) (0.01)USD 14,153,480 THB 500,000,000 11/08/2016 ANZ (77,236) (0.01)USD 29,561,631 THB 1,043,496,000 15/08/2016 HSBC (135,958) (0.01)
Total Unrealised Loss on Forward Currency Exchange Contracts (5,898,122) (0.29)
Net Unrealised Gain on Forward Currency Exchange Contracts 4,541,461 0.23
85
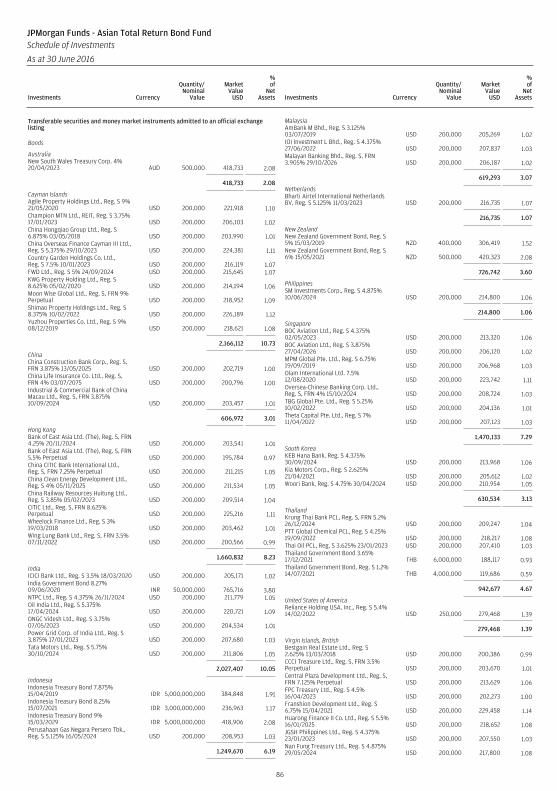
Transferable securities and money market instruments admitted to an official exchangelisting
Bonds
AustraliaNew South Wales Treasury Corp. 4%20/04/2023 AUD 500,000 418,733 2.08
418,733 2.08
Cayman IslandsAgile Property Holdings Ltd., Reg. S 9%21/05/2020 USD 200,000 221,918 1.10Champion MTN Ltd., REIT, Reg. S 3.75%17/01/2023 USD 200,000 206,103 1.02China Hongqiao Group Ltd., Reg. S6.875% 03/05/2018 USD 200,000 203,990 1.01China Overseas Finance Cayman III Ltd.,Reg. S 5.375% 29/10/2023 USD 200,000 224,381 1.11Country Garden Holdings Co. Ltd.,Reg. S 7.5% 10/01/2023 USD 200,000 216,119 1.07FWD Ltd., Reg. S 5% 24/09/2024 USD 200,000 215,645 1.07KWG Property Holding Ltd., Reg. S8.625% 05/02/2020 USD 200,000 214,194 1.06Moon Wise Global Ltd., Reg. S, FRN 9%Perpetual USD 200,000 218,952 1.09Shimao Property Holdings Ltd., Reg. S8.375% 10/02/2022 USD 200,000 226,189 1.12Yuzhou Properties Co. Ltd., Reg. S 9%08/12/2019 USD 200,000 218,621 1.08
2,166,112 10.73
ChinaChina Construction Bank Corp., Reg. S,FRN 3.875% 13/05/2025 USD 200,000 202,719 1.00China Life Insurance Co. Ltd., Reg. S,FRN 4% 03/07/2075 USD 200,000 200,796 1.00Industrial & Commercial Bank of ChinaMacau Ltd., Reg. S, FRN 3.875%10/09/2024 USD 200,000 203,457 1.01
606,972 3.01
Hong KongBank of East Asia Ltd. (The), Reg. S, FRN4.25% 20/11/2024 USD 200,000 203,541 1.01Bank of East Asia Ltd. (The), Reg. S, FRN5.5% Perpetual USD 200,000 195,784 0.97China CITIC Bank International Ltd.,Reg. S, FRN 7.25% Perpetual USD 200,000 211,215 1.05China Clean Energy Development Ltd.,Reg. S 4% 05/11/2025 USD 200,000 211,534 1.05China Railway Resources Huitung Ltd.,Reg. S 3.85% 05/02/2023 USD 200,000 209,514 1.04CITIC Ltd., Reg. S, FRN 8.625%Perpetual USD 200,000 225,216 1.11Wheelock Finance Ltd., Reg. S 3%19/03/2018 USD 200,000 203,462 1.01Wing Lung Bank Ltd., Reg. S, FRN 3.5%07/11/2022 USD 200,000 200,566 0.99
1,660,832 8.23
IndiaICICI Bank Ltd., Reg. S 3.5% 18/03/2020 USD 200,000 205,171 1.02India Government Bond 8.27%09/06/2020 INR 50,000,000 765,716 3.80NTPC Ltd., Reg. S 4.375% 26/11/2024 USD 200,000 211,779 1.05Oil India Ltd., Reg. S 5.375%17/04/2024 USD 200,000 220,721 1.09ONGC Videsh Ltd., Reg. S 3.75%07/05/2023 USD 200,000 204,534 1.01Power Grid Corp. of India Ltd., Reg. S3.875% 17/01/2023 USD 200,000 207,680 1.03Tata Motors Ltd., Reg. S 5.75%30/10/2024 USD 200,000 211,806 1.05
2,027,407 10.05
IndonesiaIndonesia Treasury Bond 7.875%15/04/2019 IDR 5,000,000,000 384,848 1.91Indonesia Treasury Bond 8.25%15/07/2021 IDR 3,000,000,000 236,963 1.17Indonesia Treasury Bond 9%15/03/2029 IDR 5,000,000,000 418,906 2.08Perusahaan Gas Negara Persero Tbk.,Reg. S 5.125% 16/05/2024 USD 200,000 208,953 1.03
1,249,670 6.19
MalaysiaAmBank M Bhd., Reg. S 3.125%03/07/2019 USD 200,000 205,269 1.02IOI Investment L Bhd., Reg. S 4.375%27/06/2022 USD 200,000 207,837 1.03Malayan Banking Bhd., Reg. S, FRN3.905% 29/10/2026 USD 200,000 206,187 1.02
619,293 3.07
NetherlandsBharti Airtel International NetherlandsBV, Reg. S 5.125% 11/03/2023 USD 200,000 216,735 1.07
216,735 1.07
New ZealandNew Zealand Government Bond, Reg. S5% 15/03/2019 NZD 400,000 306,419 1.52New Zealand Government Bond, Reg. S6% 15/05/2021 NZD 500,000 420,323 2.08
726,742 3.60
PhilippinesSM Investments Corp., Reg. S 4.875%10/06/2024 USD 200,000 214,800 1.06
214,800 1.06
SingaporeBOC Aviation Ltd., Reg. S 4.375%02/05/2023 USD 200,000 213,320 1.06BOC Aviation Ltd., Reg. S 3.875%27/04/2026 USD 200,000 206,120 1.02MPM Global Pte. Ltd., Reg. S 6.75%19/09/2019 USD 200,000 206,968 1.03Olam International Ltd. 7.5%12/08/2020 USD 200,000 223,742 1.11Oversea-Chinese Banking Corp. Ltd.,Reg. S, FRN 4% 15/10/2024 USD 200,000 208,724 1.03TBG Global Pte. Ltd., Reg. S 5.25%10/02/2022 USD 200,000 204,136 1.01Theta Capital Pte. Ltd., Reg. S 7%11/04/2022 USD 200,000 207,123 1.03
1,470,133 7.29
South KoreaKEB Hana Bank, Reg. S 4.375%30/09/2024 USD 200,000 213,968 1.06Kia Motors Corp., Reg. S 2.625%21/04/2021 USD 200,000 205,612 1.02Woori Bank, Reg. S 4.75% 30/04/2024 USD 200,000 210,954 1.05
630,534 3.13
ThailandKrung Thai Bank PCL, Reg. S, FRN 5.2%26/12/2024 USD 200,000 209,247 1.04PTT Global Chemical PCL, Reg. S 4.25%19/09/2022 USD 200,000 218,217 1.08Thai Oil PCL, Reg. S 3.625% 23/01/2023 USD 200,000 207,410 1.03Thailand Government Bond 3.65%17/12/2021 THB 6,000,000 188,117 0.93Thailand Government Bond, Reg. S 1.2%14/07/2021 THB 4,000,000 119,686 0.59
942,677 4.67
United States of AmericaReliance Holding USA, Inc., Reg. S 5.4%14/02/2022 USD 250,000 279,468 1.39
279,468 1.39
Virgin Islands, BritishBestgain Real Estate Ltd., Reg. S2.625% 13/03/2018 USD 200,000 200,386 0.99CCCI Treasure Ltd., Reg. S, FRN 3.5%Perpetual USD 200,000 203,670 1.01Central Plaza Development Ltd., Reg. S,FRN 7.125% Perpetual USD 200,000 213,629 1.06FPC Treasury Ltd., Reg. S 4.5%16/04/2023 USD 200,000 202,273 1.00Franshion Development Ltd., Reg. S6.75% 15/04/2021 USD 200,000 229,458 1.14Huarong Finance II Co. Ltd., Reg. S 5.5%16/01/2025 USD 200,000 218,652 1.08JGSH Philippines Ltd., Reg. S 4.375%23/01/2023 USD 200,000 207,550 1.03Nan Fung Treasury Ltd., Reg. S 4.875%29/05/2024 USD 200,000 217,800 1.08
86
JPMorgan Funds - Asian Total Return Bond FundSchedule of Investments
As at 30 June 2016
Investments Currency
Quantity/Nominal
Value
MarketValue
USD
%of
NetAssets Investments Currency
Quantity/Nominal
Value
MarketValue
USD
%of
NetAssets
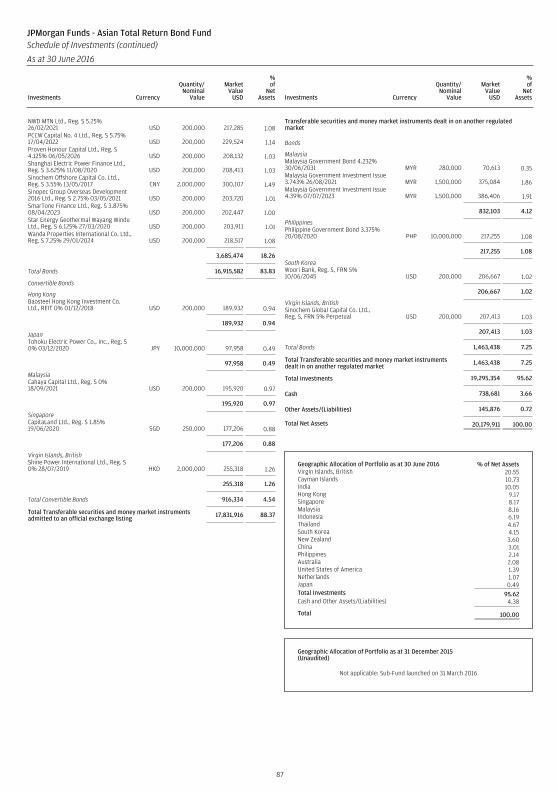
NWD MTN Ltd., Reg. S 5.25%26/02/2021 USD 200,000 217,285 1.08PCCW Capital No. 4 Ltd., Reg. S 5.75%17/04/2022 USD 200,000 229,524 1.14Proven Honour Capital Ltd., Reg. S4.125% 06/05/2026 USD 200,000 208,132 1.03Shanghai Electric Power Finance Ltd.,Reg. S 3.625% 11/08/2020 USD 200,000 208,413 1.03Sinochem Offshore Capital Co. Ltd.,Reg. S 3.55% 13/05/2017 CNY 2,000,000 300,107 1.49Sinopec Group Overseas Development2016 Ltd., Reg. S 2.75% 03/05/2021 USD 200,000 203,720 1.01SmarTone Finance Ltd., Reg. S 3.875%08/04/2023 USD 200,000 202,447 1.00Star Energy Geothermal Wayang WinduLtd., Reg. S 6.125% 27/03/2020 USD 200,000 203,911 1.01Wanda Properties International Co. Ltd.,Reg. S 7.25% 29/01/2024 USD 200,000 218,517 1.08
3,685,474 18.26
Total Bonds 16,915,582 83.83
Convertible Bonds
Hong KongBaosteel Hong Kong Investment Co.Ltd., REIT 0% 01/12/2018 USD 200,000 189,932 0.94
189,932 0.94
JapanTohoku Electric Power Co., Inc., Reg. S0% 03/12/2020 JPY 10,000,000 97,958 0.49
97,958 0.49
MalaysiaCahaya Capital Ltd., Reg. S 0%18/09/2021 USD 200,000 195,920 0.97
195,920 0.97
SingaporeCapitaLand Ltd., Reg. S 1.85%19/06/2020 SGD 250,000 177,206 0.88
177,206 0.88
Virgin Islands, BritishShine Power International Ltd., Reg. S0% 28/07/2019 HKD 2,000,000 255,318 1.26
255,318 1.26
Total Convertible Bonds 916,334 4.54
Total Transferable securities and money market instrumentsadmitted to an official exchange listing 17,831,916 88.37
Transferable securities and money market instruments dealt in on another regulatedmarket
Bonds
MalaysiaMalaysia Government Bond 4.232%30/06/2031 MYR 280,000 70,613 0.35Malaysia Government Investment Issue3.743% 26/08/2021 MYR 1,500,000 375,084 1.86Malaysia Government Investment Issue4.39% 07/07/2023 MYR 1,500,000 386,406 1.91
832,103 4.12
PhilippinesPhilippine Government Bond 3.375%20/08/2020 PHP 10,000,000 217,255 1.08
217,255 1.08
South KoreaWoori Bank, Reg. S, FRN 5%10/06/2045 USD 200,000 206,667 1.02
206,667 1.02
Virgin Islands, BritishSinochem Global Capital Co. Ltd.,Reg. S, FRN 5% Perpetual USD 200,000 207,413 1.03
207,413 1.03
Total Bonds 1,463,438 7.25
Total Transferable securities and money market instrumentsdealt in on another regulated market 1,463,438 7.25
Total Investments 19,295,354 95.62
Cash 738,681 3.66
Other Assets/(Liabilities) 145,876 0.72
Total Net Assets 20,179,911 100.00
Geographic Allocation of Portfolio as at 30 June 2016 % of Net AssetsVirgin Islands, British 20.55Cayman Islands 10.73India 10.05Hong Kong 9.17Singapore 8.17Malaysia 8.16Indonesia 6.19Thailand 4.67South Korea 4.15New Zealand 3.60China 3.01Philippines 2.14Australia 2.08United States of America 1.39Netherlands 1.07Japan 0.49Total Investments 95.62Cash and Other Assets/(Liabilities) 4.38
Total 100.00
Geographic Allocation of Portfolio as at 31 December 2015(Unaudited)
Not applicable: Sub-Fund launched on 31 March 2016
87
JPMorgan Funds - Asian Total Return Bond FundSchedule of Investments (continued)
As at 30 June 2016
Investments Currency
Quantity/Nominal
Value
MarketValue
USD
%of
NetAssets Investments Currency
Quantity/Nominal
Value
MarketValue
USD
%of
NetAssets
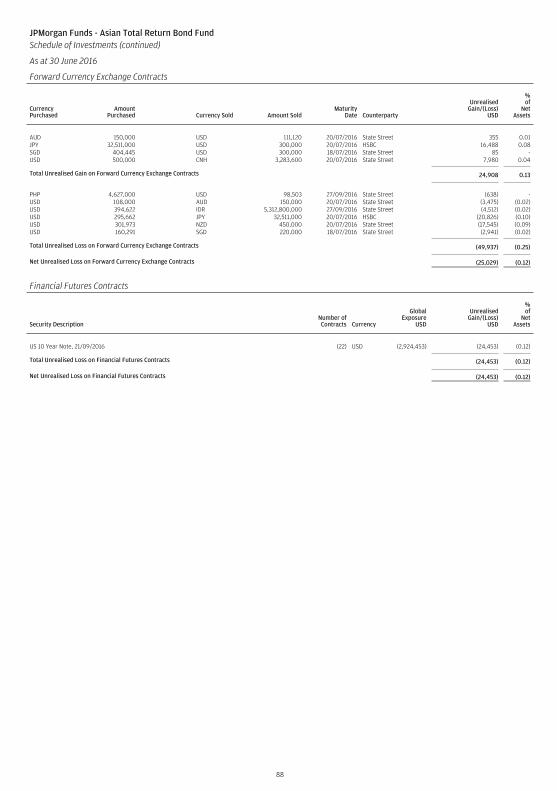
JPMorgan Funds - Asian Total Return Bond FundSchedule of Investments (continued)
As at 30 June 2016
Forward Currency Exchange Contracts
CurrencyPurchased
AmountPurchased Currency Sold Amount Sold
MaturityDate Counterparty
UnrealisedGain/(Loss)
USD
%of
NetAssets
AUD 150,000 USD 111,120 20/07/2016 State Street 355 0.01JPY 32,511,000 USD 300,000 20/07/2016 HSBC 16,488 0.08SGD 404,445 USD 300,000 18/07/2016 State Street 85 -USD 500,000 CNH 3,283,600 20/07/2016 State Street 7,980 0.04
Total Unrealised Gain on Forward Currency Exchange Contracts 24,908 0.13
PHP 4,627,000 USD 98,503 27/09/2016 State Street (638) -USD 108,000 AUD 150,000 20/07/2016 State Street (3,475) (0.02)USD 394,622 IDR 5,312,800,000 27/09/2016 State Street (4,512) (0.02)USD 295,662 JPY 32,511,000 20/07/2016 HSBC (20,826) (0.10)USD 301,973 NZD 450,000 20/07/2016 State Street (17,545) (0.09)USD 160,291 SGD 220,000 18/07/2016 State Street (2,941) (0.02)
Total Unrealised Loss on Forward Currency Exchange Contracts (49,937) (0.25)
Net Unrealised Loss on Forward Currency Exchange Contracts (25,029) (0.12)
Financial Futures Contracts
Security DescriptionNumber ofContracts Currency
GlobalExposure
USD
UnrealisedGain/(Loss)
USD
%of
NetAssets
US 10 Year Note, 21/09/2016 (22) USD (2,924,453) (24,453) (0.12)
Total Unrealised Loss on Financial Futures Contracts (24,453) (0.12)
Net Unrealised Loss on Financial Futures Contracts (24,453) (0.12)
88
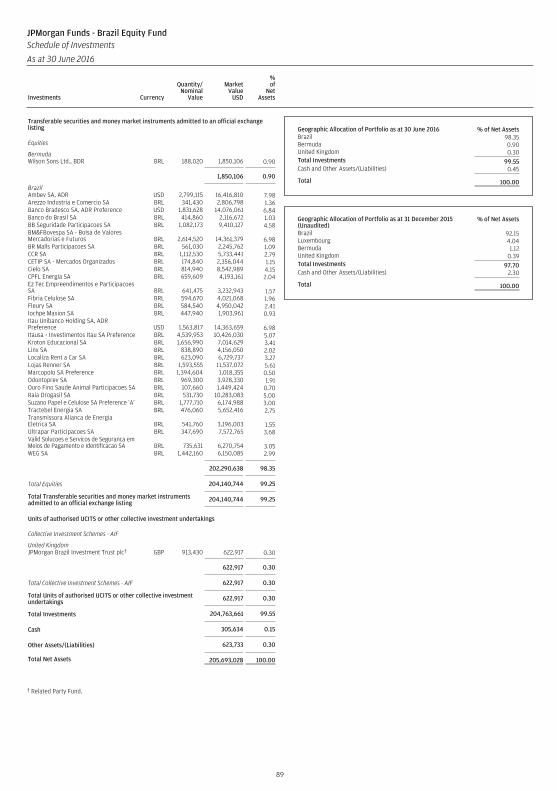
Transferable securities and money market instruments admitted to an official exchangelisting
Equities
BermudaWilson Sons Ltd., BDR BRL 188,020 1,850,106 0.90
1,850,106 0.90
BrazilAmbev SA, ADR USD 2,799,115 16,416,810 7.98Arezzo Industria e Comercio SA BRL 341,430 2,806,798 1.36Banco Bradesco SA, ADR Preference USD 1,831,628 14,076,061 6.84Banco do Brasil SA BRL 414,860 2,116,672 1.03BB Seguridade Participacoes SA BRL 1,082,173 9,410,127 4.58BM&FBovespa SA - Bolsa de ValoresMercadorias e Futuros BRL 2,614,520 14,361,379 6.98BR Malls Participacoes SA BRL 561,030 2,245,762 1.09CCR SA BRL 1,112,530 5,733,441 2.79CETIP SA - Mercados Organizados BRL 174,840 2,356,044 1.15Cielo SA BRL 814,940 8,542,989 4.15CPFL Energia SA BRL 659,609 4,193,161 2.04Ez Tec Empreendimentos e ParticipacoesSA BRL 641,475 3,232,943 1.57Fibria Celulose SA BRL 594,670 4,021,068 1.96Fleury SA BRL 584,540 4,950,042 2.41Iochpe Maxion SA BRL 447,940 1,903,961 0.93Itau Unibanco Holding SA, ADRPreference USD 1,563,817 14,363,659 6.98Itausa - Investimentos Itau SA Preference BRL 4,539,953 10,426,030 5.07Kroton Educacional SA BRL 1,656,990 7,014,629 3.41Linx SA BRL 838,890 4,156,050 2.02Localiza Rent a Car SA BRL 623,090 6,729,737 3.27Lojas Renner SA BRL 1,593,555 11,537,072 5.61Marcopolo SA Preference BRL 1,394,604 1,018,355 0.50Odontoprev SA BRL 969,300 3,928,330 1.91Ouro Fino Saude Animal Participacoes SA BRL 107,660 1,449,424 0.70Raia Drogasil SA BRL 531,730 10,283,083 5.00Suzano Papel e Celulose SA Preference ‘A’ BRL 1,777,710 6,174,988 3.00Tractebel Energia SA BRL 476,060 5,652,416 2.75Transmissora Alianca de EnergiaEletrica SA BRL 541,760 3,196,003 1.55Ultrapar Participacoes SA BRL 347,690 7,572,765 3.68Valid Solucoes e Servicos de Seguranca emMeios de Pagamento e Identificacao SA BRL 735,631 6,270,754 3.05WEG SA BRL 1,442,160 6,150,085 2.99
202,290,638 98.35
Total Equities 204,140,744 99.25
Total Transferable securities and money market instrumentsadmitted to an official exchange listing 204,140,744 99.25
Units of authorised UCITS or other collective investment undertakings
Collective Investment Schemes - AIF
United KingdomJPMorgan Brazil Investment Trust plc† GBP 913,430 622,917 0.30
622,917 0.30
Total Collective Investment Schemes - AIF 622,917 0.30
Total Units of authorised UCITS or other collective investmentundertakings 622,917 0.30
Total Investments 204,763,661 99.55
Cash 305,634 0.15
Other Assets/(Liabilities) 623,733 0.30
Total Net Assets 205,693,028 100.00
† Related Party Fund.
Geographic Allocation of Portfolio as at 30 June 2016 % of Net AssetsBrazil 98.35Bermuda 0.90United Kingdom 0.30Total Investments 99.55Cash and Other Assets/(Liabilities) 0.45
Total 100.00
Geographic Allocation of Portfolio as at 31 December 2015(Unaudited)
% of Net Assets
Brazil 92.15Luxembourg 4.04Bermuda 1.12United Kingdom 0.39Total Investments 97.70Cash and Other Assets/(Liabilities) 2.30
Total 100.00
89
JPMorgan Funds - Brazil Equity FundSchedule of Investments
As at 30 June 2016
Investments Currency
Quantity/Nominal
Value
MarketValue
USD
%of
NetAssets Investments Currency
Quantity/Nominal
Value
MarketValue
USD
%of
NetAssets
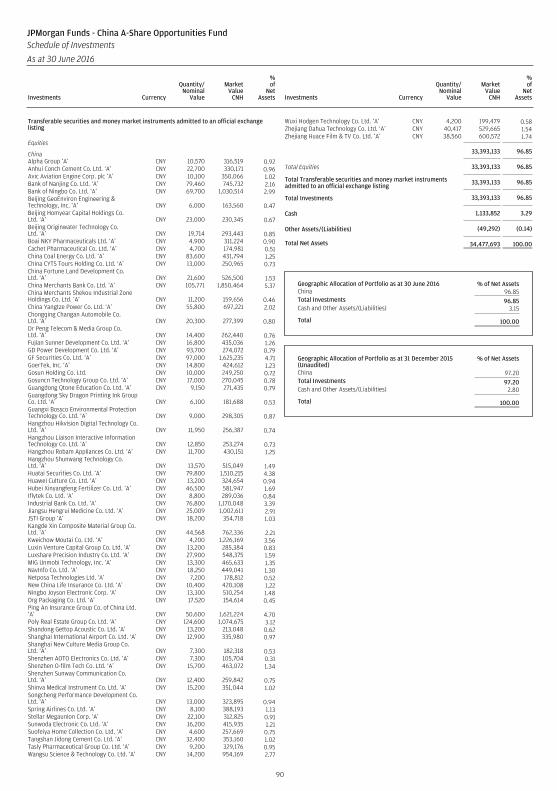
Transferable securities and money market instruments admitted to an official exchangelisting
Equities
ChinaAlpha Group ‘A’ CNY 10,570 316,519 0.92Anhui Conch Cement Co. Ltd. ‘A’ CNY 22,700 330,171 0.96Avic Aviation Engine Corp. plc ‘A’ CNY 10,100 350,066 1.02Bank of Nanjing Co. Ltd. ‘A’ CNY 79,460 745,732 2.16Bank of Ningbo Co. Ltd. ‘A’ CNY 69,700 1,030,514 2.99Beijing GeoEnviron Engineering &Technology, Inc. ‘A’ CNY 6,000 163,560 0.47Beijing Homyear Capital Holdings Co.Ltd. ‘A’ CNY 23,000 230,345 0.67Beijing Originwater Technology Co.Ltd. ‘A’ CNY 19,714 293,443 0.85Boai NKY Pharmaceuticals Ltd. ‘A’ CNY 4,900 311,224 0.90Cachet Pharmaceutical Co. Ltd. ‘A’ CNY 4,700 174,981 0.51China Coal Energy Co. Ltd. ‘A’ CNY 83,600 431,794 1.25China CYTS Tours Holding Co. Ltd. ‘A’ CNY 13,000 250,965 0.73China Fortune Land Development Co.Ltd. ‘A’ CNY 21,600 526,500 1.53China Merchants Bank Co. Ltd. ‘A’ CNY 105,771 1,850,464 5.37China Merchants Shekou Industrial ZoneHoldings Co. Ltd. ‘A’ CNY 11,200 159,656 0.46China Yangtze Power Co. Ltd. ‘A’ CNY 55,800 697,221 2.02Chongqing Changan Automobile Co.Ltd. ‘A’ CNY 20,300 277,399 0.80Dr Peng Telecom & Media Group Co.Ltd. ‘A’ CNY 14,400 262,440 0.76Fujian Sunner Development Co. Ltd. ‘A’ CNY 16,800 435,036 1.26GD Power Development Co. Ltd. ‘A’ CNY 93,700 274,072 0.79GF Securities Co. Ltd. ‘A’ CNY 97,000 1,625,235 4.71GoerTek, Inc. ‘A’ CNY 14,800 424,612 1.23Gosun Holding Co. Ltd. CNY 10,000 249,250 0.72Gosuncn Technology Group Co. Ltd. ‘A’ CNY 17,000 270,045 0.78Guangdong Qtone Education Co. Ltd. ‘A’ CNY 9,150 271,435 0.79Guangdong Sky Dragon Printing Ink GroupCo. Ltd. ‘A’ CNY 6,100 181,688 0.53Guangxi Bossco Environmental ProtectionTechnology Co. Ltd. ‘A’ CNY 9,000 298,305 0.87Hangzhou Hikvision Digital Technology Co.Ltd. ‘A’ CNY 11,950 256,387 0.74Hangzhou Liaison Interactive InformationTechnology Co. Ltd. ‘A’ CNY 12,850 253,274 0.73Hangzhou Robam Appliances Co. Ltd. ‘A’ CNY 11,700 430,151 1.25Hangzhou Shunwang Technology Co.Ltd. ‘A’ CNY 13,570 515,049 1.49Huatai Securities Co. Ltd. ‘A’ CNY 79,800 1,510,215 4.38Huawei Culture Co. Ltd. ‘A’ CNY 13,200 324,654 0.94Hubei Xinyangfeng Fertilizer Co. Ltd. ‘A’ CNY 46,500 581,947 1.69Iflytek Co. Ltd. ‘A’ CNY 8,800 289,036 0.84Industrial Bank Co. Ltd. ‘A’ CNY 76,800 1,170,048 3.39Jiangsu Hengrui Medicine Co. Ltd. ‘A’ CNY 25,009 1,002,611 2.91JSTI Group ‘A’ CNY 18,200 354,718 1.03Kangde Xin Composite Material Group Co.Ltd. ‘A’ CNY 44,568 762,336 2.21Kweichow Moutai Co. Ltd. ‘A’ CNY 4,200 1,226,169 3.56Luxin Venture Capital Group Co. Ltd. ‘A’ CNY 13,200 285,384 0.83Luxshare Precision Industry Co. Ltd. ‘A’ CNY 27,900 548,375 1.59MIG Unmobi Technology, Inc. ‘A’ CNY 13,300 465,633 1.35NavInfo Co. Ltd. ‘A’ CNY 18,250 449,041 1.30Netposa Technologies Ltd. ‘A’ CNY 7,200 178,812 0.52New China Life Insurance Co. Ltd. ‘A’ CNY 10,400 420,108 1.22Ningbo Joyson Electronic Corp. ‘A’ CNY 13,300 510,254 1.48Org Packaging Co. Ltd. ‘A’ CNY 17,520 154,614 0.45Ping An Insurance Group Co. of China Ltd.‘A’ CNY 50,600 1,621,224 4.70Poly Real Estate Group Co. Ltd. ‘A’ CNY 124,600 1,074,675 3.12Shandong Gettop Acoustic Co. Ltd. ‘A’ CNY 13,200 213,048 0.62Shanghai International Airport Co. Ltd. ‘A’ CNY 12,900 335,980 0.97Shanghai New Culture Media Group Co.Ltd. ‘A’ CNY 7,300 182,318 0.53Shenzhen AOTO Electronics Co. Ltd. ‘A’ CNY 7,300 105,704 0.31Shenzhen O-film Tech Co. Ltd. ‘A’ CNY 15,700 463,072 1.34Shenzhen Sunway Communication Co.Ltd. ‘A’ CNY 12,400 259,842 0.75Shinva Medical Instrument Co. Ltd. ‘A’ CNY 15,200 351,044 1.02Songcheng Performance Development Co.Ltd. ‘A’ CNY 13,000 323,895 0.94Spring Airlines Co. Ltd. ‘A’ CNY 8,100 388,193 1.13Stellar Megaunion Corp. ‘A’ CNY 22,100 312,825 0.91Sunwoda Electronic Co. Ltd. ‘A’ CNY 16,200 415,935 1.21Suofeiya Home Collection Co. Ltd. ‘A’ CNY 4,600 257,669 0.75Tangshan Jidong Cement Co. Ltd. ‘A’ CNY 32,400 353,160 1.02Tasly Pharmaceutical Group Co. Ltd. ‘A’ CNY 9,200 329,176 0.95Wangsu Science & Technology Co. Ltd. ‘A’ CNY 14,200 954,169 2.77
Wuxi Hodgen Technology Co. Ltd. ‘A’ CNY 4,200 199,479 0.58Zhejiang Dahua Technology Co. Ltd. ‘A’ CNY 40,417 529,665 1.54Zhejiang Huace Film & TV Co. Ltd. ‘A’ CNY 38,560 600,572 1.74
33,393,133 96.85
Total Equities 33,393,133 96.85
Total Transferable securities and money market instrumentsadmitted to an official exchange listing 33,393,133 96.85
Total Investments 33,393,133 96.85
Cash 1,133,852 3.29
Other Assets/(Liabilities) (49,292) (0.14)
Total Net Assets 34,477,693 100.00
Geographic Allocation of Portfolio as at 30 June 2016 % of Net AssetsChina 96.85Total Investments 96.85Cash and Other Assets/(Liabilities) 3.15
Total 100.00
Geographic Allocation of Portfolio as at 31 December 2015(Unaudited)
% of Net Assets
China 97.20Total Investments 97.20Cash and Other Assets/(Liabilities) 2.80
Total 100.00
90
JPMorgan Funds - China A-Share Opportunities FundSchedule of Investments
As at 30 June 2016
Investments Currency
Quantity/Nominal
Value
MarketValue
CNH
%of
NetAssets Investments Currency
Quantity/Nominal
Value
MarketValue
CNH
%of
NetAssets
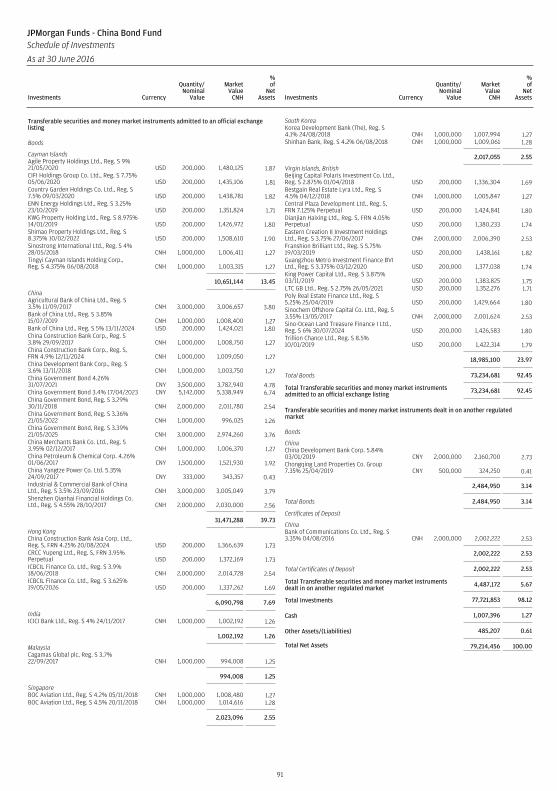
Transferable securities and money market instruments admitted to an official exchangelisting
Bonds
Cayman IslandsAgile Property Holdings Ltd., Reg. S 9%21/05/2020 USD 200,000 1,480,125 1.87CIFI Holdings Group Co. Ltd., Reg. S 7.75%05/06/2020 USD 200,000 1,435,106 1.81Country Garden Holdings Co. Ltd., Reg. S7.5% 09/03/2020 USD 200,000 1,438,781 1.82ENN Energy Holdings Ltd., Reg. S 3.25%23/10/2019 USD 200,000 1,351,824 1.71KWG Property Holding Ltd., Reg. S 8.975%14/01/2019 USD 200,000 1,426,972 1.80Shimao Property Holdings Ltd., Reg. S8.375% 10/02/2022 USD 200,000 1,508,610 1.90Sinostrong International Ltd., Reg. S 4%28/05/2018 CNH 1,000,000 1,006,411 1.27Tingyi Cayman Islands Holding Corp.,Reg. S 4.375% 06/08/2018 CNH 1,000,000 1,003,315 1.27
10,651,144 13.45
ChinaAgricultural Bank of China Ltd., Reg. S3.5% 11/09/2017 CNH 3,000,000 3,006,657 3.80Bank of China Ltd., Reg. S 3.85%15/07/2019 CNH 1,000,000 1,008,400 1.27Bank of China Ltd., Reg. S 5% 13/11/2024 USD 200,000 1,424,021 1.80China Construction Bank Corp., Reg. S3.8% 29/09/2017 CNH 1,000,000 1,008,750 1.27China Construction Bank Corp., Reg. S,FRN 4.9% 12/11/2024 CNH 1,000,000 1,009,050 1.27China Development Bank Corp., Reg. S3.6% 13/11/2018 CNH 1,000,000 1,003,750 1.27China Government Bond 4.26%31/07/2021 CNY 3,500,000 3,782,940 4.78China Government Bond 3.4% 17/04/2023 CNY 5,142,000 5,338,949 6.74China Government Bond, Reg. S 3.29%30/11/2018 CNH 2,000,000 2,011,780 2.54China Government Bond, Reg. S 3.36%21/05/2022 CNH 1,000,000 996,025 1.26China Government Bond, Reg. S 3.39%21/05/2025 CNH 3,000,000 2,974,260 3.76China Merchants Bank Co. Ltd., Reg. S3.95% 02/12/2017 CNH 1,000,000 1,006,370 1.27China Petroleum & Chemical Corp. 4.26%01/06/2017 CNY 1,500,000 1,521,930 1.92China Yangtze Power Co. Ltd. 5.35%24/09/2017 CNY 333,000 343,357 0.43Industrial & Commercial Bank of ChinaLtd., Reg. S 3.5% 23/09/2016 CNH 3,000,000 3,005,049 3.79Shenzhen Qianhai Financial Holdings Co.Ltd., Reg. S 4.55% 28/10/2017 CNH 2,000,000 2,030,000 2.56
31,471,288 39.73
Hong KongChina Construction Bank Asia Corp. Ltd.,Reg. S, FRN 4.25% 20/08/2024 USD 200,000 1,366,639 1.73CRCC Yupeng Ltd., Reg. S, FRN 3.95%Perpetual USD 200,000 1,372,169 1.73ICBCIL Finance Co. Ltd., Reg. S 3.9%18/06/2018 CNH 2,000,000 2,014,728 2.54ICBCIL Finance Co. Ltd., Reg. S 3.625%19/05/2026 USD 200,000 1,337,262 1.69
6,090,798 7.69
IndiaICICI Bank Ltd., Reg. S 4% 24/11/2017 CNH 1,000,000 1,002,192 1.26
1,002,192 1.26
MalaysiaCagamas Global plc, Reg. S 3.7%22/09/2017 CNH 1,000,000 994,008 1.25
994,008 1.25
SingaporeBOC Aviation Ltd., Reg. S 4.2% 05/11/2018 CNH 1,000,000 1,008,480 1.27BOC Aviation Ltd., Reg. S 4.5% 20/11/2018 CNH 1,000,000 1,014,616 1.28
2,023,096 2.55
South KoreaKorea Development Bank (The), Reg. S4.1% 24/08/2018 CNH 1,000,000 1,007,994 1.27Shinhan Bank, Reg. S 4.2% 06/08/2018 CNH 1,000,000 1,009,061 1.28
2,017,055 2.55
Virgin Islands, BritishBeijing Capital Polaris Investment Co. Ltd.,Reg. S 2.875% 01/04/2018 USD 200,000 1,336,304 1.69Bestgain Real Estate Lyra Ltd., Reg. S4.5% 04/12/2018 CNH 1,000,000 1,005,847 1.27Central Plaza Development Ltd., Reg. S,FRN 7.125% Perpetual USD 200,000 1,424,841 1.80Dianjian Haixing Ltd., Reg. S, FRN 4.05%Perpetual USD 200,000 1,380,233 1.74Eastern Creation II Investment HoldingsLtd., Reg. S 3.75% 27/06/2017 CNH 2,000,000 2,006,390 2.53Franshion Brilliant Ltd., Reg. S 5.75%19/03/2019 USD 200,000 1,438,161 1.82Guangzhou Metro Investment Finance BVILtd., Reg. S 3.375% 03/12/2020 USD 200,000 1,377,038 1.74King Power Capital Ltd., Reg. S 3.875%03/11/2019 USD 200,000 1,383,825 1.75LTC GB Ltd., Reg. S 2.75% 26/05/2021 USD 200,000 1,352,276 1.71Poly Real Estate Finance Ltd., Reg. S5.25% 25/04/2019 USD 200,000 1,429,664 1.80Sinochem Offshore Capital Co. Ltd., Reg. S3.55% 13/05/2017 CNH 2,000,000 2,001,624 2.53Sino-Ocean Land Treasure Finance I Ltd.,Reg. S 6% 30/07/2024 USD 200,000 1,426,583 1.80Trillion Chance Ltd., Reg. S 8.5%10/01/2019 USD 200,000 1,422,314 1.79
18,985,100 23.97
Total Bonds 73,234,681 92.45
Total Transferable securities and money market instrumentsadmitted to an official exchange listing 73,234,681 92.45
Transferable securities and money market instruments dealt in on another regulatedmarket
Bonds
ChinaChina Development Bank Corp. 5.84%03/01/2019 CNY 2,000,000 2,160,700 2.73Chongqing Land Properties Co. Group7.35% 25/04/2019 CNY 500,000 324,250 0.41
2,484,950 3.14
Total Bonds 2,484,950 3.14
Certificates of Deposit
ChinaBank of Communications Co. Ltd., Reg. S3.35% 04/08/2016 CNH 2,000,000 2,002,222 2.53
2,002,222 2.53
Total Certificates of Deposit 2,002,222 2.53
Total Transferable securities and money market instrumentsdealt in on another regulated market 4,487,172 5.67
Total Investments 77,721,853 98.12
Cash 1,007,396 1.27
Other Assets/(Liabilities) 485,207 0.61
Total Net Assets 79,214,456 100.00
91
JPMorgan Funds - China Bond FundSchedule of Investments
As at 30 June 2016
Investments Currency
Quantity/Nominal
Value
MarketValue
CNH
%of
NetAssets Investments Currency
Quantity/Nominal
Value
MarketValue
CNH
%of
NetAssets
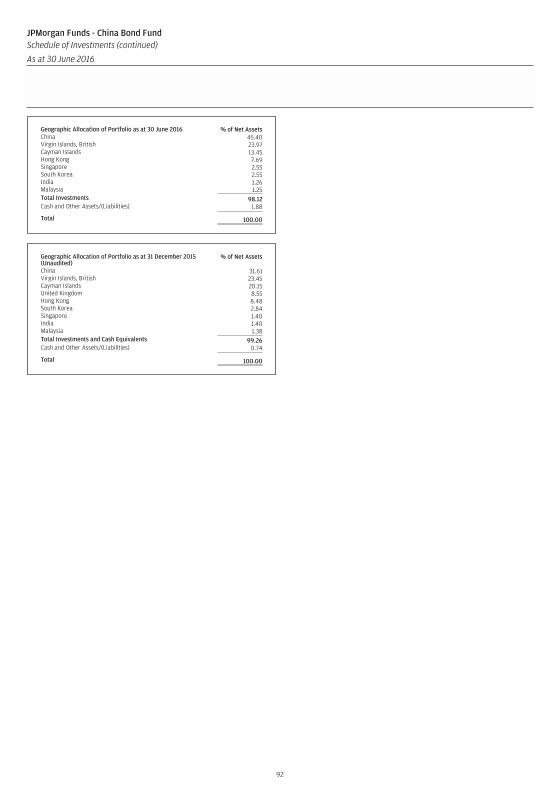
Geographic Allocation of Portfolio as at 30 June 2016 % of Net AssetsChina 45.40Virgin Islands, British 23.97Cayman Islands 13.45Hong Kong 7.69Singapore 2.55South Korea 2.55India 1.26Malaysia 1.25Total Investments 98.12Cash and Other Assets/(Liabilities) 1.88
Total 100.00
Geographic Allocation of Portfolio as at 31 December 2015(Unaudited)
% of Net Assets
China 31.61Virgin Islands, British 23.45Cayman Islands 20.15United Kingdom 8.55Hong Kong 8.48South Korea 2.84Singapore 1.40India 1.40Malaysia 1.38Total Investments and Cash Equivalents 99.26Cash and Other Assets/(Liabilities) 0.74
Total 100.00
92
JPMorgan Funds - China Bond FundSchedule of Investments (continued)
As at 30 June 2016
Investments Currency
Quantity/Nominal
Value
MarketValue
CNH
%of
NetAssets Investments Currency
Quantity/Nominal
Value
MarketValue
CNH
%of
NetAssets

JPMorgan Funds - China Bond FundSchedule of Investments (continued)
As at 30 June 2016
Forward Currency Exchange Contracts
CurrencyPurchased
AmountPurchased Currency Sold Amount Sold
MaturityDate Counterparty
UnrealisedGain/(Loss)
CNH
%of
NetAssets
GBP 995 CNH 8,901 15/07/2016 RBC 22 -HKD 1,498,213 CNH 1,275,998 15/07/2016 HSBC 12,649 0.02HKD 9,386 CNH 8,067 15/07/2016 Standard Chartered 7 -USD 1,889,812 CNH 12,487,727 15/07/2016 Barclays 122,123 0.15USD 6,558 CNH 43,710 15/07/2016 Societe Generale 48 -
Total Unrealised Gain on Forward Currency Exchange Contracts 134,849 0.17
CNH 47,498 USD 7,195 15/07/2016 Barclays (511) -CNH 27,874,210 USD 4,221,127 27/09/2016 State Street (380,044) (0.48)GBP 133,920 CNH 1,251,649 15/07/2016 Barclays (50,791) (0.06)
Total Unrealised Loss on Forward Currency Exchange Contracts (431,346) (0.54)
Net Unrealised Loss on Forward Currency Exchange Contracts (296,497) (0.37)
93

Transferable securities and money market instruments admitted to an official exchangelisting
Equities
BermudaChina Resources Gas Group Ltd. HKD 5,092,000 15,422,547 1.39
15,422,547 1.39
Cayman IslandsAAC Technologies Holdings, Inc. HKD 4,310,500 36,583,333 3.31Alibaba Group Holding Ltd., ADR USD 1,296,307 102,058,250 9.24Baidu, Inc., ADR USD 110,086 17,891,727 1.62CAR, Inc. HKD 6,374,000 6,177,742 0.56China Conch Venture Holdings Ltd. HKD 7,211,500 14,257,744 1.29China Harmony New Energy AutoHolding Ltd. HKD 16,960,000 9,060,460 0.82China Resources Land Ltd. HKD 8,239,111 19,230,858 1.74Himax Technologies, Inc., ADR USD 621,536 5,683,947 0.52IMAX China Holding, Inc. HKD 2,817,300 13,843,401 1.25JD.com, Inc., ADR USD 1,405,879 28,672,902 2.60KWG Property Holding Ltd. HKD 11,974,000 6,944,670 0.63Nexteer Automotive Group Ltd. HKD 12,068,000 10,988,725 1.00Phoenix Healthcare Group Co. Ltd. HKD 10,127,500 14,005,603 1.27Regina Miracle International HoldingsLtd. HKD 15,217,000 20,083,012 1.82Sino Biopharmaceutical Ltd. HKD 22,612,000 14,688,226 1.33Tencent Holdings Ltd. HKD 4,783,200 108,716,096 9.84Tuniu Corp., ADR USD 763,877 6,428,025 0.58Vipshop Holdings Ltd., ADR USD 1,109,190 12,062,441 1.09Wynn Macau Ltd. HKD 6,731,600 9,708,413 0.88
457,085,575 41.39
ChinaBBMG Corp. ‘H’ HKD 23,999,000 7,129,579 0.65CGN Power Co. Ltd. ‘H’ HKD 42,783,000 11,827,648 1.07China CITIC Bank Corp. Ltd. ‘H’ HKD 67,428,000 40,931,818 3.71China Construction Bank Corp. ‘H’ HKD 108,166,540 71,447,437 6.47China Machinery Engineering Corp. ‘H’ HKD 10,028,000 6,494,567 0.59China Merchants Bank Co. Ltd. ‘H’ HKD 26,460,500 59,067,118 5.35China Shenhua Energy Co. Ltd. ‘H’ HKD 5,705,500 10,486,078 0.95China Telecom Corp. Ltd. ‘H’ HKD 94,112,000 41,907,611 3.79China Vanke Co. Ltd. ‘H’ HKD 8,925,012 17,495,964 1.58Chongqing Changan Automobile Co.Ltd. ‘B’ HKD 5,317,972 7,378,361 0.67Hangzhou Hikvision Digital TechnologyCo. Ltd. ‘A’ CNY 2,524,248 8,153,953 0.74Hangzhou Robam Appliances Co.Ltd. ‘A’ CNY 2,792,499 15,457,358 1.40Han’s Laser Technology Industry GroupCo. Ltd. ‘A’ CNY 3,685,961 12,672,416 1.15Jiangsu Hengrui Medicine Co. Ltd. ‘A’ CNY 2,396,685 14,466,207 1.31Luxshare Precision Industry Co. Ltd. ‘A’ CNY 2,498,215 7,392,827 0.67PICC Property & Casualty Co. Ltd. ‘H’ HKD 12,046,000 18,816,781 1.70Ping An Insurance Group Co. of ChinaLtd. ‘H’ HKD 11,791,500 51,861,080 4.70Spring Airlines Co. Ltd. ‘A’ CNY 1,364,672 9,846,867 0.89Wangsu Science & Technology Co.Ltd. ‘A’ CNY 1,271,700 12,865,578 1.16
425,699,248 38.55
Hong KongChina Everbright International Ltd. HKD 13,667,000 15,139,758 1.37China Mobile Ltd. HKD 1,483,000 16,958,483 1.54China Taiping Insurance Holdings Co.Ltd. HKD 10,811,600 20,065,607 1.82CNOOC Ltd. HKD 60,434,000 74,969,035 6.79CSPC Pharmaceutical Group Ltd. HKD 17,286,000 15,361,323 1.39Hong Kong Exchanges and ClearingLtd. HKD 731,998 17,712,901 1.60
160,207,107 14.51
Total Equities 1,058,414,477 95.84
Warrants
Cayman IslandsGoerTek, Inc., 144A 23/04/2018 USD 2,525,275 10,908,044 0.99
10,908,044 0.99
ChinaBeijing Originwater Technology Co.Ltd. 17/07/2017 USD 4,107,801 9,217,495 0.83Hangzhou Hikvision Digital TechnologyCo. Ltd. 07/09/2018 USD 1,395,786 4,508,738 0.41Hangzhou Robam Appliances Co. Ltd.02/12/2016 USD 187,848 1,039,494 0.09Luxshare Precision Industry Co. Ltd.26/06/2017 USD 1,284,667 3,806,854 0.35Wangsu Science & Technology Co. Ltd.31/10/2018 USD 204,743 2,071,385 0.19
20,643,966 1.87
Total Warrants 31,552,010 2.86
Total Transferable securities and money market instrumentsadmitted to an official exchange listing 1,089,966,487 98.70
Other transferable securities and money market instruments
Equities
Hong KongEuro-Asia Agricultural Holdings Co.Ltd.* HKD 30,392,000 392 0.00
392 0.00
Total Equities 392 0.00
Total Other transferable securities and money marketinstruments 392 0.00
Total Investments 1,089,966,879 98.70
Cash 1,812,613 0.16
Other Assets/(Liabilities) 12,590,501 1.14
Total Net Assets 1,104,369,993 100.00
* Security is valued at its fair value under the direction of the Board of Directors.
Geographic Allocation of Portfolio as at 30 June 2016 % of Net AssetsCayman Islands 42.38China 40.42Hong Kong 14.51Bermuda 1.39Total Investments 98.70Cash and Other Assets/(Liabilities) 1.30
Total 100.00
Geographic Allocation of Portfolio as at 31 December 2015(Unaudited)
% of Net Assets
China 50.59Cayman Islands 30.13Hong Kong 14.85Bermuda 3.49Total Investments 99.06Cash and Other Assets/(Liabilities) 0.94
Total 100.00
94
JPMorgan Funds - China FundSchedule of Investments
As at 30 June 2016
Investments Currency
Quantity/Nominal
Value
MarketValue
USD
%of
NetAssets Investments Currency
Quantity/Nominal
Value
MarketValue
USD
%of
NetAssets
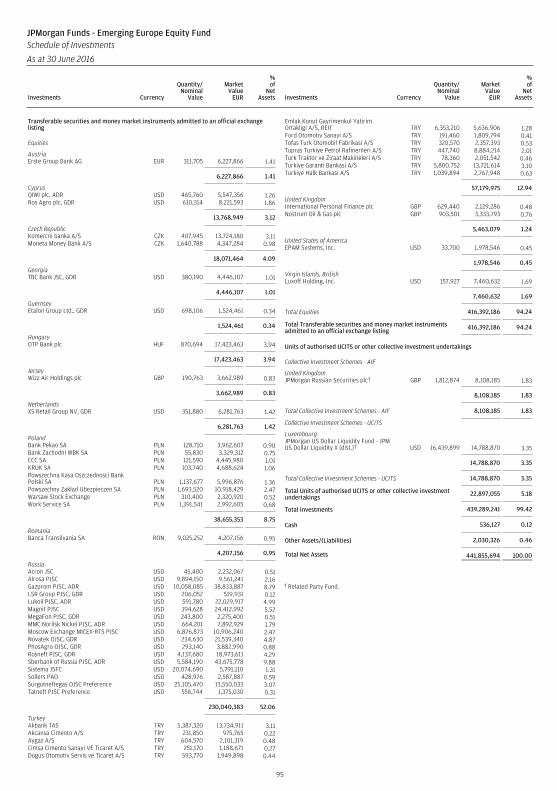
Transferable securities and money market instruments admitted to an official exchangelisting
Equities
AustriaErste Group Bank AG EUR 311,705 6,227,866 1.41
6,227,866 1.41
CyprusQIWI plc, ADR USD 465,760 5,547,356 1.26Ros Agro plc, GDR USD 610,314 8,221,593 1.86
13,768,949 3.12
Czech RepublicKomercni banka A/S CZK 407,945 13,724,180 3.11Moneta Money Bank A/S CZK 1,640,788 4,347,284 0.98
18,071,464 4.09
GeorgiaTBC Bank JSC, GDR USD 380,190 4,446,107 1.01
4,446,107 1.01
GuernseyEtalon Group Ltd., GDR USD 698,106 1,524,461 0.34
1,524,461 0.34
HungaryOTP Bank plc HUF 870,694 17,423,463 3.94
17,423,463 3.94
JerseyWizz Air Holdings plc GBP 190,763 3,662,989 0.83
3,662,989 0.83
NetherlandsX5 Retail Group NV, GDR USD 351,880 6,281,763 1.42
6,281,763 1.42
PolandBank Pekao SA PLN 128,710 3,962,607 0.90Bank Zachodni WBK SA PLN 55,830 3,329,312 0.75CCC SA PLN 121,590 4,445,980 1.01KRUK SA PLN 103,740 4,688,624 1.06Powszechna Kasa Oszczednosci BankPolski SA PLN 1,137,677 5,996,876 1.36Powszechny Zaklad Ubezpieczen SA PLN 1,693,520 10,918,429 2.47Warsaw Stock Exchange PLN 310,400 2,320,920 0.52Work Service SA PLN 1,391,541 2,992,605 0.68
38,655,353 8.75
RomaniaBanca Transilvania SA RON 9,025,252 4,207,156 0.95
4,207,156 0.95
RussiaAcron JSC USD 45,400 2,232,067 0.51Alrosa PJSC USD 9,894,150 9,561,241 2.16Gazprom PJSC, ADR USD 10,058,085 38,833,887 8.79LSR Group PJSC, GDR USD 206,052 519,931 0.12Lukoil PJSC, ADR USD 591,780 22,029,917 4.99Magnit PJSC USD 194,628 24,412,992 5.52MegaFon PJSC, GDR USD 243,800 2,275,400 0.51MMC Norilsk Nickel PJSC, ADR USD 664,201 7,892,929 1.79Moscow Exchange MICEX-RTS PJSC USD 6,876,873 10,906,240 2.47Novatek OJSC, GDR USD 234,630 21,539,340 4.87PhosAgro OJSC, GDR USD 293,140 3,882,990 0.88Rosneft PJSC, GDR USD 4,137,680 18,973,611 4.29Sberbank of Russia PJSC, ADR USD 5,584,190 43,675,778 9.88Sistema JSFC USD 20,074,690 5,791,110 1.31Sollers PAO USD 428,976 2,587,887 0.59Surgutneftegas OJSC Preference USD 25,105,470 13,550,033 3.07Tatneft PJSC Preference USD 556,744 1,375,030 0.31
230,040,383 52.06
TurkeyAkbank TAS TRY 5,387,320 13,734,911 3.11Akcansa Cimento A/S TRY 231,850 975,765 0.22Aygaz A/S TRY 604,570 2,101,319 0.48Cimsa Cimento Sanayi VE Ticaret A/S TRY 251,170 1,188,671 0.27Dogus Otomotiv Servis ve Ticaret A/S TRY 593,770 1,949,898 0.44
Emlak Konut Gayrimenkul YatirimOrtakligi A/S, REIT TRY 6,353,210 5,636,906 1.28Ford Otomotiv Sanayi A/S TRY 191,460 1,809,794 0.41Tofas Turk Otomobil Fabrikasi A/S TRY 320,570 2,357,393 0.53Tupras Turkiye Petrol Rafinerileri A/S TRY 447,740 8,884,214 2.01Turk Traktor ve Ziraat Makineleri A/S TRY 78,360 2,051,542 0.46Turkiye Garanti Bankasi A/S TRY 5,800,752 13,721,614 3.10Turkiye Halk Bankasi A/S TRY 1,039,894 2,767,948 0.63
57,179,975 12.94
United KingdomInternational Personal Finance plc GBP 629,440 2,129,286 0.48Nostrum Oil & Gas plc GBP 903,501 3,333,793 0.76
5,463,079 1.24
United States of AmericaEPAM Systems, Inc. USD 33,700 1,978,546 0.45
1,978,546 0.45
Virgin Islands, BritishLuxoft Holding, Inc. USD 157,927 7,460,632 1.69
7,460,632 1.69
Total Equities 416,392,186 94.24
Total Transferable securities and money market instrumentsadmitted to an official exchange listing 416,392,186 94.24
Units of authorised UCITS or other collective investment undertakings
Collective Investment Schemes - AIF
United KingdomJPMorgan Russian Securities plc† GBP 1,812,874 8,108,185 1.83
8,108,185 1.83
Total Collective Investment Schemes - AIF 8,108,185 1.83
Collective Investment Schemes - UCITS
LuxembourgJPMorgan US Dollar Liquidity Fund - JPMUS Dollar Liquidity X (dist.)† USD 16,439,899 14,788,870 3.35
14,788,870 3.35
Total Collective Investment Schemes - UCITS 14,788,870 3.35
Total Units of authorised UCITS or other collective investmentundertakings 22,897,055 5.18
Total Investments 439,289,241 99.42
Cash 536,127 0.12
Other Assets/(Liabilities) 2,030,326 0.46
Total Net Assets 441,855,694 100.00
† Related Party Fund.
95
JPMorgan Funds - Emerging Europe Equity FundSchedule of Investments
As at 30 June 2016
Investments Currency
Quantity/Nominal
Value
MarketValue
EUR
%of
NetAssets Investments Currency
Quantity/Nominal
Value
MarketValue
EUR
%of
NetAssets
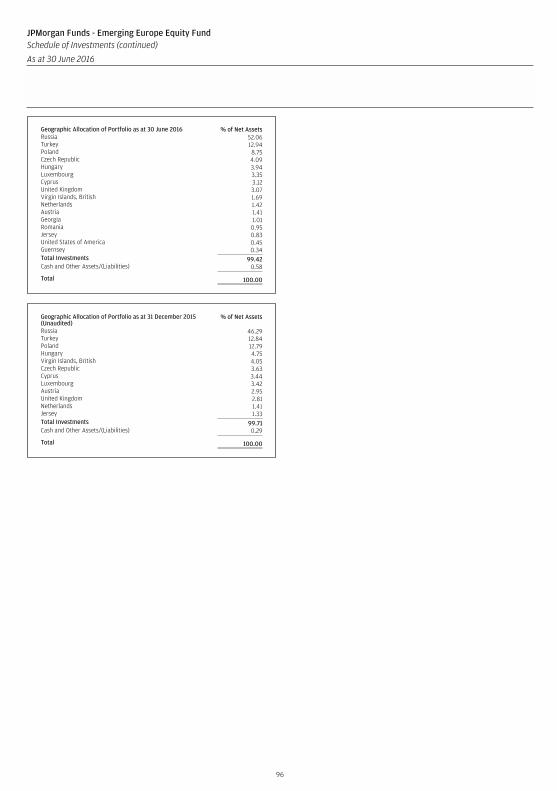
Geographic Allocation of Portfolio as at 30 June 2016 % of Net AssetsRussia 52.06Turkey 12.94Poland 8.75Czech Republic 4.09Hungary 3.94Luxembourg 3.35Cyprus 3.12United Kingdom 3.07Virgin Islands, British 1.69Netherlands 1.42Austria 1.41Georgia 1.01Romania 0.95Jersey 0.83United States of America 0.45Guernsey 0.34Total Investments 99.42Cash and Other Assets/(Liabilities) 0.58
Total 100.00
Geographic Allocation of Portfolio as at 31 December 2015(Unaudited)
% of Net Assets
Russia 46.29Turkey 12.84Poland 12.79Hungary 4.75Virgin Islands, British 4.05Czech Republic 3.63Cyprus 3.44Luxembourg 3.42Austria 2.95United Kingdom 2.81Netherlands 1.41Jersey 1.33Total Investments 99.71Cash and Other Assets/(Liabilities) 0.29
Total 100.00
96
JPMorgan Funds - Emerging Europe Equity FundSchedule of Investments (continued)
As at 30 June 2016
Investments Currency
Quantity/Nominal
Value
MarketValue
EUR
%of
NetAssets Investments Currency
Quantity/Nominal
Value
MarketValue
EUR
%of
NetAssets
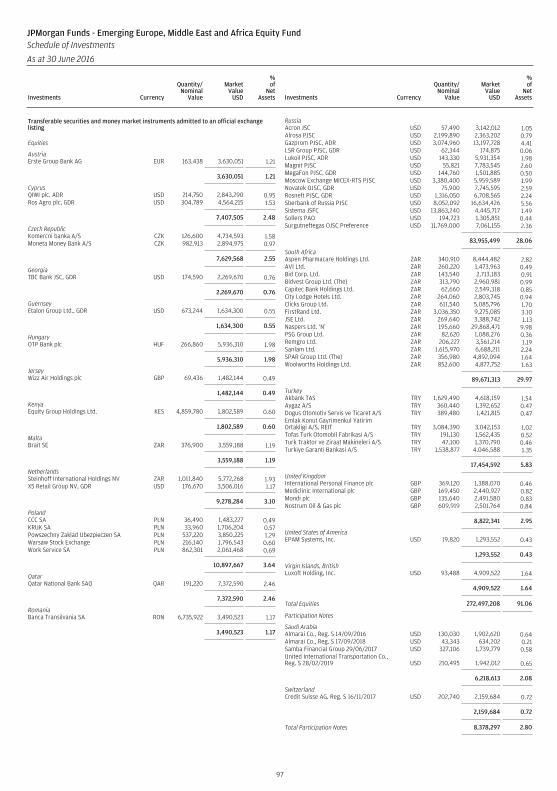
Transferable securities and money market instruments admitted to an official exchangelisting
Equities
AustriaErste Group Bank AG EUR 163,438 3,630,051 1.21
3,630,051 1.21
CyprusQIWI plc, ADR USD 214,750 2,843,290 0.95Ros Agro plc, GDR USD 304,789 4,564,215 1.53
7,407,505 2.48
Czech RepublicKomercni banka A/S CZK 126,600 4,734,593 1.58Moneta Money Bank A/S CZK 982,913 2,894,975 0.97
7,629,568 2.55
GeorgiaTBC Bank JSC, GDR USD 174,590 2,269,670 0.76
2,269,670 0.76
GuernseyEtalon Group Ltd., GDR USD 673,244 1,634,300 0.55
1,634,300 0.55
HungaryOTP Bank plc HUF 266,860 5,936,310 1.98
5,936,310 1.98
JerseyWizz Air Holdings plc GBP 69,436 1,482,144 0.49
1,482,144 0.49
KenyaEquity Group Holdings Ltd. KES 4,859,780 1,802,589 0.60
1,802,589 0.60
MaltaBrait SE ZAR 376,900 3,559,188 1.19
3,559,188 1.19
NetherlandsSteinhoff International Holdings NV ZAR 1,011,840 5,772,268 1.93X5 Retail Group NV, GDR USD 176,670 3,506,016 1.17
9,278,284 3.10
PolandCCC SA PLN 36,490 1,483,227 0.49KRUK SA PLN 33,960 1,706,204 0.57Powszechny Zaklad Ubezpieczen SA PLN 537,220 3,850,225 1.29Warsaw Stock Exchange PLN 216,140 1,796,543 0.60Work Service SA PLN 862,301 2,061,468 0.69
10,897,667 3.64
QatarQatar National Bank SAQ QAR 191,220 7,372,590 2.46
7,372,590 2.46
RomaniaBanca Transilvania SA RON 6,735,922 3,490,523 1.17
3,490,523 1.17
RussiaAcron JSC USD 57,490 3,142,012 1.05Alrosa PJSC USD 2,199,890 2,363,202 0.79Gazprom PJSC, ADR USD 3,074,960 13,197,728 4.41LSR Group PJSC, GDR USD 62,344 174,875 0.06Lukoil PJSC, ADR USD 143,330 5,931,354 1.98Magnit PJSC USD 55,821 7,783,545 2.60MegaFon PJSC, GDR USD 144,760 1,501,885 0.50Moscow Exchange MICEX-RTS PJSC USD 3,380,400 5,959,589 1.99Novatek OJSC, GDR USD 75,900 7,745,595 2.59Rosneft PJSC, GDR USD 1,316,050 6,708,565 2.24Sberbank of Russia PJSC USD 8,052,092 16,634,426 5.56Sistema JSFC USD 13,863,240 4,445,717 1.49Sollers PAO USD 194,723 1,305,851 0.44Surgutneftegas OJSC Preference USD 11,769,000 7,061,155 2.36
83,955,499 28.06
South AfricaAspen Pharmacare Holdings Ltd. ZAR 340,910 8,444,482 2.82AVI Ltd. ZAR 260,220 1,473,963 0.49Bid Corp. Ltd. ZAR 143,540 2,713,183 0.91Bidvest Group Ltd. (The) ZAR 313,790 2,960,981 0.99Capitec Bank Holdings Ltd. ZAR 62,660 2,549,318 0.85City Lodge Hotels Ltd. ZAR 264,060 2,803,745 0.94Clicks Group Ltd. ZAR 611,540 5,085,796 1.70FirstRand Ltd. ZAR 3,036,350 9,275,085 3.10JSE Ltd. ZAR 269,640 3,388,742 1.13Naspers Ltd. ‘N’ ZAR 195,660 29,868,471 9.98PSG Group Ltd. ZAR 82,620 1,088,276 0.36Remgro Ltd. ZAR 206,227 3,561,214 1.19Sanlam Ltd. ZAR 1,615,970 6,688,211 2.24SPAR Group Ltd. (The) ZAR 356,980 4,892,094 1.64Woolworths Holdings Ltd. ZAR 852,600 4,877,752 1.63
89,671,313 29.97
TurkeyAkbank TAS TRY 1,629,490 4,618,159 1.54Aygaz A/S TRY 360,440 1,392,652 0.47Dogus Otomotiv Servis ve Ticaret A/S TRY 389,480 1,421,815 0.47Emlak Konut Gayrimenkul YatirimOrtakligi A/S, REIT TRY 3,084,390 3,042,153 1.02Tofas Turk Otomobil Fabrikasi A/S TRY 191,130 1,562,435 0.52Turk Traktor ve Ziraat Makineleri A/S TRY 47,100 1,370,790 0.46Turkiye Garanti Bankasi A/S TRY 1,538,877 4,046,588 1.35
17,454,592 5.83
United KingdomInternational Personal Finance plc GBP 369,120 1,388,070 0.46Mediclinic International plc GBP 169,450 2,440,927 0.82Mondi plc GBP 135,640 2,491,580 0.83Nostrum Oil & Gas plc GBP 609,919 2,501,764 0.84
8,822,341 2.95
United States of AmericaEPAM Systems, Inc. USD 19,820 1,293,552 0.43
1,293,552 0.43
Virgin Islands, BritishLuxoft Holding, Inc. USD 93,488 4,909,522 1.64
4,909,522 1.64
Total Equities 272,497,208 91.06
Participation Notes
Saudi ArabiaAlmarai Co., Reg. S 14/09/2016 USD 130,030 1,902,620 0.64Almarai Co., Reg. S 17/09/2018 USD 43,343 634,202 0.21Samba Financial Group 29/06/2017 USD 327,106 1,739,779 0.58United International Transportation Co.,Reg. S 28/02/2019 USD 210,495 1,942,012 0.65
6,218,613 2.08
SwitzerlandCredit Suisse AG, Reg. S 16/11/2017 USD 202,740 2,159,684 0.72
2,159,684 0.72
Total Participation Notes 8,378,297 2.80
97
JPMorgan Funds - Emerging Europe, Middle East and Africa Equity FundSchedule of Investments
As at 30 June 2016
Investments Currency
Quantity/Nominal
Value
MarketValue
USD
%of
NetAssets Investments Currency
Quantity/Nominal
Value
MarketValue
USD
%of
NetAssets
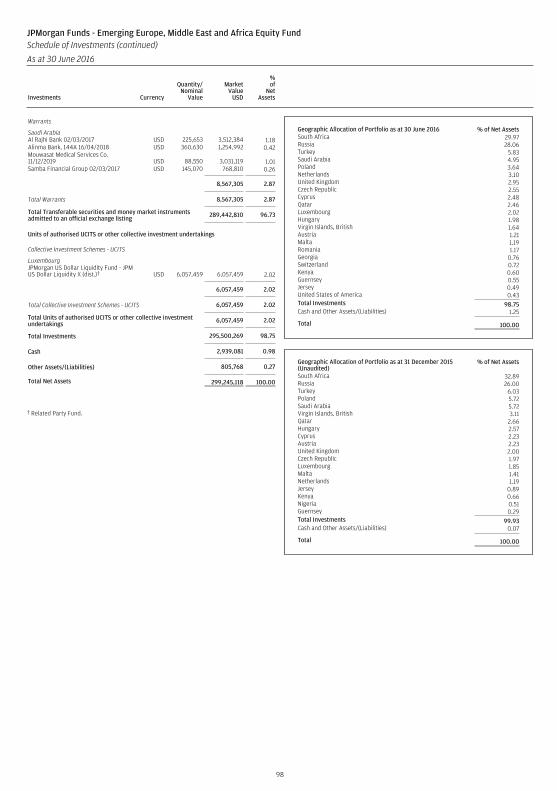
Warrants
Saudi ArabiaAl Rajhi Bank 02/03/2017 USD 225,653 3,512,384 1.18Alinma Bank, 144A 16/04/2018 USD 360,630 1,254,992 0.42Mouwasat Medical Services Co.11/12/2019 USD 88,550 3,031,119 1.01Samba Financial Group 02/03/2017 USD 145,070 768,810 0.26
8,567,305 2.87
Total Warrants 8,567,305 2.87
Total Transferable securities and money market instrumentsadmitted to an official exchange listing 289,442,810 96.73
Units of authorised UCITS or other collective investment undertakings
Collective Investment Schemes - UCITS
LuxembourgJPMorgan US Dollar Liquidity Fund - JPMUS Dollar Liquidity X (dist.)† USD 6,057,459 6,057,459 2.02
6,057,459 2.02
Total Collective Investment Schemes - UCITS 6,057,459 2.02
Total Units of authorised UCITS or other collective investmentundertakings 6,057,459 2.02
Total Investments 295,500,269 98.75
Cash 2,939,081 0.98
Other Assets/(Liabilities) 805,768 0.27
Total Net Assets 299,245,118 100.00
† Related Party Fund.
Geographic Allocation of Portfolio as at 30 June 2016 % of Net AssetsSouth Africa 29.97Russia 28.06Turkey 5.83Saudi Arabia 4.95Poland 3.64Netherlands 3.10United Kingdom 2.95Czech Republic 2.55Cyprus 2.48Qatar 2.46Luxembourg 2.02Hungary 1.98Virgin Islands, British 1.64Austria 1.21Malta 1.19Romania 1.17Georgia 0.76Switzerland 0.72Kenya 0.60Guernsey 0.55Jersey 0.49United States of America 0.43Total Investments 98.75Cash and Other Assets/(Liabilities) 1.25
Total 100.00
Geographic Allocation of Portfolio as at 31 December 2015(Unaudited)
% of Net Assets
South Africa 32.89Russia 26.00Turkey 6.03Poland 5.72Saudi Arabia 5.72Virgin Islands, British 3.11Qatar 2.66Hungary 2.57Cyprus 2.23Austria 2.23United Kingdom 2.00Czech Republic 1.97Luxembourg 1.85Malta 1.41Netherlands 1.19Jersey 0.89Kenya 0.66Nigeria 0.51Guernsey 0.29Total Investments 99.93Cash and Other Assets/(Liabilities) 0.07
Total 100.00
98
JPMorgan Funds - Emerging Europe, Middle East and Africa Equity FundSchedule of Investments (continued)
As at 30 June 2016
Investments Currency
Quantity/Nominal
Value
MarketValue
USD
%of
NetAssets Investments Currency
Quantity/Nominal
Value
MarketValue
USD
%of
NetAssets

Transferable securities and money market instruments admitted to an official exchangelisting
Bonds
AngolaAngolan Government InternationalBond, Reg. S 9.5% 12/11/2025 USD 15,539,000 15,396,663 0.96
15,396,663 0.96
ArgentinaArgentine Republic GovernmentInternational Bond, Reg. S 6.25%22/04/2019 USD 16,800,000 17,546,004 1.10Argentine Republic GovernmentInternational Bond, Reg. S 6.875%22/04/2021 USD 16,856,000 17,883,068 1.12Argentine Republic GovernmentInternational Bond, Reg. S 7.5%22/04/2026 USD 10,461,000 11,362,964 0.71Argentine Republic GovernmentInternational Bond 8.28% 31/12/2033 USD 11,300,426 12,604,213 0.79Argentine Republic GovernmentInternational Bond, STEP 2.5%31/12/2038 USD 9,710,000 6,559,105 0.41Argentine Republic GovernmentInternational Bond, Reg. S 7.625%22/04/2046 USD 5,300,000 5,757,231 0.36Provincia de Buenos Aires, Reg. S9.375% 14/09/2018 USD 1,550,000 1,677,689 0.10Provincia de Buenos Aires, Reg. S9.95% 09/06/2021 USD 8,850,000 9,910,319 0.62YPF SA, Reg. S 8.5% 23/03/2021 USD 5,980,000 6,420,277 0.40YPF SA, Reg. S 8.75% 04/04/2024 USD 9,300,000 10,029,867 0.63
99,750,737 6.24
ArmeniaArmenia International Bond, Reg. S7.15% 26/03/2025 USD 3,850,000 3,941,322 0.25
3,941,322 0.25
AzerbaijanRepublic of Azerbaijan InternationalBond, Reg. S 4.75% 18/03/2024 USD 9,610,000 9,779,088 0.61State Oil Co. of the Azerbaijan Republic,Reg. S 6.95% 18/03/2030 USD 5,605,000 5,884,157 0.37
15,663,245 0.98
BelarusBelarus International Bond, Reg. S8.95% 26/01/2018 USD 2,900,000 3,025,207 0.19
3,025,207 0.19
BelizeBelize Government International Bond,Reg. S, STEP 5% 20/02/2038 USD 2,150,700 1,220,522 0.08
1,220,522 0.08
BermudaBermuda Government InternationalBond, Reg. S 4.138% 03/01/2023 USD 2,057,000 2,145,410 0.13Bermuda Government InternationalBond, Reg. S 4.854% 06/02/2024 USD 1,757,000 1,920,445 0.12
4,065,855 0.25
BrazilBrazil Notas do Tesouro Nacional 6%15/08/2050 BRL 9,039 8,378,379 0.52Brazilian Government InternationalBond 4.875% 22/01/2021 USD 4,685,000 4,927,566 0.31Brazilian Government InternationalBond 6% 07/04/2026 USD 5,754,000 6,214,320 0.39Brazilian Government InternationalBond 8.25% 20/01/2034 USD 14,332,000 17,347,453 1.09Brazilian Government InternationalBond 7.125% 20/01/2037 USD 2,770,000 3,097,345 0.19
39,965,063 2.50
CameroonRepublic of Cameroon InternationalBond, Reg. S 9.5% 19/11/2025 USD 11,120,000 11,206,847 0.70
11,206,847 0.70
Cayman IslandsShimao Property Holdings Ltd., Reg. S8.375% 10/02/2022 USD 3,700,000 4,184,489 0.26Vale Overseas Ltd. 5.875% 10/06/2021 USD 5,367,000 5,378,942 0.34
9,563,431 0.60
ChileCorp. Nacional del Cobre de Chile,Reg. S 3.875% 03/11/2021 USD 3,400,000 3,598,968 0.23Corp. Nacional del Cobre de Chile,Reg. S 4.5% 16/09/2025 USD 12,400,000 12,993,774 0.81
16,592,742 1.04
ColombiaColombia Government InternationalBond 4.375% 12/07/2021 USD 8,175,000 8,773,206 0.55Colombia Government InternationalBond 4% 26/02/2024 USD 10,237,000 10,668,745 0.67Colombia Government InternationalBond 8.125% 21/05/2024 USD 171,000 222,095 0.02Colombia Government InternationalBond 4.5% 28/01/2026 USD 1,050,000 1,125,626 0.07Colombia Government InternationalBond 10.375% 28/01/2033 USD 3,958,000 5,966,685 0.37Colombia Government InternationalBond 7.375% 18/09/2037 USD 6,773,000 8,800,498 0.55Colombia Government InternationalBond 6.125% 18/01/2041 USD 1,576,000 1,818,625 0.11Colombia Government InternationalBond 5.625% 26/02/2044 USD 3,463,000 3,828,520 0.24Colombia Government InternationalBond 5% 15/06/2045 USD 14,937,000 15,474,508 0.97Ecopetrol SA 5.875% 28/05/2045 USD 8,000,000 6,897,960 0.43
63,576,468 3.98
Costa RicaCosta Rica Government InternationalBond, Reg. S 4.25% 26/01/2023 USD 4,031,000 3,846,743 0.24Costa Rica Government InternationalBond, Reg. S 5.625% 30/04/2043 USD 2,500,000 2,136,875 0.13Costa Rica Government InternationalBond, Reg. S 7% 04/04/2044 USD 17,672,000 17,448,979 1.09Instituto Costarricense de Electricidad,Reg. S 6.375% 15/05/2043 USD 6,529,000 5,093,110 0.32
28,525,707 1.78
CroatiaCroatia Government International Bond,Reg. S 6.75% 05/11/2019 USD 12,113,000 13,210,619 0.83Croatia Government International Bond,Reg. S 6.625% 14/07/2020 USD 3,439,000 3,759,704 0.23Croatia Government International Bond,Reg. S 5.5% 04/04/2023 USD 7,129,000 7,568,289 0.47Croatia Government International Bond,Reg. S 3% 11/03/2025 EUR 2,361,000 2,502,342 0.16Hrvatska Elektroprivreda, Reg. S5.875% 23/10/2022 USD 2,398,000 2,522,792 0.16
29,563,746 1.85
Dominican RepublicDominican Republic International Bond,Reg. S 7.5% 06/05/2021 USD 6,144,000 6,821,222 0.43Dominican Republic International Bond,Reg. S 6.6% 28/01/2024 USD 3,923,000 4,270,990 0.27Dominican Republic International Bond,Reg. S 5.875% 18/04/2024 USD 11,301,000 11,821,524 0.74Dominican Republic International Bond,Reg. S 5.5% 27/01/2025 USD 203,000 207,141 0.01Dominican Republic International Bond,Reg. S 6.875% 29/01/2026 USD 2,606,000 2,879,018 0.18Dominican Republic International Bond,Reg. S 7.45% 30/04/2044 USD 22,802,000 25,013,224 1.56
51,013,119 3.19
EcuadorEcuador Government InternationalBond, Reg. S 10.5% 24/03/2020 USD 5,932,000 5,884,781 0.37Ecuador Government InternationalBond, Reg. S 7.95% 20/06/2024 USD 10,482,000 9,197,955 0.57
15,082,736 0.94
99
JPMorgan Funds - Emerging Markets Debt FundSchedule of Investments
As at 30 June 2016
Investments Currency
Quantity/Nominal
Value
MarketValue
USD
%of
NetAssets Investments Currency
Quantity/Nominal
Value
MarketValue
USD
%of
NetAssets
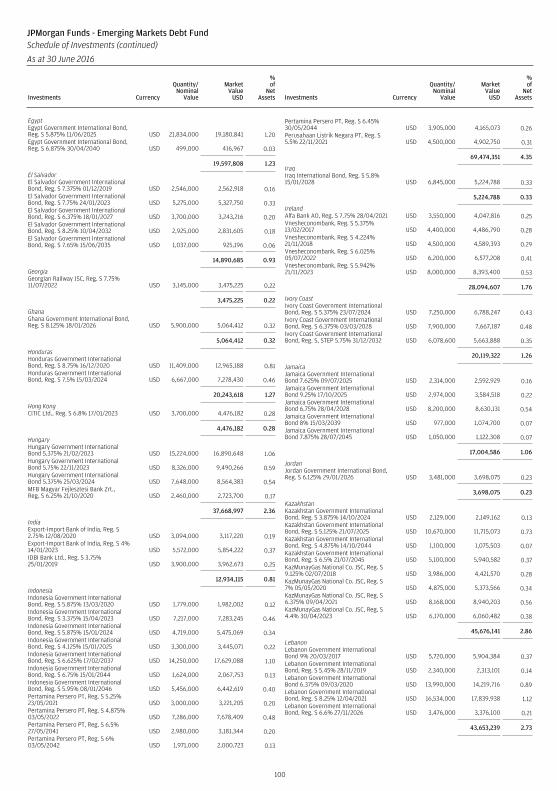
EgyptEgypt Government International Bond,Reg. S 5.875% 11/06/2025 USD 21,834,000 19,180,841 1.20Egypt Government International Bond,Reg. S 6.875% 30/04/2040 USD 499,000 416,967 0.03
19,597,808 1.23
El SalvadorEl Salvador Government InternationalBond, Reg. S 7.375% 01/12/2019 USD 2,546,000 2,562,918 0.16El Salvador Government InternationalBond, Reg. S 7.75% 24/01/2023 USD 5,275,000 5,327,750 0.33El Salvador Government InternationalBond, Reg. S 6.375% 18/01/2027 USD 3,700,000 3,243,216 0.20El Salvador Government InternationalBond, Reg. S 8.25% 10/04/2032 USD 2,925,000 2,831,605 0.18El Salvador Government InternationalBond, Reg. S 7.65% 15/06/2035 USD 1,037,000 925,196 0.06
14,890,685 0.93
GeorgiaGeorgian Railway JSC, Reg. S 7.75%11/07/2022 USD 3,145,000 3,475,225 0.22
3,475,225 0.22
GhanaGhana Government International Bond,Reg. S 8.125% 18/01/2026 USD 5,900,000 5,064,412 0.32
5,064,412 0.32
HondurasHonduras Government InternationalBond, Reg. S 8.75% 16/12/2020 USD 11,409,000 12,965,188 0.81Honduras Government InternationalBond, Reg. S 7.5% 15/03/2024 USD 6,667,000 7,278,430 0.46
20,243,618 1.27
Hong KongCITIC Ltd., Reg. S 6.8% 17/01/2023 USD 3,700,000 4,476,182 0.28
4,476,182 0.28
HungaryHungary Government InternationalBond 5.375% 21/02/2023 USD 15,224,000 16,890,648 1.06Hungary Government InternationalBond 5.75% 22/11/2023 USD 8,326,000 9,490,266 0.59Hungary Government InternationalBond 5.375% 25/03/2024 USD 7,648,000 8,564,383 0.54MFB Magyar Fejlesztesi Bank Zrt.,Reg. S 6.25% 21/10/2020 USD 2,460,000 2,723,700 0.17
37,668,997 2.36
IndiaExport-Import Bank of India, Reg. S2.75% 12/08/2020 USD 3,094,000 3,117,220 0.19Export-Import Bank of India, Reg. S 4%14/01/2023 USD 5,572,000 5,854,222 0.37IDBI Bank Ltd., Reg. S 3.75%25/01/2019 USD 3,900,000 3,962,673 0.25
12,934,115 0.81
IndonesiaIndonesia Government InternationalBond, Reg. S 5.875% 13/03/2020 USD 1,779,000 1,982,002 0.12Indonesia Government InternationalBond, Reg. S 3.375% 15/04/2023 USD 7,217,000 7,283,245 0.46Indonesia Government InternationalBond, Reg. S 5.875% 15/01/2024 USD 4,719,000 5,475,069 0.34Indonesia Government InternationalBond, Reg. S 4.125% 15/01/2025 USD 3,300,000 3,445,071 0.22Indonesia Government InternationalBond, Reg. S 6.625% 17/02/2037 USD 14,250,000 17,629,088 1.10Indonesia Government InternationalBond, Reg. S 6.75% 15/01/2044 USD 1,624,000 2,067,753 0.13Indonesia Government InternationalBond, Reg. S 5.95% 08/01/2046 USD 5,456,000 6,442,619 0.40Pertamina Persero PT, Reg. S 5.25%23/05/2021 USD 3,000,000 3,221,205 0.20Pertamina Persero PT, Reg. S 4.875%03/05/2022 USD 7,286,000 7,678,409 0.48Pertamina Persero PT, Reg. S 6.5%27/05/2041 USD 2,980,000 3,181,344 0.20Pertamina Persero PT, Reg. S 6%03/05/2042 USD 1,971,000 2,000,723 0.13
Pertamina Persero PT, Reg. S 6.45%30/05/2044 USD 3,905,000 4,165,073 0.26Perusahaan Listrik Negara PT, Reg. S5.5% 22/11/2021 USD 4,500,000 4,902,750 0.31
69,474,351 4.35
IraqIraq International Bond, Reg. S 5.8%15/01/2028 USD 6,845,000 5,224,788 0.33
5,224,788 0.33
IrelandAlfa Bank AO, Reg. S 7.75% 28/04/2021 USD 3,550,000 4,047,816 0.25Vnesheconombank, Reg. S 5.375%13/02/2017 USD 4,400,000 4,486,790 0.28Vnesheconombank, Reg. S 4.224%21/11/2018 USD 4,500,000 4,589,393 0.29Vnesheconombank, Reg. S 6.025%05/07/2022 USD 6,200,000 6,577,208 0.41Vnesheconombank, Reg. S 5.942%21/11/2023 USD 8,000,000 8,393,400 0.53
28,094,607 1.76
Ivory CoastIvory Coast Government InternationalBond, Reg. S 5.375% 23/07/2024 USD 7,250,000 6,788,247 0.43Ivory Coast Government InternationalBond, Reg. S 6.375% 03/03/2028 USD 7,900,000 7,667,187 0.48Ivory Coast Government InternationalBond, Reg. S, STEP 5.75% 31/12/2032 USD 6,078,600 5,663,888 0.35
20,119,322 1.26
JamaicaJamaica Government InternationalBond 7.625% 09/07/2025 USD 2,314,000 2,592,929 0.16Jamaica Government InternationalBond 9.25% 17/10/2025 USD 2,974,000 3,584,518 0.22Jamaica Government InternationalBond 6.75% 28/04/2028 USD 8,200,000 8,630,131 0.54Jamaica Government InternationalBond 8% 15/03/2039 USD 977,000 1,074,700 0.07Jamaica Government InternationalBond 7.875% 28/07/2045 USD 1,050,000 1,122,308 0.07
17,004,586 1.06
JordanJordan Government International Bond,Reg. S 6.125% 29/01/2026 USD 3,481,000 3,698,075 0.23
3,698,075 0.23
KazakhstanKazakhstan Government InternationalBond, Reg. S 3.875% 14/10/2024 USD 2,129,000 2,149,162 0.13Kazakhstan Government InternationalBond, Reg. S 5.125% 21/07/2025 USD 10,670,000 11,715,073 0.73Kazakhstan Government InternationalBond, Reg. S 4.875% 14/10/2044 USD 1,100,000 1,075,503 0.07Kazakhstan Government InternationalBond, Reg. S 6.5% 21/07/2045 USD 5,100,000 5,940,582 0.37KazMunayGas National Co. JSC, Reg. S9.125% 02/07/2018 USD 3,986,000 4,421,570 0.28KazMunayGas National Co. JSC, Reg. S7% 05/05/2020 USD 4,875,000 5,373,566 0.34KazMunayGas National Co. JSC, Reg. S6.375% 09/04/2021 USD 8,168,000 8,940,203 0.56KazMunayGas National Co. JSC, Reg. S4.4% 30/04/2023 USD 6,170,000 6,060,482 0.38
45,676,141 2.86
LebanonLebanon Government InternationalBond 9% 20/03/2017 USD 5,720,000 5,904,384 0.37Lebanon Government InternationalBond, Reg. S 5.45% 28/11/2019 USD 2,340,000 2,313,101 0.14Lebanon Government InternationalBond 6.375% 09/03/2020 USD 13,990,000 14,219,716 0.89Lebanon Government InternationalBond, Reg. S 8.25% 12/04/2021 USD 16,534,000 17,839,938 1.12Lebanon Government InternationalBond, Reg. S 6.6% 27/11/2026 USD 3,476,000 3,376,100 0.21
43,653,239 2.73
100
JPMorgan Funds - Emerging Markets Debt FundSchedule of Investments (continued)
As at 30 June 2016
Investments Currency
Quantity/Nominal
Value
MarketValue
USD
%of
NetAssets Investments Currency
Quantity/Nominal
Value
MarketValue
USD
%of
NetAssets
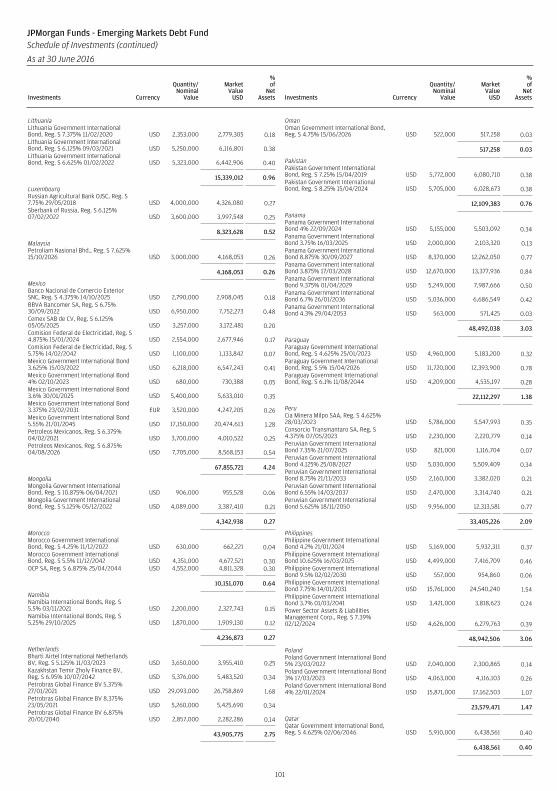
LithuaniaLithuania Government InternationalBond, Reg. S 7.375% 11/02/2020 USD 2,353,000 2,779,305 0.18Lithuania Government InternationalBond, Reg. S 6.125% 09/03/2021 USD 5,250,000 6,116,801 0.38Lithuania Government InternationalBond, Reg. S 6.625% 01/02/2022 USD 5,323,000 6,442,906 0.40
15,339,012 0.96
LuxembourgRussian Agricultural Bank OJSC, Reg. S7.75% 29/05/2018 USD 4,000,000 4,326,080 0.27Sberbank of Russia, Reg. S 6.125%07/02/2022 USD 3,600,000 3,997,548 0.25
8,323,628 0.52
MalaysiaPetroliam Nasional Bhd., Reg. S 7.625%15/10/2026 USD 3,000,000 4,168,053 0.26
4,168,053 0.26
MexicoBanco Nacional de Comercio ExteriorSNC, Reg. S 4.375% 14/10/2025 USD 2,790,000 2,908,045 0.18BBVA Bancomer SA, Reg. S 6.75%30/09/2022 USD 6,950,000 7,752,273 0.48Cemex SAB de CV, Reg. S 6.125%05/05/2025 USD 3,257,000 3,172,481 0.20Comision Federal de Electricidad, Reg. S4.875% 15/01/2024 USD 2,554,000 2,677,946 0.17Comision Federal de Electricidad, Reg. S5.75% 14/02/2042 USD 1,100,000 1,133,842 0.07Mexico Government International Bond3.625% 15/03/2022 USD 6,218,000 6,547,243 0.41Mexico Government International Bond4% 02/10/2023 USD 680,000 730,388 0.05Mexico Government International Bond3.6% 30/01/2025 USD 5,400,000 5,633,010 0.35Mexico Government International Bond3.375% 23/02/2031 EUR 3,520,000 4,247,205 0.26Mexico Government International Bond5.55% 21/01/2045 USD 17,150,000 20,474,613 1.28Petroleos Mexicanos, Reg. S 6.375%04/02/2021 USD 3,700,000 4,010,522 0.25Petroleos Mexicanos, Reg. S 6.875%04/08/2026 USD 7,705,000 8,568,153 0.54
67,855,721 4.24
MongoliaMongolia Government InternationalBond, Reg. S 10.875% 06/04/2021 USD 906,000 955,528 0.06Mongolia Government InternationalBond, Reg. S 5.125% 05/12/2022 USD 4,089,000 3,387,410 0.21
4,342,938 0.27
MoroccoMorocco Government InternationalBond, Reg. S 4.25% 11/12/2022 USD 630,000 662,221 0.04Morocco Government InternationalBond, Reg. S 5.5% 11/12/2042 USD 4,351,000 4,677,521 0.30OCP SA, Reg. S 6.875% 25/04/2044 USD 4,552,000 4,811,328 0.30
10,151,070 0.64
NamibiaNamibia International Bonds, Reg. S5.5% 03/11/2021 USD 2,200,000 2,327,743 0.15Namibia International Bonds, Reg. S5.25% 29/10/2025 USD 1,870,000 1,909,130 0.12
4,236,873 0.27
NetherlandsBharti Airtel International NetherlandsBV, Reg. S 5.125% 11/03/2023 USD 3,650,000 3,955,410 0.25Kazakhstan Temir Zholy Finance BV,Reg. S 6.95% 10/07/2042 USD 5,376,000 5,483,520 0.34Petrobras Global Finance BV 5.375%27/01/2021 USD 29,093,000 26,758,869 1.68Petrobras Global Finance BV 8.375%23/05/2021 USD 5,260,000 5,425,690 0.34Petrobras Global Finance BV 6.875%20/01/2040 USD 2,857,000 2,282,286 0.14
43,905,775 2.75
OmanOman Government International Bond,Reg. S 4.75% 15/06/2026 USD 522,000 517,258 0.03
517,258 0.03
PakistanPakistan Government InternationalBond, Reg. S 7.25% 15/04/2019 USD 5,772,000 6,080,710 0.38Pakistan Government InternationalBond, Reg. S 8.25% 15/04/2024 USD 5,705,000 6,028,673 0.38
12,109,383 0.76
PanamaPanama Government InternationalBond 4% 22/09/2024 USD 5,155,000 5,503,092 0.34Panama Government InternationalBond 3.75% 16/03/2025 USD 2,000,000 2,103,320 0.13Panama Government InternationalBond 8.875% 30/09/2027 USD 8,370,000 12,262,050 0.77Panama Government InternationalBond 3.875% 17/03/2028 USD 12,670,000 13,377,936 0.84Panama Government InternationalBond 9.375% 01/04/2029 USD 5,249,000 7,987,666 0.50Panama Government InternationalBond 6.7% 26/01/2036 USD 5,036,000 6,686,549 0.42Panama Government InternationalBond 4.3% 29/04/2053 USD 563,000 571,425 0.03
48,492,038 3.03
ParaguayParaguay Government InternationalBond, Reg. S 4.625% 25/01/2023 USD 4,960,000 5,183,200 0.32Paraguay Government InternationalBond, Reg. S 5% 15/04/2026 USD 11,720,000 12,393,900 0.78Paraguay Government InternationalBond, Reg. S 6.1% 11/08/2044 USD 4,209,000 4,535,197 0.28
22,112,297 1.38
PeruCia Minera Milpo SAA, Reg. S 4.625%28/03/2023 USD 5,786,000 5,547,993 0.35Consorcio Transmantaro SA, Reg. S4.375% 07/05/2023 USD 2,230,000 2,220,779 0.14Peruvian Government InternationalBond 7.35% 21/07/2025 USD 821,000 1,116,704 0.07Peruvian Government InternationalBond 4.125% 25/08/2027 USD 5,030,000 5,509,409 0.34Peruvian Government InternationalBond 8.75% 21/11/2033 USD 2,160,000 3,382,020 0.21Peruvian Government InternationalBond 6.55% 14/03/2037 USD 2,470,000 3,314,740 0.21Peruvian Government InternationalBond 5.625% 18/11/2050 USD 9,956,000 12,313,581 0.77
33,405,226 2.09
PhilippinesPhilippine Government InternationalBond 4.2% 21/01/2024 USD 5,169,000 5,932,311 0.37Philippine Government InternationalBond 10.625% 16/03/2025 USD 4,499,000 7,416,709 0.46Philippine Government InternationalBond 9.5% 02/02/2030 USD 557,000 954,860 0.06Philippine Government InternationalBond 7.75% 14/01/2031 USD 15,761,000 24,540,240 1.54Philippine Government InternationalBond 3.7% 01/03/2041 USD 3,421,000 3,818,623 0.24Power Sector Assets & LiabilitiesManagement Corp., Reg. S 7.39%02/12/2024 USD 4,626,000 6,279,763 0.39
48,942,506 3.06
PolandPoland Government International Bond5% 23/03/2022 USD 2,040,000 2,300,865 0.14Poland Government International Bond3% 17/03/2023 USD 4,063,000 4,116,103 0.26Poland Government International Bond4% 22/01/2024 USD 15,871,000 17,162,503 1.07
23,579,471 1.47
QatarQatar Government International Bond,Reg. S 4.625% 02/06/2046 USD 5,910,000 6,438,561 0.40
6,438,561 0.40
101
JPMorgan Funds - Emerging Markets Debt FundSchedule of Investments (continued)
As at 30 June 2016
Investments Currency
Quantity/Nominal
Value
MarketValue
USD
%of
NetAssets Investments Currency
Quantity/Nominal
Value
MarketValue
USD
%of
NetAssets
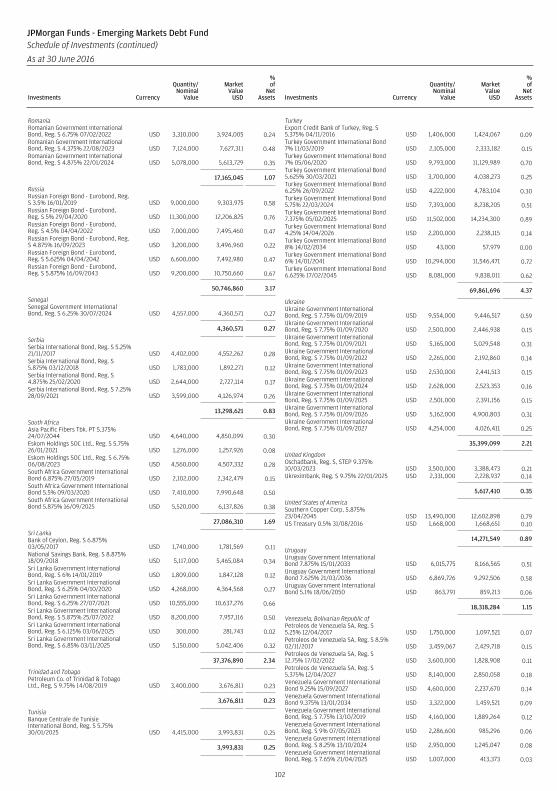
RomaniaRomanian Government InternationalBond, Reg. S 6.75% 07/02/2022 USD 3,310,000 3,924,005 0.24Romanian Government InternationalBond, Reg. S 4.375% 22/08/2023 USD 7,124,000 7,627,311 0.48Romanian Government InternationalBond, Reg. S 4.875% 22/01/2024 USD 5,078,000 5,613,729 0.35
17,165,045 1.07
RussiaRussian Foreign Bond - Eurobond, Reg.S 3.5% 16/01/2019 USD 9,000,000 9,303,975 0.58Russian Foreign Bond - Eurobond,Reg. S 5% 29/04/2020 USD 11,300,000 12,206,825 0.76Russian Foreign Bond - Eurobond,Reg. S 4.5% 04/04/2022 USD 7,000,000 7,495,460 0.47Russian Foreign Bond - Eurobond, Reg.S 4.875% 16/09/2023 USD 3,200,000 3,496,960 0.22Russian Foreign Bond - Eurobond,Reg. S 5.625% 04/04/2042 USD 6,600,000 7,492,980 0.47Russian Foreign Bond - Eurobond,Reg. S 5.875% 16/09/2043 USD 9,200,000 10,750,660 0.67
50,746,860 3.17
SenegalSenegal Government InternationalBond, Reg. S 6.25% 30/07/2024 USD 4,557,000 4,360,571 0.27
4,360,571 0.27
SerbiaSerbia International Bond, Reg. S 5.25%21/11/2017 USD 4,402,000 4,552,262 0.28Serbia International Bond, Reg. S5.875% 03/12/2018 USD 1,783,000 1,892,271 0.12Serbia International Bond, Reg. S4.875% 25/02/2020 USD 2,644,000 2,727,114 0.17Serbia International Bond, Reg. S 7.25%28/09/2021 USD 3,599,000 4,126,974 0.26
13,298,621 0.83
South AfricaAsia Pacific Fibers Tbk. PT 5.375%24/07/2044 USD 4,640,000 4,850,099 0.30Eskom Holdings SOC Ltd., Reg. S 5.75%26/01/2021 USD 1,276,000 1,257,926 0.08Eskom Holdings SOC Ltd., Reg. S 6.75%06/08/2023 USD 4,560,000 4,507,332 0.28South Africa Government InternationalBond 6.875% 27/05/2019 USD 2,102,000 2,342,479 0.15South Africa Government InternationalBond 5.5% 09/03/2020 USD 7,410,000 7,990,648 0.50South Africa Government InternationalBond 5.875% 16/09/2025 USD 5,520,000 6,137,826 0.38
27,086,310 1.69
Sri LankaBank of Ceylon, Reg. S 6.875%03/05/2017 USD 1,740,000 1,781,569 0.11National Savings Bank, Reg. S 8.875%18/09/2018 USD 5,117,000 5,465,084 0.34Sri Lanka Government InternationalBond, Reg. S 6% 14/01/2019 USD 1,809,000 1,847,128 0.12Sri Lanka Government InternationalBond, Reg. S 6.25% 04/10/2020 USD 4,268,000 4,364,568 0.27Sri Lanka Government InternationalBond, Reg. S 6.25% 27/07/2021 USD 10,555,000 10,637,276 0.66Sri Lanka Government InternationalBond, Reg. S 5.875% 25/07/2022 USD 8,200,000 7,957,116 0.50Sri Lanka Government InternationalBond, Reg. S 6.125% 03/06/2025 USD 300,000 281,743 0.02Sri Lanka Government InternationalBond, Reg. S 6.85% 03/11/2025 USD 5,150,000 5,042,406 0.32
37,376,890 2.34
Trinidad and TobagoPetroleum Co. of Trinidad & TobagoLtd., Reg. S 9.75% 14/08/2019 USD 3,400,000 3,676,811 0.23
3,676,811 0.23
TunisiaBanque Centrale de TunisieInternational Bond, Reg. S 5.75%30/01/2025 USD 4,415,000 3,993,831 0.25
3,993,831 0.25
TurkeyExport Credit Bank of Turkey, Reg. S5.375% 04/11/2016 USD 1,406,000 1,424,067 0.09Turkey Government International Bond7% 11/03/2019 USD 2,105,000 2,333,182 0.15Turkey Government International Bond7% 05/06/2020 USD 9,793,000 11,129,989 0.70Turkey Government International Bond5.625% 30/03/2021 USD 3,700,000 4,038,273 0.25Turkey Government International Bond6.25% 26/09/2022 USD 4,222,000 4,783,104 0.30Turkey Government International Bond5.75% 22/03/2024 USD 7,393,000 8,238,205 0.51Turkey Government International Bond7.375% 05/02/2025 USD 11,502,000 14,234,300 0.89Turkey Government International Bond4.25% 14/04/2026 USD 2,200,000 2,238,115 0.14Turkey Government International Bond8% 14/02/2034 USD 43,000 57,979 0.00Turkey Government International Bond6% 14/01/2041 USD 10,294,000 11,546,471 0.72Turkey Government International Bond6.625% 17/02/2045 USD 8,081,000 9,838,011 0.62
69,861,696 4.37
UkraineUkraine Government InternationalBond, Reg. S 7.75% 01/09/2019 USD 9,554,000 9,446,517 0.59Ukraine Government InternationalBond, Reg. S 7.75% 01/09/2020 USD 2,500,000 2,446,938 0.15Ukraine Government InternationalBond, Reg. S 7.75% 01/09/2021 USD 5,165,000 5,029,548 0.31Ukraine Government InternationalBond, Reg. S 7.75% 01/09/2022 USD 2,265,000 2,192,860 0.14Ukraine Government InternationalBond, Reg. S 7.75% 01/09/2023 USD 2,530,000 2,441,513 0.15Ukraine Government InternationalBond, Reg. S 7.75% 01/09/2024 USD 2,628,000 2,523,353 0.16Ukraine Government InternationalBond, Reg. S 7.75% 01/09/2025 USD 2,501,000 2,391,156 0.15Ukraine Government InternationalBond, Reg. S 7.75% 01/09/2026 USD 5,162,000 4,900,803 0.31Ukraine Government InternationalBond, Reg. S 7.75% 01/09/2027 USD 4,254,000 4,026,411 0.25
35,399,099 2.21
United KingdomOschadbank, Reg. S, STEP 9.375%10/03/2023 USD 3,500,000 3,388,473 0.21Ukreximbank, Reg. S 9.75% 22/01/2025 USD 2,331,000 2,228,937 0.14
5,617,410 0.35
United States of AmericaSouthern Copper Corp. 5.875%23/04/2045 USD 13,490,000 12,602,898 0.79US Treasury 0.5% 31/08/2016 USD 1,668,000 1,668,651 0.10
14,271,549 0.89
UruguayUruguay Government InternationalBond 7.875% 15/01/2033 USD 6,015,775 8,166,565 0.51Uruguay Government InternationalBond 7.625% 21/03/2036 USD 6,869,726 9,292,506 0.58Uruguay Government InternationalBond 5.1% 18/06/2050 USD 863,791 859,213 0.06
18,318,284 1.15
Venezuela, Bolivarian Republic ofPetroleos de Venezuela SA, Reg. S5.25% 12/04/2017 USD 1,750,000 1,097,521 0.07Petroleos de Venezuela SA, Reg. S 8.5%02/11/2017 USD 3,459,067 2,429,718 0.15Petroleos de Venezuela SA, Reg. S12.75% 17/02/2022 USD 3,600,000 1,828,908 0.11Petroleos de Venezuela SA, Reg. S5.375% 12/04/2027 USD 8,140,000 2,850,058 0.18Venezuela Government InternationalBond 9.25% 15/09/2027 USD 4,600,000 2,237,670 0.14Venezuela Government InternationalBond 9.375% 13/01/2034 USD 3,322,000 1,459,521 0.09Venezuela Government InternationalBond, Reg. S 7.75% 13/10/2019 USD 4,160,000 1,889,264 0.12Venezuela Government InternationalBond, Reg. S 9% 07/05/2023 USD 2,286,600 985,296 0.06Venezuela Government InternationalBond, Reg. S 8.25% 13/10/2024 USD 2,950,000 1,245,047 0.08Venezuela Government InternationalBond, Reg. S 7.65% 21/04/2025 USD 1,007,000 413,373 0.03
102
JPMorgan Funds - Emerging Markets Debt FundSchedule of Investments (continued)
As at 30 June 2016
Investments Currency
Quantity/Nominal
Value
MarketValue
USD
%of
NetAssets Investments Currency
Quantity/Nominal
Value
MarketValue
USD
%of
NetAssets
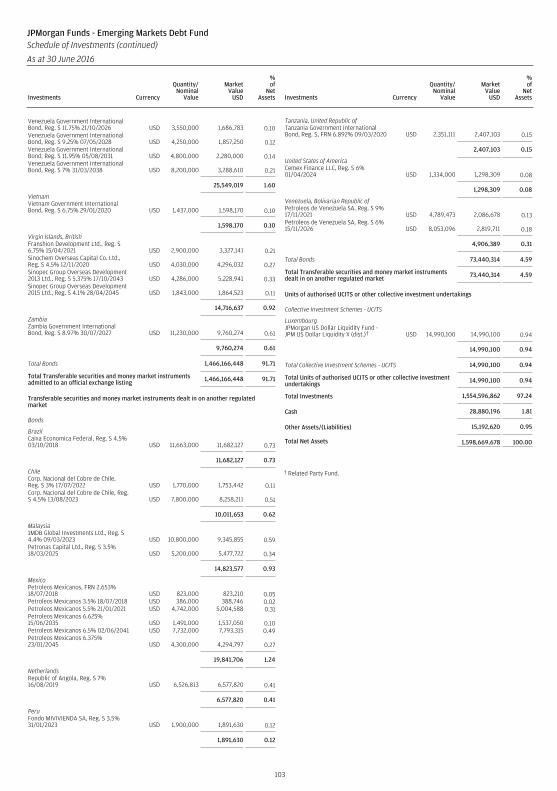
Venezuela Government InternationalBond, Reg. S 11.75% 21/10/2026 USD 3,550,000 1,686,783 0.10Venezuela Government InternationalBond, Reg. S 9.25% 07/05/2028 USD 4,250,000 1,857,250 0.12Venezuela Government InternationalBond, Reg. S 11.95% 05/08/2031 USD 4,800,000 2,280,000 0.14Venezuela Government InternationalBond, Reg. S 7% 31/03/2038 USD 8,200,000 3,288,610 0.21
25,549,019 1.60
VietnamVietnam Government InternationalBond, Reg. S 6.75% 29/01/2020 USD 1,437,000 1,598,170 0.10
1,598,170 0.10
Virgin Islands, BritishFranshion Development Ltd., Reg. S6.75% 15/04/2021 USD 2,900,000 3,327,141 0.21Sinochem Overseas Capital Co. Ltd.,Reg. S 4.5% 12/11/2020 USD 4,030,000 4,296,032 0.27Sinopec Group Overseas Development2013 Ltd., Reg. S 5.375% 17/10/2043 USD 4,286,000 5,228,941 0.33Sinopec Group Overseas Development2015 Ltd., Reg. S 4.1% 28/04/2045 USD 1,843,000 1,864,523 0.11
14,716,637 0.92
ZambiaZambia Government InternationalBond, Reg. S 8.97% 30/07/2027 USD 11,230,000 9,760,274 0.61
9,760,274 0.61
Total Bonds 1,466,166,448 91.71
Total Transferable securities and money market instrumentsadmitted to an official exchange listing 1,466,166,448 91.71
Transferable securities and money market instruments dealt in on another regulatedmarket
Bonds
BrazilCaixa Economica Federal, Reg. S 4.5%03/10/2018 USD 11,663,000 11,682,127 0.73
11,682,127 0.73
ChileCorp. Nacional del Cobre de Chile,Reg. S 3% 17/07/2022 USD 1,770,000 1,753,442 0.11Corp. Nacional del Cobre de Chile, Reg.S 4.5% 13/08/2023 USD 7,800,000 8,258,211 0.51
10,011,653 0.62
Malaysia1MDB Global Investments Ltd., Reg. S4.4% 09/03/2023 USD 10,800,000 9,345,855 0.59Petronas Capital Ltd., Reg. S 3.5%18/03/2025 USD 5,200,000 5,477,722 0.34
14,823,577 0.93
MexicoPetroleos Mexicanos, FRN 2.653%18/07/2018 USD 823,000 823,210 0.05Petroleos Mexicanos 3.5% 18/07/2018 USD 386,000 388,746 0.02Petroleos Mexicanos 5.5% 21/01/2021 USD 4,742,000 5,004,588 0.31Petroleos Mexicanos 6.625%15/06/2035 USD 1,491,000 1,537,050 0.10Petroleos Mexicanos 6.5% 02/06/2041 USD 7,732,000 7,793,315 0.49Petroleos Mexicanos 6.375%23/01/2045 USD 4,300,000 4,294,797 0.27
19,841,706 1.24
NetherlandsRepublic of Angola, Reg. S 7%16/08/2019 USD 6,526,813 6,577,820 0.41
6,577,820 0.41
PeruFondo MIVIVIENDA SA, Reg. S 3.5%31/01/2023 USD 1,900,000 1,891,630 0.12
1,891,630 0.12
Tanzania, United Republic ofTanzania Government InternationalBond, Reg. S, FRN 6.892% 09/03/2020 USD 2,351,111 2,407,103 0.15
2,407,103 0.15
United States of AmericaCemex Finance LLC, Reg. S 6%01/04/2024 USD 1,334,000 1,298,309 0.08
1,298,309 0.08
Venezuela, Bolivarian Republic ofPetroleos de Venezuela SA, Reg. S 9%17/11/2021 USD 4,789,473 2,086,678 0.13Petroleos de Venezuela SA, Reg. S 6%15/11/2026 USD 8,053,096 2,819,711 0.18
4,906,389 0.31
Total Bonds 73,440,314 4.59
Total Transferable securities and money market instrumentsdealt in on another regulated market 73,440,314 4.59
Units of authorised UCITS or other collective investment undertakings
Collective Investment Schemes - UCITS
LuxembourgJPMorgan US Dollar Liquidity Fund -JPM US Dollar Liquidity X (dist.)† USD 14,990,100 14,990,100 0.94
14,990,100 0.94
Total Collective Investment Schemes - UCITS 14,990,100 0.94
Total Units of authorised UCITS or other collective investmentundertakings 14,990,100 0.94
Total Investments 1,554,596,862 97.24
Cash 28,880,196 1.81
Other Assets/(Liabilities) 15,192,620 0.95
Total Net Assets 1,598,669,678 100.00
† Related Party Fund.
103
JPMorgan Funds - Emerging Markets Debt FundSchedule of Investments (continued)
As at 30 June 2016
Investments Currency
Quantity/Nominal
Value
MarketValue
USD
%of
NetAssets Investments Currency
Quantity/Nominal
Value
MarketValue
USD
%of
NetAssets
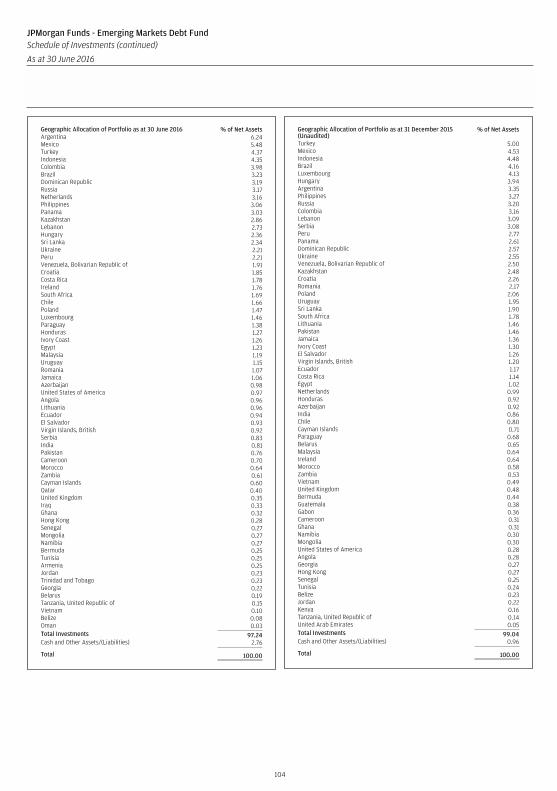
Geographic Allocation of Portfolio as at 30 June 2016 % of Net AssetsArgentina 6.24Mexico 5.48Turkey 4.37Indonesia 4.35Colombia 3.98Brazil 3.23Dominican Republic 3.19Russia 3.17Netherlands 3.16Philippines 3.06Panama 3.03Kazakhstan 2.86Lebanon 2.73Hungary 2.36Sri Lanka 2.34Ukraine 2.21Peru 2.21Venezuela, Bolivarian Republic of 1.91Croatia 1.85Costa Rica 1.78Ireland 1.76South Africa 1.69Chile 1.66Poland 1.47Luxembourg 1.46Paraguay 1.38Honduras 1.27Ivory Coast 1.26Egypt 1.23Malaysia 1.19Uruguay 1.15Romania 1.07Jamaica 1.06Azerbaijan 0.98United States of America 0.97Angola 0.96Lithuania 0.96Ecuador 0.94El Salvador 0.93Virgin Islands, British 0.92Serbia 0.83India 0.81Pakistan 0.76Cameroon 0.70Morocco 0.64Zambia 0.61Cayman Islands 0.60Qatar 0.40United Kingdom 0.35Iraq 0.33Ghana 0.32Hong Kong 0.28Senegal 0.27Mongolia 0.27Namibia 0.27Bermuda 0.25Tunisia 0.25Armenia 0.25Jordan 0.23Trinidad and Tobago 0.23Georgia 0.22Belarus 0.19Tanzania, United Republic of 0.15Vietnam 0.10Belize 0.08Oman 0.03Total Investments 97.24Cash and Other Assets/(Liabilities) 2.76
Total 100.00
Geographic Allocation of Portfolio as at 31 December 2015(Unaudited)
% of Net Assets
Turkey 5.00Mexico 4.53Indonesia 4.48Brazil 4.16Luxembourg 4.13Hungary 3.94Argentina 3.35Philippines 3.27Russia 3.20Colombia 3.16Lebanon 3.09Serbia 3.08Peru 2.77Panama 2.61Dominican Republic 2.57Ukraine 2.55Venezuela, Bolivarian Republic of 2.50Kazakhstan 2.48Croatia 2.26Romania 2.17Poland 2.06Uruguay 1.95Sri Lanka 1.90South Africa 1.78Lithuania 1.46Pakistan 1.46Jamaica 1.36Ivory Coast 1.30El Salvador 1.26Virgin Islands, British 1.20Ecuador 1.17Costa Rica 1.14Egypt 1.02Netherlands 0.99Honduras 0.92Azerbaijan 0.92India 0.86Chile 0.80Cayman Islands 0.71Paraguay 0.68Belarus 0.65Malaysia 0.64Ireland 0.64Morocco 0.58Zambia 0.53Vietnam 0.49United Kingdom 0.48Bermuda 0.44Guatemala 0.38Gabon 0.36Cameroon 0.31Ghana 0.31Namibia 0.30Mongolia 0.30United States of America 0.28Angola 0.28Georgia 0.27Hong Kong 0.27Senegal 0.25Tunisia 0.24Belize 0.23Jordan 0.22Kenya 0.16Tanzania, United Republic of 0.14United Arab Emirates 0.05Total Investments 99.04Cash and Other Assets/(Liabilities) 0.96
Total 100.00
104
JPMorgan Funds - Emerging Markets Debt FundSchedule of Investments (continued)
As at 30 June 2016
Investments Currency
Quantity/Nominal
Value
MarketValue
USD
%of
NetAssets Investments Currency
Quantity/Nominal
Value
MarketValue
USD
%of
NetAssets
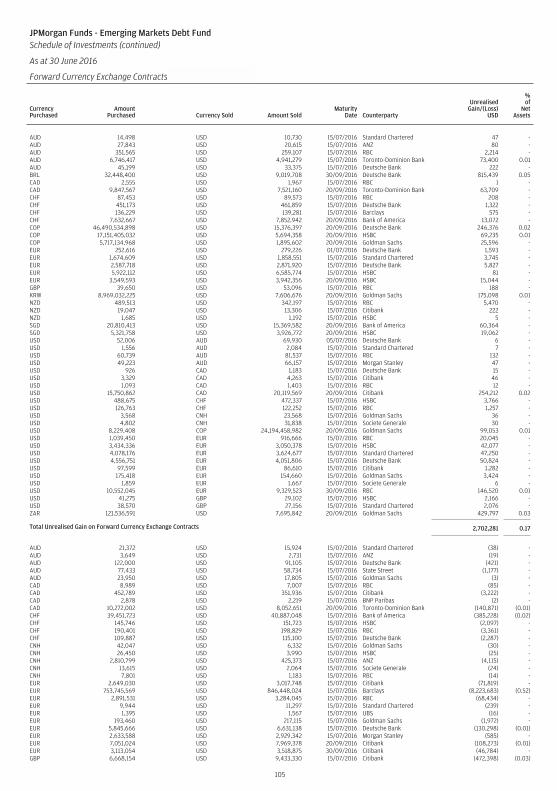
JPMorgan Funds - Emerging Markets Debt FundSchedule of Investments (continued)
As at 30 June 2016
Forward Currency Exchange Contracts (continued)
CurrencyPurchased
AmountPurchased Currency Sold Amount Sold
MaturityDate Counterparty
UnrealisedGain/(Loss)
USD
%of
NetAssets
AUD 14,498 USD 10,730 15/07/2016 Standard Chartered 47 -AUD 27,843 USD 20,615 15/07/2016 ANZ 80 -AUD 351,565 USD 259,107 15/07/2016 RBC 2,214 -AUD 6,746,417 USD 4,941,279 15/07/2016 Toronto-Dominion Bank 73,400 0.01AUD 45,199 USD 33,375 15/07/2016 Deutsche Bank 222 -BRL 32,448,400 USD 9,019,708 30/09/2016 Deutsche Bank 815,439 0.05CAD 2,555 USD 1,967 15/07/2016 RBC 1 -CAD 9,847,567 USD 7,521,160 20/09/2016 Toronto-Dominion Bank 63,709 -CHF 87,453 USD 89,573 15/07/2016 RBC 208 -CHF 451,173 USD 461,859 15/07/2016 Deutsche Bank 1,322 -CHF 136,229 USD 139,281 15/07/2016 Barclays 575 -CHF 7,632,667 USD 7,852,942 20/09/2016 Bank of America 13,072 -COP 46,490,534,898 USD 15,376,397 20/09/2016 Deutsche Bank 246,376 0.02COP 17,151,405,032 USD 5,694,358 20/09/2016 HSBC 69,235 0.01COP 5,717,134,968 USD 1,895,602 20/09/2016 Goldman Sachs 25,596 -EUR 252,616 USD 279,226 01/07/2016 Deutsche Bank 1,593 -EUR 1,674,609 USD 1,858,551 15/07/2016 Standard Chartered 3,745 -EUR 2,587,718 USD 2,871,920 15/07/2016 Deutsche Bank 5,827 -EUR 5,922,112 USD 6,585,774 15/07/2016 HSBC 81 -EUR 3,549,593 USD 3,942,356 20/09/2016 HSBC 15,044 -GBP 39,650 USD 53,096 15/07/2016 RBC 188 -KRW 8,969,032,225 USD 7,606,676 20/09/2016 Goldman Sachs 175,098 0.01NZD 489,513 USD 342,197 15/07/2016 RBC 5,470 -NZD 19,047 USD 13,306 15/07/2016 Citibank 222 -NZD 1,685 USD 1,192 15/07/2016 HSBC 5 -SGD 20,810,413 USD 15,369,582 20/09/2016 Bank of America 60,364 -SGD 5,321,758 USD 3,926,772 20/09/2016 HSBC 19,062 -USD 52,006 AUD 69,930 05/07/2016 Deutsche Bank 6 -USD 1,556 AUD 2,084 15/07/2016 Standard Chartered 7 -USD 60,739 AUD 81,537 15/07/2016 RBC 132 -USD 49,223 AUD 66,157 15/07/2016 Morgan Stanley 47 -USD 926 CAD 1,183 15/07/2016 Deutsche Bank 15 -USD 3,329 CAD 4,263 15/07/2016 Citibank 46 -USD 1,093 CAD 1,403 15/07/2016 RBC 12 -USD 15,750,862 CAD 20,119,569 20/09/2016 Citibank 254,212 0.02USD 488,675 CHF 472,337 15/07/2016 HSBC 3,766 -USD 126,763 CHF 122,252 15/07/2016 RBC 1,257 -USD 3,568 CNH 23,568 15/07/2016 Goldman Sachs 36 -USD 4,802 CNH 31,838 15/07/2016 Societe Generale 30 -USD 8,229,408 COP 24,194,458,982 20/09/2016 Goldman Sachs 99,053 0.01USD 1,039,450 EUR 916,666 15/07/2016 RBC 20,045 -USD 3,434,336 EUR 3,050,378 15/07/2016 HSBC 42,077 -USD 4,078,176 EUR 3,624,677 15/07/2016 Standard Chartered 47,250 -USD 4,556,751 EUR 4,051,806 15/07/2016 Deutsche Bank 50,824 -USD 97,599 EUR 86,610 15/07/2016 Citibank 1,282 -USD 175,418 EUR 154,660 15/07/2016 Goldman Sachs 3,424 -USD 1,859 EUR 1,667 15/07/2016 Societe Generale 6 -USD 10,552,045 EUR 9,329,523 30/09/2016 RBC 146,520 0.01USD 41,275 GBP 29,102 15/07/2016 HSBC 2,166 -USD 38,570 GBP 27,156 15/07/2016 Standard Chartered 2,076 -ZAR 121,536,591 USD 7,695,842 20/09/2016 Goldman Sachs 429,797 0.03
Total Unrealised Gain on Forward Currency Exchange Contracts 2,702,281 0.17
AUD 21,372 USD 15,924 15/07/2016 Standard Chartered (38) -AUD 3,649 USD 2,731 15/07/2016 ANZ (19) -AUD 122,000 USD 91,105 15/07/2016 Deutsche Bank (421) -AUD 77,433 USD 58,734 15/07/2016 State Street (1,177) -AUD 23,950 USD 17,805 15/07/2016 Goldman Sachs (3) -CAD 8,989 USD 7,007 15/07/2016 RBC (85) -CAD 452,789 USD 351,936 15/07/2016 Citibank (3,222) -CAD 2,878 USD 2,219 15/07/2016 BNP Paribas (2) -CAD 10,272,002 USD 8,052,651 20/09/2016 Toronto-Dominion Bank (140,871) (0.01)CHF 39,451,723 USD 40,887,048 15/07/2016 Bank of America (385,228) (0.02)CHF 145,746 USD 151,723 15/07/2016 HSBC (2,097) -CHF 190,401 USD 198,829 15/07/2016 RBC (3,361) -CHF 109,887 USD 115,100 15/07/2016 Deutsche Bank (2,287) -CNH 42,047 USD 6,332 15/07/2016 Goldman Sachs (30) -CNH 26,450 USD 3,990 15/07/2016 HSBC (25) -CNH 2,810,799 USD 425,373 15/07/2016 ANZ (4,115) -CNH 13,615 USD 2,064 15/07/2016 Societe Generale (24) -CNH 7,801 USD 1,183 15/07/2016 RBC (14) -EUR 2,649,030 USD 3,017,748 15/07/2016 Citibank (71,819) -EUR 753,745,569 USD 846,448,024 15/07/2016 Barclays (8,223,683) (0.52)EUR 2,891,531 USD 3,284,045 15/07/2016 RBC (68,434) -EUR 9,944 USD 11,297 15/07/2016 Standard Chartered (239) -EUR 1,395 USD 1,567 15/07/2016 UBS (16) -EUR 193,460 USD 217,115 15/07/2016 Goldman Sachs (1,972) -EUR 5,845,666 USD 6,631,138 15/07/2016 Deutsche Bank (130,298) (0.01)EUR 2,633,588 USD 2,929,342 15/07/2016 Morgan Stanley (585) -EUR 7,051,024 USD 7,969,378 20/09/2016 Citibank (108,273) (0.01)EUR 3,113,054 USD 3,518,875 30/09/2016 Citibank (46,784) -GBP 6,668,154 USD 9,433,330 15/07/2016 Citibank (472,398) (0.03)
105
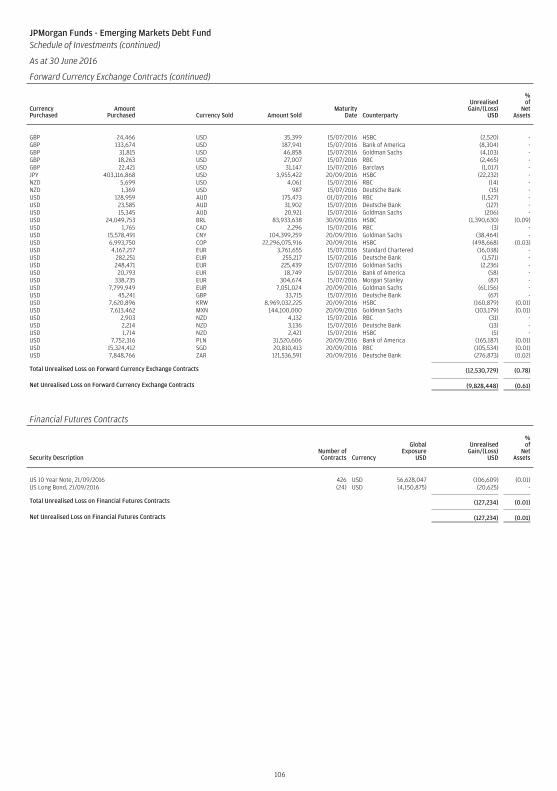
JPMorgan Funds - Emerging Markets Debt FundSchedule of Investments (continued)
As at 30 June 2016
Forward Currency Exchange Contracts (continued)
CurrencyPurchased
AmountPurchased Currency Sold Amount Sold
MaturityDate Counterparty
UnrealisedGain/(Loss)
USD
%of
NetAssets
GBP 24,466 USD 35,399 15/07/2016 HSBC (2,520) -GBP 133,674 USD 187,941 15/07/2016 Bank of America (8,304) -GBP 31,815 USD 46,858 15/07/2016 Goldman Sachs (4,103) -GBP 18,263 USD 27,007 15/07/2016 RBC (2,465) -GBP 22,421 USD 31,147 15/07/2016 Barclays (1,017) -JPY 403,116,868 USD 3,955,422 20/09/2016 HSBC (22,232) -NZD 5,699 USD 4,061 15/07/2016 RBC (14) -NZD 1,369 USD 987 15/07/2016 Deutsche Bank (15) -USD 128,959 AUD 175,473 01/07/2016 RBC (1,527) -USD 23,585 AUD 31,902 15/07/2016 Deutsche Bank (127) -USD 15,345 AUD 20,921 15/07/2016 Goldman Sachs (206) -USD 24,049,753 BRL 83,933,638 30/09/2016 HSBC (1,390,630) (0.09)USD 1,765 CAD 2,296 15/07/2016 RBC (3) -USD 15,578,491 CNY 104,399,259 20/09/2016 Goldman Sachs (38,464) -USD 6,993,750 COP 22,296,075,916 20/09/2016 HSBC (498,668) (0.03)USD 4,167,217 EUR 3,761,655 15/07/2016 Standard Chartered (16,038) -USD 282,251 EUR 255,217 15/07/2016 Deutsche Bank (1,571) -USD 248,471 EUR 225,439 15/07/2016 Goldman Sachs (2,236) -USD 20,793 EUR 18,749 15/07/2016 Bank of America (58) -USD 338,735 EUR 304,674 15/07/2016 Morgan Stanley (87) -USD 7,799,949 EUR 7,051,024 20/09/2016 Goldman Sachs (61,156) -USD 45,241 GBP 33,715 15/07/2016 Deutsche Bank (67) -USD 7,620,896 KRW 8,969,032,225 20/09/2016 HSBC (160,879) (0.01)USD 7,613,462 MXN 144,100,000 20/09/2016 Goldman Sachs (103,179) (0.01)USD 2,903 NZD 4,132 15/07/2016 RBC (31) -USD 2,214 NZD 3,136 15/07/2016 Deutsche Bank (13) -USD 1,714 NZD 2,421 15/07/2016 HSBC (5) -USD 7,752,316 PLN 31,520,606 20/09/2016 Bank of America (165,187) (0.01)USD 15,324,412 SGD 20,810,413 20/09/2016 RBC (105,534) (0.01)USD 7,848,766 ZAR 121,536,591 20/09/2016 Deutsche Bank (276,873) (0.02)
Total Unrealised Loss on Forward Currency Exchange Contracts (12,530,729) (0.78)
Net Unrealised Loss on Forward Currency Exchange Contracts (9,828,448) (0.61)
Financial Futures Contracts
Security DescriptionNumber ofContracts Currency
GlobalExposure
USD
UnrealisedGain/(Loss)
USD
%of
NetAssets
US 10 Year Note, 21/09/2016 426 USD 56,628,047 (106,609) (0.01)US Long Bond, 21/09/2016 (24) USD (4,150,875) (20,625) -
Total Unrealised Loss on Financial Futures Contracts (127,234) (0.01)
Net Unrealised Loss on Financial Futures Contracts (127,234) (0.01)
106
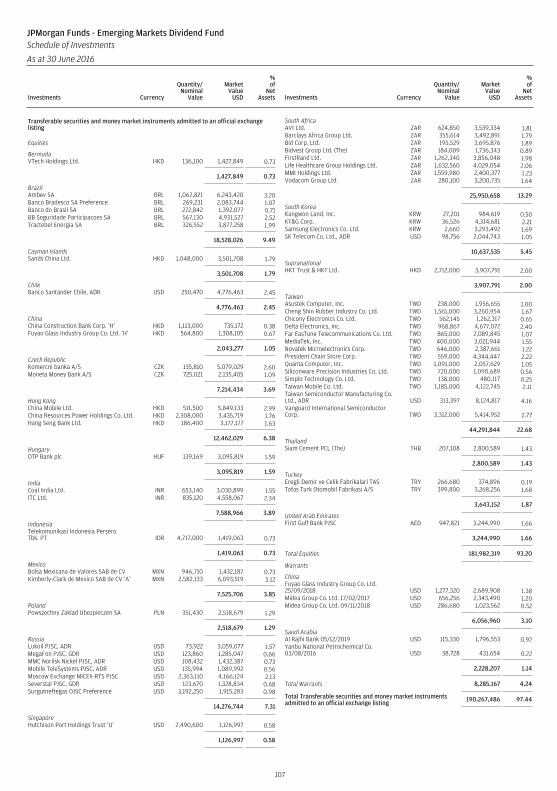
Transferable securities and money market instruments admitted to an official exchangelisting
Equities
BermudaVTech Holdings Ltd. HKD 136,100 1,427,849 0.73
1,427,849 0.73
BrazilAmbev SA BRL 1,062,821 6,243,420 3.20Banco Bradesco SA Preference BRL 269,231 2,083,744 1.07Banco do Brasil SA BRL 272,842 1,392,077 0.71BB Seguridade Participacoes SA BRL 567,130 4,931,527 2.52Tractebel Energia SA BRL 326,552 3,877,258 1.99
18,528,026 9.49
Cayman IslandsSands China Ltd. HKD 1,048,000 3,501,708 1.79
3,501,708 1.79
ChileBanco Santander Chile, ADR USD 250,470 4,776,463 2.45
4,776,463 2.45
ChinaChina Construction Bank Corp. ‘H’ HKD 1,113,000 735,172 0.38Fuyao Glass Industry Group Co. Ltd. ‘H’ HKD 564,800 1,308,105 0.67
2,043,277 1.05
Czech RepublicKomercni banka A/S CZK 135,810 5,079,029 2.60Moneta Money Bank A/S CZK 725,021 2,135,405 1.09
7,214,434 3.69
Hong KongChina Mobile Ltd. HKD 511,500 5,849,133 2.99China Resources Power Holdings Co. Ltd. HKD 2,308,000 3,435,719 1.76Hang Seng Bank Ltd. HKD 186,400 3,177,177 1.63
12,462,029 6.38
HungaryOTP Bank plc HUF 139,169 3,095,819 1.59
3,095,819 1.59
IndiaCoal India Ltd. INR 653,140 3,030,899 1.55ITC Ltd. INR 835,120 4,558,067 2.34
7,588,966 3.89
IndonesiaTelekomunikasi Indonesia PerseroTbk. PT IDR 4,717,000 1,419,063 0.73
1,419,063 0.73
MexicoBolsa Mexicana de Valores SAB de CV MXN 946,710 1,432,187 0.73Kimberly-Clark de Mexico SAB de CV ‘A’ MXN 2,582,133 6,093,519 3.12
7,525,706 3.85
PolandPowszechny Zaklad Ubezpieczen SA PLN 351,430 2,518,679 1.29
2,518,679 1.29
RussiaLukoil PJSC, ADR USD 73,922 3,059,077 1.57MegaFon PJSC, GDR USD 123,860 1,285,047 0.66MMC Norilsk Nickel PJSC, ADR USD 108,432 1,432,387 0.73Mobile TeleSystems PJSC, ADR USD 135,994 1,089,992 0.56Moscow Exchange MICEX-RTS PJSC USD 2,363,110 4,166,124 2.13Severstal PJSC, GDR USD 123,670 1,328,834 0.68Surgutneftegas OJSC Preference USD 3,192,250 1,915,283 0.98
14,276,744 7.31
SingaporeHutchison Port Holdings Trust ‘U’ USD 2,490,600 1,126,997 0.58
1,126,997 0.58
South AfricaAVI Ltd. ZAR 624,850 3,539,334 1.81Barclays Africa Group Ltd. ZAR 355,614 3,492,891 1.79Bid Corp. Ltd. ZAR 195,529 3,695,876 1.89Bidvest Group Ltd. (The) ZAR 184,009 1,736,343 0.89FirstRand Ltd. ZAR 1,262,340 3,856,048 1.98Life Healthcare Group Holdings Ltd. ZAR 1,632,560 4,029,054 2.06MMI Holdings Ltd. ZAR 1,559,980 2,400,377 1.23Vodacom Group Ltd. ZAR 280,100 3,200,735 1.64
25,950,658 13.29
South KoreaKangwon Land, Inc. KRW 27,201 984,619 0.50KT&G Corp. KRW 36,526 4,314,681 2.21Samsung Electronics Co. Ltd. KRW 2,660 3,293,492 1.69SK Telecom Co. Ltd., ADR USD 98,756 2,044,743 1.05
10,637,535 5.45
SupranationalHKT Trust & HKT Ltd. HKD 2,712,000 3,907,791 2.00
3,907,791 2.00
TaiwanAsustek Computer, Inc. TWD 238,000 1,956,655 1.00Cheng Shin Rubber Industry Co. Ltd. TWD 1,561,000 3,260,954 1.67Chicony Electronics Co. Ltd. TWD 562,145 1,262,317 0.65Delta Electronics, Inc. TWD 968,867 4,677,072 2.40Far EasTone Telecommunications Co. Ltd. TWD 865,000 2,089,845 1.07MediaTek, Inc. TWD 400,000 3,021,944 1.55Novatek Microelectronics Corp. TWD 646,000 2,387,661 1.22President Chain Store Corp. TWD 559,000 4,344,447 2.22Quanta Computer, Inc. TWD 1,091,000 2,057,629 1.05Siliconware Precision Industries Co. Ltd. TWD 720,000 1,090,689 0.56Simplo Technology Co. Ltd. TWD 138,000 480,117 0.25Taiwan Mobile Co. Ltd. TWD 1,185,000 4,122,745 2.11Taiwan Semiconductor Manufacturing Co.Ltd., ADR USD 313,397 8,124,817 4.16Vanguard International SemiconductorCorp. TWD 3,312,000 5,414,952 2.77
44,291,844 22.68
ThailandSiam Cement PCL (The) THB 207,108 2,800,589 1.43
2,800,589 1.43
TurkeyEregli Demir ve Celik Fabrikalari TAS TRY 266,680 374,896 0.19Tofas Turk Otomobil Fabrikasi A/S TRY 399,800 3,268,256 1.68
3,643,152 1.87
United Arab EmiratesFirst Gulf Bank PJSC AED 947,821 3,244,990 1.66
3,244,990 1.66
Total Equities 181,982,319 93.20
Warrants
ChinaFuyao Glass Industry Group Co. Ltd.25/09/2018 USD 1,277,320 2,689,908 1.38Midea Group Co. Ltd. 17/02/2017 USD 656,256 2,343,490 1.20Midea Group Co. Ltd. 09/11/2018 USD 286,680 1,023,562 0.52
6,056,960 3.10
Saudi ArabiaAl Rajhi Bank 05/12/2019 USD 115,330 1,796,553 0.92Yanbu National Petrochemical Co.03/08/2016 USD 38,728 431,654 0.22
2,228,207 1.14
Total Warrants 8,285,167 4.24
Total Transferable securities and money market instrumentsadmitted to an official exchange listing 190,267,486 97.44
107
JPMorgan Funds - Emerging Markets Dividend FundSchedule of Investments
As at 30 June 2016
Investments Currency
Quantity/Nominal
Value
MarketValue
USD
%of
NetAssets Investments Currency
Quantity/Nominal
Value
MarketValue
USD
%of
NetAssets
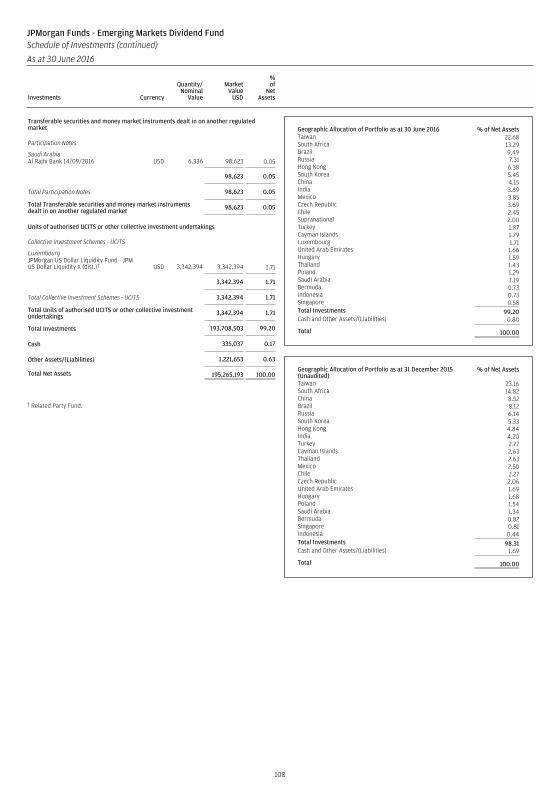
Transferable securities and money market instruments dealt in on another regulatedmarket
Participation Notes
Saudi ArabiaAl Rajhi Bank 14/09/2016 USD 6,336 98,623 0.05
98,623 0.05
Total Participation Notes 98,623 0.05
Total Transferable securities and money market instrumentsdealt in on another regulated market 98,623 0.05
Units of authorised UCITS or other collective investment undertakings
Collective Investment Schemes - UCITS
LuxembourgJPMorgan US Dollar Liquidity Fund - JPMUS Dollar Liquidity X (dist.)† USD 3,342,394 3,342,394 1.71
3,342,394 1.71
Total Collective Investment Schemes - UCITS 3,342,394 1.71
Total Units of authorised UCITS or other collective investmentundertakings 3,342,394 1.71
Total Investments 193,708,503 99.20
Cash 335,037 0.17
Other Assets/(Liabilities) 1,221,653 0.63
Total Net Assets 195,265,193 100.00
† Related Party Fund.
Geographic Allocation of Portfolio as at 30 June 2016 % of Net AssetsTaiwan 22.68South Africa 13.29Brazil 9.49Russia 7.31Hong Kong 6.38South Korea 5.45China 4.15India 3.89Mexico 3.85Czech Republic 3.69Chile 2.45Supranational 2.00Turkey 1.87Cayman Islands 1.79Luxembourg 1.71United Arab Emirates 1.66Hungary 1.59Thailand 1.43Poland 1.29Saudi Arabia 1.19Bermuda 0.73Indonesia 0.73Singapore 0.58Total Investments 99.20Cash and Other Assets/(Liabilities) 0.80
Total 100.00
Geographic Allocation of Portfolio as at 31 December 2015(Unaudited)
% of Net Assets
Taiwan 23.16South Africa 14.82China 8.52Brazil 8.12Russia 6.14South Korea 5.33Hong Kong 4.84India 4.20Turkey 2.77Cayman Islands 2.63Thailand 2.63Mexico 2.50Chile 2.27Czech Republic 2.06United Arab Emirates 1.69Hungary 1.68Poland 1.54Saudi Arabia 1.34Bermuda 0.82Singapore 0.81Indonesia 0.44Total Investments 98.31Cash and Other Assets/(Liabilities) 1.69
Total 100.00
108
JPMorgan Funds - Emerging Markets Dividend FundSchedule of Investments (continued)
As at 30 June 2016
Investments Currency
Quantity/Nominal
Value
MarketValue
USD
%of
NetAssets Investments Currency
Quantity/Nominal
Value
MarketValue
USD
%of
NetAssets
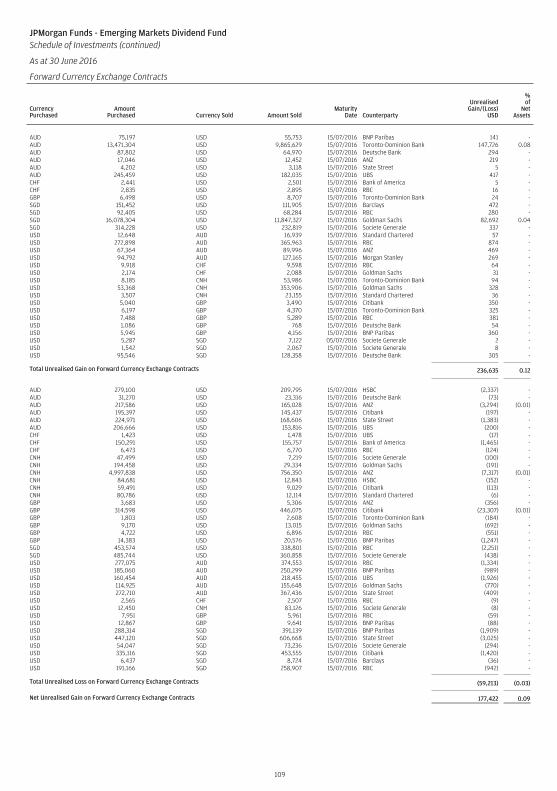
JPMorgan Funds - Emerging Markets Dividend FundSchedule of Investments (continued)
As at 30 June 2016
Forward Currency Exchange Contracts
CurrencyPurchased
AmountPurchased Currency Sold Amount Sold
MaturityDate Counterparty
UnrealisedGain/(Loss)
USD
%of
NetAssets
AUD 75,197 USD 55,753 15/07/2016 BNP Paribas 141 -AUD 13,471,304 USD 9,865,629 15/07/2016 Toronto-Dominion Bank 147,726 0.08AUD 87,802 USD 64,970 15/07/2016 Deutsche Bank 294 -AUD 17,046 USD 12,452 15/07/2016 ANZ 219 -AUD 4,202 USD 3,118 15/07/2016 State Street 5 -AUD 245,459 USD 182,035 15/07/2016 UBS 417 -CHF 2,441 USD 2,501 15/07/2016 Bank of America 5 -CHF 2,835 USD 2,895 15/07/2016 RBC 16 -GBP 6,498 USD 8,707 15/07/2016 Toronto-Dominion Bank 24 -SGD 151,452 USD 111,905 15/07/2016 Barclays 472 -SGD 92,405 USD 68,284 15/07/2016 RBC 280 -SGD 16,078,304 USD 11,847,327 15/07/2016 Goldman Sachs 82,692 0.04SGD 314,228 USD 232,819 15/07/2016 Societe Generale 337 -USD 12,648 AUD 16,939 15/07/2016 Standard Chartered 57 -USD 272,898 AUD 365,963 15/07/2016 RBC 874 -USD 67,364 AUD 89,996 15/07/2016 ANZ 469 -USD 94,792 AUD 127,165 15/07/2016 Morgan Stanley 269 -USD 9,918 CHF 9,598 15/07/2016 RBC 64 -USD 2,174 CHF 2,088 15/07/2016 Goldman Sachs 31 -USD 8,185 CNH 53,986 15/07/2016 Toronto-Dominion Bank 94 -USD 53,368 CNH 353,906 15/07/2016 Goldman Sachs 328 -USD 3,507 CNH 23,155 15/07/2016 Standard Chartered 36 -USD 5,040 GBP 3,490 15/07/2016 Citibank 350 -USD 6,197 GBP 4,370 15/07/2016 Toronto-Dominion Bank 325 -USD 7,488 GBP 5,289 15/07/2016 RBC 381 -USD 1,086 GBP 768 15/07/2016 Deutsche Bank 54 -USD 5,945 GBP 4,156 15/07/2016 BNP Paribas 360 -USD 5,287 SGD 7,122 05/07/2016 Societe Generale 2 -USD 1,542 SGD 2,067 15/07/2016 Societe Generale 8 -USD 95,546 SGD 128,358 15/07/2016 Deutsche Bank 305 -
Total Unrealised Gain on Forward Currency Exchange Contracts 236,635 0.12
AUD 279,100 USD 209,795 15/07/2016 HSBC (2,337) -AUD 31,270 USD 23,316 15/07/2016 Deutsche Bank (73) -AUD 217,586 USD 165,028 15/07/2016 ANZ (3,294) (0.01)AUD 195,397 USD 145,437 15/07/2016 Citibank (197) -AUD 224,971 USD 168,606 15/07/2016 State Street (1,383) -AUD 206,666 USD 153,816 15/07/2016 UBS (200) -CHF 1,423 USD 1,478 15/07/2016 UBS (17) -CHF 150,291 USD 155,757 15/07/2016 Bank of America (1,465) -CHF 6,473 USD 6,770 15/07/2016 RBC (124) -CNH 47,499 USD 7,219 15/07/2016 Societe Generale (100) -CNH 194,458 USD 29,334 15/07/2016 Goldman Sachs (191) -CNH 4,997,838 USD 756,350 15/07/2016 ANZ (7,317) (0.01)CNH 84,681 USD 12,843 15/07/2016 HSBC (152) -CNH 59,491 USD 9,029 15/07/2016 Citibank (113) -CNH 80,786 USD 12,114 15/07/2016 Standard Chartered (6) -GBP 3,683 USD 5,306 15/07/2016 ANZ (356) -GBP 314,598 USD 446,075 15/07/2016 Citibank (23,307) (0.01)GBP 1,803 USD 2,608 15/07/2016 Toronto-Dominion Bank (184) -GBP 9,170 USD 13,015 15/07/2016 Goldman Sachs (692) -GBP 4,722 USD 6,896 15/07/2016 RBC (551) -GBP 14,383 USD 20,576 15/07/2016 BNP Paribas (1,247) -SGD 453,574 USD 338,801 15/07/2016 RBC (2,251) -SGD 485,744 USD 360,858 15/07/2016 Societe Generale (438) -USD 277,075 AUD 374,553 15/07/2016 RBC (1,334) -USD 185,060 AUD 250,299 15/07/2016 BNP Paribas (989) -USD 160,454 AUD 218,455 15/07/2016 UBS (1,926) -USD 114,925 AUD 155,648 15/07/2016 Goldman Sachs (770) -USD 272,710 AUD 367,436 15/07/2016 State Street (409) -USD 2,565 CHF 2,507 15/07/2016 RBC (9) -USD 12,450 CNH 83,126 15/07/2016 Societe Generale (8) -USD 7,951 GBP 5,961 15/07/2016 RBC (59) -USD 12,867 GBP 9,641 15/07/2016 BNP Paribas (88) -USD 288,314 SGD 391,139 15/07/2016 BNP Paribas (1,909) -USD 447,120 SGD 606,668 15/07/2016 State Street (3,025) -USD 54,047 SGD 73,236 15/07/2016 Societe Generale (294) -USD 335,116 SGD 453,555 15/07/2016 Citibank (1,420) -USD 6,437 SGD 8,724 15/07/2016 Barclays (36) -USD 191,166 SGD 258,907 15/07/2016 RBC (942) -
Total Unrealised Loss on Forward Currency Exchange Contracts (59,213) (0.03)
Net Unrealised Gain on Forward Currency Exchange Contracts 177,422 0.09
109
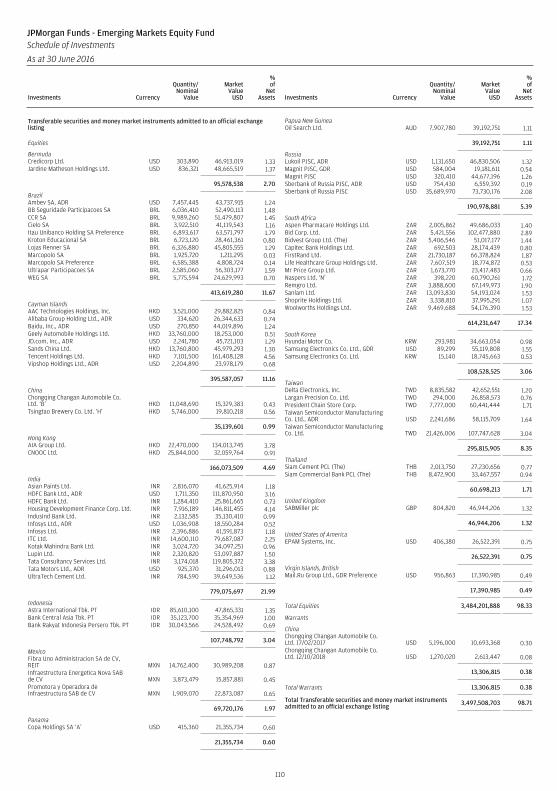
Transferable securities and money market instruments admitted to an official exchangelisting
Equities
BermudaCredicorp Ltd. USD 303,890 46,913,019 1.33Jardine Matheson Holdings Ltd. USD 836,321 48,665,519 1.37
95,578,538 2.70
BrazilAmbev SA, ADR USD 7,457,445 43,737,915 1.24BB Seguridade Participacoes SA BRL 6,036,410 52,490,113 1.48CCR SA BRL 9,989,260 51,479,807 1.45Cielo SA BRL 3,922,510 41,119,543 1.16Itau Unibanco Holding SA Preference BRL 6,893,617 63,571,797 1.79Kroton Educacional SA BRL 6,723,120 28,461,361 0.80Lojas Renner SA BRL 6,326,880 45,805,555 1.29Marcopolo SA BRL 1,925,720 1,211,295 0.03Marcopolo SA Preference BRL 6,585,388 4,808,724 0.14Ultrapar Participacoes SA BRL 2,585,060 56,303,177 1.59WEG SA BRL 5,775,594 24,629,993 0.70
413,619,280 11.67
Cayman IslandsAAC Technologies Holdings, Inc. HKD 3,521,000 29,882,825 0.84Alibaba Group Holding Ltd., ADR USD 334,620 26,344,633 0.74Baidu, Inc., ADR USD 270,850 44,019,896 1.24Geely Automobile Holdings Ltd. HKD 33,760,000 18,253,000 0.51JD.com, Inc., ADR USD 2,241,780 45,721,103 1.29Sands China Ltd. HKD 13,760,800 45,979,293 1.30Tencent Holdings Ltd. HKD 7,101,500 161,408,128 4.56Vipshop Holdings Ltd., ADR USD 2,204,890 23,978,179 0.68
395,587,057 11.16
ChinaChongqing Changan Automobile Co.Ltd. ‘B’ HKD 11,048,690 15,329,383 0.43Tsingtao Brewery Co. Ltd. ‘H’ HKD 5,746,000 19,810,218 0.56
35,139,601 0.99
Hong KongAIA Group Ltd. HKD 22,470,000 134,013,745 3.78CNOOC Ltd. HKD 25,844,000 32,059,764 0.91
166,073,509 4.69
IndiaAsian Paints Ltd. INR 2,816,070 41,625,914 1.18HDFC Bank Ltd., ADR USD 1,711,350 111,870,950 3.16HDFC Bank Ltd. INR 1,284,410 25,861,665 0.73Housing Development Finance Corp. Ltd. INR 7,916,189 146,811,455 4.14IndusInd Bank Ltd. INR 2,132,585 35,130,410 0.99Infosys Ltd., ADR USD 1,036,908 18,550,284 0.52Infosys Ltd. INR 2,396,886 41,591,873 1.18ITC Ltd. INR 14,600,110 79,687,087 2.25Kotak Mahindra Bank Ltd. INR 3,024,720 34,097,251 0.96Lupin Ltd. INR 2,320,820 53,097,887 1.50Tata Consultancy Services Ltd. INR 3,174,018 119,805,372 3.38Tata Motors Ltd., ADR USD 925,370 31,296,013 0.88UltraTech Cement Ltd. INR 784,590 39,649,536 1.12
779,075,697 21.99
IndonesiaAstra International Tbk. PT IDR 85,610,100 47,865,331 1.35Bank Central Asia Tbk. PT IDR 35,123,700 35,354,969 1.00Bank Rakyat Indonesia Persero Tbk. PT IDR 30,043,566 24,528,492 0.69
107,748,792 3.04
MexicoFibra Uno Administracion SA de CV,REIT MXN 14,762,400 30,989,208 0.87Infraestructura Energetica Nova SABde CV MXN 3,873,479 15,857,881 0.45Promotora y Operadora deInfraestructura SAB de CV MXN 1,909,070 22,873,087 0.65
69,720,176 1.97
PanamaCopa Holdings SA ‘A’ USD 415,360 21,355,734 0.60
21,355,734 0.60
Papua New GuineaOil Search Ltd. AUD 7,907,780 39,192,751 1.11
39,192,751 1.11
RussiaLukoil PJSC, ADR USD 1,131,650 46,830,506 1.32Magnit PJSC, GDR USD 584,004 19,181,611 0.54Magnit PJSC USD 320,410 44,677,196 1.26Sberbank of Russia PJSC, ADR USD 754,430 6,559,392 0.19Sberbank of Russia PJSC USD 35,689,970 73,730,176 2.08
190,978,881 5.39
South AfricaAspen Pharmacare Holdings Ltd. ZAR 2,005,862 49,686,033 1.40Bid Corp. Ltd. ZAR 5,421,556 102,477,880 2.89Bidvest Group Ltd. (The) ZAR 5,406,546 51,017,177 1.44Capitec Bank Holdings Ltd. ZAR 692,503 28,174,439 0.80FirstRand Ltd. ZAR 21,730,187 66,378,824 1.87Life Healthcare Group Holdings Ltd. ZAR 7,607,519 18,774,872 0.53Mr Price Group Ltd. ZAR 1,673,770 23,417,483 0.66Naspers Ltd. ‘N’ ZAR 398,220 60,790,261 1.72Remgro Ltd. ZAR 3,888,600 67,149,973 1.90Sanlam Ltd. ZAR 13,093,830 54,193,024 1.53Shoprite Holdings Ltd. ZAR 3,338,810 37,995,291 1.07Woolworths Holdings Ltd. ZAR 9,469,688 54,176,390 1.53
614,231,647 17.34
South KoreaHyundai Motor Co. KRW 293,981 34,663,054 0.98Samsung Electronics Co. Ltd., GDR USD 89,299 55,119,808 1.55Samsung Electronics Co. Ltd. KRW 15,140 18,745,663 0.53
108,528,525 3.06
TaiwanDelta Electronics, Inc. TWD 8,835,582 42,652,551 1.20Largan Precision Co. Ltd. TWD 294,000 26,858,573 0.76President Chain Store Corp. TWD 7,777,000 60,441,444 1.71Taiwan Semiconductor ManufacturingCo. Ltd., ADR USD 2,241,686 58,115,709 1.64Taiwan Semiconductor ManufacturingCo. Ltd. TWD 21,426,006 107,747,628 3.04
295,815,905 8.35
ThailandSiam Cement PCL (The) THB 2,013,750 27,230,656 0.77Siam Commercial Bank PCL (The) THB 8,472,900 33,467,557 0.94
60,698,213 1.71
United KingdomSABMiller plc GBP 804,820 46,944,206 1.32
46,944,206 1.32
United States of AmericaEPAM Systems, Inc. USD 406,380 26,522,391 0.75
26,522,391 0.75
Virgin Islands, BritishMail.Ru Group Ltd., GDR Preference USD 956,863 17,390,985 0.49
17,390,985 0.49
Total Equities 3,484,201,888 98.33
Warrants
ChinaChongqing Changan Automobile Co.Ltd. 17/02/2017 USD 5,196,000 10,693,368 0.30Chongqing Changan Automobile Co.Ltd. 12/10/2018 USD 1,270,020 2,613,447 0.08
13,306,815 0.38
Total Warrants 13,306,815 0.38
Total Transferable securities and money market instrumentsadmitted to an official exchange listing 3,497,508,703 98.71
110
JPMorgan Funds - Emerging Markets Equity FundSchedule of Investments
As at 30 June 2016
Investments Currency
Quantity/Nominal
Value
MarketValue
USD
%of
NetAssets Investments Currency
Quantity/Nominal
Value
MarketValue
USD
%of
NetAssets
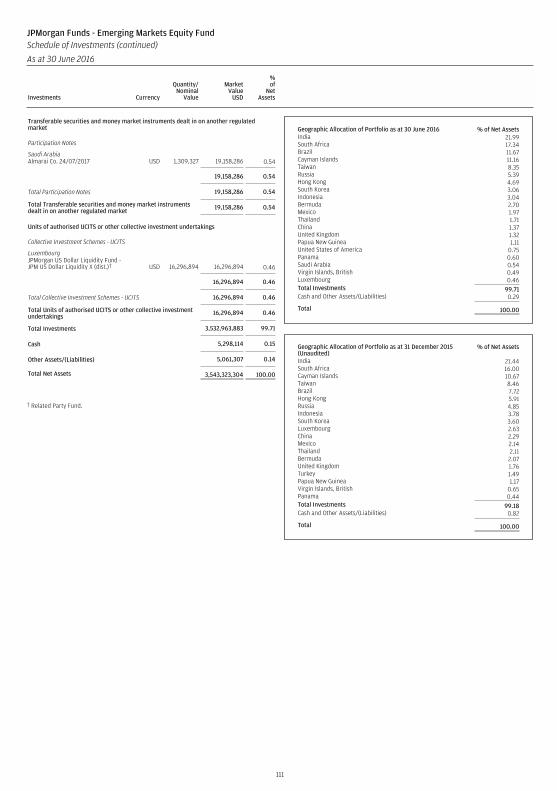
Transferable securities and money market instruments dealt in on another regulatedmarket
Participation Notes
Saudi ArabiaAlmarai Co. 24/07/2017 USD 1,309,327 19,158,286 0.54
19,158,286 0.54
Total Participation Notes 19,158,286 0.54
Total Transferable securities and money market instrumentsdealt in on another regulated market 19,158,286 0.54
Units of authorised UCITS or other collective investment undertakings
Collective Investment Schemes - UCITS
LuxembourgJPMorgan US Dollar Liquidity Fund -JPM US Dollar Liquidity X (dist.)† USD 16,296,894 16,296,894 0.46
16,296,894 0.46
Total Collective Investment Schemes - UCITS 16,296,894 0.46
Total Units of authorised UCITS or other collective investmentundertakings 16,296,894 0.46
Total Investments 3,532,963,883 99.71
Cash 5,298,114 0.15
Other Assets/(Liabilities) 5,061,307 0.14
Total Net Assets 3,543,323,304 100.00
† Related Party Fund.
Geographic Allocation of Portfolio as at 30 June 2016 % of Net AssetsIndia 21.99South Africa 17.34Brazil 11.67Cayman Islands 11.16Taiwan 8.35Russia 5.39Hong Kong 4.69South Korea 3.06Indonesia 3.04Bermuda 2.70Mexico 1.97Thailand 1.71China 1.37United Kingdom 1.32Papua New Guinea 1.11United States of America 0.75Panama 0.60Saudi Arabia 0.54Virgin Islands, British 0.49Luxembourg 0.46Total Investments 99.71Cash and Other Assets/(Liabilities) 0.29
Total 100.00
Geographic Allocation of Portfolio as at 31 December 2015(Unaudited)
% of Net Assets
India 21.44South Africa 16.00Cayman Islands 10.67Taiwan 8.46Brazil 7.72Hong Kong 5.91Russia 4.85Indonesia 3.78South Korea 3.60Luxembourg 2.63China 2.29Mexico 2.14Thailand 2.11Bermuda 2.07United Kingdom 1.76Turkey 1.49Papua New Guinea 1.17Virgin Islands, British 0.65Panama 0.44Total Investments 99.18Cash and Other Assets/(Liabilities) 0.82
Total 100.00
111
JPMorgan Funds - Emerging Markets Equity FundSchedule of Investments (continued)
As at 30 June 2016
Investments Currency
Quantity/Nominal
Value
MarketValue
USD
%of
NetAssets Investments Currency
Quantity/Nominal
Value
MarketValue
USD
%of
NetAssets
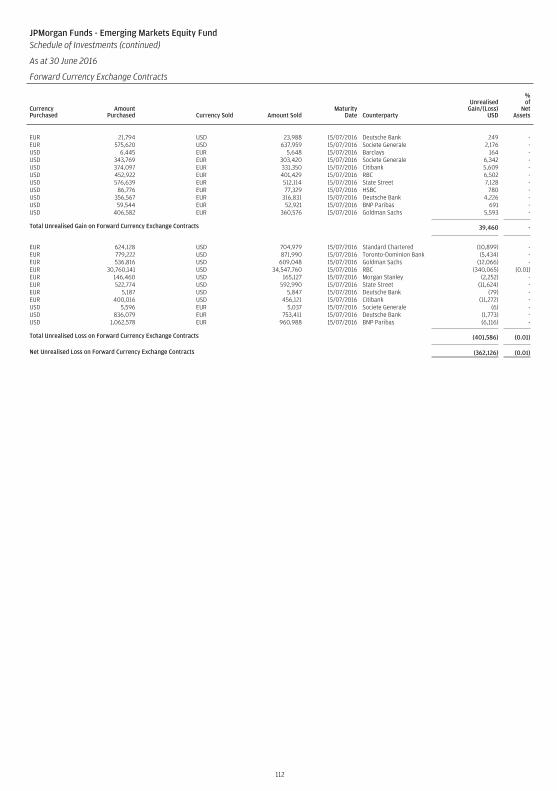
JPMorgan Funds - Emerging Markets Equity FundSchedule of Investments (continued)
As at 30 June 2016
Forward Currency Exchange Contracts
CurrencyPurchased
AmountPurchased Currency Sold Amount Sold
MaturityDate Counterparty
UnrealisedGain/(Loss)
USD
%of
NetAssets
EUR 21,794 USD 23,988 15/07/2016 Deutsche Bank 249 -EUR 575,620 USD 637,959 15/07/2016 Societe Generale 2,176 -USD 6,445 EUR 5,648 15/07/2016 Barclays 164 -USD 343,769 EUR 303,420 15/07/2016 Societe Generale 6,342 -USD 374,097 EUR 331,350 15/07/2016 Citibank 5,609 -USD 452,922 EUR 401,429 15/07/2016 RBC 6,502 -USD 576,639 EUR 512,114 15/07/2016 State Street 7,128 -USD 86,776 EUR 77,329 15/07/2016 HSBC 780 -USD 356,567 EUR 316,831 15/07/2016 Deutsche Bank 4,226 -USD 59,544 EUR 52,921 15/07/2016 BNP Paribas 691 -USD 406,582 EUR 360,576 15/07/2016 Goldman Sachs 5,593 -
Total Unrealised Gain on Forward Currency Exchange Contracts 39,460 -
EUR 624,128 USD 704,979 15/07/2016 Standard Chartered (10,899) -EUR 779,222 USD 871,990 15/07/2016 Toronto-Dominion Bank (5,434) -EUR 536,816 USD 609,048 15/07/2016 Goldman Sachs (12,066) -EUR 30,760,141 USD 34,547,760 15/07/2016 RBC (340,065) (0.01)EUR 146,460 USD 165,127 15/07/2016 Morgan Stanley (2,252) -EUR 522,774 USD 592,990 15/07/2016 State Street (11,624) -EUR 5,187 USD 5,847 15/07/2016 Deutsche Bank (79) -EUR 400,016 USD 456,121 15/07/2016 Citibank (11,272) -USD 5,596 EUR 5,037 15/07/2016 Societe Generale (6) -USD 836,079 EUR 753,411 15/07/2016 Deutsche Bank (1,773) -USD 1,062,578 EUR 960,988 15/07/2016 BNP Paribas (6,116) -
Total Unrealised Loss on Forward Currency Exchange Contracts (401,586) (0.01)
Net Unrealised Loss on Forward Currency Exchange Contracts (362,126) (0.01)
112
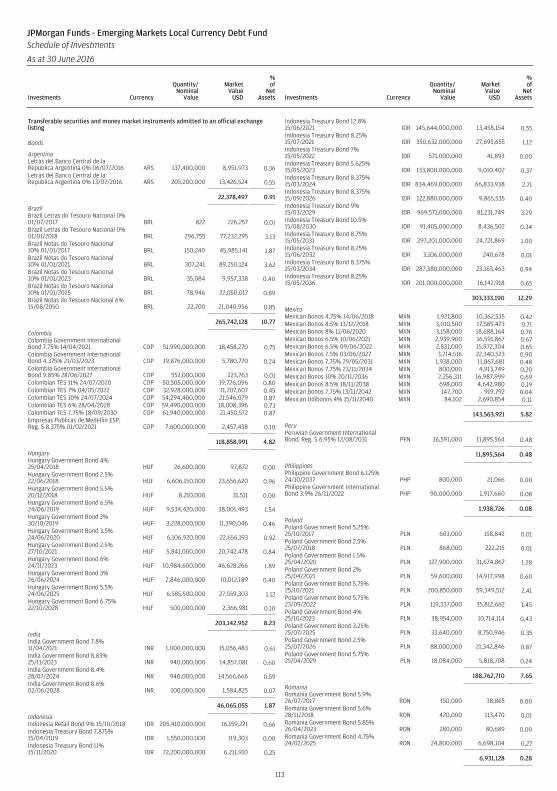
Transferable securities and money market instruments admitted to an official exchangelisting
Bonds
ArgentinaLetras del Banco Central de laRepublica Argentina 0% 06/07/2016 ARS 137,400,000 8,951,973 0.36Letras del Banco Central de laRepublica Argentina 0% 13/07/2016 ARS 205,200,000 13,426,524 0.55
22,378,497 0.91
BrazilBrazil Letras do Tesouro Nacional 0%01/07/2017 BRL 822 226,257 0.01Brazil Letras do Tesouro Nacional 0%01/01/2018 BRL 296,755 77,232,295 3.13Brazil Notas do Tesouro Nacional10% 01/01/2017 BRL 150,240 45,985,141 1.87Brazil Notas do Tesouro Nacional10% 01/01/2021 BRL 307,241 89,250,124 3.62Brazil Notas do Tesouro Nacional10% 01/01/2023 BRL 35,084 9,957,338 0.40Brazil Notas do Tesouro Nacional10% 01/01/2025 BRL 78,946 22,050,017 0.89Brazil Notas do Tesouro Nacional 6%15/08/2050 BRL 22,700 21,040,956 0.85
265,742,128 10.77
ColombiaColombia Government InternationalBond 7.75% 14/04/2021 COP 51,990,000,000 18,458,270 0.75Colombia Government InternationalBond 4.375% 21/03/2023 COP 19,876,000,000 5,780,770 0.24Colombia Government InternationalBond 9.85% 28/06/2027 COP 552,000,000 223,763 0.01Colombian TES 11% 24/07/2020 COP 50,505,000,000 19,726,096 0.80Colombian TES 7% 04/05/2022 COP 32,928,000,000 11,207,607 0.45Colombian TES 10% 24/07/2024 COP 54,294,400,000 21,546,079 0.87Colombian TES 6% 28/04/2028 COP 59,490,000,000 18,008,396 0.73Colombian TES 7.75% 18/09/2030 COP 61,940,000,000 21,450,572 0.87Empresas Publicas de Medellin ESP,Reg. S 8.375% 01/02/2021 COP 7,600,000,000 2,457,438 0.10
118,858,991 4.82
HungaryHungary Government Bond 4%25/04/2018 HUF 26,600,000 97,872 0.00Hungary Government Bond 2.5%22/06/2018 HUF 6,606,150,000 23,656,620 0.96Hungary Government Bond 5.5%20/12/2018 HUF 8,210,000 31,511 0.00Hungary Government Bond 6.5%24/06/2019 HUF 9,534,420,000 38,001,493 1.54Hungary Government Bond 2%30/10/2019 HUF 3,228,000,000 11,390,046 0.46Hungary Government Bond 3.5%24/06/2020 HUF 6,106,920,000 22,656,193 0.92Hungary Government Bond 2.5%27/10/2021 HUF 5,841,000,000 20,742,478 0.84Hungary Government Bond 6%24/11/2023 HUF 10,984,600,000 46,628,266 1.89Hungary Government Bond 3%26/06/2024 HUF 2,846,000,000 10,012,189 0.40Hungary Government Bond 5.5%24/06/2025 HUF 6,585,500,000 27,559,303 1.12Hungary Government Bond 6.75%22/10/2028 HUF 500,000,000 2,366,981 0.10
203,142,952 8.23
IndiaIndia Government Bond 7.8%11/04/2021 INR 1,000,000,000 15,056,483 0.61India Government Bond 8.83%25/11/2023 INR 940,000,000 14,857,081 0.60India Government Bond 8.4%28/07/2024 INR 940,000,000 14,566,666 0.59India Government Bond 8.6%02/06/2028 INR 100,000,000 1,584,825 0.07
46,065,055 1.87
IndonesiaIndonesia Retail Bond 9% 15/10/2018 IDR 205,410,000,000 16,159,221 0.66Indonesia Treasury Bond 7.875%15/04/2019 IDR 1,550,000,000 119,303 0.00Indonesia Treasury Bond 11%15/11/2020 IDR 72,200,000,000 6,211,910 0.25
Indonesia Treasury Bond 12.8%15/06/2021 IDR 145,644,000,000 13,458,154 0.55Indonesia Treasury Bond 8.25%15/07/2021 IDR 350,632,000,000 27,695,655 1.12Indonesia Treasury Bond 7%15/05/2022 IDR 571,000,000 41,893 0.00Indonesia Treasury Bond 5.625%15/05/2023 IDR 133,800,000,000 9,010,402 0.37Indonesia Treasury Bond 8.375%15/03/2024 IDR 834,469,000,000 66,833,938 2.71Indonesia Treasury Bond 8.375%15/09/2026 IDR 122,880,000,000 9,865,535 0.40Indonesia Treasury Bond 9%15/03/2029 IDR 969,571,000,000 81,231,749 3.29Indonesia Treasury Bond 10.5%15/08/2030 IDR 91,405,000,000 8,436,502 0.34Indonesia Treasury Bond 8.75%15/05/2031 IDR 297,201,000,000 24,721,869 1.00Indonesia Treasury Bond 8.25%15/06/2032 IDR 3,106,000,000 240,678 0.01Indonesia Treasury Bond 8.375%15/03/2034 IDR 287,380,000,000 23,163,463 0.94Indonesia Treasury Bond 8.25%15/05/2036 IDR 201,000,000,000 16,142,918 0.65
303,333,190 12.29
MexicoMexican Bonos 4.75% 14/06/2018 MXN 1,921,800 10,362,535 0.42Mexican Bonos 8.5% 13/12/2018 MXN 3,010,500 17,585,473 0.71Mexican Bonos 8% 11/06/2020 MXN 3,158,000 18,688,164 0.76Mexican Bonos 6.5% 10/06/2021 MXN 2,939,900 16,591,867 0.67Mexican Bonos 6.5% 09/06/2022 MXN 2,831,000 15,972,304 0.65Mexican Bonos 7.5% 03/06/2027 MXN 3,714,516 22,340,523 0.90Mexican Bonos 7.75% 29/05/2031 MXN 1,938,000 11,867,681 0.48Mexican Bonos 7.75% 23/11/2034 MXN 800,000 4,913,749 0.20Mexican Bonos 10% 20/11/2036 MXN 2,256,311 16,987,999 0.69Mexican Bonos 8.5% 18/11/2038 MXN 698,000 4,642,980 0.19Mexican Bonos 7.75% 13/11/2042 MXN 147,700 919,792 0.04Mexican Udibonos 4% 15/11/2040 MXN 84,102 2,690,854 0.11
143,563,921 5.82
PeruPeruvian Government InternationalBond, Reg. S 6.95% 12/08/2031 PEN 36,591,000 11,895,564 0.48
11,895,564 0.48
PhilippinesPhilippine Government Bond 6.125%24/10/2037 PHP 800,000 21,066 0.00Philippine Government InternationalBond 3.9% 26/11/2022 PHP 90,000,000 1,917,660 0.08
1,938,726 0.08
PolandPoland Government Bond 5.25%25/10/2017 PLN 603,000 158,842 0.01Poland Government Bond 2.5%25/07/2018 PLN 868,000 222,215 0.01Poland Government Bond 1.5%25/04/2020 PLN 127,900,000 31,674,867 1.28Poland Government Bond 2%25/04/2021 PLN 59,600,000 14,917,998 0.60Poland Government Bond 5.75%25/10/2021 PLN 200,850,000 59,349,512 2.41Poland Government Bond 5.75%23/09/2022 PLN 119,337,000 35,812,662 1.45Poland Government Bond 4%25/10/2023 PLN 38,954,000 10,714,114 0.43Poland Government Bond 3.25%25/07/2025 PLN 33,640,000 8,750,946 0.35Poland Government Bond 2.5%25/07/2026 PLN 88,000,000 21,342,846 0.87Poland Government Bond 5.75%25/04/2029 PLN 18,084,000 5,818,708 0.24
188,762,710 7.65
RomaniaRomania Government Bond 5.9%26/07/2017 RON 150,000 38,865 0.00Romania Government Bond 5.6%28/11/2018 RON 420,000 113,470 0.01Romania Government Bond 5.85%26/04/2023 RON 280,000 80,689 0.00Romania Government Bond 4.75%24/02/2025 RON 24,800,000 6,698,104 0.27
6,931,128 0.28
113
JPMorgan Funds - Emerging Markets Local Currency Debt FundSchedule of Investments
As at 30 June 2016
Investments Currency
Quantity/Nominal
Value
MarketValue
USD
%of
NetAssets Investments Currency
Quantity/Nominal
Value
MarketValue
USD
%of
NetAssets
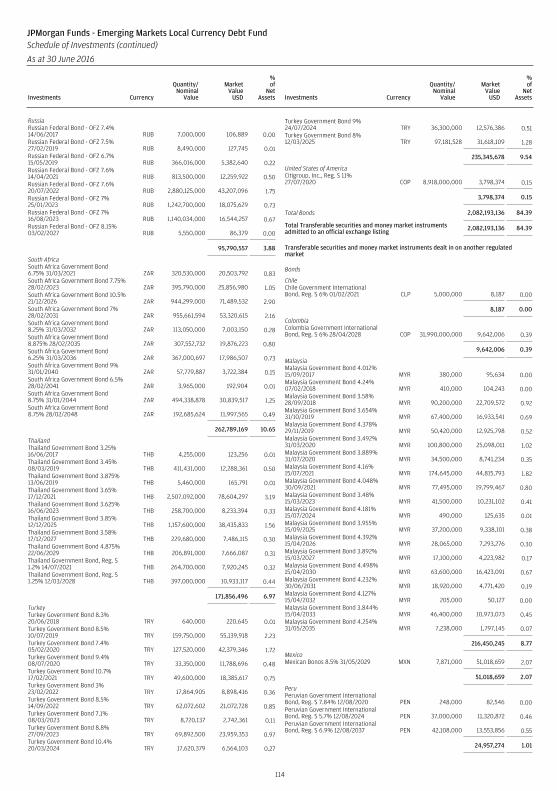
RussiaRussian Federal Bond - OFZ 7.4%14/06/2017 RUB 7,000,000 106,889 0.00Russian Federal Bond - OFZ 7.5%27/02/2019 RUB 8,490,000 127,745 0.01Russian Federal Bond - OFZ 6.7%15/05/2019 RUB 366,016,000 5,382,640 0.22Russian Federal Bond - OFZ 7.6%14/04/2021 RUB 813,500,000 12,259,922 0.50Russian Federal Bond - OFZ 7.6%20/07/2022 RUB 2,880,125,000 43,207,096 1.75Russian Federal Bond - OFZ 7%25/01/2023 RUB 1,242,700,000 18,075,629 0.73Russian Federal Bond - OFZ 7%16/08/2023 RUB 1,140,034,000 16,544,257 0.67Russian Federal Bond - OFZ 8.15%03/02/2027 RUB 5,550,000 86,379 0.00
95,790,557 3.88
South AfricaSouth Africa Government Bond6.75% 31/03/2021 ZAR 320,530,000 20,503,792 0.83South Africa Government Bond 7.75%28/02/2023 ZAR 395,790,000 25,856,980 1.05South Africa Government Bond 10.5%21/12/2026 ZAR 944,299,000 71,489,532 2.90South Africa Government Bond 7%28/02/2031 ZAR 955,661,594 53,320,615 2.16South Africa Government Bond8.25% 31/03/2032 ZAR 113,050,000 7,003,150 0.28South Africa Government Bond8.875% 28/02/2035 ZAR 307,552,732 19,876,223 0.80South Africa Government Bond6.25% 31/03/2036 ZAR 367,000,697 17,986,507 0.73South Africa Government Bond 9%31/01/2040 ZAR 57,779,887 3,722,384 0.15South Africa Government Bond 6.5%28/02/2041 ZAR 3,965,000 192,904 0.01South Africa Government Bond8.75% 31/01/2044 ZAR 494,338,878 30,839,517 1.25South Africa Government Bond8.75% 28/02/2048 ZAR 192,685,624 11,997,565 0.49
262,789,169 10.65
ThailandThailand Government Bond 3.25%16/06/2017 THB 4,255,000 123,256 0.01Thailand Government Bond 3.45%08/03/2019 THB 411,431,000 12,288,361 0.50Thailand Government Bond 3.875%13/06/2019 THB 5,460,000 165,791 0.01Thailand Government Bond 3.65%17/12/2021 THB 2,507,092,000 78,604,297 3.19Thailand Government Bond 3.625%16/06/2023 THB 258,700,000 8,233,394 0.33Thailand Government Bond 3.85%12/12/2025 THB 1,157,600,000 38,435,833 1.56Thailand Government Bond 3.58%17/12/2027 THB 229,680,000 7,486,115 0.30Thailand Government Bond 4.875%22/06/2029 THB 206,891,000 7,666,087 0.31Thailand Government Bond, Reg. S1.2% 14/07/2021 THB 264,700,000 7,920,245 0.32Thailand Government Bond, Reg. S1.25% 12/03/2028 THB 397,000,000 10,933,117 0.44
171,856,496 6.97
TurkeyTurkey Government Bond 8.3%20/06/2018 TRY 640,000 220,645 0.01Turkey Government Bond 8.5%10/07/2019 TRY 159,750,000 55,139,918 2.23Turkey Government Bond 7.4%05/02/2020 TRY 127,520,000 42,379,346 1.72Turkey Government Bond 9.4%08/07/2020 TRY 33,350,000 11,788,696 0.48Turkey Government Bond 10.7%17/02/2021 TRY 49,600,000 18,385,617 0.75Turkey Government Bond 3%23/02/2022 TRY 17,864,905 8,898,416 0.36Turkey Government Bond 8.5%14/09/2022 TRY 62,072,602 21,072,728 0.85Turkey Government Bond 7.1%08/03/2023 TRY 8,720,137 2,742,361 0.11Turkey Government Bond 8.8%27/09/2023 TRY 69,892,500 23,959,353 0.97Turkey Government Bond 10.4%20/03/2024 TRY 17,620,379 6,564,103 0.27
Turkey Government Bond 9%24/07/2024 TRY 36,300,000 12,576,386 0.51Turkey Government Bond 8%12/03/2025 TRY 97,181,528 31,618,109 1.28
235,345,678 9.54
United States of AmericaCitigroup, Inc., Reg. S 11%27/07/2020 COP 8,918,000,000 3,798,374 0.15
3,798,374 0.15
Total Bonds 2,082,193,136 84.39
Total Transferable securities and money market instrumentsadmitted to an official exchange listing 2,082,193,136 84.39
Transferable securities and money market instruments dealt in on another regulatedmarket
Bonds
ChileChile Government InternationalBond, Reg. S 6% 01/02/2021 CLP 5,000,000 8,187 0.00
8,187 0.00
ColombiaColombia Government InternationalBond, Reg. S 6% 28/04/2028 COP 31,990,000,000 9,642,006 0.39
9,642,006 0.39
MalaysiaMalaysia Government Bond 4.012%15/09/2017 MYR 380,000 95,634 0.00Malaysia Government Bond 4.24%07/02/2018 MYR 410,000 104,243 0.00Malaysia Government Bond 3.58%28/09/2018 MYR 90,200,000 22,709,572 0.92Malaysia Government Bond 3.654%31/10/2019 MYR 67,400,000 16,933,541 0.69Malaysia Government Bond 4.378%29/11/2019 MYR 50,420,000 12,925,798 0.52Malaysia Government Bond 3.492%31/03/2020 MYR 100,800,000 25,098,011 1.02Malaysia Government Bond 3.889%31/07/2020 MYR 34,500,000 8,741,234 0.35Malaysia Government Bond 4.16%15/07/2021 MYR 174,645,000 44,815,793 1.82Malaysia Government Bond 4.048%30/09/2021 MYR 77,495,000 19,799,467 0.80Malaysia Government Bond 3.48%15/03/2023 MYR 41,500,000 10,231,102 0.41Malaysia Government Bond 4.181%15/07/2024 MYR 490,000 125,635 0.01Malaysia Government Bond 3.955%15/09/2025 MYR 37,200,000 9,338,101 0.38Malaysia Government Bond 4.392%15/04/2026 MYR 28,065,000 7,293,276 0.30Malaysia Government Bond 3.892%15/03/2027 MYR 17,100,000 4,223,982 0.17Malaysia Government Bond 4.498%15/04/2030 MYR 63,600,000 16,423,091 0.67Malaysia Government Bond 4.232%30/06/2031 MYR 18,920,000 4,771,420 0.19Malaysia Government Bond 4.127%15/04/2032 MYR 205,000 50,127 0.00Malaysia Government Bond 3.844%15/04/2033 MYR 46,400,000 10,973,073 0.45Malaysia Government Bond 4.254%31/05/2035 MYR 7,238,000 1,797,145 0.07
216,450,245 8.77
MexicoMexican Bonos 8.5% 31/05/2029 MXN 7,871,000 51,018,659 2.07
51,018,659 2.07
PeruPeruvian Government InternationalBond, Reg. S 7.84% 12/08/2020 PEN 248,000 82,546 0.00Peruvian Government InternationalBond, Reg. S 5.7% 12/08/2024 PEN 37,000,000 11,320,872 0.46Peruvian Government InternationalBond, Reg. S 6.9% 12/08/2037 PEN 42,108,000 13,553,856 0.55
24,957,274 1.01
114
JPMorgan Funds - Emerging Markets Local Currency Debt FundSchedule of Investments (continued)
As at 30 June 2016
Investments Currency
Quantity/Nominal
Value
MarketValue
USD
%of
NetAssets Investments Currency
Quantity/Nominal
Value
MarketValue
USD
%of
NetAssets
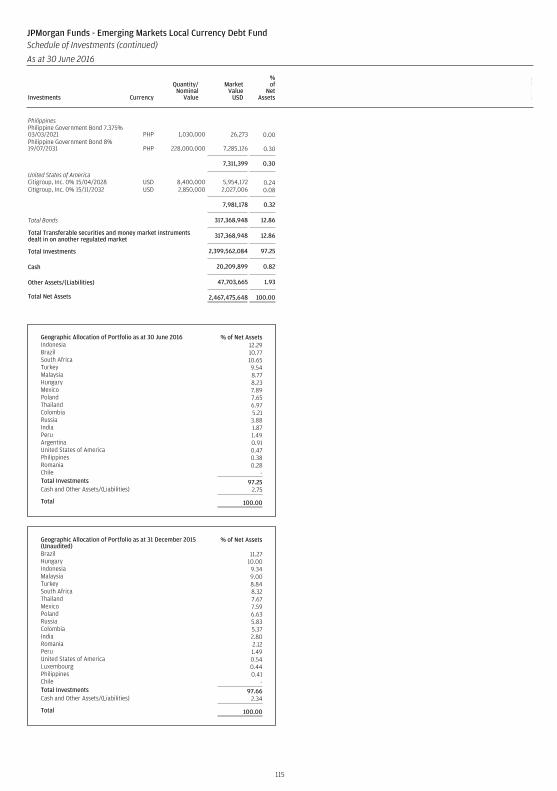
PhilippinesPhilippine Government Bond 7.375%03/03/2021 PHP 1,030,000 26,273 0.00Philippine Government Bond 8%19/07/2031 PHP 228,000,000 7,285,126 0.30
7,311,399 0.30
United States of AmericaCitigroup, Inc. 0% 15/04/2028 USD 8,400,000 5,954,172 0.24Citigroup, Inc. 0% 15/11/2032 USD 2,850,000 2,027,006 0.08
7,981,178 0.32
Total Bonds 317,368,948 12.86
Total Transferable securities and money market instrumentsdealt in on another regulated market 317,368,948 12.86
Total Investments 2,399,562,084 97.25
Cash 20,209,899 0.82
Other Assets/(Liabilities) 47,703,665 1.93
Total Net Assets 2,467,475,648 100.00
Geographic Allocation of Portfolio as at 30 June 2016 % of Net AssetsIndonesia 12.29Brazil 10.77South Africa 10.65Turkey 9.54Malaysia 8.77Hungary 8.23Mexico 7.89Poland 7.65Thailand 6.97Colombia 5.21Russia 3.88India 1.87Peru 1.49Argentina 0.91United States of America 0.47Philippines 0.38Romania 0.28Chile -Total Investments 97.25Cash and Other Assets/(Liabilities) 2.75
Total 100.00
Geographic Allocation of Portfolio as at 31 December 2015(Unaudited)
% of Net Assets
Brazil 11.27Hungary 10.00Indonesia 9.34Malaysia 9.00Turkey 8.84South Africa 8.32Thailand 7.67Mexico 7.59Poland 6.63Russia 5.83Colombia 5.37India 2.80Romania 2.12Peru 1.49United States of America 0.54Luxembourg 0.44Philippines 0.41Chile -Total Investments 97.66Cash and Other Assets/(Liabilities) 2.34
Total 100.00
115
JPMorgan Funds - Emerging Markets Local Currency Debt FundSchedule of Investments (continued)
As at 30 June 2016
Investments Currency
Quantity/Nominal
Value
MarketValue
USD
%of
NetAssets Investments Currency
Quantity/Nominal
Value
MarketValue
USD
%of
NetAssets
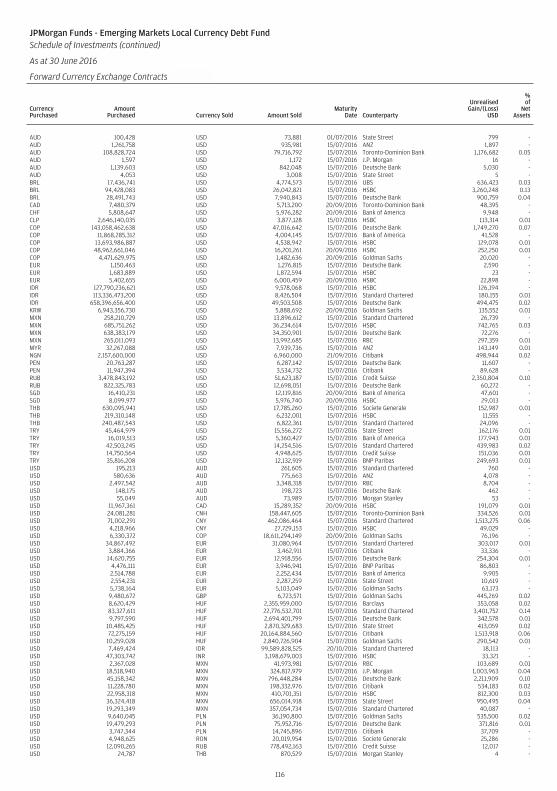
JPMorgan Funds - Emerging Markets Local Currency Debt FundSchedule of Investments (continued)
As at 30 June 2016
Forward Currency Exchange Contracts (continued)
CurrencyPurchased
AmountPurchased Currency Sold Amount Sold
MaturityDate Counterparty
UnrealisedGain/(Loss)
USD
%of
NetAssets
AUD 100,428 USD 73,881 01/07/2016 State Street 799 -AUD 1,261,758 USD 935,981 15/07/2016 ANZ 1,897 -AUD 108,828,724 USD 79,716,792 15/07/2016 Toronto-Dominion Bank 1,176,682 0.05AUD 1,597 USD 1,172 15/07/2016 J.P. Morgan 16 -AUD 1,139,603 USD 842,048 15/07/2016 Deutsche Bank 5,030 -AUD 4,053 USD 3,008 15/07/2016 State Street 5 -BRL 17,436,741 USD 4,774,573 15/07/2016 UBS 636,423 0.03BRL 94,428,083 USD 26,042,821 15/07/2016 HSBC 3,260,248 0.13BRL 28,491,743 USD 7,940,843 15/07/2016 Deutsche Bank 900,759 0.04CAD 7,480,379 USD 5,713,200 20/09/2016 Toronto-Dominion Bank 48,395 -CHF 5,808,647 USD 5,976,282 20/09/2016 Bank of America 9,948 -CLP 2,646,140,035 USD 3,877,128 15/07/2016 HSBC 113,314 0.01COP 143,058,462,638 USD 47,016,642 15/07/2016 Deutsche Bank 1,749,270 0.07COP 11,868,285,312 USD 4,004,145 15/07/2016 Bank of America 41,528 -COP 13,693,986,887 USD 4,538,942 15/07/2016 HSBC 129,078 0.01COP 48,962,661,046 USD 16,201,261 20/09/2016 HSBC 252,250 0.01COP 4,471,629,975 USD 1,482,636 20/09/2016 Goldman Sachs 20,020 -EUR 1,150,463 USD 1,276,815 15/07/2016 Deutsche Bank 2,590 -EUR 1,683,889 USD 1,872,594 15/07/2016 HSBC 23 -EUR 5,402,655 USD 6,000,459 20/09/2016 HSBC 22,898 -IDR 127,790,236,621 USD 9,578,068 15/07/2016 HSBC 126,194 -IDR 113,336,473,200 USD 8,426,504 15/07/2016 Standard Chartered 180,155 0.01IDR 658,396,656,400 USD 49,503,508 15/07/2016 Deutsche Bank 494,475 0.02KRW 6,943,356,730 USD 5,888,692 20/09/2016 Goldman Sachs 135,552 0.01MXN 258,210,729 USD 13,896,612 15/07/2016 Standard Chartered 26,739 -MXN 685,751,262 USD 36,234,614 15/07/2016 HSBC 742,765 0.03MXN 638,383,179 USD 34,350,901 15/07/2016 Deutsche Bank 72,276 -MXN 265,011,093 USD 13,992,685 15/07/2016 RBC 297,359 0.01MYR 32,267,088 USD 7,939,736 15/07/2016 ANZ 143,149 0.01NGN 2,157,600,000 USD 6,960,000 21/09/2016 Citibank 498,944 0.02PEN 20,763,287 USD 6,287,142 15/07/2016 Deutsche Bank 11,607 -PEN 11,947,394 USD 3,534,732 15/07/2016 Citibank 89,628 -RUB 3,478,843,192 USD 51,623,187 15/07/2016 Credit Suisse 2,350,804 0.10RUB 822,325,783 USD 12,698,051 15/07/2016 Deutsche Bank 60,272 -SGD 16,410,231 USD 12,119,816 20/09/2016 Bank of America 47,601 -SGD 8,099,977 USD 5,976,740 20/09/2016 HSBC 29,013 -THB 630,095,941 USD 17,785,260 15/07/2016 Societe Generale 152,987 0.01THB 219,310,148 USD 6,232,001 15/07/2016 HSBC 11,555 -THB 240,487,543 USD 6,822,361 15/07/2016 Standard Chartered 24,096 -TRY 45,464,979 USD 15,556,272 15/07/2016 State Street 162,176 0.01TRY 16,019,513 USD 5,360,427 15/07/2016 Bank of America 177,943 0.01TRY 42,503,245 USD 14,254,516 15/07/2016 Standard Chartered 439,983 0.02TRY 14,750,564 USD 4,948,625 15/07/2016 Credit Suisse 151,036 0.01TRY 35,816,208 USD 12,132,919 15/07/2016 BNP Paribas 249,693 0.01USD 195,213 AUD 261,605 15/07/2016 Standard Chartered 760 -USD 580,636 AUD 775,663 15/07/2016 ANZ 4,078 -USD 2,497,542 AUD 3,348,318 15/07/2016 RBC 8,704 -USD 148,175 AUD 198,723 15/07/2016 Deutsche Bank 462 -USD 55,049 AUD 73,989 15/07/2016 Morgan Stanley 53 -USD 11,967,361 CAD 15,289,352 20/09/2016 HSBC 191,079 0.01USD 24,081,281 CNH 158,447,605 15/07/2016 Toronto-Dominion Bank 334,526 0.01USD 71,002,291 CNY 462,086,464 15/07/2016 Standard Chartered 1,513,275 0.06USD 4,218,966 CNY 27,729,153 15/07/2016 HSBC 49,029 -USD 6,330,372 COP 18,611,294,149 20/09/2016 Goldman Sachs 76,196 -USD 34,867,492 EUR 31,080,964 15/07/2016 Standard Chartered 303,017 0.01USD 3,884,366 EUR 3,462,911 15/07/2016 Citibank 33,336 -USD 14,620,755 EUR 12,918,556 15/07/2016 Deutsche Bank 254,304 0.01USD 4,476,111 EUR 3,946,941 15/07/2016 BNP Paribas 86,803 -USD 2,514,788 EUR 2,252,434 15/07/2016 Bank of America 9,905 -USD 2,554,231 EUR 2,287,259 15/07/2016 State Street 10,619 -USD 5,738,164 EUR 5,103,049 15/07/2016 Goldman Sachs 63,173 -USD 9,480,672 GBP 6,723,571 15/07/2016 Goldman Sachs 445,269 0.02USD 8,620,429 HUF 2,355,959,000 15/07/2016 Barclays 353,058 0.02USD 83,327,611 HUF 22,776,532,701 15/07/2016 Standard Chartered 3,401,752 0.14USD 9,797,590 HUF 2,694,401,799 15/07/2016 Deutsche Bank 342,578 0.01USD 10,485,425 HUF 2,870,329,683 15/07/2016 State Street 413,059 0.02USD 72,275,159 HUF 20,164,884,560 15/07/2016 Citibank 1,513,918 0.06USD 10,259,028 HUF 2,840,726,904 15/07/2016 Goldman Sachs 290,542 0.01USD 7,469,424 IDR 99,589,828,525 20/10/2016 Standard Chartered 18,113 -USD 47,303,742 INR 3,198,679,003 15/07/2016 HSBC 33,321 -USD 2,367,028 MXN 41,973,981 15/07/2016 RBC 103,689 0.01USD 18,518,940 MXN 324,817,979 15/07/2016 J.P. Morgan 1,003,963 0.04USD 45,158,342 MXN 796,448,284 15/07/2016 Deutsche Bank 2,211,909 0.10USD 11,228,780 MXN 198,332,976 15/07/2016 Citibank 534,183 0.02USD 22,958,318 MXN 410,701,351 15/07/2016 HSBC 812,300 0.03USD 36,324,418 MXN 656,014,918 15/07/2016 State Street 950,495 0.04USD 19,293,349 MXN 357,054,734 15/07/2016 Standard Chartered 40,087 -USD 9,640,045 PLN 36,190,800 15/07/2016 Goldman Sachs 535,500 0.02USD 19,479,293 PLN 75,952,716 15/07/2016 Deutsche Bank 371,816 0.01USD 3,747,344 PLN 14,745,896 15/07/2016 Citibank 37,709 -USD 4,948,625 RON 20,019,954 15/07/2016 Societe Generale 25,286 -USD 12,090,265 RUB 778,492,163 15/07/2016 Credit Suisse 12,017 -USD 24,787 THB 870,529 15/07/2016 Morgan Stanley 4 -
116
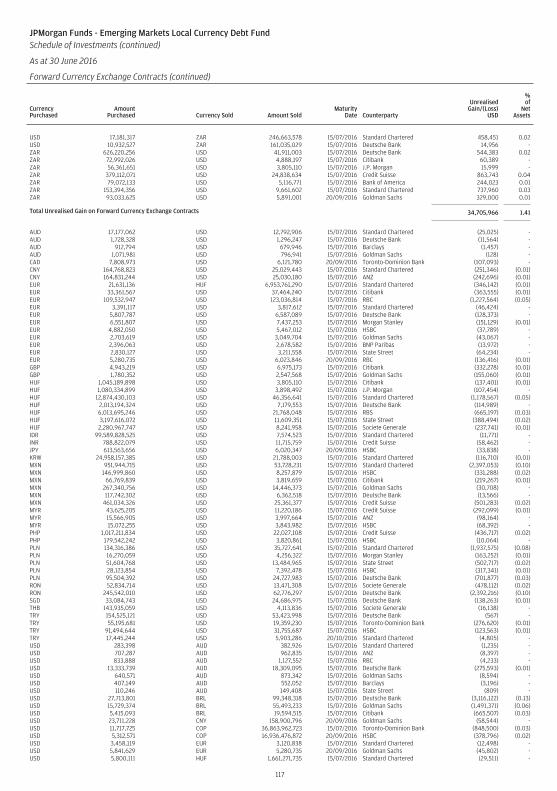
JPMorgan Funds - Emerging Markets Local Currency Debt FundSchedule of Investments (continued)
As at 30 June 2016
Forward Currency Exchange Contracts (continued)
CurrencyPurchased
AmountPurchased Currency Sold Amount Sold
MaturityDate Counterparty
UnrealisedGain/(Loss)
USD
%of
NetAssets
USD 17,181,317 ZAR 246,663,578 15/07/2016 Standard Chartered 458,451 0.02USD 10,932,527 ZAR 161,035,029 15/07/2016 Deutsche Bank 14,956 -ZAR 626,220,256 USD 41,911,003 15/07/2016 Deutsche Bank 544,383 0.02ZAR 72,992,026 USD 4,888,197 15/07/2016 Citibank 60,389 -ZAR 56,361,651 USD 3,805,110 15/07/2016 J.P. Morgan 15,999 -ZAR 379,112,071 USD 24,838,634 15/07/2016 Credit Suisse 863,743 0.04ZAR 79,072,133 USD 5,116,771 15/07/2016 Bank of America 244,023 0.01ZAR 153,394,356 USD 9,661,602 15/07/2016 Standard Chartered 737,960 0.03ZAR 93,033,625 USD 5,891,001 20/09/2016 Goldman Sachs 329,000 0.01
Total Unrealised Gain on Forward Currency Exchange Contracts 34,705,966 1.41
AUD 17,177,062 USD 12,792,906 15/07/2016 Standard Chartered (25,025) -AUD 1,728,328 USD 1,296,247 15/07/2016 Deutsche Bank (11,564) -AUD 912,794 USD 679,946 15/07/2016 Barclays (1,457) -AUD 1,071,981 USD 796,941 15/07/2016 Goldman Sachs (128) -CAD 7,808,973 USD 6,121,780 20/09/2016 Toronto-Dominion Bank (107,093) -CNY 164,768,823 USD 25,029,443 15/07/2016 Standard Chartered (251,346) (0.01)CNY 164,831,244 USD 25,030,180 15/07/2016 ANZ (242,696) (0.01)EUR 21,631,136 HUF 6,953,761,290 15/07/2016 Standard Chartered (346,142) (0.01)EUR 33,361,567 USD 37,464,240 15/07/2016 Citibank (363,555) (0.01)EUR 109,532,947 USD 123,036,814 15/07/2016 RBC (1,227,564) (0.05)EUR 3,391,117 USD 3,817,612 15/07/2016 Standard Chartered (46,424) -EUR 5,807,787 USD 6,587,089 15/07/2016 Deutsche Bank (128,373) -EUR 6,551,807 USD 7,437,253 15/07/2016 Morgan Stanley (151,129) (0.01)EUR 4,882,050 USD 5,467,012 15/07/2016 HSBC (37,789) -EUR 2,703,619 USD 3,049,704 15/07/2016 Goldman Sachs (43,067) -EUR 2,396,063 USD 2,678,582 15/07/2016 BNP Paribas (13,972) -EUR 2,830,127 USD 3,211,558 15/07/2016 State Street (64,234) -EUR 5,280,735 USD 6,023,846 20/09/2016 RBC (136,416) (0.01)GBP 4,943,219 USD 6,975,173 15/07/2016 Citibank (332,278) (0.01)GBP 1,780,352 USD 2,547,568 15/07/2016 Goldman Sachs (155,060) (0.01)HUF 1,045,189,898 USD 3,805,110 15/07/2016 Citibank (137,401) (0.01)HUF 1,080,334,899 USD 3,898,492 15/07/2016 J.P. Morgan (107,454) -HUF 12,874,430,103 USD 46,356,641 15/07/2016 Standard Chartered (1,178,567) (0.05)HUF 2,013,194,324 USD 7,179,553 15/07/2016 Deutsche Bank (114,989) -HUF 6,013,695,246 USD 21,768,048 15/07/2016 RBS (665,197) (0.03)HUF 3,197,616,072 USD 11,609,351 15/07/2016 State Street (388,494) (0.02)HUF 2,280,967,747 USD 8,241,958 15/07/2016 Societe Generale (237,741) (0.01)IDR 99,589,828,525 USD 7,574,523 15/07/2016 Standard Chartered (11,771) -INR 788,822,079 USD 11,715,759 15/07/2016 Credit Suisse (58,462) -JPY 613,563,656 USD 6,020,347 20/09/2016 HSBC (33,838) -KRW 24,958,157,385 USD 21,788,003 15/07/2016 Standard Chartered (116,710) (0.01)MXN 951,944,715 USD 53,728,231 15/07/2016 Standard Chartered (2,397,053) (0.10)MXN 146,999,860 USD 8,257,879 15/07/2016 HSBC (331,288) (0.02)MXN 66,769,839 USD 3,819,659 15/07/2016 Citibank (219,267) (0.01)MXN 267,340,756 USD 14,446,373 15/07/2016 Goldman Sachs (30,708) -MXN 117,742,302 USD 6,362,518 15/07/2016 Deutsche Bank (13,566) -MXN 461,034,326 USD 25,361,377 15/07/2016 Credit Suisse (501,283) (0.02)MYR 43,625,205 USD 11,220,186 15/07/2016 Credit Suisse (292,099) (0.01)MYR 15,566,905 USD 3,997,664 15/07/2016 ANZ (98,164) -MYR 15,072,255 USD 3,843,982 15/07/2016 HSBC (68,392) -PHP 1,017,211,834 USD 22,027,108 15/07/2016 Credit Suisse (436,717) (0.02)PHP 179,542,242 USD 3,820,861 15/07/2016 HSBC (10,064) -PLN 134,316,386 USD 35,727,641 15/07/2016 Standard Chartered (1,937,575) (0.08)PLN 16,270,059 USD 4,256,322 15/07/2016 Morgan Stanley (163,252) (0.01)PLN 51,604,768 USD 13,484,965 15/07/2016 State Street (502,717) (0.02)PLN 28,123,854 USD 7,392,478 15/07/2016 HSBC (317,341) (0.01)PLN 95,504,392 USD 24,727,983 15/07/2016 Deutsche Bank (701,877) (0.03)RON 52,834,714 USD 13,471,308 15/07/2016 Societe Generale (478,112) (0.02)RON 245,542,010 USD 62,776,297 15/07/2016 Deutsche Bank (2,392,216) (0.10)SGD 33,084,743 USD 24,686,975 15/07/2016 Deutsche Bank (138,263) (0.01)THB 143,935,059 USD 4,113,836 15/07/2016 Societe Generale (16,138) -TRY 154,525,121 USD 53,423,998 15/07/2016 Deutsche Bank (567) -TRY 55,195,681 USD 19,359,230 15/07/2016 Toronto-Dominion Bank (276,620) (0.01)TRY 91,494,644 USD 31,755,687 15/07/2016 HSBC (123,563) (0.01)TRY 17,445,244 USD 5,903,286 20/10/2016 Standard Chartered (4,805) -USD 283,398 AUD 382,926 15/07/2016 Standard Chartered (1,235) -USD 707,287 AUD 962,835 15/07/2016 ANZ (8,397) -USD 833,888 AUD 1,127,552 15/07/2016 RBC (4,233) -USD 13,333,739 AUD 18,309,095 15/07/2016 Deutsche Bank (275,593) (0.01)USD 640,571 AUD 873,342 15/07/2016 Goldman Sachs (8,594) -USD 407,149 AUD 552,052 15/07/2016 Barclays (3,196) -USD 110,246 AUD 149,408 15/07/2016 State Street (809) -USD 27,713,801 BRL 99,348,318 15/07/2016 Deutsche Bank (3,116,122) (0.13)USD 15,729,374 BRL 55,493,233 15/07/2016 Goldman Sachs (1,491,371) (0.06)USD 5,415,093 BRL 19,594,515 15/07/2016 Citibank (665,507) (0.03)USD 23,711,228 CNY 158,900,796 20/09/2016 Goldman Sachs (58,544) -USD 11,717,725 COP 36,863,962,723 15/07/2016 Toronto-Dominion Bank (848,500) (0.03)USD 5,312,571 COP 16,936,476,872 20/09/2016 HSBC (378,796) (0.02)USD 3,458,119 EUR 3,120,838 15/07/2016 Standard Chartered (12,498) -USD 5,841,629 EUR 5,280,735 20/09/2016 Goldman Sachs (45,802) -USD 5,800,111 HUF 1,661,271,735 15/07/2016 Standard Chartered (29,511) -
117

JPMorgan Funds - Emerging Markets Local Currency Debt FundSchedule of Investments (continued)
As at 30 June 2016
Forward Currency Exchange Contracts (continued)
CurrencyPurchased
AmountPurchased Currency Sold Amount Sold
MaturityDate Counterparty
UnrealisedGain/(Loss)
USD
%of
NetAssets
USD 34,370,195 IDR 459,888,599,791 15/07/2016 Standard Chartered (553,285) (0.03)USD 8,341,362 IDR 112,255,553,853 15/07/2016 HSBC (183,213) -USD 22,963,494 IDR 317,470,302,682 15/07/2016 Credit Suisse (1,144,883) (0.05)USD 8,153,294 IDR 109,498,738,420 15/07/2016 Goldman Sachs (161,931) (0.01)USD 49,503,508 IDR 698,541,950,500 15/05/2017 Deutsche Bank (748,901) (0.03)USD 11,605,811 INR 786,990,077 15/07/2016 J.P. Morgan (24,412) -USD 21,716,672 KRW 25,886,272,702 15/07/2016 J.P. Morgan (760,508) (0.03)USD 5,999,617 KRW 6,943,356,730 20/09/2016 HSBC (24,627) -USD 27,914,878 MXN 527,338,962 15/07/2016 RBC (520,524) (0.02)USD 29,582,016 MXN 572,587,308 15/07/2016 Deutsche Bank (1,293,287) (0.05)USD 5,954,985 MXN 112,710,000 20/09/2016 Goldman Sachs (80,703) -USD 3,977,088 MYR 16,286,174 15/07/2016 HSBC (102,589) -USD 23,959,507 PHP 1,131,607,496 15/07/2016 Standard Chartered (58,939) -USD 5,899,703 PLN 23,987,955 20/09/2016 Bank of America (125,711) (0.01)USD 4,444,624 RUB 301,701,093 15/07/2016 Credit Suisse (236,246) (0.01)USD 5,655,572 RUB 377,622,542 15/07/2016 Goldman Sachs (203,213) (0.01)USD 14,496,573 RUB 936,188,699 15/07/2016 Deutsche Bank (28,324) -USD 24,175,035 SGD 33,084,743 15/07/2016 ANZ (373,678) (0.02)USD 12,112,382 SGD 16,410,231 20/09/2016 HSBC (55,034) -USD 7,026,270 THB 251,294,547 15/07/2016 BNP Paribas (127,853) (0.01)USD 21,444,044 THB 765,981,252 15/07/2016 Deutsche Bank (362,732) (0.02)USD 108,662,404 TRY 315,386,954 15/07/2016 Deutsche Bank (375,227) (0.01)USD 24,008,026 TRY 71,208,244 15/07/2016 Standard Chartered (610,551) (0.03)USD 23,429,288 TRY 69,174,759 15/07/2016 Goldman Sachs (486,259) (0.02)USD 27,384,958 ZAR 438,363,787 15/07/2016 Standard Chartered (2,334,464) (0.09)USD 26,709,179 ZAR 407,344,901 15/07/2016 Deutsche Bank (907,279) (0.04)USD 19,015,559 ZAR 292,276,062 15/07/2016 Citibank (799,663) (0.03)USD 45,653,272 ZAR 694,103,867 15/07/2016 HSBC (1,404,369) (0.05)USD 36,481,802 ZAR 553,997,428 15/07/2016 State Street (1,077,147) (0.04)USD 6,137,333 ZAR 93,033,625 20/09/2016 HSBC (82,668) -ZAR 295,859,796 USD 20,173,568 15/07/2016 Standard Chartered (115,383) (0.01)
Total Unrealised Loss on Forward Currency Exchange Contracts (40,499,894) (1.64)
Net Unrealised Loss on Forward Currency Exchange Contracts (5,793,928) (0.23)
Financial Futures Contracts
Security DescriptionNumber ofContracts Currency
GlobalExposure
USD
UnrealisedGain/(Loss)
USD
%of
NetAssets
3 Month Eurodollar, 18/12/2017 (466) USD (115,506,838) 11,053 -US 5 Year Note, 30/09/2016 (10) USD (1,220,430) 430 -
Total Unrealised Gain on Financial Futures Contracts 11,483 -
3 Month Eurodollar, 19/12/2016 (1,066) USD (264,681,137) (19,988) -3 Month Eurodollar, 13/03/2017 (568) USD (140,988,250) (14,512) -US 10 Year Note, 21/09/2016 593 USD 78,827,305 (78,758) -
Total Unrealised Loss on Financial Futures Contracts (113,258) -
Net Unrealised Loss on Financial Futures Contracts (101,775) -
118
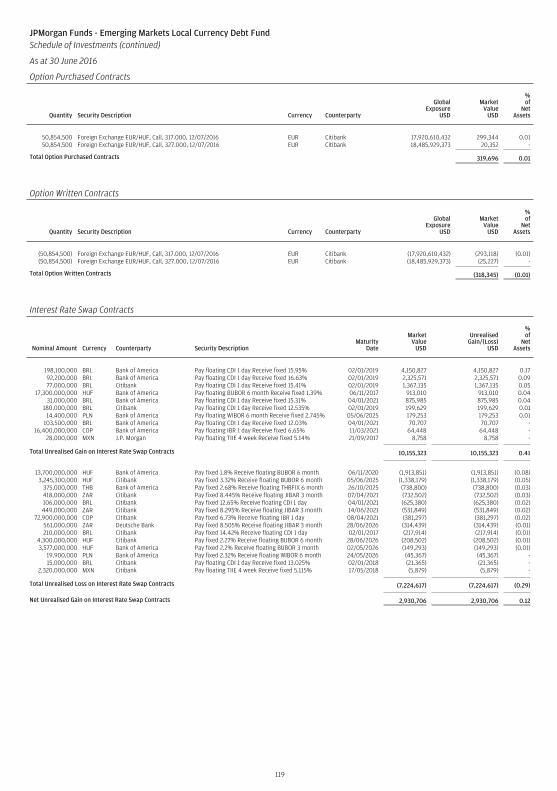
JPMorgan Funds - Emerging Markets Local Currency Debt FundSchedule of Investments (continued)
As at 30 June 2016
Option Purchased Contracts
Quantity Security Description Currency Counterparty
GlobalExposure
USD
MarketValue
USD
%of
NetAssets
50,854,500 Foreign Exchange EUR/HUF, Call, 317.000, 12/07/2016 EUR Citibank 17,920,610,432 299,344 0.0150,854,500 Foreign Exchange EUR/HUF, Call, 327.000, 12/07/2016 EUR Citibank 18,485,929,373 20,352 -
Total Option Purchased Contracts 319,696 0.01
Option Written Contracts
Quantity Security Description Currency Counterparty
GlobalExposure
USD
MarketValue
USD
%of
NetAssets
(50,854,500) Foreign Exchange EUR/HUF, Call, 317.000, 12/07/2016 EUR Citibank (17,920,610,432) (293,118) (0.01)(50,854,500) Foreign Exchange EUR/HUF, Call, 327.000, 12/07/2016 EUR Citibank (18,485,929,373) (25,227) -
Total Option Written Contracts (318,345) (0.01)
Interest Rate Swap Contracts
Nominal Amount Currency Counterparty Security DescriptionMaturity
Date
MarketValue
USD
UnrealisedGain/(Loss)
USD
%of
NetAssets
198,100,000 BRL Bank of America Pay floating CDI 1 day Receive fixed 15.95% 02/01/2019 4,150,827 4,150,827 0.1792,200,000 BRL Bank of America Pay floating CDI 1 day Receive fixed 16.63% 02/01/2019 2,325,571 2,325,571 0.0977,000,000 BRL Citibank Pay floating CDI 1 day Receive fixed 15.41% 02/01/2019 1,367,135 1,367,135 0.05
17,300,000,000 HUF Bank of America Pay floating BUBOR 6 month Receive fixed 1.39% 06/11/2017 913,010 913,010 0.0431,000,000 BRL Bank of America Pay floating CDI 1 day Receive fixed 15.31% 04/01/2021 875,985 875,985 0.04
180,000,000 BRL Citibank Pay floating CDI 1 day Receive fixed 12.535% 02/01/2019 199,629 199,629 0.0114,400,000 PLN Bank of America Pay floating WIBOR 6 month Receive fixed 2.745% 05/06/2025 179,253 179,253 0.01
103,500,000 BRL Bank of America Pay floating CDI 1 day Receive fixed 12.03% 04/01/2021 70,707 70,707 -16,400,000,000 COP Bank of America Pay floating IBR 1 day Receive fixed 6.65% 11/03/2021 64,448 64,448 -
28,000,000 MXN J.P. Morgan Pay floating TIIE 4 week Receive fixed 5.14% 21/09/2017 8,758 8,758 -
Total Unrealised Gain on Interest Rate Swap Contracts 10,155,323 10,155,323 0.41
13,700,000,000 HUF Bank of America Pay fixed 1.8% Receive floating BUBOR 6 month 06/11/2020 (1,913,851) (1,913,851) (0.08)3,245,300,000 HUF Citibank Pay fixed 3.32% Receive floating BUBOR 6 month 05/06/2025 (1,338,179) (1,338,179) (0.05)
375,000,000 THB Bank of America Pay fixed 2.68% Receive floating THBFIX 6 month 26/10/2025 (738,800) (738,800) (0.03)418,000,000 ZAR Citibank Pay fixed 8.445% Receive floating JIBAR 3 month 07/04/2021 (732,502) (732,502) (0.03)106,000,000 BRL Citibank Pay fixed 12.65% Receive floating CDI 1 day 04/01/2021 (625,380) (625,380) (0.02)449,000,000 ZAR Citibank Pay fixed 8.295% Receive floating JIBAR 3 month 14/06/2021 (531,849) (531,849) (0.02)
72,900,000,000 COP Citibank Pay fixed 6.73% Receive floating IBR 1 day 08/04/2021 (381,297) (381,297) (0.02)561,000,000 ZAR Deutsche Bank Pay fixed 8.505% Receive floating JIBAR 3 month 28/06/2026 (314,439) (314,439) (0.01)210,000,000 BRL Citibank Pay fixed 14.42% Receive floating CDI 1 day 02/01/2017 (217,914) (217,914) (0.01)
4,300,000,000 HUF Citibank Pay fixed 2.27% Receive floating BUBOR 6 month 28/06/2026 (208,502) (208,502) (0.01)3,577,000,000 HUF Bank of America Pay fixed 2.2% Receive floating BUBOR 3 month 02/05/2026 (149,293) (149,293) (0.01)
19,900,000 PLN Bank of America Pay fixed 2.32% Receive floating WIBOR 6 month 24/05/2026 (45,367) (45,367) -15,000,000 BRL Citibank Pay floating CDI 1 day Receive fixed 13.025% 02/01/2018 (21,365) (21,365) -
2,320,000,000 MXN Citibank Pay floating TIIE 4 week Receive fixed 5.115% 17/05/2018 (5,879) (5,879) -
Total Unrealised Loss on Interest Rate Swap Contracts (7,224,617) (7,224,617) (0.29)
Net Unrealised Gain on Interest Rate Swap Contracts 2,930,706 2,930,706 0.12
119
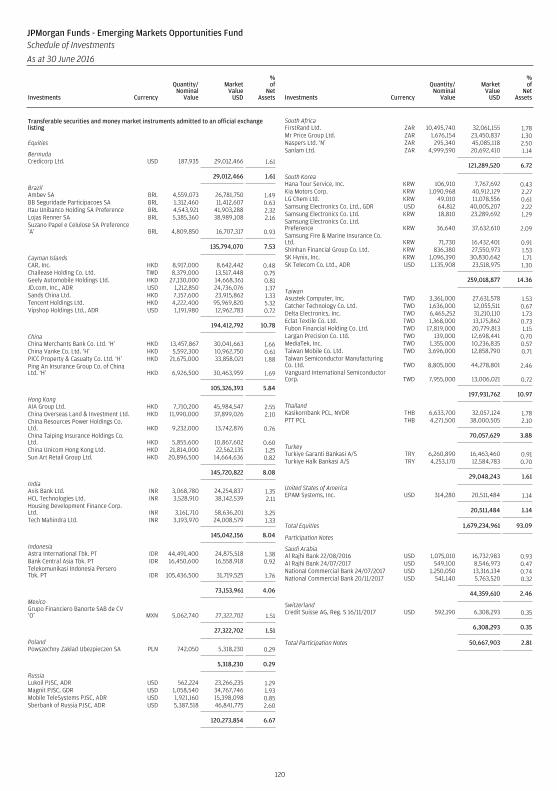
Transferable securities and money market instruments admitted to an official exchangelisting
Equities
BermudaCredicorp Ltd. USD 187,935 29,012,466 1.61
29,012,466 1.61
BrazilAmbev SA BRL 4,559,073 26,781,750 1.49BB Seguridade Participacoes SA BRL 1,312,460 11,412,607 0.63Itau Unibanco Holding SA Preference BRL 4,543,921 41,903,288 2.32Lojas Renner SA BRL 5,385,360 38,989,108 2.16Suzano Papel e Celulose SA Preference‘A’ BRL 4,809,850 16,707,317 0.93
135,794,070 7.53
Cayman IslandsCAR, Inc. HKD 8,917,000 8,642,442 0.48Chailease Holding Co. Ltd. TWD 8,379,000 13,517,448 0.75Geely Automobile Holdings Ltd. HKD 27,130,000 14,668,361 0.81JD.com, Inc., ADR USD 1,212,850 24,736,076 1.37Sands China Ltd. HKD 7,157,600 23,915,862 1.33Tencent Holdings Ltd. HKD 4,222,400 95,969,820 5.32Vipshop Holdings Ltd., ADR USD 1,191,980 12,962,783 0.72
194,412,792 10.78
ChinaChina Merchants Bank Co. Ltd. ‘H’ HKD 13,457,867 30,041,663 1.66China Vanke Co. Ltd. ‘H’ HKD 5,592,300 10,962,750 0.61PICC Property & Casualty Co. Ltd. ‘H’ HKD 21,675,000 33,858,021 1.88Ping An Insurance Group Co. of ChinaLtd. ‘H’ HKD 6,926,500 30,463,959 1.69
105,326,393 5.84
Hong KongAIA Group Ltd. HKD 7,710,200 45,984,547 2.55China Overseas Land & Investment Ltd. HKD 11,990,000 37,899,026 2.10China Resources Power Holdings Co.Ltd. HKD 9,232,000 13,742,876 0.76China Taiping Insurance Holdings Co.Ltd. HKD 5,855,600 10,867,602 0.60China Unicom Hong Kong Ltd. HKD 21,814,000 22,562,135 1.25Sun Art Retail Group Ltd. HKD 20,896,500 14,664,636 0.82
145,720,822 8.08
IndiaAxis Bank Ltd. INR 3,068,780 24,254,837 1.35HCL Technologies Ltd. INR 3,528,910 38,142,539 2.11Housing Development Finance Corp.Ltd. INR 3,161,710 58,636,201 3.25Tech Mahindra Ltd. INR 3,193,970 24,008,579 1.33
145,042,156 8.04
IndonesiaAstra International Tbk. PT IDR 44,491,400 24,875,518 1.38Bank Central Asia Tbk. PT IDR 16,450,600 16,558,918 0.92Telekomunikasi Indonesia PerseroTbk. PT IDR 105,436,500 31,719,525 1.76
73,153,961 4.06
MexicoGrupo Financiero Banorte SAB de CV‘O’ MXN 5,062,740 27,322,702 1.51
27,322,702 1.51
PolandPowszechny Zaklad Ubezpieczen SA PLN 742,050 5,318,230 0.29
5,318,230 0.29
RussiaLukoil PJSC, ADR USD 562,224 23,266,235 1.29Magnit PJSC, GDR USD 1,058,540 34,767,746 1.93Mobile TeleSystems PJSC, ADR USD 1,921,160 15,398,098 0.85Sberbank of Russia PJSC, ADR USD 5,387,518 46,841,775 2.60
120,273,854 6.67
South AfricaFirstRand Ltd. ZAR 10,495,740 32,061,155 1.78Mr Price Group Ltd. ZAR 1,676,154 23,450,837 1.30Naspers Ltd. ‘N’ ZAR 295,340 45,085,118 2.50Sanlam Ltd. ZAR 4,999,590 20,692,410 1.14
121,289,520 6.72
South KoreaHana Tour Service, Inc. KRW 106,910 7,767,692 0.43Kia Motors Corp. KRW 1,090,968 40,912,129 2.27LG Chem Ltd. KRW 49,010 11,078,556 0.61Samsung Electronics Co. Ltd., GDR USD 64,812 40,005,207 2.22Samsung Electronics Co. Ltd. KRW 18,810 23,289,692 1.29Samsung Electronics Co. Ltd.Preference KRW 36,640 37,632,610 2.09Samsung Fire & Marine Insurance Co.Ltd. KRW 71,730 16,432,401 0.91Shinhan Financial Group Co. Ltd. KRW 836,380 27,550,973 1.53SK Hynix, Inc. KRW 1,096,390 30,830,642 1.71SK Telecom Co. Ltd., ADR USD 1,135,908 23,518,975 1.30
259,018,877 14.36
TaiwanAsustek Computer, Inc. TWD 3,361,000 27,631,578 1.53Catcher Technology Co. Ltd. TWD 1,636,000 12,055,511 0.67Delta Electronics, Inc. TWD 6,465,252 31,210,110 1.73Eclat Textile Co. Ltd. TWD 1,368,000 13,175,862 0.73Fubon Financial Holding Co. Ltd. TWD 17,819,000 20,779,813 1.15Largan Precision Co. Ltd. TWD 139,000 12,698,441 0.70MediaTek, Inc. TWD 1,355,000 10,236,835 0.57Taiwan Mobile Co. Ltd. TWD 3,696,000 12,858,790 0.71Taiwan Semiconductor ManufacturingCo. Ltd. TWD 8,805,000 44,278,801 2.46Vanguard International SemiconductorCorp. TWD 7,955,000 13,006,021 0.72
197,931,762 10.97
ThailandKasikornbank PCL, NVDR THB 6,633,700 32,057,124 1.78PTT PCL THB 4,271,500 38,000,505 2.10
70,057,629 3.88
TurkeyTurkiye Garanti Bankasi A/S TRY 6,260,890 16,463,460 0.91Turkiye Halk Bankasi A/S TRY 4,253,170 12,584,783 0.70
29,048,243 1.61
United States of AmericaEPAM Systems, Inc. USD 314,280 20,511,484 1.14
20,511,484 1.14
Total Equities 1,679,234,961 93.09
Participation Notes
Saudi ArabiaAl Rajhi Bank 22/08/2016 USD 1,075,010 16,732,983 0.93Al Rajhi Bank 24/07/2017 USD 549,100 8,546,973 0.47National Commercial Bank 24/07/2017 USD 1,250,050 13,316,134 0.74National Commercial Bank 20/11/2017 USD 541,140 5,763,520 0.32
44,359,610 2.46
SwitzerlandCredit Suisse AG, Reg. S 16/11/2017 USD 592,190 6,308,293 0.35
6,308,293 0.35
Total Participation Notes 50,667,903 2.81
120
JPMorgan Funds - Emerging Markets Opportunities FundSchedule of Investments
As at 30 June 2016
Investments Currency
Quantity/Nominal
Value
MarketValue
USD
%of
NetAssets Investments Currency
Quantity/Nominal
Value
MarketValue
USD
%of
NetAssets
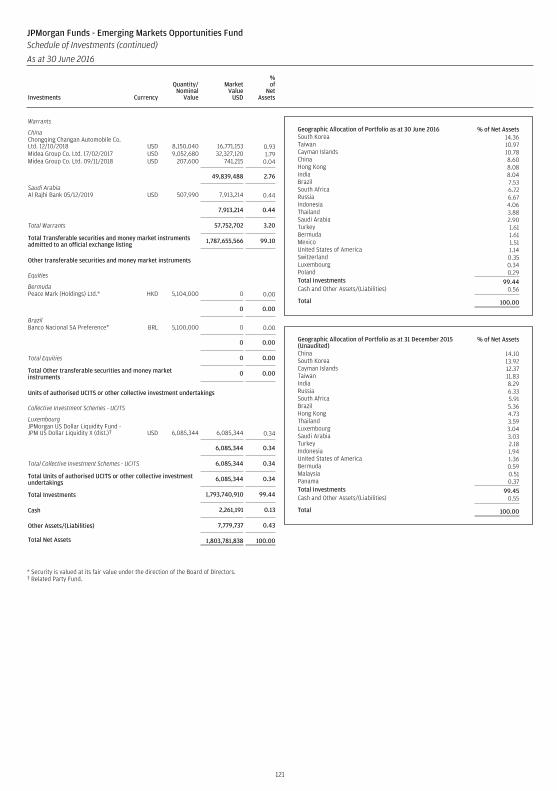
Warrants
ChinaChongqing Changan Automobile Co.Ltd. 12/10/2018 USD 8,150,040 16,771,153 0.93Midea Group Co. Ltd. 17/02/2017 USD 9,052,680 32,327,120 1.79Midea Group Co. Ltd. 09/11/2018 USD 207,600 741,215 0.04
49,839,488 2.76
Saudi ArabiaAl Rajhi Bank 05/12/2019 USD 507,990 7,913,214 0.44
7,913,214 0.44
Total Warrants 57,752,702 3.20
Total Transferable securities and money market instrumentsadmitted to an official exchange listing 1,787,655,566 99.10
Other transferable securities and money market instruments
Equities
BermudaPeace Mark (Holdings) Ltd.* HKD 5,104,000 0 0.00
0 0.00
BrazilBanco Nacional SA Preference* BRL 5,100,000 0 0.00
0 0.00
Total Equities 0 0.00
Total Other transferable securities and money marketinstruments 0 0.00
Units of authorised UCITS or other collective investment undertakings
Collective Investment Schemes - UCITS
LuxembourgJPMorgan US Dollar Liquidity Fund -JPM US Dollar Liquidity X (dist.)† USD 6,085,344 6,085,344 0.34
6,085,344 0.34
Total Collective Investment Schemes - UCITS 6,085,344 0.34
Total Units of authorised UCITS or other collective investmentundertakings 6,085,344 0.34
Total Investments 1,793,740,910 99.44
Cash 2,261,191 0.13
Other Assets/(Liabilities) 7,779,737 0.43
Total Net Assets 1,803,781,838 100.00
* Security is valued at its fair value under the direction of the Board of Directors.† Related Party Fund.
Geographic Allocation of Portfolio as at 30 June 2016 % of Net AssetsSouth Korea 14.36Taiwan 10.97Cayman Islands 10.78China 8.60Hong Kong 8.08India 8.04Brazil 7.53South Africa 6.72Russia 6.67Indonesia 4.06Thailand 3.88Saudi Arabia 2.90Turkey 1.61Bermuda 1.61Mexico 1.51United States of America 1.14Switzerland 0.35Luxembourg 0.34Poland 0.29Total Investments 99.44Cash and Other Assets/(Liabilities) 0.56
Total 100.00
Geographic Allocation of Portfolio as at 31 December 2015(Unaudited)
% of Net Assets
China 14.10South Korea 13.92Cayman Islands 12.37Taiwan 11.83India 8.29Russia 6.33South Africa 5.91Brazil 5.36Hong Kong 4.73Thailand 3.59Luxembourg 3.04Saudi Arabia 3.03Turkey 2.18Indonesia 1.94United States of America 1.36Bermuda 0.59Malaysia 0.51Panama 0.37Total Investments 99.45Cash and Other Assets/(Liabilities) 0.55
Total 100.00
121
JPMorgan Funds - Emerging Markets Opportunities FundSchedule of Investments (continued)
As at 30 June 2016
Investments Currency
Quantity/Nominal
Value
MarketValue
USD
%of
NetAssets Investments Currency
Quantity/Nominal
Value
MarketValue
USD
%of
NetAssets
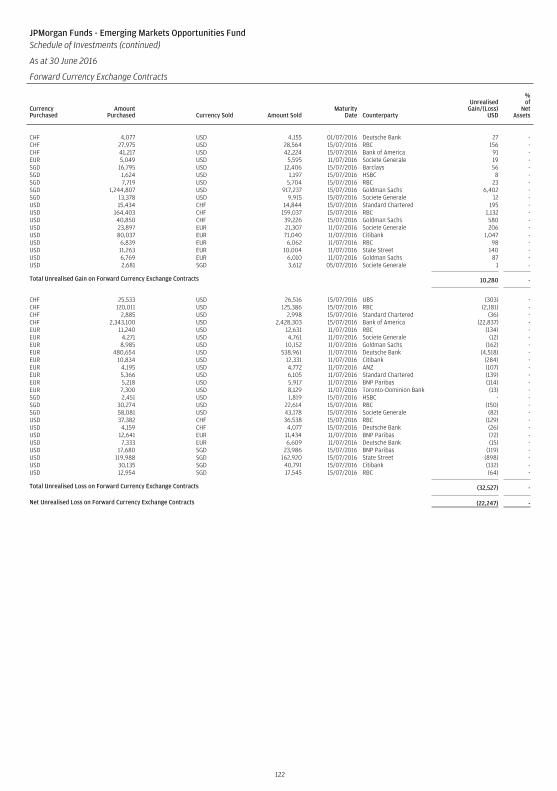
JPMorgan Funds - Emerging Markets Opportunities FundSchedule of Investments (continued)
As at 30 June 2016
Forward Currency Exchange Contracts
CurrencyPurchased
AmountPurchased Currency Sold Amount Sold
MaturityDate Counterparty
UnrealisedGain/(Loss)
USD
%of
NetAssets
CHF 4,077 USD 4,155 01/07/2016 Deutsche Bank 27 -CHF 27,975 USD 28,564 15/07/2016 RBC 156 -CHF 41,217 USD 42,224 15/07/2016 Bank of America 91 -EUR 5,049 USD 5,595 11/07/2016 Societe Generale 19 -SGD 16,795 USD 12,406 15/07/2016 Barclays 56 -SGD 1,624 USD 1,197 15/07/2016 HSBC 8 -SGD 7,719 USD 5,704 15/07/2016 RBC 23 -SGD 1,244,807 USD 917,237 15/07/2016 Goldman Sachs 6,402 -SGD 13,378 USD 9,915 15/07/2016 Societe Generale 12 -USD 15,434 CHF 14,844 15/07/2016 Standard Chartered 195 -USD 164,403 CHF 159,037 15/07/2016 RBC 1,132 -USD 40,850 CHF 39,226 15/07/2016 Goldman Sachs 580 -USD 23,897 EUR 21,307 11/07/2016 Societe Generale 206 -USD 80,037 EUR 71,040 11/07/2016 Citibank 1,047 -USD 6,839 EUR 6,062 11/07/2016 RBC 98 -USD 11,263 EUR 10,004 11/07/2016 State Street 140 -USD 6,769 EUR 6,010 11/07/2016 Goldman Sachs 87 -USD 2,681 SGD 3,612 05/07/2016 Societe Generale 1 -
Total Unrealised Gain on Forward Currency Exchange Contracts 10,280 -
CHF 25,533 USD 26,516 15/07/2016 UBS (303) -CHF 120,011 USD 125,386 15/07/2016 RBC (2,181) -CHF 2,885 USD 2,998 15/07/2016 Standard Chartered (36) -CHF 2,343,100 USD 2,428,303 15/07/2016 Bank of America (22,837) -EUR 11,240 USD 12,631 11/07/2016 RBC (134) -EUR 4,271 USD 4,761 11/07/2016 Societe Generale (12) -EUR 8,985 USD 10,152 11/07/2016 Goldman Sachs (162) -EUR 480,654 USD 538,961 11/07/2016 Deutsche Bank (4,518) -EUR 10,834 USD 12,331 11/07/2016 Citibank (284) -EUR 4,195 USD 4,772 11/07/2016 ANZ (107) -EUR 5,366 USD 6,105 11/07/2016 Standard Chartered (139) -EUR 5,218 USD 5,917 11/07/2016 BNP Paribas (114) -EUR 7,300 USD 8,129 11/07/2016 Toronto-Dominion Bank (13) -SGD 2,451 USD 1,819 15/07/2016 HSBC - -SGD 30,274 USD 22,614 15/07/2016 RBC (150) -SGD 58,081 USD 43,178 15/07/2016 Societe Generale (82) -USD 37,382 CHF 36,538 15/07/2016 RBC (129) -USD 4,159 CHF 4,077 15/07/2016 Deutsche Bank (26) -USD 12,641 EUR 11,434 11/07/2016 BNP Paribas (72) -USD 7,333 EUR 6,609 11/07/2016 Deutsche Bank (15) -USD 17,680 SGD 23,986 15/07/2016 BNP Paribas (119) -USD 119,988 SGD 162,920 15/07/2016 State Street (898) -USD 30,135 SGD 40,791 15/07/2016 Citibank (132) -USD 12,954 SGD 17,545 15/07/2016 RBC (64) -
Total Unrealised Loss on Forward Currency Exchange Contracts (32,527) -
Net Unrealised Loss on Forward Currency Exchange Contracts (22,247) -
122

Transferable securities and money market instruments admitted to an official exchangelisting
Equities
EgyptCommercial International Bank EgyptSAE, GDR USD 1,134,257 4,046,462 3.72Edita Food Industries SAE, GDR USD 42,272 350,721 0.32Edita Food Industries SAE EGP 99,360 164,874 0.15
4,562,057 4.19
KuwaitMabanee Co. SAK KWD 796,015 1,990,894 1.83National Bank of Kuwait SAKP KWD 3,039,701 5,991,394 5.50
7,982,288 7.33
LebanonBLOM Bank SAL, GDR USD 143,220 1,442,942 1.32
1,442,942 1.32
QatarMasraf Al Rayan QSC QAR 386,670 3,599,647 3.30Qatar Electricity & Water Co. QSC QAR 57,264 3,255,155 2.99Qatar Gas Transport Co. Ltd. QAR 532,510 3,376,536 3.10Qatar National Bank SAQ QAR 215,853 8,322,329 7.64
18,553,667 17.03
TurkeyAkbank TAS TRY 1,923,190 5,450,538 5.00Akcansa Cimento A/S TRY 132,710 620,878 0.57Aygaz A/S TRY 201,800 779,706 0.72BIM Birlesik Magazalar A/S TRY 94,060 1,819,569 1.67Cimsa Cimento Sanayi VE Ticaret A/S TRY 115,490 607,579 0.56Coca-Cola Icecek A/S TRY 149,110 1,807,723 1.66Dogus Otomotiv Servis ve Ticaret A/S TRY 293,690 1,072,129 0.98Emlak Konut Gayrimenkul YatirimOrtakligi A/S, REIT TRY 2,653,784 2,617,443 2.40Ford Otomotiv Sanayi A/S TRY 100,150 1,052,365 0.97KOC Holding A/S TRY 655,061 2,953,395 2.71Migros Ticaret A/S TRY 122,230 694,522 0.64Tat Gida Sanayi A/S TRY 333,790 632,402 0.58Tofas Turk Otomobil Fabrikasi A/S TRY 169,880 1,388,723 1.27Torunlar Gayrimenkul Yatirim OrtakligiA/S, REIT TRY 497,550 871,942 0.80Tukas Gida Sanayi ve Ticaret A/S TRY 2,121,700 996,673 0.91Tupras Turkiye Petrol Rafinerileri A/S TRY 187,550 4,136,893 3.80Turk Telekomunikasyon A/S TRY 625,720 1,302,634 1.20Turk Traktor ve Ziraat Makineleri A/S TRY 55,600 1,618,173 1.48Turkiye Garanti Bankasi A/S TRY 2,341,023 6,155,888 5.65Turkiye Sinai Kalkinma Bankasi A/S TRY 1,647,672 756,861 0.69
37,336,036 34.26
United Arab EmiratesAldar Properties PJSC AED 3,580,100 2,612,215 2.40Aramex PJSC AED 1,497,418 1,322,930 1.21DP World Ltd. USD 227,967 3,750,057 3.44Emaar Properties PJSC AED 3,949,596 6,661,516 6.11Emirates NBD PJSC AED 391,120 889,151 0.82Emirates Telecommunications Group Co.PJSC AED 21,180 108,985 0.10
15,344,854 14.08
Total Equities 85,221,844 78.21
Participation Notes
Saudi ArabiaAl Khaleej Training and Education Co.18/07/2016 USD 96,348 716,646 0.66Almarai Co. 31/07/2017 USD 80,313 1,174,947 1.08Almarai Co., Reg. S 14/09/2016 USD 48,900 715,513 0.65Almarai Co., Reg. S 17/09/2018 USD 36,783 538,215 0.49United International Transportation Co.,Reg. S 28/02/2019 USD 161,574 1,490,670 1.37
4,635,991 4.25
SwitzerlandCredit Suisse AG, Reg. S 16/11/2017 USD 262,470 2,795,957 2.57
2,795,957 2.57
Total Participation Notes 7,431,948 6.82
Warrants
NetherlandsBupa Arabia for Cooperative InsuranceCo. 21/07/2020 USD 27,990 1,049,541 0.96
1,049,541 0.96
Saudi ArabiaAlinma Bank, 144A 16/04/2018 USD 306,010 1,064,915 0.98Herfy Food Services Co. 07/02/2019 USD 5,200 107,770 0.10Mouwasat Medical Services Co.11/12/2019 USD 58,110 1,989,140 1.83Samba Financial Group 02/03/2017 USD 417,571 2,212,949 2.03Saudi Airlines Catering Co. 13/04/2021 USD 22,430 589,757 0.54Saudi Basic Industries Corp. 08/02/2021 USD 84,230 1,822,030 1.67Saudi Co. For Hardware LLC 20/05/2020 USD 39,020 920,635 0.84
8,707,196 7.99
Total Warrants 9,756,737 8.95
Total Transferable securities and money market instrumentsadmitted to an official exchange listing 102,410,529 93.98
Transferable securities and money market instruments dealt in on another regulatedmarket
Equities
KuwaitKuwait Food Co. Americana KWD 305,255 45,606 0.04
45,606 0.04
Total Equities 45,606 0.04
Participation Notes
Saudi ArabiaAl Rajhi Bank 14/09/2016 USD 237,588 3,698,157 3.39Saudia Dairy & Foodstuff Co. 26/04/2021 USD 17,400 690,605 0.64
4,388,762 4.03
Total Participation Notes 4,388,762 4.03
Total Transferable securities and money market instrumentsdealt in on another regulated market 4,434,368 4.07
Total Investments 106,844,897 98.05
Cash 2,360,480 2.17
Other Assets/(Liabilities) (233,075) (0.22)
Total Net Assets 108,972,302 100.00
123
JPMorgan Funds - Emerging Middle East Equity FundSchedule of Investments
As at 30 June 2016
Investments Currency
Quantity/Nominal
Value
MarketValue
USD
%of
NetAssets Investments Currency
Quantity/Nominal
Value
MarketValue
USD
%of
NetAssets
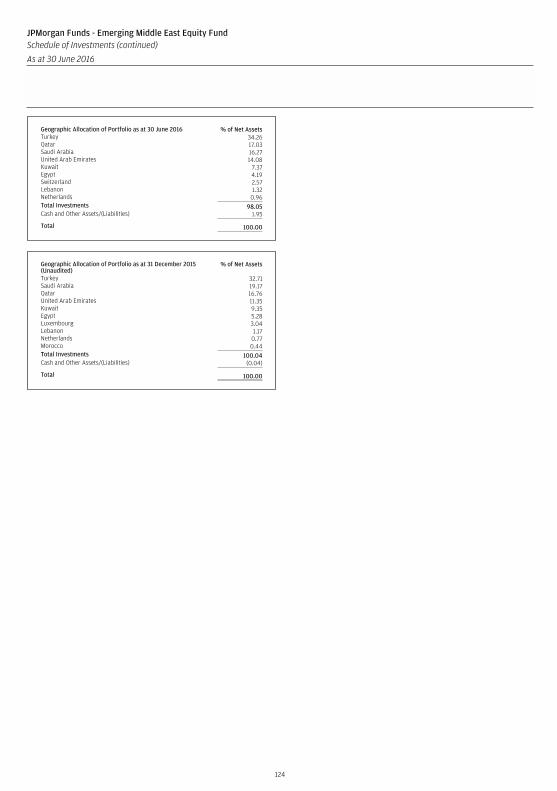
Geographic Allocation of Portfolio as at 30 June 2016 % of Net AssetsTurkey 34.26Qatar 17.03Saudi Arabia 16.27United Arab Emirates 14.08Kuwait 7.37Egypt 4.19Switzerland 2.57Lebanon 1.32Netherlands 0.96Total Investments 98.05Cash and Other Assets/(Liabilities) 1.95
Total 100.00
Geographic Allocation of Portfolio as at 31 December 2015(Unaudited)
% of Net Assets
Turkey 32.71Saudi Arabia 19.17Qatar 16.76United Arab Emirates 11.35Kuwait 9.35Egypt 5.28Luxembourg 3.04Lebanon 1.17Netherlands 0.77Morocco 0.44Total Investments 100.04Cash and Other Assets/(Liabilities) (0.04)
Total 100.00
124
JPMorgan Funds - Emerging Middle East Equity FundSchedule of Investments (continued)
As at 30 June 2016
Investments Currency
Quantity/Nominal
Value
MarketValue
USD
%of
NetAssets Investments Currency
Quantity/Nominal
Value
MarketValue
USD
%of
NetAssets
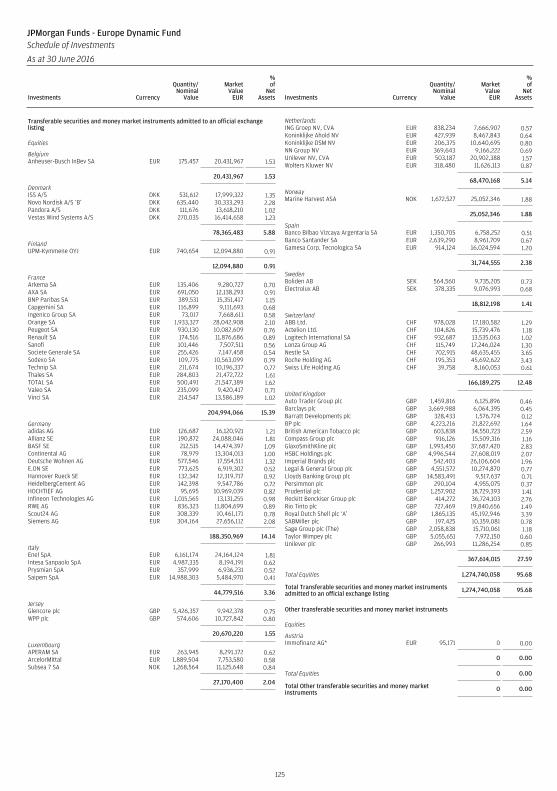
Transferable securities and money market instruments admitted to an official exchangelisting
Equities
BelgiumAnheuser-Busch InBev SA EUR 175,457 20,431,967 1.53
20,431,967 1.53
DenmarkISS A/S DKK 531,612 17,999,322 1.35Novo Nordisk A/S ‘B’ DKK 635,440 30,333,293 2.28Pandora A/S DKK 111,676 13,618,210 1.02Vestas Wind Systems A/S DKK 270,035 16,414,658 1.23
78,365,483 5.88
FinlandUPM-Kymmene OYJ EUR 740,654 12,094,880 0.91
12,094,880 0.91
FranceArkema SA EUR 135,406 9,280,727 0.70AXA SA EUR 691,050 12,138,293 0.91BNP Paribas SA EUR 389,531 15,351,417 1.15Capgemini SA EUR 116,899 9,111,693 0.68Ingenico Group SA EUR 73,017 7,668,611 0.58Orange SA EUR 1,933,327 28,042,908 2.10Peugeot SA EUR 930,130 10,082,609 0.76Renault SA EUR 174,516 11,876,686 0.89Sanofi EUR 101,446 7,507,511 0.56Societe Generale SA EUR 255,426 7,147,458 0.54Sodexo SA EUR 109,775 10,563,099 0.79Technip SA EUR 211,674 10,196,337 0.77Thales SA EUR 284,803 21,472,722 1.61TOTAL SA EUR 500,491 21,547,389 1.62Valeo SA EUR 235,099 9,420,417 0.71Vinci SA EUR 214,547 13,586,189 1.02
204,994,066 15.39
Germanyadidas AG EUR 126,687 16,120,921 1.21Allianz SE EUR 190,872 24,088,046 1.81BASF SE EUR 212,515 14,474,397 1.09Continental AG EUR 78,979 13,304,013 1.00Deutsche Wohnen AG EUR 577,546 17,554,511 1.32E.ON SE EUR 773,625 6,919,302 0.52Hannover Rueck SE EUR 132,342 12,319,717 0.92HeidelbergCement AG EUR 142,398 9,547,786 0.72HOCHTIEF AG EUR 95,695 10,969,039 0.82Infineon Technologies AG EUR 1,015,565 13,131,255 0.98RWE AG EUR 836,323 11,804,699 0.89Scout24 AG EUR 308,339 10,461,171 0.78Siemens AG EUR 304,164 27,656,112 2.08
188,350,969 14.14
ItalyEnel SpA EUR 6,161,174 24,164,124 1.81Intesa Sanpaolo SpA EUR 4,987,335 8,194,191 0.62Prysmian SpA EUR 357,999 6,936,231 0.52Saipem SpA EUR 14,988,303 5,484,970 0.41
44,779,516 3.36
JerseyGlencore plc GBP 5,426,357 9,942,378 0.75WPP plc GBP 574,606 10,727,842 0.80
20,670,220 1.55
LuxembourgAPERAM SA EUR 263,945 8,291,172 0.62ArcelorMittal EUR 1,889,504 7,753,580 0.58Subsea 7 SA NOK 1,268,564 11,125,648 0.84
27,170,400 2.04
NetherlandsING Groep NV, CVA EUR 838,234 7,666,907 0.57Koninklijke Ahold NV EUR 427,939 8,467,843 0.64Koninklijke DSM NV EUR 206,375 10,640,695 0.80NN Group NV EUR 369,643 9,166,222 0.69Unilever NV, CVA EUR 503,187 20,902,388 1.57Wolters Kluwer NV EUR 318,480 11,626,113 0.87
68,470,168 5.14
NorwayMarine Harvest ASA NOK 1,672,527 25,052,346 1.88
25,052,346 1.88
SpainBanco Bilbao Vizcaya Argentaria SA EUR 1,350,705 6,758,252 0.51Banco Santander SA EUR 2,639,290 8,961,709 0.67Gamesa Corp. Tecnologica SA EUR 914,124 16,024,594 1.20
31,744,555 2.38
SwedenBoliden AB SEK 564,560 9,735,205 0.73Electrolux AB SEK 378,335 9,076,993 0.68
18,812,198 1.41
SwitzerlandABB Ltd. CHF 978,028 17,180,582 1.29Actelion Ltd. CHF 104,826 15,739,476 1.18Logitech International SA CHF 932,687 13,535,063 1.02Lonza Group AG CHF 115,749 17,246,024 1.30Nestle SA CHF 702,915 48,635,455 3.65Roche Holding AG CHF 195,353 45,692,622 3.43Swiss Life Holding AG CHF 39,758 8,160,053 0.61
166,189,275 12.48
United KingdomAuto Trader Group plc GBP 1,459,816 6,125,896 0.46Barclays plc GBP 3,669,988 6,064,395 0.45Barratt Developments plc GBP 328,433 1,576,724 0.12BP plc GBP 4,223,216 21,822,692 1.64British American Tobacco plc GBP 603,838 34,550,723 2.59Compass Group plc GBP 916,126 15,509,316 1.16GlaxoSmithKline plc GBP 1,993,450 37,687,420 2.83HSBC Holdings plc GBP 4,996,544 27,608,019 2.07Imperial Brands plc GBP 542,403 26,106,604 1.96Legal & General Group plc GBP 4,551,572 10,274,870 0.77Lloyds Banking Group plc GBP 14,583,491 9,517,637 0.71Persimmon plc GBP 290,104 4,955,075 0.37Prudential plc GBP 1,257,902 18,729,393 1.41Reckitt Benckiser Group plc GBP 414,272 36,724,103 2.76Rio Tinto plc GBP 727,469 19,840,656 1.49Royal Dutch Shell plc ‘A’ GBP 1,865,135 45,192,946 3.39SABMiller plc GBP 197,425 10,359,081 0.78Sage Group plc (The) GBP 2,058,838 15,710,061 1.18Taylor Wimpey plc GBP 5,055,651 7,972,150 0.60Unilever plc GBP 266,993 11,286,254 0.85
367,614,015 27.59
Total Equities 1,274,740,058 95.68
Total Transferable securities and money market instrumentsadmitted to an official exchange listing 1,274,740,058 95.68
Other transferable securities and money market instruments
Equities
AustriaImmofinanz AG* EUR 95,171 0 0.00
0 0.00
Total Equities 0 0.00
Total Other transferable securities and money marketinstruments 0 0.00
125
JPMorgan Funds - Europe Dynamic FundSchedule of Investments
As at 30 June 2016
Investments Currency
Quantity/Nominal
Value
MarketValue
EUR
%of
NetAssets Investments Currency
Quantity/Nominal
Value
MarketValue
EUR
%of
NetAssets
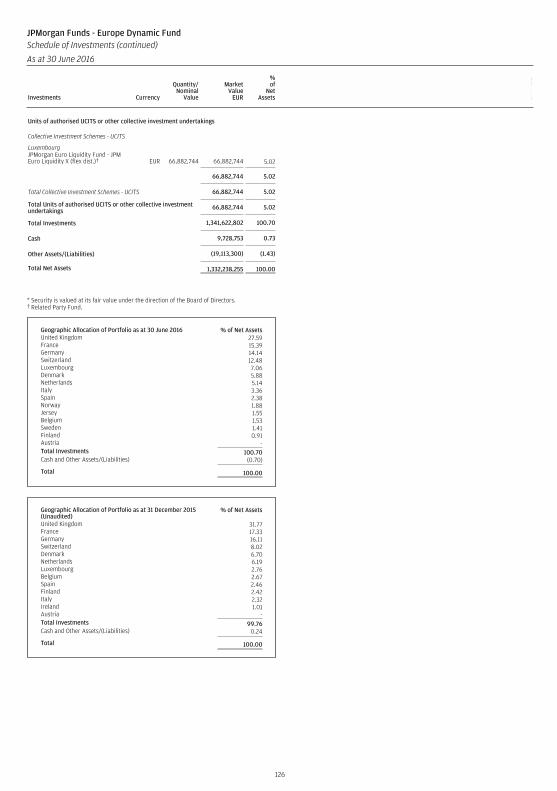
Units of authorised UCITS or other collective investment undertakings
Collective Investment Schemes - UCITS
LuxembourgJPMorgan Euro Liquidity Fund - JPMEuro Liquidity X (flex dist.)† EUR 66,882,744 66,882,744 5.02
66,882,744 5.02
Total Collective Investment Schemes - UCITS 66,882,744 5.02
Total Units of authorised UCITS or other collective investmentundertakings 66,882,744 5.02
Total Investments 1,341,622,802 100.70
Cash 9,728,753 0.73
Other Assets/(Liabilities) (19,113,300) (1.43)
Total Net Assets 1,332,238,255 100.00
* Security is valued at its fair value under the direction of the Board of Directors.† Related Party Fund.
Geographic Allocation of Portfolio as at 30 June 2016 % of Net AssetsUnited Kingdom 27.59France 15.39Germany 14.14Switzerland 12.48Luxembourg 7.06Denmark 5.88Netherlands 5.14Italy 3.36Spain 2.38Norway 1.88Jersey 1.55Belgium 1.53Sweden 1.41Finland 0.91Austria -Total Investments 100.70Cash and Other Assets/(Liabilities) (0.70)
Total 100.00
Geographic Allocation of Portfolio as at 31 December 2015(Unaudited)
% of Net Assets
United Kingdom 31.77France 17.33Germany 16.11Switzerland 8.02Denmark 6.70Netherlands 6.19Luxembourg 2.76Belgium 2.67Spain 2.46Finland 2.42Italy 2.32Ireland 1.01Austria -Total Investments 99.76Cash and Other Assets/(Liabilities) 0.24
Total 100.00
126
JPMorgan Funds - Europe Dynamic FundSchedule of Investments (continued)
As at 30 June 2016
Investments Currency
Quantity/Nominal
Value
MarketValue
EUR
%of
NetAssets Investments Currency
Quantity/Nominal
Value
MarketValue
EUR
%of
NetAssets
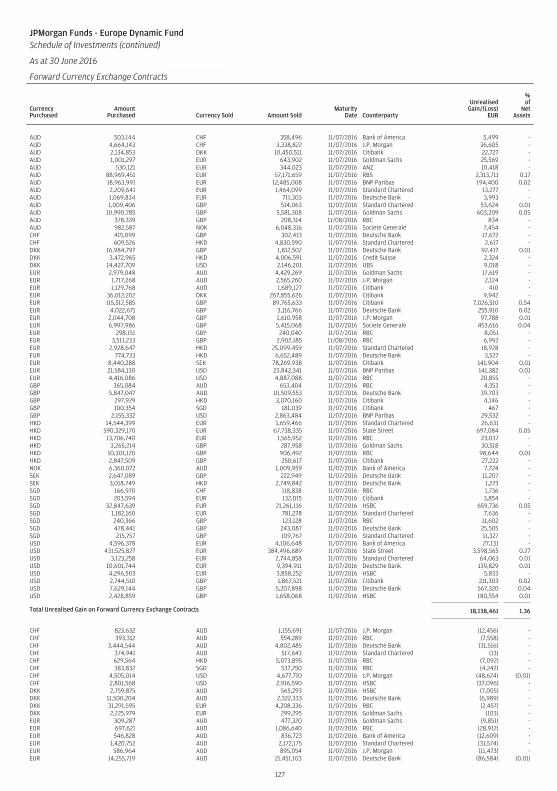
JPMorgan Funds - Europe Dynamic FundSchedule of Investments (continued)
As at 30 June 2016
Forward Currency Exchange Contracts (continued)
CurrencyPurchased
AmountPurchased Currency Sold Amount Sold
MaturityDate Counterparty
UnrealisedGain/(Loss)
EUR
%of
NetAssets
AUD 503,144 CHF 358,496 11/07/2016 Bank of America 5,499 -AUD 4,664,143 CHF 3,338,822 11/07/2016 J.P. Morgan 36,605 -AUD 2,134,853 DKK 10,450,511 11/07/2016 Citibank 22,727 -AUD 1,001,297 EUR 643,902 11/07/2016 Goldman Sachs 25,569 -AUD 530,121 EUR 344,023 11/07/2016 ANZ 10,418 -AUD 88,969,451 EUR 57,171,659 11/07/2016 RBS 2,313,711 0.17AUD 18,963,991 EUR 12,485,008 11/07/2016 BNP Paribas 194,400 0.02AUD 2,209,641 EUR 1,464,099 11/07/2016 Standard Chartered 13,277 -AUD 1,069,834 EUR 711,303 11/07/2016 Deutsche Bank 3,993 -AUD 1,009,406 GBP 514,063 11/07/2016 Standard Chartered 53,624 0.01AUD 10,990,785 GBP 5,581,308 11/07/2016 Goldman Sachs 603,209 0.05AUD 378,339 GBP 208,314 11/08/2016 RBC 834 -AUD 982,587 NOK 6,048,316 11/07/2016 Societe Generale 7,454 -CHF 415,099 GBP 302,413 11/07/2016 Deutsche Bank 17,672 -CHF 609,526 HKD 4,830,590 11/07/2016 Standard Chartered 2,617 -DKK 16,984,797 GBP 1,812,502 11/07/2016 Deutsche Bank 92,417 0.01DKK 3,472,965 HKD 4,006,591 11/07/2016 Credit Suisse 2,324 -DKK 14,427,709 USD 2,146,201 11/07/2016 UBS 9,018 -EUR 2,979,048 AUD 4,429,269 11/07/2016 Goldman Sachs 17,619 -EUR 1,717,268 AUD 2,565,260 11/07/2016 J.P. Morgan 2,124 -EUR 1,129,768 AUD 1,689,127 11/07/2016 Citibank 410 -EUR 36,012,202 DKK 267,855,626 11/07/2016 Citibank 9,942 -EUR 115,512,585 GBP 89,765,633 11/07/2016 Citibank 7,026,510 0.54EUR 4,022,671 GBP 3,116,766 11/07/2016 Deutsche Bank 255,910 0.02EUR 2,044,708 GBP 1,610,958 11/07/2016 J.P. Morgan 97,788 0.01EUR 6,997,986 GBP 5,415,068 11/07/2016 Societe Generale 453,616 0.04EUR 298,151 GBP 240,040 11/07/2016 RBC 8,051 -EUR 3,511,233 GBP 2,902,185 11/08/2016 RBC 6,992 -EUR 2,928,647 HKD 25,099,459 11/07/2016 Standard Chartered 18,928 -EUR 774,733 HKD 6,652,489 11/07/2016 Deutsche Bank 3,527 -EUR 8,440,288 SEK 78,269,938 11/07/2016 Citibank 141,904 0.01EUR 21,584,130 USD 23,842,341 11/07/2016 BNP Paribas 141,382 0.01EUR 4,416,086 USD 4,887,088 11/07/2016 RBC 20,855 -GBP 365,084 AUD 653,404 11/07/2016 RBC 4,353 -GBP 5,847,047 AUD 10,509,553 11/07/2016 Deutsche Bank 39,703 -GBP 297,929 HKD 3,070,160 11/07/2016 Citibank 4,146 -GBP 100,354 SGD 181,039 11/07/2016 Citibank 467 -GBP 2,155,332 USD 2,863,484 11/07/2016 BNP Paribas 29,532 -HKD 14,544,399 EUR 1,659,466 11/07/2016 Standard Chartered 26,631 -HKD 590,329,170 EUR 67,738,335 11/07/2016 State Street 697,084 0.05HKD 13,706,740 EUR 1,565,952 11/07/2016 RBC 23,037 -HKD 3,265,214 GBP 287,958 11/07/2016 Goldman Sachs 30,518 -HKD 10,301,120 GBP 906,492 11/07/2016 RBC 98,644 0.01HKD 2,847,509 GBP 250,617 11/07/2016 Citibank 27,222 -NOK 6,360,072 AUD 1,009,959 11/07/2016 Bank of America 7,724 -SEK 2,647,089 GBP 222,949 11/07/2016 Deutsche Bank 11,207 -SEK 3,018,749 HKD 2,749,842 11/07/2016 Deutsche Bank 1,273 -SGD 166,970 CHF 118,838 11/07/2016 RBC 1,736 -SGD 203,594 EUR 132,015 11/07/2016 Citibank 3,854 -SGD 32,847,639 EUR 21,261,116 11/07/2016 HSBC 659,736 0.05SGD 1,182,160 EUR 781,278 11/07/2016 Standard Chartered 7,636 -SGD 240,366 GBP 123,128 11/07/2016 RBC 11,602 -SGD 478,441 GBP 243,087 11/07/2016 Deutsche Bank 25,505 -SGD 215,757 GBP 109,767 11/07/2016 Standard Chartered 11,327 -USD 4,596,378 EUR 4,106,648 11/07/2016 Bank of America 27,131 -USD 431,525,827 EUR 384,496,689 11/07/2016 State Street 3,598,565 0.27USD 3,123,258 EUR 2,744,858 11/07/2016 Standard Chartered 64,063 0.01USD 10,601,744 EUR 9,394,911 11/07/2016 Deutsche Bank 139,829 0.01USD 4,296,503 EUR 3,858,252 11/07/2016 HSBC 5,833 -USD 2,744,510 GBP 1,867,521 11/07/2016 Citibank 211,303 0.02USD 7,629,144 GBP 5,207,898 11/07/2016 Deutsche Bank 567,320 0.04USD 2,428,859 GBP 1,658,068 11/07/2016 HSBC 180,554 0.01
Total Unrealised Gain on Forward Currency Exchange Contracts 18,138,461 1.36
CHF 823,632 AUD 1,155,691 11/07/2016 J.P. Morgan (12,456) -CHF 393,312 AUD 554,289 11/07/2016 RBC (7,558) -CHF 3,444,544 AUD 4,802,485 11/07/2016 Deutsche Bank (31,516) -CHF 374,941 AUD 517,643 11/07/2016 Standard Chartered (13) -CHF 629,564 HKD 5,073,895 11/07/2016 RBC (7,092) -CHF 383,832 SGD 537,250 11/07/2016 RBC (4,242) -CHF 4,505,014 USD 4,677,710 11/07/2016 J.P. Morgan (48,624) (0.01)CHF 2,801,568 USD 2,916,590 11/07/2016 HSBC (37,096) -DKK 2,759,875 AUD 565,293 11/07/2016 HSBC (7,005) -DKK 11,500,204 AUD 2,322,333 11/07/2016 Deutsche Bank (6,989) -DKK 31,291,595 EUR 4,208,336 11/07/2016 RBC (2,457) -DKK 2,225,979 EUR 299,295 11/07/2016 Goldman Sachs (103) -EUR 309,287 AUD 477,320 11/07/2016 Goldman Sachs (9,851) -EUR 697,621 AUD 1,086,640 11/07/2016 RBC (28,912) -EUR 546,828 AUD 836,723 11/07/2016 Bank of America (12,609) -EUR 1,420,752 AUD 2,172,175 11/07/2016 Standard Chartered (31,574) -EUR 586,964 AUD 895,054 11/07/2016 J.P. Morgan (11,473) -EUR 14,255,719 AUD 21,451,103 11/07/2016 Deutsche Bank (86,584) (0.01)
127
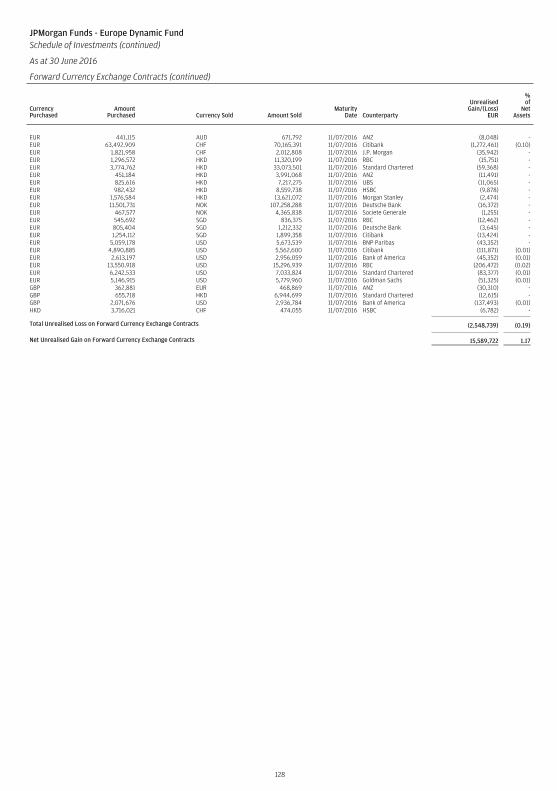
JPMorgan Funds - Europe Dynamic FundSchedule of Investments (continued)
As at 30 June 2016
Forward Currency Exchange Contracts (continued)
CurrencyPurchased
AmountPurchased Currency Sold Amount Sold
MaturityDate Counterparty
UnrealisedGain/(Loss)
EUR
%of
NetAssets
EUR 441,115 AUD 671,792 11/07/2016 ANZ (8,048) -EUR 63,492,909 CHF 70,165,391 11/07/2016 Citibank (1,272,461) (0.10)EUR 1,821,958 CHF 2,012,808 11/07/2016 J.P. Morgan (35,942) -EUR 1,296,572 HKD 11,320,199 11/07/2016 RBC (15,751) -EUR 3,774,762 HKD 33,073,501 11/07/2016 Standard Chartered (59,368) -EUR 451,184 HKD 3,991,068 11/07/2016 ANZ (11,491) -EUR 825,616 HKD 7,217,275 11/07/2016 UBS (11,065) -EUR 982,432 HKD 8,559,738 11/07/2016 HSBC (9,878) -EUR 1,576,584 HKD 13,621,072 11/07/2016 Morgan Stanley (2,474) -EUR 11,501,731 NOK 107,258,288 11/07/2016 Deutsche Bank (16,372) -EUR 467,577 NOK 4,365,838 11/07/2016 Societe Generale (1,255) -EUR 545,692 SGD 836,375 11/07/2016 RBC (12,462) -EUR 805,404 SGD 1,212,332 11/07/2016 Deutsche Bank (3,645) -EUR 1,254,112 SGD 1,899,358 11/07/2016 Citibank (13,424) -EUR 5,059,178 USD 5,673,539 11/07/2016 BNP Paribas (43,352) -EUR 4,890,885 USD 5,562,600 11/07/2016 Citibank (111,871) (0.01)EUR 2,613,197 USD 2,956,059 11/07/2016 Bank of America (45,352) (0.01)EUR 13,550,918 USD 15,296,939 11/07/2016 RBC (206,472) (0.02)EUR 6,242,533 USD 7,033,824 11/07/2016 Standard Chartered (83,377) (0.01)EUR 5,146,915 USD 5,779,960 11/07/2016 Goldman Sachs (51,325) (0.01)GBP 362,881 EUR 468,869 11/07/2016 ANZ (30,310) -GBP 655,718 HKD 6,944,699 11/07/2016 Standard Chartered (12,615) -GBP 2,071,676 USD 2,936,784 11/07/2016 Bank of America (137,493) (0.01)HKD 3,716,021 CHF 474,055 11/07/2016 HSBC (6,782) -
Total Unrealised Loss on Forward Currency Exchange Contracts (2,548,739) (0.19)
Net Unrealised Gain on Forward Currency Exchange Contracts 15,589,722 1.17
128
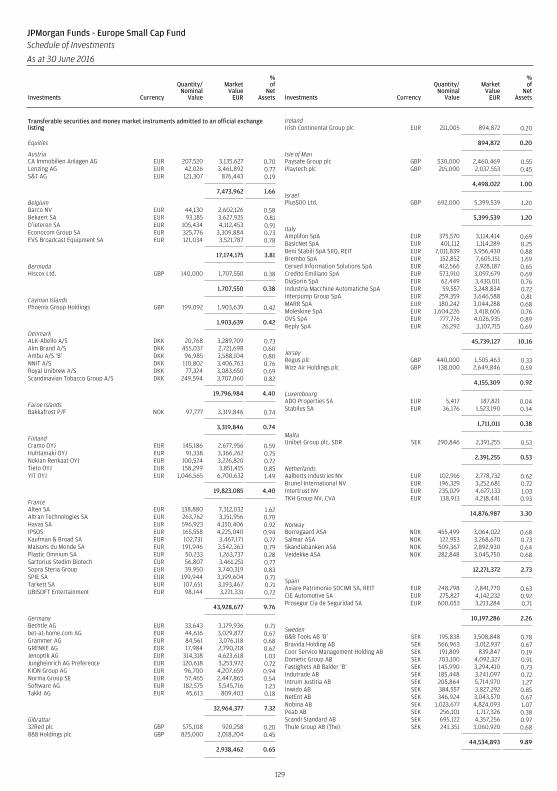
Transferable securities and money market instruments admitted to an official exchangelisting
Equities
AustriaCA Immobilien Anlagen AG EUR 207,520 3,135,627 0.70Lenzing AG EUR 42,026 3,461,892 0.77S&T AG EUR 121,307 876,443 0.19
7,473,962 1.66
BelgiumBarco NV EUR 44,130 2,602,126 0.58Bekaert SA EUR 93,185 3,627,925 0.81D’ieteren SA EUR 105,434 4,112,453 0.91Econocom Group SA EUR 325,776 3,309,884 0.73EVS Broadcast Equipment SA EUR 121,034 3,521,787 0.78
17,174,175 3.81
BermudaHiscox Ltd. GBP 140,000 1,707,550 0.38
1,707,550 0.38
Cayman IslandsPhoenix Group Holdings GBP 199,092 1,903,639 0.42
1,903,639 0.42
DenmarkALK-Abello A/S DKK 20,768 3,289,709 0.73Alm Brand A/S DKK 455,037 2,721,698 0.60Ambu A/S ‘B’ DKK 96,985 3,588,104 0.80NNIT A/S DKK 110,802 3,406,763 0.76Royal Unibrew A/S DKK 77,324 3,083,650 0.69Scandinavian Tobacco Group A/S DKK 249,594 3,707,060 0.82
19,796,984 4.40
Faroe IslandsBakkafrost P/F NOK 97,777 3,319,846 0.74
3,319,846 0.74
FinlandCramo OYJ EUR 145,186 2,677,956 0.59Huhtamaki OYJ EUR 91,338 3,366,262 0.75Nokian Renkaat OYJ EUR 100,524 3,226,820 0.72Tieto OYJ EUR 158,299 3,851,415 0.85YIT OYJ EUR 1,046,565 6,700,632 1.49
19,823,085 4.40
FranceAlten SA EUR 138,880 7,312,032 1.62Altran Technologies SA EUR 263,762 3,151,956 0.70Havas SA EUR 596,923 4,150,406 0.92IPSOS EUR 165,558 4,225,040 0.94Kaufman & Broad SA EUR 102,731 3,467,171 0.77Maisons du Monde SA EUR 191,946 3,542,363 0.79Plastic Omnium SA EUR 50,233 1,263,737 0.28Sartorius Stedim Biotech EUR 56,807 3,461,251 0.77Sopra Steria Group EUR 39,950 3,740,319 0.83SPIE SA EUR 199,944 3,199,604 0.71Tarkett SA EUR 107,651 3,193,467 0.71UBISOFT Entertainment EUR 98,144 3,221,331 0.72
43,928,677 9.76
GermanyBechtle AG EUR 33,643 3,179,936 0.71bet-at-home.com AG EUR 44,616 3,029,872 0.67Grammer AG EUR 84,561 3,076,118 0.68GRENKE AG EUR 17,984 2,790,218 0.62Jenoptik AG EUR 314,318 4,623,618 1.03Jungheinrich AG Preference EUR 120,618 3,253,972 0.72KION Group AG EUR 96,700 4,207,659 0.94Norma Group SE EUR 57,465 2,447,865 0.54Software AG EUR 182,575 5,545,716 1.23Takkt AG EUR 45,613 809,403 0.18
32,964,377 7.32
Gibraltar32Red plc GBP 575,108 920,258 0.20888 Holdings plc GBP 825,000 2,018,204 0.45
2,938,462 0.65
IrelandIrish Continental Group plc EUR 211,005 894,872 0.20
894,872 0.20
Isle of ManPaysafe Group plc GBP 530,000 2,460,469 0.55Playtech plc GBP 215,000 2,037,553 0.45
4,498,022 1.00
IsraelPlus500 Ltd. GBP 692,000 5,399,539 1.20
5,399,539 1.20
ItalyAmplifon SpA EUR 375,570 3,114,414 0.69BasicNet SpA EUR 401,112 1,114,289 0.25Beni Stabili SpA SIIQ, REIT EUR 7,011,839 3,956,430 0.88Brembo SpA EUR 152,852 7,605,151 1.69Cerved Information Solutions SpA EUR 412,566 2,928,187 0.65Credito Emiliano SpA EUR 573,910 3,097,679 0.69DiaSorin SpA EUR 62,449 3,430,011 0.76Industria Macchine Automatiche SpA EUR 59,557 3,248,834 0.72Interpump Group SpA EUR 259,359 3,646,588 0.81MARR SpA EUR 180,242 3,044,288 0.68Moleskine SpA EUR 1,604,226 3,418,606 0.76OVS SpA EUR 777,776 4,026,935 0.89Reply SpA EUR 26,292 3,107,715 0.69
45,739,127 10.16
JerseyRegus plc GBP 440,000 1,505,463 0.33Wizz Air Holdings plc GBP 138,000 2,649,846 0.59
4,155,309 0.92
LuxembourgADO Properties SA EUR 5,417 187,821 0.04Stabilus SA EUR 36,176 1,523,190 0.34
1,711,011 0.38
MaltaUnibet Group plc, SDR SEK 290,846 2,391,255 0.53
2,391,255 0.53
NetherlandsAalberts Industries NV EUR 102,916 2,778,732 0.62Brunel International NV EUR 196,329 3,252,681 0.72Intertrust NV EUR 235,029 4,627,133 1.03TKH Group NV, CVA EUR 138,913 4,218,441 0.93
14,876,987 3.30
NorwayBorregaard ASA NOK 455,499 3,064,022 0.68Salmar ASA NOK 122,953 3,268,670 0.73Skandiabanken ASA NOK 509,367 2,892,930 0.64Veidekke ASA NOK 282,848 3,045,750 0.68
12,271,372 2.73
SpainAxiare Patrimonio SOCIMI SA, REIT EUR 248,298 2,841,770 0.63CIE Automotive SA EUR 275,827 4,142,232 0.92Prosegur Cia de Seguridad SA EUR 600,053 3,213,284 0.71
10,197,286 2.26
SwedenB&B Tools AB ‘B’ SEK 195,838 3,508,848 0.78Bravida Holding AB SEK 566,963 3,012,937 0.67Coor Service Management Holding AB SEK 191,809 839,847 0.19Dometic Group AB SEK 703,100 4,092,327 0.91Fastighets AB Balder ‘B’ SEK 145,990 3,294,410 0.73Indutrade AB SEK 185,448 3,241,097 0.72Intrum Justitia AB SEK 205,864 5,714,970 1.27Inwido AB SEK 384,557 3,827,292 0.85NetEnt AB SEK 346,924 3,043,570 0.67Nobina AB SEK 1,023,677 4,824,093 1.07Peab AB SEK 256,101 1,717,326 0.38Scandi Standard AB SEK 695,122 4,357,256 0.97Thule Group AB (The) SEK 241,351 3,060,920 0.68
44,534,893 9.89
129
JPMorgan Funds - Europe Small Cap FundSchedule of Investments
As at 30 June 2016
Investments Currency
Quantity/Nominal
Value
MarketValue
EUR
%of
NetAssets Investments Currency
Quantity/Nominal
Value
MarketValue
EUR
%of
NetAssets
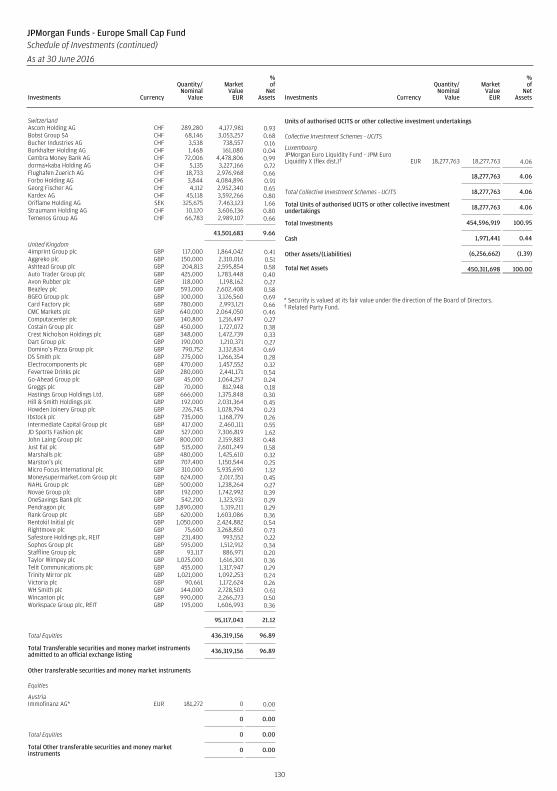
SwitzerlandAscom Holding AG CHF 289,280 4,177,981 0.93Bobst Group SA CHF 68,146 3,053,257 0.68Bucher Industries AG CHF 3,538 738,557 0.16Burkhalter Holding AG CHF 1,468 161,080 0.04Cembra Money Bank AG CHF 72,006 4,478,806 0.99dorma+kaba Holding AG CHF 5,135 3,227,166 0.72Flughafen Zuerich AG CHF 18,733 2,976,968 0.66Forbo Holding AG CHF 3,844 4,084,896 0.91Georg Fischer AG CHF 4,112 2,952,340 0.65Kardex AG CHF 45,118 3,592,266 0.80Oriflame Holding AG SEK 325,675 7,463,123 1.66Straumann Holding AG CHF 10,120 3,606,136 0.80Temenos Group AG CHF 66,783 2,989,107 0.66
43,501,683 9.66
United Kingdom4imprint Group plc GBP 117,000 1,864,042 0.41Aggreko plc GBP 150,000 2,310,016 0.51Ashtead Group plc GBP 204,813 2,595,854 0.58Auto Trader Group plc GBP 425,000 1,783,448 0.40Avon Rubber plc GBP 118,000 1,198,162 0.27Beazley plc GBP 593,000 2,602,408 0.58BGEO Group plc GBP 100,000 3,126,560 0.69Card Factory plc GBP 780,000 2,993,121 0.66CMC Markets plc GBP 640,000 2,064,050 0.46Computacenter plc GBP 140,800 1,216,497 0.27Costain Group plc GBP 450,000 1,727,072 0.38Crest Nicholson Holdings plc GBP 348,000 1,472,739 0.33Dart Group plc GBP 190,000 1,210,371 0.27Domino’s Pizza Group plc GBP 790,752 3,132,834 0.69DS Smith plc GBP 275,000 1,266,354 0.28Electrocomponents plc GBP 470,000 1,457,552 0.32Fevertree Drinks plc GBP 280,000 2,441,171 0.54Go-Ahead Group plc GBP 45,000 1,064,257 0.24Greggs plc GBP 70,000 812,948 0.18Hastings Group Holdings Ltd. GBP 666,000 1,375,848 0.30Hill & Smith Holdings plc GBP 192,000 2,031,364 0.45Howden Joinery Group plc GBP 226,745 1,028,794 0.23Ibstock plc GBP 735,000 1,168,779 0.26Intermediate Capital Group plc GBP 417,000 2,460,111 0.55JD Sports Fashion plc GBP 527,000 7,306,819 1.62John Laing Group plc GBP 800,000 2,159,883 0.48Just Eat plc GBP 515,000 2,601,249 0.58Marshalls plc GBP 480,000 1,425,610 0.32Marston’s plc GBP 707,400 1,150,544 0.25Micro Focus International plc GBP 310,000 5,935,690 1.32Moneysupermarket.com Group plc GBP 624,000 2,017,351 0.45NAHL Group plc GBP 500,000 1,238,264 0.27Novae Group plc GBP 192,000 1,742,992 0.39OneSavings Bank plc GBP 542,200 1,323,931 0.29Pendragon plc GBP 3,890,000 1,319,211 0.29Rank Group plc GBP 620,000 1,603,086 0.36Rentokil Initial plc GBP 1,050,000 2,424,882 0.54Rightmove plc GBP 75,600 3,268,850 0.73Safestore Holdings plc, REIT GBP 231,400 993,552 0.22Sophos Group plc GBP 595,000 1,512,912 0.34Staffline Group plc GBP 93,117 886,971 0.20Taylor Wimpey plc GBP 1,025,000 1,616,301 0.36Telit Communications plc GBP 455,000 1,317,947 0.29Trinity Mirror plc GBP 1,021,000 1,092,253 0.24Victoria plc GBP 90,661 1,172,624 0.26WH Smith plc GBP 144,000 2,728,503 0.61Wincanton plc GBP 990,000 2,266,273 0.50Workspace Group plc, REIT GBP 195,000 1,606,993 0.36
95,117,043 21.12
Total Equities 436,319,156 96.89
Total Transferable securities and money market instrumentsadmitted to an official exchange listing 436,319,156 96.89
Other transferable securities and money market instruments
Equities
AustriaImmofinanz AG* EUR 181,272 0 0.00
0 0.00
Total Equities 0 0.00
Total Other transferable securities and money marketinstruments 0 0.00
Units of authorised UCITS or other collective investment undertakings
Collective Investment Schemes - UCITS
LuxembourgJPMorgan Euro Liquidity Fund - JPM EuroLiquidity X (flex dist.)† EUR 18,277,763 18,277,763 4.06
18,277,763 4.06
Total Collective Investment Schemes - UCITS 18,277,763 4.06
Total Units of authorised UCITS or other collective investmentundertakings 18,277,763 4.06
Total Investments 454,596,919 100.95
Cash 1,971,441 0.44
Other Assets/(Liabilities) (6,256,662) (1.39)
Total Net Assets 450,311,698 100.00
* Security is valued at its fair value under the direction of the Board of Directors.† Related Party Fund.
130
JPMorgan Funds - Europe Small Cap FundSchedule of Investments (continued)
As at 30 June 2016
Investments Currency
Quantity/Nominal
Value
MarketValue
EUR
%of
NetAssets Investments Currency
Quantity/Nominal
Value
MarketValue
EUR
%of
NetAssets
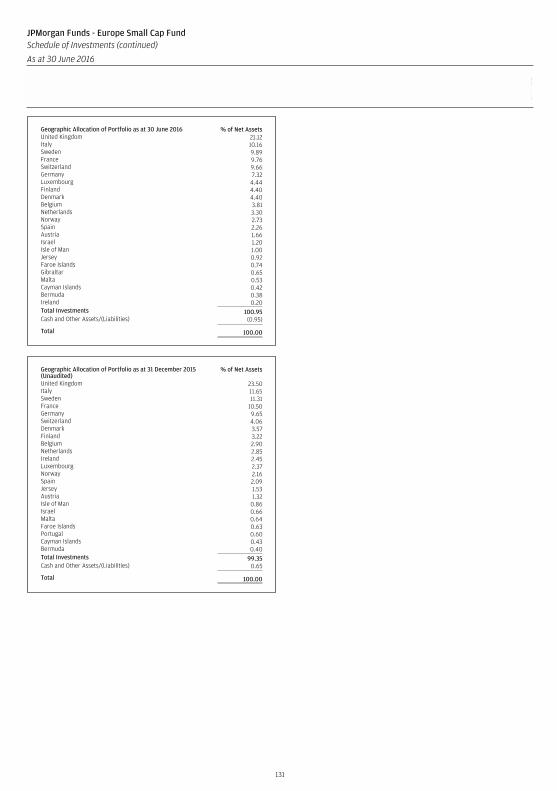
Geographic Allocation of Portfolio as at 30 June 2016 % of Net AssetsUnited Kingdom 21.12Italy 10.16Sweden 9.89France 9.76Switzerland 9.66Germany 7.32Luxembourg 4.44Finland 4.40Denmark 4.40Belgium 3.81Netherlands 3.30Norway 2.73Spain 2.26Austria 1.66Israel 1.20Isle of Man 1.00Jersey 0.92Faroe Islands 0.74Gibraltar 0.65Malta 0.53Cayman Islands 0.42Bermuda 0.38Ireland 0.20Total Investments 100.95Cash and Other Assets/(Liabilities) (0.95)
Total 100.00
Geographic Allocation of Portfolio as at 31 December 2015(Unaudited)
% of Net Assets
United Kingdom 23.50Italy 11.65Sweden 11.31France 10.50Germany 9.65Switzerland 4.06Denmark 3.57Finland 3.22Belgium 2.90Netherlands 2.85Ireland 2.45Luxembourg 2.37Norway 2.16Spain 2.09Jersey 1.53Austria 1.32Isle of Man 0.86Israel 0.66Malta 0.64Faroe Islands 0.63Portugal 0.60Cayman Islands 0.43Bermuda 0.40Total Investments 99.35Cash and Other Assets/(Liabilities) 0.65
Total 100.00
131
JPMorgan Funds - Europe Small Cap FundSchedule of Investments (continued)
As at 30 June 2016
Investments Currency
Quantity/Nominal
Value
MarketValue
EUR
%of
NetAssets Investments Currency
Quantity/Nominal
Value
MarketValue
EUR
%of
NetAssets
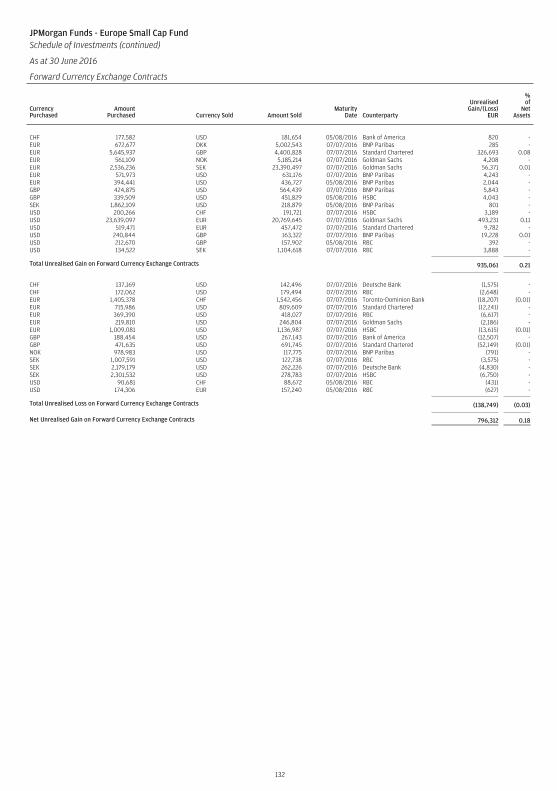
JPMorgan Funds - Europe Small Cap FundSchedule of Investments (continued)
As at 30 June 2016
Forward Currency Exchange Contracts
CurrencyPurchased
AmountPurchased Currency Sold Amount Sold
MaturityDate Counterparty
UnrealisedGain/(Loss)
EUR
%of
NetAssets
CHF 177,582 USD 181,654 05/08/2016 Bank of America 820 -EUR 672,677 DKK 5,002,543 07/07/2016 BNP Paribas 285 -EUR 5,645,937 GBP 4,400,828 07/07/2016 Standard Chartered 326,693 0.08EUR 561,109 NOK 5,185,214 07/07/2016 Goldman Sachs 4,208 -EUR 2,536,236 SEK 23,390,497 07/07/2016 Goldman Sachs 56,371 0.01EUR 571,973 USD 631,176 07/07/2016 BNP Paribas 4,243 -EUR 394,441 USD 436,727 05/08/2016 BNP Paribas 2,044 -GBP 424,875 USD 564,439 07/07/2016 BNP Paribas 5,843 -GBP 339,509 USD 451,829 05/08/2016 HSBC 4,043 -SEK 1,862,109 USD 218,879 05/08/2016 BNP Paribas 801 -USD 200,266 CHF 191,721 07/07/2016 HSBC 3,189 -USD 23,639,097 EUR 20,769,645 07/07/2016 Goldman Sachs 493,231 0.11USD 519,471 EUR 457,472 07/07/2016 Standard Chartered 9,782 -USD 240,844 GBP 163,322 07/07/2016 BNP Paribas 19,228 0.01USD 212,670 GBP 157,902 05/08/2016 RBC 392 -USD 134,522 SEK 1,104,618 07/07/2016 RBC 3,888 -
Total Unrealised Gain on Forward Currency Exchange Contracts 935,061 0.21
CHF 137,169 USD 142,496 07/07/2016 Deutsche Bank (1,575) -CHF 172,062 USD 179,494 07/07/2016 RBC (2,648) -EUR 1,405,378 CHF 1,542,456 07/07/2016 Toronto-Dominion Bank (18,207) (0.01)EUR 715,986 USD 809,609 07/07/2016 Standard Chartered (12,241) -EUR 369,390 USD 418,027 07/07/2016 RBC (6,617) -EUR 219,810 USD 246,804 07/07/2016 Goldman Sachs (2,186) -EUR 1,009,081 USD 1,136,987 07/07/2016 HSBC (13,615) (0.01)GBP 188,454 USD 267,143 07/07/2016 Bank of America (12,507) -GBP 471,635 USD 691,745 07/07/2016 Standard Chartered (52,149) (0.01)NOK 978,983 USD 117,775 07/07/2016 BNP Paribas (791) -SEK 1,007,591 USD 122,738 07/07/2016 RBC (3,575) -SEK 2,179,179 USD 262,226 07/07/2016 Deutsche Bank (4,830) -SEK 2,301,532 USD 278,783 07/07/2016 HSBC (6,750) -USD 90,681 CHF 88,672 05/08/2016 RBC (431) -USD 174,306 EUR 157,240 05/08/2016 RBC (627) -
Total Unrealised Loss on Forward Currency Exchange Contracts (138,749) (0.03)
Net Unrealised Gain on Forward Currency Exchange Contracts 796,312 0.18
132
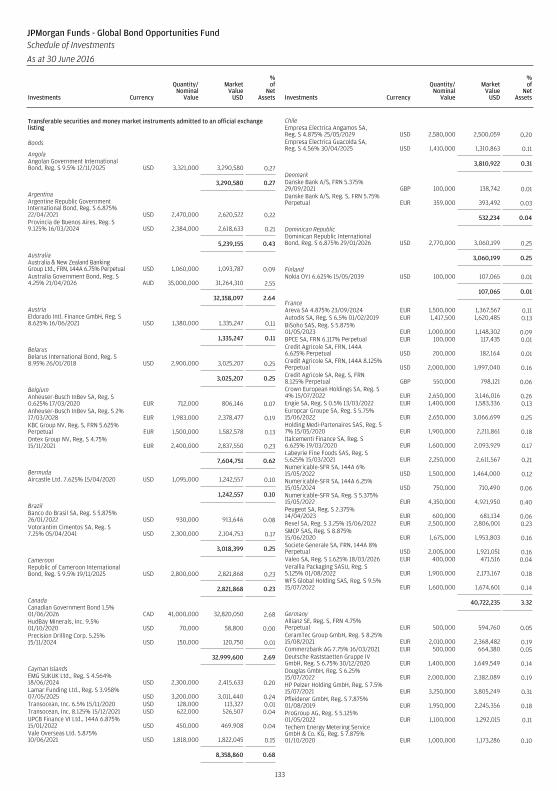
Transferable securities and money market instruments admitted to an official exchangelisting
Bonds
AngolaAngolan Government InternationalBond, Reg. S 9.5% 12/11/2025 USD 3,321,000 3,290,580 0.27
3,290,580 0.27
ArgentinaArgentine Republic GovernmentInternational Bond, Reg. S 6.875%22/04/2021 USD 2,470,000 2,620,522 0.22Provincia de Buenos Aires, Reg. S9.125% 16/03/2024 USD 2,384,000 2,618,633 0.21
5,239,155 0.43
AustraliaAustralia & New Zealand BankingGroup Ltd., FRN, 144A 6.75% Perpetual USD 1,060,000 1,093,787 0.09Australia Government Bond, Reg. S4.25% 21/04/2026 AUD 35,000,000 31,264,310 2.55
32,358,097 2.64
AustriaEldorado Intl. Finance GmbH, Reg. S8.625% 16/06/2021 USD 1,380,000 1,335,247 0.11
1,335,247 0.11
BelarusBelarus International Bond, Reg. S8.95% 26/01/2018 USD 2,900,000 3,025,207 0.25
3,025,207 0.25
BelgiumAnheuser-Busch InBev SA, Reg. S0.625% 17/03/2020 EUR 712,000 806,146 0.07Anheuser-Busch InBev SA, Reg. S 2%17/03/2028 EUR 1,983,000 2,378,477 0.19KBC Group NV, Reg. S, FRN 5.625%Perpetual EUR 1,500,000 1,582,578 0.13Ontex Group NV, Reg. S 4.75%15/11/2021 EUR 2,400,000 2,837,550 0.23
7,604,751 0.62
BermudaAircastle Ltd. 7.625% 15/04/2020 USD 1,095,000 1,242,557 0.10
1,242,557 0.10
BrazilBanco do Brasil SA, Reg. S 5.875%26/01/2022 USD 930,000 913,646 0.08Votorantim Cimentos SA, Reg. S7.25% 05/04/2041 USD 2,300,000 2,104,753 0.17
3,018,399 0.25
CameroonRepublic of Cameroon InternationalBond, Reg. S 9.5% 19/11/2025 USD 2,800,000 2,821,868 0.23
2,821,868 0.23
CanadaCanadian Government Bond 1.5%01/06/2026 CAD 41,000,000 32,820,050 2.68HudBay Minerals, Inc. 9.5%01/10/2020 USD 70,000 58,800 0.00Precision Drilling Corp. 5.25%15/11/2024 USD 150,000 120,750 0.01
32,999,600 2.69
Cayman IslandsEMG SUKUK Ltd., Reg. S 4.564%18/06/2024 USD 2,300,000 2,415,633 0.20Lamar Funding Ltd., Reg. S 3.958%07/05/2025 USD 3,200,000 3,011,440 0.24Transocean, Inc. 6.5% 15/11/2020 USD 128,000 113,327 0.01Transocean, Inc. 8.125% 15/12/2021 USD 622,000 526,507 0.04UPCB Finance VI Ltd., 144A 6.875%15/01/2022 USD 450,000 469,908 0.04Vale Overseas Ltd. 5.875%10/06/2021 USD 1,818,000 1,822,045 0.15
8,358,860 0.68
ChileEmpresa Electrica Angamos SA,Reg. S 4.875% 25/05/2029 USD 2,580,000 2,500,059 0.20Empresa Electrica Guacolda SA,Reg. S 4.56% 30/04/2025 USD 1,410,000 1,310,863 0.11
3,810,922 0.31
DenmarkDanske Bank A/S, FRN 5.375%29/09/2021 GBP 100,000 138,742 0.01Danske Bank A/S, Reg. S, FRN 5.75%Perpetual EUR 359,000 393,492 0.03
532,234 0.04
Dominican RepublicDominican Republic InternationalBond, Reg. S 6.875% 29/01/2026 USD 2,770,000 3,060,199 0.25
3,060,199 0.25
FinlandNokia OYJ 6.625% 15/05/2039 USD 100,000 107,065 0.01
107,065 0.01
FranceAreva SA 4.875% 23/09/2024 EUR 1,500,000 1,367,567 0.11Autodis SA, Reg. S 6.5% 01/02/2019 EUR 1,417,500 1,620,485 0.13BiSoho SAS, Reg. S 5.875%01/05/2023 EUR 1,000,000 1,148,302 0.09BPCE SA, FRN 6.117% Perpetual EUR 100,000 117,435 0.01Credit Agricole SA, FRN, 144A6.625% Perpetual USD 200,000 182,164 0.01Credit Agricole SA, FRN, 144A 8.125%Perpetual USD 2,000,000 1,997,040 0.16Credit Agricole SA, Reg. S, FRN8.125% Perpetual GBP 550,000 798,121 0.06Crown European Holdings SA, Reg. S4% 15/07/2022 EUR 2,650,000 3,146,016 0.26Engie SA, Reg. S 0.5% 13/03/2022 EUR 1,400,000 1,583,336 0.13Europcar Groupe SA, Reg. S 5.75%15/06/2022 EUR 2,650,000 3,066,699 0.25Holding Medi-Partenaires SAS, Reg. S7% 15/05/2020 EUR 1,900,000 2,211,861 0.18Italcementi Finance SA, Reg. S6.625% 19/03/2020 EUR 1,600,000 2,093,929 0.17Labeyrie Fine Foods SAS, Reg. S5.625% 15/03/2021 EUR 2,250,000 2,611,567 0.21Numericable-SFR SA, 144A 6%15/05/2022 USD 1,500,000 1,464,000 0.12Numericable-SFR SA, 144A 6.25%15/05/2024 USD 750,000 710,490 0.06Numericable-SFR SA, Reg. S 5.375%15/05/2022 EUR 4,350,000 4,921,950 0.40Peugeot SA, Reg. S 2.375%14/04/2023 EUR 600,000 681,134 0.06Rexel SA, Reg. S 3.25% 15/06/2022 EUR 2,500,000 2,806,001 0.23SMCP SAS, Reg. S 8.875%15/06/2020 EUR 1,675,000 1,953,803 0.16Societe Generale SA, FRN, 144A 8%Perpetual USD 2,005,000 1,921,051 0.16Valeo SA, Reg. S 1.625% 18/03/2026 EUR 400,000 471,516 0.04Verallia Packaging SASU, Reg. S5.125% 01/08/2022 EUR 1,900,000 2,173,167 0.18WFS Global Holding SAS, Reg. S 9.5%15/07/2022 EUR 1,600,000 1,674,601 0.14
40,722,235 3.32
GermanyAllianz SE, Reg. S, FRN 4.75%Perpetual EUR 500,000 594,760 0.05CeramTec Group GmbH, Reg. S 8.25%15/08/2021 EUR 2,010,000 2,368,482 0.19Commerzbank AG 7.75% 16/03/2021 EUR 500,000 664,380 0.05Deutsche Raststaetten Gruppe IVGmbH, Reg. S 6.75% 30/12/2020 EUR 1,400,000 1,649,549 0.14Douglas GmbH, Reg. S 6.25%15/07/2022 EUR 2,000,000 2,382,089 0.19HP Pelzer Holding GmbH, Reg. S 7.5%15/07/2021 EUR 3,250,000 3,805,249 0.31Pfleiderer GmbH, Reg. S 7.875%01/08/2019 EUR 1,950,000 2,245,356 0.18ProGroup AG, Reg. S 5.125%01/05/2022 EUR 1,100,000 1,292,015 0.11Techem Energy Metering ServiceGmbH & Co. KG, Reg. S 7.875%01/10/2020 EUR 1,000,000 1,173,286 0.10
133
JPMorgan Funds - Global Bond Opportunities FundSchedule of Investments
As at 30 June 2016
Investments Currency
Quantity/Nominal
Value
MarketValue
USD
%of
NetAssets Investments Currency
Quantity/Nominal
Value
MarketValue
USD
%of
NetAssets
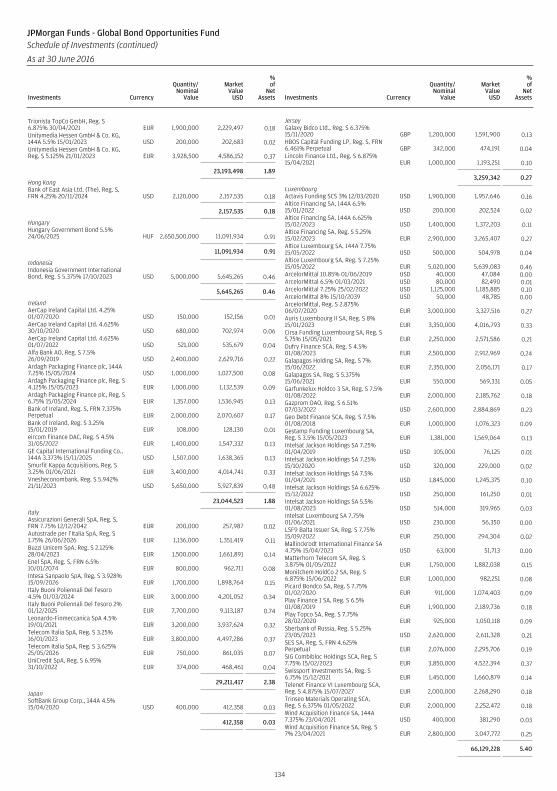
Trionista TopCo GmbH, Reg. S6.875% 30/04/2021 EUR 1,900,000 2,229,497 0.18Unitymedia Hessen GmbH & Co. KG,144A 5.5% 15/01/2023 USD 200,000 202,683 0.02Unitymedia Hessen GmbH & Co. KG,Reg. S 5.125% 21/01/2023 EUR 3,928,500 4,586,152 0.37
23,193,498 1.89
Hong KongBank of East Asia Ltd. (The), Reg. S,FRN 4.25% 20/11/2024 USD 2,120,000 2,157,535 0.18
2,157,535 0.18
HungaryHungary Government Bond 5.5%24/06/2025 HUF 2,650,500,000 11,091,934 0.91
11,091,934 0.91
IndonesiaIndonesia Government InternationalBond, Reg. S 5.375% 17/10/2023 USD 5,000,000 5,645,265 0.46
5,645,265 0.46
IrelandAerCap Ireland Capital Ltd. 4.25%01/07/2020 USD 150,000 152,156 0.01AerCap Ireland Capital Ltd. 4.625%30/10/2020 USD 680,000 702,974 0.06AerCap Ireland Capital Ltd. 4.625%01/07/2022 USD 521,000 535,679 0.04Alfa Bank AO, Reg. S 7.5%26/09/2019 USD 2,400,000 2,629,716 0.22Ardagh Packaging Finance plc, 144A7.25% 15/05/2024 USD 1,000,000 1,027,500 0.08Ardagh Packaging Finance plc, Reg. S4.125% 15/05/2023 EUR 1,000,000 1,132,539 0.09Ardagh Packaging Finance plc, Reg. S6.75% 15/05/2024 EUR 1,357,000 1,536,945 0.13Bank of Ireland, Reg. S, FRN 7.375%Perpetual EUR 2,000,000 2,070,607 0.17Bank of Ireland, Reg. S 3.25%15/01/2019 EUR 108,000 128,130 0.01eircom Finance DAC, Reg. S 4.5%31/05/2022 EUR 1,400,000 1,547,332 0.13GE Capital International Funding Co.,144A 3.373% 15/11/2025 USD 1,507,000 1,638,365 0.13Smurfit Kappa Acquisitions, Reg. S3.25% 01/06/2021 EUR 3,400,000 4,014,741 0.33Vnesheconombank, Reg. S 5.942%21/11/2023 USD 5,650,000 5,927,839 0.48
23,044,523 1.88
ItalyAssicurazioni Generali SpA, Reg. S,FRN 7.75% 12/12/2042 EUR 200,000 257,987 0.02Autostrade per l’Italia SpA, Reg. S1.75% 26/06/2026 EUR 1,136,000 1,351,419 0.11Buzzi Unicem SpA, Reg. S 2.125%28/04/2023 EUR 1,500,000 1,661,891 0.14Enel SpA, Reg. S, FRN 6.5%10/01/2074 EUR 800,000 962,711 0.08Intesa Sanpaolo SpA, Reg. S 3.928%15/09/2026 EUR 1,700,000 1,898,764 0.15Italy Buoni Poliennali Del Tesoro4.5% 01/03/2024 EUR 3,000,000 4,201,052 0.34Italy Buoni Poliennali Del Tesoro 2%01/12/2025 EUR 7,700,000 9,113,187 0.74Leonardo-Finmeccanica SpA 4.5%19/01/2021 EUR 3,200,000 3,937,624 0.32Telecom Italia SpA, Reg. S 3.25%16/01/2023 EUR 3,800,000 4,497,286 0.37Telecom Italia SpA, Reg. S 3.625%25/05/2026 EUR 750,000 861,035 0.07UniCredit SpA, Reg. S 6.95%31/10/2022 EUR 374,000 468,461 0.04
29,211,417 2.38
JapanSoftBank Group Corp., 144A 4.5%15/04/2020 USD 400,000 412,358 0.03
412,358 0.03
JerseyGalaxy Bidco Ltd., Reg. S 6.375%15/11/2020 GBP 1,200,000 1,591,900 0.13HBOS Capital Funding LP, Reg. S, FRN6.461% Perpetual GBP 342,000 474,191 0.04Lincoln Finance Ltd., Reg. S 6.875%15/04/2021 EUR 1,000,000 1,193,251 0.10
3,259,342 0.27
LuxembourgActavis Funding SCS 3% 12/03/2020 USD 1,900,000 1,957,646 0.16Altice Financing SA, 144A 6.5%15/01/2022 USD 200,000 202,524 0.02Altice Financing SA, 144A 6.625%15/02/2023 USD 1,400,000 1,372,203 0.11Altice Financing SA, Reg. S 5.25%15/02/2023 EUR 2,900,000 3,265,407 0.27Altice Luxembourg SA, 144A 7.75%15/05/2022 USD 500,000 504,978 0.04Altice Luxembourg SA, Reg. S 7.25%15/05/2022 EUR 5,020,000 5,639,083 0.46ArcelorMittal 10.85% 01/06/2019 USD 40,000 47,084 0.00ArcelorMittal 6.5% 01/03/2021 USD 80,000 82,490 0.01ArcelorMittal 7.25% 25/02/2022 USD 1,125,000 1,185,885 0.10ArcelorMittal 8% 15/10/2039 USD 50,000 48,785 0.00ArcelorMittal, Reg. S 2.875%06/07/2020 EUR 3,000,000 3,327,516 0.27Auris Luxembourg II SA, Reg. S 8%15/01/2023 EUR 3,350,000 4,016,793 0.33Cirsa Funding Luxembourg SA, Reg. S5.75% 15/05/2021 EUR 2,250,000 2,571,586 0.21Dufry Finance SCA, Reg. S 4.5%01/08/2023 EUR 2,500,000 2,912,969 0.24Galapagos Holding SA, Reg. S 7%15/06/2022 EUR 2,350,000 2,056,171 0.17Galapagos SA, Reg. S 5.375%15/06/2021 EUR 550,000 569,331 0.05Garfunkelux Holdco 3 SA, Reg. S 7.5%01/08/2022 EUR 2,000,000 2,185,762 0.18Gazprom OAO, Reg. S 6.51%07/03/2022 USD 2,600,000 2,884,869 0.23Geo Debt Finance SCA, Reg. S 7.5%01/08/2018 EUR 1,000,000 1,076,323 0.09Gestamp Funding Luxembourg SA,Reg. S 3.5% 15/05/2023 EUR 1,381,000 1,569,064 0.13Intelsat Jackson Holdings SA 7.25%01/04/2019 USD 105,000 76,125 0.01Intelsat Jackson Holdings SA 7.25%15/10/2020 USD 320,000 229,000 0.02Intelsat Jackson Holdings SA 7.5%01/04/2021 USD 1,845,000 1,245,375 0.10Intelsat Jackson Holdings SA 6.625%15/12/2022 USD 250,000 161,250 0.01Intelsat Jackson Holdings SA 5.5%01/08/2023 USD 514,000 319,965 0.03Intelsat Luxembourg SA 7.75%01/06/2021 USD 230,000 56,350 0.00LSF9 Balta Issuer SA, Reg. S 7.75%15/09/2022 EUR 250,000 294,304 0.02Mallinckrodt International Finance SA4.75% 15/04/2023 USD 63,000 51,713 0.00Matterhorn Telecom SA, Reg. S3.875% 01/05/2022 EUR 1,750,000 1,882,038 0.15Monitchem HoldCo 2 SA, Reg. S6.875% 15/06/2022 EUR 1,000,000 982,251 0.08Picard Bondco SA, Reg. S 7.75%01/02/2020 EUR 911,000 1,074,403 0.09Play Finance 1 SA, Reg. S 6.5%01/08/2019 EUR 1,900,000 2,189,736 0.18Play Topco SA, Reg. S 7.75%28/02/2020 EUR 925,000 1,050,118 0.09Sberbank of Russia, Reg. S 5.25%23/05/2023 USD 2,620,000 2,611,328 0.21SES SA, Reg. S, FRN 4.625%Perpetual EUR 2,076,000 2,295,706 0.19SIG Combibloc Holdings SCA, Reg. S7.75% 15/02/2023 EUR 3,850,000 4,522,394 0.37Swissport Investments SA, Reg. S6.75% 15/12/2021 EUR 1,450,000 1,660,879 0.14Telenet Finance VI Luxembourg SCA,Reg. S 4.875% 15/07/2027 EUR 2,000,000 2,268,290 0.18Trinseo Materials Operating SCA,Reg. S 6.375% 01/05/2022 EUR 2,000,000 2,252,472 0.18Wind Acquisition Finance SA, 144A7.375% 23/04/2021 USD 400,000 381,290 0.03Wind Acquisition Finance SA, Reg. S7% 23/04/2021 EUR 2,800,000 3,047,772 0.25
66,129,228 5.40
134
JPMorgan Funds - Global Bond Opportunities FundSchedule of Investments (continued)
As at 30 June 2016
Investments Currency
Quantity/Nominal
Value
MarketValue
USD
%of
NetAssets Investments Currency
Quantity/Nominal
Value
MarketValue
USD
%of
NetAssets
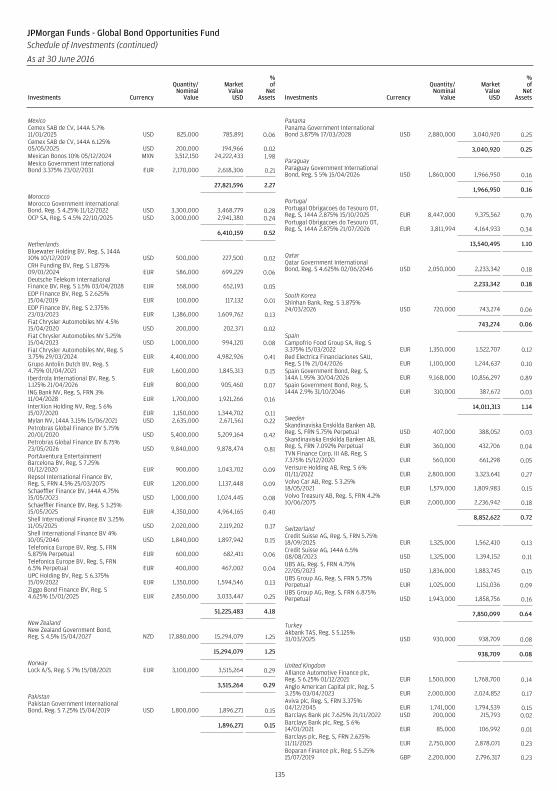
MexicoCemex SAB de CV, 144A 5.7%11/01/2025 USD 825,000 785,891 0.06Cemex SAB de CV, 144A 6.125%05/05/2025 USD 200,000 194,966 0.02Mexican Bonos 10% 05/12/2024 MXN 3,512,150 24,222,433 1.98Mexico Government InternationalBond 3.375% 23/02/2031 EUR 2,170,000 2,618,306 0.21
27,821,596 2.27
MoroccoMorocco Government InternationalBond, Reg. S 4.25% 11/12/2022 USD 3,300,000 3,468,779 0.28OCP SA, Reg. S 4.5% 22/10/2025 USD 3,000,000 2,941,380 0.24
6,410,159 0.52
NetherlandsBluewater Holding BV, Reg. S, 144A10% 10/12/2019 USD 500,000 227,500 0.02CRH Funding BV, Reg. S 1.875%09/01/2024 EUR 586,000 699,229 0.06Deutsche Telekom InternationalFinance BV, Reg. S 1.5% 03/04/2028 EUR 558,000 652,193 0.05EDP Finance BV, Reg. S 2.625%15/04/2019 EUR 100,000 117,132 0.01EDP Finance BV, Reg. S 2.375%23/03/2023 EUR 1,386,000 1,609,762 0.13Fiat Chrysler Automobiles NV 4.5%15/04/2020 USD 200,000 202,371 0.02Fiat Chrysler Automobiles NV 5.25%15/04/2023 USD 1,000,000 994,120 0.08Fiat Chrysler Automobiles NV, Reg. S3.75% 29/03/2024 EUR 4,400,000 4,982,926 0.41Grupo Antolin Dutch BV, Reg. S4.75% 01/04/2021 EUR 1,600,000 1,845,313 0.15Iberdrola International BV, Reg. S1.125% 21/04/2026 EUR 800,000 905,460 0.07ING Bank NV, Reg. S, FRN 3%11/04/2028 EUR 1,700,000 1,921,266 0.16InterXion Holding NV, Reg. S 6%15/07/2020 EUR 1,150,000 1,344,702 0.11Mylan NV, 144A 3.15% 15/06/2021 USD 2,635,000 2,671,561 0.22Petrobras Global Finance BV 5.75%20/01/2020 USD 5,400,000 5,209,164 0.42Petrobras Global Finance BV 8.75%23/05/2026 USD 9,840,000 9,878,474 0.81PortAventura EntertainmentBarcelona BV, Reg. S 7.25%01/12/2020 EUR 900,000 1,043,702 0.09Repsol International Finance BV,Reg. S, FRN 4.5% 25/03/2075 EUR 1,200,000 1,137,448 0.09Schaeffler Finance BV, 144A 4.75%15/05/2023 USD 1,000,000 1,024,445 0.08Schaeffler Finance BV, Reg. S 3.25%15/05/2025 EUR 4,350,000 4,964,165 0.40Shell International Finance BV 3.25%11/05/2025 USD 2,020,000 2,119,202 0.17Shell International Finance BV 4%10/05/2046 USD 1,840,000 1,897,942 0.15Telefonica Europe BV, Reg. S, FRN5.875% Perpetual EUR 600,000 682,411 0.06Telefonica Europe BV, Reg. S, FRN6.5% Perpetual EUR 400,000 467,002 0.04UPC Holding BV, Reg. S 6.375%15/09/2022 EUR 1,350,000 1,594,546 0.13Ziggo Bond Finance BV, Reg. S4.625% 15/01/2025 EUR 2,850,000 3,033,447 0.25
51,225,483 4.18
New ZealandNew Zealand Government Bond,Reg. S 4.5% 15/04/2027 NZD 17,880,000 15,294,079 1.25
15,294,079 1.25
NorwayLock A/S, Reg. S 7% 15/08/2021 EUR 3,100,000 3,515,264 0.29
3,515,264 0.29
PakistanPakistan Government InternationalBond, Reg. S 7.25% 15/04/2019 USD 1,800,000 1,896,271 0.15
1,896,271 0.15
PanamaPanama Government InternationalBond 3.875% 17/03/2028 USD 2,880,000 3,040,920 0.25
3,040,920 0.25
ParaguayParaguay Government InternationalBond, Reg. S 5% 15/04/2026 USD 1,860,000 1,966,950 0.16
1,966,950 0.16
PortugalPortugal Obrigacoes do Tesouro OT,Reg. S, 144A 2.875% 15/10/2025 EUR 8,447,000 9,375,562 0.76Portugal Obrigacoes do Tesouro OT,Reg. S, 144A 2.875% 21/07/2026 EUR 3,811,994 4,164,933 0.34
13,540,495 1.10
QatarQatar Government InternationalBond, Reg. S 4.625% 02/06/2046 USD 2,050,000 2,233,342 0.18
2,233,342 0.18
South KoreaShinhan Bank, Reg. S 3.875%24/03/2026 USD 720,000 743,274 0.06
743,274 0.06
SpainCampofrio Food Group SA, Reg. S3.375% 15/03/2022 EUR 1,350,000 1,522,707 0.12Red Electrica Financiaciones SAU,Reg. S 1% 21/04/2026 EUR 1,100,000 1,244,637 0.10Spain Government Bond, Reg. S,144A 1.95% 30/04/2026 EUR 9,168,000 10,856,297 0.89Spain Government Bond, Reg. S,144A 2.9% 31/10/2046 EUR 310,000 387,672 0.03
14,011,313 1.14
SwedenSkandinaviska Enskilda Banken AB,Reg. S, FRN 5.75% Perpetual USD 407,000 388,052 0.03Skandinaviska Enskilda Banken AB,Reg. S, FRN 7.092% Perpetual EUR 360,000 432,706 0.04TVN Finance Corp. III AB, Reg. S7.375% 15/12/2020 EUR 560,000 661,298 0.05Verisure Holding AB, Reg. S 6%01/11/2022 EUR 2,800,000 3,323,641 0.27Volvo Car AB, Reg. S 3.25%18/05/2021 EUR 1,579,000 1,809,983 0.15Volvo Treasury AB, Reg. S, FRN 4.2%10/06/2075 EUR 2,000,000 2,236,942 0.18
8,852,622 0.72
SwitzerlandCredit Suisse AG, Reg. S, FRN 5.75%18/09/2025 EUR 1,325,000 1,562,410 0.13Credit Suisse AG, 144A 6.5%08/08/2023 USD 1,325,000 1,394,152 0.11UBS AG, Reg. S, FRN 4.75%22/05/2023 USD 1,836,000 1,883,745 0.15UBS Group AG, Reg. S, FRN 5.75%Perpetual EUR 1,025,000 1,151,036 0.09UBS Group AG, Reg. S, FRN 6.875%Perpetual USD 1,943,000 1,858,756 0.16
7,850,099 0.64
TurkeyAkbank TAS, Reg. S 5.125%31/03/2025 USD 930,000 938,709 0.08
938,709 0.08
United KingdomAlliance Automotive Finance plc,Reg. S 6.25% 01/12/2021 EUR 1,500,000 1,768,700 0.14Anglo American Capital plc, Reg. S3.25% 03/04/2023 EUR 2,000,000 2,024,852 0.17Aviva plc, Reg. S, FRN 3.375%04/12/2045 EUR 1,741,000 1,794,539 0.15Barclays Bank plc 7.625% 21/11/2022 USD 200,000 215,793 0.02Barclays Bank plc, Reg. S 6%14/01/2021 EUR 85,000 106,992 0.01Barclays plc, Reg. S, FRN 2.625%11/11/2025 EUR 2,750,000 2,878,071 0.23Boparan Finance plc, Reg. S 5.25%15/07/2019 GBP 2,200,000 2,796,317 0.23
135
JPMorgan Funds - Global Bond Opportunities FundSchedule of Investments (continued)
As at 30 June 2016
Investments Currency
Quantity/Nominal
Value
MarketValue
USD
%of
NetAssets Investments Currency
Quantity/Nominal
Value
MarketValue
USD
%of
NetAssets
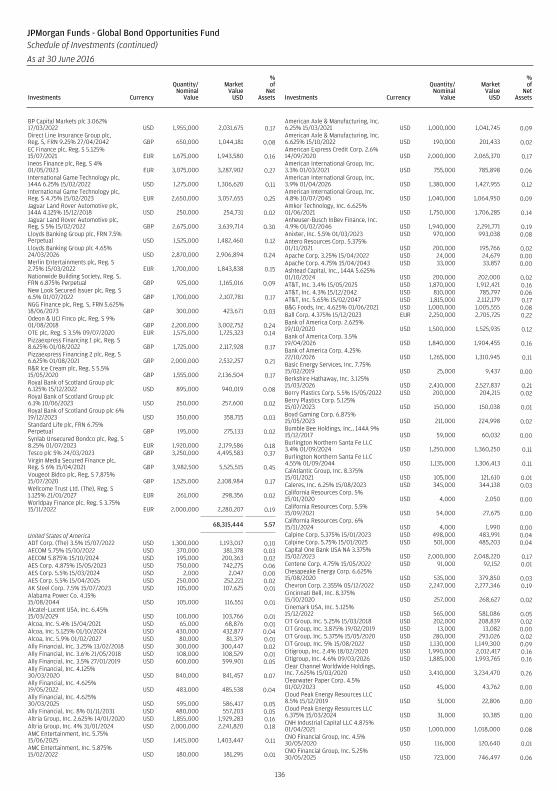
BP Capital Markets plc 3.062%17/03/2022 USD 1,955,000 2,031,675 0.17Direct Line Insurance Group plc,Reg. S, FRN 9.25% 27/04/2042 GBP 650,000 1,044,181 0.08EC Finance plc, Reg. S 5.125%15/07/2021 EUR 1,675,000 1,943,580 0.16Ineos Finance plc, Reg. S 4%01/05/2023 EUR 3,075,000 3,287,902 0.27International Game Technology plc,144A 6.25% 15/02/2022 USD 1,275,000 1,306,620 0.11International Game Technology plc,Reg. S 4.75% 15/02/2023 EUR 2,650,000 3,057,655 0.25Jaguar Land Rover Automotive plc,144A 4.125% 15/12/2018 USD 250,000 254,731 0.02Jaguar Land Rover Automotive plc,Reg. S 5% 15/02/2022 GBP 2,675,000 3,639,714 0.30Lloyds Banking Group plc, FRN 7.5%Perpetual USD 1,525,000 1,482,460 0.12Lloyds Banking Group plc 4.65%24/03/2026 USD 2,870,000 2,906,894 0.24Merlin Entertainments plc, Reg. S2.75% 15/03/2022 EUR 1,700,000 1,843,838 0.15Nationwide Building Society, Reg. S,FRN 6.875% Perpetual GBP 925,000 1,165,016 0.09New Look Secured Issuer plc, Reg. S6.5% 01/07/2022 GBP 1,700,000 2,107,781 0.17NGG Finance plc, Reg. S, FRN 5.625%18/06/2073 GBP 300,000 423,671 0.03Odeon & UCI Finco plc, Reg. S 9%01/08/2018 GBP 2,200,000 3,002,752 0.24OTE plc, Reg. S 3.5% 09/07/2020 EUR 1,575,000 1,725,323 0.14Pizzaexpress Financing 1 plc, Reg. S8.625% 01/08/2022 GBP 1,725,000 2,117,928 0.17Pizzaexpress Financing 2 plc, Reg. S6.625% 01/08/2021 GBP 2,000,000 2,532,257 0.21R&R Ice Cream plc, Reg. S 5.5%15/05/2020 GBP 1,555,000 2,136,504 0.17Royal Bank of Scotland Group plc6.125% 15/12/2022 USD 895,000 940,019 0.08Royal Bank of Scotland Group plc6.1% 10/06/2023 USD 250,000 257,600 0.02Royal Bank of Scotland Group plc 6%19/12/2023 USD 350,000 358,715 0.03Standard Life plc, FRN 6.75%Perpetual GBP 195,000 275,133 0.02Synlab Unsecured Bondco plc, Reg. S8.25% 01/07/2023 EUR 1,920,000 2,179,586 0.18Tesco plc 5% 24/03/2023 GBP 3,250,000 4,495,583 0.37Virgin Media Secured Finance plc,Reg. S 6% 15/04/2021 GBP 3,982,500 5,525,515 0.45Vougeot Bidco plc, Reg. S 7.875%15/07/2020 GBP 1,525,000 2,108,984 0.17Wellcome Trust Ltd. (The), Reg. S1.125% 21/01/2027 EUR 261,000 298,356 0.02Worldpay Finance plc, Reg. S 3.75%15/11/2022 EUR 2,000,000 2,280,207 0.19
68,315,444 5.57
United States of AmericaADT Corp. (The) 3.5% 15/07/2022 USD 1,300,000 1,193,017 0.10AECOM 5.75% 15/10/2022 USD 370,000 381,378 0.03AECOM 5.875% 15/10/2024 USD 195,000 200,363 0.02AES Corp. 4.875% 15/05/2023 USD 750,000 742,275 0.06AES Corp. 5.5% 15/03/2024 USD 2,000 2,047 0.00AES Corp. 5.5% 15/04/2025 USD 250,000 252,221 0.02AK Steel Corp. 7.5% 15/07/2023 USD 105,000 107,625 0.01Alabama Power Co. 4.15%15/08/2044 USD 105,000 116,551 0.01Alcatel-Lucent USA, Inc. 6.45%15/03/2029 USD 100,000 103,766 0.01Alcoa, Inc. 5.4% 15/04/2021 USD 65,000 68,876 0.01Alcoa, Inc. 5.125% 01/10/2024 USD 430,000 432,877 0.04Alcoa, Inc. 5.9% 01/02/2027 USD 80,000 81,379 0.01Ally Financial, Inc. 3.25% 13/02/2018 USD 300,000 300,447 0.02Ally Financial, Inc. 3.6% 21/05/2018 USD 108,000 108,529 0.01Ally Financial, Inc. 3.5% 27/01/2019 USD 600,000 599,901 0.05Ally Financial, Inc. 4.125%30/03/2020 USD 840,000 841,457 0.07Ally Financial, Inc. 4.625%19/05/2022 USD 483,000 485,538 0.04Ally Financial, Inc. 4.625%30/03/2025 USD 595,000 586,417 0.05Ally Financial, Inc. 8% 01/11/2031 USD 480,000 557,203 0.05Altria Group, Inc. 2.625% 14/01/2020 USD 1,855,000 1,929,283 0.16Altria Group, Inc. 4% 31/01/2024 USD 2,000,000 2,241,820 0.18AMC Entertainment, Inc. 5.75%15/06/2025 USD 1,415,000 1,403,447 0.11AMC Entertainment, Inc. 5.875%15/02/2022 USD 180,000 181,295 0.01
American Axle & Manufacturing, Inc.6.25% 15/03/2021 USD 1,000,000 1,041,745 0.09American Axle & Manufacturing, Inc.6.625% 15/10/2022 USD 190,000 201,433 0.02American Express Credit Corp. 2.6%14/09/2020 USD 2,000,000 2,065,370 0.17American International Group, Inc.3.3% 01/03/2021 USD 755,000 785,898 0.06American International Group, Inc.3.9% 01/04/2026 USD 1,380,000 1,427,955 0.12American International Group, Inc.4.8% 10/07/2045 USD 1,040,000 1,064,950 0.09Amkor Technology, Inc. 6.625%01/06/2021 USD 1,750,000 1,706,285 0.14Anheuser-Busch InBev Finance, Inc.4.9% 01/02/2046 USD 1,940,000 2,291,771 0.19Anixter, Inc. 5.5% 01/03/2023 USD 970,000 993,038 0.08Antero Resources Corp. 5.375%01/11/2021 USD 200,000 195,766 0.02Apache Corp. 3.25% 15/04/2022 USD 24,000 24,679 0.00Apache Corp. 4.75% 15/04/2043 USD 33,000 33,857 0.00Ashtead Capital, Inc., 144A 5.625%01/10/2024 USD 200,000 202,000 0.02AT&T, Inc. 3.4% 15/05/2025 USD 1,870,000 1,912,421 0.16AT&T, Inc. 4.3% 15/12/2042 USD 810,000 785,797 0.06AT&T, Inc. 5.65% 15/02/2047 USD 1,815,000 2,112,179 0.17B&G Foods, Inc. 4.625% 01/06/2021 USD 1,000,000 1,005,555 0.08Ball Corp. 4.375% 15/12/2023 EUR 2,250,000 2,705,725 0.22Bank of America Corp. 2.625%19/10/2020 USD 1,500,000 1,525,935 0.12Bank of America Corp. 3.5%19/04/2026 USD 1,840,000 1,904,455 0.16Bank of America Corp. 4.25%22/10/2026 USD 1,265,000 1,310,945 0.11Basic Energy Services, Inc. 7.75%15/02/2019 USD 25,000 9,437 0.00Berkshire Hathaway, Inc. 3.125%15/03/2026 USD 2,410,000 2,527,837 0.21Berry Plastics Corp. 5.5% 15/05/2022 USD 200,000 204,215 0.02Berry Plastics Corp. 5.125%15/07/2023 USD 150,000 150,038 0.01Boyd Gaming Corp. 6.875%15/05/2023 USD 211,000 224,998 0.02Bumble Bee Holdings, Inc., 144A 9%15/12/2017 USD 59,000 60,032 0.00Burlington Northern Santa Fe LLC3.4% 01/09/2024 USD 1,250,000 1,360,250 0.11Burlington Northern Santa Fe LLC4.55% 01/09/2044 USD 1,135,000 1,306,413 0.11CalAtlantic Group, Inc. 8.375%15/01/2021 USD 105,000 121,610 0.01Caleres, Inc. 6.25% 15/08/2023 USD 345,000 344,138 0.03California Resources Corp. 5%15/01/2020 USD 4,000 2,050 0.00California Resources Corp. 5.5%15/09/2021 USD 54,000 27,675 0.00California Resources Corp. 6%15/11/2024 USD 4,000 1,990 0.00Calpine Corp. 5.375% 15/01/2023 USD 498,000 483,991 0.04Calpine Corp. 5.75% 15/01/2025 USD 501,000 485,203 0.04Capital One Bank USA NA 3.375%15/02/2023 USD 2,000,000 2,048,220 0.17Centene Corp. 4.75% 15/05/2022 USD 91,000 92,152 0.01Chesapeake Energy Corp. 6.625%15/08/2020 USD 535,000 379,850 0.03Chevron Corp. 2.355% 05/12/2022 USD 2,247,000 2,277,346 0.19Cincinnati Bell, Inc. 8.375%15/10/2020 USD 257,000 268,627 0.02Cinemark USA, Inc. 5.125%15/12/2022 USD 565,000 581,086 0.05CIT Group, Inc. 5.25% 15/03/2018 USD 202,000 208,839 0.02CIT Group, Inc. 3.875% 19/02/2019 USD 13,000 13,082 0.00CIT Group, Inc. 5.375% 15/05/2020 USD 280,000 293,026 0.02CIT Group, Inc. 5% 15/08/2022 USD 1,130,000 1,149,300 0.09Citigroup, Inc. 2.4% 18/02/2020 USD 1,990,000 2,012,417 0.16Citigroup, Inc. 4.6% 09/03/2026 USD 1,885,000 1,993,765 0.16Clear Channel Worldwide Holdings,Inc. 7.625% 15/03/2020 USD 3,410,000 3,234,470 0.26Clearwater Paper Corp. 4.5%01/02/2023 USD 45,000 43,762 0.00Cloud Peak Energy Resources LLC8.5% 15/12/2019 USD 51,000 22,806 0.00Cloud Peak Energy Resources LLC6.375% 15/03/2024 USD 31,000 10,385 0.00CNH Industrial Capital LLC 4.875%01/04/2021 USD 1,000,000 1,018,000 0.08CNO Financial Group, Inc. 4.5%30/05/2020 USD 116,000 120,640 0.01CNO Financial Group, Inc. 5.25%30/05/2025 USD 723,000 746,497 0.06
136
JPMorgan Funds - Global Bond Opportunities FundSchedule of Investments (continued)
As at 30 June 2016
Investments Currency
Quantity/Nominal
Value
MarketValue
USD
%of
NetAssets Investments Currency
Quantity/Nominal
Value
MarketValue
USD
%of
NetAssets
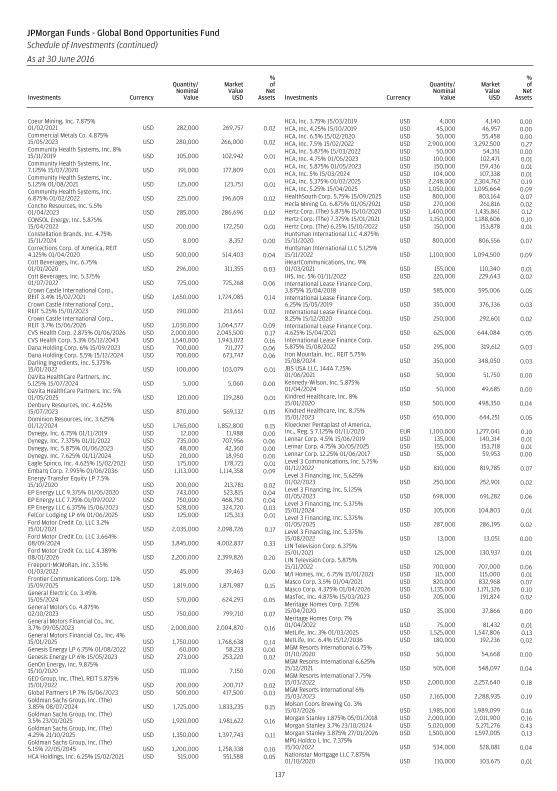
Coeur Mining, Inc. 7.875%01/02/2021 USD 282,000 269,757 0.02Commercial Metals Co. 4.875%15/05/2023 USD 280,000 266,000 0.02Community Health Systems, Inc. 8%15/11/2019 USD 105,000 102,942 0.01Community Health Systems, Inc.7.125% 15/07/2020 USD 191,000 177,809 0.01Community Health Systems, Inc.5.125% 01/08/2021 USD 125,000 123,751 0.01Community Health Systems, Inc.6.875% 01/02/2022 USD 225,000 196,609 0.02Concho Resources, Inc. 5.5%01/04/2023 USD 285,000 286,696 0.02CONSOL Energy, Inc. 5.875%15/04/2022 USD 200,000 172,250 0.01Constellation Brands, Inc. 4.75%15/11/2024 USD 8,000 8,352 0.00Corrections Corp. of America, REIT4.125% 01/04/2020 USD 500,000 514,403 0.04Cott Beverages, Inc. 6.75%01/01/2020 USD 296,000 311,355 0.03Cott Beverages, Inc. 5.375%01/07/2022 USD 725,000 725,268 0.06Crown Castle International Corp.,REIT 3.4% 15/02/2021 USD 1,650,000 1,724,085 0.14Crown Castle International Corp.,REIT 5.25% 15/01/2023 USD 190,000 213,661 0.02Crown Castle International Corp.,REIT 3.7% 15/06/2026 USD 1,030,000 1,064,577 0.09CVS Health Corp. 2.875% 01/06/2026 USD 2,000,000 2,045,500 0.17CVS Health Corp. 5.3% 05/12/2043 USD 1,540,000 1,943,072 0.16Dana Holding Corp. 6% 15/09/2023 USD 700,000 711,277 0.06Dana Holding Corp. 5.5% 15/12/2024 USD 700,000 673,747 0.06Darling Ingredients, Inc. 5.375%15/01/2022 USD 100,000 103,079 0.01DaVita HealthCare Partners, Inc.5.125% 15/07/2024 USD 5,000 5,060 0.00DaVita HealthCare Partners, Inc. 5%01/05/2025 USD 120,000 119,280 0.01Denbury Resources, Inc. 4.625%15/07/2023 USD 870,000 569,132 0.05Dominion Resources, Inc. 3.625%01/12/2024 USD 1,765,000 1,852,800 0.15Dynegy, Inc. 6.75% 01/11/2019 USD 12,000 11,988 0.00Dynegy, Inc. 7.375% 01/11/2022 USD 735,000 707,956 0.06Dynegy, Inc. 5.875% 01/06/2023 USD 48,000 42,360 0.00Dynegy, Inc. 7.625% 01/11/2024 USD 20,000 18,950 0.00Eagle Spinco, Inc. 4.625% 15/02/2021 USD 175,000 178,721 0.01Embarq Corp. 7.995% 01/06/2036 USD 1,113,000 1,114,358 0.09Energy Transfer Equity LP 7.5%15/10/2020 USD 200,000 213,781 0.02EP Energy LLC 9.375% 01/05/2020 USD 743,000 523,815 0.04EP Energy LLC 7.75% 01/09/2022 USD 750,000 468,750 0.04EP Energy LLC 6.375% 15/06/2023 USD 528,000 324,720 0.03FelCor Lodging LP 6% 01/06/2025 USD 125,000 125,313 0.01Ford Motor Credit Co. LLC 3.2%15/01/2021 USD 2,035,000 2,098,726 0.17Ford Motor Credit Co. LLC 3.664%08/09/2024 USD 3,845,000 4,002,837 0.33Ford Motor Credit Co. LLC 4.389%08/01/2026 USD 2,200,000 2,399,826 0.20Freeport-McMoRan, Inc. 3.55%01/03/2022 USD 45,000 39,463 0.00Frontier Communications Corp. 11%15/09/2025 USD 1,819,000 1,871,987 0.15General Electric Co. 3.45%15/05/2024 USD 570,000 624,293 0.05General Motors Co. 4.875%02/10/2023 USD 750,000 799,710 0.07General Motors Financial Co., Inc.3.7% 09/05/2023 USD 2,000,000 2,004,870 0.16General Motors Financial Co., Inc. 4%15/01/2025 USD 1,750,000 1,768,638 0.14Genesis Energy LP 6.75% 01/08/2022 USD 60,000 58,233 0.00Genesis Energy LP 6% 15/05/2023 USD 273,000 253,220 0.02GenOn Energy, Inc. 9.875%15/10/2020 USD 10,000 7,150 0.00GEO Group, Inc. (The), REIT 5.875%15/01/2022 USD 200,000 200,717 0.02Global Partners LP 7% 15/06/2023 USD 500,000 417,500 0.03Goldman Sachs Group, Inc. (The)3.85% 08/07/2024 USD 1,725,000 1,833,235 0.15Goldman Sachs Group, Inc. (The)3.5% 23/01/2025 USD 1,920,000 1,981,622 0.16Goldman Sachs Group, Inc. (The)4.25% 21/10/2025 USD 1,350,000 1,397,743 0.11Goldman Sachs Group, Inc. (The)5.15% 22/05/2045 USD 1,200,000 1,258,338 0.10HCA Holdings, Inc. 6.25% 15/02/2021 USD 515,000 551,588 0.05
HCA, Inc. 3.75% 15/03/2019 USD 4,000 4,140 0.00HCA, Inc. 4.25% 15/10/2019 USD 45,000 46,957 0.00HCA, Inc. 6.5% 15/02/2020 USD 50,000 55,458 0.00HCA, Inc. 7.5% 15/02/2022 USD 2,900,000 3,292,500 0.27HCA, Inc. 5.875% 15/03/2022 USD 50,000 54,351 0.00HCA, Inc. 4.75% 01/05/2023 USD 100,000 102,471 0.01HCA, Inc. 5.875% 01/05/2023 USD 150,000 159,436 0.01HCA, Inc. 5% 15/03/2024 USD 104,000 107,338 0.01HCA, Inc. 5.375% 01/02/2025 USD 2,248,000 2,304,762 0.19HCA, Inc. 5.25% 15/04/2025 USD 1,050,000 1,095,664 0.09HealthSouth Corp. 5.75% 15/09/2025 USD 800,000 803,164 0.07Hecla Mining Co. 6.875% 01/05/2021 USD 270,000 261,816 0.02Hertz Corp. (The) 5.875% 15/10/2020 USD 1,400,000 1,435,861 0.12Hertz Corp. (The) 7.375% 15/01/2021 USD 1,150,000 1,188,606 0.10Hertz Corp. (The) 6.25% 15/10/2022 USD 150,000 153,878 0.01Huntsman International LLC 4.875%15/11/2020 USD 800,000 806,556 0.07Huntsman International LLC 5.125%15/11/2022 USD 1,100,000 1,094,500 0.09iHeartCommunications, Inc. 9%01/03/2021 USD 155,000 110,340 0.01IHS, Inc. 5% 01/11/2022 USD 220,000 229,643 0.02International Lease Finance Corp.3.875% 15/04/2018 USD 585,000 595,006 0.05International Lease Finance Corp.6.25% 15/05/2019 USD 350,000 376,336 0.03International Lease Finance Corp.8.25% 15/12/2020 USD 250,000 292,601 0.02International Lease Finance Corp.4.625% 15/04/2021 USD 625,000 644,084 0.05International Lease Finance Corp.5.875% 15/08/2022 USD 295,000 319,612 0.03Iron Mountain, Inc., REIT 5.75%15/08/2024 USD 350,000 348,050 0.03JBS USA LLC, 144A 7.25%01/06/2021 USD 50,000 51,750 0.00Kennedy-Wilson, Inc. 5.875%01/04/2024 USD 50,000 49,685 0.00Kindred Healthcare, Inc. 8%15/01/2020 USD 500,000 498,350 0.04Kindred Healthcare, Inc. 8.75%15/01/2023 USD 650,000 644,251 0.05Kloeckner Pentaplast of America,Inc., Reg. S 7.125% 01/11/2020 EUR 1,100,000 1,277,041 0.10Lennar Corp. 4.5% 15/06/2019 USD 135,000 140,314 0.01Lennar Corp. 4.75% 30/05/2025 USD 155,000 153,718 0.01Lennar Corp. 12.25% 01/06/2017 USD 55,000 59,953 0.00Level 3 Communications, Inc. 5.75%01/12/2022 USD 810,000 819,785 0.07Level 3 Financing, Inc. 5.625%01/02/2023 USD 250,000 252,901 0.02Level 3 Financing, Inc. 5.125%01/05/2023 USD 698,000 691,282 0.06Level 3 Financing, Inc. 5.375%15/01/2024 USD 105,000 104,803 0.01Level 3 Financing, Inc. 5.375%01/05/2025 USD 287,000 286,195 0.02Level 3 Financing, Inc. 5.375%15/08/2022 USD 13,000 13,051 0.00LIN Television Corp. 6.375%15/01/2021 USD 125,000 130,937 0.01LIN Television Corp. 5.875%15/11/2022 USD 700,000 707,000 0.06M/I Homes, Inc. 6.75% 15/01/2021 USD 115,000 115,000 0.01Masco Corp. 3.5% 01/04/2021 USD 820,000 832,968 0.07Masco Corp. 4.375% 01/04/2026 USD 1,135,000 1,171,326 0.10MasTec, Inc. 4.875% 15/03/2023 USD 205,000 191,824 0.02Meritage Homes Corp. 7.15%15/04/2020 USD 35,000 37,866 0.00Meritage Homes Corp. 7%01/04/2022 USD 75,000 81,432 0.01MetLife, Inc. 3% 01/03/2025 USD 1,525,000 1,547,806 0.13MetLife, Inc. 6.4% 15/12/2036 USD 180,000 192,236 0.02MGM Resorts International 6.75%01/10/2020 USD 50,000 54,668 0.00MGM Resorts International 6.625%15/12/2021 USD 505,000 548,097 0.04MGM Resorts International 7.75%15/03/2022 USD 2,000,000 2,257,640 0.18MGM Resorts International 6%15/03/2023 USD 2,165,000 2,288,935 0.19Molson Coors Brewing Co. 3%15/07/2026 USD 1,985,000 1,989,099 0.16Morgan Stanley 1.875% 05/01/2018 USD 2,000,000 2,011,900 0.16Morgan Stanley 3.7% 23/10/2024 USD 5,020,000 5,271,276 0.43Morgan Stanley 3.875% 27/01/2026 USD 1,500,000 1,597,005 0.13MPG Holdco I, Inc. 7.375%15/10/2022 USD 534,000 528,081 0.04Nationstar Mortgage LLC 7.875%01/10/2020 USD 110,000 103,675 0.01
137
JPMorgan Funds - Global Bond Opportunities FundSchedule of Investments (continued)
As at 30 June 2016
Investments Currency
Quantity/Nominal
Value
MarketValue
USD
%of
NetAssets Investments Currency
Quantity/Nominal
Value
MarketValue
USD
%of
NetAssets
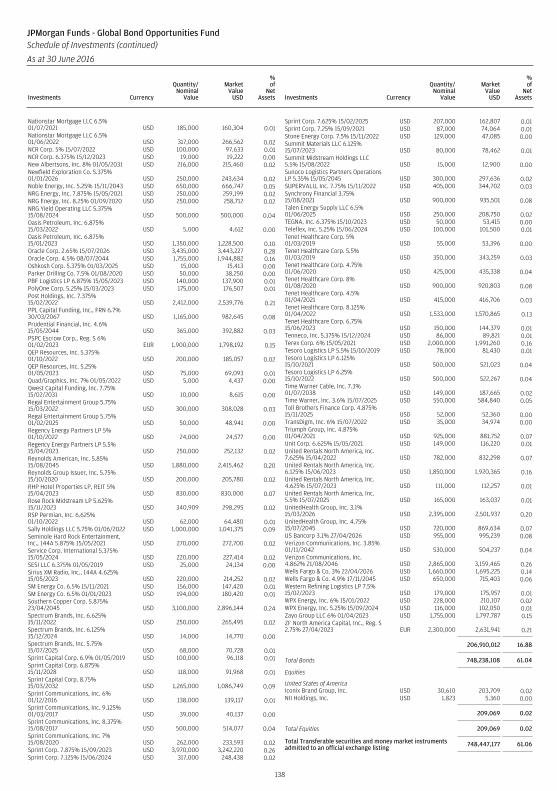
Nationstar Mortgage LLC 6.5%01/07/2021 USD 185,000 160,304 0.01Nationstar Mortgage LLC 6.5%01/06/2022 USD 317,000 266,562 0.02NCR Corp. 5% 15/07/2022 USD 100,000 97,633 0.01NCR Corp. 6.375% 15/12/2023 USD 19,000 19,222 0.00New Albertsons, Inc. 8% 01/05/2031 USD 216,000 215,460 0.02Newfield Exploration Co. 5.375%01/01/2026 USD 250,000 243,634 0.02Noble Energy, Inc. 5.25% 15/11/2043 USD 650,000 666,747 0.05NRG Energy, Inc. 7.875% 15/05/2021 USD 250,000 259,199 0.02NRG Energy, Inc. 8.25% 01/09/2020 USD 250,000 258,712 0.02NRG Yield Operating LLC 5.375%15/08/2024 USD 500,000 500,000 0.04Oasis Petroleum, Inc. 6.875%15/03/2022 USD 5,000 4,612 0.00Oasis Petroleum, Inc. 6.875%15/01/2023 USD 1,350,000 1,228,500 0.10Oracle Corp. 2.65% 15/07/2026 USD 3,435,000 3,443,227 0.28Oracle Corp. 4.5% 08/07/2044 USD 1,755,000 1,944,882 0.16Oshkosh Corp. 5.375% 01/03/2025 USD 15,000 15,413 0.00Parker Drilling Co. 7.5% 01/08/2020 USD 50,000 38,250 0.00PBF Logistics LP 6.875% 15/05/2023 USD 140,000 137,900 0.01PolyOne Corp. 5.25% 15/03/2023 USD 175,000 176,507 0.01Post Holdings, Inc. 7.375%15/02/2022 USD 2,412,000 2,539,776 0.21PPL Capital Funding, Inc., FRN 6.7%30/03/2067 USD 1,165,000 982,645 0.08Prudential Financial, Inc. 4.6%15/05/2044 USD 365,000 392,882 0.03PSPC Escrow Corp., Reg. S 6%01/02/2023 EUR 1,900,000 1,798,192 0.15QEP Resources, Inc. 5.375%01/10/2022 USD 200,000 185,057 0.02QEP Resources, Inc. 5.25%01/05/2023 USD 75,000 69,093 0.01Quad/Graphics, Inc. 7% 01/05/2022 USD 5,000 4,437 0.00Qwest Capital Funding, Inc. 7.75%15/02/2031 USD 10,000 8,615 0.00Regal Entertainment Group 5.75%15/03/2022 USD 300,000 308,028 0.03Regal Entertainment Group 5.75%01/02/2025 USD 50,000 48,941 0.00Regency Energy Partners LP 5%01/10/2022 USD 24,000 24,577 0.00Regency Energy Partners LP 5.5%15/04/2023 USD 250,000 252,132 0.02Reynolds American, Inc. 5.85%15/08/2045 USD 1,880,000 2,415,462 0.20Reynolds Group Issuer, Inc. 5.75%15/10/2020 USD 200,000 205,780 0.02RHP Hotel Properties LP, REIT 5%15/04/2023 USD 830,000 830,000 0.07Rose Rock Midstream LP 5.625%15/11/2023 USD 340,909 298,295 0.02RSP Permian, Inc. 6.625%01/10/2022 USD 62,000 64,480 0.01Sally Holdings LLC 5.75% 01/06/2022 USD 1,000,000 1,041,375 0.09Seminole Hard Rock Entertainment,Inc., 144A 5.875% 15/05/2021 USD 270,000 272,700 0.02Service Corp. International 5.375%15/05/2024 USD 220,000 227,414 0.02SESI LLC 6.375% 01/05/2019 USD 25,000 24,134 0.00Sirius XM Radio, Inc., 144A 4.625%15/05/2023 USD 220,000 214,252 0.02SM Energy Co. 6.5% 15/11/2021 USD 156,000 147,420 0.01SM Energy Co. 6.5% 01/01/2023 USD 194,000 180,420 0.01Southern Copper Corp. 5.875%23/04/2045 USD 3,100,000 2,896,144 0.24Spectrum Brands, Inc. 6.625%15/11/2022 USD 250,000 265,495 0.02Spectrum Brands, Inc. 6.125%15/12/2024 USD 14,000 14,770 0.00Spectrum Brands, Inc. 5.75%15/07/2025 USD 68,000 70,728 0.01Sprint Capital Corp. 6.9% 01/05/2019 USD 100,000 96,118 0.01Sprint Capital Corp. 6.875%15/11/2028 USD 118,000 91,968 0.01Sprint Capital Corp. 8.75%15/03/2032 USD 1,265,000 1,086,749 0.09Sprint Communications, Inc. 6%01/12/2016 USD 138,000 139,117 0.01Sprint Communications, Inc. 9.125%01/03/2017 USD 39,000 40,137 0.00Sprint Communications, Inc. 8.375%15/08/2017 USD 500,000 514,077 0.04Sprint Communications, Inc. 7%15/08/2020 USD 262,000 233,593 0.02Sprint Corp. 7.875% 15/09/2023 USD 3,970,000 3,242,220 0.26Sprint Corp. 7.125% 15/06/2024 USD 317,000 248,438 0.02
Sprint Corp. 7.625% 15/02/2025 USD 207,000 162,807 0.01Sprint Corp. 7.25% 15/09/2021 USD 87,000 74,064 0.01Stone Energy Corp. 7.5% 15/11/2022 USD 129,000 47,085 0.00Summit Materials LLC 6.125%15/07/2023 USD 80,000 78,462 0.01Summit Midstream Holdings LLC5.5% 15/08/2022 USD 15,000 12,900 0.00Sunoco Logistics Partners OperationsLP 5.35% 15/05/2045 USD 300,000 297,636 0.02SUPERVALU, Inc. 7.75% 15/11/2022 USD 405,000 344,702 0.03Synchrony Financial 3.75%15/08/2021 USD 900,000 935,501 0.08Talen Energy Supply LLC 6.5%01/06/2025 USD 250,000 208,750 0.02TEGNA, Inc. 6.375% 15/10/2023 USD 50,000 53,415 0.00Teleflex, Inc. 5.25% 15/06/2024 USD 100,000 101,500 0.01Tenet Healthcare Corp. 5%01/03/2019 USD 55,000 53,396 0.00Tenet Healthcare Corp. 5.5%01/03/2019 USD 350,000 343,259 0.03Tenet Healthcare Corp. 4.75%01/06/2020 USD 425,000 435,338 0.04Tenet Healthcare Corp. 8%01/08/2020 USD 900,000 920,803 0.08Tenet Healthcare Corp. 4.5%01/04/2021 USD 415,000 416,706 0.03Tenet Healthcare Corp. 8.125%01/04/2022 USD 1,533,000 1,570,865 0.13Tenet Healthcare Corp. 6.75%15/06/2023 USD 150,000 144,379 0.01Tenneco, Inc. 5.375% 15/12/2024 USD 86,000 89,821 0.01Terex Corp. 6% 15/05/2021 USD 2,000,000 1,991,260 0.16Tesoro Logistics LP 5.5% 15/10/2019 USD 78,000 81,430 0.01Tesoro Logistics LP 6.125%15/10/2021 USD 500,000 521,023 0.04Tesoro Logistics LP 6.25%15/10/2022 USD 500,000 522,267 0.04Time Warner Cable, Inc. 7.3%01/07/2038 USD 149,000 187,665 0.02Time Warner, Inc. 3.6% 15/07/2025 USD 550,000 584,840 0.05Toll Brothers Finance Corp. 4.875%15/11/2025 USD 52,000 52,360 0.00TransDigm, Inc. 6% 15/07/2022 USD 35,000 34,974 0.00Triumph Group, Inc. 4.875%01/04/2021 USD 925,000 881,752 0.07Unit Corp. 6.625% 15/05/2021 USD 149,000 116,220 0.01United Rentals North America, Inc.7.625% 15/04/2022 USD 782,000 832,298 0.07United Rentals North America, Inc.6.125% 15/06/2023 USD 1,850,000 1,920,365 0.16United Rentals North America, Inc.4.625% 15/07/2023 USD 111,000 112,257 0.01United Rentals North America, Inc.5.5% 15/07/2025 USD 165,000 163,037 0.01UnitedHealth Group, Inc. 3.1%15/03/2026 USD 2,395,000 2,501,937 0.20UnitedHealth Group, Inc. 4.75%15/07/2045 USD 720,000 869,634 0.07US Bancorp 3.1% 27/04/2026 USD 955,000 995,239 0.08Verizon Communications, Inc. 3.85%01/11/2042 USD 530,000 504,237 0.04Verizon Communications, Inc.4.862% 21/08/2046 USD 2,865,000 3,159,465 0.26Wells Fargo & Co. 3% 22/04/2026 USD 1,660,000 1,695,225 0.14Wells Fargo & Co. 4.9% 17/11/2045 USD 650,000 715,403 0.06Western Refining Logistics LP 7.5%15/02/2023 USD 179,000 175,957 0.01WPX Energy, Inc. 6% 15/01/2022 USD 228,000 210,107 0.02WPX Energy, Inc. 5.25% 15/09/2024 USD 116,000 102,050 0.01Zayo Group LLC 6% 01/04/2023 USD 1,755,000 1,797,787 0.15ZF North America Capital, Inc., Reg. S2.75% 27/04/2023 EUR 2,300,000 2,631,941 0.21
206,910,012 16.88
Total Bonds 748,238,108 61.04
Equities
United States of AmericaIconix Brand Group, Inc. USD 30,610 203,709 0.02NII Holdings, Inc. USD 1,823 5,360 0.00
209,069 0.02
Total Equities 209,069 0.02
Total Transferable securities and money market instrumentsadmitted to an official exchange listing 748,447,177 61.06
138
JPMorgan Funds - Global Bond Opportunities FundSchedule of Investments (continued)
As at 30 June 2016
Investments Currency
Quantity/Nominal
Value
MarketValue
USD
%of
NetAssets Investments Currency
Quantity/Nominal
Value
MarketValue
USD
%of
NetAssets
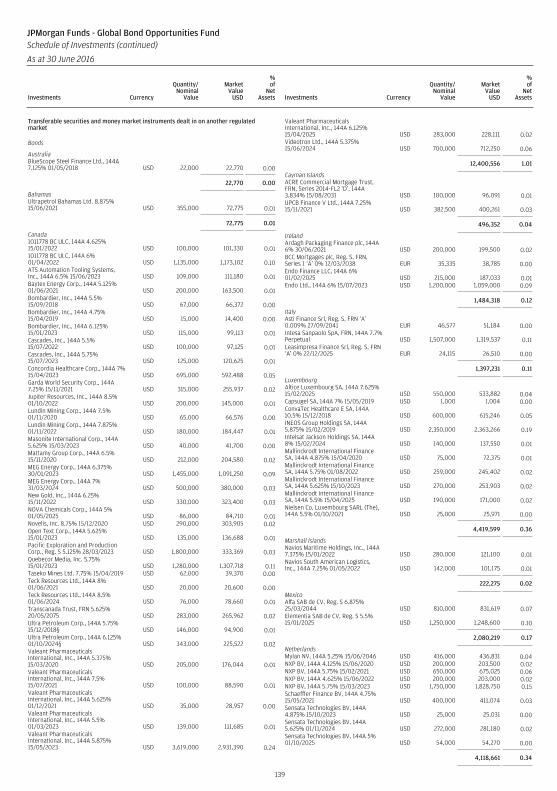
Transferable securities and money market instruments dealt in on another regulatedmarket
Bonds
AustraliaBlueScope Steel Finance Ltd., 144A7.125% 01/05/2018 USD 22,000 22,770 0.00
22,770 0.00
BahamasUltrapetrol Bahamas Ltd. 8.875%15/06/2021 USD 355,000 72,775 0.01
72,775 0.01
Canada1011778 BC ULC, 144A 4.625%15/01/2022 USD 100,000 101,330 0.011011778 BC ULC, 144A 6%01/04/2022 USD 1,135,000 1,173,102 0.10ATS Automation Tooling Systems,Inc., 144A 6.5% 15/06/2023 USD 109,000 111,180 0.01Baytex Energy Corp., 144A 5.125%01/06/2021 USD 200,000 163,500 0.01Bombardier, Inc., 144A 5.5%15/09/2018 USD 67,000 66,372 0.00Bombardier, Inc., 144A 4.75%15/04/2019 USD 15,000 14,400 0.00Bombardier, Inc., 144A 6.125%15/01/2023 USD 115,000 99,113 0.01Cascades, Inc., 144A 5.5%15/07/2022 USD 100,000 97,125 0.01Cascades, Inc., 144A 5.75%15/07/2023 USD 125,000 120,625 0.01Concordia Healthcare Corp., 144A 7%15/04/2023 USD 695,000 592,488 0.05Garda World Security Corp., 144A7.25% 15/11/2021 USD 315,000 255,937 0.02Jupiter Resources, Inc., 144A 8.5%01/10/2022 USD 200,000 145,000 0.01Lundin Mining Corp., 144A 7.5%01/11/2020 USD 65,000 66,576 0.00Lundin Mining Corp., 144A 7.875%01/11/2022 USD 180,000 184,447 0.01Masonite International Corp., 144A5.625% 15/03/2023 USD 40,000 41,700 0.00Mattamy Group Corp., 144A 6.5%15/11/2020 USD 212,000 204,580 0.02MEG Energy Corp., 144A 6.375%30/01/2023 USD 1,455,000 1,091,250 0.09MEG Energy Corp., 144A 7%31/03/2024 USD 500,000 380,000 0.03New Gold, Inc., 144A 6.25%15/11/2022 USD 330,000 323,400 0.03NOVA Chemicals Corp., 144A 5%01/05/2025 USD 86,000 84,710 0.01Novelis, Inc. 8.75% 15/12/2020 USD 290,000 303,905 0.02Open Text Corp., 144A 5.625%15/01/2023 USD 135,000 136,688 0.01Pacific Exploration and ProductionCorp., Reg. S 5.125% 28/03/2023 USD 1,800,000 333,369 0.03Quebecor Media, Inc. 5.75%15/01/2023 USD 1,280,000 1,307,718 0.11Taseko Mines Ltd. 7.75% 15/04/2019 USD 62,000 39,370 0.00Teck Resources Ltd., 144A 8%01/06/2021 USD 20,000 20,600 0.00Teck Resources Ltd., 144A 8.5%01/06/2024 USD 76,000 78,660 0.01Transcanada Trust, FRN 5.625%20/05/2075 USD 283,000 265,962 0.02Ultra Petroleum Corp., 144A 5.75%15/12/2018§ USD 146,000 94,900 0.01Ultra Petroleum Corp., 144A 6.125%01/10/2024§ USD 343,000 225,522 0.02Valeant PharmaceuticalsInternational, Inc., 144A 5.375%15/03/2020 USD 205,000 176,044 0.01Valeant PharmaceuticalsInternational, Inc., 144A 7.5%15/07/2021 USD 100,000 88,590 0.01Valeant PharmaceuticalsInternational, Inc., 144A 5.625%01/12/2021 USD 35,000 28,957 0.00Valeant PharmaceuticalsInternational, Inc., 144A 5.5%01/03/2023 USD 139,000 111,685 0.01Valeant PharmaceuticalsInternational, Inc., 144A 5.875%15/05/2023 USD 3,619,000 2,931,390 0.24
Valeant PharmaceuticalsInternational, Inc., 144A 6.125%15/04/2025 USD 283,000 228,111 0.02Videotron Ltd., 144A 5.375%15/06/2024 USD 700,000 712,250 0.06
12,400,556 1.01
Cayman IslandsACRE Commercial Mortgage Trust,FRN, Series 2014-FL2 ‘D’, 144A3.834% 15/08/2031 USD 100,000 96,091 0.01UPCB Finance V Ltd., 144A 7.25%15/11/2021 USD 382,500 400,261 0.03
496,352 0.04
IrelandArdagh Packaging Finance plc, 144A6% 30/06/2021 USD 200,000 199,500 0.02BCC Mortgages plc, Reg. S, FRN,Series 1 ‘A’ 0% 12/03/2038 EUR 35,335 38,785 0.00Endo Finance LLC, 144A 6%01/02/2025 USD 215,000 187,033 0.01Endo Ltd., 144A 6% 15/07/2023 USD 1,200,000 1,059,000 0.09
1,484,318 0.12
ItalyAsti Finance Srl, Reg. S, FRN ‘A’0.009% 27/09/2041 EUR 46,577 51,184 0.00Intesa Sanpaolo SpA, FRN, 144A 7.7%Perpetual USD 1,507,000 1,319,537 0.11Leasimpresa Finance Srl, Reg. S, FRN‘A’ 0% 22/12/2025 EUR 24,115 26,510 0.00
1,397,231 0.11
LuxembourgAltice Luxembourg SA, 144A 7.625%15/02/2025 USD 550,000 533,882 0.04Capsugel SA, 144A 7% 15/05/2019 USD 1,000 1,004 0.00ConvaTec Healthcare E SA, 144A10.5% 15/12/2018 USD 600,000 615,246 0.05INEOS Group Holdings SA, 144A5.875% 15/02/2019 USD 2,350,000 2,363,266 0.19Intelsat Jackson Holdings SA, 144A8% 15/02/2024 USD 140,000 137,550 0.01Mallinckrodt International FinanceSA, 144A 4.875% 15/04/2020 USD 75,000 72,375 0.01Mallinckrodt International FinanceSA, 144A 5.75% 01/08/2022 USD 259,000 245,402 0.02Mallinckrodt International FinanceSA, 144A 5.625% 15/10/2023 USD 270,000 253,903 0.02Mallinckrodt International FinanceSA, 144A 5.5% 15/04/2025 USD 190,000 171,000 0.02Nielsen Co. Luxembourg SARL (The),144A 5.5% 01/10/2021 USD 25,000 25,971 0.00
4,419,599 0.36
Marshall IslandsNavios Maritime Holdings, Inc., 144A7.375% 15/01/2022 USD 280,000 121,100 0.01Navios South American Logistics,Inc., 144A 7.25% 01/05/2022 USD 142,000 101,175 0.01
222,275 0.02
MexicoAlfa SAB de CV, Reg. S 6.875%25/03/2044 USD 810,000 831,619 0.07Elementia SAB de CV, Reg. S 5.5%15/01/2025 USD 1,250,000 1,248,600 0.10
2,080,219 0.17
NetherlandsMylan NV, 144A 5.25% 15/06/2046 USD 416,000 436,831 0.04NXP BV, 144A 4.125% 15/06/2020 USD 200,000 203,500 0.02NXP BV, 144A 5.75% 15/02/2021 USD 650,000 675,025 0.06NXP BV, 144A 4.625% 15/06/2022 USD 200,000 203,000 0.02NXP BV, 144A 5.75% 15/03/2023 USD 1,750,000 1,828,750 0.15Schaeffler Finance BV, 144A 4.75%15/05/2021 USD 400,000 411,074 0.03Sensata Technologies BV, 144A4.875% 15/10/2023 USD 25,000 25,031 0.00Sensata Technologies BV, 144A5.625% 01/11/2024 USD 272,000 281,180 0.02Sensata Technologies BV, 144A 5%01/10/2025 USD 54,000 54,270 0.00
4,118,661 0.34
139
JPMorgan Funds - Global Bond Opportunities FundSchedule of Investments (continued)
As at 30 June 2016
Investments Currency
Quantity/Nominal
Value
MarketValue
USD
%of
NetAssets Investments Currency
Quantity/Nominal
Value
MarketValue
USD
%of
NetAssets
SingaporeFlextronics International Ltd. 5%15/02/2023 USD 200,000 211,200 0.02
211,200 0.02
SpainBankinter 3 Fondo de TitulizacionHipotecaria, Reg. S, FRN, Series 3 ‘A’0.117% 16/10/2038 EUR 43,654 48,075 0.00
48,075 0.00
SupranationalNavios Maritime Acquisition Corp.,144A 8.125% 15/11/2021 USD 29,000 22,910 0.00
22,910 0.00
United KingdomBarclays plc, FRN 8.25% Perpetual USD 200,000 196,024 0.02Great Hall Mortgages plc, Reg. S,FRN, Series 2007-1 ‘A2B’ 0%18/03/2039 EUR 66,964 69,750 0.01Sensata Technologies UK FinancingCo. plc, 144A 6.25% 15/02/2026 USD 1,000,000 1,035,000 0.08
1,300,774 0.11
United States of AmericaABFC Trust, FRN, Series 2004-OPT2‘M2’ 1.946% 25/07/2033 USD 118,998 114,676 0.01Acadia Healthcare Co., Inc. 5.125%01/07/2022 USD 25,000 24,625 0.00Acadia Healthcare Co., Inc. 5.625%15/02/2023 USD 125,000 124,390 0.01ACCO Brands Corp. 6.75%30/04/2020 USD 275,000 288,795 0.02ACE Cash Express, Inc., 144A 11%01/02/2019 USD 136,000 60,520 0.01Activision Blizzard, Inc., 144A 5.625%15/09/2021 USD 300,000 314,550 0.03ADT Corp. (The) 6.25% 15/10/2021 USD 39,000 41,391 0.00ADT Corp. (The) 4.125% 15/06/2023 USD 1,275,000 1,198,462 0.10Advanced Micro Devices, Inc. 6.75%01/03/2019 USD 144,000 137,520 0.01Advanced Micro Devices, Inc. 7.75%01/08/2020 USD 20,000 18,673 0.00Advanced Micro Devices, Inc. 7%01/07/2024 USD 186,000 154,153 0.01Ahern Rentals, Inc., 144A 7.375%15/05/2023 USD 113,000 78,535 0.01Air Medical Merger Sub Corp., 144A6.375% 15/05/2023 USD 700,000 668,500 0.05Alere, Inc., 144A 6.375% 01/07/2023 USD 102,000 107,100 0.01Aleris International, Inc. 7.875%01/11/2020 USD 155,000 137,366 0.01Alliance Data Systems Corp., 144A5.375% 01/08/2022 USD 140,000 134,050 0.01Ally Financial, Inc., FRN 3.313%18/07/2016 USD 10,000 10,021 0.00Alternative Loan Trust, Series2005-6CB ‘1A6’ 5.5% 25/04/2035 USD 46,229 44,525 0.00Alternative Loan Trust, Series2005-21CB ‘A17’ 6% 25/06/2035 USD 1,524,580 1,474,519 0.12Alternative Loan Trust, Series2005-23CB ‘A16’ 5.5% 25/07/2035 USD 80,732 79,017 0.01Altice US Finance I Corp., 144A 5.5%15/05/2026 USD 210,000 208,425 0.02AMC Networks, Inc. 4.75%15/12/2022 USD 275,000 273,688 0.02American Airlines Pass ThroughTrust, Series 2015-1 ‘PTT’ 3.7%01/05/2023 USD 685,738 673,737 0.06Amkor Technology, Inc. 6.375%01/10/2022 USD 250,000 245,235 0.02Amsurg Corp. 5.625% 15/07/2022 USD 20,000 20,488 0.00Apple, Inc. 4.65% 23/02/2046 USD 2,605,000 2,967,590 0.24Argent Securities, Inc., FRN, Series2004-W2 ‘M2’ 2.328% 25/04/2034 USD 76,517 72,124 0.01Argent Securities, Inc., FRN, Series2004-W4 ‘A’ 0.973% 25/03/2034 USD 2,211,664 2,072,171 0.17Argos Merger Sub, Inc., 144A 7.125%15/03/2023 USD 1,972,000 2,009,014 0.16Ashland, Inc. 4.75% 15/08/2022 USD 1,170,000 1,167,660 0.10Ashtead Capital, Inc., 144A 6.5%15/07/2022 USD 1,000,000 1,037,500 0.08Avaya, Inc., 144A 7% 01/04/2019 USD 1,199,000 857,405 0.07Avaya, Inc., 144A 10.5% 01/03/2021 USD 140,000 32,200 0.00Avis Budget Car Rental LLC, 144A6.375% 01/04/2024 USD 245,000 243,775 0.02
Avis Budget Car Rental LLC 5.5%01/04/2023 USD 1,355,000 1,321,423 0.11Banc of America CommercialMortgage Trust, FRN, Series 2006-2‘B’ 5.921% 10/05/2045 USD 100,000 99,817 0.01Banc of America CommercialMortgage Trust, FRN, Series 2007-3‘B’ 5.539% 10/06/2049 USD 2,200,000 2,184,365 0.18Bank of America Corp., FRN 6.3%Perpetual USD 2,070,000 2,191,778 0.18Bank of America Corp., FRN 6.1%Perpetual USD 2,790,000 2,829,172 0.23Bear Stearns Commercial MortgageSecurities Trust, FRN, Series2006-PW13 ‘B’, 144A 5.66%11/09/2041 USD 2,620,000 2,541,092 0.21Bear Stearns Commercial MortgageSecurities Trust, FRN, Series2007-PW16 ‘AJ’ 5.72% 11/06/2040 USD 790,000 776,683 0.06Bear Stearns Commercial MortgageSecurities Trust, FRN, Series2007-PW17 ‘AJ’ 5.886% 11/06/2050 USD 3,665,000 3,665,521 0.30Bear Stearns Commercial MortgageSecurities Trust, Series 2006-PW14‘AJ’ 5.273% 11/12/2038 USD 575,000 563,970 0.05Belden, Inc., 144A 5.25% 15/07/2024 USD 45,000 43,763 0.00Biogen, Inc. 5.2% 15/09/2045 USD 1,450,000 1,661,214 0.14Blue Coat Holdings, Inc., 144A8.375% 01/06/2023 USD 249,000 282,615 0.02Blue Cube Spinco, Inc., 144A 9.75%15/10/2023 USD 234,000 272,142 0.02Blue Cube Spinco, Inc., 144A 10%15/10/2025 USD 225,000 260,438 0.02Blue Racer Midstream LLC, 144A6.125% 15/11/2022 USD 208,000 197,600 0.02BlueLine Rental Finance Corp., 144A7% 01/02/2019 USD 166,000 142,760 0.01Cablevision Systems Corp. 8.625%15/09/2017 USD 193,000 204,196 0.02Cablevision Systems Corp. 7.75%15/04/2018 USD 157,000 167,135 0.01Cablevision Systems Corp. 8%15/04/2020 USD 540,000 553,705 0.05Caesars Entertainment Operating Co.,Inc. 8.5% 15/02/2020§ USD 500,000 462,500 0.04California Resources Corp., 144A 8%15/12/2022 USD 428,000 305,485 0.03CAM Mortgage LLC, FRN, Series2015-1 ‘M’, 144A 4.75% 15/07/2064 USD 2,800,000 2,760,603 0.23Cardtronics, Inc. 5.125% 01/08/2022 USD 15,000 14,869 0.00Casella Waste Systems, Inc. 7.75%15/02/2019 USD 290,000 291,776 0.02CCO Holdings LLC, 144A 5.125%01/05/2023 USD 1,750,000 1,761,104 0.14CCO Holdings LLC, 144A 5.875%01/04/2024 USD 2,213,000 2,302,173 0.19CCO Holdings LLC, 144A 5.375%01/05/2025 USD 26,000 26,335 0.00CCO Holdings LLC, 144A 5.75%15/02/2026 USD 708,000 727,470 0.06CCO Holdings LLC, 144A 5.875%01/05/2027 USD 26,000 26,495 0.00CCO Holdings LLC 6.625%31/01/2022 USD 1,100,000 1,158,949 0.09CCO Holdings LLC 5.25% 30/09/2022 USD 50,000 51,322 0.00CCO Holdings LLC 5.75% 01/09/2023 USD 65,000 67,131 0.01CD Commercial Mortgage Trust, FRN,Series 2007-CD4 ‘AMFX’ 5.366%11/12/2049 USD 1,030,000 1,047,923 0.09CD Mortgage Trust, Series 2006-CD3‘AJ’ 5.688% 15/10/2048 USD 100,000 60,041 0.01CDW LLC 6% 15/08/2022 USD 75,000 78,403 0.01CDW LLC 5% 01/09/2023 USD 151,000 151,068 0.01CEB, Inc., 144A 5.625% 15/06/2023 USD 55,000 53,625 0.00Cemex Finance LLC, 144A 9.375%12/10/2022 USD 200,000 220,417 0.02Central Garden & Pet Co. 6.125%15/11/2023 USD 725,000 755,813 0.06Century Communities, Inc. 6.875%15/05/2022 USD 70,000 67,550 0.01CenturyLink, Inc. 6.75% 01/12/2023 USD 1,536,000 1,514,988 0.12Cenveo Corp., 144A 8.5% 15/09/2022 USD 10,000 7,050 0.00CG-CCRE Commercial Mortgage Trust,FRN, Series 2014-FL2 ‘A’, 144A2.288% 15/11/2031 USD 959,066 961,285 0.08Change Healthcare Holdings Inc 11%31/12/2019 USD 675,000 718,200 0.06Change Healthcare Holdings, Inc.,144A 6% 15/02/2021 USD 125,000 131,875 0.01Charter Communications OperatingLLC, 144A 4.908% 23/07/2025 USD 37,000 40,420 0.00
140
JPMorgan Funds - Global Bond Opportunities FundSchedule of Investments (continued)
As at 30 June 2016
Investments Currency
Quantity/Nominal
Value
MarketValue
USD
%of
NetAssets Investments Currency
Quantity/Nominal
Value
MarketValue
USD
%of
NetAssets
CIT Group, Inc., 144A 6.625%01/04/2018 USD 200,000 210,000 0.02CIT Group, Inc., 144A 5.5%15/02/2019 USD 1,730,000 1,808,577 0.15Citgo Holding, Inc., 144A 10.75%15/02/2020 USD 150,000 151,781 0.01Citigroup Commercial MortgageTrust, FRN, Series 2014-GC23 ‘D’,144A 4.507% 10/07/2047 USD 2,075,000 1,711,808 0.14Citigroup Commercial MortgageTrust, Series 2015-P1 ‘D’, 144A3.225% 15/09/2048 USD 1,645,000 1,194,232 0.10Citigroup, Inc., FRN 5.875% Perpetual USD 1,040,000 1,005,909 0.08Citigroup, Inc., FRN 6.125% Perpetual USD 2,065,000 2,095,872 0.17Claire’s Stores, Inc., 144A 9%15/03/2019 USD 340,000 205,700 0.02Claire’s Stores, Inc., 144A 6.125%15/03/2020 USD 250,000 130,000 0.01Claire’s Stores, Inc. 8.875%15/03/2019 USD 11,000 2,612 0.00Clear Channel Worldwide Holdings,Inc. 6.5% 15/11/2022 USD 1,830,000 1,831,281 0.15CNG Holdings, Inc., 144A 9.375%15/05/2020 USD 330,000 165,000 0.01Cogent Communications Finance,Inc., 144A 5.625% 15/04/2021 USD 500,000 491,250 0.04Cogent Communications Group, Inc.,144A 5.375% 01/03/2022 USD 400,000 402,000 0.03Comcast Corp. 4.6% 15/08/2045 USD 600,000 696,042 0.06COMM Mortgage Trust, FRN, Series2015-CR23 ‘CMC’, 144A 3.684%10/05/2048 USD 1,825,000 1,756,026 0.14COMM Mortgage Trust, Series2006-C8 ‘AJ’ 5.377% 10/12/2046 USD 2,370,000 2,291,282 0.19Commercial Mortgage Trust, FRN,Series 2004-GG1 ‘H’, 144A 6.052%10/06/2036 USD 100,000 94,641 0.01CommScope Technologies FinanceLLC, 144A 6% 15/06/2025 USD 1,150,000 1,177,623 0.10CommScope, Inc., 144A 5%15/06/2021 USD 200,000 204,750 0.02CommScope, Inc., 144A 5.5%15/06/2024 USD 160,000 162,200 0.01Communications Sales & Leasing,Inc., REIT, 144A 6% 15/04/2023 USD 1,112,000 1,128,680 0.09Consolidated Communications, Inc.6.5% 01/10/2022 USD 128,000 114,560 0.01Consumer Credit Origination LoanTrust, Series 2015-1 ‘B’, 144A 5.21%15/03/2021 USD 273,000 267,223 0.02Continental Airlines Pass ThroughTrust, Series 2007-1 ‘A’ 5.983%19/04/2022 USD 57,927 64,968 0.01Corrections Corp. of America, REIT4.625% 01/05/2023 USD 900,000 908,942 0.07Countrywide Asset-BackedCertificates Trust, FRN, Series2005-AB3 ‘1A1’ 0.703% 25/02/2036 USD 1,694,520 1,456,269 0.12CSI Compressco LP 7.25%15/08/2022 USD 40,000 33,000 0.00Dean Foods Co., 144A 6.5%15/03/2023 USD 937,000 970,582 0.08Denali International LLC, 144A5.625% 15/10/2020 USD 55,000 57,612 0.00Diamond 1 Finance Corp., 144A6.02% 15/06/2026 USD 2,650,000 2,749,945 0.22DISH DBS Corp., 144A 7.75%01/07/2026 USD 255,000 262,011 0.02DISH DBS Corp. 7.875% 01/09/2019 USD 30,000 33,081 0.00DISH DBS Corp. 6.75% 01/06/2021 USD 842,000 871,150 0.07DISH DBS Corp. 5.875% 15/07/2022 USD 2,915,000 2,837,140 0.23DISH DBS Corp. 5% 15/03/2023 USD 1,475,000 1,339,027 0.11DISH DBS Corp. 5.875% 15/11/2024 USD 1,000,000 934,010 0.08DJO Finco, Inc., 144A 8.125%15/06/2021 USD 1,000,000 860,000 0.07Downstream Development Authorityof the Quapaw Tribe of Oklahoma,144A 10.5% 01/07/2019 USD 390,000 369,525 0.03DS Services of America, Inc., 144A10% 01/09/2021 USD 351,000 396,191 0.03DSLA Mortgage Loan Trust, FRN,Series 2005-AR4 ‘2A1A’ 0.699%19/08/2045 USD 1,629,185 1,385,124 0.11DuPont Fabros Technology LP, REIT5.875% 15/09/2021 USD 129,000 134,334 0.01E*TRADE Financial Corp. 5.375%15/11/2022 USD 420,000 444,998 0.04Endo Finance LLC, 144A 7.75%15/01/2022 USD 50,000 46,500 0.00Energizer Holdings, Inc., 144A 5.5%15/06/2025 USD 1,000,000 992,500 0.08
EnerSys, 144A 5% 30/04/2023 USD 125,000 124,063 0.01Envision Healthcare Corp., 144A5.125% 01/07/2022 USD 20,000 20,200 0.00Equinix, Inc., REIT 5.375%01/01/2022 USD 222,000 229,723 0.02Equinix, Inc., REIT 5.375%01/04/2023 USD 200,000 205,265 0.02Equinix, Inc., REIT 5.75% 01/01/2025 USD 10,000 10,330 0.00Equity One Mortgage Pass-ThroughTrust, STEP, Series 2003-4 ‘M1’5.869% 25/10/2034 USD 56,111 54,408 0.00ESH Hospitality, Inc., REIT, 144A5.25% 01/05/2025 USD 125,000 121,063 0.01Exeter Automobile Receivables Trust,Series 2013-2A ‘C’, 144A 4.35%15/01/2019 USD 100,000 100,908 0.01Exeter Automobile Receivables Trust,Series 2014-3A ‘B’, 144A 2.77%15/11/2019 USD 444,000 443,469 0.04Express Scripts Holding Co. 3.4%01/03/2027 USD 1,890,000 1,893,714 0.15Ferrellgas LP, 144A 6.75%15/06/2023 USD 391,000 348,968 0.03FHLMC REMIC, IO, FRN, Series 3160‘SA’ 6.708% 15/05/2036 USD 749,639 126,982 0.01FHLMC REMIC, IO, FRN, Series 3459‘JS’ 5.808% 15/06/2038 USD 955,663 151,801 0.01FHLMC REMIC, IO, FRN, Series 3779‘ES’ 6.058% 15/01/2039 USD 2,420,368 251,258 0.02FHLMC REMIC, IO, FRN, Series 3795‘SA’ 5.938% 15/01/2041 USD 1,362,558 288,749 0.02FHLMC REMIC, IO, FRN, Series 3907‘SW’ 6.208% 15/07/2026 USD 3,050,883 497,438 0.04FHLMC REMIC, IO, FRN, Series 3914‘LS’ 6.358% 15/08/2026 USD 1,234,098 190,915 0.02FHLMC REMIC, IO, FRN, Series 3926‘MS’ 6.308% 15/11/2025 USD 3,420,831 328,820 0.03FHLMC REMIC, IO, FRN, Series 3958‘MS’ 6.258% 15/08/2026 USD 1,527,950 208,674 0.02FHLMC REMIC, IO, FRN, Series 3998‘KS’ 6.258% 15/02/2027 USD 2,386,719 390,014 0.03FHLMC REMIC, IO, FRN, Series 4059‘SA’ 5.558% 15/06/2042 USD 4,738,073 1,028,326 0.08FHLMC REMIC, IO, FRN, Series 4372‘SY’ 5.658% 15/08/2044 USD 2,302,721 322,104 0.03FHLMC REMIC, IO, FRN, Series 4505‘SA’ 5.708% 15/08/2045 USD 4,165,558 1,033,746 0.08FHLMC REMIC, IO, Series ‘AI’ 3%15/12/2027 USD 348,143 33,567 0.00FHLMC REMIC, IO, Series ‘BI’ 3%15/05/2027 USD 198,143 18,587 0.00FHLMC REMIC, IO, Series ‘CI’ 3%15/08/2027 USD 1,983,734 190,097 0.02FHLMC REMIC, IO, Series 3716 ‘PI’4.5% 15/04/2038 USD 176,604 15,568 0.00FHLMC REMIC, IO, Series 3881 ‘CI’3.5% 15/08/2024 USD 548,534 20,414 0.00FHLMC REMIC, IO, Series 3907 ‘AI’5% 15/05/2040 USD 770,849 109,409 0.01FHLMC REMIC, IO, Series 4018 ‘HI’4.5% 15/03/2041 USD 314,671 47,658 0.00FHLMC REMIC, IO, Series 4043 ‘PI’2.5% 15/05/2027 USD 3,601,371 296,912 0.02FHLMC REMIC, IO, Series 4057 ‘UI’3% 15/05/2027 USD 1,514,546 145,624 0.01FHLMC REMIC, IO, Series 4073 ‘IQ’4% 15/07/2042 USD 290,237 49,087 0.00FHLMC REMIC, IO, Series 4091 ‘CI’3.5% 15/06/2027 USD 287,639 28,608 0.00FHLMC REMIC, IO, Series 4119 ‘LI’3.5% 15/06/2039 USD 419,562 35,951 0.00FHLMC REMIC, IO, Series 4120 ‘UI’ 3%15/10/2027 USD 1,210,517 122,520 0.01FHLMC REMIC, IO, Series 4136 ‘IN’ 3%15/11/2027 USD 337,243 36,361 0.00FHLMC REMIC, IO, Series 4170 ‘NI’2.5% 15/02/2028 USD 12,070,108 1,096,445 0.09FHLMC REMIC, IO, Series 4173 ‘I’ 4%15/03/2043 USD 1,568,864 285,593 0.02FHLMC REMIC, IO, Series 4215 ‘LI’3.5% 15/07/2041 USD 403,282 48,443 0.00FHLMC REMIC, IO, Series 4216 ‘MI’3% 15/06/2028 USD 4,596,020 499,432 0.04FHLMC REMIC, IO, Series 4280 ‘KI’3.5% 15/09/2031 USD 1,321,838 104,504 0.01FHLMC REMIC, IO, Series 4311 ‘QI’ 3%15/10/2028 USD 1,133,222 106,812 0.01FHLMC REMIC, IO, Series 4313 ‘UI’ 3%15/03/2029 USD 1,414,216 164,274 0.01FHLMC REMIC, IO, Series 4323 ‘IW’3.5% 15/04/2028 USD 266,650 26,325 0.00
141
JPMorgan Funds - Global Bond Opportunities FundSchedule of Investments (continued)
As at 30 June 2016
Investments Currency
Quantity/Nominal
Value
MarketValue
USD
%of
NetAssets Investments Currency
Quantity/Nominal
Value
MarketValue
USD
%of
NetAssets
FHLMC REMIC, IO, Series 4324 ‘AI’3% 15/11/2028 USD 1,217,931 103,987 0.01FHLMC REMIC, IO, Series 4351 ‘GI’ 5%15/11/2019 USD 2,140,472 66,995 0.01FHLMC STRIP, IO, Series 305 ‘IO’3.5% 15/03/2028 USD 222,426 25,452 0.00Fidelity & Guaranty Life Holdings,Inc., 144A 6.375% 01/04/2021 USD 151,000 151,377 0.01First Data Corp., 144A 6.75%01/11/2020 USD 387,000 404,903 0.03First Data Corp., 144A 5.375%15/08/2023 USD 87,000 88,185 0.01First Data Corp., 144A 5%15/01/2024 USD 33,000 33,040 0.00First Data Corp., 144A 5.75%15/01/2024 USD 1,000,000 991,785 0.08First Franklin Mortgage Loan Trust,FRN, Series 2004-FF5 ‘A1’ 1.173%25/08/2034 USD 76,828 73,362 0.01FirstEnergy Transmission LLC, 144A5.45% 15/07/2044 USD 370,000 405,902 0.03FirstKey Lending Trust, FRN, Series2015-SFR1 ‘D’, 144A 4.367%09/03/2047 USD 2,340,000 2,255,485 0.18Flagship Credit Auto Trust, Series2014-2 ‘C’, 144A 3.95% 15/12/2020 USD 198,000 199,297 0.02FNMA Interest STRIP, IO, Series 401‘C6’ 4.5% 25/10/2029 USD 2,093,328 174,209 0.01FNMA Interest STRIP, IO, Series 410‘C12’ 5.5% 25/07/2024 USD 6,909,883 527,073 0.04FNMA REMIC, IO, FRN, Series2009-101 ‘SI’ 5.297% 25/12/2039 USD 1,044,870 130,370 0.01FNMA REMIC, IO, FRN, Series2011-144 ‘SA’ 6.197% 25/11/2025 USD 1,351,411 151,935 0.01FNMA REMIC, IO, FRN, Series2012-144 ‘SK’ 5.647% 25/01/2043 USD 228,331 62,145 0.01FNMA REMIC, IO, FRN, Series 2012-65‘SB’ 5.527% 25/06/2042 USD 1,114,123 176,304 0.01FNMA REMIC, IO, FRN, Series 2012-9‘SM’ 6.247% 25/12/2026 USD 2,822,341 389,913 0.03FNMA REMIC, IO, FRN, Series 2012-93‘SG’ 5.647% 25/09/2042 USD 790,743 147,849 0.01FNMA REMIC, IO, FRN, Series 2013-18‘NS’ 5.647% 25/03/2043 USD 1,130,121 231,486 0.02FNMA REMIC, IO, FRN, Series 2013-4‘ST’ 5.697% 25/02/2043 USD 6,709,250 1,348,112 0.11FNMA REMIC, IO, FRN, Series 2015-48‘ST’ 5.167% 25/07/2045 USD 4,176,678 962,093 0.08FNMA REMIC, IO, Series 2010-102 ‘IP’5% 25/12/2039 USD 179,854 18,772 0.00FNMA REMIC, IO, Series 2012-107 ‘GI’3.5% 25/09/2027 USD 331,149 35,992 0.00FNMA REMIC, IO, Series 2012-107 ‘IG’3.5% 25/10/2027 USD 230,523 25,720 0.00FNMA REMIC, IO, Series 2012-118 ‘DI’3.5% 25/01/2040 USD 196,463 21,126 0.00FNMA REMIC, IO, Series 2012-120 ‘DI’3% 25/03/2031 USD 1,103,671 102,829 0.01FNMA REMIC, IO, Series 2012-128 ‘KI’3% 25/11/2027 USD 344,396 31,426 0.00FNMA REMIC, IO, Series 2012-144 ‘EI’3% 25/01/2028 USD 283,709 30,838 0.00FNMA REMIC, IO, Series 2012-145 ‘EI’3% 25/01/2028 USD 1,990,561 187,347 0.02FNMA REMIC, IO, Series 2012-148 ‘JI’3.5% 25/12/2039 USD 209,412 23,276 0.00FNMA REMIC, IO, Series 2012-149 ‘MI’3% 25/01/2028 USD 355,711 38,027 0.00FNMA REMIC, IO, Series 2012-150 ‘BI’3% 25/01/2028 USD 361,727 34,923 0.00FNMA REMIC, IO, Series 2012-25 ‘AI’3.5% 25/03/2027 USD 301,790 31,299 0.00FNMA REMIC, IO, Series 2013-15 ‘IO’2.5% 25/03/2028 USD 2,990,175 258,831 0.02FNMA REMIC, IO, Series 2013-26 ‘IJ’3% 25/04/2028 USD 360,070 39,014 0.00FNMA REMIC, IO, Series 2013-31 ‘YI’3.5% 25/04/2028 USD 338,506 35,774 0.00FNMA REMIC, IO, Series 2013-5 ‘BI’3.5% 25/03/2040 USD 202,112 23,895 0.00FNMA REMIC, IO, Series 2013-9 ‘YI’3.5% 25/02/2028 USD 354,353 40,940 0.00FNMA REMIC, IO, Series 2014-25 ‘WY’3.5% 25/05/2029 USD 1,194,053 166,735 0.01FNMA REMIC, IO, Series 2014-35 ‘KI’3% 25/06/2029 USD 1,888,612 235,503 0.02FNMA REMIC, IO, Series 2014-44 ‘QI’3% 25/08/2029 USD 1,600,976 148,723 0.01Fremont Home Loan Trust, FRN,Series 2004-C ‘M1’ 1.428%25/08/2034 USD 118,726 111,634 0.01
Fresenius Medical Care US Finance II,Inc., 144A 4.125% 15/10/2020 USD 210,000 218,968 0.02Fresenius Medical Care US Finance II,Inc., 144A 5.875% 31/01/2022 USD 125,000 137,107 0.01Fresenius Medical Care US Finance II,Inc., 144A 4.75% 15/10/2024 USD 150,000 155,025 0.01Frontier Communications Corp.8.125% 01/10/2018 USD 25,000 27,215 0.00Frontier Communications Corp. 8.5%15/04/2020 USD 315,000 335,540 0.03Frontier Communications Corp.8.875% 15/09/2020 USD 48,000 51,124 0.00Frontier Communications Corp.9.25% 01/07/2021 USD 225,000 238,933 0.02Frontier Communications Corp.6.25% 15/09/2021 USD 315,000 299,130 0.02Frontier Communications Corp.8.75% 15/04/2022 USD 161,000 162,094 0.01Frontier Communications Corp.10.5% 15/09/2022 USD 153,000 160,740 0.01GCAT, STEP, Series 2015-2 ‘A1’, 144A3.75% 25/07/2020 USD 2,715,116 2,704,730 0.22GCI, Inc. 6.75% 01/06/2021 USD 272,000 276,759 0.02GLC II Trust, Series 2014-A ‘A’, 144A4% 18/12/2020 USD 240,035 236,665 0.02Glencore Funding LLC, 144A 2.125%16/04/2018 USD 2,900,000 2,830,748 0.23GMAC Commercial MortgageSecurities, Inc. Trust, FRN, Series2006-C1 ‘AM’ 5.29% 10/11/2045 USD 822,659 822,045 0.07GNMA, IO, FRN, Series 2002-24 ‘AG’7.508% 16/04/2032 USD 1,925,252 433,242 0.04GNMA, IO, FRN, Series 2003-69 ‘SB’6.158% 16/08/2033 USD 1,274,045 305,551 0.03GNMA, IO, FRN, Series 2011-13 ‘S’5.508% 16/01/2041 USD 675,755 126,946 0.01Goldman Sachs Group, Inc. (The), FRN5.375% Perpetual USD 2,485,000 2,452,074 0.20Goodman Networks, Inc., FRN12.125% 01/07/2018 USD 25,000 12,813 0.00Goodyear Tire & Rubber Co. (The)8.75% 15/08/2020 USD 250,000 297,185 0.02Goodyear Tire & Rubber Co. (The) 7%15/05/2022 USD 90,000 95,984 0.01Goodyear Tire & Rubber Co. (The)5.125% 15/11/2023 USD 1,000,000 1,034,600 0.08Gray Television, Inc. 7.5%01/10/2020 USD 900,000 937,705 0.08GSAMP Trust, FRN, Series 2006-HE3‘A2C’ 0.613% 25/05/2046 USD 2,133,815 1,928,407 0.16GSMSC Pass-Through Trust, FRN,Series 2008-2R ‘2A1’, 144A 7.5%25/10/2036 USD 93,518 76,785 0.01H&E Equipment Services, Inc. 7%01/09/2022 USD 240,000 247,711 0.02Halcon Resources Corp., 144A 13%15/02/2022 USD 162,000 86,670 0.01HarborView Mortgage Loan Trust,FRN, Series 2005-11 ‘2A1A’ 0.749%19/08/2045 USD 86,007 79,627 0.01HarborView Mortgage Loan Trust,FRN, Series 2007-6 ‘2A1A’ 0.638%19/08/2037 USD 118,853 100,892 0.01Hardwoods Acquisition, Inc., 144A7.5% 01/08/2021 USD 215,000 164,475 0.01Harland Clarke Holdings Corp., 144A6.875% 01/03/2020 USD 190,000 175,275 0.01HD Supply, Inc., 144A 5.25%15/12/2021 USD 1,850,000 1,926,313 0.16HD Supply, Inc. 7.5% 15/07/2020 USD 60,000 62,952 0.01Headwaters, Inc. 7.25% 15/01/2019 USD 270,000 276,750 0.02Hexion, Inc. 6.625% 15/04/2020 USD 2,427,000 2,037,018 0.17Hilcorp Energy I LP, 144A 7.625%15/04/2021 USD 138,000 142,025 0.01Hilcorp Energy I LP, 144A 5%01/12/2024 USD 500,000 467,815 0.04Hilcorp Energy I LP, 144A 5.75%01/10/2025 USD 850,000 814,937 0.07Hill-Rom Holdings, Inc., 144A 5.75%01/09/2023 USD 1,890,000 1,950,839 0.16Hologic, Inc., 144A 5.25% 15/07/2022 USD 140,000 146,860 0.01Huntington Ingalls Industries, Inc.,144A 5% 15/12/2021 USD 125,000 131,103 0.01IASIS Healthcare LLC 8.375%15/05/2019 USD 650,000 623,035 0.05Icahn Enterprises LP 5.875%01/02/2022 USD 554,000 522,037 0.04iHeartCommunications, Inc. 9%15/12/2019 USD 795,000 600,002 0.05ILFC E-Capital Trust I, FRN, 144A3.98% 21/12/2065 USD 400,000 315,000 0.03
142
JPMorgan Funds - Global Bond Opportunities FundSchedule of Investments (continued)
As at 30 June 2016
Investments Currency
Quantity/Nominal
Value
MarketValue
USD
%of
NetAssets Investments Currency
Quantity/Nominal
Value
MarketValue
USD
%of
NetAssets
ILFC E-Capital Trust II, FRN, 144A4.23% 21/12/2065 USD 407,000 323,565 0.03IMS Health, Inc., 144A 6% 01/11/2020 USD 1,350,000 1,377,000 0.11Infor Software Parent LLC, 144A7.125% 01/05/2021 USD 675,000 600,750 0.05Infor US, Inc., 144A 5.75%15/08/2020 USD 32,000 33,640 0.00Infor US, Inc. 6.5% 15/05/2022 USD 1,500,000 1,425,000 0.12Informatica LLC, 144A 7.125%15/07/2023 USD 1,301,000 1,222,133 0.10Ingles Markets, Inc. 5.75%15/06/2023 USD 200,000 202,589 0.02Intel Corp. 4.9% 29/07/2045 USD 820,000 969,269 0.08International Wire Group Holdings,Inc., 144A 8.5% 15/10/2017 USD 104,000 103,350 0.01Iron Mountain, Inc., REIT, 144A 6%01/10/2020 USD 169,000 177,323 0.01Isle of Capri Casinos, Inc. 5.875%15/03/2021 USD 100,000 104,022 0.01J.P. Morgan Chase CommercialMortgage Securities Trust, FRN,Series 2005-LDP2 ‘D’ 4.941%15/07/2042† USD 160,000 159,835 0.01J.P. Morgan Chase CommercialMortgage Securities Trust, FRN,Series 2005-LDP5 ‘D’ 5.553%15/12/2044† USD 160,000 159,468 0.01J.P. Morgan Chase CommercialMortgage Securities Trust, FRN,Series 2006-LDP8 ‘AJ’ 5.48%15/05/2045† USD 3,715,000 3,720,794 0.30J.P. Morgan Chase CommercialMortgage Securities Trust, FRN,Series 2006-LDP8 ‘C’ 5.549%15/05/2045† USD 1,050,000 1,011,690 0.08J.P. Morgan Chase CommercialMortgage Securities Trust, FRN,Series 2007-LD11 ‘AM’ 5.743%15/06/2049† USD 3,105,000 3,111,022 0.25J.P. Morgan Chase CommercialMortgage Securities Trust, FRN,Series 2007-LDPX ‘AM’ 5.464%15/01/2049† USD 4,205,000 4,141,341 0.34JBS USA LLC, 144A 8.25%01/02/2020 USD 10,000 10,437 0.00JBS USA LLC, 144A 7.25% 01/06/2021 USD 114,000 117,990 0.01JBS USA LLC, 144A 5.875%15/07/2024 USD 942,000 919,458 0.08JBS USA LLC, 144A 5.75%15/06/2025 USD 129,000 122,761 0.01Jo-Ann Stores LLC, 144A 8.125%15/03/2019 USD 100,000 95,500 0.01Kinetic Concepts, Inc., 144A 7.875%15/02/2021 USD 1,000,000 1,065,310 0.09Kinetic Concepts, Inc. 10.5%01/11/2018 USD 1,000,000 970,210 0.08Kraft Heinz Foods Co., 144A 4.875%15/02/2025 USD 240,000 263,140 0.02Kraft Heinz Foods Co., 144A 5.2%15/07/2045 USD 1,579,000 1,879,499 0.15Kraft Heinz Foods Co., 144A 4.375%01/06/2046 USD 470,000 496,459 0.04Lamar Media Corp. 5.875%01/02/2022 USD 5,000 5,176 0.00Landry’s, Inc., 144A 9.375%01/05/2020 USD 100,000 105,150 0.01LB Commercial Mortgage Trust, FRN,Series 2007-C3 ‘AJ’ 5.923%15/07/2044 USD 2,170,000 2,138,025 0.17LB-UBS Commercial Mortgage Trust,FRN, Series 2006-C6 ‘AJ’ 5.452%15/09/2039 USD 3,685,000 3,670,372 0.30LB-UBS Commercial Mortgage Trust,FRN, Series 2007-C1 ‘C’ 5.533%15/02/2040 USD 4,275,000 4,220,404 0.34LB-UBS Commercial Mortgage Trust,FRN, Series 2007-C6 ‘AJ’ 6.117%15/07/2040 USD 4,425,000 4,410,758 0.36LB-UBS Commercial Mortgage Trust,Series 2007-C1 ‘B’ 5.514%15/02/2040 USD 1,290,000 1,289,362 0.11Level 3 Financing, Inc., 144A 5.25%15/03/2026 USD 94,000 92,355 0.01LTF Merger Sub, Inc., 144A 8.5%15/06/2023 USD 1,000,000 948,750 0.08LV Tower 52 Issuer LLC, Series 2013-1‘M’, 144A 7.5% 15/07/2019 USD 1,855,835 1,750,053 0.14Michaels Stores, Inc., 144A 5.875%15/12/2020 USD 400,000 416,000 0.03Micron Technology, Inc., 144A 5.25%01/08/2023 USD 52,000 44,274 0.00
Micron Technology, Inc., 144A 5.25%15/01/2024 USD 1,646,000 1,399,100 0.11Micron Technology, Inc. 5.875%15/02/2022 USD 25,000 23,586 0.00Micron Technology, Inc. 5.5%01/02/2025 USD 1,100,000 932,883 0.08Microsoft Corp. 4.875% 15/12/2043 USD 610,000 734,727 0.06Milacron LLC, 144A 7.75%15/02/2021 USD 195,000 201,825 0.02ML-CFC Commercial Mortgage Trust,Series 2006-4 ‘AJ’ 5.239%12/12/2049 USD 820,000 814,553 0.07Momentive Performance Materials,Inc. 3.88% 24/10/2021 USD 200,000 158,869 0.01Morgan Stanley, FRN 5.55%Perpetual USD 2,440,000 2,415,161 0.20Morgan Stanley ABS Capital I, Inc.Trust, FRN, Series 2004-HE1 ‘M1’1.308% 25/01/2034 USD 2,090,169 1,996,031 0.16Morgan Stanley Capital I Trust, FRN,Series 2005-HQ7 ‘D’ 5.195%14/11/2042 USD 1,915,000 1,909,406 0.16Morgan Stanley Capital I Trust, FRN,Series 2006-HQ8 ‘D’ 5.423%12/03/2044 USD 110,000 89,931 0.01Morgan Stanley Capital I Trust, FRN,Series 2006-HQ9 ‘D’ 5.83%12/07/2044 USD 2,000,000 1,995,285 0.16Morgan Stanley Capital I Trust, FRN,Series 2006-HQ9 ‘AJ’ 5.793%12/07/2044 USD 66,722 66,726 0.01Morgan Stanley Capital I Trust, FRN,Series 2007-HQ11 ‘AJ’ 5.508%12/02/2044 USD 4,289,412 4,231,953 0.35MPH Acquisition Holdings LLC, 144A7.125% 01/06/2024 USD 260,000 273,650 0.02MPLX LP, 144A 4.875% 01/06/2025 USD 1,000,000 976,565 0.08MPLX LP, Reg. S 4.5% 15/07/2023 USD 250,000 241,885 0.02MPLX LP, Reg. S 4.875% 01/12/2024 USD 500,000 488,383 0.04MPLX LP, Reg. S 4.875% 01/06/2025 USD 439,000 428,712 0.04MSCI, Inc., 144A 5.25% 15/11/2024 USD 220,000 225,500 0.02Mustang Merger Corp., 144A 8.5%15/08/2021 USD 20,000 20,950 0.00National Financial Partners Corp.,144A 9% 15/07/2021 USD 300,000 289,125 0.02Nationstar HECM Loan Trust, Series2015-1A ‘A’, 144A 3.844%25/05/2018 USD 344,707 345,124 0.03NCI Building Systems, Inc., 144A8.25% 15/01/2023 USD 110,000 118,388 0.01Neiman Marcus Group Ltd. LLC, 144A8% 15/10/2021 USD 1,750,000 1,417,500 0.12Neiman Marcus Group Ltd. LLC, 144A8.75% 15/10/2021 USD 350,000 266,000 0.02Neptune Finco Corp., 144A 10.125%15/01/2023 USD 1,000,000 1,121,670 0.09Netflix, Inc. 5.5% 15/02/2022 USD 400,000 418,184 0.03Netflix, Inc. 5.75% 01/03/2024 USD 150,000 156,750 0.01Neuberger Berman Group LLC, 144A5.875% 15/03/2022 USD 10,000 10,450 0.00Nexstar Broadcasting, Inc., 144A6.125% 15/02/2022 USD 980,000 992,250 0.08Nexstar Broadcasting, Inc. 6.875%15/11/2020 USD 460,000 480,580 0.04Nielsen Finance LLC, 144A 5%15/04/2022 USD 1,554,000 1,583,775 0.13NRPL Trust, STEP, Series 2015-2A‘A1’, 144A 3.75% 25/10/2057 USD 1,900,978 1,873,555 0.15Nuance Communications, Inc., 144A5.375% 15/08/2020 USD 140,000 142,176 0.01Oak Hill Advisors Residential LoanTrust, STEP, Series 2015-NPL2 ‘A2’,144A 4% 25/07/2055 USD 1,795,000 1,774,214 0.15OneMain Financial Issuance Trust,Series 2014-2A ‘C’, 144A 4.33%18/09/2024 USD 112,000 109,427 0.01OneMain Financial Issuance Trust,Series 2014-2A ‘D’, 144A 5.31%18/09/2024 USD 100,000 99,061 0.01OneMain Financial Issuance Trust,Series 2015-1A ‘A’ 3.19% 18/03/2026 USD 863,000 872,876 0.07OneMain Financial Issuance Trust,Series 2015-1A ‘C’, 144A 5.12%18/03/2026 USD 415,000 414,145 0.03Option One Mortgage Loan Trust,FRN, Series 2003-1 ‘A2’ 1.286%25/02/2033 USD 146,443 137,473 0.01Outfront Media Capital LLC 5.25%15/02/2022 USD 300,000 303,138 0.02Outfront Media Capital LLC 5.625%15/02/2024 USD 75,000 76,763 0.01
143
JPMorgan Funds - Global Bond Opportunities FundSchedule of Investments (continued)
As at 30 June 2016
Investments Currency
Quantity/Nominal
Value
MarketValue
USD
%of
NetAssets Investments Currency
Quantity/Nominal
Value
MarketValue
USD
%of
NetAssets
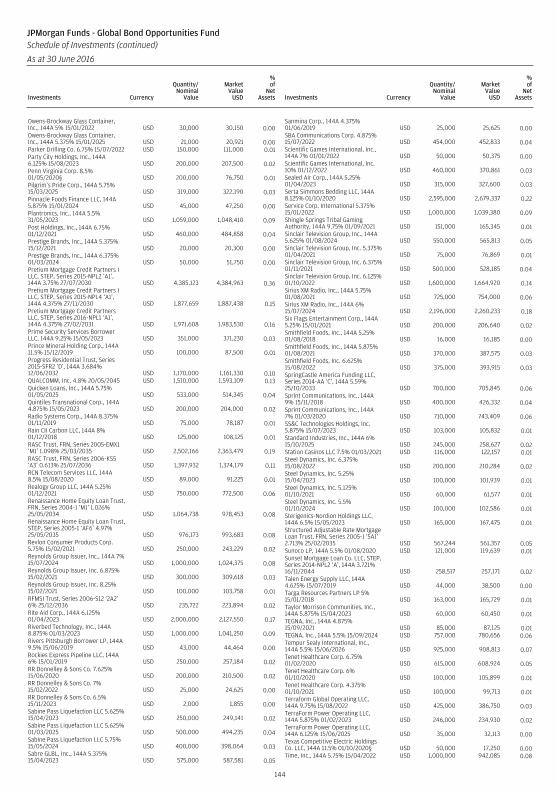
Owens-Brockway Glass Container,Inc., 144A 5% 15/01/2022 USD 30,000 30,150 0.00Owens-Brockway Glass Container,Inc., 144A 5.375% 15/01/2025 USD 21,000 20,921 0.00Parker Drilling Co. 6.75% 15/07/2022 USD 150,000 111,000 0.01Party City Holdings, Inc., 144A6.125% 15/08/2023 USD 200,000 207,500 0.02Penn Virginia Corp. 8.5%01/05/2020§ USD 200,000 76,750 0.01Pilgrim’s Pride Corp., 144A 5.75%15/03/2025 USD 319,000 322,190 0.03Pinnacle Foods Finance LLC, 144A5.875% 15/01/2024 USD 45,000 47,250 0.00Plantronics, Inc., 144A 5.5%31/05/2023 USD 1,059,000 1,048,410 0.09Post Holdings, Inc., 144A 6.75%01/12/2021 USD 460,000 484,858 0.04Prestige Brands, Inc., 144A 5.375%15/12/2021 USD 20,000 20,300 0.00Prestige Brands, Inc., 144A 6.375%01/03/2024 USD 50,000 51,750 0.00Pretium Mortgage Credit Partners ILLC, STEP, Series 2015-NPL2 ‘A1’,144A 3.75% 27/07/2030 USD 4,385,123 4,384,963 0.36Pretium Mortgage Credit Partners ILLC, STEP, Series 2015-NPL4 ‘A1’,144A 4.375% 27/11/2030 USD 1,877,659 1,887,438 0.15Pretium Mortgage Credit PartnersLLC, STEP, Series 2016-NPL1 ‘A1’,144A 4.375% 27/02/2031 USD 1,971,608 1,983,530 0.16Prime Security Services BorrowerLLC, 144A 9.25% 15/05/2023 USD 351,000 371,230 0.03Prince Mineral Holding Corp., 144A11.5% 15/12/2019 USD 100,000 87,500 0.01Progress Residential Trust, Series2015-SFR2 ‘D’, 144A 3.684%12/06/2032 USD 1,170,000 1,161,330 0.10QUALCOMM, Inc. 4.8% 20/05/2045 USD 1,510,000 1,593,109 0.13Quicken Loans, Inc., 144A 5.75%01/05/2025 USD 533,000 514,345 0.04Quintiles Transnational Corp., 144A4.875% 15/05/2023 USD 200,000 204,000 0.02Radio Systems Corp., 144A 8.375%01/11/2019 USD 75,000 78,187 0.01Rain CII Carbon LLC, 144A 8%01/12/2018 USD 125,000 108,125 0.01RASC Trust, FRN, Series 2005-EMX1‘M1’ 1.098% 25/03/2035 USD 2,502,166 2,363,479 0.19RASC Trust, FRN, Series 2006-KS5‘A3’ 0.613% 25/07/2036 USD 1,397,932 1,374,179 0.11RCN Telecom Services LLC, 144A8.5% 15/08/2020 USD 89,000 91,225 0.01Realogy Group LLC, 144A 5.25%01/12/2021 USD 750,000 772,500 0.06Renaissance Home Equity Loan Trust,FRN, Series 2004-1 ‘M1’ 1.026%25/05/2034 USD 1,064,738 978,453 0.08Renaissance Home Equity Loan Trust,STEP, Series 2005-1 ‘AF6’ 4.97%25/05/2035 USD 976,173 993,683 0.08Revlon Consumer Products Corp.5.75% 15/02/2021 USD 250,000 243,229 0.02Reynolds Group Issuer, Inc., 144A 7%15/07/2024 USD 1,000,000 1,024,375 0.08Reynolds Group Issuer, Inc. 6.875%15/02/2021 USD 300,000 309,618 0.03Reynolds Group Issuer, Inc. 8.25%15/02/2021 USD 100,000 103,758 0.01RFMSI Trust, Series 2006-S12 ‘2A2’6% 25/12/2036 USD 235,722 223,894 0.02Rite Aid Corp., 144A 6.125%01/04/2023 USD 2,000,000 2,127,550 0.17Riverbed Technology, Inc., 144A8.875% 01/03/2023 USD 1,000,000 1,041,250 0.09Rivers Pittsburgh Borrower LP, 144A9.5% 15/06/2019 USD 43,000 44,464 0.00Rockies Express Pipeline LLC, 144A6% 15/01/2019 USD 250,000 257,184 0.02RR Donnelley & Sons Co. 7.625%15/06/2020 USD 200,000 210,500 0.02RR Donnelley & Sons Co. 7%15/02/2022 USD 25,000 24,625 0.00RR Donnelley & Sons Co. 6.5%15/11/2023 USD 2,000 1,855 0.00Sabine Pass Liquefaction LLC 5.625%15/04/2023 USD 250,000 249,141 0.02Sabine Pass Liquefaction LLC 5.625%01/03/2025 USD 500,000 494,235 0.04Sabine Pass Liquefaction LLC 5.75%15/05/2024 USD 400,000 398,064 0.03Sabre GLBL, Inc., 144A 5.375%15/04/2023 USD 575,000 587,581 0.05
Sanmina Corp., 144A 4.375%01/06/2019 USD 25,000 25,625 0.00SBA Communications Corp. 4.875%15/07/2022 USD 454,000 452,833 0.04Scientific Games International, Inc.,144A 7% 01/01/2022 USD 50,000 50,375 0.00Scientific Games International, Inc.10% 01/12/2022 USD 460,000 370,861 0.03Sealed Air Corp., 144A 5.25%01/04/2023 USD 315,000 327,600 0.03Serta Simmons Bedding LLC, 144A8.125% 01/10/2020 USD 2,595,000 2,679,337 0.22Service Corp. International 5.375%15/01/2022 USD 1,000,000 1,039,380 0.09Shingle Springs Tribal GamingAuthority, 144A 9.75% 01/09/2021 USD 151,000 165,345 0.01Sinclair Television Group, Inc., 144A5.625% 01/08/2024 USD 550,000 565,813 0.05Sinclair Television Group, Inc. 5.375%01/04/2021 USD 75,000 76,869 0.01Sinclair Television Group, Inc. 6.375%01/11/2021 USD 500,000 528,185 0.04Sinclair Television Group, Inc. 6.125%01/10/2022 USD 1,600,000 1,664,920 0.14Sirius XM Radio, Inc., 144A 5.75%01/08/2021 USD 725,000 754,000 0.06Sirius XM Radio, Inc., 144A 6%15/07/2024 USD 2,196,000 2,260,233 0.18Six Flags Entertainment Corp., 144A5.25% 15/01/2021 USD 200,000 206,640 0.02Smithfield Foods, Inc., 144A 5.25%01/08/2018 USD 16,000 16,185 0.00Smithfield Foods, Inc., 144A 5.875%01/08/2021 USD 370,000 387,575 0.03Smithfield Foods, Inc. 6.625%15/08/2022 USD 375,000 393,915 0.03SpringCastle America Funding LLC,Series 2014-AA ‘C’, 144A 5.59%25/10/2033 USD 700,000 705,845 0.06Sprint Communications, Inc., 144A9% 15/11/2018 USD 400,000 426,332 0.04Sprint Communications, Inc., 144A7% 01/03/2020 USD 710,000 743,409 0.06SS&C Technologies Holdings, Inc.5.875% 15/07/2023 USD 103,000 105,832 0.01Standard Industries, Inc., 144A 6%15/10/2025 USD 245,000 258,627 0.02Station Casinos LLC 7.5% 01/03/2021 USD 116,000 122,157 0.01Steel Dynamics, Inc. 6.375%15/08/2022 USD 200,000 210,284 0.02Steel Dynamics, Inc. 5.25%15/04/2023 USD 100,000 101,939 0.01Steel Dynamics, Inc. 5.125%01/10/2021 USD 60,000 61,577 0.01Steel Dynamics, Inc. 5.5%01/10/2024 USD 100,000 102,586 0.01Sterigenics-Nordion Holdings LLC,144A 6.5% 15/05/2023 USD 165,000 167,475 0.01Structured Adjustable Rate MortgageLoan Trust, FRN, Series 2005-1 ‘5A1’2.713% 25/02/2035 USD 567,244 561,357 0.05Sunoco LP, 144A 5.5% 01/08/2020 USD 121,000 119,639 0.01Sunset Mortgage Loan Co. LLC, STEP,Series 2014-NPL2 ‘A’, 144A 3.721%16/11/2044 USD 258,517 257,171 0.02Talen Energy Supply LLC, 144A4.625% 15/07/2019 USD 44,000 38,500 0.00Targa Resources Partners LP 5%15/01/2018 USD 163,000 165,729 0.01Taylor Morrison Communities, Inc.,144A 5.875% 15/04/2023 USD 60,000 60,450 0.01TEGNA, Inc., 144A 4.875%15/09/2021 USD 85,000 87,125 0.01TEGNA, Inc., 144A 5.5% 15/09/2024 USD 757,000 780,656 0.06Tempur Sealy International, Inc.,144A 5.5% 15/06/2026 USD 925,000 908,813 0.07Tenet Healthcare Corp. 6.75%01/02/2020 USD 615,000 608,924 0.05Tenet Healthcare Corp. 6%01/10/2020 USD 100,000 105,899 0.01Tenet Healthcare Corp. 4.375%01/10/2021 USD 100,000 99,713 0.01Terraform Global Operating LLC,144A 9.75% 15/08/2022 USD 425,000 386,750 0.03TerraForm Power Operating LLC,144A 5.875% 01/02/2023 USD 246,000 234,930 0.02TerraForm Power Operating LLC,144A 6.125% 15/06/2025 USD 35,000 32,113 0.00Texas Competitive Electric HoldingsCo. LLC, 144A 11.5% 01/10/2020§ USD 50,000 17,250 0.00Time, Inc., 144A 5.75% 15/04/2022 USD 1,000,000 942,085 0.08
144
JPMorgan Funds - Global Bond Opportunities FundSchedule of Investments (continued)
As at 30 June 2016
Investments Currency
Quantity/Nominal
Value
MarketValue
USD
%of
NetAssets Investments Currency
Quantity/Nominal
Value
MarketValue
USD
%of
NetAssets
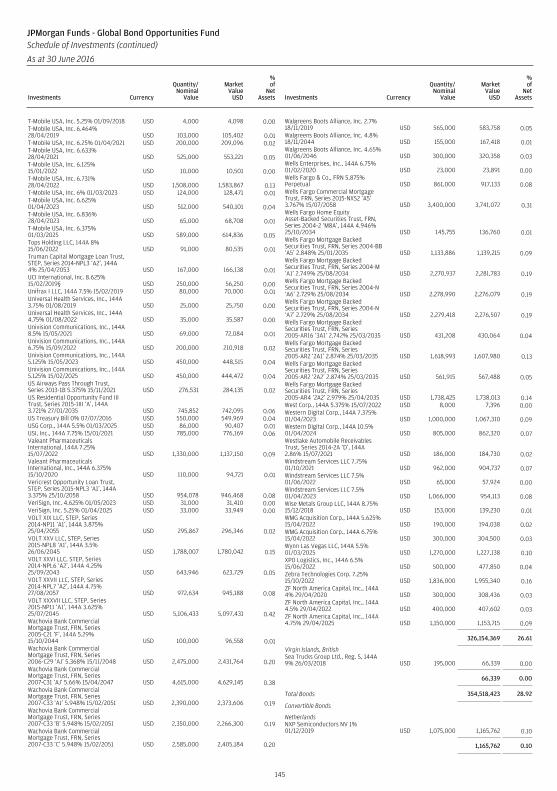
T-Mobile USA, Inc. 5.25% 01/09/2018 USD 4,000 4,098 0.00T-Mobile USA, Inc. 6.464%28/04/2019 USD 103,000 105,402 0.01T-Mobile USA, Inc. 6.25% 01/04/2021 USD 200,000 209,096 0.02T-Mobile USA, Inc. 6.633%28/04/2021 USD 525,000 553,221 0.05T-Mobile USA, Inc. 6.125%15/01/2022 USD 10,000 10,501 0.00T-Mobile USA, Inc. 6.731%28/04/2022 USD 1,508,000 1,583,867 0.13T-Mobile USA, Inc. 6% 01/03/2023 USD 124,000 128,471 0.01T-Mobile USA, Inc. 6.625%01/04/2023 USD 512,000 540,101 0.04T-Mobile USA, Inc. 6.836%28/04/2023 USD 65,000 68,708 0.01T-Mobile USA, Inc. 6.375%01/03/2025 USD 589,000 614,836 0.05Tops Holding LLC, 144A 8%15/06/2022 USD 91,000 80,535 0.01Truman Capital Mortgage Loan Trust,STEP, Series 2014-NPL3 ‘A2’, 144A4% 25/04/2053 USD 167,000 166,138 0.01UCI International, Inc. 8.625%15/02/2019§ USD 250,000 56,250 0.00Unifrax I LLC, 144A 7.5% 15/02/2019 USD 80,000 70,000 0.01Universal Health Services, Inc., 144A3.75% 01/08/2019 USD 25,000 25,750 0.00Universal Health Services, Inc., 144A4.75% 01/08/2022 USD 35,000 35,587 0.00Univision Communications, Inc., 144A8.5% 15/05/2021 USD 69,000 72,084 0.01Univision Communications, Inc., 144A6.75% 15/09/2022 USD 200,000 210,918 0.02Univision Communications, Inc., 144A5.125% 15/05/2023 USD 450,000 448,515 0.04Univision Communications, Inc., 144A5.125% 15/02/2025 USD 450,000 444,472 0.04US Airways Pass Through Trust,Series 2013-1B 5.375% 15/11/2021 USD 276,531 284,135 0.02US Residential Opportunity Fund IIITrust, Series 2015-1III ‘A’, 144A3.721% 27/01/2035 USD 745,852 742,095 0.06US Treasury Bill 0% 07/07/2016 USD 550,000 549,969 0.04USG Corp., 144A 5.5% 01/03/2025 USD 86,000 90,407 0.01USI, Inc., 144A 7.75% 15/01/2021 USD 785,000 776,169 0.06Valeant PharmaceuticalsInternational, 144A 7.25%15/07/2022 USD 1,330,000 1,137,150 0.09Valeant PharmaceuticalsInternational, Inc., 144A 6.375%15/10/2020 USD 110,000 94,721 0.01Vericrest Opportunity Loan Trust,STEP, Series 2015-NPL3 ‘A1’, 144A3.375% 25/10/2058 USD 954,078 946,468 0.08VeriSign, Inc. 4.625% 01/05/2023 USD 31,000 31,410 0.00VeriSign, Inc. 5.25% 01/04/2025 USD 33,000 33,949 0.00VOLT XIX LLC, STEP, Series2014-NP11 ‘A1’, 144A 3.875%25/04/2055 USD 295,867 296,346 0.02VOLT XXV LLC, STEP, Series2015-NPL8 ‘A1’, 144A 3.5%26/06/2045 USD 1,788,007 1,780,042 0.15VOLT XXVI LLC, STEP, Series2014-NPL6 ‘A2’, 144A 4.25%25/09/2043 USD 643,946 623,729 0.05VOLT XXVII LLC, STEP, Series2014-NPL7 ‘A2’, 144A 4.75%27/08/2057 USD 972,634 945,188 0.08VOLT XXXVII LLC, STEP, Series2015-NP11 ‘A1’, 144A 3.625%25/07/2045 USD 5,106,433 5,097,431 0.42Wachovia Bank CommercialMortgage Trust, FRN, Series2005-C21 ‘F’, 144A 5.29%15/10/2044 USD 100,000 96,558 0.01Wachovia Bank CommercialMortgage Trust, FRN, Series2006-C29 ‘AJ’ 5.368% 15/11/2048 USD 2,475,000 2,431,764 0.20Wachovia Bank CommercialMortgage Trust, FRN, Series2007-C31 ‘AJ’ 5.66% 15/04/2047 USD 4,615,000 4,629,145 0.38Wachovia Bank CommercialMortgage Trust, FRN, Series2007-C33 ‘AJ’ 5.948% 15/02/2051 USD 2,390,000 2,373,606 0.19Wachovia Bank CommercialMortgage Trust, FRN, Series2007-C33 ‘B’ 5.948% 15/02/2051 USD 2,350,000 2,266,300 0.19Wachovia Bank CommercialMortgage Trust, FRN, Series2007-C33 ‘C’ 5.948% 15/02/2051 USD 2,585,000 2,405,184 0.20
Walgreens Boots Alliance, Inc. 2.7%18/11/2019 USD 565,000 583,758 0.05Walgreens Boots Alliance, Inc. 4.8%18/11/2044 USD 155,000 167,418 0.01Walgreens Boots Alliance, Inc. 4.65%01/06/2046 USD 300,000 320,358 0.03Wells Enterprises, Inc., 144A 6.75%01/02/2020 USD 23,000 23,891 0.00Wells Fargo & Co., FRN 5.875%Perpetual USD 861,000 917,133 0.08Wells Fargo Commercial MortgageTrust, FRN, Series 2015-NXS2 ‘A5’3.767% 15/07/2058 USD 3,400,000 3,741,072 0.31Wells Fargo Home EquityAsset-Backed Securities Trust, FRN,Series 2004-2 ‘M8A’, 144A 4.946%25/10/2034 USD 145,755 136,760 0.01Wells Fargo Mortgage BackedSecurities Trust, FRN, Series 2004-BB‘A5’ 2.848% 25/01/2035 USD 1,133,886 1,139,215 0.09Wells Fargo Mortgage BackedSecurities Trust, FRN, Series 2004-M‘A1’ 2.749% 25/08/2034 USD 2,270,937 2,281,783 0.19Wells Fargo Mortgage BackedSecurities Trust, FRN, Series 2004-N‘A6’ 2.729% 25/08/2034 USD 2,278,990 2,276,079 0.19Wells Fargo Mortgage BackedSecurities Trust, FRN, Series 2004-N‘A7’ 2.729% 25/08/2034 USD 2,279,418 2,276,507 0.19Wells Fargo Mortgage BackedSecurities Trust, FRN, Series2005-AR16 ‘3A1’ 2.742% 25/03/2035 USD 431,208 430,064 0.04Wells Fargo Mortgage BackedSecurities Trust, FRN, Series2005-AR2 ‘2A1’ 2.874% 25/03/2035 USD 1,618,993 1,607,980 0.13Wells Fargo Mortgage BackedSecurities Trust, FRN, Series2005-AR2 ‘2A2’ 2.874% 25/03/2035 USD 561,915 567,488 0.05Wells Fargo Mortgage BackedSecurities Trust, FRN, Series2005-AR4 ‘2A2’ 2.979% 25/04/2035 USD 1,738,425 1,738,013 0.14West Corp., 144A 5.375% 15/07/2022 USD 8,000 7,396 0.00Western Digital Corp., 144A 7.375%01/04/2023 USD 1,000,000 1,067,310 0.09Western Digital Corp., 144A 10.5%01/04/2024 USD 805,000 862,320 0.07Westlake Automobile ReceivablesTrust, Series 2014-2A ‘D’, 144A2.86% 15/07/2021 USD 186,000 184,730 0.02Windstream Services LLC 7.75%01/10/2021 USD 962,000 904,737 0.07Windstream Services LLC 7.5%01/06/2022 USD 65,000 57,924 0.00Windstream Services LLC 7.5%01/04/2023 USD 1,066,000 954,113 0.08Wise Metals Group LLC, 144A 8.75%15/12/2018 USD 153,000 139,230 0.01WMG Acquisition Corp., 144A 5.625%15/04/2022 USD 190,000 194,038 0.02WMG Acquisition Corp., 144A 6.75%15/04/2022 USD 300,000 304,500 0.03Wynn Las Vegas LLC, 144A 5.5%01/03/2025 USD 1,270,000 1,227,138 0.10XPO Logistics, Inc., 144A 6.5%15/06/2022 USD 500,000 477,850 0.04Zebra Technologies Corp. 7.25%15/10/2022 USD 1,836,000 1,955,340 0.16ZF North America Capital, Inc., 144A4% 29/04/2020 USD 300,000 308,436 0.03ZF North America Capital, Inc., 144A4.5% 29/04/2022 USD 400,000 407,602 0.03ZF North America Capital, Inc., 144A4.75% 29/04/2025 USD 1,150,000 1,153,715 0.09
326,154,369 26.61
Virgin Islands, BritishSea Trucks Group Ltd., Reg. S, 144A9% 26/03/2018 USD 195,000 66,339 0.00
66,339 0.00
Total Bonds 354,518,423 28.92
Convertible Bonds
NetherlandsNXP Semiconductors NV 1%01/12/2019 USD 1,075,000 1,165,762 0.10
1,165,762 0.10
145
JPMorgan Funds - Global Bond Opportunities FundSchedule of Investments (continued)
As at 30 June 2016
Investments Currency
Quantity/Nominal
Value
MarketValue
USD
%of
NetAssets Investments Currency
Quantity/Nominal
Value
MarketValue
USD
%of
NetAssets
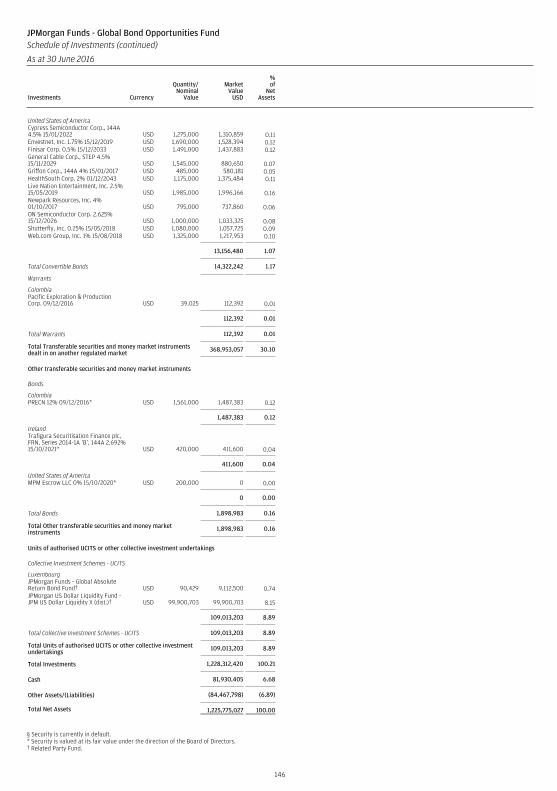
United States of AmericaCypress Semiconductor Corp., 144A4.5% 15/01/2022 USD 1,275,000 1,310,859 0.11Envestnet, Inc. 1.75% 15/12/2019 USD 1,690,000 1,528,394 0.12Finisar Corp. 0.5% 15/12/2033 USD 1,491,000 1,437,883 0.12General Cable Corp., STEP 4.5%15/11/2029 USD 1,545,000 880,650 0.07Griffon Corp., 144A 4% 15/01/2017 USD 485,000 580,181 0.05HealthSouth Corp. 2% 01/12/2043 USD 1,175,000 1,375,484 0.11Live Nation Entertainment, Inc. 2.5%15/05/2019 USD 1,985,000 1,996,166 0.16Newpark Resources, Inc. 4%01/10/2017 USD 795,000 737,860 0.06ON Semiconductor Corp. 2.625%15/12/2026 USD 1,000,000 1,033,325 0.08Shutterfly, Inc. 0.25% 15/05/2018 USD 1,080,000 1,057,725 0.09Web.com Group, Inc. 1% 15/08/2018 USD 1,325,000 1,217,953 0.10
13,156,480 1.07
Total Convertible Bonds 14,322,242 1.17
Warrants
ColombiaPacific Exploration & ProductionCorp. 09/12/2016 USD 39,025 112,392 0.01
112,392 0.01
Total Warrants 112,392 0.01
Total Transferable securities and money market instrumentsdealt in on another regulated market 368,953,057 30.10
Other transferable securities and money market instruments
Bonds
ColombiaPRECN 12% 09/12/2016* USD 1,561,000 1,487,383 0.12
1,487,383 0.12
IrelandTrafigura Securitisation Finance plc,FRN, Series 2014-1A ‘B’, 144A 2.692%15/10/2021* USD 420,000 411,600 0.04
411,600 0.04
United States of AmericaMPM Escrow LLC 0% 15/10/2020* USD 200,000 0 0.00
0 0.00
Total Bonds 1,898,983 0.16
Total Other transferable securities and money marketinstruments 1,898,983 0.16
Units of authorised UCITS or other collective investment undertakings
Collective Investment Schemes - UCITS
LuxembourgJPMorgan Funds - Global AbsoluteReturn Bond Fund† USD 90,429 9,112,500 0.74JPMorgan US Dollar Liquidity Fund -JPM US Dollar Liquidity X (dist.)† USD 99,900,703 99,900,703 8.15
109,013,203 8.89
Total Collective Investment Schemes - UCITS 109,013,203 8.89
Total Units of authorised UCITS or other collective investmentundertakings 109,013,203 8.89
Total Investments 1,228,312,420 100.21
Cash 81,930,405 6.68
Other Assets/(Liabilities) (84,467,798) (6.89)
Total Net Assets 1,225,775,027 100.00
§ Security is currently in default.* Security is valued at its fair value under the direction of the Board of Directors.† Related Party Fund.
146
JPMorgan Funds - Global Bond Opportunities FundSchedule of Investments (continued)
As at 30 June 2016
Investments Currency
Quantity/Nominal
Value
MarketValue
USD
%of
NetAssets Investments Currency
Quantity/Nominal
Value
MarketValue
USD
%of
NetAssets
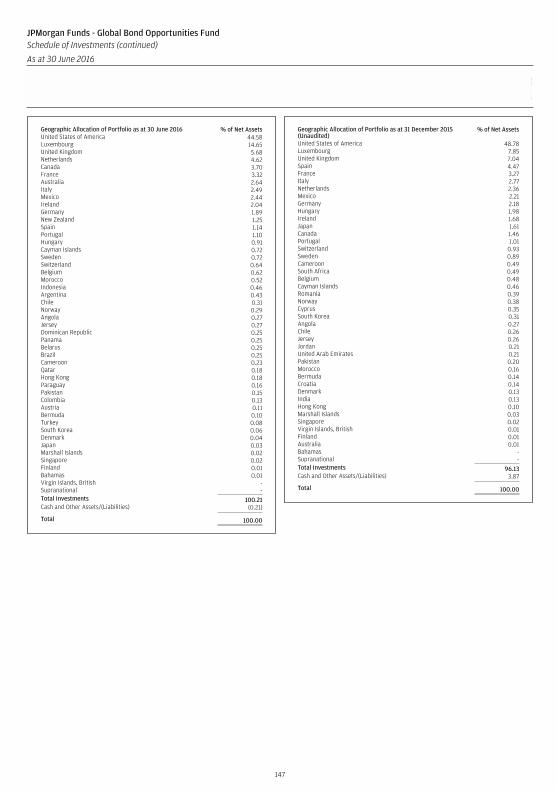
Geographic Allocation of Portfolio as at 30 June 2016 % of Net AssetsUnited States of America 44.58Luxembourg 14.65United Kingdom 5.68Netherlands 4.62Canada 3.70France 3.32Australia 2.64Italy 2.49Mexico 2.44Ireland 2.04Germany 1.89New Zealand 1.25Spain 1.14Portugal 1.10Hungary 0.91Cayman Islands 0.72Sweden 0.72Switzerland 0.64Belgium 0.62Morocco 0.52Indonesia 0.46Argentina 0.43Chile 0.31Norway 0.29Angola 0.27Jersey 0.27Dominican Republic 0.25Panama 0.25Belarus 0.25Brazil 0.25Cameroon 0.23Qatar 0.18Hong Kong 0.18Paraguay 0.16Pakistan 0.15Colombia 0.13Austria 0.11Bermuda 0.10Turkey 0.08South Korea 0.06Denmark 0.04Japan 0.03Marshall Islands 0.02Singapore 0.02Finland 0.01Bahamas 0.01Virgin Islands, British -Supranational -Total Investments 100.21Cash and Other Assets/(Liabilities) (0.21)
Total 100.00
Geographic Allocation of Portfolio as at 31 December 2015(Unaudited)
% of Net Assets
United States of America 48.78Luxembourg 7.85United Kingdom 7.04Spain 4.47France 3.27Italy 2.77Netherlands 2.36Mexico 2.21Germany 2.18Hungary 1.98Ireland 1.68Japan 1.61Canada 1.46Portugal 1.01Switzerland 0.93Sweden 0.89Cameroon 0.49South Africa 0.49Belgium 0.48Cayman Islands 0.46Romania 0.39Norway 0.38Cyprus 0.35South Korea 0.31Angola 0.27Chile 0.26Jersey 0.26Jordan 0.21United Arab Emirates 0.21Pakistan 0.20Morocco 0.16Bermuda 0.14Croatia 0.14Denmark 0.13India 0.13Hong Kong 0.10Marshall Islands 0.03Singapore 0.02Virgin Islands, British 0.01Finland 0.01Australia 0.01Bahamas -Supranational -Total Investments 96.13Cash and Other Assets/(Liabilities) 3.87
Total 100.00
147
JPMorgan Funds - Global Bond Opportunities FundSchedule of Investments (continued)
As at 30 June 2016
Investments Currency
Quantity/Nominal
Value
MarketValue
USD
%of
NetAssets Investments Currency
Quantity/Nominal
Value
MarketValue
USD
%of
NetAssets
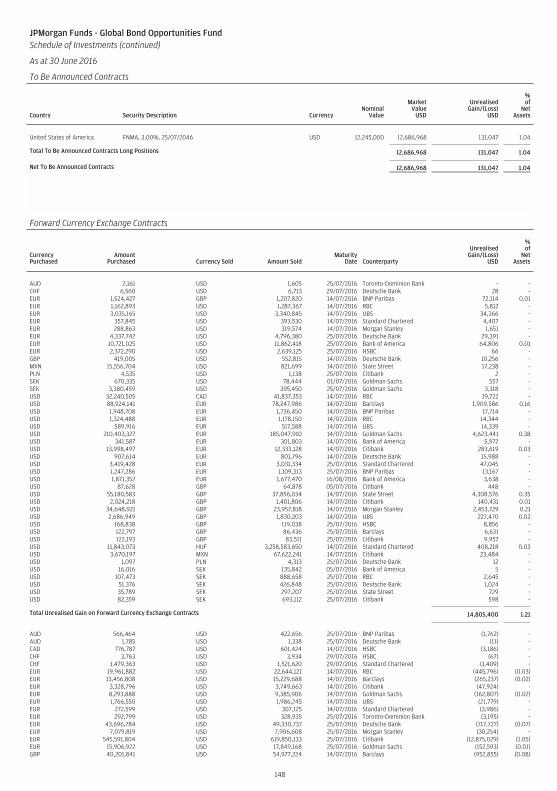
JPMorgan Funds - Global Bond Opportunities FundSchedule of Investments (continued)
As at 30 June 2016
To Be Announced Contracts
Country Security Description CurrencyNominal
Value
MarketValue
USD
UnrealisedGain/(Loss)
USD
%of
NetAssets
United States of America FNMA, 3.00%, 25/07/2046 USD 12,245,000 12,686,968 131,047 1.04
Total To Be Announced Contracts Long Positions 12,686,968 131,047 1.04
Net To Be Announced Contracts 12,686,968 131,047 1.04
JPMorgan Funds - Global Bond Opportunities FundSchedule of Investments (continued)
As at 30 June 2016
Forward Currency Exchange Contracts (continued)
CurrencyPurchased
AmountPurchased Currency Sold Amount Sold
MaturityDate Counterparty
UnrealisedGain/(Loss)
USD
%of
NetAssets
AUD 2,161 USD 1,605 25/07/2016 Toronto-Dominion Bank - -CHF 6,560 USD 6,713 29/07/2016 Deutsche Bank 28 -EUR 1,524,427 GBP 1,207,820 14/07/2016 BNP Paribas 72,114 0.01EUR 1,162,893 USD 1,287,367 14/07/2016 RBC 5,812 -EUR 3,035,165 USD 3,340,845 14/07/2016 UBS 34,366 -EUR 357,845 USD 393,530 14/07/2016 Standard Chartered 4,407 -EUR 288,863 USD 319,574 14/07/2016 Morgan Stanley 1,651 -EUR 4,337,742 USD 4,796,380 25/07/2016 Deutsche Bank 29,391 -EUR 10,721,025 USD 11,862,418 25/07/2016 Bank of America 64,806 0.01EUR 2,372,290 USD 2,639,125 25/07/2016 HSBC 66 -GBP 419,005 USD 552,815 14/07/2016 Deutsche Bank 10,256 -MXN 15,556,704 USD 821,699 14/07/2016 State Street 17,238 -PLN 4,535 USD 1,138 25/07/2016 Citibank 2 -SEK 670,335 USD 78,444 01/07/2016 Goldman Sachs 557 -SEK 3,380,459 USD 395,450 25/07/2016 Goldman Sachs 3,318 -USD 32,240,505 CAD 41,837,353 14/07/2016 RBC 19,722 -USD 88,924,141 EUR 78,247,986 14/07/2016 Barclays 1,909,586 0.16USD 1,948,708 EUR 1,736,450 14/07/2016 BNP Paribas 17,714 -USD 1,324,488 EUR 1,178,150 14/07/2016 RBC 14,344 -USD 589,916 EUR 517,588 14/07/2016 UBS 14,339 -USD 210,403,327 EUR 185,047,910 14/07/2016 Goldman Sachs 4,623,441 0.38USD 341,587 EUR 301,803 14/07/2016 Bank of America 5,972 -USD 13,998,497 EUR 12,333,128 14/07/2016 Citibank 283,619 0.03USD 907,614 EUR 801,796 14/07/2016 Deutsche Bank 15,988 -USD 3,419,428 EUR 3,031,334 25/07/2016 Standard Chartered 47,045 -USD 1,247,286 EUR 1,109,313 25/07/2016 BNP Paribas 13,167 -USD 1,871,352 EUR 1,677,470 16/08/2016 Bank of America 3,638 -USD 87,628 GBP 64,878 05/07/2016 Citibank 448 -USD 55,180,583 GBP 37,856,034 14/07/2016 State Street 4,308,576 0.35USD 2,024,218 GBP 1,401,806 14/07/2016 Citibank 140,431 0.01USD 34,648,921 GBP 23,957,818 14/07/2016 Morgan Stanley 2,453,729 0.21USD 2,686,949 GBP 1,830,203 14/07/2016 UBS 227,470 0.02USD 168,838 GBP 119,038 25/07/2016 HSBC 8,856 -USD 122,797 GBP 86,436 25/07/2016 Barclays 6,631 -USD 122,193 GBP 83,511 25/07/2016 Citibank 9,957 -USD 11,843,073 HUF 3,258,583,650 14/07/2016 Standard Chartered 408,218 0.03USD 3,670,197 MXN 67,622,241 14/07/2016 Citibank 23,484 -USD 1,097 PLN 4,313 25/07/2016 Deutsche Bank 12 -USD 16,016 SEK 135,842 05/07/2016 Bank of America 5 -USD 107,473 SEK 888,658 25/07/2016 RBC 2,645 -USD 51,376 SEK 426,848 25/07/2016 Deutsche Bank 1,024 -USD 35,789 SEK 297,207 25/07/2016 State Street 729 -USD 82,359 SEK 693,112 25/07/2016 Citibank 598 -
Total Unrealised Gain on Forward Currency Exchange Contracts 14,805,400 1.21
AUD 566,464 USD 422,656 25/07/2016 BNP Paribas (1,762) -AUD 1,785 USD 1,338 25/07/2016 Deutsche Bank (11) -CAD 776,787 USD 601,424 14/07/2016 HSBC (3,186) -CHF 3,763 USD 3,934 29/07/2016 HSBC (67) -CHF 1,479,363 USD 1,521,620 29/07/2016 Standard Chartered (1,409) -EUR 19,961,882 USD 22,644,121 14/07/2016 RBC (445,796) (0.03)EUR 13,456,808 USD 15,229,688 14/07/2016 Barclays (265,237) (0.02)EUR 3,328,796 USD 3,749,663 14/07/2016 Citibank (47,924) -EUR 8,293,888 USD 9,385,906 14/07/2016 Goldman Sachs (162,807) (0.02)EUR 1,766,550 USD 1,986,245 14/07/2016 UBS (21,779) -EUR 272,599 USD 307,125 14/07/2016 Standard Chartered (3,986) -EUR 292,799 USD 328,935 25/07/2016 Toronto-Dominion Bank (3,195) -EUR 43,696,784 USD 49,330,737 25/07/2016 Deutsche Bank (717,727) (0.07)EUR 7,079,819 USD 7,906,608 25/07/2016 Morgan Stanley (30,254) -EUR 545,591,804 USD 619,850,133 25/07/2016 Citibank (12,875,029) (1.05)EUR 15,906,922 USD 17,849,168 25/07/2016 Goldman Sachs (152,593) (0.01)GBP 40,201,841 USD 54,977,224 14/07/2016 Barclays (952,855) (0.08)
148
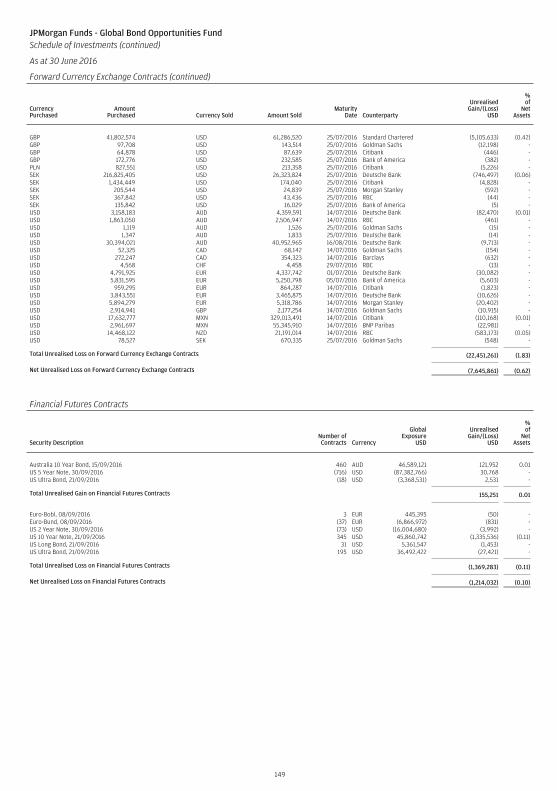
JPMorgan Funds - Global Bond Opportunities FundSchedule of Investments (continued)
As at 30 June 2016
Forward Currency Exchange Contracts (continued)
CurrencyPurchased
AmountPurchased Currency Sold Amount Sold
MaturityDate Counterparty
UnrealisedGain/(Loss)
USD
%of
NetAssets
GBP 41,802,574 USD 61,286,520 25/07/2016 Standard Chartered (5,105,633) (0.42)GBP 97,708 USD 143,514 25/07/2016 Goldman Sachs (12,198) -GBP 64,878 USD 87,639 25/07/2016 Citibank (446) -GBP 172,776 USD 232,585 25/07/2016 Bank of America (382) -PLN 827,551 USD 213,358 25/07/2016 Citibank (5,226) -SEK 216,825,405 USD 26,323,824 25/07/2016 Deutsche Bank (746,497) (0.06)SEK 1,434,449 USD 174,040 25/07/2016 Citibank (4,828) -SEK 205,544 USD 24,839 25/07/2016 Morgan Stanley (592) -SEK 367,842 USD 43,436 25/07/2016 RBC (44) -SEK 135,842 USD 16,029 25/07/2016 Bank of America (5) -USD 3,158,183 AUD 4,359,591 14/07/2016 Deutsche Bank (82,470) (0.01)USD 1,863,050 AUD 2,506,947 14/07/2016 RBC (461) -USD 1,119 AUD 1,526 25/07/2016 Goldman Sachs (15) -USD 1,347 AUD 1,833 25/07/2016 Deutsche Bank (14) -USD 30,394,021 AUD 40,952,965 16/08/2016 Deutsche Bank (9,713) -USD 52,325 CAD 68,142 14/07/2016 Goldman Sachs (154) -USD 272,247 CAD 354,323 14/07/2016 Barclays (632) -USD 4,568 CHF 4,458 29/07/2016 RBC (13) -USD 4,791,925 EUR 4,337,742 01/07/2016 Deutsche Bank (30,082) -USD 5,831,595 EUR 5,250,798 05/07/2016 Bank of America (5,603) -USD 959,295 EUR 864,287 14/07/2016 Citibank (1,823) -USD 3,843,551 EUR 3,465,875 14/07/2016 Deutsche Bank (10,626) -USD 5,894,279 EUR 5,318,786 14/07/2016 Morgan Stanley (20,402) -USD 2,914,941 GBP 2,177,254 14/07/2016 Goldman Sachs (10,915) -USD 17,632,777 MXN 329,013,491 14/07/2016 Citibank (110,168) (0.01)USD 2,961,697 MXN 55,345,910 14/07/2016 BNP Paribas (22,981) -USD 14,468,122 NZD 21,191,014 14/07/2016 RBC (583,173) (0.05)USD 78,527 SEK 670,335 25/07/2016 Goldman Sachs (548) -
Total Unrealised Loss on Forward Currency Exchange Contracts (22,451,261) (1.83)
Net Unrealised Loss on Forward Currency Exchange Contracts (7,645,861) (0.62)
Financial Futures Contracts
Security DescriptionNumber ofContracts Currency
GlobalExposure
USD
UnrealisedGain/(Loss)
USD
%of
NetAssets
Australia 10 Year Bond, 15/09/2016 460 AUD 46,589,121 121,952 0.01US 5 Year Note, 30/09/2016 (716) USD (87,382,766) 30,768 -US Ultra Bond, 21/09/2016 (18) USD (3,368,531) 2,531 -
Total Unrealised Gain on Financial Futures Contracts 155,251 0.01
Euro-Bobl, 08/09/2016 3 EUR 445,395 (50) -Euro-Bund, 08/09/2016 (37) EUR (6,866,972) (831) -US 2 Year Note, 30/09/2016 (73) USD (16,004,680) (3,992) -US 10 Year Note, 21/09/2016 345 USD 45,860,742 (1,335,536) (0.11)US Long Bond, 21/09/2016 31 USD 5,361,547 (1,453) -US Ultra Bond, 21/09/2016 195 USD 36,492,422 (27,421) -
Total Unrealised Loss on Financial Futures Contracts (1,369,283) (0.11)
Net Unrealised Loss on Financial Futures Contracts (1,214,032) (0.10)
149
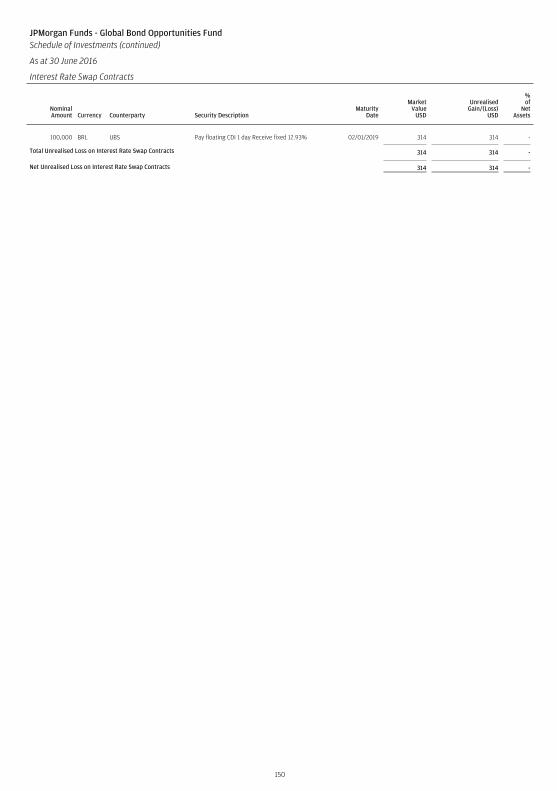
JPMorgan Funds - Global Bond Opportunities FundSchedule of Investments (continued)
As at 30 June 2016
Interest Rate Swap Contracts
NominalAmount Currency Counterparty Security Description
MaturityDate
MarketValue
USD
UnrealisedGain/(Loss)
USD
%of
NetAssets
100,000 BRL UBS Pay floating CDI 1 day Receive fixed 12.93% 02/01/2019 314 314 -
Total Unrealised Loss on Interest Rate Swap Contracts 314 314 -
Net Unrealised Loss on Interest Rate Swap Contracts 314 314 -
150
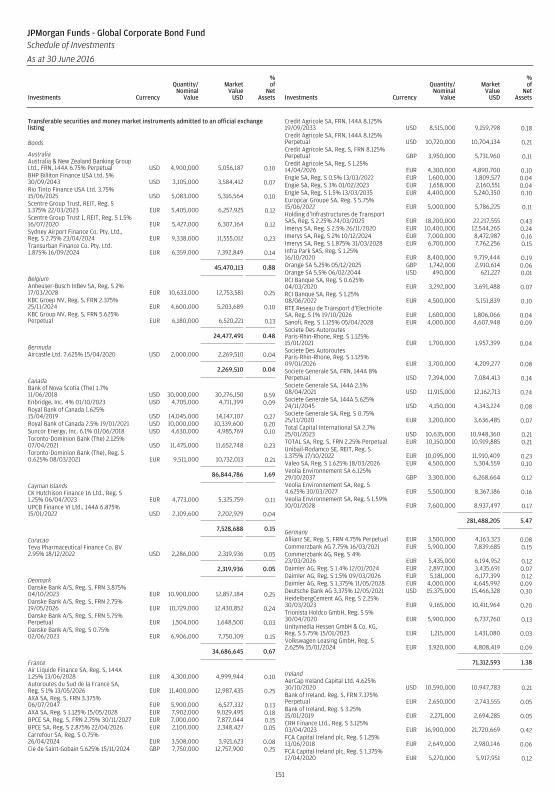
Transferable securities and money market instruments admitted to an official exchangelisting
Bonds
AustraliaAustralia & New Zealand Banking GroupLtd., FRN, 144A 6.75% Perpetual USD 4,900,000 5,056,187 0.10BHP Billiton Finance USA Ltd. 5%30/09/2043 USD 3,105,000 3,584,412 0.07Rio Tinto Finance USA Ltd. 3.75%15/06/2025 USD 5,083,000 5,316,564 0.10Scentre Group Trust, REIT, Reg. S1.375% 22/03/2023 EUR 5,405,000 6,257,925 0.12Scentre Group Trust 1, REIT, Reg. S 1.5%16/07/2020 EUR 5,427,000 6,307,164 0.12Sydney Airport Finance Co. Pty. Ltd.,Reg. S 2.75% 23/04/2024 EUR 9,338,000 11,555,012 0.23Transurban Finance Co. Pty. Ltd.1.875% 16/09/2024 EUR 6,359,000 7,392,849 0.14
45,470,113 0.88
BelgiumAnheuser-Busch InBev SA, Reg. S 2%17/03/2028 EUR 10,633,000 12,753,581 0.25KBC Groep NV, Reg. S, FRN 2.375%25/11/2024 EUR 4,600,000 5,203,689 0.10KBC Group NV, Reg. S, FRN 5.625%Perpetual EUR 6,180,000 6,520,221 0.13
24,477,491 0.48
BermudaAircastle Ltd. 7.625% 15/04/2020 USD 2,000,000 2,269,510 0.04
2,269,510 0.04
CanadaBank of Nova Scotia (The) 1.7%11/06/2018 USD 30,000,000 30,276,150 0.59Enbridge, Inc. 4% 01/10/2023 USD 4,705,000 4,711,399 0.09Royal Bank of Canada 1.625%15/04/2019 USD 14,045,000 14,147,107 0.27Royal Bank of Canada 2.5% 19/01/2021 USD 10,000,000 10,339,600 0.20Suncor Energy, Inc. 6.1% 01/06/2018 USD 4,630,000 4,985,769 0.10Toronto-Dominion Bank (The) 2.125%07/04/2021 USD 11,475,000 11,652,748 0.23Toronto-Dominion Bank (The), Reg. S0.625% 08/03/2021 EUR 9,511,000 10,732,013 0.21
86,844,786 1.69
Cayman IslandsCK Hutchison Finance 16 Ltd., Reg. S1.25% 06/04/2023 EUR 4,773,000 5,325,759 0.11UPCB Finance VI Ltd., 144A 6.875%15/01/2022 USD 2,109,600 2,202,929 0.04
7,528,688 0.15
CuracaoTeva Pharmaceutical Finance Co. BV2.95% 18/12/2022 USD 2,286,000 2,319,936 0.05
2,319,936 0.05
DenmarkDanske Bank A/S, Reg. S, FRN 3.875%04/10/2023 EUR 10,900,000 12,857,184 0.25Danske Bank A/S, Reg. S, FRN 2.75%19/05/2026 EUR 10,729,000 12,430,852 0.24Danske Bank A/S, Reg. S, FRN 5.75%Perpetual EUR 1,504,000 1,648,500 0.03Danske Bank A/S, Reg. S 0.75%02/06/2023 EUR 6,906,000 7,750,109 0.15
34,686,645 0.67
FranceAir Liquide Finance SA, Reg. S, 144A1.25% 13/06/2028 EUR 4,300,000 4,999,944 0.10Autoroutes du Sud de la France SA,Reg. S 1% 13/05/2026 EUR 11,400,000 12,987,435 0.25AXA SA, Reg. S, FRN 3.375%06/07/2047 EUR 5,900,000 6,527,332 0.13AXA SA, Reg. S 1.125% 15/05/2028 EUR 7,902,000 9,029,495 0.18BPCE SA, Reg. S, FRN 2.75% 30/11/2027 EUR 7,000,000 7,877,044 0.15BPCE SA, Reg. S 2.875% 22/04/2026 EUR 2,100,000 2,348,427 0.05Carrefour SA, Reg. S 0.75%26/04/2024 EUR 3,508,000 3,921,623 0.08Cie de Saint-Gobain 5.625% 15/11/2024 GBP 7,750,000 12,757,900 0.25
Credit Agricole SA, FRN, 144A 8.125%19/09/2033 USD 8,515,000 9,159,798 0.18Credit Agricole SA, FRN, 144A 8.125%Perpetual USD 10,720,000 10,704,134 0.21Credit Agricole SA, Reg. S, FRN 8.125%Perpetual GBP 3,950,000 5,731,960 0.11Credit Agricole SA, Reg. S 1.25%14/04/2026 EUR 4,300,000 4,890,700 0.10Engie SA, Reg. S 0.5% 13/03/2022 EUR 1,600,000 1,809,527 0.04Engie SA, Reg. S 3% 01/02/2023 EUR 1,658,000 2,160,551 0.04Engie SA, Reg. S 1.5% 13/03/2035 EUR 4,400,000 5,240,350 0.10Europcar Groupe SA, Reg. S 5.75%15/06/2022 EUR 5,000,000 5,786,225 0.11Holding d’Infrastructures de TransportSAS, Reg. S 2.25% 24/03/2025 EUR 18,200,000 22,217,555 0.43Imerys SA, Reg. S 2.5% 26/11/2020 EUR 10,400,000 12,544,265 0.24Imerys SA, Reg. S 2% 10/12/2024 EUR 7,000,000 8,472,987 0.16Imerys SA, Reg. S 1.875% 31/03/2028 EUR 6,700,000 7,762,256 0.15Infra Park SAS, Reg. S 1.25%16/10/2020 EUR 8,400,000 9,719,444 0.19Orange SA 5.25% 05/12/2025 GBP 1,742,000 2,910,614 0.06Orange SA 5.5% 06/02/2044 USD 490,000 621,227 0.01RCI Banque SA, Reg. S 0.625%04/03/2020 EUR 3,292,000 3,691,488 0.07RCI Banque SA, Reg. S 1.25%08/06/2022 EUR 4,500,000 5,151,839 0.10RTE Reseau de Transport d’ElectriciteSA, Reg. S 1% 19/10/2026 EUR 1,600,000 1,806,066 0.04Sanofi, Reg. S 1.125% 05/04/2028 EUR 4,000,000 4,607,948 0.09Societe Des AutoroutesParis-Rhin-Rhone, Reg. S 1.125%15/01/2021 EUR 1,700,000 1,957,399 0.04Societe Des AutoroutesParis-Rhin-Rhone, Reg. S 1.125%09/01/2026 EUR 3,700,000 4,209,277 0.08Societe Generale SA, FRN, 144A 8%Perpetual USD 7,394,000 7,084,413 0.14Societe Generale SA, 144A 2.5%08/04/2021 USD 11,915,000 12,162,713 0.24Societe Generale SA, 144A 5.625%24/11/2045 USD 4,150,000 4,343,224 0.08Societe Generale SA, Reg. S 0.75%25/11/2020 EUR 3,200,000 3,636,485 0.07Total Capital International SA 2.7%25/01/2023 USD 10,635,000 10,948,360 0.21TOTAL SA, Reg. S, FRN 2.25% Perpetual EUR 10,150,000 10,919,885 0.21Unibail-Rodamco SE, REIT, Reg. S1.375% 17/10/2022 EUR 10,095,000 11,910,409 0.23Valeo SA, Reg. S 1.625% 18/03/2026 EUR 4,500,000 5,304,559 0.10Veolia Environnement SA 6.125%29/10/2037 GBP 3,300,000 6,268,664 0.12Veolia Environnement SA, Reg. S4.625% 30/03/2027 EUR 5,500,000 8,367,186 0.16Veolia Environnement SA, Reg. S 1.59%10/01/2028 EUR 7,600,000 8,937,497 0.17
281,488,205 5.47
GermanyAllianz SE, Reg. S, FRN 4.75% Perpetual EUR 3,500,000 4,163,323 0.08Commerzbank AG 7.75% 16/03/2021 EUR 5,900,000 7,839,685 0.15Commerzbank AG, Reg. S 4%23/03/2026 EUR 5,435,000 6,194,952 0.12Daimler AG, Reg. S 1.4% 12/01/2024 EUR 2,897,000 3,435,691 0.07Daimler AG, Reg. S 1.5% 09/03/2026 EUR 5,181,000 6,177,399 0.12Daimler AG, Reg. S 1.375% 11/05/2028 EUR 4,000,000 4,645,992 0.09Deutsche Bank AG 3.375% 12/05/2021 USD 15,375,000 15,466,328 0.30HeidelbergCement AG, Reg. S 2.25%30/03/2023 EUR 9,165,000 10,411,964 0.20Trionista Holdco GmbH, Reg. S 5%30/04/2020 EUR 5,900,000 6,737,760 0.13Unitymedia Hessen GmbH & Co. KG,Reg. S 5.75% 15/01/2023 EUR 1,215,000 1,431,080 0.03Volkswagen Leasing GmbH, Reg. S2.625% 15/01/2024 EUR 3,920,000 4,808,419 0.09
71,312,593 1.38
IrelandAerCap Ireland Capital Ltd. 4.625%30/10/2020 USD 10,590,000 10,947,783 0.21Bank of Ireland, Reg. S, FRN 7.375%Perpetual EUR 2,650,000 2,743,555 0.05Bank of Ireland, Reg. S 3.25%15/01/2019 EUR 2,271,000 2,694,285 0.05CRH Finance Ltd., Reg. S 3.125%03/04/2023 EUR 16,900,000 21,720,669 0.42FCA Capital Ireland plc, Reg. S 1.25%13/06/2018 EUR 2,649,000 2,980,146 0.06FCA Capital Ireland plc, Reg. S 1.375%17/04/2020 EUR 5,270,000 5,917,951 0.12
151
JPMorgan Funds - Global Corporate Bond FundSchedule of Investments
As at 30 June 2016
Investments Currency
Quantity/Nominal
Value
MarketValue
USD
%of
NetAssets Investments Currency
Quantity/Nominal
Value
MarketValue
USD
%of
NetAssets
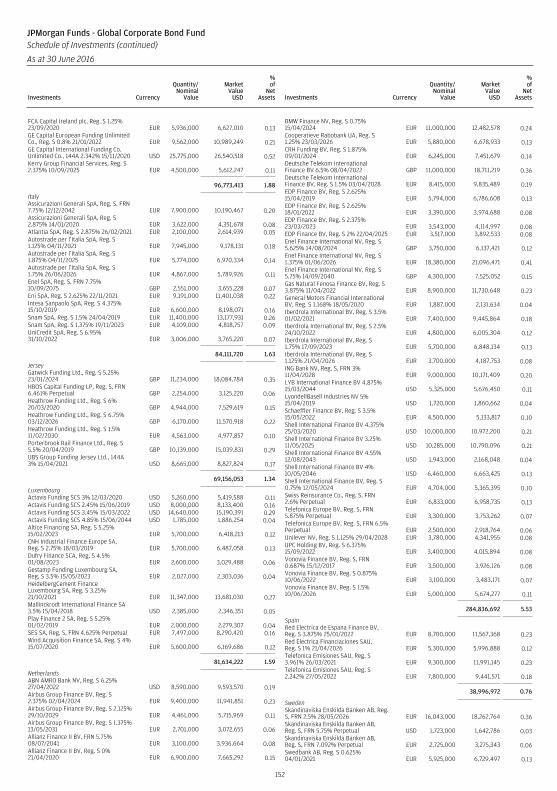
FCA Capital Ireland plc, Reg. S 1.25%23/09/2020 EUR 5,936,000 6,627,010 0.13GE Capital European Funding UnlimitedCo., Reg. S 0.8% 21/01/2022 EUR 9,562,000 10,989,249 0.21GE Capital International Funding Co.Unlimited Co., 144A 2.342% 15/11/2020 USD 25,775,000 26,540,518 0.52Kerry Group Financial Services, Reg. S2.375% 10/09/2025 EUR 4,500,000 5,612,247 0.11
96,773,413 1.88
ItalyAssicurazioni Generali SpA, Reg. S, FRN7.75% 12/12/2042 EUR 7,900,000 10,190,467 0.20Assicurazioni Generali SpA, Reg. S2.875% 14/01/2020 EUR 3,622,000 4,351,678 0.08Atlantia SpA, Reg. S 2.875% 26/02/2021 EUR 2,100,000 2,614,939 0.05Autostrade per l’Italia SpA, Reg. S1.125% 04/11/2021 EUR 7,945,000 9,178,131 0.18Autostrade per l’Italia SpA, Reg. S1.875% 04/11/2025 EUR 5,774,000 6,970,334 0.14Autostrade per l’Italia SpA, Reg. S1.75% 26/06/2026 EUR 4,867,000 5,789,926 0.11Enel SpA, Reg. S, FRN 7.75%10/09/2075 GBP 2,551,000 3,655,228 0.07Eni SpA, Reg. S 2.625% 22/11/2021 EUR 9,191,000 11,401,038 0.22Intesa Sanpaolo SpA, Reg. S 4.375%15/10/2019 EUR 6,600,000 8,198,071 0.16Snam SpA, Reg. S 1.5% 24/04/2019 EUR 11,400,000 13,177,931 0.26Snam SpA, Reg. S 1.375% 19/11/2023 EUR 4,109,000 4,818,757 0.09UniCredit SpA, Reg. S 6.95%31/10/2022 EUR 3,006,000 3,765,220 0.07
84,111,720 1.63
JerseyGatwick Funding Ltd., Reg. S 5.25%23/01/2024 GBP 11,234,000 18,084,784 0.35HBOS Capital Funding LP, Reg. S, FRN6.461% Perpetual GBP 2,254,000 3,125,220 0.06Heathrow Funding Ltd., Reg. S 6%20/03/2020 GBP 4,944,000 7,529,619 0.15Heathrow Funding Ltd., Reg. S 6.75%03/12/2026 GBP 6,170,000 11,570,918 0.22Heathrow Funding Ltd., Reg. S 1.5%11/02/2030 EUR 4,563,000 4,977,857 0.10Porterbrook Rail Finance Ltd., Reg. S5.5% 20/04/2019 GBP 10,139,000 15,039,831 0.29UBS Group Funding Jersey Ltd., 144A3% 15/04/2021 USD 8,665,000 8,827,824 0.17
69,156,053 1.34
LuxembourgActavis Funding SCS 3% 12/03/2020 USD 5,260,000 5,419,588 0.11Actavis Funding SCS 2.45% 15/06/2019 USD 8,000,000 8,133,400 0.16Actavis Funding SCS 3.45% 15/03/2022 USD 14,640,000 15,190,391 0.29Actavis Funding SCS 4.85% 15/06/2044 USD 1,785,000 1,886,254 0.04Altice Financing SA, Reg. S 5.25%15/02/2023 EUR 5,700,000 6,418,213 0.12CNH Industrial Finance Europe SA,Reg. S 2.75% 18/03/2019 EUR 5,700,000 6,487,058 0.13Dufry Finance SCA, Reg. S 4.5%01/08/2023 EUR 2,600,000 3,029,488 0.06Gestamp Funding Luxembourg SA,Reg. S 3.5% 15/05/2023 EUR 2,027,000 2,303,036 0.04HeidelbergCement FinanceLuxembourg SA, Reg. S 3.25%21/10/2021 EUR 11,347,000 13,681,030 0.27Mallinckrodt International Finance SA3.5% 15/04/2018 USD 2,385,000 2,346,351 0.05Play Finance 2 SA, Reg. S 5.25%01/02/2019 EUR 2,000,000 2,279,307 0.04SES SA, Reg. S, FRN 4.625% Perpetual EUR 7,497,000 8,290,420 0.16Wind Acquisition Finance SA, Reg. S 4%15/07/2020 EUR 5,600,000 6,169,686 0.12
81,634,222 1.59
NetherlandsABN AMRO Bank NV, Reg. S 6.25%27/04/2022 USD 8,590,000 9,593,570 0.19Airbus Group Finance BV, Reg. S2.375% 02/04/2024 EUR 9,400,000 11,941,851 0.23Airbus Group Finance BV, Reg. S 2.125%29/10/2029 EUR 4,461,000 5,715,969 0.11Airbus Group Finance BV, Reg. S 1.375%13/05/2031 EUR 2,701,000 3,072,655 0.06Allianz Finance II BV, FRN 5.75%08/07/2041 EUR 3,100,000 3,936,664 0.08Allianz Finance II BV, Reg. S 0%21/04/2020 EUR 6,900,000 7,665,292 0.15
BMW Finance NV, Reg. S 0.75%15/04/2024 EUR 11,000,000 12,482,578 0.24Cooperatieve Rabobank UA, Reg. S1.25% 23/03/2026 EUR 5,880,000 6,678,933 0.13CRH Funding BV, Reg. S 1.875%09/01/2024 EUR 6,245,000 7,451,679 0.14Deutsche Telekom InternationalFinance BV 6.5% 08/04/2022 GBP 11,000,000 18,711,219 0.36Deutsche Telekom InternationalFinance BV, Reg. S 1.5% 03/04/2028 EUR 8,415,000 9,835,489 0.19EDP Finance BV, Reg. S 2.625%15/04/2019 EUR 5,794,000 6,786,608 0.13EDP Finance BV, Reg. S 2.625%18/01/2022 EUR 3,390,000 3,974,688 0.08EDP Finance BV, Reg. S 2.375%23/03/2023 EUR 3,543,000 4,114,997 0.08EDP Finance BV, Reg. S 2% 22/04/2025 EUR 3,517,000 3,892,533 0.08Enel Finance International NV, Reg. S5.625% 14/08/2024 GBP 3,750,000 6,137,421 0.12Enel Finance International NV, Reg. S1.375% 01/06/2026 EUR 18,380,000 21,096,471 0.41Enel Finance International NV, Reg. S5.75% 14/09/2040 GBP 4,300,000 7,525,052 0.15Gas Natural Fenosa Finance BV, Reg. S3.875% 11/04/2022 EUR 8,900,000 11,730,648 0.23General Motors Financial InternationalBV, Reg. S 1.168% 18/05/2020 EUR 1,887,000 2,131,634 0.04Iberdrola International BV, Reg. S 3.5%01/02/2021 EUR 7,400,000 9,445,864 0.18Iberdrola International BV, Reg. S 2.5%24/10/2022 EUR 4,800,000 6,005,304 0.12Iberdrola International BV, Reg. S1.75% 17/09/2023 EUR 5,700,000 6,848,134 0.13Iberdrola International BV, Reg. S1.125% 21/04/2026 EUR 3,700,000 4,187,753 0.08ING Bank NV, Reg. S, FRN 3%11/04/2028 EUR 9,000,000 10,171,409 0.20LYB International Finance BV 4.875%15/03/2044 USD 5,325,000 5,676,450 0.11LyondellBasell Industries NV 5%15/04/2019 USD 1,720,000 1,860,662 0.04Schaeffler Finance BV, Reg. S 3.5%15/05/2022 EUR 4,500,000 5,133,817 0.10Shell International Finance BV 4.375%25/03/2020 USD 10,000,000 10,972,200 0.21Shell International Finance BV 3.25%11/05/2025 USD 10,285,000 10,790,096 0.21Shell International Finance BV 4.55%12/08/2043 USD 1,943,000 2,168,048 0.04Shell International Finance BV 4%10/05/2046 USD 6,460,000 6,663,425 0.13Shell International Finance BV, Reg. S0.75% 12/05/2024 EUR 4,704,000 5,365,395 0.10Swiss Reinsurance Co., Reg. S, FRN2.6% Perpetual EUR 6,833,000 6,958,735 0.13Telefonica Europe BV, Reg. S, FRN5.875% Perpetual EUR 3,300,000 3,753,262 0.07Telefonica Europe BV, Reg. S, FRN 6.5%Perpetual EUR 2,500,000 2,918,764 0.06Unilever NV, Reg. S 1.125% 29/04/2028 EUR 3,780,000 4,341,955 0.08UPC Holding BV, Reg. S 6.375%15/09/2022 EUR 3,400,000 4,015,894 0.08Vonovia Finance BV, Reg. S, FRN0.687% 15/12/2017 EUR 3,500,000 3,926,126 0.08Vonovia Finance BV, Reg. S 0.875%10/06/2022 EUR 3,100,000 3,483,171 0.07Vonovia Finance BV, Reg. S 1.5%10/06/2026 EUR 5,000,000 5,674,277 0.11
284,836,692 5.53
SpainRed Electrica de Espana Finance BV,Reg. S 3.875% 25/01/2022 EUR 8,700,000 11,567,368 0.23Red Electrica Financiaciones SAU,Reg. S 1% 21/04/2026 EUR 5,300,000 5,996,888 0.12Telefonica Emisiones SAU, Reg. S3.961% 26/03/2021 EUR 9,300,000 11,991,145 0.23Telefonica Emisiones SAU, Reg. S2.242% 27/05/2022 EUR 7,800,000 9,441,571 0.18
38,996,972 0.76
SwedenSkandinaviska Enskilda Banken AB, Reg.S, FRN 2.5% 28/05/2026 EUR 16,043,000 18,262,764 0.36Skandinaviska Enskilda Banken AB,Reg. S, FRN 5.75% Perpetual USD 1,723,000 1,642,786 0.03Skandinaviska Enskilda Banken AB,Reg. S, FRN 7.092% Perpetual EUR 2,725,000 3,275,343 0.06Swedbank AB, Reg. S 0.625%04/01/2021 EUR 5,925,000 6,729,497 0.13
152
JPMorgan Funds - Global Corporate Bond FundSchedule of Investments (continued)
As at 30 June 2016
Investments Currency
Quantity/Nominal
Value
MarketValue
USD
%of
NetAssets Investments Currency
Quantity/Nominal
Value
MarketValue
USD
%of
NetAssets
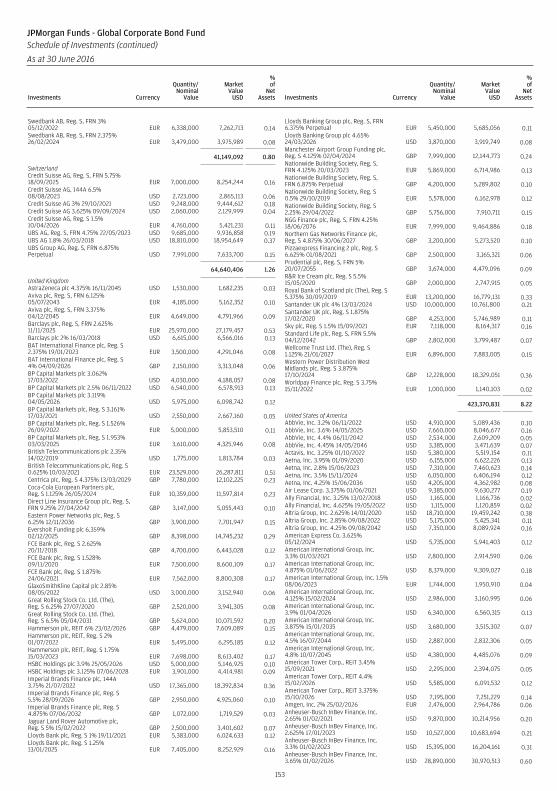
Swedbank AB, Reg. S, FRN 3%05/12/2022 EUR 6,338,000 7,262,713 0.14Swedbank AB, Reg. S, FRN 2.375%26/02/2024 EUR 3,479,000 3,975,989 0.08
41,149,092 0.80
SwitzerlandCredit Suisse AG, Reg. S, FRN 5.75%18/09/2025 EUR 7,000,000 8,254,244 0.16Credit Suisse AG, 144A 6.5%08/08/2023 USD 2,723,000 2,865,113 0.06Credit Suisse AG 3% 29/10/2021 USD 9,248,000 9,444,612 0.18Credit Suisse AG 3.625% 09/09/2024 USD 2,060,000 2,129,999 0.04Credit Suisse AG, Reg. S 1.5%10/04/2026 EUR 4,760,000 5,421,231 0.11UBS AG, Reg. S, FRN 4.75% 22/05/2023 USD 9,685,000 9,936,858 0.19UBS AG 1.8% 26/03/2018 USD 18,810,000 18,954,649 0.37UBS Group AG, Reg. S, FRN 6.875%Perpetual USD 7,991,000 7,633,700 0.15
64,640,406 1.26
United KingdomAstraZeneca plc 4.375% 16/11/2045 USD 1,530,000 1,682,235 0.03Aviva plc, Reg. S, FRN 6.125%05/07/2043 EUR 4,185,000 5,162,352 0.10Aviva plc, Reg. S, FRN 3.375%04/12/2045 EUR 4,649,000 4,791,966 0.09Barclays plc, Reg. S, FRN 2.625%11/11/2025 EUR 25,970,000 27,179,457 0.53Barclays plc 2% 16/03/2018 USD 6,615,000 6,566,016 0.13BAT International Finance plc, Reg. S2.375% 19/01/2023 EUR 3,500,000 4,291,046 0.08BAT International Finance plc, Reg. S4% 04/09/2026 GBP 2,150,000 3,313,048 0.06BP Capital Markets plc 3.062%17/03/2022 USD 4,030,000 4,188,057 0.08BP Capital Markets plc 2.5% 06/11/2022 USD 6,540,000 6,578,913 0.13BP Capital Markets plc 3.119%04/05/2026 USD 5,975,000 6,098,742 0.12BP Capital Markets plc, Reg. S 3.161%17/03/2021 USD 2,550,000 2,667,160 0.05BP Capital Markets plc, Reg. S 1.526%26/09/2022 EUR 5,000,000 5,853,510 0.11BP Capital Markets plc, Reg. S 1.953%03/03/2025 EUR 3,610,000 4,325,946 0.08British Telecommunications plc 2.35%14/02/2019 USD 1,775,000 1,813,784 0.03British Telecommunications plc, Reg. S0.625% 10/03/2021 EUR 23,529,000 26,287,811 0.51Centrica plc, Reg. S 4.375% 13/03/2029 GBP 7,780,000 12,102,225 0.23Coca-Cola European Partners plc,Reg. S 1.125% 26/05/2024 EUR 10,359,000 11,597,814 0.23Direct Line Insurance Group plc, Reg. S,FRN 9.25% 27/04/2042 GBP 3,147,000 5,055,443 0.10Eastern Power Networks plc, Reg. S6.25% 12/11/2036 GBP 3,900,000 7,701,947 0.15Eversholt Funding plc 6.359%02/12/2025 GBP 8,398,000 14,745,232 0.29FCE Bank plc, Reg. S 2.625%20/11/2018 GBP 4,700,000 6,443,028 0.12FCE Bank plc, Reg. S 1.528%09/11/2020 EUR 7,500,000 8,600,109 0.17FCE Bank plc, Reg. S 1.875%24/06/2021 EUR 7,562,000 8,800,308 0.17GlaxoSmithKline Capital plc 2.85%08/05/2022 USD 3,000,000 3,152,940 0.06Great Rolling Stock Co. Ltd. (The),Reg. S 6.25% 27/07/2020 GBP 2,520,000 3,941,305 0.08Great Rolling Stock Co. Ltd. (The),Reg. S 6.5% 05/04/2031 GBP 5,624,000 10,071,592 0.20Hammerson plc, REIT 6% 23/02/2026 GBP 4,479,000 7,609,089 0.15Hammerson plc, REIT, Reg. S 2%01/07/2022 EUR 5,495,000 6,295,185 0.12Hammerson plc, REIT, Reg. S 1.75%15/03/2023 EUR 7,698,000 8,613,402 0.17HSBC Holdings plc 3.9% 25/05/2026 USD 5,000,000 5,146,925 0.10HSBC Holdings plc 3.125% 07/06/2028 EUR 3,901,000 4,414,981 0.09Imperial Brands Finance plc, 144A3.75% 21/07/2022 USD 17,365,000 18,392,834 0.36Imperial Brands Finance plc, Reg. S5.5% 28/09/2026 GBP 2,950,000 4,925,060 0.10Imperial Brands Finance plc, Reg. S4.875% 07/06/2032 GBP 1,072,000 1,719,529 0.03Jaguar Land Rover Automotive plc,Reg. S 5% 15/02/2022 GBP 2,500,000 3,401,602 0.07Lloyds Bank plc, Reg. S 1% 19/11/2021 EUR 5,383,000 6,024,633 0.12Lloyds Bank plc, Reg. S 1.25%13/01/2025 EUR 7,405,000 8,252,929 0.16
Lloyds Banking Group plc, Reg. S, FRN6.375% Perpetual EUR 5,450,000 5,685,056 0.11Lloyds Banking Group plc 4.65%24/03/2026 USD 3,870,000 3,919,749 0.08Manchester Airport Group Funding plc,Reg. S 4.125% 02/04/2024 GBP 7,999,000 12,144,773 0.24Nationwide Building Society, Reg. S,FRN 4.125% 20/03/2023 EUR 5,869,000 6,714,986 0.13Nationwide Building Society, Reg. S,FRN 6.875% Perpetual GBP 4,200,000 5,289,802 0.10Nationwide Building Society, Reg. S0.5% 29/10/2019 EUR 5,578,000 6,162,978 0.12Nationwide Building Society, Reg. S2.25% 29/04/2022 GBP 5,756,000 7,910,711 0.15NGG Finance plc, Reg. S, FRN 4.25%18/06/2076 EUR 7,999,000 9,464,886 0.18Northern Gas Networks Finance plc,Reg. S 4.875% 30/06/2027 GBP 3,200,000 5,273,520 0.10Pizzaexpress Financing 2 plc, Reg. S6.625% 01/08/2021 GBP 2,500,000 3,165,321 0.06Prudential plc, Reg. S, FRN 5%20/07/2055 GBP 3,674,000 4,479,096 0.09R&R Ice Cream plc, Reg. S 5.5%15/05/2020 GBP 2,000,000 2,747,915 0.05Royal Bank of Scotland plc (The), Reg. S5.375% 30/09/2019 EUR 13,200,000 16,779,131 0.33Santander UK plc 4% 13/03/2024 USD 10,000,000 10,761,800 0.21Santander UK plc, Reg. S 1.875%17/02/2020 GBP 4,253,000 5,746,989 0.11Sky plc, Reg. S 1.5% 15/09/2021 EUR 7,118,000 8,164,317 0.16Standard Life plc, Reg. S, FRN 5.5%04/12/2042 GBP 2,802,000 3,799,487 0.07Wellcome Trust Ltd. (The), Reg. S1.125% 21/01/2027 EUR 6,896,000 7,883,005 0.15Western Power Distribution WestMidlands plc, Reg. S 3.875%17/10/2024 GBP 12,228,000 18,329,051 0.36Worldpay Finance plc, Reg. S 3.75%15/11/2022 EUR 1,000,000 1,140,103 0.02
423,370,831 8.22
United States of AmericaAbbVie, Inc. 3.2% 06/11/2022 USD 4,910,000 5,089,436 0.10AbbVie, Inc. 3.6% 14/05/2025 USD 7,660,000 8,046,677 0.16AbbVie, Inc. 4.4% 06/11/2042 USD 2,534,000 2,609,209 0.05AbbVie, Inc. 4.45% 14/05/2046 USD 3,385,000 3,471,639 0.07Actavis, Inc. 3.25% 01/10/2022 USD 5,380,000 5,519,154 0.11Aetna, Inc. 3.95% 01/09/2020 USD 6,155,000 6,622,226 0.13Aetna, Inc. 2.8% 15/06/2023 USD 7,310,000 7,460,623 0.14Aetna, Inc. 3.5% 15/11/2024 USD 6,050,000 6,406,194 0.12Aetna, Inc. 4.25% 15/06/2036 USD 4,205,000 4,362,982 0.08Air Lease Corp. 3.375% 01/06/2021 USD 9,385,000 9,630,277 0.19Ally Financial, Inc. 3.25% 13/02/2018 USD 1,165,000 1,166,736 0.02Ally Financial, Inc. 4.625% 19/05/2022 USD 1,115,000 1,120,859 0.02Altria Group, Inc. 2.625% 14/01/2020 USD 18,710,000 19,459,242 0.38Altria Group, Inc. 2.85% 09/08/2022 USD 5,175,000 5,425,341 0.11Altria Group, Inc. 4.25% 09/08/2042 USD 7,350,000 8,089,924 0.16American Express Co. 3.625%05/12/2024 USD 5,735,000 5,941,403 0.12American International Group, Inc.3.3% 01/03/2021 USD 2,800,000 2,914,590 0.06American International Group, Inc.4.875% 01/06/2022 USD 8,379,000 9,309,027 0.18American International Group, Inc. 1.5%08/06/2023 EUR 1,744,000 1,950,910 0.04American International Group, Inc.4.125% 15/02/2024 USD 2,986,000 3,160,995 0.06American International Group, Inc.3.9% 01/04/2026 USD 6,340,000 6,560,315 0.13American International Group, Inc.3.875% 15/01/2035 USD 3,680,000 3,515,302 0.07American International Group, Inc.4.5% 16/07/2044 USD 2,887,000 2,832,306 0.05American International Group, Inc.4.8% 10/07/2045 USD 4,380,000 4,485,076 0.09American Tower Corp., REIT 3.45%15/09/2021 USD 2,295,000 2,394,075 0.05American Tower Corp., REIT 4.4%15/02/2026 USD 5,585,000 6,091,532 0.12American Tower Corp., REIT 3.375%15/10/2026 USD 7,195,000 7,251,229 0.14Amgen, Inc. 2% 25/02/2026 EUR 2,476,000 2,964,786 0.06Anheuser-Busch InBev Finance, Inc.2.65% 01/02/2021 USD 9,870,000 10,214,956 0.20Anheuser-Busch InBev Finance, Inc.2.625% 17/01/2023 USD 10,527,000 10,683,694 0.21Anheuser-Busch InBev Finance, Inc.3.3% 01/02/2023 USD 15,395,000 16,204,161 0.31Anheuser-Busch InBev Finance, Inc.3.65% 01/02/2026 USD 28,890,000 30,970,513 0.60
153
JPMorgan Funds - Global Corporate Bond FundSchedule of Investments (continued)
As at 30 June 2016
Investments Currency
Quantity/Nominal
Value
MarketValue
USD
%of
NetAssets Investments Currency
Quantity/Nominal
Value
MarketValue
USD
%of
NetAssets
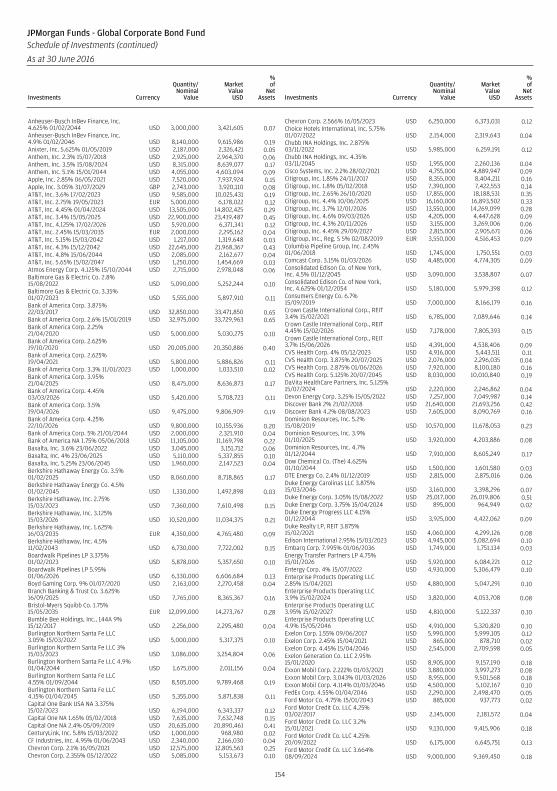
Anheuser-Busch InBev Finance, Inc.4.625% 01/02/2044 USD 3,000,000 3,421,605 0.07Anheuser-Busch InBev Finance, Inc.4.9% 01/02/2046 USD 8,140,000 9,615,986 0.19Anixter, Inc. 5.625% 01/05/2019 USD 2,187,000 2,326,421 0.05Anthem, Inc. 2.3% 15/07/2018 USD 2,925,000 2,964,370 0.06Anthem, Inc. 3.5% 15/08/2024 USD 8,315,000 8,639,077 0.17Anthem, Inc. 5.1% 15/01/2044 USD 4,055,000 4,603,094 0.09Apple, Inc. 2.85% 06/05/2021 USD 7,520,000 7,937,924 0.15Apple, Inc. 3.05% 31/07/2029 GBP 2,743,000 3,920,110 0.08AT&T, Inc. 3.6% 17/02/2023 USD 9,585,000 10,025,431 0.19AT&T, Inc. 2.75% 19/05/2023 EUR 5,000,000 6,178,022 0.12AT&T, Inc. 4.45% 01/04/2024 USD 13,505,000 14,802,425 0.29AT&T, Inc. 3.4% 15/05/2025 USD 22,900,000 23,419,487 0.45AT&T, Inc. 4.125% 17/02/2026 USD 5,920,000 6,371,341 0.12AT&T, Inc. 2.45% 15/03/2035 EUR 2,000,000 2,295,162 0.04AT&T, Inc. 5.15% 15/03/2042 USD 1,217,000 1,319,648 0.03AT&T, Inc. 4.3% 15/12/2042 USD 22,645,000 21,968,367 0.43AT&T, Inc. 4.8% 15/06/2044 USD 2,085,000 2,162,677 0.04AT&T, Inc. 5.65% 15/02/2047 USD 1,250,000 1,454,669 0.03Atmos Energy Corp. 4.125% 15/10/2044 USD 2,715,000 2,978,048 0.06Baltimore Gas & Electric Co. 2.8%15/08/2022 USD 5,090,000 5,252,244 0.10Baltimore Gas & Electric Co. 3.35%01/07/2023 USD 5,555,000 5,897,910 0.11Bank of America Corp. 3.875%22/03/2017 USD 32,850,000 33,471,850 0.65Bank of America Corp. 2.6% 15/01/2019 USD 32,975,000 33,729,963 0.65Bank of America Corp. 2.25%21/04/2020 USD 5,000,000 5,030,275 0.10Bank of America Corp. 2.625%19/10/2020 USD 20,005,000 20,350,886 0.40Bank of America Corp. 2.625%19/04/2021 USD 5,800,000 5,886,826 0.11Bank of America Corp. 3.3% 11/01/2023 USD 1,000,000 1,033,510 0.02Bank of America Corp. 3.95%21/04/2025 USD 8,475,000 8,636,873 0.17Bank of America Corp. 4.45%03/03/2026 USD 5,420,000 5,708,723 0.11Bank of America Corp. 3.5%19/04/2026 USD 9,475,000 9,806,909 0.19Bank of America Corp. 4.25%22/10/2026 USD 9,800,000 10,155,936 0.20Bank of America Corp. 5% 21/01/2044 USD 2,000,000 2,321,910 0.04Bank of America NA 1.75% 05/06/2018 USD 11,105,000 11,169,798 0.22Baxalta, Inc. 3.6% 23/06/2022 USD 3,045,000 3,151,712 0.06Baxalta, Inc. 4% 23/06/2025 USD 5,110,000 5,337,855 0.10Baxalta, Inc. 5.25% 23/06/2045 USD 1,960,000 2,147,523 0.04Berkshire Hathaway Energy Co. 3.5%01/02/2025 USD 8,060,000 8,718,865 0.17Berkshire Hathaway Energy Co. 4.5%01/02/2045 USD 1,330,000 1,492,898 0.03Berkshire Hathaway, Inc. 2.75%15/03/2023 USD 7,360,000 7,610,498 0.15Berkshire Hathaway, Inc. 3.125%15/03/2026 USD 10,520,000 11,034,375 0.21Berkshire Hathaway, Inc. 1.625%16/03/2035 EUR 4,350,000 4,765,480 0.09Berkshire Hathaway, Inc. 4.5%11/02/2043 USD 6,730,000 7,722,002 0.15Boardwalk Pipelines LP 3.375%01/02/2023 USD 5,878,000 5,357,650 0.10Boardwalk Pipelines LP 5.95%01/06/2026 USD 6,330,000 6,606,684 0.13Boyd Gaming Corp. 9% 01/07/2020 USD 2,163,000 2,270,458 0.04Branch Banking & Trust Co. 3.625%16/09/2025 USD 7,765,000 8,365,367 0.16Bristol-Myers Squibb Co. 1.75%15/05/2035 EUR 12,099,000 14,273,767 0.28Bumble Bee Holdings, Inc., 144A 9%15/12/2017 USD 2,256,000 2,295,480 0.04Burlington Northern Santa Fe LLC3.05% 15/03/2022 USD 5,000,000 5,317,375 0.10Burlington Northern Santa Fe LLC 3%15/03/2023 USD 3,086,000 3,254,804 0.06Burlington Northern Santa Fe LLC 4.9%01/04/2044 USD 1,675,000 2,011,156 0.04Burlington Northern Santa Fe LLC4.55% 01/09/2044 USD 8,505,000 9,789,468 0.19Burlington Northern Santa Fe LLC4.15% 01/04/2045 USD 5,355,000 5,871,838 0.11Capital One Bank USA NA 3.375%15/02/2023 USD 6,194,000 6,343,337 0.12Capital One NA 1.65% 05/02/2018 USD 7,635,000 7,632,748 0.15Capital One NA 2.4% 05/09/2019 USD 20,635,000 20,890,461 0.41CenturyLink, Inc. 5.8% 15/03/2022 USD 1,000,000 968,980 0.02CF Industries, Inc. 4.95% 01/06/2043 USD 2,340,000 2,166,030 0.04Chevron Corp. 2.1% 16/05/2021 USD 12,575,000 12,805,563 0.25Chevron Corp. 2.355% 05/12/2022 USD 5,085,000 5,153,673 0.10
Chevron Corp. 2.566% 16/05/2023 USD 6,250,000 6,373,031 0.12Choice Hotels International, Inc. 5.75%01/07/2022 USD 2,154,000 2,319,643 0.04Chubb INA Holdings, Inc. 2.875%03/11/2022 USD 5,985,000 6,259,191 0.12Chubb INA Holdings, Inc. 4.35%03/11/2045 USD 1,955,000 2,260,136 0.04Cisco Systems, Inc. 2.2% 28/02/2021 USD 4,755,000 4,889,947 0.09Citigroup, Inc. 1.85% 24/11/2017 USD 8,355,000 8,404,211 0.16Citigroup, Inc. 1.8% 05/02/2018 USD 7,390,000 7,422,553 0.14Citigroup, Inc. 2.65% 26/10/2020 USD 17,855,000 18,188,531 0.35Citigroup, Inc. 4.4% 10/06/2025 USD 16,160,000 16,893,502 0.33Citigroup, Inc. 3.7% 12/01/2026 USD 13,550,000 14,269,099 0.28Citigroup, Inc. 4.6% 09/03/2026 USD 4,205,000 4,447,628 0.09Citigroup, Inc. 4.3% 20/11/2026 USD 3,155,000 3,269,006 0.06Citigroup, Inc. 4.45% 29/09/2027 USD 2,815,000 2,905,671 0.06Citigroup, Inc., Reg. S 5% 02/08/2019 EUR 3,550,000 4,516,453 0.09Columbia Pipeline Group, Inc. 2.45%01/06/2018 USD 1,745,000 1,750,551 0.03Comcast Corp. 3.15% 01/03/2026 USD 4,485,000 4,774,305 0.09Consolidated Edison Co. of New York,Inc. 4.5% 01/12/2045 USD 3,090,000 3,538,807 0.07Consolidated Edison Co. of New York,Inc. 4.625% 01/12/2054 USD 5,180,000 5,979,398 0.12Consumers Energy Co. 6.7%15/09/2019 USD 7,000,000 8,166,179 0.16Crown Castle International Corp., REIT3.4% 15/02/2021 USD 6,785,000 7,089,646 0.14Crown Castle International Corp., REIT4.45% 15/02/2026 USD 7,178,000 7,805,393 0.15Crown Castle International Corp., REIT3.7% 15/06/2026 USD 4,391,000 4,538,406 0.09CVS Health Corp. 4% 05/12/2023 USD 4,916,000 5,443,511 0.11CVS Health Corp. 3.875% 20/07/2025 USD 2,076,000 2,296,035 0.04CVS Health Corp. 2.875% 01/06/2026 USD 7,920,000 8,100,180 0.16CVS Health Corp. 5.125% 20/07/2045 USD 8,030,000 10,010,840 0.19DaVita HealthCare Partners, Inc. 5.125%15/07/2024 USD 2,220,000 2,246,862 0.04Devon Energy Corp. 3.25% 15/05/2022 USD 7,257,000 7,049,987 0.14Discover Bank 2% 21/02/2018 USD 21,640,000 21,693,256 0.42Discover Bank 4.2% 08/08/2023 USD 7,605,000 8,090,769 0.16Dominion Resources, Inc. 5.2%15/08/2019 USD 10,570,000 11,678,053 0.23Dominion Resources, Inc. 3.9%01/10/2025 USD 3,920,000 4,203,886 0.08Dominion Resources, Inc. 4.7%01/12/2044 USD 7,910,000 8,605,249 0.17Dow Chemical Co. (The) 4.625%01/10/2044 USD 1,500,000 1,601,580 0.03DTE Energy Co. 2.4% 01/12/2019 USD 2,815,000 2,875,016 0.06Duke Energy Carolinas LLC 3.875%15/03/2046 USD 3,160,000 3,398,296 0.07Duke Energy Corp. 3.05% 15/08/2022 USD 25,017,000 26,019,806 0.51Duke Energy Corp. 3.75% 15/04/2024 USD 895,000 964,949 0.02Duke Energy Progress LLC 4.15%01/12/2044 USD 3,925,000 4,422,062 0.09Duke Realty LP, REIT 3.875%15/02/2021 USD 4,060,000 4,299,126 0.08Edison International 2.95% 15/03/2023 USD 4,945,000 5,082,694 0.10Embarq Corp. 7.995% 01/06/2036 USD 1,749,000 1,751,134 0.03Energy Transfer Partners LP 4.75%15/01/2026 USD 5,920,000 6,084,221 0.12Entergy Corp. 4% 15/07/2022 USD 4,930,000 5,306,479 0.10Enterprise Products Operating LLC2.85% 15/04/2021 USD 4,880,000 5,047,291 0.10Enterprise Products Operating LLC3.9% 15/02/2024 USD 3,820,000 4,053,708 0.08Enterprise Products Operating LLC3.95% 15/02/2027 USD 4,810,000 5,122,337 0.10Enterprise Products Operating LLC4.9% 15/05/2046 USD 4,910,000 5,320,820 0.10Exelon Corp. 1.55% 09/06/2017 USD 5,990,000 5,999,105 0.12Exelon Corp. 2.45% 15/04/2021 USD 865,000 878,710 0.02Exelon Corp. 4.45% 15/04/2046 USD 2,545,000 2,709,598 0.05Exelon Generation Co. LLC 2.95%15/01/2020 USD 8,905,000 9,157,190 0.18Exxon Mobil Corp. 2.222% 01/03/2021 USD 3,880,000 3,997,273 0.08Exxon Mobil Corp. 3.043% 01/03/2026 USD 8,955,000 9,501,568 0.18Exxon Mobil Corp. 4.114% 01/03/2046 USD 4,500,000 5,102,167 0.10FedEx Corp. 4.55% 01/04/2046 USD 2,290,000 2,498,470 0.05Ford Motor Co. 4.75% 15/01/2043 USD 885,000 937,773 0.02Ford Motor Credit Co. LLC 4.25%03/02/2017 USD 2,145,000 2,181,572 0.04Ford Motor Credit Co. LLC 3.2%15/01/2021 USD 9,130,000 9,415,906 0.18Ford Motor Credit Co. LLC 4.25%20/09/2022 USD 6,175,000 6,645,751 0.13Ford Motor Credit Co. LLC 3.664%08/09/2024 USD 9,000,000 9,369,450 0.18
154
JPMorgan Funds - Global Corporate Bond FundSchedule of Investments (continued)
As at 30 June 2016
Investments Currency
Quantity/Nominal
Value
MarketValue
USD
%of
NetAssets Investments Currency
Quantity/Nominal
Value
MarketValue
USD
%of
NetAssets
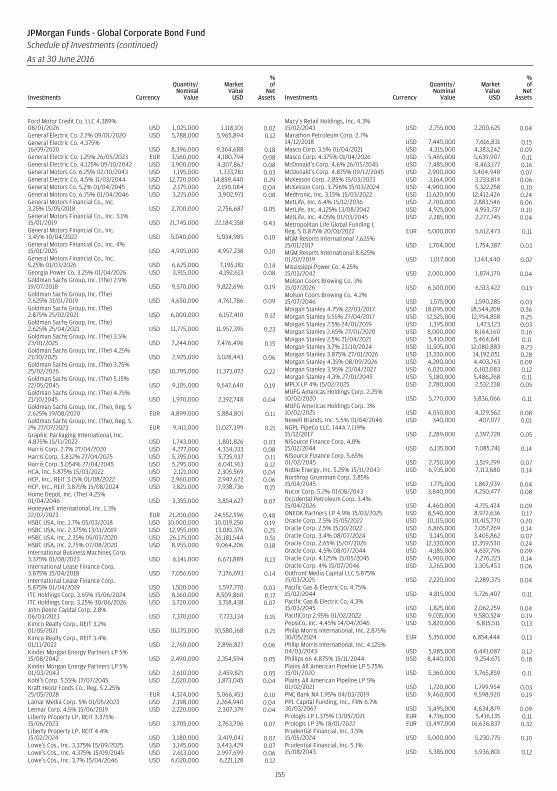
Ford Motor Credit Co. LLC 4.389%08/01/2026 USD 1,025,000 1,118,101 0.02General Electric Co. 2.2% 09/01/2020 USD 5,788,000 5,965,894 0.12General Electric Co. 4.375%16/09/2020 USD 8,396,000 9,364,688 0.18General Electric Co. 1.25% 26/05/2023 EUR 3,560,000 4,180,794 0.08General Electric Co. 4.125% 09/10/2042 USD 3,900,000 4,307,862 0.08General Motors Co. 6.25% 02/10/2043 USD 1,195,000 1,333,781 0.03General Electric Co. 4.5% 11/03/2044 USD 12,720,000 14,859,440 0.29General Motors Co. 5.2% 01/04/2045 USD 2,175,000 2,190,084 0.04General Motors Co. 6.75% 01/04/2046 USD 3,275,000 3,902,971 0.08General Motors Financial Co., Inc.3.25% 15/05/2018 USD 2,700,000 2,756,687 0.05General Motors Financial Co., Inc. 3.1%15/01/2019 USD 21,745,000 22,184,358 0.43General Motors Financial Co., Inc.3.45% 10/04/2022 USD 5,040,000 5,034,985 0.10General Motors Financial Co., Inc. 4%15/01/2025 USD 4,905,000 4,957,238 0.10General Motors Financial Co., Inc.5.25% 01/03/2026 USD 6,625,000 7,195,181 0.14Georgia Power Co. 3.25% 01/04/2026 USD 3,915,000 4,192,613 0.08Goldman Sachs Group, Inc. (The) 2.9%19/07/2018 USD 9,570,000 9,822,696 0.19Goldman Sachs Group, Inc. (The)2.625% 31/01/2019 USD 4,650,000 4,761,786 0.09Goldman Sachs Group, Inc. (The)2.875% 25/02/2021 USD 6,000,000 6,157,410 0.12Goldman Sachs Group, Inc. (The)2.625% 25/04/2021 USD 11,775,000 11,957,395 0.23Goldman Sachs Group, Inc. (The) 3.5%23/01/2025 USD 7,244,000 7,476,496 0.15Goldman Sachs Group, Inc. (The) 4.25%21/10/2025 USD 2,925,000 3,028,443 0.06Goldman Sachs Group, Inc. (The) 3.75%25/02/2026 USD 10,795,000 11,373,072 0.22Goldman Sachs Group, Inc. (The) 5.15%22/05/2045 USD 9,105,000 9,547,640 0.19Goldman Sachs Group, Inc. (The) 4.75%21/10/2045 USD 1,970,000 2,192,748 0.04Goldman Sachs Group, Inc. (The), Reg. S2.625% 19/08/2020 EUR 4,899,000 5,884,801 0.11Goldman Sachs Group, Inc. (The), Reg. S2% 27/07/2023 EUR 9,411,000 11,027,399 0.21Graphic Packaging International, Inc.4.875% 15/11/2022 USD 1,743,000 1,801,826 0.03Harris Corp. 2.7% 27/04/2020 USD 4,277,000 4,334,333 0.08Harris Corp. 3.832% 27/04/2025 USD 5,395,000 5,735,937 0.11Harris Corp. 5.054% 27/04/2045 USD 5,295,000 6,041,913 0.12HCA, Inc. 5.875% 15/03/2022 USD 2,121,000 2,305,569 0.04HCP, Inc., REIT 3.15% 01/08/2022 USD 2,960,000 2,947,672 0.06HCP, Inc., REIT 3.875% 15/08/2024 USD 7,825,000 7,938,736 0.15Home Depot, Inc. (The) 4.25%01/04/2046 USD 3,355,000 3,854,627 0.07Honeywell International, Inc. 1.3%22/02/2023 EUR 21,200,000 24,552,596 0.48HSBC USA, Inc. 1.7% 05/03/2018 USD 10,000,000 10,019,250 0.19HSBC USA, Inc. 2.375% 13/11/2019 USD 12,955,000 13,081,376 0.25HSBC USA, Inc. 2.35% 05/03/2020 USD 26,175,000 26,181,544 0.51HSBC USA, Inc. 2.75% 07/08/2020 USD 8,955,000 9,064,206 0.18International Business Machines Corp.3.375% 01/08/2023 USD 6,141,000 6,671,889 0.13International Lease Finance Corp.3.875% 15/04/2018 USD 7,056,000 7,176,693 0.14International Lease Finance Corp.5.875% 01/04/2019 USD 1,500,000 1,597,770 0.03ITC Holdings Corp. 3.65% 15/06/2024 USD 8,160,000 8,509,860 0.17ITC Holdings Corp. 3.25% 30/06/2026 USD 3,720,000 3,718,438 0.07John Deere Capital Corp. 2.8%06/03/2023 USD 7,370,000 7,723,134 0.15Kimco Realty Corp., REIT 3.2%01/05/2021 USD 10,175,000 10,580,168 0.21Kimco Realty Corp., REIT 3.4%01/11/2022 USD 2,760,000 2,896,827 0.06Kinder Morgan Energy Partners LP 5%15/08/2042 USD 2,490,000 2,354,594 0.05Kinder Morgan Energy Partners LP 5%01/03/2043 USD 2,610,000 2,459,821 0.05Kohl’s Corp. 5.55% 17/07/2045 USD 2,020,000 1,873,045 0.04Kraft Heinz Foods Co., Reg. S 2.25%25/05/2028 EUR 4,324,000 5,066,453 0.10Lamar Media Corp. 5% 01/05/2023 USD 2,198,000 2,264,940 0.04Lennar Corp. 4.5% 15/06/2019 USD 2,220,000 2,307,379 0.04Liberty Property LP, REIT 3.375%15/06/2023 USD 3,705,000 3,763,706 0.07Liberty Property LP, REIT 4.4%15/02/2024 USD 3,180,000 3,419,041 0.07Lowe’s Cos., Inc. 3.375% 15/09/2025 USD 3,145,000 3,443,429 0.07Lowe’s Cos., Inc. 4.375% 15/09/2045 USD 2,613,000 2,997,699 0.06Lowe’s Cos., Inc. 3.7% 15/04/2046 USD 6,020,000 6,221,128 0.12
Macy’s Retail Holdings, Inc. 4.3%15/02/2043 USD 2,755,000 2,200,625 0.04Marathon Petroleum Corp. 2.7%14/12/2018 USD 7,445,000 7,616,831 0.15Masco Corp. 3.5% 01/04/2021 USD 4,315,000 4,383,242 0.09Masco Corp. 4.375% 01/04/2026 USD 5,465,000 5,639,907 0.11McDonald’s Corp. 4.6% 26/05/2045 USD 7,485,000 8,463,177 0.16McDonald’s Corp. 4.875% 09/12/2045 USD 2,900,000 3,404,948 0.07McKesson Corp. 2.85% 15/03/2023 USD 3,164,000 3,233,814 0.06McKesson Corp. 3.796% 15/03/2024 USD 4,900,000 5,322,258 0.10Medtronic, Inc. 3.15% 15/03/2022 USD 11,620,000 12,412,426 0.24MetLife, Inc. 6.4% 15/12/2036 USD 2,700,000 2,883,546 0.06MetLife, Inc. 4.125% 13/08/2042 USD 4,925,000 4,953,737 0.10MetLife, Inc. 4.05% 01/03/2045 USD 2,285,000 2,277,745 0.04Metropolitan Life Global Funding I,Reg. S 0.875% 20/01/2022 EUR 5,000,000 5,612,473 0.11MGM Resorts International 7.625%15/01/2017 USD 1,704,000 1,754,387 0.03MGM Resorts International 8.625%01/02/2019 USD 1,017,000 1,144,440 0.02Mississippi Power Co. 4.25%15/03/2042 USD 2,000,000 1,874,170 0.04Molson Coors Brewing Co. 3%15/07/2026 USD 6,500,000 6,513,422 0.13Molson Coors Brewing Co. 4.2%15/07/2046 USD 1,575,000 1,590,285 0.03Morgan Stanley 4.75% 22/03/2017 USD 18,095,000 18,544,208 0.36Morgan Stanley 5.55% 27/04/2017 USD 12,525,000 12,954,858 0.25Morgan Stanley 2.5% 24/01/2019 USD 1,395,000 1,423,123 0.03Morgan Stanley 2.65% 27/01/2020 USD 8,000,000 8,164,160 0.16Morgan Stanley 2.5% 21/04/2021 USD 5,410,000 5,464,641 0.11Morgan Stanley 3.7% 23/10/2024 USD 11,505,000 12,080,883 0.23Morgan Stanley 3.875% 27/01/2026 USD 13,330,000 14,192,051 0.28Morgan Stanley 4.35% 08/09/2026 USD 4,200,000 4,403,763 0.09Morgan Stanley 3.95% 23/04/2027 USD 6,020,000 6,102,083 0.12Morgan Stanley 4.3% 27/01/2045 USD 5,180,000 5,486,268 0.11MPLX LP 4% 15/02/2025 USD 2,780,000 2,532,238 0.05MUFG Americas Holdings Corp. 2.25%10/02/2020 USD 5,770,000 5,836,066 0.11MUFG Americas Holdings Corp. 3%10/02/2025 USD 4,050,000 4,129,562 0.08Newell Brands, Inc. 5.5% 01/04/2046 USD 340,000 407,077 0.01NGPL PipeCo LLC, 144A 7.119%15/12/2017 USD 2,289,000 2,397,728 0.05NiSource Finance Corp. 4.8%15/02/2044 USD 6,135,000 7,085,741 0.14NiSource Finance Corp. 5.65%01/02/2045 USD 2,750,000 3,519,299 0.07Noble Energy, Inc. 5.25% 15/11/2043 USD 6,935,000 7,113,680 0.14Northrop Grumman Corp. 3.85%15/04/2045 USD 1,775,000 1,867,939 0.04Nucor Corp. 5.2% 01/08/2043 USD 3,840,000 4,250,477 0.08Occidental Petroleum Corp. 3.4%15/04/2026 USD 4,460,000 4,715,424 0.09ONEOK Partners LP 4.9% 15/03/2025 USD 8,540,000 8,972,636 0.17Oracle Corp. 2.5% 15/05/2022 USD 10,115,000 10,415,770 0.20Oracle Corp. 2.5% 15/10/2022 USD 6,865,000 7,057,769 0.14Oracle Corp. 3.4% 08/07/2024 USD 3,145,000 3,405,862 0.07Oracle Corp. 2.65% 15/07/2026 USD 12,330,000 12,359,530 0.24Oracle Corp. 4.5% 08/07/2044 USD 4,185,000 4,637,796 0.09Oracle Corp. 4.125% 15/05/2045 USD 6,900,000 7,276,223 0.14Oracle Corp. 4% 15/07/2046 USD 3,265,000 3,305,453 0.06Outfront Media Capital LLC 5.875%15/03/2025 USD 2,220,000 2,289,375 0.04Pacific Gas & Electric Co. 4.75%15/02/2044 USD 4,815,000 5,726,407 0.11Pacific Gas & Electric Co. 4.3%15/03/2045 USD 1,825,000 2,062,259 0.04PacifiCorp 2.95% 01/02/2022 USD 9,035,000 9,580,524 0.19PepsiCo, Inc. 4.45% 14/04/2046 USD 5,820,000 6,815,511 0.13Philip Morris International, Inc. 2.875%30/05/2024 EUR 5,350,000 6,854,444 0.13Philip Morris International, Inc. 4.125%04/03/2043 USD 5,985,000 6,441,087 0.12Phillips 66 4.875% 15/11/2044 USD 8,440,000 9,254,671 0.18Plains All American Pipeline LP 5.75%15/01/2020 USD 5,360,000 5,765,859 0.11Plains All American Pipeline LP 5%01/02/2021 USD 1,720,000 1,799,954 0.03PNC Bank NA 1.95% 04/03/2019 USD 9,460,000 9,598,920 0.19PPL Capital Funding, Inc., FRN 6.7%30/03/2067 USD 5,495,000 4,634,879 0.09Prologis LP 1.375% 13/05/2021 EUR 4,736,000 5,416,135 0.11Prologis LP 3% 18/01/2022 EUR 13,497,000 16,636,837 0.32Prudential Financial, Inc. 3.5%15/05/2024 USD 5,000,000 5,230,775 0.10Prudential Financial, Inc. 5.1%15/08/2043 USD 5,385,000 5,936,801 0.12
155
JPMorgan Funds - Global Corporate Bond FundSchedule of Investments (continued)
As at 30 June 2016
Investments Currency
Quantity/Nominal
Value
MarketValue
USD
%of
NetAssets Investments Currency
Quantity/Nominal
Value
MarketValue
USD
%of
NetAssets
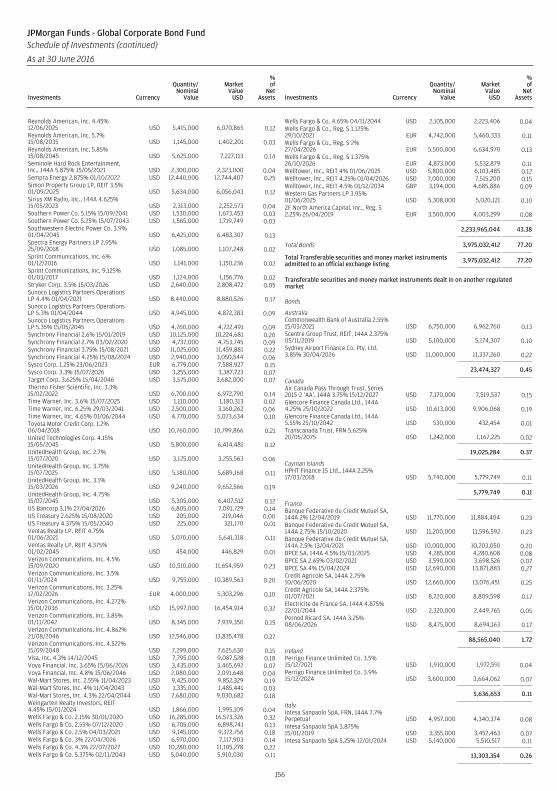
Reynolds American, Inc. 4.45%12/06/2025 USD 5,415,000 6,070,865 0.12Reynolds American, Inc. 5.7%15/08/2035 USD 1,145,000 1,402,201 0.03Reynolds American, Inc. 5.85%15/08/2045 USD 5,625,000 7,227,113 0.14Seminole Hard Rock Entertainment,Inc., 144A 5.875% 15/05/2021 USD 2,300,000 2,323,000 0.04Sempra Energy 2.875% 01/10/2022 USD 12,440,000 12,744,407 0.25Simon Property Group LP, REIT 3.5%01/09/2025 USD 5,634,000 6,056,043 0.12Sirius XM Radio, Inc., 144A 4.625%15/05/2023 USD 2,313,000 2,252,573 0.04Southern Power Co. 5.15% 15/09/2041 USD 1,530,000 1,673,453 0.03Southern Power Co. 5.25% 15/07/2043 USD 1,565,000 1,719,749 0.03Southwestern Electric Power Co. 3.9%01/04/2045 USD 6,425,000 6,483,307 0.13Spectra Energy Partners LP 2.95%25/09/2018 USD 1,085,000 1,107,248 0.02Sprint Communications, Inc. 6%01/12/2016 USD 1,141,000 1,150,236 0.02Sprint Communications, Inc. 9.125%01/03/2017 USD 1,124,000 1,156,776 0.02Stryker Corp. 3.5% 15/03/2026 USD 2,640,000 2,808,472 0.05Sunoco Logistics Partners OperationsLP 4.4% 01/04/2021 USD 8,440,000 8,880,526 0.17Sunoco Logistics Partners OperationsLP 5.3% 01/04/2044 USD 4,945,000 4,872,383 0.09Sunoco Logistics Partners OperationsLP 5.35% 15/05/2045 USD 4,760,000 4,722,491 0.09Synchrony Financial 2.6% 15/01/2019 USD 10,125,000 10,224,681 0.20Synchrony Financial 2.7% 03/02/2020 USD 4,737,000 4,753,745 0.09Synchrony Financial 3.75% 15/08/2021 USD 11,025,000 11,459,881 0.22Synchrony Financial 4.25% 15/08/2024 USD 2,940,000 3,050,544 0.06Sysco Corp. 1.25% 23/06/2023 EUR 6,779,000 7,588,927 0.15Sysco Corp. 3.3% 15/07/2026 USD 3,255,000 3,387,723 0.07Target Corp. 3.625% 15/04/2046 USD 3,575,000 3,682,000 0.07Thermo Fisher Scientific, Inc. 3.3%15/02/2022 USD 6,700,000 6,972,790 0.14Time Warner, Inc. 3.6% 15/07/2025 USD 1,110,000 1,180,313 0.02Time Warner, Inc. 6.25% 29/03/2041 USD 2,500,000 3,160,262 0.06Time Warner, Inc. 4.65% 01/06/2044 USD 4,770,000 5,073,634 0.10Toyota Motor Credit Corp. 1.2%06/04/2018 USD 10,760,000 10,799,866 0.21United Technologies Corp. 4.15%15/05/2045 USD 5,800,000 6,414,481 0.12UnitedHealth Group, Inc. 2.7%15/07/2020 USD 3,125,000 3,255,563 0.06UnitedHealth Group, Inc. 3.75%15/07/2025 USD 5,180,000 5,689,168 0.11UnitedHealth Group, Inc. 3.1%15/03/2026 USD 9,240,000 9,652,566 0.19UnitedHealth Group, Inc. 4.75%15/07/2045 USD 5,305,000 6,407,512 0.12US Bancorp 3.1% 27/04/2026 USD 6,805,000 7,091,729 0.14US Treasury 2.625% 15/08/2020 USD 205,000 219,046 0.00US Treasury 4.375% 15/05/2040 USD 225,000 321,170 0.01Ventas Realty LP, REIT 4.75%01/06/2021 USD 5,070,000 5,641,318 0.11Ventas Realty LP, REIT 4.375%01/02/2045 USD 454,000 446,829 0.01Verizon Communications, Inc. 4.5%15/09/2020 USD 10,510,000 11,654,959 0.23Verizon Communications, Inc. 3.5%01/11/2024 USD 9,755,000 10,389,563 0.20Verizon Communications, Inc. 3.25%17/02/2026 EUR 4,000,000 5,303,296 0.10Verizon Communications, Inc. 4.272%15/01/2036 USD 15,997,000 16,454,914 0.32Verizon Communications, Inc. 3.85%01/11/2042 USD 8,345,000 7,939,350 0.15Verizon Communications, Inc. 4.862%21/08/2046 USD 12,546,000 13,835,478 0.27Verizon Communications, Inc. 4.522%15/09/2048 USD 7,299,000 7,625,630 0.15Visa, Inc. 4.3% 14/12/2045 USD 7,795,000 9,087,528 0.18Voya Financial, Inc. 3.65% 15/06/2026 USD 3,435,000 3,465,692 0.07Voya Financial, Inc. 4.8% 15/06/2046 USD 2,080,000 2,091,648 0.04Wal-Mart Stores, Inc. 2.55% 11/04/2023 USD 9,425,000 9,852,329 0.19Wal-Mart Stores, Inc. 4% 11/04/2043 USD 1,335,000 1,485,441 0.03Wal-Mart Stores, Inc. 4.3% 22/04/2044 USD 7,680,000 9,030,682 0.18Weingarten Realty Investors, REIT4.45% 15/01/2024 USD 1,866,000 1,995,109 0.04Wells Fargo & Co. 2.15% 30/01/2020 USD 16,285,000 16,573,326 0.32Wells Fargo & Co. 2.55% 07/12/2020 USD 6,705,000 6,898,741 0.13Wells Fargo & Co. 2.5% 04/03/2021 USD 9,145,000 9,372,756 0.18Wells Fargo & Co. 3% 22/04/2026 USD 6,970,000 7,117,903 0.14Wells Fargo & Co. 4.3% 22/07/2027 USD 10,280,000 11,105,278 0.22Wells Fargo & Co. 5.375% 02/11/2043 USD 5,040,000 5,910,030 0.11
Wells Fargo & Co. 4.65% 04/11/2044 USD 2,105,000 2,223,406 0.04Wells Fargo & Co., Reg. S 1.125%29/10/2021 EUR 4,742,000 5,460,333 0.11Wells Fargo & Co., Reg. S 2%27/04/2026 EUR 5,500,000 6,634,970 0.13Wells Fargo & Co., Reg. S 1.375%26/10/2026 EUR 4,873,000 5,532,879 0.11Welltower, Inc., REIT 4% 01/06/2025 USD 5,800,000 6,103,485 0.12Welltower, Inc., REIT 4.25% 01/04/2026 USD 7,000,000 7,515,200 0.15Welltower, Inc., REIT 4.5% 01/12/2034 GBP 3,194,000 4,685,886 0.09Western Gas Partners LP 3.95%01/06/2025 USD 5,308,000 5,020,121 0.10ZF North America Capital, Inc., Reg. S2.25% 26/04/2019 EUR 3,500,000 4,003,299 0.08
2,233,965,044 43.38
Total Bonds 3,975,032,412 77.20
Total Transferable securities and money market instrumentsadmitted to an official exchange listing 3,975,032,412 77.20
Transferable securities and money market instruments dealt in on another regulatedmarket
Bonds
AustraliaCommonwealth Bank of Australia 2.55%15/03/2021 USD 6,750,000 6,962,760 0.13Scentre Group Trust, REIT, 144A 2.375%05/11/2019 USD 5,100,000 5,174,307 0.10Sydney Airport Finance Co. Pty. Ltd.3.85% 30/04/2026 USD 11,000,000 11,337,260 0.22
23,474,327 0.45
CanadaAir Canada Pass Through Trust, Series2015-2 ‘AA’, 144A 3.75% 15/12/2027 USD 7,170,000 7,519,537 0.15Glencore Finance Canada Ltd., 144A4.25% 25/10/2022 USD 10,613,000 9,906,068 0.19Glencore Finance Canada Ltd., 144A5.55% 25/10/2042 USD 530,000 432,454 0.01Transcanada Trust, FRN 5.625%20/05/2075 USD 1,242,000 1,167,225 0.02
19,025,284 0.37
Cayman IslandsHPHT Finance 15 Ltd., 144A 2.25%17/03/2018 USD 5,740,000 5,779,749 0.11
5,779,749 0.11
FranceBanque Federative du Credit Mutuel SA,144A 2% 12/04/2019 USD 11,770,000 11,884,404 0.23Banque Federative du Credit Mutuel SA,144A 2.75% 15/10/2020 USD 11,200,000 11,596,592 0.23Banque Federative du Credit Mutuel SA,144A 2.5% 13/04/2021 USD 10,000,000 10,203,050 0.20BPCE SA, 144A 4.5% 15/03/2025 USD 4,285,000 4,280,608 0.08BPCE SA 2.65% 03/02/2021 USD 3,590,000 3,698,526 0.07BPCE SA 4% 15/04/2024 USD 12,690,000 13,871,883 0.27Credit Agricole SA, 144A 2.75%10/06/2020 USD 12,660,000 13,076,451 0.25Credit Agricole SA, 144A 2.375%01/07/2021 USD 8,720,000 8,809,598 0.17Electricite de France SA, 144A 4.875%22/01/2044 USD 2,320,000 2,449,765 0.05Pernod Ricard SA, 144A 3.25%08/06/2026 USD 8,475,000 8,694,163 0.17
88,565,040 1.72
IrelandPerrigo Finance Unlimited Co. 3.5%15/12/2021 USD 1,910,000 1,972,591 0.04Perrigo Finance Unlimited Co. 3.9%15/12/2024 USD 3,600,000 3,664,062 0.07
5,636,653 0.11
ItalyIntesa Sanpaolo SpA, FRN, 144A 7.7%Perpetual USD 4,957,000 4,340,374 0.08Intesa Sanpaolo SpA 3.875%15/01/2019 USD 3,355,000 3,452,463 0.07Intesa Sanpaolo SpA 5.25% 12/01/2024 USD 5,140,000 5,510,517 0.11
13,303,354 0.26
156
JPMorgan Funds - Global Corporate Bond FundSchedule of Investments (continued)
As at 30 June 2016
Investments Currency
Quantity/Nominal
Value
MarketValue
USD
%of
NetAssets Investments Currency
Quantity/Nominal
Value
MarketValue
USD
%of
NetAssets
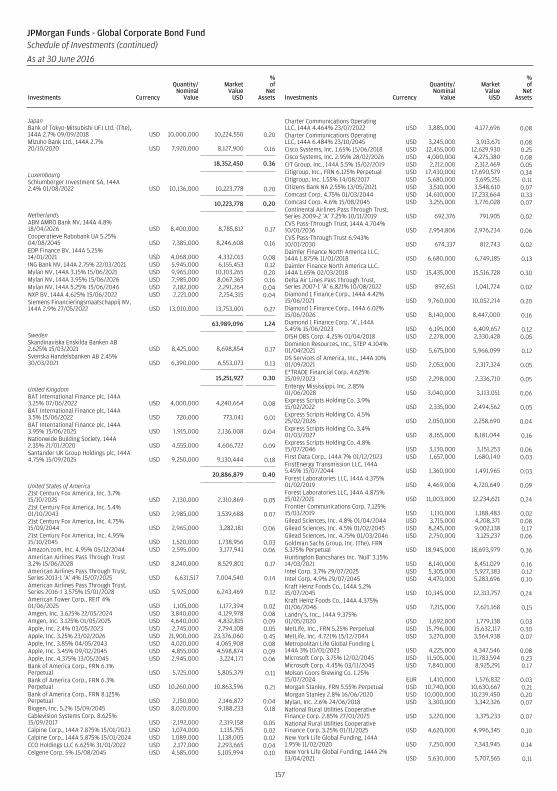
JapanBank of Tokyo-Mitsubishi UFJ Ltd. (The),144A 2.7% 09/09/2018 USD 10,000,000 10,224,550 0.20Mizuho Bank Ltd., 144A 2.7%20/10/2020 USD 7,920,000 8,127,900 0.16
18,352,450 0.36
LuxembourgSchlumberger Investment SA, 144A2.4% 01/08/2022 USD 10,136,000 10,223,778 0.20
10,223,778 0.20
NetherlandsABN AMRO Bank NV, 144A 4.8%18/04/2026 USD 8,400,000 8,785,812 0.17Cooperatieve Rabobank UA 5.25%04/08/2045 USD 7,385,000 8,246,608 0.16EDP Finance BV, 144A 5.25%14/01/2021 USD 4,068,000 4,332,013 0.08ING Bank NV, 144A 2.75% 22/03/2021 USD 5,945,000 6,155,453 0.12Mylan NV, 144A 3.15% 15/06/2021 USD 9,965,000 10,103,265 0.20Mylan NV, 144A 3.95% 15/06/2026 USD 7,985,000 8,067,365 0.16Mylan NV, 144A 5.25% 15/06/2046 USD 2,182,000 2,291,264 0.04NXP BV, 144A 4.625% 15/06/2022 USD 2,221,000 2,254,315 0.04Siemens Financieringsmaatschappij NV,144A 2.9% 27/05/2022 USD 13,010,000 13,753,001 0.27
63,989,096 1.24
SwedenSkandinaviska Enskilda Banken AB2.625% 15/03/2021 USD 8,425,000 8,698,854 0.17Svenska Handelsbanken AB 2.45%30/03/2021 USD 6,390,000 6,553,073 0.13
15,251,927 0.30
United KingdomBAT International Finance plc, 144A3.25% 07/06/2022 USD 4,000,000 4,240,664 0.08BAT International Finance plc, 144A3.5% 15/06/2022 USD 720,000 773,041 0.01BAT International Finance plc, 144A3.95% 15/06/2025 USD 1,915,000 2,136,008 0.04Nationwide Building Society, 144A2.35% 21/01/2020 USD 4,555,000 4,606,722 0.09Santander UK Group Holdings plc, 144A4.75% 15/09/2025 USD 9,250,000 9,130,444 0.18
20,886,879 0.40
United States of America21st Century Fox America, Inc. 3.7%15/10/2025 USD 2,130,000 2,310,869 0.0521st Century Fox America, Inc. 5.4%01/10/2043 USD 2,985,000 3,539,688 0.0721st Century Fox America, Inc. 4.75%15/09/2044 USD 2,965,000 3,282,181 0.0621st Century Fox America, Inc. 4.95%15/10/2045 USD 1,520,000 1,738,956 0.03Amazon.com, Inc. 4.95% 05/12/2044 USD 2,595,000 3,177,941 0.06American Airlines Pass Through Trust3.2% 15/06/2028 USD 8,240,000 8,529,801 0.17American Airlines Pass Through Trust,Series 2013-1 ‘A’ 4% 15/07/2025 USD 6,631,517 7,004,540 0.14American Airlines Pass Through Trust,Series 2016-1 3.575% 15/01/2028 USD 5,925,000 6,243,469 0.12American Tower Corp., REIT 4%01/06/2025 USD 1,105,000 1,177,394 0.02Amgen, Inc. 3.625% 22/05/2024 USD 3,840,000 4,129,978 0.08Amgen, Inc. 3.125% 01/05/2025 USD 4,640,000 4,832,815 0.09Apple, Inc. 2.4% 03/05/2023 USD 2,745,000 2,794,108 0.05Apple, Inc. 3.25% 23/02/2026 USD 21,900,000 23,376,060 0.45Apple, Inc. 3.85% 04/05/2043 USD 4,020,000 4,065,908 0.08Apple, Inc. 3.45% 09/02/2045 USD 4,855,000 4,598,874 0.09Apple, Inc. 4.375% 13/05/2045 USD 2,945,000 3,224,171 0.06Bank of America Corp., FRN 6.1%Perpetual USD 5,725,000 5,805,379 0.11Bank of America Corp., FRN 6.3%Perpetual USD 10,260,000 10,863,596 0.21Bank of America Corp., FRN 8.125%Perpetual USD 2,150,000 2,146,872 0.04Biogen, Inc. 5.2% 15/09/2045 USD 8,020,000 9,188,233 0.18Cablevision Systems Corp. 8.625%15/09/2017 USD 2,192,000 2,319,158 0.05Calpine Corp., 144A 7.875% 15/01/2023 USD 1,074,000 1,135,755 0.02Calpine Corp., 144A 5.875% 15/01/2024 USD 1,089,000 1,138,005 0.02CCO Holdings LLC 6.625% 31/01/2022 USD 2,177,000 2,293,665 0.04Celgene Corp. 5% 15/08/2045 USD 4,585,000 5,105,994 0.10
Charter Communications OperatingLLC, 144A 4.464% 23/07/2022 USD 3,885,000 4,177,696 0.08Charter Communications OperatingLLC, 144A 6.484% 23/10/2045 USD 3,245,000 3,913,671 0.08Cisco Systems, Inc. 1.65% 15/06/2018 USD 12,455,000 12,629,930 0.25Cisco Systems, Inc. 2.95% 28/02/2026 USD 4,000,000 4,275,380 0.08CIT Group, Inc., 144A 5.5% 15/02/2019 USD 2,212,000 2,312,469 0.05Citigroup, Inc., FRN 6.125% Perpetual USD 17,430,000 17,690,579 0.34Citigroup, Inc. 1.55% 14/08/2017 USD 5,680,000 5,695,251 0.11Citizens Bank NA 2.55% 13/05/2021 USD 3,510,000 3,548,610 0.07Comcast Corp. 4.75% 01/03/2044 USD 14,610,000 17,233,664 0.33Comcast Corp. 4.6% 15/08/2045 USD 3,255,000 3,776,028 0.07Continental Airlines Pass Through Trust,Series 2009-2 ‘A’ 7.25% 10/11/2019 USD 692,376 791,905 0.02CVS Pass-Through Trust, 144A 4.704%10/01/2036 USD 2,954,806 2,976,234 0.06CVS Pass-Through Trust 6.943%10/01/2030 USD 674,337 812,743 0.02Daimler Finance North America LLC,144A 1.875% 11/01/2018 USD 6,680,000 6,749,185 0.13Daimler Finance North America LLC,144A 1.65% 02/03/2018 USD 15,435,000 15,516,728 0.30Delta Air Lines Pass Through Trust,Series 2007-1 ‘A’ 6.821% 10/08/2022 USD 892,651 1,041,724 0.02Diamond 1 Finance Corp., 144A 4.42%15/06/2021 USD 9,760,000 10,052,214 0.20Diamond 1 Finance Corp., 144A 6.02%15/06/2026 USD 8,140,000 8,447,000 0.16Diamond 1 Finance Corp. ‘A’, 144A5.45% 15/06/2023 USD 6,195,000 6,409,657 0.12DISH DBS Corp. 4.25% 01/04/2018 USD 2,278,000 2,330,428 0.05Dominion Resources, Inc., STEP 4.104%01/04/2021 USD 5,675,000 5,966,099 0.12DS Services of America, Inc., 144A 10%01/09/2021 USD 2,053,000 2,317,324 0.05E*TRADE Financial Corp. 4.625%15/09/2023 USD 2,298,000 2,336,710 0.05Entergy Mississippi, Inc. 2.85%01/06/2028 USD 3,040,000 3,113,051 0.06Express Scripts Holding Co. 3.9%15/02/2022 USD 2,335,000 2,494,562 0.05Express Scripts Holding Co. 4.5%25/02/2026 USD 2,050,000 2,258,690 0.04Express Scripts Holding Co. 3.4%01/03/2027 USD 8,165,000 8,181,044 0.16Express Scripts Holding Co. 4.8%15/07/2046 USD 3,130,000 3,151,253 0.06First Data Corp., 144A 7% 01/12/2023 USD 1,657,000 1,680,140 0.03FirstEnergy Transmission LLC, 144A5.45% 15/07/2044 USD 1,360,000 1,491,965 0.03Forest Laboratories LLC, 144A 4.375%01/02/2019 USD 4,469,000 4,720,649 0.09Forest Laboratories LLC, 144A 4.875%15/02/2021 USD 11,003,000 12,234,621 0.24Frontier Communications Corp. 7.125%15/03/2019 USD 1,110,000 1,188,483 0.02Gilead Sciences, Inc. 4.8% 01/04/2044 USD 3,715,000 4,208,371 0.08Gilead Sciences, Inc. 4.5% 01/02/2045 USD 8,245,000 9,002,138 0.17Gilead Sciences, Inc. 4.75% 01/03/2046 USD 2,750,000 3,125,237 0.06Goldman Sachs Group, Inc. (The), FRN5.375% Perpetual USD 18,945,000 18,693,979 0.36Huntington Bancshares Inc. ‘Null’ 3.15%14/03/2021 USD 8,140,000 8,451,029 0.16Intel Corp. 3.7% 29/07/2025 USD 5,305,000 5,927,383 0.12Intel Corp. 4.9% 29/07/2045 USD 4,470,000 5,283,696 0.10Kraft Heinz Foods Co., 144A 5.2%15/07/2045 USD 10,345,000 12,313,757 0.24Kraft Heinz Foods Co., 144A 4.375%01/06/2046 USD 7,215,000 7,621,168 0.15Landry’s, Inc., 144A 9.375%01/05/2020 USD 1,692,000 1,779,138 0.03MetLife, Inc., FRN 5.25% Perpetual USD 15,796,000 15,632,117 0.30MetLife, Inc. 4.721% 15/12/2044 USD 3,270,000 3,564,938 0.07Metropolitan Life Global Funding I,144A 3% 10/01/2023 USD 4,225,000 4,347,546 0.08Microsoft Corp. 3.75% 12/02/2045 USD 11,505,000 11,783,594 0.23Microsoft Corp. 4.45% 03/11/2045 USD 7,840,000 8,925,291 0.17Molson Coors Brewing Co. 1.25%15/07/2024 EUR 1,410,000 1,576,832 0.03Morgan Stanley, FRN 5.55% Perpetual USD 10,740,000 10,630,667 0.21Morgan Stanley 2.8% 16/06/2020 USD 10,000,000 10,239,450 0.20Mylan, Inc. 2.6% 24/06/2018 USD 3,300,000 3,342,326 0.07National Rural Utilities CooperativeFinance Corp. 2.85% 27/01/2025 USD 3,220,000 3,375,233 0.07National Rural Utilities CooperativeFinance Corp. 3.25% 01/11/2025 USD 4,620,000 4,996,345 0.10New York Life Global Funding, 144A1.95% 11/02/2020 USD 7,250,000 7,343,945 0.14New York Life Global Funding, 144A 2%13/04/2021 USD 5,630,000 5,707,565 0.11
157
JPMorgan Funds - Global Corporate Bond FundSchedule of Investments (continued)
As at 30 June 2016
Investments Currency
Quantity/Nominal
Value
MarketValue
USD
%of
NetAssets Investments Currency
Quantity/Nominal
Value
MarketValue
USD
%of
NetAssets
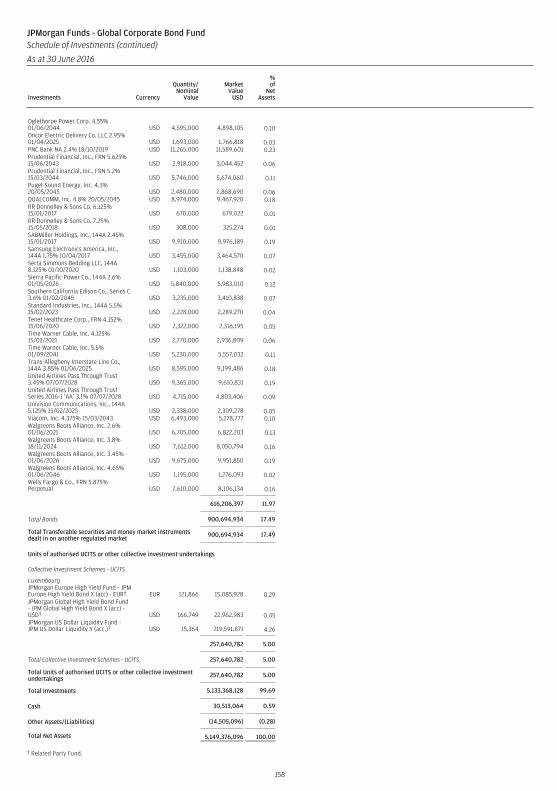
Oglethorpe Power Corp. 4.55%01/06/2044 USD 4,595,000 4,898,105 0.10Oncor Electric Delivery Co. LLC 2.95%01/04/2025 USD 1,693,000 1,766,818 0.03PNC Bank NA 2.4% 18/10/2019 USD 11,265,000 11,589,601 0.23Prudential Financial, Inc., FRN 5.625%15/06/2043 USD 2,918,000 3,044,452 0.06Prudential Financial, Inc., FRN 5.2%15/03/2044 USD 5,746,000 5,674,060 0.11Puget Sound Energy, Inc. 4.3%20/05/2045 USD 2,480,000 2,868,690 0.06QUALCOMM, Inc. 4.8% 20/05/2045 USD 8,974,000 9,467,920 0.18RR Donnelley & Sons Co. 6.125%15/01/2017 USD 670,000 679,022 0.01RR Donnelley & Sons Co. 7.25%15/05/2018 USD 308,000 325,274 0.01SABMiller Holdings, Inc., 144A 2.45%15/01/2017 USD 9,910,000 9,976,189 0.19Samsung Electronics America, Inc.,144A 1.75% 10/04/2017 USD 3,455,000 3,464,570 0.07Serta Simmons Bedding LLC, 144A8.125% 01/10/2020 USD 1,103,000 1,138,848 0.02Sierra Pacific Power Co., 144A 2.6%01/05/2026 USD 5,840,000 5,983,010 0.12Southern California Edison Co., Series C3.6% 01/02/2045 USD 3,235,000 3,410,838 0.07Standard Industries, Inc., 144A 5.5%15/02/2023 USD 2,228,000 2,289,270 0.04Tenet Healthcare Corp., FRN 4.152%15/06/2020 USD 2,322,000 2,316,195 0.05Time Warner Cable, Inc. 4.125%15/02/2021 USD 2,770,000 2,936,809 0.06Time Warner Cable, Inc. 5.5%01/09/2041 USD 5,230,000 5,557,032 0.11Trans-Allegheny Interstate Line Co.,144A 3.85% 01/06/2025 USD 8,595,000 9,199,486 0.18United Airlines Pass Through Trust3.45% 07/07/2028 USD 9,365,000 9,610,831 0.19United Airlines Pass Through TrustSeries 2016-1 ‘AA’ 3.1% 07/07/2028 USD 4,715,000 4,803,406 0.09Univision Communications, Inc., 144A5.125% 15/02/2025 USD 2,338,000 2,309,278 0.05Viacom, Inc. 4.375% 15/03/2043 USD 6,493,000 5,278,777 0.10Walgreens Boots Alliance, Inc. 2.6%01/06/2021 USD 6,705,000 6,822,203 0.13Walgreens Boots Alliance, Inc. 3.8%18/11/2024 USD 7,612,000 8,050,794 0.16Walgreens Boots Alliance, Inc. 3.45%01/06/2026 USD 9,675,000 9,951,850 0.19Walgreens Boots Alliance, Inc. 4.65%01/06/2046 USD 1,195,000 1,276,093 0.02Wells Fargo & Co., FRN 5.875%Perpetual USD 7,610,000 8,106,134 0.16
616,206,397 11.97
Total Bonds 900,694,934 17.49
Total Transferable securities and money market instrumentsdealt in on another regulated market 900,694,934 17.49
Units of authorised UCITS or other collective investment undertakings
Collective Investment Schemes - UCITS
LuxembourgJPMorgan Europe High Yield Fund - JPMEurope High Yield Bond X (acc) - EUR† EUR 121,866 15,085,928 0.29JPMorgan Global High Yield Bond Fund- JPM Global High Yield Bond X (acc) -USD† USD 166,749 22,962,983 0.45JPMorgan US Dollar Liquidity Fund -JPM US Dollar Liquidity X (acc.)† USD 15,364 219,591,871 4.26
257,640,782 5.00
Total Collective Investment Schemes - UCITS 257,640,782 5.00
Total Units of authorised UCITS or other collective investmentundertakings 257,640,782 5.00
Total Investments 5,133,368,128 99.69
Cash 30,513,064 0.59
Other Assets/(Liabilities) (14,505,096) (0.28)
Total Net Assets 5,149,376,096 100.00
† Related Party Fund.
158
JPMorgan Funds - Global Corporate Bond FundSchedule of Investments (continued)
As at 30 June 2016
Investments Currency
Quantity/Nominal
Value
MarketValue
USD
%of
NetAssets Investments Currency
Quantity/Nominal
Value
MarketValue
USD
%of
NetAssets
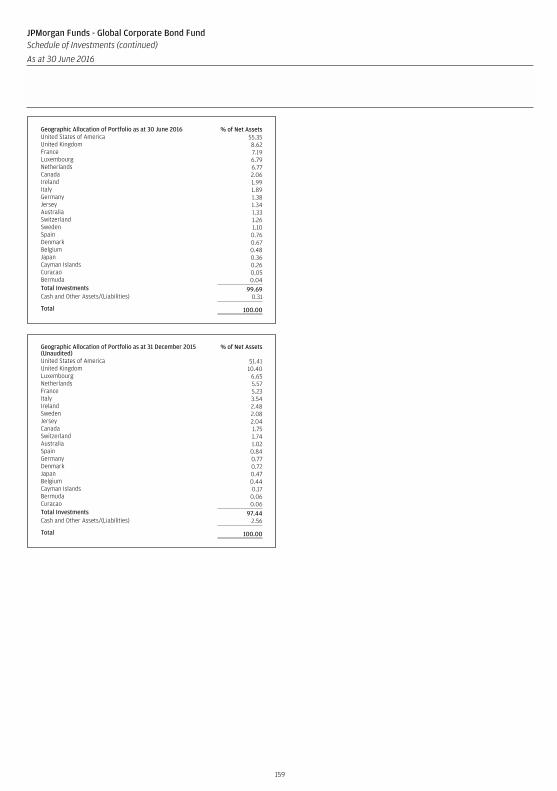
Geographic Allocation of Portfolio as at 30 June 2016 % of Net AssetsUnited States of America 55.35United Kingdom 8.62France 7.19Luxembourg 6.79Netherlands 6.77Canada 2.06Ireland 1.99Italy 1.89Germany 1.38Jersey 1.34Australia 1.33Switzerland 1.26Sweden 1.10Spain 0.76Denmark 0.67Belgium 0.48Japan 0.36Cayman Islands 0.26Curacao 0.05Bermuda 0.04Total Investments 99.69Cash and Other Assets/(Liabilities) 0.31
Total 100.00
Geographic Allocation of Portfolio as at 31 December 2015(Unaudited)
% of Net Assets
United States of America 51.41United Kingdom 10.40Luxembourg 6.65Netherlands 5.57France 5.23Italy 3.54Ireland 2.48Sweden 2.08Jersey 2.04Canada 1.75Switzerland 1.74Australia 1.02Spain 0.84Germany 0.77Denmark 0.72Japan 0.47Belgium 0.44Cayman Islands 0.17Bermuda 0.06Curacao 0.06Total Investments 97.44Cash and Other Assets/(Liabilities) 2.56
Total 100.00
159
JPMorgan Funds - Global Corporate Bond FundSchedule of Investments (continued)
As at 30 June 2016
Investments Currency
Quantity/Nominal
Value
MarketValue
USD
%of
NetAssets Investments Currency
Quantity/Nominal
Value
MarketValue
USD
%of
NetAssets
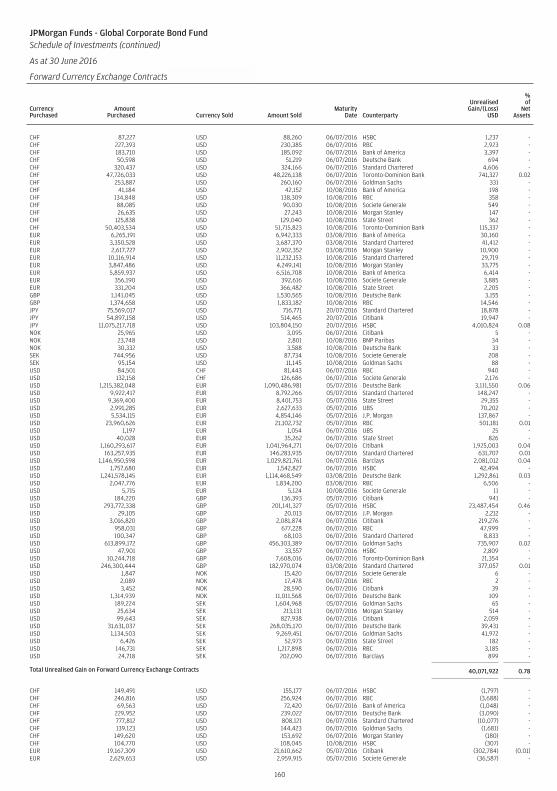
JPMorgan Funds - Global Corporate Bond FundSchedule of Investments (continued)
As at 30 June 2016
Forward Currency Exchange Contracts (continued)
CurrencyPurchased
AmountPurchased Currency Sold Amount Sold
MaturityDate Counterparty
UnrealisedGain/(Loss)
USD
%of
NetAssets
CHF 87,227 USD 88,260 06/07/2016 HSBC 1,237 -CHF 227,393 USD 230,385 06/07/2016 RBC 2,923 -CHF 183,710 USD 185,092 06/07/2016 Bank of America 3,397 -CHF 50,598 USD 51,219 06/07/2016 Deutsche Bank 694 -CHF 320,437 USD 324,166 06/07/2016 Standard Chartered 4,606 -CHF 47,726,033 USD 48,226,138 06/07/2016 Toronto-Dominion Bank 741,327 0.02CHF 253,887 USD 260,160 06/07/2016 Goldman Sachs 331 -CHF 41,184 USD 42,152 10/08/2016 Bank of America 198 -CHF 134,848 USD 138,309 10/08/2016 RBC 358 -CHF 88,085 USD 90,030 10/08/2016 Societe Generale 549 -CHF 26,635 USD 27,243 10/08/2016 Morgan Stanley 147 -CHF 125,838 USD 129,040 10/08/2016 State Street 362 -CHF 50,403,534 USD 51,715,823 10/08/2016 Toronto-Dominion Bank 115,337 -EUR 6,265,191 USD 6,942,333 03/08/2016 Bank of America 30,160 -EUR 3,350,528 USD 3,687,370 03/08/2016 Standard Chartered 41,412 -EUR 2,617,727 USD 2,902,352 03/08/2016 Morgan Stanley 10,900 -EUR 10,116,914 USD 11,232,153 10/08/2016 Standard Chartered 29,719 -EUR 3,847,486 USD 4,249,141 10/08/2016 Morgan Stanley 33,775 -EUR 5,859,937 USD 6,516,708 10/08/2016 Bank of America 6,414 -EUR 356,190 USD 392,616 10/08/2016 Societe Generale 3,885 -EUR 331,204 USD 366,482 10/08/2016 State Street 2,205 -GBP 1,141,045 USD 1,530,565 10/08/2016 Deutsche Bank 3,155 -GBP 1,374,658 USD 1,833,182 10/08/2016 RBC 14,546 -JPY 75,569,017 USD 716,771 20/07/2016 Standard Chartered 18,878 -JPY 54,897,158 USD 514,465 20/07/2016 Citibank 19,947 -JPY 11,075,217,718 USD 103,804,150 20/07/2016 HSBC 4,010,824 0.08NOK 25,965 USD 3,095 06/07/2016 Citibank 5 -NOK 23,748 USD 2,801 10/08/2016 BNP Paribas 34 -NOK 30,332 USD 3,588 10/08/2016 Deutsche Bank 33 -SEK 744,956 USD 87,734 10/08/2016 Societe Generale 208 -SEK 95,154 USD 11,145 10/08/2016 Goldman Sachs 88 -USD 84,501 CHF 81,443 06/07/2016 RBC 940 -USD 132,158 CHF 126,686 06/07/2016 Societe Generale 2,176 -USD 1,215,382,048 EUR 1,090,486,981 05/07/2016 Deutsche Bank 3,111,550 0.06USD 9,922,417 EUR 8,792,266 05/07/2016 Standard Chartered 148,247 -USD 9,369,400 EUR 8,401,753 05/07/2016 State Street 29,355 -USD 2,991,285 EUR 2,627,633 05/07/2016 UBS 70,202 -USD 5,534,115 EUR 4,854,146 05/07/2016 J.P. Morgan 137,867 -USD 23,960,626 EUR 21,102,732 05/07/2016 RBC 501,181 0.01USD 1,197 EUR 1,054 06/07/2016 UBS 25 -USD 40,028 EUR 35,262 06/07/2016 State Street 826 -USD 1,160,293,617 EUR 1,041,964,271 06/07/2016 Citibank 1,925,003 0.04USD 163,257,935 EUR 146,283,935 06/07/2016 Standard Chartered 631,707 0.01USD 1,146,950,598 EUR 1,029,821,761 06/07/2016 Barclays 2,081,012 0.04USD 1,757,680 EUR 1,542,827 06/07/2016 HSBC 42,494 -USD 1,241,578,145 EUR 1,114,468,549 03/08/2016 Deutsche Bank 1,292,861 0.03USD 2,047,776 EUR 1,834,200 03/08/2016 RBC 6,506 -USD 5,715 EUR 5,124 10/08/2016 Societe Generale 11 -USD 184,220 GBP 136,393 05/07/2016 Citibank 941 -USD 293,772,338 GBP 201,141,327 05/07/2016 HSBC 23,487,454 0.46USD 29,105 GBP 20,013 06/07/2016 J.P. Morgan 2,212 -USD 3,016,820 GBP 2,081,874 06/07/2016 Citibank 219,276 -USD 958,031 GBP 677,228 06/07/2016 RBC 47,999 -USD 100,347 GBP 68,103 06/07/2016 Standard Chartered 8,833 -USD 613,899,172 GBP 456,303,389 06/07/2016 Goldman Sachs 735,907 0.02USD 47,901 GBP 33,557 06/07/2016 HSBC 2,809 -USD 10,244,718 GBP 7,608,016 06/07/2016 Toronto-Dominion Bank 21,354 -USD 246,300,444 GBP 182,970,074 03/08/2016 Standard Chartered 377,057 0.01USD 1,847 NOK 15,420 06/07/2016 Societe Generale 6 -USD 2,089 NOK 17,478 06/07/2016 RBC 2 -USD 3,452 NOK 28,590 06/07/2016 Citibank 39 -USD 1,314,939 NOK 11,011,568 06/07/2016 Deutsche Bank 109 -USD 189,224 SEK 1,604,968 05/07/2016 Goldman Sachs 65 -USD 25,634 SEK 213,131 06/07/2016 Morgan Stanley 514 -USD 99,643 SEK 827,938 06/07/2016 Citibank 2,059 -USD 31,631,037 SEK 268,035,170 06/07/2016 Deutsche Bank 39,431 -USD 1,134,503 SEK 9,269,451 06/07/2016 Goldman Sachs 41,972 -USD 6,426 SEK 52,973 06/07/2016 State Street 182 -USD 146,731 SEK 1,217,898 06/07/2016 RBC 3,185 -USD 24,718 SEK 202,090 06/07/2016 Barclays 899 -
Total Unrealised Gain on Forward Currency Exchange Contracts 40,071,922 0.78
CHF 149,491 USD 155,177 06/07/2016 HSBC (1,797) -CHF 246,816 USD 256,924 06/07/2016 RBC (3,688) -CHF 69,563 USD 72,420 06/07/2016 Bank of America (1,048) -CHF 229,952 USD 239,022 06/07/2016 Deutsche Bank (3,090) -CHF 777,812 USD 808,121 06/07/2016 Standard Chartered (10,077) -CHF 139,123 USD 144,423 06/07/2016 Goldman Sachs (1,681) -CHF 149,620 USD 153,692 06/07/2016 Morgan Stanley (180) -CHF 104,770 USD 108,045 10/08/2016 HSBC (307) -EUR 19,167,309 USD 21,610,662 05/07/2016 Citibank (302,784) (0.01)EUR 2,629,653 USD 2,959,915 05/07/2016 Societe Generale (36,587) -
160
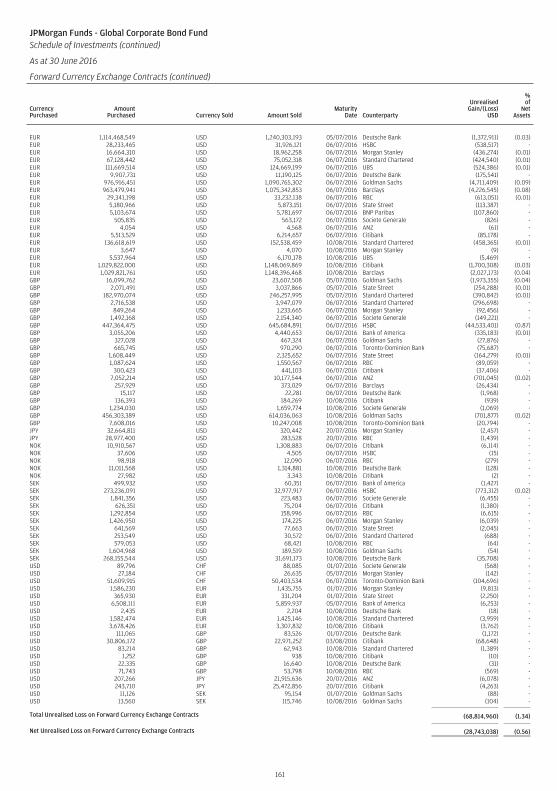
JPMorgan Funds - Global Corporate Bond FundSchedule of Investments (continued)
As at 30 June 2016
Forward Currency Exchange Contracts (continued)
CurrencyPurchased
AmountPurchased Currency Sold Amount Sold
MaturityDate Counterparty
UnrealisedGain/(Loss)
USD
%of
NetAssets
EUR 1,114,468,549 USD 1,240,303,193 05/07/2016 Deutsche Bank (1,372,911) (0.03)EUR 28,233,465 USD 31,926,121 06/07/2016 HSBC (538,517) -EUR 16,664,310 USD 18,962,258 06/07/2016 Morgan Stanley (436,274) (0.01)EUR 67,128,442 USD 75,052,318 06/07/2016 Standard Chartered (424,540) (0.01)EUR 111,669,514 USD 124,669,199 06/07/2016 UBS (524,386) (0.01)EUR 9,907,731 USD 11,190,125 06/07/2016 Deutsche Bank (175,541) -EUR 976,916,451 USD 1,090,765,302 06/07/2016 Goldman Sachs (4,711,409) (0.09)EUR 963,479,941 USD 1,075,342,853 06/07/2016 Barclays (4,226,545) (0.08)EUR 29,341,198 USD 33,232,138 06/07/2016 RBC (613,051) (0.01)EUR 5,180,966 USD 5,873,151 06/07/2016 State Street (113,387) -EUR 5,103,674 USD 5,781,697 06/07/2016 BNP Paribas (107,860) -EUR 505,835 USD 563,172 06/07/2016 Societe Generale (826) -EUR 4,054 USD 4,568 06/07/2016 ANZ (61) -EUR 5,513,529 USD 6,214,657 06/07/2016 Citibank (85,178) -EUR 136,618,619 USD 152,538,459 10/08/2016 Standard Chartered (458,365) (0.01)EUR 3,647 USD 4,070 10/08/2016 Morgan Stanley (9) -EUR 5,537,964 USD 6,170,178 10/08/2016 UBS (5,469) -EUR 1,029,822,000 USD 1,148,069,869 10/08/2016 Citibank (1,700,308) (0.03)EUR 1,029,821,761 USD 1,148,396,468 10/08/2016 Barclays (2,027,173) (0.04)GBP 16,099,762 USD 23,607,508 05/07/2016 Goldman Sachs (1,973,355) (0.04)GBP 2,071,491 USD 3,037,866 05/07/2016 State Street (254,288) (0.01)GBP 182,970,074 USD 246,257,995 05/07/2016 Standard Chartered (390,842) (0.01)GBP 2,716,538 USD 3,947,079 06/07/2016 Standard Chartered (296,698) -GBP 849,264 USD 1,233,665 06/07/2016 Morgan Stanley (92,456) -GBP 1,492,168 USD 2,154,340 06/07/2016 Societe Generale (149,221) -GBP 447,364,475 USD 645,684,891 06/07/2016 HSBC (44,533,401) (0.87)GBP 3,055,206 USD 4,440,653 06/07/2016 Bank of America (335,183) (0.01)GBP 327,028 USD 467,324 06/07/2016 Goldman Sachs (27,876) -GBP 665,745 USD 970,290 06/07/2016 Toronto-Dominion Bank (75,687) -GBP 1,608,449 USD 2,325,652 06/07/2016 State Street (164,279) (0.01)GBP 1,087,624 USD 1,550,567 06/07/2016 RBC (89,059) -GBP 300,423 USD 441,103 06/07/2016 Citibank (37,406) -GBP 7,052,214 USD 10,177,544 06/07/2016 ANZ (701,045) (0.02)GBP 257,929 USD 373,029 06/07/2016 Barclays (26,434) -GBP 15,117 USD 22,281 06/07/2016 Deutsche Bank (1,968) -GBP 136,393 USD 184,269 10/08/2016 Citibank (939) -GBP 1,234,030 USD 1,659,774 10/08/2016 Societe Generale (1,069) -GBP 456,303,389 USD 614,036,063 10/08/2016 Goldman Sachs (701,877) (0.02)GBP 7,608,016 USD 10,247,008 10/08/2016 Toronto-Dominion Bank (20,794) -JPY 32,664,811 USD 320,442 20/07/2016 Morgan Stanley (2,457) -JPY 28,977,400 USD 283,528 20/07/2016 RBC (1,439) -NOK 10,910,567 USD 1,308,883 06/07/2016 Citibank (6,114) -NOK 37,606 USD 4,505 06/07/2016 HSBC (15) -NOK 98,918 USD 12,090 06/07/2016 RBC (279) -NOK 11,011,568 USD 1,314,881 10/08/2016 Deutsche Bank (128) -NOK 27,982 USD 3,343 10/08/2016 Citibank (2) -SEK 499,932 USD 60,351 06/07/2016 Bank of America (1,427) -SEK 273,236,091 USD 32,977,917 06/07/2016 HSBC (773,312) (0.02)SEK 1,841,356 USD 223,483 06/07/2016 Societe Generale (6,455) -SEK 626,351 USD 75,204 06/07/2016 Citibank (1,380) -SEK 1,292,854 USD 158,996 06/07/2016 RBC (6,615) -SEK 1,426,950 USD 174,225 06/07/2016 Morgan Stanley (6,039) -SEK 641,569 USD 77,663 06/07/2016 State Street (2,045) -SEK 253,549 USD 30,572 06/07/2016 Standard Chartered (688) -SEK 579,053 USD 68,421 10/08/2016 RBC (64) -SEK 1,604,968 USD 189,519 10/08/2016 Goldman Sachs (54) -SEK 268,155,544 USD 31,691,173 10/08/2016 Deutsche Bank (35,708) -USD 89,796 CHF 88,085 01/07/2016 Societe Generale (568) -USD 27,184 CHF 26,635 05/07/2016 Morgan Stanley (142) -USD 51,609,915 CHF 50,403,534 06/07/2016 Toronto-Dominion Bank (104,696) -USD 1,586,230 EUR 1,435,755 01/07/2016 Morgan Stanley (9,813) -USD 365,930 EUR 331,204 01/07/2016 State Street (2,250) -USD 6,508,111 EUR 5,859,937 05/07/2016 Bank of America (6,253) -USD 2,435 EUR 2,204 10/08/2016 Deutsche Bank (18) -USD 1,582,474 EUR 1,425,146 10/08/2016 Standard Chartered (3,959) -USD 3,678,426 EUR 3,307,832 10/08/2016 Citibank (3,762) -USD 111,065 GBP 83,526 01/07/2016 Deutsche Bank (1,172) -USD 30,806,172 GBP 22,971,252 03/08/2016 Citibank (68,648) -USD 83,214 GBP 62,943 10/08/2016 Standard Chartered (1,389) -USD 1,252 GBP 938 10/08/2016 Citibank (10) -USD 22,335 GBP 16,640 10/08/2016 Deutsche Bank (31) -USD 71,743 GBP 53,798 10/08/2016 RBC (569) -USD 207,266 JPY 21,915,636 20/07/2016 ANZ (6,078) -USD 243,710 JPY 25,472,856 20/07/2016 Citibank (4,263) -USD 11,126 SEK 95,154 01/07/2016 Goldman Sachs (88) -USD 13,560 SEK 115,746 10/08/2016 Goldman Sachs (104) -
Total Unrealised Loss on Forward Currency Exchange Contracts (68,814,960) (1.34)
Net Unrealised Loss on Forward Currency Exchange Contracts (28,743,038) (0.56)
161
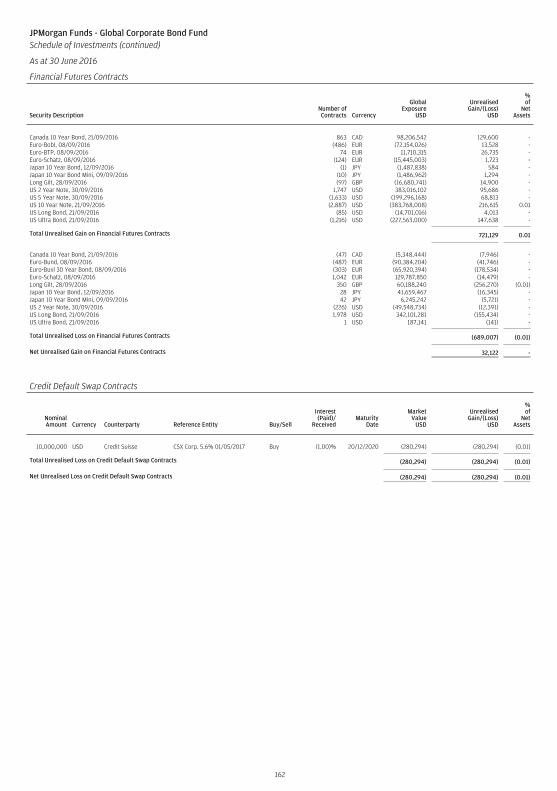
JPMorgan Funds - Global Corporate Bond FundSchedule of Investments (continued)
As at 30 June 2016
Financial Futures Contracts
Security DescriptionNumber ofContracts Currency
GlobalExposure
USD
UnrealisedGain/(Loss)
USD
%of
NetAssets
Canada 10 Year Bond, 21/09/2016 863 CAD 98,206,542 129,600 -Euro-Bobl, 08/09/2016 (486) EUR (72,154,026) 13,528 -Euro-BTP, 08/09/2016 74 EUR 11,710,315 26,735 -Euro-Schatz, 08/09/2016 (124) EUR (15,445,003) 1,723 -Japan 10 Year Bond, 12/09/2016 (1) JPY (1,487,838) 584 -Japan 10 Year Bond Mini, 09/09/2016 (10) JPY (1,486,962) 1,294 -Long Gilt, 28/09/2016 (97) GBP (16,680,741) 14,900 -US 2 Year Note, 30/09/2016 1,747 USD 383,016,102 95,686 -US 5 Year Note, 30/09/2016 (1,633) USD (199,296,168) 68,813 -US 10 Year Note, 21/09/2016 (2,887) USD (383,768,008) 216,615 0.01US Long Bond, 21/09/2016 (85) USD (14,701,016) 4,013 -US Ultra Bond, 21/09/2016 (1,216) USD (227,563,000) 147,638 -
Total Unrealised Gain on Financial Futures Contracts 721,129 0.01
Canada 10 Year Bond, 21/09/2016 (47) CAD (5,348,444) (7,946) -Euro-Bund, 08/09/2016 (487) EUR (90,384,204) (41,746) -Euro-Buxl 30 Year Bond, 08/09/2016 (303) EUR (65,920,394) (178,534) -Euro-Schatz, 08/09/2016 1,042 EUR 129,787,850 (14,479) -Long Gilt, 28/09/2016 350 GBP 60,188,240 (256,270) (0.01)Japan 10 Year Bond, 12/09/2016 28 JPY 41,659,467 (16,345) -Japan 10 Year Bond Mini, 09/09/2016 42 JPY 6,245,242 (5,721) -US 2 Year Note, 30/09/2016 (226) USD (49,548,734) (12,391) -US Long Bond, 21/09/2016 1,978 USD 342,101,281 (155,434) -US Ultra Bond, 21/09/2016 1 USD 187,141 (141) -
Total Unrealised Loss on Financial Futures Contracts (689,007) (0.01)
Net Unrealised Gain on Financial Futures Contracts 32,122 -
Credit Default Swap Contracts
NominalAmount Currency Counterparty Reference Entity Buy/Sell
Interest(Paid)/
ReceivedMaturity
Date
MarketValue
USD
UnrealisedGain/(Loss)
USD
%of
NetAssets
10,000,000 USD Credit Suisse CSX Corp. 5.6% 01/05/2017 Buy (1.00)% 20/12/2020 (280,294) (280,294) (0.01)
Total Unrealised Loss on Credit Default Swap Contracts (280,294) (280,294) (0.01)
Net Unrealised Loss on Credit Default Swap Contracts (280,294) (280,294) (0.01)
162
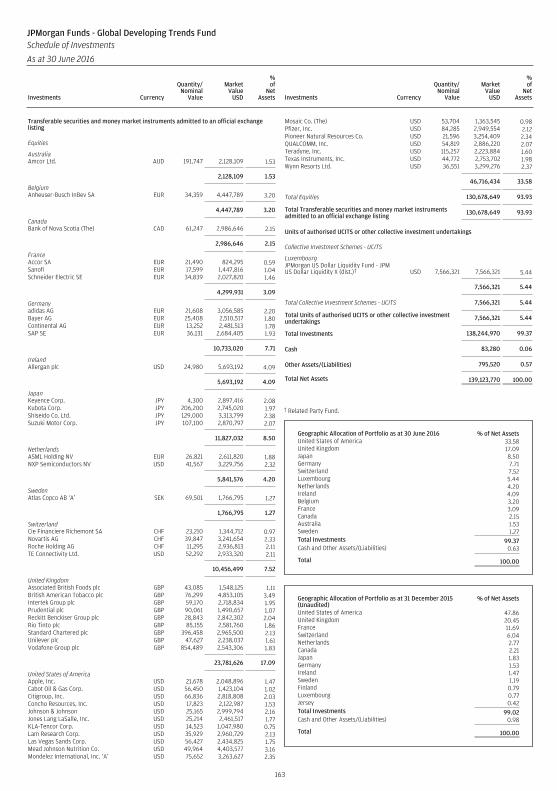
Transferable securities and money market instruments admitted to an official exchangelisting
Equities
AustraliaAmcor Ltd. AUD 191,747 2,128,109 1.53
2,128,109 1.53
BelgiumAnheuser-Busch InBev SA EUR 34,359 4,447,789 3.20
4,447,789 3.20
CanadaBank of Nova Scotia (The) CAD 61,247 2,986,646 2.15
2,986,646 2.15
FranceAccor SA EUR 21,490 824,295 0.59Sanofi EUR 17,599 1,447,816 1.04Schneider Electric SE EUR 34,839 2,027,820 1.46
4,299,931 3.09
Germanyadidas AG EUR 21,608 3,056,585 2.20Bayer AG EUR 25,408 2,510,517 1.80Continental AG EUR 13,252 2,481,513 1.78SAP SE EUR 36,131 2,684,405 1.93
10,733,020 7.71
IrelandAllergan plc USD 24,980 5,693,192 4.09
5,693,192 4.09
JapanKeyence Corp. JPY 4,300 2,897,416 2.08Kubota Corp. JPY 206,200 2,745,020 1.97Shiseido Co. Ltd. JPY 129,000 3,313,799 2.38Suzuki Motor Corp. JPY 107,100 2,870,797 2.07
11,827,032 8.50
NetherlandsASML Holding NV EUR 26,821 2,611,820 1.88NXP Semiconductors NV USD 41,567 3,229,756 2.32
5,841,576 4.20
SwedenAtlas Copco AB ‘A’ SEK 69,501 1,766,795 1.27
1,766,795 1.27
SwitzerlandCie Financiere Richemont SA CHF 23,210 1,344,712 0.97Novartis AG CHF 39,847 3,241,654 2.33Roche Holding AG CHF 11,295 2,936,813 2.11TE Connectivity Ltd. USD 52,292 2,933,320 2.11
10,456,499 7.52
United KingdomAssociated British Foods plc GBP 43,085 1,548,125 1.11British American Tobacco plc GBP 76,299 4,853,105 3.49Intertek Group plc GBP 59,170 2,718,834 1.95Prudential plc GBP 90,061 1,490,657 1.07Reckitt Benckiser Group plc GBP 28,843 2,842,302 2.04Rio Tinto plc GBP 85,155 2,581,760 1.86Standard Chartered plc GBP 396,458 2,965,500 2.13Unilever plc GBP 47,627 2,238,037 1.61Vodafone Group plc GBP 854,489 2,543,306 1.83
23,781,626 17.09
United States of AmericaApple, Inc. USD 21,678 2,048,896 1.47Cabot Oil & Gas Corp. USD 56,450 1,423,104 1.02Citigroup, Inc. USD 66,836 2,818,808 2.03Concho Resources, Inc. USD 17,823 2,122,987 1.53Johnson & Johnson USD 25,165 2,999,794 2.16Jones Lang LaSalle, Inc. USD 25,214 2,461,517 1.77KLA-Tencor Corp. USD 14,523 1,047,980 0.75Lam Research Corp. USD 35,929 2,960,729 2.13Las Vegas Sands Corp. USD 56,427 2,434,825 1.75Mead Johnson Nutrition Co. USD 49,964 4,403,577 3.16Mondelez International, Inc. ‘A’ USD 75,652 3,263,627 2.35
Mosaic Co. (The) USD 53,704 1,363,545 0.98Pfizer, Inc. USD 84,285 2,949,554 2.12Pioneer Natural Resources Co. USD 21,596 3,254,409 2.34QUALCOMM, Inc. USD 54,819 2,886,220 2.07Teradyne, Inc. USD 115,257 2,223,884 1.60Texas Instruments, Inc. USD 44,772 2,753,702 1.98Wynn Resorts Ltd. USD 36,551 3,299,276 2.37
46,716,434 33.58
Total Equities 130,678,649 93.93
Total Transferable securities and money market instrumentsadmitted to an official exchange listing 130,678,649 93.93
Units of authorised UCITS or other collective investment undertakings
Collective Investment Schemes - UCITS
LuxembourgJPMorgan US Dollar Liquidity Fund - JPMUS Dollar Liquidity X (dist.)† USD 7,566,321 7,566,321 5.44
7,566,321 5.44
Total Collective Investment Schemes - UCITS 7,566,321 5.44
Total Units of authorised UCITS or other collective investmentundertakings 7,566,321 5.44
Total Investments 138,244,970 99.37
Cash 83,280 0.06
Other Assets/(Liabilities) 795,520 0.57
Total Net Assets 139,123,770 100.00
† Related Party Fund.
Geographic Allocation of Portfolio as at 30 June 2016 % of Net AssetsUnited States of America 33.58United Kingdom 17.09Japan 8.50Germany 7.71Switzerland 7.52Luxembourg 5.44Netherlands 4.20Ireland 4.09Belgium 3.20France 3.09Canada 2.15Australia 1.53Sweden 1.27Total Investments 99.37Cash and Other Assets/(Liabilities) 0.63
Total 100.00
Geographic Allocation of Portfolio as at 31 December 2015(Unaudited)
% of Net Assets
United States of America 47.86United Kingdom 20.45France 11.69Switzerland 6.04Netherlands 2.77Canada 2.21Japan 1.83Germany 1.53Ireland 1.47Sweden 1.19Finland 0.79Luxembourg 0.77Jersey 0.42Total Investments 99.02Cash and Other Assets/(Liabilities) 0.98
Total 100.00
163
JPMorgan Funds - Global Developing Trends FundSchedule of Investments
As at 30 June 2016
Investments Currency
Quantity/Nominal
Value
MarketValue
USD
%of
NetAssets Investments Currency
Quantity/Nominal
Value
MarketValue
USD
%of
NetAssets
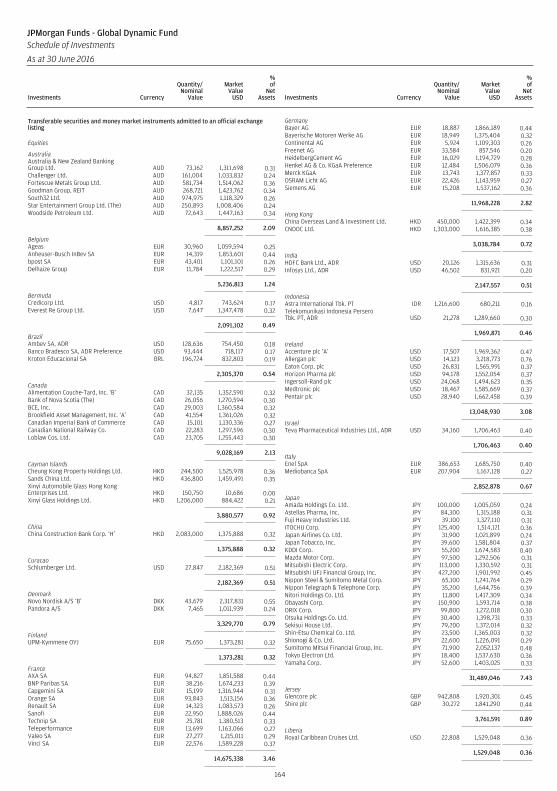
Transferable securities and money market instruments admitted to an official exchangelisting
Equities
AustraliaAustralia & New Zealand BankingGroup Ltd. AUD 73,162 1,311,698 0.31Challenger Ltd. AUD 161,004 1,033,832 0.24Fortescue Metals Group Ltd. AUD 581,734 1,514,062 0.36Goodman Group, REIT AUD 268,721 1,423,762 0.34South32 Ltd. AUD 974,975 1,118,329 0.26Star Entertainment Group Ltd. (The) AUD 250,893 1,008,406 0.24Woodside Petroleum Ltd. AUD 72,643 1,447,163 0.34
8,857,252 2.09
BelgiumAgeas EUR 30,960 1,059,594 0.25Anheuser-Busch InBev SA EUR 14,319 1,853,601 0.44bpost SA EUR 43,401 1,101,101 0.26Delhaize Group EUR 11,784 1,222,517 0.29
5,236,813 1.24
BermudaCredicorp Ltd. USD 4,817 743,624 0.17Everest Re Group Ltd. USD 7,647 1,347,478 0.32
2,091,102 0.49
BrazilAmbev SA, ADR USD 128,636 754,450 0.18Banco Bradesco SA, ADR Preference USD 93,444 718,117 0.17Kroton Educacional SA BRL 196,724 832,803 0.19
2,305,370 0.54
CanadaAlimentation Couche-Tard, Inc. ‘B’ CAD 32,135 1,352,590 0.32Bank of Nova Scotia (The) CAD 26,056 1,270,594 0.30BCE, Inc. CAD 29,003 1,360,584 0.32Brookfield Asset Management, Inc. ‘A’ CAD 41,554 1,361,026 0.32Canadian Imperial Bank of Commerce CAD 15,101 1,130,336 0.27Canadian National Railway Co. CAD 22,283 1,297,596 0.30Loblaw Cos. Ltd. CAD 23,705 1,255,443 0.30
9,028,169 2.13
Cayman IslandsCheung Kong Property Holdings Ltd. HKD 244,500 1,525,978 0.36Sands China Ltd. HKD 436,800 1,459,491 0.35Xinyi Automobile Glass Hong KongEnterprises Ltd. HKD 150,750 10,686 0.00Xinyi Glass Holdings Ltd. HKD 1,206,000 884,422 0.21
3,880,577 0.92
ChinaChina Construction Bank Corp. ‘H’ HKD 2,083,000 1,375,888 0.32
1,375,888 0.32
CuracaoSchlumberger Ltd. USD 27,847 2,182,369 0.51
2,182,369 0.51
DenmarkNovo Nordisk A/S ‘B’ DKK 43,679 2,317,831 0.55Pandora A/S DKK 7,465 1,011,939 0.24
3,329,770 0.79
FinlandUPM-Kymmene OYJ EUR 75,650 1,373,281 0.32
1,373,281 0.32
FranceAXA SA EUR 94,827 1,851,588 0.44BNP Paribas SA EUR 38,216 1,674,233 0.39Capgemini SA EUR 15,199 1,316,944 0.31Orange SA EUR 93,843 1,513,156 0.36Renault SA EUR 14,323 1,083,573 0.26Sanofi EUR 22,950 1,888,026 0.44Technip SA EUR 25,781 1,380,513 0.33Teleperformance EUR 13,699 1,163,066 0.27Valeo SA EUR 27,277 1,215,011 0.29Vinci SA EUR 22,576 1,589,228 0.37
14,675,338 3.46
GermanyBayer AG EUR 18,887 1,866,189 0.44Bayerische Motoren Werke AG EUR 18,949 1,375,404 0.32Continental AG EUR 5,924 1,109,303 0.26Freenet AG EUR 33,584 857,546 0.20HeidelbergCement AG EUR 16,029 1,194,729 0.28Henkel AG & Co. KGaA Preference EUR 12,484 1,506,079 0.36Merck KGaA EUR 13,743 1,377,857 0.33OSRAM Licht AG EUR 22,426 1,143,959 0.27Siemens AG EUR 15,208 1,537,162 0.36
11,968,228 2.82
Hong KongChina Overseas Land & Investment Ltd. HKD 450,000 1,422,399 0.34CNOOC Ltd. HKD 1,303,000 1,616,385 0.38
3,038,784 0.72
IndiaHDFC Bank Ltd., ADR USD 20,126 1,315,636 0.31Infosys Ltd., ADR USD 46,502 831,921 0.20
2,147,557 0.51
IndonesiaAstra International Tbk. PT IDR 1,216,600 680,211 0.16Telekomunikasi Indonesia PerseroTbk. PT, ADR USD 21,278 1,289,660 0.30
1,969,871 0.46
IrelandAccenture plc ‘A’ USD 17,507 1,969,362 0.47Allergan plc USD 14,123 3,218,773 0.76Eaton Corp. plc USD 26,831 1,565,991 0.37Horizon Pharma plc USD 94,178 1,552,054 0.37Ingersoll-Rand plc USD 24,068 1,494,623 0.35Medtronic plc USD 18,467 1,585,669 0.37Pentair plc USD 28,940 1,662,458 0.39
13,048,930 3.08
IsraelTeva Pharmaceutical Industries Ltd., ADR USD 34,160 1,706,463 0.40
1,706,463 0.40
ItalyEnel SpA EUR 386,653 1,685,750 0.40Mediobanca SpA EUR 207,904 1,167,128 0.27
2,852,878 0.67
JapanAmada Holdings Co. Ltd. JPY 100,000 1,005,059 0.24Astellas Pharma, Inc. JPY 84,300 1,315,188 0.31Fuji Heavy Industries Ltd. JPY 39,100 1,327,110 0.31ITOCHU Corp. JPY 125,400 1,514,121 0.36Japan Airlines Co. Ltd. JPY 31,900 1,021,899 0.24Japan Tobacco, Inc. JPY 39,600 1,581,804 0.37KDDI Corp. JPY 55,200 1,674,583 0.40Mazda Motor Corp. JPY 97,500 1,292,506 0.31Mitsubishi Electric Corp. JPY 113,000 1,330,592 0.31Mitsubishi UFJ Financial Group, Inc. JPY 427,200 1,901,992 0.45Nippon Steel & Sumitomo Metal Corp. JPY 65,100 1,241,764 0.29Nippon Telegraph & Telephone Corp. JPY 35,200 1,644,756 0.39Nitori Holdings Co. Ltd. JPY 11,800 1,417,309 0.34Obayashi Corp. JPY 150,900 1,593,714 0.38ORIX Corp. JPY 99,800 1,272,018 0.30Otsuka Holdings Co. Ltd. JPY 30,400 1,398,731 0.33Sekisui House Ltd. JPY 79,200 1,372,014 0.32Shin-Etsu Chemical Co. Ltd. JPY 23,500 1,365,003 0.32Shionogi & Co. Ltd. JPY 22,600 1,226,091 0.29Sumitomo Mitsui Financial Group, Inc. JPY 71,900 2,052,137 0.48Tokyo Electron Ltd. JPY 18,400 1,537,630 0.36Yamaha Corp. JPY 52,600 1,403,025 0.33
31,489,046 7.43
JerseyGlencore plc GBP 942,808 1,920,301 0.45Shire plc GBP 30,272 1,841,290 0.44
3,761,591 0.89
LiberiaRoyal Caribbean Cruises Ltd. USD 22,808 1,529,048 0.36
1,529,048 0.36
164
JPMorgan Funds - Global Dynamic FundSchedule of Investments
As at 30 June 2016
Investments Currency
Quantity/Nominal
Value
MarketValue
USD
%of
NetAssets Investments Currency
Quantity/Nominal
Value
MarketValue
USD
%of
NetAssets
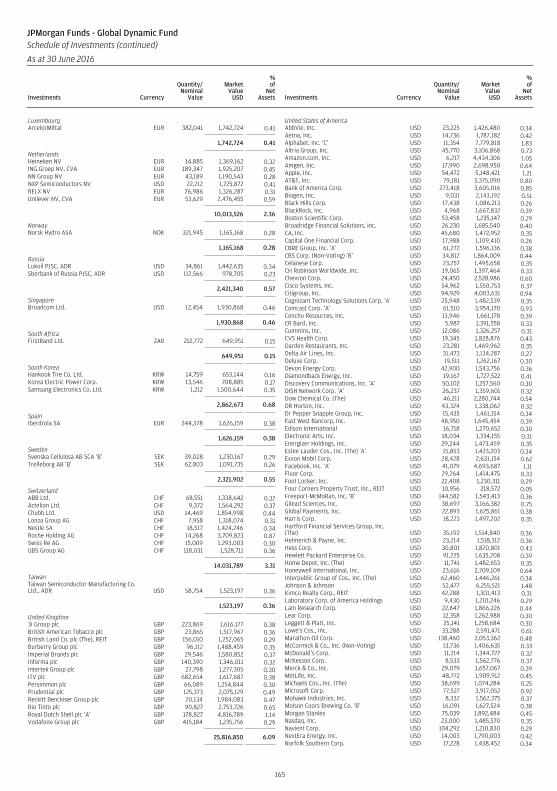
LuxembourgArcelorMittal EUR 382,041 1,742,724 0.41
1,742,724 0.41
NetherlandsHeineken NV EUR 14,885 1,369,162 0.32ING Groep NV, CVA EUR 189,347 1,925,207 0.45NN Group NV EUR 43,189 1,190,543 0.28NXP Semiconductors NV USD 22,212 1,725,872 0.41RELX NV EUR 76,986 1,326,287 0.31Unilever NV, CVA EUR 53,629 2,476,455 0.59
10,013,526 2.36
NorwayNorsk Hydro ASA NOK 321,945 1,165,168 0.28
1,165,168 0.28
RussiaLukoil PJSC, ADR USD 34,861 1,442,635 0.34Sberbank of Russia PJSC, ADR USD 112,566 978,705 0.23
2,421,340 0.57
SingaporeBroadcom Ltd. USD 12,454 1,930,868 0.46
1,930,868 0.46
South AfricaFirstRand Ltd. ZAR 212,772 649,951 0.15
649,951 0.15
South KoreaHankook Tire Co. Ltd. KRW 14,759 653,144 0.16Korea Electric Power Corp. KRW 13,546 708,885 0.17Samsung Electronics Co. Ltd. KRW 1,212 1,500,644 0.35
2,862,673 0.68
SpainIberdrola SA EUR 244,378 1,626,159 0.38
1,626,159 0.38
SwedenSvenska Cellulosa AB SCA ‘B’ SEK 39,028 1,230,167 0.29Trelleborg AB ‘B’ SEK 62,803 1,091,735 0.26
2,321,902 0.55
SwitzerlandABB Ltd. CHF 68,551 1,338,642 0.32Actelion Ltd. CHF 9,372 1,564,292 0.37Chubb Ltd. USD 14,469 1,854,998 0.44Lonza Group AG CHF 7,958 1,318,074 0.31Nestle SA CHF 18,517 1,424,246 0.34Roche Holding AG CHF 14,268 3,709,823 0.87Swiss Re AG CHF 15,009 1,293,003 0.30UBS Group AG CHF 118,031 1,528,711 0.36
14,031,789 3.31
TaiwanTaiwan Semiconductor Manufacturing Co.Ltd., ADR USD 58,754 1,523,197 0.36
1,523,197 0.36
United Kingdom3i Group plc GBP 223,869 1,616,177 0.38British American Tobacco plc GBP 23,865 1,517,967 0.36British Land Co. plc (The), REIT GBP 156,010 1,252,065 0.29Burberry Group plc GBP 96,112 1,488,459 0.35Imperial Brands plc GBP 29,546 1,580,852 0.37Informa plc GBP 140,390 1,346,011 0.32Intertek Group plc GBP 27,798 1,277,305 0.30ITV plc GBP 682,654 1,617,687 0.38Persimmon plc GBP 66,089 1,254,844 0.30Prudential plc GBP 125,373 2,075,129 0.49Reckitt Benckiser Group plc GBP 20,134 1,984,083 0.47Rio Tinto plc GBP 90,827 2,753,726 0.65Royal Dutch Shell plc ‘A’ GBP 178,827 4,816,789 1.14Vodafone Group plc GBP 415,184 1,235,756 0.29
25,816,850 6.09
United States of AmericaAbbVie, Inc. USD 23,225 1,426,480 0.34Aetna, Inc. USD 14,736 1,787,182 0.42Alphabet, Inc. ‘C’ USD 11,354 7,779,818 1.83Altria Group, Inc. USD 45,770 3,106,868 0.73Amazon.com, Inc. USD 6,217 4,434,306 1.05Amgen, Inc. USD 17,990 2,698,950 0.64Apple, Inc. USD 54,472 5,148,421 1.21AT&T, Inc. USD 79,181 3,375,090 0.80Bank of America Corp. USD 273,418 3,605,016 0.85Biogen, Inc. USD 9,031 2,143,192 0.51Black Hills Corp. USD 17,438 1,086,213 0.26BlackRock, Inc. USD 4,968 1,667,832 0.39Boston Scientific Corp. USD 53,458 1,235,147 0.29Broadridge Financial Solutions, Inc. USD 26,230 1,685,540 0.40CA, Inc. USD 45,680 1,472,952 0.35Capital One Financial Corp. USD 17,988 1,109,410 0.26CBRE Group, Inc. ‘A’ USD 61,272 1,596,136 0.38CBS Corp. (Non-Voting) ‘B’ USD 34,812 1,864,009 0.44Celanese Corp. USD 23,257 1,495,658 0.35CH Robinson Worldwide, Inc. USD 19,065 1,397,464 0.33Chevron Corp. USD 24,450 2,528,986 0.60Cisco Systems, Inc. USD 54,962 1,550,753 0.37Citigroup, Inc. USD 94,929 4,003,631 0.94Cognizant Technology Solutions Corp. ‘A’ USD 25,948 1,482,539 0.35Comcast Corp. ‘A’ USD 61,510 3,954,170 0.93Concho Resources, Inc. USD 13,946 1,661,178 0.39CR Bard, Inc. USD 5,987 1,391,558 0.33Cummins, Inc. USD 12,086 1,326,257 0.31CVS Health Corp. USD 19,345 1,828,876 0.43Darden Restaurants, Inc. USD 23,281 1,469,962 0.35Delta Air Lines, Inc. USD 31,473 1,134,287 0.27Deluxe Corp. USD 19,511 1,262,167 0.30Devon Energy Corp. USD 42,900 1,543,756 0.36Diamondback Energy, Inc. USD 19,167 1,727,522 0.41Discovery Communications, Inc. ‘A’ USD 50,102 1,257,560 0.30DISH Network Corp. ‘A’ USD 26,237 1,359,601 0.32Dow Chemical Co. (The) USD 46,211 2,280,744 0.54DR Horton, Inc. USD 43,324 1,338,062 0.32Dr Pepper Snapple Group, Inc. USD 15,435 1,461,154 0.34East West Bancorp, Inc. USD 48,950 1,645,454 0.39Edison International USD 16,718 1,270,652 0.30Electronic Arts, Inc. USD 18,034 1,334,155 0.31Energizer Holdings, Inc. USD 29,244 1,473,459 0.35Estee Lauder Cos., Inc. (The) ‘A’ USD 15,853 1,423,203 0.34Exxon Mobil Corp. USD 28,428 2,631,154 0.62Facebook, Inc. ‘A’ USD 41,079 4,693,687 1.11Fluor Corp. USD 29,264 1,414,475 0.33Foot Locker, Inc. USD 22,408 1,230,311 0.29Four Corners Property Trust, Inc., REIT USD 10,956 218,572 0.05Freeport-McMoRan, Inc. ‘B’ USD 144,582 1,543,413 0.36Gilead Sciences, Inc. USD 38,697 3,166,382 0.75Global Payments, Inc. USD 22,893 1,625,861 0.38Harris Corp. USD 18,223 1,497,202 0.35Hartford Financial Services Group, Inc.(The) USD 35,192 1,514,840 0.36Helmerich & Payne, Inc. USD 23,214 1,518,312 0.36Hess Corp. USD 30,801 1,820,801 0.43Hewlett Packard Enterprise Co. USD 91,225 1,635,208 0.39Home Depot, Inc. (The) USD 11,741 1,482,653 0.35Honeywell International, Inc. USD 23,616 2,709,109 0.64Interpublic Group of Cos., Inc. (The) USD 62,460 1,446,261 0.34Johnson & Johnson USD 52,477 6,255,521 1.48Kimco Realty Corp., REIT USD 42,288 1,301,413 0.31Laboratory Corp. of America Holdings USD 9,430 1,210,246 0.29Lam Research Corp. USD 22,647 1,866,226 0.44Lear Corp. USD 12,358 1,262,988 0.30Leggett & Platt, Inc. USD 25,141 1,258,684 0.30Lowe’s Cos., Inc. USD 33,288 2,591,471 0.61Marathon Oil Corp. USD 138,460 2,053,362 0.48McCormick & Co., Inc. (Non-Voting) USD 13,736 1,406,635 0.33McDonald’s Corp. USD 11,214 1,344,727 0.32McKesson Corp. USD 8,533 1,562,776 0.37Merck & Co., Inc. USD 29,079 1,657,067 0.39MetLife, Inc. USD 48,772 1,909,912 0.45Michaels Cos., Inc. (The) USD 38,699 1,074,284 0.25Microsoft Corp. USD 77,527 3,917,052 0.92Mohawk Industries, Inc. USD 8,332 1,562,375 0.37Molson Coors Brewing Co. ‘B’ USD 16,091 1,627,524 0.38Morgan Stanley USD 75,039 1,892,484 0.45Nasdaq, Inc. USD 23,000 1,485,570 0.35Navient Corp. USD 104,292 1,210,830 0.29NextEra Energy, Inc. USD 14,003 1,790,003 0.42Norfolk Southern Corp. USD 17,228 1,438,452 0.34
165
JPMorgan Funds - Global Dynamic FundSchedule of Investments (continued)
As at 30 June 2016
Investments Currency
Quantity/Nominal
Value
MarketValue
USD
%of
NetAssets Investments Currency
Quantity/Nominal
Value
MarketValue
USD
%of
NetAssets
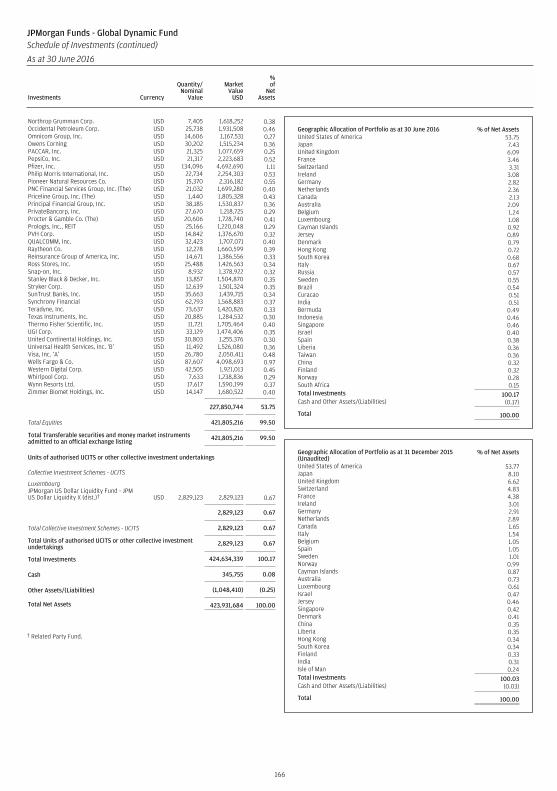
Northrop Grumman Corp. USD 7,405 1,618,252 0.38Occidental Petroleum Corp. USD 25,738 1,931,508 0.46Omnicom Group, Inc. USD 14,606 1,167,531 0.27Owens Corning USD 30,202 1,515,234 0.36PACCAR, Inc. USD 21,325 1,077,659 0.25PepsiCo, Inc. USD 21,317 2,223,683 0.52Pfizer, Inc. USD 134,096 4,692,690 1.11Philip Morris International, Inc. USD 22,734 2,254,303 0.53Pioneer Natural Resources Co. USD 15,370 2,316,182 0.55PNC Financial Services Group, Inc. (The) USD 21,032 1,699,280 0.40Priceline Group, Inc. (The) USD 1,440 1,805,328 0.43Principal Financial Group, Inc. USD 38,185 1,530,837 0.36PrivateBancorp, Inc. USD 27,670 1,218,725 0.29Procter & Gamble Co. (The) USD 20,606 1,728,740 0.41Prologis, Inc., REIT USD 25,166 1,220,048 0.29PVH Corp. USD 14,842 1,376,670 0.32QUALCOMM, Inc. USD 32,423 1,707,071 0.40Raytheon Co. USD 12,278 1,660,599 0.39Reinsurance Group of America, Inc. USD 14,671 1,386,556 0.33Ross Stores, Inc. USD 25,488 1,426,563 0.34Snap-on, Inc. USD 8,932 1,378,922 0.32Stanley Black & Decker, Inc. USD 13,857 1,504,870 0.35Stryker Corp. USD 12,639 1,501,324 0.35SunTrust Banks, Inc. USD 35,663 1,439,715 0.34Synchrony Financial USD 62,793 1,568,883 0.37Teradyne, Inc. USD 73,637 1,420,826 0.33Texas Instruments, Inc. USD 20,885 1,284,532 0.30Thermo Fisher Scientific, Inc. USD 11,721 1,705,464 0.40UGI Corp. USD 33,129 1,474,406 0.35United Continental Holdings, Inc. USD 30,803 1,255,376 0.30Universal Health Services, Inc. ‘B’ USD 11,492 1,526,080 0.36Visa, Inc. ‘A’ USD 26,780 2,050,411 0.48Wells Fargo & Co. USD 87,607 4,098,693 0.97Western Digital Corp. USD 42,505 1,921,013 0.45Whirlpool Corp. USD 7,633 1,238,836 0.29Wynn Resorts Ltd. USD 17,617 1,590,199 0.37Zimmer Biomet Holdings, Inc. USD 14,147 1,680,522 0.40
227,850,744 53.75
Total Equities 421,805,216 99.50
Total Transferable securities and money market instrumentsadmitted to an official exchange listing 421,805,216 99.50
Units of authorised UCITS or other collective investment undertakings
Collective Investment Schemes - UCITS
LuxembourgJPMorgan US Dollar Liquidity Fund - JPMUS Dollar Liquidity X (dist.)† USD 2,829,123 2,829,123 0.67
2,829,123 0.67
Total Collective Investment Schemes - UCITS 2,829,123 0.67
Total Units of authorised UCITS or other collective investmentundertakings 2,829,123 0.67
Total Investments 424,634,339 100.17
Cash 345,755 0.08
Other Assets/(Liabilities) (1,048,410) (0.25)
Total Net Assets 423,931,684 100.00
† Related Party Fund.
Geographic Allocation of Portfolio as at 30 June 2016 % of Net AssetsUnited States of America 53.75Japan 7.43United Kingdom 6.09France 3.46Switzerland 3.31Ireland 3.08Germany 2.82Netherlands 2.36Canada 2.13Australia 2.09Belgium 1.24Luxembourg 1.08Cayman Islands 0.92Jersey 0.89Denmark 0.79Hong Kong 0.72South Korea 0.68Italy 0.67Russia 0.57Sweden 0.55Brazil 0.54Curacao 0.51India 0.51Bermuda 0.49Indonesia 0.46Singapore 0.46Israel 0.40Spain 0.38Liberia 0.36Taiwan 0.36China 0.32Finland 0.32Norway 0.28South Africa 0.15Total Investments 100.17Cash and Other Assets/(Liabilities) (0.17)
Total 100.00
Geographic Allocation of Portfolio as at 31 December 2015(Unaudited)
% of Net Assets
United States of America 53.77Japan 8.10United Kingdom 6.62Switzerland 4.83France 4.38Ireland 3.01Germany 2.91Netherlands 2.89Canada 1.65Italy 1.54Belgium 1.05Spain 1.05Sweden 1.01Norway 0.99Cayman Islands 0.87Australia 0.73Luxembourg 0.61Israel 0.47Jersey 0.46Singapore 0.42Denmark 0.41China 0.35Liberia 0.35Hong Kong 0.34South Korea 0.34Finland 0.33India 0.31Isle of Man 0.24Total Investments 100.03Cash and Other Assets/(Liabilities) (0.03)
Total 100.00
166
JPMorgan Funds - Global Dynamic FundSchedule of Investments (continued)
As at 30 June 2016
Investments Currency
Quantity/Nominal
Value
MarketValue
USD
%of
NetAssets Investments Currency
Quantity/Nominal
Value
MarketValue
USD
%of
NetAssets
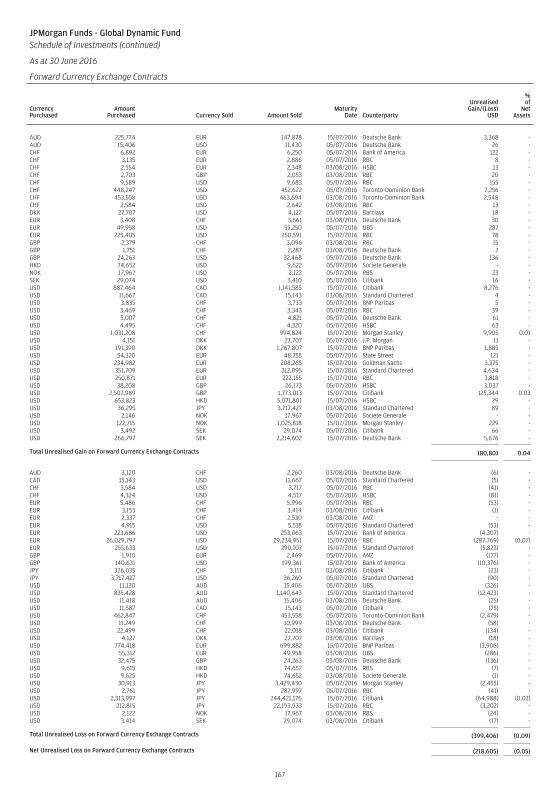
JPMorgan Funds - Global Dynamic FundSchedule of Investments (continued)
As at 30 June 2016
Forward Currency Exchange Contracts
CurrencyPurchased
AmountPurchased Currency Sold Amount Sold
MaturityDate Counterparty
UnrealisedGain/(Loss)
USD
%of
NetAssets
AUD 225,774 EUR 147,878 15/07/2016 Deutsche Bank 3,368 -AUD 15,406 USD 11,430 05/07/2016 Deutsche Bank 26 -CHF 6,892 EUR 6,250 05/07/2016 Bank of America 122 -CHF 3,135 EUR 2,886 05/07/2016 RBC 8 -CHF 2,554 EUR 2,348 03/08/2016 HSBC 13 -CHF 2,703 GBP 2,053 03/08/2016 RBC 20 -CHF 9,589 USD 9,683 05/07/2016 RBC 155 -CHF 448,247 USD 452,622 05/07/2016 Toronto-Dominion Bank 7,256 -CHF 453,558 USD 463,694 03/08/2016 Toronto-Dominion Bank 2,548 -CHF 2,584 USD 2,642 03/08/2016 RBC 13 -DKK 27,707 USD 4,122 05/07/2016 Barclays 18 -EUR 3,408 CHF 3,661 03/08/2016 Deutsche Bank 30 -EUR 49,958 USD 55,250 05/07/2016 UBS 287 -EUR 225,405 USD 250,591 15/07/2016 RBC 78 -GBP 2,379 CHF 3,096 03/08/2016 RBC 15 -GBP 1,751 CHF 2,287 03/08/2016 Deutsche Bank 2 -GBP 24,263 USD 32,468 05/07/2016 Deutsche Bank 136 -HKD 74,652 USD 9,622 05/07/2016 Societe Generale - -NOK 17,967 USD 2,122 05/07/2016 RBS 23 -SEK 29,074 USD 3,410 05/07/2016 Citibank 16 -USD 887,464 CAD 1,141,585 15/07/2016 Citibank 8,276 -USD 11,667 CAD 15,143 03/08/2016 Standard Chartered 4 -USD 3,835 CHF 3,733 05/07/2016 BNP Paribas 5 -USD 3,469 CHF 3,343 05/07/2016 RBC 39 -USD 5,007 CHF 4,821 05/07/2016 Deutsche Bank 61 -USD 4,495 CHF 4,320 05/07/2016 HSBC 63 -USD 1,031,208 CHF 994,824 15/07/2016 Morgan Stanley 9,905 0.01USD 4,151 DKK 27,707 05/07/2016 J.P. Morgan 11 -USD 191,390 DKK 1,267,807 15/07/2016 BNP Paribas 1,885 -USD 54,320 EUR 48,755 05/07/2016 State Street 121 -USD 234,982 EUR 208,265 15/07/2016 Goldman Sachs 3,375 -USD 351,709 EUR 312,095 15/07/2016 Standard Chartered 4,634 -USD 250,871 EUR 222,155 15/07/2016 RBC 3,818 -USD 38,208 GBP 26,173 05/07/2016 HSBC 3,037 -USD 2,507,989 GBP 1,773,013 15/07/2016 Citibank 125,344 0.03USD 653,823 HKD 5,071,801 15/07/2016 HSBC 29 -USD 36,295 JPY 3,717,427 03/08/2016 Standard Chartered 89 -USD 2,146 NOK 17,967 05/07/2016 Societe Generale - -USD 122,715 NOK 1,025,818 15/07/2016 Morgan Stanley 229 -USD 3,492 SEK 29,074 05/07/2016 Citibank 66 -USD 266,797 SEK 2,214,602 15/07/2016 Deutsche Bank 5,676 -
Total Unrealised Gain on Forward Currency Exchange Contracts 180,801 0.04
AUD 3,120 CHF 2,260 03/08/2016 Deutsche Bank (6) -CAD 15,143 USD 11,667 05/07/2016 Standard Chartered (5) -CHF 3,584 USD 3,717 05/07/2016 RBC (41) -CHF 4,324 USD 4,517 05/07/2016 HSBC (81) -EUR 5,486 CHF 5,996 05/07/2016 RBC (53) -EUR 3,153 CHF 3,414 03/08/2016 Citibank (1) -EUR 2,337 CHF 2,530 03/08/2016 ANZ - -EUR 4,915 USD 5,518 05/07/2016 Standard Chartered (53) -EUR 223,686 USD 253,063 15/07/2016 Bank of America (4,307) -EUR 26,029,797 USD 29,234,951 15/07/2016 RBC (287,769) (0.07)EUR 255,633 USD 290,107 15/07/2016 Standard Chartered (5,823) -GBP 1,910 EUR 2,469 05/07/2016 ANZ (177) -GBP 140,631 USD 199,361 15/07/2016 Bank of America (10,376) -JPY 326,035 CHF 3,111 03/08/2016 Citibank (23) -JPY 3,717,427 USD 36,260 05/07/2016 Standard Chartered (90) -USD 11,130 AUD 15,406 05/07/2016 UBS (326) -USD 835,428 AUD 1,140,643 15/07/2016 Standard Chartered (12,423) -USD 11,418 AUD 15,406 03/08/2016 Deutsche Bank (25) -USD 11,587 CAD 15,143 05/07/2016 Citibank (75) -USD 462,847 CHF 453,558 05/07/2016 Toronto-Dominion Bank (2,479) -USD 11,249 CHF 10,999 03/08/2016 Deutsche Bank (58) -USD 22,499 CHF 22,018 03/08/2016 Citibank (134) -USD 4,127 DKK 27,707 03/08/2016 Barclays (18) -USD 774,418 EUR 699,882 15/07/2016 BNP Paribas (3,906) -USD 55,312 EUR 49,958 03/08/2016 UBS (286) -USD 32,475 GBP 24,263 03/08/2016 Deutsche Bank (136) -USD 9,615 HKD 74,652 05/07/2016 RBS (7) -USD 9,625 HKD 74,652 03/08/2016 Societe Generale (1) -USD 30,913 JPY 3,429,430 05/07/2016 Morgan Stanley (2,455) -USD 2,761 JPY 287,997 05/07/2016 RBC (41) -USD 2,313,997 JPY 244,421,176 15/07/2016 Citibank (64,988) (0.02)USD 212,815 JPY 22,193,933 15/07/2016 RBC (3,202) -USD 2,122 NOK 17,967 03/08/2016 RBS (24) -USD 3,414 SEK 29,074 03/08/2016 Citibank (17) -
Total Unrealised Loss on Forward Currency Exchange Contracts (399,406) (0.09)
Net Unrealised Loss on Forward Currency Exchange Contracts (218,605) (0.05)
167
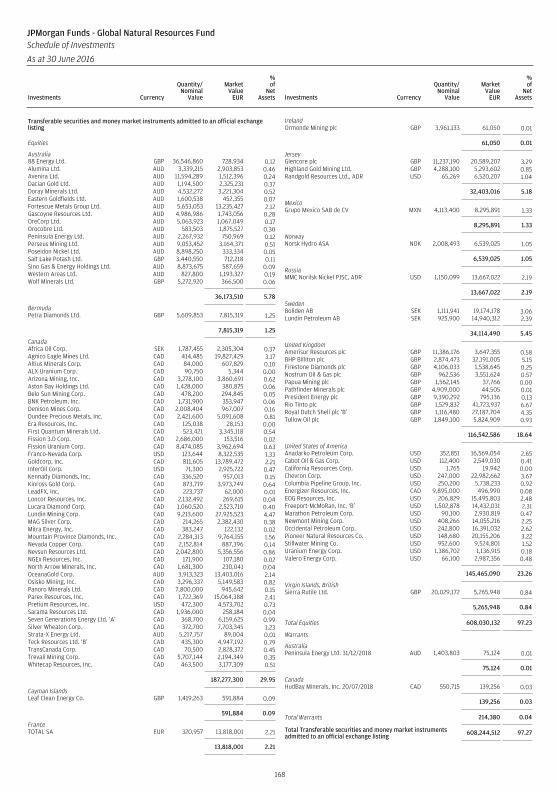
Transferable securities and money market instruments admitted to an official exchangelisting
Equities
Australia88 Energy Ltd. GBP 36,546,860 728,934 0.12Alumina Ltd. AUD 3,339,215 2,903,853 0.46Avenira Ltd. AUD 11,594,289 1,512,396 0.24Dacian Gold Ltd. AUD 1,194,500 2,325,231 0.37Doray Minerals Ltd. AUD 4,532,272 3,221,304 0.52Eastern Goldfields Ltd. AUD 1,600,538 452,355 0.07Fortescue Metals Group Ltd. AUD 5,653,053 13,235,427 2.12Gascoyne Resources Ltd. AUD 4,986,986 1,743,056 0.28OreCorp Ltd. AUD 5,063,923 1,067,049 0.17Orocobre Ltd. AUD 583,503 1,875,527 0.30Peninsula Energy Ltd. AUD 2,267,932 750,969 0.12Perseus Mining Ltd. AUD 9,053,452 3,164,371 0.51Poseidon Nickel Ltd. AUD 8,898,250 333,334 0.05Salt Lake Potash Ltd. GBP 3,440,550 712,218 0.11Sino Gas & Energy Holdings Ltd. AUD 8,873,675 587,659 0.09Western Areas Ltd. AUD 827,800 1,193,327 0.19Wolf Minerals Ltd. GBP 5,272,920 366,500 0.06
36,173,510 5.78
BermudaPetra Diamonds Ltd. GBP 5,609,853 7,815,319 1.25
7,815,319 1.25
CanadaAfrica Oil Corp. SEK 1,787,455 2,305,304 0.37Agnico Eagle Mines Ltd. CAD 414,485 19,827,429 3.17Altius Minerals Corp. CAD 84,000 607,829 0.10ALX Uranium Corp. CAD 90,750 5,344 0.00Arizona Mining, Inc. CAD 3,278,100 3,860,691 0.62Aston Bay Holdings Ltd. CAD 1,428,000 380,875 0.06Belo Sun Mining Corp. CAD 478,200 294,845 0.05BNK Petroleum, Inc. CAD 1,731,900 353,947 0.06Denison Mines Corp. CAD 2,008,404 967,007 0.16Dundee Precious Metals, Inc. CAD 2,421,600 5,091,608 0.81Era Resources, Inc. CAD 125,038 28,153 0.00First Quantum Minerals Ltd. CAD 523,421 3,345,118 0.54Fission 3.0 Corp. CAD 2,686,000 153,516 0.02Fission Uranium Corp. CAD 8,474,085 3,962,694 0.63Franco-Nevada Corp. USD 123,644 8,322,535 1.33Goldcorp, Inc. CAD 811,605 13,789,472 2.21InterOil Corp. USD 71,300 2,925,722 0.47Kennady Diamonds, Inc. CAD 336,520 957,013 0.15Kinross Gold Corp. CAD 873,719 3,973,749 0.64LeadFX, Inc. CAD 223,737 62,000 0.01Loncor Resources, Inc. CAD 2,132,492 269,615 0.04Lucara Diamond Corp. CAD 1,060,520 2,523,710 0.40Lundin Mining Corp. CAD 9,213,600 27,925,523 4.47MAG Silver Corp. CAD 214,265 2,382,430 0.38Mitra Energy, Inc. CAD 383,247 122,132 0.02Mountain Province Diamonds, Inc. CAD 2,284,313 9,764,155 1.56Nevada Copper Corp. CAD 2,152,814 887,396 0.14Nevsun Resources Ltd. CAD 2,042,800 5,356,556 0.86NGEx Resources, Inc. CAD 171,900 107,180 0.02North Arrow Minerals, Inc. CAD 1,681,300 230,041 0.04OceanaGold Corp. AUD 3,913,323 13,403,016 2.14Osisko Mining, Inc. CAD 3,296,337 5,149,583 0.82Panoro Minerals Ltd. CAD 7,800,000 945,642 0.15Parex Resources, Inc. CAD 1,722,369 15,064,388 2.41Pretium Resources, Inc. USD 472,300 4,573,702 0.73Sarama Resources Ltd. CAD 1,936,000 258,184 0.04Seven Generations Energy Ltd. ‘A’ CAD 368,700 6,159,625 0.99Silver Wheaton Corp. CAD 372,700 7,703,345 1.23Strata-X Energy Ltd. AUD 5,217,757 89,004 0.01Teck Resources Ltd. ‘B’ CAD 435,300 4,947,192 0.79TransCanada Corp. CAD 70,500 2,828,372 0.45Trevali Mining Corp. CAD 5,707,144 2,194,349 0.35Whitecap Resources, Inc. CAD 463,500 3,177,309 0.51
187,277,300 29.95
Cayman IslandsLeaf Clean Energy Co. GBP 1,419,263 591,884 0.09
591,884 0.09
FranceTOTAL SA EUR 320,957 13,818,001 2.21
13,818,001 2.21
IrelandOrmonde Mining plc GBP 3,961,133 61,050 0.01
61,050 0.01
JerseyGlencore plc GBP 11,237,190 20,589,207 3.29Highland Gold Mining Ltd. GBP 4,288,100 5,293,602 0.85Randgold Resources Ltd., ADR USD 65,269 6,520,207 1.04
32,403,016 5.18
MexicoGrupo Mexico SAB de CV MXN 4,113,400 8,295,891 1.33
8,295,891 1.33
NorwayNorsk Hydro ASA NOK 2,008,493 6,539,025 1.05
6,539,025 1.05
RussiaMMC Norilsk Nickel PJSC, ADR USD 1,150,099 13,667,022 2.19
13,667,022 2.19
SwedenBoliden AB SEK 1,111,941 19,174,178 3.06Lundin Petroleum AB SEK 925,900 14,940,312 2.39
34,114,490 5.45
United KingdomAmerisur Resources plc GBP 11,386,176 3,647,355 0.58BHP Billiton plc GBP 2,874,473 32,191,005 5.15Firestone Diamonds plc GBP 4,106,033 1,538,645 0.25Nostrum Oil & Gas plc GBP 962,536 3,551,624 0.57Papua Mining plc GBP 1,562,145 37,766 0.00Pathfinder Minerals plc GBP 4,909,000 44,505 0.01President Energy plc GBP 9,390,292 795,136 0.13Rio Tinto plc GBP 1,529,832 41,723,937 6.67Royal Dutch Shell plc ‘B’ GBP 1,116,480 27,187,704 4.35Tullow Oil plc GBP 1,849,100 5,824,909 0.93
116,542,586 18.64
United States of AmericaAnadarko Petroleum Corp. USD 352,851 16,569,054 2.65Cabot Oil & Gas Corp. USD 112,400 2,549,030 0.41California Resources Corp. USD 1,765 19,942 0.00Chevron Corp. USD 247,000 22,982,662 3.67Columbia Pipeline Group, Inc. USD 250,200 5,738,233 0.92Energizer Resources, Inc. CAD 9,895,000 496,990 0.08EOG Resources, Inc. USD 206,829 15,495,803 2.48Freeport-McMoRan, Inc. ‘B’ USD 1,502,878 14,432,031 2.31Marathon Petroleum Corp. USD 90,100 2,930,819 0.47Newmont Mining Corp. USD 408,266 14,055,216 2.25Occidental Petroleum Corp. USD 242,800 16,391,032 2.62Pioneer Natural Resources Co. USD 148,680 20,155,206 3.22Stillwater Mining Co. USD 952,600 9,524,801 1.52Uranium Energy Corp. USD 1,386,702 1,136,915 0.18Valero Energy Corp. USD 66,100 2,987,356 0.48
145,465,090 23.26
Virgin Islands, BritishSierra Rutile Ltd. GBP 20,029,172 5,265,948 0.84
5,265,948 0.84
Total Equities 608,030,132 97.23
Warrants
AustraliaPeninsula Energy Ltd. 31/12/2018 AUD 1,403,803 75,124 0.01
75,124 0.01
CanadaHudBay Minerals, Inc. 20/07/2018 CAD 550,715 139,256 0.03
139,256 0.03
Total Warrants 214,380 0.04
Total Transferable securities and money market instrumentsadmitted to an official exchange listing 608,244,512 97.27
168
JPMorgan Funds - Global Natural Resources FundSchedule of Investments
As at 30 June 2016
Investments Currency
Quantity/Nominal
Value
MarketValue
EUR
%of
NetAssets Investments Currency
Quantity/Nominal
Value
MarketValue
EUR
%of
NetAssets
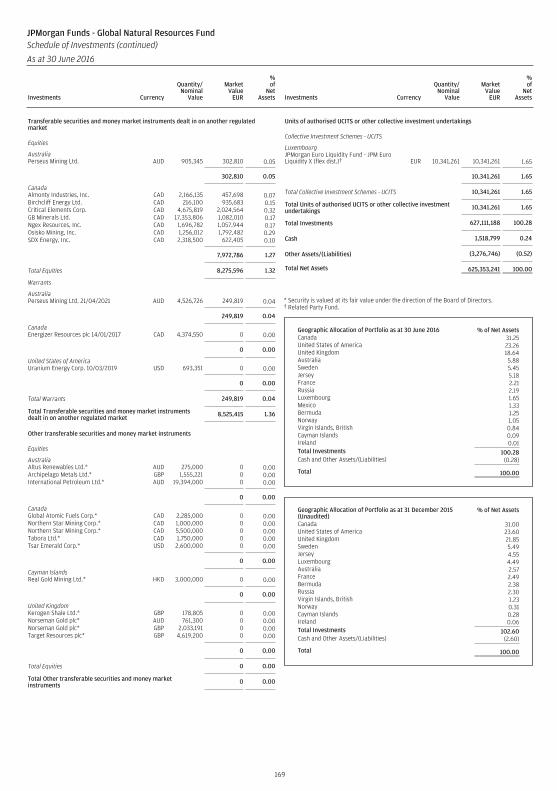
Transferable securities and money market instruments dealt in on another regulatedmarket
Equities
AustraliaPerseus Mining Ltd. AUD 905,345 302,810 0.05
302,810 0.05
CanadaAlmonty Industries, Inc. CAD 2,166,135 457,698 0.07Birchcliff Energy Ltd. CAD 216,100 935,683 0.15Critical Elements Corp. CAD 4,675,819 2,024,564 0.32GB Minerals Ltd. CAD 17,353,806 1,082,010 0.17Ngex Resources, Inc. CAD 1,696,782 1,057,944 0.17Osisko Mining, Inc. CAD 1,256,012 1,792,482 0.29SDX Energy, Inc. CAD 2,318,500 622,405 0.10
7,972,786 1.27
Total Equities 8,275,596 1.32
Warrants
AustraliaPerseus Mining Ltd. 21/04/2021 AUD 4,526,726 249,819 0.04
249,819 0.04
CanadaEnergizer Resources plc 14/01/2017 CAD 4,374,550 0 0.00
0 0.00
United States of AmericaUranium Energy Corp. 10/03/2019 USD 693,351 0 0.00
0 0.00
Total Warrants 249,819 0.04
Total Transferable securities and money market instrumentsdealt in on another regulated market 8,525,415 1.36
Other transferable securities and money market instruments
Equities
AustraliaAltus Renewables Ltd.* AUD 275,000 0 0.00Archipelago Metals Ltd.* GBP 1,555,221 0 0.00International Petroleum Ltd.* AUD 19,394,000 0 0.00
0 0.00
CanadaGlobal Atomic Fuels Corp.* CAD 2,285,000 0 0.00Northern Star Mining Corp.* CAD 1,000,000 0 0.00Northern Star Mining Corp.* CAD 5,500,000 0 0.00Tabora Ltd.* CAD 1,750,000 0 0.00Tsar Emerald Corp.* USD 2,600,000 0 0.00
0 0.00
Cayman IslandsReal Gold Mining Ltd.* HKD 3,000,000 0 0.00
0 0.00
United KingdomKerogen Shale Ltd.* GBP 178,805 0 0.00Norseman Gold plc* AUD 761,300 0 0.00Norseman Gold plc* GBP 2,033,191 0 0.00Target Resources plc* GBP 4,619,200 0 0.00
0 0.00
Total Equities 0 0.00
Total Other transferable securities and money marketinstruments 0 0.00
Units of authorised UCITS or other collective investment undertakings
Collective Investment Schemes - UCITS
LuxembourgJPMorgan Euro Liquidity Fund - JPM EuroLiquidity X (flex dist.)† EUR 10,341,261 10,341,261 1.65
10,341,261 1.65
Total Collective Investment Schemes - UCITS 10,341,261 1.65
Total Units of authorised UCITS or other collective investmentundertakings 10,341,261 1.65
Total Investments 627,111,188 100.28
Cash 1,518,799 0.24
Other Assets/(Liabilities) (3,276,746) (0.52)
Total Net Assets 625,353,241 100.00
* Security is valued at its fair value under the direction of the Board of Directors.† Related Party Fund.
Geographic Allocation of Portfolio as at 30 June 2016 % of Net AssetsCanada 31.25United States of America 23.26United Kingdom 18.64Australia 5.88Sweden 5.45Jersey 5.18France 2.21Russia 2.19Luxembourg 1.65Mexico 1.33Bermuda 1.25Norway 1.05Virgin Islands, British 0.84Cayman Islands 0.09Ireland 0.01Total Investments 100.28Cash and Other Assets/(Liabilities) (0.28)
Total 100.00
Geographic Allocation of Portfolio as at 31 December 2015(Unaudited)
% of Net Assets
Canada 31.00United States of America 23.60United Kingdom 21.85Sweden 5.49Jersey 4.55Luxembourg 4.49Australia 2.57France 2.49Bermuda 2.38Russia 2.30Virgin Islands, British 1.23Norway 0.31Cayman Islands 0.28Ireland 0.06Total Investments 102.60Cash and Other Assets/(Liabilities) (2.60)
Total 100.00
169
JPMorgan Funds - Global Natural Resources FundSchedule of Investments (continued)
As at 30 June 2016
Investments Currency
Quantity/Nominal
Value
MarketValue
EUR
%of
NetAssets Investments Currency
Quantity/Nominal
Value
MarketValue
EUR
%of
NetAssets
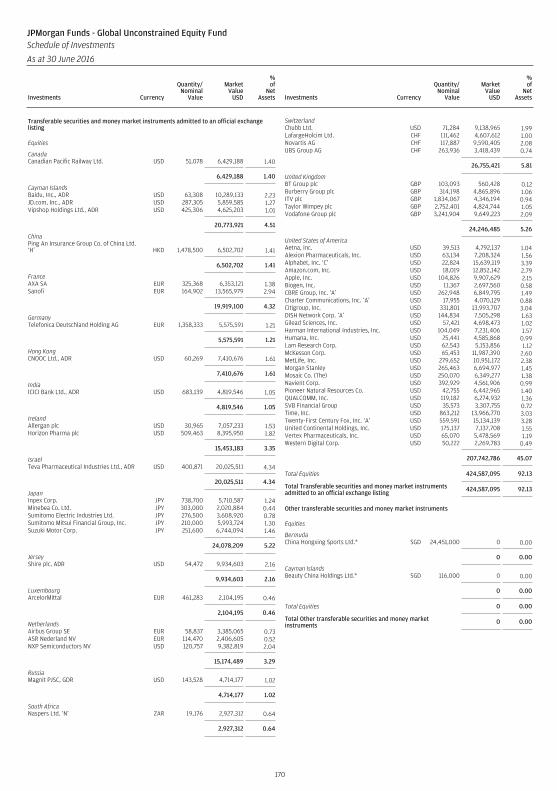
Transferable securities and money market instruments admitted to an official exchangelisting
Equities
CanadaCanadian Pacific Railway Ltd. USD 51,078 6,429,188 1.40
6,429,188 1.40
Cayman IslandsBaidu, Inc., ADR USD 63,308 10,289,133 2.23JD.com, Inc., ADR USD 287,305 5,859,585 1.27Vipshop Holdings Ltd., ADR USD 425,306 4,625,203 1.01
20,773,921 4.51
ChinaPing An Insurance Group Co. of China Ltd.‘H’ HKD 1,478,500 6,502,702 1.41
6,502,702 1.41
FranceAXA SA EUR 325,368 6,353,121 1.38Sanofi EUR 164,902 13,565,979 2.94
19,919,100 4.32
GermanyTelefonica Deutschland Holding AG EUR 1,358,333 5,575,591 1.21
5,575,591 1.21
Hong KongCNOOC Ltd., ADR USD 60,269 7,410,676 1.61
7,410,676 1.61
IndiaICICI Bank Ltd., ADR USD 683,139 4,819,546 1.05
4,819,546 1.05
IrelandAllergan plc USD 30,965 7,057,233 1.53Horizon Pharma plc USD 509,463 8,395,950 1.82
15,453,183 3.35
IsraelTeva Pharmaceutical Industries Ltd., ADR USD 400,871 20,025,511 4.34
20,025,511 4.34
JapanInpex Corp. JPY 738,700 5,710,587 1.24Minebea Co. Ltd. JPY 303,000 2,020,884 0.44Sumitomo Electric Industries Ltd. JPY 276,500 3,608,920 0.78Sumitomo Mitsui Financial Group, Inc. JPY 210,000 5,993,724 1.30Suzuki Motor Corp. JPY 251,600 6,744,094 1.46
24,078,209 5.22
JerseyShire plc, ADR USD 54,472 9,934,603 2.16
9,934,603 2.16
LuxembourgArcelorMittal EUR 461,283 2,104,195 0.46
2,104,195 0.46
NetherlandsAirbus Group SE EUR 58,837 3,385,065 0.73ASR Nederland NV EUR 114,470 2,406,605 0.52NXP Semiconductors NV USD 120,757 9,382,819 2.04
15,174,489 3.29
RussiaMagnit PJSC, GDR USD 143,528 4,714,177 1.02
4,714,177 1.02
South AfricaNaspers Ltd. ‘N’ ZAR 19,176 2,927,312 0.64
2,927,312 0.64
SwitzerlandChubb Ltd. USD 71,284 9,138,965 1.99LafargeHolcim Ltd. CHF 111,462 4,607,612 1.00Novartis AG CHF 117,887 9,590,405 2.08UBS Group AG CHF 263,936 3,418,439 0.74
26,755,421 5.81
United KingdomBT Group plc GBP 103,093 560,428 0.12Burberry Group plc GBP 314,198 4,865,896 1.06ITV plc GBP 1,834,067 4,346,194 0.94Taylor Wimpey plc GBP 2,752,401 4,824,744 1.05Vodafone Group plc GBP 3,241,904 9,649,223 2.09
24,246,485 5.26
United States of AmericaAetna, Inc. USD 39,513 4,792,137 1.04Alexion Pharmaceuticals, Inc. USD 63,134 7,208,324 1.56Alphabet, Inc. ‘C’ USD 22,824 15,639,119 3.39Amazon.com, Inc. USD 18,019 12,852,142 2.79Apple, Inc. USD 104,826 9,907,629 2.15Biogen, Inc. USD 11,367 2,697,560 0.58CBRE Group, Inc. ‘A’ USD 262,948 6,849,795 1.49Charter Communications, Inc. ‘A’ USD 17,955 4,070,129 0.88Citigroup, Inc. USD 331,801 13,993,707 3.04DISH Network Corp. ‘A’ USD 144,834 7,505,298 1.63Gilead Sciences, Inc. USD 57,421 4,698,473 1.02Harman International Industries, Inc. USD 104,049 7,231,406 1.57Humana, Inc. USD 25,441 4,585,868 0.99Lam Research Corp. USD 62,543 5,153,856 1.12McKesson Corp. USD 65,453 11,987,390 2.60MetLife, Inc. USD 279,652 10,951,172 2.38Morgan Stanley USD 265,463 6,694,977 1.45Mosaic Co. (The) USD 250,070 6,349,277 1.38Navient Corp. USD 392,929 4,561,906 0.99Pioneer Natural Resources Co. USD 42,755 6,442,965 1.40QUALCOMM, Inc. USD 119,182 6,274,932 1.36SVB Financial Group USD 35,573 3,307,755 0.72Time, Inc. USD 863,212 13,966,770 3.03Twenty-First Century Fox, Inc. ‘A’ USD 559,591 15,134,139 3.28United Continental Holdings, Inc. USD 175,137 7,137,708 1.55Vertex Pharmaceuticals, Inc. USD 65,070 5,478,569 1.19Western Digital Corp. USD 50,222 2,269,783 0.49
207,742,786 45.07
Total Equities 424,587,095 92.13
Total Transferable securities and money market instrumentsadmitted to an official exchange listing 424,587,095 92.13
Other transferable securities and money market instruments
Equities
BermudaChina Hongxing Sports Ltd.* SGD 24,451,000 0 0.00
0 0.00
Cayman IslandsBeauty China Holdings Ltd.* SGD 116,000 0 0.00
0 0.00
Total Equities 0 0.00
Total Other transferable securities and money marketinstruments 0 0.00
170
JPMorgan Funds - Global Unconstrained Equity FundSchedule of Investments
As at 30 June 2016
Investments Currency
Quantity/Nominal
Value
MarketValue
USD
%of
NetAssets Investments Currency
Quantity/Nominal
Value
MarketValue
USD
%of
NetAssets
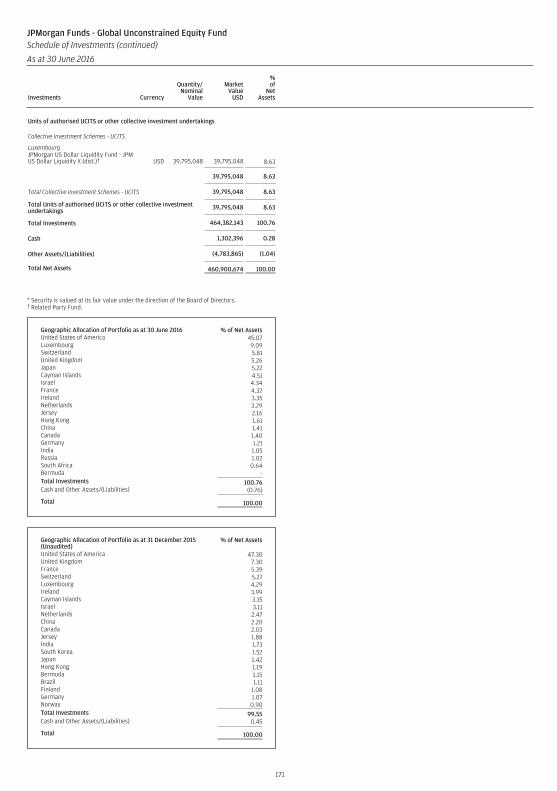
Units of authorised UCITS or other collective investment undertakings
Collective Investment Schemes - UCITS
LuxembourgJPMorgan US Dollar Liquidity Fund - JPMUS Dollar Liquidity X (dist.)† USD 39,795,048 39,795,048 8.63
39,795,048 8.63
Total Collective Investment Schemes - UCITS 39,795,048 8.63
Total Units of authorised UCITS or other collective investmentundertakings 39,795,048 8.63
Total Investments 464,382,143 100.76
Cash 1,302,396 0.28
Other Assets/(Liabilities) (4,783,865) (1.04)
Total Net Assets 460,900,674 100.00
* Security is valued at its fair value under the direction of the Board of Directors.† Related Party Fund.
Geographic Allocation of Portfolio as at 30 June 2016 % of Net AssetsUnited States of America 45.07Luxembourg 9.09Switzerland 5.81United Kingdom 5.26Japan 5.22Cayman Islands 4.51Israel 4.34France 4.32Ireland 3.35Netherlands 3.29Jersey 2.16Hong Kong 1.61China 1.41Canada 1.40Germany 1.21India 1.05Russia 1.02South Africa 0.64Bermuda -Total Investments 100.76Cash and Other Assets/(Liabilities) (0.76)
Total 100.00
Geographic Allocation of Portfolio as at 31 December 2015(Unaudited)
% of Net Assets
United States of America 47.30United Kingdom 7.30France 5.39Switzerland 5.27Luxembourg 4.29Ireland 3.99Cayman Islands 3.15Israel 3.11Netherlands 2.47China 2.20Canada 2.03Jersey 1.88India 1.73South Korea 1.52Japan 1.42Hong Kong 1.19Bermuda 1.15Brazil 1.11Finland 1.08Germany 1.07Norway 0.90Total Investments 99.55Cash and Other Assets/(Liabilities) 0.45
Total 100.00
171
JPMorgan Funds - Global Unconstrained Equity FundSchedule of Investments (continued)
As at 30 June 2016
Investments Currency
Quantity/Nominal
Value
MarketValue
USD
%of
NetAssets Investments Currency
Quantity/Nominal
Value
MarketValue
USD
%of
NetAssets
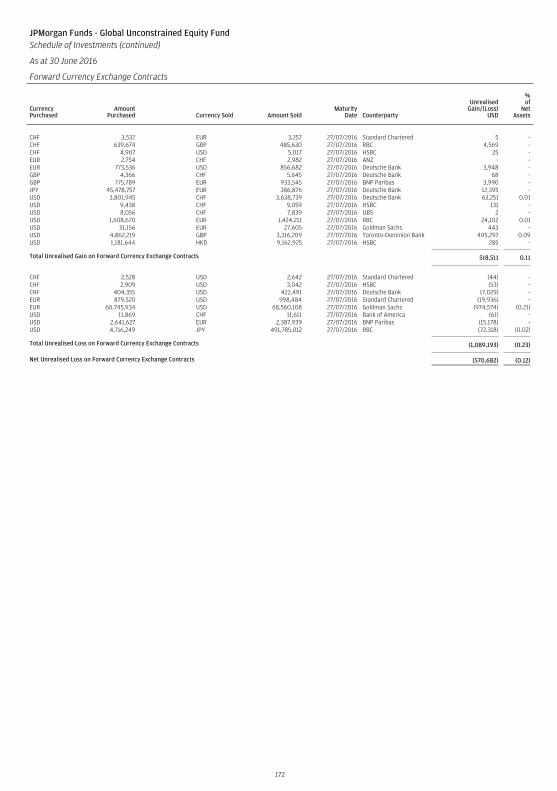
JPMorgan Funds - Global Unconstrained Equity FundSchedule of Investments (continued)
As at 30 June 2016
Forward Currency Exchange Contracts
CurrencyPurchased
AmountPurchased Currency Sold Amount Sold
MaturityDate Counterparty
UnrealisedGain/(Loss)
USD
%of
NetAssets
CHF 3,532 EUR 3,257 27/07/2016 Standard Chartered 5 -CHF 639,674 GBP 485,630 27/07/2016 RBC 4,569 -CHF 4,907 USD 5,017 27/07/2016 HSBC 25 -EUR 2,754 CHF 2,982 27/07/2016 ANZ - -EUR 773,536 USD 856,682 27/07/2016 Deutsche Bank 3,948 -GBP 4,366 CHF 5,645 27/07/2016 Deutsche Bank 68 -GBP 775,789 EUR 933,545 27/07/2016 BNP Paribas 3,990 -JPY 45,478,757 EUR 386,876 27/07/2016 Deutsche Bank 12,395 -USD 3,801,945 CHF 3,638,739 27/07/2016 Deutsche Bank 63,251 0.01USD 9,438 CHF 9,059 27/07/2016 HSBC 131 -USD 8,056 CHF 7,839 27/07/2016 UBS 2 -USD 1,608,670 EUR 1,424,211 27/07/2016 RBC 24,102 0.01USD 31,156 EUR 27,605 27/07/2016 Goldman Sachs 443 -USD 4,862,219 GBP 3,316,209 27/07/2016 Toronto-Dominion Bank 405,297 0.09USD 1,181,644 HKD 9,162,925 27/07/2016 HSBC 285 -
Total Unrealised Gain on Forward Currency Exchange Contracts 518,511 0.11
CHF 2,528 USD 2,642 27/07/2016 Standard Chartered (44) -CHF 2,909 USD 3,042 27/07/2016 HSBC (53) -CHF 404,355 USD 422,491 27/07/2016 Deutsche Bank (7,029) -EUR 879,520 USD 998,484 27/07/2016 Standard Chartered (19,936) -EUR 60,745,934 USD 68,560,108 27/07/2016 Goldman Sachs (974,574) (0.21)USD 11,869 CHF 11,611 27/07/2016 Bank of America (61) -USD 2,641,627 EUR 2,387,939 27/07/2016 BNP Paribas (15,178) -USD 4,716,249 JPY 491,785,012 27/07/2016 RBC (72,318) (0.02)
Total Unrealised Loss on Forward Currency Exchange Contracts (1,089,193) (0.23)
Net Unrealised Loss on Forward Currency Exchange Contracts (570,682) (0.12)
172
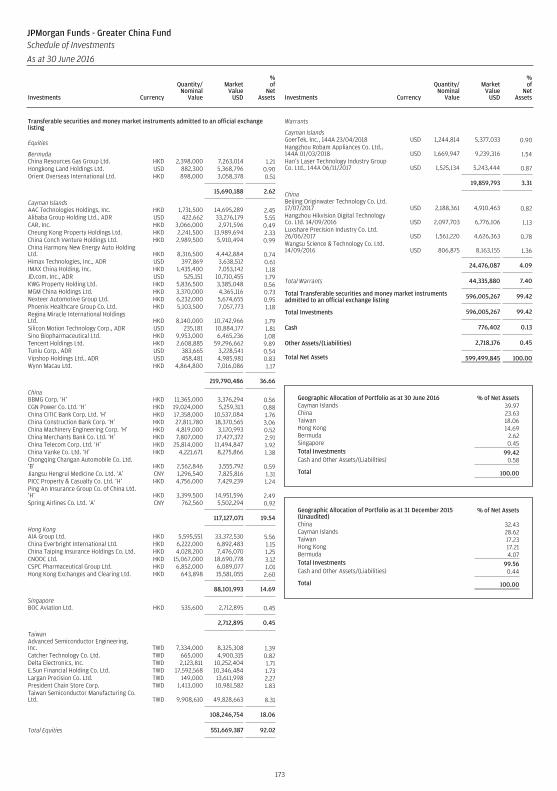
Transferable securities and money market instruments admitted to an official exchangelisting
Equities
BermudaChina Resources Gas Group Ltd. HKD 2,398,000 7,263,014 1.21Hongkong Land Holdings Ltd. USD 882,300 5,368,796 0.90Orient Overseas International Ltd. HKD 898,000 3,058,378 0.51
15,690,188 2.62
Cayman IslandsAAC Technologies Holdings, Inc. HKD 1,731,500 14,695,289 2.45Alibaba Group Holding Ltd., ADR USD 422,662 33,276,179 5.55CAR, Inc. HKD 3,066,000 2,971,596 0.49Cheung Kong Property Holdings Ltd. HKD 2,241,500 13,989,694 2.33China Conch Venture Holdings Ltd. HKD 2,989,500 5,910,494 0.99China Harmony New Energy Auto HoldingLtd. HKD 8,316,500 4,442,884 0.74Himax Technologies, Inc., ADR USD 397,869 3,638,512 0.61IMAX China Holding, Inc. HKD 1,435,400 7,053,142 1.18JD.com, Inc., ADR USD 525,151 10,710,455 1.79KWG Property Holding Ltd. HKD 5,836,500 3,385,048 0.56MGM China Holdings Ltd. HKD 3,370,000 4,365,116 0.73Nexteer Automotive Group Ltd. HKD 6,232,000 5,674,655 0.95Phoenix Healthcare Group Co. Ltd. HKD 5,103,500 7,057,773 1.18Regina Miracle International HoldingsLtd. HKD 8,140,000 10,742,966 1.79Silicon Motion Technology Corp., ADR USD 235,181 10,884,177 1.81Sino Biopharmaceutical Ltd. HKD 9,953,000 6,465,236 1.08Tencent Holdings Ltd. HKD 2,608,885 59,296,662 9.89Tuniu Corp., ADR USD 383,665 3,228,541 0.54Vipshop Holdings Ltd., ADR USD 458,481 4,985,981 0.83Wynn Macau Ltd. HKD 4,864,800 7,016,086 1.17
219,790,486 36.66
ChinaBBMG Corp. ‘H’ HKD 11,365,000 3,376,294 0.56CGN Power Co. Ltd. ‘H’ HKD 19,024,000 5,259,313 0.88China CITIC Bank Corp. Ltd. ‘H’ HKD 17,358,000 10,537,084 1.76China Construction Bank Corp. ‘H’ HKD 27,811,780 18,370,565 3.06China Machinery Engineering Corp. ‘H’ HKD 4,819,000 3,120,993 0.52China Merchants Bank Co. Ltd. ‘H’ HKD 7,807,000 17,427,372 2.91China Telecom Corp. Ltd. ‘H’ HKD 25,814,000 11,494,847 1.92China Vanke Co. Ltd. ‘H’ HKD 4,221,671 8,275,866 1.38Chongqing Changan Automobile Co. Ltd.‘B’ HKD 2,562,846 3,555,792 0.59Jiangsu Hengrui Medicine Co. Ltd. ‘A’ CNY 1,296,540 7,825,816 1.31PICC Property & Casualty Co. Ltd. ‘H’ HKD 4,756,000 7,429,239 1.24Ping An Insurance Group Co. of China Ltd.‘H’ HKD 3,399,500 14,951,596 2.49Spring Airlines Co. Ltd. ‘A’ CNY 762,560 5,502,294 0.92
117,127,071 19.54
Hong KongAIA Group Ltd. HKD 5,595,551 33,372,530 5.56China Everbright International Ltd. HKD 6,222,000 6,892,483 1.15China Taiping Insurance Holdings Co. Ltd. HKD 4,028,200 7,476,070 1.25CNOOC Ltd. HKD 15,067,000 18,690,778 3.12CSPC Pharmaceutical Group Ltd. HKD 6,852,000 6,089,077 1.01Hong Kong Exchanges and Clearing Ltd. HKD 643,898 15,581,055 2.60
88,101,993 14.69
SingaporeBOC Aviation Ltd. HKD 535,600 2,712,895 0.45
2,712,895 0.45
TaiwanAdvanced Semiconductor Engineering,Inc. TWD 7,334,000 8,325,308 1.39Catcher Technology Co. Ltd. TWD 665,000 4,900,315 0.82Delta Electronics, Inc. TWD 2,123,811 10,252,404 1.71E.Sun Financial Holding Co. Ltd. TWD 17,592,568 10,346,484 1.73Largan Precision Co. Ltd. TWD 149,000 13,611,998 2.27President Chain Store Corp. TWD 1,413,000 10,981,582 1.83Taiwan Semiconductor Manufacturing Co.Ltd. TWD 9,908,610 49,828,663 8.31
108,246,754 18.06
Total Equities 551,669,387 92.02
Warrants
Cayman IslandsGoerTek, Inc., 144A 23/04/2018 USD 1,244,814 5,377,033 0.90Hangzhou Robam Appliances Co. Ltd.,144A 01/03/2018 USD 1,669,947 9,239,316 1.54Han’s Laser Technology Industry GroupCo. Ltd., 144A 06/11/2017 USD 1,525,134 5,243,444 0.87
19,859,793 3.31
ChinaBeijing Originwater Technology Co. Ltd.17/07/2017 USD 2,188,361 4,910,463 0.82Hangzhou Hikvision Digital TechnologyCo. Ltd. 14/09/2016 USD 2,097,703 6,776,106 1.13Luxshare Precision Industry Co. Ltd.26/06/2017 USD 1,561,220 4,626,363 0.78Wangsu Science & Technology Co. Ltd.14/09/2016 USD 806,875 8,163,155 1.36
24,476,087 4.09
Total Warrants 44,335,880 7.40
Total Transferable securities and money market instrumentsadmitted to an official exchange listing 596,005,267 99.42
Total Investments 596,005,267 99.42
Cash 776,402 0.13
Other Assets/(Liabilities) 2,718,176 0.45
Total Net Assets 599,499,845 100.00
Geographic Allocation of Portfolio as at 30 June 2016 % of Net AssetsCayman Islands 39.97China 23.63Taiwan 18.06Hong Kong 14.69Bermuda 2.62Singapore 0.45Total Investments 99.42Cash and Other Assets/(Liabilities) 0.58
Total 100.00
Geographic Allocation of Portfolio as at 31 December 2015(Unaudited)
% of Net Assets
China 32.43Cayman Islands 28.62Taiwan 17.23Hong Kong 17.21Bermuda 4.07Total Investments 99.56Cash and Other Assets/(Liabilities) 0.44
Total 100.00
173
JPMorgan Funds - Greater China FundSchedule of Investments
As at 30 June 2016
Investments Currency
Quantity/Nominal
Value
MarketValue
USD
%of
NetAssets Investments Currency
Quantity/Nominal
Value
MarketValue
USD
%of
NetAssets
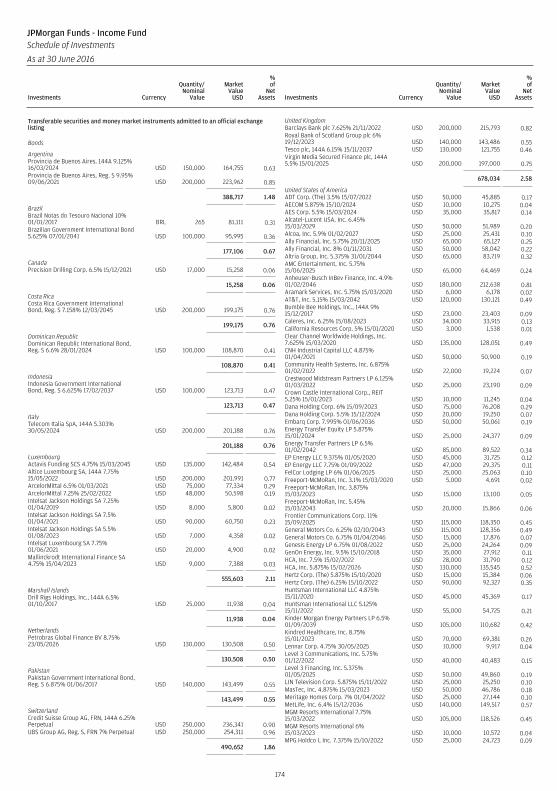
Transferable securities and money market instruments admitted to an official exchangelisting
Bonds
ArgentinaProvincia de Buenos Aires, 144A 9.125%16/03/2024 USD 150,000 164,755 0.63Provincia de Buenos Aires, Reg. S 9.95%09/06/2021 USD 200,000 223,962 0.85
388,717 1.48
BrazilBrazil Notas do Tesouro Nacional 10%01/01/2017 BRL 265 81,111 0.31Brazilian Government International Bond5.625% 07/01/2041 USD 100,000 95,995 0.36
177,106 0.67
CanadaPrecision Drilling Corp. 6.5% 15/12/2021 USD 17,000 15,258 0.06
15,258 0.06
Costa RicaCosta Rica Government InternationalBond, Reg. S 7.158% 12/03/2045 USD 200,000 199,175 0.76
199,175 0.76
Dominican RepublicDominican Republic International Bond,Reg. S 6.6% 28/01/2024 USD 100,000 108,870 0.41
108,870 0.41
IndonesiaIndonesia Government InternationalBond, Reg. S 6.625% 17/02/2037 USD 100,000 123,713 0.47
123,713 0.47
ItalyTelecom Italia SpA, 144A 5.303%30/05/2024 USD 200,000 201,188 0.76
201,188 0.76
LuxembourgActavis Funding SCS 4.75% 15/03/2045 USD 135,000 142,484 0.54Altice Luxembourg SA, 144A 7.75%15/05/2022 USD 200,000 201,991 0.77ArcelorMittal 6.5% 01/03/2021 USD 75,000 77,334 0.29ArcelorMittal 7.25% 25/02/2022 USD 48,000 50,598 0.19Intelsat Jackson Holdings SA 7.25%01/04/2019 USD 8,000 5,800 0.02Intelsat Jackson Holdings SA 7.5%01/04/2021 USD 90,000 60,750 0.23Intelsat Jackson Holdings SA 5.5%01/08/2023 USD 7,000 4,358 0.02Intelsat Luxembourg SA 7.75%01/06/2021 USD 20,000 4,900 0.02Mallinckrodt International Finance SA4.75% 15/04/2023 USD 9,000 7,388 0.03
555,603 2.11
Marshall IslandsDrill Rigs Holdings, Inc., 144A 6.5%01/10/2017 USD 25,000 11,938 0.04
11,938 0.04
NetherlandsPetrobras Global Finance BV 8.75%23/05/2026 USD 130,000 130,508 0.50
130,508 0.50
PakistanPakistan Government International Bond,Reg. S 6.875% 01/06/2017 USD 140,000 143,499 0.55
143,499 0.55
SwitzerlandCredit Suisse Group AG, FRN, 144A 6.25%Perpetual USD 250,000 236,341 0.90UBS Group AG, Reg. S, FRN 7% Perpetual USD 250,000 254,311 0.96
490,652 1.86
United KingdomBarclays Bank plc 7.625% 21/11/2022 USD 200,000 215,793 0.82Royal Bank of Scotland Group plc 6%19/12/2023 USD 140,000 143,486 0.55Tesco plc, 144A 6.15% 15/11/2037 USD 130,000 121,755 0.46Virgin Media Secured Finance plc, 144A5.5% 15/01/2025 USD 200,000 197,000 0.75
678,034 2.58
United States of AmericaADT Corp. (The) 3.5% 15/07/2022 USD 50,000 45,885 0.17AECOM 5.875% 15/10/2024 USD 10,000 10,275 0.04AES Corp. 5.5% 15/03/2024 USD 35,000 35,817 0.14Alcatel-Lucent USA, Inc. 6.45%15/03/2029 USD 50,000 51,989 0.20Alcoa, Inc. 5.9% 01/02/2027 USD 25,000 25,431 0.10Ally Financial, Inc. 5.75% 20/11/2025 USD 65,000 65,127 0.25Ally Financial, Inc. 8% 01/11/2031 USD 50,000 58,042 0.22Altria Group, Inc. 5.375% 31/01/2044 USD 65,000 83,719 0.32AMC Entertainment, Inc. 5.75%15/06/2025 USD 65,000 64,469 0.24Anheuser-Busch InBev Finance, Inc. 4.9%01/02/2046 USD 180,000 212,638 0.81Aramark Services, Inc. 5.75% 15/03/2020 USD 6,000 6,178 0.02AT&T, Inc. 5.15% 15/03/2042 USD 120,000 130,121 0.49Bumble Bee Holdings, Inc., 144A 9%15/12/2017 USD 23,000 23,403 0.09Caleres, Inc. 6.25% 15/08/2023 USD 34,000 33,915 0.13California Resources Corp. 5% 15/01/2020 USD 3,000 1,538 0.01Clear Channel Worldwide Holdings, Inc.7.625% 15/03/2020 USD 135,000 128,051 0.49CNH Industrial Capital LLC 4.875%01/04/2021 USD 50,000 50,900 0.19Community Health Systems, Inc. 6.875%01/02/2022 USD 22,000 19,224 0.07Crestwood Midstream Partners LP 6.125%01/03/2022 USD 25,000 23,190 0.09Crown Castle International Corp., REIT5.25% 15/01/2023 USD 10,000 11,245 0.04Dana Holding Corp. 6% 15/09/2023 USD 75,000 76,208 0.29Dana Holding Corp. 5.5% 15/12/2024 USD 20,000 19,250 0.07Embarq Corp. 7.995% 01/06/2036 USD 50,000 50,061 0.19Energy Transfer Equity LP 5.875%15/01/2024 USD 25,000 24,377 0.09Energy Transfer Partners LP 6.5%01/02/2042 USD 85,000 89,522 0.34EP Energy LLC 9.375% 01/05/2020 USD 45,000 31,725 0.12EP Energy LLC 7.75% 01/09/2022 USD 47,000 29,375 0.11FelCor Lodging LP 6% 01/06/2025 USD 25,000 25,063 0.10Freeport-McMoRan, Inc. 3.1% 15/03/2020 USD 5,000 4,691 0.02Freeport-McMoRan, Inc. 3.875%15/03/2023 USD 15,000 13,100 0.05Freeport-McMoRan, Inc. 5.45%15/03/2043 USD 20,000 15,866 0.06Frontier Communications Corp. 11%15/09/2025 USD 115,000 118,350 0.45General Motors Co. 6.25% 02/10/2043 USD 115,000 128,356 0.49General Motors Co. 6.75% 01/04/2046 USD 15,000 17,876 0.07Genesis Energy LP 6.75% 01/08/2022 USD 25,000 24,264 0.09GenOn Energy, Inc. 9.5% 15/10/2018 USD 35,000 27,912 0.11HCA, Inc. 7.5% 15/02/2022 USD 28,000 31,790 0.12HCA, Inc. 5.875% 15/02/2026 USD 130,000 135,545 0.52Hertz Corp. (The) 5.875% 15/10/2020 USD 15,000 15,384 0.06Hertz Corp. (The) 6.25% 15/10/2022 USD 90,000 92,327 0.35Huntsman International LLC 4.875%15/11/2020 USD 45,000 45,369 0.17Huntsman International LLC 5.125%15/11/2022 USD 55,000 54,725 0.21Kinder Morgan Energy Partners LP 6.5%01/09/2039 USD 105,000 110,682 0.42Kindred Healthcare, Inc. 8.75%15/01/2023 USD 70,000 69,381 0.26Lennar Corp. 4.75% 30/05/2025 USD 10,000 9,917 0.04Level 3 Communications, Inc. 5.75%01/12/2022 USD 40,000 40,483 0.15Level 3 Financing, Inc. 5.375%01/05/2025 USD 50,000 49,860 0.19LIN Television Corp. 5.875% 15/11/2022 USD 25,000 25,250 0.10MasTec, Inc. 4.875% 15/03/2023 USD 50,000 46,786 0.18Meritage Homes Corp. 7% 01/04/2022 USD 25,000 27,144 0.10MetLife, Inc. 6.4% 15/12/2036 USD 140,000 149,517 0.57MGM Resorts International 7.75%15/03/2022 USD 105,000 118,526 0.45MGM Resorts International 6%15/03/2023 USD 10,000 10,572 0.04MPG Holdco I, Inc. 7.375% 15/10/2022 USD 25,000 24,723 0.09
174
JPMorgan Funds - Income FundSchedule of Investments
As at 30 June 2016
Investments Currency
Quantity/Nominal
Value
MarketValue
USD
%of
NetAssets Investments Currency
Quantity/Nominal
Value
MarketValue
USD
%of
NetAssets
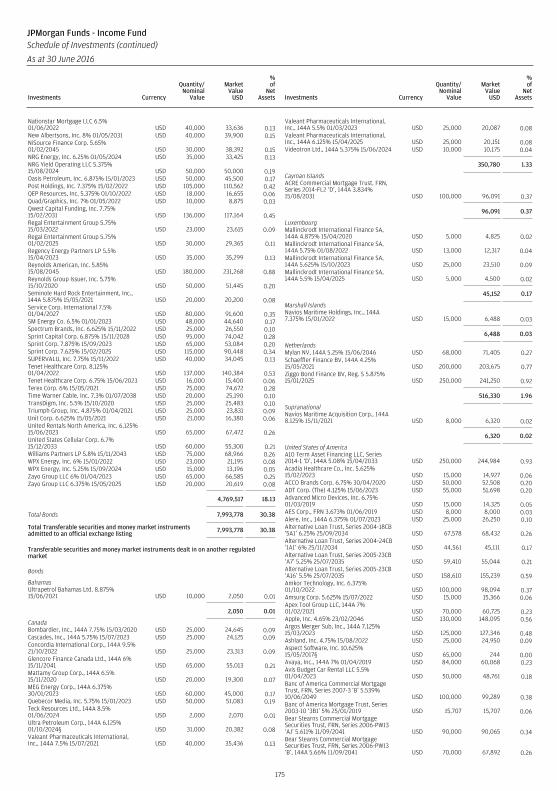
Nationstar Mortgage LLC 6.5%01/06/2022 USD 40,000 33,636 0.13New Albertsons, Inc. 8% 01/05/2031 USD 40,000 39,900 0.15NiSource Finance Corp. 5.65%01/02/2045 USD 30,000 38,392 0.15NRG Energy, Inc. 6.25% 01/05/2024 USD 35,000 33,425 0.13NRG Yield Operating LLC 5.375%15/08/2024 USD 50,000 50,000 0.19Oasis Petroleum, Inc. 6.875% 15/01/2023 USD 50,000 45,500 0.17Post Holdings, Inc. 7.375% 15/02/2022 USD 105,000 110,562 0.42QEP Resources, Inc. 5.375% 01/10/2022 USD 18,000 16,655 0.06Quad/Graphics, Inc. 7% 01/05/2022 USD 10,000 8,875 0.03Qwest Capital Funding, Inc. 7.75%15/02/2031 USD 136,000 117,164 0.45Regal Entertainment Group 5.75%15/03/2022 USD 23,000 23,615 0.09Regal Entertainment Group 5.75%01/02/2025 USD 30,000 29,365 0.11Regency Energy Partners LP 5.5%15/04/2023 USD 35,000 35,299 0.13Reynolds American, Inc. 5.85%15/08/2045 USD 180,000 231,268 0.88Reynolds Group Issuer, Inc. 5.75%15/10/2020 USD 50,000 51,445 0.20Seminole Hard Rock Entertainment, Inc.,144A 5.875% 15/05/2021 USD 20,000 20,200 0.08Service Corp. International 7.5%01/04/2027 USD 80,000 91,600 0.35SM Energy Co. 6.5% 01/01/2023 USD 48,000 44,640 0.17Spectrum Brands, Inc. 6.625% 15/11/2022 USD 25,000 26,550 0.10Sprint Capital Corp. 6.875% 15/11/2028 USD 95,000 74,042 0.28Sprint Corp. 7.875% 15/09/2023 USD 65,000 53,084 0.20Sprint Corp. 7.625% 15/02/2025 USD 115,000 90,448 0.34SUPERVALU, Inc. 7.75% 15/11/2022 USD 40,000 34,045 0.13Tenet Healthcare Corp. 8.125%01/04/2022 USD 137,000 140,384 0.53Tenet Healthcare Corp. 6.75% 15/06/2023 USD 16,000 15,400 0.06Terex Corp. 6% 15/05/2021 USD 75,000 74,672 0.28Time Warner Cable, Inc. 7.3% 01/07/2038 USD 20,000 25,190 0.10TransDigm, Inc. 5.5% 15/10/2020 USD 25,000 25,483 0.10Triumph Group, Inc. 4.875% 01/04/2021 USD 25,000 23,831 0.09Unit Corp. 6.625% 15/05/2021 USD 21,000 16,380 0.06United Rentals North America, Inc. 6.125%15/06/2023 USD 65,000 67,472 0.26United States Cellular Corp. 6.7%15/12/2033 USD 60,000 55,300 0.21Williams Partners LP 5.8% 15/11/2043 USD 75,000 68,966 0.26WPX Energy, Inc. 6% 15/01/2022 USD 23,000 21,195 0.08WPX Energy, Inc. 5.25% 15/09/2024 USD 15,000 13,196 0.05Zayo Group LLC 6% 01/04/2023 USD 65,000 66,585 0.25Zayo Group LLC 6.375% 15/05/2025 USD 20,000 20,619 0.08
4,769,517 18.13
Total Bonds 7,993,778 30.38
Total Transferable securities and money market instrumentsadmitted to an official exchange listing 7,993,778 30.38
Transferable securities and money market instruments dealt in on another regulatedmarket
Bonds
BahamasUltrapetrol Bahamas Ltd. 8.875%15/06/2021 USD 10,000 2,050 0.01
2,050 0.01
CanadaBombardier, Inc., 144A 7.75% 15/03/2020 USD 25,000 24,645 0.09Cascades, Inc., 144A 5.75% 15/07/2023 USD 25,000 24,125 0.09Concordia International Corp., 144A 9.5%21/10/2022 USD 25,000 23,313 0.09Glencore Finance Canada Ltd., 144A 6%15/11/2041 USD 65,000 55,013 0.21Mattamy Group Corp., 144A 6.5%15/11/2020 USD 20,000 19,300 0.07MEG Energy Corp., 144A 6.375%30/01/2023 USD 60,000 45,000 0.17Quebecor Media, Inc. 5.75% 15/01/2023 USD 50,000 51,083 0.19Teck Resources Ltd., 144A 8.5%01/06/2024 USD 2,000 2,070 0.01Ultra Petroleum Corp., 144A 6.125%01/10/2024§ USD 31,000 20,382 0.08Valeant Pharmaceuticals International,Inc., 144A 7.5% 15/07/2021 USD 40,000 35,436 0.13
Valeant Pharmaceuticals International,Inc., 144A 5.5% 01/03/2023 USD 25,000 20,087 0.08Valeant Pharmaceuticals International,Inc., 144A 6.125% 15/04/2025 USD 25,000 20,151 0.08Videotron Ltd., 144A 5.375% 15/06/2024 USD 10,000 10,175 0.04
350,780 1.33
Cayman IslandsACRE Commercial Mortgage Trust, FRN,Series 2014-FL2 ‘D’, 144A 3.834%15/08/2031 USD 100,000 96,091 0.37
96,091 0.37
LuxembourgMallinckrodt International Finance SA,144A 4.875% 15/04/2020 USD 5,000 4,825 0.02Mallinckrodt International Finance SA,144A 5.75% 01/08/2022 USD 13,000 12,317 0.04Mallinckrodt International Finance SA,144A 5.625% 15/10/2023 USD 25,000 23,510 0.09Mallinckrodt International Finance SA,144A 5.5% 15/04/2025 USD 5,000 4,500 0.02
45,152 0.17
Marshall IslandsNavios Maritime Holdings, Inc., 144A7.375% 15/01/2022 USD 15,000 6,488 0.03
6,488 0.03
NetherlandsMylan NV, 144A 5.25% 15/06/2046 USD 68,000 71,405 0.27Schaeffler Finance BV, 144A 4.25%15/05/2021 USD 200,000 203,675 0.77Ziggo Bond Finance BV, Reg. S 5.875%15/01/2025 USD 250,000 241,250 0.92
516,330 1.96
SupranationalNavios Maritime Acquisition Corp., 144A8.125% 15/11/2021 USD 8,000 6,320 0.02
6,320 0.02
United States of AmericaA10 Term Asset Financing LLC, Series2014-1 ‘D’, 144A 5.08% 15/04/2033 USD 250,000 244,984 0.93Acadia Healthcare Co., Inc. 5.625%15/02/2023 USD 15,000 14,927 0.06ACCO Brands Corp. 6.75% 30/04/2020 USD 50,000 52,508 0.20ADT Corp. (The) 4.125% 15/06/2023 USD 55,000 51,698 0.20Advanced Micro Devices, Inc. 6.75%01/03/2019 USD 15,000 14,325 0.05AES Corp., FRN 3.673% 01/06/2019 USD 8,000 8,000 0.03Alere, Inc., 144A 6.375% 01/07/2023 USD 25,000 26,250 0.10Alternative Loan Trust, Series 2004-18CB‘5A1’ 6.25% 25/09/2034 USD 67,578 68,432 0.26Alternative Loan Trust, Series 2004-24CB‘1A1’ 6% 25/11/2034 USD 44,561 45,111 0.17Alternative Loan Trust, Series 2005-23CB‘A7’ 5.25% 25/07/2035 USD 59,410 55,044 0.21Alternative Loan Trust, Series 2005-23CB‘A16’ 5.5% 25/07/2035 USD 158,610 155,239 0.59Amkor Technology, Inc. 6.375%01/10/2022 USD 100,000 98,094 0.37Amsurg Corp. 5.625% 15/07/2022 USD 15,000 15,366 0.06Apex Tool Group LLC, 144A 7%01/02/2021 USD 70,000 60,725 0.23Apple, Inc. 4.65% 23/02/2046 USD 130,000 148,095 0.56Argos Merger Sub, Inc., 144A 7.125%15/03/2023 USD 125,000 127,346 0.48Ashland, Inc. 4.75% 15/08/2022 USD 25,000 24,950 0.09Aspect Software, Inc. 10.625%15/05/2017§ USD 65,000 244 0.00Avaya, Inc., 144A 7% 01/04/2019 USD 84,000 60,068 0.23Avis Budget Car Rental LLC 5.5%01/04/2023 USD 50,000 48,761 0.18Banc of America Commercial MortgageTrust, FRN, Series 2007-3 ‘B’ 5.539%10/06/2049 USD 100,000 99,289 0.38Banc of America Mortgage Trust, Series2003-10 ‘3B1’ 5% 25/01/2019 USD 15,707 15,707 0.06Bear Stearns Commercial MortgageSecurities Trust, FRN, Series 2006-PW13‘AJ’ 5.611% 11/09/2041 USD 90,000 90,065 0.34Bear Stearns Commercial MortgageSecurities Trust, FRN, Series 2006-PW13‘B’, 144A 5.66% 11/09/2041 USD 70,000 67,892 0.26
175
JPMorgan Funds - Income FundSchedule of Investments (continued)
As at 30 June 2016
Investments Currency
Quantity/Nominal
Value
MarketValue
USD
%of
NetAssets Investments Currency
Quantity/Nominal
Value
MarketValue
USD
%of
NetAssets
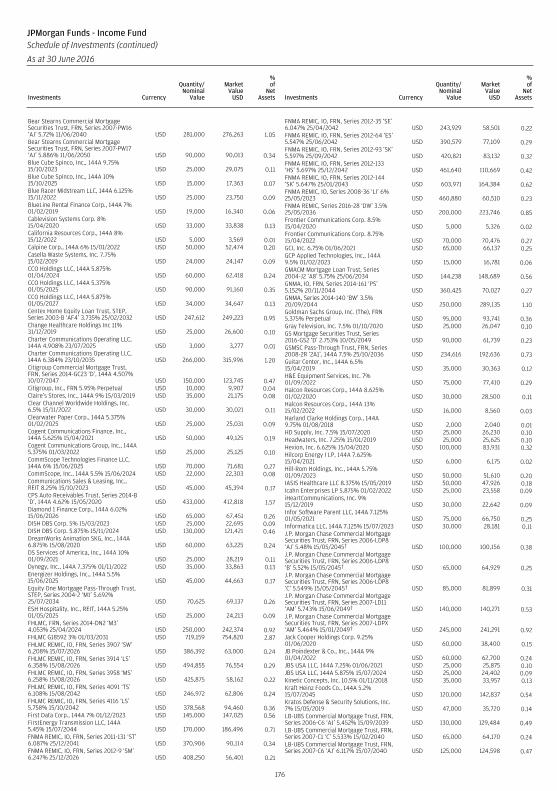
Bear Stearns Commercial MortgageSecurities Trust, FRN, Series 2007-PW16‘AJ’ 5.72% 11/06/2040 USD 281,000 276,263 1.05Bear Stearns Commercial MortgageSecurities Trust, FRN, Series 2007-PW17‘AJ’ 5.886% 11/06/2050 USD 90,000 90,013 0.34Blue Cube Spinco, Inc., 144A 9.75%15/10/2023 USD 25,000 29,075 0.11Blue Cube Spinco, Inc., 144A 10%15/10/2025 USD 15,000 17,363 0.07Blue Racer Midstream LLC, 144A 6.125%15/11/2022 USD 25,000 23,750 0.09BlueLine Rental Finance Corp., 144A 7%01/02/2019 USD 19,000 16,340 0.06Cablevision Systems Corp. 8%15/04/2020 USD 33,000 33,838 0.13California Resources Corp., 144A 8%15/12/2022 USD 5,000 3,569 0.01Calpine Corp., 144A 6% 15/01/2022 USD 50,000 52,474 0.20Casella Waste Systems, Inc. 7.75%15/02/2019 USD 24,000 24,147 0.09CCO Holdings LLC, 144A 5.875%01/04/2024 USD 60,000 62,418 0.24CCO Holdings LLC, 144A 5.375%01/05/2025 USD 90,000 91,160 0.35CCO Holdings LLC, 144A 5.875%01/05/2027 USD 34,000 34,647 0.13Centex Home Equity Loan Trust, STEP,Series 2003-B ‘AF4’ 3.735% 25/02/2032 USD 247,612 249,223 0.95Change Healthcare Holdings Inc 11%31/12/2019 USD 25,000 26,600 0.10Charter Communications Operating LLC,144A 4.908% 23/07/2025 USD 3,000 3,277 0.01Charter Communications Operating LLC,144A 6.384% 23/10/2035 USD 266,000 315,996 1.20Citigroup Commercial Mortgage Trust,FRN, Series 2014-GC23 ‘D’, 144A 4.507%10/07/2047 USD 150,000 123,745 0.47Citigroup, Inc., FRN 5.95% Perpetual USD 10,000 9,907 0.04Claire’s Stores, Inc., 144A 9% 15/03/2019 USD 35,000 21,175 0.08Clear Channel Worldwide Holdings, Inc.6.5% 15/11/2022 USD 30,000 30,021 0.11Clearwater Paper Corp., 144A 5.375%01/02/2025 USD 25,000 25,031 0.09Cogent Communications Finance, Inc.,144A 5.625% 15/04/2021 USD 50,000 49,125 0.19Cogent Communications Group, Inc., 144A5.375% 01/03/2022 USD 25,000 25,125 0.10CommScope Technologies Finance LLC,144A 6% 15/06/2025 USD 70,000 71,681 0.27CommScope, Inc., 144A 5.5% 15/06/2024 USD 22,000 22,303 0.08Communications Sales & Leasing, Inc.,REIT 8.25% 15/10/2023 USD 45,000 45,394 0.17CPS Auto Receivables Trust, Series 2014-B‘D’, 144A 4.62% 15/05/2020 USD 433,000 412,818 1.57Diamond 1 Finance Corp., 144A 6.02%15/06/2026 USD 65,000 67,451 0.26DISH DBS Corp. 5% 15/03/2023 USD 25,000 22,695 0.09DISH DBS Corp. 5.875% 15/11/2024 USD 130,000 121,421 0.46DreamWorks Animation SKG, Inc., 144A6.875% 15/08/2020 USD 60,000 63,225 0.24DS Services of America, Inc., 144A 10%01/09/2021 USD 25,000 28,219 0.11Dynegy, Inc., 144A 7.375% 01/11/2022 USD 35,000 33,863 0.13Energizer Holdings, Inc., 144A 5.5%15/06/2025 USD 45,000 44,663 0.17Equity One Mortgage Pass-Through Trust,STEP, Series 2004-2 ‘M1’ 5.692%25/07/2034 USD 70,625 69,137 0.26ESH Hospitality, Inc., REIT, 144A 5.25%01/05/2025 USD 25,000 24,213 0.09FHLMC, FRN, Series 2014-DN2 ‘M3’4.053% 25/04/2024 USD 250,000 242,374 0.92FHLMC G18592 3% 01/03/2031 USD 719,159 754,820 2.87FHLMC REMIC, IO, FRN, Series 3907 ‘SW’6.208% 15/07/2026 USD 386,392 63,000 0.24FHLMC REMIC, IO, FRN, Series 3914 ‘LS’6.358% 15/08/2026 USD 494,855 76,554 0.29FHLMC REMIC, IO, FRN, Series 3958 ‘MS’6.258% 15/08/2026 USD 425,875 58,162 0.22FHLMC REMIC, IO, FRN, Series 4091 ‘TS’6.108% 15/08/2042 USD 246,972 62,806 0.24FHLMC REMIC, IO, FRN, Series 4116 ‘LS’5.758% 15/10/2042 USD 378,568 94,460 0.36First Data Corp., 144A 7% 01/12/2023 USD 145,000 147,025 0.56FirstEnergy Transmission LLC, 144A5.45% 15/07/2044 USD 170,000 186,496 0.71FNMA REMIC, IO, FRN, Series 2011-131 ‘ST’6.087% 25/12/2041 USD 370,906 90,114 0.34FNMA REMIC, IO, FRN, Series 2012-9 ‘SM’6.247% 25/12/2026 USD 408,250 56,401 0.21
FNMA REMIC, IO, FRN, Series 2012-35 ‘SE’6.047% 25/04/2042 USD 243,929 58,501 0.22FNMA REMIC, IO, FRN, Series 2012-64 ‘ES’5.547% 25/06/2042 USD 390,579 77,109 0.29FNMA REMIC, IO, FRN, Series 2012-93 ‘SK’5.597% 25/09/2042 USD 420,821 83,132 0.32FNMA REMIC, IO, FRN, Series 2012-133‘HS’ 5.697% 25/12/2042 USD 461,640 110,669 0.42FNMA REMIC, IO, FRN, Series 2012-144‘SK’ 5.647% 25/01/2043 USD 603,971 164,384 0.62FNMA REMIC, IO, Series 2008-36 ‘LI’ 6%25/05/2023 USD 460,880 60,510 0.23FNMA REMIC, Series 2016-28 ‘DW’ 3.5%25/05/2036 USD 200,000 223,746 0.85Frontier Communications Corp. 8.5%15/04/2020 USD 5,000 5,326 0.02Frontier Communications Corp. 8.75%15/04/2022 USD 70,000 70,476 0.27GCI, Inc. 6.75% 01/06/2021 USD 65,000 66,137 0.25GCP Applied Technologies, Inc., 144A9.5% 01/02/2023 USD 15,000 16,781 0.06GMACM Mortgage Loan Trust, Series2004-J2 ‘A8’ 5.75% 25/06/2034 USD 144,238 148,689 0.56GNMA, IO, FRN, Series 2014-161 ‘PS’5.152% 20/11/2044 USD 360,425 70,027 0.27GNMA, Series 2014-140 ‘BW’ 3.5%20/09/2044 USD 250,000 289,135 1.10Goldman Sachs Group, Inc. (The), FRN5.375% Perpetual USD 95,000 93,741 0.36Gray Television, Inc. 7.5% 01/10/2020 USD 25,000 26,047 0.10GS Mortgage Securities Trust, Series2016-GS2 ‘D’ 2.753% 10/05/2049 USD 90,000 61,739 0.23GSMSC Pass-Through Trust, FRN, Series2008-2R ‘2A1’, 144A 7.5% 25/10/2036 USD 234,616 192,636 0.73Guitar Center, Inc., 144A 6.5%15/04/2019 USD 35,000 30,363 0.12H&E Equipment Services, Inc. 7%01/09/2022 USD 75,000 77,410 0.29Halcon Resources Corp., 144A 8.625%01/02/2020 USD 30,000 28,500 0.11Halcon Resources Corp., 144A 13%15/02/2022 USD 16,000 8,560 0.03Harland Clarke Holdings Corp., 144A9.75% 01/08/2018 USD 2,000 2,040 0.01HD Supply, Inc. 7.5% 15/07/2020 USD 25,000 26,230 0.10Headwaters, Inc. 7.25% 15/01/2019 USD 25,000 25,625 0.10Hexion, Inc. 6.625% 15/04/2020 USD 100,000 83,931 0.32Hilcorp Energy I LP, 144A 7.625%15/04/2021 USD 6,000 6,175 0.02Hill-Rom Holdings, Inc., 144A 5.75%01/09/2023 USD 50,000 51,610 0.20IASIS Healthcare LLC 8.375% 15/05/2019 USD 50,000 47,926 0.18Icahn Enterprises LP 5.875% 01/02/2022 USD 25,000 23,558 0.09iHeartCommunications, Inc. 9%15/12/2019 USD 30,000 22,642 0.09Infor Software Parent LLC, 144A 7.125%01/05/2021 USD 75,000 66,750 0.25Informatica LLC, 144A 7.125% 15/07/2023 USD 30,000 28,181 0.11J.P. Morgan Chase Commercial MortgageSecurities Trust, FRN, Series 2006-LDP8‘AJ’ 5.48% 15/05/2045† USD 100,000 100,156 0.38J.P. Morgan Chase Commercial MortgageSecurities Trust, FRN, Series 2006-LDP8‘B’ 5.52% 15/05/2045† USD 65,000 64,929 0.25J.P. Morgan Chase Commercial MortgageSecurities Trust, FRN, Series 2006-LDP8‘C’ 5.549% 15/05/2045† USD 85,000 81,899 0.31J.P. Morgan Chase Commercial MortgageSecurities Trust, FRN, Series 2007-LD11‘AM’ 5.743% 15/06/2049† USD 140,000 140,271 0.53J.P. Morgan Chase Commercial MortgageSecurities Trust, FRN, Series 2007-LDPX‘AM’ 5.464% 15/01/2049† USD 245,000 241,291 0.92Jack Cooper Holdings Corp. 9.25%01/06/2020 USD 60,000 38,400 0.15JB Poindexter & Co., Inc., 144A 9%01/04/2022 USD 60,000 62,700 0.24JBS USA LLC, 144A 7.25% 01/06/2021 USD 25,000 25,875 0.10JBS USA LLC, 144A 5.875% 15/07/2024 USD 25,000 24,402 0.09Kinetic Concepts, Inc. 10.5% 01/11/2018 USD 35,000 33,957 0.13Kraft Heinz Foods Co., 144A 5.2%15/07/2045 USD 120,000 142,837 0.54Kratos Defense & Security Solutions, Inc.7% 15/05/2019 USD 47,000 35,720 0.14LB-UBS Commercial Mortgage Trust, FRN,Series 2006-C6 ‘AJ’ 5.452% 15/09/2039 USD 130,000 129,484 0.49LB-UBS Commercial Mortgage Trust, FRN,Series 2007-C1 ‘C’ 5.533% 15/02/2040 USD 65,000 64,170 0.24LB-UBS Commercial Mortgage Trust, FRN,Series 2007-C6 ‘AJ’ 6.117% 15/07/2040 USD 125,000 124,598 0.47
176
JPMorgan Funds - Income FundSchedule of Investments (continued)
As at 30 June 2016
Investments Currency
Quantity/Nominal
Value
MarketValue
USD
%of
NetAssets Investments Currency
Quantity/Nominal
Value
MarketValue
USD
%of
NetAssets
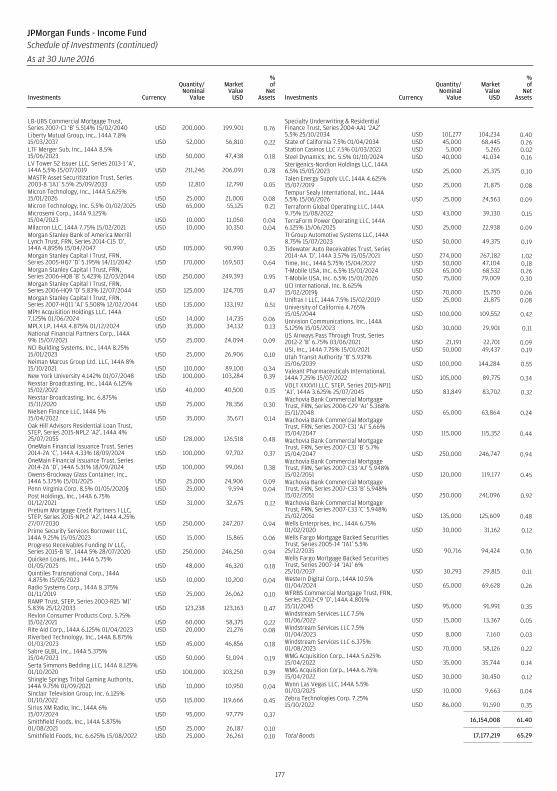
LB-UBS Commercial Mortgage Trust,Series 2007-C1 ‘B’ 5.514% 15/02/2040 USD 200,000 199,901 0.76Liberty Mutual Group, Inc., 144A 7.8%15/03/2037 USD 52,000 56,810 0.22LTF Merger Sub, Inc., 144A 8.5%15/06/2023 USD 50,000 47,438 0.18LV Tower 52 Issuer LLC, Series 2013-1 ‘A’,144A 5.5% 15/07/2019 USD 211,246 206,091 0.78MASTR Asset Securitization Trust, Series2003-8 ‘1A1’ 5.5% 25/09/2033 USD 12,810 12,790 0.05Micron Technology, Inc., 144A 5.625%15/01/2026 USD 25,000 21,000 0.08Micron Technology, Inc. 5.5% 01/02/2025 USD 65,000 55,125 0.21Microsemi Corp., 144A 9.125%15/04/2023 USD 10,000 11,050 0.04Milacron LLC, 144A 7.75% 15/02/2021 USD 10,000 10,350 0.04Morgan Stanley Bank of America MerrillLynch Trust, FRN, Series 2014-C15 ‘D’,144A 4.895% 15/04/2047 USD 105,000 90,990 0.35Morgan Stanley Capital I Trust, FRN,Series 2005-HQ7 ‘D’ 5.195% 14/11/2042 USD 170,000 169,503 0.64Morgan Stanley Capital I Trust, FRN,Series 2006-HQ8 ‘B’ 5.423% 12/03/2044 USD 250,000 249,393 0.95Morgan Stanley Capital I Trust, FRN,Series 2006-HQ9 ‘D’ 5.83% 12/07/2044 USD 125,000 124,705 0.47Morgan Stanley Capital I Trust, FRN,Series 2007-HQ11 ‘AJ’ 5.508% 12/02/2044 USD 135,000 133,192 0.51MPH Acquisition Holdings LLC, 144A7.125% 01/06/2024 USD 14,000 14,735 0.06MPLX LP, 144A 4.875% 01/12/2024 USD 35,000 34,132 0.13National Financial Partners Corp., 144A9% 15/07/2021 USD 25,000 24,094 0.09NCI Building Systems, Inc., 144A 8.25%15/01/2023 USD 25,000 26,906 0.10Neiman Marcus Group Ltd. LLC, 144A 8%15/10/2021 USD 110,000 89,100 0.34New York University 4.142% 01/07/2048 USD 100,000 103,284 0.39Nexstar Broadcasting, Inc., 144A 6.125%15/02/2022 USD 40,000 40,500 0.15Nexstar Broadcasting, Inc. 6.875%15/11/2020 USD 75,000 78,356 0.30Nielsen Finance LLC, 144A 5%15/04/2022 USD 35,000 35,671 0.14Oak Hill Advisors Residential Loan Trust,STEP, Series 2015-NPL2 ‘A2’, 144A 4%25/07/2055 USD 128,000 126,518 0.48OneMain Financial Issuance Trust, Series2014-2A ‘C’, 144A 4.33% 18/09/2024 USD 100,000 97,702 0.37OneMain Financial Issuance Trust, Series2014-2A ‘D’, 144A 5.31% 18/09/2024 USD 100,000 99,061 0.38Owens-Brockway Glass Container, Inc.,144A 5.375% 15/01/2025 USD 25,000 24,906 0.09Penn Virginia Corp. 8.5% 01/05/2020§ USD 25,000 9,594 0.04Post Holdings, Inc., 144A 6.75%01/12/2021 USD 31,000 32,675 0.12Pretium Mortgage Credit Partners I LLC,STEP, Series 2015-NPL2 ‘A2’, 144A 4.25%27/07/2030 USD 250,000 247,207 0.94Prime Security Services Borrower LLC,144A 9.25% 15/05/2023 USD 15,000 15,865 0.06Progreso Receivables Funding IV LLC,Series 2015-B ‘B’, 144A 5% 28/07/2020 USD 250,000 246,250 0.94Quicken Loans, Inc., 144A 5.75%01/05/2025 USD 48,000 46,320 0.18Quintiles Transnational Corp., 144A4.875% 15/05/2023 USD 10,000 10,200 0.04Radio Systems Corp., 144A 8.375%01/11/2019 USD 25,000 26,062 0.10RAMP Trust, STEP, Series 2003-RZ5 ‘M1’5.83% 25/12/2033 USD 123,238 123,163 0.47Revlon Consumer Products Corp. 5.75%15/02/2021 USD 60,000 58,375 0.22Rite Aid Corp., 144A 6.125% 01/04/2023 USD 20,000 21,276 0.08Riverbed Technology, Inc., 144A 8.875%01/03/2023 USD 45,000 46,856 0.18Sabre GLBL, Inc., 144A 5.375%15/04/2023 USD 50,000 51,094 0.19Serta Simmons Bedding LLC, 144A 8.125%01/10/2020 USD 100,000 103,250 0.39Shingle Springs Tribal Gaming Authority,144A 9.75% 01/09/2021 USD 10,000 10,950 0.04Sinclair Television Group, Inc. 6.125%01/10/2022 USD 115,000 119,666 0.45Sirius XM Radio, Inc., 144A 6%15/07/2024 USD 95,000 97,779 0.37Smithfield Foods, Inc., 144A 5.875%01/08/2021 USD 25,000 26,187 0.10Smithfield Foods, Inc. 6.625% 15/08/2022 USD 25,000 26,261 0.10
Specialty Underwriting & ResidentialFinance Trust, Series 2004-AA1 ‘2A2’5.5% 25/10/2034 USD 101,277 104,234 0.40State of California 7.5% 01/04/2034 USD 45,000 68,445 0.26Station Casinos LLC 7.5% 01/03/2021 USD 5,000 5,265 0.02Steel Dynamics, Inc. 5.5% 01/10/2024 USD 40,000 41,034 0.16Sterigenics-Nordion Holdings LLC, 144A6.5% 15/05/2023 USD 25,000 25,375 0.10Talen Energy Supply LLC, 144A 4.625%15/07/2019 USD 25,000 21,875 0.08Tempur Sealy International, Inc., 144A5.5% 15/06/2026 USD 25,000 24,563 0.09Terraform Global Operating LLC, 144A9.75% 15/08/2022 USD 43,000 39,130 0.15TerraForm Power Operating LLC, 144A6.125% 15/06/2025 USD 25,000 22,938 0.09TI Group Automotive Systems LLC, 144A8.75% 15/07/2023 USD 50,000 49,375 0.19Tidewater Auto Receivables Trust, Series2014-AA ‘D’, 144A 3.57% 15/05/2021 USD 274,000 267,182 1.02Time, Inc., 144A 5.75% 15/04/2022 USD 50,000 47,104 0.18T-Mobile USA, Inc. 6.5% 15/01/2024 USD 65,000 68,532 0.26T-Mobile USA, Inc. 6.5% 15/01/2026 USD 75,000 79,009 0.30UCI International, Inc. 8.625%15/02/2019§ USD 70,000 15,750 0.06Unifrax I LLC, 144A 7.5% 15/02/2019 USD 25,000 21,875 0.08University of California 4.765%15/05/2044 USD 100,000 109,552 0.42Univision Communications, Inc., 144A5.125% 15/05/2023 USD 30,000 29,901 0.11US Airways Pass Through Trust, Series2012-2 ‘B’ 6.75% 03/06/2021 USD 21,191 22,701 0.09USI, Inc., 144A 7.75% 15/01/2021 USD 50,000 49,437 0.19Utah Transit Authority ‘B’ 5.937%15/06/2039 USD 100,000 144,284 0.55Valeant Pharmaceuticals International,144A 7.25% 15/07/2022 USD 105,000 89,775 0.34VOLT XXXVII LLC, STEP, Series 2015-NP11‘A1’, 144A 3.625% 25/07/2045 USD 83,849 83,702 0.32Wachovia Bank Commercial MortgageTrust, FRN, Series 2006-C29 ‘AJ’ 5.368%15/11/2048 USD 65,000 63,864 0.24Wachovia Bank Commercial MortgageTrust, FRN, Series 2007-C31 ‘AJ’ 5.66%15/04/2047 USD 115,000 115,352 0.44Wachovia Bank Commercial MortgageTrust, FRN, Series 2007-C31 ‘B’ 5.7%15/04/2047 USD 250,000 246,747 0.94Wachovia Bank Commercial MortgageTrust, FRN, Series 2007-C33 ‘AJ’ 5.948%15/02/2051 USD 120,000 119,177 0.45Wachovia Bank Commercial MortgageTrust, FRN, Series 2007-C33 ‘B’ 5.948%15/02/2051 USD 250,000 241,096 0.92Wachovia Bank Commercial MortgageTrust, FRN, Series 2007-C33 ‘C’ 5.948%15/02/2051 USD 135,000 125,609 0.48Wells Enterprises, Inc., 144A 6.75%01/02/2020 USD 30,000 31,162 0.12Wells Fargo Mortgage Backed SecuritiesTrust, Series 2005-14 ‘1A1’ 5.5%25/12/2035 USD 90,716 94,424 0.36Wells Fargo Mortgage Backed SecuritiesTrust, Series 2007-14 ‘1A1’ 6%25/10/2037 USD 30,293 29,815 0.11Western Digital Corp., 144A 10.5%01/04/2024 USD 65,000 69,628 0.26WFRBS Commercial Mortgage Trust, FRN,Series 2012-C9 ‘D’, 144A 4.801%15/11/2045 USD 95,000 91,991 0.35Windstream Services LLC 7.5%01/06/2022 USD 15,000 13,367 0.05Windstream Services LLC 7.5%01/04/2023 USD 8,000 7,160 0.03Windstream Services LLC 6.375%01/08/2023 USD 70,000 58,126 0.22WMG Acquisition Corp., 144A 5.625%15/04/2022 USD 35,000 35,744 0.14WMG Acquisition Corp., 144A 6.75%15/04/2022 USD 30,000 30,450 0.12Wynn Las Vegas LLC, 144A 5.5%01/03/2025 USD 10,000 9,663 0.04Zebra Technologies Corp. 7.25%15/10/2022 USD 86,000 91,590 0.35
16,154,008 61.40
Total Bonds 17,177,219 65.29
177
JPMorgan Funds - Income FundSchedule of Investments (continued)
As at 30 June 2016
Investments Currency
Quantity/Nominal
Value
MarketValue
USD
%of
NetAssets Investments Currency
Quantity/Nominal
Value
MarketValue
USD
%of
NetAssets
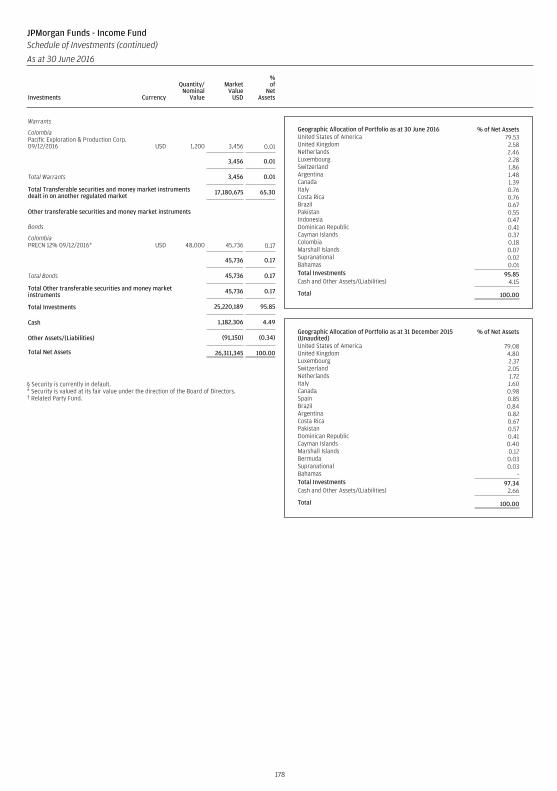
Warrants
ColombiaPacific Exploration & Production Corp.09/12/2016 USD 1,200 3,456 0.01
3,456 0.01
Total Warrants 3,456 0.01
Total Transferable securities and money market instrumentsdealt in on another regulated market 17,180,675 65.30
Other transferable securities and money market instruments
Bonds
ColombiaPRECN 12% 09/12/2016* USD 48,000 45,736 0.17
45,736 0.17
Total Bonds 45,736 0.17
Total Other transferable securities and money marketinstruments 45,736 0.17
Total Investments 25,220,189 95.85
Cash 1,182,306 4.49
Other Assets/(Liabilities) (91,150) (0.34)
Total Net Assets 26,311,345 100.00
§ Security is currently in default.* Security is valued at its fair value under the direction of the Board of Directors.† Related Party Fund.
Geographic Allocation of Portfolio as at 30 June 2016 % of Net AssetsUnited States of America 79.53United Kingdom 2.58Netherlands 2.46Luxembourg 2.28Switzerland 1.86Argentina 1.48Canada 1.39Italy 0.76Costa Rica 0.76Brazil 0.67Pakistan 0.55Indonesia 0.47Dominican Republic 0.41Cayman Islands 0.37Colombia 0.18Marshall Islands 0.07Supranational 0.02Bahamas 0.01Total Investments 95.85Cash and Other Assets/(Liabilities) 4.15
Total 100.00
Geographic Allocation of Portfolio as at 31 December 2015(Unaudited)
% of Net Assets
United States of America 79.08United Kingdom 4.80Luxembourg 2.37Switzerland 2.05Netherlands 1.72Italy 1.60Canada 0.98Spain 0.85Brazil 0.84Argentina 0.82Costa Rica 0.67Pakistan 0.57Dominican Republic 0.41Cayman Islands 0.40Marshall Islands 0.12Bermuda 0.03Supranational 0.03Bahamas -Total Investments 97.34Cash and Other Assets/(Liabilities) 2.66
Total 100.00
178
JPMorgan Funds - Income FundSchedule of Investments (continued)
As at 30 June 2016
Investments Currency
Quantity/Nominal
Value
MarketValue
USD
%of
NetAssets Investments Currency
Quantity/Nominal
Value
MarketValue
USD
%of
NetAssets
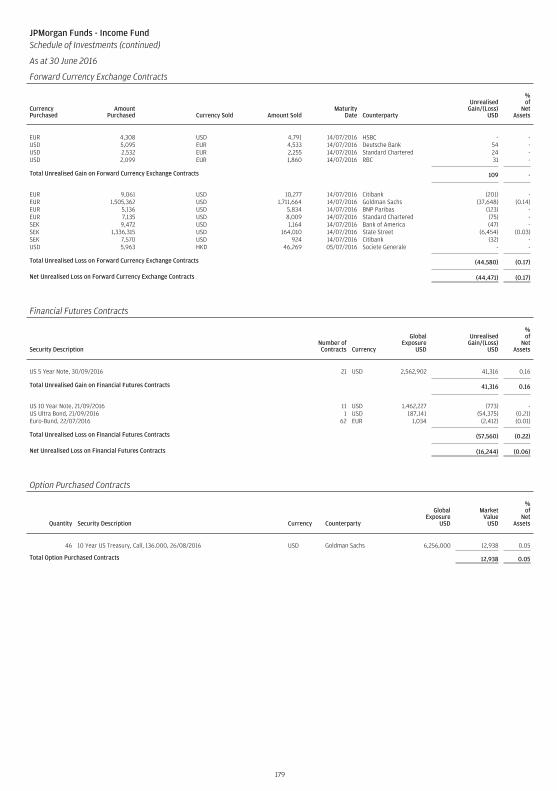
JPMorgan Funds - Income FundSchedule of Investments (continued)
As at 30 June 2016
Forward Currency Exchange Contracts
CurrencyPurchased
AmountPurchased Currency Sold Amount Sold
MaturityDate Counterparty
UnrealisedGain/(Loss)
USD
%of
NetAssets
EUR 4,308 USD 4,791 14/07/2016 HSBC - -USD 5,095 EUR 4,533 14/07/2016 Deutsche Bank 54 -USD 2,532 EUR 2,255 14/07/2016 Standard Chartered 24 -USD 2,099 EUR 1,860 14/07/2016 RBC 31 -
Total Unrealised Gain on Forward Currency Exchange Contracts 109 -
EUR 9,061 USD 10,277 14/07/2016 Citibank (201) -EUR 1,505,362 USD 1,711,664 14/07/2016 Goldman Sachs (37,648) (0.14)EUR 5,136 USD 5,834 14/07/2016 BNP Paribas (123) -EUR 7,135 USD 8,009 14/07/2016 Standard Chartered (75) -SEK 9,472 USD 1,164 14/07/2016 Bank of America (47) -SEK 1,336,315 USD 164,010 14/07/2016 State Street (6,454) (0.03)SEK 7,570 USD 924 14/07/2016 Citibank (32) -USD 5,963 HKD 46,269 05/07/2016 Societe Generale - -
Total Unrealised Loss on Forward Currency Exchange Contracts (44,580) (0.17)
Net Unrealised Loss on Forward Currency Exchange Contracts (44,471) (0.17)
Financial Futures Contracts
Security DescriptionNumber ofContracts Currency
GlobalExposure
USD
UnrealisedGain/(Loss)
USD
%of
NetAssets
US 5 Year Note, 30/09/2016 21 USD 2,562,902 41,316 0.16
Total Unrealised Gain on Financial Futures Contracts 41,316 0.16
US 10 Year Note, 21/09/2016 11 USD 1,462,227 (773) -US Ultra Bond, 21/09/2016 1 USD 187,141 (54,375) (0.21)Euro-Bund, 22/07/2016 62 EUR 1,034 (2,412) (0.01)
Total Unrealised Loss on Financial Futures Contracts (57,560) (0.22)
Net Unrealised Loss on Financial Futures Contracts (16,244) (0.06)
Option Purchased Contracts
Quantity Security Description Currency Counterparty
GlobalExposure
USD
MarketValue
USD
%of
NetAssets
46 10 Year US Treasury, Call, 136.000, 26/08/2016 USD Goldman Sachs 6,256,000 12,938 0.05
Total Option Purchased Contracts 12,938 0.05
179
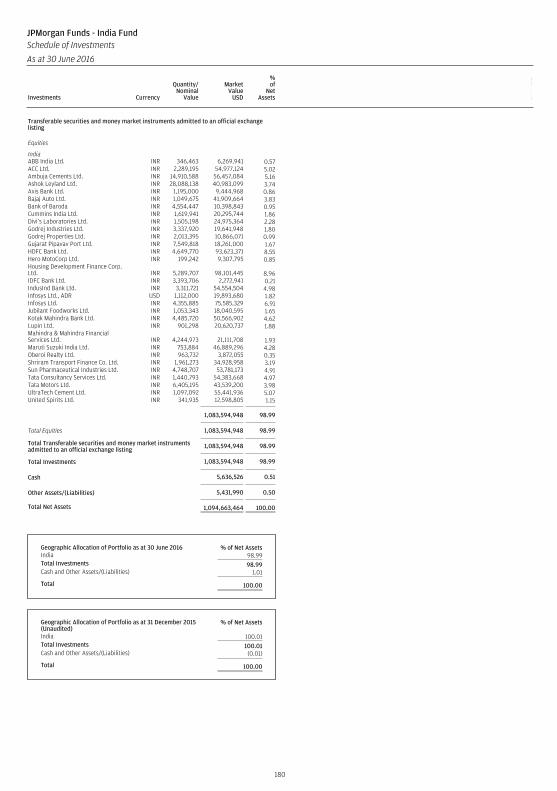
Transferable securities and money market instruments admitted to an official exchangelisting
Equities
IndiaABB India Ltd. INR 346,463 6,269,941 0.57ACC Ltd. INR 2,289,195 54,977,124 5.02Ambuja Cements Ltd. INR 14,910,588 56,457,084 5.16Ashok Leyland Ltd. INR 28,088,138 40,983,099 3.74Axis Bank Ltd. INR 1,195,000 9,444,968 0.86Bajaj Auto Ltd. INR 1,049,675 41,909,664 3.83Bank of Baroda INR 4,554,447 10,398,843 0.95Cummins India Ltd. INR 1,619,941 20,295,744 1.86Divi’s Laboratories Ltd. INR 1,505,198 24,975,364 2.28Godrej Industries Ltd. INR 3,337,920 19,641,948 1.80Godrej Properties Ltd. INR 2,013,395 10,866,071 0.99Gujarat Pipavav Port Ltd. INR 7,549,818 18,261,000 1.67HDFC Bank Ltd. INR 4,649,770 93,623,371 8.55Hero MotoCorp Ltd. INR 199,242 9,307,795 0.85Housing Development Finance Corp.Ltd. INR 5,289,707 98,101,445 8.96IDFC Bank Ltd. INR 3,393,706 2,272,941 0.21IndusInd Bank Ltd. INR 3,311,721 54,554,504 4.98Infosys Ltd., ADR USD 1,112,000 19,893,680 1.82Infosys Ltd. INR 4,355,885 75,585,329 6.91Jubilant Foodworks Ltd. INR 1,053,343 18,040,595 1.65Kotak Mahindra Bank Ltd. INR 4,485,720 50,566,902 4.62Lupin Ltd. INR 901,298 20,620,737 1.88Mahindra & Mahindra FinancialServices Ltd. INR 4,244,973 21,111,708 1.93Maruti Suzuki India Ltd. INR 753,884 46,889,296 4.28Oberoi Realty Ltd. INR 963,732 3,872,055 0.35Shriram Transport Finance Co. Ltd. INR 1,961,273 34,928,958 3.19Sun Pharmaceutical Industries Ltd. INR 4,748,707 53,781,173 4.91Tata Consultancy Services Ltd. INR 1,440,793 54,383,668 4.97Tata Motors Ltd. INR 6,405,195 43,539,200 3.98UltraTech Cement Ltd. INR 1,097,092 55,441,936 5.07United Spirits Ltd. INR 341,935 12,598,805 1.15
1,083,594,948 98.99
Total Equities 1,083,594,948 98.99
Total Transferable securities and money market instrumentsadmitted to an official exchange listing 1,083,594,948 98.99
Total Investments 1,083,594,948 98.99
Cash 5,636,526 0.51
Other Assets/(Liabilities) 5,431,990 0.50
Total Net Assets 1,094,663,464 100.00
Geographic Allocation of Portfolio as at 30 June 2016 % of Net AssetsIndia 98.99Total Investments 98.99Cash and Other Assets/(Liabilities) 1.01
Total 100.00
Geographic Allocation of Portfolio as at 31 December 2015(Unaudited)
% of Net Assets
India 100.01Total Investments 100.01Cash and Other Assets/(Liabilities) (0.01)
Total 100.00
180
JPMorgan Funds - India FundSchedule of Investments
As at 30 June 2016
Investments Currency
Quantity/Nominal
Value
MarketValue
USD
%of
NetAssets Investments Currency
Quantity/Nominal
Value
MarketValue
USD
%of
NetAssets
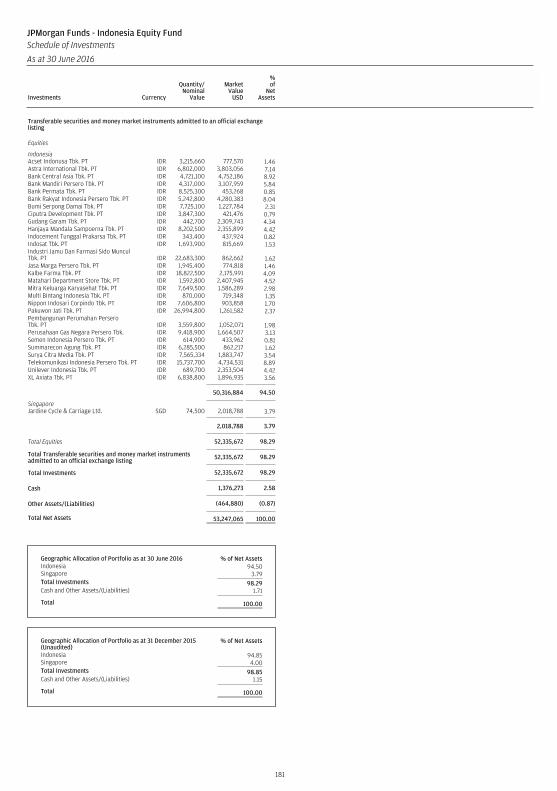
Transferable securities and money market instruments admitted to an official exchangelisting
Equities
IndonesiaAcset Indonusa Tbk. PT IDR 3,215,660 777,570 1.46Astra International Tbk. PT IDR 6,802,000 3,803,056 7.14Bank Central Asia Tbk. PT IDR 4,721,100 4,752,186 8.92Bank Mandiri Persero Tbk. PT IDR 4,317,000 3,107,959 5.84Bank Permata Tbk. PT IDR 8,525,300 453,268 0.85Bank Rakyat Indonesia Persero Tbk. PT IDR 5,242,800 4,280,383 8.04Bumi Serpong Damai Tbk. PT IDR 7,725,100 1,227,784 2.31Ciputra Development Tbk. PT IDR 3,847,300 421,476 0.79Gudang Garam Tbk. PT IDR 442,700 2,309,743 4.34Hanjaya Mandala Sampoerna Tbk. PT IDR 8,202,500 2,355,899 4.42Indocement Tunggal Prakarsa Tbk. PT IDR 343,400 437,924 0.82Indosat Tbk. PT IDR 1,693,900 815,669 1.53Industri Jamu Dan Farmasi Sido MunculTbk. PT IDR 22,683,300 862,662 1.62Jasa Marga Persero Tbk. PT IDR 1,945,400 774,818 1.46Kalbe Farma Tbk. PT IDR 18,822,500 2,175,991 4.09Matahari Department Store Tbk. PT IDR 1,592,800 2,407,945 4.52Mitra Keluarga Karyasehat Tbk. PT IDR 7,649,500 1,586,289 2.98Multi Bintang Indonesia Tbk. PT IDR 870,000 719,348 1.35Nippon Indosari Corpindo Tbk. PT IDR 7,606,800 903,858 1.70Pakuwon Jati Tbk. PT IDR 26,994,800 1,261,582 2.37Pembangunan Perumahan PerseroTbk. PT IDR 3,559,800 1,052,071 1.98Perusahaan Gas Negara Persero Tbk. IDR 9,418,900 1,664,507 3.13Semen Indonesia Persero Tbk. PT IDR 614,900 433,962 0.81Summarecon Agung Tbk. PT IDR 6,285,500 862,217 1.62Surya Citra Media Tbk. PT IDR 7,565,334 1,883,747 3.54Telekomunikasi Indonesia Persero Tbk. PT IDR 15,737,700 4,734,531 8.89Unilever Indonesia Tbk. PT IDR 689,700 2,353,504 4.42XL Axiata Tbk. PT IDR 6,838,800 1,896,935 3.56
50,316,884 94.50
SingaporeJardine Cycle & Carriage Ltd. SGD 74,500 2,018,788 3.79
2,018,788 3.79
Total Equities 52,335,672 98.29
Total Transferable securities and money market instrumentsadmitted to an official exchange listing 52,335,672 98.29
Total Investments 52,335,672 98.29
Cash 1,376,273 2.58
Other Assets/(Liabilities) (464,880) (0.87)
Total Net Assets 53,247,065 100.00
Geographic Allocation of Portfolio as at 30 June 2016 % of Net AssetsIndonesia 94.50Singapore 3.79Total Investments 98.29Cash and Other Assets/(Liabilities) 1.71
Total 100.00
Geographic Allocation of Portfolio as at 31 December 2015(Unaudited)
% of Net Assets
Indonesia 94.85Singapore 4.00Total Investments 98.85Cash and Other Assets/(Liabilities) 1.15
Total 100.00
181
JPMorgan Funds - Indonesia Equity FundSchedule of Investments
As at 30 June 2016
Investments Currency
Quantity/Nominal
Value
MarketValue
USD
%of
NetAssets Investments Currency
Quantity/Nominal
Value
MarketValue
USD
%of
NetAssets
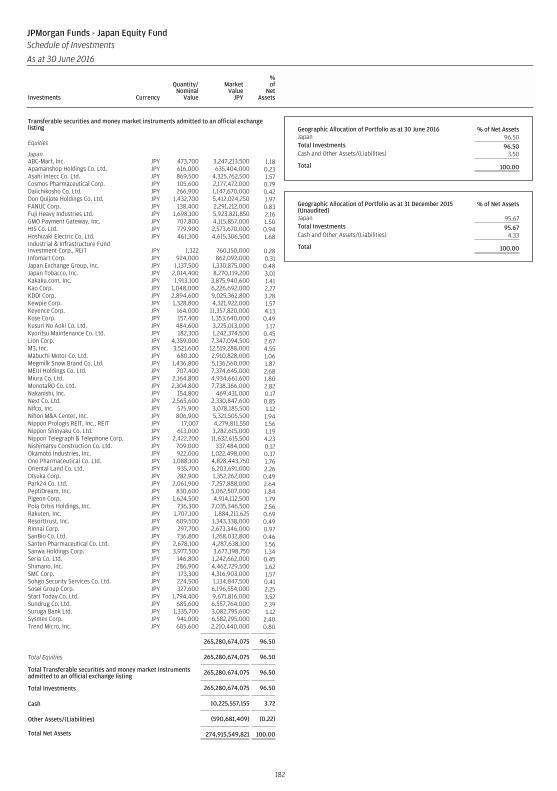
Transferable securities and money market instruments admitted to an official exchangelisting
Equities
JapanABC-Mart, Inc. JPY 473,700 3,247,213,500 1.18Apamanshop Holdings Co. Ltd. JPY 616,000 635,404,000 0.23Asahi Intecc Co. Ltd. JPY 869,500 4,325,762,500 1.57Cosmos Pharmaceutical Corp. JPY 105,600 2,177,472,000 0.79Daiichikosho Co. Ltd. JPY 266,900 1,147,670,000 0.42Don Quijote Holdings Co. Ltd. JPY 1,432,700 5,412,024,250 1.97FANUC Corp. JPY 138,400 2,291,212,000 0.83Fuji Heavy Industries Ltd. JPY 1,698,100 5,923,821,850 2.16GMO Payment Gateway, Inc. JPY 707,800 4,115,857,000 1.50HIS Co. Ltd. JPY 779,900 2,573,670,000 0.94Hoshizaki Electric Co. Ltd. JPY 461,300 4,615,306,500 1.68Industrial & Infrastructure FundInvestment Corp., REIT JPY 1,322 760,150,000 0.28Infomart Corp. JPY 924,000 862,092,000 0.31Japan Exchange Group, Inc. JPY 1,137,500 1,330,875,000 0.48Japan Tobacco, Inc. JPY 2,014,400 8,270,119,200 3.01Kakaku.com, Inc. JPY 1,913,100 3,875,940,600 1.41Kao Corp. JPY 1,048,000 6,226,692,000 2.27KDDI Corp. JPY 2,894,600 9,025,362,800 3.28Kewpie Corp. JPY 1,328,800 4,321,922,000 1.57Keyence Corp. JPY 164,000 11,357,820,000 4.13Kose Corp. JPY 157,400 1,353,640,000 0.49Kusuri No Aoki Co. Ltd. JPY 484,600 3,225,013,000 1.17Kyoritsu Maintenance Co. Ltd. JPY 182,300 1,242,374,500 0.45Lion Corp. JPY 4,359,000 7,347,094,500 2.67M3, Inc. JPY 3,521,600 12,519,288,000 4.55Mabuchi Motor Co. Ltd. JPY 680,100 2,910,828,000 1.06Megmilk Snow Brand Co. Ltd. JPY 1,436,800 5,136,560,000 1.87MEIJI Holdings Co. Ltd. JPY 707,400 7,374,645,000 2.68Miura Co. Ltd. JPY 2,164,800 4,934,661,600 1.80MonotaRO Co. Ltd. JPY 2,304,800 7,738,366,000 2.82Nakanishi, Inc. JPY 154,800 469,431,000 0.17Next Co. Ltd. JPY 2,565,600 2,330,847,600 0.85Nifco, Inc. JPY 575,900 3,078,185,500 1.12Nihon M&A Center, Inc. JPY 806,900 5,321,505,500 1.94Nippon Prologis REIT, Inc., REIT JPY 17,007 4,279,811,550 1.56Nippon Shinyaku Co. Ltd. JPY 613,000 3,282,615,000 1.19Nippon Telegraph & Telephone Corp. JPY 2,422,200 11,632,615,500 4.23Nishimatsu Construction Co. Ltd. JPY 709,000 337,484,000 0.12Okamoto Industries, Inc. JPY 922,000 1,022,498,000 0.37Ono Pharmaceutical Co. Ltd. JPY 1,088,100 4,828,443,750 1.76Oriental Land Co. Ltd. JPY 935,700 6,203,691,000 2.26Otsuka Corp. JPY 282,900 1,352,262,000 0.49Park24 Co. Ltd. JPY 2,061,900 7,257,888,000 2.64PeptiDream, Inc. JPY 830,600 5,062,507,000 1.84Pigeon Corp. JPY 1,624,500 4,914,112,500 1.79Pola Orbis Holdings, Inc. JPY 736,300 7,035,346,500 2.56Rakuten, Inc. JPY 1,707,100 1,884,211,625 0.69Resorttrust, Inc. JPY 609,500 1,343,338,000 0.49Rinnai Corp. JPY 297,700 2,673,346,000 0.97SanBio Co. Ltd. JPY 736,800 1,268,032,800 0.46Santen Pharmaceutical Co. Ltd. JPY 2,678,100 4,287,638,100 1.56Sanwa Holdings Corp. JPY 3,977,500 3,677,198,750 1.34Seria Co. Ltd. JPY 146,800 1,242,662,000 0.45Shimano, Inc. JPY 286,900 4,462,729,500 1.62SMC Corp. JPY 173,300 4,316,903,000 1.57Sohgo Security Services Co. Ltd. JPY 224,500 1,134,847,500 0.41Sosei Group Corp. JPY 327,600 6,196,554,000 2.25Start Today Co. Ltd. JPY 1,794,400 9,671,816,000 3.52Sundrug Co. Ltd. JPY 685,600 6,557,764,000 2.39Suruga Bank Ltd. JPY 1,335,700 3,082,795,600 1.12Sysmex Corp. JPY 941,000 6,582,295,000 2.40Trend Micro, Inc. JPY 605,600 2,210,440,000 0.80
265,280,674,075 96.50
Total Equities 265,280,674,075 96.50
Total Transferable securities and money market instrumentsadmitted to an official exchange listing 265,280,674,075 96.50
Total Investments 265,280,674,075 96.50
Cash 10,225,557,155 3.72
Other Assets/(Liabilities) (590,681,409) (0.22)
Total Net Assets 274,915,549,821 100.00
Geographic Allocation of Portfolio as at 30 June 2016 % of Net AssetsJapan 96.50Total Investments 96.50Cash and Other Assets/(Liabilities) 3.50
Total 100.00
Geographic Allocation of Portfolio as at 31 December 2015(Unaudited)
% of Net Assets
Japan 95.67Total Investments 95.67Cash and Other Assets/(Liabilities) 4.33
Total 100.00
182
JPMorgan Funds - Japan Equity FundSchedule of Investments
As at 30 June 2016
Investments Currency
Quantity/Nominal
Value
MarketValue
JPY
%of
NetAssets Investments Currency
Quantity/Nominal
Value
MarketValue
JPY
%of
NetAssets
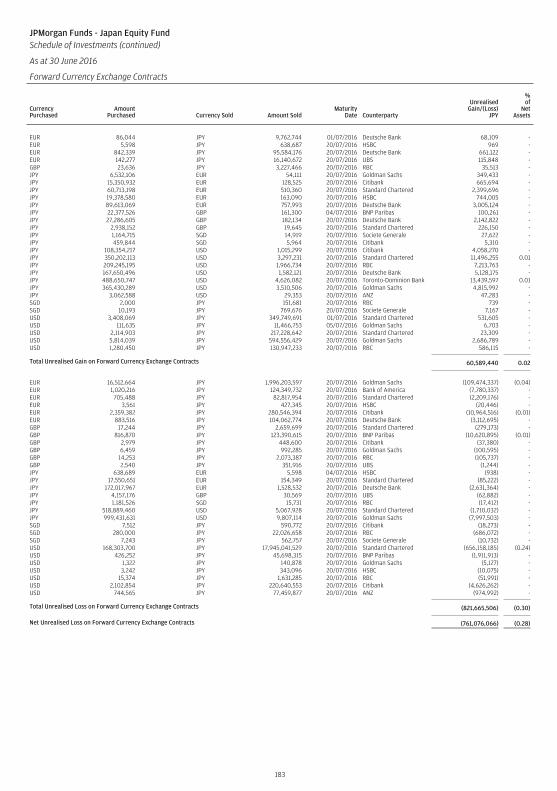
JPMorgan Funds - Japan Equity FundSchedule of Investments (continued)
As at 30 June 2016
Forward Currency Exchange Contracts
CurrencyPurchased
AmountPurchased Currency Sold Amount Sold
MaturityDate Counterparty
UnrealisedGain/(Loss)
JPY
%of
NetAssets
EUR 86,044 JPY 9,762,744 01/07/2016 Deutsche Bank 68,109 -EUR 5,598 JPY 638,687 20/07/2016 HSBC 969 -EUR 842,339 JPY 95,584,176 20/07/2016 Deutsche Bank 661,122 -EUR 142,277 JPY 16,140,672 20/07/2016 UBS 115,848 -GBP 23,636 JPY 3,227,466 20/07/2016 RBC 35,513 -JPY 6,532,106 EUR 54,111 20/07/2016 Goldman Sachs 349,433 -JPY 15,350,932 EUR 128,525 20/07/2016 Citibank 665,694 -JPY 60,713,198 EUR 510,360 20/07/2016 Standard Chartered 2,399,696 -JPY 19,378,580 EUR 163,090 20/07/2016 HSBC 744,005 -JPY 89,613,069 EUR 757,993 20/07/2016 Deutsche Bank 3,005,124 -JPY 22,377,526 GBP 161,300 04/07/2016 BNP Paribas 100,261 -JPY 27,286,605 GBP 182,134 20/07/2016 Deutsche Bank 2,142,822 -JPY 2,938,152 GBP 19,645 20/07/2016 Standard Chartered 226,150 -JPY 1,164,715 SGD 14,919 20/07/2016 Societe Generale 27,622 -JPY 459,844 SGD 5,964 20/07/2016 Citibank 5,310 -JPY 108,354,217 USD 1,015,299 20/07/2016 Citibank 4,058,270 -JPY 350,202,113 USD 3,297,231 20/07/2016 Standard Chartered 11,496,255 0.01JPY 209,245,195 USD 1,966,734 20/07/2016 RBC 7,213,763 -JPY 167,650,496 USD 1,582,121 20/07/2016 Deutsche Bank 5,128,175 -JPY 488,650,747 USD 4,626,082 20/07/2016 Toronto-Dominion Bank 13,439,597 0.01JPY 365,430,289 USD 3,510,506 20/07/2016 Goldman Sachs 4,815,992 -JPY 3,062,588 USD 29,353 20/07/2016 ANZ 47,283 -SGD 2,000 JPY 151,681 20/07/2016 RBC 739 -SGD 10,193 JPY 769,676 20/07/2016 Societe Generale 7,167 -USD 3,408,069 JPY 349,749,691 01/07/2016 Standard Chartered 531,605 -USD 111,635 JPY 11,466,753 05/07/2016 Goldman Sachs 6,703 -USD 2,114,903 JPY 217,228,642 20/07/2016 Standard Chartered 23,309 -USD 5,814,039 JPY 594,556,429 20/07/2016 Goldman Sachs 2,686,789 -USD 1,280,450 JPY 130,947,233 20/07/2016 RBC 586,115 -
Total Unrealised Gain on Forward Currency Exchange Contracts 60,589,440 0.02
EUR 16,512,664 JPY 1,996,203,597 20/07/2016 Goldman Sachs (109,474,337) (0.04)EUR 1,020,216 JPY 124,349,732 20/07/2016 Bank of America (7,780,337) -EUR 705,488 JPY 82,817,954 20/07/2016 Standard Chartered (2,209,176) -EUR 3,561 JPY 427,345 20/07/2016 HSBC (20,446) -EUR 2,359,382 JPY 280,546,394 20/07/2016 Citibank (10,964,516) (0.01)EUR 883,516 JPY 104,062,774 20/07/2016 Deutsche Bank (3,112,695) -GBP 17,244 JPY 2,659,699 20/07/2016 Standard Chartered (279,173) -GBP 816,870 JPY 123,390,615 20/07/2016 BNP Paribas (10,620,895) (0.01)GBP 2,979 JPY 448,600 20/07/2016 Citibank (37,380) -GBP 6,459 JPY 992,285 20/07/2016 Goldman Sachs (100,595) -GBP 14,253 JPY 2,073,387 20/07/2016 RBC (105,737) -GBP 2,540 JPY 351,916 20/07/2016 UBS (1,244) -JPY 638,689 EUR 5,598 04/07/2016 HSBC (938) -JPY 17,550,651 EUR 154,349 20/07/2016 Standard Chartered (85,222) -JPY 172,017,967 EUR 1,528,532 20/07/2016 Deutsche Bank (2,631,364) -JPY 4,157,176 GBP 30,569 20/07/2016 UBS (62,882) -JPY 1,181,526 SGD 15,731 20/07/2016 RBC (17,412) -JPY 518,889,460 USD 5,067,928 20/07/2016 Standard Chartered (1,710,032) -JPY 999,431,631 USD 9,807,114 20/07/2016 Goldman Sachs (7,997,503) -SGD 7,512 JPY 590,772 20/07/2016 Citibank (18,273) -SGD 280,000 JPY 22,026,658 20/07/2016 RBC (686,072) -SGD 7,243 JPY 562,757 20/07/2016 Societe Generale (10,732) -USD 168,303,700 JPY 17,945,041,529 20/07/2016 Standard Chartered (656,158,185) (0.24)USD 426,252 JPY 45,698,315 20/07/2016 BNP Paribas (1,911,913) -USD 1,322 JPY 140,878 20/07/2016 Goldman Sachs (5,127) -USD 3,242 JPY 343,096 20/07/2016 HSBC (10,075) -USD 15,374 JPY 1,631,285 20/07/2016 RBC (51,991) -USD 2,102,854 JPY 220,640,553 20/07/2016 Citibank (4,626,262) -USD 744,565 JPY 77,459,877 20/07/2016 ANZ (974,992) -
Total Unrealised Loss on Forward Currency Exchange Contracts (821,665,506) (0.30)
Net Unrealised Loss on Forward Currency Exchange Contracts (761,076,066) (0.28)
183
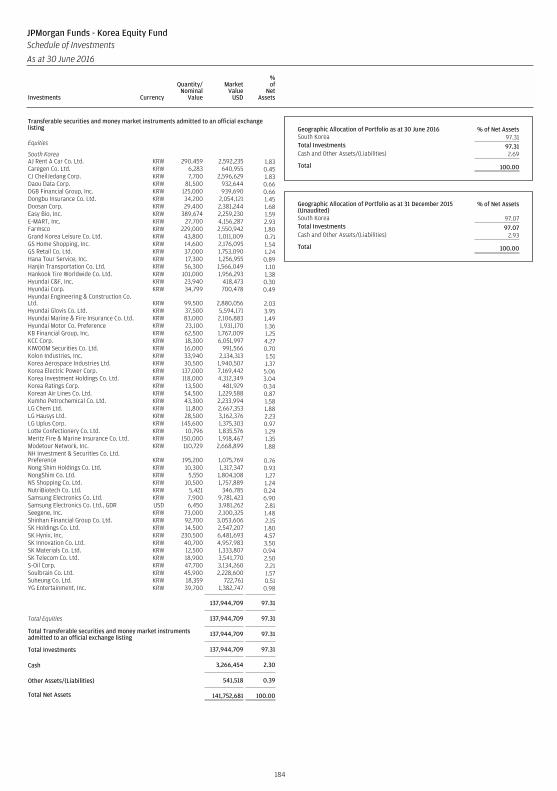
Transferable securities and money market instruments admitted to an official exchangelisting
Equities
South KoreaAJ Rent A Car Co. Ltd. KRW 290,459 2,592,235 1.83Caregen Co. Ltd. KRW 6,283 640,955 0.45CJ CheilJedang Corp. KRW 7,700 2,596,629 1.83Daou Data Corp. KRW 81,500 932,644 0.66DGB Financial Group, Inc. KRW 125,000 939,690 0.66Dongbu Insurance Co. Ltd. KRW 34,200 2,054,121 1.45Doosan Corp. KRW 29,400 2,381,244 1.68Easy Bio, Inc. KRW 389,674 2,259,230 1.59E-MART, Inc. KRW 27,700 4,156,287 2.93Farmsco KRW 229,000 2,550,942 1.80Grand Korea Leisure Co. Ltd. KRW 43,800 1,011,009 0.71GS Home Shopping, Inc. KRW 14,600 2,176,095 1.54GS Retail Co. Ltd. KRW 37,000 1,753,090 1.24Hana Tour Service, Inc. KRW 17,300 1,256,955 0.89Hanjin Transportation Co. Ltd. KRW 56,300 1,566,049 1.10Hankook Tire Worldwide Co. Ltd. KRW 101,000 1,956,293 1.38Hyundai C&F, Inc. KRW 23,940 418,473 0.30Hyundai Corp. KRW 34,799 700,478 0.49Hyundai Engineering & Construction Co.Ltd. KRW 99,500 2,880,056 2.03Hyundai Glovis Co. Ltd. KRW 37,500 5,594,171 3.95Hyundai Marine & Fire Insurance Co. Ltd. KRW 83,000 2,106,883 1.49Hyundai Motor Co. Preference KRW 23,100 1,931,170 1.36KB Financial Group, Inc. KRW 62,500 1,767,009 1.25KCC Corp. KRW 18,300 6,051,997 4.27KIWOOM Securities Co. Ltd. KRW 16,000 991,566 0.70Kolon Industries, Inc. KRW 33,940 2,134,313 1.51Korea Aerospace Industries Ltd. KRW 30,500 1,940,507 1.37Korea Electric Power Corp. KRW 137,000 7,169,442 5.06Korea Investment Holdings Co. Ltd. KRW 118,000 4,312,349 3.04Korea Ratings Corp. KRW 13,500 481,929 0.34Korean Air Lines Co. Ltd. KRW 54,500 1,229,588 0.87Kumho Petrochemical Co. Ltd. KRW 43,300 2,233,994 1.58LG Chem Ltd. KRW 11,800 2,667,353 1.88LG Hausys Ltd. KRW 28,500 3,162,376 2.23LG Uplus Corp. KRW 145,600 1,375,303 0.97Lotte Confectionery Co. Ltd. KRW 10,796 1,835,576 1.29Meritz Fire & Marine Insurance Co. Ltd. KRW 150,000 1,918,467 1.35Modetour Network, Inc. KRW 110,729 2,668,899 1.88NH Investment & Securities Co. Ltd.Preference KRW 195,200 1,075,769 0.76Nong Shim Holdings Co. Ltd. KRW 10,300 1,317,347 0.93NongShim Co. Ltd. KRW 5,550 1,804,108 1.27NS Shopping Co. Ltd. KRW 10,500 1,757,889 1.24NutriBiotech Co. Ltd. KRW 5,421 346,785 0.24Samsung Electronics Co. Ltd. KRW 7,900 9,781,423 6.90Samsung Electronics Co. Ltd., GDR USD 6,450 3,981,262 2.81Seegene, Inc. KRW 73,000 2,100,325 1.48Shinhan Financial Group Co. Ltd. KRW 92,700 3,053,606 2.15SK Holdings Co. Ltd. KRW 14,500 2,547,207 1.80SK Hynix, Inc. KRW 230,500 6,481,693 4.57SK Innovation Co. Ltd. KRW 40,700 4,957,983 3.50SK Materials Co. Ltd. KRW 12,500 1,333,807 0.94SK Telecom Co. Ltd. KRW 18,900 3,541,770 2.50S-Oil Corp. KRW 47,700 3,134,260 2.21Soulbrain Co. Ltd. KRW 45,900 2,228,600 1.57Suheung Co. Ltd. KRW 18,359 722,761 0.51YG Entertainment, Inc. KRW 39,700 1,382,747 0.98
137,944,709 97.31
Total Equities 137,944,709 97.31
Total Transferable securities and money market instrumentsadmitted to an official exchange listing 137,944,709 97.31
Total Investments 137,944,709 97.31
Cash 3,266,454 2.30
Other Assets/(Liabilities) 541,518 0.39
Total Net Assets 141,752,681 100.00
Geographic Allocation of Portfolio as at 30 June 2016 % of Net AssetsSouth Korea 97.31Total Investments 97.31Cash and Other Assets/(Liabilities) 2.69
Total 100.00
Geographic Allocation of Portfolio as at 31 December 2015(Unaudited)
% of Net Assets
South Korea 97.07Total Investments 97.07Cash and Other Assets/(Liabilities) 2.93
Total 100.00
184
JPMorgan Funds - Korea Equity FundSchedule of Investments
As at 30 June 2016
Investments Currency
Quantity/Nominal
Value
MarketValue
USD
%of
NetAssets Investments Currency
Quantity/Nominal
Value
MarketValue
USD
%of
NetAssets
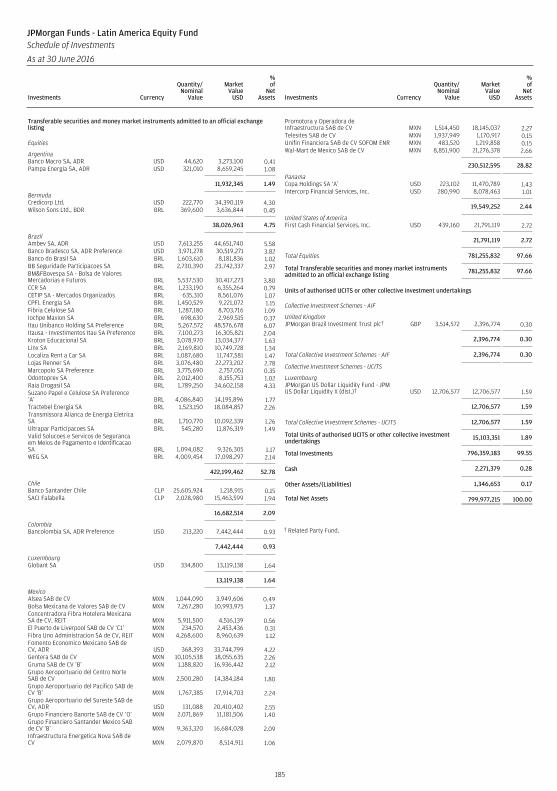
Transferable securities and money market instruments admitted to an official exchangelisting
Equities
ArgentinaBanco Macro SA, ADR USD 44,620 3,273,100 0.41Pampa Energia SA, ADR USD 321,010 8,659,245 1.08
11,932,345 1.49
BermudaCredicorp Ltd. USD 222,770 34,390,119 4.30Wilson Sons Ltd., BDR BRL 369,600 3,636,844 0.45
38,026,963 4.75
BrazilAmbev SA, ADR USD 7,613,255 44,651,740 5.58Banco Bradesco SA, ADR Preference USD 3,971,278 30,519,271 3.82Banco do Brasil SA BRL 1,603,610 8,181,836 1.02BB Seguridade Participacoes SA BRL 2,730,390 23,742,337 2.97BM&FBovespa SA - Bolsa de ValoresMercadorias e Futuros BRL 5,537,530 30,417,273 3.80CCR SA BRL 1,233,190 6,355,264 0.79CETIP SA - Mercados Organizados BRL 635,310 8,561,076 1.07CPFL Energia SA BRL 1,450,529 9,221,072 1.15Fibria Celulose SA BRL 1,287,180 8,703,716 1.09Iochpe Maxion SA BRL 698,630 2,969,515 0.37Itau Unibanco Holding SA Preference BRL 5,267,572 48,576,678 6.07Itausa - Investimentos Itau SA Preference BRL 7,100,273 16,305,821 2.04Kroton Educacional SA BRL 3,078,970 13,034,377 1.63Linx SA BRL 2,169,810 10,749,728 1.34Localiza Rent a Car SA BRL 1,087,680 11,747,581 1.47Lojas Renner SA BRL 3,076,480 22,273,202 2.78Marcopolo SA Preference BRL 3,775,690 2,757,051 0.35Odontoprev SA BRL 2,012,400 8,155,753 1.02Raia Drogasil SA BRL 1,789,250 34,602,158 4.33Suzano Papel e Celulose SA Preference‘A’ BRL 4,086,840 14,195,896 1.77Tractebel Energia SA BRL 1,523,150 18,084,857 2.26Transmissora Alianca de Energia EletricaSA BRL 1,710,770 10,092,339 1.26Ultrapar Participacoes SA BRL 545,280 11,876,319 1.49Valid Solucoes e Servicos de Segurancaem Meios de Pagamento e IdentificacaoSA BRL 1,094,082 9,326,305 1.17WEG SA BRL 4,009,454 17,098,297 2.14
422,199,462 52.78
ChileBanco Santander Chile CLP 25,605,924 1,218,915 0.15SACI Falabella CLP 2,028,980 15,463,599 1.94
16,682,514 2.09
ColombiaBancolombia SA, ADR Preference USD 213,220 7,442,444 0.93
7,442,444 0.93
LuxembourgGlobant SA USD 334,800 13,119,138 1.64
13,119,138 1.64
MexicoAlsea SAB de CV MXN 1,044,090 3,949,606 0.49Bolsa Mexicana de Valores SAB de CV MXN 7,267,280 10,993,975 1.37Concentradora Fibra Hotelera MexicanaSA de CV, REIT MXN 5,911,500 4,516,139 0.56El Puerto de Liverpool SAB de CV ‘C1’ MXN 234,570 2,453,436 0.31Fibra Uno Administracion SA de CV, REIT MXN 4,268,600 8,960,639 1.12Fomento Economico Mexicano SAB deCV, ADR USD 368,393 33,744,799 4.22Gentera SAB de CV MXN 10,105,538 18,055,635 2.26Gruma SAB de CV ‘B’ MXN 1,188,820 16,936,442 2.12Grupo Aeroportuario del Centro NorteSAB de CV MXN 2,500,280 14,384,184 1.80Grupo Aeroportuario del Pacifico SAB deCV ‘B’ MXN 1,767,385 17,914,703 2.24Grupo Aeroportuario del Sureste SAB deCV, ADR USD 131,088 20,410,402 2.55Grupo Financiero Banorte SAB de CV ‘O’ MXN 2,071,869 11,181,506 1.40Grupo Financiero Santander Mexico SABde CV ‘B’ MXN 9,363,320 16,684,028 2.09Infraestructura Energetica Nova SAB deCV MXN 2,079,870 8,514,911 1.06
Promotora y Operadora deInfraestructura SAB de CV MXN 1,514,450 18,145,037 2.27Telesites SAB de CV MXN 1,937,949 1,170,917 0.15Unifin Financiera SAB de CV SOFOM ENR MXN 483,520 1,219,858 0.15Wal-Mart de Mexico SAB de CV MXN 8,851,900 21,276,378 2.66
230,512,595 28.82
PanamaCopa Holdings SA ‘A’ USD 223,102 11,470,789 1.43Intercorp Financial Services, Inc. USD 280,990 8,078,463 1.01
19,549,252 2.44
United States of AmericaFirst Cash Financial Services, Inc. USD 439,160 21,791,119 2.72
21,791,119 2.72
Total Equities 781,255,832 97.66
Total Transferable securities and money market instrumentsadmitted to an official exchange listing 781,255,832 97.66
Units of authorised UCITS or other collective investment undertakings
Collective Investment Schemes - AIF
United KingdomJPMorgan Brazil Investment Trust plc† GBP 3,514,572 2,396,774 0.30
2,396,774 0.30
Total Collective Investment Schemes - AIF 2,396,774 0.30
Collective Investment Schemes - UCITS
LuxembourgJPMorgan US Dollar Liquidity Fund - JPMUS Dollar Liquidity X (dist.)† USD 12,706,577 12,706,577 1.59
12,706,577 1.59
Total Collective Investment Schemes - UCITS 12,706,577 1.59
Total Units of authorised UCITS or other collective investmentundertakings 15,103,351 1.89
Total Investments 796,359,183 99.55
Cash 2,271,379 0.28
Other Assets/(Liabilities) 1,346,653 0.17
Total Net Assets 799,977,215 100.00
† Related Party Fund.
185
JPMorgan Funds - Latin America Equity FundSchedule of Investments
As at 30 June 2016
Investments Currency
Quantity/Nominal
Value
MarketValue
USD
%of
NetAssets Investments Currency
Quantity/Nominal
Value
MarketValue
USD
%of
NetAssets
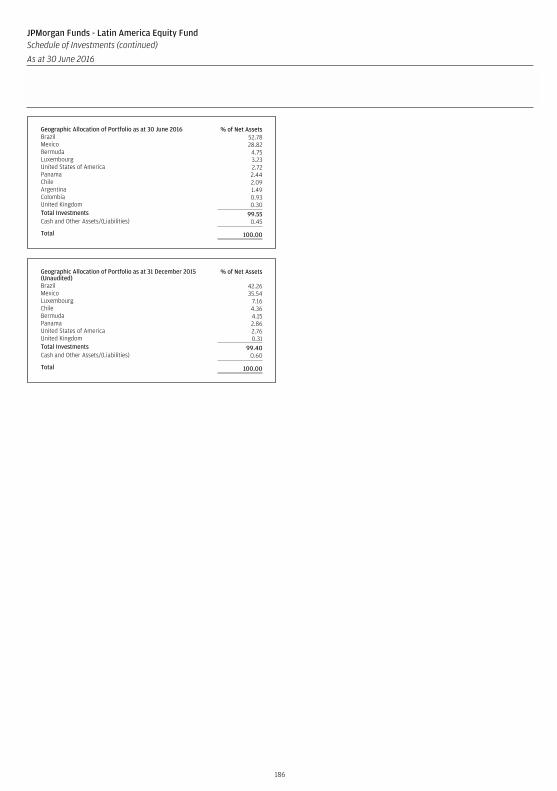
Geographic Allocation of Portfolio as at 30 June 2016 % of Net AssetsBrazil 52.78Mexico 28.82Bermuda 4.75Luxembourg 3.23United States of America 2.72Panama 2.44Chile 2.09Argentina 1.49Colombia 0.93United Kingdom 0.30Total Investments 99.55Cash and Other Assets/(Liabilities) 0.45
Total 100.00
Geographic Allocation of Portfolio as at 31 December 2015(Unaudited)
% of Net Assets
Brazil 42.26Mexico 35.54Luxembourg 7.16Chile 4.36Bermuda 4.15Panama 2.86United States of America 2.76United Kingdom 0.31Total Investments 99.40Cash and Other Assets/(Liabilities) 0.60
Total 100.00
186
JPMorgan Funds - Latin America Equity FundSchedule of Investments (continued)
As at 30 June 2016
Investments Currency
Quantity/Nominal
Value
MarketValue
USD
%of
NetAssets Investments Currency
Quantity/Nominal
Value
MarketValue
USD
%of
NetAssets
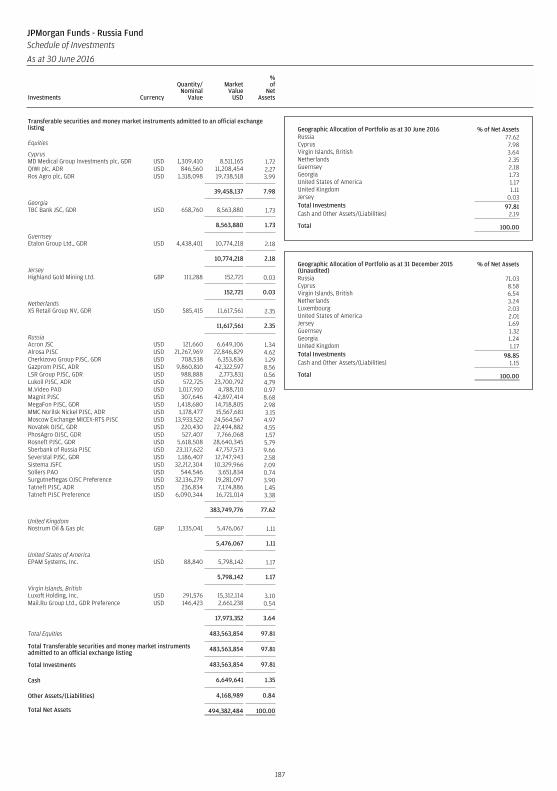
Transferable securities and money market instruments admitted to an official exchangelisting
Equities
CyprusMD Medical Group Investments plc, GDR USD 1,309,410 8,511,165 1.72QIWI plc, ADR USD 846,560 11,208,454 2.27Ros Agro plc, GDR USD 1,318,098 19,738,518 3.99
39,458,137 7.98
GeorgiaTBC Bank JSC, GDR USD 658,760 8,563,880 1.73
8,563,880 1.73
GuernseyEtalon Group Ltd., GDR USD 4,438,401 10,774,218 2.18
10,774,218 2.18
JerseyHighland Gold Mining Ltd. GBP 111,288 152,721 0.03
152,721 0.03
NetherlandsX5 Retail Group NV, GDR USD 585,415 11,617,561 2.35
11,617,561 2.35
RussiaAcron JSC USD 121,660 6,649,106 1.34Alrosa PJSC USD 21,267,969 22,846,829 4.62Cherkizovo Group PJSC, GDR USD 708,538 6,353,836 1.29Gazprom PJSC, ADR USD 9,860,810 42,322,597 8.56LSR Group PJSC, GDR USD 988,888 2,773,831 0.56Lukoil PJSC, ADR USD 572,725 23,700,792 4.79M.Video PAO USD 1,017,910 4,788,710 0.97Magnit PJSC USD 307,646 42,897,414 8.68MegaFon PJSC, GDR USD 1,418,680 14,718,805 2.98MMC Norilsk Nickel PJSC, ADR USD 1,178,477 15,567,681 3.15Moscow Exchange MICEX-RTS PJSC USD 13,933,522 24,564,567 4.97Novatek OJSC, GDR USD 220,430 22,494,882 4.55PhosAgro OJSC, GDR USD 527,407 7,766,068 1.57Rosneft PJSC, GDR USD 5,618,508 28,640,345 5.79Sberbank of Russia PJSC USD 23,117,622 47,757,573 9.66Severstal PJSC, GDR USD 1,186,407 12,747,943 2.58Sistema JSFC USD 32,212,304 10,329,966 2.09Sollers PAO USD 544,546 3,651,834 0.74Surgutneftegas OJSC Preference USD 32,136,279 19,281,097 3.90Tatneft PJSC, ADR USD 236,834 7,174,886 1.45Tatneft PJSC Preference USD 6,090,344 16,721,014 3.38
383,749,776 77.62
United KingdomNostrum Oil & Gas plc GBP 1,335,041 5,476,067 1.11
5,476,067 1.11
United States of AmericaEPAM Systems, Inc. USD 88,840 5,798,142 1.17
5,798,142 1.17
Virgin Islands, BritishLuxoft Holding, Inc. USD 291,576 15,312,114 3.10Mail.Ru Group Ltd., GDR Preference USD 146,423 2,661,238 0.54
17,973,352 3.64
Total Equities 483,563,854 97.81
Total Transferable securities and money market instrumentsadmitted to an official exchange listing 483,563,854 97.81
Total Investments 483,563,854 97.81
Cash 6,649,641 1.35
Other Assets/(Liabilities) 4,168,989 0.84
Total Net Assets 494,382,484 100.00
Geographic Allocation of Portfolio as at 30 June 2016 % of Net AssetsRussia 77.62Cyprus 7.98Virgin Islands, British 3.64Netherlands 2.35Guernsey 2.18Georgia 1.73United States of America 1.17United Kingdom 1.11Jersey 0.03Total Investments 97.81Cash and Other Assets/(Liabilities) 2.19
Total 100.00
Geographic Allocation of Portfolio as at 31 December 2015(Unaudited)
% of Net Assets
Russia 71.03Cyprus 8.58Virgin Islands, British 6.54Netherlands 3.24Luxembourg 2.03United States of America 2.01Jersey 1.69Guernsey 1.32Georgia 1.24United Kingdom 1.17Total Investments 98.85Cash and Other Assets/(Liabilities) 1.15
Total 100.00
187
JPMorgan Funds - Russia FundSchedule of Investments
As at 30 June 2016
Investments Currency
Quantity/Nominal
Value
MarketValue
USD
%of
NetAssets Investments Currency
Quantity/Nominal
Value
MarketValue
USD
%of
NetAssets
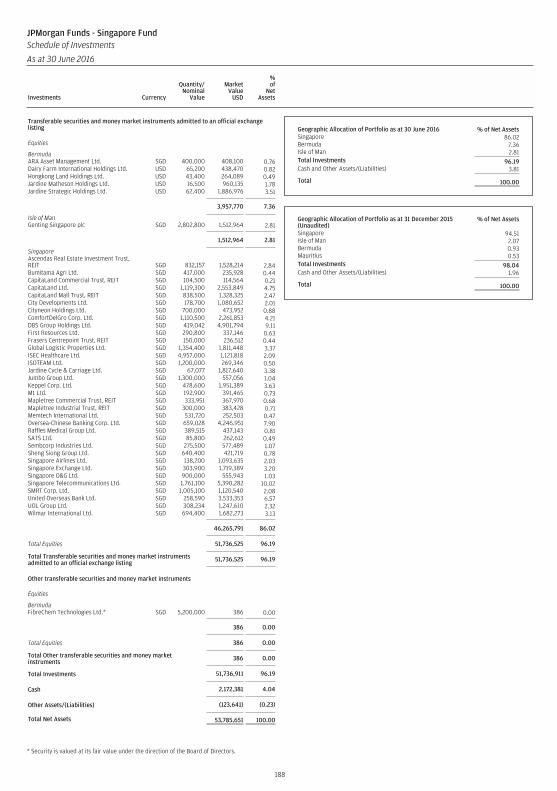
Transferable securities and money market instruments admitted to an official exchangelisting
Equities
BermudaARA Asset Management Ltd. SGD 400,000 408,100 0.76Dairy Farm International Holdings Ltd. USD 65,200 438,470 0.82Hongkong Land Holdings Ltd. USD 43,400 264,089 0.49Jardine Matheson Holdings Ltd. USD 16,500 960,135 1.78Jardine Strategic Holdings Ltd. USD 62,400 1,886,976 3.51
3,957,770 7.36
Isle of ManGenting Singapore plc SGD 2,802,800 1,512,964 2.81
1,512,964 2.81
SingaporeAscendas Real Estate Investment Trust,REIT SGD 832,157 1,528,214 2.84Bumitama Agri Ltd. SGD 417,000 235,928 0.44CapitaLand Commercial Trust, REIT SGD 104,500 114,564 0.21CapitaLand Ltd. SGD 1,119,300 2,553,849 4.75CapitaLand Mall Trust, REIT SGD 838,500 1,328,325 2.47City Developments Ltd. SGD 178,700 1,080,652 2.01Cityneon Holdings Ltd. SGD 700,000 473,952 0.88ComfortDelGro Corp. Ltd. SGD 1,110,500 2,261,853 4.21DBS Group Holdings Ltd. SGD 419,042 4,901,794 9.11First Resources Ltd. SGD 290,800 337,146 0.63Frasers Centrepoint Trust, REIT SGD 150,000 236,512 0.44Global Logistic Properties Ltd. SGD 1,354,400 1,811,448 3.37ISEC Healthcare Ltd. SGD 4,957,000 1,121,818 2.09ISOTEAM Ltd. SGD 1,200,000 269,346 0.50Jardine Cycle & Carriage Ltd. SGD 67,077 1,817,640 3.38Jumbo Group Ltd. SGD 1,300,000 557,056 1.04Keppel Corp. Ltd. SGD 478,600 1,951,389 3.63M1 Ltd. SGD 192,900 391,465 0.73Mapletree Commercial Trust, REIT SGD 333,951 367,970 0.68Mapletree Industrial Trust, REIT SGD 300,000 383,428 0.71Memtech International Ltd. SGD 531,720 252,503 0.47Oversea-Chinese Banking Corp. Ltd. SGD 659,028 4,246,951 7.90Raffles Medical Group Ltd. SGD 389,515 437,143 0.81SATS Ltd. SGD 85,800 262,612 0.49Sembcorp Industries Ltd. SGD 275,500 577,489 1.07Sheng Siong Group Ltd. SGD 640,400 421,719 0.78Singapore Airlines Ltd. SGD 138,200 1,093,635 2.03Singapore Exchange Ltd. SGD 303,900 1,719,389 3.20Singapore O&G Ltd. SGD 900,000 555,943 1.03Singapore Telecommunications Ltd. SGD 1,761,100 5,390,282 10.02SMRT Corp. Ltd. SGD 1,005,100 1,120,540 2.08United Overseas Bank Ltd. SGD 258,590 3,533,353 6.57UOL Group Ltd. SGD 308,234 1,247,610 2.32Wilmar International Ltd. SGD 694,400 1,682,273 3.13
46,265,791 86.02
Total Equities 51,736,525 96.19
Total Transferable securities and money market instrumentsadmitted to an official exchange listing 51,736,525 96.19
Other transferable securities and money market instruments
Equities
BermudaFibreChem Technologies Ltd.* SGD 5,200,000 386 0.00
386 0.00
Total Equities 386 0.00
Total Other transferable securities and money marketinstruments 386 0.00
Total Investments 51,736,911 96.19
Cash 2,172,381 4.04
Other Assets/(Liabilities) (123,641) (0.23)
Total Net Assets 53,785,651 100.00
* Security is valued at its fair value under the direction of the Board of Directors.
Geographic Allocation of Portfolio as at 30 June 2016 % of Net AssetsSingapore 86.02Bermuda 7.36Isle of Man 2.81Total Investments 96.19Cash and Other Assets/(Liabilities) 3.81
Total 100.00
Geographic Allocation of Portfolio as at 31 December 2015(Unaudited)
% of Net Assets
Singapore 94.51Isle of Man 2.07Bermuda 0.93Mauritius 0.53Total Investments 98.04Cash and Other Assets/(Liabilities) 1.96
Total 100.00
188
JPMorgan Funds - Singapore FundSchedule of Investments
As at 30 June 2016
Investments Currency
Quantity/Nominal
Value
MarketValue
USD
%of
NetAssets Investments Currency
Quantity/Nominal
Value
MarketValue
USD
%of
NetAssets
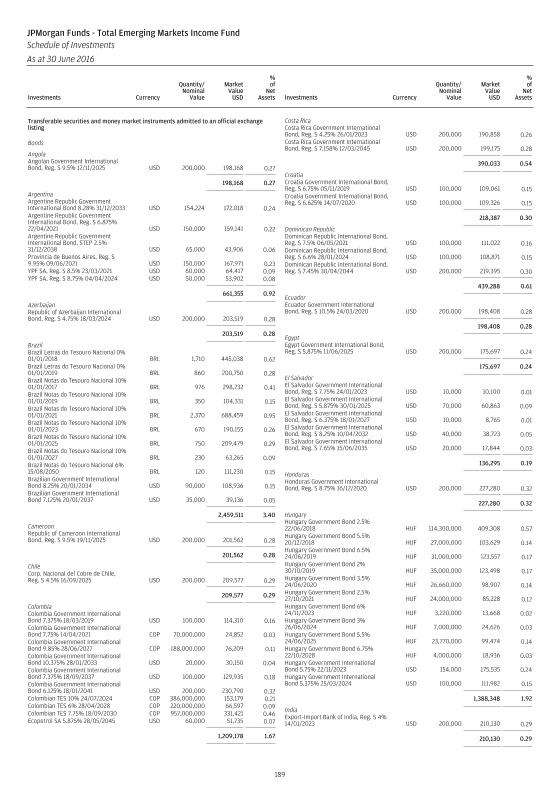
Transferable securities and money market instruments admitted to an official exchangelisting
Bonds
AngolaAngolan Government InternationalBond, Reg. S 9.5% 12/11/2025 USD 200,000 198,168 0.27
198,168 0.27
ArgentinaArgentine Republic GovernmentInternational Bond 8.28% 31/12/2033 USD 154,224 172,018 0.24Argentine Republic GovernmentInternational Bond, Reg. S 6.875%22/04/2021 USD 150,000 159,141 0.22Argentine Republic GovernmentInternational Bond, STEP 2.5%31/12/2038 USD 65,000 43,906 0.06Provincia de Buenos Aires, Reg. S9.95% 09/06/2021 USD 150,000 167,971 0.23YPF SA, Reg. S 8.5% 23/03/2021 USD 60,000 64,417 0.09YPF SA, Reg. S 8.75% 04/04/2024 USD 50,000 53,902 0.08
661,355 0.92
AzerbaijanRepublic of Azerbaijan InternationalBond, Reg. S 4.75% 18/03/2024 USD 200,000 203,519 0.28
203,519 0.28
BrazilBrazil Letras do Tesouro Nacional 0%01/01/2018 BRL 1,710 445,038 0.62Brazil Letras do Tesouro Nacional 0%01/01/2019 BRL 860 200,750 0.28Brazil Notas do Tesouro Nacional 10%01/01/2017 BRL 976 298,732 0.41Brazil Notas do Tesouro Nacional 10%01/01/2019 BRL 350 104,331 0.15Brazil Notas do Tesouro Nacional 10%01/01/2021 BRL 2,370 688,459 0.95Brazil Notas do Tesouro Nacional 10%01/01/2023 BRL 670 190,155 0.26Brazil Notas do Tesouro Nacional 10%01/01/2025 BRL 750 209,479 0.29Brazil Notas do Tesouro Nacional 10%01/01/2027 BRL 230 63,265 0.09Brazil Notas do Tesouro Nacional 6%15/08/2050 BRL 120 111,230 0.15Brazilian Government InternationalBond 8.25% 20/01/2034 USD 90,000 108,936 0.15Brazilian Government InternationalBond 7.125% 20/01/2037 USD 35,000 39,136 0.05
2,459,511 3.40
CameroonRepublic of Cameroon InternationalBond, Reg. S 9.5% 19/11/2025 USD 200,000 201,562 0.28
201,562 0.28
ChileCorp. Nacional del Cobre de Chile,Reg. S 4.5% 16/09/2025 USD 200,000 209,577 0.29
209,577 0.29
ColombiaColombia Government InternationalBond 7.375% 18/03/2019 USD 100,000 114,310 0.16Colombia Government InternationalBond 7.75% 14/04/2021 COP 70,000,000 24,852 0.03Colombia Government InternationalBond 9.85% 28/06/2027 COP 188,000,000 76,209 0.11Colombia Government InternationalBond 10.375% 28/01/2033 USD 20,000 30,150 0.04Colombia Government InternationalBond 7.375% 18/09/2037 USD 100,000 129,935 0.18Colombia Government InternationalBond 6.125% 18/01/2041 USD 200,000 230,790 0.32Colombian TES 10% 24/07/2024 COP 386,000,000 153,179 0.21Colombian TES 6% 28/04/2028 COP 220,000,000 66,597 0.09Colombian TES 7.75% 18/09/2030 COP 957,000,000 331,421 0.46Ecopetrol SA 5.875% 28/05/2045 USD 60,000 51,735 0.07
1,209,178 1.67
Costa RicaCosta Rica Government InternationalBond, Reg. S 4.25% 26/01/2023 USD 200,000 190,858 0.26Costa Rica Government InternationalBond, Reg. S 7.158% 12/03/2045 USD 200,000 199,175 0.28
390,033 0.54
CroatiaCroatia Government International Bond,Reg. S 6.75% 05/11/2019 USD 100,000 109,061 0.15Croatia Government International Bond,Reg. S 6.625% 14/07/2020 USD 100,000 109,326 0.15
218,387 0.30
Dominican RepublicDominican Republic International Bond,Reg. S 7.5% 06/05/2021 USD 100,000 111,022 0.16Dominican Republic International Bond,Reg. S 6.6% 28/01/2024 USD 100,000 108,871 0.15Dominican Republic International Bond,Reg. S 7.45% 30/04/2044 USD 200,000 219,395 0.30
439,288 0.61
EcuadorEcuador Government InternationalBond, Reg. S 10.5% 24/03/2020 USD 200,000 198,408 0.28
198,408 0.28
EgyptEgypt Government International Bond,Reg. S 5.875% 11/06/2025 USD 200,000 175,697 0.24
175,697 0.24
El SalvadorEl Salvador Government InternationalBond, Reg. S 7.75% 24/01/2023 USD 10,000 10,100 0.01El Salvador Government InternationalBond, Reg. S 5.875% 30/01/2025 USD 70,000 60,863 0.09El Salvador Government InternationalBond, Reg. S 6.375% 18/01/2027 USD 10,000 8,765 0.01El Salvador Government InternationalBond, Reg. S 8.25% 10/04/2032 USD 40,000 38,723 0.05El Salvador Government InternationalBond, Reg. S 7.65% 15/06/2035 USD 20,000 17,844 0.03
136,295 0.19
HondurasHonduras Government InternationalBond, Reg. S 8.75% 16/12/2020 USD 200,000 227,280 0.32
227,280 0.32
HungaryHungary Government Bond 2.5%22/06/2018 HUF 114,300,000 409,308 0.57Hungary Government Bond 5.5%20/12/2018 HUF 27,000,000 103,629 0.14Hungary Government Bond 6.5%24/06/2019 HUF 31,000,000 123,557 0.17Hungary Government Bond 2%30/10/2019 HUF 35,000,000 123,498 0.17Hungary Government Bond 3.5%24/06/2020 HUF 26,660,000 98,907 0.14Hungary Government Bond 2.5%27/10/2021 HUF 24,000,000 85,228 0.12Hungary Government Bond 6%24/11/2023 HUF 3,220,000 13,668 0.02Hungary Government Bond 3%26/06/2024 HUF 7,000,000 24,626 0.03Hungary Government Bond 5.5%24/06/2025 HUF 23,770,000 99,474 0.14Hungary Government Bond 6.75%22/10/2028 HUF 4,000,000 18,936 0.03Hungary Government InternationalBond 5.75% 22/11/2023 USD 154,000 175,535 0.24Hungary Government InternationalBond 5.375% 25/03/2024 USD 100,000 111,982 0.15
1,388,348 1.92
IndiaExport-Import Bank of India, Reg. S 4%14/01/2023 USD 200,000 210,130 0.29
210,130 0.29
189
JPMorgan Funds - Total Emerging Markets Income FundSchedule of Investments
As at 30 June 2016
Investments Currency
Quantity/Nominal
Value
MarketValue
USD
%of
NetAssets Investments Currency
Quantity/Nominal
Value
MarketValue
USD
%of
NetAssets
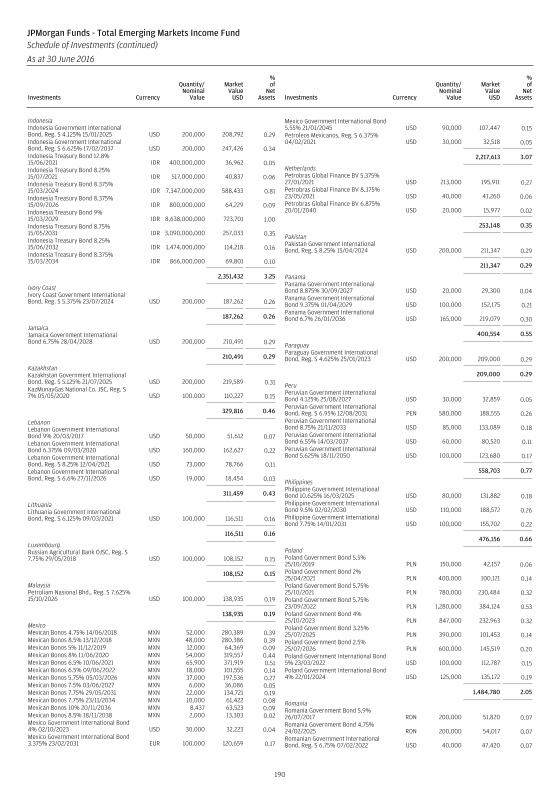
IndonesiaIndonesia Government InternationalBond, Reg. S 4.125% 15/01/2025 USD 200,000 208,792 0.29Indonesia Government InternationalBond, Reg. S 6.625% 17/02/2037 USD 200,000 247,426 0.34Indonesia Treasury Bond 12.8%15/06/2021 IDR 400,000,000 36,962 0.05Indonesia Treasury Bond 8.25%15/07/2021 IDR 517,000,000 40,837 0.06Indonesia Treasury Bond 8.375%15/03/2024 IDR 7,347,000,000 588,433 0.81Indonesia Treasury Bond 8.375%15/09/2026 IDR 800,000,000 64,229 0.09Indonesia Treasury Bond 9%15/03/2029 IDR 8,638,000,000 723,701 1.00Indonesia Treasury Bond 8.75%15/05/2031 IDR 3,090,000,000 257,033 0.35Indonesia Treasury Bond 8.25%15/06/2032 IDR 1,474,000,000 114,218 0.16Indonesia Treasury Bond 8.375%15/03/2034 IDR 866,000,000 69,801 0.10
2,351,432 3.25
Ivory CoastIvory Coast Government InternationalBond, Reg. S 5.375% 23/07/2024 USD 200,000 187,262 0.26
187,262 0.26
JamaicaJamaica Government InternationalBond 6.75% 28/04/2028 USD 200,000 210,491 0.29
210,491 0.29
KazakhstanKazakhstan Government InternationalBond, Reg. S 5.125% 21/07/2025 USD 200,000 219,589 0.31KazMunayGas National Co. JSC, Reg. S7% 05/05/2020 USD 100,000 110,227 0.15
329,816 0.46
LebanonLebanon Government InternationalBond 9% 20/03/2017 USD 50,000 51,612 0.07Lebanon Government InternationalBond 6.375% 09/03/2020 USD 160,000 162,627 0.22Lebanon Government InternationalBond, Reg. S 8.25% 12/04/2021 USD 73,000 78,766 0.11Lebanon Government InternationalBond, Reg. S 6.6% 27/11/2026 USD 19,000 18,454 0.03
311,459 0.43
LithuaniaLithuania Government InternationalBond, Reg. S 6.125% 09/03/2021 USD 100,000 116,511 0.16
116,511 0.16
LuxembourgRussian Agricultural Bank OJSC, Reg. S7.75% 29/05/2018 USD 100,000 108,152 0.15
108,152 0.15
MalaysiaPetroliam Nasional Bhd., Reg. S 7.625%15/10/2026 USD 100,000 138,935 0.19
138,935 0.19
MexicoMexican Bonos 4.75% 14/06/2018 MXN 52,000 280,389 0.39Mexican Bonos 8.5% 13/12/2018 MXN 48,000 280,386 0.39Mexican Bonos 5% 11/12/2019 MXN 12,000 64,369 0.09Mexican Bonos 8% 11/06/2020 MXN 54,000 319,557 0.44Mexican Bonos 6.5% 10/06/2021 MXN 65,900 371,919 0.51Mexican Bonos 6.5% 09/06/2022 MXN 18,000 101,555 0.14Mexican Bonos 5.75% 05/03/2026 MXN 37,000 197,536 0.27Mexican Bonos 7.5% 03/06/2027 MXN 6,000 36,086 0.05Mexican Bonos 7.75% 29/05/2031 MXN 22,000 134,721 0.19Mexican Bonos 7.75% 23/11/2034 MXN 10,000 61,422 0.08Mexican Bonos 10% 20/11/2036 MXN 8,437 63,523 0.09Mexican Bonos 8.5% 18/11/2038 MXN 2,000 13,303 0.02Mexico Government International Bond4% 02/10/2023 USD 30,000 32,223 0.04Mexico Government International Bond3.375% 23/02/2031 EUR 100,000 120,659 0.17
Mexico Government International Bond5.55% 21/01/2045 USD 90,000 107,447 0.15Petroleos Mexicanos, Reg. S 6.375%04/02/2021 USD 30,000 32,518 0.05
2,217,613 3.07
NetherlandsPetrobras Global Finance BV 5.375%27/01/2021 USD 213,000 195,911 0.27Petrobras Global Finance BV 8.375%23/05/2021 USD 40,000 41,260 0.06Petrobras Global Finance BV 6.875%20/01/2040 USD 20,000 15,977 0.02
253,148 0.35
PakistanPakistan Government InternationalBond, Reg. S 8.25% 15/04/2024 USD 200,000 211,347 0.29
211,347 0.29
PanamaPanama Government InternationalBond 8.875% 30/09/2027 USD 20,000 29,300 0.04Panama Government InternationalBond 9.375% 01/04/2029 USD 100,000 152,175 0.21Panama Government InternationalBond 6.7% 26/01/2036 USD 165,000 219,079 0.30
400,554 0.55
ParaguayParaguay Government InternationalBond, Reg. S 4.625% 25/01/2023 USD 200,000 209,000 0.29
209,000 0.29
PeruPeruvian Government InternationalBond 4.125% 25/08/2027 USD 30,000 32,859 0.05Peruvian Government InternationalBond, Reg. S 6.95% 12/08/2031 PEN 580,000 188,555 0.26Peruvian Government InternationalBond 8.75% 21/11/2033 USD 85,000 133,089 0.18Peruvian Government InternationalBond 6.55% 14/03/2037 USD 60,000 80,520 0.11Peruvian Government InternationalBond 5.625% 18/11/2050 USD 100,000 123,680 0.17
558,703 0.77
PhilippinesPhilippine Government InternationalBond 10.625% 16/03/2025 USD 80,000 131,882 0.18Philippine Government InternationalBond 9.5% 02/02/2030 USD 110,000 188,572 0.26Philippine Government InternationalBond 7.75% 14/01/2031 USD 100,000 155,702 0.22
476,156 0.66
PolandPoland Government Bond 5.5%25/10/2019 PLN 150,000 42,157 0.06Poland Government Bond 2%25/04/2021 PLN 400,000 100,121 0.14Poland Government Bond 5.75%25/10/2021 PLN 780,000 230,484 0.32Poland Government Bond 5.75%23/09/2022 PLN 1,280,000 384,124 0.53Poland Government Bond 4%25/10/2023 PLN 847,000 232,963 0.32Poland Government Bond 3.25%25/07/2025 PLN 390,000 101,453 0.14Poland Government Bond 2.5%25/07/2026 PLN 600,000 145,519 0.20Poland Government International Bond5% 23/03/2022 USD 100,000 112,787 0.15Poland Government International Bond4% 22/01/2024 USD 125,000 135,172 0.19
1,484,780 2.05
RomaniaRomania Government Bond 5.9%26/07/2017 RON 200,000 51,820 0.07Romania Government Bond 4.75%24/02/2025 RON 200,000 54,017 0.07Romanian Government InternationalBond, Reg. S 6.75% 07/02/2022 USD 40,000 47,420 0.07
190
JPMorgan Funds - Total Emerging Markets Income FundSchedule of Investments (continued)
As at 30 June 2016
Investments Currency
Quantity/Nominal
Value
MarketValue
USD
%of
NetAssets Investments Currency
Quantity/Nominal
Value
MarketValue
USD
%of
NetAssets
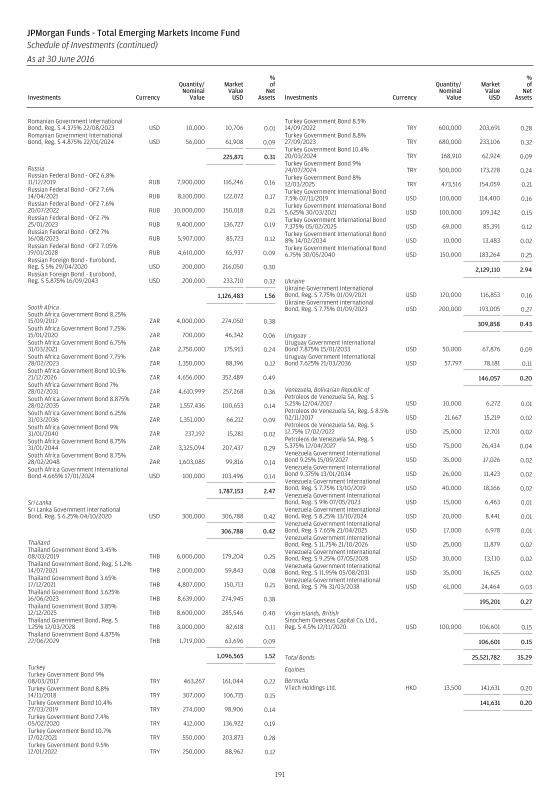
Romanian Government InternationalBond, Reg. S 4.375% 22/08/2023 USD 10,000 10,706 0.01Romanian Government InternationalBond, Reg. S 4.875% 22/01/2024 USD 56,000 61,908 0.09
225,871 0.31
RussiaRussian Federal Bond - OFZ 6.8%11/12/2019 RUB 7,900,000 116,246 0.16Russian Federal Bond - OFZ 7.6%14/04/2021 RUB 8,100,000 122,072 0.17Russian Federal Bond - OFZ 7.6%20/07/2022 RUB 10,000,000 150,018 0.21Russian Federal Bond - OFZ 7%25/01/2023 RUB 9,400,000 136,727 0.19Russian Federal Bond - OFZ 7%16/08/2023 RUB 5,907,000 85,723 0.12Russian Federal Bond - OFZ 7.05%19/01/2028 RUB 4,610,000 65,937 0.09Russian Foreign Bond - Eurobond,Reg. S 5% 29/04/2020 USD 200,000 216,050 0.30Russian Foreign Bond - Eurobond,Reg. S 5.875% 16/09/2043 USD 200,000 233,710 0.32
1,126,483 1.56
South AfricaSouth Africa Government Bond 8.25%15/09/2017 ZAR 4,000,000 274,050 0.38South Africa Government Bond 7.25%15/01/2020 ZAR 700,000 46,342 0.06South Africa Government Bond 6.75%31/03/2021 ZAR 2,750,000 175,913 0.24South Africa Government Bond 7.75%28/02/2023 ZAR 1,350,000 88,196 0.12South Africa Government Bond 10.5%21/12/2026 ZAR 4,656,000 352,489 0.49South Africa Government Bond 7%28/02/2031 ZAR 4,610,999 257,268 0.36South Africa Government Bond 8.875%28/02/2035 ZAR 1,557,436 100,653 0.14South Africa Government Bond 6.25%31/03/2036 ZAR 1,351,000 66,212 0.09South Africa Government Bond 9%31/01/2040 ZAR 237,192 15,281 0.02South Africa Government Bond 8.75%31/01/2044 ZAR 3,325,094 207,437 0.29South Africa Government Bond 8.75%28/02/2048 ZAR 1,603,085 99,816 0.14South Africa Government InternationalBond 4.665% 17/01/2024 USD 100,000 103,496 0.14
1,787,153 2.47
Sri LankaSri Lanka Government InternationalBond, Reg. S 6.25% 04/10/2020 USD 300,000 306,788 0.42
306,788 0.42
ThailandThailand Government Bond 3.45%08/03/2019 THB 6,000,000 179,204 0.25Thailand Government Bond, Reg. S 1.2%14/07/2021 THB 2,000,000 59,843 0.08Thailand Government Bond 3.65%17/12/2021 THB 4,807,000 150,713 0.21Thailand Government Bond 3.625%16/06/2023 THB 8,639,000 274,945 0.38Thailand Government Bond 3.85%12/12/2025 THB 8,600,000 285,546 0.40Thailand Government Bond, Reg. S1.25% 12/03/2028 THB 3,000,000 82,618 0.11Thailand Government Bond 4.875%22/06/2029 THB 1,719,000 63,696 0.09
1,096,565 1.52
TurkeyTurkey Government Bond 9%08/03/2017 TRY 463,267 161,044 0.22Turkey Government Bond 8.8%14/11/2018 TRY 307,000 106,715 0.15Turkey Government Bond 10.4%27/03/2019 TRY 274,000 98,906 0.14Turkey Government Bond 7.4%05/02/2020 TRY 412,000 136,922 0.19Turkey Government Bond 10.7%17/02/2021 TRY 550,000 203,873 0.28Turkey Government Bond 9.5%12/01/2022 TRY 250,000 88,962 0.12
Turkey Government Bond 8.5%14/09/2022 TRY 600,000 203,691 0.28Turkey Government Bond 8.8%27/09/2023 TRY 680,000 233,106 0.32Turkey Government Bond 10.4%20/03/2024 TRY 168,910 62,924 0.09Turkey Government Bond 9%24/07/2024 TRY 500,000 173,228 0.24Turkey Government Bond 8%12/03/2025 TRY 473,516 154,059 0.21Turkey Government International Bond7.5% 07/11/2019 USD 100,000 114,400 0.16Turkey Government International Bond5.625% 30/03/2021 USD 100,000 109,142 0.15Turkey Government International Bond7.375% 05/02/2025 USD 69,000 85,391 0.12Turkey Government International Bond8% 14/02/2034 USD 10,000 13,483 0.02Turkey Government International Bond6.75% 30/05/2040 USD 150,000 183,264 0.25
2,129,110 2.94
UkraineUkraine Government InternationalBond, Reg. S 7.75% 01/09/2021 USD 120,000 116,853 0.16Ukraine Government InternationalBond, Reg. S 7.75% 01/09/2023 USD 200,000 193,005 0.27
309,858 0.43
UruguayUruguay Government InternationalBond 7.875% 15/01/2033 USD 50,000 67,876 0.09Uruguay Government InternationalBond 7.625% 21/03/2036 USD 57,797 78,181 0.11
146,057 0.20
Venezuela, Bolivarian Republic ofPetroleos de Venezuela SA, Reg. S5.25% 12/04/2017 USD 10,000 6,272 0.01Petroleos de Venezuela SA, Reg. S 8.5%02/11/2017 USD 21,667 15,219 0.02Petroleos de Venezuela SA, Reg. S12.75% 17/02/2022 USD 25,000 12,701 0.02Petroleos de Venezuela SA, Reg. S5.375% 12/04/2027 USD 75,000 26,434 0.04Venezuela Government InternationalBond 9.25% 15/09/2027 USD 35,000 17,026 0.02Venezuela Government InternationalBond 9.375% 13/01/2034 USD 26,000 11,423 0.02Venezuela Government InternationalBond, Reg. S 7.75% 13/10/2019 USD 40,000 18,166 0.02Venezuela Government InternationalBond, Reg. S 9% 07/05/2023 USD 15,000 6,463 0.01Venezuela Government InternationalBond, Reg. S 8.25% 13/10/2024 USD 20,000 8,441 0.01Venezuela Government InternationalBond, Reg. S 7.65% 21/04/2025 USD 17,000 6,978 0.01Venezuela Government InternationalBond, Reg. S 11.75% 21/10/2026 USD 25,000 11,879 0.02Venezuela Government InternationalBond, Reg. S 9.25% 07/05/2028 USD 30,000 13,110 0.02Venezuela Government InternationalBond, Reg. S 11.95% 05/08/2031 USD 35,000 16,625 0.02Venezuela Government InternationalBond, Reg. S 7% 31/03/2038 USD 61,000 24,464 0.03
195,201 0.27
Virgin Islands, BritishSinochem Overseas Capital Co. Ltd.,Reg. S 4.5% 12/11/2020 USD 100,000 106,601 0.15
106,601 0.15
Total Bonds 25,521,782 35.29
Equities
BermudaVTech Holdings Ltd. HKD 13,500 141,631 0.20
141,631 0.20
191
JPMorgan Funds - Total Emerging Markets Income FundSchedule of Investments (continued)
As at 30 June 2016
Investments Currency
Quantity/Nominal
Value
MarketValue
USD
%of
NetAssets Investments Currency
Quantity/Nominal
Value
MarketValue
USD
%of
NetAssets
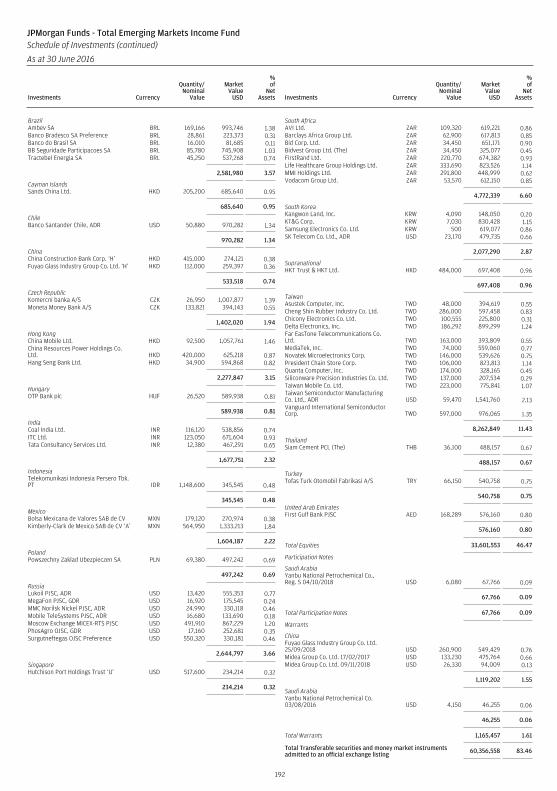
BrazilAmbev SA BRL 169,166 993,746 1.38Banco Bradesco SA Preference BRL 28,861 223,373 0.31Banco do Brasil SA BRL 16,010 81,685 0.11BB Seguridade Participacoes SA BRL 85,780 745,908 1.03Tractebel Energia SA BRL 45,250 537,268 0.74
2,581,980 3.57
Cayman IslandsSands China Ltd. HKD 205,200 685,640 0.95
685,640 0.95
ChileBanco Santander Chile, ADR USD 50,880 970,282 1.34
970,282 1.34
ChinaChina Construction Bank Corp. ‘H’ HKD 415,000 274,121 0.38Fuyao Glass Industry Group Co. Ltd. ‘H’ HKD 112,000 259,397 0.36
533,518 0.74
Czech RepublicKomercni banka A/S CZK 26,950 1,007,877 1.39Moneta Money Bank A/S CZK 133,821 394,143 0.55
1,402,020 1.94
Hong KongChina Mobile Ltd. HKD 92,500 1,057,761 1.46China Resources Power Holdings Co.Ltd. HKD 420,000 625,218 0.87Hang Seng Bank Ltd. HKD 34,900 594,868 0.82
2,277,847 3.15
HungaryOTP Bank plc HUF 26,520 589,938 0.81
589,938 0.81
IndiaCoal India Ltd. INR 116,120 538,856 0.74ITC Ltd. INR 123,050 671,604 0.93Tata Consultancy Services Ltd. INR 12,380 467,291 0.65
1,677,751 2.32
IndonesiaTelekomunikasi Indonesia Persero Tbk.PT IDR 1,148,600 345,545 0.48
345,545 0.48
MexicoBolsa Mexicana de Valores SAB de CV MXN 179,120 270,974 0.38Kimberly-Clark de Mexico SAB de CV ‘A’ MXN 564,950 1,333,213 1.84
1,604,187 2.22
PolandPowszechny Zaklad Ubezpieczen SA PLN 69,380 497,242 0.69
497,242 0.69
RussiaLukoil PJSC, ADR USD 13,420 555,353 0.77MegaFon PJSC, GDR USD 16,920 175,545 0.24MMC Norilsk Nickel PJSC, ADR USD 24,990 330,118 0.46Mobile TeleSystems PJSC, ADR USD 16,680 133,690 0.18Moscow Exchange MICEX-RTS PJSC USD 491,910 867,229 1.20PhosAgro OJSC, GDR USD 17,160 252,681 0.35Surgutneftegas OJSC Preference USD 550,320 330,181 0.46
2,644,797 3.66
SingaporeHutchison Port Holdings Trust ‘U’ USD 517,600 234,214 0.32
234,214 0.32
South AfricaAVI Ltd. ZAR 109,320 619,221 0.86Barclays Africa Group Ltd. ZAR 62,900 617,813 0.85Bid Corp. Ltd. ZAR 34,450 651,171 0.90Bidvest Group Ltd. (The) ZAR 34,450 325,077 0.45FirstRand Ltd. ZAR 220,770 674,382 0.93Life Healthcare Group Holdings Ltd. ZAR 333,690 823,526 1.14MMI Holdings Ltd. ZAR 291,800 448,999 0.62Vodacom Group Ltd. ZAR 53,570 612,150 0.85
4,772,339 6.60
South KoreaKangwon Land, Inc. KRW 4,090 148,050 0.20KT&G Corp. KRW 7,030 830,428 1.15Samsung Electronics Co. Ltd. KRW 500 619,077 0.86SK Telecom Co. Ltd., ADR USD 23,170 479,735 0.66
2,077,290 2.87
SupranationalHKT Trust & HKT Ltd. HKD 484,000 697,408 0.96
697,408 0.96
TaiwanAsustek Computer, Inc. TWD 48,000 394,619 0.55Cheng Shin Rubber Industry Co. Ltd. TWD 286,000 597,458 0.83Chicony Electronics Co. Ltd. TWD 100,555 225,800 0.31Delta Electronics, Inc. TWD 186,292 899,299 1.24Far EasTone Telecommunications Co.Ltd. TWD 163,000 393,809 0.55MediaTek, Inc. TWD 74,000 559,060 0.77Novatek Microelectronics Corp. TWD 146,000 539,626 0.75President Chain Store Corp. TWD 106,000 823,813 1.14Quanta Computer, Inc. TWD 174,000 328,165 0.45Siliconware Precision Industries Co. Ltd. TWD 137,000 207,534 0.29Taiwan Mobile Co. Ltd. TWD 223,000 775,841 1.07Taiwan Semiconductor ManufacturingCo. Ltd., ADR USD 59,470 1,541,760 2.13Vanguard International SemiconductorCorp. TWD 597,000 976,065 1.35
8,262,849 11.43
ThailandSiam Cement PCL (The) THB 36,100 488,157 0.67
488,157 0.67
TurkeyTofas Turk Otomobil Fabrikasi A/S TRY 66,150 540,758 0.75
540,758 0.75
United Arab EmiratesFirst Gulf Bank PJSC AED 168,289 576,160 0.80
576,160 0.80
Total Equities 33,601,553 46.47
Participation Notes
Saudi ArabiaYanbu National Petrochemical Co.,Reg. S 04/10/2018 USD 6,080 67,766 0.09
67,766 0.09
Total Participation Notes 67,766 0.09
Warrants
ChinaFuyao Glass Industry Group Co. Ltd.25/09/2018 USD 260,900 549,429 0.76Midea Group Co. Ltd. 17/02/2017 USD 133,230 475,764 0.66Midea Group Co. Ltd. 09/11/2018 USD 26,330 94,009 0.13
1,119,202 1.55
Saudi ArabiaYanbu National Petrochemical Co.03/08/2016 USD 4,150 46,255 0.06
46,255 0.06
Total Warrants 1,165,457 1.61
Total Transferable securities and money market instrumentsadmitted to an official exchange listing 60,356,558 83.46
192
JPMorgan Funds - Total Emerging Markets Income FundSchedule of Investments (continued)
As at 30 June 2016
Investments Currency
Quantity/Nominal
Value
MarketValue
USD
%of
NetAssets Investments Currency
Quantity/Nominal
Value
MarketValue
USD
%of
NetAssets
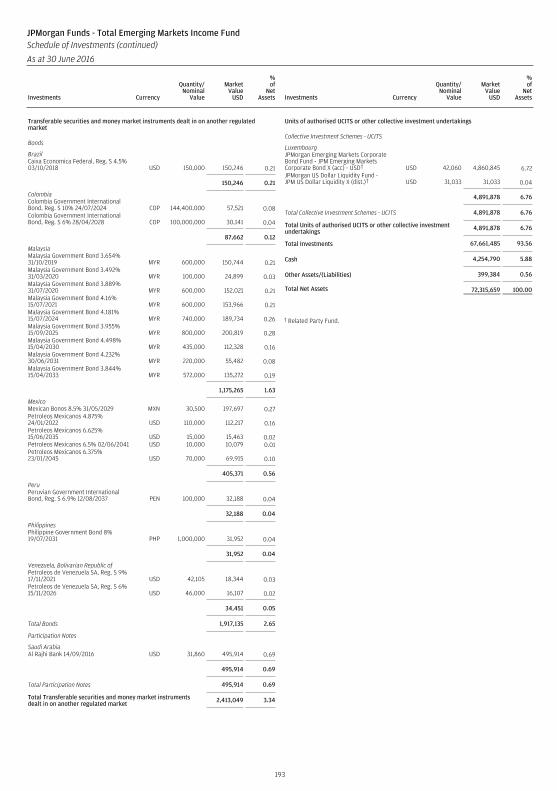
Transferable securities and money market instruments dealt in on another regulatedmarket
Bonds
BrazilCaixa Economica Federal, Reg. S 4.5%03/10/2018 USD 150,000 150,246 0.21
150,246 0.21
ColombiaColombia Government InternationalBond, Reg. S 10% 24/07/2024 COP 144,400,000 57,521 0.08Colombia Government InternationalBond, Reg. S 6% 28/04/2028 COP 100,000,000 30,141 0.04
87,662 0.12
MalaysiaMalaysia Government Bond 3.654%31/10/2019 MYR 600,000 150,744 0.21Malaysia Government Bond 3.492%31/03/2020 MYR 100,000 24,899 0.03Malaysia Government Bond 3.889%31/07/2020 MYR 600,000 152,021 0.21Malaysia Government Bond 4.16%15/07/2021 MYR 600,000 153,966 0.21Malaysia Government Bond 4.181%15/07/2024 MYR 740,000 189,734 0.26Malaysia Government Bond 3.955%15/09/2025 MYR 800,000 200,819 0.28Malaysia Government Bond 4.498%15/04/2030 MYR 435,000 112,328 0.16Malaysia Government Bond 4.232%30/06/2031 MYR 220,000 55,482 0.08Malaysia Government Bond 3.844%15/04/2033 MYR 572,000 135,272 0.19
1,175,265 1.63
MexicoMexican Bonos 8.5% 31/05/2029 MXN 30,500 197,697 0.27Petroleos Mexicanos 4.875%24/01/2022 USD 110,000 112,217 0.16Petroleos Mexicanos 6.625%15/06/2035 USD 15,000 15,463 0.02Petroleos Mexicanos 6.5% 02/06/2041 USD 10,000 10,079 0.01Petroleos Mexicanos 6.375%23/01/2045 USD 70,000 69,915 0.10
405,371 0.56
PeruPeruvian Government InternationalBond, Reg. S 6.9% 12/08/2037 PEN 100,000 32,188 0.04
32,188 0.04
PhilippinesPhilippine Government Bond 8%19/07/2031 PHP 1,000,000 31,952 0.04
31,952 0.04
Venezuela, Bolivarian Republic ofPetroleos de Venezuela SA, Reg. S 9%17/11/2021 USD 42,105 18,344 0.03Petroleos de Venezuela SA, Reg. S 6%15/11/2026 USD 46,000 16,107 0.02
34,451 0.05
Total Bonds 1,917,135 2.65
Participation Notes
Saudi ArabiaAl Rajhi Bank 14/09/2016 USD 31,860 495,914 0.69
495,914 0.69
Total Participation Notes 495,914 0.69
Total Transferable securities and money market instrumentsdealt in on another regulated market 2,413,049 3.34
Units of authorised UCITS or other collective investment undertakings
Collective Investment Schemes - UCITS
LuxembourgJPMorgan Emerging Markets CorporateBond Fund - JPM Emerging MarketsCorporate Bond X (acc) - USD† USD 42,060 4,860,845 6.72JPMorgan US Dollar Liquidity Fund -JPM US Dollar Liquidity X (dist.)† USD 31,033 31,033 0.04
4,891,878 6.76
Total Collective Investment Schemes - UCITS 4,891,878 6.76
Total Units of authorised UCITS or other collective investmentundertakings 4,891,878 6.76
Total Investments 67,661,485 93.56
Cash 4,254,790 5.88
Other Assets/(Liabilities) 399,384 0.56
Total Net Assets 72,315,659 100.00
† Related Party Fund.
193
JPMorgan Funds - Total Emerging Markets Income FundSchedule of Investments (continued)
As at 30 June 2016
Investments Currency
Quantity/Nominal
Value
MarketValue
USD
%of
NetAssets Investments Currency
Quantity/Nominal
Value
MarketValue
USD
%of
NetAssets
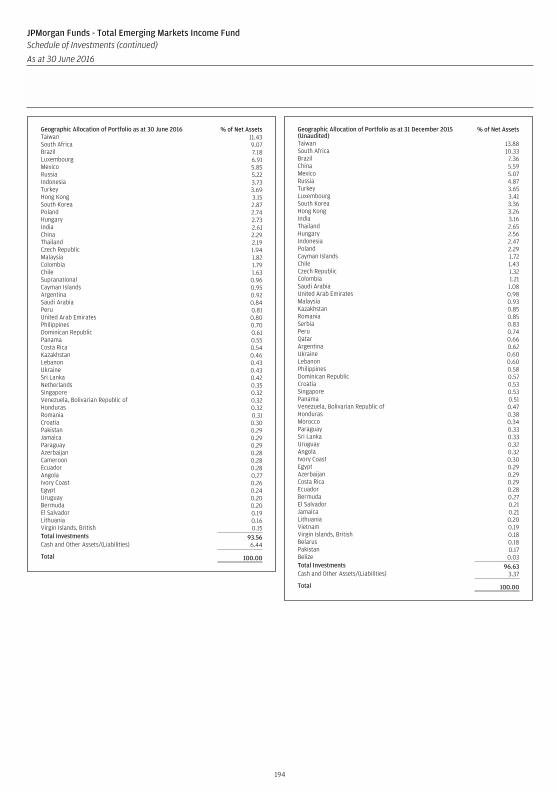
Geographic Allocation of Portfolio as at 30 June 2016 % of Net AssetsTaiwan 11.43South Africa 9.07Brazil 7.18Luxembourg 6.91Mexico 5.85Russia 5.22Indonesia 3.73Turkey 3.69Hong Kong 3.15South Korea 2.87Poland 2.74Hungary 2.73India 2.61China 2.29Thailand 2.19Czech Republic 1.94Malaysia 1.82Colombia 1.79Chile 1.63Supranational 0.96Cayman Islands 0.95Argentina 0.92Saudi Arabia 0.84Peru 0.81United Arab Emirates 0.80Philippines 0.70Dominican Republic 0.61Panama 0.55Costa Rica 0.54Kazakhstan 0.46Lebanon 0.43Ukraine 0.43Sri Lanka 0.42Netherlands 0.35Singapore 0.32Venezuela, Bolivarian Republic of 0.32Honduras 0.32Romania 0.31Croatia 0.30Pakistan 0.29Jamaica 0.29Paraguay 0.29Azerbaijan 0.28Cameroon 0.28Ecuador 0.28Angola 0.27Ivory Coast 0.26Egypt 0.24Uruguay 0.20Bermuda 0.20El Salvador 0.19Lithuania 0.16Virgin Islands, British 0.15Total Investments 93.56Cash and Other Assets/(Liabilities) 6.44
Total 100.00
Geographic Allocation of Portfolio as at 31 December 2015(Unaudited)
% of Net Assets
Taiwan 13.88South Africa 10.33Brazil 7.36China 5.59Mexico 5.07Russia 4.87Turkey 3.65Luxembourg 3.41South Korea 3.36Hong Kong 3.26India 3.16Thailand 2.65Hungary 2.56Indonesia 2.47Poland 2.29Cayman Islands 1.72Chile 1.43Czech Republic 1.32Colombia 1.21Saudi Arabia 1.08United Arab Emirates 0.98Malaysia 0.93Kazakhstan 0.85Romania 0.85Serbia 0.83Peru 0.74Qatar 0.66Argentina 0.62Ukraine 0.60Lebanon 0.60Philippines 0.58Dominican Republic 0.57Croatia 0.53Singapore 0.53Panama 0.51Venezuela, Bolivarian Republic of 0.47Honduras 0.38Morocco 0.34Paraguay 0.33Sri Lanka 0.33Uruguay 0.32Angola 0.32Ivory Coast 0.30Egypt 0.29Azerbaijan 0.29Costa Rica 0.29Ecuador 0.28Bermuda 0.27El Salvador 0.21Jamaica 0.21Lithuania 0.20Vietnam 0.19Virgin Islands, British 0.18Belarus 0.18Pakistan 0.17Belize 0.03Total Investments 96.63Cash and Other Assets/(Liabilities) 3.37
Total 100.00
194
JPMorgan Funds - Total Emerging Markets Income FundSchedule of Investments (continued)
As at 30 June 2016
Investments Currency
Quantity/Nominal
Value
MarketValue
USD
%of
NetAssets Investments Currency
Quantity/Nominal
Value
MarketValue
USD
%of
NetAssets
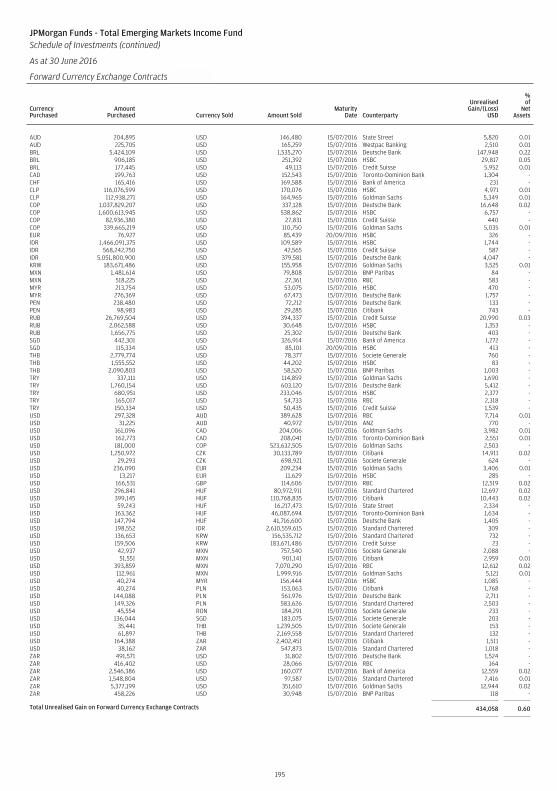
JPMorgan Funds - Total Emerging Markets Income FundSchedule of Investments (continued)
As at 30 June 2016
Forward Currency Exchange Contracts (continued)
CurrencyPurchased
AmountPurchased Currency Sold Amount Sold
MaturityDate Counterparty
UnrealisedGain/(Loss)
USD
%of
NetAssets
AUD 204,895 USD 146,480 15/07/2016 State Street 5,820 0.01AUD 225,705 USD 165,259 15/07/2016 Westpac Banking 2,510 0.01BRL 5,424,109 USD 1,535,270 15/07/2016 Deutsche Bank 147,948 0.22BRL 906,185 USD 251,392 15/07/2016 HSBC 29,817 0.05BRL 177,445 USD 49,113 15/07/2016 Credit Suisse 5,952 0.01CAD 199,763 USD 152,543 15/07/2016 Toronto-Dominion Bank 1,304 -CHF 165,416 USD 169,588 15/07/2016 Bank of America 231 -CLP 116,076,599 USD 170,076 15/07/2016 HSBC 4,971 0.01CLP 112,938,271 USD 164,965 15/07/2016 Goldman Sachs 5,349 0.01COP 1,037,829,207 USD 337,128 15/07/2016 Deutsche Bank 16,648 0.02COP 1,600,613,945 USD 538,862 15/07/2016 HSBC 6,757 -COP 82,936,380 USD 27,831 15/07/2016 Credit Suisse 440 -COP 339,665,219 USD 110,750 15/07/2016 Goldman Sachs 5,035 0.01EUR 76,927 USD 85,439 20/09/2016 HSBC 326 -IDR 1,466,091,375 USD 109,589 15/07/2016 HSBC 1,744 -IDR 568,242,750 USD 42,565 15/07/2016 Credit Suisse 587 -IDR 5,051,800,900 USD 379,581 15/07/2016 Deutsche Bank 4,047 -KRW 183,671,486 USD 155,958 15/07/2016 Goldman Sachs 3,525 0.01MXN 1,481,614 USD 79,808 15/07/2016 BNP Paribas 84 -MXN 518,225 USD 27,361 15/07/2016 RBC 583 -MYR 213,754 USD 53,075 15/07/2016 HSBC 470 -MYR 276,369 USD 67,473 15/07/2016 Deutsche Bank 1,757 -PEN 238,480 USD 72,212 15/07/2016 Deutsche Bank 133 -PEN 98,983 USD 29,285 15/07/2016 Citibank 743 -RUB 26,769,504 USD 394,337 15/07/2016 Credit Suisse 20,990 0.03RUB 2,062,588 USD 30,648 15/07/2016 HSBC 1,353 -RUB 1,656,775 USD 25,302 15/07/2016 Deutsche Bank 403 -SGD 442,301 USD 326,914 15/07/2016 Bank of America 1,272 -SGD 115,334 USD 85,101 20/09/2016 HSBC 413 -THB 2,779,774 USD 78,377 15/07/2016 Societe Generale 760 -THB 1,555,552 USD 44,202 15/07/2016 HSBC 83 -THB 2,090,803 USD 58,520 15/07/2016 BNP Paribas 1,003 -TRY 337,111 USD 114,859 15/07/2016 Goldman Sachs 1,690 -TRY 1,760,154 USD 603,120 15/07/2016 Deutsche Bank 5,412 -TRY 680,951 USD 233,046 15/07/2016 HSBC 2,377 -TRY 165,017 USD 54,733 15/07/2016 RBC 2,318 -TRY 150,334 USD 50,435 15/07/2016 Credit Suisse 1,539 -USD 297,328 AUD 389,628 15/07/2016 RBC 7,714 0.01USD 31,225 AUD 40,972 15/07/2016 ANZ 770 -USD 161,096 CAD 204,006 15/07/2016 Goldman Sachs 3,982 0.01USD 162,773 CAD 208,041 15/07/2016 Toronto-Dominion Bank 2,551 0.01USD 181,000 COP 523,632,505 15/07/2016 Goldman Sachs 2,503 -USD 1,250,972 CZK 30,133,789 15/07/2016 Citibank 14,911 0.02USD 29,293 CZK 698,921 15/07/2016 Societe Generale 624 -USD 236,090 EUR 209,234 15/07/2016 Goldman Sachs 3,406 0.01USD 13,217 EUR 11,629 15/07/2016 HSBC 285 -USD 166,531 GBP 114,606 15/07/2016 RBC 12,519 0.02USD 296,841 HUF 80,972,911 15/07/2016 Standard Chartered 12,697 0.02USD 399,145 HUF 110,768,835 15/07/2016 Citibank 10,443 0.02USD 59,243 HUF 16,217,473 15/07/2016 State Street 2,334 -USD 163,362 HUF 46,087,694 15/07/2016 Toronto-Dominion Bank 1,634 -USD 147,794 HUF 41,716,600 15/07/2016 Deutsche Bank 1,405 -USD 198,552 IDR 2,610,559,615 15/07/2016 Standard Chartered 309 -USD 136,653 KRW 156,535,712 15/07/2016 Standard Chartered 732 -USD 159,506 KRW 183,671,486 15/07/2016 Credit Suisse 23 -USD 42,937 MXN 757,540 15/07/2016 Societe Generale 2,088 -USD 51,551 MXN 901,141 15/07/2016 Citibank 2,959 0.01USD 393,859 MXN 7,070,290 15/07/2016 RBC 12,612 0.02USD 112,961 MXN 1,999,916 15/07/2016 Goldman Sachs 5,121 0.01USD 40,274 MYR 156,444 15/07/2016 HSBC 1,085 -USD 40,274 PLN 153,063 15/07/2016 Citibank 1,768 -USD 144,088 PLN 561,976 15/07/2016 Deutsche Bank 2,711 -USD 149,326 PLN 583,626 15/07/2016 Standard Chartered 2,503 -USD 45,554 RON 184,291 15/07/2016 Societe Generale 233 -USD 136,044 SGD 183,075 15/07/2016 Societe Generale 203 -USD 35,441 THB 1,239,505 15/07/2016 Societe Generale 153 -USD 61,897 THB 2,169,558 15/07/2016 Standard Chartered 132 -USD 164,388 ZAR 2,402,451 15/07/2016 Citibank 1,511 -USD 38,162 ZAR 547,873 15/07/2016 Standard Chartered 1,018 -ZAR 491,571 USD 31,802 15/07/2016 Deutsche Bank 1,524 -ZAR 416,402 USD 28,066 15/07/2016 RBC 164 -ZAR 2,546,386 USD 160,077 15/07/2016 Bank of America 12,559 0.02ZAR 1,548,804 USD 97,587 15/07/2016 Standard Chartered 7,416 0.01ZAR 5,377,199 USD 351,610 15/07/2016 Goldman Sachs 12,944 0.02ZAR 458,226 USD 30,948 15/07/2016 BNP Paribas 118 -
Total Unrealised Gain on Forward Currency Exchange Contracts 434,058 0.60
195
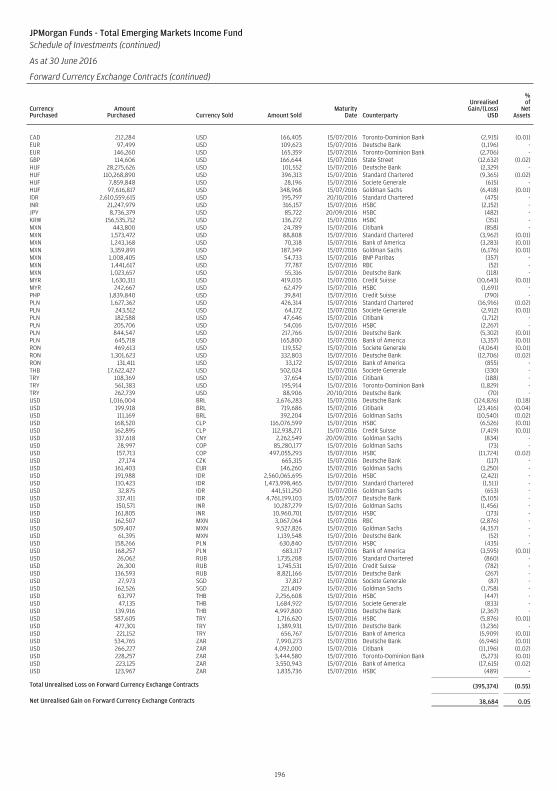
JPMorgan Funds - Total Emerging Markets Income FundSchedule of Investments (continued)
As at 30 June 2016
Forward Currency Exchange Contracts (continued)
CurrencyPurchased
AmountPurchased Currency Sold Amount Sold
MaturityDate Counterparty
UnrealisedGain/(Loss)
USD
%of
NetAssets
CAD 212,284 USD 166,405 15/07/2016 Toronto-Dominion Bank (2,915) (0.01)EUR 97,499 USD 109,623 15/07/2016 Deutsche Bank (1,196) -EUR 146,260 USD 165,359 15/07/2016 Toronto-Dominion Bank (2,706) -GBP 114,606 USD 166,644 15/07/2016 State Street (12,632) (0.02)HUF 28,275,626 USD 101,552 15/07/2016 Deutsche Bank (2,329) -HUF 110,268,890 USD 396,313 15/07/2016 Standard Chartered (9,365) (0.02)HUF 7,859,848 USD 28,196 15/07/2016 Societe Generale (615) -HUF 97,616,817 USD 348,968 15/07/2016 Goldman Sachs (6,418) (0.01)IDR 2,610,559,615 USD 195,797 20/10/2016 Standard Chartered (475) -INR 21,247,979 USD 316,157 15/07/2016 HSBC (2,152) -JPY 8,736,379 USD 85,722 20/09/2016 HSBC (482) -KRW 156,535,712 USD 136,272 15/07/2016 HSBC (351) -MXN 443,800 USD 24,789 15/07/2016 Citibank (858) -MXN 1,573,472 USD 88,808 15/07/2016 Standard Chartered (3,962) (0.01)MXN 1,243,168 USD 70,318 15/07/2016 Bank of America (3,283) (0.01)MXN 3,359,891 USD 187,349 15/07/2016 Goldman Sachs (6,176) (0.01)MXN 1,008,405 USD 54,733 15/07/2016 BNP Paribas (357) -MXN 1,441,617 USD 77,787 15/07/2016 RBC (52) -MXN 1,023,657 USD 55,316 15/07/2016 Deutsche Bank (118) -MYR 1,630,311 USD 419,035 15/07/2016 Credit Suisse (10,643) (0.01)MYR 242,667 USD 62,479 15/07/2016 HSBC (1,691) -PHP 1,839,840 USD 39,841 15/07/2016 Credit Suisse (790) -PLN 1,627,362 USD 426,314 15/07/2016 Standard Chartered (16,916) (0.02)PLN 243,512 USD 64,172 15/07/2016 Societe Generale (2,912) (0.01)PLN 182,588 USD 47,646 15/07/2016 Citibank (1,712) -PLN 205,706 USD 54,016 15/07/2016 HSBC (2,267) -PLN 844,547 USD 217,766 15/07/2016 Deutsche Bank (5,302) (0.01)PLN 645,718 USD 165,800 15/07/2016 Bank of America (3,357) (0.01)RON 469,613 USD 119,552 15/07/2016 Societe Generale (4,064) (0.01)RON 1,301,623 USD 332,803 15/07/2016 Deutsche Bank (12,706) (0.02)RON 131,411 USD 33,172 15/07/2016 Bank of America (855) -THB 17,622,427 USD 502,024 15/07/2016 Societe Generale (330) -TRY 108,369 USD 37,654 15/07/2016 Citibank (188) -TRY 561,383 USD 195,914 15/07/2016 Toronto-Dominion Bank (1,829) -TRY 262,739 USD 88,906 20/10/2016 Deutsche Bank (70) -USD 1,016,004 BRL 3,676,283 15/07/2016 Deutsche Bank (124,826) (0.18)USD 199,918 BRL 719,686 15/07/2016 Citibank (23,416) (0.04)USD 111,169 BRL 392,204 15/07/2016 Goldman Sachs (10,540) (0.02)USD 168,520 CLP 116,076,599 15/07/2016 HSBC (6,526) (0.01)USD 162,895 CLP 112,938,271 15/07/2016 Credit Suisse (7,419) (0.01)USD 337,618 CNY 2,262,549 20/09/2016 Goldman Sachs (834) -USD 28,997 COP 85,280,177 15/07/2016 Goldman Sachs (73) -USD 157,713 COP 497,055,293 15/07/2016 HSBC (11,724) (0.02)USD 27,174 CZK 665,315 15/07/2016 Deutsche Bank (117) -USD 161,403 EUR 146,260 15/07/2016 Goldman Sachs (1,250) -USD 191,988 IDR 2,560,065,695 15/07/2016 HSBC (2,421) -USD 110,423 IDR 1,473,998,465 15/07/2016 Standard Chartered (1,511) -USD 32,875 IDR 441,511,250 15/07/2016 Goldman Sachs (653) -USD 337,411 IDR 4,761,199,103 15/05/2017 Deutsche Bank (5,105) -USD 150,571 INR 10,287,279 15/07/2016 Goldman Sachs (1,456) -USD 161,805 INR 10,960,701 15/07/2016 HSBC (173) -USD 162,507 MXN 3,067,064 15/07/2016 RBC (2,876) -USD 509,407 MXN 9,527,826 15/07/2016 Goldman Sachs (4,357) -USD 61,395 MXN 1,139,548 15/07/2016 Deutsche Bank (52) -USD 158,266 PLN 630,840 15/07/2016 HSBC (435) -USD 168,257 PLN 683,117 15/07/2016 Bank of America (3,595) (0.01)USD 26,062 RUB 1,735,208 15/07/2016 Standard Chartered (860) -USD 26,300 RUB 1,745,531 15/07/2016 Credit Suisse (782) -USD 136,593 RUB 8,821,166 15/07/2016 Deutsche Bank (267) -USD 27,973 SGD 37,817 15/07/2016 Societe Generale (87) -USD 162,526 SGD 221,409 15/07/2016 Goldman Sachs (1,758) -USD 63,797 THB 2,256,608 15/07/2016 HSBC (447) -USD 47,135 THB 1,684,922 15/07/2016 Societe Generale (833) -USD 139,916 THB 4,997,800 15/07/2016 Deutsche Bank (2,367) -USD 587,605 TRY 1,716,620 15/07/2016 HSBC (5,876) (0.01)USD 477,301 TRY 1,389,931 15/07/2016 Deutsche Bank (3,236) -USD 221,152 TRY 656,767 15/07/2016 Bank of America (5,909) (0.01)USD 534,765 ZAR 7,990,273 15/07/2016 Deutsche Bank (6,946) (0.01)USD 266,227 ZAR 4,092,000 15/07/2016 Citibank (11,196) (0.02)USD 228,257 ZAR 3,444,580 15/07/2016 Toronto-Dominion Bank (5,273) (0.01)USD 223,125 ZAR 3,550,943 15/07/2016 Bank of America (17,615) (0.02)USD 123,967 ZAR 1,835,736 15/07/2016 HSBC (489) -
Total Unrealised Loss on Forward Currency Exchange Contracts (395,374) (0.55)
Net Unrealised Gain on Forward Currency Exchange Contracts 38,684 0.05
196
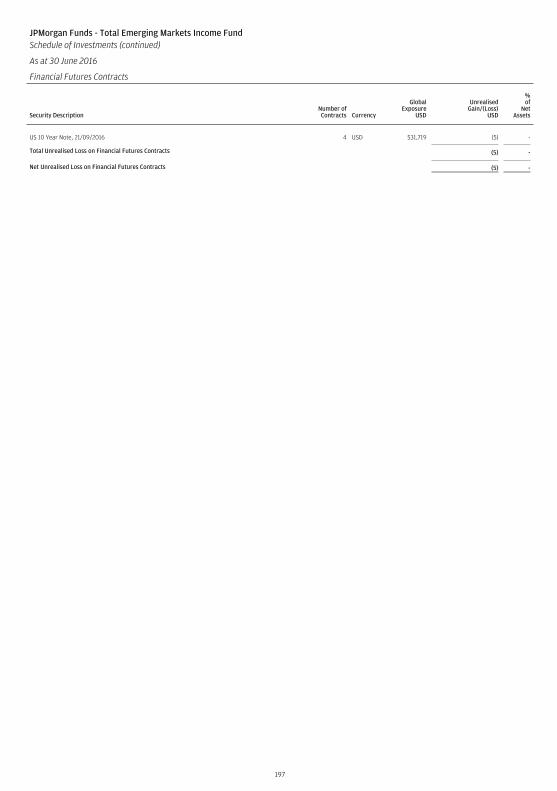
JPMorgan Funds - Total Emerging Markets Income FundSchedule of Investments (continued)
As at 30 June 2016
Financial Futures Contracts
Security DescriptionNumber ofContracts Currency
GlobalExposure
USD
UnrealisedGain/(Loss)
USD
%of
NetAssets
US 10 Year Note, 21/09/2016 4 USD 531,719 (5) -
Total Unrealised Loss on Financial Futures Contracts (5) -
Net Unrealised Loss on Financial Futures Contracts (5) -
197
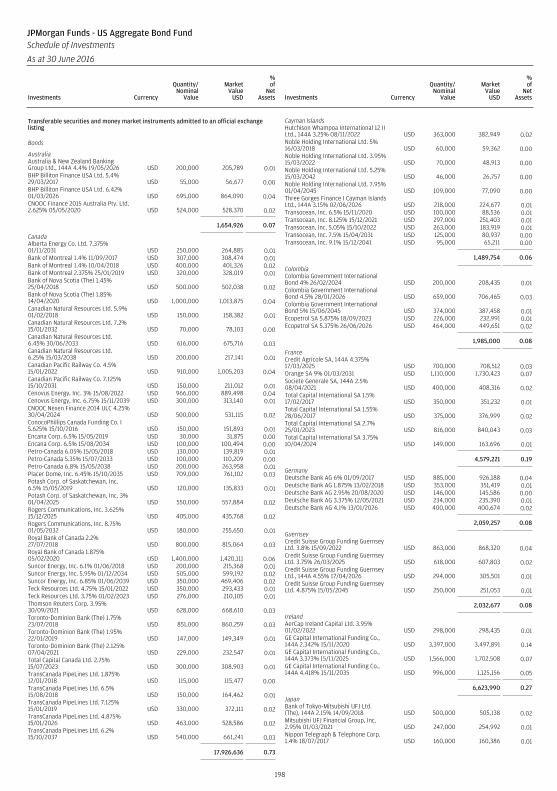
Transferable securities and money market instruments admitted to an official exchangelisting
Bonds
AustraliaAustralia & New Zealand BankingGroup Ltd., 144A 4.4% 19/05/2026 USD 200,000 205,789 0.01BHP Billiton Finance USA Ltd. 5.4%29/03/2017 USD 55,000 56,677 0.00BHP Billiton Finance USA Ltd. 6.42%01/03/2026 USD 695,000 864,090 0.04CNOOC Finance 2015 Australia Pty. Ltd.2.625% 05/05/2020 USD 524,000 528,370 0.02
1,654,926 0.07
CanadaAlberta Energy Co. Ltd. 7.375%01/11/2031 USD 250,000 264,885 0.01Bank of Montreal 1.4% 11/09/2017 USD 307,000 308,474 0.01Bank of Montreal 1.4% 10/04/2018 USD 400,000 401,326 0.02Bank of Montreal 2.375% 25/01/2019 USD 320,000 328,019 0.01Bank of Nova Scotia (The) 1.45%25/04/2018 USD 500,000 502,038 0.02Bank of Nova Scotia (The) 1.85%14/04/2020 USD 1,000,000 1,013,875 0.04Canadian Natural Resources Ltd. 5.9%01/02/2018 USD 150,000 158,382 0.01Canadian Natural Resources Ltd. 7.2%15/01/2032 USD 70,000 78,103 0.00Canadian Natural Resources Ltd.6.45% 30/06/2033 USD 616,000 675,716 0.03Canadian Natural Resources Ltd.6.25% 15/03/2038 USD 200,000 217,141 0.01Canadian Pacific Railway Co. 4.5%15/01/2022 USD 910,000 1,005,203 0.04Canadian Pacific Railway Co. 7.125%15/10/2031 USD 150,000 211,012 0.01Cenovus Energy, Inc. 3% 15/08/2022 USD 966,000 889,498 0.04Cenovus Energy, Inc. 6.75% 15/11/2039 USD 300,000 313,140 0.01CNOOC Nexen Finance 2014 ULC 4.25%30/04/2024 USD 500,000 531,115 0.02ConocoPhillips Canada Funding Co. I5.625% 15/10/2016 USD 150,000 151,893 0.01Encana Corp. 6.5% 15/05/2019 USD 30,000 31,875 0.00Encana Corp. 6.5% 15/08/2034 USD 100,000 100,494 0.00Petro-Canada 6.05% 15/05/2018 USD 130,000 139,819 0.01Petro-Canada 5.35% 15/07/2033 USD 100,000 110,209 0.00Petro-Canada 6.8% 15/05/2038 USD 200,000 263,958 0.01Placer Dome, Inc. 6.45% 15/10/2035 USD 709,000 761,102 0.03Potash Corp. of Saskatchewan, Inc.6.5% 15/05/2019 USD 120,000 135,833 0.01Potash Corp. of Saskatchewan, Inc. 3%01/04/2025 USD 550,000 557,884 0.02Rogers Communications, Inc. 3.625%15/12/2025 USD 405,000 435,768 0.02Rogers Communications, Inc. 8.75%01/05/2032 USD 180,000 255,650 0.01Royal Bank of Canada 2.2%27/07/2018 USD 800,000 815,064 0.03Royal Bank of Canada 1.875%05/02/2020 USD 1,400,000 1,420,111 0.06Suncor Energy, Inc. 6.1% 01/06/2018 USD 200,000 215,368 0.01Suncor Energy, Inc. 5.95% 01/12/2034 USD 505,000 599,192 0.02Suncor Energy, Inc. 6.85% 01/06/2039 USD 350,000 469,406 0.02Teck Resources Ltd. 4.75% 15/01/2022 USD 350,000 293,433 0.01Teck Resources Ltd. 3.75% 01/02/2023 USD 276,000 210,105 0.01Thomson Reuters Corp. 3.95%30/09/2021 USD 628,000 668,610 0.03Toronto-Dominion Bank (The) 1.75%23/07/2018 USD 851,000 860,259 0.03Toronto-Dominion Bank (The) 1.95%22/01/2019 USD 147,000 149,349 0.01Toronto-Dominion Bank (The) 2.125%07/04/2021 USD 229,000 232,547 0.01Total Capital Canada Ltd. 2.75%15/07/2023 USD 300,000 308,903 0.01TransCanada PipeLines Ltd. 1.875%12/01/2018 USD 115,000 115,477 0.00TransCanada PipeLines Ltd. 6.5%15/08/2018 USD 150,000 164,462 0.01TransCanada PipeLines Ltd. 7.125%15/01/2019 USD 330,000 372,111 0.02TransCanada PipeLines Ltd. 4.875%15/01/2026 USD 463,000 528,586 0.02TransCanada PipeLines Ltd. 6.2%15/10/2037 USD 540,000 661,241 0.03
17,926,636 0.73
Cayman IslandsHutchison Whampoa International 12 IILtd., 144A 3.25% 08/11/2022 USD 363,000 382,949 0.02Noble Holding International Ltd. 5%16/03/2018 USD 60,000 59,362 0.00Noble Holding International Ltd. 3.95%15/03/2022 USD 70,000 48,913 0.00Noble Holding International Ltd. 5.25%15/03/2042 USD 46,000 26,757 0.00Noble Holding International Ltd. 7.95%01/04/2045 USD 109,000 77,090 0.00Three Gorges Finance I Cayman IslandsLtd., 144A 3.15% 02/06/2026 USD 218,000 224,677 0.01Transocean, Inc. 6.5% 15/11/2020 USD 100,000 88,536 0.01Transocean, Inc. 8.125% 15/12/2021 USD 297,000 251,403 0.01Transocean, Inc. 5.05% 15/10/2022 USD 263,000 183,919 0.01Transocean, Inc. 7.5% 15/04/2031 USD 125,000 80,937 0.00Transocean, Inc. 9.1% 15/12/2041 USD 95,000 65,211 0.00
1,489,754 0.06
ColombiaColombia Government InternationalBond 4% 26/02/2024 USD 200,000 208,435 0.01Colombia Government InternationalBond 4.5% 28/01/2026 USD 659,000 706,465 0.03Colombia Government InternationalBond 5% 15/06/2045 USD 374,000 387,458 0.01Ecopetrol SA 5.875% 18/09/2023 USD 226,000 232,991 0.01Ecopetrol SA 5.375% 26/06/2026 USD 464,000 449,651 0.02
1,985,000 0.08
FranceCredit Agricole SA, 144A 4.375%17/03/2025 USD 700,000 708,512 0.03Orange SA 9% 01/03/2031 USD 1,110,000 1,730,423 0.07Societe Generale SA, 144A 2.5%08/04/2021 USD 400,000 408,316 0.02Total Capital International SA 1.5%17/02/2017 USD 350,000 351,232 0.01Total Capital International SA 1.55%28/06/2017 USD 375,000 376,999 0.02Total Capital International SA 2.7%25/01/2023 USD 816,000 840,043 0.03Total Capital International SA 3.75%10/04/2024 USD 149,000 163,696 0.01
4,579,221 0.19
GermanyDeutsche Bank AG 6% 01/09/2017 USD 885,000 926,188 0.04Deutsche Bank AG 1.875% 13/02/2018 USD 353,000 351,419 0.01Deutsche Bank AG 2.95% 20/08/2020 USD 146,000 145,586 0.00Deutsche Bank AG 3.375% 12/05/2021 USD 234,000 235,390 0.01Deutsche Bank AG 4.1% 13/01/2026 USD 400,000 400,674 0.02
2,059,257 0.08
GuernseyCredit Suisse Group Funding GuernseyLtd. 3.8% 15/09/2022 USD 863,000 868,320 0.04Credit Suisse Group Funding GuernseyLtd. 3.75% 26/03/2025 USD 618,000 607,803 0.02Credit Suisse Group Funding GuernseyLtd., 144A 4.55% 17/04/2026 USD 294,000 305,501 0.01Credit Suisse Group Funding GuernseyLtd. 4.875% 15/05/2045 USD 250,000 251,053 0.01
2,032,677 0.08
IrelandAerCap Ireland Capital Ltd. 3.95%01/02/2022 USD 298,000 298,435 0.01GE Capital International Funding Co.,144A 2.342% 15/11/2020 USD 3,397,000 3,497,891 0.14GE Capital International Funding Co.,144A 3.373% 15/11/2025 USD 1,566,000 1,702,508 0.07GE Capital International Funding Co.,144A 4.418% 15/11/2035 USD 996,000 1,125,156 0.05
6,623,990 0.27
JapanBank of Tokyo-Mitsubishi UFJ Ltd.(The), 144A 2.15% 14/09/2018 USD 500,000 505,138 0.02Mitsubishi UFJ Financial Group, Inc.2.95% 01/03/2021 USD 247,000 254,992 0.01Nippon Telegraph & Telephone Corp.1.4% 18/07/2017 USD 160,000 160,386 0.01
198
JPMorgan Funds - US Aggregate Bond FundSchedule of Investments
As at 30 June 2016
Investments Currency
Quantity/Nominal
Value
MarketValue
USD
%of
NetAssets Investments Currency
Quantity/Nominal
Value
MarketValue
USD
%of
NetAssets
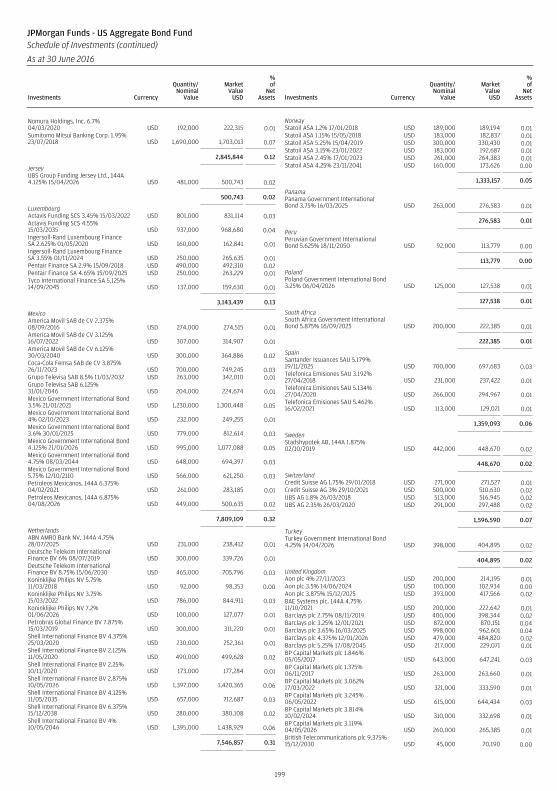
Nomura Holdings, Inc. 6.7%04/03/2020 USD 192,000 222,315 0.01Sumitomo Mitsui Banking Corp. 1.95%23/07/2018 USD 1,690,000 1,703,013 0.07
2,845,844 0.12
JerseyUBS Group Funding Jersey Ltd., 144A4.125% 15/04/2026 USD 481,000 500,743 0.02
500,743 0.02
LuxembourgActavis Funding SCS 3.45% 15/03/2022 USD 801,000 831,114 0.03Actavis Funding SCS 4.55%15/03/2035 USD 937,000 968,680 0.04Ingersoll-Rand Luxembourg FinanceSA 2.625% 01/05/2020 USD 160,000 162,841 0.01Ingersoll-Rand Luxembourg FinanceSA 3.55% 01/11/2024 USD 250,000 265,635 0.01Pentair Finance SA 2.9% 15/09/2018 USD 490,000 492,310 0.02Pentair Finance SA 4.65% 15/09/2025 USD 250,000 263,229 0.01Tyco International Finance SA 5.125%14/09/2045 USD 137,000 159,630 0.01
3,143,439 0.13
MexicoAmerica Movil SAB de CV 2.375%08/09/2016 USD 274,000 274,515 0.01America Movil SAB de CV 3.125%16/07/2022 USD 307,000 314,907 0.01America Movil SAB de CV 6.125%30/03/2040 USD 300,000 364,886 0.02Coca-Cola Femsa SAB de CV 3.875%26/11/2023 USD 700,000 749,245 0.03Grupo Televisa SAB 8.5% 11/03/2032 USD 263,000 342,010 0.01Grupo Televisa SAB 6.125%31/01/2046 USD 204,000 224,674 0.01Mexico Government International Bond3.5% 21/01/2021 USD 1,230,000 1,300,448 0.05Mexico Government International Bond4% 02/10/2023 USD 232,000 249,255 0.01Mexico Government International Bond3.6% 30/01/2025 USD 779,000 812,614 0.03Mexico Government International Bond4.125% 21/01/2026 USD 995,000 1,077,088 0.05Mexico Government International Bond4.75% 08/03/2044 USD 648,000 694,397 0.03Mexico Government International Bond5.75% 12/10/2110 USD 566,000 621,250 0.03Petroleos Mexicanos, 144A 6.375%04/02/2021 USD 261,000 283,185 0.01Petroleos Mexicanos, 144A 6.875%04/08/2026 USD 449,000 500,635 0.02
7,809,109 0.32
NetherlandsABN AMRO Bank NV, 144A 4.75%28/07/2025 USD 231,000 238,412 0.01Deutsche Telekom InternationalFinance BV 6% 08/07/2019 USD 300,000 339,726 0.01Deutsche Telekom InternationalFinance BV 8.75% 15/06/2030 USD 465,000 705,796 0.03Koninklijke Philips NV 5.75%11/03/2018 USD 92,000 98,353 0.00Koninklijke Philips NV 3.75%15/03/2022 USD 786,000 844,911 0.03Koninklijke Philips NV 7.2%01/06/2026 USD 100,000 127,077 0.01Petrobras Global Finance BV 7.875%15/03/2019 USD 300,000 311,220 0.01Shell International Finance BV 4.375%25/03/2020 USD 230,000 252,361 0.01Shell International Finance BV 2.125%11/05/2020 USD 490,000 499,628 0.02Shell International Finance BV 2.25%10/11/2020 USD 173,000 177,284 0.01Shell International Finance BV 2.875%10/05/2026 USD 1,397,000 1,420,365 0.06Shell International Finance BV 4.125%11/05/2035 USD 657,000 712,687 0.03Shell International Finance BV 6.375%15/12/2038 USD 280,000 380,108 0.02Shell International Finance BV 4%10/05/2046 USD 1,395,000 1,438,929 0.06
7,546,857 0.31
NorwayStatoil ASA 1.2% 17/01/2018 USD 189,000 189,194 0.01Statoil ASA 1.15% 15/05/2018 USD 183,000 182,837 0.01Statoil ASA 5.25% 15/04/2019 USD 300,000 330,430 0.01Statoil ASA 3.15% 23/01/2022 USD 183,000 192,687 0.01Statoil ASA 2.45% 17/01/2023 USD 261,000 264,383 0.01Statoil ASA 4.25% 23/11/2041 USD 160,000 173,626 0.00
1,333,157 0.05
PanamaPanama Government InternationalBond 3.75% 16/03/2025 USD 263,000 276,583 0.01
276,583 0.01
PeruPeruvian Government InternationalBond 5.625% 18/11/2050 USD 92,000 113,779 0.00
113,779 0.00
PolandPoland Government International Bond3.25% 06/04/2026 USD 125,000 127,538 0.01
127,538 0.01
South AfricaSouth Africa Government InternationalBond 5.875% 16/09/2025 USD 200,000 222,385 0.01
222,385 0.01
SpainSantander Issuances SAU 5.179%19/11/2025 USD 700,000 697,683 0.03Telefonica Emisiones SAU 3.192%27/04/2018 USD 231,000 237,422 0.01Telefonica Emisiones SAU 5.134%27/04/2020 USD 266,000 294,967 0.01Telefonica Emisiones SAU 5.462%16/02/2021 USD 113,000 129,021 0.01
1,359,093 0.06
SwedenStadshypotek AB, 144A 1.875%02/10/2019 USD 442,000 448,670 0.02
448,670 0.02
SwitzerlandCredit Suisse AG 1.75% 29/01/2018 USD 271,000 271,527 0.01Credit Suisse AG 3% 29/10/2021 USD 500,000 510,630 0.02UBS AG 1.8% 26/03/2018 USD 513,000 516,945 0.02UBS AG 2.35% 26/03/2020 USD 291,000 297,488 0.02
1,596,590 0.07
TurkeyTurkey Government International Bond4.25% 14/04/2026 USD 398,000 404,895 0.02
404,895 0.02
United KingdomAon plc 4% 27/11/2023 USD 200,000 214,195 0.01Aon plc 3.5% 14/06/2024 USD 100,000 102,934 0.00Aon plc 3.875% 15/12/2025 USD 393,000 417,566 0.02BAE Systems plc, 144A 4.75%11/10/2021 USD 200,000 222,642 0.01Barclays plc 2.75% 08/11/2019 USD 400,000 398,344 0.02Barclays plc 3.25% 12/01/2021 USD 872,000 870,151 0.04Barclays plc 3.65% 16/03/2025 USD 998,000 962,601 0.04Barclays plc 4.375% 12/01/2026 USD 479,000 484,820 0.02Barclays plc 5.25% 17/08/2045 USD 217,000 229,071 0.01BP Capital Markets plc 1.846%05/05/2017 USD 643,000 647,241 0.03BP Capital Markets plc 1.375%06/11/2017 USD 263,000 263,660 0.01BP Capital Markets plc 3.062%17/03/2022 USD 321,000 333,590 0.01BP Capital Markets plc 3.245%06/05/2022 USD 615,000 644,434 0.03BP Capital Markets plc 3.814%10/02/2024 USD 310,000 332,698 0.01BP Capital Markets plc 3.119%04/05/2026 USD 260,000 265,385 0.01British Telecommunications plc 9.375%15/12/2030 USD 45,000 70,190 0.00
199
JPMorgan Funds - US Aggregate Bond FundSchedule of Investments (continued)
As at 30 June 2016
Investments Currency
Quantity/Nominal
Value
MarketValue
USD
%of
NetAssets Investments Currency
Quantity/Nominal
Value
MarketValue
USD
%of
NetAssets
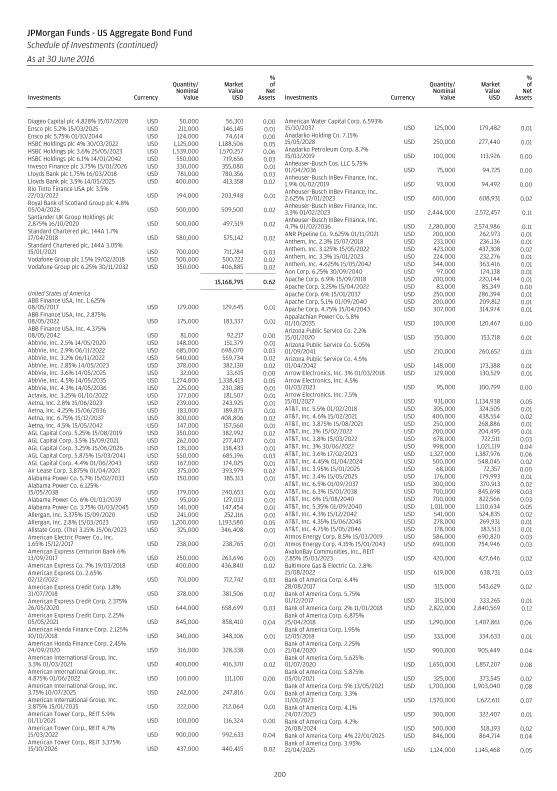
Diageo Capital plc 4.828% 15/07/2020 USD 50,000 56,301 0.00Ensco plc 5.2% 15/03/2025 USD 211,000 146,145 0.01Ensco plc 5.75% 01/10/2044 USD 124,000 74,614 0.00HSBC Holdings plc 4% 30/03/2022 USD 1,125,000 1,188,506 0.05HSBC Holdings plc 3.6% 25/05/2023 USD 1,539,000 1,570,257 0.06HSBC Holdings plc 6.1% 14/01/2042 USD 550,000 719,656 0.03Invesco Finance plc 3.75% 15/01/2026 USD 330,000 355,080 0.01Lloyds Bank plc 1.75% 16/03/2018 USD 781,000 780,356 0.03Lloyds Bank plc 3.5% 14/05/2025 USD 400,000 413,358 0.02Rio Tinto Finance USA plc 3.5%22/03/2022 USD 194,000 203,948 0.01Royal Bank of Scotland Group plc 4.8%05/04/2026 USD 500,000 509,500 0.02Santander UK Group Holdings plc2.875% 16/10/2020 USD 500,000 497,519 0.02Standard Chartered plc, 144A 1.7%17/04/2018 USD 580,000 575,142 0.02Standard Chartered plc, 144A 3.05%15/01/2021 USD 700,000 711,284 0.03Vodafone Group plc 1.5% 19/02/2018 USD 500,000 500,722 0.02Vodafone Group plc 6.25% 30/11/2032 USD 350,000 406,885 0.02
15,168,795 0.62
United States of AmericaABB Finance USA, Inc. 1.625%08/05/2017 USD 129,000 129,645 0.01ABB Finance USA, Inc. 2.875%08/05/2022 USD 175,000 183,337 0.01ABB Finance USA, Inc. 4.375%08/05/2042 USD 81,000 92,217 0.00AbbVie, Inc. 2.5% 14/05/2020 USD 148,000 151,379 0.01AbbVie, Inc. 2.9% 06/11/2022 USD 685,000 698,070 0.03AbbVie, Inc. 3.2% 06/11/2022 USD 540,000 559,734 0.02AbbVie, Inc. 2.85% 14/05/2023 USD 378,000 382,130 0.02AbbVie, Inc. 3.6% 14/05/2025 USD 32,000 33,615 0.00AbbVie, Inc. 4.5% 14/05/2035 USD 1,274,000 1,338,413 0.05AbbVie, Inc. 4.3% 14/05/2036 USD 225,000 230,385 0.01Actavis, Inc. 3.25% 01/10/2022 USD 177,000 181,507 0.01Aetna, Inc. 2.8% 15/06/2023 USD 239,000 243,925 0.01Aetna, Inc. 4.25% 15/06/2036 USD 183,000 189,875 0.01Aetna, Inc. 6.75% 15/12/2037 USD 300,000 408,806 0.02Aetna, Inc. 4.5% 15/05/2042 USD 147,000 157,560 0.01AGL Capital Corp. 5.25% 15/08/2019 USD 350,000 382,992 0.02AGL Capital Corp. 3.5% 15/09/2021 USD 262,000 277,407 0.01AGL Capital Corp. 3.25% 15/06/2026 USD 135,000 138,433 0.01AGL Capital Corp. 5.875% 15/03/2041 USD 550,000 685,196 0.03AGL Capital Corp. 4.4% 01/06/2043 USD 167,000 174,025 0.01Air Lease Corp. 3.875% 01/04/2021 USD 375,000 393,979 0.02Alabama Power Co. 5.7% 15/02/2033 USD 150,000 185,313 0.01Alabama Power Co. 6.125%15/05/2038 USD 179,000 240,653 0.01Alabama Power Co. 6% 01/03/2039 USD 95,000 127,033 0.01Alabama Power Co. 3.75% 01/03/2045 USD 141,000 147,454 0.01Allergan, Inc. 3.375% 15/09/2020 USD 241,000 252,116 0.01Allergan, Inc. 2.8% 15/03/2023 USD 1,200,000 1,193,580 0.05Allstate Corp. (The) 3.15% 15/06/2023 USD 325,000 346,408 0.01American Electric Power Co., Inc.1.65% 15/12/2017 USD 238,000 238,765 0.01American Express Centurion Bank 6%13/09/2017 USD 250,000 263,696 0.01American Express Co. 7% 19/03/2018 USD 400,000 436,840 0.02American Express Co. 2.65%02/12/2022 USD 701,000 712,742 0.03American Express Credit Corp. 1.8%31/07/2018 USD 378,000 381,506 0.02American Express Credit Corp. 2.375%26/05/2020 USD 644,000 658,699 0.03American Express Credit Corp. 2.25%05/05/2021 USD 845,000 858,410 0.04American Honda Finance Corp. 2.125%10/10/2018 USD 340,000 348,106 0.01American Honda Finance Corp. 2.45%24/09/2020 USD 316,000 328,338 0.01American International Group, Inc.3.3% 01/03/2021 USD 400,000 416,370 0.02American International Group, Inc.4.875% 01/06/2022 USD 100,000 111,100 0.00American International Group, Inc.3.75% 10/07/2025 USD 242,000 247,816 0.01American International Group, Inc.3.875% 15/01/2035 USD 222,000 212,064 0.01American Tower Corp., REIT 5.9%01/11/2021 USD 100,000 116,324 0.00American Tower Corp., REIT 4.7%15/03/2022 USD 900,000 992,633 0.04American Tower Corp., REIT 3.375%15/10/2026 USD 437,000 440,415 0.02
American Water Capital Corp. 6.593%15/10/2037 USD 125,000 179,482 0.01Anadarko Holding Co. 7.15%15/05/2028 USD 250,000 277,440 0.01Anadarko Petroleum Corp. 8.7%15/03/2019 USD 100,000 113,926 0.00Anheuser-Busch Cos. LLC 5.75%01/04/2036 USD 75,000 94,725 0.00Anheuser-Busch InBev Finance, Inc.1.9% 01/02/2019 USD 93,000 94,492 0.00Anheuser-Busch InBev Finance, Inc.2.625% 17/01/2023 USD 600,000 608,931 0.02Anheuser-Busch InBev Finance, Inc.3.3% 01/02/2023 USD 2,444,000 2,572,457 0.11Anheuser-Busch InBev Finance, Inc.4.7% 01/02/2036 USD 2,280,000 2,574,986 0.11ANR Pipeline Co. 9.625% 01/11/2021 USD 200,000 262,973 0.01Anthem, Inc. 2.3% 15/07/2018 USD 233,000 236,136 0.01Anthem, Inc. 3.125% 15/05/2022 USD 423,000 437,308 0.02Anthem, Inc. 3.3% 15/01/2023 USD 224,000 232,276 0.01Anthem, Inc. 4.625% 15/05/2042 USD 344,000 363,416 0.01Aon Corp. 6.25% 30/09/2040 USD 97,000 124,138 0.01Apache Corp. 6.9% 15/09/2018 USD 200,000 220,144 0.01Apache Corp. 3.25% 15/04/2022 USD 83,000 85,349 0.00Apache Corp. 6% 15/01/2037 USD 250,000 286,394 0.01Apache Corp. 5.1% 01/09/2040 USD 200,000 209,812 0.01Apache Corp. 4.75% 15/04/2043 USD 307,000 314,974 0.01Appalachian Power Co. 5.8%01/10/2035 USD 100,000 120,467 0.00Arizona Public Service Co. 2.2%15/01/2020 USD 150,000 153,718 0.01Arizona Public Service Co. 5.05%01/09/2041 USD 210,000 260,652 0.01Arizona Public Service Co. 4.5%01/04/2042 USD 148,000 173,388 0.01Arrow Electronics, Inc. 3% 01/03/2018 USD 129,000 130,529 0.01Arrow Electronics, Inc. 4.5%01/03/2023 USD 95,000 100,799 0.00Arrow Electronics, Inc. 7.5%15/01/2027 USD 931,000 1,134,938 0.05AT&T, Inc. 5.5% 01/02/2018 USD 305,000 324,505 0.01AT&T, Inc. 4.6% 15/02/2021 USD 400,000 438,554 0.02AT&T, Inc. 3.875% 15/08/2021 USD 250,000 268,886 0.01AT&T, Inc. 3% 15/02/2022 USD 200,000 204,495 0.01AT&T, Inc. 3.8% 15/03/2022 USD 678,000 722,511 0.03AT&T, Inc. 3% 30/06/2022 USD 998,000 1,021,119 0.04AT&T, Inc. 3.6% 17/02/2023 USD 1,327,000 1,387,976 0.06AT&T, Inc. 4.45% 01/04/2024 USD 500,000 548,045 0.02AT&T, Inc. 3.95% 15/01/2025 USD 68,000 72,357 0.00AT&T, Inc. 3.4% 15/05/2025 USD 176,000 179,993 0.01AT&T, Inc. 6.5% 01/09/2037 USD 300,000 370,913 0.02AT&T, Inc. 6.3% 15/01/2038 USD 700,000 845,698 0.03AT&T, Inc. 6% 15/08/2040 USD 700,000 822,566 0.03AT&T, Inc. 5.35% 01/09/2040 USD 1,011,000 1,110,634 0.05AT&T, Inc. 4.3% 15/12/2042 USD 541,000 524,835 0.02AT&T, Inc. 4.35% 15/06/2045 USD 278,000 269,931 0.01AT&T, Inc. 4.75% 15/05/2046 USD 178,000 183,513 0.01Atmos Energy Corp. 8.5% 15/03/2019 USD 586,000 690,820 0.03Atmos Energy Corp. 4.15% 15/01/2043 USD 690,000 754,946 0.03AvalonBay Communities, Inc., REIT2.85% 15/03/2023 USD 420,000 427,646 0.02Baltimore Gas & Electric Co. 2.8%15/08/2022 USD 619,000 638,731 0.03Bank of America Corp. 6.4%28/08/2017 USD 515,000 543,629 0.02Bank of America Corp. 5.75%01/12/2017 USD 315,000 333,265 0.01Bank of America Corp. 2% 11/01/2018 USD 2,822,000 2,840,569 0.12Bank of America Corp. 6.875%25/04/2018 USD 1,290,000 1,407,861 0.06Bank of America Corp. 1.95%12/05/2018 USD 333,000 334,633 0.01Bank of America Corp. 2.25%21/04/2020 USD 900,000 905,449 0.04Bank of America Corp. 5.625%01/07/2020 USD 1,650,000 1,857,207 0.08Bank of America Corp. 5.875%05/01/2021 USD 325,000 373,545 0.02Bank of America Corp. 5% 13/05/2021 USD 1,700,000 1,903,040 0.08Bank of America Corp. 3.3%11/01/2023 USD 1,570,000 1,622,611 0.07Bank of America Corp. 4.1%24/07/2023 USD 300,000 322,407 0.01Bank of America Corp. 4.2%26/08/2024 USD 500,000 518,193 0.02Bank of America Corp. 4% 22/01/2025 USD 846,000 864,714 0.04Bank of America Corp. 3.95%21/04/2025 USD 1,124,000 1,145,468 0.05
200
JPMorgan Funds - US Aggregate Bond FundSchedule of Investments (continued)
As at 30 June 2016
Investments Currency
Quantity/Nominal
Value
MarketValue
USD
%of
NetAssets Investments Currency
Quantity/Nominal
Value
MarketValue
USD
%of
NetAssets
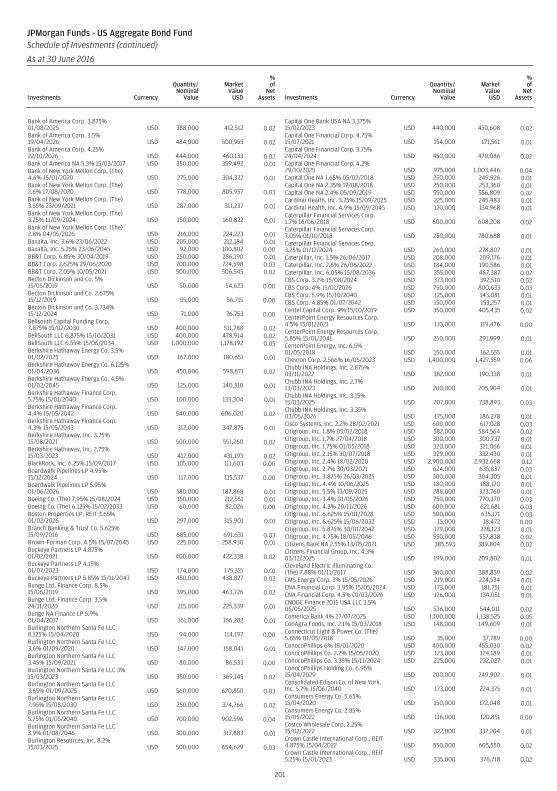
Bank of America Corp. 3.875%01/08/2025 USD 388,000 412,512 0.02Bank of America Corp. 3.5%19/04/2026 USD 484,000 500,955 0.02Bank of America Corp. 4.25%22/10/2026 USD 444,000 460,133 0.02Bank of America NA 5.3% 15/03/2017 USD 350,000 359,492 0.01Bank of New York Mellon Corp. (The)4.6% 15/01/2020 USD 275,000 304,322 0.01Bank of New York Mellon Corp. (The)2.6% 17/08/2020 USD 778,000 805,957 0.03Bank of New York Mellon Corp. (The)3.55% 23/09/2021 USD 287,000 311,237 0.01Bank of New York Mellon Corp. (The)3.25% 11/09/2024 USD 150,000 160,822 0.01Bank of New York Mellon Corp. (The)2.8% 04/05/2026 USD 216,000 224,223 0.01Baxalta, Inc. 3.6% 23/06/2022 USD 205,000 212,184 0.01Baxalta, Inc. 5.25% 23/06/2045 USD 92,000 100,802 0.00BB&T Corp. 6.85% 30/04/2019 USD 250,000 286,190 0.01BB&T Corp. 2.625% 29/06/2020 USD 700,000 724,598 0.03BB&T Corp. 2.05% 10/05/2021 USD 500,000 506,545 0.02Becton Dickinson and Co. 5%15/05/2019 USD 50,000 54,623 0.00Becton Dickinson and Co. 2.675%15/12/2019 USD 55,000 56,715 0.00Becton Dickinson and Co. 3.734%15/12/2024 USD 71,000 76,753 0.00Bellsouth Capital Funding Corp.7.875% 15/02/2030 USD 400,000 511,788 0.02BellSouth LLC 6.875% 15/10/2031 USD 400,000 478,914 0.02BellSouth LLC 6.55% 15/06/2034 USD 1,000,000 1,178,192 0.05Berkshire Hathaway Energy Co. 3.5%01/02/2025 USD 167,000 180,651 0.01Berkshire Hathaway Energy Co. 6.125%01/04/2036 USD 450,000 598,871 0.02Berkshire Hathaway Energy Co. 4.5%01/02/2045 USD 125,000 140,310 0.01Berkshire Hathaway Finance Corp.5.75% 15/01/2040 USD 100,000 133,304 0.01Berkshire Hathaway Finance Corp.4.4% 15/05/2042 USD 540,000 606,020 0.02Berkshire Hathaway Finance Corp.4.3% 15/05/2043 USD 312,000 347,875 0.01Berkshire Hathaway, Inc. 3.75%15/08/2021 USD 500,000 551,260 0.02Berkshire Hathaway, Inc. 2.75%15/03/2023 USD 417,000 431,193 0.02BlackRock, Inc. 6.25% 15/09/2017 USD 105,000 111,603 0.00Boardwalk Pipelines LP 4.95%15/12/2024 USD 117,000 115,537 0.00Boardwalk Pipelines LP 5.95%01/06/2026 USD 180,000 187,868 0.01Boeing Co. (The) 7.95% 15/08/2024 USD 150,000 212,551 0.01Boeing Co. (The) 6.125% 15/02/2033 USD 60,000 82,026 0.00Boston Properties LP, REIT 3.65%01/02/2026 USD 297,000 315,901 0.01Branch Banking & Trust Co. 5.625%15/09/2016 USD 685,000 691,631 0.03Brown-Forman Corp. 4.5% 15/07/2045 USD 225,000 258,930 0.01Buckeye Partners LP 4.875%01/02/2021 USD 400,000 422,338 0.02Buckeye Partners LP 4.15%01/07/2023 USD 174,000 175,315 0.01Buckeye Partners LP 5.85% 15/11/2043 USD 450,000 438,827 0.02Bunge Ltd. Finance Corp. 8.5%15/06/2019 USD 395,000 463,726 0.02Bunge Ltd. Finance Corp. 3.5%24/11/2020 USD 215,000 225,339 0.01Bunge NA Finance LP 5.9%01/04/2017 USD 161,000 166,282 0.01Burlington Northern Santa Fe LLC8.125% 15/04/2020 USD 94,000 114,197 0.00Burlington Northern Santa Fe LLC3.6% 01/09/2020 USD 147,000 158,041 0.01Burlington Northern Santa Fe LLC3.45% 15/09/2021 USD 80,000 86,533 0.00Burlington Northern Santa Fe LLC 3%15/03/2023 USD 350,000 369,145 0.02Burlington Northern Santa Fe LLC3.65% 01/09/2025 USD 560,000 620,850 0.03Burlington Northern Santa Fe LLC7.95% 15/08/2030 USD 250,000 374,766 0.02Burlington Northern Santa Fe LLC5.75% 01/05/2040 USD 700,000 902,596 0.04Burlington Northern Santa Fe LLC3.9% 01/08/2046 USD 300,000 317,883 0.01Burlington Resources, Inc. 8.2%15/03/2025 USD 500,000 654,629 0.03
Capital One Bank USA NA 3.375%15/02/2023 USD 440,000 450,608 0.02Capital One Financial Corp. 4.75%15/07/2021 USD 154,000 171,561 0.01Capital One Financial Corp. 3.75%24/04/2024 USD 450,000 470,086 0.02Capital One Financial Corp. 4.2%29/10/2025 USD 975,000 1,003,446 0.04Capital One NA 1.65% 05/02/2018 USD 250,000 249,926 0.01Capital One NA 2.35% 17/08/2018 USD 250,000 253,360 0.01Capital One NA 2.4% 05/09/2019 USD 550,000 556,809 0.02Cardinal Health, Inc. 3.75% 15/09/2025 USD 225,000 245,483 0.01Cardinal Health, Inc. 4.9% 15/09/2045 USD 120,000 134,968 0.01Caterpillar Financial Services Corp.1.7% 16/06/2018 USD 600,000 608,208 0.02Caterpillar Financial Services Corp.7.05% 01/10/2018 USD 250,000 280,688 0.01Caterpillar Financial Services Corp.3.25% 01/12/2024 USD 260,000 278,807 0.01Caterpillar, Inc. 1.5% 26/06/2017 USD 208,000 209,176 0.01Caterpillar, Inc. 2.6% 26/06/2022 USD 184,000 190,586 0.01Caterpillar, Inc. 6.05% 15/08/2036 USD 355,000 467,387 0.02CBS Corp. 3.7% 15/08/2024 USD 373,000 392,510 0.02CBS Corp. 4% 15/01/2026 USD 750,000 800,633 0.03CBS Corp. 5.9% 15/10/2040 USD 125,000 143,081 0.01CBS Corp. 4.85% 01/07/2042 USD 150,000 153,257 0.01Centel Capital Corp. 9% 15/10/2019 USD 350,000 405,435 0.02CenterPoint Energy Resources Corp.4.5% 15/01/2021 USD 110,000 119,476 0.00CenterPoint Energy Resources Corp.5.85% 15/01/2041 USD 250,000 291,999 0.01CenterPoint Energy, Inc. 6.5%01/05/2018 USD 150,000 162,555 0.01Chevron Corp. 2.566% 16/05/2023 USD 1,400,000 1,427,559 0.06Chubb INA Holdings, Inc. 2.875%03/11/2022 USD 182,000 190,338 0.01Chubb INA Holdings, Inc. 2.7%13/03/2023 USD 200,000 205,904 0.01Chubb INA Holdings, Inc. 3.15%15/03/2025 USD 707,000 738,893 0.03Chubb INA Holdings, Inc. 3.35%03/05/2026 USD 175,000 186,278 0.01Cisco Systems, Inc. 2.2% 28/02/2021 USD 600,000 617,028 0.03Citigroup, Inc. 1.8% 05/02/2018 USD 582,000 584,564 0.02Citigroup, Inc. 1.7% 27/04/2018 USD 300,000 300,737 0.01Citigroup, Inc. 1.75% 01/05/2018 USD 320,000 321,066 0.01Citigroup, Inc. 2.15% 30/07/2018 USD 329,000 332,430 0.01Citigroup, Inc. 2.4% 18/02/2020 USD 2,900,000 2,932,668 0.12Citigroup, Inc. 2.7% 30/03/2021 USD 624,000 635,837 0.03Citigroup, Inc. 3.875% 26/03/2025 USD 300,000 304,305 0.01Citigroup, Inc. 4.4% 10/06/2025 USD 180,000 188,170 0.01Citigroup, Inc. 5.5% 13/09/2025 USD 288,000 323,760 0.01Citigroup, Inc. 3.4% 01/05/2026 USD 750,000 770,370 0.03Citigroup, Inc. 4.3% 20/11/2026 USD 600,000 621,681 0.03Citigroup, Inc. 6.625% 15/01/2028 USD 500,000 635,171 0.03Citigroup, Inc. 6.625% 15/06/2032 USD 15,000 18,472 0.00Citigroup, Inc. 5.875% 30/01/2042 USD 179,000 228,123 0.01Citigroup, Inc. 4.75% 18/05/2046 USD 550,000 557,838 0.02Citizens Bank NA 2.55% 13/05/2021 USD 385,593 389,804 0.02Citizens Financial Group, Inc. 4.3%03/12/2025 USD 199,000 209,802 0.01Cleveland Electric Illuminating Co.(The) 7.88% 01/11/2017 USD 360,000 388,839 0.02CMS Energy Corp. 3% 15/05/2026 USD 219,000 224,534 0.01CNA Financial Corp. 3.95% 15/05/2024 USD 173,000 181,751 0.01CNA Financial Corp. 4.5% 01/03/2026 USD 126,000 134,051 0.01CNOOC Finance 2015 USA LLC 3.5%05/05/2025 USD 536,000 544,011 0.02Comerica Bank 4% 27/07/2025 USD 1,100,000 1,138,525 0.05ConAgra Foods, Inc. 2.1% 15/03/2018 USD 148,000 149,609 0.01Connecticut Light & Power Co. (The)5.65% 01/05/2018 USD 35,000 37,789 0.00ConocoPhillips 6% 15/01/2020 USD 400,000 455,030 0.02ConocoPhillips Co. 2.2% 15/05/2020 USD 123,000 124,189 0.01ConocoPhillips Co. 3.35% 15/11/2024 USD 225,000 232,027 0.01ConocoPhillips Holding Co. 6.95%15/04/2029 USD 200,000 249,902 0.01Consolidated Edison Co. of New York,Inc. 5.7% 15/06/2040 USD 173,000 224,375 0.01Consumers Energy Co. 5.65%15/04/2020 USD 150,000 172,048 0.01Consumers Energy Co. 2.85%15/05/2022 USD 116,000 120,851 0.00Costco Wholesale Corp. 2.25%15/02/2022 USD 322,000 332,204 0.01Crown Castle International Corp., REIT4.875% 15/04/2022 USD 550,000 605,550 0.02Crown Castle International Corp., REIT5.25% 15/01/2023 USD 335,000 376,718 0.02
201
JPMorgan Funds - US Aggregate Bond FundSchedule of Investments (continued)
As at 30 June 2016
Investments Currency
Quantity/Nominal
Value
MarketValue
USD
%of
NetAssets Investments Currency
Quantity/Nominal
Value
MarketValue
USD
%of
NetAssets
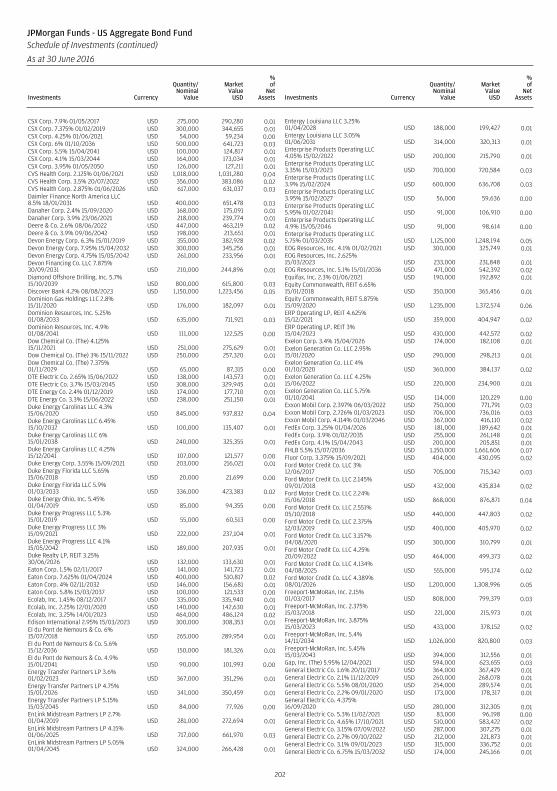
CSX Corp. 7.9% 01/05/2017 USD 275,000 290,280 0.01CSX Corp. 7.375% 01/02/2019 USD 300,000 344,655 0.01CSX Corp. 4.25% 01/06/2021 USD 54,000 59,234 0.00CSX Corp. 6% 01/10/2036 USD 500,000 641,723 0.03CSX Corp. 5.5% 15/04/2041 USD 100,000 124,817 0.01CSX Corp. 4.1% 15/03/2044 USD 164,000 173,034 0.01CSX Corp. 3.95% 01/05/2050 USD 126,000 127,211 0.01CVS Health Corp. 2.125% 01/06/2021 USD 1,018,000 1,031,280 0.04CVS Health Corp. 3.5% 20/07/2022 USD 356,000 383,086 0.02CVS Health Corp. 2.875% 01/06/2026 USD 617,000 631,037 0.03Daimler Finance North America LLC8.5% 18/01/2031 USD 400,000 651,478 0.03Danaher Corp. 2.4% 15/09/2020 USD 168,000 175,091 0.01Danaher Corp. 3.9% 23/06/2021 USD 218,000 239,774 0.01Deere & Co. 2.6% 08/06/2022 USD 447,000 463,219 0.02Deere & Co. 3.9% 09/06/2042 USD 198,000 213,651 0.01Devon Energy Corp. 6.3% 15/01/2019 USD 355,000 382,928 0.02Devon Energy Corp. 7.95% 15/04/2032 USD 300,000 345,256 0.01Devon Energy Corp. 4.75% 15/05/2042 USD 261,000 233,956 0.01Devon Financing Co. LLC 7.875%30/09/2031 USD 210,000 244,896 0.01Diamond Offshore Drilling, Inc. 5.7%15/10/2039 USD 800,000 615,800 0.03Discover Bank 4.2% 08/08/2023 USD 1,150,000 1,223,456 0.05Dominion Gas Holdings LLC 2.8%15/11/2020 USD 176,000 182,097 0.01Dominion Resources, Inc. 5.25%01/08/2033 USD 635,000 711,921 0.03Dominion Resources, Inc. 4.9%01/08/2041 USD 111,000 122,525 0.00Dow Chemical Co. (The) 4.125%15/11/2021 USD 251,000 275,629 0.01Dow Chemical Co. (The) 3% 15/11/2022 USD 250,000 257,320 0.01Dow Chemical Co. (The) 7.375%01/11/2029 USD 65,000 87,315 0.00DTE Electric Co. 2.65% 15/06/2022 USD 138,000 143,573 0.01DTE Electric Co. 3.7% 15/03/2045 USD 308,000 329,945 0.01DTE Energy Co. 2.4% 01/12/2019 USD 174,000 177,710 0.01DTE Energy Co. 3.3% 15/06/2022 USD 238,000 251,150 0.01Duke Energy Carolinas LLC 4.3%15/06/2020 USD 845,000 937,832 0.04Duke Energy Carolinas LLC 6.45%15/10/2032 USD 100,000 135,407 0.01Duke Energy Carolinas LLC 6%15/01/2038 USD 240,000 325,355 0.01Duke Energy Carolinas LLC 4.25%15/12/2041 USD 107,000 121,577 0.00Duke Energy Corp. 3.55% 15/09/2021 USD 203,000 216,021 0.01Duke Energy Florida LLC 5.65%15/06/2018 USD 20,000 21,699 0.00Duke Energy Florida LLC 5.9%01/03/2033 USD 336,000 423,383 0.02Duke Energy Ohio, Inc. 5.45%01/04/2019 USD 85,000 94,355 0.00Duke Energy Progress LLC 5.3%15/01/2019 USD 55,000 60,513 0.00Duke Energy Progress LLC 3%15/09/2021 USD 222,000 237,104 0.01Duke Energy Progress LLC 4.1%15/05/2042 USD 189,000 207,935 0.01Duke Realty LP, REIT 3.25%30/06/2026 USD 132,000 133,630 0.01Eaton Corp. 1.5% 02/11/2017 USD 141,000 141,723 0.01Eaton Corp. 7.625% 01/04/2024 USD 400,000 510,817 0.02Eaton Corp. 4% 02/11/2032 USD 146,000 156,681 0.01Eaton Corp. 5.8% 15/03/2037 USD 100,000 121,533 0.00Ecolab, Inc. 1.45% 08/12/2017 USD 335,000 335,940 0.01Ecolab, Inc. 2.25% 12/01/2020 USD 140,000 142,630 0.01Ecolab, Inc. 3.25% 14/01/2023 USD 464,000 486,124 0.02Edison International 2.95% 15/03/2023 USD 300,000 308,353 0.01EI du Pont de Nemours & Co. 6%15/07/2018 USD 265,000 289,954 0.01EI du Pont de Nemours & Co. 5.6%15/12/2036 USD 150,000 181,326 0.01EI du Pont de Nemours & Co. 4.9%15/01/2041 USD 90,000 101,993 0.00Energy Transfer Partners LP 3.6%01/02/2023 USD 367,000 351,296 0.01Energy Transfer Partners LP 4.75%15/01/2026 USD 341,000 350,459 0.01Energy Transfer Partners LP 5.15%15/03/2045 USD 84,000 77,926 0.00EnLink Midstream Partners LP 2.7%01/04/2019 USD 281,000 272,694 0.01EnLink Midstream Partners LP 4.15%01/06/2025 USD 717,000 661,970 0.03EnLink Midstream Partners LP 5.05%01/04/2045 USD 324,000 266,428 0.01
Entergy Louisiana LLC 3.25%01/04/2028 USD 188,000 199,427 0.01Entergy Louisiana LLC 3.05%01/06/2031 USD 314,000 320,313 0.01Enterprise Products Operating LLC4.05% 15/02/2022 USD 200,000 215,790 0.01Enterprise Products Operating LLC3.35% 15/03/2023 USD 700,000 720,584 0.03Enterprise Products Operating LLC3.9% 15/02/2024 USD 600,000 636,708 0.03Enterprise Products Operating LLC3.95% 15/02/2027 USD 56,000 59,636 0.00Enterprise Products Operating LLC5.95% 01/02/2041 USD 91,000 106,910 0.00Enterprise Products Operating LLC4.9% 15/05/2046 USD 91,000 98,614 0.00Enterprise Products Operating LLC5.75% 01/03/2035 USD 1,125,000 1,248,194 0.05EOG Resources, Inc. 4.1% 01/02/2021 USD 300,000 325,749 0.01EOG Resources, Inc. 2.625%15/03/2023 USD 233,000 231,848 0.01EOG Resources, Inc. 5.1% 15/01/2036 USD 471,000 542,392 0.02Equifax, Inc. 2.3% 01/06/2021 USD 190,000 192,892 0.01Equity Commonwealth, REIT 6.65%15/01/2018 USD 350,000 365,456 0.01Equity Commonwealth, REIT 5.875%15/09/2020 USD 1,235,000 1,372,574 0.06ERP Operating LP, REIT 4.625%15/12/2021 USD 359,000 404,947 0.02ERP Operating LP, REIT 3%15/04/2023 USD 430,000 442,572 0.02Exelon Corp. 3.4% 15/04/2026 USD 174,000 182,108 0.01Exelon Generation Co. LLC 2.95%15/01/2020 USD 290,000 298,213 0.01Exelon Generation Co. LLC 4%01/10/2020 USD 360,000 384,137 0.02Exelon Generation Co. LLC 4.25%15/06/2022 USD 220,000 234,900 0.01Exelon Generation Co. LLC 5.75%01/10/2041 USD 114,000 120,229 0.00Exxon Mobil Corp. 2.397% 06/03/2022 USD 750,000 771,791 0.03Exxon Mobil Corp. 2.726% 01/03/2023 USD 706,000 736,016 0.03Exxon Mobil Corp. 4.114% 01/03/2046 USD 367,000 416,110 0.02FedEx Corp. 3.25% 01/04/2026 USD 181,000 189,642 0.01FedEx Corp. 3.9% 01/02/2035 USD 255,000 261,148 0.01FedEx Corp. 4.1% 15/04/2043 USD 200,000 205,851 0.01FHLB 5.5% 15/07/2036 USD 1,150,000 1,661,606 0.07Fluor Corp. 3.375% 15/09/2021 USD 404,000 430,095 0.02Ford Motor Credit Co. LLC 3%12/06/2017 USD 705,000 715,342 0.03Ford Motor Credit Co. LLC 2.145%09/01/2018 USD 432,000 435,834 0.02Ford Motor Credit Co. LLC 2.24%15/06/2018 USD 868,000 876,871 0.04Ford Motor Credit Co. LLC 2.551%05/10/2018 USD 440,000 447,803 0.02Ford Motor Credit Co. LLC 2.375%12/03/2019 USD 400,000 405,970 0.02Ford Motor Credit Co. LLC 3.157%04/08/2020 USD 300,000 310,799 0.01Ford Motor Credit Co. LLC 4.25%20/09/2022 USD 464,000 499,373 0.02Ford Motor Credit Co. LLC 4.134%04/08/2025 USD 555,000 595,174 0.02Ford Motor Credit Co. LLC 4.389%08/01/2026 USD 1,200,000 1,308,996 0.05Freeport-McMoRan, Inc. 2.15%01/03/2017 USD 808,000 799,379 0.03Freeport-McMoRan, Inc. 2.375%15/03/2018 USD 221,000 215,973 0.01Freeport-McMoRan, Inc. 3.875%15/03/2023 USD 433,000 378,152 0.02Freeport-McMoRan, Inc. 5.4%14/11/2034 USD 1,026,000 820,800 0.03Freeport-McMoRan, Inc. 5.45%15/03/2043 USD 394,000 312,556 0.01Gap, Inc. (The) 5.95% 12/04/2021 USD 594,000 623,655 0.03General Electric Co. 1.6% 20/11/2017 USD 364,000 367,429 0.01General Electric Co. 2.1% 11/12/2019 USD 260,000 268,078 0.01General Electric Co. 5.5% 08/01/2020 USD 254,000 289,574 0.01General Electric Co. 2.2% 09/01/2020 USD 173,000 178,317 0.01General Electric Co. 4.375%16/09/2020 USD 280,000 312,305 0.01General Electric Co. 5.3% 11/02/2021 USD 83,000 96,198 0.00General Electric Co. 4.65% 17/10/2021 USD 510,000 583,422 0.02General Electric Co. 3.15% 07/09/2022 USD 287,000 307,275 0.01General Electric Co. 2.7% 09/10/2022 USD 212,000 221,873 0.01General Electric Co. 3.1% 09/01/2023 USD 315,000 336,752 0.01General Electric Co. 6.75% 15/03/2032 USD 174,000 245,166 0.01
202
JPMorgan Funds - US Aggregate Bond FundSchedule of Investments (continued)
As at 30 June 2016
Investments Currency
Quantity/Nominal
Value
MarketValue
USD
%of
NetAssets Investments Currency
Quantity/Nominal
Value
MarketValue
USD
%of
NetAssets
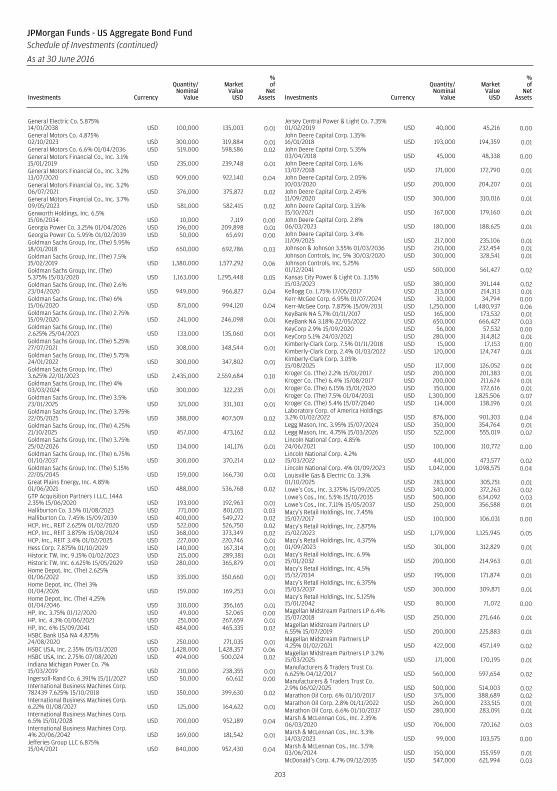
General Electric Co. 5.875%14/01/2038 USD 100,000 135,003 0.01General Motors Co. 4.875%02/10/2023 USD 300,000 319,884 0.01General Motors Co. 6.6% 01/04/2036 USD 519,000 598,586 0.02General Motors Financial Co., Inc. 3.1%15/01/2019 USD 235,000 239,748 0.01General Motors Financial Co., Inc. 3.2%13/07/2020 USD 909,000 922,140 0.04General Motors Financial Co., Inc. 3.2%06/07/2021 USD 376,000 375,872 0.02General Motors Financial Co., Inc. 3.7%09/05/2023 USD 581,000 582,415 0.02Genworth Holdings, Inc. 6.5%15/06/2034 USD 10,000 7,119 0.00Georgia Power Co. 3.25% 01/04/2026 USD 196,000 209,898 0.01Georgia Power Co. 5.95% 01/02/2039 USD 50,000 65,691 0.00Goldman Sachs Group, Inc. (The) 5.95%18/01/2018 USD 650,000 692,786 0.03Goldman Sachs Group, Inc. (The) 7.5%15/02/2019 USD 1,380,000 1,577,292 0.06Goldman Sachs Group, Inc. (The)5.375% 15/03/2020 USD 1,163,000 1,295,448 0.05Goldman Sachs Group, Inc. (The) 2.6%23/04/2020 USD 949,000 966,827 0.04Goldman Sachs Group, Inc. (The) 6%15/06/2020 USD 871,000 994,120 0.04Goldman Sachs Group, Inc. (The) 2.75%15/09/2020 USD 241,000 246,098 0.01Goldman Sachs Group, Inc. (The)2.625% 25/04/2021 USD 133,000 135,060 0.01Goldman Sachs Group, Inc. (The) 5.25%27/07/2021 USD 308,000 348,544 0.01Goldman Sachs Group, Inc. (The) 5.75%24/01/2022 USD 300,000 347,802 0.01Goldman Sachs Group, Inc. (The)3.625% 22/01/2023 USD 2,435,000 2,559,684 0.10Goldman Sachs Group, Inc. (The) 4%03/03/2024 USD 300,000 322,235 0.01Goldman Sachs Group, Inc. (The) 3.5%23/01/2025 USD 321,000 331,303 0.01Goldman Sachs Group, Inc. (The) 3.75%22/05/2025 USD 388,000 407,509 0.02Goldman Sachs Group, Inc. (The) 4.25%21/10/2025 USD 457,000 473,162 0.02Goldman Sachs Group, Inc. (The) 3.75%25/02/2026 USD 134,000 141,176 0.01Goldman Sachs Group, Inc. (The) 6.75%01/10/2037 USD 300,000 370,214 0.02Goldman Sachs Group, Inc. (The) 5.15%22/05/2045 USD 159,000 166,730 0.01Great Plains Energy, Inc. 4.85%01/06/2021 USD 488,000 536,768 0.02GTP Acquisition Partners I LLC, 144A2.35% 15/06/2020 USD 193,000 192,963 0.01Halliburton Co. 3.5% 01/08/2023 USD 771,000 801,015 0.03Halliburton Co. 7.45% 15/09/2039 USD 400,000 549,272 0.02HCP, Inc., REIT 2.625% 01/02/2020 USD 522,000 526,750 0.02HCP, Inc., REIT 3.875% 15/08/2024 USD 368,000 373,349 0.02HCP, Inc., REIT 3.4% 01/02/2025 USD 227,000 220,746 0.01Hess Corp. 7.875% 01/10/2029 USD 140,000 167,314 0.01Historic TW, Inc. 9.15% 01/02/2023 USD 215,000 289,381 0.01Historic TW, Inc. 6.625% 15/05/2029 USD 280,000 365,879 0.01Home Depot, Inc. (The) 2.625%01/06/2022 USD 335,000 350,660 0.01Home Depot, Inc. (The) 3%01/04/2026 USD 159,000 169,253 0.01Home Depot, Inc. (The) 4.25%01/04/2046 USD 310,000 356,165 0.01HP, Inc. 3.75% 01/12/2020 USD 49,000 52,065 0.00HP, Inc. 4.3% 01/06/2021 USD 251,000 267,659 0.01HP, Inc. 6% 15/09/2041 USD 484,000 465,335 0.02HSBC Bank USA NA 4.875%24/08/2020 USD 250,000 271,035 0.01HSBC USA, Inc. 2.35% 05/03/2020 USD 1,428,000 1,428,357 0.06HSBC USA, Inc. 2.75% 07/08/2020 USD 494,000 500,024 0.02Indiana Michigan Power Co. 7%15/03/2019 USD 210,000 238,355 0.01Ingersoll-Rand Co. 6.391% 15/11/2027 USD 50,000 60,612 0.00International Business Machines Corp.782439 7.625% 15/10/2018 USD 350,000 399,630 0.02International Business Machines Corp.6.22% 01/08/2027 USD 125,000 164,622 0.01International Business Machines Corp.6.5% 15/01/2028 USD 700,000 952,189 0.04International Business Machines Corp.4% 20/06/2042 USD 169,000 181,542 0.01Jefferies Group LLC 6.875%15/04/2021 USD 840,000 952,430 0.04
Jersey Central Power & Light Co. 7.35%01/02/2019 USD 40,000 45,216 0.00John Deere Capital Corp. 1.35%16/01/2018 USD 193,000 194,359 0.01John Deere Capital Corp. 5.35%03/04/2018 USD 45,000 48,338 0.00John Deere Capital Corp. 1.6%13/07/2018 USD 171,000 172,790 0.01John Deere Capital Corp. 2.05%10/03/2020 USD 200,000 204,207 0.01John Deere Capital Corp. 2.45%11/09/2020 USD 300,000 310,016 0.01John Deere Capital Corp. 3.15%15/10/2021 USD 167,000 179,160 0.01John Deere Capital Corp. 2.8%06/03/2023 USD 180,000 188,625 0.01John Deere Capital Corp. 3.4%11/09/2025 USD 217,000 235,106 0.01Johnson & Johnson 3.55% 01/03/2036 USD 210,000 232,454 0.01Johnson Controls, Inc. 5% 30/03/2020 USD 300,000 328,541 0.01Johnson Controls, Inc. 5.25%01/12/2041 USD 500,000 561,427 0.02Kansas City Power & Light Co. 3.15%15/03/2023 USD 380,000 391,144 0.02Kellogg Co. 1.75% 17/05/2017 USD 213,000 214,313 0.01Kerr-McGee Corp. 6.95% 01/07/2024 USD 30,000 34,794 0.00Kerr-McGee Corp. 7.875% 15/09/2031 USD 1,250,000 1,480,937 0.06KeyBank NA 5.7% 01/11/2017 USD 165,000 173,532 0.01KeyBank NA 3.18% 22/05/2022 USD 650,000 666,427 0.03KeyCorp 2.9% 15/09/2020 USD 56,000 57,532 0.00KeyCorp 5.1% 24/03/2021 USD 280,000 314,812 0.01Kimberly-Clark Corp. 7.5% 01/11/2018 USD 15,000 17,153 0.00Kimberly-Clark Corp. 2.4% 01/03/2022 USD 120,000 124,747 0.01Kimberly-Clark Corp. 3.05%15/08/2025 USD 117,000 126,052 0.01Kroger Co. (The) 2.2% 15/01/2017 USD 200,000 201,383 0.01Kroger Co. (The) 6.4% 15/08/2017 USD 200,000 211,624 0.01Kroger Co. (The) 6.15% 15/01/2020 USD 150,000 172,616 0.01Kroger Co. (The) 7.5% 01/04/2031 USD 1,300,000 1,825,506 0.07Kroger Co. (The) 5.4% 15/07/2040 USD 114,000 138,196 0.01Laboratory Corp. of America Holdings3.2% 01/02/2022 USD 876,000 901,303 0.04Legg Mason, Inc. 3.95% 15/07/2024 USD 350,000 354,764 0.01Legg Mason, Inc. 4.75% 15/03/2026 USD 522,000 555,019 0.02Lincoln National Corp. 4.85%24/06/2021 USD 100,000 110,772 0.00Lincoln National Corp. 4.2%15/03/2022 USD 441,000 473,577 0.02Lincoln National Corp. 4% 01/09/2023 USD 1,042,000 1,098,575 0.04Louisville Gas & Electric Co. 3.3%01/10/2025 USD 283,000 305,251 0.01Lowe’s Cos., Inc. 3.375% 15/09/2025 USD 340,000 372,263 0.02Lowe’s Cos., Inc. 5.5% 15/10/2035 USD 500,000 634,092 0.03Lowe’s Cos., Inc. 7.11% 15/05/2037 USD 250,000 356,588 0.01Macy’s Retail Holdings, Inc. 7.45%15/07/2017 USD 100,000 106,031 0.00Macy’s Retail Holdings, Inc. 2.875%15/02/2023 USD 1,179,000 1,125,945 0.05Macy’s Retail Holdings, Inc. 4.375%01/09/2023 USD 301,000 312,829 0.01Macy’s Retail Holdings, Inc. 6.9%15/01/2032 USD 200,000 214,963 0.01Macy’s Retail Holdings, Inc. 4.5%15/12/2034 USD 195,000 171,874 0.01Macy’s Retail Holdings, Inc. 6.375%15/03/2037 USD 300,000 309,871 0.01Macy’s Retail Holdings, Inc. 5.125%15/01/2042 USD 80,000 71,072 0.00Magellan Midstream Partners LP 6.4%15/07/2018 USD 250,000 271,646 0.01Magellan Midstream Partners LP6.55% 15/07/2019 USD 200,000 225,883 0.01Magellan Midstream Partners LP4.25% 01/02/2021 USD 422,000 457,149 0.02Magellan Midstream Partners LP 3.2%15/03/2025 USD 171,000 170,195 0.01Manufacturers & Traders Trust Co.6.625% 04/12/2017 USD 560,000 597,654 0.02Manufacturers & Traders Trust Co.2.9% 06/02/2025 USD 500,000 514,003 0.02Marathon Oil Corp. 6% 01/10/2017 USD 375,000 388,689 0.02Marathon Oil Corp. 2.8% 01/11/2022 USD 260,000 233,515 0.01Marathon Oil Corp. 6.6% 01/10/2037 USD 280,000 283,091 0.01Marsh & McLennan Cos., Inc. 2.35%06/03/2020 USD 706,000 720,162 0.03Marsh & McLennan Cos., Inc. 3.3%14/03/2023 USD 99,000 103,575 0.00Marsh & McLennan Cos., Inc. 3.5%03/06/2024 USD 150,000 155,959 0.01McDonald’s Corp. 4.7% 09/12/2035 USD 547,000 621,994 0.03
203
JPMorgan Funds - US Aggregate Bond FundSchedule of Investments (continued)
As at 30 June 2016
Investments Currency
Quantity/Nominal
Value
MarketValue
USD
%of
NetAssets Investments Currency
Quantity/Nominal
Value
MarketValue
USD
%of
NetAssets
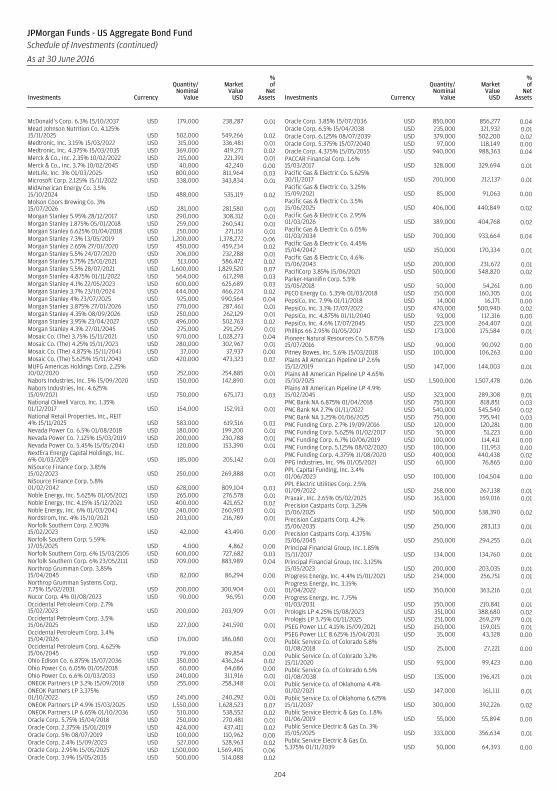
McDonald’s Corp. 6.3% 15/10/2037 USD 179,000 238,287 0.01Mead Johnson Nutrition Co. 4.125%15/11/2025 USD 502,000 549,266 0.02Medtronic, Inc. 3.15% 15/03/2022 USD 315,000 336,481 0.01Medtronic, Inc. 4.375% 15/03/2035 USD 369,000 419,271 0.02Merck & Co., Inc. 2.35% 10/02/2022 USD 215,000 221,391 0.01Merck & Co., Inc. 3.7% 10/02/2045 USD 40,000 42,240 0.00MetLife, Inc. 3% 01/03/2025 USD 800,000 811,964 0.03Microsoft Corp. 2.125% 15/11/2022 USD 338,000 343,834 0.01MidAmerican Energy Co. 3.5%15/10/2024 USD 488,000 535,119 0.02Molson Coors Brewing Co. 3%15/07/2026 USD 281,000 281,580 0.01Morgan Stanley 5.95% 28/12/2017 USD 290,000 308,312 0.01Morgan Stanley 1.875% 05/01/2018 USD 259,000 260,541 0.01Morgan Stanley 6.625% 01/04/2018 USD 250,000 271,151 0.01Morgan Stanley 7.3% 13/05/2019 USD 1,200,000 1,378,272 0.06Morgan Stanley 2.65% 27/01/2020 USD 450,000 459,234 0.02Morgan Stanley 5.5% 24/07/2020 USD 206,000 232,288 0.01Morgan Stanley 5.75% 25/01/2021 USD 513,000 586,472 0.02Morgan Stanley 5.5% 28/07/2021 USD 1,600,000 1,829,520 0.07Morgan Stanley 4.875% 01/11/2022 USD 564,000 617,298 0.03Morgan Stanley 4.1% 22/05/2023 USD 600,000 625,689 0.03Morgan Stanley 3.7% 23/10/2024 USD 444,000 466,224 0.02Morgan Stanley 4% 23/07/2025 USD 925,000 990,564 0.04Morgan Stanley 3.875% 27/01/2026 USD 270,000 287,461 0.01Morgan Stanley 4.35% 08/09/2026 USD 250,000 262,129 0.01Morgan Stanley 3.95% 23/04/2027 USD 496,000 502,763 0.02Morgan Stanley 4.3% 27/01/2045 USD 275,000 291,259 0.01Mosaic Co. (The) 3.75% 15/11/2021 USD 970,000 1,028,273 0.04Mosaic Co. (The) 4.25% 15/11/2023 USD 280,000 302,967 0.01Mosaic Co. (The) 4.875% 15/11/2041 USD 37,000 37,937 0.00Mosaic Co. (The) 5.625% 15/11/2043 USD 420,000 473,323 0.02MUFG Americas Holdings Corp. 2.25%10/02/2020 USD 252,000 254,885 0.01Nabors Industries, Inc. 5% 15/09/2020 USD 150,000 142,890 0.01Nabors Industries, Inc. 4.625%15/09/2021 USD 750,000 675,173 0.03National Oilwell Varco, Inc. 1.35%01/12/2017 USD 154,000 152,913 0.01National Retail Properties, Inc., REIT4% 15/11/2025 USD 583,000 619,516 0.03Nevada Power Co. 6.5% 01/08/2018 USD 180,000 199,200 0.01Nevada Power Co. 7.125% 15/03/2019 USD 200,000 230,788 0.01Nevada Power Co. 5.45% 15/05/2041 USD 120,000 153,390 0.01NextEra Energy Capital Holdings, Inc.6% 01/03/2019 USD 185,000 205,142 0.01NiSource Finance Corp. 3.85%15/02/2023 USD 250,000 269,888 0.01NiSource Finance Corp. 5.8%01/02/2042 USD 628,000 809,104 0.03Noble Energy, Inc. 5.625% 01/05/2021 USD 265,000 276,578 0.01Noble Energy, Inc. 4.15% 15/12/2021 USD 400,000 421,652 0.02Noble Energy, Inc. 6% 01/03/2041 USD 240,000 260,903 0.01Nordstrom, Inc. 4% 15/10/2021 USD 203,000 216,789 0.01Norfolk Southern Corp. 2.903%15/02/2023 USD 42,000 43,490 0.00Norfolk Southern Corp. 5.59%17/05/2025 USD 4,000 4,862 0.00Norfolk Southern Corp. 6% 15/03/2105 USD 600,000 727,682 0.03Norfolk Southern Corp. 6% 23/05/2111 USD 709,000 883,989 0.04Northrop Grumman Corp. 3.85%15/04/2045 USD 82,000 86,294 0.00Northrop Grumman Systems Corp.7.75% 15/02/2031 USD 200,000 300,904 0.01Nucor Corp. 4% 01/08/2023 USD 90,000 96,951 0.00Occidental Petroleum Corp. 2.7%15/02/2023 USD 200,000 203,909 0.01Occidental Petroleum Corp. 3.5%15/06/2025 USD 227,000 241,590 0.01Occidental Petroleum Corp. 3.4%15/04/2026 USD 176,000 186,080 0.01Occidental Petroleum Corp. 4.625%15/06/2045 USD 79,000 89,854 0.00Ohio Edison Co. 6.875% 15/07/2036 USD 350,000 436,264 0.02Ohio Power Co. 6.05% 01/05/2018 USD 60,000 64,686 0.00Ohio Power Co. 6.6% 01/03/2033 USD 240,000 311,916 0.01ONEOK Partners LP 3.2% 15/09/2018 USD 255,000 258,348 0.01ONEOK Partners LP 3.375%01/10/2022 USD 245,000 240,292 0.01ONEOK Partners LP 4.9% 15/03/2025 USD 1,550,000 1,628,523 0.07ONEOK Partners LP 6.65% 01/10/2036 USD 510,000 538,552 0.02Oracle Corp. 5.75% 15/04/2018 USD 250,000 270,481 0.01Oracle Corp. 2.375% 15/01/2019 USD 424,000 437,411 0.02Oracle Corp. 5% 08/07/2019 USD 100,000 110,962 0.00Oracle Corp. 2.4% 15/09/2023 USD 527,000 528,963 0.02Oracle Corp. 2.95% 15/05/2025 USD 1,500,000 1,569,405 0.06Oracle Corp. 3.9% 15/05/2035 USD 500,000 514,088 0.02
Oracle Corp. 3.85% 15/07/2036 USD 850,000 856,277 0.04Oracle Corp. 6.5% 15/04/2038 USD 235,000 321,932 0.01Oracle Corp. 6.125% 08/07/2039 USD 379,000 502,200 0.02Oracle Corp. 5.375% 15/07/2040 USD 97,000 118,149 0.00Oracle Corp. 4.375% 15/05/2055 USD 940,000 988,363 0.04PACCAR Financial Corp. 1.6%15/03/2017 USD 328,000 329,694 0.01Pacific Gas & Electric Co. 5.625%30/11/2017 USD 200,000 212,137 0.01Pacific Gas & Electric Co. 3.25%15/09/2021 USD 85,000 91,063 0.00Pacific Gas & Electric Co. 3.5%15/06/2025 USD 406,000 440,849 0.02Pacific Gas & Electric Co. 2.95%01/03/2026 USD 389,000 404,768 0.02Pacific Gas & Electric Co. 6.05%01/03/2034 USD 700,000 933,664 0.04Pacific Gas & Electric Co. 4.45%15/04/2042 USD 150,000 170,334 0.01Pacific Gas & Electric Co. 4.6%15/06/2043 USD 200,000 231,672 0.01PacifiCorp 3.85% 15/06/2021 USD 500,000 548,820 0.02Parker-Hannifin Corp. 5.5%15/05/2018 USD 50,000 54,261 0.00PECO Energy Co. 5.35% 01/03/2018 USD 150,000 160,305 0.01PepsiCo, Inc. 7.9% 01/11/2018 USD 14,000 16,171 0.00PepsiCo, Inc. 3.1% 17/07/2022 USD 470,000 500,940 0.02PepsiCo, Inc. 4.875% 01/11/2040 USD 93,000 112,316 0.00PepsiCo, Inc. 4.6% 17/07/2045 USD 223,000 264,407 0.01Phillips 66 2.95% 01/05/2017 USD 173,000 175,584 0.01Pioneer Natural Resources Co. 5.875%15/07/2016 USD 90,000 90,092 0.00Pitney Bowes, Inc. 5.6% 15/03/2018 USD 100,000 106,263 0.00Plains All American Pipeline LP 2.6%15/12/2019 USD 147,000 144,003 0.01Plains All American Pipeline LP 4.65%15/10/2025 USD 1,500,000 1,507,478 0.06Plains All American Pipeline LP 4.9%15/02/2045 USD 323,000 289,308 0.01PNC Bank NA 6.875% 01/04/2018 USD 750,000 818,851 0.03PNC Bank NA 2.7% 01/11/2022 USD 540,000 545,540 0.02PNC Bank NA 3.25% 01/06/2025 USD 750,000 795,941 0.03PNC Funding Corp. 2.7% 19/09/2016 USD 120,000 120,281 0.00PNC Funding Corp. 5.625% 01/02/2017 USD 50,000 51,223 0.00PNC Funding Corp. 6.7% 10/06/2019 USD 100,000 114,411 0.00PNC Funding Corp. 5.125% 08/02/2020 USD 100,000 111,953 0.00PNC Funding Corp. 4.375% 11/08/2020 USD 400,000 440,438 0.02PPG Industries, Inc. 9% 01/05/2021 USD 60,000 76,865 0.00PPL Capital Funding, Inc. 3.4%01/06/2023 USD 100,000 104,504 0.00PPL Electric Utilities Corp. 2.5%01/09/2022 USD 258,000 267,138 0.01Praxair, Inc. 2.65% 05/02/2025 USD 163,000 169,016 0.01Precision Castparts Corp. 3.25%15/06/2025 USD 500,000 538,390 0.02Precision Castparts Corp. 4.2%15/06/2035 USD 250,000 283,113 0.01Precision Castparts Corp. 4.375%15/06/2045 USD 250,000 294,255 0.01Principal Financial Group, Inc. 1.85%15/11/2017 USD 134,000 134,760 0.01Principal Financial Group, Inc. 3.125%15/05/2023 USD 200,000 203,035 0.01Progress Energy, Inc. 4.4% 15/01/2021 USD 234,000 256,751 0.01Progress Energy, Inc. 3.15%01/04/2022 USD 350,000 363,216 0.01Progress Energy, Inc. 7.75%01/03/2031 USD 150,000 210,841 0.01Prologis LP 4.25% 15/08/2023 USD 351,000 388,680 0.02Prologis LP 3.75% 01/11/2025 USD 251,000 269,279 0.01PSEG Power LLC 4.15% 15/09/2021 USD 150,000 159,015 0.01PSEG Power LLC 8.625% 15/04/2031 USD 35,000 43,328 0.00Public Service Co. of Colorado 5.8%01/08/2018 USD 25,000 27,221 0.00Public Service Co. of Colorado 3.2%15/11/2020 USD 93,000 99,423 0.00Public Service Co. of Colorado 6.5%01/08/2038 USD 135,000 196,421 0.01Public Service Co. of Oklahoma 4.4%01/02/2021 USD 147,000 161,111 0.01Public Service Co. of Oklahoma 6.625%15/11/2037 USD 300,000 392,226 0.02Public Service Electric & Gas Co. 1.8%01/06/2019 USD 55,000 55,894 0.00Public Service Electric & Gas Co. 3%15/05/2025 USD 333,000 356,634 0.01Public Service Electric & Gas Co.5.375% 01/11/2039 USD 50,000 64,393 0.00
204
JPMorgan Funds - US Aggregate Bond FundSchedule of Investments (continued)
As at 30 June 2016
Investments Currency
Quantity/Nominal
Value
MarketValue
USD
%of
NetAssets Investments Currency
Quantity/Nominal
Value
MarketValue
USD
%of
NetAssets
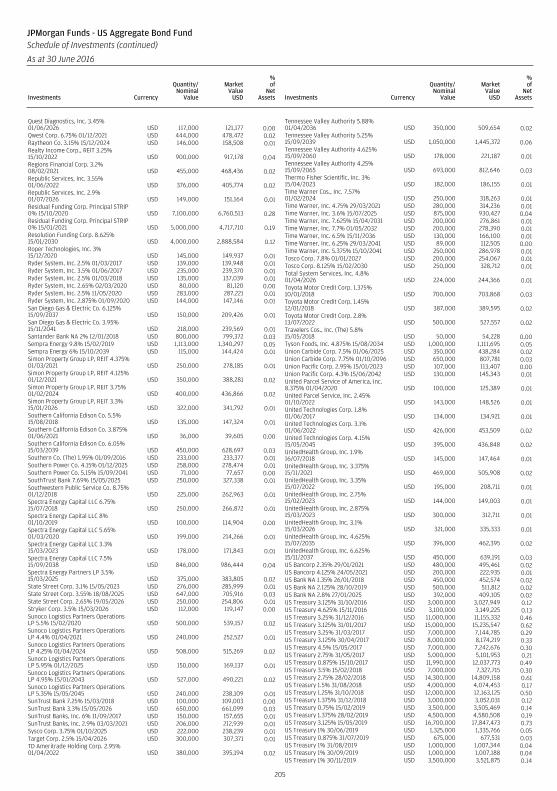
Quest Diagnostics, Inc. 3.45%01/06/2026 USD 117,000 121,177 0.00Qwest Corp. 6.75% 01/12/2021 USD 444,000 478,472 0.02Raytheon Co. 3.15% 15/12/2024 USD 146,000 158,508 0.01Realty Income Corp., REIT 3.25%15/10/2022 USD 900,000 917,178 0.04Regions Financial Corp. 3.2%08/02/2021 USD 455,000 468,436 0.02Republic Services, Inc. 3.55%01/06/2022 USD 376,000 405,774 0.02Republic Services, Inc. 2.9%01/07/2026 USD 149,000 151,164 0.01Residual Funding Corp. Principal STRIP0% 15/10/2020 USD 7,100,000 6,760,513 0.28Residual Funding Corp. Principal STRIP0% 15/01/2021 USD 5,000,000 4,717,710 0.19Resolution Funding Corp. 8.625%15/01/2030 USD 4,000,000 2,888,584 0.12Roper Technologies, Inc. 3%15/12/2020 USD 145,000 149,937 0.01Ryder System, Inc. 2.5% 01/03/2017 USD 139,000 139,948 0.01Ryder System, Inc. 3.5% 01/06/2017 USD 235,000 239,370 0.01Ryder System, Inc. 2.5% 01/03/2018 USD 135,000 137,039 0.01Ryder System, Inc. 2.65% 02/03/2020 USD 80,000 81,120 0.00Ryder System, Inc. 2.5% 11/05/2020 USD 283,000 287,221 0.01Ryder System, Inc. 2.875% 01/09/2020 USD 144,000 147,146 0.01San Diego Gas & Electric Co. 6.125%15/09/2037 USD 150,000 209,426 0.01San Diego Gas & Electric Co. 3.95%15/11/2041 USD 218,000 239,569 0.01Santander Bank NA 2% 12/01/2018 USD 800,000 799,372 0.03Sempra Energy 9.8% 15/02/2019 USD 1,113,000 1,340,297 0.05Sempra Energy 6% 15/10/2039 USD 115,000 144,424 0.01Simon Property Group LP, REIT 4.375%01/03/2021 USD 250,000 278,185 0.01Simon Property Group LP, REIT 4.125%01/12/2021 USD 350,000 388,281 0.02Simon Property Group LP, REIT 3.75%01/02/2024 USD 400,000 436,866 0.02Simon Property Group LP, REIT 3.3%15/01/2026 USD 322,000 341,792 0.01Southern California Edison Co. 5.5%15/08/2018 USD 135,000 147,324 0.01Southern California Edison Co. 3.875%01/06/2021 USD 36,000 39,605 0.00Southern California Edison Co. 6.05%15/03/2039 USD 450,000 628,697 0.03Southern Co. (The) 1.95% 01/09/2016 USD 233,000 233,377 0.01Southern Power Co. 4.15% 01/12/2025 USD 258,000 278,474 0.01Southern Power Co. 5.15% 15/09/2041 USD 71,000 77,657 0.00SouthTrust Bank 7.69% 15/05/2025 USD 250,000 327,338 0.01Southwestern Public Service Co. 8.75%01/12/2018 USD 225,000 262,963 0.01Spectra Energy Capital LLC 6.75%15/07/2018 USD 250,000 266,872 0.01Spectra Energy Capital LLC 8%01/10/2019 USD 100,000 114,904 0.00Spectra Energy Capital LLC 5.65%01/03/2020 USD 199,000 214,266 0.01Spectra Energy Capital LLC 3.3%15/03/2023 USD 178,000 171,843 0.01Spectra Energy Capital LLC 7.5%15/09/2038 USD 846,000 986,444 0.04Spectra Energy Partners LP 3.5%15/03/2025 USD 375,000 383,805 0.02State Street Corp. 3.1% 15/05/2023 USD 276,000 285,999 0.01State Street Corp. 3.55% 18/08/2025 USD 647,000 705,916 0.03State Street Corp. 2.65% 19/05/2026 USD 250,000 254,806 0.01Stryker Corp. 3.5% 15/03/2026 USD 112,000 119,147 0.00Sunoco Logistics Partners OperationsLP 5.5% 15/02/2020 USD 500,000 539,157 0.02Sunoco Logistics Partners OperationsLP 4.4% 01/04/2021 USD 240,000 252,527 0.01Sunoco Logistics Partners OperationsLP 4.25% 01/04/2024 USD 508,000 515,269 0.02Sunoco Logistics Partners OperationsLP 5.95% 01/12/2025 USD 150,000 169,137 0.01Sunoco Logistics Partners OperationsLP 4.95% 15/01/2043 USD 527,000 490,221 0.02Sunoco Logistics Partners OperationsLP 5.35% 15/05/2045 USD 240,000 238,109 0.01SunTrust Bank 7.25% 15/03/2018 USD 100,000 109,003 0.00SunTrust Bank 3.3% 15/05/2026 USD 650,000 661,099 0.03SunTrust Banks, Inc. 6% 11/09/2017 USD 150,000 157,655 0.01SunTrust Banks, Inc. 2.9% 03/03/2021 USD 206,000 212,939 0.01Sysco Corp. 3.75% 01/10/2025 USD 222,000 238,239 0.01Target Corp. 2.5% 15/04/2026 USD 300,000 307,371 0.01TD Ameritrade Holding Corp. 2.95%01/04/2022 USD 380,000 395,194 0.02
Tennessee Valley Authority 5.88%01/04/2036 USD 350,000 509,654 0.02Tennessee Valley Authority 5.25%15/09/2039 USD 1,050,000 1,445,372 0.06Tennessee Valley Authority 4.625%15/09/2060 USD 178,000 221,187 0.01Tennessee Valley Authority 4.25%15/09/2065 USD 693,000 812,646 0.03Thermo Fisher Scientific, Inc. 3%15/04/2023 USD 182,000 186,155 0.01Time Warner Cos., Inc. 7.57%01/02/2024 USD 250,000 318,263 0.01Time Warner, Inc. 4.75% 29/03/2021 USD 280,000 314,236 0.01Time Warner, Inc. 3.6% 15/07/2025 USD 875,000 930,427 0.04Time Warner, Inc. 7.625% 15/04/2031 USD 200,000 276,861 0.01Time Warner, Inc. 7.7% 01/05/2032 USD 200,000 278,390 0.01Time Warner, Inc. 6.5% 15/11/2036 USD 130,000 166,100 0.01Time Warner, Inc. 6.25% 29/03/2041 USD 89,000 112,505 0.00Time Warner, Inc. 5.375% 15/10/2041 USD 250,000 286,978 0.01Tosco Corp. 7.8% 01/01/2027 USD 200,000 254,067 0.01Tosco Corp. 8.125% 15/02/2030 USD 250,000 328,712 0.01Total System Services, Inc. 4.8%01/04/2026 USD 224,000 244,366 0.01Toyota Motor Credit Corp. 1.375%10/01/2018 USD 700,000 703,868 0.03Toyota Motor Credit Corp. 1.45%12/01/2018 USD 387,000 389,595 0.02Toyota Motor Credit Corp. 2.8%13/07/2022 USD 500,000 527,557 0.02Travelers Cos., Inc. (The) 5.8%15/05/2018 USD 50,000 54,228 0.00Tyson Foods, Inc. 4.875% 15/08/2034 USD 1,000,000 1,111,695 0.05Union Carbide Corp. 7.5% 01/06/2025 USD 350,000 438,284 0.02Union Carbide Corp. 7.75% 01/10/2096 USD 650,000 807,781 0.03Union Pacific Corp. 2.95% 15/01/2023 USD 107,000 113,407 0.00Union Pacific Corp. 4.3% 15/06/2042 USD 130,000 145,343 0.01United Parcel Service of America, Inc.8.375% 01/04/2020 USD 100,000 125,389 0.01United Parcel Service, Inc. 2.45%01/10/2022 USD 143,000 148,526 0.01United Technologies Corp. 1.8%01/06/2017 USD 134,000 134,921 0.01United Technologies Corp. 3.1%01/06/2022 USD 426,000 453,509 0.02United Technologies Corp. 4.15%15/05/2045 USD 395,000 436,848 0.02UnitedHealth Group, Inc. 1.9%16/07/2018 USD 145,000 147,464 0.01UnitedHealth Group, Inc. 3.375%15/11/2021 USD 469,000 505,908 0.02UnitedHealth Group, Inc. 3.35%15/07/2022 USD 195,000 208,711 0.01UnitedHealth Group, Inc. 2.75%15/02/2023 USD 144,000 149,003 0.01UnitedHealth Group, Inc. 2.875%15/03/2023 USD 300,000 312,711 0.01UnitedHealth Group, Inc. 3.1%15/03/2026 USD 321,000 335,333 0.01UnitedHealth Group, Inc. 4.625%15/07/2035 USD 396,000 462,395 0.02UnitedHealth Group, Inc. 6.625%15/11/2037 USD 450,000 639,191 0.03US Bancorp 2.35% 29/01/2021 USD 480,000 495,461 0.02US Bancorp 4.125% 24/05/2021 USD 200,000 222,935 0.01US Bank NA 1.35% 26/01/2018 USD 450,000 452,574 0.02US Bank NA 2.125% 28/10/2019 USD 500,000 511,812 0.02US Bank NA 2.8% 27/01/2025 USD 392,000 409,105 0.02US Treasury 3.125% 31/10/2016 USD 3,000,000 3,027,949 0.12US Treasury 4.625% 15/11/2016 USD 3,100,000 3,149,225 0.13US Treasury 3.25% 31/12/2016 USD 11,000,000 11,155,332 0.46US Treasury 3.125% 31/01/2017 USD 15,000,000 15,235,547 0.62US Treasury 3.25% 31/03/2017 USD 7,000,000 7,144,785 0.29US Treasury 3.125% 30/04/2017 USD 8,000,000 8,174,219 0.33US Treasury 4.5% 15/05/2017 USD 7,000,000 7,242,676 0.30US Treasury 2.75% 31/05/2017 USD 5,000,000 5,101,953 0.21US Treasury 0.875% 15/10/2017 USD 11,990,000 12,037,773 0.49US Treasury 3.5% 15/02/2018 USD 7,000,000 7,327,715 0.30US Treasury 2.75% 28/02/2018 USD 14,300,000 14,809,158 0.61US Treasury 1.5% 31/08/2018 USD 4,000,000 4,074,453 0.17US Treasury 1.25% 31/10/2018 USD 12,000,000 12,163,125 0.50US Treasury 1.375% 31/12/2018 USD 3,000,000 3,052,031 0.12US Treasury 0.75% 15/02/2019 USD 3,500,000 3,505,469 0.14US Treasury 1.375% 28/02/2019 USD 4,500,000 4,580,508 0.19US Treasury 3.125% 15/05/2019 USD 16,700,000 17,847,473 0.73US Treasury 1% 30/06/2019 USD 1,325,000 1,335,766 0.05US Treasury 0.875% 31/07/2019 USD 675,000 677,531 0.03US Treasury 1% 31/08/2019 USD 1,000,000 1,007,344 0.04US Treasury 1% 30/09/2019 USD 1,000,000 1,007,188 0.04US Treasury 1% 30/11/2019 USD 3,500,000 3,521,875 0.14
205
JPMorgan Funds - US Aggregate Bond FundSchedule of Investments (continued)
As at 30 June 2016
Investments Currency
Quantity/Nominal
Value
MarketValue
USD
%of
NetAssets Investments Currency
Quantity/Nominal
Value
MarketValue
USD
%of
NetAssets
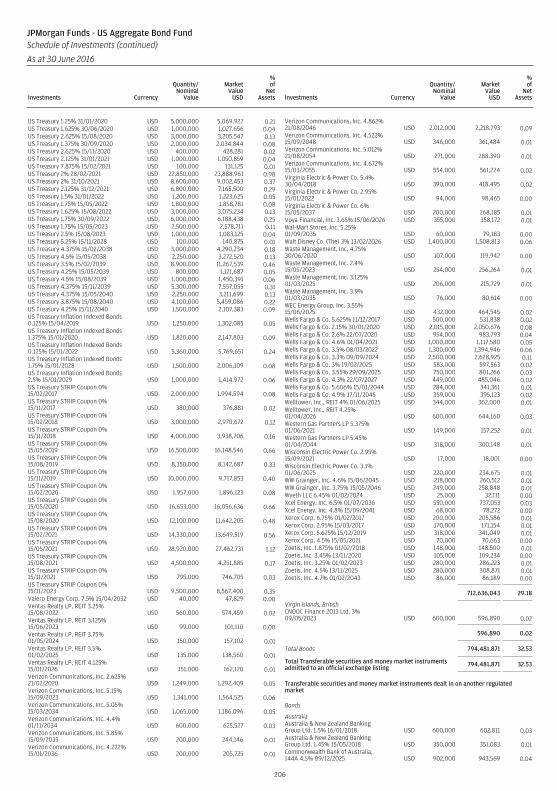
US Treasury 1.25% 31/01/2020 USD 5,000,000 5,069,922 0.21US Treasury 1.625% 30/06/2020 USD 1,000,000 1,027,656 0.04US Treasury 2.625% 15/08/2020 USD 3,000,000 3,205,547 0.13US Treasury 1.375% 30/09/2020 USD 2,000,000 2,034,844 0.08US Treasury 2.625% 15/11/2020 USD 400,000 428,281 0.02US Treasury 2.125% 31/01/2021 USD 1,000,000 1,050,859 0.04US Treasury 7.875% 15/02/2021 USD 100,000 131,125 0.01US Treasury 2% 28/02/2021 USD 22,850,000 23,888,961 0.98US Treasury 2% 31/10/2021 USD 8,600,000 9,002,453 0.37US Treasury 2.125% 31/12/2021 USD 6,800,000 7,165,500 0.29US Treasury 1.5% 31/01/2022 USD 1,200,000 1,223,625 0.05US Treasury 1.75% 15/05/2022 USD 1,800,000 1,858,781 0.08US Treasury 1.625% 15/08/2022 USD 3,000,000 3,075,234 0.13US Treasury 1.75% 30/09/2022 USD 6,000,000 6,188,438 0.25US Treasury 1.75% 15/05/2023 USD 2,500,000 2,578,711 0.11US Treasury 2.5% 15/08/2023 USD 1,000,000 1,083,125 0.04US Treasury 5.25% 15/11/2028 USD 100,000 140,875 0.01US Treasury 4.375% 15/02/2038 USD 3,000,000 4,290,234 0.18US Treasury 4.5% 15/05/2038 USD 2,250,000 3,272,520 0.13US Treasury 3.5% 15/02/2039 USD 8,900,000 11,267,539 0.46US Treasury 4.25% 15/05/2039 USD 800,000 1,121,687 0.05US Treasury 4.5% 15/08/2039 USD 1,000,000 1,450,391 0.06US Treasury 4.375% 15/11/2039 USD 5,300,000 7,557,055 0.31US Treasury 4.375% 15/05/2040 USD 2,250,000 3,211,699 0.13US Treasury 3.875% 15/08/2040 USD 4,100,000 5,459,086 0.22US Treasury 4.25% 15/11/2040 USD 1,500,000 2,107,383 0.09US Treasury Inflation Indexed Bonds0.125% 15/04/2019 USD 1,250,000 1,302,085 0.05US Treasury Inflation Indexed Bonds1.375% 15/01/2020 USD 1,820,000 2,147,803 0.09US Treasury Inflation Indexed Bonds0.125% 15/01/2022 USD 5,360,000 5,769,651 0.24US Treasury Inflation Indexed Bonds1.75% 15/01/2028 USD 1,500,000 2,006,109 0.08US Treasury Inflation Indexed Bonds2.5% 15/01/2029 USD 1,000,000 1,414,972 0.06US Treasury STRIP Coupon 0%15/02/2017 USD 2,000,000 1,994,594 0.08US Treasury STRIP Coupon 0%15/11/2017 USD 380,000 376,881 0.02US Treasury STRIP Coupon 0%15/02/2018 USD 3,000,000 2,970,672 0.12US Treasury STRIP Coupon 0%15/11/2018 USD 4,000,000 3,938,706 0.16US Treasury STRIP Coupon 0%15/05/2019 USD 16,500,000 16,148,546 0.66US Treasury STRIP Coupon 0%15/08/2019 USD 8,350,000 8,142,687 0.33US Treasury STRIP Coupon 0%15/11/2019 USD 10,000,000 9,717,853 0.40US Treasury STRIP Coupon 0%15/02/2020 USD 1,957,000 1,896,123 0.08US Treasury STRIP Coupon 0%15/05/2020 USD 16,653,000 16,056,636 0.66US Treasury STRIP Coupon 0%15/08/2020 USD 12,100,000 11,642,205 0.48US Treasury STRIP Coupon 0%15/02/2021 USD 14,330,000 13,649,519 0.56US Treasury STRIP Coupon 0%15/05/2021 USD 28,920,000 27,462,731 1.12US Treasury STRIP Coupon 0%15/08/2021 USD 4,500,000 4,251,885 0.17US Treasury STRIP Coupon 0%15/11/2021 USD 795,000 746,705 0.03US Treasury STRIP Coupon 0%15/11/2023 USD 9,500,000 8,567,400 0.35Valero Energy Corp. 7.5% 15/04/2032 USD 40,000 47,829 0.00Ventas Realty LP, REIT 3.25%15/08/2022 USD 560,000 574,459 0.02Ventas Realty LP, REIT 3.125%15/06/2023 USD 99,000 101,110 0.00Ventas Realty LP, REIT 3.75%01/05/2024 USD 150,000 157,102 0.01Ventas Realty LP, REIT 3.5%01/02/2025 USD 135,000 138,560 0.01Ventas Realty LP, REIT 4.125%15/01/2026 USD 151,000 162,120 0.01Verizon Communications, Inc. 2.625%21/02/2020 USD 1,249,000 1,292,409 0.05Verizon Communications, Inc. 5.15%15/09/2023 USD 1,341,000 1,564,525 0.06Verizon Communications, Inc. 5.05%15/03/2034 USD 1,065,000 1,186,096 0.05Verizon Communications, Inc. 4.4%01/11/2034 USD 600,000 625,527 0.03Verizon Communications, Inc. 5.85%15/09/2035 USD 200,000 244,146 0.01Verizon Communications, Inc. 4.272%15/01/2036 USD 200,000 205,725 0.01
Verizon Communications, Inc. 4.862%21/08/2046 USD 2,012,000 2,218,793 0.09Verizon Communications, Inc. 4.522%15/09/2048 USD 346,000 361,484 0.01Verizon Communications, Inc. 5.012%21/08/2054 USD 271,000 288,390 0.01Verizon Communications, Inc. 4.672%15/03/2055 USD 554,000 561,224 0.02Virginia Electric & Power Co. 5.4%30/04/2018 USD 390,000 418,495 0.02Virginia Electric & Power Co. 2.95%15/01/2022 USD 94,000 98,465 0.00Virginia Electric & Power Co. 6%15/05/2037 USD 200,000 268,185 0.01Voya Financial, Inc. 3.65% 15/06/2026 USD 355,000 358,172 0.01Wal-Mart Stores, Inc. 5.25%01/09/2035 USD 60,000 79,183 0.00Walt Disney Co. (The) 3% 13/02/2026 USD 1,400,000 1,508,813 0.06Waste Management, Inc. 4.75%30/06/2020 USD 107,000 119,942 0.00Waste Management, Inc. 2.4%15/05/2023 USD 254,000 256,264 0.01Waste Management, Inc. 3.125%01/03/2025 USD 206,000 215,729 0.01Waste Management, Inc. 3.9%01/03/2035 USD 76,000 80,614 0.00WEC Energy Group, Inc. 3.55%15/06/2025 USD 432,000 464,545 0.02Wells Fargo & Co. 5.625% 11/12/2017 USD 500,000 531,838 0.02Wells Fargo & Co. 2.15% 30/01/2020 USD 2,015,000 2,050,676 0.08Wells Fargo & Co. 2.6% 22/07/2020 USD 954,000 983,793 0.04Wells Fargo & Co. 4.6% 01/04/2021 USD 1,000,000 1,117,580 0.05Wells Fargo & Co. 3.5% 08/03/2022 USD 1,300,000 1,394,946 0.06Wells Fargo & Co. 3.3% 09/09/2024 USD 2,500,000 2,628,925 0.11Wells Fargo & Co. 3% 19/02/2025 USD 583,000 597,563 0.02Wells Fargo & Co. 3.55% 29/09/2025 USD 750,000 801,266 0.03Wells Fargo & Co. 4.3% 22/07/2027 USD 449,000 485,046 0.02Wells Fargo & Co. 5.606% 15/01/2044 USD 284,000 341,361 0.01Wells Fargo & Co. 4.9% 17/11/2045 USD 359,000 395,123 0.02Welltower, Inc., REIT 4% 01/06/2025 USD 344,000 362,000 0.01Welltower, Inc., REIT 4.25%01/04/2026 USD 600,000 644,160 0.03Western Gas Partners LP 5.375%01/06/2021 USD 149,000 157,252 0.01Western Gas Partners LP 5.45%01/04/2044 USD 318,000 300,148 0.01Wisconsin Electric Power Co. 2.95%15/09/2021 USD 17,000 18,001 0.00Wisconsin Electric Power Co. 3.1%01/06/2025 USD 220,000 234,675 0.01WW Grainger, Inc. 4.6% 15/06/2045 USD 218,000 260,512 0.01WW Grainger, Inc. 3.75% 15/05/2046 USD 249,000 258,848 0.01Wyeth LLC 6.45% 01/02/2024 USD 25,000 32,111 0.00Xcel Energy, Inc. 6.5% 01/07/2036 USD 550,000 737,053 0.03Xcel Energy, Inc. 4.8% 15/09/2041 USD 68,000 78,272 0.00Xerox Corp. 6.75% 01/02/2017 USD 200,000 205,586 0.01Xerox Corp. 2.95% 15/03/2017 USD 170,000 171,154 0.01Xerox Corp. 5.625% 15/12/2019 USD 318,000 341,049 0.01Xerox Corp. 4.5% 15/05/2021 USD 70,000 70,663 0.00Zoetis, Inc. 1.875% 01/02/2018 USD 148,000 148,500 0.01Zoetis, Inc. 3.45% 13/11/2020 USD 105,000 109,234 0.00Zoetis, Inc. 3.25% 01/02/2023 USD 280,000 286,223 0.01Zoetis, Inc. 4.5% 13/11/2025 USD 280,000 308,871 0.01Zoetis, Inc. 4.7% 01/02/2043 USD 86,000 86,189 0.00
712,636,043 29.18
Virgin Islands, BritishCNOOC Finance 2013 Ltd. 3%09/05/2023 USD 600,000 596,890 0.02
596,890 0.02
Total Bonds 794,481,871 32.53
Total Transferable securities and money market instrumentsadmitted to an official exchange listing 794,481,871 32.53
Transferable securities and money market instruments dealt in on another regulatedmarket
Bonds
AustraliaAustralia & New Zealand BankingGroup Ltd. 1.5% 16/01/2018 USD 600,000 602,811 0.03Australia & New Zealand BankingGroup Ltd. 1.45% 15/05/2018 USD 350,000 351,083 0.01Commonwealth Bank of Australia,144A 4.5% 09/12/2025 USD 902,000 943,569 0.04
206
JPMorgan Funds - US Aggregate Bond FundSchedule of Investments (continued)
As at 30 June 2016
Investments Currency
Quantity/Nominal
Value
MarketValue
USD
%of
NetAssets Investments Currency
Quantity/Nominal
Value
MarketValue
USD
%of
NetAssets
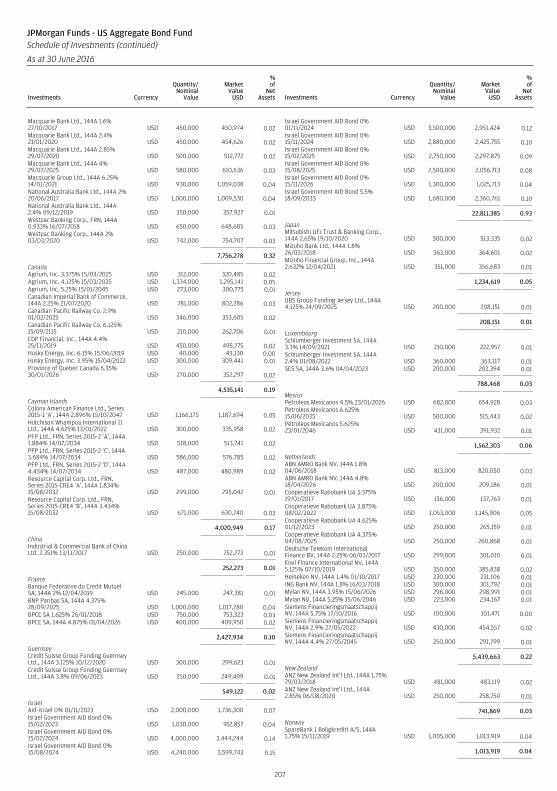
Macquarie Bank Ltd., 144A 1.6%27/10/2017 USD 450,000 450,974 0.02Macquarie Bank Ltd., 144A 2.4%21/01/2020 USD 450,000 454,626 0.02Macquarie Bank Ltd., 144A 2.85%29/07/2020 USD 500,000 512,772 0.02Macquarie Bank Ltd., 144A 4%29/07/2025 USD 580,000 610,636 0.03Macquarie Group Ltd., 144A 6.25%14/01/2021 USD 930,000 1,059,038 0.04National Australia Bank Ltd., 144A 2%20/06/2017 USD 1,000,000 1,009,530 0.04National Australia Bank Ltd., 144A2.4% 09/12/2019 USD 350,000 357,927 0.01Westpac Banking Corp., FRN, 144A0.933% 16/07/2018 USD 650,000 648,605 0.03Westpac Banking Corp., 144A 2%03/03/2020 USD 742,000 754,707 0.03
7,756,278 0.32
CanadaAgrium, Inc. 3.375% 15/03/2025 USD 312,000 320,485 0.02Agrium, Inc. 4.125% 15/03/2035 USD 1,334,000 1,295,141 0.05Agrium, Inc. 5.25% 15/01/2045 USD 273,000 300,775 0.01Canadian Imperial Bank of Commerce,144A 2.25% 21/07/2020 USD 781,000 802,286 0.03Canadian Pacific Railway Co. 2.9%01/02/2025 USD 346,000 353,605 0.02Canadian Pacific Railway Co. 6.125%15/09/2115 USD 210,000 262,706 0.01CDP Financial, Inc., 144A 4.4%25/11/2019 USD 450,000 495,275 0.02Husky Energy, Inc. 6.15% 15/06/2019 USD 40,000 43,130 0.00Husky Energy, Inc. 3.95% 15/04/2022 USD 300,000 309,441 0.01Province of Quebec Canada 6.35%30/01/2026 USD 270,000 352,297 0.02
4,535,141 0.19
Cayman IslandsColony American Finance Ltd., Series2015-1 ‘A’, 144A 2.896% 15/10/2047 USD 1,166,175 1,187,694 0.05Hutchison Whampoa International 11Ltd., 144A 4.625% 13/01/2022 USD 300,000 335,958 0.02PFP Ltd., FRN, Series 2015-2 ‘A’, 144A1.884% 14/07/2034 USD 518,000 513,741 0.02PFP Ltd., FRN, Series 2015-2 ‘C’, 144A3.684% 14/07/2034 USD 586,000 576,785 0.02PFP Ltd., FRN, Series 2015-2 ‘D’, 144A4.434% 14/07/2034 USD 487,000 480,989 0.02Resource Capital Corp. Ltd., FRN,Series 2015-CRE4 ‘A’, 144A 1.834%15/08/2032 USD 299,000 295,042 0.01Resource Capital Corp. Ltd., FRN,Series 2015-CRE4 ‘B’, 144A 3.434%15/08/2032 USD 671,000 630,740 0.03
4,020,949 0.17
ChinaIndustrial & Commercial Bank of ChinaLtd. 2.351% 13/11/2017 USD 250,000 252,273 0.01
252,273 0.01
FranceBanque Federative du Credit MutuelSA, 144A 2% 12/04/2019 USD 245,000 247,381 0.01BNP Paribas SA, 144A 4.375%28/09/2025 USD 1,000,000 1,017,280 0.04BPCE SA 1.625% 26/01/2018 USD 750,000 753,323 0.03BPCE SA, 144A 4.875% 01/04/2026 USD 400,000 409,950 0.02
2,427,934 0.10
GuernseyCredit Suisse Group Funding GuernseyLtd., 144A 3.125% 10/12/2020 USD 300,000 299,623 0.01Credit Suisse Group Funding GuernseyLtd., 144A 3.8% 09/06/2023 USD 250,000 249,499 0.01
549,122 0.02
IsraelAid-israel 0% 01/11/2023 USD 2,000,000 1,736,300 0.07Israel Government AID Bond 0%15/02/2023 USD 1,030,000 912,857 0.04Israel Government AID Bond 0%15/02/2024 USD 4,000,000 3,444,244 0.14Israel Government AID Bond 0%15/08/2024 USD 4,240,000 3,599,743 0.15
Israel Government AID Bond 0%01/11/2024 USD 3,500,000 2,951,424 0.12Israel Government AID Bond 0%15/11/2024 USD 2,880,000 2,425,755 0.10Israel Government AID Bond 0%15/02/2025 USD 2,750,000 2,297,875 0.09Israel Government AID Bond 0%15/08/2025 USD 2,500,000 2,056,713 0.08Israel Government AID Bond 0%15/11/2026 USD 1,300,000 1,025,713 0.04Israel Government AID Bond 5.5%18/09/2033 USD 1,680,000 2,360,761 0.10
22,811,385 0.93
JapanMitsubishi UFJ Trust & Banking Corp.,144A 2.65% 19/10/2020 USD 500,000 513,335 0.02Mizuho Bank Ltd., 144A 1.8%26/03/2018 USD 363,000 364,601 0.02Mizuho Financial Group, Inc., 144A2.632% 12/04/2021 USD 351,000 356,683 0.01
1,234,619 0.05
JerseyUBS Group Funding Jersey Ltd., 144A4.125% 24/09/2025 USD 200,000 208,151 0.01
208,151 0.01
LuxembourgSchlumberger Investment SA, 144A3.3% 14/09/2021 USD 210,000 222,957 0.01Schlumberger Investment SA, 144A2.4% 01/08/2022 USD 360,000 363,117 0.01SES SA, 144A 3.6% 04/04/2023 USD 200,000 202,394 0.01
788,468 0.03
MexicoPetroleos Mexicanos 4.5% 23/01/2026 USD 682,000 654,928 0.03Petroleos Mexicanos 6.625%15/06/2035 USD 500,000 515,443 0.02Petroleos Mexicanos 5.625%23/01/2046 USD 431,000 391,932 0.01
1,562,303 0.06
NetherlandsABN AMRO Bank NV, 144A 1.8%04/06/2018 USD 813,000 820,050 0.03ABN AMRO Bank NV, 144A 4.8%18/04/2026 USD 200,000 209,186 0.01Cooperatieve Rabobank UA 3.375%19/01/2017 USD 136,000 137,763 0.01Cooperatieve Rabobank UA 3.875%08/02/2022 USD 1,053,000 1,145,906 0.05Cooperatieve Rabobank UA 4.625%01/12/2023 USD 250,000 265,159 0.01Cooperatieve Rabobank UA 4.375%04/08/2025 USD 250,000 260,868 0.01Deutsche Telekom InternationalFinance BV, 144A 2.25% 06/03/2017 USD 299,000 301,010 0.01Enel Finance International NV, 144A5.125% 07/10/2019 USD 350,000 385,838 0.02Heineken NV, 144A 1.4% 01/10/2017 USD 230,000 231,106 0.01ING Bank NV, 144A 1.8% 16/03/2018 USD 300,000 301,792 0.01Mylan NV, 144A 3.95% 15/06/2026 USD 296,000 298,991 0.01Mylan NV, 144A 5.25% 15/06/2046 USD 223,000 234,167 0.01Siemens FinancieringsmaatschappijNV, 144A 5.75% 17/10/2016 USD 100,000 101,471 0.00Siemens FinancieringsmaatschappijNV, 144A 2.9% 27/05/2022 USD 430,000 454,557 0.02Siemens FinancieringsmaatschappijNV, 144A 4.4% 27/05/2045 USD 250,000 291,799 0.01
5,439,663 0.22
New ZealandANZ New Zealand Int’l Ltd., 144A 1.75%29/03/2018 USD 481,000 483,119 0.02ANZ New Zealand Int’l Ltd., 144A2.85% 06/08/2020 USD 250,000 258,750 0.01
741,869 0.03
NorwaySpareBank 1 Boligkreditt A/S, 144A1.75% 15/11/2019 USD 1,005,000 1,013,919 0.04
1,013,919 0.04
207
JPMorgan Funds - US Aggregate Bond FundSchedule of Investments (continued)
As at 30 June 2016
Investments Currency
Quantity/Nominal
Value
MarketValue
USD
%of
NetAssets Investments Currency
Quantity/Nominal
Value
MarketValue
USD
%of
NetAssets
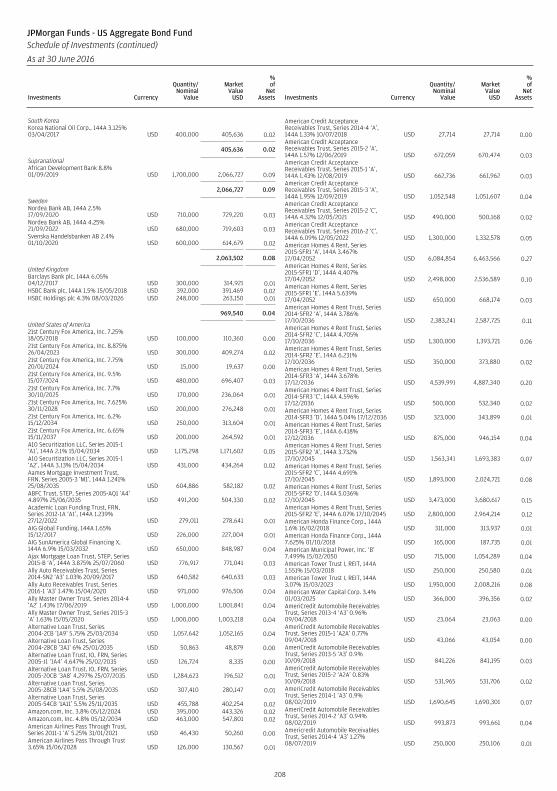
South KoreaKorea National Oil Corp., 144A 3.125%03/04/2017 USD 400,000 405,636 0.02
405,636 0.02
SupranationalAfrican Development Bank 8.8%01/09/2019 USD 1,700,000 2,066,727 0.09
2,066,727 0.09
SwedenNordea Bank AB, 144A 2.5%17/09/2020 USD 710,000 729,220 0.03Nordea Bank AB, 144A 4.25%21/09/2022 USD 680,000 719,603 0.03Svenska Handelsbanken AB 2.4%01/10/2020 USD 600,000 614,679 0.02
2,063,502 0.08
United KingdomBarclays Bank plc, 144A 6.05%04/12/2017 USD 300,000 314,921 0.01HSBC Bank plc, 144A 1.5% 15/05/2018 USD 392,000 391,469 0.02HSBC Holdings plc 4.3% 08/03/2026 USD 248,000 263,150 0.01
969,540 0.04
United States of America21st Century Fox America, Inc. 7.25%18/05/2018 USD 100,000 110,360 0.0021st Century Fox America, Inc. 8.875%26/04/2023 USD 300,000 409,274 0.0221st Century Fox America, Inc. 7.75%20/01/2024 USD 15,000 19,637 0.0021st Century Fox America, Inc. 9.5%15/07/2024 USD 480,000 696,407 0.0321st Century Fox America, Inc. 7.7%30/10/2025 USD 170,000 236,064 0.0121st Century Fox America, Inc. 7.625%30/11/2028 USD 200,000 276,248 0.0121st Century Fox America, Inc. 6.2%15/12/2034 USD 250,000 313,604 0.0121st Century Fox America, Inc. 6.65%15/11/2037 USD 200,000 264,592 0.01A10 Securitization LLC, Series 2015-1‘A1’, 144A 2.1% 15/04/2034 USD 1,175,298 1,171,602 0.05A10 Securitization LLC, Series 2015-1‘A2’, 144A 3.13% 15/04/2034 USD 431,000 434,264 0.02Aames Mortgage Investment Trust,FRN, Series 2005-3 ‘M1’, 144A 1.241%25/08/2035 USD 604,886 582,182 0.02ABFC Trust, STEP, Series 2005-AQ1 ‘A4’4.897% 25/06/2035 USD 491,200 504,330 0.02Academic Loan Funding Trust, FRN,Series 2012-1A ‘A1’, 144A 1.239%27/12/2022 USD 279,011 278,641 0.01AIG Global Funding, 144A 1.65%15/12/2017 USD 226,000 227,004 0.01AIG SunAmerica Global Financing X,144A 6.9% 15/03/2032 USD 650,000 848,987 0.04Ajax Mortgage Loan Trust, STEP, Series2015-B ‘A’, 144A 3.875% 25/07/2060 USD 776,917 771,041 0.03Ally Auto Receivables Trust, Series2014-SN2 ‘A3’ 1.03% 20/09/2017 USD 640,582 640,633 0.03Ally Auto Receivables Trust, Series2016-1 ‘A3’ 1.47% 15/04/2020 USD 971,000 976,506 0.04Ally Master Owner Trust, Series 2014-4‘A2’ 1.43% 17/06/2019 USD 1,000,000 1,001,841 0.04Ally Master Owner Trust, Series 2015-3‘A’ 1.63% 15/05/2020 USD 1,000,000 1,003,218 0.04Alternative Loan Trust, Series2004-2CB ‘1A9’ 5.75% 25/03/2034 USD 1,057,642 1,052,165 0.04Alternative Loan Trust, Series2004-28CB ‘3A1’ 6% 25/01/2035 USD 50,863 48,879 0.00Alternative Loan Trust, IO, FRN, Series2005-J1 ‘1A4’ 4.647% 25/02/2035 USD 126,724 8,335 0.00Alternative Loan Trust, IO, FRN, Series2005-20CB ‘3A8’ 4.297% 25/07/2035 USD 1,284,623 196,512 0.01Alternative Loan Trust, Series2005-28CB ‘1A4’ 5.5% 25/08/2035 USD 307,410 280,147 0.01Alternative Loan Trust, Series2005-54CB ‘1A11’ 5.5% 25/11/2035 USD 455,788 402,254 0.02Amazon.com, Inc. 3.8% 05/12/2024 USD 395,000 443,326 0.02Amazon.com, Inc. 4.8% 05/12/2034 USD 463,000 547,801 0.02American Airlines Pass Through Trust,Series 2011-1 ‘A’ 5.25% 31/01/2021 USD 46,430 50,260 0.00American Airlines Pass Through Trust3.65% 15/06/2028 USD 126,000 130,567 0.01
American Credit AcceptanceReceivables Trust, Series 2014-4 ‘A’,144A 1.33% 10/07/2018 USD 27,714 27,714 0.00American Credit AcceptanceReceivables Trust, Series 2015-2 ‘A’,144A 1.57% 12/06/2019 USD 672,059 670,474 0.03American Credit AcceptanceReceivables Trust, Series 2015-1 ‘A’,144A 1.43% 12/08/2019 USD 662,736 661,962 0.03American Credit AcceptanceReceivables Trust, Series 2015-3 ‘A’,144A 1.95% 12/09/2019 USD 1,052,548 1,051,607 0.04American Credit AcceptanceReceivables Trust, Series 2015-2 ‘C’,144A 4.32% 12/05/2021 USD 490,000 500,168 0.02American Credit AcceptanceReceivables Trust, Series 2016-2 ‘C’,144A 6.09% 12/05/2022 USD 1,300,000 1,332,578 0.05American Homes 4 Rent, Series2015-SFR1 ‘A’, 144A 3.467%17/04/2052 USD 6,084,854 6,463,566 0.27American Homes 4 Rent, Series2015-SFR1 ‘D’, 144A 4.407%17/04/2052 USD 2,498,000 2,536,589 0.10American Homes 4 Rent, Series2015-SFR1 ‘E’, 144A 5.639%17/04/2052 USD 650,000 668,174 0.03American Homes 4 Rent Trust, Series2014-SFR2 ‘A’, 144A 3.786%17/10/2036 USD 2,383,241 2,587,725 0.11American Homes 4 Rent Trust, Series2014-SFR2 ‘C’, 144A 4.705%17/10/2036 USD 1,300,000 1,393,721 0.06American Homes 4 Rent Trust, Series2014-SFR2 ‘E’, 144A 6.231%17/10/2036 USD 350,000 373,880 0.02American Homes 4 Rent Trust, Series2014-SFR3 ‘A’, 144A 3.678%17/12/2036 USD 4,539,991 4,887,340 0.20American Homes 4 Rent Trust, Series2014-SFR3 ‘C’, 144A 4.596%17/12/2036 USD 500,000 532,340 0.02American Homes 4 Rent Trust, Series2014-SFR3 ‘D’, 144A 5.04% 17/12/2036 USD 323,000 343,899 0.01American Homes 4 Rent Trust, Series2014-SFR3 ‘E’, 144A 6.418%17/12/2036 USD 875,000 946,154 0.04American Homes 4 Rent Trust, Series2015-SFR2 ‘A’, 144A 3.732%17/10/2045 USD 1,563,341 1,693,383 0.07American Homes 4 Rent Trust, Series2015-SFR2 ‘C’, 144A 4.691%17/10/2045 USD 1,893,000 2,024,721 0.08American Homes 4 Rent Trust, Series2015-SFR2 ‘D’, 144A 5.036%17/10/2045 USD 3,473,000 3,680,617 0.15American Homes 4 Rent Trust, Series2015-SFR2 ‘E’, 144A 6.07% 17/10/2045 USD 2,800,000 2,964,214 0.12American Honda Finance Corp., 144A1.6% 16/02/2018 USD 311,000 313,937 0.01American Honda Finance Corp., 144A7.625% 01/10/2018 USD 165,000 187,735 0.01American Municipal Power, Inc. ‘B’7.499% 15/02/2050 USD 715,000 1,054,289 0.04American Tower Trust I, REIT, 144A1.551% 15/03/2018 USD 250,000 250,580 0.01American Tower Trust I, REIT, 144A3.07% 15/03/2023 USD 1,950,000 2,008,216 0.08American Water Capital Corp. 3.4%01/03/2025 USD 366,000 396,356 0.02AmeriCredit Automobile ReceivablesTrust, Series 2013-4 ‘A3’ 0.96%09/04/2018 USD 23,064 23,063 0.00AmeriCredit Automobile ReceivablesTrust, Series 2015-1 ‘A2A’ 0.77%09/04/2018 USD 43,066 43,054 0.00AmeriCredit Automobile ReceivablesTrust, Series 2013-5 ‘A3’ 0.9%10/09/2018 USD 841,226 841,195 0.03AmeriCredit Automobile ReceivablesTrust, Series 2015-2 ‘A2A’ 0.83%10/09/2018 USD 531,965 531,706 0.02AmeriCredit Automobile ReceivablesTrust, Series 2014-1 ‘A3’ 0.9%08/02/2019 USD 1,690,645 1,690,301 0.07AmeriCredit Automobile ReceivablesTrust, Series 2014-2 ‘A3’ 0.94%08/02/2019 USD 993,873 993,661 0.04Americredit Automobile ReceivablesTrust, Series 2014-4 ‘A3’ 1.27%08/07/2019 USD 250,000 250,106 0.01
208
JPMorgan Funds - US Aggregate Bond FundSchedule of Investments (continued)
As at 30 June 2016
Investments Currency
Quantity/Nominal
Value
MarketValue
USD
%of
NetAssets Investments Currency
Quantity/Nominal
Value
MarketValue
USD
%of
NetAssets
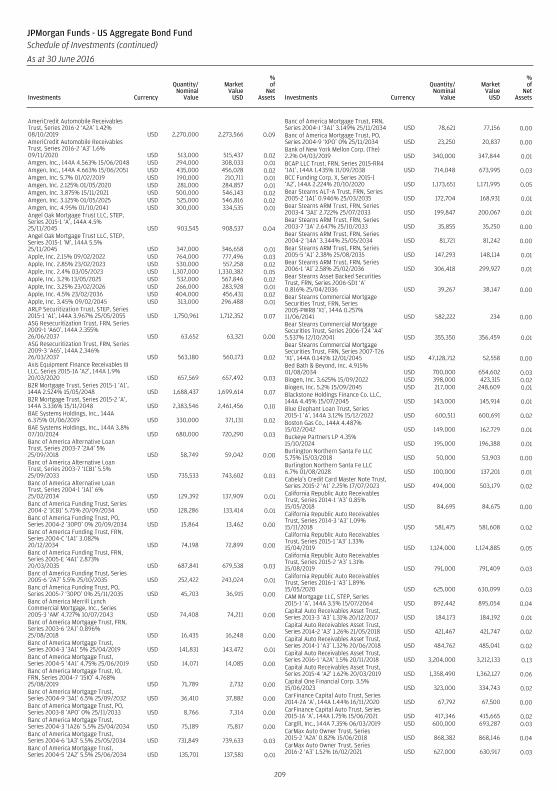
AmeriCredit Automobile ReceivablesTrust, Series 2016-2 ‘A2A’ 1.42%08/10/2019 USD 2,270,000 2,273,566 0.09AmeriCredit Automobile ReceivablesTrust, Series 2016-2 ‘A3’ 1.6%09/11/2020 USD 513,000 515,437 0.02Amgen, Inc., 144A 4.563% 15/06/2048 USD 294,000 308,033 0.01Amgen, Inc., 144A 4.663% 15/06/2051 USD 435,000 456,028 0.02Amgen, Inc. 5.7% 01/02/2019 USD 190,000 210,711 0.01Amgen, Inc. 2.125% 01/05/2020 USD 281,000 284,857 0.01Amgen, Inc. 3.875% 15/11/2021 USD 500,000 546,143 0.02Amgen, Inc. 3.125% 01/05/2025 USD 525,000 546,816 0.02Amgen, Inc. 4.95% 01/10/2041 USD 300,000 334,535 0.01Angel Oak Mortgage Trust LLC, STEP,Series 2015-1 ‘A’, 144A 4.5%25/11/2045 USD 903,545 908,537 0.04Angel Oak Mortgage Trust LLC, STEP,Series 2015-1 ‘M’, 144A 5.5%25/11/2045 USD 347,000 346,658 0.01Apple, Inc. 2.15% 09/02/2022 USD 764,000 777,496 0.03Apple, Inc. 2.85% 23/02/2023 USD 530,000 557,258 0.02Apple, Inc. 2.4% 03/05/2023 USD 1,307,000 1,330,382 0.05Apple, Inc. 3.2% 13/05/2025 USD 532,000 567,846 0.02Apple, Inc. 3.25% 23/02/2026 USD 266,000 283,928 0.01Apple, Inc. 4.5% 23/02/2036 USD 404,000 456,431 0.02Apple, Inc. 3.45% 09/02/2045 USD 313,000 296,488 0.01ARLP Securitization Trust, STEP, Series2015-1 ‘A1’, 144A 3.967% 25/05/2055 USD 1,750,961 1,712,352 0.07ASG Resecuritization Trust, FRN, Series2009-1 ‘A60’, 144A 2.355%26/06/2037 USD 63,652 63,321 0.00ASG Resecuritization Trust, FRN, Series2009-3 ‘A65’, 144A 2.346%26/03/2037 USD 563,180 560,173 0.02Axis Equipment Finance Receivables IIILLC, Series 2015-1A ‘A2’, 144A 1.9%20/03/2020 USD 657,569 657,492 0.03B2R Mortgage Trust, Series 2015-1 ‘A1’,144A 2.524% 15/05/2048 USD 1,688,437 1,699,614 0.07B2R Mortgage Trust, Series 2015-2 ‘A’,144A 3.336% 15/11/2048 USD 2,383,546 2,461,456 0.10BAE Systems Holdings, Inc., 144A6.375% 01/06/2019 USD 330,000 371,131 0.02BAE Systems Holdings, Inc., 144A 3.8%07/10/2024 USD 680,000 720,290 0.03Banc of America Alternative LoanTrust, Series 2003-7 ‘2A4’ 5%25/09/2018 USD 58,749 59,042 0.00Banc of America Alternative LoanTrust, Series 2003-7 ‘1CB1’ 5.5%25/09/2033 USD 735,533 743,602 0.03Banc of America Alternative LoanTrust, Series 2004-1 ‘1A1’ 6%25/02/2034 USD 129,392 137,909 0.01Banc of America Funding Trust, Series2004-2 ‘1CB1’ 5.75% 20/09/2034 USD 128,286 133,414 0.01Banc of America Funding Trust, PO,Series 2004-2 ‘30PO’ 0% 20/09/2034 USD 15,864 13,462 0.00Banc of America Funding Trust, FRN,Series 2004-C ‘1A1’ 3.082%20/12/2034 USD 74,198 72,899 0.00Banc of America Funding Trust, FRN,Series 2005-E ‘4A1’ 2.873%20/03/2035 USD 687,841 679,538 0.03Banc of America Funding Trust, Series2005-6 ‘2A7’ 5.5% 25/10/2035 USD 252,422 243,024 0.01Banc of America Funding Trust, PO,Series 2005-7 ‘30PO’ 0% 25/11/2035 USD 45,703 36,915 0.00Banc of America Merrill LynchCommercial Mortgage, Inc., Series2005-3 ‘AM’ 4.727% 10/07/2043 USD 74,408 74,211 0.00Banc of America Mortgage Trust, FRN,Series 2003-6 ‘2A1’ 0.896%25/08/2018 USD 16,435 16,248 0.00Banc of America Mortgage Trust,Series 2004-3 ‘3A1’ 5% 25/04/2019 USD 141,831 143,472 0.01Banc of America Mortgage Trust,Series 2004-5 ‘4A1’ 4.75% 25/06/2019 USD 14,071 14,085 0.00Banc of America Mortgage Trust, IO,FRN, Series 2004-7 ‘15IO’ 4.768%25/08/2019 USD 71,789 2,732 0.00Banc of America Mortgage Trust,Series 2004-9 ‘3A1’ 6.5% 25/09/2032 USD 36,410 37,882 0.00Banc of America Mortgage Trust, PO,Series 2003-8 ‘APO’ 0% 25/11/2033 USD 8,766 7,314 0.00Banc of America Mortgage Trust,Series 2004-3 ‘1A26’ 5.5% 25/04/2034 USD 75,189 75,817 0.00Banc of America Mortgage Trust,Series 2004-6 ‘1A3’ 5.5% 25/05/2034 USD 731,849 739,633 0.03Banc of America Mortgage Trust,Series 2004-5 ‘2A2’ 5.5% 25/06/2034 USD 135,701 137,581 0.01
Banc of America Mortgage Trust, FRN,Series 2004-J ‘3A1’ 3.149% 25/11/2034 USD 78,621 77,156 0.00Banc of America Mortgage Trust, PO,Series 2004-9 ‘XPO’ 0% 25/11/2034 USD 23,250 20,837 0.00Bank of New York Mellon Corp. (The)2.2% 04/03/2019 USD 340,000 347,844 0.01BCAP LLC Trust, FRN, Series 2015-RR4‘1A1’, 144A 1.435% 11/09/2038 USD 714,048 673,995 0.03BCC Funding Corp. X, Series 2015-1‘A2’, 144A 2.224% 20/10/2020 USD 1,173,651 1,171,995 0.05Bear Stearns ALT-A Trust, FRN, Series2005-2 ‘1A1’ 0.946% 25/03/2035 USD 172,704 168,931 0.01Bear Stearns ARM Trust, FRN, Series2003-4 ‘3A1’ 2.722% 25/07/2033 USD 199,847 200,067 0.01Bear Stearns ARM Trust, FRN, Series2003-7 ‘3A’ 2.647% 25/10/2033 USD 35,855 35,250 0.00Bear Stearns ARM Trust, FRN, Series2004-2 ‘14A’ 3.344% 25/05/2034 USD 81,721 81,242 0.00Bear Stearns ARM Trust, FRN, Series2005-5 ‘A1’ 2.38% 25/08/2035 USD 147,293 148,114 0.01Bear Stearns ARM Trust, FRN, Series2006-1 ‘A1’ 2.58% 25/02/2036 USD 306,418 299,927 0.01Bear Stearns Asset Backed SecuritiesTrust, FRN, Series 2006-SD1 ‘A’0.816% 25/04/2036 USD 39,267 38,147 0.00Bear Stearns Commercial MortgageSecurities Trust, FRN, Series2005-PWR8 ‘X1’, 144A 0.257%11/06/2041 USD 582,222 234 0.00Bear Stearns Commercial MortgageSecurities Trust, Series 2006-T24 ‘A4’5.537% 12/10/2041 USD 355,350 356,459 0.01Bear Stearns Commercial MortgageSecurities Trust, FRN, Series 2007-T26‘X1’, 144A 0.141% 12/01/2045 USD 47,128,712 52,558 0.00Bed Bath & Beyond, Inc. 4.915%01/08/2034 USD 700,000 654,602 0.03Biogen, Inc. 3.625% 15/09/2022 USD 398,000 423,315 0.02Biogen, Inc. 5.2% 15/09/2045 USD 217,000 248,609 0.01Blackstone Holdings Finance Co. LLC,144A 4.45% 15/07/2045 USD 143,000 145,914 0.01Blue Elephant Loan Trust, Series2015-1 ‘A’, 144A 3.12% 15/12/2022 USD 600,511 600,691 0.02Boston Gas Co., 144A 4.487%15/02/2042 USD 149,000 162,729 0.01Buckeye Partners LP 4.35%15/10/2024 USD 195,000 196,388 0.01Burlington Northern Santa Fe LLC5.75% 15/03/2018 USD 50,000 53,903 0.00Burlington Northern Santa Fe LLC6.7% 01/08/2028 USD 100,000 137,201 0.01Cabela’s Credit Card Master Note Trust,Series 2015-2 ‘A1’ 2.25% 17/07/2023 USD 494,000 503,179 0.02California Republic Auto ReceivablesTrust, Series 2014-1 ‘A3’ 0.85%15/05/2018 USD 84,695 84,675 0.00California Republic Auto ReceivablesTrust, Series 2014-3 ‘A3’ 1.09%15/11/2018 USD 581,475 581,608 0.02California Republic Auto ReceivablesTrust, Series 2015-1 ‘A3’ 1.33%15/04/2019 USD 1,124,000 1,124,885 0.05California Republic Auto ReceivablesTrust, Series 2015-2 ‘A3’ 1.31%15/08/2019 USD 791,000 791,409 0.03California Republic Auto ReceivablesTrust, Series 2016-1 ‘A3’ 1.89%15/05/2020 USD 625,000 630,099 0.03CAM Mortgage LLC, STEP, Series2015-1 ‘A’, 144A 3.5% 15/07/2064 USD 892,442 895,054 0.04Capital Auto Receivables Asset Trust,Series 2013-3 ‘A3’ 1.31% 20/12/2017 USD 184,173 184,192 0.01Capital Auto Receivables Asset Trust,Series 2014-2 ‘A3’ 1.26% 21/05/2018 USD 421,467 421,747 0.02Capital Auto Receivables Asset Trust,Series 2014-1 ‘A3’ 1.32% 20/06/2018 USD 484,762 485,041 0.02Capital Auto Receivables Asset Trust,Series 2016-1 ‘A2A’ 1.5% 20/11/2018 USD 3,204,000 3,212,133 0.13Capital Auto Receivables Asset Trust,Series 2015-4 ‘A2’ 1.62% 20/03/2019 USD 1,358,490 1,362,127 0.06Capital One Financial Corp. 3.5%15/06/2023 USD 323,000 334,743 0.02CarFinance Capital Auto Trust, Series2014-2A ‘A’, 144A 1.44% 16/11/2020 USD 67,792 67,500 0.00CarFinance Capital Auto Trust, Series2015-1A ‘A’, 144A 1.75% 15/06/2021 USD 417,346 415,665 0.02Cargill, Inc., 144A 7.35% 06/03/2019 USD 600,000 693,287 0.03CarMax Auto Owner Trust, Series2015-2 ‘A2A’ 0.82% 15/06/2018 USD 868,382 868,146 0.04CarMax Auto Owner Trust, Series2016-2 ‘A3’ 1.52% 16/02/2021 USD 627,000 630,917 0.03
209
JPMorgan Funds - US Aggregate Bond FundSchedule of Investments (continued)
As at 30 June 2016
Investments Currency
Quantity/Nominal
Value
MarketValue
USD
%of
NetAssets Investments Currency
Quantity/Nominal
Value
MarketValue
USD
%of
NetAssets
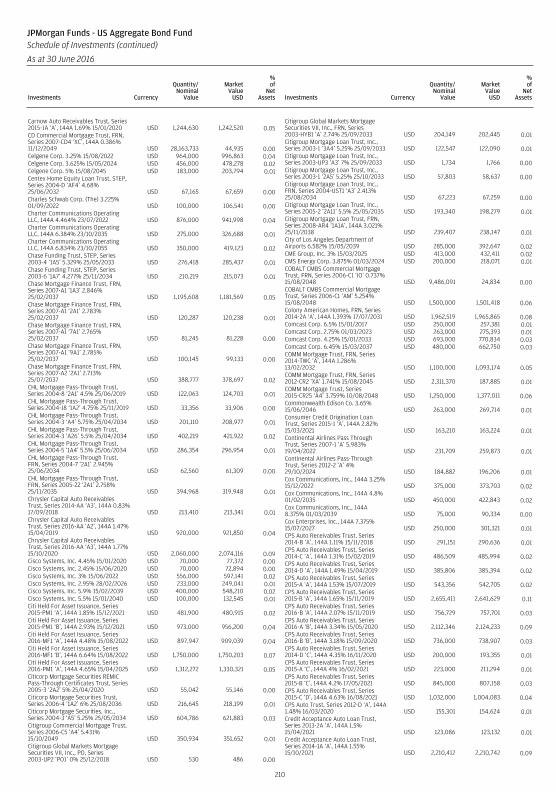
Carnow Auto Receivables Trust, Series2015-1A ‘A’, 144A 1.69% 15/01/2020 USD 1,244,630 1,242,520 0.05CD Commercial Mortgage Trust, FRN,Series 2007-CD4 ‘XC’, 144A 0.386%11/12/2049 USD 28,163,733 44,935 0.00Celgene Corp. 3.25% 15/08/2022 USD 964,000 996,863 0.04Celgene Corp. 3.625% 15/05/2024 USD 456,000 478,278 0.02Celgene Corp. 5% 15/08/2045 USD 183,000 203,794 0.01Centex Home Equity Loan Trust, STEP,Series 2004-D ‘AF4’ 4.68%25/06/2032 USD 67,165 67,659 0.00Charles Schwab Corp. (The) 3.225%01/09/2022 USD 100,000 106,541 0.00Charter Communications OperatingLLC, 144A 4.464% 23/07/2022 USD 876,000 941,998 0.04Charter Communications OperatingLLC, 144A 6.384% 23/10/2035 USD 275,000 326,688 0.01Charter Communications OperatingLLC, 144A 6.834% 23/10/2055 USD 350,000 419,123 0.02Chase Funding Trust, STEP, Series2003-4 ‘1A5’ 5.329% 25/05/2033 USD 276,418 285,437 0.01Chase Funding Trust, STEP, Series2003-6 ‘1A7’ 4.277% 25/11/2034 USD 210,219 215,073 0.01Chase Mortgage Finance Trust, FRN,Series 2007-A1 ‘1A3’ 2.846%25/02/2037 USD 1,195,608 1,181,569 0.05Chase Mortgage Finance Trust, FRN,Series 2007-A1 ‘2A1’ 2.783%25/02/2037 USD 120,287 120,238 0.01Chase Mortgage Finance Trust, FRN,Series 2007-A1 ‘7A1’ 2.765%25/02/2037 USD 81,245 81,228 0.00Chase Mortgage Finance Trust, FRN,Series 2007-A1 ‘9A1’ 2.785%25/02/2037 USD 100,145 99,133 0.00Chase Mortgage Finance Trust, FRN,Series 2007-A2 ‘2A1’ 2.713%25/07/2037 USD 388,777 378,697 0.02CHL Mortgage Pass-Through Trust,Series 2004-8 ‘2A1’ 4.5% 25/06/2019 USD 122,063 124,703 0.01CHL Mortgage Pass-Through Trust,Series 2004-J8 ‘1A2’ 4.75% 25/11/2019 USD 33,356 33,906 0.00CHL Mortgage Pass-Through Trust,Series 2004-3 ‘A4’ 5.75% 25/04/2034 USD 201,110 208,977 0.01CHL Mortgage Pass-Through Trust,Series 2004-3 ‘A26’ 5.5% 25/04/2034 USD 402,219 421,922 0.02CHL Mortgage Pass-Through Trust,Series 2004-5 ‘1A4’ 5.5% 25/06/2034 USD 286,354 296,954 0.01CHL Mortgage Pass-Through Trust,FRN, Series 2004-7 ‘2A1’ 2.945%25/06/2034 USD 62,560 61,309 0.00CHL Mortgage Pass-Through Trust,FRN, Series 2005-22 ‘2A1’ 2.758%25/11/2035 USD 394,968 319,948 0.01Chrysler Capital Auto ReceivablesTrust, Series 2014-AA ‘A3’, 144A 0.83%17/09/2018 USD 213,410 213,341 0.01Chrysler Capital Auto ReceivablesTrust, Series 2016-AA ‘A2’, 144A 1.47%15/04/2019 USD 920,000 921,850 0.04Chrysler Capital Auto ReceivablesTrust, Series 2016-AA ‘A3’, 144A 1.77%15/10/2020 USD 2,060,000 2,074,116 0.09Cisco Systems, Inc. 4.45% 15/01/2020 USD 70,000 77,372 0.00Cisco Systems, Inc. 2.45% 15/06/2020 USD 70,000 72,894 0.00Cisco Systems, Inc. 3% 15/06/2022 USD 556,000 597,141 0.02Cisco Systems, Inc. 2.95% 28/02/2026 USD 233,000 249,041 0.01Cisco Systems, Inc. 5.9% 15/02/2039 USD 400,000 548,210 0.02Cisco Systems, Inc. 5.5% 15/01/2040 USD 100,000 132,545 0.01Citi Held For Asset Issuance, Series2015-PM1 ‘A’, 144A 1.85% 15/12/2021 USD 481,900 480,915 0.02Citi Held For Asset Issuance, Series2015-PM1 ‘B’, 144A 2.93% 15/12/2021 USD 973,000 956,200 0.04Citi Held For Asset Issuance, Series2016-MF1 ‘A’, 144A 4.48% 15/08/2022 USD 897,947 909,039 0.04Citi Held For Asset Issuance, Series2016-MF1 ‘B’, 144A 6.64% 15/08/2022 USD 1,750,000 1,750,203 0.07Citi Held For Asset Issuance, Series2016-PM1 ‘A’, 144A 4.65% 15/04/2025 USD 1,312,272 1,330,321 0.05Citicorp Mortgage Securities REMICPass-Through Certificates Trust, Series2005-3 ‘2A2’ 5% 25/04/2020 USD 55,042 55,146 0.00Citicorp Mortgage Securities Trust,Series 2006-4 ‘1A2’ 6% 25/08/2036 USD 216,645 218,199 0.01Citicorp Mortgage Securities, Inc.,Series 2004-3 ‘A5’ 5.25% 25/05/2034 USD 604,786 621,883 0.03Citigroup Commercial Mortgage Trust,Series 2006-C5 ‘A4’ 5.431%15/10/2049 USD 350,934 351,652 0.01Citigroup Global Markets MortgageSecurities VII, Inc., PO, Series2003-UP2 ‘PO1’ 0% 25/12/2018 USD 530 486 0.00
Citigroup Global Markets MortgageSecurities VII, Inc., FRN, Series2003-HYB1 ‘A’ 2.74% 25/09/2033 USD 204,149 202,445 0.01Citigroup Mortgage Loan Trust, Inc.,Series 2003-1 ‘3A4’ 5.25% 25/09/2033 USD 122,547 122,090 0.01Citigroup Mortgage Loan Trust, Inc.,Series 2003-UP3 ‘A3’ 7% 25/09/2033 USD 1,734 1,766 0.00Citigroup Mortgage Loan Trust, Inc.,Series 2003-1 ‘2A5’ 5.25% 25/10/2033 USD 57,803 58,637 0.00Citigroup Mortgage Loan Trust, Inc.,FRN, Series 2004-UST1 ‘A3’ 2.413%25/08/2034 USD 67,223 67,259 0.00Citigroup Mortgage Loan Trust, Inc.,Series 2005-2 ‘2A11’ 5.5% 25/05/2035 USD 193,340 198,279 0.01Citigroup Mortgage Loan Trust, FRN,Series 2008-AR4 ‘1A1A’, 144A 3.021%25/11/2038 USD 239,407 238,147 0.01City of Los Angeles Department ofAirports 6.582% 15/05/2039 USD 285,000 392,647 0.02CME Group, Inc. 3% 15/03/2025 USD 413,000 432,411 0.02CMS Energy Corp. 3.875% 01/03/2024 USD 200,000 218,071 0.01COBALT CMBS Commercial MortgageTrust, FRN, Series 2006-C1 ‘IO’ 0.737%15/08/2048 USD 9,486,091 24,834 0.00COBALT CMBS Commercial MortgageTrust, Series 2006-C1 ‘AM’ 5.254%15/08/2048 USD 1,500,000 1,501,418 0.06Colony American Homes, FRN, Series2014-2A ‘A’, 144A 1.393% 17/07/2031 USD 1,962,519 1,965,865 0.08Comcast Corp. 6.5% 15/01/2017 USD 250,000 257,381 0.01Comcast Corp. 2.75% 01/03/2023 USD 263,000 275,393 0.01Comcast Corp. 4.25% 15/01/2033 USD 693,000 770,834 0.03Comcast Corp. 6.45% 15/03/2037 USD 480,000 662,750 0.03COMM Mortgage Trust, FRN, Series2014-TWC ‘A’, 144A 1.286%13/02/2032 USD 1,100,000 1,093,174 0.05COMM Mortgage Trust, FRN, Series2012-CR2 ‘XA’ 1.741% 15/08/2045 USD 2,311,370 187,885 0.01COMM Mortgage Trust, Series2015-CR25 ‘A4’ 3.759% 10/08/2048 USD 1,250,000 1,377,011 0.06Commonwealth Edison Co. 3.65%15/06/2046 USD 263,000 269,714 0.01Consumer Credit Origination LoanTrust, Series 2015-1 ‘A’, 144A 2.82%15/03/2021 USD 163,210 163,224 0.01Continental Airlines Pass ThroughTrust, Series 2007-1 ‘A’ 5.983%19/04/2022 USD 231,709 259,873 0.01Continental Airlines Pass-ThroughTrust, Series 2012-2 ‘A’ 4%29/10/2024 USD 184,882 196,206 0.01Cox Communications, Inc., 144A 3.25%15/12/2022 USD 375,000 373,703 0.02Cox Communications, Inc., 144A 4.8%01/02/2035 USD 450,000 422,843 0.02Cox Communications, Inc., 144A8.375% 01/03/2039 USD 75,000 90,334 0.00Cox Enterprises, Inc., 144A 7.375%15/07/2027 USD 250,000 301,321 0.01CPS Auto Receivables Trust, Series2014-B ‘A’, 144A 1.11% 15/11/2018 USD 291,151 290,636 0.01CPS Auto Receivables Trust, Series2014-C ‘A’, 144A 1.31% 15/02/2019 USD 486,509 485,994 0.02CPS Auto Receivables Trust, Series2014-D ‘A’, 144A 1.49% 15/04/2019 USD 385,806 385,394 0.02CPS Auto Receivables Trust, Series2015-A ‘A’, 144A 1.53% 15/07/2019 USD 543,356 542,705 0.02CPS Auto Receivables Trust, Series2015-B ‘A’, 144A 1.65% 15/11/2019 USD 2,655,411 2,641,629 0.11CPS Auto Receivables Trust, Series2016-B ‘A’, 144A 2.07% 15/11/2019 USD 756,729 757,701 0.03CPS Auto Receivables Trust, Series2016-A ‘B’, 144A 3.34% 15/05/2020 USD 2,112,346 2,124,233 0.09CPS Auto Receivables Trust, Series2016-B ‘B’, 144A 3.18% 15/09/2020 USD 736,000 738,907 0.03CPS Auto Receivables Trust, Series2014-D ‘C’, 144A 4.35% 16/11/2020 USD 200,000 193,355 0.01CPS Auto Receivables Trust, Series2015-A ‘C’, 144A 4% 16/02/2021 USD 223,000 211,294 0.01CPS Auto Receivables Trust, Series2015-B ‘C’, 144A 4.2% 17/05/2021 USD 845,000 807,158 0.03CPS Auto Receivables Trust, Series2015-C ‘D’, 144A 4.63% 16/08/2021 USD 1,032,000 1,004,083 0.04CPS Auto Trust, Series 2012-D ‘A’, 144A1.48% 16/03/2020 USD 155,301 154,624 0.01Credit Acceptance Auto Loan Trust,Series 2013-2A ‘A’, 144A 1.5%15/04/2021 USD 123,086 123,132 0.01Credit Acceptance Auto Loan Trust,Series 2014-1A ‘A’, 144A 1.55%15/10/2021 USD 2,210,412 2,210,742 0.09
210
JPMorgan Funds - US Aggregate Bond FundSchedule of Investments (continued)
As at 30 June 2016
Investments Currency
Quantity/Nominal
Value
MarketValue
USD
%of
NetAssets Investments Currency
Quantity/Nominal
Value
MarketValue
USD
%of
NetAssets
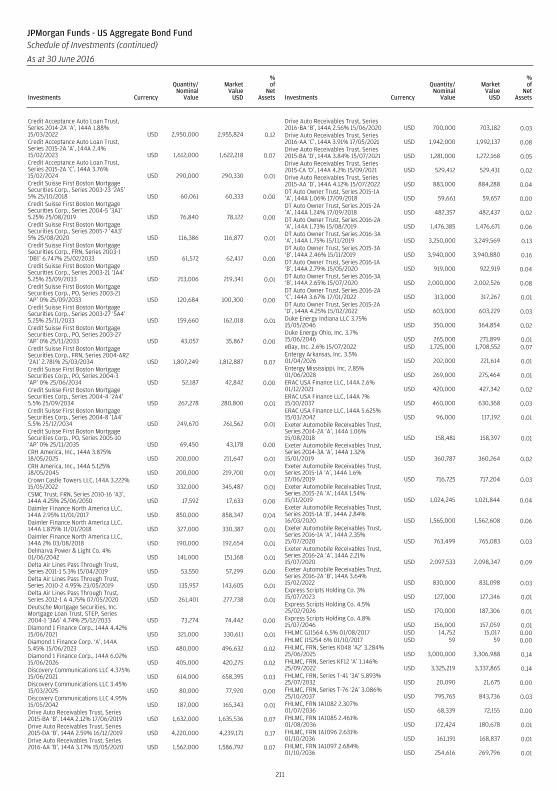
Credit Acceptance Auto Loan Trust,Series 2014-2A ‘A’, 144A 1.88%15/03/2022 USD 2,950,000 2,955,824 0.12Credit Acceptance Auto Loan Trust,Series 2015-2A ‘A’, 144A 2.4%15/02/2023 USD 1,612,000 1,622,218 0.07Credit Acceptance Auto Loan Trust,Series 2015-2A ‘C’, 144A 3.76%15/02/2024 USD 290,000 290,330 0.01Credit Suisse First Boston MortgageSecurities Corp., Series 2003-23 ‘2A5’5% 25/10/2018 USD 60,061 60,333 0.00Credit Suisse First Boston MortgageSecurities Corp., Series 2004-5 ‘3A1’5.25% 25/08/2019 USD 76,840 78,122 0.00Credit Suisse First Boston MortgageSecurities Corp., Series 2005-7 ‘4A3’5% 25/08/2020 USD 116,386 116,877 0.01Credit Suisse First Boston MortgageSecurities Corp., FRN, Series 2003-1‘DB1’ 6.747% 25/02/2033 USD 61,572 62,417 0.00Credit Suisse First Boston MortgageSecurities Corp., Series 2003-21 ‘1A4’5.25% 25/09/2033 USD 213,006 219,341 0.01Credit Suisse First Boston MortgageSecurities Corp., PO, Series 2003-21‘AP’ 0% 25/09/2033 USD 120,684 100,300 0.00Credit Suisse First Boston MortgageSecurities Corp., Series 2003-27 ‘5A4’5.25% 25/11/2033 USD 159,660 162,018 0.01Credit Suisse First Boston MortgageSecurities Corp., PO, Series 2003-27‘AP’ 0% 25/11/2033 USD 43,057 35,867 0.00Credit Suisse First Boston MortgageSecurities Corp., FRN, Series 2004-AR2‘2A1’ 2.781% 25/03/2034 USD 1,807,249 1,812,887 0.07Credit Suisse First Boston MortgageSecurities Corp., PO, Series 2004-3‘AP’ 0% 25/06/2034 USD 52,187 42,842 0.00Credit Suisse First Boston MortgageSecurities Corp., Series 2004-4 ‘2A4’5.5% 25/09/2034 USD 267,278 280,800 0.01Credit Suisse First Boston MortgageSecurities Corp., Series 2004-8 ‘1A4’5.5% 25/12/2034 USD 249,670 261,562 0.01Credit Suisse First Boston MortgageSecurities Corp., PO, Series 2005-10‘AP’ 0% 25/11/2035 USD 69,450 43,178 0.00CRH America, Inc., 144A 3.875%18/05/2025 USD 200,000 211,647 0.01CRH America, Inc., 144A 5.125%18/05/2045 USD 200,000 219,700 0.01Crown Castle Towers LLC, 144A 3.222%15/05/2022 USD 332,000 345,487 0.01CSMC Trust, FRN, Series 2010-16 ‘A3’,144A 4.25% 25/06/2050 USD 17,592 17,633 0.00Daimler Finance North America LLC,144A 2.95% 11/01/2017 USD 850,000 858,347 0.04Daimler Finance North America LLC,144A 1.875% 11/01/2018 USD 327,000 330,387 0.01Daimler Finance North America LLC,144A 2% 03/08/2018 USD 190,000 192,654 0.01Delmarva Power & Light Co. 4%01/06/2042 USD 141,000 151,168 0.01Delta Air Lines Pass Through Trust,Series 2011-1 5.3% 15/04/2019 USD 53,550 57,299 0.00Delta Air Lines Pass Through Trust,Series 2010-2 4.95% 23/05/2019 USD 135,957 143,605 0.01Delta Air Lines Pass Through Trust,Series 2012-1 A 4.75% 07/05/2020 USD 261,401 277,738 0.01Deutsche Mortgage Securities, Inc.Mortgage Loan Trust, STEP, Series2004-1 ‘3A6’ 4.74% 25/12/2033 USD 73,274 74,442 0.00Diamond 1 Finance Corp., 144A 4.42%15/06/2021 USD 321,000 330,611 0.01Diamond 1 Finance Corp. ‘A’, 144A5.45% 15/06/2023 USD 480,000 496,632 0.02Diamond 1 Finance Corp., 144A 6.02%15/06/2026 USD 405,000 420,275 0.02Discovery Communications LLC 4.375%15/06/2021 USD 614,000 658,395 0.03Discovery Communications LLC 3.45%15/03/2025 USD 80,000 77,920 0.00Discovery Communications LLC 4.95%15/05/2042 USD 187,000 165,343 0.01Drive Auto Receivables Trust, Series2015-BA ‘B’, 144A 2.12% 17/06/2019 USD 1,632,000 1,635,536 0.07Drive Auto Receivables Trust, Series2015-DA ‘B’, 144A 2.59% 16/12/2019 USD 4,220,000 4,239,171 0.17Drive Auto Receivables Trust, Series2016-AA ‘B’, 144A 3.17% 15/05/2020 USD 1,562,000 1,586,792 0.07
Drive Auto Receivables Trust, Series2016-BA ‘B’, 144A 2.56% 15/06/2020 USD 700,000 703,182 0.03Drive Auto Receivables Trust, Series2016-AA ‘C’, 144A 3.91% 17/05/2021 USD 1,942,000 1,992,137 0.08Drive Auto Receivables Trust, Series2015-BA ‘D’, 144A 3.84% 15/07/2021 USD 1,281,000 1,272,168 0.05Drive Auto Receivables Trust, Series2015-CA ‘D’, 144A 4.2% 15/09/2021 USD 529,412 529,431 0.02Drive Auto Receivables Trust, Series2015-AA ‘D’, 144A 4.12% 15/07/2022 USD 883,000 884,288 0.04DT Auto Owner Trust, Series 2015-1A‘A’, 144A 1.06% 17/09/2018 USD 59,661 59,657 0.00DT Auto Owner Trust, Series 2015-2A‘A’, 144A 1.24% 17/09/2018 USD 482,357 482,437 0.02DT Auto Owner Trust, Series 2016-2A‘A’, 144A 1.73% 15/08/2019 USD 1,476,385 1,476,671 0.06DT Auto Owner Trust, Series 2016-3A‘A’, 144A 1.75% 15/11/2019 USD 3,250,000 3,249,569 0.13DT Auto Owner Trust, Series 2015-3A‘B’, 144A 2.46% 15/11/2019 USD 3,940,000 3,940,880 0.16DT Auto Owner Trust, Series 2016-1A‘B’, 144A 2.79% 15/05/2020 USD 919,000 922,919 0.04DT Auto Owner Trust, Series 2016-3A‘B’, 144A 2.65% 15/07/2020 USD 2,000,000 2,002,526 0.08DT Auto Owner Trust, Series 2016-2A‘C’, 144A 3.67% 17/01/2022 USD 313,000 317,267 0.01DT Auto Owner Trust, Series 2015-2A‘D’, 144A 4.25% 15/02/2022 USD 603,000 603,229 0.03Duke Energy Indiana LLC 3.75%15/05/2046 USD 350,000 364,854 0.02Duke Energy Ohio, Inc. 3.7%15/06/2046 USD 265,000 271,899 0.01eBay, Inc. 2.6% 15/07/2022 USD 1,725,000 1,708,552 0.07Entergy Arkansas, Inc. 3.5%01/04/2026 USD 202,000 221,614 0.01Entergy Mississippi, Inc. 2.85%01/06/2028 USD 269,000 275,464 0.01ERAC USA Finance LLC, 144A 2.6%01/12/2021 USD 420,000 427,342 0.02ERAC USA Finance LLC, 144A 7%15/10/2037 USD 460,000 630,368 0.03ERAC USA Finance LLC, 144A 5.625%15/03/2042 USD 96,000 117,192 0.01Exeter Automobile Receivables Trust,Series 2014-2A ‘A’, 144A 1.06%15/08/2018 USD 158,481 158,397 0.01Exeter Automobile Receivables Trust,Series 2014-3A ‘A’, 144A 1.32%15/01/2019 USD 360,787 360,264 0.02Exeter Automobile Receivables Trust,Series 2015-1A ‘A’, 144A 1.6%17/06/2019 USD 716,725 717,204 0.03Exeter Automobile Receivables Trust,Series 2015-2A ‘A’, 144A 1.54%15/11/2019 USD 1,024,245 1,021,844 0.04Exeter Automobile Receivables Trust,Series 2015-1A ‘B’, 144A 2.84%16/03/2020 USD 1,565,000 1,562,608 0.06Exeter Automobile Receivables Trust,Series 2016-1A ‘A’, 144A 2.35%15/07/2020 USD 763,499 765,083 0.03Exeter Automobile Receivables Trust,Series 2016-2A ‘A’, 144A 2.21%15/07/2020 USD 2,097,533 2,098,347 0.09Exeter Automobile Receivables Trust,Series 2016-2A ‘B’, 144A 3.64%15/02/2022 USD 830,000 831,098 0.03Express Scripts Holding Co. 3%15/07/2023 USD 127,000 127,346 0.01Express Scripts Holding Co. 4.5%25/02/2026 USD 170,000 187,306 0.01Express Scripts Holding Co. 4.8%15/07/2046 USD 156,000 157,059 0.01FHLMC G11564 6.5% 01/08/2017 USD 14,752 15,017 0.00FHLMC J15254 6% 01/10/2017 USD 59 59 0.00FHLMC, FRN, Series K048 ‘A2’ 3.284%25/06/2025 USD 3,000,000 3,306,988 0.14FHLMC, FRN, Series KF12 ‘A’ 1.146%25/09/2022 USD 3,325,219 3,337,865 0.14FHLMC, FRN, Series T-41 ‘3A’ 5.893%25/07/2032 USD 20,090 21,675 0.00FHLMC, FRN, Series T-76 ‘2A’ 3.086%25/10/2037 USD 795,765 843,736 0.03FHLMC, FRN 1A1082 2.307%01/07/2036 USD 68,339 72,155 0.00FHLMC, FRN 1A1085 2.461%01/08/2036 USD 172,424 180,678 0.01FHLMC, FRN 1A1096 2.631%01/10/2036 USD 161,191 168,837 0.01FHLMC, FRN 1A1097 2.684%01/10/2036 USD 254,616 269,796 0.01
211
JPMorgan Funds - US Aggregate Bond FundSchedule of Investments (continued)
As at 30 June 2016
Investments Currency
Quantity/Nominal
Value
MarketValue
USD
%of
NetAssets Investments Currency
Quantity/Nominal
Value
MarketValue
USD
%of
NetAssets
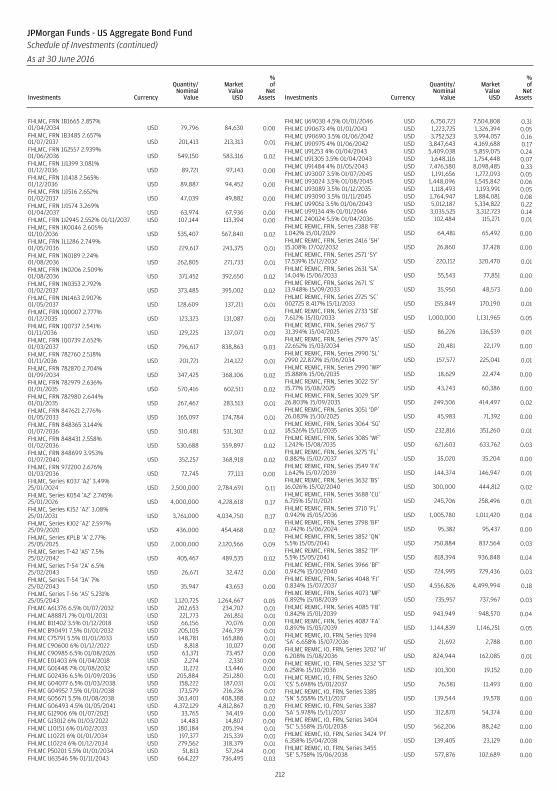
FHLMC, FRN 1B1665 2.857%01/04/2034 USD 79,796 84,630 0.00FHLMC, FRN 1B3485 2.657%01/07/2037 USD 201,413 213,313 0.01FHLMC, FRN 1G2557 2.939%01/06/2036 USD 549,150 583,316 0.02FHLMC, FRN 1J1399 3.081%01/12/2036 USD 89,721 97,143 0.00FHLMC, FRN 1J1418 2.565%01/12/2036 USD 89,887 94,452 0.00FHLMC, FRN 1J1516 2.652%01/02/2037 USD 47,039 49,882 0.00FHLMC, FRN 1J1574 3.269%01/04/2037 USD 63,974 67,936 0.00FHLMC, FRN 1J2945 2.552% 01/11/2037 USD 107,144 113,394 0.00FHLMC, FRN 1K0046 2.605%01/10/2036 USD 535,407 567,840 0.02FHLMC, FRN 1L1286 2.749%01/05/2036 USD 229,617 243,375 0.01FHLMC, FRN 1N0189 2.24%01/08/2036 USD 262,805 271,733 0.01FHLMC, FRN 1N0206 2.509%01/08/2036 USD 371,452 392,650 0.02FHLMC, FRN 1N0353 2.792%01/02/2037 USD 373,485 395,002 0.02FHLMC, FRN 1N1463 2.907%01/05/2037 USD 128,609 137,211 0.01FHLMC, FRN 1Q0007 2.777%01/12/2035 USD 123,323 131,087 0.01FHLMC, FRN 1Q0737 2.541%01/11/2036 USD 129,225 137,071 0.01FHLMC, FRN 1Q0739 2.652%01/03/2037 USD 796,617 838,863 0.03FHLMC, FRN 782760 2.518%01/11/2036 USD 201,721 214,122 0.01FHLMC, FRN 782870 2.704%01/09/2034 USD 347,425 368,106 0.02FHLMC, FRN 782979 2.636%01/01/2035 USD 570,416 602,511 0.02FHLMC, FRN 782980 2.644%01/01/2035 USD 267,467 283,513 0.01FHLMC, FRN 847621 2.776%01/05/2033 USD 165,097 174,784 0.01FHLMC, FRN 848365 3.144%01/07/2036 USD 510,481 531,302 0.02FHLMC, FRN 848431 2.558%01/02/2036 USD 530,688 559,897 0.02FHLMC, FRN 848699 3.953%01/07/2040 USD 352,257 368,918 0.02FHLMC, FRN 972200 2.676%01/03/2036 USD 72,745 77,113 0.00FHLMC, Series K037 ‘A2’ 3.49%25/01/2024 USD 2,500,000 2,784,691 0.11FHLMC, Series K054 ‘A2’ 2.745%25/01/2026 USD 4,000,000 4,228,618 0.17FHLMC, Series K152 ‘A2’ 3.08%25/01/2031 USD 3,761,000 4,034,750 0.17FHLMC, Series KJ02 ‘A2’ 2.597%25/09/2020 USD 436,000 454,468 0.02FHLMC, Series KPLB ‘A’ 2.77%25/05/2025 USD 2,000,000 2,120,566 0.09FHLMC, Series T-42 ‘A5’ 7.5%25/02/2042 USD 405,467 489,535 0.02FHLMC, Series T-54 ‘2A’ 6.5%25/02/2043 USD 26,671 32,472 0.00FHLMC, Series T-54 ‘3A’ 7%25/02/2043 USD 35,947 43,653 0.00FHLMC, Series T-56 ‘A5’ 5.231%25/05/2043 USD 1,120,725 1,264,667 0.05FHLMC A61376 6.5% 01/07/2032 USD 202,653 234,707 0.01FHLMC A88871 7% 01/01/2031 USD 221,773 261,851 0.01FHLMC B11402 3.5% 01/12/2018 USD 66,156 70,076 0.00FHLMC B90491 7.5% 01/01/2032 USD 205,105 246,739 0.01FHLMC C75791 5.5% 01/01/2033 USD 148,781 165,886 0.01FHLMC C90600 6% 01/12/2022 USD 8,818 10,027 0.00FHLMC C90985 6.5% 01/08/2026 USD 63,371 73,457 0.00FHLMC E01403 6% 01/04/2018 USD 2,274 2,330 0.00FHLMC G01448 7% 01/08/2032 USD 11,272 13,446 0.00FHLMC G02436 6.5% 01/09/2036 USD 205,884 251,280 0.01FHLMC G04077 6.5% 01/03/2038 USD 158,222 187,031 0.01FHLMC G04952 7.5% 01/01/2038 USD 173,579 216,236 0.01FHLMC G05671 5.5% 01/08/2038 USD 363,401 408,388 0.02FHLMC G06493 4.5% 01/05/2041 USD 4,372,129 4,812,867 0.20FHLMC G12906 6% 01/07/2021 USD 33,765 34,419 0.00FHLMC G13012 6% 01/03/2022 USD 14,483 14,807 0.00FHLMC L10151 6% 01/02/2033 USD 180,184 205,194 0.01FHLMC L10221 6% 01/01/2034 USD 197,377 215,339 0.01FHLMC L10224 6% 01/12/2034 USD 279,562 318,379 0.01FHLMC P50201 5.5% 01/01/2034 USD 51,813 57,264 0.00FHLMC U63546 5% 01/11/2043 USD 664,227 736,495 0.03
FHLMC U69030 4.5% 01/01/2046 USD 6,750,721 7,504,808 0.31FHLMC U90673 4% 01/01/2043 USD 1,223,725 1,326,394 0.05FHLMC U90690 3.5% 01/06/2042 USD 3,752,523 3,994,057 0.16FHLMC U90975 4% 01/06/2042 USD 3,847,643 4,169,688 0.17FHLMC U91253 4% 01/04/2043 USD 5,409,038 5,859,075 0.24FHLMC U91305 3.5% 01/04/2043 USD 1,648,116 1,754,448 0.07FHLMC U91484 4% 01/05/2043 USD 7,476,580 8,098,485 0.33FHLMC U93007 3.5% 01/07/2045 USD 1,191,656 1,272,093 0.05FHLMC U93024 3.5% 01/08/2045 USD 1,448,096 1,545,842 0.06FHLMC U93089 3.5% 01/12/2035 USD 1,118,493 1,193,991 0.05FHLMC U93090 3.5% 01/11/2045 USD 1,764,947 1,884,081 0.08FHLMC U99051 3.5% 01/06/2043 USD 5,012,187 5,334,822 0.22FHLMC U99134 4% 01/01/2046 USD 3,035,525 3,312,723 0.14FHLMC Z40024 5.5% 01/04/2036 USD 102,484 115,271 0.01FHLMC REMIC, FRN, Series 2388 ‘FB’1.042% 15/01/2029 USD 64,481 65,492 0.00FHLMC REMIC, FRN, Series 2416 ‘SH’15.108% 17/02/2032 USD 26,860 37,428 0.00FHLMC REMIC, FRN, Series 2571 ‘SY’17.539% 15/12/2032 USD 220,112 320,470 0.01FHLMC REMIC, FRN, Series 2631 ‘SA’14.04% 15/06/2033 USD 55,543 77,851 0.00FHLMC REMIC, FRN, Series 2671 ‘S’13.948% 15/09/2033 USD 35,950 48,573 0.00FHLMC REMIC, FRN, Series 2725 ‘SC’002725 8.417% 15/11/2033 USD 155,849 170,190 0.01FHLMC REMIC, FRN, Series 2733 ‘SB’7.612% 15/10/2033 USD 1,000,000 1,131,965 0.05FHLMC REMIC, FRN, Series 2967 ‘S’31.394% 15/04/2025 USD 86,226 136,539 0.01FHLMC REMIC, FRN, Series 2979 ‘AS’22.652% 15/03/2034 USD 20,481 22,179 0.00FHLMC REMIC, FRN, Series 2990 ‘SL’2990 22.872% 15/06/2034 USD 157,577 225,041 0.01FHLMC REMIC, FRN, Series 2990 ‘WP’15.888% 15/06/2035 USD 18,629 22,474 0.00FHLMC REMIC, FRN, Series 3022 ‘SY’15.77% 15/08/2025 USD 43,243 60,386 0.00FHLMC REMIC, FRN, Series 3029 ‘SP’26.803% 15/09/2035 USD 249,506 414,497 0.02FHLMC REMIC, FRN, Series 3051 ‘DP’26.083% 15/10/2025 USD 45,983 71,392 0.00FHLMC REMIC, FRN, Series 3064 ‘SG’18.526% 15/11/2035 USD 232,816 351,260 0.01FHLMC REMIC, FRN, Series 3085 ‘WF’1.242% 15/08/2035 USD 621,603 633,762 0.03FHLMC REMIC, FRN, Series 3275 ‘FL’0.882% 15/02/2037 USD 35,020 35,204 0.00FHLMC REMIC, FRN, Series 3549 ‘FA’1.642% 15/07/2039 USD 144,374 146,947 0.01FHLMC REMIC, FRN, Series 3632 ‘BS’16.026% 15/02/2040 USD 300,000 444,812 0.02FHLMC REMIC, FRN, Series 3688 ‘CU’6.715% 15/11/2021 USD 245,706 258,496 0.01FHLMC REMIC, FRN, Series 3710 ‘FL’0.942% 15/05/2036 USD 1,005,780 1,011,420 0.04FHLMC REMIC, FRN, Series 3798 ‘BF’0.742% 15/06/2024 USD 95,382 95,437 0.00FHLMC REMIC, FRN, Series 3852 ‘QN’5.5% 15/05/2041 USD 750,884 837,564 0.03FHLMC REMIC, FRN, Series 3852 ‘TP’5.5% 15/05/2041 USD 818,394 936,848 0.04FHLMC REMIC, FRN, Series 3966 ‘BF’0.942% 15/10/2040 USD 724,995 729,436 0.03FHLMC REMIC, FRN, Series 4048 ‘FJ’0.834% 15/07/2037 USD 4,556,826 4,499,994 0.18FHLMC REMIC, FRN, Series 4073 ‘MF’0.892% 15/08/2039 USD 735,957 737,967 0.03FHLMC REMIC, FRN, Series 4085 ‘FB’0.842% 15/01/2039 USD 943,949 948,570 0.04FHLMC REMIC, FRN, Series 4087 ‘FA’0.892% 15/05/2039 USD 1,144,839 1,146,251 0.05FHLMC REMIC, IO, FRN, Series 3194‘SA’ 6.658% 15/07/2036 USD 21,692 2,788 0.00FHLMC REMIC, IO, FRN, Series 3202 ‘HI’6.208% 15/08/2036 USD 824,944 162,085 0.01FHLMC REMIC, IO, FRN, Series 3232 ‘ST’6.258% 15/10/2036 USD 101,300 19,152 0.00FHLMC REMIC, IO, FRN, Series 3260‘CS’ 5.698% 15/01/2037 USD 76,581 11,493 0.00FHLMC REMIC, IO, FRN, Series 3385‘SN’ 5.558% 15/11/2037 USD 139,544 19,578 0.00FHLMC REMIC, IO, FRN, Series 3387‘SA’ 5.978% 15/11/2037 USD 312,870 54,374 0.00FHLMC REMIC, IO, FRN, Series 3404‘SC’ 5.558% 15/01/2038 USD 562,206 88,242 0.00FHLMC REMIC, IO, FRN, Series 3424 ‘PI’6.358% 15/04/2038 USD 139,405 23,129 0.00FHLMC REMIC, IO, FRN, Series 3455‘SE’ 5.758% 15/06/2038 USD 577,876 102,689 0.00
212
JPMorgan Funds - US Aggregate Bond FundSchedule of Investments (continued)
As at 30 June 2016
Investments Currency
Quantity/Nominal
Value
MarketValue
USD
%of
NetAssets Investments Currency
Quantity/Nominal
Value
MarketValue
USD
%of
NetAssets
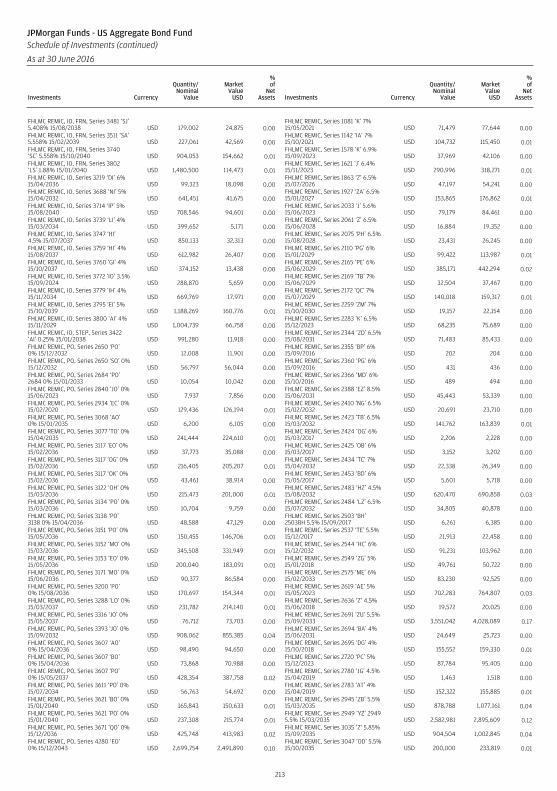
FHLMC REMIC, IO, FRN, Series 3481 ‘SJ’5.408% 15/08/2038 USD 179,002 24,875 0.00FHLMC REMIC, IO, FRN, Series 3511 ‘SA’5.558% 15/02/2039 USD 227,061 42,569 0.00FHLMC REMIC, IO, FRN, Series 3740‘SC’ 5.558% 15/10/2040 USD 904,053 154,662 0.01FHLMC REMIC, IO, FRN, Series 3802‘LS’ 1.88% 15/01/2040 USD 1,480,500 114,473 0.01FHLMC REMIC, IO, Series 3219 ‘DI’ 6%15/04/2036 USD 99,323 18,098 0.00FHLMC REMIC, IO, Series 3688 ‘NI’ 5%15/04/2032 USD 641,451 41,675 0.00FHLMC REMIC, IO, Series 3714 ‘IP’ 5%15/08/2040 USD 708,546 94,601 0.00FHLMC REMIC, IO, Series 3739 ‘LI’ 4%15/03/2034 USD 399,652 5,171 0.00FHLMC REMIC, IO, Series 3747 ‘HI’4.5% 15/07/2037 USD 850,133 32,313 0.00FHLMC REMIC, IO, Series 3759 ‘HI’ 4%15/08/2037 USD 612,982 26,407 0.00FHLMC REMIC, IO, Series 3760 ‘GI’ 4%15/10/2037 USD 374,152 13,438 0.00FHLMC REMIC, IO, Series 3772 ‘IO’ 3.5%15/09/2024 USD 288,870 5,659 0.00FHLMC REMIC, IO, Series 3779 ‘IH’ 4%15/11/2034 USD 669,769 17,971 0.00FHLMC REMIC, IO, Series 3795 ‘EI’ 5%15/10/2039 USD 1,188,269 160,776 0.01FHLMC REMIC, IO, Series 3800 ‘AI’ 4%15/11/2029 USD 1,004,739 66,758 0.00FHLMC REMIC, IO, STEP, Series 3422‘AI’ 0.25% 15/01/2038 USD 991,280 11,918 0.00FHLMC REMIC, PO, Series 2650 ‘PO’0% 15/12/2032 USD 12,008 11,901 0.00FHLMC REMIC, PO, Series 2650 ‘SO’ 0%15/12/2032 USD 56,797 56,044 0.00FHLMC REMIC, PO, Series 2684 ‘PO’2684 0% 15/01/2033 USD 10,054 10,042 0.00FHLMC REMIC, PO, Series 2840 ‘JO’ 0%15/06/2023 USD 7,937 7,856 0.00FHLMC REMIC, PO, Series 2934 ‘EC’ 0%15/02/2020 USD 129,436 126,194 0.01FHLMC REMIC, PO, Series 3068 ‘AO’0% 15/01/2035 USD 6,200 6,105 0.00FHLMC REMIC, PO, Series 3077 ‘TO’ 0%15/04/2035 USD 241,444 224,610 0.01FHLMC REMIC, PO, Series 3117 ‘EO’ 0%15/02/2036 USD 37,773 35,088 0.00FHLMC REMIC, PO, Series 3117 ‘OG’ 0%15/02/2036 USD 216,405 205,207 0.01FHLMC REMIC, PO, Series 3117 ‘OK’ 0%15/02/2036 USD 43,461 38,914 0.00FHLMC REMIC, PO, Series 3122 ‘OH’ 0%15/03/2036 USD 215,473 201,000 0.01FHLMC REMIC, PO, Series 3134 ‘PO’ 0%15/03/2036 USD 10,704 9,759 0.00FHLMC REMIC, PO, Series 3138 ‘PO’3138 0% 15/04/2036 USD 48,588 47,129 0.00FHLMC REMIC, PO, Series 3151 ‘PO’ 0%15/05/2036 USD 150,455 146,706 0.01FHLMC REMIC, PO, Series 3152 ‘MO’ 0%15/03/2036 USD 345,508 331,949 0.01FHLMC REMIC, PO, Series 3153 ‘EO’ 0%15/05/2036 USD 200,040 183,091 0.01FHLMC REMIC, PO, Series 3171 ‘MO’ 0%15/06/2036 USD 90,377 86,584 0.00FHLMC REMIC, PO, Series 3200 ‘PO’0% 15/08/2036 USD 170,697 154,344 0.01FHLMC REMIC, PO, Series 3288 ‘LO’ 0%15/03/2037 USD 231,782 214,140 0.01FHLMC REMIC, PO, Series 3316 ‘JO’ 0%15/05/2037 USD 76,712 73,703 0.00FHLMC REMIC, PO, Series 3393 ‘JO’ 0%15/09/2032 USD 908,062 855,385 0.04FHLMC REMIC, PO, Series 3607 ‘AO’0% 15/04/2036 USD 98,490 94,650 0.00FHLMC REMIC, PO, Series 3607 ‘BO’0% 15/04/2036 USD 73,868 70,988 0.00FHLMC REMIC, PO, Series 3607 ‘PO’0% 15/05/2037 USD 428,354 387,758 0.02FHLMC REMIC, PO, Series 3611 ‘PO’ 0%15/07/2034 USD 56,763 54,692 0.00FHLMC REMIC, PO, Series 3621 ‘BO’ 0%15/01/2040 USD 165,843 150,633 0.01FHLMC REMIC, PO, Series 3621 ‘PO’ 0%15/01/2040 USD 237,308 215,774 0.01FHLMC REMIC, PO, Series 3671 ‘QO’ 0%15/12/2036 USD 425,748 413,983 0.02FHLMC REMIC, PO, Series 4280 ‘EO’0% 15/12/2043 USD 2,699,754 2,491,890 0.10
FHLMC REMIC, Series 1081 ‘K’ 7%15/05/2021 USD 71,479 77,644 0.00FHLMC REMIC, Series 1142 ‘IA’ 7%15/10/2021 USD 104,732 115,450 0.01FHLMC REMIC, Series 1578 ‘K’ 6.9%15/09/2023 USD 37,969 42,106 0.00FHLMC REMIC, Series 1621 ‘J’ 6.4%15/11/2023 USD 290,996 318,271 0.01FHLMC REMIC, Series 1863 ‘Z’ 6.5%15/07/2026 USD 47,197 54,241 0.00FHLMC REMIC, Series 1927 ‘ZA’ 6.5%15/01/2027 USD 153,865 176,862 0.01FHLMC REMIC, Series 2033 ‘J’ 5.6%15/06/2023 USD 79,179 84,461 0.00FHLMC REMIC, Series 2061 ‘Z’ 6.5%15/06/2028 USD 16,884 19,352 0.00FHLMC REMIC, Series 2075 ‘PH’ 6.5%15/08/2028 USD 23,431 26,245 0.00FHLMC REMIC, Series 2110 ‘PG’ 6%15/01/2029 USD 99,422 113,987 0.01FHLMC REMIC, Series 2165 ‘PE’ 6%15/06/2029 USD 385,171 442,294 0.02FHLMC REMIC, Series 2169 ‘TB’ 7%15/06/2029 USD 32,504 37,467 0.00FHLMC REMIC, Series 2172 ‘QC’ 7%15/07/2029 USD 140,018 159,317 0.01FHLMC REMIC, Series 2259 ‘ZM’ 7%15/10/2030 USD 19,157 22,154 0.00FHLMC REMIC, Series 2283 ‘K’ 6.5%15/12/2023 USD 68,235 75,689 0.00FHLMC REMIC, Series 2344 ‘ZD’ 6.5%15/08/2031 USD 71,483 85,433 0.00FHLMC REMIC, Series 2355 ‘BP’ 6%15/09/2016 USD 202 204 0.00FHLMC REMIC, Series 2360 ‘PG’ 6%15/09/2016 USD 431 436 0.00FHLMC REMIC, Series 2366 ‘MD’ 6%15/10/2016 USD 489 494 0.00FHLMC REMIC, Series 2388 ‘EZ’ 8.5%15/06/2031 USD 45,443 53,339 0.00FHLMC REMIC, Series 2410 ‘NG’ 6.5%15/02/2032 USD 20,691 23,710 0.00FHLMC REMIC, Series 2423 ‘TB’ 6.5%15/03/2032 USD 141,762 163,839 0.01FHLMC REMIC, Series 2424 ‘OG’ 6%15/03/2017 USD 2,206 2,228 0.00FHLMC REMIC, Series 2425 ‘OB’ 6%15/03/2017 USD 3,152 3,202 0.00FHLMC REMIC, Series 2434 ‘TC’ 7%15/04/2032 USD 22,338 26,349 0.00FHLMC REMIC, Series 2453 ‘BD’ 6%15/05/2017 USD 5,601 5,718 0.00FHLMC REMIC, Series 2483 ‘HZ’ 4.5%15/08/2032 USD 620,470 690,858 0.03FHLMC REMIC, Series 2484 ‘LZ’ 6.5%15/07/2032 USD 34,805 40,878 0.00FHLMC REMIC, Series 2503 ‘BH’2503BH 5.5% 15/09/2017 USD 6,261 6,385 0.00FHLMC REMIC, Series 2537 ‘TE’ 5.5%15/12/2017 USD 21,913 22,458 0.00FHLMC REMIC, Series 2544 ‘HC’ 6%15/12/2032 USD 91,231 103,962 0.00FHLMC REMIC, Series 2549 ‘ZG’ 5%15/01/2018 USD 49,761 50,722 0.00FHLMC REMIC, Series 2575 ‘ME’ 6%15/02/2033 USD 83,230 92,525 0.00FHLMC REMIC, Series 2619 ‘AE’ 5%15/05/2023 USD 702,283 764,807 0.03FHLMC REMIC, Series 2636 ‘Z’ 4.5%15/06/2018 USD 19,572 20,025 0.00FHLMC REMIC, Series 2691 ‘ZU’ 5.5%15/09/2033 USD 3,551,042 4,028,089 0.17FHLMC REMIC, Series 2694 ‘BA’ 4%15/06/2031 USD 24,649 25,723 0.00FHLMC REMIC, Series 2695 ‘DG’ 4%15/10/2018 USD 155,552 159,330 0.01FHLMC REMIC, Series 2720 ‘PC’ 5%15/12/2023 USD 87,784 95,405 0.00FHLMC REMIC, Series 2780 ‘JG’ 4.5%15/04/2019 USD 1,463 1,518 0.00FHLMC REMIC, Series 2783 ‘AT’ 4%15/04/2019 USD 152,322 155,885 0.01FHLMC REMIC, Series 2945 ‘ZB’ 5.5%15/03/2035 USD 878,788 1,077,161 0.04FHLMC REMIC, Series 2949 ‘YZ’ 29495.5% 15/03/2035 USD 2,582,981 2,895,609 0.12FHLMC REMIC, Series 3035 ‘Z’ 5.85%15/09/2035 USD 904,504 1,002,845 0.04FHLMC REMIC, Series 3047 ‘OD’ 5.5%15/10/2035 USD 200,000 233,819 0.01
213
JPMorgan Funds - US Aggregate Bond FundSchedule of Investments (continued)
As at 30 June 2016
Investments Currency
Quantity/Nominal
Value
MarketValue
USD
%of
NetAssets Investments Currency
Quantity/Nominal
Value
MarketValue
USD
%of
NetAssets
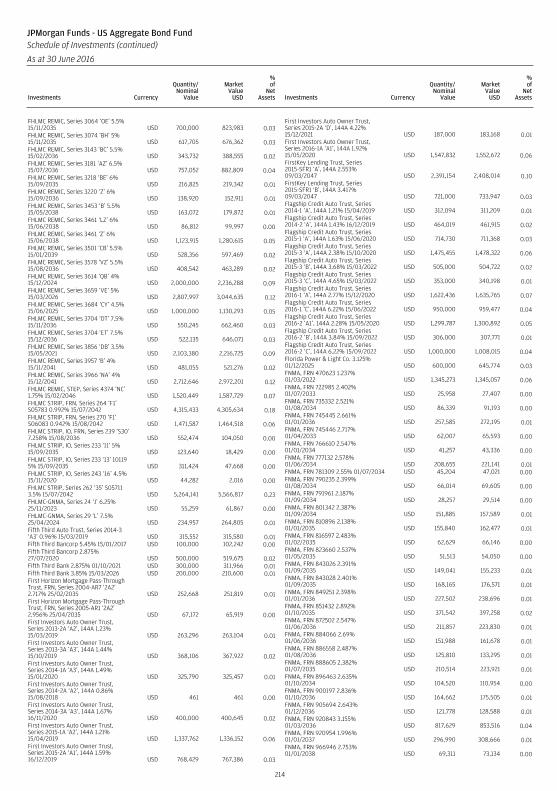
FHLMC REMIC, Series 3064 ‘OE’ 5.5%15/11/2035 USD 700,000 823,983 0.03FHLMC REMIC, Series 3074 ‘BH’ 5%15/11/2035 USD 617,705 676,362 0.03FHLMC REMIC, Series 3143 ‘BC’ 5.5%15/02/2036 USD 343,732 388,555 0.02FHLMC REMIC, Series 3181 ‘AZ’ 6.5%15/07/2036 USD 757,052 882,809 0.04FHLMC REMIC, Series 3218 ‘BE’ 6%15/09/2035 USD 216,825 219,342 0.01FHLMC REMIC, Series 3220 ‘Z’ 6%15/09/2036 USD 138,920 152,911 0.01FHLMC REMIC, Series 3453 ‘B’ 5.5%15/05/2038 USD 163,072 179,872 0.01FHLMC REMIC, Series 3461 ‘LZ’ 6%15/06/2038 USD 86,812 99,997 0.00FHLMC REMIC, Series 3461 ‘Z’ 6%15/06/2038 USD 1,123,915 1,280,615 0.05FHLMC REMIC, Series 3501 ‘CB’ 5.5%15/01/2039 USD 528,356 597,469 0.02FHLMC REMIC, Series 3578 ‘VZ’ 5.5%15/08/2036 USD 408,542 463,289 0.02FHLMC REMIC, Series 3614 ‘QB’ 4%15/12/2024 USD 2,000,000 2,236,288 0.09FHLMC REMIC, Series 3659 ‘VE’ 5%15/03/2026 USD 2,807,997 3,044,635 0.12FHLMC REMIC, Series 3684 ‘CY’ 4.5%15/06/2025 USD 1,000,000 1,130,293 0.05FHLMC REMIC, Series 3704 ‘DT’ 7.5%15/11/2036 USD 550,245 662,460 0.03FHLMC REMIC, Series 3704 ‘ET’ 7.5%15/12/2036 USD 522,135 646,071 0.03FHLMC REMIC, Series 3856 ‘DB’ 3.5%15/05/2021 USD 2,103,380 2,216,725 0.09FHLMC REMIC, Series 3957 ‘B’ 4%15/11/2041 USD 481,055 521,276 0.02FHLMC REMIC, Series 3966 ‘NA’ 4%15/12/2041 USD 2,712,646 2,972,201 0.12FHLMC REMIC, STEP, Series 4374 ‘NC’1.75% 15/02/2046 USD 1,520,449 1,587,729 0.07FHLMC STRIP, FRN, Series 264 ‘F1’S05783 0.992% 15/07/2042 USD 4,315,433 4,305,634 0.18FHLMC STRIP, FRN, Series 270 ‘F1’S06083 0.942% 15/08/2042 USD 1,471,587 1,464,518 0.06FHLMC STRIP, IO, FRN, Series 239 ‘S30’7.258% 15/08/2036 USD 552,474 104,050 0.00FHLMC STRIP, IO, Series 233 ‘11’ 5%15/09/2035 USD 123,640 18,429 0.00FHLMC STRIP, IO, Series 233 ‘13’ 101195% 15/09/2035 USD 311,424 47,668 0.00FHLMC STRIP, IO, Series 243 ‘16’ 4.5%15/11/2020 USD 44,282 2,016 0.00FHLMC STRIP, Series 262 ‘35’ S057113.5% 15/07/2042 USD 5,264,141 5,566,817 0.23FHLMC-GNMA, Series 24 ‘J’ 6.25%25/11/2023 USD 55,259 61,867 0.00FHLMC-GNMA, Series 29 ‘L’ 7.5%25/04/2024 USD 234,957 264,805 0.01Fifth Third Auto Trust, Series 2014-3‘A3’ 0.96% 15/03/2019 USD 315,552 315,580 0.01Fifth Third Bancorp 5.45% 15/01/2017 USD 100,000 102,242 0.00Fifth Third Bancorp 2.875%27/07/2020 USD 500,000 519,675 0.02Fifth Third Bank 2.875% 01/10/2021 USD 300,000 311,966 0.01Fifth Third Bank 3.85% 15/03/2026 USD 200,000 210,600 0.01First Horizon Mortgage Pass-ThroughTrust, FRN, Series 2004-AR7 ‘2A2’2.717% 25/02/2035 USD 252,668 251,819 0.01First Horizon Mortgage Pass-ThroughTrust, FRN, Series 2005-AR1 ‘2A2’2.956% 25/04/2035 USD 67,172 65,919 0.00First Investors Auto Owner Trust,Series 2013-2A ‘A2’, 144A 1.23%15/03/2019 USD 263,296 263,104 0.01First Investors Auto Owner Trust,Series 2013-3A ‘A3’, 144A 1.44%15/10/2019 USD 368,106 367,922 0.02First Investors Auto Owner Trust,Series 2014-1A ‘A3’, 144A 1.49%15/01/2020 USD 325,790 325,457 0.01First Investors Auto Owner Trust,Series 2014-2A ‘A2’, 144A 0.86%15/08/2018 USD 461 461 0.00First Investors Auto Owner Trust,Series 2014-3A ‘A3’, 144A 1.67%16/11/2020 USD 400,000 400,645 0.02First Investors Auto Owner Trust,Series 2015-1A ‘A2’, 144A 1.21%15/04/2019 USD 1,337,762 1,336,152 0.06First Investors Auto Owner Trust,Series 2015-2A ‘A1’, 144A 1.59%16/12/2019 USD 768,429 767,386 0.03
First Investors Auto Owner Trust,Series 2015-2A ‘D’, 144A 4.22%15/12/2021 USD 187,000 183,168 0.01First Investors Auto Owner Trust,Series 2016-1A ‘A1’, 144A 1.92%15/05/2020 USD 1,547,832 1,552,672 0.06FirstKey Lending Trust, Series2015-SFR1 ‘A’, 144A 2.553%09/03/2047 USD 2,391,154 2,408,014 0.10FirstKey Lending Trust, Series2015-SFR1 ‘B’, 144A 3.417%09/03/2047 USD 721,000 733,947 0.03Flagship Credit Auto Trust, Series2014-1 ‘A’, 144A 1.21% 15/04/2019 USD 312,094 311,209 0.01Flagship Credit Auto Trust, Series2014-2 ‘A’, 144A 1.43% 16/12/2019 USD 464,019 461,915 0.02Flagship Credit Auto Trust, Series2015-1 ‘A’, 144A 1.63% 15/06/2020 USD 714,730 711,368 0.03Flagship Credit Auto Trust, Series2015-3 ‘A’, 144A 2.38% 15/10/2020 USD 1,475,455 1,478,322 0.06Flagship Credit Auto Trust, Series2015-3 ‘B’, 144A 3.68% 15/03/2022 USD 505,000 504,722 0.02Flagship Credit Auto Trust, Series2015-3 ‘C’, 144A 4.65% 15/03/2022 USD 353,000 340,198 0.01Flagship Credit Auto Trust, Series2016-1 ‘A’, 144A 2.77% 15/12/2020 USD 1,622,436 1,635,765 0.07Flagship Credit Auto Trust, Series2016-1 ‘C’, 144A 6.22% 15/06/2022 USD 950,000 959,477 0.04Flagship Credit Auto Trust, Series2016-2 ‘A1’, 144A 2.28% 15/05/2020 USD 1,299,787 1,300,892 0.05Flagship Credit Auto Trust, Series2016-2 ‘B’, 144A 3.84% 15/09/2022 USD 306,000 307,771 0.01Flagship Credit Auto Trust, Series2016-2 ‘C’, 144A 6.22% 15/09/2022 USD 1,000,000 1,008,015 0.04Florida Power & Light Co. 3.125%01/12/2025 USD 600,000 645,774 0.03FNMA, FRN 470623 1.237%01/03/2022 USD 1,345,273 1,345,057 0.06FNMA, FRN 722985 2.402%01/07/2033 USD 25,958 27,407 0.00FNMA, FRN 735332 2.521%01/08/2034 USD 86,339 91,193 0.00FNMA, FRN 745445 2.661%01/01/2036 USD 257,585 272,195 0.01FNMA, FRN 745446 2.717%01/04/2033 USD 62,007 65,593 0.00FNMA, FRN 766610 2.547%01/01/2034 USD 41,257 43,336 0.00FNMA, FRN 777132 2.578%01/06/2034 USD 208,655 221,141 0.01FNMA, FRN 781309 2.55% 01/07/2034 USD 45,204 47,021 0.00FNMA, FRN 790235 2.399%01/08/2034 USD 66,014 69,605 0.00FNMA, FRN 791961 2.187%01/09/2034 USD 28,257 29,514 0.00FNMA, FRN 801342 2.387%01/09/2034 USD 151,885 157,589 0.01FNMA, FRN 810896 2.138%01/01/2035 USD 155,840 162,477 0.01FNMA, FRN 816597 2.483%01/02/2035 USD 62,629 66,146 0.00FNMA, FRN 823660 2.537%01/05/2035 USD 51,513 54,050 0.00FNMA, FRN 843026 2.391%01/09/2035 USD 149,041 155,233 0.01FNMA, FRN 843028 2.401%01/09/2035 USD 168,165 176,571 0.01FNMA, FRN 849251 2.398%01/01/2036 USD 227,502 238,696 0.01FNMA, FRN 851432 2.892%01/10/2035 USD 371,542 397,258 0.02FNMA, FRN 872502 2.547%01/06/2036 USD 211,857 223,830 0.01FNMA, FRN 884066 2.69%01/06/2036 USD 151,988 161,678 0.01FNMA, FRN 886558 2.487%01/08/2036 USD 125,810 133,295 0.01FNMA, FRN 888605 2.382%01/07/2035 USD 210,514 223,921 0.01FNMA, FRN 896463 2.635%01/10/2034 USD 104,520 110,954 0.00FNMA, FRN 900197 2.836%01/10/2036 USD 164,662 175,505 0.01FNMA, FRN 905694 2.643%01/12/2036 USD 121,778 128,588 0.01FNMA, FRN 920843 3.155%01/03/2036 USD 817,629 853,516 0.04FNMA, FRN 920954 1.996%01/01/2037 USD 296,990 308,666 0.01FNMA, FRN 966946 2.753%01/01/2038 USD 69,311 73,134 0.00
214
JPMorgan Funds - US Aggregate Bond FundSchedule of Investments (continued)
As at 30 June 2016
Investments Currency
Quantity/Nominal
Value
MarketValue
USD
%of
NetAssets Investments Currency
Quantity/Nominal
Value
MarketValue
USD
%of
NetAssets
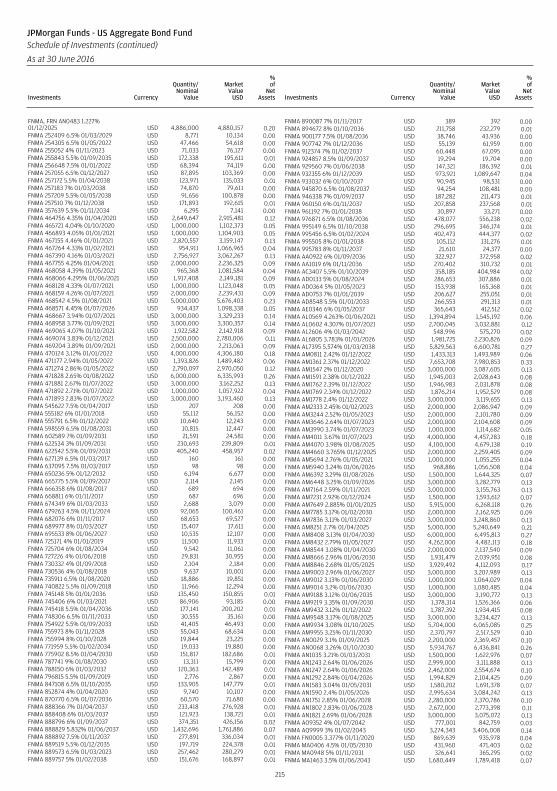
FNMA, FRN AN0483 1.227%01/12/2025 USD 4,886,000 4,880,157 0.20FNMA 252409 6.5% 01/03/2029 USD 8,771 10,134 0.00FNMA 254305 6.5% 01/05/2022 USD 47,466 54,618 0.00FNMA 255052 4% 01/11/2023 USD 71,033 76,127 0.00FNMA 255843 5.5% 01/09/2035 USD 172,338 195,611 0.01FNMA 256648 7.5% 01/01/2022 USD 68,394 74,119 0.00FNMA 257055 6.5% 01/12/2027 USD 87,895 103,369 0.00FNMA 257172 5.5% 01/04/2038 USD 123,971 135,033 0.01FNMA 257183 7% 01/03/2038 USD 74,870 79,611 0.00FNMA 257209 5.5% 01/05/2038 USD 91,656 100,878 0.00FNMA 257510 7% 01/12/2038 USD 171,893 192,615 0.01FNMA 357639 5.5% 01/11/2034 USD 6,295 7,141 0.00FNMA 464756 4.35% 01/04/2020 USD 2,649,647 2,915,481 0.12FNMA 465721 4.04% 01/10/2020 USD 1,000,000 1,102,373 0.05FNMA 466893 4.05% 01/01/2021 USD 1,000,000 1,104,903 0.05FNMA 467155 4.46% 01/01/2021 USD 2,820,557 3,159,147 0.13FNMA 467264 4.33% 01/02/2021 USD 954,911 1,066,965 0.04FNMA 467390 4.16% 01/03/2021 USD 2,756,927 3,062,267 0.13FNMA 467755 4.25% 01/04/2021 USD 2,000,000 2,236,325 0.09FNMA 468058 4.39% 01/05/2021 USD 965,368 1,081,584 0.04FNMA 468066 4.295% 01/06/2021 USD 1,917,408 2,149,181 0.09FNMA 468128 4.33% 01/07/2021 USD 1,000,000 1,123,048 0.05FNMA 468159 4.26% 01/07/2021 USD 2,000,000 2,239,431 0.09FNMA 468542 4.5% 01/08/2021 USD 5,000,000 5,676,403 0.23FNMA 468571 4.45% 01/07/2026 USD 934,437 1,098,338 0.05FNMA 468667 3.94% 01/07/2021 USD 3,000,000 3,329,233 0.14FNMA 468958 3.77% 01/09/2021 USD 3,000,000 3,300,357 0.14FNMA 469065 4.07% 01/10/2021 USD 1,922,582 2,142,918 0.09FNMA 469074 3.83% 01/12/2021 USD 2,500,000 2,780,006 0.11FNMA 469204 3.89% 01/09/2021 USD 2,000,000 2,213,063 0.09FNMA 470124 3.12% 01/01/2022 USD 4,000,000 4,306,180 0.18FNMA 471177 2.94% 01/05/2022 USD 1,393,826 1,489,482 0.06FNMA 471274 2.86% 01/05/2022 USD 2,790,097 2,970,050 0.12FNMA 471828 2.65% 01/08/2022 USD 6,000,000 6,335,993 0.26FNMA 471881 2.67% 01/07/2022 USD 3,000,000 3,162,252 0.13FNMA 471892 2.71% 01/07/2022 USD 1,000,000 1,057,922 0.04FNMA 471893 2.83% 01/07/2022 USD 3,000,000 3,193,460 0.13FNMA 545622 7.5% 01/04/2017 USD 207 208 0.00FNMA 555182 6% 01/01/2018 USD 55,112 56,152 0.00FNMA 555791 6.5% 01/12/2022 USD 10,640 12,243 0.00FNMA 598559 6.5% 01/08/2031 USD 10,815 12,447 0.00FNMA 602589 7% 01/09/2031 USD 21,591 24,581 0.00FNMA 622534 3% 01/09/2031 USD 230,693 239,809 0.01FNMA 622542 5.5% 01/09/2031 USD 405,240 458,957 0.02FNMA 627139 6.5% 01/03/2017 USD 160 161 0.00FNMA 637095 7.5% 01/03/2017 USD 98 98 0.00FNMA 650236 5% 01/12/2032 USD 6,194 6,677 0.00FNMA 665775 5.5% 01/09/2017 USD 2,114 2,145 0.00FNMA 666358 6% 01/08/2017 USD 689 694 0.00FNMA 668811 6% 01/11/2017 USD 687 696 0.00FNMA 674349 6% 01/03/2033 USD 2,688 3,079 0.00FNMA 679263 4.5% 01/11/2024 USD 92,065 100,461 0.00FNMA 682076 6% 01/11/2017 USD 68,653 69,527 0.00FNMA 689977 8% 01/03/2027 USD 15,407 17,611 0.00FNMA 695533 8% 01/06/2027 USD 10,535 12,107 0.00FNMA 725171 4% 01/01/2019 USD 11,500 11,933 0.00FNMA 725704 6% 01/08/2034 USD 9,542 11,061 0.00FNMA 727226 4% 01/06/2018 USD 29,831 30,955 0.00FNMA 730332 4% 01/09/2018 USD 2,104 2,184 0.00FNMA 730536 4% 01/08/2018 USD 9,637 10,001 0.00FNMA 735911 6.5% 01/08/2020 USD 18,886 19,851 0.00FNMA 740822 5.5% 01/09/2018 USD 11,966 12,294 0.00FNMA 745148 5% 01/01/2036 USD 135,450 150,855 0.01FNMA 745406 6% 01/03/2021 USD 86,906 93,185 0.00FNMA 745418 5.5% 01/04/2036 USD 177,141 200,202 0.01FNMA 748306 6.5% 01/11/2033 USD 30,555 35,161 0.00FNMA 754922 5.5% 01/09/2033 USD 41,405 46,493 0.00FNMA 755973 8% 01/11/2028 USD 55,043 68,634 0.00FNMA 755994 8% 01/10/2028 USD 19,844 23,225 0.00FNMA 771959 5.5% 01/02/2034 USD 19,033 19,880 0.00FNMA 775902 8.5% 01/04/2030 USD 151,817 182,686 0.01FNMA 787741 9% 01/08/2030 USD 13,311 15,799 0.00FNMA 788150 6% 01/03/2032 USD 120,363 142,489 0.01FNMA 796815 5.5% 01/09/2019 USD 2,776 2,867 0.00FNMA 847108 6.5% 01/10/2035 USD 133,905 147,779 0.01FNMA 852874 4% 01/04/2020 USD 9,740 10,107 0.00FNMA 870770 6.5% 01/07/2036 USD 60,570 71,680 0.00FNMA 888366 7% 01/04/2037 USD 233,418 276,928 0.01FNMA 888408 6% 01/03/2037 USD 121,923 138,721 0.01FNMA 888796 6% 01/09/2037 USD 374,351 426,156 0.02FNMA 888829 5.832% 01/06/2037 USD 1,432,696 1,761,886 0.07FNMA 888892 7.5% 01/11/2037 USD 277,891 336,034 0.01FNMA 889519 5.5% 01/12/2035 USD 197,719 224,378 0.01FNMA 889573 6.5% 01/03/2023 USD 257,462 280,279 0.01FNMA 889757 5% 01/02/2038 USD 151,676 168,897 0.01
FNMA 890087 7% 01/11/2017 USD 389 392 0.00FNMA 894672 8% 01/10/2036 USD 211,758 232,279 0.01FNMA 900177 7.5% 01/08/2036 USD 38,746 43,936 0.00FNMA 907742 7% 01/12/2036 USD 55,139 61,959 0.00FNMA 912374 7% 01/02/2037 USD 60,448 67,095 0.00FNMA 924857 8.5% 01/09/2037 USD 19,294 19,704 0.00FNMA 929560 7% 01/06/2038 USD 147,321 186,392 0.01FNMA 932355 6% 01/12/2039 USD 973,921 1,089,647 0.04FNMA 933032 6% 01/10/2037 USD 90,945 98,531 0.00FNMA 945870 6.5% 01/08/2037 USD 94,254 108,481 0.00FNMA 946338 7% 01/09/2037 USD 187,282 211,473 0.01FNMA 960150 6% 01/11/2037 USD 207,858 237,568 0.01FNMA 961192 7% 01/01/2038 USD 30,897 33,271 0.00FNMA 976871 6.5% 01/08/2036 USD 478,077 556,238 0.02FNMA 995149 6.5% 01/10/2038 USD 296,695 346,174 0.01FNMA 995456 6.5% 01/02/2024 USD 402,473 444,377 0.02FNMA 995505 8% 01/01/2038 USD 105,112 131,276 0.01FNMA 995783 8% 01/11/2037 USD 21,610 24,377 0.00FNMA AA0922 6% 01/09/2036 USD 322,927 372,958 0.02FNMA AA1019 6% 01/11/2036 USD 270,402 310,732 0.01FNMA AC3407 5.5% 01/10/2039 USD 358,185 404,984 0.02FNMA AD0133 5% 01/08/2024 USD 286,653 307,886 0.01FNMA AD0364 5% 01/05/2023 USD 153,938 165,368 0.01FNMA AD0753 7% 01/01/2039 USD 206,627 255,051 0.01FNMA AD8548 5.5% 01/01/2033 USD 266,553 291,313 0.01FNMA AE0346 6% 01/05/2037 USD 365,643 412,512 0.02FNMA AL0569 4.263% 01/06/2021 USD 1,394,894 1,545,192 0.06FNMA AL0602 4.307% 01/07/2021 USD 2,700,045 3,032,881 0.12FNMA AL2606 4% 01/03/2042 USD 548,996 575,270 0.02FNMA AL6805 3.783% 01/01/2026 USD 1,981,725 2,230,826 0.09FNMA AL7395 5.574% 01/03/2038 USD 5,829,563 6,600,781 0.27FNMA AM0811 2.42% 01/12/2022 USD 1,433,313 1,493,989 0.06FNMA AM1361 2.37% 01/12/2022 USD 7,653,708 7,980,853 0.33FNMA AM1547 2% 01/12/2020 USD 3,000,000 3,087,605 0.13FNMA AM1591 2.38% 01/12/2022 USD 1,945,003 2,028,643 0.08FNMA AM1762 2.39% 01/12/2022 USD 1,946,983 2,031,878 0.08FNMA AM1769 2.34% 01/12/2022 USD 1,876,214 1,952,529 0.08FNMA AM1778 2.4% 01/12/2022 USD 3,000,000 3,119,655 0.13FNMA AM2333 2.45% 01/02/2023 USD 2,000,000 2,086,947 0.09FNMA AM3244 2.52% 01/05/2023 USD 2,000,000 2,101,780 0.09FNMA AM3646 2.64% 01/07/2023 USD 2,000,000 2,104,608 0.09FNMA AM3990 3.74% 01/07/2023 USD 1,000,000 1,114,682 0.05FNMA AM4011 3.67% 01/07/2023 USD 4,000,000 4,457,283 0.18FNMA AM4070 3.98% 01/08/2025 USD 4,100,000 4,679,138 0.19FNMA AM4660 3.765% 01/12/2025 USD 2,000,000 2,259,405 0.09FNMA AM5694 2.76% 01/05/2021 USD 1,000,000 1,055,255 0.04FNMA AM5940 3.24% 01/06/2026 USD 968,886 1,056,508 0.04FNMA AM6392 3.29% 01/08/2026 USD 1,500,000 1,644,325 0.07FNMA AM6448 3.25% 01/09/2026 USD 3,000,000 3,282,779 0.13FNMA AM7164 2.59% 01/11/2021 USD 3,000,000 3,155,763 0.13FNMA AM7231 2.92% 01/12/2024 USD 1,500,000 1,593,612 0.07FNMA AM7649 2.885% 01/01/2025 USD 5,915,000 6,268,118 0.26FNMA AM7785 3.17% 01/02/2030 USD 2,000,000 2,162,925 0.09FNMA AM7836 3.11% 01/03/2027 USD 3,000,000 3,248,860 0.13FNMA AM8251 2.7% 01/04/2025 USD 5,000,000 5,240,649 0.21FNMA AM8408 3.13% 01/04/2030 USD 6,000,000 6,495,813 0.27FNMA AM8432 2.79% 01/05/2027 USD 4,262,000 4,482,113 0.18FNMA AM8544 3.08% 01/04/2030 USD 2,000,000 2,137,540 0.09FNMA AM8666 2.96% 01/06/2030 USD 1,931,479 2,039,951 0.08FNMA AM8846 2.68% 01/05/2025 USD 3,929,492 4,112,093 0.17FNMA AM9003 2.96% 01/06/2027 USD 3,000,000 3,207,989 0.13FNMA AM9012 3.13% 01/06/2030 USD 1,000,000 1,064,029 0.04FNMA AM9014 3.2% 01/06/2030 USD 1,000,000 1,080,485 0.04FNMA AM9188 3.12% 01/06/2035 USD 3,000,000 3,190,772 0.13FNMA AM9219 3.35% 01/09/2030 USD 1,378,314 1,526,366 0.06FNMA AM9432 3.12% 01/12/2022 USD 1,787,392 1,934,415 0.08FNMA AM9548 3.17% 01/08/2025 USD 3,000,000 3,234,427 0.13FNMA AM9934 3.08% 01/10/2025 USD 5,704,000 6,065,085 0.25FNMA AM9955 3.25% 01/11/2030 USD 2,370,797 2,517,529 0.10FNMA AN0029 3.1% 01/09/2025 USD 2,200,000 2,369,457 0.10FNMA AN0068 3.26% 01/10/2030 USD 5,934,767 6,436,841 0.26FNMA AN1035 3.21% 01/03/2031 USD 1,500,000 1,622,976 0.07FNMA AN1243 2.64% 01/06/2026 USD 2,999,000 3,111,888 0.13FNMA AN1247 2.64% 01/06/2026 USD 2,462,000 2,554,674 0.10FNMA AN1292 2.84% 01/04/2026 USD 1,994,829 2,104,425 0.09FNMA AN1583 3.04% 01/05/2031 USD 1,580,202 1,691,378 0.07FNMA AN1590 2.4% 01/05/2026 USD 2,995,634 3,084,242 0.13FNMA AN1751 2.85% 01/06/2028 USD 2,280,000 2,370,786 0.10FNMA AN1802 2.83% 01/06/2028 USD 2,672,000 2,773,398 0.11FNMA AN1821 2.69% 01/06/2028 USD 3,000,000 3,075,072 0.13FNMA AO9352 4% 01/07/2042 USD 777,001 842,759 0.03FNMA AQ9999 3% 01/02/2043 USD 3,274,343 3,406,008 0.14FNMA FN0005 3.377% 01/11/2020 USD 869,639 935,978 0.04FNMA MA0406 4.5% 01/05/2030 USD 431,960 471,403 0.02FNMA MA0948 5% 01/11/2031 USD 326,641 365,295 0.02FNMA MA1463 3.5% 01/06/2043 USD 1,680,449 1,789,418 0.07
215
JPMorgan Funds - US Aggregate Bond FundSchedule of Investments (continued)
As at 30 June 2016
Investments Currency
Quantity/Nominal
Value
MarketValue
USD
%of
NetAssets Investments Currency
Quantity/Nominal
Value
MarketValue
USD
%of
NetAssets
FNMA Grantor Trust, FRN, Series2004-T3 ‘PT1’ 9.085% 25/01/2044 USD 293,819 267,149 0.01FNMA Grantor Trust, Series 2000-T6‘A1’ 7.5% 25/06/2030 USD 275,507 316,080 0.01FNMA Grantor Trust, Series 2001-T7‘A1’ 7.5% 25/02/2041 USD 226,311 274,659 0.01FNMA Grantor Trust, Series 2002-T16‘A2’ 7% 25/07/2042 USD 29,128 35,054 0.00FNMA Grantor Trust, Series 2004-T2‘1A4’ 7.5% 25/11/2043 USD 467,504 563,208 0.02FNMA Interest STRIP, FRN, Series 412‘F2’ 0.953% 25/08/2042 USD 1,492,202 1,481,232 0.06FNMA Interest STRIP, PO, Series 293 ‘1’0% 25/12/2024 USD 176,376 169,877 0.01FNMA Interest STRIP, PO, Series 300 ‘1’0% 25/09/2024 USD 181,488 169,656 0.01FNMA Interest STRIP, IO, Series 339‘18’ 4.5% 25/07/2018 USD 37,978 1,224 0.00FNMA Interest STRIP, IO, Series 383‘32’ 6% 25/01/2038 USD 124,905 23,573 0.00FNMA REMIC, FRN, Series 1993-136‘ZB’ 6.792% 25/07/2023 USD 166,929 183,724 0.01FNMA REMIC, FRN, Series 2002-5 ‘SE’14.72% 25/02/2032 USD 76,600 109,973 0.00FNMA REMIC, FRN, Series 2003-119‘FH’ 0.953% 25/12/2033 USD 355,122 358,419 0.02FNMA REMIC, FRN, Series 2003-130‘CS’ 13.193% 25/12/2033 USD 254,124 290,058 0.01FNMA REMIC, FRN, Series 2003-52 ‘SX’21.59% 25/10/2031 USD 18,236 28,245 0.00FNMA REMIC, FRN, Series 2004-10 ‘SC’26.787% 25/02/2034 USD 11,961 14,972 0.00FNMA REMIC, FRN, Series 2004-25 ‘SA’18.278% 25/04/2034 USD 15,878 23,423 0.00FNMA REMIC, FRN, Series 2004-46 ‘SK’15.253% 25/05/2034 USD 177,109 239,954 0.01FNMA REMIC, FRN, Series 2004-61 ‘FH’1.253% 25/11/2032 USD 417,239 426,972 0.02FNMA REMIC, FRN, Series 2004-61 ‘SH’22.175% 25/11/2032 USD 52,155 80,483 0.00FNMA REMIC, FRN, Series 2004-74‘SW’ 14.604% 25/11/2031 USD 66,692 96,511 0.00FNMA REMIC, FRN, Series 2005-122‘SC’ 21.513% 25/06/2035 USD 640,934 891,677 0.04FNMA REMIC, FRN, Series 2005-45 ‘DC’22.648% 25/06/2035 USD 186,196 305,250 0.01FNMA REMIC, FRN, Series 2005-56 ‘TP’16.79% 25/08/2033 USD 123,686 172,590 0.01FNMA REMIC, FRN, Series 2005-57 ‘DC’20.302% 25/12/2034 USD 11,130 12,151 0.00FNMA REMIC, FRN, Series 2005-74 ‘CS’18.773% 25/05/2035 USD 224,027 325,710 0.01FNMA REMIC, FRN, Series 2005-74 ‘SK’18.883% 25/05/2035 USD 224,027 326,475 0.01FNMA REMIC, FRN, Series 2005-75 ‘SV’22.387% 25/09/2035 USD 253,027 407,940 0.02FNMA REMIC, FRN, Series 2005-90 ‘ES’15.742% 25/10/2035 USD 141,570 196,670 0.01FNMA REMIC, FRN, Series 2006-11 ‘PS’22.905% 25/03/2036 USD 123,707 196,677 0.01FNMA REMIC, FRN, Series 2006-124‘HB’ 5.671% 25/11/2036 USD 139,373 147,578 0.01FNMA REMIC, FRN, Series 2006-33 ‘LS’28.11% 25/05/2036 USD 108,990 204,065 0.01FNMA REMIC, FRN, Series 2006-62 ‘PS’37.18% 25/07/2036 USD 27,581 56,670 0.00FNMA REMIC, FRN, Series 2006-79 ‘DF’0.803% 25/08/2036 USD 80,005 80,503 0.00FNMA REMIC, FRN, Series 2006-95 ‘SG’24.387% 25/10/2036 USD 62,555 103,984 0.00FNMA REMIC, FRN, Series 2007-1 ‘SD’36.28% 25/02/2037 USD 20,326 54,649 0.00FNMA REMIC, FRN, Series 2007-101‘A2’ 0.683% 27/06/2036 USD 369,849 369,485 0.02FNMA REMIC, FRN, Series 2007-106‘A7’ 6.116% 25/10/2037 USD 294,852 332,001 0.01FNMA REMIC, FRN, Series 2007-114‘A6’ 0.653% 27/10/2037 USD 611,149 609,565 0.03FNMA REMIC, FRN, Series 2007-16 ‘FC’1.203% 25/03/2037 USD 35,756 36,323 0.00FNMA REMIC, FRN, Series 2007-29 ‘SG’21.155% 25/04/2037 USD 83,777 128,913 0.01FNMA REMIC, FRN, Series 2007-54 ‘FA’0.853% 25/06/2037 USD 97,589 98,301 0.00FNMA REMIC, FRN, Series 2007-85 ‘SL’15.017% 25/09/2037 USD 50,886 73,322 0.00FNMA REMIC, FRN, Series 2008-18 ‘SP’13.093% 25/03/2038 USD 40,726 51,225 0.00FNMA REMIC, FRN, Series 2008-28 ‘QS’19.34% 25/04/2038 USD 112,632 166,950 0.01
FNMA REMIC, FRN, Series 2008-76 ‘GF’1.103% 25/09/2023 USD 202,523 202,775 0.01FNMA REMIC, FRN, Series 2009-103‘MB’ 2.716% 25/12/2039 USD 322,097 340,896 0.01FNMA REMIC, FRN, Series 2010-1 ‘WA’6.22% 25/02/2040 USD 292,714 337,476 0.01FNMA REMIC, FRN, Series 2010-40 ‘FJ’1.053% 25/04/2040 USD 679,540 684,782 0.03FNMA REMIC, FRN, Series 2010-43 ‘FD’1.053% 25/05/2040 USD 681,655 690,213 0.03FNMA REMIC, FRN, Series 2010-49 ‘SC’11.753% 25/03/2040 USD 630,260 820,330 0.03FNMA REMIC, FRN, Series 2010-61 ‘WA’5.952% 25/06/2040 USD 300,556 347,599 0.01FNMA REMIC, FRN, Series 2011-43 ‘WA’5.811% 25/05/2051 USD 415,484 475,874 0.02FNMA REMIC, FRN, Series 2012-137 ‘CF’0.753% 25/08/2041 USD 2,744,156 2,704,109 0.11FNMA REMIC, FRN, Series 2012-58 ‘FA’0.953% 25/03/2039 USD 1,479,593 1,484,686 0.06FNMA REMIC, FRN, Series G93-17 ‘SH’28.448% 25/04/2023 USD 30,946 52,232 0.00FNMA REMIC, IO, FRN, Series 1996-4‘SA’ 8.047% 25/02/2024 USD 128,344 26,046 0.00FNMA REMIC, IO, FRN, Series 1997-50‘SK’ 6.547% 25/05/2023 USD 120,150 19,075 0.00FNMA REMIC, IO, FRN, Series 2003-116‘SB’ 7.147% 25/11/2033 USD 54,863 12,989 0.00FNMA REMIC, IO, FRN, Series 2003-80‘SY’ 7.197% 25/06/2023 USD 9,251 297 0.00FNMA REMIC, IO, FRN, Series 2005-56‘S’ 6.257% 25/07/2035 USD 177,356 35,770 0.00FNMA REMIC, IO, FRN, Series 2006-53‘US’ 6.127% 25/06/2036 USD 297,110 45,992 0.00FNMA REMIC, IO, FRN, Series 2006-8‘WN’ 6.247% 25/03/2036 USD 2,005,173 432,324 0.02FNMA REMIC, IO, FRN, Series 2006-94‘GI’ 6.197% 25/10/2026 USD 439,443 76,015 0.00FNMA REMIC, IO, FRN, Series 2007-108‘SA’ 5.907% 25/12/2037 USD 68,223 8,523 0.00FNMA REMIC, IO, FRN, Series 2007-109‘PI’ 5.897% 25/12/2037 USD 940,270 150,945 0.01FNMA REMIC, IO, FRN, Series 2007-116‘HI’ 1.529% 25/01/2038 USD 421,806 28,588 0.00FNMA REMIC, IO, FRN, Series 2007-53‘SH’ 5.647% 25/06/2037 USD 296,943 47,871 0.00FNMA REMIC, IO, FRN, Series 2007-60‘AX’ 6.697% 25/07/2037 USD 733,199 171,189 0.01FNMA REMIC, IO, FRN, Series 2007-65‘KI’ 6.167% 25/07/2037 USD 374,668 50,974 0.00FNMA REMIC, IO, FRN, Series 2007-7‘SG’ 6.047% 25/08/2036 USD 84,673 20,733 0.00FNMA REMIC, IO, FRN, Series 2007-72‘EK’ 5.947% 25/07/2037 USD 946,956 172,198 0.01FNMA REMIC, IO, FRN, Series 2007-88‘VI’ 6.087% 25/09/2037 USD 487,102 105,803 0.00FNMA REMIC, IO, FRN, Series 2007-92‘YS’ 5.327% 25/06/2037 USD 588,476 91,034 0.00FNMA REMIC, IO, FRN, Series 2008-1‘BI’ 5.457% 25/02/2038 USD 335,751 56,019 0.00FNMA REMIC, IO, FRN, Series 2008-10‘XI’ 5.777% 25/03/2038 USD 73,397 11,440 0.00FNMA REMIC, IO, FRN, Series 2008-16‘IS’ 5.747% 25/03/2038 USD 115,136 19,565 0.00FNMA REMIC, IO, FRN, Series 2008-46‘HI’ 1.72% 25/06/2038 USD 332,381 23,080 0.00FNMA REMIC, IO, FRN, Series 2008-47‘SI’ 6.047% 25/06/2023 USD 47,357 4,288 0.00FNMA REMIC, IO, FRN, Series 2008-53‘CI’ 6.747% 25/07/2038 USD 136,483 27,830 0.00FNMA REMIC, IO, FRN, Series 2008-80‘SA’ 5.397% 25/09/2038 USD 185,365 27,629 0.00FNMA REMIC, IO, FRN, Series 2008-81‘SB’ 5.397% 25/09/2038 USD 211,993 31,663 0.00FNMA REMIC, IO, FRN, Series 2009-112‘ST’ 5.797% 25/01/2040 USD 346,271 56,199 0.00FNMA REMIC, IO, FRN, Series 2009-17‘QS’ 6.197% 25/03/2039 USD 330,559 52,569 0.00FNMA REMIC, IO, FRN, Series 2009-6‘GS’ 6.097% 25/02/2039 USD 206,979 45,055 0.00FNMA REMIC, IO, FRN, Series 2009-84‘WS’ 5.447% 25/10/2039 USD 141,909 17,977 0.00FNMA REMIC, IO, FRN, Series 2010-125‘SA’ 3.987% 25/11/2040 USD 1,490,144 153,837 0.01FNMA REMIC, IO, FRN, Series 2010-23‘KS’ 6.647% 25/02/2040 USD 346,732 48,455 0.00FNMA REMIC, IO, FRN, Series 2010-35‘SB’ 5.967% 25/04/2040 USD 268,202 36,486 0.00FNMA REMIC, IO, FRN, Series 2010-68‘SA’ 4.547% 25/07/2040 USD 1,447,010 174,126 0.01
216
JPMorgan Funds - US Aggregate Bond FundSchedule of Investments (continued)
As at 30 June 2016
Investments Currency
Quantity/Nominal
Value
MarketValue
USD
%of
NetAssets Investments Currency
Quantity/Nominal
Value
MarketValue
USD
%of
NetAssets
FNMA REMIC, IO, FRN, Series 2011-30‘LS’ 1.858% 25/04/2041 USD 1,181,584 82,467 0.00FNMA REMIC, IO, Series 2003-33 ‘IA’6.5% 25/05/2033 USD 215,264 38,167 0.00FNMA REMIC, IO, Series 2003-35 ‘IU’6% 25/05/2033 USD 189,215 39,493 0.00FNMA REMIC, IO, Series 2003-44 ‘IU’7% 25/06/2033 USD 62,741 15,103 0.00FNMA REMIC, IO, Series 2008-19 ‘IC’5% 25/03/2023 USD 70,490 2,629 0.00FNMA REMIC, IO, Series 2009-18 ‘IO’5% 25/03/2024 USD 71,919 3,830 0.00FNMA REMIC, IO, Series 2009-52 ‘PI’5% 25/07/2039 USD 142,645 19,032 0.00FNMA REMIC, IO, Series 2009-86 ‘IP’5.5% 25/10/2039 USD 191,155 28,426 0.00FNMA REMIC, PO, Series 2004-46 ‘EP’0% 25/03/2034 USD 187,870 178,389 0.01FNMA REMIC, PO, Series 2005-90 ‘PO’0% 25/09/2035 USD 59,882 57,989 0.00FNMA REMIC, PO, Series 2006-110 ‘PO’0% 25/11/2036 USD 47,879 46,179 0.00FNMA REMIC, PO, Series 2006-111 ‘EO’0% 25/11/2036 USD 18,950 18,313 0.00FNMA REMIC, PO, Series 2006-113 ‘PO’0% 25/07/2036 USD 130,448 128,111 0.01FNMA REMIC, PO, Series 2006-15 ‘OP’0% 25/03/2036 USD 211,662 194,542 0.01FNMA REMIC, PO, Series 2006-22 ‘AO’0% 25/04/2036 USD 65,383 58,961 0.00FNMA REMIC, PO, Series 2006-27 ‘OH’0% 25/04/2036 USD 139,778 130,473 0.01FNMA REMIC, PO, Series 2006-36 ‘PO’0% 25/05/2036 USD 178,522 172,422 0.01FNMA REMIC, PO, Series 2006-44 ‘GO’0% 25/06/2036 USD 39,339 37,552 0.00FNMA REMIC, PO, Series 2006-44 ‘P’0% 25/12/2033 USD 104,689 100,730 0.00FNMA REMIC, PO, Series 2006-58 ‘AP’0% 25/07/2036 USD 55,566 53,592 0.00FNMA REMIC, PO, Series 2006-58 ‘PO’0% 25/07/2036 USD 126,562 121,755 0.01FNMA REMIC, PO, Series 2006-59 ‘QO’0% 25/01/2033 USD 19,984 19,646 0.00FNMA REMIC, PO, Series 2006-60 ‘DO’0% 25/04/2035 USD 167,421 162,388 0.01FNMA REMIC, PO, Series 2006-65 ‘QO’0% 25/07/2036 USD 36,362 34,750 0.00FNMA REMIC, PO, Series 2006-72 ‘TO’0% 25/08/2036 USD 49,613 48,171 0.00FNMA REMIC, PO, Series 2006-79 ‘DO’0% 25/08/2036 USD 57,882 55,086 0.00FNMA REMIC, PO, Series 2006-8 ‘WQ’0% 25/03/2036 USD 546,865 486,385 0.02FNMA REMIC, PO, Series 2007-15 ‘NO’0% 25/03/2022 USD 19,395 18,575 0.00FNMA REMIC, PO, Series 2007-42 ‘AO’0% 25/05/2037 USD 72,103 70,042 0.00FNMA REMIC, PO, Series 2007-48 ‘PO’0% 25/05/2037 USD 270,664 256,645 0.01FNMA REMIC, PO, Series 2009-113 ‘AO’0% 25/01/2040 USD 184,205 175,256 0.01FNMA REMIC, PO, Series 2009-69 ‘PO’0% 25/09/2039 USD 204,506 197,060 0.01FNMA REMIC, PO, Series 2009-86 ‘OT’0% 25/10/2037 USD 487,698 449,037 0.02FNMA REMIC, PO, Series 2013-92 ‘PO’0% 25/09/2043 USD 826,797 692,738 0.03FNMA REMIC, Series 1992-145 ‘ZB’ 8%25/08/2022 USD 76,887 85,669 0.00FNMA REMIC, Series 1992-69 ‘Z’ 8%25/05/2022 USD 262,158 293,132 0.01FNMA REMIC, Series 1993-141 ‘Z’ 7%25/08/2023 USD 205,759 227,544 0.01FNMA REMIC, Series 1993-203 ‘PL’6.5% 25/10/2023 USD 113,072 130,172 0.01FNMA REMIC, Series 1993-25 ‘J’ 7.5%25/03/2023 USD 12,876 14,282 0.00FNMA REMIC, Series 1993-99 ‘Z’ 7%25/07/2023 USD 156,526 171,606 0.01FNMA REMIC, Series 1994-63 ‘PK’ 7%25/04/2024 USD 155,211 175,116 0.01FNMA REMIC, Series 1996-48 ‘Z’ 7%25/11/2026 USD 232,874 259,487 0.01FNMA REMIC, Series 1997-39 ‘PD’ 7.5%20/05/2027 USD 25,977 30,502 0.00FNMA REMIC, Series 1998-36 ‘ZB’ 6%18/07/2028 USD 5,470 6,261 0.00FNMA REMIC, Series 1998-44 ‘ZA’ 6.5%20/07/2028 USD 906,500 1,074,706 0.04
FNMA REMIC, Series 1998-58 ‘PC’ 6.5%25/10/2028 USD 107,246 121,107 0.01FNMA REMIC, Series 2001-44 ‘PD’ 7%25/09/2031 USD 5,800 6,631 0.00FNMA REMIC, Series 2001-7 ‘PF’ 7%25/03/2031 USD 3,927 4,555 0.00FNMA REMIC, Series 2001-79 ‘BA’ 7%25/03/2045 USD 182,048 216,374 0.01FNMA REMIC, Series 2001-81 ‘HE’ 6.5%25/01/2032 USD 615,917 717,513 0.03FNMA REMIC, Series 2002-2 ‘MG’ 6%25/02/2017 USD 2,566 2,608 0.00FNMA REMIC, Series 2002-3 ‘OG’ 6%25/02/2017 USD 743 747 0.00FNMA REMIC, Series 2002-30 ‘Z’ 6%25/05/2032 USD 316,353 363,916 0.02FNMA REMIC, Series 2002-47 ‘PE’ 5.5%25/08/2017 USD 1,327 1,338 0.00FNMA REMIC, Series 2002-50 ‘ZA’ 6%25/05/2031 USD 493,511 543,626 0.02FNMA REMIC, Series 2002-63 ‘KC’ 5%25/10/2017 USD 26,618 26,994 0.00FNMA REMIC, Series 2003-105 ‘AZ’5.5% 25/10/2033 USD 1,670,474 1,919,649 0.08FNMA REMIC, Series 2003-32 ‘KC’ 5%25/05/2018 USD 43,001 44,021 0.00FNMA REMIC, Series 2004-50 ‘VZ’5.5% 25/07/2034 USD 1,937,114 2,182,707 0.09FNMA REMIC, Series 2005-109 ‘PC’ 6%25/12/2035 USD 424,320 475,954 0.02FNMA REMIC, Series 2005-3 ‘CE’ 5.5%25/08/2034 USD 705,000 734,706 0.03FNMA REMIC, Series 2005-67 ‘EY’ 5.5%25/08/2025 USD 273,371 303,472 0.01FNMA REMIC, Series 2005-76 ‘PZ’ 5.5%25/09/2035 USD 453,019 549,346 0.02FNMA REMIC, Series 2005-84 ‘MB’5.75% 25/10/2035 USD 231,531 259,855 0.01FNMA REMIC, Series 2005-84 ‘XH’5.75% 25/10/2035 USD 1,360,000 1,597,043 0.07FNMA REMIC, Series 2005-84 ‘XM’5.75% 25/10/2035 USD 140,025 153,756 0.01FNMA REMIC, Series 2006-53 ‘WE’ 6%25/06/2036 USD 1,000,000 1,192,119 0.05FNMA REMIC, Series 2006-77 ‘PC’ 6.5%25/08/2036 USD 292,647 340,643 0.01FNMA REMIC, Series 2006-85 ‘MZ’6.5% 25/09/2036 USD 247,009 282,212 0.01FNMA REMIC, Series 2007-42 ‘B’ 6%25/05/2037 USD 991,884 1,133,725 0.05FNMA REMIC, Series 2007-71 ‘GB’ 6%25/07/2037 USD 290,359 333,854 0.01FNMA REMIC, Series 2007-76 ‘AZ’ 5.5%25/08/2037 USD 380,651 419,752 0.02FNMA REMIC, Series 2007-76 ‘ZG’ 6%25/08/2037 USD 740,007 836,773 0.03FNMA REMIC, Series 2008-56 ‘AC’ 5%25/07/2038 USD 309,034 340,612 0.01FNMA REMIC, Series 2009-59 ‘HB’ 5%25/08/2039 USD 616,746 689,070 0.03FNMA REMIC, Series 2009-63 ‘P’ 5%25/03/2037 USD 46,239 51,120 0.00FNMA REMIC, Series 2009-69 ‘GL’ 5%25/09/2039 USD 1,286,042 1,439,604 0.06FNMA REMIC, Series 2009-79 ‘UA’ 7%25/03/2038 USD 53,224 61,034 0.00FNMA REMIC, Series 2010-111 ‘AM’5.5% 25/10/2040 USD 2,000,000 2,401,109 0.10FNMA REMIC, Series 2010-26 ‘B’ 5.5%25/03/2025 USD 3,050,000 3,261,941 0.13FNMA REMIC, Series 2011-118 ‘LB’ 7%25/11/2041 USD 2,381,954 2,852,103 0.12FNMA REMIC, Series 2011-118 ‘MT’ 7%25/11/2041 USD 2,338,686 2,800,389 0.11FNMA REMIC, Series 2011-118 ‘NT’ 7%25/11/2041 USD 2,819,271 3,354,893 0.14FNMA REMIC, Series 2011-39 ‘ZA’ 6%25/11/2032 USD 795,448 920,033 0.04FNMA REMIC, Series 2011-47 ‘ZA’ 5.5%25/07/2038 USD 1,206,226 1,326,939 0.05FNMA REMIC, Series 2016-38 ‘NA’ 3%25/01/2046 USD 4,972,878 5,252,001 0.22FNMA REMIC, Series G92-43 ‘Z’ 7.5%25/07/2022 USD 70,055 77,606 0.00FNMA REMIC, Series G92-61 ‘Z’ 7%25/10/2022 USD 154,937 172,402 0.01FNMA REMIC, Series G93-1 ‘KA’ 7.9%25/01/2023 USD 9,281 10,499 0.00FNMA REMIC Trust, IO, FRN, Series2002-W10 ‘IO’ 0.939% 25/08/2042 USD 1,624,601 42,123 0.00
217
JPMorgan Funds - US Aggregate Bond FundSchedule of Investments (continued)
As at 30 June 2016
Investments Currency
Quantity/Nominal
Value
MarketValue
USD
%of
NetAssets Investments Currency
Quantity/Nominal
Value
MarketValue
USD
%of
NetAssets
FNMA REMIC Trust, FRN, Series2002-W6 ‘2A1’ 6.256% 25/06/2042 USD 119,200 142,440 0.01FNMA REMIC Trust, FRN, Series2003-W4 ‘2A’ 6.326% 25/10/2042 USD 9,386 11,091 0.00FNMA REMIC Trust, FRN, Series2007-W7 ‘1A4’ 36.46% 25/07/2037 USD 26,242 42,167 0.00FNMA REMIC Trust, STEP, Series2001-W4 ‘AF6’ 5.61% 25/01/2032 USD 118,490 131,044 0.01FNMA REMIC Trust, Series 2004-W11‘1A1’ 6% 25/05/2044 USD 632,407 758,247 0.03FNMA REMIC Trust, Series 2005-W1‘1A2’ 6.5% 25/10/2044 USD 612,851 729,295 0.03FNMA REMIC Trust, Series 2006-W3‘2A’ 6% 25/09/2046 USD 298,956 337,264 0.01FNMA REMIC Trust, Series 2009-W1 ‘A’6% 25/12/2049 USD 955,183 1,107,033 0.05FNMA Trust, IO, FRN, Series 2003-W6‘4T’ 0.55% 25/09/2042 USD 4,745,127 85,350 0.00FNMA Trust, FRN, Series 2003-W8 ‘3F1’0.853% 25/05/2042 USD 114,806 113,684 0.00FNMA Trust, FRN, Series 2005-W3 ‘2AF’0.673% 25/03/2045 USD 1,207,106 1,175,485 0.05FNMA Trust, Series 2004-W1 ‘2A2’ 7%25/12/2033 USD 95,097 114,598 0.01FNMA Trust, Series 2004-W2 ‘2A2’ 7%25/02/2044 USD 29,474 34,710 0.00FNMA-Aces, FRN, Series 2014-M12‘ASV2’ 2.614% 25/10/2021 USD 2,500,000 2,626,255 0.11FNMA-Aces, FRN, Series 2015-M10 ‘A2’3.092% 25/04/2027 USD 3,500,000 3,823,788 0.16FNMA-Aces, FRN, Series 2015-M17 ‘FA’1.369% 25/11/2022 USD 3,284,013 3,297,318 0.14FNMA-Aces, Series 2011-M2 ‘A2’3.645% 25/04/2021 USD 1,732,000 1,885,144 0.08FNMA-Aces, Series 2011-M2 ‘A3’3.764% 25/04/2021 USD 4,050,000 4,459,903 0.18FNMA-Aces, Series 2011-M8 ‘A2’2.922% 25/08/2021 USD 630,887 672,399 0.03FNMA-Aces, Series 2013-M7 ‘A2’ 2.28%27/12/2022 USD 2,504,000 2,592,299 0.11FNMA-Aces, Series 2015-M1 ‘A2’2.532% 25/09/2024 USD 2,779,000 2,890,304 0.12FNMA-Aces, Series 2015-M3 ‘A2’2.723% 25/10/2024 USD 5,000,000 5,264,660 0.22FNMA-Aces, Series 2015-M7 ‘A2’ 2.59%25/12/2024 USD 3,280,000 3,423,060 0.14FNMA-Aces, Series 2016-M6 ‘A2’2.488% 25/05/2026 USD 4,725,000 4,853,940 0.20Ford Credit Auto Owner Trust, Series2014-C ‘A3’ 1.06% 15/05/2019 USD 1,182,806 1,183,593 0.05Ford Credit Auto Owner Trust, Series2015-A ‘A2A’ 0.81% 15/01/2018 USD 346,061 345,955 0.01Ford Credit Auto Owner Trust, Series2015-B ‘A2A’ 0.72% 15/03/2018 USD 1,100,645 1,100,433 0.05Ford Credit Auto Owner Trust, Series2016-B ‘A3’ 1.33% 15/10/2020 USD 700,000 703,656 0.03FREMF Mortgage Trust, FRN, Series2016-K722 ‘B’, 144A 3.835%25/07/2049 USD 1,845,000 1,778,752 0.07GCAT, STEP, Series 2015-2 ‘A1’, 144A3.75% 25/07/2020 USD 1,629,070 1,622,838 0.07Gilead Sciences, Inc. 3.25%01/09/2022 USD 196,000 209,000 0.01Gilead Sciences, Inc. 3.65%01/03/2026 USD 135,000 146,842 0.01Gilead Sciences, Inc. 4.6% 01/09/2035 USD 752,000 838,852 0.03GLS Auto Receivables Trust, Series2015-1A ‘A’, 144A 2.25% 15/12/2020 USD 1,522,523 1,521,158 0.06GLS Auto Receivables Trust, Series2016-1A ‘A’, 144A 2.73% 15/10/2020 USD 1,854,760 1,855,137 0.08GLS Auto Receivables Trust, Series2016-1A ‘B’, 144A 4.39% 15/01/2021 USD 570,000 570,987 0.02GLS Auto Receivables Trust, Series2016-1A ‘C’, 144A 6.9% 15/10/2021 USD 1,000,000 1,002,393 0.04GM Financial Automobile LeasingTrust, Series 2014-1A ‘A3’, 144A 1.01%22/05/2017 USD 359,422 359,418 0.02GM Financial Automobile LeasingTrust, Series 2016-2 ‘A3’ 1.62%20/09/2019 USD 1,192,000 1,194,906 0.05GMACM Mortgage Loan Trust, FRN,Series 2003-AR1 ‘A4’ 3.167%19/10/2033 USD 155,176 153,431 0.01GMACM Mortgage Loan Trust, FRN,Series 2003-AR2 ‘2A4’ 3.14%19/12/2033 USD 622,886 613,842 0.03GMACM Mortgage Loan Trust, FRN,Series 2005-AR3 ‘3A4’ 3.201%19/06/2035 USD 391,743 383,838 0.02GMACM Mortgage Loan Trust, Series2004-J5 ‘A7’ 6.5% 25/01/2035 USD 357,629 370,899 0.02
GMACM Mortgage Loan Trust, Series2004-J6 ‘1A1’ 5% 25/01/2020 USD 26,880 27,490 0.00GNMA, FRN, Series 2001-22 ‘PS’19.848% 17/03/2031 USD 109,023 184,667 0.01GNMA, FRN, Series 2001-51 ‘SA’30.583% 16/10/2031 USD 44,799 78,463 0.00GNMA, FRN, Series 2003-67 ‘SD’15.624% 20/08/2033 USD 118,316 191,985 0.01GNMA, FRN, Series 2004-94 ‘TS’17.193% 20/10/2034 USD 196,506 287,962 0.01GNMA, FRN, Series 2005-35 ‘FL’0.798% 20/03/2032 USD 111,918 112,473 0.00GNMA, FRN, Series 2005-66 ‘SP’19.359% 16/08/2035 USD 110,227 171,188 0.01GNMA, FRN, Series 2005-68 ‘DP’15.368% 17/06/2035 USD 264,124 383,608 0.02GNMA, FRN, Series 2005-7 ‘JM’15.747% 18/05/2034 USD 11,320 14,460 0.00GNMA, FRN, Series 2007-16 ‘NS’21.707% 20/04/2037 USD 202,225 327,201 0.01GNMA, FRN, Series 2007-53 ‘SW’18.861% 20/09/2037 USD 91,219 132,448 0.01GNMA, FRN, Series 2010-129 ‘AW’6.111% 20/04/2037 USD 519,276 588,724 0.02GNMA, FRN, Series 2010-H17 ‘XQ’5.238% 20/07/2060 USD 4,070,203 4,365,358 0.18GNMA, FRN, Series 2010-H22 ‘FE’0.786% 20/05/2059 USD 1,882,447 1,870,908 0.08GNMA, FRN, Series 2011-137 ‘WA’5.535% 20/07/2040 USD 4,114,040 4,711,418 0.19GNMA, FRN, Series 2011-163 ‘WA’5.853% 20/12/2038 USD 955,370 1,100,385 0.05GNMA, FRN, Series 2011-H09 ‘AF’0.936% 20/03/2061 USD 1,463,354 1,457,835 0.06GNMA, FRN, Series 2012-138 ‘PT’3.952% 16/11/2042 USD 1,227,656 1,286,438 0.05GNMA, FRN, Series 2012-141 ‘WC’3.719% 20/01/2042 USD 1,918,503 2,052,152 0.08GNMA, FRN, Series 2012-H08 ‘FS’1.136% 20/04/2062 USD 1,270,665 1,276,236 0.05GNMA, FRN, Series 2012-H10 ‘FA’0.986% 20/12/2061 USD 3,822,767 3,815,450 0.16GNMA, FRN, Series 2012-H15 ‘FA’0.886% 20/05/2062 USD 1,114,472 1,114,780 0.05GNMA, FRN, Series 2012-H21 ‘CF’1.136% 20/05/2061 USD 1,774,143 1,774,892 0.07GNMA, FRN, Series 2012-H21 ‘DF’1.086% 20/05/2061 USD 3,166,179 3,164,142 0.13GNMA, FRN, Series 2012-H22 ‘FD’0.906% 20/01/2061 USD 5,668,799 5,641,716 0.23GNMA, FRN, Series 2012-H23 ‘WA’0.956% 20/10/2062 USD 1,012,670 1,009,420 0.04GNMA, FRN, Series 2012-H24 ‘FA’0.886% 20/03/2060 USD 686,277 686,456 0.03GNMA, FRN, Series 2012-H24 ‘FG’0.866% 20/04/2060 USD 2,160,913 2,152,235 0.09GNMA, FRN, Series 2012-H26 ‘JA’0.986% 20/10/2061 USD 2,086,336 2,086,523 0.09GNMA, FRN, Series 2012-H26 ‘MA’0.986% 20/07/2062 USD 1,603,787 1,599,358 0.07GNMA, FRN, Series 2012-H27 ‘FB’0.936% 20/10/2062 USD 2,644,370 2,638,316 0.11GNMA, FRN, Series 2012-H28 ‘FA’1.016% 20/09/2062 USD 3,625,925 3,620,894 0.15GNMA, FRN, Series 2012-H29 ‘FA’0.951% 20/10/2062 USD 3,594,109 3,582,285 0.15GNMA, FRN, Series 2012-H30 ‘JA’0.916% 20/01/2060 USD 763,363 763,738 0.03GNMA, FRN, Series 2012-H30 ‘PA’0.886% 20/11/2059 USD 1,261,374 1,261,740 0.05GNMA, FRN, Series 2012-H31 ‘FD’0.776% 20/12/2062 USD 2,117,159 2,096,241 0.09GNMA, FRN, Series 2013-H01 ‘JA’0.756% 20/01/2063 USD 2,384,758 2,356,095 0.10GNMA, FRN, Series 2013-H01 ‘TA’0.936% 20/01/2063 USD 2,152,547 2,151,293 0.09GNMA, FRN, Series 2013-H03 ‘FA’0.736% 20/08/2060 USD 769,114 768,987 0.03GNMA, FRN, Series 2013-H07 ‘HA’0.846% 20/03/2063 USD 1,256,238 1,246,171 0.05GNMA, FRN, Series 2013-H08 ‘BF’0.837% 20/03/2063 USD 3,063,724 3,036,897 0.12GNMA, FRN, Series 2014-168 ‘VB’3.494% 16/06/2047 USD 1,130,880 1,238,696 0.05GNMA, FRN, Series 2014-H17 ‘FC’0.936% 20/07/2064 USD 762,026 757,868 0.03GNMA, FRN, Series 2015-137 ‘W’ 5.55%20/10/2040 USD 2,846,390 3,136,061 0.13GNMA, FRN, Series 2015-151 ‘WX’4.766% 20/10/2043 USD 2,667,258 2,977,439 0.12
218
JPMorgan Funds - US Aggregate Bond FundSchedule of Investments (continued)
As at 30 June 2016
Investments Currency
Quantity/Nominal
Value
MarketValue
USD
%of
NetAssets Investments Currency
Quantity/Nominal
Value
MarketValue
USD
%of
NetAssets
GNMA, FRN, Series 2015-H05 ‘FC’0.916% 20/02/2065 USD 2,829,422 2,810,314 0.12GNMA, FRN, Series 2015-H06 ‘FA’0.916% 20/02/2065 USD 2,508,540 2,494,894 0.10GNMA, FRN, Series 2015-H07 ‘ES’ 0%20/02/2065 USD 2,890,333 2,874,375 0.12GNMA, FRN, Series 2015-H08 ‘FC’0.917% 20/03/2065 USD 5,710,838 5,637,784 0.23GNMA, FRN, Series 2015-H10 ‘FC’0.916% 20/04/2065 USD 2,918,434 2,898,292 0.12GNMA, FRN, Series 2015-H12 ‘FA’0.916% 20/05/2065 USD 4,741,586 4,680,808 0.19GNMA, FRN, Series 2015-H15 ‘FJ’0.876% 20/06/2065 USD 1,965,272 1,934,624 0.08GNMA, FRN, Series 2015-H16 ‘FL’0.876% 20/07/2065 USD 2,986,420 2,957,775 0.12GNMA, FRN, Series 2015-H23 ‘FB’0.956% 20/09/2065 USD 2,423,636 2,412,519 0.10GNMA, FRN, Series 2015-H26 ‘FG’0.956% 20/10/2065 USD 1,530,262 1,522,944 0.06GNMA, FRN, Series 2015-H29 ‘FL’1.036% 20/11/2065 USD 7,929,554 7,929,122 0.32GNMA, FRN, Series 2015-H32 ‘FH’1.096% 20/12/2065 USD 1,599,178 1,604,813 0.07GNMA, FRN, Series 2016-H07 ‘FQ’1.136% 20/03/2066 USD 4,953,726 4,982,430 0.20GNMA, FRN, Series 2016-H11 ‘FD’0.836% 20/05/2066 USD 1,966,948 1,968,419 0.08GNMA, FRN, Series 2016-H13 ‘FT’1.02% 20/05/2066 USD 10,000,000 10,000,000 0.41GNMA, IO, FRN, Series 2002-41 ‘SY’7.058% 16/06/2032 USD 107,451 20,224 0.00GNMA, IO, FRN, Series 2004-90 ‘SI’5.652% 20/10/2034 USD 476,871 76,862 0.00GNMA, IO, FRN, Series 2005-68 ‘KI’5.852% 20/09/2035 USD 724,882 133,614 0.01GNMA, IO, FRN, Series 2006-38 ‘SW’6.052% 20/06/2036 USD 183,880 24,202 0.00GNMA, IO, FRN, Series 2006-59 ‘SD’6.252% 20/10/2036 USD 245,706 45,083 0.00GNMA, IO, FRN, Series 2006-65 ‘SA’6.352% 20/11/2036 USD 249,907 51,145 0.00GNMA, IO, FRN, Series 2007-17 ‘JI’6.368% 16/04/2037 USD 385,365 82,004 0.00GNMA, IO, FRN, Series 2007-27 ‘SA’5.752% 20/05/2037 USD 218,828 40,555 0.00GNMA, IO, FRN, Series 2007-36 ‘SE’6.028% 16/06/2037 USD 150,701 29,413 0.00GNMA, IO, FRN, Series 2007-40 ‘SB’6.302% 20/07/2037 USD 330,004 62,371 0.00GNMA, IO, FRN, Series 2007-40 ‘SN’6.232% 20/07/2037 USD 489,996 90,758 0.00GNMA, IO, FRN, Series 2007-42 ‘SB’6.302% 20/07/2037 USD 197,443 37,423 0.00GNMA, IO, FRN, Series 2007-50 ‘AI’6.327% 20/08/2037 USD 182,012 28,067 0.00GNMA, IO, FRN, Series 2007-53 ‘ES’6.102% 20/09/2037 USD 341,281 66,824 0.00GNMA, IO, FRN, Series 2007-67 ‘SI’6.062% 20/11/2037 USD 228,358 40,113 0.00GNMA, IO, FRN, Series 2007-73 ‘MI’5.552% 20/11/2037 USD 427,251 69,091 0.00GNMA, IO, FRN, Series 2007-74 ‘SL’6.098% 16/11/2037 USD 309,045 55,437 0.00GNMA, IO, FRN, Series 2007-76 ‘SA’6.082% 20/11/2037 USD 207,968 38,517 0.00GNMA, IO, FRN, Series 2007-76 ‘SD’5.352% 20/11/2037 USD 570,894 96,055 0.00GNMA, IO, FRN, Series 2007-79 ‘SY’6.102% 20/12/2037 USD 306,757 57,822 0.00GNMA, IO, FRN, Series 2007-81 ‘SB’6.202% 20/12/2037 USD 557,873 102,604 0.00GNMA, IO, FRN, Series 2008-40 ‘SA’5.958% 16/05/2038 USD 190,566 37,677 0.00GNMA, IO, FRN, Series 2008-76 ‘US’5.452% 20/09/2038 USD 656,493 98,115 0.00GNMA, IO, FRN, Series 2008-93 ‘AS’5.252% 20/12/2038 USD 216,076 33,531 0.00GNMA, IO, FRN, Series 2008-95 ‘DS’6.852% 20/12/2038 USD 531,355 107,174 0.00GNMA, IO, FRN, Series 2009-10 ‘SA’5.502% 20/02/2039 USD 390,689 55,753 0.00GNMA, IO, FRN, Series 2009-10 ‘SL’6.058% 16/03/2034 USD 154,924 6,846 0.00GNMA, IO, FRN, Series 2009-102 ‘SM’5.958% 16/06/2039 USD 368,175 31,849 0.00GNMA, IO, FRN, Series 2009-106 ‘AS’5.958% 16/11/2039 USD 586,382 104,246 0.00GNMA, IO, FRN, Series 2009-22 ‘SA’5.822% 20/04/2039 USD 518,857 83,226 0.00
GNMA, IO, FRN, Series 2009-31 ‘TS’5.852% 20/03/2039 USD 460,307 54,590 0.00GNMA, IO, FRN, Series 2009-42 ‘SC’5.632% 20/06/2039 USD 408,015 72,530 0.00GNMA, IO, FRN, Series 2009-6 ‘SA’5.658% 16/02/2039 USD 171,277 27,525 0.00GNMA, IO, FRN, Series 2009-64 ‘SN’5.658% 16/07/2039 USD 456,339 51,837 0.00GNMA, IO, Series 2007-27 ‘MI’ 5.5%20/09/2036 USD 25,511 419 0.00GNMA, IO, Series 2008-32 ‘PI’ 5.5%16/10/2037 USD 309,382 35,145 0.00GNMA, IO, Series 2009-14 ‘NI’ 6.5%20/03/2039 USD 160,406 34,938 0.00GNMA, IO, Series 2009-33 ‘TI’ 6%20/05/2039 USD 127,156 22,894 0.00GNMA, PO, Series 2006-22 ‘AO’ 0%20/05/2036 USD 102,860 99,134 0.00GNMA, PO, Series 2007-38 ‘AO’ 0%16/06/2037 USD 1,451,097 1,404,147 0.06GNMA, PO, Series 2008-60 ‘PO’ 0%20/01/2038 USD 27,870 27,598 0.00GNMA, PO, Series 2009-79 ‘OK’ 0%16/11/2037 USD 208,486 190,076 0.01GNMA, PO, Series 2010-14 ‘AO’ 0%20/12/2032 USD 160,220 156,764 0.01GNMA, PO, Series 2010-14 ‘BO’ 0%20/11/2035 USD 237,366 223,045 0.01GNMA, PO, Series 2010-14 ‘CO’ 0%20/08/2035 USD 197,058 188,328 0.01GNMA, PO, Series 2010-157 ‘OP’ 0%20/12/2040 USD 521,116 475,925 0.02GNMA, Series 1994-7 ‘PQ’ 6.5%16/10/2024 USD 117,412 133,376 0.01GNMA, Series 2001-21 ‘PE’ 6.5%16/05/2031 USD 301,985 343,945 0.01GNMA, Series 2002-40 ‘UK’ 6.5%20/06/2032 USD 64,539 77,308 0.00GNMA, Series 2002-45 ‘QE’ 6.5%20/06/2032 USD 58,747 70,551 0.00GNMA, Series 2002-47 ‘PG’ 6.5%16/07/2032 USD 17,288 20,478 0.00GNMA, Series 2003-10 ‘PZ’ 5.5%20/02/2033 USD 2,613,384 2,956,090 0.12GNMA, Series 2003-70 ‘LG’ 5%20/08/2033 USD 1,500,000 1,687,593 0.07GNMA, Series 2003-75 ‘ZX’ 6%16/09/2033 USD 2,926,535 3,352,782 0.14GNMA, Series 2005-72 ‘AZ’ 5.5%20/09/2035 USD 1,627,408 1,839,425 0.08GNMA, Series 2006-33 ‘Z’ 6.5%20/07/2036 USD 1,148,980 1,376,098 0.06GNMA, Series 2006-57 ‘PZ’ 5.565%20/10/2036 USD 1,710,332 1,933,207 0.08GNMA, Series 2009-104 ‘AB’ 7%16/08/2039 USD 349,679 394,741 0.02GNMA, Series 2010-130 ‘CP’ 7%16/10/2040 USD 344,288 409,418 0.02GNMA, Series 2010-14 ‘QP’ 6%20/12/2039 USD 190,597 197,684 0.01GNMA, Series 2013-H01 ‘FA’ 1.65%20/01/2063 USD 4,705,814 4,726,529 0.19GNMA 4189 6.5% 20/07/2038 USD 119,697 132,446 0.01GNMA 4217 6.5% 20/08/2038 USD 31,646 34,557 0.00GNMA 4285 6% 20/11/2038 USD 60,131 65,497 0.00GNMA 456388 7.5% 15/03/2028 USD 65,636 70,218 0.00GNMA 465505 7.5% 15/06/2028 USD 11,807 13,408 0.00GNMA 530795 6.5% 15/01/2023 USD 36,711 39,788 0.00GNMA 569568 6.5% 15/01/2032 USD 132,969 160,561 0.01GNMA 591882 6.5% 15/07/2032 USD 4,020 4,585 0.00GNMA 607645 6.5% 15/02/2033 USD 7,275 8,320 0.00GNMA 607728 6% 15/03/2033 USD 3,403 3,944 0.00GNMA 611453 7% 15/04/2032 USD 17,937 20,372 0.00GNMA 621970 6% 15/02/2034 USD 12,842 14,926 0.00GNMA 748766 6.5% 20/01/2039 USD 264,141 309,239 0.01GNMA 781328 7% 15/09/2031 USD 192,910 238,780 0.01GNMA 781614 7% 15/06/2033 USD 5,405 6,800 0.00GNMA 781648 6% 15/08/2033 USD 41,117 48,219 0.00GNMA 782507 9.5% 15/10/2024 USD 128,839 140,459 0.01GNMA 782615 7% 15/06/2035 USD 281,699 343,845 0.01GNMA 783123 5.5% 15/04/2033 USD 335,521 386,817 0.02GNMA 783389 6% 20/08/2039 USD 688,919 796,807 0.03GNMA 783444 5.5% 20/09/2039 USD 591,845 674,559 0.03GNMA 784045 4.5% 20/07/2045 USD 2,713,916 2,916,236 0.12GO Financial Auto Securitization Trust,Series 2015-1 ‘A’, 144A 1.81%15/03/2018 USD 558,791 558,475 0.02GO Financial Auto Securitization Trust,Series 2015-1 ‘B’, 144A 3.59%15/10/2020 USD 997,000 994,957 0.04
219
JPMorgan Funds - US Aggregate Bond FundSchedule of Investments (continued)
As at 30 June 2016
Investments Currency
Quantity/Nominal
Value
MarketValue
USD
%of
NetAssets Investments Currency
Quantity/Nominal
Value
MarketValue
USD
%of
NetAssets
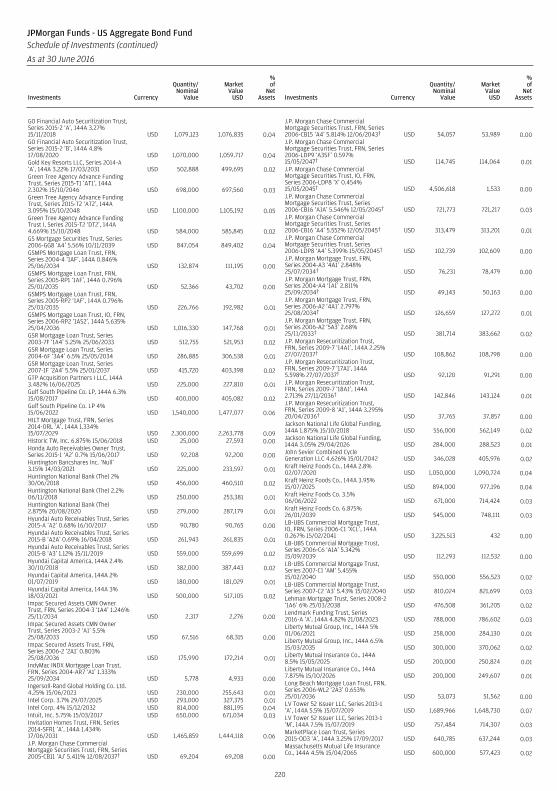
GO Financial Auto Securitization Trust,Series 2015-2 ‘A’, 144A 3.27%15/11/2018 USD 1,079,123 1,076,835 0.04GO Financial Auto Securitization Trust,Series 2015-2 ‘B’, 144A 4.8%17/08/2020 USD 1,070,000 1,059,717 0.04Gold Key Resorts LLC, Series 2014-A‘A’, 144A 3.22% 17/03/2031 USD 502,888 499,695 0.02Green Tree Agency Advance FundingTrust, Series 2015-T1 ‘AT1’, 144A2.302% 15/10/2046 USD 698,000 697,560 0.03Green Tree Agency Advance FundingTrust, Series 2015-T2 ‘AT2’, 144A3.095% 15/10/2048 USD 1,100,000 1,105,192 0.05Green Tree Agency Advance FundingTrust I, Series 2015-T2 ‘DT2’, 144A4.669% 15/10/2048 USD 584,000 585,845 0.02GS Mortgage Securities Trust, Series2006-GG8 ‘A4’ 5.56% 10/11/2039 USD 847,054 849,402 0.04GSMPS Mortgage Loan Trust, FRN,Series 2004-4 ‘1AF’, 144A 0.846%25/06/2034 USD 132,874 111,195 0.00GSMPS Mortgage Loan Trust, FRN,Series 2005-RP1 ‘1AF’, 144A 0.796%25/01/2035 USD 52,366 43,702 0.00GSMPS Mortgage Loan Trust, FRN,Series 2005-RP2 ‘1AF’, 144A 0.796%25/03/2035 USD 226,766 192,982 0.01GSMPS Mortgage Loan Trust, IO, FRN,Series 2006-RP2 ‘1AS2’, 144A 5.635%25/04/2036 USD 1,016,330 147,768 0.01GSR Mortgage Loan Trust, Series2003-7F ‘1A4’ 5.25% 25/06/2033 USD 512,755 521,953 0.02GSR Mortgage Loan Trust, Series2004-6F ‘3A4’ 6.5% 25/05/2034 USD 286,885 306,538 0.01GSR Mortgage Loan Trust, Series2007-1F ‘2A4’ 5.5% 25/01/2037 USD 415,720 403,398 0.02GTP Acquisition Partners I LLC, 144A3.482% 16/06/2025 USD 225,000 227,810 0.01Gulf South Pipeline Co. LP, 144A 6.3%15/08/2017 USD 400,000 405,082 0.02Gulf South Pipeline Co. LP 4%15/06/2022 USD 1,540,000 1,477,077 0.06HILT Mortgage Trust, FRN, Series2014-ORL ‘A’, 144A 1.334%15/07/2029 USD 2,300,000 2,263,778 0.09Historic TW, Inc. 6.875% 15/06/2018 USD 25,000 27,593 0.00Honda Auto Receivables Owner Trust,Series 2015-1 ‘A2’ 0.7% 15/06/2017 USD 92,208 92,200 0.00Huntington Bancshares Inc. ‘Null’3.15% 14/03/2021 USD 225,000 233,597 0.01Huntington National Bank (The) 2%30/06/2018 USD 456,000 460,510 0.02Huntington National Bank (The) 2.2%06/11/2018 USD 250,000 253,381 0.01Huntington National Bank (The)2.875% 20/08/2020 USD 279,000 287,179 0.01Hyundai Auto Receivables Trust, Series2015-A ‘A2’ 0.68% 16/10/2017 USD 90,780 90,765 0.00Hyundai Auto Receivables Trust, Series2015-B ‘A2A’ 0.69% 16/04/2018 USD 261,943 261,835 0.01Hyundai Auto Receivables Trust, Series2015-B ‘A3’ 1.12% 15/11/2019 USD 559,000 559,699 0.02Hyundai Capital America, 144A 2.4%30/10/2018 USD 382,000 387,443 0.02Hyundai Capital America, 144A 2%01/07/2019 USD 180,000 181,029 0.01Hyundai Capital America, 144A 3%18/03/2021 USD 500,000 517,105 0.02Impac Secured Assets CMN OwnerTrust, FRN, Series 2004-3 ‘1A4’ 1.246%25/11/2034 USD 2,317 2,276 0.00Impac Secured Assets CMN OwnerTrust, Series 2003-2 ‘A1’ 5.5%25/08/2033 USD 67,516 68,315 0.00Impac Secured Assets Trust, FRN,Series 2006-2 ‘2A1’ 0.803%25/08/2036 USD 175,990 172,214 0.01IndyMac INDX Mortgage Loan Trust,FRN, Series 2004-AR7 ‘A1’ 1.333%25/09/2034 USD 5,778 4,933 0.00Ingersoll-Rand Global Holding Co. Ltd.4.25% 15/06/2023 USD 230,000 255,643 0.01Intel Corp. 3.7% 29/07/2025 USD 293,000 327,375 0.01Intel Corp. 4% 15/12/2032 USD 814,000 881,195 0.04Intuit, Inc. 5.75% 15/03/2017 USD 650,000 671,034 0.03Invitation Homes Trust, FRN, Series2014-SFR1 ‘A’, 144A 1.434%17/06/2031 USD 1,465,859 1,444,118 0.06J.P. Morgan Chase CommercialMortgage Securities Trust, FRN, Series2005-CB11 ‘AJ’ 5.411% 12/08/2037† USD 69,204 69,208 0.00
J.P. Morgan Chase CommercialMortgage Securities Trust, FRN, Series2006-CB15 ‘A4’ 5.814% 12/06/2043† USD 54,057 53,989 0.00J.P. Morgan Chase CommercialMortgage Securities Trust, FRN, Series2006-LDP9 ‘A3SF’ 0.597%15/05/2047† USD 114,745 114,064 0.01J.P. Morgan Chase CommercialMortgage Securities Trust, IO, FRN,Series 2006-LDP8 ‘X’ 0.454%15/05/2045† USD 4,506,618 1,533 0.00J.P. Morgan Chase CommercialMortgage Securities Trust, Series2006-CB16 ‘A1A’ 5.546% 12/05/2045† USD 721,773 721,217 0.03J.P. Morgan Chase CommercialMortgage Securities Trust, Series2006-CB16 ‘A4’ 5.552% 12/05/2045† USD 313,479 313,201 0.01J.P. Morgan Chase CommercialMortgage Securities Trust, Series2006-LDP8 ‘A4’ 5.399% 15/05/2045† USD 102,739 102,609 0.00J.P. Morgan Mortgage Trust, FRN,Series 2004-A3 ‘4A1’ 2.848%25/07/2034† USD 76,231 78,479 0.00J.P. Morgan Mortgage Trust, FRN,Series 2004-A4 ‘1A1’ 2.811%25/09/2034† USD 49,143 50,163 0.00J.P. Morgan Mortgage Trust, FRN,Series 2006-A2 ‘4A1’ 2.797%25/08/2034† USD 126,659 127,272 0.01J.P. Morgan Mortgage Trust, FRN,Series 2006-A2 ‘5A3’ 2.68%25/11/2033† USD 381,714 383,662 0.02J.P. Morgan Resecuritization Trust,FRN, Series 2009-7 ‘14A1’, 144A 2.25%27/07/2037† USD 108,862 108,798 0.00J.P. Morgan Resecuritization Trust,FRN, Series 2009-7 ‘17A1’, 144A5.598% 27/07/2037† USD 92,120 91,291 0.00J.P. Morgan Resecuritization Trust,FRN, Series 2009-7 ‘18A1’, 144A2.713% 27/11/2036† USD 142,846 143,124 0.01J.P. Morgan Resecuritization Trust,FRN, Series 2009-8 ‘A1’, 144A 3.295%20/04/2036† USD 37,765 37,857 0.00Jackson National Life Global Funding,144A 1.875% 15/10/2018 USD 556,000 562,149 0.02Jackson National Life Global Funding,144A 3.05% 29/04/2026 USD 284,000 288,523 0.01John Sevier Combined CycleGeneration LLC 4.626% 15/01/2042 USD 346,028 405,976 0.02Kraft Heinz Foods Co., 144A 2.8%02/07/2020 USD 1,050,000 1,090,724 0.04Kraft Heinz Foods Co., 144A 3.95%15/07/2025 USD 894,000 977,196 0.04Kraft Heinz Foods Co. 3.5%06/06/2022 USD 671,000 714,424 0.03Kraft Heinz Foods Co. 6.875%26/01/2039 USD 545,000 748,111 0.03LB-UBS Commercial Mortgage Trust,IO, FRN, Series 2006-C1 ‘XCL’, 144A0.267% 15/02/2041 USD 3,225,513 432 0.00LB-UBS Commercial Mortgage Trust,Series 2006-C6 ‘A1A’ 5.342%15/09/2039 USD 112,293 112,532 0.00LB-UBS Commercial Mortgage Trust,Series 2007-C1 ‘AM’ 5.455%15/02/2040 USD 550,000 556,523 0.02LB-UBS Commercial Mortgage Trust,Series 2007-C2 ‘A3’ 5.43% 15/02/2040 USD 810,024 821,699 0.03Lehman Mortgage Trust, Series 2008-2‘1A6’ 6% 25/03/2038 USD 476,508 361,205 0.02Lendmark Funding Trust, Series2016-A ‘A’, 144A 4.82% 21/08/2023 USD 788,000 786,602 0.03Liberty Mutual Group, Inc., 144A 5%01/06/2021 USD 258,000 284,130 0.01Liberty Mutual Group, Inc., 144A 6.5%15/03/2035 USD 300,000 370,062 0.02Liberty Mutual Insurance Co., 144A8.5% 15/05/2025 USD 200,000 250,824 0.01Liberty Mutual Insurance Co., 144A7.875% 15/10/2026 USD 200,000 249,607 0.01Long Beach Mortgage Loan Trust, FRN,Series 2006-WL2 ‘2A3’ 0.653%25/01/2036 USD 53,073 51,562 0.00LV Tower 52 Issuer LLC, Series 2013-1‘A’, 144A 5.5% 15/07/2019 USD 1,689,966 1,648,730 0.07LV Tower 52 Issuer LLC, Series 2013-1‘M’, 144A 7.5% 15/07/2019 USD 757,484 714,307 0.03MarketPlace Loan Trust, Series2015-OD3 ‘A’, 144A 3.25% 17/09/2017 USD 640,785 637,244 0.03Massachusetts Mutual Life InsuranceCo., 144A 4.5% 15/04/2065 USD 600,000 577,423 0.02
220
JPMorgan Funds - US Aggregate Bond FundSchedule of Investments (continued)
As at 30 June 2016
Investments Currency
Quantity/Nominal
Value
MarketValue
USD
%of
NetAssets Investments Currency
Quantity/Nominal
Value
MarketValue
USD
%of
NetAssets
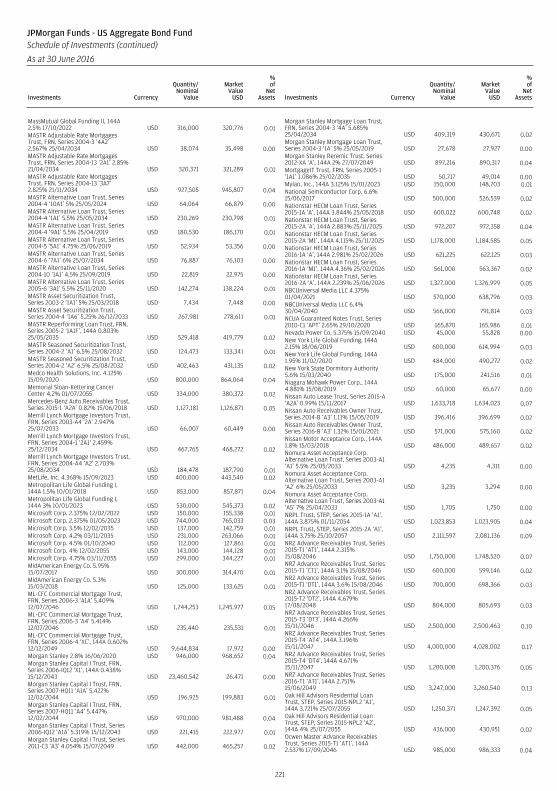
MassMutual Global Funding II, 144A2.5% 17/10/2022 USD 316,000 320,776 0.01MASTR Adjustable Rate MortgagesTrust, FRN, Series 2004-3 ‘4A2’2.567% 25/04/2034 USD 38,074 35,498 0.00MASTR Adjustable Rate MortgagesTrust, FRN, Series 2004-13 ‘2A1’ 2.85%21/04/2034 USD 320,371 321,289 0.01MASTR Adjustable Rate MortgagesTrust, FRN, Series 2004-13 ‘3A7’2.825% 21/11/2034 USD 927,505 945,807 0.04MASTR Alternative Loan Trust, Series2004-4 ‘10A1’ 5% 25/05/2024 USD 64,064 66,879 0.00MASTR Alternative Loan Trust, Series2004-4 ‘1A1’ 5.5% 25/05/2034 USD 230,269 230,798 0.01MASTR Alternative Loan Trust, Series2004-4 ‘9A1’ 5.5% 25/04/2019 USD 180,530 186,170 0.01MASTR Alternative Loan Trust, Series2004-5 ‘5A1’ 4.75% 25/06/2019 USD 52,934 53,356 0.00MASTR Alternative Loan Trust, Series2004-6 ‘7A1’ 6% 25/07/2034 USD 76,887 76,103 0.00MASTR Alternative Loan Trust, Series2004-10 ‘1A1’ 4.5% 25/09/2019 USD 22,819 22,975 0.00MASTR Alternative Loan Trust, Series2005-6 ‘3A1’ 5.5% 25/11/2020 USD 142,274 138,224 0.01MASTR Asset Securitization Trust,Series 2003-2 ‘1A1’ 5% 25/03/2018 USD 7,434 7,448 0.00MASTR Asset Securitization Trust,Series 2004-4 ‘1A6’ 5.25% 26/12/2033 USD 267,981 278,611 0.01MASTR Reperforming Loan Trust, FRN,Series 2005-2 ‘1A1F’, 144A 0.803%25/05/2035 USD 529,418 419,779 0.02MASTR Seasoned Securitization Trust,Series 2004-2 ‘A1’ 6.5% 25/08/2032 USD 124,473 133,341 0.01MASTR Seasoned Securitization Trust,Series 2004-2 ‘A2’ 6.5% 25/08/2032 USD 402,463 431,135 0.02Medco Health Solutions, Inc. 4.125%15/09/2020 USD 800,000 864,064 0.04Memorial Sloan-Kettering CancerCenter 4.2% 01/07/2055 USD 334,000 380,372 0.02Mercedes-Benz Auto Receivables Trust,Series 2015-1 ‘A2A’ 0.82% 15/06/2018 USD 1,127,181 1,126,871 0.05Merrill Lynch Mortgage Investors Trust,FRN, Series 2003-A4 ‘2A’ 2.947%25/07/2033 USD 66,007 60,449 0.00Merrill Lynch Mortgage Investors Trust,FRN, Series 2004-1 ‘2A1’ 2.459%25/12/2034 USD 467,765 468,272 0.02Merrill Lynch Mortgage Investors Trust,FRN, Series 2004-A4 ‘A2’ 2.703%25/08/2034 USD 184,478 187,790 0.01MetLife, Inc. 4.368% 15/09/2023 USD 400,000 443,540 0.02Metropolitan Life Global Funding I,144A 1.5% 10/01/2018 USD 853,000 857,871 0.04Metropolitan Life Global Funding I,144A 3% 10/01/2023 USD 530,000 545,373 0.02Microsoft Corp. 2.375% 12/02/2022 USD 150,000 155,338 0.01Microsoft Corp. 2.375% 01/05/2023 USD 744,000 765,033 0.03Microsoft Corp. 3.5% 12/02/2035 USD 137,000 142,759 0.01Microsoft Corp. 4.2% 03/11/2035 USD 231,000 263,066 0.01Microsoft Corp. 4.5% 01/10/2040 USD 112,000 127,861 0.01Microsoft Corp. 4% 12/02/2055 USD 143,000 144,128 0.01Microsoft Corp. 4.75% 03/11/2055 USD 299,000 344,227 0.01MidAmerican Energy Co. 5.95%15/07/2017 USD 300,000 314,470 0.01MidAmerican Energy Co. 5.3%15/03/2018 USD 125,000 133,625 0.01ML-CFC Commercial Mortgage Trust,FRN, Series 2006-3 ‘A1A’ 5.409%12/07/2046 USD 1,244,253 1,245,977 0.05ML-CFC Commercial Mortgage Trust,FRN, Series 2006-3 ‘A4’ 5.414%12/07/2046 USD 235,440 235,531 0.01ML-CFC Commercial Mortgage Trust,FRN, Series 2006-4 ‘XC’, 144A 0.602%12/12/2049 USD 9,644,834 17,972 0.00Morgan Stanley 2.8% 16/06/2020 USD 946,000 968,652 0.04Morgan Stanley Capital I Trust, FRN,Series 2006-IQ12 ‘X1’, 144A 0.438%15/12/2043 USD 23,460,542 26,471 0.00Morgan Stanley Capital I Trust, FRN,Series 2007-HQ11 ‘A1A’ 5.422%12/02/2044 USD 196,925 199,883 0.01Morgan Stanley Capital I Trust, FRN,Series 2007-HQ11 ‘A4’ 5.447%12/02/2044 USD 970,000 981,488 0.04Morgan Stanley Capital I Trust, Series2006-IQ12 ‘A1A’ 5.319% 15/12/2043 USD 221,415 222,977 0.01Morgan Stanley Capital I Trust, Series2011-C3 ‘A3’ 4.054% 15/07/2049 USD 442,000 465,257 0.02
Morgan Stanley Mortgage Loan Trust,FRN, Series 2004-3 ‘4A’ 5.685%25/04/2034 USD 409,319 430,671 0.02Morgan Stanley Mortgage Loan Trust,Series 2004-3 ‘1A’ 5% 25/05/2019 USD 27,678 27,927 0.00Morgan Stanley Reremic Trust, Series2012-XA ‘A’, 144A 2% 27/07/2049 USD 897,216 890,317 0.04MortgageIT Trust, FRN, Series 2005-1‘1A1’ 1.086% 25/02/2035 USD 50,717 49,014 0.00Mylan, Inc., 144A 3.125% 15/01/2023 USD 150,000 148,703 0.01National Semiconductor Corp. 6.6%15/06/2017 USD 500,000 526,539 0.02Nationstar HECM Loan Trust, Series2015-1A ‘A’, 144A 3.844% 25/05/2018 USD 600,022 600,748 0.02Nationstar HECM Loan Trust, Series2015-2A ‘A’, 144A 2.883% 25/11/2025 USD 972,207 972,358 0.04Nationstar HECM Loan Trust, Series2015-2A ‘M1’, 144A 4.115% 25/11/2025 USD 1,178,000 1,184,585 0.05Nationstar HECM Loan Trust, Series2016-1A ‘A’, 144A 2.981% 25/02/2026 USD 621,225 622,125 0.03Nationstar HECM Loan Trust, Series2016-1A ‘M1’, 144A 4.36% 25/02/2026 USD 561,000 563,367 0.02Nationstar HECM Loan Trust, Series2016-2A ‘A’, 144A 2.239% 25/06/2026 USD 1,327,000 1,326,999 0.05NBCUniversal Media LLC 4.375%01/04/2021 USD 570,000 638,796 0.03NBCUniversal Media LLC 6.4%30/04/2040 USD 566,000 791,814 0.03NCUA Guaranteed Notes Trust, Series2010-C1 ‘APT’ 2.65% 29/10/2020 USD 165,870 165,986 0.01Nevada Power Co. 5.375% 15/09/2040 USD 45,000 55,828 0.00New York Life Global Funding, 144A2.15% 18/06/2019 USD 600,000 614,994 0.03New York Life Global Funding, 144A1.95% 11/02/2020 USD 484,000 490,272 0.02New York State Dormitory Authority5.6% 15/03/2040 USD 175,000 241,516 0.01Niagara Mohawk Power Corp., 144A4.881% 15/08/2019 USD 60,000 65,677 0.00Nissan Auto Lease Trust, Series 2015-A‘A2A’ 0.99% 15/11/2017 USD 1,633,718 1,634,023 0.07Nissan Auto Receivables Owner Trust,Series 2014-B ‘A3’ 1.11% 15/05/2019 USD 396,416 396,699 0.02Nissan Auto Receivables Owner Trust,Series 2016-B ‘A3’ 1.32% 15/01/2021 USD 571,000 575,160 0.02Nissan Motor Acceptance Corp., 144A1.8% 15/03/2018 USD 486,000 489,657 0.02Nomura Asset Acceptance Corp.Alternative Loan Trust, Series 2003-A1‘A1’ 5.5% 25/05/2033 USD 4,235 4,311 0.00Nomura Asset Acceptance Corp.Alternative Loan Trust, Series 2003-A1‘A2’ 6% 25/05/2033 USD 3,235 3,294 0.00Nomura Asset Acceptance Corp.Alternative Loan Trust, Series 2003-A1‘A5’ 7% 25/04/2033 USD 1,705 1,750 0.00NRPL Trust, STEP, Series 2015-1A ‘A1’,144A 3.875% 01/11/2054 USD 1,023,853 1,023,905 0.04NRPL Trust, STEP, Series 2015-2A ‘A1’,144A 3.75% 25/10/2057 USD 2,111,597 2,081,136 0.09NRZ Advance Receivables Trust, Series2015-T1 ‘AT1’, 144A 2.315%15/08/2046 USD 1,750,000 1,748,520 0.07NRZ Advance Receivables Trust, Series2015-T1 ‘CT1’, 144A 3.1% 15/08/2046 USD 600,000 599,146 0.02NRZ Advance Receivables Trust, Series2015-T1 ‘DT1’, 144A 3.6% 15/08/2046 USD 700,000 698,366 0.03NRZ Advance Receivables Trust, Series2015-T2 ‘DT2’, 144A 4.679%17/08/2048 USD 804,000 805,693 0.03NRZ Advance Receivables Trust, Series2015-T3 ‘DT3’, 144A 4.266%15/11/2046 USD 2,500,000 2,500,463 0.10NRZ Advance Receivables Trust, Series2015-T4 ‘AT4’, 144A 3.196%15/11/2047 USD 4,000,000 4,028,002 0.17NRZ Advance Receivables Trust, Series2015-T4 ‘DT4’, 144A 4.671%15/11/2047 USD 1,200,000 1,200,376 0.05NRZ Advance Receivables Trust, Series2016-T1 ‘AT1’, 144A 2.751%15/06/2049 USD 3,247,000 3,260,540 0.13Oak Hill Advisors Residential LoanTrust, STEP, Series 2015-NPL2 ‘A1’,144A 3.721% 25/07/2055 USD 1,250,371 1,247,392 0.05Oak Hill Advisors Residential LoanTrust, STEP, Series 2015-NPL2 ‘A2’,144A 4% 25/07/2055 USD 436,000 430,951 0.02Ocwen Master Advance ReceivablesTrust, Series 2015-T1 ‘AT1’, 144A2.537% 17/09/2046 USD 985,000 986,333 0.04
221
JPMorgan Funds - US Aggregate Bond FundSchedule of Investments (continued)
As at 30 June 2016
Investments Currency
Quantity/Nominal
Value
MarketValue
USD
%of
NetAssets Investments Currency
Quantity/Nominal
Value
MarketValue
USD
%of
NetAssets
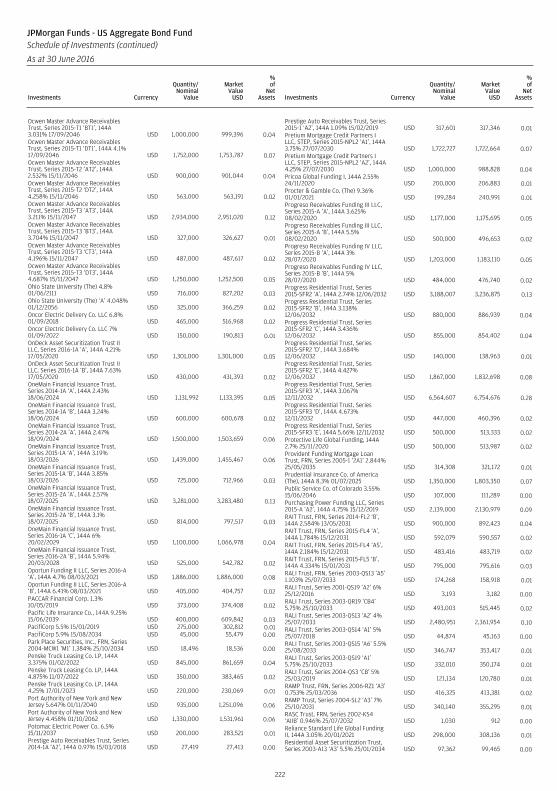
Ocwen Master Advance ReceivablesTrust, Series 2015-T1 ‘BT1’, 144A3.031% 17/09/2046 USD 1,000,000 999,396 0.04Ocwen Master Advance ReceivablesTrust, Series 2015-T1 ‘DT1’, 144A 4.1%17/09/2046 USD 1,752,000 1,753,787 0.07Ocwen Master Advance ReceivablesTrust, Series 2015-T2 ‘AT2’, 144A2.532% 15/11/2046 USD 900,000 901,044 0.04Ocwen Master Advance ReceivablesTrust, Series 2015-T2 ‘DT2’, 144A4.258% 15/11/2046 USD 563,000 563,191 0.02Ocwen Master Advance ReceivablesTrust, Series 2015-T3 ‘AT3’, 144A3.211% 15/11/2047 USD 2,934,000 2,951,020 0.12Ocwen Master Advance ReceivablesTrust, Series 2015-T3 ‘BT3’, 144A3.704% 15/11/2047 USD 327,000 326,627 0.01Ocwen Master Advance ReceivablesTrust, Series 2015-T3 ‘CT3’, 144A4.196% 15/11/2047 USD 487,000 487,617 0.02Ocwen Master Advance ReceivablesTrust, Series 2015-T3 ‘DT3’, 144A4.687% 15/11/2047 USD 1,250,000 1,252,500 0.05Ohio State University (The) 4.8%01/06/2111 USD 716,000 827,202 0.03Ohio State University (The) ‘A’ 4.048%01/12/2056 USD 325,000 366,259 0.02Oncor Electric Delivery Co. LLC 6.8%01/09/2018 USD 465,000 516,968 0.02Oncor Electric Delivery Co. LLC 7%01/09/2022 USD 150,000 190,813 0.01OnDeck Asset Securitization Trust IILLC, Series 2016-1A ‘A’, 144A 4.21%17/05/2020 USD 1,301,000 1,301,000 0.05OnDeck Asset Securitization Trust IILLC, Series 2016-1A ‘B’, 144A 7.63%17/05/2020 USD 430,000 431,393 0.02OneMain Financial Issuance Trust,Series 2014-1A ‘A’, 144A 2.43%18/06/2024 USD 1,131,992 1,133,395 0.05OneMain Financial Issuance Trust,Series 2014-1A ‘B’, 144A 3.24%18/06/2024 USD 600,000 600,678 0.02OneMain Financial Issuance Trust,Series 2014-2A ‘A’, 144A 2.47%18/09/2024 USD 1,500,000 1,503,659 0.06OneMain Financial Issuance Trust,Series 2015-1A ‘A’, 144A 3.19%18/03/2026 USD 1,439,000 1,455,467 0.06OneMain Financial Issuance Trust,Series 2015-1A ‘B’, 144A 3.85%18/03/2026 USD 725,000 712,966 0.03OneMain Financial Issuance Trust,Series 2015-2A ‘A’, 144A 2.57%18/07/2025 USD 3,281,000 3,283,480 0.13OneMain Financial Issuance Trust,Series 2015-2A ‘B’, 144A 3.1%18/07/2025 USD 814,000 797,517 0.03OneMain Financial Issuance Trust,Series 2016-1A ‘C’, 144A 6%20/02/2029 USD 1,100,000 1,066,978 0.04OneMain Financial Issuance Trust,Series 2016-2A ‘B’, 144A 5.94%20/03/2028 USD 525,000 542,782 0.02Oportun Funding II LLC, Series 2016-A‘A’, 144A 4.7% 08/03/2021 USD 1,886,000 1,886,000 0.08Oportun Funding II LLC, Series 2016-A‘B’, 144A 6.41% 08/03/2021 USD 405,000 404,757 0.02PACCAR Financial Corp. 1.3%10/05/2019 USD 373,000 374,408 0.02Pacific Life Insurance Co., 144A 9.25%15/06/2039 USD 400,000 609,842 0.03PacifiCorp 5.5% 15/01/2019 USD 275,000 302,812 0.01PacifiCorp 5.9% 15/08/2034 USD 45,000 55,479 0.00Park Place Securities, Inc., FRN, Series2004-MCW1 ‘M1’ 1.384% 25/10/2034 USD 18,496 18,536 0.00Penske Truck Leasing Co. LP, 144A3.375% 01/02/2022 USD 845,000 861,659 0.04Penske Truck Leasing Co. LP, 144A4.875% 11/07/2022 USD 350,000 383,465 0.02Penske Truck Leasing Co. LP, 144A4.25% 17/01/2023 USD 220,000 230,069 0.01Port Authority of New York and NewJersey 5.647% 01/11/2040 USD 935,000 1,251,096 0.06Port Authority of New York and NewJersey 4.458% 01/10/2062 USD 1,330,000 1,531,961 0.06Potomac Electric Power Co. 6.5%15/11/2037 USD 200,000 283,521 0.01Prestige Auto Receivables Trust, Series2014-1A ‘A2’, 144A 0.97% 15/03/2018 USD 27,419 27,413 0.00
Prestige Auto Receivables Trust, Series2015-1 ‘A2’, 144A 1.09% 15/02/2019 USD 317,601 317,346 0.01Pretium Mortgage Credit Partners ILLC, STEP, Series 2015-NPL2 ‘A1’, 144A3.75% 27/07/2030 USD 1,722,727 1,722,664 0.07Pretium Mortgage Credit Partners ILLC, STEP, Series 2015-NPL2 ‘A2’, 144A4.25% 27/07/2030 USD 1,000,000 988,828 0.04Pricoa Global Funding I, 144A 2.55%24/11/2020 USD 200,000 206,883 0.01Procter & Gamble Co. (The) 9.36%01/01/2021 USD 199,284 240,991 0.01Progreso Receivables Funding III LLC,Series 2015-A ‘A’, 144A 3.625%08/02/2020 USD 1,177,000 1,175,695 0.05Progreso Receivables Funding III LLC,Series 2015-A ‘B’, 144A 5.5%08/02/2020 USD 500,000 496,653 0.02Progreso Receivables Funding IV LLC,Series 2015-B ‘A’, 144A 3%28/07/2020 USD 1,203,000 1,183,110 0.05Progreso Receivables Funding IV LLC,Series 2015-B ‘B’, 144A 5%28/07/2020 USD 484,000 476,740 0.02Progress Residential Trust, Series2015-SFR2 ‘A’, 144A 2.74% 12/06/2032 USD 3,188,007 3,236,875 0.13Progress Residential Trust, Series2015-SFR2 ‘B’, 144A 3.138%12/06/2032 USD 880,000 886,939 0.04Progress Residential Trust, Series2015-SFR2 ‘C’, 144A 3.436%12/06/2032 USD 855,000 854,402 0.04Progress Residential Trust, Series2015-SFR2 ‘D’, 144A 3.684%12/06/2032 USD 140,000 138,963 0.01Progress Residential Trust, Series2015-SFR2 ‘E’, 144A 4.427%12/06/2032 USD 1,867,000 1,832,698 0.08Progress Residential Trust, Series2015-SFR3 ‘A’, 144A 3.067%12/11/2032 USD 6,564,607 6,754,676 0.28Progress Residential Trust, Series2015-SFR3 ‘D’, 144A 4.673%12/11/2032 USD 447,000 460,396 0.02Progress Residential Trust, Series2015-SFR3 ‘E’, 144A 5.66% 12/11/2032 USD 500,000 513,333 0.02Protective Life Global Funding, 144A2.7% 25/11/2020 USD 500,000 513,987 0.02Provident Funding Mortgage LoanTrust, FRN, Series 2005-1 ‘2A1’ 2.844%25/05/2035 USD 314,308 321,172 0.01Prudential Insurance Co. of America(The), 144A 8.3% 01/07/2025 USD 1,350,000 1,803,350 0.07Public Service Co. of Colorado 3.55%15/06/2046 USD 107,000 111,289 0.00Purchasing Power Funding LLC, Series2015-A ‘A2’, 144A 4.75% 15/12/2019 USD 2,139,000 2,130,979 0.09RAIT Trust, FRN, Series 2014-FL2 ‘B’,144A 2.584% 13/05/2031 USD 900,000 892,423 0.04RAIT Trust, FRN, Series 2015-FL4 ‘A’,144A 1.784% 15/12/2031 USD 592,079 590,557 0.02RAIT Trust, FRN, Series 2015-FL4 ‘AS’,144A 2.184% 15/12/2031 USD 483,416 483,719 0.02RAIT Trust, FRN, Series 2015-FL5 ‘B’,144A 4.334% 15/01/2031 USD 795,000 795,616 0.03RALI Trust, FRN, Series 2003-QS13 ‘A5’1.103% 25/07/2033 USD 174,268 158,918 0.01RALI Trust, Series 2001-QS19 ‘A2’ 6%25/12/2016 USD 3,193 3,182 0.00RALI Trust, Series 2003-QR19 ‘CB4’5.75% 25/10/2033 USD 493,003 515,445 0.02RALI Trust, Series 2003-QS13 ‘A2’ 4%25/07/2033 USD 2,480,951 2,361,954 0.10RALI Trust, Series 2003-QS14 ‘A1’ 5%25/07/2018 USD 44,874 45,163 0.00RALI Trust, Series 2003-QS15 ‘A6’ 5.5%25/08/2033 USD 346,747 353,417 0.01RALI Trust, Series 2003-QS19 ‘A1’5.75% 25/10/2033 USD 332,010 350,174 0.01RALI Trust, Series 2004-QS3 ‘CB’ 5%25/03/2019 USD 121,134 120,780 0.01RAMP Trust, FRN, Series 2006-RZ1 ‘A3’0.753% 25/03/2036 USD 416,325 413,381 0.02RAMP Trust, Series 2004-SL2 ‘A3’ 7%25/10/2031 USD 340,140 355,295 0.01RASC Trust, FRN, Series 2002-KS4‘AIIB’ 0.946% 25/07/2032 USD 1,030 912 0.00Reliance Standard Life Global FundingII, 144A 3.05% 20/01/2021 USD 298,000 308,136 0.01Residential Asset Securitization Trust,Series 2003-A13 ‘A3’ 5.5% 25/01/2034 USD 97,362 99,465 0.00
222
JPMorgan Funds - US Aggregate Bond FundSchedule of Investments (continued)
As at 30 June 2016
Investments Currency
Quantity/Nominal
Value
MarketValue
USD
%of
NetAssets Investments Currency
Quantity/Nominal
Value
MarketValue
USD
%of
NetAssets
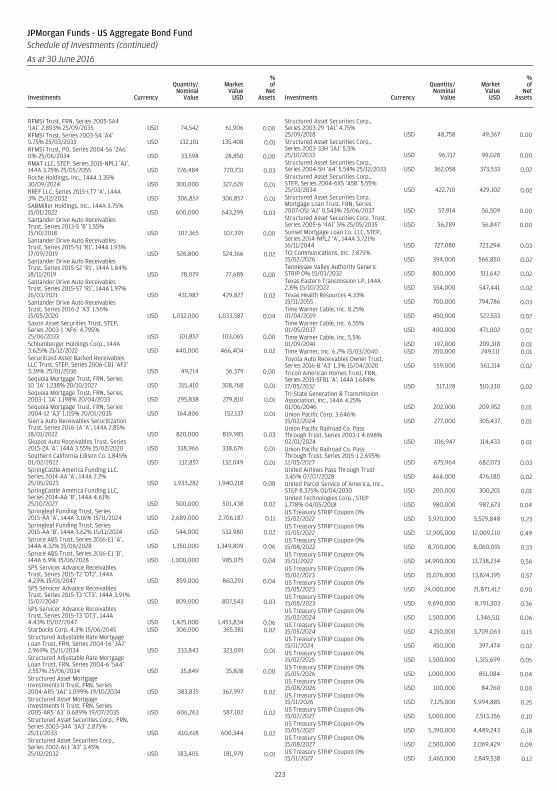
RFMSI Trust, FRN, Series 2005-SA4‘1A1’ 2.893% 25/09/2035 USD 74,542 61,906 0.00RFMSI Trust, Series 2003-S4 ‘A4’5.75% 25/03/2033 USD 132,101 135,408 0.01RFMSI Trust, PO, Series 2004-S6 ‘2A6’0% 25/06/2034 USD 33,598 28,850 0.00RMAT LLC, STEP, Series 2015-NPL1 ‘A1’,144A 3.75% 25/05/2055 USD 726,484 720,731 0.03Roche Holdings, Inc., 144A 3.35%30/09/2024 USD 300,000 327,620 0.01RREF LLC, Series 2015-LT7 ‘A’, 144A3% 25/12/2032 USD 306,857 306,857 0.01SABMiller Holdings, Inc., 144A 3.75%15/01/2022 USD 600,000 643,299 0.03Santander Drive Auto ReceivablesTrust, Series 2013-5 ‘B’ 1.55%15/10/2018 USD 107,365 107,391 0.00Santander Drive Auto ReceivablesTrust, Series 2015-S1 ‘R1’, 144A 1.93%17/09/2019 USD 526,800 524,166 0.02Santander Drive Auto ReceivablesTrust, Series 2015-S2 ‘R1’, 144A 1.84%18/11/2019 USD 78,079 77,689 0.00Santander Drive Auto ReceivablesTrust, Series 2015-S7 ‘R1’, 144A 1.97%16/03/2021 USD 431,987 429,827 0.02Santander Drive Auto ReceivablesTrust, Series 2016-2 ‘A3’ 1.56%15/05/2020 USD 1,032,000 1,033,587 0.04Saxon Asset Securities Trust, STEP,Series 2003-1 ‘AF6’ 4.795%25/06/2033 USD 101,857 103,065 0.00Schlumberger Holdings Corp., 144A3.625% 21/12/2022 USD 440,000 466,404 0.02Securitized Asset Backed ReceivablesLLC Trust, STEP, Series 2006-CB1 ‘AF2’3.39% 25/01/2036 USD 49,214 36,379 0.00Sequoia Mortgage Trust, FRN, Series10 ‘1A’ 1.238% 20/10/2027 USD 315,410 308,768 0.01Sequoia Mortgage Trust, FRN, Series2003-1 ‘1A’ 1.198% 20/04/2033 USD 295,838 279,810 0.01Sequoia Mortgage Trust, FRN, Series2004-12 ‘A3’ 1.115% 20/01/2035 USD 164,806 152,137 0.01Sierra Auto Receivables SecuritizationTrust, Series 2016-1A ‘A’, 144A 2.85%18/01/2022 USD 820,000 819,985 0.03Skopos Auto Receivables Trust, Series2015-2A ‘A’, 144A 3.55% 15/02/2020 USD 338,966 338,676 0.01Southern California Edison Co. 1.845%01/02/2022 USD 132,857 132,049 0.01SpringCastle America Funding LLC,Series 2014-AA ‘A’, 144A 2.7%25/05/2023 USD 1,933,282 1,940,218 0.08SpringCastle America Funding LLC,Series 2014-AA ‘B’, 144A 4.61%25/10/2027 USD 500,000 501,438 0.02Springleaf Funding Trust, Series2015-AA ‘A’, 144A 3.16% 15/11/2024 USD 2,689,000 2,706,187 0.11Springleaf Funding Trust, Series2015-AA ‘B’, 144A 3.62% 15/11/2024 USD 544,000 532,980 0.02Spruce ABS Trust, Series 2016-E1 ‘A’,144A 4.32% 15/06/2028 USD 1,350,000 1,349,809 0.06Spruce ABS Trust, Series 2016-E1 ‘B’,144A 6.9% 15/06/2028 USD 1,000,000 985,075 0.04SPS Servicer Advance ReceivablesTrust, Series 2015-T2 ‘DT2’, 144A4.23% 15/01/2047 USD 859,000 860,291 0.04SPS Servicer Advance ReceivablesTrust, Series 2015-T3 ‘CT3’, 144A 3.91%15/07/2047 USD 809,000 807,543 0.03SPS Servicer Advance ReceivablesTrust, Series 2015-T3 ‘DT3’, 144A4.43% 15/07/2047 USD 1,425,000 1,453,834 0.06Starbucks Corp. 4.3% 15/06/2045 USD 306,000 365,381 0.02Structured Adjustable Rate MortgageLoan Trust, FRN, Series 2004-16 ‘3A2’2.969% 25/11/2034 USD 333,843 323,091 0.01Structured Adjustable Rate MortgageLoan Trust, FRN, Series 2004-6 ‘5A4’2.557% 25/06/2034 USD 35,849 35,828 0.00Structured Asset MortgageInvestments II Trust, FRN, Series2004-AR5 ‘1A1’ 1.099% 19/10/2034 USD 383,835 367,997 0.02Structured Asset MortgageInvestments II Trust, FRN, Series2005-AR5 ‘A3’ 0.689% 19/07/2035 USD 606,263 587,102 0.02Structured Asset Securities Corp., FRN,Series 2003-34A ‘3A3’ 2.875%25/11/2033 USD 610,618 600,344 0.02Structured Asset Securities Corp.,Series 2002-AL1 ‘A3’ 3.45%25/02/2032 USD 183,405 181,979 0.01
Structured Asset Securities Corp.,Series 2003-29 ‘1A1’ 4.75%25/09/2018 USD 48,758 49,367 0.00Structured Asset Securities Corp.,Series 2003-33H ‘1A1’ 5.5%25/10/2033 USD 96,717 99,028 0.00Structured Asset Securities Corp.,Series 2004-5H ‘A4’ 5.54% 25/12/2033 USD 362,058 373,533 0.02Structured Asset Securities Corp.,STEP, Series 2004-6XS ‘A5B’ 5.55%25/03/2034 USD 422,710 429,102 0.02Structured Asset Securities Corp.Mortgage Loan Trust, FRN, Series2007-OSI ‘A2’ 0.543% 25/06/2037 USD 57,914 56,509 0.00Structured Asset Securities Corp. Trust,Series 2005-6 ‘4A1’ 5% 25/05/2035 USD 56,289 56,847 0.00Sunset Mortgage Loan Co. LLC, STEP,Series 2014-NPL2 ‘A’, 144A 3.721%16/11/2044 USD 727,080 723,294 0.03TCI Communications, Inc. 7.875%15/02/2026 USD 394,000 566,850 0.02Tennessee Valley Authority GenericSTRIP 0% 15/03/2032 USD 800,000 511,642 0.02Texas Eastern Transmission LP, 144A2.8% 15/10/2022 USD 554,000 547,441 0.02Texas Health Resources 4.33%15/11/2055 USD 700,000 794,786 0.03Time Warner Cable, Inc. 8.25%01/04/2019 USD 450,000 522,533 0.02Time Warner Cable, Inc. 6.55%01/05/2037 USD 400,000 471,002 0.02Time Warner Cable, Inc. 5.5%01/09/2041 USD 197,000 209,318 0.01Time Warner, Inc. 6.2% 15/03/2040 USD 200,000 249,111 0.01Toyota Auto Receivables Owner Trust,Series 2016-B ‘A3’ 1.3% 15/04/2020 USD 559,000 561,314 0.02Tricon American Homes Trust, FRN,Series 2015-SFR1 ‘A’, 144A 1.684%17/05/2032 USD 517,128 510,330 0.02Tri-State Generation & TransmissionAssociation, Inc., 144A 4.25%01/06/2046 USD 202,000 209,952 0.01Union Pacific Corp. 3.646%15/02/2024 USD 277,000 305,437 0.01Union Pacific Railroad Co. PassThrough Trust, Series 2003-1 4.698%02/01/2024 USD 106,947 114,433 0.01Union Pacific Railroad Co. PassThrough Trust, Series 2015-1 2.695%12/05/2027 USD 675,964 682,073 0.03United Airlines Pass Through Trust3.45% 07/07/2028 USD 464,000 476,180 0.02United Parcel Service of America, Inc.,STEP 8.375% 01/04/2030 USD 200,000 300,201 0.01United Technologies Corp., STEP1.778% 04/05/2018 USD 980,000 987,673 0.04US Treasury STRIP Coupon 0%15/02/2022 USD 5,920,000 5,529,848 0.23US Treasury STRIP Coupon 0%15/05/2022 USD 12,905,000 12,009,110 0.49US Treasury STRIP Coupon 0%15/08/2022 USD 8,700,000 8,060,091 0.33US Treasury STRIP Coupon 0%15/11/2022 USD 14,900,000 13,738,234 0.56US Treasury STRIP Coupon 0%15/02/2023 USD 15,076,000 13,824,195 0.57US Treasury STRIP Coupon 0%15/05/2023 USD 24,000,000 21,871,412 0.90US Treasury STRIP Coupon 0%15/08/2023 USD 9,690,000 8,791,303 0.36US Treasury STRIP Coupon 0%15/02/2024 USD 1,500,000 1,346,511 0.06US Treasury STRIP Coupon 0%15/05/2024 USD 4,150,000 3,709,063 0.15US Treasury STRIP Coupon 0%15/11/2024 USD 450,000 397,474 0.02US Treasury STRIP Coupon 0%15/02/2025 USD 1,500,000 1,315,699 0.05US Treasury STRIP Coupon 0%15/05/2026 USD 1,000,000 851,084 0.04US Treasury STRIP Coupon 0%15/08/2026 USD 100,000 84,760 0.00US Treasury STRIP Coupon 0%15/11/2026 USD 7,125,000 5,994,885 0.25US Treasury STRIP Coupon 0%15/02/2027 USD 3,000,000 2,513,356 0.10US Treasury STRIP Coupon 0%15/05/2027 USD 5,390,000 4,489,243 0.18US Treasury STRIP Coupon 0%15/08/2027 USD 2,500,000 2,069,429 0.09US Treasury STRIP Coupon 0%15/11/2027 USD 3,465,000 2,849,538 0.12
223
JPMorgan Funds - US Aggregate Bond FundSchedule of Investments (continued)
As at 30 June 2016
Investments Currency
Quantity/Nominal
Value
MarketValue
USD
%of
NetAssets Investments Currency
Quantity/Nominal
Value
MarketValue
USD
%of
NetAssets
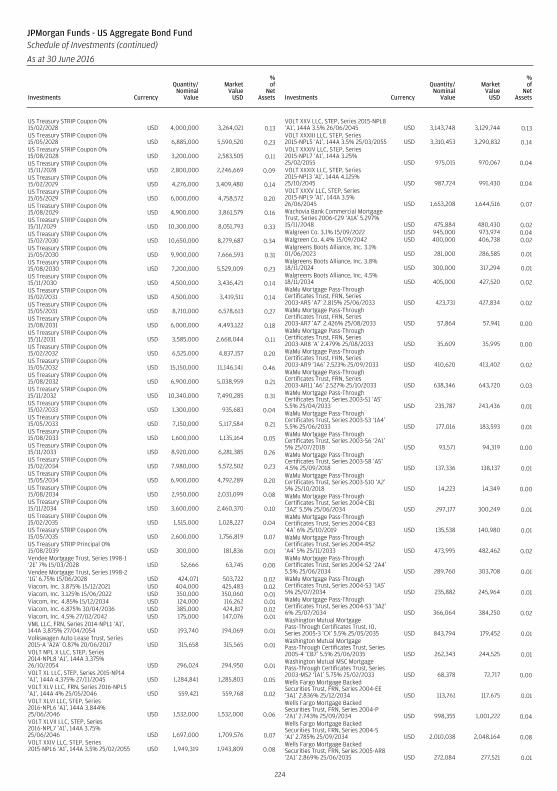
US Treasury STRIP Coupon 0%15/02/2028 USD 4,000,000 3,264,021 0.13US Treasury STRIP Coupon 0%15/05/2028 USD 6,885,000 5,590,520 0.23US Treasury STRIP Coupon 0%15/08/2028 USD 3,200,000 2,583,505 0.11US Treasury STRIP Coupon 0%15/11/2028 USD 2,800,000 2,246,669 0.09US Treasury STRIP Coupon 0%15/02/2029 USD 4,276,000 3,409,480 0.14US Treasury STRIP Coupon 0%15/05/2029 USD 6,000,000 4,758,572 0.20US Treasury STRIP Coupon 0%15/08/2029 USD 4,900,000 3,861,579 0.16US Treasury STRIP Coupon 0%15/11/2029 USD 10,300,000 8,051,793 0.33US Treasury STRIP Coupon 0%15/02/2030 USD 10,650,000 8,279,687 0.34US Treasury STRIP Coupon 0%15/05/2030 USD 9,900,000 7,666,593 0.31US Treasury STRIP Coupon 0%15/08/2030 USD 7,200,000 5,529,009 0.23US Treasury STRIP Coupon 0%15/11/2030 USD 4,500,000 3,436,421 0.14US Treasury STRIP Coupon 0%15/02/2031 USD 4,500,000 3,419,511 0.14US Treasury STRIP Coupon 0%15/05/2031 USD 8,710,000 6,578,613 0.27US Treasury STRIP Coupon 0%15/08/2031 USD 6,000,000 4,493,122 0.18US Treasury STRIP Coupon 0%15/11/2031 USD 3,585,000 2,668,044 0.11US Treasury STRIP Coupon 0%15/02/2032 USD 6,525,000 4,837,157 0.20US Treasury STRIP Coupon 0%15/05/2032 USD 15,150,000 11,146,141 0.46US Treasury STRIP Coupon 0%15/08/2032 USD 6,900,000 5,038,959 0.21US Treasury STRIP Coupon 0%15/11/2032 USD 10,340,000 7,490,285 0.31US Treasury STRIP Coupon 0%15/02/2033 USD 1,300,000 935,683 0.04US Treasury STRIP Coupon 0%15/05/2033 USD 7,150,000 5,117,584 0.21US Treasury STRIP Coupon 0%15/08/2033 USD 1,600,000 1,135,164 0.05US Treasury STRIP Coupon 0%15/11/2033 USD 8,920,000 6,281,385 0.26US Treasury STRIP Coupon 0%15/02/2034 USD 7,980,000 5,572,502 0.23US Treasury STRIP Coupon 0%15/05/2034 USD 6,900,000 4,792,289 0.20US Treasury STRIP Coupon 0%15/08/2034 USD 2,950,000 2,031,099 0.08US Treasury STRIP Coupon 0%15/11/2034 USD 3,600,000 2,460,370 0.10US Treasury STRIP Coupon 0%15/02/2035 USD 1,515,000 1,028,227 0.04US Treasury STRIP Coupon 0%15/05/2035 USD 2,600,000 1,756,819 0.07US Treasury STRIP Principal 0%15/08/2039 USD 300,000 181,836 0.01Vendee Mortgage Trust, Series 1998-1‘2E’ 7% 15/03/2028 USD 52,666 63,745 0.00Vendee Mortgage Trust, Series 1998-2‘1G’ 6.75% 15/06/2028 USD 424,071 503,722 0.02Viacom, Inc. 3.875% 15/12/2021 USD 404,000 425,483 0.02Viacom, Inc. 3.125% 15/06/2022 USD 350,000 350,060 0.01Viacom, Inc. 4.85% 15/12/2034 USD 124,000 116,262 0.01Viacom, Inc. 6.875% 30/04/2036 USD 385,000 424,817 0.02Viacom, Inc. 4.5% 27/02/2042 USD 175,000 147,076 0.01VML LLC, FRN, Series 2014-NPL1 ‘A1’,144A 3.875% 27/04/2054 USD 193,740 194,069 0.01Volkswagen Auto Lease Trust, Series2015-A ‘A2A’ 0.87% 20/06/2017 USD 315,658 315,565 0.01VOLT NPL X LLC, STEP, Series2014-NPL8 ‘A1’, 144A 3.375%26/10/2054 USD 296,024 294,950 0.01VOLT XL LLC, STEP, Series 2015-NP14‘A1’, 144A 4.375% 27/11/2045 USD 1,284,841 1,285,803 0.05VOLT XLV LLC, FRN, Series 2016-NPL5‘A1’, 144A 4% 25/05/2046 USD 559,421 559,768 0.02VOLT XLVI LLC, STEP, Series2016-NPL6 ‘A1’, 144A 3.844%25/06/2046 USD 1,532,000 1,532,000 0.06VOLT XLVII LLC, STEP, Series2016-NPL7 ‘A1’, 144A 3.75%25/06/2046 USD 1,697,000 1,709,576 0.07VOLT XXIV LLC, STEP, Series2015-NPL6 ‘A1’, 144A 3.5% 25/02/2055 USD 1,949,319 1,943,809 0.08
VOLT XXV LLC, STEP, Series 2015-NPL8‘A1’, 144A 3.5% 26/06/2045 USD 3,143,748 3,129,744 0.13VOLT XXXIII LLC, STEP, Series2015-NPL5 ‘A1’, 144A 3.5% 25/03/2055 USD 3,310,453 3,290,832 0.14VOLT XXXIV LLC, STEP, Series2015-NPL7 ‘A1’, 144A 3.25%25/02/2055 USD 975,015 970,067 0.04VOLT XXXIX LLC, STEP, Series2015-NP13 ‘A1’, 144A 4.125%25/10/2045 USD 987,724 991,430 0.04VOLT XXXV LLC, STEP, Series2015-NPL9 ‘A1’, 144A 3.5%26/06/2045 USD 1,653,208 1,644,516 0.07Wachovia Bank Commercial MortgageTrust, Series 2006-C29 ‘A1A’ 5.297%15/11/2048 USD 475,884 480,430 0.02Walgreen Co. 3.1% 15/09/2022 USD 945,000 973,974 0.04Walgreen Co. 4.4% 15/09/2042 USD 400,000 406,738 0.02Walgreens Boots Alliance, Inc. 3.1%01/06/2023 USD 281,000 286,585 0.01Walgreens Boots Alliance, Inc. 3.8%18/11/2024 USD 300,000 317,294 0.01Walgreens Boots Alliance, Inc. 4.5%18/11/2034 USD 405,000 427,520 0.02WaMu Mortgage Pass-ThroughCertificates Trust, FRN, Series2003-AR5 ‘A7’ 2.815% 25/06/2033 USD 423,731 427,834 0.02WaMu Mortgage Pass-ThroughCertificates Trust, FRN, Series2003-AR7 ‘A7’ 2.426% 25/08/2033 USD 57,864 57,941 0.00WaMu Mortgage Pass-ThroughCertificates Trust, FRN, Series2003-AR8 ‘A’ 2.479% 25/08/2033 USD 35,609 35,995 0.00WaMu Mortgage Pass-ThroughCertificates Trust, FRN, Series2003-AR9 ‘1A6’ 2.523% 25/09/2033 USD 410,620 413,402 0.02WaMu Mortgage Pass-ThroughCertificates Trust, FRN, Series2003-AR11 ‘A6’ 2.527% 25/10/2033 USD 638,346 643,720 0.03WaMu Mortgage Pass-ThroughCertificates Trust, Series 2003-S1 ‘A5’5.5% 25/04/2033 USD 235,787 243,436 0.01WaMu Mortgage Pass-ThroughCertificates Trust, Series 2003-S3 ‘1A4’5.5% 25/06/2033 USD 177,016 183,593 0.01WaMu Mortgage Pass-ThroughCertificates Trust, Series 2003-S6 ‘2A1’5% 25/07/2018 USD 93,571 94,319 0.00WaMu Mortgage Pass-ThroughCertificates Trust, Series 2003-S8 ‘A5’4.5% 25/09/2018 USD 137,336 138,137 0.01WaMu Mortgage Pass-ThroughCertificates Trust, Series 2003-S10 ‘A2’5% 25/10/2018 USD 14,223 14,349 0.00WaMu Mortgage Pass-ThroughCertificates Trust, Series 2004-CB1‘3A2’ 5.5% 25/06/2034 USD 297,177 300,249 0.01WaMu Mortgage Pass-ThroughCertificates Trust, Series 2004-CB3‘4A’ 6% 25/10/2019 USD 135,538 140,980 0.01WaMu Mortgage Pass-ThroughCertificates Trust, Series 2004-RS2‘A4’ 5% 25/11/2033 USD 473,995 482,462 0.02WaMu Mortgage Pass-ThroughCertificates Trust, Series 2004-S2 ‘2A4’5.5% 25/06/2034 USD 289,760 303,708 0.01WaMu Mortgage Pass-ThroughCertificates Trust, Series 2004-S3 ‘1A5’5% 25/07/2034 USD 235,882 245,964 0.01WaMu Mortgage Pass-ThroughCertificates Trust, Series 2004-S3 ‘3A2’6% 25/07/2034 USD 366,064 384,250 0.02Washington Mutual MortgagePass-Through Certificates Trust, IO,Series 2005-3 ‘CX’ 5.5% 25/05/2035 USD 843,794 179,452 0.01Washington Mutual MortgagePass-Through Certificates Trust, Series2005-4 ‘CB7’ 5.5% 25/06/2035 USD 262,343 244,525 0.01Washington Mutual MSC MortgagePass-Through Certificates Trust, Series2003-MS2 ‘1A1’ 5.75% 25/02/2033 USD 68,378 72,717 0.00Wells Fargo Mortgage BackedSecurities Trust, FRN, Series 2004-EE‘3A1’ 2.836% 25/12/2034 USD 113,761 117,675 0.01Wells Fargo Mortgage BackedSecurities Trust, FRN, Series 2004-P‘2A1’ 2.743% 25/09/2034 USD 998,355 1,001,222 0.04Wells Fargo Mortgage BackedSecurities Trust, FRN, Series 2004-S‘A1’ 2.785% 25/09/2034 USD 2,010,038 2,048,164 0.08Wells Fargo Mortgage BackedSecurities Trust, FRN, Series 2005-AR8‘2A1’ 2.869% 25/06/2035 USD 272,084 277,521 0.01
224
JPMorgan Funds - US Aggregate Bond FundSchedule of Investments (continued)
As at 30 June 2016
Investments Currency
Quantity/Nominal
Value
MarketValue
USD
%of
NetAssets Investments Currency
Quantity/Nominal
Value
MarketValue
USD
%of
NetAssets
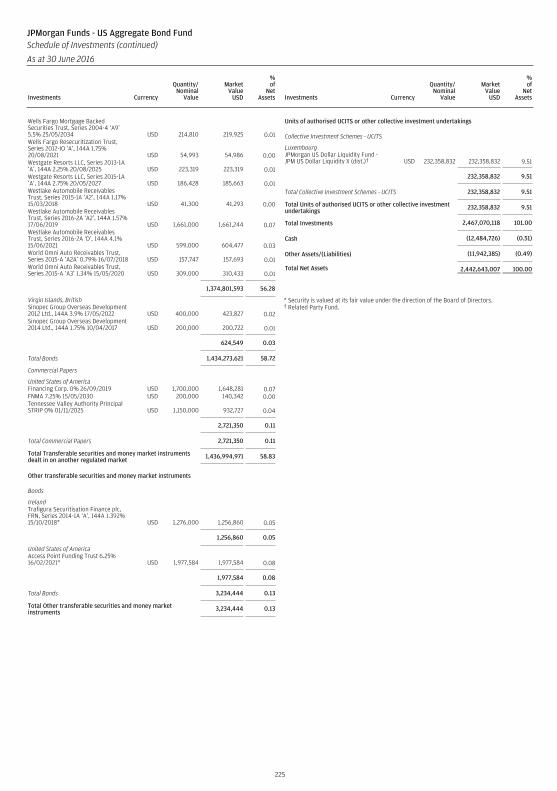
Wells Fargo Mortgage BackedSecurities Trust, Series 2004-4 ‘A9’5.5% 25/05/2034 USD 214,810 219,925 0.01Wells Fargo Resecuritization Trust,Series 2012-IO ‘A’, 144A 1.75%20/08/2021 USD 54,993 54,986 0.00Westgate Resorts LLC, Series 2013-1A‘A’, 144A 2.25% 20/08/2025 USD 223,319 223,319 0.01Westgate Resorts LLC, Series 2015-1A‘A’, 144A 2.75% 20/05/2027 USD 186,428 185,663 0.01Westlake Automobile ReceivablesTrust, Series 2015-1A ‘A2’, 144A 1.17%15/03/2018 USD 41,300 41,293 0.00Westlake Automobile ReceivablesTrust, Series 2016-2A ‘A2’, 144A 1.57%17/06/2019 USD 1,661,000 1,661,244 0.07Westlake Automobile ReceivablesTrust, Series 2016-2A ‘D’, 144A 4.1%15/06/2021 USD 599,000 604,477 0.03World Omni Auto Receivables Trust,Series 2015-A ‘A2A’ 0.79% 16/07/2018 USD 157,747 157,693 0.01World Omni Auto Receivables Trust,Series 2015-A ‘A3’ 1.34% 15/05/2020 USD 309,000 310,433 0.01
1,374,801,593 56.28
Virgin Islands, BritishSinopec Group Overseas Development2012 Ltd., 144A 3.9% 17/05/2022 USD 400,000 423,827 0.02Sinopec Group Overseas Development2014 Ltd., 144A 1.75% 10/04/2017 USD 200,000 200,722 0.01
624,549 0.03
Total Bonds 1,434,273,621 58.72
Commercial Papers
United States of AmericaFinancing Corp. 0% 26/09/2019 USD 1,700,000 1,648,281 0.07FNMA 7.25% 15/05/2030 USD 200,000 140,342 0.00Tennessee Valley Authority PrincipalSTRIP 0% 01/11/2025 USD 1,150,000 932,727 0.04
2,721,350 0.11
Total Commercial Papers 2,721,350 0.11
Total Transferable securities and money market instrumentsdealt in on another regulated market 1,436,994,971 58.83
Other transferable securities and money market instruments
Bonds
IrelandTrafigura Securitisation Finance plc,FRN, Series 2014-1A ‘A’, 144A 1.392%15/10/2018* USD 1,276,000 1,256,860 0.05
1,256,860 0.05
United States of AmericaAccess Point Funding Trust 6.25%16/02/2021* USD 1,977,584 1,977,584 0.08
1,977,584 0.08
Total Bonds 3,234,444 0.13
Total Other transferable securities and money marketinstruments 3,234,444 0.13
Units of authorised UCITS or other collective investment undertakings
Collective Investment Schemes - UCITS
LuxembourgJPMorgan US Dollar Liquidity Fund -JPM US Dollar Liquidity X (dist.)† USD 232,358,832 232,358,832 9.51
232,358,832 9.51
Total Collective Investment Schemes - UCITS 232,358,832 9.51
Total Units of authorised UCITS or other collective investmentundertakings 232,358,832 9.51
Total Investments 2,467,070,118 101.00
Cash (12,484,726) (0.51)
Other Assets/(Liabilities) (11,942,385) (0.49)
Total Net Assets 2,442,643,007 100.00
* Security is valued at its fair value under the direction of the Board of Directors.† Related Party Fund.
225
JPMorgan Funds - US Aggregate Bond FundSchedule of Investments (continued)
As at 30 June 2016
Investments Currency
Quantity/Nominal
Value
MarketValue
USD
%of
NetAssets Investments Currency
Quantity/Nominal
Value
MarketValue
USD
%of
NetAssets
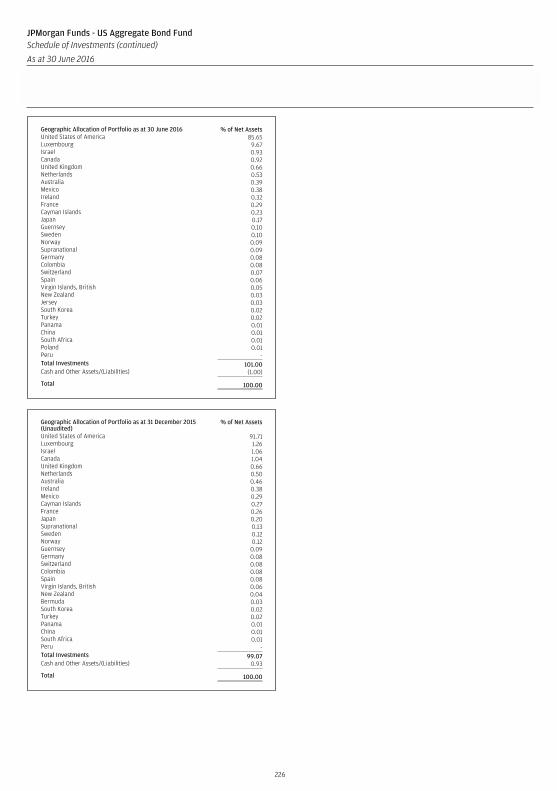
Geographic Allocation of Portfolio as at 30 June 2016 % of Net AssetsUnited States of America 85.65Luxembourg 9.67Israel 0.93Canada 0.92United Kingdom 0.66Netherlands 0.53Australia 0.39Mexico 0.38Ireland 0.32France 0.29Cayman Islands 0.23Japan 0.17Guernsey 0.10Sweden 0.10Norway 0.09Supranational 0.09Germany 0.08Colombia 0.08Switzerland 0.07Spain 0.06Virgin Islands, British 0.05New Zealand 0.03Jersey 0.03South Korea 0.02Turkey 0.02Panama 0.01China 0.01South Africa 0.01Poland 0.01Peru -Total Investments 101.00Cash and Other Assets/(Liabilities) (1.00)
Total 100.00
Geographic Allocation of Portfolio as at 31 December 2015(Unaudited)
% of Net Assets
United States of America 91.71Luxembourg 1.26Israel 1.06Canada 1.04United Kingdom 0.66Netherlands 0.50Australia 0.46Ireland 0.38Mexico 0.29Cayman Islands 0.27France 0.26Japan 0.20Supranational 0.13Sweden 0.12Norway 0.12Guernsey 0.09Germany 0.08Switzerland 0.08Colombia 0.08Spain 0.08Virgin Islands, British 0.06New Zealand 0.04Bermuda 0.03South Korea 0.02Turkey 0.02Panama 0.01China 0.01South Africa 0.01Peru -Total Investments 99.07Cash and Other Assets/(Liabilities) 0.93
Total 100.00
226
JPMorgan Funds - US Aggregate Bond FundSchedule of Investments (continued)
As at 30 June 2016
Investments Currency
Quantity/Nominal
Value
MarketValue
USD
%of
NetAssets Investments Currency
Quantity/Nominal
Value
MarketValue
USD
%of
NetAssets
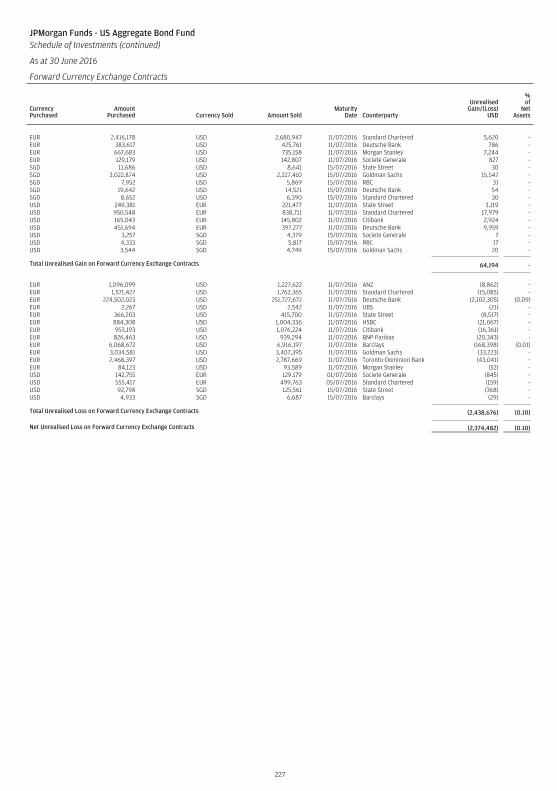
JPMorgan Funds - US Aggregate Bond FundSchedule of Investments (continued)
As at 30 June 2016
Forward Currency Exchange Contracts
CurrencyPurchased
AmountPurchased Currency Sold Amount Sold
MaturityDate Counterparty
UnrealisedGain/(Loss)
USD
%of
NetAssets
EUR 2,416,178 USD 2,680,947 11/07/2016 Standard Chartered 5,620 -EUR 383,617 USD 425,761 11/07/2016 Deutsche Bank 786 -EUR 667,683 USD 735,158 11/07/2016 Morgan Stanley 7,244 -EUR 129,179 USD 142,807 11/07/2016 Societe Generale 827 -SGD 11,686 USD 8,641 15/07/2016 State Street 30 -SGD 3,022,874 USD 2,227,410 15/07/2016 Goldman Sachs 15,547 -SGD 7,952 USD 5,869 15/07/2016 RBC 31 -SGD 19,642 USD 14,521 15/07/2016 Deutsche Bank 54 -SGD 8,652 USD 6,390 15/07/2016 Standard Chartered 30 -USD 249,381 EUR 221,477 11/07/2016 State Street 3,119 -USD 950,548 EUR 838,711 11/07/2016 Standard Chartered 17,979 -USD 165,043 EUR 145,802 11/07/2016 Citibank 2,924 -USD 451,694 EUR 397,277 11/07/2016 Deutsche Bank 9,959 -USD 3,257 SGD 4,379 15/07/2016 Societe Generale 7 -USD 4,333 SGD 5,817 15/07/2016 RBC 17 -USD 3,544 SGD 4,749 15/07/2016 Goldman Sachs 20 -
Total Unrealised Gain on Forward Currency Exchange Contracts 64,194 -
EUR 1,096,099 USD 1,227,622 11/07/2016 ANZ (8,862) -EUR 1,571,427 USD 1,762,365 11/07/2016 Standard Chartered (15,085) -EUR 224,502,023 USD 251,727,672 11/07/2016 Deutsche Bank (2,102,305) (0.09)EUR 2,267 USD 2,542 11/07/2016 UBS (21) -EUR 366,203 USD 415,700 11/07/2016 State Street (8,517) -EUR 884,308 USD 1,004,336 11/07/2016 HSBC (21,067) -EUR 953,193 USD 1,076,224 11/07/2016 Citibank (16,361) -EUR 826,463 USD 939,294 11/07/2016 BNP Paribas (20,343) -EUR 6,068,672 USD 6,916,197 11/07/2016 Barclays (168,398) (0.01)EUR 3,034,581 USD 3,407,395 11/07/2016 Goldman Sachs (33,223) -EUR 2,468,397 USD 2,787,669 11/07/2016 Toronto-Dominion Bank (43,041) -EUR 84,123 USD 93,589 11/07/2016 Morgan Stanley (52) -USD 142,755 EUR 129,179 01/07/2016 Societe Generale (845) -USD 555,417 EUR 499,763 05/07/2016 Standard Chartered (159) -USD 92,798 SGD 125,561 15/07/2016 State Street (368) -USD 4,933 SGD 6,687 15/07/2016 Barclays (29) -
Total Unrealised Loss on Forward Currency Exchange Contracts (2,438,676) (0.10)
Net Unrealised Loss on Forward Currency Exchange Contracts (2,374,482) (0.10)
227
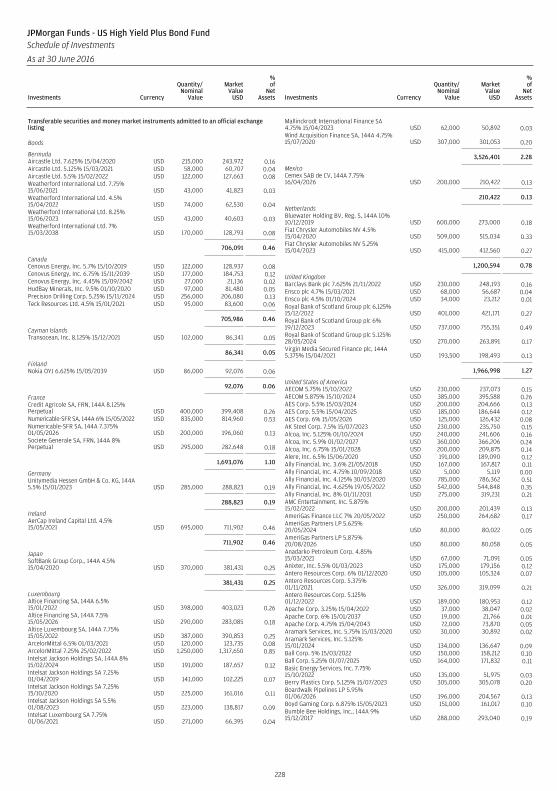
Transferable securities and money market instruments admitted to an official exchangelisting
Bonds
BermudaAircastle Ltd. 7.625% 15/04/2020 USD 215,000 243,972 0.16Aircastle Ltd. 5.125% 15/03/2021 USD 58,000 60,707 0.04Aircastle Ltd. 5.5% 15/02/2022 USD 122,000 127,663 0.08Weatherford International Ltd. 7.75%15/06/2021 USD 43,000 41,823 0.03Weatherford International Ltd. 4.5%15/04/2022 USD 74,000 62,530 0.04Weatherford International Ltd. 8.25%15/06/2023 USD 43,000 40,603 0.03Weatherford International Ltd. 7%15/03/2038 USD 170,000 128,793 0.08
706,091 0.46
CanadaCenovus Energy, Inc. 5.7% 15/10/2019 USD 122,000 128,937 0.08Cenovus Energy, Inc. 6.75% 15/11/2039 USD 177,000 184,753 0.12Cenovus Energy, Inc. 4.45% 15/09/2042 USD 27,000 21,136 0.02HudBay Minerals, Inc. 9.5% 01/10/2020 USD 97,000 81,480 0.05Precision Drilling Corp. 5.25% 15/11/2024 USD 256,000 206,080 0.13Teck Resources Ltd. 4.5% 15/01/2021 USD 95,000 83,600 0.06
705,986 0.46
Cayman IslandsTransocean, Inc. 8.125% 15/12/2021 USD 102,000 86,341 0.05
86,341 0.05
FinlandNokia OYJ 6.625% 15/05/2039 USD 86,000 92,076 0.06
92,076 0.06
FranceCredit Agricole SA, FRN, 144A 8.125%Perpetual USD 400,000 399,408 0.26Numericable-SFR SA, 144A 6% 15/05/2022 USD 835,000 814,960 0.53Numericable-SFR SA, 144A 7.375%01/05/2026 USD 200,000 196,060 0.13Societe Generale SA, FRN, 144A 8%Perpetual USD 295,000 282,648 0.18
1,693,076 1.10
GermanyUnitymedia Hessen GmbH & Co. KG, 144A5.5% 15/01/2023 USD 285,000 288,823 0.19
288,823 0.19
IrelandAerCap Ireland Capital Ltd. 4.5%15/05/2021 USD 695,000 711,902 0.46
711,902 0.46
JapanSoftBank Group Corp., 144A 4.5%15/04/2020 USD 370,000 381,431 0.25
381,431 0.25
LuxembourgAltice Financing SA, 144A 6.5%15/01/2022 USD 398,000 403,023 0.26Altice Financing SA, 144A 7.5%15/05/2026 USD 290,000 283,085 0.18Altice Luxembourg SA, 144A 7.75%15/05/2022 USD 387,000 390,853 0.25ArcelorMittal 6.5% 01/03/2021 USD 120,000 123,735 0.08ArcelorMittal 7.25% 25/02/2022 USD 1,250,000 1,317,650 0.85Intelsat Jackson Holdings SA, 144A 8%15/02/2024 USD 191,000 187,657 0.12Intelsat Jackson Holdings SA 7.25%01/04/2019 USD 141,000 102,225 0.07Intelsat Jackson Holdings SA 7.25%15/10/2020 USD 225,000 161,016 0.11Intelsat Jackson Holdings SA 5.5%01/08/2023 USD 223,000 138,817 0.09Intelsat Luxembourg SA 7.75%01/06/2021 USD 271,000 66,395 0.04
Mallinckrodt International Finance SA4.75% 15/04/2023 USD 62,000 50,892 0.03Wind Acquisition Finance SA, 144A 4.75%15/07/2020 USD 307,000 301,053 0.20
3,526,401 2.28
MexicoCemex SAB de CV, 144A 7.75%16/04/2026 USD 200,000 210,422 0.13
210,422 0.13
NetherlandsBluewater Holding BV, Reg. S, 144A 10%10/12/2019 USD 600,000 273,000 0.18Fiat Chrysler Automobiles NV 4.5%15/04/2020 USD 509,000 515,034 0.33Fiat Chrysler Automobiles NV 5.25%15/04/2023 USD 415,000 412,560 0.27
1,200,594 0.78
United KingdomBarclays Bank plc 7.625% 21/11/2022 USD 230,000 248,193 0.16Ensco plc 4.7% 15/03/2021 USD 68,000 56,687 0.04Ensco plc 4.5% 01/10/2024 USD 34,000 23,212 0.01Royal Bank of Scotland Group plc 6.125%15/12/2022 USD 401,000 421,171 0.27Royal Bank of Scotland Group plc 6%19/12/2023 USD 737,000 755,351 0.49Royal Bank of Scotland Group plc 5.125%28/05/2024 USD 270,000 263,891 0.17Virgin Media Secured Finance plc, 144A5.375% 15/04/2021 USD 193,500 198,493 0.13
1,966,998 1.27
United States of AmericaAECOM 5.75% 15/10/2022 USD 230,000 237,073 0.15AECOM 5.875% 15/10/2024 USD 385,000 395,588 0.26AES Corp. 5.5% 15/03/2024 USD 200,000 204,666 0.13AES Corp. 5.5% 15/04/2025 USD 185,000 186,644 0.12AES Corp. 6% 15/05/2026 USD 125,000 126,432 0.08AK Steel Corp. 7.5% 15/07/2023 USD 230,000 235,750 0.15Alcoa, Inc. 5.125% 01/10/2024 USD 240,000 241,606 0.16Alcoa, Inc. 5.9% 01/02/2027 USD 360,000 366,206 0.24Alcoa, Inc. 6.75% 15/01/2028 USD 200,000 209,875 0.14Alere, Inc. 6.5% 15/06/2020 USD 191,000 189,090 0.12Ally Financial, Inc. 3.6% 21/05/2018 USD 167,000 167,817 0.11Ally Financial, Inc. 4.75% 10/09/2018 USD 5,000 5,119 0.00Ally Financial, Inc. 4.125% 30/03/2020 USD 785,000 786,362 0.51Ally Financial, Inc. 4.625% 19/05/2022 USD 542,000 544,848 0.35Ally Financial, Inc. 8% 01/11/2031 USD 275,000 319,231 0.21AMC Entertainment, Inc. 5.875%15/02/2022 USD 200,000 201,439 0.13AmeriGas Finance LLC 7% 20/05/2022 USD 250,000 264,682 0.17AmeriGas Partners LP 5.625%20/05/2024 USD 80,000 80,022 0.05AmeriGas Partners LP 5.875%20/08/2026 USD 80,000 80,058 0.05Anadarko Petroleum Corp. 4.85%15/03/2021 USD 67,000 71,091 0.05Anixter, Inc. 5.5% 01/03/2023 USD 175,000 179,156 0.12Antero Resources Corp. 6% 01/12/2020 USD 105,000 105,324 0.07Antero Resources Corp. 5.375%01/11/2021 USD 326,000 319,099 0.21Antero Resources Corp. 5.125%01/12/2022 USD 189,000 180,953 0.12Apache Corp. 3.25% 15/04/2022 USD 37,000 38,047 0.02Apache Corp. 6% 15/01/2037 USD 19,000 21,766 0.01Apache Corp. 4.75% 15/04/2043 USD 72,000 73,870 0.05Aramark Services, Inc. 5.75% 15/03/2020 USD 30,000 30,892 0.02Aramark Services, Inc. 5.125%15/01/2024 USD 134,000 136,647 0.09Ball Corp. 5% 15/03/2022 USD 150,000 158,212 0.10Ball Corp. 5.25% 01/07/2025 USD 164,000 171,832 0.11Basic Energy Services, Inc. 7.75%15/10/2022 USD 135,000 51,975 0.03Berry Plastics Corp. 5.125% 15/07/2023 USD 305,000 305,078 0.20Boardwalk Pipelines LP 5.95%01/06/2026 USD 196,000 204,567 0.13Boyd Gaming Corp. 6.875% 15/05/2023 USD 151,000 161,017 0.10Bumble Bee Holdings, Inc., 144A 9%15/12/2017 USD 288,000 293,040 0.19
228
JPMorgan Funds - US High Yield Plus Bond FundSchedule of Investments
As at 30 June 2016
Investments Currency
Quantity/Nominal
Value
MarketValue
USD
%of
NetAssets Investments Currency
Quantity/Nominal
Value
MarketValue
USD
%of
NetAssets
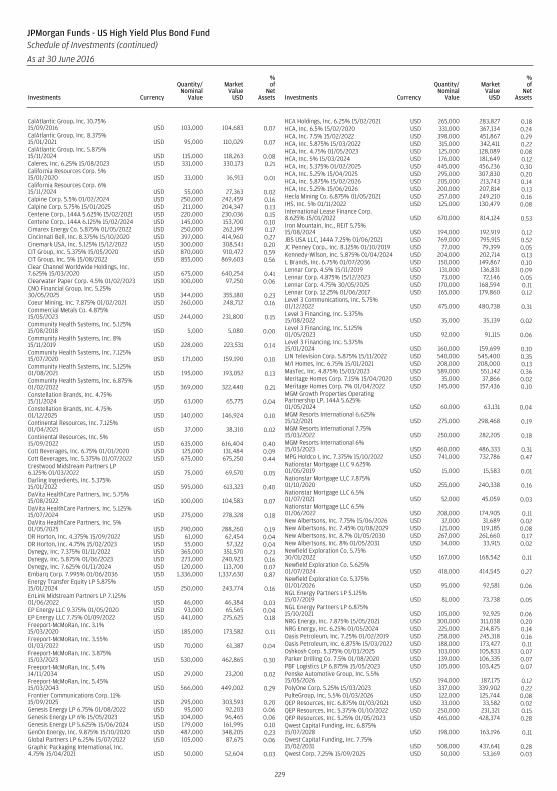
CalAtlantic Group, Inc. 10.75%15/09/2016 USD 103,000 104,683 0.07CalAtlantic Group, Inc. 8.375%15/01/2021 USD 95,000 110,029 0.07CalAtlantic Group, Inc. 5.875%15/11/2024 USD 115,000 118,263 0.08Caleres, Inc. 6.25% 15/08/2023 USD 331,000 330,173 0.21California Resources Corp. 5%15/01/2020 USD 33,000 16,913 0.01California Resources Corp. 6%15/11/2024 USD 55,000 27,363 0.02Calpine Corp. 5.5% 01/02/2024 USD 250,000 242,459 0.16Calpine Corp. 5.75% 15/01/2025 USD 211,000 204,347 0.13Centene Corp., 144A 5.625% 15/02/2021 USD 220,000 230,036 0.15Centene Corp., 144A 6.125% 15/02/2024 USD 145,000 153,700 0.10Cimarex Energy Co. 5.875% 01/05/2022 USD 250,000 262,199 0.17Cincinnati Bell, Inc. 8.375% 15/10/2020 USD 397,000 414,960 0.27Cinemark USA, Inc. 5.125% 15/12/2022 USD 300,000 308,541 0.20CIT Group, Inc. 5.375% 15/05/2020 USD 870,000 910,472 0.59CIT Group, Inc. 5% 15/08/2022 USD 855,000 869,603 0.56Clear Channel Worldwide Holdings, Inc.7.625% 15/03/2020 USD 675,000 640,254 0.41Clearwater Paper Corp. 4.5% 01/02/2023 USD 100,000 97,250 0.06CNO Financial Group, Inc. 5.25%30/05/2025 USD 344,000 355,180 0.23Coeur Mining, Inc. 7.875% 01/02/2021 USD 260,000 248,712 0.16Commercial Metals Co. 4.875%15/05/2023 USD 244,000 231,800 0.15Community Health Systems, Inc. 5.125%15/08/2018 USD 5,000 5,080 0.00Community Health Systems, Inc. 8%15/11/2019 USD 228,000 223,531 0.14Community Health Systems, Inc. 7.125%15/07/2020 USD 171,000 159,190 0.10Community Health Systems, Inc. 5.125%01/08/2021 USD 195,000 193,052 0.13Community Health Systems, Inc. 6.875%01/02/2022 USD 369,000 322,440 0.21Constellation Brands, Inc. 4.75%15/11/2024 USD 63,000 65,775 0.04Constellation Brands, Inc. 4.75%01/12/2025 USD 140,000 146,924 0.10Continental Resources, Inc. 7.125%01/04/2021 USD 37,000 38,310 0.02Continental Resources, Inc. 5%15/09/2022 USD 635,000 616,404 0.40Cott Beverages, Inc. 6.75% 01/01/2020 USD 125,000 131,484 0.09Cott Beverages, Inc. 5.375% 01/07/2022 USD 675,000 675,250 0.44Crestwood Midstream Partners LP6.125% 01/03/2022 USD 75,000 69,570 0.05Darling Ingredients, Inc. 5.375%15/01/2022 USD 595,000 613,323 0.40DaVita HealthCare Partners, Inc. 5.75%15/08/2022 USD 100,000 104,583 0.07DaVita HealthCare Partners, Inc. 5.125%15/07/2024 USD 275,000 278,328 0.18DaVita HealthCare Partners, Inc. 5%01/05/2025 USD 290,000 288,260 0.19DR Horton, Inc. 4.375% 15/09/2022 USD 61,000 62,454 0.04DR Horton, Inc. 4.75% 15/02/2023 USD 55,000 57,322 0.04Dynegy, Inc. 7.375% 01/11/2022 USD 365,000 351,570 0.23Dynegy, Inc. 5.875% 01/06/2023 USD 273,000 240,923 0.16Dynegy, Inc. 7.625% 01/11/2024 USD 120,000 113,700 0.07Embarq Corp. 7.995% 01/06/2036 USD 1,336,000 1,337,630 0.87Energy Transfer Equity LP 5.875%15/01/2024 USD 250,000 243,774 0.16EnLink Midstream Partners LP 7.125%01/06/2022 USD 46,000 46,384 0.03EP Energy LLC 9.375% 01/05/2020 USD 93,000 65,565 0.04EP Energy LLC 7.75% 01/09/2022 USD 441,000 275,625 0.18Freeport-McMoRan, Inc. 3.1%15/03/2020 USD 185,000 173,582 0.11Freeport-McMoRan, Inc. 3.55%01/03/2022 USD 70,000 61,387 0.04Freeport-McMoRan, Inc. 3.875%15/03/2023 USD 530,000 462,865 0.30Freeport-McMoRan, Inc. 5.4%14/11/2034 USD 29,000 23,200 0.02Freeport-McMoRan, Inc. 5.45%15/03/2043 USD 566,000 449,002 0.29Frontier Communications Corp. 11%15/09/2025 USD 295,000 303,593 0.20Genesis Energy LP 6.75% 01/08/2022 USD 95,000 92,203 0.06Genesis Energy LP 6% 15/05/2023 USD 104,000 96,465 0.06Genesis Energy LP 5.625% 15/06/2024 USD 179,000 161,995 0.10GenOn Energy, Inc. 9.875% 15/10/2020 USD 487,000 348,205 0.23Global Partners LP 6.25% 15/07/2022 USD 105,000 87,675 0.06Graphic Packaging International, Inc.4.75% 15/04/2021 USD 50,000 52,604 0.03
HCA Holdings, Inc. 6.25% 15/02/2021 USD 265,000 283,827 0.18HCA, Inc. 6.5% 15/02/2020 USD 331,000 367,134 0.24HCA, Inc. 7.5% 15/02/2022 USD 398,000 451,867 0.29HCA, Inc. 5.875% 15/03/2022 USD 315,000 342,411 0.22HCA, Inc. 4.75% 01/05/2023 USD 125,000 128,089 0.08HCA, Inc. 5% 15/03/2024 USD 176,000 181,649 0.12HCA, Inc. 5.375% 01/02/2025 USD 445,000 456,236 0.30HCA, Inc. 5.25% 15/04/2025 USD 295,000 307,830 0.20HCA, Inc. 5.875% 15/02/2026 USD 205,000 213,743 0.14HCA, Inc. 5.25% 15/06/2026 USD 200,000 207,814 0.13Hecla Mining Co. 6.875% 01/05/2021 USD 257,000 249,210 0.16IHS, Inc. 5% 01/11/2022 USD 125,000 130,479 0.08International Lease Finance Corp.8.625% 15/01/2022 USD 670,000 814,124 0.53Iron Mountain, Inc., REIT 5.75%15/08/2024 USD 194,000 192,919 0.12JBS USA LLC, 144A 7.25% 01/06/2021 USD 769,000 795,915 0.52JC Penney Corp., Inc. 8.125% 01/10/2019 USD 77,000 79,399 0.05Kennedy-Wilson, Inc. 5.875% 01/04/2024 USD 204,000 202,714 0.13L Brands, Inc. 6.75% 01/07/2036 USD 150,000 149,867 0.10Lennar Corp. 4.5% 15/11/2019 USD 131,000 136,831 0.09Lennar Corp. 4.875% 15/12/2023 USD 73,000 72,146 0.05Lennar Corp. 4.75% 30/05/2025 USD 170,000 168,594 0.11Lennar Corp. 12.25% 01/06/2017 USD 165,000 179,860 0.12Level 3 Communications, Inc. 5.75%01/12/2022 USD 475,000 480,738 0.31Level 3 Financing, Inc. 5.375%15/08/2022 USD 35,000 35,139 0.02Level 3 Financing, Inc. 5.125%01/05/2023 USD 92,000 91,115 0.06Level 3 Financing, Inc. 5.375%15/01/2024 USD 160,000 159,699 0.10LIN Television Corp. 5.875% 15/11/2022 USD 540,000 545,400 0.35M/I Homes, Inc. 6.75% 15/01/2021 USD 208,000 208,000 0.13MasTec, Inc. 4.875% 15/03/2023 USD 589,000 551,142 0.36Meritage Homes Corp. 7.15% 15/04/2020 USD 35,000 37,866 0.02Meritage Homes Corp. 7% 01/04/2022 USD 145,000 157,436 0.10MGM Growth Properties OperatingPartnership LP, 144A 5.625%01/05/2024 USD 60,000 63,131 0.04MGM Resorts International 6.625%15/12/2021 USD 275,000 298,468 0.19MGM Resorts International 7.75%15/03/2022 USD 250,000 282,205 0.18MGM Resorts International 6%15/03/2023 USD 460,000 486,333 0.31MPG Holdco I, Inc. 7.375% 15/10/2022 USD 741,000 732,786 0.47Nationstar Mortgage LLC 9.625%01/05/2019 USD 15,000 15,583 0.01Nationstar Mortgage LLC 7.875%01/10/2020 USD 255,000 240,338 0.16Nationstar Mortgage LLC 6.5%01/07/2021 USD 52,000 45,059 0.03Nationstar Mortgage LLC 6.5%01/06/2022 USD 208,000 174,905 0.11New Albertsons, Inc. 7.75% 15/06/2026 USD 32,000 31,689 0.02New Albertsons, Inc. 7.45% 01/08/2029 USD 121,000 119,185 0.08New Albertsons, Inc. 8.7% 01/05/2030 USD 267,000 261,660 0.17New Albertsons, Inc. 8% 01/05/2031 USD 34,000 33,915 0.02Newfield Exploration Co. 5.75%30/01/2022 USD 167,000 168,542 0.11Newfield Exploration Co. 5.625%01/07/2024 USD 418,000 414,545 0.27Newfield Exploration Co. 5.375%01/01/2026 USD 95,000 92,581 0.06NGL Energy Partners LP 5.125%15/07/2019 USD 81,000 73,738 0.05NGL Energy Partners LP 6.875%15/10/2021 USD 105,000 92,925 0.06NRG Energy, Inc. 7.875% 15/05/2021 USD 300,000 311,038 0.20NRG Energy, Inc. 6.25% 01/05/2024 USD 225,000 214,875 0.14Oasis Petroleum, Inc. 7.25% 01/02/2019 USD 258,000 245,318 0.16Oasis Petroleum, Inc. 6.875% 15/03/2022 USD 188,000 173,427 0.11Oshkosh Corp. 5.375% 01/03/2025 USD 103,000 105,833 0.07Parker Drilling Co. 7.5% 01/08/2020 USD 139,000 106,335 0.07PBF Logistics LP 6.875% 15/05/2023 USD 105,000 103,425 0.07Penske Automotive Group, Inc. 5.5%15/05/2026 USD 194,000 187,175 0.12PolyOne Corp. 5.25% 15/03/2023 USD 337,000 339,902 0.22PulteGroup, Inc. 5.5% 01/03/2026 USD 122,000 125,744 0.08QEP Resources, Inc. 6.875% 01/03/2021 USD 33,000 33,582 0.02QEP Resources, Inc. 5.375% 01/10/2022 USD 250,000 231,321 0.15QEP Resources, Inc. 5.25% 01/05/2023 USD 465,000 428,374 0.28Qwest Capital Funding, Inc. 6.875%15/07/2028 USD 198,000 163,196 0.11Qwest Capital Funding, Inc. 7.75%15/02/2031 USD 508,000 437,641 0.28Qwest Corp. 7.25% 15/09/2025 USD 50,000 53,169 0.03
229
JPMorgan Funds - US High Yield Plus Bond FundSchedule of Investments (continued)
As at 30 June 2016
Investments Currency
Quantity/Nominal
Value
MarketValue
USD
%of
NetAssets Investments Currency
Quantity/Nominal
Value
MarketValue
USD
%of
NetAssets
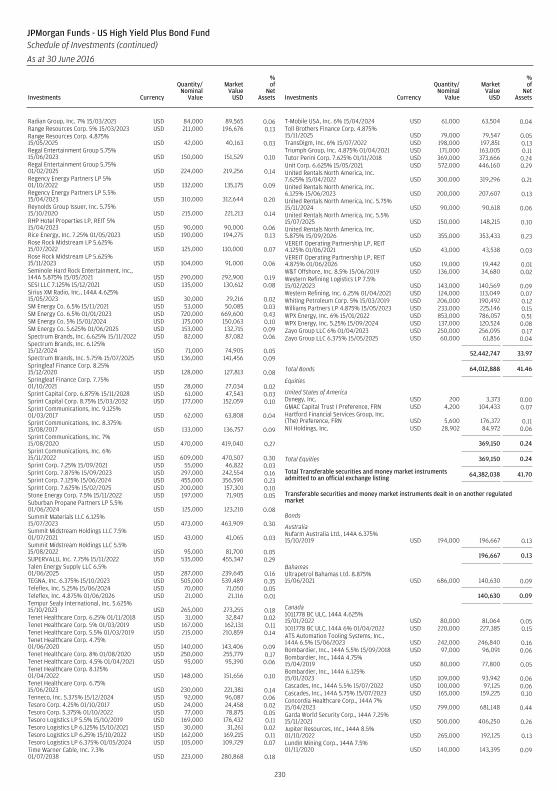
Radian Group, Inc. 7% 15/03/2021 USD 84,000 89,565 0.06Range Resources Corp. 5% 15/03/2023 USD 211,000 196,676 0.13Range Resources Corp. 4.875%15/05/2025 USD 42,000 40,163 0.03Regal Entertainment Group 5.75%15/06/2023 USD 150,000 151,529 0.10Regal Entertainment Group 5.75%01/02/2025 USD 224,000 219,256 0.14Regency Energy Partners LP 5%01/10/2022 USD 132,000 135,175 0.09Regency Energy Partners LP 5.5%15/04/2023 USD 310,000 312,644 0.20Reynolds Group Issuer, Inc. 5.75%15/10/2020 USD 215,000 221,213 0.14RHP Hotel Properties LP, REIT 5%15/04/2023 USD 90,000 90,000 0.06Rice Energy, Inc. 7.25% 01/05/2023 USD 190,000 194,275 0.13Rose Rock Midstream LP 5.625%15/07/2022 USD 125,000 110,000 0.07Rose Rock Midstream LP 5.625%15/11/2023 USD 104,000 91,000 0.06Seminole Hard Rock Entertainment, Inc.,144A 5.875% 15/05/2021 USD 290,000 292,900 0.19SESI LLC 7.125% 15/12/2021 USD 135,000 130,612 0.08Sirius XM Radio, Inc., 144A 4.625%15/05/2023 USD 30,000 29,216 0.02SM Energy Co. 6.5% 15/11/2021 USD 53,000 50,085 0.03SM Energy Co. 6.5% 01/01/2023 USD 720,000 669,600 0.43SM Energy Co. 5% 15/01/2024 USD 175,000 150,063 0.10SM Energy Co. 5.625% 01/06/2025 USD 153,000 132,715 0.09Spectrum Brands, Inc. 6.625% 15/11/2022 USD 82,000 87,082 0.06Spectrum Brands, Inc. 6.125%15/12/2024 USD 71,000 74,905 0.05Spectrum Brands, Inc. 5.75% 15/07/2025 USD 136,000 141,456 0.09Springleaf Finance Corp. 8.25%15/12/2020 USD 128,000 127,813 0.08Springleaf Finance Corp. 7.75%01/10/2021 USD 28,000 27,034 0.02Sprint Capital Corp. 6.875% 15/11/2028 USD 61,000 47,543 0.03Sprint Capital Corp. 8.75% 15/03/2032 USD 177,000 152,059 0.10Sprint Communications, Inc. 9.125%01/03/2017 USD 62,000 63,808 0.04Sprint Communications, Inc. 8.375%15/08/2017 USD 133,000 136,757 0.09Sprint Communications, Inc. 7%15/08/2020 USD 470,000 419,040 0.27Sprint Communications, Inc. 6%15/11/2022 USD 609,000 470,507 0.30Sprint Corp. 7.25% 15/09/2021 USD 55,000 46,822 0.03Sprint Corp. 7.875% 15/09/2023 USD 297,000 242,554 0.16Sprint Corp. 7.125% 15/06/2024 USD 455,000 356,590 0.23Sprint Corp. 7.625% 15/02/2025 USD 200,000 157,301 0.10Stone Energy Corp. 7.5% 15/11/2022 USD 197,000 71,905 0.05Suburban Propane Partners LP 5.5%01/06/2024 USD 125,000 123,210 0.08Summit Materials LLC 6.125%15/07/2023 USD 473,000 463,909 0.30Summit Midstream Holdings LLC 7.5%01/07/2021 USD 43,000 41,065 0.03Summit Midstream Holdings LLC 5.5%15/08/2022 USD 95,000 81,700 0.05SUPERVALU, Inc. 7.75% 15/11/2022 USD 535,000 455,347 0.29Talen Energy Supply LLC 6.5%01/06/2025 USD 287,000 239,645 0.16TEGNA, Inc. 6.375% 15/10/2023 USD 505,000 539,489 0.35Teleflex, Inc. 5.25% 15/06/2024 USD 70,000 71,050 0.05Teleflex, Inc. 4.875% 01/06/2026 USD 21,000 21,116 0.01Tempur Sealy International, Inc. 5.625%15/10/2023 USD 265,000 273,255 0.18Tenet Healthcare Corp. 6.25% 01/11/2018 USD 31,000 32,847 0.02Tenet Healthcare Corp. 5% 01/03/2019 USD 167,000 162,131 0.11Tenet Healthcare Corp. 5.5% 01/03/2019 USD 215,000 210,859 0.14Tenet Healthcare Corp. 4.75%01/06/2020 USD 140,000 143,406 0.09Tenet Healthcare Corp. 8% 01/08/2020 USD 250,000 255,779 0.17Tenet Healthcare Corp. 4.5% 01/04/2021 USD 95,000 95,390 0.06Tenet Healthcare Corp. 8.125%01/04/2022 USD 148,000 151,656 0.10Tenet Healthcare Corp. 6.75%15/06/2023 USD 230,000 221,381 0.14Tenneco, Inc. 5.375% 15/12/2024 USD 92,000 96,087 0.06Tesoro Corp. 4.25% 01/10/2017 USD 24,000 24,458 0.02Tesoro Corp. 5.375% 01/10/2022 USD 77,000 78,875 0.05Tesoro Logistics LP 5.5% 15/10/2019 USD 169,000 176,432 0.11Tesoro Logistics LP 6.125% 15/10/2021 USD 30,000 31,261 0.02Tesoro Logistics LP 6.25% 15/10/2022 USD 162,000 169,215 0.11Tesoro Logistics LP 6.375% 01/05/2024 USD 105,000 109,729 0.07Time Warner Cable, Inc. 7.3%01/07/2038 USD 223,000 280,868 0.18
T-Mobile USA, Inc. 6% 15/04/2024 USD 61,000 63,504 0.04Toll Brothers Finance Corp. 4.875%15/11/2025 USD 79,000 79,547 0.05TransDigm, Inc. 6% 15/07/2022 USD 198,000 197,851 0.13Triumph Group, Inc. 4.875% 01/04/2021 USD 171,000 163,005 0.11Tutor Perini Corp. 7.625% 01/11/2018 USD 369,000 373,666 0.24Unit Corp. 6.625% 15/05/2021 USD 572,000 446,160 0.29United Rentals North America, Inc.7.625% 15/04/2022 USD 300,000 319,296 0.21United Rentals North America, Inc.6.125% 15/06/2023 USD 200,000 207,607 0.13United Rentals North America, Inc. 5.75%15/11/2024 USD 90,000 90,618 0.06United Rentals North America, Inc. 5.5%15/07/2025 USD 150,000 148,215 0.10United Rentals North America, Inc.5.875% 15/09/2026 USD 355,000 353,433 0.23VEREIT Operating Partnership LP, REIT4.125% 01/06/2021 USD 43,000 43,538 0.03VEREIT Operating Partnership LP, REIT4.875% 01/06/2026 USD 19,000 19,442 0.01W&T Offshore, Inc. 8.5% 15/06/2019 USD 136,000 34,680 0.02Western Refining Logistics LP 7.5%15/02/2023 USD 143,000 140,569 0.09Western Refining, Inc. 6.25% 01/04/2021 USD 124,000 113,049 0.07Whiting Petroleum Corp. 5% 15/03/2019 USD 206,000 190,492 0.12Williams Partners LP 4.875% 15/05/2023 USD 233,000 225,146 0.15WPX Energy, Inc. 6% 15/01/2022 USD 853,000 786,057 0.51WPX Energy, Inc. 5.25% 15/09/2024 USD 137,000 120,524 0.08Zayo Group LLC 6% 01/04/2023 USD 250,000 256,095 0.17Zayo Group LLC 6.375% 15/05/2025 USD 60,000 61,856 0.04
52,442,747 33.97
Total Bonds 64,012,888 41.46
Equities
United States of AmericaDynegy, Inc. USD 200 3,373 0.00GMAC Capital Trust I Preference, FRN USD 4,200 104,433 0.07Hartford Financial Services Group, Inc.(The) Preference, FRN USD 5,600 176,372 0.11NII Holdings, Inc. USD 28,902 84,972 0.06
369,150 0.24
Total Equities 369,150 0.24
Total Transferable securities and money market instrumentsadmitted to an official exchange listing 64,382,038 41.70
Transferable securities and money market instruments dealt in on another regulatedmarket
Bonds
AustraliaNufarm Australia Ltd., 144A 6.375%15/10/2019 USD 194,000 196,667 0.13
196,667 0.13
BahamasUltrapetrol Bahamas Ltd. 8.875%15/06/2021 USD 686,000 140,630 0.09
140,630 0.09
Canada1011778 BC ULC, 144A 4.625%15/01/2022 USD 80,000 81,064 0.051011778 BC ULC, 144A 6% 01/04/2022 USD 220,000 227,385 0.15ATS Automation Tooling Systems, Inc.,144A 6.5% 15/06/2023 USD 242,000 246,840 0.16Bombardier, Inc., 144A 5.5% 15/09/2018 USD 97,000 96,091 0.06Bombardier, Inc., 144A 4.75%15/04/2019 USD 80,000 77,800 0.05Bombardier, Inc., 144A 6.125%15/01/2023 USD 109,000 93,942 0.06Cascades, Inc., 144A 5.5% 15/07/2022 USD 100,000 97,125 0.06Cascades, Inc., 144A 5.75% 15/07/2023 USD 165,000 159,225 0.10Concordia Healthcare Corp., 144A 7%15/04/2023 USD 799,000 681,148 0.44Garda World Security Corp., 144A 7.25%15/11/2021 USD 500,000 406,250 0.26Jupiter Resources, Inc., 144A 8.5%01/10/2022 USD 265,000 192,125 0.13Lundin Mining Corp., 144A 7.5%01/11/2020 USD 140,000 143,395 0.09
230
JPMorgan Funds - US High Yield Plus Bond FundSchedule of Investments (continued)
As at 30 June 2016
Investments Currency
Quantity/Nominal
Value
MarketValue
USD
%of
NetAssets Investments Currency
Quantity/Nominal
Value
MarketValue
USD
%of
NetAssets
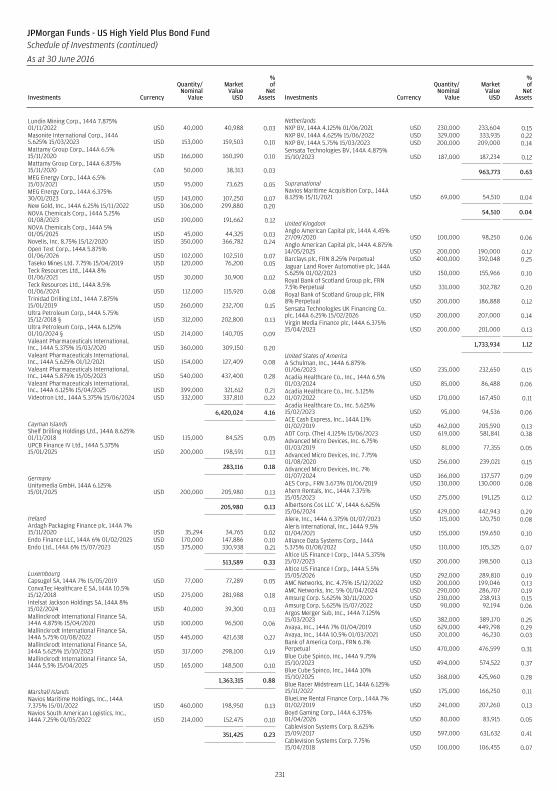
Lundin Mining Corp., 144A 7.875%01/11/2022 USD 40,000 40,988 0.03Masonite International Corp., 144A5.625% 15/03/2023 USD 153,000 159,503 0.10Mattamy Group Corp., 144A 6.5%15/11/2020 USD 166,000 160,190 0.10Mattamy Group Corp., 144A 6.875%15/11/2020 CAD 50,000 38,313 0.03MEG Energy Corp., 144A 6.5%15/03/2021 USD 95,000 73,625 0.05MEG Energy Corp., 144A 6.375%30/01/2023 USD 143,000 107,250 0.07New Gold, Inc., 144A 6.25% 15/11/2022 USD 306,000 299,880 0.20NOVA Chemicals Corp., 144A 5.25%01/08/2023 USD 190,000 191,662 0.12NOVA Chemicals Corp., 144A 5%01/05/2025 USD 45,000 44,325 0.03Novelis, Inc. 8.75% 15/12/2020 USD 350,000 366,782 0.24Open Text Corp., 144A 5.875%01/06/2026 USD 102,000 102,510 0.07Taseko Mines Ltd. 7.75% 15/04/2019 USD 120,000 76,200 0.05Teck Resources Ltd., 144A 8%01/06/2021 USD 30,000 30,900 0.02Teck Resources Ltd., 144A 8.5%01/06/2024 USD 112,000 115,920 0.08Trinidad Drilling Ltd., 144A 7.875%15/01/2019 USD 260,000 232,700 0.15Ultra Petroleum Corp., 144A 5.75%15/12/2018 § USD 312,000 202,800 0.13Ultra Petroleum Corp., 144A 6.125%01/10/2024 § USD 214,000 140,705 0.09Valeant Pharmaceuticals International,Inc., 144A 5.375% 15/03/2020 USD 360,000 309,150 0.20Valeant Pharmaceuticals International,Inc., 144A 5.625% 01/12/2021 USD 154,000 127,409 0.08Valeant Pharmaceuticals International,Inc., 144A 5.875% 15/05/2023 USD 540,000 437,400 0.28Valeant Pharmaceuticals International,Inc., 144A 6.125% 15/04/2025 USD 399,000 321,612 0.21Videotron Ltd., 144A 5.375% 15/06/2024 USD 332,000 337,810 0.22
6,420,024 4.16
Cayman IslandsShelf Drilling Holdings Ltd., 144A 8.625%01/11/2018 USD 115,000 84,525 0.05UPCB Finance IV Ltd., 144A 5.375%15/01/2025 USD 200,000 198,591 0.13
283,116 0.18
GermanyUnitymedia GmbH, 144A 6.125%15/01/2025 USD 200,000 205,980 0.13
205,980 0.13
IrelandArdagh Packaging Finance plc, 144A 7%15/11/2020 USD 35,294 34,765 0.02Endo Finance LLC, 144A 6% 01/02/2025 USD 170,000 147,886 0.10Endo Ltd., 144A 6% 15/07/2023 USD 375,000 330,938 0.21
513,589 0.33
LuxembourgCapsugel SA, 144A 7% 15/05/2019 USD 77,000 77,289 0.05ConvaTec Healthcare E SA, 144A 10.5%15/12/2018 USD 275,000 281,988 0.18Intelsat Jackson Holdings SA, 144A 8%15/02/2024 USD 40,000 39,300 0.03Mallinckrodt International Finance SA,144A 4.875% 15/04/2020 USD 100,000 96,500 0.06Mallinckrodt International Finance SA,144A 5.75% 01/08/2022 USD 445,000 421,638 0.27Mallinckrodt International Finance SA,144A 5.625% 15/10/2023 USD 317,000 298,100 0.19Mallinckrodt International Finance SA,144A 5.5% 15/04/2025 USD 165,000 148,500 0.10
1,363,315 0.88
Marshall IslandsNavios Maritime Holdings, Inc., 144A7.375% 15/01/2022 USD 460,000 198,950 0.13Navios South American Logistics, Inc.,144A 7.25% 01/05/2022 USD 214,000 152,475 0.10
351,425 0.23
NetherlandsNXP BV, 144A 4.125% 01/06/2021 USD 230,000 233,604 0.15NXP BV, 144A 4.625% 15/06/2022 USD 329,000 333,935 0.22NXP BV, 144A 5.75% 15/03/2023 USD 200,000 209,000 0.14Sensata Technologies BV, 144A 4.875%15/10/2023 USD 187,000 187,234 0.12
963,773 0.63
SupranationalNavios Maritime Acquisition Corp., 144A8.125% 15/11/2021 USD 69,000 54,510 0.04
54,510 0.04
United KingdomAnglo American Capital plc, 144A 4.45%27/09/2020 USD 100,000 98,250 0.06Anglo American Capital plc, 144A 4.875%14/05/2025 USD 200,000 190,000 0.12Barclays plc, FRN 8.25% Perpetual USD 400,000 392,048 0.25Jaguar Land Rover Automotive plc, 144A5.625% 01/02/2023 USD 150,000 155,966 0.10Royal Bank of Scotland Group plc, FRN7.5% Perpetual USD 331,000 302,782 0.20Royal Bank of Scotland Group plc, FRN8% Perpetual USD 200,000 186,888 0.12Sensata Technologies UK Financing Co.plc, 144A 6.25% 15/02/2026 USD 200,000 207,000 0.14Virgin Media Finance plc, 144A 6.375%15/04/2023 USD 200,000 201,000 0.13
1,733,934 1.12
United States of AmericaA Schulman, Inc., 144A 6.875%01/06/2023 USD 235,000 232,650 0.15Acadia Healthcare Co., Inc., 144A 6.5%01/03/2024 USD 85,000 86,488 0.06Acadia Healthcare Co., Inc. 5.125%01/07/2022 USD 170,000 167,450 0.11Acadia Healthcare Co., Inc. 5.625%15/02/2023 USD 95,000 94,536 0.06ACE Cash Express, Inc., 144A 11%01/02/2019 USD 462,000 205,590 0.13ADT Corp. (The) 4.125% 15/06/2023 USD 619,000 581,841 0.38Advanced Micro Devices, Inc. 6.75%01/03/2019 USD 81,000 77,355 0.05Advanced Micro Devices, Inc. 7.75%01/08/2020 USD 256,000 239,021 0.15Advanced Micro Devices, Inc. 7%01/07/2024 USD 166,000 137,577 0.09AES Corp., FRN 3.673% 01/06/2019 USD 130,000 130,000 0.08Ahern Rentals, Inc., 144A 7.375%15/05/2023 USD 275,000 191,125 0.12Albertsons Cos LLC ‘A’, 144A 6.625%15/06/2024 USD 429,000 442,943 0.29Alere, Inc., 144A 6.375% 01/07/2023 USD 115,000 120,750 0.08Aleris International, Inc., 144A 9.5%01/04/2021 USD 155,000 159,650 0.10Alliance Data Systems Corp., 144A5.375% 01/08/2022 USD 110,000 105,325 0.07Altice US Finance I Corp., 144A 5.375%15/07/2023 USD 200,000 198,500 0.13Altice US Finance I Corp., 144A 5.5%15/05/2026 USD 292,000 289,810 0.19AMC Networks, Inc. 4.75% 15/12/2022 USD 200,000 199,046 0.13AMC Networks, Inc. 5% 01/04/2024 USD 290,000 286,707 0.19Amsurg Corp. 5.625% 30/11/2020 USD 230,000 238,913 0.15Amsurg Corp. 5.625% 15/07/2022 USD 90,000 92,194 0.06Argos Merger Sub, Inc., 144A 7.125%15/03/2023 USD 382,000 389,170 0.25Avaya, Inc., 144A 7% 01/04/2019 USD 629,000 449,798 0.29Avaya, Inc., 144A 10.5% 01/03/2021 USD 201,000 46,230 0.03Bank of America Corp., FRN 6.1%Perpetual USD 470,000 476,599 0.31Blue Cube Spinco, Inc., 144A 9.75%15/10/2023 USD 494,000 574,522 0.37Blue Cube Spinco, Inc., 144A 10%15/10/2025 USD 368,000 425,960 0.28Blue Racer Midstream LLC, 144A 6.125%15/11/2022 USD 175,000 166,250 0.11BlueLine Rental Finance Corp., 144A 7%01/02/2019 USD 241,000 207,260 0.13Boyd Gaming Corp., 144A 6.375%01/04/2026 USD 80,000 83,915 0.05Cablevision Systems Corp. 8.625%15/09/2017 USD 597,000 631,632 0.41Cablevision Systems Corp. 7.75%15/04/2018 USD 100,000 106,455 0.07
231
JPMorgan Funds - US High Yield Plus Bond FundSchedule of Investments (continued)
As at 30 June 2016
Investments Currency
Quantity/Nominal
Value
MarketValue
USD
%of
NetAssets Investments Currency
Quantity/Nominal
Value
MarketValue
USD
%of
NetAssets
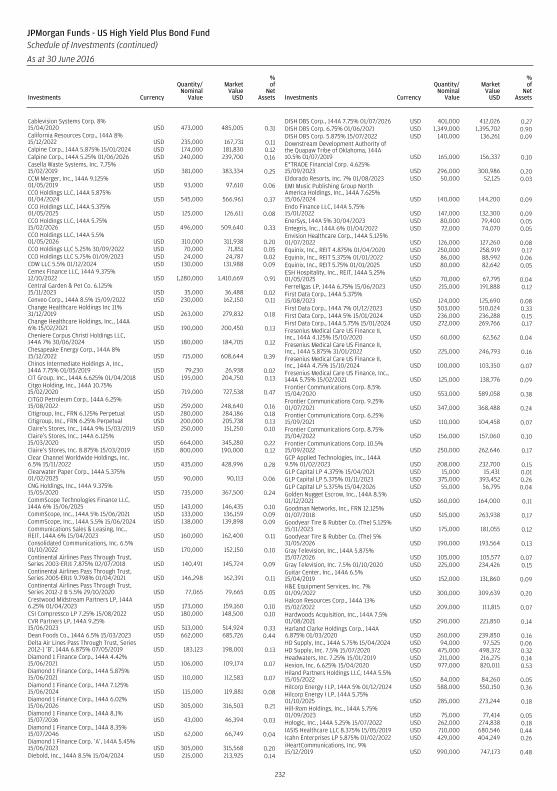
Cablevision Systems Corp. 8%15/04/2020 USD 473,000 485,005 0.31California Resources Corp., 144A 8%15/12/2022 USD 235,000 167,731 0.11Calpine Corp., 144A 5.875% 15/01/2024 USD 174,000 181,830 0.12Calpine Corp., 144A 5.25% 01/06/2026 USD 240,000 239,700 0.16Casella Waste Systems, Inc. 7.75%15/02/2019 USD 381,000 383,334 0.25CCM Merger, Inc., 144A 9.125%01/05/2019 USD 93,000 97,610 0.06CCO Holdings LLC, 144A 5.875%01/04/2024 USD 545,000 566,961 0.37CCO Holdings LLC, 144A 5.375%01/05/2025 USD 125,000 126,611 0.08CCO Holdings LLC, 144A 5.75%15/02/2026 USD 496,000 509,640 0.33CCO Holdings LLC, 144A 5.5%01/05/2026 USD 310,000 311,938 0.20CCO Holdings LLC 5.25% 30/09/2022 USD 70,000 71,851 0.05CCO Holdings LLC 5.75% 01/09/2023 USD 24,000 24,787 0.02CDW LLC 5.5% 01/12/2024 USD 130,000 131,988 0.09Cemex Finance LLC, 144A 9.375%12/10/2022 USD 1,280,000 1,410,669 0.91Central Garden & Pet Co. 6.125%15/11/2023 USD 35,000 36,488 0.02Cenveo Corp., 144A 8.5% 15/09/2022 USD 230,000 162,150 0.11Change Healthcare Holdings Inc 11%31/12/2019 USD 263,000 279,832 0.18Change Healthcare Holdings, Inc., 144A6% 15/02/2021 USD 190,000 200,450 0.13Cheniere Corpus Christi Holdings LLC,144A 7% 30/06/2024 USD 180,000 184,705 0.12Chesapeake Energy Corp., 144A 8%15/12/2022 USD 715,000 608,644 0.39Chinos Intermediate Holdings A, Inc.,144A 7.75% 01/05/2019 USD 79,230 26,938 0.02CIT Group, Inc., 144A 6.625% 01/04/2018 USD 195,000 204,750 0.13Citgo Holding, Inc., 144A 10.75%15/02/2020 USD 719,000 727,538 0.47CITGO Petroleum Corp., 144A 6.25%15/08/2022 USD 259,000 248,640 0.16Citigroup, Inc., FRN 6.125% Perpetual USD 280,000 284,186 0.18Citigroup, Inc., FRN 6.25% Perpetual USD 200,000 205,738 0.13Claire’s Stores, Inc., 144A 9% 15/03/2019 USD 250,000 151,250 0.10Claire’s Stores, Inc., 144A 6.125%15/03/2020 USD 664,000 345,280 0.22Claire’s Stores, Inc. 8.875% 15/03/2019 USD 800,000 190,000 0.12Clear Channel Worldwide Holdings, Inc.6.5% 15/11/2022 USD 435,000 428,996 0.28Clearwater Paper Corp., 144A 5.375%01/02/2025 USD 90,000 90,113 0.06CNG Holdings, Inc., 144A 9.375%15/05/2020 USD 735,000 367,500 0.24CommScope Technologies Finance LLC,144A 6% 15/06/2025 USD 143,000 146,435 0.10CommScope, Inc., 144A 5% 15/06/2021 USD 133,000 136,159 0.09CommScope, Inc., 144A 5.5% 15/06/2024 USD 138,000 139,898 0.09Communications Sales & Leasing, Inc.,REIT, 144A 6% 15/04/2023 USD 160,000 162,400 0.11Consolidated Communications, Inc. 6.5%01/10/2022 USD 170,000 152,150 0.10Continental Airlines Pass Through Trust,Series 2003-ERJ1 7.875% 02/07/2018 USD 140,491 145,724 0.09Continental Airlines Pass Through Trust,Series 2005-ERJ1 9.798% 01/04/2021 USD 146,298 162,391 0.11Continental Airlines Pass Through Trust,Series 2012-2 B 5.5% 29/10/2020 USD 77,065 79,665 0.05Crestwood Midstream Partners LP, 144A6.25% 01/04/2023 USD 173,000 159,160 0.10CSI Compressco LP 7.25% 15/08/2022 USD 180,000 148,500 0.10CVR Partners LP, 144A 9.25%15/06/2023 USD 513,000 514,924 0.33Dean Foods Co., 144A 6.5% 15/03/2023 USD 662,000 685,726 0.44Delta Air Lines Pass Through Trust, Series2012-1 ‘B’, 144A 6.875% 07/05/2019 USD 183,123 198,001 0.13Diamond 1 Finance Corp., 144A 4.42%15/06/2021 USD 106,000 109,174 0.07Diamond 1 Finance Corp., 144A 5.875%15/06/2021 USD 110,000 112,583 0.07Diamond 1 Finance Corp., 144A 7.125%15/06/2024 USD 115,000 119,881 0.08Diamond 1 Finance Corp., 144A 6.02%15/06/2026 USD 305,000 316,503 0.21Diamond 1 Finance Corp., 144A 8.1%15/07/2036 USD 43,000 46,394 0.03Diamond 1 Finance Corp., 144A 8.35%15/07/2046 USD 62,000 66,749 0.04Diamond 1 Finance Corp. ‘A’, 144A 5.45%15/06/2023 USD 305,000 315,568 0.20Diebold, Inc., 144A 8.5% 15/04/2024 USD 215,000 213,925 0.14
DISH DBS Corp., 144A 7.75% 01/07/2026 USD 401,000 412,026 0.27DISH DBS Corp. 6.75% 01/06/2021 USD 1,349,000 1,395,702 0.90DISH DBS Corp. 5.875% 15/07/2022 USD 140,000 136,261 0.09Downstream Development Authority ofthe Quapaw Tribe of Oklahoma, 144A10.5% 01/07/2019 USD 165,000 156,337 0.10E*TRADE Financial Corp. 4.625%15/09/2023 USD 296,000 300,986 0.20Eldorado Resorts, Inc. 7% 01/08/2023 USD 50,000 52,125 0.03EMI Music Publishing Group NorthAmerica Holdings, Inc., 144A 7.625%15/06/2024 USD 140,000 144,200 0.09Endo Finance LLC, 144A 5.75%15/01/2022 USD 147,000 132,300 0.09EnerSys, 144A 5% 30/04/2023 USD 80,000 79,400 0.05Entegris, Inc., 144A 6% 01/04/2022 USD 72,000 74,070 0.05Envision Healthcare Corp., 144A 5.125%01/07/2022 USD 126,000 127,260 0.08Equinix, Inc., REIT 4.875% 01/04/2020 USD 250,000 258,919 0.17Equinix, Inc., REIT 5.375% 01/01/2022 USD 86,000 88,992 0.06Equinix, Inc., REIT 5.75% 01/01/2025 USD 80,000 82,642 0.05ESH Hospitality, Inc., REIT, 144A 5.25%01/05/2025 USD 70,000 67,795 0.04Ferrellgas LP, 144A 6.75% 15/06/2023 USD 215,000 191,888 0.12First Data Corp., 144A 5.375%15/08/2023 USD 124,000 125,690 0.08First Data Corp., 144A 7% 01/12/2023 USD 503,000 510,024 0.33First Data Corp., 144A 5% 15/01/2024 USD 236,000 236,288 0.15First Data Corp., 144A 5.75% 15/01/2024 USD 272,000 269,766 0.17Fresenius Medical Care US Finance II,Inc., 144A 4.125% 15/10/2020 USD 60,000 62,562 0.04Fresenius Medical Care US Finance II,Inc., 144A 5.875% 31/01/2022 USD 225,000 246,793 0.16Fresenius Medical Care US Finance II,Inc., 144A 4.75% 15/10/2024 USD 100,000 103,350 0.07Fresenius Medical Care US Finance, Inc.,144A 5.75% 15/02/2021 USD 125,000 138,776 0.09Frontier Communications Corp. 8.5%15/04/2020 USD 553,000 589,058 0.38Frontier Communications Corp. 9.25%01/07/2021 USD 347,000 368,488 0.24Frontier Communications Corp. 6.25%15/09/2021 USD 110,000 104,458 0.07Frontier Communications Corp. 8.75%15/04/2022 USD 156,000 157,060 0.10Frontier Communications Corp. 10.5%15/09/2022 USD 250,000 262,646 0.17GCP Applied Technologies, Inc., 144A9.5% 01/02/2023 USD 208,000 232,700 0.15GLP Capital LP 4.375% 15/04/2021 USD 15,000 15,431 0.01GLP Capital LP 5.375% 01/11/2023 USD 375,000 393,452 0.26GLP Capital LP 5.375% 15/04/2026 USD 55,000 56,795 0.04Golden Nugget Escrow, Inc., 144A 8.5%01/12/2021 USD 160,000 164,000 0.11Goodman Networks, Inc., FRN 12.125%01/07/2018 USD 515,000 263,938 0.17Goodyear Tire & Rubber Co. (The) 5.125%15/11/2023 USD 175,000 181,055 0.12Goodyear Tire & Rubber Co. (The) 5%31/05/2026 USD 190,000 193,564 0.13Gray Television, Inc., 144A 5.875%15/07/2026 USD 105,000 105,577 0.07Gray Television, Inc. 7.5% 01/10/2020 USD 225,000 234,426 0.15Guitar Center, Inc., 144A 6.5%15/04/2019 USD 152,000 131,860 0.09H&E Equipment Services, Inc. 7%01/09/2022 USD 300,000 309,639 0.20Halcon Resources Corp., 144A 13%15/02/2022 USD 209,000 111,815 0.07Hardwoods Acquisition, Inc., 144A 7.5%01/08/2021 USD 290,000 221,850 0.14Harland Clarke Holdings Corp., 144A6.875% 01/03/2020 USD 260,000 239,850 0.16HD Supply, Inc., 144A 5.75% 15/04/2024 USD 94,000 97,525 0.06HD Supply, Inc. 7.5% 15/07/2020 USD 475,000 498,372 0.32Headwaters, Inc. 7.25% 15/01/2019 USD 211,000 216,275 0.14Hexion, Inc. 6.625% 15/04/2020 USD 977,000 820,011 0.53Hiland Partners Holdings LLC, 144A 5.5%15/05/2022 USD 84,000 84,260 0.05Hilcorp Energy I LP, 144A 5% 01/12/2024 USD 588,000 550,150 0.36Hilcorp Energy I LP, 144A 5.75%01/10/2025 USD 285,000 273,244 0.18Hill-Rom Holdings, Inc., 144A 5.75%01/09/2023 USD 75,000 77,414 0.05Hologic, Inc., 144A 5.25% 15/07/2022 USD 262,000 274,838 0.18IASIS Healthcare LLC 8.375% 15/05/2019 USD 710,000 680,546 0.44Icahn Enterprises LP 5.875% 01/02/2022 USD 429,000 404,249 0.26iHeartCommunications, Inc. 9%15/12/2019 USD 990,000 747,173 0.48
232
JPMorgan Funds - US High Yield Plus Bond FundSchedule of Investments (continued)
As at 30 June 2016
Investments Currency
Quantity/Nominal
Value
MarketValue
USD
%of
NetAssets Investments Currency
Quantity/Nominal
Value
MarketValue
USD
%of
NetAssets
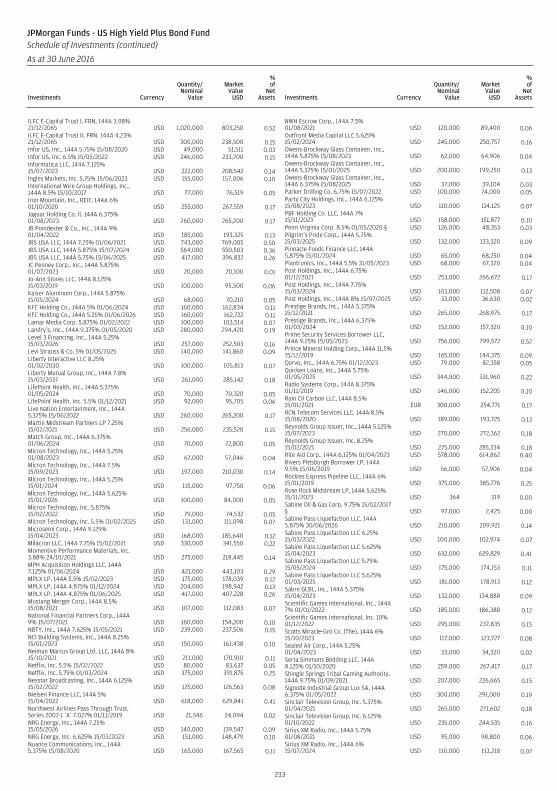
ILFC E-Capital Trust I, FRN, 144A 3.98%21/12/2065 USD 1,020,000 803,250 0.52ILFC E-Capital Trust II, FRN, 144A 4.23%21/12/2065 USD 300,000 238,500 0.15Infor US, Inc., 144A 5.75% 15/08/2020 USD 49,000 51,511 0.03Infor US, Inc. 6.5% 15/05/2022 USD 246,000 233,700 0.15Informatica LLC, 144A 7.125%15/07/2023 USD 222,000 208,542 0.14Ingles Markets, Inc. 5.75% 15/06/2023 USD 155,000 157,006 0.10International Wire Group Holdings, Inc.,144A 8.5% 15/10/2017 USD 77,000 76,519 0.05Iron Mountain, Inc., REIT, 144A 6%01/10/2020 USD 255,000 267,559 0.17Jaguar Holding Co. ll, 144A 6.375%01/08/2023 USD 260,000 265,200 0.17JB Poindexter & Co., Inc., 144A 9%01/04/2022 USD 185,000 193,325 0.13JBS USA LLC, 144A 7.25% 01/06/2021 USD 743,000 769,005 0.50JBS USA LLC, 144A 5.875% 15/07/2024 USD 564,000 550,503 0.36JBS USA LLC, 144A 5.75% 15/06/2025 USD 417,000 396,832 0.26JC Penney Corp., Inc., 144A 5.875%01/07/2023 USD 20,000 20,100 0.01Jo-Ann Stores LLC, 144A 8.125%15/03/2019 USD 100,000 95,500 0.06Kaiser Aluminum Corp., 144A 5.875%15/05/2024 USD 68,000 70,210 0.05KFC Holding Co., 144A 5% 01/06/2024 USD 160,000 162,834 0.11KFC Holding Co., 144A 5.25% 01/06/2026 USD 160,000 162,722 0.11Lamar Media Corp. 5.875% 01/02/2022 USD 100,000 103,514 0.07Landry’s, Inc., 144A 9.375% 01/05/2020 USD 280,000 294,420 0.19Level 3 Financing, Inc., 144A 5.25%15/03/2026 USD 257,000 252,503 0.16Levi Strauss & Co. 5% 01/05/2025 USD 140,000 141,860 0.09Liberty Interactive LLC 8.25%01/02/2030 USD 100,000 105,813 0.07Liberty Mutual Group, Inc., 144A 7.8%15/03/2037 USD 261,000 285,142 0.18LifePoint Health, Inc., 144A 5.375%01/05/2024 USD 70,000 70,320 0.05LifePoint Health, Inc. 5.5% 01/12/2021 USD 92,000 95,705 0.06Live Nation Entertainment, Inc., 144A5.375% 15/06/2022 USD 260,000 265,200 0.17Martin Midstream Partners LP 7.25%15/02/2021 USD 256,000 235,520 0.15Match Group, Inc., 144A 6.375%01/06/2024 USD 70,000 72,800 0.05Micron Technology, Inc., 144A 5.25%01/08/2023 USD 67,000 57,046 0.04Micron Technology, Inc., 144A 7.5%15/09/2023 USD 197,000 210,030 0.14Micron Technology, Inc., 144A 5.25%15/01/2024 USD 115,000 97,750 0.06Micron Technology, Inc., 144A 5.625%15/01/2026 USD 100,000 84,000 0.05Micron Technology, Inc. 5.875%15/02/2022 USD 79,000 74,532 0.05Micron Technology, Inc. 5.5% 01/02/2025 USD 131,000 111,098 0.07Microsemi Corp., 144A 9.125%15/04/2023 USD 168,000 185,640 0.12Milacron LLC, 144A 7.75% 15/02/2021 USD 330,000 341,550 0.22Momentive Performance Materials, Inc.3.88% 24/10/2021 USD 275,000 218,445 0.14MPH Acquisition Holdings LLC, 144A7.125% 01/06/2024 USD 421,000 443,103 0.29MPLX LP, 144A 5.5% 15/02/2023 USD 175,000 178,039 0.12MPLX LP, 144A 4.875% 01/12/2024 USD 204,000 198,942 0.13MPLX LP, 144A 4.875% 01/06/2025 USD 417,000 407,228 0.26Mustang Merger Corp., 144A 8.5%15/08/2021 USD 107,000 112,083 0.07National Financial Partners Corp., 144A9% 15/07/2021 USD 160,000 154,200 0.10NBTY, Inc., 144A 7.625% 15/05/2021 USD 239,000 237,506 0.15NCI Building Systems, Inc., 144A 8.25%15/01/2023 USD 150,000 161,438 0.10Neiman Marcus Group Ltd. LLC, 144A 8%15/10/2021 USD 211,000 170,910 0.11Netflix, Inc. 5.5% 15/02/2022 USD 80,000 83,637 0.05Netflix, Inc. 5.75% 01/03/2024 USD 375,000 391,875 0.25Nexstar Broadcasting, Inc., 144A 6.125%15/02/2022 USD 125,000 126,563 0.08Nielsen Finance LLC, 144A 5%15/04/2022 USD 618,000 629,841 0.41Northwest Airlines Pass Through Trust,Series 2007-1 ‘A’ 7.027% 01/11/2019 USD 21,346 24,094 0.02NRG Energy, Inc., 144A 7.25%15/05/2026 USD 140,000 139,547 0.09NRG Energy, Inc. 6.625% 15/03/2023 USD 151,000 148,479 0.10Nuance Communications, Inc., 144A5.375% 15/08/2020 USD 165,000 167,565 0.11
NWH Escrow Corp., 144A 7.5%01/08/2021 USD 120,000 89,400 0.06Outfront Media Capital LLC 5.625%15/02/2024 USD 245,000 250,757 0.16Owens-Brockway Glass Container, Inc.,144A 5.875% 15/08/2023 USD 62,000 64,906 0.04Owens-Brockway Glass Container, Inc.,144A 5.375% 15/01/2025 USD 200,000 199,250 0.13Owens-Brockway Glass Container, Inc.,144A 6.375% 15/08/2025 USD 37,000 39,104 0.03Parker Drilling Co. 6.75% 15/07/2022 USD 100,000 74,000 0.05Party City Holdings, Inc., 144A 6.125%15/08/2023 USD 110,000 114,125 0.07PBF Holding Co. LLC, 144A 7%15/11/2023 USD 158,000 151,877 0.10Penn Virginia Corp. 8.5% 01/05/2020 § USD 126,000 48,353 0.03Pilgrim’s Pride Corp., 144A 5.75%15/03/2025 USD 132,000 133,320 0.09Pinnacle Foods Finance LLC, 144A5.875% 15/01/2024 USD 65,000 68,250 0.04Plantronics, Inc., 144A 5.5% 31/05/2023 USD 68,000 67,320 0.04Post Holdings, Inc., 144A 6.75%01/12/2021 USD 253,000 266,672 0.17Post Holdings, Inc., 144A 7.75%15/03/2024 USD 103,000 112,508 0.07Post Holdings, Inc., 144A 8% 15/07/2025 USD 33,000 36,630 0.02Prestige Brands, Inc., 144A 5.375%15/12/2021 USD 265,000 268,975 0.17Prestige Brands, Inc., 144A 6.375%01/03/2024 USD 152,000 157,320 0.10Prime Security Services Borrower LLC,144A 9.25% 15/05/2023 USD 756,000 799,572 0.52Prince Mineral Holding Corp., 144A 11.5%15/12/2019 USD 165,000 144,375 0.09Qorvo, Inc., 144A 6.75% 01/12/2023 USD 79,000 82,358 0.05Quicken Loans, Inc., 144A 5.75%01/05/2025 USD 344,000 331,960 0.22Radio Systems Corp., 144A 8.375%01/11/2019 USD 146,000 152,205 0.10Rain CII Carbon LLC, 144A 8.5%15/01/2021 EUR 300,000 254,771 0.17RCN Telecom Services LLC, 144A 8.5%15/08/2020 USD 189,000 193,725 0.13Reynolds Group Issuer, Inc., 144A 5.125%15/07/2023 USD 270,000 272,362 0.18Reynolds Group Issuer, Inc. 8.25%15/02/2021 USD 275,000 285,334 0.18Rite Aid Corp., 144A 6.125% 01/04/2023 USD 578,000 614,862 0.40Rivers Pittsburgh Borrower LP, 144A9.5% 15/06/2019 USD 56,000 57,906 0.04Rockies Express Pipeline LLC, 144A 6%15/01/2019 USD 375,000 385,776 0.25Rose Rock Midstream LP, 144A 5.625%15/11/2023 USD 364 319 0.00Sabine Oil & Gas Corp. 9.75% 15/02/2017§ USD 97,000 2,425 0.00Sabine Pass Liquefaction LLC, 144A5.875% 30/06/2026 USD 210,000 209,921 0.14Sabine Pass Liquefaction LLC 6.25%15/03/2022 USD 100,000 102,974 0.07Sabine Pass Liquefaction LLC 5.625%15/04/2023 USD 632,000 629,829 0.41Sabine Pass Liquefaction LLC 5.75%15/05/2024 USD 175,000 174,153 0.11Sabine Pass Liquefaction LLC 5.625%01/03/2025 USD 181,000 178,913 0.12Sabre GLBL, Inc., 144A 5.375%15/04/2023 USD 132,000 134,888 0.09Scientific Games International, Inc., 144A7% 01/01/2022 USD 185,000 186,388 0.12Scientific Games International, Inc. 10%01/12/2022 USD 295,000 237,835 0.15Scotts Miracle-Gro Co. (The), 144A 6%15/10/2023 USD 117,000 123,727 0.08Sealed Air Corp., 144A 5.25%01/04/2023 USD 33,000 34,320 0.02Serta Simmons Bedding LLC, 144A8.125% 01/10/2020 USD 259,000 267,417 0.17Shingle Springs Tribal Gaming Authority,144A 9.75% 01/09/2021 USD 207,000 226,665 0.15Signode Industrial Group Lux SA, 144A6.375% 01/05/2022 USD 300,000 291,000 0.19Sinclair Television Group, Inc. 5.375%01/04/2021 USD 265,000 271,602 0.18Sinclair Television Group, Inc. 6.125%01/10/2022 USD 235,000 244,535 0.16Sirius XM Radio, Inc., 144A 5.75%01/08/2021 USD 95,000 98,800 0.06Sirius XM Radio, Inc., 144A 6%15/07/2024 USD 110,000 113,218 0.07
233
JPMorgan Funds - US High Yield Plus Bond FundSchedule of Investments (continued)
As at 30 June 2016
Investments Currency
Quantity/Nominal
Value
MarketValue
USD
%of
NetAssets Investments Currency
Quantity/Nominal
Value
MarketValue
USD
%of
NetAssets
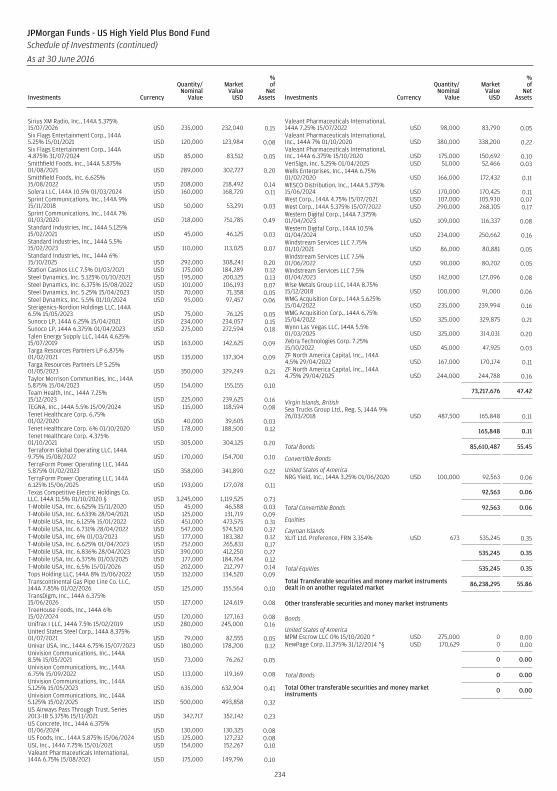
Sirius XM Radio, Inc., 144A 5.375%15/07/2026 USD 235,000 232,040 0.15Six Flags Entertainment Corp., 144A5.25% 15/01/2021 USD 120,000 123,984 0.08Six Flags Entertainment Corp., 144A4.875% 31/07/2024 USD 85,000 83,512 0.05Smithfield Foods, Inc., 144A 5.875%01/08/2021 USD 289,000 302,727 0.20Smithfield Foods, Inc. 6.625%15/08/2022 USD 208,000 218,492 0.14Solera LLC, 144A 10.5% 01/03/2024 USD 160,000 168,720 0.11Sprint Communications, Inc., 144A 9%15/11/2018 USD 50,000 53,291 0.03Sprint Communications, Inc., 144A 7%01/03/2020 USD 718,000 751,785 0.49Standard Industries, Inc., 144A 5.125%15/02/2021 USD 45,000 46,125 0.03Standard Industries, Inc., 144A 5.5%15/02/2023 USD 110,000 113,025 0.07Standard Industries, Inc., 144A 6%15/10/2025 USD 292,000 308,241 0.20Station Casinos LLC 7.5% 01/03/2021 USD 175,000 184,289 0.12Steel Dynamics, Inc. 5.125% 01/10/2021 USD 195,000 200,125 0.13Steel Dynamics, Inc. 6.375% 15/08/2022 USD 101,000 106,193 0.07Steel Dynamics, Inc. 5.25% 15/04/2023 USD 70,000 71,358 0.05Steel Dynamics, Inc. 5.5% 01/10/2024 USD 95,000 97,457 0.06Sterigenics-Nordion Holdings LLC, 144A6.5% 15/05/2023 USD 75,000 76,125 0.05Sunoco LP, 144A 6.25% 15/04/2021 USD 234,000 234,057 0.15Sunoco LP, 144A 6.375% 01/04/2023 USD 275,000 272,594 0.18Talen Energy Supply LLC, 144A 4.625%15/07/2019 USD 163,000 142,625 0.09Targa Resources Partners LP 6.875%01/02/2021 USD 135,000 137,304 0.09Targa Resources Partners LP 5.25%01/05/2023 USD 350,000 329,249 0.21Taylor Morrison Communities, Inc., 144A5.875% 15/04/2023 USD 154,000 155,155 0.10Team Health, Inc., 144A 7.25%15/12/2023 USD 225,000 239,625 0.16TEGNA, Inc., 144A 5.5% 15/09/2024 USD 115,000 118,594 0.08Tenet Healthcare Corp. 6.75%01/02/2020 USD 40,000 39,605 0.03Tenet Healthcare Corp. 6% 01/10/2020 USD 178,000 188,500 0.12Tenet Healthcare Corp. 4.375%01/10/2021 USD 305,000 304,125 0.20Terraform Global Operating LLC, 144A9.75% 15/08/2022 USD 170,000 154,700 0.10TerraForm Power Operating LLC, 144A5.875% 01/02/2023 USD 358,000 341,890 0.22TerraForm Power Operating LLC, 144A6.125% 15/06/2025 USD 193,000 177,078 0.11Texas Competitive Electric Holdings Co.LLC, 144A 11.5% 01/10/2020 § USD 3,245,000 1,119,525 0.73T-Mobile USA, Inc. 6.625% 15/11/2020 USD 45,000 46,588 0.03T-Mobile USA, Inc. 6.633% 28/04/2021 USD 125,000 131,719 0.09T-Mobile USA, Inc. 6.125% 15/01/2022 USD 451,000 473,575 0.31T-Mobile USA, Inc. 6.731% 28/04/2022 USD 547,000 574,520 0.37T-Mobile USA, Inc. 6% 01/03/2023 USD 177,000 183,382 0.12T-Mobile USA, Inc. 6.625% 01/04/2023 USD 252,000 265,831 0.17T-Mobile USA, Inc. 6.836% 28/04/2023 USD 390,000 412,250 0.27T-Mobile USA, Inc. 6.375% 01/03/2025 USD 177,000 184,764 0.12T-Mobile USA, Inc. 6.5% 15/01/2026 USD 202,000 212,797 0.14Tops Holding LLC, 144A 8% 15/06/2022 USD 152,000 134,520 0.09Transcontinental Gas Pipe Line Co. LLC,144A 7.85% 01/02/2026 USD 125,000 155,564 0.10TransDigm, Inc., 144A 6.375%15/06/2026 USD 127,000 124,619 0.08TreeHouse Foods, Inc., 144A 6%15/02/2024 USD 120,000 127,163 0.08Unifrax I LLC, 144A 7.5% 15/02/2019 USD 280,000 245,000 0.16United States Steel Corp., 144A 8.375%01/07/2021 USD 79,000 82,555 0.05Univar USA, Inc., 144A 6.75% 15/07/2023 USD 180,000 178,200 0.12Univision Communications, Inc., 144A8.5% 15/05/2021 USD 73,000 76,262 0.05Univision Communications, Inc., 144A6.75% 15/09/2022 USD 113,000 119,169 0.08Univision Communications, Inc., 144A5.125% 15/05/2023 USD 635,000 632,904 0.41Univision Communications, Inc., 144A5.125% 15/02/2025 USD 500,000 493,858 0.32US Airways Pass Through Trust, Series2013-1B 5.375% 15/11/2021 USD 342,717 352,142 0.23US Concrete, Inc., 144A 6.375%01/06/2024 USD 130,000 130,325 0.08US Foods, Inc., 144A 5.875% 15/06/2024 USD 125,000 127,232 0.08USI, Inc., 144A 7.75% 15/01/2021 USD 154,000 152,267 0.10Valeant Pharmaceuticals International,144A 6.75% 15/08/2021 USD 175,000 149,796 0.10
Valeant Pharmaceuticals International,144A 7.25% 15/07/2022 USD 98,000 83,790 0.05Valeant Pharmaceuticals International,Inc., 144A 7% 01/10/2020 USD 380,000 338,200 0.22Valeant Pharmaceuticals International,Inc., 144A 6.375% 15/10/2020 USD 175,000 150,692 0.10VeriSign, Inc. 5.25% 01/04/2025 USD 51,000 52,466 0.03Wells Enterprises, Inc., 144A 6.75%01/02/2020 USD 166,000 172,432 0.11WESCO Distribution, Inc., 144A 5.375%15/06/2024 USD 170,000 170,425 0.11West Corp., 144A 4.75% 15/07/2021 USD 107,000 105,930 0.07West Corp., 144A 5.375% 15/07/2022 USD 290,000 268,105 0.17Western Digital Corp., 144A 7.375%01/04/2023 USD 109,000 116,337 0.08Western Digital Corp., 144A 10.5%01/04/2024 USD 234,000 250,662 0.16Windstream Services LLC 7.75%01/10/2021 USD 86,000 80,881 0.05Windstream Services LLC 7.5%01/06/2022 USD 90,000 80,202 0.05Windstream Services LLC 7.5%01/04/2023 USD 142,000 127,096 0.08Wise Metals Group LLC, 144A 8.75%15/12/2018 USD 100,000 91,000 0.06WMG Acquisition Corp., 144A 5.625%15/04/2022 USD 235,000 239,994 0.16WMG Acquisition Corp., 144A 6.75%15/04/2022 USD 325,000 329,875 0.21Wynn Las Vegas LLC, 144A 5.5%01/03/2025 USD 325,000 314,031 0.20Zebra Technologies Corp. 7.25%15/10/2022 USD 45,000 47,925 0.03ZF North America Capital, Inc., 144A4.5% 29/04/2022 USD 167,000 170,174 0.11ZF North America Capital, Inc., 144A4.75% 29/04/2025 USD 244,000 244,788 0.16
73,217,676 47.42
Virgin Islands, BritishSea Trucks Group Ltd., Reg. S, 144A 9%26/03/2018 USD 487,500 165,848 0.11
165,848 0.11
Total Bonds 85,610,487 55.45
Convertible Bonds
United States of AmericaNRG Yield, Inc., 144A 3.25% 01/06/2020 USD 100,000 92,563 0.06
92,563 0.06
Total Convertible Bonds 92,563 0.06
Equities
Cayman IslandsXLIT Ltd. Preference, FRN 3.354% USD 673 535,245 0.35
535,245 0.35
Total Equities 535,245 0.35
Total Transferable securities and money market instrumentsdealt in on another regulated market 86,238,295 55.86
Other transferable securities and money market instruments
Bonds
United States of AmericaMPM Escrow LLC 0% 15/10/2020 * USD 275,000 0 0.00NewPage Corp. 11.375% 31/12/2014 *§ USD 170,629 0 0.00
0 0.00
Total Bonds 0 0.00
Total Other transferable securities and money marketinstruments 0 0.00
234
JPMorgan Funds - US High Yield Plus Bond FundSchedule of Investments (continued)
As at 30 June 2016
Investments Currency
Quantity/Nominal
Value
MarketValue
USD
%of
NetAssets Investments Currency
Quantity/Nominal
Value
MarketValue
USD
%of
NetAssets
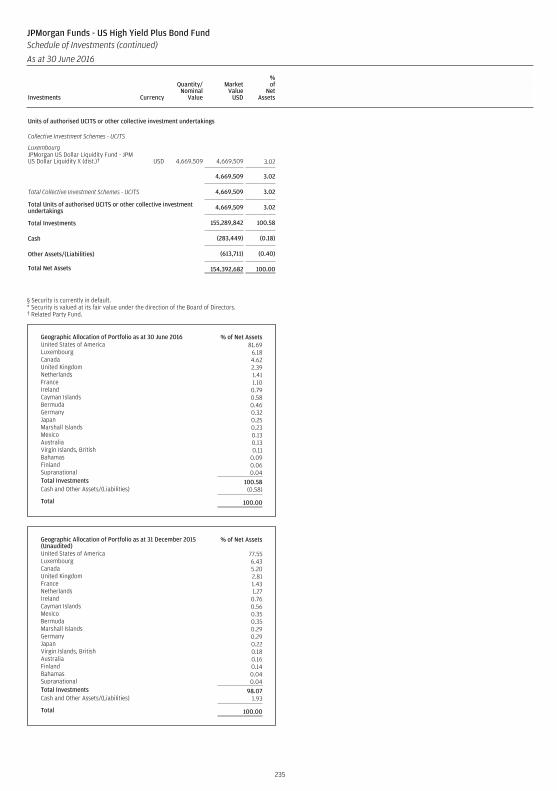
Units of authorised UCITS or other collective investment undertakings
Collective Investment Schemes - UCITS
LuxembourgJPMorgan US Dollar Liquidity Fund - JPMUS Dollar Liquidity X (dist.)† USD 4,669,509 4,669,509 3.02
4,669,509 3.02
Total Collective Investment Schemes - UCITS 4,669,509 3.02
Total Units of authorised UCITS or other collective investmentundertakings 4,669,509 3.02
Total Investments 155,289,842 100.58
Cash (283,449) (0.18)
Other Assets/(Liabilities) (613,711) (0.40)
Total Net Assets 154,392,682 100.00
§ Security is currently in default.* Security is valued at its fair value under the direction of the Board of Directors.† Related Party Fund.
Geographic Allocation of Portfolio as at 30 June 2016 % of Net AssetsUnited States of America 81.69Luxembourg 6.18Canada 4.62United Kingdom 2.39Netherlands 1.41France 1.10Ireland 0.79Cayman Islands 0.58Bermuda 0.46Germany 0.32Japan 0.25Marshall Islands 0.23Mexico 0.13Australia 0.13Virgin Islands, British 0.11Bahamas 0.09Finland 0.06Supranational 0.04Total Investments 100.58Cash and Other Assets/(Liabilities) (0.58)
Total 100.00
Geographic Allocation of Portfolio as at 31 December 2015(Unaudited)
% of Net Assets
United States of America 77.55Luxembourg 6.43Canada 5.20United Kingdom 2.81France 1.43Netherlands 1.27Ireland 0.76Cayman Islands 0.56Mexico 0.35Bermuda 0.35Marshall Islands 0.29Germany 0.29Japan 0.22Virgin Islands, British 0.18Australia 0.16Finland 0.14Bahamas 0.04Supranational 0.04Total Investments 98.07Cash and Other Assets/(Liabilities) 1.93
Total 100.00
235
JPMorgan Funds - US High Yield Plus Bond FundSchedule of Investments (continued)
As at 30 June 2016
Investments Currency
Quantity/Nominal
Value
MarketValue
USD
%of
NetAssets Investments Currency
Quantity/Nominal
Value
MarketValue
USD
%of
NetAssets
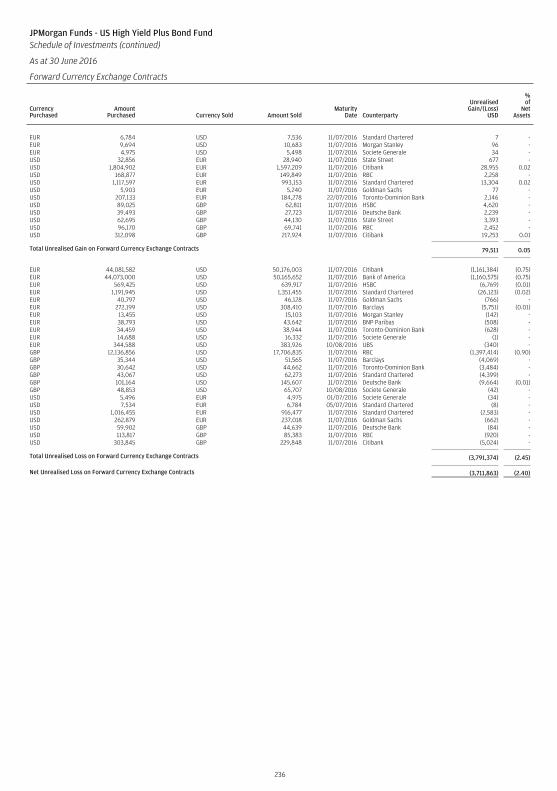
JPMorgan Funds - US High Yield Plus Bond FundSchedule of Investments (continued)
As at 30 June 2016
Forward Currency Exchange Contracts
CurrencyPurchased
AmountPurchased Currency Sold Amount Sold
MaturityDate Counterparty
UnrealisedGain/(Loss)
USD
%of
NetAssets
EUR 6,784 USD 7,536 11/07/2016 Standard Chartered 7 -EUR 9,694 USD 10,683 11/07/2016 Morgan Stanley 96 -EUR 4,975 USD 5,498 11/07/2016 Societe Generale 34 -USD 32,856 EUR 28,940 11/07/2016 State Street 677 -USD 1,804,902 EUR 1,597,209 11/07/2016 Citibank 28,955 0.02USD 168,877 EUR 149,849 11/07/2016 RBC 2,258 -USD 1,117,597 EUR 993,153 11/07/2016 Standard Chartered 13,304 0.02USD 5,903 EUR 5,240 11/07/2016 Goldman Sachs 77 -USD 207,133 EUR 184,278 22/07/2016 Toronto-Dominion Bank 2,146 -USD 89,025 GBP 62,811 11/07/2016 HSBC 4,620 -USD 39,493 GBP 27,723 11/07/2016 Deutsche Bank 2,239 -USD 62,695 GBP 44,130 11/07/2016 State Street 3,393 -USD 96,170 GBP 69,741 11/07/2016 RBC 2,452 -USD 312,098 GBP 217,924 11/07/2016 Citibank 19,253 0.01
Total Unrealised Gain on Forward Currency Exchange Contracts 79,511 0.05
EUR 44,081,582 USD 50,176,003 11/07/2016 Citibank (1,161,384) (0.75)EUR 44,073,000 USD 50,165,652 11/07/2016 Bank of America (1,160,575) (0.75)EUR 569,425 USD 639,917 11/07/2016 HSBC (6,769) (0.01)EUR 1,191,945 USD 1,351,455 11/07/2016 Standard Chartered (26,123) (0.02)EUR 40,797 USD 46,128 11/07/2016 Goldman Sachs (766) -EUR 272,199 USD 308,410 11/07/2016 Barclays (5,751) (0.01)EUR 13,455 USD 15,103 11/07/2016 Morgan Stanley (142) -EUR 38,793 USD 43,642 11/07/2016 BNP Paribas (508) -EUR 34,459 USD 38,944 11/07/2016 Toronto-Dominion Bank (628) -EUR 14,688 USD 16,332 11/07/2016 Societe Generale (1) -EUR 344,588 USD 383,926 10/08/2016 UBS (340) -GBP 12,136,856 USD 17,706,835 11/07/2016 RBC (1,397,414) (0.90)GBP 35,344 USD 51,565 11/07/2016 Barclays (4,069) -GBP 30,642 USD 44,662 11/07/2016 Toronto-Dominion Bank (3,484) -GBP 43,067 USD 62,273 11/07/2016 Standard Chartered (4,399) -GBP 101,164 USD 145,607 11/07/2016 Deutsche Bank (9,664) (0.01)GBP 48,853 USD 65,707 10/08/2016 Societe Generale (42) -USD 5,496 EUR 4,975 01/07/2016 Societe Generale (34) -USD 7,534 EUR 6,784 05/07/2016 Standard Chartered (8) -USD 1,016,455 EUR 916,477 11/07/2016 Standard Chartered (2,583) -USD 262,879 EUR 237,018 11/07/2016 Goldman Sachs (662) -USD 59,902 GBP 44,639 11/07/2016 Deutsche Bank (84) -USD 113,817 GBP 85,383 11/07/2016 RBC (920) -USD 303,845 GBP 229,848 11/07/2016 Citibank (5,024) -
Total Unrealised Loss on Forward Currency Exchange Contracts (3,791,374) (2.45)
Net Unrealised Loss on Forward Currency Exchange Contracts (3,711,863) (2.40)
236
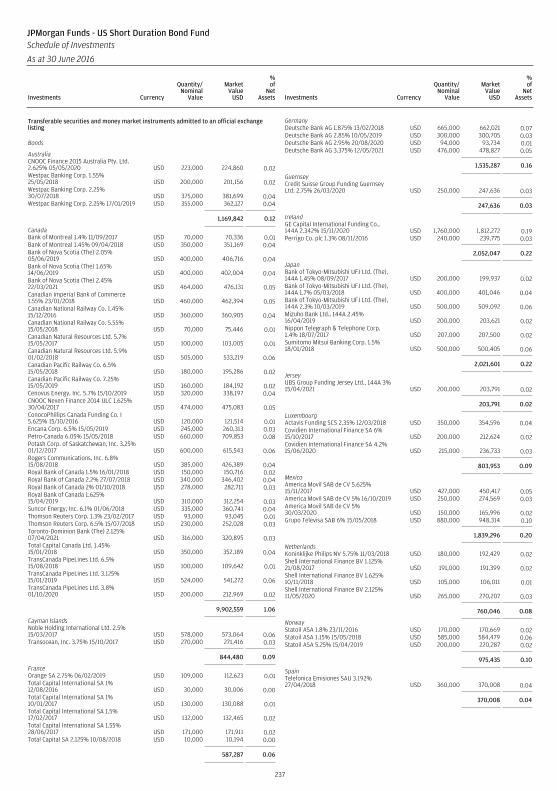
Transferable securities and money market instruments admitted to an official exchangelisting
Bonds
AustraliaCNOOC Finance 2015 Australia Pty. Ltd.2.625% 05/05/2020 USD 223,000 224,860 0.02Westpac Banking Corp. 1.55%25/05/2018 USD 200,000 201,156 0.02Westpac Banking Corp. 2.25%30/07/2018 USD 375,000 381,699 0.04Westpac Banking Corp. 2.25% 17/01/2019 USD 355,000 362,127 0.04
1,169,842 0.12
CanadaBank of Montreal 1.4% 11/09/2017 USD 70,000 70,336 0.01Bank of Montreal 1.45% 09/04/2018 USD 350,000 351,169 0.04Bank of Nova Scotia (The) 2.05%05/06/2019 USD 400,000 406,716 0.04Bank of Nova Scotia (The) 1.65%14/06/2019 USD 400,000 402,004 0.04Bank of Nova Scotia (The) 2.45%22/03/2021 USD 464,000 476,131 0.05Canadian Imperial Bank of Commerce1.55% 23/01/2018 USD 460,000 462,394 0.05Canadian National Railway Co. 1.45%15/12/2016 USD 360,000 360,905 0.04Canadian National Railway Co. 5.55%15/05/2018 USD 70,000 75,446 0.01Canadian Natural Resources Ltd. 5.7%15/05/2017 USD 100,000 103,005 0.01Canadian Natural Resources Ltd. 5.9%01/02/2018 USD 505,000 533,219 0.06Canadian Pacific Railway Co. 6.5%15/05/2018 USD 180,000 195,286 0.02Canadian Pacific Railway Co. 7.25%15/05/2019 USD 160,000 184,192 0.02Cenovus Energy, Inc. 5.7% 15/10/2019 USD 320,000 338,197 0.04CNOOC Nexen Finance 2014 ULC 1.625%30/04/2017 USD 474,000 475,083 0.05ConocoPhillips Canada Funding Co. I5.625% 15/10/2016 USD 120,000 121,514 0.01Encana Corp. 6.5% 15/05/2019 USD 245,000 260,313 0.03Petro-Canada 6.05% 15/05/2018 USD 660,000 709,853 0.08Potash Corp. of Saskatchewan, Inc. 3.25%01/12/2017 USD 600,000 615,543 0.06Rogers Communications, Inc. 6.8%15/08/2018 USD 385,000 426,389 0.04Royal Bank of Canada 1.5% 16/01/2018 USD 150,000 150,716 0.02Royal Bank of Canada 2.2% 27/07/2018 USD 340,000 346,402 0.04Royal Bank of Canada 2% 01/10/2018 USD 278,000 282,711 0.03Royal Bank of Canada 1.625%15/04/2019 USD 310,000 312,254 0.03Suncor Energy, Inc. 6.1% 01/06/2018 USD 335,000 360,741 0.04Thomson Reuters Corp. 1.3% 23/02/2017 USD 93,000 93,045 0.01Thomson Reuters Corp. 6.5% 15/07/2018 USD 230,000 252,028 0.03Toronto-Dominion Bank (The) 2.125%07/04/2021 USD 316,000 320,895 0.03Total Capital Canada Ltd. 1.45%15/01/2018 USD 350,000 352,189 0.04TransCanada PipeLines Ltd. 6.5%15/08/2018 USD 100,000 109,642 0.01TransCanada PipeLines Ltd. 3.125%15/01/2019 USD 524,000 541,272 0.06TransCanada PipeLines Ltd. 3.8%01/10/2020 USD 200,000 212,969 0.02
9,902,559 1.06
Cayman IslandsNoble Holding International Ltd. 2.5%15/03/2017 USD 578,000 573,064 0.06Transocean, Inc. 3.75% 15/10/2017 USD 270,000 271,416 0.03
844,480 0.09
FranceOrange SA 2.75% 06/02/2019 USD 109,000 112,623 0.01Total Capital International SA 1%12/08/2016 USD 30,000 30,006 0.00Total Capital International SA 1%10/01/2017 USD 130,000 130,088 0.01Total Capital International SA 1.5%17/02/2017 USD 132,000 132,465 0.02Total Capital International SA 1.55%28/06/2017 USD 171,000 171,911 0.02Total Capital SA 2.125% 10/08/2018 USD 10,000 10,194 0.00
587,287 0.06
GermanyDeutsche Bank AG 1.875% 13/02/2018 USD 665,000 662,021 0.07Deutsche Bank AG 2.85% 10/05/2019 USD 300,000 300,705 0.03Deutsche Bank AG 2.95% 20/08/2020 USD 94,000 93,734 0.01Deutsche Bank AG 3.375% 12/05/2021 USD 476,000 478,827 0.05
1,535,287 0.16
GuernseyCredit Suisse Group Funding GuernseyLtd. 2.75% 26/03/2020 USD 250,000 247,636 0.03
247,636 0.03
IrelandGE Capital International Funding Co.,144A 2.342% 15/11/2020 USD 1,760,000 1,812,272 0.19Perrigo Co. plc 1.3% 08/11/2016 USD 240,000 239,775 0.03
2,052,047 0.22
JapanBank of Tokyo-Mitsubishi UFJ Ltd. (The),144A 1.45% 08/09/2017 USD 200,000 199,937 0.02Bank of Tokyo-Mitsubishi UFJ Ltd. (The),144A 1.7% 05/03/2018 USD 400,000 401,046 0.04Bank of Tokyo-Mitsubishi UFJ Ltd. (The),144A 2.3% 10/03/2019 USD 500,000 509,092 0.06Mizuho Bank Ltd., 144A 2.45%16/04/2019 USD 200,000 203,621 0.02Nippon Telegraph & Telephone Corp.1.4% 18/07/2017 USD 207,000 207,500 0.02Sumitomo Mitsui Banking Corp. 1.5%18/01/2018 USD 500,000 500,405 0.06
2,021,601 0.22
JerseyUBS Group Funding Jersey Ltd., 144A 3%15/04/2021 USD 200,000 203,791 0.02
203,791 0.02
LuxembourgActavis Funding SCS 2.35% 12/03/2018 USD 350,000 354,596 0.04Covidien International Finance SA 6%15/10/2017 USD 200,000 212,624 0.02Covidien International Finance SA 4.2%15/06/2020 USD 215,000 236,733 0.03
803,953 0.09
MexicoAmerica Movil SAB de CV 5.625%15/11/2017 USD 427,000 450,417 0.05America Movil SAB de CV 5% 16/10/2019 USD 250,000 274,569 0.03America Movil SAB de CV 5%30/03/2020 USD 150,000 165,996 0.02Grupo Televisa SAB 6% 15/05/2018 USD 880,000 948,314 0.10
1,839,296 0.20
NetherlandsKoninklijke Philips NV 5.75% 11/03/2018 USD 180,000 192,429 0.02Shell International Finance BV 1.125%21/08/2017 USD 191,000 191,399 0.02Shell International Finance BV 1.625%10/11/2018 USD 105,000 106,011 0.01Shell International Finance BV 2.125%11/05/2020 USD 265,000 270,207 0.03
760,046 0.08
NorwayStatoil ASA 1.8% 23/11/2016 USD 170,000 170,669 0.02Statoil ASA 1.15% 15/05/2018 USD 585,000 584,479 0.06Statoil ASA 5.25% 15/04/2019 USD 200,000 220,287 0.02
975,435 0.10
SpainTelefonica Emisiones SAU 3.192%27/04/2018 USD 360,000 370,008 0.04
370,008 0.04
237
JPMorgan Funds - US Short Duration Bond FundSchedule of Investments
As at 30 June 2016
Investments Currency
Quantity/Nominal
Value
MarketValue
USD
%of
NetAssets Investments Currency
Quantity/Nominal
Value
MarketValue
USD
%of
NetAssets
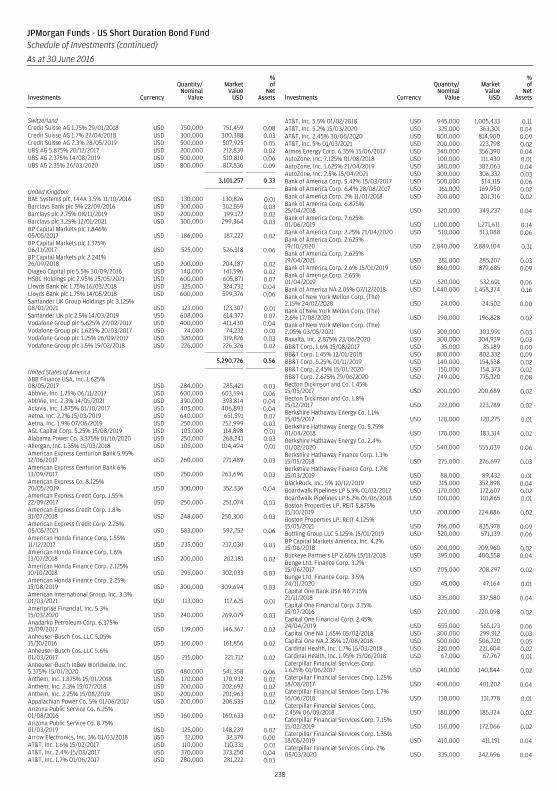
SwitzerlandCredit Suisse AG 1.75% 29/01/2018 USD 750,000 751,459 0.08Credit Suisse AG 1.7% 27/04/2018 USD 300,000 300,388 0.03Credit Suisse AG 2.3% 28/05/2019 USD 500,000 507,925 0.05UBS AG 5.875% 20/12/2017 USD 200,000 212,839 0.02UBS AG 2.375% 14/08/2019 USD 500,000 510,810 0.06UBS AG 2.35% 26/03/2020 USD 800,000 817,836 0.09
3,101,257 0.33
United KingdomBAE Systems plc, 144A 3.5% 11/10/2016 USD 130,000 130,826 0.01Barclays Bank plc 5% 22/09/2016 USD 300,000 302,559 0.03Barclays plc 2.75% 08/11/2019 USD 200,000 199,172 0.02Barclays plc 3.25% 12/01/2021 USD 300,000 299,364 0.03BP Capital Markets plc 1.846%05/05/2017 USD 186,000 187,227 0.02BP Capital Markets plc 1.375%06/11/2017 USD 525,000 526,318 0.06BP Capital Markets plc 2.241%26/09/2018 USD 200,000 204,187 0.02Diageo Capital plc 5.5% 30/09/2016 USD 140,000 141,596 0.02HSBC Holdings plc 2.95% 25/05/2021 USD 600,000 605,871 0.07Lloyds Bank plc 1.75% 16/03/2018 USD 325,000 324,732 0.04Lloyds Bank plc 1.75% 14/05/2018 USD 600,000 599,376 0.06Santander UK Group Holdings plc 3.125%08/01/2021 USD 123,000 123,307 0.01Santander UK plc 2.5% 14/03/2019 USD 608,000 614,377 0.07Vodafone Group plc 5.625% 27/02/2017 USD 400,000 411,430 0.04Vodafone Group plc 1.625% 20/03/2017 USD 74,000 74,232 0.01Vodafone Group plc 1.25% 26/09/2017 USD 320,000 319,826 0.03Vodafone Group plc 1.5% 19/02/2018 USD 226,000 226,326 0.02
5,290,726 0.56
United States of AmericaABB Finance USA, Inc. 1.625%08/05/2017 USD 284,000 285,421 0.03AbbVie, Inc. 1.75% 06/11/2017 USD 600,000 603,594 0.06AbbVie, Inc. 2.3% 14/05/2021 USD 390,000 393,814 0.04Actavis, Inc. 1.875% 01/10/2017 USD 405,000 406,893 0.04Aetna, Inc. 2.2% 15/03/2019 USD 640,000 651,591 0.07Aetna, Inc. 1.9% 07/06/2019 USD 250,000 252,999 0.03AGL Capital Corp. 5.25% 15/08/2019 USD 105,000 114,898 0.01Alabama Power Co. 3.375% 01/10/2020 USD 250,000 268,241 0.03Allergan, Inc. 1.35% 15/03/2018 USD 105,000 104,494 0.01American Express Centurion Bank 5.95%12/06/2017 USD 260,000 271,489 0.03American Express Centurion Bank 6%13/09/2017 USD 250,000 263,696 0.03American Express Co. 8.125%20/05/2019 USD 300,000 352,336 0.04American Express Credit Corp. 1.55%22/09/2017 USD 250,000 251,074 0.03American Express Credit Corp. 1.8%31/07/2018 USD 248,000 250,300 0.03American Express Credit Corp. 2.25%05/05/2021 USD 583,000 592,252 0.06American Honda Finance Corp. 1.55%11/12/2017 USD 235,000 237,030 0.03American Honda Finance Corp. 1.6%13/07/2018 USD 200,000 202,181 0.02American Honda Finance Corp. 2.125%10/10/2018 USD 295,000 302,033 0.03American Honda Finance Corp. 2.25%15/08/2019 USD 300,000 309,694 0.03American International Group, Inc. 3.3%01/03/2021 USD 113,000 117,625 0.01Ameriprise Financial, Inc. 5.3%15/03/2020 USD 240,000 269,079 0.03Anadarko Petroleum Corp. 6.375%15/09/2017 USD 139,000 146,367 0.02Anheuser-Busch Cos. LLC 5.05%15/10/2016 USD 160,000 161,856 0.02Anheuser-Busch Cos. LLC 5.6%01/03/2017 USD 215,000 221,712 0.02Anheuser-Busch InBev Worldwide, Inc.5.375% 15/01/2020 USD 480,000 541,358 0.06Anthem, Inc. 1.875% 15/01/2018 USD 170,000 170,932 0.02Anthem, Inc. 2.3% 15/07/2018 USD 200,000 202,692 0.02Anthem, Inc. 2.25% 15/08/2019 USD 200,000 201,963 0.02Appalachian Power Co. 5% 01/06/2017 USD 200,000 206,535 0.02Arizona Public Service Co. 6.25%01/08/2016 USD 160,000 160,633 0.02Arizona Public Service Co. 8.75%01/03/2019 USD 125,000 148,239 0.02Arrow Electronics, Inc. 3% 01/03/2018 USD 32,000 32,379 0.00AT&T, Inc. 1.6% 15/02/2017 USD 110,000 110,331 0.01AT&T, Inc. 2.4% 15/03/2017 USD 370,000 373,250 0.04AT&T, Inc. 1.7% 01/06/2017 USD 280,000 281,222 0.03
AT&T, Inc. 5.5% 01/02/2018 USD 945,000 1,005,433 0.11AT&T, Inc. 5.2% 15/03/2020 USD 325,000 363,301 0.04AT&T, Inc. 2.45% 30/06/2020 USD 800,000 814,900 0.09AT&T, Inc. 5% 01/03/2021 USD 200,000 223,798 0.02Atmos Energy Corp. 6.35% 15/06/2017 USD 340,000 356,390 0.04AutoZone, Inc. 7.125% 01/08/2018 USD 100,000 111,430 0.01AutoZone, Inc. 1.625% 21/04/2019 USD 380,000 382,063 0.04AutoZone, Inc. 2.5% 15/04/2021 USD 300,000 306,332 0.03Bank of America Corp. 5.42% 15/03/2017 USD 500,000 514,115 0.06Bank of America Corp. 6.4% 28/08/2017 USD 161,000 169,950 0.02Bank of America Corp. 2% 11/01/2018 USD 200,000 201,316 0.02Bank of America Corp. 6.875%25/04/2018 USD 320,000 349,237 0.04Bank of America Corp. 7.625%01/06/2019 USD 1,100,000 1,271,611 0.14Bank of America Corp. 2.25% 21/04/2020 USD 510,000 513,088 0.06Bank of America Corp. 2.625%19/10/2020 USD 2,840,000 2,889,104 0.31Bank of America Corp. 2.625%19/04/2021 USD 281,000 285,207 0.03Bank of America Corp. 2.6% 15/01/2019 USD 860,000 879,685 0.09Bank of America Corp. 2.65%01/04/2019 USD 520,000 532,691 0.06Bank of America NA 2.05% 07/12/2018 USD 1,440,000 1,458,374 0.16Bank of New York Mellon Corp. (The)2.15% 24/02/2020 USD 24,000 24,502 0.00Bank of New York Mellon Corp. (The)2.6% 17/08/2020 USD 190,000 196,828 0.02Bank of New York Mellon Corp. (The)2.05% 03/05/2021 USD 300,000 303,991 0.03Baxalta, Inc. 2.875% 23/06/2020 USD 300,000 304,939 0.03BB&T Corp. 1.6% 15/08/2017 USD 35,000 35,189 0.00BB&T Corp. 1.45% 12/01/2018 USD 800,000 802,332 0.09BB&T Corp. 5.25% 01/11/2019 USD 140,000 154,538 0.02BB&T Corp. 2.45% 15/01/2020 USD 150,000 154,373 0.02BB&T Corp. 2.625% 29/06/2020 USD 749,000 775,320 0.08Becton Dickinson and Co. 1.45%15/05/2017 USD 200,000 200,689 0.02Becton Dickinson and Co. 1.8%15/12/2017 USD 222,000 223,789 0.02Berkshire Hathaway Energy Co. 1.1%15/05/2017 USD 120,000 120,275 0.01Berkshire Hathaway Energy Co. 5.75%01/04/2018 USD 170,000 183,314 0.02Berkshire Hathaway Energy Co. 2.4%01/02/2020 USD 540,000 555,039 0.06Berkshire Hathaway Finance Corp. 1.3%15/05/2018 USD 275,000 276,697 0.03Berkshire Hathaway Finance Corp. 1.7%15/03/2019 USD 88,000 89,432 0.01BlackRock, Inc. 5% 10/12/2019 USD 315,000 352,898 0.04Boardwalk Pipelines LP 5.5% 01/02/2017 USD 170,000 172,607 0.02Boardwalk Pipelines LP 5.2% 01/06/2018 USD 100,000 101,865 0.01Boston Properties LP, REIT 5.875%15/10/2019 USD 200,000 224,886 0.02Boston Properties LP, REIT 4.125%15/05/2021 USD 766,000 835,978 0.09Bottling Group LLC 5.125% 15/01/2019 USD 520,000 571,139 0.06BP Capital Markets America, Inc. 4.2%15/06/2018 USD 200,000 209,960 0.02Buckeye Partners LP 2.65% 15/11/2018 USD 395,000 400,558 0.04Bunge Ltd. Finance Corp. 3.2%15/06/2017 USD 205,000 208,297 0.02Bunge Ltd. Finance Corp. 3.5%24/11/2020 USD 45,000 47,164 0.01Capital One Bank USA NA 2.15%21/11/2018 USD 335,000 337,580 0.04Capital One Financial Corp. 3.15%15/07/2016 USD 220,000 220,098 0.02Capital One Financial Corp. 2.45%24/04/2019 USD 555,000 565,123 0.06Capital One NA 1.65% 05/02/2018 USD 300,000 299,912 0.03Capital One NA 2.35% 17/08/2018 USD 500,000 506,720 0.05Cardinal Health, Inc. 1.7% 15/03/2018 USD 220,000 221,604 0.02Cardinal Health, Inc. 1.95% 15/06/2018 USD 67,000 67,767 0.01Caterpillar Financial Services Corp.1.625% 01/06/2017 USD 140,000 140,844 0.02Caterpillar Financial Services Corp. 1.25%18/08/2017 USD 400,000 401,202 0.04Caterpillar Financial Services Corp. 1.7%16/06/2018 USD 130,000 131,778 0.01Caterpillar Financial Services Corp.2.45% 06/09/2018 USD 180,000 185,324 0.02Caterpillar Financial Services Corp. 7.15%15/02/2019 USD 150,000 172,066 0.02Caterpillar Financial Services Corp. 1.35%18/05/2019 USD 410,000 411,191 0.04Caterpillar Financial Services Corp. 2%05/03/2020 USD 335,000 342,696 0.04
238
JPMorgan Funds - US Short Duration Bond FundSchedule of Investments (continued)
As at 30 June 2016
Investments Currency
Quantity/Nominal
Value
MarketValue
USD
%of
NetAssets Investments Currency
Quantity/Nominal
Value
MarketValue
USD
%of
NetAssets
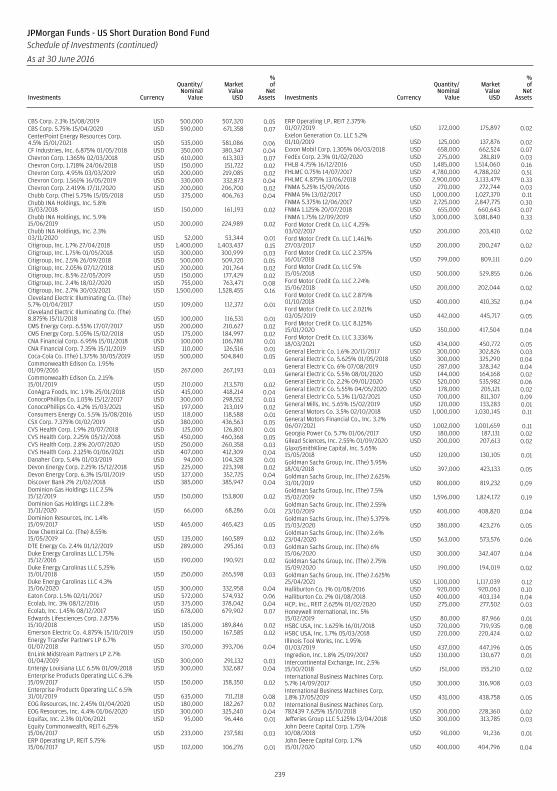
CBS Corp. 2.3% 15/08/2019 USD 500,000 507,320 0.05CBS Corp. 5.75% 15/04/2020 USD 590,000 671,358 0.07CenterPoint Energy Resources Corp.4.5% 15/01/2021 USD 535,000 581,086 0.06CF Industries, Inc. 6.875% 01/05/2018 USD 350,000 380,347 0.04Chevron Corp. 1.365% 02/03/2018 USD 610,000 613,303 0.07Chevron Corp. 1.718% 24/06/2018 USD 150,000 151,722 0.02Chevron Corp. 4.95% 03/03/2019 USD 200,000 219,085 0.02Chevron Corp. 1.561% 16/05/2019 USD 330,000 332,873 0.04Chevron Corp. 2.419% 17/11/2020 USD 200,000 206,700 0.02Chubb Corp. (The) 5.75% 15/05/2018 USD 375,000 406,763 0.04Chubb INA Holdings, Inc. 5.8%15/03/2018 USD 150,000 161,193 0.02Chubb INA Holdings, Inc. 5.9%15/06/2019 USD 200,000 224,989 0.02Chubb INA Holdings, Inc. 2.3%03/11/2020 USD 52,000 53,344 0.01Citigroup, Inc. 1.7% 27/04/2018 USD 1,400,000 1,403,437 0.15Citigroup, Inc. 1.75% 01/05/2018 USD 300,000 300,999 0.03Citigroup, Inc. 2.5% 26/09/2018 USD 500,000 509,720 0.05Citigroup, Inc. 2.05% 07/12/2018 USD 200,000 201,764 0.02Citigroup, Inc. 8.5% 22/05/2019 USD 150,000 177,429 0.02Citigroup, Inc. 2.4% 18/02/2020 USD 755,000 763,471 0.08Citigroup, Inc. 2.7% 30/03/2021 USD 1,500,000 1,528,455 0.16Cleveland Electric Illuminating Co. (The)5.7% 01/04/2017 USD 109,000 112,372 0.01Cleveland Electric Illuminating Co. (The)8.875% 15/11/2018 USD 100,000 116,531 0.01CMS Energy Corp. 6.55% 17/07/2017 USD 200,000 210,627 0.02CMS Energy Corp. 5.05% 15/02/2018 USD 175,000 184,997 0.02CNA Financial Corp. 6.95% 15/01/2018 USD 100,000 106,780 0.01CNA Financial Corp. 7.35% 15/11/2019 USD 110,000 126,516 0.01Coca-Cola Co. (The) 1.375% 30/05/2019 USD 500,000 504,840 0.05Commonwealth Edison Co. 1.95%01/09/2016 USD 267,000 267,193 0.03Commonwealth Edison Co. 2.15%15/01/2019 USD 210,000 213,570 0.02ConAgra Foods, Inc. 1.9% 25/01/2018 USD 415,000 418,214 0.04ConocoPhillips Co. 1.05% 15/12/2017 USD 300,000 298,552 0.03ConocoPhillips Co. 4.2% 15/03/2021 USD 197,000 213,019 0.02Consumers Energy Co. 5.5% 15/08/2016 USD 118,000 118,588 0.01CSX Corp. 7.375% 01/02/2019 USD 380,000 436,563 0.05CVS Health Corp. 1.9% 20/07/2018 USD 125,000 126,801 0.01CVS Health Corp. 2.25% 05/12/2018 USD 450,000 460,368 0.05CVS Health Corp. 2.8% 20/07/2020 USD 250,000 260,358 0.03CVS Health Corp. 2.125% 01/06/2021 USD 407,000 412,309 0.04Danaher Corp. 5.4% 01/03/2019 USD 94,000 104,328 0.01Devon Energy Corp. 2.25% 15/12/2018 USD 225,000 223,398 0.02Devon Energy Corp. 6.3% 15/01/2019 USD 327,000 352,725 0.04Discover Bank 2% 21/02/2018 USD 385,000 385,947 0.04Dominion Gas Holdings LLC 2.5%15/12/2019 USD 150,000 153,800 0.02Dominion Gas Holdings LLC 2.8%15/11/2020 USD 66,000 68,286 0.01Dominion Resources, Inc. 1.4%15/09/2017 USD 465,000 465,423 0.05Dow Chemical Co. (The) 8.55%15/05/2019 USD 135,000 160,589 0.02DTE Energy Co. 2.4% 01/12/2019 USD 289,000 295,161 0.03Duke Energy Carolinas LLC 1.75%15/12/2016 USD 190,000 190,921 0.02Duke Energy Carolinas LLC 5.25%15/01/2018 USD 250,000 265,598 0.03Duke Energy Carolinas LLC 4.3%15/06/2020 USD 300,000 332,958 0.04Eaton Corp. 1.5% 02/11/2017 USD 572,000 574,932 0.06Ecolab, Inc. 3% 08/12/2016 USD 375,000 378,042 0.04Ecolab, Inc. 1.45% 08/12/2017 USD 678,000 679,902 0.07Edwards Lifesciences Corp. 2.875%15/10/2018 USD 185,000 189,846 0.02Emerson Electric Co. 4.875% 15/10/2019 USD 150,000 167,585 0.02Energy Transfer Partners LP 6.7%01/07/2018 USD 370,000 393,706 0.04EnLink Midstream Partners LP 2.7%01/04/2019 USD 300,000 291,132 0.03Entergy Louisiana LLC 6.5% 01/09/2018 USD 300,000 332,687 0.04Enterprise Products Operating LLC 6.3%15/09/2017 USD 150,000 158,350 0.02Enterprise Products Operating LLC 6.5%31/01/2019 USD 635,000 711,218 0.08EOG Resources, Inc. 2.45% 01/04/2020 USD 180,000 182,267 0.02EOG Resources, Inc. 4.4% 01/06/2020 USD 300,000 325,240 0.04Equifax, Inc. 2.3% 01/06/2021 USD 95,000 96,446 0.01Equity Commonwealth, REIT 6.25%15/06/2017 USD 233,000 237,581 0.03ERP Operating LP, REIT 5.75%15/06/2017 USD 102,000 106,276 0.01
ERP Operating LP, REIT 2.375%01/07/2019 USD 172,000 175,897 0.02Exelon Generation Co. LLC 5.2%01/10/2019 USD 125,000 137,876 0.02Exxon Mobil Corp. 1.305% 06/03/2018 USD 658,000 662,524 0.07FedEx Corp. 2.3% 01/02/2020 USD 275,000 281,819 0.03FHLB 4.75% 16/12/2016 USD 1,485,000 1,514,060 0.16FHLMC 0.75% 14/07/2017 USD 4,780,000 4,788,202 0.51FHLMC 4.875% 13/06/2018 USD 2,900,000 3,133,479 0.33FNMA 5.25% 15/09/2016 USD 270,000 272,744 0.03FNMA 5% 13/02/2017 USD 1,000,000 1,027,370 0.11FNMA 5.375% 12/06/2017 USD 2,725,000 2,847,775 0.30FNMA 1.125% 20/07/2018 USD 655,000 660,643 0.07FNMA 1.75% 12/09/2019 USD 3,000,000 3,081,840 0.33Ford Motor Credit Co. LLC 4.25%03/02/2017 USD 200,000 203,410 0.02Ford Motor Credit Co. LLC 1.461%27/03/2017 USD 200,000 200,247 0.02Ford Motor Credit Co. LLC 2.375%16/01/2018 USD 799,000 809,111 0.09Ford Motor Credit Co. LLC 5%15/05/2018 USD 500,000 529,855 0.06Ford Motor Credit Co. LLC 2.24%15/06/2018 USD 200,000 202,044 0.02Ford Motor Credit Co. LLC 2.875%01/10/2018 USD 400,000 410,352 0.04Ford Motor Credit Co. LLC 2.021%03/05/2019 USD 442,000 445,717 0.05Ford Motor Credit Co. LLC 8.125%15/01/2020 USD 350,000 417,504 0.04Ford Motor Credit Co. LLC 3.336%18/03/2021 USD 434,000 450,772 0.05General Electric Co. 1.6% 20/11/2017 USD 300,000 302,826 0.03General Electric Co. 5.625% 01/05/2018 USD 300,000 325,290 0.04General Electric Co. 6% 07/08/2019 USD 287,000 328,342 0.04General Electric Co. 5.5% 08/01/2020 USD 144,000 164,168 0.02General Electric Co. 2.2% 09/01/2020 USD 520,000 535,982 0.06General Electric Co. 5.55% 04/05/2020 USD 178,000 205,121 0.02General Electric Co. 5.3% 11/02/2021 USD 700,000 811,307 0.09General Mills, Inc. 5.65% 15/02/2019 USD 120,000 133,283 0.01General Motors Co. 3.5% 02/10/2018 USD 1,000,000 1,030,145 0.11General Motors Financial Co., Inc. 3.2%06/07/2021 USD 1,002,000 1,001,659 0.11Georgia Power Co. 5.7% 01/06/2017 USD 180,000 187,131 0.02Gilead Sciences, Inc. 2.55% 01/09/2020 USD 200,000 207,613 0.02GlaxoSmithKline Capital, Inc. 5.65%15/05/2018 USD 120,000 130,105 0.01Goldman Sachs Group, Inc. (The) 5.95%18/01/2018 USD 397,000 423,133 0.05Goldman Sachs Group, Inc. (The) 2.625%31/01/2019 USD 800,000 819,232 0.09Goldman Sachs Group, Inc. (The) 7.5%15/02/2019 USD 1,596,000 1,824,172 0.19Goldman Sachs Group, Inc. (The) 2.55%23/10/2019 USD 400,000 408,820 0.04Goldman Sachs Group, Inc. (The) 5.375%15/03/2020 USD 380,000 423,276 0.05Goldman Sachs Group, Inc. (The) 2.6%23/04/2020 USD 563,000 573,576 0.06Goldman Sachs Group, Inc. (The) 6%15/06/2020 USD 300,000 342,407 0.04Goldman Sachs Group, Inc. (The) 2.75%15/09/2020 USD 190,000 194,019 0.02Goldman Sachs Group, Inc. (The) 2.625%25/04/2021 USD 1,100,000 1,117,039 0.12Halliburton Co. 1% 01/08/2016 USD 920,000 920,063 0.10Halliburton Co. 2% 01/08/2018 USD 400,000 403,134 0.04HCP, Inc., REIT 2.625% 01/02/2020 USD 275,000 277,502 0.03Honeywell International, Inc. 5%15/02/2019 USD 80,000 87,966 0.01HSBC USA, Inc. 1.625% 16/01/2018 USD 720,000 719,935 0.08HSBC USA, Inc. 1.7% 05/03/2018 USD 220,000 220,424 0.02Illinois Tool Works, Inc. 1.95%01/03/2019 USD 437,000 447,196 0.05Ingredion, Inc. 1.8% 25/09/2017 USD 130,000 130,677 0.01Intercontinental Exchange, Inc. 2.5%15/10/2018 USD 151,000 155,210 0.02International Business Machines Corp.5.7% 14/09/2017 USD 300,000 316,908 0.03International Business Machines Corp.1.8% 17/05/2019 USD 431,000 438,758 0.05International Business Machines Corp.782439 7.625% 15/10/2018 USD 200,000 228,360 0.02Jefferies Group LLC 5.125% 13/04/2018 USD 300,000 313,785 0.03John Deere Capital Corp. 1.75%10/08/2018 USD 90,000 91,236 0.01John Deere Capital Corp. 1.7%15/01/2020 USD 400,000 404,796 0.04
239
JPMorgan Funds - US Short Duration Bond FundSchedule of Investments (continued)
As at 30 June 2016
Investments Currency
Quantity/Nominal
Value
MarketValue
USD
%of
NetAssets Investments Currency
Quantity/Nominal
Value
MarketValue
USD
%of
NetAssets
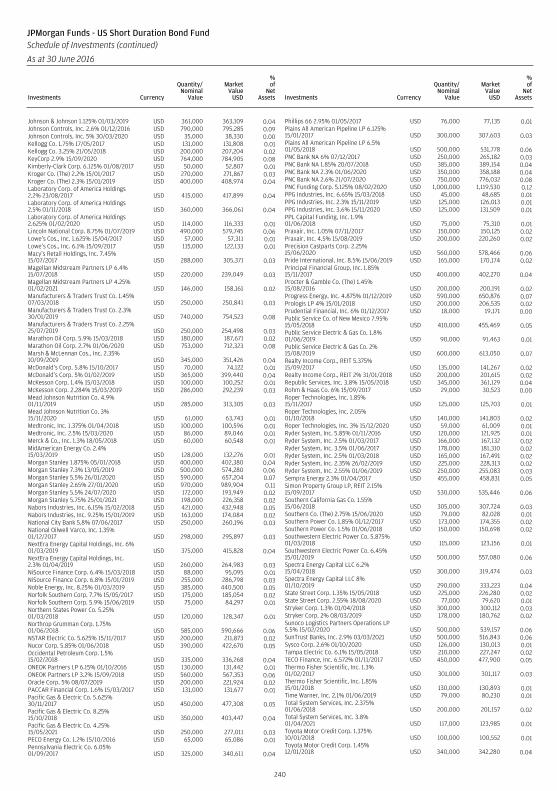
Johnson & Johnson 1.125% 01/03/2019 USD 361,000 363,109 0.04Johnson Controls, Inc. 2.6% 01/12/2016 USD 790,000 795,285 0.09Johnson Controls, Inc. 5% 30/03/2020 USD 35,000 38,330 0.00Kellogg Co. 1.75% 17/05/2017 USD 131,000 131,808 0.01Kellogg Co. 3.25% 21/05/2018 USD 200,000 207,204 0.02KeyCorp 2.9% 15/09/2020 USD 764,000 784,905 0.08Kimberly-Clark Corp. 6.125% 01/08/2017 USD 50,000 52,807 0.01Kroger Co. (The) 2.2% 15/01/2017 USD 270,000 271,867 0.03Kroger Co. (The) 2.3% 15/01/2019 USD 400,000 408,974 0.04Laboratory Corp. of America Holdings2.2% 23/08/2017 USD 415,000 417,899 0.04Laboratory Corp. of America Holdings2.5% 01/11/2018 USD 360,000 366,061 0.04Laboratory Corp. of America Holdings2.625% 01/02/2020 USD 114,000 116,333 0.01Lincoln National Corp. 8.75% 01/07/2019 USD 490,000 579,745 0.06Lowe’s Cos., Inc. 1.625% 15/04/2017 USD 57,000 57,311 0.01Lowe’s Cos., Inc. 6.1% 15/09/2017 USD 115,000 122,133 0.01Macy’s Retail Holdings, Inc. 7.45%15/07/2017 USD 288,000 305,371 0.03Magellan Midstream Partners LP 6.4%15/07/2018 USD 220,000 239,049 0.03Magellan Midstream Partners LP 4.25%01/02/2021 USD 146,000 158,161 0.02Manufacturers & Traders Trust Co. 1.45%07/03/2018 USD 250,000 250,841 0.03Manufacturers & Traders Trust Co. 2.3%30/01/2019 USD 740,000 754,523 0.08Manufacturers & Traders Trust Co. 2.25%25/07/2019 USD 250,000 254,498 0.03Marathon Oil Corp. 5.9% 15/03/2018 USD 180,000 187,671 0.02Marathon Oil Corp. 2.7% 01/06/2020 USD 753,000 712,323 0.08Marsh & McLennan Cos., Inc. 2.35%10/09/2019 USD 345,000 351,426 0.04McDonald’s Corp. 5.8% 15/10/2017 USD 70,000 74,122 0.01McDonald’s Corp. 5% 01/02/2019 USD 365,000 399,440 0.04McKesson Corp. 1.4% 15/03/2018 USD 100,000 100,252 0.01McKesson Corp. 2.284% 15/03/2019 USD 286,000 292,239 0.03Mead Johnson Nutrition Co. 4.9%01/11/2019 USD 285,000 313,305 0.03Mead Johnson Nutrition Co. 3%15/11/2020 USD 61,000 63,743 0.01Medtronic, Inc. 1.375% 01/04/2018 USD 100,000 100,596 0.01Medtronic, Inc. 2.5% 15/03/2020 USD 86,000 89,046 0.01Merck & Co., Inc. 1.3% 18/05/2018 USD 60,000 60,548 0.01MidAmerican Energy Co. 2.4%15/03/2019 USD 128,000 132,276 0.01Morgan Stanley 1.875% 05/01/2018 USD 400,000 402,380 0.04Morgan Stanley 7.3% 13/05/2019 USD 500,000 574,280 0.06Morgan Stanley 5.5% 26/01/2020 USD 590,000 657,204 0.07Morgan Stanley 2.65% 27/01/2020 USD 970,000 989,904 0.11Morgan Stanley 5.5% 24/07/2020 USD 172,000 193,949 0.02Morgan Stanley 5.75% 25/01/2021 USD 198,000 226,358 0.02Nabors Industries, Inc. 6.15% 15/02/2018 USD 421,000 432,948 0.05Nabors Industries, Inc. 9.25% 15/01/2019 USD 163,000 174,084 0.02National City Bank 5.8% 07/06/2017 USD 250,000 260,196 0.03National Oilwell Varco, Inc. 1.35%01/12/2017 USD 298,000 295,897 0.03NextEra Energy Capital Holdings, Inc. 6%01/03/2019 USD 375,000 415,828 0.04NextEra Energy Capital Holdings, Inc.2.3% 01/04/2019 USD 260,000 264,983 0.03NiSource Finance Corp. 6.4% 15/03/2018 USD 88,000 95,095 0.01NiSource Finance Corp. 6.8% 15/01/2019 USD 255,000 286,798 0.03Noble Energy, Inc. 8.25% 01/03/2019 USD 385,000 440,500 0.05Norfolk Southern Corp. 7.7% 15/05/2017 USD 175,000 185,054 0.02Norfolk Southern Corp. 5.9% 15/06/2019 USD 75,000 84,297 0.01Northern States Power Co. 5.25%01/03/2018 USD 120,000 128,347 0.01Northrop Grumman Corp. 1.75%01/06/2018 USD 585,000 590,666 0.06NSTAR Electric Co. 5.625% 15/11/2017 USD 200,000 211,873 0.02Nucor Corp. 5.85% 01/06/2018 USD 390,000 422,670 0.05Occidental Petroleum Corp. 1.5%15/02/2018 USD 335,000 336,268 0.04ONEOK Partners LP 6.15% 01/10/2016 USD 130,000 131,442 0.01ONEOK Partners LP 3.2% 15/09/2018 USD 560,000 567,353 0.06Oracle Corp. 5% 08/07/2019 USD 200,000 221,924 0.02PACCAR Financial Corp. 1.6% 15/03/2017 USD 131,000 131,677 0.01Pacific Gas & Electric Co. 5.625%30/11/2017 USD 450,000 477,308 0.05Pacific Gas & Electric Co. 8.25%15/10/2018 USD 350,000 403,447 0.04Pacific Gas & Electric Co. 4.25%15/05/2021 USD 250,000 277,011 0.03PECO Energy Co. 1.2% 15/10/2016 USD 65,000 65,086 0.01Pennsylvania Electric Co. 6.05%01/09/2017 USD 325,000 340,611 0.04
Phillips 66 2.95% 01/05/2017 USD 76,000 77,135 0.01Plains All American Pipeline LP 6.125%15/01/2017 USD 300,000 307,603 0.03Plains All American Pipeline LP 6.5%01/05/2018 USD 500,000 531,778 0.06PNC Bank NA 6% 07/12/2017 USD 250,000 265,182 0.03PNC Bank NA 1.85% 20/07/2018 USD 385,000 389,154 0.04PNC Bank NA 2.3% 01/06/2020 USD 350,000 358,188 0.04PNC Bank NA 2.6% 21/07/2020 USD 750,000 776,032 0.08PNC Funding Corp. 5.125% 08/02/2020 USD 1,000,000 1,119,530 0.12PPG Industries, Inc. 6.65% 15/03/2018 USD 45,000 48,685 0.01PPG Industries, Inc. 2.3% 15/11/2019 USD 125,000 126,013 0.01PPG Industries, Inc. 3.6% 15/11/2020 USD 125,000 131,509 0.01PPL Capital Funding, Inc. 1.9%01/06/2018 USD 75,000 75,310 0.01Praxair, Inc. 1.05% 07/11/2017 USD 150,000 150,125 0.02Praxair, Inc. 4.5% 15/08/2019 USD 200,000 220,260 0.02Precision Castparts Corp. 2.25%15/06/2020 USD 560,000 578,466 0.06Pride International, Inc. 8.5% 15/06/2019 USD 165,000 170,174 0.02Principal Financial Group, Inc. 1.85%15/11/2017 USD 400,000 402,270 0.04Procter & Gamble Co. (The) 1.45%15/08/2016 USD 200,000 200,191 0.02Progress Energy, Inc. 4.875% 01/12/2019 USD 590,000 650,876 0.07Prologis LP 4% 15/01/2018 USD 200,000 206,535 0.02Prudential Financial, Inc. 6% 01/12/2017 USD 18,000 19,171 0.00Public Service Co. of New Mexico 7.95%15/05/2018 USD 410,000 455,469 0.05Public Service Electric & Gas Co. 1.8%01/06/2019 USD 90,000 91,463 0.01Public Service Electric & Gas Co. 2%15/08/2019 USD 600,000 613,050 0.07Realty Income Corp., REIT 5.375%15/09/2017 USD 135,000 141,267 0.02Realty Income Corp., REIT 2% 31/01/2018 USD 200,000 201,615 0.02Republic Services, Inc. 3.8% 15/05/2018 USD 345,000 361,129 0.04Rohm & Haas Co. 6% 15/09/2017 USD 29,000 30,523 0.00Roper Technologies, Inc. 1.85%15/11/2017 USD 125,000 125,703 0.01Roper Technologies, Inc. 2.05%01/10/2018 USD 140,000 141,803 0.02Roper Technologies, Inc. 3% 15/12/2020 USD 59,000 61,009 0.01Ryder System, Inc. 5.85% 01/11/2016 USD 120,000 121,925 0.01Ryder System, Inc. 2.5% 01/03/2017 USD 166,000 167,132 0.02Ryder System, Inc. 3.5% 01/06/2017 USD 178,000 181,310 0.02Ryder System, Inc. 2.5% 01/03/2018 USD 165,000 167,491 0.02Ryder System, Inc. 2.35% 26/02/2019 USD 225,000 228,313 0.02Ryder System, Inc. 2.55% 01/06/2019 USD 250,000 255,083 0.03Sempra Energy 2.3% 01/04/2017 USD 455,000 458,831 0.05Simon Property Group LP, REIT 2.15%15/09/2017 USD 530,000 535,446 0.06Southern California Gas Co. 1.55%15/06/2018 USD 305,000 307,724 0.03Southern Co. (The) 2.75% 15/06/2020 USD 79,000 82,028 0.01Southern Power Co. 1.85% 01/12/2017 USD 173,000 174,355 0.02Southern Power Co. 1.5% 01/06/2018 USD 150,000 150,698 0.02Southwestern Electric Power Co. 5.875%01/03/2018 USD 115,000 123,156 0.01Southwestern Electric Power Co. 6.45%15/01/2019 USD 500,000 557,080 0.06Spectra Energy Capital LLC 6.2%15/04/2018 USD 300,000 319,474 0.03Spectra Energy Capital LLC 8%01/10/2019 USD 290,000 333,223 0.04State Street Corp. 1.35% 15/05/2018 USD 225,000 226,280 0.02State Street Corp. 2.55% 18/08/2020 USD 77,000 79,620 0.01Stryker Corp. 1.3% 01/04/2018 USD 300,000 300,112 0.03Stryker Corp. 2% 08/03/2019 USD 178,000 180,762 0.02Sunoco Logistics Partners Operations LP5.5% 15/02/2020 USD 500,000 539,157 0.06SunTrust Banks, Inc. 2.9% 03/03/2021 USD 500,000 516,843 0.06Sysco Corp. 2.6% 01/10/2020 USD 126,000 130,013 0.01Tampa Electric Co. 6.1% 15/05/2018 USD 210,000 227,247 0.02TECO Finance, Inc. 6.572% 01/11/2017 USD 450,000 477,900 0.05Thermo Fisher Scientific, Inc. 1.3%01/02/2017 USD 301,000 301,117 0.03Thermo Fisher Scientific, Inc. 1.85%15/01/2018 USD 130,000 130,893 0.01Time Warner, Inc. 2.1% 01/06/2019 USD 79,000 80,230 0.01Total System Services, Inc. 2.375%01/06/2018 USD 200,000 201,157 0.02Total System Services, Inc. 3.8%01/04/2021 USD 117,000 123,985 0.01Toyota Motor Credit Corp. 1.375%10/01/2018 USD 100,000 100,552 0.01Toyota Motor Credit Corp. 1.45%12/01/2018 USD 340,000 342,280 0.04
240
JPMorgan Funds - US Short Duration Bond FundSchedule of Investments (continued)
As at 30 June 2016
Investments Currency
Quantity/Nominal
Value
MarketValue
USD
%of
NetAssets Investments Currency
Quantity/Nominal
Value
MarketValue
USD
%of
NetAssets
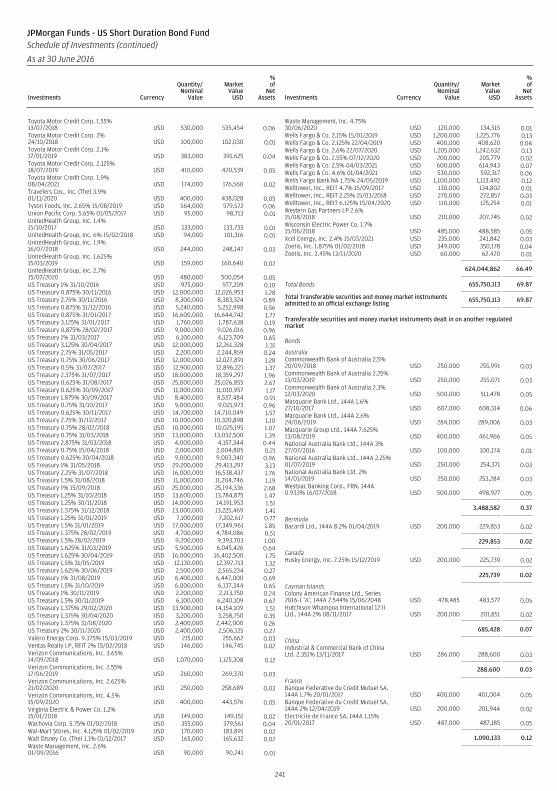
Toyota Motor Credit Corp. 1.55%13/07/2018 USD 530,000 535,454 0.06Toyota Motor Credit Corp. 2%24/10/2018 USD 100,000 102,030 0.01Toyota Motor Credit Corp. 2.1%17/01/2019 USD 383,000 391,625 0.04Toyota Motor Credit Corp. 2.125%18/07/2019 USD 410,000 420,539 0.05Toyota Motor Credit Corp. 1.9%08/04/2021 USD 174,000 176,560 0.02Travelers Cos., Inc. (The) 3.9%01/11/2020 USD 400,000 438,028 0.05Tyson Foods, Inc. 2.65% 15/08/2019 USD 564,000 579,572 0.06Union Pacific Corp. 5.65% 01/05/2017 USD 95,000 98,713 0.01UnitedHealth Group, Inc. 1.4%15/10/2017 USD 133,000 133,733 0.01UnitedHealth Group, Inc. 6% 15/02/2018 USD 94,000 101,316 0.01UnitedHealth Group, Inc. 1.9%16/07/2018 USD 244,000 248,147 0.03UnitedHealth Group, Inc. 1.625%15/03/2019 USD 159,000 160,640 0.02UnitedHealth Group, Inc. 2.7%15/07/2020 USD 480,000 500,054 0.05US Treasury 1% 31/10/2016 USD 975,000 977,209 0.10US Treasury 0.875% 30/11/2016 USD 12,000,000 12,026,953 1.28US Treasury 2.75% 30/11/2016 USD 8,300,000 8,383,324 0.89US Treasury 0.875% 31/12/2016 USD 5,240,000 5,252,998 0.56US Treasury 0.875% 31/01/2017 USD 16,600,000 16,644,742 1.77US Treasury 3.125% 31/01/2017 USD 1,760,000 1,787,638 0.19US Treasury 0.875% 28/02/2017 USD 9,000,000 9,026,016 0.96US Treasury 1% 31/03/2017 USD 6,100,000 6,123,709 0.65US Treasury 3.125% 30/04/2017 USD 12,000,000 12,261,328 1.31US Treasury 2.75% 31/05/2017 USD 2,200,000 2,244,859 0.24US Treasury 0.75% 30/06/2017 USD 12,000,000 12,027,891 1.28US Treasury 0.5% 31/07/2017 USD 12,900,000 12,896,221 1.37US Treasury 2.375% 31/07/2017 USD 18,000,000 18,359,297 1.96US Treasury 0.625% 31/08/2017 USD 25,000,000 25,026,855 2.67US Treasury 0.625% 30/09/2017 USD 11,000,000 11,010,957 1.17US Treasury 1.875% 30/09/2017 USD 8,400,000 8,537,484 0.91US Treasury 0.75% 31/10/2017 USD 9,000,000 9,021,973 0.96US Treasury 0.625% 30/11/2017 USD 14,700,000 14,710,049 1.57US Treasury 2.75% 31/12/2017 USD 10,000,000 10,320,898 1.10US Treasury 0.75% 28/02/2018 USD 10,000,000 10,025,195 1.07US Treasury 0.75% 31/03/2018 USD 13,000,000 13,032,500 1.39US Treasury 2.875% 31/03/2018 USD 4,000,000 4,157,344 0.44US Treasury 0.75% 15/04/2018 USD 2,000,000 2,004,805 0.21US Treasury 0.625% 30/04/2018 USD 9,000,000 9,003,340 0.96US Treasury 1% 31/05/2018 USD 29,200,000 29,413,297 3.13US Treasury 2.25% 31/07/2018 USD 16,000,000 16,538,437 1.76US Treasury 1.5% 31/08/2018 USD 11,000,000 11,204,746 1.19US Treasury 1% 15/09/2018 USD 25,000,000 25,194,336 2.68US Treasury 1.25% 31/10/2018 USD 13,600,000 13,784,875 1.47US Treasury 1.25% 30/11/2018 USD 14,000,000 14,191,953 1.51US Treasury 1.375% 31/12/2018 USD 13,000,000 13,225,469 1.41US Treasury 1.25% 31/01/2019 USD 7,100,000 7,202,617 0.77US Treasury 1.5% 31/01/2019 USD 17,000,000 17,349,961 1.85US Treasury 1.375% 28/02/2019 USD 4,700,000 4,784,086 0.51US Treasury 1.5% 28/02/2019 USD 9,200,000 9,393,703 1.00US Treasury 1.625% 31/03/2019 USD 5,900,000 6,045,426 0.64US Treasury 1.625% 30/04/2019 USD 16,000,000 16,402,500 1.75US Treasury 1.5% 31/05/2019 USD 12,130,000 12,397,713 1.32US Treasury 1.625% 30/06/2019 USD 2,500,000 2,565,234 0.27US Treasury 1% 31/08/2019 USD 6,400,000 6,447,000 0.69US Treasury 1.5% 31/10/2019 USD 6,000,000 6,137,344 0.65US Treasury 1% 30/11/2019 USD 2,200,000 2,213,750 0.24US Treasury 1.5% 30/11/2019 USD 6,100,000 6,240,109 0.67US Treasury 1.375% 29/02/2020 USD 13,900,000 14,154,109 1.51US Treasury 1.375% 30/04/2020 USD 3,200,000 3,258,750 0.35US Treasury 1.375% 31/08/2020 USD 2,400,000 2,442,000 0.26US Treasury 2% 30/11/2020 USD 2,400,000 2,506,125 0.27Valero Energy Corp. 9.375% 15/03/2019 USD 215,000 255,662 0.03Ventas Realty LP, REIT 2% 15/02/2018 USD 146,000 146,745 0.02Verizon Communications, Inc. 3.65%14/09/2018 USD 1,070,000 1,125,308 0.12Verizon Communications, Inc. 2.55%17/06/2019 USD 260,000 269,370 0.03Verizon Communications, Inc. 2.625%21/02/2020 USD 250,000 258,689 0.03Verizon Communications, Inc. 4.5%15/09/2020 USD 400,000 443,576 0.05Virginia Electric & Power Co. 1.2%15/01/2018 USD 149,000 149,151 0.02Wachovia Corp. 5.75% 01/02/2018 USD 355,000 379,561 0.04Wal-Mart Stores, Inc. 4.125% 01/02/2019 USD 170,000 183,891 0.02Walt Disney Co. (The) 1.1% 01/12/2017 USD 165,000 165,632 0.02Waste Management, Inc. 2.6%01/09/2016 USD 90,000 90,241 0.01
Waste Management, Inc. 4.75%30/06/2020 USD 120,000 134,515 0.01Wells Fargo & Co. 2.15% 15/01/2019 USD 1,200,000 1,225,776 0.13Wells Fargo & Co. 2.125% 22/04/2019 USD 400,000 408,620 0.04Wells Fargo & Co. 2.6% 22/07/2020 USD 1,205,000 1,242,632 0.13Wells Fargo & Co. 2.55% 07/12/2020 USD 200,000 205,779 0.02Wells Fargo & Co. 2.5% 04/03/2021 USD 600,000 614,943 0.07Wells Fargo & Co. 4.6% 01/04/2021 USD 530,000 592,317 0.06Wells Fargo Bank NA 1.75% 24/05/2019 USD 1,100,000 1,113,492 0.12Welltower, Inc., REIT 4.7% 15/09/2017 USD 130,000 134,802 0.01Welltower, Inc., REIT 2.25% 15/03/2018 USD 270,000 272,857 0.03Welltower, Inc., REIT 6.125% 15/04/2020 USD 110,000 125,254 0.01Western Gas Partners LP 2.6%15/08/2018 USD 210,000 207,745 0.02Wisconsin Electric Power Co. 1.7%15/06/2018 USD 485,000 488,585 0.05Xcel Energy, Inc. 2.4% 15/03/2021 USD 235,000 241,842 0.03Zoetis, Inc. 1.875% 01/02/2018 USD 349,000 350,178 0.04Zoetis, Inc. 3.45% 13/11/2020 USD 60,000 62,420 0.01
624,044,862 66.49
Total Bonds 655,750,113 69.87
Total Transferable securities and money market instrumentsadmitted to an official exchange listing 655,750,113 69.87
Transferable securities and money market instruments dealt in on another regulatedmarket
Bonds
AustraliaCommonwealth Bank of Australia 2.5%20/09/2018 USD 250,000 255,991 0.03Commonwealth Bank of Australia 2.25%13/03/2019 USD 250,000 255,071 0.03Commonwealth Bank of Australia 2.3%12/03/2020 USD 500,000 511,478 0.05Macquarie Bank Ltd., 144A 1.6%27/10/2017 USD 607,000 608,314 0.06Macquarie Bank Ltd., 144A 2.6%24/06/2019 USD 284,000 289,006 0.03Macquarie Group Ltd., 144A 7.625%13/08/2019 USD 400,000 461,966 0.05National Australia Bank Ltd., 144A 3%27/07/2016 USD 100,000 100,174 0.01National Australia Bank Ltd., 144A 2.25%01/07/2019 USD 250,000 254,371 0.03National Australia Bank Ltd. 2%14/01/2019 USD 250,000 253,284 0.03Westpac Banking Corp., FRN, 144A0.933% 16/07/2018 USD 500,000 498,927 0.05
3,488,582 0.37
BermudaBacardi Ltd., 144A 8.2% 01/04/2019 USD 200,000 229,853 0.02
229,853 0.02
CanadaHusky Energy, Inc. 7.25% 15/12/2019 USD 200,000 225,739 0.02
225,739 0.02
Cayman IslandsColony American Finance Ltd., Series2016-1 ‘A’, 144A 2.544% 15/06/2048 USD 478,485 483,577 0.05Hutchison Whampoa International 12 IILtd., 144A 2% 08/11/2017 USD 200,000 201,851 0.02
685,428 0.07
ChinaIndustrial & Commercial Bank of ChinaLtd. 2.351% 13/11/2017 USD 286,000 288,600 0.03
288,600 0.03
FranceBanque Federative du Credit Mutuel SA,144A 1.7% 20/01/2017 USD 400,000 401,004 0.05Banque Federative du Credit Mutuel SA,144A 2% 12/04/2019 USD 200,000 201,944 0.02Electricite de France SA, 144A 1.15%20/01/2017 USD 487,000 487,185 0.05
1,090,133 0.12
241
JPMorgan Funds - US Short Duration Bond FundSchedule of Investments (continued)
As at 30 June 2016
Investments Currency
Quantity/Nominal
Value
MarketValue
USD
%of
NetAssets Investments Currency
Quantity/Nominal
Value
MarketValue
USD
%of
NetAssets
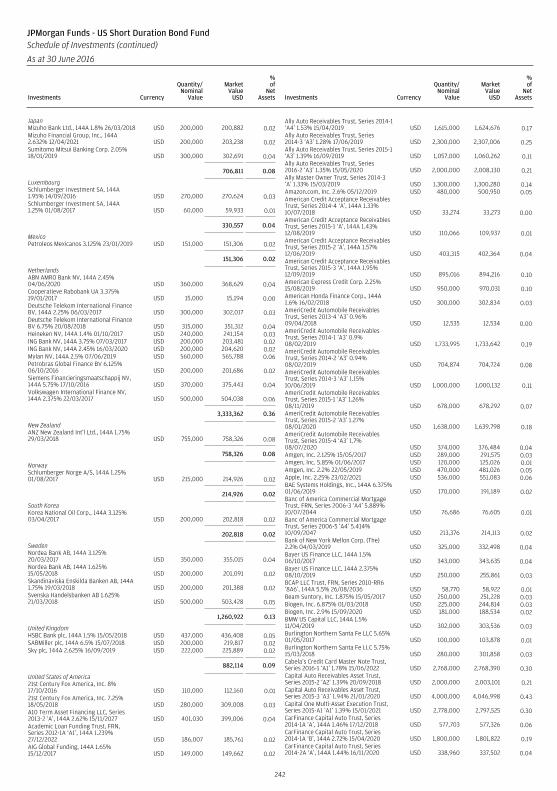
JapanMizuho Bank Ltd., 144A 1.8% 26/03/2018 USD 200,000 200,882 0.02Mizuho Financial Group, Inc., 144A2.632% 12/04/2021 USD 200,000 203,238 0.02Sumitomo Mitsui Banking Corp. 2.05%18/01/2019 USD 300,000 302,691 0.04
706,811 0.08
LuxembourgSchlumberger Investment SA, 144A1.95% 14/09/2016 USD 270,000 270,624 0.03Schlumberger Investment SA, 144A1.25% 01/08/2017 USD 60,000 59,933 0.01
330,557 0.04
MexicoPetroleos Mexicanos 3.125% 23/01/2019 USD 151,000 151,306 0.02
151,306 0.02
NetherlandsABN AMRO Bank NV, 144A 2.45%04/06/2020 USD 360,000 368,629 0.04Cooperatieve Rabobank UA 3.375%19/01/2017 USD 15,000 15,194 0.00Deutsche Telekom International FinanceBV, 144A 2.25% 06/03/2017 USD 300,000 302,017 0.03Deutsche Telekom International FinanceBV 6.75% 20/08/2018 USD 315,000 351,312 0.04Heineken NV, 144A 1.4% 01/10/2017 USD 240,000 241,154 0.03ING Bank NV, 144A 3.75% 07/03/2017 USD 200,000 203,481 0.02ING Bank NV, 144A 2.45% 16/03/2020 USD 200,000 204,620 0.02Mylan NV, 144A 2.5% 07/06/2019 USD 560,000 565,788 0.06Petrobras Global Finance BV 6.125%06/10/2016 USD 200,000 201,686 0.02Siemens Financieringsmaatschappij NV,144A 5.75% 17/10/2016 USD 370,000 375,443 0.04Volkswagen International Finance NV,144A 2.375% 22/03/2017 USD 500,000 504,038 0.06
3,333,362 0.36
New ZealandANZ New Zealand Int’l Ltd., 144A 1.75%29/03/2018 USD 755,000 758,326 0.08
758,326 0.08
NorwaySchlumberger Norge A/S, 144A 1.25%01/08/2017 USD 215,000 214,926 0.02
214,926 0.02
South KoreaKorea National Oil Corp., 144A 3.125%03/04/2017 USD 200,000 202,818 0.02
202,818 0.02
SwedenNordea Bank AB, 144A 3.125%20/03/2017 USD 350,000 355,015 0.04Nordea Bank AB, 144A 1.625%15/05/2018 USD 200,000 201,091 0.02Skandinaviska Enskilda Banken AB, 144A1.75% 19/03/2018 USD 200,000 201,388 0.02Svenska Handelsbanken AB 1.625%21/03/2018 USD 500,000 503,428 0.05
1,260,922 0.13
United KingdomHSBC Bank plc, 144A 1.5% 15/05/2018 USD 437,000 436,408 0.05SABMiller plc, 144A 6.5% 15/07/2018 USD 200,000 219,817 0.02Sky plc, 144A 2.625% 16/09/2019 USD 222,000 225,889 0.02
882,114 0.09
United States of America21st Century Fox America, Inc. 8%17/10/2016 USD 110,000 112,160 0.0121st Century Fox America, Inc. 7.25%18/05/2018 USD 280,000 309,008 0.03A10 Term Asset Financing LLC, Series2013-2 ‘A’, 144A 2.62% 15/11/2027 USD 401,030 399,006 0.04Academic Loan Funding Trust, FRN,Series 2012-1A ‘A1’, 144A 1.239%27/12/2022 USD 186,007 185,761 0.02AIG Global Funding, 144A 1.65%15/12/2017 USD 149,000 149,662 0.02
Ally Auto Receivables Trust, Series 2014-1‘A4’ 1.53% 15/04/2019 USD 1,615,000 1,624,676 0.17Ally Auto Receivables Trust, Series2014-3 ‘A3’ 1.28% 17/06/2019 USD 2,300,000 2,307,006 0.25Ally Auto Receivables Trust, Series 2015-1‘A3’ 1.39% 16/09/2019 USD 1,057,000 1,060,262 0.11Ally Auto Receivables Trust, Series2016-2 ‘A3’ 1.35% 15/05/2020 USD 2,000,000 2,008,130 0.21Ally Master Owner Trust, Series 2014-3‘A’ 1.33% 15/03/2019 USD 1,300,000 1,300,280 0.14Amazon.com, Inc. 2.6% 05/12/2019 USD 480,000 500,950 0.05American Credit Acceptance ReceivablesTrust, Series 2014-4 ‘A’, 144A 1.33%10/07/2018 USD 33,274 33,273 0.00American Credit Acceptance ReceivablesTrust, Series 2015-1 ‘A’, 144A 1.43%12/08/2019 USD 110,066 109,937 0.01American Credit Acceptance ReceivablesTrust, Series 2015-2 ‘A’, 144A 1.57%12/06/2019 USD 403,315 402,364 0.04American Credit Acceptance ReceivablesTrust, Series 2015-3 ‘A’, 144A 1.95%12/09/2019 USD 895,016 894,216 0.10American Express Credit Corp. 2.25%15/08/2019 USD 950,000 970,031 0.10American Honda Finance Corp., 144A1.6% 16/02/2018 USD 300,000 302,834 0.03AmeriCredit Automobile ReceivablesTrust, Series 2013-4 ‘A3’ 0.96%09/04/2018 USD 12,535 12,534 0.00AmeriCredit Automobile ReceivablesTrust, Series 2014-1 ‘A3’ 0.9%08/02/2019 USD 1,733,995 1,733,642 0.19AmeriCredit Automobile ReceivablesTrust, Series 2014-2 ‘A3’ 0.94%08/02/2019 USD 704,874 704,724 0.08AmeriCredit Automobile ReceivablesTrust, Series 2014-3 ‘A3’ 1.15%10/06/2019 USD 1,000,000 1,000,132 0.11AmeriCredit Automobile ReceivablesTrust, Series 2015-1 ‘A3’ 1.26%08/11/2019 USD 678,000 678,292 0.07AmeriCredit Automobile ReceivablesTrust, Series 2015-2 ‘A3’ 1.27%08/01/2020 USD 1,638,000 1,639,798 0.18AmeriCredit Automobile ReceivablesTrust, Series 2015-4 ‘A3’ 1.7%08/07/2020 USD 374,000 376,484 0.04Amgen, Inc. 2.125% 15/05/2017 USD 289,000 291,575 0.03Amgen, Inc. 5.85% 01/06/2017 USD 120,000 125,026 0.01Amgen, Inc. 2.2% 22/05/2019 USD 470,000 481,026 0.05Apple, Inc. 2.25% 23/02/2021 USD 536,000 551,083 0.06BAE Systems Holdings, Inc., 144A 6.375%01/06/2019 USD 170,000 191,189 0.02Banc of America Commercial MortgageTrust, FRN, Series 2006-3 ‘A4’ 5.889%10/07/2044 USD 76,686 76,605 0.01Banc of America Commercial MortgageTrust, Series 2006-5 ‘A4’ 5.414%10/09/2047 USD 213,376 214,113 0.02Bank of New York Mellon Corp. (The)2.2% 04/03/2019 USD 325,000 332,498 0.04Bayer US Finance LLC, 144A 1.5%06/10/2017 USD 343,000 343,635 0.04Bayer US Finance LLC, 144A 2.375%08/10/2019 USD 250,000 255,861 0.03BCAP LLC Trust, FRN, Series 2010-RR6‘8A6’, 144A 5.5% 26/08/2036 USD 58,770 58,922 0.01Beam Suntory, Inc. 1.875% 15/05/2017 USD 250,000 251,228 0.03Biogen, Inc. 6.875% 01/03/2018 USD 225,000 244,814 0.03Biogen, Inc. 2.9% 15/09/2020 USD 181,000 188,534 0.02BMW US Capital LLC, 144A 1.5%11/04/2019 USD 302,000 303,536 0.03Burlington Northern Santa Fe LLC 5.65%01/05/2017 USD 100,000 103,878 0.01Burlington Northern Santa Fe LLC 5.75%15/03/2018 USD 280,000 301,858 0.03Cabela’s Credit Card Master Note Trust,Series 2016-1 ‘A1’ 1.78% 15/06/2022 USD 2,768,000 2,768,390 0.30Capital Auto Receivables Asset Trust,Series 2015-2 ‘A2’ 1.39% 20/09/2018 USD 2,000,000 2,003,101 0.21Capital Auto Receivables Asset Trust,Series 2015-3 ‘A3’ 1.94% 21/01/2020 USD 4,000,000 4,046,998 0.43Capital One Multi-Asset Execution Trust,Series 2015-A1 ‘A1’ 1.39% 15/01/2021 USD 2,778,000 2,797,525 0.30CarFinance Capital Auto Trust, Series2014-1A ‘A’, 144A 1.46% 17/12/2018 USD 577,703 577,326 0.06CarFinance Capital Auto Trust, Series2014-1A ‘B’, 144A 2.72% 15/04/2020 USD 1,800,000 1,801,822 0.19CarFinance Capital Auto Trust, Series2014-2A ‘A’, 144A 1.44% 16/11/2020 USD 338,960 337,502 0.04
242
JPMorgan Funds - US Short Duration Bond FundSchedule of Investments (continued)
As at 30 June 2016
Investments Currency
Quantity/Nominal
Value
MarketValue
USD
%of
NetAssets Investments Currency
Quantity/Nominal
Value
MarketValue
USD
%of
NetAssets

CarFinance Capital Auto Trust, Series2015-1A ‘A’, 144A 1.75% 15/06/2021 USD 208,673 207,832 0.02Cargill, Inc., 144A 1.9% 01/03/2017 USD 210,000 211,404 0.02Cargill, Inc., 144A 6% 27/11/2017 USD 118,000 125,898 0.01CarMax Auto Owner Trust, Series 2013-3‘A3’ 0.97% 16/04/2018 USD 116,959 117,000 0.01CarMax Auto Owner Trust, Series 2014-1‘A3’ 0.79% 15/10/2018 USD 1,319,767 1,317,661 0.14CarMax Auto Owner Trust, Series 2014-4‘A3’ 1.25% 15/11/2019 USD 1,800,000 1,803,456 0.19CarMax Auto Owner Trust, Series 2015-4‘A3’ 1.56% 16/11/2020 USD 3,348,000 3,381,220 0.36Carnow Auto Receivables Trust, Series2015-1A ‘A’, 144A 1.69% 15/01/2020 USD 407,408 406,717 0.04Celgene Corp. 2.125% 15/08/2018 USD 600,000 609,009 0.07Celgene Corp. 2.3% 15/08/2018 USD 79,000 80,450 0.01Chrysler Capital Auto Receivables Trust,Series 2015-BA ‘A3’, 144A 1.91%16/03/2020 USD 1,262,000 1,269,341 0.14CIT Equipment Collateral, Series2014-VT1 ‘A3’, 144A 1.5% 21/10/2019 USD 979,000 979,792 0.10Citi Held For Asset Issuance, Series2015-PM1 ‘A’, 144A 1.85% 15/12/2021 USD 344,214 343,511 0.04Citibank Credit Card Issuance Trust,Series 2007-A8 ‘A8’ 5.65% 20/09/2019 USD 1,115,000 1,178,356 0.13Citibank Credit Card Issuance Trust,Series 2014-A2 ‘A2’ 1.02% 22/02/2019 USD 2,000,000 2,003,015 0.21Citicorp Mortgage Securities Trust, Series2006-1 ‘2A1’ 5% 25/02/2021 USD 7,145 7,364 0.00CNH Equipment Trust, Series 2013-A ‘A3’0.69% 15/06/2018 USD 3,846 3,846 0.00CNH Equipment Trust, Series 2016-B ‘A3’1.63% 15/08/2021 USD 448,000 451,265 0.05COBALT CMBS Commercial MortgageTrust, Series 2006-C1 ‘A4’ 5.223%15/08/2048 USD 238,106 238,842 0.03Comcast Cable Communications LLC8.875% 01/05/2017 USD 25,000 26,612 0.00Comcast Corp. 6.5% 15/01/2017 USD 150,000 154,429 0.02Comcast Corp. 6.3% 15/11/2017 USD 100,000 107,318 0.01Comcast Corp. 5.7% 15/05/2018 USD 80,000 86,875 0.01COMM Mortgage Trust, FRN, Series2014-PAT ‘A’, 144A 1.235% 13/08/2027 USD 594,000 588,500 0.06COMM Mortgage Trust, FRN, Series2014-TWC ‘A’, 144A 1.286% 13/02/2032 USD 1,175,000 1,167,709 0.13Consumer Credit Origination Loan Trust,Series 2015-1 ‘A’, 144A 2.82% 15/03/2021 USD 81,605 81,612 0.01Cox Communications, Inc., 144A 5.875%01/12/2016 USD 185,000 188,207 0.02CPS Auto Receivables Trust, Series2012-B ‘A’, 144A 2.52% 16/09/2019 USD 103,755 104,002 0.01CPS Auto Receivables Trust, Series2013-A ‘A’, 144A 1.31% 15/06/2020 USD 152,731 151,277 0.02CPS Auto Receivables Trust, Series2013-B ‘A’, 144A 1.82% 15/09/2020 USD 507,605 505,691 0.05CPS Auto Receivables Trust, Series2014-D ‘A’, 144A 1.49% 15/04/2019 USD 771,611 770,789 0.08CPS Auto Receivables Trust, Series2015-A ‘A’, 144A 1.53% 15/07/2019 USD 217,648 217,388 0.02CPS Auto Trust, Series 2012-D ‘A’, 144A1.48% 16/03/2020 USD 51,094 50,871 0.01Credit Acceptance Auto Loan Trust,Series 2013-2A ‘A’, 144A 1.5%15/04/2021 USD 189,363 189,433 0.02Credit Acceptance Auto Loan Trust,Series 2014-2A ‘A’, 144A 1.88%15/03/2022 USD 1,594,000 1,597,147 0.17Credit Acceptance Auto Loan Trust,Series 2015-2A ‘A’, 144A 2.4%15/02/2023 USD 605,000 608,835 0.07Daimler Finance North America LLC,144A 1.375% 01/08/2017 USD 150,000 150,410 0.02Daimler Finance North America LLC,144A 1.875% 11/01/2018 USD 150,000 151,554 0.02Daimler Finance North America LLC,144A 2% 03/08/2018 USD 800,000 811,176 0.09Discover Card Execution Note Trust,Series 2015-A2 ‘A’ 1.9% 17/10/2022 USD 2,000,000 2,047,416 0.22Drive Auto Receivables Trust, Series2015-AA ‘A3’, 144A 1.43% 16/07/2018 USD 313,541 313,542 0.03Drive Auto Receivables Trust, Series2015-DA ‘A3’, 144A 1.59% 17/12/2018 USD 353,000 353,219 0.04Drive Auto Receivables Trust, Series2016-AA ‘A3’, 144A 2.11% 15/05/2019 USD 1,300,000 1,305,379 0.14Drive Auto Receivables Trust, Series2016-BA ‘A3’, 144A 1.67% 15/07/2019 USD 212,000 212,200 0.02DT Auto Owner Trust, Series 2015-3A ‘A’,144A 1.66% 15/03/2019 USD 492,868 493,463 0.05DT Auto Owner Trust, Series 2016-2A ‘A’,144A 1.73% 15/08/2019 USD 393,473 393,549 0.04
DT Auto Owner Trust, Series 2016-3A ‘A’,144A 1.75% 15/11/2019 USD 3,000,000 2,999,602 0.32eBay, Inc. 2.2% 01/08/2019 USD 104,000 105,584 0.01ERAC USA Finance LLC, 144A 6.2%01/11/2016 USD 300,000 305,052 0.03ERAC USA Finance LLC, 144A 6.375%15/10/2017 USD 350,000 371,033 0.04Exeter Automobile Receivables Trust,Series 2014-3A ‘A’, 144A 1.32%15/01/2019 USD 595,299 594,435 0.06Exeter Automobile Receivables Trust,Series 2015-1A ‘A’, 144A 1.6%17/06/2019 USD 546,369 546,734 0.06Exeter Automobile Receivables Trust,Series 2015-2A ‘A’, 144A 1.54%15/11/2019 USD 336,508 335,719 0.04Express Scripts Holding Co. 2.25%15/06/2019 USD 150,000 152,381 0.02Express Scripts, Inc. 7.25% 15/06/2019 USD 120,000 138,333 0.02FHLB 0.75% 28/08/2017 USD 1,600,000 1,602,856 0.17FHLB 0.875% 29/06/2018 USD 2,625,000 2,634,135 0.28FHLB 1.125% 21/06/2019 USD 3,000,000 3,026,910 0.32FHLB, Series YP-2017 ‘1’ 5.25%15/06/2017 USD 309,207 320,256 0.03FHLMC 1% 08/03/2017 USD 1,215,000 1,218,530 0.13FHLMC C01428 5.5% 01/11/2032 USD 344,626 389,794 0.04FHLMC D98357 4.5% 01/05/2030 USD 874,940 955,233 0.10FHLMC G01665 5.5% 01/03/2034 USD 250,533 284,213 0.03FHLMC G01770 5.5% 01/01/2035 USD 529,558 598,995 0.06FHLMC G03073 5.5% 01/07/2037 USD 132,207 149,474 0.02FHLMC G04510 5% 01/02/2036 USD 193,629 215,409 0.02FHLMC G08046 5.5% 01/03/2035 USD 90,378 102,241 0.01FHLMC G11977 6% 01/05/2021 USD 15,403 16,637 0.00FHLMC G12365 6.5% 01/09/2021 USD 660,227 715,701 0.08FHLMC G12654 5% 01/05/2022 USD 21,843 23,395 0.00FHLMC G12880 5% 01/01/2021 USD 70,135 72,087 0.01FHLMC G13043 5.5% 01/02/2023 USD 262,910 287,729 0.03FHLMC G13301 5.5% 01/10/2023 USD 215,437 234,546 0.03FHLMC J06627 6% 01/12/2022 USD 91,843 98,820 0.01FHLMC J09926 4.5% 01/06/2024 USD 518,261 556,384 0.06FHLMC J14494 4% 01/02/2026 USD 709,503 756,945 0.08FHLMC J15974 4% 01/06/2026 USD 245,898 259,971 0.03FHLMC N31311 5.5% 01/08/2036 USD 15,418 17,018 0.00FHLMC REMIC, Series 1608 ‘L’ 6.5%15/09/2023 USD 169,093 194,326 0.02FHLMC REMIC, Series 1680 ‘PK’ 6.5%15/02/2024 USD 135,570 155,800 0.02FHLMC REMIC, Series 1966 ‘PC’ 4.5%15/06/2027 USD 436,232 457,821 0.05FHLMC REMIC, Series 2522 ‘GD’ 5.5%15/11/2017 USD 6,636 6,799 0.00FHLMC REMIC, Series 2574 ‘PE’ 5.5%15/02/2033 USD 291,676 329,363 0.04FHLMC REMIC, Series 2594 ‘PW’ 3.75%15/03/2032 USD 42,921 45,255 0.01FHLMC REMIC, Series 2613 ‘H’ 4.5%15/05/2018 USD 17,339 17,793 0.00FHLMC REMIC, Series 2627 ‘LY’ 4.5%15/06/2018 USD 298,971 305,884 0.03FHLMC REMIC, Series 2629 ‘AD’ 4.5%15/06/2018 USD 96,720 98,963 0.01FHLMC REMIC, Series 2761 ‘CB’ 4%15/03/2019 USD 4,184 4,298 0.00FHLMC REMIC, Series 2835 ‘HB’ 5.5%15/08/2024 USD 60,199 65,734 0.01FHLMC REMIC, Series 2843 ‘BC’ 5%15/08/2019 USD 273,347 282,898 0.03FHLMC REMIC, Series 2854 ‘AK’ 4%15/09/2019 USD 5,898 6,084 0.00FHLMC REMIC, Series 2862 ‘GB’ 5%15/09/2024 USD 110,525 119,342 0.01FHLMC REMIC, Series 2886 ‘BE’ 4.5%15/11/2019 USD 50,962 52,607 0.01FHLMC REMIC, Series 2976 ‘HZ’ 4.5%15/05/2035 USD 639,124 688,837 0.07FHLMC REMIC, Series 2988 ‘TY’ 5.5%15/06/2025 USD 92,585 102,710 0.01FHLMC REMIC, Series 3005 ‘ED’ 5%15/07/2025 USD 353,391 384,628 0.04FHLMC REMIC, Series 3028 ‘PG’ 5.5%15/09/2035 USD 23,396 26,687 0.00FHLMC REMIC, Series 3035 ‘PA’ 5.5%15/09/2035 USD 52,941 59,563 0.01FHLMC REMIC, Series 3209 ‘EG’ 4.5%15/08/2020 USD 43,496 44,835 0.01FHLMC REMIC, Series 3439 ‘CY’ 4.5%15/04/2023 USD 493,206 504,844 0.05FHLMC REMIC, Series 3536 ‘PC’ 4.5%15/05/2039 USD 2,324 2,443 0.00
243
JPMorgan Funds - US Short Duration Bond FundSchedule of Investments (continued)
As at 30 June 2016
Investments Currency
Quantity/Nominal
Value
MarketValue
USD
%of
NetAssets Investments Currency
Quantity/Nominal
Value
MarketValue
USD
%of
NetAssets

FHLMC REMIC, Series 3567 ‘ND’ 4%15/12/2017 USD 97,662 99,234 0.01FHLMC REMIC, Series 3578 ‘VZ’ 5.5%15/08/2036 USD 614,855 697,250 0.07FHLMC REMIC, Series 3652 ‘AP’ 4.5%15/03/2040 USD 282,211 309,609 0.03FHLMC REMIC, Series 3674 ‘HJ’ 5.5%15/04/2040 USD 696,016 788,061 0.08FHLMC REMIC, Series 3835 ‘DA’ 5%15/04/2036 USD 104,005 104,930 0.01FHLMC REMIC, Series 3855 ‘AM’ 6.5%15/11/2036 USD 187,543 210,005 0.02FHLMC REMIC, Series 4088 ‘LE’ 4%15/10/2040 USD 1,974,549 2,072,179 0.22FHLMC REMIC, Series 4165 ‘JM’ 3.5%15/09/2041 USD 1,198,450 1,287,067 0.14FHLMC REMIC, Series 4229 ‘MA’ 3.5%15/05/2041 USD 2,815,312 3,026,965 0.32FHLMC REMIC, Series 4247 ‘AK’ 4.5%15/12/2042 USD 2,607,575 2,855,721 0.30FHLMC REMIC, Series 4305 ‘A’ 3.5%15/06/2048 USD 2,259,139 2,380,651 0.25FHLMC REMIC, Series 4305 ‘KA’ 3%15/03/2038 USD 1,264,723 1,299,579 0.14FHLMC REMIC, Series 3416 ‘BJ’ 3416 4%15/02/2023 USD 15,983 16,718 0.00Fifth Third Auto Trust, Series 2014-3 ‘A3’0.96% 15/03/2019 USD 766,591 766,659 0.08Fifth Third Auto Trust, Series 2015-1 ‘A3’1.42% 16/03/2020 USD 1,988,000 1,996,455 0.21Fifth Third Bancorp 2.875% 27/07/2020 USD 484,000 503,045 0.05Fifth Third Bank 2.375% 25/04/2019 USD 400,000 408,906 0.04First Investors Auto Owner Trust, Series2014-3A ‘A2’, 144A 1.06% 15/11/2018 USD 101,274 101,267 0.01Flagship Credit Auto Trust, Series 2014-2‘A’, 144A 1.43% 16/12/2019 USD 1,142,201 1,137,022 0.12Flagship Credit Auto Trust, Series 2015-1‘A’, 144A 1.63% 15/06/2020 USD 428,942 426,924 0.05Flagship Credit Auto Trust, Series 2015-3‘A’, 144A 2.38% 15/10/2020 USD 2,508,119 2,512,993 0.27Flagship Credit Auto Trust, Series 2016-2‘A1’, 144A 2.28% 15/05/2020 USD 432,941 433,310 0.05FNMA 1.125% 27/04/2017 USD 1,720,000 1,727,551 0.18FNMA 254548 5.5% 01/12/2032 USD 118,921 134,894 0.01FNMA 254766 5% 01/06/2033 USD 18,949 21,162 0.00FNMA 255813 5% 01/08/2035 USD 15,731 17,498 0.00FNMA 256101 5.5% 01/02/2036 USD 71,106 79,968 0.01FNMA 256275 6% 01/06/2026 USD 6,625 7,572 0.00FNMA 257003 5.5% 01/12/2037 USD 47,606 53,632 0.01FNMA 465468 3.33% 01/07/2020 USD 412,136 431,306 0.05FNMA 469711 2.59% 01/12/2018 USD 1,187,477 1,228,644 0.13FNMA 555458 5.5% 01/05/2033 USD 179,812 208,118 0.02FNMA 730231 5.5% 01/08/2023 USD 3,016 3,386 0.00FNMA 745275 5% 01/02/2036 USD 276,648 308,042 0.03FNMA 745398 6% 01/06/2035 USD 248,970 289,156 0.03FNMA 745431 5% 01/07/2020 USD 106,147 111,374 0.01FNMA 745748 5.5% 01/07/2036 USD 207,637 234,369 0.03FNMA 780914 5% 01/06/2034 USD 21,711 24,098 0.00FNMA 826305 5% 01/07/2035 USD 35,835 39,909 0.00FNMA 848647 5.5% 01/01/2036 USD 63,145 71,400 0.01FNMA 889009 5% 01/01/2023 USD 198,126 207,369 0.02FNMA 889318 5.5% 01/07/2020 USD 12,875 13,411 0.00FNMA 890170 4.5% 01/09/2019 USD 14,774 15,173 0.00FNMA 975364 4.5% 01/06/2023 USD 9,866 10,249 0.00FNMA 995428 5.5% 01/11/2023 USD 30,390 32,698 0.00FNMA 995838 5.5% 01/05/2039 USD 54,484 61,322 0.01FNMA AC3237 5% 01/10/2039 USD 904,494 1,017,858 0.11FNMA AD0672 4.5% 01/01/2020 USD 69,407 71,287 0.01FNMA AI3059 5% 01/05/2041 USD 806,829 907,046 0.10FNMA AL0229 5.5% 01/09/2023 USD 8,235 8,812 0.00FNMA AL4465 3% 01/07/2028 USD 1,282,576 1,352,613 0.14FNMA MA0465 4.5% 01/06/2020 USD 97,846 100,700 0.01FNMA MA0816 4.5% 01/08/2031 USD 443,687 488,332 0.05FNMA REMIC, FRN, Series 2009-41 ‘WA’6.58% 25/06/2039 USD 13,962 16,541 0.00FNMA REMIC, Series 1990-9 ‘E’ 8.5%25/01/2020 USD 9,587 10,104 0.00FNMA REMIC, Series 1993-119 ‘H’ 6.5%25/07/2023 USD 5,936 6,588 0.00FNMA REMIC, Series 1997-81 ‘PD’ 6.35%18/12/2027 USD 11,041 12,254 0.00FNMA REMIC, Series 2001-60 ‘GK’ 6%25/11/2031 USD 31,946 35,749 0.00FNMA REMIC, Series 2001-81 ‘HE’ 6.5%25/01/2032 USD 166,092 193,489 0.02FNMA REMIC, Series 2002-63 ‘NB’ 5.5%25/10/2032 USD 11,351 12,821 0.00FNMA REMIC, Series 2002-64 ‘PG’ 5.5%25/10/2032 USD 213,615 242,883 0.03
FNMA REMIC, Series 2002-67 ‘PE’ 5.5%25/11/2032 USD 11,025 12,372 0.00FNMA REMIC, Series 2003-117 ‘KJ’ 3.75%25/08/2033 USD 9,790 9,958 0.00FNMA REMIC, Series 2003-41 ‘OA’ 4%25/05/2033 USD 19,996 21,189 0.00FNMA REMIC, Series 2003-94 ‘CE’ 5%25/10/2033 USD 8,924 9,739 0.00FNMA REMIC, Series 2004-70 ‘EB’ 5%25/10/2024 USD 34,071 37,008 0.00FNMA REMIC, Series 2005-110 ‘MB’ 5.5%25/09/2035 USD 15,974 17,063 0.00FNMA REMIC, Series 2005-14 ‘PE’ 5%25/12/2033 USD 10,849 10,959 0.00FNMA REMIC, Series 2005-29 ‘AT’ 4.5%25/04/2035 USD 1,116 1,160 0.00FNMA REMIC, Series 2005-29 ‘WC’ 4.75%25/04/2035 USD 12,606 14,006 0.00FNMA REMIC, Series 2005-5 ‘PA’ 5%25/01/2035 USD 316,266 350,116 0.04FNMA REMIC, Series 2005-64 ‘PL’ 5.5%25/07/2035 USD 403,111 458,176 0.05FNMA REMIC, Series 2005-68 ‘BC’ 5.25%25/06/2035 USD 281,709 300,161 0.03FNMA REMIC, Series 2005-68 ‘PG’ 5.5%25/08/2035 USD 200,956 228,920 0.02FNMA REMIC, Series 2006-77 ‘PC’ 6.5%25/08/2036 USD 29,265 34,064 0.00FNMA REMIC, Series 2007-75 ‘BZ’ 5%25/08/2037 USD 1,066,834 1,167,180 0.12FNMA REMIC, Series 2008-17 ‘PA’ 4.5%25/10/2037 USD 9,875 10,625 0.00FNMA REMIC, Series 2008-93 ‘AM’ 5.5%25/06/2037 USD 167,052 177,968 0.02FNMA REMIC, Series 2009-15 ‘AC’ 5.5%25/03/2029 USD 111,887 125,637 0.01FNMA REMIC, Series 2009-47 ‘PA’ 4.5%25/07/2039 USD 15,457 16,328 0.00FNMA REMIC, Series 2009-62 ‘HJ’ 6%25/05/2039 USD 25,739 28,848 0.00FNMA REMIC, Series 2009-71 ‘JT’ 6%25/06/2036 USD 430,241 489,010 0.05FNMA REMIC, Series 2009-77 ‘ND’ 4%25/04/2039 USD 87,877 89,546 0.01FNMA REMIC, IO, Series 2010-126 ‘LI’ 4%25/11/2040 USD 370,349 24,575 0.00FNMA REMIC, Series 2010-150 ‘PG’ 4.5%25/10/2040 USD 516,297 570,777 0.06FNMA REMIC, Series 2011-42 ‘DE’ 3.25%25/11/2028 USD 311,836 315,871 0.03FNMA REMIC, Series 2011-57 ‘EC’ 3.5%25/07/2026 USD 779,965 825,251 0.09FNMA REMIC, Series 2012-120 ‘AH’ 2.5%25/02/2032 USD 1,697,400 1,749,755 0.19FNMA REMIC, Series 2013-1 ‘BA’ 3%25/02/2040 USD 2,336,969 2,442,385 0.26FNMA REMIC, Series 2013-55 ‘BA’ 3%25/06/2037 USD 2,315,695 2,405,513 0.26FNMA REMIC, Series 2013-83 ‘CA’ 3.5%25/10/2037 USD 867,579 913,068 0.10FNMA REMIC, Series 2013-9 ‘CB’ 5.5%25/04/2042 USD 692,291 776,571 0.08FNMA REMIC, Series 2013-90 ‘DK’ 3.5%25/12/2031 USD 2,468,846 2,615,930 0.28FNMA REMIC, Series 2013-92 ‘A’ 3.5%25/12/2038 USD 2,248,570 2,362,252 0.25FNMA REMIC, Series 2013-96 ‘CA’ 4%25/04/2041 USD 2,285,831 2,440,489 0.26FNMA REMIC, Series 2015-76 ‘BZ’ 4%25/10/2039 USD 631,320 634,093 0.07FNMA REMIC, Series 2003-92 ‘PE’200392 4.5% 25/09/2018 USD 8,225 8,439 0.00FNMA REMIC, Series 2013-96 ‘YA’AO2398 3.5% 25/09/2038 USD 2,475,065 2,631,810 0.28FNMA-Aces, Series 2011-M2 ‘A1’ 2.019%25/04/2021 USD 18,221 18,397 0.00Ford Credit Auto Owner Trust, Series2014-C ‘A3’ 1.06% 15/05/2019 USD 1,478,749 1,479,734 0.16Ford Credit Auto Owner Trust, Series2015-A ‘A3’ 1.28% 15/09/2019 USD 785,000 788,237 0.08Ford Credit Auto Owner Trust, Series2015-C ‘A3’ 1.41% 15/02/2020 USD 1,170,000 1,177,225 0.13Ford Credit Auto Owner Trust, Series2016-B ‘A3’ 1.33% 15/10/2020 USD 303,000 304,583 0.03Forest Laboratories LLC, 144A 4.375%01/02/2019 USD 365,000 385,553 0.04Gilead Sciences, Inc. 3.05% 01/12/2016 USD 125,000 126,112 0.01Gilead Sciences, Inc. 2.05% 01/04/2019 USD 136,000 139,140 0.02GLS Auto Receivables Trust, Series2016-1A ‘A’, 144A 2.73% 15/10/2020 USD 1,912,124 1,912,512 0.20
244
JPMorgan Funds - US Short Duration Bond FundSchedule of Investments (continued)
As at 30 June 2016
Investments Currency
Quantity/Nominal
Value
MarketValue
USD
%of
NetAssets Investments Currency
Quantity/Nominal
Value
MarketValue
USD
%of
NetAssets
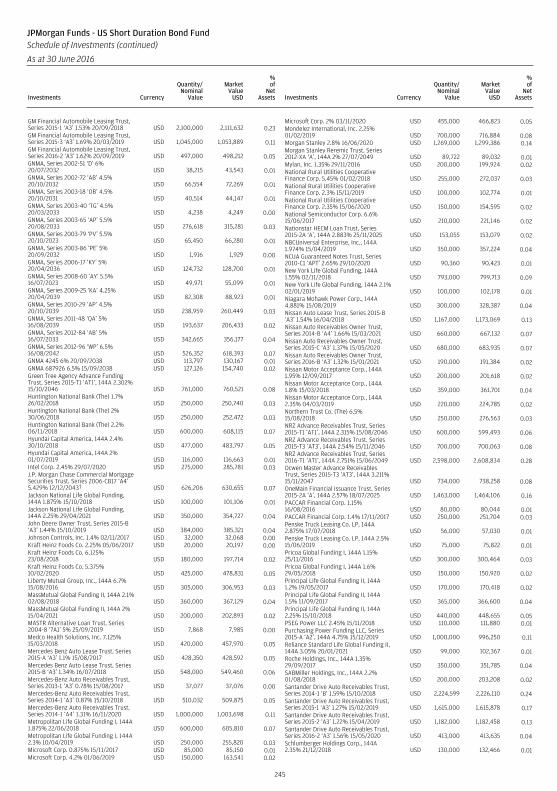
GM Financial Automobile Leasing Trust,Series 2015-1 ‘A3’ 1.53% 20/09/2018 USD 2,100,000 2,111,632 0.23GM Financial Automobile Leasing Trust,Series 2015-3 ‘A3’ 1.69% 20/03/2019 USD 1,045,000 1,053,889 0.11GM Financial Automobile Leasing Trust,Series 2016-2 ‘A3’ 1.62% 20/09/2019 USD 497,000 498,212 0.05GNMA, Series 2002-51 ‘D’ 6%20/07/2032 USD 38,215 43,543 0.01GNMA, Series 2002-72 ‘AB’ 4.5%20/10/2032 USD 66,554 72,269 0.01GNMA, Series 2003-18 ‘OB’ 4.5%20/10/2031 USD 40,514 44,147 0.01GNMA, Series 2003-40 ‘TG’ 4.5%20/03/2033 USD 4,238 4,249 0.00GNMA, Series 2003-65 ‘AP’ 5.5%20/08/2033 USD 276,618 315,281 0.03GNMA, Series 2003-79 ‘PV’ 5.5%20/10/2023 USD 65,450 66,280 0.01GNMA, Series 2003-86 ‘PE’ 5%20/09/2032 USD 1,916 1,929 0.00GNMA, Series 2006-17 ‘KY’ 5%20/04/2036 USD 124,732 128,700 0.01GNMA, Series 2008-60 ‘AY’ 5.5%16/07/2023 USD 49,971 55,099 0.01GNMA, Series 2009-25 ‘KA’ 4.25%20/04/2039 USD 82,308 88,923 0.01GNMA, Series 2010-29 ‘AP’ 4.5%20/10/2039 USD 238,959 260,449 0.03GNMA, Series 2011-48 ‘QA’ 5%16/08/2039 USD 193,637 206,433 0.02GNMA, Series 2012-84 ‘AB’ 5%16/07/2033 USD 342,665 356,177 0.04GNMA, Series 2012-96 ‘WP’ 6.5%16/08/2042 USD 526,352 618,393 0.07GNMA 4245 6% 20/09/2038 USD 113,797 130,167 0.01GNMA 687926 6.5% 15/09/2038 USD 127,126 154,740 0.02Green Tree Agency Advance FundingTrust, Series 2015-T1 ‘AT1’, 144A 2.302%15/10/2046 USD 761,000 760,521 0.08Huntington National Bank (The) 1.7%26/02/2018 USD 250,000 250,740 0.03Huntington National Bank (The) 2%30/06/2018 USD 250,000 252,472 0.03Huntington National Bank (The) 2.2%06/11/2018 USD 600,000 608,115 0.07Hyundai Capital America, 144A 2.4%30/10/2018 USD 477,000 483,797 0.05Hyundai Capital America, 144A 2%01/07/2019 USD 116,000 116,663 0.01Intel Corp. 2.45% 29/07/2020 USD 275,000 285,781 0.03J.P. Morgan Chase Commercial MortgageSecurities Trust, Series 2006-CB17 ‘A4’5.429% 12/12/2043† USD 626,206 630,655 0.07Jackson National Life Global Funding,144A 1.875% 15/10/2018 USD 100,000 101,106 0.01Jackson National Life Global Funding,144A 2.25% 29/04/2021 USD 350,000 354,727 0.04John Deere Owner Trust, Series 2015-B‘A3’ 1.44% 15/10/2019 USD 384,000 385,321 0.04Johnson Controls, Inc. 1.4% 02/11/2017 USD 32,000 32,068 0.00Kraft Heinz Foods Co. 2.25% 05/06/2017 USD 20,000 20,197 0.00Kraft Heinz Foods Co. 6.125%23/08/2018 USD 180,000 197,714 0.02Kraft Heinz Foods Co. 5.375%10/02/2020 USD 425,000 478,831 0.05Liberty Mutual Group, Inc., 144A 6.7%15/08/2016 USD 305,000 306,953 0.03MassMutual Global Funding II, 144A 2.1%02/08/2018 USD 360,000 367,129 0.04MassMutual Global Funding II, 144A 2%15/04/2021 USD 200,000 202,893 0.02MASTR Alternative Loan Trust, Series2004-8 ‘7A1’ 5% 25/09/2019 USD 7,868 7,985 0.00Medco Health Solutions, Inc. 7.125%15/03/2018 USD 420,000 457,970 0.05Mercedes Benz Auto Lease Trust, Series2015-A ‘A3’ 1.1% 15/08/2017 USD 428,350 428,592 0.05Mercedes Benz Auto Lease Trust, Series2015-B ‘A3’ 1.34% 16/07/2018 USD 548,000 549,460 0.06Mercedes-Benz Auto Receivables Trust,Series 2013-1 ‘A3’ 0.78% 15/08/2017 USD 37,077 37,076 0.00Mercedes-Benz Auto Receivables Trust,Series 2014-1 ‘A3’ 0.87% 15/10/2018 USD 510,032 509,875 0.05Mercedes-Benz Auto Receivables Trust,Series 2014-1 ‘A4’ 1.31% 16/11/2020 USD 1,000,000 1,003,698 0.11Metropolitan Life Global Funding I, 144A1.875% 22/06/2018 USD 600,000 605,810 0.07Metropolitan Life Global Funding I, 144A2.3% 10/04/2019 USD 250,000 255,820 0.03Microsoft Corp. 0.875% 15/11/2017 USD 85,000 85,150 0.01Microsoft Corp. 4.2% 01/06/2019 USD 150,000 163,541 0.02
Microsoft Corp. 2% 03/11/2020 USD 455,000 466,823 0.05Mondelez International, Inc. 2.25%01/02/2019 USD 700,000 716,884 0.08Morgan Stanley 2.8% 16/06/2020 USD 1,269,000 1,299,386 0.14Morgan Stanley Reremic Trust, Series2012-XA ‘A’, 144A 2% 27/07/2049 USD 89,722 89,032 0.01Mylan, Inc. 1.35% 29/11/2016 USD 200,000 199,924 0.02National Rural Utilities CooperativeFinance Corp. 5.45% 01/02/2018 USD 255,000 272,037 0.03National Rural Utilities CooperativeFinance Corp. 2.3% 15/11/2019 USD 100,000 102,774 0.01National Rural Utilities CooperativeFinance Corp. 2.35% 15/06/2020 USD 150,000 154,595 0.02National Semiconductor Corp. 6.6%15/06/2017 USD 210,000 221,146 0.02Nationstar HECM Loan Trust, Series2015-2A ‘A’, 144A 2.883% 25/11/2025 USD 153,055 153,079 0.02NBCUniversal Enterprise, Inc., 144A1.974% 15/04/2019 USD 350,000 357,224 0.04NCUA Guaranteed Notes Trust, Series2010-C1 ‘APT’ 2.65% 29/10/2020 USD 90,360 90,423 0.01New York Life Global Funding, 144A1.55% 02/11/2018 USD 793,000 799,713 0.09New York Life Global Funding, 144A 2.1%02/01/2019 USD 100,000 102,178 0.01Niagara Mohawk Power Corp., 144A4.881% 15/08/2019 USD 300,000 328,387 0.04Nissan Auto Lease Trust, Series 2015-B‘A3’ 1.54% 16/04/2018 USD 1,167,000 1,173,069 0.13Nissan Auto Receivables Owner Trust,Series 2014-B ‘A4’ 1.66% 15/03/2021 USD 660,000 667,132 0.07Nissan Auto Receivables Owner Trust,Series 2015-C ‘A3’ 1.37% 15/05/2020 USD 680,000 683,935 0.07Nissan Auto Receivables Owner Trust,Series 2016-B ‘A3’ 1.32% 15/01/2021 USD 190,000 191,384 0.02Nissan Motor Acceptance Corp., 144A1.95% 12/09/2017 USD 200,000 201,618 0.02Nissan Motor Acceptance Corp., 144A1.8% 15/03/2018 USD 359,000 361,701 0.04Nissan Motor Acceptance Corp., 144A2.35% 04/03/2019 USD 220,000 224,785 0.02Northern Trust Co. (The) 6.5%15/08/2018 USD 250,000 276,563 0.03NRZ Advance Receivables Trust, Series2015-T1 ‘AT1’, 144A 2.315% 15/08/2046 USD 600,000 599,493 0.06NRZ Advance Receivables Trust, Series2015-T3 ‘AT3’, 144A 2.54% 15/11/2046 USD 700,000 700,063 0.08NRZ Advance Receivables Trust, Series2016-T1 ‘AT1’, 144A 2.751% 15/06/2049 USD 2,598,000 2,608,834 0.28Ocwen Master Advance ReceivablesTrust, Series 2015-T3 ‘AT3’, 144A 3.211%15/11/2047 USD 734,000 738,258 0.08OneMain Financial Issuance Trust, Series2015-2A ‘A’, 144A 2.57% 18/07/2025 USD 1,463,000 1,464,106 0.16PACCAR Financial Corp. 1.15%16/08/2016 USD 80,000 80,044 0.01PACCAR Financial Corp. 1.4% 17/11/2017 USD 250,000 251,704 0.03Penske Truck Leasing Co. LP, 144A2.875% 17/07/2018 USD 56,000 57,030 0.01Penske Truck Leasing Co. LP, 144A 2.5%15/06/2019 USD 75,000 75,822 0.01Pricoa Global Funding I, 144A 1.15%25/11/2016 USD 300,000 300,464 0.03Pricoa Global Funding I, 144A 1.6%29/05/2018 USD 150,000 150,920 0.02Principal Life Global Funding II, 144A1.2% 19/05/2017 USD 170,000 170,418 0.02Principal Life Global Funding II, 144A1.5% 11/09/2017 USD 365,000 366,600 0.04Principal Life Global Funding II, 144A2.25% 15/10/2018 USD 440,000 448,655 0.05PSEG Power LLC 2.45% 15/11/2018 USD 110,000 111,880 0.01Purchasing Power Funding LLC, Series2015-A ‘A2’, 144A 4.75% 15/12/2019 USD 1,000,000 996,250 0.11Reliance Standard Life Global Funding II,144A 3.05% 20/01/2021 USD 99,000 102,367 0.01Roche Holdings, Inc., 144A 1.35%29/09/2017 USD 350,000 351,785 0.04SABMiller Holdings, Inc., 144A 2.2%01/08/2018 USD 200,000 203,208 0.02Santander Drive Auto Receivables Trust,Series 2014-1 ‘B’ 1.59% 15/10/2018 USD 2,224,599 2,226,110 0.24Santander Drive Auto Receivables Trust,Series 2015-1 ‘A3’ 1.27% 15/02/2019 USD 1,615,000 1,615,878 0.17Santander Drive Auto Receivables Trust,Series 2015-2 ‘A3’ 1.22% 15/04/2019 USD 1,182,000 1,182,458 0.13Santander Drive Auto Receivables Trust,Series 2016-2 ‘A3’ 1.56% 15/05/2020 USD 413,000 413,635 0.04Schlumberger Holdings Corp., 144A2.35% 21/12/2018 USD 130,000 132,466 0.01
245
JPMorgan Funds - US Short Duration Bond FundSchedule of Investments (continued)
As at 30 June 2016
Investments Currency
Quantity/Nominal
Value
MarketValue
USD
%of
NetAssets Investments Currency
Quantity/Nominal
Value
MarketValue
USD
%of
NetAssets
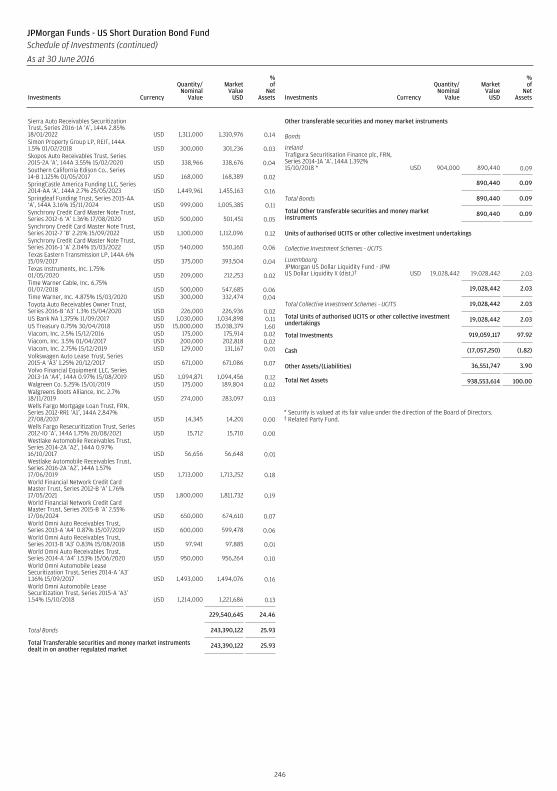
Sierra Auto Receivables SecuritizationTrust, Series 2016-1A ‘A’, 144A 2.85%18/01/2022 USD 1,311,000 1,310,976 0.14Simon Property Group LP, REIT, 144A1.5% 01/02/2018 USD 300,000 301,236 0.03Skopos Auto Receivables Trust, Series2015-2A ‘A’, 144A 3.55% 15/02/2020 USD 338,966 338,676 0.04Southern California Edison Co., Series14-B 1.125% 01/05/2017 USD 168,000 168,389 0.02SpringCastle America Funding LLC, Series2014-AA ‘A’, 144A 2.7% 25/05/2023 USD 1,449,961 1,455,163 0.16Springleaf Funding Trust, Series 2015-AA‘A’, 144A 3.16% 15/11/2024 USD 999,000 1,005,385 0.11Synchrony Credit Card Master Note Trust,Series 2012-6 ‘A’ 1.36% 17/08/2020 USD 500,000 501,451 0.05Synchrony Credit Card Master Note Trust,Series 2012-7 ‘B’ 2.21% 15/09/2022 USD 1,100,000 1,112,096 0.12Synchrony Credit Card Master Note Trust,Series 2016-1 ‘A’ 2.04% 15/03/2022 USD 540,000 550,160 0.06Texas Eastern Transmission LP, 144A 6%15/09/2017 USD 375,000 393,504 0.04Texas Instruments, Inc. 1.75%01/05/2020 USD 209,000 212,253 0.02Time Warner Cable, Inc. 6.75%01/07/2018 USD 500,000 547,685 0.06Time Warner, Inc. 4.875% 15/03/2020 USD 300,000 332,474 0.04Toyota Auto Receivables Owner Trust,Series 2016-B ‘A3’ 1.3% 15/04/2020 USD 226,000 226,936 0.02US Bank NA 1.375% 11/09/2017 USD 1,030,000 1,034,898 0.11US Treasury 0.75% 30/04/2018 USD 15,000,000 15,038,379 1.60Viacom, Inc. 2.5% 15/12/2016 USD 175,000 175,914 0.02Viacom, Inc. 3.5% 01/04/2017 USD 200,000 202,818 0.02Viacom, Inc. 2.75% 15/12/2019 USD 129,000 131,167 0.01Volkswagen Auto Lease Trust, Series2015-A ‘A3’ 1.25% 20/12/2017 USD 671,000 671,086 0.07Volvo Financial Equipment LLC, Series2013-1A ‘A4’, 144A 0.97% 15/08/2019 USD 1,094,871 1,094,456 0.12Walgreen Co. 5.25% 15/01/2019 USD 175,000 189,804 0.02Walgreens Boots Alliance, Inc. 2.7%18/11/2019 USD 274,000 283,097 0.03Wells Fargo Mortgage Loan Trust, FRN,Series 2012-RR1 ‘A1’, 144A 2.847%27/08/2037 USD 14,345 14,201 0.00Wells Fargo Resecuritization Trust, Series2012-IO ‘A’, 144A 1.75% 20/08/2021 USD 15,712 15,710 0.00Westlake Automobile Receivables Trust,Series 2014-2A ‘A2’, 144A 0.97%16/10/2017 USD 56,656 56,648 0.01Westlake Automobile Receivables Trust,Series 2016-2A ‘A2’, 144A 1.57%17/06/2019 USD 1,713,000 1,713,252 0.18World Financial Network Credit CardMaster Trust, Series 2012-B ‘A’ 1.76%17/05/2021 USD 1,800,000 1,811,732 0.19World Financial Network Credit CardMaster Trust, Series 2015-B ‘A’ 2.55%17/06/2024 USD 650,000 674,610 0.07World Omni Auto Receivables Trust,Series 2013-A ‘A4’ 0.87% 15/07/2019 USD 600,000 599,478 0.06World Omni Auto Receivables Trust,Series 2013-B ‘A3’ 0.83% 15/08/2018 USD 97,941 97,885 0.01World Omni Auto Receivables Trust,Series 2014-A ‘A4’ 1.53% 15/06/2020 USD 950,000 956,264 0.10World Omni Automobile LeaseSecuritization Trust, Series 2014-A ‘A3’1.16% 15/09/2017 USD 1,493,000 1,494,076 0.16World Omni Automobile LeaseSecuritization Trust, Series 2015-A ‘A3’1.54% 15/10/2018 USD 1,214,000 1,221,686 0.13
229,540,645 24.46
Total Bonds 243,390,122 25.93
Total Transferable securities and money market instrumentsdealt in on another regulated market 243,390,122 25.93
Other transferable securities and money market instruments
Bonds
IrelandTrafigura Securitisation Finance plc, FRN,Series 2014-1A ‘A’, 144A 1.392%15/10/2018 * USD 904,000 890,440 0.09
890,440 0.09
Total Bonds 890,440 0.09
Total Other transferable securities and money marketinstruments 890,440 0.09
Units of authorised UCITS or other collective investment undertakings
Collective Investment Schemes - UCITS
LuxembourgJPMorgan US Dollar Liquidity Fund - JPMUS Dollar Liquidity X (dist.)† USD 19,028,442 19,028,442 2.03
19,028,442 2.03
Total Collective Investment Schemes - UCITS 19,028,442 2.03
Total Units of authorised UCITS or other collective investmentundertakings 19,028,442 2.03
Total Investments 919,059,117 97.92
Cash (17,057,250) (1.82)
Other Assets/(Liabilities) 36,551,747 3.90
Total Net Assets 938,553,614 100.00
* Security is valued at its fair value under the direction of the Board of Directors.† Related Party Fund.
246
JPMorgan Funds - US Short Duration Bond FundSchedule of Investments (continued)
As at 30 June 2016
Investments Currency
Quantity/Nominal
Value
MarketValue
USD
%of
NetAssets Investments Currency
Quantity/Nominal
Value
MarketValue
USD
%of
NetAssets
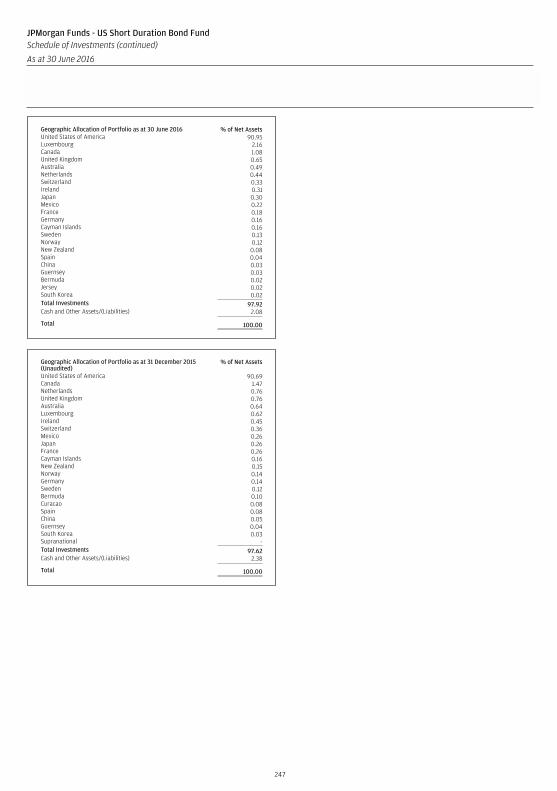
Geographic Allocation of Portfolio as at 30 June 2016 % of Net AssetsUnited States of America 90.95Luxembourg 2.16Canada 1.08United Kingdom 0.65Australia 0.49Netherlands 0.44Switzerland 0.33Ireland 0.31Japan 0.30Mexico 0.22France 0.18Germany 0.16Cayman Islands 0.16Sweden 0.13Norway 0.12New Zealand 0.08Spain 0.04China 0.03Guernsey 0.03Bermuda 0.02Jersey 0.02South Korea 0.02Total Investments 97.92Cash and Other Assets/(Liabilities) 2.08
Total 100.00
Geographic Allocation of Portfolio as at 31 December 2015(Unaudited)
% of Net Assets
United States of America 90.69Canada 1.47Netherlands 0.76United Kingdom 0.76Australia 0.64Luxembourg 0.62Ireland 0.45Switzerland 0.36Mexico 0.26Japan 0.26France 0.26Cayman Islands 0.16New Zealand 0.15Norway 0.14Germany 0.14Sweden 0.12Bermuda 0.10Curacao 0.08Spain 0.08China 0.05Guernsey 0.04South Korea 0.03Supranational -Total Investments 97.62Cash and Other Assets/(Liabilities) 2.38
Total 100.00
247
JPMorgan Funds - US Short Duration Bond FundSchedule of Investments (continued)
As at 30 June 2016
Investments Currency
Quantity/Nominal
Value
MarketValue
USD
%of
NetAssets Investments Currency
Quantity/Nominal
Value
MarketValue
USD
%of
NetAssets
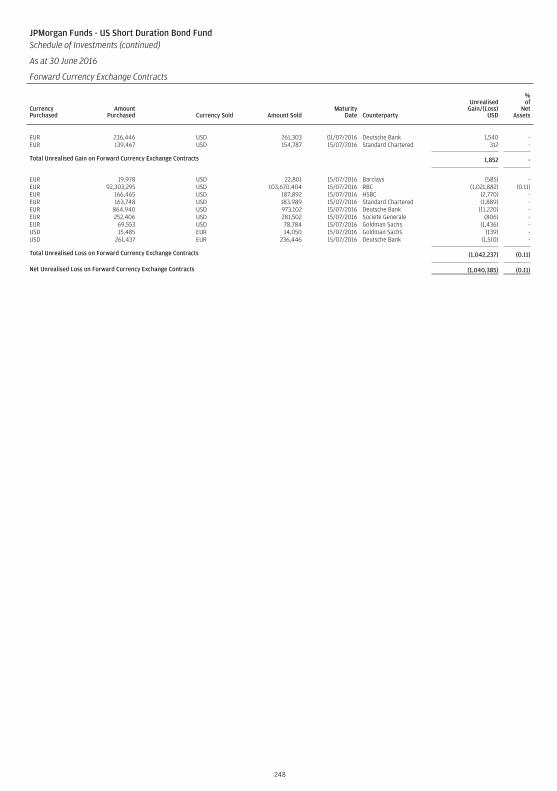
JPMorgan Funds - US Short Duration Bond FundSchedule of Investments (continued)
As at 30 June 2016
Forward Currency Exchange Contracts
CurrencyPurchased
AmountPurchased Currency Sold Amount Sold
MaturityDate Counterparty
UnrealisedGain/(Loss)
USD
%of
NetAssets
EUR 236,446 USD 261,303 01/07/2016 Deutsche Bank 1,540 -EUR 139,467 USD 154,787 15/07/2016 Standard Chartered 312 -
Total Unrealised Gain on Forward Currency Exchange Contracts 1,852 -
EUR 19,978 USD 22,801 15/07/2016 Barclays (585) -EUR 92,303,295 USD 103,670,404 15/07/2016 RBC (1,021,882) (0.11)EUR 166,465 USD 187,892 15/07/2016 HSBC (2,770) -EUR 163,748 USD 183,989 15/07/2016 Standard Chartered (1,889) -EUR 864,940 USD 973,102 15/07/2016 Deutsche Bank (11,220) -EUR 252,406 USD 281,502 15/07/2016 Societe Generale (806) -EUR 69,553 USD 78,784 15/07/2016 Goldman Sachs (1,436) -USD 15,485 EUR 14,050 15/07/2016 Goldman Sachs (139) -USD 261,437 EUR 236,446 15/07/2016 Deutsche Bank (1,510) -
Total Unrealised Loss on Forward Currency Exchange Contracts (1,042,237) (0.11)
Net Unrealised Loss on Forward Currency Exchange Contracts (1,040,385) (0.11)
248
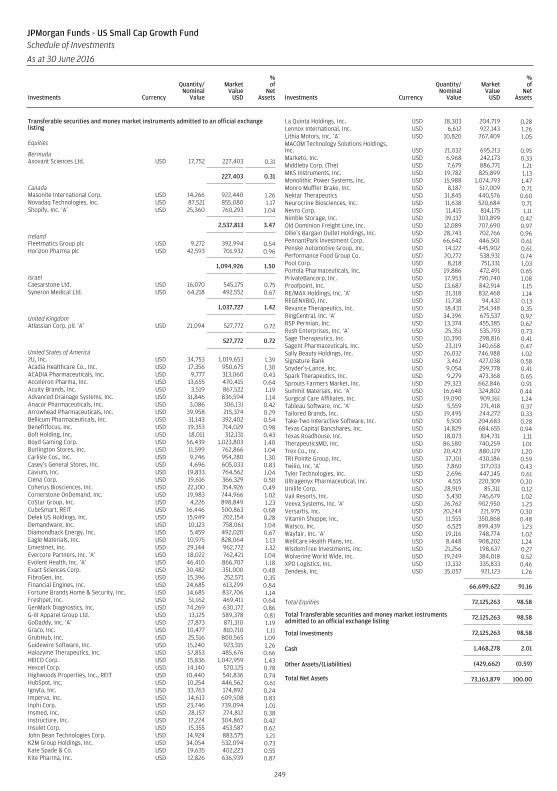
Transferable securities and money market instruments admitted to an official exchangelisting
Equities
BermudaAxovant Sciences Ltd. USD 17,752 227,403 0.31
227,403 0.31
CanadaMasonite International Corp. USD 14,266 922,440 1.26Novadaq Technologies, Inc. USD 87,521 855,080 1.17Shopify, Inc. ‘A’ USD 25,360 760,293 1.04
2,537,813 3.47
IrelandFleetmatics Group plc USD 9,272 392,994 0.54Horizon Pharma plc USD 42,593 701,932 0.96
1,094,926 1.50
IsraelCaesarstone Ltd. USD 16,070 545,175 0.75Syneron Medical Ltd. USD 64,218 492,552 0.67
1,037,727 1.42
United KingdomAtlassian Corp. plc ‘A’ USD 21,094 527,772 0.72
527,772 0.72
United States of America2U, Inc. USD 34,753 1,019,653 1.39Acadia Healthcare Co., Inc. USD 17,356 950,675 1.30ACADIA Pharmaceuticals, Inc. USD 9,777 313,060 0.43Acceleron Pharma, Inc. USD 13,655 470,415 0.64Acuity Brands, Inc. USD 3,519 867,522 1.19Advanced Drainage Systems, Inc. USD 31,846 836,594 1.14Anacor Pharmaceuticals, Inc. USD 3,086 306,131 0.42Arrowhead Pharmaceuticals, Inc. USD 39,958 215,374 0.29Bellicum Pharmaceuticals, Inc. USD 31,143 392,402 0.54Benefitfocus, Inc. USD 19,353 714,029 0.98BofI Holding, Inc. USD 18,011 312,131 0.43Boyd Gaming Corp. USD 56,439 1,023,803 1.40Burlington Stores, Inc. USD 11,599 762,866 1.04Carlisle Cos., Inc. USD 9,246 954,280 1.30Casey’s General Stores, Inc. USD 4,696 605,033 0.83Cavium, Inc. USD 19,833 764,562 1.04Ciena Corp. USD 19,616 366,329 0.50Coherus Biosciences, Inc. USD 22,100 354,926 0.49Cornerstone OnDemand, Inc. USD 19,983 744,966 1.02CoStar Group, Inc. USD 4,226 898,849 1.23CubeSmart, REIT USD 16,446 500,863 0.68Delek US Holdings, Inc. USD 15,949 202,154 0.28Demandware, Inc. USD 10,123 758,061 1.04Diamondback Energy, Inc. USD 5,459 492,020 0.67Eagle Materials, Inc. USD 10,975 828,064 1.13Envestnet, Inc. USD 29,144 962,772 1.32Evercore Partners, Inc. ‘A’ USD 18,022 762,421 1.04Evolent Health, Inc. ‘A’ USD 46,410 866,707 1.18Exact Sciences Corp. USD 30,482 351,000 0.48FibroGen, Inc. USD 15,396 252,571 0.35Financial Engines, Inc. USD 24,685 613,299 0.84Fortune Brands Home & Security, Inc. USD 14,685 837,706 1.14Freshpet, Inc. USD 51,162 469,411 0.64GenMark Diagnostics, Inc. USD 74,269 630,172 0.86G-III Apparel Group Ltd. USD 13,125 589,378 0.81GoDaddy, Inc. ‘A’ USD 27,873 871,310 1.19Graco, Inc. USD 10,477 810,710 1.11GrubHub, Inc. USD 25,516 800,565 1.09Guidewire Software, Inc. USD 15,240 923,315 1.26Halozyme Therapeutics, Inc. USD 57,853 485,676 0.66HEICO Corp. USD 15,836 1,042,959 1.43Hexcel Corp. USD 14,140 570,125 0.78Highwoods Properties, Inc., REIT USD 10,440 541,836 0.74HubSpot, Inc. USD 10,254 446,562 0.61Ignyta, Inc. USD 33,763 174,892 0.24Imperva, Inc. USD 14,613 609,508 0.83Inphi Corp. USD 23,746 739,094 1.01Insmed, Inc. USD 28,157 274,812 0.38Instructure, Inc. USD 17,224 304,865 0.42Insulet Corp. USD 15,355 453,587 0.62John Bean Technologies Corp. USD 14,924 883,575 1.21K2M Group Holdings, Inc. USD 34,054 532,094 0.73Kate Spade & Co. USD 19,635 402,223 0.55Kite Pharma, Inc. USD 12,826 636,939 0.87
La Quinta Holdings, Inc. USD 18,303 204,719 0.28Lennox International, Inc. USD 6,612 922,143 1.26Lithia Motors, Inc. ‘A’ USD 10,820 767,409 1.05MACOM Technology Solutions Holdings,Inc. USD 21,032 695,213 0.95Marketo, Inc. USD 6,968 242,173 0.33Middleby Corp. (The) USD 7,679 886,771 1.21MKS Instruments, Inc. USD 19,782 825,899 1.13Monolithic Power Systems, Inc. USD 15,988 1,074,793 1.47Monro Muffler Brake, Inc. USD 8,187 517,009 0.71Nektar Therapeutics USD 31,845 440,576 0.60Neurocrine Biosciences, Inc. USD 11,638 520,684 0.71Nevro Corp. USD 11,415 814,175 1.11Nimble Storage, Inc. USD 39,137 303,899 0.42Old Dominion Freight Line, Inc. USD 12,089 707,690 0.97Ollie’s Bargain Outlet Holdings, Inc. USD 28,743 702,766 0.96PennantPark Investment Corp. USD 66,642 446,501 0.61Penske Automotive Group, Inc. USD 14,122 445,902 0.61Performance Food Group Co. USD 20,272 538,931 0.74Pool Corp. USD 8,218 751,331 1.03Portola Pharmaceuticals, Inc. USD 19,886 472,491 0.65PrivateBancorp, Inc. USD 17,953 790,740 1.08Proofpoint, Inc. USD 13,687 842,914 1.15RE/MAX Holdings, Inc. ‘A’ USD 21,318 832,468 1.14REGENXBIO, Inc. USD 11,738 94,432 0.13Revance Therapeutics, Inc. USD 18,431 254,348 0.35RingCentral, Inc. ‘A’ USD 34,396 675,537 0.92RSP Permian, Inc. USD 13,374 455,385 0.62Rush Enterprises, Inc. ‘A’ USD 25,351 535,793 0.73Sage Therapeutics, Inc. USD 10,390 298,816 0.41Sagent Pharmaceuticals, Inc. USD 23,119 340,658 0.47Sally Beauty Holdings, Inc. USD 26,032 746,988 1.02Signature Bank USD 3,462 427,038 0.58Snyder’s-Lance, Inc. USD 9,054 299,778 0.41Spark Therapeutics, Inc. USD 9,279 473,368 0.65Sprouts Farmers Market, Inc. USD 29,323 662,846 0.91Summit Materials, Inc. ‘A’ USD 16,648 324,802 0.44Surgical Care Affiliates, Inc. USD 19,090 909,161 1.24Tableau Software, Inc. ‘A’ USD 5,559 271,418 0.37Tailored Brands, Inc. USD 19,495 244,272 0.33Take-Two Interactive Software, Inc. USD 5,500 204,683 0.28Texas Capital Bancshares, Inc. USD 14,829 684,655 0.94Texas Roadhouse, Inc. USD 18,073 814,731 1.11TherapeuticsMD, Inc. USD 86,580 740,259 1.01Trex Co., Inc. USD 20,423 880,129 1.20TRI Pointe Group, Inc. USD 37,101 430,186 0.59Twilio, Inc. ‘A’ USD 7,860 317,033 0.43Tyler Technologies, Inc. USD 2,696 447,145 0.61Ultragenyx Pharmaceutical, Inc. USD 4,515 220,309 0.30Unilife Corp. USD 28,919 85,311 0.12Vail Resorts, Inc. USD 5,430 746,679 1.02Veeva Systems, Inc. ‘A’ USD 26,762 902,950 1.23Versartis, Inc. USD 20,244 221,975 0.30Vitamin Shoppe, Inc. USD 11,555 350,868 0.48Watsco, Inc. USD 6,525 899,439 1.23Wayfair, Inc. ‘A’ USD 19,116 748,774 1.02WellCare Health Plans, Inc. USD 8,448 908,202 1.24WisdomTree Investments, Inc. USD 21,256 198,637 0.27Wolverine World Wide, Inc. USD 19,249 384,018 0.52XPO Logistics, Inc. USD 13,332 335,833 0.46Zendesk, Inc. USD 35,057 921,123 1.26
66,699,622 91.16
Total Equities 72,125,263 98.58
Total Transferable securities and money market instrumentsadmitted to an official exchange listing 72,125,263 98.58
Total Investments 72,125,263 98.58
Cash 1,468,278 2.01
Other Assets/(Liabilities) (429,662) (0.59)
Total Net Assets 73,163,879 100.00
249
JPMorgan Funds - US Small Cap Growth FundSchedule of Investments
As at 30 June 2016
Investments Currency
Quantity/Nominal
Value
MarketValue
USD
%of
NetAssets Investments Currency
Quantity/Nominal
Value
MarketValue
USD
%of
NetAssets
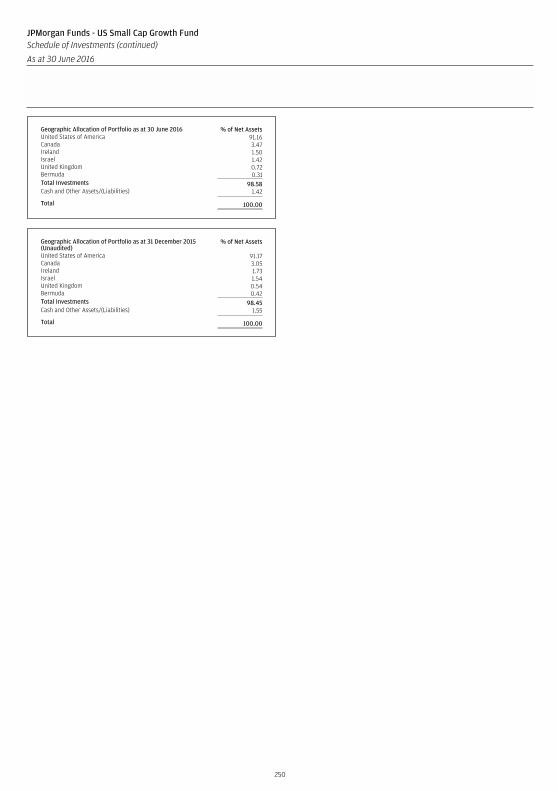
Geographic Allocation of Portfolio as at 30 June 2016 % of Net AssetsUnited States of America 91.16Canada 3.47Ireland 1.50Israel 1.42United Kingdom 0.72Bermuda 0.31Total Investments 98.58Cash and Other Assets/(Liabilities) 1.42
Total 100.00
Geographic Allocation of Portfolio as at 31 December 2015(Unaudited)
% of Net Assets
United States of America 91.17Canada 3.05Ireland 1.73Israel 1.54United Kingdom 0.54Bermuda 0.42Total Investments 98.45Cash and Other Assets/(Liabilities) 1.55
Total 100.00
250
JPMorgan Funds - US Small Cap Growth FundSchedule of Investments (continued)
As at 30 June 2016
Investments Currency
Quantity/Nominal
Value
MarketValue
USD
%of
NetAssets Investments Currency
Quantity/Nominal
Value
MarketValue
USD
%of
NetAssets
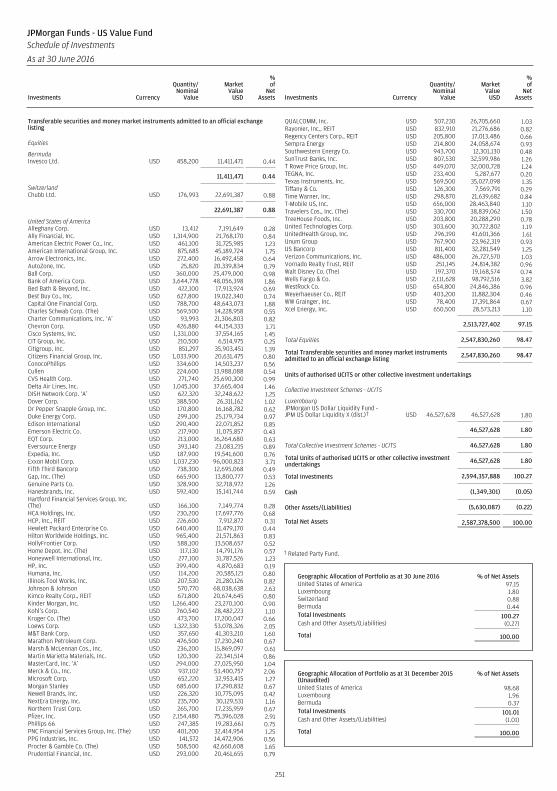
Transferable securities and money market instruments admitted to an official exchangelisting
Equities
BermudaInvesco Ltd. USD 458,200 11,411,471 0.44
11,411,471 0.44
SwitzerlandChubb Ltd. USD 176,993 22,691,387 0.88
22,691,387 0.88
United States of AmericaAlleghany Corp. USD 13,412 7,191,649 0.28Ally Financial, Inc. USD 1,314,900 21,768,170 0.84American Electric Power Co., Inc. USD 461,100 31,725,985 1.23American International Group, Inc. USD 875,685 45,189,724 1.75Arrow Electronics, Inc. USD 272,400 16,492,458 0.64AutoZone, Inc. USD 25,820 20,339,834 0.79Ball Corp. USD 360,000 25,479,000 0.98Bank of America Corp. USD 3,644,778 48,056,398 1.86Bed Bath & Beyond, Inc. USD 422,100 17,913,924 0.69Best Buy Co., Inc. USD 627,800 19,022,340 0.74Capital One Financial Corp. USD 788,700 48,643,073 1.88Charles Schwab Corp. (The) USD 569,500 14,228,958 0.55Charter Communications, Inc. ‘A’ USD 93,993 21,306,803 0.82Chevron Corp. USD 426,880 44,154,333 1.71Cisco Systems, Inc. USD 1,331,000 37,554,165 1.45CIT Group, Inc. USD 210,500 6,514,975 0.25Citigroup, Inc. USD 851,297 35,903,451 1.39Citizens Financial Group, Inc. USD 1,033,900 20,631,475 0.80ConocoPhillips USD 334,600 14,503,237 0.56Cullen USD 224,600 13,988,088 0.54CVS Health Corp. USD 271,740 25,690,300 0.99Delta Air Lines, Inc. USD 1,045,100 37,665,404 1.46DISH Network Corp. ‘A’ USD 622,320 32,248,622 1.25Dover Corp. USD 388,500 26,311,162 1.02Dr Pepper Snapple Group, Inc. USD 170,800 16,168,782 0.62Duke Energy Corp. USD 299,100 25,179,734 0.97Edison International USD 290,400 22,071,852 0.85Emerson Electric Co. USD 217,900 11,075,857 0.43EQT Corp. USD 213,000 16,264,680 0.63Eversource Energy USD 393,140 23,083,215 0.89Expedia, Inc. USD 187,900 19,541,600 0.76Exxon Mobil Corp. USD 1,037,230 96,000,823 3.71Fifth Third Bancorp USD 738,300 12,695,068 0.49Gap, Inc. (The) USD 665,900 13,800,777 0.53Genuine Parts Co. USD 328,900 32,718,972 1.26Hanesbrands, Inc. USD 592,400 15,141,744 0.59Hartford Financial Services Group, Inc.(The) USD 166,100 7,149,774 0.28HCA Holdings, Inc. USD 230,200 17,697,776 0.68HCP, Inc., REIT USD 226,600 7,912,872 0.31Hewlett Packard Enterprise Co. USD 640,400 11,479,170 0.44Hilton Worldwide Holdings, Inc. USD 965,400 21,571,863 0.83HollyFrontier Corp. USD 588,100 13,508,657 0.52Home Depot, Inc. (The) USD 117,130 14,791,176 0.57Honeywell International, Inc. USD 277,100 31,787,526 1.23HP, Inc. USD 399,400 4,870,683 0.19Humana, Inc. USD 114,200 20,585,121 0.80Illinois Tool Works, Inc. USD 207,530 21,280,126 0.82Johnson & Johnson USD 570,770 68,038,638 2.63Kimco Realty Corp., REIT USD 671,800 20,674,645 0.80Kinder Morgan, Inc. USD 1,266,400 23,270,100 0.90Kohl’s Corp. USD 760,540 28,482,223 1.10Kroger Co. (The) USD 473,700 17,200,047 0.66Loews Corp. USD 1,322,330 53,078,326 2.05M&T Bank Corp. USD 357,650 41,303,210 1.60Marathon Petroleum Corp. USD 476,500 17,230,240 0.67Marsh & McLennan Cos., Inc. USD 236,200 15,869,097 0.61Martin Marietta Materials, Inc. USD 120,300 22,341,514 0.86MasterCard, Inc. ‘A’ USD 294,000 27,025,950 1.04Merck & Co., Inc. USD 937,102 53,400,757 2.06Microsoft Corp. USD 652,220 32,953,415 1.27Morgan Stanley USD 685,600 17,290,832 0.67Newell Brands, Inc. USD 226,320 10,775,095 0.42NextEra Energy, Inc. USD 235,700 30,129,531 1.16Northern Trust Corp. USD 265,700 17,235,959 0.67Pfizer, Inc. USD 2,154,480 75,396,028 2.91Phillips 66 USD 247,385 19,283,661 0.75PNC Financial Services Group, Inc. (The) USD 401,200 32,414,954 1.25PPG Industries, Inc. USD 141,572 14,472,906 0.56Procter & Gamble Co. (The) USD 508,500 42,660,608 1.65Prudential Financial, Inc. USD 293,000 20,461,655 0.79
QUALCOMM, Inc. USD 507,230 26,705,660 1.03Rayonier, Inc., REIT USD 832,910 21,276,686 0.82Regency Centers Corp., REIT USD 205,800 17,013,486 0.66Sempra Energy USD 214,800 24,058,674 0.93Southwestern Energy Co. USD 943,700 12,301,130 0.48SunTrust Banks, Inc. USD 807,530 32,599,986 1.26T Rowe Price Group, Inc. USD 449,070 32,000,728 1.24TEGNA, Inc. USD 233,400 5,287,677 0.20Texas Instruments, Inc. USD 569,500 35,027,098 1.35Tiffany & Co. USD 126,300 7,569,791 0.29Time Warner, Inc. USD 298,870 21,639,682 0.84T-Mobile US, Inc. USD 656,000 28,463,840 1.10Travelers Cos., Inc. (The) USD 330,700 38,839,062 1.50TreeHouse Foods, Inc. USD 203,800 20,288,290 0.78United Technologies Corp. USD 303,600 30,722,802 1.19UnitedHealth Group, Inc. USD 296,190 41,601,366 1.61Unum Group USD 767,900 23,962,319 0.93US Bancorp USD 811,400 32,281,549 1.25Verizon Communications, Inc. USD 486,000 26,727,570 1.03Vornado Realty Trust, REIT USD 251,145 24,814,382 0.96Walt Disney Co. (The) USD 197,370 19,168,574 0.74Wells Fargo & Co. USD 2,111,628 98,792,516 3.82WestRock Co. USD 654,800 24,846,386 0.96Weyerhaeuser Co., REIT USD 403,200 11,882,304 0.46WW Grainger, Inc. USD 78,400 17,391,864 0.67Xcel Energy, Inc. USD 650,500 28,573,213 1.10
2,513,727,402 97.15
Total Equities 2,547,830,260 98.47
Total Transferable securities and money market instrumentsadmitted to an official exchange listing 2,547,830,260 98.47
Units of authorised UCITS or other collective investment undertakings
Collective Investment Schemes - UCITS
LuxembourgJPMorgan US Dollar Liquidity Fund -JPM US Dollar Liquidity X (dist.)† USD 46,527,628 46,527,628 1.80
46,527,628 1.80
Total Collective Investment Schemes - UCITS 46,527,628 1.80
Total Units of authorised UCITS or other collective investmentundertakings 46,527,628 1.80
Total Investments 2,594,357,888 100.27
Cash (1,349,301) (0.05)
Other Assets/(Liabilities) (5,630,087) (0.22)
Total Net Assets 2,587,378,500 100.00
† Related Party Fund.
Geographic Allocation of Portfolio as at 30 June 2016 % of Net AssetsUnited States of America 97.15Luxembourg 1.80Switzerland 0.88Bermuda 0.44Total Investments 100.27Cash and Other Assets/(Liabilities) (0.27)
Total 100.00
Geographic Allocation of Portfolio as at 31 December 2015(Unaudited)
% of Net Assets
United States of America 98.68Luxembourg 1.96Bermuda 0.37Total Investments 101.01Cash and Other Assets/(Liabilities) (1.01)
Total 100.00
251
JPMorgan Funds - US Value FundSchedule of Investments
As at 30 June 2016
Investments Currency
Quantity/Nominal
Value
MarketValue
USD
%of
NetAssets Investments Currency
Quantity/Nominal
Value
MarketValue
USD
%of
NetAssets
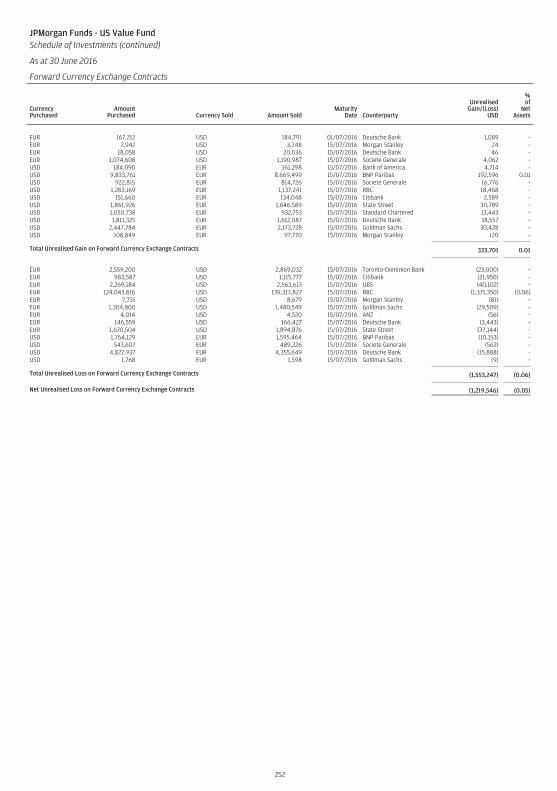
JPMorgan Funds - US Value FundSchedule of Investments (continued)
As at 30 June 2016
Forward Currency Exchange Contracts
CurrencyPurchased
AmountPurchased Currency Sold Amount Sold
MaturityDate Counterparty
UnrealisedGain/(Loss)
USD
%of
NetAssets
EUR 167,212 USD 184,791 01/07/2016 Deutsche Bank 1,089 -EUR 2,942 USD 3,248 15/07/2016 Morgan Stanley 24 -EUR 18,058 USD 20,036 15/07/2016 Deutsche Bank 46 -EUR 1,074,608 USD 1,190,987 15/07/2016 Societe Generale 4,062 -USD 184,090 EUR 161,298 15/07/2016 Bank of America 4,714 -USD 9,833,761 EUR 8,669,499 15/07/2016 BNP Paribas 192,596 0.01USD 922,815 EUR 814,726 15/07/2016 Societe Generale 16,776 -USD 1,283,169 EUR 1,137,241 15/07/2016 RBC 18,468 -USD 151,660 EUR 134,048 15/07/2016 Citibank 2,589 -USD 1,861,926 EUR 1,646,589 15/07/2016 State Street 30,789 -USD 1,050,738 EUR 932,753 15/07/2016 Standard Chartered 13,443 -USD 1,811,325 EUR 1,612,087 15/07/2016 Deutsche Bank 18,557 -USD 2,447,784 EUR 2,173,728 15/07/2016 Goldman Sachs 30,428 -USD 108,849 EUR 97,770 15/07/2016 Morgan Stanley 120 -
Total Unrealised Gain on Forward Currency Exchange Contracts 333,701 0.01
EUR 2,559,200 USD 2,869,032 15/07/2016 Toronto-Dominion Bank (23,000) -EUR 983,587 USD 1,115,777 15/07/2016 Citibank (21,950) -EUR 2,269,184 USD 2,563,613 15/07/2016 UBS (40,102) -EUR 124,043,816 USD 139,317,827 15/07/2016 RBC (1,371,350) (0.06)EUR 7,731 USD 8,679 15/07/2016 Morgan Stanley (81) -EUR 1,304,800 USD 1,480,549 15/07/2016 Goldman Sachs (29,509) -EUR 4,014 USD 4,520 15/07/2016 ANZ (56) -EUR 146,559 USD 166,427 15/07/2016 Deutsche Bank (3,443) -EUR 1,670,504 USD 1,894,876 15/07/2016 State Street (37,144) -USD 1,764,129 EUR 1,595,464 15/07/2016 BNP Paribas (10,153) -USD 543,607 EUR 489,326 15/07/2016 Societe Generale (562) -USD 4,827,937 EUR 4,355,649 15/07/2016 Deutsche Bank (15,888) -USD 1,768 EUR 1,598 15/07/2016 Goldman Sachs (9) -
Total Unrealised Loss on Forward Currency Exchange Contracts (1,553,247) (0.06)
Net Unrealised Loss on Forward Currency Exchange Contracts (1,219,546) (0.05)
252
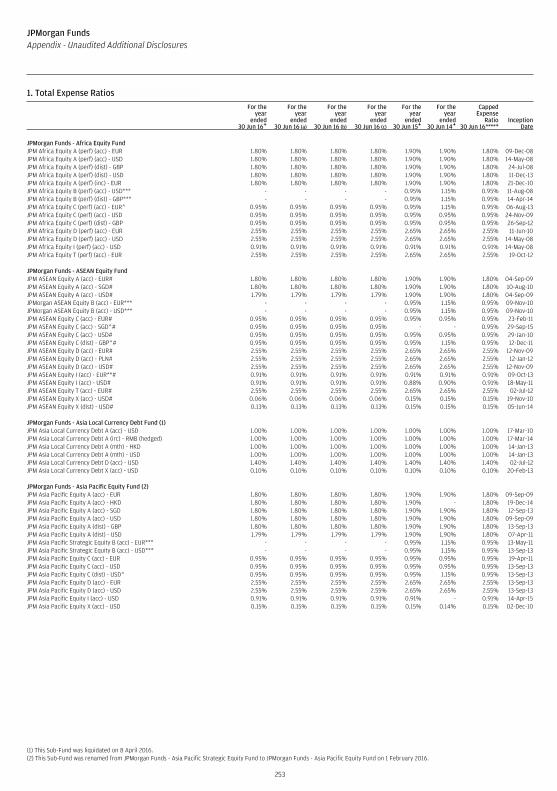
1. Total Expense Ratios (continued)For the
yearended
30 Jun 16+
For theyear
ended30 Jun 16 (a)
For theyear
ended30 Jun 16 (b)
For theyear
ended30 Jun 16 (c)
For theyear
ended30 Jun 15+
For theyear
ended30 Jun 14+
CappedExpense
Ratio30 Jun 16****+
InceptionDate
JPMorgan Funds - Africa Equity FundJPM Africa Equity A (perf) (acc) - EUR 1.80% 1.80% 1.80% 1.80% 1.90% 1.90% 1.80% 09-Dec-08JPM Africa Equity A (perf) (acc) - USD 1.80% 1.80% 1.80% 1.80% 1.90% 1.90% 1.80% 14-May-08JPM Africa Equity A (perf) (dist) - GBP 1.80% 1.80% 1.80% 1.80% 1.90% 1.90% 1.80% 24-Jul-08JPM Africa Equity A (perf) (dist) - USD 1.80% 1.80% 1.80% 1.80% 1.90% 1.90% 1.80% 11-Dec-13JPM Africa Equity A (perf) (inc) - EUR 1.80% 1.80% 1.80% 1.80% 1.90% 1.90% 1.80% 21-Dec-10JPM Africa Equity B (perf) (acc) - USD*** - - - - 0.95% 1.15% 0.95% 11-Aug-08JPM Africa Equity B (perf) (dist) - GBP*** - - - - 0.95% 1.15% 0.95% 14-Apr-14JPM Africa Equity C (perf) (acc) - EUR^ 0.95% 0.95% 0.95% 0.95% 0.95% 1.15% 0.95% 06-Aug-13JPM Africa Equity C (perf) (acc) - USD 0.95% 0.95% 0.95% 0.95% 0.95% 0.95% 0.95% 24-Nov-09JPM Africa Equity C (perf) (dist) - GBP 0.95% 0.95% 0.95% 0.95% 0.95% 0.95% 0.95% 26-Sep-12JPM Africa Equity D (perf) (acc) - EUR 2.55% 2.55% 2.55% 2.55% 2.65% 2.65% 2.55% 11-Jun-10JPM Africa Equity D (perf) (acc) - USD 2.55% 2.55% 2.55% 2.55% 2.65% 2.65% 2.55% 14-May-08JPM Africa Equity I (perf) (acc) - USD 0.91% 0.91% 0.91% 0.91% 0.91% 0.91% 0.91% 14-May-08JPM Africa Equity T (perf) (acc) - EUR 2.55% 2.55% 2.55% 2.55% 2.65% 2.65% 2.55% 19-Oct-12
JPMorgan Funds - ASEAN Equity FundJPM ASEAN Equity A (acc) - EUR# 1.80% 1.80% 1.80% 1.80% 1.90% 1.90% 1.80% 04-Sep-09JPM ASEAN Equity A (acc) - SGD# 1.80% 1.80% 1.80% 1.80% 1.90% 1.90% 1.80% 10-Aug-10JPM ASEAN Equity A (acc) - USD# 1.79% 1.79% 1.79% 1.79% 1.90% 1.90% 1.80% 04-Sep-09JPMorgan ASEAN Equity B (acc) - EUR*** - - - - 0.95% 1.15% 0.95% 09-Nov-10JPMorgan ASEAN Equity B (acc) - USD*** - - - - 0.95% 1.15% 0.95% 09-Nov-10JPM ASEAN Equity C (acc) - EUR# 0.95% 0.95% 0.95% 0.95% 0.95% 0.95% 0.95% 23-Feb-11JPM ASEAN Equity C (acc) - SGD^# 0.95% 0.95% 0.95% 0.95% - - 0.95% 29-Sep-15JPM ASEAN Equity C (acc) - USD# 0.95% 0.95% 0.95% 0.95% 0.95% 0.95% 0.95% 29-Jan-10JPM ASEAN Equity C (dist) - GBP^# 0.95% 0.95% 0.95% 0.95% 0.95% 1.15% 0.95% 12-Dec-11JPM ASEAN Equity D (acc) - EUR# 2.55% 2.55% 2.55% 2.55% 2.65% 2.65% 2.55% 12-Nov-09JPM ASEAN Equity D (acc) - PLN# 2.55% 2.55% 2.55% 2.55% 2.65% 2.65% 2.55% 12-Jan-12JPM ASEAN Equity D (acc) - USD# 2.55% 2.55% 2.55% 2.55% 2.65% 2.65% 2.55% 12-Nov-09JPM ASEAN Equity I (acc) - EUR**# 0.91% 0.91% 0.91% 0.91% 0.91% 0.91% 0.91% 09-Oct-13JPM ASEAN Equity I (acc) - USD# 0.91% 0.91% 0.91% 0.91% 0.88% 0.90% 0.91% 18-May-11JPM ASEAN Equity T (acc) - EUR# 2.55% 2.55% 2.55% 2.55% 2.65% 2.65% 2.55% 02-Jul-12JPM ASEAN Equity X (acc) - USD# 0.06% 0.06% 0.06% 0.06% 0.15% 0.15% 0.15% 19-Nov-10JPM ASEAN Equity X (dist) - USD# 0.13% 0.13% 0.13% 0.13% 0.15% 0.15% 0.15% 05-Jun-14
JPMorgan Funds - Asia Local Currency Debt Fund (1)JPM Asia Local Currency Debt A (acc) - USD 1.00% 1.00% 1.00% 1.00% 1.00% 1.00% 1.00% 17-Mar-10JPM Asia Local Currency Debt A (irc) - RMB (hedged) 1.00% 1.00% 1.00% 1.00% 1.00% 1.00% 1.00% 17-Mar-14JPM Asia Local Currency Debt A (mth) - HKD 1.00% 1.00% 1.00% 1.00% 1.00% 1.00% 1.00% 14-Jan-13JPM Asia Local Currency Debt A (mth) - USD 1.00% 1.00% 1.00% 1.00% 1.00% 1.00% 1.00% 14-Jan-13JPM Asia Local Currency Debt D (acc) - USD 1.40% 1.40% 1.40% 1.40% 1.40% 1.40% 1.40% 02-Jul-12JPM Asia Local Currency Debt X (acc) - USD 0.10% 0.10% 0.10% 0.10% 0.10% 0.10% 0.10% 20-Feb-13
JPMorgan Funds - Asia Pacific Equity Fund (2)JPM Asia Pacific Equity A (acc) - EUR 1.80% 1.80% 1.80% 1.80% 1.90% 1.90% 1.80% 09-Sep-09JPM Asia Pacific Equity A (acc) - HKD 1.80% 1.80% 1.80% 1.80% 1.90% - 1.80% 19-Dec-14JPM Asia Pacific Equity A (acc) - SGD 1.80% 1.80% 1.80% 1.80% 1.90% 1.90% 1.80% 12-Sep-13JPM Asia Pacific Equity A (acc) - USD 1.80% 1.80% 1.80% 1.80% 1.90% 1.90% 1.80% 09-Sep-09JPM Asia Pacific Equity A (dist) - GBP 1.80% 1.80% 1.80% 1.80% 1.90% 1.90% 1.80% 13-Sep-13JPM Asia Pacific Equity A (dist) - USD 1.79% 1.79% 1.79% 1.79% 1.90% 1.90% 1.80% 07-Apr-11JPM Asia Pacific Strategic Equity B (acc) - EUR*** - - - - 0.95% 1.15% 0.95% 13-May-11JPM Asia Pacific Strategic Equity B (acc) - USD*** - - - - 0.95% 1.15% 0.95% 13-Sep-13JPM Asia Pacific Equity C (acc) - EUR 0.95% 0.95% 0.95% 0.95% 0.95% 0.95% 0.95% 19-Apr-11JPM Asia Pacific Equity C (acc) - USD 0.95% 0.95% 0.95% 0.95% 0.95% 0.95% 0.95% 13-Sep-13JPM Asia Pacific Equity C (dist) - USD^ 0.95% 0.95% 0.95% 0.95% 0.95% 1.15% 0.95% 13-Sep-13JPM Asia Pacific Equity D (acc) - EUR 2.55% 2.55% 2.55% 2.55% 2.65% 2.65% 2.55% 13-Sep-13JPM Asia Pacific Equity D (acc) - USD 2.55% 2.55% 2.55% 2.55% 2.65% 2.65% 2.55% 13-Sep-13JPM Asia Pacific Equity I (acc) - USD 0.91% 0.91% 0.91% 0.91% 0.91% - 0.91% 14-Apr-15JPM Asia Pacific Equity X (acc) - USD 0.15% 0.15% 0.15% 0.15% 0.15% 0.14% 0.15% 02-Dec-10
(1) This Sub-Fund was liquidated on 8 April 2016.(2) This Sub-Fund was renamed from JPMorgan Funds - Asia Pacific Strategic Equity Fund to JPMorgan Funds - Asia Pacific Equity Fund on 1 February 2016.
253
JPMorgan FundsAppendix - Unaudited Additional Disclosures
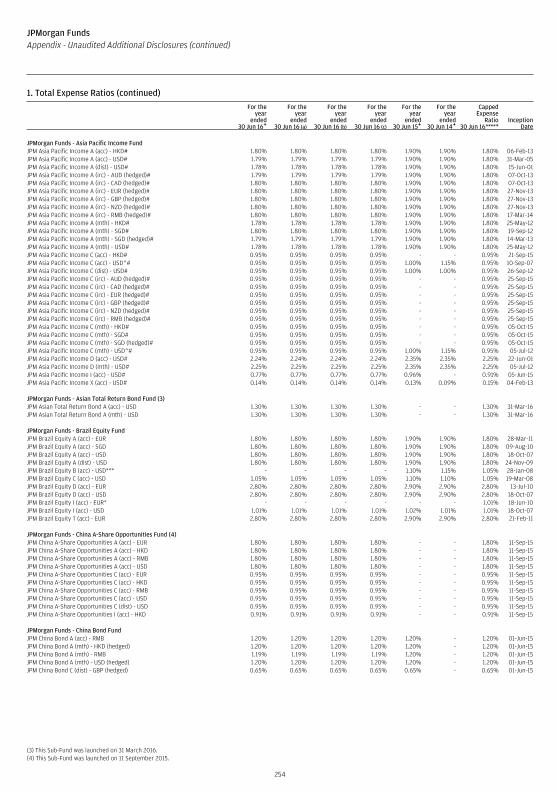
1. Total Expense Ratios (continued)For the
yearended
30 Jun 16+
For theyear
ended30 Jun 16 (a)
For theyear
ended30 Jun 16 (b)
For theyear
ended30 Jun 16 (c)
For theyear
ended30 Jun 15+
For theyear
ended30 Jun 14+
CappedExpense
Ratio30 Jun 16****+
InceptionDate
JPMorgan Funds - Asia Pacific Income FundJPM Asia Pacific Income A (acc) - HKD# 1.80% 1.80% 1.80% 1.80% 1.90% 1.90% 1.80% 06-Feb-13JPM Asia Pacific Income A (acc) - USD# 1.79% 1.79% 1.79% 1.79% 1.90% 1.90% 1.80% 31-Mar-05JPM Asia Pacific Income A (dist) - USD# 1.78% 1.78% 1.78% 1.78% 1.90% 1.90% 1.80% 15-Jun-01JPM Asia Pacific Income A (irc) - AUD (hedged)# 1.79% 1.79% 1.79% 1.79% 1.90% 1.90% 1.80% 07-Oct-13JPM Asia Pacific Income A (irc) - CAD (hedged)# 1.80% 1.80% 1.80% 1.80% 1.90% 1.90% 1.80% 07-Oct-13JPM Asia Pacific Income A (irc) - EUR (hedged)# 1.80% 1.80% 1.80% 1.80% 1.90% 1.90% 1.80% 27-Nov-13JPM Asia Pacific Income A (irc) - GBP (hedged)# 1.80% 1.80% 1.80% 1.80% 1.90% 1.90% 1.80% 27-Nov-13JPM Asia Pacific Income A (irc) - NZD (hedged)# 1.80% 1.80% 1.80% 1.80% 1.90% 1.90% 1.80% 27-Nov-13JPM Asia Pacific Income A (irc) - RMB (hedged)# 1.80% 1.80% 1.80% 1.80% 1.90% 1.90% 1.80% 17-Mar-14JPM Asia Pacific Income A (mth) - HKD# 1.78% 1.78% 1.78% 1.78% 1.90% 1.90% 1.80% 25-May-12JPM Asia Pacific Income A (mth) - SGD# 1.80% 1.80% 1.80% 1.80% 1.90% 1.90% 1.80% 19-Sep-12JPM Asia Pacific Income A (mth) - SGD (hedged)# 1.79% 1.79% 1.79% 1.79% 1.90% 1.90% 1.80% 14-Mar-13JPM Asia Pacific Income A (mth) - USD# 1.78% 1.78% 1.78% 1.78% 1.90% 1.90% 1.80% 25-May-12JPM Asia Pacific Income C (acc) - HKD# 0.95% 0.95% 0.95% 0.95% - - 0.95% 21-Sep-15JPM Asia Pacific Income C (acc) - USD^# 0.95% 0.95% 0.95% 0.95% 1.00% 1.15% 0.95% 10-Sep-07JPM Asia Pacific Income C (dist) - USD# 0.95% 0.95% 0.95% 0.95% 1.00% 1.00% 0.95% 26-Sep-12JPM Asia Pacific Income C (irc) - AUD (hedged)# 0.95% 0.95% 0.95% 0.95% - - 0.95% 25-Sep-15JPM Asia Pacific Income C (irc) - CAD (hedged)# 0.95% 0.95% 0.95% 0.95% - - 0.95% 25-Sep-15JPM Asia Pacific Income C (irc) - EUR (hedged)# 0.95% 0.95% 0.95% 0.95% - - 0.95% 25-Sep-15JPM Asia Pacific Income C (irc) - GBP (hedged)# 0.95% 0.95% 0.95% 0.95% - - 0.95% 25-Sep-15JPM Asia Pacific Income C (irc) - NZD (hedged)# 0.95% 0.95% 0.95% 0.95% - - 0.95% 25-Sep-15JPM Asia Pacific Income C (irc) - RMB (hedged)# 0.95% 0.95% 0.95% 0.95% - - 0.95% 25-Sep-15JPM Asia Pacific Income C (mth) - HKD# 0.95% 0.95% 0.95% 0.95% - - 0.95% 05-Oct-15JPM Asia Pacific Income C (mth) - SGD# 0.95% 0.95% 0.95% 0.95% - - 0.95% 05-Oct-15JPM Asia Pacific Income C (mth) - SGD (hedged)# 0.95% 0.95% 0.95% 0.95% - - 0.95% 05-Oct-15JPM Asia Pacific Income C (mth) - USD^# 0.95% 0.95% 0.95% 0.95% 1.00% 1.15% 0.95% 05-Jul-12JPM Asia Pacific Income D (acc) - USD# 2.24% 2.24% 2.24% 2.24% 2.35% 2.35% 2.25% 22-Jun-01JPM Asia Pacific Income D (mth) - USD# 2.25% 2.25% 2.25% 2.25% 2.35% 2.35% 2.25% 05-Jul-12JPM Asia Pacific Income I (acc) - USD# 0.77% 0.77% 0.77% 0.77% 0.96% - 0.91% 05-Jun-15JPM Asia Pacific Income X (acc) - USD# 0.14% 0.14% 0.14% 0.14% 0.13% 0.09% 0.15% 04-Feb-13
JPMorgan Funds - Asian Total Return Bond Fund (3)JPM Asian Total Return Bond A (acc) - USD 1.30% 1.30% 1.30% 1.30% - - 1.30% 31-Mar-16JPM Asian Total Return Bond A (mth) - USD 1.30% 1.30% 1.30% 1.30% - - 1.30% 31-Mar-16
JPMorgan Funds - Brazil Equity FundJPM Brazil Equity A (acc) - EUR 1.80% 1.80% 1.80% 1.80% 1.90% 1.90% 1.80% 28-Mar-11JPM Brazil Equity A (acc) - SGD 1.80% 1.80% 1.80% 1.80% 1.90% 1.90% 1.80% 09-Aug-10JPM Brazil Equity A (acc) - USD 1.80% 1.80% 1.80% 1.80% 1.90% 1.90% 1.80% 18-Oct-07JPM Brazil Equity A (dist) - USD 1.80% 1.80% 1.80% 1.80% 1.90% 1.90% 1.80% 24-Nov-09JPM Brazil Equity B (acc) - USD*** - - - - 1.10% 1.15% 1.05% 28-Jan-08JPM Brazil Equity C (acc) - USD 1.05% 1.05% 1.05% 1.05% 1.10% 1.10% 1.05% 19-Mar-08JPM Brazil Equity D (acc) - EUR 2.80% 2.80% 2.80% 2.80% 2.90% 2.90% 2.80% 13-Jul-10JPM Brazil Equity D (acc) - USD 2.80% 2.80% 2.80% 2.80% 2.90% 2.90% 2.80% 18-Oct-07JPM Brazil Equity I (acc) - EUR* - - - - - - 1.01% 18-Jun-10JPM Brazil Equity I (acc) - USD 1.01% 1.01% 1.01% 1.01% 1.02% 1.01% 1.01% 18-Oct-07JPM Brazil Equity T (acc) - EUR 2.80% 2.80% 2.80% 2.80% 2.90% 2.90% 2.80% 21-Feb-11
JPMorgan Funds - China A-Share Opportunities Fund (4)JPM China A-Share Opportunities A (acc) - EUR 1.80% 1.80% 1.80% 1.80% - - 1.80% 11-Sep-15JPM China A-Share Opportunities A (acc) - HKD 1.80% 1.80% 1.80% 1.80% - - 1.80% 11-Sep-15JPM China A-Share Opportunities A (acc) - RMB 1.80% 1.80% 1.80% 1.80% - - 1.80% 11-Sep-15JPM China A-Share Opportunities A (acc) - USD 1.80% 1.80% 1.80% 1.80% - - 1.80% 11-Sep-15JPM China A-Share Opportunities C (acc) - EUR 0.95% 0.95% 0.95% 0.95% - - 0.95% 11-Sep-15JPM China A-Share Opportunities C (acc) - HKD 0.95% 0.95% 0.95% 0.95% - - 0.95% 11-Sep-15JPM China A-Share Opportunities C (acc) - RMB 0.95% 0.95% 0.95% 0.95% - - 0.95% 11-Sep-15JPM China A-Share Opportunities C (acc) - USD 0.95% 0.95% 0.95% 0.95% - - 0.95% 11-Sep-15JPM China A-Share Opportunities C (dist) - USD 0.95% 0.95% 0.95% 0.95% - - 0.95% 11-Sep-15JPM China A-Share Opportunities I (acc) - HKD 0.91% 0.91% 0.91% 0.91% - - 0.91% 11-Sep-15
JPMorgan Funds - China Bond FundJPM China Bond A (acc) - RMB 1.20% 1.20% 1.20% 1.20% 1.20% - 1.20% 01-Jun-15JPM China Bond A (mth) - HKD (hedged) 1.20% 1.20% 1.20% 1.20% 1.20% - 1.20% 01-Jun-15JPM China Bond A (mth) - RMB 1.19% 1.19% 1.19% 1.19% 1.20% - 1.20% 01-Jun-15JPM China Bond A (mth) - USD (hedged) 1.20% 1.20% 1.20% 1.20% 1.20% - 1.20% 01-Jun-15JPM China Bond C (dist) - GBP (hedged) 0.65% 0.65% 0.65% 0.65% 0.65% - 0.65% 01-Jun-15
(3) This Sub-Fund was launched on 31 March 2016.(4) This Sub-Fund was launched on 11 September 2015.
254
JPMorgan FundsAppendix - Unaudited Additional Disclosures (continued)
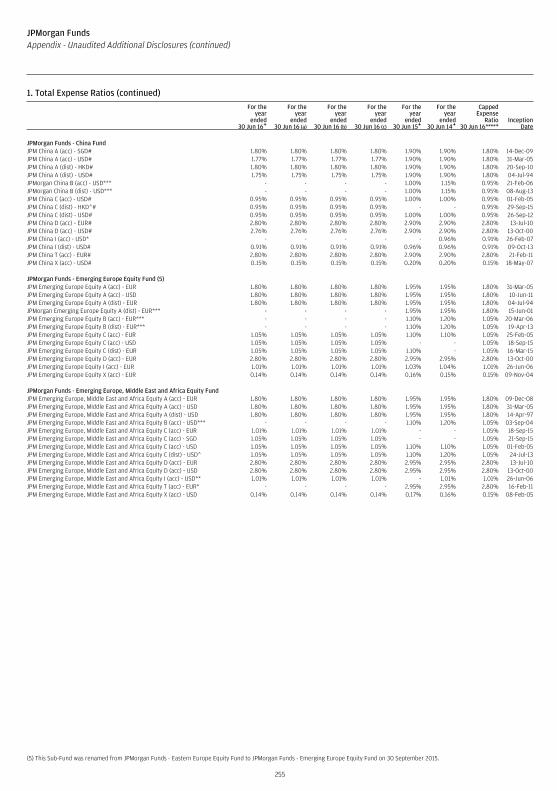
1. Total Expense Ratios (continued)For the
yearended
30 Jun 16+
For theyear
ended30 Jun 16 (a)
For theyear
ended30 Jun 16 (b)
For theyear
ended30 Jun 16 (c)
For theyear
ended30 Jun 15+
For theyear
ended30 Jun 14+
CappedExpense
Ratio30 Jun 16****+
InceptionDate
JPMorgan Funds - China FundJPM China A (acc) - SGD# 1.80% 1.80% 1.80% 1.80% 1.90% 1.90% 1.80% 14-Dec-09JPM China A (acc) - USD# 1.77% 1.77% 1.77% 1.77% 1.90% 1.90% 1.80% 31-Mar-05JPM China A (dist) - HKD# 1.80% 1.80% 1.80% 1.80% 1.90% 1.90% 1.80% 20-Sep-10JPM China A (dist) - USD# 1.75% 1.75% 1.75% 1.75% 1.90% 1.90% 1.80% 04-Jul-94JPMorgan China B (acc) - USD*** - - - - 1.00% 1.15% 0.95% 21-Feb-06JPMorgan China B (dist) - USD*** - - - - 1.00% 1.15% 0.95% 08-Aug-13JPM China C (acc) - USD# 0.95% 0.95% 0.95% 0.95% 1.00% 1.00% 0.95% 01-Feb-05JPM China C (dist) - HKD^# 0.95% 0.95% 0.95% 0.95% - - 0.95% 29-Sep-15JPM China C (dist) - USD# 0.95% 0.95% 0.95% 0.95% 1.00% 1.00% 0.95% 26-Sep-12JPM China D (acc) - EUR# 2.80% 2.80% 2.80% 2.80% 2.90% 2.90% 2.80% 13-Jul-10JPM China D (acc) - USD# 2.76% 2.76% 2.76% 2.76% 2.90% 2.90% 2.80% 13-Oct-00JPM China I (acc) - USD* - - - - - 0.96% 0.91% 26-Feb-07JPM China I (dist) - USD# 0.91% 0.91% 0.91% 0.91% 0.96% 0.96% 0.91% 09-Oct-13JPM China T (acc) - EUR# 2.80% 2.80% 2.80% 2.80% 2.90% 2.90% 2.80% 21-Feb-11JPM China X (acc) - USD# 0.15% 0.15% 0.15% 0.15% 0.20% 0.20% 0.15% 18-May-07
JPMorgan Funds - Emerging Europe Equity Fund (5)JPM Emerging Europe Equity A (acc) - EUR 1.80% 1.80% 1.80% 1.80% 1.95% 1.95% 1.80% 31-Mar-05JPM Emerging Europe Equity A (acc) - USD 1.80% 1.80% 1.80% 1.80% 1.95% 1.95% 1.80% 10-Jun-11JPM Emerging Europe Equity A (dist) - EUR 1.80% 1.80% 1.80% 1.80% 1.95% 1.95% 1.80% 04-Jul-94JPMorgan Emerging Europe Equity A (dist) - EUR*** - - - - 1.95% 1.95% 1.80% 15-Jun-01JPM Emerging Europe Equity B (acc) - EUR*** - - - - 1.10% 1.20% 1.05% 20-Mar-06JPM Emerging Europe Equity B (dist) - EUR*** - - - - 1.10% 1.20% 1.05% 19-Apr-13JPM Emerging Europe Equity C (acc) - EUR 1.05% 1.05% 1.05% 1.05% 1.10% 1.10% 1.05% 25-Feb-05JPM Emerging Europe Equity C (acc) - USD 1.05% 1.05% 1.05% 1.05% - - 1.05% 18-Sep-15JPM Emerging Europe Equity C (dist) - EUR 1.05% 1.05% 1.05% 1.05% 1.10% - 1.05% 16-Mar-15JPM Emerging Europe Equity D (acc) - EUR 2.80% 2.80% 2.80% 2.80% 2.95% 2.95% 2.80% 13-Oct-00JPM Emerging Europe Equity I (acc) - EUR 1.01% 1.01% 1.01% 1.01% 1.03% 1.04% 1.01% 26-Jun-06JPM Emerging Europe Equity X (acc) - EUR 0.14% 0.14% 0.14% 0.14% 0.16% 0.15% 0.15% 09-Nov-04
JPMorgan Funds - Emerging Europe, Middle East and Africa Equity FundJPM Emerging Europe, Middle East and Africa Equity A (acc) - EUR 1.80% 1.80% 1.80% 1.80% 1.95% 1.95% 1.80% 09-Dec-08JPM Emerging Europe, Middle East and Africa Equity A (acc) - USD 1.80% 1.80% 1.80% 1.80% 1.95% 1.95% 1.80% 31-Mar-05JPM Emerging Europe, Middle East and Africa Equity A (dist) - USD 1.80% 1.80% 1.80% 1.80% 1.95% 1.95% 1.80% 14-Apr-97JPM Emerging Europe, Middle East and Africa Equity B (acc) - USD*** - - - - 1.10% 1.20% 1.05% 03-Sep-04JPM Emerging Europe, Middle East and Africa Equity C (acc) - EUR 1.01% 1.01% 1.01% 1.01% - - 1.05% 18-Sep-15JPM Emerging Europe, Middle East and Africa Equity C (acc) - SGD 1.05% 1.05% 1.05% 1.05% - - 1.05% 21-Sep-15JPM Emerging Europe, Middle East and Africa Equity C (acc) - USD 1.05% 1.05% 1.05% 1.05% 1.10% 1.10% 1.05% 01-Feb-05JPM Emerging Europe, Middle East and Africa Equity C (dist) - USD^ 1.05% 1.05% 1.05% 1.05% 1.10% 1.20% 1.05% 24-Jul-13JPM Emerging Europe, Middle East and Africa Equity D (acc) - EUR 2.80% 2.80% 2.80% 2.80% 2.95% 2.95% 2.80% 13-Jul-10JPM Emerging Europe, Middle East and Africa Equity D (acc) - USD 2.80% 2.80% 2.80% 2.80% 2.95% 2.95% 2.80% 13-Oct-00JPM Emerging Europe, Middle East and Africa Equity I (acc) - USD** 1.01% 1.01% 1.01% 1.01% - 1.01% 1.01% 26-Jun-06JPM Emerging Europe, Middle East and Africa Equity T (acc) - EUR* - - - - 2.95% 2.95% 2.80% 16-Feb-11JPM Emerging Europe, Middle East and Africa Equity X (acc) - USD 0.14% 0.14% 0.14% 0.14% 0.17% 0.16% 0.15% 08-Feb-05
(5) This Sub-Fund was renamed from JPMorgan Funds - Eastern Europe Equity Fund to JPMorgan Funds - Emerging Europe Equity Fund on 30 September 2015.
255
JPMorgan FundsAppendix - Unaudited Additional Disclosures (continued)
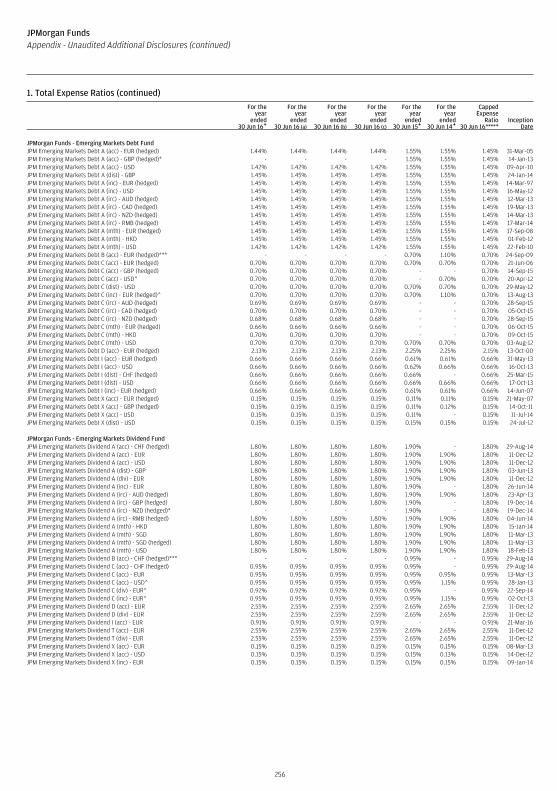
1. Total Expense Ratios (continued)For the
yearended
30 Jun 16+
For theyear
ended30 Jun 16 (a)
For theyear
ended30 Jun 16 (b)
For theyear
ended30 Jun 16 (c)
For theyear
ended30 Jun 15+
For theyear
ended30 Jun 14+
CappedExpense
Ratio30 Jun 16****+
InceptionDate
JPMorgan Funds - Emerging Markets Debt FundJPM Emerging Markets Debt A (acc) - EUR (hedged) 1.44% 1.44% 1.44% 1.44% 1.55% 1.55% 1.45% 31-Mar-05JPM Emerging Markets Debt A (acc) - GBP (hedged)* - - - - 1.55% 1.55% 1.45% 14-Jan-13JPM Emerging Markets Debt A (acc) - USD 1.42% 1.42% 1.42% 1.42% 1.55% 1.55% 1.45% 09-Apr-10JPM Emerging Markets Debt A (dist) - GBP 1.45% 1.45% 1.45% 1.45% 1.55% 1.55% 1.45% 24-Jan-14JPM Emerging Markets Debt A (inc) - EUR (hedged) 1.45% 1.45% 1.45% 1.45% 1.55% 1.55% 1.45% 14-Mar-97JPM Emerging Markets Debt A (inc) - USD 1.45% 1.45% 1.45% 1.45% 1.55% 1.55% 1.45% 16-May-12JPM Emerging Markets Debt A (irc) - AUD (hedged) 1.45% 1.45% 1.45% 1.45% 1.55% 1.55% 1.45% 12-Mar-13JPM Emerging Markets Debt A (irc) - CAD (hedged) 1.45% 1.45% 1.45% 1.45% 1.55% 1.55% 1.45% 19-Mar-13JPM Emerging Markets Debt A (irc) - NZD (hedged) 1.45% 1.45% 1.45% 1.45% 1.55% 1.55% 1.45% 14-Mar-13JPM Emerging Markets Debt A (irc) - RMB (hedged) 1.45% 1.45% 1.45% 1.45% 1.55% 1.55% 1.45% 17-Mar-14JPM Emerging Markets Debt A (mth) - EUR (hedged) 1.45% 1.45% 1.45% 1.45% 1.55% 1.55% 1.45% 17-Sep-08JPM Emerging Markets Debt A (mth) - HKD 1.45% 1.45% 1.45% 1.45% 1.55% 1.55% 1.45% 01-Feb-12JPM Emerging Markets Debt A (mth) - USD 1.42% 1.42% 1.42% 1.42% 1.55% 1.55% 1.45% 22-Feb-10JPM Emerging Markets Debt B (acc) - EUR (hedged)*** - - - - 0.70% 1.10% 0.70% 24-Sep-09JPM Emerging Markets Debt C (acc) - EUR (hedged) 0.70% 0.70% 0.70% 0.70% 0.70% 0.70% 0.70% 21-Jun-06JPM Emerging Markets Debt C (acc) - GBP (hedged) 0.70% 0.70% 0.70% 0.70% - - 0.70% 14-Sep-15JPM Emerging Markets Debt C (acc) - USD^ 0.70% 0.70% 0.70% 0.70% - 0.70% 0.70% 20-Apr-12JPM Emerging Markets Debt C (dist) - USD 0.70% 0.70% 0.70% 0.70% 0.70% 0.70% 0.70% 29-May-12JPM Emerging Markets Debt C (inc) - EUR (hedged)^ 0.70% 0.70% 0.70% 0.70% 0.70% 1.10% 0.70% 13-Aug-13JPM Emerging Markets Debt C (irc) - AUD (hedged) 0.69% 0.69% 0.69% 0.69% - - 0.70% 28-Sep-15JPM Emerging Markets Debt C (irc) - CAD (hedged) 0.70% 0.70% 0.70% 0.70% - - 0.70% 05-Oct-15JPM Emerging Markets Debt C (irc) - NZD (hedged) 0.68% 0.68% 0.68% 0.68% - - 0.70% 28-Sep-15JPM Emerging Markets Debt C (mth) - EUR (hedged) 0.66% 0.66% 0.66% 0.66% - - 0.70% 06-Oct-15JPM Emerging Markets Debt C (mth) - HKD 0.70% 0.70% 0.70% 0.70% - - 0.70% 09-Oct-15JPM Emerging Markets Debt C (mth) - USD 0.70% 0.70% 0.70% 0.70% 0.70% 0.70% 0.70% 03-Aug-12JPM Emerging Markets Debt D (acc) - EUR (hedged) 2.13% 2.13% 2.13% 2.13% 2.25% 2.25% 2.15% 13-Oct-00JPM Emerging Markets Debt I (acc) - EUR (hedged) 0.66% 0.66% 0.66% 0.66% 0.61% 0.61% 0.66% 31-May-13JPM Emerging Markets Debt I (acc) - USD 0.66% 0.66% 0.66% 0.66% 0.62% 0.66% 0.66% 16-Oct-13JPM Emerging Markets Debt I (dist) - CHF (hedged) 0.66% 0.66% 0.66% 0.66% 0.66% - 0.66% 25-Mar-15JPM Emerging Markets Debt I (dist) - USD 0.66% 0.66% 0.66% 0.66% 0.66% 0.66% 0.66% 17-Oct-13JPM Emerging Markets Debt I (inc) - EUR (hedged) 0.66% 0.66% 0.66% 0.66% 0.61% 0.61% 0.66% 14-Jun-07JPM Emerging Markets Debt X (acc) - EUR (hedged) 0.15% 0.15% 0.15% 0.15% 0.11% 0.11% 0.15% 21-May-07JPM Emerging Markets Debt X (acc) - GBP (hedged) 0.15% 0.15% 0.15% 0.15% 0.11% 0.12% 0.15% 14-Oct-11JPM Emerging Markets Debt X (acc) - USD 0.15% 0.15% 0.15% 0.15% 0.11% - 0.15% 11-Jul-14JPM Emerging Markets Debt X (dist) - USD 0.15% 0.15% 0.15% 0.15% 0.15% 0.15% 0.15% 24-Jul-12
JPMorgan Funds - Emerging Markets Dividend FundJPM Emerging Markets Dividend A (acc) - CHF (hedged) 1.80% 1.80% 1.80% 1.80% 1.90% - 1.80% 29-Aug-14JPM Emerging Markets Dividend A (acc) - EUR 1.80% 1.80% 1.80% 1.80% 1.90% 1.90% 1.80% 11-Dec-12JPM Emerging Markets Dividend A (acc) - USD 1.80% 1.80% 1.80% 1.80% 1.90% 1.90% 1.80% 11-Dec-12JPM Emerging Markets Dividend A (dist) - GBP 1.80% 1.80% 1.80% 1.80% 1.90% 1.90% 1.80% 03-Jun-13JPM Emerging Markets Dividend A (div) - EUR 1.80% 1.80% 1.80% 1.80% 1.90% 1.90% 1.80% 11-Dec-12JPM Emerging Markets Dividend A (inc) - EUR 1.80% 1.80% 1.80% 1.80% 1.90% - 1.80% 26-Jun-14JPM Emerging Markets Dividend A (irc) - AUD (hedged) 1.80% 1.80% 1.80% 1.80% 1.90% 1.90% 1.80% 23-Apr-13JPM Emerging Markets Dividend A (irc) - GBP (hedged) 1.80% 1.80% 1.80% 1.80% 1.90% - 1.80% 19-Dec-14JPM Emerging Markets Dividend A (irc) - NZD (hedged)* - - - - 1.90% - 1.80% 19-Dec-14JPM Emerging Markets Dividend A (irc) - RMB (hedged) 1.80% 1.80% 1.80% 1.80% 1.90% 1.90% 1.80% 04-Jun-14JPM Emerging Markets Dividend A (mth) - HKD 1.80% 1.80% 1.80% 1.80% 1.90% 1.90% 1.80% 15-Jan-14JPM Emerging Markets Dividend A (mth) - SGD 1.80% 1.80% 1.80% 1.80% 1.90% 1.90% 1.80% 11-Mar-13JPM Emerging Markets Dividend A (mth) - SGD (hedged) 1.80% 1.80% 1.80% 1.80% 1.90% 1.90% 1.80% 11-Mar-13JPM Emerging Markets Dividend A (mth) - USD 1.80% 1.80% 1.80% 1.80% 1.90% 1.90% 1.80% 18-Feb-13JPM Emerging Markets Dividend B (acc) - CHF (hedged)*** - - - - 0.95% - 0.95% 29-Aug-14JPM Emerging Markets Dividend C (acc) - CHF (hedged) 0.95% 0.95% 0.95% 0.95% 0.95% - 0.95% 29-Aug-14JPM Emerging Markets Dividend C (acc) - EUR 0.95% 0.95% 0.95% 0.95% 0.95% 0.95% 0.95% 13-Mar-13JPM Emerging Markets Dividend C (acc) - USD^ 0.95% 0.95% 0.95% 0.95% 0.95% 1.15% 0.95% 28-Jan-13JPM Emerging Markets Dividend C (div) - EUR^ 0.92% 0.92% 0.92% 0.92% 0.95% - 0.95% 22-Sep-14JPM Emerging Markets Dividend C (inc) - EUR^ 0.95% 0.95% 0.95% 0.95% 0.95% 1.15% 0.95% 02-Oct-13JPM Emerging Markets Dividend D (acc) - EUR 2.55% 2.55% 2.55% 2.55% 2.65% 2.65% 2.55% 11-Dec-12JPM Emerging Markets Dividend D (div) - EUR 2.55% 2.55% 2.55% 2.55% 2.65% 2.65% 2.55% 11-Dec-12JPM Emerging Markets Dividend I (acc) - EUR 0.91% 0.91% 0.91% 0.91% - - 0.91% 21-Mar-16JPM Emerging Markets Dividend T (acc) - EUR 2.55% 2.55% 2.55% 2.55% 2.65% 2.65% 2.55% 11-Dec-12JPM Emerging Markets Dividend T (div) - EUR 2.55% 2.55% 2.55% 2.55% 2.65% 2.65% 2.55% 11-Dec-12JPM Emerging Markets Dividend X (acc) - EUR 0.15% 0.15% 0.15% 0.15% 0.15% 0.15% 0.15% 08-Mar-13JPM Emerging Markets Dividend X (acc) - USD 0.15% 0.15% 0.15% 0.15% 0.15% 0.13% 0.15% 14-Dec-12JPM Emerging Markets Dividend X (inc) - EUR 0.15% 0.15% 0.15% 0.15% 0.15% 0.15% 0.15% 09-Jan-14
256
JPMorgan FundsAppendix - Unaudited Additional Disclosures (continued)
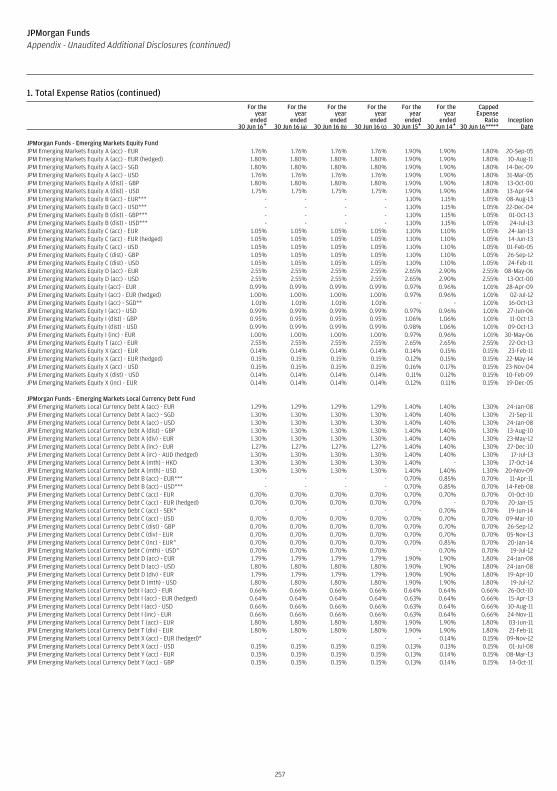
1. Total Expense Ratios (continued)For the
yearended
30 Jun 16+
For theyear
ended30 Jun 16 (a)
For theyear
ended30 Jun 16 (b)
For theyear
ended30 Jun 16 (c)
For theyear
ended30 Jun 15+
For theyear
ended30 Jun 14+
CappedExpense
Ratio30 Jun 16****+
InceptionDate
JPMorgan Funds - Emerging Markets Equity FundJPM Emerging Markets Equity A (acc) - EUR 1.76% 1.76% 1.76% 1.76% 1.90% 1.90% 1.80% 20-Sep-05JPM Emerging Markets Equity A (acc) - EUR (hedged) 1.80% 1.80% 1.80% 1.80% 1.90% 1.90% 1.80% 10-Aug-11JPM Emerging Markets Equity A (acc) - SGD 1.80% 1.80% 1.80% 1.80% 1.90% 1.90% 1.80% 14-Dec-09JPM Emerging Markets Equity A (acc) - USD 1.76% 1.76% 1.76% 1.76% 1.90% 1.90% 1.80% 31-Mar-05JPM Emerging Markets Equity A (dist) - GBP 1.80% 1.80% 1.80% 1.80% 1.90% 1.90% 1.80% 13-Oct-00JPM Emerging Markets Equity A (dist) - USD 1.75% 1.75% 1.75% 1.75% 1.90% 1.90% 1.80% 13-Apr-94JPM Emerging Markets Equity B (acc) - EUR*** - - - - 1.10% 1.15% 1.05% 08-Aug-13JPM Emerging Markets Equity B (acc) - USD*** - - - - 1.10% 1.15% 1.05% 22-Dec-04JPM Emerging Markets Equity B (dist) - GBP*** - - - - 1.10% 1.15% 1.05% 01-Oct-13JPM Emerging Markets Equity B (dist) - USD*** - - - - 1.10% 1.15% 1.05% 24-Jul-13JPM Emerging Markets Equity C (acc) - EUR 1.05% 1.05% 1.05% 1.05% 1.10% 1.10% 1.05% 24-Jan-13JPM Emerging Markets Equity C (acc) - EUR (hedged) 1.05% 1.05% 1.05% 1.05% 1.10% 1.10% 1.05% 14-Jun-13JPM Emerging Markets Equity C (acc) - USD 1.05% 1.05% 1.05% 1.05% 1.10% 1.10% 1.05% 01-Feb-05JPM Emerging Markets Equity C (dist) - GBP 1.05% 1.05% 1.05% 1.05% 1.10% 1.10% 1.05% 26-Sep-12JPM Emerging Markets Equity C (dist) - USD 1.05% 1.05% 1.05% 1.05% 1.10% 1.10% 1.05% 24-Feb-11JPM Emerging Markets Equity D (acc) - EUR 2.55% 2.55% 2.55% 2.55% 2.65% 2.90% 2.55% 08-May-06JPM Emerging Markets Equity D (acc) - USD 2.55% 2.55% 2.55% 2.55% 2.65% 2.90% 2.55% 13-Oct-00JPM Emerging Markets Equity I (acc) - EUR 0.99% 0.99% 0.99% 0.99% 0.97% 0.96% 1.01% 28-Apr-09JPM Emerging Markets Equity I (acc) - EUR (hedged) 1.00% 1.00% 1.00% 1.00% 0.97% 0.96% 1.01% 02-Jul-12JPM Emerging Markets Equity I (acc) - SGD** 1.01% 1.01% 1.01% 1.01% - - 1.01% 16-Oct-13JPM Emerging Markets Equity I (acc) - USD 0.99% 0.99% 0.99% 0.99% 0.97% 0.96% 1.01% 27-Jun-06JPM Emerging Markets Equity I (dist) - GBP 0.95% 0.95% 0.95% 0.95% 1.06% 1.06% 1.01% 11-Oct-13JPM Emerging Markets Equity I (dist) - USD 0.99% 0.99% 0.99% 0.99% 0.98% 1.06% 1.01% 09-Oct-13JPM Emerging Markets Equity I (inc) - EUR 1.00% 1.00% 1.00% 1.00% 0.97% 0.96% 1.01% 30-May-06JPM Emerging Markets Equity T (acc) - EUR 2.55% 2.55% 2.55% 2.55% 2.65% 2.65% 2.55% 22-Oct-13JPM Emerging Markets Equity X (acc) - EUR 0.14% 0.14% 0.14% 0.14% 0.14% 0.15% 0.15% 23-Feb-11JPM Emerging Markets Equity X (acc) - EUR (hedged) 0.15% 0.15% 0.15% 0.15% 0.12% 0.15% 0.15% 22-May-14JPM Emerging Markets Equity X (acc) - USD 0.15% 0.15% 0.15% 0.15% 0.16% 0.17% 0.15% 23-Nov-04JPM Emerging Markets Equity X (dist) - USD 0.14% 0.14% 0.14% 0.14% 0.11% 0.12% 0.15% 10-Feb-09JPM Emerging Markets Equity X (inc) - EUR 0.14% 0.14% 0.14% 0.14% 0.12% 0.11% 0.15% 19-Dec-05
JPMorgan Funds - Emerging Markets Local Currency Debt FundJPM Emerging Markets Local Currency Debt A (acc) - EUR 1.29% 1.29% 1.29% 1.29% 1.40% 1.40% 1.30% 24-Jan-08JPM Emerging Markets Local Currency Debt A (acc) - SGD 1.30% 1.30% 1.30% 1.30% 1.40% 1.40% 1.30% 21-Sep-11JPM Emerging Markets Local Currency Debt A (acc) - USD 1.30% 1.30% 1.30% 1.30% 1.40% 1.40% 1.30% 24-Jan-08JPM Emerging Markets Local Currency Debt A (dist) - GBP 1.30% 1.30% 1.30% 1.30% 1.40% 1.40% 1.30% 13-Aug-10JPM Emerging Markets Local Currency Debt A (div) - EUR 1.30% 1.30% 1.30% 1.30% 1.40% 1.40% 1.30% 23-May-12JPM Emerging Markets Local Currency Debt A (inc) - EUR 1.27% 1.27% 1.27% 1.27% 1.40% 1.40% 1.30% 27-Dec-10JPM Emerging Markets Local Currency Debt A (irc) - AUD (hedged) 1.30% 1.30% 1.30% 1.30% 1.40% 1.40% 1.30% 17-Jul-13JPM Emerging Markets Local Currency Debt A (mth) - HKD 1.30% 1.30% 1.30% 1.30% 1.40% - 1.30% 17-Oct-14JPM Emerging Markets Local Currency Debt A (mth) - USD 1.30% 1.30% 1.30% 1.30% 1.40% 1.40% 1.30% 20-Nov-09JPM Emerging Markets Local Currency Debt B (acc) - EUR*** - - - - 0.70% 0.85% 0.70% 11-Apr-11JPM Emerging Markets Local Currency Debt B (acc) - USD*** - - - - 0.70% 0.85% 0.70% 14-Feb-08JPM Emerging Markets Local Currency Debt C (acc) - EUR 0.70% 0.70% 0.70% 0.70% 0.70% 0.70% 0.70% 01-Oct-10JPM Emerging Markets Local Currency Debt C (acc) - EUR (hedged) 0.70% 0.70% 0.70% 0.70% 0.70% - 0.70% 20-Jan-15JPM Emerging Markets Local Currency Debt C (acc) - SEK* - - - - - 0.70% 0.70% 19-Jun-14JPM Emerging Markets Local Currency Debt C (acc) - USD 0.70% 0.70% 0.70% 0.70% 0.70% 0.70% 0.70% 09-Mar-10JPM Emerging Markets Local Currency Debt C (dist) - GBP 0.70% 0.70% 0.70% 0.70% 0.70% 0.70% 0.70% 26-Sep-12JPM Emerging Markets Local Currency Debt C (div) - EUR 0.70% 0.70% 0.70% 0.70% 0.70% 0.70% 0.70% 05-Nov-13JPM Emerging Markets Local Currency Debt C (inc) - EUR^ 0.70% 0.70% 0.70% 0.70% 0.70% 0.85% 0.70% 20-Jan-14JPM Emerging Markets Local Currency Debt C (mth) - USD^ 0.70% 0.70% 0.70% 0.70% - 0.70% 0.70% 19-Jul-12JPM Emerging Markets Local Currency Debt D (acc) - EUR 1.79% 1.79% 1.79% 1.79% 1.90% 1.90% 1.80% 24-Jan-08JPM Emerging Markets Local Currency Debt D (acc) - USD 1.80% 1.80% 1.80% 1.80% 1.90% 1.90% 1.80% 24-Jan-08JPM Emerging Markets Local Currency Debt D (div) - EUR 1.79% 1.79% 1.79% 1.79% 1.90% 1.90% 1.80% 19-Apr-10JPM Emerging Markets Local Currency Debt D (mth) - USD 1.80% 1.80% 1.80% 1.80% 1.90% 1.90% 1.80% 19-Jul-12JPM Emerging Markets Local Currency Debt I (acc) - EUR 0.66% 0.66% 0.66% 0.66% 0.64% 0.64% 0.66% 26-Oct-10JPM Emerging Markets Local Currency Debt I (acc) - EUR (hedged) 0.64% 0.64% 0.64% 0.64% 0.63% 0.64% 0.66% 15-Apr-13JPM Emerging Markets Local Currency Debt I (acc) - USD 0.66% 0.66% 0.66% 0.66% 0.63% 0.64% 0.66% 10-Aug-11JPM Emerging Markets Local Currency Debt I (inc) - EUR 0.66% 0.66% 0.66% 0.66% 0.63% 0.64% 0.66% 24-Nov-11JPM Emerging Markets Local Currency Debt T (acc) - EUR 1.80% 1.80% 1.80% 1.80% 1.90% 1.90% 1.80% 03-Jun-11JPM Emerging Markets Local Currency Debt T (div) - EUR 1.80% 1.80% 1.80% 1.80% 1.90% 1.90% 1.80% 21-Feb-11JPM Emerging Markets Local Currency Debt X (acc) - EUR (hedged)* - - - - - 0.14% 0.15% 09-Nov-12JPM Emerging Markets Local Currency Debt X (acc) - USD 0.15% 0.15% 0.15% 0.15% 0.13% 0.13% 0.15% 01-Jul-08JPM Emerging Markets Local Currency Debt Y (acc) - EUR 0.15% 0.15% 0.15% 0.15% 0.13% 0.14% 0.15% 08-Mar-13JPM Emerging Markets Local Currency Debt Y (acc) - GBP 0.15% 0.15% 0.15% 0.15% 0.13% 0.14% 0.15% 14-Oct-11
257
JPMorgan FundsAppendix - Unaudited Additional Disclosures (continued)
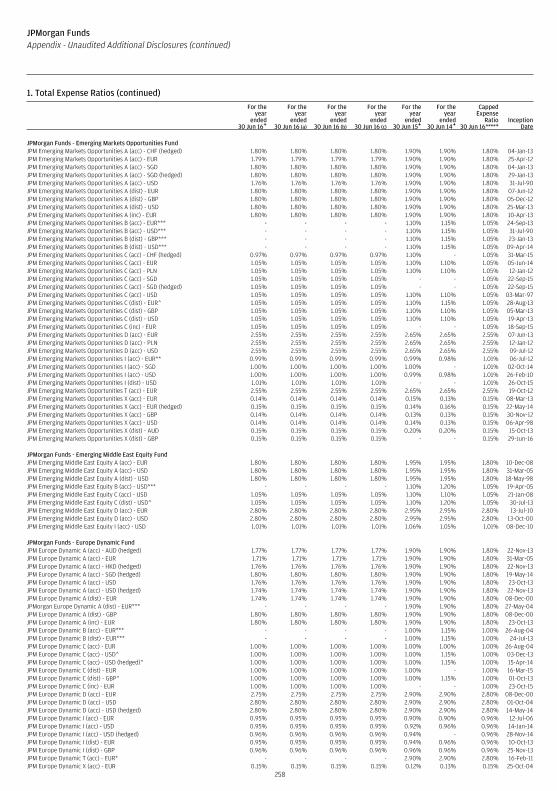
1. Total Expense Ratios (continued)For the
yearended
30 Jun 16+
For theyear
ended30 Jun 16 (a)
For theyear
ended30 Jun 16 (b)
For theyear
ended30 Jun 16 (c)
For theyear
ended30 Jun 15+
For theyear
ended30 Jun 14+
CappedExpense
Ratio30 Jun 16****+
InceptionDate
JPMorgan Funds - Emerging Markets Opportunities FundJPM Emerging Markets Opportunities A (acc) - CHF (hedged) 1.80% 1.80% 1.80% 1.80% 1.90% 1.90% 1.80% 04-Jan-13JPM Emerging Markets Opportunities A (acc) - EUR 1.79% 1.79% 1.79% 1.79% 1.90% 1.90% 1.80% 25-Apr-12JPM Emerging Markets Opportunities A (acc) - SGD 1.80% 1.80% 1.80% 1.80% 1.90% 1.90% 1.80% 04-Jan-13JPM Emerging Markets Opportunities A (acc) - SGD (hedged) 1.80% 1.80% 1.80% 1.80% 1.90% 1.90% 1.80% 29-Jan-13JPM Emerging Markets Opportunities A (acc) - USD 1.76% 1.76% 1.76% 1.76% 1.90% 1.90% 1.80% 31-Jul-90JPM Emerging Markets Opportunities A (dist) - EUR 1.80% 1.80% 1.80% 1.80% 1.90% 1.90% 1.80% 07-Jun-12JPM Emerging Markets Opportunities A (dist) - GBP 1.80% 1.80% 1.80% 1.80% 1.90% 1.90% 1.80% 05-Dec-12JPM Emerging Markets Opportunities A (dist) - USD 1.80% 1.80% 1.80% 1.80% 1.90% 1.90% 1.80% 25-Mar-13JPM Emerging Markets Opportunities A (inc) - EUR 1.80% 1.80% 1.80% 1.80% 1.90% 1.90% 1.80% 10-Apr-13JPM Emerging Markets Opportunities B (acc) - EUR*** - - - - 1.10% 1.15% 1.05% 24-Sep-13JPM Emerging Markets Opportunities B (acc) - USD*** - - - - 1.10% 1.15% 1.05% 31-Jul-90JPM Emerging Markets Opportunities B (dist) - GBP*** - - - - 1.10% 1.15% 1.05% 23-Jan-13JPM Emerging Markets Opportunities B (dist) - USD*** - - - - 1.10% 1.15% 1.05% 09-Apr-14JPM Emerging Markets Opportunities C (acc) - CHF (hedged) 0.97% 0.97% 0.97% 0.97% 1.10% - 1.05% 31-Mar-15JPM Emerging Markets Opportunities C (acc) - EUR 1.05% 1.05% 1.05% 1.05% 1.10% 1.10% 1.05% 05-Jun-14JPM Emerging Markets Opportunities C (acc) - PLN 1.05% 1.05% 1.05% 1.05% 1.10% 1.10% 1.05% 12-Jan-12JPM Emerging Markets Opportunities C (acc) - SGD 1.05% 1.05% 1.05% 1.05% - - 1.05% 22-Sep-15JPM Emerging Markets Opportunities C (acc) - SGD (hedged) 1.05% 1.05% 1.05% 1.05% - - 1.05% 22-Sep-15JPM Emerging Markets Opportunities C (acc) - USD 1.05% 1.05% 1.05% 1.05% 1.10% 1.10% 1.05% 03-Mar-97JPM Emerging Markets Opportunities C (dist) - EUR^ 1.05% 1.05% 1.05% 1.05% 1.10% 1.15% 1.05% 28-Aug-13JPM Emerging Markets Opportunities C (dist) - GBP 1.05% 1.05% 1.05% 1.05% 1.10% 1.10% 1.05% 05-Mar-13JPM Emerging Markets Opportunities C (dist) - USD 1.05% 1.05% 1.05% 1.05% 1.10% 1.10% 1.05% 19-Apr-13JPM Emerging Markets Opportunities C (inc) - EUR 1.05% 1.05% 1.05% 1.05% - - 1.05% 18-Sep-15JPM Emerging Markets Opportunities D (acc) - EUR 2.55% 2.55% 2.55% 2.55% 2.65% 2.65% 2.55% 07-Jun-13JPM Emerging Markets Opportunities D (acc) - PLN 2.55% 2.55% 2.55% 2.55% 2.65% 2.65% 2.55% 12-Jan-12JPM Emerging Markets Opportunities D (acc) - USD 2.55% 2.55% 2.55% 2.55% 2.65% 2.65% 2.55% 09-Jul-12JPM Emerging Markets Opportunities I (acc) - EUR** 0.99% 0.99% 0.99% 0.99% 0.99% 0.98% 1.01% 06-Jul-12JPM Emerging Markets Opportunities I (acc) - SGD 1.00% 1.00% 1.00% 1.00% 1.00% - 1.01% 02-Oct-14JPM Emerging Markets Opportunities I (acc) - USD 1.00% 1.00% 1.00% 1.00% 0.99% 0.98% 1.01% 26-Feb-10JPM Emerging Markets Opportunities I (dist) - USD 1.01% 1.01% 1.01% 1.01% - - 1.01% 26-Oct-15JPM Emerging Markets Opportunities T (acc) - EUR 2.55% 2.55% 2.55% 2.55% 2.65% 2.65% 2.55% 19-Oct-12JPM Emerging Markets Opportunities X (acc) - EUR 0.14% 0.14% 0.14% 0.14% 0.15% 0.13% 0.15% 08-Mar-13JPM Emerging Markets Opportunities X (acc) - EUR (hedged) 0.15% 0.15% 0.15% 0.15% 0.14% 0.16% 0.15% 22-May-14JPM Emerging Markets Opportunities X (acc) - GBP 0.14% 0.14% 0.14% 0.14% 0.13% 0.13% 0.15% 30-Nov-12JPM Emerging Markets Opportunities X (acc) - USD 0.14% 0.14% 0.14% 0.14% 0.14% 0.13% 0.15% 06-Apr-98JPM Emerging Markets Opportunities X (dist) - AUD 0.15% 0.15% 0.15% 0.15% 0.20% 0.20% 0.15% 15-Oct-13JPM Emerging Markets Opportunities X (dist) - GBP 0.15% 0.15% 0.15% 0.15% - - 0.15% 29-Jun-16
JPMorgan Funds - Emerging Middle East Equity FundJPM Emerging Middle East Equity A (acc) - EUR 1.80% 1.80% 1.80% 1.80% 1.95% 1.95% 1.80% 10-Dec-08JPM Emerging Middle East Equity A (acc) - USD 1.80% 1.80% 1.80% 1.80% 1.95% 1.95% 1.80% 31-Mar-05JPM Emerging Middle East Equity A (dist) - USD 1.80% 1.80% 1.80% 1.80% 1.95% 1.95% 1.80% 18-May-98JPM Emerging Middle East Equity B (acc) - USD*** - - - - 1.10% 1.20% 1.05% 19-Apr-05JPM Emerging Middle East Equity C (acc) - USD 1.05% 1.05% 1.05% 1.05% 1.10% 1.10% 1.05% 21-Jan-08JPM Emerging Middle East Equity C (dist) - USD^ 1.05% 1.05% 1.05% 1.05% 1.10% 1.20% 1.05% 30-Jul-13JPM Emerging Middle East Equity D (acc) - EUR 2.80% 2.80% 2.80% 2.80% 2.95% 2.95% 2.80% 13-Jul-10JPM Emerging Middle East Equity D (acc) - USD 2.80% 2.80% 2.80% 2.80% 2.95% 2.95% 2.80% 13-Oct-00JPM Emerging Middle East Equity I (acc) - USD 1.01% 1.01% 1.01% 1.01% 1.06% 1.05% 1.01% 08-Dec-10
JPMorgan Funds - Europe Dynamic FundJPM Europe Dynamic A (acc) - AUD (hedged) 1.77% 1.77% 1.77% 1.77% 1.90% 1.90% 1.80% 22-Nov-13JPM Europe Dynamic A (acc) - EUR 1.71% 1.71% 1.71% 1.71% 1.90% 1.90% 1.80% 31-Mar-05JPM Europe Dynamic A (acc) - HKD (hedged) 1.76% 1.76% 1.76% 1.76% 1.90% 1.90% 1.80% 22-Nov-13JPM Europe Dynamic A (acc) - SGD (hedged) 1.80% 1.80% 1.80% 1.80% 1.90% 1.90% 1.80% 19-May-14JPM Europe Dynamic A (acc) - USD 1.76% 1.76% 1.76% 1.76% 1.90% 1.90% 1.80% 23-Oct-13JPM Europe Dynamic A (acc) - USD (hedged) 1.74% 1.74% 1.74% 1.74% 1.90% 1.90% 1.80% 22-Nov-13JPM Europe Dynamic A (dist) - EUR 1.74% 1.74% 1.74% 1.74% 1.90% 1.90% 1.80% 08-Dec-00JPMorgan Europe Dynamic A (dist) - EUR*** - - - - 1.90% 1.90% 1.80% 27-May-04JPM Europe Dynamic A (dist) - GBP 1.80% 1.80% 1.80% 1.80% 1.90% 1.90% 1.80% 08-Dec-00JPM Europe Dynamic A (inc) - EUR 1.80% 1.80% 1.80% 1.80% 1.90% 1.90% 1.80% 23-Oct-13JPM Europe Dynamic B (acc) - EUR*** - - - - 1.00% 1.15% 1.00% 26-Aug-04JPM Europe Dynamic B (dist) - EUR*** - - - - 1.00% 1.15% 1.00% 24-Jul-13JPM Europe Dynamic C (acc) - EUR 1.00% 1.00% 1.00% 1.00% 1.00% 1.00% 1.00% 26-Aug-04JPM Europe Dynamic C (acc) - USD^ 1.00% 1.00% 1.00% 1.00% 1.00% 1.15% 1.00% 03-Dec-13JPM Europe Dynamic C (acc) - USD (hedged)^ 1.00% 1.00% 1.00% 1.00% 1.00% 1.15% 1.00% 15-Apr-14JPM Europe Dynamic C (dist) - EUR 1.00% 1.00% 1.00% 1.00% 1.00% - 1.00% 16-Mar-15JPM Europe Dynamic C (dist) - GBP^ 1.00% 1.00% 1.00% 1.00% 1.00% 1.15% 1.00% 01-Oct-13JPM Europe Dynamic C (inc) - EUR 1.00% 1.00% 1.00% 1.00% - - 1.00% 23-Oct-15JPM Europe Dynamic D (acc) - EUR 2.75% 2.75% 2.75% 2.75% 2.90% 2.90% 2.80% 08-Dec-00JPM Europe Dynamic D (acc) - USD 2.80% 2.80% 2.80% 2.80% 2.90% 2.90% 2.80% 01-Oct-04JPM Europe Dynamic D (acc) - USD (hedged) 2.80% 2.80% 2.80% 2.80% 2.90% 2.90% 2.80% 14-May-14JPM Europe Dynamic I (acc) - EUR 0.95% 0.95% 0.95% 0.95% 0.90% 0.90% 0.96% 12-Jul-06JPM Europe Dynamic I (acc) - USD 0.95% 0.95% 0.95% 0.95% 0.92% 0.96% 0.96% 14-Jan-14JPM Europe Dynamic I (acc) - USD (hedged) 0.96% 0.96% 0.96% 0.96% 0.94% - 0.96% 28-Nov-14JPM Europe Dynamic I (dist) - EUR 0.95% 0.95% 0.95% 0.95% 0.94% 0.96% 0.96% 10-Oct-13JPM Europe Dynamic I (dist) - GBP 0.96% 0.96% 0.96% 0.96% 0.96% 0.96% 0.96% 25-Nov-13JPM Europe Dynamic T (acc) - EUR* - - - - 2.90% 2.90% 2.80% 16-Feb-11JPM Europe Dynamic X (acc) - EUR 0.15% 0.15% 0.15% 0.15% 0.12% 0.13% 0.15% 25-Oct-04
258
JPMorgan FundsAppendix - Unaudited Additional Disclosures (continued)
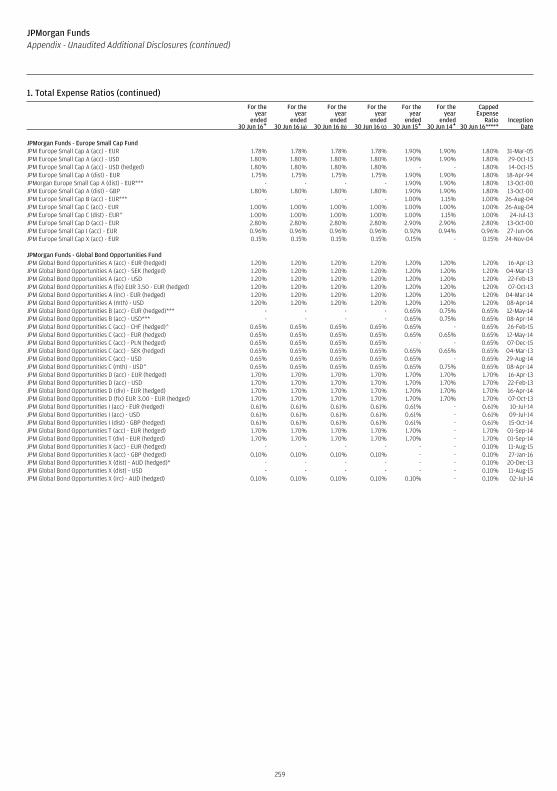
1. Total Expense Ratios (continued)For the
yearended
30 Jun 16+
For theyear
ended30 Jun 16 (a)
For theyear
ended30 Jun 16 (b)
For theyear
ended30 Jun 16 (c)
For theyear
ended30 Jun 15+
For theyear
ended30 Jun 14+
CappedExpense
Ratio30 Jun 16****+
InceptionDate
JPMorgan Funds - Europe Small Cap FundJPM Europe Small Cap A (acc) - EUR 1.78% 1.78% 1.78% 1.78% 1.90% 1.90% 1.80% 31-Mar-05JPM Europe Small Cap A (acc) - USD 1.80% 1.80% 1.80% 1.80% 1.90% 1.90% 1.80% 29-Oct-13JPM Europe Small Cap A (acc) - USD (hedged) 1.80% 1.80% 1.80% 1.80% - - 1.80% 14-Oct-15JPM Europe Small Cap A (dist) - EUR 1.75% 1.75% 1.75% 1.75% 1.90% 1.90% 1.80% 18-Apr-94JPMorgan Europe Small Cap A (dist) - EUR*** - - - - 1.90% 1.90% 1.80% 13-Oct-00JPM Europe Small Cap A (dist) - GBP 1.80% 1.80% 1.80% 1.80% 1.90% 1.90% 1.80% 13-Oct-00JPM Europe Small Cap B (acc) - EUR*** - - - - 1.00% 1.15% 1.00% 26-Aug-04JPM Europe Small Cap C (acc) - EUR 1.00% 1.00% 1.00% 1.00% 1.00% 1.00% 1.00% 26-Aug-04JPM Europe Small Cap C (dist) - EUR^ 1.00% 1.00% 1.00% 1.00% 1.00% 1.15% 1.00% 24-Jul-13JPM Europe Small Cap D (acc) - EUR 2.80% 2.80% 2.80% 2.80% 2.90% 2.90% 2.80% 13-Oct-00JPM Europe Small Cap I (acc) - EUR 0.96% 0.96% 0.96% 0.96% 0.92% 0.94% 0.96% 27-Jun-06JPM Europe Small Cap X (acc) - EUR 0.15% 0.15% 0.15% 0.15% 0.15% - 0.15% 24-Nov-04
JPMorgan Funds - Global Bond Opportunities FundJPM Global Bond Opportunities A (acc) - EUR (hedged) 1.20% 1.20% 1.20% 1.20% 1.20% 1.20% 1.20% 16-Apr-13JPM Global Bond Opportunities A (acc) - SEK (hedged) 1.20% 1.20% 1.20% 1.20% 1.20% 1.20% 1.20% 04-Mar-13JPM Global Bond Opportunities A (acc) - USD 1.20% 1.20% 1.20% 1.20% 1.20% 1.20% 1.20% 22-Feb-13JPM Global Bond Opportunities A (fix) EUR 3.50 - EUR (hedged) 1.20% 1.20% 1.20% 1.20% 1.20% 1.20% 1.20% 07-Oct-13JPM Global Bond Opportunities A (inc) - EUR (hedged) 1.20% 1.20% 1.20% 1.20% 1.20% 1.20% 1.20% 04-Mar-14JPM Global Bond Opportunities A (mth) - USD 1.20% 1.20% 1.20% 1.20% 1.20% 1.20% 1.20% 08-Apr-14JPM Global Bond Opportunities B (acc) - EUR (hedged)*** - - - - 0.65% 0.75% 0.65% 12-May-14JPM Global Bond Opportunities B (acc) - USD*** - - - - 0.65% 0.75% 0.65% 08-Apr-14JPM Global Bond Opportunities C (acc) - CHF (hedged)^ 0.65% 0.65% 0.65% 0.65% 0.65% - 0.65% 26-Feb-15JPM Global Bond Opportunities C (acc) - EUR (hedged) 0.65% 0.65% 0.65% 0.65% 0.65% 0.65% 0.65% 12-May-14JPM Global Bond Opportunities C (acc) - PLN (hedged) 0.65% 0.65% 0.65% 0.65% - - 0.65% 07-Dec-15JPM Global Bond Opportunities C (acc) - SEK (hedged) 0.65% 0.65% 0.65% 0.65% 0.65% 0.65% 0.65% 04-Mar-13JPM Global Bond Opportunities C (acc) - USD 0.65% 0.65% 0.65% 0.65% 0.65% - 0.65% 29-Aug-14JPM Global Bond Opportunities C (mth) - USD^ 0.65% 0.65% 0.65% 0.65% 0.65% 0.75% 0.65% 08-Apr-14JPM Global Bond Opportunities D (acc) - EUR (hedged) 1.70% 1.70% 1.70% 1.70% 1.70% 1.70% 1.70% 16-Apr-13JPM Global Bond Opportunities D (acc) - USD 1.70% 1.70% 1.70% 1.70% 1.70% 1.70% 1.70% 22-Feb-13JPM Global Bond Opportunities D (div) - EUR (hedged) 1.70% 1.70% 1.70% 1.70% 1.70% 1.70% 1.70% 16-Apr-14JPM Global Bond Opportunities D (fix) EUR 3.00 - EUR (hedged) 1.70% 1.70% 1.70% 1.70% 1.70% 1.70% 1.70% 07-Oct-13JPM Global Bond Opportunities I (acc) - EUR (hedged) 0.61% 0.61% 0.61% 0.61% 0.61% - 0.61% 10-Jul-14JPM Global Bond Opportunities I (acc) - USD 0.61% 0.61% 0.61% 0.61% 0.61% - 0.61% 09-Jul-14JPM Global Bond Opportunities I (dist) - GBP (hedged) 0.61% 0.61% 0.61% 0.61% 0.61% - 0.61% 15-Oct-14JPM Global Bond Opportunities T (acc) - EUR (hedged) 1.70% 1.70% 1.70% 1.70% 1.70% - 1.70% 01-Sep-14JPM Global Bond Opportunities T (div) - EUR (hedged) 1.70% 1.70% 1.70% 1.70% 1.70% - 1.70% 01-Sep-14JPM Global Bond Opportunities X (acc) - EUR (hedged) - - - - - - 0.10% 11-Aug-15JPM Global Bond Opportunities X (acc) - GBP (hedged) 0.10% 0.10% 0.10% 0.10% - - 0.10% 27-Jan-16JPM Global Bond Opportunities X (dist) - AUD (hedged)* - - - - - - 0.10% 20-Dec-13JPM Global Bond Opportunities X (dist) - USD - - - - - - 0.10% 11-Aug-15JPM Global Bond Opportunities X (irc) - AUD (hedged) 0.10% 0.10% 0.10% 0.10% 0.10% - 0.10% 02-Jul-14
259
JPMorgan FundsAppendix - Unaudited Additional Disclosures (continued)
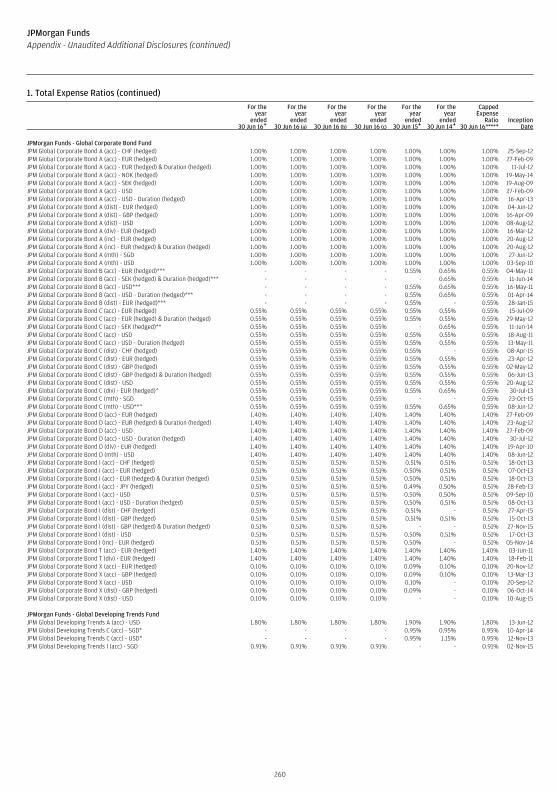
1. Total Expense Ratios (continued)For the
yearended
30 Jun 16+
For theyear
ended30 Jun 16 (a)
For theyear
ended30 Jun 16 (b)
For theyear
ended30 Jun 16 (c)
For theyear
ended30 Jun 15+
For theyear
ended30 Jun 14+
CappedExpense
Ratio30 Jun 16****+
InceptionDate
JPMorgan Funds - Global Corporate Bond FundJPM Global Corporate Bond A (acc) - CHF (hedged) 1.00% 1.00% 1.00% 1.00% 1.00% 1.00% 1.00% 25-Sep-12JPM Global Corporate Bond A (acc) - EUR (hedged) 1.00% 1.00% 1.00% 1.00% 1.00% 1.00% 1.00% 27-Feb-09JPM Global Corporate Bond A (acc) - EUR (hedged) & Duration (hedged) 1.00% 1.00% 1.00% 1.00% 1.00% 1.00% 1.00% 11-Jul-12JPM Global Corporate Bond A (acc) - NOK (hedged) 1.00% 1.00% 1.00% 1.00% 1.00% 1.00% 1.00% 19-May-14JPM Global Corporate Bond A (acc) - SEK (hedged) 1.00% 1.00% 1.00% 1.00% 1.00% 1.00% 1.00% 19-Aug-09JPM Global Corporate Bond A (acc) - USD 1.00% 1.00% 1.00% 1.00% 1.00% 1.00% 1.00% 27-Feb-09JPM Global Corporate Bond A (acc) - USD - Duration (hedged) 1.00% 1.00% 1.00% 1.00% 1.00% 1.00% 1.00% 16-Apr-13JPM Global Corporate Bond A (dist) - EUR (hedged) 1.00% 1.00% 1.00% 1.00% 1.00% 1.00% 1.00% 04-Jun-12JPM Global Corporate Bond A (dist) - GBP (hedged) 1.00% 1.00% 1.00% 1.00% 1.00% 1.00% 1.00% 16-Apr-09JPM Global Corporate Bond A (dist) - USD 1.00% 1.00% 1.00% 1.00% 1.00% 1.00% 1.00% 08-Aug-12JPM Global Corporate Bond A (div) - EUR (hedged) 1.00% 1.00% 1.00% 1.00% 1.00% 1.00% 1.00% 16-Mar-12JPM Global Corporate Bond A (inc) - EUR (hedged) 1.00% 1.00% 1.00% 1.00% 1.00% 1.00% 1.00% 20-Aug-12JPM Global Corporate Bond A (inc) - EUR (hedged) & Duration (hedged) 1.00% 1.00% 1.00% 1.00% 1.00% 1.00% 1.00% 20-Aug-12JPM Global Corporate Bond A (mth) - SGD 1.00% 1.00% 1.00% 1.00% 1.00% 1.00% 1.00% 27-Jun-12JPM Global Corporate Bond A (mth) - USD 1.00% 1.00% 1.00% 1.00% 1.00% 1.00% 1.00% 03-Sep-10JPM Global Corporate Bond B (acc) - EUR (hedged)*** - - - - 0.55% 0.65% 0.55% 04-May-11JPM Global Corporate Bond B (acc) - SEK (hedged) & Duration (hedged)*** - - - - - 0.65% 0.55% 11-Jun-14JPM Global Corporate Bond B (acc) - USD*** - - - - 0.55% 0.65% 0.55% 16-May-11JPM Global Corporate Bond B (acc) - USD - Duration (hedged)*** - - - - 0.55% 0.65% 0.55% 01-Apr-14JPM Global Corporate Bond B (dist) - EUR (hedged)*** - - - - 0.55% - 0.55% 28-Jan-15JPM Global Corporate Bond C (acc) - EUR (hedged) 0.55% 0.55% 0.55% 0.55% 0.55% 0.55% 0.55% 15-Jul-09JPM Global Corporate Bond C (acc) - EUR (hedged) & Duration (hedged) 0.55% 0.55% 0.55% 0.55% 0.55% 0.55% 0.55% 29-May-12JPM Global Corporate Bond C (acc) - SEK (hedged)** 0.55% 0.55% 0.55% 0.55% - 0.65% 0.55% 11-Jun-14JPM Global Corporate Bond C (acc) - USD 0.55% 0.55% 0.55% 0.55% 0.55% 0.55% 0.55% 18-Aug-11JPM Global Corporate Bond C (acc) - USD - Duration (hedged) 0.55% 0.55% 0.55% 0.55% 0.55% 0.55% 0.55% 13-May-11JPM Global Corporate Bond C (dist) - CHF (hedged) 0.55% 0.55% 0.55% 0.55% 0.55% - 0.55% 08-Apr-15JPM Global Corporate Bond C (dist) - EUR (hedged) 0.55% 0.55% 0.55% 0.55% 0.55% 0.55% 0.55% 23-Apr-12JPM Global Corporate Bond C (dist) - GBP (hedged) 0.55% 0.55% 0.55% 0.55% 0.55% 0.55% 0.55% 02-May-12JPM Global Corporate Bond C (dist) - GBP (hedged) & Duration (hedged) 0.55% 0.55% 0.55% 0.55% 0.55% 0.55% 0.55% 06-Jun-13JPM Global Corporate Bond C (dist) - USD 0.55% 0.55% 0.55% 0.55% 0.55% 0.55% 0.55% 20-Aug-12JPM Global Corporate Bond C (div) - EUR (hedged)^ 0.55% 0.55% 0.55% 0.55% 0.55% 0.65% 0.55% 30-Jul-13JPM Global Corporate Bond C (mth) - SGD 0.55% 0.55% 0.55% 0.55% - - 0.55% 23-Oct-15JPM Global Corporate Bond C (mth) - USD**^ 0.55% 0.55% 0.55% 0.55% 0.55% 0.65% 0.55% 08-Jun-12JPM Global Corporate Bond D (acc) - EUR (hedged) 1.40% 1.40% 1.40% 1.40% 1.40% 1.40% 1.40% 27-Feb-09JPM Global Corporate Bond D (acc) - EUR (hedged) & Duration (hedged) 1.40% 1.40% 1.40% 1.40% 1.40% 1.40% 1.40% 23-Aug-12JPM Global Corporate Bond D (acc) - USD 1.40% 1.40% 1.40% 1.40% 1.40% 1.40% 1.40% 27-Feb-09JPM Global Corporate Bond D (acc) - USD - Duration (hedged) 1.40% 1.40% 1.40% 1.40% 1.40% 1.40% 1.40% 30-Jul-12JPM Global Corporate Bond D (div) - EUR (hedged) 1.40% 1.40% 1.40% 1.40% 1.40% 1.40% 1.40% 19-Apr-10JPM Global Corporate Bond D (mth) - USD 1.40% 1.40% 1.40% 1.40% 1.40% 1.40% 1.40% 08-Jun-12JPM Global Corporate Bond I (acc) - CHF (hedged) 0.51% 0.51% 0.51% 0.51% 0.51% 0.51% 0.51% 18-Oct-13JPM Global Corporate Bond I (acc) - EUR (hedged) 0.51% 0.51% 0.51% 0.51% 0.50% 0.51% 0.51% 07-Oct-13JPM Global Corporate Bond I (acc) - EUR (hedged) & Duration (hedged) 0.51% 0.51% 0.51% 0.51% 0.50% 0.51% 0.51% 18-Oct-13JPM Global Corporate Bond I (acc) - JPY (hedged) 0.51% 0.51% 0.51% 0.51% 0.49% 0.50% 0.51% 28-Feb-13JPM Global Corporate Bond I (acc) - USD 0.51% 0.51% 0.51% 0.51% 0.50% 0.50% 0.51% 09-Sep-10JPM Global Corporate Bond I (acc) - USD - Duration (hedged) 0.51% 0.51% 0.51% 0.51% 0.50% 0.51% 0.51% 08-Oct-13JPM Global Corporate Bond I (dist) - CHF (hedged) 0.51% 0.51% 0.51% 0.51% 0.51% - 0.51% 27-Apr-15JPM Global Corporate Bond I (dist) - GBP (hedged) 0.51% 0.51% 0.51% 0.51% 0.51% 0.51% 0.51% 15-Oct-13JPM Global Corporate Bond I (dist) - GBP (hedged) & Duration (hedged) 0.51% 0.51% 0.51% 0.51% - - 0.51% 27-Nov-15JPM Global Corporate Bond I (dist) - USD 0.51% 0.51% 0.51% 0.51% 0.50% 0.51% 0.51% 17-Oct-13JPM Global Corporate Bond I (inc) - EUR (hedged) 0.51% 0.51% 0.51% 0.51% 0.50% - 0.51% 05-Nov-14JPM Global Corporate Bond T (acc) - EUR (hedged) 1.40% 1.40% 1.40% 1.40% 1.40% 1.40% 1.40% 03-Jun-11JPM Global Corporate Bond T (div) - EUR (hedged) 1.40% 1.40% 1.40% 1.40% 1.40% 1.40% 1.40% 18-Feb-11JPM Global Corporate Bond X (acc) - EUR (hedged) 0.10% 0.10% 0.10% 0.10% 0.09% 0.10% 0.10% 20-Nov-12JPM Global Corporate Bond X (acc) - GBP (hedged) 0.10% 0.10% 0.10% 0.10% 0.09% 0.10% 0.10% 13-Mar-13JPM Global Corporate Bond X (acc) - USD 0.10% 0.10% 0.10% 0.10% 0.10% - 0.10% 20-Sep-12JPM Global Corporate Bond X (dist) - GBP (hedged) 0.10% 0.10% 0.10% 0.10% 0.09% - 0.10% 06-Oct-14JPM Global Corporate Bond X (dist) - USD 0.10% 0.10% 0.10% 0.10% - - 0.10% 10-Aug-15
JPMorgan Funds - Global Developing Trends FundJPM Global Developing Trends A (acc) - USD 1.80% 1.80% 1.80% 1.80% 1.90% 1.90% 1.80% 13-Jun-12JPM Global Developing Trends C (acc) - SGD* - - - - 0.95% 0.95% 0.95% 10-Apr-14JPM Global Developing Trends C (acc) - USD* - - - - 0.95% 1.15% 0.95% 12-Nov-13JPM Global Developing Trends I (acc) - SGD 0.91% 0.91% 0.91% 0.91% - - 0.91% 02-Nov-15
260
JPMorgan FundsAppendix - Unaudited Additional Disclosures (continued)
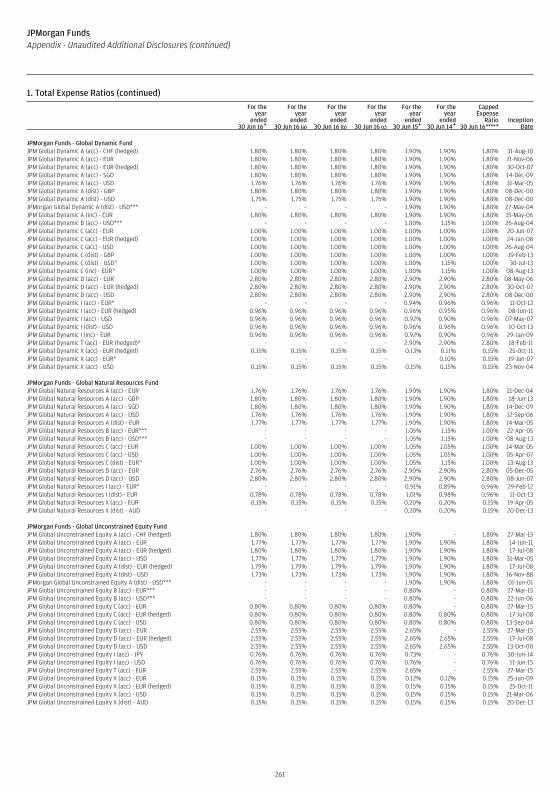
1. Total Expense Ratios (continued)For the
yearended
30 Jun 16+
For theyear
ended30 Jun 16 (a)
For theyear
ended30 Jun 16 (b)
For theyear
ended30 Jun 16 (c)
For theyear
ended30 Jun 15+
For theyear
ended30 Jun 14+
CappedExpense
Ratio30 Jun 16****+
InceptionDate
JPMorgan Funds - Global Dynamic FundJPM Global Dynamic A (acc) - CHF (hedged) 1.80% 1.80% 1.80% 1.80% 1.90% 1.90% 1.80% 31-Aug-10JPM Global Dynamic A (acc) - EUR 1.80% 1.80% 1.80% 1.80% 1.90% 1.90% 1.80% 21-Nov-06JPM Global Dynamic A (acc) - EUR (hedged) 1.80% 1.80% 1.80% 1.80% 1.90% 1.90% 1.80% 30-Oct-07JPM Global Dynamic A (acc) - SGD 1.80% 1.80% 1.80% 1.80% 1.90% 1.90% 1.80% 14-Dec-09JPM Global Dynamic A (acc) - USD 1.76% 1.76% 1.76% 1.76% 1.90% 1.90% 1.80% 31-Mar-05JPM Global Dynamic A (dist) - GBP 1.80% 1.80% 1.80% 1.80% 1.90% 1.90% 1.80% 08-Dec-00JPM Global Dynamic A (dist) - USD 1.75% 1.75% 1.75% 1.75% 1.90% 1.90% 1.80% 08-Dec-00JPMorgan Global Dynamic A (dist) - USD*** - - - - 1.90% 1.90% 1.80% 27-May-04JPM Global Dynamic A (inc) - EUR 1.80% 1.80% 1.80% 1.80% 1.90% 1.90% 1.80% 15-May-06JPM Global Dynamic B (acc) - USD*** - - - - 1.00% 1.15% 1.00% 26-Aug-04JPM Global Dynamic C (acc) - EUR 1.00% 1.00% 1.00% 1.00% 1.00% 1.00% 1.00% 20-Jun-07JPM Global Dynamic C (acc) - EUR (hedged) 1.00% 1.00% 1.00% 1.00% 1.00% 1.00% 1.00% 24-Jan-08JPM Global Dynamic C (acc) - USD 1.00% 1.00% 1.00% 1.00% 1.00% 1.00% 1.00% 26-Aug-04JPM Global Dynamic C (dist) - GBP 1.00% 1.00% 1.00% 1.00% 1.00% 1.00% 1.00% 19-Feb-13JPM Global Dynamic C (dist) - USD^ 1.00% 1.00% 1.00% 1.00% 1.00% 1.15% 1.00% 30-Jul-13JPM Global Dynamic C (inc) - EUR^ 1.00% 1.00% 1.00% 1.00% 1.00% 1.15% 1.00% 08-Aug-13JPM Global Dynamic D (acc) - EUR 2.80% 2.80% 2.80% 2.80% 2.90% 2.90% 2.80% 08-May-06JPM Global Dynamic D (acc) - EUR (hedged) 2.80% 2.80% 2.80% 2.80% 2.90% 2.90% 2.80% 30-Oct-07JPM Global Dynamic D (acc) - USD 2.80% 2.80% 2.80% 2.80% 2.90% 2.90% 2.80% 08-Dec-00JPM Global Dynamic I (acc) - EUR* - - - - 0.94% 0.96% 0.96% 11-Oct-13JPM Global Dynamic I (acc) - EUR (hedged) 0.96% 0.96% 0.96% 0.96% 0.96% 0.95% 0.96% 08-Jun-11JPM Global Dynamic I (acc) - USD 0.96% 0.96% 0.96% 0.96% 0.92% 0.90% 0.96% 07-May-07JPM Global Dynamic I (dist) - USD 0.96% 0.96% 0.96% 0.96% 0.96% 0.96% 0.96% 10-Oct-13JPM Global Dynamic I (inc) - EUR 0.96% 0.96% 0.96% 0.96% 0.92% 0.90% 0.96% 29-Jan-09JPM Global Dynamic T (acc) - EUR (hedged)* - - - - 2.90% 2.90% 2.80% 18-Feb-11JPM Global Dynamic X (acc) - EUR (hedged) 0.15% 0.15% 0.15% 0.15% 0.13% 0.11% 0.15% 25-Oct-11JPM Global Dynamic X (acc) - EUR* - - - - - 0.10% 0.15% 19-Jan-07JPM Global Dynamic X (acc) - USD 0.15% 0.15% 0.15% 0.15% 0.15% 0.15% 0.15% 23-Nov-04
JPMorgan Funds - Global Natural Resources FundJPM Global Natural Resources A (acc) - EUR 1.76% 1.76% 1.76% 1.76% 1.90% 1.90% 1.80% 21-Dec-04JPM Global Natural Resources A (acc) - GBP 1.80% 1.80% 1.80% 1.80% 1.90% 1.90% 1.80% 18-Jun-13JPM Global Natural Resources A (acc) - SGD 1.80% 1.80% 1.80% 1.80% 1.90% 1.90% 1.80% 14-Dec-09JPM Global Natural Resources A (acc) - USD 1.76% 1.76% 1.76% 1.76% 1.90% 1.90% 1.80% 12-Sep-06JPM Global Natural Resources A (dist) - EUR 1.77% 1.77% 1.77% 1.77% 1.90% 1.90% 1.80% 14-Mar-05JPM Global Natural Resources B (acc) - EUR*** - - - - 1.05% 1.15% 1.00% 22-Apr-05JPM Global Natural Resources B (acc) - USD*** - - - - 1.05% 1.15% 1.00% 08-Aug-13JPM Global Natural Resources C (acc) - EUR 1.00% 1.00% 1.00% 1.00% 1.05% 1.05% 1.00% 14-Mar-05JPM Global Natural Resources C (acc) - USD 1.00% 1.00% 1.00% 1.00% 1.05% 1.05% 1.00% 05-Apr-07JPM Global Natural Resources C (dist) - EUR^ 1.00% 1.00% 1.00% 1.00% 1.05% 1.15% 1.00% 13-Aug-13JPM Global Natural Resources D (acc) - EUR 2.76% 2.76% 2.76% 2.76% 2.90% 2.90% 2.80% 05-Dec-05JPM Global Natural Resources D (acc) - USD 2.80% 2.80% 2.80% 2.80% 2.90% 2.90% 2.80% 08-Jun-07JPM Global Natural Resources I (acc) - EUR* - - - - 0.91% 0.89% 0.96% 29-Feb-12JPM Global Natural Resources I (dist) - EUR 0.78% 0.78% 0.78% 0.78% 1.01% 0.98% 0.96% 11-Oct-13JPM Global Natural Resources X (acc) - EUR 0.15% 0.15% 0.15% 0.15% 0.20% 0.20% 0.15% 19-Apr-05JPM Global Natural Resources X (dist) - AUD - - - - 0.20% 0.20% 0.15% 20-Dec-13
JPMorgan Funds - Global Unconstrained Equity FundJPM Global Unconstrained Equity A (acc) - CHF (hedged) 1.80% 1.80% 1.80% 1.80% 1.90% - 1.80% 27-Mar-15JPM Global Unconstrained Equity A (acc) - EUR 1.77% 1.77% 1.77% 1.77% 1.90% 1.90% 1.80% 14-Jun-11JPM Global Unconstrained Equity A (acc) - EUR (hedged) 1.80% 1.80% 1.80% 1.80% 1.90% 1.90% 1.80% 17-Jul-08JPM Global Unconstrained Equity A (acc) - USD 1.77% 1.77% 1.77% 1.77% 1.90% 1.90% 1.80% 31-Mar-05JPM Global Unconstrained Equity A (dist) - EUR (hedged) 1.79% 1.79% 1.79% 1.79% 1.90% 1.90% 1.80% 17-Jul-08JPM Global Unconstrained Equity A (dist) - USD 1.73% 1.73% 1.73% 1.73% 1.90% 1.90% 1.80% 16-Nov-88JPMorgan Global Unconstrained Equity A (dist) - USD*** - - - - 1.90% 1.90% 1.80% 01-Jun-01JPM Global Unconstrained Equity B (acc) - EUR*** - - - - 0.80% - 0.80% 27-Mar-15JPM Global Unconstrained Equity B (acc) - USD*** - - - - 0.80% - 0.80% 22-Jun-06JPM Global Unconstrained Equity C (acc) - EUR 0.80% 0.80% 0.80% 0.80% 0.80% - 0.80% 27-Mar-15JPM Global Unconstrained Equity C (acc) - EUR (hedged) 0.80% 0.80% 0.80% 0.80% 0.80% 0.80% 0.80% 17-Jul-08JPM Global Unconstrained Equity C (acc) - USD 0.80% 0.80% 0.80% 0.80% 0.80% 0.80% 0.80% 13-Sep-04JPM Global Unconstrained Equity D (acc) - EUR 2.55% 2.55% 2.55% 2.55% 2.65% - 2.55% 27-Mar-15JPM Global Unconstrained Equity D (acc) - EUR (hedged) 2.55% 2.55% 2.55% 2.55% 2.65% 2.65% 2.55% 17-Jul-08JPM Global Unconstrained Equity D (acc) - USD 2.55% 2.55% 2.55% 2.55% 2.65% 2.65% 2.55% 13-Oct-00JPM Global Unconstrained Equity I (acc) - JPY 0.76% 0.76% 0.76% 0.76% 0.73% - 0.76% 30-Jun-14JPM Global Unconstrained Equity I (acc) - USD 0.76% 0.76% 0.76% 0.76% 0.76% - 0.76% 11-Jun-15JPM Global Unconstrained Equity T (acc) - EUR 2.55% 2.55% 2.55% 2.55% 2.65% - 2.55% 27-Mar-15JPM Global Unconstrained Equity X (acc) - EUR 0.15% 0.15% 0.15% 0.15% 0.12% 0.12% 0.15% 25-Jun-09JPM Global Unconstrained Equity X (acc) - EUR (hedged) 0.15% 0.15% 0.15% 0.15% 0.15% 0.15% 0.15% 25-Oct-11JPM Global Unconstrained Equity X (acc) - USD 0.15% 0.15% 0.15% 0.15% 0.15% 0.15% 0.15% 21-Mar-06JPM Global Unconstrained Equity X (dist) - AUD 0.15% 0.15% 0.15% 0.15% 0.15% 0.15% 0.15% 20-Dec-13
261
JPMorgan FundsAppendix - Unaudited Additional Disclosures (continued)
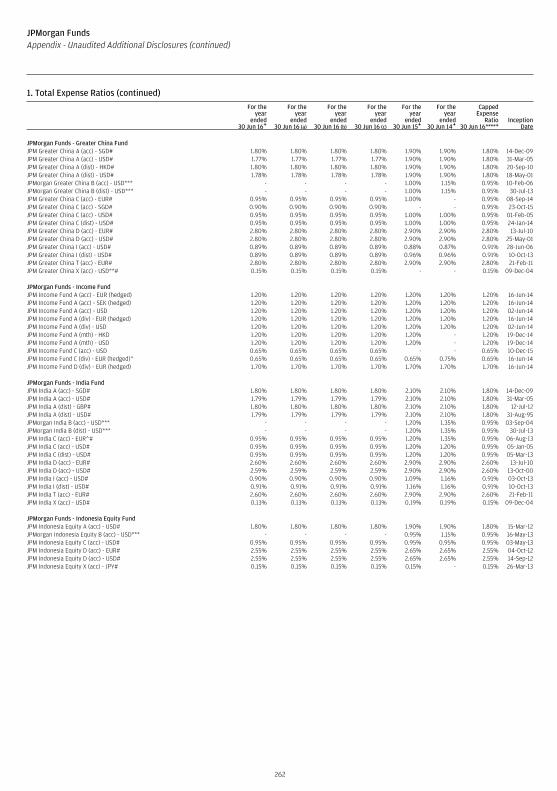
1. Total Expense Ratios (continued)For the
yearended
30 Jun 16+
For theyear
ended30 Jun 16 (a)
For theyear
ended30 Jun 16 (b)
For theyear
ended30 Jun 16 (c)
For theyear
ended30 Jun 15+
For theyear
ended30 Jun 14+
CappedExpense
Ratio30 Jun 16****+
InceptionDate
JPMorgan Funds - Greater China FundJPM Greater China A (acc) - SGD# 1.80% 1.80% 1.80% 1.80% 1.90% 1.90% 1.80% 14-Dec-09JPM Greater China A (acc) - USD# 1.77% 1.77% 1.77% 1.77% 1.90% 1.90% 1.80% 31-Mar-05JPM Greater China A (dist) - HKD# 1.80% 1.80% 1.80% 1.80% 1.90% 1.90% 1.80% 20-Sep-10JPM Greater China A (dist) - USD# 1.78% 1.78% 1.78% 1.78% 1.90% 1.90% 1.80% 18-May-01JPMorgan Greater China B (acc) - USD*** - - - - 1.00% 1.15% 0.95% 10-Feb-06JPMorgan Greater China B (dist) - USD*** - - - - 1.00% 1.15% 0.95% 30-Jul-13JPM Greater China C (acc) - EUR# 0.95% 0.95% 0.95% 0.95% 1.00% - 0.95% 08-Sep-14JPM Greater China C (acc) - SGD# 0.90% 0.90% 0.90% 0.90% - - 0.95% 23-Oct-15JPM Greater China C (acc) - USD# 0.95% 0.95% 0.95% 0.95% 1.00% 1.00% 0.95% 01-Feb-05JPM Greater China C (dist) - USD# 0.95% 0.95% 0.95% 0.95% 1.00% 1.00% 0.95% 24-Jan-14JPM Greater China D (acc) - EUR# 2.80% 2.80% 2.80% 2.80% 2.90% 2.90% 2.80% 13-Jul-10JPM Greater China D (acc) - USD# 2.80% 2.80% 2.80% 2.80% 2.90% 2.90% 2.80% 25-May-01JPM Greater China I (acc) - USD# 0.89% 0.89% 0.89% 0.89% 0.88% 0.87% 0.91% 28-Jun-06JPM Greater China I (dist) - USD# 0.89% 0.89% 0.89% 0.89% 0.96% 0.96% 0.91% 10-Oct-13JPM Greater China T (acc) - EUR# 2.80% 2.80% 2.80% 2.80% 2.90% 2.90% 2.80% 21-Feb-11JPM Greater China X (acc) - USD**# 0.15% 0.15% 0.15% 0.15% - - 0.15% 09-Dec-04
JPMorgan Funds - Income FundJPM Income Fund A (acc) - EUR (hedged) 1.20% 1.20% 1.20% 1.20% 1.20% 1.20% 1.20% 16-Jun-14JPM Income Fund A (acc) - SEK (hedged) 1.20% 1.20% 1.20% 1.20% 1.20% 1.20% 1.20% 16-Jun-14JPM Income Fund A (acc) - USD 1.20% 1.20% 1.20% 1.20% 1.20% 1.20% 1.20% 02-Jun-14JPM Income Fund A (div) - EUR (hedged) 1.20% 1.20% 1.20% 1.20% 1.20% 1.20% 1.20% 16-Jun-14JPM Income Fund A (div) - USD 1.20% 1.20% 1.20% 1.20% 1.20% 1.20% 1.20% 02-Jun-14JPM Income Fund A (mth) - HKD 1.20% 1.20% 1.20% 1.20% 1.20% - 1.20% 19-Dec-14JPM Income Fund A (mth) - USD 1.20% 1.20% 1.20% 1.20% 1.20% - 1.20% 19-Dec-14JPM Income Fund C (acc) - USD 0.65% 0.65% 0.65% 0.65% - - 0.65% 10-Dec-15JPM Income Fund C (div) - EUR (hedged)^ 0.65% 0.65% 0.65% 0.65% 0.65% 0.75% 0.65% 16-Jun-14JPM Income Fund D (div) - EUR (hedged) 1.70% 1.70% 1.70% 1.70% 1.70% 1.70% 1.70% 16-Jun-14
JPMorgan Funds - India FundJPM India A (acc) - SGD# 1.80% 1.80% 1.80% 1.80% 2.10% 2.10% 1.80% 14-Dec-09JPM India A (acc) - USD# 1.79% 1.79% 1.79% 1.79% 2.10% 2.10% 1.80% 31-Mar-05JPM India A (dist) - GBP# 1.80% 1.80% 1.80% 1.80% 2.10% 2.10% 1.80% 12-Jul-12JPM India A (dist) - USD# 1.79% 1.79% 1.79% 1.79% 2.10% 2.10% 1.80% 31-Aug-95JPMorgan India B (acc) - USD*** - - - - 1.20% 1.35% 0.95% 03-Sep-04JPMorgan India B (dist) - USD*** - - - - 1.20% 1.35% 0.95% 30-Jul-13JPM India C (acc) - EUR^# 0.95% 0.95% 0.95% 0.95% 1.20% 1.35% 0.95% 06-Aug-13JPM India C (acc) - USD# 0.95% 0.95% 0.95% 0.95% 1.20% 1.20% 0.95% 05-Jan-05JPM India C (dist) - USD# 0.95% 0.95% 0.95% 0.95% 1.20% 1.20% 0.95% 05-Mar-13JPM India D (acc) - EUR# 2.60% 2.60% 2.60% 2.60% 2.90% 2.90% 2.60% 13-Jul-10JPM India D (acc) - USD# 2.59% 2.59% 2.59% 2.59% 2.90% 2.90% 2.60% 13-Oct-00JPM India I (acc) - USD# 0.90% 0.90% 0.90% 0.90% 1.09% 1.16% 0.91% 03-Oct-13JPM India I (dist) - USD# 0.91% 0.91% 0.91% 0.91% 1.16% 1.16% 0.91% 10-Oct-13JPM India T (acc) - EUR# 2.60% 2.60% 2.60% 2.60% 2.90% 2.90% 2.60% 21-Feb-11JPM India X (acc) - USD# 0.13% 0.13% 0.13% 0.13% 0.19% 0.19% 0.15% 09-Dec-04
JPMorgan Funds - Indonesia Equity FundJPM Indonesia Equity A (acc) - USD# 1.80% 1.80% 1.80% 1.80% 1.90% 1.90% 1.80% 15-Mar-12JPMorgan Indonesia Equity B (acc) - USD*** - - - - 0.95% 1.15% 0.95% 16-May-13JPM Indonesia Equity C (acc) - USD# 0.95% 0.95% 0.95% 0.95% 0.95% 0.95% 0.95% 03-May-13JPM Indonesia Equity D (acc) - EUR# 2.55% 2.55% 2.55% 2.55% 2.65% 2.65% 2.55% 04-Oct-12JPM Indonesia Equity D (acc) - USD# 2.55% 2.55% 2.55% 2.55% 2.65% 2.65% 2.55% 14-Sep-12JPM Indonesia Equity X (acc) - JPY# 0.15% 0.15% 0.15% 0.15% 0.15% - 0.15% 26-Mar-13
262
JPMorgan FundsAppendix - Unaudited Additional Disclosures (continued)
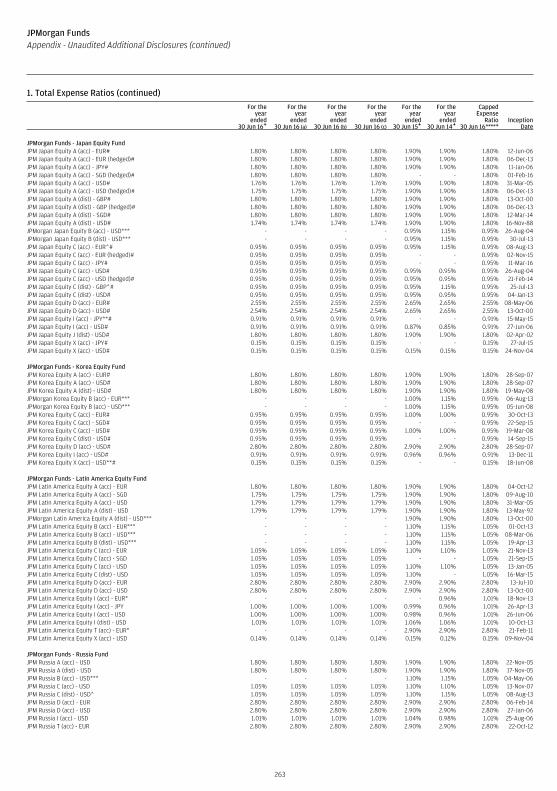
1. Total Expense Ratios (continued)For the
yearended
30 Jun 16+
For theyear
ended30 Jun 16 (a)
For theyear
ended30 Jun 16 (b)
For theyear
ended30 Jun 16 (c)
For theyear
ended30 Jun 15+
For theyear
ended30 Jun 14+
CappedExpense
Ratio30 Jun 16****+
InceptionDate
JPMorgan Funds - Japan Equity FundJPM Japan Equity A (acc) - EUR# 1.80% 1.80% 1.80% 1.80% 1.90% 1.90% 1.80% 12-Jun-06JPM Japan Equity A (acc) - EUR (hedged)# 1.80% 1.80% 1.80% 1.80% 1.90% 1.90% 1.80% 06-Dec-13JPM Japan Equity A (acc) - JPY# 1.80% 1.80% 1.80% 1.80% 1.90% 1.90% 1.80% 11-Jan-06JPM Japan Equity A (acc) - SGD (hedged)# 1.80% 1.80% 1.80% 1.80% - - 1.80% 01-Feb-16JPM Japan Equity A (acc) - USD# 1.76% 1.76% 1.76% 1.76% 1.90% 1.90% 1.80% 31-Mar-05JPM Japan Equity A (acc) - USD (hedged)# 1.75% 1.75% 1.75% 1.75% 1.90% 1.90% 1.80% 06-Dec-13JPM Japan Equity A (dist) - GBP# 1.80% 1.80% 1.80% 1.80% 1.90% 1.90% 1.80% 13-Oct-00JPM Japan Equity A (dist) - GBP (hedged)# 1.80% 1.80% 1.80% 1.80% 1.90% 1.90% 1.80% 06-Dec-13JPM Japan Equity A (dist) - SGD# 1.80% 1.80% 1.80% 1.80% 1.90% 1.90% 1.80% 12-Mar-14JPM Japan Equity A (dist) - USD# 1.74% 1.74% 1.74% 1.74% 1.90% 1.90% 1.80% 16-Nov-88JPMorgan Japan Equity B (acc) - USD*** - - - - 0.95% 1.15% 0.95% 26-Aug-04JPMorgan Japan Equity B (dist) - USD*** - - - - 0.95% 1.15% 0.95% 30-Jul-13JPM Japan Equity C (acc) - EUR^# 0.95% 0.95% 0.95% 0.95% 0.95% 1.15% 0.95% 08-Aug-13JPM Japan Equity C (acc) - EUR (hedged)# 0.95% 0.95% 0.95% 0.95% - - 0.95% 02-Nov-15JPM Japan Equity C (acc) - JPY# 0.95% 0.95% 0.95% 0.95% - - 0.95% 11-Mar-16JPM Japan Equity C (acc) - USD# 0.95% 0.95% 0.95% 0.95% 0.95% 0.95% 0.95% 26-Aug-04JPM Japan Equity C (acc) - USD (hedged)# 0.95% 0.95% 0.95% 0.95% 0.95% 0.95% 0.95% 21-Feb-14JPM Japan Equity C (dist) - GBP^# 0.95% 0.95% 0.95% 0.95% 0.95% 1.15% 0.95% 25-Jul-13JPM Japan Equity C (dist) - USD# 0.95% 0.95% 0.95% 0.95% 0.95% 0.95% 0.95% 04-Jan-13JPM Japan Equity D (acc) - EUR# 2.55% 2.55% 2.55% 2.55% 2.65% 2.65% 2.55% 08-May-06JPM Japan Equity D (acc) - USD# 2.54% 2.54% 2.54% 2.54% 2.65% 2.65% 2.55% 13-Oct-00JPM Japan Equity I (acc) - JPY**# 0.91% 0.91% 0.91% 0.91% - - 0.91% 15-May-15JPM Japan Equity I (acc) - USD# 0.91% 0.91% 0.91% 0.91% 0.87% 0.85% 0.91% 27-Jun-06JPM Japan Equity J (dist) - USD# 1.80% 1.80% 1.80% 1.80% 1.90% 1.90% 1.80% 02-Apr-02JPM Japan Equity X (acc) - JPY# 0.15% 0.15% 0.15% 0.15% - - 0.15% 27-Jul-15JPM Japan Equity X (acc) - USD# 0.15% 0.15% 0.15% 0.15% 0.15% 0.15% 0.15% 24-Nov-04
JPMorgan Funds - Korea Equity FundJPM Korea Equity A (acc) - EUR# 1.80% 1.80% 1.80% 1.80% 1.90% 1.90% 1.80% 28-Sep-07JPM Korea Equity A (acc) - USD# 1.80% 1.80% 1.80% 1.80% 1.90% 1.90% 1.80% 28-Sep-07JPM Korea Equity A (dist) - USD# 1.80% 1.80% 1.80% 1.80% 1.90% 1.90% 1.80% 19-May-08JPMorgan Korea Equity B (acc) - EUR*** - - - - 1.00% 1.15% 0.95% 06-Aug-13JPMorgan Korea Equity B (acc) - USD*** - - - - 1.00% 1.15% 0.95% 05-Jun-08JPM Korea Equity C (acc) - EUR# 0.95% 0.95% 0.95% 0.95% 1.00% 1.00% 0.95% 30-Oct-13JPM Korea Equity C (acc) - SGD# 0.95% 0.95% 0.95% 0.95% - - 0.95% 22-Sep-15JPM Korea Equity C (acc) - USD# 0.95% 0.95% 0.95% 0.95% 1.00% 1.00% 0.95% 19-Mar-08JPM Korea Equity C (dist) - USD# 0.95% 0.95% 0.95% 0.95% - - 0.95% 14-Sep-15JPM Korea Equity D (acc) - USD# 2.80% 2.80% 2.80% 2.80% 2.90% 2.90% 2.80% 28-Sep-07JPM Korea Equity I (acc) - USD# 0.91% 0.91% 0.91% 0.91% 0.96% 0.96% 0.91% 13-Dec-11JPM Korea Equity X (acc) - USD**# 0.15% 0.15% 0.15% 0.15% - - 0.15% 18-Jun-08
JPMorgan Funds - Latin America Equity FundJPM Latin America Equity A (acc) - EUR 1.80% 1.80% 1.80% 1.80% 1.90% 1.90% 1.80% 04-Oct-12JPM Latin America Equity A (acc) - SGD 1.75% 1.75% 1.75% 1.75% 1.90% 1.90% 1.80% 09-Aug-10JPM Latin America Equity A (acc) - USD 1.79% 1.79% 1.79% 1.79% 1.90% 1.90% 1.80% 31-Mar-05JPM Latin America Equity A (dist) - USD 1.79% 1.79% 1.79% 1.79% 1.90% 1.90% 1.80% 13-May-92JPMorgan Latin America Equity A (dist) - USD*** - - - - 1.90% 1.90% 1.80% 13-Oct-00JPM Latin America Equity B (acc) - EUR*** - - - - 1.10% 1.15% 1.05% 01-Oct-13JPM Latin America Equity B (acc) - USD*** - - - - 1.10% 1.15% 1.05% 08-Mar-06JPM Latin America Equity B (dist) - USD*** - - - - 1.10% 1.15% 1.05% 19-Apr-13JPM Latin America Equity C (acc) - EUR 1.05% 1.05% 1.05% 1.05% 1.10% 1.10% 1.05% 21-Nov-13JPM Latin America Equity C (acc) - SGD 1.05% 1.05% 1.05% 1.05% - - 1.05% 21-Sep-15JPM Latin America Equity C (acc) - USD 1.05% 1.05% 1.05% 1.05% 1.10% 1.10% 1.05% 13-Jan-05JPM Latin America Equity C (dist) - USD 1.05% 1.05% 1.05% 1.05% 1.10% - 1.05% 16-Mar-15JPM Latin America Equity D (acc) - EUR 2.80% 2.80% 2.80% 2.80% 2.90% 2.90% 2.80% 13-Jul-10JPM Latin America Equity D (acc) - USD 2.80% 2.80% 2.80% 2.80% 2.90% 2.90% 2.80% 13-Oct-00JPM Latin America Equity I (acc) - EUR* - - - - - 0.96% 1.01% 18-Nov-13JPM Latin America Equity I (acc) - JPY 1.00% 1.00% 1.00% 1.00% 0.99% 0.96% 1.01% 26-Apr-13JPM Latin America Equity I (acc) - USD 1.00% 1.00% 1.00% 1.00% 0.98% 0.96% 1.01% 26-Jun-06JPM Latin America Equity I (dist) - USD 1.01% 1.01% 1.01% 1.01% 1.06% 1.06% 1.01% 10-Oct-13JPM Latin America Equity T (acc) - EUR* - - - - 2.90% 2.90% 2.80% 21-Feb-11JPM Latin America Equity X (acc) - USD 0.14% 0.14% 0.14% 0.14% 0.15% 0.12% 0.15% 09-Nov-04
JPMorgan Funds - Russia FundJPM Russia A (acc) - USD 1.80% 1.80% 1.80% 1.80% 1.90% 1.90% 1.80% 22-Nov-05JPM Russia A (dist) - USD 1.80% 1.80% 1.80% 1.80% 1.90% 1.90% 1.80% 17-Nov-05JPM Russia B (acc) - USD*** - - - - 1.10% 1.15% 1.05% 04-May-06JPM Russia C (acc) - USD 1.05% 1.05% 1.05% 1.05% 1.10% 1.10% 1.05% 13-Nov-07JPM Russia C (dist) - USD^ 1.05% 1.05% 1.05% 1.05% 1.10% 1.15% 1.05% 08-Aug-13JPM Russia D (acc) - EUR 2.80% 2.80% 2.80% 2.80% 2.90% 2.90% 2.80% 06-Feb-14JPM Russia D (acc) - USD 2.80% 2.80% 2.80% 2.80% 2.90% 2.90% 2.80% 27-Jan-06JPM Russia I (acc) - USD 1.01% 1.01% 1.01% 1.01% 1.04% 0.98% 1.01% 25-Aug-06JPM Russia T (acc) - EUR 2.80% 2.80% 2.80% 2.80% 2.90% 2.90% 2.80% 22-Oct-12
263
JPMorgan FundsAppendix - Unaudited Additional Disclosures (continued)
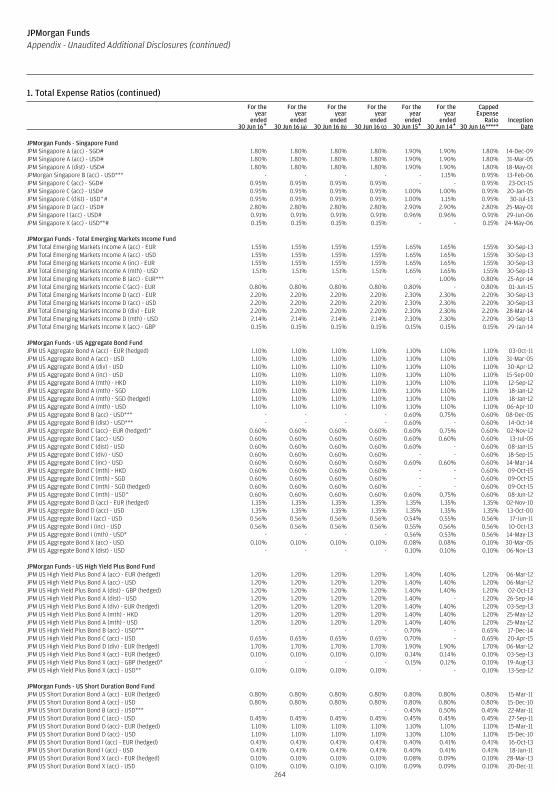
1. Total Expense Ratios (continued)For the
yearended
30 Jun 16+
For theyear
ended30 Jun 16 (a)
For theyear
ended30 Jun 16 (b)
For theyear
ended30 Jun 16 (c)
For theyear
ended30 Jun 15+
For theyear
ended30 Jun 14+
CappedExpense
Ratio30 Jun 16****+
InceptionDate
JPMorgan Funds - Singapore FundJPM Singapore A (acc) - SGD# 1.80% 1.80% 1.80% 1.80% 1.90% 1.90% 1.80% 14-Dec-09JPM Singapore A (acc) - USD# 1.80% 1.80% 1.80% 1.80% 1.90% 1.90% 1.80% 31-Mar-05JPM Singapore A (dist) - USD# 1.80% 1.80% 1.80% 1.80% 1.90% 1.90% 1.80% 18-May-01JPMorgan Singapore B (acc) - USD*** - - - - - 1.15% 0.95% 13-Feb-06JPM Singapore C (acc) - SGD# 0.95% 0.95% 0.95% 0.95% - - 0.95% 23-Oct-15JPM Singapore C (acc) - USD# 0.95% 0.95% 0.95% 0.95% 1.00% 1.00% 0.95% 20-Jan-05JPM Singapore C (dist) - USD^# 0.95% 0.95% 0.95% 0.95% 1.00% 1.15% 0.95% 30-Jul-13JPM Singapore D (acc) - USD# 2.80% 2.80% 2.80% 2.80% 2.90% 2.90% 2.80% 25-May-01JPM Singapore I (acc) - USD# 0.91% 0.91% 0.91% 0.91% 0.96% 0.96% 0.91% 29-Jun-06JPM Singapore X (acc) - USD**# 0.15% 0.15% 0.15% 0.15% - - 0.15% 24-May-06
JPMorgan Funds - Total Emerging Markets Income FundJPM Total Emerging Markets Income A (acc) - EUR 1.55% 1.55% 1.55% 1.55% 1.65% 1.65% 1.55% 30-Sep-13JPM Total Emerging Markets Income A (acc) - USD 1.55% 1.55% 1.55% 1.55% 1.65% 1.65% 1.55% 30-Sep-13JPM Total Emerging Markets Income A (inc) - EUR 1.55% 1.55% 1.55% 1.55% 1.65% 1.65% 1.55% 30-Sep-13JPM Total Emerging Markets Income A (mth) - USD 1.51% 1.51% 1.51% 1.51% 1.65% 1.65% 1.55% 30-Sep-13JPM Total Emerging Markets Income B (acc) - EUR*** - - - - - 1.00% 0.80% 25-Apr-14JPM Total Emerging Markets Income C (acc) - EUR 0.80% 0.80% 0.80% 0.80% 0.80% - 0.80% 01-Jun-15JPM Total Emerging Markets Income D (acc) - EUR 2.20% 2.20% 2.20% 2.20% 2.30% 2.30% 2.20% 30-Sep-13JPM Total Emerging Markets Income D (acc) - USD 2.20% 2.20% 2.20% 2.20% 2.30% 2.30% 2.20% 30-Sep-13JPM Total Emerging Markets Income D (div) - EUR 2.20% 2.20% 2.20% 2.20% 2.30% 2.30% 2.20% 28-Mar-14JPM Total Emerging Markets Income D (mth) - USD 2.14% 2.14% 2.14% 2.14% 2.30% 2.30% 2.20% 30-Sep-13JPM Total Emerging Markets Income X (acc) - GBP 0.15% 0.15% 0.15% 0.15% 0.15% 0.15% 0.15% 29-Jan-14
JPMorgan Funds - US Aggregate Bond FundJPM US Aggregate Bond A (acc) - EUR (hedged) 1.10% 1.10% 1.10% 1.10% 1.10% 1.10% 1.10% 03-Oct-11JPM US Aggregate Bond A (acc) - USD 1.10% 1.10% 1.10% 1.10% 1.10% 1.10% 1.10% 31-Mar-05JPM US Aggregate Bond A (div) - USD 1.10% 1.10% 1.10% 1.10% 1.10% 1.10% 1.10% 30-Apr-12JPM US Aggregate Bond A (inc) - USD 1.10% 1.10% 1.10% 1.10% 1.10% 1.10% 1.10% 15-Sep-00JPM US Aggregate Bond A (mth) - HKD 1.10% 1.10% 1.10% 1.10% 1.10% 1.10% 1.10% 12-Sep-12JPM US Aggregate Bond A (mth) - SGD 1.10% 1.10% 1.10% 1.10% 1.10% 1.10% 1.10% 18-Jan-12JPM US Aggregate Bond A (mth) - SGD (hedged) 1.10% 1.10% 1.10% 1.10% 1.10% 1.10% 1.10% 18-Jan-12JPM US Aggregate Bond A (mth) - USD 1.10% 1.10% 1.10% 1.10% 1.10% 1.10% 1.10% 06-Apr-10JPM US Aggregate Bond B (acc) - USD*** - - - - 0.60% 0.75% 0.60% 08-Dec-05JPM US Aggregate Bond B (dist) - USD*** - - - - 0.60% - 0.60% 14-Oct-14JPM US Aggregate Bond C (acc) - EUR (hedged)^ 0.60% 0.60% 0.60% 0.60% 0.60% 0.75% 0.60% 02-Nov-12JPM US Aggregate Bond C (acc) - USD 0.60% 0.60% 0.60% 0.60% 0.60% 0.60% 0.60% 13-Jul-05JPM US Aggregate Bond C (dist) - USD 0.60% 0.60% 0.60% 0.60% 0.60% - 0.60% 08-Jan-15JPM US Aggregate Bond C (div) - USD 0.60% 0.60% 0.60% 0.60% - - 0.60% 18-Sep-15JPM US Aggregate Bond C (inc) - USD 0.60% 0.60% 0.60% 0.60% 0.60% 0.60% 0.60% 14-Mar-14JPM US Aggregate Bond C (mth) - HKD 0.60% 0.60% 0.60% 0.60% - - 0.60% 09-Oct-15JPM US Aggregate Bond C (mth) - SGD 0.60% 0.60% 0.60% 0.60% - - 0.60% 09-Oct-15JPM US Aggregate Bond C (mth) - SGD (hedged) 0.60% 0.60% 0.60% 0.60% - - 0.60% 09-Oct-15JPM US Aggregate Bond C (mth) - USD^ 0.60% 0.60% 0.60% 0.60% 0.60% 0.75% 0.60% 08-Jun-12JPM US Aggregate Bond D (acc) - EUR (hedged) 1.35% 1.35% 1.35% 1.35% 1.35% 1.35% 1.35% 02-Nov-10JPM US Aggregate Bond D (acc) - USD 1.35% 1.35% 1.35% 1.35% 1.35% 1.35% 1.35% 13-Oct-00JPM US Aggregate Bond I (acc) - USD 0.56% 0.56% 0.56% 0.56% 0.54% 0.55% 0.56% 17-Jun-11JPM US Aggregate Bond I (inc) - USD 0.56% 0.56% 0.56% 0.56% 0.55% 0.56% 0.56% 10-Oct-13JPM US Aggregate Bond I (mth) - USD* - - - - 0.56% 0.53% 0.56% 14-May-13JPM US Aggregate Bond X (acc) - USD 0.10% 0.10% 0.10% 0.10% 0.08% 0.08% 0.10% 30-Mar-05JPM US Aggregate Bond X (dist) - USD - - - - 0.10% 0.10% 0.10% 06-Nov-13
JPMorgan Funds - US High Yield Plus Bond FundJPM US High Yield Plus Bond A (acc) - EUR (hedged) 1.20% 1.20% 1.20% 1.20% 1.40% 1.40% 1.20% 06-Mar-12JPM US High Yield Plus Bond A (acc) - USD 1.20% 1.20% 1.20% 1.20% 1.40% 1.40% 1.20% 06-Mar-12JPM US High Yield Plus Bond A (dist) - GBP (hedged) 1.20% 1.20% 1.20% 1.20% 1.40% 1.40% 1.20% 02-Oct-13JPM US High Yield Plus Bond A (dist) - USD 1.20% 1.20% 1.20% 1.20% 1.40% - 1.20% 26-Sep-14JPM US High Yield Plus Bond A (div) - EUR (hedged) 1.20% 1.20% 1.20% 1.20% 1.40% 1.40% 1.20% 03-Sep-13JPM US High Yield Plus Bond A (mth) - HKD 1.20% 1.20% 1.20% 1.20% 1.40% 1.40% 1.20% 25-May-12JPM US High Yield Plus Bond A (mth) - USD 1.20% 1.20% 1.20% 1.20% 1.40% 1.40% 1.20% 25-May-12JPM US High Yield Plus Bond B (acc) - USD*** - - - - 0.70% - 0.65% 17-Dec-14JPM US High Yield Plus Bond C (acc) - USD 0.65% 0.65% 0.65% 0.65% 0.70% - 0.65% 20-Apr-15JPM US High Yield Plus Bond D (div) - EUR (hedged) 1.70% 1.70% 1.70% 1.70% 1.90% 1.90% 1.70% 06-Mar-12JPM US High Yield Plus Bond X (acc) - EUR (hedged) 0.10% 0.10% 0.10% 0.10% 0.14% 0.14% 0.10% 03-Sep-13JPM US High Yield Plus Bond X (acc) - GBP (hedged)* - - - - 0.15% 0.12% 0.10% 19-Aug-13JPM US High Yield Plus Bond X (acc) - USD** 0.10% 0.10% 0.10% 0.10% - - 0.10% 13-Sep-12
JPMorgan Funds - US Short Duration Bond FundJPM US Short Duration Bond A (acc) - EUR (hedged) 0.80% 0.80% 0.80% 0.80% 0.80% 0.80% 0.80% 15-Mar-11JPM US Short Duration Bond A (acc) - USD 0.80% 0.80% 0.80% 0.80% 0.80% 0.80% 0.80% 15-Dec-10JPM US Short Duration Bond B (acc) - USD*** - - - - 0.45% 0.50% 0.45% 22-Mar-11JPM US Short Duration Bond C (acc) - USD 0.45% 0.45% 0.45% 0.45% 0.45% 0.45% 0.45% 27-Sep-11JPM US Short Duration Bond D (acc) - EUR (hedged) 1.10% 1.10% 1.10% 1.10% 1.10% 1.10% 1.10% 15-Mar-11JPM US Short Duration Bond D (acc) - USD 1.10% 1.10% 1.10% 1.10% 1.10% 1.10% 1.10% 15-Dec-10JPM US Short Duration Bond I (acc) - EUR (hedged) 0.41% 0.41% 0.41% 0.41% 0.40% 0.41% 0.41% 16-Oct-13JPM US Short Duration Bond I (acc) - USD 0.41% 0.41% 0.41% 0.41% 0.40% 0.41% 0.41% 18-Jan-11JPM US Short Duration Bond X (acc) - EUR (hedged) 0.10% 0.10% 0.10% 0.10% 0.08% 0.09% 0.10% 28-Mar-13JPM US Short Duration Bond X (acc) - USD 0.10% 0.10% 0.10% 0.10% 0.09% 0.09% 0.10% 20-Dec-11
264
JPMorgan FundsAppendix - Unaudited Additional Disclosures (continued)
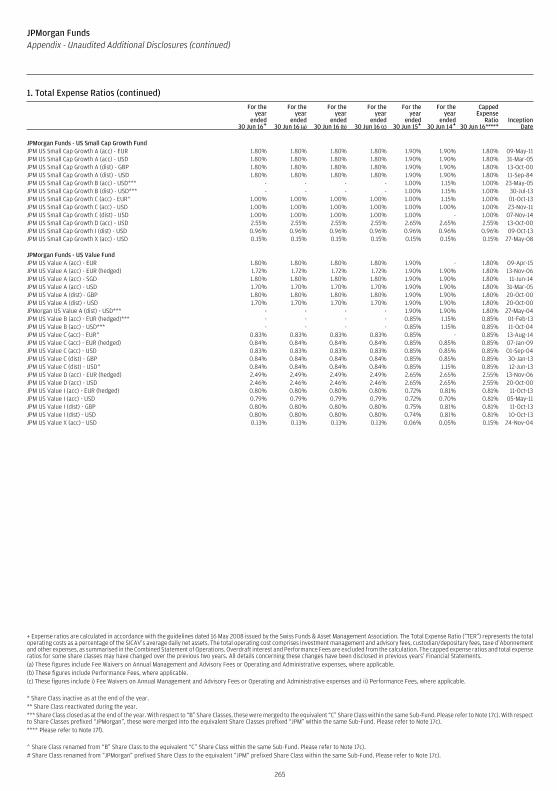
1. Total Expense Ratios (continued)For the
yearended
30 Jun 16+
For theyear
ended30 Jun 16 (a)
For theyear
ended30 Jun 16 (b)
For theyear
ended30 Jun 16 (c)
For theyear
ended30 Jun 15+
For theyear
ended30 Jun 14+
CappedExpense
Ratio30 Jun 16****+
InceptionDate
JPMorgan Funds - US Small Cap Growth FundJPM US Small Cap Growth A (acc) - EUR 1.80% 1.80% 1.80% 1.80% 1.90% 1.90% 1.80% 09-May-11JPM US Small Cap Growth A (acc) - USD 1.80% 1.80% 1.80% 1.80% 1.90% 1.90% 1.80% 31-Mar-05JPM US Small Cap Growth A (dist) - GBP 1.80% 1.80% 1.80% 1.80% 1.90% 1.90% 1.80% 13-Oct-00JPM US Small Cap Growth A (dist) - USD 1.80% 1.80% 1.80% 1.80% 1.90% 1.90% 1.80% 11-Sep-84JPM US Small Cap Growth B (acc) - USD*** - - - - 1.00% 1.15% 1.00% 23-May-05JPM US Small Cap Growth B (dist) - USD*** - - - - 1.00% 1.15% 1.00% 30-Jul-13JPM US Small Cap Growth C (acc) - EUR^ 1.00% 1.00% 1.00% 1.00% 1.00% 1.15% 1.00% 01-Oct-13JPM US Small Cap Growth C (acc) - USD 1.00% 1.00% 1.00% 1.00% 1.00% 1.00% 1.00% 23-Nov-11JPM US Small Cap Growth C (dist) - USD 1.00% 1.00% 1.00% 1.00% 1.00% - 1.00% 07-Nov-14JPM US Small Cap Growth D (acc) - USD 2.55% 2.55% 2.55% 2.55% 2.65% 2.65% 2.55% 13-Oct-00JPM US Small Cap Growth I (dist) - USD 0.96% 0.96% 0.96% 0.96% 0.96% 0.96% 0.96% 09-Oct-13JPM US Small Cap Growth X (acc) - USD 0.15% 0.15% 0.15% 0.15% 0.15% 0.15% 0.15% 27-May-08
JPMorgan Funds - US Value FundJPM US Value A (acc) - EUR 1.80% 1.80% 1.80% 1.80% 1.90% - 1.80% 09-Apr-15JPM US Value A (acc) - EUR (hedged) 1.72% 1.72% 1.72% 1.72% 1.90% 1.90% 1.80% 13-Nov-06JPM US Value A (acc) - SGD 1.80% 1.80% 1.80% 1.80% 1.90% 1.90% 1.80% 11-Jun-14JPM US Value A (acc) - USD 1.70% 1.70% 1.70% 1.70% 1.90% 1.90% 1.80% 31-Mar-05JPM US Value A (dist) - GBP 1.80% 1.80% 1.80% 1.80% 1.90% 1.90% 1.80% 20-Oct-00JPM US Value A (dist) - USD 1.70% 1.70% 1.70% 1.70% 1.90% 1.90% 1.80% 20-Oct-00JPMorgan US Value A (dist) - USD*** - - - - 1.90% 1.90% 1.80% 27-May-04JPM US Value B (acc) - EUR (hedged)*** - - - - 0.85% 1.15% 0.85% 01-Feb-13JPM US Value B (acc) - USD*** - - - - 0.85% 1.15% 0.85% 11-Oct-04JPM US Value C (acc) - EUR^ 0.83% 0.83% 0.83% 0.83% 0.85% - 0.85% 13-Aug-14JPM US Value C (acc) - EUR (hedged) 0.84% 0.84% 0.84% 0.84% 0.85% 0.85% 0.85% 07-Jan-09JPM US Value C (acc) - USD 0.83% 0.83% 0.83% 0.83% 0.85% 0.85% 0.85% 01-Sep-04JPM US Value C (dist) - GBP 0.84% 0.84% 0.84% 0.84% 0.85% 0.85% 0.85% 30-Jan-13JPM US Value C (dist) - USD^ 0.84% 0.84% 0.84% 0.84% 0.85% 1.15% 0.85% 12-Jun-13JPM US Value D (acc) - EUR (hedged) 2.49% 2.49% 2.49% 2.49% 2.65% 2.65% 2.55% 13-Nov-06JPM US Value D (acc) - USD 2.46% 2.46% 2.46% 2.46% 2.65% 2.65% 2.55% 20-Oct-00JPM US Value I (acc) - EUR (hedged) 0.80% 0.80% 0.80% 0.80% 0.72% 0.81% 0.81% 11-Oct-13JPM US Value I (acc) - USD 0.79% 0.79% 0.79% 0.79% 0.72% 0.70% 0.81% 05-May-11JPM US Value I (dist) - GBP 0.80% 0.80% 0.80% 0.80% 0.75% 0.81% 0.81% 11-Oct-13JPM US Value I (dist) - USD 0.80% 0.80% 0.80% 0.80% 0.74% 0.81% 0.81% 10-Oct-13JPM US Value X (acc) - USD 0.13% 0.13% 0.13% 0.13% 0.06% 0.05% 0.15% 24-Nov-04
+ Expense ratios are calculated in accordance with the guidelines dated 16 May 2008 issued by the Swiss Funds & Asset Management Association. The Total Expense Ratio (“TER”) represents the totaloperating costs as a percentage of the SICAV’s average daily net assets. The total operating cost comprises investment management and advisory fees, custodian/depositary fees, taxe d’Abonnementand other expenses, as summarised in the Combined Statement of Operations. Overdraft interest and Performance Fees are excluded from the calculation. The capped expense ratios and total expenseratios for some share classes may have changed over the previous two years. All details concerning these changes have been disclosed in previous years’ Financial Statements.(a) These figures include Fee Waivers on Annual Management and Advisory Fees or Operating and Administrative expenses, where applicable.(b) These figures include Performance Fees, where applicable.(c) These figures include i) Fee Waivers on Annual Management and Advisory Fees or Operating and Administrative expenses and ii) Performance Fees, where applicable.
* Share Class inactive as at the end of the year.** Share Class reactivated during the year.*** Share Class closed as at the end of the year. With respect to “B” Share Classes, these were merged to the equivalent “C” Share Class within the same Sub-Fund. Please refer to Note 17c). With respectto Share Classes prefixed “JPMorgan”, these were merged into the equivalent Share Classes prefixed “JPM” within the same Sub-Fund. Please refer to Note 17c).**** Please refer to Note 17f).
^ Share Class renamed from “B” Share Class to the equivalent “C” Share Class within the same Sub-Fund. Please refer to Note 17c).# Share Class renamed from “JPMorgan” prefixed Share Class to the equivalent “JPM” prefixed Share Class within the same Sub-Fund. Please refer to Note 17c).
265
JPMorgan FundsAppendix - Unaudited Additional Disclosures (continued)

JPMorgan Funds - Africa Equity Fund
Seeks to provide long-term capital growth by investing primarily in a portfolio of African companies.
JPMorgan Funds - ASEAN Equity Fund
Seeks to provide long-term capital growth by investing primarily in companies of countries which are members of the Association of South East AsianNations (ASEAN).
JPMorgan Funds - Asia Pacific Equity Fund
Seeks to provide long-term capital growth by investing primarily in companies in the Asia Pacific Basin (excluding Japan).
JPMorgan Funds - Asia Pacific Income Fund
Seeks to provide income and long term capital growth by investing primarily in income generating securities of countries in the Asia Pacific region (excludingJapan).
JPMorgan Funds - Asian Total Return Bond Fund
Seek to achieve a return in excess of the benchmark by investing in debt securities of countries in the Asia Pacific region (excluding Japan), using financialderivatives where appropriate.
JPMorgan Funds - Brazil Equity Fund
Seeks to provide long term capital growth by investing primarily in a concentrated portfolio of Brazilian companies.
JPMorgan Funds - China A-Share Opportunities Fund
Seeks to provide long-term capital growth by investing primarily in China A-Shares from companies in the PRC.
JPMorgan Funds - China Bond Fund
Seeks to achieve a return in excess of the China bond markets by primarily investing in Chinese debt securities.
JPMorgan Funds - China Fund
Seeks to provide long-term capital growth by investing primarily in companies of the People’s Republic of China.
JPMorgan Funds - Emerging Europe Equity Fund
Seeks to provide long-term capital growth by investing primarily in companies in European emerging market countries including Russia (the “EmergingEuropean Countries”).
JPMorgan Funds - Emerging Europe, Middle East and Africa Equity Fund
Seeks to provide long-term capital growth by investing primarily in companies of the emerging markets of central, eastern and southern Europe, Middle Eastand Africa.
JPMorgan Funds - Emerging Markets Debt Fund
Seeks to achieve a return in excess of the bond markets of emerging countries by investing primarily in emerging market debt securities, including corporatesecurities and securities issued in local currencies, using financial derivative instruments where appropriate.
JPMorgan Funds - Emerging Markets Dividend Fund
Seeks to provide income by investing primarily in dividend-yielding equity securities of emerging market companies, whilst participating in long term capitalgrowth.
JPMorgan Funds - Emerging Markets Equity Fund
Seeks to provide long-term capital growth by investing primarily in emerging market companies.
JPMorgan Funds - Emerging Markets Local Currency Debt Fund
Seeks to achieve a return in excess of government bond markets of emerging markets countries by investing primarily in emerging market local currencydebt securities, using financial derivative instruments where appropriate.
JPMorgan Funds - Emerging Markets Opportunities Fund
Seeks to provide long-term capital growth by investing primarily in an aggressively managed portfolio of emerging market companies.
JPMorgan Funds - Emerging Middle East Equity Fund
Seeks to provide long-term capital growth by investing primarily in companies of the emerging markets of the Middle East region.
JPMorgan Funds - Europe Dynamic Fund
Seeks to maximise long-term capital growth by investing primarily in an aggressively managed portfolio of European companies.
266
JPMorgan FundsAppendix - Unaudited Additional Disclosures (continued)
2. Summary of Investment Objectives of the Sub-Funds
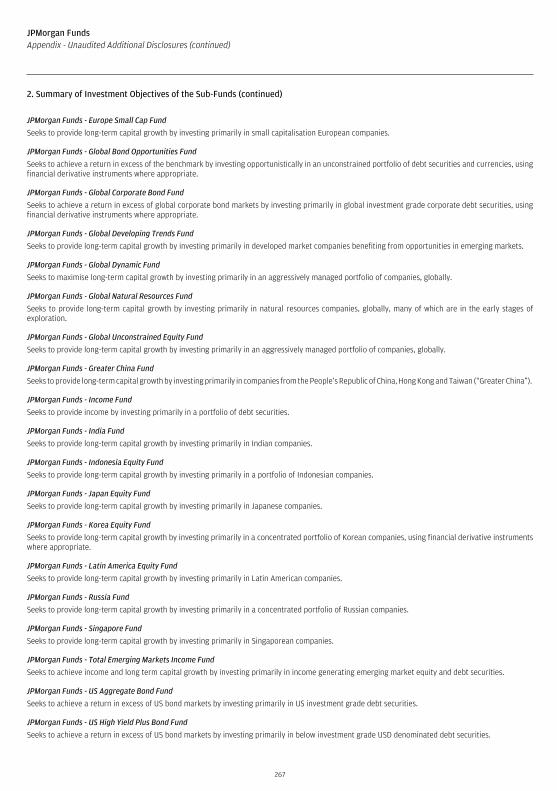
JPMorgan Funds - Europe Small Cap Fund
Seeks to provide long-term capital growth by investing primarily in small capitalisation European companies.
JPMorgan Funds - Global Bond Opportunities Fund
Seeks to achieve a return in excess of the benchmark by investing opportunistically in an unconstrained portfolio of debt securities and currencies, usingfinancial derivative instruments where appropriate.
JPMorgan Funds - Global Corporate Bond Fund
Seeks to achieve a return in excess of global corporate bond markets by investing primarily in global investment grade corporate debt securities, usingfinancial derivative instruments where appropriate.
JPMorgan Funds - Global Developing Trends Fund
Seeks to provide long-term capital growth by investing primarily in developed market companies benefiting from opportunities in emerging markets.
JPMorgan Funds - Global Dynamic Fund
Seeks to maximise long-term capital growth by investing primarily in an aggressively managed portfolio of companies, globally.
JPMorgan Funds - Global Natural Resources Fund
Seeks to provide long-term capital growth by investing primarily in natural resources companies, globally, many of which are in the early stages ofexploration.
JPMorgan Funds - Global Unconstrained Equity Fund
Seeks to provide long-term capital growth by investing primarily in an aggressively managed portfolio of companies, globally.
JPMorgan Funds - Greater China Fund
Seeks to provide long-term capital growth by investing primarily in companies from the People’s Republic of China, Hong Kong and Taiwan (“Greater China”).
JPMorgan Funds - Income Fund
Seeks to provide income by investing primarily in a portfolio of debt securities.
JPMorgan Funds - India Fund
Seeks to provide long-term capital growth by investing primarily in Indian companies.
JPMorgan Funds - Indonesia Equity Fund
Seeks to provide long-term capital growth by investing primarily in a portfolio of Indonesian companies.
JPMorgan Funds - Japan Equity Fund
Seeks to provide long-term capital growth by investing primarily in Japanese companies.
JPMorgan Funds - Korea Equity Fund
Seeks to provide long-term capital growth by investing primarily in a concentrated portfolio of Korean companies, using financial derivative instrumentswhere appropriate.
JPMorgan Funds - Latin America Equity Fund
Seeks to provide long-term capital growth by investing primarily in Latin American companies.
JPMorgan Funds - Russia Fund
Seeks to provide long-term capital growth by investing primarily in a concentrated portfolio of Russian companies.
JPMorgan Funds - Singapore Fund
Seeks to provide long-term capital growth by investing primarily in Singaporean companies.
JPMorgan Funds - Total Emerging Markets Income Fund
Seeks to achieve income and long term capital growth by investing primarily in income generating emerging market equity and debt securities.
JPMorgan Funds - US Aggregate Bond Fund
Seeks to achieve a return in excess of US bond markets by investing primarily in US investment grade debt securities.
JPMorgan Funds - US High Yield Plus Bond Fund
Seeks to achieve a return in excess of US bond markets by investing primarily in below investment grade USD denominated debt securities.
267
JPMorgan FundsAppendix - Unaudited Additional Disclosures (continued)
2. Summary of Investment Objectives of the Sub-Funds (continued)

JPMorgan Funds - US Short Duration Bond Fund
Seeks to achieve a return in excess of US short duration bond markets by investing primarily in US investment grade debt securities, including asset-backedand mortgage-backed securities.
JPMorgan Funds - US Small Cap Growth Fund
Seeks to provide long-term capital growth by investing primarily in a growth style biased portfolio of small capitalisation US companies.
JPMorgan Funds - US Value Fund
Seeks to provide long-term capital growth by investing primarily in a value style biased portfolio of US companies.
268
JPMorgan FundsAppendix - Unaudited Additional Disclosures (continued)
2. Summary of Investment Objectives of the Sub-Funds (continued)
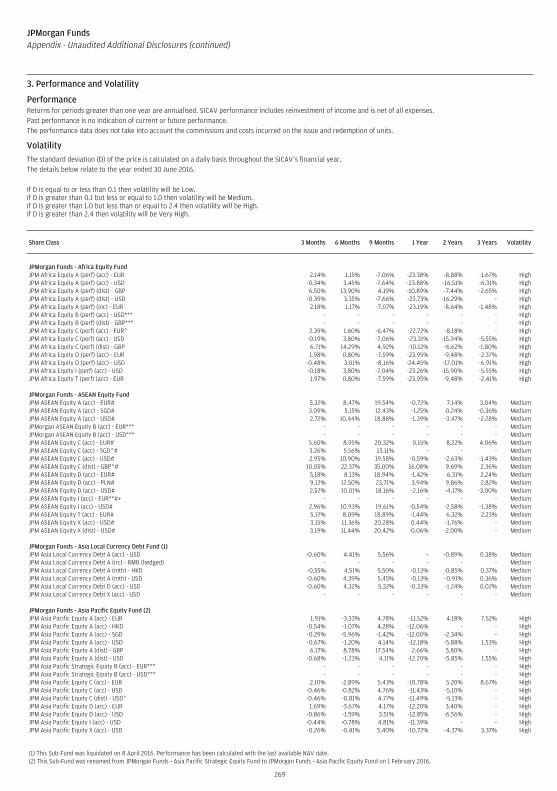
PerformanceReturns for periods greater than one year are annualised. SICAV performance includes reinvestment of income and is net of all expenses.Past performance is no indication of current or future performance.The performance data does not take into account the commissions and costs incurred on the issue and redemption of units.
Volatility
The standard deviation (D) of the price is calculated on a daily basis throughout the SICAV’s financial year.The details below relate to the year ended 30 June 2016.
If D is equal to or less than 0.1 then volatility will be Low.If D is greater than 0.1 but less or equal to 1.0 then volatility will be Medium.If D is greater than 1.0 but less than or equal to 2.4 then volatility will be High.If D is greater than 2.4 then volatility will be Very High.
Share Class 3 Months 6 Months 9 Months 1 Year 2 Years 3 Years Volatility
JPMorgan Funds - Africa Equity FundJPM Africa Equity A (perf) (acc) - EUR 2.14% 1.15% -7.06% -23.38% -8.88% -1.67% HighJPM Africa Equity A (perf) (acc) - USD -0.34% 3.45% -7.64% -23.88% -16.51% -6.31% HighJPM Africa Equity A (perf) (dist) - GBP 6.50% 13.90% 4.19% -10.89% -7.44% -2.65% HighJPM Africa Equity A (perf) (dist) - USD -0.39% 3.35% -7.66% -23.73% -16.29% - HighJPM Africa Equity A (perf) (inc) - EUR 2.18% 1.17% -7.07% -23.19% -8.64% -1.48% HighJPM Africa Equity B (perf) (acc) - USD*** - - - - - - HighJPM Africa Equity B (perf) (dist) - GBP*** - - - - - - HighJPM Africa Equity C (perf) (acc) - EUR^ 2.39% 1.60% -6.47% -22.72% -8.18% - HighJPM Africa Equity C (perf) (acc) - USD -0.19% 3.80% -7.06% -23.31% -15.94% -5.55% HighJPM Africa Equity C (perf) (dist) - GBP 6.71% 14.29% 4.92% -10.12% -6.62% -1.80% HighJPM Africa Equity D (perf) (acc) - EUR 1.98% 0.80% -7.59% -23.95% -9.48% -2.37% HighJPM Africa Equity D (perf) (acc) - USD -0.48% 3.01% -8.16% -24.45% -17.01% -6.91% HighJPM Africa Equity I (perf) (acc) - USD -0.18% 3.80% -7.04% -23.26% -15.90% -5.55% HighJPM Africa Equity T (perf) (acc) - EUR 1.97% 0.80% -7.59% -23.95% -9.48% -2.41% High
JPMorgan Funds - ASEAN Equity FundJPM ASEAN Equity A (acc) - EUR# 5.32% 8.47% 19.54% -0.72% 7.14% 3.04% MediumJPM ASEAN Equity A (acc) - SGD# 3.09% 5.15% 12.43% -1.25% 0.24% -0.36% MediumJPM ASEAN Equity A (acc) - USD# 2.72% 10.44% 18.88% -1.39% -3.47% -2.28% MediumJPMorgan ASEAN Equity B (acc) - EUR*** - - - - - - MediumJPMorgan ASEAN Equity B (acc) - USD*** - - - - - - MediumJPM ASEAN Equity C (acc) - EUR# 5.60% 8.95% 20.32% 0.15% 8.22% 4.06% MediumJPM ASEAN Equity C (acc) - SGD^# 3.26% 5.56% 13.11% - - - MediumJPM ASEAN Equity C (acc) - USD# 2.95% 10.90% 19.58% -0.59% -2.63% -1.43% MediumJPM ASEAN Equity C (dist) - GBP^# 10.05% 22.37% 35.00% 16.08% 9.69% 2.36% MediumJPM ASEAN Equity D (acc) - EUR# 5.18% 8.13% 18.94% -1.42% 6.31% 2.24% MediumJPM ASEAN Equity D (acc) - PLN# 9.12% 12.50% 23.71% 3.94% 9.86% 2.82% MediumJPM ASEAN Equity D (acc) - USD# 2.52% 10.01% 18.16% -2.16% -4.17% -3.00% MediumJPM ASEAN Equity I (acc) - EUR**#+ - - - - - - MediumJPM ASEAN Equity I (acc) - USD# 2.96% 10.93% 19.61% -0.54% -2.58% -1.38% MediumJPM ASEAN Equity T (acc) - EUR# 5.17% 8.09% 18.89% -1.44% 6.32% 2.23% MediumJPM ASEAN Equity X (acc) - USD# 3.15% 11.36% 20.28% 0.44% -1.76% - MediumJPM ASEAN Equity X (dist) - USD# 3.19% 11.44% 20.42% -0.06% -2.00% - Medium
JPMorgan Funds - Asia Local Currency Debt Fund (1)JPM Asia Local Currency Debt A (acc) - USD -0.60% 4.41% 5.56% - -0.89% 0.38% MediumJPM Asia Local Currency Debt A (irc) - RMB (hedged) - - - - - - MediumJPM Asia Local Currency Debt A (mth) - HKD -0.55% 4.51% 5.50% -0.13% -0.85% 0.37% MediumJPM Asia Local Currency Debt A (mth) - USD -0.60% 4.39% 5.45% -0.13% -0.91% 0.36% MediumJPM Asia Local Currency Debt D (acc) - USD -0.60% 4.32% 5.32% -0.33% -1.24% 0.02% MediumJPM Asia Local Currency Debt X (acc) - USD - - - - - - Medium
JPMorgan Funds - Asia Pacific Equity Fund (2)JPM Asia Pacific Equity A (acc) - EUR 1.91% -3.33% 4.78% -11.52% 4.18% 7.52% HighJPM Asia Pacific Equity A (acc) - HKD -0.54% -1.07% 4.28% -12.06% - - HighJPM Asia Pacific Equity A (acc) - SGD -0.29% -5.96% -1.42% -12.00% -2.34% - HighJPM Asia Pacific Equity A (acc) - USD -0.67% -1.20% 4.14% -12.18% -5.88% 1.53% HighJPM Asia Pacific Equity A (dist) - GBP 6.17% 8.78% 17.54% 2.66% 5.80% - HighJPM Asia Pacific Equity A (dist) - USD -0.68% -1.23% 4.11% -12.20% -5.85% 1.55% HighJPM Asia Pacific Strategic Equity B (acc) - EUR*** - - - - - - HighJPM Asia Pacific Strategic Equity B (acc) - USD*** - - - - - - HighJPM Asia Pacific Equity C (acc) - EUR 2.10% -2.89% 5.43% -10.78% 5.20% 8.67% HighJPM Asia Pacific Equity C (acc) - USD -0.46% -0.82% 4.76% -11.43% -5.10% - HighJPM Asia Pacific Equity C (dist) - USD^ -0.46% -0.81% 4.77% -11.49% -5.13% - HighJPM Asia Pacific Equity D (acc) - EUR 1.69% -3.67% 4.17% -12.20% 3.40% - HighJPM Asia Pacific Equity D (acc) - USD -0.86% -1.59% 3.51% -12.85% -6.56% - HighJPM Asia Pacific Equity I (acc) - USD -0.44% -0.78% 4.81% -11.39% - - HighJPM Asia Pacific Equity X (acc) - USD -0.26% -0.41% 5.40% -10.72% -4.37% 3.37% High
(1) This Sub-Fund was liquidated on 8 April 2016. Performance has been calculated with the last available NAV date.(2) This Sub-Fund was renamed from JPMorgan Funds - Asia Pacific Strategic Equity Fund to JPMorgan Funds - Asia Pacific Equity Fund on 1 February 2016.
269
JPMorgan FundsAppendix - Unaudited Additional Disclosures (continued)
3. Performance and Volatility
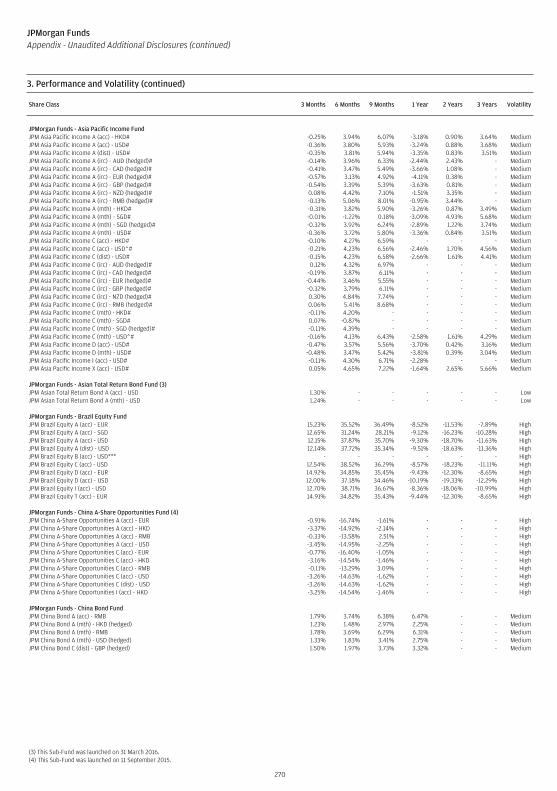
Share Class 3 Months 6 Months 9 Months 1 Year 2 Years 3 Years Volatility
JPMorgan Funds - Asia Pacific Income FundJPM Asia Pacific Income A (acc) - HKD# -0.25% 3.94% 6.07% -3.18% 0.90% 3.64% MediumJPM Asia Pacific Income A (acc) - USD# -0.36% 3.80% 5.93% -3.24% 0.88% 3.68% MediumJPM Asia Pacific Income A (dist) - USD# -0.35% 3.81% 5.94% -3.35% 0.83% 3.51% MediumJPM Asia Pacific Income A (irc) - AUD (hedged)# -0.14% 3.96% 6.33% -2.44% 2.43% - MediumJPM Asia Pacific Income A (irc) - CAD (hedged)# -0.41% 3.47% 5.49% -3.66% 1.08% - MediumJPM Asia Pacific Income A (irc) - EUR (hedged)# -0.57% 3.13% 4.92% -4.11% 0.38% - MediumJPM Asia Pacific Income A (irc) - GBP (hedged)# -0.54% 3.39% 5.39% -3.63% 0.81% - MediumJPM Asia Pacific Income A (irc) - NZD (hedged)# 0.08% 4.42% 7.10% -1.51% 3.35% - MediumJPM Asia Pacific Income A (irc) - RMB (hedged)# -0.13% 5.06% 8.01% -0.95% 3.44% - MediumJPM Asia Pacific Income A (mth) - HKD# -0.31% 3.82% 5.90% -3.26% 0.87% 3.49% MediumJPM Asia Pacific Income A (mth) - SGD# -0.01% -1.22% 0.18% -3.09% 4.93% 5.68% MediumJPM Asia Pacific Income A (mth) - SGD (hedged)# -0.32% 3.92% 6.24% -2.89% 1.22% 3.74% MediumJPM Asia Pacific Income A (mth) - USD# -0.36% 3.72% 5.80% -3.36% 0.84% 3.51% MediumJPM Asia Pacific Income C (acc) - HKD# -0.10% 4.27% 6.59% - - - MediumJPM Asia Pacific Income C (acc) - USD^# -0.21% 4.23% 6.56% -2.46% 1.70% 4.56% MediumJPM Asia Pacific Income C (dist) - USD# -0.15% 4.23% 6.58% -2.66% 1.61% 4.41% MediumJPM Asia Pacific Income C (irc) - AUD (hedged)# 0.12% 4.32% 6.97% - - - MediumJPM Asia Pacific Income C (irc) - CAD (hedged)# -0.19% 3.87% 6.11% - - - MediumJPM Asia Pacific Income C (irc) - EUR (hedged)# -0.44% 3.46% 5.55% - - - MediumJPM Asia Pacific Income C (irc) - GBP (hedged)# -0.32% 3.79% 6.11% - - - MediumJPM Asia Pacific Income C (irc) - NZD (hedged)# 0.30% 4.84% 7.74% - - - MediumJPM Asia Pacific Income C (irc) - RMB (hedged)# 0.06% 5.41% 8.68% - - - MediumJPM Asia Pacific Income C (mth) - HKD# -0.11% 4.20% - - - - MediumJPM Asia Pacific Income C (mth) - SGD# 0.07% -0.87% - - - - MediumJPM Asia Pacific Income C (mth) - SGD (hedged)# -0.11% 4.39% - - - - MediumJPM Asia Pacific Income C (mth) - USD^# -0.16% 4.13% 6.43% -2.58% 1.61% 4.29% MediumJPM Asia Pacific Income D (acc) - USD# -0.47% 3.57% 5.56% -3.70% 0.42% 3.16% MediumJPM Asia Pacific Income D (mth) - USD# -0.48% 3.47% 5.42% -3.81% 0.39% 3.04% MediumJPM Asia Pacific Income I (acc) - USD# -0.11% 4.30% 6.71% -2.28% - - MediumJPM Asia Pacific Income X (acc) - USD# 0.05% 4.65% 7.22% -1.64% 2.65% 5.66% Medium
JPMorgan Funds - Asian Total Return Bond Fund (3)JPM Asian Total Return Bond A (acc) - USD 1.30% - - - - - LowJPM Asian Total Return Bond A (mth) - USD 1.24% - - - - - Low
JPMorgan Funds - Brazil Equity FundJPM Brazil Equity A (acc) - EUR 15.23% 35.52% 36.49% -8.52% -11.53% -7.89% HighJPM Brazil Equity A (acc) - SGD 12.65% 31.24% 28.21% -9.12% -16.23% -10.28% HighJPM Brazil Equity A (acc) - USD 12.15% 37.87% 35.70% -9.30% -18.70% -11.63% HighJPM Brazil Equity A (dist) - USD 12.14% 37.72% 35.34% -9.51% -18.63% -11.36% HighJPM Brazil Equity B (acc) - USD*** - - - - - - HighJPM Brazil Equity C (acc) - USD 12.54% 38.52% 36.29% -8.57% -18.23% -11.11% HighJPM Brazil Equity D (acc) - EUR 14.92% 34.85% 35.45% -9.43% -12.30% -8.65% HighJPM Brazil Equity D (acc) - USD 12.00% 37.18% 34.46% -10.19% -19.33% -12.29% HighJPM Brazil Equity I (acc) - USD 12.70% 38.71% 36.67% -8.36% -18.06% -10.99% HighJPM Brazil Equity T (acc) - EUR 14.91% 34.82% 35.43% -9.44% -12.30% -8.65% High
JPMorgan Funds - China A-Share Opportunities Fund (4)JPM China A-Share Opportunities A (acc) - EUR -0.91% -16.74% -1.61% - - - HighJPM China A-Share Opportunities A (acc) - HKD -3.37% -14.92% -2.14% - - - HighJPM China A-Share Opportunities A (acc) - RMB -0.33% -13.58% 2.51% - - - HighJPM China A-Share Opportunities A (acc) - USD -3.45% -14.95% -2.25% - - - HighJPM China A-Share Opportunities C (acc) - EUR -0.77% -16.40% -1.05% - - - HighJPM China A-Share Opportunities C (acc) - HKD -3.16% -14.54% -1.46% - - - HighJPM China A-Share Opportunities C (acc) - RMB -0.11% -13.29% 3.09% - - - HighJPM China A-Share Opportunities C (acc) - USD -3.26% -14.63% -1.62% - - - HighJPM China A-Share Opportunities C (dist) - USD -3.26% -14.63% -1.62% - - - HighJPM China A-Share Opportunities I (acc) - HKD -3.25% -14.54% -1.46% - - - High
JPMorgan Funds - China Bond FundJPM China Bond A (acc) - RMB 1.79% 3.74% 6.38% 6.47% - - MediumJPM China Bond A (mth) - HKD (hedged) 1.23% 1.48% 2.97% 2.25% - - MediumJPM China Bond A (mth) - RMB 1.78% 3.69% 6.29% 6.31% - - MediumJPM China Bond A (mth) - USD (hedged) 1.33% 1.83% 3.41% 2.75% - - MediumJPM China Bond C (dist) - GBP (hedged) 1.50% 1.97% 3.73% 3.32% - - Medium
(3) This Sub-Fund was launched on 31 March 2016.(4) This Sub-Fund was launched on 11 September 2015.
270
JPMorgan FundsAppendix - Unaudited Additional Disclosures (continued)
3. Performance and Volatility (continued)
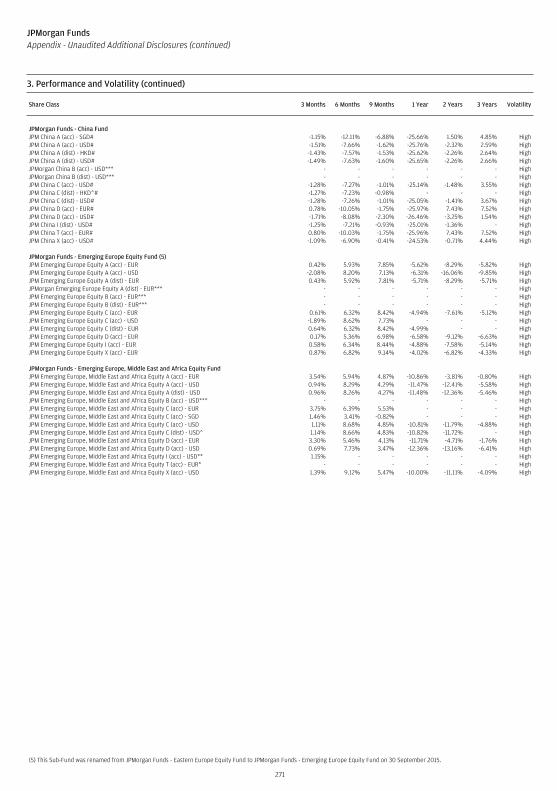
Share Class 3 Months 6 Months 9 Months 1 Year 2 Years 3 Years Volatility
JPMorgan Funds - China FundJPM China A (acc) - SGD# -1.15% -12.11% -6.88% -25.66% 1.50% 4.85% HighJPM China A (acc) - USD# -1.51% -7.66% -1.62% -25.76% -2.32% 2.59% HighJPM China A (dist) - HKD# -1.43% -7.57% -1.53% -25.62% -2.26% 2.64% HighJPM China A (dist) - USD# -1.49% -7.63% -1.60% -25.65% -2.26% 2.66% HighJPMorgan China B (acc) - USD*** - - - - - - HighJPMorgan China B (dist) - USD*** - - - - - - HighJPM China C (acc) - USD# -1.28% -7.27% -1.01% -25.14% -1.48% 3.55% HighJPM China C (dist) - HKD^# -1.27% -7.23% -0.98% - - - HighJPM China C (dist) - USD# -1.28% -7.26% -1.01% -25.05% -1.41% 3.67% HighJPM China D (acc) - EUR# 0.78% -10.05% -1.75% -25.97% 7.43% 7.52% HighJPM China D (acc) - USD# -1.71% -8.08% -2.30% -26.46% -3.25% 1.54% HighJPM China I (dist) - USD# -1.25% -7.21% -0.93% -25.01% -1.36% - HighJPM China T (acc) - EUR# 0.80% -10.03% -1.75% -25.96% 7.43% 7.52% HighJPM China X (acc) - USD# -1.09% -6.90% -0.41% -24.53% -0.71% 4.44% High
JPMorgan Funds - Emerging Europe Equity Fund (5)JPM Emerging Europe Equity A (acc) - EUR 0.42% 5.93% 7.85% -5.62% -8.29% -5.82% HighJPM Emerging Europe Equity A (acc) - USD -2.08% 8.20% 7.13% -6.31% -16.06% -9.85% HighJPM Emerging Europe Equity A (dist) - EUR 0.43% 5.92% 7.81% -5.71% -8.29% -5.71% HighJPMorgan Emerging Europe Equity A (dist) - EUR*** - - - - - - HighJPM Emerging Europe Equity B (acc) - EUR*** - - - - - - HighJPM Emerging Europe Equity B (dist) - EUR*** - - - - - - HighJPM Emerging Europe Equity C (acc) - EUR 0.61% 6.32% 8.42% -4.94% -7.61% -5.12% HighJPM Emerging Europe Equity C (acc) - USD -1.89% 8.62% 7.73% - - - HighJPM Emerging Europe Equity C (dist) - EUR 0.64% 6.32% 8.42% -4.99% - - HighJPM Emerging Europe Equity D (acc) - EUR 0.17% 5.36% 6.98% -6.58% -9.12% -6.63% HighJPM Emerging Europe Equity I (acc) - EUR 0.58% 6.34% 8.44% -4.88% -7.58% -5.14% HighJPM Emerging Europe Equity X (acc) - EUR 0.87% 6.82% 9.14% -4.02% -6.82% -4.33% High
JPMorgan Funds - Emerging Europe, Middle East and Africa Equity FundJPM Emerging Europe, Middle East and Africa Equity A (acc) - EUR 3.54% 5.94% 4.87% -10.86% -3.81% -0.80% HighJPM Emerging Europe, Middle East and Africa Equity A (acc) - USD 0.94% 8.29% 4.29% -11.47% -12.41% -5.58% HighJPM Emerging Europe, Middle East and Africa Equity A (dist) - USD 0.96% 8.26% 4.27% -11.48% -12.36% -5.46% HighJPM Emerging Europe, Middle East and Africa Equity B (acc) - USD*** - - - - - - HighJPM Emerging Europe, Middle East and Africa Equity C (acc) - EUR 3.75% 6.39% 5.53% - - - HighJPM Emerging Europe, Middle East and Africa Equity C (acc) - SGD 1.46% 3.41% -0.82% - - - HighJPM Emerging Europe, Middle East and Africa Equity C (acc) - USD 1.11% 8.68% 4.85% -10.81% -11.79% -4.88% HighJPM Emerging Europe, Middle East and Africa Equity C (dist) - USD^ 1.14% 8.66% 4.83% -10.82% -11.72% - HighJPM Emerging Europe, Middle East and Africa Equity D (acc) - EUR 3.30% 5.46% 4.13% -11.71% -4.71% -1.76% HighJPM Emerging Europe, Middle East and Africa Equity D (acc) - USD 0.69% 7.73% 3.47% -12.36% -13.16% -6.41% HighJPM Emerging Europe, Middle East and Africa Equity I (acc) - USD** 1.15% - - - - - HighJPM Emerging Europe, Middle East and Africa Equity T (acc) - EUR* - - - - - - HighJPM Emerging Europe, Middle East and Africa Equity X (acc) - USD 1.39% 9.12% 5.47% -10.00% -11.11% -4.09% High
(5) This Sub-Fund was renamed from JPMorgan Funds - Eastern Europe Equity Fund to JPMorgan Funds - Emerging Europe Equity Fund on 30 September 2015.
271
JPMorgan FundsAppendix - Unaudited Additional Disclosures (continued)
3. Performance and Volatility (continued)
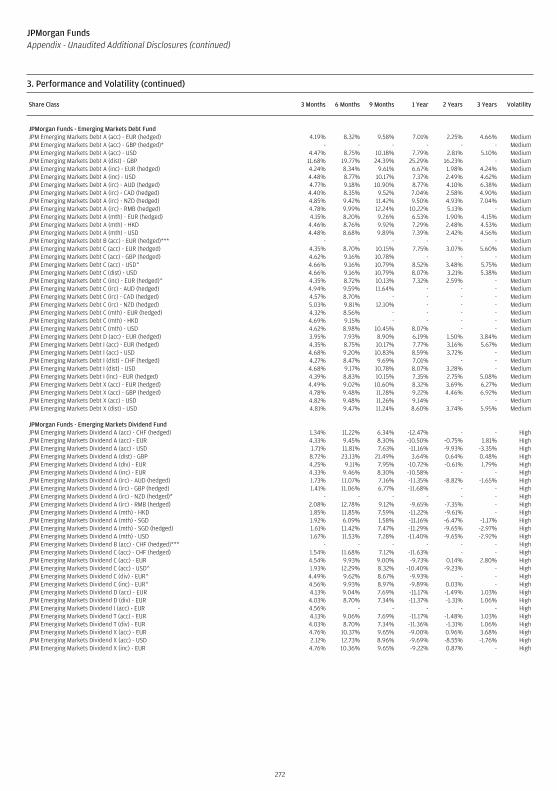
Share Class 3 Months 6 Months 9 Months 1 Year 2 Years 3 Years Volatility
JPMorgan Funds - Emerging Markets Debt FundJPM Emerging Markets Debt A (acc) - EUR (hedged) 4.19% 8.32% 9.58% 7.01% 2.25% 4.66% MediumJPM Emerging Markets Debt A (acc) - GBP (hedged)* - - - - - - MediumJPM Emerging Markets Debt A (acc) - USD 4.47% 8.75% 10.18% 7.79% 2.81% 5.10% MediumJPM Emerging Markets Debt A (dist) - GBP 11.68% 19.77% 24.39% 25.29% 16.23% - MediumJPM Emerging Markets Debt A (inc) - EUR (hedged) 4.24% 8.34% 9.61% 6.67% 1.98% 4.24% MediumJPM Emerging Markets Debt A (inc) - USD 4.48% 8.77% 10.17% 7.37% 2.49% 4.62% MediumJPM Emerging Markets Debt A (irc) - AUD (hedged) 4.77% 9.18% 10.90% 8.77% 4.10% 6.38% MediumJPM Emerging Markets Debt A (irc) - CAD (hedged) 4.40% 8.35% 9.52% 7.04% 2.58% 4.90% MediumJPM Emerging Markets Debt A (irc) - NZD (hedged) 4.85% 9.42% 11.42% 9.50% 4.93% 7.04% MediumJPM Emerging Markets Debt A (irc) - RMB (hedged) 4.78% 9.99% 12.24% 10.22% 5.13% - MediumJPM Emerging Markets Debt A (mth) - EUR (hedged) 4.15% 8.20% 9.26% 6.53% 1.90% 4.15% MediumJPM Emerging Markets Debt A (mth) - HKD 4.46% 8.76% 9.92% 7.29% 2.48% 4.53% MediumJPM Emerging Markets Debt A (mth) - USD 4.48% 8.68% 9.89% 7.39% 2.42% 4.56% MediumJPM Emerging Markets Debt B (acc) - EUR (hedged)*** - - - - - - MediumJPM Emerging Markets Debt C (acc) - EUR (hedged) 4.35% 8.70% 10.15% 7.75% 3.07% 5.60% MediumJPM Emerging Markets Debt C (acc) - GBP (hedged) 4.62% 9.16% 10.78% - - - MediumJPM Emerging Markets Debt C (acc) - USD^ 4.66% 9.16% 10.79% 8.52% 3.48% 5.75% MediumJPM Emerging Markets Debt C (dist) - USD 4.66% 9.16% 10.79% 8.07% 3.21% 5.38% MediumJPM Emerging Markets Debt C (inc) - EUR (hedged)^ 4.35% 8.72% 10.13% 7.32% 2.59% - MediumJPM Emerging Markets Debt C (irc) - AUD (hedged) 4.94% 9.59% 11.64% - - - MediumJPM Emerging Markets Debt C (irc) - CAD (hedged) 4.57% 8.70% - - - - MediumJPM Emerging Markets Debt C (irc) - NZD (hedged) 5.03% 9.81% 12.10% - - - MediumJPM Emerging Markets Debt C (mth) - EUR (hedged) 4.32% 8.56% - - - - MediumJPM Emerging Markets Debt C (mth) - HKD 4.69% 9.15% - - - - MediumJPM Emerging Markets Debt C (mth) - USD 4.62% 8.98% 10.45% 8.07% - - MediumJPM Emerging Markets Debt D (acc) - EUR (hedged) 3.95% 7.93% 8.90% 6.19% 1.50% 3.84% MediumJPM Emerging Markets Debt I (acc) - EUR (hedged) 4.35% 8.75% 10.17% 7.77% 3.16% 5.67% MediumJPM Emerging Markets Debt I (acc) - USD 4.68% 9.20% 10.83% 8.59% 3.72% - MediumJPM Emerging Markets Debt I (dist) - CHF (hedged) 4.27% 8.47% 9.69% 7.01% - - MediumJPM Emerging Markets Debt I (dist) - USD 4.68% 9.17% 10.78% 8.07% 3.28% - MediumJPM Emerging Markets Debt I (inc) - EUR (hedged) 4.39% 8.83% 10.15% 7.35% 2.75% 5.08% MediumJPM Emerging Markets Debt X (acc) - EUR (hedged) 4.49% 9.02% 10.60% 8.32% 3.69% 6.27% MediumJPM Emerging Markets Debt X (acc) - GBP (hedged) 4.78% 9.48% 11.28% 9.22% 4.46% 6.92% MediumJPM Emerging Markets Debt X (acc) - USD 4.82% 9.48% 11.26% 9.14% - - MediumJPM Emerging Markets Debt X (dist) - USD 4.81% 9.47% 11.24% 8.60% 3.74% 5.95% Medium
JPMorgan Funds - Emerging Markets Dividend FundJPM Emerging Markets Dividend A (acc) - CHF (hedged) 1.34% 11.22% 6.34% -12.47% - - HighJPM Emerging Markets Dividend A (acc) - EUR 4.33% 9.45% 8.30% -10.50% -0.75% 1.81% HighJPM Emerging Markets Dividend A (acc) - USD 1.71% 11.81% 7.63% -11.16% -9.93% -3.35% HighJPM Emerging Markets Dividend A (dist) - GBP 8.72% 23.13% 21.49% 3.64% 0.64% 0.48% HighJPM Emerging Markets Dividend A (div) - EUR 4.25% 9.11% 7.95% -10.72% -0.61% 1.79% HighJPM Emerging Markets Dividend A (inc) - EUR 4.33% 9.46% 8.30% -10.58% - - HighJPM Emerging Markets Dividend A (irc) - AUD (hedged) 1.73% 11.07% 7.16% -11.35% -8.82% -1.65% HighJPM Emerging Markets Dividend A (irc) - GBP (hedged) 1.41% 11.06% 6.77% -11.68% - - HighJPM Emerging Markets Dividend A (irc) - NZD (hedged)* - - - - - - HighJPM Emerging Markets Dividend A (irc) - RMB (hedged) 2.08% 12.78% 9.12% -9.65% -7.35% - HighJPM Emerging Markets Dividend A (mth) - HKD 1.85% 11.85% 7.59% -11.22% -9.61% - HighJPM Emerging Markets Dividend A (mth) - SGD 1.92% 6.09% 1.58% -11.16% -6.47% -1.17% HighJPM Emerging Markets Dividend A (mth) - SGD (hedged) 1.61% 11.42% 7.47% -11.29% -9.65% -2.97% HighJPM Emerging Markets Dividend A (mth) - USD 1.67% 11.53% 7.28% -11.40% -9.65% -2.92% HighJPM Emerging Markets Dividend B (acc) - CHF (hedged)*** - - - - - - HighJPM Emerging Markets Dividend C (acc) - CHF (hedged) 1.54% 11.68% 7.12% -11.63% - - HighJPM Emerging Markets Dividend C (acc) - EUR 4.54% 9.93% 9.00% -9.73% 0.14% 2.80% HighJPM Emerging Markets Dividend C (acc) - USD^ 1.93% 12.29% 8.32% -10.40% -9.23% - HighJPM Emerging Markets Dividend C (div) - EUR^ 4.49% 9.62% 8.67% -9.93% - - HighJPM Emerging Markets Dividend C (inc) - EUR^ 4.56% 9.93% 8.97% -9.89% 0.03% - HighJPM Emerging Markets Dividend D (acc) - EUR 4.13% 9.04% 7.69% -11.17% -1.49% 1.03% HighJPM Emerging Markets Dividend D (div) - EUR 4.03% 8.70% 7.34% -11.37% -1.31% 1.06% HighJPM Emerging Markets Dividend I (acc) - EUR 4.56% - - - - - HighJPM Emerging Markets Dividend T (acc) - EUR 4.13% 9.06% 7.69% -11.17% -1.48% 1.03% HighJPM Emerging Markets Dividend T (div) - EUR 4.03% 8.70% 7.34% -11.36% -1.31% 1.06% HighJPM Emerging Markets Dividend X (acc) - EUR 4.76% 10.37% 9.65% -9.00% 0.96% 3.68% HighJPM Emerging Markets Dividend X (acc) - USD 2.12% 12.73% 8.96% -9.69% -8.55% -1.76% HighJPM Emerging Markets Dividend X (inc) - EUR 4.76% 10.36% 9.65% -9.22% 0.87% - High
272
JPMorgan FundsAppendix - Unaudited Additional Disclosures (continued)
3. Performance and Volatility (continued)
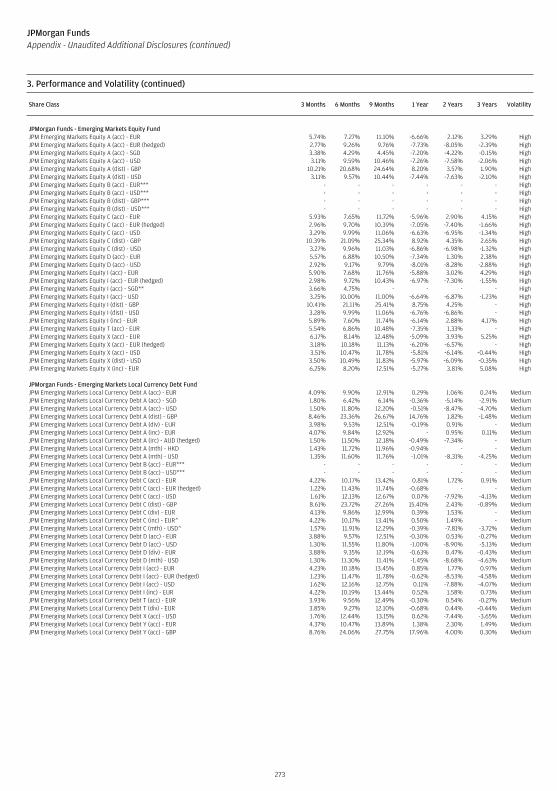
Share Class 3 Months 6 Months 9 Months 1 Year 2 Years 3 Years Volatility
JPMorgan Funds - Emerging Markets Equity FundJPM Emerging Markets Equity A (acc) - EUR 5.74% 7.27% 11.10% -6.66% 2.12% 3.29% HighJPM Emerging Markets Equity A (acc) - EUR (hedged) 2.77% 9.26% 9.76% -7.73% -8.05% -2.39% HighJPM Emerging Markets Equity A (acc) - SGD 3.38% 4.29% 4.45% -7.20% -4.22% -0.15% HighJPM Emerging Markets Equity A (acc) - USD 3.11% 9.59% 10.46% -7.26% -7.58% -2.06% HighJPM Emerging Markets Equity A (dist) - GBP 10.21% 20.68% 24.64% 8.20% 3.57% 1.90% HighJPM Emerging Markets Equity A (dist) - USD 3.11% 9.57% 10.44% -7.44% -7.63% -2.10% HighJPM Emerging Markets Equity B (acc) - EUR*** - - - - - - HighJPM Emerging Markets Equity B (acc) - USD*** - - - - - - HighJPM Emerging Markets Equity B (dist) - GBP*** - - - - - - HighJPM Emerging Markets Equity B (dist) - USD*** - - - - - - HighJPM Emerging Markets Equity C (acc) - EUR 5.93% 7.65% 11.72% -5.96% 2.90% 4.15% HighJPM Emerging Markets Equity C (acc) - EUR (hedged) 2.96% 9.70% 10.39% -7.05% -7.40% -1.66% HighJPM Emerging Markets Equity C (acc) - USD 3.29% 9.99% 11.06% -6.63% -6.95% -1.34% HighJPM Emerging Markets Equity C (dist) - GBP 10.39% 21.09% 25.34% 8.92% 4.35% 2.65% HighJPM Emerging Markets Equity C (dist) - USD 3.27% 9.96% 11.03% -6.86% -6.98% -1.32% HighJPM Emerging Markets Equity D (acc) - EUR 5.57% 6.88% 10.50% -7.34% 1.30% 2.38% HighJPM Emerging Markets Equity D (acc) - USD 2.92% 9.17% 9.79% -8.01% -8.28% -2.88% HighJPM Emerging Markets Equity I (acc) - EUR 5.90% 7.68% 11.76% -5.88% 3.02% 4.29% HighJPM Emerging Markets Equity I (acc) - EUR (hedged) 2.98% 9.72% 10.43% -6.97% -7.30% -1.55% HighJPM Emerging Markets Equity I (acc) - SGD** 3.66% 4.75% - - - - HighJPM Emerging Markets Equity I (acc) - USD 3.25% 10.00% 11.00% -6.64% -6.87% -1.23% HighJPM Emerging Markets Equity I (dist) - GBP 10.41% 21.11% 25.41% 8.75% 4.25% - HighJPM Emerging Markets Equity I (dist) - USD 3.28% 9.99% 11.06% -6.76% -6.86% - HighJPM Emerging Markets Equity I (inc) - EUR 5.89% 7.60% 11.74% -6.14% 2.88% 4.17% HighJPM Emerging Markets Equity T (acc) - EUR 5.54% 6.86% 10.48% -7.35% 1.33% - HighJPM Emerging Markets Equity X (acc) - EUR 6.17% 8.14% 12.48% -5.09% 3.93% 5.25% HighJPM Emerging Markets Equity X (acc) - EUR (hedged) 3.18% 10.18% 11.13% -6.20% -6.57% - HighJPM Emerging Markets Equity X (acc) - USD 3.51% 10.47% 11.78% -5.81% -6.14% -0.44% HighJPM Emerging Markets Equity X (dist) - USD 3.50% 10.49% 11.83% -5.97% -6.09% -0.35% HighJPM Emerging Markets Equity X (inc) - EUR 6.25% 8.20% 12.51% -5.27% 3.81% 5.08% High
JPMorgan Funds - Emerging Markets Local Currency Debt FundJPM Emerging Markets Local Currency Debt A (acc) - EUR 4.09% 9.90% 12.91% 0.29% 1.06% 0.24% MediumJPM Emerging Markets Local Currency Debt A (acc) - SGD 1.80% 6.42% 6.14% -0.36% -5.14% -2.91% MediumJPM Emerging Markets Local Currency Debt A (acc) - USD 1.50% 11.80% 12.20% -0.51% -8.47% -4.70% MediumJPM Emerging Markets Local Currency Debt A (dist) - GBP 8.46% 23.36% 26.67% 14.76% 1.82% -1.48% MediumJPM Emerging Markets Local Currency Debt A (div) - EUR 3.98% 9.53% 12.51% -0.19% 0.91% - MediumJPM Emerging Markets Local Currency Debt A (inc) - EUR 4.07% 9.84% 12.92% - 0.95% 0.11% MediumJPM Emerging Markets Local Currency Debt A (irc) - AUD (hedged) 1.50% 11.50% 12.18% -0.49% -7.34% - MediumJPM Emerging Markets Local Currency Debt A (mth) - HKD 1.43% 11.72% 11.96% -0.94% - - MediumJPM Emerging Markets Local Currency Debt A (mth) - USD 1.35% 11.60% 11.76% -1.01% -8.31% -4.25% MediumJPM Emerging Markets Local Currency Debt B (acc) - EUR*** - - - - - - MediumJPM Emerging Markets Local Currency Debt B (acc) - USD*** - - - - - - MediumJPM Emerging Markets Local Currency Debt C (acc) - EUR 4.22% 10.17% 13.42% 0.81% 1.72% 0.91% MediumJPM Emerging Markets Local Currency Debt C (acc) - EUR (hedged) 1.22% 11.43% 11.74% -0.68% - - MediumJPM Emerging Markets Local Currency Debt C (acc) - USD 1.61% 12.13% 12.67% 0.07% -7.92% -4.13% MediumJPM Emerging Markets Local Currency Debt C (dist) - GBP 8.61% 23.72% 27.26% 15.40% 2.43% -0.89% MediumJPM Emerging Markets Local Currency Debt C (div) - EUR 4.13% 9.86% 12.99% 0.39% 1.53% - MediumJPM Emerging Markets Local Currency Debt C (inc) - EUR^ 4.22% 10.17% 13.41% 0.50% 1.49% - MediumJPM Emerging Markets Local Currency Debt C (mth) - USD^ 1.57% 11.91% 12.29% -0.39% -7.81% -3.72% MediumJPM Emerging Markets Local Currency Debt D (acc) - EUR 3.88% 9.57% 12.51% -0.30% 0.53% -0.27% MediumJPM Emerging Markets Local Currency Debt D (acc) - USD 1.30% 11.55% 11.80% -1.00% -8.90% -5.13% MediumJPM Emerging Markets Local Currency Debt D (div) - EUR 3.88% 9.35% 12.19% -0.63% 0.47% -0.43% MediumJPM Emerging Markets Local Currency Debt D (mth) - USD 1.30% 11.30% 11.41% -1.45% -8.68% -4.63% MediumJPM Emerging Markets Local Currency Debt I (acc) - EUR 4.23% 10.18% 13.45% 0.85% 1.77% 0.97% MediumJPM Emerging Markets Local Currency Debt I (acc) - EUR (hedged) 1.23% 11.47% 11.78% -0.62% -8.53% -4.58% MediumJPM Emerging Markets Local Currency Debt I (acc) - USD 1.62% 12.16% 12.75% 0.11% -7.88% -4.07% MediumJPM Emerging Markets Local Currency Debt I (inc) - EUR 4.22% 10.19% 13.44% 0.52% 1.58% 0.73% MediumJPM Emerging Markets Local Currency Debt T (acc) - EUR 3.93% 9.56% 12.49% -0.30% 0.54% -0.27% MediumJPM Emerging Markets Local Currency Debt T (div) - EUR 3.85% 9.27% 12.10% -0.68% 0.44% -0.44% MediumJPM Emerging Markets Local Currency Debt X (acc) - USD 1.76% 12.44% 13.15% 0.62% -7.44% -3.65% MediumJPM Emerging Markets Local Currency Debt Y (acc) - EUR 4.37% 10.47% 13.89% 1.38% 2.30% 1.49% MediumJPM Emerging Markets Local Currency Debt Y (acc) - GBP 8.76% 24.06% 27.75% 17.96% 4.00% 0.30% Medium
273
JPMorgan FundsAppendix - Unaudited Additional Disclosures (continued)
3. Performance and Volatility (continued)
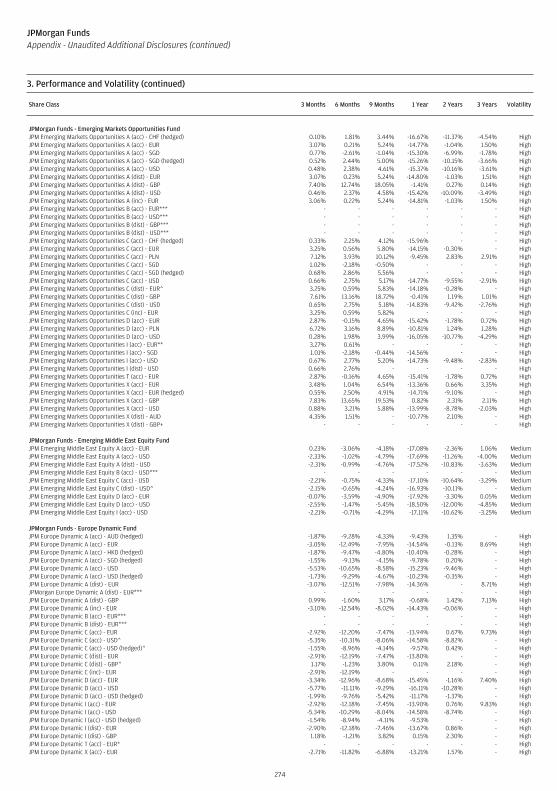
Share Class 3 Months 6 Months 9 Months 1 Year 2 Years 3 Years Volatility
JPMorgan Funds - Emerging Markets Opportunities FundJPM Emerging Markets Opportunities A (acc) - CHF (hedged) 0.10% 1.81% 3.44% -16.67% -11.37% -4.54% HighJPM Emerging Markets Opportunities A (acc) - EUR 3.07% 0.21% 5.24% -14.77% -1.04% 1.50% HighJPM Emerging Markets Opportunities A (acc) - SGD 0.77% -2.61% -1.04% -15.30% -6.99% -1.78% HighJPM Emerging Markets Opportunities A (acc) - SGD (hedged) 0.52% 2.44% 5.00% -15.26% -10.15% -3.66% HighJPM Emerging Markets Opportunities A (acc) - USD 0.48% 2.38% 4.61% -15.37% -10.16% -3.61% HighJPM Emerging Markets Opportunities A (dist) - EUR 3.07% 0.23% 5.24% -14.80% -1.03% 1.51% HighJPM Emerging Markets Opportunities A (dist) - GBP 7.40% 12.74% 18.05% -1.41% 0.27% 0.14% HighJPM Emerging Markets Opportunities A (dist) - USD 0.46% 2.37% 4.58% -15.42% -10.09% -3.49% HighJPM Emerging Markets Opportunities A (inc) - EUR 3.06% 0.22% 5.24% -14.81% -1.03% 1.50% HighJPM Emerging Markets Opportunities B (acc) - EUR*** - - - - - - HighJPM Emerging Markets Opportunities B (acc) - USD*** - - - - - - HighJPM Emerging Markets Opportunities B (dist) - GBP*** - - - - - - HighJPM Emerging Markets Opportunities B (dist) - USD*** - - - - - - HighJPM Emerging Markets Opportunities C (acc) - CHF (hedged) 0.33% 2.25% 4.12% -15.96% - - HighJPM Emerging Markets Opportunities C (acc) - EUR 3.25% 0.56% 5.80% -14.15% -0.30% - HighJPM Emerging Markets Opportunities C (acc) - PLN 7.12% 3.93% 10.12% -9.45% 2.83% 2.91% HighJPM Emerging Markets Opportunities C (acc) - SGD 1.02% -2.18% -0.50% - - - HighJPM Emerging Markets Opportunities C (acc) - SGD (hedged) 0.68% 2.86% 5.56% - - - HighJPM Emerging Markets Opportunities C (acc) - USD 0.66% 2.75% 5.17% -14.77% -9.55% -2.91% HighJPM Emerging Markets Opportunities C (dist) - EUR^ 3.25% 0.59% 5.83% -14.18% -0.28% - HighJPM Emerging Markets Opportunities C (dist) - GBP 7.61% 13.16% 18.72% -0.41% 1.19% 1.01% HighJPM Emerging Markets Opportunities C (dist) - USD 0.65% 2.75% 5.18% -14.83% -9.42% -2.76% HighJPM Emerging Markets Opportunities C (inc) - EUR 3.25% 0.59% 5.82% - - - HighJPM Emerging Markets Opportunities D (acc) - EUR 2.87% -0.15% 4.65% -15.42% -1.78% 0.72% HighJPM Emerging Markets Opportunities D (acc) - PLN 6.72% 3.16% 8.89% -10.81% 1.24% 1.28% HighJPM Emerging Markets Opportunities D (acc) - USD 0.28% 1.98% 3.99% -16.05% -10.77% -4.29% HighJPM Emerging Markets Opportunities I (acc) - EUR** 3.27% 0.61% - - - - HighJPM Emerging Markets Opportunities I (acc) - SGD 1.01% -2.18% -0.44% -14.56% - - HighJPM Emerging Markets Opportunities I (acc) - USD 0.67% 2.77% 5.20% -14.73% -9.48% -2.83% HighJPM Emerging Markets Opportunities I (dist) - USD 0.66% 2.76% - - - - HighJPM Emerging Markets Opportunities T (acc) - EUR 2.87% -0.16% 4.65% -15.41% -1.78% 0.72% HighJPM Emerging Markets Opportunities X (acc) - EUR 3.48% 1.04% 6.54% -13.36% 0.66% 3.35% HighJPM Emerging Markets Opportunities X (acc) - EUR (hedged) 0.55% 2.50% 4.91% -14.71% -9.10% - HighJPM Emerging Markets Opportunities X (acc) - GBP 7.83% 13.65% 19.53% 0.82% 2.31% 2.11% HighJPM Emerging Markets Opportunities X (acc) - USD 0.88% 3.21% 5.88% -13.99% -8.78% -2.03% HighJPM Emerging Markets Opportunities X (dist) - AUD 4.35% 1.51% - -10.77% 2.10% - HighJPM Emerging Markets Opportunities X (dist) - GBP+ - - - - - - High
JPMorgan Funds - Emerging Middle East Equity FundJPM Emerging Middle East Equity A (acc) - EUR 0.23% -3.06% -4.18% -17.08% -2.36% 1.06% MediumJPM Emerging Middle East Equity A (acc) - USD -2.33% -1.02% -4.79% -17.69% -11.26% -4.00% MediumJPM Emerging Middle East Equity A (dist) - USD -2.31% -0.99% -4.76% -17.52% -10.83% -3.63% MediumJPM Emerging Middle East Equity B (acc) - USD*** - - - - - - MediumJPM Emerging Middle East Equity C (acc) - USD -2.21% -0.75% -4.33% -17.10% -10.64% -3.29% MediumJPM Emerging Middle East Equity C (dist) - USD^ -2.15% -0.65% -4.24% -16.93% -10.11% - MediumJPM Emerging Middle East Equity D (acc) - EUR -0.07% -3.59% -4.90% -17.92% -3.30% 0.05% MediumJPM Emerging Middle East Equity D (acc) - USD -2.55% -1.47% -5.45% -18.50% -12.00% -4.85% MediumJPM Emerging Middle East Equity I (acc) - USD -2.21% -0.71% -4.29% -17.11% -10.62% -3.25% Medium
JPMorgan Funds - Europe Dynamic FundJPM Europe Dynamic A (acc) - AUD (hedged) -1.87% -9.28% -4.33% -9.43% 1.35% - HighJPM Europe Dynamic A (acc) - EUR -3.05% -12.49% -7.95% -14.54% -0.13% 8.69% HighJPM Europe Dynamic A (acc) - HKD (hedged) -1.87% -9.47% -4.80% -10.40% -0.28% - HighJPM Europe Dynamic A (acc) - SGD (hedged) -1.55% -9.13% -4.15% -9.78% 0.20% - HighJPM Europe Dynamic A (acc) - USD -5.53% -10.65% -8.58% -15.23% -9.46% - HighJPM Europe Dynamic A (acc) - USD (hedged) -1.73% -9.29% -4.67% -10.23% -0.35% - HighJPM Europe Dynamic A (dist) - EUR -3.07% -12.51% -7.98% -14.36% - 8.71% HighJPMorgan Europe Dynamic A (dist) - EUR*** - - - - - - HighJPM Europe Dynamic A (dist) - GBP 0.99% -1.60% 3.17% -0.68% 1.42% 7.13% HighJPM Europe Dynamic A (inc) - EUR -3.10% -12.54% -8.02% -14.43% -0.06% - HighJPM Europe Dynamic B (acc) - EUR*** - - - - - - HighJPM Europe Dynamic B (dist) - EUR*** - - - - - - HighJPM Europe Dynamic C (acc) - EUR -2.92% -12.20% -7.47% -13.94% 0.67% 9.73% HighJPM Europe Dynamic C (acc) - USD^ -5.35% -10.31% -8.06% -14.58% -8.82% - HighJPM Europe Dynamic C (acc) - USD (hedged)^ -1.55% -8.96% -4.14% -9.57% 0.42% - HighJPM Europe Dynamic C (dist) - EUR -2.91% -12.19% -7.47% -13.80% - - HighJPM Europe Dynamic C (dist) - GBP^ 1.17% -1.23% 3.80% 0.11% 2.18% - HighJPM Europe Dynamic C (inc) - EUR -2.91% -12.19% - - - - HighJPM Europe Dynamic D (acc) - EUR -3.34% -12.96% -8.68% -15.45% -1.16% 7.40% HighJPM Europe Dynamic D (acc) - USD -5.77% -11.11% -9.29% -16.11% -10.28% - HighJPM Europe Dynamic D (acc) - USD (hedged) -1.99% -9.76% -5.42% -11.17% -1.37% - HighJPM Europe Dynamic I (acc) - EUR -2.92% -12.18% -7.45% -13.90% 0.76% 9.83% HighJPM Europe Dynamic I (acc) - USD -5.34% -10.29% -8.04% -14.58% -8.74% - HighJPM Europe Dynamic I (acc) - USD (hedged) -1.54% -8.94% -4.11% -9.53% - - HighJPM Europe Dynamic I (dist) - EUR -2.90% -12.18% -7.46% -13.67% 0.86% - HighJPM Europe Dynamic I (dist) - GBP 1.18% -1.21% 3.82% 0.15% 2.30% - HighJPM Europe Dynamic T (acc) - EUR* - - - - - - HighJPM Europe Dynamic X (acc) - EUR -2.71% -11.82% -6.88% -13.21% 1.57% - High
274
JPMorgan FundsAppendix - Unaudited Additional Disclosures (continued)
3. Performance and Volatility (continued)
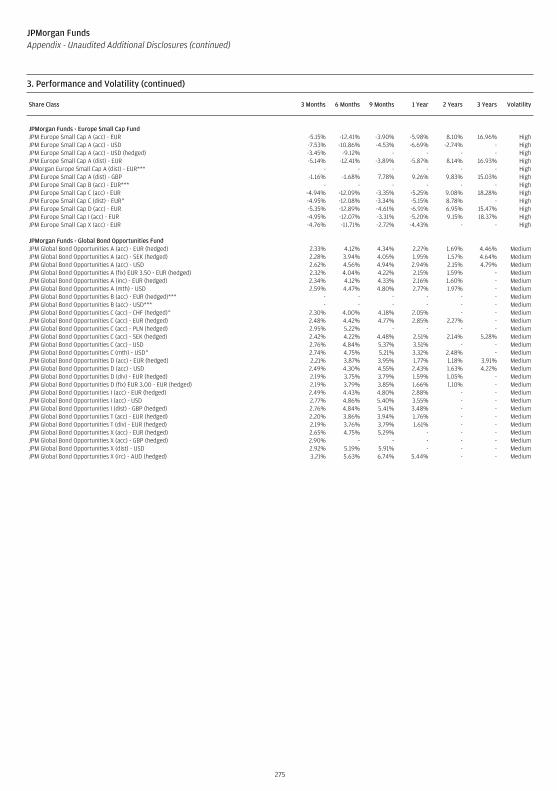
Share Class 3 Months 6 Months 9 Months 1 Year 2 Years 3 Years Volatility
JPMorgan Funds - Europe Small Cap FundJPM Europe Small Cap A (acc) - EUR -5.15% -12.41% -3.90% -5.98% 8.10% 16.96% HighJPM Europe Small Cap A (acc) - USD -7.53% -10.86% -4.53% -6.69% -2.74% - HighJPM Europe Small Cap A (acc) - USD (hedged) -3.45% -9.12% - - - - HighJPM Europe Small Cap A (dist) - EUR -5.14% -12.41% -3.89% -5.87% 8.14% 16.93% HighJPMorgan Europe Small Cap A (dist) - EUR*** - - - - - - HighJPM Europe Small Cap A (dist) - GBP -1.16% -1.68% 7.78% 9.26% 9.83% 15.03% HighJPM Europe Small Cap B (acc) - EUR*** - - - - - - HighJPM Europe Small Cap C (acc) - EUR -4.94% -12.09% -3.35% -5.25% 9.08% 18.28% HighJPM Europe Small Cap C (dist) - EUR^ -4.95% -12.08% -3.34% -5.15% 8.78% - HighJPM Europe Small Cap D (acc) - EUR -5.35% -12.89% -4.61% -6.91% 6.95% 15.47% HighJPM Europe Small Cap I (acc) - EUR -4.95% -12.07% -3.31% -5.20% 9.15% 18.37% HighJPM Europe Small Cap X (acc) - EUR -4.76% -11.71% -2.72% -4.43% - - High
JPMorgan Funds - Global Bond Opportunities FundJPM Global Bond Opportunities A (acc) - EUR (hedged) 2.33% 4.12% 4.34% 2.27% 1.69% 4.46% MediumJPM Global Bond Opportunities A (acc) - SEK (hedged) 2.28% 3.94% 4.05% 1.95% 1.57% 4.64% MediumJPM Global Bond Opportunities A (acc) - USD 2.62% 4.56% 4.94% 2.94% 2.15% 4.79% MediumJPM Global Bond Opportunities A (fix) EUR 3.50 - EUR (hedged) 2.32% 4.04% 4.22% 2.15% 1.59% - MediumJPM Global Bond Opportunities A (inc) - EUR (hedged) 2.34% 4.12% 4.33% 2.16% 1.60% - MediumJPM Global Bond Opportunities A (mth) - USD 2.59% 4.47% 4.80% 2.77% 1.97% - MediumJPM Global Bond Opportunities B (acc) - EUR (hedged)*** - - - - - - MediumJPM Global Bond Opportunities B (acc) - USD*** - - - - - - MediumJPM Global Bond Opportunities C (acc) - CHF (hedged)^ 2.30% 4.00% 4.18% 2.05% - - MediumJPM Global Bond Opportunities C (acc) - EUR (hedged) 2.48% 4.42% 4.77% 2.85% 2.27% - MediumJPM Global Bond Opportunities C (acc) - PLN (hedged) 2.95% 5.22% - - - - MediumJPM Global Bond Opportunities C (acc) - SEK (hedged) 2.42% 4.22% 4.48% 2.51% 2.14% 5.28% MediumJPM Global Bond Opportunities C (acc) - USD 2.76% 4.84% 5.37% 3.51% - - MediumJPM Global Bond Opportunities C (mth) - USD^ 2.74% 4.75% 5.21% 3.32% 2.48% - MediumJPM Global Bond Opportunities D (acc) - EUR (hedged) 2.21% 3.87% 3.95% 1.77% 1.18% 3.91% MediumJPM Global Bond Opportunities D (acc) - USD 2.49% 4.30% 4.55% 2.43% 1.63% 4.22% MediumJPM Global Bond Opportunities D (div) - EUR (hedged) 2.19% 3.75% 3.79% 1.59% 1.05% - MediumJPM Global Bond Opportunities D (fix) EUR 3.00 - EUR (hedged) 2.19% 3.79% 3.85% 1.66% 1.10% - MediumJPM Global Bond Opportunities I (acc) - EUR (hedged) 2.49% 4.43% 4.80% 2.88% - - MediumJPM Global Bond Opportunities I (acc) - USD 2.77% 4.86% 5.40% 3.55% - - MediumJPM Global Bond Opportunities I (dist) - GBP (hedged) 2.76% 4.84% 5.41% 3.48% - - MediumJPM Global Bond Opportunities T (acc) - EUR (hedged) 2.20% 3.86% 3.94% 1.76% - - MediumJPM Global Bond Opportunities T (div) - EUR (hedged) 2.19% 3.76% 3.79% 1.61% - - MediumJPM Global Bond Opportunities X (acc) - EUR (hedged) 2.65% 4.75% 5.29% - - - MediumJPM Global Bond Opportunities X (acc) - GBP (hedged) 2.90% - - - - - MediumJPM Global Bond Opportunities X (dist) - USD 2.92% 5.19% 5.91% - - - MediumJPM Global Bond Opportunities X (irc) - AUD (hedged) 3.21% 5.63% 6.74% 5.44% - - Medium
275
JPMorgan FundsAppendix - Unaudited Additional Disclosures (continued)
3. Performance and Volatility (continued)
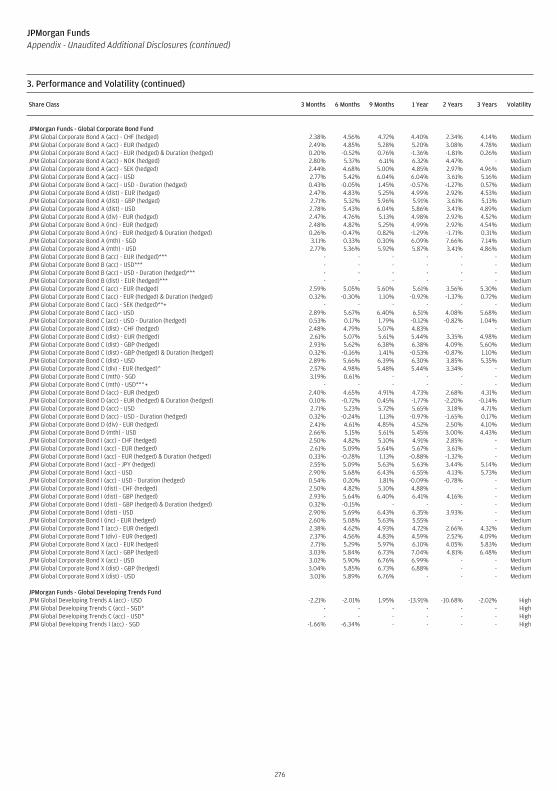
Share Class 3 Months 6 Months 9 Months 1 Year 2 Years 3 Years Volatility
JPMorgan Funds - Global Corporate Bond FundJPM Global Corporate Bond A (acc) - CHF (hedged) 2.38% 4.56% 4.72% 4.40% 2.34% 4.14% MediumJPM Global Corporate Bond A (acc) - EUR (hedged) 2.49% 4.85% 5.28% 5.20% 3.08% 4.78% MediumJPM Global Corporate Bond A (acc) - EUR (hedged) & Duration (hedged) 0.20% -0.52% 0.76% -1.36% -1.81% 0.26% MediumJPM Global Corporate Bond A (acc) - NOK (hedged) 2.80% 5.37% 6.11% 6.32% 4.47% - MediumJPM Global Corporate Bond A (acc) - SEK (hedged) 2.44% 4.68% 5.00% 4.85% 2.97% 4.96% MediumJPM Global Corporate Bond A (acc) - USD 2.77% 5.42% 6.04% 6.04% 3.61% 5.16% MediumJPM Global Corporate Bond A (acc) - USD - Duration (hedged) 0.43% -0.05% 1.45% -0.57% -1.27% 0.57% MediumJPM Global Corporate Bond A (dist) - EUR (hedged) 2.47% 4.83% 5.25% 4.99% 2.92% 4.53% MediumJPM Global Corporate Bond A (dist) - GBP (hedged) 2.71% 5.32% 5.96% 5.91% 3.61% 5.13% MediumJPM Global Corporate Bond A (dist) - USD 2.78% 5.43% 6.04% 5.86% 3.41% 4.89% MediumJPM Global Corporate Bond A (div) - EUR (hedged) 2.47% 4.76% 5.13% 4.98% 2.92% 4.52% MediumJPM Global Corporate Bond A (inc) - EUR (hedged) 2.48% 4.82% 5.25% 4.99% 2.92% 4.54% MediumJPM Global Corporate Bond A (inc) - EUR (hedged) & Duration (hedged) 0.26% -0.47% 0.82% -1.29% -1.71% 0.31% MediumJPM Global Corporate Bond A (mth) - SGD 3.11% 0.33% 0.30% 6.09% 7.66% 7.14% MediumJPM Global Corporate Bond A (mth) - USD 2.77% 5.36% 5.92% 5.87% 3.41% 4.86% MediumJPM Global Corporate Bond B (acc) - EUR (hedged)*** - - - - - - MediumJPM Global Corporate Bond B (acc) - USD*** - - - - - - MediumJPM Global Corporate Bond B (acc) - USD - Duration (hedged)*** - - - - - - MediumJPM Global Corporate Bond B (dist) - EUR (hedged)*** - - - - - - MediumJPM Global Corporate Bond C (acc) - EUR (hedged) 2.59% 5.05% 5.60% 5.61% 3.56% 5.30% MediumJPM Global Corporate Bond C (acc) - EUR (hedged) & Duration (hedged) 0.32% -0.30% 1.10% -0.92% -1.37% 0.72% MediumJPM Global Corporate Bond C (acc) - SEK (hedged)**+ - - - - - - MediumJPM Global Corporate Bond C (acc) - USD 2.89% 5.67% 6.40% 6.51% 4.08% 5.68% MediumJPM Global Corporate Bond C (acc) - USD - Duration (hedged) 0.53% 0.17% 1.79% -0.12% -0.82% 1.04% MediumJPM Global Corporate Bond C (dist) - CHF (hedged) 2.48% 4.79% 5.07% 4.83% - - MediumJPM Global Corporate Bond C (dist) - EUR (hedged) 2.61% 5.07% 5.61% 5.44% 3.35% 4.98% MediumJPM Global Corporate Bond C (dist) - GBP (hedged) 2.93% 5.62% 6.38% 6.38% 4.09% 5.60% MediumJPM Global Corporate Bond C (dist) - GBP (hedged) & Duration (hedged) 0.32% -0.16% 1.41% -0.53% -0.87% 1.10% MediumJPM Global Corporate Bond C (dist) - USD 2.89% 5.66% 6.39% 6.30% 3.85% 5.35% MediumJPM Global Corporate Bond C (div) - EUR (hedged)^ 2.57% 4.98% 5.48% 5.44% 3.34% - MediumJPM Global Corporate Bond C (mth) - SGD 3.19% 0.61% - - - - MediumJPM Global Corporate Bond C (mth) - USD**^+ - - - - - - MediumJPM Global Corporate Bond D (acc) - EUR (hedged) 2.40% 4.65% 4.91% 4.73% 2.68% 4.31% MediumJPM Global Corporate Bond D (acc) - EUR (hedged) & Duration (hedged) 0.10% -0.72% 0.45% -1.77% -2.20% -0.14% MediumJPM Global Corporate Bond D (acc) - USD 2.71% 5.23% 5.72% 5.65% 3.18% 4.71% MediumJPM Global Corporate Bond D (acc) - USD - Duration (hedged) 0.32% -0.24% 1.13% -0.97% -1.65% 0.17% MediumJPM Global Corporate Bond D (div) - EUR (hedged) 2.41% 4.61% 4.85% 4.52% 2.50% 4.10% MediumJPM Global Corporate Bond D (mth) - USD 2.66% 5.15% 5.61% 5.45% 3.00% 4.43% MediumJPM Global Corporate Bond I (acc) - CHF (hedged) 2.50% 4.82% 5.10% 4.91% 2.85% - MediumJPM Global Corporate Bond I (acc) - EUR (hedged) 2.61% 5.09% 5.64% 5.67% 3.61% - MediumJPM Global Corporate Bond I (acc) - EUR (hedged) & Duration (hedged) 0.33% -0.28% 1.13% -0.88% -1.32% - MediumJPM Global Corporate Bond I (acc) - JPY (hedged) 2.55% 5.09% 5.63% 5.63% 3.44% 5.14% MediumJPM Global Corporate Bond I (acc) - USD 2.90% 5.68% 6.43% 6.55% 4.13% 5.73% MediumJPM Global Corporate Bond I (acc) - USD - Duration (hedged) 0.54% 0.20% 1.81% -0.09% -0.78% - MediumJPM Global Corporate Bond I (dist) - CHF (hedged) 2.50% 4.82% 5.10% 4.88% - - MediumJPM Global Corporate Bond I (dist) - GBP (hedged) 2.93% 5.64% 6.40% 6.41% 4.16% - MediumJPM Global Corporate Bond I (dist) - GBP (hedged) & Duration (hedged) 0.32% -0.15% - - - - MediumJPM Global Corporate Bond I (dist) - USD 2.90% 5.69% 6.43% 6.35% 3.93% - MediumJPM Global Corporate Bond I (inc) - EUR (hedged) 2.60% 5.08% 5.63% 5.55% - - MediumJPM Global Corporate Bond T (acc) - EUR (hedged) 2.38% 4.62% 4.93% 4.72% 2.66% 4.32% MediumJPM Global Corporate Bond T (div) - EUR (hedged) 2.37% 4.56% 4.83% 4.59% 2.52% 4.09% MediumJPM Global Corporate Bond X (acc) - EUR (hedged) 2.71% 5.29% 5.97% 6.10% 4.05% 5.83% MediumJPM Global Corporate Bond X (acc) - GBP (hedged) 3.03% 5.84% 6.73% 7.04% 4.81% 6.48% MediumJPM Global Corporate Bond X (acc) - USD 3.02% 5.90% 6.76% 6.99% - - MediumJPM Global Corporate Bond X (dist) - GBP (hedged) 3.04% 5.85% 6.73% 6.88% - - MediumJPM Global Corporate Bond X (dist) - USD 3.01% 5.89% 6.76% - - - Medium
JPMorgan Funds - Global Developing Trends FundJPM Global Developing Trends A (acc) - USD -2.21% -2.01% 1.95% -13.91% -10.68% -2.02% HighJPM Global Developing Trends C (acc) - SGD* - - - - - - HighJPM Global Developing Trends C (acc) - USD* - - - - - - HighJPM Global Developing Trends I (acc) - SGD -1.66% -6.34% - - - - High
276
JPMorgan FundsAppendix - Unaudited Additional Disclosures (continued)
3. Performance and Volatility (continued)
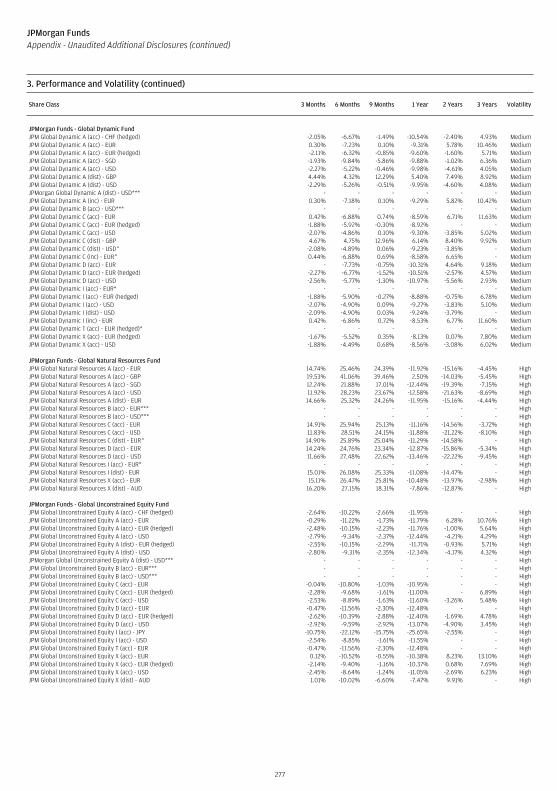
Share Class 3 Months 6 Months 9 Months 1 Year 2 Years 3 Years Volatility
JPMorgan Funds - Global Dynamic FundJPM Global Dynamic A (acc) - CHF (hedged) -2.05% -6.67% -1.49% -10.54% -2.40% 4.93% MediumJPM Global Dynamic A (acc) - EUR 0.30% -7.23% 0.10% -9.31% 5.78% 10.46% MediumJPM Global Dynamic A (acc) - EUR (hedged) -2.11% -6.32% -0.85% -9.60% -1.60% 5.71% MediumJPM Global Dynamic A (acc) - SGD -1.93% -9.84% -5.86% -9.88% -1.02% 6.36% MediumJPM Global Dynamic A (acc) - USD -2.27% -5.22% -0.46% -9.98% -4.61% 4.05% MediumJPM Global Dynamic A (dist) - GBP 4.44% 4.32% 12.29% 5.40% 7.49% 8.92% MediumJPM Global Dynamic A (dist) - USD -2.29% -5.26% -0.51% -9.95% -4.60% 4.08% MediumJPMorgan Global Dynamic A (dist) - USD*** - - - - - - MediumJPM Global Dynamic A (inc) - EUR 0.30% -7.18% 0.10% -9.29% 5.82% 10.42% MediumJPM Global Dynamic B (acc) - USD*** - - - - - - MediumJPM Global Dynamic C (acc) - EUR 0.42% -6.88% 0.74% -8.59% 6.71% 11.63% MediumJPM Global Dynamic C (acc) - EUR (hedged) -1.88% -5.92% -0.30% -8.92% - - MediumJPM Global Dynamic C (acc) - USD -2.07% -4.86% 0.10% -9.30% -3.85% 5.02% MediumJPM Global Dynamic C (dist) - GBP 4.67% 4.75% 12.96% 6.14% 8.40% 9.92% MediumJPM Global Dynamic C (dist) - USD^ -2.08% -4.89% 0.06% -9.23% -3.85% - MediumJPM Global Dynamic C (inc) - EUR^ 0.44% -6.88% 0.69% -8.58% 6.65% - MediumJPM Global Dynamic D (acc) - EUR - -7.73% -0.75% -10.31% 4.64% 9.18% MediumJPM Global Dynamic D (acc) - EUR (hedged) -2.27% -6.77% -1.52% -10.51% -2.57% 4.57% MediumJPM Global Dynamic D (acc) - USD -2.56% -5.77% -1.30% -10.97% -5.56% 2.93% MediumJPM Global Dynamic I (acc) - EUR* - - - - - - MediumJPM Global Dynamic I (acc) - EUR (hedged) -1.88% -5.90% -0.27% -8.88% -0.75% 6.78% MediumJPM Global Dynamic I (acc) - USD -2.07% -4.90% 0.09% -9.27% -3.83% 5.10% MediumJPM Global Dynamic I (dist) - USD -2.09% -4.90% 0.03% -9.24% -3.79% - MediumJPM Global Dynamic I (inc) - EUR 0.42% -6.86% 0.72% -8.53% 6.77% 11.60% MediumJPM Global Dynamic T (acc) - EUR (hedged)* - - - - - - MediumJPM Global Dynamic X (acc) - EUR (hedged) -1.67% -5.52% 0.35% -8.13% 0.07% 7.80% MediumJPM Global Dynamic X (acc) - USD -1.88% -4.49% 0.68% -8.56% -3.08% 6.02% Medium
JPMorgan Funds - Global Natural Resources FundJPM Global Natural Resources A (acc) - EUR 14.74% 25.46% 24.39% -11.92% -15.16% -4.45% HighJPM Global Natural Resources A (acc) - GBP 19.53% 41.06% 39.46% 2.50% -14.03% -5.45% HighJPM Global Natural Resources A (acc) - SGD 12.24% 21.88% 17.01% -12.44% -19.39% -7.15% HighJPM Global Natural Resources A (acc) - USD 11.92% 28.23% 23.67% -12.58% -21.63% -8.69% HighJPM Global Natural Resources A (dist) - EUR 14.66% 25.32% 24.26% -11.95% -15.16% -4.44% HighJPM Global Natural Resources B (acc) - EUR*** - - - - - - HighJPM Global Natural Resources B (acc) - USD*** - - - - - - HighJPM Global Natural Resources C (acc) - EUR 14.91% 25.94% 25.13% -11.16% -14.56% -3.72% HighJPM Global Natural Resources C (acc) - USD 11.83% 28.51% 24.15% -11.88% -21.22% -8.10% HighJPM Global Natural Resources C (dist) - EUR^ 14.90% 25.89% 25.04% -11.29% -14.58% - HighJPM Global Natural Resources D (acc) - EUR 14.24% 24.76% 23.34% -12.87% -15.86% -5.34% HighJPM Global Natural Resources D (acc) - USD 11.66% 27.48% 22.62% -13.46% -22.22% -9.45% HighJPM Global Natural Resources I (acc) - EUR* - - - - - - HighJPM Global Natural Resources I (dist) - EUR 15.01% 26.08% 25.33% -11.08% -14.47% - HighJPM Global Natural Resources X (acc) - EUR 15.11% 26.47% 25.81% -10.48% -13.97% -2.98% HighJPM Global Natural Resources X (dist) - AUD 16.20% 27.15% 18.31% -7.86% -12.87% - High
JPMorgan Funds - Global Unconstrained Equity FundJPM Global Unconstrained Equity A (acc) - CHF (hedged) -2.64% -10.22% -2.66% -11.95% - - HighJPM Global Unconstrained Equity A (acc) - EUR -0.29% -11.22% -1.73% -11.79% 6.28% 10.76% HighJPM Global Unconstrained Equity A (acc) - EUR (hedged) -2.48% -10.15% -2.23% -11.76% -1.00% 5.64% HighJPM Global Unconstrained Equity A (acc) - USD -2.79% -9.34% -2.37% -12.44% -4.21% 4.29% HighJPM Global Unconstrained Equity A (dist) - EUR (hedged) -2.55% -10.15% -2.29% -11.71% -0.93% 5.71% HighJPM Global Unconstrained Equity A (dist) - USD -2.80% -9.31% -2.35% -12.34% -4.17% 4.32% HighJPMorgan Global Unconstrained Equity A (dist) - USD*** - - - - - - HighJPM Global Unconstrained Equity B (acc) - EUR*** - - - - - - HighJPM Global Unconstrained Equity B (acc) - USD*** - - - - - - HighJPM Global Unconstrained Equity C (acc) - EUR -0.04% -10.80% -1.03% -10.95% - - HighJPM Global Unconstrained Equity C (acc) - EUR (hedged) -2.28% -9.68% -1.61% -11.00% - 6.89% HighJPM Global Unconstrained Equity C (acc) - USD -2.53% -8.89% -1.63% -11.60% -3.26% 5.48% HighJPM Global Unconstrained Equity D (acc) - EUR -0.47% -11.56% -2.30% -12.48% - - HighJPM Global Unconstrained Equity D (acc) - EUR (hedged) -2.62% -10.39% -2.88% -12.40% -1.69% 4.78% HighJPM Global Unconstrained Equity D (acc) - USD -2.92% -9.59% -2.92% -13.07% -4.90% 3.45% HighJPM Global Unconstrained Equity I (acc) - JPY -10.75% -22.12% -15.75% -25.65% -2.55% - HighJPM Global Unconstrained Equity I (acc) - USD -2.54% -8.85% -1.61% -11.55% - - HighJPM Global Unconstrained Equity T (acc) - EUR -0.47% -11.56% -2.30% -12.48% - - HighJPM Global Unconstrained Equity X (acc) - EUR 0.12% -10.52% -0.55% -10.38% 8.23% 13.10% HighJPM Global Unconstrained Equity X (acc) - EUR (hedged) -2.14% -9.40% -1.16% -10.37% 0.68% 7.69% HighJPM Global Unconstrained Equity X (acc) - USD -2.45% -8.64% -1.24% -11.05% -2.69% 6.23% HighJPM Global Unconstrained Equity X (dist) - AUD 1.01% -10.02% -6.60% -7.47% 9.91% - High
277
JPMorgan FundsAppendix - Unaudited Additional Disclosures (continued)
3. Performance and Volatility (continued)

Share Class 3 Months 6 Months 9 Months 1 Year 2 Years 3 Years Volatility
JPMorgan Funds - Greater China FundJPM Greater China A (acc) - SGD# -0.18% -9.40% -4.85% -18.90% 0.34% 5.52% HighJPM Greater China A (acc) - USD# -0.53% -4.75% 0.58% -18.99% -3.36% 3.27% HighJPM Greater China A (dist) - HKD# -0.41% -4.67% 0.74% -18.84% -3.28% 3.30% HighJPM Greater China A (dist) - USD# -0.52% -4.77% 0.59% -18.92% -3.30% 3.30% HighJPMorgan Greater China B (acc) - USD*** - - - - - - HighJPMorgan Greater China B (dist) - USD*** - - - - - - HighJPM Greater China C (acc) - EUR# 2.25% -6.38% 1.85% -17.70% - - HighJPM Greater China C (acc) - SGD# 0.11% -8.94% - - - - HighJPM Greater China C (acc) - USD# -0.33% -4.38% 1.19% -18.33% -2.57% 4.24% HighJPM Greater China C (dist) - USD# -0.31% -4.37% 1.21% -18.25% -2.48% - HighJPM Greater China D (acc) - EUR# 1.78% -7.24% 0.44% -19.22% 6.17% 8.28% HighJPM Greater China D (acc) - USD# -0.78% -5.24% -0.20% -19.82% -4.31% 2.17% HighJPM Greater China I (acc) - USD# -0.31% -4.35% 1.23% -18.27% -2.47% 4.36% HighJPM Greater China I (dist) - USD# -0.27% -4.28% 1.28% -18.19% -2.43% - HighJPM Greater China T (acc) - EUR# 1.78% -7.23% 0.44% -19.22% 6.16% 8.28% HighJPM Greater China X (acc) - USD**# -0.12% - - - - - High
JPMorgan Funds - Income FundJPM Income Fund A (acc) - EUR (hedged) 2.94% 4.68% 3.49% 1.73% 1.15% - MediumJPM Income Fund A (acc) - SEK (hedged) 2.89% 4.48% 3.21% 1.39% 1.04% - MediumJPM Income Fund A (acc) - USD 3.23% 5.11% 4.13% 2.46% 1.67% - MediumJPM Income Fund A (div) - EUR (hedged) 2.94% 4.60% 3.39% 1.61% 1.06% - MediumJPM Income Fund A (div) - USD 3.20% 5.00% 3.99% 2.28% 1.52% - MediumJPM Income Fund A (mth) - HKD 3.33% 5.22% 4.20% 2.40% - - MediumJPM Income Fund A (mth) - USD 3.23% 5.00% 3.99% 2.30% - - MediumJPM Income Fund C (acc) - USD 3.37% 5.38% - - - - MediumJPM Income Fund C (div) - EUR (hedged)^ 3.08% 4.88% 3.80% 2.15% 1.55% - MediumJPM Income Fund D (div) - EUR (hedged) 2.80% 4.34% 3.00% 1.11% 0.57% - Medium
JPMorgan Funds - India FundJPM India A (acc) - SGD# 5.17% -2.24% -4.17% -2.46% 9.25% 13.47% HighJPM India A (acc) - USD# 4.79% 2.66% 1.24% -2.59% 4.89% 10.73% HighJPM India A (dist) - GBP# 12.00% 13.07% 14.28% 14.08% 19.58% 16.56% HighJPM India A (dist) - USD# 4.78% 2.68% 1.25% -2.62% 4.87% 10.72% HighJPMorgan India B (acc) - USD*** - - - - - - HighJPMorgan India B (dist) - USD*** - - - - - - HighJPM India C (acc) - EUR^# 7.70% 0.94% 2.52% -1.06% 18.55% - HighJPM India C (acc) - USD# 4.99% 3.10% 1.88% -1.78% 5.84% 11.91% HighJPM India C (dist) - USD# 5.00% 3.12% 1.89% -1.83% 5.76% 11.12% HighJPM India D (acc) - EUR# 7.26% 0.12% 1.26% -2.68% 16.37% 17.09% HighJPM India D (acc) - USD# 4.58% 2.28% 0.64% -3.38% 4.01% 9.69% HighJPM India I (acc) - USD# 5.01% 3.13% 1.91% -1.73% 5.93% - HighJPM India I (dist) - USD# 5.01% 3.13% 1.91% -1.99% 5.80% - HighJPM India T (acc) - EUR# 7.27% 0.12% 1.26% -2.68% 16.37% 17.09% HighJPM India X (acc) - USD# 5.19% 3.50% 2.47% -0.99% 6.91% 13.25% High
JPMorgan Funds - Indonesia Equity FundJPM Indonesia Equity A (acc) - USD# 3.78% 13.77% 34.61% 5.17% -2.49% -6.60% HighJPMorgan Indonesia Equity B (acc) - USD*** - - - - - - HighJPM Indonesia Equity C (acc) - USD# 4.00% 14.27% 35.49% 6.08% -1.62% -5.85% HighJPM Indonesia Equity D (acc) - EUR# 6.25% 11.34% 34.70% 5.15% 7.52% -2.69% HighJPM Indonesia Equity D (acc) - USD# 3.58% 13.34% 33.87% 4.38% -3.20% -7.19% HighJPM Indonesia Equity X (acc) - JPY# -4.58% -2.23% 16.68% -10.13% -0.16% -4.08% High
278
JPMorgan FundsAppendix - Unaudited Additional Disclosures (continued)
3. Performance and Volatility (continued)
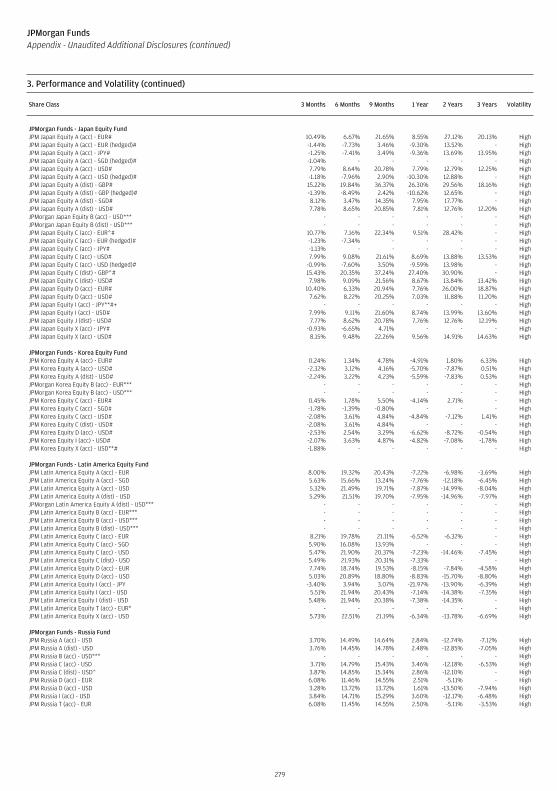
Share Class 3 Months 6 Months 9 Months 1 Year 2 Years 3 Years Volatility
JPMorgan Funds - Japan Equity FundJPM Japan Equity A (acc) - EUR# 10.49% 6.67% 21.65% 8.55% 27.12% 20.13% HighJPM Japan Equity A (acc) - EUR (hedged)# -1.44% -7.73% 3.46% -9.30% 13.52% - HighJPM Japan Equity A (acc) - JPY# -1.25% -7.41% 3.49% -9.36% 13.69% 13.95% HighJPM Japan Equity A (acc) - SGD (hedged)# -1.04% - - - - - HighJPM Japan Equity A (acc) - USD# 7.79% 8.64% 20.78% 7.79% 12.79% 12.25% HighJPM Japan Equity A (acc) - USD (hedged)# -1.18% -7.96% 2.90% -10.30% 12.88% - HighJPM Japan Equity A (dist) - GBP# 15.22% 19.84% 36.37% 26.30% 29.56% 18.16% HighJPM Japan Equity A (dist) - GBP (hedged)# -1.39% -8.49% 2.42% -10.62% 12.65% - HighJPM Japan Equity A (dist) - SGD# 8.12% 3.47% 14.35% 7.95% 17.77% - HighJPM Japan Equity A (dist) - USD# 7.78% 8.65% 20.85% 7.81% 12.76% 12.20% HighJPMorgan Japan Equity B (acc) - USD*** - - - - - - HighJPMorgan Japan Equity B (dist) - USD*** - - - - - - HighJPM Japan Equity C (acc) - EUR^# 10.77% 7.16% 22.34% 9.51% 28.42% - HighJPM Japan Equity C (acc) - EUR (hedged)# -1.23% -7.34% - - - - HighJPM Japan Equity C (acc) - JPY# -1.13% - - - - - HighJPM Japan Equity C (acc) - USD# 7.99% 9.08% 21.61% 8.69% 13.88% 13.53% HighJPM Japan Equity C (acc) - USD (hedged)# -0.99% -7.60% 3.50% -9.59% 13.98% - HighJPM Japan Equity C (dist) - GBP^# 15.43% 20.35% 37.24% 27.40% 30.90% - HighJPM Japan Equity C (dist) - USD# 7.98% 9.09% 21.56% 8.67% 13.84% 13.42% HighJPM Japan Equity D (acc) - EUR# 10.40% 6.33% 20.94% 7.76% 26.00% 18.87% HighJPM Japan Equity D (acc) - USD# 7.62% 8.22% 20.25% 7.03% 11.88% 11.20% HighJPM Japan Equity I (acc) - JPY**#+ - - - - - - HighJPM Japan Equity I (acc) - USD# 7.99% 9.11% 21.60% 8.74% 13.99% 13.60% HighJPM Japan Equity J (dist) - USD# 7.77% 8.62% 20.78% 7.76% 12.76% 12.19% HighJPM Japan Equity X (acc) - JPY# -0.93% -6.65% 4.71% - - - HighJPM Japan Equity X (acc) - USD# 8.15% 9.48% 22.26% 9.56% 14.91% 14.63% High
JPMorgan Funds - Korea Equity FundJPM Korea Equity A (acc) - EUR# 0.24% 1.34% 4.78% -4.91% 1.80% 6.33% HighJPM Korea Equity A (acc) - USD# -2.32% 3.12% 4.16% -5.70% -7.87% 0.51% HighJPM Korea Equity A (dist) - USD# -2.24% 3.22% 4.23% -5.59% -7.83% 0.53% HighJPMorgan Korea Equity B (acc) - EUR*** - - - - - - HighJPMorgan Korea Equity B (acc) - USD*** - - - - - - HighJPM Korea Equity C (acc) - EUR# 0.45% 1.78% 5.50% -4.14% 2.71% - HighJPM Korea Equity C (acc) - SGD# -1.78% -1.39% -0.80% - - - HighJPM Korea Equity C (acc) - USD# -2.08% 3.61% 4.84% -4.84% -7.12% 1.41% HighJPM Korea Equity C (dist) - USD# -2.08% 3.61% 4.84% - - - HighJPM Korea Equity D (acc) - USD# -2.53% 2.54% 3.29% -6.62% -8.72% -0.54% HighJPM Korea Equity I (acc) - USD# -2.07% 3.63% 4.87% -4.82% -7.08% -1.78% HighJPM Korea Equity X (acc) - USD**# -1.88% - - - - - High
JPMorgan Funds - Latin America Equity FundJPM Latin America Equity A (acc) - EUR 8.00% 19.32% 20.43% -7.22% -6.98% -3.69% HighJPM Latin America Equity A (acc) - SGD 5.63% 15.66% 13.24% -7.76% -12.18% -6.45% HighJPM Latin America Equity A (acc) - USD 5.32% 21.49% 19.71% -7.87% -14.99% -8.04% HighJPM Latin America Equity A (dist) - USD 5.29% 21.51% 19.70% -7.95% -14.96% -7.97% HighJPMorgan Latin America Equity A (dist) - USD*** - - - - - - HighJPM Latin America Equity B (acc) - EUR*** - - - - - - HighJPM Latin America Equity B (acc) - USD*** - - - - - - HighJPM Latin America Equity B (dist) - USD*** - - - - - - HighJPM Latin America Equity C (acc) - EUR 8.21% 19.78% 21.11% -6.52% -6.32% - HighJPM Latin America Equity C (acc) - SGD 5.90% 16.08% 13.93% - - - HighJPM Latin America Equity C (acc) - USD 5.47% 21.90% 20.37% -7.23% -14.46% -7.45% HighJPM Latin America Equity C (dist) - USD 5.49% 21.93% 20.31% -7.33% - - HighJPM Latin America Equity D (acc) - EUR 7.74% 18.74% 19.53% -8.15% -7.84% -4.58% HighJPM Latin America Equity D (acc) - USD 5.03% 20.89% 18.80% -8.83% -15.70% -8.80% HighJPM Latin America Equity I (acc) - JPY -3.40% 3.94% 3.07% -21.97% -13.90% -6.39% HighJPM Latin America Equity I (acc) - USD 5.51% 21.94% 20.43% -7.14% -14.38% -7.35% HighJPM Latin America Equity I (dist) - USD 5.48% 21.94% 20.38% -7.38% -14.35% - HighJPM Latin America Equity T (acc) - EUR* - - - - - - HighJPM Latin America Equity X (acc) - USD 5.73% 22.51% 21.19% -6.34% -13.78% -6.69% High
JPMorgan Funds - Russia FundJPM Russia A (acc) - USD 3.70% 14.49% 14.64% 2.84% -12.74% -7.12% HighJPM Russia A (dist) - USD 3.76% 14.45% 14.78% 2.48% -12.85% -7.05% HighJPM Russia B (acc) - USD*** - - - - - - HighJPM Russia C (acc) - USD 3.71% 14.79% 15.43% 3.46% -12.18% -6.53% HighJPM Russia C (dist) - USD^ 3.87% 14.85% 15.34% 2.86% -12.10% - HighJPM Russia D (acc) - EUR 6.08% 11.46% 14.55% 2.51% -5.11% - HighJPM Russia D (acc) - USD 3.28% 13.72% 13.72% 1.61% -13.50% -7.94% HighJPM Russia I (acc) - USD 3.84% 14.71% 15.29% 3.60% -12.17% -6.48% HighJPM Russia T (acc) - EUR 6.08% 11.45% 14.55% 2.50% -5.11% -3.53% High
279
JPMorgan FundsAppendix - Unaudited Additional Disclosures (continued)
3. Performance and Volatility (continued)
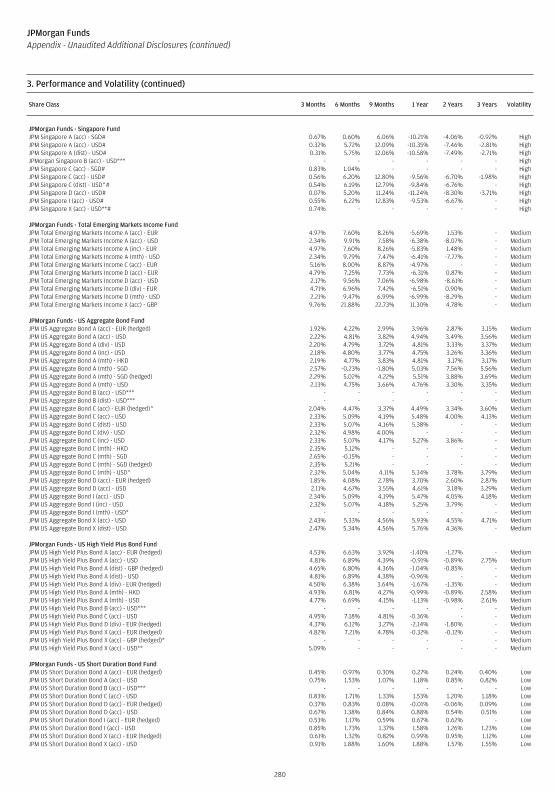
Share Class 3 Months 6 Months 9 Months 1 Year 2 Years 3 Years Volatility
JPMorgan Funds - Singapore FundJPM Singapore A (acc) - SGD# 0.67% 0.60% 6.06% -10.21% -4.06% -0.92% HighJPM Singapore A (acc) - USD# 0.32% 5.72% 12.09% -10.35% -7.46% -2.81% HighJPM Singapore A (dist) - USD# 0.31% 5.75% 12.06% -10.58% -7.49% -2.71% HighJPMorgan Singapore B (acc) - USD*** - - - - - - HighJPM Singapore C (acc) - SGD# 0.83% 1.04% - - - - HighJPM Singapore C (acc) - USD# 0.56% 6.20% 12.80% -9.56% -6.70% -1.98% HighJPM Singapore C (dist) - USD^# 0.54% 6.19% 12.79% -9.84% -6.76% - HighJPM Singapore D (acc) - USD# 0.07% 5.20% 11.24% -11.24% -8.30% -3.71% HighJPM Singapore I (acc) - USD# 0.55% 6.22% 12.83% -9.53% -6.67% - HighJPM Singapore X (acc) - USD**# 0.74% - - - - - High
JPMorgan Funds - Total Emerging Markets Income FundJPM Total Emerging Markets Income A (acc) - EUR 4.97% 7.60% 8.26% -5.69% 1.53% - MediumJPM Total Emerging Markets Income A (acc) - USD 2.34% 9.91% 7.58% -6.38% -8.07% - MediumJPM Total Emerging Markets Income A (inc) - EUR 4.97% 7.60% 8.26% -5.83% 1.48% - MediumJPM Total Emerging Markets Income A (mth) - USD 2.34% 9.79% 7.47% -6.41% -7.77% - MediumJPM Total Emerging Markets Income C (acc) - EUR 5.16% 8.00% 8.87% -4.97% - - MediumJPM Total Emerging Markets Income D (acc) - EUR 4.79% 7.25% 7.73% -6.31% 0.87% - MediumJPM Total Emerging Markets Income D (acc) - USD 2.17% 9.56% 7.06% -6.98% -8.61% - MediumJPM Total Emerging Markets Income D (div) - EUR 4.71% 6.96% 7.42% -6.51% 0.90% - MediumJPM Total Emerging Markets Income D (mth) - USD 2.21% 9.47% 6.99% -6.99% -8.29% - MediumJPM Total Emerging Markets Income X (acc) - GBP 9.76% 21.88% 22.73% 11.30% 4.78% - Medium
JPMorgan Funds - US Aggregate Bond FundJPM US Aggregate Bond A (acc) - EUR (hedged) 1.92% 4.22% 2.99% 3.96% 2.87% 3.15% MediumJPM US Aggregate Bond A (acc) - USD 2.22% 4.81% 3.82% 4.94% 3.49% 3.56% MediumJPM US Aggregate Bond A (div) - USD 2.20% 4.79% 3.72% 4.81% 3.33% 3.37% MediumJPM US Aggregate Bond A (inc) - USD 2.18% 4.80% 3.77% 4.75% 3.26% 3.36% MediumJPM US Aggregate Bond A (mth) - HKD 2.19% 4.77% 3.83% 4.81% 3.17% 3.17% MediumJPM US Aggregate Bond A (mth) - SGD 2.57% -0.23% -1.80% 5.03% 7.56% 5.56% MediumJPM US Aggregate Bond A (mth) - SGD (hedged) 2.29% 5.02% 4.22% 5.51% 3.88% 3.69% MediumJPM US Aggregate Bond A (mth) - USD 2.13% 4.75% 3.66% 4.76% 3.30% 3.35% MediumJPM US Aggregate Bond B (acc) - USD*** - - - - - - MediumJPM US Aggregate Bond B (dist) - USD*** - - - - - - MediumJPM US Aggregate Bond C (acc) - EUR (hedged)^ 2.04% 4.47% 3.37% 4.49% 3.34% 3.60% MediumJPM US Aggregate Bond C (acc) - USD 2.33% 5.09% 4.19% 5.48% 4.00% 4.13% MediumJPM US Aggregate Bond C (dist) - USD 2.33% 5.07% 4.16% 5.38% - - MediumJPM US Aggregate Bond C (div) - USD 2.32% 4.98% 4.00% - - - MediumJPM US Aggregate Bond C (inc) - USD 2.33% 5.07% 4.17% 5.27% 3.86% - MediumJPM US Aggregate Bond C (mth) - HKD 2.35% 5.12% - - - - MediumJPM US Aggregate Bond C (mth) - SGD 2.65% -0.15% - - - - MediumJPM US Aggregate Bond C (mth) - SGD (hedged) 2.35% 5.21% - - - - MediumJPM US Aggregate Bond C (mth) - USD^ 2.32% 5.04% 4.11% 5.34% 3.78% 3.79% MediumJPM US Aggregate Bond D (acc) - EUR (hedged) 1.85% 4.08% 2.78% 3.70% 2.60% 2.87% MediumJPM US Aggregate Bond D (acc) - USD 2.11% 4.67% 3.55% 4.61% 3.18% 3.29% MediumJPM US Aggregate Bond I (acc) - USD 2.34% 5.09% 4.19% 5.47% 4.05% 4.18% MediumJPM US Aggregate Bond I (inc) - USD 2.32% 5.07% 4.18% 5.25% 3.79% - MediumJPM US Aggregate Bond I (mth) - USD* - - - - - - MediumJPM US Aggregate Bond X (acc) - USD 2.43% 5.33% 4.56% 5.93% 4.55% 4.71% MediumJPM US Aggregate Bond X (dist) - USD 2.47% 5.34% 4.56% 5.76% 4.36% - Medium
JPMorgan Funds - US High Yield Plus Bond FundJPM US High Yield Plus Bond A (acc) - EUR (hedged) 4.53% 6.63% 3.92% -1.40% -1.27% - MediumJPM US High Yield Plus Bond A (acc) - USD 4.81% 6.89% 4.39% -0.91% -0.89% 2.75% MediumJPM US High Yield Plus Bond A (dist) - GBP (hedged) 4.65% 6.80% 4.36% -1.04% -0.85% - MediumJPM US High Yield Plus Bond A (dist) - USD 4.81% 6.89% 4.38% -0.96% - - MediumJPM US High Yield Plus Bond A (div) - EUR (hedged) 4.50% 6.38% 3.64% -1.67% -1.35% - MediumJPM US High Yield Plus Bond A (mth) - HKD 4.93% 6.81% 4.27% -0.99% -0.89% 2.58% MediumJPM US High Yield Plus Bond A (mth) - USD 4.77% 6.69% 4.15% -1.13% -0.98% 2.61% MediumJPM US High Yield Plus Bond B (acc) - USD*** - - - - - - MediumJPM US High Yield Plus Bond C (acc) - USD 4.95% 7.18% 4.81% -0.36% - - MediumJPM US High Yield Plus Bond D (div) - EUR (hedged) 4.37% 6.12% 3.27% -2.14% -1.80% - MediumJPM US High Yield Plus Bond X (acc) - EUR (hedged) 4.82% 7.21% 4.78% -0.32% -0.12% - MediumJPM US High Yield Plus Bond X (acc) - GBP (hedged)* - - - - - - MediumJPM US High Yield Plus Bond X (acc) - USD** 5.09% - - - - - Medium
JPMorgan Funds - US Short Duration Bond FundJPM US Short Duration Bond A (acc) - EUR (hedged) 0.45% 0.97% 0.30% 0.27% 0.24% 0.40% LowJPM US Short Duration Bond A (acc) - USD 0.75% 1.53% 1.07% 1.18% 0.85% 0.82% LowJPM US Short Duration Bond B (acc) - USD*** - - - - - - LowJPM US Short Duration Bond C (acc) - USD 0.83% 1.71% 1.33% 1.53% 1.20% 1.18% LowJPM US Short Duration Bond D (acc) - EUR (hedged) 0.37% 0.83% 0.08% -0.01% -0.06% 0.09% LowJPM US Short Duration Bond D (acc) - USD 0.67% 1.38% 0.84% 0.88% 0.54% 0.51% LowJPM US Short Duration Bond I (acc) - EUR (hedged) 0.53% 1.17% 0.59% 0.67% 0.62% - LowJPM US Short Duration Bond I (acc) - USD 0.85% 1.73% 1.37% 1.58% 1.26% 1.23% LowJPM US Short Duration Bond X (acc) - EUR (hedged) 0.61% 1.32% 0.82% 0.99% 0.95% 1.12% LowJPM US Short Duration Bond X (acc) - USD 0.91% 1.88% 1.60% 1.88% 1.57% 1.55% Low
280
JPMorgan FundsAppendix - Unaudited Additional Disclosures (continued)
3. Performance and Volatility (continued)
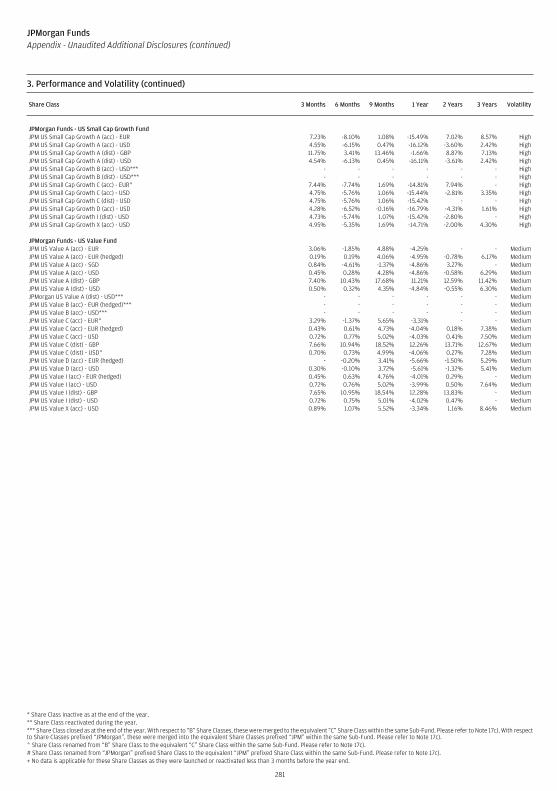
Share Class 3 Months 6 Months 9 Months 1 Year 2 Years 3 Years Volatility
JPMorgan Funds - US Small Cap Growth FundJPM US Small Cap Growth A (acc) - EUR 7.23% -8.10% 1.08% -15.49% 7.02% 8.57% HighJPM US Small Cap Growth A (acc) - USD 4.55% -6.15% 0.47% -16.12% -3.60% 2.42% HighJPM US Small Cap Growth A (dist) - GBP 11.75% 3.41% 13.46% -1.66% 8.87% 7.13% HighJPM US Small Cap Growth A (dist) - USD 4.54% -6.13% 0.45% -16.11% -3.61% 2.42% HighJPM US Small Cap Growth B (acc) - USD*** - - - - - - HighJPM US Small Cap Growth B (dist) - USD*** - - - - - - HighJPM US Small Cap Growth C (acc) - EUR^ 7.44% -7.74% 1.69% -14.81% 7.94% - HighJPM US Small Cap Growth C (acc) - USD 4.75% -5.76% 1.06% -15.44% -2.81% 3.35% HighJPM US Small Cap Growth C (dist) - USD 4.75% -5.76% 1.06% -15.42% - - HighJPM US Small Cap Growth D (acc) - USD 4.28% -6.52% -0.16% -16.79% -4.31% 1.61% HighJPM US Small Cap Growth I (dist) - USD 4.73% -5.74% 1.07% -15.42% -2.80% - HighJPM US Small Cap Growth X (acc) - USD 4.95% -5.35% 1.69% -14.71% -2.00% 4.30% High
JPMorgan Funds - US Value FundJPM US Value A (acc) - EUR 3.06% -1.85% 4.88% -4.25% - - MediumJPM US Value A (acc) - EUR (hedged) 0.19% 0.19% 4.06% -4.95% -0.78% 6.17% MediumJPM US Value A (acc) - SGD 0.84% -4.61% -1.37% -4.86% 3.27% - MediumJPM US Value A (acc) - USD 0.45% 0.28% 4.28% -4.86% -0.58% 6.29% MediumJPM US Value A (dist) - GBP 7.40% 10.43% 17.68% 11.21% 12.59% 11.42% MediumJPM US Value A (dist) - USD 0.50% 0.32% 4.35% -4.84% -0.55% 6.30% MediumJPMorgan US Value A (dist) - USD*** - - - - - - MediumJPM US Value B (acc) - EUR (hedged)*** - - - - - - MediumJPM US Value B (acc) - USD*** - - - - - - MediumJPM US Value C (acc) - EUR^ 3.29% -1.37% 5.65% -3.31% - - MediumJPM US Value C (acc) - EUR (hedged) 0.43% 0.61% 4.73% -4.04% 0.18% 7.38% MediumJPM US Value C (acc) - USD 0.72% 0.77% 5.02% -4.03% 0.41% 7.50% MediumJPM US Value C (dist) - GBP 7.66% 10.94% 18.52% 12.26% 13.71% 12.67% MediumJPM US Value C (dist) - USD^ 0.70% 0.73% 4.99% -4.06% 0.27% 7.28% MediumJPM US Value D (acc) - EUR (hedged) - -0.20% 3.41% -5.66% -1.50% 5.29% MediumJPM US Value D (acc) - USD 0.30% -0.10% 3.72% -5.61% -1.32% 5.41% MediumJPM US Value I (acc) - EUR (hedged) 0.45% 0.63% 4.76% -4.01% 0.29% - MediumJPM US Value I (acc) - USD 0.72% 0.76% 5.02% -3.99% 0.50% 7.64% MediumJPM US Value I (dist) - GBP 7.65% 10.95% 18.54% 12.28% 13.83% - MediumJPM US Value I (dist) - USD 0.72% 0.75% 5.01% -4.02% 0.47% - MediumJPM US Value X (acc) - USD 0.89% 1.07% 5.52% -3.34% 1.16% 8.46% Medium
* Share Class inactive as at the end of the year.** Share Class reactivated during the year.*** Share Class closed as at the end of the year. With respect to “B” Share Classes, these were merged to the equivalent “C” Share Class within the same Sub-Fund. Please refer to Note 17c). With respectto Share Classes prefixed “JPMorgan”, these were merged into the equivalent Share Classes prefixed “JPM” within the same Sub-Fund. Please refer to Note 17c).^ Share Class renamed from “B” Share Class to the equivalent “C” Share Class within the same Sub-Fund. Please refer to Note 17c).# Share Class renamed from “JPMorgan” prefixed Share Class to the equivalent “JPM” prefixed Share Class within the same Sub-Fund. Please refer to Note 17c).+ No data is applicable for these Share Classes as they were launched or reactivated less than 3 months before the year end.
281
JPMorgan FundsAppendix - Unaudited Additional Disclosures (continued)
3. Performance and Volatility (continued)
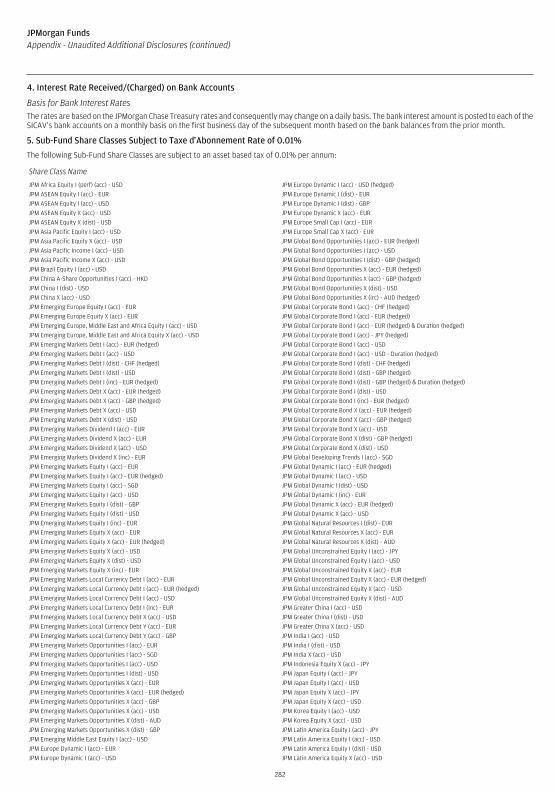
4. Interest Rate Received/(Charged) on Bank Accounts
Basis for Bank Interest RatesThe rates are based on the JPMorgan Chase Treasury rates and consequently may change on a daily basis. The bank interest amount is posted to each of theSICAV’s bank accounts on a monthly basis on the first business day of the subsequent month based on the bank balances from the prior month.
5. Sub-Fund Share Classes Subject to Taxe d’Abonnement Rate of 0.01%
The following Sub-Fund Share Classes are subject to an asset based tax of 0.01% per annum:
Share Class Name
JPM Africa Equity I (perf) (acc) - USD JPM Europe Dynamic I (acc) - USD (hedged)
JPM ASEAN Equity I (acc) - EUR JPM Europe Dynamic I (dist) - EUR
JPM ASEAN Equity I (acc) - USD JPM Europe Dynamic I (dist) - GBP
JPM ASEAN Equity X (acc) - USD JPM Europe Dynamic X (acc) - EUR
JPM ASEAN Equity X (dist) - USD JPM Europe Small Cap I (acc) - EUR
JPM Asia Pacific Equity I (acc) - USD JPM Europe Small Cap X (acc) - EUR
JPM Asia Pacific Equity X (acc) - USD JPM Global Bond Opportunities I (acc) - EUR (hedged)
JPM Asia Pacific Income I (acc) - USD JPM Global Bond Opportunities I (acc) - USD
JPM Asia Pacific Income X (acc) - USD JPM Global Bond Opportunities I (dist) - GBP (hedged)
JPM Brazil Equity I (acc) - USD JPM Global Bond Opportunities X (acc) - EUR (hedged)
JPM China A-Share Opportunities I (acc) - HKD JPM Global Bond Opportunities X (acc) - GBP (hedged)
JPM China I (dist) - USD JPM Global Bond Opportunities X (dist) - USD
JPM China X (acc) - USD JPM Global Bond Opportunities X (irc) - AUD (hedged)
JPM Emerging Europe Equity I (acc) - EUR JPM Global Corporate Bond I (acc) - CHF (hedged)
JPM Emerging Europe Equity X (acc) - EUR JPM Global Corporate Bond I (acc) - EUR (hedged)
JPM Emerging Europe, Middle East and Africa Equity I (acc) - USD JPM Global Corporate Bond I (acc) - EUR (hedged) & Duration (hedged)
JPM Emerging Europe, Middle East and Africa Equity X (acc) - USD JPM Global Corporate Bond I (acc) - JPY (hedged)
JPM Emerging Markets Debt I (acc) - EUR (hedged) JPM Global Corporate Bond I (acc) - USD
JPM Emerging Markets Debt I (acc) - USD JPM Global Corporate Bond I (acc) - USD - Duration (hedged)
JPM Emerging Markets Debt I (dist) - CHF (hedged) JPM Global Corporate Bond I (dist) - CHF (hedged)
JPM Emerging Markets Debt I (dist) - USD JPM Global Corporate Bond I (dist) - GBP (hedged)
JPM Emerging Markets Debt I (inc) - EUR (hedged) JPM Global Corporate Bond I (dist) - GBP (hedged) & Duration (hedged)
JPM Emerging Markets Debt X (acc) - EUR (hedged) JPM Global Corporate Bond I (dist) - USD
JPM Emerging Markets Debt X (acc) - GBP (hedged) JPM Global Corporate Bond I (inc) - EUR (hedged)
JPM Emerging Markets Debt X (acc) - USD JPM Global Corporate Bond X (acc) - EUR (hedged)
JPM Emerging Markets Debt X (dist) - USD JPM Global Corporate Bond X (acc) - GBP (hedged)
JPM Emerging Markets Dividend I (acc) - EUR JPM Global Corporate Bond X (acc) - USD
JPM Emerging Markets Dividend X (acc) - EUR JPM Global Corporate Bond X (dist) - GBP (hedged)
JPM Emerging Markets Dividend X (acc) - USD JPM Global Corporate Bond X (dist) - USD
JPM Emerging Markets Dividend X (inc) - EUR JPM Global Developing Trends I (acc) - SGD
JPM Emerging Markets Equity I (acc) - EUR JPM Global Dynamic I (acc) - EUR (hedged)
JPM Emerging Markets Equity I (acc) - EUR (hedged) JPM Global Dynamic I (acc) - USD
JPM Emerging Markets Equity I (acc) - SGD JPM Global Dynamic I (dist) - USD
JPM Emerging Markets Equity I (acc) - USD JPM Global Dynamic I (inc) - EUR
JPM Emerging Markets Equity I (dist) - GBP JPM Global Dynamic X (acc) - EUR (hedged)
JPM Emerging Markets Equity I (dist) - USD JPM Global Dynamic X (acc) - USD
JPM Emerging Markets Equity I (inc) - EUR JPM Global Natural Resources I (dist) - EUR
JPM Emerging Markets Equity X (acc) - EUR JPM Global Natural Resources X (acc) - EUR
JPM Emerging Markets Equity X (acc) - EUR (hedged) JPM Global Natural Resources X (dist) - AUD
JPM Emerging Markets Equity X (acc) - USD JPM Global Unconstrained Equity I (acc) - JPY
JPM Emerging Markets Equity X (dist) - USD JPM Global Unconstrained Equity I (acc) - USD
JPM Emerging Markets Equity X (inc) - EUR JPM Global Unconstrained Equity X (acc) - EUR
JPM Emerging Markets Local Currency Debt I (acc) - EUR JPM Global Unconstrained Equity X (acc) - EUR (hedged)
JPM Emerging Markets Local Currency Debt I (acc) - EUR (hedged) JPM Global Unconstrained Equity X (acc) - USD
JPM Emerging Markets Local Currency Debt I (acc) - USD JPM Global Unconstrained Equity X (dist) - AUD
JPM Emerging Markets Local Currency Debt I (inc) - EUR JPM Greater China I (acc) - USD
JPM Emerging Markets Local Currency Debt X (acc) - USD JPM Greater China I (dist) - USD
JPM Emerging Markets Local Currency Debt Y (acc) - EUR JPM Greater China X (acc) - USD
JPM Emerging Markets Local Currency Debt Y (acc) - GBP JPM India I (acc) - USD
JPM Emerging Markets Opportunities I (acc) - EUR JPM India I (dist) - USD
JPM Emerging Markets Opportunities I (acc) - SGD JPM India X (acc) - USD
JPM Emerging Markets Opportunities I (acc) - USD JPM Indonesia Equity X (acc) - JPY
JPM Emerging Markets Opportunities I (dist) - USD JPM Japan Equity I (acc) - JPY
JPM Emerging Markets Opportunities X (acc) - EUR JPM Japan Equity I (acc) - USD
JPM Emerging Markets Opportunities X (acc) - EUR (hedged) JPM Japan Equity X (acc) - JPY
JPM Emerging Markets Opportunities X (acc) - GBP JPM Japan Equity X (acc) - USD
JPM Emerging Markets Opportunities X (acc) - USD JPM Korea Equity I (acc) - USD
JPM Emerging Markets Opportunities X (dist) - AUD JPM Korea Equity X (acc) - USD
JPM Emerging Markets Opportunities X (dist) - GBP JPM Latin America Equity I (acc) - JPY
JPM Emerging Middle East Equity I (acc) - USD JPM Latin America Equity I (acc) - USD
JPM Europe Dynamic I (acc) - EUR JPM Latin America Equity I (dist) - USD
JPM Europe Dynamic I (acc) - USD JPM Latin America Equity X (acc) - USD
282
JPMorgan FundsAppendix - Unaudited Additional Disclosures (continued)
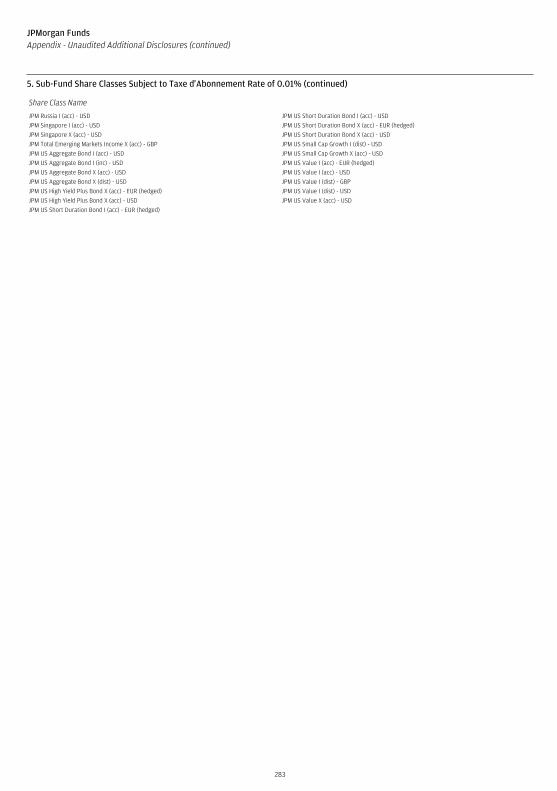
Share Class Name
JPM Russia I (acc) - USD JPM US Short Duration Bond I (acc) - USD
JPM Singapore I (acc) - USD JPM US Short Duration Bond X (acc) - EUR (hedged)
JPM Singapore X (acc) - USD JPM US Short Duration Bond X (acc) - USD
JPM Total Emerging Markets Income X (acc) - GBP JPM US Small Cap Growth I (dist) - USD
JPM US Aggregate Bond I (acc) - USD JPM US Small Cap Growth X (acc) - USD
JPM US Aggregate Bond I (inc) - USD JPM US Value I (acc) - EUR (hedged)
JPM US Aggregate Bond X (acc) - USD JPM US Value I (acc) - USD
JPM US Aggregate Bond X (dist) - USD JPM US Value I (dist) - GBP
JPM US High Yield Plus Bond X (acc) - EUR (hedged) JPM US Value I (dist) - USD
JPM US High Yield Plus Bond X (acc) - USD JPM US Value X (acc) - USD
JPM US Short Duration Bond I (acc) - EUR (hedged)
283
JPMorgan FundsAppendix - Unaudited Additional Disclosures (continued)
5. Sub-Fund Share Classes Subject to Taxe d’Abonnement Rate of 0.01% (continued)
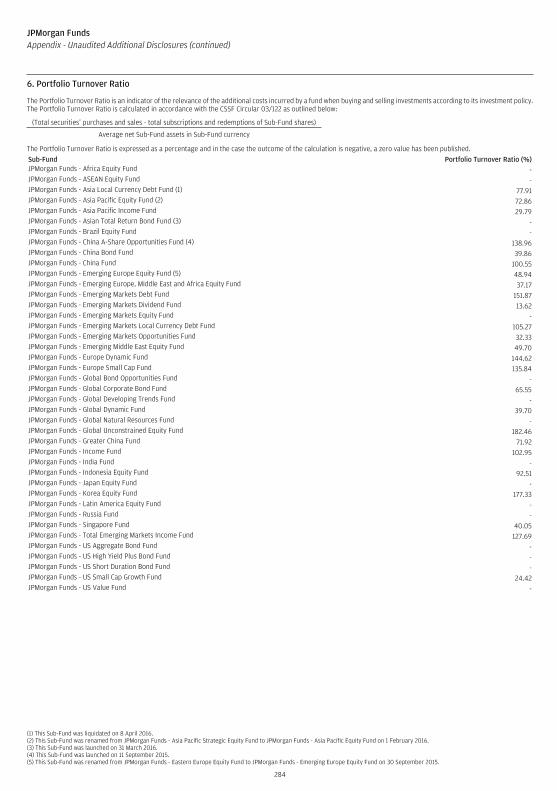
The Portfolio Turnover Ratio is an indicator of the relevance of the additional costs incurred by a fund when buying and selling investments according to its investment policy.The Portfolio Turnover Ratio is calculated in accordance with the CSSF Circular 03/122 as outlined below:
(Total securities’ purchases and sales - total subscriptions and redemptions of Sub-Fund shares)
Average net Sub-Fund assets in Sub-Fund currency
The Portfolio Turnover Ratio is expressed as a percentage and in the case the outcome of the calculation is negative, a zero value has been published.
Sub-Fund Portfolio Turnover Ratio (%)JPMorgan Funds - Africa Equity Fund -JPMorgan Funds - ASEAN Equity Fund -JPMorgan Funds - Asia Local Currency Debt Fund (1) 77.91JPMorgan Funds - Asia Pacific Equity Fund (2) 72.86JPMorgan Funds - Asia Pacific Income Fund 29.79JPMorgan Funds - Asian Total Return Bond Fund (3) -JPMorgan Funds - Brazil Equity Fund -JPMorgan Funds - China A-Share Opportunities Fund (4) 138.96JPMorgan Funds - China Bond Fund 39.86JPMorgan Funds - China Fund 100.55JPMorgan Funds - Emerging Europe Equity Fund (5) 48.94JPMorgan Funds - Emerging Europe, Middle East and Africa Equity Fund 37.17JPMorgan Funds - Emerging Markets Debt Fund 151.87JPMorgan Funds - Emerging Markets Dividend Fund 13.62JPMorgan Funds - Emerging Markets Equity Fund -JPMorgan Funds - Emerging Markets Local Currency Debt Fund 105.27JPMorgan Funds - Emerging Markets Opportunities Fund 32.33JPMorgan Funds - Emerging Middle East Equity Fund 49.70JPMorgan Funds - Europe Dynamic Fund 144.62JPMorgan Funds - Europe Small Cap Fund 135.84JPMorgan Funds - Global Bond Opportunities Fund -JPMorgan Funds - Global Corporate Bond Fund 65.55JPMorgan Funds - Global Developing Trends Fund -JPMorgan Funds - Global Dynamic Fund 39.70JPMorgan Funds - Global Natural Resources Fund -JPMorgan Funds - Global Unconstrained Equity Fund 182.46JPMorgan Funds - Greater China Fund 71.92JPMorgan Funds - Income Fund 102.95JPMorgan Funds - India Fund -JPMorgan Funds - Indonesia Equity Fund 92.51JPMorgan Funds - Japan Equity Fund -JPMorgan Funds - Korea Equity Fund 177.33JPMorgan Funds - Latin America Equity Fund -JPMorgan Funds - Russia Fund -JPMorgan Funds - Singapore Fund 40.05JPMorgan Funds - Total Emerging Markets Income Fund 127.69JPMorgan Funds - US Aggregate Bond Fund -JPMorgan Funds - US High Yield Plus Bond Fund -JPMorgan Funds - US Short Duration Bond Fund -JPMorgan Funds - US Small Cap Growth Fund 24.42JPMorgan Funds - US Value Fund -
(1) This Sub-Fund was liquidated on 8 April 2016.(2) This Sub-Fund was renamed from JPMorgan Funds - Asia Pacific Strategic Equity Fund to JPMorgan Funds - Asia Pacific Equity Fund on 1 February 2016.(3) This Sub-Fund was launched on 31 March 2016.(4) This Sub-Fund was launched on 11 September 2015.(5) This Sub-Fund was renamed from JPMorgan Funds - Eastern Europe Equity Fund to JPMorgan Funds - Emerging Europe Equity Fund on 30 September 2015.
284
JPMorgan FundsAppendix - Unaudited Additional Disclosures (continued)
6. Portfolio Turnover Ratio
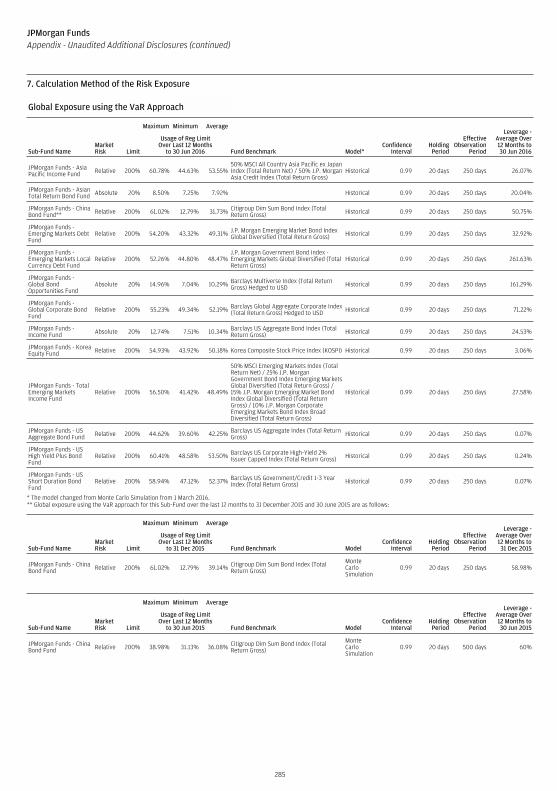
Global Exposure using the VaR Approach (continued)
MarketRisk
Maximum Minimum Average
ConfidenceInterval
HoldingPeriod
EffectiveObservation
Period
Leverage -Average Over12 Months to30 Jun 2016Sub-Fund Name Limit
Usage of Reg LimitOver Last 12 Months
to 30 Jun 2016 Fund Benchmark Model*
JPMorgan Funds - AsiaPacific Income Fund Relative 200% 60.78% 44.63% 53.55%
50% MSCI All Country Asia Pacific ex JapanIndex (Total Return Net) / 50% J.P. MorganAsia Credit Index (Total Return Gross)
Historical 0.99 20 days 250 days 26.07%
JPMorgan Funds - AsianTotal Return Bond Fund Absolute 20% 8.50% 7.25% 7.92% Historical 0.99 20 days 250 days 20.04%
JPMorgan Funds - ChinaBond Fund** Relative 200% 61.02% 12.79% 31.73% Citigroup Dim Sum Bond Index (Total
Return Gross) Historical 0.99 20 days 250 days 50.75%
JPMorgan Funds -Emerging Markets DebtFund
Relative 200% 54.20% 43.32% 49.31% J.P. Morgan Emerging Market Bond IndexGlobal Diversified (Total Return Gross) Historical 0.99 20 days 250 days 32.92%
JPMorgan Funds -Emerging Markets LocalCurrency Debt Fund
Relative 200% 52.26% 44.80% 48.47%J.P. Morgan Government Bond Index -Emerging Markets Global Diversified (TotalReturn Gross)
Historical 0.99 20 days 250 days 261.63%
JPMorgan Funds -Global BondOpportunities Fund
Absolute 20% 14.96% 7.04% 10.29% Barclays Multiverse Index (Total ReturnGross) Hedged to USD Historical 0.99 20 days 250 days 161.29%
JPMorgan Funds -Global Corporate BondFund
Relative 200% 55.23% 49.34% 52.19% Barclays Global Aggregate Corporate Index(Total Return Gross) Hedged to USD Historical 0.99 20 days 250 days 71.22%
JPMorgan Funds -Income Fund Absolute 20% 12.74% 7.51% 10.34% Barclays US Aggregate Bond Index (Total
Return Gross) Historical 0.99 20 days 250 days 24.53%
JPMorgan Funds - KoreaEquity Fund Relative 200% 54.93% 43.92% 50.18% Korea Composite Stock Price Index (KOSPI) Historical 0.99 20 days 250 days 3.06%
JPMorgan Funds - TotalEmerging MarketsIncome Fund
Relative 200% 56.50% 41.42% 48.49%
50% MSCI Emerging Markets Index (TotalReturn Net) / 25% J.P. MorganGovernment Bond Index Emerging MarketsGlobal Diversified (Total Return Gross) /15% J.P. Morgan Emerging Market BondIndex Global Diversified (Total ReturnGross) / 10% J.P. Morgan CorporateEmerging Markets Bond Index BroadDiversified (Total Return Gross)
Historical 0.99 20 days 250 days 27.58%
JPMorgan Funds - USAggregate Bond Fund Relative 200% 44.62% 39.60% 42.25% Barclays US Aggregate Index (Total Return
Gross) Historical 0.99 20 days 250 days 0.07%
JPMorgan Funds - USHigh Yield Plus BondFund
Relative 200% 60.41% 48.58% 53.50% Barclays US Corporate High-Yield 2%Issuer Capped Index (Total Return Gross) Historical 0.99 20 days 250 days 0.24%
JPMorgan Funds - USShort Duration BondFund
Relative 200% 58.94% 47.12% 52.37% Barclays US Government/Credit 1-3 YearIndex (Total Return Gross) Historical 0.99 20 days 250 days 0.07%
* The model changed from Monte Carlo Simulation from 1 March 2016.** Global exposure using the VaR approach for this Sub-Fund over the last 12 months to 31 December 2015 and 30 June 2015 are as follows:
MarketRisk
Maximum Minimum Average
ConfidenceInterval
HoldingPeriod
EffectiveObservation
Period
Leverage -Average Over12 Months to31 Dec 2015Sub-Fund Name Limit
Usage of Reg LimitOver Last 12 Months
to 31 Dec 2015 Fund Benchmark Model
JPMorgan Funds - ChinaBond Fund Relative 200% 61.02% 12.79% 39.14% Citigroup Dim Sum Bond Index (Total
Return Gross)
MonteCarloSimulation
0.99 20 days 250 days 58.98%
MarketRisk
Maximum Minimum Average
ConfidenceInterval
HoldingPeriod
EffectiveObservation
Period
Leverage -Average Over12 Months to30 Jun 2015Sub-Fund Name Limit
Usage of Reg LimitOver Last 12 Months
to 30 Jun 2015 Fund Benchmark Model
JPMorgan Funds - ChinaBond Fund Relative 200% 38.98% 31.13% 36.08% Citigroup Dim Sum Bond Index (Total
Return Gross)
MonteCarloSimulation
0.99 20 days 500 days 60%
285
JPMorgan FundsAppendix - Unaudited Additional Disclosures (continued)
7. Calculation Method of the Risk Exposure
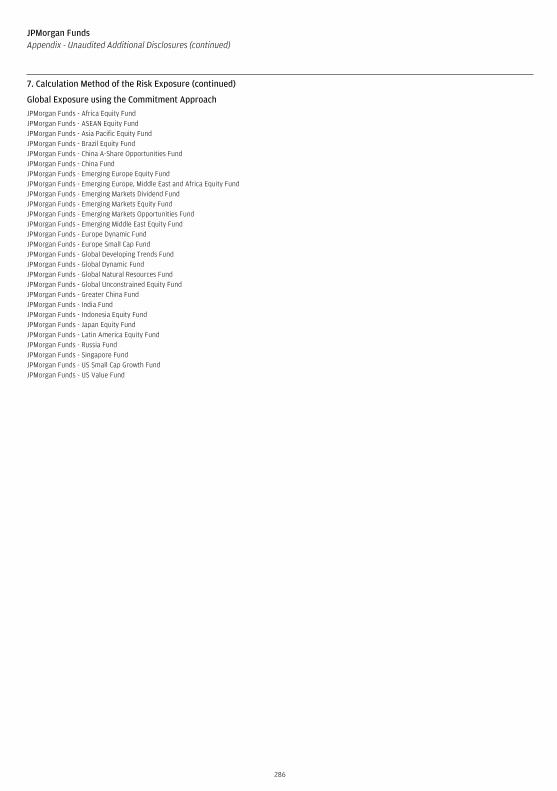
Global Exposure using the Commitment Approach
JPMorgan Funds - Africa Equity FundJPMorgan Funds - ASEAN Equity FundJPMorgan Funds - Asia Pacific Equity FundJPMorgan Funds - Brazil Equity FundJPMorgan Funds - China A-Share Opportunities FundJPMorgan Funds - China FundJPMorgan Funds - Emerging Europe Equity FundJPMorgan Funds - Emerging Europe, Middle East and Africa Equity FundJPMorgan Funds - Emerging Markets Dividend FundJPMorgan Funds - Emerging Markets Equity FundJPMorgan Funds - Emerging Markets Opportunities FundJPMorgan Funds - Emerging Middle East Equity FundJPMorgan Funds - Europe Dynamic FundJPMorgan Funds - Europe Small Cap FundJPMorgan Funds - Global Developing Trends FundJPMorgan Funds - Global Dynamic FundJPMorgan Funds - Global Natural Resources FundJPMorgan Funds - Global Unconstrained Equity FundJPMorgan Funds - Greater China FundJPMorgan Funds - India FundJPMorgan Funds - Indonesia Equity FundJPMorgan Funds - Japan Equity FundJPMorgan Funds - Latin America Equity FundJPMorgan Funds - Russia FundJPMorgan Funds - Singapore FundJPMorgan Funds - US Small Cap Growth FundJPMorgan Funds - US Value Fund
286
JPMorgan FundsAppendix - Unaudited Additional Disclosures (continued)
7. Calculation Method of the Risk Exposure (continued)
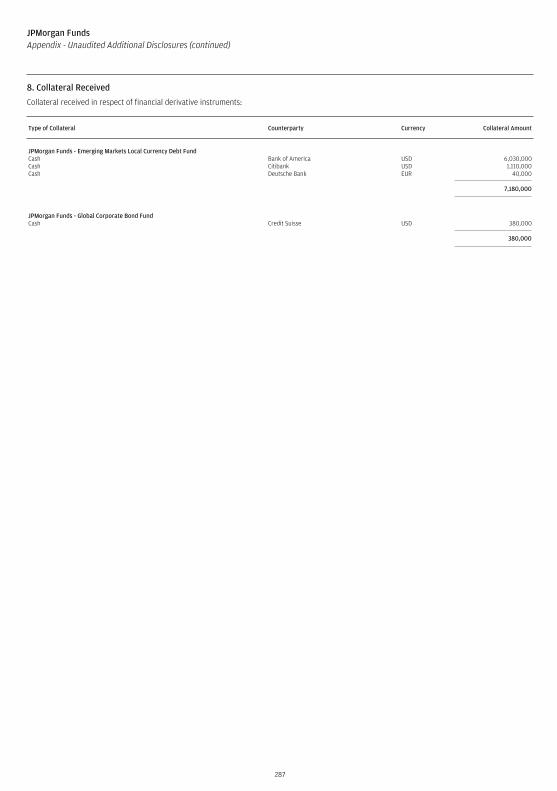
8. Collateral Received
Collateral received in respect of financial derivative instruments:
Type of Collateral Counterparty Currency Collateral Amount
JPMorgan Funds - Emerging Markets Local Currency Debt FundCash Bank of America USD 6,030,000Cash Citibank USD 1,110,000Cash Deutsche Bank EUR 40,000
7,180,000
JPMorgan Funds - Global Corporate Bond FundCash Credit Suisse USD 380,000
380,000
287
JPMorgan FundsAppendix - Unaudited Additional Disclosures (continued)
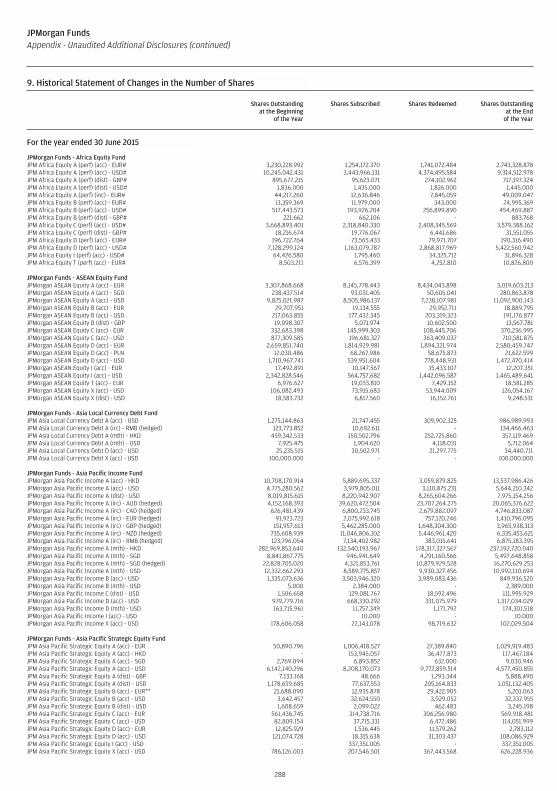
JPMorgan FundsAppendix - Unaudited Additional Disclosures (continued)
9. Historical Statement of Changes in the Number of Shares (continued)
Shares Outstandingat the Beginning
of the Year
Shares Subscribed Shares Redeemed Shares Outstandingat the End
of the Year
For the year ended 30 June 2015 (continued)
JPMorgan Funds - Africa Equity FundJPM Africa Equity A (perf) (acc) - EUR# 3,230,228.992 1,254,172.370 1,741,072.484 2,743,328.878JPM Africa Equity A (perf) (acc) - USD# 10,245,042.431 3,443,966.131 4,374,495.584 9,314,512.978JPM Africa Equity A (perf) (dist) - GBP# 895,677.215 95,623.071 274,102.962 717,197.324JPM Africa Equity A (perf) (dist) - USD# 1,836.000 1,435.000 1,826.000 1,445.000JPM Africa Equity A (perf) (inc) - EUR# 44,217.260 12,636.846 7,845.059 49,009.047JPM Africa Equity B (perf) (acc) - EUR# 13,359.369 11,979.000 343.000 24,995.369JPM Africa Equity B (perf) (acc) - USD# 517,443.573 193,926.204 256,899.890 454,469.887JPM Africa Equity B (perf) (dist) - GBP# 221.662 662.106 - 883.768JPM Africa Equity C (perf) (acc) - USD# 3,668,893.401 2,318,840.330 2,408,345.569 3,579,388.162JPM Africa Equity C (perf) (dist) - GBP# 18,216.674 19,776.067 6,441.686 31,551.055JPM Africa Equity D (perf) (acc) - EUR# 196,722.764 73,565.433 79,971.707 190,316.490JPM Africa Equity D (perf) (acc) - USD# 7,128,299.124 1,163,079.787 2,868,817.969 5,422,560.942JPM Africa Equity I (perf) (acc) - USD# 64,426.580 1,795.460 34,325.712 31,896.328JPM Africa Equity T (perf) (acc) - EUR# 8,503.211 6,576.399 4,252.810 10,826.800
JPMorgan Funds - ASEAN Equity FundJPMorgan ASEAN Equity A (acc) - EUR 3,307,868.668 8,145,778.443 8,434,043.898 3,019,603.213JPMorgan ASEAN Equity A (acc) - SGD 238,437.514 93,031.405 50,605.041 280,863.878JPMorgan ASEAN Equity A (acc) - USD 9,825,021.987 8,505,986.137 7,238,107.981 11,092,900.143JPMorgan ASEAN Equity B (acc) - EUR 29,707.951 19,134.555 29,952.711 18,889.795JPMorgan ASEAN Equity B (acc) - USD 217,063.855 177,432.345 203,319.323 191,176.877JPMorgan ASEAN Equity B (dist) - GBP 19,098.307 5,071.974 10,602.500 13,567.781JPMorgan ASEAN Equity C (acc) - EUR 332,683.398 145,999.303 108,445.706 370,236.995JPMorgan ASEAN Equity C (acc) - USD 877,309.585 196,681.327 363,409.037 710,581.875JPMorgan ASEAN Equity D (acc) - EUR 2,659,851.740 1,814,929.981 1,894,321.974 2,580,459.747JPMorgan ASEAN Equity D (acc) - PLN 12,030.486 68,267.986 58,675.873 21,622.599JPMorgan ASEAN Equity D (acc) - USD 1,710,967.741 539,951.604 778,448.931 1,472,470.414JPMorgan ASEAN Equity I (acc) - EUR 17,492.891 10,147.567 15,433.107 12,207.351JPMorgan ASEAN Equity I (acc) - USD 2,342,828.546 564,757.682 1,442,096.587 1,465,489.641JPMorgan ASEAN Equity T (acc) - EUR 6,976.627 19,033.810 7,429.152 18,581.285JPMorgan ASEAN Equity X (acc) - USD 106,082.493 73,915.683 53,944.009 126,054.167JPMorgan ASEAN Equity X (dist) - USD 18,583.732 6,817.560 16,152.761 9,248.531
JPMorgan Funds - Asia Local Currency Debt FundJPM Asia Local Currency Debt A (acc) - USD 1,275,144.863 21,747.455 309,902.325 986,989.993JPM Asia Local Currency Debt A (irc) - RMB (hedged) 123,773.852 10,692.611 - 134,466.463JPM Asia Local Currency Debt A (mth) - HKD 459,342.533 150,502.796 252,725.860 357,119.469JPM Asia Local Currency Debt A (mth) - USD 7,925.475 1,904.620 4,118.031 5,712.064JPM Asia Local Currency Debt D (acc) - USD 25,235.515 30,502.971 21,297.775 34,440.711JPM Asia Local Currency Debt X (acc) - USD 100,000.000 - - 100,000.000
JPMorgan Funds - Asia Pacific Income FundJPMorgan Asia Pacific Income A (acc) - HKD 10,708,170.914 5,889,695.337 3,059,879.825 13,537,986.426JPMorgan Asia Pacific Income A (acc) - USD 4,775,280.562 3,979,805.011 3,110,875.231 5,644,210.342JPMorgan Asia Pacific Income A (dist) - USD 8,019,815.615 8,220,942.907 8,265,604.266 7,975,154.256JPMorgan Asia Pacific Income A (irc) - AUD (hedged) 4,152,168.393 39,620,472.504 23,707,264.275 20,065,376.622JPMorgan Asia Pacific Income A (irc) - CAD (hedged) 626,481.439 6,800,233.745 2,679,882.097 4,746,833.087JPMorgan Asia Pacific Income A (irc) - EUR (hedged) 91,923.723 2,075,992.618 757,120.246 1,410,796.095JPMorgan Asia Pacific Income A (irc) - GBP (hedged) 151,957.613 5,462,285.000 1,648,304.300 3,965,938.313JPMorgan Asia Pacific Income A (irc) - NZD (hedged) 735,608.939 11,046,806.102 5,446,961.420 6,335,453.621JPMorgan Asia Pacific Income A (irc) - RMB (hedged) 123,796.054 7,134,402.982 383,015.641 6,875,183.395JPMorgan Asia Pacific Income A (mth) - HKD 282,969,853.640 132,540,193.967 178,317,327.567 237,192,720.040JPMorgan Asia Pacific Income A (mth) - SGD 8,841,867.775 946,941.649 4,291,160.566 5,497,648.858JPMorgan Asia Pacific Income A (mth) - SGD (hedged) 22,828,705.020 4,321,853.761 10,879,929.528 16,270,629.253JPMorgan Asia Pacific Income A (mth) - USD 12,332,662.293 8,589,775.857 9,930,327.456 10,992,110.694JPMorgan Asia Pacific Income B (acc) - USD 1,335,073.636 3,503,946.320 3,989,083.436 849,936.520JPMorgan Asia Pacific Income B (mth) - USD 5.000 2,384.000 - 2,389.000JPMorgan Asia Pacific Income C (dist) - USD 1,506.658 129,081.767 18,592.496 111,995.929JPMorgan Asia Pacific Income D (acc) - USD 979,779.716 668,330.292 331,075.979 1,317,034.029JPMorgan Asia Pacific Income D (mth) - USD 163,715.961 11,757.349 1,171.792 174,301.518JPMorgan Asia Pacific Income I (acc) - USD - 10.000 - 10.000JPMorgan Asia Pacific Income X (acc) - USD 178,606.058 22,143.078 98,719.632 102,029.504
JPMorgan Funds - Asia Pacific Strategic Equity FundJPM Asia Pacific Strategic Equity A (acc) - EUR 50,890.796 1,006,418.527 27,389.840 1,029,919.483JPM Asia Pacific Strategic Equity A (acc) - HKD - 153,945.057 36,477.873 117,467.184JPM Asia Pacific Strategic Equity A (acc) - SGD 2,769.094 6,893.852 632.000 9,030.946JPM Asia Pacific Strategic Equity A (acc) - USD 6,142,140.296 8,208,170.073 9,772,859.514 4,577,450.855JPM Asia Pacific Strategic Equity A (dist) - GBP 7,133.168 48.666 1,293.344 5,888.490JPM Asia Pacific Strategic Equity A (dist) - USD 1,178,659.685 77,637.553 205,164.833 1,051,132.405JPM Asia Pacific Strategic Equity B (acc) - EUR** 21,688.090 12,935.878 29,422.905 5,201.063JPM Asia Pacific Strategic Equity B (acc) - USD 3,642.457 32,624.550 3,929.052 32,337.955JPM Asia Pacific Strategic Equity B (dist) - USD 1,608.659 2,099.022 462.483 3,245.198JPM Asia Pacific Strategic Equity C (acc) - EUR 561,436.745 314,738.716 306,256.980 569,918.481JPM Asia Pacific Strategic Equity C (acc) - USD 82,809.154 37,715.331 6,472.486 114,051.999JPM Asia Pacific Strategic Equity D (acc) - EUR 12,825.929 1,536.445 11,579.262 2,783.112JPM Asia Pacific Strategic Equity D (acc) - USD 121,074.728 18,315.638 31,303.437 108,086.929JPM Asia Pacific Strategic Equity I (acc) - USD - 337,351.005 - 337,351.005JPM Asia Pacific Strategic Equity X (acc) - USD 786,126.003 207,546.501 367,443.568 626,228.936
288
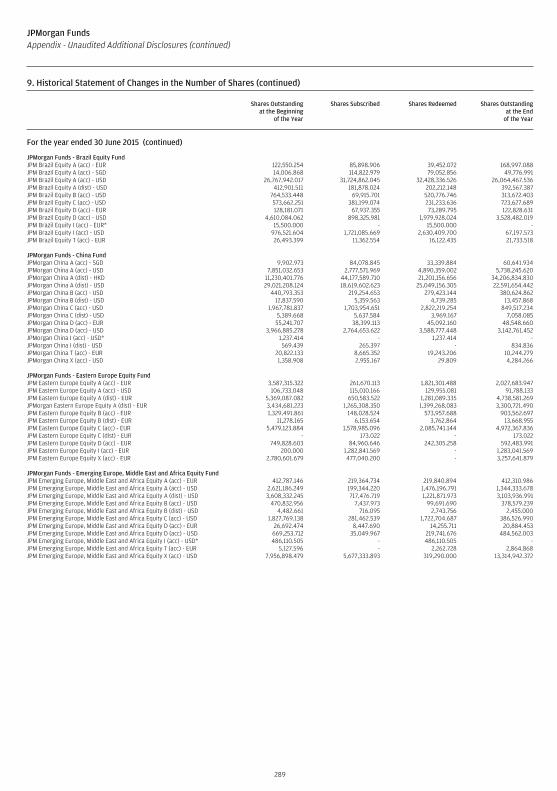
JPMorgan FundsAppendix - Unaudited Additional Disclosures (continued)
9. Historical Statement of Changes in the Number of Shares (continued)
Shares Outstandingat the Beginning
of the Year
Shares Subscribed Shares Redeemed Shares Outstandingat the End
of the Year
For the year ended 30 June 2015 (continued)
JPMorgan Funds - Brazil Equity FundJPM Brazil Equity A (acc) - EUR 122,550.254 85,898.906 39,452.072 168,997.088JPM Brazil Equity A (acc) - SGD 14,006.868 114,822.979 79,052.856 49,776.991JPM Brazil Equity A (acc) - USD 26,767,942.017 31,724,862.045 32,428,336.526 26,064,467.536JPM Brazil Equity A (dist) - USD 412,901.511 181,878.024 202,212.148 392,567.387JPM Brazil Equity B (acc) - USD 764,533.448 69,915.701 520,776.746 313,672.403JPM Brazil Equity C (acc) - USD 573,662.251 381,199.074 231,233.636 723,627.689JPM Brazil Equity D (acc) - EUR 128,181.071 67,937.355 73,289.795 122,828.631JPM Brazil Equity D (acc) - USD 4,610,084.062 898,325.981 1,979,928.024 3,528,482.019JPM Brazil Equity I (acc) - EUR* 15,500.000 - 15,500.000 -JPM Brazil Equity I (acc) - USD 976,521.604 1,721,085.669 2,630,409.700 67,197.573JPM Brazil Equity T (acc) - EUR 26,493.399 11,362.554 16,122.435 21,733.518
JPMorgan Funds - China FundJPMorgan China A (acc) - SGD 9,902.973 84,078.845 33,339.884 60,641.934JPMorgan China A (acc) - USD 7,851,032.653 2,777,571.969 4,890,359.002 5,738,245.620JPMorgan China A (dist) - HKD 11,230,401.776 44,177,589.710 21,201,156.656 34,206,834.830JPMorgan China A (dist) - USD 29,021,208.124 18,619,602.623 25,049,156.305 22,591,654.442JPMorgan China B (acc) - USD 440,793.353 219,254.653 279,423.144 380,624.862JPMorgan China B (dist) - USD 12,837.590 5,359.563 4,739.285 13,457.868JPMorgan China C (acc) - USD 1,967,781.837 1,703,954.651 2,822,219.254 849,517.234JPMorgan China C (dist) - USD 5,389.668 5,637.584 3,969.167 7,058.085JPMorgan China D (acc) - EUR 55,241.707 38,399.113 45,092.160 48,548.660JPMorgan China D (acc) - USD 3,966,885.278 2,764,653.622 3,588,777.448 3,142,761.452JPMorgan China I (acc) - USD* 1,237.414 - 1,237.414 -JPMorgan China I (dist) - USD 569.439 265.397 - 834.836JPMorgan China T (acc) - EUR 20,822.133 8,665.352 19,243.206 10,244.279JPMorgan China X (acc) - USD 1,358.908 2,955.167 29.809 4,284.266
JPMorgan Funds - Eastern Europe Equity FundJPM Eastern Europe Equity A (acc) - EUR 3,587,315.322 261,670.113 1,821,301.488 2,027,683.947JPM Eastern Europe Equity A (acc) - USD 106,733.048 115,010.166 129,955.081 91,788.133JPM Eastern Europe Equity A (dist) - EUR 5,369,087.082 650,583.522 1,281,089.335 4,738,581.269JPMorgan Eastern Europe Equity A (dist) - EUR 3,434,681.223 1,265,308.350 1,399,268.083 3,300,721.490JPM Eastern Europe Equity B (acc) - EUR 1,329,491.861 148,028.524 573,957.688 903,562.697JPM Eastern Europe Equity B (dist) - EUR 11,278.165 6,153.654 3,762.864 13,668.955JPM Eastern Europe Equity C (acc) - EUR 5,479,123.884 1,578,985.096 2,085,741.144 4,972,367.836JPM Eastern Europe Equity C (dist) - EUR - 173.022 - 173.022JPM Eastern Europe Equity D (acc) - EUR 749,828.603 84,960.646 242,305.258 592,483.991JPM Eastern Europe Equity I (acc) - EUR 200.000 1,282,841.569 - 1,283,041.569JPM Eastern Europe Equity X (acc) - EUR 2,780,601.679 477,040.200 - 3,257,641.879
JPMorgan Funds - Emerging Europe, Middle East and Africa Equity FundJPM Emerging Europe, Middle East and Africa Equity A (acc) - EUR 412,787.146 219,364.734 219,840.894 412,310.986JPM Emerging Europe, Middle East and Africa Equity A (acc) - USD 2,621,186.249 199,344.220 1,476,196.791 1,344,333.678JPM Emerging Europe, Middle East and Africa Equity A (dist) - USD 3,608,332.245 717,476.719 1,221,871.973 3,103,936.991JPM Emerging Europe, Middle East and Africa Equity B (acc) - USD 470,832.956 7,437.973 99,691.690 378,579.239JPM Emerging Europe, Middle East and Africa Equity B (dist) - USD 4,482.661 716.095 2,743.756 2,455.000JPM Emerging Europe, Middle East and Africa Equity C (acc) - USD 1,827,769.138 281,462.539 1,722,704.687 386,526.990JPM Emerging Europe, Middle East and Africa Equity D (acc) - EUR 26,692.474 8,447.690 14,255.711 20,884.453JPM Emerging Europe, Middle East and Africa Equity D (acc) - USD 669,253.712 35,049.967 219,741.676 484,562.003JPM Emerging Europe, Middle East and Africa Equity I (acc) - USD* 486,110.505 - 486,110.505 -JPM Emerging Europe, Middle East and Africa Equity T (acc) - EUR 5,127.596 - 2,262.728 2,864.868JPM Emerging Europe, Middle East and Africa Equity X (acc) - USD 7,956,898.479 5,677,333.893 319,290.000 13,314,942.372
289
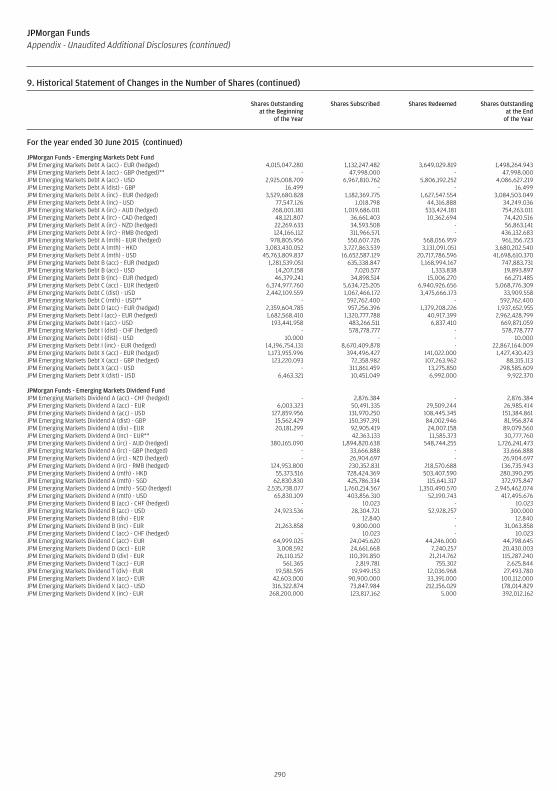
JPMorgan FundsAppendix - Unaudited Additional Disclosures (continued)
9. Historical Statement of Changes in the Number of Shares (continued)
Shares Outstandingat the Beginning
of the Year
Shares Subscribed Shares Redeemed Shares Outstandingat the End
of the Year
For the year ended 30 June 2015 (continued)
JPMorgan Funds - Emerging Markets Debt FundJPM Emerging Markets Debt A (acc) - EUR (hedged) 4,015,047.280 1,132,247.482 3,649,029.819 1,498,264.943JPM Emerging Markets Debt A (acc) - GBP (hedged)** - 47,998.000 - 47,998.000JPM Emerging Markets Debt A (acc) - USD 2,925,008.709 6,967,810.762 5,806,192.252 4,086,627.219JPM Emerging Markets Debt A (dist) - GBP 16.499 - - 16.499JPM Emerging Markets Debt A (inc) - EUR (hedged) 3,529,680.828 1,182,369.775 1,627,547.554 3,084,503.049JPM Emerging Markets Debt A (inc) - USD 77,547.126 1,018.798 44,316.888 34,249.036JPM Emerging Markets Debt A (irc) - AUD (hedged) 268,001.181 1,019,686.011 533,424.181 754,263.011JPM Emerging Markets Debt A (irc) - CAD (hedged) 48,121.807 36,661.403 10,362.694 74,420.516JPM Emerging Markets Debt A (irc) - NZD (hedged) 22,269.633 34,593.508 - 56,863.141JPM Emerging Markets Debt A (irc) - RMB (hedged) 124,166.112 311,966.571 - 436,132.683JPM Emerging Markets Debt A (mth) - EUR (hedged) 978,805.956 550,607.726 568,056.959 961,356.723JPM Emerging Markets Debt A (mth) - HKD 3,083,430.052 3,727,863.539 3,131,091.051 3,680,202.540JPM Emerging Markets Debt A (mth) - USD 45,763,809.837 16,652,587.129 20,717,786.596 41,698,610.370JPM Emerging Markets Debt B (acc) - EUR (hedged) 1,281,539.051 635,338.847 1,168,994.167 747,883.731JPM Emerging Markets Debt B (acc) - USD 14,207.158 7,020.577 1,333.838 19,893.897JPM Emerging Markets Debt B (inc) - EUR (hedged) 46,379.241 34,898.514 15,006.270 66,271.485JPM Emerging Markets Debt C (acc) - EUR (hedged) 6,374,977.760 5,634,725.205 6,940,926.656 5,068,776.309JPM Emerging Markets Debt C (dist) - USD 2,442,109.559 1,067,466.172 3,475,666.173 33,909.558JPM Emerging Markets Debt C (mth) - USD** - 592,762.400 - 592,762.400JPM Emerging Markets Debt D (acc) - EUR (hedged) 2,359,604.785 957,256.396 1,379,208.226 1,937,652.955JPM Emerging Markets Debt I (acc) - EUR (hedged) 1,682,568.410 1,320,777.788 40,917.399 2,962,428.799JPM Emerging Markets Debt I (acc) - USD 193,441.958 483,266.511 6,837.410 669,871.059JPM Emerging Markets Debt I (dist) - CHF (hedged) - 578,778.777 - 578,778.777JPM Emerging Markets Debt I (dist) - USD 10.000 - - 10.000JPM Emerging Markets Debt I (inc) - EUR (hedged) 14,196,754.131 8,670,409.878 - 22,867,164.009JPM Emerging Markets Debt X (acc) - EUR (hedged) 1,173,955.996 394,496.427 141,022.000 1,427,430.423JPM Emerging Markets Debt X (acc) - GBP (hedged) 123,220.093 72,358.982 107,263.962 88,315.113JPM Emerging Markets Debt X (acc) - USD - 311,861.459 13,275.850 298,585.609JPM Emerging Markets Debt X (dist) - USD 6,463.321 10,451.049 6,992.000 9,922.370
JPMorgan Funds - Emerging Markets Dividend FundJPM Emerging Markets Dividend A (acc) - CHF (hedged) - 2,876.384 - 2,876.384JPM Emerging Markets Dividend A (acc) - EUR 6,003.323 50,491.335 29,509.244 26,985.414JPM Emerging Markets Dividend A (acc) - USD 127,859.956 131,970.250 108,445.345 151,384.861JPM Emerging Markets Dividend A (dist) - GBP 15,562.429 150,397.391 84,002.946 81,956.874JPM Emerging Markets Dividend A (div) - EUR 20,181.299 92,905.419 24,007.158 89,079.560JPM Emerging Markets Dividend A (inc) - EUR** - 42,363.133 11,585.373 30,777.760JPM Emerging Markets Dividend A (irc) - AUD (hedged) 380,165.090 1,894,820.638 548,744.255 1,726,241.473JPM Emerging Markets Dividend A (irc) - GBP (hedged) - 33,666.888 - 33,666.888JPM Emerging Markets Dividend A (irc) - NZD (hedged) - 26,904.697 - 26,904.697JPM Emerging Markets Dividend A (irc) - RMB (hedged) 124,953.800 230,352.831 218,570.688 136,735.943JPM Emerging Markets Dividend A (mth) - HKD 55,373.516 728,424.369 503,407.590 280,390.295JPM Emerging Markets Dividend A (mth) - SGD 62,830.830 425,786.334 115,641.317 372,975.847JPM Emerging Markets Dividend A (mth) - SGD (hedged) 2,535,738.077 1,760,214.567 1,350,490.570 2,945,462.074JPM Emerging Markets Dividend A (mth) - USD 65,830.109 403,856.310 52,190.743 417,495.676JPM Emerging Markets Dividend B (acc) - CHF (hedged) - 10.023 - 10.023JPM Emerging Markets Dividend B (acc) - USD 24,923.536 28,304.721 52,928.257 300.000JPM Emerging Markets Dividend B (div) - EUR - 12.840 - 12.840JPM Emerging Markets Dividend B (inc) - EUR 21,263.858 9,800.000 - 31,063.858JPM Emerging Markets Dividend C (acc) - CHF (hedged) - 10.023 - 10.023JPM Emerging Markets Dividend C (acc) - EUR 64,999.025 24,045.620 44,246.000 44,798.645JPM Emerging Markets Dividend D (acc) - EUR 3,008.592 24,661.668 7,240.257 20,430.003JPM Emerging Markets Dividend D (div) - EUR 26,110.152 110,391.850 21,214.762 115,287.240JPM Emerging Markets Dividend T (acc) - EUR 561.365 2,819.781 755.302 2,625.844JPM Emerging Markets Dividend T (div) - EUR 19,581.595 19,949.153 12,036.968 27,493.780JPM Emerging Markets Dividend X (acc) - EUR 42,603.000 90,900.000 33,391.000 100,112.000JPM Emerging Markets Dividend X (acc) - USD 316,322.874 73,847.984 212,156.029 178,014.829JPM Emerging Markets Dividend X (inc) - EUR 268,200.000 123,817.162 5.000 392,012.162
290
JPMorgan FundsAppendix - Unaudited Additional Disclosures (continued)
9. Historical Statement of Changes in the Number of Shares (continued)
Shares Outstandingat the Beginning
of the Year
Shares Subscribed Shares Redeemed Shares Outstandingat the End
of the Year
For the year ended 30 June 2015 (continued)
JPMorgan Funds - Emerging Markets Equity FundJPM Emerging Markets Equity A (acc) - EUR 23,038,946.396 6,769,092.548 9,496,601.721 20,311,437.223JPM Emerging Markets Equity A (acc) - EUR (hedged) 103,492.897 52,463.913 72,894.043 83,062.767JPM Emerging Markets Equity A (acc) - SGD 249,712.099 93,682.493 110,335.906 233,058.686JPM Emerging Markets Equity A (acc) - USD 12,940,889.965 3,056,546.530 7,179,994.389 8,817,442.106JPM Emerging Markets Equity A (dist) - GBP 263,470.749 66,298.398 97,620.993 232,148.154JPM Emerging Markets Equity A (dist) - USD 26,171,649.423 4,651,054.627 10,522,277.951 20,300,426.099JPM Emerging Markets Equity B (acc) - EUR 230,962.457 15,573.710 83,098.567 163,437.600JPM Emerging Markets Equity B (acc) - USD 1,993,153.200 2,225,384.263 2,669,504.386 1,549,033.077JPM Emerging Markets Equity B (dist) - GBP 251.061 17,444.381 394.115 17,301.327JPM Emerging Markets Equity B (dist) - USD 104,111.644 5,190.861 22,516.017 86,786.488JPM Emerging Markets Equity C (acc) - EUR 93,273.189 157,703.869 184,235.814 66,741.244JPM Emerging Markets Equity C (acc) - EUR (hedged) 11,921.185 28,355.057 14,070.921 26,205.321JPM Emerging Markets Equity C (acc) - USD 25,849,707.303 13,521,248.976 15,974,700.863 23,396,255.416JPM Emerging Markets Equity C (dist) - GBP 7,365.076 1,125.154 3,944.651 4,545.579JPM Emerging Markets Equity C (dist) - USD 3,092,648.058 448,937.021 3,441,828.231 99,756.848JPM Emerging Markets Equity D (acc) - EUR 2,750,169.794 1,787,107.032 1,842,311.897 2,694,964.929JPM Emerging Markets Equity D (acc) - USD 2,075,776.131 213,639.492 685,395.507 1,604,020.116JPM Emerging Markets Equity I (acc) - EUR 4,801,460.213 220,829.521 22,224.839 5,000,064.895JPM Emerging Markets Equity I (acc) - EUR (hedged) 174,167.893 5,789.047 8,862.106 171,094.834JPM Emerging Markets Equity I (acc) - USD 24,555,680.810 2,654,026.114 8,493,086.609 18,716,620.315JPM Emerging Markets Equity I (dist) - GBP 1,933.359 - 1,923.357 10.002JPM Emerging Markets Equity I (dist) - USD 121,988.830 - 54,957.837 67,030.993JPM Emerging Markets Equity I (inc) - EUR 4,091,483.277 120,344.000 138,682.000 4,073,145.277JPM Emerging Markets Equity T (acc) - EUR 3,756.960 5,007.549 3,440.629 5,323.880JPM Emerging Markets Equity X (acc) - EUR 109,598.837 87,196.000 45,212.428 151,582.409JPM Emerging Markets Equity X (acc) - EUR (hedged) 86,177.000 10,666.000 86,143.000 10,700.000JPM Emerging Markets Equity X (acc) - USD 43,504,090.232 4,085,322.279 1,397,464.317 46,191,948.194JPM Emerging Markets Equity X (dist) - USD 2,810,694.528 59,219.158 978,842.000 1,891,071.686JPM Emerging Markets Equity X (inc) - EUR 24,272,113.779 7,938,586.015 376,148.069 31,834,551.725
JPMorgan Funds - Emerging Markets Local Currency Debt FundJPM Emerging Markets Local Currency Debt A (acc) - EUR 9,691,409.833 3,598,958.968 7,255,856.198 6,034,512.603JPM Emerging Markets Local Currency Debt A (acc) - SGD 830,022.879 1,265,445.839 258,923.328 1,836,545.390JPM Emerging Markets Local Currency Debt A (acc) - USD 5,864,734.716 3,201,682.685 4,268,013.797 4,798,403.604JPM Emerging Markets Local Currency Debt A (dist) - GBP 2,251.318 39.686 198.815 2,092.189JPM Emerging Markets Local Currency Debt A (div) - EUR 48,024.547 100,343.870 40,195.011 108,173.406JPM Emerging Markets Local Currency Debt A (inc) - EUR 1,997,228.987 910,633.475 348,903.532 2,558,958.930JPM Emerging Markets Local Currency Debt A (irc) - AUD (hedged) 5,620,123.493 25,146,806.780 12,704,635.734 18,062,294.539JPM Emerging Markets Local Currency Debt A (mth) - HKD - 34,196.751 - 34,196.751JPM Emerging Markets Local Currency Debt A (mth) - USD 61,726,518.983 66,561,652.701 60,772,084.540 67,516,087.144JPM Emerging Markets Local Currency Debt B (acc) - EUR 73,963.285 30,826.675 56,096.064 48,693.896JPM Emerging Markets Local Currency Debt B (acc) - USD 6,358,930.489 3,254,110.027 4,239,506.595 5,373,533.921JPM Emerging Markets Local Currency Debt B (inc) - EUR 74,805.804 24,512.719 7,000.000 92,318.523JPM Emerging Markets Local Currency Debt B (mth) - USD 10.000 685.000 - 695.000JPM Emerging Markets Local Currency Debt C (acc) - EUR 245,631.238 460,447.842 345,053.280 361,025.800JPM Emerging Markets Local Currency Debt C (acc) - EUR (hedged) - 278,545.000 27,870.000 250,675.000JPM Emerging Markets Local Currency Debt C (acc) - SEK* 1,161,844.683 808,856.000 1,970,700.683 -JPM Emerging Markets Local Currency Debt C (acc) - USD 5,518,816.111 3,165,963.573 4,100,594.338 4,584,185.346JPM Emerging Markets Local Currency Debt C (dist) - GBP 7,151.345 67,694.392 1,334.632 73,511.105JPM Emerging Markets Local Currency Debt C (div) - EUR 134,698.276 53,676.865 - 188,375.141JPM Emerging Markets Local Currency Debt D (acc) - EUR 5,747,622.799 1,441,939.813 2,069,003.704 5,120,558.908JPM Emerging Markets Local Currency Debt D (acc) - USD 103,240.005 20,846.762 84,180.505 39,906.262JPM Emerging Markets Local Currency Debt D (div) - EUR 14,655,011.405 8,594,118.206 4,795,517.645 18,453,611.966JPM Emerging Markets Local Currency Debt D (mth) - USD 8,089.668 31,115.864 4,285.593 34,919.939JPM Emerging Markets Local Currency Debt I (acc) - EUR 150,590.000 22,506.537 927.265 172,169.272JPM Emerging Markets Local Currency Debt I (acc) - EUR (hedged) 1,069,765.000 828,262.000 1,253,145.000 644,882.000JPM Emerging Markets Local Currency Debt I (acc) - USD 667,455.633 181,215.415 145,088.109 703,582.939JPM Emerging Markets Local Currency Debt I (inc) - EUR 3,464,757.074 225,416.678 18,354.736 3,671,819.016JPM Emerging Markets Local Currency Debt T (acc) - EUR 49,902.661 24,007.928 38,461.738 35,448.851JPM Emerging Markets Local Currency Debt T (div) - EUR 476,801.943 201,468.558 182,208.150 496,062.351JPM Emerging Markets Local Currency Debt X (acc) - EUR (hedged)* 585,300.000 - 585,300.000 -JPM Emerging Markets Local Currency Debt X (acc) - USD 35,366.121 1,498,849.650 118,432.433 1,415,783.338JPM Emerging Markets Local Currency Debt X (dist) - USD* - 3,208.675 3,208.675 -JPM Emerging Markets Local Currency Debt Y (acc) - EUR 2,433,220.593 57,324.000 38,101.000 2,452,443.593JPM Emerging Markets Local Currency Debt Y (acc) - GBP 1,858,633.879 434,435.934 205,786.816 2,087,282.997
291
JPMorgan FundsAppendix - Unaudited Additional Disclosures (continued)
9. Historical Statement of Changes in the Number of Shares (continued)
Shares Outstandingat the Beginning
of the Year
Shares Subscribed Shares Redeemed Shares Outstandingat the End
of the Year
For the year ended 30 June 2015 (continued)
JPMorgan Funds - Emerging Markets Opportunities FundJPM Emerging Markets Opportunities A (acc) - CHF (hedged) 38,667.135 33,557.384 9,132.903 63,091.616JPM Emerging Markets Opportunities A (acc) - EUR 966,213.311 405,342.047 755,219.710 616,335.648JPM Emerging Markets Opportunities A (acc) - SGD 27,763.304 70,722.991 32,021.937 66,464.358JPM Emerging Markets Opportunities A (acc) - SGD (hedged) 281,105.446 106,645.599 169,440.609 218,310.436JPM Emerging Markets Opportunities A (acc) - USD 2,325,769.284 1,077,481.899 1,954,707.700 1,448,543.483JPM Emerging Markets Opportunities A (dist) - EUR 386,548.730 154,999.084 282,817.102 258,730.712JPM Emerging Markets Opportunities A (dist) - GBP 75,027.870 22,542.513 65,588.942 31,981.441JPM Emerging Markets Opportunities A (dist) - USD 142,265.940 54,269.871 108,947.162 87,588.649JPM Emerging Markets Opportunities A (inc) - EUR 18,810.166 4,197.376 2,160.000 20,847.542JPM Emerging Markets Opportunities B (acc) - EUR 825,003.974 1,168,052.451 192,176.906 1,800,879.519JPM Emerging Markets Opportunities B (acc) - USD 497,051.946 152,793.663 203,603.363 446,242.246JPM Emerging Markets Opportunities B (dist) - EUR 52,908.620 25,039.450 14,168.953 63,779.117JPM Emerging Markets Opportunities B (dist) - GBP 396,711.518 33,229.497 392,010.935 37,930.080JPM Emerging Markets Opportunities B (dist) - USD 26.573 2,251.452 - 2,278.025JPM Emerging Markets Opportunities C (acc) - CHF (hedged) - 9.976 - 9.976JPM Emerging Markets Opportunities C (acc) - EUR 277.822 8,537.425 794.928 8,020.319JPM Emerging Markets Opportunities C (acc) - PLN 24,459.652 163,306.762 37,237.909 150,528.505JPM Emerging Markets Opportunities C (acc) - USD 2,283,208.140 756,047.046 1,717,139.611 1,322,115.575JPM Emerging Markets Opportunities C (dist) - GBP 2,050,980.965 1,660,173.743 1,026,099.248 2,685,055.460JPM Emerging Markets Opportunities C (dist) - USD 648,765.573 1,382,238.611 656,330.771 1,374,673.413JPM Emerging Markets Opportunities D (acc) - EUR 45,155.021 52,632.336 27,509.407 70,277.950JPM Emerging Markets Opportunities D (acc) - PLN 308.222 14,285.518 3,639.900 10,953.840JPM Emerging Markets Opportunities D (acc) - USD 104,795.441 39,376.794 58,193.509 85,978.726JPM Emerging Markets Opportunities I (acc) - EUR 222,627.000 10,347.279 9,477.295 223,496.984JPM Emerging Markets Opportunities I (acc) - SGD - 8,916,362.429 - 8,916,362.429JPM Emerging Markets Opportunities I (acc) - USD 725,596.009 1,586,864.928 156,946.550 2,155,514.387JPM Emerging Markets Opportunities T (acc) - EUR 18,234.065 8,939.790 6,654.659 20,519.196JPM Emerging Markets Opportunities X (acc) - EUR 955,905.882 1,221,655.523 129,238.045 2,048,323.360JPM Emerging Markets Opportunities X (acc) - EUR (hedged) 86,237.000 9,238.000 84,793.000 10,682.000JPM Emerging Markets Opportunities X (acc) - GBP 2,657,080.695 53,947.652 418,993.079 2,292,035.268JPM Emerging Markets Opportunities X (acc) - USD 436,742.650 377,574.367 38,198.579 776,118.438JPM Emerging Markets Opportunities X (dist) - AUD 96,894.655 1,074.219 180.995 97,787.879
JPMorgan Funds - Emerging Middle East Equity FundJPM Emerging Middle East Equity A (acc) - EUR 435,909.172 158,504.209 403,893.319 190,520.062JPM Emerging Middle East Equity A (acc) - USD 2,167,843.694 253,492.706 1,480,626.193 940,710.207JPM Emerging Middle East Equity A (dist) - USD 5,418,967.737 1,695,671.618 3,008,434.234 4,106,205.121JPM Emerging Middle East Equity B (acc) - USD 128,669.695 78,230.468 120,041.538 86,858.625JPM Emerging Middle East Equity B (dist) - USD 18,144.457 643.225 12,866.379 5,921.303JPM Emerging Middle East Equity C (acc) - USD 7,201,291.517 546,308.751 2,196,567.315 5,551,032.953JPM Emerging Middle East Equity D (acc) - EUR 24,508.530 10,352.851 16,033.443 18,827.938JPM Emerging Middle East Equity D (acc) - USD 910,299.898 75,719.859 341,990.396 644,029.361JPM Emerging Middle East Equity I (acc) - USD 36,606.308 3,284.212 38,902.075 988.445
JPMorgan Funds - Europe Dynamic FundJPM Europe Dynamic A (acc) - AUD (hedged) 5,607,056.676 13,228,002.644 10,289,758.279 8,545,301.041JPM Europe Dynamic A (acc) - EUR 8,211,357.801 6,181,562.369 4,247,281.078 10,145,639.092JPM Europe Dynamic A (acc) - HKD (hedged) 57,607,915.579 74,831,401.155 74,433,205.269 58,006,111.465JPM Europe Dynamic A (acc) - SGD (hedged) 84,072.557 2,201,802.328 165,423.503 2,120,451.382JPM Europe Dynamic A (acc) - USD 1,160,692.542 702,086.871 1,389,418.442 473,360.971JPM Europe Dynamic A (acc) - USD (hedged) 1,238,706.749 4,183,937.571 2,240,186.114 3,182,458.206JPM Europe Dynamic A (dist) - EUR 3,944,431.560 1,689,150.389 1,277,797.635 4,355,784.314JPMorgan Europe Dynamic A (dist) - EUR 4,854,933.827 3,382,336.058 3,651,641.004 4,585,628.881JPM Europe Dynamic A (dist) - GBP 37,127.243 6,003.654 11,372.124 31,758.773JPM Europe Dynamic A (inc) - EUR 413.875 3.040 - 416.915JPM Europe Dynamic B (acc) - EUR 2,229,052.795 1,762,356.489 2,055,029.203 1,936,380.081JPM Europe Dynamic B (acc) - USD 64,566.624 15,287.688 53,522.101 26,332.211JPM Europe Dynamic B (acc) - USD (hedged) 7.245 154,714.820 39,287.474 115,434.591JPM Europe Dynamic B (dist) - EUR 4,532.716 8,339.668 721.866 12,150.518JPM Europe Dynamic B (dist) - GBP 2,869.113 330.017 2,634.000 565.130JPM Europe Dynamic C (acc) - EUR 5,371,199.687 4,713,817.133 3,108,609.615 6,976,407.205JPM Europe Dynamic C (dist) - EUR - 385.726 - 385.726JPM Europe Dynamic D (acc) - EUR 1,947,646.842 580,931.457 859,270.945 1,669,307.354JPM Europe Dynamic D (acc) - USD 5,305.919 8,042.297 4,558.817 8,789.399JPM Europe Dynamic D (acc) - USD (hedged) 7.293 26,561.800 1.000 26,568.093JPM Europe Dynamic I (acc) - EUR 22,503,849.261 5,761,963.816 22,334,532.791 5,931,280.286JPM Europe Dynamic I (acc) - USD 45,908.476 39,411.491 65,119.897 20,200.070JPM Europe Dynamic I (acc) - USD (hedged) - 58,228.698 14,552.323 43,676.375JPM Europe Dynamic I (dist) - EUR 75,731.006 55,967.962 65,337.572 66,361.396JPM Europe Dynamic I (dist) - GBP 6,578.383 1,525.308 5,261.487 2,842.204JPM Europe Dynamic T (acc) - EUR 2,499.790 - 1,228.034 1,271.756JPM Europe Dynamic X (acc) - EUR 392,925.320 937,706.304 341,962.154 988,669.470
292
JPMorgan FundsAppendix - Unaudited Additional Disclosures (continued)
9. Historical Statement of Changes in the Number of Shares (continued)
Shares Outstandingat the Beginning
of the Year
Shares Subscribed Shares Redeemed Shares Outstandingat the End
of the Year
For the year ended 30 June 2015 (continued)
JPMorgan Funds - Global Bond Opportunities FundJPM Global Bond Opportunities A (acc) - EUR (hedged) 113,630.032 799,399.589 125,015.979 788,013.642JPM Global Bond Opportunities A (acc) - SEK (hedged) 4,978.301 273,899.104 320.792 278,556.613JPM Global Bond Opportunities A (acc) - USD 139,106.693 2,534,787.057 356,144.685 2,317,749.065JPM Global Bond Opportunities A (fix) EUR 3.50 - EUR (hedged) 84,182.017 70,457.803 25,735.897 128,903.923JPM Global Bond Opportunities A (inc) - EUR (hedged) 108.757 14,617.510 95.000 14,631.267JPM Global Bond Opportunities A (mth) - USD 21,160.000 67,294.945 14.520 88,440.425JPM Global Bond Opportunities B (acc) - CHF (hedged) - 36,134.000 2,435.000 33,699.000JPM Global Bond Opportunities B (acc) - EUR (hedged) 13.767 615,316.783 28,834.699 586,495.851JPM Global Bond Opportunities B (acc) - USD 10.000 1,560,272.032 267,177.280 1,293,104.752JPM Global Bond Opportunities B (mth) - USD 10.000 2,097.100 - 2,107.100JPM Global Bond Opportunities C (acc) - EUR (hedged) 13.767 1,097,561.518 24,202.902 1,073,372.383JPM Global Bond Opportunities C (acc) - SEK (hedged) 4,978.301 - - 4,978.301JPM Global Bond Opportunities C (acc) - USD - 915,316.963 28,932.140 886,384.823JPM Global Bond Opportunities D (acc) - EUR (hedged) 17,149.104 256,795.127 33,758.921 240,185.310JPM Global Bond Opportunities D (acc) - USD 133,828.602 128,812.598 162,370.981 100,270.219JPM Global Bond Opportunities D (div) - EUR (hedged) 12,388.196 392,102.747 23,409.308 381,081.635JPM Global Bond Opportunities D (fix) EUR 3.00 - EUR (hedged) 32,113.743 154,440.090 15,676.903 170,876.930JPM Global Bond Opportunities I (acc) - EUR (hedged) - 1,172,966.398 133,512.141 1,039,454.257JPM Global Bond Opportunities I (acc) - USD - 1,023,737.692 426,514.845 597,222.847JPM Global Bond Opportunities I (dist) - GBP (hedged) - 14,834.404 5,083.727 9,750.677JPM Global Bond Opportunities T (acc) - EUR (hedged) - 8,465.676 179.215 8,286.461JPM Global Bond Opportunities T (div) - EUR (hedged) - 43,058.350 5,059.508 37,998.842JPM Global Bond Opportunities X (dist) - AUD (hedged)* 49,700.000 - 49,700.000 -JPM Global Bond Opportunities X (irc) - AUD (hedged) - 55,348.982 - 55,348.982
JPMorgan Funds - Global Corporate Bond FundJPM Global Corporate Bond A (acc) - CHF (hedged) 12,195.000 26,554.977 18,169.813 20,580.164JPM Global Corporate Bond A (acc) - EUR (hedged) 7,984,361.661 15,767,592.900 2,952,055.565 20,799,898.996JPM Global Corporate Bond A (acc) - EUR (hedged) & Duration (hedged) 89,159.921 1,361,250.486 85,625.687 1,364,784.720JPM Global Corporate Bond A (acc) - NOK (hedged) 11,156.686 28,905.502 9,788.638 30,273.550JPM Global Corporate Bond A (acc) - SEK (hedged) 3,253,811.004 1,840,765.357 1,684,027.045 3,410,549.316JPM Global Corporate Bond A (acc) - USD 10,452,799.377 18,211,038.382 7,199,311.387 21,464,526.372JPM Global Corporate Bond A (acc) - USD - Duration (hedged) 264,382.699 435,030.874 498,061.605 201,351.968JPM Global Corporate Bond A (dist) - EUR (hedged) 41,264.478 6,890.861 7,050.000 41,105.339JPM Global Corporate Bond A (dist) - GBP (hedged) 15,268,669.574 1,593,678.952 3,010,907.480 13,851,441.046JPM Global Corporate Bond A (dist) - USD 9,127.721 37,504.876 9,089.008 37,543.589JPM Global Corporate Bond A (div) - EUR (hedged) 113,838.529 50,459.002 67,509.809 96,787.722JPM Global Corporate Bond A (inc) - EUR (hedged) 187.315 10,200.000 - 10,387.315JPM Global Corporate Bond A (inc) - EUR (hedged) & Duration (hedged) 12.315 880.000 - 892.315JPM Global Corporate Bond A (mth) - SGD 15,849.927 45,923.269 27,848.812 33,924.384JPM Global Corporate Bond A (mth) - USD 487,373.078 1,253,945.630 586,128.671 1,155,190.037JPM Global Corporate Bond B (acc) - EUR (hedged) 235,875.399 360,147.116 210,910.753 385,111.762JPM Global Corporate Bond B (acc) - SEK (hedged) & Duration (hedged)*** 42,984.347 - 42,984.347 -JPM Global Corporate Bond B (acc) - SEK (hedged)* 42,984.347 - 42,984.347 -JPM Global Corporate Bond B (acc) - USD 145,141.083 50,880.385 61,376.600 134,644.868JPM Global Corporate Bond B (acc) - USD - Duration (hedged) 16,970.305 78,116.815 36,936.407 58,150.713JPM Global Corporate Bond B (dist) - EUR (hedged) - 22,011.408 - 22,011.408JPM Global Corporate Bond B (div) - EUR (hedged) 7,217.056 2,580.220 5,317.636 4,479.640JPM Global Corporate Bond B (mth) - USD 5.000 4,500.000 - 4,505.000JPM Global Corporate Bond C (acc) - EUR (hedged) 2,092,623.910 3,486,541.319 2,074,729.420 3,504,435.809JPM Global Corporate Bond C (acc) - EUR (hedged) & Duration (hedged) 2,729,020.860 2,300,172.172 2,331,246.954 2,697,946.078JPM Global Corporate Bond C (acc) - USD 500,568.762 831,020.841 687,558.239 644,031.364JPM Global Corporate Bond C (acc) - USD - Duration (hedged) 1,056,902.400 561,797.084 1,132,135.658 486,563.826JPM Global Corporate Bond C (dist) - CHF (hedged) - 36,262.927 3,720.000 32,542.927JPM Global Corporate Bond C (dist) - EUR (hedged) 229,482.756 57,213.569 249,295.668 37,400.657JPM Global Corporate Bond C (dist) - GBP (hedged) 663,012.310 833,932.462 932,775.911 564,168.861JPM Global Corporate Bond C (dist) - GBP (hedged) & Duration (hedged) 401,497.102 72,177.216 425,036.858 48,637.460JPM Global Corporate Bond C (dist) - USD 175,868.035 230,180.934 213,555.125 192,493.844JPM Global Corporate Bond D (acc) - EUR (hedged) 5,379,154.574 1,367,007.107 2,417,237.264 4,328,924.417JPM Global Corporate Bond D (acc) - EUR (hedged) & Duration (hedged) 66,043.809 87,878.996 35,548.863 118,373.942JPM Global Corporate Bond D (acc) - USD 2,744,638.532 1,496,675.478 1,493,141.056 2,748,172.954JPM Global Corporate Bond D (acc) - USD - Duration (hedged) 286,302.115 40,338.879 184,531.124 142,109.870JPM Global Corporate Bond D (div) - EUR (hedged) 16,687,904.750 7,162,935.510 5,311,170.403 18,539,669.857JPM Global Corporate Bond D (mth) - USD 16,093.978 52,875.504 3,872.607 65,096.875JPM Global Corporate Bond I (acc) - CHF (hedged) 8,997.636 5,172.373 4,479.686 9,690.323JPM Global Corporate Bond I (acc) - EUR (hedged) 316,931.701 584,387.073 238,883.816 662,434.958JPM Global Corporate Bond I (acc) - EUR (hedged) & Duration (hedged) 714,784.639 704,260.730 684,990.569 734,054.800JPM Global Corporate Bond I (acc) - JPY (hedged) 1,289,151.113 - 256.351 1,288,894.762JPM Global Corporate Bond I (acc) - USD 414,020.509 1,958,543.624 493,847.314 1,878,716.819JPM Global Corporate Bond I (acc) - USD - Duration (hedged) 1,725,424.377 544,261.738 1,893,355.015 376,331.100JPM Global Corporate Bond I (dist) - CHF (hedged) - 372,192.976 - 372,192.976JPM Global Corporate Bond I (dist) - GBP (hedged) 18,544.966 102,693.302 49,836.114 71,402.154JPM Global Corporate Bond I (dist) - USD 42,535.879 351,002.188 278,533.471 115,004.596JPM Global Corporate Bond I (inc) - EUR (hedged) - 5,453,645.208 133,000.000 5,320,645.208JPM Global Corporate Bond T (acc) - EUR (hedged) 39,322.918 20,061.552 22,969.697 36,414.773JPM Global Corporate Bond T (div) - EUR (hedged) 616,260.902 140,254.824 241,065.796 515,449.930JPM Global Corporate Bond X (acc) - EUR (hedged) 567,182.000 1,912,701.715 323,511.498 2,156,372.217JPM Global Corporate Bond X (acc) - GBP (hedged) 3,787,656.396 451,769.289 3,008.000 4,236,417.685JPM Global Corporate Bond X (acc) - USD** - 1,144,471.502 44,607.060 1,099,864.442JPM Global Corporate Bond X (dist) - GBP (hedged) - 1,053,579.989 6,615.211 1,046,964.778
293
JPMorgan FundsAppendix - Unaudited Additional Disclosures (continued)
9. Historical Statement of Changes in the Number of Shares (continued)
Shares Outstandingat the Beginning
of the Year
Shares Subscribed Shares Redeemed Shares Outstandingat the End
of the Year
For the year ended 30 June 2015 (continued)
JPMorgan Funds - Global Developing Trends FundJPM Global Developing Trends A (acc) - USD 57,527.553 344.649 54,549.403 3,322.799JPM Global Developing Trends B (acc) - USD 42,819.661 - 36,867.086 5,952.575JPM Global Developing Trends C (acc) - SGD 622.850 22,690,552.557 1,823,193.936 20,867,981.471
JPMorgan Funds - Global Dynamic FundJPM Global Dynamic A (acc) - CHF (hedged) 17,203.183 773.962 5,264.733 12,712.412JPM Global Dynamic A (acc) - EUR 1,189,589.504 196,663.712 422,695.058 963,558.158JPM Global Dynamic A (acc) - EUR (hedged) 1,144,509.193 226,755.932 672,501.846 698,763.279JPM Global Dynamic A (acc) - SGD 92,114.616 84,248.545 46,778.256 129,584.905JPM Global Dynamic A (acc) - USD 3,026,534.199 417,596.517 752,936.600 2,691,194.116JPM Global Dynamic A (dist) - GBP 348,761.610 21,119.953 85,598.588 284,282.975JPM Global Dynamic A (dist) - USD 4,631,704.258 1,575,966.735 2,441,739.479 3,765,931.514JPMorgan Global Dynamic A (dist) - USD 2,087,924.366 970,495.498 2,063,097.369 995,322.495JPM Global Dynamic A (inc) - EUR 66,628.948 22,299.166 28,807.466 60,120.648JPM Global Dynamic B (acc) - USD 10,326,164.525 229,824.871 2,177,463.241 8,378,526.155JPM Global Dynamic B (dist) - USD 174,999.920 60,183.314 33,892.311 201,290.923JPM Global Dynamic B (inc) - EUR 40,037.976 5,825.323 10,102.592 35,760.707JPM Global Dynamic C (acc) - EUR 621,461.610 297,145.427 134,907.880 783,699.157JPM Global Dynamic C (acc) - EUR (hedged)** 1,474,468.458 402,043.017 1,705,868.459 170,643.016JPM Global Dynamic C (acc) - USD 5,241,653.314 4,451.769 745,027.511 4,501,077.572JPM Global Dynamic C (dist) - GBP 2,123.790 265.207 139.675 2,249.322JPM Global Dynamic D (acc) - EUR 228,177.354 243,093.339 95,255.203 376,015.490JPM Global Dynamic D (acc) - EUR (hedged) 722,560.714 499,334.041 295,628.261 926,266.494JPM Global Dynamic D (acc) - USD 990,559.750 219,597.758 391,895.028 818,262.480JPM Global Dynamic I (acc) - EUR 65,039.631 29,090.760 43,732.409 50,397.982JPM Global Dynamic I (acc) - EUR (hedged) 10,866.791 - 8,069.139 2,797.652JPM Global Dynamic I (acc) - USD 3,125,885.853 1,235,981.198 2,932,188.986 1,429,678.065JPM Global Dynamic I (dist) - USD 1,845.113 - 1,835.114 9.999JPM Global Dynamic I (inc) - EUR 1,959,098.265 21,431.298 261,056.511 1,719,473.052JPM Global Dynamic T (acc) - EUR (hedged) 5,412.588 - 4,756.762 655.826JPM Global Dynamic X (acc) - EUR (hedged) 78,509.605 4,387.034 8,294.000 74,602.639JPM Global Dynamic X (acc) - EUR* 38,058,612.079 - 38,058,612.079 -JPM Global Dynamic X (acc) - USD 24,382.395 5,634.490 8,161.097 21,855.788
JPMorgan Funds - Global Natural Resources FundJPM Global Natural Resources A (acc) - EUR 14,705,021.683 6,637,906.366 9,498,790.918 11,844,137.131JPM Global Natural Resources A (acc) - GBP 138,507.607 19,258.891 11,029.380 146,737.118JPM Global Natural Resources A (acc) - SGD 406,238.813 110,992.604 99,780.590 417,450.827JPM Global Natural Resources A (acc) - USD 32,664,971.447 16,967,088.431 16,810,295.118 32,821,764.760JPM Global Natural Resources A (dist) - EUR 12,624,291.458 3,447,798.694 3,765,553.865 12,306,536.287JPM Global Natural Resources B (acc) - EUR 1,899,243.422 1,590,369.613 1,479,502.067 2,010,110.968JPM Global Natural Resources B (acc) - USD 587.000 21,336.221 6,573.000 15,350.221JPM Global Natural Resources B (dist) - EUR 75,458.331 3,183.000 25,295.001 53,346.330JPM Global Natural Resources C (acc) - EUR 786,845.060 313,329.085 202,255.849 897,918.296JPM Global Natural Resources C (acc) - USD 2,458,053.206 601,910.848 332,694.829 2,727,269.225JPM Global Natural Resources D (acc) - EUR 6,955,983.447 3,408,977.617 2,761,823.558 7,603,137.506JPM Global Natural Resources D (acc) - USD 286,047.112 140,876.212 184,492.606 242,430.718JPM Global Natural Resources I (acc) - EUR 183,145.780 - - 183,145.780JPM Global Natural Resources I (dist) - EUR 7.390 - - 7.390JPM Global Natural Resources X (acc) - EUR 37,886.741 44,811.082 14,562.840 68,134.983JPM Global Natural Resources X (dist) - AUD 49,600.000 94.650 49,600.001 94.649
JPMorgan Funds - Global Unconstrained Equity FundJPM Global Unconstrained Equity A (acc) - CHF (hedged) - 2,207.415 250.865 1,956.550JPM Global Unconstrained Equity A (acc) - EUR 6,184.320 290,723.025 76,725.163 220,182.182JPM Global Unconstrained Equity A (acc) - EUR (hedged) 201,874.456 266,379.621 90,836.377 377,417.700JPM Global Unconstrained Equity A (acc) - USD 106,071.805 2,570,381.557 889,848.078 1,786,605.284JPM Global Unconstrained Equity A (dist) - EUR (hedged) 2,314,931.435 53,286.470 274,722.266 2,093,495.639JPM Global Unconstrained Equity A (dist) - USD 151,561.411 7,676.323 41,983.535 117,254.199JPMorgan Global Unconstrained Equity A (dist) - USD 1,120,878.827 281,929.190 346,800.393 1,056,007.624JPM Global Unconstrained Equity B (acc) - EUR - 305.974 150.974 155.000JPM Global Unconstrained Equity B (acc) - USD** - 2,622.061 469.591 2,152.470JPM Global Unconstrained Equity C (acc) - EUR - 34,752.994 20,630.279 14,122.715JPM Global Unconstrained Equity C (acc) - EUR (hedged) 5,930,099.894 532,030.128 2,221.674 6,459,908.348JPM Global Unconstrained Equity C (acc) - USD 5,455,351.272 1,393,546.700 588,315.700 6,260,582.272JPM Global Unconstrained Equity D (acc) - EUR - 122,610.204 16,705.042 105,905.162JPM Global Unconstrained Equity D (acc) - EUR (hedged) 175,630.885 90,782.090 94,418.777 171,994.198JPM Global Unconstrained Equity D (acc) - USD 103,417.979 91,508.098 63,330.866 131,595.211JPM Global Unconstrained Equity I (acc) - JPY - 456,417.420 195,560.379 260,857.041JPM Global Unconstrained Equity I (acc) - USD - 120,000.000 - 120,000.000JPM Global Unconstrained Equity T (acc) - EUR - 52,701.054 6,231.658 46,469.396JPM Global Unconstrained Equity X (acc) - EUR 5,363,275.873 2,269,305.195 2,294,720.082 5,337,860.986JPM Global Unconstrained Equity X (acc) - EUR (hedged) 6,828.893 - - 6,828.893JPM Global Unconstrained Equity X (acc) - USD 49,454.377 4,487,805.429 11,932.708 4,525,327.098JPM Global Unconstrained Equity X (dist) - AUD 49,600.000 197.107 262.323 49,534.784
294
JPMorgan FundsAppendix - Unaudited Additional Disclosures (continued)
9. Historical Statement of Changes in the Number of Shares (continued)
Shares Outstandingat the Beginning
of the Year
Shares Subscribed Shares Redeemed Shares Outstandingat the End
of the Year
For the year ended 30 June 2015 (continued)
JPMorgan Funds - Greater China FundJPMorgan Greater China A (acc) - SGD 36,487.231 33,621.362 28,791.660 41,316.933JPMorgan Greater China A (acc) - USD 6,064,165.548 4,692,373.872 5,688,490.844 5,068,048.576JPMorgan Greater China A (dist) - HKD 2,250,727.233 1,343,131.697 1,226,452.193 2,367,406.737JPMorgan Greater China A (dist) - USD 9,830,400.807 7,820,544.978 8,376,574.631 9,274,371.154JPMorgan Greater China B (acc) - USD 1,007,098.356 821,253.537 476,274.443 1,352,077.450JPMorgan Greater China B (dist) - USD 22,555.379 1,543.048 4,597.916 19,500.511JPMorgan Greater China C (acc) - EUR - 132.293 0.470 131.823JPMorgan Greater China C (acc) - USD 4,397,734.281 4,570,132.106 4,879,277.640 4,088,588.747JPMorgan Greater China C (dist) - USD 1,403.621 1,824.458 1,722.944 1,505.135JPMorgan Greater China D (acc) - EUR 176,763.852 121,155.619 238,379.002 59,540.469JPMorgan Greater China D (acc) - USD 1,363,023.209 895,162.960 907,469.507 1,350,716.662JPMorgan Greater China I (acc) - USD 6,201,794.358 2,476,084.381 3,642,153.576 5,035,725.163JPMorgan Greater China I (dist) - USD 502.887 - 492.887 10.000JPMorgan Greater China T (acc) - EUR 18,991.441 13,713.607 11,338.137 21,366.911
JPMorgan Funds - Income FundJPM Income Fund A (acc) - EUR (hedged) 499.385 13,667.176 - 14,166.561JPM Income Fund A (acc) - SEK (hedged) 1,997.107 - - 1,997.107JPM Income Fund A (acc) - USD 121,005.193 7,747.377 - 128,752.570JPM Income Fund A (div) - EUR (hedged) 499.385 20.000 20.000 499.385JPM Income Fund A (div) - USD 125,000.000 292.000 - 125,292.000JPM Income Fund A (mth) - HKD - 39,857.334 2,021.797 37,835.537JPM Income Fund A (mth) - USD - 204.767 - 204.767JPM Income Fund B (div) - EUR (hedged) 499.385 - - 499.385JPM Income Fund D (div) - EUR (hedged) 499.385 - - 499.385
JPMorgan Funds - India FundJPMorgan India A (acc) - SGD 47,067.738 73,656.108 8,689.981 112,033.865JPMorgan India A (acc) - USD 15,984,106.391 7,388,770.174 9,578,479.926 13,794,396.639JPMorgan India A (dist) - GBP 8.617 1,404.458 - 1,413.075JPMorgan India A (dist) - USD 7,099,504.161 850,624.241 2,389,018.035 5,561,110.367JPMorgan India B (acc) - EUR 105.823 16,431.435 11,317.285 5,219.973JPMorgan India B (acc) - USD 194,112.944 308,453.013 237,127.549 265,438.408JPMorgan India B (dist) - USD 54,914.166 44,072.159 25,996.595 72,989.730JPMorgan India C (acc) - USD 4,544,620.831 1,038,135.675 4,251,299.688 1,331,456.818JPMorgan India C (dist) - USD 65,359.953 11,898.602 2,732.969 74,525.586JPMorgan India D (acc) - EUR 99,690.800 211,248.508 112,983.044 197,956.264JPMorgan India D (acc) - USD 5,506,698.353 2,706,168.045 2,022,317.598 6,190,548.800JPMorgan India I (acc) - USD 23,257.402 13,833.737 22,704.283 14,386.856JPMorgan India I (dist) - USD 7,131.171 1,299.581 7,174.159 1,256.593JPMorgan India T (acc) - EUR 11,432.941 29,230.015 14,064.728 26,598.228JPMorgan India X (acc) - USD 2,396,561.681 620,506.481 2,320,642.034 696,426.128
JPMorgan Funds - Indonesia Equity FundJPMorgan Indonesia Equity A (acc) - USD 27,741.361 65,358.695 41,352.939 51,747.117JPMorgan Indonesia Equity B (acc) - USD 6,122.369 - - 6,122.369JPMorgan Indonesia Equity C (acc) - USD 13,196.708 2,200.985 7,998.609 7,399.084JPMorgan Indonesia Equity D (acc) - EUR 45,402.255 26,738.405 23,849.073 48,291.587JPMorgan Indonesia Equity D (acc) - USD 22,805.481 17,229.893 23,093.213 16,942.161JPMorgan Indonesia Equity X (acc) - JPY 4,187,787.862 751,274.649 3,706,839.546 1,232,222.965
JPMorgan Funds - Japan Equity FundJPMorgan Japan Equity A (acc) - EUR 191,217.411 2,133,689.657 923,389.551 1,401,517.517JPMorgan Japan Equity A (acc) - EUR (hedged) 60,205.037 100,594.368 67,225.120 93,574.285JPMorgan Japan Equity A (acc) - JPY 3,261,434.900 13,343,347.253 15,237,918.970 1,366,863.183JPMorgan Japan Equity A (acc) - USD 4,060,417.424 2,806,163.353 2,989,547.711 3,877,033.066JPMorgan Japan Equity A (acc) - USD (hedged) 736,918.332 1,383,898.414 1,165,922.711 954,894.035JPMorgan Japan Equity A (dist) - GBP 31,215.920 461.972 14,396.241 17,281.651JPMorgan Japan Equity A (dist) - GBP (hedged) 5,765.381 1,328.464 3,709.160 3,384.685JPMorgan Japan Equity A (dist) - SGD 40,906.754 299,154.975 117,003.049 223,058.680JPMorgan Japan Equity A (dist) - USD 4,271,104.183 7,618,701.713 7,447,456.817 4,442,349.079JPMorgan Japan Equity B (acc) - EUR 1,928.595 4,974.506 1,951.665 4,951.436JPMorgan Japan Equity B (acc) - USD 576,915.755 627,002.434 512,060.377 691,857.812JPMorgan Japan Equity B (dist) - GBP 92,948.921 2,640.759 53,934.832 41,654.848JPMorgan Japan Equity B (dist) - USD 14,495.966 2,074.436 3,152.921 13,417.481JPMorgan Japan Equity C (acc) - USD 14,370,051.538 4,101,122.145 4,828,966.567 13,642,207.116JPMorgan Japan Equity C (acc) - USD (hedged) 18,945.032 360,243.463 224,401.867 154,786.628JPMorgan Japan Equity C (dist) - USD 532.432 20.290 16.663 536.059JPMorgan Japan Equity D (acc) - EUR 73,466.055 1,119,650.192 727,102.093 466,014.154JPMorgan Japan Equity D (acc) - USD 2,352,510.890 1,590,958.840 1,361,077.306 2,582,392.424JPMorgan Japan Equity I (acc) - USD 3,283,942.328 2,743,128.662 2,382,133.483 3,644,937.507JPMorgan Japan Equity J (dist) - USD 2,362,050.445 1,106,148.764 2,026,356.361 1,441,842.848JPMorgan Japan Equity X (acc) - USD 38,586.796 71,119.786 12,021.488 97,685.094
295
JPMorgan FundsAppendix - Unaudited Additional Disclosures (continued)
9. Historical Statement of Changes in the Number of Shares (continued)
Shares Outstandingat the Beginning
of the Year
Shares Subscribed Shares Redeemed Shares Outstandingat the End
of the Year
For the year ended 30 June 2015 (continued)
JPMorgan Funds - Korea Equity FundJPMorgan Korea Equity A (acc) - EUR 612,046.785 241,280.596 361,790.572 491,536.809JPMorgan Korea Equity A (acc) - USD 6,404,902.856 2,257,006.612 4,215,823.295 4,446,086.173JPMorgan Korea Equity A (dist) - USD 76,263.842 17,291.740 31,051.541 62,504.041JPMorgan Korea Equity B (acc) - EUR 1,123.000 465.000 95.000 1,493.000JPMorgan Korea Equity B (acc) - USD 1,625,563.068 710,267.039 690,392.740 1,645,437.367JPMorgan Korea Equity C (acc) - EUR 229,760.000 14,102.909 33,862.909 210,000.000JPMorgan Korea Equity C (acc) - USD 1,142,327.670 576,875.417 873,525.118 845,677.969JPMorgan Korea Equity D (acc) - USD 828,630.732 1,815,005.045 1,513,024.574 1,130,611.203JPMorgan Korea Equity I (acc) - USD 1,436.267 379.221 25.584 1,789.904
JPMorgan Funds - Latin America Equity FundJPM Latin America Equity A (acc) - EUR 34,441.837 1,689,609.659 1,689,339.918 34,711.578JPM Latin America Equity A (acc) - SGD 100.000 - - 100.000JPM Latin America Equity A (acc) - USD 8,545,135.004 1,396,240.526 4,827,155.195 5,114,220.335JPM Latin America Equity A (dist) - USD 2,832,192.803 298,860.904 640,392.765 2,490,660.942JPMorgan Latin America Equity A (dist) - USD 5,634,290.683 2,830,492.273 3,420,422.779 5,044,360.177JPM Latin America Equity B (acc) - EUR 4,484.401 58,717.658 5,156.906 58,045.153JPM Latin America Equity B (acc) - USD 2,541,034.297 473,956.121 676,483.582 2,338,506.836JPM Latin America Equity B (dist) - USD 34,525.774 661,981.105 20,262.384 676,244.495JPM Latin America Equity C (acc) - EUR 6,452.729 78,301.009 31,262.934 53,490.804JPM Latin America Equity C (acc) - USD 2,474,112.286 715,461.327 1,364,155.875 1,825,417.738JPM Latin America Equity C (dist) - USD - 406.495 - 406.495JPM Latin America Equity D (acc) - EUR 48,415.271 56,245.883 42,114.314 62,546.840JPM Latin America Equity D (acc) - USD 1,268,588.774 135,116.443 457,445.489 946,259.728JPM Latin America Equity I (acc) - EUR* 365,000.000 - 365,000.000 -JPM Latin America Equity I (acc) - JPY 643,283.338 414,493.395 820,397.223 237,379.510JPM Latin America Equity I (acc) - USD 21,680,497.521 9,048,590.841 19,259,278.151 11,469,810.211JPM Latin America Equity I (dist) - USD 2,118.273 - - 2,118.273JPM Latin America Equity T (acc) - EUR 2,672.272 - 660.679 2,011.593JPM Latin America Equity X (acc) - USD 2,390,263.951 1,802,211.096 399,080.001 3,793,395.046
JPMorgan Funds - Russia FundJPM Russia A (acc) - USD 9,390,449.944 9,575,462.474 7,730,955.499 11,234,956.919JPM Russia A (dist) - USD 26,857,633.177 74,108,550.262 51,823,391.606 49,142,791.833JPM Russia B (acc) - USD 1,291,023.627 1,395,297.643 1,632,903.866 1,053,417.404JPM Russia B (dist) - USD 1,696.305 968.078 1,375.425 1,288.958JPM Russia C (acc) - USD 2,972,619.937 2,223,405.193 4,052,767.545 1,143,257.585JPM Russia D (acc) - EUR 4,176.288 81,462.278 30,523.786 55,114.780JPM Russia D (acc) - USD 5,951,999.743 4,125,232.376 3,439,550.538 6,637,681.581JPM Russia I (acc) - USD 624,570.406 173,381.629 611,246.798 186,705.237JPM Russia T (acc) - EUR 5,152.509 75,299.467 57,858.163 22,593.813
JPMorgan Funds - Singapore FundJPMorgan Singapore A (acc) - SGD 391,874.436 243,933.586 318,312.033 317,495.989JPMorgan Singapore A (acc) - USD 650,467.377 317,858.359 471,485.733 496,840.003JPMorgan Singapore A (dist) - USD 1,436,507.287 134,965.543 430,808.001 1,140,664.829JPMorgan Singapore B (acc) - USD* 24,461.507 - 24,461.507 -JPMorgan Singapore B (dist) - USD 152.270 1,994.450 295.708 1,851.012JPMorgan Singapore C (acc) - USD 365,934.134 152,079.800 511,686.925 6,327.009JPMorgan Singapore D (acc) - USD 474,123.650 34,751.538 136,446.489 372,428.699JPMorgan Singapore I (acc) - USD 3,651.708 16,829.221 17,266.889 3,214.040
JPMorgan Funds - Total Emerging Markets Income FundJPM Total Emerging Markets Income A (acc) - EUR 62,753.839 55,614.067 69,277.539 49,090.367JPM Total Emerging Markets Income A (acc) - USD 255,358.023 13,436.935 3,047.521 265,747.437JPM Total Emerging Markets Income A (inc) - EUR 1,185.019 21,669.491 1,164.815 21,689.695JPM Total Emerging Markets Income A (mth) - USD 10.000 - - 10.000JPM Total Emerging Markets Income B (acc) - EUR*** 5,500.000 2,600.000 8,100.000 -JPM Total Emerging Markets Income C (acc) - EUR - 118,000.000 - 118,000.000JPM Total Emerging Markets Income D (acc) - EUR 23,763.464 130,548.779 23,200.706 131,111.537JPM Total Emerging Markets Income D (acc) - USD 7,740.467 34,855.471 9,002.127 33,593.811JPM Total Emerging Markets Income D (div) - EUR 2,469.416 117,443.560 9,171.089 110,741.887JPM Total Emerging Markets Income D (mth) - USD 10.000 - - 10.000JPM Total Emerging Markets Income X (acc) - GBP 64,658.640 - - 64,658.640
296
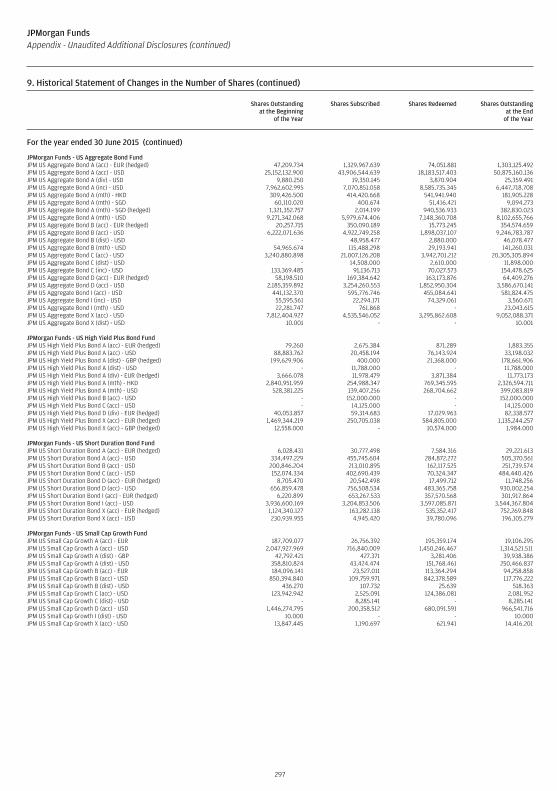
JPMorgan FundsAppendix - Unaudited Additional Disclosures (continued)
9. Historical Statement of Changes in the Number of Shares (continued)
Shares Outstandingat the Beginning
of the Year
Shares Subscribed Shares Redeemed Shares Outstandingat the End
of the Year
For the year ended 30 June 2015 (continued)
JPMorgan Funds - US Aggregate Bond FundJPM US Aggregate Bond A (acc) - EUR (hedged) 47,209.734 1,329,967.639 74,051.881 1,303,125.492JPM US Aggregate Bond A (acc) - USD 25,152,132.900 43,906,544.639 18,183,517.403 50,875,160.136JPM US Aggregate Bond A (div) - USD 9,880.250 19,350.145 3,870.904 25,359.491JPM US Aggregate Bond A (inc) - USD 7,962,602.995 7,070,851.058 8,585,735.345 6,447,718.708JPM US Aggregate Bond A (mth) - HKD 309,426.500 414,420.668 541,941.940 181,905.228JPM US Aggregate Bond A (mth) - SGD 60,110.020 400.674 51,416.421 9,094.273JPM US Aggregate Bond A (mth) - SGD (hedged) 1,321,352.757 2,014.199 940,536.933 382,830.023JPM US Aggregate Bond A (mth) - USD 9,271,342.068 5,979,674.406 7,148,360.708 8,102,655.766JPM US Aggregate Bond B (acc) - EUR (hedged) 20,257.715 350,090.189 15,773.245 354,574.659JPM US Aggregate Bond B (acc) - USD 6,222,071.636 4,922,749.258 1,898,037.107 9,246,783.787JPM US Aggregate Bond B (dist) - USD - 48,958.477 2,880.000 46,078.477JPM US Aggregate Bond B (mth) - USD 54,965.674 115,488.298 29,193.941 141,260.031JPM US Aggregate Bond C (acc) - USD 3,240,880.898 21,007,126.208 3,942,701.212 20,305,305.894JPM US Aggregate Bond C (dist) - USD - 14,508.000 2,610.000 11,898.000JPM US Aggregate Bond C (inc) - USD 133,369.485 91,136.713 70,027.573 154,478.625JPM US Aggregate Bond D (acc) - EUR (hedged) 58,198.510 169,384.642 163,173.876 64,409.276JPM US Aggregate Bond D (acc) - USD 2,185,359.892 3,254,260.553 1,852,950.304 3,586,670.141JPM US Aggregate Bond I (acc) - USD 441,132.370 595,776.746 455,084.641 581,824.475JPM US Aggregate Bond I (inc) - USD 55,595.561 22,294.171 74,329.061 3,560.671JPM US Aggregate Bond I (mth) - USD 22,281.747 761.868 - 23,043.615JPM US Aggregate Bond X (acc) - USD 7,812,404.927 4,535,546.052 3,295,862.608 9,052,088.371JPM US Aggregate Bond X (dist) - USD 10.001 - - 10.001
JPMorgan Funds - US High Yield Plus Bond FundJPM US High Yield Plus Bond A (acc) - EUR (hedged) 79.260 2,675.384 871.289 1,883.355JPM US High Yield Plus Bond A (acc) - USD 88,883.762 20,458.194 76,143.924 33,198.032JPM US High Yield Plus Bond A (dist) - GBP (hedged) 199,629.906 400.000 21,368.000 178,661.906JPM US High Yield Plus Bond A (dist) - USD - 11,788.000 - 11,788.000JPM US High Yield Plus Bond A (div) - EUR (hedged) 3,666.078 11,978.479 3,871.384 11,773.173JPM US High Yield Plus Bond A (mth) - HKD 2,840,951.959 254,988.347 769,345.595 2,326,594.711JPM US High Yield Plus Bond A (mth) - USD 528,381.225 139,407.256 268,704.662 399,083.819JPM US High Yield Plus Bond B (acc) - USD - 152,000.000 - 152,000.000JPM US High Yield Plus Bond C (acc) - USD - 14,125.000 - 14,125.000JPM US High Yield Plus Bond D (div) - EUR (hedged) 40,053.857 59,314.683 17,029.963 82,338.577JPM US High Yield Plus Bond X (acc) - EUR (hedged) 1,469,344.219 250,705.038 584,805.000 1,135,244.257JPM US High Yield Plus Bond X (acc) - GBP (hedged) 12,558.000 - 10,574.000 1,984.000
JPMorgan Funds - US Short Duration Bond FundJPM US Short Duration Bond A (acc) - EUR (hedged) 6,028.431 30,777.498 7,584.316 29,221.613JPM US Short Duration Bond A (acc) - USD 334,497.229 455,745.604 284,872.272 505,370.561JPM US Short Duration Bond B (acc) - USD 200,846.204 213,010.895 162,117.525 251,739.574JPM US Short Duration Bond C (acc) - USD 152,074.334 402,690.439 70,324.347 484,440.426JPM US Short Duration Bond D (acc) - EUR (hedged) 8,705.470 20,542.498 17,499.712 11,748.256JPM US Short Duration Bond D (acc) - USD 656,859.478 756,508.534 483,365.758 930,002.254JPM US Short Duration Bond I (acc) - EUR (hedged) 6,220.899 653,267.533 357,570.568 301,917.864JPM US Short Duration Bond I (acc) - USD 3,936,600.169 3,204,853.506 3,597,085.871 3,544,367.804JPM US Short Duration Bond X (acc) - EUR (hedged) 1,124,340.127 163,282.138 535,352.417 752,269.848JPM US Short Duration Bond X (acc) - USD 230,939.955 4,945.420 39,780.096 196,105.279
JPMorgan Funds - US Small Cap Growth FundJPM US Small Cap Growth A (acc) - EUR 187,709.077 26,756.392 195,359.174 19,106.295JPM US Small Cap Growth A (acc) - USD 2,047,927.969 716,840.009 1,450,246.467 1,314,521.511JPM US Small Cap Growth A (dist) - GBP 42,792.421 427.371 3,281.406 39,938.386JPM US Small Cap Growth A (dist) - USD 358,810.824 43,424.474 151,768.461 250,466.837JPM US Small Cap Growth B (acc) - EUR 184,096.141 23,527.011 113,364.294 94,258.858JPM US Small Cap Growth B (acc) - USD 850,394.840 109,759.971 842,378.589 117,776.222JPM US Small Cap Growth B (dist) - USD 436.270 107.732 25.639 518.363JPM US Small Cap Growth C (acc) - USD 123,942.942 2,525.091 124,386.081 2,081.952JPM US Small Cap Growth C (dist) - USD - 8,285.141 - 8,285.141JPM US Small Cap Growth D (acc) - USD 1,446,274.795 200,358.512 680,091.591 966,541.716JPM US Small Cap Growth I (dist) - USD 10.000 - - 10.000JPM US Small Cap Growth X (acc) - USD 13,847.445 1,190.697 621.941 14,416.201
297
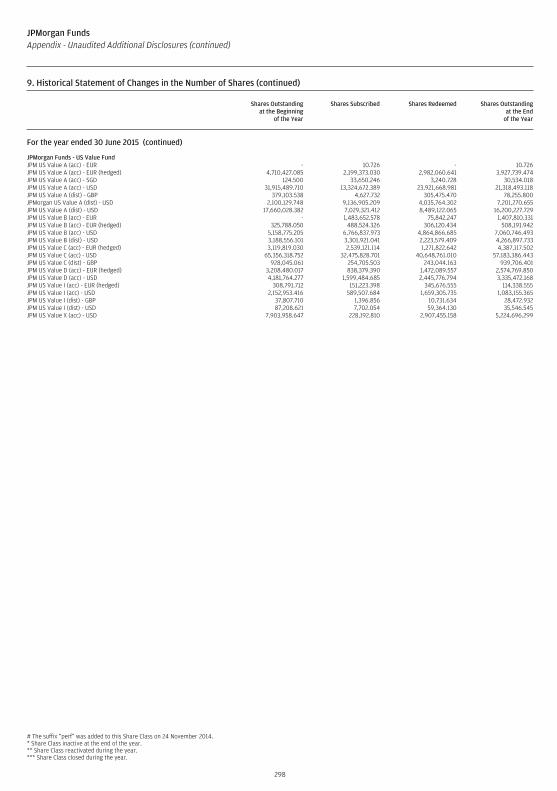
JPMorgan FundsAppendix - Unaudited Additional Disclosures (continued)
9. Historical Statement of Changes in the Number of Shares (continued)
Shares Outstandingat the Beginning
of the Year
Shares Subscribed Shares Redeemed Shares Outstandingat the End
of the Year
For the year ended 30 June 2015 (continued)
JPMorgan Funds - US Value FundJPM US Value A (acc) - EUR - 10.726 - 10.726JPM US Value A (acc) - EUR (hedged) 4,710,427.085 2,199,373.030 2,982,060.641 3,927,739.474JPM US Value A (acc) - SGD 124.500 33,650.246 3,240.728 30,534.018JPM US Value A (acc) - USD 31,915,489.710 13,324,672.389 23,921,668.981 21,318,493.118JPM US Value A (dist) - GBP 379,103.538 4,627.732 305,475.470 78,255.800JPMorgan US Value A (dist) - USD 2,100,129.748 9,136,905.209 4,035,764.302 7,201,270.655JPM US Value A (dist) - USD 17,660,028.382 7,029,321.412 8,489,122.065 16,200,227.729JPM US Value B (acc) - EUR - 1,483,652.578 75,842.247 1,407,810.331JPM US Value B (acc) - EUR (hedged) 325,788.050 488,524.326 306,120.434 508,191.942JPM US Value B (acc) - USD 5,158,775.205 6,766,837.973 4,864,866.685 7,060,746.493JPM US Value B (dist) - USD 3,188,556.101 3,301,921.041 2,223,579.409 4,266,897.733JPM US Value C (acc) - EUR (hedged) 3,119,819.030 2,539,121.114 1,271,822.642 4,387,117.502JPM US Value C (acc) - USD 65,356,318.752 32,475,828.701 40,648,761.010 57,183,386.443JPM US Value C (dist) - GBP 928,045.061 254,705.503 243,044.163 939,706.401JPM US Value D (acc) - EUR (hedged) 3,208,480.017 838,379.390 1,472,089.557 2,574,769.850JPM US Value D (acc) - USD 4,181,764.277 1,599,484.685 2,445,776.794 3,335,472.168JPM US Value I (acc) - EUR (hedged) 308,791.712 151,223.398 345,676.555 114,338.555JPM US Value I (acc) - USD 2,152,953.416 589,507.684 1,659,305.735 1,083,155.365JPM US Value I (dist) - GBP 37,807.710 1,396.856 10,731.634 28,472.932JPM US Value I (dist) - USD 87,208.621 7,702.054 59,364.130 35,546.545JPM US Value X (acc) - USD 7,903,958.647 228,192.810 2,907,455.158 5,224,696.299
# The suffix “perf” was added to this Share Class on 24 November 2014.* Share Class inactive at the end of the year.** Share Class reactivated during the year.*** Share Class closed during the year.
298
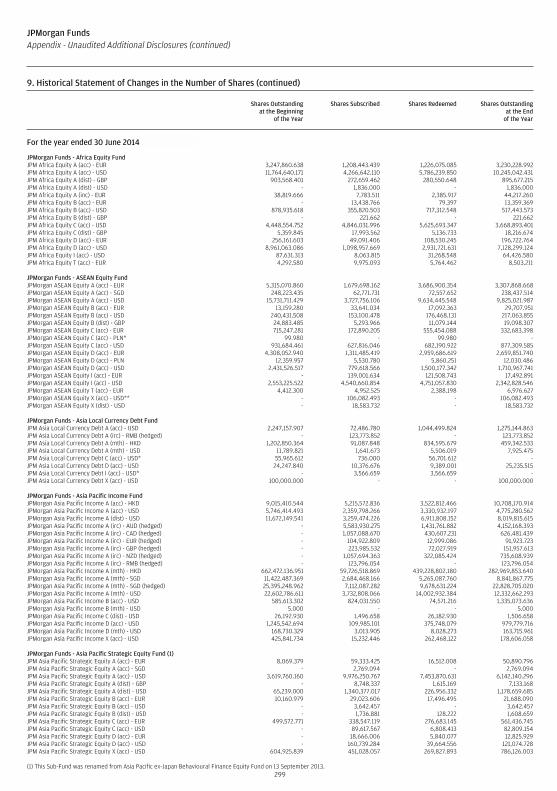
JPMorgan FundsAppendix - Unaudited Additional Disclosures (continued)
9. Historical Statement of Changes in the Number of Shares (continued)
Shares Outstandingat the Beginning
of the Year
Shares Subscribed Shares Redeemed Shares Outstandingat the End
of the Year
For the year ended 30 June 2014 (continued)
JPMorgan Funds - Africa Equity FundJPM Africa Equity A (acc) - EUR 3,247,860.638 1,208,443.439 1,226,075.085 3,230,228.992JPM Africa Equity A (acc) - USD 11,764,640.171 4,266,642.110 5,786,239.850 10,245,042.431JPM Africa Equity A (dist) - GBP 903,568.401 272,659.462 280,550.648 895,677.215JPM Africa Equity A (dist) - USD - 1,836.000 - 1,836.000JPM Africa Equity A (inc) - EUR 38,819.666 7,783.511 2,385.917 44,217.260JPM Africa Equity B (acc) - EUR - 13,438.766 79.397 13,359.369JPM Africa Equity B (acc) - USD 878,935.618 355,820.503 717,312.548 517,443.573JPM Africa Equity B (dist) - GBP - 221.662 - 221.662JPM Africa Equity C (acc) - USD 4,448,554.752 4,846,031.996 5,625,693.347 3,668,893.401JPM Africa Equity C (dist) - GBP 5,359.845 17,993.562 5,136.733 18,216.674JPM Africa Equity D (acc) - EUR 256,161.603 49,091.406 108,530.245 196,722.764JPM Africa Equity D (acc) - USD 8,961,063.086 1,098,957.669 2,931,721.631 7,128,299.124JPM Africa Equity I (acc) - USD 87,631.313 8,063.815 31,268.548 64,426.580JPM Africa Equity T (acc) - EUR 4,292.580 9,975.093 5,764.462 8,503.211
JPMorgan Funds - ASEAN Equity FundJPMorgan ASEAN Equity A (acc) - EUR 5,315,070.860 1,679,698.162 3,686,900.354 3,307,868.668JPMorgan ASEAN Equity A (acc) - SGD 248,223.435 62,771.731 72,557.652 238,437.514JPMorgan ASEAN Equity A (acc) - USD 15,731,711.429 3,727,756.106 9,634,445.548 9,825,021.987JPMorgan ASEAN Equity B (acc) - EUR 13,159.280 33,641.034 17,092.363 29,707.951JPMorgan ASEAN Equity B (acc) - USD 240,431.508 153,100.478 176,468.131 217,063.855JPMorgan ASEAN Equity B (dist) - GBP 24,883.485 5,293.966 11,079.144 19,098.307JPMorgan ASEAN Equity C (acc) - EUR 715,247.281 172,890.205 555,454.088 332,683.398JPMorgan ASEAN Equity C (acc) - PLN* 99.980 - 99.980 -JPMorgan ASEAN Equity C (acc) - USD 931,684.461 627,816.046 682,190.922 877,309.585JPMorgan ASEAN Equity D (acc) - EUR 4,308,052.940 1,311,485.419 2,959,686.619 2,659,851.740JPMorgan ASEAN Equity D (acc) - PLN 12,359.957 5,530.780 5,860.251 12,030.486JPMorgan ASEAN Equity D (acc) - USD 2,431,526.517 779,618.566 1,500,177.342 1,710,967.741JPMorgan ASEAN Equity I (acc) - EUR - 139,001.634 121,508.743 17,492.891JPMorgan ASEAN Equity I (acc) - USD 2,553,225.522 4,540,660.854 4,751,057.830 2,342,828.546JPMorgan ASEAN Equity T (acc) - EUR 4,412.300 4,952.525 2,388.198 6,976.627JPMorgan ASEAN Equity X (acc) - USD** - 106,082.493 - 106,082.493JPMorgan ASEAN Equity X (dist) - USD - 18,583.732 - 18,583.732
JPMorgan Funds - Asia Local Currency Debt FundJPM Asia Local Currency Debt A (acc) - USD 2,247,157.907 72,486.780 1,044,499.824 1,275,144.863JPM Asia Local Currency Debt A (irc) - RMB (hedged) - 123,773.852 - 123,773.852JPM Asia Local Currency Debt A (mth) - HKD 1,202,850.364 91,087.848 834,595.679 459,342.533JPM Asia Local Currency Debt A (mth) - USD 11,789.821 1,641.673 5,506.019 7,925.475JPM Asia Local Currency Debt C (acc) - USD* 55,965.612 736.000 56,701.612 -JPM Asia Local Currency Debt D (acc) - USD 24,247.840 10,376.676 9,389.001 25,235.515JPM Asia Local Currency Debt I (acc) - USD* - 3,566.659 3,566.659 -JPM Asia Local Currency Debt X (acc) - USD 100,000.000 - - 100,000.000
JPMorgan Funds - Asia Pacific Income FundJPMorgan Asia Pacific Income A (acc) - HKD 9,015,410.544 5,215,572.836 3,522,812.466 10,708,170.914JPMorgan Asia Pacific Income A (acc) - USD 5,746,414.493 2,359,798.266 3,330,932.197 4,775,280.562JPMorgan Asia Pacific Income A (dist) - USD 11,672,149.541 3,259,474.226 6,911,808.152 8,019,815.615JPMorgan Asia Pacific Income A (irc) - AUD (hedged) - 5,583,930.275 1,431,761.882 4,152,168.393JPMorgan Asia Pacific Income A (irc) - CAD (hedged) - 1,057,088.670 430,607.231 626,481.439JPMorgan Asia Pacific Income A (irc) - EUR (hedged) - 104,922.809 12,999.086 91,923.723JPMorgan Asia Pacific Income A (irc) - GBP (hedged) - 223,985.532 72,027.919 151,957.613JPMorgan Asia Pacific Income A (irc) - NZD (hedged) - 1,057,694.363 322,085.424 735,608.939JPMorgan Asia Pacific Income A (irc) - RMB (hedged) - 123,796.054 - 123,796.054JPMorgan Asia Pacific Income A (mth) - HKD 662,472,136.951 59,726,518.869 439,228,802.180 282,969,853.640JPMorgan Asia Pacific Income A (mth) - SGD 11,422,487.369 2,684,468.166 5,265,087.760 8,841,867.775JPMorgan Asia Pacific Income A (mth) - SGD (hedged) 25,395,248.962 7,112,087.282 9,678,631.224 22,828,705.020JPMorgan Asia Pacific Income A (mth) - USD 22,602,786.611 3,732,808.066 14,002,932.384 12,332,662.293JPMorgan Asia Pacific Income B (acc) - USD 585,613.302 824,031.550 74,571.216 1,335,073.636JPMorgan Asia Pacific Income B (mth) - USD 5.000 - - 5.000JPMorgan Asia Pacific Income C (dist) - USD 26,192.930 1,496.658 26,182.930 1,506.658JPMorgan Asia Pacific Income D (acc) - USD 1,245,542.694 109,985.101 375,748.079 979,779.716JPMorgan Asia Pacific Income D (mth) - USD 168,730.329 3,013.905 8,028.273 163,715.961JPMorgan Asia Pacific Income X (acc) - USD 425,841.734 15,232.446 262,468.122 178,606.058
JPMorgan Funds - Asia Pacific Strategic Equity Fund (1)JPM Asia Pacific Strategic Equity A (acc) - EUR 8,069.379 59,333.425 16,512.008 50,890.796JPM Asia Pacific Strategic Equity A (acc) - SGD - 2,769.094 - 2,769.094JPM Asia Pacific Strategic Equity A (acc) - USD 3,619,760.160 9,976,250.767 7,453,870.631 6,142,140.296JPM Asia Pacific Strategic Equity A (dist) - GBP - 8,748.337 1,615.169 7,133.168JPM Asia Pacific Strategic Equity A (dist) - USD 65,239.000 1,340,377.017 226,956.332 1,178,659.685JPM Asia Pacific Strategic Equity B (acc) - EUR 10,160.979 29,023.606 17,496.495 21,688.090JPM Asia Pacific Strategic Equity B (acc) - USD - 3,642.457 - 3,642.457JPM Asia Pacific Strategic Equity B (dist) - USD - 1,736.881 128.222 1,608.659JPM Asia Pacific Strategic Equity C (acc) - EUR 499,572.771 338,547.119 276,683.145 561,436.745JPM Asia Pacific Strategic Equity C (acc) - USD - 89,617.567 6,808.413 82,809.154JPM Asia Pacific Strategic Equity D (acc) - EUR - 18,666.006 5,840.077 12,825.929JPM Asia Pacific Strategic Equity D (acc) - USD - 160,739.284 39,664.556 121,074.728JPM Asia Pacific Strategic Equity X (acc) - USD 604,925.839 451,028.057 269,827.893 786,126.003
(1) This Sub-Fund was renamed from Asia Pacific ex-Japan Behavioural Finance Equity Fund on 13 September 2013.299
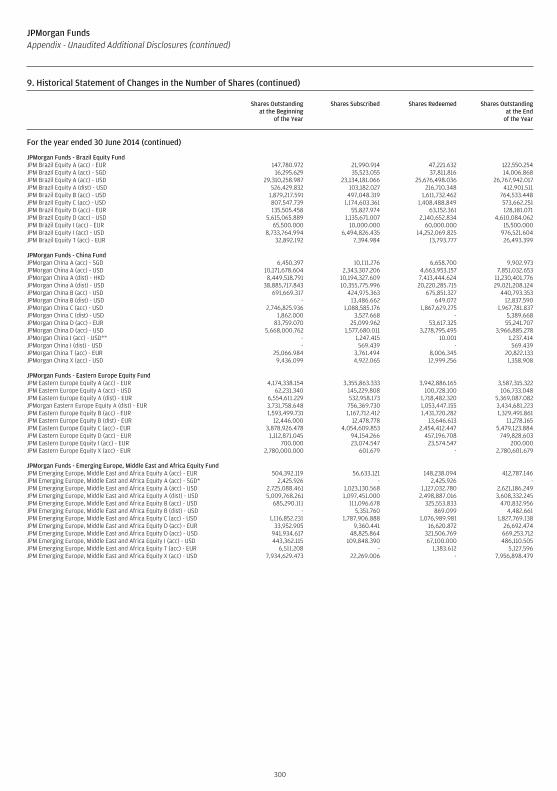
JPMorgan FundsAppendix - Unaudited Additional Disclosures (continued)
9. Historical Statement of Changes in the Number of Shares (continued)
Shares Outstandingat the Beginning
of the Year
Shares Subscribed Shares Redeemed Shares Outstandingat the End
of the Year
For the year ended 30 June 2014 (continued)
JPMorgan Funds - Brazil Equity FundJPM Brazil Equity A (acc) - EUR 147,780.972 21,990.914 47,221.632 122,550.254JPM Brazil Equity A (acc) - SGD 16,295.629 35,523.055 37,811.816 14,006.868JPM Brazil Equity A (acc) - USD 29,310,258.987 23,134,181.066 25,676,498.036 26,767,942.017JPM Brazil Equity A (dist) - USD 526,429.832 103,182.027 216,710.348 412,901.511JPM Brazil Equity B (acc) - USD 1,879,217.591 497,048.319 1,611,732.462 764,533.448JPM Brazil Equity C (acc) - USD 807,547.739 1,174,603.361 1,408,488.849 573,662.251JPM Brazil Equity D (acc) - EUR 135,505.458 55,827.974 63,152.361 128,181.071JPM Brazil Equity D (acc) - USD 5,615,065.889 1,135,671.007 2,140,652.834 4,610,084.062JPM Brazil Equity I (acc) - EUR 65,500.000 10,000.000 60,000.000 15,500.000JPM Brazil Equity I (acc) - USD 8,733,764.994 6,494,826.435 14,252,069.825 976,521.604JPM Brazil Equity T (acc) - EUR 32,892.192 7,394.984 13,793.777 26,493.399
JPMorgan Funds - China FundJPMorgan China A (acc) - SGD 6,450.397 10,111.276 6,658.700 9,902.973JPMorgan China A (acc) - USD 10,171,678.604 2,343,307.206 4,663,953.157 7,851,032.653JPMorgan China A (dist) - HKD 8,449,518.791 10,194,327.609 7,413,444.624 11,230,401.776JPMorgan China A (dist) - USD 38,885,717.843 10,355,775.996 20,220,285.715 29,021,208.124JPMorgan China B (acc) - USD 691,669.317 424,975.363 675,851.327 440,793.353JPMorgan China B (dist) - USD - 13,486.662 649.072 12,837.590JPMorgan China C (acc) - USD 2,746,825.936 1,088,585.176 1,867,629.275 1,967,781.837JPMorgan China C (dist) - USD 1,862.000 3,527.668 - 5,389.668JPMorgan China D (acc) - EUR 83,759.070 25,099.962 53,617.325 55,241.707JPMorgan China D (acc) - USD 5,668,000.762 1,577,680.011 3,278,795.495 3,966,885.278JPMorgan China I (acc) - USD** - 1,247.415 10.001 1,237.414JPMorgan China I (dist) - USD - 569.439 - 569.439JPMorgan China T (acc) - EUR 25,066.984 3,761.494 8,006.345 20,822.133JPMorgan China X (acc) - USD 9,436.099 4,922.065 12,999.256 1,358.908
JPMorgan Funds - Eastern Europe Equity FundJPM Eastern Europe Equity A (acc) - EUR 4,174,338.154 3,355,863.333 3,942,886.165 3,587,315.322JPM Eastern Europe Equity A (acc) - USD 62,231.340 145,229.808 100,728.100 106,733.048JPM Eastern Europe Equity A (dist) - EUR 6,554,611.229 532,958.173 1,718,482.320 5,369,087.082JPMorgan Eastern Europe Equity A (dist) - EUR 3,731,758.648 756,369.730 1,053,447.155 3,434,681.223JPM Eastern Europe Equity B (acc) - EUR 1,593,499.731 1,167,712.412 1,431,720.282 1,329,491.861JPM Eastern Europe Equity B (dist) - EUR 12,446.000 12,478.778 13,646.613 11,278.165JPM Eastern Europe Equity C (acc) - EUR 3,878,926.478 4,054,609.853 2,454,412.447 5,479,123.884JPM Eastern Europe Equity D (acc) - EUR 1,112,871.045 94,154.266 457,196.708 749,828.603JPM Eastern Europe Equity I (acc) - EUR 700.000 23,074.547 23,574.547 200.000JPM Eastern Europe Equity X (acc) - EUR 2,780,000.000 601.679 - 2,780,601.679
JPMorgan Funds - Emerging Europe, Middle East and Africa Equity FundJPM Emerging Europe, Middle East and Africa Equity A (acc) - EUR 504,392.119 56,633.121 148,238.094 412,787.146JPM Emerging Europe, Middle East and Africa Equity A (acc) - SGD* 2,425.926 - 2,425.926 -JPM Emerging Europe, Middle East and Africa Equity A (acc) - USD 2,725,088.461 1,023,130.568 1,127,032.780 2,621,186.249JPM Emerging Europe, Middle East and Africa Equity A (dist) - USD 5,009,768.261 1,097,451.000 2,498,887.016 3,608,332.245JPM Emerging Europe, Middle East and Africa Equity B (acc) - USD 685,290.111 111,096.678 325,553.833 470,832.956JPM Emerging Europe, Middle East and Africa Equity B (dist) - USD - 5,351.760 869.099 4,482.661JPM Emerging Europe, Middle East and Africa Equity C (acc) - USD 1,116,852.231 1,787,906.888 1,076,989.981 1,827,769.138JPM Emerging Europe, Middle East and Africa Equity D (acc) - EUR 33,952.905 9,360.441 16,620.872 26,692.474JPM Emerging Europe, Middle East and Africa Equity D (acc) - USD 941,934.617 48,825.864 321,506.769 669,253.712JPM Emerging Europe, Middle East and Africa Equity I (acc) - USD 443,362.115 109,848.390 67,100.000 486,110.505JPM Emerging Europe, Middle East and Africa Equity T (acc) - EUR 6,511.208 - 1,383.612 5,127.596JPM Emerging Europe, Middle East and Africa Equity X (acc) - USD 7,934,629.473 22,269.006 - 7,956,898.479
300
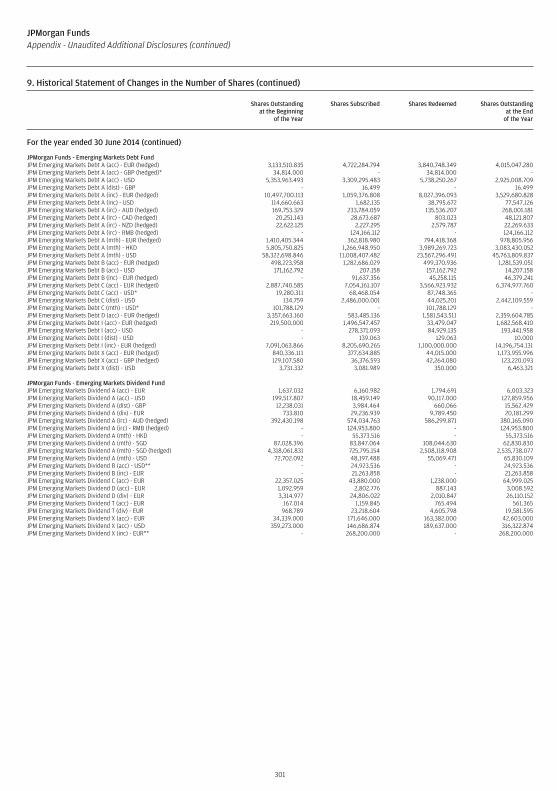
JPMorgan FundsAppendix - Unaudited Additional Disclosures (continued)
9. Historical Statement of Changes in the Number of Shares (continued)
Shares Outstandingat the Beginning
of the Year
Shares Subscribed Shares Redeemed Shares Outstandingat the End
of the Year
For the year ended 30 June 2014 (continued)
JPMorgan Funds - Emerging Markets Debt FundJPM Emerging Markets Debt A (acc) - EUR (hedged) 3,133,510.835 4,722,284.794 3,840,748.349 4,015,047.280JPM Emerging Markets Debt A (acc) - GBP (hedged)* 34,814.000 - 34,814.000 -JPM Emerging Markets Debt A (acc) - USD 5,353,963.493 3,309,295.483 5,738,250.267 2,925,008.709JPM Emerging Markets Debt A (dist) - GBP - 16.499 - 16.499JPM Emerging Markets Debt A (inc) - EUR (hedged) 10,497,700.113 1,059,376.808 8,027,396.093 3,529,680.828JPM Emerging Markets Debt A (inc) - USD 114,660.663 1,682.135 38,795.672 77,547.126JPM Emerging Markets Debt A (irc) - AUD (hedged) 169,753.329 233,784.059 135,536.207 268,001.181JPM Emerging Markets Debt A (irc) - CAD (hedged) 20,251.143 28,673.687 803.023 48,121.807JPM Emerging Markets Debt A (irc) - NZD (hedged) 22,622.125 2,227.295 2,579.787 22,269.633JPM Emerging Markets Debt A (irc) - RMB (hedged) - 124,166.112 - 124,166.112JPM Emerging Markets Debt A (mth) - EUR (hedged) 1,410,405.344 362,818.980 794,418.368 978,805.956JPM Emerging Markets Debt A (mth) - HKD 5,805,750.825 1,266,948.950 3,989,269.723 3,083,430.052JPM Emerging Markets Debt A (mth) - USD 58,322,698.846 11,008,407.482 23,567,296.491 45,763,809.837JPM Emerging Markets Debt B (acc) - EUR (hedged) 498,223.958 1,282,686.029 499,370.936 1,281,539.051JPM Emerging Markets Debt B (acc) - USD 171,162.792 207.158 157,162.792 14,207.158JPM Emerging Markets Debt B (inc) - EUR (hedged) - 91,637.356 45,258.115 46,379.241JPM Emerging Markets Debt C (acc) - EUR (hedged) 2,887,740.585 7,054,161.107 3,566,923.932 6,374,977.760JPM Emerging Markets Debt C (acc) - USD* 19,280.311 68,468.054 87,748.365 -JPM Emerging Markets Debt C (dist) - USD 134.759 2,486,000.001 44,025.201 2,442,109.559JPM Emerging Markets Debt C (mth) - USD* 101,788.129 - 101,788.129 -JPM Emerging Markets Debt D (acc) - EUR (hedged) 3,357,663.160 583,485.136 1,581,543.511 2,359,604.785JPM Emerging Markets Debt I (acc) - EUR (hedged) 219,500.000 1,496,547.457 33,479.047 1,682,568.410JPM Emerging Markets Debt I (acc) - USD - 278,371.093 84,929.135 193,441.958JPM Emerging Markets Debt I (dist) - USD - 139.063 129.063 10.000JPM Emerging Markets Debt I (inc) - EUR (hedged) 7,091,063.866 8,205,690.265 1,100,000.000 14,196,754.131JPM Emerging Markets Debt X (acc) - EUR (hedged) 840,336.111 377,634.885 44,015.000 1,173,955.996JPM Emerging Markets Debt X (acc) - GBP (hedged) 129,107.580 36,376.593 42,264.080 123,220.093JPM Emerging Markets Debt X (dist) - USD 3,731.332 3,081.989 350.000 6,463.321
JPMorgan Funds - Emerging Markets Dividend FundJPM Emerging Markets Dividend A (acc) - EUR 1,637.032 6,160.982 1,794.691 6,003.323JPM Emerging Markets Dividend A (acc) - USD 199,517.807 18,459.149 90,117.000 127,859.956JPM Emerging Markets Dividend A (dist) - GBP 12,238.031 3,984.464 660.066 15,562.429JPM Emerging Markets Dividend A (div) - EUR 733.810 29,236.939 9,789.450 20,181.299JPM Emerging Markets Dividend A (irc) - AUD (hedged) 392,430.198 574,034.763 586,299.871 380,165.090JPM Emerging Markets Dividend A (irc) - RMB (hedged) - 124,953.800 - 124,953.800JPM Emerging Markets Dividend A (mth) - HKD - 55,373.516 - 55,373.516JPM Emerging Markets Dividend A (mth) - SGD 87,028.396 83,847.064 108,044.630 62,830.830JPM Emerging Markets Dividend A (mth) - SGD (hedged) 4,318,061.831 725,795.154 2,508,118.908 2,535,738.077JPM Emerging Markets Dividend A (mth) - USD 72,702.092 48,197.488 55,069.471 65,830.109JPM Emerging Markets Dividend B (acc) - USD** - 24,923.536 - 24,923.536JPM Emerging Markets Dividend B (inc) - EUR - 21,263.858 - 21,263.858JPM Emerging Markets Dividend C (acc) - EUR 22,357.025 43,880.000 1,238.000 64,999.025JPM Emerging Markets Dividend D (acc) - EUR 1,092.959 2,802.776 887.143 3,008.592JPM Emerging Markets Dividend D (div) - EUR 3,314.977 24,806.022 2,010.847 26,110.152JPM Emerging Markets Dividend T (acc) - EUR 167.014 1,159.845 765.494 561.365JPM Emerging Markets Dividend T (div) - EUR 968.789 23,218.604 4,605.798 19,581.595JPM Emerging Markets Dividend X (acc) - EUR 34,339.000 171,646.000 163,382.000 42,603.000JPM Emerging Markets Dividend X (acc) - USD 359,273.000 146,686.874 189,637.000 316,322.874JPM Emerging Markets Dividend X (inc) - EUR** - 268,200.000 - 268,200.000
301
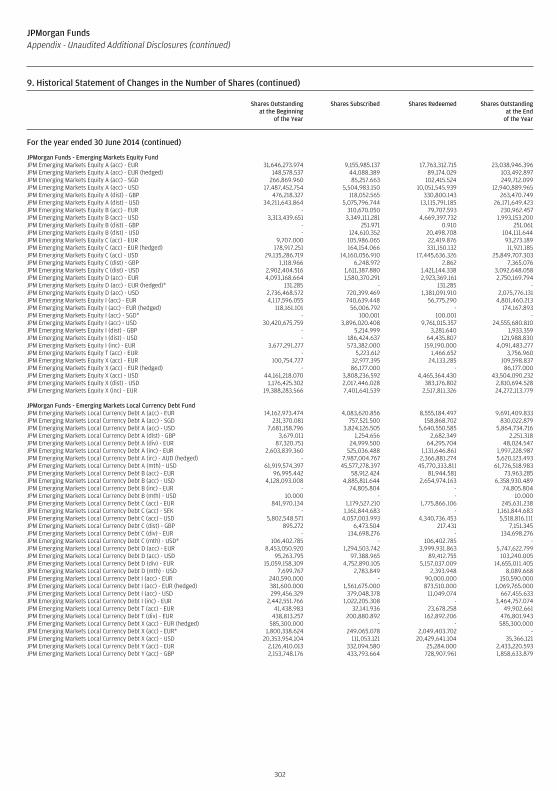
JPMorgan FundsAppendix - Unaudited Additional Disclosures (continued)
9. Historical Statement of Changes in the Number of Shares (continued)
Shares Outstandingat the Beginning
of the Year
Shares Subscribed Shares Redeemed Shares Outstandingat the End
of the Year
For the year ended 30 June 2014 (continued)
JPMorgan Funds - Emerging Markets Equity FundJPM Emerging Markets Equity A (acc) - EUR 31,646,273.974 9,155,985.137 17,763,312.715 23,038,946.396JPM Emerging Markets Equity A (acc) - EUR (hedged) 148,578.537 44,088.389 89,174.029 103,492.897JPM Emerging Markets Equity A (acc) - SGD 266,869.960 85,257.663 102,415.524 249,712.099JPM Emerging Markets Equity A (acc) - USD 17,487,452.754 5,504,983.150 10,051,545.939 12,940,889.965JPM Emerging Markets Equity A (dist) - GBP 476,218.327 118,052.565 330,800.143 263,470.749JPM Emerging Markets Equity A (dist) - USD 34,211,643.864 5,075,796.744 13,115,791.185 26,171,649.423JPM Emerging Markets Equity B (acc) - EUR - 310,670.050 79,707.593 230,962.457JPM Emerging Markets Equity B (acc) - USD 3,313,439.651 3,349,111.281 4,669,397.732 1,993,153.200JPM Emerging Markets Equity B (dist) - GBP - 251.971 0.910 251.061JPM Emerging Markets Equity B (dist) - USD - 124,610.352 20,498.708 104,111.644JPM Emerging Markets Equity C (acc) - EUR 9,707.000 105,986.065 22,419.876 93,273.189JPM Emerging Markets Equity C (acc) - EUR (hedged) 178,917.251 164,154.066 331,150.132 11,921.185JPM Emerging Markets Equity C (acc) - USD 29,135,286.719 14,160,056.910 17,445,636.326 25,849,707.303JPM Emerging Markets Equity C (dist) - GBP 1,118.966 6,248.972 2.862 7,365.076JPM Emerging Markets Equity C (dist) - USD 2,902,404.516 1,611,387.880 1,421,144.338 3,092,648.058JPM Emerging Markets Equity D (acc) - EUR 4,093,168.664 1,580,370.291 2,923,369.161 2,750,169.794JPM Emerging Markets Equity D (acc) - EUR (hedged)* 131.285 - 131.285 -JPM Emerging Markets Equity D (acc) - USD 2,736,468.572 720,399.469 1,381,091.910 2,075,776.131JPM Emerging Markets Equity I (acc) - EUR 4,117,596.055 740,639.448 56,775.290 4,801,460.213JPM Emerging Markets Equity I (acc) - EUR (hedged) 118,161.101 56,006.792 - 174,167.893JPM Emerging Markets Equity I (acc) - SGD* - 100.001 100.001 -JPM Emerging Markets Equity I (acc) - USD 30,420,675.759 3,896,020.408 9,761,015.357 24,555,680.810JPM Emerging Markets Equity I (dist) - GBP - 5,214.999 3,281.640 1,933.359JPM Emerging Markets Equity I (dist) - USD - 186,424.637 64,435.807 121,988.830JPM Emerging Markets Equity I (inc) - EUR 3,677,291.277 573,382.000 159,190.000 4,091,483.277JPM Emerging Markets Equity T (acc) - EUR - 5,223.612 1,466.652 3,756.960JPM Emerging Markets Equity X (acc) - EUR 100,754.727 32,977.395 24,133.285 109,598.837JPM Emerging Markets Equity X (acc) - EUR (hedged) - 86,177.000 - 86,177.000JPM Emerging Markets Equity X (acc) - USD 44,161,218.070 3,808,236.592 4,465,364.430 43,504,090.232JPM Emerging Markets Equity X (dist) - USD 1,176,425.302 2,017,446.028 383,176.802 2,810,694.528JPM Emerging Markets Equity X (inc) - EUR 19,388,283.566 7,401,641.539 2,517,811.326 24,272,113.779
JPMorgan Funds - Emerging Markets Local Currency Debt FundJPM Emerging Markets Local Currency Debt A (acc) - EUR 14,162,973.474 4,083,620.856 8,555,184.497 9,691,409.833JPM Emerging Markets Local Currency Debt A (acc) - SGD 231,370.081 757,521.500 158,868.702 830,022.879JPM Emerging Markets Local Currency Debt A (acc) - USD 7,681,158.796 3,824,126.505 5,640,550.585 5,864,734.716JPM Emerging Markets Local Currency Debt A (dist) - GBP 3,679.011 1,254.656 2,682.349 2,251.318JPM Emerging Markets Local Currency Debt A (div) - EUR 87,320.751 24,999.500 64,295.704 48,024.547JPM Emerging Markets Local Currency Debt A (inc) - EUR 2,603,839.360 525,036.488 1,131,646.861 1,997,228.987JPM Emerging Markets Local Currency Debt A (irc) - AUD (hedged) - 7,987,004.767 2,366,881.274 5,620,123.493JPM Emerging Markets Local Currency Debt A (mth) - USD 61,919,574.397 45,577,278.397 45,770,333.811 61,726,518.983JPM Emerging Markets Local Currency Debt B (acc) - EUR 96,995.442 58,912.424 81,944.581 73,963.285JPM Emerging Markets Local Currency Debt B (acc) - USD 4,128,093.008 4,885,811.644 2,654,974.163 6,358,930.489JPM Emerging Markets Local Currency Debt B (inc) - EUR - 74,805.804 - 74,805.804JPM Emerging Markets Local Currency Debt B (mth) - USD 10.000 - - 10.000JPM Emerging Markets Local Currency Debt C (acc) - EUR 841,970.134 1,179,527.210 1,775,866.106 245,631.238JPM Emerging Markets Local Currency Debt C (acc) - SEK - 1,161,844.683 - 1,161,844.683JPM Emerging Markets Local Currency Debt C (acc) - USD 5,802,548.571 4,057,003.993 4,340,736.453 5,518,816.111JPM Emerging Markets Local Currency Debt C (dist) - GBP 895.272 6,473.504 217.431 7,151.345JPM Emerging Markets Local Currency Debt C (div) - EUR - 134,698.276 - 134,698.276JPM Emerging Markets Local Currency Debt C (mth) - USD* 106,402.785 - 106,402.785 -JPM Emerging Markets Local Currency Debt D (acc) - EUR 8,453,050.920 1,294,503.742 3,999,931.863 5,747,622.799JPM Emerging Markets Local Currency Debt D (acc) - USD 95,263.795 97,388.965 89,412.755 103,240.005JPM Emerging Markets Local Currency Debt D (div) - EUR 15,059,158.309 4,752,890.105 5,157,037.009 14,655,011.405JPM Emerging Markets Local Currency Debt D (mth) - USD 7,699.767 2,783.849 2,393.948 8,089.668JPM Emerging Markets Local Currency Debt I (acc) - EUR 240,590.000 - 90,000.000 150,590.000JPM Emerging Markets Local Currency Debt I (acc) - EUR (hedged) 381,600.000 1,561,675.000 873,510.000 1,069,765.000JPM Emerging Markets Local Currency Debt I (acc) - USD 299,456.329 379,048.378 11,049.074 667,455.633JPM Emerging Markets Local Currency Debt I (inc) - EUR 2,442,551.766 1,022,205.308 - 3,464,757.074JPM Emerging Markets Local Currency Debt T (acc) - EUR 41,438.983 32,141.936 23,678.258 49,902.661JPM Emerging Markets Local Currency Debt T (div) - EUR 438,813.257 200,880.892 162,892.206 476,801.943JPM Emerging Markets Local Currency Debt X (acc) - EUR (hedged) 585,300.000 - - 585,300.000JPM Emerging Markets Local Currency Debt X (acc) - EUR* 1,800,338.624 249,065.078 2,049,403.702 -JPM Emerging Markets Local Currency Debt X (acc) - USD 20,353,954.104 111,053.121 20,429,641.104 35,366.121JPM Emerging Markets Local Currency Debt Y (acc) - EUR 2,126,410.013 332,094.580 25,284.000 2,433,220.593JPM Emerging Markets Local Currency Debt Y (acc) - GBP 2,153,748.176 433,793.664 728,907.961 1,858,633.879
302
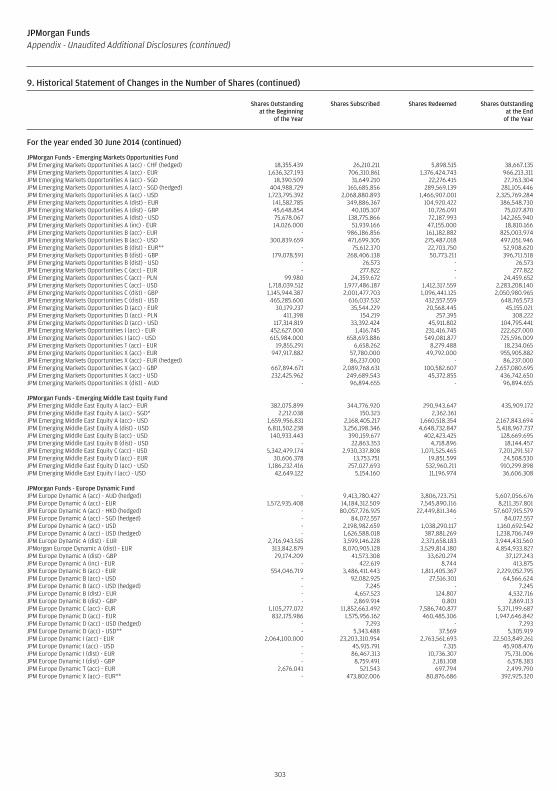
JPMorgan FundsAppendix - Unaudited Additional Disclosures (continued)
9. Historical Statement of Changes in the Number of Shares (continued)
Shares Outstandingat the Beginning
of the Year
Shares Subscribed Shares Redeemed Shares Outstandingat the End
of the Year
For the year ended 30 June 2014 (continued)
JPMorgan Funds - Emerging Markets Opportunities FundJPM Emerging Markets Opportunities A (acc) - CHF (hedged) 18,355.439 26,210.211 5,898.515 38,667.135JPM Emerging Markets Opportunities A (acc) - EUR 1,636,327.193 706,310.861 1,376,424.743 966,213.311JPM Emerging Markets Opportunities A (acc) - SGD 18,390.509 31,649.210 22,276.415 27,763.304JPM Emerging Markets Opportunities A (acc) - SGD (hedged) 404,988.729 165,685.856 289,569.139 281,105.446JPM Emerging Markets Opportunities A (acc) - USD 1,723,795.392 2,068,880.893 1,466,907.001 2,325,769.284JPM Emerging Markets Opportunities A (dist) - EUR 141,582.785 349,886.367 104,920.422 386,548.730JPM Emerging Markets Opportunities A (dist) - GBP 45,648.854 40,105.107 10,726.091 75,027.870JPM Emerging Markets Opportunities A (dist) - USD 75,678.067 138,775.866 72,187.993 142,265.940JPM Emerging Markets Opportunities A (inc) - EUR 14,026.000 51,939.166 47,155.000 18,810.166JPM Emerging Markets Opportunities B (acc) - EUR - 986,186.856 161,182.882 825,003.974JPM Emerging Markets Opportunities B (acc) - USD 300,839.659 471,699.305 275,487.018 497,051.946JPM Emerging Markets Opportunities B (dist) - EUR** - 75,612.370 22,703.750 52,908.620JPM Emerging Markets Opportunities B (dist) - GBP 179,078.591 268,406.138 50,773.211 396,711.518JPM Emerging Markets Opportunities B (dist) - USD - 26.573 - 26.573JPM Emerging Markets Opportunities C (acc) - EUR - 277.822 - 277.822JPM Emerging Markets Opportunities C (acc) - PLN 99.980 24,359.672 - 24,459.652JPM Emerging Markets Opportunities C (acc) - USD 1,718,039.512 1,977,486.187 1,412,317.559 2,283,208.140JPM Emerging Markets Opportunities C (dist) - GBP 1,145,944.387 2,001,477.703 1,096,441.125 2,050,980.965JPM Emerging Markets Opportunities C (dist) - USD 465,285.600 616,037.532 432,557.559 648,765.573JPM Emerging Markets Opportunities D (acc) - EUR 30,179.237 35,544.229 20,568.445 45,155.021JPM Emerging Markets Opportunities D (acc) - PLN 411.398 154.219 257.395 308.222JPM Emerging Markets Opportunities D (acc) - USD 117,314.819 33,392.424 45,911.802 104,795.441JPM Emerging Markets Opportunities I (acc) - EUR 452,627.000 1,416.745 231,416.745 222,627.000JPM Emerging Markets Opportunities I (acc) - USD 615,984.000 658,693.886 549,081.877 725,596.009JPM Emerging Markets Opportunities T (acc) - EUR 19,855.291 6,658.262 8,279.488 18,234.065JPM Emerging Markets Opportunities X (acc) - EUR 947,917.882 57,780.000 49,792.000 955,905.882JPM Emerging Markets Opportunities X (acc) - EUR (hedged) - 86,237.000 - 86,237.000JPM Emerging Markets Opportunities X (acc) - GBP 667,894.671 2,089,768.631 100,582.607 2,657,080.695JPM Emerging Markets Opportunities X (acc) - USD 232,425.962 249,689.543 45,372.855 436,742.650JPM Emerging Markets Opportunities X (dist) - AUD - 96,894.655 - 96,894.655
JPMorgan Funds - Emerging Middle East Equity FundJPM Emerging Middle East Equity A (acc) - EUR 382,075.899 344,776.920 290,943.647 435,909.172JPM Emerging Middle East Equity A (acc) - SGD* 2,212.038 150.323 2,362.361 -JPM Emerging Middle East Equity A (acc) - USD 1,659,956.831 2,168,405.217 1,660,518.354 2,167,843.694JPM Emerging Middle East Equity A (dist) - USD 6,811,502.238 3,256,198.346 4,648,732.847 5,418,967.737JPM Emerging Middle East Equity B (acc) - USD 140,933.443 390,159.677 402,423.425 128,669.695JPM Emerging Middle East Equity B (dist) - USD - 22,863.353 4,718.896 18,144.457JPM Emerging Middle East Equity C (acc) - USD 5,342,479.174 2,930,337.808 1,071,525.465 7,201,291.517JPM Emerging Middle East Equity D (acc) - EUR 30,606.378 13,753.751 19,851.599 24,508.530JPM Emerging Middle East Equity D (acc) - USD 1,186,232.416 257,027.693 532,960.211 910,299.898JPM Emerging Middle East Equity I (acc) - USD 42,649.122 5,154.160 11,196.974 36,606.308
JPMorgan Funds - Europe Dynamic FundJPM Europe Dynamic A (acc) - AUD (hedged) - 9,413,780.427 3,806,723.751 5,607,056.676JPM Europe Dynamic A (acc) - EUR 1,572,935.408 14,184,312.509 7,545,890.116 8,211,357.801JPM Europe Dynamic A (acc) - HKD (hedged) - 80,057,726.925 22,449,811.346 57,607,915.579JPM Europe Dynamic A (acc) - SGD (hedged) - 84,072.557 - 84,072.557JPM Europe Dynamic A (acc) - USD - 2,198,982.659 1,038,290.117 1,160,692.542JPM Europe Dynamic A (acc) - USD (hedged) - 1,626,588.018 387,881.269 1,238,706.749JPM Europe Dynamic A (dist) - EUR 2,716,943.515 3,599,146.228 2,371,658.183 3,944,431.560JPMorgan Europe Dynamic A (dist) - EUR 313,842.879 8,070,905.128 3,529,814.180 4,854,933.827JPM Europe Dynamic A (dist) - GBP 29,174.209 41,573.308 33,620.274 37,127.243JPM Europe Dynamic A (inc) - EUR - 422.619 8.744 413.875JPM Europe Dynamic B (acc) - EUR 554,046.719 3,486,411.443 1,811,405.367 2,229,052.795JPM Europe Dynamic B (acc) - USD - 92,082.925 27,516.301 64,566.624JPM Europe Dynamic B (acc) - USD (hedged) - 7.245 - 7.245JPM Europe Dynamic B (dist) - EUR - 4,657.523 124.807 4,532.716JPM Europe Dynamic B (dist) - GBP - 2,869.914 0.801 2,869.113JPM Europe Dynamic C (acc) - EUR 1,105,277.072 11,852,663.492 7,586,740.877 5,371,199.687JPM Europe Dynamic D (acc) - EUR 832,175.986 1,575,956.162 460,485.306 1,947,646.842JPM Europe Dynamic D (acc) - USD (hedged) - 7.293 - 7.293JPM Europe Dynamic D (acc) - USD** - 5,343.488 37.569 5,305.919JPM Europe Dynamic I (acc) - EUR 2,064,100.000 23,203,310.954 2,763,561.693 22,503,849.261JPM Europe Dynamic I (acc) - USD - 45,915.791 7.315 45,908.476JPM Europe Dynamic I (dist) - EUR - 86,467.313 10,736.307 75,731.006JPM Europe Dynamic I (dist) - GBP - 8,759.491 2,181.108 6,578.383JPM Europe Dynamic T (acc) - EUR 2,676.041 521.543 697.794 2,499.790JPM Europe Dynamic X (acc) - EUR** - 473,802.006 80,876.686 392,925.320
303
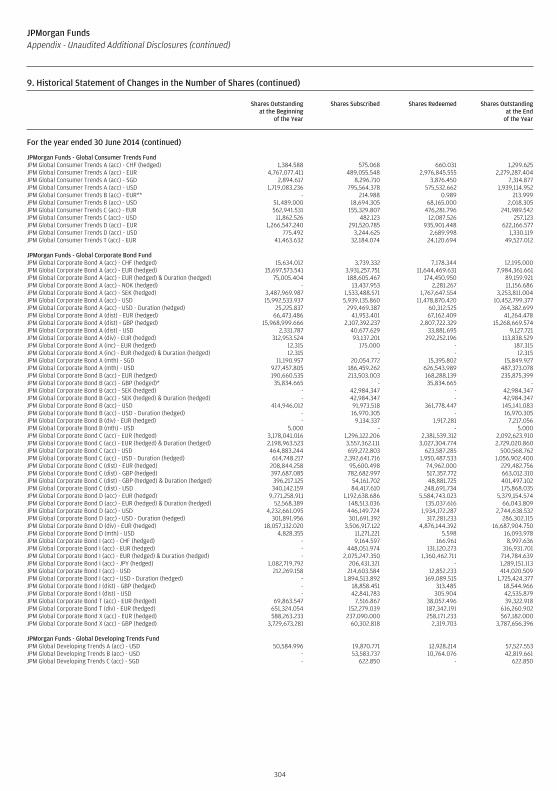
JPMorgan FundsAppendix - Unaudited Additional Disclosures (continued)
9. Historical Statement of Changes in the Number of Shares (continued)
Shares Outstandingat the Beginning
of the Year
Shares Subscribed Shares Redeemed Shares Outstandingat the End
of the Year
For the year ended 30 June 2014 (continued)
JPMorgan Funds - Global Consumer Trends FundJPM Global Consumer Trends A (acc) - CHF (hedged) 1,384.588 575.068 660.031 1,299.625JPM Global Consumer Trends A (acc) - EUR 4,767,077.411 489,055.548 2,976,845.555 2,279,287.404JPM Global Consumer Trends A (acc) - SGD 2,894.617 8,296.710 3,876.450 7,314.877JPM Global Consumer Trends A (acc) - USD 1,719,083.236 795,564.378 575,532.662 1,939,114.952JPM Global Consumer Trends B (acc) - EUR** - 214.988 0.989 213.999JPM Global Consumer Trends B (acc) - USD 51,489.000 18,694.305 68,165.000 2,018.305JPM Global Consumer Trends C (acc) - EUR 562,941.531 155,329.807 476,281.796 241,989.542JPM Global Consumer Trends C (acc) - USD 11,862.526 482.123 12,087.526 257.123JPM Global Consumer Trends D (acc) - EUR 1,266,547.240 291,520.785 935,901.448 622,166.577JPM Global Consumer Trends D (acc) - USD 775.492 3,244.625 2,689.998 1,330.119JPM Global Consumer Trends T (acc) - EUR 41,463.632 32,184.074 24,120.694 49,527.012
JPMorgan Funds - Global Corporate Bond FundJPM Global Corporate Bond A (acc) - CHF (hedged) 15,634.012 3,739.332 7,178.344 12,195.000JPM Global Corporate Bond A (acc) - EUR (hedged) 15,697,573.541 3,931,257.751 11,644,469.631 7,984,361.661JPM Global Corporate Bond A (acc) - EUR (hedged) & Duration (hedged) 75,005.404 188,605.467 174,450.950 89,159.921JPM Global Corporate Bond A (acc) - NOK (hedged) - 13,437.953 2,281.267 11,156.686JPM Global Corporate Bond A (acc) - SEK (hedged) 3,487,969.987 1,533,488.571 1,767,647.554 3,253,811.004JPM Global Corporate Bond A (acc) - USD 15,992,533.937 5,939,135.860 11,478,870.420 10,452,799.377JPM Global Corporate Bond A (acc) - USD - Duration (hedged) 25,225.837 299,469.387 60,312.525 264,382.699JPM Global Corporate Bond A (dist) - EUR (hedged) 66,473.486 41,953.401 67,162.409 41,264.478JPM Global Corporate Bond A (dist) - GBP (hedged) 15,968,999.666 2,107,392.237 2,807,722.329 15,268,669.574JPM Global Corporate Bond A (dist) - USD 2,331.787 40,677.629 33,881.695 9,127.721JPM Global Corporate Bond A (div) - EUR (hedged) 312,953.524 93,137.201 292,252.196 113,838.529JPM Global Corporate Bond A (inc) - EUR (hedged) 12.315 175.000 - 187.315JPM Global Corporate Bond A (inc) - EUR (hedged) & Duration (hedged) 12.315 - - 12.315JPM Global Corporate Bond A (mth) - SGD 11,190.957 20,054.772 15,395.802 15,849.927JPM Global Corporate Bond A (mth) - USD 927,457.805 186,459.262 626,543.989 487,373.078JPM Global Corporate Bond B (acc) - EUR (hedged) 190,660.535 213,503.003 168,288.139 235,875.399JPM Global Corporate Bond B (acc) - GBP (hedged)* 35,834.665 - 35,834.665 -JPM Global Corporate Bond B (acc) - SEK (hedged) - 42,984.347 - 42,984.347JPM Global Corporate Bond B (acc) - SEK (hedged) & Duration (hedged) - 42,984.347 - 42,984.347JPM Global Corporate Bond B (acc) - USD 414,946.012 91,973.518 361,778.447 145,141.083JPM Global Corporate Bond B (acc) - USD - Duration (hedged) - 16,970.305 - 16,970.305JPM Global Corporate Bond B (div) - EUR (hedged) - 9,134.337 1,917.281 7,217.056JPM Global Corporate Bond B (mth) - USD 5.000 - - 5.000JPM Global Corporate Bond C (acc) - EUR (hedged) 3,178,041.016 1,296,122.206 2,381,539.312 2,092,623.910JPM Global Corporate Bond C (acc) - EUR (hedged) & Duration (hedged) 2,198,963.523 3,557,362.111 3,027,304.774 2,729,020.860JPM Global Corporate Bond C (acc) - USD 464,883.244 659,272.803 623,587.285 500,568.762JPM Global Corporate Bond C (acc) - USD - Duration (hedged) 614,748.217 2,392,641.716 1,950,487.533 1,056,902.400JPM Global Corporate Bond C (dist) - EUR (hedged) 208,844.258 95,600.498 74,962.000 229,482.756JPM Global Corporate Bond C (dist) - GBP (hedged) 397,687.085 782,682.997 517,357.772 663,012.310JPM Global Corporate Bond C (dist) - GBP (hedged) & Duration (hedged) 396,217.125 54,161.702 48,881.725 401,497.102JPM Global Corporate Bond C (dist) - USD 340,142.159 84,417.610 248,691.734 175,868.035JPM Global Corporate Bond D (acc) - EUR (hedged) 9,771,258.911 1,192,638.686 5,584,743.023 5,379,154.574JPM Global Corporate Bond D (acc) - EUR (hedged) & Duration (hedged) 52,568.389 148,513.036 135,037.616 66,043.809JPM Global Corporate Bond D (acc) - USD 4,232,661.095 446,149.724 1,934,172.287 2,744,638.532JPM Global Corporate Bond D (acc) - USD - Duration (hedged) 301,891.956 301,691.392 317,281.233 286,302.115JPM Global Corporate Bond D (div) - EUR (hedged) 18,057,132.020 3,506,917.122 4,876,144.392 16,687,904.750JPM Global Corporate Bond D (mth) - USD 4,828.355 11,271.221 5.598 16,093.978JPM Global Corporate Bond I (acc) - CHF (hedged) - 9,164.597 166.961 8,997.636JPM Global Corporate Bond I (acc) - EUR (hedged) - 448,051.974 131,120.273 316,931.701JPM Global Corporate Bond I (acc) - EUR (hedged) & Duration (hedged) - 2,075,247.350 1,360,462.711 714,784.639JPM Global Corporate Bond I (acc) - JPY (hedged) 1,082,719.792 206,431.321 - 1,289,151.113JPM Global Corporate Bond I (acc) - USD 212,269.158 214,603.584 12,852.233 414,020.509JPM Global Corporate Bond I (acc) - USD - Duration (hedged) - 1,894,513.892 169,089.515 1,725,424.377JPM Global Corporate Bond I (dist) - GBP (hedged) - 18,858.451 313.485 18,544.966JPM Global Corporate Bond I (dist) - USD - 42,841.783 305.904 42,535.879JPM Global Corporate Bond T (acc) - EUR (hedged) 69,863.547 7,516.867 38,057.496 39,322.918JPM Global Corporate Bond T (div) - EUR (hedged) 651,324.054 152,279.039 187,342.191 616,260.902JPM Global Corporate Bond X (acc) - EUR (hedged) 588,263.233 237,090.000 258,171.233 567,182.000JPM Global Corporate Bond X (acc) - GBP (hedged) 3,729,673.281 60,302.818 2,319.703 3,787,656.396
JPMorgan Funds - Global Developing Trends FundJPM Global Developing Trends A (acc) - USD 50,584.996 19,870.771 12,928.214 57,527.553JPM Global Developing Trends B (acc) - USD - 53,583.737 10,764.076 42,819.661JPM Global Developing Trends C (acc) - SGD - 622.850 - 622.850
304
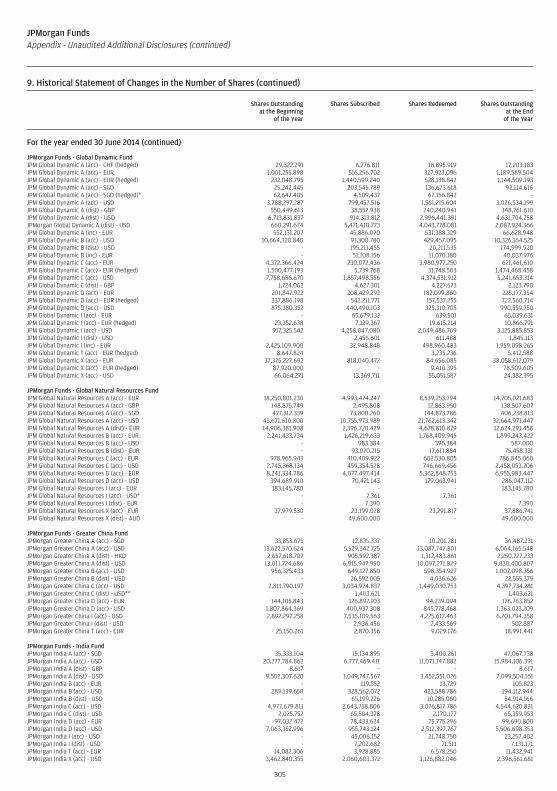
JPMorgan FundsAppendix - Unaudited Additional Disclosures (continued)
9. Historical Statement of Changes in the Number of Shares (continued)
Shares Outstandingat the Beginning
of the Year
Shares Subscribed Shares Redeemed Shares Outstandingat the End
of the Year
For the year ended 30 June 2014 (continued)
JPMorgan Funds - Global Dynamic FundJPM Global Dynamic A (acc) - CHF (hedged) 29,322.291 6,776.811 18,895.919 17,203.183JPM Global Dynamic A (acc) - EUR 1,001,255.898 516,256.702 327,923.096 1,189,589.504JPM Global Dynamic A (acc) - EUR (hedged) 232,048.795 1,440,599.240 528,138.842 1,144,509.193JPM Global Dynamic A (acc) - SGD 25,242.445 203,545.789 136,673.618 92,114.616JPM Global Dynamic A (acc) - SGD (hedged)* 62,647.405 4,509.437 67,156.842 -JPM Global Dynamic A (acc) - USD 3,788,297.287 799,452.516 1,561,215.604 3,026,534.199JPM Global Dynamic A (dist) - GBP 550,449.613 38,552.938 240,240.941 348,761.610JPM Global Dynamic A (dist) - USD 6,713,831.837 914,313.812 2,996,441.391 4,631,704.258JPMorgan Global Dynamic A (dist) - USD 660,291.674 5,471,410.773 4,043,778.081 2,087,924.366JPM Global Dynamic A (inc) - EUR 552,131.207 45,886.070 531,388.329 66,628.948JPM Global Dynamic B (acc) - USD 10,664,320.840 91,300.780 429,457.095 10,326,164.525JPM Global Dynamic B (dist) - USD - 195,211.455 20,211.535 174,999.920JPM Global Dynamic B (inc) - EUR - 51,108.156 11,070.180 40,037.976JPM Global Dynamic C (acc) - EUR 4,372,366.424 230,072.436 3,980,977.250 621,461.610JPM Global Dynamic C (acc) - EUR (hedged) 1,500,477.193 5,739.768 31,748.503 1,474,468.458JPM Global Dynamic C (acc) - USD 7,758,686.670 1,857,498.556 4,374,531.912 5,241,653.314JPM Global Dynamic C (dist) - GBP 1,724.062 4,627.301 4,227.573 2,123.790JPM Global Dynamic D (acc) - EUR 201,847.922 208,429.292 182,099.860 228,177.354JPM Global Dynamic D (acc) - EUR (hedged) 337,886.198 542,211.771 157,537.255 722,560.714JPM Global Dynamic D (acc) - USD 875,380.352 440,490.103 325,310.705 990,559.750JPM Global Dynamic I (acc) - EUR - 65,679.132 639.501 65,039.631JPM Global Dynamic I (acc) - EUR (hedged) 23,352.638 7,129.367 19,615.214 10,866.791JPM Global Dynamic I (acc) - USD 917,325.542 4,258,047.080 2,049,486.769 3,125,885.853JPM Global Dynamic I (dist) - USD - 2,456.601 611.488 1,845.113JPM Global Dynamic I (inc) - EUR 2,425,109.900 32,948.848 498,960.483 1,959,098.265JPM Global Dynamic T (acc) - EUR (hedged) 8,647.824 - 3,235.236 5,412.588JPM Global Dynamic X (acc) - EUR 37,325,227.692 818,040.472 84,656.085 38,058,612.079JPM Global Dynamic X (acc) - EUR (hedged) 87,920.000 - 9,410.395 78,509.605JPM Global Dynamic X (acc) - USD 66,064.271 13,369.711 55,051.587 24,382.395
JPMorgan Funds - Global Natural Resources FundJPM Global Natural Resources A (acc) - EUR 18,250,801.230 4,993,474.247 8,539,253.794 14,705,021.683JPM Global Natural Resources A (acc) - GBP 148,875.749 2,495.808 12,863.950 138,507.607JPM Global Natural Resources A (acc) - SGD 477,312.339 73,800.260 144,873.786 406,238.813JPM Global Natural Resources A (acc) - USD 43,671,610.800 10,755,973.989 21,762,613.342 32,664,971.447JPM Global Natural Resources A (dist) - EUR 14,906,381.908 2,396,720.429 4,678,810.879 12,624,291.458JPM Global Natural Resources B (acc) - EUR 2,241,433.734 1,426,219.633 1,768,409.945 1,899,243.422JPM Global Natural Resources B (acc) - USD - 983.384 396.384 587.000JPM Global Natural Resources B (dist) - EUR - 93,070.215 17,611.884 75,458.331JPM Global Natural Resources C (acc) - EUR 978,965.943 410,409.922 602,530.805 786,845.060JPM Global Natural Resources C (acc) - USD 2,745,368.134 459,354.528 746,669.456 2,458,053.206JPM Global Natural Resources D (acc) - EUR 8,241,334.786 4,077,497.414 5,362,848.753 6,955,983.447JPM Global Natural Resources D (acc) - USD 394,689.910 70,421.143 179,063.941 286,047.112JPM Global Natural Resources I (acc) - EUR 183,145.780 - - 183,145.780JPM Global Natural Resources I (acc) - USD* - 7.361 7.361 -JPM Global Natural Resources I (dist) - EUR - 7.390 - 7.390JPM Global Natural Resources X (acc) - EUR 37,979.530 23,199.028 23,291.817 37,886.741JPM Global Natural Resources X (dist) - AUD - 49,600.000 - 49,600.000
JPMorgan Funds - Greater China FundJPMorgan Greater China A (acc) - SGD 33,853.675 12,835.337 10,201.781 36,487.231JPMorgan Greater China A (acc) - USD 13,622,570.624 5,529,342.725 13,087,747.801 6,064,165.548JPMorgan Greater China A (dist) - HKD 2,657,618.707 905,592.387 1,312,483.861 2,250,727.233JPMorgan Greater China A (dist) - USD 13,011,724.686 6,915,947.950 10,097,271.829 9,830,400.807JPMorgan Greater China B (acc) - USD 956,325.433 649,127.850 598,354.927 1,007,098.356JPMorgan Greater China B (dist) - USD - 26,592.005 4,036.626 22,555.379JPMorgan Greater China C (acc) - USD 2,811,790.197 3,034,974.837 1,449,030.753 4,397,734.281JPMorgan Greater China C (dist) - USD** - 1,403.621 - 1,403.621JPMorgan Greater China D (acc) - EUR 144,105.843 126,897.103 94,239.094 176,763.852JPMorgan Greater China D (acc) - USD 1,807,864.369 400,937.308 845,778.468 1,363,023.209JPMorgan Greater China I (acc) - USD 2,892,297.258 7,535,109.563 4,225,612.463 6,201,794.358JPMorgan Greater China I (dist) - USD - 2,936.456 2,433.569 502.887JPMorgan Greater China T (acc) - EUR 25,150.261 2,870.356 9,029.176 18,991.441
JPMorgan Funds - India FundJPMorgan India A (acc) - SGD 35,333.104 15,134.895 3,400.261 47,067.738JPMorgan India A (acc) - USD 20,277,784.862 6,777,469.411 11,071,147.882 15,984,106.391JPMorgan India A (dist) - GBP 8.617 - - 8.617JPMorgan India A (dist) - USD 9,502,307.620 1,049,747.567 3,452,551.026 7,099,504.161JPMorgan India B (acc) - EUR - 119.552 13.729 105.823JPMorgan India B (acc) - USD 289,139.658 328,562.072 423,588.786 194,112.944JPMorgan India B (dist) - USD - 65,199.226 10,285.060 54,914.166JPMorgan India C (acc) - USD 4,977,679.811 2,643,758.806 3,076,817.786 4,544,620.831JPMorgan India C (dist) - USD 2,025.752 65,504.378 2,170.177 65,359.953JPMorgan India D (acc) - EUR 97,032.472 78,433.624 75,775.296 99,690.800JPMorgan India D (acc) - USD 7,063,352.996 955,743.124 2,512,397.767 5,506,698.353JPMorgan India I (acc) - USD - 45,006.152 21,748.750 23,257.402JPMorgan India I (dist) - USD - 7,202.682 71.511 7,131.171JPMorgan India T (acc) - EUR 14,082.306 3,928.885 6,578.250 11,432.941JPMorgan India X (acc) - USD 3,462,840.355 2,060,603.372 3,126,882.046 2,396,561.681
305

JPMorgan FundsAppendix - Unaudited Additional Disclosures (continued)
9. Historical Statement of Changes in the Number of Shares (continued)
Shares Outstandingat the Beginning
of the Year
Shares Subscribed Shares Redeemed Shares Outstandingat the End
of the Year
For the year ended 30 June 2014 (continued)
JPMorgan Funds - Indonesia Equity FundJPMorgan Indonesia Equity A (acc) - USD 29,276.083 49,189.313 50,724.035 27,741.361JPMorgan Indonesia Equity B (acc) - USD 7,672.369 - 1,550.000 6,122.369JPMorgan Indonesia Equity C (acc) - USD 5,000.000 79,689.288 71,492.580 13,196.708JPMorgan Indonesia Equity D (acc) - EUR 53,106.733 25,707.165 33,411.643 45,402.255JPMorgan Indonesia Equity D (acc) - USD 16,171.320 23,374.775 16,740.614 22,805.481JPMorgan Indonesia Equity X (acc) - JPY 5,270,209.245 1,695,108.318 2,777,529.701 4,187,787.862
JPMorgan Funds - Japan Equity Fund (2)JPMorgan Japan Equity A (acc) - EUR 381,840.822 328,837.205 519,460.616 191,217.411JPMorgan Japan Equity A (acc) - EUR (hedged) - 200,456.940 140,251.903 60,205.037JPMorgan Japan Equity A (acc) - JPY 938,229.435 6,107,570.120 3,784,364.655 3,261,434.900JPMorgan Japan Equity A (acc) - USD 6,747,496.868 11,471,947.852 14,159,027.296 4,060,417.424JPMorgan Japan Equity A (acc) - USD (hedged) - 1,107,317.737 370,399.405 736,918.332JPMorgan Japan Equity A (dist) - GBP 45,991.436 21,331.415 36,106.931 31,215.920JPMorgan Japan Equity A (dist) - GBP (hedged) - 5,765.381 - 5,765.381JPMorgan Japan Equity A (dist) - SGD - 40,906.754 - 40,906.754JPMorgan Japan Equity A (dist) - USD 4,956,854.486 6,505,876.199 7,191,626.502 4,271,104.183JPMorgan Japan Equity B (acc) - EUR - 5,427.077 3,498.482 1,928.595JPMorgan Japan Equity B (acc) - USD 832,630.353 612,136.143 867,850.741 576,915.755JPMorgan Japan Equity B (dist) - GBP - 115,373.847 22,424.926 92,948.921JPMorgan Japan Equity B (dist) - USD - 16,679.964 2,183.998 14,495.966JPMorgan Japan Equity C (acc) - USD 677,485.587 14,150,370.133 457,804.182 14,370,051.538JPMorgan Japan Equity C (acc) - USD (hedged) - 18,945.032 - 18,945.032JPMorgan Japan Equity C (dist) - USD 520.044 12.388 - 532.432JPMorgan Japan Equity D (acc) - EUR 159,829.888 332,362.684 418,726.517 73,466.055JPMorgan Japan Equity D (acc) - USD 1,979,714.409 1,522,449.380 1,149,652.899 2,352,510.890JPMorgan Japan Equity I (acc) - USD 102,634.980 7,292,629.341 4,111,321.993 3,283,942.328JPMorgan Japan Equity J (dist) - USD 1,720,626.452 4,098,853.145 3,457,429.152 2,362,050.445JPMorgan Japan Equity X (acc) - USD 21,213.353 22,821.497 5,448.054 38,586.796
JPMorgan Funds - Korea Equity FundJPMorgan Korea Equity A (acc) - EUR 693,511.601 283,439.859 364,904.675 612,046.785JPMorgan Korea Equity A (acc) - SGD* 22,376.667 7,382.645 29,759.312 -JPMorgan Korea Equity A (acc) - USD 7,868,986.155 4,229,622.923 5,693,706.222 6,404,902.856JPMorgan Korea Equity A (dist) - USD 151,256.449 66,557.619 141,550.226 76,263.842JPMorgan Korea Equity B (acc) - EUR - 1,751.117 628.117 1,123.000JPMorgan Korea Equity B (acc) - USD 720,923.192 1,714,941.846 810,301.970 1,625,563.068JPMorgan Korea Equity C (acc) - EUR - 369,760.000 140,000.000 229,760.000JPMorgan Korea Equity C (acc) - USD 514,206.462 1,247,071.230 618,950.022 1,142,327.670JPMorgan Korea Equity D (acc) - USD 1,700,599.772 2,560,480.741 3,432,449.781 828,630.732JPMorgan Korea Equity I (acc) - USD** 145,543.952 12,040.942 156,148.627 1,436.267
JPMorgan Funds - Latin America Equity FundJPM Latin America Equity A (acc) - EUR 16,933.296 28,128.084 10,619.543 34,441.837JPM Latin America Equity A (acc) - SGD 1,651.971 7.483 1,559.454 100.000JPM Latin America Equity A (acc) - USD 7,502,843.824 5,534,513.083 4,492,221.903 8,545,135.004JPM Latin America Equity A (dist) - USD 4,090,494.243 336,265.462 1,594,566.902 2,832,192.803JPMorgan Latin America Equity A (dist) - USD 5,854,264.560 2,606,284.897 2,826,258.774 5,634,290.683JPM Latin America Equity B (acc) - EUR - 5,799.917 1,315.516 4,484.401JPM Latin America Equity B (acc) - USD 2,541,242.343 2,705,236.618 2,705,444.664 2,541,034.297JPM Latin America Equity B (dist) - USD 8,707.000 43,218.772 17,399.998 34,525.774JPM Latin America Equity C (acc) - EUR - 6,452.729 - 6,452.729JPM Latin America Equity C (acc) - USD 2,400,699.308 1,323,162.252 1,249,749.274 2,474,112.286JPM Latin America Equity D (acc) - EUR 50,912.920 28,612.307 31,109.956 48,415.271JPM Latin America Equity D (acc) - USD 1,941,165.518 79,646.126 752,222.870 1,268,588.774JPM Latin America Equity I (acc) - EUR - 675,000.000 310,000.000 365,000.000JPM Latin America Equity I (acc) - JPY 1,710,723.065 389,729.496 1,457,169.223 643,283.338JPM Latin America Equity I (acc) - USD 19,882,043.684 20,056,589.914 18,258,136.077 21,680,497.521JPM Latin America Equity I (dist) - USD - 2,118.273 - 2,118.273JPM Latin America Equity T (acc) - EUR 4,510.949 - 1,838.677 2,672.272JPM Latin America Equity X (acc) - USD 2,441,151.078 40,263.951 91,151.078 2,390,263.951
JPMorgan Funds - Russia FundJPM Russia A (acc) - USD 21,534,950.607 5,477,484.409 17,621,985.072 9,390,449.944JPM Russia A (dist) - USD 28,153,070.068 28,128,352.813 29,423,789.704 26,857,633.177JPM Russia B (acc) - USD 2,378,987.570 2,275,351.236 3,363,315.179 1,291,023.627JPM Russia B (dist) - USD - 1,696.742 0.437 1,696.305JPM Russia C (acc) - USD 3,305,541.197 2,144,810.691 2,477,731.951 2,972,619.937JPM Russia D (acc) - EUR - 4,176.288 - 4,176.288JPM Russia D (acc) - USD 7,751,407.126 1,267,884.886 3,067,292.269 5,951,999.743JPM Russia I (acc) - USD 48,688,847.714 3,355,388.613 51,419,665.921 624,570.406JPM Russia T (acc) - EUR 2,858.410 5,443.650 3,149.551 5,152.509
(2) This Sub-Fund changed its currency to JPY on 2 December 2013.
306
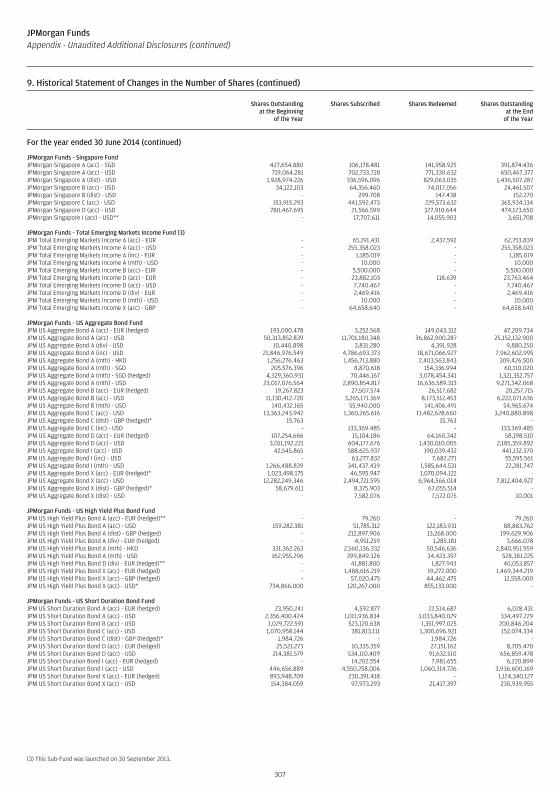
JPMorgan FundsAppendix - Unaudited Additional Disclosures (continued)
9. Historical Statement of Changes in the Number of Shares (continued)
Shares Outstandingat the Beginning
of the Year
Shares Subscribed Shares Redeemed Shares Outstandingat the End
of the Year
For the year ended 30 June 2014 (continued)
JPMorgan Funds - Singapore FundJPMorgan Singapore A (acc) - SGD 427,654.880 106,178.481 141,958.925 391,874.436JPMorgan Singapore A (acc) - USD 719,064.281 702,733.728 771,330.632 650,467.377JPMorgan Singapore A (dist) - USD 1,928,974.226 336,596.096 829,063.035 1,436,507.287JPMorgan Singapore B (acc) - USD 34,122.103 64,356.460 74,017.056 24,461.507JPMorgan Singapore B (dist) - USD - 299.708 147.438 152.270JPMorgan Singapore C (acc) - USD 153,915.293 441,592.473 229,573.632 365,934.134JPMorgan Singapore D (acc) - USD 780,467.695 21,566.599 327,910.644 474,123.650JPMorgan Singapore I (acc) - USD** - 17,707.611 14,055.903 3,651.708
JPMorgan Funds - Total Emerging Markets Income Fund (3)JPM Total Emerging Markets Income A (acc) - EUR - 65,191.431 2,437.592 62,753.839JPM Total Emerging Markets Income A (acc) - USD - 255,358.023 - 255,358.023JPM Total Emerging Markets Income A (inc) - EUR - 1,185.019 - 1,185.019JPM Total Emerging Markets Income A (mth) - USD - 10.000 - 10.000JPM Total Emerging Markets Income B (acc) - EUR - 5,500.000 - 5,500.000JPM Total Emerging Markets Income D (acc) - EUR - 23,882.103 118.639 23,763.464JPM Total Emerging Markets Income D (acc) - USD - 7,740.467 - 7,740.467JPM Total Emerging Markets Income D (div) - EUR - 2,469.416 - 2,469.416JPM Total Emerging Markets Income D (mth) - USD - 10.000 - 10.000JPM Total Emerging Markets Income X (acc) - GBP - 64,658.640 - 64,658.640
JPMorgan Funds - US Aggregate Bond FundJPM US Aggregate Bond A (acc) - EUR (hedged) 193,000.478 3,252.568 149,043.312 47,209.734JPM US Aggregate Bond A (acc) - USD 50,313,852.839 11,701,180.348 36,862,900.287 25,152,132.900JPM US Aggregate Bond A (div) - USD 10,440.898 3,831.280 4,391.928 9,880.250JPM US Aggregate Bond A (inc) - USD 21,846,976.549 4,786,693.373 18,671,066.927 7,962,602.995JPM US Aggregate Bond A (mth) - HKD 1,256,276.463 1,456,713.880 2,403,563.843 309,426.500JPM US Aggregate Bond A (mth) - SGD 205,576.396 8,870.618 154,336.994 60,110.020JPM US Aggregate Bond A (mth) - SGD (hedged) 4,329,360.931 70,446.167 3,078,454.341 1,321,352.757JPM US Aggregate Bond A (mth) - USD 23,017,076.564 2,890,854.817 16,636,589.313 9,271,342.068JPM US Aggregate Bond B (acc) - EUR (hedged) 19,267.823 27,507.574 26,517.682 20,257.715JPM US Aggregate Bond B (acc) - USD 11,130,412.720 3,265,171.369 8,173,512.453 6,222,071.636JPM US Aggregate Bond B (mth) - USD 140,432.165 55,940.000 141,406.491 54,965.674JPM US Aggregate Bond C (acc) - USD 13,363,243.942 1,360,265.616 11,482,628.660 3,240,880.898JPM US Aggregate Bond C (dist) - GBP (hedged)* 15.763 - 15.763 -JPM US Aggregate Bond C (inc) - USD - 133,369.485 - 133,369.485JPM US Aggregate Bond D (acc) - EUR (hedged) 107,254.666 15,104.186 64,160.342 58,198.510JPM US Aggregate Bond D (acc) - USD 3,011,192.221 604,177.676 1,430,010.005 2,185,359.892JPM US Aggregate Bond I (acc) - USD 42,545.865 588,625.937 190,039.432 441,132.370JPM US Aggregate Bond I (inc) - USD - 63,277.832 7,682.271 55,595.561JPM US Aggregate Bond I (mth) - USD 1,266,488.839 341,437.439 1,585,644.531 22,281.747JPM US Aggregate Bond X (acc) - EUR (hedged)* 1,023,498.175 46,595.947 1,070,094.122 -JPM US Aggregate Bond X (acc) - USD 12,282,249.346 2,494,721.595 6,964,566.014 7,812,404.927JPM US Aggregate Bond X (dist) - GBP (hedged)* 58,679.611 8,375.903 67,055.514 -JPM US Aggregate Bond X (dist) - USD - 7,582.076 7,572.075 10.001
JPMorgan Funds - US High Yield Plus Bond FundJPM US High Yield Plus Bond A (acc) - EUR (hedged)** - 79.260 - 79.260JPM US High Yield Plus Bond A (acc) - USD 159,282.381 51,785.312 122,183.931 88,883.762JPM US High Yield Plus Bond A (dist) - GBP (hedged) - 212,897.906 13,268.000 199,629.906JPM US High Yield Plus Bond A (div) - EUR (hedged) - 4,951.259 1,285.181 3,666.078JPM US High Yield Plus Bond A (mth) - HKD 331,362.263 2,560,136.332 50,546.636 2,840,951.959JPM US High Yield Plus Bond A (mth) - USD 162,955.296 399,849.326 34,423.397 528,381.225JPM US High Yield Plus Bond D (div) - EUR (hedged)** - 41,881.800 1,827.943 40,053.857JPM US High Yield Plus Bond X (acc) - EUR (hedged) - 1,488,616.219 19,272.000 1,469,344.219JPM US High Yield Plus Bond X (acc) - GBP (hedged) - 57,020.475 44,462.475 12,558.000JPM US High Yield Plus Bond X (acc) - USD* 734,866.000 120,267.000 855,133.000 -
JPMorgan Funds - US Short Duration Bond FundJPM US Short Duration Bond A (acc) - EUR (hedged) 23,950.241 4,592.877 22,514.687 6,028.431JPM US Short Duration Bond A (acc) - USD 2,356,400.424 1,011,936.834 3,033,840.029 334,497.229JPM US Short Duration Bond B (acc) - USD 1,029,722.591 523,120.638 1,351,997.025 200,846.204JPM US Short Duration Bond C (acc) - USD 1,070,958.144 381,813.111 1,300,696.921 152,074.334JPM US Short Duration Bond C (dist) - GBP (hedged)* 1,984.726 - 1,984.726 -JPM US Short Duration Bond D (acc) - EUR (hedged) 25,521.273 10,335.359 27,151.162 8,705.470JPM US Short Duration Bond D (acc) - USD 214,381.579 534,110.409 91,632.510 656,859.478JPM US Short Duration Bond I (acc) - EUR (hedged) - 14,202.554 7,981.655 6,220.899JPM US Short Duration Bond I (acc) - USD 446,656.889 4,550,258.006 1,060,314.726 3,936,600.169JPM US Short Duration Bond X (acc) - EUR (hedged) 893,948.709 230,391.418 - 1,124,340.127JPM US Short Duration Bond X (acc) - USD 154,384.059 97,973.293 21,417.397 230,939.955
(3) This Sub-Fund was launched on 30 September 2013.
307
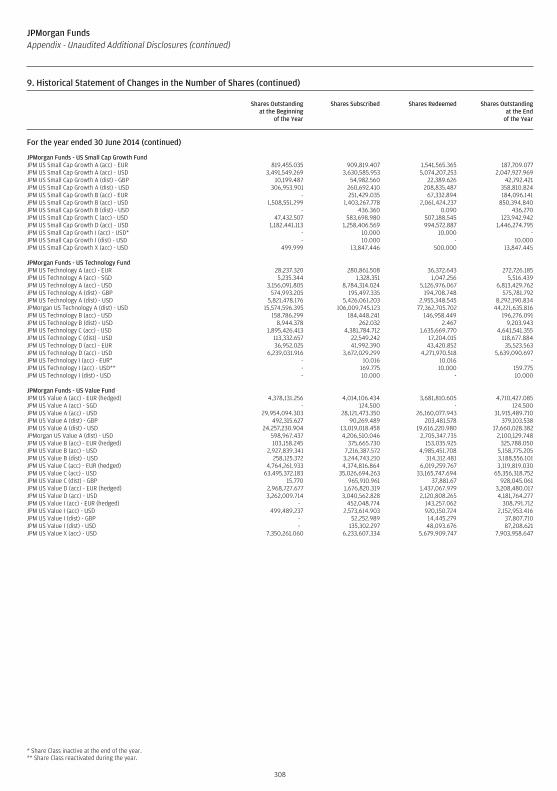
JPMorgan FundsAppendix - Unaudited Additional Disclosures (continued)
9. Historical Statement of Changes in the Number of Shares (continued)
Shares Outstandingat the Beginning
of the Year
Shares Subscribed Shares Redeemed Shares Outstandingat the End
of the Year
For the year ended 30 June 2014 (continued)
JPMorgan Funds - US Small Cap Growth FundJPM US Small Cap Growth A (acc) - EUR 819,455.035 909,819.407 1,541,565.365 187,709.077JPM US Small Cap Growth A (acc) - USD 3,491,549.269 3,630,585.953 5,074,207.253 2,047,927.969JPM US Small Cap Growth A (dist) - GBP 10,199.487 54,982.560 22,389.626 42,792.421JPM US Small Cap Growth A (dist) - USD 306,953.901 260,692.410 208,835.487 358,810.824JPM US Small Cap Growth B (acc) - EUR - 251,429.035 67,332.894 184,096.141JPM US Small Cap Growth B (acc) - USD 1,508,551.299 1,403,267.778 2,061,424.237 850,394.840JPM US Small Cap Growth B (dist) - USD - 436.360 0.090 436.270JPM US Small Cap Growth C (acc) - USD 47,432.507 583,698.980 507,188.545 123,942.942JPM US Small Cap Growth D (acc) - USD 1,182,441.113 1,258,406.569 994,572.887 1,446,274.795JPM US Small Cap Growth I (acc) - USD* - 10.000 10.000 -JPM US Small Cap Growth I (dist) - USD - 10.000 - 10.000JPM US Small Cap Growth X (acc) - USD 499.999 13,847.446 500.000 13,847.445
JPMorgan Funds - US Technology FundJPM US Technology A (acc) - EUR 28,237.320 280,861.508 36,372.643 272,726.185JPM US Technology A (acc) - SGD 5,235.344 1,328.351 1,047.256 5,516.439JPM US Technology A (acc) - USD 3,156,091.805 8,784,314.024 5,126,976.067 6,813,429.762JPM US Technology A (dist) - GBP 574,993.205 195,497.335 194,708.748 575,781.792JPM US Technology A (dist) - USD 5,821,478.176 5,426,061.203 2,955,348.545 8,292,190.834JPMorgan US Technology A (dist) - USD 15,574,596.395 106,009,745.123 77,362,705.702 44,221,635.816JPM US Technology B (acc) - USD 158,786.299 184,448.241 146,958.449 196,276.091JPM US Technology B (dist) - USD 8,944.378 262.032 2.467 9,203.943JPM US Technology C (acc) - USD 1,895,426.413 4,381,784.712 1,635,669.770 4,641,541.355JPM US Technology C (dist) - USD 113,332.657 22,549.242 17,204.015 118,677.884JPM US Technology D (acc) - EUR 36,952.025 41,992.390 43,420.852 35,523.563JPM US Technology D (acc) - USD 6,239,031.916 3,672,029.299 4,271,970.518 5,639,090.697JPM US Technology I (acc) - EUR* - 10.016 10.016 -JPM US Technology I (acc) - USD** - 169.775 10.000 159.775JPM US Technology I (dist) - USD - 10.000 - 10.000
JPMorgan Funds - US Value FundJPM US Value A (acc) - EUR (hedged) 4,378,131.256 4,014,106.434 3,681,810.605 4,710,427.085JPM US Value A (acc) - SGD - 124.500 - 124.500JPM US Value A (acc) - USD 29,954,094.303 28,121,473.350 26,160,077.943 31,915,489.710JPM US Value A (dist) - GBP 492,315.627 90,269.489 203,481.578 379,103.538JPM US Value A (dist) - USD 24,257,230.904 13,019,018.458 19,616,220.980 17,660,028.382JPMorgan US Value A (dist) - USD 598,967.437 4,206,510.046 2,705,347.735 2,100,129.748JPM US Value B (acc) - EUR (hedged) 103,158.245 375,665.730 153,035.925 325,788.050JPM US Value B (acc) - USD 2,927,839.341 7,216,387.572 4,985,451.708 5,158,775.205JPM US Value B (dist) - USD 258,125.372 3,244,743.210 314,312.481 3,188,556.101JPM US Value C (acc) - EUR (hedged) 4,764,261.933 4,374,816.864 6,019,259.767 3,119,819.030JPM US Value C (acc) - USD 63,495,372.183 35,026,694.263 33,165,747.694 65,356,318.752JPM US Value C (dist) - GBP 15.770 965,910.961 37,881.67 928,045.061JPM US Value D (acc) - EUR (hedged) 2,968,727.677 1,676,820.319 1,437,067.979 3,208,480.017JPM US Value D (acc) - USD 3,262,009.714 3,040,562.828 2,120,808.265 4,181,764.277JPM US Value I (acc) - EUR (hedged) - 452,048.774 143,257.062 308,791.712JPM US Value I (acc) - USD 499,489.237 2,573,614.903 920,150.724 2,152,953.416JPM US Value I (dist) - GBP - 52,252.989 14,445.279 37,807.710JPM US Value I (dist) - USD - 135,302.297 48,093.676 87,208.621JPM US Value X (acc) - USD 7,350,261.060 6,233,607.334 5,679,909.747 7,903,958.647
* Share Class inactive at the end of the year.** Share Class reactivated during the year.
308

www.jpmorganam.com.sg
FR/DP/1016(SG version)