Lumyna Funds
324
Lumyna Funds Audited annual report as at March 31, 2021 Société d’Investissement à Capital Variable R.C.S. Luxembourg B 133.445 No subscriptions can be received on the basis of financial reports alone. Subscriptions are only valid if made on the basis of the current prospectus and the latest key investor information document.
-
Upload
khangminh22 -
Category
Documents
-
view
0 -
download
0
Transcript of Lumyna Funds

Lumyna Funds
Audited annual reportas at March 31, 2021
Société d’Investissement à Capital Variable
R.C.S. Luxembourg B 133.445
No subscriptions can be received on the basis of financial reports alone. Subscriptions are only valid ifmade on the basis of the current prospectus and the latest key investor information document.

Table of contents Page
Management and administration 2
Information to the Shareholders 4
Investment Managers’ Report 5
Independent auditor's report 37
Statements of net assets 40
Statements of operations and changes in net assets 43
Statistical information 46
Schedule of investments 62
Lumyna – Marshall Wace TOPS (Market Neutral) UCITS Fund 62
Lumyna – York Asian Event-Driven UCITS Fund 111
Lumyna – BOFA Enhanced Equity Volatility Premium UCITS Fund 120
Lumyna – BOFA MLCX Commodity Enhanced Beta UCITS Fund 122
Lumyna – BOFA MLCX Commodity Alpha UCITS Fund 124
Lumyna – Zeal Greater China Long Short UCITS Fund 126
Lumyna – Ramius Merger Arbitrage UCITS Fund 129
Lumyna – Millburn Diversified UCITS Fund 141
Lumyna – Global Debt - Credit UCITS Fund 147
Lumyna – Global Debt - Government UCITS Fund 182
Lumyna – Global Debt - Securitised UCITS Fund 234
Lumyna – PSAM Global Event UCITS Fund 255
Lumyna – Sandbar Global Equity Market Neutral UCITS Fund 269
Lumyna – Millburn Adaptive Allocation Program UCITS Fund 274
Lumyna – Bluecove Alternative Credit UCITS Fund 277
Notes to the financial statements 291
Appendix I – Total Expense Ratio (unaudited) 306
Appendix II – Global exposure and leverage (unaudited) 310
Appendix III – Securities Financing Transactions Regulation (SFTR) Disclosures (unaudited) 312
Appendix IV – Index tracking portfolios (unaudited) 318
Appendix V – Remuneration note (unaudited) 319
Appendix VI – Supplementary information (unaudited) 321
1Lumyna Funds
Audited annual report
Board of directors of the SICAV
ChairmanMr Claude Kremer,Partner,Arendt & Medernach S.A.,41A, avenue John F. Kennedy,L-2082 Luxembourg,Grand Duchy of Luxembourg
MembersMr Paul Guillaume,Managing Partner,Altra Partners S.A.,370 route de Longwy,L-1940 Luxembourg,Grand Duchy of Luxembourg
Mr Philippe Lopategui,Chief Executive Officer,Lumyna Investments Limited,11 Bressenden Place,London SW1E 5BYUnited Kingdom
Mr Thomas Nummer,TRINOVA S.A.,5 Heienhaff,L-1736 Senningerberg,Grand Duchy of Luxembourg
Management CompanyLumyna Investments Limited, (until December 13, 2020)11 Bressenden Place,London SW1E 5BYUnited Kingdom
Generali Investments Luxembourg S.A., (since December 14, 2020)4, rue Jean Monnet,L-2180 Luxembourg,Grand Duchy of Luxembourg
Registered Office of the SICAVState Street Bank International GmbH, Luxembourg Branch,49, avenue J. F. Kennedy,L-1855 Luxembourg,Grand Duchy of Luxembourg
Depositary and Paying AgentState Street Bank International GmbH, Luxembourg Branch,49, avenue J. F. Kennedy,L-1855 Luxembourg,Grand Duchy of Luxembourg
Registrar and Transfer AgentState Street Bank International GmbH, Luxembourg Branch,49, avenue J. F. Kennedy,L-1855 Luxembourg,Grand Duchy of Luxembourg
Administrative, Corporate and Domiciliary AgentState Street Bank International GmbH, Luxembourg Branch,49, avenue J. F. Kennedy,L-1855 Luxembourg,Grand Duchy of Luxembourg
Principal Investment Manager and Principal DistributorLumyna Investments Limited,11 Bressenden Place,London SW1E 5BYUnited Kingdom
Legal AdviserArendt & Medernach S.A.,41A, avenue J. F. Kennedy,L-2082 Luxembourg,Grand Duchy of Luxembourg
Listing AgentState Street Bank International GmbH, Luxembourg Branch,49, avenue J. F. Kennedy,L-1855 Luxembourg,Grand Duchy of Luxembourg
AuditorPricewaterhouseCoopers, Société coopérative,2, rue Gerhard Mercator,L-2182 Luxembourg,Grand Duchy of Luxembourg
Investment ManagersFor the sub-funds Lumyna –Marshall Wace TOPS (Market Neutral) UCITS Fund:Marshall Wace LLP,The Adelphi, 13th Floor,1/11 John Adam Street,London WC2N 6HT,United Kingdom
Lumyna –York Event-Driven UCITS Fund and Lumyna – York AsianEvent-Driven UCITS Fund1:York UCITS Holdings, LLC,767 Fifth Avenue, 17th Floor,New York 10153,USA
Lumyna –AQR Global Relative Value UCITS Fund2:AQR Capital Management LLC,:CNH Partners, LLC,Two Greenwich Plaza, 3rd Floor,Greenwich, CT 06830,USA
1 York Event-Driven UCITS Fund was liquidated on December 23, 20202 AQR Global Relative Value UCITS Fund was liquidated on May 29, 2020
2 Lumyna Funds
Management and administration
Audited annual report
Investment Managers (cont)
Lumyna – BOFA Enhanced Equity Volatility Premium UCITS Fund,Lumyna – BOFA MLCX Commodity Enhanced Beta UCITS Fund,Lumyna – BOFA MLCX Commodity Alpha UCITS Fund:Lumyna Investments Limited,11 Bressenden Place,London SW1E 5BYUnited Kingdom
Lumyna –Zeal Greater China Long Short UCITS Fund:Zeal Asset Management Limited,Suite 2605, Tower 1, Lippo Centre,89 Queensway,Hong Kong
Lumyna –Ramius Merger Arbitrage UCITS Fund:Cowen Investment Advisors LLC,599 Lexington Avenue,New York, NY 10022,USA
Lumyna –KLS Fixed Income UCITS Fund3:KLS Diversified Asset Management LP,452 Fifth Avenue,22nd Floor,New York, NY 10018,USA
Lumyna –Millburn Diversified UCITS Fund and Lumyna – MillburnAdaptive Allocation Program UCITS Fund:Millburn Ridgefield Corporation,55 West 46th Street,31st Floor,New York, NY 10036USA
Lumyna –Global Debt - Securitised UCITS Fund, Lumyna – GlobalDebt - Government UCITS Fund, Lumyna – Global Debt -Credit UCITS Fund:Blackrock Investment Management (UK) Limited,12 Throgmorton Avenue,London, EC2N 2DL,United Kingdom
Lumyna –PSAM Global Event UCITS Fund:P. Schoenfeld Asset Management LP,1350 Avenue of the Americas,21st Floor,New York, NY 10019,USA
Investment Managers (cont)
Lumyna –Sandbar Global Equity Market Neutral UCITS Fund:Sandbar Asset Management LLP,Warnford Court,29 Throgmorton Street,London, EC2N 2AT,United Kingdom
Lumyna –Bluecove Alternative Credit UCITS Fund4:BlueCove Limited,10 New Burlington Street,London, W1S 3BE,United Kingdom
Investment AdvisorsFor the sub-funds Lumyna –Marshall Wace TOPS (Market Neutral) UCITS Fund:
Marshall Wace Asia Limited,28/F One IFC One Harbour View Road,Hong Kong
Marshall Wace North America L.P.,55 Railroad Avenue, Greenwich,Connecticut,USA
Lumyna – BOFA Enhanced Equity Volatility Premium UCITS Fund:Union Investment Institutional GmbH,Product Management,Wiesenhüttenstraße 10,60329 Frankfurt am Main,Germany
3 KLS Fixed Income UCITS Fund was liquidated on March 25, 2021
4 Bluecove Alternative Credit UCITS Fund was launched on December 17,2020
3Lumyna Funds
Management and administration (cont.)
Audited annual report

The annual report and audited financial statements as of the end of each fiscal year will be established as per the last day of themonth of March. In addition, unaudited semi-annual report and financial statements will be established as per the last day of themonth of September. The annual report shall be published within four months following the end of the accounting year andunaudited semi-annual reports shall be published within two months following the end of the period to which they refer. Thereports are made available to shareholders free of charge at the registered office of the SICAV, at the Depositary and at theManagement Company website: www.lumyna.com.
The annual and semi-annual reports provide information on each of the sub-fund’s assets as well as the consolidated (“combined”)accounts of Lumyna Funds (the “SICAV”). The financial statements for each sub-fund are established in the base currency of thesub-fund and the combined accounts of the SICAV are in Euro. The SICAVs financial statements comprise a statement of net assets,statement of operations and changes in net assets for the year (annual report only), schedule of investments and notes to thefinancial statements.
The annual general meeting of shareholders will be held within four months of the end of each financial year in Luxembourg inorder to approve the financial statements of the SICAV for the previous financial year. The annual general meeting of shareholderswill be held at the registered office of the SICAV, or at such alternative location in Luxembourg asmay be specified in the conveningnotice of such meeting. Notices to shareholders will be published in the Luxemburger Wort and / or in any other newspaper(s) inthose countries where the shares are sold, as determined by the Board of Directors from time to time. In addition, such notices toshareholders may be sent by fax, email or other electronic information means, as determined by the Board of Directors from timeto time in accordance with applicable laws and regulations. Notices to shareholders are also available at the ManagementCompany website: www.lumyna.com.
The Board has adopted the principles of the ALFI Code of Conduct (the “Code”) which sets out principles of good governance forLuxembourg funds. The Board considers that the SICAV has been in compliance with the principles of the Code in all materialaspects throughout this financial year.
4 Lumyna Funds
Shareholders' information
Audited annual report
Lumyna – Marshall Wace TOPS (Market Neutral) UCITS Fund
Performance (in class currency)
NAV 31 March, 2020 31 March, 2021 % Change
Class USD B (acc) 146.45 169.21 15.54%Class USD C (acc) 128.69 148.02 15.02%
Market Review
TheMSCI ACWorld Local Index (NDLEACWF) returned 51.53% over the last 12months ending 31March 2021 despite nearly theentire period being consumed by the first major global pandemic in a century. The period under review followed historicmarket, policy, economic and political developments in response to one of the deepest and sharpest sell-offs in history inQ1 2020 as a result of the economic shutdowns brought on by the SARS-COV-2 virus and its attending illness, COVID-19. Theremarkable rebound in global equities during the second half of 2020, the result of unprecedentedmonetary and fiscal supportthat helped mitigate the economic effects of the second and third waves of the virus, was broad-based but with clearoutperformance in the US and China.
Equity markets began to recover by the end of March and early April on the back of three positive developments:
1. The lockdownmeasures enforced and the alleviating effects of the end of the winter season, began to curb the spread of thevirus.
2. Central banks around the world responded to the crisis with aggressive easing. Significant liquidity injections helped torestore confidence in the financial system.
3. Governments around the world responded with major fiscal stimulus to stabilise their economies and support theirrecoveries. On top of these measures, governments announced significant loan guarantee programs to support businesses.
The strong recovery was able to continue into H2 2020 as both emerging and developed economies around theworld benefitedfrom the dialling back of coronavirus restrictions in Q2 and Q3. Additional monetary and fiscal policy support measures wereannounced around the world in H2. On the monetary side, the second half of 2020 saw the European Central Bank expand andextend its Pandemic Emergency Purchase Plan (“PEPP”) QE program. Meanwhile, in August the Fed announced a materialdovish change to how it plans to conductmonetary policy going forward as it shifts to an “average inflation targeting” approach.This implies that the central bank would be likely to tighten policy more slowly in the future if/when inflation pressuresincreased.
On the fiscal side, the EU reached an agreement on a €750bn Recovery Fund in H2. In the US, Congress passed a second majorstimulus deal in December worth around $900bn to support the recovery. The conclusion of the US general election inNovember also contributed to positive market sentiment. In Europe, the UK and EU concluded an agreement on their futuretrading relationship, taking another tail risk off the table for markets.
On the back of these developments, global equities rallied strongly in H2 withMSCIWorld returning +20.66% in H2. The US andEmerging Markets saw the strongest performance in the second half, rising by +24.34% (MZ2USLG) and +26.05% (NDLEEGF),respectively.
In Q1 2021 the market rally paused in January before investors turned from "COVID-winning" sectors to more value-orientatednames.
Performance Review
The Fund returned 15.54% (class B USD) during the period under review. Over the period, the net market exposure averaged6.03%, resulting in gross trading alpha of 18.38%. The average gross market exposure was 289.93%.
5Lumyna Funds
Investment Managers’ Report
Audited annual report
Performance Review (cont.)
Over the period, Banks, Semiconductors and Retailing were the best performing industry groups. Positions in Software &Services, Media & Entertainment and Energy detracted the most from P&L during the same period. Diversified Financials,Capital Goods and Retailing were the largest average net long exposures. Software & Services was the largest average net shortexposure over the month, followed by , Energy and Household & Personal Products.
The Lumyna - Marshall Wace TOPS (Market Neutral) UCITS Fund remains highly diversified and liquid, with 913 positionsgreater than ±0.05% of NME (1,861 positions in total) on average over the month and with 98% of investments able to beliquidated in a single day (calculation based on trading a third of the 30 day average volume).
Marshall Wace’s proprietary Alpha Regime Indicator (“ARI”) seeks to assess the external risk regime in which the MW TOPSstrategies operate. Across all regions, the ARI oscillated between level 1 and 2 (on a scale of 1 to 5, with 5 being the moststressed) during January 2020 before spiking to levels 4 and 5when COVID-19 becamewidespread in February andMarch 2020.The indicator remained around level 3, with a few temporary oscillations, for most of the second half of the year and the firstquarter of 2021.
Investment Outlook
Market leadership was dominated in the last few months of the period under review by the news on vaccine roll outs. For thenext few months, the recovery in economies and markets will continue to be vaccine-shaped. With the emergence of new andmore infectious strains, the vaccines have become absolutely critical and we all owe a great deal to the ingenuity and diligenceof the scientists behind the various vaccines.
Meanwhile, though the Brexit trade deal signed in December is likely to hamper the recovery by not including services, theagreement does provide tariff-free trade on most goods. There is scope for individual service sector agreements to be reachedthroughout 2021, and UK equity valuations in the UK have been supressed by the uncertainty going back to the original2016 vote to leave the customs Union. Though the UK and Europe enter 2021 in a second recession due to repeatCOVID-19 lockdowns, the accelerating vaccine rollout brings reason for hope.
China, the only major economy to experience GDP growth in 2020 at 2.3%, took a different approach during the crisis, aiming tokeep industrial production in gear and offering more muted stimulus programs to households. While their early strictlockdowns led to better containment of the virus than the western world, they enter 2021 with new pockets of contagionreaching their worst levels sinceMarch 2020. That being said, the Chinese economy is due to benefit from a pickup in exports asand when the rest of the world resumes normal activity.
Finally, the Blue Wave in the US elections consolidates a historic regime change in US economic policy from the monetaryinflation–targeting regime which has characterized the past forty years back to the more Keynesian demand managementwhich preceded it. The scale of the stimulus in the US (monetary and fiscal combined) is unprecedented and is likely to generateboom conditions, especially in combination with the natural recovery from COVID-19.
COVID-19 aside, we now find ourselves in a moment of innovation in multiple sectors across the globe that exceeds what wesaw in the Technology, Media and Telecommunications (TMT) boom of the late 90s. There is the potential for disruption inenergy, hydrogen, batteries, automobiles, transportation, biotech, genomics, synthetic biology, medtech, fintech and digitalcurrencies. It is therefore entirely understandable that markets are excited about the potential of these sectors. What we haveto navigate as managers is the risk of irrational exuberance.
6 Lumyna Funds
Investment Managers’ Report (cont.)
Audited annual report

Lumyna – York Event-Driven UCITS Fund
Performance (in class currency)
NAV 31 March, 2020 31 March, 2021 % Change
Class AUD E (acc) 125.13 N/A1 N/A1
Class CHF A (acc) 121.59 N/A1 N/A1
1 Liquidated on December 23, 2020
Market Review
2020 was dominated by the global impact of the COVID-19 crisis. The quickest bear market we have witnessed in global equitymarkets was followed by the most massive global fiscal and monetary easing in history and, maybe not so surprisingly, apowerful recovery in risky assets. US equity markets rebounded in response to the blunt force of the stimuli, despite the poorhandling of the COVID-19 crisis. At nearly 20% of US GDP, the US fiscal response dwarfs any previous stimulus plan. At leastinitially, it seemed that the European response to the COVID-19 crisis was much more consistent and successful than in the US.Most countries went nearly simultaneously into strict lockdowns which lasted six to eight weeks.
In Q2, Geopolitics continued to provide a generally negative undercurrent, with tensions rising between the US and China on anumber of fronts. Additionally, the passing of the National Security law amendment by China in Hong Kong also createdincremental stress. The “trust deficit” between the US and China has continued to widen and potential risks relating to trade,technology and finance continue to rise.
It was notable however to see EU leaders come together and reach a landmark agreement on July 21st to create a recoveryfund. The fund has the potential to be a game changer for Europe, both in terms of jointly issuing bonds (at the EuropeanCommission level) and effecting fiscal transfers across the union.
In Japan, corporates remained much healthier than their global counterparts in terms of leverage, cash balances and dividendswhich, for the most part, had been maintained throughout the COVID-19 crisis. Identifying takeover candidates in Japanremained a focal point of our exposure. As we had predicted, despite concerns around the virus and its potential impact oncorporate events, activity during the quarter was quite robust. Notwithstanding unprecedented instability, Japan set records in2020 in certain aspects of M&A activity. For example, in just the first six months of 2020, ¥3 trillion of tender offers wereannounced, already exceeding the previous full year record of ¥2.5 trillion in 2007
We entered the fourth quarter facing a very heavy macro calendar, which included the finalization (eventually) of along-awaited post Brexit trade deal defining the future relationship between the UK and the EU, the negotiations of additionalgovernment stimulus in every major economic area and of course the US presidential election. Whilst we witnessed asubstantial secondwave of infections in Europe, and the beginning of a thirdwave in the US,markets were relieved to seemajornews flow around a vaccine as European governments endeavored to strike the difficult balance between keeping economiesopen while introducing measures to slow case numbers. Despite a significant rise in COVID-19 infections across the US andEurope during this last quarter, global equity markets rallied on news of a Biden presidential victory as well as the approval ofmultiple vaccines. Against this backdrop, we began liquidating the portfolio in November.
Performance Review
We must be mindful that the world is a very different place than before COVID-19 but believe our core strength remains ourability to analyze change quickly to take advantage of dislocations. We initially spent much time identifying high qualitycompanies that we believed had been oversold in March on the back of the COVID-19 risk-off environment. Our largestcontributor to performance for the year was one such example, JD.com.
One feature of the subsequent recovery globally from the virus has been the varied pace and success of “opening up”. Europegenerally took a conservative and measured approach to the pace of reopening and benefited initially with a relatively smooth
7Lumyna Funds
Investment Managers’ Report (cont.)
Audited annual report
Performance Review (cont.)
and successful journey. As such, during the second quarter, we increased exposure to domestic assets within Europe thatoffered significant upside to the reopening phase of the recovery. This included companies such as the payments companyWorldlinewhich is the second biggest winner for the year with contactless card usage and card penetration stepping up sharply.The third largest contributor to performance was Amazon, which traded higher as a beneficiary of the shift to online shoppingand cloud computing being accelerated.
One theme that continues to strengthen across all markets and is increasingly central in government agendas is the focus on theenvironment and renewable energy. The Eurozone recently increased its targets for carbon reduction by 2030 and theEurozone recovery fund stimulus spend is heavily weighted towards renewable energy capex and other decarbonizationstrategies. The impact of the Biden victory was also a significant event for the renewable energy industry and in our view wasnot fully priced into renewable developers and asset owners such as RWE which was our fourth biggest winner.
All of the top 10 losers were markets hedges which of course make up the majority of our short exposure and are a key part ofmanaging our beta positioning.
8 Lumyna Funds
Investment Managers’ Report (cont.)
Audited annual report
Lumyna – York Asian Event-Driven UCITS Fund
Performance (in class currency)
NAV 31 March, 2020 31 March, 2021 % Change
Class EUR B (acc) 143.62 176.77 23.08%Class EUR C (acc) 106.41 130.41 22.55%
Market Review
2020 was dominated by the global COVID-19 crisis which brought an end to the longest economic expansion phase on record.The pandemic-driven downturn was then subsequently followed by the sharpest recorded recovery, aided by anunprecedented quantity of global monetary easing and fiscal policy action. The overall volatility experienced during this periodwas historic. Against this backdrop, the York Asian Event-Driven UCITS Fund generated a net gain of 19.8% for the fiscal yearending March 31st.
Markets gyrated throughout the year according to the ebb and flow of COVID-19 waves around the globe before seeing aremarkable rally in November, supported by positive news flow around effective vaccines and removal of uncertainty aroundthe U.S. elections. Within Asia, ASEAN markets were the biggest initial winners, bolstered by maximum re-rating potential of atravel and tourism recovery, followed by perceived “value” markets such as Japan, which had lagged more growth-orientatedmarkets to that date.
In Asia, geopolitics continued to provide a generally challenging undercurrent during the period, with tensions between the USand China building from fractious trade negotiations, which began under the Trump administration. The passing of the NationalSecurity Law amendment in Hong Kong became a source of additional contention, which coincided with notable relativeunderperformance of the Hang Seng. In general, the broader “trust deficit” between the US and China widened as it related totrade, technology, and finance.
The American Depositary Receipt market faced a perfect storm of negative sentiment towards the end of the period when inMarch of 2021, the SEC’s update on the Holding Foreign Companies Accountable Act re-ignited de-listing concerns for Chinesecompanies. This coincided with speculation of heightened domestic regulation on the internet, e-cigarettes, and after-schooltutoring sectors, driving a broad correction for many of these sectors of a magnitude not seen since March 2020, andculminated in a historic margin call on a highly leveraged fund with concentrated holdings in the space.
Despite the global pandemic, global M&A activity set new records over the period. Indeed, the second half of 2020 was thestrongest second half ever in the M&Amarket’s history. Driven by mega-deals such as the acquisition of Speedway by Seven &I Holdings (the largest Asian cross-border transaction of 2020), M&A activity in Asia-Pacific and Japan ended +11% versus 2019.This generated the second-highest share of global activity since 2011, with Japan ranking 3rd globally behind the US and the UKin terms of Cross-Border M&A.
We have consistently commented on the healthy potential for domestic tender offers for listed subsidiaries in Japan. Driven bydeals involving the likes of Sony and NTT, we saw tender offers rise over four times year-on-year in 2020, further highlightingthe relative strength of corporate Japan’s balance sheets prior to the pandemic. Topix also has a high beta to work trade andglobal economic growth, and historically Japanese equity returns have tended to be strong when US nominal rates are rising,driving recent market outperformance.
Optimism around the progress of COVID-19 vaccination initiatives and the prospect of further US fiscal stimulus underPresident Biden shifted investor focus firmly in early 2021 to the three R’s of re-opening, recovery, and reflation. However, thelast three months have been punctuated by a series of month-end mini-shocks that highlighted the risks associated withsingle-stock short squeezes, surging bond yields and forced deleveraging.
9Lumyna Funds
Investment Managers’ Report (cont.)
Audited annual report

Market Review (cont.)
The backup in US 10-year note yields over the first quarter of the year was the worst start to a year in the history of theaggregate index, and high levels of volatility in the US Treasury market over the quarter drove multiple risk-off rotations forgrowth-oriented areas of the market along with momentum and technology sectors.
Performance Review
Starting in the second calendar quarter of 2020, we focused our efforts on identifying high-quality companies that we believedhad been oversold on the back of the COVID-19 risk-off environment and stood to benefit from the new economic conditionstriggered by the pandemic. A special focus was also paid to the active monetization of these trades during the period amidsthighly volatile trading conditions.
The top performer for the fund was Hitachi Metals in Japan, which gained on news flow around the potential sale of thebusiness by the parent Hitachi to Private Equity. The second top Japanese performer was our auto-electrification play, whichrebounded strongly over the second half. Our position in Japanese internet giant Z-Holdings benefited from general strength inthe e-commerce sector, and a focus on post-merger synergies from the transaction with dominant messaging and paymentplayer Line.
In China, our top contributor was Wuxi Biologics, which we have been highly active in trading over the period around multipleequity placements. Wuxi contributes 50% of the world’s COVID-19 nAb (neutralizing antibody) projects. Driven by this and aslew of other new projects growth unsurprisingly further accelerated for the company in the second half of 2020.
The second-largest contributor to performance in China was JD.com, a Chinese e-commerce company, which traded higherafter earnings consistently beat consensus. Another notable winner in our portfolio was A-Share listed EV battery playerContemporary Amperex Technology (CATL). CATL has newly emerged as a world-beating national champion in China's EVsupply chain, supplying all major global manufacturers, including Tesla.
Unsurprisingly given broadmarket strength over the period, the largest detractors for the period were our Overlay Index hedgepositions across the region, as well as a customised basket hedge for Hitachi Metals. Our largest detractors for the period wereoverlay positions at the index level.
Investment Outlook
Our Equity Capital Markets strategy and pre-M&A event books remain a core focus for us given the high level of corporateactivity across the region.We expect thatM&A activity in Japanwill continue to build on the powerful trends set over the recentperiod as the world continued to normalize by the end of the year. The number of M&A deals occurring in Japan in Q1 isproviding further confirmation of a structural uptrend.
Private equity dry powder remains extremely elevated in the region and we think it is fair to expect activity here to build on themomentum of previous years. The recent news flow around CVC and potential competing bids from other rival Private Equityplayers looking to acquire Toshiba is further evidence of this trend.
One of the key stories in global equities of early 2021 has been the stark under performance of Chinese equities. Aside fromsome of the standalone news events towards the end of the period, we believe much of this under performance also tracesback to a simple point: China has been clamping down on financial conditions, while most of the G-10 continues to engage inrecord Quantitative Easing and fiscal stimulus.
While a focus on idiosyncratic bottom-up event-driven trades is always our primary focus, one of the larger challenges will likelyremain the need to dynamically manage the weightings of our barbell approach to exposures to both growth/COVIDbeneficiaries and value/reopening beneficiaries amidst ongoing volatile market conditions and constant sentiment shifts.Judging whenever the pendulum has shifted too far on these thematics will remain a focus for our trading.
In China, ongoing geopolitical tensions and China’s “dual circulation” policy will continue to accelerate existing trends ofdomestic companies gaining market share at the expense of foreign imports. This will hold true with hardware and software
10 Lumyna Funds
Investment Managers’ Report (cont.)
Audited annual report

Investment Outlook (cont.)
industries, where Beijing is trying to reduce foreign reliance, and the consumer industry, where domestic brands areincreasingly popular. We believe identifying these local substitution beneficiaries and the emergence of new global championsearly will be an important source of out performance.
11Lumyna Funds
Investment Managers’ Report (cont.)
Audited annual report
Lumyna – AQR Global Relative Value UCITS Fund
Performance (in class currency)
NAV 31 March, 2020 31 March, 2021 % Change
Class USD A (acc) 75.19 N/A1 N/A1
Class USD C (acc) 67.12 N/A1 N/A1
1 Liquidated on May 29, 2020
Market Review
Not applicable due to the short period.
Performance Review
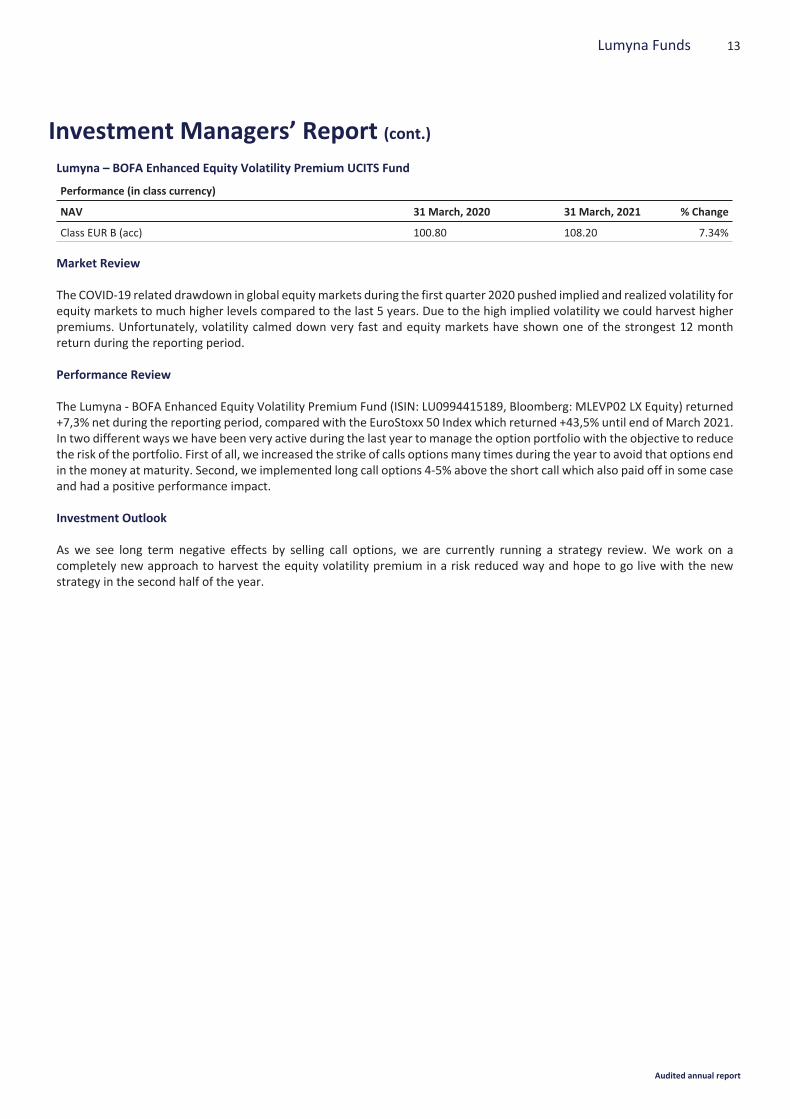
For the partial year starting on April 1st 2020 and ending on May 4th 2020, the Sub-Fund’s Class A shares returned -0.39%. TheClass A shares are denominated in U.S. dollars, which is the reference currency of the Sub-Fund. This period saw equity marketsrebound meaningfully from the COVID-19 driven drawdown in the first quarter of 2020 as risk sentiment improved andgovernments provided largely unprecedented fiscal and monetary stimulus.
During the period, performance was roughly split into three groups by strategy type. The stock selection strategy was the maindetractor over the period driven largely by the continued headwinds faced by value themes. The performance of the macrostrategies (Global Macro, Emerging Markets, Managed Futures, Fixed Income Relative Value) ranged from flat to slightly downwhile both arbitrage strategies provided some meaningful offset to the stock selection driven losses.
12 Lumyna Funds
Investment Managers’ Report (cont.)
Audited annual report
Lumyna – BOFA Enhanced Equity Volatility Premium UCITS Fund
Performance (in class currency)
NAV 31 March, 2020 31 March, 2021 % Change
Class EUR B (acc) 100.80 108.20 7.34%
Market Review
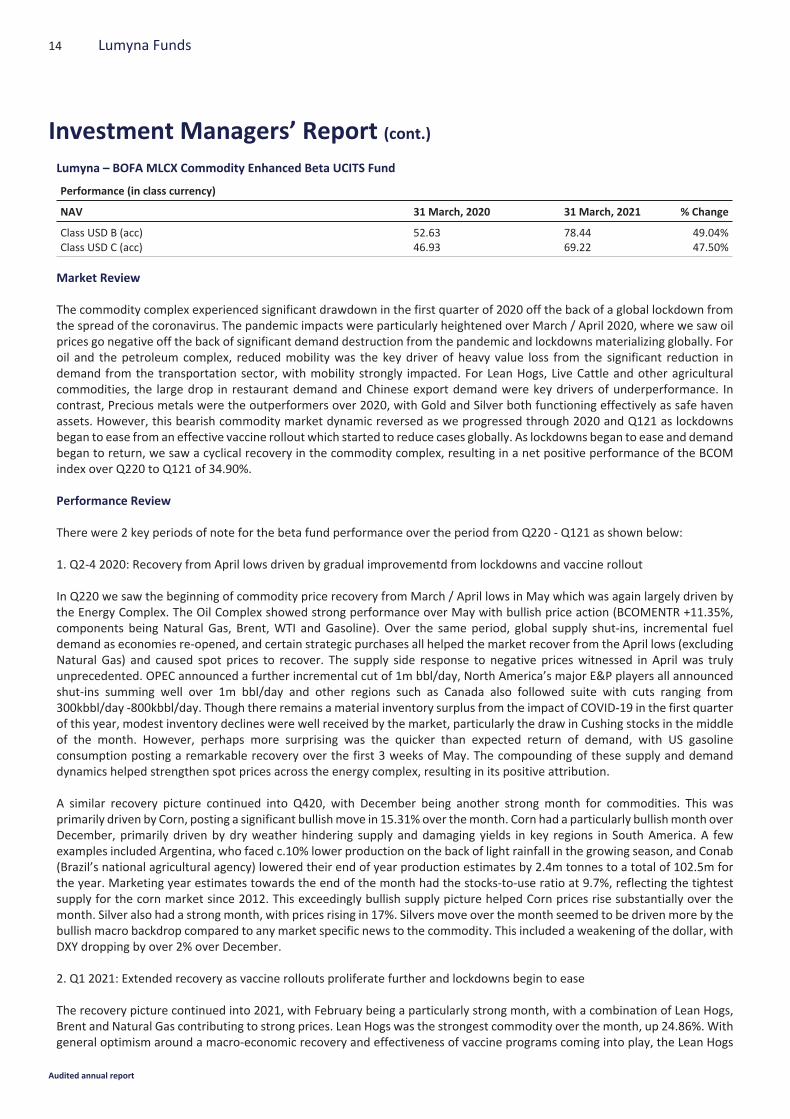
The COVID-19 related drawdown in global equitymarkets during the first quarter 2020 pushed implied and realized volatility forequity markets to much higher levels compared to the last 5 years. Due to the high implied volatility we could harvest higherpremiums. Unfortunately, volatility calmed down very fast and equity markets have shown one of the strongest 12 monthreturn during the reporting period.
Performance Review
The Lumyna - BOFA Enhanced Equity Volatility Premium Fund (ISIN: LU0994415189, Bloomberg: MLEVP02 LX Equity) returned+7,3% net during the reporting period, compared with the EuroStoxx 50 Index which returned +43,5% until end of March 2021.In two different ways we have been very active during the last year to manage the option portfolio with the objective to reducethe risk of the portfolio. First of all, we increased the strike of calls optionsmany times during the year to avoid that options endin the money at maturity. Second, we implemented long call options 4-5% above the short call which also paid off in some caseand had a positive performance impact.
Investment Outlook
As we see long term negative effects by selling call options, we are currently running a strategy review. We work on acompletely new approach to harvest the equity volatility premium in a risk reduced way and hope to go live with the newstrategy in the second half of the year.
13Lumyna Funds
Investment Managers’ Report (cont.)
Audited annual report
Lumyna – BOFA MLCX Commodity Enhanced Beta UCITS Fund
Performance (in class currency)
NAV 31 March, 2020 31 March, 2021 % Change
Class USD B (acc) 52.63 78.44 49.04%Class USD C (acc) 46.93 69.22 47.50%
Market Review
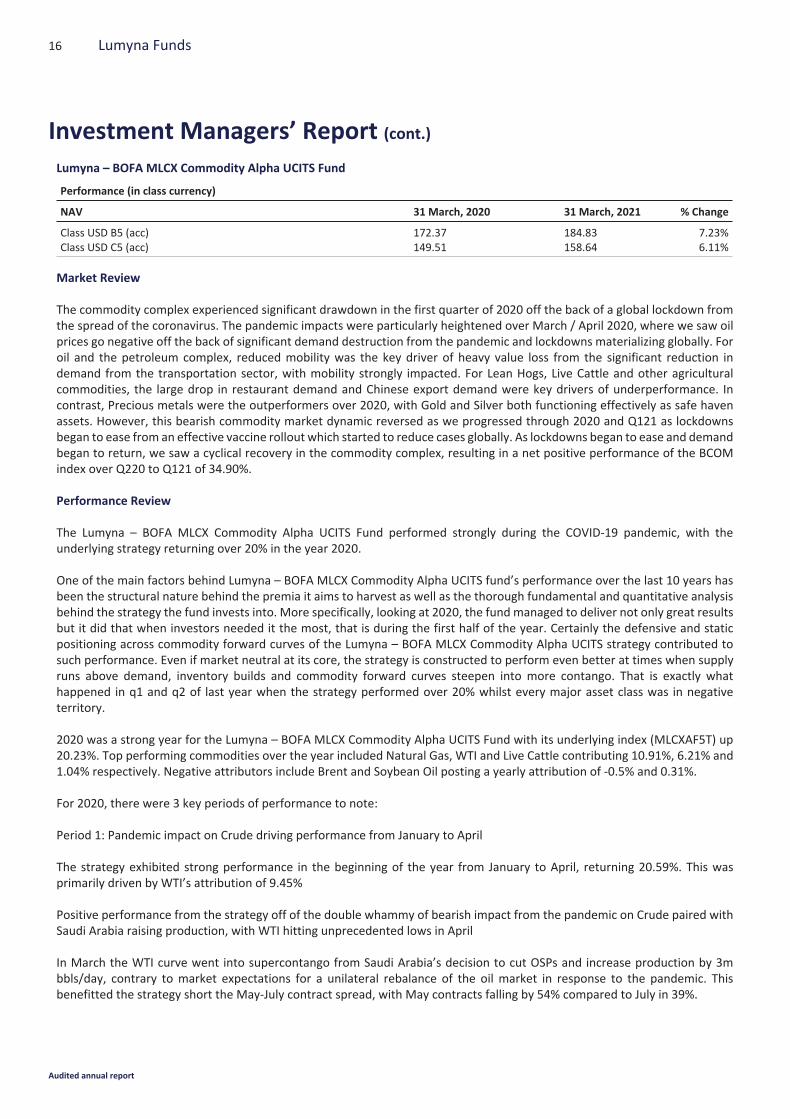
The commodity complex experienced significant drawdown in the first quarter of 2020 off the back of a global lockdown fromthe spread of the coronavirus. The pandemic impacts were particularly heightened over March / April 2020, where we saw oilprices go negative off the back of significant demand destruction from the pandemic and lockdowns materializing globally. Foroil and the petroleum complex, reduced mobility was the key driver of heavy value loss from the significant reduction indemand from the transportation sector, with mobility strongly impacted. For Lean Hogs, Live Cattle and other agriculturalcommodities, the large drop in restaurant demand and Chinese export demand were key drivers of underperformance. Incontrast, Precious metals were the outperformers over 2020, with Gold and Silver both functioning effectively as safe havenassets. However, this bearish commodity market dynamic reversed as we progressed through 2020 and Q121 as lockdownsbegan to ease from an effective vaccine rollout which started to reduce cases globally. As lockdowns began to ease and demandbegan to return, we saw a cyclical recovery in the commodity complex, resulting in a net positive performance of the BCOMindex over Q220 to Q121 of 34.90%.
Performance Review
There were 2 key periods of note for the beta fund performance over the period from Q220 - Q121 as shown below:
1. Q2-4 2020: Recovery from April lows driven by gradual improvementd from lockdowns and vaccine rollout
In Q220 we saw the beginning of commodity price recovery from March / April lows in May which was again largely driven bythe Energy Complex. The Oil Complex showed strong performance over May with bullish price action (BCOMENTR +11.35%,components being Natural Gas, Brent, WTI and Gasoline). Over the same period, global supply shut-ins, incremental fueldemand as economies re-opened, and certain strategic purchases all helped the market recover from the April lows (excludingNatural Gas) and caused spot prices to recover. The supply side response to negative prices witnessed in April was trulyunprecedented. OPEC announced a further incremental cut of 1m bbl/day, North America’s major E&P players all announcedshut-ins summing well over 1m bbl/day and other regions such as Canada also followed suite with cuts ranging from300kbbl/day -800kbbl/day. Though there remains a material inventory surplus from the impact of COVID-19 in the first quarterof this year, modest inventory declines were well received by the market, particularly the draw in Cushing stocks in the middleof the month. However, perhaps more surprising was the quicker than expected return of demand, with US gasolineconsumption posting a remarkable recovery over the first 3 weeks of May. The compounding of these supply and demanddynamics helped strengthen spot prices across the energy complex, resulting in its positive attribution.
A similar recovery picture continued into Q420, with December being another strong month for commodities. This wasprimarily driven by Corn, posting a significant bullishmove in 15.31% over themonth. Corn had a particularly bullishmonth overDecember, primarily driven by dry weather hindering supply and damaging yields in key regions in South America. A fewexamples included Argentina, who faced c.10% lower production on the back of light rainfall in the growing season, and Conab(Brazil’s national agricultural agency) lowered their end of year production estimates by 2.4m tonnes to a total of 102.5m forthe year. Marketing year estimates towards the end of the month had the stocks-to-use ratio at 9.7%, reflecting the tightestsupply for the corn market since 2012. This exceedingly bullish supply picture helped Corn prices rise substantially over themonth. Silver also had a strong month, with prices rising in 17%. Silvers move over the month seemed to be driven more by thebullish macro backdrop compared to any market specific news to the commodity. This included a weakening of the dollar, withDXY dropping by over 2% over December.
2. Q1 2021: Extended recovery as vaccine rollouts proliferate further and lockdowns begin to ease
The recovery picture continued into 2021, with February being a particularly strong month, with a combination of Lean Hogs,Brent and Natural Gas contributing to strong prices. Lean Hogs was the strongest commodity over the month, up 24.86%. Withgeneral optimism around a macro-economic recovery and effectiveness of vaccine programs coming into play, the Lean Hogs
14 Lumyna Funds
Investment Managers’ Report (cont.)
Audited annual report

Performance Review (cont.)
market experiences a significantly bullish month. Drivers of this price action, other than the expected surge in demand fromeconomies (and restaurant) reopening, also included supply concerns – cold storage stocks for the end of January were over25% below the previous year. Positioning also surged over the month, with total open interest more than doubling in the Aprilcontract (compared to the beginning of the year). The confluence of demand expectations, supply concerns and speculativepositioning drove the front contracts strongly higher of over the month. Natural Gas also had a bullish month, up 8%. Themajority of bullish action came in the first half of the month, where March contracts rose dramatically by 13.57% between29/01 and 12/02. The jump in front Natural Gas prices on Valentine’s day weekend was a core driver of this price action, fuelledby severe weather events in Texas. Prolonged cold temperatures on the weekend preceding President’s day caused electricitydemand in the Texas power grid to explode leaving millions of Texans without power, heat and clean water. The storm’s coldtemperatures effectively caused gas pipelines to freeze-off, cutting off around 18 Bcf/day of supply. Considering Texas accountsfor nearly 25% of US Natural Gas production, this caused a large spike in Natural Gas front prices. For the second half of themonth, as the storm impacts were faded and the market returned to being driven by fundamentals, gas prices reverted withMarch expiring 46c/MMbtu lower than the peak seen over the month. Mostly normal temperature forecasts into mid-March,paired with production quickly reverting back to pre–freeze levels caused spreads to overall mean revert and weaken. On nethowever, the initial bullish impact of the storm outweighed the mean reversion over the month.
Investment Outlook
Commodity prices have recovered from the abyss of Q2 2020, inventories have started to draw from very high levels andcommodity forward curves have flattened. If we continue to experience this positive cyclical recovery in 2021 we would expectthe Lumyna - BOFA MLCX Commodity Beta fund to perform positively going forward. With the potential of a structuralsuper-cycle for some commodities such as the looking forward from the all the potential uses of metals global decarbonisationeffort across the globe. In addition, with the gradual expected reopening of economies from continued vaccine rollouts anddissipation of vaccine demand impacts, we can expect to see a healthy return of commodity demand to themarket whichwouldsupport commodity prices going forward.
15Lumyna Funds
Investment Managers’ Report (cont.)
Audited annual report
Lumyna – BOFA MLCX Commodity Alpha UCITS Fund
Performance (in class currency)
NAV 31 March, 2020 31 March, 2021 % Change
Class USD B5 (acc) 172.37 184.83 7.23%Class USD C5 (acc) 149.51 158.64 6.11%
Market Review
The commodity complex experienced significant drawdown in the first quarter of 2020 off the back of a global lockdown fromthe spread of the coronavirus. The pandemic impacts were particularly heightened over March / April 2020, where we saw oilprices go negative off the back of significant demand destruction from the pandemic and lockdowns materializing globally. Foroil and the petroleum complex, reduced mobility was the key driver of heavy value loss from the significant reduction indemand from the transportation sector, with mobility strongly impacted. For Lean Hogs, Live Cattle and other agriculturalcommodities, the large drop in restaurant demand and Chinese export demand were key drivers of underperformance. Incontrast, Precious metals were the outperformers over 2020, with Gold and Silver both functioning effectively as safe havenassets. However, this bearish commodity market dynamic reversed as we progressed through 2020 and Q121 as lockdownsbegan to ease from an effective vaccine rollout which started to reduce cases globally. As lockdowns began to ease and demandbegan to return, we saw a cyclical recovery in the commodity complex, resulting in a net positive performance of the BCOMindex over Q220 to Q121 of 34.90%.
Performance Review
The Lumyna – BOFA MLCX Commodity Alpha UCITS Fund performed strongly during the COVID-19 pandemic, with theunderlying strategy returning over 20% in the year 2020.
One of the main factors behind Lumyna – BOFA MLCX Commodity Alpha UCITS fund’s performance over the last 10 years hasbeen the structural nature behind the premia it aims to harvest as well as the thorough fundamental and quantitative analysisbehind the strategy the fund invests into. More specifically, looking at 2020, the fund managed to deliver not only great resultsbut it did that when investors needed it the most, that is during the first half of the year. Certainly the defensive and staticpositioning across commodity forward curves of the Lumyna – BOFA MLCX Commodity Alpha UCITS strategy contributed tosuch performance. Even if market neutral at its core, the strategy is constructed to perform even better at times when supplyruns above demand, inventory builds and commodity forward curves steepen into more contango. That is exactly whathappened in q1 and q2 of last year when the strategy performed over 20% whilst every major asset class was in negativeterritory.
2020 was a strong year for the Lumyna – BOFA MLCX Commodity Alpha UCITS Fund with its underlying index (MLCXAF5T) up20.23%. Top performing commodities over the year included Natural Gas, WTI and Live Cattle contributing 10.91%, 6.21% and1.04% respectively. Negative attributors include Brent and Soybean Oil posting a yearly attribution of -0.5% and 0.31%.
For 2020, there were 3 key periods of performance to note:
Period 1: Pandemic impact on Crude driving performance from January to April
The strategy exhibited strong performance in the beginning of the year from January to April, returning 20.59%. This wasprimarily driven by WTI’s attribution of 9.45%
Positive performance from the strategy off of the double whammy of bearish impact from the pandemic on Crude paired withSaudi Arabia raising production, with WTI hitting unprecedented lows in April
In March the WTI curve went into supercontango from Saudi Arabia’s decision to cut OSPs and increase production by 3mbbls/day, contrary to market expectations for a unilateral rebalance of the oil market in response to the pandemic. Thisbenefitted the strategy short the May-July contract spread, with May contracts falling by 54% compared to July in 39%.
16 Lumyna Funds
Investment Managers’ Report (cont.)
Audited annual report
Performance Review (cont.)
Over April, though OPEC’s historic deal to reduce supply output by 9.7m bbls/day (c.10% drop in global supply) helped alleviatesome bearish action, the demand drop from COVID-19 proved far greater with WTI May Contracts posting a historic negativesettle. It was clear that the estimated drop of 25m bbls/day of demand was not being matched fast enough by supplyrestrictions.The strategy benefitted from rolling being short May-Jul to Jul-Aug spreads, both of which weakened significantlyover the month.
Period 2: Steady crude market recovery paired with bullish gas in October drove underperformance
A steadily recovering crudemarket compoundedwith a bullish reversion in the gasmarket in October drove the strategy’s grindlower from May to October, with the strategy down 4.91%, driven by contributions from WTI and Brent (-2.45% and -1.7%respectively). In addition Natural Gas also had a significant negative contribution in October at -5.63%.
The crude complex constituted most of the negative attribution from May to end of September. In May we saw a strongrebound in Crude prices, with global supply shut-ins and incremental fuel demand as economies re-opened, helping the oilmarket recover from the April lows. This bullish trend for the crude complex continued to materialise fromMay to September,causing benchmark curves for Brent and WTI to flatten unfavourably.
Period 3: Warmer than expected winter weather weighed heavily on Natural Gas causing a favourable bearish move in thecurve, and positive strategy performance.
The story for Natural Gas over the year was of high inventories and demand destruction causing concern of storagecontainment in October. Gas bucked this bearish trend in October, as storage containment was avoided, and the fundamentalsflipped to a market with tight balances. This bullish move had an unfavourable shift in strategy spreads, where Nov-Jan andJan-Feb spread strengthened by 47% and 15% respectively.
For 2021 the Alpha Fund had 2 key periods of performance.
1. Underperformance in end of January / February driven by the impacts of the Texas storms on Natural Gas and Lean Hogs
Lean Hogs was one of the main underperformers over the February attributing -0.53%. The strategy was short the Apr-Juncontract spread, which strengthened strongly led by Apr contract rising by 13.58% compared to Jun contract up only 7.89%.With general optimism around a macro-economic recovery and effectiveness of vaccine programs coming into play, the LeanHogs market staged an impressive rally. On top of the expected surge in demand from economies (and restaurants) reopening,supply concerns also emerged as cold storage stocks at the end of January were 25% below the previous year. Speculativepositioning exacerbated the move, with total open interest more than doubling in the April contract (compared to thebeginning of the year) by the second week of February. Supply, demand and spec positioning dynamics caused spreads to rallyhelped further by some producer hedging into summer which weighed on longer dated contracts.
Natural Gas also posted a negative attribution of -0.51% over February. The strategy was rolling from being short the Mar-Juncontract spread into being short the May-Jun contract spread. The majority of Natural Gas contribution came in the first half ofthemonth withMarch contracts rising dramatically by over 13% and outperformingMay and June contracts by over 2% and 3%respectively. The jump in front Natural Gas prices on Valentine’s day weekend was a core driver of this price action, fuelled bysevere weather events in Texas. Prolonged cold temperatures on the weekend preceding President’s day caused electricitydemand in the Texas power grid to explode leaving millions of Texans without power, heat and clean water. The storm’s coldtemperatures effectively caused gas pipelines to freeze-off, cutting off around 18 Bcf/day of supply. Considering Texas accountsfor nearly 25% of US Natural Gas production, this caused a large spike in Natural Gas front prices. Overall, spreads ralliedsignificantly as a result of the storm hurting the strategy in the first half of the month. For the second half of the month, as thestorm impacts were faded and the market returned to being driven by medium-term fundamentals, gas prices reverted withMarch expiring 46c/MMbtu lower than the peak seen over the month. Mostly normal temperature forecasts into mid-March,pairedwith production quickly reverting back to pre–freeze levels caused spreads tomean revert andweaken. On net however,the initial negative impact of the storm outweighed the positive attribution from the mean reversion over the month, resultingin gas’s net negative attribution to the strategy.
17Lumyna Funds
Investment Managers’ Report (cont.)
Audited annual report
Performance Review (cont.)
2. Positive mean reversion of performance over march driven by a variety of commodities
The alpha fund had a strong month in March, gaining 2.17%. The top performers over the month included WTI, Sugar, andNatural Gas contributing 0.75%, 0.58% and 0.28% respectively. Soybean Oil, Corn and Lean Hogs were the top underperformersattributing -0.41%, -0.27% and -0.11% respectively. Commodities overall had a weaker month with BCOMTR down 2.17%,bonds also underperformed (US00 Index -1.04%) whilst Equities had a strong month and were up 4.38%.
WTI was the strongest contributor inMarch at 0.75%. Over themonth the strategy was rolling being short theMay-Jun contractspread intoMay-Jul, completely rolling out of Jun contracts by 19thMarch. TheWTI curve favourably flattened over the monthwith May / Jun / Jul contracts falling 3.38% / 2.57% / 1.75% respectively. This benefitted the strategy’s short spread positions,realising the positive attribution. In the first few days of the month, we saw Crude rally off the back of a bullish OPEC+ meetingelecting for an extension of production cuts by another month. This unexpected outcome saw WTI prices rallying from 2nd to5th of March leading to a small negative attribution in the alpha strategy. However, WTI contracts fell over the second half ofthe month, largely driven by complications to the expected global synchronized economic recovery from vaccine rollouts. Theprice of European hesitation on administering the AstraZeneca vaccine, further lockdowns in Europe and rising cases in Brazilwere some of the factors complicating the expected recovery picture. In addition, Powell’s comments stating the FEDwould notfront-run inflation sent treasury yields soaring and the dollar higher – weighing on crude. Weakness persisted in the physicalmarket from Chinese purchases of sanctioned Iranian crude and US refineries in the Gulf remaining offline dampening demandin the US. All of these factors worked to create a bearish environment for WTI, driving the aforementioned flattening of thecurve and positive attribution to the strategy.
Natural Gaswas another positive contributor in the energy complex at 0.28%. The strategywas short theMay-Jun spread rollinginto May-Jul over the month. Over March, the curve favourably steepened into contango, with May / Jun / Jul contracts fallingby 7.16% / 6.81% / 6.41% respectively. The move lower in Natural Gas was largely driven by growing concern of increasingproduction and weak power burns. This led to speculative money reducing length to the lowest levels since August last year.Weather was notably bearish too, with the pattern dominated by a strong polar vortex setting up a ridge through the middle ofthe US, preventing cooler air from either the arctic or pacific reaching the central or east coast. Other than through bearish priceaction, NG provided good attribution via positive carry during March.
Sugar was a standout attributor in the agricultural complex, providing positive performance in 0.58%. The strategy was shortthe May-Jul spread over the month, which favourably weakened with March contracts falling by 10.21% compared to Julcontracts by 6.82%. Sugar prices were largely driven by the combination of easing supply concerns, a weakening Brazilian Realand increasing short positioning fromManagedMoney market participants. The weakness in BRL is a key component weighingon sugar prices (being Brazil a major Sugar producer) as it incentivizes mills to market their crop to foreign customers at lowerUSD prices. Also sugar prices tend to be positively correlated to crude oil, as with higher crude prices, sugar mills can capitaliseby switching their production to focus on ethanol instead of sugar. Bearish crude price action over the second half of themonthweighted on sugar prices too. Finally we saw also supply concerns easing with much needed rain in the second week of theMarch providing some reprieve to drier than normal conditions in Brazil. All of these factors exacerbated price action andflattening of the forward curve from backwardation, helping the alpha strategy.
Investment Outlook
Commodity prices have recovered from the abyss of Q2 2020, inventories have started to draw from very high levels andcommodity forward curves have flattened. If we continue to experience this positive cyclical recovery in 2021 we would expectthe Lumyna - BOFA MLCX Commodity Alpha UCITS fund to perform positively but somewhat below than the 8 to 10% averageof the last 3 years. The appeal for investors to hold this fund in 2021 is not so much in its return potential under normal marketconditions though, but in its potential to provide diversification and defend portfolios as it has done over the last 10 years.Looking at this fund's performance over some of the recent macro shocks it is easy to note that it is a “diversifier byconstruction”. In an environment where equity valuations are undoubtedly high, the 40 years bond rally is coming to an end (assignalled by rising 10y rates) and the Covid 19 has not yet gone away, the Lumyna - BOFAMLCX Commodity Alpha UCITS fund isone of the few investment products that could provide shelter to investors.
18 Lumyna Funds
Investment Managers’ Report (cont.)
Audited annual report
Lumyna – Zeal Greater China Long Short UCITS Fund
Performance (in class currency)
NAV 31 March, 2020 31 March, 2021 % Change
Class USD B (acc) 123.56 166.45 34.71%Class USD Z (acc) 125.06 169.31 35.38%
Market Review
In early 2020, the coronavirus swept across the globe. Adding more pain to the global economy, an oil price war emerged inMarch between Russia and Saudi Arabia. These two combined triggered panic selling which further developed into a creditcrunch. Stock markets around the world experienced deep plunges. The credit crunch was assuaged with a series of monetarypolicies rolled out by major central banks, and markets around the world recovered some lost ground.
In April, major markets witnessed somewhat recovered against the backdrop of a looming global recession. Investor’sconfidence was restored and China witnessed a healthy revival of economic activity at the end of April. In June, the GreaterChina market had a strong month supported by strong institutional and retail liquidity.
In October, China’s offshore market saw dispersed performances in different sectors, banks and ecommerce names rallied,while most of the rest of the market registered negative returns on continued profit-taking likely triggered by the uncertaintiesbefore the US presidential election. Fundamentally, we saw continuous and solid recovery of the Chinese economy and webelieved the potential upside in the Chinese equity market should stem from the improving quality of China’s growth modelcoupled with more innovative elements in corporate earnings drivers.
At the end of October, the 5th Plenum unveiled a part of China’s long-term strategic initiatives under the 14th Five Year Plan(2021- 2025). After the Plenum, China’s state media Xinhua released a speech by President Xi Jinping to the party’s CentralCommittee, in which he expressed his confidence to double the size of China’s economy and per capita income by 2035,meaning that the annual growth rate of real GDP could reach 4.7% in the next 15 years1 . In November, economic datacontinued to point to a broad recovery of China’s economy, with promising data onManufacturing PMI, nonmanufacturing PMIand growth in retail sales. In December, Beijing signalled a gradual exit of easing policies, and the policymeasures will bemainlyfocused on preventing potential over-heating of the economy.
As 2021 kicked off, January was a volatile month where the offshore Chinese market saw a euphoric rise driven by the massivesouthbound and overseas fund inflow, but then took a deep plunge at the end of January on the fear of Mainland liquiditytightening together with the volatilities in the overseasmarkets instigated by the GameStop fiasco. And then at the beginning ofFebruary, the Chinese regulators published the “Anti-monopoly Guidelines for Online Platform Economies”, developed fromthe consultation paper released last November. It is the official legal framework on how the government would superviseChina’s e-commerce companies, with more clarity added on how the law will protect consumer interests against monopolisticpractices including exclusive partnership, discriminatory pricing, unreasonable additional fees, forced bundled sales, etc. Afterthe release of the law, sentiments towards e-commerce companies dampened as some business practices needed to bemodified. Chinese equities experienced a volatile month in February and the volatilities extended well into March. On the backof higher US bond yields, due to rising global inflation expectations, high valuation growth stocks took a tumble which then spiltover to the rest of the market, resulting in indiscriminate sell off.
Performance Review
Over the 12-month period ending Mar 31, 2021, the Fund (Class USD B Acc) returned +34.71%. One of our contributors isShenzhou International Group Holdings Limited (2313 HK), a garment manufacturer headquartered in Ningbo, China thatserves major global brands such as Adidas, Nike, Puma, and Uniqlo and we have been covering this company for over 10 years.One of the core competitiveness of Shenzhou comes from its vertically integrated business model, they design and producein-house fabric for their own garment products. From producing its own fabric to concentrating all the production process in
19Lumyna Funds
Investment Managers’ Report (cont.)
Audited annual report
Performance Review (cont.)
the same area, Shenzhou is able to reduce the time and costs on logistics, minimize the production costs, and have good qualitycontrol over their products. This is also one of the main reasons why Shenzhou’s stock price has been more resilient than itspeers during the COVID-19 pandemic.
We held Shenzhou throughout the pandemic, even when the company experienced a sharp pullback in stock price as marketnaturally worried about its potential decline in sales revenues being an exporter in Q1 2020. We took advantage of this tofurther increase our exposure in the first half of 2020, as we believed that since Shenzhou is a supplier of choice of majorbrands, this was an opportunity for it to further strengthen its relationships with main clients. Our views were eventuallyvalidated during results season in August 2020 when the company announced consensus beating 1H20 results. The stock wasup +98.35% over the 12-month period ending Mar 31, 20212 .
The other contributor is Zai Lab Limited (ZLAB US), a Health Care stock that we first invested back in Q1 2019. The company hasestablished a comprehensive product line through internal Research & Development (R&D) and partnerships with leadingglobal biopharma companies. Through these partnerships, ZLAB has earned some long-term strategic partners for globalclinical development and made a sound reputation among those global biopharmaceutical companies who want to break intothe Chinese market. Apart from the strong earnings visibility of its in- licensing strategy, we also like this company for itsexperienced team and positive industry outlook. This investment thesis played out well throughout the 12-month periodending Mar 31, 2021 - the stock was up +159.19%3.
Investment Outlook
US Inflation Expectations on the Rise
By the time of writing, we saw a steep rise in 10-year US government bond yield, flirting with the 1.6% level, hitting the highestlevel since March3. This was driven by the rising inflation expectations in the US, which in turn triggered concerns that the USFed might tighten earlier than expected.
While we concur that the US inflation is on the rise and the US bond yields can hardly go lower, we don't think that investors arenecessarily disagreeing with the Fed’s assessment that inflation pressure in the US is only ‘transitory’. Intuitively, we expectcore personal consumption expenditures (“PCE”) inflation in the US to spike in the next few months on the back of a low base,themassive stimuli implemented, and the abundant cash US consumers have been hoarding. However, the sustainability of theCPI strengths ought to be questioned. While we don't think the market has any strong conviction on the strength and thedurability of the CPI, we believe that as investors have never experienced a post-pandemic recovery driven by herd immunity onlarge scale and effective vaccination coverage, nobody knows how drastic the recovery could be and its impact on the ratesmarket. This is the real, albeit temporary, overhang in the market.
Global Fund Flow in Chinese Equities
Looking forward, we believe Chinese equities will continue to attract global capital inflows as the rise of the underrepresentedChinese equity market in global equity indexes will continue to mandate increases in global capital allocations. With China’seconomy accounting for around 16% of the world’s GDP in 2019, and its equity market cap only accounting for 5% in thebenchmark MSCI All Country World Index (ACWI) in Jan 20214 . In the future, as global indexes are likely to raise China’sweighting, the Chinese market should arguably expect continuous global fund inflow in the long run.
1Source: Morgan Stanley, as of November 20202Source: Bloomberg, as of March 20213Source: Investopedia as of March 20214Source: MSCI as of March 2021
20 Lumyna Funds
Investment Managers’ Report (cont.)
Audited annual report

Lumyna – Ramius Merger Arbitrage UCITS Fund
Performance (in class currency)
NAV 31 March, 2020 31 March, 2021 % Change
Class USD B (acc) 105.39 122.55 16.28%Class USD C (acc) 102.90 120.08 16.70%
Market Review
Last March, the financial market upheaval brought echoes of 2008, but by the fourth quarter the more apt comparison mayhave been 1998. The year ended in bull market formation:Multi-billion dollarM&A transactions being inked almost weekly, theIPO market at its strongest in 20 years, retail investors chasing hyperbolic single stocks, and new technologies/asset classes(bitcoin) attracting speculative attention. We would note that even during the bull market of the late 1990’s, the marketwitnessed several large drawdowns, and that was with the broader economy in much stronger standing and theU.S. government running balanced budgets.
Adversity is inevitable (even as much as you often don’t see it coming), but you can control how you respond to the challenge.The merger arbitrage investment environment in Spring 2020 was unprecedented, both in terms of the stress in pending dealsand the lack of new transactions. We kept a steady hand by staying true to our research process and trading strategies. We alsoadapted to the environment around us by seeking opportunities in the wreckage, and by finding new ones when deal activityresumed, and SPAC issuance took flight.
By the end of the year, our robust investment process—honed over a decade of this team’s portfolio management and twodecades of this firm’s history in merger arbitrage—succeeded in delivering another positive year.
Performance Review
Our performance this year has been a testament to the fortitude of our investment process. Over the ten-year history of thisinvestment team's management of themerger arbitrage strategy, we have navigatedmany disparate investment climates. Likemost investment strategies, we go through periods of drawdown; however, our repeatable and differentiated process hashistorically enabled us to recover drawdowns in a timely manner. The COVID-19 crisis precipitated an unprecedentedinvestment environment for merger arbitrage, even including the 2008 financial crisis; Many transactions signed prior to thecrisis came under pressure, and new deal activity essentially ground to a halt between March and May. In the face of thesechallenges, we stayed focused on our process, asking: (1) what does our fundamental research indicate about the probabilitythat a transaction will complete, the timing, and the upcoming interim events, and (2) how capital efficient is the trade (i.e. howmuch profit can we generate per unit of risk, per unit of time, relative to other opportunities in the universe and relative to ourfundamental research view)? For several months now, we have highlighted three legs to our near-term opportunity set:(1) Pre-COVID-19 deals with optionality; (2) Post-COVID-19 deals with attractive spreads; and (3) SPACs.
The Taubman/Simon Property transaction was the largest positive contributor for the year and our most significant detractorwas our market hedge. We have had a view that many pre-COVID-19 deals offered asymmetric risk/reward opportunities. Webelieved that these trades carried limited procedural downside given their respective deal timelines but meaningful upside onseveral potential events
Investment Outlook
Despite our own general disbelief at a stock market seemingly untethered from realistic valuation analysis, we would like tohighlight two critical points for merger arbitrage investors. First, historically, this type of financial markets backdrop has beenvery fertile ground for event-driven investing, including heavy deal volume, bidding wars, sale processes playing out favorably,etc. Second, with negative-yielding debt reaching record levels, we believe the yield-like, short-duration characteristics ofmerger arbitrage spreads provide a compelling alternative in today’s world of razor-thin corporate bond spreads.
The broader world we live in is quite different than it was just one year ago, and we believe the merger arbitrage universe islikely to be somewhat altered as well. We see several carryover themes from 2020 that we believe are likely to be meaningfulM&Adrivers in the coming year, including: (1) the newU.S. presidency, (2) governmental stimulus, particularly by central banks,and its effects on currencies, (3) the medical solution(s) to COVID-19, and (4) the IPO market.
21Lumyna Funds
Investment Managers’ Report (cont.)
Audited annual report
Investment Outlook (cont.)
We believe the expected proliferation of multi-billion-dollar transactions in 2021 plays to our strengths; We generally thrive onlarge, liquid situations with interesting research questions to answer, ample spreads to capture, multiple securities to examine,and the ability to trade opportunistically. Moreover, despite the many changes going on around us, we believe some things inmerger arbitrage are likely to remain the same; Regardless ofmarketmoves, merger arbitrage spreads aremean reverting if thedeals close on terms, and even last year almost all the pre-COVID-19 deals that went to litigation closed with renegotiatedterms. Further, the largest deals continue to trade with excess risk premium simply—we believe—because they are too big forevent driven investors to constrain.
22 Lumyna Funds
Investment Managers’ Report (cont.)
Audited annual report
Lumyna – KLS Fixed Income UCITS Fund
Performance (in class currency)
NAV 31 March, 2020 31 March, 2021 % Change
Class USD D (acc) 88.72 87.621 (1.24%)
1 NAV as on liquidation date March 25, 2021
Market Review
The past year has been severely impacted by the COVID-19 global pandemic. All markets had increased volatility and pricingpressures and as a result produced product dislocations. These dislocations varied in both depth and duration but have sinceexhibited a significant recovery in asset prices, but have not come back in full.
Performance Review
KLS Diversified AssetManagement LPmanaged the portfolio throughout the pandemic and the portfolio was severely impactedby the pandemic. The portfolio was particularly challenged by the positioning when the pandemic hit. KLS was happy with therecovery, which partially reduced the losses over the course of the year. It should be noted that during the year, KLS did moreadditional tail hedges, which were added to control portfolio risks, which also hurt performance.
23Lumyna Funds
Investment Managers’ Report (cont.)
Audited annual report
Lumyna – Millburn Diversified UCITS Fund
Performance (in class currency)
NAV 31 March, 2020 31 March, 2021 % Change
Class USD B (acc) 99.21 111.50 12.39%Class USD C (acc) 97.39 108.95 11.87%
Market Review
From April through September market sentiment generally improved in response to the steady stream of aggressive monetaryand fiscal policy actions taken by global authorities—especially in the U.S.; surprising improvements in economic activity aseconomies cautiously reopened; and sporadic encouraging news concerning COVID-19 therapies and vaccines. But this overallattitude improvement was muted at times by the still horrific statistical reports on growth and unemployment globally; freshoutbursts of COVID-19 cases in many countries; a tapering of fiscal support programs; uncertainty surrounding the NovemberU.S. elections; continued tensions between Beijing and Washington; and contentious Brexit talks.
During the second half of the FY, the global reflation trade gathered momentum in response to the unexpectedly rapid rolloutof COVID-19 vaccinations globally; the further expansion of massive fiscal stimulus—first in December from the TrumpAdministration and then inMarch from the new Biden Administration; Federal Reserve Chairman Powell’s repeated statementsthat the Fed will maintain ultralow interest rates and continue hefty asset purchases until “substantial further progress hasbeenmade toward its employment and inflation goals”, and the resurgence in the growth of global trade. Even during this time,however, the growth outlook and investor enthusiasm were tamped down and markets experienced increased volatilityperiodically due to concerns about the slow pace of vaccine distribution in Europe, Asia and emerging markets relative to theU.S. and U.K.; evidence of moderating monetary and fiscal policy support out of China, and the expanding geopolitical conflictbetween China and the U.S.
Global equity markets climbed surprisingly swiftly from the depths reached in late March 2020. As the reopening and reflationthemes followed one another, stock markets across the world rose towards record highs despite numerous temporarysetbacks.
Currency trading was mixed but profitable this FY. The U.S. dollar vacillated narrowly before spiking 8-9%higher in mid-March2020 in response to pandemic driven safe haven demand. Thereafter, from late March through yearend, the U.S. dollar fellabout 13-15% in volatile trading. During that time, market participants saw the pillars of dollar strength eroded. The interestrate differential collapsed as the Federal Reserve cut policy rates to near zero. The numerous other Fed programs, especiallyexpanded swap lines, mitigated any feared dollar shortage. The passage of a joint European fiscal program led to euro strength.Relatively strong growth in China and Asia led to gains for the renminbi and Asian currencies more generally. Uncertaintyaround the U.S. elections dampened enthusiasm for the greenback. The Brexit agreement was a fillip for the pound. In contrast,in the first three months of 2021, the dollar reversed course and bounced higher in again volatile trading amid downgrades tothe growth prospects outside the U.S.
Metal markets were roiled by the fluid growth, inflation, currency and interest rate developments throughout the year andperformance was mixed.
At the start of the FY, long interest rate futures positions were profitable as historically accommodative monetary policies, aplunge in global growth, and disinflationary impulses worldwide restrained interest rates across yield curves. Safe haven buyingof government securities also placed downward pressure on rates. Through the final six months of 2020 global interest rateswere buffeted by conflicting forces and were quite volatile. On the one hand, persistently accommodative monetary policyglobally, quiescent inflation throughout the developed world and safe haven demand for government securities weighed downinterest rates. On the other hand, historically large and possibly rising government deficits and debts, the announcement of theFederal Reserve’s new long run average inflation targeting framework and hope for a strong global economic rebound asvaccinations become widespread, raised concerns about increasing inflation, rising long-term interest rates, and steepeningyield curves. These growth, inflation and government borrowing concerns caused global note and bond yields to spike sharplyhigher during the January-February period, although they pulled back when growth optimism faded at fiscal yearend.
24 Lumyna Funds
Investment Managers’ Report (cont.)
Audited annual report
Market Review (cont.)
Energy markets were also buffeted by conflicting forces throughout the fiscal year. Initially, the massive COVID-19 demandshock caused a collapse of Brent crude oil prices from near $68/barrel at the start of 2020 to only $19/barrel near the end ofApril. Subsequently, supply reductions from OPEC+ and non-OPEC producers in response to plunging market prices put a floorunder the market and helped prices to recover sharply in May and June to around $40/barrel as market participants wereencouraged by signs of economic reopening. During the summer and into mid-November, crude oil prices vacillated in a$38-46/barrel range as production control efforts and signs of economic reopening, especially in China, undergirded prices,while the huge demand destruction from the COVID-19 pandemic, rising US fuel inventories and rising Libyan productionrestrained any upward impulse. Thereafter, prices surged on the strength of the reflation trade and OPEC+’s productionrestraint, reaching over 2-year highs in early March. Then, once again crude prices dropped sharply as demand expectationsreceded, and Brent crude which had reached nearly $71/barrel on March 7, plunged to under $58/barrel on March 22. Andeven though the closure of the Suez Canal provided some fillip to crude prices, Brent still closed the month and FY under$63/barrel.
Performance Review
The Fund was profitable during the fiscal year (FY) almost entirely due to profits from trading stock index futures. There werealso profits from trading currency forwards and grain and metal futures, but those modest gains were more than offset bylosses from trading interest rate, energy and to a lesser extent soft commodity and livestock futures.
In the equity sector, long positions in U.S., Canadian, Chinese, Hong Kong, Taiwanese, Korea, European, EAFE, and EEMemerging market index futures were profitable. A short VIX index trade was also profitable.
In the currency sector, short dollar trades against the euro, South African rand, Singapore dollar, Indian rupee, Chilean peso andIsraeli shekel, and trading the dollar versus the currencies of Great Britain, Switzerland and New Zealand were profitable.Meanwhile, short dollar positions relative to the Russian ruble, and Swedish krona, a long U.S. dollar/short Canadian dollarposition and trading the U.S unit versus the currencies of Australia, Brazil and Mexico posted partially offsetting losses.
In the grains sector, during the October-March period, strong Chinese demand for U.S. exports, a weaker than expectedU.S. harvest of row crops and dry weather in South America led to higher grain prices and profits on long corn, soybean andsoybean oil trades. Then, onMarch 31, 2021 the USDA reported that farmers are likely to plant much lower-than-expected cornand soybean acreage in 2021, and corn and soybean prices traded limit-up on the day, reinforcing results from earlier in theperiod. On the other hand, short wheat trades posted partially offsetting losses.
In metals, a long silver trade was profitable due to increased industrial demand because of the metal’s use in electronics andsolar panels. Silver also benefitted at times from safe haven demand for precious metals. Meanwhile, small gains and lossesfrom trading other metal markets netted to a small partially offsetting loss.
In the interest rate sector, long positions in U.S., British, Australian, Canadian, French and Japanese long bond futures and inGerman bobl and bund futures were unprofitable. On the other hand, long positions during 2020 in Eurodollar and Italian10-year and short-term interest rate futures, and a short position in the German ultra-long bond future in February registeredpartially offsetting gains.
In energy, trading of WTI crude oil, RBOB gasoline, heating oil and London gas oil registered losses. Short natural gas tradeswere also unprofitable on several occasions including: during August as a result of strong cooling demand due to anextraordinarily hot summer in the U.S. and rising industrial demand as economies gradually emerged from lockdown; duringJanuary when prices rose in response to unusually cold weather across Europe and China, and in February in the wake of theweather-induced energy market turmoil in Texas. Elsewhere, trading of Brent crude oil was slightly profitable.
Lastly, losses from trading coffee and hog futures slightly outpaced the gains from trading cocoa and live cattle futures.
25Lumyna Funds
Investment Managers’ Report (cont.)
Audited annual report
Investment Outlook
As market participants react to divergent growth and inflation trends across the globe; to the ebb and flow of political andgeopolitical tensions; to shifts in trade policy; to environmental and health crises; and to the changing patterns ofmonetary andfiscal policies globally, it seems likely that capital flows from market to market and from country to country will generate priceactivity that can be beneficial to Millburn’s quantitative, systematic approach to trading global markets.
26 Lumyna Funds
Investment Managers’ Report (cont.)
Audited annual report
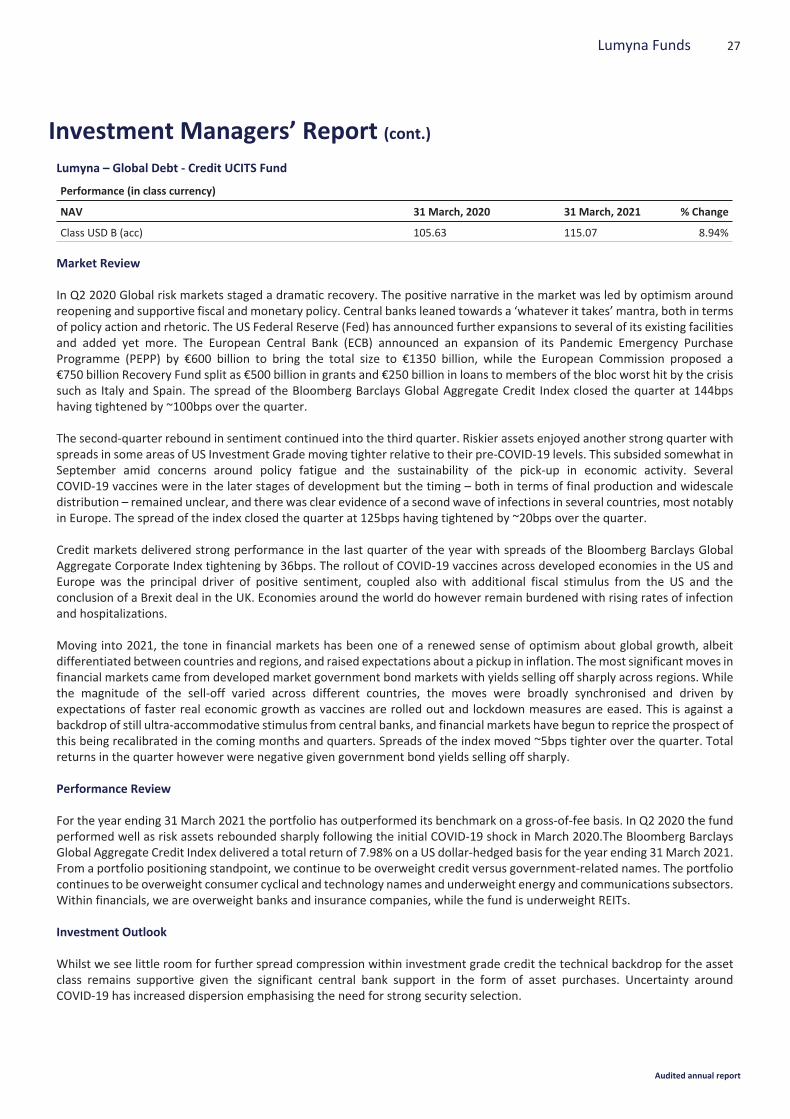
Lumyna – Global Debt - Credit UCITS Fund
Performance (in class currency)
NAV 31 March, 2020 31 March, 2021 % Change
Class USD B (acc) 105.63 115.07 8.94%
Market Review
In Q2 2020 Global risk markets staged a dramatic recovery. The positive narrative in the market was led by optimism aroundreopening and supportive fiscal and monetary policy. Central banks leaned towards a ‘whatever it takes’ mantra, both in termsof policy action and rhetoric. The US Federal Reserve (Fed) has announced further expansions to several of its existing facilitiesand added yet more. The European Central Bank (ECB) announced an expansion of its Pandemic Emergency PurchaseProgramme (PEPP) by €600 billion to bring the total size to €1350 billion, while the European Commission proposed a€750 billion Recovery Fund split as €500 billion in grants and €250 billion in loans to members of the bloc worst hit by the crisissuch as Italy and Spain. The spread of the Bloomberg Barclays Global Aggregate Credit Index closed the quarter at 144bpshaving tightened by ~100bps over the quarter.
The second-quarter rebound in sentiment continued into the third quarter. Riskier assets enjoyed another strong quarter withspreads in some areas of US Investment Grade moving tighter relative to their pre-COVID-19 levels. This subsided somewhat inSeptember amid concerns around policy fatigue and the sustainability of the pick-up in economic activity. SeveralCOVID-19 vaccines were in the later stages of development but the timing – both in terms of final production and widescaledistribution – remained unclear, and there was clear evidence of a second wave of infections in several countries, most notablyin Europe. The spread of the index closed the quarter at 125bps having tightened by ~20bps over the quarter.
Credit markets delivered strong performance in the last quarter of the year with spreads of the Bloomberg Barclays GlobalAggregate Corporate Index tightening by 36bps. The rollout of COVID-19 vaccines across developed economies in the US andEurope was the principal driver of positive sentiment, coupled also with additional fiscal stimulus from the US and theconclusion of a Brexit deal in the UK. Economies around the world do however remain burdened with rising rates of infectionand hospitalizations.
Moving into 2021, the tone in financial markets has been one of a renewed sense of optimism about global growth, albeitdifferentiated between countries and regions, and raised expectations about a pickup in inflation. Themost significantmoves infinancial markets came from developed market government bond markets with yields selling off sharply across regions. Whilethe magnitude of the sell-off varied across different countries, the moves were broadly synchronised and driven byexpectations of faster real economic growth as vaccines are rolled out and lockdown measures are eased. This is against abackdrop of still ultra-accommodative stimulus from central banks, and financial markets have begun to reprice the prospect ofthis being recalibrated in the coming months and quarters. Spreads of the index moved ~5bps tighter over the quarter. Totalreturns in the quarter however were negative given government bond yields selling off sharply.
Performance Review
For the year ending 31 March 2021 the portfolio has outperformed its benchmark on a gross-of-fee basis. In Q2 2020 the fundperformed well as risk assets rebounded sharply following the initial COVID-19 shock in March 2020.The Bloomberg BarclaysGlobal Aggregate Credit Index delivered a total return of 7.98% on a US dollar-hedged basis for the year ending 31March 2021.From a portfolio positioning standpoint, we continue to be overweight credit versus government-related names. The portfoliocontinues to be overweight consumer cyclical and technology names and underweight energy and communications subsectors.Within financials, we are overweight banks and insurance companies, while the fund is underweight REITs.
Investment Outlook
Whilst we see little room for further spread compression within investment grade credit the technical backdrop for the assetclass remains supportive given the significant central bank support in the form of asset purchases. Uncertainty aroundCOVID-19 has increased dispersion emphasising the need for strong security selection.
27Lumyna Funds
Investment Managers’ Report (cont.)
Audited annual report
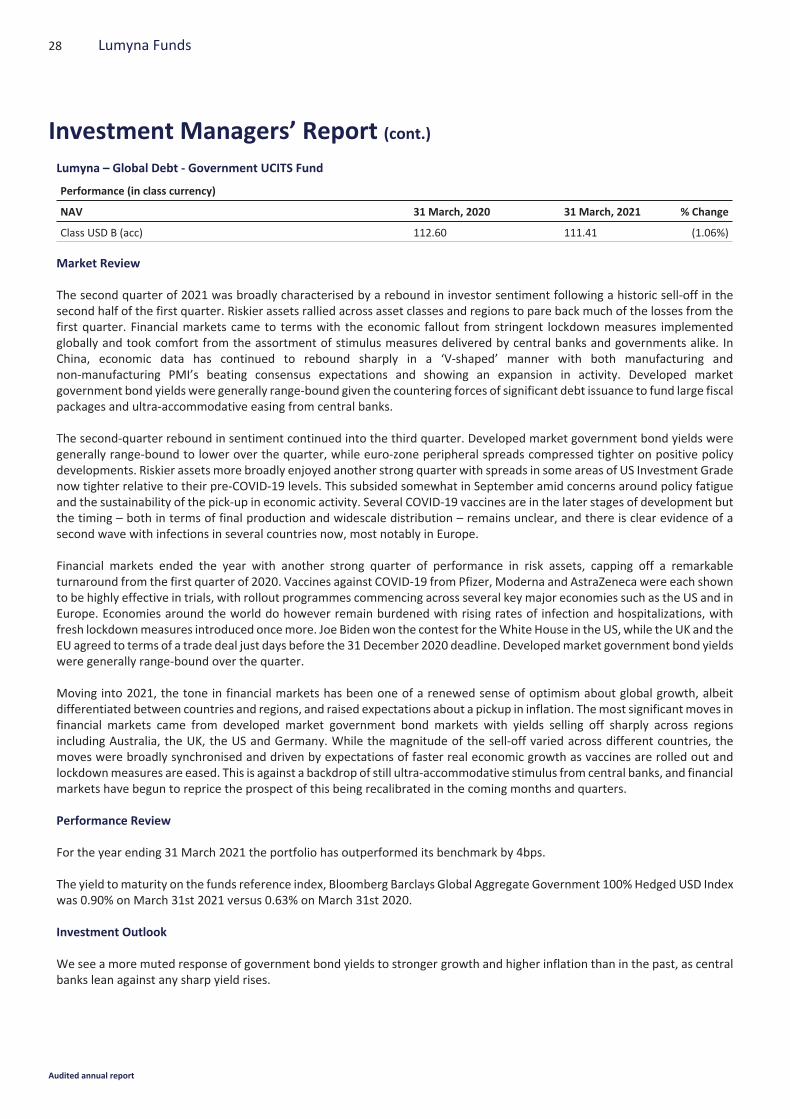
Lumyna – Global Debt - Government UCITS Fund
Performance (in class currency)
NAV 31 March, 2020 31 March, 2021 % Change
Class USD B (acc) 112.60 111.41 (1.06%)
Market Review
The second quarter of 2021 was broadly characterised by a rebound in investor sentiment following a historic sell-off in thesecond half of the first quarter. Riskier assets rallied across asset classes and regions to pare back much of the losses from thefirst quarter. Financial markets came to terms with the economic fallout from stringent lockdown measures implementedglobally and took comfort from the assortment of stimulus measures delivered by central banks and governments alike. InChina, economic data has continued to rebound sharply in a ‘V-shaped’ manner with both manufacturing andnon-manufacturing PMI’s beating consensus expectations and showing an expansion in activity. Developed marketgovernment bond yields were generally range-bound given the countering forces of significant debt issuance to fund large fiscalpackages and ultra-accommodative easing from central banks.
The second-quarter rebound in sentiment continued into the third quarter. Developed market government bond yields weregenerally range-bound to lower over the quarter, while euro-zone peripheral spreads compressed tighter on positive policydevelopments. Riskier assets more broadly enjoyed another strong quarter with spreads in some areas of US Investment Gradenow tighter relative to their pre-COVID-19 levels. This subsided somewhat in September amid concerns around policy fatigueand the sustainability of the pick-up in economic activity. Several COVID-19 vaccines are in the later stages of development butthe timing – both in terms of final production and widescale distribution – remains unclear, and there is clear evidence of asecond wave with infections in several countries now, most notably in Europe.
Financial markets ended the year with another strong quarter of performance in risk assets, capping off a remarkableturnaround from the first quarter of 2020. Vaccines against COVID-19 from Pfizer, Moderna and AstraZeneca were each shownto be highly effective in trials, with rollout programmes commencing across several key major economies such as the US and inEurope. Economies around the world do however remain burdened with rising rates of infection and hospitalizations, withfresh lockdownmeasures introduced oncemore. Joe Bidenwon the contest for theWhite House in the US, while the UK and theEU agreed to terms of a trade deal just days before the 31 December 2020 deadline. Developedmarket government bond yieldswere generally range-bound over the quarter.
Moving into 2021, the tone in financial markets has been one of a renewed sense of optimism about global growth, albeitdifferentiated between countries and regions, and raised expectations about a pickup in inflation. Themost significantmoves infinancial markets came from developed market government bond markets with yields selling off sharply across regionsincluding Australia, the UK, the US and Germany. While the magnitude of the sell-off varied across different countries, themoves were broadly synchronised and driven by expectations of faster real economic growth as vaccines are rolled out andlockdownmeasures are eased. This is against a backdrop of still ultra-accommodative stimulus from central banks, and financialmarkets have begun to reprice the prospect of this being recalibrated in the coming months and quarters.
Performance Review
For the year ending 31 March 2021 the portfolio has outperformed its benchmark by 4bps.
The yield tomaturity on the funds reference index, Bloomberg Barclays Global Aggregate Government 100%Hedged USD Indexwas 0.90% on March 31st 2021 versus 0.63% on March 31st 2020.
Investment Outlook
We see a more muted response of government bond yields to stronger growth and higher inflation than in the past, as centralbanks lean against any sharp yield rises.
28 Lumyna Funds
Investment Managers’ Report (cont.)
Audited annual report
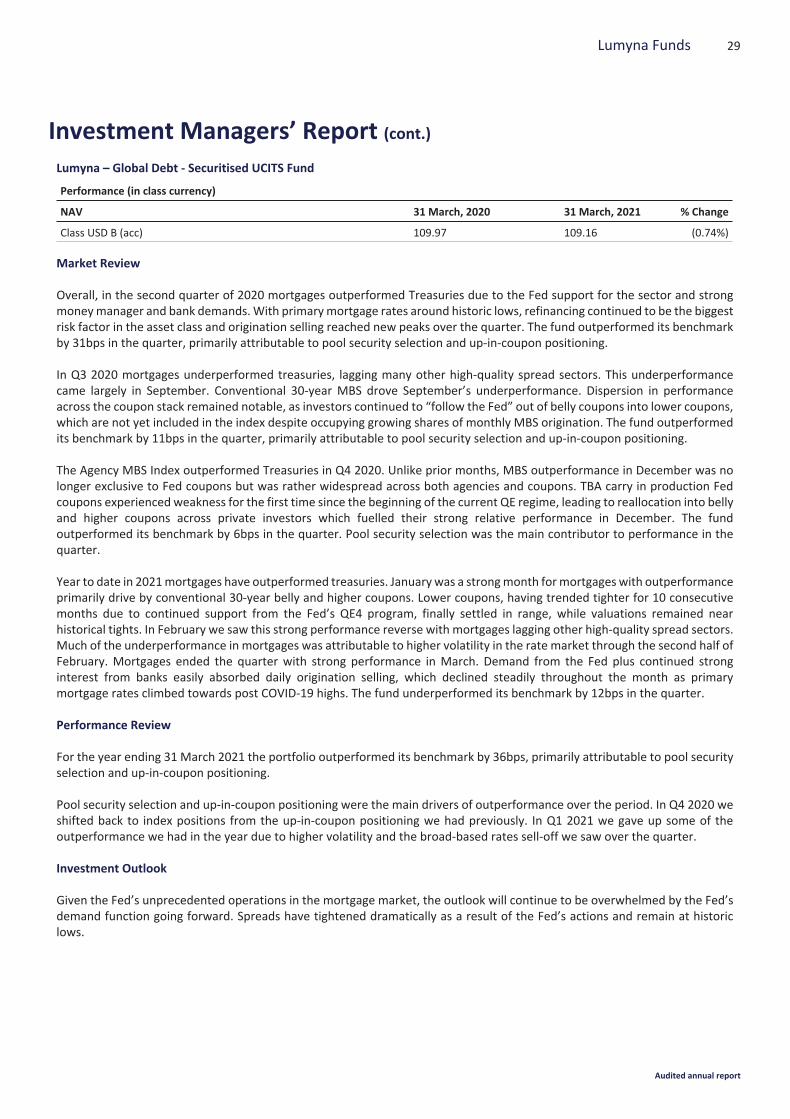
Lumyna – Global Debt - Securitised UCITS Fund
Performance (in class currency)
NAV 31 March, 2020 31 March, 2021 % Change
Class USD B (acc) 109.97 109.16 (0.74%)
Market Review
Overall, in the second quarter of 2020 mortgages outperformed Treasuries due to the Fed support for the sector and strongmoneymanager and bank demands.With primarymortgage rates around historic lows, refinancing continued to be the biggestrisk factor in the asset class and origination selling reached new peaks over the quarter. The fund outperformed its benchmarkby 31bps in the quarter, primarily attributable to pool security selection and up-in-coupon positioning.
In Q3 2020 mortgages underperformed treasuries, lagging many other high-quality spread sectors. This underperformancecame largely in September. Conventional 30-year MBS drove September’s underperformance. Dispersion in performanceacross the coupon stack remained notable, as investors continued to “follow the Fed” out of belly coupons into lower coupons,which are not yet included in the index despite occupying growing shares of monthly MBS origination. The fund outperformedits benchmark by 11bps in the quarter, primarily attributable to pool security selection and up-in-coupon positioning.
The Agency MBS Index outperformed Treasuries in Q4 2020. Unlike prior months, MBS outperformance in December was nolonger exclusive to Fed coupons but was rather widespread across both agencies and coupons. TBA carry in production Fedcoupons experienced weakness for the first time since the beginning of the current QE regime, leading to reallocation into bellyand higher coupons across private investors which fuelled their strong relative performance in December. The fundoutperformed its benchmark by 6bps in the quarter. Pool security selection was the main contributor to performance in thequarter.
Year to date in 2021mortgages have outperformed treasuries. Januarywas a strongmonth formortgageswith outperformanceprimarily drive by conventional 30-year belly and higher coupons. Lower coupons, having trended tighter for 10 consecutivemonths due to continued support from the Fed’s QE4 program, finally settled in range, while valuations remained nearhistorical tights. In February we saw this strong performance reverse with mortgages lagging other high-quality spread sectors.Much of the underperformance in mortgages was attributable to higher volatility in the rate market through the second half ofFebruary. Mortgages ended the quarter with strong performance in March. Demand from the Fed plus continued stronginterest from banks easily absorbed daily origination selling, which declined steadily throughout the month as primarymortgage rates climbed towards post COVID-19 highs. The fund underperformed its benchmark by 12bps in the quarter.
Performance Review
For the year ending 31 March 2021 the portfolio outperformed its benchmark by 36bps, primarily attributable to pool securityselection and up-in-coupon positioning.
Pool security selection and up-in-coupon positioning were the main drivers of outperformance over the period. In Q4 2020 weshifted back to index positions from the up-in-coupon positioning we had previously. In Q1 2021 we gave up some of theoutperformance we had in the year due to higher volatility and the broad-based rates sell-off we saw over the quarter.
Investment Outlook
Given the Fed’s unprecedented operations in the mortgage market, the outlook will continue to be overwhelmed by the Fed’sdemand function going forward. Spreads have tightened dramatically as a result of the Fed’s actions and remain at historiclows.
29Lumyna Funds
Investment Managers’ Report (cont.)
Audited annual report

Lumyna – PSAM Global Event UCITS Fund
Performance (in class currency)
NAV 31 March, 2020 31 March, 2021 % Change
Class EUR A (acc) 124.58 153.59 23.29%Class EUR E (acc) 112.00 137.58 22.84%
Market Review
Over the period, we adhered to our disciplined, repeatable process which helped us navigate a volatile and uncertain period forfinancial markets. All three investment strategies: (Merger Arbitrage, Credit Opportunities and Special Situations) generatedpositive contributions to performance and our team actively traded and initiated new positions as the pandemic shifted riskappetite and patterns in consumer and corporate behavior evolved.Given the market backdrop, our alpha generation stands out more than any other year of our performance record. Alphageneration was driven by a number of factors including proprietary deal sourcing with active engagement, process-orientedinvestments and the realization of corporate events across the portfolio. Our net beta adjusted exposure averaged 21% duringthe period.
Tactical asset allocation decisions to increase investments in certain areas of the portfolio accelerated the recovery from ourMarch drawdown. We emphasized lower beta M&A situations with tight contracts and hard catalyst credit situations as riskpricing relationships completely broke down and liquidity replaced most other factors in asset price discovery. As governmentsand global central banks moved quickly to provide stimulus and inject liquidity into financial markets, we continued to stay thecourse and favored situations where we believed there was a strong event profile to drive alpha, while limiting situations whereinvestment outcomes were heavily dependent upon return to pre-COVID-19 patterns in consumer and corporate behavior.
While M&A volumes remained depressed for most of 2020 due to the pandemic, Special Purpose Acquisition Company(“SPAC”) issuance skyrocketed. Our increased exposure to this asset class coincided with the surge in new activity. SPACs offertarget companies a unique set of comparative advantages to their existing alternatives such as initial public offerings and salesto private equity or strategic buyers and have emerged as a legitimate option, in some cases the preferred option, to efficientlyand cost-effectively transition private firms into the public markets.
Performance Review
During the period, PSAM shifted incremental capital into two areas of note: Special Purpose Acquisition Companies (SPACs) andcredit opportunities. Our approach to SPAC’s seeks to capitalize on compelling, low volatility, risk-adjusted return opportunitiessymbiotic with PSAM’s existing event-driven research efforts.
Our current SPAC arbitrage strategy enables us to deploy capital into a unique asset class with attractive risk/rewardcharacteristics. PSAM seeks to invest alongside strong management teams, independently evaluate proposed mergertransactions, analyze legal and shareholder vote dynamics, and assess capital market implications, all while retaining aninherent put right near cost basis.
Exposure to the combination of Nikola Corporation (“Nikola”) and VectoIQ Acquisition Corp. (“VectoIQ”) provided the largestgains during the period. Nikola raised more than $700 million through the merger and PIPE. We expect the capital will helpaccelerate Nikola’s production of battery-electric (BEV) and hydrogen fuel-cell electric vehicles (FCEV). PSAM was a foundingco-sponsor of VectoIQ and an anchor investor in the PIPE.
Additional gains were derived from the debt of Hertz Global Holdings (“Hertz”). Hertz filed for bankruptcy protection in Mayafter the pandemic pressured its liquidity position and left it unable to fund rent payments owed to its primary vehicle ABSstructure. As the country begins to re-open and travel resumes, we remain enthusiastic about the prospects for our Hertzposition.
30 Lumyna Funds
Investment Managers’ Report (cont.)
Audited annual report

Performance Review (cont.)
The successful merger between Caesars Entertainment Corporation / Eldorado Resorts, Inc. also contributed to performance.Portfolio Hedges were the largest detractor over the period.
Investment Outlook
Most economists and strategists to which we subscribe are extremely bullish about the post-COVID-19 environment. Elevatedconsumer savings rates are adding to the pent-up demand that could be unleashed with a successful vaccination program. Weexpect the next 12 months to be a busy period for corporate activity with greater clarity and optimism on the horizon. After ayear of stockpiling cash and fortifying balance sheets, companies and boards have already begun to reengage at an aggressivepace. Boards are focused on strategic planning to address secular changes brought on by the pandemic, which resulted in arenewed appetite for deal making. Historically low interest rates are likely to compel companies to prioritize M&A to drivegrowth, fill gaps in technology or to drive efficiencies and to remain competitive.Withmore than $2.1 trillion of dry powder, weanticipate private equity firms will be active acquirers as well.
Despite the recent volatility, we expect the SPAC landscape to be a recurring source of attractive investment opportunities asthe SPAC structure and associated ecosystem continue to evolve. The bulk of our SPAC exposure is in SPACs seeking targetacquisitions, where we look to invest alongside strong management teams with extensive networks and access to proprietarydeal flow.
In credit, the unprecedented capital market support by central banks, record levels of loan amendments, and increaseddistressed exchange activity has dampened defaults relative to expectations. Improved growth prospects and continuedliquidity are likely to push default rates lower, although rates are still expected to remain above historical averages due tolingering stress. Efforts to avoid default may prove temporary in many instances, as leverage and interest coverage ratiosremain a concern.
We continue to leverage our multi-asset class investment platform to source a diversified set of global catalyst-orientedinvestments that in our view should yield a portfolio that is less sensitive to the broader markets.
31Lumyna Funds
Investment Managers’ Report (cont.)
Audited annual report
Lumyna – Sandbar Global Equity Market Neutral UCITS Fund
Performance (in class currency)
NAV 31 March, 2020 31 March, 2021 % Change
Class USD B (acc) 106.54 102.31 (3.97%)Class USD C (acc) 106.35 101.38 (4.67%)
Market Review
The last few months of 2020 and the first quarter of 2021 have seen some significant and material dislocations in markets.There have been a lot of outliers and “extremes”, in everything from Hedge Fund alpha, the relationship between earningsrevisions and share prices through to market flows and factor volatilities. These dislocations have had a material impact on ourability to generate alpha in the short term, even though in the broader context of our alpha since the inception of Sandbar (andthe longer-term track-record for the strategy) this remains more of a bump in the road.
Flipping some of the questions we have had from investors on their head, the fact that we have not been able to generate alphain a period where earnings revisions are negatively correlated to share prices in some of our core subsectors should providesome meagre relief. It means that we are actually doing what we tell you we are doing and what you pay us to do. We are notchanging our strategy because it did not work this week or last – which should be the starting point of any repeatable processthat can survive over time and compound long-term returns.
Until we have a better grasp on “when” the strategy will work, we will keep doing what we are doing and continue to tightlymanage risk. There are a lot of encouraging signs that we have reached (or are close to reaching) inflection points in some ofthese dislocations we have discussed.Moreover, we are looking forward to Q1 earnings seasonwhich starts in the coming days,to see how potential fundamental paydays are developing relative to the last few quarters. Finally, with durable re-openingfinally looking likemore of a reality in some parts of theworld, we are not just happy to finally be able to get out for a bite to eat,but evenmore so to see that the retail trading cohort in the US (which has wreaked its fair share of havoc) has also started to dothe same.
Performance Review
Negative monthly and quarterly gross alpha (-180bps/-484bps respectively) explain strategy returns, as residual sector andfactor exposures have provided a small tailwind. At the sector level, pairs within Industrials have detracted over the month andthe year (-120bps in March/-306bps YTD) as have Materials (-43bps/-1bp). So far this year, there have been no significantindividual outlier pairs to explain our alpha, instead there have been two notable periods in January andMarch where we haveseen a steady grind lower (primarily led by disappointing short alpha) in many pairs across subsectors where we have allocateddecent amount of capital, and with little else to offset. We suspect that this is likely symptomatic of some of the broaderde-grossing dynamics in markets we describe below. At the sub-sector level, Industrial Machinery (-139bps), Aerospace &Defence (-110bps), Building Products (-40bps) and Construction Machinery & Heavy Trucks (-38bps) have weighed most. AutoOEMs (+57bps), Heavy Electrical Equipment (+42bps) and Trading Companies & Distributors (+41bps) have been the winners.
Average correlations of returns and earnings revisions across all the sub-sectors we invest in have not seen this level in the lastdecade. Factors and styles have also experienced some significant dislocations as well. When we look at European equities forexample, we see that we have just been through quite a unique period relative to history, in which 20 day realized factorvolatility for the average L/S factor pair (Value, Growth, Quality, Momentum, etc.) is realizing 7 percentage points highervolatility than the benchmark Europe STOXX 50 (SX5E) index, which is the 99th percentile since 2008. This basically means thatbeing long and short stocks with certain factor attributes is generating muchmore risk (volatility) than a directional bet (long orshort) on the market.
Much of this has clearly been driven by the significant portfolio rotations undertaken over the last 3-6months in thewake of theCOVID-19 recovery (and the wall of money that ended up in markets through monetary and fiscal stimulus), and there is plentyof evidence to suggest that HFs and Active Managers alike have been unwinding long-held factor tilts to Momentum, Quality,Growth and Low Volatility, and this has been one of the principal drivers of this factor volatility. Looking at Q1 2021 so far,
32 Lumyna Funds
Investment Managers’ Report (cont.)
Audited annual report

Performance Review (cont.)
Morgan Stanley’s EU L/S Value factor basket is up +21% versus L/S Growth, its best start to any year in data back to 2007 and+10% better than the next best year (2009 was +11% to this point). Meanwhile L/S Momentum is having its second worst startto a year on record, down -6% (with the worst year being 2009 when down -12% by April).
Investment Outlook
We do not know when conditions will improve, but we have a clearer idea of how (simple mean reversion) and why (becausefundamentals will ultimately reassert themselves as the primary driver of asset prices). As we discussed above, we think itwould be a money-losing proposition to bet that some of the weakening correlations we have observed between earnings andshare prices will continue for very long, as it would always have been in the past.
These dislocations should help to explain why fundamental alpha has beenmore difficult to harvest, relative to the opportunityset for directional bets on beta, sectors and thematics. As we go through them we do try to make some observations on the“when” (the environment becomes more supportive for the strategy), with the caveat that these are just observations andeducated guesses based on history.
For our strategy, the most impactful market driver has been the lower overall level of idiosyncratic risk. This is the single-mostimportant determinant for our strategy that does not seek to harvest returns from beta, sector, or factor exposures. Putdifferently, when we dig down into the quantitative metrics that are moving stocks, we have seen more recently that theirunique fundamental attributes are driving prices much less than systematic drivers such as their sector classifications or theirstylistic traits.
The reality is that factor, thematic and macro risk have dominated equity performance over the last 12 months as the varianceexplained by idiosyncratic risk in the average Large Cap name in Europe touched a 10Y trough of ~25%.We find encouragementin the fact that is has risen back very recently (to 42% today), even if it remains lower than any point since 2016. What seemsclear is that just like the earnings revisions/performance data we presented at the start of this letter, over longer horizons, thisis a) a mean-reverting phenomenon and, b) we would seem to be much closer to the bottom than we are to the top.
33Lumyna Funds
Investment Managers’ Report (cont.)
Audited annual report
Lumyna – Millburn Adaptive Allocation Program UCITS Fund
Performance (in class currency)
NAV 31 March, 2020 31 March, 2021 % Change
Class USD B (acc) 85.24 92.05 7.99%
Market Review
From April through September market sentiment generally improved in response to the steady stream of aggressive monetaryand fiscal policy actions taken by global authorities—especially in the U.S.; surprising improvements in economic activity aseconomies cautiously reopened; and sporadic encouraging news concerning COVID-19 therapies and vaccines. But this overallattitude improvement was muted at times by the still horrific statistical reports on growth and unemployment globally; freshoutbursts of COVID-19 cases in many countries; a tapering of fiscal support programs; uncertainty surrounding the NovemberU.S. elections; continued tensions between Beijing and Washington; and contentious Brexit talks.
During the second half of the FY, the global reflation trade gathered momentum in response to the unexpectedly rapid rolloutof COVID-19 vaccinations globally; the further expansion of massive fiscal stimulus—first in December from the TrumpAdministration and then inMarch from the new Biden Administration; Federal Reserve Chairman Powell’s repeated statementsthat the Fed will maintain ultralow interest rates and continue hefty asset purchases until “substantial further progress hasbeenmade toward its employment and inflation goals”, and the resurgence in the growth of global trade. Even during this time,however, the growth outlook and investor enthusiasm were tamped down and markets experienced increased volatilityperiodically due to concerns about the slow pace of vaccine distribution in Europe, Asia and emerging markets relative to theU.S. and U.K.; evidence of moderating monetary and fiscal policy support out of China, and the expanding geopolitical conflictbetween China and the U.S.
Global equity markets climbed surprisingly swiftly from the depths reached in late March 2020. As the reopening and reflationthemes followed one another, stock markets across the world rose towards record highs despite numerous temporarysetbacks.
At the start of the FY, long interest rate futures positions were profitable as historically accommodative monetary policies, aplunge in global growth, and disinflationary impulses worldwide restrained interest rates across yield curves. Safe haven buyingof government securities also placed downward pressure on rates. Through the final six months of 2020 global interest rateswere buffeted by conflicting forces and were quite volatile. On the one hand, persistently accommodative monetary policyglobally, quiescent inflation throughout the developed world and safe haven demand for government securities weighed downinterest rates. On the other hand, historically large and possibly rising government deficits and debts, the announcement of theFederal Reserve’s new long run average inflation targeting framework and hope for a strong global economic rebound asvaccinations become widespread, raised concerns about increasing inflation, rising long-term interest rates, and steepeningyield curves. These growth, inflation and government borrowing concerns caused global note and bond yields to spike sharplyhigher during the January-February period, although they pulled back when growth optimism faded at fiscal yearend.
Performance Review
The Fund was profitable during the fiscal year (FY) due to profits from equity investments. On the other hand, losses fromlong-term government fixed income positions outpaced small gains from fixed income ETF positions and partially offset theequity gains.
In the equity sector, positions in U.S., European, Japanese, Hong Kong and emerging market equity investments wereprofitable.
In the interest rate sector, positions in U.S., and to a lesser extent German, Canadian, Australian and Japanese long–term fixedincome instruments were unprofitable, especially in the last quarter of the FY. Positions in corporate, mortgage backed andemerging market bond ETF’s posted partially offsetting profits as accommodative policies reduced default risk and increasedthe search for yield.
34 Lumyna Funds
Investment Managers’ Report (cont.)
Audited annual report
Investment Outlook
As market participants react to divergent growth and inflation trends across the globe; to the ebb and flow of political andgeopolitical tensions; to shifts in trade policy; to environmental and health crises; and to the changing patterns ofmonetary andfiscal policies globally, it seems likely that capital flows from market to market and from country to country will generate priceactivity that can be beneficial to Millburn’s quantitative, systematic approach to trading global markets.
35Lumyna Funds
Investment Managers’ Report (cont.)
Audited annual report
Lumyna – Bluecove Alternative Credit UCITS Fund
Performance (in class currency)
NAV 17 December, 2020 31 March, 2021 % Change
Class USD B (acc) 100.001 98.46 (1.54%)2
1 Launched on December 17, 20202 Since inception
Market Review
The fund launched on 17 December 2020, hence this report covers the period since launch.
Credit spreads were well supported over the period as equities traded higher. Early in 2021, equity volatility spiked on the backof sharp equity price increases in some companies that were heavily shorted. However, the continued COVID-19 vaccine rollout, higher than expected US stimulus package, and a positive end to the fourth quarter reporting provided a strong backdropto credit markets. This occurred despite continued concerns about new virus variants potentially reducing the efficacy ofexisting vaccines to these new strains. As a result, spread dispersion continued to decline from the highs seen in 2020. Globalreflationary concerns drove a selloff in government bond markets, evidenced by 10-year US Treasuries yields which rose by34bp in February 2021 with volatility stabilising at higher levels as US stimulus checks rolled out and the market began to looktoward a post-COVID-19 economic recovery. Risk assets including US equities and high yield bonds posted good returnstowards the end of the first quarter in 2021.
Performance Review
The initial months after launch were challenging for the fund, it returned -1.54% over the period. This was mainly driven by anunusual convergence of market conditions for the core credit security selection strategies: historically low levels of spreaddispersion (which drove a muted alpha opportunity set) and strong credit spread outperformance from companies with theweakest credit metrics (which blunted the efficacy of fundamental and sentiment signals). Its ancillary interest rate relativevalue and asset allocation strategies detracted also from the performance over the same period. It should be noted that returnswere affected by the one-off transaction costs of ramping up the portfolio at its inception in January; net of such costs the fundreturned -0.79% since inception. It is important to highlight that the underperformance of the fund’s credit strategies (and inparticular the degree to which they were negatively affected by the junk rally described above) was not the result of a failure bythe model involved to adapt to a post-COVID-19 world. This is evidenced by the fact that many of the fund’s sector gains incredit during the period came from sectors positively impacted by the re-opening of economies – such as airlines, autos andretail. The issue, rather, was the extent to which a glut of global liquidity and an increasingly desperate reach for yield drove agrowing disconnect between creditworthiness and spread performance, in the process negatively affecting the performance ofsentiment and fundamental signals.
Investment Outlook
The ultra-easy financial conditions engineered by governments and central banks since April 2020 has, in a period of less than ayear, resulted in credit spread dispersion reverting to levels that took almost five years to achieve following the GFC in 2008.The challenging financing conditions following the GFC forced many financially weak companies to deleverage, restructure, ortake other durable steps to improve their credit quality. Such discipline has been largely absent during the course of the lastyear, as unprecedentedly loose monetary and fiscal conditions have allowed companies to sidestep such measures and simplytap into abundant global liquidity instead. These market dynamics, accompanied by ultra-low interest rates, have contributedboth to historically low levels of spread dispersion and to credit metrics that would appear unsustainable unless currentultra-easy financing conditions are extended indefinitely. Therefore we believe our disciplined approach will be rewarded asthe year develops. With global interest rates rising, the upside on bonds by definition capped, and spreads at historically tightlevels, the risk/reward profile of strategies relying on long carry feels increasingly asymmetric. The unwind of such strategieswhen it comes, moreover, will be exacerbated both by the negative convexity of the asset class and by the crowded positioningthat has developed within it. This would likely create a fertile environment for the fund.
36 Lumyna Funds
Investment Managers’ Report (cont.)
Audited annual report
PricewaterhouseCoopers, Société coopérative, 2 rue Gerhard Mercator, B.P. 1443, L-1014 LuxembourgT : +352 494848 1, F : +352 494848 2900, www.pwc.lu Cabinet de révision agréé. Expert-comptable (autorisation gouvernementale n°10028256)R.C.S. Luxembourg B 65 477 - TVA LU25482518
Audit report
To the Shareholders ofLumyna Funds
Our opinion
In our opinion, the accompanying financial statements give a true and fair view of the financial position of Lumyna Funds (the “Fund”) and of each of its sub-funds as at 31 March 2021, and of the results of their operations and changes in their net assets for the year then ended in accordance with Luxembourg legal and regulatory requirements relating to the preparation and presentation of the financial statements.
What we have audited
The Fund’s financial statements comprise:
the statement of net assets as at 31 March 2021; the statement of operations and changes in net assets for the year then ended; the schedule of investments as at 31 March 2021; and the notes to the financial statements, which include a summary of significant accounting policies.
Basis for opinion
We conducted our audit in accordance with the Law of 23 July 2016 on the audit profession (Law of 23 July 2016) and with International Standards on Auditing (ISAs) as adopted for Luxembourg by the “Commission de Surveillance du Secteur Financier” (CSSF). Our responsibilities under the Law of 23 July 2016 and ISAs as adopted for Luxembourg by the CSSF are further described in the “Responsibilities of the “Réviseur d’entreprises agréé” for the audit of the financial statements” section of our report.
We believe that the audit evidence we have obtained is sufficient and appropriate to provide a basis for our opinion.
We are independent of the Fund in accordance with the International Code of Ethics for Professional Accountants, including International Independence Standards, issued by the International Ethics Standards Board for Accountants (IESBA Code) as adopted for Luxembourg by the CSSF together with the ethical requirements that are relevant to our audit of the financial statements. We have fulfilled our other ethical responsibilities under those ethical requirements.
Other information
The Board of Directors of the Fund is responsible for the other information. The other information comprises the information stated in the annual report but does not include the financial statements and our audit report thereon.
Our opinion on the financial statements does not cover the other information and we do not express any form of assurance conclusion thereon.
38
In connection with our audit of the financial statements, our responsibility is to read the other information identified above and, in doing so, consider whether the other information is materially inconsistent with the financial statements or our knowledge obtained in the audit, or otherwise appears to be materially misstated. If, based on the work we have performed, we conclude that there is a material misstatement of this other information, we are required to report that fact. We have nothing to report in this regard.
Responsibilities of the Board of Directors of the Fund for the financial statements
The Board of Directors of the Fund is responsible for the preparation and fair presentation of the financial statements in accordance with Luxembourg legal and regulatory requirements relating to the preparation and presentation of the financial statements, and for such internal control as the Board of Directors of the Fund determines is necessary to enable the preparation of financial statements that are free from material misstatement, whether due to fraud or error.
In preparing the financial statements, the Board of Directors of the Fund is responsible for assessing the Fund’s and each of its sub-funds' ability to continue as a going concern, disclosing, as applicable, matters related to going concern and using the going concern basis of accounting unless the Board of Directors of the Fund either intends to liquidate the Fund or close any of its sub-funds or to cease operations, or has no realistic alternative but to do so.
Responsibilities of the “Réviseur d’entreprises agréé” for the audit of the financial statements
The objectives of our audit are to obtain reasonable assurance about whether the financial statements as a whole are free from material misstatement, whether due to fraud or error, and to issue an audit report that includes our opinion. Reasonable assurance is a high level of assurance, but is not a guarantee that an audit conducted in accordance with the Law of 23 July 2016 and with ISAs as adopted for Luxembourg by the CSSF will always detect a material misstatement when it exists. Misstatements can arise from fraud or error and are considered material if, individually or in the aggregate, they could reasonably be expected to influence the economic decisions of users taken on the basis of these financial statements.
As part of an audit in accordance with the Law of 23 July 2016 and with ISAs as adopted for Luxembourg by the CSSF, we exercise professional judgment and maintain professional scepticism throughout the audit. We also:
identify and assess the risks of material misstatement of the financial statements, whether due to fraud or error, design and perform audit procedures responsive to those risks, and obtain audit evidence that is sufficient and appropriate to provide a basis for our opinion. The risk of not detecting a material misstatement resulting from fraud is higher than for one resulting from error, as fraud may involve collusion, forgery, intentional omissions, misrepresentations, or the override of internal control;
obtain an understanding of internal control relevant to the audit in order to design audit procedures that are appropriate in the circumstances, but not for the purpose of expressing an opinion on the effectiveness of the Fund’s internal control;
evaluate the appropriateness of accounting policies used and the reasonableness of accounting estimates and related disclosures made by the Board of Directors of the Fund;

39
conclude on the appropriateness of the Board of Directors of the Fund’s use of the going concern basis of accounting and, based on the audit evidence obtained, whether a material uncertainty exists related to events or conditions that may cast significant doubt on the Fund’s or any of its sub-funds' ability to continue as a going concern. If we conclude that a material uncertainty exists, we are required to draw attention in our audit report to the related disclosures in the financial statements or, if such disclosures are inadequate, to modify our opinion. Our conclusions are based on the audit evidence obtained up to the date of our audit report. However, future events or conditions may cause the Fund or any of its sub-funds to cease to continue as a going concern;
evaluate the overall presentation, structure and content of the financial statements, including the disclosures, and whether the financial statements represent the underlying transactions and events in a manner that achieves fair presentation.
We communicate with those charged with governance regarding, among other matters, the planned scope and timing of the audit and significant audit findings, including any significant deficiencies in internal control that we identify during our audit.
PricewaterhouseCoopers, Société coopérativeRepresented by@esig
@esigRégis Malcourant
Luxembourg, 2 July 2021
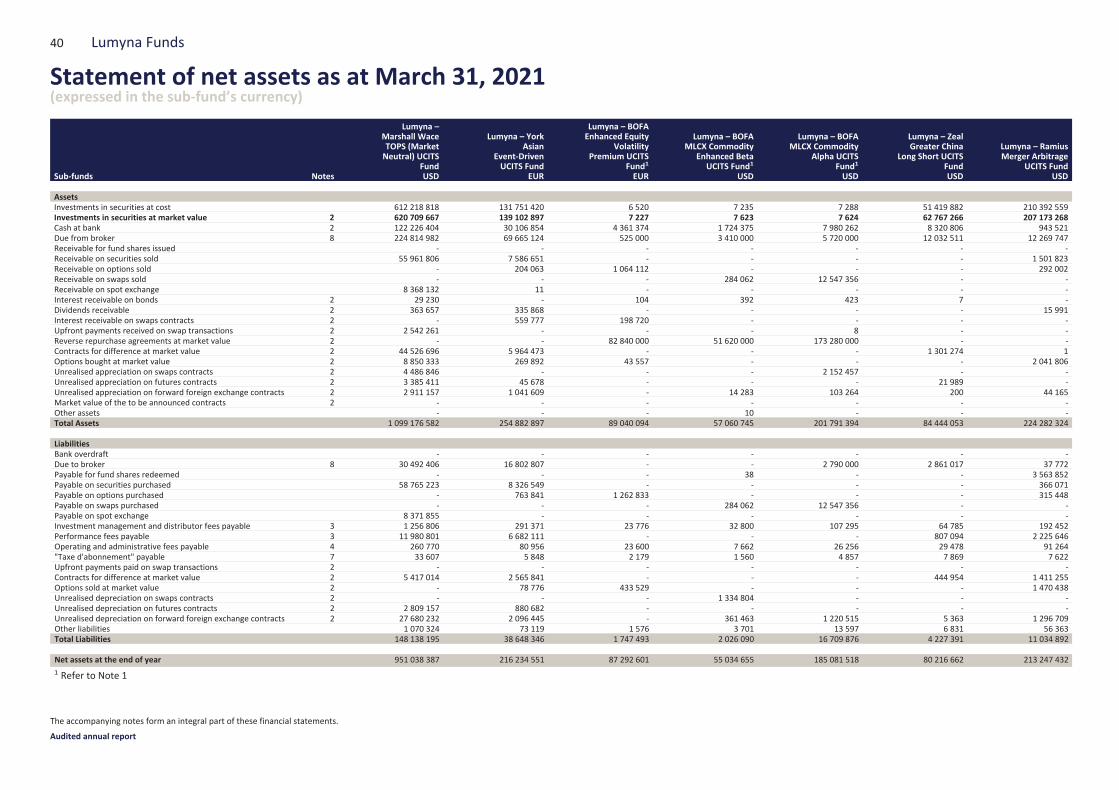
Sub-funds Notes
Lumyna –Marshall WaceTOPS (MarketNeutral) UCITS
FundUSD
Lumyna – YorkAsian
Event-DrivenUCITS Fund
EUR
Lumyna – BOFAEnhanced Equity
VolatilityPremium UCITS
Fund1
EUR
Lumyna – BOFAMLCX Commodity
Enhanced BetaUCITS Fund1
USD
Lumyna – BOFAMLCX Commodity
Alpha UCITSFund1
USD
Lumyna – ZealGreater China
Long Short UCITSFundUSD
Lumyna – RamiusMerger Arbitrage
UCITS FundUSD
AssetsInvestments in securities at cost 612 218 818 131 751 420 6 520 7 235 7 288 51 419 882 210 392 559Investments in securities at market value 2 620 709 667 139 102 897 7 227 7 623 7 624 62 767 266 207 173 268Cash at bank 2 122 226 404 30 106 854 4 361 374 1 724 375 7 980 262 8 320 806 943 521Due from broker 8 224 814 982 69 665 124 525 000 3 410 000 5 720 000 12 032 511 12 269 747Receivable for fund shares issued - - - - - - -Receivable on securities sold 55 961 806 7 586 651 - - - - 1 501 823Receivable on options sold - 204 063 1 064 112 - - - 292 002Receivable on swaps sold - - - 284 062 12 547 356 - -Receivable on spot exchange 8 368 132 11 - - - - -Interest receivable on bonds 2 29 230 - 104 392 423 7 -Dividends receivable 2 363 657 335 868 - - - - 15 991Interest receivable on swaps contracts 2 - 559 777 198 720 - - - -Upfront payments received on swap transactions 2 2 542 261 - - - 8 - -Reverse repurchase agreements at market value 2 - - 82 840 000 51 620 000 173 280 000 - -Contracts for difference at market value 2 44 526 696 5 964 473 - - - 1 301 274 1Options bought at market value 2 8 850 333 269 892 43 557 - - - 2 041 806Unrealised appreciation on swaps contracts 2 4 486 846 - - - 2 152 457 - -Unrealised appreciation on futures contracts 2 3 385 411 45 678 - - - 21 989 -Unrealised appreciation on forward foreign exchange contracts 2 2 911 157 1 041 609 - 14 283 103 264 200 44 165Market value of the to be announced contracts 2 - - - - - - -Other assets - - - 10 - - -Total Assets 1 099 176 582 254 882 897 89 040 094 57 060 745 201 791 394 84 444 053 224 282 324
LiabilitiesBank overdraft - - - - - - -Due to broker 8 30 492 406 16 802 807 - - 2 790 000 2 861 017 37 772Payable for fund shares redeemed - - - 38 - - 3 563 852Payable on securities purchased 58 765 223 8 326 549 - - - - 366 071Payable on options purchased - 763 841 1 262 833 - - - 315 448Payable on swaps purchased - - - 284 062 12 547 356 - -Payable on spot exchange 8 371 855 - - - - - -Investment management and distributor fees payable 3 1 256 806 291 371 23 776 32 800 107 295 64 785 192 452Performance fees payable 3 11 980 801 6 682 111 - - - 807 094 2 225 646Operating and administrative fees payable 4 260 770 80 956 23 600 7 662 26 256 29 478 91 264"Taxe d'abonnement" payable 7 33 607 5 848 2 179 1 560 4 857 7 869 7 622Upfront payments paid on swap transactions 2 - - - - - - -Contracts for difference at market value 2 5 417 014 2 565 841 - - - 444 954 1 411 255Options sold at market value 2 - 78 776 433 529 - - - 1 470 438Unrealised depreciation on swaps contracts 2 - - - 1 334 804 - - -Unrealised depreciation on futures contracts 2 2 809 157 880 682 - - - - -Unrealised depreciation on forward foreign exchange contracts 2 27 680 232 2 096 445 - 361 463 1 220 515 5 363 1 296 709Other liabilities 1 070 324 73 119 1 576 3 701 13 597 6 831 56 363Total Liabilities 148 138 195 38 648 346 1 747 493 2 026 090 16 709 876 4 227 391 11 034 892
Net assets at the end of year 951 038 387 216 234 551 87 292 601 55 034 655 185 081 518 80 216 662 213 247 4321 Refer to Note 1
40 Lumyna Funds
Statement of net assets as at March 31, 2021(expressed in the sub-fund’s currency)
The accompanying notes form an integral part of these financial statements.
Audited annual report

Sub-funds Notes
Lumyna –Millburn
Diversified UCITSFundUSD
Lumyna – GlobalDebt - CreditUCITS Fund
USD
Lumyna – GlobalDebt -
GovernmentUCITS Fund
USD
Lumyna – GlobalDebt - Securitised
UCITS FundUSD
Lumyna – PSAMGlobal EventUCITS Fund
EUR
Lumyna –Sandbar GlobalEquity MarketNeutral UCITS
FundUSD
Lumyna –Millburn Adaptive
AllocationProgram UCITS
FundUSD
AssetsInvestments in securities at cost 86 231 154 820 115 243 5 338 079 208 468 300 548 678 395 546 1 559 349 727 39 394 899Investments in securities at market value 2 87 903 309 837 020 448 5 567 856 254 475 896 257 711 860 961 1 559 704 675 38 610 436Cash at bank 2 2 429 428 23 735 840 64 150 474 13 978 434 17 540 430 24 238 278 147 665Due from broker 8 38 988 779 1 053 369 850 000 150 179 32 640 352 111 204 158 3 219 651Receivable for fund shares issued - 1 101 370 6 984 857 119 686 603 430 2 708 789 -Receivable on securities sold - 14 750 876 32 639 871 12 518 007 10 161 168 - -Receivable on options sold 3 360 - - - - - -Receivable on swaps sold - - - - - - -Receivable on spot exchange 144 443 220 - 1 444 743 789 - - - -Interest receivable on bonds 2 314 630 6 759 134 34 116 289 1 154 430 1 116 809 21 585 144 704Dividends receivable 2 - - 4 352 12 79 692 - -Interest receivable on swaps contracts 2 - - - - - - -Upfront payments received on swap transactions 2 - - - - 27 386 - -Reverse repurchase agreements at market value 2 - - - - - 100 000 000 -Contracts for difference at market value 2 - - - - - 12 166 472 924 019Options bought at market value 2 437 - - - 2 416 657 - -Unrealised appreciation on swaps contracts 2 - - - - - - -Unrealised appreciation on futures contracts 2 861 057 1 050 423 - 67 383 116 023 - 72 961Unrealised appreciation on forward foreign exchange contracts 2 5 593 260 9 410 971 121 002 728 2 914 891 1 056 804 3 614 567 8 790Market value of the to be announced contracts 2 - - - 34 618 259 - - -Other assets - - - - 1 925 720 - -Total Assets 280 537 480 894 882 431 7 272 348 614 541 417 538 779 545 432 1 813 658 524 43 128 226
LiabilitiesBank overdraft - - - - - - -Due to broker 8 5 444 749 188 428 980 000 - 20 705 522 30 935 158 45Payable for fund shares redeemed 1 637 447 1 305 199 5 613 564 359 702 103 026 1 462 323 -Payable on securities purchased - 9 538 572 55 100 144 60 872 231 10 510 284 - -Payable on options purchased 437 - - - 48 392 - -Payable on swaps purchased - - - - - - -Payable on spot exchange 144 458 923 - 1 442 101 050 - - - -Investment management and distributor fees payable 3 147 203 95 171 206 179 38 803 884 526 1 737 039 30 276Performance fees payable 3 52 510 - - - 13 773 700 - -Operating and administrative fees payable 4 49 253 103 815 674 719 56 437 263 183 633 027 7 763"Taxe d'abonnement" payable 7 4 045 21 670 141 575 11 769 20 168 63 377 1 059Upfront payments paid on swap transactions 2 - - - - - - -Contracts for difference at market value 2 - - - - 1 854 072 - -Options sold at market value 2 - - - - 2 336 410 - -Unrealised depreciation on swaps contracts 2 - - - - 122 916 - -Unrealised depreciation on futures contracts 2 860 995 902 136 - 169 585 3 062 - 345 903Unrealised depreciation on forward foreign exchange contracts 2 7 649 035 14 184 018 99 546 697 8 499 660 14 907 981 11 408 181 397 407Other liabilities 9 787 30 322 196 096 18 103 616 203 1 336 267 9 643Total Liabilities 160 314 384 26 369 331 1 604 560 024 70 026 290 66 149 445 47 575 372 792 096
Net assets at the end of year 120 223 096 868 513 100 5 667 788 590 471 391 248 713 395 987 1 766 083 152 42 336 130
41Lumyna Funds
Statement of net assets as at March 31, 2021 (cont.)(expressed in the sub-fund’s currency)
The accompanying notes form an integral part of these financial statements.
Audited annual report
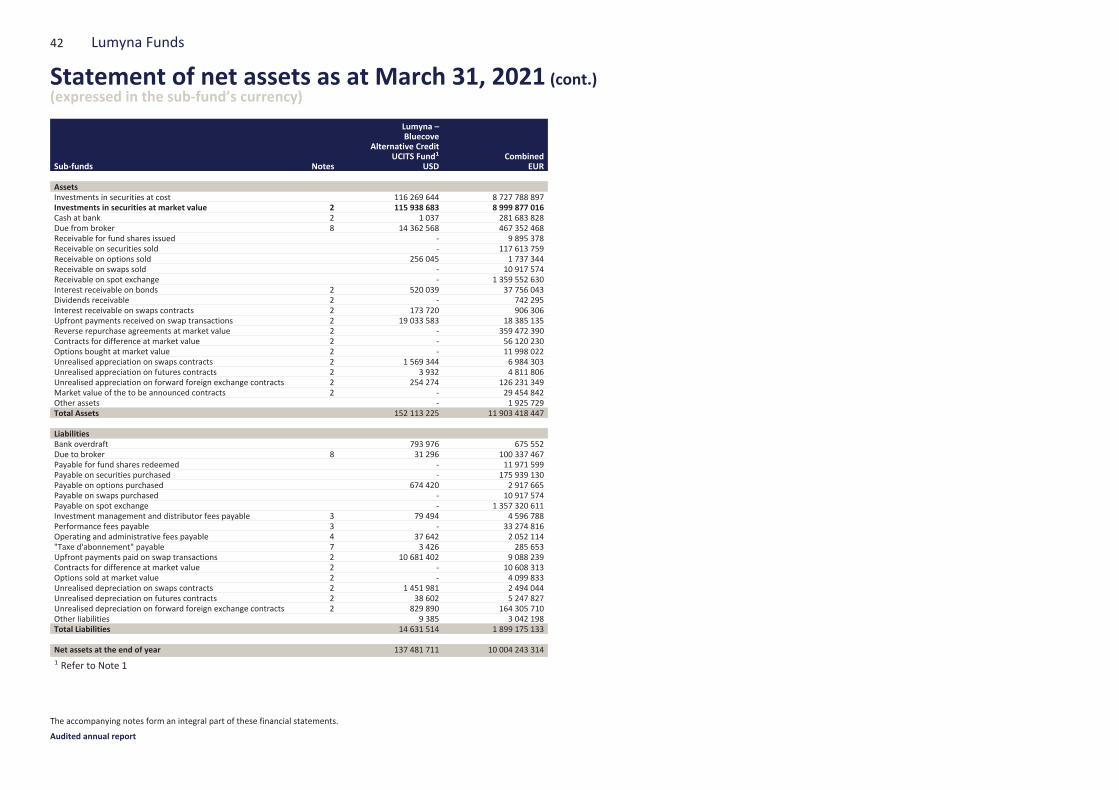
Sub-funds Notes
Lumyna –Bluecove
Alternative CreditUCITS Fund1
USDCombined
EUR
AssetsInvestments in securities at cost 116 269 644 8 727 788 897Investments in securities at market value 2 115 938 683 8 999 877 016Cash at bank 2 1 037 281 683 828Due from broker 8 14 362 568 467 352 468Receivable for fund shares issued - 9 895 378Receivable on securities sold - 117 613 759Receivable on options sold 256 045 1 737 344Receivable on swaps sold - 10 917 574Receivable on spot exchange - 1 359 552 630Interest receivable on bonds 2 520 039 37 756 043Dividends receivable 2 - 742 295Interest receivable on swaps contracts 2 173 720 906 306Upfront payments received on swap transactions 2 19 033 583 18 385 135Reverse repurchase agreements at market value 2 - 359 472 390Contracts for difference at market value 2 - 56 120 230Options bought at market value 2 - 11 998 022Unrealised appreciation on swaps contracts 2 1 569 344 6 984 303Unrealised appreciation on futures contracts 2 3 932 4 811 806Unrealised appreciation on forward foreign exchange contracts 2 254 274 126 231 349Market value of the to be announced contracts 2 - 29 454 842Other assets - 1 925 729Total Assets 152 113 225 11 903 418 447
LiabilitiesBank overdraft 793 976 675 552Due to broker 8 31 296 100 337 467Payable for fund shares redeemed - 11 971 599Payable on securities purchased - 175 939 130Payable on options purchased 674 420 2 917 665Payable on swaps purchased - 10 917 574Payable on spot exchange - 1 357 320 611Investment management and distributor fees payable 3 79 494 4 596 788Performance fees payable 3 - 33 274 816Operating and administrative fees payable 4 37 642 2 052 114"Taxe d'abonnement" payable 7 3 426 285 653Upfront payments paid on swap transactions 2 10 681 402 9 088 239Contracts for difference at market value 2 - 10 608 313Options sold at market value 2 - 4 099 833Unrealised depreciation on swaps contracts 2 1 451 981 2 494 044Unrealised depreciation on futures contracts 2 38 602 5 247 827Unrealised depreciation on forward foreign exchange contracts 2 829 890 164 305 710Other liabilities 9 385 3 042 198Total Liabilities 14 631 514 1 899 175 133
Net assets at the end of year 137 481 711 10 004 243 3141 Refer to Note 1
42 Lumyna Funds
Statement of net assets as at March 31, 2021 (cont.)(expressed in the sub-fund’s currency)
The accompanying notes form an integral part of these financial statements.
Audited annual report
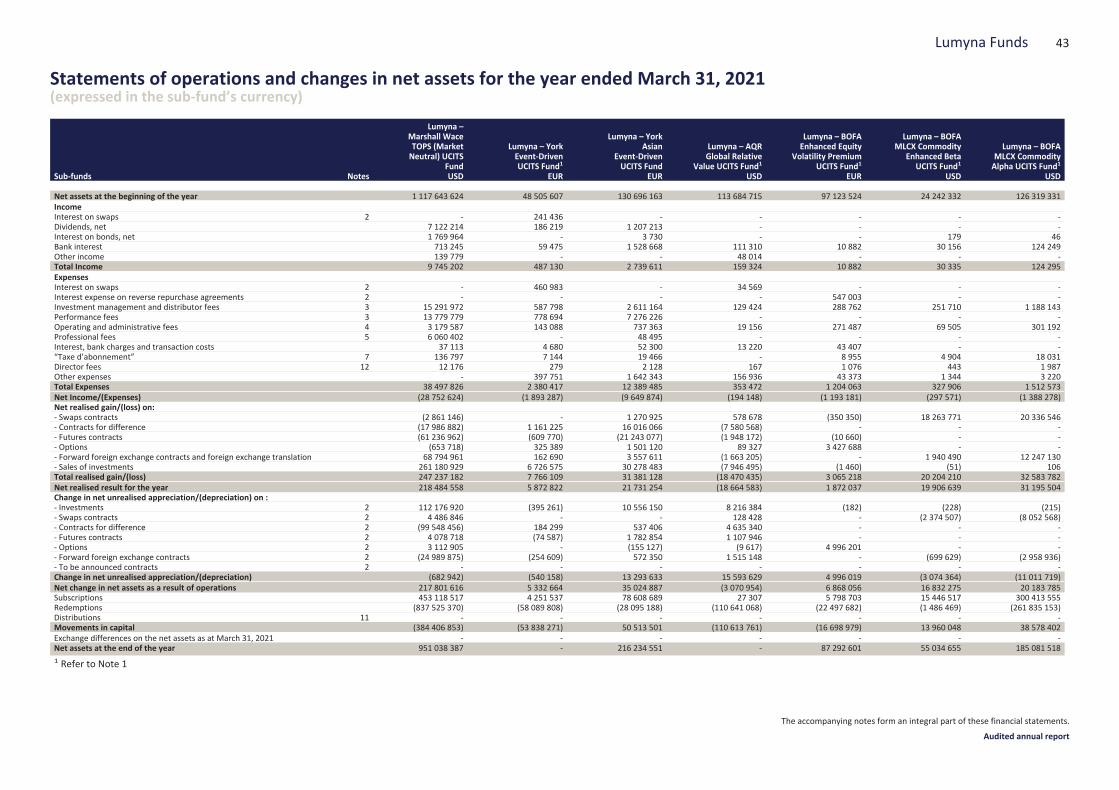
Sub-funds Notes
Lumyna –Marshall WaceTOPS (MarketNeutral) UCITS
FundUSD
Lumyna – YorkEvent-DrivenUCITS Fund1
EUR
Lumyna – YorkAsian
Event-DrivenUCITS Fund
EUR
Lumyna – AQRGlobal Relative
Value UCITS Fund1
USD
Lumyna – BOFAEnhanced Equity
Volatility PremiumUCITS Fund1
EUR
Lumyna – BOFAMLCX Commodity
Enhanced BetaUCITS Fund1
USD
Lumyna – BOFAMLCX CommodityAlpha UCITS Fund1
USD
Net assets at the beginning of the year 1 117 643 624 48 505 607 130 696 163 113 684 715 97 123 524 24 242 332 126 319 331IncomeInterest on swaps 2 - 241 436 - - - - -Dividends, net 7 122 214 186 219 1 207 213 - - - -Interest on bonds, net 1 769 964 - 3 730 - - 179 46Bank interest 713 245 59 475 1 528 668 111 310 10 882 30 156 124 249Other income 139 779 - - 48 014 - - -Total Income 9 745 202 487 130 2 739 611 159 324 10 882 30 335 124 295ExpensesInterest on swaps 2 - 460 983 - 34 569 - - -Interest expense on reverse repurchase agreements 2 - - - - 547 003 - -Investment management and distributor fees 3 15 291 972 587 798 2 611 164 129 424 288 762 251 710 1 188 143Performance fees 3 13 779 779 778 694 7 276 226 - - - -Operating and administrative fees 4 3 179 587 143 088 737 363 19 156 271 487 69 505 301 192Professional fees 5 6 060 402 - 48 495 - - - -Interest, bank charges and transaction costs 37 113 4 680 52 300 13 220 43 407 - -“Taxe d’abonnement” 7 136 797 7 144 19 466 - 8 955 4 904 18 031Director fees 12 12 176 279 2 128 167 1 076 443 1 987Other expenses - 397 751 1 642 343 156 936 43 373 1 344 3 220Total Expenses 38 497 826 2 380 417 12 389 485 353 472 1 204 063 327 906 1 512 573Net Income/(Expenses) (28 752 624) (1 893 287) (9 649 874) (194 148) (1 193 181) (297 571) (1 388 278)Net realised gain/(loss) on:- Swaps contracts (2 861 146) - 1 270 925 578 678 (350 350) 18 263 771 20 336 546- Contracts for difference (17 986 882) 1 161 225 16 016 066 (7 580 568) - - -- Futures contracts (61 236 962) (609 770) (21 243 077) (1 948 172) (10 660) - -- Options (653 718) 325 389 1 501 120 89 327 3 427 688 - -- Forward foreign exchange contracts and foreign exchange translation 68 794 961 162 690 3 557 611 (1 663 205) - 1 940 490 12 247 130- Sales of investments 261 180 929 6 726 575 30 278 483 (7 946 495) (1 460) (51) 106Total realised gain/(loss) 247 237 182 7 766 109 31 381 128 (18 470 435) 3 065 218 20 204 210 32 583 782Net realised result for the year 218 484 558 5 872 822 21 731 254 (18 664 583) 1 872 037 19 906 639 31 195 504Change in net unrealised appreciation/(depreciation) on :- Investments 2 112 176 920 (395 261) 10 556 150 8 216 384 (182) (228) (215)- Swaps contracts 2 4 486 846 - - 128 428 - (2 374 507) (8 052 568)- Contracts for difference 2 (99 548 456) 184 299 537 406 4 635 340 - - -- Futures contracts 2 4 078 718 (74 587) 1 782 854 1 107 946 - - -- Options 2 3 112 905 - (155 127) (9 617) 4 996 201 - -- Forward foreign exchange contracts 2 (24 989 875) (254 609) 572 350 1 515 148 - (699 629) (2 958 936)- To be announced contracts 2 - - - - - - -Change in net unrealised appreciation/(depreciation) (682 942) (540 158) 13 293 633 15 593 629 4 996 019 (3 074 364) (11 011 719)Net change in net assets as a result of operations 217 801 616 5 332 664 35 024 887 (3 070 954) 6 868 056 16 832 275 20 183 785Subscriptions 453 118 517 4 251 537 78 608 689 27 307 5 798 703 15 446 517 300 413 555Redemptions (837 525 370) (58 089 808) (28 095 188) (110 641 068) (22 497 682) (1 486 469) (261 835 153)Distributions 11 - - - - - - -Movements in capital (384 406 853) (53 838 271) 50 513 501 (110 613 761) (16 698 979) 13 960 048 38 578 402Exchange differences on the net assets as at March 31, 2021 - - - - - - -Net assets at the end of the year 951 038 387 - 216 234 551 - 87 292 601 55 034 655 185 081 5181 Refer to Note 1
43Lumyna Funds
Statements of operations and changes in net assets for the year ended March 31, 2021(expressed in the sub-fund’s currency)
The accompanying notes form an integral part of these financial statements.
Audited annual report
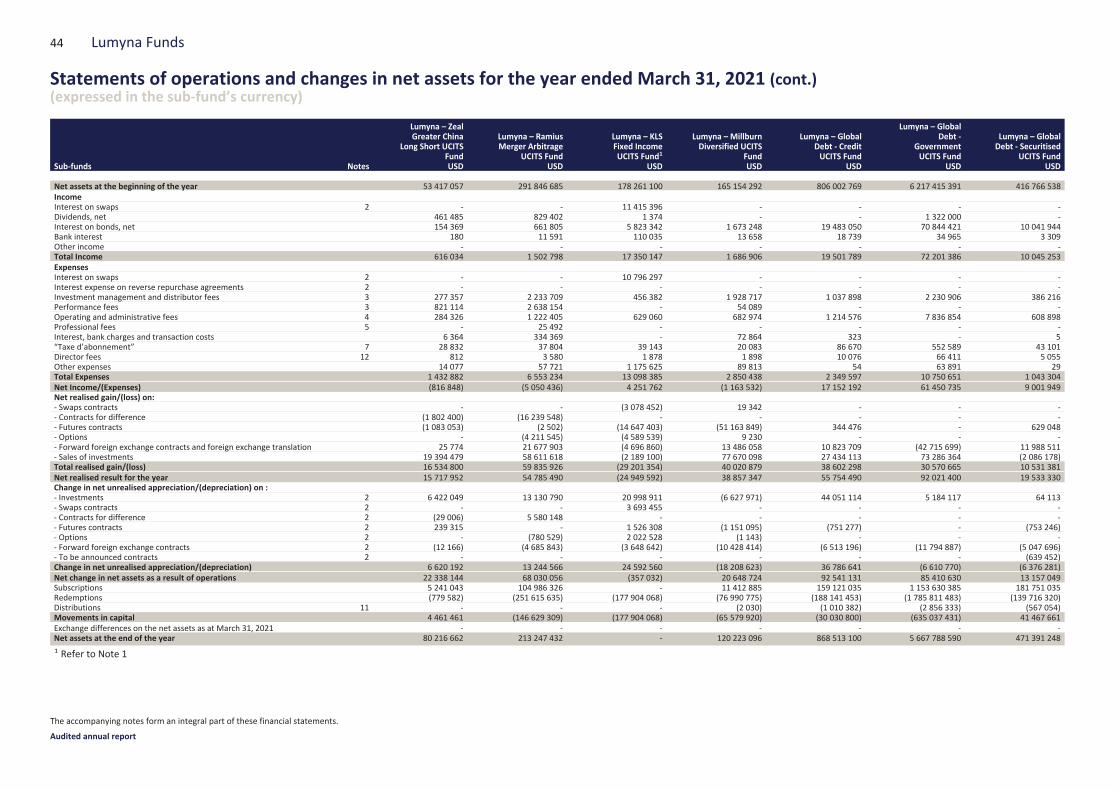
Sub-funds Notes
Lumyna – ZealGreater China
Long Short UCITSFundUSD
Lumyna – RamiusMerger Arbitrage
UCITS FundUSD
Lumyna – KLSFixed IncomeUCITS Fund1
USD
Lumyna – MillburnDiversified UCITS
FundUSD
Lumyna – GlobalDebt - CreditUCITS Fund
USD
Lumyna – GlobalDebt -
GovernmentUCITS Fund
USD
Lumyna – GlobalDebt - Securitised
UCITS FundUSD
Net assets at the beginning of the year 53 417 057 291 846 685 178 261 100 165 154 292 806 002 769 6 217 415 391 416 766 538IncomeInterest on swaps 2 - - 11 415 396 - - - -Dividends, net 461 485 829 402 1 374 - - 1 322 000 -Interest on bonds, net 154 369 661 805 5 823 342 1 673 248 19 483 050 70 844 421 10 041 944Bank interest 180 11 591 110 035 13 658 18 739 34 965 3 309Other income - - - - - - -Total Income 616 034 1 502 798 17 350 147 1 686 906 19 501 789 72 201 386 10 045 253ExpensesInterest on swaps 2 - - 10 796 297 - - - -Interest expense on reverse repurchase agreements 2 - - - - - - -Investment management and distributor fees 3 277 357 2 233 709 456 382 1 928 717 1 037 898 2 230 906 386 216Performance fees 3 821 114 2 638 154 - 54 089 - - -Operating and administrative fees 4 284 326 1 222 405 629 060 682 974 1 214 576 7 836 854 608 898Professional fees 5 - 25 492 - - - - -Interest, bank charges and transaction costs 6 364 334 369 - 72 864 323 - 5“Taxe d’abonnement” 7 28 832 37 804 39 143 20 083 86 670 552 589 43 101Director fees 12 812 3 580 1 878 1 898 10 076 66 411 5 055Other expenses 14 077 57 721 1 175 625 89 813 54 63 891 29Total Expenses 1 432 882 6 553 234 13 098 385 2 850 438 2 349 597 10 750 651 1 043 304Net Income/(Expenses) (816 848) (5 050 436) 4 251 762 (1 163 532) 17 152 192 61 450 735 9 001 949Net realised gain/(loss) on:- Swaps contracts - - (3 078 452) 19 342 - - -- Contracts for difference (1 802 400) (16 239 548) - - - - -- Futures contracts (1 083 053) (2 502) (14 647 403) (51 163 849) 344 476 - 629 048- Options - (4 211 545) (4 589 539) 9 230 - - -- Forward foreign exchange contracts and foreign exchange translation 25 774 21 677 903 (4 696 860) 13 486 058 10 823 709 (42 715 699) 11 988 511- Sales of investments 19 394 479 58 611 618 (2 189 100) 77 670 098 27 434 113 73 286 364 (2 086 178)Total realised gain/(loss) 16 534 800 59 835 926 (29 201 354) 40 020 879 38 602 298 30 570 665 10 531 381Net realised result for the year 15 717 952 54 785 490 (24 949 592) 38 857 347 55 754 490 92 021 400 19 533 330Change in net unrealised appreciation/(depreciation) on :- Investments 2 6 422 049 13 130 790 20 998 911 (6 627 971) 44 051 114 5 184 117 64 113- Swaps contracts 2 - - 3 693 455 - - - -- Contracts for difference 2 (29 006) 5 580 148 - - - - -- Futures contracts 2 239 315 - 1 526 308 (1 151 095) (751 277) - (753 246)- Options 2 - (780 529) 2 022 528 (1 143) - - -- Forward foreign exchange contracts 2 (12 166) (4 685 843) (3 648 642) (10 428 414) (6 513 196) (11 794 887) (5 047 696)- To be announced contracts 2 - - - - - - (639 452)Change in net unrealised appreciation/(depreciation) 6 620 192 13 244 566 24 592 560 (18 208 623) 36 786 641 (6 610 770) (6 376 281)Net change in net assets as a result of operations 22 338 144 68 030 056 (357 032) 20 648 724 92 541 131 85 410 630 13 157 049Subscriptions 5 241 043 104 986 326 - 11 412 885 159 121 035 1 153 630 385 181 751 035Redemptions (779 582) (251 615 635) (177 904 068) (76 990 775) (188 141 453) (1 785 811 483) (139 716 320)Distributions 11 - - - (2 030) (1 010 382) (2 856 333) (567 054)Movements in capital 4 461 461 (146 629 309) (177 904 068) (65 579 920) (30 030 800) (635 037 431) 41 467 661Exchange differences on the net assets as at March 31, 2021 - - - - - - -Net assets at the end of the year 80 216 662 213 247 432 - 120 223 096 868 513 100 5 667 788 590 471 391 2481 Refer to Note 1
44 Lumyna Funds
Statements of operations and changes in net assets for the year ended March 31, 2021 (cont.)(expressed in the sub-fund’s currency)
The accompanying notes form an integral part of these financial statements.
Audited annual report
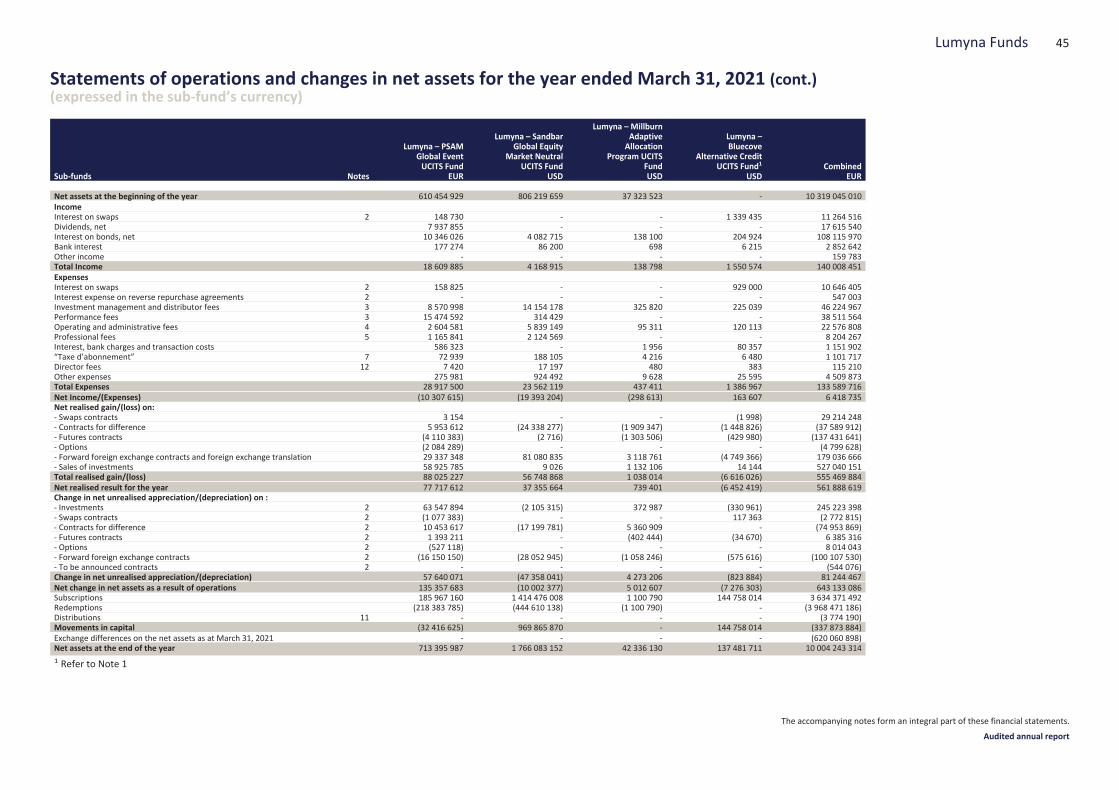
Sub-funds Notes
Lumyna – PSAMGlobal EventUCITS Fund
EUR
Lumyna – SandbarGlobal Equity
Market NeutralUCITS Fund
USD
Lumyna – MillburnAdaptiveAllocation
Program UCITSFundUSD
Lumyna –Bluecove
Alternative CreditUCITS Fund1
USDCombined
EUR
Net assets at the beginning of the year 610 454 929 806 219 659 37 323 523 - 10 319 045 010IncomeInterest on swaps 2 148 730 - - 1 339 435 11 264 516Dividends, net 7 937 855 - - - 17 615 540Interest on bonds, net 10 346 026 4 082 715 138 100 204 924 108 115 970Bank interest 177 274 86 200 698 6 215 2 852 642Other income - - - - 159 783Total Income 18 609 885 4 168 915 138 798 1 550 574 140 008 451ExpensesInterest on swaps 2 158 825 - - 929 000 10 646 405Interest expense on reverse repurchase agreements 2 - - - - 547 003Investment management and distributor fees 3 8 570 998 14 154 178 325 820 225 039 46 224 967Performance fees 3 15 474 592 314 429 - - 38 511 564Operating and administrative fees 4 2 604 581 5 839 149 95 311 120 113 22 576 808Professional fees 5 1 165 841 2 124 569 - - 8 204 267Interest, bank charges and transaction costs 586 323 - 1 956 80 357 1 151 902“Taxe d’abonnement” 7 72 939 188 105 4 216 6 480 1 101 717Director fees 12 7 420 17 197 480 383 115 210Other expenses 275 981 924 492 9 628 25 595 4 509 873Total Expenses 28 917 500 23 562 119 437 411 1 386 967 133 589 716Net Income/(Expenses) (10 307 615) (19 393 204) (298 613) 163 607 6 418 735Net realised gain/(loss) on:- Swaps contracts 3 154 - - (1 998) 29 214 248- Contracts for difference 5 953 612 (24 338 277) (1 909 347) (1 448 826) (37 589 912)- Futures contracts (4 110 383) (2 716) (1 303 506) (429 980) (137 431 641)- Options (2 084 289) - - - (4 799 628)- Forward foreign exchange contracts and foreign exchange translation 29 337 348 81 080 835 3 118 761 (4 749 366) 179 036 666- Sales of investments 58 925 785 9 026 1 132 106 14 144 527 040 151Total realised gain/(loss) 88 025 227 56 748 868 1 038 014 (6 616 026) 555 469 884Net realised result for the year 77 717 612 37 355 664 739 401 (6 452 419) 561 888 619Change in net unrealised appreciation/(depreciation) on :- Investments 2 63 547 894 (2 105 315) 372 987 (330 961) 245 223 398- Swaps contracts 2 (1 077 383) - - 117 363 (2 772 815)- Contracts for difference 2 10 453 617 (17 199 781) 5 360 909 - (74 953 869)- Futures contracts 2 1 393 211 - (402 444) (34 670) 6 385 316- Options 2 (527 118) - - - 8 014 043- Forward foreign exchange contracts 2 (16 150 150) (28 052 945) (1 058 246) (575 616) (100 107 530)- To be announced contracts 2 - - - - (544 076)Change in net unrealised appreciation/(depreciation) 57 640 071 (47 358 041) 4 273 206 (823 884) 81 244 467Net change in net assets as a result of operations 135 357 683 (10 002 377) 5 012 607 (7 276 303) 643 133 086Subscriptions 185 967 160 1 414 476 008 1 100 790 144 758 014 3 634 371 492Redemptions (218 383 785) (444 610 138) (1 100 790) - (3 968 471 186)Distributions 11 - - - - (3 774 190)Movements in capital (32 416 625) 969 865 870 - 144 758 014 (337 873 884)Exchange differences on the net assets as at March 31, 2021 - - - - (620 060 898)Net assets at the end of the year 713 395 987 1 766 083 152 42 336 130 137 481 711 10 004 243 3141 Refer to Note 1
45Lumyna Funds
Statements of operations and changes in net assets for the year ended March 31, 2021 (cont.)(expressed in the sub-fund’s currency)
The accompanying notes form an integral part of these financial statements.
Audited annual report
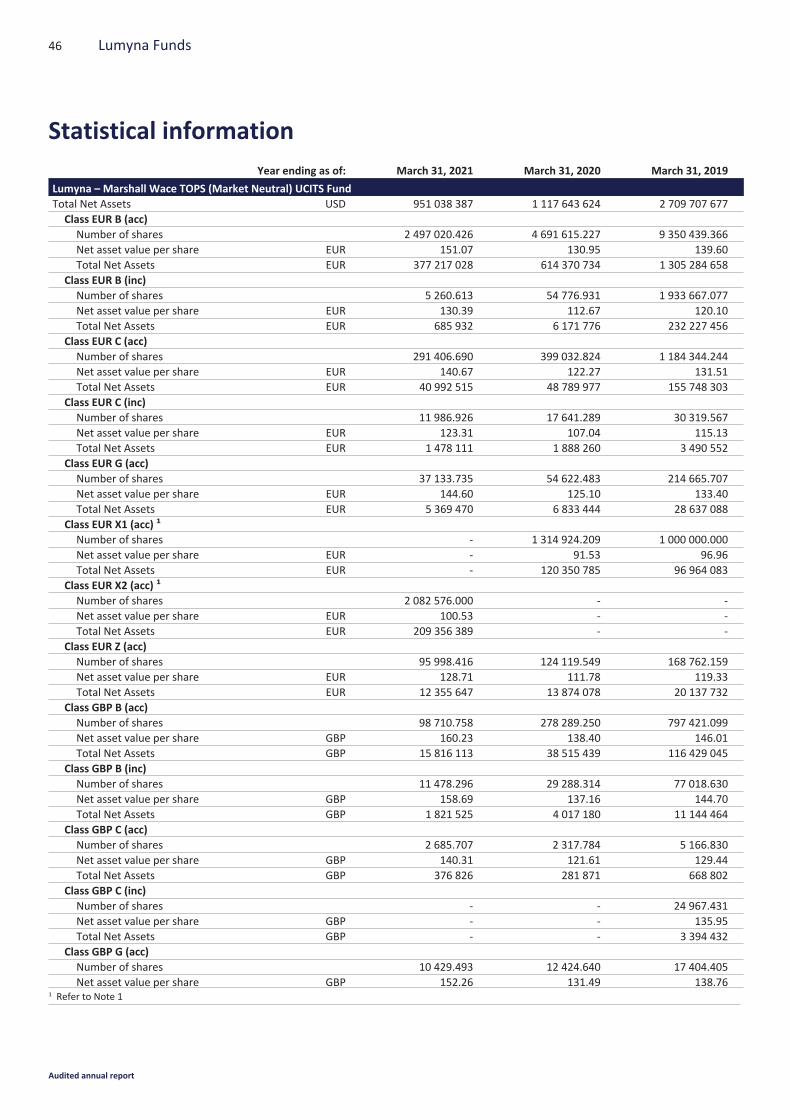
Year ending as of: March 31, 2021 March 31, 2020 March 31, 2019
Lumyna – Marshall Wace TOPS (Market Neutral) UCITS FundTotal Net Assets USD 951 038 387 1 117 643 624 2 709 707 677Class EUR B (acc)
Number of shares 2 497 020.426 4 691 615.227 9 350 439.366Net asset value per share EUR 151.07 130.95 139.60Total Net Assets EUR 377 217 028 614 370 734 1 305 284 658
Class EUR B (inc)Number of shares 5 260.613 54 776.931 1 933 667.077Net asset value per share EUR 130.39 112.67 120.10Total Net Assets EUR 685 932 6 171 776 232 227 456
Class EUR C (acc)Number of shares 291 406.690 399 032.824 1 184 344.244Net asset value per share EUR 140.67 122.27 131.51Total Net Assets EUR 40 992 515 48 789 977 155 748 303
Class EUR C (inc)Number of shares 11 986.926 17 641.289 30 319.567Net asset value per share EUR 123.31 107.04 115.13Total Net Assets EUR 1 478 111 1 888 260 3 490 552
Class EUR G (acc)Number of shares 37 133.735 54 622.483 214 665.707Net asset value per share EUR 144.60 125.10 133.40Total Net Assets EUR 5 369 470 6 833 444 28 637 088
Class EUR X1 (acc) 1
Number of shares - 1 314 924.209 1 000 000.000Net asset value per share EUR - 91.53 96.96Total Net Assets EUR - 120 350 785 96 964 083
Class EUR X2 (acc) 1
Number of shares 2 082 576.000 - -Net asset value per share EUR 100.53 - -Total Net Assets EUR 209 356 389 - -
Class EUR Z (acc)Number of shares 95 998.416 124 119.549 168 762.159Net asset value per share EUR 128.71 111.78 119.33Total Net Assets EUR 12 355 647 13 874 078 20 137 732
Class GBP B (acc)Number of shares 98 710.758 278 289.250 797 421.099Net asset value per share GBP 160.23 138.40 146.01Total Net Assets GBP 15 816 113 38 515 439 116 429 045
Class GBP B (inc)Number of shares 11 478.296 29 288.314 77 018.630Net asset value per share GBP 158.69 137.16 144.70Total Net Assets GBP 1 821 525 4 017 180 11 144 464
Class GBP C (acc)Number of shares 2 685.707 2 317.784 5 166.830Net asset value per share GBP 140.31 121.61 129.44Total Net Assets GBP 376 826 281 871 668 802
Class GBP C (inc)Number of shares - - 24 967.431Net asset value per share GBP - - 135.95Total Net Assets GBP - - 3 394 432
Class GBP G (acc)Number of shares 10 429.493 12 424.640 17 404.405Net asset value per share GBP 152.26 131.49 138.76
1 Refer to Note 1
46 Lumyna Funds
Statistical information
Audited annual report

Year ending as of: March 31, 2021 March 31, 2020 March 31, 2019
Lumyna – Marshall Wace TOPS (Market Neutral) UCITS Fund (cont.)Total Net Assets GBP 1 588 041 1 633 663 2 415 093
Class GBP Management (inc)Number of shares 293.678 293.678 293.678Net asset value per share GBP 203.27 172.99 180.93Total Net Assets GBP 59 696 50 805 53 134
Class GBP Z (acc)Number of shares 562.160 562.160 1 628.579Net asset value per share GBP 131.28 113.41 119.80Total Net Assets GBP 73 799 63 755 195 108
Class JPY B (acc) 1
Number of shares - 4 569 613.065 23 876 650.228Net asset value per share JPY - 907.24 965.22Total Net Assets JPY - 4 145 750 051 23 046 238 575
Class USD B (acc)Number of shares 830 412.910 753 126.877 1 456 200.868Net asset value per share USD 169.21 146.45 151.74Total Net Assets USD 140 514 158 110 296 781 220 961 849
Class USD C (acc)Number of shares 129 138.303 151 948.731 231 734.475Net asset value per share USD 148.02 128.69 134.54Total Net Assets USD 19 115 264 19 555 041 31 177 006
Class USD G (acc)Number of shares 18 721.137 20 450.525 38 826.103Net asset value per share USD 158.26 137.04 142.04Total Net Assets USD 2 962 863 2 802 574 5 514 855
Class USD Z (acc)Number of shares 2 390.103 602.255 -Net asset value per share USD 109.92 95.62 -Total Net Assets USD 262 728 57 588 -
Lumyna – York Event-Driven UCITS Fund 1
Total Net Assets EUR - 48 505 607 58 094 721Class AUD E (acc)
Number of shares - - 1 322.180Net asset value per share AUD - - 90.93Total Net Assets AUD - - 120 225
Class CHF A (acc) 1
Number of shares - 50.000 50.000Net asset value per share CHF - 86.13 81.70Total Net Assets CHF - 4 307 4 085
Class CHF E (acc)Number of shares - - 2 591.724Net asset value per share CHF - - 86.59Total Net Assets CHF - - 224 409
Class CHF F (acc) 1
Number of shares - 18 511.519 25 479.013Net asset value per share CHF - 103.25 99.03Total Net Assets CHF - 1 911 239 2 523 220
Class EUR A (acc) 1
Number of shares - 43 592.558 67 212.832Net asset value per share EUR - 125.13 119.94Total Net Assets EUR - 5 454 553 8 061 533
1 Refer to Note 1
47Lumyna Funds
Statistical information (cont.)
Audited annual report
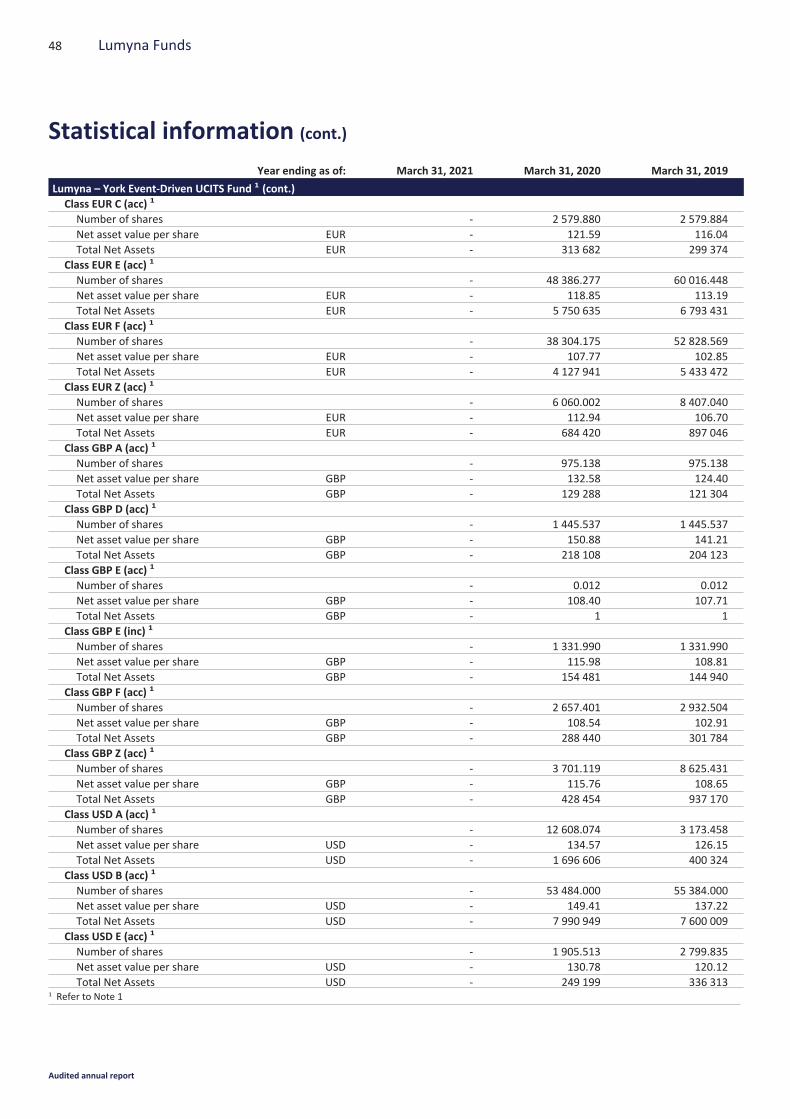
Year ending as of: March 31, 2021 March 31, 2020 March 31, 2019
Lumyna – York Event-Driven UCITS Fund 1 (cont.)Class EUR C (acc) 1
Number of shares - 2 579.880 2 579.884Net asset value per share EUR - 121.59 116.04Total Net Assets EUR - 313 682 299 374
Class EUR E (acc) 1
Number of shares - 48 386.277 60 016.448Net asset value per share EUR - 118.85 113.19Total Net Assets EUR - 5 750 635 6 793 431
Class EUR F (acc) 1
Number of shares - 38 304.175 52 828.569Net asset value per share EUR - 107.77 102.85Total Net Assets EUR - 4 127 941 5 433 472
Class EUR Z (acc) 1
Number of shares - 6 060.002 8 407.040Net asset value per share EUR - 112.94 106.70Total Net Assets EUR - 684 420 897 046
Class GBP A (acc) 1
Number of shares - 975.138 975.138Net asset value per share GBP - 132.58 124.40Total Net Assets GBP - 129 288 121 304
Class GBP D (acc) 1
Number of shares - 1 445.537 1 445.537Net asset value per share GBP - 150.88 141.21Total Net Assets GBP - 218 108 204 123
Class GBP E (acc) 1
Number of shares - 0.012 0.012Net asset value per share GBP - 108.40 107.71Total Net Assets GBP - 1 1
Class GBP E (inc) 1
Number of shares - 1 331.990 1 331.990Net asset value per share GBP - 115.98 108.81Total Net Assets GBP - 154 481 144 940
Class GBP F (acc) 1
Number of shares - 2 657.401 2 932.504Net asset value per share GBP - 108.54 102.91Total Net Assets GBP - 288 440 301 784
Class GBP Z (acc) 1
Number of shares - 3 701.119 8 625.431Net asset value per share GBP - 115.76 108.65Total Net Assets GBP - 428 454 937 170
Class USD A (acc) 1
Number of shares - 12 608.074 3 173.458Net asset value per share USD - 134.57 126.15Total Net Assets USD - 1 696 606 400 324
Class USD B (acc) 1
Number of shares - 53 484.000 55 384.000Net asset value per share USD - 149.41 137.22Total Net Assets USD - 7 990 949 7 600 009
Class USD E (acc) 1
Number of shares - 1 905.513 2 799.835Net asset value per share USD - 130.78 120.12Total Net Assets USD - 249 199 336 313
1 Refer to Note 1
48 Lumyna Funds
Statistical information (cont.)
Audited annual report

Year ending as of: March 31, 2021 March 31, 2020 March 31, 2019
Lumyna – York Event-Driven UCITS Fund 1 (cont.)Class USD F (acc) 1
Number of shares - 180 849.995 240 167.006Net asset value per share USD - 119.24 110.66Total Net Assets USD - 21 564 043 26 577 704
Class USD Z (acc) 1
Number of shares - 3 402.216 13 071.964Net asset value per share USD - 91.57 85.47Total Net Assets USD - 311 541 1 117 255
Lumyna – York Asian Event-Driven UCITS FundTotal Net Assets EUR 216 234 551 130 696 163 117 075 250Class CHF B (acc) 1
Number of shares 10 553.295 - -Net asset value per share CHF 114.82 - -Total Net Assets CHF 1 211 775 - -
Class CHF D (acc)Number of shares - - 25 000.000Net asset value per share CHF - - 123.47Total Net Assets CHF - - 3 086 838
Class EUR B (acc)Number of shares 715 592.607 530 364.130 116 331.797Net asset value per share EUR 176.77 143.62 128.94Total Net Assets EUR 126 496 504 76 170 273 14 999 565
Class EUR C (acc)Number of shares 2 259.220 10.332 46.261Net asset value per share EUR 130.41 106.41 94.07Total Net Assets EUR 294 631 1 099 4 352
Class EUR D (acc)Number of shares 238 844.169 256 448.216 589 645.195Net asset value per share EUR 202.21 159.76 141.35Total Net Assets EUR 48 295 685 40 969 928 83 346 972
Class EUR Z (acc)Number of shares 17 577.085 4 636.923 -Net asset value per share EUR 116.69 94.09 -Total Net Assets EUR 2 051 025 436 274 -
Class GBP C (acc)Number of shares 114.384 70.000 143.992Net asset value per share GBP 180.29 146.92 131.33Total Net Assets GBP 20 623 10 284 18 910
Class USD B (acc)Number of shares 198 641.312 63 337.330 65 320.039Net asset value per share USD 197.28 158.85 139.59Total Net Assets USD 39 188 801 10 061 204 9 118 299
Class USD D (acc)Number of shares 24 375.598 24 711.598 58 198.754Net asset value per share USD 223.40 174.83 150.90Total Net Assets USD 5 445 537 4 320 421 8 782 162
Lumyna – AQR Global Relative Value UCITS Fund 1
Total Net Assets USD - 113 684 715 633 262 9661 Refer to Note 1
49Lumyna Funds
Statistical information (cont.)
Audited annual report
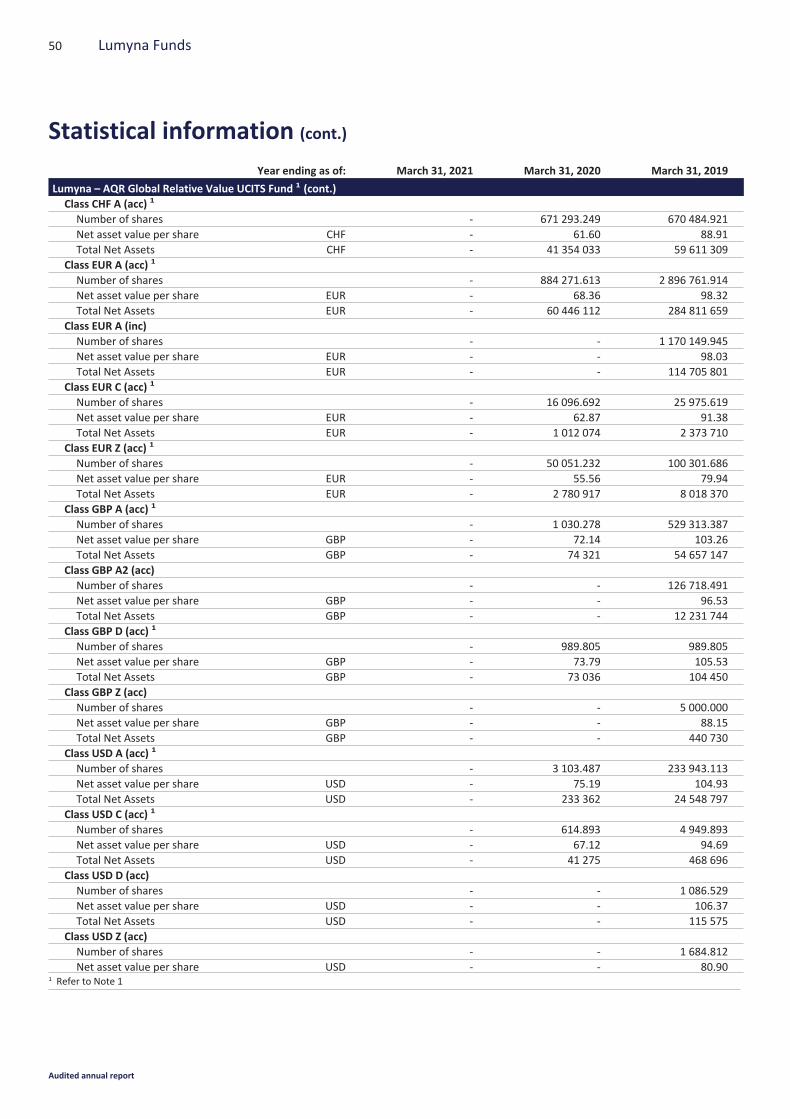
Year ending as of: March 31, 2021 March 31, 2020 March 31, 2019
Lumyna – AQR Global Relative Value UCITS Fund 1 (cont.)Class CHF A (acc) 1
Number of shares - 671 293.249 670 484.921Net asset value per share CHF - 61.60 88.91Total Net Assets CHF - 41 354 033 59 611 309
Class EUR A (acc) 1
Number of shares - 884 271.613 2 896 761.914Net asset value per share EUR - 68.36 98.32Total Net Assets EUR - 60 446 112 284 811 659
Class EUR A (inc)Number of shares - - 1 170 149.945Net asset value per share EUR - - 98.03Total Net Assets EUR - - 114 705 801
Class EUR C (acc) 1
Number of shares - 16 096.692 25 975.619Net asset value per share EUR - 62.87 91.38Total Net Assets EUR - 1 012 074 2 373 710
Class EUR Z (acc) 1
Number of shares - 50 051.232 100 301.686Net asset value per share EUR - 55.56 79.94Total Net Assets EUR - 2 780 917 8 018 370
Class GBP A (acc) 1
Number of shares - 1 030.278 529 313.387Net asset value per share GBP - 72.14 103.26Total Net Assets GBP - 74 321 54 657 147
Class GBP A2 (acc)Number of shares - - 126 718.491Net asset value per share GBP - - 96.53Total Net Assets GBP - - 12 231 744
Class GBP D (acc) 1
Number of shares - 989.805 989.805Net asset value per share GBP - 73.79 105.53Total Net Assets GBP - 73 036 104 450
Class GBP Z (acc)Number of shares - - 5 000.000Net asset value per share GBP - - 88.15Total Net Assets GBP - - 440 730
Class USD A (acc) 1
Number of shares - 3 103.487 233 943.113Net asset value per share USD - 75.19 104.93Total Net Assets USD - 233 362 24 548 797
Class USD C (acc) 1
Number of shares - 614.893 4 949.893Net asset value per share USD - 67.12 94.69Total Net Assets USD - 41 275 468 696
Class USD D (acc)Number of shares - - 1 086.529Net asset value per share USD - - 106.37Total Net Assets USD - - 115 575
Class USD Z (acc)Number of shares - - 1 684.812Net asset value per share USD - - 80.90
1 Refer to Note 1
50 Lumyna Funds
Statistical information (cont.)
Audited annual report
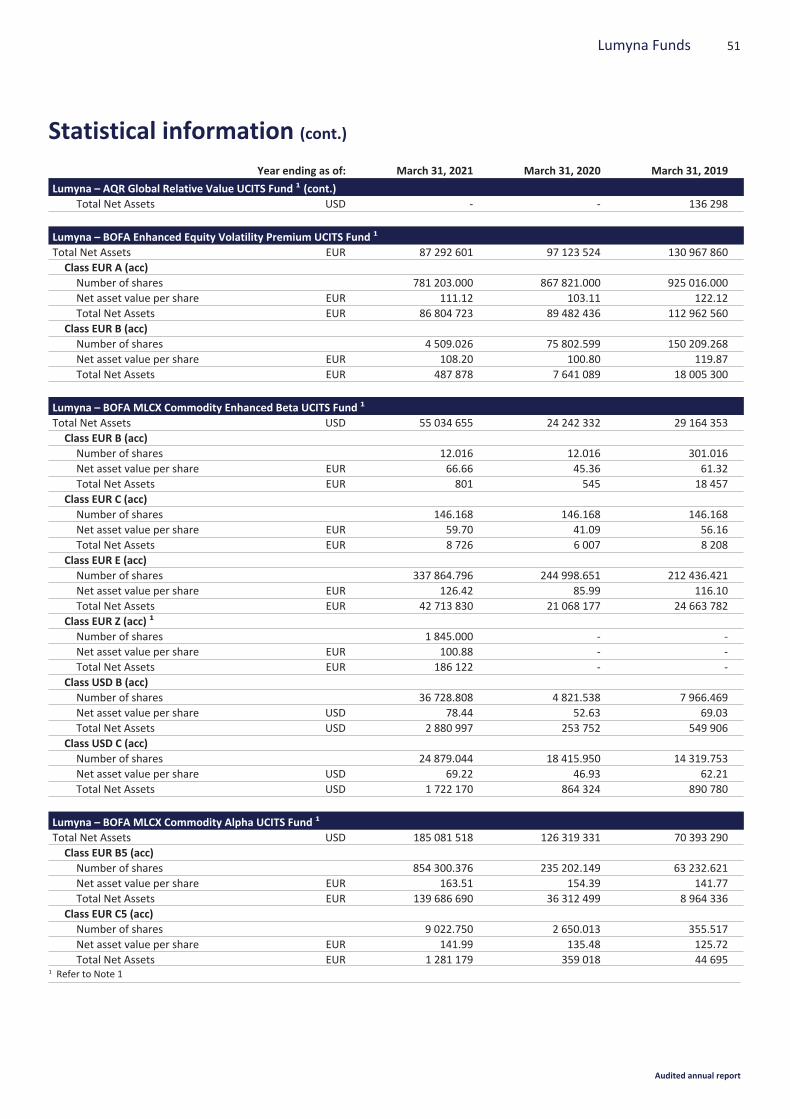
Year ending as of: March 31, 2021 March 31, 2020 March 31, 2019
Lumyna – AQR Global Relative Value UCITS Fund 1 (cont.)Total Net Assets USD - - 136 298
Lumyna – BOFA Enhanced Equity Volatility Premium UCITS Fund 1
Total Net Assets EUR 87 292 601 97 123 524 130 967 860Class EUR A (acc)
Number of shares 781 203.000 867 821.000 925 016.000Net asset value per share EUR 111.12 103.11 122.12Total Net Assets EUR 86 804 723 89 482 436 112 962 560
Class EUR B (acc)Number of shares 4 509.026 75 802.599 150 209.268Net asset value per share EUR 108.20 100.80 119.87Total Net Assets EUR 487 878 7 641 089 18 005 300
Lumyna – BOFA MLCX Commodity Enhanced Beta UCITS Fund 1
Total Net Assets USD 55 034 655 24 242 332 29 164 353Class EUR B (acc)
Number of shares 12.016 12.016 301.016Net asset value per share EUR 66.66 45.36 61.32Total Net Assets EUR 801 545 18 457
Class EUR C (acc)Number of shares 146.168 146.168 146.168Net asset value per share EUR 59.70 41.09 56.16Total Net Assets EUR 8 726 6 007 8 208
Class EUR E (acc)Number of shares 337 864.796 244 998.651 212 436.421Net asset value per share EUR 126.42 85.99 116.10Total Net Assets EUR 42 713 830 21 068 177 24 663 782
Class EUR Z (acc) 1
Number of shares 1 845.000 - -Net asset value per share EUR 100.88 - -Total Net Assets EUR 186 122 - -
Class USD B (acc)Number of shares 36 728.808 4 821.538 7 966.469Net asset value per share USD 78.44 52.63 69.03Total Net Assets USD 2 880 997 253 752 549 906
Class USD C (acc)Number of shares 24 879.044 18 415.950 14 319.753Net asset value per share USD 69.22 46.93 62.21Total Net Assets USD 1 722 170 864 324 890 780
Lumyna – BOFA MLCX Commodity Alpha UCITS Fund 1
Total Net Assets USD 185 081 518 126 319 331 70 393 290Class EUR B5 (acc)
Number of shares 854 300.376 235 202.149 63 232.621Net asset value per share EUR 163.51 154.39 141.77Total Net Assets EUR 139 686 690 36 312 499 8 964 336
Class EUR C5 (acc)Number of shares 9 022.750 2 650.013 355.517Net asset value per share EUR 141.99 135.48 125.72Total Net Assets EUR 1 281 179 359 018 44 695
1 Refer to Note 1
51Lumyna Funds
Statistical information (cont.)
Audited annual report
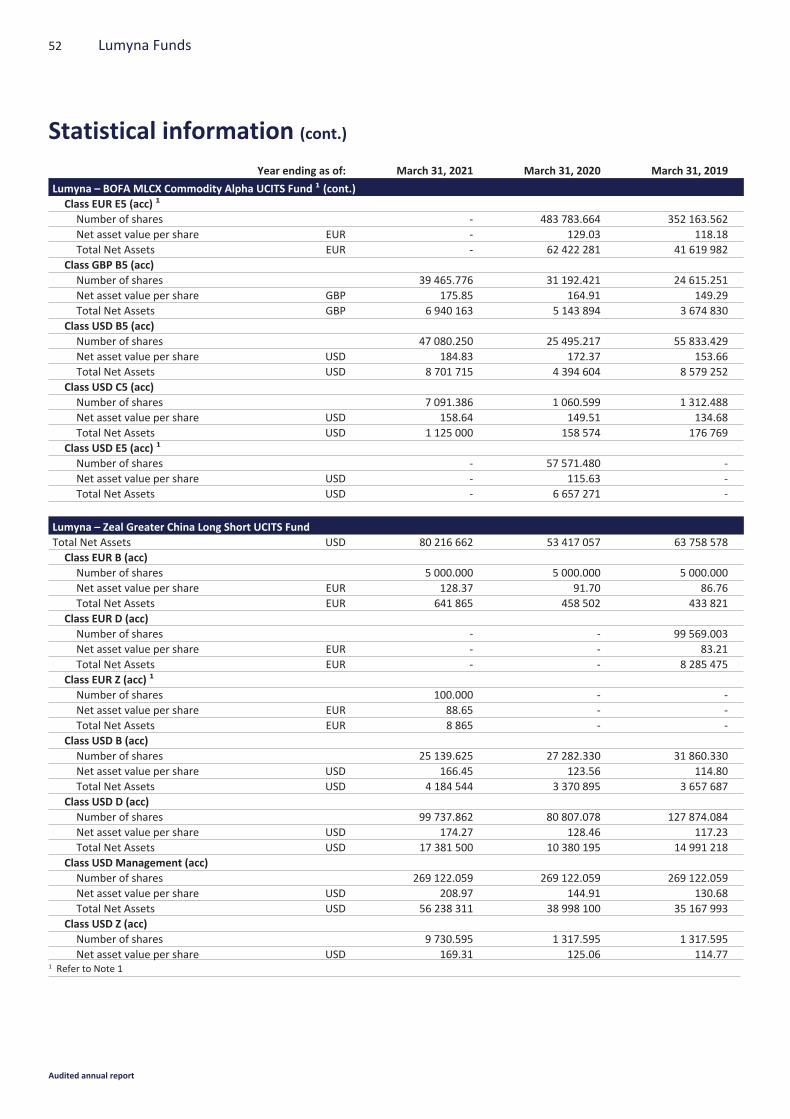
Year ending as of: March 31, 2021 March 31, 2020 March 31, 2019
Lumyna – BOFA MLCX Commodity Alpha UCITS Fund 1 (cont.)Class EUR E5 (acc) 1
Number of shares - 483 783.664 352 163.562Net asset value per share EUR - 129.03 118.18Total Net Assets EUR - 62 422 281 41 619 982
Class GBP B5 (acc)Number of shares 39 465.776 31 192.421 24 615.251Net asset value per share GBP 175.85 164.91 149.29Total Net Assets GBP 6 940 163 5 143 894 3 674 830
Class USD B5 (acc)Number of shares 47 080.250 25 495.217 55 833.429Net asset value per share USD 184.83 172.37 153.66Total Net Assets USD 8 701 715 4 394 604 8 579 252
Class USD C5 (acc)Number of shares 7 091.386 1 060.599 1 312.488Net asset value per share USD 158.64 149.51 134.68Total Net Assets USD 1 125 000 158 574 176 769
Class USD E5 (acc) 1
Number of shares - 57 571.480 -Net asset value per share USD - 115.63 -Total Net Assets USD - 6 657 271 -
Lumyna – Zeal Greater China Long Short UCITS FundTotal Net Assets USD 80 216 662 53 417 057 63 758 578Class EUR B (acc)
Number of shares 5 000.000 5 000.000 5 000.000Net asset value per share EUR 128.37 91.70 86.76Total Net Assets EUR 641 865 458 502 433 821
Class EUR D (acc)Number of shares - - 99 569.003Net asset value per share EUR - - 83.21Total Net Assets EUR - - 8 285 475
Class EUR Z (acc) 1
Number of shares 100.000 - -Net asset value per share EUR 88.65 - -Total Net Assets EUR 8 865 - -
Class USD B (acc)Number of shares 25 139.625 27 282.330 31 860.330Net asset value per share USD 166.45 123.56 114.80Total Net Assets USD 4 184 544 3 370 895 3 657 687
Class USD D (acc)Number of shares 99 737.862 80 807.078 127 874.084Net asset value per share USD 174.27 128.46 117.23Total Net Assets USD 17 381 500 10 380 195 14 991 218
Class USD Management (acc)Number of shares 269 122.059 269 122.059 269 122.059Net asset value per share USD 208.97 144.91 130.68Total Net Assets USD 56 238 311 38 998 100 35 167 993
Class USD Z (acc)Number of shares 9 730.595 1 317.595 1 317.595Net asset value per share USD 169.31 125.06 114.77
1 Refer to Note 1
52 Lumyna Funds
Statistical information (cont.)
Audited annual report

Year ending as of: March 31, 2021 March 31, 2020 March 31, 2019
Lumyna – Zeal Greater China Long Short UCITS Fund (cont.)Total Net Assets USD 1 647 504 164 774 151 220
Lumyna – Ramius Merger Arbitrage UCITS FundTotal Net Assets USD 213 247 432 291 846 685 297 553 788Class EUR B (acc)
Number of shares 139 035.185 202 269.129 -Net asset value per share EUR 103.46 89.14 -Total Net Assets EUR 14 384 607 18 030 956 -
Class EUR C (acc)Number of shares 11 580.605 14 395.981 12 685.590Net asset value per share EUR 107.34 92.52 104.74Total Net Assets EUR 1 243 010 1 331 921 1 328 728
Class EUR D (acc)Number of shares 793 777.067 815 961.221 822 622.731Net asset value per share EUR 112.94 96.52 108.12Total Net Assets EUR 89 652 527 78 757 366 88 943 815
Class EUR X1 (acc) 1
Number of shares - 227 954.000 139 023.000Net asset value per share EUR - 94.14 104.94Total Net Assets EUR - 21 458 966 14 589 002
Class EUR X2 (acc)Number of shares 140 120.143 126 437.424 246 102.154Net asset value per share EUR 107.62 91.67 102.26Total Net Assets EUR 15 080 141 11 590 250 25 166 428
Class EUR X3 (acc)Number of shares 25 970.878 509 414.869 565 234.869Net asset value per share EUR 107.01 90.99 101.23Total Net Assets EUR 2 779 179 46 353 143 57 216 707
Class EUR X4 (acc)Number of shares 259 277.000 330 104.000 146 200.000Net asset value per share EUR 106.57 90.83 101.78Total Net Assets EUR 27 630 729 29 984 934 14 880 957
Class EUR X5 (acc) 1
Number of shares - 150 000.000 -Net asset value per share EUR - 88.56 -Total Net Assets EUR - 13 283 775 -
Class EUR Z (acc)Number of shares 3 511.771 3 000.000 -Net asset value per share EUR 116.48 102.37 -Total Net Assets EUR 409 048 307 099 -
Class GBP D (acc)Number of shares - - 30 000.000Net asset value per share GBP - - 100.69Total Net Assets GBP - - 3 020 773
Class SEK X1 (acc)Number of shares 742.624 5 605.491 646 478.893Net asset value per share SEK 109.70 93.21 104.51Total Net Assets SEK 81 463 522 469 67 564 745
Class USD B (acc)Number of shares 106 873.598 94 553.997 22 941.769Net asset value per share USD 122.55 105.39 115.04Total Net Assets USD 13 097 327 9 964 762 2 639 285
1 Refer to Note 1
53Lumyna Funds
Statistical information (cont.)
Audited annual report
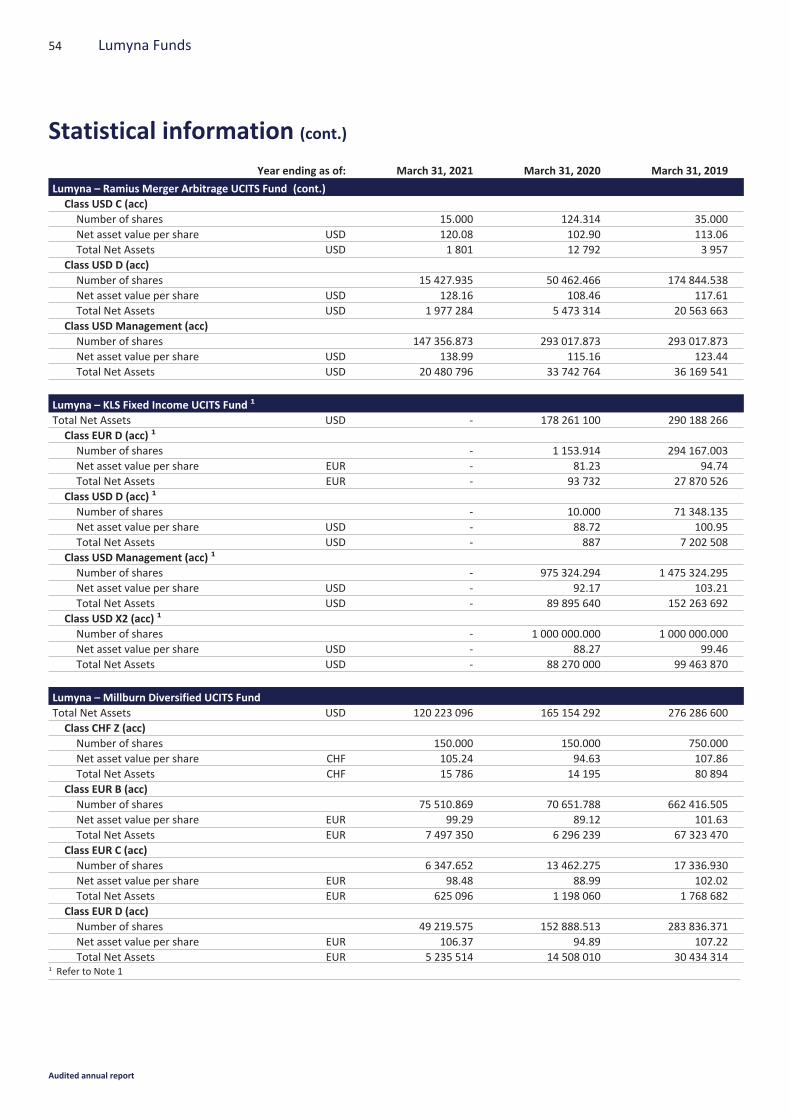
Year ending as of: March 31, 2021 March 31, 2020 March 31, 2019
Lumyna – Ramius Merger Arbitrage UCITS Fund (cont.)Class USD C (acc)
Number of shares 15.000 124.314 35.000Net asset value per share USD 120.08 102.90 113.06Total Net Assets USD 1 801 12 792 3 957
Class USD D (acc)Number of shares 15 427.935 50 462.466 174 844.538Net asset value per share USD 128.16 108.46 117.61Total Net Assets USD 1 977 284 5 473 314 20 563 663
Class USD Management (acc)Number of shares 147 356.873 293 017.873 293 017.873Net asset value per share USD 138.99 115.16 123.44Total Net Assets USD 20 480 796 33 742 764 36 169 541
Lumyna – KLS Fixed Income UCITS Fund 1
Total Net Assets USD - 178 261 100 290 188 266Class EUR D (acc) 1
Number of shares - 1 153.914 294 167.003Net asset value per share EUR - 81.23 94.74Total Net Assets EUR - 93 732 27 870 526
Class USD D (acc) 1
Number of shares - 10.000 71 348.135Net asset value per share USD - 88.72 100.95Total Net Assets USD - 887 7 202 508
Class USD Management (acc) 1
Number of shares - 975 324.294 1 475 324.295Net asset value per share USD - 92.17 103.21Total Net Assets USD - 89 895 640 152 263 692
Class USD X2 (acc) 1
Number of shares - 1 000 000.000 1 000 000.000Net asset value per share USD - 88.27 99.46Total Net Assets USD - 88 270 000 99 463 870
Lumyna – Millburn Diversified UCITS FundTotal Net Assets USD 120 223 096 165 154 292 276 286 600Class CHF Z (acc)
Number of shares 150.000 150.000 750.000Net asset value per share CHF 105.24 94.63 107.86Total Net Assets CHF 15 786 14 195 80 894
Class EUR B (acc)Number of shares 75 510.869 70 651.788 662 416.505Net asset value per share EUR 99.29 89.12 101.63Total Net Assets EUR 7 497 350 6 296 239 67 323 470
Class EUR C (acc)Number of shares 6 347.652 13 462.275 17 336.930Net asset value per share EUR 98.48 88.99 102.02Total Net Assets EUR 625 096 1 198 060 1 768 682
Class EUR D (acc)Number of shares 49 219.575 152 888.513 283 836.371Net asset value per share EUR 106.37 94.89 107.22Total Net Assets EUR 5 235 514 14 508 010 30 434 314
1 Refer to Note 1
54 Lumyna Funds
Statistical information (cont.)
Audited annual report

Year ending as of: March 31, 2021 March 31, 2020 March 31, 2019
Lumyna – Millburn Diversified UCITS Fund (cont.)Class EUR X2 (acc)
Number of shares 108 172.743 137 928.744 156 956.429Net asset value per share EUR 103.39 91.86 103.36Total Net Assets EUR 11 183 966 12 670 668 16 223 734
Class EUR X3 (acc)Number of shares - - 41 000.000Net asset value per share EUR - - 101.19Total Net Assets EUR - - 4 148 777
Class EUR X4 (inc)Number of shares 910.000 13 505.000 73 532.000Net asset value per share EUR 102.32 91.70 103.79Total Net Assets EUR 93 109 1 238 353 7 631 618
Class EUR X6 (acc)Number of shares 67 438.466 64 386.180 -Net asset value per share EUR 99.31 88.59 -Total Net Assets EUR 6 697 411 5 703 903 -
Class EUR Y1 (acc)Number of shares - - 7 500.000Net asset value per share EUR - - 106.80Total Net Assets EUR - - 801 006
Class EUR Z (acc)Number of shares 4 678.977 6 879.300 6 943.483Net asset value per share EUR 96.86 86.87 99.14Total Net Assets EUR 453 186 597 633 688 354
Class GBP B (acc)Number of shares 6 708.000 32 772.947 10 959.407Net asset value per share GBP 103.55 92.28 104.60Total Net Assets GBP 694 631 3 024 150 1 146 312
Class GBP D (acc) 1
Number of shares - 586.790 16 786.459Net asset value per share GBP - 93.79 105.29Total Net Assets GBP - 55 038 1 767 397
Class GBP X4 (inc) 1
Number of shares - 1 523.813 271 867.500Net asset value per share GBP - 93.83 105.43Total Net Assets GBP - 142 986 28 663 276
Class GBP Z (acc)Number of shares 3 898.774 19 559.895 21 022.026Net asset value per share GBP 99.62 88.80 100.23Total Net Assets GBP 388 415 1 736 868 2 106 949
Class JPY X5 (acc)Number of shares 7 237 707.820 10 375 195.020 6 264 429.084Net asset value per share JPY 1 055.09 940.12 1 067.46Total Net Assets JPY 7 636 426 104 9 753 964 920 6 687 016 818
Class USD B (acc)Number of shares 34 995.034 105 973.022 119 895.456Net asset value per share USD 111.50 99.21 109.94Total Net Assets USD 3 902 037 10 514 002 13 181 869
Class USD C (acc)Number of shares 3 221.317 5 920.657 8 845.193Net asset value per share USD 108.95 97.39 108.43Total Net Assets USD 350 975 576 590 959 127
1 Refer to Note 1
55Lumyna Funds
Statistical information (cont.)
Audited annual report

Year ending as of: March 31, 2021 March 31, 2020 March 31, 2019
Lumyna – Millburn Diversified UCITS Fund (cont.)Class USD D (acc)
Number of shares - - 2 076.764Net asset value per share USD - - 112.08Total Net Assets USD - - 232 755
Class USD X4 (inc) 1
Number of shares - 6 023.000 69 498.000Net asset value per share USD - 97.94 107.81Total Net Assets USD - 589 870 7 492 320
Class USD Y1 (acc)Number of shares 68 058.007 93 636.597 39 626.168Net asset value per share USD 107.04 95.28 105.82Total Net Assets USD 7 284 979 8 921 582 4 193 188
Class USD Z (acc)Number of shares 9 065.270 13 605.569 12 540.299Net asset value per share USD 104.51 93.34 103.07Total Net Assets USD 947 382 1 269 889 1 292 549
Lumyna – Global Debt - Credit UCITS FundTotal Net Assets USD 868 513 100 806 002 769 846 220 619Class EUR B (acc)
Number of shares 2 910 770.563 3 292 454.109 3 035 588.454Net asset value per share EUR 105.94 98.30 99.36Total Net Assets EUR 308 354 628 323 647 321 301 621 983
Class EUR B (inc)Number of shares 50 342.278 45 396.867 21 490.969Net asset value per share EUR 103.63 98.44 101.88Total Net Assets EUR 5 216 828 4 468 643 2 189 592
Class GBP B (inc)Number of shares 159 107.575 157 360.642 178 662.892Net asset value per share GBP 103.67 97.85 100.25Total Net Assets GBP 16 494 771 15 397 457 17 910 996
Class USD B (acc)Number of shares 4 016 523.591 3 914 090.656 4 510 530.533Net asset value per share USD 115.07 105.63 103.39Total Net Assets USD 462 193 661 413 448 227 466 338 131
Class USD B (inc)Number of shares 134 144.628 127 748.440 146 260.747Net asset value per share USD 111.98 105.18 105.35Total Net Assets USD 15 021 241 13 437 089 15 408 765
Lumyna – Global Debt - Government UCITS FundTotal Net Assets USD 5 667 788 590 6 217 415 391 5 209 567 257Class EUR B (acc)
Number of shares 20 118 197.409 22 430 539.652 18 438 420.264Net asset value per share EUR 102.91 105.03 100.78Total Net Assets EUR 2 070 438 077 2 355 971 696 1 858 233 565
Class EUR B (inc)Number of shares 345 143.310 285 909.691 170 415.366Net asset value per share EUR 101.96 105.09 101.72Total Net Assets EUR 35 191 064 30 045 308 17 334 767
1 Refer to Note 1
56 Lumyna Funds
Statistical information (cont.)
Audited annual report
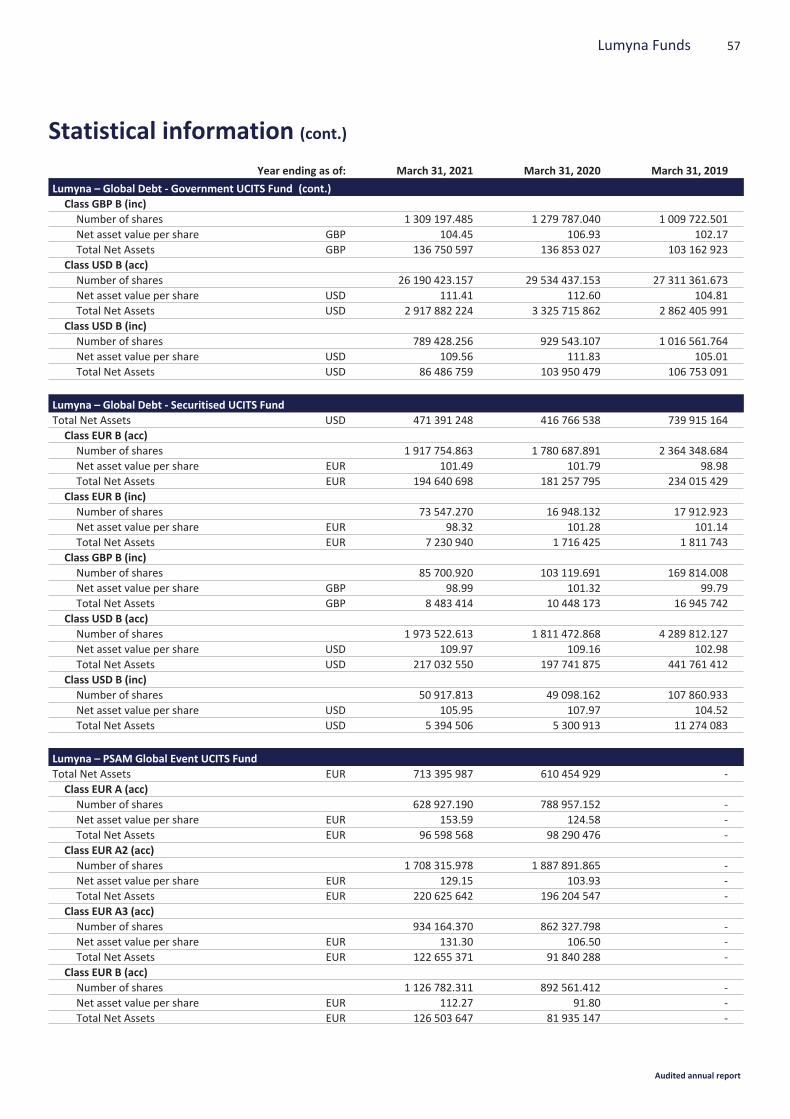
Year ending as of: March 31, 2021 March 31, 2020 March 31, 2019
Lumyna – Global Debt - Government UCITS Fund (cont.)Class GBP B (inc)
Number of shares 1 309 197.485 1 279 787.040 1 009 722.501Net asset value per share GBP 104.45 106.93 102.17Total Net Assets GBP 136 750 597 136 853 027 103 162 923
Class USD B (acc)Number of shares 26 190 423.157 29 534 437.153 27 311 361.673Net asset value per share USD 111.41 112.60 104.81Total Net Assets USD 2 917 882 224 3 325 715 862 2 862 405 991
Class USD B (inc)Number of shares 789 428.256 929 543.107 1 016 561.764Net asset value per share USD 109.56 111.83 105.01Total Net Assets USD 86 486 759 103 950 479 106 753 091
Lumyna – Global Debt - Securitised UCITS FundTotal Net Assets USD 471 391 248 416 766 538 739 915 164Class EUR B (acc)
Number of shares 1 917 754.863 1 780 687.891 2 364 348.684Net asset value per share EUR 101.49 101.79 98.98Total Net Assets EUR 194 640 698 181 257 795 234 015 429
Class EUR B (inc)Number of shares 73 547.270 16 948.132 17 912.923Net asset value per share EUR 98.32 101.28 101.14Total Net Assets EUR 7 230 940 1 716 425 1 811 743
Class GBP B (inc)Number of shares 85 700.920 103 119.691 169 814.008Net asset value per share GBP 98.99 101.32 99.79Total Net Assets GBP 8 483 414 10 448 173 16 945 742
Class USD B (acc)Number of shares 1 973 522.613 1 811 472.868 4 289 812.127Net asset value per share USD 109.97 109.16 102.98Total Net Assets USD 217 032 550 197 741 875 441 761 412
Class USD B (inc)Number of shares 50 917.813 49 098.162 107 860.933Net asset value per share USD 105.95 107.97 104.52Total Net Assets USD 5 394 506 5 300 913 11 274 083
Lumyna – PSAM Global Event UCITS FundTotal Net Assets EUR 713 395 987 610 454 929 -Class EUR A (acc)
Number of shares 628 927.190 788 957.152 -Net asset value per share EUR 153.59 124.58 -Total Net Assets EUR 96 598 568 98 290 476 -
Class EUR A2 (acc)Number of shares 1 708 315.978 1 887 891.865 -Net asset value per share EUR 129.15 103.93 -Total Net Assets EUR 220 625 642 196 204 547 -
Class EUR A3 (acc)Number of shares 934 164.370 862 327.798 -Net asset value per share EUR 131.30 106.50 -Total Net Assets EUR 122 655 371 91 840 288 -
Class EUR B (acc)Number of shares 1 126 782.311 892 561.412 -Net asset value per share EUR 112.27 91.80 -Total Net Assets EUR 126 503 647 81 935 147 -
57Lumyna Funds
Statistical information (cont.)
Audited annual report
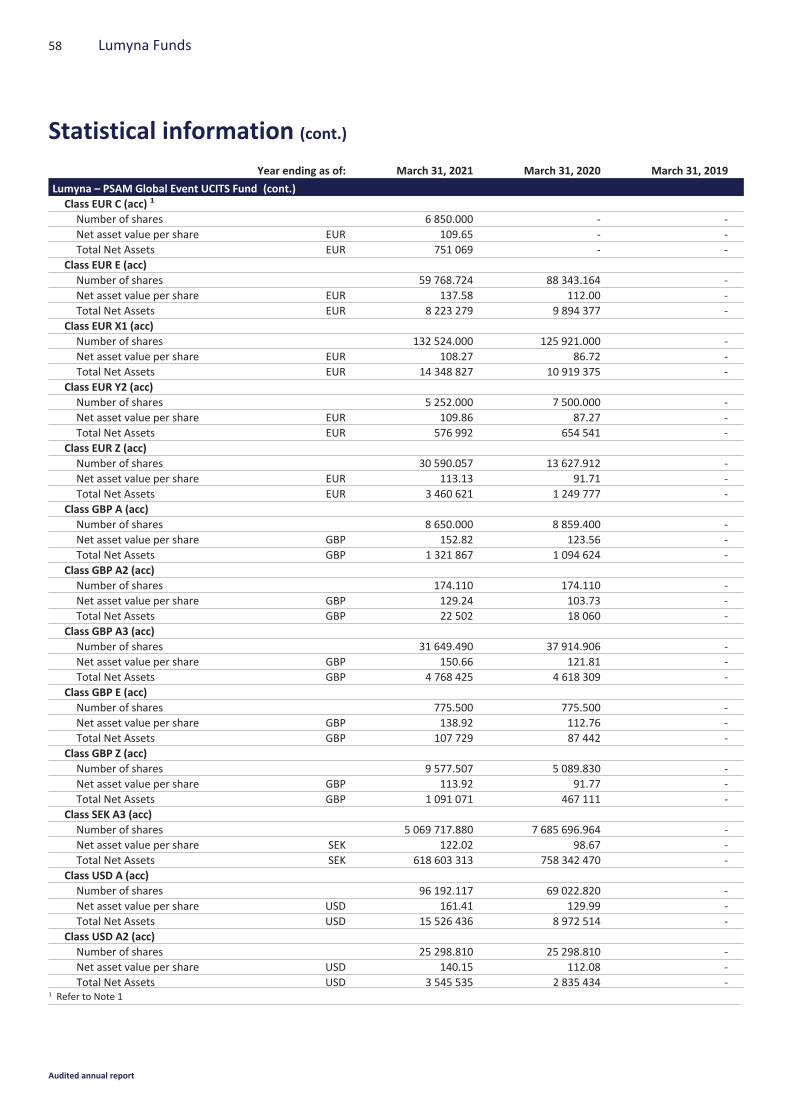
Year ending as of: March 31, 2021 March 31, 2020 March 31, 2019
Lumyna – PSAM Global Event UCITS Fund (cont.)Class EUR C (acc) 1
Number of shares 6 850.000 - -Net asset value per share EUR 109.65 - -Total Net Assets EUR 751 069 - -
Class EUR E (acc)Number of shares 59 768.724 88 343.164 -Net asset value per share EUR 137.58 112.00 -Total Net Assets EUR 8 223 279 9 894 377 -
Class EUR X1 (acc)Number of shares 132 524.000 125 921.000 -Net asset value per share EUR 108.27 86.72 -Total Net Assets EUR 14 348 827 10 919 375 -
Class EUR Y2 (acc)Number of shares 5 252.000 7 500.000 -Net asset value per share EUR 109.86 87.27 -Total Net Assets EUR 576 992 654 541 -
Class EUR Z (acc)Number of shares 30 590.057 13 627.912 -Net asset value per share EUR 113.13 91.71 -Total Net Assets EUR 3 460 621 1 249 777 -
Class GBP A (acc)Number of shares 8 650.000 8 859.400 -Net asset value per share GBP 152.82 123.56 -Total Net Assets GBP 1 321 867 1 094 624 -
Class GBP A2 (acc)Number of shares 174.110 174.110 -Net asset value per share GBP 129.24 103.73 -Total Net Assets GBP 22 502 18 060 -
Class GBP A3 (acc)Number of shares 31 649.490 37 914.906 -Net asset value per share GBP 150.66 121.81 -Total Net Assets GBP 4 768 425 4 618 309 -
Class GBP E (acc)Number of shares 775.500 775.500 -Net asset value per share GBP 138.92 112.76 -Total Net Assets GBP 107 729 87 442 -
Class GBP Z (acc)Number of shares 9 577.507 5 089.830 -Net asset value per share GBP 113.92 91.77 -Total Net Assets GBP 1 091 071 467 111 -
Class SEK A3 (acc)Number of shares 5 069 717.880 7 685 696.964 -Net asset value per share SEK 122.02 98.67 -Total Net Assets SEK 618 603 313 758 342 470 -
Class USD A (acc)Number of shares 96 192.117 69 022.820 -Net asset value per share USD 161.41 129.99 -Total Net Assets USD 15 526 436 8 972 514 -
Class USD A2 (acc)Number of shares 25 298.810 25 298.810 -Net asset value per share USD 140.15 112.08 -Total Net Assets USD 3 545 535 2 835 434 -
1 Refer to Note 1
58 Lumyna Funds
Statistical information (cont.)
Audited annual report
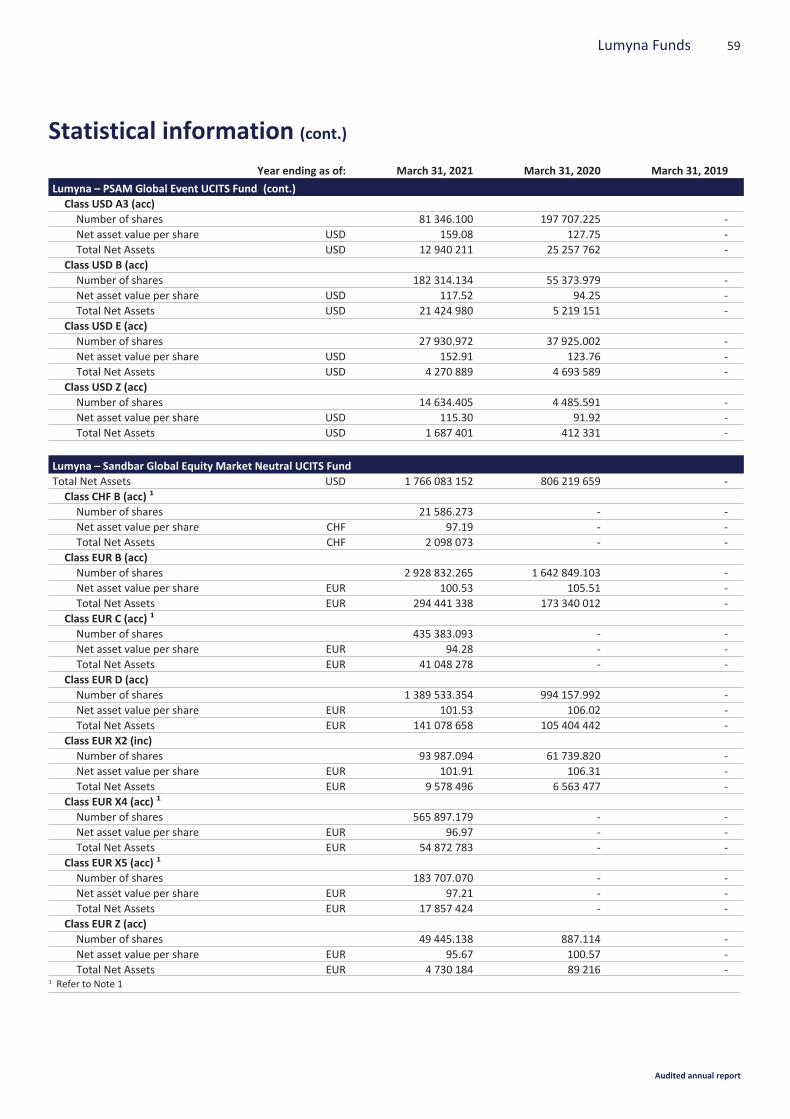
Year ending as of: March 31, 2021 March 31, 2020 March 31, 2019
Lumyna – PSAM Global Event UCITS Fund (cont.)Class USD A3 (acc)
Number of shares 81 346.100 197 707.225 -Net asset value per share USD 159.08 127.75 -Total Net Assets USD 12 940 211 25 257 762 -
Class USD B (acc)Number of shares 182 314.134 55 373.979 -Net asset value per share USD 117.52 94.25 -Total Net Assets USD 21 424 980 5 219 151 -
Class USD E (acc)Number of shares 27 930.972 37 925.002 -Net asset value per share USD 152.91 123.76 -Total Net Assets USD 4 270 889 4 693 589 -
Class USD Z (acc)Number of shares 14 634.405 4 485.591 -Net asset value per share USD 115.30 91.92 -Total Net Assets USD 1 687 401 412 331 -
Lumyna – Sandbar Global Equity Market Neutral UCITS FundTotal Net Assets USD 1 766 083 152 806 219 659 -Class CHF B (acc) 1
Number of shares 21 586.273 - -Net asset value per share CHF 97.19 - -Total Net Assets CHF 2 098 073 - -
Class EUR B (acc)Number of shares 2 928 832.265 1 642 849.103 -Net asset value per share EUR 100.53 105.51 -Total Net Assets EUR 294 441 338 173 340 012 -
Class EUR C (acc) 1
Number of shares 435 383.093 - -Net asset value per share EUR 94.28 - -Total Net Assets EUR 41 048 278 - -
Class EUR D (acc)Number of shares 1 389 533.354 994 157.992 -Net asset value per share EUR 101.53 106.02 -Total Net Assets EUR 141 078 658 105 404 442 -
Class EUR X2 (inc)Number of shares 93 987.094 61 739.820 -Net asset value per share EUR 101.91 106.31 -Total Net Assets EUR 9 578 496 6 563 477 -
Class EUR X4 (acc) 1
Number of shares 565 897.179 - -Net asset value per share EUR 96.97 - -Total Net Assets EUR 54 872 783 - -
Class EUR X5 (acc) 1
Number of shares 183 707.070 - -Net asset value per share EUR 97.21 - -Total Net Assets EUR 17 857 424 - -
Class EUR Z (acc)Number of shares 49 445.138 887.114 -Net asset value per share EUR 95.67 100.57 -Total Net Assets EUR 4 730 184 89 216 -
1 Refer to Note 1
59Lumyna Funds
Statistical information (cont.)
Audited annual report
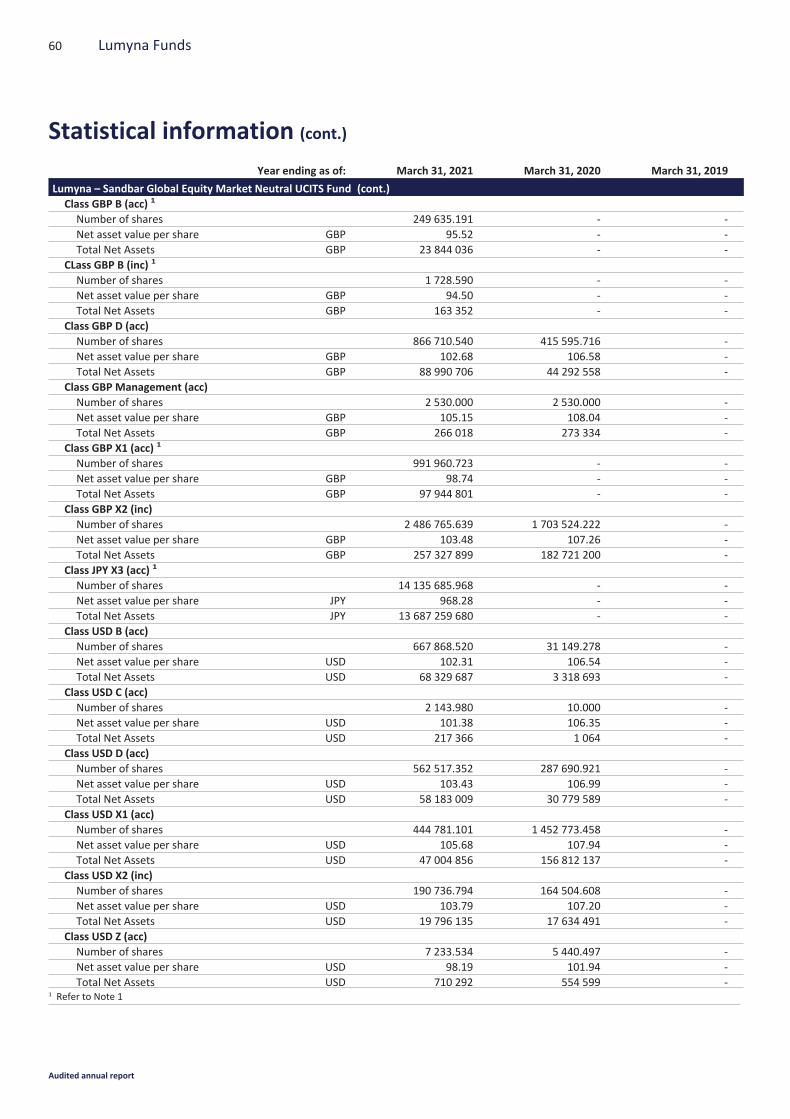
Year ending as of: March 31, 2021 March 31, 2020 March 31, 2019
Lumyna – Sandbar Global Equity Market Neutral UCITS Fund (cont.)Class GBP B (acc) 1
Number of shares 249 635.191 - -Net asset value per share GBP 95.52 - -Total Net Assets GBP 23 844 036 - -
CLass GBP B (inc) 1
Number of shares 1 728.590 - -Net asset value per share GBP 94.50 - -Total Net Assets GBP 163 352 - -
Class GBP D (acc)Number of shares 866 710.540 415 595.716 -Net asset value per share GBP 102.68 106.58 -Total Net Assets GBP 88 990 706 44 292 558 -
Class GBP Management (acc)Number of shares 2 530.000 2 530.000 -Net asset value per share GBP 105.15 108.04 -Total Net Assets GBP 266 018 273 334 -
Class GBP X1 (acc) 1
Number of shares 991 960.723 - -Net asset value per share GBP 98.74 - -Total Net Assets GBP 97 944 801 - -
Class GBP X2 (inc)Number of shares 2 486 765.639 1 703 524.222 -Net asset value per share GBP 103.48 107.26 -Total Net Assets GBP 257 327 899 182 721 200 -
Class JPY X3 (acc) 1
Number of shares 14 135 685.968 - -Net asset value per share JPY 968.28 - -Total Net Assets JPY 13 687 259 680 - -
Class USD B (acc)Number of shares 667 868.520 31 149.278 -Net asset value per share USD 102.31 106.54 -Total Net Assets USD 68 329 687 3 318 693 -
Class USD C (acc)Number of shares 2 143.980 10.000 -Net asset value per share USD 101.38 106.35 -Total Net Assets USD 217 366 1 064 -
Class USD D (acc)Number of shares 562 517.352 287 690.921 -Net asset value per share USD 103.43 106.99 -Total Net Assets USD 58 183 009 30 779 589 -
Class USD X1 (acc)Number of shares 444 781.101 1 452 773.458 -Net asset value per share USD 105.68 107.94 -Total Net Assets USD 47 004 856 156 812 137 -
Class USD X2 (inc)Number of shares 190 736.794 164 504.608 -Net asset value per share USD 103.79 107.20 -Total Net Assets USD 19 796 135 17 634 491 -
Class USD Z (acc)Number of shares 7 233.534 5 440.497 -Net asset value per share USD 98.19 101.94 -Total Net Assets USD 710 292 554 599 -
1 Refer to Note 1
60 Lumyna Funds
Statistical information (cont.)
Audited annual report

Year ending as of: March 31, 2021 March 31, 2020 March 31, 2019
Lumyna – Sandbar Global Equity Market Neutral UCITS Fund (cont.)Class SEK Z (acc) 1
Number of shares 2 510 888.991 - -Net asset value per share SEK 484.91 - -Total Net Assets SEK 1 217 549 436 - -
Lumyna – Millburn Adaptive Allocation Program UCITS FundTotal Net Assets USD 42 336 130 37 323 523 -Class EUR X1 (acc)
Number of shares 400 005.003 400 005.003 -Net asset value per share EUR 90.25 84.70 -Total Net Assets EUR 36 102 154 33 878 870 -
Class USD B (acc)Number of shares 10.000 10.000 -Net asset value per share USD 92.05 85.24 -Total Net Assets USD 921 852 -
Lumyna – Bluecove Alternative Credit UCITS Fund 1
Total Net Assets USD 137 481 711 - -Class EUR X1 (acc) 1
Number of shares 1 000 000.000 - -Net asset value per share EUR 98.26 - -Total Net Assets EUR 98 263 059 - -
Class GBP D (acc) 1
Number of shares 139 705.225 - -Net asset value per share GBP 98.91 - -Total Net Assets GBP 13 818 037 - -
Class GBP X2 (acc) 1
Number of shares 6 165.000 - -Net asset value per share GBP 98.86 - -Total Net Assets GBP 609 491 - -
Class USD B (acc) 1
Number of shares 10.000 - -Net asset value per share USD 98.46 - -Total Net Assets USD 985 - -
Class USD D (acc) 1
Number of shares 21 181.023 - -Net asset value per share USD 98.51 - -Total Net Assets USD 2 086 542 - -
1 Refer to Note 1
61Lumyna Funds
Statistical information (cont.)
Audited annual report

Quantity DescriptionQuotationcurrency
CostUSD
Marketvalue USD
% of netassets
Transferable securities and money market instruments admitted to an official exchange listing or dealt in on another regulated market
Shares
Australia41 148 BHP Group Plc. - ADR USD 1 617 415 2 380 823 0.25
11 Piedmont Lithium Ltd. - ADR USD 770 765 0.00
Total Australia 1 618 185 2 381 588 0.25
Bahamas60 045 Leo Hldg. III Corp. USD 600 486 588 441 0.06
Total Bahamas 600 486 588 441 0.06
Bermuda55 272 Triton International Ltd. USD 2 122 318 3 039 407 0.32
356 Watford Hldg. Ltd. USD 12 334 12 321 0.00
Total Bermuda 2 134 652 3 051 728 0.32
Brazil128 568 Petroleo Brasileiro S.A. - ADR USD 1 129 566 1 090 257 0.12
Total Brazil 1 129 566 1 090 257 0.12
Canada1 788 Aphria, Inc. USD 32 774 32 846 0.004 197 CAE, Inc. USD 115 417 119 573 0.01
60 029 DRI Healthcare Trust USD 600 011 498 241 0.058 652 Enbridge, Inc. USD 305 538 314 933 0.036 157 Lightspeed POS, Inc. USD 430 990 386 721 0.041 354 Lululemon Athletica, Inc. USD 423 135 415 285 0.058 725 Magna International, Inc. USD 634 219 768 149 0.08129 Shopify, Inc. - A USD 142 478 142 738 0.02
104 543 Suncor Energy, Inc. USD 2 037 286 2 184 949 0.235 945 TELUS International CDA, Inc. USD 180 728 166 341 0.02
31 807 Tilray, Inc. USD 804 594 722 973 0.08
Total Canada 5 707 170 5 752 749 0.61
Cayman Islands39 523 AEA-Bridges Impact Corp. - A USD 376 305 388 116 0.0430 216 Alussa Energy Acquisition Corp. - A USD 301 879 302 160 0.0345 226 Avanti Acquisition Corp. - A USD 431 081 441 858 0.0554 029 TB S.A. Acquisition Corp. USD 540 290 532 186 0.0535 354 Vy Global Growth - A USD 340 464 357 782 0.04
Total Cayman Islands 1 990 019 2 022 102 0.21
China1 298 Adagene, Inc. - ADR USD 33 499 23 299 0.006 300 Autohome, Inc. - A HKD 144 534 150 157 0.02
49 800 Baidu, Inc. - A HKD 1 632 031 1 364 392 0.141 092 Baidu, Inc. - ADR USD 238 727 237 565 0.036 920 Bilibili, Inc. - ADR USD 727 487 740 855 0.08218 China Biologic Products Hldg., Inc. USD 25 688 25 813 0.00
62 Lumyna Funds
Lumyna – Marshall Wace TOPS (Market Neutral)UCITS FundSchedule of investments as at March 31, 2021
The accompanying notes form an integral part of these financial statements.
Audited annual report
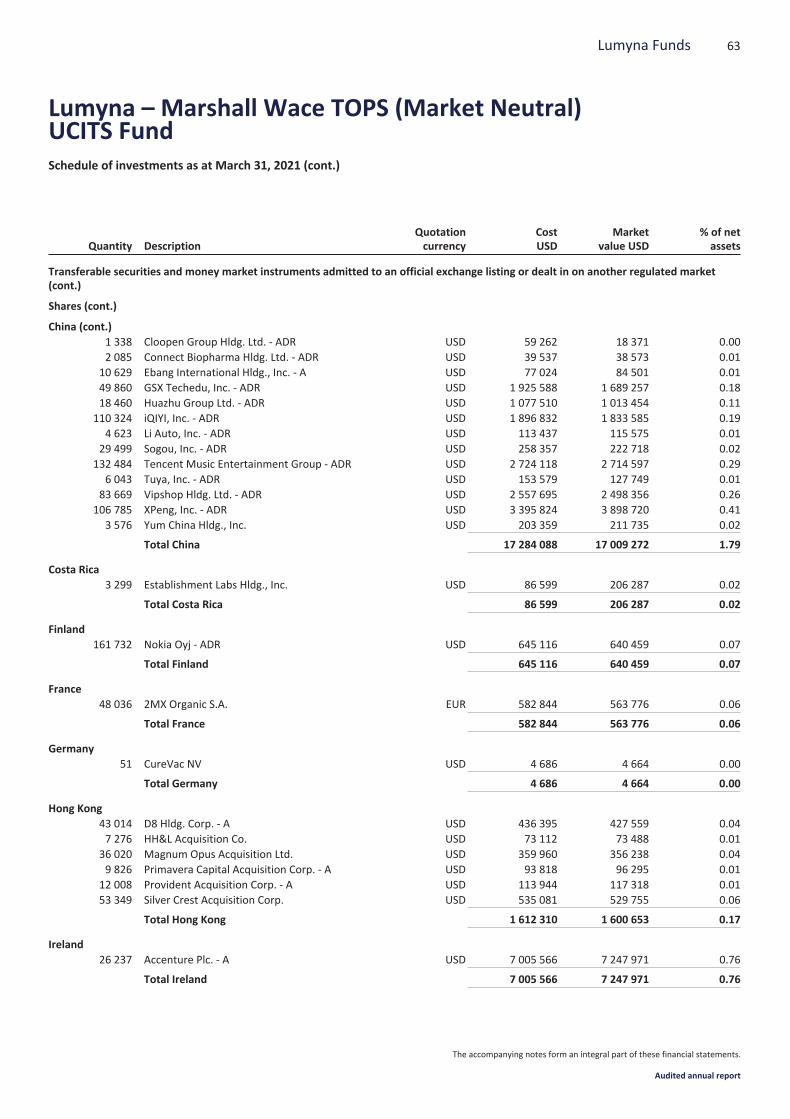
Quantity DescriptionQuotationcurrency
CostUSD
Marketvalue USD
% of netassets
Transferable securities and money market instruments admitted to an official exchange listing or dealt in on another regulated market(cont.)
Shares (cont.)
China (cont.)1 338 Cloopen Group Hldg. Ltd. - ADR USD 59 262 18 371 0.002 085 Connect Biopharma Hldg. Ltd. - ADR USD 39 537 38 573 0.01
10 629 Ebang International Hldg., Inc. - A USD 77 024 84 501 0.0149 860 GSX Techedu, Inc. - ADR USD 1 925 588 1 689 257 0.1818 460 Huazhu Group Ltd. - ADR USD 1 077 510 1 013 454 0.11
110 324 iQIYI, Inc. - ADR USD 1 896 832 1 833 585 0.194 623 Li Auto, Inc. - ADR USD 113 437 115 575 0.01
29 499 Sogou, Inc. - ADR USD 258 357 222 718 0.02132 484 Tencent Music Entertainment Group - ADR USD 2 724 118 2 714 597 0.29
6 043 Tuya, Inc. - ADR USD 153 579 127 749 0.0183 669 Vipshop Hldg. Ltd. - ADR USD 2 557 695 2 498 356 0.26
106 785 XPeng, Inc. - ADR USD 3 395 824 3 898 720 0.413 576 Yum China Hldg., Inc. USD 203 359 211 735 0.02
Total China 17 284 088 17 009 272 1.79
Costa Rica3 299 Establishment Labs Hldg., Inc. USD 86 599 206 287 0.02
Total Costa Rica 86 599 206 287 0.02
Finland161 732 Nokia Oyj - ADR USD 645 116 640 459 0.07
Total Finland 645 116 640 459 0.07
France48 036 2MX Organic S.A. EUR 582 844 563 776 0.06
Total France 582 844 563 776 0.06
Germany51 CureVac NV USD 4 686 4 664 0.00
Total Germany 4 686 4 664 0.00
Hong Kong43 014 D8 Hldg. Corp. - A USD 436 395 427 559 0.047 276 HH&L Acquisition Co. USD 73 112 73 488 0.01
36 020 Magnum Opus Acquisition Ltd. USD 359 960 356 238 0.049 826 Primavera Capital Acquisition Corp. - A USD 93 818 96 295 0.01
12 008 Provident Acquisition Corp. - A USD 113 944 117 318 0.0153 349 Silver Crest Acquisition Corp. USD 535 081 529 755 0.06
Total Hong Kong 1 612 310 1 600 653 0.17
Ireland26 237 Accenture Plc. - A USD 7 005 566 7 247 971 0.76
Total Ireland 7 005 566 7 247 971 0.76
63Lumyna Funds
Lumyna – Marshall Wace TOPS (Market Neutral)UCITS FundSchedule of investments as at March 31, 2021 (cont.)
The accompanying notes form an integral part of these financial statements.
Audited annual report
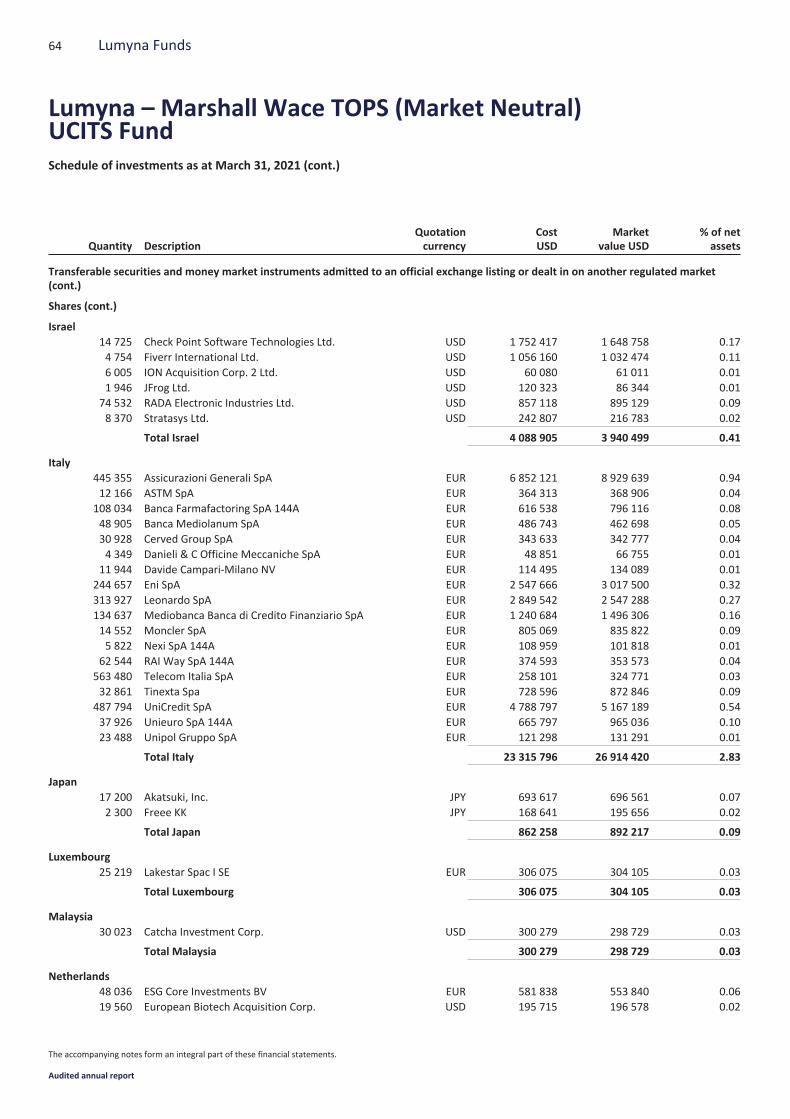
Quantity DescriptionQuotationcurrency
CostUSD
Marketvalue USD
% of netassets
Transferable securities and money market instruments admitted to an official exchange listing or dealt in on another regulated market(cont.)
Shares (cont.)
Israel14 725 Check Point Software Technologies Ltd. USD 1 752 417 1 648 758 0.174 754 Fiverr International Ltd. USD 1 056 160 1 032 474 0.116 005 ION Acquisition Corp. 2 Ltd. USD 60 080 61 011 0.011 946 JFrog Ltd. USD 120 323 86 344 0.01
74 532 RADA Electronic Industries Ltd. USD 857 118 895 129 0.098 370 Stratasys Ltd. USD 242 807 216 783 0.02
Total Israel 4 088 905 3 940 499 0.41
Italy445 355 Assicurazioni Generali SpA EUR 6 852 121 8 929 639 0.9412 166 ASTM SpA EUR 364 313 368 906 0.04
108 034 Banca Farmafactoring SpA 144A EUR 616 538 796 116 0.0848 905 Banca Mediolanum SpA EUR 486 743 462 698 0.0530 928 Cerved Group SpA EUR 343 633 342 777 0.044 349 Danieli & C Officine Meccaniche SpA EUR 48 851 66 755 0.01
11 944 Davide Campari-Milano NV EUR 114 495 134 089 0.01244 657 Eni SpA EUR 2 547 666 3 017 500 0.32313 927 Leonardo SpA EUR 2 849 542 2 547 288 0.27134 637 Mediobanca Banca di Credito Finanziario SpA EUR 1 240 684 1 496 306 0.1614 552 Moncler SpA EUR 805 069 835 822 0.095 822 Nexi SpA 144A EUR 108 959 101 818 0.01
62 544 RAI Way SpA 144A EUR 374 593 353 573 0.04563 480 Telecom Italia SpA EUR 258 101 324 771 0.0332 861 Tinexta Spa EUR 728 596 872 846 0.09
487 794 UniCredit SpA EUR 4 788 797 5 167 189 0.5437 926 Unieuro SpA 144A EUR 665 797 965 036 0.1023 488 Unipol Gruppo SpA EUR 121 298 131 291 0.01
Total Italy 23 315 796 26 914 420 2.83
Japan17 200 Akatsuki, Inc. JPY 693 617 696 561 0.072 300 Freee KK JPY 168 641 195 656 0.02
Total Japan 862 258 892 217 0.09
Luxembourg25 219 Lakestar Spac I SE EUR 306 075 304 105 0.03
Total Luxembourg 306 075 304 105 0.03
Malaysia30 023 Catcha Investment Corp. USD 300 279 298 729 0.03
Total Malaysia 300 279 298 729 0.03
Netherlands48 036 ESG Core Investments BV EUR 581 838 553 840 0.0619 560 European Biotech Acquisition Corp. USD 195 715 196 578 0.02
64 Lumyna Funds
Lumyna – Marshall Wace TOPS (Market Neutral)UCITS FundSchedule of investments as at March 31, 2021 (cont.)
The accompanying notes form an integral part of these financial statements.
Audited annual report
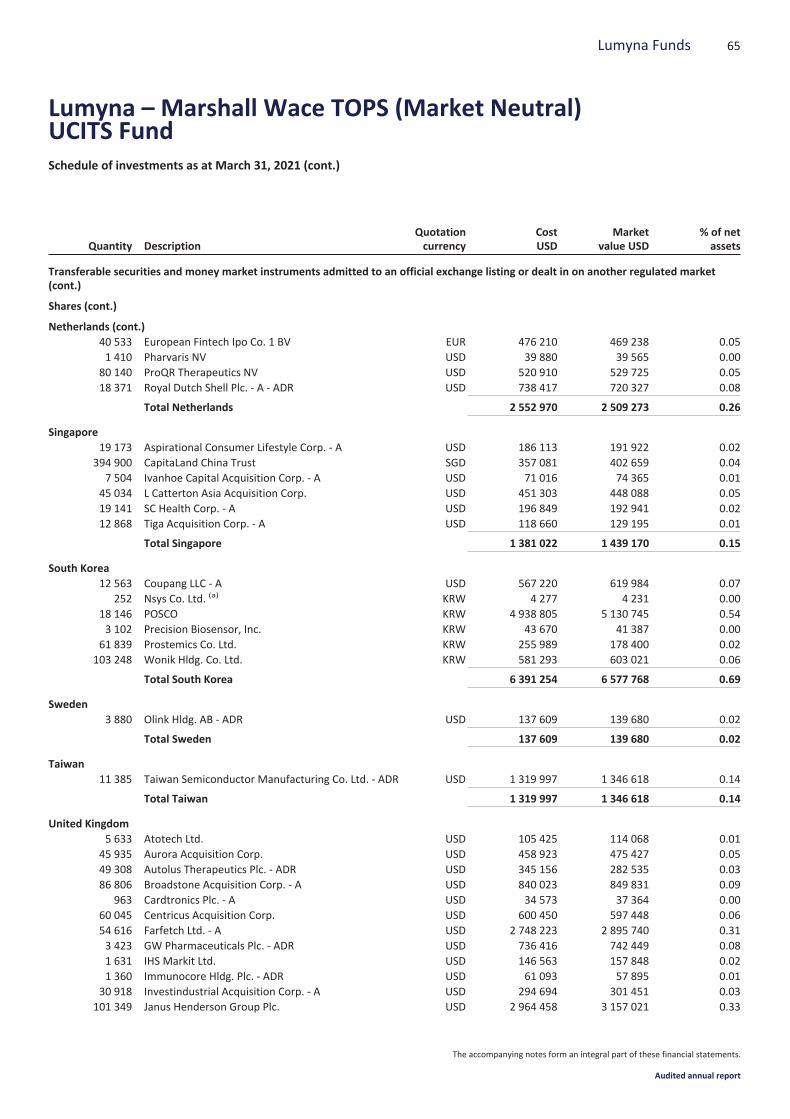
Quantity DescriptionQuotationcurrency
CostUSD
Marketvalue USD
% of netassets
Transferable securities and money market instruments admitted to an official exchange listing or dealt in on another regulated market(cont.)
Shares (cont.)
Netherlands (cont.)40 533 European Fintech Ipo Co. 1 BV EUR 476 210 469 238 0.051 410 Pharvaris NV USD 39 880 39 565 0.00
80 140 ProQR Therapeutics NV USD 520 910 529 725 0.0518 371 Royal Dutch Shell Plc. - A - ADR USD 738 417 720 327 0.08
Total Netherlands 2 552 970 2 509 273 0.26
Singapore19 173 Aspirational Consumer Lifestyle Corp. - A USD 186 113 191 922 0.02
394 900 CapitaLand China Trust SGD 357 081 402 659 0.047 504 Ivanhoe Capital Acquisition Corp. - A USD 71 016 74 365 0.01
45 034 L Catterton Asia Acquisition Corp. USD 451 303 448 088 0.0519 141 SC Health Corp. - A USD 196 849 192 941 0.0212 868 Tiga Acquisition Corp. - A USD 118 660 129 195 0.01
Total Singapore 1 381 022 1 439 170 0.15
South Korea12 563 Coupang LLC - A USD 567 220 619 984 0.07
252 Nsys Co. Ltd. (a) KRW 4 277 4 231 0.0018 146 POSCO KRW 4 938 805 5 130 745 0.543 102 Precision Biosensor, Inc. KRW 43 670 41 387 0.00
61 839 Prostemics Co. Ltd. KRW 255 989 178 400 0.02103 248 Wonik Hldg. Co. Ltd. KRW 581 293 603 021 0.06
Total South Korea 6 391 254 6 577 768 0.69
Sweden3 880 Olink Hldg. AB - ADR USD 137 609 139 680 0.02
Total Sweden 137 609 139 680 0.02
Taiwan11 385 Taiwan Semiconductor Manufacturing Co. Ltd. - ADR USD 1 319 997 1 346 618 0.14
Total Taiwan 1 319 997 1 346 618 0.14
United Kingdom5 633 Atotech Ltd. USD 105 425 114 068 0.01
45 935 Aurora Acquisition Corp. USD 458 923 475 427 0.0549 308 Autolus Therapeutics Plc. - ADR USD 345 156 282 535 0.0386 806 Broadstone Acquisition Corp. - A USD 840 023 849 831 0.09
963 Cardtronics Plc. - A USD 34 573 37 364 0.0060 045 Centricus Acquisition Corp. USD 600 450 597 448 0.0654 616 Farfetch Ltd. - A USD 2 748 223 2 895 740 0.313 423 GW Pharmaceuticals Plc. - ADR USD 736 416 742 449 0.081 631 IHS Markit Ltd. USD 146 563 157 848 0.021 360 Immunocore Hldg. Plc. - ADR USD 61 093 57 895 0.01
30 918 Investindustrial Acquisition Corp. - A USD 294 694 301 451 0.03101 349 Janus Henderson Group Plc. USD 2 964 458 3 157 021 0.33
65Lumyna Funds
Lumyna – Marshall Wace TOPS (Market Neutral)UCITS FundSchedule of investments as at March 31, 2021 (cont.)
The accompanying notes form an integral part of these financial statements.
Audited annual report
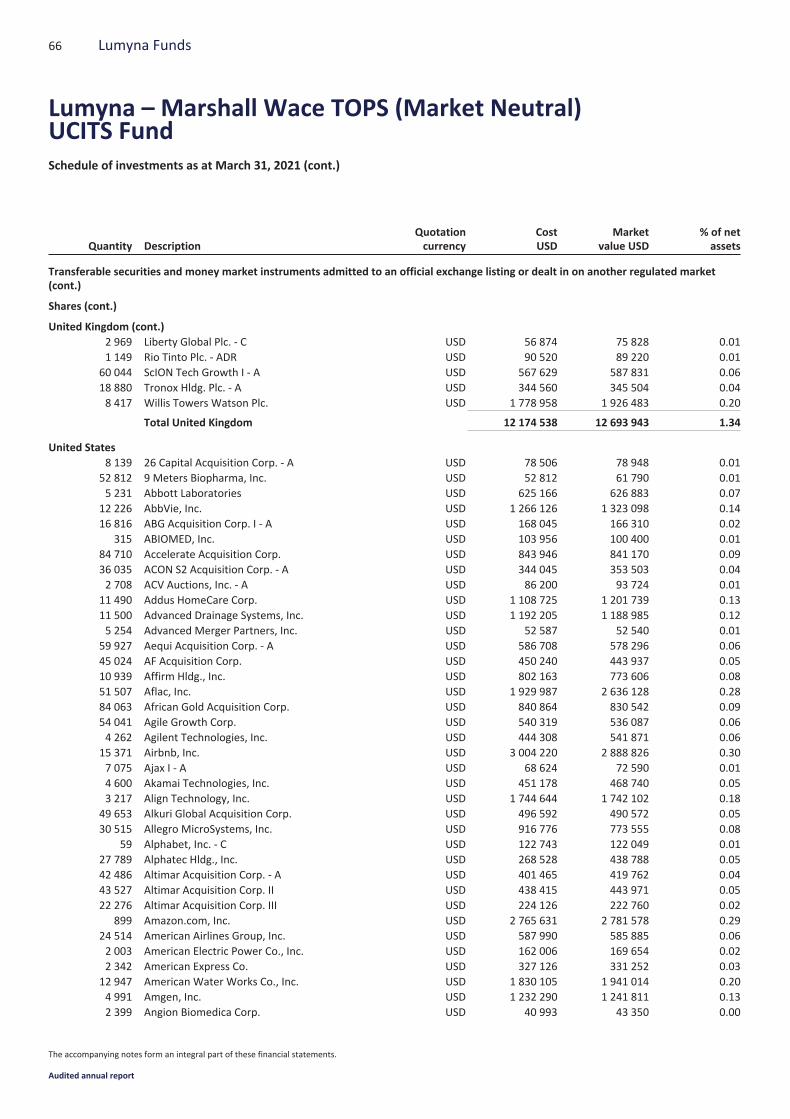
Quantity DescriptionQuotationcurrency
CostUSD
Marketvalue USD
% of netassets
Transferable securities and money market instruments admitted to an official exchange listing or dealt in on another regulated market(cont.)
Shares (cont.)
United Kingdom (cont.)2 969 Liberty Global Plc. - C USD 56 874 75 828 0.011 149 Rio Tinto Plc. - ADR USD 90 520 89 220 0.01
60 044 ScION Tech Growth I - A USD 567 629 587 831 0.0618 880 Tronox Hldg. Plc. - A USD 344 560 345 504 0.048 417 Willis Towers Watson Plc. USD 1 778 958 1 926 483 0.20
Total United Kingdom 12 174 538 12 693 943 1.34
United States8 139 26 Capital Acquisition Corp. - A USD 78 506 78 948 0.01
52 812 9 Meters Biopharma, Inc. USD 52 812 61 790 0.015 231 Abbott Laboratories USD 625 166 626 883 0.07
12 226 AbbVie, Inc. USD 1 266 126 1 323 098 0.1416 816 ABG Acquisition Corp. I - A USD 168 045 166 310 0.02
315 ABIOMED, Inc. USD 103 956 100 400 0.0184 710 Accelerate Acquisition Corp. USD 843 946 841 170 0.0936 035 ACON S2 Acquisition Corp. - A USD 344 045 353 503 0.042 708 ACV Auctions, Inc. - A USD 86 200 93 724 0.01
11 490 Addus HomeCare Corp. USD 1 108 725 1 201 739 0.1311 500 Advanced Drainage Systems, Inc. USD 1 192 205 1 188 985 0.125 254 Advanced Merger Partners, Inc. USD 52 587 52 540 0.01
59 927 Aequi Acquisition Corp. - A USD 586 708 578 296 0.0645 024 AF Acquisition Corp. USD 450 240 443 937 0.0510 939 Affirm Hldg., Inc. USD 802 163 773 606 0.0851 507 Aflac, Inc. USD 1 929 987 2 636 128 0.2884 063 African Gold Acquisition Corp. USD 840 864 830 542 0.0954 041 Agile Growth Corp. USD 540 319 536 087 0.064 262 Agilent Technologies, Inc. USD 444 308 541 871 0.06
15 371 Airbnb, Inc. USD 3 004 220 2 888 826 0.307 075 Ajax I - A USD 68 624 72 590 0.014 600 Akamai Technologies, Inc. USD 451 178 468 740 0.053 217 Align Technology, Inc. USD 1 744 644 1 742 102 0.18
49 653 Alkuri Global Acquisition Corp. USD 496 592 490 572 0.0530 515 Allegro MicroSystems, Inc. USD 916 776 773 555 0.08
59 Alphabet, Inc. - C USD 122 743 122 049 0.0127 789 Alphatec Hldg., Inc. USD 268 528 438 788 0.0542 486 Altimar Acquisition Corp. - A USD 401 465 419 762 0.0443 527 Altimar Acquisition Corp. II USD 438 415 443 971 0.0522 276 Altimar Acquisition Corp. III USD 224 126 222 760 0.02
899 Amazon.com, Inc. USD 2 765 631 2 781 578 0.2924 514 American Airlines Group, Inc. USD 587 990 585 885 0.062 003 American Electric Power Co., Inc. USD 162 006 169 654 0.022 342 American Express Co. USD 327 126 331 252 0.03
12 947 American Water Works Co., Inc. USD 1 830 105 1 941 014 0.204 991 Amgen, Inc. USD 1 232 290 1 241 811 0.132 399 Angion Biomedica Corp. USD 40 993 43 350 0.00
66 Lumyna Funds
Lumyna – Marshall Wace TOPS (Market Neutral)UCITS FundSchedule of investments as at March 31, 2021 (cont.)
The accompanying notes form an integral part of these financial statements.
Audited annual report
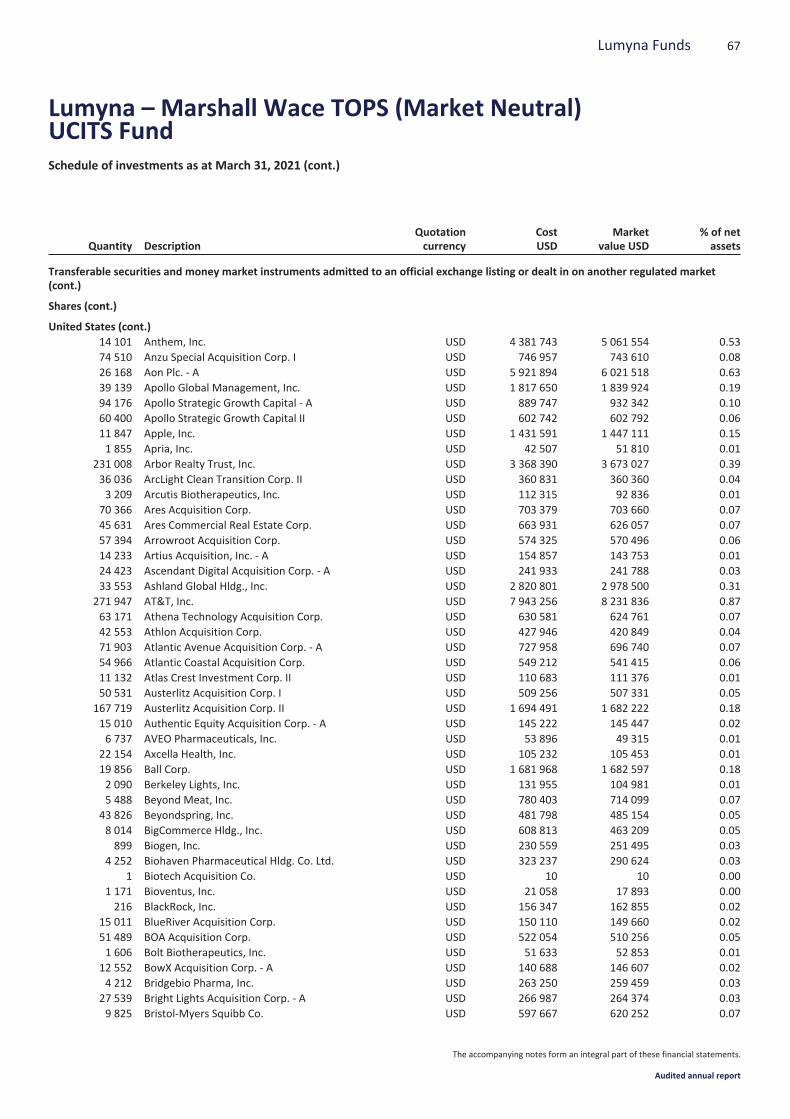
Quantity DescriptionQuotationcurrency
CostUSD
Marketvalue USD
% of netassets
Transferable securities and money market instruments admitted to an official exchange listing or dealt in on another regulated market(cont.)
Shares (cont.)
United States (cont.)14 101 Anthem, Inc. USD 4 381 743 5 061 554 0.5374 510 Anzu Special Acquisition Corp. I USD 746 957 743 610 0.0826 168 Aon Plc. - A USD 5 921 894 6 021 518 0.6339 139 Apollo Global Management, Inc. USD 1 817 650 1 839 924 0.1994 176 Apollo Strategic Growth Capital - A USD 889 747 932 342 0.1060 400 Apollo Strategic Growth Capital II USD 602 742 602 792 0.0611 847 Apple, Inc. USD 1 431 591 1 447 111 0.151 855 Apria, Inc. USD 42 507 51 810 0.01
231 008 Arbor Realty Trust, Inc. USD 3 368 390 3 673 027 0.3936 036 ArcLight Clean Transition Corp. II USD 360 831 360 360 0.043 209 Arcutis Biotherapeutics, Inc. USD 112 315 92 836 0.01
70 366 Ares Acquisition Corp. USD 703 379 703 660 0.0745 631 Ares Commercial Real Estate Corp. USD 663 931 626 057 0.0757 394 Arrowroot Acquisition Corp. USD 574 325 570 496 0.0614 233 Artius Acquisition, Inc. - A USD 154 857 143 753 0.0124 423 Ascendant Digital Acquisition Corp. - A USD 241 933 241 788 0.0333 553 Ashland Global Hldg., Inc. USD 2 820 801 2 978 500 0.31
271 947 AT&T, Inc. USD 7 943 256 8 231 836 0.8763 171 Athena Technology Acquisition Corp. USD 630 581 624 761 0.0742 553 Athlon Acquisition Corp. USD 427 946 420 849 0.0471 903 Atlantic Avenue Acquisition Corp. - A USD 727 958 696 740 0.0754 966 Atlantic Coastal Acquisition Corp. USD 549 212 541 415 0.0611 132 Atlas Crest Investment Corp. II USD 110 683 111 376 0.0150 531 Austerlitz Acquisition Corp. I USD 509 256 507 331 0.05
167 719 Austerlitz Acquisition Corp. II USD 1 694 491 1 682 222 0.1815 010 Authentic Equity Acquisition Corp. - A USD 145 222 145 447 0.026 737 AVEO Pharmaceuticals, Inc. USD 53 896 49 315 0.01
22 154 Axcella Health, Inc. USD 105 232 105 453 0.0119 856 Ball Corp. USD 1 681 968 1 682 597 0.182 090 Berkeley Lights, Inc. USD 131 955 104 981 0.015 488 Beyond Meat, Inc. USD 780 403 714 099 0.07
43 826 Beyondspring, Inc. USD 481 798 485 154 0.058 014 BigCommerce Hldg., Inc. USD 608 813 463 209 0.05899 Biogen, Inc. USD 230 559 251 495 0.03
4 252 Biohaven Pharmaceutical Hldg. Co. Ltd. USD 323 237 290 624 0.031 Biotech Acquisition Co. USD 10 10 0.00
1 171 Bioventus, Inc. USD 21 058 17 893 0.00216 BlackRock, Inc. USD 156 347 162 855 0.02
15 011 BlueRiver Acquisition Corp. USD 150 110 149 660 0.0251 489 BOA Acquisition Corp. USD 522 054 510 256 0.051 606 Bolt Biotherapeutics, Inc. USD 51 633 52 853 0.01
12 552 BowX Acquisition Corp. - A USD 140 688 146 607 0.024 212 Bridgebio Pharma, Inc. USD 263 250 259 459 0.03
27 539 Bright Lights Acquisition Corp. - A USD 266 987 264 374 0.039 825 Bristol-Myers Squibb Co. USD 597 667 620 252 0.07
67Lumyna Funds
Lumyna – Marshall Wace TOPS (Market Neutral)UCITS FundSchedule of investments as at March 31, 2021 (cont.)
The accompanying notes form an integral part of these financial statements.
Audited annual report
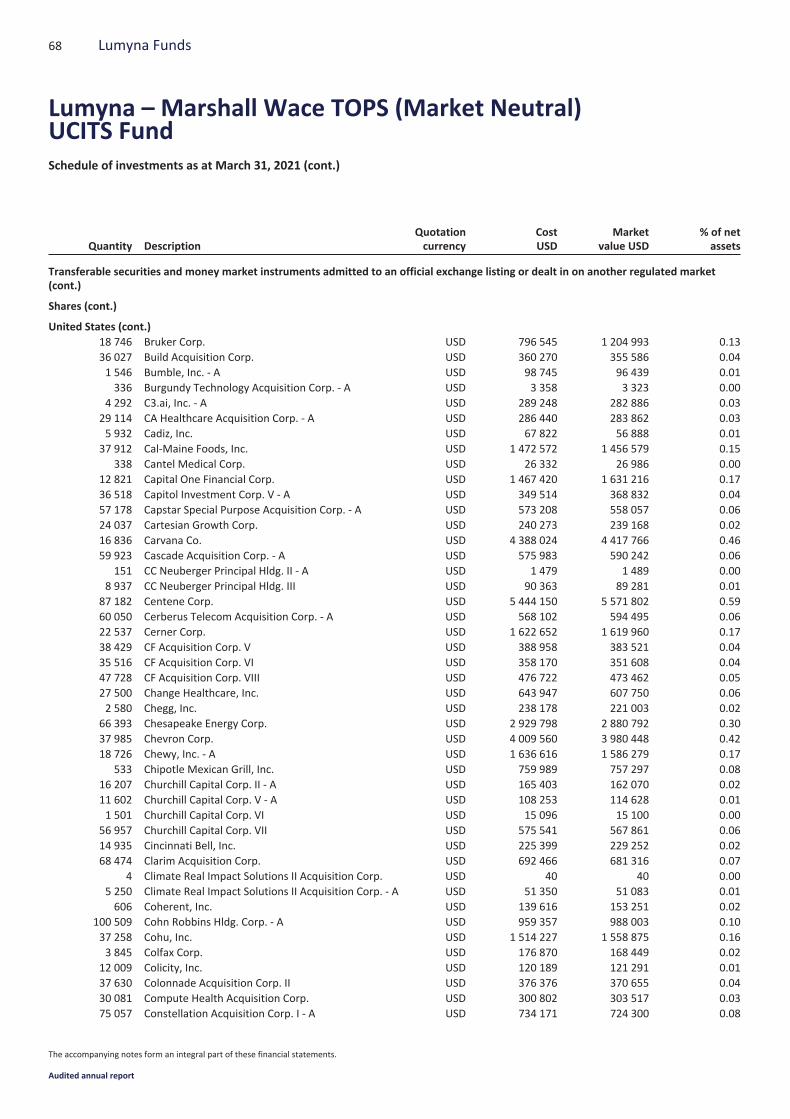
Quantity DescriptionQuotationcurrency
CostUSD
Marketvalue USD
% of netassets
Transferable securities and money market instruments admitted to an official exchange listing or dealt in on another regulated market(cont.)
Shares (cont.)
United States (cont.)18 746 Bruker Corp. USD 796 545 1 204 993 0.1336 027 Build Acquisition Corp. USD 360 270 355 586 0.041 546 Bumble, Inc. - A USD 98 745 96 439 0.01336 Burgundy Technology Acquisition Corp. - A USD 3 358 3 323 0.00
4 292 C3.ai, Inc. - A USD 289 248 282 886 0.0329 114 CA Healthcare Acquisition Corp. - A USD 286 440 283 862 0.035 932 Cadiz, Inc. USD 67 822 56 888 0.01
37 912 Cal-Maine Foods, Inc. USD 1 472 572 1 456 579 0.15338 Cantel Medical Corp. USD 26 332 26 986 0.00
12 821 Capital One Financial Corp. USD 1 467 420 1 631 216 0.1736 518 Capitol Investment Corp. V - A USD 349 514 368 832 0.0457 178 Capstar Special Purpose Acquisition Corp. - A USD 573 208 558 057 0.0624 037 Cartesian Growth Corp. USD 240 273 239 168 0.0216 836 Carvana Co. USD 4 388 024 4 417 766 0.4659 923 Cascade Acquisition Corp. - A USD 575 983 590 242 0.06
151 CC Neuberger Principal Hldg. II - A USD 1 479 1 489 0.008 937 CC Neuberger Principal Hldg. III USD 90 363 89 281 0.01
87 182 Centene Corp. USD 5 444 150 5 571 802 0.5960 050 Cerberus Telecom Acquisition Corp. - A USD 568 102 594 495 0.0622 537 Cerner Corp. USD 1 622 652 1 619 960 0.1738 429 CF Acquisition Corp. V USD 388 958 383 521 0.0435 516 CF Acquisition Corp. VI USD 358 170 351 608 0.0447 728 CF Acquisition Corp. VIII USD 476 722 473 462 0.0527 500 Change Healthcare, Inc. USD 643 947 607 750 0.062 580 Chegg, Inc. USD 238 178 221 003 0.02
66 393 Chesapeake Energy Corp. USD 2 929 798 2 880 792 0.3037 985 Chevron Corp. USD 4 009 560 3 980 448 0.4218 726 Chewy, Inc. - A USD 1 636 616 1 586 279 0.17
533 Chipotle Mexican Grill, Inc. USD 759 989 757 297 0.0816 207 Churchill Capital Corp. II - A USD 165 403 162 070 0.0211 602 Churchill Capital Corp. V - A USD 108 253 114 628 0.011 501 Churchill Capital Corp. VI USD 15 096 15 100 0.00
56 957 Churchill Capital Corp. VII USD 575 541 567 861 0.0614 935 Cincinnati Bell, Inc. USD 225 399 229 252 0.0268 474 Clarim Acquisition Corp. USD 692 466 681 316 0.07
4 Climate Real Impact Solutions II Acquisition Corp. USD 40 40 0.005 250 Climate Real Impact Solutions II Acquisition Corp. - A USD 51 350 51 083 0.01606 Coherent, Inc. USD 139 616 153 251 0.02
100 509 Cohn Robbins Hldg. Corp. - A USD 959 357 988 003 0.1037 258 Cohu, Inc. USD 1 514 227 1 558 875 0.163 845 Colfax Corp. USD 176 870 168 449 0.02
12 009 Colicity, Inc. USD 120 189 121 291 0.0137 630 Colonnade Acquisition Corp. II USD 376 376 370 655 0.0430 081 Compute Health Acquisition Corp. USD 300 802 303 517 0.0375 057 Constellation Acquisition Corp. I - A USD 734 171 724 300 0.08
68 Lumyna Funds
Lumyna – Marshall Wace TOPS (Market Neutral)UCITS FundSchedule of investments as at March 31, 2021 (cont.)
The accompanying notes form an integral part of these financial statements.
Audited annual report
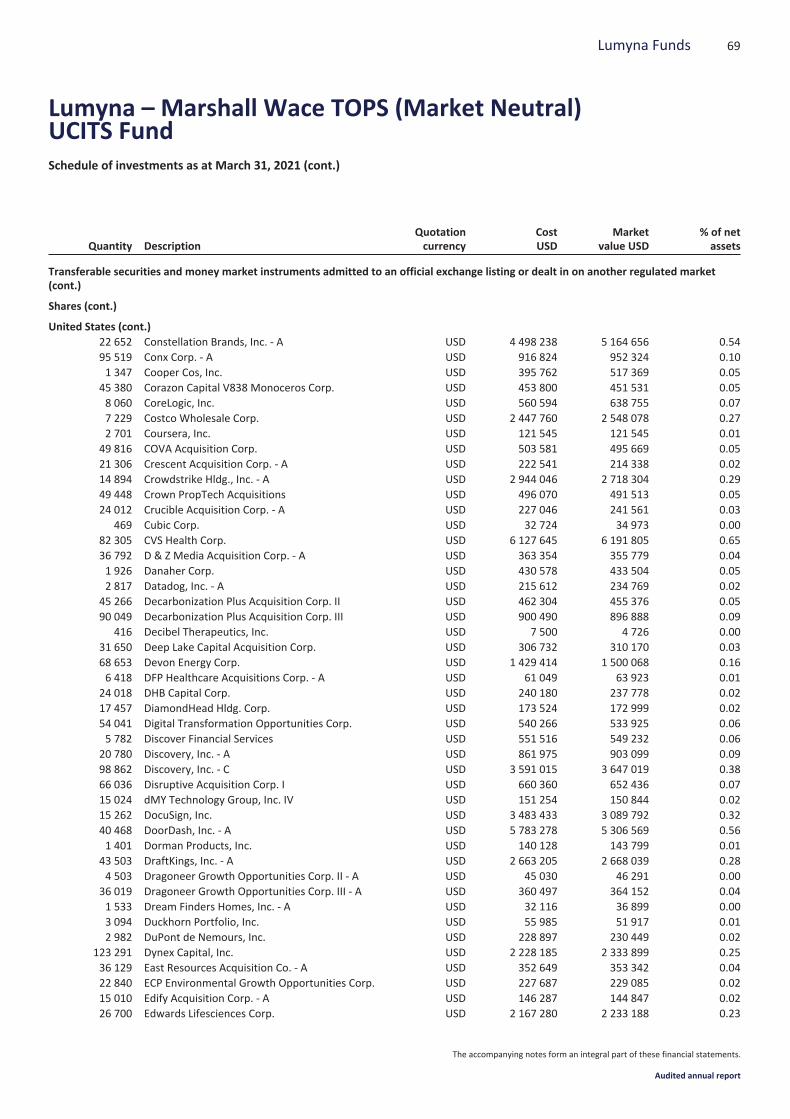
Quantity DescriptionQuotationcurrency
CostUSD
Marketvalue USD
% of netassets
Transferable securities and money market instruments admitted to an official exchange listing or dealt in on another regulated market(cont.)
Shares (cont.)
United States (cont.)22 652 Constellation Brands, Inc. - A USD 4 498 238 5 164 656 0.5495 519 Conx Corp. - A USD 916 824 952 324 0.101 347 Cooper Cos, Inc. USD 395 762 517 369 0.05
45 380 Corazon Capital V838 Monoceros Corp. USD 453 800 451 531 0.058 060 CoreLogic, Inc. USD 560 594 638 755 0.077 229 Costco Wholesale Corp. USD 2 447 760 2 548 078 0.272 701 Coursera, Inc. USD 121 545 121 545 0.01
49 816 COVA Acquisition Corp. USD 503 581 495 669 0.0521 306 Crescent Acquisition Corp. - A USD 222 541 214 338 0.0214 894 Crowdstrike Hldg., Inc. - A USD 2 944 046 2 718 304 0.2949 448 Crown PropTech Acquisitions USD 496 070 491 513 0.0524 012 Crucible Acquisition Corp. - A USD 227 046 241 561 0.03
469 Cubic Corp. USD 32 724 34 973 0.0082 305 CVS Health Corp. USD 6 127 645 6 191 805 0.6536 792 D & Z Media Acquisition Corp. - A USD 363 354 355 779 0.041 926 Danaher Corp. USD 430 578 433 504 0.052 817 Datadog, Inc. - A USD 215 612 234 769 0.02
45 266 Decarbonization Plus Acquisition Corp. II USD 462 304 455 376 0.0590 049 Decarbonization Plus Acquisition Corp. III USD 900 490 896 888 0.09
416 Decibel Therapeutics, Inc. USD 7 500 4 726 0.0031 650 Deep Lake Capital Acquisition Corp. USD 306 732 310 170 0.0368 653 Devon Energy Corp. USD 1 429 414 1 500 068 0.166 418 DFP Healthcare Acquisitions Corp. - A USD 61 049 63 923 0.01
24 018 DHB Capital Corp. USD 240 180 237 778 0.0217 457 DiamondHead Hldg. Corp. USD 173 524 172 999 0.0254 041 Digital Transformation Opportunities Corp. USD 540 266 533 925 0.065 782 Discover Financial Services USD 551 516 549 232 0.06
20 780 Discovery, Inc. - A USD 861 975 903 099 0.0998 862 Discovery, Inc. - C USD 3 591 015 3 647 019 0.3866 036 Disruptive Acquisition Corp. I USD 660 360 652 436 0.0715 024 dMY Technology Group, Inc. IV USD 151 254 150 844 0.0215 262 DocuSign, Inc. USD 3 483 433 3 089 792 0.3240 468 DoorDash, Inc. - A USD 5 783 278 5 306 569 0.561 401 Dorman Products, Inc. USD 140 128 143 799 0.01
43 503 DraftKings, Inc. - A USD 2 663 205 2 668 039 0.284 503 Dragoneer Growth Opportunities Corp. II - A USD 45 030 46 291 0.00
36 019 Dragoneer Growth Opportunities Corp. III - A USD 360 497 364 152 0.041 533 Dream Finders Homes, Inc. - A USD 32 116 36 899 0.003 094 Duckhorn Portfolio, Inc. USD 55 985 51 917 0.012 982 DuPont de Nemours, Inc. USD 228 897 230 449 0.02
123 291 Dynex Capital, Inc. USD 2 228 185 2 333 899 0.2536 129 East Resources Acquisition Co. - A USD 352 649 353 342 0.0422 840 ECP Environmental Growth Opportunities Corp. USD 227 687 229 085 0.0215 010 Edify Acquisition Corp. - A USD 146 287 144 847 0.0226 700 Edwards Lifesciences Corp. USD 2 167 280 2 233 188 0.23
69Lumyna Funds
Lumyna – Marshall Wace TOPS (Market Neutral)UCITS FundSchedule of investments as at March 31, 2021 (cont.)
The accompanying notes form an integral part of these financial statements.
Audited annual report
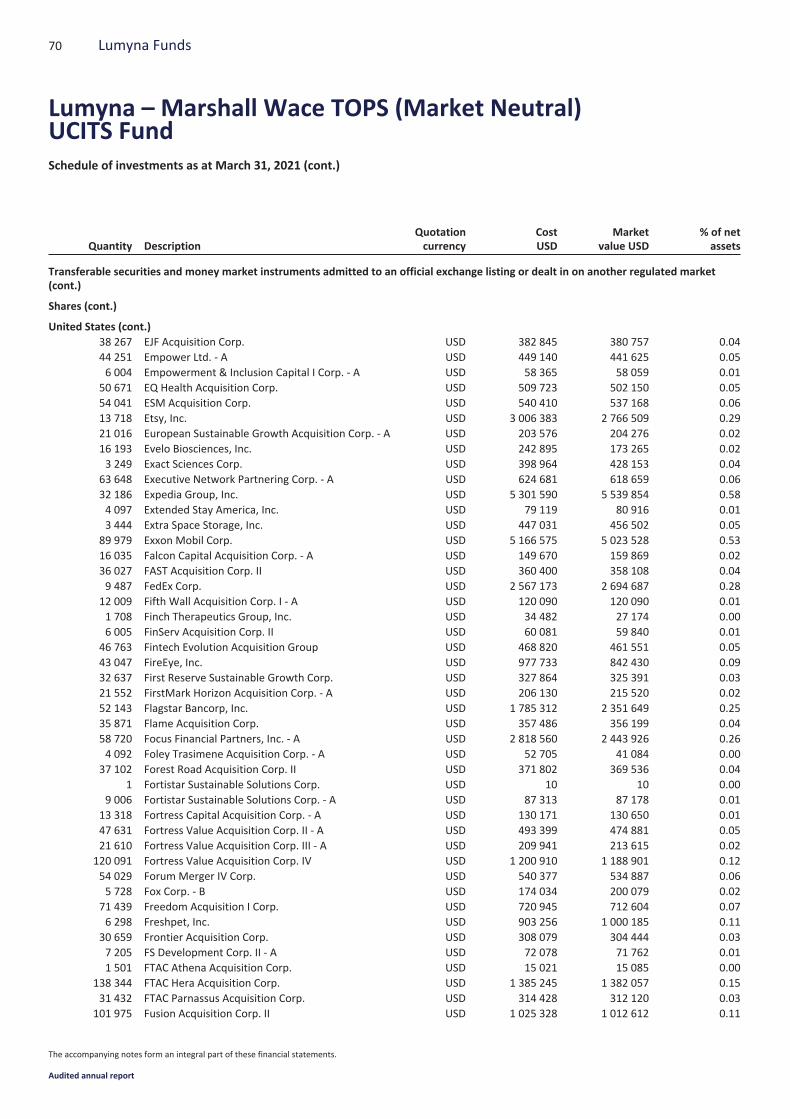
Quantity DescriptionQuotationcurrency
CostUSD
Marketvalue USD
% of netassets
Transferable securities and money market instruments admitted to an official exchange listing or dealt in on another regulated market(cont.)
Shares (cont.)
United States (cont.)38 267 EJF Acquisition Corp. USD 382 845 380 757 0.0444 251 Empower Ltd. - A USD 449 140 441 625 0.056 004 Empowerment & Inclusion Capital I Corp. - A USD 58 365 58 059 0.01
50 671 EQ Health Acquisition Corp. USD 509 723 502 150 0.0554 041 ESM Acquisition Corp. USD 540 410 537 168 0.0613 718 Etsy, Inc. USD 3 006 383 2 766 509 0.2921 016 European Sustainable Growth Acquisition Corp. - A USD 203 576 204 276 0.0216 193 Evelo Biosciences, Inc. USD 242 895 173 265 0.023 249 Exact Sciences Corp. USD 398 964 428 153 0.04
63 648 Executive Network Partnering Corp. - A USD 624 681 618 659 0.0632 186 Expedia Group, Inc. USD 5 301 590 5 539 854 0.584 097 Extended Stay America, Inc. USD 79 119 80 916 0.013 444 Extra Space Storage, Inc. USD 447 031 456 502 0.05
89 979 Exxon Mobil Corp. USD 5 166 575 5 023 528 0.5316 035 Falcon Capital Acquisition Corp. - A USD 149 670 159 869 0.0236 027 FAST Acquisition Corp. II USD 360 400 358 108 0.049 487 FedEx Corp. USD 2 567 173 2 694 687 0.28
12 009 Fifth Wall Acquisition Corp. I - A USD 120 090 120 090 0.011 708 Finch Therapeutics Group, Inc. USD 34 482 27 174 0.006 005 FinServ Acquisition Corp. II USD 60 081 59 840 0.01
46 763 Fintech Evolution Acquisition Group USD 468 820 461 551 0.0543 047 FireEye, Inc. USD 977 733 842 430 0.0932 637 First Reserve Sustainable Growth Corp. USD 327 864 325 391 0.0321 552 FirstMark Horizon Acquisition Corp. - A USD 206 130 215 520 0.0252 143 Flagstar Bancorp, Inc. USD 1 785 312 2 351 649 0.2535 871 Flame Acquisition Corp. USD 357 486 356 199 0.0458 720 Focus Financial Partners, Inc. - A USD 2 818 560 2 443 926 0.264 092 Foley Trasimene Acquisition Corp. - A USD 52 705 41 084 0.00
37 102 Forest Road Acquisition Corp. II USD 371 802 369 536 0.041 Fortistar Sustainable Solutions Corp. USD 10 10 0.00
9 006 Fortistar Sustainable Solutions Corp. - A USD 87 313 87 178 0.0113 318 Fortress Capital Acquisition Corp. - A USD 130 171 130 650 0.0147 631 Fortress Value Acquisition Corp. II - A USD 493 399 474 881 0.0521 610 Fortress Value Acquisition Corp. III - A USD 209 941 213 615 0.02
120 091 Fortress Value Acquisition Corp. IV USD 1 200 910 1 188 901 0.1254 029 Forum Merger IV Corp. USD 540 377 534 887 0.065 728 Fox Corp. - B USD 174 034 200 079 0.02
71 439 Freedom Acquisition I Corp. USD 720 945 712 604 0.076 298 Freshpet, Inc. USD 903 256 1 000 185 0.11
30 659 Frontier Acquisition Corp. USD 308 079 304 444 0.037 205 FS Development Corp. II - A USD 72 078 71 762 0.011 501 FTAC Athena Acquisition Corp. USD 15 021 15 085 0.00
138 344 FTAC Hera Acquisition Corp. USD 1 385 245 1 382 057 0.1531 432 FTAC Parnassus Acquisition Corp. USD 314 428 312 120 0.03
101 975 Fusion Acquisition Corp. II USD 1 025 328 1 012 612 0.11
70 Lumyna Funds
Lumyna – Marshall Wace TOPS (Market Neutral)UCITS FundSchedule of investments as at March 31, 2021 (cont.)
The accompanying notes form an integral part of these financial statements.
Audited annual report
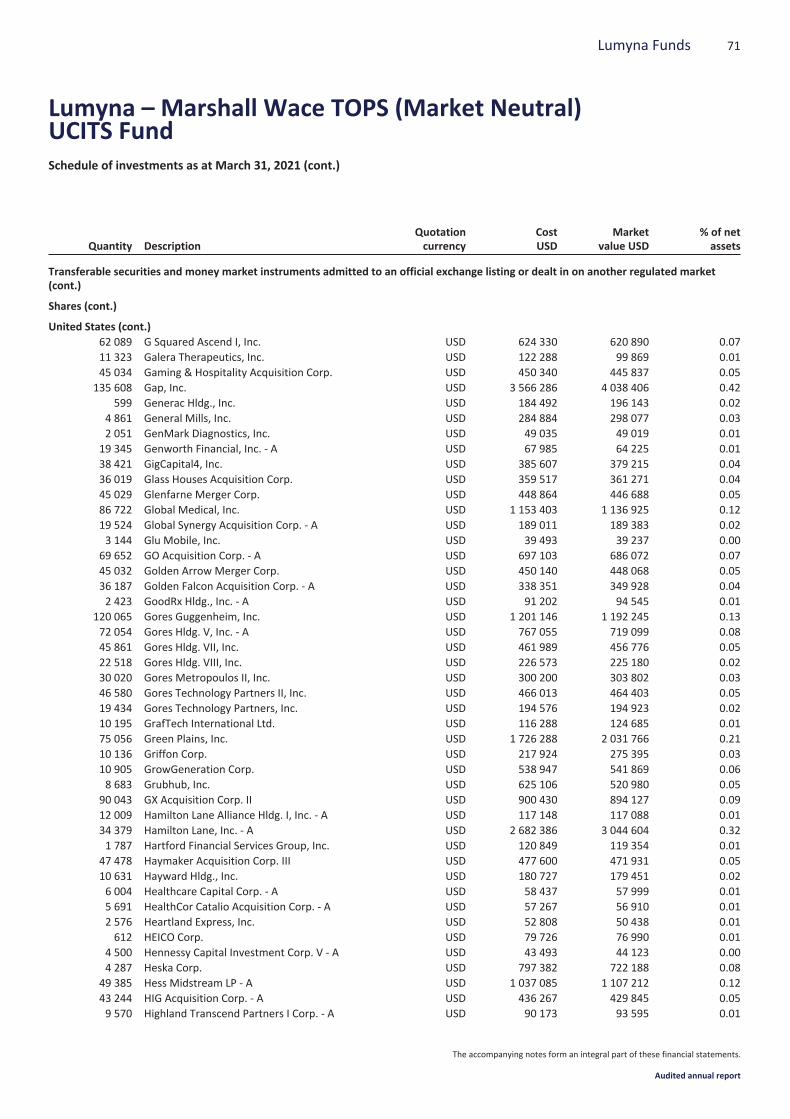
Quantity DescriptionQuotationcurrency
CostUSD
Marketvalue USD
% of netassets
Transferable securities and money market instruments admitted to an official exchange listing or dealt in on another regulated market(cont.)
Shares (cont.)
United States (cont.)62 089 G Squared Ascend I, Inc. USD 624 330 620 890 0.0711 323 Galera Therapeutics, Inc. USD 122 288 99 869 0.0145 034 Gaming & Hospitality Acquisition Corp. USD 450 340 445 837 0.05
135 608 Gap, Inc. USD 3 566 286 4 038 406 0.42599 Generac Hldg., Inc. USD 184 492 196 143 0.02
4 861 General Mills, Inc. USD 284 884 298 077 0.032 051 GenMark Diagnostics, Inc. USD 49 035 49 019 0.01
19 345 Genworth Financial, Inc. - A USD 67 985 64 225 0.0138 421 GigCapital4, Inc. USD 385 607 379 215 0.0436 019 Glass Houses Acquisition Corp. USD 359 517 361 271 0.0445 029 Glenfarne Merger Corp. USD 448 864 446 688 0.0586 722 Global Medical, Inc. USD 1 153 403 1 136 925 0.1219 524 Global Synergy Acquisition Corp. - A USD 189 011 189 383 0.023 144 Glu Mobile, Inc. USD 39 493 39 237 0.00
69 652 GO Acquisition Corp. - A USD 697 103 686 072 0.0745 032 Golden Arrow Merger Corp. USD 450 140 448 068 0.0536 187 Golden Falcon Acquisition Corp. - A USD 338 351 349 928 0.042 423 GoodRx Hldg., Inc. - A USD 91 202 94 545 0.01
120 065 Gores Guggenheim, Inc. USD 1 201 146 1 192 245 0.1372 054 Gores Hldg. V, Inc. - A USD 767 055 719 099 0.0845 861 Gores Hldg. VII, Inc. USD 461 989 456 776 0.0522 518 Gores Hldg. VIII, Inc. USD 226 573 225 180 0.0230 020 Gores Metropoulos II, Inc. USD 300 200 303 802 0.0346 580 Gores Technology Partners II, Inc. USD 466 013 464 403 0.0519 434 Gores Technology Partners, Inc. USD 194 576 194 923 0.0210 195 GrafTech International Ltd. USD 116 288 124 685 0.0175 056 Green Plains, Inc. USD 1 726 288 2 031 766 0.2110 136 Griffon Corp. USD 217 924 275 395 0.0310 905 GrowGeneration Corp. USD 538 947 541 869 0.068 683 Grubhub, Inc. USD 625 106 520 980 0.05
90 043 GX Acquisition Corp. II USD 900 430 894 127 0.0912 009 Hamilton Lane Alliance Hldg. I, Inc. - A USD 117 148 117 088 0.0134 379 Hamilton Lane, Inc. - A USD 2 682 386 3 044 604 0.321 787 Hartford Financial Services Group, Inc. USD 120 849 119 354 0.01
47 478 Haymaker Acquisition Corp. III USD 477 600 471 931 0.0510 631 Hayward Hldg., Inc. USD 180 727 179 451 0.026 004 Healthcare Capital Corp. - A USD 58 437 57 999 0.015 691 HealthCor Catalio Acquisition Corp. - A USD 57 267 56 910 0.012 576 Heartland Express, Inc. USD 52 808 50 438 0.01612 HEICO Corp. USD 79 726 76 990 0.01
4 500 Hennessy Capital Investment Corp. V - A USD 43 493 44 123 0.004 287 Heska Corp. USD 797 382 722 188 0.08
49 385 Hess Midstream LP - A USD 1 037 085 1 107 212 0.1243 244 HIG Acquisition Corp. - A USD 436 267 429 845 0.059 570 Highland Transcend Partners I Corp. - A USD 90 173 93 595 0.01
71Lumyna Funds
Lumyna – Marshall Wace TOPS (Market Neutral)UCITS FundSchedule of investments as at March 31, 2021 (cont.)
The accompanying notes form an integral part of these financial statements.
Audited annual report
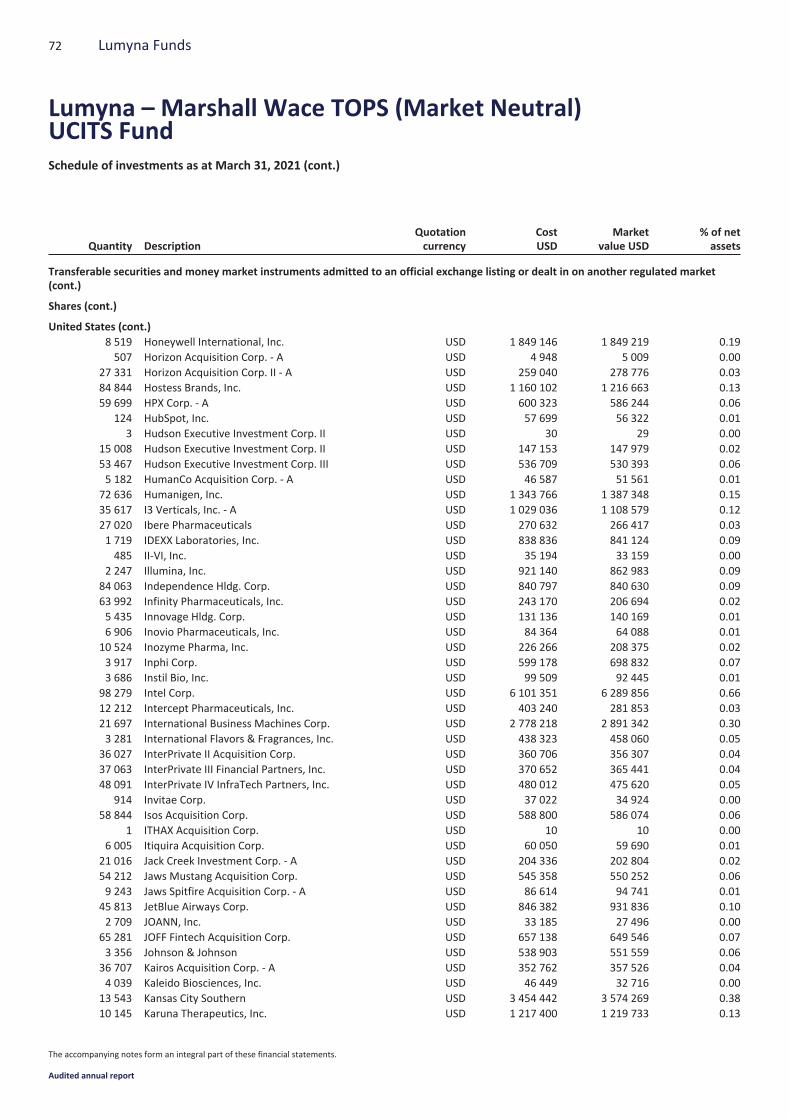
Quantity DescriptionQuotationcurrency
CostUSD
Marketvalue USD
% of netassets
Transferable securities and money market instruments admitted to an official exchange listing or dealt in on another regulated market(cont.)
Shares (cont.)
United States (cont.)8 519 Honeywell International, Inc. USD 1 849 146 1 849 219 0.19507 Horizon Acquisition Corp. - A USD 4 948 5 009 0.00
27 331 Horizon Acquisition Corp. II - A USD 259 040 278 776 0.0384 844 Hostess Brands, Inc. USD 1 160 102 1 216 663 0.1359 699 HPX Corp. - A USD 600 323 586 244 0.06
124 HubSpot, Inc. USD 57 699 56 322 0.013 Hudson Executive Investment Corp. II USD 30 29 0.00
15 008 Hudson Executive Investment Corp. II USD 147 153 147 979 0.0253 467 Hudson Executive Investment Corp. III USD 536 709 530 393 0.065 182 HumanCo Acquisition Corp. - A USD 46 587 51 561 0.01
72 636 Humanigen, Inc. USD 1 343 766 1 387 348 0.1535 617 I3 Verticals, Inc. - A USD 1 029 036 1 108 579 0.1227 020 Ibere Pharmaceuticals USD 270 632 266 417 0.031 719 IDEXX Laboratories, Inc. USD 838 836 841 124 0.09485 II-VI, Inc. USD 35 194 33 159 0.00
2 247 Illumina, Inc. USD 921 140 862 983 0.0984 063 Independence Hldg. Corp. USD 840 797 840 630 0.0963 992 Infinity Pharmaceuticals, Inc. USD 243 170 206 694 0.025 435 Innovage Hldg. Corp. USD 131 136 140 169 0.016 906 Inovio Pharmaceuticals, Inc. USD 84 364 64 088 0.01
10 524 Inozyme Pharma, Inc. USD 226 266 208 375 0.023 917 Inphi Corp. USD 599 178 698 832 0.073 686 Instil Bio, Inc. USD 99 509 92 445 0.01
98 279 Intel Corp. USD 6 101 351 6 289 856 0.6612 212 Intercept Pharmaceuticals, Inc. USD 403 240 281 853 0.0321 697 International Business Machines Corp. USD 2 778 218 2 891 342 0.303 281 International Flavors & Fragrances, Inc. USD 438 323 458 060 0.05
36 027 InterPrivate II Acquisition Corp. USD 360 706 356 307 0.0437 063 InterPrivate III Financial Partners, Inc. USD 370 652 365 441 0.0448 091 InterPrivate IV InfraTech Partners, Inc. USD 480 012 475 620 0.05
914 Invitae Corp. USD 37 022 34 924 0.0058 844 Isos Acquisition Corp. USD 588 800 586 074 0.06
1 ITHAX Acquisition Corp. USD 10 10 0.006 005 Itiquira Acquisition Corp. USD 60 050 59 690 0.01
21 016 Jack Creek Investment Corp. - A USD 204 336 202 804 0.0254 212 Jaws Mustang Acquisition Corp. USD 545 358 550 252 0.069 243 Jaws Spitfire Acquisition Corp. - A USD 86 614 94 741 0.01
45 813 JetBlue Airways Corp. USD 846 382 931 836 0.102 709 JOANN, Inc. USD 33 185 27 496 0.00
65 281 JOFF Fintech Acquisition Corp. USD 657 138 649 546 0.073 356 Johnson & Johnson USD 538 903 551 559 0.06
36 707 Kairos Acquisition Corp. - A USD 352 762 357 526 0.044 039 Kaleido Biosciences, Inc. USD 46 449 32 716 0.00
13 543 Kansas City Southern USD 3 454 442 3 574 269 0.3810 145 Karuna Therapeutics, Inc. USD 1 217 400 1 219 733 0.13
72 Lumyna Funds
Lumyna – Marshall Wace TOPS (Market Neutral)UCITS FundSchedule of investments as at March 31, 2021 (cont.)
The accompanying notes form an integral part of these financial statements.
Audited annual report
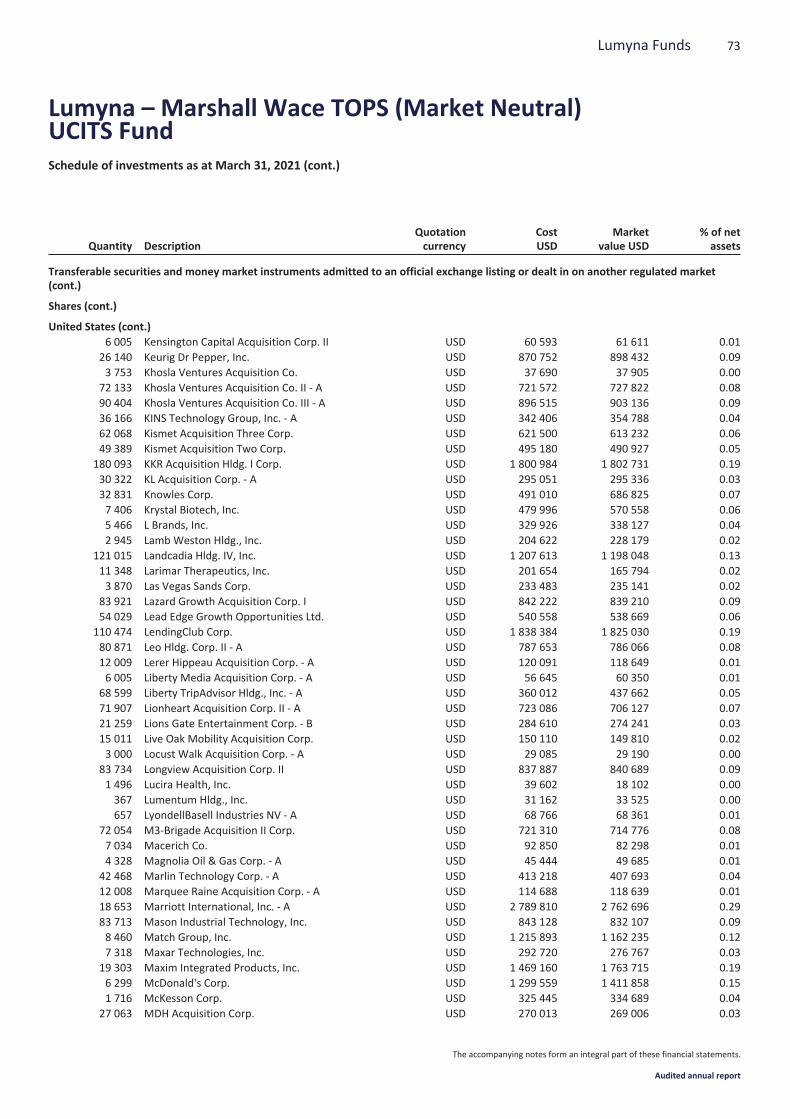
Quantity DescriptionQuotationcurrency
CostUSD
Marketvalue USD
% of netassets
Transferable securities and money market instruments admitted to an official exchange listing or dealt in on another regulated market(cont.)
Shares (cont.)
United States (cont.)6 005 Kensington Capital Acquisition Corp. II USD 60 593 61 611 0.01
26 140 Keurig Dr Pepper, Inc. USD 870 752 898 432 0.093 753 Khosla Ventures Acquisition Co. USD 37 690 37 905 0.00
72 133 Khosla Ventures Acquisition Co. II - A USD 721 572 727 822 0.0890 404 Khosla Ventures Acquisition Co. III - A USD 896 515 903 136 0.0936 166 KINS Technology Group, Inc. - A USD 342 406 354 788 0.0462 068 Kismet Acquisition Three Corp. USD 621 500 613 232 0.0649 389 Kismet Acquisition Two Corp. USD 495 180 490 927 0.05
180 093 KKR Acquisition Hldg. I Corp. USD 1 800 984 1 802 731 0.1930 322 KL Acquisition Corp. - A USD 295 051 295 336 0.0332 831 Knowles Corp. USD 491 010 686 825 0.077 406 Krystal Biotech, Inc. USD 479 996 570 558 0.065 466 L Brands, Inc. USD 329 926 338 127 0.042 945 Lamb Weston Hldg., Inc. USD 204 622 228 179 0.02
121 015 Landcadia Hldg. IV, Inc. USD 1 207 613 1 198 048 0.1311 348 Larimar Therapeutics, Inc. USD 201 654 165 794 0.023 870 Las Vegas Sands Corp. USD 233 483 235 141 0.02
83 921 Lazard Growth Acquisition Corp. I USD 842 222 839 210 0.0954 029 Lead Edge Growth Opportunities Ltd. USD 540 558 538 669 0.06
110 474 LendingClub Corp. USD 1 838 384 1 825 030 0.1980 871 Leo Hldg. Corp. II - A USD 787 653 786 066 0.0812 009 Lerer Hippeau Acquisition Corp. - A USD 120 091 118 649 0.016 005 Liberty Media Acquisition Corp. - A USD 56 645 60 350 0.01
68 599 Liberty TripAdvisor Hldg., Inc. - A USD 360 012 437 662 0.0571 907 Lionheart Acquisition Corp. II - A USD 723 086 706 127 0.0721 259 Lions Gate Entertainment Corp. - B USD 284 610 274 241 0.0315 011 Live Oak Mobility Acquisition Corp. USD 150 110 149 810 0.023 000 Locust Walk Acquisition Corp. - A USD 29 085 29 190 0.00
83 734 Longview Acquisition Corp. II USD 837 887 840 689 0.091 496 Lucira Health, Inc. USD 39 602 18 102 0.00367 Lumentum Hldg., Inc. USD 31 162 33 525 0.00657 LyondellBasell Industries NV - A USD 68 766 68 361 0.01
72 054 M3-Brigade Acquisition II Corp. USD 721 310 714 776 0.087 034 Macerich Co. USD 92 850 82 298 0.014 328 Magnolia Oil & Gas Corp. - A USD 45 444 49 685 0.01
42 468 Marlin Technology Corp. - A USD 413 218 407 693 0.0412 008 Marquee Raine Acquisition Corp. - A USD 114 688 118 639 0.0118 653 Marriott International, Inc. - A USD 2 789 810 2 762 696 0.2983 713 Mason Industrial Technology, Inc. USD 843 128 832 107 0.098 460 Match Group, Inc. USD 1 215 893 1 162 235 0.127 318 Maxar Technologies, Inc. USD 292 720 276 767 0.03
19 303 Maxim Integrated Products, Inc. USD 1 469 160 1 763 715 0.196 299 McDonald's Corp. USD 1 299 559 1 411 858 0.151 716 McKesson Corp. USD 325 445 334 689 0.04
27 063 MDH Acquisition Corp. USD 270 013 269 006 0.03
73Lumyna Funds
Lumyna – Marshall Wace TOPS (Market Neutral)UCITS FundSchedule of investments as at March 31, 2021 (cont.)
The accompanying notes form an integral part of these financial statements.
Audited annual report
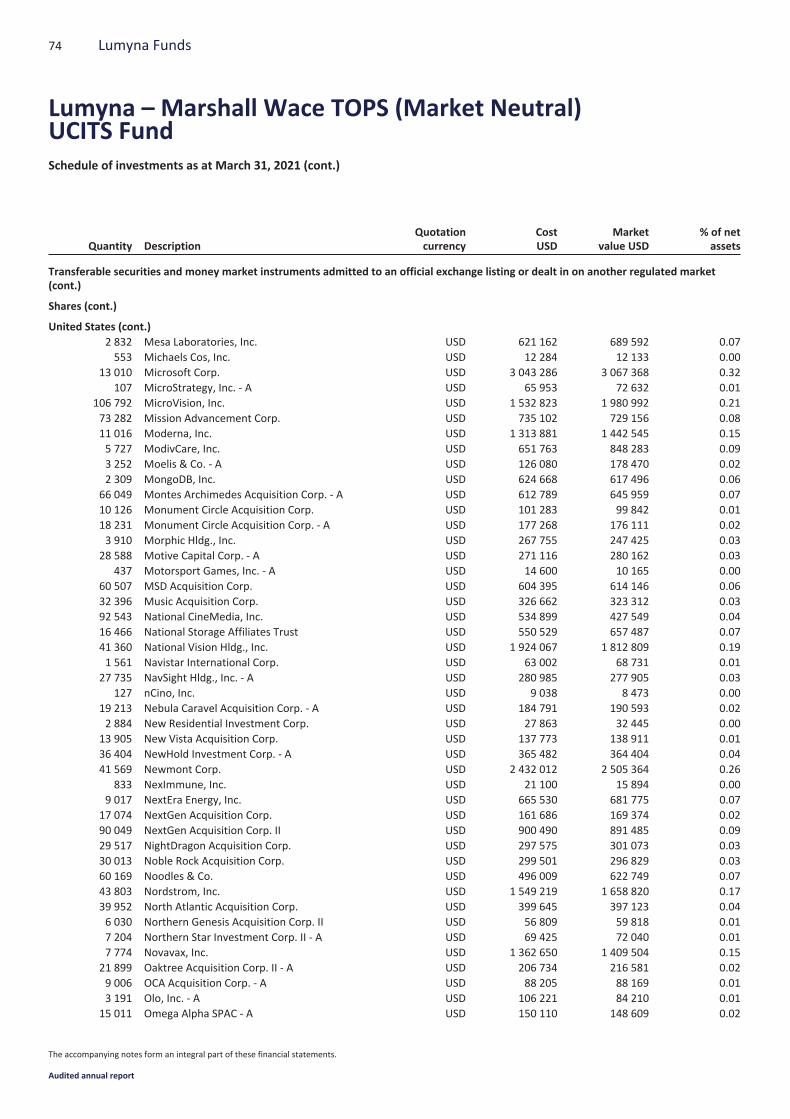
Quantity DescriptionQuotationcurrency
CostUSD
Marketvalue USD
% of netassets
Transferable securities and money market instruments admitted to an official exchange listing or dealt in on another regulated market(cont.)
Shares (cont.)
United States (cont.)2 832 Mesa Laboratories, Inc. USD 621 162 689 592 0.07553 Michaels Cos, Inc. USD 12 284 12 133 0.00
13 010 Microsoft Corp. USD 3 043 286 3 067 368 0.32107 MicroStrategy, Inc. - A USD 65 953 72 632 0.01
106 792 MicroVision, Inc. USD 1 532 823 1 980 992 0.2173 282 Mission Advancement Corp. USD 735 102 729 156 0.0811 016 Moderna, Inc. USD 1 313 881 1 442 545 0.155 727 ModivCare, Inc. USD 651 763 848 283 0.093 252 Moelis & Co. - A USD 126 080 178 470 0.022 309 MongoDB, Inc. USD 624 668 617 496 0.06
66 049 Montes Archimedes Acquisition Corp. - A USD 612 789 645 959 0.0710 126 Monument Circle Acquisition Corp. USD 101 283 99 842 0.0118 231 Monument Circle Acquisition Corp. - A USD 177 268 176 111 0.023 910 Morphic Hldg., Inc. USD 267 755 247 425 0.03
28 588 Motive Capital Corp. - A USD 271 116 280 162 0.03437 Motorsport Games, Inc. - A USD 14 600 10 165 0.00
60 507 MSD Acquisition Corp. USD 604 395 614 146 0.0632 396 Music Acquisition Corp. USD 326 662 323 312 0.0392 543 National CineMedia, Inc. USD 534 899 427 549 0.0416 466 National Storage Affiliates Trust USD 550 529 657 487 0.0741 360 National Vision Hldg., Inc. USD 1 924 067 1 812 809 0.191 561 Navistar International Corp. USD 63 002 68 731 0.01
27 735 NavSight Hldg., Inc. - A USD 280 985 277 905 0.03127 nCino, Inc. USD 9 038 8 473 0.00
19 213 Nebula Caravel Acquisition Corp. - A USD 184 791 190 593 0.022 884 New Residential Investment Corp. USD 27 863 32 445 0.00
13 905 New Vista Acquisition Corp. USD 137 773 138 911 0.0136 404 NewHold Investment Corp. - A USD 365 482 364 404 0.0441 569 Newmont Corp. USD 2 432 012 2 505 364 0.26
833 NexImmune, Inc. USD 21 100 15 894 0.009 017 NextEra Energy, Inc. USD 665 530 681 775 0.07
17 074 NextGen Acquisition Corp. USD 161 686 169 374 0.0290 049 NextGen Acquisition Corp. II USD 900 490 891 485 0.0929 517 NightDragon Acquisition Corp. USD 297 575 301 073 0.0330 013 Noble Rock Acquisition Corp. USD 299 501 296 829 0.0360 169 Noodles & Co. USD 496 009 622 749 0.0743 803 Nordstrom, Inc. USD 1 549 219 1 658 820 0.1739 952 North Atlantic Acquisition Corp. USD 399 645 397 123 0.046 030 Northern Genesis Acquisition Corp. II USD 56 809 59 818 0.017 204 Northern Star Investment Corp. II - A USD 69 425 72 040 0.017 774 Novavax, Inc. USD 1 362 650 1 409 504 0.15
21 899 Oaktree Acquisition Corp. II - A USD 206 734 216 581 0.029 006 OCA Acquisition Corp. - A USD 88 205 88 169 0.013 191 Olo, Inc. - A USD 106 221 84 210 0.01
15 011 Omega Alpha SPAC - A USD 150 110 148 609 0.02
74 Lumyna Funds
Lumyna – Marshall Wace TOPS (Market Neutral)UCITS FundSchedule of investments as at March 31, 2021 (cont.)
The accompanying notes form an integral part of these financial statements.
Audited annual report
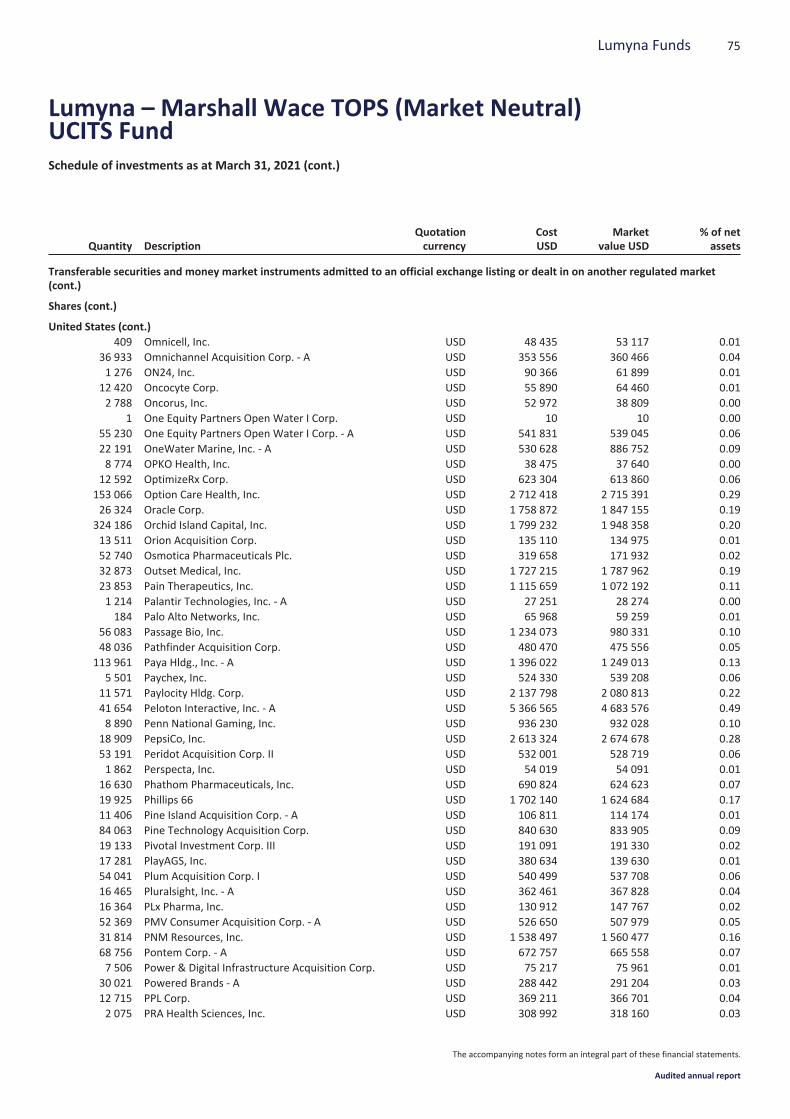
Quantity DescriptionQuotationcurrency
CostUSD
Marketvalue USD
% of netassets
Transferable securities and money market instruments admitted to an official exchange listing or dealt in on another regulated market(cont.)
Shares (cont.)
United States (cont.)409 Omnicell, Inc. USD 48 435 53 117 0.01
36 933 Omnichannel Acquisition Corp. - A USD 353 556 360 466 0.041 276 ON24, Inc. USD 90 366 61 899 0.01
12 420 Oncocyte Corp. USD 55 890 64 460 0.012 788 Oncorus, Inc. USD 52 972 38 809 0.00
1 One Equity Partners Open Water I Corp. USD 10 10 0.0055 230 One Equity Partners Open Water I Corp. - A USD 541 831 539 045 0.0622 191 OneWater Marine, Inc. - A USD 530 628 886 752 0.098 774 OPKO Health, Inc. USD 38 475 37 640 0.00
12 592 OptimizeRx Corp. USD 623 304 613 860 0.06153 066 Option Care Health, Inc. USD 2 712 418 2 715 391 0.2926 324 Oracle Corp. USD 1 758 872 1 847 155 0.19
324 186 Orchid Island Capital, Inc. USD 1 799 232 1 948 358 0.2013 511 Orion Acquisition Corp. USD 135 110 134 975 0.0152 740 Osmotica Pharmaceuticals Plc. USD 319 658 171 932 0.0232 873 Outset Medical, Inc. USD 1 727 215 1 787 962 0.1923 853 Pain Therapeutics, Inc. USD 1 115 659 1 072 192 0.111 214 Palantir Technologies, Inc. - A USD 27 251 28 274 0.00184 Palo Alto Networks, Inc. USD 65 968 59 259 0.01
56 083 Passage Bio, Inc. USD 1 234 073 980 331 0.1048 036 Pathfinder Acquisition Corp. USD 480 470 475 556 0.05
113 961 Paya Hldg., Inc. - A USD 1 396 022 1 249 013 0.135 501 Paychex, Inc. USD 524 330 539 208 0.06
11 571 Paylocity Hldg. Corp. USD 2 137 798 2 080 813 0.2241 654 Peloton Interactive, Inc. - A USD 5 366 565 4 683 576 0.498 890 Penn National Gaming, Inc. USD 936 230 932 028 0.10
18 909 PepsiCo, Inc. USD 2 613 324 2 674 678 0.2853 191 Peridot Acquisition Corp. II USD 532 001 528 719 0.061 862 Perspecta, Inc. USD 54 019 54 091 0.01
16 630 Phathom Pharmaceuticals, Inc. USD 690 824 624 623 0.0719 925 Phillips 66 USD 1 702 140 1 624 684 0.1711 406 Pine Island Acquisition Corp. - A USD 106 811 114 174 0.0184 063 Pine Technology Acquisition Corp. USD 840 630 833 905 0.0919 133 Pivotal Investment Corp. III USD 191 091 191 330 0.0217 281 PlayAGS, Inc. USD 380 634 139 630 0.0154 041 Plum Acquisition Corp. I USD 540 499 537 708 0.0616 465 Pluralsight, Inc. - A USD 362 461 367 828 0.0416 364 PLx Pharma, Inc. USD 130 912 147 767 0.0252 369 PMV Consumer Acquisition Corp. - A USD 526 650 507 979 0.0531 814 PNM Resources, Inc. USD 1 538 497 1 560 477 0.1668 756 Pontem Corp. - A USD 672 757 665 558 0.077 506 Power & Digital Infrastructure Acquisition Corp. USD 75 217 75 961 0.01
30 021 Powered Brands - A USD 288 442 291 204 0.0312 715 PPL Corp. USD 369 211 366 701 0.042 075 PRA Health Sciences, Inc. USD 308 992 318 160 0.03
75Lumyna Funds
Lumyna – Marshall Wace TOPS (Market Neutral)UCITS FundSchedule of investments as at March 31, 2021 (cont.)
The accompanying notes form an integral part of these financial statements.
Audited annual report

Quantity DescriptionQuotationcurrency
CostUSD
Marketvalue USD
% of netassets
Transferable securities and money market instruments admitted to an official exchange listing or dealt in on another regulated market(cont.)
Shares (cont.)
United States (cont.)48 036 Prime Impact Acquisition I - A USD 456 102 467 390 0.0527 811 Primoris Services Corp. USD 973 385 921 378 0.1018 074 Priveterra Acquisition Corp. USD 179 988 179 656 0.025 269 Progressive Corp. USD 459 293 503 769 0.052 716 Prometheus Biosciences, Inc. USD 68 688 49 594 0.01
21 236 Prospector Capital Corp. - A USD 203 847 206 626 0.025 889 Protara Therapeutics, Inc. USD 126 731 92 693 0.01
21 755 Prudential Financial, Inc. USD 1 512 987 1 981 880 0.214 303 pSivida Corp. USD 47 333 43 718 0.00
71 421 PulteGroup, Inc. USD 3 249 952 3 745 317 0.395 702 Quaker Chemical Corp. USD 1 382 849 1 389 977 0.154 117 QUALCOMM, Inc. USD 536 966 545 873 0.067 829 Ralph Lauren Corp. USD 795 656 964 220 0.10
58 657 RealPage, Inc. USD 5 087 932 5 114 890 0.545 802 Realty Income Corp. USD 335 608 368 427 0.04
45 485 Recharge Acquisition Corp. - A USD 457 281 444 843 0.051 833 Regeneron Pharmaceuticals, Inc. USD 878 869 867 266 0.09
23 318 Regions Financial Corp. USD 473 781 481 750 0.0560 045 Reinvent Technology Partners Y USD 608 380 602 852 0.0643 915 Replay Acquisition Corp. USD 447 219 419 388 0.046 034 Repligen Corp. USD 1 137 116 1 173 070 0.12
13 728 Research Alliance Corp. II - A USD 137 630 140 712 0.01257 Revolution Acceleration Acquisition Corp. - A USD 2 605 2 606 0.00
56 869 Rexford Industrial Realty, Inc. USD 2 691 015 2 866 198 0.305 925 RH USD 3 509 809 3 534 855 0.37
13 314 Rhythm Pharmaceuticals, Inc. USD 381 069 283 189 0.0315 541 RMG Acquisition Corp. II - A USD 144 212 155 721 0.0238 449 RMG Acquisition Corp. III USD 387 482 382 568 0.0440 302 ROBLOX Corp. - A USD 2 983 322 2 612 779 0.2725 995 Roku, Inc. USD 10 401 423 8 468 391 0.8958 308 Rosecliff Acquisition Corp. I USD 585 971 578 415 0.0660 050 Ross Acquisition Corp. II USD 600 581 598 098 0.0630 213 Rotor Acquisition Corp. - A USD 293 120 296 087 0.0318 310 Royal Caribbean Cruises Ltd. USD 1 606 986 1 567 519 0.1659 714 RXR Acquisition Corp. USD 598 779 588 183 0.063 588 S&P Global, Inc. USD 1 270 999 1 266 098 0.13
19 126 Sabre Corp. USD 311 251 283 256 0.032 458 salesforce.com, Inc. USD 514 607 520 776 0.051 394 Sana Biotechnology, Inc. USD 48 929 46 657 0.00
67 251 Sandbridge Acquisition Corp. - A USD 662 982 666 457 0.0773 768 Sandbridge X2 Corp. USD 737 680 736 942 0.0840 870 Science Strategic Acquisition Corp. Alpha USD 409 429 406 248 0.0434 449 SCP & Co. Healthcare Acquisition Co. USD 343 960 343 457 0.041 910 SEACOR Hldg., Inc. USD 81 720 77 833 0.012 880 Seagen, Inc. USD 432 225 399 917 0.04
76 Lumyna Funds
Lumyna – Marshall Wace TOPS (Market Neutral)UCITS FundSchedule of investments as at March 31, 2021 (cont.)
The accompanying notes form an integral part of these financial statements.
Audited annual report
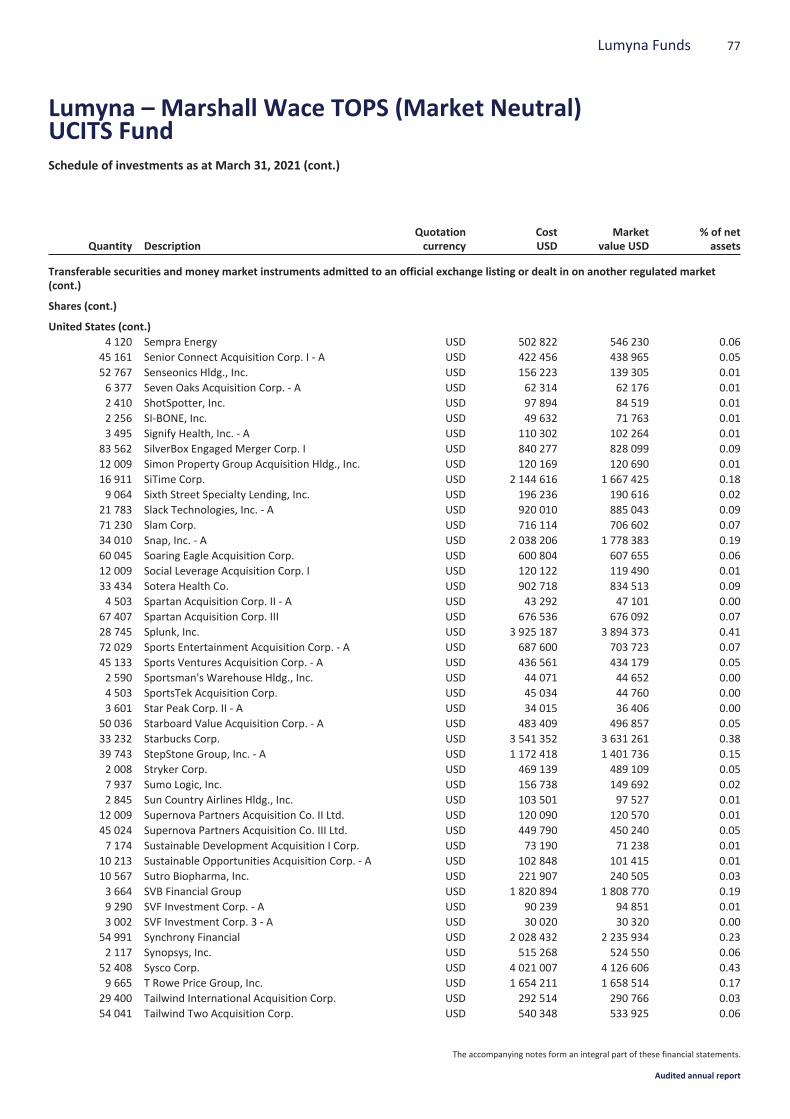
Quantity DescriptionQuotationcurrency
CostUSD
Marketvalue USD
% of netassets
Transferable securities and money market instruments admitted to an official exchange listing or dealt in on another regulated market(cont.)
Shares (cont.)
United States (cont.)4 120 Sempra Energy USD 502 822 546 230 0.06
45 161 Senior Connect Acquisition Corp. I - A USD 422 456 438 965 0.0552 767 Senseonics Hldg., Inc. USD 156 223 139 305 0.016 377 Seven Oaks Acquisition Corp. - A USD 62 314 62 176 0.012 410 ShotSpotter, Inc. USD 97 894 84 519 0.012 256 SI-BONE, Inc. USD 49 632 71 763 0.013 495 Signify Health, Inc. - A USD 110 302 102 264 0.01
83 562 SilverBox Engaged Merger Corp. I USD 840 277 828 099 0.0912 009 Simon Property Group Acquisition Hldg., Inc. USD 120 169 120 690 0.0116 911 SiTime Corp. USD 2 144 616 1 667 425 0.189 064 Sixth Street Specialty Lending, Inc. USD 196 236 190 616 0.02
21 783 Slack Technologies, Inc. - A USD 920 010 885 043 0.0971 230 Slam Corp. USD 716 114 706 602 0.0734 010 Snap, Inc. - A USD 2 038 206 1 778 383 0.1960 045 Soaring Eagle Acquisition Corp. USD 600 804 607 655 0.0612 009 Social Leverage Acquisition Corp. I USD 120 122 119 490 0.0133 434 Sotera Health Co. USD 902 718 834 513 0.094 503 Spartan Acquisition Corp. II - A USD 43 292 47 101 0.00
67 407 Spartan Acquisition Corp. III USD 676 536 676 092 0.0728 745 Splunk, Inc. USD 3 925 187 3 894 373 0.4172 029 Sports Entertainment Acquisition Corp. - A USD 687 600 703 723 0.0745 133 Sports Ventures Acquisition Corp. - A USD 436 561 434 179 0.052 590 Sportsman's Warehouse Hldg., Inc. USD 44 071 44 652 0.004 503 SportsTek Acquisition Corp. USD 45 034 44 760 0.003 601 Star Peak Corp. II - A USD 34 015 36 406 0.00
50 036 Starboard Value Acquisition Corp. - A USD 483 409 496 857 0.0533 232 Starbucks Corp. USD 3 541 352 3 631 261 0.3839 743 StepStone Group, Inc. - A USD 1 172 418 1 401 736 0.152 008 Stryker Corp. USD 469 139 489 109 0.057 937 Sumo Logic, Inc. USD 156 738 149 692 0.022 845 Sun Country Airlines Hldg., Inc. USD 103 501 97 527 0.01
12 009 Supernova Partners Acquisition Co. II Ltd. USD 120 090 120 570 0.0145 024 Supernova Partners Acquisition Co. III Ltd. USD 449 790 450 240 0.057 174 Sustainable Development Acquisition I Corp. USD 73 190 71 238 0.01
10 213 Sustainable Opportunities Acquisition Corp. - A USD 102 848 101 415 0.0110 567 Sutro Biopharma, Inc. USD 221 907 240 505 0.033 664 SVB Financial Group USD 1 820 894 1 808 770 0.199 290 SVF Investment Corp. - A USD 90 239 94 851 0.013 002 SVF Investment Corp. 3 - A USD 30 020 30 320 0.00
54 991 Synchrony Financial USD 2 028 432 2 235 934 0.232 117 Synopsys, Inc. USD 515 268 524 550 0.06
52 408 Sysco Corp. USD 4 021 007 4 126 606 0.439 665 T Rowe Price Group, Inc. USD 1 654 211 1 658 514 0.17
29 400 Tailwind International Acquisition Corp. USD 292 514 290 766 0.0354 041 Tailwind Two Acquisition Corp. USD 540 348 533 925 0.06
77Lumyna Funds
Lumyna – Marshall Wace TOPS (Market Neutral)UCITS FundSchedule of investments as at March 31, 2021 (cont.)
The accompanying notes form an integral part of these financial statements.
Audited annual report
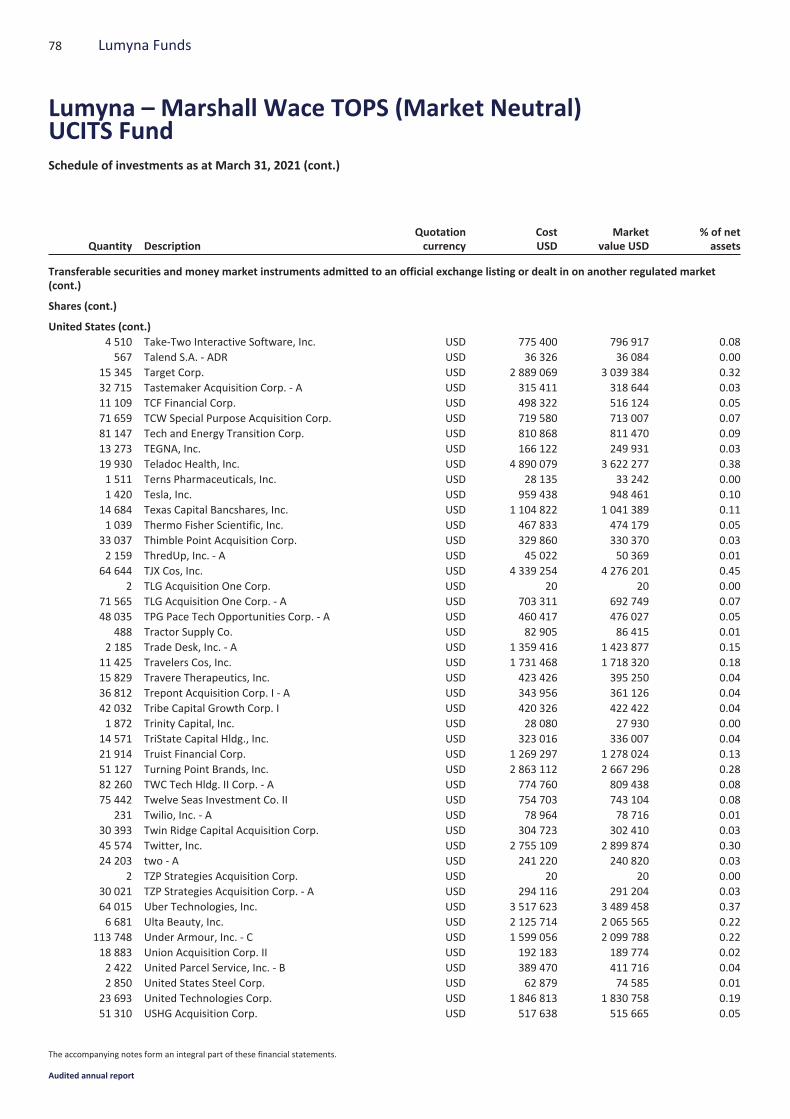
Quantity DescriptionQuotationcurrency
CostUSD
Marketvalue USD
% of netassets
Transferable securities and money market instruments admitted to an official exchange listing or dealt in on another regulated market(cont.)
Shares (cont.)
United States (cont.)4 510 Take-Two Interactive Software, Inc. USD 775 400 796 917 0.08567 Talend S.A. - ADR USD 36 326 36 084 0.00
15 345 Target Corp. USD 2 889 069 3 039 384 0.3232 715 Tastemaker Acquisition Corp. - A USD 315 411 318 644 0.0311 109 TCF Financial Corp. USD 498 322 516 124 0.0571 659 TCW Special Purpose Acquisition Corp. USD 719 580 713 007 0.0781 147 Tech and Energy Transition Corp. USD 810 868 811 470 0.0913 273 TEGNA, Inc. USD 166 122 249 931 0.0319 930 Teladoc Health, Inc. USD 4 890 079 3 622 277 0.381 511 Terns Pharmaceuticals, Inc. USD 28 135 33 242 0.001 420 Tesla, Inc. USD 959 438 948 461 0.10
14 684 Texas Capital Bancshares, Inc. USD 1 104 822 1 041 389 0.111 039 Thermo Fisher Scientific, Inc. USD 467 833 474 179 0.05
33 037 Thimble Point Acquisition Corp. USD 329 860 330 370 0.032 159 ThredUp, Inc. - A USD 45 022 50 369 0.01
64 644 TJX Cos, Inc. USD 4 339 254 4 276 201 0.452 TLG Acquisition One Corp. USD 20 20 0.00
71 565 TLG Acquisition One Corp. - A USD 703 311 692 749 0.0748 035 TPG Pace Tech Opportunities Corp. - A USD 460 417 476 027 0.05
488 Tractor Supply Co. USD 82 905 86 415 0.012 185 Trade Desk, Inc. - A USD 1 359 416 1 423 877 0.15
11 425 Travelers Cos, Inc. USD 1 731 468 1 718 320 0.1815 829 Travere Therapeutics, Inc. USD 423 426 395 250 0.0436 812 Trepont Acquisition Corp. I - A USD 343 956 361 126 0.0442 032 Tribe Capital Growth Corp. I USD 420 326 422 422 0.041 872 Trinity Capital, Inc. USD 28 080 27 930 0.00
14 571 TriState Capital Hldg., Inc. USD 323 016 336 007 0.0421 914 Truist Financial Corp. USD 1 269 297 1 278 024 0.1351 127 Turning Point Brands, Inc. USD 2 863 112 2 667 296 0.2882 260 TWC Tech Hldg. II Corp. - A USD 774 760 809 438 0.0875 442 Twelve Seas Investment Co. II USD 754 703 743 104 0.08
231 Twilio, Inc. - A USD 78 964 78 716 0.0130 393 Twin Ridge Capital Acquisition Corp. USD 304 723 302 410 0.0345 574 Twitter, Inc. USD 2 755 109 2 899 874 0.3024 203 two - A USD 241 220 240 820 0.03
2 TZP Strategies Acquisition Corp. USD 20 20 0.0030 021 TZP Strategies Acquisition Corp. - A USD 294 116 291 204 0.0364 015 Uber Technologies, Inc. USD 3 517 623 3 489 458 0.376 681 Ulta Beauty, Inc. USD 2 125 714 2 065 565 0.22
113 748 Under Armour, Inc. - C USD 1 599 056 2 099 788 0.2218 883 Union Acquisition Corp. II USD 192 183 189 774 0.022 422 United Parcel Service, Inc. - B USD 389 470 411 716 0.042 850 United States Steel Corp. USD 62 879 74 585 0.01
23 693 United Technologies Corp. USD 1 846 813 1 830 758 0.1951 310 USHG Acquisition Corp. USD 517 638 515 665 0.05
78 Lumyna Funds
Lumyna – Marshall Wace TOPS (Market Neutral)UCITS FundSchedule of investments as at March 31, 2021 (cont.)
The accompanying notes form an integral part of these financial statements.
Audited annual report
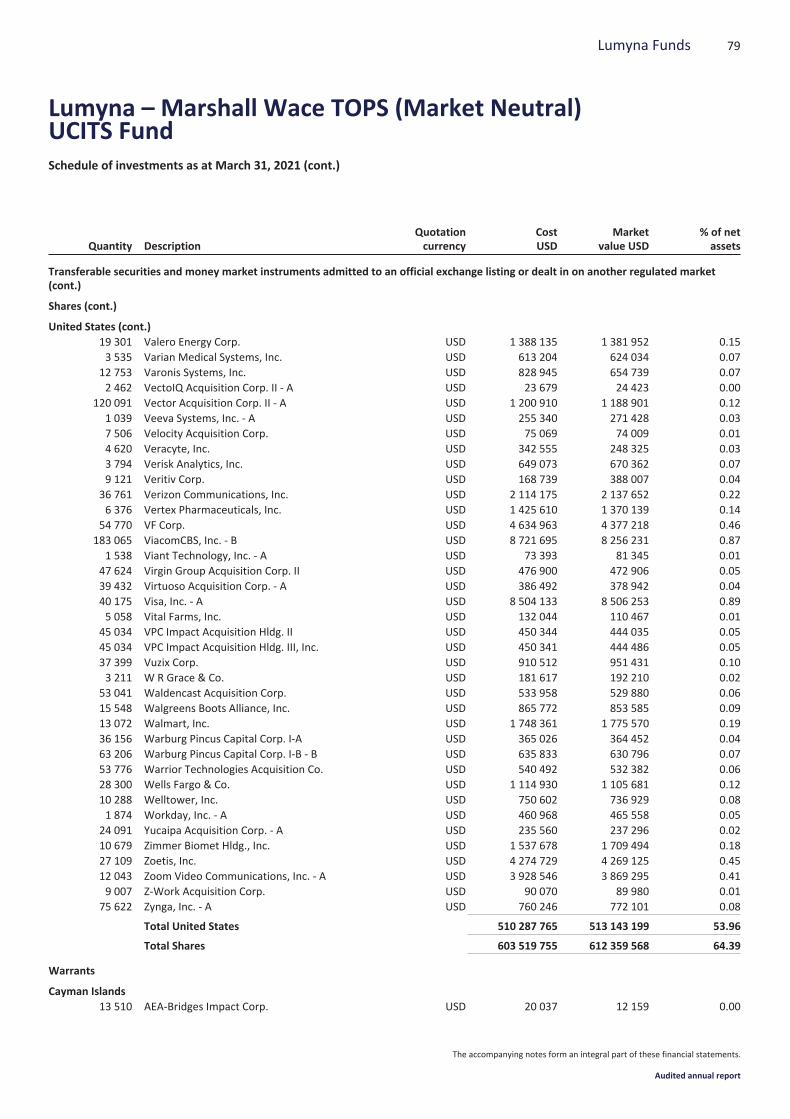
Quantity DescriptionQuotationcurrency
CostUSD
Marketvalue USD
% of netassets
Transferable securities and money market instruments admitted to an official exchange listing or dealt in on another regulated market(cont.)
Shares (cont.)
United States (cont.)19 301 Valero Energy Corp. USD 1 388 135 1 381 952 0.153 535 Varian Medical Systems, Inc. USD 613 204 624 034 0.07
12 753 Varonis Systems, Inc. USD 828 945 654 739 0.072 462 VectoIQ Acquisition Corp. II - A USD 23 679 24 423 0.00
120 091 Vector Acquisition Corp. II - A USD 1 200 910 1 188 901 0.121 039 Veeva Systems, Inc. - A USD 255 340 271 428 0.037 506 Velocity Acquisition Corp. USD 75 069 74 009 0.014 620 Veracyte, Inc. USD 342 555 248 325 0.033 794 Verisk Analytics, Inc. USD 649 073 670 362 0.079 121 Veritiv Corp. USD 168 739 388 007 0.04
36 761 Verizon Communications, Inc. USD 2 114 175 2 137 652 0.226 376 Vertex Pharmaceuticals, Inc. USD 1 425 610 1 370 139 0.14
54 770 VF Corp. USD 4 634 963 4 377 218 0.46183 065 ViacomCBS, Inc. - B USD 8 721 695 8 256 231 0.87
1 538 Viant Technology, Inc. - A USD 73 393 81 345 0.0147 624 Virgin Group Acquisition Corp. II USD 476 900 472 906 0.0539 432 Virtuoso Acquisition Corp. - A USD 386 492 378 942 0.0440 175 Visa, Inc. - A USD 8 504 133 8 506 253 0.895 058 Vital Farms, Inc. USD 132 044 110 467 0.01
45 034 VPC Impact Acquisition Hldg. II USD 450 344 444 035 0.0545 034 VPC Impact Acquisition Hldg. III, Inc. USD 450 341 444 486 0.0537 399 Vuzix Corp. USD 910 512 951 431 0.103 211 W R Grace & Co. USD 181 617 192 210 0.02
53 041 Waldencast Acquisition Corp. USD 533 958 529 880 0.0615 548 Walgreens Boots Alliance, Inc. USD 865 772 853 585 0.0913 072 Walmart, Inc. USD 1 748 361 1 775 570 0.1936 156 Warburg Pincus Capital Corp. I-A USD 365 026 364 452 0.0463 206 Warburg Pincus Capital Corp. I-B - B USD 635 833 630 796 0.0753 776 Warrior Technologies Acquisition Co. USD 540 492 532 382 0.0628 300 Wells Fargo & Co. USD 1 114 930 1 105 681 0.1210 288 Welltower, Inc. USD 750 602 736 929 0.081 874 Workday, Inc. - A USD 460 968 465 558 0.05
24 091 Yucaipa Acquisition Corp. - A USD 235 560 237 296 0.0210 679 Zimmer Biomet Hldg., Inc. USD 1 537 678 1 709 494 0.1827 109 Zoetis, Inc. USD 4 274 729 4 269 125 0.4512 043 Zoom Video Communications, Inc. - A USD 3 928 546 3 869 295 0.419 007 Z-Work Acquisition Corp. USD 90 070 89 980 0.01
75 622 Zynga, Inc. - A USD 760 246 772 101 0.08
Total United States 510 287 765 513 143 199 53.96
Total Shares 603 519 755 612 359 568 64.39
Warrants
Cayman Islands13 510 AEA-Bridges Impact Corp. USD 20 037 12 159 0.00
79Lumyna Funds
Lumyna – Marshall Wace TOPS (Market Neutral)UCITS FundSchedule of investments as at March 31, 2021 (cont.)
The accompanying notes form an integral part of these financial statements.
Audited annual report
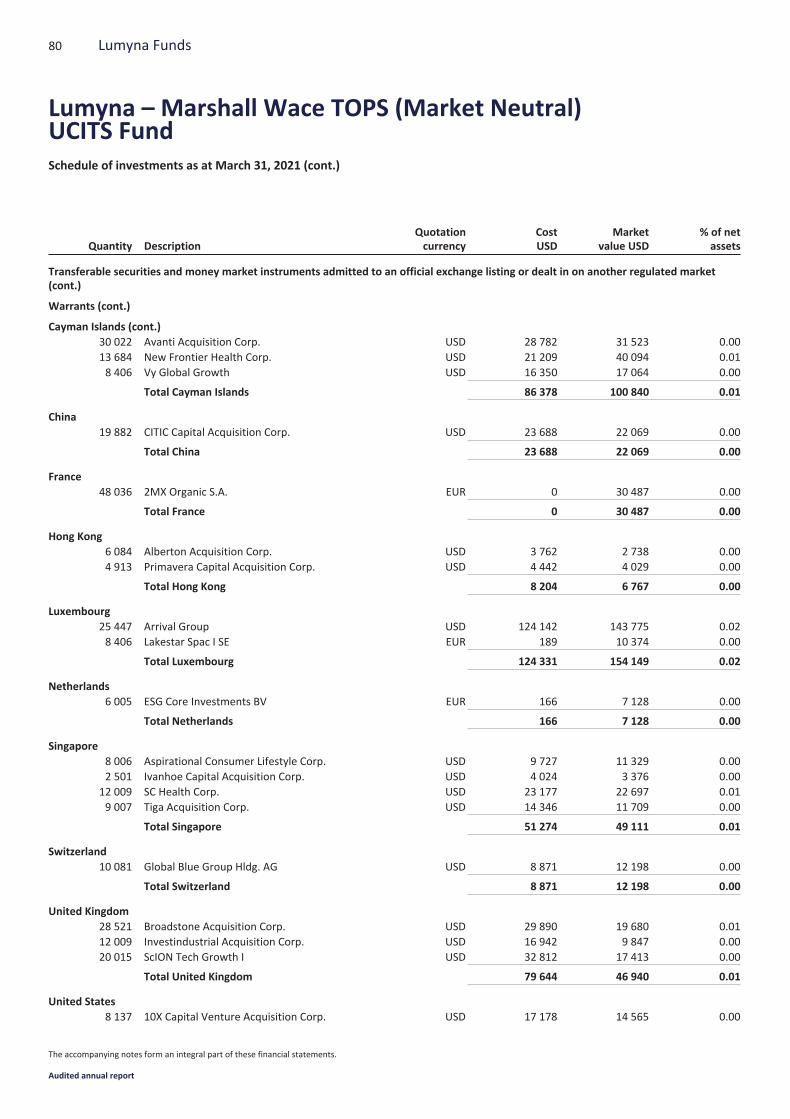
Quantity DescriptionQuotationcurrency
CostUSD
Marketvalue USD
% of netassets
Transferable securities and money market instruments admitted to an official exchange listing or dealt in on another regulated market(cont.)
Warrants (cont.)
Cayman Islands (cont.)30 022 Avanti Acquisition Corp. USD 28 782 31 523 0.0013 684 New Frontier Health Corp. USD 21 209 40 094 0.018 406 Vy Global Growth USD 16 350 17 064 0.00
Total Cayman Islands 86 378 100 840 0.01
China19 882 CITIC Capital Acquisition Corp. USD 23 688 22 069 0.00
Total China 23 688 22 069 0.00
France48 036 2MX Organic S.A. EUR 0 30 487 0.00
Total France 0 30 487 0.00
Hong Kong6 084 Alberton Acquisition Corp. USD 3 762 2 738 0.004 913 Primavera Capital Acquisition Corp. USD 4 442 4 029 0.00
Total Hong Kong 8 204 6 767 0.00
Luxembourg25 447 Arrival Group USD 124 142 143 775 0.028 406 Lakestar Spac I SE EUR 189 10 374 0.00
Total Luxembourg 124 331 154 149 0.02
Netherlands6 005 ESG Core Investments BV EUR 166 7 128 0.00
Total Netherlands 166 7 128 0.00
Singapore8 006 Aspirational Consumer Lifestyle Corp. USD 9 727 11 329 0.002 501 Ivanhoe Capital Acquisition Corp. USD 4 024 3 376 0.00
12 009 SC Health Corp. USD 23 177 22 697 0.019 007 Tiga Acquisition Corp. USD 14 346 11 709 0.00
Total Singapore 51 274 49 111 0.01
Switzerland10 081 Global Blue Group Hldg. AG USD 8 871 12 198 0.00
Total Switzerland 8 871 12 198 0.00
United Kingdom28 521 Broadstone Acquisition Corp. USD 29 890 19 680 0.0112 009 Investindustrial Acquisition Corp. USD 16 942 9 847 0.0020 015 ScION Tech Growth I USD 32 812 17 413 0.00
Total United Kingdom 79 644 46 940 0.01
United States8 137 10X Capital Venture Acquisition Corp. USD 17 178 14 565 0.00
80 Lumyna Funds
Lumyna – Marshall Wace TOPS (Market Neutral)UCITS FundSchedule of investments as at March 31, 2021 (cont.)
The accompanying notes form an integral part of these financial statements.
Audited annual report

Quantity DescriptionQuotationcurrency
CostUSD
Marketvalue USD
% of netassets
Transferable securities and money market instruments admitted to an official exchange listing or dealt in on another regulated market(cont.)
Warrants (cont.)
United States (cont.)3 037 26 Capital Acquisition Corp. USD 2 213 2 399 0.00
11 438 ACE Convergence Acquisition Corp. USD 26 947 22 876 0.0010 007 ACON S2 Acquisition Corp. USD 16 782 9 114 0.009 123 Advantage Solutions, Inc. USD 17 602 29 285 0.00
15 537 Advent Technologies Hldg., Inc. USD 36 736 35 735 0.0110 007 Aequi Acquisition Corp. USD 13 600 9 507 0.008 404 Aeva Technologies, Inc. USD 37 494 27 901 0.00
18 013 Ajax I USD 43 880 30 442 0.004 564 Alpha Healthcare Acquisition Corp. USD 15 154 13 646 0.00
16 687 Altimar Acquisition Corp. USD 35 875 23 445 0.001 200 Altimeter Growth Corp. USD 3 762 3 732 0.00
10 206 Altitude Acquisition Corp. USD 23 850 17 248 0.0032 558 Altus Midstream Co. USD 50 465 2 230 0.0020 387 Apex Technology Acquisition Corp. USD 68 594 53 414 0.0130 253 Apollo Strategic Growth Capital USD 51 868 38 119 0.0118 254 ArcLight Clean Transition Corp. USD 130 289 104 961 0.0132 251 Artius Acquisition, Inc. USD 89 433 55 472 0.0112 009 Ascendant Digital Acquisition Corp. USD 13 690 12 129 0.0014 663 Atlas Crest Investment Corp. USD 35 836 26 393 0.007 505 Authentic Equity Acquisition Corp. USD 4 878 4 803 0.003 002 Biotech Acquisition Co. USD 1 540 1 831 0.004 466 BM Technologies, Inc. USD 11 293 8 932 0.00
13 248 BowX Acquisition Corp. USD 27 547 28 881 0.007 504 Bright Lights Acquisition Corp. USD 6 815 4 502 0.00
19 515 BTRS Hldg., Inc. USD 42 933 92 696 0.019 006 BurgerFi International, Inc. USD 34 844 35 574 0.01
18 014 Butterfly Network, Inc. USD 145 676 116 190 0.0114 557 CA Healthcare Acquisition Corp. USD 7 375 7 280 0.0018 025 Capitol Investment Corp. V USD 23 199 24 334 0.0028 657 CarLotz, Inc. USD 49 123 46 998 0.0118 013 Cascade Acquisition Corp. USD 23 929 16 212 0.0020 010 Cerberus Telecom Acquisition Corp. USD 32 387 21 011 0.005 523 CF Finance Acquisition Corp. III USD 9 362 7 732 0.00
12 129 ChargePoint Hldg., Inc. USD 62 766 183 754 0.0220 373 Churchill Capital Corp. II USD 28 055 29 948 0.0031 293 Churchill Capital Corp. IV USD 370 960 348 917 0.043 002 Churchill Capital Corp. V USD 8 671 3 873 0.00
12 236 Climate Change Crisis Real Impact I Acquisition Corp. USD 29 959 39 889 0.011 050 Climate Real Impact Solutions II Acquisition Corp. USD 1 150 1 155 0.00
15 343 Clover Health Investments Corp. USD 28 582 24 242 0.0030 378 Cohn Robbins Hldg. Corp. USD 50 597 36 454 0.0125 019 Constellation Acquisition Corp. I USD 16 399 16 012 0.0027 020 Conx Corp. USD 44 097 31 884 0.0122 022 Crescent Acquisition Corp. USD 32 851 25 105 0.008 004 Crucible Acquisition Corp. USD 13 074 11 126 0.00
81Lumyna Funds
Lumyna – Marshall Wace TOPS (Market Neutral)UCITS FundSchedule of investments as at March 31, 2021 (cont.)
The accompanying notes form an integral part of these financial statements.
Audited annual report
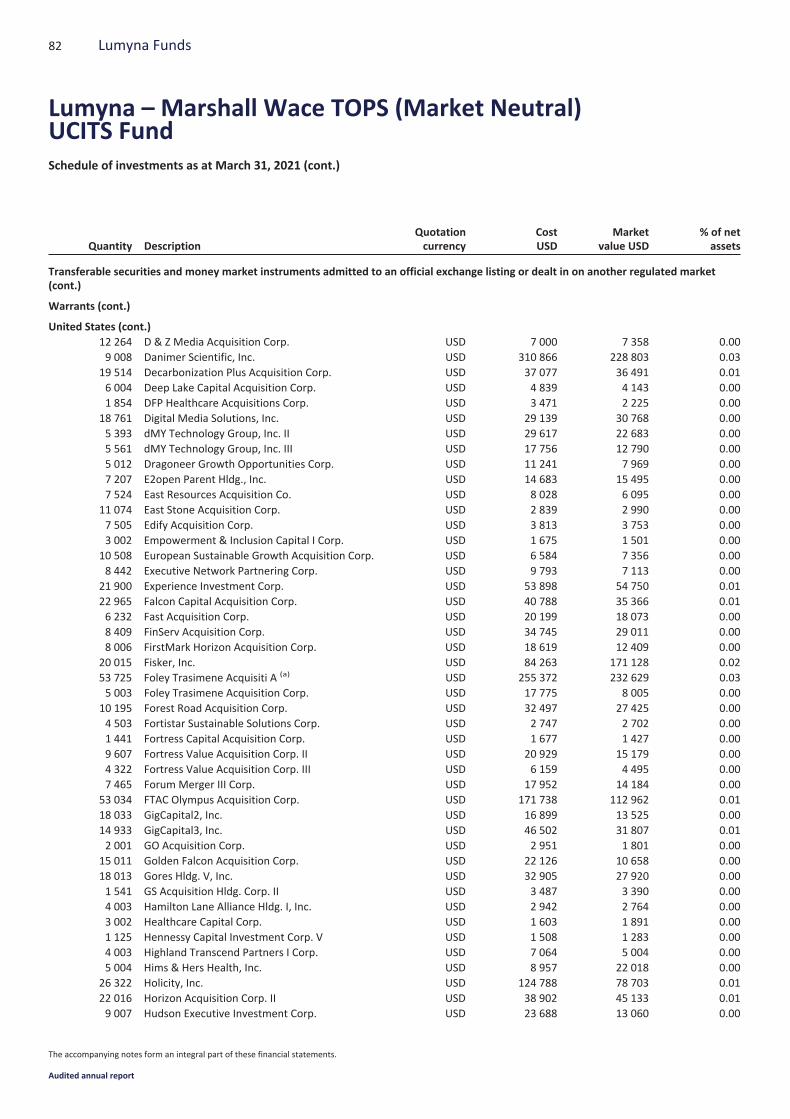
Quantity DescriptionQuotationcurrency
CostUSD
Marketvalue USD
% of netassets
Transferable securities and money market instruments admitted to an official exchange listing or dealt in on another regulated market(cont.)
Warrants (cont.)
United States (cont.)12 264 D & Z Media Acquisition Corp. USD 7 000 7 358 0.009 008 Danimer Scientific, Inc. USD 310 866 228 803 0.03
19 514 Decarbonization Plus Acquisition Corp. USD 37 077 36 491 0.016 004 Deep Lake Capital Acquisition Corp. USD 4 839 4 143 0.001 854 DFP Healthcare Acquisitions Corp. USD 3 471 2 225 0.00
18 761 Digital Media Solutions, Inc. USD 29 139 30 768 0.005 393 dMY Technology Group, Inc. II USD 29 617 22 683 0.005 561 dMY Technology Group, Inc. III USD 17 756 12 790 0.005 012 Dragoneer Growth Opportunities Corp. USD 11 241 7 969 0.007 207 E2open Parent Hldg., Inc. USD 14 683 15 495 0.007 524 East Resources Acquisition Co. USD 8 028 6 095 0.00
11 074 East Stone Acquisition Corp. USD 2 839 2 990 0.007 505 Edify Acquisition Corp. USD 3 813 3 753 0.003 002 Empowerment & Inclusion Capital I Corp. USD 1 675 1 501 0.00
10 508 European Sustainable Growth Acquisition Corp. USD 6 584 7 356 0.008 442 Executive Network Partnering Corp. USD 9 793 7 113 0.00
21 900 Experience Investment Corp. USD 53 898 54 750 0.0122 965 Falcon Capital Acquisition Corp. USD 40 788 35 366 0.016 232 Fast Acquisition Corp. USD 20 199 18 073 0.008 409 FinServ Acquisition Corp. USD 34 745 29 011 0.008 006 FirstMark Horizon Acquisition Corp. USD 18 619 12 409 0.00
20 015 Fisker, Inc. USD 84 263 171 128 0.0253 725 Foley Trasimene Acquisiti A (a) USD 255 372 232 629 0.035 003 Foley Trasimene Acquisition Corp. USD 17 775 8 005 0.00
10 195 Forest Road Acquisition Corp. USD 32 497 27 425 0.004 503 Fortistar Sustainable Solutions Corp. USD 2 747 2 702 0.001 441 Fortress Capital Acquisition Corp. USD 1 677 1 427 0.009 607 Fortress Value Acquisition Corp. II USD 20 929 15 179 0.004 322 Fortress Value Acquisition Corp. III USD 6 159 4 495 0.007 465 Forum Merger III Corp. USD 17 952 14 184 0.00
53 034 FTAC Olympus Acquisition Corp. USD 171 738 112 962 0.0118 033 GigCapital2, Inc. USD 16 899 13 525 0.0014 933 GigCapital3, Inc. USD 46 502 31 807 0.012 001 GO Acquisition Corp. USD 2 951 1 801 0.00
15 011 Golden Falcon Acquisition Corp. USD 22 126 10 658 0.0018 013 Gores Hldg. V, Inc. USD 32 905 27 920 0.001 541 GS Acquisition Hldg. Corp. II USD 3 487 3 390 0.004 003 Hamilton Lane Alliance Hldg. I, Inc. USD 2 942 2 764 0.003 002 Healthcare Capital Corp. USD 1 603 1 891 0.001 125 Hennessy Capital Investment Corp. V USD 1 508 1 283 0.004 003 Highland Transcend Partners I Corp. USD 7 064 5 004 0.005 004 Hims & Hers Health, Inc. USD 8 957 22 018 0.00
26 322 Holicity, Inc. USD 124 788 78 703 0.0122 016 Horizon Acquisition Corp. II USD 38 902 45 133 0.019 007 Hudson Executive Investment Corp. USD 23 688 13 060 0.00
82 Lumyna Funds
Lumyna – Marshall Wace TOPS (Market Neutral)UCITS FundSchedule of investments as at March 31, 2021 (cont.)
The accompanying notes form an integral part of these financial statements.
Audited annual report
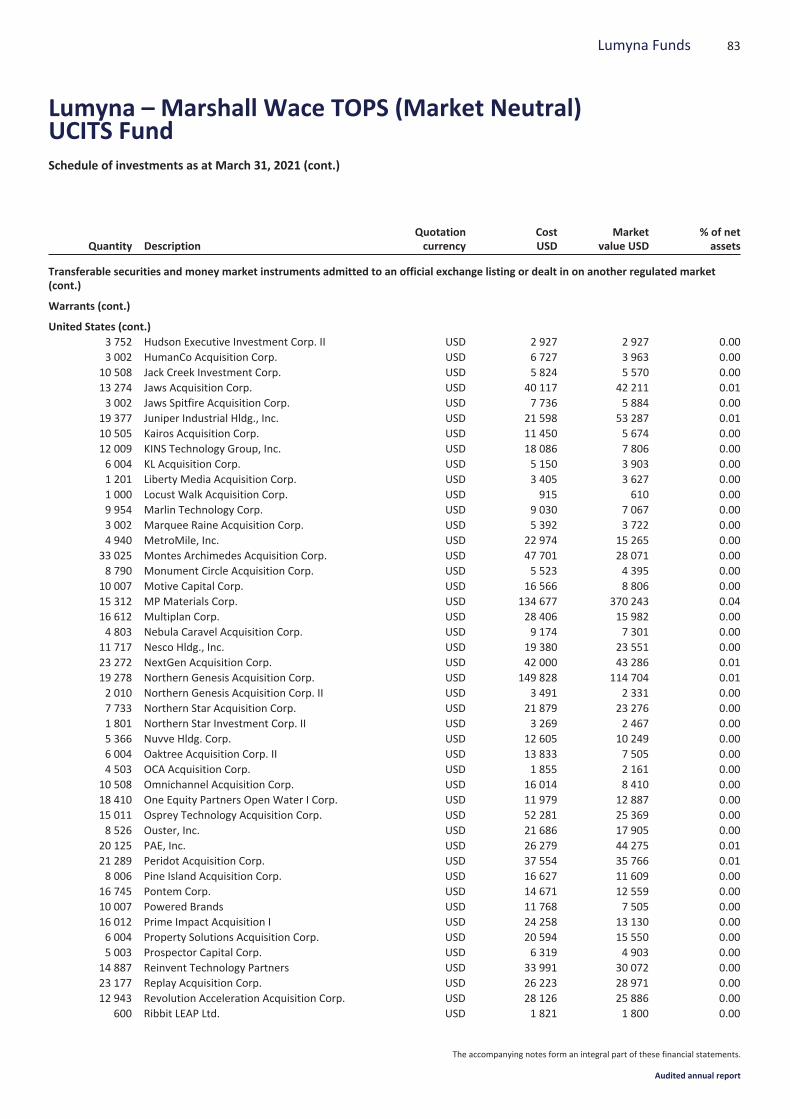
Quantity DescriptionQuotationcurrency
CostUSD
Marketvalue USD
% of netassets
Transferable securities and money market instruments admitted to an official exchange listing or dealt in on another regulated market(cont.)
Warrants (cont.)
United States (cont.)3 752 Hudson Executive Investment Corp. II USD 2 927 2 927 0.003 002 HumanCo Acquisition Corp. USD 6 727 3 963 0.00
10 508 Jack Creek Investment Corp. USD 5 824 5 570 0.0013 274 Jaws Acquisition Corp. USD 40 117 42 211 0.013 002 Jaws Spitfire Acquisition Corp. USD 7 736 5 884 0.00
19 377 Juniper Industrial Hldg., Inc. USD 21 598 53 287 0.0110 505 Kairos Acquisition Corp. USD 11 450 5 674 0.0012 009 KINS Technology Group, Inc. USD 18 086 7 806 0.006 004 KL Acquisition Corp. USD 5 150 3 903 0.001 201 Liberty Media Acquisition Corp. USD 3 405 3 627 0.001 000 Locust Walk Acquisition Corp. USD 915 610 0.009 954 Marlin Technology Corp. USD 9 030 7 067 0.003 002 Marquee Raine Acquisition Corp. USD 5 392 3 722 0.004 940 MetroMile, Inc. USD 22 974 15 265 0.00
33 025 Montes Archimedes Acquisition Corp. USD 47 701 28 071 0.008 790 Monument Circle Acquisition Corp. USD 5 523 4 395 0.00
10 007 Motive Capital Corp. USD 16 566 8 806 0.0015 312 MP Materials Corp. USD 134 677 370 243 0.0416 612 Multiplan Corp. USD 28 406 15 982 0.004 803 Nebula Caravel Acquisition Corp. USD 9 174 7 301 0.00
11 717 Nesco Hldg., Inc. USD 19 380 23 551 0.0023 272 NextGen Acquisition Corp. USD 42 000 43 286 0.0119 278 Northern Genesis Acquisition Corp. USD 149 828 114 704 0.012 010 Northern Genesis Acquisition Corp. II USD 3 491 2 331 0.007 733 Northern Star Acquisition Corp. USD 21 879 23 276 0.001 801 Northern Star Investment Corp. II USD 3 269 2 467 0.005 366 Nuvve Hldg. Corp. USD 12 605 10 249 0.006 004 Oaktree Acquisition Corp. II USD 13 833 7 505 0.004 503 OCA Acquisition Corp. USD 1 855 2 161 0.00
10 508 Omnichannel Acquisition Corp. USD 16 014 8 410 0.0018 410 One Equity Partners Open Water I Corp. USD 11 979 12 887 0.0015 011 Osprey Technology Acquisition Corp. USD 52 281 25 369 0.008 526 Ouster, Inc. USD 21 686 17 905 0.00
20 125 PAE, Inc. USD 26 279 44 275 0.0121 289 Peridot Acquisition Corp. USD 37 554 35 766 0.018 006 Pine Island Acquisition Corp. USD 16 627 11 609 0.00
16 745 Pontem Corp. USD 14 671 12 559 0.0010 007 Powered Brands USD 11 768 7 505 0.0016 012 Prime Impact Acquisition I USD 24 258 13 130 0.006 004 Property Solutions Acquisition Corp. USD 20 594 15 550 0.005 003 Prospector Capital Corp. USD 6 319 4 903 0.00
14 887 Reinvent Technology Partners USD 33 991 30 072 0.0023 177 Replay Acquisition Corp. USD 26 223 28 971 0.0012 943 Revolution Acceleration Acquisition Corp. USD 28 126 25 886 0.00
600 Ribbit LEAP Ltd. USD 1 821 1 800 0.00
83Lumyna Funds
Lumyna – Marshall Wace TOPS (Market Neutral)UCITS FundSchedule of investments as at March 31, 2021 (cont.)
The accompanying notes form an integral part of these financial statements.
Audited annual report
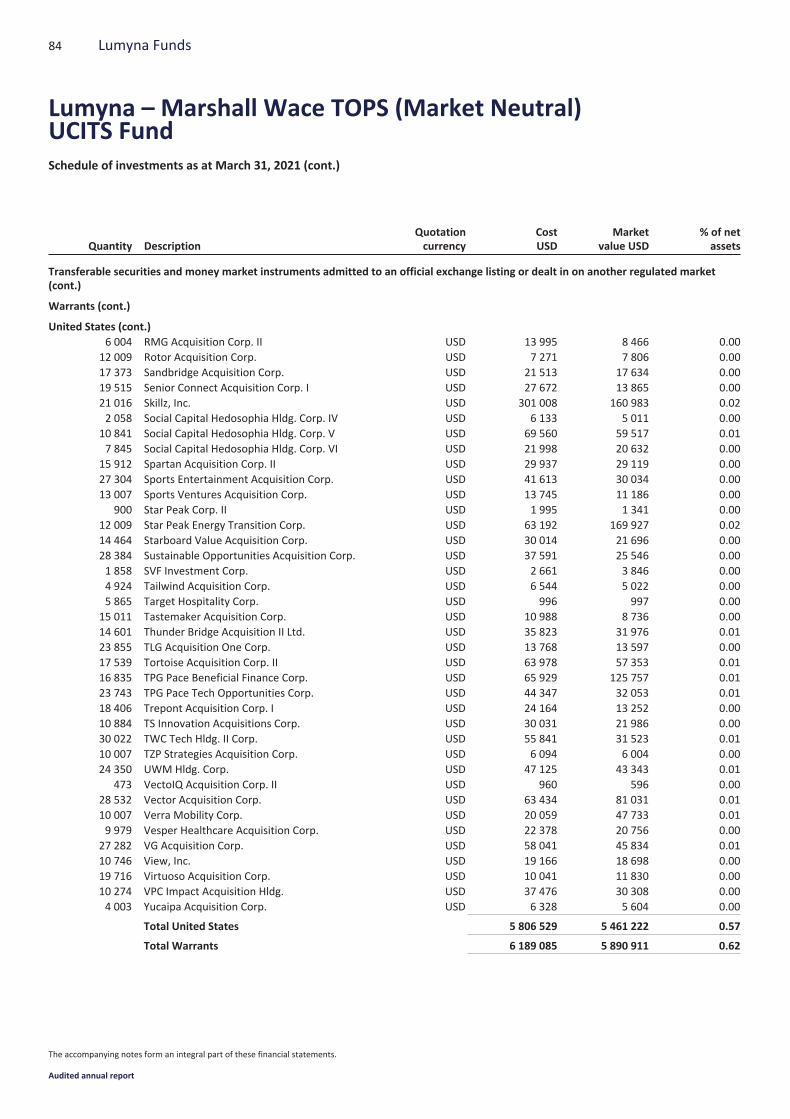
Quantity DescriptionQuotationcurrency
CostUSD
Marketvalue USD
% of netassets
Transferable securities and money market instruments admitted to an official exchange listing or dealt in on another regulated market(cont.)
Warrants (cont.)
United States (cont.)6 004 RMG Acquisition Corp. II USD 13 995 8 466 0.00
12 009 Rotor Acquisition Corp. USD 7 271 7 806 0.0017 373 Sandbridge Acquisition Corp. USD 21 513 17 634 0.0019 515 Senior Connect Acquisition Corp. I USD 27 672 13 865 0.0021 016 Skillz, Inc. USD 301 008 160 983 0.022 058 Social Capital Hedosophia Hldg. Corp. IV USD 6 133 5 011 0.00
10 841 Social Capital Hedosophia Hldg. Corp. V USD 69 560 59 517 0.017 845 Social Capital Hedosophia Hldg. Corp. VI USD 21 998 20 632 0.00
15 912 Spartan Acquisition Corp. II USD 29 937 29 119 0.0027 304 Sports Entertainment Acquisition Corp. USD 41 613 30 034 0.0013 007 Sports Ventures Acquisition Corp. USD 13 745 11 186 0.00
900 Star Peak Corp. II USD 1 995 1 341 0.0012 009 Star Peak Energy Transition Corp. USD 63 192 169 927 0.0214 464 Starboard Value Acquisition Corp. USD 30 014 21 696 0.0028 384 Sustainable Opportunities Acquisition Corp. USD 37 591 25 546 0.001 858 SVF Investment Corp. USD 2 661 3 846 0.004 924 Tailwind Acquisition Corp. USD 6 544 5 022 0.005 865 Target Hospitality Corp. USD 996 997 0.00
15 011 Tastemaker Acquisition Corp. USD 10 988 8 736 0.0014 601 Thunder Bridge Acquisition II Ltd. USD 35 823 31 976 0.0123 855 TLG Acquisition One Corp. USD 13 768 13 597 0.0017 539 Tortoise Acquisition Corp. II USD 63 978 57 353 0.0116 835 TPG Pace Beneficial Finance Corp. USD 65 929 125 757 0.0123 743 TPG Pace Tech Opportunities Corp. USD 44 347 32 053 0.0118 406 Trepont Acquisition Corp. I USD 24 164 13 252 0.0010 884 TS Innovation Acquisitions Corp. USD 30 031 21 986 0.0030 022 TWC Tech Hldg. II Corp. USD 55 841 31 523 0.0110 007 TZP Strategies Acquisition Corp. USD 6 094 6 004 0.0024 350 UWM Hldg. Corp. USD 47 125 43 343 0.01
473 VectoIQ Acquisition Corp. II USD 960 596 0.0028 532 Vector Acquisition Corp. USD 63 434 81 031 0.0110 007 Verra Mobility Corp. USD 20 059 47 733 0.019 979 Vesper Healthcare Acquisition Corp. USD 22 378 20 756 0.00
27 282 VG Acquisition Corp. USD 58 041 45 834 0.0110 746 View, Inc. USD 19 166 18 698 0.0019 716 Virtuoso Acquisition Corp. USD 10 041 11 830 0.0010 274 VPC Impact Acquisition Hldg. USD 37 476 30 308 0.004 003 Yucaipa Acquisition Corp. USD 6 328 5 604 0.00
Total United States 5 806 529 5 461 222 0.57
Total Warrants 6 189 085 5 890 911 0.62
84 Lumyna Funds
Lumyna – Marshall Wace TOPS (Market Neutral)UCITS FundSchedule of investments as at March 31, 2021 (cont.)
The accompanying notes form an integral part of these financial statements.
Audited annual report
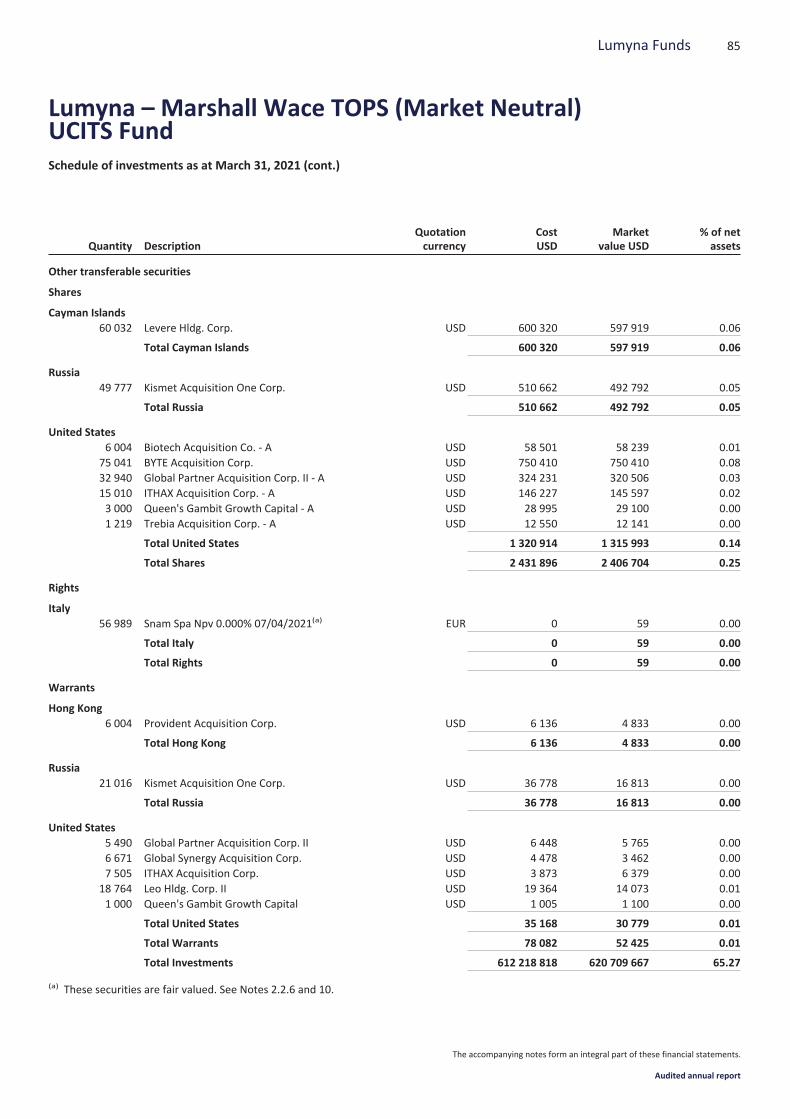
Quantity DescriptionQuotationcurrency
CostUSD
Marketvalue USD
% of netassets
Other transferable securities
Shares
Cayman Islands60 032 Levere Hldg. Corp. USD 600 320 597 919 0.06
Total Cayman Islands 600 320 597 919 0.06
Russia49 777 Kismet Acquisition One Corp. USD 510 662 492 792 0.05
Total Russia 510 662 492 792 0.05
United States6 004 Biotech Acquisition Co. - A USD 58 501 58 239 0.01
75 041 BYTE Acquisition Corp. USD 750 410 750 410 0.0832 940 Global Partner Acquisition Corp. II - A USD 324 231 320 506 0.0315 010 ITHAX Acquisition Corp. - A USD 146 227 145 597 0.023 000 Queen's Gambit Growth Capital - A USD 28 995 29 100 0.001 219 Trebia Acquisition Corp. - A USD 12 550 12 141 0.00
Total United States 1 320 914 1 315 993 0.14
Total Shares 2 431 896 2 406 704 0.25
Rights
Italy56 989 Snam Spa Npv 0.000% 07/04/2021(a) EUR 0 59 0.00
Total Italy 0 59 0.00
Total Rights 0 59 0.00
Warrants
Hong Kong6 004 Provident Acquisition Corp. USD 6 136 4 833 0.00
Total Hong Kong 6 136 4 833 0.00
Russia21 016 Kismet Acquisition One Corp. USD 36 778 16 813 0.00
Total Russia 36 778 16 813 0.00
United States5 490 Global Partner Acquisition Corp. II USD 6 448 5 765 0.006 671 Global Synergy Acquisition Corp. USD 4 478 3 462 0.007 505 ITHAX Acquisition Corp. USD 3 873 6 379 0.00
18 764 Leo Hldg. Corp. II USD 19 364 14 073 0.011 000 Queen's Gambit Growth Capital USD 1 005 1 100 0.00
Total United States 35 168 30 779 0.01
Total Warrants 78 082 52 425 0.01
Total Investments 612 218 818 620 709 667 65.27
(a) These securities are fair valued. See Notes 2.2.6 and 10.
85Lumyna Funds
Lumyna – Marshall Wace TOPS (Market Neutral)UCITS FundSchedule of investments as at March 31, 2021 (cont.)
The accompanying notes form an integral part of these financial statements.
Audited annual report

Industrial classification of investments(as a percentage of net assets as at March 31, 2021) %
Holding Companies-Diversified 13.48Internet 5.89Retail 4.32Software 4.27Diversified Financial Services 2.90Insurance 2.52Oil & Gas 2.49Pharmaceuticals 2.39Computers 1.90Healthcare-Services 1.84Biotechnology 1.75Banks 1.69REITS 1.62Semiconductors 1.60Media 1.40Healthcare-Products 1.38Telecommunications 1.25Beverages 0.93Commercial Services 0.86Food 0.83Leisure Time 0.79Apparel 0.78Transportation 0.72Electronics 0.71Chemicals 0.64Mining 0.56Auto Manufacturers 0.55Iron/Steel 0.55
Industrial classification of investments(as a percentage of net assets as at March 31, 2021) %
Entertainment 0.49Aerospace/Defense 0.48Lodging 0.43Home Builders 0.39Distribution/Wholesale 0.37Agriculture 0.36Electric 0.35Energy-Alternate Sources 0.22Investment Companies 0.22Water 0.20Private Equity 0.19Packaging & Containers 0.18Airlines 0.17Pipelines 0.15Engineering & Construction 0.12Metal Fabricate/Hardware 0.12Auto Parts & Equipment 0.09Building Materials 0.05Electrical Components & Equipment 0.04Miscellaneous Manufacturing 0.02Machinery-Construction & Mining 0.01Machinery-Diversified 0.01Gas 0.00Real Estate 0.00Short terms 0.00
65.27
Futures contracts
Currencycontract Details Market
Maturitydate Counterparty
Number ofcontracts
bought/(sold)Commitment
USD
Unrealisedappreciation/(depreciation)
USD
USD10 Year US TreasuryNote
Chicago Board ofTrade 21/06/2021 UBS AG (221) 28 937 187 (13 812)
USD 2 Year US Treasury NoteChicago Board ofTrade 30/06/2021 UBS AG (131) 28 915 180 13 305
USD 5 Year US Treasury NoteChicago Board ofTrade 30/06/2021 UBS AG (234) 28 875 234 1 828
EUR Allianz Eurex Deutschland 16/12/2022 UBS AG 6 67 627 11 565EUR Allianz Eurex Deutschland 15/12/2023 UBS AG 6 67 345 18 158EUR Amsterdam Index Euronext EQF 16/04/2021 UBS AG (2) 328 680 (8 199)EUR ASS Generali Eurex Deutschland 17/12/2021 UBS AG 91 157 220 98 396EUR ASS Generali Eurex Deutschland 16/12/2022 UBS AG 164 204 507 91 143EUR ASS Generali Eurex Deutschland 15/12/2023 UBS AG 49 54 710 4 607EUR AXA S.A. Eurex Deutschland 17/12/2021 UBS AG 112 188 236 75 478EUR AXA S.A. Eurex Deutschland 16/12/2022 UBS AG 122 200 024 95 693EUR AXA S.A. Eurex Deutschland 15/12/2023 UBS AG 61 96 786 34 507EUR Basf SE Eurex Deutschland 17/12/2021 UBS AG 18 69 813 29 618EUR Basf SE Eurex Deutschland 16/12/2022 UBS AG 37 135 111 17 628
86 Lumyna Funds
Lumyna – Marshall Wace TOPS (Market Neutral)UCITS FundSchedule of investments as at March 31, 2021 (cont.)
The accompanying notes form an integral part of these financial statements.
Audited annual report
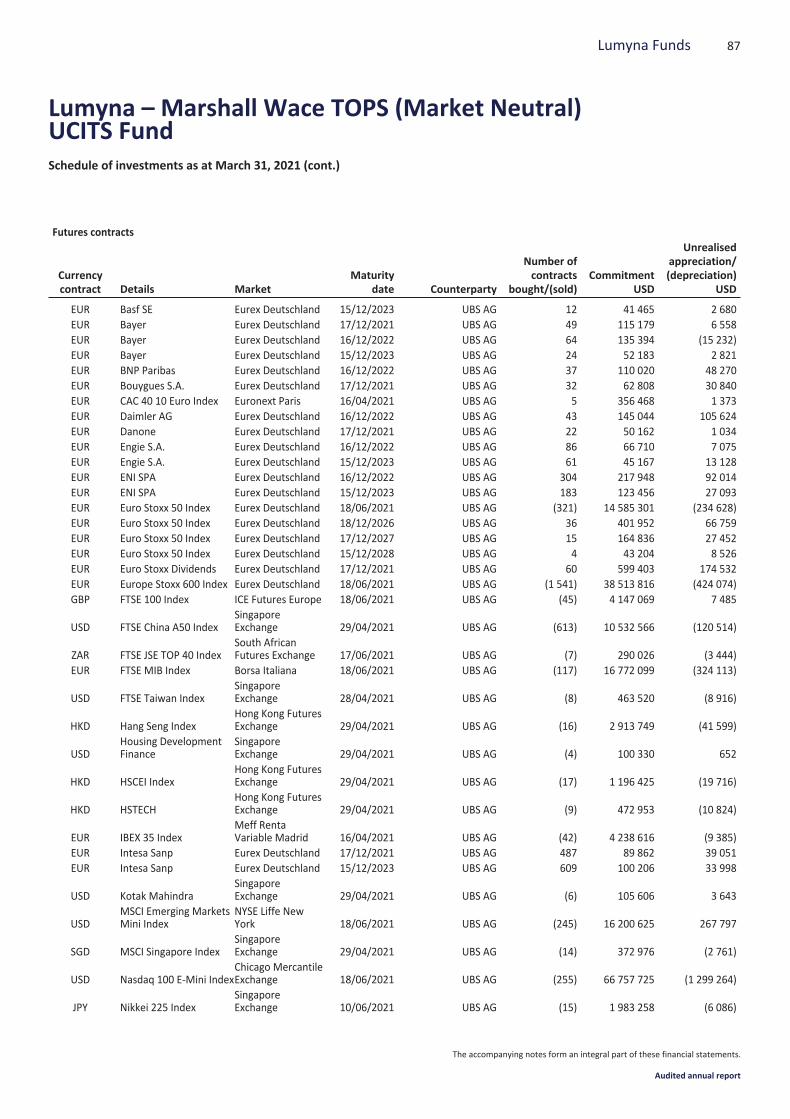
Futures contracts
Currencycontract Details Market
Maturitydate Counterparty
Number ofcontracts
bought/(sold)Commitment
USD
Unrealisedappreciation/(depreciation)
USD
EUR Basf SE Eurex Deutschland 15/12/2023 UBS AG 12 41 465 2 680EUR Bayer Eurex Deutschland 17/12/2021 UBS AG 49 115 179 6 558EUR Bayer Eurex Deutschland 16/12/2022 UBS AG 64 135 394 (15 232)EUR Bayer Eurex Deutschland 15/12/2023 UBS AG 24 52 183 2 821EUR BNP Paribas Eurex Deutschland 16/12/2022 UBS AG 37 110 020 48 270EUR Bouygues S.A. Eurex Deutschland 17/12/2021 UBS AG 32 62 808 30 840EUR CAC 40 10 Euro Index Euronext Paris 16/04/2021 UBS AG 5 356 468 1 373EUR Daimler AG Eurex Deutschland 16/12/2022 UBS AG 43 145 044 105 624EUR Danone Eurex Deutschland 17/12/2021 UBS AG 22 50 162 1 034EUR Engie S.A. Eurex Deutschland 16/12/2022 UBS AG 86 66 710 7 075EUR Engie S.A. Eurex Deutschland 15/12/2023 UBS AG 61 45 167 13 128EUR ENI SPA Eurex Deutschland 16/12/2022 UBS AG 304 217 948 92 014EUR ENI SPA Eurex Deutschland 15/12/2023 UBS AG 183 123 456 27 093EUR Euro Stoxx 50 Index Eurex Deutschland 18/06/2021 UBS AG (321) 14 585 301 (234 628)EUR Euro Stoxx 50 Index Eurex Deutschland 18/12/2026 UBS AG 36 401 952 66 759EUR Euro Stoxx 50 Index Eurex Deutschland 17/12/2027 UBS AG 15 164 836 27 452EUR Euro Stoxx 50 Index Eurex Deutschland 15/12/2028 UBS AG 4 43 204 8 526EUR Euro Stoxx Dividends Eurex Deutschland 17/12/2021 UBS AG 60 599 403 174 532EUR Europe Stoxx 600 Index Eurex Deutschland 18/06/2021 UBS AG (1 541) 38 513 816 (424 074)GBP FTSE 100 Index ICE Futures Europe 18/06/2021 UBS AG (45) 4 147 069 7 485
USD FTSE China A50 IndexSingaporeExchange 29/04/2021 UBS AG (613) 10 532 566 (120 514)
ZAR FTSE JSE TOP 40 IndexSouth AfricanFutures Exchange 17/06/2021 UBS AG (7) 290 026 (3 444)
EUR FTSE MIB Index Borsa Italiana 18/06/2021 UBS AG (117) 16 772 099 (324 113)
USD FTSE Taiwan IndexSingaporeExchange 28/04/2021 UBS AG (8) 463 520 (8 916)
HKD Hang Seng IndexHong Kong FuturesExchange 29/04/2021 UBS AG (16) 2 913 749 (41 599)
USDHousing DevelopmentFinance
SingaporeExchange 29/04/2021 UBS AG (4) 100 330 652
HKD HSCEI IndexHong Kong FuturesExchange 29/04/2021 UBS AG (17) 1 196 425 (19 716)
HKD HSTECHHong Kong FuturesExchange 29/04/2021 UBS AG (9) 472 953 (10 824)
EUR IBEX 35 IndexMeff RentaVariable Madrid 16/04/2021 UBS AG (42) 4 238 616 (9 385)
EUR Intesa Sanp Eurex Deutschland 17/12/2021 UBS AG 487 89 862 39 051EUR Intesa Sanp Eurex Deutschland 15/12/2023 UBS AG 609 100 206 33 998
USD Kotak MahindraSingaporeExchange 29/04/2021 UBS AG (6) 105 606 3 643
USDMSCI Emerging MarketsMini Index
NYSE Liffe NewYork 18/06/2021 UBS AG (245) 16 200 625 267 797
SGD MSCI Singapore IndexSingaporeExchange 29/04/2021 UBS AG (14) 372 976 (2 761)
USD Nasdaq 100 E-Mini IndexChicago MercantileExchange 18/06/2021 UBS AG (255) 66 757 725 (1 299 264)
JPY Nikkei 225 IndexSingaporeExchange 10/06/2021 UBS AG (15) 1 983 258 (6 086)
87Lumyna Funds
Lumyna – Marshall Wace TOPS (Market Neutral)UCITS FundSchedule of investments as at March 31, 2021 (cont.)
The accompanying notes form an integral part of these financial statements.
Audited annual report
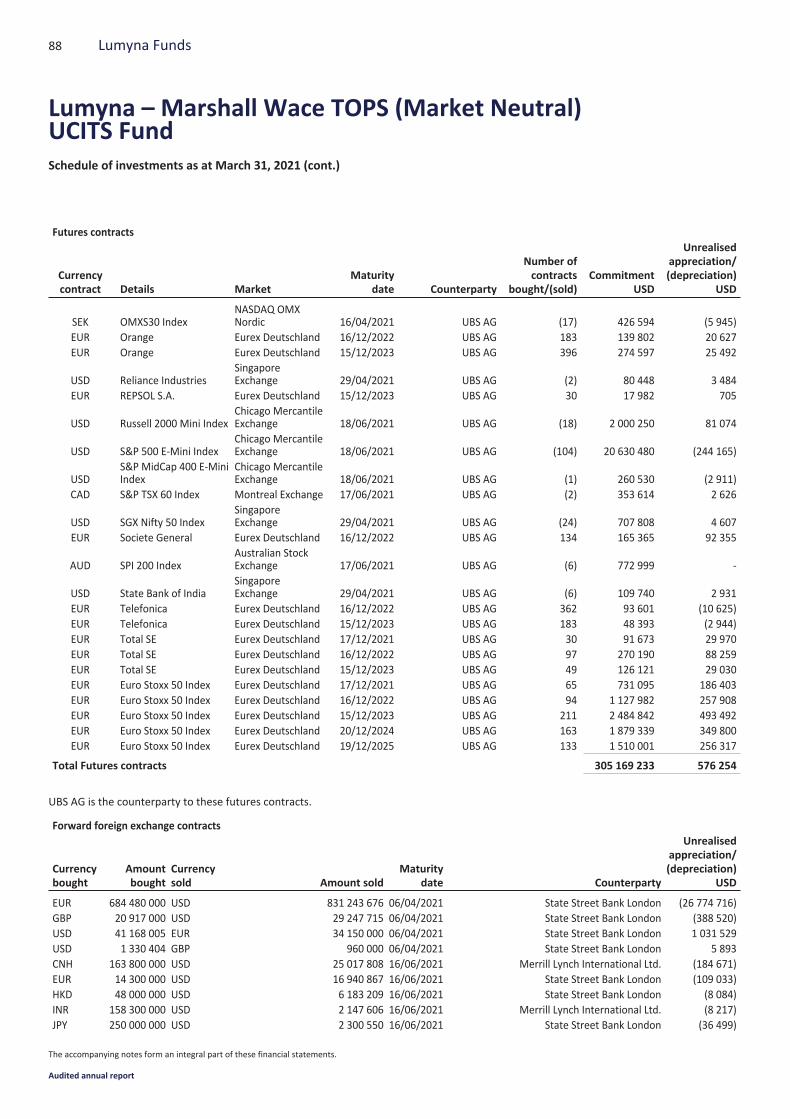
Futures contracts
Currencycontract Details Market
Maturitydate Counterparty
Number ofcontracts
bought/(sold)Commitment
USD
Unrealisedappreciation/(depreciation)
USD
SEK OMXS30 IndexNASDAQ OMXNordic 16/04/2021 UBS AG (17) 426 594 (5 945)
EUR Orange Eurex Deutschland 16/12/2022 UBS AG 183 139 802 20 627EUR Orange Eurex Deutschland 15/12/2023 UBS AG 396 274 597 25 492
USD Reliance IndustriesSingaporeExchange 29/04/2021 UBS AG (2) 80 448 3 484
EUR REPSOL S.A. Eurex Deutschland 15/12/2023 UBS AG 30 17 982 705
USD Russell 2000 Mini IndexChicago MercantileExchange 18/06/2021 UBS AG (18) 2 000 250 81 074
USD S&P 500 E-Mini IndexChicago MercantileExchange 18/06/2021 UBS AG (104) 20 630 480 (244 165)
USDS&P MidCap 400 E-MiniIndex
Chicago MercantileExchange 18/06/2021 UBS AG (1) 260 530 (2 911)
CAD S&P TSX 60 Index Montreal Exchange 17/06/2021 UBS AG (2) 353 614 2 626
USD SGX Nifty 50 IndexSingaporeExchange 29/04/2021 UBS AG (24) 707 808 4 607
EUR Societe General Eurex Deutschland 16/12/2022 UBS AG 134 165 365 92 355
AUD SPI 200 IndexAustralian StockExchange 17/06/2021 UBS AG (6) 772 999 -
USD State Bank of IndiaSingaporeExchange 29/04/2021 UBS AG (6) 109 740 2 931
EUR Telefonica Eurex Deutschland 16/12/2022 UBS AG 362 93 601 (10 625)EUR Telefonica Eurex Deutschland 15/12/2023 UBS AG 183 48 393 (2 944)EUR Total SE Eurex Deutschland 17/12/2021 UBS AG 30 91 673 29 970EUR Total SE Eurex Deutschland 16/12/2022 UBS AG 97 270 190 88 259EUR Total SE Eurex Deutschland 15/12/2023 UBS AG 49 126 121 29 030EUR Euro Stoxx 50 Index Eurex Deutschland 17/12/2021 UBS AG 65 731 095 186 403EUR Euro Stoxx 50 Index Eurex Deutschland 16/12/2022 UBS AG 94 1 127 982 257 908EUR Euro Stoxx 50 Index Eurex Deutschland 15/12/2023 UBS AG 211 2 484 842 493 492EUR Euro Stoxx 50 Index Eurex Deutschland 20/12/2024 UBS AG 163 1 879 339 349 800EUR Euro Stoxx 50 Index Eurex Deutschland 19/12/2025 UBS AG 133 1 510 001 256 317
Total Futures contracts 305 169 233 576 254
UBS AG is the counterparty to these futures contracts.
Forward foreign exchange contracts
Currencybought
Amountbought
Currencysold Amount sold
Maturitydate Counterparty
Unrealisedappreciation/(depreciation)
USD
EUR 684 480 000 USD 831 243 676 06/04/2021 State Street Bank London (26 774 716)GBP 20 917 000 USD 29 247 715 06/04/2021 State Street Bank London (388 520)USD 41 168 005 EUR 34 150 000 06/04/2021 State Street Bank London 1 031 529USD 1 330 404 GBP 960 000 06/04/2021 State Street Bank London 5 893CNH 163 800 000 USD 25 017 808 16/06/2021 Merrill Lynch International Ltd. (184 671)EUR 14 300 000 USD 16 940 867 16/06/2021 State Street Bank London (109 033)HKD 48 000 000 USD 6 183 209 16/06/2021 State Street Bank London (8 084)INR 158 300 000 USD 2 147 606 16/06/2021 Merrill Lynch International Ltd. (8 217)JPY 250 000 000 USD 2 300 550 16/06/2021 State Street Bank London (36 499)
88 Lumyna Funds
Lumyna – Marshall Wace TOPS (Market Neutral)UCITS FundSchedule of investments as at March 31, 2021 (cont.)
The accompanying notes form an integral part of these financial statements.
Audited annual report
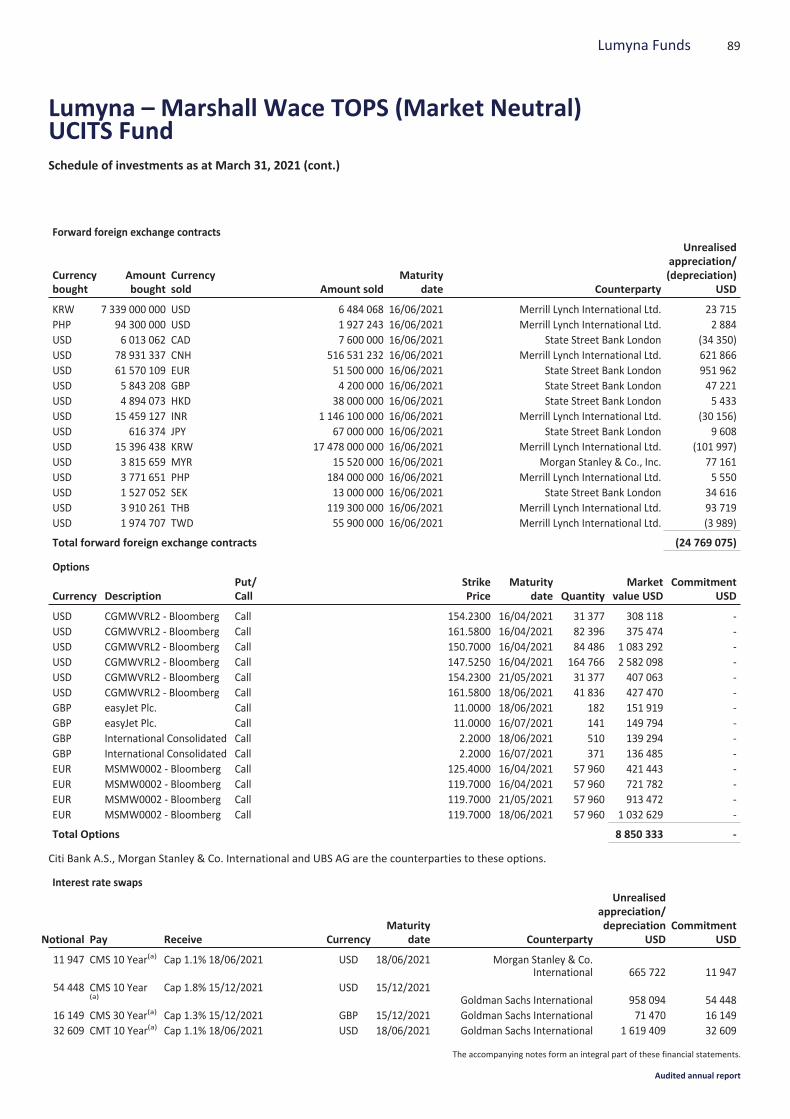
Forward foreign exchange contracts
Currencybought
Amountbought
Currencysold Amount sold
Maturitydate Counterparty
Unrealisedappreciation/(depreciation)
USD
KRW 7 339 000 000 USD 6 484 068 16/06/2021 Merrill Lynch International Ltd. 23 715PHP 94 300 000 USD 1 927 243 16/06/2021 Merrill Lynch International Ltd. 2 884USD 6 013 062 CAD 7 600 000 16/06/2021 State Street Bank London (34 350)USD 78 931 337 CNH 516 531 232 16/06/2021 Merrill Lynch International Ltd. 621 866USD 61 570 109 EUR 51 500 000 16/06/2021 State Street Bank London 951 962USD 5 843 208 GBP 4 200 000 16/06/2021 State Street Bank London 47 221USD 4 894 073 HKD 38 000 000 16/06/2021 State Street Bank London 5 433USD 15 459 127 INR 1 146 100 000 16/06/2021 Merrill Lynch International Ltd. (30 156)USD 616 374 JPY 67 000 000 16/06/2021 State Street Bank London 9 608USD 15 396 438 KRW 17 478 000 000 16/06/2021 Merrill Lynch International Ltd. (101 997)USD 3 815 659 MYR 15 520 000 16/06/2021 Morgan Stanley & Co., Inc. 77 161USD 3 771 651 PHP 184 000 000 16/06/2021 Merrill Lynch International Ltd. 5 550USD 1 527 052 SEK 13 000 000 16/06/2021 State Street Bank London 34 616USD 3 910 261 THB 119 300 000 16/06/2021 Merrill Lynch International Ltd. 93 719USD 1 974 707 TWD 55 900 000 16/06/2021 Merrill Lynch International Ltd. (3 989)
Total forward foreign exchange contracts (24 769 075)
Options
Currency DescriptionPut/Call
StrikePrice
Maturitydate Quantity
Marketvalue USD
CommitmentUSD
USD CGMWVRL2 - Bloomberg Call 154.2300 16/04/2021 31 377 308 118 -USD CGMWVRL2 - Bloomberg Call 161.5800 16/04/2021 82 396 375 474 -USD CGMWVRL2 - Bloomberg Call 150.7000 16/04/2021 84 486 1 083 292 -USD CGMWVRL2 - Bloomberg Call 147.5250 16/04/2021 164 766 2 582 098 -USD CGMWVRL2 - Bloomberg Call 154.2300 21/05/2021 31 377 407 063 -USD CGMWVRL2 - Bloomberg Call 161.5800 18/06/2021 41 836 427 470 -GBP easyJet Plc. Call 11.0000 18/06/2021 182 151 919 -GBP easyJet Plc. Call 11.0000 16/07/2021 141 149 794 -GBP International Consolidated Call 2.2000 18/06/2021 510 139 294 -GBP International Consolidated Call 2.2000 16/07/2021 371 136 485 -EUR MSMW0002 - Bloomberg Call 125.4000 16/04/2021 57 960 421 443 -EUR MSMW0002 - Bloomberg Call 119.7000 16/04/2021 57 960 721 782 -EUR MSMW0002 - Bloomberg Call 119.7000 21/05/2021 57 960 913 472 -EUR MSMW0002 - Bloomberg Call 119.7000 18/06/2021 57 960 1 032 629 -
Total Options 8 850 333 -
Citi Bank A.S., Morgan Stanley & Co. International and UBS AG are the counterparties to these options.
Interest rate swaps
Notional Pay Receive CurrencyMaturity
date Counterparty
Unrealisedappreciation/depreciation
USDCommitment
USD
11 947 CMS 10 Year(a) Cap 1.1% 18/06/2021 USD 18/06/2021 Morgan Stanley & Co.International 665 722 11 947
54 448 CMS 10 Year(a)
Cap 1.8% 15/12/2021 USD 15/12/2021Goldman Sachs International 958 094 54 448
16 149 CMS 30 Year(a) Cap 1.3% 15/12/2021 GBP 15/12/2021 Goldman Sachs International 71 470 16 14932 609 CMT 10 Year(a) Cap 1.1% 18/06/2021 USD 18/06/2021 Goldman Sachs International 1 619 409 32 609
89Lumyna Funds
Lumyna – Marshall Wace TOPS (Market Neutral)UCITS FundSchedule of investments as at March 31, 2021 (cont.)
The accompanying notes form an integral part of these financial statements.
Audited annual report

Interest rate swaps
Notional Pay Receive CurrencyMaturity
date Counterparty
Unrealisedappreciation/depreciation
USDCommitment
USD
14 407 CMT 10 Year(a) Cap 1.2% 17/09/2021 USD 17/09/2021 Goldman Sachs International 696 056 14 4078 376 CMT 10 Year(a) Cap 1.2% 17/09/2021 USD 17/09/2021 Goldman Sachs International 476 095 8 376
Total Interest rate swaps 4 486 846 137 936(a) These securities are fair valued. See Notes 2.2.6 and 10.
Contracts for difference
Counterparty Industrial sectorUnderlyingnature Long/Short
CommitmentUSD
Unrealisedappreciation/(depreciation)
USD
Barclays Bank Plc. Advertising Equity Long 449 357 (37 298)Barclays Bank Plc. Advertising Equity Short 28 167 (2 466)Barclays Bank Plc. Aerospace/Defense Equity Long 136 782 (2 638)Barclays Bank Plc. Aerospace/Defense Equity Short 1 487 575 (108 577)Barclays Bank Plc. Agriculture Equity Long 556 909 52 890Barclays Bank Plc. Airlines Equity Long 10 044 960 2 084 129Barclays Bank Plc. Apparel Equity Long 10 124 024 912 738Barclays Bank Plc. Apparel Equity Short 1 854 282 (493 712)Barclays Bank Plc. Auto Manufacturers Equity Long 14 709 969 1 551 691Barclays Bank Plc. Auto Manufacturers Equity Short 1 780 187 (193 453)Barclays Bank Plc. Auto Parts & Equipment Equity Long 324 955 (804)Barclays Bank Plc. Auto Parts & Equipment Equity Short 311 300 (46 536)Barclays Bank Plc. Banks Equity Long 1 417 209 6 958Barclays Bank Plc. Banks Equity Short 3 409 721 (196 344)Barclays Bank Plc. Beverages Equity Long 272 522 (4 609)Barclays Bank Plc. Beverages Equity Short 845 246 12 396Barclays Bank Plc. Biotechnology Equity Long 25 716 (3 490)Barclays Bank Plc. Biotechnology Equity Short 1 052 175 99 931Barclays Bank Plc. Building Materials Equity Long 7 683 363 363 553Barclays Bank Plc. Building Materials Equity Short 1 310 162 (238 851)Barclays Bank Plc. Chemicals Equity Long 165 801 (7 790)Barclays Bank Plc. Chemicals Equity Short 669 437 (24 853)Barclays Bank Plc. Commercial Services Equity Long 4 787 618 (201 324)Barclays Bank Plc. Commercial Services Equity Short 708 710 (78 470)Barclays Bank Plc. Cosmetics/Personal Care Equity Long 89 921 2 231Barclays Bank Plc. Diversified Financial
ServicesEquity Long 1 190 847 (131 064)
Barclays Bank Plc. Diversified FinancialServices
Equity Short 635 300 86
Barclays Bank Plc. Electric Equity Long 7 191 145 904 495Barclays Bank Plc. Electric Equity Short 1 440 912 49 652Barclays Bank Plc. Electrical Components &
EquipmentEquity Long 2 056 199 62 425
Barclays Bank Plc. Electrical Components &Equipment
Equity Short 210 049 69 081
Barclays Bank Plc. Electronics Equity Long 36 262 1 390Barclays Bank Plc. Energy-Alternate Sources Equity Short 1 031 600 (74 056)
90 Lumyna Funds
Lumyna – Marshall Wace TOPS (Market Neutral)UCITS FundSchedule of investments as at March 31, 2021 (cont.)
The accompanying notes form an integral part of these financial statements.
Audited annual report
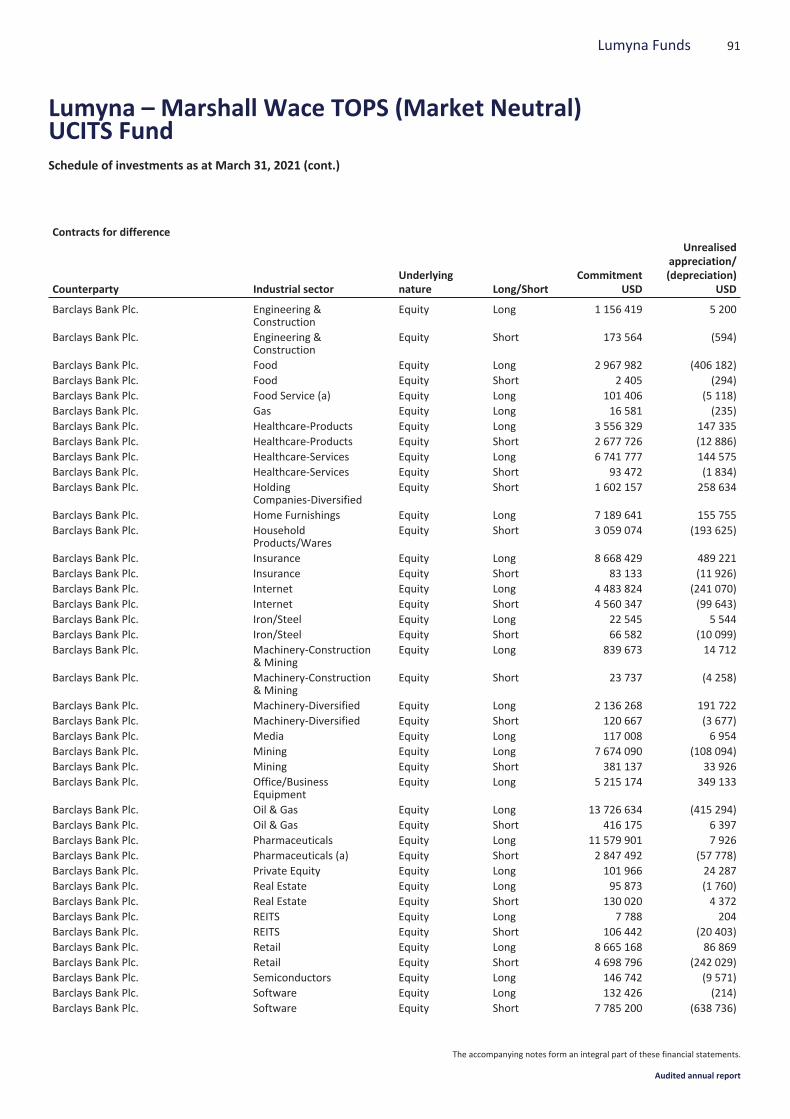
Contracts for difference
Counterparty Industrial sectorUnderlyingnature Long/Short
CommitmentUSD
Unrealisedappreciation/(depreciation)
USD
Barclays Bank Plc. Engineering &Construction
Equity Long 1 156 419 5 200
Barclays Bank Plc. Engineering &Construction
Equity Short 173 564 (594)
Barclays Bank Plc. Food Equity Long 2 967 982 (406 182)Barclays Bank Plc. Food Equity Short 2 405 (294)Barclays Bank Plc. Food Service (a) Equity Long 101 406 (5 118)Barclays Bank Plc. Gas Equity Long 16 581 (235)Barclays Bank Plc. Healthcare-Products Equity Long 3 556 329 147 335Barclays Bank Plc. Healthcare-Products Equity Short 2 677 726 (12 886)Barclays Bank Plc. Healthcare-Services Equity Long 6 741 777 144 575Barclays Bank Plc. Healthcare-Services Equity Short 93 472 (1 834)Barclays Bank Plc. Holding
Companies-DiversifiedEquity Short 1 602 157 258 634
Barclays Bank Plc. Home Furnishings Equity Long 7 189 641 155 755Barclays Bank Plc. Household
Products/WaresEquity Short 3 059 074 (193 625)
Barclays Bank Plc. Insurance Equity Long 8 668 429 489 221Barclays Bank Plc. Insurance Equity Short 83 133 (11 926)Barclays Bank Plc. Internet Equity Long 4 483 824 (241 070)Barclays Bank Plc. Internet Equity Short 4 560 347 (99 643)Barclays Bank Plc. Iron/Steel Equity Long 22 545 5 544Barclays Bank Plc. Iron/Steel Equity Short 66 582 (10 099)Barclays Bank Plc. Machinery-Construction
& MiningEquity Long 839 673 14 712
Barclays Bank Plc. Machinery-Construction& Mining
Equity Short 23 737 (4 258)
Barclays Bank Plc. Machinery-Diversified Equity Long 2 136 268 191 722Barclays Bank Plc. Machinery-Diversified Equity Short 120 667 (3 677)Barclays Bank Plc. Media Equity Long 117 008 6 954Barclays Bank Plc. Mining Equity Long 7 674 090 (108 094)Barclays Bank Plc. Mining Equity Short 381 137 33 926Barclays Bank Plc. Office/Business
EquipmentEquity Long 5 215 174 349 133
Barclays Bank Plc. Oil & Gas Equity Long 13 726 634 (415 294)Barclays Bank Plc. Oil & Gas Equity Short 416 175 6 397Barclays Bank Plc. Pharmaceuticals Equity Long 11 579 901 7 926Barclays Bank Plc. Pharmaceuticals (a) Equity Short 2 847 492 (57 778)Barclays Bank Plc. Private Equity Equity Long 101 966 24 287Barclays Bank Plc. Real Estate Equity Long 95 873 (1 760)Barclays Bank Plc. Real Estate Equity Short 130 020 4 372Barclays Bank Plc. REITS Equity Long 7 788 204Barclays Bank Plc. REITS Equity Short 106 442 (20 403)Barclays Bank Plc. Retail Equity Long 8 665 168 86 869Barclays Bank Plc. Retail Equity Short 4 698 796 (242 029)Barclays Bank Plc. Semiconductors Equity Long 146 742 (9 571)Barclays Bank Plc. Software Equity Long 132 426 (214)Barclays Bank Plc. Software Equity Short 7 785 200 (638 736)
91Lumyna Funds
Lumyna – Marshall Wace TOPS (Market Neutral)UCITS FundSchedule of investments as at March 31, 2021 (cont.)
The accompanying notes form an integral part of these financial statements.
Audited annual report

Contracts for difference
Counterparty Industrial sectorUnderlyingnature Long/Short
CommitmentUSD
Unrealisedappreciation/(depreciation)
USD
Barclays Bank Plc. Telecommunications Equity Long 1 376 464 13 037Barclays Bank Plc. Telecommunications Equity Short 4 914 933 (261 449)Barclays Bank Plc. Transportation Equity Long 285 131 (1 422)Barclays Bank Plc. Water Equity Long 756 789 88 639Citibank N.A. Advertising Equity Short 130 276 (2 990)Citibank N.A. Aerospace/Defense Equity Short 113 828 4 303Citibank N.A. Agriculture Equity Long 6 107 360 455 384Citibank N.A. Agriculture Equity Short 1 321 144 84 213Citibank N.A. Airlines Equity Short 500 921 (41 798)Citibank N.A. Apparel Equity Long 9 764 787 325 165Citibank N.A. Apparel Equity Short 11 118 899 (113 584)Citibank N.A. Auto Manufacturers Equity Long 2 186 260 819 721Citibank N.A. Auto Manufacturers Equity Short 307 456 20 778Citibank N.A. Auto Parts & Equipment Equity Short 26 940 (1 607)Citibank N.A. Banks Equity Long 13 724 884 1 302 745Citibank N.A. Banks Equity Short 7 272 116 129 802Citibank N.A. Beverages Equity Long 1 377 290 8 560Citibank N.A. Beverages Equity Short 2 186 708 38 489Citibank N.A. Biotechnology Equity Long 1 499 573 28 692Citibank N.A. Biotechnology Equity Short 26 383 1 460Citibank N.A. Building Materials Equity Long 1 317 832 20 760Citibank N.A. Building Materials Equity Short 102 778 (8 770)Citibank N.A. Chemicals Equity Long 3 334 827 (207 506)Citibank N.A. Chemicals Equity Short 4 228 035 (100 101)Citibank N.A. Coal Equity Short 2 328 (186)Citibank N.A. Commercial Services Equity Long 45 218 7 044Citibank N.A. Commercial Services Equity Short 3 379 292 129 212Citibank N.A. Computers Equity Short 2 753 866 19 269Citibank N.A. Cosmetics/Personal Care Equity Short 215 759 (11 738)Citibank N.A. Diversified Financial
ServicesEquity Long 58 235 (529)
Citibank N.A. Diversified FinancialServices
Equity Short 64 468 (5 241)
Citibank N.A. Electric Equity Long 1 336 468 201 843Citibank N.A. Electrical Components &
EquipmentEquity Long 8 148 290 219 026
Citibank N.A. Electrical Components &Equipment
Equity Short 1 404 122 11 733
Citibank N.A. Electronics Equity Long 23 812 1 560Citibank N.A. Electronics Equity Short 585 114 73 465Citibank N.A. Energy-Alternate Sources Equity Long 43 784 28 495Citibank N.A. Energy-Alternate Sources Equity Short 208 840 (15 138)Citibank N.A. Engineering &
ConstructionEquity Long 4 599 274 70 215
Citibank N.A. Engineering &Construction
Equity Short 129 711 (20 260)
Citibank N.A. Entertainment Equity Short 7 845 471 440 129Citibank N.A. Environmental Control Equity Short 73 741 3 252
92 Lumyna Funds
Lumyna – Marshall Wace TOPS (Market Neutral)UCITS FundSchedule of investments as at March 31, 2021 (cont.)
The accompanying notes form an integral part of these financial statements.
Audited annual report

Contracts for difference
Counterparty Industrial sectorUnderlyingnature Long/Short
CommitmentUSD
Unrealisedappreciation/(depreciation)
USD
Citibank N.A. Food Equity Long 77 995 (2 192)Citibank N.A. Food Equity Short 7 128 157 (860 178)Citibank N.A. Food Service Equity Long 28 814 (13 504)Citibank N.A. Future Index Derivatives Short 9 124 506 (20 253)Citibank N.A. Gas Equity Long 128 911 (3 390)Citibank N.A. Healthcare-Products Equity Long 84 401 9 263Citibank N.A. Healthcare-Services Equity Long 56 908 (135)Citibank N.A. Insurance Equity Long 779 511 (75 628)Citibank N.A. Insurance Equity Short 1 702 649 46 812Citibank N.A. Internet Equity Long 25 168 (87)Citibank N.A. Investment Companies Equity Long 20 072 1 233Citibank N.A. Investment Companies Equity Short 121 717 (8 094)Citibank N.A. Iron/Steel Equity Long 1 705 338 612 806Citibank N.A. Iron/Steel Equity Short 2 626 917 (337 349)Citibank N.A. Leisure Time Equity Long 459 159 185 885Citibank N.A. Machinery-Construction
& MiningEquity Long 498 864 14 140
Citibank N.A. Machinery-Construction& Mining
Equity Short 2 223 538 52 424
Citibank N.A. Machinery-Diversified Equity Long 287 481 2 899Citibank N.A. Machinery-Diversified Equity Short 2 397 024 (71 508)Citibank N.A. Media Equity Long 57 402 5 328Citibank N.A. Media Equity Short 873 (176)Citibank N.A. Metal
Fabricate/HardwareEquity Long 315 1
Citibank N.A. Mining Equity Long 1 200 130 (231 432)Citibank N.A. Miscellaneous
ManufacturingEquity Long 309 830 3 501
Citibank N.A. Oil & Gas Equity Long 1 223 077 (91 019)Citibank N.A. Oil & Gas Equity Short 385 033 (12 196)Citibank N.A. Oil & Gas Services Equity Long 456 931 (18 627)Citibank N.A. Oil & Gas Services Equity Short 5 794 (1 084)Citibank N.A. Pharmaceuticals Equity Long 6 722 267Citibank N.A. Pharmaceuticals Equity Short 3 009 884 60 412Citibank N.A. Private Equity Equity Short 2 504 671 (173 791)Citibank N.A. Real Estate Equity Long 1 123 829 36 669Citibank N.A. Real Estate Equity Short 1 391 590 28 180Citibank N.A. REITS Equity Long 356 460 (183)Citibank N.A. REITS Equity Short 26 747 (278)Citibank N.A. Retail Equity Long 370 298 21 880Citibank N.A. Retail Equity Short 4 877 794 (140 652)Citibank N.A. Semiconductors Equity Long 1 157 003 (47 046)Citibank N.A. Semiconductors Equity Short 4 111 601 (307 244)Citibank N.A. Software Equity Long 641 785 5 925Citibank N.A. Software Equity Short 855 357 44 946Citibank N.A. Swap Index - Diversified Derivatives Short 16 639 918 662 085Citibank N.A. Telecommunications Equity Long 59 895 5 380Citibank N.A. Telecommunications Equity Short 11 684 387 (941 718)
93Lumyna Funds
Lumyna – Marshall Wace TOPS (Market Neutral)UCITS FundSchedule of investments as at March 31, 2021 (cont.)
The accompanying notes form an integral part of these financial statements.
Audited annual report
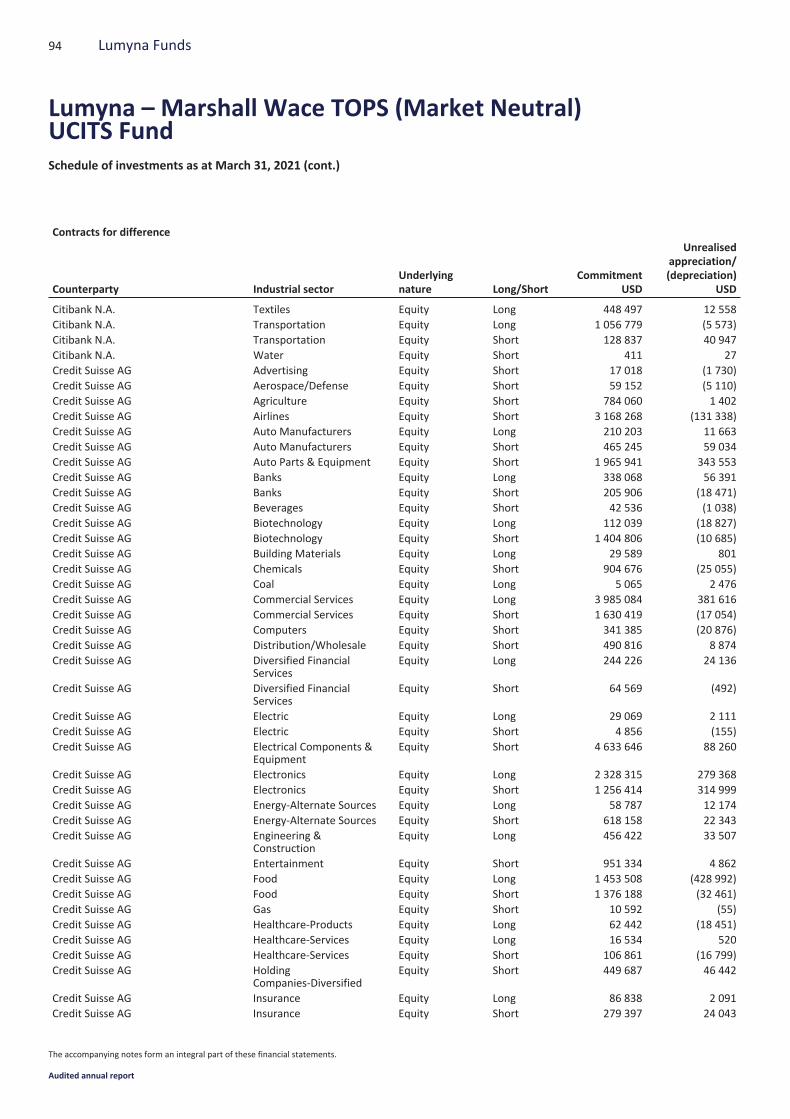
Contracts for difference
Counterparty Industrial sectorUnderlyingnature Long/Short
CommitmentUSD
Unrealisedappreciation/(depreciation)
USD
Citibank N.A. Textiles Equity Long 448 497 12 558Citibank N.A. Transportation Equity Long 1 056 779 (5 573)Citibank N.A. Transportation Equity Short 128 837 40 947Citibank N.A. Water Equity Short 411 27Credit Suisse AG Advertising Equity Short 17 018 (1 730)Credit Suisse AG Aerospace/Defense Equity Short 59 152 (5 110)Credit Suisse AG Agriculture Equity Short 784 060 1 402Credit Suisse AG Airlines Equity Short 3 168 268 (131 338)Credit Suisse AG Auto Manufacturers Equity Long 210 203 11 663Credit Suisse AG Auto Manufacturers Equity Short 465 245 59 034Credit Suisse AG Auto Parts & Equipment Equity Short 1 965 941 343 553Credit Suisse AG Banks Equity Long 338 068 56 391Credit Suisse AG Banks Equity Short 205 906 (18 471)Credit Suisse AG Beverages Equity Short 42 536 (1 038)Credit Suisse AG Biotechnology Equity Long 112 039 (18 827)Credit Suisse AG Biotechnology Equity Short 1 404 806 (10 685)Credit Suisse AG Building Materials Equity Long 29 589 801Credit Suisse AG Chemicals Equity Short 904 676 (25 055)Credit Suisse AG Coal Equity Long 5 065 2 476Credit Suisse AG Commercial Services Equity Long 3 985 084 381 616Credit Suisse AG Commercial Services Equity Short 1 630 419 (17 054)Credit Suisse AG Computers Equity Short 341 385 (20 876)Credit Suisse AG Distribution/Wholesale Equity Short 490 816 8 874Credit Suisse AG Diversified Financial
ServicesEquity Long 244 226 24 136
Credit Suisse AG Diversified FinancialServices
Equity Short 64 569 (492)
Credit Suisse AG Electric Equity Long 29 069 2 111Credit Suisse AG Electric Equity Short 4 856 (155)Credit Suisse AG Electrical Components &
EquipmentEquity Short 4 633 646 88 260
Credit Suisse AG Electronics Equity Long 2 328 315 279 368Credit Suisse AG Electronics Equity Short 1 256 414 314 999Credit Suisse AG Energy-Alternate Sources Equity Long 58 787 12 174Credit Suisse AG Energy-Alternate Sources Equity Short 618 158 22 343Credit Suisse AG Engineering &
ConstructionEquity Long 456 422 33 507
Credit Suisse AG Entertainment Equity Short 951 334 4 862Credit Suisse AG Food Equity Long 1 453 508 (428 992)Credit Suisse AG Food Equity Short 1 376 188 (32 461)Credit Suisse AG Gas Equity Short 10 592 (55)Credit Suisse AG Healthcare-Products Equity Long 62 442 (18 451)Credit Suisse AG Healthcare-Services Equity Long 16 534 520Credit Suisse AG Healthcare-Services Equity Short 106 861 (16 799)Credit Suisse AG Holding
Companies-DiversifiedEquity Short 449 687 46 442
Credit Suisse AG Insurance Equity Long 86 838 2 091Credit Suisse AG Insurance Equity Short 279 397 24 043
94 Lumyna Funds
Lumyna – Marshall Wace TOPS (Market Neutral)UCITS FundSchedule of investments as at March 31, 2021 (cont.)
The accompanying notes form an integral part of these financial statements.
Audited annual report
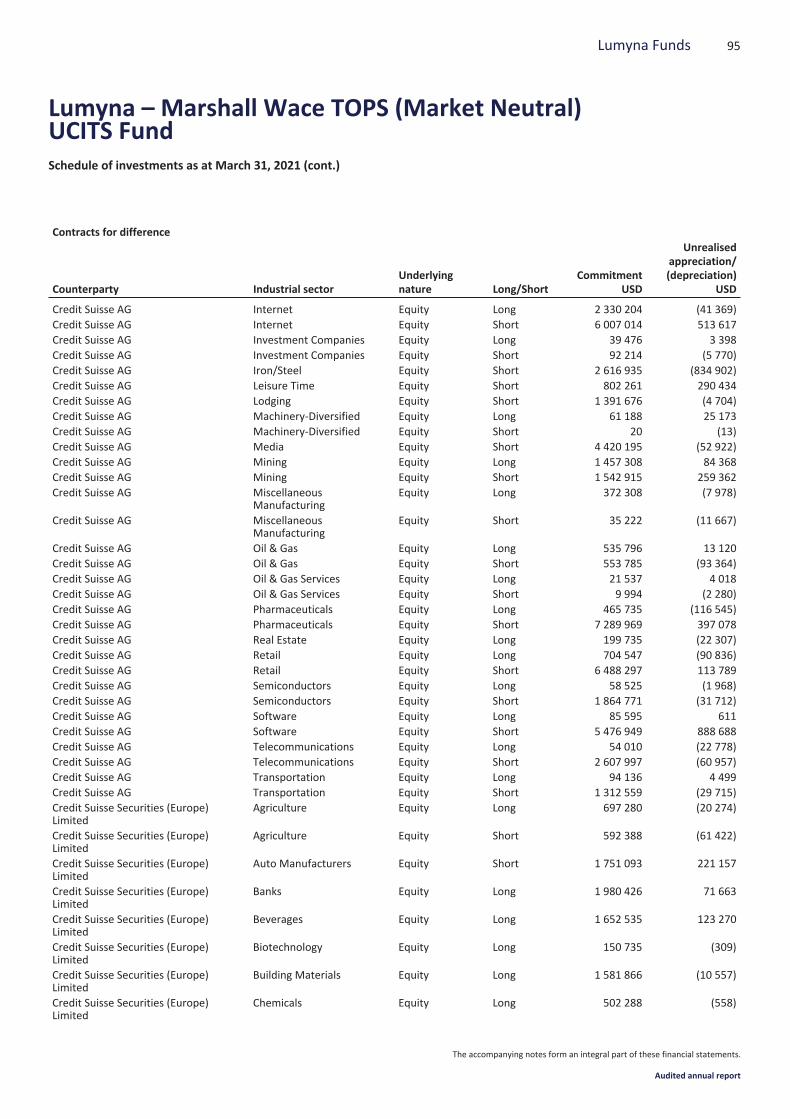
Contracts for difference
Counterparty Industrial sectorUnderlyingnature Long/Short
CommitmentUSD
Unrealisedappreciation/(depreciation)
USD
Credit Suisse AG Internet Equity Long 2 330 204 (41 369)Credit Suisse AG Internet Equity Short 6 007 014 513 617Credit Suisse AG Investment Companies Equity Long 39 476 3 398Credit Suisse AG Investment Companies Equity Short 92 214 (5 770)Credit Suisse AG Iron/Steel Equity Short 2 616 935 (834 902)Credit Suisse AG Leisure Time Equity Short 802 261 290 434Credit Suisse AG Lodging Equity Short 1 391 676 (4 704)Credit Suisse AG Machinery-Diversified Equity Long 61 188 25 173Credit Suisse AG Machinery-Diversified Equity Short 20 (13)Credit Suisse AG Media Equity Short 4 420 195 (52 922)Credit Suisse AG Mining Equity Long 1 457 308 84 368Credit Suisse AG Mining Equity Short 1 542 915 259 362Credit Suisse AG Miscellaneous
ManufacturingEquity Long 372 308 (7 978)
Credit Suisse AG MiscellaneousManufacturing
Equity Short 35 222 (11 667)
Credit Suisse AG Oil & Gas Equity Long 535 796 13 120Credit Suisse AG Oil & Gas Equity Short 553 785 (93 364)Credit Suisse AG Oil & Gas Services Equity Long 21 537 4 018Credit Suisse AG Oil & Gas Services Equity Short 9 994 (2 280)Credit Suisse AG Pharmaceuticals Equity Long 465 735 (116 545)Credit Suisse AG Pharmaceuticals Equity Short 7 289 969 397 078Credit Suisse AG Real Estate Equity Long 199 735 (22 307)Credit Suisse AG Retail Equity Long 704 547 (90 836)Credit Suisse AG Retail Equity Short 6 488 297 113 789Credit Suisse AG Semiconductors Equity Long 58 525 (1 968)Credit Suisse AG Semiconductors Equity Short 1 864 771 (31 712)Credit Suisse AG Software Equity Long 85 595 611Credit Suisse AG Software Equity Short 5 476 949 888 688Credit Suisse AG Telecommunications Equity Long 54 010 (22 778)Credit Suisse AG Telecommunications Equity Short 2 607 997 (60 957)Credit Suisse AG Transportation Equity Long 94 136 4 499Credit Suisse AG Transportation Equity Short 1 312 559 (29 715)Credit Suisse Securities (Europe)Limited
Agriculture Equity Long 697 280 (20 274)
Credit Suisse Securities (Europe)Limited
Agriculture Equity Short 592 388 (61 422)
Credit Suisse Securities (Europe)Limited
Auto Manufacturers Equity Short 1 751 093 221 157
Credit Suisse Securities (Europe)Limited
Banks Equity Long 1 980 426 71 663
Credit Suisse Securities (Europe)Limited
Beverages Equity Long 1 652 535 123 270
Credit Suisse Securities (Europe)Limited
Biotechnology Equity Long 150 735 (309)
Credit Suisse Securities (Europe)Limited
Building Materials Equity Long 1 581 866 (10 557)
Credit Suisse Securities (Europe)Limited
Chemicals Equity Long 502 288 (558)
95Lumyna Funds
Lumyna – Marshall Wace TOPS (Market Neutral)UCITS FundSchedule of investments as at March 31, 2021 (cont.)
The accompanying notes form an integral part of these financial statements.
Audited annual report
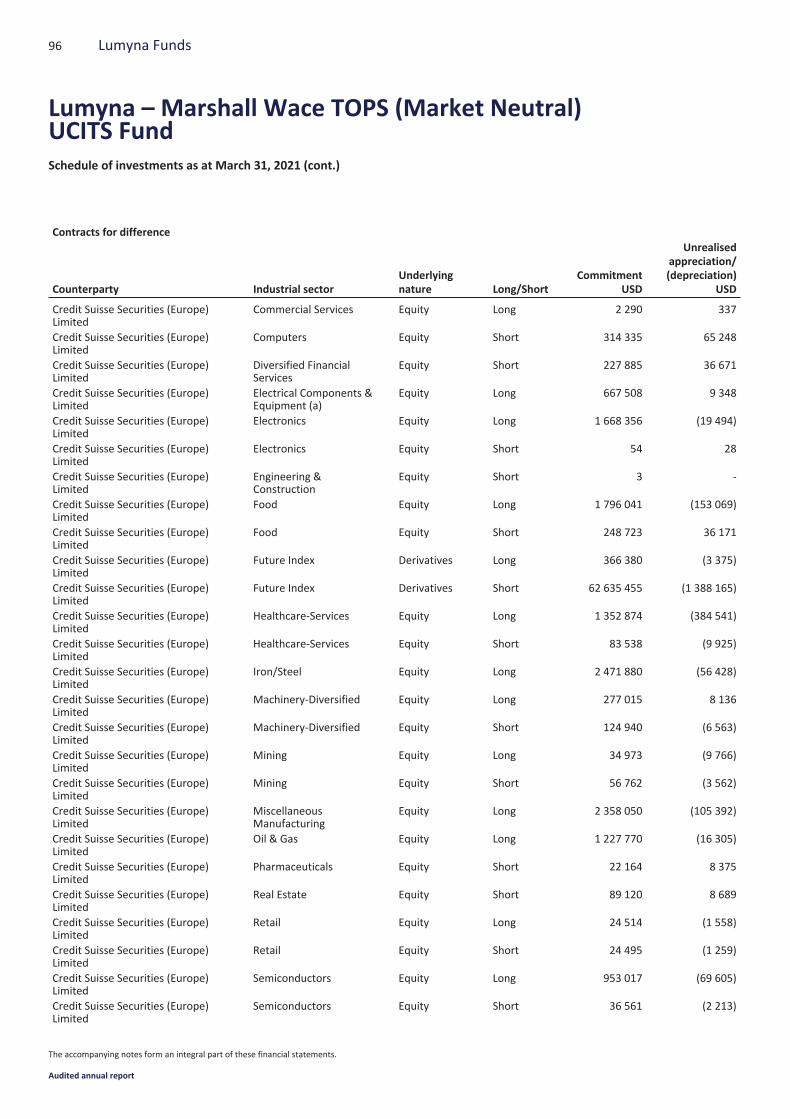
Contracts for difference
Counterparty Industrial sectorUnderlyingnature Long/Short
CommitmentUSD
Unrealisedappreciation/(depreciation)
USD
Credit Suisse Securities (Europe)Limited
Commercial Services Equity Long 2 290 337
Credit Suisse Securities (Europe)Limited
Computers Equity Short 314 335 65 248
Credit Suisse Securities (Europe)Limited
Diversified FinancialServices
Equity Short 227 885 36 671
Credit Suisse Securities (Europe)Limited
Electrical Components &Equipment (a)
Equity Long 667 508 9 348
Credit Suisse Securities (Europe)Limited
Electronics Equity Long 1 668 356 (19 494)
Credit Suisse Securities (Europe)Limited
Electronics Equity Short 54 28
Credit Suisse Securities (Europe)Limited
Engineering &Construction
Equity Short 3 -
Credit Suisse Securities (Europe)Limited
Food Equity Long 1 796 041 (153 069)
Credit Suisse Securities (Europe)Limited
Food Equity Short 248 723 36 171
Credit Suisse Securities (Europe)Limited
Future Index Derivatives Long 366 380 (3 375)
Credit Suisse Securities (Europe)Limited
Future Index Derivatives Short 62 635 455 (1 388 165)
Credit Suisse Securities (Europe)Limited
Healthcare-Services Equity Long 1 352 874 (384 541)
Credit Suisse Securities (Europe)Limited
Healthcare-Services Equity Short 83 538 (9 925)
Credit Suisse Securities (Europe)Limited
Iron/Steel Equity Long 2 471 880 (56 428)
Credit Suisse Securities (Europe)Limited
Machinery-Diversified Equity Long 277 015 8 136
Credit Suisse Securities (Europe)Limited
Machinery-Diversified Equity Short 124 940 (6 563)
Credit Suisse Securities (Europe)Limited
Mining Equity Long 34 973 (9 766)
Credit Suisse Securities (Europe)Limited
Mining Equity Short 56 762 (3 562)
Credit Suisse Securities (Europe)Limited
MiscellaneousManufacturing
Equity Long 2 358 050 (105 392)
Credit Suisse Securities (Europe)Limited
Oil & Gas Equity Long 1 227 770 (16 305)
Credit Suisse Securities (Europe)Limited
Pharmaceuticals Equity Short 22 164 8 375
Credit Suisse Securities (Europe)Limited
Real Estate Equity Short 89 120 8 689
Credit Suisse Securities (Europe)Limited
Retail Equity Long 24 514 (1 558)
Credit Suisse Securities (Europe)Limited
Retail Equity Short 24 495 (1 259)
Credit Suisse Securities (Europe)Limited
Semiconductors Equity Long 953 017 (69 605)
Credit Suisse Securities (Europe)Limited
Semiconductors Equity Short 36 561 (2 213)
96 Lumyna Funds
Lumyna – Marshall Wace TOPS (Market Neutral)UCITS FundSchedule of investments as at March 31, 2021 (cont.)
The accompanying notes form an integral part of these financial statements.
Audited annual report
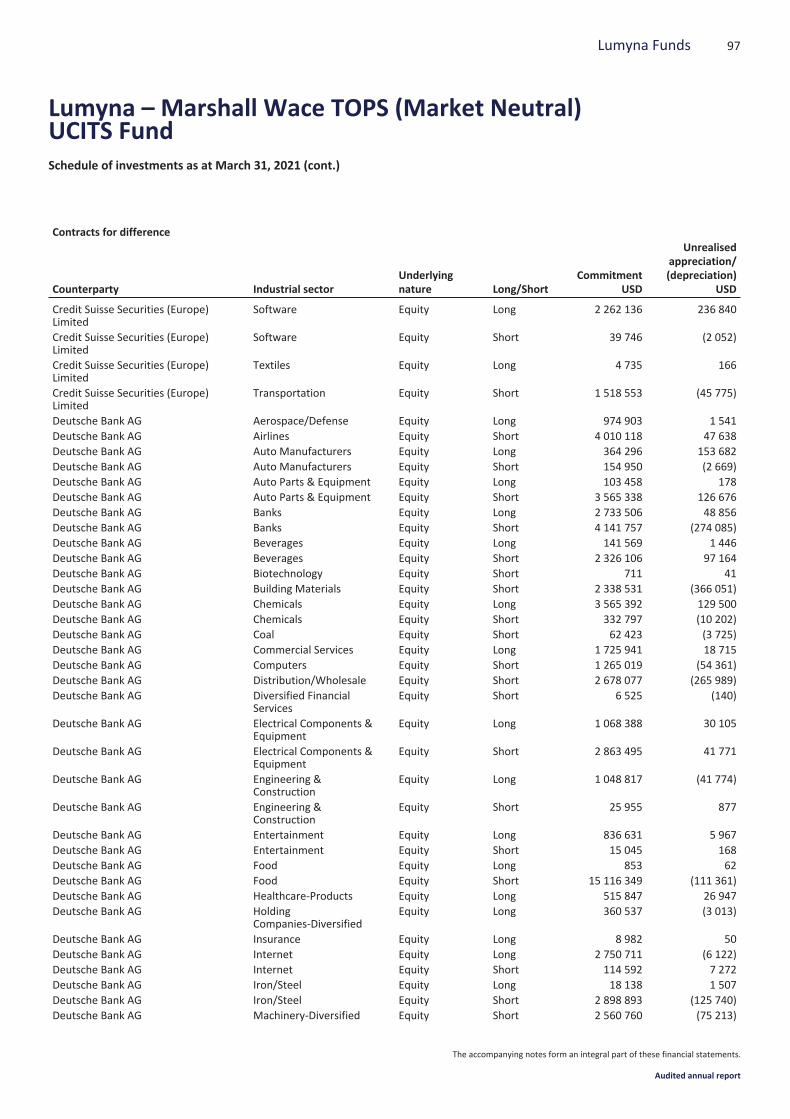
Contracts for difference
Counterparty Industrial sectorUnderlyingnature Long/Short
CommitmentUSD
Unrealisedappreciation/(depreciation)
USD
Credit Suisse Securities (Europe)Limited
Software Equity Long 2 262 136 236 840
Credit Suisse Securities (Europe)Limited
Software Equity Short 39 746 (2 052)
Credit Suisse Securities (Europe)Limited
Textiles Equity Long 4 735 166
Credit Suisse Securities (Europe)Limited
Transportation Equity Short 1 518 553 (45 775)
Deutsche Bank AG Aerospace/Defense Equity Long 974 903 1 541Deutsche Bank AG Airlines Equity Short 4 010 118 47 638Deutsche Bank AG Auto Manufacturers Equity Long 364 296 153 682Deutsche Bank AG Auto Manufacturers Equity Short 154 950 (2 669)Deutsche Bank AG Auto Parts & Equipment Equity Long 103 458 178Deutsche Bank AG Auto Parts & Equipment Equity Short 3 565 338 126 676Deutsche Bank AG Banks Equity Long 2 733 506 48 856Deutsche Bank AG Banks Equity Short 4 141 757 (274 085)Deutsche Bank AG Beverages Equity Long 141 569 1 446Deutsche Bank AG Beverages Equity Short 2 326 106 97 164Deutsche Bank AG Biotechnology Equity Short 711 41Deutsche Bank AG Building Materials Equity Short 2 338 531 (366 051)Deutsche Bank AG Chemicals Equity Long 3 565 392 129 500Deutsche Bank AG Chemicals Equity Short 332 797 (10 202)Deutsche Bank AG Coal Equity Short 62 423 (3 725)Deutsche Bank AG Commercial Services Equity Long 1 725 941 18 715Deutsche Bank AG Computers Equity Short 1 265 019 (54 361)Deutsche Bank AG Distribution/Wholesale Equity Short 2 678 077 (265 989)Deutsche Bank AG Diversified Financial
ServicesEquity Short 6 525 (140)
Deutsche Bank AG Electrical Components &Equipment
Equity Long 1 068 388 30 105
Deutsche Bank AG Electrical Components &Equipment
Equity Short 2 863 495 41 771
Deutsche Bank AG Engineering &Construction
Equity Long 1 048 817 (41 774)
Deutsche Bank AG Engineering &Construction
Equity Short 25 955 877
Deutsche Bank AG Entertainment Equity Long 836 631 5 967Deutsche Bank AG Entertainment Equity Short 15 045 168Deutsche Bank AG Food Equity Long 853 62Deutsche Bank AG Food Equity Short 15 116 349 (111 361)Deutsche Bank AG Healthcare-Products Equity Long 515 847 26 947Deutsche Bank AG Holding
Companies-DiversifiedEquity Long 360 537 (3 013)
Deutsche Bank AG Insurance Equity Long 8 982 50Deutsche Bank AG Internet Equity Long 2 750 711 (6 122)Deutsche Bank AG Internet Equity Short 114 592 7 272Deutsche Bank AG Iron/Steel Equity Long 18 138 1 507Deutsche Bank AG Iron/Steel Equity Short 2 898 893 (125 740)Deutsche Bank AG Machinery-Diversified Equity Short 2 560 760 (75 213)
97Lumyna Funds
Lumyna – Marshall Wace TOPS (Market Neutral)UCITS FundSchedule of investments as at March 31, 2021 (cont.)
The accompanying notes form an integral part of these financial statements.
Audited annual report
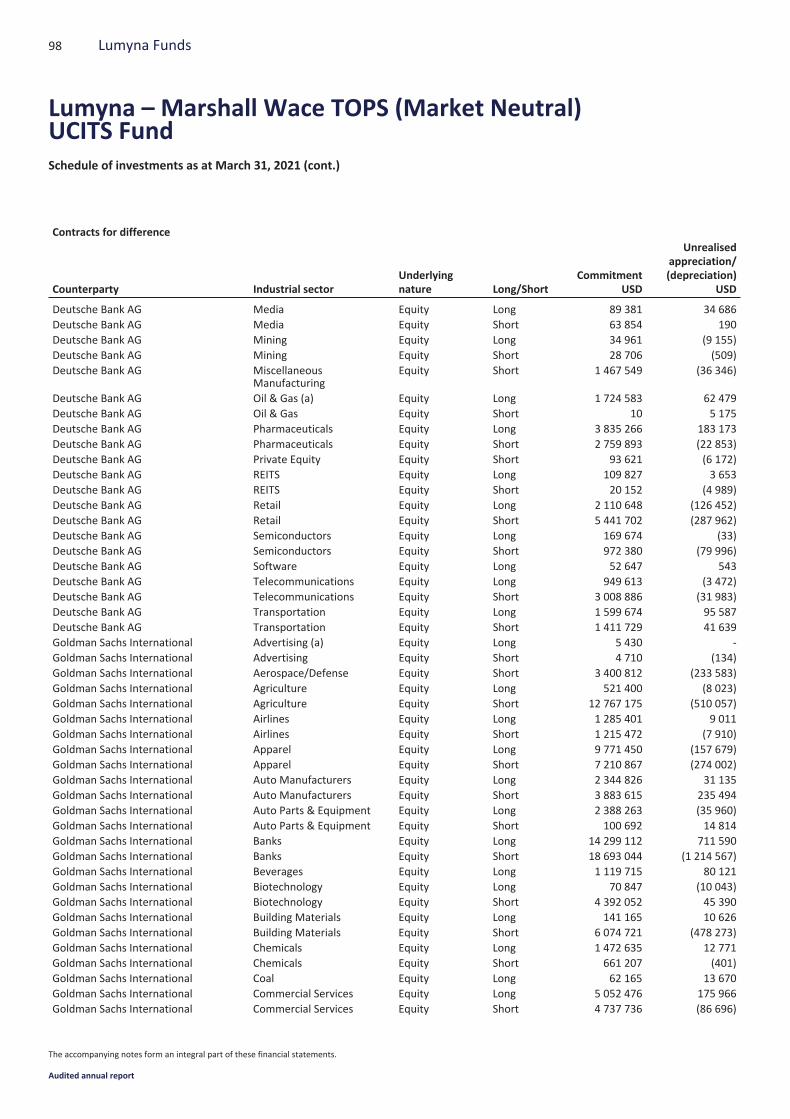
Contracts for difference
Counterparty Industrial sectorUnderlyingnature Long/Short
CommitmentUSD
Unrealisedappreciation/(depreciation)
USD
Deutsche Bank AG Media Equity Long 89 381 34 686Deutsche Bank AG Media Equity Short 63 854 190Deutsche Bank AG Mining Equity Long 34 961 (9 155)Deutsche Bank AG Mining Equity Short 28 706 (509)Deutsche Bank AG Miscellaneous
ManufacturingEquity Short 1 467 549 (36 346)
Deutsche Bank AG Oil & Gas (a) Equity Long 1 724 583 62 479Deutsche Bank AG Oil & Gas Equity Short 10 5 175Deutsche Bank AG Pharmaceuticals Equity Long 3 835 266 183 173Deutsche Bank AG Pharmaceuticals Equity Short 2 759 893 (22 853)Deutsche Bank AG Private Equity Equity Short 93 621 (6 172)Deutsche Bank AG REITS Equity Long 109 827 3 653Deutsche Bank AG REITS Equity Short 20 152 (4 989)Deutsche Bank AG Retail Equity Long 2 110 648 (126 452)Deutsche Bank AG Retail Equity Short 5 441 702 (287 962)Deutsche Bank AG Semiconductors Equity Long 169 674 (33)Deutsche Bank AG Semiconductors Equity Short 972 380 (79 996)Deutsche Bank AG Software Equity Long 52 647 543Deutsche Bank AG Telecommunications Equity Long 949 613 (3 472)Deutsche Bank AG Telecommunications Equity Short 3 008 886 (31 983)Deutsche Bank AG Transportation Equity Long 1 599 674 95 587Deutsche Bank AG Transportation Equity Short 1 411 729 41 639Goldman Sachs International Advertising (a) Equity Long 5 430 -Goldman Sachs International Advertising Equity Short 4 710 (134)Goldman Sachs International Aerospace/Defense Equity Short 3 400 812 (233 583)Goldman Sachs International Agriculture Equity Long 521 400 (8 023)Goldman Sachs International Agriculture Equity Short 12 767 175 (510 057)Goldman Sachs International Airlines Equity Long 1 285 401 9 011Goldman Sachs International Airlines Equity Short 1 215 472 (7 910)Goldman Sachs International Apparel Equity Long 9 771 450 (157 679)Goldman Sachs International Apparel Equity Short 7 210 867 (274 002)Goldman Sachs International Auto Manufacturers Equity Long 2 344 826 31 135Goldman Sachs International Auto Manufacturers Equity Short 3 883 615 235 494Goldman Sachs International Auto Parts & Equipment Equity Long 2 388 263 (35 960)Goldman Sachs International Auto Parts & Equipment Equity Short 100 692 14 814Goldman Sachs International Banks Equity Long 14 299 112 711 590Goldman Sachs International Banks Equity Short 18 693 044 (1 214 567)Goldman Sachs International Beverages Equity Long 1 119 715 80 121Goldman Sachs International Biotechnology Equity Long 70 847 (10 043)Goldman Sachs International Biotechnology Equity Short 4 392 052 45 390Goldman Sachs International Building Materials Equity Long 141 165 10 626Goldman Sachs International Building Materials Equity Short 6 074 721 (478 273)Goldman Sachs International Chemicals Equity Long 1 472 635 12 771Goldman Sachs International Chemicals Equity Short 661 207 (401)Goldman Sachs International Coal Equity Long 62 165 13 670Goldman Sachs International Commercial Services Equity Long 5 052 476 175 966Goldman Sachs International Commercial Services Equity Short 4 737 736 (86 696)
98 Lumyna Funds
Lumyna – Marshall Wace TOPS (Market Neutral)UCITS FundSchedule of investments as at March 31, 2021 (cont.)
The accompanying notes form an integral part of these financial statements.
Audited annual report
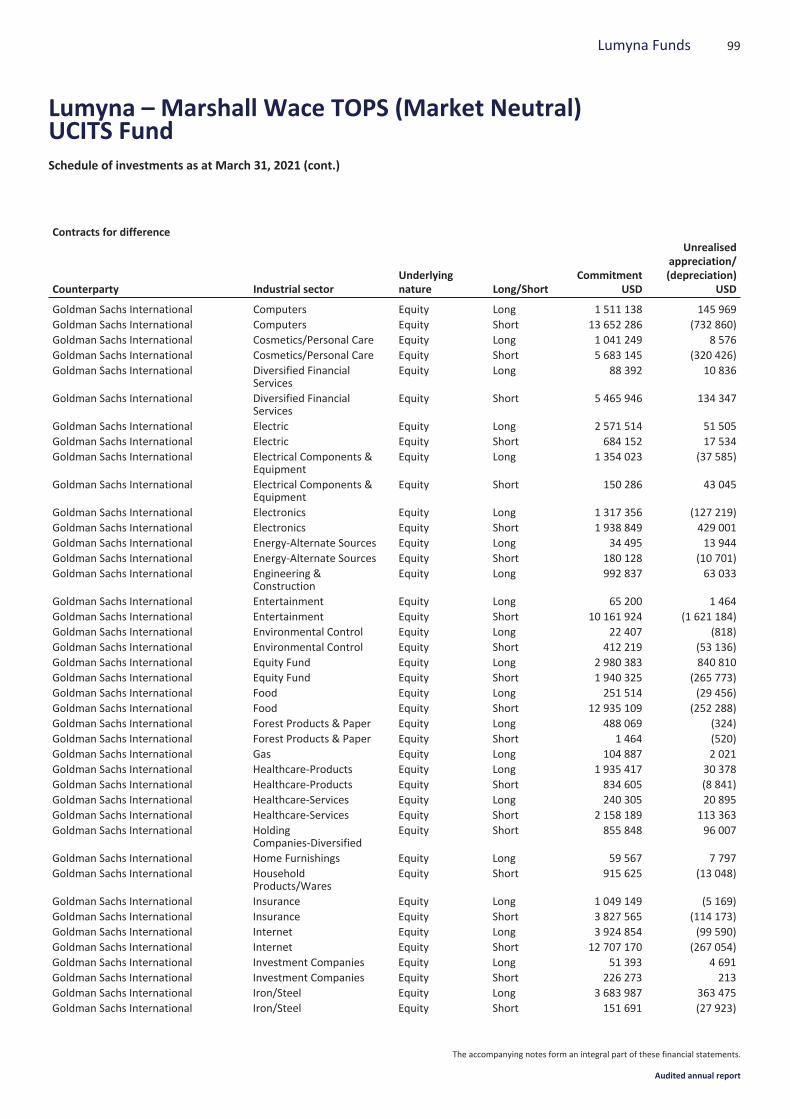
Contracts for difference
Counterparty Industrial sectorUnderlyingnature Long/Short
CommitmentUSD
Unrealisedappreciation/(depreciation)
USD
Goldman Sachs International Computers Equity Long 1 511 138 145 969Goldman Sachs International Computers Equity Short 13 652 286 (732 860)Goldman Sachs International Cosmetics/Personal Care Equity Long 1 041 249 8 576Goldman Sachs International Cosmetics/Personal Care Equity Short 5 683 145 (320 426)Goldman Sachs International Diversified Financial
ServicesEquity Long 88 392 10 836
Goldman Sachs International Diversified FinancialServices
Equity Short 5 465 946 134 347
Goldman Sachs International Electric Equity Long 2 571 514 51 505Goldman Sachs International Electric Equity Short 684 152 17 534Goldman Sachs International Electrical Components &
EquipmentEquity Long 1 354 023 (37 585)
Goldman Sachs International Electrical Components &Equipment
Equity Short 150 286 43 045
Goldman Sachs International Electronics Equity Long 1 317 356 (127 219)Goldman Sachs International Electronics Equity Short 1 938 849 429 001Goldman Sachs International Energy-Alternate Sources Equity Long 34 495 13 944Goldman Sachs International Energy-Alternate Sources Equity Short 180 128 (10 701)Goldman Sachs International Engineering &
ConstructionEquity Long 992 837 63 033
Goldman Sachs International Entertainment Equity Long 65 200 1 464Goldman Sachs International Entertainment Equity Short 10 161 924 (1 621 184)Goldman Sachs International Environmental Control Equity Long 22 407 (818)Goldman Sachs International Environmental Control Equity Short 412 219 (53 136)Goldman Sachs International Equity Fund Equity Long 2 980 383 840 810Goldman Sachs International Equity Fund Equity Short 1 940 325 (265 773)Goldman Sachs International Food Equity Long 251 514 (29 456)Goldman Sachs International Food Equity Short 12 935 109 (252 288)Goldman Sachs International Forest Products & Paper Equity Long 488 069 (324)Goldman Sachs International Forest Products & Paper Equity Short 1 464 (520)Goldman Sachs International Gas Equity Long 104 887 2 021Goldman Sachs International Healthcare-Products Equity Long 1 935 417 30 378Goldman Sachs International Healthcare-Products Equity Short 834 605 (8 841)Goldman Sachs International Healthcare-Services Equity Long 240 305 20 895Goldman Sachs International Healthcare-Services Equity Short 2 158 189 113 363Goldman Sachs International Holding
Companies-DiversifiedEquity Short 855 848 96 007
Goldman Sachs International Home Furnishings Equity Long 59 567 7 797Goldman Sachs International Household
Products/WaresEquity Short 915 625 (13 048)
Goldman Sachs International Insurance Equity Long 1 049 149 (5 169)Goldman Sachs International Insurance Equity Short 3 827 565 (114 173)Goldman Sachs International Internet Equity Long 3 924 854 (99 590)Goldman Sachs International Internet Equity Short 12 707 170 (267 054)Goldman Sachs International Investment Companies Equity Long 51 393 4 691Goldman Sachs International Investment Companies Equity Short 226 273 213Goldman Sachs International Iron/Steel Equity Long 3 683 987 363 475Goldman Sachs International Iron/Steel Equity Short 151 691 (27 923)
99Lumyna Funds
Lumyna – Marshall Wace TOPS (Market Neutral)UCITS FundSchedule of investments as at March 31, 2021 (cont.)
The accompanying notes form an integral part of these financial statements.
Audited annual report
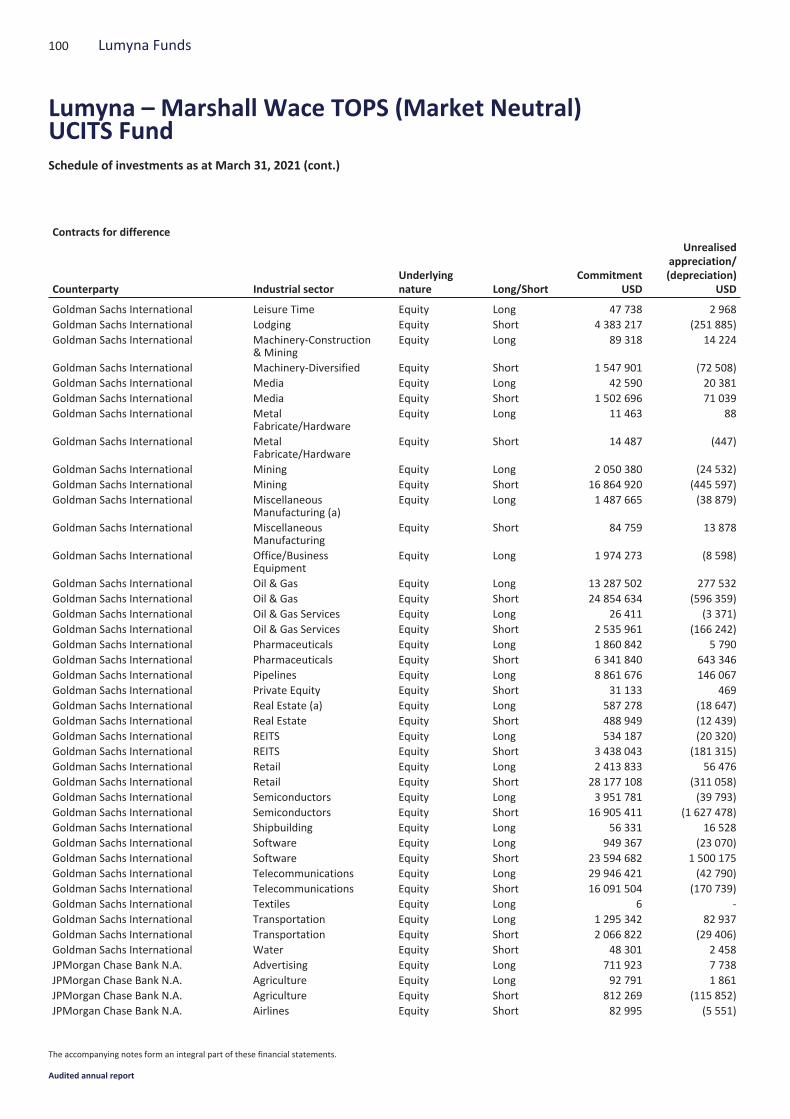
Contracts for difference
Counterparty Industrial sectorUnderlyingnature Long/Short
CommitmentUSD
Unrealisedappreciation/(depreciation)
USD
Goldman Sachs International Leisure Time Equity Long 47 738 2 968Goldman Sachs International Lodging Equity Short 4 383 217 (251 885)Goldman Sachs International Machinery-Construction
& MiningEquity Long 89 318 14 224
Goldman Sachs International Machinery-Diversified Equity Short 1 547 901 (72 508)Goldman Sachs International Media Equity Long 42 590 20 381Goldman Sachs International Media Equity Short 1 502 696 71 039Goldman Sachs International Metal
Fabricate/HardwareEquity Long 11 463 88
Goldman Sachs International MetalFabricate/Hardware
Equity Short 14 487 (447)
Goldman Sachs International Mining Equity Long 2 050 380 (24 532)Goldman Sachs International Mining Equity Short 16 864 920 (445 597)Goldman Sachs International Miscellaneous
Manufacturing (a)Equity Long 1 487 665 (38 879)
Goldman Sachs International MiscellaneousManufacturing
Equity Short 84 759 13 878
Goldman Sachs International Office/BusinessEquipment
Equity Long 1 974 273 (8 598)
Goldman Sachs International Oil & Gas Equity Long 13 287 502 277 532Goldman Sachs International Oil & Gas Equity Short 24 854 634 (596 359)Goldman Sachs International Oil & Gas Services Equity Long 26 411 (3 371)Goldman Sachs International Oil & Gas Services Equity Short 2 535 961 (166 242)Goldman Sachs International Pharmaceuticals Equity Long 1 860 842 5 790Goldman Sachs International Pharmaceuticals Equity Short 6 341 840 643 346Goldman Sachs International Pipelines Equity Long 8 861 676 146 067Goldman Sachs International Private Equity Equity Short 31 133 469Goldman Sachs International Real Estate (a) Equity Long 587 278 (18 647)Goldman Sachs International Real Estate Equity Short 488 949 (12 439)Goldman Sachs International REITS Equity Long 534 187 (20 320)Goldman Sachs International REITS Equity Short 3 438 043 (181 315)Goldman Sachs International Retail Equity Long 2 413 833 56 476Goldman Sachs International Retail Equity Short 28 177 108 (311 058)Goldman Sachs International Semiconductors Equity Long 3 951 781 (39 793)Goldman Sachs International Semiconductors Equity Short 16 905 411 (1 627 478)Goldman Sachs International Shipbuilding Equity Long 56 331 16 528Goldman Sachs International Software Equity Long 949 367 (23 070)Goldman Sachs International Software Equity Short 23 594 682 1 500 175Goldman Sachs International Telecommunications Equity Long 29 946 421 (42 790)Goldman Sachs International Telecommunications Equity Short 16 091 504 (170 739)Goldman Sachs International Textiles Equity Long 6 -Goldman Sachs International Transportation Equity Long 1 295 342 82 937Goldman Sachs International Transportation Equity Short 2 066 822 (29 406)Goldman Sachs International Water Equity Short 48 301 2 458JPMorgan Chase Bank N.A. Advertising Equity Long 711 923 7 738JPMorgan Chase Bank N.A. Agriculture Equity Long 92 791 1 861JPMorgan Chase Bank N.A. Agriculture Equity Short 812 269 (115 852)JPMorgan Chase Bank N.A. Airlines Equity Short 82 995 (5 551)
100 Lumyna Funds
Lumyna – Marshall Wace TOPS (Market Neutral)UCITS FundSchedule of investments as at March 31, 2021 (cont.)
The accompanying notes form an integral part of these financial statements.
Audited annual report

Contracts for difference
Counterparty Industrial sectorUnderlyingnature Long/Short
CommitmentUSD
Unrealisedappreciation/(depreciation)
USD
JPMorgan Chase Bank N.A. Apparel Equity Long 411 432 44 092JPMorgan Chase Bank N.A. Auto Manufacturers (a) Equity Long 1 838 487 (955 293)JPMorgan Chase Bank N.A. Auto Manufacturers Equity Short 6 760 963 (298 084)JPMorgan Chase Bank N.A. Auto Parts & Equipment Equity Long 243 631 9 383JPMorgan Chase Bank N.A. Auto Parts & Equipment Equity Short 269 681 673JPMorgan Chase Bank N.A. Banks Equity Long 39 639 747 1 144 024JPMorgan Chase Bank N.A. Banks Equity Short 7 078 686 216 178JPMorgan Chase Bank N.A. Beverages Equity Long 5 139 689 175 191JPMorgan Chase Bank N.A. Beverages Equity Short 356 599 39 056JPMorgan Chase Bank N.A. Biotechnology Equity Long 1 027 704 14 038JPMorgan Chase Bank N.A. Biotechnology Equity Short 41 480 2 078JPMorgan Chase Bank N.A. Building Materials Equity Long 3 400 119 296 269JPMorgan Chase Bank N.A. Building Materials Equity Short 932 846 (45 699)JPMorgan Chase Bank N.A. Chemicals Equity Long 14 505 036 (2 568 383)JPMorgan Chase Bank N.A. Chemicals Equity Short 1 926 974 (93 167)JPMorgan Chase Bank N.A. Coal Equity Short 307 (3)JPMorgan Chase Bank N.A. Commercial Services Equity Long 737 830 89 832JPMorgan Chase Bank N.A. Commercial Services Equity Short 180 026 (18 982)JPMorgan Chase Bank N.A. Computers Equity Long 627 642 21 129JPMorgan Chase Bank N.A. Computers Equity Short 6 224 593 (320 418)JPMorgan Chase Bank N.A. Cosmetics/Personal Care Equity Long 13 520 (677)JPMorgan Chase Bank N.A. Cosmetics/Personal Care Equity Short 2 238 823 (90 684)JPMorgan Chase Bank N.A. Distribution/Wholesale Equity Short 184 160 893JPMorgan Chase Bank N.A. Diversified Financial
ServicesEquity Long 3 345 213 (57 336)
JPMorgan Chase Bank N.A. Diversified FinancialServices
Equity Short 1 196 810 (13 944)
JPMorgan Chase Bank N.A. Electric Equity Long 5 031 655 129 760JPMorgan Chase Bank N.A. Electric Equity Short 3 443 042 19 337JPMorgan Chase Bank N.A. Electrical Components &
EquipmentEquity Long 1 503 167 (3 999)
JPMorgan Chase Bank N.A. Electrical Components &Equipment
Equity Short 8 312 842
JPMorgan Chase Bank N.A. Electronics Equity Long 14 785 698 385 457JPMorgan Chase Bank N.A. Electronics Equity Short 2 344 664 523 305JPMorgan Chase Bank N.A. Energy-Alternate Sources Equity Long 65 198 771JPMorgan Chase Bank N.A. Energy-Alternate Sources Equity Short 2 870 231 168 500JPMorgan Chase Bank N.A. Engineering &
ConstructionEquity Long 4 517 100 173 078
JPMorgan Chase Bank N.A. Engineering &Construction
Equity Short 94 602 (25 681)
JPMorgan Chase Bank N.A. Entertainment Equity Long 46 972 17 451JPMorgan Chase Bank N.A. Food Equity Long 357 157 14 212JPMorgan Chase Bank N.A. Food Equity Short 1 922 686 (223)JPMorgan Chase Bank N.A. Food Service Equity Long 23 948 2 300JPMorgan Chase Bank N.A. Food Service Equity Short 104 203 (46 971)JPMorgan Chase Bank N.A. Gas Equity Short 5 296 2 017JPMorgan Chase Bank N.A. Healthcare-Products Equity Long 802 863 36 494
101Lumyna Funds
Lumyna – Marshall Wace TOPS (Market Neutral)UCITS FundSchedule of investments as at March 31, 2021 (cont.)
The accompanying notes form an integral part of these financial statements.
Audited annual report
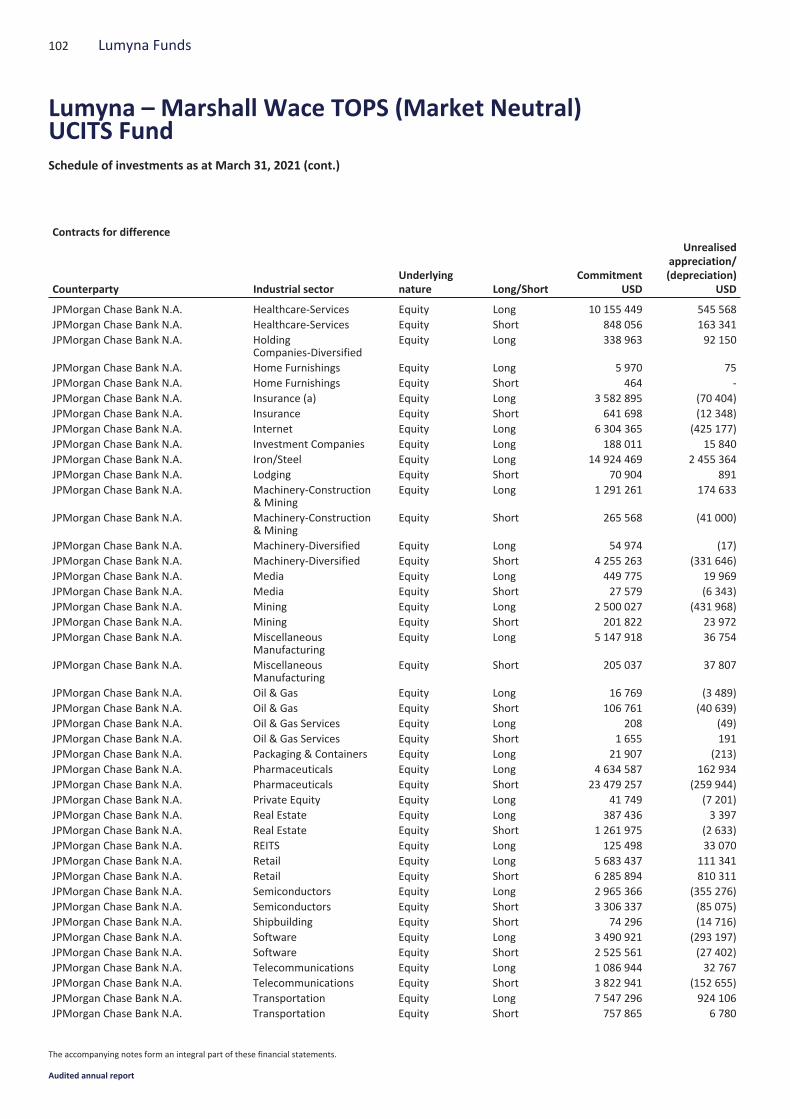
Contracts for difference
Counterparty Industrial sectorUnderlyingnature Long/Short
CommitmentUSD
Unrealisedappreciation/(depreciation)
USD
JPMorgan Chase Bank N.A. Healthcare-Services Equity Long 10 155 449 545 568JPMorgan Chase Bank N.A. Healthcare-Services Equity Short 848 056 163 341JPMorgan Chase Bank N.A. Holding
Companies-DiversifiedEquity Long 338 963 92 150
JPMorgan Chase Bank N.A. Home Furnishings Equity Long 5 970 75JPMorgan Chase Bank N.A. Home Furnishings Equity Short 464 -JPMorgan Chase Bank N.A. Insurance (a) Equity Long 3 582 895 (70 404)JPMorgan Chase Bank N.A. Insurance Equity Short 641 698 (12 348)JPMorgan Chase Bank N.A. Internet Equity Long 6 304 365 (425 177)JPMorgan Chase Bank N.A. Investment Companies Equity Long 188 011 15 840JPMorgan Chase Bank N.A. Iron/Steel Equity Long 14 924 469 2 455 364JPMorgan Chase Bank N.A. Lodging Equity Short 70 904 891JPMorgan Chase Bank N.A. Machinery-Construction
& MiningEquity Long 1 291 261 174 633
JPMorgan Chase Bank N.A. Machinery-Construction& Mining
Equity Short 265 568 (41 000)
JPMorgan Chase Bank N.A. Machinery-Diversified Equity Long 54 974 (17)JPMorgan Chase Bank N.A. Machinery-Diversified Equity Short 4 255 263 (331 646)JPMorgan Chase Bank N.A. Media Equity Long 449 775 19 969JPMorgan Chase Bank N.A. Media Equity Short 27 579 (6 343)JPMorgan Chase Bank N.A. Mining Equity Long 2 500 027 (431 968)JPMorgan Chase Bank N.A. Mining Equity Short 201 822 23 972JPMorgan Chase Bank N.A. Miscellaneous
ManufacturingEquity Long 5 147 918 36 754
JPMorgan Chase Bank N.A. MiscellaneousManufacturing
Equity Short 205 037 37 807
JPMorgan Chase Bank N.A. Oil & Gas Equity Long 16 769 (3 489)JPMorgan Chase Bank N.A. Oil & Gas Equity Short 106 761 (40 639)JPMorgan Chase Bank N.A. Oil & Gas Services Equity Long 208 (49)JPMorgan Chase Bank N.A. Oil & Gas Services Equity Short 1 655 191JPMorgan Chase Bank N.A. Packaging & Containers Equity Long 21 907 (213)JPMorgan Chase Bank N.A. Pharmaceuticals Equity Long 4 634 587 162 934JPMorgan Chase Bank N.A. Pharmaceuticals Equity Short 23 479 257 (259 944)JPMorgan Chase Bank N.A. Private Equity Equity Long 41 749 (7 201)JPMorgan Chase Bank N.A. Real Estate Equity Long 387 436 3 397JPMorgan Chase Bank N.A. Real Estate Equity Short 1 261 975 (2 633)JPMorgan Chase Bank N.A. REITS Equity Long 125 498 33 070JPMorgan Chase Bank N.A. Retail Equity Long 5 683 437 111 341JPMorgan Chase Bank N.A. Retail Equity Short 6 285 894 810 311JPMorgan Chase Bank N.A. Semiconductors Equity Long 2 965 366 (355 276)JPMorgan Chase Bank N.A. Semiconductors Equity Short 3 306 337 (85 075)JPMorgan Chase Bank N.A. Shipbuilding Equity Short 74 296 (14 716)JPMorgan Chase Bank N.A. Software Equity Long 3 490 921 (293 197)JPMorgan Chase Bank N.A. Software Equity Short 2 525 561 (27 402)JPMorgan Chase Bank N.A. Telecommunications Equity Long 1 086 944 32 767JPMorgan Chase Bank N.A. Telecommunications Equity Short 3 822 941 (152 655)JPMorgan Chase Bank N.A. Transportation Equity Long 7 547 296 924 106JPMorgan Chase Bank N.A. Transportation Equity Short 757 865 6 780
102 Lumyna Funds
Lumyna – Marshall Wace TOPS (Market Neutral)UCITS FundSchedule of investments as at March 31, 2021 (cont.)
The accompanying notes form an integral part of these financial statements.
Audited annual report

Contracts for difference
Counterparty Industrial sectorUnderlyingnature Long/Short
CommitmentUSD
Unrealisedappreciation/(depreciation)
USD
Merrill Lynch International Bank Ltd. Advertising Equity Short 4 1Merrill Lynch International Bank Ltd. Aerospace/Defense Equity Long 117 941 2 879Merrill Lynch International Bank Ltd. Aerospace/Defense Equity Short 625 -Merrill Lynch International Bank Ltd. Agriculture Equity Long 381 116 (18 732)Merrill Lynch International Bank Ltd. Agriculture Equity Short 1 802 601 100 688Merrill Lynch International Bank Ltd. Airlines Equity Short 496 260 15 958Merrill Lynch International Bank Ltd. Apparel Equity Long 31 130 (772)Merrill Lynch International Bank Ltd. Apparel Equity Short 2 100 798 35 340Merrill Lynch International Bank Ltd. Auto Manufacturers Equity Long 8 166 571 (1 259 079)Merrill Lynch International Bank Ltd. Auto Manufacturers Equity Short 545 521 198 796Merrill Lynch International Bank Ltd. Auto Parts & Equipment Equity Long 1 294 859 (277 829)Merrill Lynch International Bank Ltd. Auto Parts & Equipment Equity Short 276 615 4 208Merrill Lynch International Bank Ltd. Banks Equity Long 5 688 811 73 081Merrill Lynch International Bank Ltd. Banks Equity Short 23 062 747 653 628Merrill Lynch International Bank Ltd. Beverages Equity Long 781 864 (112 562)Merrill Lynch International Bank Ltd. Beverages Equity Short 1 865 686 (47 392)Merrill Lynch International Bank Ltd. Biotechnology Equity Long 461 463 29 359Merrill Lynch International Bank Ltd. Building Materials Equity Long 990 935 (23 004)Merrill Lynch International Bank Ltd. Building Materials Equity Short 65 889 (3 454)Merrill Lynch International Bank Ltd. Chemicals Equity Long 11 729 257 (15 229)Merrill Lynch International Bank Ltd. Chemicals Equity Short 900 581 12 333Merrill Lynch International Bank Ltd. Coal Equity Short 9 955 (327)Merrill Lynch International Bank Ltd. Commercial Services Equity Long 3 381 334 (215 039)Merrill Lynch International Bank Ltd. Commercial Services Equity Short 7 899 785 (227 065)Merrill Lynch International Bank Ltd. Computers Equity Long 3 594 354 67 240Merrill Lynch International Bank Ltd. Computers Equity Short 3 071 889 (118 707)Merrill Lynch International Bank Ltd. Cosmetics/Personal Care Equity Short 5 491 272 (77 590)Merrill Lynch International Bank Ltd. Distribution/Wholesale Equity Short 427 665 (21 394)Merrill Lynch International Bank Ltd. Diversified Financial
ServicesEquity Long 2 222 440 (42 787)
Merrill Lynch International Bank Ltd. Diversified FinancialServices
Equity Short 10 821 240 136 442
Merrill Lynch International Bank Ltd. Electric Equity Long 16 112 579 592 035Merrill Lynch International Bank Ltd. Electric Equity Short 2 039 686 (20 237)Merrill Lynch International Bank Ltd. Electrical Components &
EquipmentEquity Long 1 049 948 5 830
Merrill Lynch International Bank Ltd. Electrical Components &Equipment
Equity Short 2 002 887 7 110
Merrill Lynch International Bank Ltd. Electronics Equity Long 3 715 566 (195 163)Merrill Lynch International Bank Ltd. Electronics Equity Short 3 633 453 188 253Merrill Lynch International Bank Ltd. Energy-Alternate Sources Equity Long 2 062 778 (125 356)Merrill Lynch International Bank Ltd. Energy-Alternate Sources Equity Short 2 966 754 149 506Merrill Lynch International Bank Ltd. Engineering &
ConstructionEquity Long 945 849 (18 156)
Merrill Lynch International Bank Ltd. Engineering &Construction
Equity Short 49 804 3 457
Merrill Lynch International Bank Ltd. Entertainment Equity Long 1 107 308 20 230Merrill Lynch International Bank Ltd. Entertainment Equity Short 442 934 (3 398)
103Lumyna Funds
Lumyna – Marshall Wace TOPS (Market Neutral)UCITS FundSchedule of investments as at March 31, 2021 (cont.)
The accompanying notes form an integral part of these financial statements.
Audited annual report
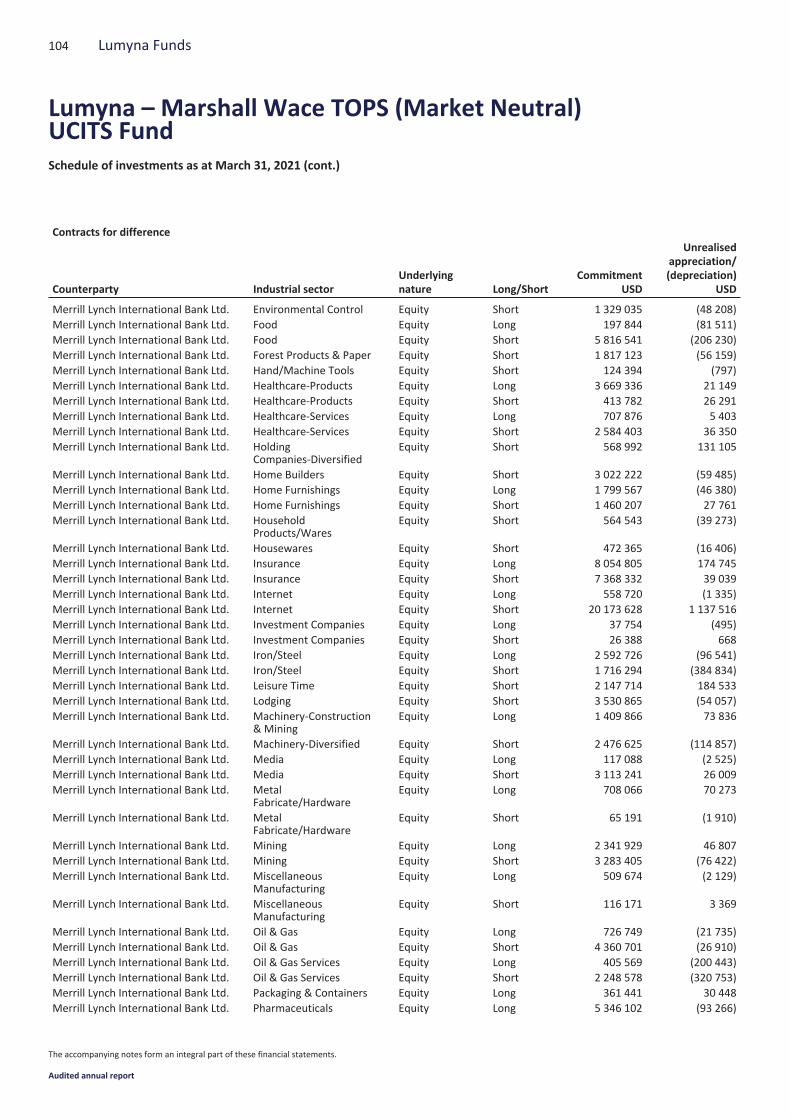
Contracts for difference
Counterparty Industrial sectorUnderlyingnature Long/Short
CommitmentUSD
Unrealisedappreciation/(depreciation)
USD
Merrill Lynch International Bank Ltd. Environmental Control Equity Short 1 329 035 (48 208)Merrill Lynch International Bank Ltd. Food Equity Long 197 844 (81 511)Merrill Lynch International Bank Ltd. Food Equity Short 5 816 541 (206 230)Merrill Lynch International Bank Ltd. Forest Products & Paper Equity Short 1 817 123 (56 159)Merrill Lynch International Bank Ltd. Hand/Machine Tools Equity Short 124 394 (797)Merrill Lynch International Bank Ltd. Healthcare-Products Equity Long 3 669 336 21 149Merrill Lynch International Bank Ltd. Healthcare-Products Equity Short 413 782 26 291Merrill Lynch International Bank Ltd. Healthcare-Services Equity Long 707 876 5 403Merrill Lynch International Bank Ltd. Healthcare-Services Equity Short 2 584 403 36 350Merrill Lynch International Bank Ltd. Holding
Companies-DiversifiedEquity Short 568 992 131 105
Merrill Lynch International Bank Ltd. Home Builders Equity Short 3 022 222 (59 485)Merrill Lynch International Bank Ltd. Home Furnishings Equity Long 1 799 567 (46 380)Merrill Lynch International Bank Ltd. Home Furnishings Equity Short 1 460 207 27 761Merrill Lynch International Bank Ltd. Household
Products/WaresEquity Short 564 543 (39 273)
Merrill Lynch International Bank Ltd. Housewares Equity Short 472 365 (16 406)Merrill Lynch International Bank Ltd. Insurance Equity Long 8 054 805 174 745Merrill Lynch International Bank Ltd. Insurance Equity Short 7 368 332 39 039Merrill Lynch International Bank Ltd. Internet Equity Long 558 720 (1 335)Merrill Lynch International Bank Ltd. Internet Equity Short 20 173 628 1 137 516Merrill Lynch International Bank Ltd. Investment Companies Equity Long 37 754 (495)Merrill Lynch International Bank Ltd. Investment Companies Equity Short 26 388 668Merrill Lynch International Bank Ltd. Iron/Steel Equity Long 2 592 726 (96 541)Merrill Lynch International Bank Ltd. Iron/Steel Equity Short 1 716 294 (384 834)Merrill Lynch International Bank Ltd. Leisure Time Equity Short 2 147 714 184 533Merrill Lynch International Bank Ltd. Lodging Equity Short 3 530 865 (54 057)Merrill Lynch International Bank Ltd. Machinery-Construction
& MiningEquity Long 1 409 866 73 836
Merrill Lynch International Bank Ltd. Machinery-Diversified Equity Short 2 476 625 (114 857)Merrill Lynch International Bank Ltd. Media Equity Long 117 088 (2 525)Merrill Lynch International Bank Ltd. Media Equity Short 3 113 241 26 009Merrill Lynch International Bank Ltd. Metal
Fabricate/HardwareEquity Long 708 066 70 273
Merrill Lynch International Bank Ltd. MetalFabricate/Hardware
Equity Short 65 191 (1 910)
Merrill Lynch International Bank Ltd. Mining Equity Long 2 341 929 46 807Merrill Lynch International Bank Ltd. Mining Equity Short 3 283 405 (76 422)Merrill Lynch International Bank Ltd. Miscellaneous
ManufacturingEquity Long 509 674 (2 129)
Merrill Lynch International Bank Ltd. MiscellaneousManufacturing
Equity Short 116 171 3 369
Merrill Lynch International Bank Ltd. Oil & Gas Equity Long 726 749 (21 735)Merrill Lynch International Bank Ltd. Oil & Gas Equity Short 4 360 701 (26 910)Merrill Lynch International Bank Ltd. Oil & Gas Services Equity Long 405 569 (200 443)Merrill Lynch International Bank Ltd. Oil & Gas Services Equity Short 2 248 578 (320 753)Merrill Lynch International Bank Ltd. Packaging & Containers Equity Long 361 441 30 448Merrill Lynch International Bank Ltd. Pharmaceuticals Equity Long 5 346 102 (93 266)
104 Lumyna Funds
Lumyna – Marshall Wace TOPS (Market Neutral)UCITS FundSchedule of investments as at March 31, 2021 (cont.)
The accompanying notes form an integral part of these financial statements.
Audited annual report
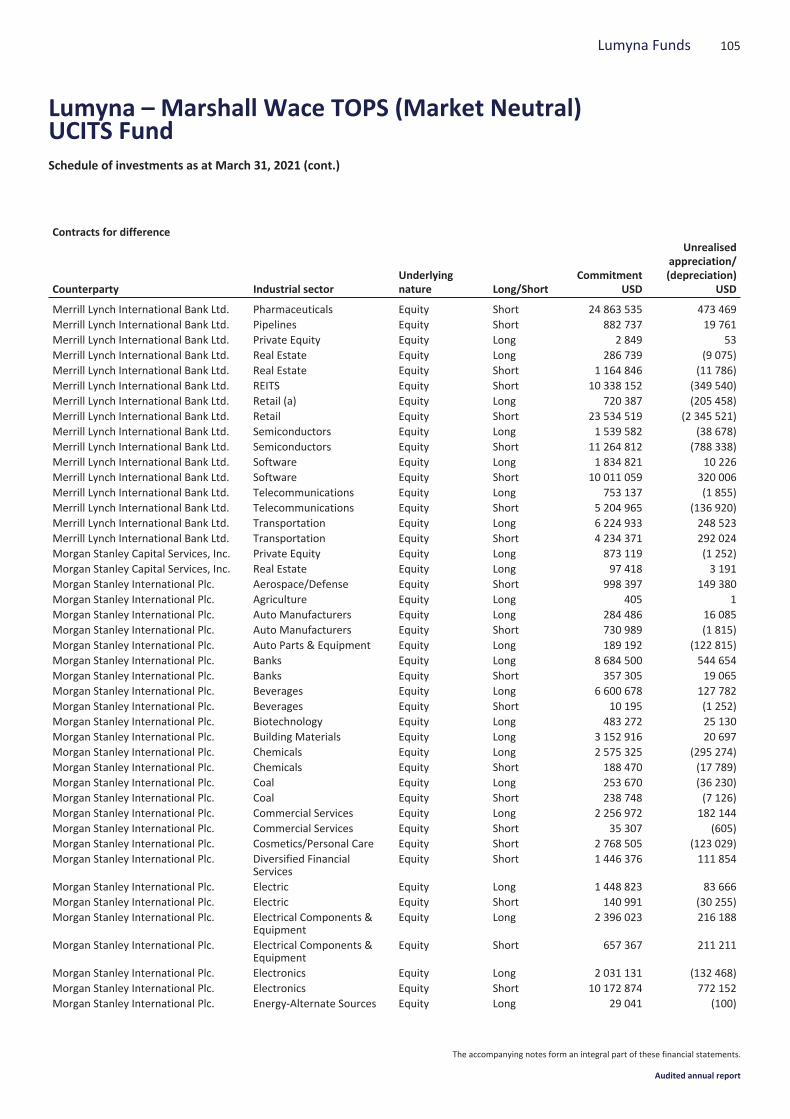
Contracts for difference
Counterparty Industrial sectorUnderlyingnature Long/Short
CommitmentUSD
Unrealisedappreciation/(depreciation)
USD
Merrill Lynch International Bank Ltd. Pharmaceuticals Equity Short 24 863 535 473 469Merrill Lynch International Bank Ltd. Pipelines Equity Short 882 737 19 761Merrill Lynch International Bank Ltd. Private Equity Equity Long 2 849 53Merrill Lynch International Bank Ltd. Real Estate Equity Long 286 739 (9 075)Merrill Lynch International Bank Ltd. Real Estate Equity Short 1 164 846 (11 786)Merrill Lynch International Bank Ltd. REITS Equity Short 10 338 152 (349 540)Merrill Lynch International Bank Ltd. Retail (a) Equity Long 720 387 (205 458)Merrill Lynch International Bank Ltd. Retail Equity Short 23 534 519 (2 345 521)Merrill Lynch International Bank Ltd. Semiconductors Equity Long 1 539 582 (38 678)Merrill Lynch International Bank Ltd. Semiconductors Equity Short 11 264 812 (788 338)Merrill Lynch International Bank Ltd. Software Equity Long 1 834 821 10 226Merrill Lynch International Bank Ltd. Software Equity Short 10 011 059 320 006Merrill Lynch International Bank Ltd. Telecommunications Equity Long 753 137 (1 855)Merrill Lynch International Bank Ltd. Telecommunications Equity Short 5 204 965 (136 920)Merrill Lynch International Bank Ltd. Transportation Equity Long 6 224 933 248 523Merrill Lynch International Bank Ltd. Transportation Equity Short 4 234 371 292 024Morgan Stanley Capital Services, Inc. Private Equity Equity Long 873 119 (1 252)Morgan Stanley Capital Services, Inc. Real Estate Equity Long 97 418 3 191Morgan Stanley International Plc. Aerospace/Defense Equity Short 998 397 149 380Morgan Stanley International Plc. Agriculture Equity Long 405 1Morgan Stanley International Plc. Auto Manufacturers Equity Long 284 486 16 085Morgan Stanley International Plc. Auto Manufacturers Equity Short 730 989 (1 815)Morgan Stanley International Plc. Auto Parts & Equipment Equity Long 189 192 (122 815)Morgan Stanley International Plc. Banks Equity Long 8 684 500 544 654Morgan Stanley International Plc. Banks Equity Short 357 305 19 065Morgan Stanley International Plc. Beverages Equity Long 6 600 678 127 782Morgan Stanley International Plc. Beverages Equity Short 10 195 (1 252)Morgan Stanley International Plc. Biotechnology Equity Long 483 272 25 130Morgan Stanley International Plc. Building Materials Equity Long 3 152 916 20 697Morgan Stanley International Plc. Chemicals Equity Long 2 575 325 (295 274)Morgan Stanley International Plc. Chemicals Equity Short 188 470 (17 789)Morgan Stanley International Plc. Coal Equity Long 253 670 (36 230)Morgan Stanley International Plc. Coal Equity Short 238 748 (7 126)Morgan Stanley International Plc. Commercial Services Equity Long 2 256 972 182 144Morgan Stanley International Plc. Commercial Services Equity Short 35 307 (605)Morgan Stanley International Plc. Cosmetics/Personal Care Equity Short 2 768 505 (123 029)Morgan Stanley International Plc. Diversified Financial
ServicesEquity Short 1 446 376 111 854
Morgan Stanley International Plc. Electric Equity Long 1 448 823 83 666Morgan Stanley International Plc. Electric Equity Short 140 991 (30 255)Morgan Stanley International Plc. Electrical Components &
EquipmentEquity Long 2 396 023 216 188
Morgan Stanley International Plc. Electrical Components &Equipment
Equity Short 657 367 211 211
Morgan Stanley International Plc. Electronics Equity Long 2 031 131 (132 468)Morgan Stanley International Plc. Electronics Equity Short 10 172 874 772 152Morgan Stanley International Plc. Energy-Alternate Sources Equity Long 29 041 (100)
105Lumyna Funds
Lumyna – Marshall Wace TOPS (Market Neutral)UCITS FundSchedule of investments as at March 31, 2021 (cont.)
The accompanying notes form an integral part of these financial statements.
Audited annual report

Contracts for difference
Counterparty Industrial sectorUnderlyingnature Long/Short
CommitmentUSD
Unrealisedappreciation/(depreciation)
USD
Morgan Stanley International Plc. Engineering &Construction
Equity Long 2 150 254 (7 547)
Morgan Stanley International Plc. Environmental Control Equity Long 98 991 24 562Morgan Stanley International Plc. Food Equity Long 1 070 857 (68 589)Morgan Stanley International Plc. Food Equity Short 439 070 1 927Morgan Stanley International Plc. Forest Products & Paper Equity Long 205 463 (36 918)Morgan Stanley International Plc. Future Index Derivatives Long 699 407 (29 059)Morgan Stanley International Plc. Future Index Derivatives Short 909 876 17 277Morgan Stanley International Plc. Healthcare-Products Equity Long 65 560 5 683Morgan Stanley International Plc. Healthcare-Products Equity Short 37 697 (1 212)Morgan Stanley International Plc. Healthcare-Services Equity Long 7 341 109 (543 700)Morgan Stanley International Plc. Healthcare-Services Equity Short 150 568 48 832Morgan Stanley International Plc. Home Furnishings Equity Long 1 982 028 (94 381)Morgan Stanley International Plc. Home Furnishings Equity Short 91 250 2 812Morgan Stanley International Plc. Insurance Equity Long 6 342 36Morgan Stanley International Plc. Internet Equity Short 3 311 314 628 370Morgan Stanley International Plc. Investment Companies Equity Long 28 845 (3 104)Morgan Stanley International Plc. Iron/Steel Equity Long 3 696 298 (49 250)Morgan Stanley International Plc. Iron/Steel Equity Short 32 319 2 290Morgan Stanley International Plc. Machinery-Construction
& MiningEquity Short 4 027 564 (405 654)
Morgan Stanley International Plc. Machinery-Diversified Equity Long 30 936 63Morgan Stanley International Plc. Mining Equity Long 575 100 (89 560)Morgan Stanley International Plc. Mining Equity Short 713 019 34 484Morgan Stanley International Plc. Miscellaneous
ManufacturingEquity Long 1 456 173 (30 338)
Morgan Stanley International Plc. MiscellaneousManufacturing
Equity Short 9 948 1 230
Morgan Stanley International Plc. Oil & Gas Equity Long 4 554 335 445 911Morgan Stanley International Plc. Oil & Gas Equity Short 57 808 (1 666)Morgan Stanley International Plc. Oil & Gas Services Equity Long 486 853 (34 830)Morgan Stanley International Plc. Packaging & Containers Equity Long 44 995 769Morgan Stanley International Plc. Pharmaceuticals Equity Long 381 391 (67 408)Morgan Stanley International Plc. Real Estate (a) Equity Long - -Morgan Stanley International Plc. REITS Equity Long 61 872 (6 665)Morgan Stanley International Plc. Retail Equity Long 23 036 1 013Morgan Stanley International Plc. Retail Equity Short 2 651 885 52 529Morgan Stanley International Plc. Semiconductors Equity Long 1 158 979 (50 665)Morgan Stanley International Plc. Semiconductors Equity Short 689 325 (16 510)Morgan Stanley International Plc. Software Equity Long 3 526 307 329 412Morgan Stanley International Plc. Software Equity Short 104 134 5 781Morgan Stanley International Plc. Transportation Equity Short 9 233 1 328Morgan Stanley International Plc. Water Equity Short 159 894 (16 390)Société Générale Aerospace/Defense Equity Long 1 143 711 279 574Société Générale Airlines Equity Short 134 118 1 713Société Générale Apparel Equity Long 2 520 851 137 263Société Générale Auto Manufacturers Equity Long 4 239 745 175 860Société Générale Auto Parts & Equipment Equity Long 92 168 (9 656)
106 Lumyna Funds
Lumyna – Marshall Wace TOPS (Market Neutral)UCITS FundSchedule of investments as at March 31, 2021 (cont.)
The accompanying notes form an integral part of these financial statements.
Audited annual report
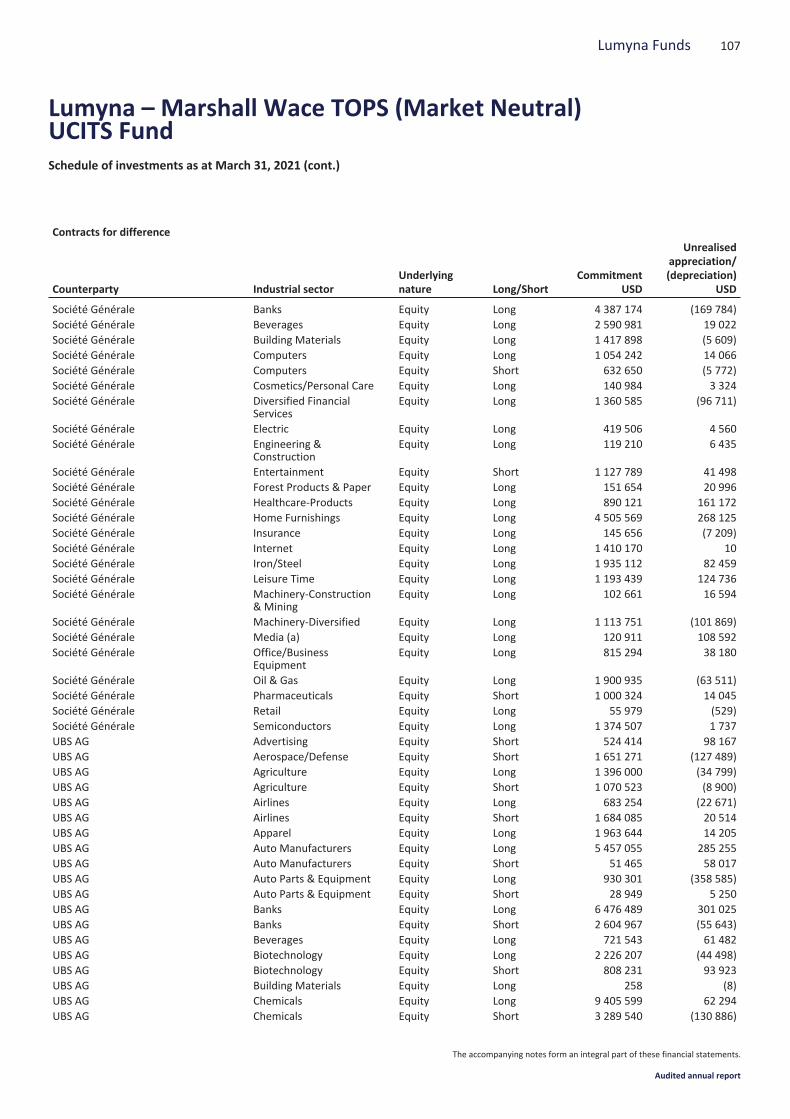
Contracts for difference
Counterparty Industrial sectorUnderlyingnature Long/Short
CommitmentUSD
Unrealisedappreciation/(depreciation)
USD
Société Générale Banks Equity Long 4 387 174 (169 784)Société Générale Beverages Equity Long 2 590 981 19 022Société Générale Building Materials Equity Long 1 417 898 (5 609)Société Générale Computers Equity Long 1 054 242 14 066Société Générale Computers Equity Short 632 650 (5 772)Société Générale Cosmetics/Personal Care Equity Long 140 984 3 324Société Générale Diversified Financial
ServicesEquity Long 1 360 585 (96 711)
Société Générale Electric Equity Long 419 506 4 560Société Générale Engineering &
ConstructionEquity Long 119 210 6 435
Société Générale Entertainment Equity Short 1 127 789 41 498Société Générale Forest Products & Paper Equity Long 151 654 20 996Société Générale Healthcare-Products Equity Long 890 121 161 172Société Générale Home Furnishings Equity Long 4 505 569 268 125Société Générale Insurance Equity Long 145 656 (7 209)Société Générale Internet Equity Long 1 410 170 10Société Générale Iron/Steel Equity Long 1 935 112 82 459Société Générale Leisure Time Equity Long 1 193 439 124 736Société Générale Machinery-Construction
& MiningEquity Long 102 661 16 594
Société Générale Machinery-Diversified Equity Long 1 113 751 (101 869)Société Générale Media (a) Equity Long 120 911 108 592Société Générale Office/Business
EquipmentEquity Long 815 294 38 180
Société Générale Oil & Gas Equity Long 1 900 935 (63 511)Société Générale Pharmaceuticals Equity Short 1 000 324 14 045Société Générale Retail Equity Long 55 979 (529)Société Générale Semiconductors Equity Long 1 374 507 1 737UBS AG Advertising Equity Short 524 414 98 167UBS AG Aerospace/Defense Equity Short 1 651 271 (127 489)UBS AG Agriculture Equity Long 1 396 000 (34 799)UBS AG Agriculture Equity Short 1 070 523 (8 900)UBS AG Airlines Equity Long 683 254 (22 671)UBS AG Airlines Equity Short 1 684 085 20 514UBS AG Apparel Equity Long 1 963 644 14 205UBS AG Auto Manufacturers Equity Long 5 457 055 285 255UBS AG Auto Manufacturers Equity Short 51 465 58 017UBS AG Auto Parts & Equipment Equity Long 930 301 (358 585)UBS AG Auto Parts & Equipment Equity Short 28 949 5 250UBS AG Banks Equity Long 6 476 489 301 025UBS AG Banks Equity Short 2 604 967 (55 643)UBS AG Beverages Equity Long 721 543 61 482UBS AG Biotechnology Equity Long 2 226 207 (44 498)UBS AG Biotechnology Equity Short 808 231 93 923UBS AG Building Materials Equity Long 258 (8)UBS AG Chemicals Equity Long 9 405 599 62 294UBS AG Chemicals Equity Short 3 289 540 (130 886)
107Lumyna Funds
Lumyna – Marshall Wace TOPS (Market Neutral)UCITS FundSchedule of investments as at March 31, 2021 (cont.)
The accompanying notes form an integral part of these financial statements.
Audited annual report
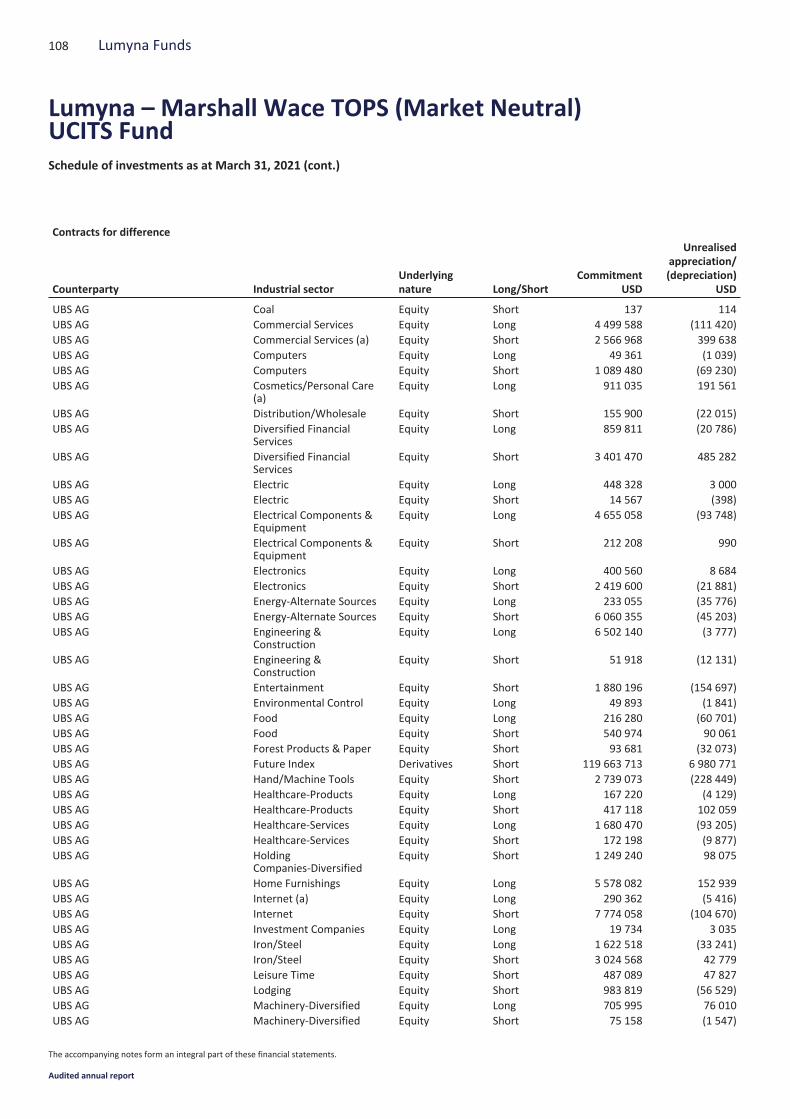
Contracts for difference
Counterparty Industrial sectorUnderlyingnature Long/Short
CommitmentUSD
Unrealisedappreciation/(depreciation)
USD
UBS AG Coal Equity Short 137 114UBS AG Commercial Services Equity Long 4 499 588 (111 420)UBS AG Commercial Services (a) Equity Short 2 566 968 399 638UBS AG Computers Equity Long 49 361 (1 039)UBS AG Computers Equity Short 1 089 480 (69 230)UBS AG Cosmetics/Personal Care
(a)Equity Long 911 035 191 561
UBS AG Distribution/Wholesale Equity Short 155 900 (22 015)UBS AG Diversified Financial
ServicesEquity Long 859 811 (20 786)
UBS AG Diversified FinancialServices
Equity Short 3 401 470 485 282
UBS AG Electric Equity Long 448 328 3 000UBS AG Electric Equity Short 14 567 (398)UBS AG Electrical Components &
EquipmentEquity Long 4 655 058 (93 748)
UBS AG Electrical Components &Equipment
Equity Short 212 208 990
UBS AG Electronics Equity Long 400 560 8 684UBS AG Electronics Equity Short 2 419 600 (21 881)UBS AG Energy-Alternate Sources Equity Long 233 055 (35 776)UBS AG Energy-Alternate Sources Equity Short 6 060 355 (45 203)UBS AG Engineering &
ConstructionEquity Long 6 502 140 (3 777)
UBS AG Engineering &Construction
Equity Short 51 918 (12 131)
UBS AG Entertainment Equity Short 1 880 196 (154 697)UBS AG Environmental Control Equity Long 49 893 (1 841)UBS AG Food Equity Long 216 280 (60 701)UBS AG Food Equity Short 540 974 90 061UBS AG Forest Products & Paper Equity Short 93 681 (32 073)UBS AG Future Index Derivatives Short 119 663 713 6 980 771UBS AG Hand/Machine Tools Equity Short 2 739 073 (228 449)UBS AG Healthcare-Products Equity Long 167 220 (4 129)UBS AG Healthcare-Products Equity Short 417 118 102 059UBS AG Healthcare-Services Equity Long 1 680 470 (93 205)UBS AG Healthcare-Services Equity Short 172 198 (9 877)UBS AG Holding
Companies-DiversifiedEquity Short 1 249 240 98 075
UBS AG Home Furnishings Equity Long 5 578 082 152 939UBS AG Internet (a) Equity Long 290 362 (5 416)UBS AG Internet Equity Short 7 774 058 (104 670)UBS AG Investment Companies Equity Long 19 734 3 035UBS AG Iron/Steel Equity Long 1 622 518 (33 241)UBS AG Iron/Steel Equity Short 3 024 568 42 779UBS AG Leisure Time Equity Short 487 089 47 827UBS AG Lodging Equity Short 983 819 (56 529)UBS AG Machinery-Diversified Equity Long 705 995 76 010UBS AG Machinery-Diversified Equity Short 75 158 (1 547)
108 Lumyna Funds
Lumyna – Marshall Wace TOPS (Market Neutral)UCITS FundSchedule of investments as at March 31, 2021 (cont.)
The accompanying notes form an integral part of these financial statements.
Audited annual report
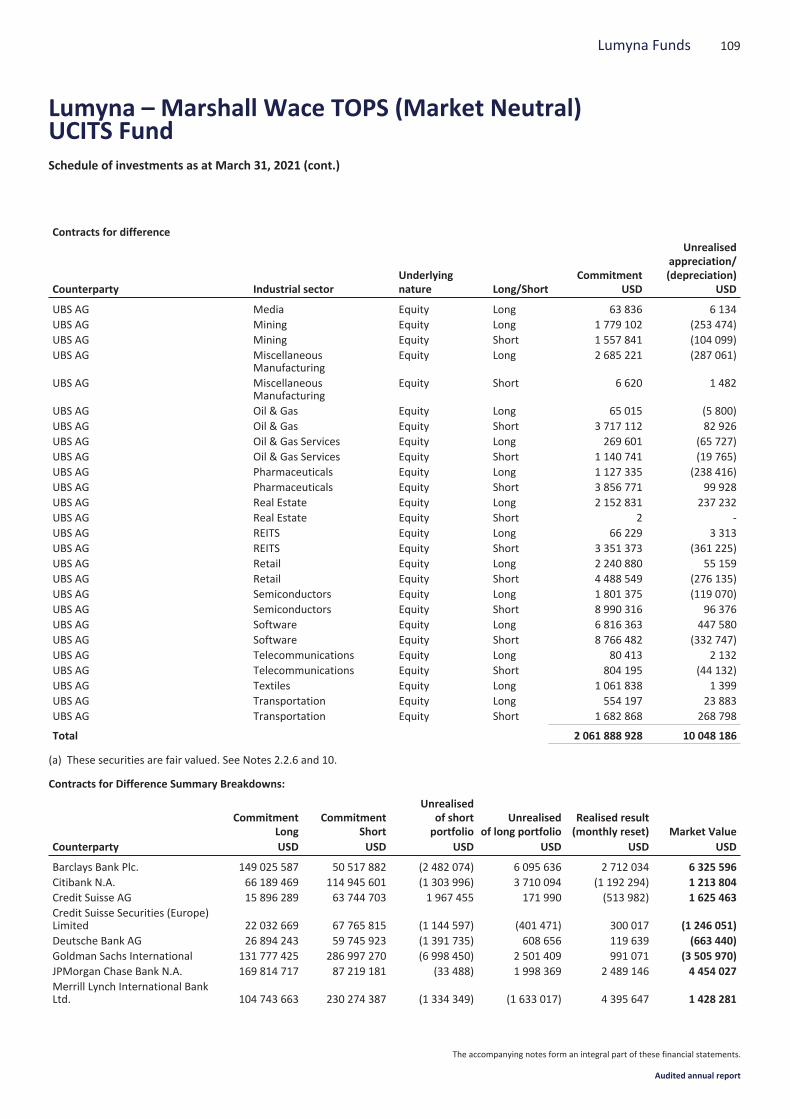
Contracts for difference
Counterparty Industrial sectorUnderlyingnature Long/Short
CommitmentUSD
Unrealisedappreciation/(depreciation)
USD
UBS AG Media Equity Long 63 836 6 134UBS AG Mining Equity Long 1 779 102 (253 474)UBS AG Mining Equity Short 1 557 841 (104 099)UBS AG Miscellaneous
ManufacturingEquity Long 2 685 221 (287 061)
UBS AG MiscellaneousManufacturing
Equity Short 6 620 1 482
UBS AG Oil & Gas Equity Long 65 015 (5 800)UBS AG Oil & Gas Equity Short 3 717 112 82 926UBS AG Oil & Gas Services Equity Long 269 601 (65 727)UBS AG Oil & Gas Services Equity Short 1 140 741 (19 765)UBS AG Pharmaceuticals Equity Long 1 127 335 (238 416)UBS AG Pharmaceuticals Equity Short 3 856 771 99 928UBS AG Real Estate Equity Long 2 152 831 237 232UBS AG Real Estate Equity Short 2 -UBS AG REITS Equity Long 66 229 3 313UBS AG REITS Equity Short 3 351 373 (361 225)UBS AG Retail Equity Long 2 240 880 55 159UBS AG Retail Equity Short 4 488 549 (276 135)UBS AG Semiconductors Equity Long 1 801 375 (119 070)UBS AG Semiconductors Equity Short 8 990 316 96 376UBS AG Software Equity Long 6 816 363 447 580UBS AG Software Equity Short 8 766 482 (332 747)UBS AG Telecommunications Equity Long 80 413 2 132UBS AG Telecommunications Equity Short 804 195 (44 132)UBS AG Textiles Equity Long 1 061 838 1 399UBS AG Transportation Equity Long 554 197 23 883UBS AG Transportation Equity Short 1 682 868 268 798
Total 2 061 888 928 10 048 186
(a) These securities are fair valued. See Notes 2.2.6 and 10.
Contracts for Difference Summary Breakdowns:
CommitmentLong
CommitmentShort
Unrealisedof shortportfolio
Unrealisedof long portfolio
Realised result(monthly reset) Market Value
Counterparty USD USD USD USD USD USD
Barclays Bank Plc. 149 025 587 50 517 882 (2 482 074) 6 095 636 2 712 034 6 325 596Citibank N.A. 66 189 469 114 945 601 (1 303 996) 3 710 094 (1 192 294) 1 213 804Credit Suisse AG 15 896 289 63 744 703 1 967 455 171 990 (513 982) 1 625 463Credit Suisse Securities (Europe)Limited 22 032 669 67 765 815 (1 144 597) (401 471) 300 017 (1 246 051)Deutsche Bank AG 26 894 243 59 745 923 (1 391 735) 608 656 119 639 (663 440)Goldman Sachs International 131 777 425 286 997 270 (6 998 450) 2 501 409 991 071 (3 505 970)JPMorgan Chase Bank N.A. 169 814 717 87 219 181 (33 488) 1 998 369 2 489 146 4 454 027Merrill Lynch International BankLtd. 104 743 663 230 274 387 (1 334 349) (1 633 017) 4 395 647 1 428 281
109Lumyna Funds
Lumyna – Marshall Wace TOPS (Market Neutral)UCITS FundSchedule of investments as at March 31, 2021 (cont.)
The accompanying notes form an integral part of these financial statements.
Audited annual report
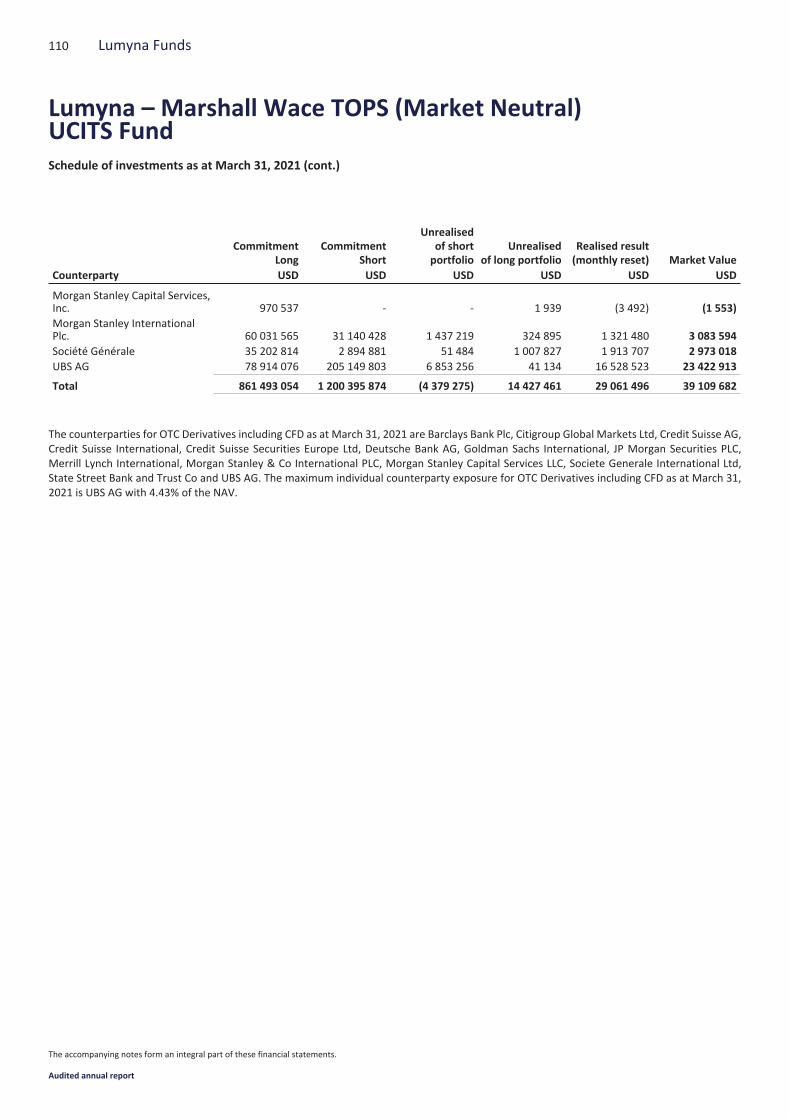
CommitmentLong
CommitmentShort
Unrealisedof shortportfolio
Unrealisedof long portfolio
Realised result(monthly reset) Market Value
Counterparty USD USD USD USD USD USD
Morgan Stanley Capital Services,Inc. 970 537 - - 1 939 (3 492) (1 553)Morgan Stanley InternationalPlc. 60 031 565 31 140 428 1 437 219 324 895 1 321 480 3 083 594Société Générale 35 202 814 2 894 881 51 484 1 007 827 1 913 707 2 973 018UBS AG 78 914 076 205 149 803 6 853 256 41 134 16 528 523 23 422 913
Total 861 493 054 1 200 395 874 (4 379 275) 14 427 461 29 061 496 39 109 682
The counterparties for OTC Derivatives including CFD as at March 31, 2021 are Barclays Bank Plc, Citigroup Global Markets Ltd, Credit Suisse AG,Credit Suisse International, Credit Suisse Securities Europe Ltd, Deutsche Bank AG, Goldman Sachs International, JP Morgan Securities PLC,Merrill Lynch International, Morgan Stanley & Co International PLC, Morgan Stanley Capital Services LLC, Societe Generale International Ltd,State Street Bank and Trust Co and UBS AG. The maximum individual counterparty exposure for OTC Derivatives including CFD as at March 31,2021 is UBS AG with 4.43% of the NAV.
110 Lumyna Funds
Lumyna – Marshall Wace TOPS (Market Neutral)UCITS FundSchedule of investments as at March 31, 2021 (cont.)
The accompanying notes form an integral part of these financial statements.
Audited annual report
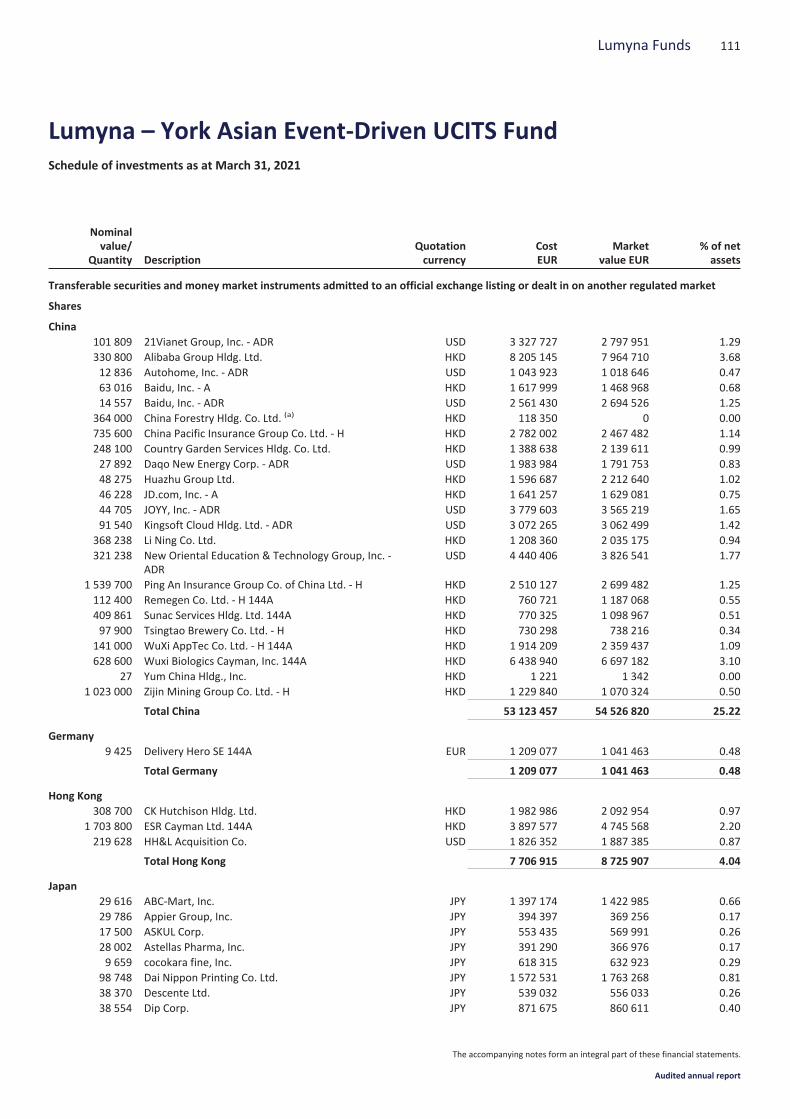
Nominalvalue/
Quantity DescriptionQuotationcurrency
CostEUR
Marketvalue EUR
% of netassets
Transferable securities and money market instruments admitted to an official exchange listing or dealt in on another regulated market
Shares
China101 809 21Vianet Group, Inc. - ADR USD 3 327 727 2 797 951 1.29330 800 Alibaba Group Hldg. Ltd. HKD 8 205 145 7 964 710 3.6812 836 Autohome, Inc. - ADR USD 1 043 923 1 018 646 0.4763 016 Baidu, Inc. - A HKD 1 617 999 1 468 968 0.6814 557 Baidu, Inc. - ADR USD 2 561 430 2 694 526 1.25
364 000 China Forestry Hldg. Co. Ltd. (a) HKD 118 350 0 0.00735 600 China Pacific Insurance Group Co. Ltd. - H HKD 2 782 002 2 467 482 1.14248 100 Country Garden Services Hldg. Co. Ltd. HKD 1 388 638 2 139 611 0.9927 892 Daqo New Energy Corp. - ADR USD 1 983 984 1 791 753 0.8348 275 Huazhu Group Ltd. HKD 1 596 687 2 212 640 1.0246 228 JD.com, Inc. - A HKD 1 641 257 1 629 081 0.7544 705 JOYY, Inc. - ADR USD 3 779 603 3 565 219 1.6591 540 Kingsoft Cloud Hldg. Ltd. - ADR USD 3 072 265 3 062 499 1.42
368 238 Li Ning Co. Ltd. HKD 1 208 360 2 035 175 0.94321 238 New Oriental Education & Technology Group, Inc. -
ADRUSD 4 440 406 3 826 541 1.77
1 539 700 Ping An Insurance Group Co. of China Ltd. - H HKD 2 510 127 2 699 482 1.25112 400 Remegen Co. Ltd. - H 144A HKD 760 721 1 187 068 0.55409 861 Sunac Services Hldg. Ltd. 144A HKD 770 325 1 098 967 0.5197 900 Tsingtao Brewery Co. Ltd. - H HKD 730 298 738 216 0.34
141 000 WuXi AppTec Co. Ltd. - H 144A HKD 1 914 209 2 359 437 1.09628 600 Wuxi Biologics Cayman, Inc. 144A HKD 6 438 940 6 697 182 3.10
27 Yum China Hldg., Inc. HKD 1 221 1 342 0.001 023 000 Zijin Mining Group Co. Ltd. - H HKD 1 229 840 1 070 324 0.50
Total China 53 123 457 54 526 820 25.22
Germany9 425 Delivery Hero SE 144A EUR 1 209 077 1 041 463 0.48
Total Germany 1 209 077 1 041 463 0.48
Hong Kong308 700 CK Hutchison Hldg. Ltd. HKD 1 982 986 2 092 954 0.97
1 703 800 ESR Cayman Ltd. 144A HKD 3 897 577 4 745 568 2.20219 628 HH&L Acquisition Co. USD 1 826 352 1 887 385 0.87
Total Hong Kong 7 706 915 8 725 907 4.04
Japan29 616 ABC-Mart, Inc. JPY 1 397 174 1 422 985 0.6629 786 Appier Group, Inc. JPY 394 397 369 256 0.1717 500 ASKUL Corp. JPY 553 435 569 991 0.2628 002 Astellas Pharma, Inc. JPY 391 290 366 976 0.179 659 cocokara fine, Inc. JPY 618 315 632 923 0.29
98 748 Dai Nippon Printing Co. Ltd. JPY 1 572 531 1 763 268 0.8138 370 Descente Ltd. JPY 539 032 556 033 0.2638 554 Dip Corp. JPY 871 675 860 611 0.40
111Lumyna Funds
Lumyna – York Asian Event-Driven UCITS FundSchedule of investments as at March 31, 2021
The accompanying notes form an integral part of these financial statements.
Audited annual report
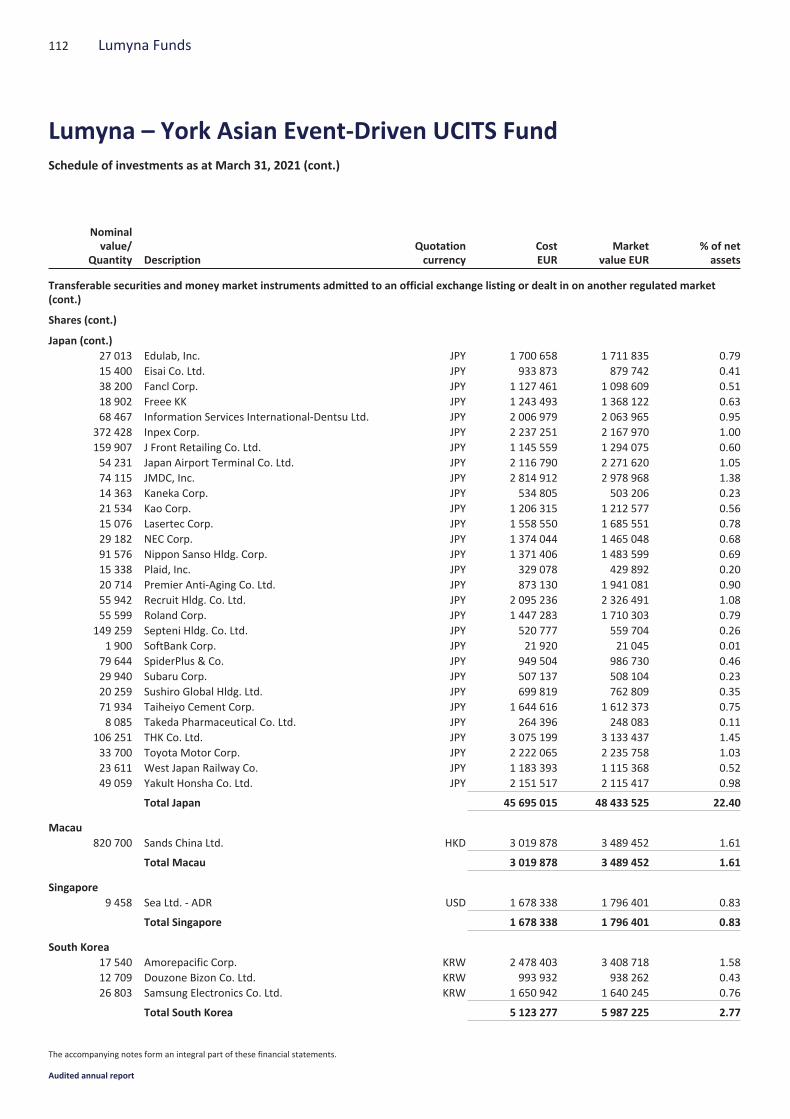
Nominalvalue/
Quantity DescriptionQuotationcurrency
CostEUR
Marketvalue EUR
% of netassets
Transferable securities and money market instruments admitted to an official exchange listing or dealt in on another regulated market(cont.)
Shares (cont.)
Japan (cont.)27 013 Edulab, Inc. JPY 1 700 658 1 711 835 0.7915 400 Eisai Co. Ltd. JPY 933 873 879 742 0.4138 200 Fancl Corp. JPY 1 127 461 1 098 609 0.5118 902 Freee KK JPY 1 243 493 1 368 122 0.6368 467 Information Services International-Dentsu Ltd. JPY 2 006 979 2 063 965 0.95
372 428 Inpex Corp. JPY 2 237 251 2 167 970 1.00159 907 J Front Retailing Co. Ltd. JPY 1 145 559 1 294 075 0.6054 231 Japan Airport Terminal Co. Ltd. JPY 2 116 790 2 271 620 1.0574 115 JMDC, Inc. JPY 2 814 912 2 978 968 1.3814 363 Kaneka Corp. JPY 534 805 503 206 0.2321 534 Kao Corp. JPY 1 206 315 1 212 577 0.5615 076 Lasertec Corp. JPY 1 558 550 1 685 551 0.7829 182 NEC Corp. JPY 1 374 044 1 465 048 0.6891 576 Nippon Sanso Hldg. Corp. JPY 1 371 406 1 483 599 0.6915 338 Plaid, Inc. JPY 329 078 429 892 0.2020 714 Premier Anti-Aging Co. Ltd. JPY 873 130 1 941 081 0.9055 942 Recruit Hldg. Co. Ltd. JPY 2 095 236 2 326 491 1.0855 599 Roland Corp. JPY 1 447 283 1 710 303 0.79
149 259 Septeni Hldg. Co. Ltd. JPY 520 777 559 704 0.261 900 SoftBank Corp. JPY 21 920 21 045 0.01
79 644 SpiderPlus & Co. JPY 949 504 986 730 0.4629 940 Subaru Corp. JPY 507 137 508 104 0.2320 259 Sushiro Global Hldg. Ltd. JPY 699 819 762 809 0.3571 934 Taiheiyo Cement Corp. JPY 1 644 616 1 612 373 0.758 085 Takeda Pharmaceutical Co. Ltd. JPY 264 396 248 083 0.11
106 251 THK Co. Ltd. JPY 3 075 199 3 133 437 1.4533 700 Toyota Motor Corp. JPY 2 222 065 2 235 758 1.0323 611 West Japan Railway Co. JPY 1 183 393 1 115 368 0.5249 059 Yakult Honsha Co. Ltd. JPY 2 151 517 2 115 417 0.98
Total Japan 45 695 015 48 433 525 22.40
Macau820 700 Sands China Ltd. HKD 3 019 878 3 489 452 1.61
Total Macau 3 019 878 3 489 452 1.61
Singapore9 458 Sea Ltd. - ADR USD 1 678 338 1 796 401 0.83
Total Singapore 1 678 338 1 796 401 0.83
South Korea17 540 Amorepacific Corp. KRW 2 478 403 3 408 718 1.5812 709 Douzone Bizon Co. Ltd. KRW 993 932 938 262 0.4326 803 Samsung Electronics Co. Ltd. KRW 1 650 942 1 640 245 0.76
Total South Korea 5 123 277 5 987 225 2.77
112 Lumyna Funds
Lumyna – York Asian Event-Driven UCITS FundSchedule of investments as at March 31, 2021 (cont.)
The accompanying notes form an integral part of these financial statements.
Audited annual report
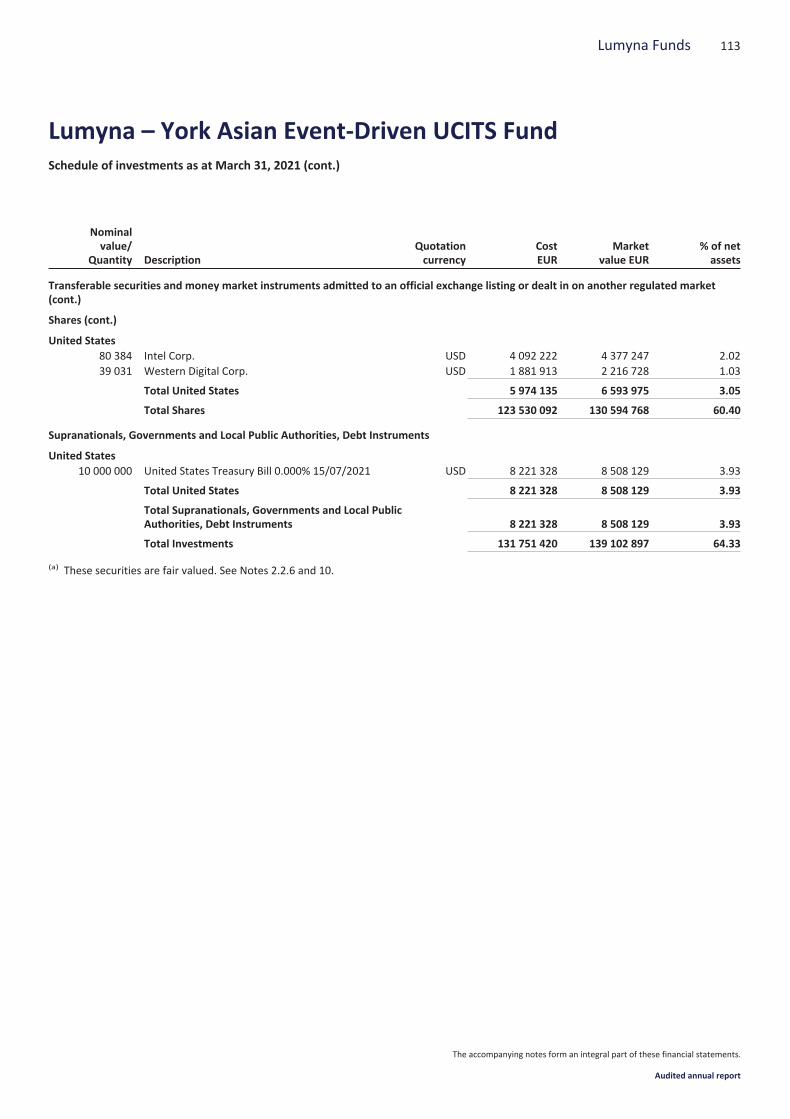
Nominalvalue/
Quantity DescriptionQuotationcurrency
CostEUR
Marketvalue EUR
% of netassets
Transferable securities and money market instruments admitted to an official exchange listing or dealt in on another regulated market(cont.)
Shares (cont.)
United States80 384 Intel Corp. USD 4 092 222 4 377 247 2.0239 031 Western Digital Corp. USD 1 881 913 2 216 728 1.03
Total United States 5 974 135 6 593 975 3.05
Total Shares 123 530 092 130 594 768 60.40
Supranationals, Governments and Local Public Authorities, Debt Instruments
United States10 000 000 United States Treasury Bill 0.000% 15/07/2021 USD 8 221 328 8 508 129 3.93
Total United States 8 221 328 8 508 129 3.93
Total Supranationals, Governments and Local PublicAuthorities, Debt Instruments 8 221 328 8 508 129 3.93
Total Investments 131 751 420 139 102 897 64.33
(a) These securities are fair valued. See Notes 2.2.6 and 10.
113Lumyna Funds
Lumyna – York Asian Event-Driven UCITS FundSchedule of investments as at March 31, 2021 (cont.)
The accompanying notes form an integral part of these financial statements.
Audited annual report
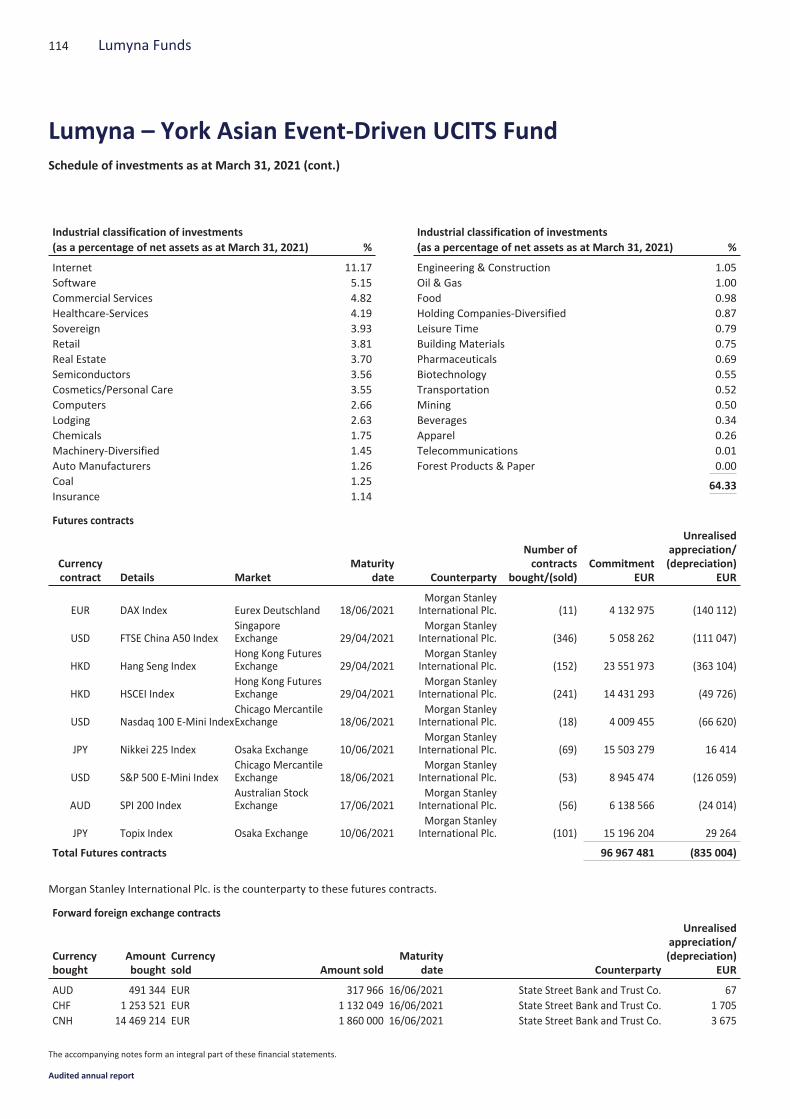
Industrial classification of investments(as a percentage of net assets as at March 31, 2021) %
Internet 11.17Software 5.15Commercial Services 4.82Healthcare-Services 4.19Sovereign 3.93Retail 3.81Real Estate 3.70Semiconductors 3.56Cosmetics/Personal Care 3.55Computers 2.66Lodging 2.63Chemicals 1.75Machinery-Diversified 1.45Auto Manufacturers 1.26Coal 1.25Insurance 1.14
Industrial classification of investments(as a percentage of net assets as at March 31, 2021) %
Engineering & Construction 1.05Oil & Gas 1.00Food 0.98Holding Companies-Diversified 0.87Leisure Time 0.79Building Materials 0.75Pharmaceuticals 0.69Biotechnology 0.55Transportation 0.52Mining 0.50Beverages 0.34Apparel 0.26Telecommunications 0.01Forest Products & Paper 0.00
64.33
Futures contracts
Currencycontract Details Market
Maturitydate Counterparty
Number ofcontracts
bought/(sold)Commitment
EUR
Unrealisedappreciation/(depreciation)
EUR
EUR DAX Index Eurex Deutschland 18/06/2021Morgan Stanley
International Plc. (11) 4 132 975 (140 112)
USD FTSE China A50 IndexSingaporeExchange 29/04/2021
Morgan StanleyInternational Plc. (346) 5 058 262 (111 047)
HKD Hang Seng IndexHong Kong FuturesExchange 29/04/2021
Morgan StanleyInternational Plc. (152) 23 551 973 (363 104)
HKD HSCEI IndexHong Kong FuturesExchange 29/04/2021
Morgan StanleyInternational Plc. (241) 14 431 293 (49 726)
USD Nasdaq 100 E-Mini IndexChicago MercantileExchange 18/06/2021
Morgan StanleyInternational Plc. (18) 4 009 455 (66 620)
JPY Nikkei 225 Index Osaka Exchange 10/06/2021Morgan Stanley
International Plc. (69) 15 503 279 16 414
USD S&P 500 E-Mini IndexChicago MercantileExchange 18/06/2021
Morgan StanleyInternational Plc. (53) 8 945 474 (126 059)
AUD SPI 200 IndexAustralian StockExchange 17/06/2021
Morgan StanleyInternational Plc. (56) 6 138 566 (24 014)
JPY Topix Index Osaka Exchange 10/06/2021Morgan Stanley
International Plc. (101) 15 196 204 29 264
Total Futures contracts 96 967 481 (835 004)
Morgan Stanley International Plc. is the counterparty to these futures contracts.
Forward foreign exchange contracts
Currencybought
Amountbought
Currencysold Amount sold
Maturitydate Counterparty
Unrealisedappreciation/(depreciation)
EUR
AUD 491 344 EUR 317 966 16/06/2021 State Street Bank and Trust Co. 67CHF 1 253 521 EUR 1 132 049 16/06/2021 State Street Bank and Trust Co. 1 705CNH 14 469 214 EUR 1 860 000 16/06/2021 State Street Bank and Trust Co. 3 675
114 Lumyna Funds
Lumyna – York Asian Event-Driven UCITS FundSchedule of investments as at March 31, 2021 (cont.)
The accompanying notes form an integral part of these financial statements.
Audited annual report
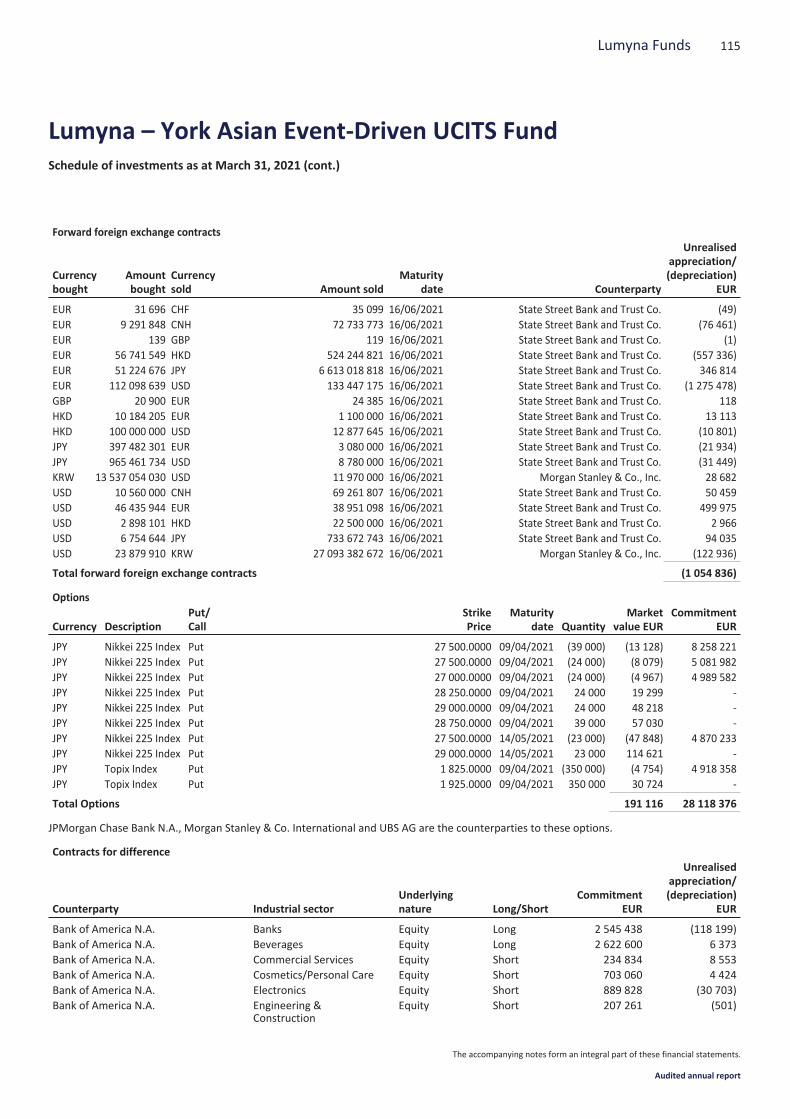
Forward foreign exchange contracts
Currencybought
Amountbought
Currencysold Amount sold
Maturitydate Counterparty
Unrealisedappreciation/(depreciation)
EUR
EUR 31 696 CHF 35 099 16/06/2021 State Street Bank and Trust Co. (49)EUR 9 291 848 CNH 72 733 773 16/06/2021 State Street Bank and Trust Co. (76 461)EUR 139 GBP 119 16/06/2021 State Street Bank and Trust Co. (1)EUR 56 741 549 HKD 524 244 821 16/06/2021 State Street Bank and Trust Co. (557 336)EUR 51 224 676 JPY 6 613 018 818 16/06/2021 State Street Bank and Trust Co. 346 814EUR 112 098 639 USD 133 447 175 16/06/2021 State Street Bank and Trust Co. (1 275 478)GBP 20 900 EUR 24 385 16/06/2021 State Street Bank and Trust Co. 118HKD 10 184 205 EUR 1 100 000 16/06/2021 State Street Bank and Trust Co. 13 113HKD 100 000 000 USD 12 877 645 16/06/2021 State Street Bank and Trust Co. (10 801)JPY 397 482 301 EUR 3 080 000 16/06/2021 State Street Bank and Trust Co. (21 934)JPY 965 461 734 USD 8 780 000 16/06/2021 State Street Bank and Trust Co. (31 449)KRW 13 537 054 030 USD 11 970 000 16/06/2021 Morgan Stanley & Co., Inc. 28 682USD 10 560 000 CNH 69 261 807 16/06/2021 State Street Bank and Trust Co. 50 459USD 46 435 944 EUR 38 951 098 16/06/2021 State Street Bank and Trust Co. 499 975USD 2 898 101 HKD 22 500 000 16/06/2021 State Street Bank and Trust Co. 2 966USD 6 754 644 JPY 733 672 743 16/06/2021 State Street Bank and Trust Co. 94 035USD 23 879 910 KRW 27 093 382 672 16/06/2021 Morgan Stanley & Co., Inc. (122 936)
Total forward foreign exchange contracts (1 054 836)
Options
Currency DescriptionPut/Call
StrikePrice
Maturitydate Quantity
Marketvalue EUR
CommitmentEUR
JPY Nikkei 225 Index Put 27 500.0000 09/04/2021 (39 000) (13 128) 8 258 221JPY Nikkei 225 Index Put 27 500.0000 09/04/2021 (24 000) (8 079) 5 081 982JPY Nikkei 225 Index Put 27 000.0000 09/04/2021 (24 000) (4 967) 4 989 582JPY Nikkei 225 Index Put 28 250.0000 09/04/2021 24 000 19 299 -JPY Nikkei 225 Index Put 29 000.0000 09/04/2021 24 000 48 218 -JPY Nikkei 225 Index Put 28 750.0000 09/04/2021 39 000 57 030 -JPY Nikkei 225 Index Put 27 500.0000 14/05/2021 (23 000) (47 848) 4 870 233JPY Nikkei 225 Index Put 29 000.0000 14/05/2021 23 000 114 621 -JPY Topix Index Put 1 825.0000 09/04/2021 (350 000) (4 754) 4 918 358JPY Topix Index Put 1 925.0000 09/04/2021 350 000 30 724 -
Total Options 191 116 28 118 376
JPMorgan Chase Bank N.A., Morgan Stanley & Co. International and UBS AG are the counterparties to these options.
Contracts for difference
Counterparty Industrial sectorUnderlyingnature Long/Short
CommitmentEUR
Unrealisedappreciation/(depreciation)
EUR
Bank of America N.A. Banks Equity Long 2 545 438 (118 199)Bank of America N.A. Beverages Equity Long 2 622 600 6 373Bank of America N.A. Commercial Services Equity Short 234 834 8 553Bank of America N.A. Cosmetics/Personal Care Equity Short 703 060 4 424Bank of America N.A. Electronics Equity Short 889 828 (30 703)Bank of America N.A. Engineering &
ConstructionEquity Short 207 261 (501)
115Lumyna Funds
Lumyna – York Asian Event-Driven UCITS FundSchedule of investments as at March 31, 2021 (cont.)
The accompanying notes form an integral part of these financial statements.
Audited annual report
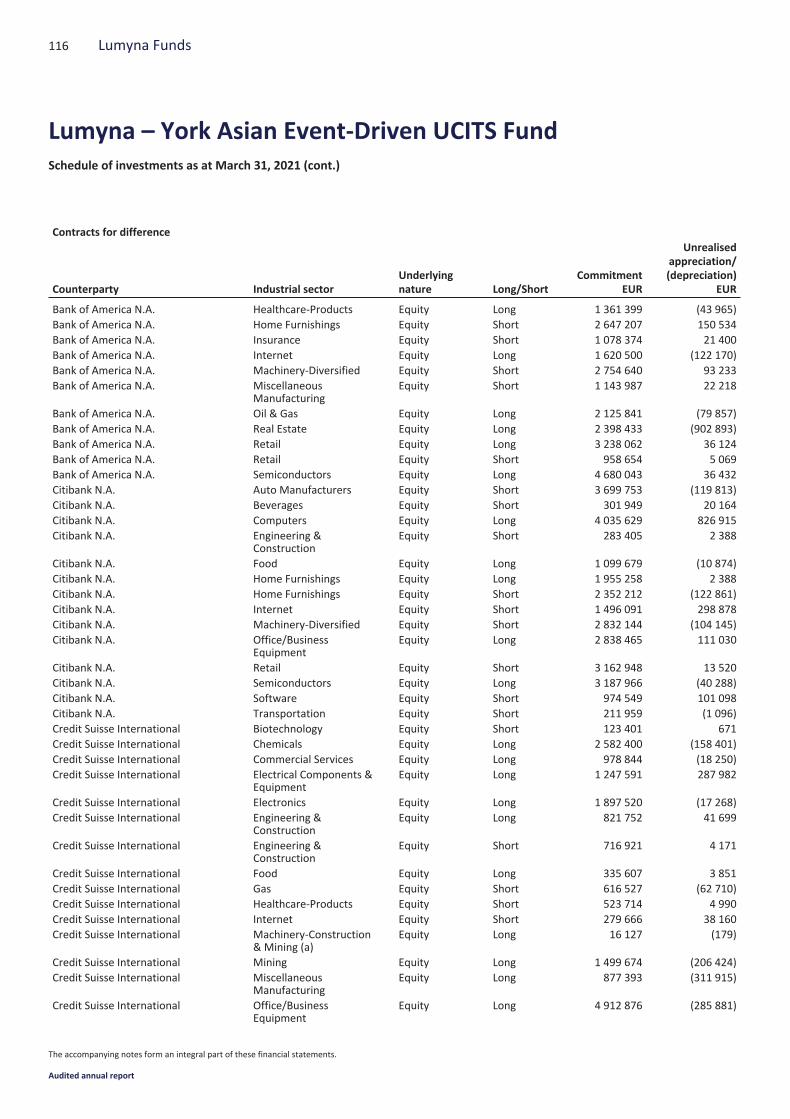
Contracts for difference
Counterparty Industrial sectorUnderlyingnature Long/Short
CommitmentEUR
Unrealisedappreciation/(depreciation)
EUR
Bank of America N.A. Healthcare-Products Equity Long 1 361 399 (43 965)Bank of America N.A. Home Furnishings Equity Short 2 647 207 150 534Bank of America N.A. Insurance Equity Short 1 078 374 21 400Bank of America N.A. Internet Equity Long 1 620 500 (122 170)Bank of America N.A. Machinery-Diversified Equity Short 2 754 640 93 233Bank of America N.A. Miscellaneous
ManufacturingEquity Short 1 143 987 22 218
Bank of America N.A. Oil & Gas Equity Long 2 125 841 (79 857)Bank of America N.A. Real Estate Equity Long 2 398 433 (902 893)Bank of America N.A. Retail Equity Long 3 238 062 36 124Bank of America N.A. Retail Equity Short 958 654 5 069Bank of America N.A. Semiconductors Equity Long 4 680 043 36 432Citibank N.A. Auto Manufacturers Equity Short 3 699 753 (119 813)Citibank N.A. Beverages Equity Short 301 949 20 164Citibank N.A. Computers Equity Long 4 035 629 826 915Citibank N.A. Engineering &
ConstructionEquity Short 283 405 2 388
Citibank N.A. Food Equity Long 1 099 679 (10 874)Citibank N.A. Home Furnishings Equity Long 1 955 258 2 388Citibank N.A. Home Furnishings Equity Short 2 352 212 (122 861)Citibank N.A. Internet Equity Short 1 496 091 298 878Citibank N.A. Machinery-Diversified Equity Short 2 832 144 (104 145)Citibank N.A. Office/Business
EquipmentEquity Long 2 838 465 111 030
Citibank N.A. Retail Equity Short 3 162 948 13 520Citibank N.A. Semiconductors Equity Long 3 187 966 (40 288)Citibank N.A. Software Equity Short 974 549 101 098Citibank N.A. Transportation Equity Short 211 959 (1 096)Credit Suisse International Biotechnology Equity Short 123 401 671Credit Suisse International Chemicals Equity Long 2 582 400 (158 401)Credit Suisse International Commercial Services Equity Long 978 844 (18 250)Credit Suisse International Electrical Components &
EquipmentEquity Long 1 247 591 287 982
Credit Suisse International Electronics Equity Long 1 897 520 (17 268)Credit Suisse International Engineering &
ConstructionEquity Long 821 752 41 699
Credit Suisse International Engineering &Construction
Equity Short 716 921 4 171
Credit Suisse International Food Equity Long 335 607 3 851Credit Suisse International Gas Equity Short 616 527 (62 710)Credit Suisse International Healthcare-Products Equity Short 523 714 4 990Credit Suisse International Internet Equity Short 279 666 38 160Credit Suisse International Machinery-Construction
& Mining (a)Equity Long 16 127 (179)
Credit Suisse International Mining Equity Long 1 499 674 (206 424)Credit Suisse International Miscellaneous
ManufacturingEquity Long 877 393 (311 915)
Credit Suisse International Office/BusinessEquipment
Equity Long 4 912 876 (285 881)
116 Lumyna Funds
Lumyna – York Asian Event-Driven UCITS FundSchedule of investments as at March 31, 2021 (cont.)
The accompanying notes form an integral part of these financial statements.
Audited annual report
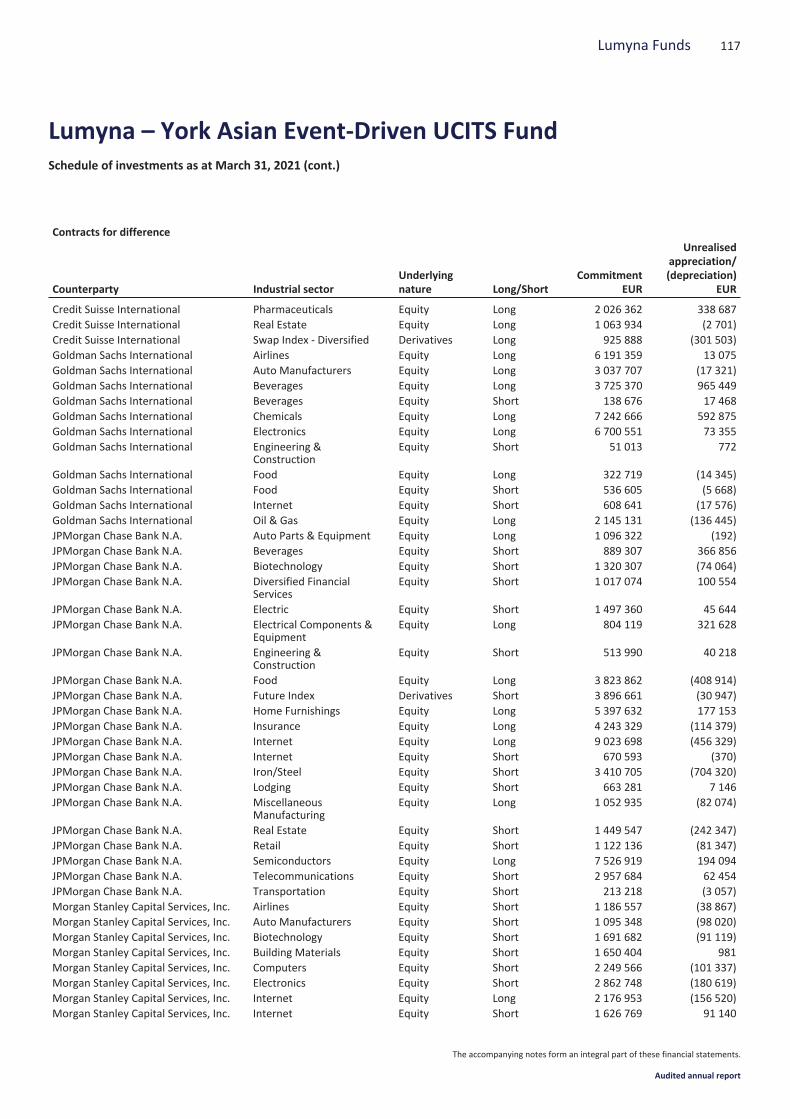
Contracts for difference
Counterparty Industrial sectorUnderlyingnature Long/Short
CommitmentEUR
Unrealisedappreciation/(depreciation)
EUR
Credit Suisse International Pharmaceuticals Equity Long 2 026 362 338 687Credit Suisse International Real Estate Equity Long 1 063 934 (2 701)Credit Suisse International Swap Index - Diversified Derivatives Long 925 888 (301 503)Goldman Sachs International Airlines Equity Long 6 191 359 13 075Goldman Sachs International Auto Manufacturers Equity Long 3 037 707 (17 321)Goldman Sachs International Beverages Equity Long 3 725 370 965 449Goldman Sachs International Beverages Equity Short 138 676 17 468Goldman Sachs International Chemicals Equity Long 7 242 666 592 875Goldman Sachs International Electronics Equity Long 6 700 551 73 355Goldman Sachs International Engineering &
ConstructionEquity Short 51 013 772
Goldman Sachs International Food Equity Long 322 719 (14 345)Goldman Sachs International Food Equity Short 536 605 (5 668)Goldman Sachs International Internet Equity Short 608 641 (17 576)Goldman Sachs International Oil & Gas Equity Long 2 145 131 (136 445)JPMorgan Chase Bank N.A. Auto Parts & Equipment Equity Long 1 096 322 (192)JPMorgan Chase Bank N.A. Beverages Equity Short 889 307 366 856JPMorgan Chase Bank N.A. Biotechnology Equity Short 1 320 307 (74 064)JPMorgan Chase Bank N.A. Diversified Financial
ServicesEquity Short 1 017 074 100 554
JPMorgan Chase Bank N.A. Electric Equity Short 1 497 360 45 644JPMorgan Chase Bank N.A. Electrical Components &
EquipmentEquity Long 804 119 321 628
JPMorgan Chase Bank N.A. Engineering &Construction
Equity Short 513 990 40 218
JPMorgan Chase Bank N.A. Food Equity Long 3 823 862 (408 914)JPMorgan Chase Bank N.A. Future Index Derivatives Short 3 896 661 (30 947)JPMorgan Chase Bank N.A. Home Furnishings Equity Long 5 397 632 177 153JPMorgan Chase Bank N.A. Insurance Equity Long 4 243 329 (114 379)JPMorgan Chase Bank N.A. Internet Equity Long 9 023 698 (456 329)JPMorgan Chase Bank N.A. Internet Equity Short 670 593 (370)JPMorgan Chase Bank N.A. Iron/Steel Equity Short 3 410 705 (704 320)JPMorgan Chase Bank N.A. Lodging Equity Short 663 281 7 146JPMorgan Chase Bank N.A. Miscellaneous
ManufacturingEquity Long 1 052 935 (82 074)
JPMorgan Chase Bank N.A. Real Estate Equity Short 1 449 547 (242 347)JPMorgan Chase Bank N.A. Retail Equity Short 1 122 136 (81 347)JPMorgan Chase Bank N.A. Semiconductors Equity Long 7 526 919 194 094JPMorgan Chase Bank N.A. Telecommunications Equity Short 2 957 684 62 454JPMorgan Chase Bank N.A. Transportation Equity Short 213 218 (3 057)Morgan Stanley Capital Services, Inc. Airlines Equity Short 1 186 557 (38 867)Morgan Stanley Capital Services, Inc. Auto Manufacturers Equity Short 1 095 348 (98 020)Morgan Stanley Capital Services, Inc. Biotechnology Equity Short 1 691 682 (91 119)Morgan Stanley Capital Services, Inc. Building Materials Equity Short 1 650 404 981Morgan Stanley Capital Services, Inc. Computers Equity Short 2 249 566 (101 337)Morgan Stanley Capital Services, Inc. Electronics Equity Short 2 862 748 (180 619)Morgan Stanley Capital Services, Inc. Internet Equity Long 2 176 953 (156 520)Morgan Stanley Capital Services, Inc. Internet Equity Short 1 626 769 91 140
117Lumyna Funds
Lumyna – York Asian Event-Driven UCITS FundSchedule of investments as at March 31, 2021 (cont.)
The accompanying notes form an integral part of these financial statements.
Audited annual report

Contracts for difference
Counterparty Industrial sectorUnderlyingnature Long/Short
CommitmentEUR
Unrealisedappreciation/(depreciation)
EUR
Morgan Stanley Capital Services, Inc. Iron/Steel Equity Short 3 017 887 (619 627)Morgan Stanley Capital Services, Inc. Lodging Equity Short 1 003 083 34 095Morgan Stanley Capital Services, Inc. Machinery-Diversified Equity Short 1 625 726 16 227Morgan Stanley Capital Services, Inc. Mining Equity Long 1 517 564 48 714Morgan Stanley Capital Services, Inc. Mining Equity Short 1 515 091 (55 812)Morgan Stanley Capital Services, Inc. Real Estate Equity Short 3 337 840 (275 835)Morgan Stanley Capital Services, Inc. REITS Equity Short 2 883 187 (88 518)Morgan Stanley Capital Services, Inc. Retail Equity Short 2 644 177 746Morgan Stanley Capital Services, Inc. Software Equity Long 2 582 909 (447 275)Morgan Stanley Capital Services, Inc. Software Equity Short 4 646 828 562 755Morgan Stanley Capital Services, Inc. Swap Index - Diversified Derivatives Short 13 374 946 (531 028)UBS AG Airlines Equity Long 2 023 602 (13 481)UBS AG Beverages Equity Long 3 796 811 41 652UBS AG Chemicals Equity Short 2 148 395 75 426UBS AG Commercial Services Equity Short 909 147 145 923UBS AG Diversified Financial
ServicesEquity Long 554 952 48 443
UBS AG Diversified FinancialServices
Equity Short 370 079 60 894
UBS AG Electronics Equity Long 5 921 069 645 499UBS AG Engineering &
ConstructionEquity Short 1 064 397 (40 145)
UBS AG Internet Equity Long 703 681 (108 246)UBS AG Iron/Steel Equity Long 14 572 076 2 025 692UBS AG Leisure Time Equity Short 303 712 25 090UBS AG Office/Business
EquipmentEquity Long 24 584 (499)
UBS AG Oil & Gas Equity Long 4 724 537 (123 895)UBS AG Pharmaceuticals Equity Long 3 441 664 (96 637)UBS AG Retail Equity Short 943 160 (100 878)UBS AG Swap Index - Diversified Derivatives Short 2 052 804 (11 786)UBS AG Telecommunications Equity Long 1 093 827 1 932UBS AG Telecommunications Equity Short 539 676 (59 164)UBS AG Toys/Games/Hobbies Equity Short 745 315 (37 395)UBS AG Transportation Equity Long 565 517 (47 885)
Total 263 567 752 508 022
(a) These securities are fair valued. See Notes 2.2.6 and 10.
Contracts for Difference Summary Breakdowns:
CommitmentLong
CommitmentShort
Unrealisedof shortportfolio
Unrealisedof long portfolio
Realised result(monthly reset) Market Value
Counterparty EUR EUR EUR EUR EUR EUR
Bank of America N.A. 20 592 316 10 617 845 274 227 (1 188 155) 20 850 (893 078)Citibank N.A. 13 116 997 15 315 010 88 133 889 171 508 321 1 485 625Credit Suisse International 19 185 968 2 260 229 (14 718) (630 303) 342 495 (302 526)
118 Lumyna Funds
Lumyna – York Asian Event-Driven UCITS FundSchedule of investments as at March 31, 2021 (cont.)
The accompanying notes form an integral part of these financial statements.
Audited annual report
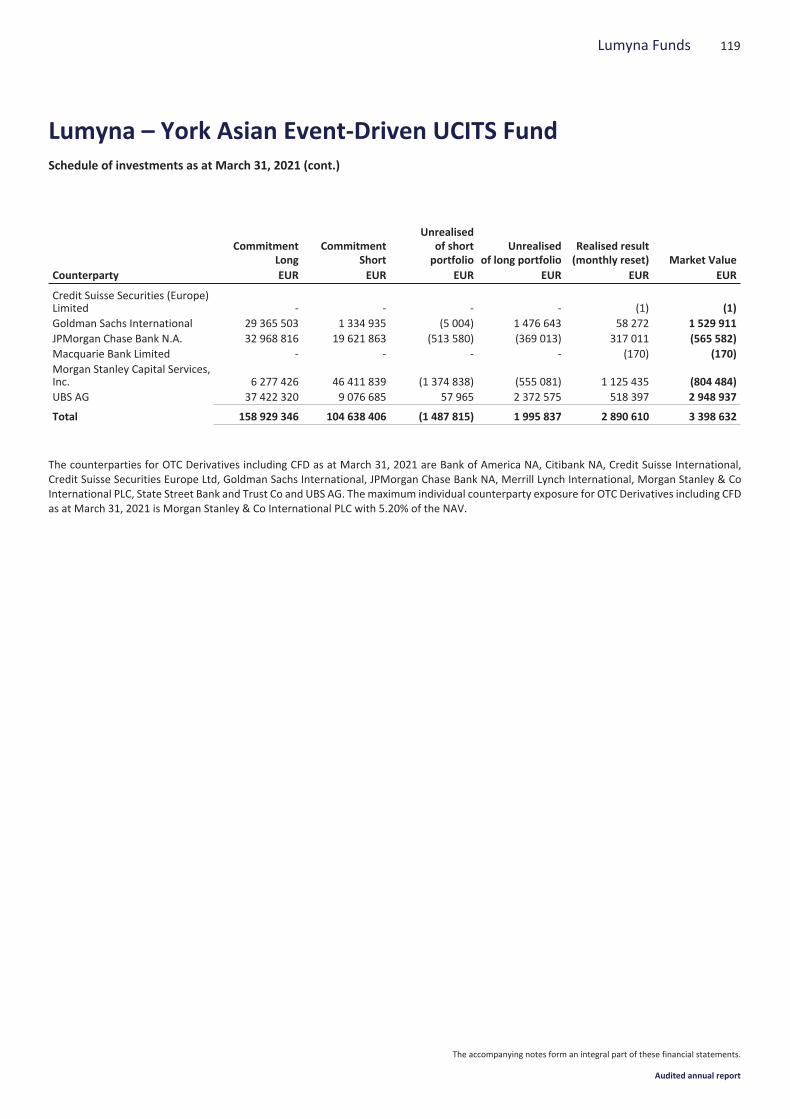
CommitmentLong
CommitmentShort
Unrealisedof shortportfolio
Unrealisedof long portfolio
Realised result(monthly reset) Market Value
Counterparty EUR EUR EUR EUR EUR EUR
Credit Suisse Securities (Europe)Limited - - - - (1) (1)Goldman Sachs International 29 365 503 1 334 935 (5 004) 1 476 643 58 272 1 529 911JPMorgan Chase Bank N.A. 32 968 816 19 621 863 (513 580) (369 013) 317 011 (565 582)Macquarie Bank Limited - - - - (170) (170)Morgan Stanley Capital Services,Inc. 6 277 426 46 411 839 (1 374 838) (555 081) 1 125 435 (804 484)UBS AG 37 422 320 9 076 685 57 965 2 372 575 518 397 2 948 937
Total 158 929 346 104 638 406 (1 487 815) 1 995 837 2 890 610 3 398 632
The counterparties for OTC Derivatives including CFD as at March 31, 2021 are Bank of America NA, Citibank NA, Credit Suisse International,Credit Suisse Securities Europe Ltd, Goldman Sachs International, JPMorgan Chase Bank NA, Merrill Lynch International, Morgan Stanley & CoInternational PLC, State Street Bank and Trust Co and UBS AG. Themaximum individual counterparty exposure for OTC Derivatives including CFDas at March 31, 2021 is Morgan Stanley & Co International PLC with 5.20% of the NAV.
119Lumyna Funds
Lumyna – York Asian Event-Driven UCITS FundSchedule of investments as at March 31, 2021 (cont.)
The accompanying notes form an integral part of these financial statements.
Audited annual report

Nominalvalue Description
Quotationcurrency
CostEUR
Marketvalue EUR
% of netassets
Transferable securities and money market instruments admitted to an official exchange listing or dealt in on another regulated market
Supranationals, Governments and Local Public Authorities, Debt Instruments
Germany1 000 Bundesrepublik Deutschland Bundesanleihe - Reg
1.500% 15/02/2023EUR 996 1 041 0.00
1 000 Bundesrepublik Deutschland Bundesanleihe - Reg1.500% 15/05/2023
EUR 994 1 047 0.00
1 000 Bundesrepublik Deutschland Bundesanleihe - Reg2.000% 15/08/2023
EUR 1 003 1 065 0.00
1 000 Bundesrepublik Deutschland Bundesanleihe - Reg5.625% 04/01/2028
EUR 1 188 1 427 0.00
1 000 Bundesrepublik Deutschland Bundesanleihe - Reg6.250% 04/01/2024
EUR 1 111 1 194 0.00
1 000 Bundesrepublik Deutschland Bundesanleihe - Reg6.500% 04/07/2027
EUR 1 228 1 453 0.01
Total Germany 6 520 7 227 0.01
Total Supranationals, Governments and Local PublicAuthorities, Debt Instruments 6 520 7 227 0.01
Total Investments 6 520 7 227 0.01
Repurchase Agreement
Notional DescriptionCurrency Nominal value
EURMarket value
EUR% of netassets
82 840 000 Union Weekly -0.685% 07/04/2021 31/03/2050 EUR 82 840 000 82 840 000 94.90
Total Repurchase Agreement 82 840 000 82 840 000 94.90
120 Lumyna Funds
Lumyna – BOFA Enhanced Equity VolatilityPremium UCITS FundSchedule of investments as at March 31, 2021
The accompanying notes form an integral part of these financial statements.
Audited annual report
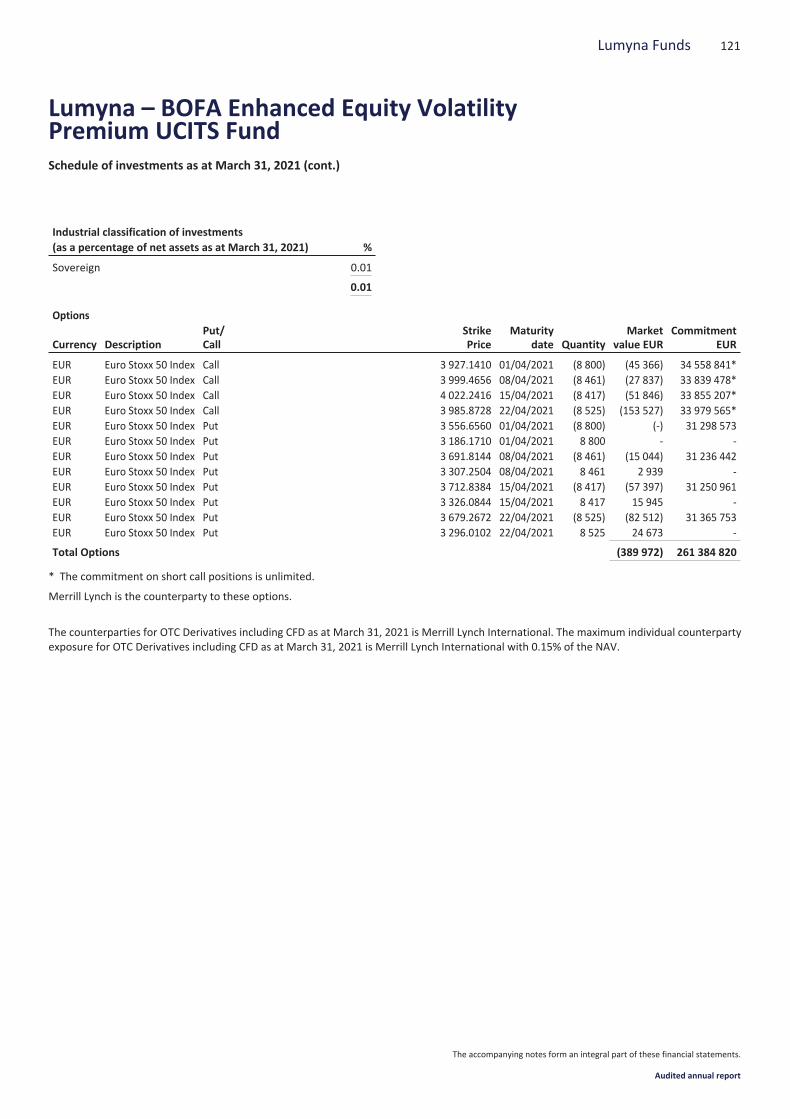
Industrial classification of investments(as a percentage of net assets as at March 31, 2021) %
Sovereign 0.01
0.01
Options
Currency DescriptionPut/Call
StrikePrice
Maturitydate Quantity
Marketvalue EUR
CommitmentEUR
EUR Euro Stoxx 50 Index Call 3 927.1410 01/04/2021 (8 800) (45 366) 34 558 841*EUR Euro Stoxx 50 Index Call 3 999.4656 08/04/2021 (8 461) (27 837) 33 839 478*EUR Euro Stoxx 50 Index Call 4 022.2416 15/04/2021 (8 417) (51 846) 33 855 207*EUR Euro Stoxx 50 Index Call 3 985.8728 22/04/2021 (8 525) (153 527) 33 979 565*EUR Euro Stoxx 50 Index Put 3 556.6560 01/04/2021 (8 800) (-) 31 298 573EUR Euro Stoxx 50 Index Put 3 186.1710 01/04/2021 8 800 - -EUR Euro Stoxx 50 Index Put 3 691.8144 08/04/2021 (8 461) (15 044) 31 236 442EUR Euro Stoxx 50 Index Put 3 307.2504 08/04/2021 8 461 2 939 -EUR Euro Stoxx 50 Index Put 3 712.8384 15/04/2021 (8 417) (57 397) 31 250 961EUR Euro Stoxx 50 Index Put 3 326.0844 15/04/2021 8 417 15 945 -EUR Euro Stoxx 50 Index Put 3 679.2672 22/04/2021 (8 525) (82 512) 31 365 753EUR Euro Stoxx 50 Index Put 3 296.0102 22/04/2021 8 525 24 673 -
Total Options (389 972) 261 384 820
* The commitment on short call positions is unlimited.
Merrill Lynch is the counterparty to these options.
The counterparties for OTC Derivatives including CFD as at March 31, 2021 is Merrill Lynch International. The maximum individual counterpartyexposure for OTC Derivatives including CFD as at March 31, 2021 is Merrill Lynch International with 0.15% of the NAV.
121Lumyna Funds
Lumyna – BOFA Enhanced Equity VolatilityPremium UCITS FundSchedule of investments as at March 31, 2021 (cont.)
The accompanying notes form an integral part of these financial statements.
Audited annual report
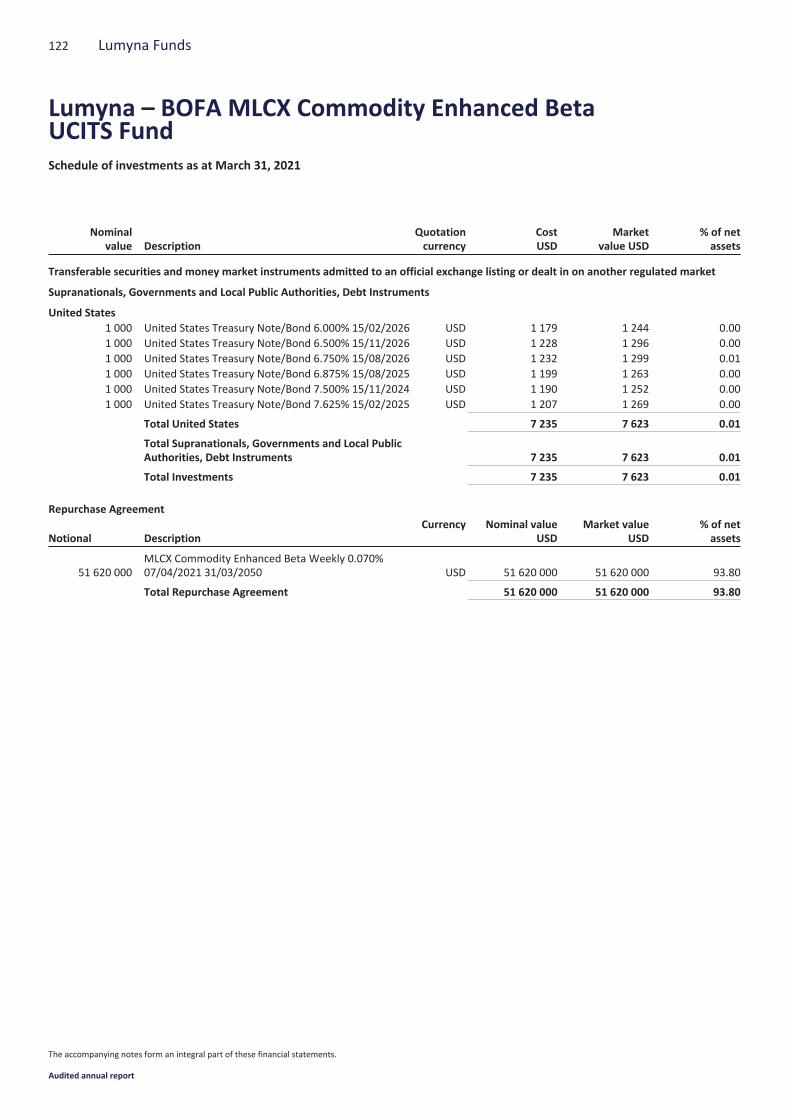
Nominalvalue Description
Quotationcurrency
CostUSD
Marketvalue USD
% of netassets
Transferable securities and money market instruments admitted to an official exchange listing or dealt in on another regulated market
Supranationals, Governments and Local Public Authorities, Debt Instruments
United States1 000 United States Treasury Note/Bond 6.000% 15/02/2026 USD 1 179 1 244 0.001 000 United States Treasury Note/Bond 6.500% 15/11/2026 USD 1 228 1 296 0.001 000 United States Treasury Note/Bond 6.750% 15/08/2026 USD 1 232 1 299 0.011 000 United States Treasury Note/Bond 6.875% 15/08/2025 USD 1 199 1 263 0.001 000 United States Treasury Note/Bond 7.500% 15/11/2024 USD 1 190 1 252 0.001 000 United States Treasury Note/Bond 7.625% 15/02/2025 USD 1 207 1 269 0.00
Total United States 7 235 7 623 0.01
Total Supranationals, Governments and Local PublicAuthorities, Debt Instruments 7 235 7 623 0.01
Total Investments 7 235 7 623 0.01
Repurchase Agreement
Notional DescriptionCurrency Nominal value
USDMarket value
USD% of netassets
51 620 000MLCX Commodity Enhanced Beta Weekly 0.070%07/04/2021 31/03/2050 USD 51 620 000 51 620 000 93.80
Total Repurchase Agreement 51 620 000 51 620 000 93.80
122 Lumyna Funds
Lumyna – BOFA MLCX Commodity Enhanced BetaUCITS FundSchedule of investments as at March 31, 2021
The accompanying notes form an integral part of these financial statements.
Audited annual report
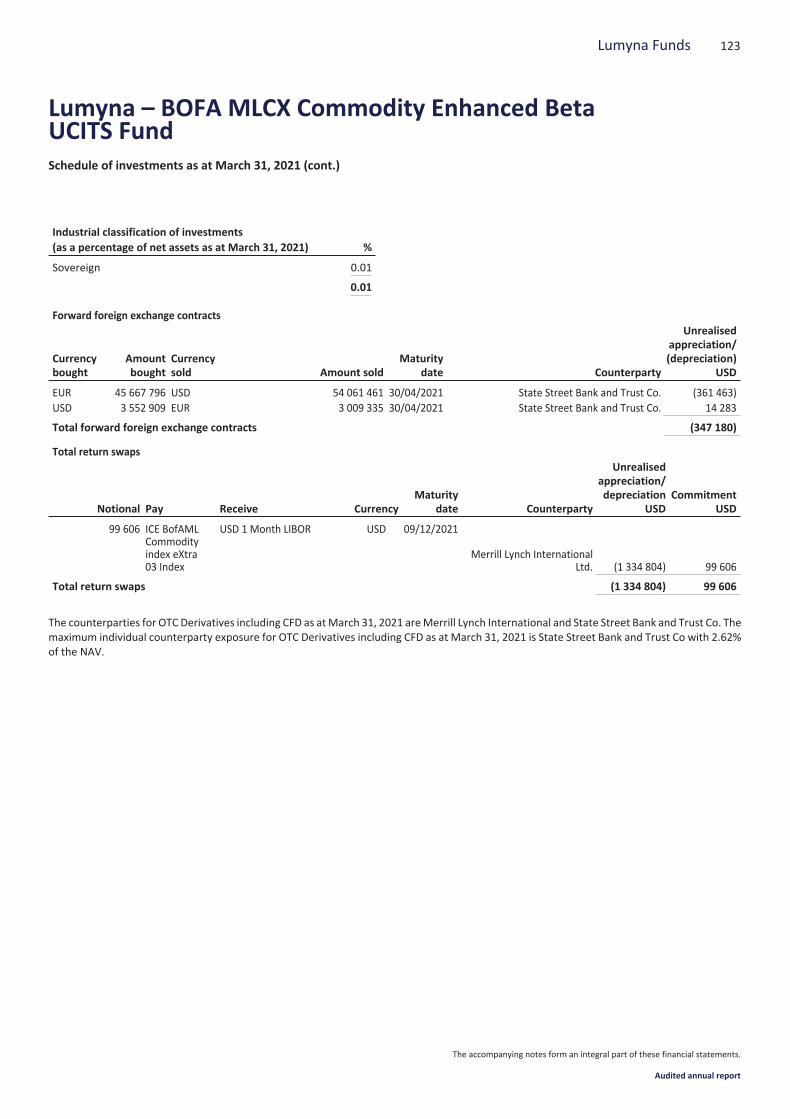
Industrial classification of investments(as a percentage of net assets as at March 31, 2021) %
Sovereign 0.01
0.01
Forward foreign exchange contracts
Currencybought
Amountbought
Currencysold Amount sold
Maturitydate Counterparty
Unrealisedappreciation/(depreciation)
USD
EUR 45 667 796 USD 54 061 461 30/04/2021 State Street Bank and Trust Co. (361 463)USD 3 552 909 EUR 3 009 335 30/04/2021 State Street Bank and Trust Co. 14 283
Total forward foreign exchange contracts (347 180)
Total return swaps
Notional Pay Receive CurrencyMaturity
date Counterparty
Unrealisedappreciation/depreciation
USDCommitment
USD
99 606 ICE BofAMLCommodityindex eXtra03 Index
USD 1 Month LIBOR USD 09/12/2021
Merrill Lynch InternationalLtd. (1 334 804) 99 606
Total return swaps (1 334 804) 99 606
The counterparties for OTC Derivatives including CFD as atMarch 31, 2021 areMerrill Lynch International and State Street Bank and Trust Co. Themaximum individual counterparty exposure for OTC Derivatives including CFD as at March 31, 2021 is State Street Bank and Trust Co with 2.62%of the NAV.
123Lumyna Funds
Lumyna – BOFA MLCX Commodity Enhanced BetaUCITS FundSchedule of investments as at March 31, 2021 (cont.)
The accompanying notes form an integral part of these financial statements.
Audited annual report
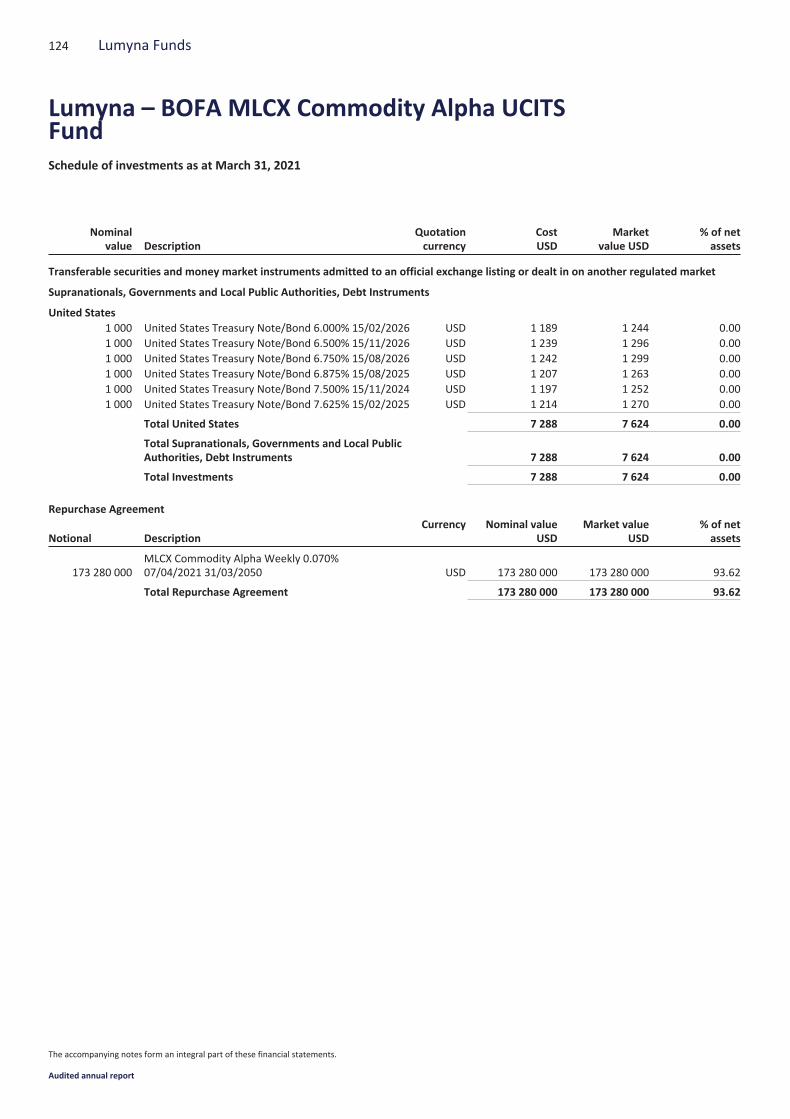
Nominalvalue Description
Quotationcurrency
CostUSD
Marketvalue USD
% of netassets
Transferable securities and money market instruments admitted to an official exchange listing or dealt in on another regulated market
Supranationals, Governments and Local Public Authorities, Debt Instruments
United States1 000 United States Treasury Note/Bond 6.000% 15/02/2026 USD 1 189 1 244 0.001 000 United States Treasury Note/Bond 6.500% 15/11/2026 USD 1 239 1 296 0.001 000 United States Treasury Note/Bond 6.750% 15/08/2026 USD 1 242 1 299 0.001 000 United States Treasury Note/Bond 6.875% 15/08/2025 USD 1 207 1 263 0.001 000 United States Treasury Note/Bond 7.500% 15/11/2024 USD 1 197 1 252 0.001 000 United States Treasury Note/Bond 7.625% 15/02/2025 USD 1 214 1 270 0.00
Total United States 7 288 7 624 0.00
Total Supranationals, Governments and Local PublicAuthorities, Debt Instruments 7 288 7 624 0.00
Total Investments 7 288 7 624 0.00
Repurchase Agreement
Notional DescriptionCurrency Nominal value
USDMarket value
USD% of netassets
173 280 000MLCX Commodity Alpha Weekly 0.070%07/04/2021 31/03/2050 USD 173 280 000 173 280 000 93.62
Total Repurchase Agreement 173 280 000 173 280 000 93.62
124 Lumyna Funds
Lumyna – BOFA MLCX Commodity Alpha UCITSFundSchedule of investments as at March 31, 2021
The accompanying notes form an integral part of these financial statements.
Audited annual report
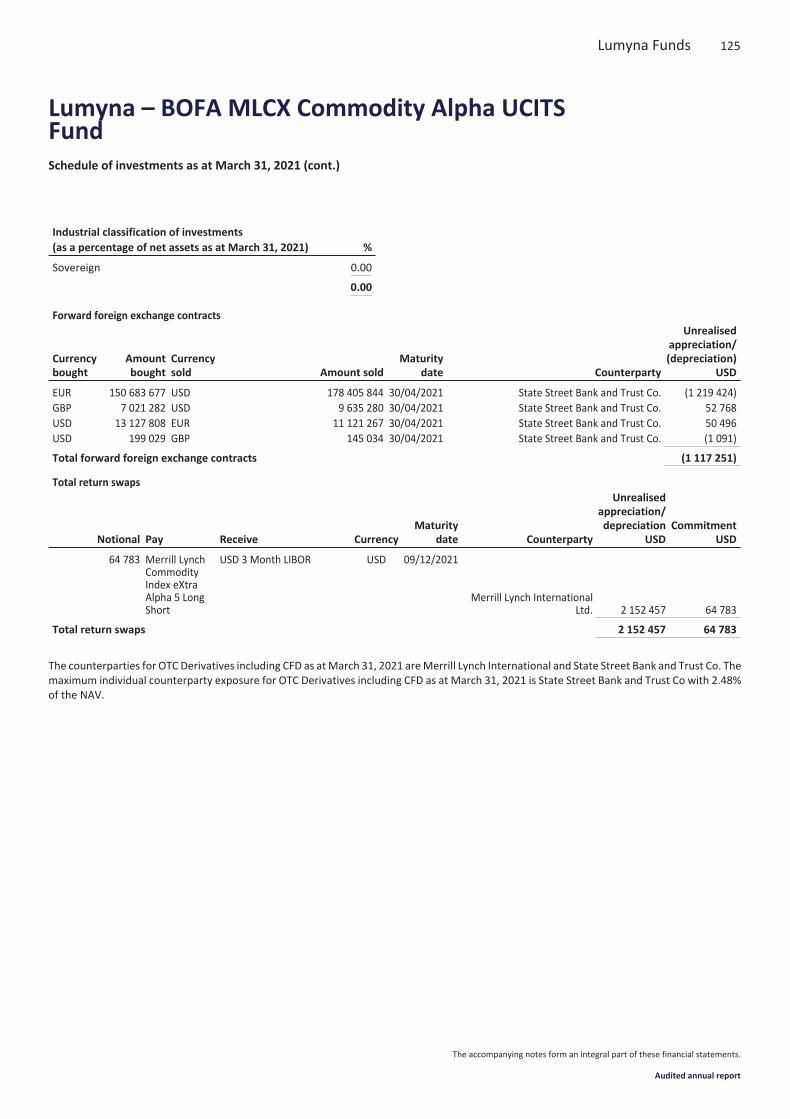
Industrial classification of investments(as a percentage of net assets as at March 31, 2021) %
Sovereign 0.00
0.00
Forward foreign exchange contracts
Currencybought
Amountbought
Currencysold Amount sold
Maturitydate Counterparty
Unrealisedappreciation/(depreciation)
USD
EUR 150 683 677 USD 178 405 844 30/04/2021 State Street Bank and Trust Co. (1 219 424)GBP 7 021 282 USD 9 635 280 30/04/2021 State Street Bank and Trust Co. 52 768USD 13 127 808 EUR 11 121 267 30/04/2021 State Street Bank and Trust Co. 50 496USD 199 029 GBP 145 034 30/04/2021 State Street Bank and Trust Co. (1 091)
Total forward foreign exchange contracts (1 117 251)
Total return swaps
Notional Pay Receive CurrencyMaturity
date Counterparty
Unrealisedappreciation/depreciation
USDCommitment
USD
64 783 Merrill LynchCommodityIndex eXtraAlpha 5 LongShort
USD 3 Month LIBOR USD 09/12/2021
Merrill Lynch InternationalLtd. 2 152 457 64 783
Total return swaps 2 152 457 64 783
The counterparties for OTC Derivatives including CFD as atMarch 31, 2021 areMerrill Lynch International and State Street Bank and Trust Co. Themaximum individual counterparty exposure for OTC Derivatives including CFD as at March 31, 2021 is State Street Bank and Trust Co with 2.48%of the NAV.
125Lumyna Funds
Lumyna – BOFA MLCX Commodity Alpha UCITSFundSchedule of investments as at March 31, 2021 (cont.)
The accompanying notes form an integral part of these financial statements.
Audited annual report
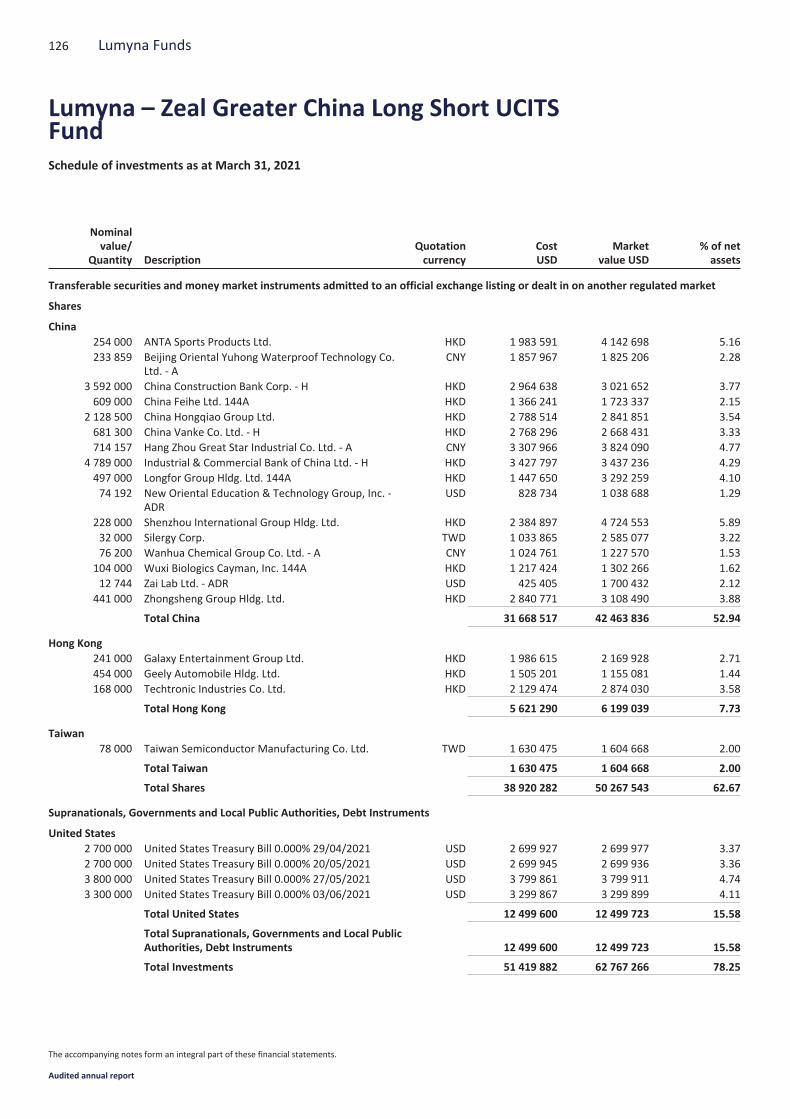
Nominalvalue/
Quantity DescriptionQuotationcurrency
CostUSD
Marketvalue USD
% of netassets
Transferable securities and money market instruments admitted to an official exchange listing or dealt in on another regulated market
Shares
China254 000 ANTA Sports Products Ltd. HKD 1 983 591 4 142 698 5.16233 859 Beijing Oriental Yuhong Waterproof Technology Co.
Ltd. - ACNY 1 857 967 1 825 206 2.28
3 592 000 China Construction Bank Corp. - H HKD 2 964 638 3 021 652 3.77609 000 China Feihe Ltd. 144A HKD 1 366 241 1 723 337 2.15
2 128 500 China Hongqiao Group Ltd. HKD 2 788 514 2 841 851 3.54681 300 China Vanke Co. Ltd. - H HKD 2 768 296 2 668 431 3.33714 157 Hang Zhou Great Star Industrial Co. Ltd. - A CNY 3 307 966 3 824 090 4.77
4 789 000 Industrial & Commercial Bank of China Ltd. - H HKD 3 427 797 3 437 236 4.29497 000 Longfor Group Hldg. Ltd. 144A HKD 1 447 650 3 292 259 4.1074 192 New Oriental Education & Technology Group, Inc. -
ADRUSD 828 734 1 038 688 1.29
228 000 Shenzhou International Group Hldg. Ltd. HKD 2 384 897 4 724 553 5.8932 000 Silergy Corp. TWD 1 033 865 2 585 077 3.2276 200 Wanhua Chemical Group Co. Ltd. - A CNY 1 024 761 1 227 570 1.53
104 000 Wuxi Biologics Cayman, Inc. 144A HKD 1 217 424 1 302 266 1.6212 744 Zai Lab Ltd. - ADR USD 425 405 1 700 432 2.12
441 000 Zhongsheng Group Hldg. Ltd. HKD 2 840 771 3 108 490 3.88
Total China 31 668 517 42 463 836 52.94
Hong Kong241 000 Galaxy Entertainment Group Ltd. HKD 1 986 615 2 169 928 2.71454 000 Geely Automobile Hldg. Ltd. HKD 1 505 201 1 155 081 1.44168 000 Techtronic Industries Co. Ltd. HKD 2 129 474 2 874 030 3.58
Total Hong Kong 5 621 290 6 199 039 7.73
Taiwan78 000 Taiwan Semiconductor Manufacturing Co. Ltd. TWD 1 630 475 1 604 668 2.00
Total Taiwan 1 630 475 1 604 668 2.00
Total Shares 38 920 282 50 267 543 62.67
Supranationals, Governments and Local Public Authorities, Debt Instruments
United States2 700 000 United States Treasury Bill 0.000% 29/04/2021 USD 2 699 927 2 699 977 3.372 700 000 United States Treasury Bill 0.000% 20/05/2021 USD 2 699 945 2 699 936 3.363 800 000 United States Treasury Bill 0.000% 27/05/2021 USD 3 799 861 3 799 911 4.743 300 000 United States Treasury Bill 0.000% 03/06/2021 USD 3 299 867 3 299 899 4.11
Total United States 12 499 600 12 499 723 15.58
Total Supranationals, Governments and Local PublicAuthorities, Debt Instruments 12 499 600 12 499 723 15.58
Total Investments 51 419 882 62 767 266 78.25
126 Lumyna Funds
Lumyna – Zeal Greater China Long Short UCITSFundSchedule of investments as at March 31, 2021
The accompanying notes form an integral part of these financial statements.
Audited annual report

Industrial classification of investments(as a percentage of net assets as at March 31, 2021) %
Sovereign 15.58Retail 9.04Hand/Machine Tools 8.35Banks 8.06Real Estate 7.43Apparel 5.89Mining 3.54Electronics 3.22Lodging 2.71Building Materials 2.28
Industrial classification of investments(as a percentage of net assets as at March 31, 2021) %
Food 2.15Biotechnology 2.12Semiconductors 2.00Healthcare-Services 1.62Chemicals 1.53Auto Manufacturers 1.44Commercial Services 1.29
78.25
Futures contracts
Currencycontract Details Market
Maturitydate Counterparty
Number ofcontracts
bought/(sold)Commitment
USD
Unrealisedappreciation/(depreciation)
USD
HKD HSTECHHong Kong FuturesExchange 29/04/2021
Morgan StanleyInternational Plc. (302) 15 870 203 21 989
Total Futures contracts 15 870 203 21 989
Morgan Stanley International Plc. is the counterparty to these futures contracts.
Forward foreign exchange contracts
Currencybought
Amountbought
Currencysold Amount sold
Maturitydate Counterparty
Unrealisedappreciation/(depreciation)
USD
EUR 680 486 USD 805 536 30/04/2021 State Street Bank and Trust Co. (5 363)USD 30 334 EUR 25 626 30/04/2021 State Street Bank and Trust Co. 200
Total forward foreign exchange contracts (5 163)
Contracts for difference
Counterparty Industrial sectorUnderlyingnature Long/Short
CommitmentUSD
Unrealisedappreciation/(depreciation)
USD
Merrill Lynch International Bank Ltd. Auto Manufacturers Equity Short 1 384 531 (71 393)Merrill Lynch International Bank Ltd. Engineering &
ConstructionEquity Short 1 243 123 51 280
Merrill Lynch International Bank Ltd. Internet Equity Short 2 029 054 (22 564)Merrill Lynch International Bank Ltd. Pharmaceuticals Equity Short 803 689 (41 500)Merrill Lynch International Bank Ltd. Retail Equity Short 2 042 878 (325 950)Merrill Lynch International Bank Ltd. Transportation Equity Short 776 760 (32 986)Morgan Stanley International Plc. Apparel Equity Short 796 410 (36 579)Morgan Stanley International Plc. Biotechnology Equity Long 2 781 882 1 377 203Morgan Stanley International Plc. Coal Equity Short 890 178 (82 839)Morgan Stanley International Plc. Diversified Financial
ServicesEquity Short 813 619 8 214
Morgan Stanley International Plc. Energy-Alternate Sources Equity Long 2 839 480 654 722Morgan Stanley International Plc. Internet Equity Short 2 135 842 (134 670)
127Lumyna Funds
Lumyna – Zeal Greater China Long Short UCITSFundSchedule of investments as at March 31, 2021 (cont.)
The accompanying notes form an integral part of these financial statements.
Audited annual report
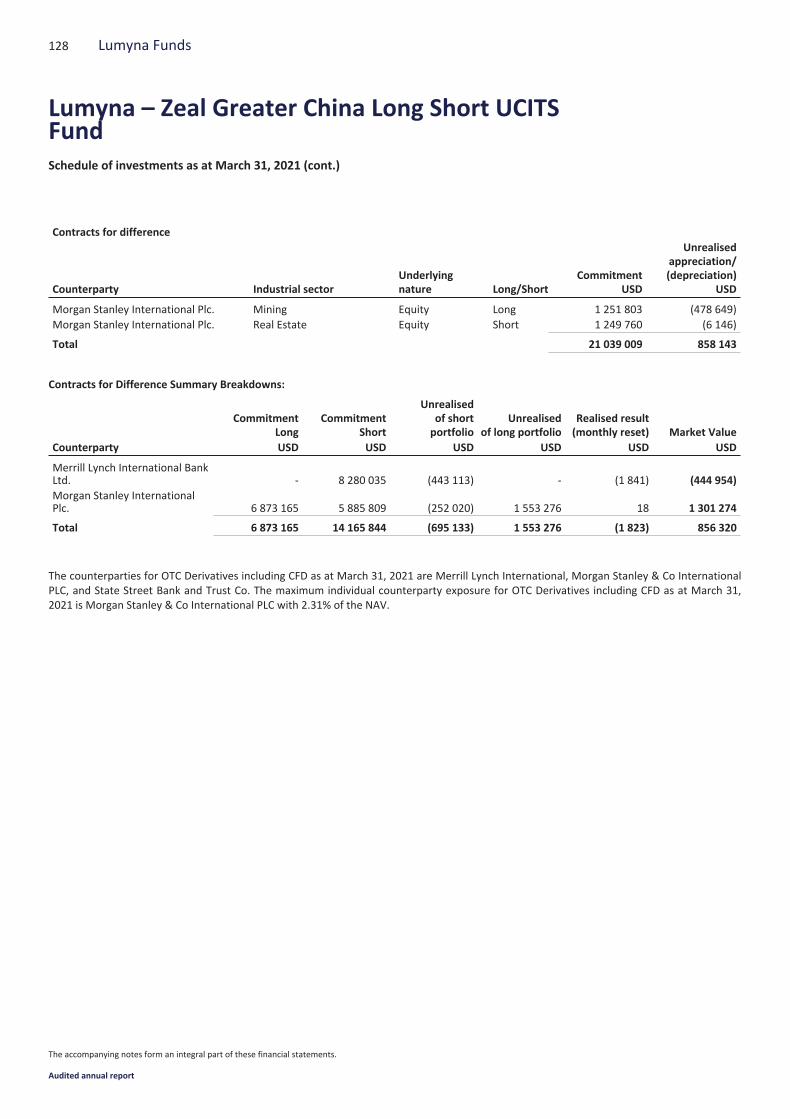
Contracts for difference
Counterparty Industrial sectorUnderlyingnature Long/Short
CommitmentUSD
Unrealisedappreciation/(depreciation)
USD
Morgan Stanley International Plc. Mining Equity Long 1 251 803 (478 649)Morgan Stanley International Plc. Real Estate Equity Short 1 249 760 (6 146)
Total 21 039 009 858 143
Contracts for Difference Summary Breakdowns:
CommitmentLong
CommitmentShort
Unrealisedof shortportfolio
Unrealisedof long portfolio
Realised result(monthly reset) Market Value
Counterparty USD USD USD USD USD USD
Merrill Lynch International BankLtd. - 8 280 035 (443 113) - (1 841) (444 954)Morgan Stanley InternationalPlc. 6 873 165 5 885 809 (252 020) 1 553 276 18 1 301 274
Total 6 873 165 14 165 844 (695 133) 1 553 276 (1 823) 856 320
The counterparties for OTC Derivatives including CFD as at March 31, 2021 are Merrill Lynch International, Morgan Stanley & Co InternationalPLC, and State Street Bank and Trust Co. The maximum individual counterparty exposure for OTC Derivatives including CFD as at March 31,2021 is Morgan Stanley & Co International PLC with 2.31% of the NAV.
128 Lumyna Funds
Lumyna – Zeal Greater China Long Short UCITSFundSchedule of investments as at March 31, 2021 (cont.)
The accompanying notes form an integral part of these financial statements.
Audited annual report
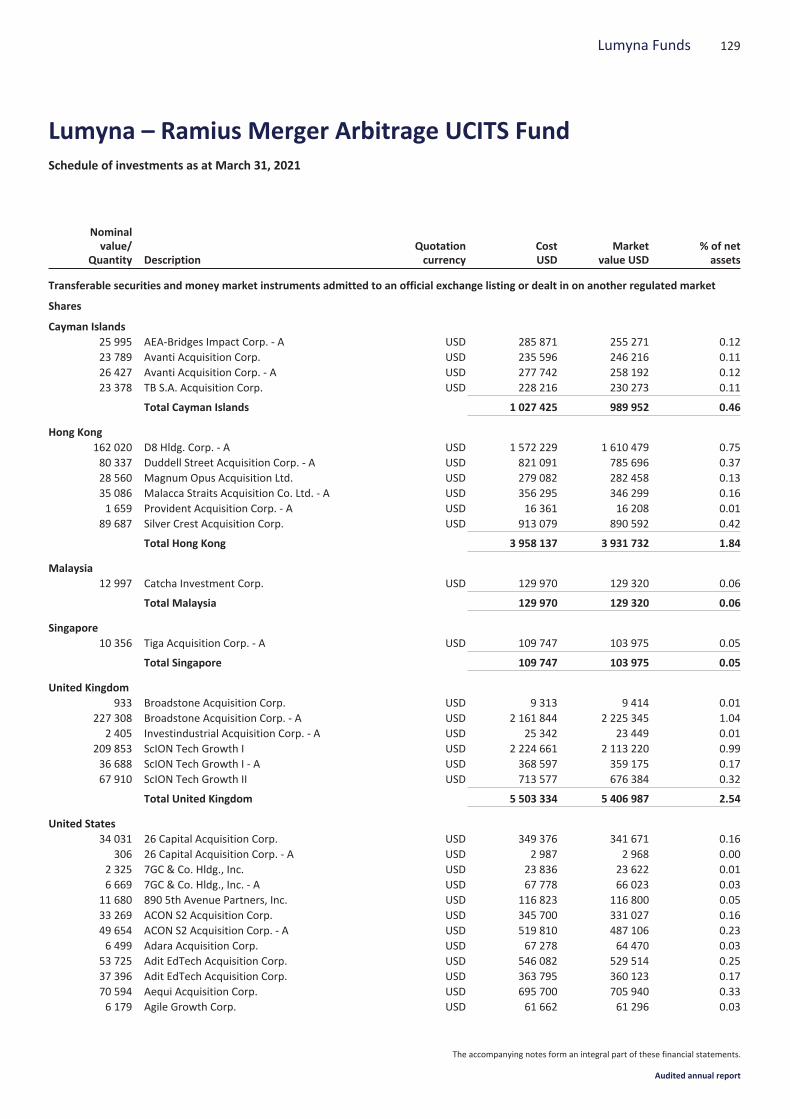
Nominalvalue/
Quantity DescriptionQuotationcurrency
CostUSD
Marketvalue USD
% of netassets
Transferable securities and money market instruments admitted to an official exchange listing or dealt in on another regulated market
Shares
Cayman Islands25 995 AEA-Bridges Impact Corp. - A USD 285 871 255 271 0.1223 789 Avanti Acquisition Corp. USD 235 596 246 216 0.1126 427 Avanti Acquisition Corp. - A USD 277 742 258 192 0.1223 378 TB S.A. Acquisition Corp. USD 228 216 230 273 0.11
Total Cayman Islands 1 027 425 989 952 0.46
Hong Kong162 020 D8 Hldg. Corp. - A USD 1 572 229 1 610 479 0.7580 337 Duddell Street Acquisition Corp. - A USD 821 091 785 696 0.3728 560 Magnum Opus Acquisition Ltd. USD 279 082 282 458 0.1335 086 Malacca Straits Acquisition Co. Ltd. - A USD 356 295 346 299 0.161 659 Provident Acquisition Corp. - A USD 16 361 16 208 0.01
89 687 Silver Crest Acquisition Corp. USD 913 079 890 592 0.42
Total Hong Kong 3 958 137 3 931 732 1.84
Malaysia12 997 Catcha Investment Corp. USD 129 970 129 320 0.06
Total Malaysia 129 970 129 320 0.06
Singapore10 356 Tiga Acquisition Corp. - A USD 109 747 103 975 0.05
Total Singapore 109 747 103 975 0.05
United Kingdom933 Broadstone Acquisition Corp. USD 9 313 9 414 0.01
227 308 Broadstone Acquisition Corp. - A USD 2 161 844 2 225 345 1.042 405 Investindustrial Acquisition Corp. - A USD 25 342 23 449 0.01
209 853 ScION Tech Growth I USD 2 224 661 2 113 220 0.9936 688 ScION Tech Growth I - A USD 368 597 359 175 0.1767 910 ScION Tech Growth II USD 713 577 676 384 0.32
Total United Kingdom 5 503 334 5 406 987 2.54
United States34 031 26 Capital Acquisition Corp. USD 349 376 341 671 0.16
306 26 Capital Acquisition Corp. - A USD 2 987 2 968 0.002 325 7GC & Co. Hldg., Inc. USD 23 836 23 622 0.016 669 7GC & Co. Hldg., Inc. - A USD 67 778 66 023 0.03
11 680 890 5th Avenue Partners, Inc. USD 116 823 116 800 0.0533 269 ACON S2 Acquisition Corp. USD 345 700 331 027 0.1649 654 ACON S2 Acquisition Corp. - A USD 519 810 487 106 0.236 499 Adara Acquisition Corp. USD 67 278 64 470 0.03
53 725 Adit EdTech Acquisition Corp. USD 546 082 529 514 0.2537 396 Adit EdTech Acquisition Corp. USD 363 795 360 123 0.1770 594 Aequi Acquisition Corp. USD 695 700 705 940 0.336 179 Agile Growth Corp. USD 61 662 61 296 0.03
129Lumyna Funds
Lumyna – Ramius Merger Arbitrage UCITS FundSchedule of investments as at March 31, 2021
The accompanying notes form an integral part of these financial statements.
Audited annual report
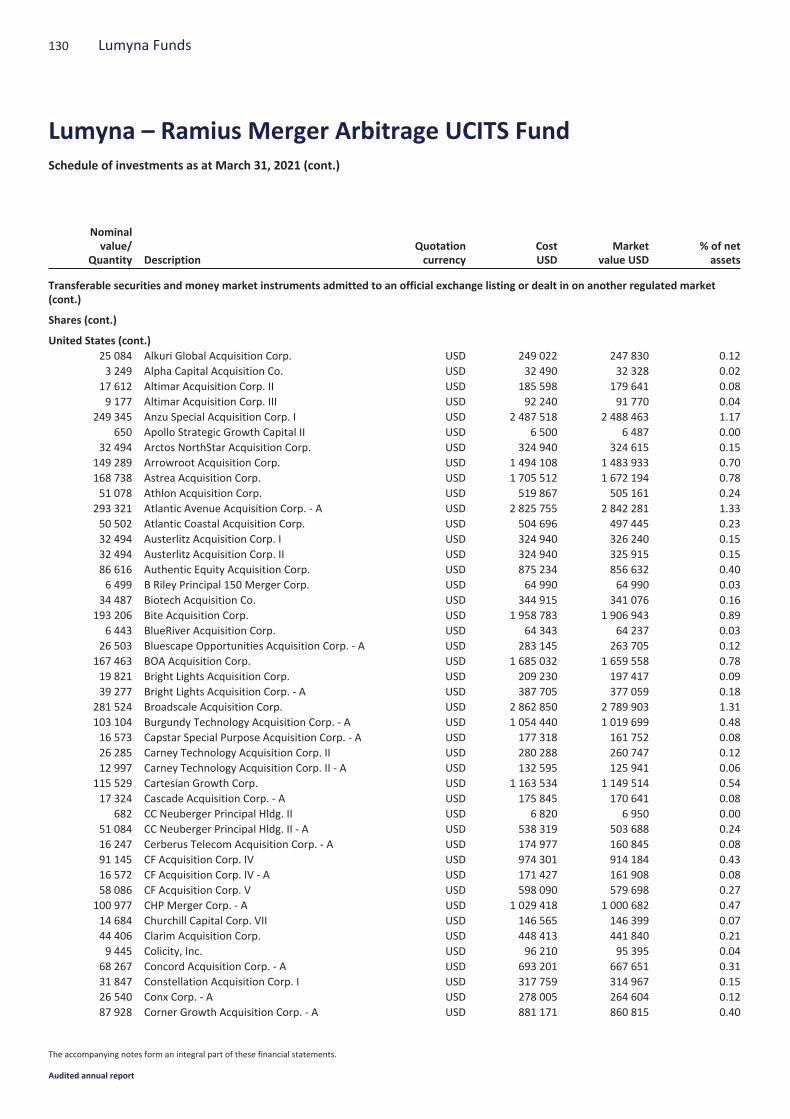
Nominalvalue/
Quantity DescriptionQuotationcurrency
CostUSD
Marketvalue USD
% of netassets
Transferable securities and money market instruments admitted to an official exchange listing or dealt in on another regulated market(cont.)
Shares (cont.)
United States (cont.)25 084 Alkuri Global Acquisition Corp. USD 249 022 247 830 0.123 249 Alpha Capital Acquisition Co. USD 32 490 32 328 0.02
17 612 Altimar Acquisition Corp. II USD 185 598 179 641 0.089 177 Altimar Acquisition Corp. III USD 92 240 91 770 0.04
249 345 Anzu Special Acquisition Corp. I USD 2 487 518 2 488 463 1.17650 Apollo Strategic Growth Capital II USD 6 500 6 487 0.00
32 494 Arctos NorthStar Acquisition Corp. USD 324 940 324 615 0.15149 289 Arrowroot Acquisition Corp. USD 1 494 108 1 483 933 0.70168 738 Astrea Acquisition Corp. USD 1 705 512 1 672 194 0.7851 078 Athlon Acquisition Corp. USD 519 867 505 161 0.24
293 321 Atlantic Avenue Acquisition Corp. - A USD 2 825 755 2 842 281 1.3350 502 Atlantic Coastal Acquisition Corp. USD 504 696 497 445 0.2332 494 Austerlitz Acquisition Corp. I USD 324 940 326 240 0.1532 494 Austerlitz Acquisition Corp. II USD 324 940 325 915 0.1586 616 Authentic Equity Acquisition Corp. USD 875 234 856 632 0.406 499 B Riley Principal 150 Merger Corp. USD 64 990 64 990 0.03
34 487 Biotech Acquisition Co. USD 344 915 341 076 0.16193 206 Bite Acquisition Corp. USD 1 958 783 1 906 943 0.89
6 443 BlueRiver Acquisition Corp. USD 64 343 64 237 0.0326 503 Bluescape Opportunities Acquisition Corp. - A USD 283 145 263 705 0.12
167 463 BOA Acquisition Corp. USD 1 685 032 1 659 558 0.7819 821 Bright Lights Acquisition Corp. USD 209 230 197 417 0.0939 277 Bright Lights Acquisition Corp. - A USD 387 705 377 059 0.18
281 524 Broadscale Acquisition Corp. USD 2 862 850 2 789 903 1.31103 104 Burgundy Technology Acquisition Corp. - A USD 1 054 440 1 019 699 0.4816 573 Capstar Special Purpose Acquisition Corp. - A USD 177 318 161 752 0.0826 285 Carney Technology Acquisition Corp. II USD 280 288 260 747 0.1212 997 Carney Technology Acquisition Corp. II - A USD 132 595 125 941 0.06
115 529 Cartesian Growth Corp. USD 1 163 534 1 149 514 0.5417 324 Cascade Acquisition Corp. - A USD 175 845 170 641 0.08
682 CC Neuberger Principal Hldg. II USD 6 820 6 950 0.0051 084 CC Neuberger Principal Hldg. II - A USD 538 319 503 688 0.2416 247 Cerberus Telecom Acquisition Corp. - A USD 174 977 160 845 0.0891 145 CF Acquisition Corp. IV USD 974 301 914 184 0.4316 572 CF Acquisition Corp. IV - A USD 171 427 161 908 0.0858 086 CF Acquisition Corp. V USD 598 090 579 698 0.27
100 977 CHP Merger Corp. - A USD 1 029 418 1 000 682 0.4714 684 Churchill Capital Corp. VII USD 146 565 146 399 0.0744 406 Clarim Acquisition Corp. USD 448 413 441 840 0.219 445 Colicity, Inc. USD 96 210 95 395 0.04
68 267 Concord Acquisition Corp. - A USD 693 201 667 651 0.3131 847 Constellation Acquisition Corp. I USD 317 759 314 967 0.1526 540 Conx Corp. - A USD 278 005 264 604 0.1287 928 Corner Growth Acquisition Corp. - A USD 881 171 860 815 0.40
130 Lumyna Funds
Lumyna – Ramius Merger Arbitrage UCITS FundSchedule of investments as at March 31, 2021 (cont.)
The accompanying notes form an integral part of these financial statements.
Audited annual report
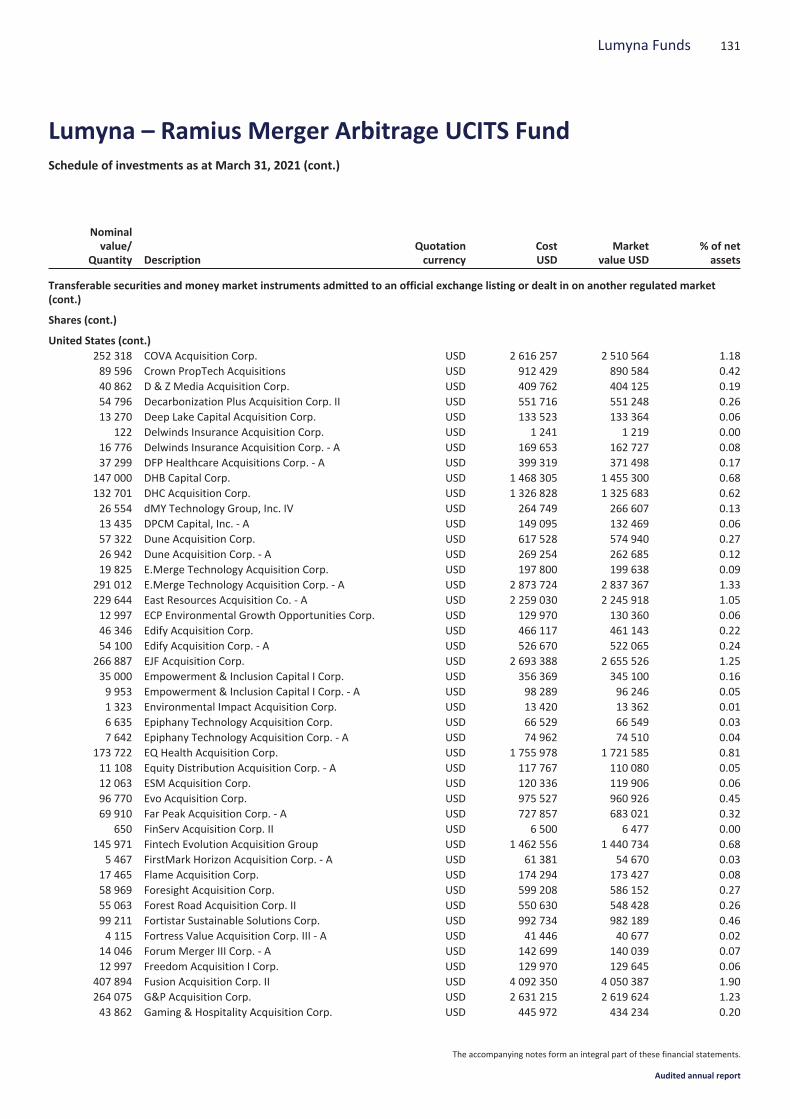
Nominalvalue/
Quantity DescriptionQuotationcurrency
CostUSD
Marketvalue USD
% of netassets
Transferable securities and money market instruments admitted to an official exchange listing or dealt in on another regulated market(cont.)
Shares (cont.)
United States (cont.)252 318 COVA Acquisition Corp. USD 2 616 257 2 510 564 1.1889 596 Crown PropTech Acquisitions USD 912 429 890 584 0.4240 862 D & Z Media Acquisition Corp. USD 409 762 404 125 0.1954 796 Decarbonization Plus Acquisition Corp. II USD 551 716 551 248 0.2613 270 Deep Lake Capital Acquisition Corp. USD 133 523 133 364 0.06
122 Delwinds Insurance Acquisition Corp. USD 1 241 1 219 0.0016 776 Delwinds Insurance Acquisition Corp. - A USD 169 653 162 727 0.0837 299 DFP Healthcare Acquisitions Corp. - A USD 399 319 371 498 0.17
147 000 DHB Capital Corp. USD 1 468 305 1 455 300 0.68132 701 DHC Acquisition Corp. USD 1 326 828 1 325 683 0.6226 554 dMY Technology Group, Inc. IV USD 264 749 266 607 0.1313 435 DPCM Capital, Inc. - A USD 149 095 132 469 0.0657 322 Dune Acquisition Corp. USD 617 528 574 940 0.2726 942 Dune Acquisition Corp. - A USD 269 254 262 685 0.1219 825 E.Merge Technology Acquisition Corp. USD 197 800 199 638 0.09
291 012 E.Merge Technology Acquisition Corp. - A USD 2 873 724 2 837 367 1.33229 644 East Resources Acquisition Co. - A USD 2 259 030 2 245 918 1.0512 997 ECP Environmental Growth Opportunities Corp. USD 129 970 130 360 0.0646 346 Edify Acquisition Corp. USD 466 117 461 143 0.2254 100 Edify Acquisition Corp. - A USD 526 670 522 065 0.24
266 887 EJF Acquisition Corp. USD 2 693 388 2 655 526 1.2535 000 Empowerment & Inclusion Capital I Corp. USD 356 369 345 100 0.169 953 Empowerment & Inclusion Capital I Corp. - A USD 98 289 96 246 0.051 323 Environmental Impact Acquisition Corp. USD 13 420 13 362 0.016 635 Epiphany Technology Acquisition Corp. USD 66 529 66 549 0.037 642 Epiphany Technology Acquisition Corp. - A USD 74 962 74 510 0.04
173 722 EQ Health Acquisition Corp. USD 1 755 978 1 721 585 0.8111 108 Equity Distribution Acquisition Corp. - A USD 117 767 110 080 0.0512 063 ESM Acquisition Corp. USD 120 336 119 906 0.0696 770 Evo Acquisition Corp. USD 975 527 960 926 0.4569 910 Far Peak Acquisition Corp. - A USD 727 857 683 021 0.32
650 FinServ Acquisition Corp. II USD 6 500 6 477 0.00145 971 Fintech Evolution Acquisition Group USD 1 462 556 1 440 734 0.68
5 467 FirstMark Horizon Acquisition Corp. - A USD 61 381 54 670 0.0317 465 Flame Acquisition Corp. USD 174 294 173 427 0.0858 969 Foresight Acquisition Corp. USD 599 208 586 152 0.2755 063 Forest Road Acquisition Corp. II USD 550 630 548 428 0.2699 211 Fortistar Sustainable Solutions Corp. USD 992 734 982 189 0.464 115 Fortress Value Acquisition Corp. III - A USD 41 446 40 677 0.02
14 046 Forum Merger III Corp. - A USD 142 699 140 039 0.0712 997 Freedom Acquisition I Corp. USD 129 970 129 645 0.06
407 894 Fusion Acquisition Corp. II USD 4 092 350 4 050 387 1.90264 075 G&P Acquisition Corp. USD 2 631 215 2 619 624 1.2343 862 Gaming & Hospitality Acquisition Corp. USD 445 972 434 234 0.20
131Lumyna Funds
Lumyna – Ramius Merger Arbitrage UCITS FundSchedule of investments as at March 31, 2021 (cont.)
The accompanying notes form an integral part of these financial statements.
Audited annual report

Nominalvalue/
Quantity DescriptionQuotationcurrency
CostUSD
Marketvalue USD
% of netassets
Transferable securities and money market instruments admitted to an official exchange listing or dealt in on another regulated market(cont.)
Shares (cont.)
United States (cont.)101 457 GigCapital4, Inc. USD 1 017 480 1 001 381 0.4730 020 Global Partner Acquisition Corp. II USD 302 512 295 997 0.1414 736 Global Synergy Acquisition Corp. USD 152 456 146 771 0.076 635 Global Synergy Acquisition Corp. - A USD 65 434 64 360 0.03
153 132 GO Acquisition Corp. - A USD 1 506 453 1 508 350 0.71263 674 Goal Acquisitions Corp. USD 2 709 623 2 649 924 1.24
5 521 Golden Falcon Acquisition Corp. - A USD 56 877 53 388 0.036 499 Gores Hldg. VII, Inc. USD 64 990 64 730 0.03
233 848 Growth Capital Acquisition Corp. USD 2 361 194 2 315 095 1.0923 001 Hamilton Lane Alliance Hldg. I, Inc. USD 233 344 228 630 0.116 635 Haymaker Acquisition Corp. III USD 66 430 65 952 0.03
98 089 Healthcare Capital Corp. USD 986 857 968 138 0.4510 031 Healthcare Capital Corp. - A USD 97 220 96 899 0.0552 654 Hennessy Capital Investment Corp. V USD 522 434 532 858 0.2551 966 HIG Acquisition Corp. USD 521 460 532 132 0.254 809 HIG Acquisition Corp. - A USD 50 224 47 801 0.02
26 748 Horizon Acquisition Corp. - A USD 284 625 264 270 0.12167 114 HPX Corp. USD 1 682 531 1 704 563 0.80
6 490 HPX Corp. - A USD 63 889 63 732 0.0325 150 Hudson Executive Investment Corp. III USD 251 500 249 488 0.1228 776 IG Acquisition Corp. USD 286 770 294 091 0.14
118 950 IG Acquisition Corp. - A USD 1 213 897 1 175 226 0.5529 142 INSU Acquisition Corp. III - A USD 296 709 289 963 0.14
202 369 Isleworth Healthcare Acquisition Corp. USD 1 996 136 1 960 956 0.9266 350 Isos Acquisition Corp. USD 663 583 660 833 0.31
209 790 ITHAX Acquisition Corp. USD 2 115 489 2 104 194 0.9982 849 Itiquira Acquisition Corp. USD 830 610 823 519 0.39
133 303 Jack Creek Investment Corp. USD 1 343 709 1 321 033 0.6214 775 Jaws Mustang Acquisition Corp. USD 151 443 149 966 0.079 090 JOFF Fintech Acquisition Corp. USD 91 827 90 446 0.04
82 374 Kairos Acquisition Corp. USD 832 024 822 093 0.397 149 Kairos Acquisition Corp. - A USD 71 329 69 631 0.03
86 420 Kernel Group Hldg., Inc. USD 875 371 862 472 0.4041 072 KINS Technology Group, Inc. USD 411 027 415 649 0.19
133 637 Kismet Acquisition Three Corp. USD 1 354 034 1 320 334 0.62160 729 Kismet Acquisition Two Corp. USD 1 630 089 1 597 646 0.75
5 220 KL Acquisition Corp. USD 52 471 51 730 0.027 839 KL Acquisition Corp. - A USD 77 453 76 352 0.043 318 KludeIn I Acquisition Corp. - A USD 32 722 32 284 0.02
19 131 L&F Acquisition Corp. - A USD 196 097 188 440 0.09152 871 Lefteris Acquisition Corp. - A USD 1 617 669 1 501 193 0.70432 919 Legato Merger Corp. USD 4 435 272 4 385 469 2.0625 897 Leo Hldg. Corp. II USD 270 133 256 639 0.129 284 Leo Hldg. Corp. II - A USD 92 129 90 240 0.04
132 Lumyna Funds
Lumyna – Ramius Merger Arbitrage UCITS FundSchedule of investments as at March 31, 2021 (cont.)
The accompanying notes form an integral part of these financial statements.
Audited annual report
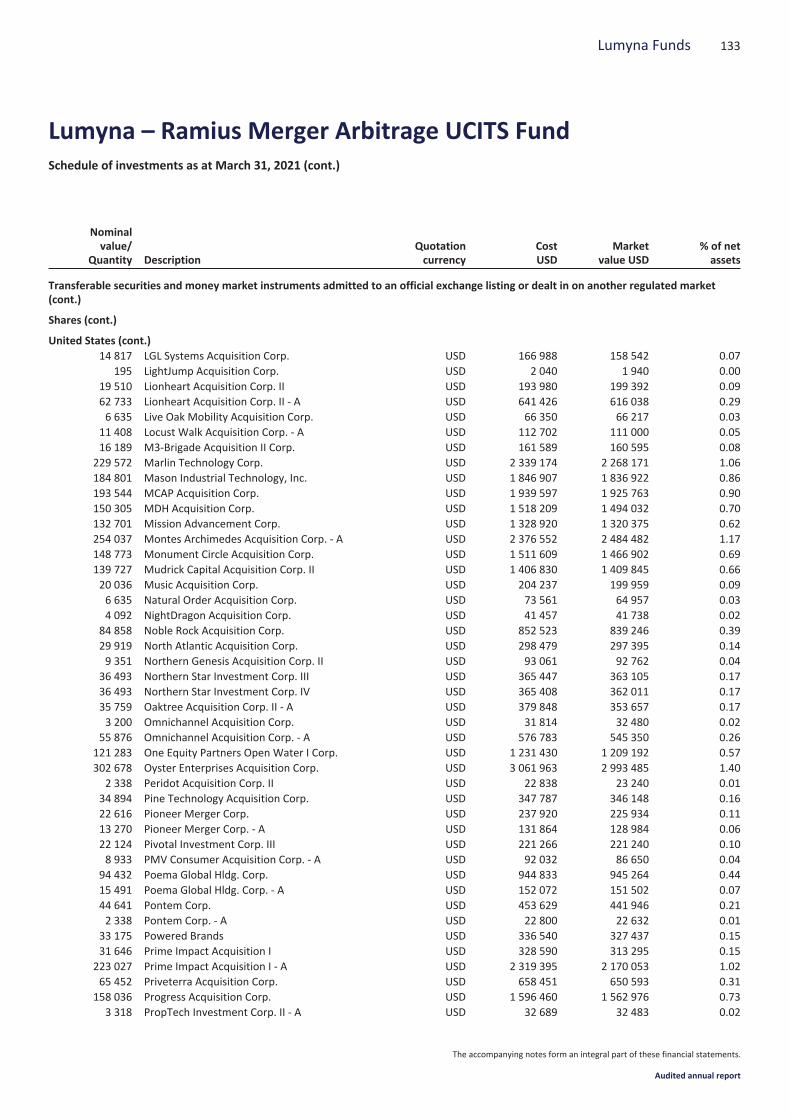
Nominalvalue/
Quantity DescriptionQuotationcurrency
CostUSD
Marketvalue USD
% of netassets
Transferable securities and money market instruments admitted to an official exchange listing or dealt in on another regulated market(cont.)
Shares (cont.)
United States (cont.)14 817 LGL Systems Acquisition Corp. USD 166 988 158 542 0.07
195 LightJump Acquisition Corp. USD 2 040 1 940 0.0019 510 Lionheart Acquisition Corp. II USD 193 980 199 392 0.0962 733 Lionheart Acquisition Corp. II - A USD 641 426 616 038 0.296 635 Live Oak Mobility Acquisition Corp. USD 66 350 66 217 0.03
11 408 Locust Walk Acquisition Corp. - A USD 112 702 111 000 0.0516 189 M3-Brigade Acquisition II Corp. USD 161 589 160 595 0.08
229 572 Marlin Technology Corp. USD 2 339 174 2 268 171 1.06184 801 Mason Industrial Technology, Inc. USD 1 846 907 1 836 922 0.86193 544 MCAP Acquisition Corp. USD 1 939 597 1 925 763 0.90150 305 MDH Acquisition Corp. USD 1 518 209 1 494 032 0.70132 701 Mission Advancement Corp. USD 1 328 920 1 320 375 0.62254 037 Montes Archimedes Acquisition Corp. - A USD 2 376 552 2 484 482 1.17148 773 Monument Circle Acquisition Corp. USD 1 511 609 1 466 902 0.69139 727 Mudrick Capital Acquisition Corp. II USD 1 406 830 1 409 845 0.6620 036 Music Acquisition Corp. USD 204 237 199 959 0.096 635 Natural Order Acquisition Corp. USD 73 561 64 957 0.034 092 NightDragon Acquisition Corp. USD 41 457 41 738 0.02
84 858 Noble Rock Acquisition Corp. USD 852 523 839 246 0.3929 919 North Atlantic Acquisition Corp. USD 298 479 297 395 0.149 351 Northern Genesis Acquisition Corp. II USD 93 061 92 762 0.04
36 493 Northern Star Investment Corp. III USD 365 447 363 105 0.1736 493 Northern Star Investment Corp. IV USD 365 408 362 011 0.1735 759 Oaktree Acquisition Corp. II - A USD 379 848 353 657 0.173 200 Omnichannel Acquisition Corp. USD 31 814 32 480 0.02
55 876 Omnichannel Acquisition Corp. - A USD 576 783 545 350 0.26121 283 One Equity Partners Open Water I Corp. USD 1 231 430 1 209 192 0.57302 678 Oyster Enterprises Acquisition Corp. USD 3 061 963 2 993 485 1.40
2 338 Peridot Acquisition Corp. II USD 22 838 23 240 0.0134 894 Pine Technology Acquisition Corp. USD 347 787 346 148 0.1622 616 Pioneer Merger Corp. USD 237 920 225 934 0.1113 270 Pioneer Merger Corp. - A USD 131 864 128 984 0.0622 124 Pivotal Investment Corp. III USD 221 266 221 240 0.108 933 PMV Consumer Acquisition Corp. - A USD 92 032 86 650 0.04
94 432 Poema Global Hldg. Corp. USD 944 833 945 264 0.4415 491 Poema Global Hldg. Corp. - A USD 152 072 151 502 0.0744 641 Pontem Corp. USD 453 629 441 946 0.212 338 Pontem Corp. - A USD 22 800 22 632 0.01
33 175 Powered Brands USD 336 540 327 437 0.1531 646 Prime Impact Acquisition I USD 328 590 313 295 0.15
223 027 Prime Impact Acquisition I - A USD 2 319 395 2 170 053 1.0265 452 Priveterra Acquisition Corp. USD 658 451 650 593 0.31
158 036 Progress Acquisition Corp. USD 1 596 460 1 562 976 0.733 318 PropTech Investment Corp. II - A USD 32 689 32 483 0.02
133Lumyna Funds
Lumyna – Ramius Merger Arbitrage UCITS FundSchedule of investments as at March 31, 2021 (cont.)
The accompanying notes form an integral part of these financial statements.
Audited annual report
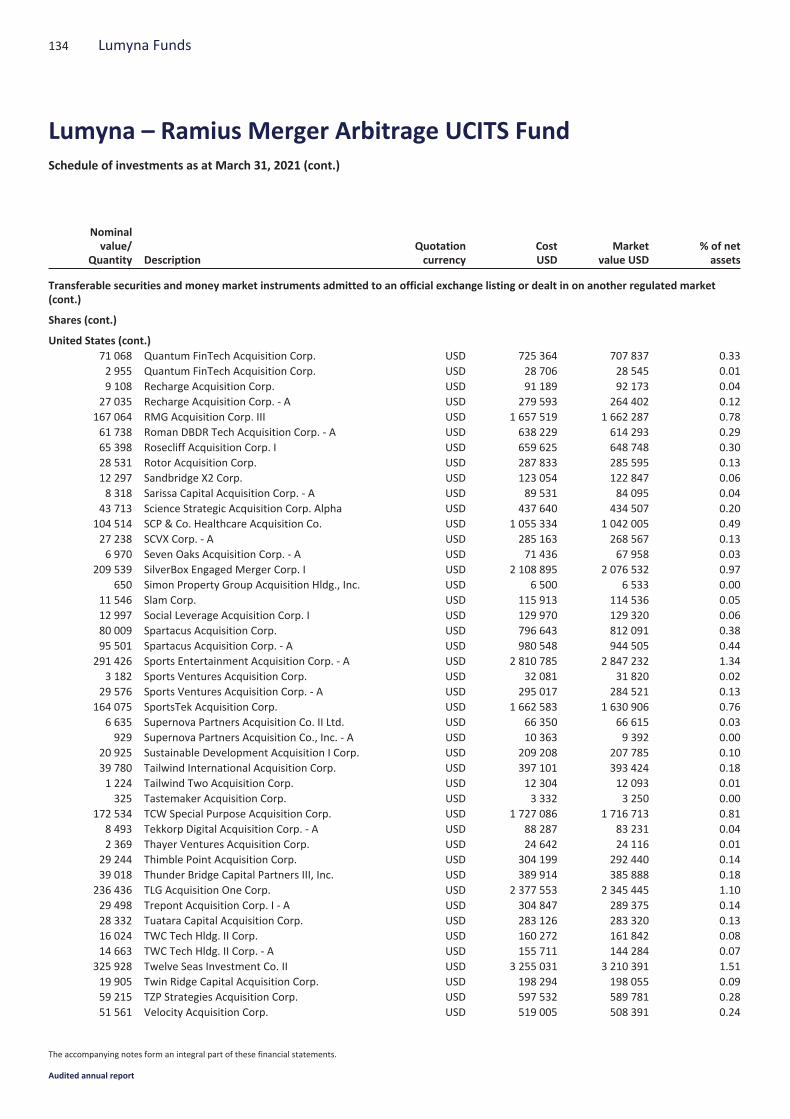
Nominalvalue/
Quantity DescriptionQuotationcurrency
CostUSD
Marketvalue USD
% of netassets
Transferable securities and money market instruments admitted to an official exchange listing or dealt in on another regulated market(cont.)
Shares (cont.)
United States (cont.)71 068 Quantum FinTech Acquisition Corp. USD 725 364 707 837 0.332 955 Quantum FinTech Acquisition Corp. USD 28 706 28 545 0.019 108 Recharge Acquisition Corp. USD 91 189 92 173 0.04
27 035 Recharge Acquisition Corp. - A USD 279 593 264 402 0.12167 064 RMG Acquisition Corp. III USD 1 657 519 1 662 287 0.7861 738 Roman DBDR Tech Acquisition Corp. - A USD 638 229 614 293 0.2965 398 Rosecliff Acquisition Corp. I USD 659 625 648 748 0.3028 531 Rotor Acquisition Corp. USD 287 833 285 595 0.1312 297 Sandbridge X2 Corp. USD 123 054 122 847 0.068 318 Sarissa Capital Acquisition Corp. - A USD 89 531 84 095 0.04
43 713 Science Strategic Acquisition Corp. Alpha USD 437 640 434 507 0.20104 514 SCP & Co. Healthcare Acquisition Co. USD 1 055 334 1 042 005 0.4927 238 SCVX Corp. - A USD 285 163 268 567 0.136 970 Seven Oaks Acquisition Corp. - A USD 71 436 67 958 0.03
209 539 SilverBox Engaged Merger Corp. I USD 2 108 895 2 076 532 0.97650 Simon Property Group Acquisition Hldg., Inc. USD 6 500 6 533 0.00
11 546 Slam Corp. USD 115 913 114 536 0.0512 997 Social Leverage Acquisition Corp. I USD 129 970 129 320 0.0680 009 Spartacus Acquisition Corp. USD 796 643 812 091 0.3895 501 Spartacus Acquisition Corp. - A USD 980 548 944 505 0.44
291 426 Sports Entertainment Acquisition Corp. - A USD 2 810 785 2 847 232 1.343 182 Sports Ventures Acquisition Corp. USD 32 081 31 820 0.02
29 576 Sports Ventures Acquisition Corp. - A USD 295 017 284 521 0.13164 075 SportsTek Acquisition Corp. USD 1 662 583 1 630 906 0.76
6 635 Supernova Partners Acquisition Co. II Ltd. USD 66 350 66 615 0.03929 Supernova Partners Acquisition Co., Inc. - A USD 10 363 9 392 0.00
20 925 Sustainable Development Acquisition I Corp. USD 209 208 207 785 0.1039 780 Tailwind International Acquisition Corp. USD 397 101 393 424 0.181 224 Tailwind Two Acquisition Corp. USD 12 304 12 093 0.01325 Tastemaker Acquisition Corp. USD 3 332 3 250 0.00
172 534 TCW Special Purpose Acquisition Corp. USD 1 727 086 1 716 713 0.818 493 Tekkorp Digital Acquisition Corp. - A USD 88 287 83 231 0.042 369 Thayer Ventures Acquisition Corp. USD 24 642 24 116 0.01
29 244 Thimble Point Acquisition Corp. USD 304 199 292 440 0.1439 018 Thunder Bridge Capital Partners III, Inc. USD 389 914 385 888 0.18
236 436 TLG Acquisition One Corp. USD 2 377 553 2 345 445 1.1029 498 Trepont Acquisition Corp. I - A USD 304 847 289 375 0.1428 332 Tuatara Capital Acquisition Corp. USD 283 126 283 320 0.1316 024 TWC Tech Hldg. II Corp. USD 160 272 161 842 0.0814 663 TWC Tech Hldg. II Corp. - A USD 155 711 144 284 0.07
325 928 Twelve Seas Investment Co. II USD 3 255 031 3 210 391 1.5119 905 Twin Ridge Capital Acquisition Corp. USD 198 294 198 055 0.0959 215 TZP Strategies Acquisition Corp. USD 597 532 589 781 0.2851 561 Velocity Acquisition Corp. USD 519 005 508 391 0.24
134 Lumyna Funds
Lumyna – Ramius Merger Arbitrage UCITS FundSchedule of investments as at March 31, 2021 (cont.)
The accompanying notes form an integral part of these financial statements.
Audited annual report
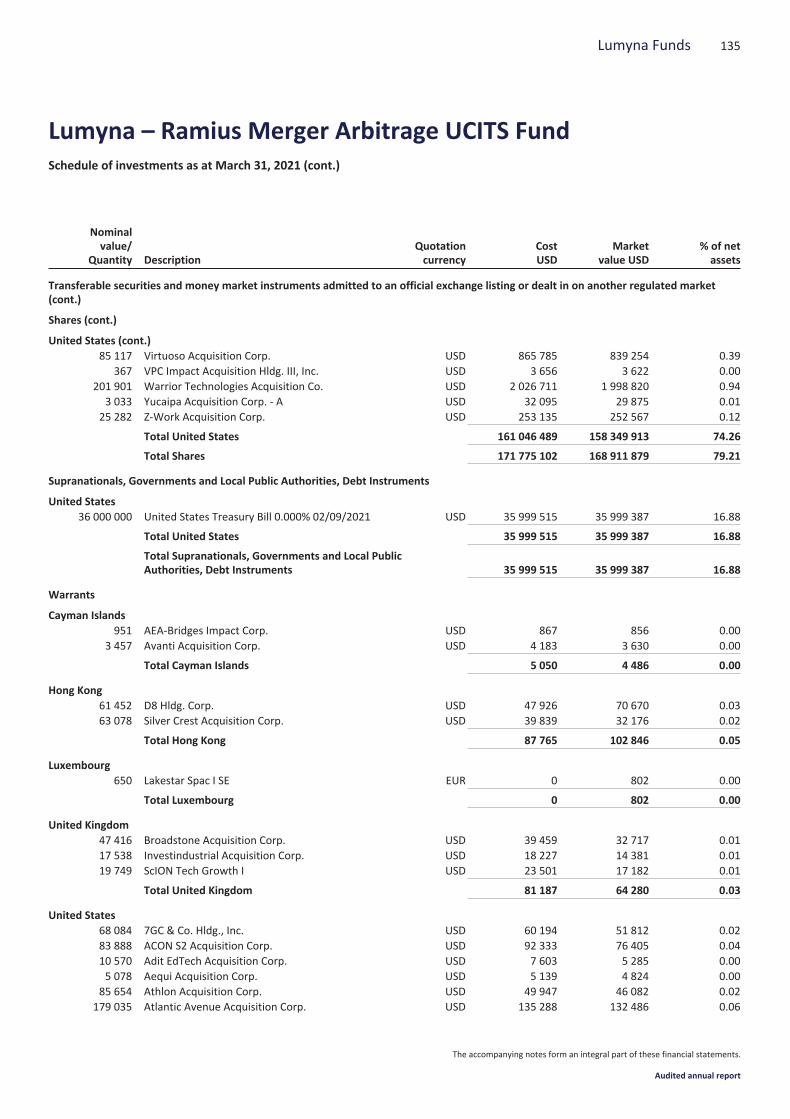
Nominalvalue/
Quantity DescriptionQuotationcurrency
CostUSD
Marketvalue USD
% of netassets
Transferable securities and money market instruments admitted to an official exchange listing or dealt in on another regulated market(cont.)
Shares (cont.)
United States (cont.)85 117 Virtuoso Acquisition Corp. USD 865 785 839 254 0.39
367 VPC Impact Acquisition Hldg. III, Inc. USD 3 656 3 622 0.00201 901 Warrior Technologies Acquisition Co. USD 2 026 711 1 998 820 0.94
3 033 Yucaipa Acquisition Corp. - A USD 32 095 29 875 0.0125 282 Z-Work Acquisition Corp. USD 253 135 252 567 0.12
Total United States 161 046 489 158 349 913 74.26
Total Shares 171 775 102 168 911 879 79.21
Supranationals, Governments and Local Public Authorities, Debt Instruments
United States36 000 000 United States Treasury Bill 0.000% 02/09/2021 USD 35 999 515 35 999 387 16.88
Total United States 35 999 515 35 999 387 16.88
Total Supranationals, Governments and Local PublicAuthorities, Debt Instruments 35 999 515 35 999 387 16.88
Warrants
Cayman Islands951 AEA-Bridges Impact Corp. USD 867 856 0.00
3 457 Avanti Acquisition Corp. USD 4 183 3 630 0.00
Total Cayman Islands 5 050 4 486 0.00
Hong Kong61 452 D8 Hldg. Corp. USD 47 926 70 670 0.0363 078 Silver Crest Acquisition Corp. USD 39 839 32 176 0.02
Total Hong Kong 87 765 102 846 0.05
Luxembourg650 Lakestar Spac I SE EUR 0 802 0.00
Total Luxembourg 0 802 0.00
United Kingdom47 416 Broadstone Acquisition Corp. USD 39 459 32 717 0.0117 538 Investindustrial Acquisition Corp. USD 18 227 14 381 0.0119 749 ScION Tech Growth I USD 23 501 17 182 0.01
Total United Kingdom 81 187 64 280 0.03
United States68 084 7GC & Co. Hldg., Inc. USD 60 194 51 812 0.0283 888 ACON S2 Acquisition Corp. USD 92 333 76 405 0.0410 570 Adit EdTech Acquisition Corp. USD 7 603 5 285 0.005 078 Aequi Acquisition Corp. USD 5 139 4 824 0.00
85 654 Athlon Acquisition Corp. USD 49 947 46 082 0.02179 035 Atlantic Avenue Acquisition Corp. USD 135 288 132 486 0.06
135Lumyna Funds
Lumyna – Ramius Merger Arbitrage UCITS FundSchedule of investments as at March 31, 2021 (cont.)
The accompanying notes form an integral part of these financial statements.
Audited annual report
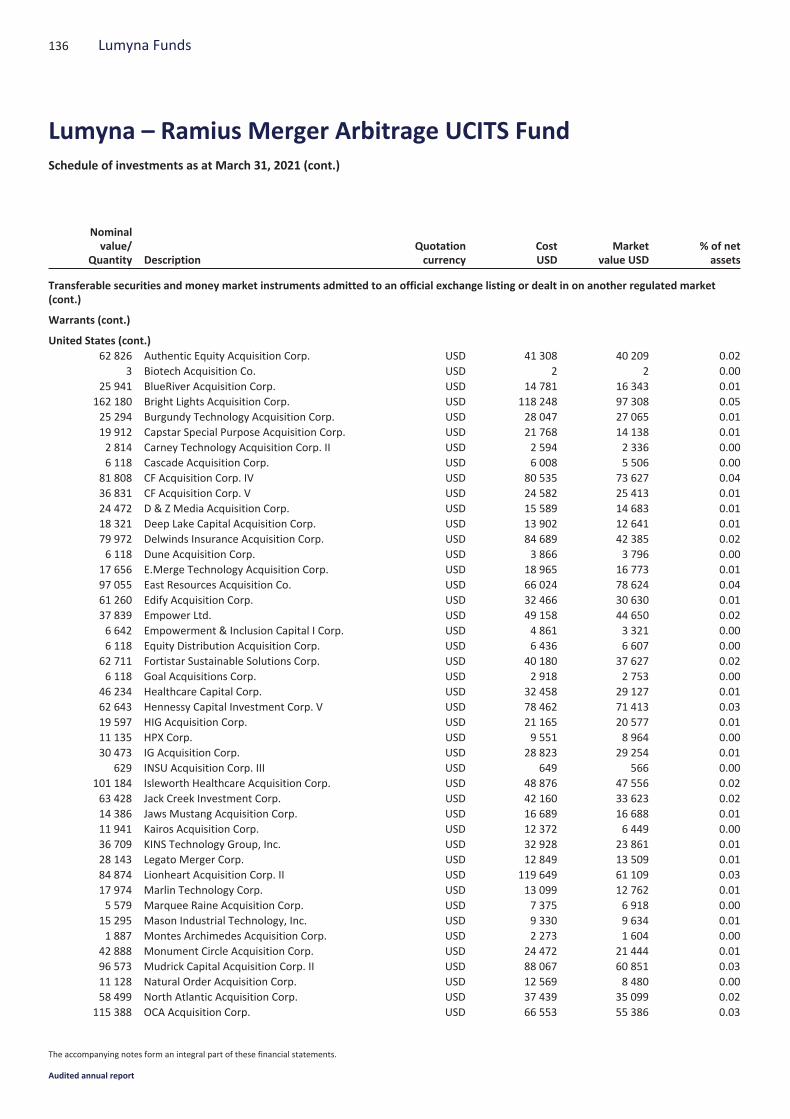
Nominalvalue/
Quantity DescriptionQuotationcurrency
CostUSD
Marketvalue USD
% of netassets
Transferable securities and money market instruments admitted to an official exchange listing or dealt in on another regulated market(cont.)
Warrants (cont.)
United States (cont.)62 826 Authentic Equity Acquisition Corp. USD 41 308 40 209 0.02
3 Biotech Acquisition Co. USD 2 2 0.0025 941 BlueRiver Acquisition Corp. USD 14 781 16 343 0.01
162 180 Bright Lights Acquisition Corp. USD 118 248 97 308 0.0525 294 Burgundy Technology Acquisition Corp. USD 28 047 27 065 0.0119 912 Capstar Special Purpose Acquisition Corp. USD 21 768 14 138 0.012 814 Carney Technology Acquisition Corp. II USD 2 594 2 336 0.006 118 Cascade Acquisition Corp. USD 6 008 5 506 0.00
81 808 CF Acquisition Corp. IV USD 80 535 73 627 0.0436 831 CF Acquisition Corp. V USD 24 582 25 413 0.0124 472 D & Z Media Acquisition Corp. USD 15 589 14 683 0.0118 321 Deep Lake Capital Acquisition Corp. USD 13 902 12 641 0.0179 972 Delwinds Insurance Acquisition Corp. USD 84 689 42 385 0.026 118 Dune Acquisition Corp. USD 3 866 3 796 0.00
17 656 E.Merge Technology Acquisition Corp. USD 18 965 16 773 0.0197 055 East Resources Acquisition Co. USD 66 024 78 624 0.0461 260 Edify Acquisition Corp. USD 32 466 30 630 0.0137 839 Empower Ltd. USD 49 158 44 650 0.026 642 Empowerment & Inclusion Capital I Corp. USD 4 861 3 321 0.006 118 Equity Distribution Acquisition Corp. USD 6 436 6 607 0.00
62 711 Fortistar Sustainable Solutions Corp. USD 40 180 37 627 0.026 118 Goal Acquisitions Corp. USD 2 918 2 753 0.00
46 234 Healthcare Capital Corp. USD 32 458 29 127 0.0162 643 Hennessy Capital Investment Corp. V USD 78 462 71 413 0.0319 597 HIG Acquisition Corp. USD 21 165 20 577 0.0111 135 HPX Corp. USD 9 551 8 964 0.0030 473 IG Acquisition Corp. USD 28 823 29 254 0.01
629 INSU Acquisition Corp. III USD 649 566 0.00101 184 Isleworth Healthcare Acquisition Corp. USD 48 876 47 556 0.0263 428 Jack Creek Investment Corp. USD 42 160 33 623 0.0214 386 Jaws Mustang Acquisition Corp. USD 16 689 16 688 0.0111 941 Kairos Acquisition Corp. USD 12 372 6 449 0.0036 709 KINS Technology Group, Inc. USD 32 928 23 861 0.0128 143 Legato Merger Corp. USD 12 849 13 509 0.0184 874 Lionheart Acquisition Corp. II USD 119 649 61 109 0.0317 974 Marlin Technology Corp. USD 13 099 12 762 0.015 579 Marquee Raine Acquisition Corp. USD 7 375 6 918 0.00
15 295 Mason Industrial Technology, Inc. USD 9 330 9 634 0.011 887 Montes Archimedes Acquisition Corp. USD 2 273 1 604 0.00
42 888 Monument Circle Acquisition Corp. USD 24 472 21 444 0.0196 573 Mudrick Capital Acquisition Corp. II USD 88 067 60 851 0.0311 128 Natural Order Acquisition Corp. USD 12 569 8 480 0.0058 499 North Atlantic Acquisition Corp. USD 37 439 35 099 0.02
115 388 OCA Acquisition Corp. USD 66 553 55 386 0.03
136 Lumyna Funds
Lumyna – Ramius Merger Arbitrage UCITS FundSchedule of investments as at March 31, 2021 (cont.)
The accompanying notes form an integral part of these financial statements.
Audited annual report
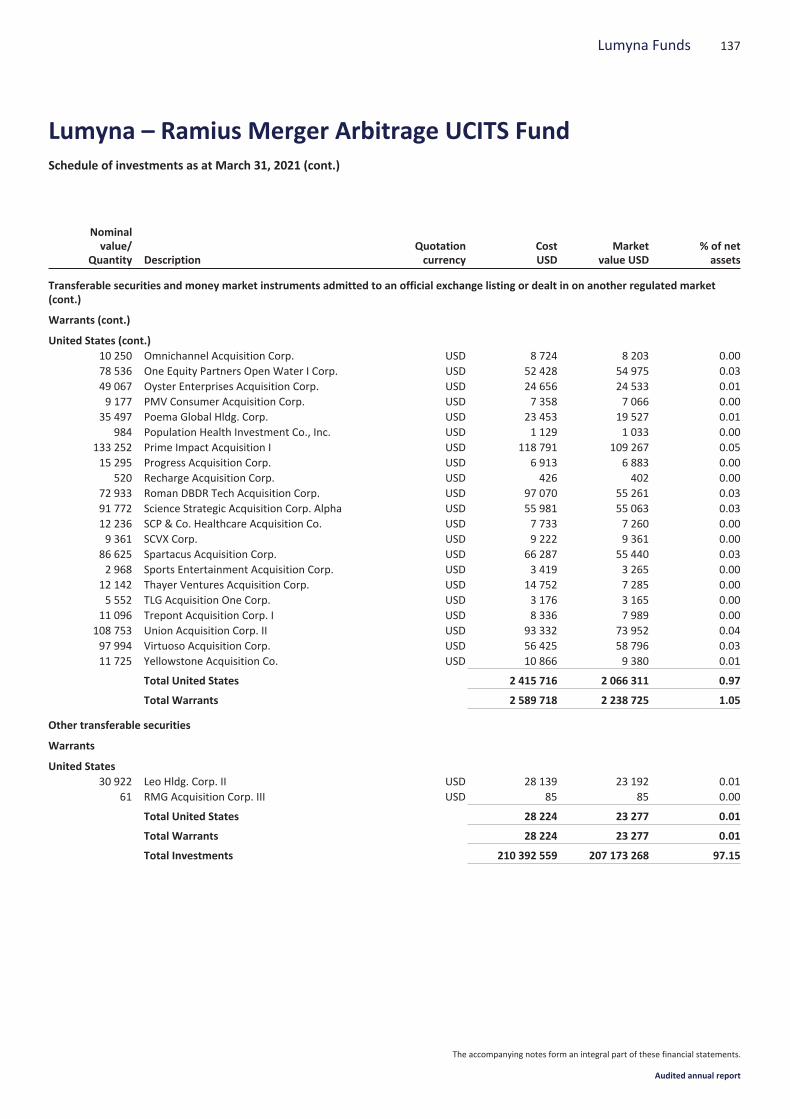
Nominalvalue/
Quantity DescriptionQuotationcurrency
CostUSD
Marketvalue USD
% of netassets
Transferable securities and money market instruments admitted to an official exchange listing or dealt in on another regulated market(cont.)
Warrants (cont.)
United States (cont.)10 250 Omnichannel Acquisition Corp. USD 8 724 8 203 0.0078 536 One Equity Partners Open Water I Corp. USD 52 428 54 975 0.0349 067 Oyster Enterprises Acquisition Corp. USD 24 656 24 533 0.019 177 PMV Consumer Acquisition Corp. USD 7 358 7 066 0.00
35 497 Poema Global Hldg. Corp. USD 23 453 19 527 0.01984 Population Health Investment Co., Inc. USD 1 129 1 033 0.00
133 252 Prime Impact Acquisition I USD 118 791 109 267 0.0515 295 Progress Acquisition Corp. USD 6 913 6 883 0.00
520 Recharge Acquisition Corp. USD 426 402 0.0072 933 Roman DBDR Tech Acquisition Corp. USD 97 070 55 261 0.0391 772 Science Strategic Acquisition Corp. Alpha USD 55 981 55 063 0.0312 236 SCP & Co. Healthcare Acquisition Co. USD 7 733 7 260 0.009 361 SCVX Corp. USD 9 222 9 361 0.00
86 625 Spartacus Acquisition Corp. USD 66 287 55 440 0.032 968 Sports Entertainment Acquisition Corp. USD 3 419 3 265 0.00
12 142 Thayer Ventures Acquisition Corp. USD 14 752 7 285 0.005 552 TLG Acquisition One Corp. USD 3 176 3 165 0.00
11 096 Trepont Acquisition Corp. I USD 8 336 7 989 0.00108 753 Union Acquisition Corp. II USD 93 332 73 952 0.0497 994 Virtuoso Acquisition Corp. USD 56 425 58 796 0.0311 725 Yellowstone Acquisition Co. USD 10 866 9 380 0.01
Total United States 2 415 716 2 066 311 0.97
Total Warrants 2 589 718 2 238 725 1.05
Other transferable securities
Warrants
United States30 922 Leo Hldg. Corp. II USD 28 139 23 192 0.01
61 RMG Acquisition Corp. III USD 85 85 0.00
Total United States 28 224 23 277 0.01
Total Warrants 28 224 23 277 0.01
Total Investments 210 392 559 207 173 268 97.15
137Lumyna Funds
Lumyna – Ramius Merger Arbitrage UCITS FundSchedule of investments as at March 31, 2021 (cont.)
The accompanying notes form an integral part of these financial statements.
Audited annual report
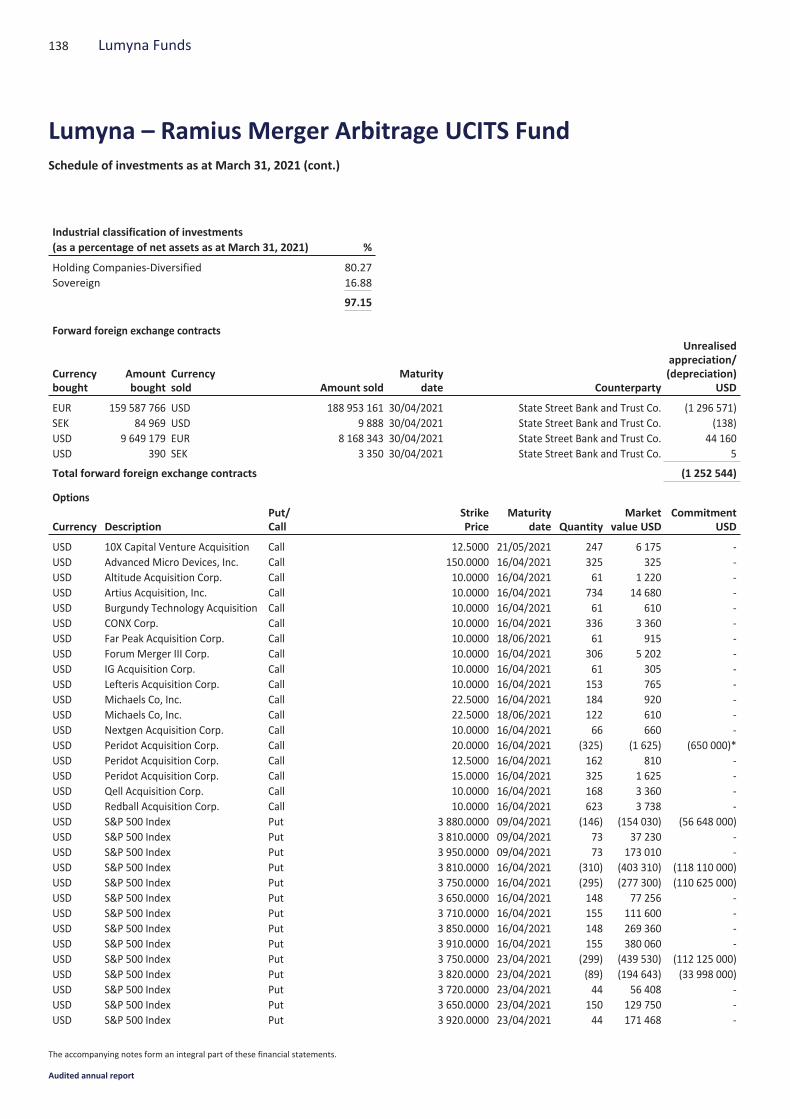
Industrial classification of investments(as a percentage of net assets as at March 31, 2021) %
Holding Companies-Diversified 80.27Sovereign 16.88
97.15
Forward foreign exchange contracts
Currencybought
Amountbought
Currencysold Amount sold
Maturitydate Counterparty
Unrealisedappreciation/(depreciation)
USD
EUR 159 587 766 USD 188 953 161 30/04/2021 State Street Bank and Trust Co. (1 296 571)SEK 84 969 USD 9 888 30/04/2021 State Street Bank and Trust Co. (138)USD 9 649 179 EUR 8 168 343 30/04/2021 State Street Bank and Trust Co. 44 160USD 390 SEK 3 350 30/04/2021 State Street Bank and Trust Co. 5
Total forward foreign exchange contracts (1 252 544)
Options
Currency DescriptionPut/Call
StrikePrice
Maturitydate Quantity
Marketvalue USD
CommitmentUSD
USD 10X Capital Venture Acquisition Call 12.5000 21/05/2021 247 6 175 -USD Advanced Micro Devices, Inc. Call 150.0000 16/04/2021 325 325 -USD Altitude Acquisition Corp. Call 10.0000 16/04/2021 61 1 220 -USD Artius Acquisition, Inc. Call 10.0000 16/04/2021 734 14 680 -USD Burgundy Technology Acquisition Call 10.0000 16/04/2021 61 610 -USD CONX Corp. Call 10.0000 16/04/2021 336 3 360 -USD Far Peak Acquisition Corp. Call 10.0000 18/06/2021 61 915 -USD Forum Merger III Corp. Call 10.0000 16/04/2021 306 5 202 -USD IG Acquisition Corp. Call 10.0000 16/04/2021 61 305 -USD Lefteris Acquisition Corp. Call 10.0000 16/04/2021 153 765 -USD Michaels Co, Inc. Call 22.5000 16/04/2021 184 920 -USD Michaels Co, Inc. Call 22.5000 18/06/2021 122 610 -USD Nextgen Acquisition Corp. Call 10.0000 16/04/2021 66 660 -USD Peridot Acquisition Corp. Call 20.0000 16/04/2021 (325) (1 625) (650 000)*USD Peridot Acquisition Corp. Call 12.5000 16/04/2021 162 810 -USD Peridot Acquisition Corp. Call 15.0000 16/04/2021 325 1 625 -USD Qell Acquisition Corp. Call 10.0000 16/04/2021 168 3 360 -USD Redball Acquisition Corp. Call 10.0000 16/04/2021 623 3 738 -USD S&P 500 Index Put 3 880.0000 09/04/2021 (146) (154 030) (56 648 000)USD S&P 500 Index Put 3 810.0000 09/04/2021 73 37 230 -USD S&P 500 Index Put 3 950.0000 09/04/2021 73 173 010 -USD S&P 500 Index Put 3 810.0000 16/04/2021 (310) (403 310) (118 110 000)USD S&P 500 Index Put 3 750.0000 16/04/2021 (295) (277 300) (110 625 000)USD S&P 500 Index Put 3 650.0000 16/04/2021 148 77 256 -USD S&P 500 Index Put 3 710.0000 16/04/2021 155 111 600 -USD S&P 500 Index Put 3 850.0000 16/04/2021 148 269 360 -USD S&P 500 Index Put 3 910.0000 16/04/2021 155 380 060 -USD S&P 500 Index Put 3 750.0000 23/04/2021 (299) (439 530) (112 125 000)USD S&P 500 Index Put 3 820.0000 23/04/2021 (89) (194 643) (33 998 000)USD S&P 500 Index Put 3 720.0000 23/04/2021 44 56 408 -USD S&P 500 Index Put 3 650.0000 23/04/2021 150 129 750 -USD S&P 500 Index Put 3 920.0000 23/04/2021 44 171 468 -
138 Lumyna Funds
Lumyna – Ramius Merger Arbitrage UCITS FundSchedule of investments as at March 31, 2021 (cont.)
The accompanying notes form an integral part of these financial statements.
Audited annual report
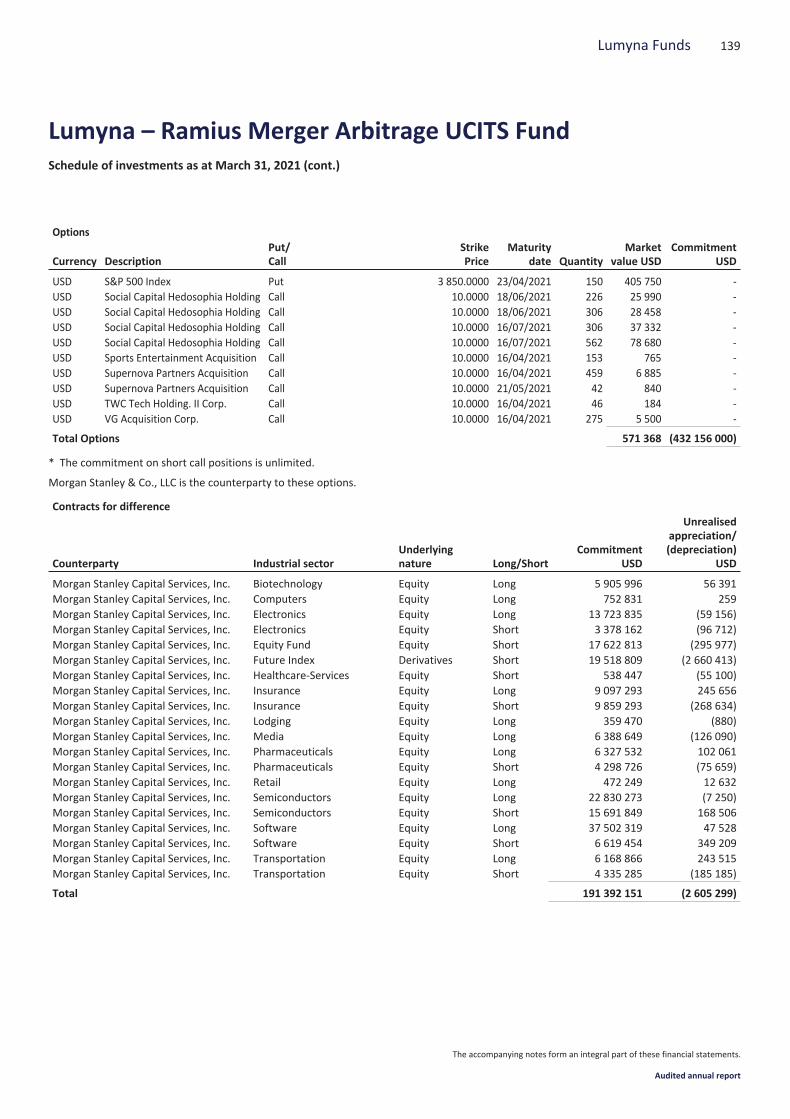
Options
Currency DescriptionPut/Call
StrikePrice
Maturitydate Quantity
Marketvalue USD
CommitmentUSD
USD S&P 500 Index Put 3 850.0000 23/04/2021 150 405 750 -USD Social Capital Hedosophia Holding Call 10.0000 18/06/2021 226 25 990 -USD Social Capital Hedosophia Holding Call 10.0000 18/06/2021 306 28 458 -USD Social Capital Hedosophia Holding Call 10.0000 16/07/2021 306 37 332 -USD Social Capital Hedosophia Holding Call 10.0000 16/07/2021 562 78 680 -USD Sports Entertainment Acquisition Call 10.0000 16/04/2021 153 765 -USD Supernova Partners Acquisition Call 10.0000 16/04/2021 459 6 885 -USD Supernova Partners Acquisition Call 10.0000 21/05/2021 42 840 -USD TWC Tech Holding. II Corp. Call 10.0000 16/04/2021 46 184 -USD VG Acquisition Corp. Call 10.0000 16/04/2021 275 5 500 -
Total Options 571 368 (432 156 000)
* The commitment on short call positions is unlimited.
Morgan Stanley & Co., LLC is the counterparty to these options.
Contracts for difference
Counterparty Industrial sectorUnderlyingnature Long/Short
CommitmentUSD
Unrealisedappreciation/(depreciation)
USD
Morgan Stanley Capital Services, Inc. Biotechnology Equity Long 5 905 996 56 391Morgan Stanley Capital Services, Inc. Computers Equity Long 752 831 259Morgan Stanley Capital Services, Inc. Electronics Equity Long 13 723 835 (59 156)Morgan Stanley Capital Services, Inc. Electronics Equity Short 3 378 162 (96 712)Morgan Stanley Capital Services, Inc. Equity Fund Equity Short 17 622 813 (295 977)Morgan Stanley Capital Services, Inc. Future Index Derivatives Short 19 518 809 (2 660 413)Morgan Stanley Capital Services, Inc. Healthcare-Services Equity Short 538 447 (55 100)Morgan Stanley Capital Services, Inc. Insurance Equity Long 9 097 293 245 656Morgan Stanley Capital Services, Inc. Insurance Equity Short 9 859 293 (268 634)Morgan Stanley Capital Services, Inc. Lodging Equity Long 359 470 (880)Morgan Stanley Capital Services, Inc. Media Equity Long 6 388 649 (126 090)Morgan Stanley Capital Services, Inc. Pharmaceuticals Equity Long 6 327 532 102 061Morgan Stanley Capital Services, Inc. Pharmaceuticals Equity Short 4 298 726 (75 659)Morgan Stanley Capital Services, Inc. Retail Equity Long 472 249 12 632Morgan Stanley Capital Services, Inc. Semiconductors Equity Long 22 830 273 (7 250)Morgan Stanley Capital Services, Inc. Semiconductors Equity Short 15 691 849 168 506Morgan Stanley Capital Services, Inc. Software Equity Long 37 502 319 47 528Morgan Stanley Capital Services, Inc. Software Equity Short 6 619 454 349 209Morgan Stanley Capital Services, Inc. Transportation Equity Long 6 168 866 243 515Morgan Stanley Capital Services, Inc. Transportation Equity Short 4 335 285 (185 185)
Total 191 392 151 (2 605 299)
139Lumyna Funds
Lumyna – Ramius Merger Arbitrage UCITS FundSchedule of investments as at March 31, 2021 (cont.)
The accompanying notes form an integral part of these financial statements.
Audited annual report

Contracts for Difference Summary Breakdowns:
CommitmentLong
CommitmentShort
Unrealisedof shortportfolio
Unrealisedof long portfolio
Realised result(monthly reset) Market Value
Counterparty USD USD USD USD USD USD
Merrill Lynch International BankLtd. - - - - 1 1Morgan Stanley Capital Services,Inc. 109 529 313 81 862 838 (3 119 965) 514 666 1 194 044 (1 411 255)
Total 109 529 313 81 862 838 (3 119 965) 514 666 1 194 045 (1 411 254)
The counterparties for OTC Derivatives including CFD as at March 31, 2021 are Merrill Lynch International, Morgan Stanley Capital Services LLC,and State Street Bank and Trust Co. The maximum individual counterparty exposure for OTC Derivatives including CFD as at March 31, 2021 isState Street Bank and Trust Co with 2.91% of the NAV.
140 Lumyna Funds
Lumyna – Ramius Merger Arbitrage UCITS FundSchedule of investments as at March 31, 2021 (cont.)
The accompanying notes form an integral part of these financial statements.
Audited annual report

Nominalvalue Description
Quotationcurrency
CostUSD
Marketvalue USD
% of netassets
Transferable securities and money market instruments admitted to an official exchange listing or dealt in on another regulated market
Bonds
Supranational22 000 000 European Investment Bank 2.625% 20/05/2022 USD 22 620 603 22 605 883 18.81
Total Supranational 22 620 603 22 605 883 18.81
Total Bonds 22 620 603 22 605 883 18.81
Supranationals, Governments and Local Public Authorities, Debt Instruments
Supranational25 000 000 International Bank for Reconstruction & Development
1.375% 20/09/2021USD 24 942 335 25 136 250 20.90
25 000 000 International Bank for Reconstruction & Development1.625% 10/02/2022
USD 24 999 480 25 306 950 21.05
7 000 000 International Bank for Reconstruction & Development2.750% 23/07/2021
USD 7 026 395 7 054 950 5.87
Total Supranational 56 968 210 57 498 150 47.82
United States1 000 United States Treasury Note/Bond 3.500% 15/02/2039 USD 1 059 1 196 0.001 000 United States Treasury Note/Bond 4.250% 15/05/2039 USD 1 156 1 311 0.001 000 United States Treasury Note/Bond 4.375% 15/02/2038 USD 1 177 1 320 0.001 000 United States Treasury Note/Bond 4.500% 15/05/2038 USD 1 193 1 340 0.001 000 United States Treasury Note/Bond 4.750% 15/02/2037 USD 1 219 1 366 0.001 000 United States Treasury Note/Bond 5.000% 15/05/2037 USD 1 252 1 402 0.01
Total United States 7 056 7 935 0.01
Total Supranationals, Governments and Local PublicAuthorities, Debt Instruments 56 975 266 57 506 085 47.83
Other transferable securities
Bonds
Ireland7 823 417 Star Compass Plc. 0.000% 01/02/2022 USD 6 635 285 7 791 341 6.48
Total Ireland 6 635 285 7 791 341 6.48
Total Bonds 6 635 285 7 791 341 6.48
Total Investments 86 231 154 87 903 309 73.12
141Lumyna Funds
Lumyna – Millburn Diversified UCITS FundSchedule of investments as at March 31, 2021
The accompanying notes form an integral part of these financial statements.
Audited annual report
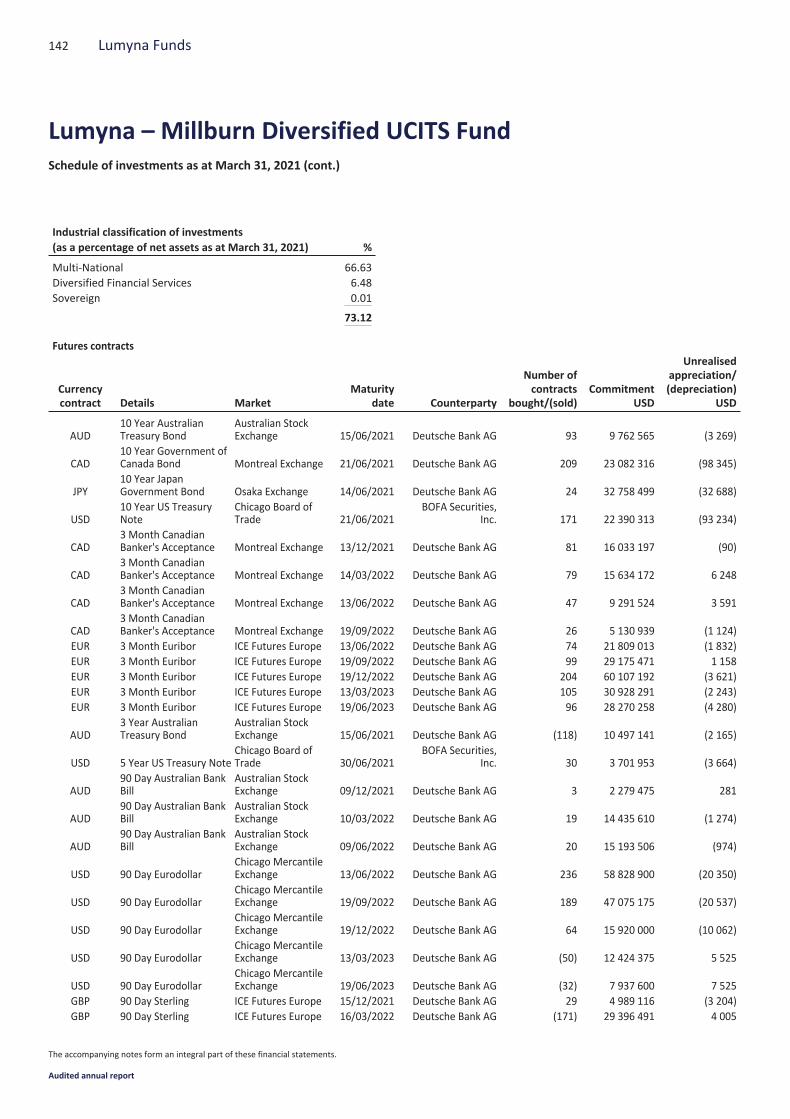
Industrial classification of investments(as a percentage of net assets as at March 31, 2021) %
Multi-National 66.63Diversified Financial Services 6.48Sovereign 0.01
73.12
Futures contracts
Currencycontract Details Market
Maturitydate Counterparty
Number ofcontracts
bought/(sold)Commitment
USD
Unrealisedappreciation/(depreciation)
USD
AUD10 Year AustralianTreasury Bond
Australian StockExchange 15/06/2021 Deutsche Bank AG 93 9 762 565 (3 269)
CAD10 Year Government ofCanada Bond Montreal Exchange 21/06/2021 Deutsche Bank AG 209 23 082 316 (98 345)
JPY10 Year JapanGovernment Bond Osaka Exchange 14/06/2021 Deutsche Bank AG 24 32 758 499 (32 688)
USD10 Year US TreasuryNote
Chicago Board ofTrade 21/06/2021
BOFA Securities,Inc. 171 22 390 313 (93 234)
CAD3 Month CanadianBanker's Acceptance Montreal Exchange 13/12/2021 Deutsche Bank AG 81 16 033 197 (90)
CAD3 Month CanadianBanker's Acceptance Montreal Exchange 14/03/2022 Deutsche Bank AG 79 15 634 172 6 248
CAD3 Month CanadianBanker's Acceptance Montreal Exchange 13/06/2022 Deutsche Bank AG 47 9 291 524 3 591
CAD3 Month CanadianBanker's Acceptance Montreal Exchange 19/09/2022 Deutsche Bank AG 26 5 130 939 (1 124)
EUR 3 Month Euribor ICE Futures Europe 13/06/2022 Deutsche Bank AG 74 21 809 013 (1 832)EUR 3 Month Euribor ICE Futures Europe 19/09/2022 Deutsche Bank AG 99 29 175 471 1 158EUR 3 Month Euribor ICE Futures Europe 19/12/2022 Deutsche Bank AG 204 60 107 192 (3 621)EUR 3 Month Euribor ICE Futures Europe 13/03/2023 Deutsche Bank AG 105 30 928 291 (2 243)EUR 3 Month Euribor ICE Futures Europe 19/06/2023 Deutsche Bank AG 96 28 270 258 (4 280)
AUD3 Year AustralianTreasury Bond
Australian StockExchange 15/06/2021 Deutsche Bank AG (118) 10 497 141 (2 165)
USD 5 Year US Treasury NoteChicago Board ofTrade 30/06/2021
BOFA Securities,Inc. 30 3 701 953 (3 664)
AUD90 Day Australian BankBill
Australian StockExchange 09/12/2021 Deutsche Bank AG 3 2 279 475 281
AUD90 Day Australian BankBill
Australian StockExchange 10/03/2022 Deutsche Bank AG 19 14 435 610 (1 274)
AUD90 Day Australian BankBill
Australian StockExchange 09/06/2022 Deutsche Bank AG 20 15 193 506 (974)
USD 90 Day EurodollarChicago MercantileExchange 13/06/2022 Deutsche Bank AG 236 58 828 900 (20 350)
USD 90 Day EurodollarChicago MercantileExchange 19/09/2022 Deutsche Bank AG 189 47 075 175 (20 537)
USD 90 Day EurodollarChicago MercantileExchange 19/12/2022 Deutsche Bank AG 64 15 920 000 (10 062)
USD 90 Day EurodollarChicago MercantileExchange 13/03/2023 Deutsche Bank AG (50) 12 424 375 5 525
USD 90 Day EurodollarChicago MercantileExchange 19/06/2023 Deutsche Bank AG (32) 7 937 600 7 525
GBP 90 Day Sterling ICE Futures Europe 15/12/2021 Deutsche Bank AG 29 4 989 116 (3 204)GBP 90 Day Sterling ICE Futures Europe 16/03/2022 Deutsche Bank AG (171) 29 396 491 4 005
142 Lumyna Funds
Lumyna – Millburn Diversified UCITS FundSchedule of investments as at March 31, 2021 (cont.)
The accompanying notes form an integral part of these financial statements.
Audited annual report
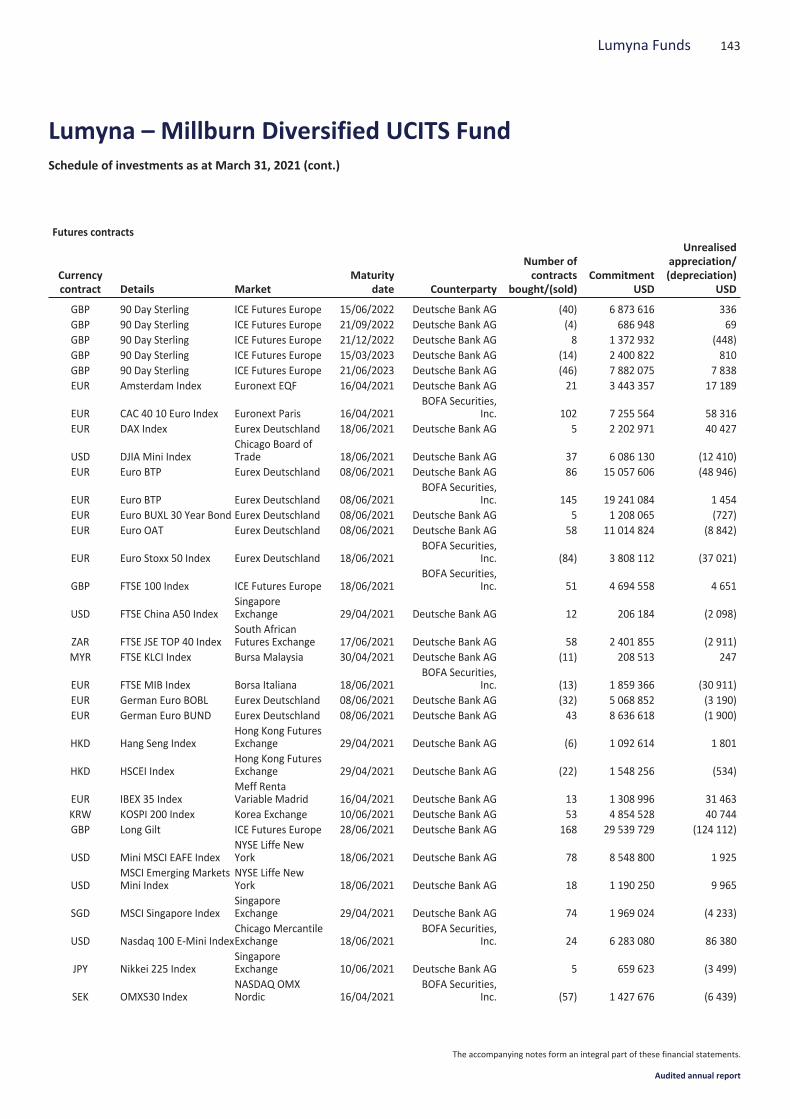
Futures contracts
Currencycontract Details Market
Maturitydate Counterparty
Number ofcontracts
bought/(sold)Commitment
USD
Unrealisedappreciation/(depreciation)
USD
GBP 90 Day Sterling ICE Futures Europe 15/06/2022 Deutsche Bank AG (40) 6 873 616 336GBP 90 Day Sterling ICE Futures Europe 21/09/2022 Deutsche Bank AG (4) 686 948 69GBP 90 Day Sterling ICE Futures Europe 21/12/2022 Deutsche Bank AG 8 1 372 932 (448)GBP 90 Day Sterling ICE Futures Europe 15/03/2023 Deutsche Bank AG (14) 2 400 822 810GBP 90 Day Sterling ICE Futures Europe 21/06/2023 Deutsche Bank AG (46) 7 882 075 7 838EUR Amsterdam Index Euronext EQF 16/04/2021 Deutsche Bank AG 21 3 443 357 17 189
EUR CAC 40 10 Euro Index Euronext Paris 16/04/2021BOFA Securities,
Inc. 102 7 255 564 58 316EUR DAX Index Eurex Deutschland 18/06/2021 Deutsche Bank AG 5 2 202 971 40 427
USD DJIA Mini IndexChicago Board ofTrade 18/06/2021 Deutsche Bank AG 37 6 086 130 (12 410)
EUR Euro BTP Eurex Deutschland 08/06/2021 Deutsche Bank AG 86 15 057 606 (48 946)
EUR Euro BTP Eurex Deutschland 08/06/2021BOFA Securities,
Inc. 145 19 241 084 1 454EUR Euro BUXL 30 Year Bond Eurex Deutschland 08/06/2021 Deutsche Bank AG 5 1 208 065 (727)EUR Euro OAT Eurex Deutschland 08/06/2021 Deutsche Bank AG 58 11 014 824 (8 842)
EUR Euro Stoxx 50 Index Eurex Deutschland 18/06/2021BOFA Securities,
Inc. (84) 3 808 112 (37 021)
GBP FTSE 100 Index ICE Futures Europe 18/06/2021BOFA Securities,
Inc. 51 4 694 558 4 651
USD FTSE China A50 IndexSingaporeExchange 29/04/2021 Deutsche Bank AG 12 206 184 (2 098)
ZAR FTSE JSE TOP 40 IndexSouth AfricanFutures Exchange 17/06/2021 Deutsche Bank AG 58 2 401 855 (2 911)
MYR FTSE KLCI Index Bursa Malaysia 30/04/2021 Deutsche Bank AG (11) 208 513 247
EUR FTSE MIB Index Borsa Italiana 18/06/2021BOFA Securities,
Inc. (13) 1 859 366 (30 911)EUR German Euro BOBL Eurex Deutschland 08/06/2021 Deutsche Bank AG (32) 5 068 852 (3 190)EUR German Euro BUND Eurex Deutschland 08/06/2021 Deutsche Bank AG 43 8 636 618 (1 900)
HKD Hang Seng IndexHong Kong FuturesExchange 29/04/2021 Deutsche Bank AG (6) 1 092 614 1 801
HKD HSCEI IndexHong Kong FuturesExchange 29/04/2021 Deutsche Bank AG (22) 1 548 256 (534)
EUR IBEX 35 IndexMeff RentaVariable Madrid 16/04/2021 Deutsche Bank AG 13 1 308 996 31 463
KRW KOSPI 200 Index Korea Exchange 10/06/2021 Deutsche Bank AG 53 4 854 528 40 744GBP Long Gilt ICE Futures Europe 28/06/2021 Deutsche Bank AG 168 29 539 729 (124 112)
USD Mini MSCI EAFE IndexNYSE Liffe NewYork 18/06/2021 Deutsche Bank AG 78 8 548 800 1 925
USDMSCI Emerging MarketsMini Index
NYSE Liffe NewYork 18/06/2021 Deutsche Bank AG 18 1 190 250 9 965
SGD MSCI Singapore IndexSingaporeExchange 29/04/2021 Deutsche Bank AG 74 1 969 024 (4 233)
USD Nasdaq 100 E-Mini IndexChicago MercantileExchange 18/06/2021
BOFA Securities,Inc. 24 6 283 080 86 380
JPY Nikkei 225 IndexSingaporeExchange 10/06/2021 Deutsche Bank AG 5 659 623 (3 499)
SEK OMXS30 IndexNASDAQ OMXNordic 16/04/2021
BOFA Securities,Inc. (57) 1 427 676 (6 439)
143Lumyna Funds
Lumyna – Millburn Diversified UCITS FundSchedule of investments as at March 31, 2021 (cont.)
The accompanying notes form an integral part of these financial statements.
Audited annual report
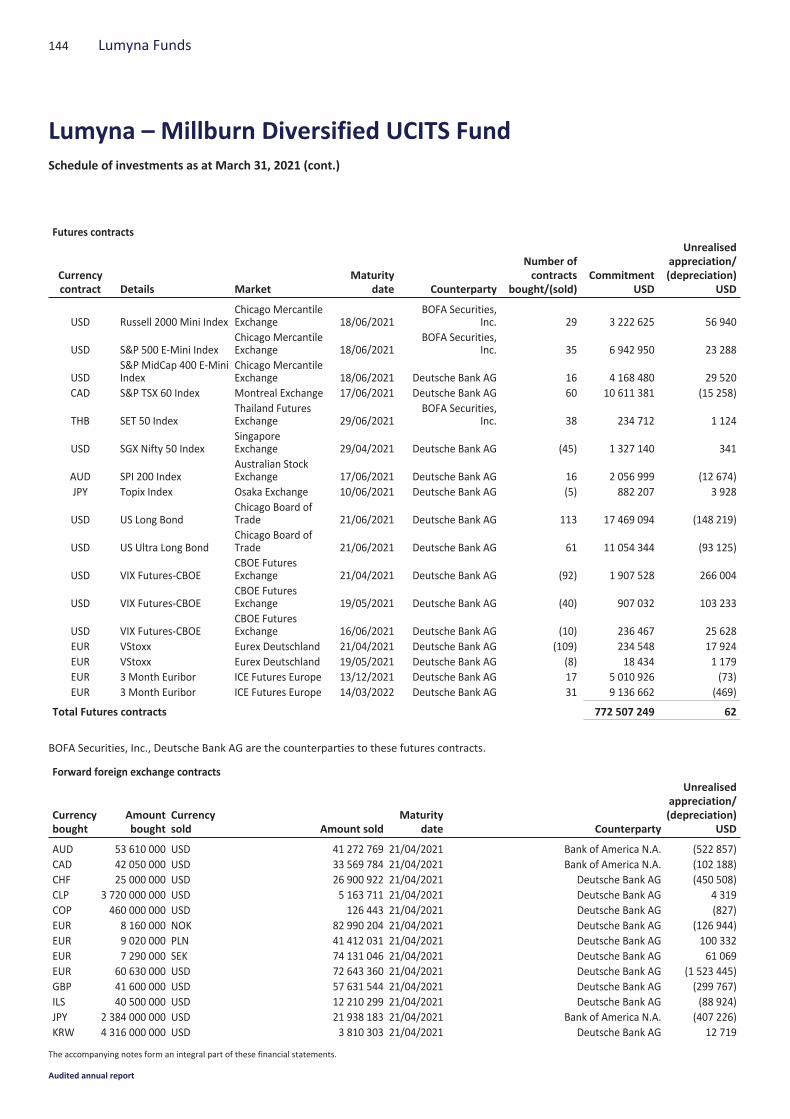
Futures contracts
Currencycontract Details Market
Maturitydate Counterparty
Number ofcontracts
bought/(sold)Commitment
USD
Unrealisedappreciation/(depreciation)
USD
USD Russell 2000 Mini IndexChicago MercantileExchange 18/06/2021
BOFA Securities,Inc. 29 3 222 625 56 940
USD S&P 500 E-Mini IndexChicago MercantileExchange 18/06/2021
BOFA Securities,Inc. 35 6 942 950 23 288
USDS&P MidCap 400 E-MiniIndex
Chicago MercantileExchange 18/06/2021 Deutsche Bank AG 16 4 168 480 29 520
CAD S&P TSX 60 Index Montreal Exchange 17/06/2021 Deutsche Bank AG 60 10 611 381 (15 258)
THB SET 50 IndexThailand FuturesExchange 29/06/2021
BOFA Securities,Inc. 38 234 712 1 124
USD SGX Nifty 50 IndexSingaporeExchange 29/04/2021 Deutsche Bank AG (45) 1 327 140 341
AUD SPI 200 IndexAustralian StockExchange 17/06/2021 Deutsche Bank AG 16 2 056 999 (12 674)
JPY Topix Index Osaka Exchange 10/06/2021 Deutsche Bank AG (5) 882 207 3 928
USD US Long BondChicago Board ofTrade 21/06/2021 Deutsche Bank AG 113 17 469 094 (148 219)
USD US Ultra Long BondChicago Board ofTrade 21/06/2021 Deutsche Bank AG 61 11 054 344 (93 125)
USD VIX Futures-CBOECBOE FuturesExchange 21/04/2021 Deutsche Bank AG (92) 1 907 528 266 004
USD VIX Futures-CBOECBOE FuturesExchange 19/05/2021 Deutsche Bank AG (40) 907 032 103 233
USD VIX Futures-CBOECBOE FuturesExchange 16/06/2021 Deutsche Bank AG (10) 236 467 25 628
EUR VStoxx Eurex Deutschland 21/04/2021 Deutsche Bank AG (109) 234 548 17 924EUR VStoxx Eurex Deutschland 19/05/2021 Deutsche Bank AG (8) 18 434 1 179EUR 3 Month Euribor ICE Futures Europe 13/12/2021 Deutsche Bank AG 17 5 010 926 (73)EUR 3 Month Euribor ICE Futures Europe 14/03/2022 Deutsche Bank AG 31 9 136 662 (469)
Total Futures contracts 772 507 249 62
BOFA Securities, Inc., Deutsche Bank AG are the counterparties to these futures contracts.
Forward foreign exchange contracts
Currencybought
Amountbought
Currencysold Amount sold
Maturitydate Counterparty
Unrealisedappreciation/(depreciation)
USD
AUD 53 610 000 USD 41 272 769 21/04/2021 Bank of America N.A. (522 857)CAD 42 050 000 USD 33 569 784 21/04/2021 Bank of America N.A. (102 188)CHF 25 000 000 USD 26 900 922 21/04/2021 Deutsche Bank AG (450 508)CLP 3 720 000 000 USD 5 163 711 21/04/2021 Deutsche Bank AG 4 319COP 460 000 000 USD 126 443 21/04/2021 Deutsche Bank AG (827)EUR 8 160 000 NOK 82 990 204 21/04/2021 Deutsche Bank AG (126 944)EUR 9 020 000 PLN 41 412 031 21/04/2021 Deutsche Bank AG 100 332EUR 7 290 000 SEK 74 131 046 21/04/2021 Deutsche Bank AG 61 069EUR 60 630 000 USD 72 643 360 21/04/2021 Deutsche Bank AG (1 523 445)GBP 41 600 000 USD 57 631 544 21/04/2021 Deutsche Bank AG (299 767)ILS 40 500 000 USD 12 210 299 21/04/2021 Deutsche Bank AG (88 924)JPY 2 384 000 000 USD 21 938 183 21/04/2021 Bank of America N.A. (407 226)KRW 4 316 000 000 USD 3 810 303 21/04/2021 Deutsche Bank AG 12 719
144 Lumyna Funds
Lumyna – Millburn Diversified UCITS FundSchedule of investments as at March 31, 2021 (cont.)
The accompanying notes form an integral part of these financial statements.
Audited annual report
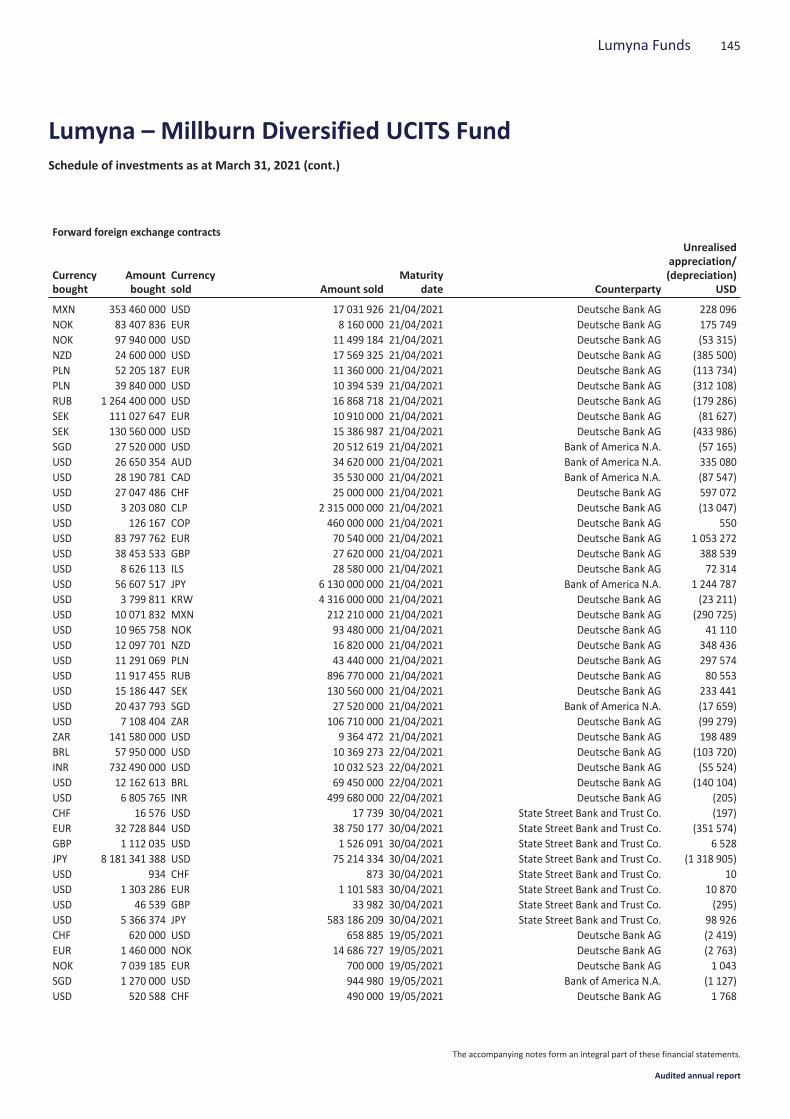
Forward foreign exchange contracts
Currencybought
Amountbought
Currencysold Amount sold
Maturitydate Counterparty
Unrealisedappreciation/(depreciation)
USD
MXN 353 460 000 USD 17 031 926 21/04/2021 Deutsche Bank AG 228 096NOK 83 407 836 EUR 8 160 000 21/04/2021 Deutsche Bank AG 175 749NOK 97 940 000 USD 11 499 184 21/04/2021 Deutsche Bank AG (53 315)NZD 24 600 000 USD 17 569 325 21/04/2021 Deutsche Bank AG (385 500)PLN 52 205 187 EUR 11 360 000 21/04/2021 Deutsche Bank AG (113 734)PLN 39 840 000 USD 10 394 539 21/04/2021 Deutsche Bank AG (312 108)RUB 1 264 400 000 USD 16 868 718 21/04/2021 Deutsche Bank AG (179 286)SEK 111 027 647 EUR 10 910 000 21/04/2021 Deutsche Bank AG (81 627)SEK 130 560 000 USD 15 386 987 21/04/2021 Deutsche Bank AG (433 986)SGD 27 520 000 USD 20 512 619 21/04/2021 Bank of America N.A. (57 165)USD 26 650 354 AUD 34 620 000 21/04/2021 Bank of America N.A. 335 080USD 28 190 781 CAD 35 530 000 21/04/2021 Bank of America N.A. (87 547)USD 27 047 486 CHF 25 000 000 21/04/2021 Deutsche Bank AG 597 072USD 3 203 080 CLP 2 315 000 000 21/04/2021 Deutsche Bank AG (13 047)USD 126 167 COP 460 000 000 21/04/2021 Deutsche Bank AG 550USD 83 797 762 EUR 70 540 000 21/04/2021 Deutsche Bank AG 1 053 272USD 38 453 533 GBP 27 620 000 21/04/2021 Deutsche Bank AG 388 539USD 8 626 113 ILS 28 580 000 21/04/2021 Deutsche Bank AG 72 314USD 56 607 517 JPY 6 130 000 000 21/04/2021 Bank of America N.A. 1 244 787USD 3 799 811 KRW 4 316 000 000 21/04/2021 Deutsche Bank AG (23 211)USD 10 071 832 MXN 212 210 000 21/04/2021 Deutsche Bank AG (290 725)USD 10 965 758 NOK 93 480 000 21/04/2021 Deutsche Bank AG 41 110USD 12 097 701 NZD 16 820 000 21/04/2021 Deutsche Bank AG 348 436USD 11 291 069 PLN 43 440 000 21/04/2021 Deutsche Bank AG 297 574USD 11 917 455 RUB 896 770 000 21/04/2021 Deutsche Bank AG 80 553USD 15 186 447 SEK 130 560 000 21/04/2021 Deutsche Bank AG 233 441USD 20 437 793 SGD 27 520 000 21/04/2021 Bank of America N.A. (17 659)USD 7 108 404 ZAR 106 710 000 21/04/2021 Deutsche Bank AG (99 279)ZAR 141 580 000 USD 9 364 472 21/04/2021 Deutsche Bank AG 198 489BRL 57 950 000 USD 10 369 273 22/04/2021 Deutsche Bank AG (103 720)INR 732 490 000 USD 10 032 523 22/04/2021 Deutsche Bank AG (55 524)USD 12 162 613 BRL 69 450 000 22/04/2021 Deutsche Bank AG (140 104)USD 6 805 765 INR 499 680 000 22/04/2021 Deutsche Bank AG (205)CHF 16 576 USD 17 739 30/04/2021 State Street Bank and Trust Co. (197)EUR 32 728 844 USD 38 750 177 30/04/2021 State Street Bank and Trust Co. (351 574)GBP 1 112 035 USD 1 526 091 30/04/2021 State Street Bank and Trust Co. 6 528JPY 8 181 341 388 USD 75 214 334 30/04/2021 State Street Bank and Trust Co. (1 318 905)USD 934 CHF 873 30/04/2021 State Street Bank and Trust Co. 10USD 1 303 286 EUR 1 101 583 30/04/2021 State Street Bank and Trust Co. 10 870USD 46 539 GBP 33 982 30/04/2021 State Street Bank and Trust Co. (295)USD 5 366 374 JPY 583 186 209 30/04/2021 State Street Bank and Trust Co. 98 926CHF 620 000 USD 658 885 19/05/2021 Deutsche Bank AG (2 419)EUR 1 460 000 NOK 14 686 727 19/05/2021 Deutsche Bank AG (2 763)NOK 7 039 185 EUR 700 000 19/05/2021 Deutsche Bank AG 1 043SGD 1 270 000 USD 944 980 19/05/2021 Bank of America N.A. (1 127)USD 520 588 CHF 490 000 19/05/2021 Deutsche Bank AG 1 768
145Lumyna Funds
Lumyna – Millburn Diversified UCITS FundSchedule of investments as at March 31, 2021 (cont.)
The accompanying notes form an integral part of these financial statements.
Audited annual report

Forward foreign exchange contracts
Currencybought
Amountbought
Currencysold Amount sold
Maturitydate Counterparty
Unrealisedappreciation/(depreciation)
USD
USD 341 998 SEK 2 980 000 19/05/2021 Deutsche Bank AG 614USD 727 000 SGD 980 000 19/05/2021 Bank of America N.A. (1 327)
Total forward foreign exchange contracts (2 055 775)
Options
Currency DescriptionPut/Call
StrikePrice
Maturitydate Quantity
Marketvalue USD
CommitmentUSD
USD UBS ETC Linked to a Millburn Strategy Put 83.7723 31/03/2021 (584 516) 437 48 966 284
Total Options 437 48 966 284
UBS AG is the counterparty to this option.
The counterparties for OTC Derivatives including CFD as at March 31, 2021 are Bank of America NA, Deutsche Bank AG, State Street Bank andTrust Co and UBS AG. Themaximum individual counterparty exposure for OTC Derivatives including CFD as atMarch 31, 2021 is State Street Bankand Trust Co with 3.18% of the NAV.
146 Lumyna Funds
Lumyna – Millburn Diversified UCITS FundSchedule of investments as at March 31, 2021 (cont.)
The accompanying notes form an integral part of these financial statements.
Audited annual report
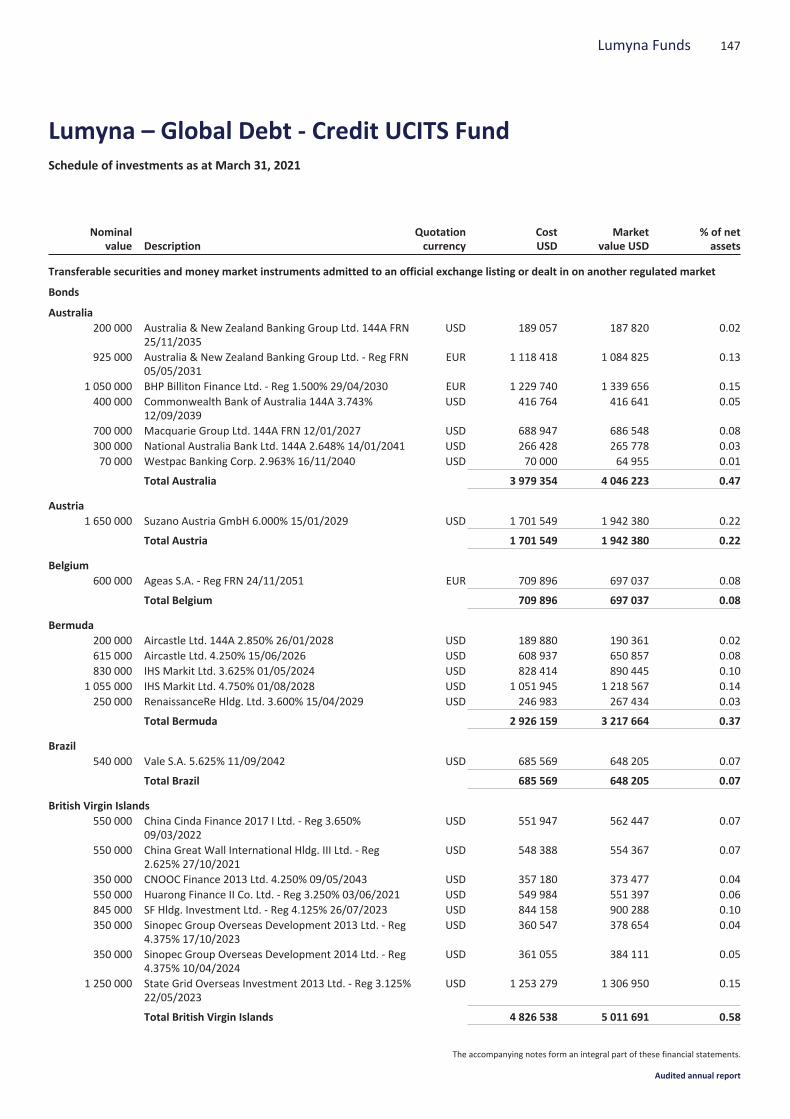
Nominalvalue Description
Quotationcurrency
CostUSD
Marketvalue USD
% of netassets
Transferable securities and money market instruments admitted to an official exchange listing or dealt in on another regulated market
Bonds
Australia200 000 Australia & New Zealand Banking Group Ltd. 144A FRN
25/11/2035USD 189 057 187 820 0.02
925 000 Australia & New Zealand Banking Group Ltd. - Reg FRN05/05/2031
EUR 1 118 418 1 084 825 0.13
1 050 000 BHP Billiton Finance Ltd. - Reg 1.500% 29/04/2030 EUR 1 229 740 1 339 656 0.15400 000 Commonwealth Bank of Australia 144A 3.743%
12/09/2039USD 416 764 416 641 0.05
700 000 Macquarie Group Ltd. 144A FRN 12/01/2027 USD 688 947 686 548 0.08300 000 National Australia Bank Ltd. 144A 2.648% 14/01/2041 USD 266 428 265 778 0.0370 000 Westpac Banking Corp. 2.963% 16/11/2040 USD 70 000 64 955 0.01
Total Australia 3 979 354 4 046 223 0.47
Austria1 650 000 Suzano Austria GmbH 6.000% 15/01/2029 USD 1 701 549 1 942 380 0.22
Total Austria 1 701 549 1 942 380 0.22
Belgium600 000 Ageas S.A. - Reg FRN 24/11/2051 EUR 709 896 697 037 0.08
Total Belgium 709 896 697 037 0.08
Bermuda200 000 Aircastle Ltd. 144A 2.850% 26/01/2028 USD 189 880 190 361 0.02615 000 Aircastle Ltd. 4.250% 15/06/2026 USD 608 937 650 857 0.08830 000 IHS Markit Ltd. 3.625% 01/05/2024 USD 828 414 890 445 0.10
1 055 000 IHS Markit Ltd. 4.750% 01/08/2028 USD 1 051 945 1 218 567 0.14250 000 RenaissanceRe Hldg. Ltd. 3.600% 15/04/2029 USD 246 983 267 434 0.03
Total Bermuda 2 926 159 3 217 664 0.37
Brazil540 000 Vale S.A. 5.625% 11/09/2042 USD 685 569 648 205 0.07
Total Brazil 685 569 648 205 0.07
British Virgin Islands550 000 China Cinda Finance 2017 I Ltd. - Reg 3.650%
09/03/2022USD 551 947 562 447 0.07
550 000 China Great Wall International Hldg. III Ltd. - Reg2.625% 27/10/2021
USD 548 388 554 367 0.07
350 000 CNOOC Finance 2013 Ltd. 4.250% 09/05/2043 USD 357 180 373 477 0.04550 000 Huarong Finance II Co. Ltd. - Reg 3.250% 03/06/2021 USD 549 984 551 397 0.06845 000 SF Hldg. Investment Ltd. - Reg 4.125% 26/07/2023 USD 844 158 900 288 0.10350 000 Sinopec Group Overseas Development 2013 Ltd. - Reg
4.375% 17/10/2023USD 360 547 378 654 0.04
350 000 Sinopec Group Overseas Development 2014 Ltd. - Reg4.375% 10/04/2024
USD 361 055 384 111 0.05
1 250 000 State Grid Overseas Investment 2013 Ltd. - Reg 3.125%22/05/2023
USD 1 253 279 1 306 950 0.15
Total British Virgin Islands 4 826 538 5 011 691 0.58
147Lumyna Funds
Lumyna – Global Debt - Credit UCITS FundSchedule of investments as at March 31, 2021
The accompanying notes form an integral part of these financial statements.
Audited annual report
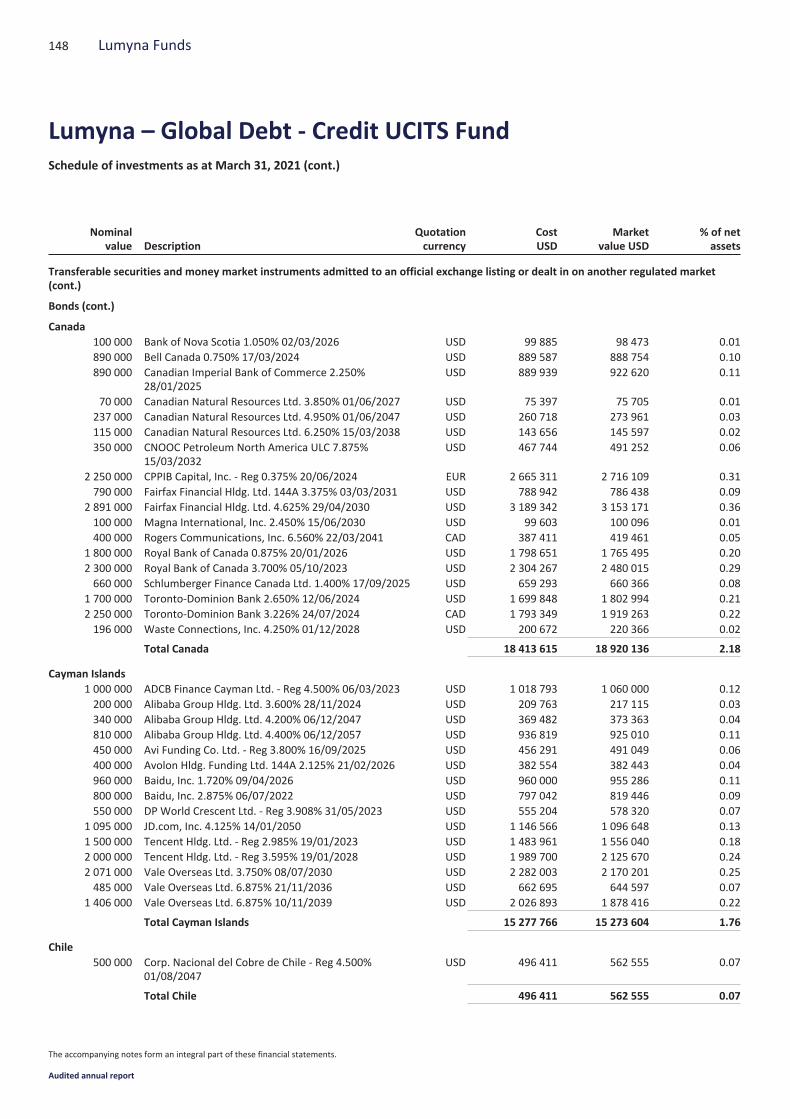
Nominalvalue Description
Quotationcurrency
CostUSD
Marketvalue USD
% of netassets
Transferable securities and money market instruments admitted to an official exchange listing or dealt in on another regulated market(cont.)
Bonds (cont.)
Canada100 000 Bank of Nova Scotia 1.050% 02/03/2026 USD 99 885 98 473 0.01890 000 Bell Canada 0.750% 17/03/2024 USD 889 587 888 754 0.10890 000 Canadian Imperial Bank of Commerce 2.250%
28/01/2025USD 889 939 922 620 0.11
70 000 Canadian Natural Resources Ltd. 3.850% 01/06/2027 USD 75 397 75 705 0.01237 000 Canadian Natural Resources Ltd. 4.950% 01/06/2047 USD 260 718 273 961 0.03115 000 Canadian Natural Resources Ltd. 6.250% 15/03/2038 USD 143 656 145 597 0.02350 000 CNOOC Petroleum North America ULC 7.875%
15/03/2032USD 467 744 491 252 0.06
2 250 000 CPPIB Capital, Inc. - Reg 0.375% 20/06/2024 EUR 2 665 311 2 716 109 0.31790 000 Fairfax Financial Hldg. Ltd. 144A 3.375% 03/03/2031 USD 788 942 786 438 0.09
2 891 000 Fairfax Financial Hldg. Ltd. 4.625% 29/04/2030 USD 3 189 342 3 153 171 0.36100 000 Magna International, Inc. 2.450% 15/06/2030 USD 99 603 100 096 0.01400 000 Rogers Communications, Inc. 6.560% 22/03/2041 CAD 387 411 419 461 0.05
1 800 000 Royal Bank of Canada 0.875% 20/01/2026 USD 1 798 651 1 765 495 0.202 300 000 Royal Bank of Canada 3.700% 05/10/2023 USD 2 304 267 2 480 015 0.29660 000 Schlumberger Finance Canada Ltd. 1.400% 17/09/2025 USD 659 293 660 366 0.08
1 700 000 Toronto-Dominion Bank 2.650% 12/06/2024 USD 1 699 848 1 802 994 0.212 250 000 Toronto-Dominion Bank 3.226% 24/07/2024 CAD 1 793 349 1 919 263 0.22196 000 Waste Connections, Inc. 4.250% 01/12/2028 USD 200 672 220 366 0.02
Total Canada 18 413 615 18 920 136 2.18
Cayman Islands1 000 000 ADCB Finance Cayman Ltd. - Reg 4.500% 06/03/2023 USD 1 018 793 1 060 000 0.12200 000 Alibaba Group Hldg. Ltd. 3.600% 28/11/2024 USD 209 763 217 115 0.03340 000 Alibaba Group Hldg. Ltd. 4.200% 06/12/2047 USD 369 482 373 363 0.04810 000 Alibaba Group Hldg. Ltd. 4.400% 06/12/2057 USD 936 819 925 010 0.11450 000 Avi Funding Co. Ltd. - Reg 3.800% 16/09/2025 USD 456 291 491 049 0.06400 000 Avolon Hldg. Funding Ltd. 144A 2.125% 21/02/2026 USD 382 554 382 443 0.04960 000 Baidu, Inc. 1.720% 09/04/2026 USD 960 000 955 286 0.11800 000 Baidu, Inc. 2.875% 06/07/2022 USD 797 042 819 446 0.09550 000 DP World Crescent Ltd. - Reg 3.908% 31/05/2023 USD 555 204 578 320 0.07
1 095 000 JD.com, Inc. 4.125% 14/01/2050 USD 1 146 566 1 096 648 0.131 500 000 Tencent Hldg. Ltd. - Reg 2.985% 19/01/2023 USD 1 483 961 1 556 040 0.182 000 000 Tencent Hldg. Ltd. - Reg 3.595% 19/01/2028 USD 1 989 700 2 125 670 0.242 071 000 Vale Overseas Ltd. 3.750% 08/07/2030 USD 2 282 003 2 170 201 0.25485 000 Vale Overseas Ltd. 6.875% 21/11/2036 USD 662 695 644 597 0.07
1 406 000 Vale Overseas Ltd. 6.875% 10/11/2039 USD 2 026 893 1 878 416 0.22
Total Cayman Islands 15 277 766 15 273 604 1.76
Chile500 000 Corp. Nacional del Cobre de Chile - Reg 4.500%
01/08/2047USD 496 411 562 555 0.07
Total Chile 496 411 562 555 0.07
148 Lumyna Funds
Lumyna – Global Debt - Credit UCITS FundSchedule of investments as at March 31, 2021 (cont.)
The accompanying notes form an integral part of these financial statements.
Audited annual report

Nominalvalue Description
Quotationcurrency
CostUSD
Marketvalue USD
% of netassets
Transferable securities and money market instruments admitted to an official exchange listing or dealt in on another regulated market(cont.)
Bonds (cont.)
China800 000 Industrial & Commercial Bank of China Ltd. 2.635%
26/05/2021USD 799 763 802 008 0.09
Total China 799 763 802 008 0.09
Colombia1 500 000 Ecopetrol S.A. 4.125% 16/01/2025 USD 1 507 692 1 601 100 0.18
Total Colombia 1 507 692 1 601 100 0.18
Denmark245 000 AP Moller - Maersk A/S - Reg 1.750% 16/03/2026 EUR 300 824 309 320 0.04350 000 AP Moller - Maersk A/S - Reg 4.000% 04/04/2025 GBP 475 040 533 297 0.06500 000 Danske Bank A/S 144A FRN 11/09/2026 USD 496 066 494 390 0.06375 000 Danske Bank A/S - Reg FRN 02/09/2030 EUR 442 380 450 179 0.05
1 000 000 Orsted A/S - Reg 2.625% 19/09/2022 EUR 1 242 405 1 224 862 0.14
Total Denmark 2 956 715 3 012 048 0.35
Finland450 000 Metso Outotec Oyj - Reg 0.875% 26/05/2028 EUR 528 570 535 231 0.06
Total Finland 528 570 535 231 0.06
France2 000 000 Autoroutes du Sud de la France S.A. - Reg 2.875%
18/01/2023EUR 2 501 728 2 481 179 0.29
300 000 Banque Federative du Credit Mutuel S.A. 144A 2.375%21/11/2024
USD 314 901 314 817 0.04
700 000 Banque Federative du Credit Mutuel S.A. - Reg 1.875%18/06/2029
EUR 786 300 882 412 0.10
400 000 BNP Paribas S.A. 144A FRN 30/09/2028 USD 395 525 392 934 0.04400 000 BNP Paribas S.A. 144A 2.824% 26/01/2041 USD 363 033 359 854 0.04400 000 BNP Paribas S.A. 144A 4.375% 12/05/2026 USD 444 422 442 023 0.05400 000 BNP Paribas S.A. 144A FRN 10/01/2025 USD 439 909 438 760 0.05500 000 BNP Paribas S.A. - Reg FRN 04/06/2026 EUR 549 136 596 347 0.07900 000 BNP Paribas S.A. - Reg 1.125% 16/08/2022 GBP 1 200 592 1 254 272 0.14
1 000 000 BNP Paribas S.A. - Reg FRN 15/01/2032 EUR 1 111 880 1 183 183 0.141 400 000 BNP Paribas S.A. - Reg 1.875% 14/12/2027 GBP 1 828 288 1 964 050 0.23500 000 BPCE S.A. - Reg 0.250% 15/01/2026 EUR 555 559 593 289 0.07400 000 BPCE S.A. - Reg 0.625% 15/01/2030 EUR 444 343 477 077 0.05500 000 CNP Assurances - Reg 0.375% 08/03/2028 EUR 599 985 576 119 0.07100 000 CNP Assurances - Reg FRN 30/09/2041 EUR 142 164 121 295 0.01
1 000 000 Credit Agricole S.A. 144A FRN 26/01/2027 USD 981 490 977 610 0.111 100 000 Credit Agricole S.A. - Reg FRN 22/04/2026 EUR 1 206 007 1 335 749 0.15700 000 Credit Agricole S.A. - Reg 2.000% 25/03/2029 EUR 788 993 887 868 0.10600 000 Credit Mutuel Arkea S.A. - Reg 1.625% 15/04/2026 EUR 671 257 750 753 0.09595 000 Electricite de France S.A. 144A 4.950% 13/10/2045 USD 740 982 706 558 0.0840 000 Electricite de France S.A. 144A 6.000% 22/01/2114 USD 54 920 52 933 0.01
100 000 Electricite de France S.A. - Reg 6.000% 23/01/2114 GBP 198 283 223 046 0.03
149Lumyna Funds
Lumyna – Global Debt - Credit UCITS FundSchedule of investments as at March 31, 2021 (cont.)
The accompanying notes form an integral part of these financial statements.
Audited annual report
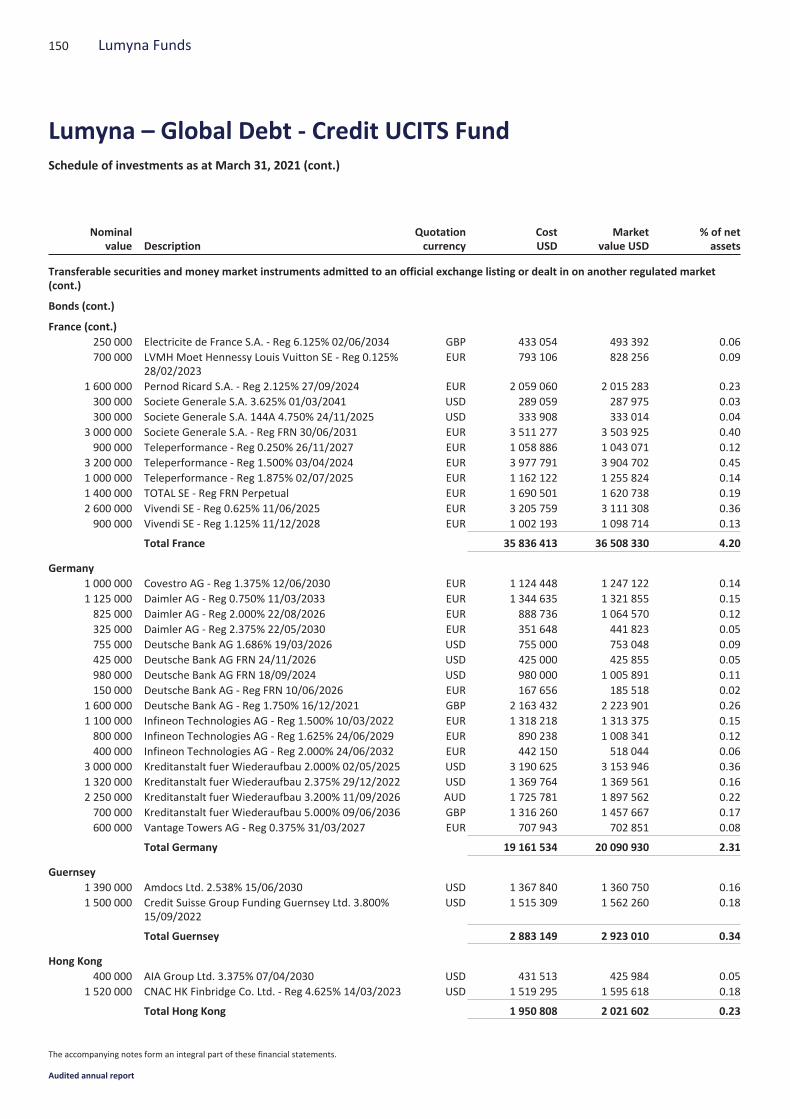
Nominalvalue Description
Quotationcurrency
CostUSD
Marketvalue USD
% of netassets
Transferable securities and money market instruments admitted to an official exchange listing or dealt in on another regulated market(cont.)
Bonds (cont.)
France (cont.)250 000 Electricite de France S.A. - Reg 6.125% 02/06/2034 GBP 433 054 493 392 0.06700 000 LVMHMoet Hennessy Louis Vuitton SE - Reg 0.125%
28/02/2023EUR 793 106 828 256 0.09
1 600 000 Pernod Ricard S.A. - Reg 2.125% 27/09/2024 EUR 2 059 060 2 015 283 0.23300 000 Societe Generale S.A. 3.625% 01/03/2041 USD 289 059 287 975 0.03300 000 Societe Generale S.A. 144A 4.750% 24/11/2025 USD 333 908 333 014 0.04
3 000 000 Societe Generale S.A. - Reg FRN 30/06/2031 EUR 3 511 277 3 503 925 0.40900 000 Teleperformance - Reg 0.250% 26/11/2027 EUR 1 058 886 1 043 071 0.12
3 200 000 Teleperformance - Reg 1.500% 03/04/2024 EUR 3 977 791 3 904 702 0.451 000 000 Teleperformance - Reg 1.875% 02/07/2025 EUR 1 162 122 1 255 824 0.141 400 000 TOTAL SE - Reg FRN Perpetual EUR 1 690 501 1 620 738 0.192 600 000 Vivendi SE - Reg 0.625% 11/06/2025 EUR 3 205 759 3 111 308 0.36900 000 Vivendi SE - Reg 1.125% 11/12/2028 EUR 1 002 193 1 098 714 0.13
Total France 35 836 413 36 508 330 4.20
Germany1 000 000 Covestro AG - Reg 1.375% 12/06/2030 EUR 1 124 448 1 247 122 0.141 125 000 Daimler AG - Reg 0.750% 11/03/2033 EUR 1 344 635 1 321 855 0.15825 000 Daimler AG - Reg 2.000% 22/08/2026 EUR 888 736 1 064 570 0.12325 000 Daimler AG - Reg 2.375% 22/05/2030 EUR 351 648 441 823 0.05755 000 Deutsche Bank AG 1.686% 19/03/2026 USD 755 000 753 048 0.09425 000 Deutsche Bank AG FRN 24/11/2026 USD 425 000 425 855 0.05980 000 Deutsche Bank AG FRN 18/09/2024 USD 980 000 1 005 891 0.11150 000 Deutsche Bank AG - Reg FRN 10/06/2026 EUR 167 656 185 518 0.02
1 600 000 Deutsche Bank AG - Reg 1.750% 16/12/2021 GBP 2 163 432 2 223 901 0.261 100 000 Infineon Technologies AG - Reg 1.500% 10/03/2022 EUR 1 318 218 1 313 375 0.15800 000 Infineon Technologies AG - Reg 1.625% 24/06/2029 EUR 890 238 1 008 341 0.12400 000 Infineon Technologies AG - Reg 2.000% 24/06/2032 EUR 442 150 518 044 0.06
3 000 000 Kreditanstalt fuer Wiederaufbau 2.000% 02/05/2025 USD 3 190 625 3 153 946 0.361 320 000 Kreditanstalt fuer Wiederaufbau 2.375% 29/12/2022 USD 1 369 764 1 369 561 0.162 250 000 Kreditanstalt fuer Wiederaufbau 3.200% 11/09/2026 AUD 1 725 781 1 897 562 0.22700 000 Kreditanstalt fuer Wiederaufbau 5.000% 09/06/2036 GBP 1 316 260 1 457 667 0.17600 000 Vantage Towers AG - Reg 0.375% 31/03/2027 EUR 707 943 702 851 0.08
Total Germany 19 161 534 20 090 930 2.31
Guernsey1 390 000 Amdocs Ltd. 2.538% 15/06/2030 USD 1 367 840 1 360 750 0.161 500 000 Credit Suisse Group Funding Guernsey Ltd. 3.800%
15/09/2022USD 1 515 309 1 562 260 0.18
Total Guernsey 2 883 149 2 923 010 0.34
Hong Kong400 000 AIA Group Ltd. 3.375% 07/04/2030 USD 431 513 425 984 0.05
1 520 000 CNAC HK Finbridge Co. Ltd. - Reg 4.625% 14/03/2023 USD 1 519 295 1 595 618 0.18
Total Hong Kong 1 950 808 2 021 602 0.23
150 Lumyna Funds
Lumyna – Global Debt - Credit UCITS FundSchedule of investments as at March 31, 2021 (cont.)
The accompanying notes form an integral part of these financial statements.
Audited annual report
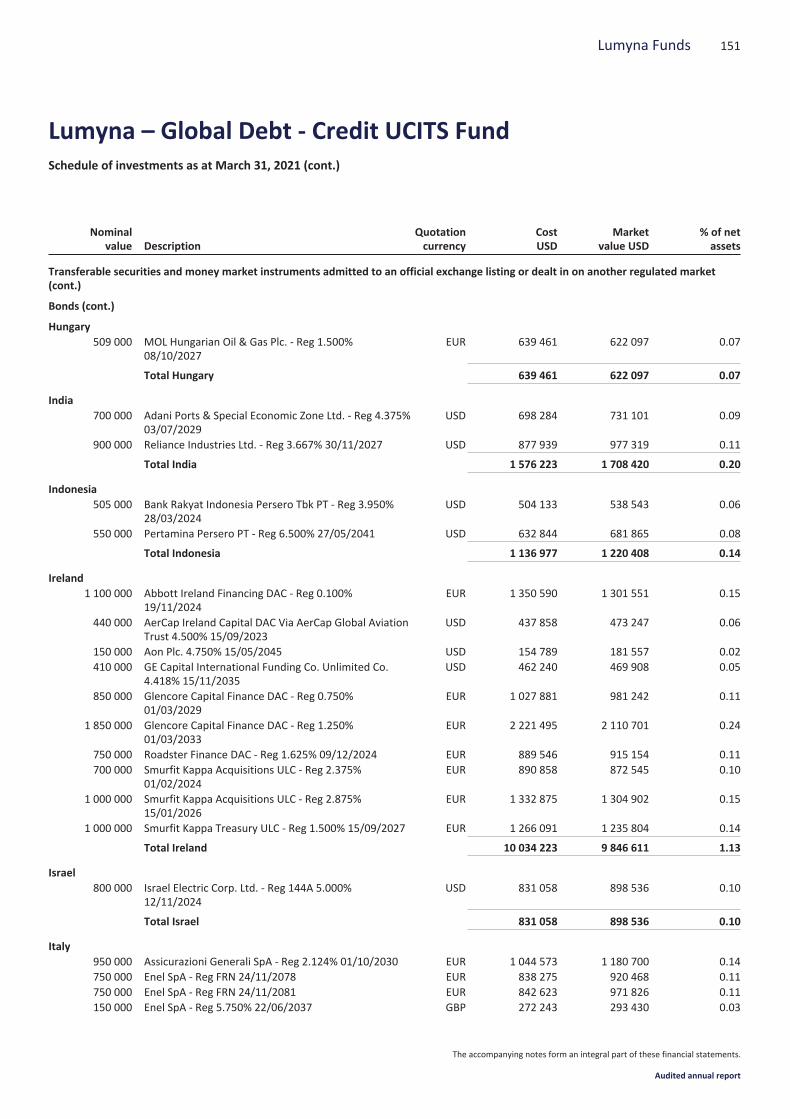
Nominalvalue Description
Quotationcurrency
CostUSD
Marketvalue USD
% of netassets
Transferable securities and money market instruments admitted to an official exchange listing or dealt in on another regulated market(cont.)
Bonds (cont.)
Hungary509 000 MOL Hungarian Oil & Gas Plc. - Reg 1.500%
08/10/2027EUR 639 461 622 097 0.07
Total Hungary 639 461 622 097 0.07
India700 000 Adani Ports & Special Economic Zone Ltd. - Reg 4.375%
03/07/2029USD 698 284 731 101 0.09
900 000 Reliance Industries Ltd. - Reg 3.667% 30/11/2027 USD 877 939 977 319 0.11
Total India 1 576 223 1 708 420 0.20
Indonesia505 000 Bank Rakyat Indonesia Persero Tbk PT - Reg 3.950%
28/03/2024USD 504 133 538 543 0.06
550 000 Pertamina Persero PT - Reg 6.500% 27/05/2041 USD 632 844 681 865 0.08
Total Indonesia 1 136 977 1 220 408 0.14
Ireland1 100 000 Abbott Ireland Financing DAC - Reg 0.100%
19/11/2024EUR 1 350 590 1 301 551 0.15
440 000 AerCap Ireland Capital DAC Via AerCap Global AviationTrust 4.500% 15/09/2023
USD 437 858 473 247 0.06
150 000 Aon Plc. 4.750% 15/05/2045 USD 154 789 181 557 0.02410 000 GE Capital International Funding Co. Unlimited Co.
4.418% 15/11/2035USD 462 240 469 908 0.05
850 000 Glencore Capital Finance DAC - Reg 0.750%01/03/2029
EUR 1 027 881 981 242 0.11
1 850 000 Glencore Capital Finance DAC - Reg 1.250%01/03/2033
EUR 2 221 495 2 110 701 0.24
750 000 Roadster Finance DAC - Reg 1.625% 09/12/2024 EUR 889 546 915 154 0.11700 000 Smurfit Kappa Acquisitions ULC - Reg 2.375%
01/02/2024EUR 890 858 872 545 0.10
1 000 000 Smurfit Kappa Acquisitions ULC - Reg 2.875%15/01/2026
EUR 1 332 875 1 304 902 0.15
1 000 000 Smurfit Kappa Treasury ULC - Reg 1.500% 15/09/2027 EUR 1 266 091 1 235 804 0.14
Total Ireland 10 034 223 9 846 611 1.13
Israel800 000 Israel Electric Corp. Ltd. - Reg 144A 5.000%
12/11/2024USD 831 058 898 536 0.10
Total Israel 831 058 898 536 0.10
Italy950 000 Assicurazioni Generali SpA - Reg 2.124% 01/10/2030 EUR 1 044 573 1 180 700 0.14750 000 Enel SpA - Reg FRN 24/11/2078 EUR 838 275 920 468 0.11750 000 Enel SpA - Reg FRN 24/11/2081 EUR 842 623 971 826 0.11150 000 Enel SpA - Reg 5.750% 22/06/2037 GBP 272 243 293 430 0.03
151Lumyna Funds
Lumyna – Global Debt - Credit UCITS FundSchedule of investments as at March 31, 2021 (cont.)
The accompanying notes form an integral part of these financial statements.
Audited annual report
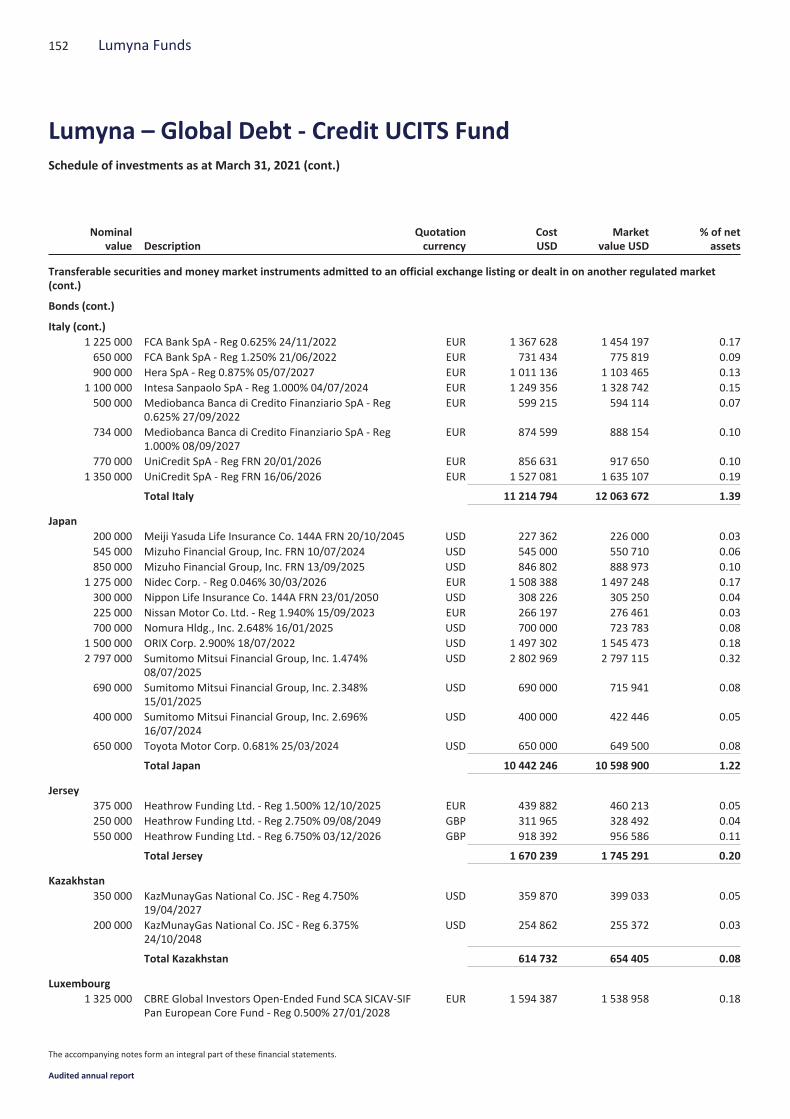
Nominalvalue Description
Quotationcurrency
CostUSD
Marketvalue USD
% of netassets
Transferable securities and money market instruments admitted to an official exchange listing or dealt in on another regulated market(cont.)
Bonds (cont.)
Italy (cont.)1 225 000 FCA Bank SpA - Reg 0.625% 24/11/2022 EUR 1 367 628 1 454 197 0.17650 000 FCA Bank SpA - Reg 1.250% 21/06/2022 EUR 731 434 775 819 0.09900 000 Hera SpA - Reg 0.875% 05/07/2027 EUR 1 011 136 1 103 465 0.13
1 100 000 Intesa Sanpaolo SpA - Reg 1.000% 04/07/2024 EUR 1 249 356 1 328 742 0.15500 000 Mediobanca Banca di Credito Finanziario SpA - Reg
0.625% 27/09/2022EUR 599 215 594 114 0.07
734 000 Mediobanca Banca di Credito Finanziario SpA - Reg1.000% 08/09/2027
EUR 874 599 888 154 0.10
770 000 UniCredit SpA - Reg FRN 20/01/2026 EUR 856 631 917 650 0.101 350 000 UniCredit SpA - Reg FRN 16/06/2026 EUR 1 527 081 1 635 107 0.19
Total Italy 11 214 794 12 063 672 1.39
Japan200 000 Meiji Yasuda Life Insurance Co. 144A FRN 20/10/2045 USD 227 362 226 000 0.03545 000 Mizuho Financial Group, Inc. FRN 10/07/2024 USD 545 000 550 710 0.06850 000 Mizuho Financial Group, Inc. FRN 13/09/2025 USD 846 802 888 973 0.10
1 275 000 Nidec Corp. - Reg 0.046% 30/03/2026 EUR 1 508 388 1 497 248 0.17300 000 Nippon Life Insurance Co. 144A FRN 23/01/2050 USD 308 226 305 250 0.04225 000 Nissan Motor Co. Ltd. - Reg 1.940% 15/09/2023 EUR 266 197 276 461 0.03700 000 Nomura Hldg., Inc. 2.648% 16/01/2025 USD 700 000 723 783 0.08
1 500 000 ORIX Corp. 2.900% 18/07/2022 USD 1 497 302 1 545 473 0.182 797 000 Sumitomo Mitsui Financial Group, Inc. 1.474%
08/07/2025USD 2 802 969 2 797 115 0.32
690 000 Sumitomo Mitsui Financial Group, Inc. 2.348%15/01/2025
USD 690 000 715 941 0.08
400 000 Sumitomo Mitsui Financial Group, Inc. 2.696%16/07/2024
USD 400 000 422 446 0.05
650 000 Toyota Motor Corp. 0.681% 25/03/2024 USD 650 000 649 500 0.08
Total Japan 10 442 246 10 598 900 1.22
Jersey375 000 Heathrow Funding Ltd. - Reg 1.500% 12/10/2025 EUR 439 882 460 213 0.05250 000 Heathrow Funding Ltd. - Reg 2.750% 09/08/2049 GBP 311 965 328 492 0.04550 000 Heathrow Funding Ltd. - Reg 6.750% 03/12/2026 GBP 918 392 956 586 0.11
Total Jersey 1 670 239 1 745 291 0.20
Kazakhstan350 000 KazMunayGas National Co. JSC - Reg 4.750%
19/04/2027USD 359 870 399 033 0.05
200 000 KazMunayGas National Co. JSC - Reg 6.375%24/10/2048
USD 254 862 255 372 0.03
Total Kazakhstan 614 732 654 405 0.08
Luxembourg1 325 000 CBRE Global Investors Open-Ended Fund SCA SICAV-SIF
Pan European Core Fund - Reg 0.500% 27/01/2028EUR 1 594 387 1 538 958 0.18
152 Lumyna Funds
Lumyna – Global Debt - Credit UCITS FundSchedule of investments as at March 31, 2021 (cont.)
The accompanying notes form an integral part of these financial statements.
Audited annual report
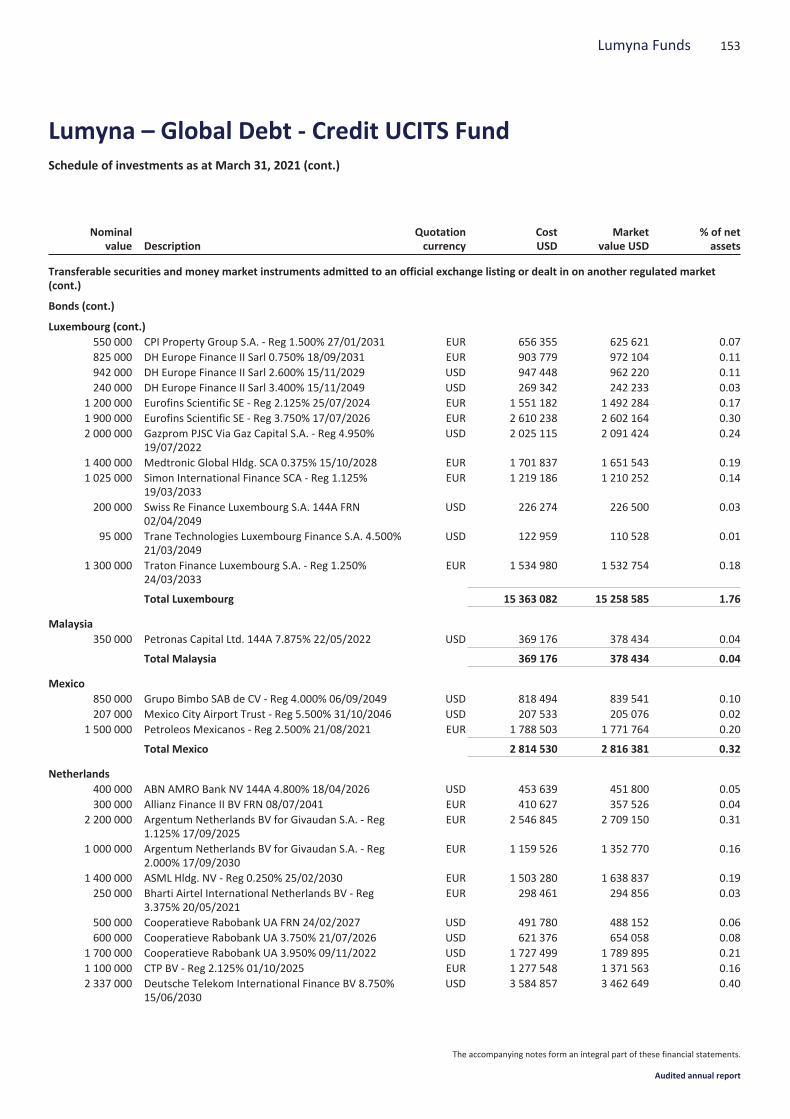
Nominalvalue Description
Quotationcurrency
CostUSD
Marketvalue USD
% of netassets
Transferable securities and money market instruments admitted to an official exchange listing or dealt in on another regulated market(cont.)
Bonds (cont.)
Luxembourg (cont.)550 000 CPI Property Group S.A. - Reg 1.500% 27/01/2031 EUR 656 355 625 621 0.07825 000 DH Europe Finance II Sarl 0.750% 18/09/2031 EUR 903 779 972 104 0.11942 000 DH Europe Finance II Sarl 2.600% 15/11/2029 USD 947 448 962 220 0.11240 000 DH Europe Finance II Sarl 3.400% 15/11/2049 USD 269 342 242 233 0.03
1 200 000 Eurofins Scientific SE - Reg 2.125% 25/07/2024 EUR 1 551 182 1 492 284 0.171 900 000 Eurofins Scientific SE - Reg 3.750% 17/07/2026 EUR 2 610 238 2 602 164 0.302 000 000 Gazprom PJSC Via Gaz Capital S.A. - Reg 4.950%
19/07/2022USD 2 025 115 2 091 424 0.24
1 400 000 Medtronic Global Hldg. SCA 0.375% 15/10/2028 EUR 1 701 837 1 651 543 0.191 025 000 Simon International Finance SCA - Reg 1.125%
19/03/2033EUR 1 219 186 1 210 252 0.14
200 000 Swiss Re Finance Luxembourg S.A. 144A FRN02/04/2049
USD 226 274 226 500 0.03
95 000 Trane Technologies Luxembourg Finance S.A. 4.500%21/03/2049
USD 122 959 110 528 0.01
1 300 000 Traton Finance Luxembourg S.A. - Reg 1.250%24/03/2033
EUR 1 534 980 1 532 754 0.18
Total Luxembourg 15 363 082 15 258 585 1.76
Malaysia350 000 Petronas Capital Ltd. 144A 7.875% 22/05/2022 USD 369 176 378 434 0.04
Total Malaysia 369 176 378 434 0.04
Mexico850 000 Grupo Bimbo SAB de CV - Reg 4.000% 06/09/2049 USD 818 494 839 541 0.10207 000 Mexico City Airport Trust - Reg 5.500% 31/10/2046 USD 207 533 205 076 0.02
1 500 000 Petroleos Mexicanos - Reg 2.500% 21/08/2021 EUR 1 788 503 1 771 764 0.20
Total Mexico 2 814 530 2 816 381 0.32
Netherlands400 000 ABN AMRO Bank NV 144A 4.800% 18/04/2026 USD 453 639 451 800 0.05300 000 Allianz Finance II BV FRN 08/07/2041 EUR 410 627 357 526 0.04
2 200 000 Argentum Netherlands BV for Givaudan S.A. - Reg1.125% 17/09/2025
EUR 2 546 845 2 709 150 0.31
1 000 000 Argentum Netherlands BV for Givaudan S.A. - Reg2.000% 17/09/2030
EUR 1 159 526 1 352 770 0.16
1 400 000 ASML Hldg. NV - Reg 0.250% 25/02/2030 EUR 1 503 280 1 638 837 0.19250 000 Bharti Airtel International Netherlands BV - Reg
3.375% 20/05/2021EUR 298 461 294 856 0.03
500 000 Cooperatieve Rabobank UA FRN 24/02/2027 USD 491 780 488 152 0.06600 000 Cooperatieve Rabobank UA 3.750% 21/07/2026 USD 621 376 654 058 0.08
1 700 000 Cooperatieve Rabobank UA 3.950% 09/11/2022 USD 1 727 499 1 789 895 0.211 100 000 CTP BV - Reg 2.125% 01/10/2025 EUR 1 277 548 1 371 563 0.162 337 000 Deutsche Telekom International Finance BV 8.750%
15/06/2030USD 3 584 857 3 462 649 0.40
153Lumyna Funds
Lumyna – Global Debt - Credit UCITS FundSchedule of investments as at March 31, 2021 (cont.)
The accompanying notes form an integral part of these financial statements.
Audited annual report
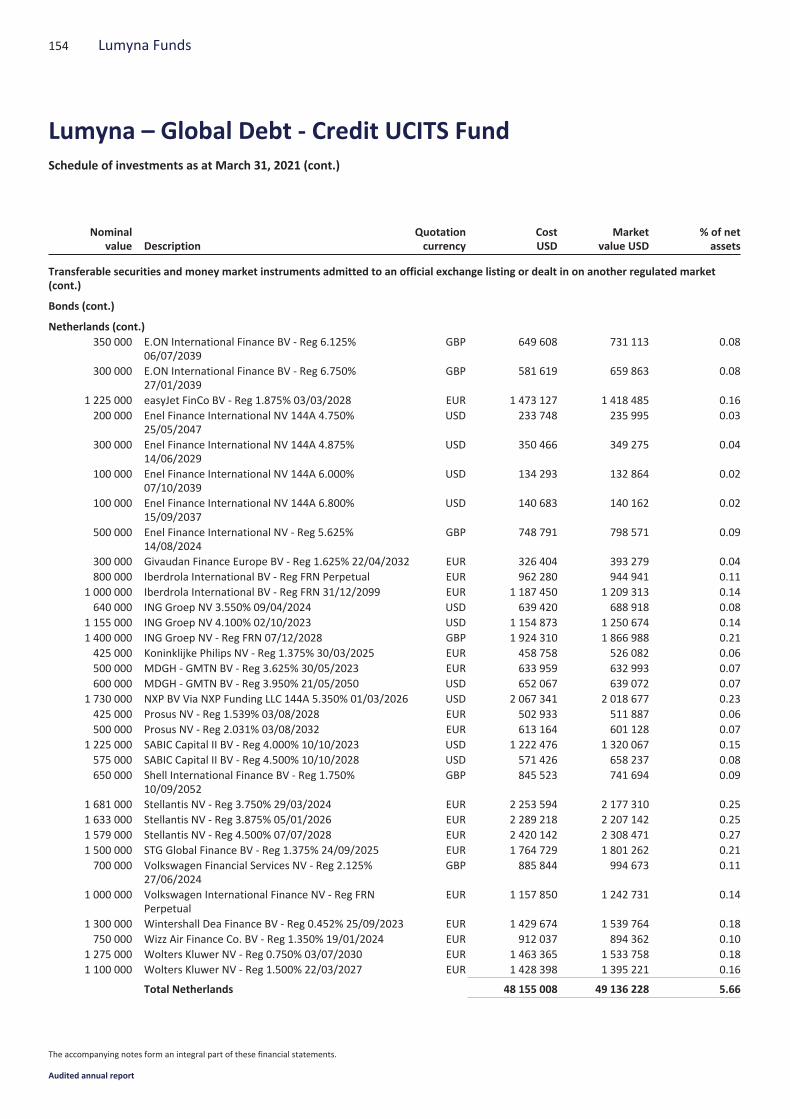
Nominalvalue Description
Quotationcurrency
CostUSD
Marketvalue USD
% of netassets
Transferable securities and money market instruments admitted to an official exchange listing or dealt in on another regulated market(cont.)
Bonds (cont.)
Netherlands (cont.)350 000 E.ON International Finance BV - Reg 6.125%
06/07/2039GBP 649 608 731 113 0.08
300 000 E.ON International Finance BV - Reg 6.750%27/01/2039
GBP 581 619 659 863 0.08
1 225 000 easyJet FinCo BV - Reg 1.875% 03/03/2028 EUR 1 473 127 1 418 485 0.16200 000 Enel Finance International NV 144A 4.750%
25/05/2047USD 233 748 235 995 0.03
300 000 Enel Finance International NV 144A 4.875%14/06/2029
USD 350 466 349 275 0.04
100 000 Enel Finance International NV 144A 6.000%07/10/2039
USD 134 293 132 864 0.02
100 000 Enel Finance International NV 144A 6.800%15/09/2037
USD 140 683 140 162 0.02
500 000 Enel Finance International NV - Reg 5.625%14/08/2024
GBP 748 791 798 571 0.09
300 000 Givaudan Finance Europe BV - Reg 1.625% 22/04/2032 EUR 326 404 393 279 0.04800 000 Iberdrola International BV - Reg FRN Perpetual EUR 962 280 944 941 0.11
1 000 000 Iberdrola International BV - Reg FRN 31/12/2099 EUR 1 187 450 1 209 313 0.14640 000 ING Groep NV 3.550% 09/04/2024 USD 639 420 688 918 0.08
1 155 000 ING Groep NV 4.100% 02/10/2023 USD 1 154 873 1 250 674 0.141 400 000 ING Groep NV - Reg FRN 07/12/2028 GBP 1 924 310 1 866 988 0.21425 000 Koninklijke Philips NV - Reg 1.375% 30/03/2025 EUR 458 758 526 082 0.06500 000 MDGH - GMTN BV - Reg 3.625% 30/05/2023 EUR 633 959 632 993 0.07600 000 MDGH - GMTN BV - Reg 3.950% 21/05/2050 USD 652 067 639 072 0.07
1 730 000 NXP BV Via NXP Funding LLC 144A 5.350% 01/03/2026 USD 2 067 341 2 018 677 0.23425 000 Prosus NV - Reg 1.539% 03/08/2028 EUR 502 933 511 887 0.06500 000 Prosus NV - Reg 2.031% 03/08/2032 EUR 613 164 601 128 0.07
1 225 000 SABIC Capital II BV - Reg 4.000% 10/10/2023 USD 1 222 476 1 320 067 0.15575 000 SABIC Capital II BV - Reg 4.500% 10/10/2028 USD 571 426 658 237 0.08650 000 Shell International Finance BV - Reg 1.750%
10/09/2052GBP 845 523 741 694 0.09
1 681 000 Stellantis NV - Reg 3.750% 29/03/2024 EUR 2 253 594 2 177 310 0.251 633 000 Stellantis NV - Reg 3.875% 05/01/2026 EUR 2 289 218 2 207 142 0.251 579 000 Stellantis NV - Reg 4.500% 07/07/2028 EUR 2 420 142 2 308 471 0.271 500 000 STG Global Finance BV - Reg 1.375% 24/09/2025 EUR 1 764 729 1 801 262 0.21700 000 Volkswagen Financial Services NV - Reg 2.125%
27/06/2024GBP 885 844 994 673 0.11
1 000 000 Volkswagen International Finance NV - Reg FRNPerpetual
EUR 1 157 850 1 242 731 0.14
1 300 000 Wintershall Dea Finance BV - Reg 0.452% 25/09/2023 EUR 1 429 674 1 539 764 0.18750 000 Wizz Air Finance Co. BV - Reg 1.350% 19/01/2024 EUR 912 037 894 362 0.10
1 275 000 Wolters Kluwer NV - Reg 0.750% 03/07/2030 EUR 1 463 365 1 533 758 0.181 100 000 Wolters Kluwer NV - Reg 1.500% 22/03/2027 EUR 1 428 398 1 395 221 0.16
Total Netherlands 48 155 008 49 136 228 5.66
154 Lumyna Funds
Lumyna – Global Debt - Credit UCITS FundSchedule of investments as at March 31, 2021 (cont.)
The accompanying notes form an integral part of these financial statements.
Audited annual report
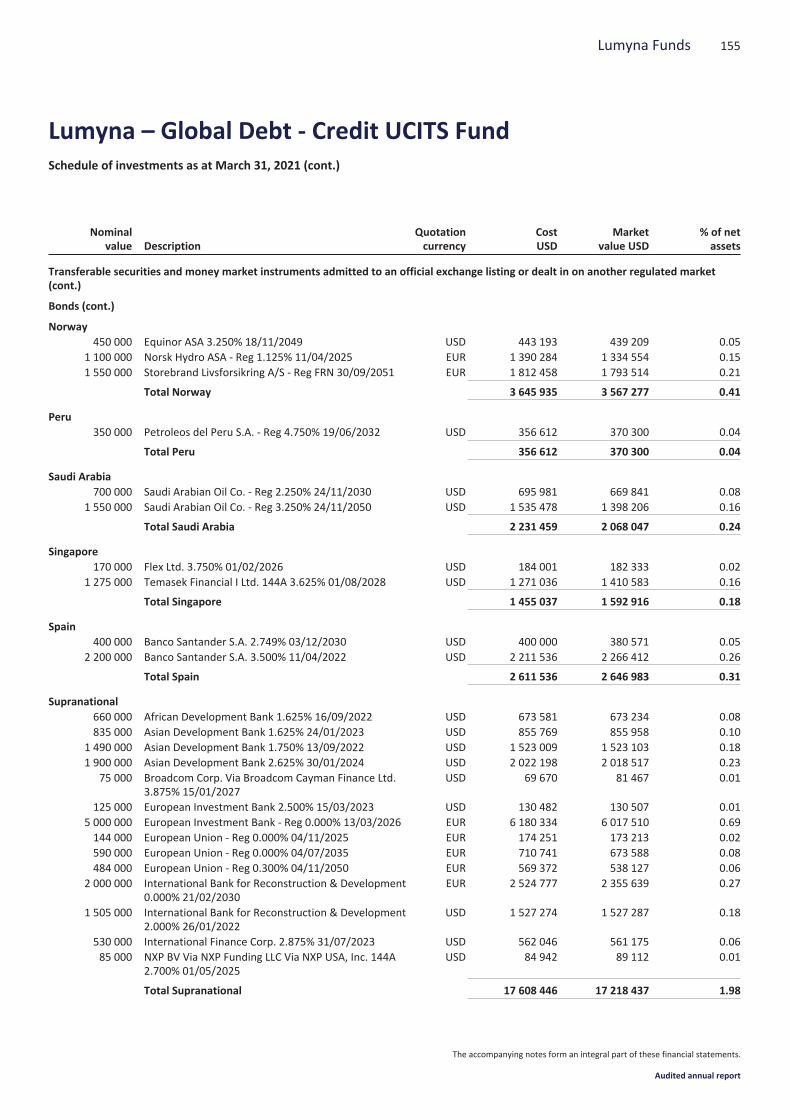
Nominalvalue Description
Quotationcurrency
CostUSD
Marketvalue USD
% of netassets
Transferable securities and money market instruments admitted to an official exchange listing or dealt in on another regulated market(cont.)
Bonds (cont.)
Norway450 000 Equinor ASA 3.250% 18/11/2049 USD 443 193 439 209 0.05
1 100 000 Norsk Hydro ASA - Reg 1.125% 11/04/2025 EUR 1 390 284 1 334 554 0.151 550 000 Storebrand Livsforsikring A/S - Reg FRN 30/09/2051 EUR 1 812 458 1 793 514 0.21
Total Norway 3 645 935 3 567 277 0.41
Peru350 000 Petroleos del Peru S.A. - Reg 4.750% 19/06/2032 USD 356 612 370 300 0.04
Total Peru 356 612 370 300 0.04
Saudi Arabia700 000 Saudi Arabian Oil Co. - Reg 2.250% 24/11/2030 USD 695 981 669 841 0.08
1 550 000 Saudi Arabian Oil Co. - Reg 3.250% 24/11/2050 USD 1 535 478 1 398 206 0.16
Total Saudi Arabia 2 231 459 2 068 047 0.24
Singapore170 000 Flex Ltd. 3.750% 01/02/2026 USD 184 001 182 333 0.02
1 275 000 Temasek Financial I Ltd. 144A 3.625% 01/08/2028 USD 1 271 036 1 410 583 0.16
Total Singapore 1 455 037 1 592 916 0.18
Spain400 000 Banco Santander S.A. 2.749% 03/12/2030 USD 400 000 380 571 0.05
2 200 000 Banco Santander S.A. 3.500% 11/04/2022 USD 2 211 536 2 266 412 0.26
Total Spain 2 611 536 2 646 983 0.31
Supranational660 000 African Development Bank 1.625% 16/09/2022 USD 673 581 673 234 0.08835 000 Asian Development Bank 1.625% 24/01/2023 USD 855 769 855 958 0.10
1 490 000 Asian Development Bank 1.750% 13/09/2022 USD 1 523 009 1 523 103 0.181 900 000 Asian Development Bank 2.625% 30/01/2024 USD 2 022 198 2 018 517 0.23
75 000 Broadcom Corp. Via Broadcom Cayman Finance Ltd.3.875% 15/01/2027
USD 69 670 81 467 0.01
125 000 European Investment Bank 2.500% 15/03/2023 USD 130 482 130 507 0.015 000 000 European Investment Bank - Reg 0.000% 13/03/2026 EUR 6 180 334 6 017 510 0.69144 000 European Union - Reg 0.000% 04/11/2025 EUR 174 251 173 213 0.02590 000 European Union - Reg 0.000% 04/07/2035 EUR 710 741 673 588 0.08484 000 European Union - Reg 0.300% 04/11/2050 EUR 569 372 538 127 0.06
2 000 000 International Bank for Reconstruction & Development0.000% 21/02/2030
EUR 2 524 777 2 355 639 0.27
1 505 000 International Bank for Reconstruction & Development2.000% 26/01/2022
USD 1 527 274 1 527 287 0.18
530 000 International Finance Corp. 2.875% 31/07/2023 USD 562 046 561 175 0.0685 000 NXP BV Via NXP Funding LLC Via NXP USA, Inc. 144A
2.700% 01/05/2025USD 84 942 89 112 0.01
Total Supranational 17 608 446 17 218 437 1.98
155Lumyna Funds
Lumyna – Global Debt - Credit UCITS FundSchedule of investments as at March 31, 2021 (cont.)
The accompanying notes form an integral part of these financial statements.
Audited annual report

Nominalvalue Description
Quotationcurrency
CostUSD
Marketvalue USD
% of netassets
Transferable securities and money market instruments admitted to an official exchange listing or dealt in on another regulated market(cont.)
Bonds (cont.)
Sweden325 000 Fastighets AB Balder - Reg 1.250% 28/01/2028 EUR 359 301 385 569 0.04800 000 Investor AB - Reg 1.500% 20/06/2039 EUR 900 676 1 044 862 0.12
2 100 000 Molnlycke Hldg. AB - Reg 0.625% 15/01/2031 EUR 2 554 490 2 389 035 0.28123 000 Swedish Match AB - Reg 0.875% 26/02/2027 EUR 132 115 144 403 0.02
2 700 000 Telefonaktiebolaget LM Ericsson - Reg 1.875%01/03/2024
EUR 3 391 718 3 332 101 0.38
Total Sweden 7 338 300 7 295 970 0.84
Switzerland975 000 Credit Suisse AG 0.495% 02/02/2024 USD 975 000 963 928 0.11275 000 Credit Suisse AG 1.000% 05/05/2023 USD 274 554 276 369 0.03825 000 UBS AG - Reg 0.750% 21/04/2023 EUR 903 681 988 386 0.12500 000 UBS Group AG 144A FRN 30/01/2027 USD 495 083 492 501 0.06400 000 UBS Group AG 144A FRN 11/02/2032 USD 380 863 378 162 0.04
Total Switzerland 3 029 181 3 099 346 0.36
United Arab Emirates300 000 DP World Plc. - Reg 5.625% 25/09/2048 USD 303 636 351 375 0.04
1 300 000 Emirates Telecommunications Group Co. PJSC - Reg1.750% 18/06/2021
EUR 1 582 447 1 533 527 0.18
Total United Arab Emirates 1 886 083 1 884 902 0.22
United Kingdom250 000 3i Group Plc. - Reg 3.750% 05/06/2040 GBP 307 143 378 732 0.04
1 475 000 Anglo American Capital Plc. 144A 3.625% 11/09/2024 USD 1 473 667 1 595 186 0.181 000 000 Annington Funding Plc. - Reg 1.650% 12/07/2024 EUR 1 196 970 1 229 483 0.14250 000 Annington Funding Plc. - Reg 3.935% 12/07/2047 GBP 350 872 414 043 0.05350 000 Assura Financing Plc. - Reg 1.500% 15/09/2030 GBP 454 855 474 372 0.05500 000 Aviva Plc. - Reg FRN 14/11/2036 GBP 784 956 836 862 0.10200 000 BAE Systems Plc. 144A 3.000% 15/09/2050 USD 184 066 181 428 0.02670 000 Barclays Plc. FRN 10/12/2024 USD 670 000 670 231 0.08200 000 Barclays Plc. FRN 10/03/2042 USD 196 151 195 511 0.02
1 025 000 Barclays Plc. - Reg 3.000% 08/05/2026 GBP 1 339 021 1 508 576 0.17350 000 BUPA Finance Plc. - Reg 5.000% 08/12/2026 GBP 514 864 559 047 0.06525 000 Compass Group Plc. - Reg 2.000% 05/09/2025 GBP 680 885 756 624 0.09
1 030 000 Diageo Capital Plc. 2.000% 29/04/2030 USD 1 025 540 1 006 260 0.122 000 000 Diageo Finance Plc. - Reg 0.500% 19/06/2024 EUR 2 402 161 2 394 729 0.281 100 000 Experian Finance Plc. - Reg 0.739% 29/10/2025 GBP 1 412 565 1 491 859 0.171 450 000 GKN Hldg. Ltd. - Reg 5.375% 19/09/2022 GBP 2 035 908 2 104 091 0.242 150 000 HSBC Hldg. Plc. FRN 18/04/2026 USD 2 150 000 2 150 510 0.251 675 000 HSBC Hldg. Plc. FRN 27/06/2023 GBP 2 225 573 2 349 615 0.27350 000 HSBC Hldg. Plc. - Reg 2.625% 16/08/2028 GBP 470 292 509 545 0.06850 000 InterContinental Hotels Group Plc. - Reg 3.875%
28/11/2022GBP 1 181 689 1 222 744 0.14
1 500 000 ITV Plc. 1.375% 26/09/2026 EUR 1 879 991 1 828 460 0.21
156 Lumyna Funds
Lumyna – Global Debt - Credit UCITS FundSchedule of investments as at March 31, 2021 (cont.)
The accompanying notes form an integral part of these financial statements.
Audited annual report

Nominalvalue Description
Quotationcurrency
CostUSD
Marketvalue USD
% of netassets
Transferable securities and money market instruments admitted to an official exchange listing or dealt in on another regulated market(cont.)
Bonds (cont.)
United Kingdom (cont.)175 000 Legal & General Group Plc. - Reg FRN 14/11/2048 GBP 228 987 279 015 0.03350 000 Liberty Living Finance Plc. - Reg 2.625% 28/11/2024 GBP 469 421 506 340 0.06920 000 Lloyds Banking Group Plc. FRN 11/05/2024 USD 920 000 919 564 0.11200 000 LSEGA Financing Plc. 144A 2.500% 06/04/2031 USD 199 666 197 251 0.02200 000 LSEGA Financing Plc. 144A 3.200% 06/04/2041 USD 199 004 197 621 0.02550 000 M&G Plc. - Reg FRN 20/07/2049 GBP 688 479 802 332 0.09300 000 M&G Plc. - Reg FRN 20/07/2055 GBP 468 728 474 677 0.05300 000 Nationwide Building Society 144A FRN 18/07/2030 USD 329 504 327 164 0.04300 000 Natwest Group Plc. FRN 22/05/2024 USD 300 000 309 506 0.04600 000 Next Group Plc. - Reg 3.000% 26/08/2025 GBP 781 759 885 329 0.10300 000 Reckitt Benckiser Treasury Services Plc. - Reg 1.750%
19/05/2032GBP 365 650 410 833 0.05
55 000 Royalty Pharma Plc. 144A 0.750% 02/09/2023 USD 54 699 54 943 0.0155 000 Royalty Pharma Plc. 144A 1.200% 02/09/2025 USD 54 453 53 840 0.01
912 000 Santander UK Group Hldg. Plc. FRN 03/11/2028 USD 1 022 336 995 179 0.11500 000 Segro Plc. 5.750% 20/06/2035 GBP 893 171 996 559 0.11
1 000 000 Segro Plc. - Reg 2.375% 11/10/2029 GBP 1 360 126 1 468 023 0.17300 000 Standard Chartered Plc. 144A FRN 30/01/2026 USD 312 615 311 802 0.04200 000 Standard Chartered Plc. 144A FRN 01/04/2031 USD 227 923 226 847 0.03300 000 Standard Chartered Plc. 144A 5.300% 09/01/2043 USD 355 786 351 732 0.04357 000 Tesco Corporate Treasury Services Plc. - Reg 2.750%
27/04/2030GBP 443 683 518 091 0.06
550 000 Thames Water Utilities Finance Plc. - Reg 2.375%03/05/2023
GBP 733 900 768 435 0.09
250 000 Thames Water Utilities Finance Plc. - Reg 4.375%03/07/2034
GBP 402 096 425 151 0.05
150 000 University of Oxford - Reg 2.544% 08/12/2117 GBP 216 942 243 714 0.03690 000 Whitbread Group Plc. - Reg 3.375% 16/10/2025 GBP 991 612 1 001 975 0.11350 000 WmMorrison Supermarkets Plc. - Reg 2.500%
01/10/2031GBP 435 016 498 933 0.06
842 000 WmMorrison Supermarkets Plc. - Reg 4.625%08/12/2023
GBP 1 185 115 1 278 903 0.15
Total United Kingdom 36 577 840 38 361 667 4.42
United States65 000 7-Eleven, Inc. 144A 0.950% 10/02/2026 USD 63 610 63 225 0.0155 000 7-Eleven, Inc. 144A 1.300% 10/02/2028 USD 53 067 52 720 0.0190 000 7-Eleven, Inc. 144A 1.800% 10/02/2031 USD 84 827 83 981 0.0140 000 7-Eleven, Inc. 144A 2.500% 10/02/2041 USD 36 247 36 103 0.00
165 000 7-Eleven, Inc. 144A 2.800% 10/02/2051 USD 147 850 147 278 0.02345 000 Abbott Laboratories 4.900% 30/11/2046 USD 450 434 448 083 0.05175 000 AbbVie, Inc. 4.700% 14/05/2045 USD 217 717 207 607 0.02175 000 Activision Blizzard, Inc. 1.350% 15/09/2030 USD 174 367 157 970 0.02
1 285 000 Activision Blizzard, Inc. 2.500% 15/09/2050 USD 1 170 414 1 076 035 0.12900 000 Adobe, Inc. 2.300% 01/02/2030 USD 903 364 909 544 0.10
157Lumyna Funds
Lumyna – Global Debt - Credit UCITS FundSchedule of investments as at March 31, 2021 (cont.)
The accompanying notes form an integral part of these financial statements.
Audited annual report
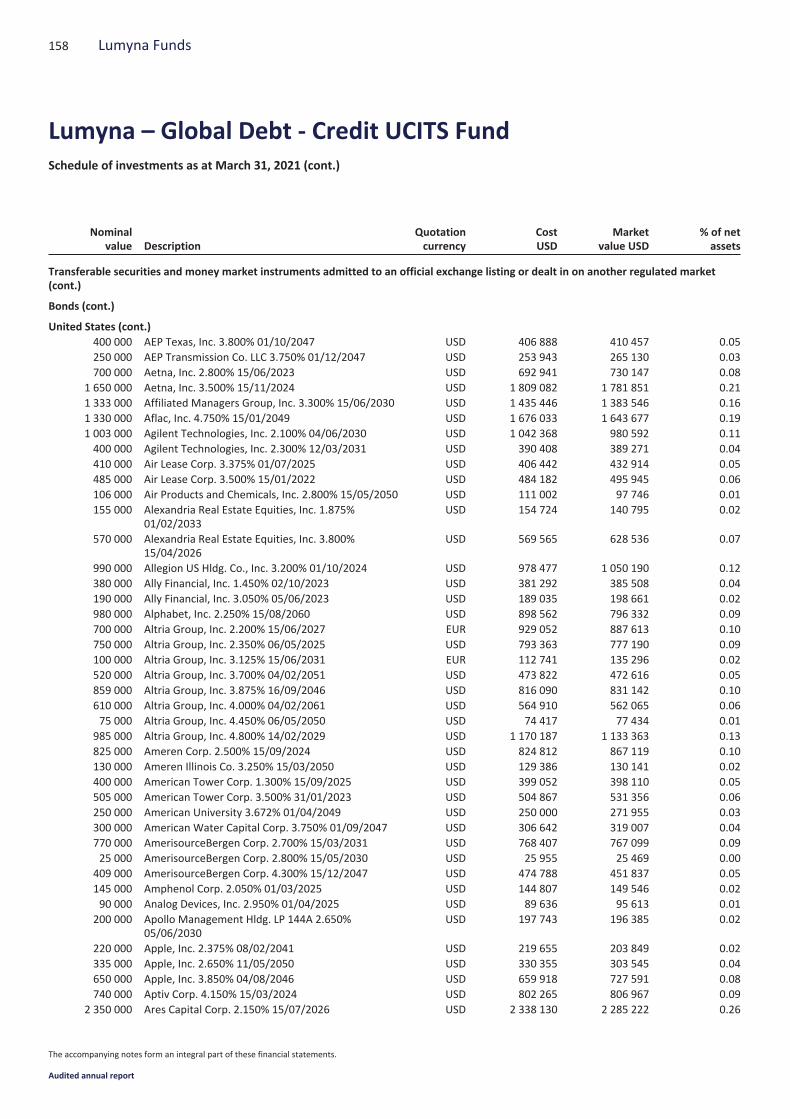
Nominalvalue Description
Quotationcurrency
CostUSD
Marketvalue USD
% of netassets
Transferable securities and money market instruments admitted to an official exchange listing or dealt in on another regulated market(cont.)
Bonds (cont.)
United States (cont.)400 000 AEP Texas, Inc. 3.800% 01/10/2047 USD 406 888 410 457 0.05250 000 AEP Transmission Co. LLC 3.750% 01/12/2047 USD 253 943 265 130 0.03700 000 Aetna, Inc. 2.800% 15/06/2023 USD 692 941 730 147 0.08
1 650 000 Aetna, Inc. 3.500% 15/11/2024 USD 1 809 082 1 781 851 0.211 333 000 Affiliated Managers Group, Inc. 3.300% 15/06/2030 USD 1 435 446 1 383 546 0.161 330 000 Aflac, Inc. 4.750% 15/01/2049 USD 1 676 033 1 643 677 0.191 003 000 Agilent Technologies, Inc. 2.100% 04/06/2030 USD 1 042 368 980 592 0.11400 000 Agilent Technologies, Inc. 2.300% 12/03/2031 USD 390 408 389 271 0.04410 000 Air Lease Corp. 3.375% 01/07/2025 USD 406 442 432 914 0.05485 000 Air Lease Corp. 3.500% 15/01/2022 USD 484 182 495 945 0.06106 000 Air Products and Chemicals, Inc. 2.800% 15/05/2050 USD 111 002 97 746 0.01155 000 Alexandria Real Estate Equities, Inc. 1.875%
01/02/2033USD 154 724 140 795 0.02
570 000 Alexandria Real Estate Equities, Inc. 3.800%15/04/2026
USD 569 565 628 536 0.07
990 000 Allegion US Hldg. Co., Inc. 3.200% 01/10/2024 USD 978 477 1 050 190 0.12380 000 Ally Financial, Inc. 1.450% 02/10/2023 USD 381 292 385 508 0.04190 000 Ally Financial, Inc. 3.050% 05/06/2023 USD 189 035 198 661 0.02980 000 Alphabet, Inc. 2.250% 15/08/2060 USD 898 562 796 332 0.09700 000 Altria Group, Inc. 2.200% 15/06/2027 EUR 929 052 887 613 0.10750 000 Altria Group, Inc. 2.350% 06/05/2025 USD 793 363 777 190 0.09100 000 Altria Group, Inc. 3.125% 15/06/2031 EUR 112 741 135 296 0.02520 000 Altria Group, Inc. 3.700% 04/02/2051 USD 473 822 472 616 0.05859 000 Altria Group, Inc. 3.875% 16/09/2046 USD 816 090 831 142 0.10610 000 Altria Group, Inc. 4.000% 04/02/2061 USD 564 910 562 065 0.0675 000 Altria Group, Inc. 4.450% 06/05/2050 USD 74 417 77 434 0.01
985 000 Altria Group, Inc. 4.800% 14/02/2029 USD 1 170 187 1 133 363 0.13825 000 Ameren Corp. 2.500% 15/09/2024 USD 824 812 867 119 0.10130 000 Ameren Illinois Co. 3.250% 15/03/2050 USD 129 386 130 141 0.02400 000 American Tower Corp. 1.300% 15/09/2025 USD 399 052 398 110 0.05505 000 American Tower Corp. 3.500% 31/01/2023 USD 504 867 531 356 0.06250 000 American University 3.672% 01/04/2049 USD 250 000 271 955 0.03300 000 American Water Capital Corp. 3.750% 01/09/2047 USD 306 642 319 007 0.04770 000 AmerisourceBergen Corp. 2.700% 15/03/2031 USD 768 407 767 099 0.0925 000 AmerisourceBergen Corp. 2.800% 15/05/2030 USD 25 955 25 469 0.00
409 000 AmerisourceBergen Corp. 4.300% 15/12/2047 USD 474 788 451 837 0.05145 000 Amphenol Corp. 2.050% 01/03/2025 USD 144 807 149 546 0.0290 000 Analog Devices, Inc. 2.950% 01/04/2025 USD 89 636 95 613 0.01
200 000 Apollo Management Hldg. LP 144A 2.650%05/06/2030
USD 197 743 196 385 0.02
220 000 Apple, Inc. 2.375% 08/02/2041 USD 219 655 203 849 0.02335 000 Apple, Inc. 2.650% 11/05/2050 USD 330 355 303 545 0.04650 000 Apple, Inc. 3.850% 04/08/2046 USD 659 918 727 591 0.08740 000 Aptiv Corp. 4.150% 15/03/2024 USD 802 265 806 967 0.09
2 350 000 Ares Capital Corp. 2.150% 15/07/2026 USD 2 338 130 2 285 222 0.26
158 Lumyna Funds
Lumyna – Global Debt - Credit UCITS FundSchedule of investments as at March 31, 2021 (cont.)
The accompanying notes form an integral part of these financial statements.
Audited annual report

Nominalvalue Description
Quotationcurrency
CostUSD
Marketvalue USD
% of netassets
Transferable securities and money market instruments admitted to an official exchange listing or dealt in on another regulated market(cont.)
Bonds (cont.)
United States (cont.)830 000 Ares Capital Corp. 3.250% 15/07/2025 USD 827 967 855 689 0.10
2 682 000 Ares Capital Corp. 3.500% 10/02/2023 USD 2 669 021 2 796 427 0.32380 000 Ares Capital Corp. 3.875% 15/01/2026 USD 399 697 400 312 0.05
1 400 000 Ares Capital Corp. 4.200% 10/06/2024 USD 1 398 284 1 509 395 0.171 000 000 Ares Capital Corp. 4.250% 01/03/2025 USD 990 788 1 072 470 0.12540 000 Arizona Public Service Co. 2.600% 15/08/2029 USD 536 632 552 730 0.06230 000 Arizona Public Service Co. 3.500% 01/12/2049 USD 229 877 233 736 0.03880 000 AT&T, Inc. 0.900% 25/03/2024 USD 879 171 880 694 0.10
1 400 000 AT&T, Inc. 1.700% 25/03/2026 USD 1 397 674 1 399 613 0.16655 000 AT&T, Inc. 3.100% 01/02/2043 USD 654 695 609 507 0.07190 000 AT&T, Inc. 3.500% 01/02/2061 USD 189 880 171 792 0.02332 000 AT&T, Inc. 144A 3.800% 01/12/2057 USD 344 841 314 434 0.04350 000 AT&T, Inc. 4.250% 01/06/2043 GBP 519 299 579 762 0.0745 000 AT&T, Inc. 4.300% 15/12/2042 USD 49 752 49 132 0.01
765 000 AT&T, Inc. 4.450% 01/04/2024 USD 770 829 839 036 0.101 250 000 AT&T, Inc. 4.500% 15/05/2035 USD 1 229 333 1 408 528 0.16230 000 AT&T, Inc. 4.800% 15/06/2044 USD 256 309 262 031 0.03620 000 AT&T, Inc. 4.850% 01/03/2039 USD 593 885 718 255 0.08250 000 AT&T, Inc. 7.000% 30/04/2040 GBP 488 722 547 591 0.06300 000 Athene Global Funding 144A 2.500% 14/01/2025 USD 309 440 310 656 0.04
1 825 000 Athene Global Funding - Reg 1.750% 24/11/2027 GBP 2 409 306 2 512 112 0.29200 000 Atlantic City Electric Co. 2.300% 15/03/2031 USD 199 893 197 492 0.02660 000 Atmos Energy Corp. 1.500% 15/01/2031 USD 657 268 602 397 0.07484 000 Autodesk, Inc. 2.850% 15/01/2030 USD 515 700 496 303 0.06400 000 AutoNation, Inc. 4.750% 01/06/2030 USD 475 769 460 922 0.05100 000 Avangrid, Inc. 3.800% 01/06/2029 USD 99 885 109 936 0.01200 000 Aviation Capital Group LLC 144A 5.500% 15/12/2024 USD 224 217 223 608 0.03990 000 Baker Hughes a GE Co. LLC Via Baker Hughes
Co-Obligor, Inc. 4.080% 15/12/2047USD 1 077 860 1 052 324 0.12
120 000 Baltimore Gas and Electric Co. 2.900% 15/06/2050 USD 120 926 111 049 0.01430 000 Bank of America Corp. FRN 25/09/2025 USD 430 000 428 843 0.05210 000 Bank of America Corp. FRN 24/10/2026 USD 210 000 207 060 0.02850 000 Bank of America Corp. FRN 22/10/2025 USD 849 635 891 110 0.10
1 145 000 Bank of America Corp. FRN 19/06/2041 USD 1 145 000 1 069 708 0.121 150 000 Bank of America Corp. FRN 21/07/2023 USD 1 149 831 1 183 836 0.142 070 000 Bank of America Corp. FRN 22/10/2030 USD 2 142 633 2 126 598 0.24800 000 Bank of America Corp. FRN 20/12/2028 USD 786 708 857 564 0.10215 000 Bank of America Corp. FRN 13/03/2052 USD 215 000 218 373 0.03600 000 Bank of America Corp. FRN 20/01/2028 USD 606 910 658 834 0.08400 000 Bank of America Corp. 3.950% 21/04/2025 USD 442 872 438 311 0.05800 000 Bank of America Corp. FRN 07/02/2030 USD 856 941 883 854 0.10
1 491 000 Bank of America Corp. FRN 20/03/2051 USD 1 872 198 1 661 707 0.192 450 000 Bank of America Corp. 4.450% 03/03/2026 USD 2 527 531 2 751 856 0.32900 000 Bank of America Corp. - Reg FRN 31/03/2029 EUR 971 685 1 283 610 0.15800 000 Bank of America Corp. - Reg 7.000% 31/07/2028 GBP 1 385 135 1 518 278 0.17
159Lumyna Funds
Lumyna – Global Debt - Credit UCITS FundSchedule of investments as at March 31, 2021 (cont.)
The accompanying notes form an integral part of these financial statements.
Audited annual report

Nominalvalue Description
Quotationcurrency
CostUSD
Marketvalue USD
% of netassets
Transferable securities and money market instruments admitted to an official exchange listing or dealt in on another regulated market(cont.)
Bonds (cont.)
United States (cont.)31 000 Banner Health 2.913% 01/01/2051 USD 31 000 28 436 0.00
1 030 000 BAT Capital Corp. 3.222% 15/08/2024 USD 1 110 087 1 096 396 0.13125 000 BAT Capital Corp. 3.734% 25/09/2040 USD 125 000 119 220 0.0140 000 BAT Capital Corp. 3.984% 25/09/2050 USD 40 000 37 457 0.00
410 000 BAT Capital Corp. 4.758% 06/09/2049 USD 467 438 420 049 0.05270 000 BAT Capital Corp. - Reg 2.125% 15/08/2025 GBP 356 280 383 652 0.04672 000 Baxter International, Inc. 2.600% 15/08/2026 USD 635 655 713 432 0.0886 000 Baylor Scott & White Hldg. 2.839% 15/11/2050 USD 86 000 80 653 0.01
1 000 000 Becton Dickinson and Co. 1.000% 15/12/2022 EUR 1 166 868 1 195 811 0.14130 000 Berkshire Hathaway Energy Co. 3.700% 15/07/2030 USD 129 981 143 951 0.02
1 050 000 Berkshire Hathaway Energy Co. 4.500% 01/02/2045 USD 1 152 564 1 213 930 0.14185 000 Berkshire Hathaway Finance Corp. 2.850% 15/10/2050 USD 184 854 169 938 0.02755 000 Berkshire Hathaway Finance Corp. 4.200% 15/08/2048 USD 991 632 864 565 0.1060 000 Block Financial LLC 3.875% 15/08/2030 USD 62 460 61 866 0.01
1 600 000 Booking Hldg., Inc. 0.500% 08/03/2028 EUR 1 930 350 1 891 749 0.2298 000 Booking Hldg., Inc. 4.625% 13/04/2030 USD 104 695 114 081 0.01
695 000 Bristol-Myers Squibb Co. 2.550% 13/11/2050 USD 692 996 618 604 0.07341 000 Bristol-Myers Squibb Co. 3.450% 15/11/2027 USD 356 790 374 752 0.04375 000 Broadcom, Inc. 3.150% 15/11/2025 USD 374 573 399 524 0.05
1 160 000 Broadcom, Inc. 3.459% 15/09/2026 USD 1 159 716 1 243 470 0.141 405 000 Broadcom, Inc. 144A 3.500% 15/02/2041 USD 1 422 630 1 337 479 0.15785 000 Broadcom, Inc. 144A 3.750% 15/02/2051 USD 795 238 753 908 0.09475 000 Broadcom, Inc. 4.150% 15/11/2030 USD 474 518 513 239 0.06900 000 Broadcom, Inc. 4.250% 15/04/2026 USD 895 233 998 509 0.12
2 580 000 Broadcom, Inc. 4.300% 15/11/2032 USD 2 779 115 2 806 670 0.322 265 000 Broadcom, Inc. 4.700% 15/04/2025 USD 2 527 670 2 552 050 0.29120 000 Brooklyn Union Gas Co. 144A 4.273% 15/03/2048 USD 152 184 132 545 0.02615 000 Brown & Brown, Inc. 4.200% 15/09/2024 USD 674 854 676 202 0.08570 000 Bunge Ltd. Finance Corp. 1.630% 17/08/2025 USD 569 975 570 019 0.07200 000 Burlington Northern Santa Fe LLC 4.050% 15/06/2048 USD 199 542 223 542 0.03750 000 Burlington Northern Santa Fe LLC 4.125% 15/06/2047 USD 800 063 847 769 0.10170 000 Camden Property Trust 3.150% 01/07/2029 USD 173 096 179 672 0.02
1 258 000 Capital One Financial Corp. 1.650% 12/06/2029 EUR 1 635 477 1 570 201 0.182 650 000 Capital One Financial Corp. 3.050% 09/03/2022 USD 2 655 810 2 710 216 0.31
18 000 Cardinal Health, Inc. 4.368% 15/06/2047 USD 20 294 19 500 0.00180 000 Carrier Global Corp. 2.242% 15/02/2025 USD 180 000 186 315 0.02240 000 Carrier Global Corp. 3.377% 05/04/2040 USD 243 260 237 561 0.03540 000 Carrier Global Corp. 3.577% 05/04/2050 USD 579 679 528 633 0.06
1 105 000 Caterpillar Financial Services Corp. 0.800% 13/11/2025 USD 1 103 703 1 087 085 0.13880 000 Caterpillar Financial Services Corp. 0.900% 02/03/2026 USD 878 019 864 890 0.10250 000 Caterpillar Financial Services Corp. 1.950% 18/11/2022 USD 249 934 256 447 0.03
1 125 000 Caterpillar, Inc. 1.900% 12/03/2031 USD 1 116 911 1 081 703 0.12250 000 Caterpillar, Inc. 3.250% 09/04/2050 USD 259 025 254 626 0.03255 000 CBRE Services, Inc. 4.875% 01/03/2026 USD 268 210 292 804 0.03
160 Lumyna Funds
Lumyna – Global Debt - Credit UCITS FundSchedule of investments as at March 31, 2021 (cont.)
The accompanying notes form an integral part of these financial statements.
Audited annual report

Nominalvalue Description
Quotationcurrency
CostUSD
Marketvalue USD
% of netassets
Transferable securities and money market instruments admitted to an official exchange listing or dealt in on another regulated market(cont.)
Bonds (cont.)
United States (cont.)200 000 CenterPoint Energy Houston Electric LLC 2.900%
01/07/2050USD 208 785 186 598 0.02
2 650 000 Charter Communications Operating LLC Via CharterCommunications Operating Capital 4.464%23/07/2022
USD 2 675 025 2 763 769 0.32
690 000 Charter Communications Operating LLC Via CharterCommunications Operating Capital 5.750%01/04/2048
USD 718 482 839 147 0.10
3 672 000 Cheniere Corpus Christi Hldg. LLC 3.700% 15/11/2029 USD 3 915 127 3 867 715 0.451 205 000 Cheniere Corpus Christi Hldg. LLC 5.875% 31/03/2025 USD 1 332 362 1 372 745 0.16230 000 Chevron Corp. 1.554% 11/05/2025 USD 230 000 234 603 0.0340 000 Chevron Corp. 1.995% 11/05/2027 USD 40 000 40 874 0.0075 000 Chevron Corp. 2.236% 11/05/2030 USD 75 000 74 569 0.0135 000 Chevron Corp. 2.978% 11/05/2040 USD 35 000 34 569 0.00
600 000 Chevron USA, Inc. 5.250% 15/11/2043 USD 824 756 774 278 0.09255 000 Choice Hotels International, Inc. 3.700% 15/01/2031 USD 259 397 268 117 0.03
1 050 000 Chubb INA Hldg., Inc. 0.300% 15/12/2024 EUR 1 162 718 1 245 507 0.144 330 000 Citigroup, Inc. FRN 30/10/2024 USD 4 330 000 4 326 842 0.501 585 000 Citigroup, Inc. FRN 08/04/2026 USD 1 585 000 1 693 683 0.201 370 000 Citigroup, Inc. FRN 24/04/2025 USD 1 370 000 1 464 134 0.171 000 000 Citigroup, Inc. FRN 01/06/2024 USD 1 038 595 1 071 251 0.12945 000 Citigroup, Inc. 4.650% 23/07/2048 USD 1 178 641 1 155 137 0.13460 000 Citigroup, Inc. 4.750% 18/05/2046 USD 548 054 546 551 0.06740 000 Citrix Systems, Inc. 1.250% 01/03/2026 USD 738 453 727 144 0.08500 000 CME Group, Inc. 4.150% 15/06/2048 USD 603 670 597 893 0.07236 000 CME Group, Inc. 5.300% 15/09/2043 USD 322 342 318 040 0.04650 000 Coca-Cola Co. 0.125% 09/03/2029 EUR 775 847 755 558 0.09825 000 Coca-Cola Co. 0.500% 09/03/2033 EUR 984 763 956 096 0.11650 000 Coca-Cola Co. 1.000% 09/03/2041 EUR 777 592 746 067 0.09
1 625 000 Colgate-Palmolive Co. 0.500% 06/03/2026 EUR 1 838 215 1 962 494 0.23825 000 Comcast Corp. 0.750% 20/02/2032 EUR 906 354 979 532 0.11
1 500 000 Comcast Corp. 2.650% 15/08/2062 USD 1 486 663 1 267 482 0.15320 000 Comcast Corp. 3.450% 01/02/2050 USD 319 271 329 109 0.04870 000 Comcast Corp. 3.950% 15/10/2025 USD 869 309 970 456 0.11170 000 Comcast Corp. 4.600% 15/10/2038 USD 169 902 204 765 0.02270 000 Comcast Corp. 4.950% 15/10/2058 USD 350 136 352 070 0.04107 000 CommonSpirit Health 3.910% 01/10/2050 USD 107 000 108 672 0.01160 000 Consolidated Edison Co. of New York, Inc. 3.350%
01/04/2030USD 159 672 171 010 0.02
550 000 Consolidated Edison Co. of New York, Inc. 4.000%15/11/2057
USD 554 911 572 740 0.07
3 250 000 Constellation Brands, Inc. 2.700% 09/05/2022 USD 3 248 207 3 320 555 0.38150 000 Consumers Energy Co. 3.750% 15/02/2050 USD 169 354 164 947 0.02705 000 Costco Wholesale Corp. 1.375% 20/06/2027 USD 703 623 702 147 0.0830 000 Costco Wholesale Corp. 1.600% 20/04/2030 USD 29 952 28 710 0.00
161Lumyna Funds
Lumyna – Global Debt - Credit UCITS FundSchedule of investments as at March 31, 2021 (cont.)
The accompanying notes form an integral part of these financial statements.
Audited annual report
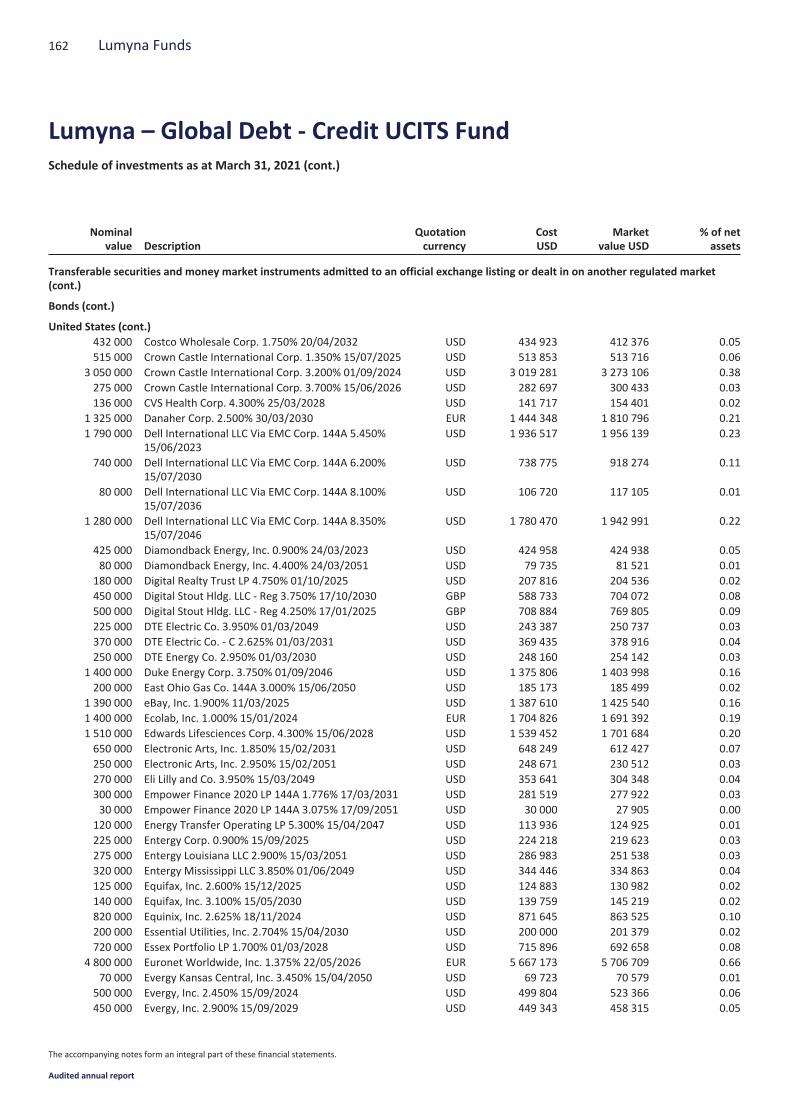
Nominalvalue Description
Quotationcurrency
CostUSD
Marketvalue USD
% of netassets
Transferable securities and money market instruments admitted to an official exchange listing or dealt in on another regulated market(cont.)
Bonds (cont.)
United States (cont.)432 000 Costco Wholesale Corp. 1.750% 20/04/2032 USD 434 923 412 376 0.05515 000 Crown Castle International Corp. 1.350% 15/07/2025 USD 513 853 513 716 0.06
3 050 000 Crown Castle International Corp. 3.200% 01/09/2024 USD 3 019 281 3 273 106 0.38275 000 Crown Castle International Corp. 3.700% 15/06/2026 USD 282 697 300 433 0.03136 000 CVS Health Corp. 4.300% 25/03/2028 USD 141 717 154 401 0.02
1 325 000 Danaher Corp. 2.500% 30/03/2030 EUR 1 444 348 1 810 796 0.211 790 000 Dell International LLC Via EMC Corp. 144A 5.450%
15/06/2023USD 1 936 517 1 956 139 0.23
740 000 Dell International LLC Via EMC Corp. 144A 6.200%15/07/2030
USD 738 775 918 274 0.11
80 000 Dell International LLC Via EMC Corp. 144A 8.100%15/07/2036
USD 106 720 117 105 0.01
1 280 000 Dell International LLC Via EMC Corp. 144A 8.350%15/07/2046
USD 1 780 470 1 942 991 0.22
425 000 Diamondback Energy, Inc. 0.900% 24/03/2023 USD 424 958 424 938 0.0580 000 Diamondback Energy, Inc. 4.400% 24/03/2051 USD 79 735 81 521 0.01
180 000 Digital Realty Trust LP 4.750% 01/10/2025 USD 207 816 204 536 0.02450 000 Digital Stout Hldg. LLC - Reg 3.750% 17/10/2030 GBP 588 733 704 072 0.08500 000 Digital Stout Hldg. LLC - Reg 4.250% 17/01/2025 GBP 708 884 769 805 0.09225 000 DTE Electric Co. 3.950% 01/03/2049 USD 243 387 250 737 0.03370 000 DTE Electric Co. - C 2.625% 01/03/2031 USD 369 435 378 916 0.04250 000 DTE Energy Co. 2.950% 01/03/2030 USD 248 160 254 142 0.03
1 400 000 Duke Energy Corp. 3.750% 01/09/2046 USD 1 375 806 1 403 998 0.16200 000 East Ohio Gas Co. 144A 3.000% 15/06/2050 USD 185 173 185 499 0.02
1 390 000 eBay, Inc. 1.900% 11/03/2025 USD 1 387 610 1 425 540 0.161 400 000 Ecolab, Inc. 1.000% 15/01/2024 EUR 1 704 826 1 691 392 0.191 510 000 Edwards Lifesciences Corp. 4.300% 15/06/2028 USD 1 539 452 1 701 684 0.20650 000 Electronic Arts, Inc. 1.850% 15/02/2031 USD 648 249 612 427 0.07250 000 Electronic Arts, Inc. 2.950% 15/02/2051 USD 248 671 230 512 0.03270 000 Eli Lilly and Co. 3.950% 15/03/2049 USD 353 641 304 348 0.04300 000 Empower Finance 2020 LP 144A 1.776% 17/03/2031 USD 281 519 277 922 0.0330 000 Empower Finance 2020 LP 144A 3.075% 17/09/2051 USD 30 000 27 905 0.00
120 000 Energy Transfer Operating LP 5.300% 15/04/2047 USD 113 936 124 925 0.01225 000 Entergy Corp. 0.900% 15/09/2025 USD 224 218 219 623 0.03275 000 Entergy Louisiana LLC 2.900% 15/03/2051 USD 286 983 251 538 0.03320 000 Entergy Mississippi LLC 3.850% 01/06/2049 USD 344 446 334 863 0.04125 000 Equifax, Inc. 2.600% 15/12/2025 USD 124 883 130 982 0.02140 000 Equifax, Inc. 3.100% 15/05/2030 USD 139 759 145 219 0.02820 000 Equinix, Inc. 2.625% 18/11/2024 USD 871 645 863 525 0.10200 000 Essential Utilities, Inc. 2.704% 15/04/2030 USD 200 000 201 379 0.02720 000 Essex Portfolio LP 1.700% 01/03/2028 USD 715 896 692 658 0.08
4 800 000 Euronet Worldwide, Inc. 1.375% 22/05/2026 EUR 5 667 173 5 706 709 0.6670 000 Evergy Kansas Central, Inc. 3.450% 15/04/2050 USD 69 723 70 579 0.01
500 000 Evergy, Inc. 2.450% 15/09/2024 USD 499 804 523 366 0.06450 000 Evergy, Inc. 2.900% 15/09/2029 USD 449 343 458 315 0.05
162 Lumyna Funds
Lumyna – Global Debt - Credit UCITS FundSchedule of investments as at March 31, 2021 (cont.)
The accompanying notes form an integral part of these financial statements.
Audited annual report
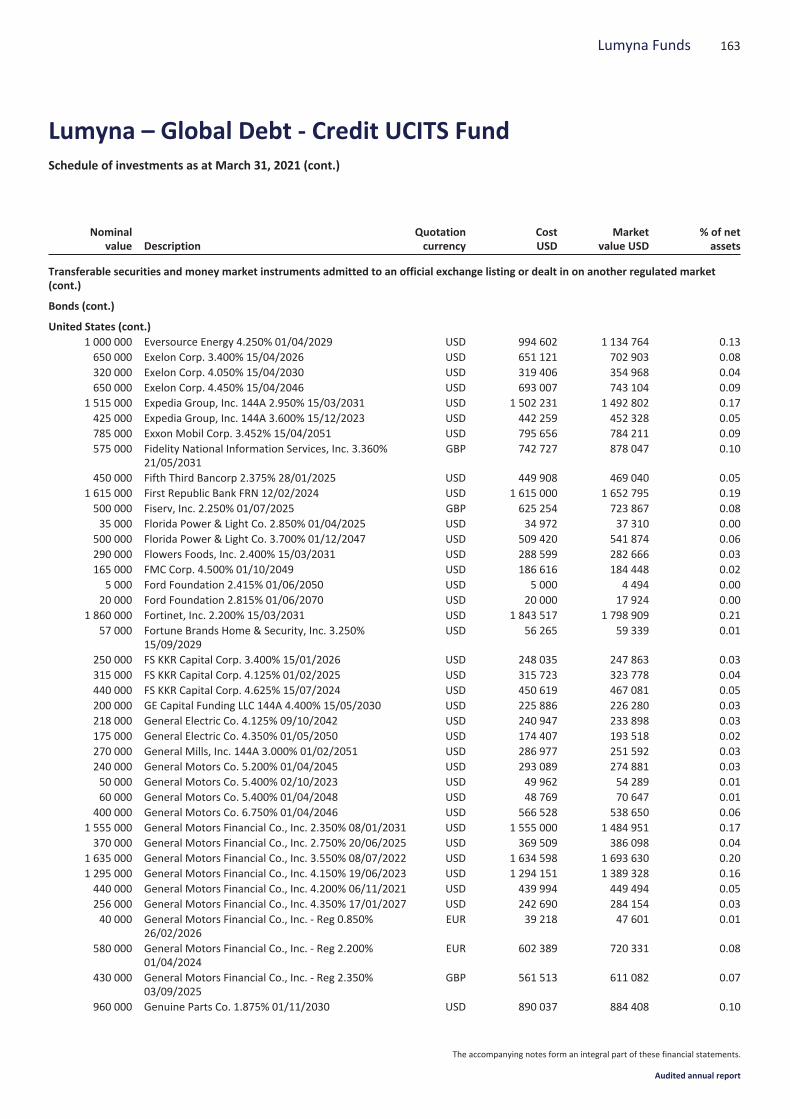
Nominalvalue Description
Quotationcurrency
CostUSD
Marketvalue USD
% of netassets
Transferable securities and money market instruments admitted to an official exchange listing or dealt in on another regulated market(cont.)
Bonds (cont.)
United States (cont.)1 000 000 Eversource Energy 4.250% 01/04/2029 USD 994 602 1 134 764 0.13650 000 Exelon Corp. 3.400% 15/04/2026 USD 651 121 702 903 0.08320 000 Exelon Corp. 4.050% 15/04/2030 USD 319 406 354 968 0.04650 000 Exelon Corp. 4.450% 15/04/2046 USD 693 007 743 104 0.09
1 515 000 Expedia Group, Inc. 144A 2.950% 15/03/2031 USD 1 502 231 1 492 802 0.17425 000 Expedia Group, Inc. 144A 3.600% 15/12/2023 USD 442 259 452 328 0.05785 000 Exxon Mobil Corp. 3.452% 15/04/2051 USD 795 656 784 211 0.09575 000 Fidelity National Information Services, Inc. 3.360%
21/05/2031GBP 742 727 878 047 0.10
450 000 Fifth Third Bancorp 2.375% 28/01/2025 USD 449 908 469 040 0.051 615 000 First Republic Bank FRN 12/02/2024 USD 1 615 000 1 652 795 0.19500 000 Fiserv, Inc. 2.250% 01/07/2025 GBP 625 254 723 867 0.0835 000 Florida Power & Light Co. 2.850% 01/04/2025 USD 34 972 37 310 0.00
500 000 Florida Power & Light Co. 3.700% 01/12/2047 USD 509 420 541 874 0.06290 000 Flowers Foods, Inc. 2.400% 15/03/2031 USD 288 599 282 666 0.03165 000 FMC Corp. 4.500% 01/10/2049 USD 186 616 184 448 0.02
5 000 Ford Foundation 2.415% 01/06/2050 USD 5 000 4 494 0.0020 000 Ford Foundation 2.815% 01/06/2070 USD 20 000 17 924 0.00
1 860 000 Fortinet, Inc. 2.200% 15/03/2031 USD 1 843 517 1 798 909 0.2157 000 Fortune Brands Home & Security, Inc. 3.250%
15/09/2029USD 56 265 59 339 0.01
250 000 FS KKR Capital Corp. 3.400% 15/01/2026 USD 248 035 247 863 0.03315 000 FS KKR Capital Corp. 4.125% 01/02/2025 USD 315 723 323 778 0.04440 000 FS KKR Capital Corp. 4.625% 15/07/2024 USD 450 619 467 081 0.05200 000 GE Capital Funding LLC 144A 4.400% 15/05/2030 USD 225 886 226 280 0.03218 000 General Electric Co. 4.125% 09/10/2042 USD 240 947 233 898 0.03175 000 General Electric Co. 4.350% 01/05/2050 USD 174 407 193 518 0.02270 000 General Mills, Inc. 144A 3.000% 01/02/2051 USD 286 977 251 592 0.03240 000 General Motors Co. 5.200% 01/04/2045 USD 293 089 274 881 0.0350 000 General Motors Co. 5.400% 02/10/2023 USD 49 962 54 289 0.0160 000 General Motors Co. 5.400% 01/04/2048 USD 48 769 70 647 0.01
400 000 General Motors Co. 6.750% 01/04/2046 USD 566 528 538 650 0.061 555 000 General Motors Financial Co., Inc. 2.350% 08/01/2031 USD 1 555 000 1 484 951 0.17370 000 General Motors Financial Co., Inc. 2.750% 20/06/2025 USD 369 509 386 098 0.04
1 635 000 General Motors Financial Co., Inc. 3.550% 08/07/2022 USD 1 634 598 1 693 630 0.201 295 000 General Motors Financial Co., Inc. 4.150% 19/06/2023 USD 1 294 151 1 389 328 0.16440 000 General Motors Financial Co., Inc. 4.200% 06/11/2021 USD 439 994 449 494 0.05256 000 General Motors Financial Co., Inc. 4.350% 17/01/2027 USD 242 690 284 154 0.0340 000 General Motors Financial Co., Inc. - Reg 0.850%
26/02/2026EUR 39 218 47 601 0.01
580 000 General Motors Financial Co., Inc. - Reg 2.200%01/04/2024
EUR 602 389 720 331 0.08
430 000 General Motors Financial Co., Inc. - Reg 2.350%03/09/2025
GBP 561 513 611 082 0.07
960 000 Genuine Parts Co. 1.875% 01/11/2030 USD 890 037 884 408 0.10
163Lumyna Funds
Lumyna – Global Debt - Credit UCITS FundSchedule of investments as at March 31, 2021 (cont.)
The accompanying notes form an integral part of these financial statements.
Audited annual report
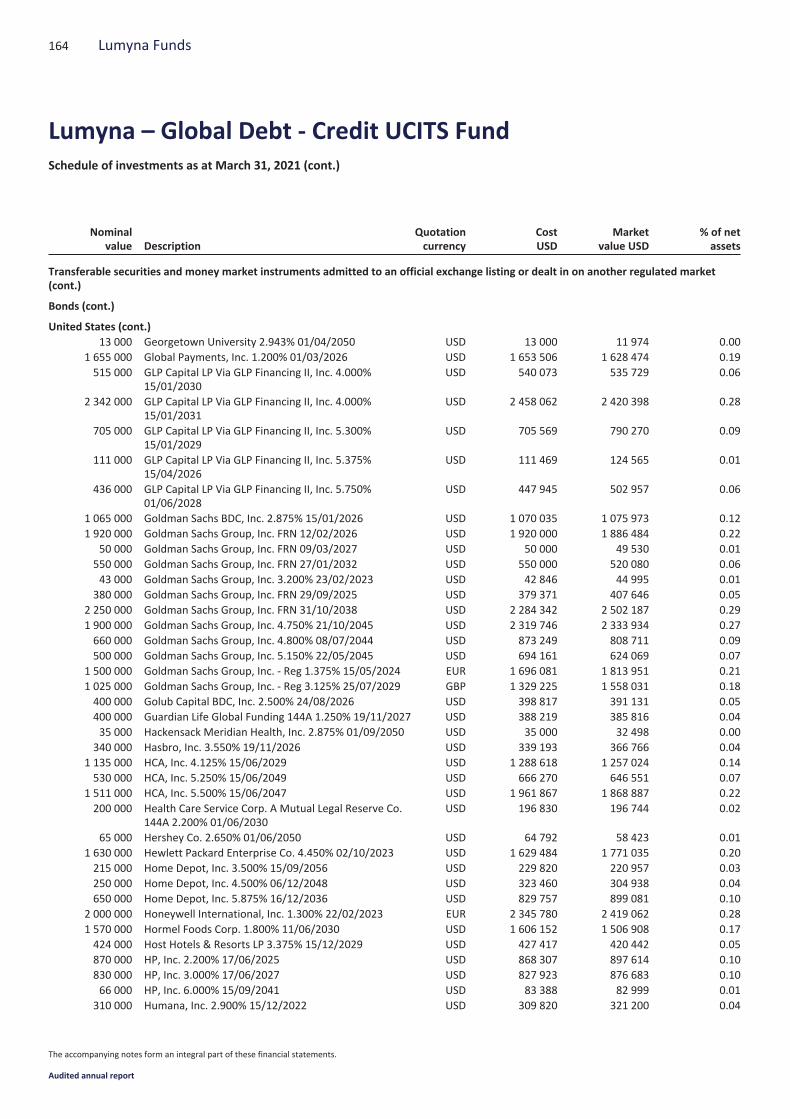
Nominalvalue Description
Quotationcurrency
CostUSD
Marketvalue USD
% of netassets
Transferable securities and money market instruments admitted to an official exchange listing or dealt in on another regulated market(cont.)
Bonds (cont.)
United States (cont.)13 000 Georgetown University 2.943% 01/04/2050 USD 13 000 11 974 0.00
1 655 000 Global Payments, Inc. 1.200% 01/03/2026 USD 1 653 506 1 628 474 0.19515 000 GLP Capital LP Via GLP Financing II, Inc. 4.000%
15/01/2030USD 540 073 535 729 0.06
2 342 000 GLP Capital LP Via GLP Financing II, Inc. 4.000%15/01/2031
USD 2 458 062 2 420 398 0.28
705 000 GLP Capital LP Via GLP Financing II, Inc. 5.300%15/01/2029
USD 705 569 790 270 0.09
111 000 GLP Capital LP Via GLP Financing II, Inc. 5.375%15/04/2026
USD 111 469 124 565 0.01
436 000 GLP Capital LP Via GLP Financing II, Inc. 5.750%01/06/2028
USD 447 945 502 957 0.06
1 065 000 Goldman Sachs BDC, Inc. 2.875% 15/01/2026 USD 1 070 035 1 075 973 0.121 920 000 Goldman Sachs Group, Inc. FRN 12/02/2026 USD 1 920 000 1 886 484 0.22
50 000 Goldman Sachs Group, Inc. FRN 09/03/2027 USD 50 000 49 530 0.01550 000 Goldman Sachs Group, Inc. FRN 27/01/2032 USD 550 000 520 080 0.0643 000 Goldman Sachs Group, Inc. 3.200% 23/02/2023 USD 42 846 44 995 0.01
380 000 Goldman Sachs Group, Inc. FRN 29/09/2025 USD 379 371 407 646 0.052 250 000 Goldman Sachs Group, Inc. FRN 31/10/2038 USD 2 284 342 2 502 187 0.291 900 000 Goldman Sachs Group, Inc. 4.750% 21/10/2045 USD 2 319 746 2 333 934 0.27660 000 Goldman Sachs Group, Inc. 4.800% 08/07/2044 USD 873 249 808 711 0.09500 000 Goldman Sachs Group, Inc. 5.150% 22/05/2045 USD 694 161 624 069 0.07
1 500 000 Goldman Sachs Group, Inc. - Reg 1.375% 15/05/2024 EUR 1 696 081 1 813 951 0.211 025 000 Goldman Sachs Group, Inc. - Reg 3.125% 25/07/2029 GBP 1 329 225 1 558 031 0.18400 000 Golub Capital BDC, Inc. 2.500% 24/08/2026 USD 398 817 391 131 0.05400 000 Guardian Life Global Funding 144A 1.250% 19/11/2027 USD 388 219 385 816 0.0435 000 Hackensack Meridian Health, Inc. 2.875% 01/09/2050 USD 35 000 32 498 0.00
340 000 Hasbro, Inc. 3.550% 19/11/2026 USD 339 193 366 766 0.041 135 000 HCA, Inc. 4.125% 15/06/2029 USD 1 288 618 1 257 024 0.14530 000 HCA, Inc. 5.250% 15/06/2049 USD 666 270 646 551 0.07
1 511 000 HCA, Inc. 5.500% 15/06/2047 USD 1 961 867 1 868 887 0.22200 000 Health Care Service Corp. A Mutual Legal Reserve Co.
144A 2.200% 01/06/2030USD 196 830 196 744 0.02
65 000 Hershey Co. 2.650% 01/06/2050 USD 64 792 58 423 0.011 630 000 Hewlett Packard Enterprise Co. 4.450% 02/10/2023 USD 1 629 484 1 771 035 0.20215 000 Home Depot, Inc. 3.500% 15/09/2056 USD 229 820 220 957 0.03250 000 Home Depot, Inc. 4.500% 06/12/2048 USD 323 460 304 938 0.04650 000 Home Depot, Inc. 5.875% 16/12/2036 USD 829 757 899 081 0.10
2 000 000 Honeywell International, Inc. 1.300% 22/02/2023 EUR 2 345 780 2 419 062 0.281 570 000 Hormel Foods Corp. 1.800% 11/06/2030 USD 1 606 152 1 506 908 0.17424 000 Host Hotels & Resorts LP 3.375% 15/12/2029 USD 427 417 420 442 0.05870 000 HP, Inc. 2.200% 17/06/2025 USD 868 307 897 614 0.10830 000 HP, Inc. 3.000% 17/06/2027 USD 827 923 876 683 0.1066 000 HP, Inc. 6.000% 15/09/2041 USD 83 388 82 999 0.01
310 000 Humana, Inc. 2.900% 15/12/2022 USD 309 820 321 200 0.04
164 Lumyna Funds
Lumyna – Global Debt - Credit UCITS FundSchedule of investments as at March 31, 2021 (cont.)
The accompanying notes form an integral part of these financial statements.
Audited annual report
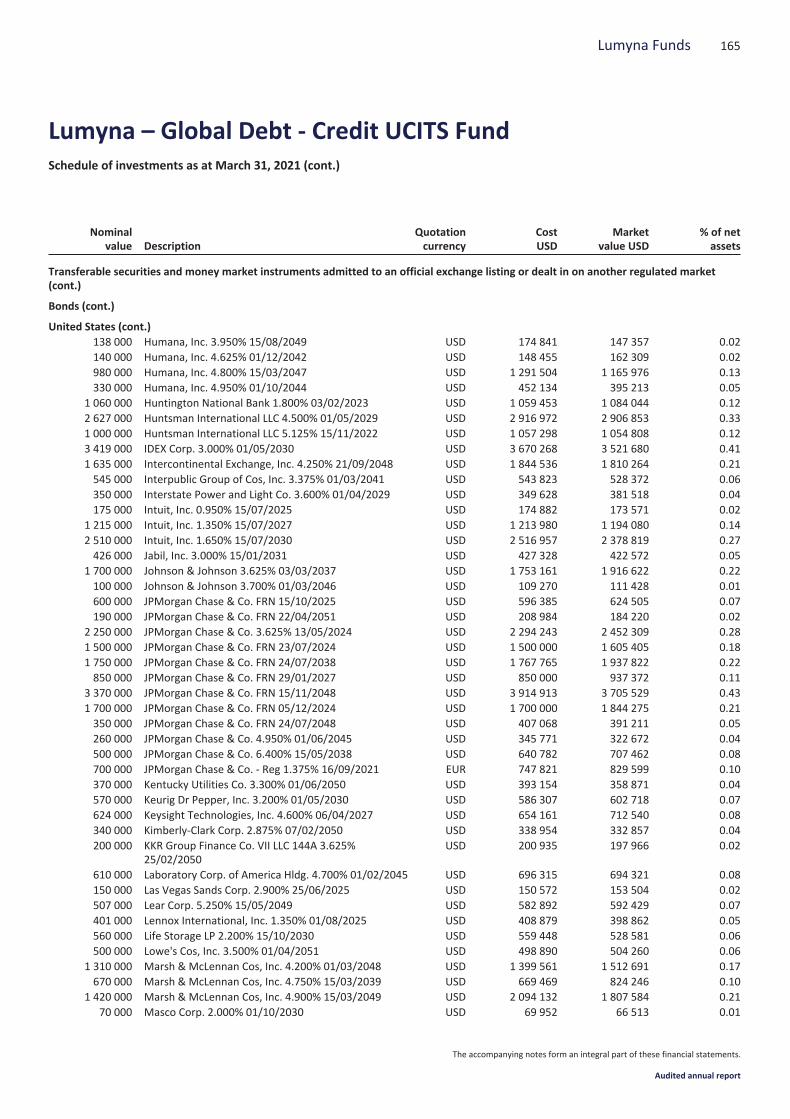
Nominalvalue Description
Quotationcurrency
CostUSD
Marketvalue USD
% of netassets
Transferable securities and money market instruments admitted to an official exchange listing or dealt in on another regulated market(cont.)
Bonds (cont.)
United States (cont.)138 000 Humana, Inc. 3.950% 15/08/2049 USD 174 841 147 357 0.02140 000 Humana, Inc. 4.625% 01/12/2042 USD 148 455 162 309 0.02980 000 Humana, Inc. 4.800% 15/03/2047 USD 1 291 504 1 165 976 0.13330 000 Humana, Inc. 4.950% 01/10/2044 USD 452 134 395 213 0.05
1 060 000 Huntington National Bank 1.800% 03/02/2023 USD 1 059 453 1 084 044 0.122 627 000 Huntsman International LLC 4.500% 01/05/2029 USD 2 916 972 2 906 853 0.331 000 000 Huntsman International LLC 5.125% 15/11/2022 USD 1 057 298 1 054 808 0.123 419 000 IDEX Corp. 3.000% 01/05/2030 USD 3 670 268 3 521 680 0.411 635 000 Intercontinental Exchange, Inc. 4.250% 21/09/2048 USD 1 844 536 1 810 264 0.21545 000 Interpublic Group of Cos, Inc. 3.375% 01/03/2041 USD 543 823 528 372 0.06350 000 Interstate Power and Light Co. 3.600% 01/04/2029 USD 349 628 381 518 0.04175 000 Intuit, Inc. 0.950% 15/07/2025 USD 174 882 173 571 0.02
1 215 000 Intuit, Inc. 1.350% 15/07/2027 USD 1 213 980 1 194 080 0.142 510 000 Intuit, Inc. 1.650% 15/07/2030 USD 2 516 957 2 378 819 0.27426 000 Jabil, Inc. 3.000% 15/01/2031 USD 427 328 422 572 0.05
1 700 000 Johnson & Johnson 3.625% 03/03/2037 USD 1 753 161 1 916 622 0.22100 000 Johnson & Johnson 3.700% 01/03/2046 USD 109 270 111 428 0.01600 000 JPMorgan Chase & Co. FRN 15/10/2025 USD 596 385 624 505 0.07190 000 JPMorgan Chase & Co. FRN 22/04/2051 USD 208 984 184 220 0.02
2 250 000 JPMorgan Chase & Co. 3.625% 13/05/2024 USD 2 294 243 2 452 309 0.281 500 000 JPMorgan Chase & Co. FRN 23/07/2024 USD 1 500 000 1 605 405 0.181 750 000 JPMorgan Chase & Co. FRN 24/07/2038 USD 1 767 765 1 937 822 0.22850 000 JPMorgan Chase & Co. FRN 29/01/2027 USD 850 000 937 372 0.11
3 370 000 JPMorgan Chase & Co. FRN 15/11/2048 USD 3 914 913 3 705 529 0.431 700 000 JPMorgan Chase & Co. FRN 05/12/2024 USD 1 700 000 1 844 275 0.21350 000 JPMorgan Chase & Co. FRN 24/07/2048 USD 407 068 391 211 0.05260 000 JPMorgan Chase & Co. 4.950% 01/06/2045 USD 345 771 322 672 0.04500 000 JPMorgan Chase & Co. 6.400% 15/05/2038 USD 640 782 707 462 0.08700 000 JPMorgan Chase & Co. - Reg 1.375% 16/09/2021 EUR 747 821 829 599 0.10370 000 Kentucky Utilities Co. 3.300% 01/06/2050 USD 393 154 358 871 0.04570 000 Keurig Dr Pepper, Inc. 3.200% 01/05/2030 USD 586 307 602 718 0.07624 000 Keysight Technologies, Inc. 4.600% 06/04/2027 USD 654 161 712 540 0.08340 000 Kimberly-Clark Corp. 2.875% 07/02/2050 USD 338 954 332 857 0.04200 000 KKR Group Finance Co. VII LLC 144A 3.625%
25/02/2050USD 200 935 197 966 0.02
610 000 Laboratory Corp. of America Hldg. 4.700% 01/02/2045 USD 696 315 694 321 0.08150 000 Las Vegas Sands Corp. 2.900% 25/06/2025 USD 150 572 153 504 0.02507 000 Lear Corp. 5.250% 15/05/2049 USD 582 892 592 429 0.07401 000 Lennox International, Inc. 1.350% 01/08/2025 USD 408 879 398 862 0.05560 000 Life Storage LP 2.200% 15/10/2030 USD 559 448 528 581 0.06500 000 Lowe's Cos, Inc. 3.500% 01/04/2051 USD 498 890 504 260 0.06
1 310 000 Marsh & McLennan Cos, Inc. 4.200% 01/03/2048 USD 1 399 561 1 512 691 0.17670 000 Marsh & McLennan Cos, Inc. 4.750% 15/03/2039 USD 669 469 824 246 0.10
1 420 000 Marsh & McLennan Cos, Inc. 4.900% 15/03/2049 USD 2 094 132 1 807 584 0.2170 000 Masco Corp. 2.000% 01/10/2030 USD 69 952 66 513 0.01
165Lumyna Funds
Lumyna – Global Debt - Credit UCITS FundSchedule of investments as at March 31, 2021 (cont.)
The accompanying notes form an integral part of these financial statements.
Audited annual report
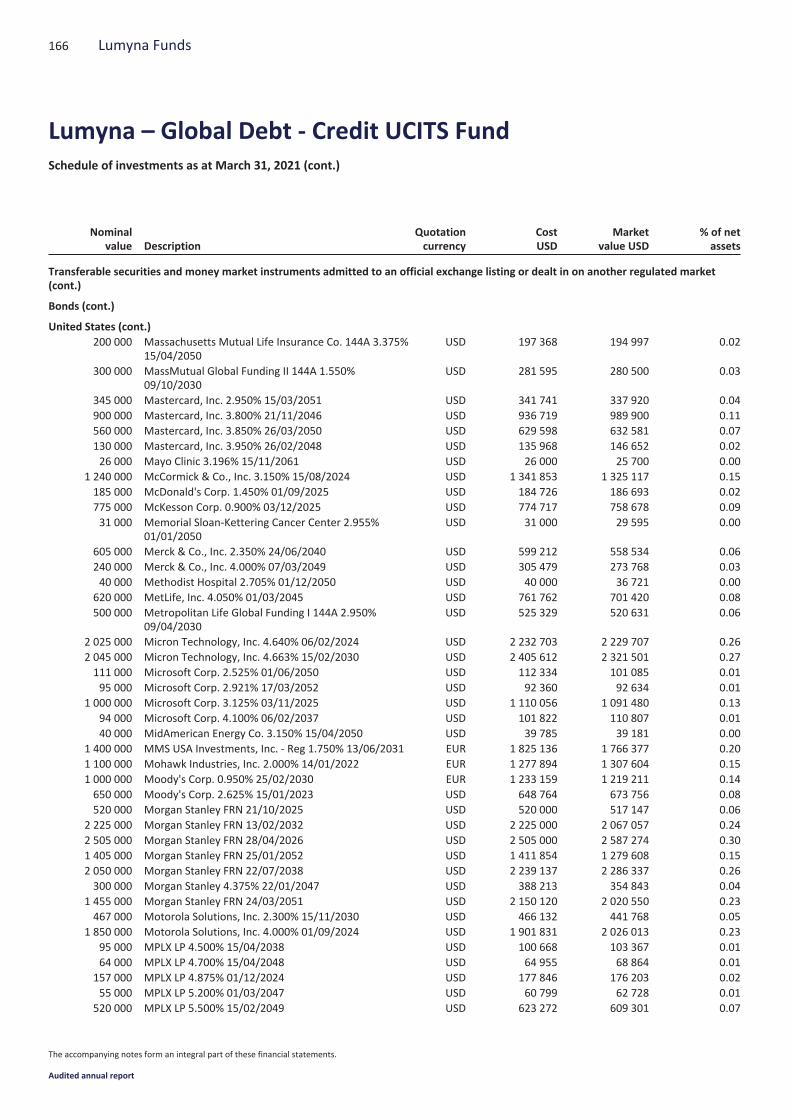
Nominalvalue Description
Quotationcurrency
CostUSD
Marketvalue USD
% of netassets
Transferable securities and money market instruments admitted to an official exchange listing or dealt in on another regulated market(cont.)
Bonds (cont.)
United States (cont.)200 000 Massachusetts Mutual Life Insurance Co. 144A 3.375%
15/04/2050USD 197 368 194 997 0.02
300 000 MassMutual Global Funding II 144A 1.550%09/10/2030
USD 281 595 280 500 0.03
345 000 Mastercard, Inc. 2.950% 15/03/2051 USD 341 741 337 920 0.04900 000 Mastercard, Inc. 3.800% 21/11/2046 USD 936 719 989 900 0.11560 000 Mastercard, Inc. 3.850% 26/03/2050 USD 629 598 632 581 0.07130 000 Mastercard, Inc. 3.950% 26/02/2048 USD 135 968 146 652 0.0226 000 Mayo Clinic 3.196% 15/11/2061 USD 26 000 25 700 0.00
1 240 000 McCormick & Co., Inc. 3.150% 15/08/2024 USD 1 341 853 1 325 117 0.15185 000 McDonald's Corp. 1.450% 01/09/2025 USD 184 726 186 693 0.02775 000 McKesson Corp. 0.900% 03/12/2025 USD 774 717 758 678 0.0931 000 Memorial Sloan-Kettering Cancer Center 2.955%
01/01/2050USD 31 000 29 595 0.00
605 000 Merck & Co., Inc. 2.350% 24/06/2040 USD 599 212 558 534 0.06240 000 Merck & Co., Inc. 4.000% 07/03/2049 USD 305 479 273 768 0.0340 000 Methodist Hospital 2.705% 01/12/2050 USD 40 000 36 721 0.00
620 000 MetLife, Inc. 4.050% 01/03/2045 USD 761 762 701 420 0.08500 000 Metropolitan Life Global Funding I 144A 2.950%
09/04/2030USD 525 329 520 631 0.06
2 025 000 Micron Technology, Inc. 4.640% 06/02/2024 USD 2 232 703 2 229 707 0.262 045 000 Micron Technology, Inc. 4.663% 15/02/2030 USD 2 405 612 2 321 501 0.27111 000 Microsoft Corp. 2.525% 01/06/2050 USD 112 334 101 085 0.0195 000 Microsoft Corp. 2.921% 17/03/2052 USD 92 360 92 634 0.01
1 000 000 Microsoft Corp. 3.125% 03/11/2025 USD 1 110 056 1 091 480 0.1394 000 Microsoft Corp. 4.100% 06/02/2037 USD 101 822 110 807 0.0140 000 MidAmerican Energy Co. 3.150% 15/04/2050 USD 39 785 39 181 0.00
1 400 000 MMS USA Investments, Inc. - Reg 1.750% 13/06/2031 EUR 1 825 136 1 766 377 0.201 100 000 Mohawk Industries, Inc. 2.000% 14/01/2022 EUR 1 277 894 1 307 604 0.151 000 000 Moody's Corp. 0.950% 25/02/2030 EUR 1 233 159 1 219 211 0.14650 000 Moody's Corp. 2.625% 15/01/2023 USD 648 764 673 756 0.08520 000 Morgan Stanley FRN 21/10/2025 USD 520 000 517 147 0.06
2 225 000 Morgan Stanley FRN 13/02/2032 USD 2 225 000 2 067 057 0.242 505 000 Morgan Stanley FRN 28/04/2026 USD 2 505 000 2 587 274 0.301 405 000 Morgan Stanley FRN 25/01/2052 USD 1 411 854 1 279 608 0.152 050 000 Morgan Stanley FRN 22/07/2038 USD 2 239 137 2 286 337 0.26300 000 Morgan Stanley 4.375% 22/01/2047 USD 388 213 354 843 0.04
1 455 000 Morgan Stanley FRN 24/03/2051 USD 2 150 120 2 020 550 0.23467 000 Motorola Solutions, Inc. 2.300% 15/11/2030 USD 466 132 441 768 0.05
1 850 000 Motorola Solutions, Inc. 4.000% 01/09/2024 USD 1 901 831 2 026 013 0.2395 000 MPLX LP 4.500% 15/04/2038 USD 100 668 103 367 0.0164 000 MPLX LP 4.700% 15/04/2048 USD 64 955 68 864 0.01
157 000 MPLX LP 4.875% 01/12/2024 USD 177 846 176 203 0.0255 000 MPLX LP 5.200% 01/03/2047 USD 60 799 62 728 0.01
520 000 MPLX LP 5.500% 15/02/2049 USD 623 272 609 301 0.07
166 Lumyna Funds
Lumyna – Global Debt - Credit UCITS FundSchedule of investments as at March 31, 2021 (cont.)
The accompanying notes form an integral part of these financial statements.
Audited annual report

Nominalvalue Description
Quotationcurrency
CostUSD
Marketvalue USD
% of netassets
Transferable securities and money market instruments admitted to an official exchange listing or dealt in on another regulated market(cont.)
Bonds (cont.)
United States (cont.)13 000 MultiCare Health System 2.803% 15/08/2050 USD 13 000 11 890 0.00
700 000 Nasdaq, Inc. 0.875% 13/02/2030 EUR 880 744 833 645 0.101 650 000 Nasdaq, Inc. 1.750% 19/05/2023 EUR 2 014 261 2 005 257 0.23200 000 National Fuel Gas Co. 2.950% 01/03/2031 USD 199 879 192 447 0.02
1 050 000 National Rural Utilities Cooperative Finance Corp.3.400% 07/02/2028
USD 1 047 884 1 127 959 0.13
200 000 Nationwide Mutual Insurance Co. 144A 4.350%30/04/2050
USD 210 302 209 330 0.02
115 000 NetApp, Inc. 2.375% 22/06/2027 USD 114 836 117 410 0.01200 000 Nevada Power Co. 2.400% 01/05/2030 USD 199 539 199 170 0.02300 000 New York Life Global Funding 144A 1.200%
07/08/2030USD 273 584 271 551 0.03
300 000 New York Life Insurance Co. 144A 3.750% 15/05/2050 USD 315 220 314 866 0.04185 000 Newmont Corp. 4.875% 15/03/2042 USD 234 737 222 741 0.03230 000 NextEra Energy Capital Hldg., Inc. 0.650% 01/03/2023 USD 229 977 230 786 0.03650 000 NextEra Energy Capital Hldg., Inc. 3.550% 01/05/2027 USD 660 748 710 237 0.08285 000 Niagara Mohawk Power Corp. 144A 3.025%
27/06/2050USD 307 049 258 701 0.03
705 000 NIKE, Inc. 3.250% 27/03/2040 USD 779 788 738 415 0.09729 000 NIKE, Inc. 3.375% 27/03/2050 USD 843 207 762 798 0.09135 000 NiSource, Inc. 1.700% 15/02/2031 USD 134 903 124 940 0.01850 000 NiSource, Inc. 3.490% 15/05/2027 USD 860 330 921 858 0.11350 000 NiSource, Inc. 4.375% 15/05/2047 USD 373 389 391 125 0.0520 000 Northeastern University 2.894% 01/10/2050 USD 20 000 18 919 0.00
565 000 Northern States Power Co. 3.600% 15/09/2047 USD 569 736 600 606 0.07450 000 Northwestern Mutual Life Insurance Co. 144A 3.450%
30/03/2051USD 448 435 447 367 0.05
117 000 Northwestern University 2.640% 01/12/2050 USD 117 000 110 779 0.0146 000 NOV, Inc. 3.600% 01/12/2029 USD 37 685 46 232 0.01
531 000 Novartis Capital Corp. 2.750% 14/08/2050 USD 533 798 502 264 0.06140 000 NSTAR Electric Co. 3.950% 01/04/2030 USD 139 311 157 215 0.02
2 063 000 NVR, Inc. 3.000% 15/05/2030 USD 2 224 404 2 115 920 0.2490 000 Oglethorpe Power Corp. 5.050% 01/10/2048 USD 104 792 105 674 0.01
160 000 Oklahoma Gas and Electric Co. 3.250% 01/04/2030 USD 159 927 169 315 0.02192 000 Omega Healthcare Investors, Inc. 4.750% 15/01/2028 USD 195 925 210 769 0.0240 000 Oncor Electric Delivery Co. LLC 3.100% 15/09/2049 USD 39 809 38 707 0.00
200 000 Oncor Electric Delivery Co. LLC 3.800% 01/06/2049 USD 198 867 216 780 0.032 000 000 ONEOK Partners LP 3.375% 01/10/2022 USD 2 008 621 2 066 189 0.241 000 000 ONEOK Partners LP 4.900% 15/03/2025 USD 1 026 551 1 110 415 0.13200 000 ONEOK, Inc. 7.150% 15/01/2051 USD 238 715 264 458 0.03
2 140 000 Oracle Corp. 1.650% 25/03/2026 USD 2 144 658 2 155 656 0.25530 000 Oracle Corp. 3.650% 25/03/2041 USD 533 280 534 978 0.06550 000 Oracle Corp. 3.850% 15/07/2036 USD 567 244 582 290 0.07470 000 Oracle Corp. 3.950% 25/03/2051 USD 481 077 481 942 0.06680 000 Oracle Corp. 4.100% 25/03/2061 USD 698 080 699 094 0.08
167Lumyna Funds
Lumyna – Global Debt - Credit UCITS FundSchedule of investments as at March 31, 2021 (cont.)
The accompanying notes form an integral part of these financial statements.
Audited annual report
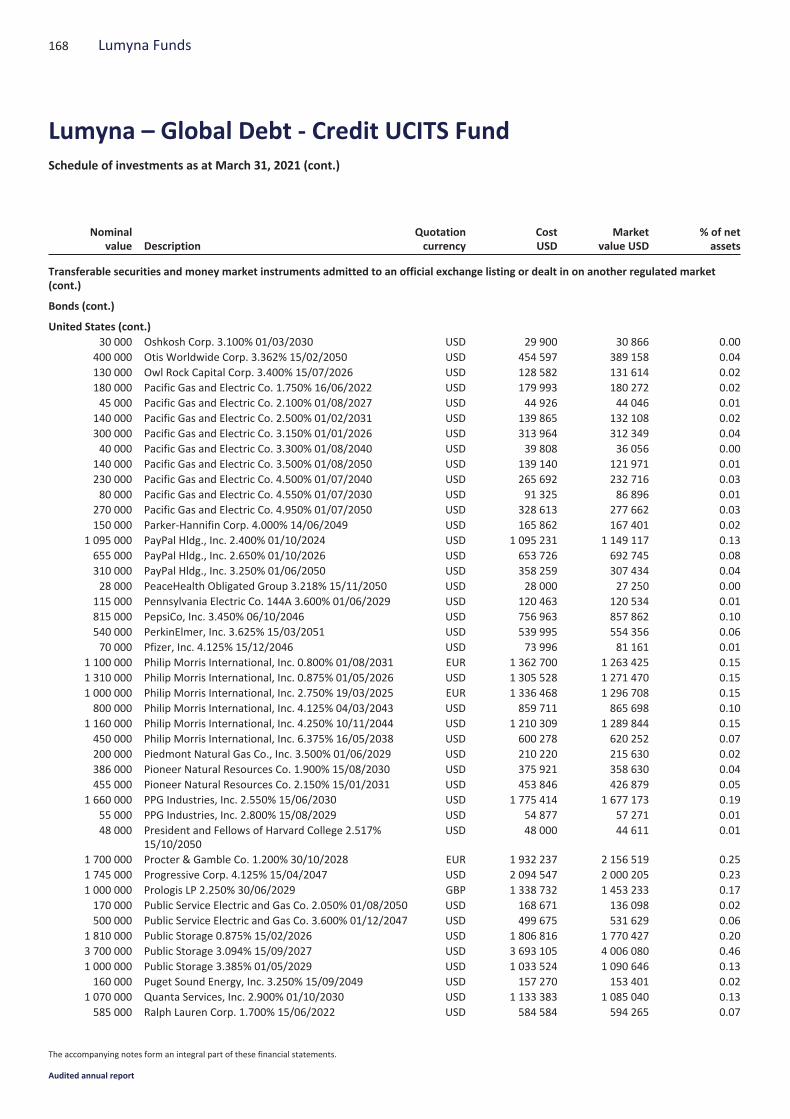
Nominalvalue Description
Quotationcurrency
CostUSD
Marketvalue USD
% of netassets
Transferable securities and money market instruments admitted to an official exchange listing or dealt in on another regulated market(cont.)
Bonds (cont.)
United States (cont.)30 000 Oshkosh Corp. 3.100% 01/03/2030 USD 29 900 30 866 0.00
400 000 Otis Worldwide Corp. 3.362% 15/02/2050 USD 454 597 389 158 0.04130 000 Owl Rock Capital Corp. 3.400% 15/07/2026 USD 128 582 131 614 0.02180 000 Pacific Gas and Electric Co. 1.750% 16/06/2022 USD 179 993 180 272 0.0245 000 Pacific Gas and Electric Co. 2.100% 01/08/2027 USD 44 926 44 046 0.01
140 000 Pacific Gas and Electric Co. 2.500% 01/02/2031 USD 139 865 132 108 0.02300 000 Pacific Gas and Electric Co. 3.150% 01/01/2026 USD 313 964 312 349 0.0440 000 Pacific Gas and Electric Co. 3.300% 01/08/2040 USD 39 808 36 056 0.00
140 000 Pacific Gas and Electric Co. 3.500% 01/08/2050 USD 139 140 121 971 0.01230 000 Pacific Gas and Electric Co. 4.500% 01/07/2040 USD 265 692 232 716 0.0380 000 Pacific Gas and Electric Co. 4.550% 01/07/2030 USD 91 325 86 896 0.01
270 000 Pacific Gas and Electric Co. 4.950% 01/07/2050 USD 328 613 277 662 0.03150 000 Parker-Hannifin Corp. 4.000% 14/06/2049 USD 165 862 167 401 0.02
1 095 000 PayPal Hldg., Inc. 2.400% 01/10/2024 USD 1 095 231 1 149 117 0.13655 000 PayPal Hldg., Inc. 2.650% 01/10/2026 USD 653 726 692 745 0.08310 000 PayPal Hldg., Inc. 3.250% 01/06/2050 USD 358 259 307 434 0.0428 000 PeaceHealth Obligated Group 3.218% 15/11/2050 USD 28 000 27 250 0.00
115 000 Pennsylvania Electric Co. 144A 3.600% 01/06/2029 USD 120 463 120 534 0.01815 000 PepsiCo, Inc. 3.450% 06/10/2046 USD 756 963 857 862 0.10540 000 PerkinElmer, Inc. 3.625% 15/03/2051 USD 539 995 554 356 0.0670 000 Pfizer, Inc. 4.125% 15/12/2046 USD 73 996 81 161 0.01
1 100 000 Philip Morris International, Inc. 0.800% 01/08/2031 EUR 1 362 700 1 263 425 0.151 310 000 Philip Morris International, Inc. 0.875% 01/05/2026 USD 1 305 528 1 271 470 0.151 000 000 Philip Morris International, Inc. 2.750% 19/03/2025 EUR 1 336 468 1 296 708 0.15800 000 Philip Morris International, Inc. 4.125% 04/03/2043 USD 859 711 865 698 0.10
1 160 000 Philip Morris International, Inc. 4.250% 10/11/2044 USD 1 210 309 1 289 844 0.15450 000 Philip Morris International, Inc. 6.375% 16/05/2038 USD 600 278 620 252 0.07200 000 Piedmont Natural Gas Co., Inc. 3.500% 01/06/2029 USD 210 220 215 630 0.02386 000 Pioneer Natural Resources Co. 1.900% 15/08/2030 USD 375 921 358 630 0.04455 000 Pioneer Natural Resources Co. 2.150% 15/01/2031 USD 453 846 426 879 0.05
1 660 000 PPG Industries, Inc. 2.550% 15/06/2030 USD 1 775 414 1 677 173 0.1955 000 PPG Industries, Inc. 2.800% 15/08/2029 USD 54 877 57 271 0.0148 000 President and Fellows of Harvard College 2.517%
15/10/2050USD 48 000 44 611 0.01
1 700 000 Procter & Gamble Co. 1.200% 30/10/2028 EUR 1 932 237 2 156 519 0.251 745 000 Progressive Corp. 4.125% 15/04/2047 USD 2 094 547 2 000 205 0.231 000 000 Prologis LP 2.250% 30/06/2029 GBP 1 338 732 1 453 233 0.17170 000 Public Service Electric and Gas Co. 2.050% 01/08/2050 USD 168 671 136 098 0.02500 000 Public Service Electric and Gas Co. 3.600% 01/12/2047 USD 499 675 531 629 0.06
1 810 000 Public Storage 0.875% 15/02/2026 USD 1 806 816 1 770 427 0.203 700 000 Public Storage 3.094% 15/09/2027 USD 3 693 105 4 006 080 0.461 000 000 Public Storage 3.385% 01/05/2029 USD 1 033 524 1 090 646 0.13160 000 Puget Sound Energy, Inc. 3.250% 15/09/2049 USD 157 270 153 401 0.02
1 070 000 Quanta Services, Inc. 2.900% 01/10/2030 USD 1 133 383 1 085 040 0.13585 000 Ralph Lauren Corp. 1.700% 15/06/2022 USD 584 584 594 265 0.07
168 Lumyna Funds
Lumyna – Global Debt - Credit UCITS FundSchedule of investments as at March 31, 2021 (cont.)
The accompanying notes form an integral part of these financial statements.
Audited annual report
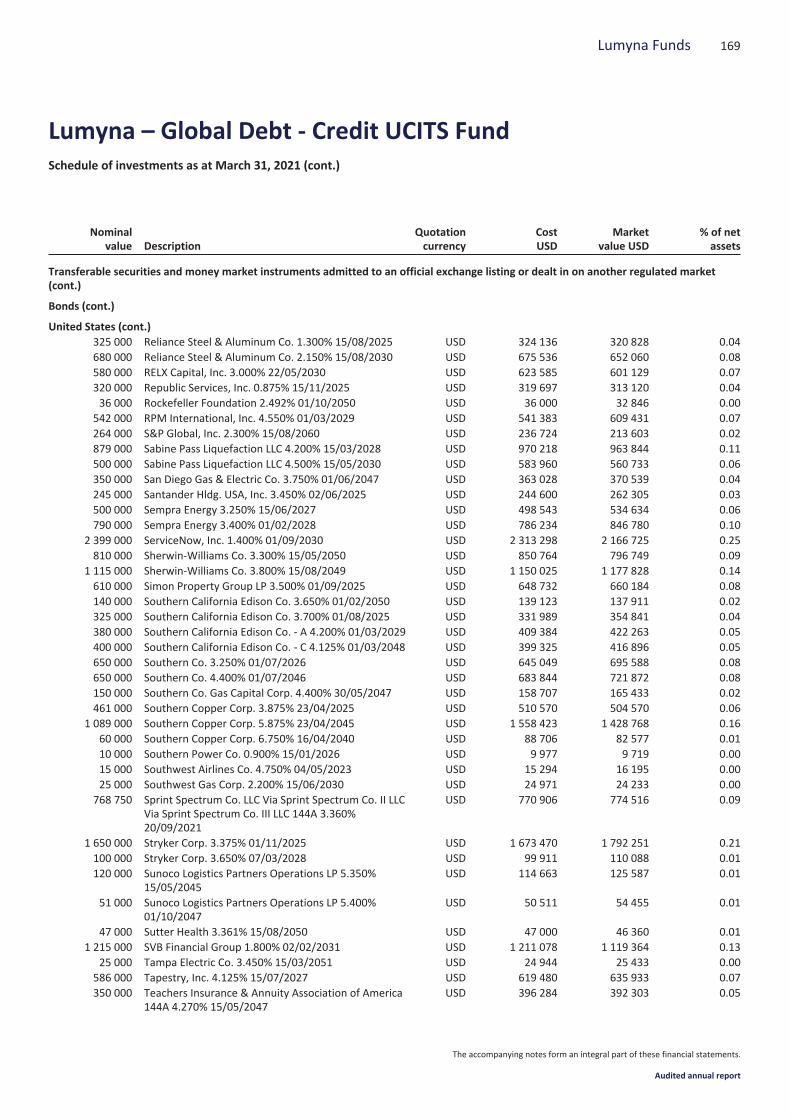
Nominalvalue Description
Quotationcurrency
CostUSD
Marketvalue USD
% of netassets
Transferable securities and money market instruments admitted to an official exchange listing or dealt in on another regulated market(cont.)
Bonds (cont.)
United States (cont.)325 000 Reliance Steel & Aluminum Co. 1.300% 15/08/2025 USD 324 136 320 828 0.04680 000 Reliance Steel & Aluminum Co. 2.150% 15/08/2030 USD 675 536 652 060 0.08580 000 RELX Capital, Inc. 3.000% 22/05/2030 USD 623 585 601 129 0.07320 000 Republic Services, Inc. 0.875% 15/11/2025 USD 319 697 313 120 0.0436 000 Rockefeller Foundation 2.492% 01/10/2050 USD 36 000 32 846 0.00
542 000 RPM International, Inc. 4.550% 01/03/2029 USD 541 383 609 431 0.07264 000 S&P Global, Inc. 2.300% 15/08/2060 USD 236 724 213 603 0.02879 000 Sabine Pass Liquefaction LLC 4.200% 15/03/2028 USD 970 218 963 844 0.11500 000 Sabine Pass Liquefaction LLC 4.500% 15/05/2030 USD 583 960 560 733 0.06350 000 San Diego Gas & Electric Co. 3.750% 01/06/2047 USD 363 028 370 539 0.04245 000 Santander Hldg. USA, Inc. 3.450% 02/06/2025 USD 244 600 262 305 0.03500 000 Sempra Energy 3.250% 15/06/2027 USD 498 543 534 634 0.06790 000 Sempra Energy 3.400% 01/02/2028 USD 786 234 846 780 0.10
2 399 000 ServiceNow, Inc. 1.400% 01/09/2030 USD 2 313 298 2 166 725 0.25810 000 Sherwin-Williams Co. 3.300% 15/05/2050 USD 850 764 796 749 0.09
1 115 000 Sherwin-Williams Co. 3.800% 15/08/2049 USD 1 150 025 1 177 828 0.14610 000 Simon Property Group LP 3.500% 01/09/2025 USD 648 732 660 184 0.08140 000 Southern California Edison Co. 3.650% 01/02/2050 USD 139 123 137 911 0.02325 000 Southern California Edison Co. 3.700% 01/08/2025 USD 331 989 354 841 0.04380 000 Southern California Edison Co. - A 4.200% 01/03/2029 USD 409 384 422 263 0.05400 000 Southern California Edison Co. - C 4.125% 01/03/2048 USD 399 325 416 896 0.05650 000 Southern Co. 3.250% 01/07/2026 USD 645 049 695 588 0.08650 000 Southern Co. 4.400% 01/07/2046 USD 683 844 721 872 0.08150 000 Southern Co. Gas Capital Corp. 4.400% 30/05/2047 USD 158 707 165 433 0.02461 000 Southern Copper Corp. 3.875% 23/04/2025 USD 510 570 504 570 0.06
1 089 000 Southern Copper Corp. 5.875% 23/04/2045 USD 1 558 423 1 428 768 0.1660 000 Southern Copper Corp. 6.750% 16/04/2040 USD 88 706 82 577 0.0110 000 Southern Power Co. 0.900% 15/01/2026 USD 9 977 9 719 0.0015 000 Southwest Airlines Co. 4.750% 04/05/2023 USD 15 294 16 195 0.0025 000 Southwest Gas Corp. 2.200% 15/06/2030 USD 24 971 24 233 0.00
768 750 Sprint Spectrum Co. LLC Via Sprint Spectrum Co. II LLCVia Sprint Spectrum Co. III LLC 144A 3.360%20/09/2021
USD 770 906 774 516 0.09
1 650 000 Stryker Corp. 3.375% 01/11/2025 USD 1 673 470 1 792 251 0.21100 000 Stryker Corp. 3.650% 07/03/2028 USD 99 911 110 088 0.01120 000 Sunoco Logistics Partners Operations LP 5.350%
15/05/2045USD 114 663 125 587 0.01
51 000 Sunoco Logistics Partners Operations LP 5.400%01/10/2047
USD 50 511 54 455 0.01
47 000 Sutter Health 3.361% 15/08/2050 USD 47 000 46 360 0.011 215 000 SVB Financial Group 1.800% 02/02/2031 USD 1 211 078 1 119 364 0.13
25 000 Tampa Electric Co. 3.450% 15/03/2051 USD 24 944 25 433 0.00586 000 Tapestry, Inc. 4.125% 15/07/2027 USD 619 480 635 933 0.07350 000 Teachers Insurance & Annuity Association of America
144A 4.270% 15/05/2047USD 396 284 392 303 0.05
169Lumyna Funds
Lumyna – Global Debt - Credit UCITS FundSchedule of investments as at March 31, 2021 (cont.)
The accompanying notes form an integral part of these financial statements.
Audited annual report
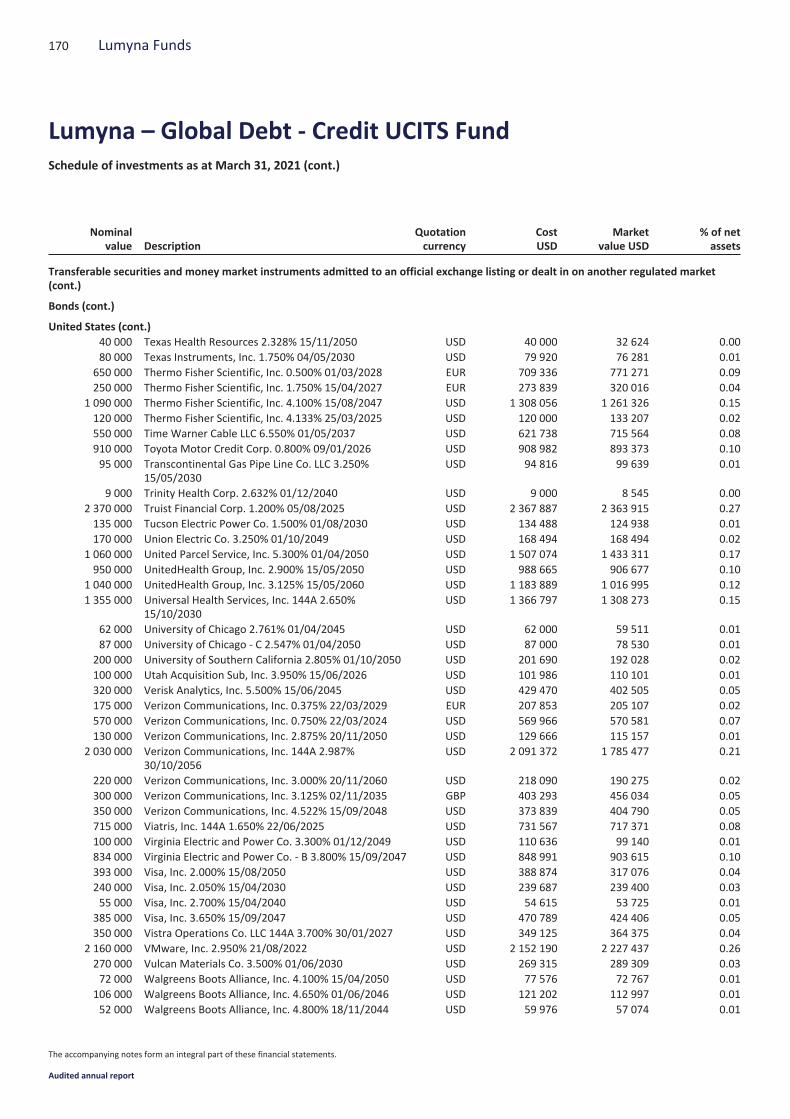
Nominalvalue Description
Quotationcurrency
CostUSD
Marketvalue USD
% of netassets
Transferable securities and money market instruments admitted to an official exchange listing or dealt in on another regulated market(cont.)
Bonds (cont.)
United States (cont.)40 000 Texas Health Resources 2.328% 15/11/2050 USD 40 000 32 624 0.0080 000 Texas Instruments, Inc. 1.750% 04/05/2030 USD 79 920 76 281 0.01
650 000 Thermo Fisher Scientific, Inc. 0.500% 01/03/2028 EUR 709 336 771 271 0.09250 000 Thermo Fisher Scientific, Inc. 1.750% 15/04/2027 EUR 273 839 320 016 0.04
1 090 000 Thermo Fisher Scientific, Inc. 4.100% 15/08/2047 USD 1 308 056 1 261 326 0.15120 000 Thermo Fisher Scientific, Inc. 4.133% 25/03/2025 USD 120 000 133 207 0.02550 000 Time Warner Cable LLC 6.550% 01/05/2037 USD 621 738 715 564 0.08910 000 Toyota Motor Credit Corp. 0.800% 09/01/2026 USD 908 982 893 373 0.1095 000 Transcontinental Gas Pipe Line Co. LLC 3.250%
15/05/2030USD 94 816 99 639 0.01
9 000 Trinity Health Corp. 2.632% 01/12/2040 USD 9 000 8 545 0.002 370 000 Truist Financial Corp. 1.200% 05/08/2025 USD 2 367 887 2 363 915 0.27135 000 Tucson Electric Power Co. 1.500% 01/08/2030 USD 134 488 124 938 0.01170 000 Union Electric Co. 3.250% 01/10/2049 USD 168 494 168 494 0.02
1 060 000 United Parcel Service, Inc. 5.300% 01/04/2050 USD 1 507 074 1 433 311 0.17950 000 UnitedHealth Group, Inc. 2.900% 15/05/2050 USD 988 665 906 677 0.10
1 040 000 UnitedHealth Group, Inc. 3.125% 15/05/2060 USD 1 183 889 1 016 995 0.121 355 000 Universal Health Services, Inc. 144A 2.650%
15/10/2030USD 1 366 797 1 308 273 0.15
62 000 University of Chicago 2.761% 01/04/2045 USD 62 000 59 511 0.0187 000 University of Chicago - C 2.547% 01/04/2050 USD 87 000 78 530 0.01
200 000 University of Southern California 2.805% 01/10/2050 USD 201 690 192 028 0.02100 000 Utah Acquisition Sub, Inc. 3.950% 15/06/2026 USD 101 986 110 101 0.01320 000 Verisk Analytics, Inc. 5.500% 15/06/2045 USD 429 470 402 505 0.05175 000 Verizon Communications, Inc. 0.375% 22/03/2029 EUR 207 853 205 107 0.02570 000 Verizon Communications, Inc. 0.750% 22/03/2024 USD 569 966 570 581 0.07130 000 Verizon Communications, Inc. 2.875% 20/11/2050 USD 129 666 115 157 0.01
2 030 000 Verizon Communications, Inc. 144A 2.987%30/10/2056
USD 2 091 372 1 785 477 0.21
220 000 Verizon Communications, Inc. 3.000% 20/11/2060 USD 218 090 190 275 0.02300 000 Verizon Communications, Inc. 3.125% 02/11/2035 GBP 403 293 456 034 0.05350 000 Verizon Communications, Inc. 4.522% 15/09/2048 USD 373 839 404 790 0.05715 000 Viatris, Inc. 144A 1.650% 22/06/2025 USD 731 567 717 371 0.08100 000 Virginia Electric and Power Co. 3.300% 01/12/2049 USD 110 636 99 140 0.01834 000 Virginia Electric and Power Co. - B 3.800% 15/09/2047 USD 848 991 903 615 0.10393 000 Visa, Inc. 2.000% 15/08/2050 USD 388 874 317 076 0.04240 000 Visa, Inc. 2.050% 15/04/2030 USD 239 687 239 400 0.0355 000 Visa, Inc. 2.700% 15/04/2040 USD 54 615 53 725 0.01
385 000 Visa, Inc. 3.650% 15/09/2047 USD 470 789 424 406 0.05350 000 Vistra Operations Co. LLC 144A 3.700% 30/01/2027 USD 349 125 364 375 0.04
2 160 000 VMware, Inc. 2.950% 21/08/2022 USD 2 152 190 2 227 437 0.26270 000 Vulcan Materials Co. 3.500% 01/06/2030 USD 269 315 289 309 0.0372 000 Walgreens Boots Alliance, Inc. 4.100% 15/04/2050 USD 77 576 72 767 0.01
106 000 Walgreens Boots Alliance, Inc. 4.650% 01/06/2046 USD 121 202 112 997 0.0152 000 Walgreens Boots Alliance, Inc. 4.800% 18/11/2044 USD 59 976 57 074 0.01
170 Lumyna Funds
Lumyna – Global Debt - Credit UCITS FundSchedule of investments as at March 31, 2021 (cont.)
The accompanying notes form an integral part of these financial statements.
Audited annual report
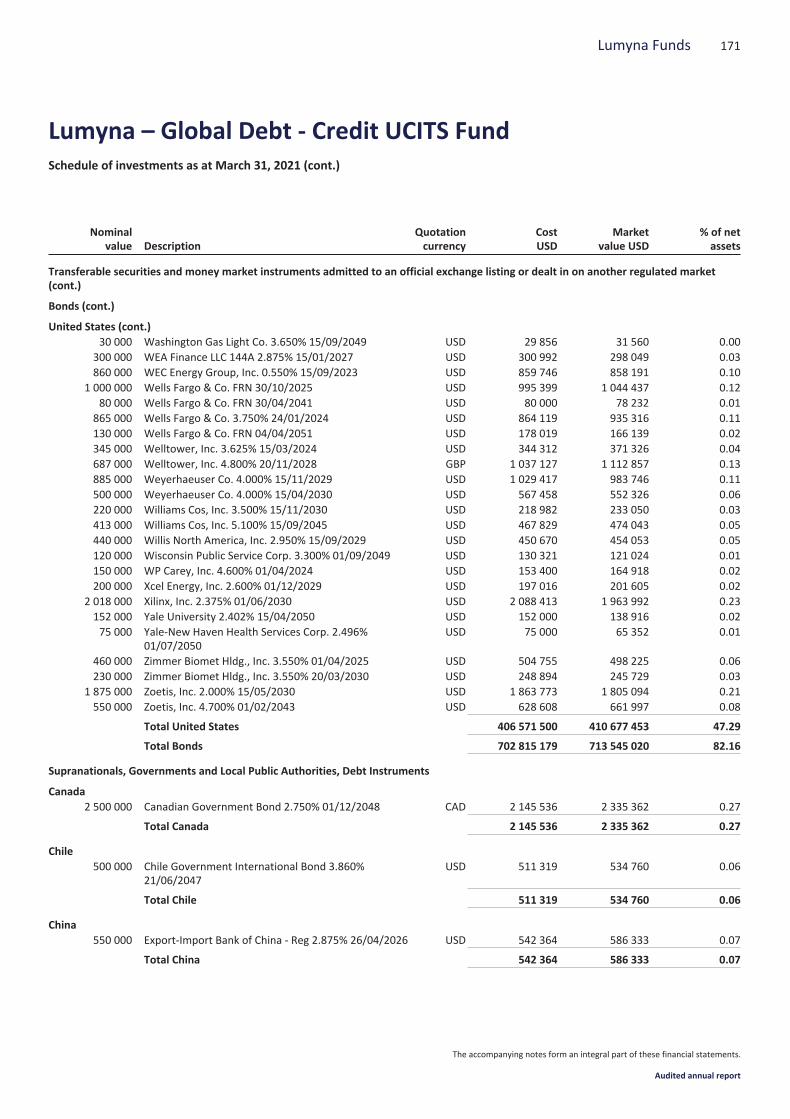
Nominalvalue Description
Quotationcurrency
CostUSD
Marketvalue USD
% of netassets
Transferable securities and money market instruments admitted to an official exchange listing or dealt in on another regulated market(cont.)
Bonds (cont.)
United States (cont.)30 000 Washington Gas Light Co. 3.650% 15/09/2049 USD 29 856 31 560 0.00
300 000 WEA Finance LLC 144A 2.875% 15/01/2027 USD 300 992 298 049 0.03860 000 WEC Energy Group, Inc. 0.550% 15/09/2023 USD 859 746 858 191 0.10
1 000 000 Wells Fargo & Co. FRN 30/10/2025 USD 995 399 1 044 437 0.1280 000 Wells Fargo & Co. FRN 30/04/2041 USD 80 000 78 232 0.01
865 000 Wells Fargo & Co. 3.750% 24/01/2024 USD 864 119 935 316 0.11130 000 Wells Fargo & Co. FRN 04/04/2051 USD 178 019 166 139 0.02345 000 Welltower, Inc. 3.625% 15/03/2024 USD 344 312 371 326 0.04687 000 Welltower, Inc. 4.800% 20/11/2028 GBP 1 037 127 1 112 857 0.13885 000 Weyerhaeuser Co. 4.000% 15/11/2029 USD 1 029 417 983 746 0.11500 000 Weyerhaeuser Co. 4.000% 15/04/2030 USD 567 458 552 326 0.06220 000 Williams Cos, Inc. 3.500% 15/11/2030 USD 218 982 233 050 0.03413 000 Williams Cos, Inc. 5.100% 15/09/2045 USD 467 829 474 043 0.05440 000 Willis North America, Inc. 2.950% 15/09/2029 USD 450 670 454 053 0.05120 000 Wisconsin Public Service Corp. 3.300% 01/09/2049 USD 130 321 121 024 0.01150 000 WP Carey, Inc. 4.600% 01/04/2024 USD 153 400 164 918 0.02200 000 Xcel Energy, Inc. 2.600% 01/12/2029 USD 197 016 201 605 0.02
2 018 000 Xilinx, Inc. 2.375% 01/06/2030 USD 2 088 413 1 963 992 0.23152 000 Yale University 2.402% 15/04/2050 USD 152 000 138 916 0.0275 000 Yale-New Haven Health Services Corp. 2.496%
01/07/2050USD 75 000 65 352 0.01
460 000 Zimmer Biomet Hldg., Inc. 3.550% 01/04/2025 USD 504 755 498 225 0.06230 000 Zimmer Biomet Hldg., Inc. 3.550% 20/03/2030 USD 248 894 245 729 0.03
1 875 000 Zoetis, Inc. 2.000% 15/05/2030 USD 1 863 773 1 805 094 0.21550 000 Zoetis, Inc. 4.700% 01/02/2043 USD 628 608 661 997 0.08
Total United States 406 571 500 410 677 453 47.29
Total Bonds 702 815 179 713 545 020 82.16
Supranationals, Governments and Local Public Authorities, Debt Instruments
Canada2 500 000 Canadian Government Bond 2.750% 01/12/2048 CAD 2 145 536 2 335 362 0.27
Total Canada 2 145 536 2 335 362 0.27
Chile500 000 Chile Government International Bond 3.860%
21/06/2047USD 511 319 534 760 0.06
Total Chile 511 319 534 760 0.06
China550 000 Export-Import Bank of China - Reg 2.875% 26/04/2026 USD 542 364 586 333 0.07
Total China 542 364 586 333 0.07
171Lumyna Funds
Lumyna – Global Debt - Credit UCITS FundSchedule of investments as at March 31, 2021 (cont.)
The accompanying notes form an integral part of these financial statements.
Audited annual report

Nominalvalue Description
Quotationcurrency
CostUSD
Marketvalue USD
% of netassets
Transferable securities and money market instruments admitted to an official exchange listing or dealt in on another regulated market(cont.)
Supranationals, Governments and Local Public Authorities, Debt Instruments (cont.)
Colombia450 000 Colombia Government International Bond 5.000%
15/06/2045USD 468 755 478 418 0.05
600 000 Colombia Government International Bond 5.625%26/02/2044
USD 676 885 679 578 0.08
Total Colombia 1 145 640 1 157 996 0.13
Hungary900 000 Hungary Government International Bond 5.375%
25/03/2024USD 957 985 1 019 221 0.12
Total Hungary 957 985 1 019 221 0.12
Indonesia775 000 Indonesia Government International Bond 4.750%
11/02/2029USD 773 490 889 774 0.10
625 000 Indonesia Government International Bond 5.350%11/02/2049
USD 622 339 776 678 0.09
800 000 Indonesia Government International Bond - Reg2.625% 14/06/2023
EUR 985 822 988 651 0.11
2 000 000 Indonesia Government International Bond - Reg4.125% 15/01/2025
USD 2 044 462 2 190 508 0.25
500 000 Indonesia Government International Bond - Reg4.750% 08/01/2026
USD 514 000 565 900 0.07
500 000 Indonesia Government International Bond - Reg6.750% 15/01/2044
USD 644 038 707 582 0.08
Total Indonesia 5 584 151 6 119 093 0.70
Israel550 000 Israel Government International Bond 4.500%
30/01/2043USD 593 243 663 262 0.08
Total Israel 593 243 663 262 0.08
Japan1 260 000 Japan Bank for International Cooperation 2.375%
21/07/2022USD 1 293 267 1 293 997 0.15
Total Japan 1 293 267 1 293 997 0.15
Kazakhstan900 000 Kazakhstan Government International Bond - Reg
5.125% 21/07/2025USD 960 289 1 044 000 0.12
300 000 Kazakhstan Government International Bond - Reg6.500% 21/07/2045
USD 381 371 425 107 0.05
Total Kazakhstan 1 341 660 1 469 107 0.17
172 Lumyna Funds
Lumyna – Global Debt - Credit UCITS FundSchedule of investments as at March 31, 2021 (cont.)
The accompanying notes form an integral part of these financial statements.
Audited annual report
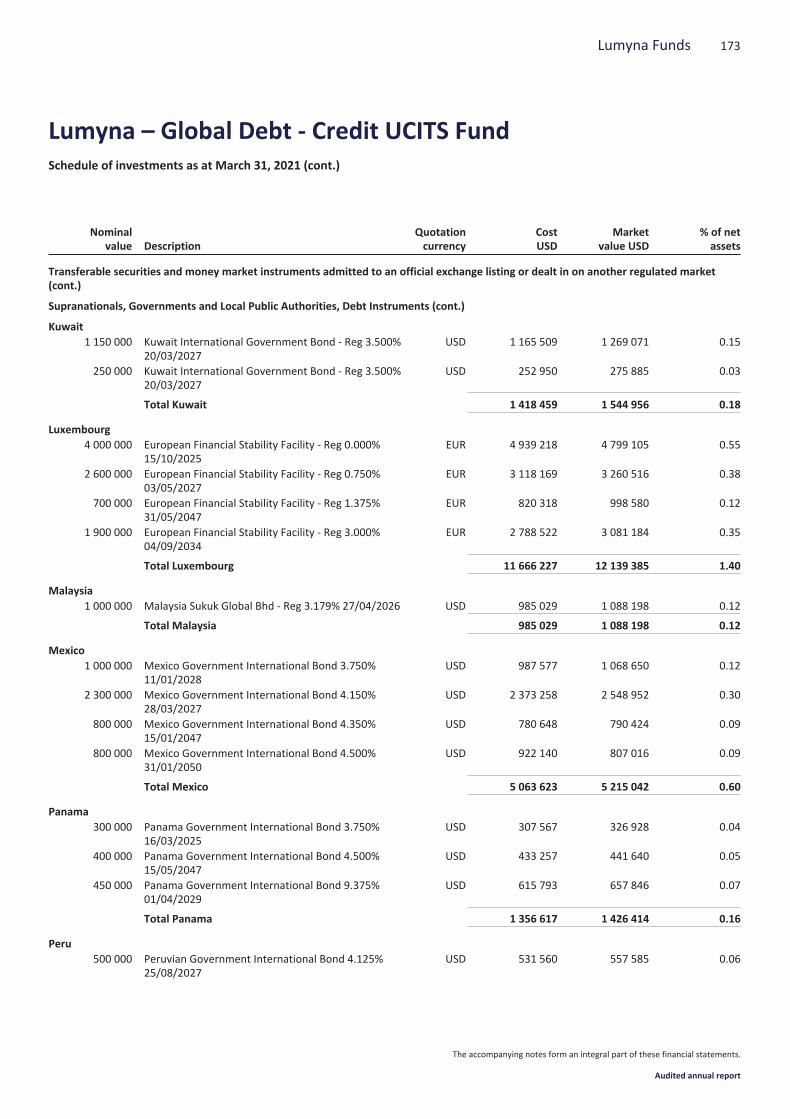
Nominalvalue Description
Quotationcurrency
CostUSD
Marketvalue USD
% of netassets
Transferable securities and money market instruments admitted to an official exchange listing or dealt in on another regulated market(cont.)
Supranationals, Governments and Local Public Authorities, Debt Instruments (cont.)
Kuwait1 150 000 Kuwait International Government Bond - Reg 3.500%
20/03/2027USD 1 165 509 1 269 071 0.15
250 000 Kuwait International Government Bond - Reg 3.500%20/03/2027
USD 252 950 275 885 0.03
Total Kuwait 1 418 459 1 544 956 0.18
Luxembourg4 000 000 European Financial Stability Facility - Reg 0.000%
15/10/2025EUR 4 939 218 4 799 105 0.55
2 600 000 European Financial Stability Facility - Reg 0.750%03/05/2027
EUR 3 118 169 3 260 516 0.38
700 000 European Financial Stability Facility - Reg 1.375%31/05/2047
EUR 820 318 998 580 0.12
1 900 000 European Financial Stability Facility - Reg 3.000%04/09/2034
EUR 2 788 522 3 081 184 0.35
Total Luxembourg 11 666 227 12 139 385 1.40
Malaysia1 000 000 Malaysia Sukuk Global Bhd - Reg 3.179% 27/04/2026 USD 985 029 1 088 198 0.12
Total Malaysia 985 029 1 088 198 0.12
Mexico1 000 000 Mexico Government International Bond 3.750%
11/01/2028USD 987 577 1 068 650 0.12
2 300 000 Mexico Government International Bond 4.150%28/03/2027
USD 2 373 258 2 548 952 0.30
800 000 Mexico Government International Bond 4.350%15/01/2047
USD 780 648 790 424 0.09
800 000 Mexico Government International Bond 4.500%31/01/2050
USD 922 140 807 016 0.09
Total Mexico 5 063 623 5 215 042 0.60
Panama300 000 Panama Government International Bond 3.750%
16/03/2025USD 307 567 326 928 0.04
400 000 Panama Government International Bond 4.500%15/05/2047
USD 433 257 441 640 0.05
450 000 Panama Government International Bond 9.375%01/04/2029
USD 615 793 657 846 0.07
Total Panama 1 356 617 1 426 414 0.16
Peru500 000 Peruvian Government International Bond 4.125%
25/08/2027USD 531 560 557 585 0.06
173Lumyna Funds
Lumyna – Global Debt - Credit UCITS FundSchedule of investments as at March 31, 2021 (cont.)
The accompanying notes form an integral part of these financial statements.
Audited annual report
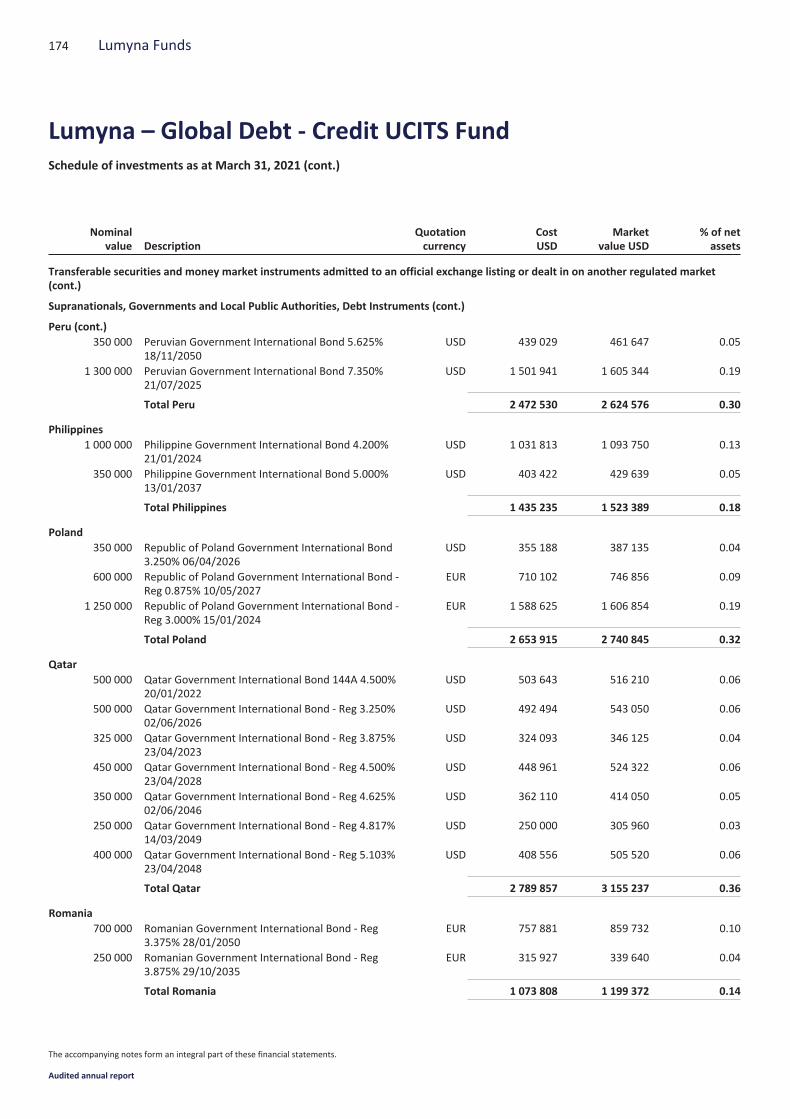
Nominalvalue Description
Quotationcurrency
CostUSD
Marketvalue USD
% of netassets
Transferable securities and money market instruments admitted to an official exchange listing or dealt in on another regulated market(cont.)
Supranationals, Governments and Local Public Authorities, Debt Instruments (cont.)
Peru (cont.)350 000 Peruvian Government International Bond 5.625%
18/11/2050USD 439 029 461 647 0.05
1 300 000 Peruvian Government International Bond 7.350%21/07/2025
USD 1 501 941 1 605 344 0.19
Total Peru 2 472 530 2 624 576 0.30
Philippines1 000 000 Philippine Government International Bond 4.200%
21/01/2024USD 1 031 813 1 093 750 0.13
350 000 Philippine Government International Bond 5.000%13/01/2037
USD 403 422 429 639 0.05
Total Philippines 1 435 235 1 523 389 0.18
Poland350 000 Republic of Poland Government International Bond
3.250% 06/04/2026USD 355 188 387 135 0.04
600 000 Republic of Poland Government International Bond -Reg 0.875% 10/05/2027
EUR 710 102 746 856 0.09
1 250 000 Republic of Poland Government International Bond -Reg 3.000% 15/01/2024
EUR 1 588 625 1 606 854 0.19
Total Poland 2 653 915 2 740 845 0.32
Qatar500 000 Qatar Government International Bond 144A 4.500%
20/01/2022USD 503 643 516 210 0.06
500 000 Qatar Government International Bond - Reg 3.250%02/06/2026
USD 492 494 543 050 0.06
325 000 Qatar Government International Bond - Reg 3.875%23/04/2023
USD 324 093 346 125 0.04
450 000 Qatar Government International Bond - Reg 4.500%23/04/2028
USD 448 961 524 322 0.06
350 000 Qatar Government International Bond - Reg 4.625%02/06/2046
USD 362 110 414 050 0.05
250 000 Qatar Government International Bond - Reg 4.817%14/03/2049
USD 250 000 305 960 0.03
400 000 Qatar Government International Bond - Reg 5.103%23/04/2048
USD 408 556 505 520 0.06
Total Qatar 2 789 857 3 155 237 0.36
Romania700 000 Romanian Government International Bond - Reg
3.375% 28/01/2050EUR 757 881 859 732 0.10
250 000 Romanian Government International Bond - Reg3.875% 29/10/2035
EUR 315 927 339 640 0.04
Total Romania 1 073 808 1 199 372 0.14
174 Lumyna Funds
Lumyna – Global Debt - Credit UCITS FundSchedule of investments as at March 31, 2021 (cont.)
The accompanying notes form an integral part of these financial statements.
Audited annual report
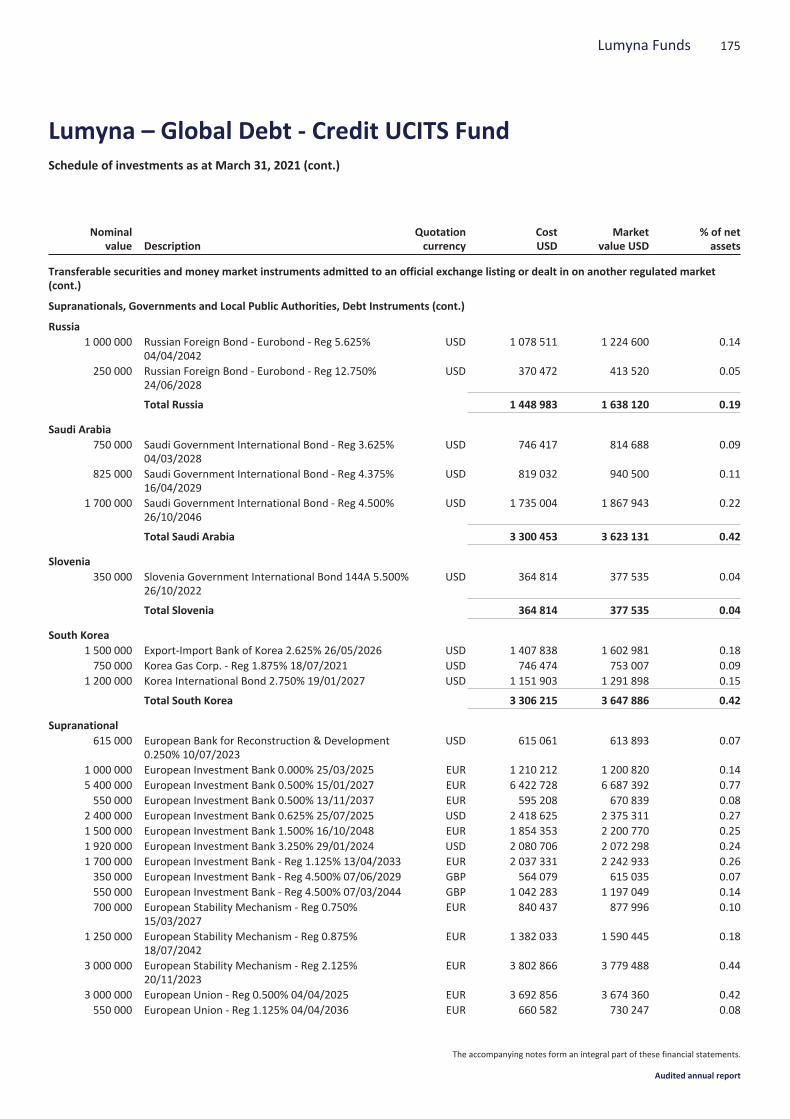
Nominalvalue Description
Quotationcurrency
CostUSD
Marketvalue USD
% of netassets
Transferable securities and money market instruments admitted to an official exchange listing or dealt in on another regulated market(cont.)
Supranationals, Governments and Local Public Authorities, Debt Instruments (cont.)
Russia1 000 000 Russian Foreign Bond - Eurobond - Reg 5.625%
04/04/2042USD 1 078 511 1 224 600 0.14
250 000 Russian Foreign Bond - Eurobond - Reg 12.750%24/06/2028
USD 370 472 413 520 0.05
Total Russia 1 448 983 1 638 120 0.19
Saudi Arabia750 000 Saudi Government International Bond - Reg 3.625%
04/03/2028USD 746 417 814 688 0.09
825 000 Saudi Government International Bond - Reg 4.375%16/04/2029
USD 819 032 940 500 0.11
1 700 000 Saudi Government International Bond - Reg 4.500%26/10/2046
USD 1 735 004 1 867 943 0.22
Total Saudi Arabia 3 300 453 3 623 131 0.42
Slovenia350 000 Slovenia Government International Bond 144A 5.500%
26/10/2022USD 364 814 377 535 0.04
Total Slovenia 364 814 377 535 0.04
South Korea1 500 000 Export-Import Bank of Korea 2.625% 26/05/2026 USD 1 407 838 1 602 981 0.18750 000 Korea Gas Corp. - Reg 1.875% 18/07/2021 USD 746 474 753 007 0.09
1 200 000 Korea International Bond 2.750% 19/01/2027 USD 1 151 903 1 291 898 0.15
Total South Korea 3 306 215 3 647 886 0.42
Supranational615 000 European Bank for Reconstruction & Development
0.250% 10/07/2023USD 615 061 613 893 0.07
1 000 000 European Investment Bank 0.000% 25/03/2025 EUR 1 210 212 1 200 820 0.145 400 000 European Investment Bank 0.500% 15/01/2027 EUR 6 422 728 6 687 392 0.77550 000 European Investment Bank 0.500% 13/11/2037 EUR 595 208 670 839 0.08
2 400 000 European Investment Bank 0.625% 25/07/2025 USD 2 418 625 2 375 311 0.271 500 000 European Investment Bank 1.500% 16/10/2048 EUR 1 854 353 2 200 770 0.251 920 000 European Investment Bank 3.250% 29/01/2024 USD 2 080 706 2 072 298 0.241 700 000 European Investment Bank - Reg 1.125% 13/04/2033 EUR 2 037 331 2 242 933 0.26350 000 European Investment Bank - Reg 4.500% 07/06/2029 GBP 564 079 615 035 0.07550 000 European Investment Bank - Reg 4.500% 07/03/2044 GBP 1 042 283 1 197 049 0.14700 000 European Stability Mechanism - Reg 0.750%
15/03/2027EUR 840 437 877 996 0.10
1 250 000 European Stability Mechanism - Reg 0.875%18/07/2042
EUR 1 382 033 1 590 445 0.18
3 000 000 European Stability Mechanism - Reg 2.125%20/11/2023
EUR 3 802 866 3 779 488 0.44
3 000 000 European Union - Reg 0.500% 04/04/2025 EUR 3 692 856 3 674 360 0.42550 000 European Union - Reg 1.125% 04/04/2036 EUR 660 582 730 247 0.08
175Lumyna Funds
Lumyna – Global Debt - Credit UCITS FundSchedule of investments as at March 31, 2021 (cont.)
The accompanying notes form an integral part of these financial statements.
Audited annual report
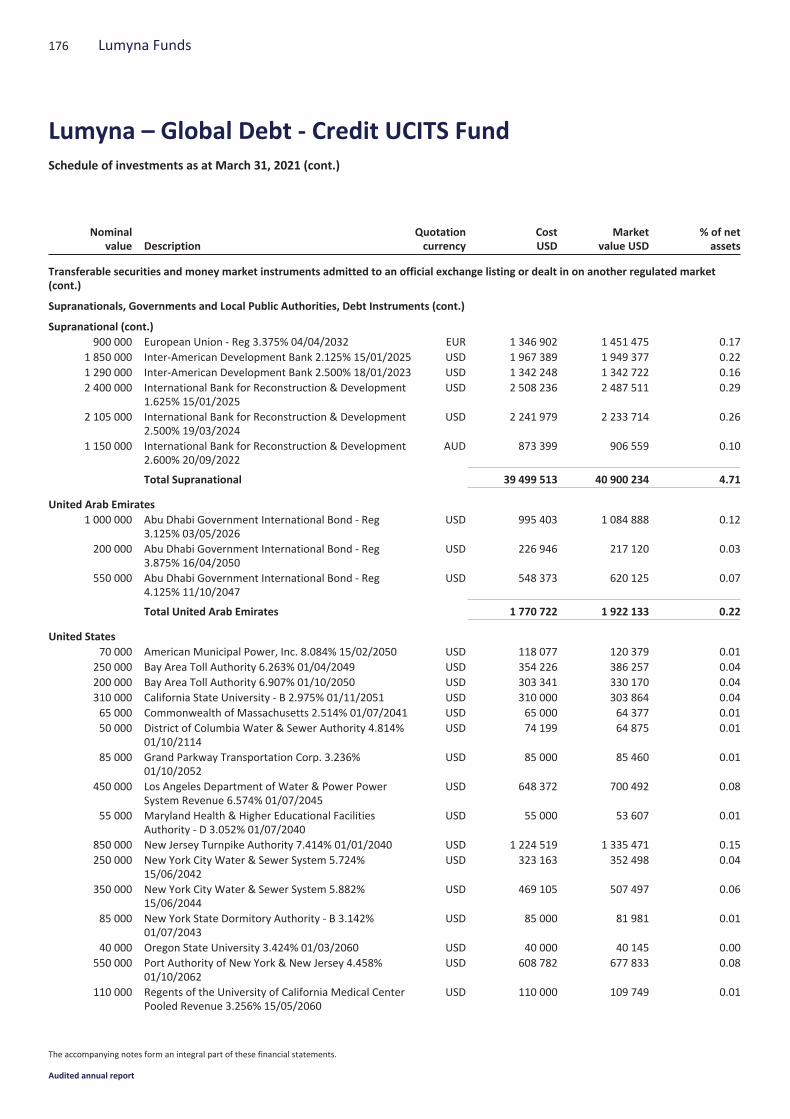
Nominalvalue Description
Quotationcurrency
CostUSD
Marketvalue USD
% of netassets
Transferable securities and money market instruments admitted to an official exchange listing or dealt in on another regulated market(cont.)
Supranationals, Governments and Local Public Authorities, Debt Instruments (cont.)
Supranational (cont.)900 000 European Union - Reg 3.375% 04/04/2032 EUR 1 346 902 1 451 475 0.17
1 850 000 Inter-American Development Bank 2.125% 15/01/2025 USD 1 967 389 1 949 377 0.221 290 000 Inter-American Development Bank 2.500% 18/01/2023 USD 1 342 248 1 342 722 0.162 400 000 International Bank for Reconstruction & Development
1.625% 15/01/2025USD 2 508 236 2 487 511 0.29
2 105 000 International Bank for Reconstruction & Development2.500% 19/03/2024
USD 2 241 979 2 233 714 0.26
1 150 000 International Bank for Reconstruction & Development2.600% 20/09/2022
AUD 873 399 906 559 0.10
Total Supranational 39 499 513 40 900 234 4.71
United Arab Emirates1 000 000 Abu Dhabi Government International Bond - Reg
3.125% 03/05/2026USD 995 403 1 084 888 0.12
200 000 Abu Dhabi Government International Bond - Reg3.875% 16/04/2050
USD 226 946 217 120 0.03
550 000 Abu Dhabi Government International Bond - Reg4.125% 11/10/2047
USD 548 373 620 125 0.07
Total United Arab Emirates 1 770 722 1 922 133 0.22
United States70 000 American Municipal Power, Inc. 8.084% 15/02/2050 USD 118 077 120 379 0.01
250 000 Bay Area Toll Authority 6.263% 01/04/2049 USD 354 226 386 257 0.04200 000 Bay Area Toll Authority 6.907% 01/10/2050 USD 303 341 330 170 0.04310 000 California State University - B 2.975% 01/11/2051 USD 310 000 303 864 0.0465 000 Commonwealth of Massachusetts 2.514% 01/07/2041 USD 65 000 64 377 0.0150 000 District of Columbia Water & Sewer Authority 4.814%
01/10/2114USD 74 199 64 875 0.01
85 000 Grand Parkway Transportation Corp. 3.236%01/10/2052
USD 85 000 85 460 0.01
450 000 Los Angeles Department of Water & Power PowerSystem Revenue 6.574% 01/07/2045
USD 648 372 700 492 0.08
55 000 Maryland Health & Higher Educational FacilitiesAuthority - D 3.052% 01/07/2040
USD 55 000 53 607 0.01
850 000 New Jersey Turnpike Authority 7.414% 01/01/2040 USD 1 224 519 1 335 471 0.15250 000 New York City Water & Sewer System 5.724%
15/06/2042USD 323 163 352 498 0.04
350 000 New York City Water & Sewer System 5.882%15/06/2044
USD 469 105 507 497 0.06
85 000 New York State Dormitory Authority - B 3.142%01/07/2043
USD 85 000 81 981 0.01
40 000 Oregon State University 3.424% 01/03/2060 USD 40 000 40 145 0.00550 000 Port Authority of New York & New Jersey 4.458%
01/10/2062USD 608 782 677 833 0.08
110 000 Regents of the University of California Medical CenterPooled Revenue 3.256% 15/05/2060
USD 110 000 109 749 0.01
176 Lumyna Funds
Lumyna – Global Debt - Credit UCITS FundSchedule of investments as at March 31, 2021 (cont.)
The accompanying notes form an integral part of these financial statements.
Audited annual report
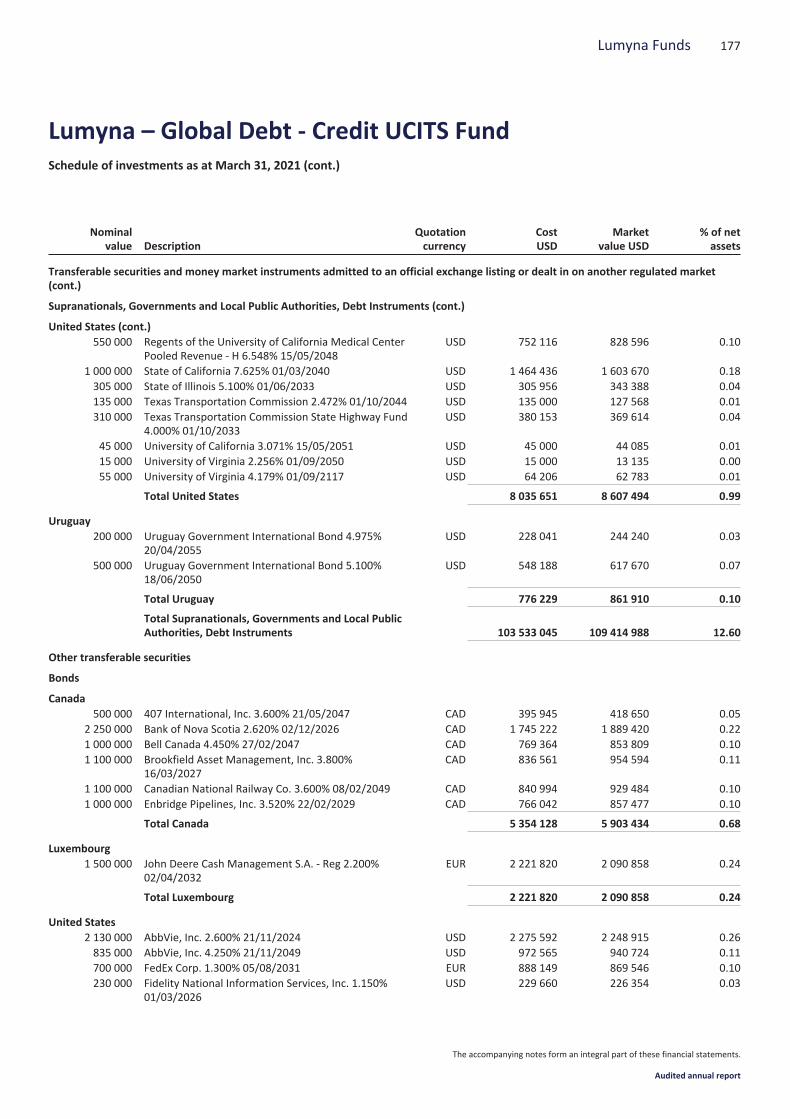
Nominalvalue Description
Quotationcurrency
CostUSD
Marketvalue USD
% of netassets
Transferable securities and money market instruments admitted to an official exchange listing or dealt in on another regulated market(cont.)
Supranationals, Governments and Local Public Authorities, Debt Instruments (cont.)
United States (cont.)550 000 Regents of the University of California Medical Center
Pooled Revenue - H 6.548% 15/05/2048USD 752 116 828 596 0.10
1 000 000 State of California 7.625% 01/03/2040 USD 1 464 436 1 603 670 0.18305 000 State of Illinois 5.100% 01/06/2033 USD 305 956 343 388 0.04135 000 Texas Transportation Commission 2.472% 01/10/2044 USD 135 000 127 568 0.01310 000 Texas Transportation Commission State Highway Fund
4.000% 01/10/2033USD 380 153 369 614 0.04
45 000 University of California 3.071% 15/05/2051 USD 45 000 44 085 0.0115 000 University of Virginia 2.256% 01/09/2050 USD 15 000 13 135 0.0055 000 University of Virginia 4.179% 01/09/2117 USD 64 206 62 783 0.01
Total United States 8 035 651 8 607 494 0.99
Uruguay200 000 Uruguay Government International Bond 4.975%
20/04/2055USD 228 041 244 240 0.03
500 000 Uruguay Government International Bond 5.100%18/06/2050
USD 548 188 617 670 0.07
Total Uruguay 776 229 861 910 0.10
Total Supranationals, Governments and Local PublicAuthorities, Debt Instruments 103 533 045 109 414 988 12.60
Other transferable securities
Bonds
Canada500 000 407 International, Inc. 3.600% 21/05/2047 CAD 395 945 418 650 0.05
2 250 000 Bank of Nova Scotia 2.620% 02/12/2026 CAD 1 745 222 1 889 420 0.221 000 000 Bell Canada 4.450% 27/02/2047 CAD 769 364 853 809 0.101 100 000 Brookfield Asset Management, Inc. 3.800%
16/03/2027CAD 836 561 954 594 0.11
1 100 000 Canadian National Railway Co. 3.600% 08/02/2049 CAD 840 994 929 484 0.101 000 000 Enbridge Pipelines, Inc. 3.520% 22/02/2029 CAD 766 042 857 477 0.10
Total Canada 5 354 128 5 903 434 0.68
Luxembourg1 500 000 John Deere Cash Management S.A. - Reg 2.200%
02/04/2032EUR 2 221 820 2 090 858 0.24
Total Luxembourg 2 221 820 2 090 858 0.24
United States2 130 000 AbbVie, Inc. 2.600% 21/11/2024 USD 2 275 592 2 248 915 0.26835 000 AbbVie, Inc. 4.250% 21/11/2049 USD 972 565 940 724 0.11700 000 FedEx Corp. 1.300% 05/08/2031 EUR 888 149 869 546 0.10230 000 Fidelity National Information Services, Inc. 1.150%
01/03/2026USD 229 660 226 354 0.03
177Lumyna Funds
Lumyna – Global Debt - Credit UCITS FundSchedule of investments as at March 31, 2021 (cont.)
The accompanying notes form an integral part of these financial statements.
Audited annual report
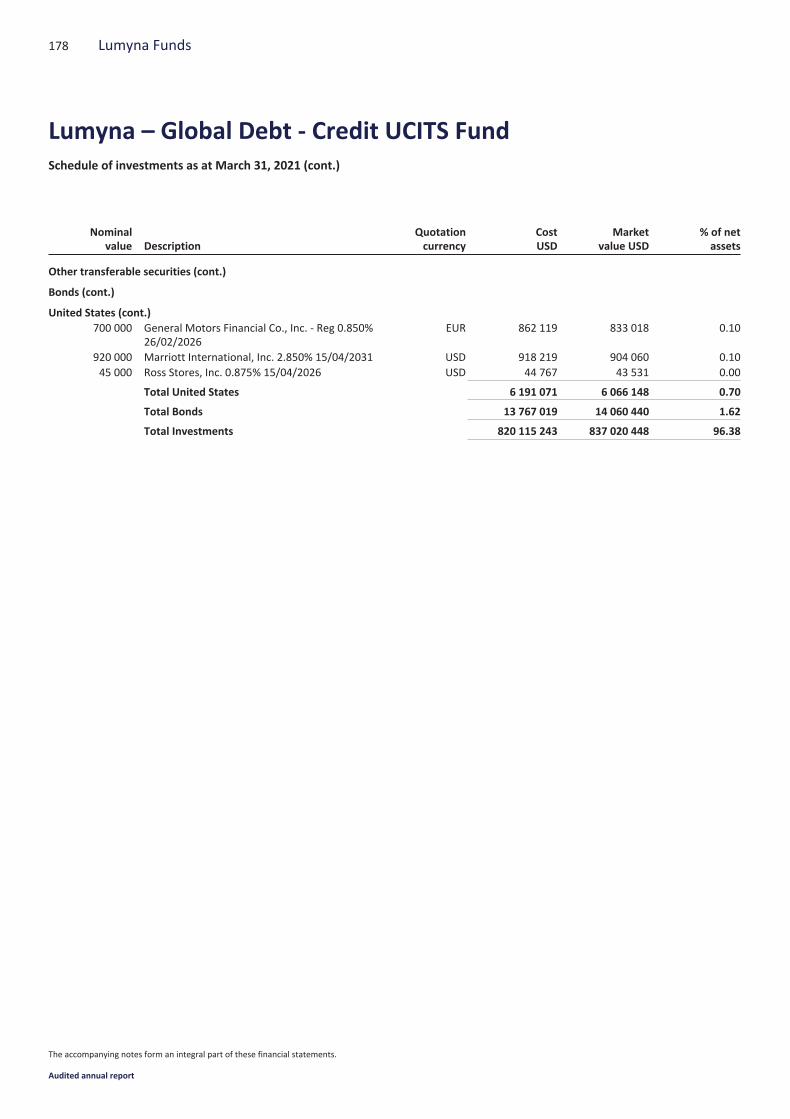
Nominalvalue Description
Quotationcurrency
CostUSD
Marketvalue USD
% of netassets
Other transferable securities (cont.)
Bonds (cont.)
United States (cont.)700 000 General Motors Financial Co., Inc. - Reg 0.850%
26/02/2026EUR 862 119 833 018 0.10
920 000 Marriott International, Inc. 2.850% 15/04/2031 USD 918 219 904 060 0.1045 000 Ross Stores, Inc. 0.875% 15/04/2026 USD 44 767 43 531 0.00
Total United States 6 191 071 6 066 148 0.70
Total Bonds 13 767 019 14 060 440 1.62
Total Investments 820 115 243 837 020 448 96.38
178 Lumyna Funds
Lumyna – Global Debt - Credit UCITS FundSchedule of investments as at March 31, 2021 (cont.)
The accompanying notes form an integral part of these financial statements.
Audited annual report
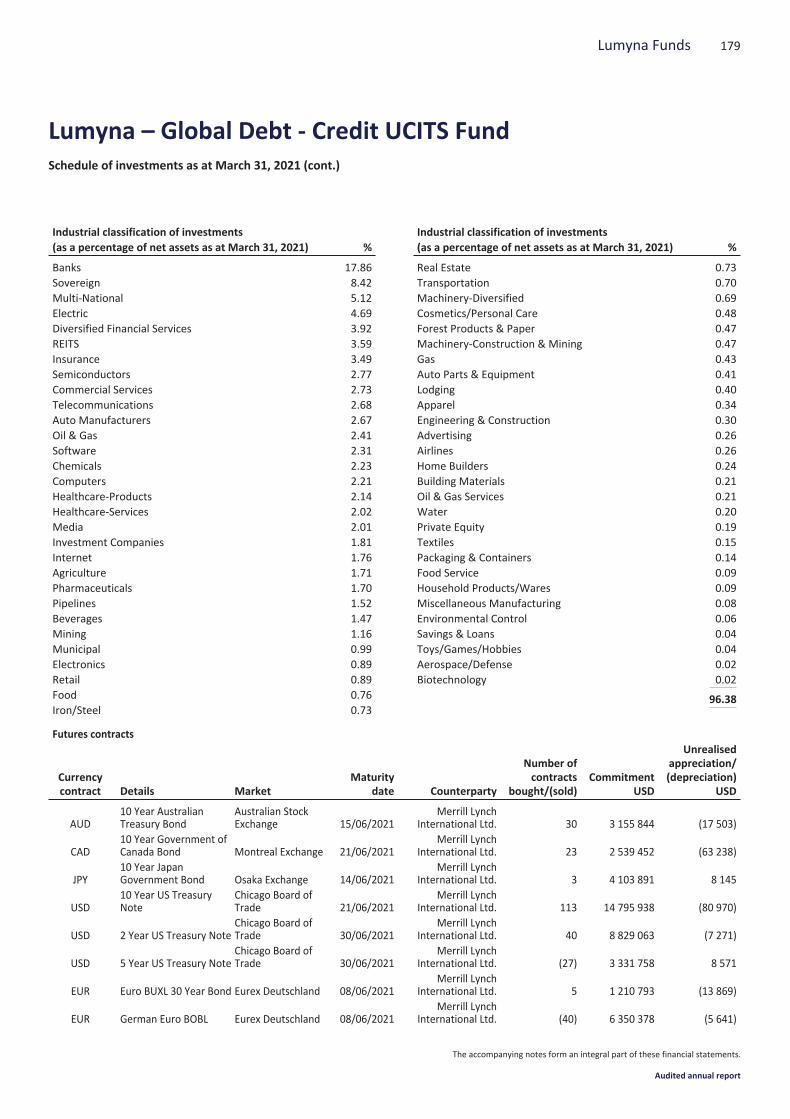
Industrial classification of investments(as a percentage of net assets as at March 31, 2021) %
Banks 17.86Sovereign 8.42Multi-National 5.12Electric 4.69Diversified Financial Services 3.92REITS 3.59Insurance 3.49Semiconductors 2.77Commercial Services 2.73Telecommunications 2.68Auto Manufacturers 2.67Oil & Gas 2.41Software 2.31Chemicals 2.23Computers 2.21Healthcare-Products 2.14Healthcare-Services 2.02Media 2.01Investment Companies 1.81Internet 1.76Agriculture 1.71Pharmaceuticals 1.70Pipelines 1.52Beverages 1.47Mining 1.16Municipal 0.99Electronics 0.89Retail 0.89Food 0.76Iron/Steel 0.73
Industrial classification of investments(as a percentage of net assets as at March 31, 2021) %
Real Estate 0.73Transportation 0.70Machinery-Diversified 0.69Cosmetics/Personal Care 0.48Forest Products & Paper 0.47Machinery-Construction & Mining 0.47Gas 0.43Auto Parts & Equipment 0.41Lodging 0.40Apparel 0.34Engineering & Construction 0.30Advertising 0.26Airlines 0.26Home Builders 0.24Building Materials 0.21Oil & Gas Services 0.21Water 0.20Private Equity 0.19Textiles 0.15Packaging & Containers 0.14Food Service 0.09Household Products/Wares 0.09Miscellaneous Manufacturing 0.08Environmental Control 0.06Savings & Loans 0.04Toys/Games/Hobbies 0.04Aerospace/Defense 0.02Biotechnology 0.02
96.38
Futures contracts
Currencycontract Details Market
Maturitydate Counterparty
Number ofcontracts
bought/(sold)Commitment
USD
Unrealisedappreciation/(depreciation)
USD
AUD10 Year AustralianTreasury Bond
Australian StockExchange 15/06/2021
Merrill LynchInternational Ltd. 30 3 155 844 (17 503)
CAD10 Year Government ofCanada Bond Montreal Exchange 21/06/2021
Merrill LynchInternational Ltd. 23 2 539 452 (63 238)
JPY10 Year JapanGovernment Bond Osaka Exchange 14/06/2021
Merrill LynchInternational Ltd. 3 4 103 891 8 145
USD10 Year US TreasuryNote
Chicago Board ofTrade 21/06/2021
Merrill LynchInternational Ltd. 113 14 795 938 (80 970)
USD 2 Year US Treasury NoteChicago Board ofTrade 30/06/2021
Merrill LynchInternational Ltd. 40 8 829 063 (7 271)
USD 5 Year US Treasury NoteChicago Board ofTrade 30/06/2021
Merrill LynchInternational Ltd. (27) 3 331 758 8 571
EUR Euro BUXL 30 Year Bond Eurex Deutschland 08/06/2021Merrill Lynch
International Ltd. 5 1 210 793 (13 869)
EUR German Euro BOBL Eurex Deutschland 08/06/2021Merrill Lynch
International Ltd. (40) 6 350 378 (5 641)
179Lumyna Funds
Lumyna – Global Debt - Credit UCITS FundSchedule of investments as at March 31, 2021 (cont.)
The accompanying notes form an integral part of these financial statements.
Audited annual report
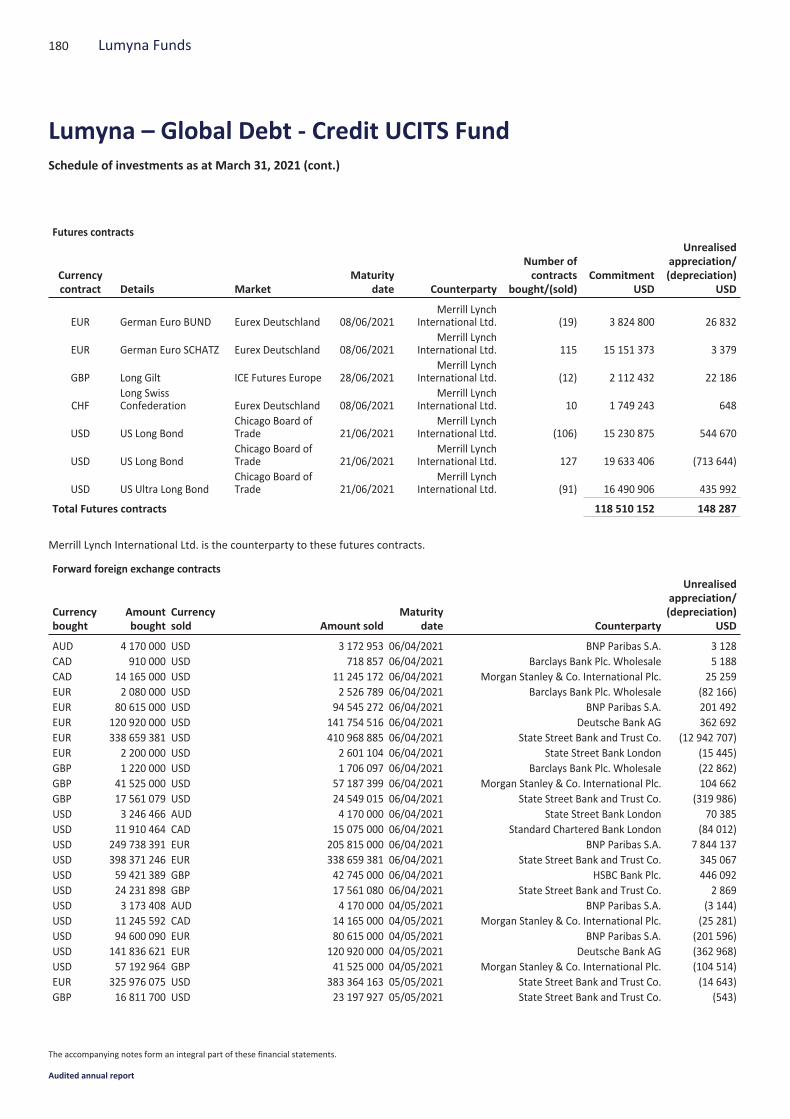
Futures contracts
Currencycontract Details Market
Maturitydate Counterparty
Number ofcontracts
bought/(sold)Commitment
USD
Unrealisedappreciation/(depreciation)
USD
EUR German Euro BUND Eurex Deutschland 08/06/2021Merrill Lynch
International Ltd. (19) 3 824 800 26 832
EUR German Euro SCHATZ Eurex Deutschland 08/06/2021Merrill Lynch
International Ltd. 115 15 151 373 3 379
GBP Long Gilt ICE Futures Europe 28/06/2021Merrill Lynch
International Ltd. (12) 2 112 432 22 186
CHFLong SwissConfederation Eurex Deutschland 08/06/2021
Merrill LynchInternational Ltd. 10 1 749 243 648
USD US Long BondChicago Board ofTrade 21/06/2021
Merrill LynchInternational Ltd. (106) 15 230 875 544 670
USD US Long BondChicago Board ofTrade 21/06/2021
Merrill LynchInternational Ltd. 127 19 633 406 (713 644)
USD US Ultra Long BondChicago Board ofTrade 21/06/2021
Merrill LynchInternational Ltd. (91) 16 490 906 435 992
Total Futures contracts 118 510 152 148 287
Merrill Lynch International Ltd. is the counterparty to these futures contracts.
Forward foreign exchange contracts
Currencybought
Amountbought
Currencysold Amount sold
Maturitydate Counterparty
Unrealisedappreciation/(depreciation)
USD
AUD 4 170 000 USD 3 172 953 06/04/2021 BNP Paribas S.A. 3 128CAD 910 000 USD 718 857 06/04/2021 Barclays Bank Plc. Wholesale 5 188CAD 14 165 000 USD 11 245 172 06/04/2021 Morgan Stanley & Co. International Plc. 25 259EUR 2 080 000 USD 2 526 789 06/04/2021 Barclays Bank Plc. Wholesale (82 166)EUR 80 615 000 USD 94 545 272 06/04/2021 BNP Paribas S.A. 201 492EUR 120 920 000 USD 141 754 516 06/04/2021 Deutsche Bank AG 362 692EUR 338 659 381 USD 410 968 885 06/04/2021 State Street Bank and Trust Co. (12 942 707)EUR 2 200 000 USD 2 601 104 06/04/2021 State Street Bank London (15 445)GBP 1 220 000 USD 1 706 097 06/04/2021 Barclays Bank Plc. Wholesale (22 862)GBP 41 525 000 USD 57 187 399 06/04/2021 Morgan Stanley & Co. International Plc. 104 662GBP 17 561 079 USD 24 549 015 06/04/2021 State Street Bank and Trust Co. (319 986)USD 3 246 466 AUD 4 170 000 06/04/2021 State Street Bank London 70 385USD 11 910 464 CAD 15 075 000 06/04/2021 Standard Chartered Bank London (84 012)USD 249 738 391 EUR 205 815 000 06/04/2021 BNP Paribas S.A. 7 844 137USD 398 371 246 EUR 338 659 381 06/04/2021 State Street Bank and Trust Co. 345 067USD 59 421 389 GBP 42 745 000 06/04/2021 HSBC Bank Plc. 446 092USD 24 231 898 GBP 17 561 080 06/04/2021 State Street Bank and Trust Co. 2 869USD 3 173 408 AUD 4 170 000 04/05/2021 BNP Paribas S.A. (3 144)USD 11 245 592 CAD 14 165 000 04/05/2021 Morgan Stanley & Co. International Plc. (25 281)USD 94 600 090 EUR 80 615 000 04/05/2021 BNP Paribas S.A. (201 596)USD 141 836 621 EUR 120 920 000 04/05/2021 Deutsche Bank AG (362 968)USD 57 192 964 GBP 41 525 000 04/05/2021 Morgan Stanley & Co. International Plc. (104 514)EUR 325 976 075 USD 383 364 163 05/05/2021 State Street Bank and Trust Co. (14 643)GBP 16 811 700 USD 23 197 927 05/05/2021 State Street Bank and Trust Co. (543)
180 Lumyna Funds
Lumyna – Global Debt - Credit UCITS FundSchedule of investments as at March 31, 2021 (cont.)
The accompanying notes form an integral part of these financial statements.
Audited annual report
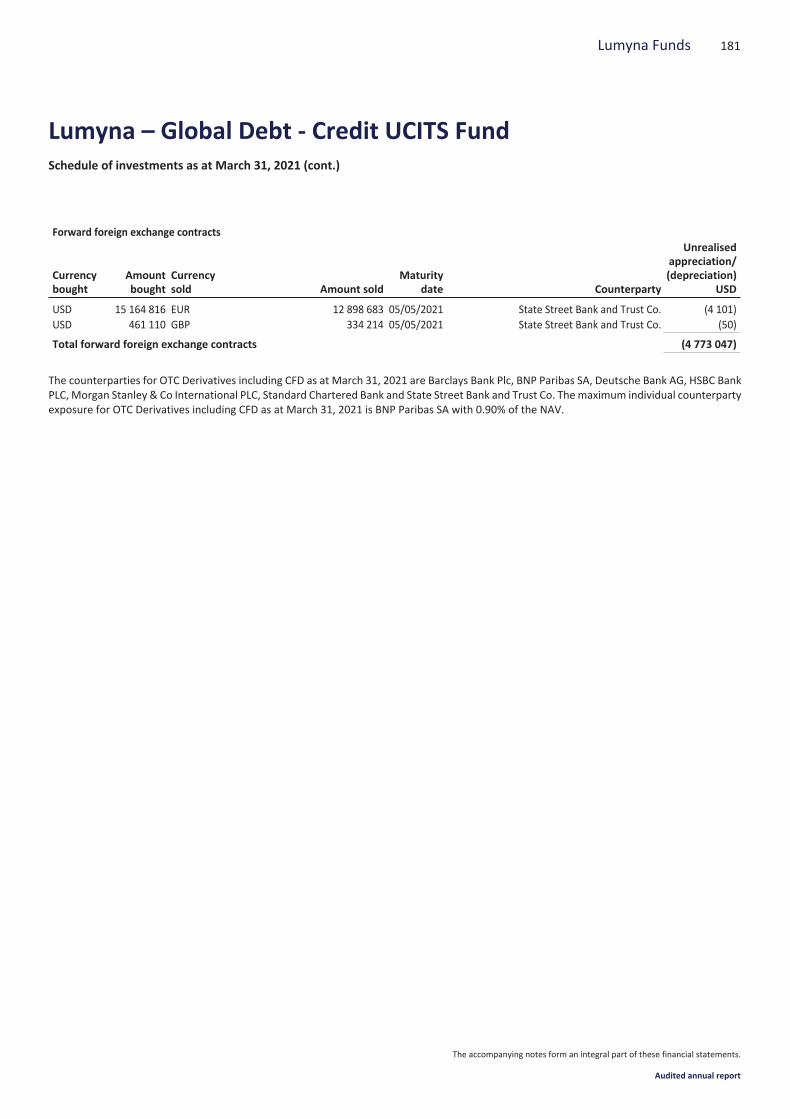
Forward foreign exchange contracts
Currencybought
Amountbought
Currencysold Amount sold
Maturitydate Counterparty
Unrealisedappreciation/(depreciation)
USD
USD 15 164 816 EUR 12 898 683 05/05/2021 State Street Bank and Trust Co. (4 101)USD 461 110 GBP 334 214 05/05/2021 State Street Bank and Trust Co. (50)
Total forward foreign exchange contracts (4 773 047)
The counterparties for OTC Derivatives including CFD as at March 31, 2021 are Barclays Bank Plc, BNP Paribas SA, Deutsche Bank AG, HSBC BankPLC, Morgan Stanley & Co International PLC, Standard Chartered Bank and State Street Bank and Trust Co. Themaximum individual counterpartyexposure for OTC Derivatives including CFD as at March 31, 2021 is BNP Paribas SA with 0.90% of the NAV.
181Lumyna Funds
Lumyna – Global Debt - Credit UCITS FundSchedule of investments as at March 31, 2021 (cont.)
The accompanying notes form an integral part of these financial statements.
Audited annual report

Nominalvalue Description
Quotationcurrency
CostUSD
Marketvalue USD
% of netassets
Transferable securities and money market instruments admitted to an official exchange listing or dealt in on another regulated market
Bonds
Austria300 000 Autobahnen- und Schnell- strassen-Finanzierungs AG -
Reg 1.375% 09/04/2021EUR 356 199 352 643 0.01
300 000 HYPO NOE Landesbank fuer Niederoesterreich undWien AG - Reg 0.125% 30/06/2026
EUR 352 100 351 426 0.00
50 000 KAF Kaerntner Ausgleichszahlungs-Fonds - Reg 0.000%14/01/2032
EUR 52 626 56 306 0.00
600 000 OeBB-Infrastruktur AG 3.000% 24/10/2033 EUR 832 338 940 550 0.02750 000 OeBB-Infrastruktur AG - Reg 1.000% 18/11/2024 EUR 901 130 927 999 0.02
1 000 000 OeBB-Infrastruktur AG - Reg 2.250% 04/07/2023 EUR 1 233 868 1 248 970 0.021 000 000 Oesterreichische Kontrollbank AG - Reg 0.000%
06/04/2023EUR 1 101 801 1 188 296 0.02
200 000 Verbund AG - Reg 0.900% 01/04/2041 EUR 233 685 232 603 0.00
Total Austria 5 063 747 5 298 793 0.09
Belgium200 000 FLUVIUS System Operator CVBA - Reg 1.750%
04/12/2026EUR 252 179 257 237 0.01
200 000 Proximus SADP - Reg 0.500% 22/03/2022 EUR 240 298 236 384 0.00
Total Belgium 492 477 493 621 0.01
Finland400 000 Fortum Oyj - Reg 2.125% 27/02/2029 EUR 457 959 527 286 0.01100 000 Fortum Oyj - Reg 4.000% 24/05/2021 EUR 119 544 118 201 0.00
Total Finland 577 503 645 487 0.01
France200 000 Aeroports de Paris - Reg 1.000% 13/12/2027 EUR 243 154 247 553 0.00200 000 Aeroports de Paris - Reg 1.125% 18/06/2034 EUR 231 289 241 793 0.00500 000 Aeroports de Paris - Reg 2.125% 02/10/2026 EUR 575 075 649 800 0.01200 000 Aeroports de Paris - Reg 2.125% 11/10/2038 EUR 230 934 270 883 0.01100 000 Aeroports de Paris - Reg 3.125% 11/06/2024 EUR 129 365 130 020 0.00
1 000 000 Caisse Centrale du Credit Immobilier de France S.A. -Reg 0.000% 22/01/2023
EUR 1 143 126 1 183 527 0.02
100 000 Coentreprise de Transport d'Electricite S.A. - Reg0.875% 29/09/2024
EUR 119 081 121 004 0.00
400 000 Coentreprise de Transport d'Electricite S.A. - Reg2.125% 29/07/2032
EUR 472 567 540 590 0.01
1 000 000 Dexia Credit Local S.A. - Reg 0.010% 22/01/2027 EUR 1 118 893 1 186 773 0.021 000 000 Dexia Credit Local S.A. - Reg 0.250% 01/06/2023 EUR 1 145 696 1 194 222 0.02400 000 Dexia Credit Local S.A. - Reg 0.500% 17/01/2025 EUR 487 993 484 666 0.01500 000 Dexia Credit Local S.A. - Reg 0.500% 17/01/2025 EUR 613 319 605 833 0.01500 000 Dexia Credit Local S.A. - Reg 0.625% 17/01/2026 EUR 567 925 612 037 0.01200 000 Dexia Credit Local S.A. - Reg 1.000% 18/10/2027 EUR 239 009 251 890 0.01
1 300 000 Electricite de France S.A. - Reg 1.000% 13/10/2026 EUR 1 480 484 1 600 977 0.03100 000 Electricite de France S.A. - Reg 1.875% 13/10/2036 EUR 114 312 131 147 0.00500 000 Electricite de France S.A. - Reg 2.000% 02/10/2030 EUR 572 984 667 844 0.01100 000 Electricite de France S.A. - Reg 2.000% 09/12/2049 EUR 114 209 125 926 0.00
182 Lumyna Funds
Lumyna – Global Debt - Government UCITS FundSchedule of investments as at March 31, 2021
The accompanying notes form an integral part of these financial statements.
Audited annual report
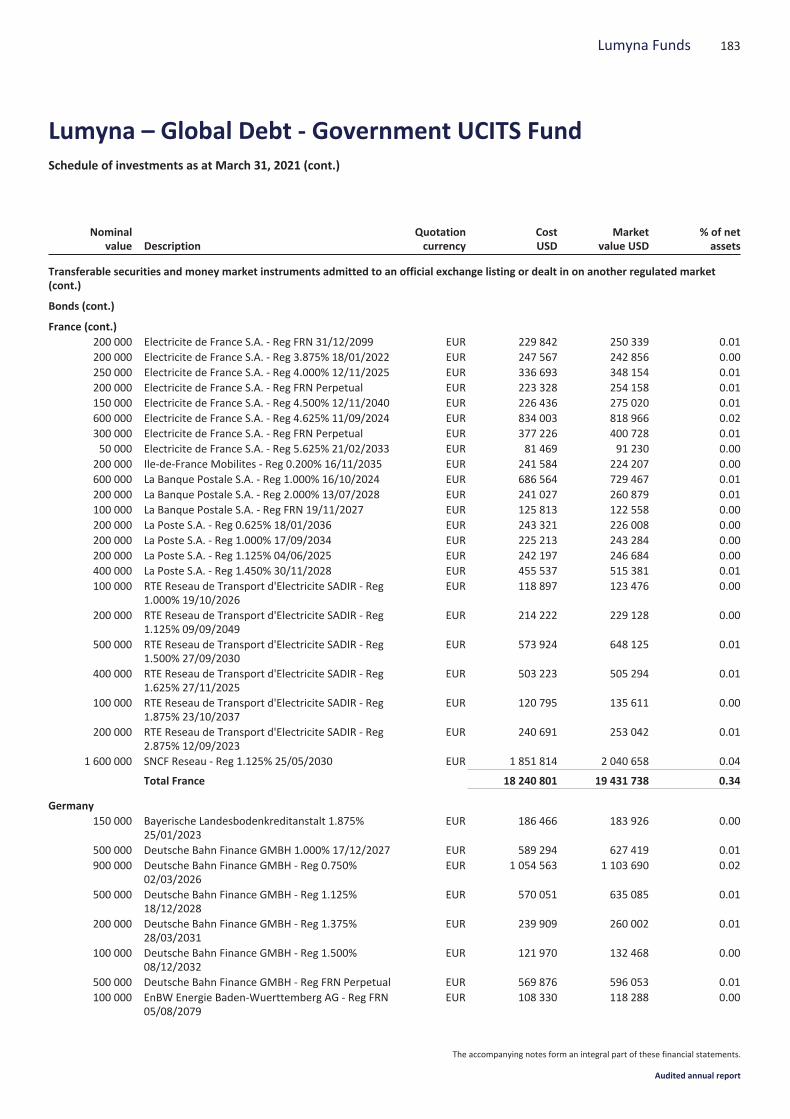
Nominalvalue Description
Quotationcurrency
CostUSD
Marketvalue USD
% of netassets
Transferable securities and money market instruments admitted to an official exchange listing or dealt in on another regulated market(cont.)
Bonds (cont.)
France (cont.)200 000 Electricite de France S.A. - Reg FRN 31/12/2099 EUR 229 842 250 339 0.01200 000 Electricite de France S.A. - Reg 3.875% 18/01/2022 EUR 247 567 242 856 0.00250 000 Electricite de France S.A. - Reg 4.000% 12/11/2025 EUR 336 693 348 154 0.01200 000 Electricite de France S.A. - Reg FRN Perpetual EUR 223 328 254 158 0.01150 000 Electricite de France S.A. - Reg 4.500% 12/11/2040 EUR 226 436 275 020 0.01600 000 Electricite de France S.A. - Reg 4.625% 11/09/2024 EUR 834 003 818 966 0.02300 000 Electricite de France S.A. - Reg FRN Perpetual EUR 377 226 400 728 0.0150 000 Electricite de France S.A. - Reg 5.625% 21/02/2033 EUR 81 469 91 230 0.00
200 000 Ile-de-France Mobilites - Reg 0.200% 16/11/2035 EUR 241 584 224 207 0.00600 000 La Banque Postale S.A. - Reg 1.000% 16/10/2024 EUR 686 564 729 467 0.01200 000 La Banque Postale S.A. - Reg 2.000% 13/07/2028 EUR 241 027 260 879 0.01100 000 La Banque Postale S.A. - Reg FRN 19/11/2027 EUR 125 813 122 558 0.00200 000 La Poste S.A. - Reg 0.625% 18/01/2036 EUR 243 321 226 008 0.00200 000 La Poste S.A. - Reg 1.000% 17/09/2034 EUR 225 213 243 284 0.00200 000 La Poste S.A. - Reg 1.125% 04/06/2025 EUR 242 197 246 684 0.00400 000 La Poste S.A. - Reg 1.450% 30/11/2028 EUR 455 537 515 381 0.01100 000 RTE Reseau de Transport d'Electricite SADIR - Reg
1.000% 19/10/2026EUR 118 897 123 476 0.00
200 000 RTE Reseau de Transport d'Electricite SADIR - Reg1.125% 09/09/2049
EUR 214 222 229 128 0.00
500 000 RTE Reseau de Transport d'Electricite SADIR - Reg1.500% 27/09/2030
EUR 573 924 648 125 0.01
400 000 RTE Reseau de Transport d'Electricite SADIR - Reg1.625% 27/11/2025
EUR 503 223 505 294 0.01
100 000 RTE Reseau de Transport d'Electricite SADIR - Reg1.875% 23/10/2037
EUR 120 795 135 611 0.00
200 000 RTE Reseau de Transport d'Electricite SADIR - Reg2.875% 12/09/2023
EUR 240 691 253 042 0.01
1 600 000 SNCF Reseau - Reg 1.125% 25/05/2030 EUR 1 851 814 2 040 658 0.04
Total France 18 240 801 19 431 738 0.34
Germany150 000 Bayerische Landesbodenkreditanstalt 1.875%
25/01/2023EUR 186 466 183 926 0.00
500 000 Deutsche Bahn Finance GMBH 1.000% 17/12/2027 EUR 589 294 627 419 0.01900 000 Deutsche Bahn Finance GMBH - Reg 0.750%
02/03/2026EUR 1 054 563 1 103 690 0.02
500 000 Deutsche Bahn Finance GMBH - Reg 1.125%18/12/2028
EUR 570 051 635 085 0.01
200 000 Deutsche Bahn Finance GMBH - Reg 1.375%28/03/2031
EUR 239 909 260 002 0.01
100 000 Deutsche Bahn Finance GMBH - Reg 1.500%08/12/2032
EUR 121 970 132 468 0.00
500 000 Deutsche Bahn Finance GMBH - Reg FRN Perpetual EUR 569 876 596 053 0.01100 000 EnBW Energie Baden-Wuerttemberg AG - Reg FRN
05/08/2079EUR 108 330 118 288 0.00
183Lumyna Funds
Lumyna – Global Debt - Government UCITS FundSchedule of investments as at March 31, 2021 (cont.)
The accompanying notes form an integral part of these financial statements.
Audited annual report

Nominalvalue Description
Quotationcurrency
CostUSD
Marketvalue USD
% of netassets
Transferable securities and money market instruments admitted to an official exchange listing or dealt in on another regulated market(cont.)
Bonds (cont.)
Germany (cont.)70 000 EnBW Energie Baden-Wuerttemberg AG - Reg FRN
05/04/2077EUR 88 654 84 328 0.00
1 000 000 EnBW Energie Baden-Wuerttemberg AG - Reg FRN02/04/2076
EUR 1 255 792 1 175 299 0.02
200 000 HSH Finanzfonds AoeR - Reg 0.250% 07/02/2023 EUR 240 643 238 072 0.00300 000 Investitionsbank Berlin 0.500% 17/04/2026 EUR 340 677 367 099 0.01500 000 Kreditanstalt fuer Wiederaufbau 0.000% 15/12/2022 EUR 601 685 594 114 0.01
1 500 000 Kreditanstalt fuer Wiederaufbau 0.125% 24/02/2023 EUR 1 785 740 1 788 459 0.036 600 000 Kreditanstalt fuer Wiederaufbau 0.125% 07/06/2023 EUR 7 553 571 7 886 890 0.143 000 000 Kreditanstalt fuer Wiederaufbau 0.125% 07/11/2023 EUR 3 436 515 3 594 428 0.061 000 000 Kreditanstalt fuer Wiederaufbau 0.125% 15/01/2024 EUR 1 218 570 1 199 452 0.02600 000 Kreditanstalt fuer Wiederaufbau 0.125% 04/10/2024 EUR 738 214 722 246 0.01
4 000 000 Kreditanstalt fuer Wiederaufbau 0.250% 15/09/2025 EUR 4 606 512 4 858 359 0.091 250 000 Kreditanstalt fuer Wiederaufbau 0.625% 22/02/2027 EUR 1 529 538 1 555 970 0.032 500 000 Kreditanstalt fuer Wiederaufbau 0.625% 07/01/2028 EUR 2 911 641 3 121 331 0.061 000 000 Kreditanstalt fuer Wiederaufbau 0.750% 28/06/2028 EUR 1 131 506 1 261 463 0.021 000 000 Kreditanstalt fuer Wiederaufbau - Reg 0.000%
18/02/2025EUR 1 126 255 1 199 544 0.02
500 000 Kreditanstalt fuer Wiederaufbau - Reg 0.000%15/12/2027
EUR 602 954 599 504 0.01
1 500 000 Kreditanstalt fuer Wiederaufbau - Reg 0.000%10/01/2031
EUR 1 863 069 1 777 130 0.03
2 000 000 Kreditanstalt fuer Wiederaufbau - Reg 0.750%15/01/2029
EUR 2 313 916 2 527 806 0.05
500 000 Kreditanstalt fuer Wiederaufbau - Reg 1.125%09/05/2033
EUR 580 514 659 914 0.01
400 000 Kreditanstalt fuer Wiederaufbau - Reg 1.125%15/06/2037
EUR 463 053 530 483 0.01
500 000 Kreditanstalt fuer Wiederaufbau - Reg 1.250%04/07/2036
EUR 599 011 671 761 0.01
400 000 Landesbank Baden-Wuerttemberg - Reg 0.375%18/02/2027
EUR 437 312 473 860 0.01
1 200 000 Landesbank Baden-Wuerttemberg - Reg 0.500%07/06/2022
EUR 1 395 085 1 422 497 0.03
400 000 Landesbank Hessen-Thueringen Girozentrale - Reg0.375% 12/05/2025
EUR 444 742 479 804 0.01
500 000 Landeskreditbank Baden-Wuerttemberg Foerderbank -Reg 0.375% 13/04/2026
EUR 574 725 608 504 0.01
1 000 000 Landwirtschaftliche Rentenbank - Reg 0.000%27/11/2029
EUR 1 105 021 1 190 202 0.02
300 000 Landwirtschaftliche Rentenbank - Reg 0.250%15/07/2024
EUR 356 751 361 761 0.01
1 200 000 Landwirtschaftliche Rentenbank - Reg 0.500%06/03/2025
EUR 1 431 427 1 465 916 0.03
1 250 000 Landwirtschaftliche Rentenbank - Reg 0.625%20/02/2030
EUR 1 420 899 1 565 866 0.03
184 Lumyna Funds
Lumyna – Global Debt - Government UCITS FundSchedule of investments as at March 31, 2021 (cont.)
The accompanying notes form an integral part of these financial statements.
Audited annual report
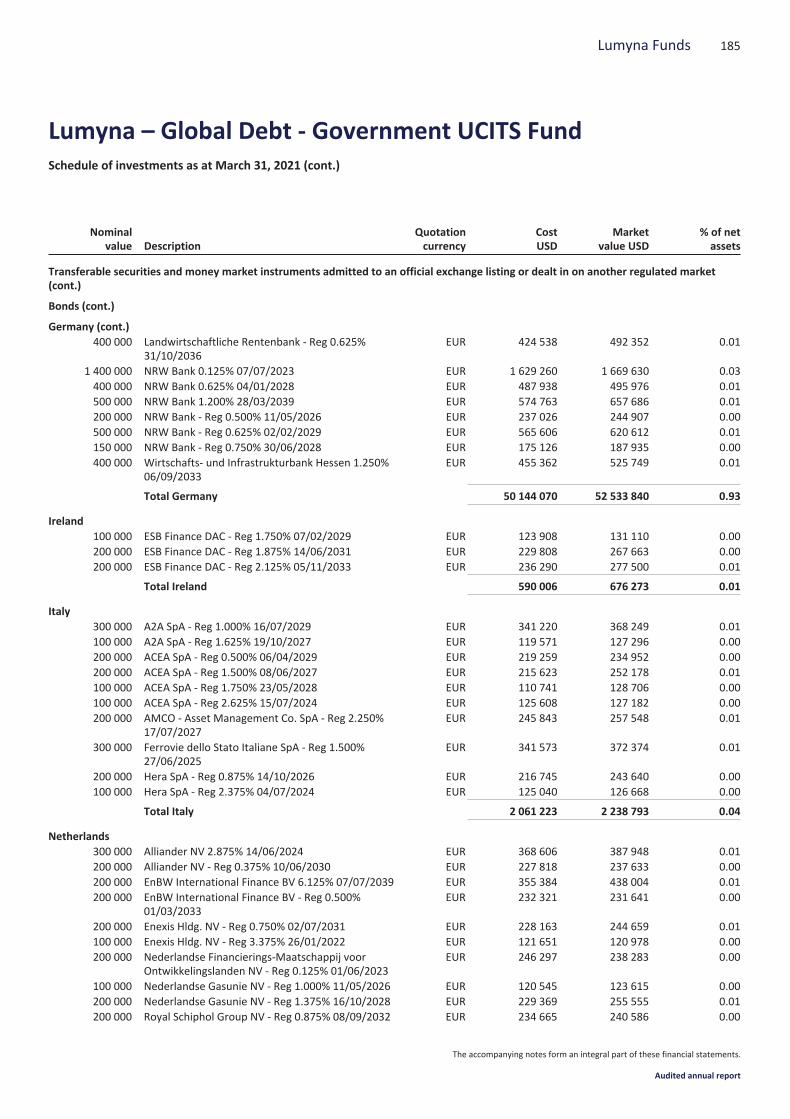
Nominalvalue Description
Quotationcurrency
CostUSD
Marketvalue USD
% of netassets
Transferable securities and money market instruments admitted to an official exchange listing or dealt in on another regulated market(cont.)
Bonds (cont.)
Germany (cont.)400 000 Landwirtschaftliche Rentenbank - Reg 0.625%
31/10/2036EUR 424 538 492 352 0.01
1 400 000 NRW Bank 0.125% 07/07/2023 EUR 1 629 260 1 669 630 0.03400 000 NRW Bank 0.625% 04/01/2028 EUR 487 938 495 976 0.01500 000 NRW Bank 1.200% 28/03/2039 EUR 574 763 657 686 0.01200 000 NRW Bank - Reg 0.500% 11/05/2026 EUR 237 026 244 907 0.00500 000 NRW Bank - Reg 0.625% 02/02/2029 EUR 565 606 620 612 0.01150 000 NRW Bank - Reg 0.750% 30/06/2028 EUR 175 126 187 935 0.00400 000 Wirtschafts- und Infrastrukturbank Hessen 1.250%
06/09/2033EUR 455 362 525 749 0.01
Total Germany 50 144 070 52 533 840 0.93
Ireland100 000 ESB Finance DAC - Reg 1.750% 07/02/2029 EUR 123 908 131 110 0.00200 000 ESB Finance DAC - Reg 1.875% 14/06/2031 EUR 229 808 267 663 0.00200 000 ESB Finance DAC - Reg 2.125% 05/11/2033 EUR 236 290 277 500 0.01
Total Ireland 590 006 676 273 0.01
Italy300 000 A2A SpA - Reg 1.000% 16/07/2029 EUR 341 220 368 249 0.01100 000 A2A SpA - Reg 1.625% 19/10/2027 EUR 119 571 127 296 0.00200 000 ACEA SpA - Reg 0.500% 06/04/2029 EUR 219 259 234 952 0.00200 000 ACEA SpA - Reg 1.500% 08/06/2027 EUR 215 623 252 178 0.01100 000 ACEA SpA - Reg 1.750% 23/05/2028 EUR 110 741 128 706 0.00100 000 ACEA SpA - Reg 2.625% 15/07/2024 EUR 125 608 127 182 0.00200 000 AMCO - Asset Management Co. SpA - Reg 2.250%
17/07/2027EUR 245 843 257 548 0.01
300 000 Ferrovie dello Stato Italiane SpA - Reg 1.500%27/06/2025
EUR 341 573 372 374 0.01
200 000 Hera SpA - Reg 0.875% 14/10/2026 EUR 216 745 243 640 0.00100 000 Hera SpA - Reg 2.375% 04/07/2024 EUR 125 040 126 668 0.00
Total Italy 2 061 223 2 238 793 0.04
Netherlands300 000 Alliander NV 2.875% 14/06/2024 EUR 368 606 387 948 0.01200 000 Alliander NV - Reg 0.375% 10/06/2030 EUR 227 818 237 633 0.00200 000 EnBW International Finance BV 6.125% 07/07/2039 EUR 355 384 438 004 0.01200 000 EnBW International Finance BV - Reg 0.500%
01/03/2033EUR 232 321 231 641 0.00
200 000 Enexis Hldg. NV - Reg 0.750% 02/07/2031 EUR 228 163 244 659 0.01100 000 Enexis Hldg. NV - Reg 3.375% 26/01/2022 EUR 121 651 120 978 0.00200 000 Nederlandse Financierings-Maatschappij voor
Ontwikkelingslanden NV - Reg 0.125% 01/06/2023EUR 246 297 238 283 0.00
100 000 Nederlandse Gasunie NV - Reg 1.000% 11/05/2026 EUR 120 545 123 615 0.00200 000 Nederlandse Gasunie NV - Reg 1.375% 16/10/2028 EUR 229 369 255 555 0.01200 000 Royal Schiphol Group NV - Reg 0.875% 08/09/2032 EUR 234 665 240 586 0.00
185Lumyna Funds
Lumyna – Global Debt - Government UCITS FundSchedule of investments as at March 31, 2021 (cont.)
The accompanying notes form an integral part of these financial statements.
Audited annual report
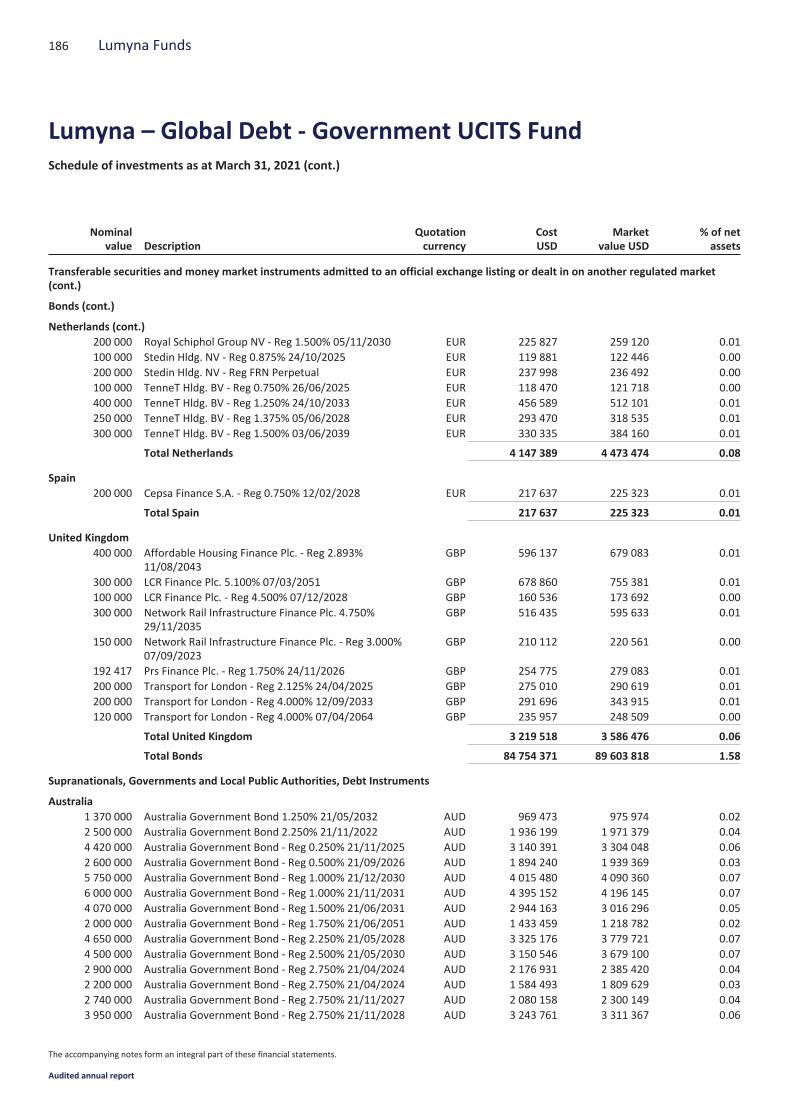
Nominalvalue Description
Quotationcurrency
CostUSD
Marketvalue USD
% of netassets
Transferable securities and money market instruments admitted to an official exchange listing or dealt in on another regulated market(cont.)
Bonds (cont.)
Netherlands (cont.)200 000 Royal Schiphol Group NV - Reg 1.500% 05/11/2030 EUR 225 827 259 120 0.01100 000 Stedin Hldg. NV - Reg 0.875% 24/10/2025 EUR 119 881 122 446 0.00200 000 Stedin Hldg. NV - Reg FRN Perpetual EUR 237 998 236 492 0.00100 000 TenneT Hldg. BV - Reg 0.750% 26/06/2025 EUR 118 470 121 718 0.00400 000 TenneT Hldg. BV - Reg 1.250% 24/10/2033 EUR 456 589 512 101 0.01250 000 TenneT Hldg. BV - Reg 1.375% 05/06/2028 EUR 293 470 318 535 0.01300 000 TenneT Hldg. BV - Reg 1.500% 03/06/2039 EUR 330 335 384 160 0.01
Total Netherlands 4 147 389 4 473 474 0.08
Spain200 000 Cepsa Finance S.A. - Reg 0.750% 12/02/2028 EUR 217 637 225 323 0.01
Total Spain 217 637 225 323 0.01
United Kingdom400 000 Affordable Housing Finance Plc. - Reg 2.893%
11/08/2043GBP 596 137 679 083 0.01
300 000 LCR Finance Plc. 5.100% 07/03/2051 GBP 678 860 755 381 0.01100 000 LCR Finance Plc. - Reg 4.500% 07/12/2028 GBP 160 536 173 692 0.00300 000 Network Rail Infrastructure Finance Plc. 4.750%
29/11/2035GBP 516 435 595 633 0.01
150 000 Network Rail Infrastructure Finance Plc. - Reg 3.000%07/09/2023
GBP 210 112 220 561 0.00
192 417 Prs Finance Plc. - Reg 1.750% 24/11/2026 GBP 254 775 279 083 0.01200 000 Transport for London - Reg 2.125% 24/04/2025 GBP 275 010 290 619 0.01200 000 Transport for London - Reg 4.000% 12/09/2033 GBP 291 696 343 915 0.01120 000 Transport for London - Reg 4.000% 07/04/2064 GBP 235 957 248 509 0.00
Total United Kingdom 3 219 518 3 586 476 0.06
Total Bonds 84 754 371 89 603 818 1.58
Supranationals, Governments and Local Public Authorities, Debt Instruments
Australia1 370 000 Australia Government Bond 1.250% 21/05/2032 AUD 969 473 975 974 0.022 500 000 Australia Government Bond 2.250% 21/11/2022 AUD 1 936 199 1 971 379 0.044 420 000 Australia Government Bond - Reg 0.250% 21/11/2025 AUD 3 140 391 3 304 048 0.062 600 000 Australia Government Bond - Reg 0.500% 21/09/2026 AUD 1 894 240 1 939 369 0.035 750 000 Australia Government Bond - Reg 1.000% 21/12/2030 AUD 4 015 480 4 090 360 0.076 000 000 Australia Government Bond - Reg 1.000% 21/11/2031 AUD 4 395 152 4 196 145 0.074 070 000 Australia Government Bond - Reg 1.500% 21/06/2031 AUD 2 944 163 3 016 296 0.052 000 000 Australia Government Bond - Reg 1.750% 21/06/2051 AUD 1 433 459 1 218 782 0.024 650 000 Australia Government Bond - Reg 2.250% 21/05/2028 AUD 3 325 176 3 779 721 0.074 500 000 Australia Government Bond - Reg 2.500% 21/05/2030 AUD 3 150 546 3 679 100 0.072 900 000 Australia Government Bond - Reg 2.750% 21/04/2024 AUD 2 176 931 2 385 420 0.042 200 000 Australia Government Bond - Reg 2.750% 21/04/2024 AUD 1 584 493 1 809 629 0.032 740 000 Australia Government Bond - Reg 2.750% 21/11/2027 AUD 2 080 158 2 300 149 0.043 950 000 Australia Government Bond - Reg 2.750% 21/11/2028 AUD 3 243 761 3 311 367 0.06
186 Lumyna Funds
Lumyna – Global Debt - Government UCITS FundSchedule of investments as at March 31, 2021 (cont.)
The accompanying notes form an integral part of these financial statements.
Audited annual report
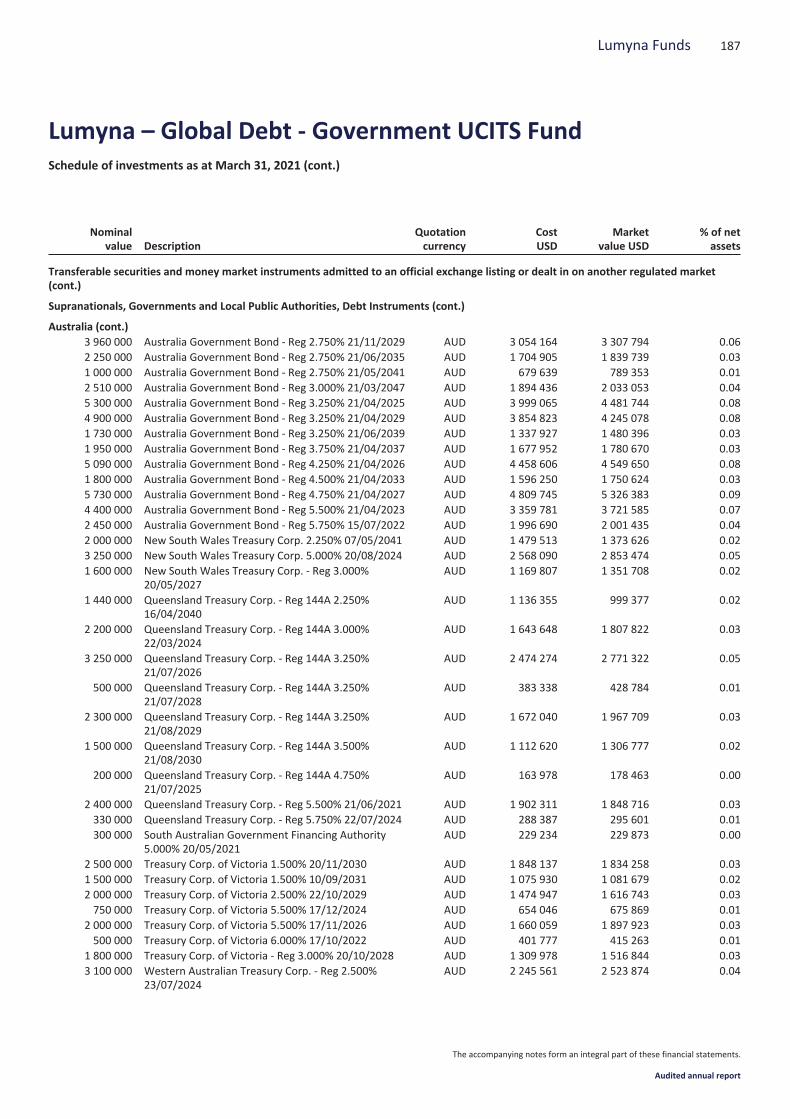
Nominalvalue Description
Quotationcurrency
CostUSD
Marketvalue USD
% of netassets
Transferable securities and money market instruments admitted to an official exchange listing or dealt in on another regulated market(cont.)
Supranationals, Governments and Local Public Authorities, Debt Instruments (cont.)
Australia (cont.)3 960 000 Australia Government Bond - Reg 2.750% 21/11/2029 AUD 3 054 164 3 307 794 0.062 250 000 Australia Government Bond - Reg 2.750% 21/06/2035 AUD 1 704 905 1 839 739 0.031 000 000 Australia Government Bond - Reg 2.750% 21/05/2041 AUD 679 639 789 353 0.012 510 000 Australia Government Bond - Reg 3.000% 21/03/2047 AUD 1 894 436 2 033 053 0.045 300 000 Australia Government Bond - Reg 3.250% 21/04/2025 AUD 3 999 065 4 481 744 0.084 900 000 Australia Government Bond - Reg 3.250% 21/04/2029 AUD 3 854 823 4 245 078 0.081 730 000 Australia Government Bond - Reg 3.250% 21/06/2039 AUD 1 337 927 1 480 396 0.031 950 000 Australia Government Bond - Reg 3.750% 21/04/2037 AUD 1 677 952 1 780 670 0.035 090 000 Australia Government Bond - Reg 4.250% 21/04/2026 AUD 4 458 606 4 549 650 0.081 800 000 Australia Government Bond - Reg 4.500% 21/04/2033 AUD 1 596 250 1 750 624 0.035 730 000 Australia Government Bond - Reg 4.750% 21/04/2027 AUD 4 809 745 5 326 383 0.094 400 000 Australia Government Bond - Reg 5.500% 21/04/2023 AUD 3 359 781 3 721 585 0.072 450 000 Australia Government Bond - Reg 5.750% 15/07/2022 AUD 1 996 690 2 001 435 0.042 000 000 New South Wales Treasury Corp. 2.250% 07/05/2041 AUD 1 479 513 1 373 626 0.023 250 000 New South Wales Treasury Corp. 5.000% 20/08/2024 AUD 2 568 090 2 853 474 0.051 600 000 New South Wales Treasury Corp. - Reg 3.000%
20/05/2027AUD 1 169 807 1 351 708 0.02
1 440 000 Queensland Treasury Corp. - Reg 144A 2.250%16/04/2040
AUD 1 136 355 999 377 0.02
2 200 000 Queensland Treasury Corp. - Reg 144A 3.000%22/03/2024
AUD 1 643 648 1 807 822 0.03
3 250 000 Queensland Treasury Corp. - Reg 144A 3.250%21/07/2026
AUD 2 474 274 2 771 322 0.05
500 000 Queensland Treasury Corp. - Reg 144A 3.250%21/07/2028
AUD 383 338 428 784 0.01
2 300 000 Queensland Treasury Corp. - Reg 144A 3.250%21/08/2029
AUD 1 672 040 1 967 709 0.03
1 500 000 Queensland Treasury Corp. - Reg 144A 3.500%21/08/2030
AUD 1 112 620 1 306 777 0.02
200 000 Queensland Treasury Corp. - Reg 144A 4.750%21/07/2025
AUD 163 978 178 463 0.00
2 400 000 Queensland Treasury Corp. - Reg 5.500% 21/06/2021 AUD 1 902 311 1 848 716 0.03330 000 Queensland Treasury Corp. - Reg 5.750% 22/07/2024 AUD 288 387 295 601 0.01300 000 South Australian Government Financing Authority
5.000% 20/05/2021AUD 229 234 229 873 0.00
2 500 000 Treasury Corp. of Victoria 1.500% 20/11/2030 AUD 1 848 137 1 834 258 0.031 500 000 Treasury Corp. of Victoria 1.500% 10/09/2031 AUD 1 075 930 1 081 679 0.022 000 000 Treasury Corp. of Victoria 2.500% 22/10/2029 AUD 1 474 947 1 616 743 0.03750 000 Treasury Corp. of Victoria 5.500% 17/12/2024 AUD 654 046 675 869 0.01
2 000 000 Treasury Corp. of Victoria 5.500% 17/11/2026 AUD 1 660 059 1 897 923 0.03500 000 Treasury Corp. of Victoria 6.000% 17/10/2022 AUD 401 777 415 263 0.01
1 800 000 Treasury Corp. of Victoria - Reg 3.000% 20/10/2028 AUD 1 309 978 1 516 844 0.033 100 000 Western Australian Treasury Corp. - Reg 2.500%
23/07/2024AUD 2 245 561 2 523 874 0.04
187Lumyna Funds
Lumyna – Global Debt - Government UCITS FundSchedule of investments as at March 31, 2021 (cont.)
The accompanying notes form an integral part of these financial statements.
Audited annual report
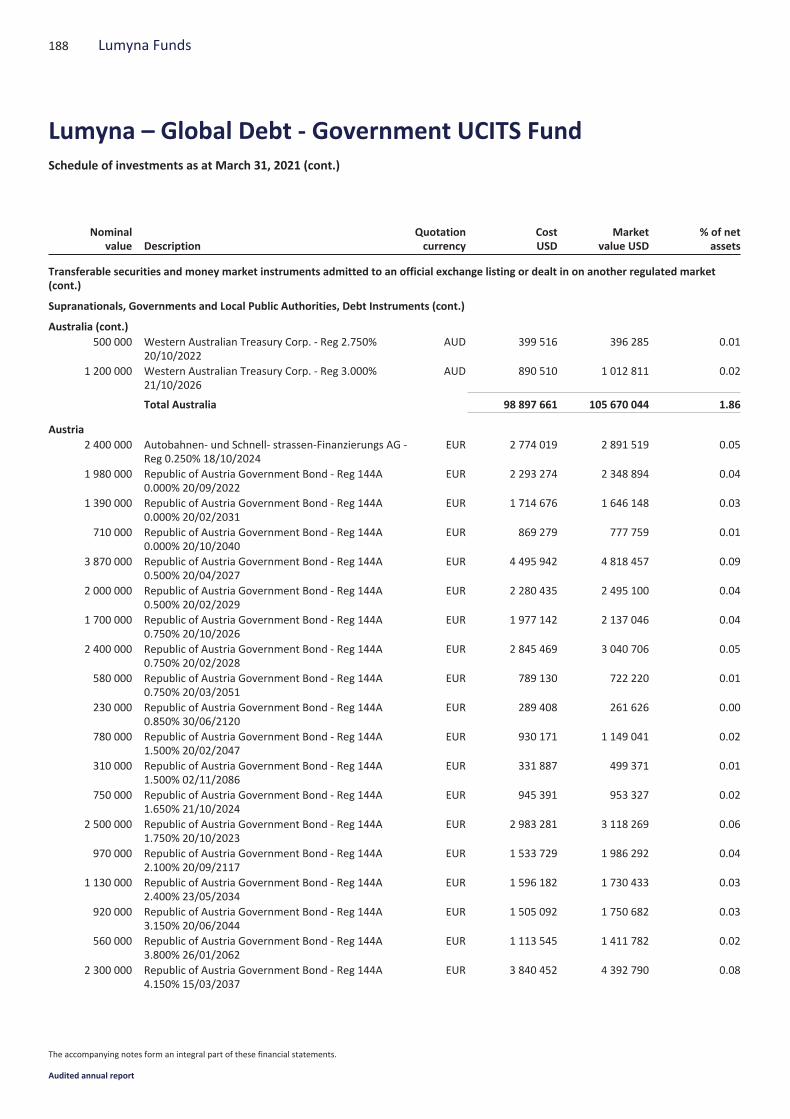
Nominalvalue Description
Quotationcurrency
CostUSD
Marketvalue USD
% of netassets
Transferable securities and money market instruments admitted to an official exchange listing or dealt in on another regulated market(cont.)
Supranationals, Governments and Local Public Authorities, Debt Instruments (cont.)
Australia (cont.)500 000 Western Australian Treasury Corp. - Reg 2.750%
20/10/2022AUD 399 516 396 285 0.01
1 200 000 Western Australian Treasury Corp. - Reg 3.000%21/10/2026
AUD 890 510 1 012 811 0.02
Total Australia 98 897 661 105 670 044 1.86
Austria2 400 000 Autobahnen- und Schnell- strassen-Finanzierungs AG -
Reg 0.250% 18/10/2024EUR 2 774 019 2 891 519 0.05
1 980 000 Republic of Austria Government Bond - Reg 144A0.000% 20/09/2022
EUR 2 293 274 2 348 894 0.04
1 390 000 Republic of Austria Government Bond - Reg 144A0.000% 20/02/2031
EUR 1 714 676 1 646 148 0.03
710 000 Republic of Austria Government Bond - Reg 144A0.000% 20/10/2040
EUR 869 279 777 759 0.01
3 870 000 Republic of Austria Government Bond - Reg 144A0.500% 20/04/2027
EUR 4 495 942 4 818 457 0.09
2 000 000 Republic of Austria Government Bond - Reg 144A0.500% 20/02/2029
EUR 2 280 435 2 495 100 0.04
1 700 000 Republic of Austria Government Bond - Reg 144A0.750% 20/10/2026
EUR 1 977 142 2 137 046 0.04
2 400 000 Republic of Austria Government Bond - Reg 144A0.750% 20/02/2028
EUR 2 845 469 3 040 706 0.05
580 000 Republic of Austria Government Bond - Reg 144A0.750% 20/03/2051
EUR 789 130 722 220 0.01
230 000 Republic of Austria Government Bond - Reg 144A0.850% 30/06/2120
EUR 289 408 261 626 0.00
780 000 Republic of Austria Government Bond - Reg 144A1.500% 20/02/2047
EUR 930 171 1 149 041 0.02
310 000 Republic of Austria Government Bond - Reg 144A1.500% 02/11/2086
EUR 331 887 499 371 0.01
750 000 Republic of Austria Government Bond - Reg 144A1.650% 21/10/2024
EUR 945 391 953 327 0.02
2 500 000 Republic of Austria Government Bond - Reg 144A1.750% 20/10/2023
EUR 2 983 281 3 118 269 0.06
970 000 Republic of Austria Government Bond - Reg 144A2.100% 20/09/2117
EUR 1 533 729 1 986 292 0.04
1 130 000 Republic of Austria Government Bond - Reg 144A2.400% 23/05/2034
EUR 1 596 182 1 730 433 0.03
920 000 Republic of Austria Government Bond - Reg 144A3.150% 20/06/2044
EUR 1 505 092 1 750 682 0.03
560 000 Republic of Austria Government Bond - Reg 144A3.800% 26/01/2062
EUR 1 113 545 1 411 782 0.02
2 300 000 Republic of Austria Government Bond - Reg 144A4.150% 15/03/2037
EUR 3 840 452 4 392 790 0.08
188 Lumyna Funds
Lumyna – Global Debt - Government UCITS FundSchedule of investments as at March 31, 2021 (cont.)
The accompanying notes form an integral part of these financial statements.
Audited annual report

Nominalvalue Description
Quotationcurrency
CostUSD
Marketvalue USD
% of netassets
Transferable securities and money market instruments admitted to an official exchange listing or dealt in on another regulated market(cont.)
Supranationals, Governments and Local Public Authorities, Debt Instruments (cont.)
Austria (cont.)1 870 000 Republic of Austria Government Bond - Reg 144A
4.850% 15/03/2026EUR 2 797 117 2 793 821 0.05
100 000 State of Lower Austria - Reg 0.000% 16/11/2035 EUR 119 483 110 832 0.00
Total Austria 38 025 104 41 036 115 0.72
Belgium1 380 000 Kingdom of Belgium Government Bond 4.000%
28/03/2022EUR 1 635 001 1 695 804 0.03
1 500 000 Kingdom of Belgium Government Bond - Reg 0.100%22/06/2030
EUR 1 884 803 1 799 847 0.03
1 200 000 Kingdom of Belgium Government Bond - Reg 144A0.200% 22/10/2023
EUR 1 478 928 1 441 338 0.03
2 240 000 Kingdom of Belgium Government Bond - Reg 144A0.500% 22/10/2024
EUR 2 664 623 2 737 567 0.05
650 000 Kingdom of Belgium Government Bond - Reg 144A0.650% 22/06/2071
EUR 707 907 659 401 0.01
2 000 000 Kingdom of Belgium Government Bond - Reg 144A0.800% 22/06/2025
EUR 2 393 971 2 488 607 0.04
3 240 000 Kingdom of Belgium Government Bond - Reg 144A0.800% 22/06/2027
EUR 3 776 877 4 100 133 0.07
1 370 000 Kingdom of Belgium Government Bond - Reg 144A0.800% 22/06/2028
EUR 1 653 177 1 742 998 0.03
2 000 000 Kingdom of Belgium Government Bond - Reg 144A0.800% 22/06/2028
EUR 2 334 365 2 544 523 0.05
2 250 000 Kingdom of Belgium Government Bond - Reg 144A0.900% 22/06/2029
EUR 2 627 035 2 890 535 0.05
2 980 000 Kingdom of Belgium Government Bond - Reg 144A1.000% 22/06/2026
EUR 3 566 665 3 779 782 0.07
3 000 000 Kingdom of Belgium Government Bond - Reg 144A1.000% 22/06/2031
EUR 3 493 905 3 904 580 0.07
2 220 000 Kingdom of Belgium Government Bond - Reg 1.250%22/04/2033
EUR 2 741 234 2 976 702 0.05
450 000 Kingdom of Belgium Government Bond - Reg 144A1.450% 22/06/2037
EUR 547 609 619 427 0.01
1 760 000 Kingdom of Belgium Government Bond - Reg 144A1.600% 22/06/2047
EUR 2 050 828 2 497 854 0.04
1 180 000 Kingdom of Belgium Government Bond - Reg 144A1.700% 22/06/2050
EUR 1 760 347 1 721 210 0.03
1 050 000 Kingdom of Belgium Government Bond - Reg 144A1.900% 22/06/2038
EUR 1 321 472 1 542 124 0.03
280 000 Kingdom of Belgium Government Bond - Reg 144A2.150% 22/06/2066
EUR 367 324 475 329 0.01
670 000 Kingdom of Belgium Government Bond - Reg 144A2.150% 22/06/2066
EUR 942 524 1 137 394 0.02
950 000 Kingdom of Belgium Government Bond - Reg 2.250%22/06/2023
EUR 1 225 773 1 189 306 0.02
189Lumyna Funds
Lumyna – Global Debt - Government UCITS FundSchedule of investments as at March 31, 2021 (cont.)
The accompanying notes form an integral part of these financial statements.
Audited annual report
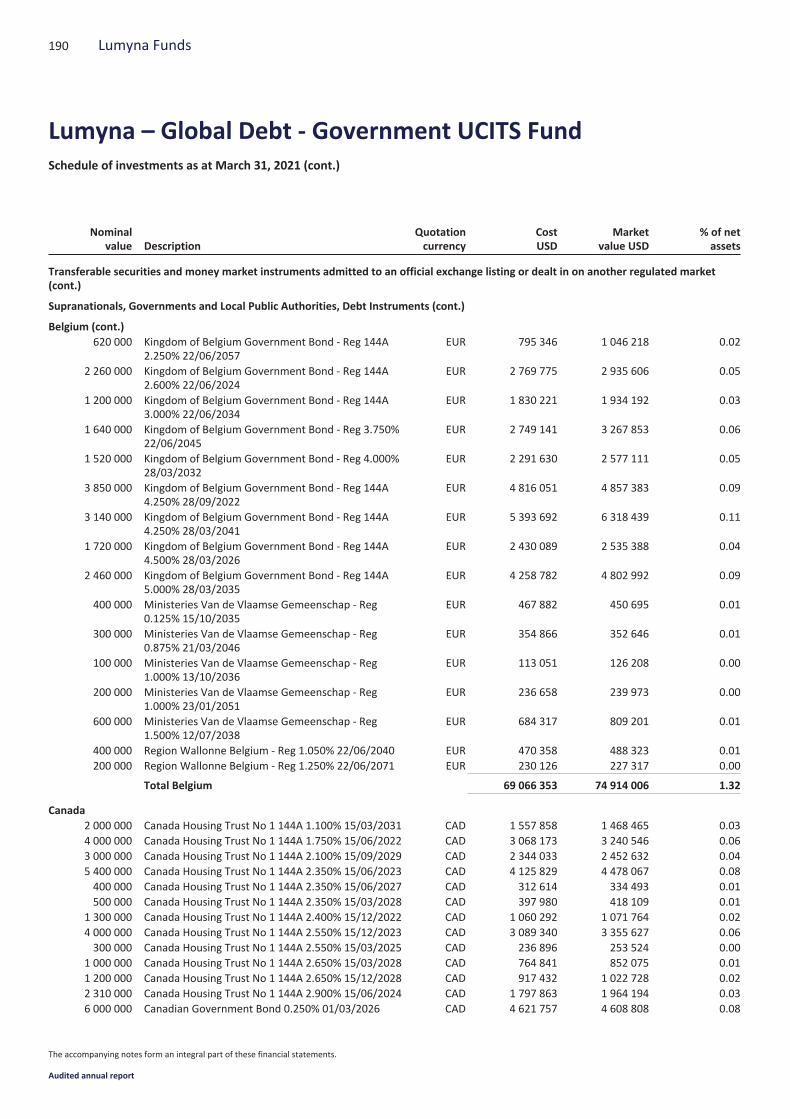
Nominalvalue Description
Quotationcurrency
CostUSD
Marketvalue USD
% of netassets
Transferable securities and money market instruments admitted to an official exchange listing or dealt in on another regulated market(cont.)
Supranationals, Governments and Local Public Authorities, Debt Instruments (cont.)
Belgium (cont.)620 000 Kingdom of Belgium Government Bond - Reg 144A
2.250% 22/06/2057EUR 795 346 1 046 218 0.02
2 260 000 Kingdom of Belgium Government Bond - Reg 144A2.600% 22/06/2024
EUR 2 769 775 2 935 606 0.05
1 200 000 Kingdom of Belgium Government Bond - Reg 144A3.000% 22/06/2034
EUR 1 830 221 1 934 192 0.03
1 640 000 Kingdom of Belgium Government Bond - Reg 3.750%22/06/2045
EUR 2 749 141 3 267 853 0.06
1 520 000 Kingdom of Belgium Government Bond - Reg 4.000%28/03/2032
EUR 2 291 630 2 577 111 0.05
3 850 000 Kingdom of Belgium Government Bond - Reg 144A4.250% 28/09/2022
EUR 4 816 051 4 857 383 0.09
3 140 000 Kingdom of Belgium Government Bond - Reg 144A4.250% 28/03/2041
EUR 5 393 692 6 318 439 0.11
1 720 000 Kingdom of Belgium Government Bond - Reg 144A4.500% 28/03/2026
EUR 2 430 089 2 535 388 0.04
2 460 000 Kingdom of Belgium Government Bond - Reg 144A5.000% 28/03/2035
EUR 4 258 782 4 802 992 0.09
400 000 Ministeries Van de Vlaamse Gemeenschap - Reg0.125% 15/10/2035
EUR 467 882 450 695 0.01
300 000 Ministeries Van de Vlaamse Gemeenschap - Reg0.875% 21/03/2046
EUR 354 866 352 646 0.01
100 000 Ministeries Van de Vlaamse Gemeenschap - Reg1.000% 13/10/2036
EUR 113 051 126 208 0.00
200 000 Ministeries Van de Vlaamse Gemeenschap - Reg1.000% 23/01/2051
EUR 236 658 239 973 0.00
600 000 Ministeries Van de Vlaamse Gemeenschap - Reg1.500% 12/07/2038
EUR 684 317 809 201 0.01
400 000 Region Wallonne Belgium - Reg 1.050% 22/06/2040 EUR 470 358 488 323 0.01200 000 Region Wallonne Belgium - Reg 1.250% 22/06/2071 EUR 230 126 227 317 0.00
Total Belgium 69 066 353 74 914 006 1.32
Canada2 000 000 Canada Housing Trust No 1 144A 1.100% 15/03/2031 CAD 1 557 858 1 468 465 0.034 000 000 Canada Housing Trust No 1 144A 1.750% 15/06/2022 CAD 3 068 173 3 240 546 0.063 000 000 Canada Housing Trust No 1 144A 2.100% 15/09/2029 CAD 2 344 033 2 452 632 0.045 400 000 Canada Housing Trust No 1 144A 2.350% 15/06/2023 CAD 4 125 829 4 478 067 0.08400 000 Canada Housing Trust No 1 144A 2.350% 15/06/2027 CAD 312 614 334 493 0.01500 000 Canada Housing Trust No 1 144A 2.350% 15/03/2028 CAD 397 980 418 109 0.01
1 300 000 Canada Housing Trust No 1 144A 2.400% 15/12/2022 CAD 1 060 292 1 071 764 0.024 000 000 Canada Housing Trust No 1 144A 2.550% 15/12/2023 CAD 3 089 340 3 355 627 0.06300 000 Canada Housing Trust No 1 144A 2.550% 15/03/2025 CAD 236 896 253 524 0.00
1 000 000 Canada Housing Trust No 1 144A 2.650% 15/03/2028 CAD 764 841 852 075 0.011 200 000 Canada Housing Trust No 1 144A 2.650% 15/12/2028 CAD 917 432 1 022 728 0.022 310 000 Canada Housing Trust No 1 144A 2.900% 15/06/2024 CAD 1 797 863 1 964 194 0.036 000 000 Canadian Government Bond 0.250% 01/03/2026 CAD 4 621 757 4 608 808 0.08
190 Lumyna Funds
Lumyna – Global Debt - Government UCITS FundSchedule of investments as at March 31, 2021 (cont.)
The accompanying notes form an integral part of these financial statements.
Audited annual report
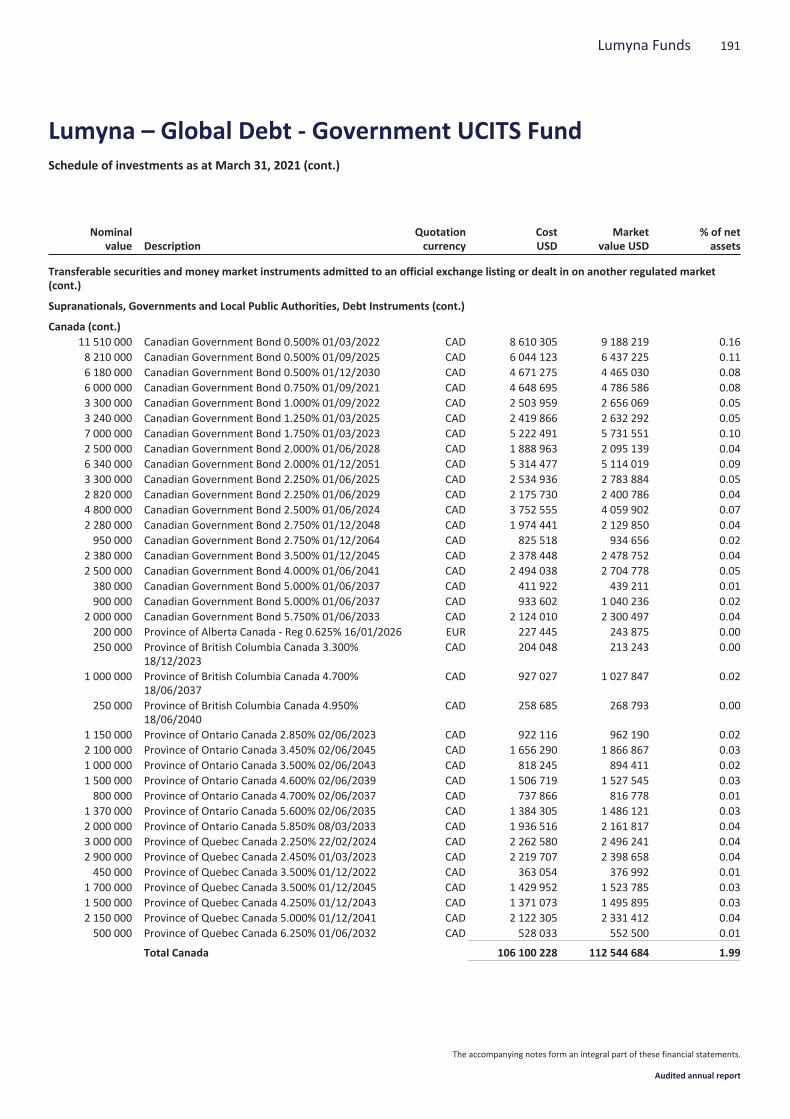
Nominalvalue Description
Quotationcurrency
CostUSD
Marketvalue USD
% of netassets
Transferable securities and money market instruments admitted to an official exchange listing or dealt in on another regulated market(cont.)
Supranationals, Governments and Local Public Authorities, Debt Instruments (cont.)
Canada (cont.)11 510 000 Canadian Government Bond 0.500% 01/03/2022 CAD 8 610 305 9 188 219 0.168 210 000 Canadian Government Bond 0.500% 01/09/2025 CAD 6 044 123 6 437 225 0.116 180 000 Canadian Government Bond 0.500% 01/12/2030 CAD 4 671 275 4 465 030 0.086 000 000 Canadian Government Bond 0.750% 01/09/2021 CAD 4 648 695 4 786 586 0.083 300 000 Canadian Government Bond 1.000% 01/09/2022 CAD 2 503 959 2 656 069 0.053 240 000 Canadian Government Bond 1.250% 01/03/2025 CAD 2 419 866 2 632 292 0.057 000 000 Canadian Government Bond 1.750% 01/03/2023 CAD 5 222 491 5 731 551 0.102 500 000 Canadian Government Bond 2.000% 01/06/2028 CAD 1 888 963 2 095 139 0.046 340 000 Canadian Government Bond 2.000% 01/12/2051 CAD 5 314 477 5 114 019 0.093 300 000 Canadian Government Bond 2.250% 01/06/2025 CAD 2 534 936 2 783 884 0.052 820 000 Canadian Government Bond 2.250% 01/06/2029 CAD 2 175 730 2 400 786 0.044 800 000 Canadian Government Bond 2.500% 01/06/2024 CAD 3 752 555 4 059 902 0.072 280 000 Canadian Government Bond 2.750% 01/12/2048 CAD 1 974 441 2 129 850 0.04950 000 Canadian Government Bond 2.750% 01/12/2064 CAD 825 518 934 656 0.02
2 380 000 Canadian Government Bond 3.500% 01/12/2045 CAD 2 378 448 2 478 752 0.042 500 000 Canadian Government Bond 4.000% 01/06/2041 CAD 2 494 038 2 704 778 0.05380 000 Canadian Government Bond 5.000% 01/06/2037 CAD 411 922 439 211 0.01900 000 Canadian Government Bond 5.000% 01/06/2037 CAD 933 602 1 040 236 0.02
2 000 000 Canadian Government Bond 5.750% 01/06/2033 CAD 2 124 010 2 300 497 0.04200 000 Province of Alberta Canada - Reg 0.625% 16/01/2026 EUR 227 445 243 875 0.00250 000 Province of British Columbia Canada 3.300%
18/12/2023CAD 204 048 213 243 0.00
1 000 000 Province of British Columbia Canada 4.700%18/06/2037
CAD 927 027 1 027 847 0.02
250 000 Province of British Columbia Canada 4.950%18/06/2040
CAD 258 685 268 793 0.00
1 150 000 Province of Ontario Canada 2.850% 02/06/2023 CAD 922 116 962 190 0.022 100 000 Province of Ontario Canada 3.450% 02/06/2045 CAD 1 656 290 1 866 867 0.031 000 000 Province of Ontario Canada 3.500% 02/06/2043 CAD 818 245 894 411 0.021 500 000 Province of Ontario Canada 4.600% 02/06/2039 CAD 1 506 719 1 527 545 0.03800 000 Province of Ontario Canada 4.700% 02/06/2037 CAD 737 866 816 778 0.01
1 370 000 Province of Ontario Canada 5.600% 02/06/2035 CAD 1 384 305 1 486 121 0.032 000 000 Province of Ontario Canada 5.850% 08/03/2033 CAD 1 936 516 2 161 817 0.043 000 000 Province of Quebec Canada 2.250% 22/02/2024 CAD 2 262 580 2 496 241 0.042 900 000 Province of Quebec Canada 2.450% 01/03/2023 CAD 2 219 707 2 398 658 0.04450 000 Province of Quebec Canada 3.500% 01/12/2022 CAD 363 054 376 992 0.01
1 700 000 Province of Quebec Canada 3.500% 01/12/2045 CAD 1 429 952 1 523 785 0.031 500 000 Province of Quebec Canada 4.250% 01/12/2043 CAD 1 371 073 1 495 895 0.032 150 000 Province of Quebec Canada 5.000% 01/12/2041 CAD 2 122 305 2 331 412 0.04500 000 Province of Quebec Canada 6.250% 01/06/2032 CAD 528 033 552 500 0.01
Total Canada 106 100 228 112 544 684 1.99
191Lumyna Funds
Lumyna – Global Debt - Government UCITS FundSchedule of investments as at March 31, 2021 (cont.)
The accompanying notes form an integral part of these financial statements.
Audited annual report
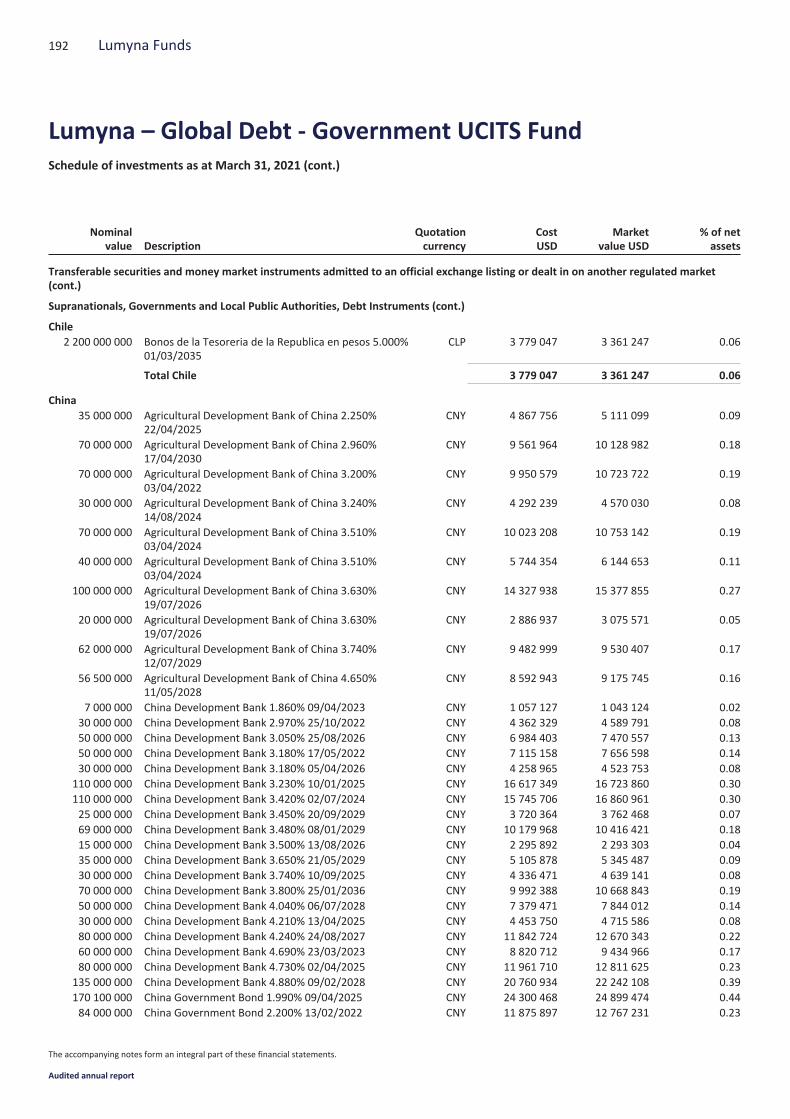
Nominalvalue Description
Quotationcurrency
CostUSD
Marketvalue USD
% of netassets
Transferable securities and money market instruments admitted to an official exchange listing or dealt in on another regulated market(cont.)
Supranationals, Governments and Local Public Authorities, Debt Instruments (cont.)
Chile2 200 000 000 Bonos de la Tesoreria de la Republica en pesos 5.000%
01/03/2035CLP 3 779 047 3 361 247 0.06
Total Chile 3 779 047 3 361 247 0.06
China35 000 000 Agricultural Development Bank of China 2.250%
22/04/2025CNY 4 867 756 5 111 099 0.09
70 000 000 Agricultural Development Bank of China 2.960%17/04/2030
CNY 9 561 964 10 128 982 0.18
70 000 000 Agricultural Development Bank of China 3.200%03/04/2022
CNY 9 950 579 10 723 722 0.19
30 000 000 Agricultural Development Bank of China 3.240%14/08/2024
CNY 4 292 239 4 570 030 0.08
70 000 000 Agricultural Development Bank of China 3.510%03/04/2024
CNY 10 023 208 10 753 142 0.19
40 000 000 Agricultural Development Bank of China 3.510%03/04/2024
CNY 5 744 354 6 144 653 0.11
100 000 000 Agricultural Development Bank of China 3.630%19/07/2026
CNY 14 327 938 15 377 855 0.27
20 000 000 Agricultural Development Bank of China 3.630%19/07/2026
CNY 2 886 937 3 075 571 0.05
62 000 000 Agricultural Development Bank of China 3.740%12/07/2029
CNY 9 482 999 9 530 407 0.17
56 500 000 Agricultural Development Bank of China 4.650%11/05/2028
CNY 8 592 943 9 175 745 0.16
7 000 000 China Development Bank 1.860% 09/04/2023 CNY 1 057 127 1 043 124 0.0230 000 000 China Development Bank 2.970% 25/10/2022 CNY 4 362 329 4 589 791 0.0850 000 000 China Development Bank 3.050% 25/08/2026 CNY 6 984 403 7 470 557 0.1350 000 000 China Development Bank 3.180% 17/05/2022 CNY 7 115 158 7 656 598 0.1430 000 000 China Development Bank 3.180% 05/04/2026 CNY 4 258 965 4 523 753 0.08
110 000 000 China Development Bank 3.230% 10/01/2025 CNY 16 617 349 16 723 860 0.30110 000 000 China Development Bank 3.420% 02/07/2024 CNY 15 745 706 16 860 961 0.3025 000 000 China Development Bank 3.450% 20/09/2029 CNY 3 720 364 3 762 468 0.0769 000 000 China Development Bank 3.480% 08/01/2029 CNY 10 179 968 10 416 421 0.1815 000 000 China Development Bank 3.500% 13/08/2026 CNY 2 295 892 2 293 303 0.0435 000 000 China Development Bank 3.650% 21/05/2029 CNY 5 105 878 5 345 487 0.0930 000 000 China Development Bank 3.740% 10/09/2025 CNY 4 336 471 4 639 141 0.0870 000 000 China Development Bank 3.800% 25/01/2036 CNY 9 992 388 10 668 843 0.1950 000 000 China Development Bank 4.040% 06/07/2028 CNY 7 379 471 7 844 012 0.1430 000 000 China Development Bank 4.210% 13/04/2025 CNY 4 453 750 4 715 586 0.0880 000 000 China Development Bank 4.240% 24/08/2027 CNY 11 842 724 12 670 343 0.2260 000 000 China Development Bank 4.690% 23/03/2023 CNY 8 820 712 9 434 966 0.1780 000 000 China Development Bank 4.730% 02/04/2025 CNY 11 961 710 12 811 625 0.23
135 000 000 China Development Bank 4.880% 09/02/2028 CNY 20 760 934 22 242 108 0.39170 100 000 China Government Bond 1.990% 09/04/2025 CNY 24 300 468 24 899 474 0.4484 000 000 China Government Bond 2.200% 13/02/2022 CNY 11 875 897 12 767 231 0.23
192 Lumyna Funds
Lumyna – Global Debt - Government UCITS FundSchedule of investments as at March 31, 2021 (cont.)
The accompanying notes form an integral part of these financial statements.
Audited annual report
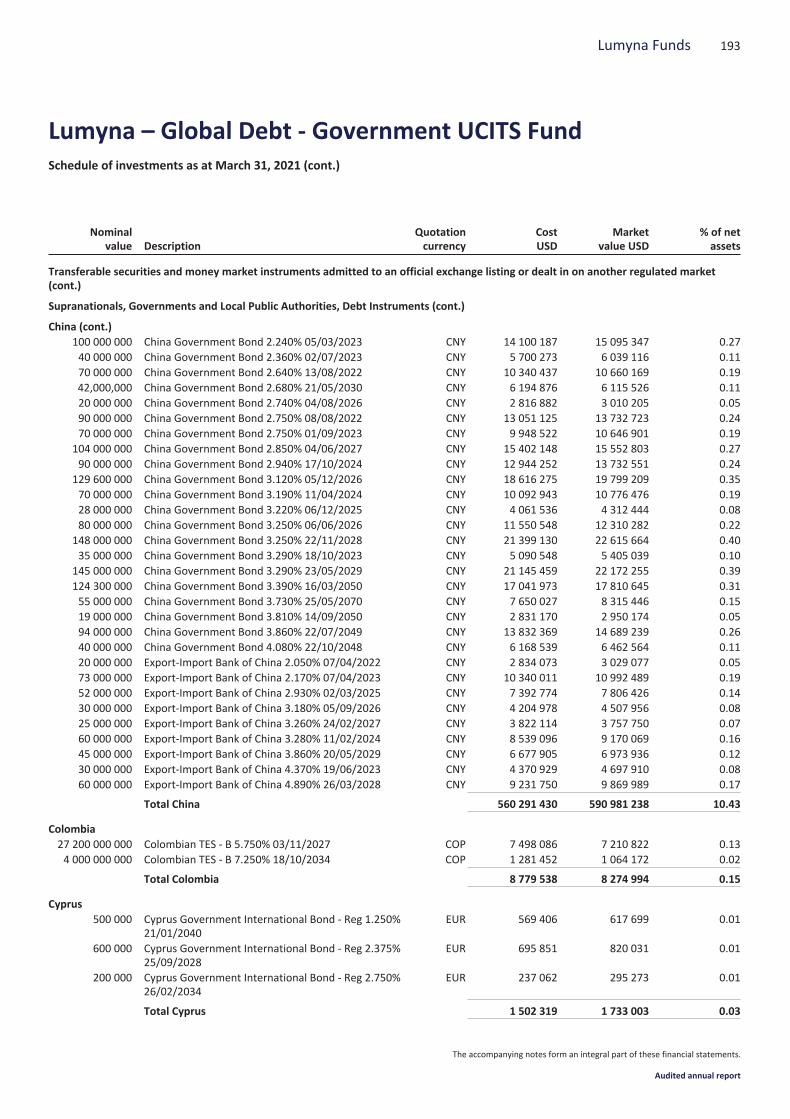
Nominalvalue Description
Quotationcurrency
CostUSD
Marketvalue USD
% of netassets
Transferable securities and money market instruments admitted to an official exchange listing or dealt in on another regulated market(cont.)
Supranationals, Governments and Local Public Authorities, Debt Instruments (cont.)
China (cont.)100 000 000 China Government Bond 2.240% 05/03/2023 CNY 14 100 187 15 095 347 0.2740 000 000 China Government Bond 2.360% 02/07/2023 CNY 5 700 273 6 039 116 0.1170 000 000 China Government Bond 2.640% 13/08/2022 CNY 10 340 437 10 660 169 0.1942,000,000 China Government Bond 2.680% 21/05/2030 CNY 6 194 876 6 115 526 0.1120 000 000 China Government Bond 2.740% 04/08/2026 CNY 2 816 882 3 010 205 0.0590 000 000 China Government Bond 2.750% 08/08/2022 CNY 13 051 125 13 732 723 0.2470 000 000 China Government Bond 2.750% 01/09/2023 CNY 9 948 522 10 646 901 0.19
104 000 000 China Government Bond 2.850% 04/06/2027 CNY 15 402 148 15 552 803 0.2790 000 000 China Government Bond 2.940% 17/10/2024 CNY 12 944 252 13 732 551 0.24
129 600 000 China Government Bond 3.120% 05/12/2026 CNY 18 616 275 19 799 209 0.3570 000 000 China Government Bond 3.190% 11/04/2024 CNY 10 092 943 10 776 476 0.1928 000 000 China Government Bond 3.220% 06/12/2025 CNY 4 061 536 4 312 444 0.0880 000 000 China Government Bond 3.250% 06/06/2026 CNY 11 550 548 12 310 282 0.22
148 000 000 China Government Bond 3.250% 22/11/2028 CNY 21 399 130 22 615 664 0.4035 000 000 China Government Bond 3.290% 18/10/2023 CNY 5 090 548 5 405 039 0.10
145 000 000 China Government Bond 3.290% 23/05/2029 CNY 21 145 459 22 172 255 0.39124 300 000 China Government Bond 3.390% 16/03/2050 CNY 17 041 973 17 810 645 0.3155 000 000 China Government Bond 3.730% 25/05/2070 CNY 7 650 027 8 315 446 0.1519 000 000 China Government Bond 3.810% 14/09/2050 CNY 2 831 170 2 950 174 0.0594 000 000 China Government Bond 3.860% 22/07/2049 CNY 13 832 369 14 689 239 0.2640 000 000 China Government Bond 4.080% 22/10/2048 CNY 6 168 539 6 462 564 0.1120 000 000 Export-Import Bank of China 2.050% 07/04/2022 CNY 2 834 073 3 029 077 0.0573 000 000 Export-Import Bank of China 2.170% 07/04/2023 CNY 10 340 011 10 992 489 0.1952 000 000 Export-Import Bank of China 2.930% 02/03/2025 CNY 7 392 774 7 806 426 0.1430 000 000 Export-Import Bank of China 3.180% 05/09/2026 CNY 4 204 978 4 507 956 0.0825 000 000 Export-Import Bank of China 3.260% 24/02/2027 CNY 3 822 114 3 757 750 0.0760 000 000 Export-Import Bank of China 3.280% 11/02/2024 CNY 8 539 096 9 170 069 0.1645 000 000 Export-Import Bank of China 3.860% 20/05/2029 CNY 6 677 905 6 973 936 0.1230 000 000 Export-Import Bank of China 4.370% 19/06/2023 CNY 4 370 929 4 697 910 0.0860 000 000 Export-Import Bank of China 4.890% 26/03/2028 CNY 9 231 750 9 869 989 0.17
Total China 560 291 430 590 981 238 10.43
Colombia27 200 000 000 Colombian TES - B 5.750% 03/11/2027 COP 7 498 086 7 210 822 0.134 000 000 000 Colombian TES - B 7.250% 18/10/2034 COP 1 281 452 1 064 172 0.02
Total Colombia 8 779 538 8 274 994 0.15
Cyprus500 000 Cyprus Government International Bond - Reg 1.250%
21/01/2040EUR 569 406 617 699 0.01
600 000 Cyprus Government International Bond - Reg 2.375%25/09/2028
EUR 695 851 820 031 0.01
200 000 Cyprus Government International Bond - Reg 2.750%26/02/2034
EUR 237 062 295 273 0.01
Total Cyprus 1 502 319 1 733 003 0.03
193Lumyna Funds
Lumyna – Global Debt - Government UCITS FundSchedule of investments as at March 31, 2021 (cont.)
The accompanying notes form an integral part of these financial statements.
Audited annual report

Nominalvalue Description
Quotationcurrency
CostUSD
Marketvalue USD
% of netassets
Transferable securities and money market instruments admitted to an official exchange listing or dealt in on another regulated market(cont.)
Supranationals, Governments and Local Public Authorities, Debt Instruments (cont.)
Czech Republic38 000 000 Czech Republic Government Bond 0.250% 10/02/2027 CZK 1 585 218 1 578 597 0.0355 000 000 Czech Republic Government Bond 1.250% 14/02/2025 CZK 2 572 995 2 464 303 0.0420 700 000 Czech Republic Government Bond 2.000% 13/10/2033 CZK 931 494 919 311 0.0245 000 000 Czech Republic Government Bond 2.750% 23/07/2029 CZK 2 109 292 2 168 111 0.0426 130 000 Czech Republic Government Bond - Reg 0.950%
15/05/2030CZK 1 078 191 1 082 850 0.02
3 000 000 Czech Republic Government Bond - Reg 4.200%04/12/2036
CZK 179 800 171 139 0.00
17 000 000 Czech Republic Government Bond - Reg 5.700%25/05/2024
CZK 922 683 873 172 0.01
Total Czech Republic 9 379 673 9 257 483 0.16
Denmark16 090 000 Denmark Government Bond 0.500% 15/11/2027 DKK 2 552 868 2 679 357 0.0524 200 000 Denmark Government Bond 1.500% 15/11/2023 DKK 3 928 694 4 026 318 0.0712 000 000 Denmark Government Bond 1.750% 15/11/2025 DKK 2 040 831 2 089 587 0.0319 570 000 Denmark Government Bond 4.500% 15/11/2039 DKK 5 043 010 5 498 075 0.1010 000 000 Denmark Government Bond - Reg 144A 0.500%
15/11/2029DKK 1 551 784 1 668 076 0.03
Total Denmark 15 117 187 15 961 413 0.28
Finland2 100 000 Finland Government Bond - Reg 144A 0.000%
15/09/2023EUR 2 425 806 2 507 634 0.04
750 000 Finland Government Bond - Reg 144A 0.125%15/04/2036
EUR 908 834 871 121 0.02
520 000 Finland Government Bond - Reg 144A 0.125%15/04/2052
EUR 579 289 546 343 0.01
600 000 Finland Government Bond - Reg 144A 0.250%15/09/2040
EUR 742 622 694 767 0.01
850 000 Finland Government Bond - Reg 144A 0.500%15/04/2026
EUR 1 043 339 1 052 172 0.02
1 240 000 Finland Government Bond - Reg 144A 0.500%15/09/2027
EUR 1 457 202 1 547 379 0.03
1 870 000 Finland Government Bond - Reg 144A 0.500%15/09/2028
EUR 2 138 780 2 336 593 0.04
1 700 000 Finland Government Bond - Reg 144A 0.750%15/04/2031
EUR 1 952 282 2 172 907 0.04
240 000 Finland Government Bond - Reg 144A 0.875%15/09/2025
EUR 295 238 300 501 0.01
560 000 Finland Government Bond - Reg 144A 1.375%15/04/2047
EUR 682 873 815 970 0.01
2 400 000 Finland Government Bond - Reg 144A 1.625%15/09/2022
EUR 2 899 472 2 914 654 0.05
920 000 Finland Government Bond - Reg 144A 2.000%15/04/2024
EUR 1 175 344 1 169 086 0.02
194 Lumyna Funds
Lumyna – Global Debt - Government UCITS FundSchedule of investments as at March 31, 2021 (cont.)
The accompanying notes form an integral part of these financial statements.
Audited annual report
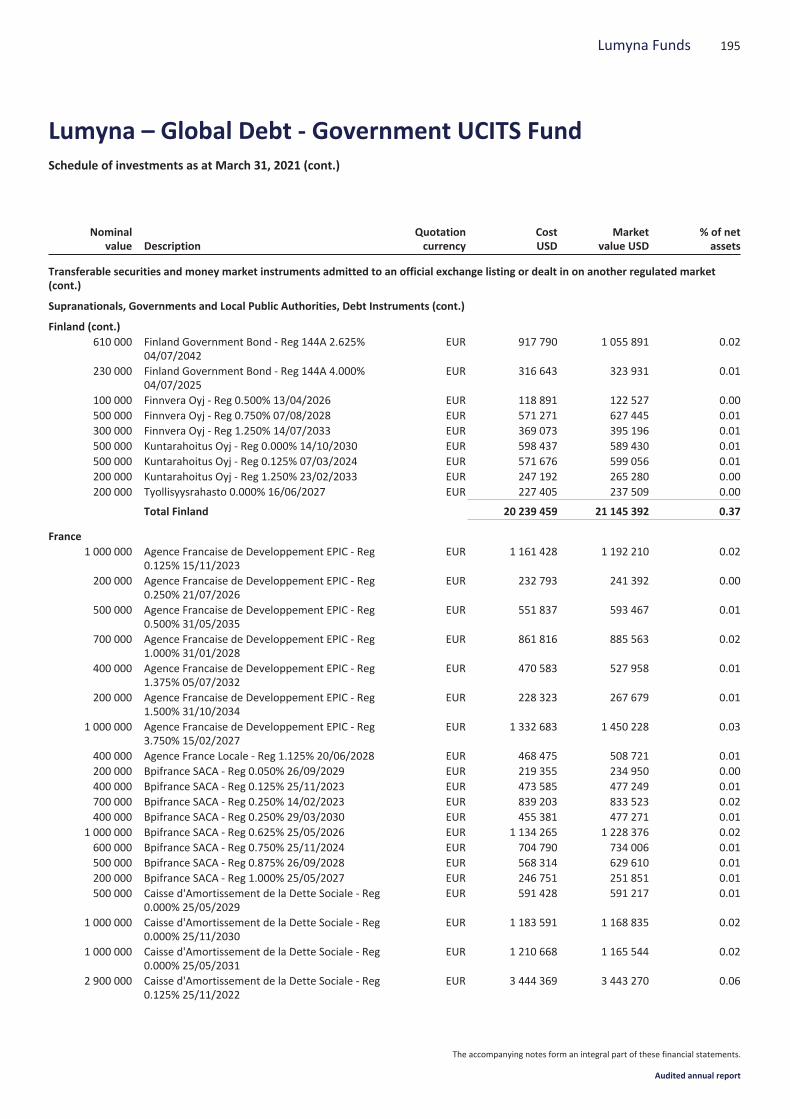
Nominalvalue Description
Quotationcurrency
CostUSD
Marketvalue USD
% of netassets
Transferable securities and money market instruments admitted to an official exchange listing or dealt in on another regulated market(cont.)
Supranationals, Governments and Local Public Authorities, Debt Instruments (cont.)
Finland (cont.)610 000 Finland Government Bond - Reg 144A 2.625%
04/07/2042EUR 917 790 1 055 891 0.02
230 000 Finland Government Bond - Reg 144A 4.000%04/07/2025
EUR 316 643 323 931 0.01
100 000 Finnvera Oyj - Reg 0.500% 13/04/2026 EUR 118 891 122 527 0.00500 000 Finnvera Oyj - Reg 0.750% 07/08/2028 EUR 571 271 627 445 0.01300 000 Finnvera Oyj - Reg 1.250% 14/07/2033 EUR 369 073 395 196 0.01500 000 Kuntarahoitus Oyj - Reg 0.000% 14/10/2030 EUR 598 437 589 430 0.01500 000 Kuntarahoitus Oyj - Reg 0.125% 07/03/2024 EUR 571 676 599 056 0.01200 000 Kuntarahoitus Oyj - Reg 1.250% 23/02/2033 EUR 247 192 265 280 0.00200 000 Tyollisyysrahasto 0.000% 16/06/2027 EUR 227 405 237 509 0.00
Total Finland 20 239 459 21 145 392 0.37
France1 000 000 Agence Francaise de Developpement EPIC - Reg
0.125% 15/11/2023EUR 1 161 428 1 192 210 0.02
200 000 Agence Francaise de Developpement EPIC - Reg0.250% 21/07/2026
EUR 232 793 241 392 0.00
500 000 Agence Francaise de Developpement EPIC - Reg0.500% 31/05/2035
EUR 551 837 593 467 0.01
700 000 Agence Francaise de Developpement EPIC - Reg1.000% 31/01/2028
EUR 861 816 885 563 0.02
400 000 Agence Francaise de Developpement EPIC - Reg1.375% 05/07/2032
EUR 470 583 527 958 0.01
200 000 Agence Francaise de Developpement EPIC - Reg1.500% 31/10/2034
EUR 228 323 267 679 0.01
1 000 000 Agence Francaise de Developpement EPIC - Reg3.750% 15/02/2027
EUR 1 332 683 1 450 228 0.03
400 000 Agence France Locale - Reg 1.125% 20/06/2028 EUR 468 475 508 721 0.01200 000 Bpifrance SACA - Reg 0.050% 26/09/2029 EUR 219 355 234 950 0.00400 000 Bpifrance SACA - Reg 0.125% 25/11/2023 EUR 473 585 477 249 0.01700 000 Bpifrance SACA - Reg 0.250% 14/02/2023 EUR 839 203 833 523 0.02400 000 Bpifrance SACA - Reg 0.250% 29/03/2030 EUR 455 381 477 271 0.01
1 000 000 Bpifrance SACA - Reg 0.625% 25/05/2026 EUR 1 134 265 1 228 376 0.02600 000 Bpifrance SACA - Reg 0.750% 25/11/2024 EUR 704 790 734 006 0.01500 000 Bpifrance SACA - Reg 0.875% 26/09/2028 EUR 568 314 629 610 0.01200 000 Bpifrance SACA - Reg 1.000% 25/05/2027 EUR 246 751 251 851 0.01500 000 Caisse d'Amortissement de la Dette Sociale - Reg
0.000% 25/05/2029EUR 591 428 591 217 0.01
1 000 000 Caisse d'Amortissement de la Dette Sociale - Reg0.000% 25/11/2030
EUR 1 183 591 1 168 835 0.02
1 000 000 Caisse d'Amortissement de la Dette Sociale - Reg0.000% 25/05/2031
EUR 1 210 668 1 165 544 0.02
2 900 000 Caisse d'Amortissement de la Dette Sociale - Reg0.125% 25/11/2022
EUR 3 444 369 3 443 270 0.06
195Lumyna Funds
Lumyna – Global Debt - Government UCITS FundSchedule of investments as at March 31, 2021 (cont.)
The accompanying notes form an integral part of these financial statements.
Audited annual report
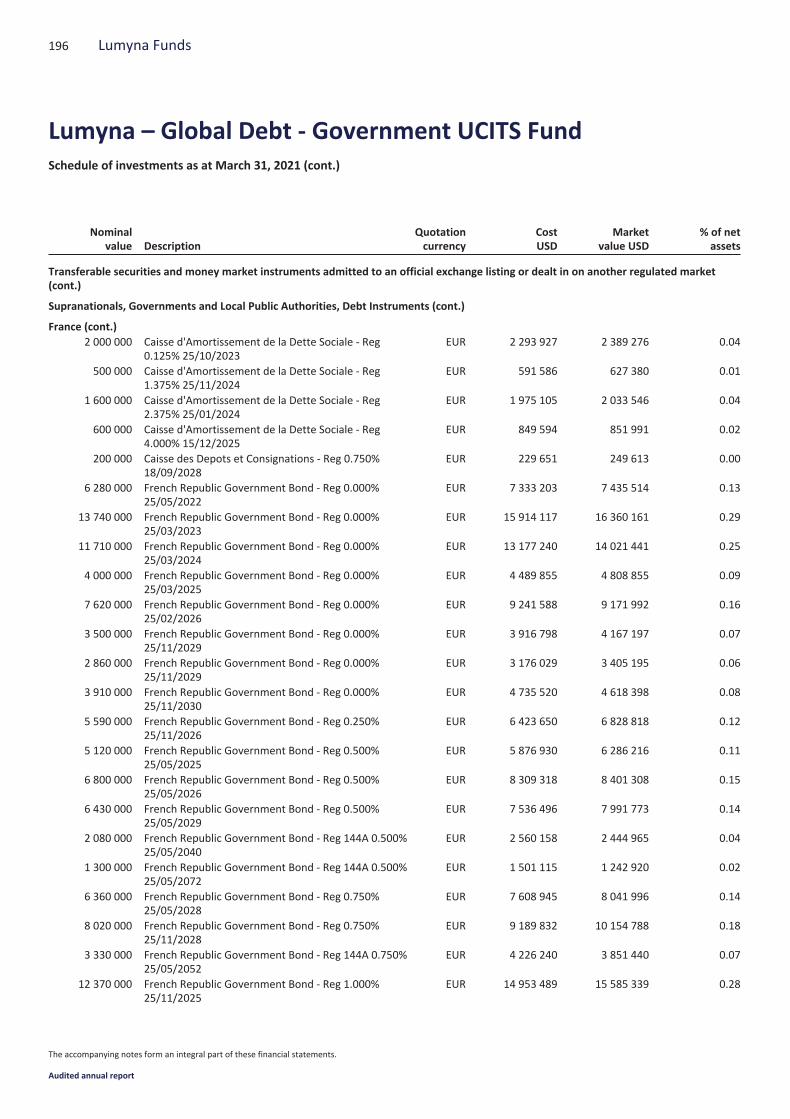
Nominalvalue Description
Quotationcurrency
CostUSD
Marketvalue USD
% of netassets
Transferable securities and money market instruments admitted to an official exchange listing or dealt in on another regulated market(cont.)
Supranationals, Governments and Local Public Authorities, Debt Instruments (cont.)
France (cont.)2 000 000 Caisse d'Amortissement de la Dette Sociale - Reg
0.125% 25/10/2023EUR 2 293 927 2 389 276 0.04
500 000 Caisse d'Amortissement de la Dette Sociale - Reg1.375% 25/11/2024
EUR 591 586 627 380 0.01
1 600 000 Caisse d'Amortissement de la Dette Sociale - Reg2.375% 25/01/2024
EUR 1 975 105 2 033 546 0.04
600 000 Caisse d'Amortissement de la Dette Sociale - Reg4.000% 15/12/2025
EUR 849 594 851 991 0.02
200 000 Caisse des Depots et Consignations - Reg 0.750%18/09/2028
EUR 229 651 249 613 0.00
6 280 000 French Republic Government Bond - Reg 0.000%25/05/2022
EUR 7 333 203 7 435 514 0.13
13 740 000 French Republic Government Bond - Reg 0.000%25/03/2023
EUR 15 914 117 16 360 161 0.29
11 710 000 French Republic Government Bond - Reg 0.000%25/03/2024
EUR 13 177 240 14 021 441 0.25
4 000 000 French Republic Government Bond - Reg 0.000%25/03/2025
EUR 4 489 855 4 808 855 0.09
7 620 000 French Republic Government Bond - Reg 0.000%25/02/2026
EUR 9 241 588 9 171 992 0.16
3 500 000 French Republic Government Bond - Reg 0.000%25/11/2029
EUR 3 916 798 4 167 197 0.07
2 860 000 French Republic Government Bond - Reg 0.000%25/11/2029
EUR 3 176 029 3 405 195 0.06
3 910 000 French Republic Government Bond - Reg 0.000%25/11/2030
EUR 4 735 520 4 618 398 0.08
5 590 000 French Republic Government Bond - Reg 0.250%25/11/2026
EUR 6 423 650 6 828 818 0.12
5 120 000 French Republic Government Bond - Reg 0.500%25/05/2025
EUR 5 876 930 6 286 216 0.11
6 800 000 French Republic Government Bond - Reg 0.500%25/05/2026
EUR 8 309 318 8 401 308 0.15
6 430 000 French Republic Government Bond - Reg 0.500%25/05/2029
EUR 7 536 496 7 991 773 0.14
2 080 000 French Republic Government Bond - Reg 144A 0.500%25/05/2040
EUR 2 560 158 2 444 965 0.04
1 300 000 French Republic Government Bond - Reg 144A 0.500%25/05/2072
EUR 1 501 115 1 242 920 0.02
6 360 000 French Republic Government Bond - Reg 0.750%25/05/2028
EUR 7 608 945 8 041 996 0.14
8 020 000 French Republic Government Bond - Reg 0.750%25/11/2028
EUR 9 189 832 10 154 788 0.18
3 330 000 French Republic Government Bond - Reg 144A 0.750%25/05/2052
EUR 4 226 240 3 851 440 0.07
12 370 000 French Republic Government Bond - Reg 1.000%25/11/2025
EUR 14 953 489 15 585 339 0.28
196 Lumyna Funds
Lumyna – Global Debt - Government UCITS FundSchedule of investments as at March 31, 2021 (cont.)
The accompanying notes form an integral part of these financial statements.
Audited annual report
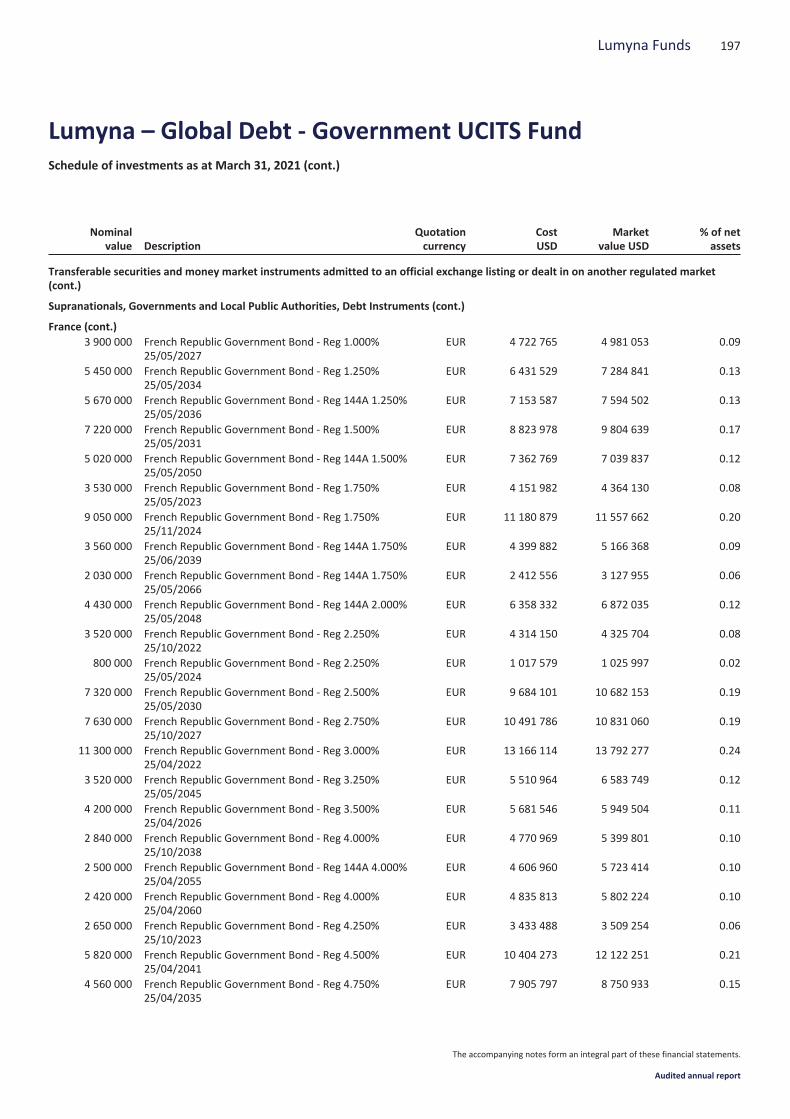
Nominalvalue Description
Quotationcurrency
CostUSD
Marketvalue USD
% of netassets
Transferable securities and money market instruments admitted to an official exchange listing or dealt in on another regulated market(cont.)
Supranationals, Governments and Local Public Authorities, Debt Instruments (cont.)
France (cont.)3 900 000 French Republic Government Bond - Reg 1.000%
25/05/2027EUR 4 722 765 4 981 053 0.09
5 450 000 French Republic Government Bond - Reg 1.250%25/05/2034
EUR 6 431 529 7 284 841 0.13
5 670 000 French Republic Government Bond - Reg 144A 1.250%25/05/2036
EUR 7 153 587 7 594 502 0.13
7 220 000 French Republic Government Bond - Reg 1.500%25/05/2031
EUR 8 823 978 9 804 639 0.17
5 020 000 French Republic Government Bond - Reg 144A 1.500%25/05/2050
EUR 7 362 769 7 039 837 0.12
3 530 000 French Republic Government Bond - Reg 1.750%25/05/2023
EUR 4 151 982 4 364 130 0.08
9 050 000 French Republic Government Bond - Reg 1.750%25/11/2024
EUR 11 180 879 11 557 662 0.20
3 560 000 French Republic Government Bond - Reg 144A 1.750%25/06/2039
EUR 4 399 882 5 166 368 0.09
2 030 000 French Republic Government Bond - Reg 144A 1.750%25/05/2066
EUR 2 412 556 3 127 955 0.06
4 430 000 French Republic Government Bond - Reg 144A 2.000%25/05/2048
EUR 6 358 332 6 872 035 0.12
3 520 000 French Republic Government Bond - Reg 2.250%25/10/2022
EUR 4 314 150 4 325 704 0.08
800 000 French Republic Government Bond - Reg 2.250%25/05/2024
EUR 1 017 579 1 025 997 0.02
7 320 000 French Republic Government Bond - Reg 2.500%25/05/2030
EUR 9 684 101 10 682 153 0.19
7 630 000 French Republic Government Bond - Reg 2.750%25/10/2027
EUR 10 491 786 10 831 060 0.19
11 300 000 French Republic Government Bond - Reg 3.000%25/04/2022
EUR 13 166 114 13 792 277 0.24
3 520 000 French Republic Government Bond - Reg 3.250%25/05/2045
EUR 5 510 964 6 583 749 0.12
4 200 000 French Republic Government Bond - Reg 3.500%25/04/2026
EUR 5 681 546 5 949 504 0.11
2 840 000 French Republic Government Bond - Reg 4.000%25/10/2038
EUR 4 770 969 5 399 801 0.10
2 500 000 French Republic Government Bond - Reg 144A 4.000%25/04/2055
EUR 4 606 960 5 723 414 0.10
2 420 000 French Republic Government Bond - Reg 4.000%25/04/2060
EUR 4 835 813 5 802 224 0.10
2 650 000 French Republic Government Bond - Reg 4.250%25/10/2023
EUR 3 433 488 3 509 254 0.06
5 820 000 French Republic Government Bond - Reg 4.500%25/04/2041
EUR 10 404 273 12 122 251 0.21
4 560 000 French Republic Government Bond - Reg 4.750%25/04/2035
EUR 7 905 797 8 750 933 0.15
197Lumyna Funds
Lumyna – Global Debt - Government UCITS FundSchedule of investments as at March 31, 2021 (cont.)
The accompanying notes form an integral part of these financial statements.
Audited annual report

Nominalvalue Description
Quotationcurrency
CostUSD
Marketvalue USD
% of netassets
Transferable securities and money market instruments admitted to an official exchange listing or dealt in on another regulated market(cont.)
Supranationals, Governments and Local Public Authorities, Debt Instruments (cont.)
France (cont.)4 090 000 French Republic Government Bond - Reg 5.750%
25/10/2032EUR 7 308 364 7 986 231 0.14
600 000 Gestion Securite de Stocks Securite S.A. - Reg 0.625%25/05/2023
EUR 701 336 719 453 0.01
100 000 Gestion Securite de Stocks Securite S.A. - Reg 0.625%20/10/2028
EUR 117 234 122 420 0.00
800 000 Regie Autonome des Transports Parisiens - Reg 0.875%25/05/2027
EUR 930 340 996 357 0.02
400 000 Region of Ile de France - Reg 0.500% 14/06/2025 EUR 489 515 486 660 0.01500 000 Region of Ile de France - Reg 1.375% 20/06/2033 EUR 584 355 658 579 0.01500 000 SFIL S.A. - Reg 0.000% 24/05/2024 EUR 559 247 594 971 0.01200 000 SFIL S.A. - Reg 0.750% 06/02/2026 EUR 244 318 246 530 0.00500 000 SNCF EPIC - Reg 0.625% 17/04/2030 EUR 554 600 611 621 0.01800 000 SNCF Reseau 4.375% 02/06/2022 EUR 1 045 485 992 611 0.02600 000 SNCF Reseau - Reg 0.750% 25/05/2036 EUR 675 646 728 109 0.01100 000 SNCF Reseau - Reg 1.875% 30/03/2034 EUR 126 555 138 613 0.00400 000 SNCF Reseau - Reg 2.000% 05/02/2048 EUR 477 376 567 036 0.01200 000 SNCF Reseau - Reg 2.625% 29/12/2025 EUR 260 788 267 142 0.01700 000 SNCF Reseau - Reg 4.250% 07/10/2026 EUR 1 025 183 1 025 072 0.02500 000 Societe Du Grand Paris EPIC - Reg 0.700% 15/10/2060 EUR 592 943 520 599 0.01500 000 Societe Du Grand Paris EPIC - Reg 1.000% 18/02/2070 EUR 588 311 559 971 0.01200 000 Societe Du Grand Paris EPIC - Reg 1.125% 22/10/2028 EUR 230 187 256 380 0.01
1 000 000 Societe Du Grand Paris EPIC - Reg 1.125% 25/05/2034 EUR 1 217 311 1 284 774 0.02100 000 Societe Nationale SNCF S.A. - Reg 1.000% 25/05/2040 EUR 113 603 118 272 0.00300 000 Societe Nationale SNCF S.A. - Reg 1.000% 19/01/2061 EUR 354 087 306 819 0.01100 000 Societe Nationale SNCF S.A. - Reg 1.500% 02/02/2029 EUR 123 347 129 694 0.00
1 000 000 Societe Nationale SNCF S.A. - Reg 4.875% 12/06/2023 EUR 1 283 297 1 310 412 0.021 600 000 UNEDIC ASSEO 0.125% 25/11/2024 EUR 1 861 423 1 915 099 0.03500 000 UNEDIC ASSEO - Reg 0.000% 25/11/2028 EUR 596 196 592 714 0.01500 000 UNEDIC ASSEO - Reg 0.000% 19/11/2030 EUR 609 349 584 565 0.01500 000 UNEDIC ASSEO - Reg 0.010% 25/05/2031 EUR 583 454 582 996 0.01400 000 UNEDIC ASSEO - Reg 0.100% 25/05/2034 EUR 474 291 459 034 0.01400 000 UNEDIC ASSEO - Reg 0.125% 25/05/2022 EUR 482 352 473 407 0.01
1 000 000 UNEDIC ASSEO - Reg 0.250% 25/11/2029 EUR 1 146 633 1 202 581 0.021 000 000 UNEDIC ASSEO - Reg 0.875% 25/05/2028 EUR 1 155 444 1 261 566 0.02300 000 UNEDIC ASSEO - Reg 1.250% 28/03/2027 EUR 381 565 384 292 0.01
1 000 000 UNEDIC ASSEO - Reg 1.500% 20/04/2032 EUR 1 217 498 1 351 237 0.02400 000 Ville de Paris - Reg 1.375% 20/11/2034 EUR 460 312 524 541 0.01
Total France 329 883 768 350 124 743 6.18
Germany10 000 000 Bundesobligation - Reg 0.000% 08/04/2022 EUR 12 314 906 11 831 011 0.215 720 000 Bundesrepublik Deutschland Bundesanleihe - Reg
0.000% 15/08/2026EUR 6 538 601 6 953 853 0.12
198 Lumyna Funds
Lumyna – Global Debt - Government UCITS FundSchedule of investments as at March 31, 2021 (cont.)
The accompanying notes form an integral part of these financial statements.
Audited annual report
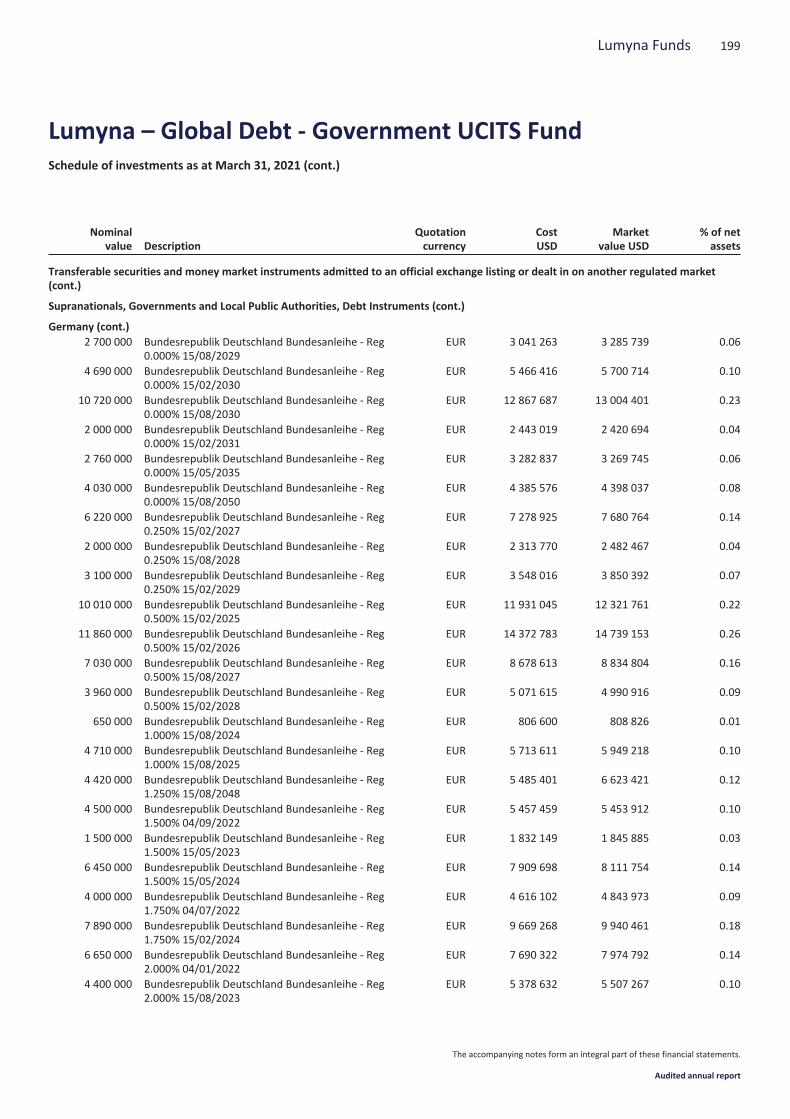
Nominalvalue Description
Quotationcurrency
CostUSD
Marketvalue USD
% of netassets
Transferable securities and money market instruments admitted to an official exchange listing or dealt in on another regulated market(cont.)
Supranationals, Governments and Local Public Authorities, Debt Instruments (cont.)
Germany (cont.)2 700 000 Bundesrepublik Deutschland Bundesanleihe - Reg
0.000% 15/08/2029EUR 3 041 263 3 285 739 0.06
4 690 000 Bundesrepublik Deutschland Bundesanleihe - Reg0.000% 15/02/2030
EUR 5 466 416 5 700 714 0.10
10 720 000 Bundesrepublik Deutschland Bundesanleihe - Reg0.000% 15/08/2030
EUR 12 867 687 13 004 401 0.23
2 000 000 Bundesrepublik Deutschland Bundesanleihe - Reg0.000% 15/02/2031
EUR 2 443 019 2 420 694 0.04
2 760 000 Bundesrepublik Deutschland Bundesanleihe - Reg0.000% 15/05/2035
EUR 3 282 837 3 269 745 0.06
4 030 000 Bundesrepublik Deutschland Bundesanleihe - Reg0.000% 15/08/2050
EUR 4 385 576 4 398 037 0.08
6 220 000 Bundesrepublik Deutschland Bundesanleihe - Reg0.250% 15/02/2027
EUR 7 278 925 7 680 764 0.14
2 000 000 Bundesrepublik Deutschland Bundesanleihe - Reg0.250% 15/08/2028
EUR 2 313 770 2 482 467 0.04
3 100 000 Bundesrepublik Deutschland Bundesanleihe - Reg0.250% 15/02/2029
EUR 3 548 016 3 850 392 0.07
10 010 000 Bundesrepublik Deutschland Bundesanleihe - Reg0.500% 15/02/2025
EUR 11 931 045 12 321 761 0.22
11 860 000 Bundesrepublik Deutschland Bundesanleihe - Reg0.500% 15/02/2026
EUR 14 372 783 14 739 153 0.26
7 030 000 Bundesrepublik Deutschland Bundesanleihe - Reg0.500% 15/08/2027
EUR 8 678 613 8 834 804 0.16
3 960 000 Bundesrepublik Deutschland Bundesanleihe - Reg0.500% 15/02/2028
EUR 5 071 615 4 990 916 0.09
650 000 Bundesrepublik Deutschland Bundesanleihe - Reg1.000% 15/08/2024
EUR 806 600 808 826 0.01
4 710 000 Bundesrepublik Deutschland Bundesanleihe - Reg1.000% 15/08/2025
EUR 5 713 611 5 949 218 0.10
4 420 000 Bundesrepublik Deutschland Bundesanleihe - Reg1.250% 15/08/2048
EUR 5 485 401 6 623 421 0.12
4 500 000 Bundesrepublik Deutschland Bundesanleihe - Reg1.500% 04/09/2022
EUR 5 457 459 5 453 912 0.10
1 500 000 Bundesrepublik Deutschland Bundesanleihe - Reg1.500% 15/05/2023
EUR 1 832 149 1 845 885 0.03
6 450 000 Bundesrepublik Deutschland Bundesanleihe - Reg1.500% 15/05/2024
EUR 7 909 698 8 111 754 0.14
4 000 000 Bundesrepublik Deutschland Bundesanleihe - Reg1.750% 04/07/2022
EUR 4 616 102 4 843 973 0.09
7 890 000 Bundesrepublik Deutschland Bundesanleihe - Reg1.750% 15/02/2024
EUR 9 669 268 9 940 461 0.18
6 650 000 Bundesrepublik Deutschland Bundesanleihe - Reg2.000% 04/01/2022
EUR 7 690 322 7 974 792 0.14
4 400 000 Bundesrepublik Deutschland Bundesanleihe - Reg2.000% 15/08/2023
EUR 5 378 632 5 507 267 0.10
199Lumyna Funds
Lumyna – Global Debt - Government UCITS FundSchedule of investments as at March 31, 2021 (cont.)
The accompanying notes form an integral part of these financial statements.
Audited annual report
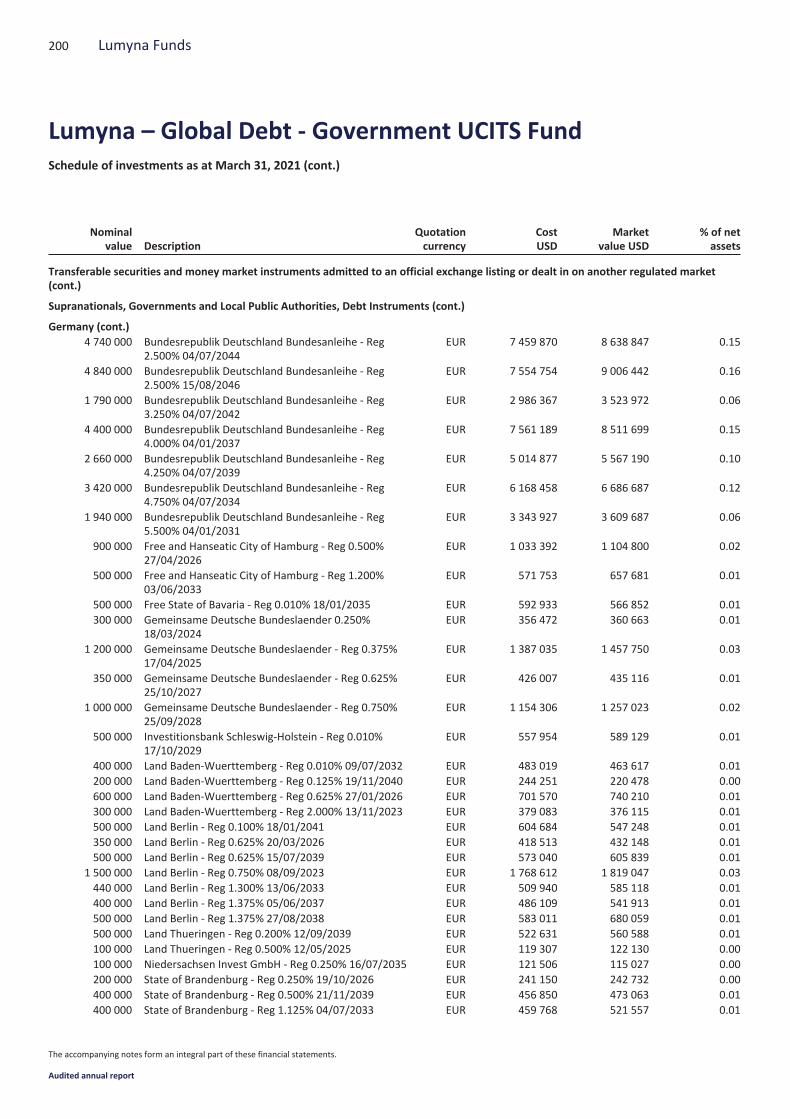
Nominalvalue Description
Quotationcurrency
CostUSD
Marketvalue USD
% of netassets
Transferable securities and money market instruments admitted to an official exchange listing or dealt in on another regulated market(cont.)
Supranationals, Governments and Local Public Authorities, Debt Instruments (cont.)
Germany (cont.)4 740 000 Bundesrepublik Deutschland Bundesanleihe - Reg
2.500% 04/07/2044EUR 7 459 870 8 638 847 0.15
4 840 000 Bundesrepublik Deutschland Bundesanleihe - Reg2.500% 15/08/2046
EUR 7 554 754 9 006 442 0.16
1 790 000 Bundesrepublik Deutschland Bundesanleihe - Reg3.250% 04/07/2042
EUR 2 986 367 3 523 972 0.06
4 400 000 Bundesrepublik Deutschland Bundesanleihe - Reg4.000% 04/01/2037
EUR 7 561 189 8 511 699 0.15
2 660 000 Bundesrepublik Deutschland Bundesanleihe - Reg4.250% 04/07/2039
EUR 5 014 877 5 567 190 0.10
3 420 000 Bundesrepublik Deutschland Bundesanleihe - Reg4.750% 04/07/2034
EUR 6 168 458 6 686 687 0.12
1 940 000 Bundesrepublik Deutschland Bundesanleihe - Reg5.500% 04/01/2031
EUR 3 343 927 3 609 687 0.06
900 000 Free and Hanseatic City of Hamburg - Reg 0.500%27/04/2026
EUR 1 033 392 1 104 800 0.02
500 000 Free and Hanseatic City of Hamburg - Reg 1.200%03/06/2033
EUR 571 753 657 681 0.01
500 000 Free State of Bavaria - Reg 0.010% 18/01/2035 EUR 592 933 566 852 0.01300 000 Gemeinsame Deutsche Bundeslaender 0.250%
18/03/2024EUR 356 472 360 663 0.01
1 200 000 Gemeinsame Deutsche Bundeslaender - Reg 0.375%17/04/2025
EUR 1 387 035 1 457 750 0.03
350 000 Gemeinsame Deutsche Bundeslaender - Reg 0.625%25/10/2027
EUR 426 007 435 116 0.01
1 000 000 Gemeinsame Deutsche Bundeslaender - Reg 0.750%25/09/2028
EUR 1 154 306 1 257 023 0.02
500 000 Investitionsbank Schleswig-Holstein - Reg 0.010%17/10/2029
EUR 557 954 589 129 0.01
400 000 Land Baden-Wuerttemberg - Reg 0.010% 09/07/2032 EUR 483 019 463 617 0.01200 000 Land Baden-Wuerttemberg - Reg 0.125% 19/11/2040 EUR 244 251 220 478 0.00600 000 Land Baden-Wuerttemberg - Reg 0.625% 27/01/2026 EUR 701 570 740 210 0.01300 000 Land Baden-Wuerttemberg - Reg 2.000% 13/11/2023 EUR 379 083 376 115 0.01500 000 Land Berlin - Reg 0.100% 18/01/2041 EUR 604 684 547 248 0.01350 000 Land Berlin - Reg 0.625% 20/03/2026 EUR 418 513 432 148 0.01500 000 Land Berlin - Reg 0.625% 15/07/2039 EUR 573 040 605 839 0.01
1 500 000 Land Berlin - Reg 0.750% 08/09/2023 EUR 1 768 612 1 819 047 0.03440 000 Land Berlin - Reg 1.300% 13/06/2033 EUR 509 940 585 118 0.01400 000 Land Berlin - Reg 1.375% 05/06/2037 EUR 486 109 541 913 0.01500 000 Land Berlin - Reg 1.375% 27/08/2038 EUR 583 011 680 059 0.01500 000 Land Thueringen - Reg 0.200% 12/09/2039 EUR 522 631 560 588 0.01100 000 Land Thueringen - Reg 0.500% 12/05/2025 EUR 119 307 122 130 0.00100 000 Niedersachsen Invest GmbH - Reg 0.250% 16/07/2035 EUR 121 506 115 027 0.00200 000 State of Brandenburg - Reg 0.250% 19/10/2026 EUR 241 150 242 732 0.00400 000 State of Brandenburg - Reg 0.500% 21/11/2039 EUR 456 850 473 063 0.01400 000 State of Brandenburg - Reg 1.125% 04/07/2033 EUR 459 768 521 557 0.01
200 Lumyna Funds
Lumyna – Global Debt - Government UCITS FundSchedule of investments as at March 31, 2021 (cont.)
The accompanying notes form an integral part of these financial statements.
Audited annual report
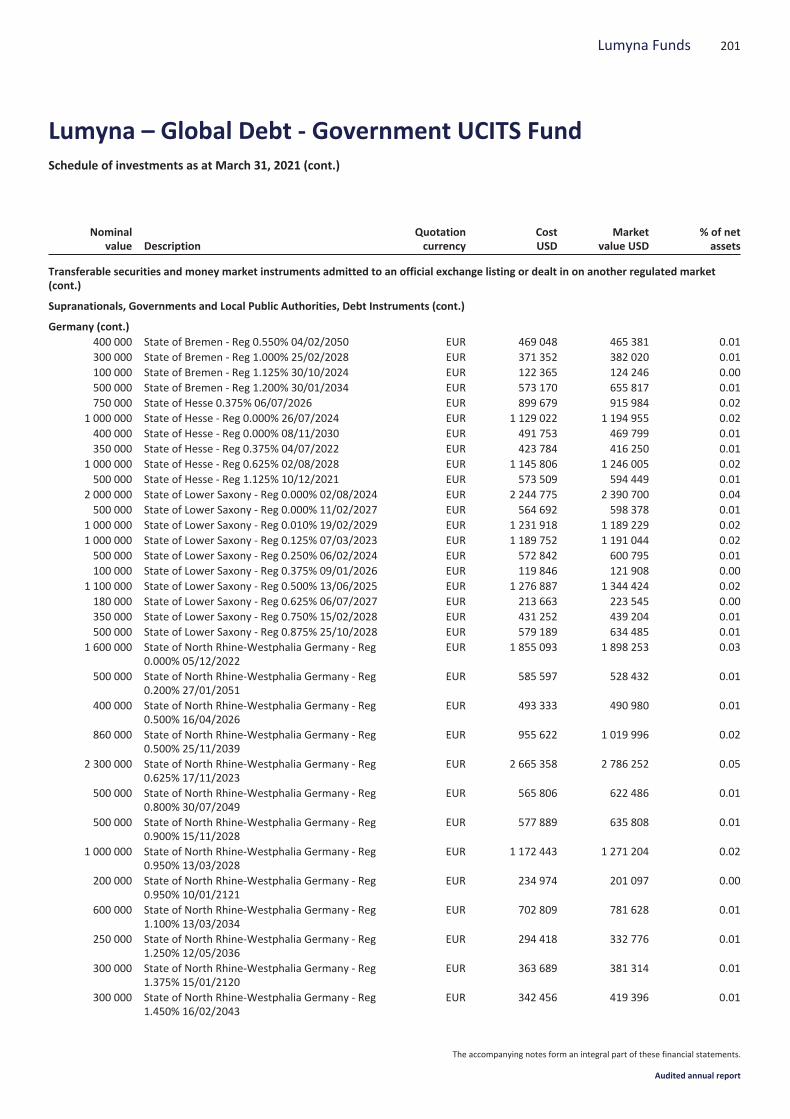
Nominalvalue Description
Quotationcurrency
CostUSD
Marketvalue USD
% of netassets
Transferable securities and money market instruments admitted to an official exchange listing or dealt in on another regulated market(cont.)
Supranationals, Governments and Local Public Authorities, Debt Instruments (cont.)
Germany (cont.)400 000 State of Bremen - Reg 0.550% 04/02/2050 EUR 469 048 465 381 0.01300 000 State of Bremen - Reg 1.000% 25/02/2028 EUR 371 352 382 020 0.01100 000 State of Bremen - Reg 1.125% 30/10/2024 EUR 122 365 124 246 0.00500 000 State of Bremen - Reg 1.200% 30/01/2034 EUR 573 170 655 817 0.01750 000 State of Hesse 0.375% 06/07/2026 EUR 899 679 915 984 0.02
1 000 000 State of Hesse - Reg 0.000% 26/07/2024 EUR 1 129 022 1 194 955 0.02400 000 State of Hesse - Reg 0.000% 08/11/2030 EUR 491 753 469 799 0.01350 000 State of Hesse - Reg 0.375% 04/07/2022 EUR 423 784 416 250 0.01
1 000 000 State of Hesse - Reg 0.625% 02/08/2028 EUR 1 145 806 1 246 005 0.02500 000 State of Hesse - Reg 1.125% 10/12/2021 EUR 573 509 594 449 0.01
2 000 000 State of Lower Saxony - Reg 0.000% 02/08/2024 EUR 2 244 775 2 390 700 0.04500 000 State of Lower Saxony - Reg 0.000% 11/02/2027 EUR 564 692 598 378 0.01
1 000 000 State of Lower Saxony - Reg 0.010% 19/02/2029 EUR 1 231 918 1 189 229 0.021 000 000 State of Lower Saxony - Reg 0.125% 07/03/2023 EUR 1 189 752 1 191 044 0.02500 000 State of Lower Saxony - Reg 0.250% 06/02/2024 EUR 572 842 600 795 0.01100 000 State of Lower Saxony - Reg 0.375% 09/01/2026 EUR 119 846 121 908 0.00
1 100 000 State of Lower Saxony - Reg 0.500% 13/06/2025 EUR 1 276 887 1 344 424 0.02180 000 State of Lower Saxony - Reg 0.625% 06/07/2027 EUR 213 663 223 545 0.00350 000 State of Lower Saxony - Reg 0.750% 15/02/2028 EUR 431 252 439 204 0.01500 000 State of Lower Saxony - Reg 0.875% 25/10/2028 EUR 579 189 634 485 0.01
1 600 000 State of North Rhine-Westphalia Germany - Reg0.000% 05/12/2022
EUR 1 855 093 1 898 253 0.03
500 000 State of North Rhine-Westphalia Germany - Reg0.200% 27/01/2051
EUR 585 597 528 432 0.01
400 000 State of North Rhine-Westphalia Germany - Reg0.500% 16/04/2026
EUR 493 333 490 980 0.01
860 000 State of North Rhine-Westphalia Germany - Reg0.500% 25/11/2039
EUR 955 622 1 019 996 0.02
2 300 000 State of North Rhine-Westphalia Germany - Reg0.625% 17/11/2023
EUR 2 665 358 2 786 252 0.05
500 000 State of North Rhine-Westphalia Germany - Reg0.800% 30/07/2049
EUR 565 806 622 486 0.01
500 000 State of North Rhine-Westphalia Germany - Reg0.900% 15/11/2028
EUR 577 889 635 808 0.01
1 000 000 State of North Rhine-Westphalia Germany - Reg0.950% 13/03/2028
EUR 1 172 443 1 271 204 0.02
200 000 State of North Rhine-Westphalia Germany - Reg0.950% 10/01/2121
EUR 234 974 201 097 0.00
600 000 State of North Rhine-Westphalia Germany - Reg1.100% 13/03/2034
EUR 702 809 781 628 0.01
250 000 State of North Rhine-Westphalia Germany - Reg1.250% 12/05/2036
EUR 294 418 332 776 0.01
300 000 State of North Rhine-Westphalia Germany - Reg1.375% 15/01/2120
EUR 363 689 381 314 0.01
300 000 State of North Rhine-Westphalia Germany - Reg1.450% 16/02/2043
EUR 342 456 419 396 0.01
201Lumyna Funds
Lumyna – Global Debt - Government UCITS FundSchedule of investments as at March 31, 2021 (cont.)
The accompanying notes form an integral part of these financial statements.
Audited annual report
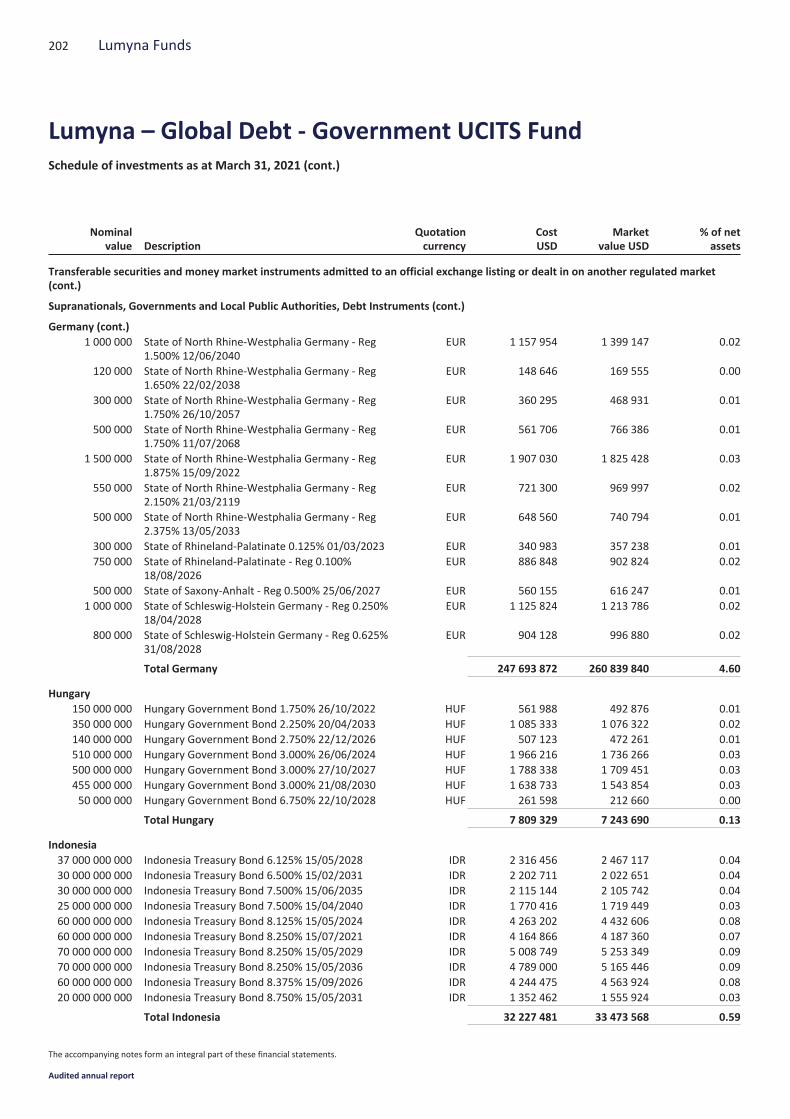
Nominalvalue Description
Quotationcurrency
CostUSD
Marketvalue USD
% of netassets
Transferable securities and money market instruments admitted to an official exchange listing or dealt in on another regulated market(cont.)
Supranationals, Governments and Local Public Authorities, Debt Instruments (cont.)
Germany (cont.)1 000 000 State of North Rhine-Westphalia Germany - Reg
1.500% 12/06/2040EUR 1 157 954 1 399 147 0.02
120 000 State of North Rhine-Westphalia Germany - Reg1.650% 22/02/2038
EUR 148 646 169 555 0.00
300 000 State of North Rhine-Westphalia Germany - Reg1.750% 26/10/2057
EUR 360 295 468 931 0.01
500 000 State of North Rhine-Westphalia Germany - Reg1.750% 11/07/2068
EUR 561 706 766 386 0.01
1 500 000 State of North Rhine-Westphalia Germany - Reg1.875% 15/09/2022
EUR 1 907 030 1 825 428 0.03
550 000 State of North Rhine-Westphalia Germany - Reg2.150% 21/03/2119
EUR 721 300 969 997 0.02
500 000 State of North Rhine-Westphalia Germany - Reg2.375% 13/05/2033
EUR 648 560 740 794 0.01
300 000 State of Rhineland-Palatinate 0.125% 01/03/2023 EUR 340 983 357 238 0.01750 000 State of Rhineland-Palatinate - Reg 0.100%
18/08/2026EUR 886 848 902 824 0.02
500 000 State of Saxony-Anhalt - Reg 0.500% 25/06/2027 EUR 560 155 616 247 0.011 000 000 State of Schleswig-Holstein Germany - Reg 0.250%
18/04/2028EUR 1 125 824 1 213 786 0.02
800 000 State of Schleswig-Holstein Germany - Reg 0.625%31/08/2028
EUR 904 128 996 880 0.02
Total Germany 247 693 872 260 839 840 4.60
Hungary150 000 000 Hungary Government Bond 1.750% 26/10/2022 HUF 561 988 492 876 0.01350 000 000 Hungary Government Bond 2.250% 20/04/2033 HUF 1 085 333 1 076 322 0.02140 000 000 Hungary Government Bond 2.750% 22/12/2026 HUF 507 123 472 261 0.01510 000 000 Hungary Government Bond 3.000% 26/06/2024 HUF 1 966 216 1 736 266 0.03500 000 000 Hungary Government Bond 3.000% 27/10/2027 HUF 1 788 338 1 709 451 0.03455 000 000 Hungary Government Bond 3.000% 21/08/2030 HUF 1 638 733 1 543 854 0.0350 000 000 Hungary Government Bond 6.750% 22/10/2028 HUF 261 598 212 660 0.00
Total Hungary 7 809 329 7 243 690 0.13
Indonesia37 000 000 000 Indonesia Treasury Bond 6.125% 15/05/2028 IDR 2 316 456 2 467 117 0.0430 000 000 000 Indonesia Treasury Bond 6.500% 15/02/2031 IDR 2 202 711 2 022 651 0.0430 000 000 000 Indonesia Treasury Bond 7.500% 15/06/2035 IDR 2 115 144 2 105 742 0.0425 000 000 000 Indonesia Treasury Bond 7.500% 15/04/2040 IDR 1 770 416 1 719 449 0.0360 000 000 000 Indonesia Treasury Bond 8.125% 15/05/2024 IDR 4 263 202 4 432 606 0.0860 000 000 000 Indonesia Treasury Bond 8.250% 15/07/2021 IDR 4 164 866 4 187 360 0.0770 000 000 000 Indonesia Treasury Bond 8.250% 15/05/2029 IDR 5 008 749 5 253 349 0.0970 000 000 000 Indonesia Treasury Bond 8.250% 15/05/2036 IDR 4 789 000 5 165 446 0.0960 000 000 000 Indonesia Treasury Bond 8.375% 15/09/2026 IDR 4 244 475 4 563 924 0.0820 000 000 000 Indonesia Treasury Bond 8.750% 15/05/2031 IDR 1 352 462 1 555 924 0.03
Total Indonesia 32 227 481 33 473 568 0.59
202 Lumyna Funds
Lumyna – Global Debt - Government UCITS FundSchedule of investments as at March 31, 2021 (cont.)
The accompanying notes form an integral part of these financial statements.
Audited annual report
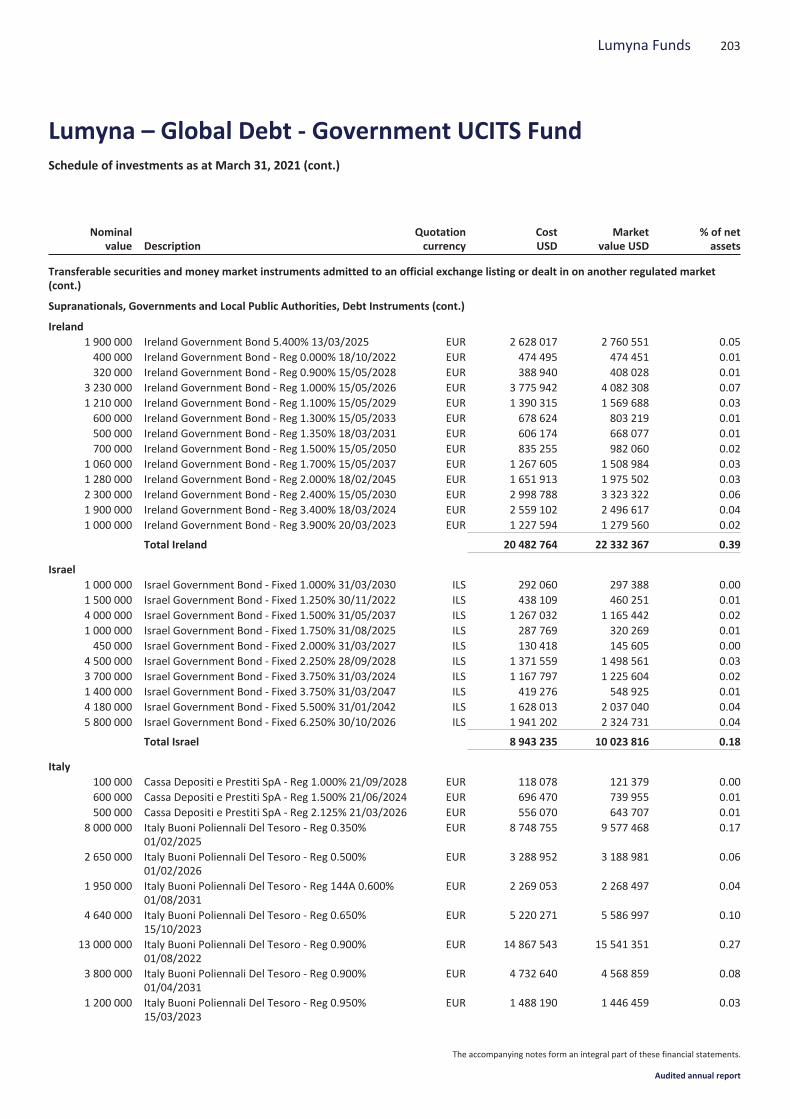
Nominalvalue Description
Quotationcurrency
CostUSD
Marketvalue USD
% of netassets
Transferable securities and money market instruments admitted to an official exchange listing or dealt in on another regulated market(cont.)
Supranationals, Governments and Local Public Authorities, Debt Instruments (cont.)
Ireland1 900 000 Ireland Government Bond 5.400% 13/03/2025 EUR 2 628 017 2 760 551 0.05400 000 Ireland Government Bond - Reg 0.000% 18/10/2022 EUR 474 495 474 451 0.01320 000 Ireland Government Bond - Reg 0.900% 15/05/2028 EUR 388 940 408 028 0.01
3 230 000 Ireland Government Bond - Reg 1.000% 15/05/2026 EUR 3 775 942 4 082 308 0.071 210 000 Ireland Government Bond - Reg 1.100% 15/05/2029 EUR 1 390 315 1 569 688 0.03600 000 Ireland Government Bond - Reg 1.300% 15/05/2033 EUR 678 624 803 219 0.01500 000 Ireland Government Bond - Reg 1.350% 18/03/2031 EUR 606 174 668 077 0.01700 000 Ireland Government Bond - Reg 1.500% 15/05/2050 EUR 835 255 982 060 0.02
1 060 000 Ireland Government Bond - Reg 1.700% 15/05/2037 EUR 1 267 605 1 508 984 0.031 280 000 Ireland Government Bond - Reg 2.000% 18/02/2045 EUR 1 651 913 1 975 502 0.032 300 000 Ireland Government Bond - Reg 2.400% 15/05/2030 EUR 2 998 788 3 323 322 0.061 900 000 Ireland Government Bond - Reg 3.400% 18/03/2024 EUR 2 559 102 2 496 617 0.041 000 000 Ireland Government Bond - Reg 3.900% 20/03/2023 EUR 1 227 594 1 279 560 0.02
Total Ireland 20 482 764 22 332 367 0.39
Israel1 000 000 Israel Government Bond - Fixed 1.000% 31/03/2030 ILS 292 060 297 388 0.001 500 000 Israel Government Bond - Fixed 1.250% 30/11/2022 ILS 438 109 460 251 0.014 000 000 Israel Government Bond - Fixed 1.500% 31/05/2037 ILS 1 267 032 1 165 442 0.021 000 000 Israel Government Bond - Fixed 1.750% 31/08/2025 ILS 287 769 320 269 0.01450 000 Israel Government Bond - Fixed 2.000% 31/03/2027 ILS 130 418 145 605 0.00
4 500 000 Israel Government Bond - Fixed 2.250% 28/09/2028 ILS 1 371 559 1 498 561 0.033 700 000 Israel Government Bond - Fixed 3.750% 31/03/2024 ILS 1 167 797 1 225 604 0.021 400 000 Israel Government Bond - Fixed 3.750% 31/03/2047 ILS 419 276 548 925 0.014 180 000 Israel Government Bond - Fixed 5.500% 31/01/2042 ILS 1 628 013 2 037 040 0.045 800 000 Israel Government Bond - Fixed 6.250% 30/10/2026 ILS 1 941 202 2 324 731 0.04
Total Israel 8 943 235 10 023 816 0.18
Italy100 000 Cassa Depositi e Prestiti SpA - Reg 1.000% 21/09/2028 EUR 118 078 121 379 0.00600 000 Cassa Depositi e Prestiti SpA - Reg 1.500% 21/06/2024 EUR 696 470 739 955 0.01500 000 Cassa Depositi e Prestiti SpA - Reg 2.125% 21/03/2026 EUR 556 070 643 707 0.01
8 000 000 Italy Buoni Poliennali Del Tesoro - Reg 0.350%01/02/2025
EUR 8 748 755 9 577 468 0.17
2 650 000 Italy Buoni Poliennali Del Tesoro - Reg 0.500%01/02/2026
EUR 3 288 952 3 188 981 0.06
1 950 000 Italy Buoni Poliennali Del Tesoro - Reg 144A 0.600%01/08/2031
EUR 2 269 053 2 268 497 0.04
4 640 000 Italy Buoni Poliennali Del Tesoro - Reg 0.650%15/10/2023
EUR 5 220 271 5 586 997 0.10
13 000 000 Italy Buoni Poliennali Del Tesoro - Reg 0.900%01/08/2022
EUR 14 867 543 15 541 351 0.27
3 800 000 Italy Buoni Poliennali Del Tesoro - Reg 0.900%01/04/2031
EUR 4 732 640 4 568 859 0.08
1 200 000 Italy Buoni Poliennali Del Tesoro - Reg 0.950%15/03/2023
EUR 1 488 190 1 446 459 0.03
203Lumyna Funds
Lumyna – Global Debt - Government UCITS FundSchedule of investments as at March 31, 2021 (cont.)
The accompanying notes form an integral part of these financial statements.
Audited annual report

Nominalvalue Description
Quotationcurrency
CostUSD
Marketvalue USD
% of netassets
Transferable securities and money market instruments admitted to an official exchange listing or dealt in on another regulated market(cont.)
Supranationals, Governments and Local Public Authorities, Debt Instruments (cont.)
Italy (cont.)1 450 000 Italy Buoni Poliennali Del Tesoro - Reg 0.950%
01/08/2030EUR 1 776 969 1 760 657 0.03
5 500 000 Italy Buoni Poliennali Del Tesoro - Reg 1.200%01/04/2022
EUR 6 797 145 6 568 814 0.12
7 420 000 Italy Buoni Poliennali Del Tesoro - Reg 1.250%01/12/2026
EUR 8 587 082 9 278 255 0.16
5 280 000 Italy Buoni Poliennali Del Tesoro - Reg 1.350%01/04/2030
EUR 5 922 932 6 642 814 0.12
11 100 000 Italy Buoni Poliennali Del Tesoro - Reg 1.450%15/09/2022
EUR 12 979 163 13 393 652 0.24
14 700 000 Italy Buoni Poliennali Del Tesoro - Reg 1.450%15/11/2024
EUR 16 501 630 18 292 784 0.32
1 000 000 Italy Buoni Poliennali Del Tesoro - Reg 1.500%01/06/2025
EUR 1 239 945 1 253 390 0.02
4 090 000 Italy Buoni Poliennali Del Tesoro - Reg 1.600%01/06/2026
EUR 4 951 063 5 190 918 0.09
3 680 000 Italy Buoni Poliennali Del Tesoro - Reg 144A 1.650%01/12/2030
EUR 4 616 745 4 739 447 0.08
2 230 000 Italy Buoni Poliennali Del Tesoro - Reg 144A 1.650%01/03/2032
EUR 2 340 808 2 867 546 0.05
5 890 000 Italy Buoni Poliennali Del Tesoro - Reg 1.750%01/07/2024
EUR 6 664 805 7 363 622 0.13
6 350 000 Italy Buoni Poliennali Del Tesoro - Reg 1.850%15/05/2024
EUR 7 300 623 7 946 764 0.14
5 620 000 Italy Buoni Poliennali Del Tesoro - Reg 144A 1.850%01/07/2025
EUR 6 609 129 7 144 007 0.13
360 000 Italy Buoni Poliennali Del Tesoro - Reg 2.000%01/12/2025
EUR 438 322 463 171 0.01
2 170 000 Italy Buoni Poliennali Del Tesoro - Reg 2.000%01/02/2028
EUR 2 490 858 2 845 756 0.05
7 770 000 Italy Buoni Poliennali Del Tesoro - Reg 2.050%01/08/2027
EUR 8 682 222 10 184 111 0.18
3 890 000 Italy Buoni Poliennali Del Tesoro - Reg 2.200%01/06/2027
EUR 4 377 850 5 135 632 0.09
6 600 000 Italy Buoni Poliennali Del Tesoro - Reg 144A 2.250%01/09/2036
EUR 6 976 455 9 041 221 0.16
4 000 000 Italy Buoni Poliennali Del Tesoro - Reg 2.450%01/10/2023
EUR 4 578 655 5 026 051 0.09
4 040 000 Italy Buoni Poliennali Del Tesoro - Reg 144A 2.450%01/09/2033
EUR 4 486 019 5 614 492 0.10
2 130 000 Italy Buoni Poliennali Del Tesoro - Reg 144A 2.450%01/09/2050
EUR 2 810 501 2 975 276 0.05
3 000 000 Italy Buoni Poliennali Del Tesoro - Reg 2.500%15/11/2025
EUR 4 038 390 3 939 134 0.07
3 240 000 Italy Buoni Poliennali Del Tesoro - Reg 144A 2.700%01/03/2047
EUR 3 322 395 4 733 429 0.08
204 Lumyna Funds
Lumyna – Global Debt - Government UCITS FundSchedule of investments as at March 31, 2021 (cont.)
The accompanying notes form an integral part of these financial statements.
Audited annual report
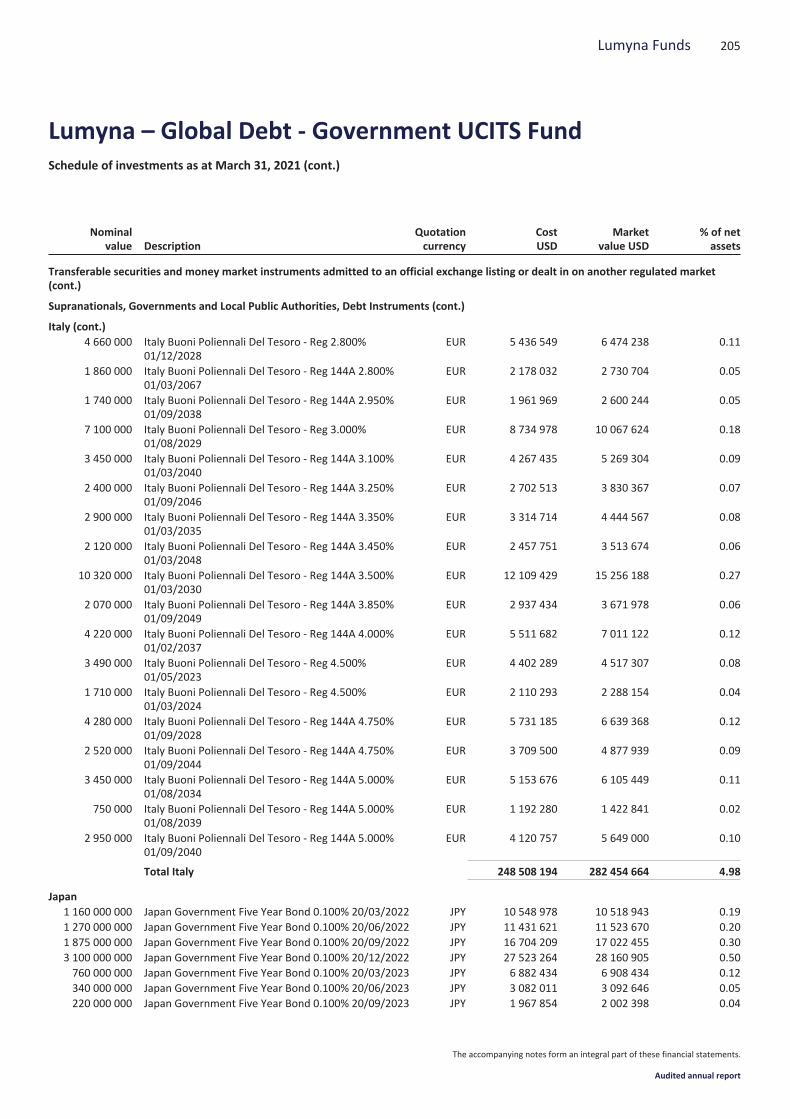
Nominalvalue Description
Quotationcurrency
CostUSD
Marketvalue USD
% of netassets
Transferable securities and money market instruments admitted to an official exchange listing or dealt in on another regulated market(cont.)
Supranationals, Governments and Local Public Authorities, Debt Instruments (cont.)
Italy (cont.)4 660 000 Italy Buoni Poliennali Del Tesoro - Reg 2.800%
01/12/2028EUR 5 436 549 6 474 238 0.11
1 860 000 Italy Buoni Poliennali Del Tesoro - Reg 144A 2.800%01/03/2067
EUR 2 178 032 2 730 704 0.05
1 740 000 Italy Buoni Poliennali Del Tesoro - Reg 144A 2.950%01/09/2038
EUR 1 961 969 2 600 244 0.05
7 100 000 Italy Buoni Poliennali Del Tesoro - Reg 3.000%01/08/2029
EUR 8 734 978 10 067 624 0.18
3 450 000 Italy Buoni Poliennali Del Tesoro - Reg 144A 3.100%01/03/2040
EUR 4 267 435 5 269 304 0.09
2 400 000 Italy Buoni Poliennali Del Tesoro - Reg 144A 3.250%01/09/2046
EUR 2 702 513 3 830 367 0.07
2 900 000 Italy Buoni Poliennali Del Tesoro - Reg 144A 3.350%01/03/2035
EUR 3 314 714 4 444 567 0.08
2 120 000 Italy Buoni Poliennali Del Tesoro - Reg 144A 3.450%01/03/2048
EUR 2 457 751 3 513 674 0.06
10 320 000 Italy Buoni Poliennali Del Tesoro - Reg 144A 3.500%01/03/2030
EUR 12 109 429 15 256 188 0.27
2 070 000 Italy Buoni Poliennali Del Tesoro - Reg 144A 3.850%01/09/2049
EUR 2 937 434 3 671 978 0.06
4 220 000 Italy Buoni Poliennali Del Tesoro - Reg 144A 4.000%01/02/2037
EUR 5 511 682 7 011 122 0.12
3 490 000 Italy Buoni Poliennali Del Tesoro - Reg 4.500%01/05/2023
EUR 4 402 289 4 517 307 0.08
1 710 000 Italy Buoni Poliennali Del Tesoro - Reg 4.500%01/03/2024
EUR 2 110 293 2 288 154 0.04
4 280 000 Italy Buoni Poliennali Del Tesoro - Reg 144A 4.750%01/09/2028
EUR 5 731 185 6 639 368 0.12
2 520 000 Italy Buoni Poliennali Del Tesoro - Reg 144A 4.750%01/09/2044
EUR 3 709 500 4 877 939 0.09
3 450 000 Italy Buoni Poliennali Del Tesoro - Reg 144A 5.000%01/08/2034
EUR 5 153 676 6 105 449 0.11
750 000 Italy Buoni Poliennali Del Tesoro - Reg 144A 5.000%01/08/2039
EUR 1 192 280 1 422 841 0.02
2 950 000 Italy Buoni Poliennali Del Tesoro - Reg 144A 5.000%01/09/2040
EUR 4 120 757 5 649 000 0.10
Total Italy 248 508 194 282 454 664 4.98
Japan1 160 000 000 Japan Government Five Year Bond 0.100% 20/03/2022 JPY 10 548 978 10 518 943 0.191 270 000 000 Japan Government Five Year Bond 0.100% 20/06/2022 JPY 11 431 621 11 523 670 0.201 875 000 000 Japan Government Five Year Bond 0.100% 20/09/2022 JPY 16 704 209 17 022 455 0.303 100 000 000 Japan Government Five Year Bond 0.100% 20/12/2022 JPY 27 523 264 28 160 905 0.50760 000 000 Japan Government Five Year Bond 0.100% 20/03/2023 JPY 6 882 434 6 908 434 0.12340 000 000 Japan Government Five Year Bond 0.100% 20/06/2023 JPY 3 082 011 3 092 646 0.05220 000 000 Japan Government Five Year Bond 0.100% 20/09/2023 JPY 1 967 854 2 002 398 0.04
205Lumyna Funds
Lumyna – Global Debt - Government UCITS FundSchedule of investments as at March 31, 2021 (cont.)
The accompanying notes form an integral part of these financial statements.
Audited annual report
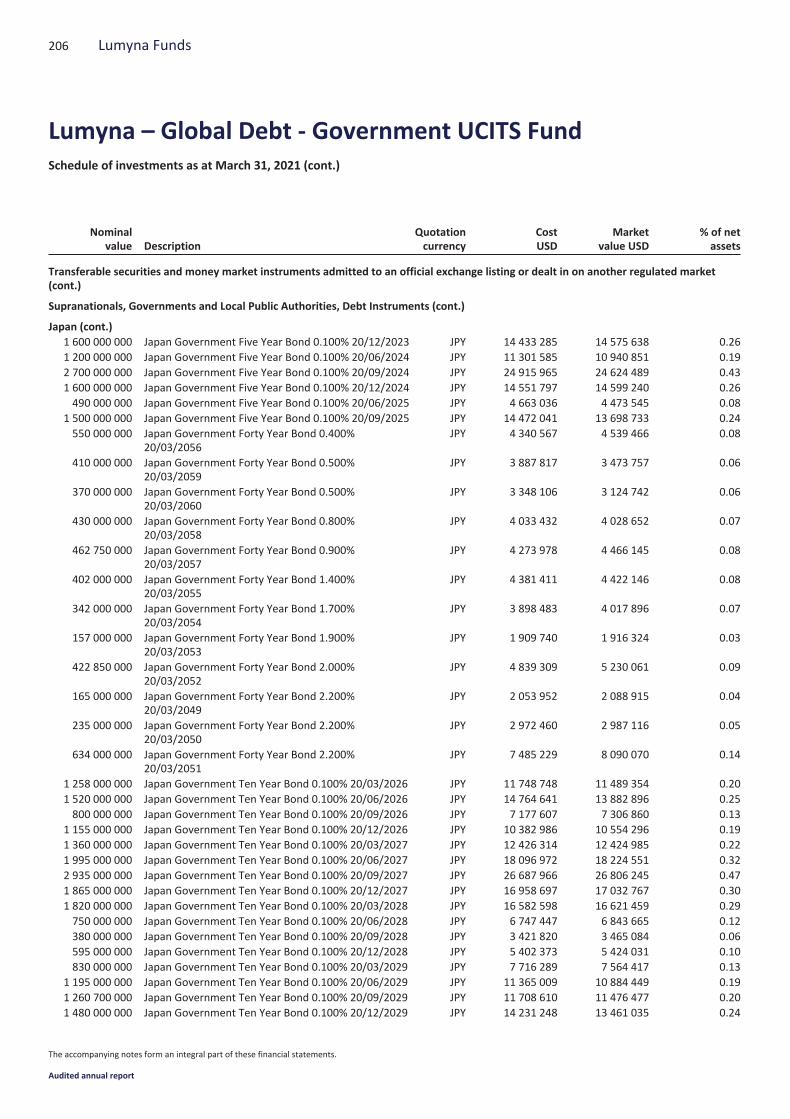
Nominalvalue Description
Quotationcurrency
CostUSD
Marketvalue USD
% of netassets
Transferable securities and money market instruments admitted to an official exchange listing or dealt in on another regulated market(cont.)
Supranationals, Governments and Local Public Authorities, Debt Instruments (cont.)
Japan (cont.)1 600 000 000 Japan Government Five Year Bond 0.100% 20/12/2023 JPY 14 433 285 14 575 638 0.261 200 000 000 Japan Government Five Year Bond 0.100% 20/06/2024 JPY 11 301 585 10 940 851 0.192 700 000 000 Japan Government Five Year Bond 0.100% 20/09/2024 JPY 24 915 965 24 624 489 0.431 600 000 000 Japan Government Five Year Bond 0.100% 20/12/2024 JPY 14 551 797 14 599 240 0.26490 000 000 Japan Government Five Year Bond 0.100% 20/06/2025 JPY 4 663 036 4 473 545 0.08
1 500 000 000 Japan Government Five Year Bond 0.100% 20/09/2025 JPY 14 472 041 13 698 733 0.24550 000 000 Japan Government Forty Year Bond 0.400%
20/03/2056JPY 4 340 567 4 539 466 0.08
410 000 000 Japan Government Forty Year Bond 0.500%20/03/2059
JPY 3 887 817 3 473 757 0.06
370 000 000 Japan Government Forty Year Bond 0.500%20/03/2060
JPY 3 348 106 3 124 742 0.06
430 000 000 Japan Government Forty Year Bond 0.800%20/03/2058
JPY 4 033 432 4 028 652 0.07
462 750 000 Japan Government Forty Year Bond 0.900%20/03/2057
JPY 4 273 978 4 466 145 0.08
402 000 000 Japan Government Forty Year Bond 1.400%20/03/2055
JPY 4 381 411 4 422 146 0.08
342 000 000 Japan Government Forty Year Bond 1.700%20/03/2054
JPY 3 898 483 4 017 896 0.07
157 000 000 Japan Government Forty Year Bond 1.900%20/03/2053
JPY 1 909 740 1 916 324 0.03
422 850 000 Japan Government Forty Year Bond 2.000%20/03/2052
JPY 4 839 309 5 230 061 0.09
165 000 000 Japan Government Forty Year Bond 2.200%20/03/2049
JPY 2 053 952 2 088 915 0.04
235 000 000 Japan Government Forty Year Bond 2.200%20/03/2050
JPY 2 972 460 2 987 116 0.05
634 000 000 Japan Government Forty Year Bond 2.200%20/03/2051
JPY 7 485 229 8 090 070 0.14
1 258 000 000 Japan Government Ten Year Bond 0.100% 20/03/2026 JPY 11 748 748 11 489 354 0.201 520 000 000 Japan Government Ten Year Bond 0.100% 20/06/2026 JPY 14 764 641 13 882 896 0.25800 000 000 Japan Government Ten Year Bond 0.100% 20/09/2026 JPY 7 177 607 7 306 860 0.13
1 155 000 000 Japan Government Ten Year Bond 0.100% 20/12/2026 JPY 10 382 986 10 554 296 0.191 360 000 000 Japan Government Ten Year Bond 0.100% 20/03/2027 JPY 12 426 314 12 424 985 0.221 995 000 000 Japan Government Ten Year Bond 0.100% 20/06/2027 JPY 18 096 972 18 224 551 0.322 935 000 000 Japan Government Ten Year Bond 0.100% 20/09/2027 JPY 26 687 966 26 806 245 0.471 865 000 000 Japan Government Ten Year Bond 0.100% 20/12/2027 JPY 16 958 697 17 032 767 0.301 820 000 000 Japan Government Ten Year Bond 0.100% 20/03/2028 JPY 16 582 598 16 621 459 0.29750 000 000 Japan Government Ten Year Bond 0.100% 20/06/2028 JPY 6 747 447 6 843 665 0.12380 000 000 Japan Government Ten Year Bond 0.100% 20/09/2028 JPY 3 421 820 3 465 084 0.06595 000 000 Japan Government Ten Year Bond 0.100% 20/12/2028 JPY 5 402 373 5 424 031 0.10830 000 000 Japan Government Ten Year Bond 0.100% 20/03/2029 JPY 7 716 289 7 564 417 0.13
1 195 000 000 Japan Government Ten Year Bond 0.100% 20/06/2029 JPY 11 365 009 10 884 449 0.191 260 700 000 Japan Government Ten Year Bond 0.100% 20/09/2029 JPY 11 708 610 11 476 477 0.201 480 000 000 Japan Government Ten Year Bond 0.100% 20/12/2029 JPY 14 231 248 13 461 035 0.24
206 Lumyna Funds
Lumyna – Global Debt - Government UCITS FundSchedule of investments as at March 31, 2021 (cont.)
The accompanying notes form an integral part of these financial statements.
Audited annual report
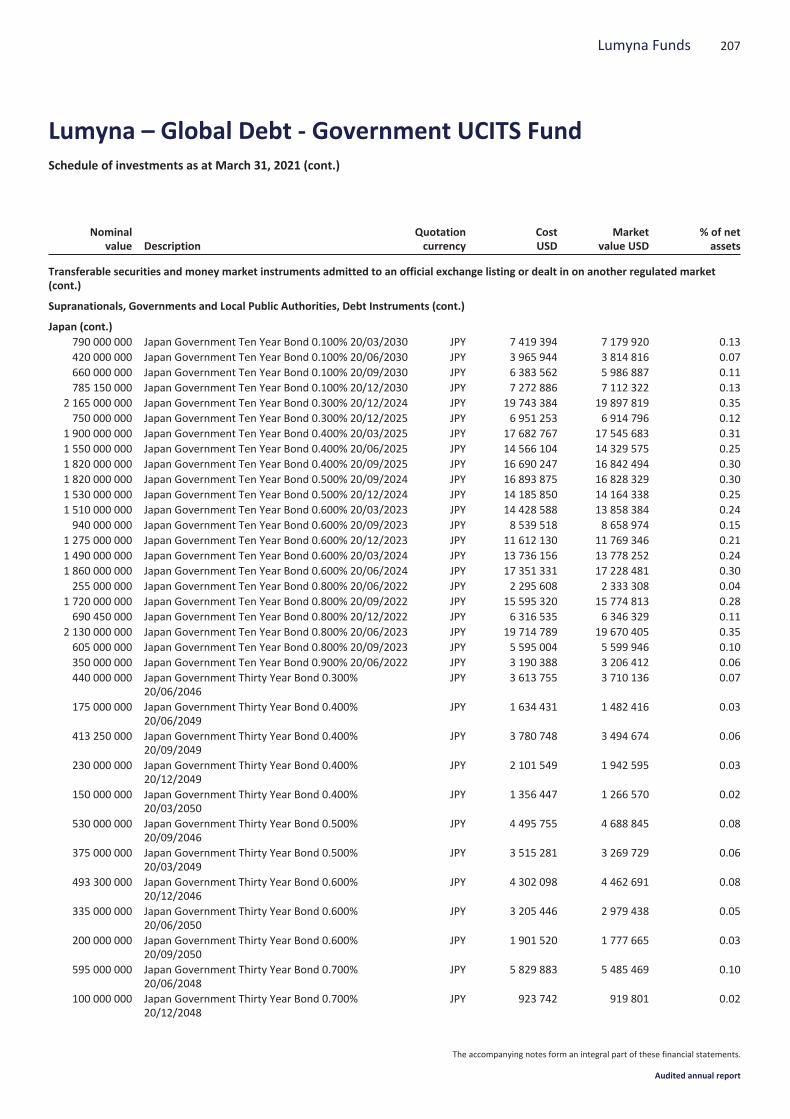
Nominalvalue Description
Quotationcurrency
CostUSD
Marketvalue USD
% of netassets
Transferable securities and money market instruments admitted to an official exchange listing or dealt in on another regulated market(cont.)
Supranationals, Governments and Local Public Authorities, Debt Instruments (cont.)
Japan (cont.)790 000 000 Japan Government Ten Year Bond 0.100% 20/03/2030 JPY 7 419 394 7 179 920 0.13420 000 000 Japan Government Ten Year Bond 0.100% 20/06/2030 JPY 3 965 944 3 814 816 0.07660 000 000 Japan Government Ten Year Bond 0.100% 20/09/2030 JPY 6 383 562 5 986 887 0.11785 150 000 Japan Government Ten Year Bond 0.100% 20/12/2030 JPY 7 272 886 7 112 322 0.13
2 165 000 000 Japan Government Ten Year Bond 0.300% 20/12/2024 JPY 19 743 384 19 897 819 0.35750 000 000 Japan Government Ten Year Bond 0.300% 20/12/2025 JPY 6 951 253 6 914 796 0.12
1 900 000 000 Japan Government Ten Year Bond 0.400% 20/03/2025 JPY 17 682 767 17 545 683 0.311 550 000 000 Japan Government Ten Year Bond 0.400% 20/06/2025 JPY 14 566 104 14 329 575 0.251 820 000 000 Japan Government Ten Year Bond 0.400% 20/09/2025 JPY 16 690 247 16 842 494 0.301 820 000 000 Japan Government Ten Year Bond 0.500% 20/09/2024 JPY 16 893 875 16 828 329 0.301 530 000 000 Japan Government Ten Year Bond 0.500% 20/12/2024 JPY 14 185 850 14 164 338 0.251 510 000 000 Japan Government Ten Year Bond 0.600% 20/03/2023 JPY 14 428 588 13 858 384 0.24940 000 000 Japan Government Ten Year Bond 0.600% 20/09/2023 JPY 8 539 518 8 658 974 0.15
1 275 000 000 Japan Government Ten Year Bond 0.600% 20/12/2023 JPY 11 612 130 11 769 346 0.211 490 000 000 Japan Government Ten Year Bond 0.600% 20/03/2024 JPY 13 736 156 13 778 252 0.241 860 000 000 Japan Government Ten Year Bond 0.600% 20/06/2024 JPY 17 351 331 17 228 481 0.30255 000 000 Japan Government Ten Year Bond 0.800% 20/06/2022 JPY 2 295 608 2 333 308 0.04
1 720 000 000 Japan Government Ten Year Bond 0.800% 20/09/2022 JPY 15 595 320 15 774 813 0.28690 450 000 Japan Government Ten Year Bond 0.800% 20/12/2022 JPY 6 316 535 6 346 329 0.11
2 130 000 000 Japan Government Ten Year Bond 0.800% 20/06/2023 JPY 19 714 789 19 670 405 0.35605 000 000 Japan Government Ten Year Bond 0.800% 20/09/2023 JPY 5 595 004 5 599 946 0.10350 000 000 Japan Government Ten Year Bond 0.900% 20/06/2022 JPY 3 190 388 3 206 412 0.06440 000 000 Japan Government Thirty Year Bond 0.300%
20/06/2046JPY 3 613 755 3 710 136 0.07
175 000 000 Japan Government Thirty Year Bond 0.400%20/06/2049
JPY 1 634 431 1 482 416 0.03
413 250 000 Japan Government Thirty Year Bond 0.400%20/09/2049
JPY 3 780 748 3 494 674 0.06
230 000 000 Japan Government Thirty Year Bond 0.400%20/12/2049
JPY 2 101 549 1 942 595 0.03
150 000 000 Japan Government Thirty Year Bond 0.400%20/03/2050
JPY 1 356 447 1 266 570 0.02
530 000 000 Japan Government Thirty Year Bond 0.500%20/09/2046
JPY 4 495 755 4 688 845 0.08
375 000 000 Japan Government Thirty Year Bond 0.500%20/03/2049
JPY 3 515 281 3 269 729 0.06
493 300 000 Japan Government Thirty Year Bond 0.600%20/12/2046
JPY 4 302 098 4 462 691 0.08
335 000 000 Japan Government Thirty Year Bond 0.600%20/06/2050
JPY 3 205 446 2 979 438 0.05
200 000 000 Japan Government Thirty Year Bond 0.600%20/09/2050
JPY 1 901 520 1 777 665 0.03
595 000 000 Japan Government Thirty Year Bond 0.700%20/06/2048
JPY 5 829 883 5 485 469 0.10
100 000 000 Japan Government Thirty Year Bond 0.700%20/12/2048
JPY 923 742 919 801 0.02
207Lumyna Funds
Lumyna – Global Debt - Government UCITS FundSchedule of investments as at March 31, 2021 (cont.)
The accompanying notes form an integral part of these financial statements.
Audited annual report
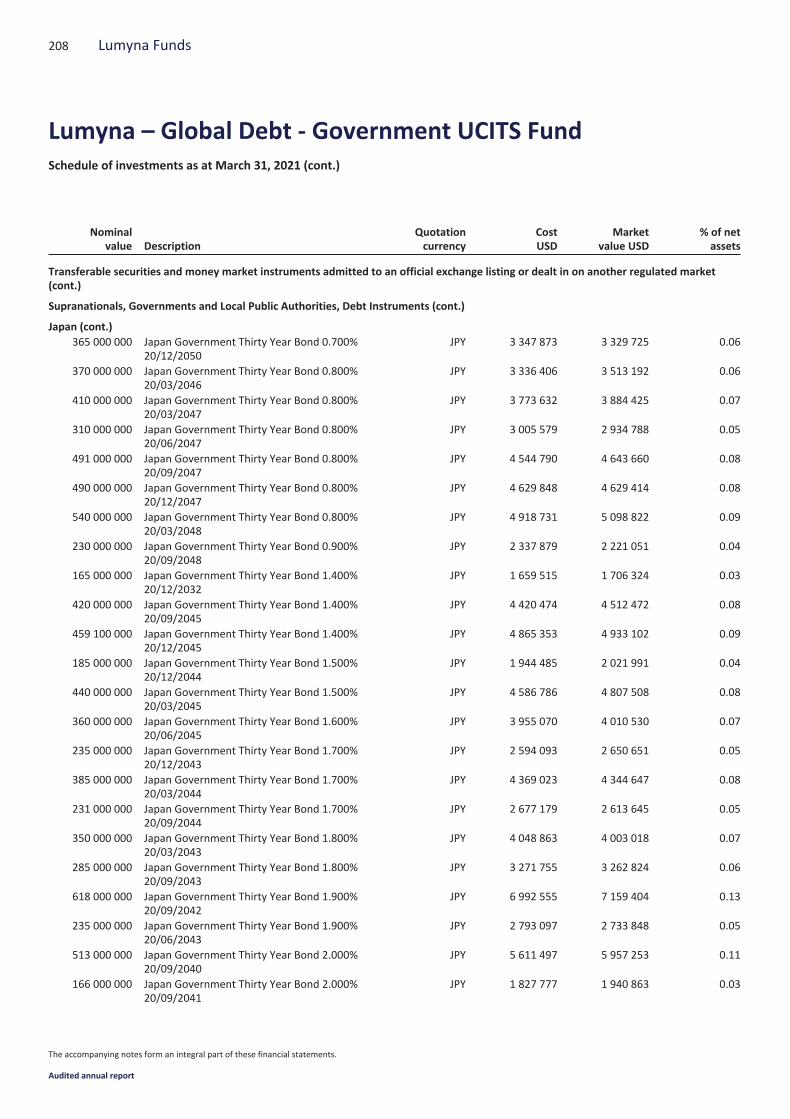
Nominalvalue Description
Quotationcurrency
CostUSD
Marketvalue USD
% of netassets
Transferable securities and money market instruments admitted to an official exchange listing or dealt in on another regulated market(cont.)
Supranationals, Governments and Local Public Authorities, Debt Instruments (cont.)
Japan (cont.)365 000 000 Japan Government Thirty Year Bond 0.700%
20/12/2050JPY 3 347 873 3 329 725 0.06
370 000 000 Japan Government Thirty Year Bond 0.800%20/03/2046
JPY 3 336 406 3 513 192 0.06
410 000 000 Japan Government Thirty Year Bond 0.800%20/03/2047
JPY 3 773 632 3 884 425 0.07
310 000 000 Japan Government Thirty Year Bond 0.800%20/06/2047
JPY 3 005 579 2 934 788 0.05
491 000 000 Japan Government Thirty Year Bond 0.800%20/09/2047
JPY 4 544 790 4 643 660 0.08
490 000 000 Japan Government Thirty Year Bond 0.800%20/12/2047
JPY 4 629 848 4 629 414 0.08
540 000 000 Japan Government Thirty Year Bond 0.800%20/03/2048
JPY 4 918 731 5 098 822 0.09
230 000 000 Japan Government Thirty Year Bond 0.900%20/09/2048
JPY 2 337 879 2 221 051 0.04
165 000 000 Japan Government Thirty Year Bond 1.400%20/12/2032
JPY 1 659 515 1 706 324 0.03
420 000 000 Japan Government Thirty Year Bond 1.400%20/09/2045
JPY 4 420 474 4 512 472 0.08
459 100 000 Japan Government Thirty Year Bond 1.400%20/12/2045
JPY 4 865 353 4 933 102 0.09
185 000 000 Japan Government Thirty Year Bond 1.500%20/12/2044
JPY 1 944 485 2 021 991 0.04
440 000 000 Japan Government Thirty Year Bond 1.500%20/03/2045
JPY 4 586 786 4 807 508 0.08
360 000 000 Japan Government Thirty Year Bond 1.600%20/06/2045
JPY 3 955 070 4 010 530 0.07
235 000 000 Japan Government Thirty Year Bond 1.700%20/12/2043
JPY 2 594 093 2 650 651 0.05
385 000 000 Japan Government Thirty Year Bond 1.700%20/03/2044
JPY 4 369 023 4 344 647 0.08
231 000 000 Japan Government Thirty Year Bond 1.700%20/09/2044
JPY 2 677 179 2 613 645 0.05
350 000 000 Japan Government Thirty Year Bond 1.800%20/03/2043
JPY 4 048 863 4 003 018 0.07
285 000 000 Japan Government Thirty Year Bond 1.800%20/09/2043
JPY 3 271 755 3 262 824 0.06
618 000 000 Japan Government Thirty Year Bond 1.900%20/09/2042
JPY 6 992 555 7 159 404 0.13
235 000 000 Japan Government Thirty Year Bond 1.900%20/06/2043
JPY 2 793 097 2 733 848 0.05
513 000 000 Japan Government Thirty Year Bond 2.000%20/09/2040
JPY 5 611 497 5 957 253 0.11
166 000 000 Japan Government Thirty Year Bond 2.000%20/09/2041
JPY 1 827 777 1 940 863 0.03
208 Lumyna Funds
Lumyna – Global Debt - Government UCITS FundSchedule of investments as at March 31, 2021 (cont.)
The accompanying notes form an integral part of these financial statements.
Audited annual report

Nominalvalue Description
Quotationcurrency
CostUSD
Marketvalue USD
% of netassets
Transferable securities and money market instruments admitted to an official exchange listing or dealt in on another regulated market(cont.)
Supranationals, Governments and Local Public Authorities, Debt Instruments (cont.)
Japan (cont.)795 000 000 Japan Government Thirty Year Bond 2.000%
20/03/2042JPY 8 845 295 9 323 803 0.16
380 000 000 Japan Government Thirty Year Bond 2.200%20/09/2039
JPY 4 271 283 4 505 700 0.08
660 000 000 Japan Government Thirty Year Bond 2.200%20/03/2041
JPY 7 754 972 7 913 609 0.14
100 000 000 Japan Government Thirty Year Bond 2.300%20/05/2030
JPY 1 095 046 1 089 448 0.02
360 000 000 Japan Government Thirty Year Bond 2.300%20/03/2035
JPY 4 266 420 4 162 773 0.07
260 000 000 Japan Government Thirty Year Bond 2.300%20/03/2039
JPY 2 967 399 3 105 765 0.05
525 000 000 Japan Government Thirty Year Bond 2.300%20/03/2040
JPY 6 149 598 6 329 932 0.11
500 000 000 Japan Government Thirty Year Bond 2.400%20/09/2038
JPY 5 808 034 6 043 710 0.11
93 800 000 Japan Government Thirty Year Bond 2.500%20/03/2038
JPY 1 093 656 1 142 535 0.02
1 365 000 000 Japan Government Twenty Year Bond 0.200%20/06/2036
JPY 12 020 553 12 126 388 0.21
555 000 000 Japan Government Twenty Year Bond 0.300%20/06/2039
JPY 5 182 339 4 902 433 0.09
449 000 000 Japan Government Twenty Year Bond 0.300%20/09/2039
JPY 4 172 630 3 958 108 0.07
480 000 000 Japan Government Twenty Year Bond 0.300%20/12/2039
JPY 4 494 888 4 223 739 0.07
695 000 000 Japan Government Twenty Year Bond 0.400%20/03/2036
JPY 6 085 766 6 373 622 0.11
220 000 000 Japan Government Twenty Year Bond 0.400%20/03/2039
JPY 2 011 807 1 980 478 0.04
439 850 000 Japan Government Twenty Year Bond 0.400%20/03/2040
JPY 4 153 066 3 936 478 0.07
403 100 000 Japan Government Twenty Year Bond 0.400%20/06/2040
JPY 3 799 582 3 602 620 0.06
315 000 000 Japan Government Twenty Year Bond 0.400%20/09/2040
JPY 3 024 561 2 811 824 0.05
915 000 000 Japan Government Twenty Year Bond 0.500%20/09/2036
JPY 8 401 800 8 493 187 0.15
1 050 000 000 Japan Government Twenty Year Bond 0.500%20/03/2038
JPY 9 378 916 9 681 475 0.17
480 000 000 Japan Government Twenty Year Bond 0.500%20/06/2038
JPY 4 690 372 4 416 261 0.08
560 000 000 Japan Government Twenty Year Bond 0.500%20/12/2038
JPY 5 123 876 5 141 003 0.09
657 300 000 Japan Government Twenty Year Bond 0.500%20/12/2040
JPY 6 019 062 5 973 519 0.11
209Lumyna Funds
Lumyna – Global Debt - Government UCITS FundSchedule of investments as at March 31, 2021 (cont.)
The accompanying notes form an integral part of these financial statements.
Audited annual report
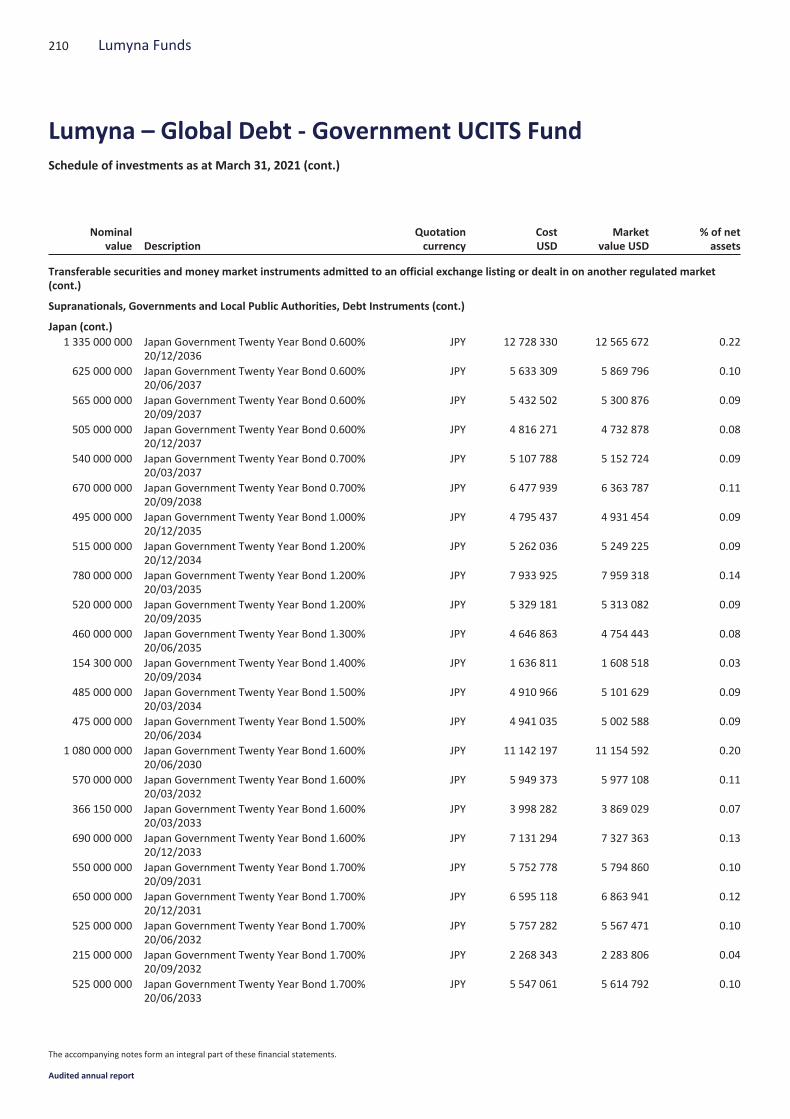
Nominalvalue Description
Quotationcurrency
CostUSD
Marketvalue USD
% of netassets
Transferable securities and money market instruments admitted to an official exchange listing or dealt in on another regulated market(cont.)
Supranationals, Governments and Local Public Authorities, Debt Instruments (cont.)
Japan (cont.)1 335 000 000 Japan Government Twenty Year Bond 0.600%
20/12/2036JPY 12 728 330 12 565 672 0.22
625 000 000 Japan Government Twenty Year Bond 0.600%20/06/2037
JPY 5 633 309 5 869 796 0.10
565 000 000 Japan Government Twenty Year Bond 0.600%20/09/2037
JPY 5 432 502 5 300 876 0.09
505 000 000 Japan Government Twenty Year Bond 0.600%20/12/2037
JPY 4 816 271 4 732 878 0.08
540 000 000 Japan Government Twenty Year Bond 0.700%20/03/2037
JPY 5 107 788 5 152 724 0.09
670 000 000 Japan Government Twenty Year Bond 0.700%20/09/2038
JPY 6 477 939 6 363 787 0.11
495 000 000 Japan Government Twenty Year Bond 1.000%20/12/2035
JPY 4 795 437 4 931 454 0.09
515 000 000 Japan Government Twenty Year Bond 1.200%20/12/2034
JPY 5 262 036 5 249 225 0.09
780 000 000 Japan Government Twenty Year Bond 1.200%20/03/2035
JPY 7 933 925 7 959 318 0.14
520 000 000 Japan Government Twenty Year Bond 1.200%20/09/2035
JPY 5 329 181 5 313 082 0.09
460 000 000 Japan Government Twenty Year Bond 1.300%20/06/2035
JPY 4 646 863 4 754 443 0.08
154 300 000 Japan Government Twenty Year Bond 1.400%20/09/2034
JPY 1 636 811 1 608 518 0.03
485 000 000 Japan Government Twenty Year Bond 1.500%20/03/2034
JPY 4 910 966 5 101 629 0.09
475 000 000 Japan Government Twenty Year Bond 1.500%20/06/2034
JPY 4 941 035 5 002 588 0.09
1 080 000 000 Japan Government Twenty Year Bond 1.600%20/06/2030
JPY 11 142 197 11 154 592 0.20
570 000 000 Japan Government Twenty Year Bond 1.600%20/03/2032
JPY 5 949 373 5 977 108 0.11
366 150 000 Japan Government Twenty Year Bond 1.600%20/03/2033
JPY 3 998 282 3 869 029 0.07
690 000 000 Japan Government Twenty Year Bond 1.600%20/12/2033
JPY 7 131 294 7 327 363 0.13
550 000 000 Japan Government Twenty Year Bond 1.700%20/09/2031
JPY 5 752 778 5 794 860 0.10
650 000 000 Japan Government Twenty Year Bond 1.700%20/12/2031
JPY 6 595 118 6 863 941 0.12
525 000 000 Japan Government Twenty Year Bond 1.700%20/06/2032
JPY 5 757 282 5 567 471 0.10
215 000 000 Japan Government Twenty Year Bond 1.700%20/09/2032
JPY 2 268 343 2 283 806 0.04
525 000 000 Japan Government Twenty Year Bond 1.700%20/06/2033
JPY 5 547 061 5 614 792 0.10
210 Lumyna Funds
Lumyna – Global Debt - Government UCITS FundSchedule of investments as at March 31, 2021 (cont.)
The accompanying notes form an integral part of these financial statements.
Audited annual report
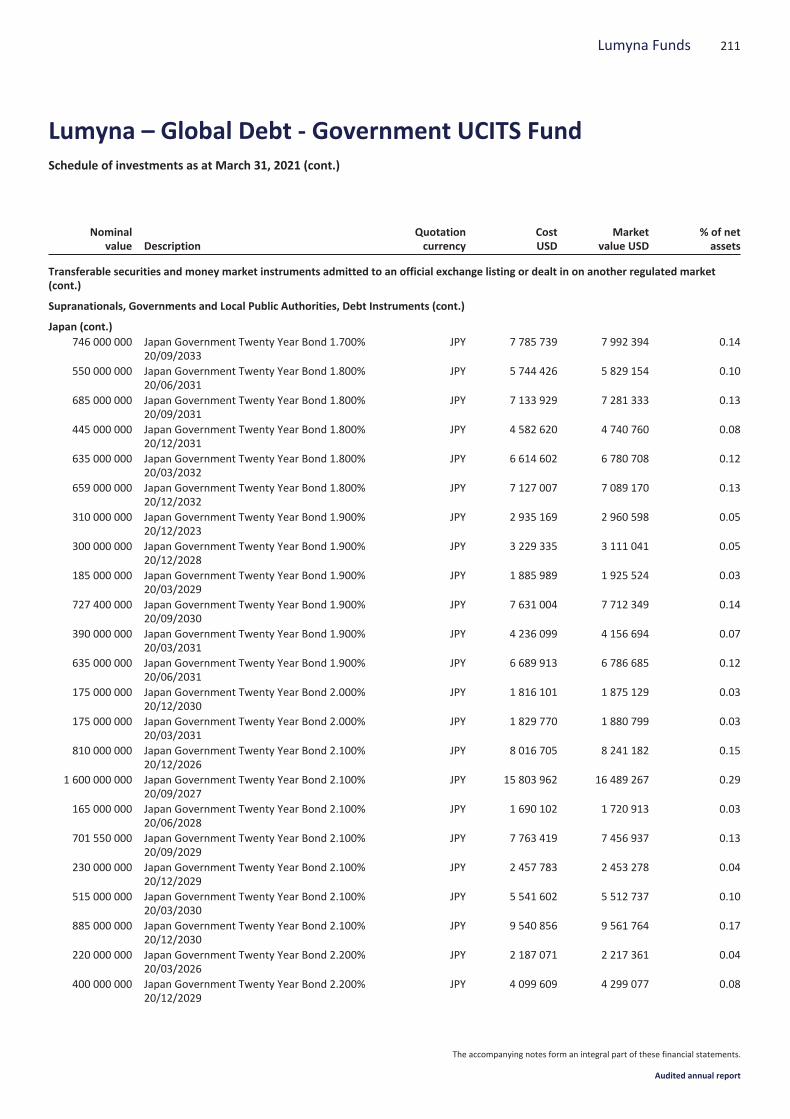
Nominalvalue Description
Quotationcurrency
CostUSD
Marketvalue USD
% of netassets
Transferable securities and money market instruments admitted to an official exchange listing or dealt in on another regulated market(cont.)
Supranationals, Governments and Local Public Authorities, Debt Instruments (cont.)
Japan (cont.)746 000 000 Japan Government Twenty Year Bond 1.700%
20/09/2033JPY 7 785 739 7 992 394 0.14
550 000 000 Japan Government Twenty Year Bond 1.800%20/06/2031
JPY 5 744 426 5 829 154 0.10
685 000 000 Japan Government Twenty Year Bond 1.800%20/09/2031
JPY 7 133 929 7 281 333 0.13
445 000 000 Japan Government Twenty Year Bond 1.800%20/12/2031
JPY 4 582 620 4 740 760 0.08
635 000 000 Japan Government Twenty Year Bond 1.800%20/03/2032
JPY 6 614 602 6 780 708 0.12
659 000 000 Japan Government Twenty Year Bond 1.800%20/12/2032
JPY 7 127 007 7 089 170 0.13
310 000 000 Japan Government Twenty Year Bond 1.900%20/12/2023
JPY 2 935 169 2 960 598 0.05
300 000 000 Japan Government Twenty Year Bond 1.900%20/12/2028
JPY 3 229 335 3 111 041 0.05
185 000 000 Japan Government Twenty Year Bond 1.900%20/03/2029
JPY 1 885 989 1 925 524 0.03
727 400 000 Japan Government Twenty Year Bond 1.900%20/09/2030
JPY 7 631 004 7 712 349 0.14
390 000 000 Japan Government Twenty Year Bond 1.900%20/03/2031
JPY 4 236 099 4 156 694 0.07
635 000 000 Japan Government Twenty Year Bond 1.900%20/06/2031
JPY 6 689 913 6 786 685 0.12
175 000 000 Japan Government Twenty Year Bond 2.000%20/12/2030
JPY 1 816 101 1 875 129 0.03
175 000 000 Japan Government Twenty Year Bond 2.000%20/03/2031
JPY 1 829 770 1 880 799 0.03
810 000 000 Japan Government Twenty Year Bond 2.100%20/12/2026
JPY 8 016 705 8 241 182 0.15
1 600 000 000 Japan Government Twenty Year Bond 2.100%20/09/2027
JPY 15 803 962 16 489 267 0.29
165 000 000 Japan Government Twenty Year Bond 2.100%20/06/2028
JPY 1 690 102 1 720 913 0.03
701 550 000 Japan Government Twenty Year Bond 2.100%20/09/2029
JPY 7 763 419 7 456 937 0.13
230 000 000 Japan Government Twenty Year Bond 2.100%20/12/2029
JPY 2 457 783 2 453 278 0.04
515 000 000 Japan Government Twenty Year Bond 2.100%20/03/2030
JPY 5 541 602 5 512 737 0.10
885 000 000 Japan Government Twenty Year Bond 2.100%20/12/2030
JPY 9 540 856 9 561 764 0.17
220 000 000 Japan Government Twenty Year Bond 2.200%20/03/2026
JPY 2 187 071 2 217 361 0.04
400 000 000 Japan Government Twenty Year Bond 2.200%20/12/2029
JPY 4 099 609 4 299 077 0.08
211Lumyna Funds
Lumyna – Global Debt - Government UCITS FundSchedule of investments as at March 31, 2021 (cont.)
The accompanying notes form an integral part of these financial statements.
Audited annual report

Nominalvalue Description
Quotationcurrency
CostUSD
Marketvalue USD
% of netassets
Transferable securities and money market instruments admitted to an official exchange listing or dealt in on another regulated market(cont.)
Supranationals, Governments and Local Public Authorities, Debt Instruments (cont.)
Japan (cont.)555 000 000 Japan Government Twenty Year Bond 2.200%
20/03/2031JPY 5 834 694 6 064 467 0.11
380 000 000 Japan Government Twenty Year Bond 2.300%20/06/2026
JPY 3 852 004 3 866 543 0.07
800 000 000 Japan Government Twenty Year Bond 2.300%20/06/2027
JPY 8 628 663 8 300 091 0.15
630 000 000 Japan Government Two Year Bond 0.100% 01/01/2023 JPY 6 020 213 5 723 650 0.102 100 000 000 Japan Government Two Year Bond 0.100% 01/02/2023 JPY 20 063 468 19 085 674 0.34
Total Japan 1 202 972 333 1 201 937 264 21.21
Latvia1 000 000 Latvia Government International Bond - Reg 0.375%
07/10/2026EUR 1 118 110 1 217 375 0.02
200 000 Latvia Government International Bond - Reg 2.250%15/02/2047
EUR 250 782 335 764 0.01
Total Latvia 1 368 892 1 553 139 0.03
Lithuania500 000 Lithuania Government International Bond - Reg
0.500% 28/07/2050EUR 607 132 563 532 0.01
100 000 Lithuania Government International Bond - Reg0.950% 26/05/2027
EUR 119 500 125 501 0.00
1 000 000 Lithuania Government International Bond - Reg1.250% 22/10/2025
EUR 1 185 320 1 264 432 0.02
100 000 Lithuania Government International Bond - Reg2.100% 26/05/2047
EUR 129 957 164 018 0.01
1 000 000 Republic of Lithuania - Reg 0.500% 19/06/2029 EUR 1 153 790 1 222 781 0.02
Total Lithuania 3 195 699 3 340 264 0.06
Luxembourg1 000 000 Luxembourg Government Bond - Reg 0.625%
01/02/2027EUR 1 154 495 1 244 121 0.02
Total Luxembourg 1 154 495 1 244 121 0.02
Mexico56 000 000 Mexican Bonos 5.750% 05/03/2026 MXN 2 671 558 2 713 744 0.0583 000 000 Mexican Bonos 6.500% 10/06/2021 MXN 4 450 028 4 069 416 0.0710 000 000 Mexican Bonos 6.500% 09/06/2022 MXN 536 128 498 394 0.0140 000 000 Mexican Bonos 7.500% 03/06/2027 MXN 1 968 672 2 082 139 0.0335 000 000 Mexican Bonos 7.750% 29/05/2031 MXN 1 884 147 1 822 607 0.039 000 000 Mexican Bonos 7.750% 23/11/2034 MXN 507 649 462 129 0.01
44 000 000 Mexican Bonos 7.750% 13/11/2042 MXN 2 287 123 2 170 635 0.0440 000 000 Mexican Bonos 8.000% 07/12/2023 MXN 2 164 036 2 083 859 0.0424 000 000 Mexican Bonos 8.000% 07/11/2047 MXN 1 355 615 1 203 267 0.0231 000 000 Mexican Bonos 8.500% 31/05/2029 MXN 1 687 129 1 700 186 0.03
212 Lumyna Funds
Lumyna – Global Debt - Government UCITS FundSchedule of investments as at March 31, 2021 (cont.)
The accompanying notes form an integral part of these financial statements.
Audited annual report
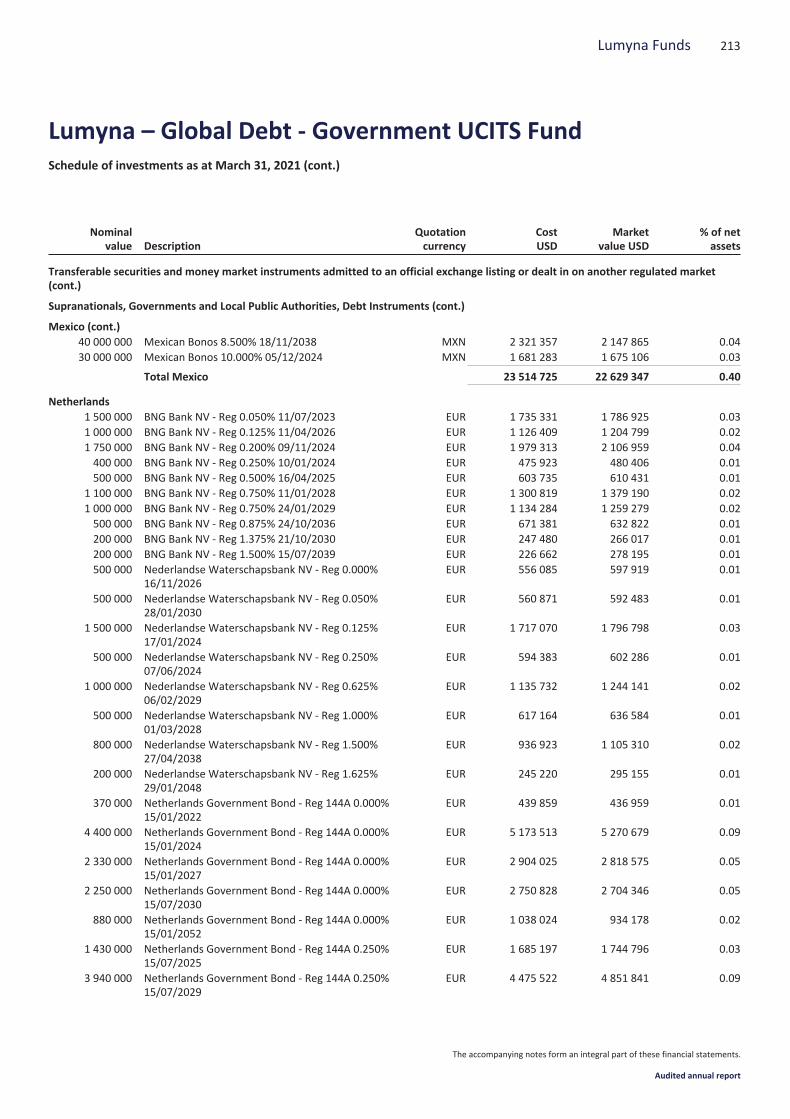
Nominalvalue Description
Quotationcurrency
CostUSD
Marketvalue USD
% of netassets
Transferable securities and money market instruments admitted to an official exchange listing or dealt in on another regulated market(cont.)
Supranationals, Governments and Local Public Authorities, Debt Instruments (cont.)
Mexico (cont.)40 000 000 Mexican Bonos 8.500% 18/11/2038 MXN 2 321 357 2 147 865 0.0430 000 000 Mexican Bonos 10.000% 05/12/2024 MXN 1 681 283 1 675 106 0.03
Total Mexico 23 514 725 22 629 347 0.40
Netherlands1 500 000 BNG Bank NV - Reg 0.050% 11/07/2023 EUR 1 735 331 1 786 925 0.031 000 000 BNG Bank NV - Reg 0.125% 11/04/2026 EUR 1 126 409 1 204 799 0.021 750 000 BNG Bank NV - Reg 0.200% 09/11/2024 EUR 1 979 313 2 106 959 0.04400 000 BNG Bank NV - Reg 0.250% 10/01/2024 EUR 475 923 480 406 0.01500 000 BNG Bank NV - Reg 0.500% 16/04/2025 EUR 603 735 610 431 0.01
1 100 000 BNG Bank NV - Reg 0.750% 11/01/2028 EUR 1 300 819 1 379 190 0.021 000 000 BNG Bank NV - Reg 0.750% 24/01/2029 EUR 1 134 284 1 259 279 0.02500 000 BNG Bank NV - Reg 0.875% 24/10/2036 EUR 671 381 632 822 0.01200 000 BNG Bank NV - Reg 1.375% 21/10/2030 EUR 247 480 266 017 0.01200 000 BNG Bank NV - Reg 1.500% 15/07/2039 EUR 226 662 278 195 0.01500 000 Nederlandse Waterschapsbank NV - Reg 0.000%
16/11/2026EUR 556 085 597 919 0.01
500 000 Nederlandse Waterschapsbank NV - Reg 0.050%28/01/2030
EUR 560 871 592 483 0.01
1 500 000 Nederlandse Waterschapsbank NV - Reg 0.125%17/01/2024
EUR 1 717 070 1 796 798 0.03
500 000 Nederlandse Waterschapsbank NV - Reg 0.250%07/06/2024
EUR 594 383 602 286 0.01
1 000 000 Nederlandse Waterschapsbank NV - Reg 0.625%06/02/2029
EUR 1 135 732 1 244 141 0.02
500 000 Nederlandse Waterschapsbank NV - Reg 1.000%01/03/2028
EUR 617 164 636 584 0.01
800 000 Nederlandse Waterschapsbank NV - Reg 1.500%27/04/2038
EUR 936 923 1 105 310 0.02
200 000 Nederlandse Waterschapsbank NV - Reg 1.625%29/01/2048
EUR 245 220 295 155 0.01
370 000 Netherlands Government Bond - Reg 144A 0.000%15/01/2022
EUR 439 859 436 959 0.01
4 400 000 Netherlands Government Bond - Reg 144A 0.000%15/01/2024
EUR 5 173 513 5 270 679 0.09
2 330 000 Netherlands Government Bond - Reg 144A 0.000%15/01/2027
EUR 2 904 025 2 818 575 0.05
2 250 000 Netherlands Government Bond - Reg 144A 0.000%15/07/2030
EUR 2 750 828 2 704 346 0.05
880 000 Netherlands Government Bond - Reg 144A 0.000%15/01/2052
EUR 1 038 024 934 178 0.02
1 430 000 Netherlands Government Bond - Reg 144A 0.250%15/07/2025
EUR 1 685 197 1 744 796 0.03
3 940 000 Netherlands Government Bond - Reg 144A 0.250%15/07/2029
EUR 4 475 522 4 851 841 0.09
213Lumyna Funds
Lumyna – Global Debt - Government UCITS FundSchedule of investments as at March 31, 2021 (cont.)
The accompanying notes form an integral part of these financial statements.
Audited annual report

Nominalvalue Description
Quotationcurrency
CostUSD
Marketvalue USD
% of netassets
Transferable securities and money market instruments admitted to an official exchange listing or dealt in on another regulated market(cont.)
Supranationals, Governments and Local Public Authorities, Debt Instruments (cont.)
Netherlands (cont.)1 120 000 Netherlands Government Bond - Reg 144A 0.500%
15/07/2026EUR 1 302 196 1 391 419 0.02
1 590 000 Netherlands Government Bond - Reg 144A 0.500%15/01/2040
EUR 1 904 283 1 984 195 0.04
3 100 000 Netherlands Government Bond - Reg 144A 0.750%15/07/2027
EUR 3 707 405 3 929 066 0.07
900 000 Netherlands Government Bond - Reg 144A 1.750%15/07/2023
EUR 1 114 183 1 117 220 0.02
1 550 000 Netherlands Government Bond - Reg 144A 2.000%15/07/2024
EUR 1 950 023 1 983 089 0.04
2 290 000 Netherlands Government Bond - Reg 144A 2.250%15/07/2022
EUR 2 899 425 2 791 616 0.05
1 950 000 Netherlands Government Bond - Reg 144A 2.500%15/01/2033
EUR 2 715 643 2 998 544 0.05
2 340 000 Netherlands Government Bond - Reg 144A 2.750%15/01/2047
EUR 3 761 536 4 482 426 0.08
2 840 000 Netherlands Government Bond - Reg 144A 3.750%15/01/2023
EUR 3 543 166 3 603 764 0.06
1 790 000 Netherlands Government Bond - Reg 144A 3.750%15/01/2042
EUR 3 193 629 3 644 557 0.06
1 000 000 Netherlands Government Bond - Reg 144A 4.000%15/01/2037
EUR 1 695 222 1 905 983 0.03
1 620 000 Netherlands Government Bond - Reg 144A 4.000%15/01/2037
EUR 2 819 590 3 087 693 0.05
Total Netherlands 64 938 054 68 556 645 1.21
New Zealand900 000 New Zealand Government Bond 1.750% 15/05/2041 NZD 638 960 541 208 0.01
2 350 000 New Zealand Government Bond 3.000% 20/04/2029 NZD 1 691 298 1 829 480 0.03400 000 New Zealand Government Bond - Reg 2.750%
15/04/2025NZD 291 566 302 647 0.00
1 450 000 New Zealand Government Bond - Reg 2.750%15/04/2037
NZD 1 056 685 1 067 502 0.02
1 250 000 New Zealand Government Bond - Reg 3.500%14/04/2033
NZD 890 692 1 010 071 0.02
1 900 000 New Zealand Government Bond - Reg 4.500%15/04/2027
NZD 1 458 689 1 591 556 0.03
3 000 000 New Zealand Government Bond - Reg 5.500%15/04/2023
NZD 2 133 391 2 322 060 0.04
600 000 New Zealand Government Bond - Reg 6.000%15/05/2021
NZD 416 582 422 819 0.01
3 000 000 New Zealand Local Government Funding Agency Bond- Reg 1.500% 15/04/2026
NZD 2 048 641 2 112 547 0.04
Total New Zealand 10 626 504 11 199 890 0.20
214 Lumyna Funds
Lumyna – Global Debt - Government UCITS FundSchedule of investments as at March 31, 2021 (cont.)
The accompanying notes form an integral part of these financial statements.
Audited annual report
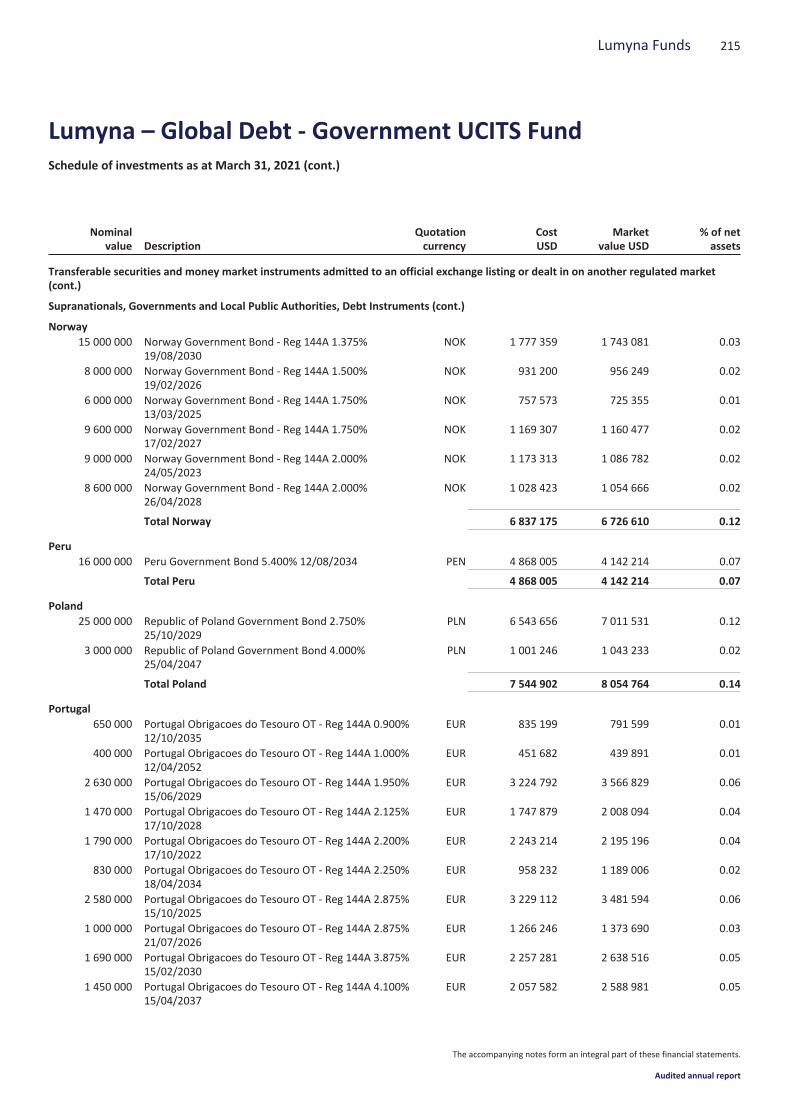
Nominalvalue Description
Quotationcurrency
CostUSD
Marketvalue USD
% of netassets
Transferable securities and money market instruments admitted to an official exchange listing or dealt in on another regulated market(cont.)
Supranationals, Governments and Local Public Authorities, Debt Instruments (cont.)
Norway15 000 000 Norway Government Bond - Reg 144A 1.375%
19/08/2030NOK 1 777 359 1 743 081 0.03
8 000 000 Norway Government Bond - Reg 144A 1.500%19/02/2026
NOK 931 200 956 249 0.02
6 000 000 Norway Government Bond - Reg 144A 1.750%13/03/2025
NOK 757 573 725 355 0.01
9 600 000 Norway Government Bond - Reg 144A 1.750%17/02/2027
NOK 1 169 307 1 160 477 0.02
9 000 000 Norway Government Bond - Reg 144A 2.000%24/05/2023
NOK 1 173 313 1 086 782 0.02
8 600 000 Norway Government Bond - Reg 144A 2.000%26/04/2028
NOK 1 028 423 1 054 666 0.02
Total Norway 6 837 175 6 726 610 0.12
Peru16 000 000 Peru Government Bond 5.400% 12/08/2034 PEN 4 868 005 4 142 214 0.07
Total Peru 4 868 005 4 142 214 0.07
Poland25 000 000 Republic of Poland Government Bond 2.750%
25/10/2029PLN 6 543 656 7 011 531 0.12
3 000 000 Republic of Poland Government Bond 4.000%25/04/2047
PLN 1 001 246 1 043 233 0.02
Total Poland 7 544 902 8 054 764 0.14
Portugal650 000 Portugal Obrigacoes do Tesouro OT - Reg 144A 0.900%
12/10/2035EUR 835 199 791 599 0.01
400 000 Portugal Obrigacoes do Tesouro OT - Reg 144A 1.000%12/04/2052
EUR 451 682 439 891 0.01
2 630 000 Portugal Obrigacoes do Tesouro OT - Reg 144A 1.950%15/06/2029
EUR 3 224 792 3 566 829 0.06
1 470 000 Portugal Obrigacoes do Tesouro OT - Reg 144A 2.125%17/10/2028
EUR 1 747 879 2 008 094 0.04
1 790 000 Portugal Obrigacoes do Tesouro OT - Reg 144A 2.200%17/10/2022
EUR 2 243 214 2 195 196 0.04
830 000 Portugal Obrigacoes do Tesouro OT - Reg 144A 2.250%18/04/2034
EUR 958 232 1 189 006 0.02
2 580 000 Portugal Obrigacoes do Tesouro OT - Reg 144A 2.875%15/10/2025
EUR 3 229 112 3 481 594 0.06
1 000 000 Portugal Obrigacoes do Tesouro OT - Reg 144A 2.875%21/07/2026
EUR 1 266 246 1 373 690 0.03
1 690 000 Portugal Obrigacoes do Tesouro OT - Reg 144A 3.875%15/02/2030
EUR 2 257 281 2 638 516 0.05
1 450 000 Portugal Obrigacoes do Tesouro OT - Reg 144A 4.100%15/04/2037
EUR 2 057 582 2 588 981 0.05
215Lumyna Funds
Lumyna – Global Debt - Government UCITS FundSchedule of investments as at March 31, 2021 (cont.)
The accompanying notes form an integral part of these financial statements.
Audited annual report

Nominalvalue Description
Quotationcurrency
CostUSD
Marketvalue USD
% of netassets
Transferable securities and money market instruments admitted to an official exchange listing or dealt in on another regulated market(cont.)
Supranationals, Governments and Local Public Authorities, Debt Instruments (cont.)
Portugal (cont.)930 000 Portugal Obrigacoes do Tesouro OT - Reg 144A 4.100%
15/02/2045EUR 1 510 194 1 798 775 0.03
1 300 000 Portugal Obrigacoes do Tesouro OT - Reg 144A 4.125%14/04/2027
EUR 1 728 005 1 930 008 0.03
2 600 000 Portugal Obrigacoes do Tesouro OT - Reg 144A 5.650%15/02/2024
EUR 3 460 947 3 596 716 0.06
Total Portugal 24 970 365 27 598 895 0.49
Romania20 000 000 Romania Government Bond 3.650% 28/07/2025 RON 4 982 896 4 985 740 0.09
Total Romania 4 982 896 4 985 740 0.09
Russia55 000 000 Russian Federal Bond - OFZ 6.500% 28/02/2024 RUB 850 732 737 217 0.01
120 000 000 Russian Federal Bond - OFZ 6.900% 23/05/2029 RUB 1 705 916 1 586 801 0.03186 000 000 Russian Federal Bond - OFZ 7.400% 07/12/2022 RUB 2 958 392 2 535 413 0.0428 000 000 Russian Federal Bond - OFZ 7.500% 18/08/2021 RUB 480 262 374 565 0.01
150 000 000 Russian Federal Bond - OFZ 7.650% 10/04/2030 RUB 2 439 375 2 082 595 0.048 000 000 Russian Federal Bond - OFZ 7.700% 23/03/2033 RUB 141 315 111 731 0.00
165 000 000 Russian Federal Bond - OFZ 7.750% 16/09/2026 RUB 2 670 132 2 293 477 0.04150 000 000 Russian Federal Bond - OFZ 7.950% 07/10/2026 RUB 2 667 637 2 101 667 0.04145 000 000 Russian Federal Bond - OFZ 8.500% 17/09/2031 RUB 2 417 306 2 137 595 0.04
Total Russia 16 331 067 13 961 061 0.25
Singapore600 000 Singapore Government Bond 1.875% 01/03/2050 SGD 507 422 429 101 0.01
1 500 000 Singapore Government Bond 2.125% 01/06/2026 SGD 1 128 491 1 174 233 0.021 400 000 Singapore Government Bond 2.250% 01/08/2036 SGD 1 009 632 1 067 880 0.022 750 000 Singapore Government Bond 2.375% 01/06/2025 SGD 2 055 024 2 174 661 0.04800 000 Singapore Government Bond 2.375% 01/07/2039 SGD 612 073 621 048 0.01
2 000 000 Singapore Government Bond 2.625% 01/05/2028 SGD 1 522 230 1 608 366 0.03360 000 Singapore Government Bond 2.750% 01/04/2042 SGD 256 983 297 544 0.01
1 550 000 Singapore Government Bond 2.750% 01/03/2046 SGD 1 238 173 1 290 321 0.022 200 000 Singapore Government Bond 2.875% 01/09/2030 SGD 1 640 831 1 798 135 0.03240 000 Singapore Government Bond 3.000% 01/09/2024 SGD 183 601 192 218 0.00
4 300 000 Singapore Government Bond 3.125% 01/09/2022 SGD 3 240 513 3 319 731 0.06200 000 Singapore Government Bond 3.375% 01/09/2033 SGD 163 088 171 777 0.00720 000 Singapore Government Bond 3.500% 01/03/2027 SGD 579 458 604 198 0.01
Total Singapore 14 137 519 14 749 213 0.26
Slovakia500 000 Slovakia Government Bond 0.000% 13/11/2023 EUR 612 578 595 136 0.01
1 530 000 Slovakia Government Bond 0.625% 22/05/2026 EUR 1 790 060 1 895 671 0.03500 000 Slovakia Government Bond - Reg 0.750% 09/04/2030 EUR 584 385 632 511 0.01
1 000 000 Slovakia Government Bond - Reg 1.000% 12/06/2028 EUR 1 161 193 1 282 886 0.02
216 Lumyna Funds
Lumyna – Global Debt - Government UCITS FundSchedule of investments as at March 31, 2021 (cont.)
The accompanying notes form an integral part of these financial statements.
Audited annual report
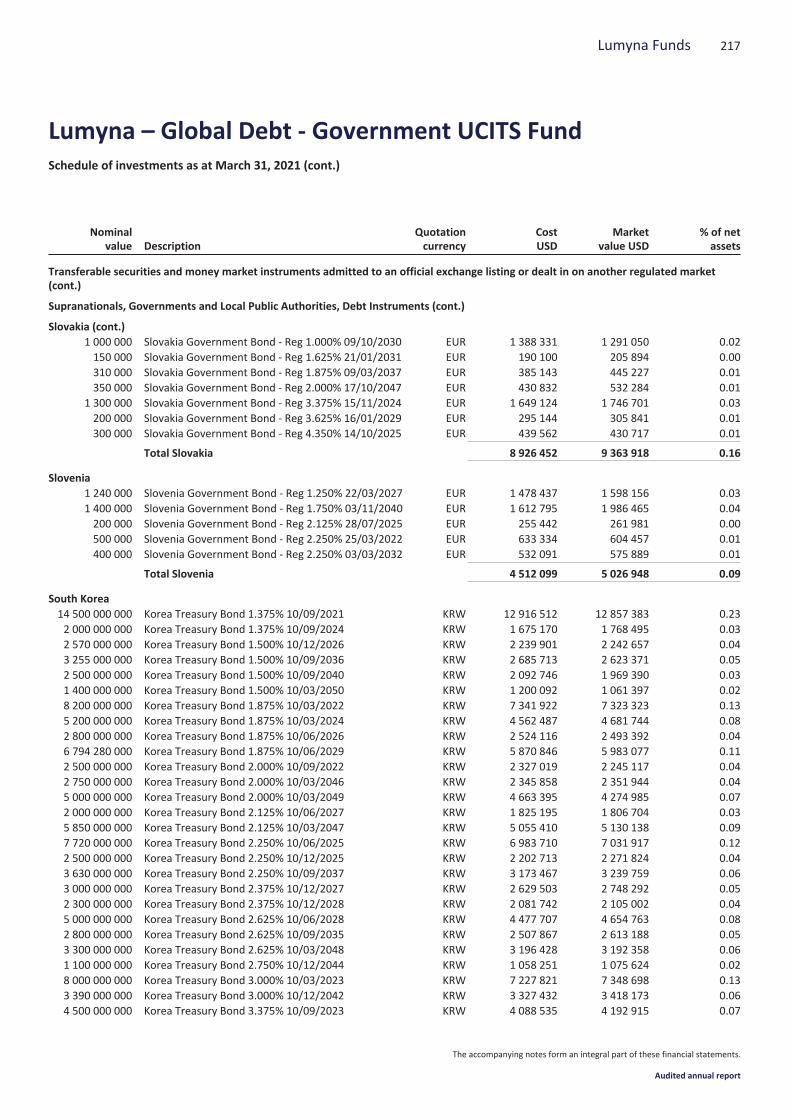
Nominalvalue Description
Quotationcurrency
CostUSD
Marketvalue USD
% of netassets
Transferable securities and money market instruments admitted to an official exchange listing or dealt in on another regulated market(cont.)
Supranationals, Governments and Local Public Authorities, Debt Instruments (cont.)
Slovakia (cont.)1 000 000 Slovakia Government Bond - Reg 1.000% 09/10/2030 EUR 1 388 331 1 291 050 0.02150 000 Slovakia Government Bond - Reg 1.625% 21/01/2031 EUR 190 100 205 894 0.00310 000 Slovakia Government Bond - Reg 1.875% 09/03/2037 EUR 385 143 445 227 0.01350 000 Slovakia Government Bond - Reg 2.000% 17/10/2047 EUR 430 832 532 284 0.01
1 300 000 Slovakia Government Bond - Reg 3.375% 15/11/2024 EUR 1 649 124 1 746 701 0.03200 000 Slovakia Government Bond - Reg 3.625% 16/01/2029 EUR 295 144 305 841 0.01300 000 Slovakia Government Bond - Reg 4.350% 14/10/2025 EUR 439 562 430 717 0.01
Total Slovakia 8 926 452 9 363 918 0.16
Slovenia1 240 000 Slovenia Government Bond - Reg 1.250% 22/03/2027 EUR 1 478 437 1 598 156 0.031 400 000 Slovenia Government Bond - Reg 1.750% 03/11/2040 EUR 1 612 795 1 986 465 0.04200 000 Slovenia Government Bond - Reg 2.125% 28/07/2025 EUR 255 442 261 981 0.00500 000 Slovenia Government Bond - Reg 2.250% 25/03/2022 EUR 633 334 604 457 0.01400 000 Slovenia Government Bond - Reg 2.250% 03/03/2032 EUR 532 091 575 889 0.01
Total Slovenia 4 512 099 5 026 948 0.09
South Korea14 500 000 000 Korea Treasury Bond 1.375% 10/09/2021 KRW 12 916 512 12 857 383 0.232 000 000 000 Korea Treasury Bond 1.375% 10/09/2024 KRW 1 675 170 1 768 495 0.032 570 000 000 Korea Treasury Bond 1.500% 10/12/2026 KRW 2 239 901 2 242 657 0.043 255 000 000 Korea Treasury Bond 1.500% 10/09/2036 KRW 2 685 713 2 623 371 0.052 500 000 000 Korea Treasury Bond 1.500% 10/09/2040 KRW 2 092 746 1 969 390 0.031 400 000 000 Korea Treasury Bond 1.500% 10/03/2050 KRW 1 200 092 1 061 397 0.028 200 000 000 Korea Treasury Bond 1.875% 10/03/2022 KRW 7 341 922 7 323 323 0.135 200 000 000 Korea Treasury Bond 1.875% 10/03/2024 KRW 4 562 487 4 681 744 0.082 800 000 000 Korea Treasury Bond 1.875% 10/06/2026 KRW 2 524 116 2 493 392 0.046 794 280 000 Korea Treasury Bond 1.875% 10/06/2029 KRW 5 870 846 5 983 077 0.112 500 000 000 Korea Treasury Bond 2.000% 10/09/2022 KRW 2 327 019 2 245 117 0.042 750 000 000 Korea Treasury Bond 2.000% 10/03/2046 KRW 2 345 858 2 351 944 0.045 000 000 000 Korea Treasury Bond 2.000% 10/03/2049 KRW 4 663 395 4 274 985 0.072 000 000 000 Korea Treasury Bond 2.125% 10/06/2027 KRW 1 825 195 1 806 704 0.035 850 000 000 Korea Treasury Bond 2.125% 10/03/2047 KRW 5 055 410 5 130 138 0.097 720 000 000 Korea Treasury Bond 2.250% 10/06/2025 KRW 6 983 710 7 031 917 0.122 500 000 000 Korea Treasury Bond 2.250% 10/12/2025 KRW 2 202 713 2 271 824 0.043 630 000 000 Korea Treasury Bond 2.250% 10/09/2037 KRW 3 173 467 3 239 759 0.063 000 000 000 Korea Treasury Bond 2.375% 10/12/2027 KRW 2 629 503 2 748 292 0.052 300 000 000 Korea Treasury Bond 2.375% 10/12/2028 KRW 2 081 742 2 105 002 0.045 000 000 000 Korea Treasury Bond 2.625% 10/06/2028 KRW 4 477 707 4 654 763 0.082 800 000 000 Korea Treasury Bond 2.625% 10/09/2035 KRW 2 507 867 2 613 188 0.053 300 000 000 Korea Treasury Bond 2.625% 10/03/2048 KRW 3 196 428 3 192 358 0.061 100 000 000 Korea Treasury Bond 2.750% 10/12/2044 KRW 1 058 251 1 075 624 0.028 000 000 000 Korea Treasury Bond 3.000% 10/03/2023 KRW 7 227 821 7 348 698 0.133 390 000 000 Korea Treasury Bond 3.000% 10/12/2042 KRW 3 327 432 3 418 173 0.064 500 000 000 Korea Treasury Bond 3.375% 10/09/2023 KRW 4 088 535 4 192 915 0.07
217Lumyna Funds
Lumyna – Global Debt - Government UCITS FundSchedule of investments as at March 31, 2021 (cont.)
The accompanying notes form an integral part of these financial statements.
Audited annual report
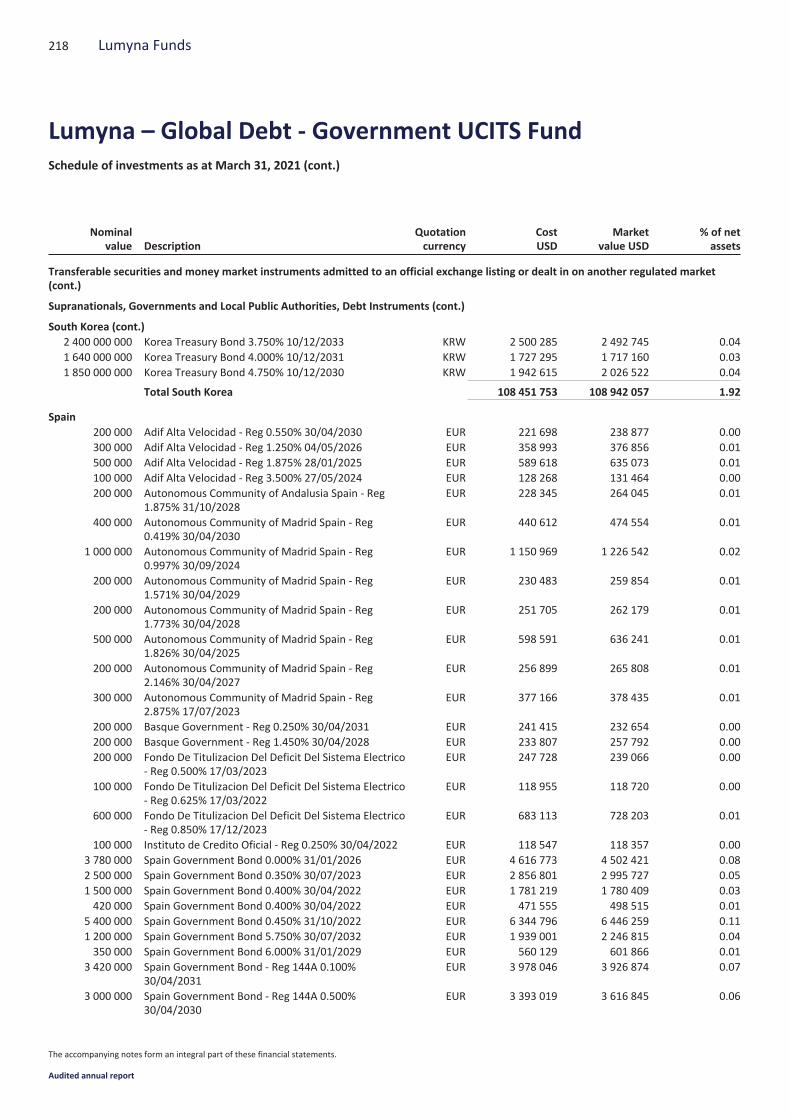
Nominalvalue Description
Quotationcurrency
CostUSD
Marketvalue USD
% of netassets
Transferable securities and money market instruments admitted to an official exchange listing or dealt in on another regulated market(cont.)
Supranationals, Governments and Local Public Authorities, Debt Instruments (cont.)
South Korea (cont.)2 400 000 000 Korea Treasury Bond 3.750% 10/12/2033 KRW 2 500 285 2 492 745 0.041 640 000 000 Korea Treasury Bond 4.000% 10/12/2031 KRW 1 727 295 1 717 160 0.031 850 000 000 Korea Treasury Bond 4.750% 10/12/2030 KRW 1 942 615 2 026 522 0.04
Total South Korea 108 451 753 108 942 057 1.92
Spain200 000 Adif Alta Velocidad - Reg 0.550% 30/04/2030 EUR 221 698 238 877 0.00300 000 Adif Alta Velocidad - Reg 1.250% 04/05/2026 EUR 358 993 376 856 0.01500 000 Adif Alta Velocidad - Reg 1.875% 28/01/2025 EUR 589 618 635 073 0.01100 000 Adif Alta Velocidad - Reg 3.500% 27/05/2024 EUR 128 268 131 464 0.00200 000 Autonomous Community of Andalusia Spain - Reg
1.875% 31/10/2028EUR 228 345 264 045 0.01
400 000 Autonomous Community of Madrid Spain - Reg0.419% 30/04/2030
EUR 440 612 474 554 0.01
1 000 000 Autonomous Community of Madrid Spain - Reg0.997% 30/09/2024
EUR 1 150 969 1 226 542 0.02
200 000 Autonomous Community of Madrid Spain - Reg1.571% 30/04/2029
EUR 230 483 259 854 0.01
200 000 Autonomous Community of Madrid Spain - Reg1.773% 30/04/2028
EUR 251 705 262 179 0.01
500 000 Autonomous Community of Madrid Spain - Reg1.826% 30/04/2025
EUR 598 591 636 241 0.01
200 000 Autonomous Community of Madrid Spain - Reg2.146% 30/04/2027
EUR 256 899 265 808 0.01
300 000 Autonomous Community of Madrid Spain - Reg2.875% 17/07/2023
EUR 377 166 378 435 0.01
200 000 Basque Government - Reg 0.250% 30/04/2031 EUR 241 415 232 654 0.00200 000 Basque Government - Reg 1.450% 30/04/2028 EUR 233 807 257 792 0.00200 000 Fondo De Titulizacion Del Deficit Del Sistema Electrico
- Reg 0.500% 17/03/2023EUR 247 728 239 066 0.00
100 000 Fondo De Titulizacion Del Deficit Del Sistema Electrico- Reg 0.625% 17/03/2022
EUR 118 955 118 720 0.00
600 000 Fondo De Titulizacion Del Deficit Del Sistema Electrico- Reg 0.850% 17/12/2023
EUR 683 113 728 203 0.01
100 000 Instituto de Credito Oficial - Reg 0.250% 30/04/2022 EUR 118 547 118 357 0.003 780 000 Spain Government Bond 0.000% 31/01/2026 EUR 4 616 773 4 502 421 0.082 500 000 Spain Government Bond 0.350% 30/07/2023 EUR 2 856 801 2 995 727 0.051 500 000 Spain Government Bond 0.400% 30/04/2022 EUR 1 781 219 1 780 409 0.03420 000 Spain Government Bond 0.400% 30/04/2022 EUR 471 555 498 515 0.01
5 400 000 Spain Government Bond 0.450% 31/10/2022 EUR 6 344 796 6 446 259 0.111 200 000 Spain Government Bond 5.750% 30/07/2032 EUR 1 939 001 2 246 815 0.04350 000 Spain Government Bond 6.000% 31/01/2029 EUR 560 129 601 866 0.01
3 420 000 Spain Government Bond - Reg 144A 0.100%30/04/2031
EUR 3 978 046 3 926 874 0.07
3 000 000 Spain Government Bond - Reg 144A 0.500%30/04/2030
EUR 3 393 019 3 616 845 0.06
218 Lumyna Funds
Lumyna – Global Debt - Government UCITS FundSchedule of investments as at March 31, 2021 (cont.)
The accompanying notes form an integral part of these financial statements.
Audited annual report
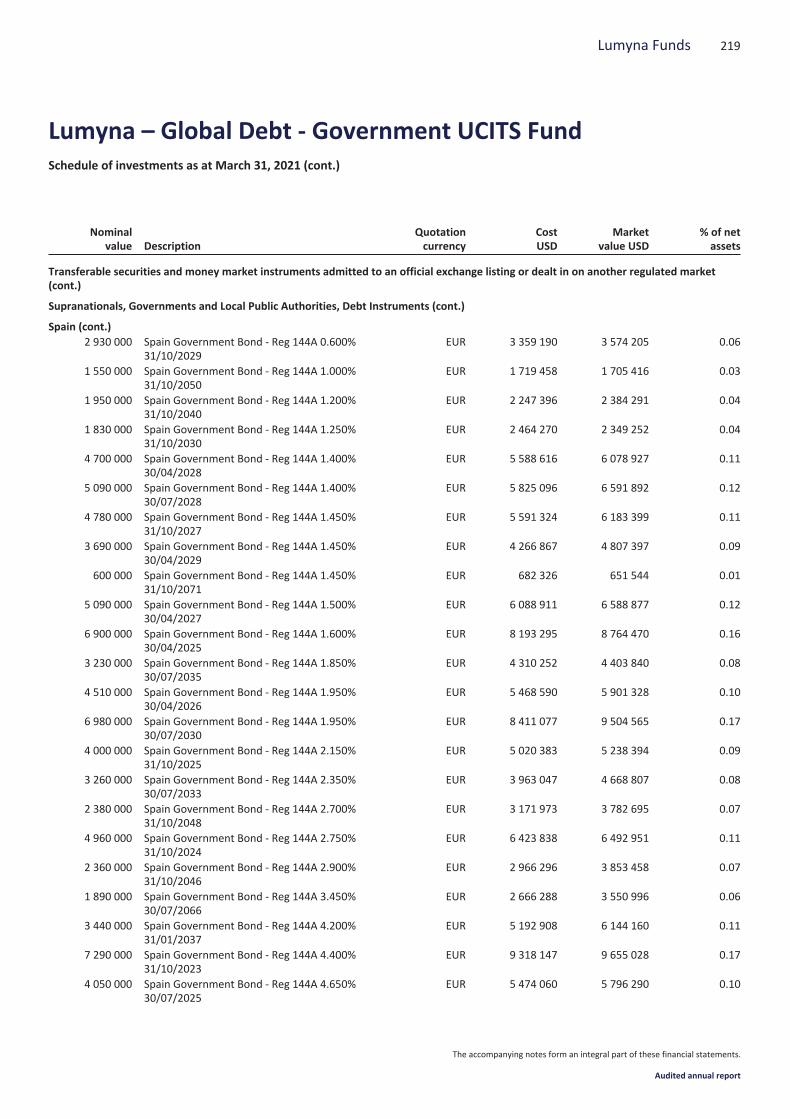
Nominalvalue Description
Quotationcurrency
CostUSD
Marketvalue USD
% of netassets
Transferable securities and money market instruments admitted to an official exchange listing or dealt in on another regulated market(cont.)
Supranationals, Governments and Local Public Authorities, Debt Instruments (cont.)
Spain (cont.)2 930 000 Spain Government Bond - Reg 144A 0.600%
31/10/2029EUR 3 359 190 3 574 205 0.06
1 550 000 Spain Government Bond - Reg 144A 1.000%31/10/2050
EUR 1 719 458 1 705 416 0.03
1 950 000 Spain Government Bond - Reg 144A 1.200%31/10/2040
EUR 2 247 396 2 384 291 0.04
1 830 000 Spain Government Bond - Reg 144A 1.250%31/10/2030
EUR 2 464 270 2 349 252 0.04
4 700 000 Spain Government Bond - Reg 144A 1.400%30/04/2028
EUR 5 588 616 6 078 927 0.11
5 090 000 Spain Government Bond - Reg 144A 1.400%30/07/2028
EUR 5 825 096 6 591 892 0.12
4 780 000 Spain Government Bond - Reg 144A 1.450%31/10/2027
EUR 5 591 324 6 183 399 0.11
3 690 000 Spain Government Bond - Reg 144A 1.450%30/04/2029
EUR 4 266 867 4 807 397 0.09
600 000 Spain Government Bond - Reg 144A 1.450%31/10/2071
EUR 682 326 651 544 0.01
5 090 000 Spain Government Bond - Reg 144A 1.500%30/04/2027
EUR 6 088 911 6 588 877 0.12
6 900 000 Spain Government Bond - Reg 144A 1.600%30/04/2025
EUR 8 193 295 8 764 470 0.16
3 230 000 Spain Government Bond - Reg 144A 1.850%30/07/2035
EUR 4 310 252 4 403 840 0.08
4 510 000 Spain Government Bond - Reg 144A 1.950%30/04/2026
EUR 5 468 590 5 901 328 0.10
6 980 000 Spain Government Bond - Reg 144A 1.950%30/07/2030
EUR 8 411 077 9 504 565 0.17
4 000 000 Spain Government Bond - Reg 144A 2.150%31/10/2025
EUR 5 020 383 5 238 394 0.09
3 260 000 Spain Government Bond - Reg 144A 2.350%30/07/2033
EUR 3 963 047 4 668 807 0.08
2 380 000 Spain Government Bond - Reg 144A 2.700%31/10/2048
EUR 3 171 973 3 782 695 0.07
4 960 000 Spain Government Bond - Reg 144A 2.750%31/10/2024
EUR 6 423 838 6 492 951 0.11
2 360 000 Spain Government Bond - Reg 144A 2.900%31/10/2046
EUR 2 966 296 3 853 458 0.07
1 890 000 Spain Government Bond - Reg 144A 3.450%30/07/2066
EUR 2 666 288 3 550 996 0.06
3 440 000 Spain Government Bond - Reg 144A 4.200%31/01/2037
EUR 5 192 908 6 144 160 0.11
7 290 000 Spain Government Bond - Reg 144A 4.400%31/10/2023
EUR 9 318 147 9 655 028 0.17
4 050 000 Spain Government Bond - Reg 144A 4.650%30/07/2025
EUR 5 474 060 5 796 290 0.10
219Lumyna Funds
Lumyna – Global Debt - Government UCITS FundSchedule of investments as at March 31, 2021 (cont.)
The accompanying notes form an integral part of these financial statements.
Audited annual report
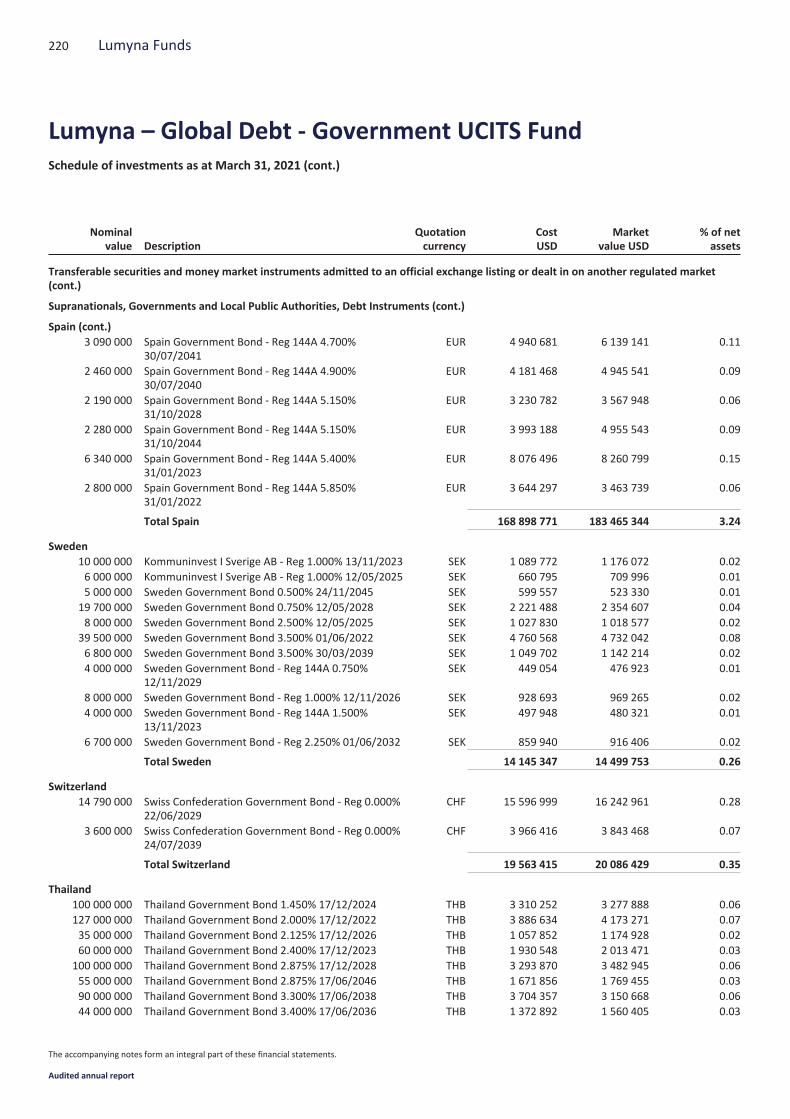
Nominalvalue Description
Quotationcurrency
CostUSD
Marketvalue USD
% of netassets
Transferable securities and money market instruments admitted to an official exchange listing or dealt in on another regulated market(cont.)
Supranationals, Governments and Local Public Authorities, Debt Instruments (cont.)
Spain (cont.)3 090 000 Spain Government Bond - Reg 144A 4.700%
30/07/2041EUR 4 940 681 6 139 141 0.11
2 460 000 Spain Government Bond - Reg 144A 4.900%30/07/2040
EUR 4 181 468 4 945 541 0.09
2 190 000 Spain Government Bond - Reg 144A 5.150%31/10/2028
EUR 3 230 782 3 567 948 0.06
2 280 000 Spain Government Bond - Reg 144A 5.150%31/10/2044
EUR 3 993 188 4 955 543 0.09
6 340 000 Spain Government Bond - Reg 144A 5.400%31/01/2023
EUR 8 076 496 8 260 799 0.15
2 800 000 Spain Government Bond - Reg 144A 5.850%31/01/2022
EUR 3 644 297 3 463 739 0.06
Total Spain 168 898 771 183 465 344 3.24
Sweden10 000 000 Kommuninvest I Sverige AB - Reg 1.000% 13/11/2023 SEK 1 089 772 1 176 072 0.026 000 000 Kommuninvest I Sverige AB - Reg 1.000% 12/05/2025 SEK 660 795 709 996 0.015 000 000 Sweden Government Bond 0.500% 24/11/2045 SEK 599 557 523 330 0.01
19 700 000 Sweden Government Bond 0.750% 12/05/2028 SEK 2 221 488 2 354 607 0.048 000 000 Sweden Government Bond 2.500% 12/05/2025 SEK 1 027 830 1 018 577 0.02
39 500 000 Sweden Government Bond 3.500% 01/06/2022 SEK 4 760 568 4 732 042 0.086 800 000 Sweden Government Bond 3.500% 30/03/2039 SEK 1 049 702 1 142 214 0.024 000 000 Sweden Government Bond - Reg 144A 0.750%
12/11/2029SEK 449 054 476 923 0.01
8 000 000 Sweden Government Bond - Reg 1.000% 12/11/2026 SEK 928 693 969 265 0.024 000 000 Sweden Government Bond - Reg 144A 1.500%
13/11/2023SEK 497 948 480 321 0.01
6 700 000 Sweden Government Bond - Reg 2.250% 01/06/2032 SEK 859 940 916 406 0.02
Total Sweden 14 145 347 14 499 753 0.26
Switzerland14 790 000 Swiss Confederation Government Bond - Reg 0.000%
22/06/2029CHF 15 596 999 16 242 961 0.28
3 600 000 Swiss Confederation Government Bond - Reg 0.000%24/07/2039
CHF 3 966 416 3 843 468 0.07
Total Switzerland 19 563 415 20 086 429 0.35
Thailand100 000 000 Thailand Government Bond 1.450% 17/12/2024 THB 3 310 252 3 277 888 0.06127 000 000 Thailand Government Bond 2.000% 17/12/2022 THB 3 886 634 4 173 271 0.0735 000 000 Thailand Government Bond 2.125% 17/12/2026 THB 1 057 852 1 174 928 0.0260 000 000 Thailand Government Bond 2.400% 17/12/2023 THB 1 930 548 2 013 471 0.03
100 000 000 Thailand Government Bond 2.875% 17/12/2028 THB 3 293 870 3 482 945 0.0655 000 000 Thailand Government Bond 2.875% 17/06/2046 THB 1 671 856 1 769 455 0.0390 000 000 Thailand Government Bond 3.300% 17/06/2038 THB 3 704 357 3 150 668 0.0644 000 000 Thailand Government Bond 3.400% 17/06/2036 THB 1 372 892 1 560 405 0.03
220 Lumyna Funds
Lumyna – Global Debt - Government UCITS FundSchedule of investments as at March 31, 2021 (cont.)
The accompanying notes form an integral part of these financial statements.
Audited annual report

Nominalvalue Description
Quotationcurrency
CostUSD
Marketvalue USD
% of netassets
Transferable securities and money market instruments admitted to an official exchange listing or dealt in on another regulated market(cont.)
Supranationals, Governments and Local Public Authorities, Debt Instruments (cont.)
Thailand (cont.)7 000 000 Thailand Government Bond 3.580% 17/12/2027 THB 233 757 254 460 0.00
14 280 000 Thailand Government Bond 3.600% 17/06/2067 THB 666 645 506 081 0.0127 000 000 Thailand Government Bond 3.650% 20/06/2031 THB 904 083 1 000 405 0.0210 000 000 Thailand Government Bond 3.850% 12/12/2025 THB 327 720 361 157 0.0130 000 000 Thailand Government Bond 4.000% 17/06/2066 THB 1 010 348 1 159 987 0.0227 800 000 Thailand Government Bond 4.675% 29/06/2044 THB 1 055 071 1 175 105 0.027 500 000 Thailand Government Bond 4.850% 17/06/2061 THB 301 652 333 709 0.01
55 000 000 Thailand Government Bond 4.875% 22/06/2029 THB 1 885 407 2 187 029 0.04
Total Thailand 26 612 944 27 580 964 0.49
United Kingdom2 830 000 United Kingdom Gilt - Reg 0.125% 31/01/2024 GBP 3 875 385 3 896 680 0.076 680 000 United Kingdom Gilt - Reg 0.125% 30/01/2026 GBP 8 926 276 9 102 151 0.163 490 000 United Kingdom Gilt - Reg 0.125% 31/01/2028 GBP 4 520 216 4 656 736 0.081 500 000 United Kingdom Gilt - Reg 0.250% 31/07/2031 GBP 2 026 626 1 927 315 0.033 840 000 United Kingdom Gilt - Reg 0.375% 22/10/2030 GBP 5 121 311 5 055 664 0.097 400 000 United Kingdom Gilt - Reg 0.500% 22/07/2022 GBP 9 649 121 10 275 126 0.182 520 000 United Kingdom Gilt - Reg 0.500% 22/10/2061 GBP 2 962 016 2 618 867 0.054 300 000 United Kingdom Gilt - Reg 0.625% 07/06/2025 GBP 5 569 004 6 018 289 0.112 210 000 United Kingdom Gilt - Reg 0.625% 31/07/2035 GBP 2 910 994 2 814 691 0.054 420 000 United Kingdom Gilt - Reg 0.625% 22/10/2050 GBP 5 430 466 4 975 388 0.095 800 000 United Kingdom Gilt - Reg 0.750% 22/07/2023 GBP 7 585 689 8 121 631 0.148 600 000 United Kingdom Gilt - Reg 0.875% 22/10/2029 GBP 11 107 350 11 959 446 0.21620 000 United Kingdom Gilt - Reg 0.875% 31/01/2046 GBP 772 490 760 848 0.01
5 820 000 United Kingdom Gilt - Reg 1.000% 22/04/2024 GBP 7 490 987 8 235 148 0.153 880 000 United Kingdom Gilt - Reg 1.250% 22/07/2027 GBP 5 097 460 5 590 504 0.102 690 000 United Kingdom Gilt - Reg 1.250% 22/10/2041 GBP 3 985 299 3 643 881 0.065 800 000 United Kingdom Gilt - Reg 1.500% 22/07/2026 GBP 8 113 086 8 460 579 0.153 530 000 United Kingdom Gilt - Reg 1.500% 22/07/2047 GBP 4 546 439 4 991 214 0.097 670 000 United Kingdom Gilt - Reg 1.625% 22/10/2028 GBP 10 249 364 11 337 496 0.201 770 000 United Kingdom Gilt - Reg 1.625% 22/10/2054 GBP 2 583 859 2 614 867 0.052 120 000 United Kingdom Gilt - Reg 1.625% 22/10/2071 GBP 3 110 065 3 390 039 0.063 290 000 United Kingdom Gilt - Reg 1.750% 07/09/2022 GBP 4 382 258 4 650 596 0.084 300 000 United Kingdom Gilt - Reg 1.750% 07/09/2037 GBP 5 717 393 6 370 546 0.112 920 000 United Kingdom Gilt - Reg 1.750% 22/01/2049 GBP 4 127 873 4 372 690 0.083 810 000 United Kingdom Gilt - Reg 1.750% 22/07/2057 GBP 5 716 112 5 907 088 0.107 780 000 United Kingdom Gilt - Reg 2.000% 07/09/2025 GBP 10 636 012 11 546 360 0.206 670 000 United Kingdom Gilt - Reg 2.250% 07/09/2023 GBP 8 996 547 9 682 187 0.172 660 000 United Kingdom Gilt - Reg 2.500% 22/07/2065 GBP 4 515 821 5 191 775 0.095 930 000 United Kingdom Gilt - Reg 2.750% 07/09/2024 GBP 8 164 704 8 898 139 0.163 850 000 United Kingdom Gilt - Reg 3.250% 22/01/2044 GBP 6 529 060 7 265 493 0.134 110 000 United Kingdom Gilt - Reg 3.500% 22/01/2045 GBP 7 455 423 8 115 906 0.142 900 000 United Kingdom Gilt - Reg 3.500% 22/07/2068 GBP 6 104 546 7 203 326 0.134 050 000 United Kingdom Gilt - Reg 3.750% 22/07/2052 GBP 7 916 581 8 991 688 0.163 900 000 United Kingdom Gilt - Reg 4.000% 22/01/2060 GBP 8 554 208 9 820 287 0.17
221Lumyna Funds
Lumyna – Global Debt - Government UCITS FundSchedule of investments as at March 31, 2021 (cont.)
The accompanying notes form an integral part of these financial statements.
Audited annual report
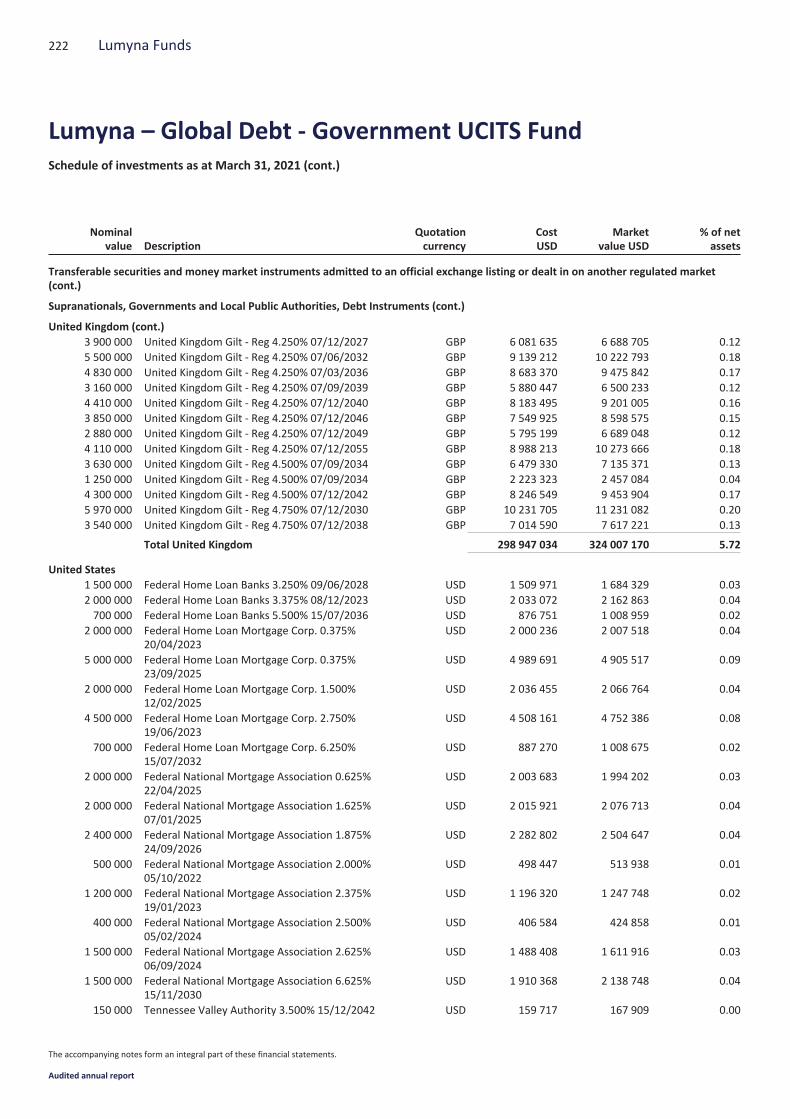
Nominalvalue Description
Quotationcurrency
CostUSD
Marketvalue USD
% of netassets
Transferable securities and money market instruments admitted to an official exchange listing or dealt in on another regulated market(cont.)
Supranationals, Governments and Local Public Authorities, Debt Instruments (cont.)
United Kingdom (cont.)3 900 000 United Kingdom Gilt - Reg 4.250% 07/12/2027 GBP 6 081 635 6 688 705 0.125 500 000 United Kingdom Gilt - Reg 4.250% 07/06/2032 GBP 9 139 212 10 222 793 0.184 830 000 United Kingdom Gilt - Reg 4.250% 07/03/2036 GBP 8 683 370 9 475 842 0.173 160 000 United Kingdom Gilt - Reg 4.250% 07/09/2039 GBP 5 880 447 6 500 233 0.124 410 000 United Kingdom Gilt - Reg 4.250% 07/12/2040 GBP 8 183 495 9 201 005 0.163 850 000 United Kingdom Gilt - Reg 4.250% 07/12/2046 GBP 7 549 925 8 598 575 0.152 880 000 United Kingdom Gilt - Reg 4.250% 07/12/2049 GBP 5 795 199 6 689 048 0.124 110 000 United Kingdom Gilt - Reg 4.250% 07/12/2055 GBP 8 988 213 10 273 666 0.183 630 000 United Kingdom Gilt - Reg 4.500% 07/09/2034 GBP 6 479 330 7 135 371 0.131 250 000 United Kingdom Gilt - Reg 4.500% 07/09/2034 GBP 2 223 323 2 457 084 0.044 300 000 United Kingdom Gilt - Reg 4.500% 07/12/2042 GBP 8 246 549 9 453 904 0.175 970 000 United Kingdom Gilt - Reg 4.750% 07/12/2030 GBP 10 231 705 11 231 082 0.203 540 000 United Kingdom Gilt - Reg 4.750% 07/12/2038 GBP 7 014 590 7 617 221 0.13
Total United Kingdom 298 947 034 324 007 170 5.72
United States1 500 000 Federal Home Loan Banks 3.250% 09/06/2028 USD 1 509 971 1 684 329 0.032 000 000 Federal Home Loan Banks 3.375% 08/12/2023 USD 2 033 072 2 162 863 0.04700 000 Federal Home Loan Banks 5.500% 15/07/2036 USD 876 751 1 008 959 0.02
2 000 000 Federal Home Loan Mortgage Corp. 0.375%20/04/2023
USD 2 000 236 2 007 518 0.04
5 000 000 Federal Home Loan Mortgage Corp. 0.375%23/09/2025
USD 4 989 691 4 905 517 0.09
2 000 000 Federal Home Loan Mortgage Corp. 1.500%12/02/2025
USD 2 036 455 2 066 764 0.04
4 500 000 Federal Home Loan Mortgage Corp. 2.750%19/06/2023
USD 4 508 161 4 752 386 0.08
700 000 Federal Home Loan Mortgage Corp. 6.250%15/07/2032
USD 887 270 1 008 675 0.02
2 000 000 Federal National Mortgage Association 0.625%22/04/2025
USD 2 003 683 1 994 202 0.03
2 000 000 Federal National Mortgage Association 1.625%07/01/2025
USD 2 015 921 2 076 713 0.04
2 400 000 Federal National Mortgage Association 1.875%24/09/2026
USD 2 282 802 2 504 647 0.04
500 000 Federal National Mortgage Association 2.000%05/10/2022
USD 498 447 513 938 0.01
1 200 000 Federal National Mortgage Association 2.375%19/01/2023
USD 1 196 320 1 247 748 0.02
400 000 Federal National Mortgage Association 2.500%05/02/2024
USD 406 584 424 858 0.01
1 500 000 Federal National Mortgage Association 2.625%06/09/2024
USD 1 488 408 1 611 916 0.03
1 500 000 Federal National Mortgage Association 6.625%15/11/2030
USD 1 910 368 2 138 748 0.04
150 000 Tennessee Valley Authority 3.500% 15/12/2042 USD 159 717 167 909 0.00
222 Lumyna Funds
Lumyna – Global Debt - Government UCITS FundSchedule of investments as at March 31, 2021 (cont.)
The accompanying notes form an integral part of these financial statements.
Audited annual report
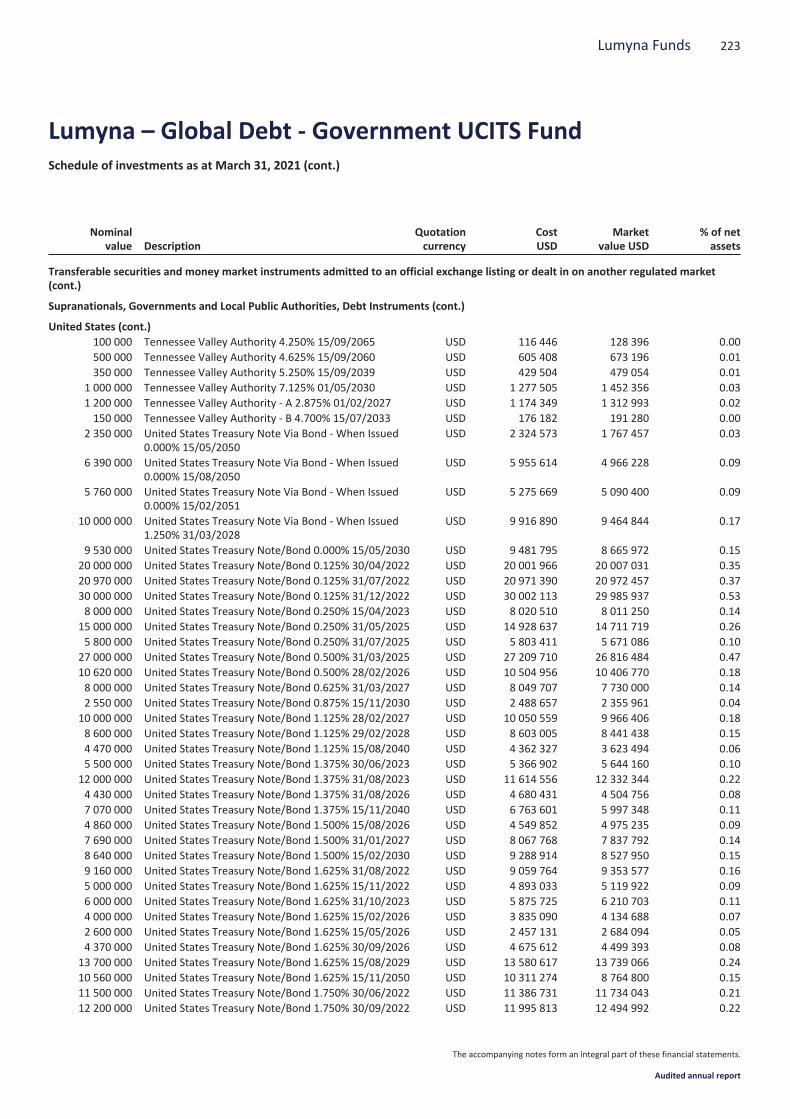
Nominalvalue Description
Quotationcurrency
CostUSD
Marketvalue USD
% of netassets
Transferable securities and money market instruments admitted to an official exchange listing or dealt in on another regulated market(cont.)
Supranationals, Governments and Local Public Authorities, Debt Instruments (cont.)
United States (cont.)100 000 Tennessee Valley Authority 4.250% 15/09/2065 USD 116 446 128 396 0.00500 000 Tennessee Valley Authority 4.625% 15/09/2060 USD 605 408 673 196 0.01350 000 Tennessee Valley Authority 5.250% 15/09/2039 USD 429 504 479 054 0.01
1 000 000 Tennessee Valley Authority 7.125% 01/05/2030 USD 1 277 505 1 452 356 0.031 200 000 Tennessee Valley Authority - A 2.875% 01/02/2027 USD 1 174 349 1 312 993 0.02150 000 Tennessee Valley Authority - B 4.700% 15/07/2033 USD 176 182 191 280 0.00
2 350 000 United States Treasury Note Via Bond - When Issued0.000% 15/05/2050
USD 2 324 573 1 767 457 0.03
6 390 000 United States Treasury Note Via Bond - When Issued0.000% 15/08/2050
USD 5 955 614 4 966 228 0.09
5 760 000 United States Treasury Note Via Bond - When Issued0.000% 15/02/2051
USD 5 275 669 5 090 400 0.09
10 000 000 United States Treasury Note Via Bond - When Issued1.250% 31/03/2028
USD 9 916 890 9 464 844 0.17
9 530 000 United States Treasury Note/Bond 0.000% 15/05/2030 USD 9 481 795 8 665 972 0.1520 000 000 United States Treasury Note/Bond 0.125% 30/04/2022 USD 20 001 966 20 007 031 0.3520 970 000 United States Treasury Note/Bond 0.125% 31/07/2022 USD 20 971 390 20 972 457 0.3730 000 000 United States Treasury Note/Bond 0.125% 31/12/2022 USD 30 002 113 29 985 937 0.538 000 000 United States Treasury Note/Bond 0.250% 15/04/2023 USD 8 020 510 8 011 250 0.14
15 000 000 United States Treasury Note/Bond 0.250% 31/05/2025 USD 14 928 637 14 711 719 0.265 800 000 United States Treasury Note/Bond 0.250% 31/07/2025 USD 5 803 411 5 671 086 0.10
27 000 000 United States Treasury Note/Bond 0.500% 31/03/2025 USD 27 209 710 26 816 484 0.4710 620 000 United States Treasury Note/Bond 0.500% 28/02/2026 USD 10 504 956 10 406 770 0.188 000 000 United States Treasury Note/Bond 0.625% 31/03/2027 USD 8 049 707 7 730 000 0.142 550 000 United States Treasury Note/Bond 0.875% 15/11/2030 USD 2 488 657 2 355 961 0.04
10 000 000 United States Treasury Note/Bond 1.125% 28/02/2027 USD 10 050 559 9 966 406 0.188 600 000 United States Treasury Note/Bond 1.125% 29/02/2028 USD 8 603 005 8 441 438 0.154 470 000 United States Treasury Note/Bond 1.125% 15/08/2040 USD 4 362 327 3 623 494 0.065 500 000 United States Treasury Note/Bond 1.375% 30/06/2023 USD 5 366 902 5 644 160 0.10
12 000 000 United States Treasury Note/Bond 1.375% 31/08/2023 USD 11 614 556 12 332 344 0.224 430 000 United States Treasury Note/Bond 1.375% 31/08/2026 USD 4 680 431 4 504 756 0.087 070 000 United States Treasury Note/Bond 1.375% 15/11/2040 USD 6 763 601 5 997 348 0.114 860 000 United States Treasury Note/Bond 1.500% 15/08/2026 USD 4 549 852 4 975 235 0.097 690 000 United States Treasury Note/Bond 1.500% 31/01/2027 USD 8 067 768 7 837 792 0.148 640 000 United States Treasury Note/Bond 1.500% 15/02/2030 USD 9 288 914 8 527 950 0.159 160 000 United States Treasury Note/Bond 1.625% 31/08/2022 USD 9 059 764 9 353 577 0.165 000 000 United States Treasury Note/Bond 1.625% 15/11/2022 USD 4 893 033 5 119 922 0.096 000 000 United States Treasury Note/Bond 1.625% 31/10/2023 USD 5 875 725 6 210 703 0.114 000 000 United States Treasury Note/Bond 1.625% 15/02/2026 USD 3 835 090 4 134 688 0.072 600 000 United States Treasury Note/Bond 1.625% 15/05/2026 USD 2 457 131 2 684 094 0.054 370 000 United States Treasury Note/Bond 1.625% 30/09/2026 USD 4 675 612 4 499 393 0.08
13 700 000 United States Treasury Note/Bond 1.625% 15/08/2029 USD 13 580 617 13 739 066 0.2410 560 000 United States Treasury Note/Bond 1.625% 15/11/2050 USD 10 311 274 8 764 800 0.1511 500 000 United States Treasury Note/Bond 1.750% 30/06/2022 USD 11 386 731 11 734 043 0.2112 200 000 United States Treasury Note/Bond 1.750% 30/09/2022 USD 11 995 813 12 494 992 0.22
223Lumyna Funds
Lumyna – Global Debt - Government UCITS FundSchedule of investments as at March 31, 2021 (cont.)
The accompanying notes form an integral part of these financial statements.
Audited annual report

Nominalvalue Description
Quotationcurrency
CostUSD
Marketvalue USD
% of netassets
Transferable securities and money market instruments admitted to an official exchange listing or dealt in on another regulated market(cont.)
Supranationals, Governments and Local Public Authorities, Debt Instruments (cont.)
United States (cont.)11 400 000 United States Treasury Note/Bond 1.750% 31/01/2023 USD 11 162 618 11 730 867 0.2115 000 000 United States Treasury Note/Bond 1.750% 15/05/2023 USD 14 712 153 15 492 773 0.2714 300 000 United States Treasury Note/Bond 1.750% 15/11/2029 USD 14 614 677 14 458 641 0.258 830 000 United States Treasury Note/Bond 1.875% 31/07/2022 USD 8 755 060 9 036 263 0.162 000 000 United States Treasury Note/Bond 1.875% 30/09/2022 USD 1 992 295 2 052 109 0.04
24 000 000 United States Treasury Note/Bond 1.875% 31/10/2022 USD 23 695 740 24 656 250 0.435 000 000 United States Treasury Note/Bond 1.875% 31/08/2024 USD 4 987 914 5 235 742 0.091 130 000 United States Treasury Note/Bond 1.875% 15/02/2041 USD 1 059 132 1 049 488 0.028 600 000 United States Treasury Note/Bond 2.000% 31/07/2022 USD 8 571 644 8 816 008 0.16
15 900 000 United States Treasury Note/Bond 2.000% 31/10/2022 USD 15 713 044 16 366 441 0.2917 700 000 United States Treasury Note/Bond 2.000% 30/11/2022 USD 17 543 204 18 244 828 0.325 000 000 United States Treasury Note/Bond 2.000% 15/02/2023 USD 4 955 649 5 170 703 0.097 000 000 United States Treasury Note/Bond 2.000% 30/04/2024 USD 6 890 064 7 345 625 0.138 000 000 United States Treasury Note/Bond 2.000% 31/05/2024 USD 7 799 603 8 399 375 0.157 500 000 United States Treasury Note/Bond 2.000% 15/02/2025 USD 7 235 819 7 896 094 0.14
15 000 000 United States Treasury Note/Bond 2.000% 15/08/2025 USD 14 464 631 15 798 633 0.2811 500 000 United States Treasury Note/Bond 2.000% 15/11/2026 USD 11 080 580 12 060 625 0.215 000 000 United States Treasury Note/Bond 2.000% 15/02/2050 USD 5 388 994 4 558 594 0.088 000 000 United States Treasury Note/Bond 2.125% 15/05/2022 USD 8 028 102 8 180 938 0.14
12 000 000 United States Treasury Note/Bond 2.125% 30/11/2023 USD 11 835 635 12 590 156 0.2210 590 000 United States Treasury Note/Bond 2.125% 29/02/2024 USD 10 479 216 11 136 874 0.205 300 000 United States Treasury Note/Bond 2.125% 31/03/2024 USD 5 230 443 5 577 836 0.102 800 000 United States Treasury Note/Bond 2.125% 31/07/2024 USD 2 745 913 2 954 656 0.051 000 000 United States Treasury Note/Bond 2.125% 30/11/2024 USD 979 282 1 056 680 0.027 500 000 United States Treasury Note/Bond 2.125% 15/05/2025 USD 7 331 585 7 936 230 0.14
13 100 000 United States Treasury Note/Bond 2.250% 31/12/2023 USD 13 068 545 13 797 984 0.249 000 000 United States Treasury Note/Bond 2.250% 31/01/2024 USD 8 879 826 9 489 727 0.174 000 000 United States Treasury Note/Bond 2.250% 15/11/2024 USD 3 989 910 4 243 438 0.077 000 000 United States Treasury Note/Bond 2.250% 31/12/2024 USD 6 904 859 7 434 219 0.132 300 000 United States Treasury Note/Bond 2.250% 15/11/2025 USD 2 292 894 2 448 152 0.045 000 000 United States Treasury Note/Bond 2.250% 31/03/2026 USD 4 985 219 5 320 703 0.09
13 250 000 United States Treasury Note/Bond 2.250% 15/02/2027 USD 12 929 274 14 066 221 0.2512 670 000 United States Treasury Note/Bond 2.250% 15/08/2027 USD 12 741 770 13 421 291 0.2415 460 000 United States Treasury Note/Bond 2.250% 15/11/2027 USD 15 181 866 16 354 989 0.294 390 000 United States Treasury Note/Bond 2.250% 15/08/2046 USD 3 633 759 4 248 525 0.07
11 170 000 United States Treasury Note/Bond 2.250% 15/08/2049 USD 11 360 378 10 767 269 0.192 600 000 United States Treasury Note/Bond 2.375% 15/08/2024 USD 2 609 517 2 766 359 0.05
17 140 000 United States Treasury Note/Bond 2.375% 15/05/2027 USD 16 787 624 18 309 671 0.3227 070 000 United States Treasury Note/Bond 2.375% 15/05/2029 USD 28 347 170 28 744 956 0.519 590 000 United States Treasury Note/Bond 2.375% 15/11/2049 USD 9 975 304 9 500 094 0.17
16 000 000 United States Treasury Note/Bond 2.500% 31/03/2023 USD 15 985 653 16 744 375 0.306 750 000 United States Treasury Note/Bond 2.500% 31/01/2024 USD 6 747 268 7 164 229 0.136 710 000 United States Treasury Note/Bond 2.500% 15/05/2024 USD 6 715 141 7 149 820 0.13
11 000 000 United States Treasury Note/Bond 2.500% 31/01/2025 USD 10 803 336 11 792 344 0.215 000 000 United States Treasury Note/Bond 2.500% 28/02/2026 USD 5 015 229 5 381 836 0.09
224 Lumyna Funds
Lumyna – Global Debt - Government UCITS FundSchedule of investments as at March 31, 2021 (cont.)
The accompanying notes form an integral part of these financial statements.
Audited annual report
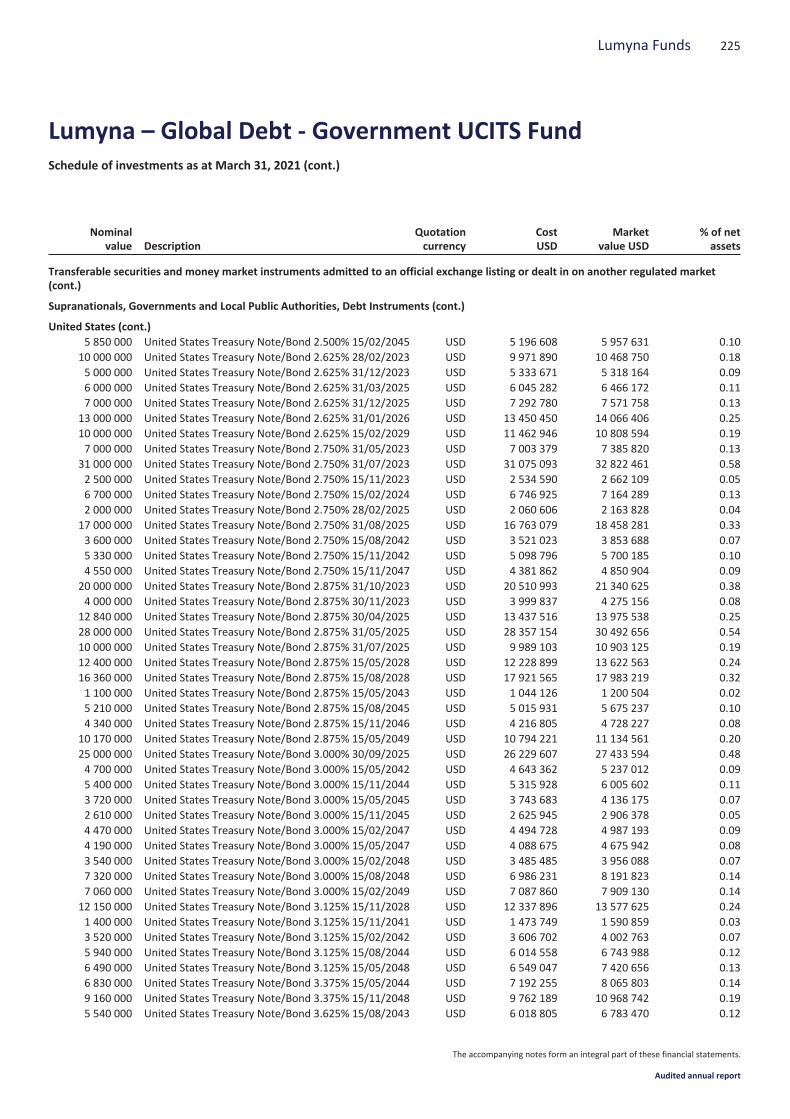
Nominalvalue Description
Quotationcurrency
CostUSD
Marketvalue USD
% of netassets
Transferable securities and money market instruments admitted to an official exchange listing or dealt in on another regulated market(cont.)
Supranationals, Governments and Local Public Authorities, Debt Instruments (cont.)
United States (cont.)5 850 000 United States Treasury Note/Bond 2.500% 15/02/2045 USD 5 196 608 5 957 631 0.10
10 000 000 United States Treasury Note/Bond 2.625% 28/02/2023 USD 9 971 890 10 468 750 0.185 000 000 United States Treasury Note/Bond 2.625% 31/12/2023 USD 5 333 671 5 318 164 0.096 000 000 United States Treasury Note/Bond 2.625% 31/03/2025 USD 6 045 282 6 466 172 0.117 000 000 United States Treasury Note/Bond 2.625% 31/12/2025 USD 7 292 780 7 571 758 0.13
13 000 000 United States Treasury Note/Bond 2.625% 31/01/2026 USD 13 450 450 14 066 406 0.2510 000 000 United States Treasury Note/Bond 2.625% 15/02/2029 USD 11 462 946 10 808 594 0.197 000 000 United States Treasury Note/Bond 2.750% 31/05/2023 USD 7 003 379 7 385 820 0.13
31 000 000 United States Treasury Note/Bond 2.750% 31/07/2023 USD 31 075 093 32 822 461 0.582 500 000 United States Treasury Note/Bond 2.750% 15/11/2023 USD 2 534 590 2 662 109 0.056 700 000 United States Treasury Note/Bond 2.750% 15/02/2024 USD 6 746 925 7 164 289 0.132 000 000 United States Treasury Note/Bond 2.750% 28/02/2025 USD 2 060 606 2 163 828 0.04
17 000 000 United States Treasury Note/Bond 2.750% 31/08/2025 USD 16 763 079 18 458 281 0.333 600 000 United States Treasury Note/Bond 2.750% 15/08/2042 USD 3 521 023 3 853 688 0.075 330 000 United States Treasury Note/Bond 2.750% 15/11/2042 USD 5 098 796 5 700 185 0.104 550 000 United States Treasury Note/Bond 2.750% 15/11/2047 USD 4 381 862 4 850 904 0.09
20 000 000 United States Treasury Note/Bond 2.875% 31/10/2023 USD 20 510 993 21 340 625 0.384 000 000 United States Treasury Note/Bond 2.875% 30/11/2023 USD 3 999 837 4 275 156 0.08
12 840 000 United States Treasury Note/Bond 2.875% 30/04/2025 USD 13 437 516 13 975 538 0.2528 000 000 United States Treasury Note/Bond 2.875% 31/05/2025 USD 28 357 154 30 492 656 0.5410 000 000 United States Treasury Note/Bond 2.875% 31/07/2025 USD 9 989 103 10 903 125 0.1912 400 000 United States Treasury Note/Bond 2.875% 15/05/2028 USD 12 228 899 13 622 563 0.2416 360 000 United States Treasury Note/Bond 2.875% 15/08/2028 USD 17 921 565 17 983 219 0.321 100 000 United States Treasury Note/Bond 2.875% 15/05/2043 USD 1 044 126 1 200 504 0.025 210 000 United States Treasury Note/Bond 2.875% 15/08/2045 USD 5 015 931 5 675 237 0.104 340 000 United States Treasury Note/Bond 2.875% 15/11/2046 USD 4 216 805 4 728 227 0.08
10 170 000 United States Treasury Note/Bond 2.875% 15/05/2049 USD 10 794 221 11 134 561 0.2025 000 000 United States Treasury Note/Bond 3.000% 30/09/2025 USD 26 229 607 27 433 594 0.484 700 000 United States Treasury Note/Bond 3.000% 15/05/2042 USD 4 643 362 5 237 012 0.095 400 000 United States Treasury Note/Bond 3.000% 15/11/2044 USD 5 315 928 6 005 602 0.113 720 000 United States Treasury Note/Bond 3.000% 15/05/2045 USD 3 743 683 4 136 175 0.072 610 000 United States Treasury Note/Bond 3.000% 15/11/2045 USD 2 625 945 2 906 378 0.054 470 000 United States Treasury Note/Bond 3.000% 15/02/2047 USD 4 494 728 4 987 193 0.094 190 000 United States Treasury Note/Bond 3.000% 15/05/2047 USD 4 088 675 4 675 942 0.083 540 000 United States Treasury Note/Bond 3.000% 15/02/2048 USD 3 485 485 3 956 088 0.077 320 000 United States Treasury Note/Bond 3.000% 15/08/2048 USD 6 986 231 8 191 823 0.147 060 000 United States Treasury Note/Bond 3.000% 15/02/2049 USD 7 087 860 7 909 130 0.14
12 150 000 United States Treasury Note/Bond 3.125% 15/11/2028 USD 12 337 896 13 577 625 0.241 400 000 United States Treasury Note/Bond 3.125% 15/11/2041 USD 1 473 749 1 590 859 0.033 520 000 United States Treasury Note/Bond 3.125% 15/02/2042 USD 3 606 702 4 002 763 0.075 940 000 United States Treasury Note/Bond 3.125% 15/08/2044 USD 6 014 558 6 743 988 0.126 490 000 United States Treasury Note/Bond 3.125% 15/05/2048 USD 6 549 047 7 420 656 0.136 830 000 United States Treasury Note/Bond 3.375% 15/05/2044 USD 7 192 255 8 065 803 0.149 160 000 United States Treasury Note/Bond 3.375% 15/11/2048 USD 9 762 189 10 968 742 0.195 540 000 United States Treasury Note/Bond 3.625% 15/08/2043 USD 6 018 805 6 783 470 0.12
225Lumyna Funds
Lumyna – Global Debt - Government UCITS FundSchedule of investments as at March 31, 2021 (cont.)
The accompanying notes form an integral part of these financial statements.
Audited annual report

Nominalvalue Description
Quotationcurrency
CostUSD
Marketvalue USD
% of netassets
Transferable securities and money market instruments admitted to an official exchange listing or dealt in on another regulated market(cont.)
Supranationals, Governments and Local Public Authorities, Debt Instruments (cont.)
United States (cont.)4 080 000 United States Treasury Note/Bond 3.625% 15/02/2044 USD 4 532 842 5 003 738 0.092 730 000 United States Treasury Note/Bond 3.750% 15/08/2041 USD 2 942 947 3 387 439 0.069 450 000 United States Treasury Note/Bond 3.750% 15/11/2043 USD 11 844 204 11 795 889 0.212 000 000 United States Treasury Note/Bond 3.875% 15/08/2040 USD 2 418 329 2 517 031 0.042 850 000 United States Treasury Note/Bond 4.250% 15/05/2039 USD 3 396 989 3 737 619 0.072 500 000 United States Treasury Note/Bond 4.250% 15/11/2040 USD 2 920 004 3 300 879 0.062 700 000 United States Treasury Note/Bond 4.375% 15/02/2038 USD 3 230 548 3 564 844 0.06770 000 United States Treasury Note/Bond 4.375% 15/05/2040 USD 923 862 1 030 176 0.02
2 500 000 United States Treasury Note/Bond 4.375% 15/05/2041 USD 3 015 917 3 360 547 0.062 000 000 United States Treasury Note/Bond 4.500% 15/02/2036 USD 2 402 436 2 642 500 0.053 000 000 United States Treasury Note/Bond 4.750% 15/02/2037 USD 3 699 786 4 096 875 0.075 740 000 United States Treasury Note/Bond 4.750% 15/02/2041 USD 7 992 862 8 064 476 0.141 200 000 United States Treasury Note/Bond 5.375% 15/02/2031 USD 1 452 578 1 603 547 0.03500 000 United States Treasury Note/Bond 6.125% 15/08/2029 USD 635 687 680 879 0.01
Total United States 1 231 665 919 1 281 103 126 22.60
Total Supranationals, Governments and Local PublicAuthorities, Debt Instruments 5 095 893 007 5 316 127 183 93.80
Other transferable securities
Bonds
Canada700 000 Lower Mattagami Energy LP 2.307% 21/10/2026 CAD 517 595 579 928 0.01400 000 Ontario Power Generation, Inc. 2.947% 21/02/2051 CAD 288 309 290 170 0.01100 000 Ontario Power Generation, Inc. 3.838% 22/06/2048 CAD 76 931 85 682 0.00600 000 OPB Finance Trust 2.980% 25/01/2027 CAD 461 384 509 736 0.01
1 000 000 Toronto Hydro Corp. 2.520% 25/08/2026 CAD 745 607 832 796 0.01
Total Canada 2 089 826 2 298 312 0.04
Germany200 000 Bayerische Landesbodenkreditanstalt - Reg 0.250%
21/03/2036EUR 232 971 231 958 0.00
Total Germany 232 971 231 958 0.00
Ireland200 000 DAA Finance Plc. - Reg 1.601% 05/11/2032 EUR 261 751 249 248 0.01
Total Ireland 261 751 249 248 0.01
Italy200 000 Ferrovie dello Stato Italiane SpA - Reg 0.375%
25/03/2028EUR 235 039 234 853 0.00
Total Italy 235 039 234 853 0.00
Total Bonds 2 819 587 3 014 371 0.05
226 Lumyna Funds
Lumyna – Global Debt - Government UCITS FundSchedule of investments as at March 31, 2021 (cont.)
The accompanying notes form an integral part of these financial statements.
Audited annual report
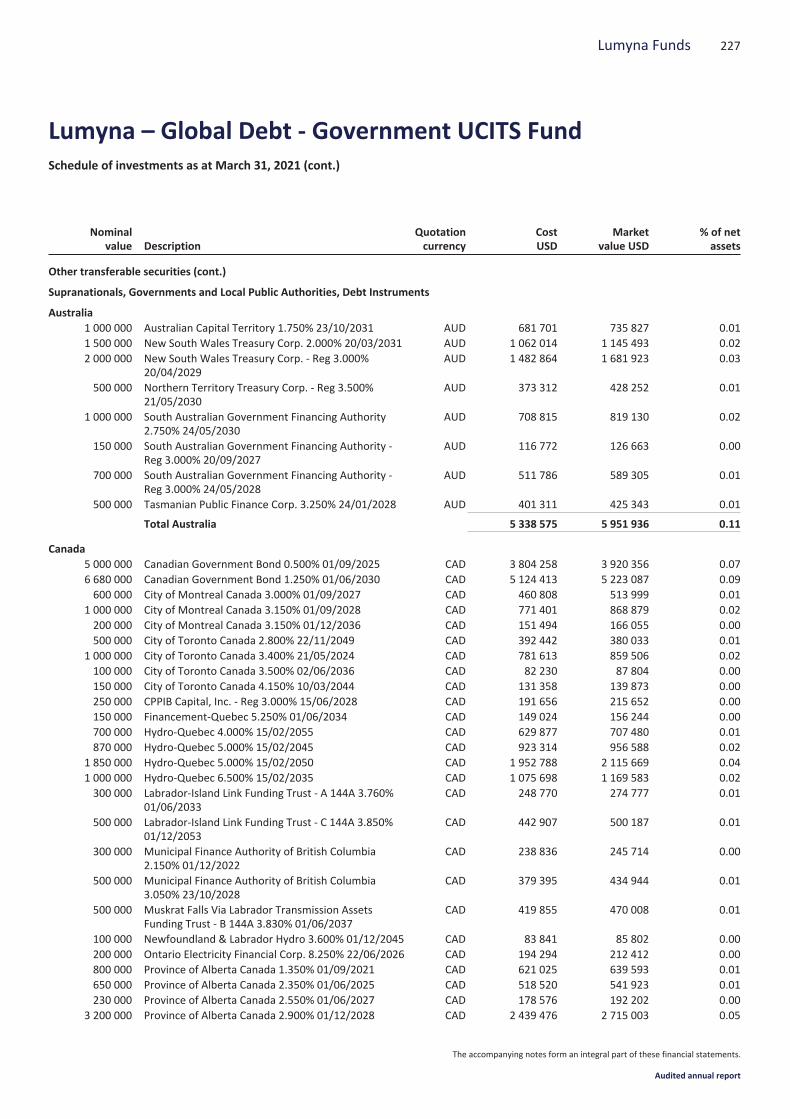
Nominalvalue Description
Quotationcurrency
CostUSD
Marketvalue USD
% of netassets
Other transferable securities (cont.)
Supranationals, Governments and Local Public Authorities, Debt Instruments
Australia1 000 000 Australian Capital Territory 1.750% 23/10/2031 AUD 681 701 735 827 0.011 500 000 New South Wales Treasury Corp. 2.000% 20/03/2031 AUD 1 062 014 1 145 493 0.022 000 000 New South Wales Treasury Corp. - Reg 3.000%
20/04/2029AUD 1 482 864 1 681 923 0.03
500 000 Northern Territory Treasury Corp. - Reg 3.500%21/05/2030
AUD 373 312 428 252 0.01
1 000 000 South Australian Government Financing Authority2.750% 24/05/2030
AUD 708 815 819 130 0.02
150 000 South Australian Government Financing Authority -Reg 3.000% 20/09/2027
AUD 116 772 126 663 0.00
700 000 South Australian Government Financing Authority -Reg 3.000% 24/05/2028
AUD 511 786 589 305 0.01
500 000 Tasmanian Public Finance Corp. 3.250% 24/01/2028 AUD 401 311 425 343 0.01
Total Australia 5 338 575 5 951 936 0.11
Canada5 000 000 Canadian Government Bond 0.500% 01/09/2025 CAD 3 804 258 3 920 356 0.076 680 000 Canadian Government Bond 1.250% 01/06/2030 CAD 5 124 413 5 223 087 0.09600 000 City of Montreal Canada 3.000% 01/09/2027 CAD 460 808 513 999 0.01
1 000 000 City of Montreal Canada 3.150% 01/09/2028 CAD 771 401 868 879 0.02200 000 City of Montreal Canada 3.150% 01/12/2036 CAD 151 494 166 055 0.00500 000 City of Toronto Canada 2.800% 22/11/2049 CAD 392 442 380 033 0.01
1 000 000 City of Toronto Canada 3.400% 21/05/2024 CAD 781 613 859 506 0.02100 000 City of Toronto Canada 3.500% 02/06/2036 CAD 82 230 87 804 0.00150 000 City of Toronto Canada 4.150% 10/03/2044 CAD 131 358 139 873 0.00250 000 CPPIB Capital, Inc. - Reg 3.000% 15/06/2028 CAD 191 656 215 652 0.00150 000 Financement-Quebec 5.250% 01/06/2034 CAD 149 024 156 244 0.00700 000 Hydro-Quebec 4.000% 15/02/2055 CAD 629 877 707 480 0.01870 000 Hydro-Quebec 5.000% 15/02/2045 CAD 923 314 956 588 0.02
1 850 000 Hydro-Quebec 5.000% 15/02/2050 CAD 1 952 788 2 115 669 0.041 000 000 Hydro-Quebec 6.500% 15/02/2035 CAD 1 075 698 1 169 583 0.02300 000 Labrador-Island Link Funding Trust - A 144A 3.760%
01/06/2033CAD 248 770 274 777 0.01
500 000 Labrador-Island Link Funding Trust - C 144A 3.850%01/12/2053
CAD 442 907 500 187 0.01
300 000 Municipal Finance Authority of British Columbia2.150% 01/12/2022
CAD 238 836 245 714 0.00
500 000 Municipal Finance Authority of British Columbia3.050% 23/10/2028
CAD 379 395 434 944 0.01
500 000 Muskrat Falls Via Labrador Transmission AssetsFunding Trust - B 144A 3.830% 01/06/2037
CAD 419 855 470 008 0.01
100 000 Newfoundland & Labrador Hydro 3.600% 01/12/2045 CAD 83 841 85 802 0.00200 000 Ontario Electricity Financial Corp. 8.250% 22/06/2026 CAD 194 294 212 412 0.00800 000 Province of Alberta Canada 1.350% 01/09/2021 CAD 621 025 639 593 0.01650 000 Province of Alberta Canada 2.350% 01/06/2025 CAD 518 520 541 923 0.01230 000 Province of Alberta Canada 2.550% 01/06/2027 CAD 178 576 192 202 0.00
3 200 000 Province of Alberta Canada 2.900% 01/12/2028 CAD 2 439 476 2 715 003 0.05
227Lumyna Funds
Lumyna – Global Debt - Government UCITS FundSchedule of investments as at March 31, 2021 (cont.)
The accompanying notes form an integral part of these financial statements.
Audited annual report
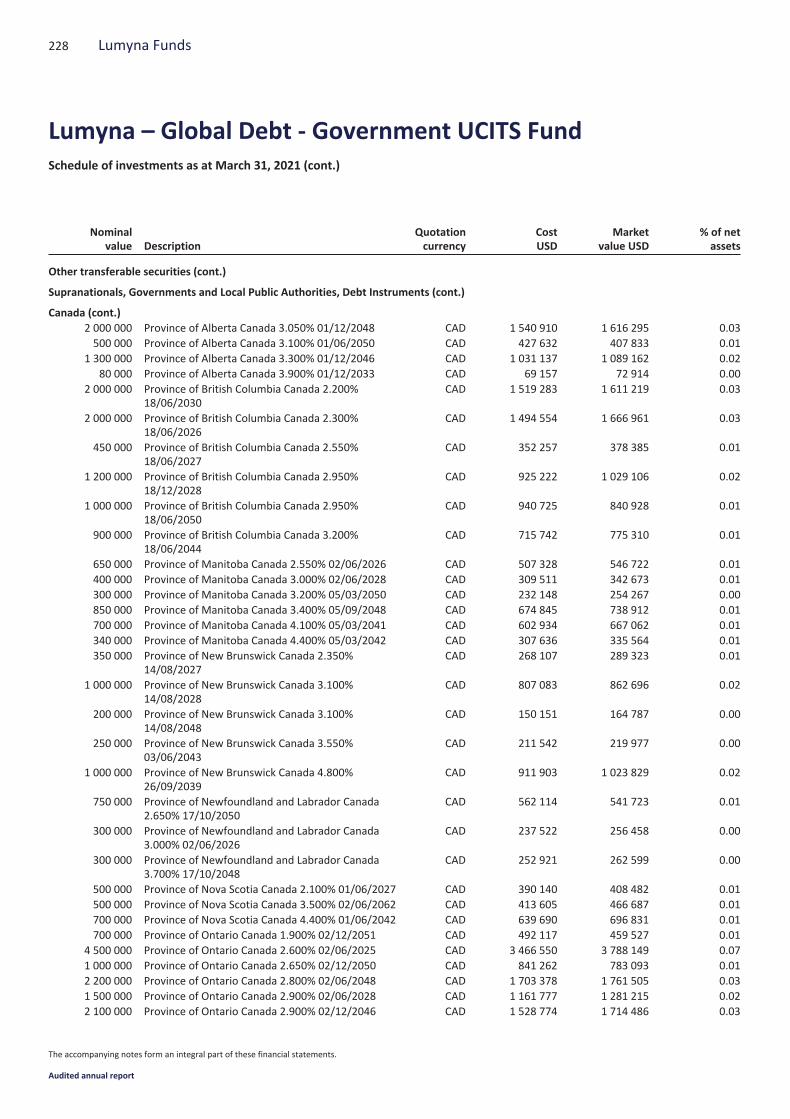
Nominalvalue Description
Quotationcurrency
CostUSD
Marketvalue USD
% of netassets
Other transferable securities (cont.)
Supranationals, Governments and Local Public Authorities, Debt Instruments (cont.)
Canada (cont.)2 000 000 Province of Alberta Canada 3.050% 01/12/2048 CAD 1 540 910 1 616 295 0.03500 000 Province of Alberta Canada 3.100% 01/06/2050 CAD 427 632 407 833 0.01
1 300 000 Province of Alberta Canada 3.300% 01/12/2046 CAD 1 031 137 1 089 162 0.0280 000 Province of Alberta Canada 3.900% 01/12/2033 CAD 69 157 72 914 0.00
2 000 000 Province of British Columbia Canada 2.200%18/06/2030
CAD 1 519 283 1 611 219 0.03
2 000 000 Province of British Columbia Canada 2.300%18/06/2026
CAD 1 494 554 1 666 961 0.03
450 000 Province of British Columbia Canada 2.550%18/06/2027
CAD 352 257 378 385 0.01
1 200 000 Province of British Columbia Canada 2.950%18/12/2028
CAD 925 222 1 029 106 0.02
1 000 000 Province of British Columbia Canada 2.950%18/06/2050
CAD 940 725 840 928 0.01
900 000 Province of British Columbia Canada 3.200%18/06/2044
CAD 715 742 775 310 0.01
650 000 Province of Manitoba Canada 2.550% 02/06/2026 CAD 507 328 546 722 0.01400 000 Province of Manitoba Canada 3.000% 02/06/2028 CAD 309 511 342 673 0.01300 000 Province of Manitoba Canada 3.200% 05/03/2050 CAD 232 148 254 267 0.00850 000 Province of Manitoba Canada 3.400% 05/09/2048 CAD 674 845 738 912 0.01700 000 Province of Manitoba Canada 4.100% 05/03/2041 CAD 602 934 667 062 0.01340 000 Province of Manitoba Canada 4.400% 05/03/2042 CAD 307 636 335 564 0.01350 000 Province of New Brunswick Canada 2.350%
14/08/2027CAD 268 107 289 323 0.01
1 000 000 Province of New Brunswick Canada 3.100%14/08/2028
CAD 807 083 862 696 0.02
200 000 Province of New Brunswick Canada 3.100%14/08/2048
CAD 150 151 164 787 0.00
250 000 Province of New Brunswick Canada 3.550%03/06/2043
CAD 211 542 219 977 0.00
1 000 000 Province of New Brunswick Canada 4.800%26/09/2039
CAD 911 903 1 023 829 0.02
750 000 Province of Newfoundland and Labrador Canada2.650% 17/10/2050
CAD 562 114 541 723 0.01
300 000 Province of Newfoundland and Labrador Canada3.000% 02/06/2026
CAD 237 522 256 458 0.00
300 000 Province of Newfoundland and Labrador Canada3.700% 17/10/2048
CAD 252 921 262 599 0.00
500 000 Province of Nova Scotia Canada 2.100% 01/06/2027 CAD 390 140 408 482 0.01500 000 Province of Nova Scotia Canada 3.500% 02/06/2062 CAD 413 605 466 687 0.01700 000 Province of Nova Scotia Canada 4.400% 01/06/2042 CAD 639 690 696 831 0.01700 000 Province of Ontario Canada 1.900% 02/12/2051 CAD 492 117 459 527 0.01
4 500 000 Province of Ontario Canada 2.600% 02/06/2025 CAD 3 466 550 3 788 149 0.071 000 000 Province of Ontario Canada 2.650% 02/12/2050 CAD 841 262 783 093 0.012 200 000 Province of Ontario Canada 2.800% 02/06/2048 CAD 1 703 378 1 761 505 0.031 500 000 Province of Ontario Canada 2.900% 02/06/2028 CAD 1 161 777 1 281 215 0.022 100 000 Province of Ontario Canada 2.900% 02/12/2046 CAD 1 528 774 1 714 486 0.03
228 Lumyna Funds
Lumyna – Global Debt - Government UCITS FundSchedule of investments as at March 31, 2021 (cont.)
The accompanying notes form an integral part of these financial statements.
Audited annual report
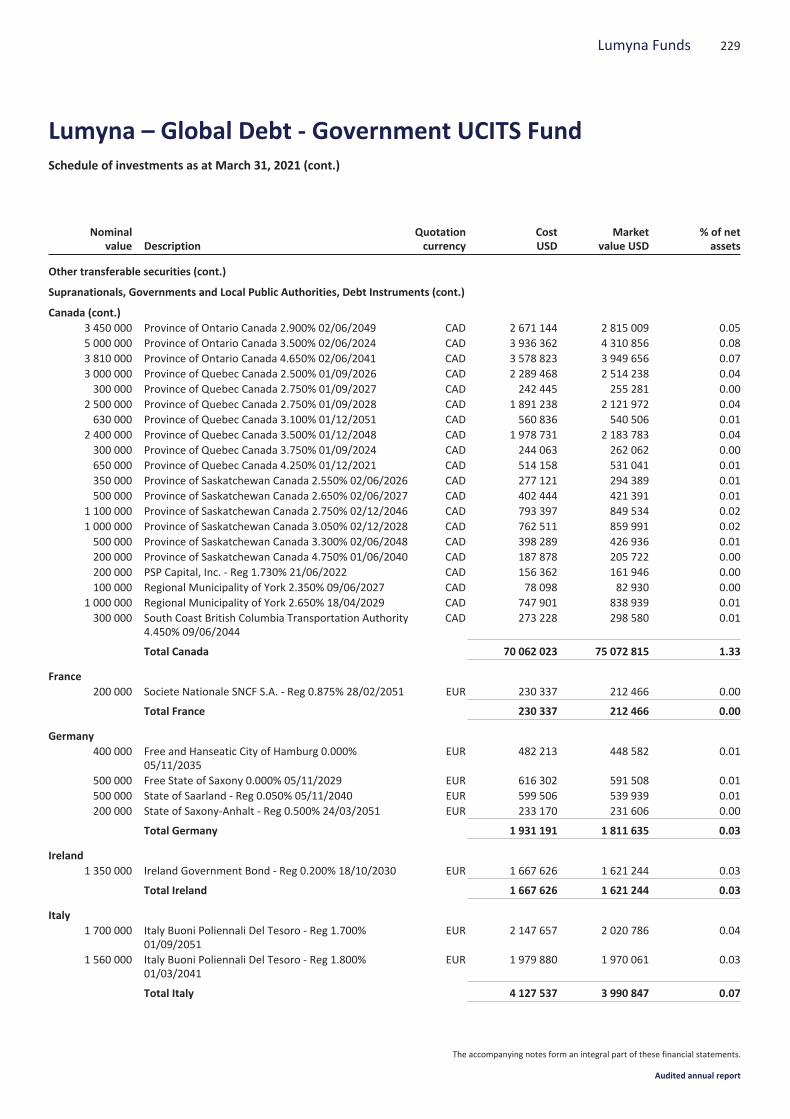
Nominalvalue Description
Quotationcurrency
CostUSD
Marketvalue USD
% of netassets
Other transferable securities (cont.)
Supranationals, Governments and Local Public Authorities, Debt Instruments (cont.)
Canada (cont.)3 450 000 Province of Ontario Canada 2.900% 02/06/2049 CAD 2 671 144 2 815 009 0.055 000 000 Province of Ontario Canada 3.500% 02/06/2024 CAD 3 936 362 4 310 856 0.083 810 000 Province of Ontario Canada 4.650% 02/06/2041 CAD 3 578 823 3 949 656 0.073 000 000 Province of Quebec Canada 2.500% 01/09/2026 CAD 2 289 468 2 514 238 0.04300 000 Province of Quebec Canada 2.750% 01/09/2027 CAD 242 445 255 281 0.00
2 500 000 Province of Quebec Canada 2.750% 01/09/2028 CAD 1 891 238 2 121 972 0.04630 000 Province of Quebec Canada 3.100% 01/12/2051 CAD 560 836 540 506 0.01
2 400 000 Province of Quebec Canada 3.500% 01/12/2048 CAD 1 978 731 2 183 783 0.04300 000 Province of Quebec Canada 3.750% 01/09/2024 CAD 244 063 262 062 0.00650 000 Province of Quebec Canada 4.250% 01/12/2021 CAD 514 158 531 041 0.01350 000 Province of Saskatchewan Canada 2.550% 02/06/2026 CAD 277 121 294 389 0.01500 000 Province of Saskatchewan Canada 2.650% 02/06/2027 CAD 402 444 421 391 0.01
1 100 000 Province of Saskatchewan Canada 2.750% 02/12/2046 CAD 793 397 849 534 0.021 000 000 Province of Saskatchewan Canada 3.050% 02/12/2028 CAD 762 511 859 991 0.02500 000 Province of Saskatchewan Canada 3.300% 02/06/2048 CAD 398 289 426 936 0.01200 000 Province of Saskatchewan Canada 4.750% 01/06/2040 CAD 187 878 205 722 0.00200 000 PSP Capital, Inc. - Reg 1.730% 21/06/2022 CAD 156 362 161 946 0.00100 000 Regional Municipality of York 2.350% 09/06/2027 CAD 78 098 82 930 0.00
1 000 000 Regional Municipality of York 2.650% 18/04/2029 CAD 747 901 838 939 0.01300 000 South Coast British Columbia Transportation Authority
4.450% 09/06/2044CAD 273 228 298 580 0.01
Total Canada 70 062 023 75 072 815 1.33
France200 000 Societe Nationale SNCF S.A. - Reg 0.875% 28/02/2051 EUR 230 337 212 466 0.00
Total France 230 337 212 466 0.00
Germany400 000 Free and Hanseatic City of Hamburg 0.000%
05/11/2035EUR 482 213 448 582 0.01
500 000 Free State of Saxony 0.000% 05/11/2029 EUR 616 302 591 508 0.01500 000 State of Saarland - Reg 0.050% 05/11/2040 EUR 599 506 539 939 0.01200 000 State of Saxony-Anhalt - Reg 0.500% 24/03/2051 EUR 233 170 231 606 0.00
Total Germany 1 931 191 1 811 635 0.03
Ireland1 350 000 Ireland Government Bond - Reg 0.200% 18/10/2030 EUR 1 667 626 1 621 244 0.03
Total Ireland 1 667 626 1 621 244 0.03
Italy1 700 000 Italy Buoni Poliennali Del Tesoro - Reg 1.700%
01/09/2051EUR 2 147 657 2 020 786 0.04
1 560 000 Italy Buoni Poliennali Del Tesoro - Reg 1.800%01/03/2041
EUR 1 979 880 1 970 061 0.03
Total Italy 4 127 537 3 990 847 0.07
229Lumyna Funds
Lumyna – Global Debt - Government UCITS FundSchedule of investments as at March 31, 2021 (cont.)
The accompanying notes form an integral part of these financial statements.
Audited annual report
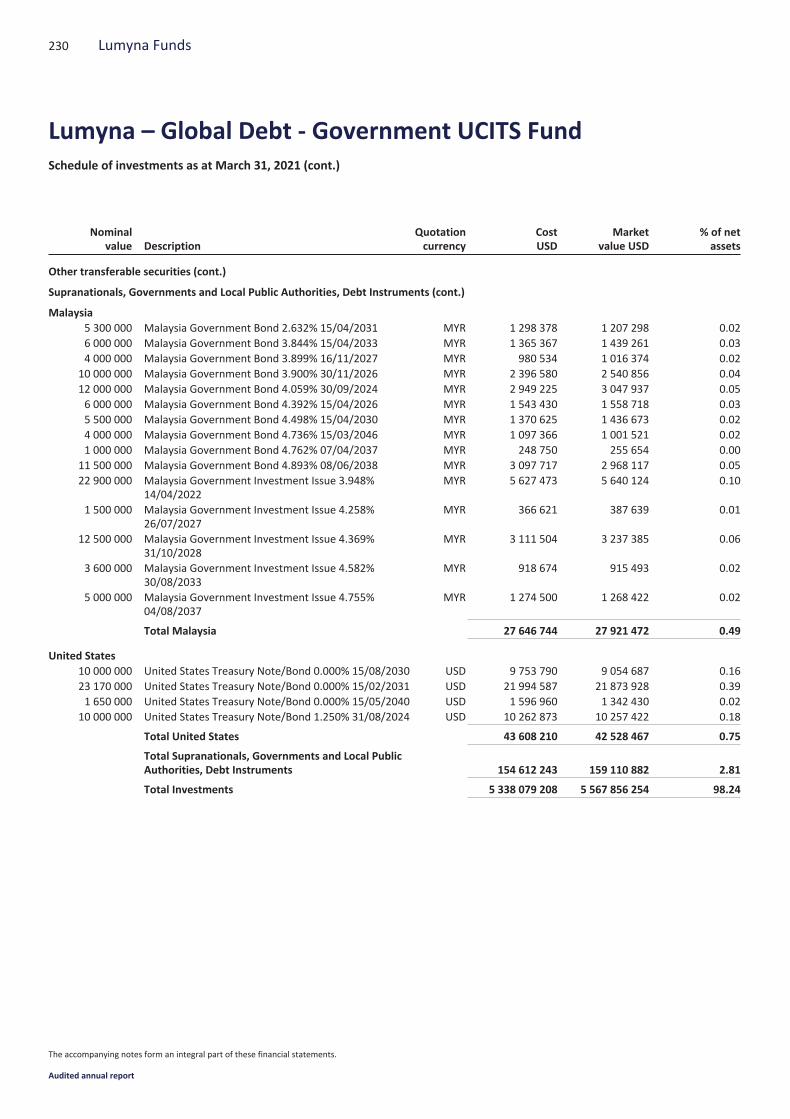
Nominalvalue Description
Quotationcurrency
CostUSD
Marketvalue USD
% of netassets
Other transferable securities (cont.)
Supranationals, Governments and Local Public Authorities, Debt Instruments (cont.)
Malaysia5 300 000 Malaysia Government Bond 2.632% 15/04/2031 MYR 1 298 378 1 207 298 0.026 000 000 Malaysia Government Bond 3.844% 15/04/2033 MYR 1 365 367 1 439 261 0.034 000 000 Malaysia Government Bond 3.899% 16/11/2027 MYR 980 534 1 016 374 0.02
10 000 000 Malaysia Government Bond 3.900% 30/11/2026 MYR 2 396 580 2 540 856 0.0412 000 000 Malaysia Government Bond 4.059% 30/09/2024 MYR 2 949 225 3 047 937 0.056 000 000 Malaysia Government Bond 4.392% 15/04/2026 MYR 1 543 430 1 558 718 0.035 500 000 Malaysia Government Bond 4.498% 15/04/2030 MYR 1 370 625 1 436 673 0.024 000 000 Malaysia Government Bond 4.736% 15/03/2046 MYR 1 097 366 1 001 521 0.021 000 000 Malaysia Government Bond 4.762% 07/04/2037 MYR 248 750 255 654 0.00
11 500 000 Malaysia Government Bond 4.893% 08/06/2038 MYR 3 097 717 2 968 117 0.0522 900 000 Malaysia Government Investment Issue 3.948%
14/04/2022MYR 5 627 473 5 640 124 0.10
1 500 000 Malaysia Government Investment Issue 4.258%26/07/2027
MYR 366 621 387 639 0.01
12 500 000 Malaysia Government Investment Issue 4.369%31/10/2028
MYR 3 111 504 3 237 385 0.06
3 600 000 Malaysia Government Investment Issue 4.582%30/08/2033
MYR 918 674 915 493 0.02
5 000 000 Malaysia Government Investment Issue 4.755%04/08/2037
MYR 1 274 500 1 268 422 0.02
Total Malaysia 27 646 744 27 921 472 0.49
United States10 000 000 United States Treasury Note/Bond 0.000% 15/08/2030 USD 9 753 790 9 054 687 0.1623 170 000 United States Treasury Note/Bond 0.000% 15/02/2031 USD 21 994 587 21 873 928 0.391 650 000 United States Treasury Note/Bond 0.000% 15/05/2040 USD 1 596 960 1 342 430 0.02
10 000 000 United States Treasury Note/Bond 1.250% 31/08/2024 USD 10 262 873 10 257 422 0.18
Total United States 43 608 210 42 528 467 0.75
Total Supranationals, Governments and Local PublicAuthorities, Debt Instruments 154 612 243 159 110 882 2.81
Total Investments 5 338 079 208 5 567 856 254 98.24
230 Lumyna Funds
Lumyna – Global Debt - Government UCITS FundSchedule of investments as at March 31, 2021 (cont.)
The accompanying notes form an integral part of these financial statements.
Audited annual report
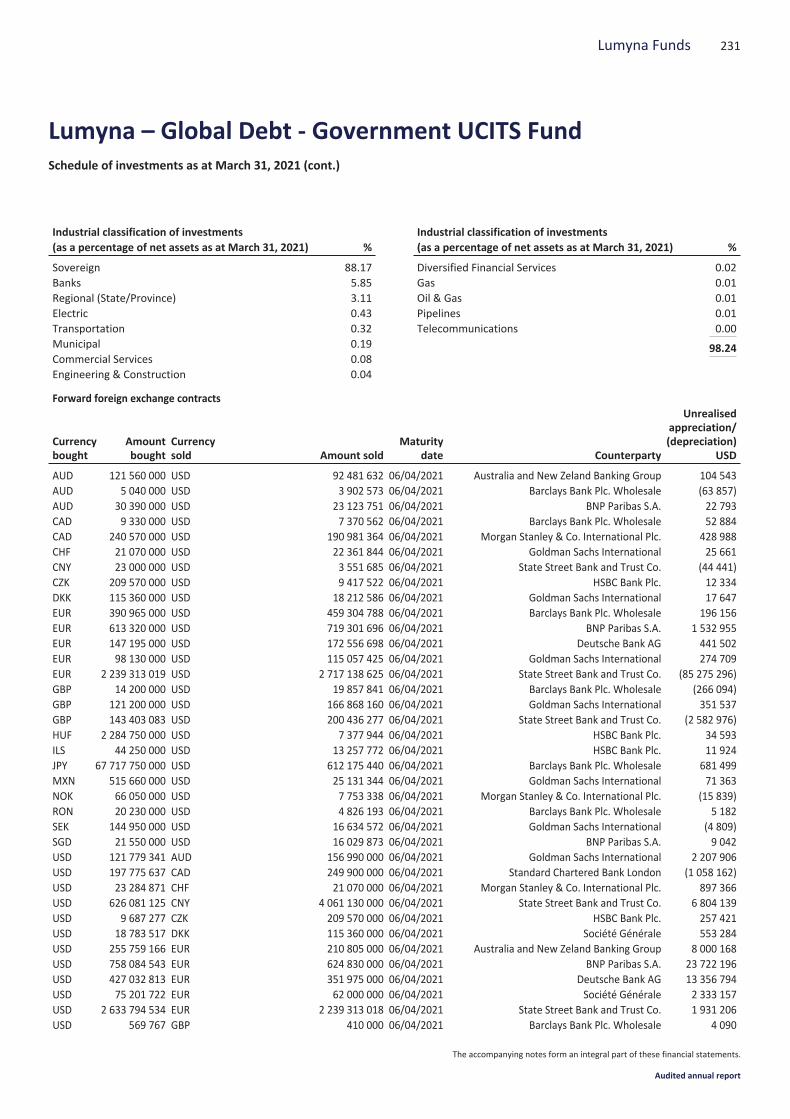
Industrial classification of investments(as a percentage of net assets as at March 31, 2021) %
Sovereign 88.17Banks 5.85Regional (State/Province) 3.11Electric 0.43Transportation 0.32Municipal 0.19Commercial Services 0.08Engineering & Construction 0.04
Industrial classification of investments(as a percentage of net assets as at March 31, 2021) %
Diversified Financial Services 0.02Gas 0.01Oil & Gas 0.01Pipelines 0.01Telecommunications 0.00
98.24
Forward foreign exchange contracts
Currencybought
Amountbought
Currencysold Amount sold
Maturitydate Counterparty
Unrealisedappreciation/(depreciation)
USD
AUD 121 560 000 USD 92 481 632 06/04/2021 Australia and New Zeland Banking Group 104 543AUD 5 040 000 USD 3 902 573 06/04/2021 Barclays Bank Plc. Wholesale (63 857)AUD 30 390 000 USD 23 123 751 06/04/2021 BNP Paribas S.A. 22 793CAD 9 330 000 USD 7 370 562 06/04/2021 Barclays Bank Plc. Wholesale 52 884CAD 240 570 000 USD 190 981 364 06/04/2021 Morgan Stanley & Co. International Plc. 428 988CHF 21 070 000 USD 22 361 844 06/04/2021 Goldman Sachs International 25 661CNY 23 000 000 USD 3 551 685 06/04/2021 State Street Bank and Trust Co. (44 441)CZK 209 570 000 USD 9 417 522 06/04/2021 HSBC Bank Plc. 12 334DKK 115 360 000 USD 18 212 586 06/04/2021 Goldman Sachs International 17 647EUR 390 965 000 USD 459 304 788 06/04/2021 Barclays Bank Plc. Wholesale 196 156EUR 613 320 000 USD 719 301 696 06/04/2021 BNP Paribas S.A. 1 532 955EUR 147 195 000 USD 172 556 698 06/04/2021 Deutsche Bank AG 441 502EUR 98 130 000 USD 115 057 425 06/04/2021 Goldman Sachs International 274 709EUR 2 239 313 019 USD 2 717 138 625 06/04/2021 State Street Bank and Trust Co. (85 275 296)GBP 14 200 000 USD 19 857 841 06/04/2021 Barclays Bank Plc. Wholesale (266 094)GBP 121 200 000 USD 166 868 160 06/04/2021 Goldman Sachs International 351 537GBP 143 403 083 USD 200 436 277 06/04/2021 State Street Bank and Trust Co. (2 582 976)HUF 2 284 750 000 USD 7 377 944 06/04/2021 HSBC Bank Plc. 34 593ILS 44 250 000 USD 13 257 772 06/04/2021 HSBC Bank Plc. 11 924JPY 67 717 750 000 USD 612 175 440 06/04/2021 Barclays Bank Plc. Wholesale 681 499MXN 515 660 000 USD 25 131 344 06/04/2021 Goldman Sachs International 71 363NOK 66 050 000 USD 7 753 338 06/04/2021 Morgan Stanley & Co. International Plc. (15 839)RON 20 230 000 USD 4 826 193 06/04/2021 Barclays Bank Plc. Wholesale 5 182SEK 144 950 000 USD 16 634 572 06/04/2021 Goldman Sachs International (4 809)SGD 21 550 000 USD 16 029 873 06/04/2021 BNP Paribas S.A. 9 042USD 121 779 341 AUD 156 990 000 06/04/2021 Goldman Sachs International 2 207 906USD 197 775 637 CAD 249 900 000 06/04/2021 Standard Chartered Bank London (1 058 162)USD 23 284 871 CHF 21 070 000 06/04/2021 Morgan Stanley & Co. International Plc. 897 366USD 626 081 125 CNY 4 061 130 000 06/04/2021 State Street Bank and Trust Co. 6 804 139USD 9 687 277 CZK 209 570 000 06/04/2021 HSBC Bank Plc. 257 421USD 18 783 517 DKK 115 360 000 06/04/2021 Société Générale 553 284USD 255 759 166 EUR 210 805 000 06/04/2021 Australia and New Zeland Banking Group 8 000 168USD 758 084 543 EUR 624 830 000 06/04/2021 BNP Paribas S.A. 23 722 196USD 427 032 813 EUR 351 975 000 06/04/2021 Deutsche Bank AG 13 356 794USD 75 201 722 EUR 62 000 000 06/04/2021 Société Générale 2 333 157USD 2 633 794 534 EUR 2 239 313 018 06/04/2021 State Street Bank and Trust Co. 1 931 206USD 569 767 GBP 410 000 06/04/2021 Barclays Bank Plc. Wholesale 4 090
231Lumyna Funds
Lumyna – Global Debt - Government UCITS FundSchedule of investments as at March 31, 2021 (cont.)
The accompanying notes form an integral part of these financial statements.
Audited annual report
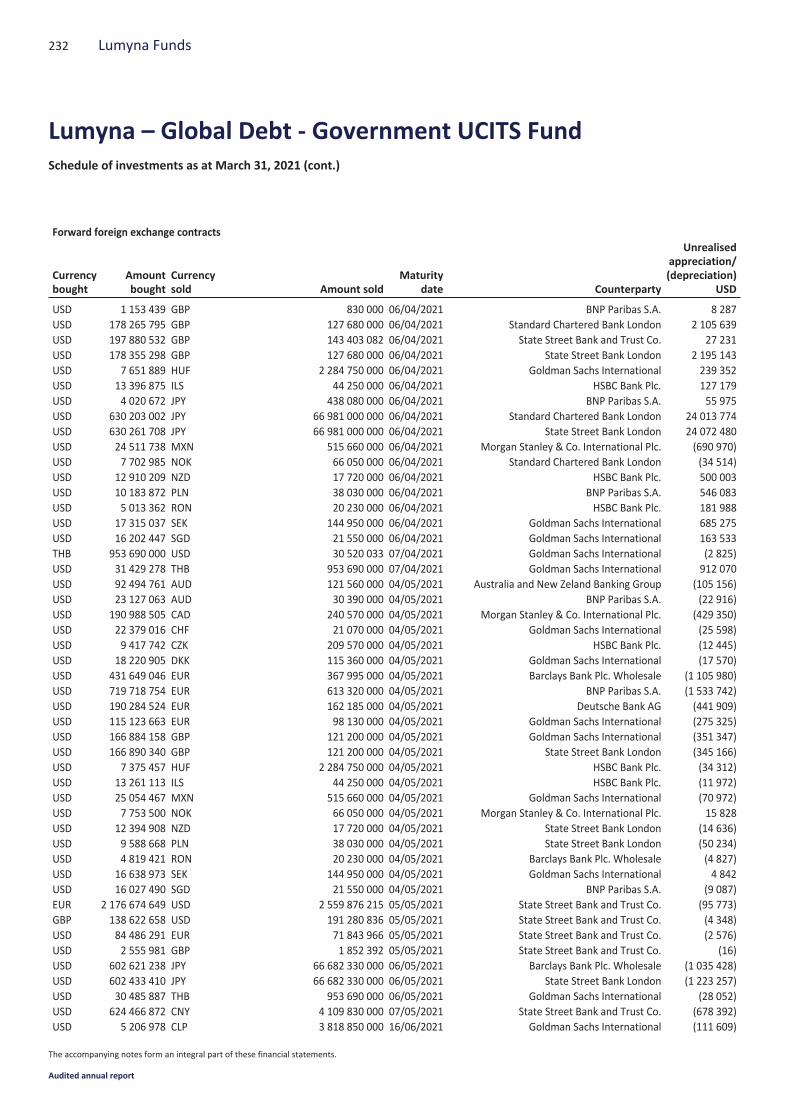
Forward foreign exchange contracts
Currencybought
Amountbought
Currencysold Amount sold
Maturitydate Counterparty
Unrealisedappreciation/(depreciation)
USD
USD 1 153 439 GBP 830 000 06/04/2021 BNP Paribas S.A. 8 287USD 178 265 795 GBP 127 680 000 06/04/2021 Standard Chartered Bank London 2 105 639USD 197 880 532 GBP 143 403 082 06/04/2021 State Street Bank and Trust Co. 27 231USD 178 355 298 GBP 127 680 000 06/04/2021 State Street Bank London 2 195 143USD 7 651 889 HUF 2 284 750 000 06/04/2021 Goldman Sachs International 239 352USD 13 396 875 ILS 44 250 000 06/04/2021 HSBC Bank Plc. 127 179USD 4 020 672 JPY 438 080 000 06/04/2021 BNP Paribas S.A. 55 975USD 630 203 002 JPY 66 981 000 000 06/04/2021 Standard Chartered Bank London 24 013 774USD 630 261 708 JPY 66 981 000 000 06/04/2021 State Street Bank London 24 072 480USD 24 511 738 MXN 515 660 000 06/04/2021 Morgan Stanley & Co. International Plc. (690 970)USD 7 702 985 NOK 66 050 000 06/04/2021 Standard Chartered Bank London (34 514)USD 12 910 209 NZD 17 720 000 06/04/2021 HSBC Bank Plc. 500 003USD 10 183 872 PLN 38 030 000 06/04/2021 BNP Paribas S.A. 546 083USD 5 013 362 RON 20 230 000 06/04/2021 HSBC Bank Plc. 181 988USD 17 315 037 SEK 144 950 000 06/04/2021 Goldman Sachs International 685 275USD 16 202 447 SGD 21 550 000 06/04/2021 Goldman Sachs International 163 533THB 953 690 000 USD 30 520 033 07/04/2021 Goldman Sachs International (2 825)USD 31 429 278 THB 953 690 000 07/04/2021 Goldman Sachs International 912 070USD 92 494 761 AUD 121 560 000 04/05/2021 Australia and New Zeland Banking Group (105 156)USD 23 127 063 AUD 30 390 000 04/05/2021 BNP Paribas S.A. (22 916)USD 190 988 505 CAD 240 570 000 04/05/2021 Morgan Stanley & Co. International Plc. (429 350)USD 22 379 016 CHF 21 070 000 04/05/2021 Goldman Sachs International (25 598)USD 9 417 742 CZK 209 570 000 04/05/2021 HSBC Bank Plc. (12 445)USD 18 220 905 DKK 115 360 000 04/05/2021 Goldman Sachs International (17 570)USD 431 649 046 EUR 367 995 000 04/05/2021 Barclays Bank Plc. Wholesale (1 105 980)USD 719 718 754 EUR 613 320 000 04/05/2021 BNP Paribas S.A. (1 533 742)USD 190 284 524 EUR 162 185 000 04/05/2021 Deutsche Bank AG (441 909)USD 115 123 663 EUR 98 130 000 04/05/2021 Goldman Sachs International (275 325)USD 166 884 158 GBP 121 200 000 04/05/2021 Goldman Sachs International (351 347)USD 166 890 340 GBP 121 200 000 04/05/2021 State Street Bank London (345 166)USD 7 375 457 HUF 2 284 750 000 04/05/2021 HSBC Bank Plc. (34 312)USD 13 261 113 ILS 44 250 000 04/05/2021 HSBC Bank Plc. (11 972)USD 25 054 467 MXN 515 660 000 04/05/2021 Goldman Sachs International (70 972)USD 7 753 500 NOK 66 050 000 04/05/2021 Morgan Stanley & Co. International Plc. 15 828USD 12 394 908 NZD 17 720 000 04/05/2021 State Street Bank London (14 636)USD 9 588 668 PLN 38 030 000 04/05/2021 State Street Bank London (50 234)USD 4 819 421 RON 20 230 000 04/05/2021 Barclays Bank Plc. Wholesale (4 827)USD 16 638 973 SEK 144 950 000 04/05/2021 Goldman Sachs International 4 842USD 16 027 490 SGD 21 550 000 04/05/2021 BNP Paribas S.A. (9 087)EUR 2 176 674 649 USD 2 559 876 215 05/05/2021 State Street Bank and Trust Co. (95 773)GBP 138 622 658 USD 191 280 836 05/05/2021 State Street Bank and Trust Co. (4 348)USD 84 486 291 EUR 71 843 966 05/05/2021 State Street Bank and Trust Co. (2 576)USD 2 555 981 GBP 1 852 392 05/05/2021 State Street Bank and Trust Co. (16)USD 602 621 238 JPY 66 682 330 000 06/05/2021 Barclays Bank Plc. Wholesale (1 035 428)USD 602 433 410 JPY 66 682 330 000 06/05/2021 State Street Bank London (1 223 257)USD 30 485 887 THB 953 690 000 06/05/2021 Goldman Sachs International (28 052)USD 624 466 872 CNY 4 109 830 000 07/05/2021 State Street Bank and Trust Co. (678 392)USD 5 206 978 CLP 3 818 850 000 16/06/2021 Goldman Sachs International (111 609)
232 Lumyna Funds
Lumyna – Global Debt - Government UCITS FundSchedule of investments as at March 31, 2021 (cont.)
The accompanying notes form an integral part of these financial statements.
Audited annual report
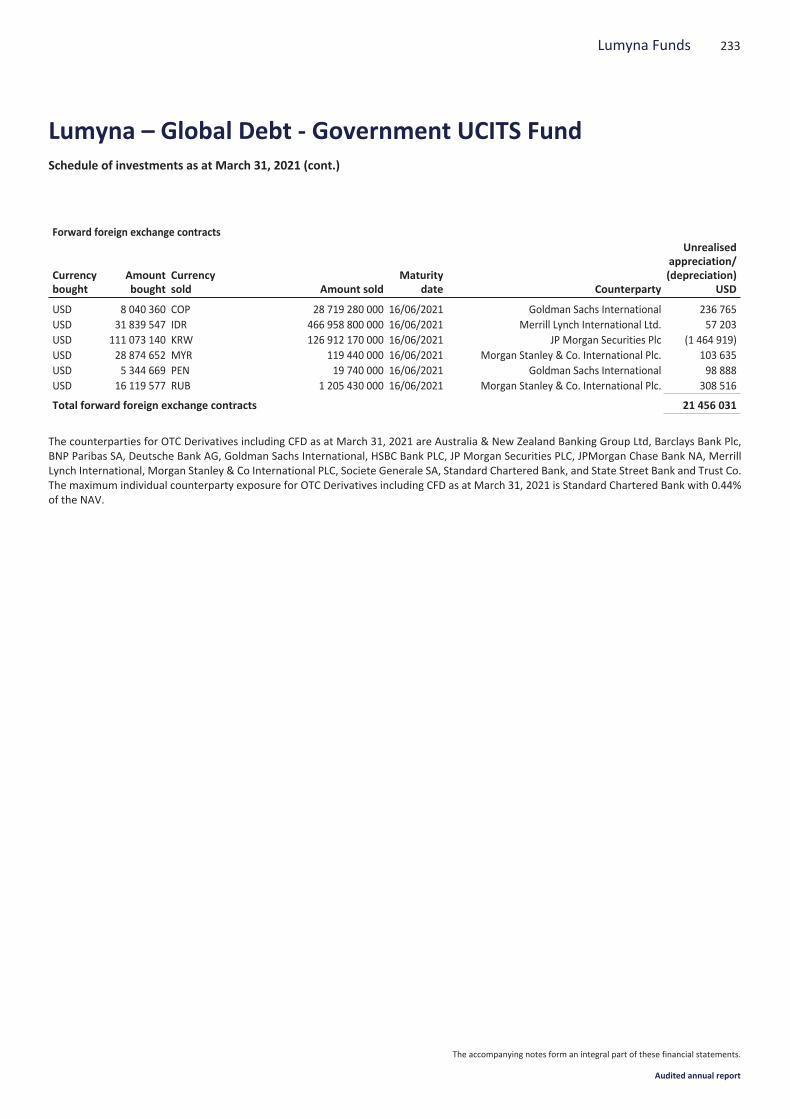
Forward foreign exchange contracts
Currencybought
Amountbought
Currencysold Amount sold
Maturitydate Counterparty
Unrealisedappreciation/(depreciation)
USD
USD 8 040 360 COP 28 719 280 000 16/06/2021 Goldman Sachs International 236 765USD 31 839 547 IDR 466 958 800 000 16/06/2021 Merrill Lynch International Ltd. 57 203USD 111 073 140 KRW 126 912 170 000 16/06/2021 JP Morgan Securities Plc (1 464 919)USD 28 874 652 MYR 119 440 000 16/06/2021 Morgan Stanley & Co. International Plc. 103 635USD 5 344 669 PEN 19 740 000 16/06/2021 Goldman Sachs International 98 888USD 16 119 577 RUB 1 205 430 000 16/06/2021 Morgan Stanley & Co. International Plc. 308 516
Total forward foreign exchange contracts 21 456 031
The counterparties for OTC Derivatives including CFD as at March 31, 2021 are Australia & New Zealand Banking Group Ltd, Barclays Bank Plc,BNP Paribas SA, Deutsche Bank AG, Goldman Sachs International, HSBC Bank PLC, JP Morgan Securities PLC, JPMorgan Chase Bank NA, MerrillLynch International, Morgan Stanley & Co International PLC, Societe Generale SA, Standard Chartered Bank, and State Street Bank and Trust Co.The maximum individual counterparty exposure for OTC Derivatives including CFD as at March 31, 2021 is Standard Chartered Bank with 0.44%of the NAV.
233Lumyna Funds
Lumyna – Global Debt - Government UCITS FundSchedule of investments as at March 31, 2021 (cont.)
The accompanying notes form an integral part of these financial statements.
Audited annual report

Nominalvalue Description
Quotationcurrency
CostUSD
Marketvalue USD
% of netassets
Transferable securities and money market instruments admitted to an official exchange listing or dealt in on another regulated market
Bonds
Australia200 000 Australia & New Zealand Banking Group Ltd. - Reg
2.500% 16/01/2024EUR 238 869 253 975 0.05
100 000 Bank of Queensland Ltd. - Reg 0.125% 04/06/2024 EUR 111 210 119 098 0.03300 000 Commonwealth Bank of Australia - Reg 0.375%
24/04/2023EUR 361 712 358 708 0.08
150 000 Commonwealth Bank of Australia - Reg 0.875%19/02/2029
EUR 168 292 188 065 0.04
200 000 Commonwealth Bank of Australia - Reg 1.125%22/12/2021
GBP 268 076 277 797 0.06
300 000 National Australia Bank Ltd. - Reg 0.750% 30/01/2026 EUR 342 373 369 708 0.08200 000 Westpac Banking Corp. 144A 2.000% 16/01/2025 USD 210 840 207 991 0.04100 000 Westpac Banking Corp. - Reg 0.375% 02/04/2026 EUR 112 177 121 182 0.03175 000 Westpac Banking Corp. - Reg 0.500% 04/12/2023 EUR 197 555 210 865 0.04200 000 Westpac Banking Corp. - Reg 0.500% 16/01/2025 EUR 248 464 242 598 0.05100 000 Westpac Banking Corp. - Reg 0.625% 14/01/2022 EUR 119 123 118 557 0.02
Total Australia 2 378 691 2 468 544 0.52
Austria100 000 BAWAG PSK Bank fuer Arbeit und Wirtschaft und
Oesterreichische Postsparkasse AG - Reg 0.010%23/09/2030
EUR 125 291 117 473 0.02
100 000 BAWAG PSK Bank fuer Arbeit und Wirtschaft undOesterreichische Postsparkasse AG - Reg 0.010%19/11/2035
EUR 118 556 112 477 0.02
300 000 Erste Group Bank AG - Reg 0.625% 17/04/2026 EUR 368 387 369 574 0.08100 000 Erste Group Bank AG - Reg 0.750% 05/02/2025 EUR 127 133 122 840 0.03200 000 HYPO NOE Landesbank fuer Niederoesterreich und
Wien AG - Reg 0.375% 04/04/2023EUR 237 750 239 172 0.05
100 000 Oberoesterreichische Landesbank AG - Reg 0.625%16/05/2025
EUR 118 165 121 683 0.03
200 000 Raiffeisenlandesbank Niederoesterreich-Wien AG0.625% 28/08/2026
EUR 230 082 246 695 0.05
100 000 Raiffeisen-Landesbank Steiermark AG - Reg 1.375%11/05/2033
EUR 118 766 133 877 0.03
100 000 UniCredit Bank Austria AG - Reg 0.050% 21/09/2035 EUR 118 113 113 070 0.02100 000 UniCredit Bank Austria AG - Reg 0.625% 20/03/2029 EUR 112 188 124 314 0.03100 000 Volksbank Wien AG - Reg 0.375% 04/03/2026 EUR 112 955 121 496 0.03
Total Austria 1 787 386 1 822 671 0.39
Belgium100 000 Argenta Spaarbank NV - Reg 0.010% 11/02/2031 EUR 122 019 117 127 0.02300 000 Belfius Bank S.A. - Reg 2.125% 30/01/2023 EUR 347 871 369 497 0.08100 000 BNP Paribas Fortis S.A. - Reg 0.875% 22/03/2028 EUR 122 308 126 023 0.03200 000 ING Belgium S.A. - Reg 0.750% 28/09/2026 EUR 234 436 248 813 0.05300 000 KBC Bank NV - Reg 0.000% 03/12/2025 EUR 362 919 358 739 0.08
Total Belgium 1 189 553 1 220 199 0.26
234 Lumyna Funds
Lumyna – Global Debt - Securitised UCITS FundSchedule of investments as at March 31, 2021
The accompanying notes form an integral part of these financial statements.
Audited annual report

Nominalvalue Description
Quotationcurrency
CostUSD
Marketvalue USD
% of netassets
Transferable securities and money market instruments admitted to an official exchange listing or dealt in on another regulated market(cont.)
Bonds (cont.)
Canada500 000 Bank of Montreal 144A 2.500% 11/01/2022 USD 498 489 508 789 0.11200 000 Bank of Montreal - Reg 0.125% 26/03/2023 EUR 239 964 237 851 0.05300 000 Bank of Montreal - Reg 0.200% 26/01/2023 EUR 355 605 356 911 0.08200 000 Bank of Nova Scotia - Reg 0.010% 14/01/2027 EUR 239 966 237 906 0.05100 000 Bank of Nova Scotia - Reg 0.250% 11/01/2024 EUR 124 989 119 771 0.03300 000 Bank of Nova Scotia - Reg 0.500% 22/01/2025 EUR 362 866 364 306 0.08100 000 Canadian Imperial Bank of Commerce - Reg 0.000%
25/07/2022EUR 118 535 118 281 0.02
100 000 Canadian Imperial Bank of Commerce - Reg 0.040%09/07/2027
EUR 125 303 119 044 0.02
150 000 Canadian Imperial Bank of Commerce - Reg 0.250%24/01/2023
EUR 183 371 178 578 0.04
200 000 Federation des Caisses Desjardins du Quebec - Reg0.350% 30/01/2024
EUR 224 951 240 273 0.05
200 000 National Bank of Canada - Reg 0.750% 13/03/2025 EUR 247 603 245 304 0.05200 000 Royal Bank of Canada - Reg 0.125% 25/03/2025 EUR 240 438 239 681 0.05200 000 Royal Bank of Canada - Reg 0.625% 10/09/2025 EUR 227 629 245 106 0.05200 000 Royal Bank of Canada - Reg 0.875% 17/06/2022 EUR 248 966 238 960 0.05500 000 Toronto-Dominion Bank 144A 2.500% 18/01/2022 USD 500 297 508 766 0.11600 000 Toronto-Dominion Bank - Reg 0.375% 27/04/2023 EUR 713 968 717 513 0.15300 000 Toronto-Dominion Bank - Reg 1.680% 08/06/2021 CAD 233 254 239 298 0.05
Total Canada 4 886 194 4 916 338 1.04
Czech Republic100 000 Komercni banka A/S - Reg 0.010% 20/01/2026 EUR 123 523 118 851 0.03
Total Czech Republic 123 523 118 851 0.03
Denmark200 000 Danske Bank A/S - Reg 0.125% 14/02/2022 EUR 226 625 236 353 0.05200 000 Jyske Realkredit A/S - Reg 0.375% 01/07/2024 EUR 237 019 241 082 0.05
2 000 000 Jyske Realkredit A/S - Reg 1.000% 01/04/2021 DKK 331 836 316 058 0.062 000 000 Nordea Kredit Realkreditaktieselskab - Reg 1.000%
01/10/2021DKK 320 997 317 959 0.07
3 500 000 Nykredit Realkredit A/S - Reg 1.000% 01/07/2021 DKK 563 052 554 442 0.12
Total Denmark 1 679 529 1 665 894 0.35
Finland100 000 Aktia Bank Oyj - Reg 0.375% 05/03/2026 EUR 113 387 121 790 0.02200 000 Danske Mortgage Bank Plc. - Reg 0.010% 14/01/2028 EUR 245 311 238 278 0.05200 000 Nordea Kiinnitysluottopankki Oyj - Reg 0.125%
18/06/2027EUR 226 039 241 166 0.05
200 000 Nordea Kiinnitysluottopankki Oyj - Reg 0.250%28/02/2023
EUR 245 739 238 618 0.05
200 000 Nordea Kiinnitysluottopankki Oyj - Reg 0.250%18/03/2026
EUR 223 736 242 284 0.05
300 000 OP Mortgage Bank - Reg 0.050% 21/04/2028 EUR 332 389 359 227 0.08
235Lumyna Funds
Lumyna – Global Debt - Securitised UCITS FundSchedule of investments as at March 31, 2021 (cont.)
The accompanying notes form an integral part of these financial statements.
Audited annual report
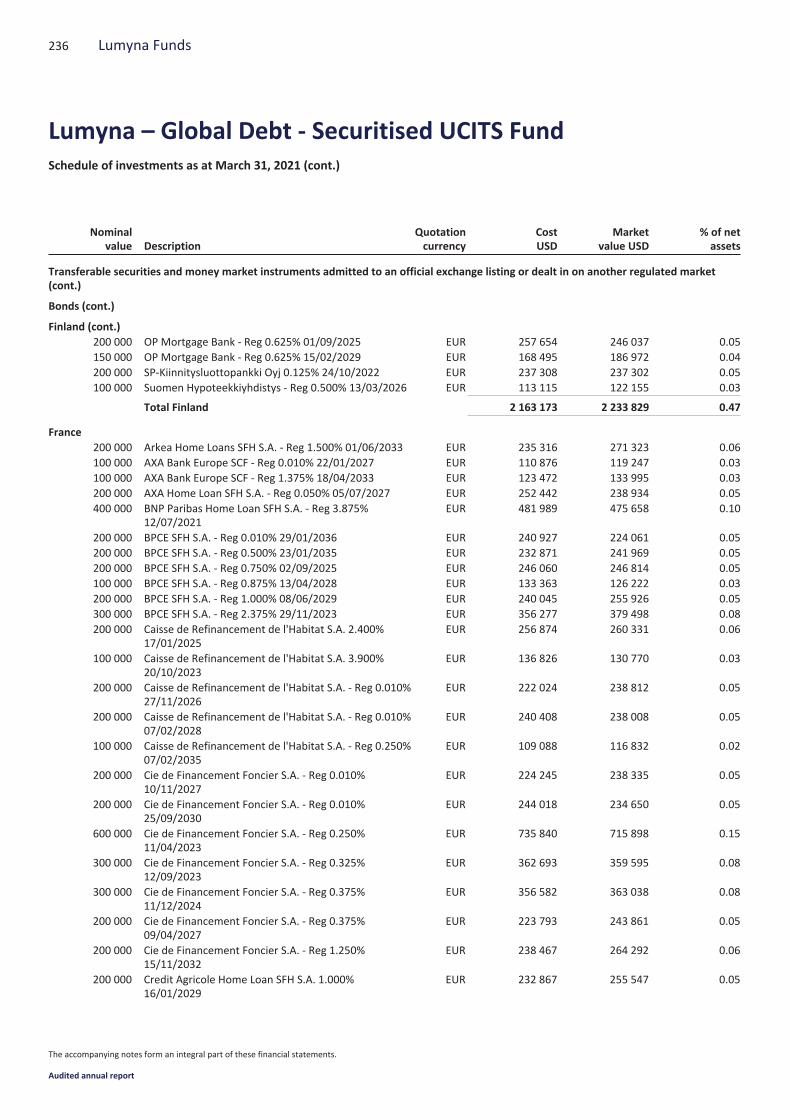
Nominalvalue Description
Quotationcurrency
CostUSD
Marketvalue USD
% of netassets
Transferable securities and money market instruments admitted to an official exchange listing or dealt in on another regulated market(cont.)
Bonds (cont.)
Finland (cont.)200 000 OP Mortgage Bank - Reg 0.625% 01/09/2025 EUR 257 654 246 037 0.05150 000 OP Mortgage Bank - Reg 0.625% 15/02/2029 EUR 168 495 186 972 0.04200 000 SP-Kiinnitysluottopankki Oyj 0.125% 24/10/2022 EUR 237 308 237 302 0.05100 000 Suomen Hypoteekkiyhdistys - Reg 0.500% 13/03/2026 EUR 113 115 122 155 0.03
Total Finland 2 163 173 2 233 829 0.47
France200 000 Arkea Home Loans SFH S.A. - Reg 1.500% 01/06/2033 EUR 235 316 271 323 0.06100 000 AXA Bank Europe SCF - Reg 0.010% 22/01/2027 EUR 110 876 119 247 0.03100 000 AXA Bank Europe SCF - Reg 1.375% 18/04/2033 EUR 123 472 133 995 0.03200 000 AXA Home Loan SFH S.A. - Reg 0.050% 05/07/2027 EUR 252 442 238 934 0.05400 000 BNP Paribas Home Loan SFH S.A. - Reg 3.875%
12/07/2021EUR 481 989 475 658 0.10
200 000 BPCE SFH S.A. - Reg 0.010% 29/01/2036 EUR 240 927 224 061 0.05200 000 BPCE SFH S.A. - Reg 0.500% 23/01/2035 EUR 232 871 241 969 0.05200 000 BPCE SFH S.A. - Reg 0.750% 02/09/2025 EUR 246 060 246 814 0.05100 000 BPCE SFH S.A. - Reg 0.875% 13/04/2028 EUR 133 363 126 222 0.03200 000 BPCE SFH S.A. - Reg 1.000% 08/06/2029 EUR 240 045 255 926 0.05300 000 BPCE SFH S.A. - Reg 2.375% 29/11/2023 EUR 356 277 379 498 0.08200 000 Caisse de Refinancement de l'Habitat S.A. 2.400%
17/01/2025EUR 256 874 260 331 0.06
100 000 Caisse de Refinancement de l'Habitat S.A. 3.900%20/10/2023
EUR 136 826 130 770 0.03
200 000 Caisse de Refinancement de l'Habitat S.A. - Reg 0.010%27/11/2026
EUR 222 024 238 812 0.05
200 000 Caisse de Refinancement de l'Habitat S.A. - Reg 0.010%07/02/2028
EUR 240 408 238 008 0.05
100 000 Caisse de Refinancement de l'Habitat S.A. - Reg 0.250%07/02/2035
EUR 109 088 116 832 0.02
200 000 Cie de Financement Foncier S.A. - Reg 0.010%10/11/2027
EUR 224 245 238 335 0.05
200 000 Cie de Financement Foncier S.A. - Reg 0.010%25/09/2030
EUR 244 018 234 650 0.05
600 000 Cie de Financement Foncier S.A. - Reg 0.250%11/04/2023
EUR 735 840 715 898 0.15
300 000 Cie de Financement Foncier S.A. - Reg 0.325%12/09/2023
EUR 362 693 359 595 0.08
300 000 Cie de Financement Foncier S.A. - Reg 0.375%11/12/2024
EUR 356 582 363 038 0.08
200 000 Cie de Financement Foncier S.A. - Reg 0.375%09/04/2027
EUR 223 793 243 861 0.05
200 000 Cie de Financement Foncier S.A. - Reg 1.250%15/11/2032
EUR 238 467 264 292 0.06
200 000 Credit Agricole Home Loan SFH S.A. 1.000%16/01/2029
EUR 232 867 255 547 0.05
236 Lumyna Funds
Lumyna – Global Debt - Securitised UCITS FundSchedule of investments as at March 31, 2021 (cont.)
The accompanying notes form an integral part of these financial statements.
Audited annual report
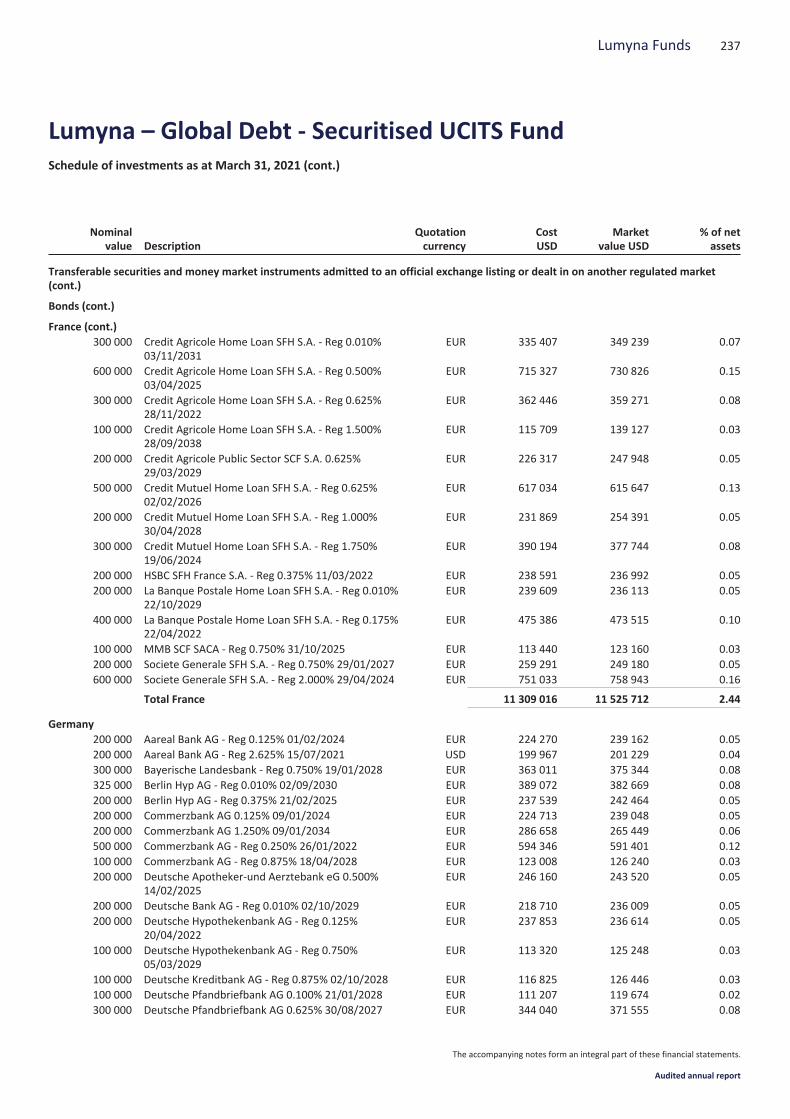
Nominalvalue Description
Quotationcurrency
CostUSD
Marketvalue USD
% of netassets
Transferable securities and money market instruments admitted to an official exchange listing or dealt in on another regulated market(cont.)
Bonds (cont.)
France (cont.)300 000 Credit Agricole Home Loan SFH S.A. - Reg 0.010%
03/11/2031EUR 335 407 349 239 0.07
600 000 Credit Agricole Home Loan SFH S.A. - Reg 0.500%03/04/2025
EUR 715 327 730 826 0.15
300 000 Credit Agricole Home Loan SFH S.A. - Reg 0.625%28/11/2022
EUR 362 446 359 271 0.08
100 000 Credit Agricole Home Loan SFH S.A. - Reg 1.500%28/09/2038
EUR 115 709 139 127 0.03
200 000 Credit Agricole Public Sector SCF S.A. 0.625%29/03/2029
EUR 226 317 247 948 0.05
500 000 Credit Mutuel Home Loan SFH S.A. - Reg 0.625%02/02/2026
EUR 617 034 615 647 0.13
200 000 Credit Mutuel Home Loan SFH S.A. - Reg 1.000%30/04/2028
EUR 231 869 254 391 0.05
300 000 Credit Mutuel Home Loan SFH S.A. - Reg 1.750%19/06/2024
EUR 390 194 377 744 0.08
200 000 HSBC SFH France S.A. - Reg 0.375% 11/03/2022 EUR 238 591 236 992 0.05200 000 La Banque Postale Home Loan SFH S.A. - Reg 0.010%
22/10/2029EUR 239 609 236 113 0.05
400 000 La Banque Postale Home Loan SFH S.A. - Reg 0.175%22/04/2022
EUR 475 386 473 515 0.10
100 000 MMB SCF SACA - Reg 0.750% 31/10/2025 EUR 113 440 123 160 0.03200 000 Societe Generale SFH S.A. - Reg 0.750% 29/01/2027 EUR 259 291 249 180 0.05600 000 Societe Generale SFH S.A. - Reg 2.000% 29/04/2024 EUR 751 033 758 943 0.16
Total France 11 309 016 11 525 712 2.44
Germany200 000 Aareal Bank AG - Reg 0.125% 01/02/2024 EUR 224 270 239 162 0.05200 000 Aareal Bank AG - Reg 2.625% 15/07/2021 USD 199 967 201 229 0.04300 000 Bayerische Landesbank - Reg 0.750% 19/01/2028 EUR 363 011 375 344 0.08325 000 Berlin Hyp AG - Reg 0.010% 02/09/2030 EUR 389 072 382 669 0.08200 000 Berlin Hyp AG - Reg 0.375% 21/02/2025 EUR 237 539 242 464 0.05200 000 Commerzbank AG 0.125% 09/01/2024 EUR 224 713 239 048 0.05200 000 Commerzbank AG 1.250% 09/01/2034 EUR 286 658 265 449 0.06500 000 Commerzbank AG - Reg 0.250% 26/01/2022 EUR 594 346 591 401 0.12100 000 Commerzbank AG - Reg 0.875% 18/04/2028 EUR 123 008 126 240 0.03200 000 Deutsche Apotheker-und Aerztebank eG 0.500%
14/02/2025EUR 246 160 243 520 0.05
200 000 Deutsche Bank AG - Reg 0.010% 02/10/2029 EUR 218 710 236 009 0.05200 000 Deutsche Hypothekenbank AG - Reg 0.125%
20/04/2022EUR 237 853 236 614 0.05
100 000 Deutsche Hypothekenbank AG - Reg 0.750%05/03/2029
EUR 113 320 125 248 0.03
100 000 Deutsche Kreditbank AG - Reg 0.875% 02/10/2028 EUR 116 825 126 446 0.03100 000 Deutsche Pfandbriefbank AG 0.100% 21/01/2028 EUR 111 207 119 674 0.02300 000 Deutsche Pfandbriefbank AG 0.625% 30/08/2027 EUR 344 040 371 555 0.08
237Lumyna Funds
Lumyna – Global Debt - Securitised UCITS FundSchedule of investments as at March 31, 2021 (cont.)
The accompanying notes form an integral part of these financial statements.
Audited annual report
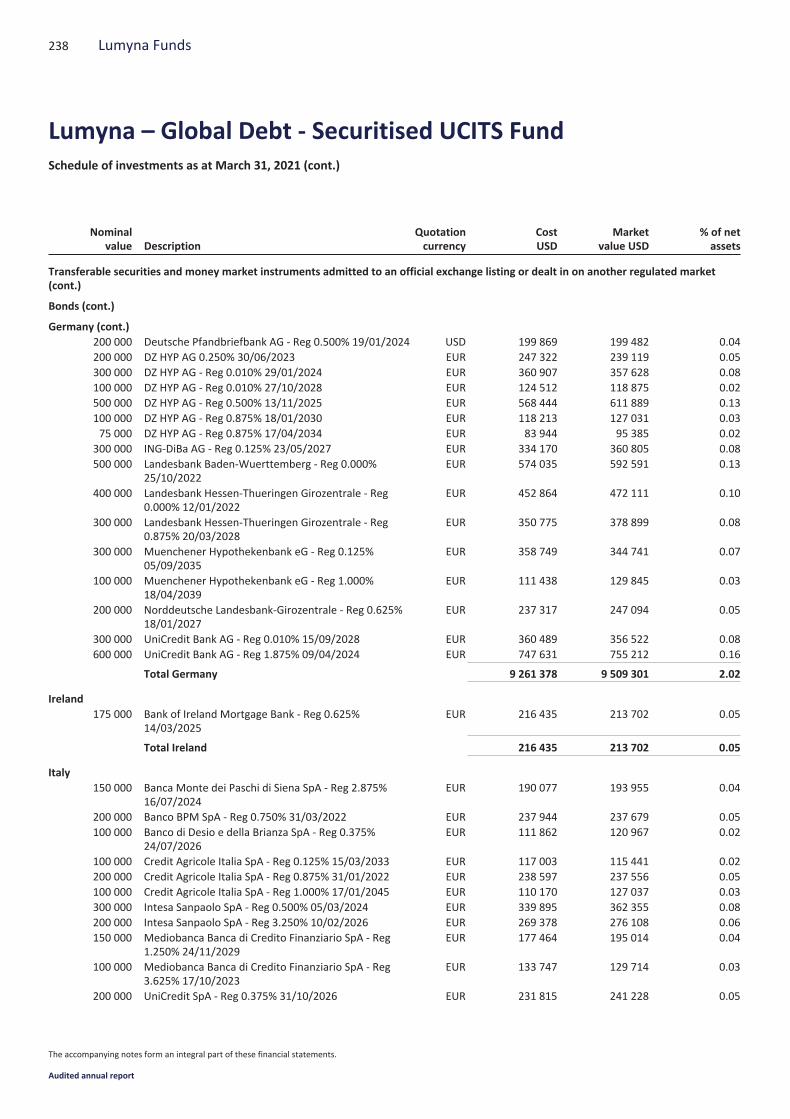
Nominalvalue Description
Quotationcurrency
CostUSD
Marketvalue USD
% of netassets
Transferable securities and money market instruments admitted to an official exchange listing or dealt in on another regulated market(cont.)
Bonds (cont.)
Germany (cont.)200 000 Deutsche Pfandbriefbank AG - Reg 0.500% 19/01/2024 USD 199 869 199 482 0.04200 000 DZ HYP AG 0.250% 30/06/2023 EUR 247 322 239 119 0.05300 000 DZ HYP AG - Reg 0.010% 29/01/2024 EUR 360 907 357 628 0.08100 000 DZ HYP AG - Reg 0.010% 27/10/2028 EUR 124 512 118 875 0.02500 000 DZ HYP AG - Reg 0.500% 13/11/2025 EUR 568 444 611 889 0.13100 000 DZ HYP AG - Reg 0.875% 18/01/2030 EUR 118 213 127 031 0.0375 000 DZ HYP AG - Reg 0.875% 17/04/2034 EUR 83 944 95 385 0.02
300 000 ING-DiBa AG - Reg 0.125% 23/05/2027 EUR 334 170 360 805 0.08500 000 Landesbank Baden-Wuerttemberg - Reg 0.000%
25/10/2022EUR 574 035 592 591 0.13
400 000 Landesbank Hessen-Thueringen Girozentrale - Reg0.000% 12/01/2022
EUR 452 864 472 111 0.10
300 000 Landesbank Hessen-Thueringen Girozentrale - Reg0.875% 20/03/2028
EUR 350 775 378 899 0.08
300 000 Muenchener Hypothekenbank eG - Reg 0.125%05/09/2035
EUR 358 749 344 741 0.07
100 000 Muenchener Hypothekenbank eG - Reg 1.000%18/04/2039
EUR 111 438 129 845 0.03
200 000 Norddeutsche Landesbank-Girozentrale - Reg 0.625%18/01/2027
EUR 237 317 247 094 0.05
300 000 UniCredit Bank AG - Reg 0.010% 15/09/2028 EUR 360 489 356 522 0.08600 000 UniCredit Bank AG - Reg 1.875% 09/04/2024 EUR 747 631 755 212 0.16
Total Germany 9 261 378 9 509 301 2.02
Ireland175 000 Bank of Ireland Mortgage Bank - Reg 0.625%
14/03/2025EUR 216 435 213 702 0.05
Total Ireland 216 435 213 702 0.05
Italy150 000 Banca Monte dei Paschi di Siena SpA - Reg 2.875%
16/07/2024EUR 190 077 193 955 0.04
200 000 Banco BPM SpA - Reg 0.750% 31/03/2022 EUR 237 944 237 679 0.05100 000 Banco di Desio e della Brianza SpA - Reg 0.375%
24/07/2026EUR 111 862 120 967 0.02
100 000 Credit Agricole Italia SpA - Reg 0.125% 15/03/2033 EUR 117 003 115 441 0.02200 000 Credit Agricole Italia SpA - Reg 0.875% 31/01/2022 EUR 238 597 237 556 0.05100 000 Credit Agricole Italia SpA - Reg 1.000% 17/01/2045 EUR 110 170 127 037 0.03300 000 Intesa Sanpaolo SpA - Reg 0.500% 05/03/2024 EUR 339 895 362 355 0.08200 000 Intesa Sanpaolo SpA - Reg 3.250% 10/02/2026 EUR 269 378 276 108 0.06150 000 Mediobanca Banca di Credito Finanziario SpA - Reg
1.250% 24/11/2029EUR 177 464 195 014 0.04
100 000 Mediobanca Banca di Credito Finanziario SpA - Reg3.625% 17/10/2023
EUR 133 747 129 714 0.03
200 000 UniCredit SpA - Reg 0.375% 31/10/2026 EUR 231 815 241 228 0.05
238 Lumyna Funds
Lumyna – Global Debt - Securitised UCITS FundSchedule of investments as at March 31, 2021 (cont.)
The accompanying notes form an integral part of these financial statements.
Audited annual report
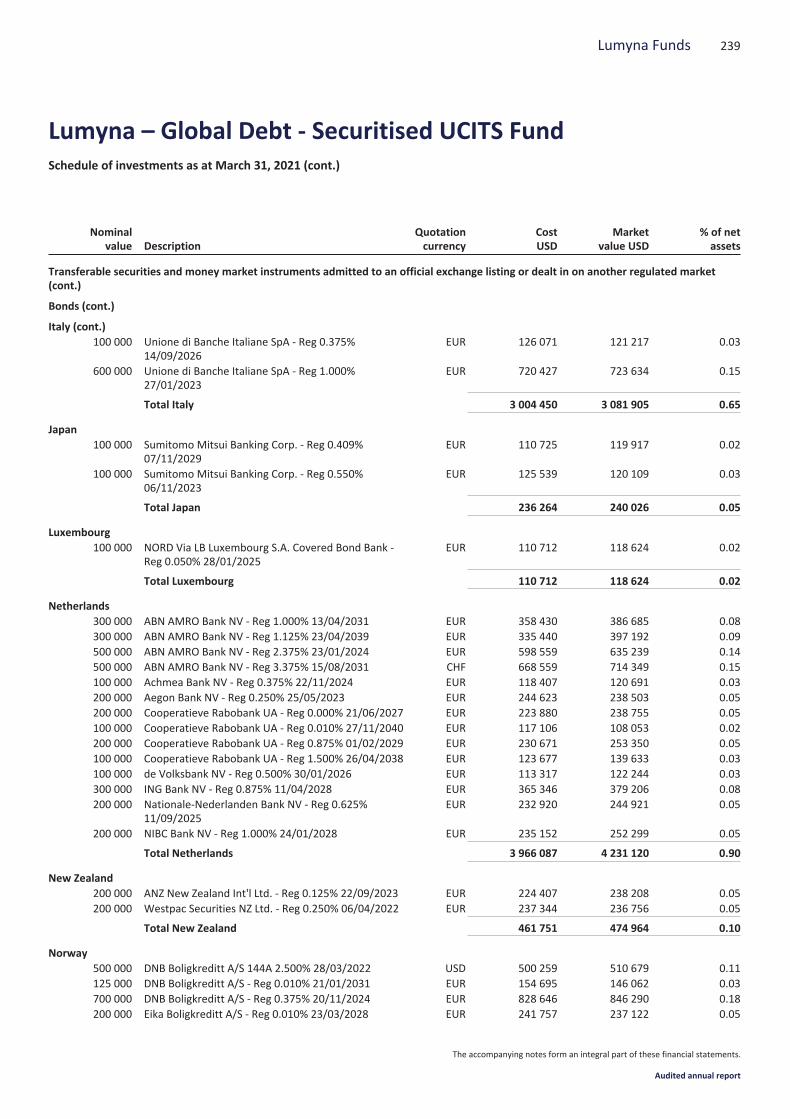
Nominalvalue Description
Quotationcurrency
CostUSD
Marketvalue USD
% of netassets
Transferable securities and money market instruments admitted to an official exchange listing or dealt in on another regulated market(cont.)
Bonds (cont.)
Italy (cont.)100 000 Unione di Banche Italiane SpA - Reg 0.375%
14/09/2026EUR 126 071 121 217 0.03
600 000 Unione di Banche Italiane SpA - Reg 1.000%27/01/2023
EUR 720 427 723 634 0.15
Total Italy 3 004 450 3 081 905 0.65
Japan100 000 Sumitomo Mitsui Banking Corp. - Reg 0.409%
07/11/2029EUR 110 725 119 917 0.02
100 000 Sumitomo Mitsui Banking Corp. - Reg 0.550%06/11/2023
EUR 125 539 120 109 0.03
Total Japan 236 264 240 026 0.05
Luxembourg100 000 NORD Via LB Luxembourg S.A. Covered Bond Bank -
Reg 0.050% 28/01/2025EUR 110 712 118 624 0.02
Total Luxembourg 110 712 118 624 0.02
Netherlands300 000 ABN AMRO Bank NV - Reg 1.000% 13/04/2031 EUR 358 430 386 685 0.08300 000 ABN AMRO Bank NV - Reg 1.125% 23/04/2039 EUR 335 440 397 192 0.09500 000 ABN AMRO Bank NV - Reg 2.375% 23/01/2024 EUR 598 559 635 239 0.14500 000 ABN AMRO Bank NV - Reg 3.375% 15/08/2031 CHF 668 559 714 349 0.15100 000 Achmea Bank NV - Reg 0.375% 22/11/2024 EUR 118 407 120 691 0.03200 000 Aegon Bank NV - Reg 0.250% 25/05/2023 EUR 244 623 238 503 0.05200 000 Cooperatieve Rabobank UA - Reg 0.000% 21/06/2027 EUR 223 880 238 755 0.05100 000 Cooperatieve Rabobank UA - Reg 0.010% 27/11/2040 EUR 117 106 108 053 0.02200 000 Cooperatieve Rabobank UA - Reg 0.875% 01/02/2029 EUR 230 671 253 350 0.05100 000 Cooperatieve Rabobank UA - Reg 1.500% 26/04/2038 EUR 123 677 139 633 0.03100 000 de Volksbank NV - Reg 0.500% 30/01/2026 EUR 113 317 122 244 0.03300 000 ING Bank NV - Reg 0.875% 11/04/2028 EUR 365 346 379 206 0.08200 000 Nationale-Nederlanden Bank NV - Reg 0.625%
11/09/2025EUR 232 920 244 921 0.05
200 000 NIBC Bank NV - Reg 1.000% 24/01/2028 EUR 235 152 252 299 0.05
Total Netherlands 3 966 087 4 231 120 0.90
New Zealand200 000 ANZ New Zealand Int'l Ltd. - Reg 0.125% 22/09/2023 EUR 224 407 238 208 0.05200 000 Westpac Securities NZ Ltd. - Reg 0.250% 06/04/2022 EUR 237 344 236 756 0.05
Total New Zealand 461 751 474 964 0.10
Norway500 000 DNB Boligkreditt A/S 144A 2.500% 28/03/2022 USD 500 259 510 679 0.11125 000 DNB Boligkreditt A/S - Reg 0.010% 21/01/2031 EUR 154 695 146 062 0.03700 000 DNB Boligkreditt A/S - Reg 0.375% 20/11/2024 EUR 828 646 846 290 0.18200 000 Eika Boligkreditt A/S - Reg 0.010% 23/03/2028 EUR 241 757 237 122 0.05
239Lumyna Funds
Lumyna – Global Debt - Securitised UCITS FundSchedule of investments as at March 31, 2021 (cont.)
The accompanying notes form an integral part of these financial statements.
Audited annual report
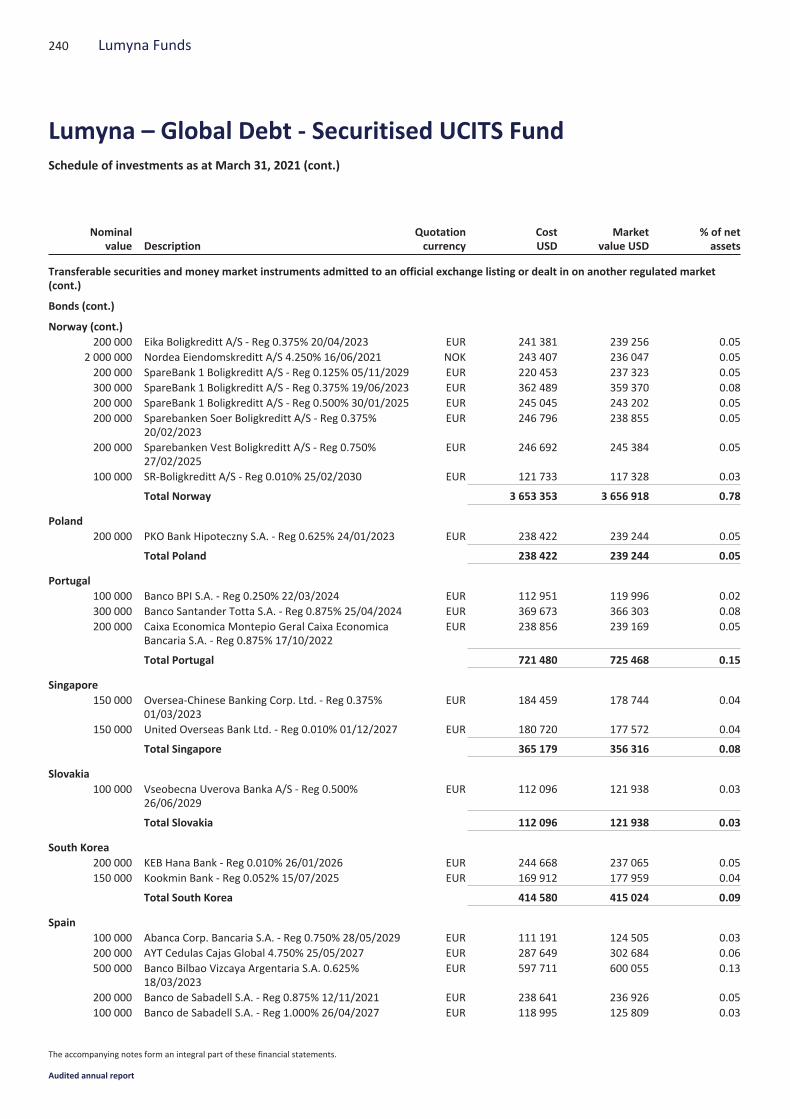
Nominalvalue Description
Quotationcurrency
CostUSD
Marketvalue USD
% of netassets
Transferable securities and money market instruments admitted to an official exchange listing or dealt in on another regulated market(cont.)
Bonds (cont.)
Norway (cont.)200 000 Eika Boligkreditt A/S - Reg 0.375% 20/04/2023 EUR 241 381 239 256 0.05
2 000 000 Nordea Eiendomskreditt A/S 4.250% 16/06/2021 NOK 243 407 236 047 0.05200 000 SpareBank 1 Boligkreditt A/S - Reg 0.125% 05/11/2029 EUR 220 453 237 323 0.05300 000 SpareBank 1 Boligkreditt A/S - Reg 0.375% 19/06/2023 EUR 362 489 359 370 0.08200 000 SpareBank 1 Boligkreditt A/S - Reg 0.500% 30/01/2025 EUR 245 045 243 202 0.05200 000 Sparebanken Soer Boligkreditt A/S - Reg 0.375%
20/02/2023EUR 246 796 238 855 0.05
200 000 Sparebanken Vest Boligkreditt A/S - Reg 0.750%27/02/2025
EUR 246 692 245 384 0.05
100 000 SR-Boligkreditt A/S - Reg 0.010% 25/02/2030 EUR 121 733 117 328 0.03
Total Norway 3 653 353 3 656 918 0.78
Poland200 000 PKO Bank Hipoteczny S.A. - Reg 0.625% 24/01/2023 EUR 238 422 239 244 0.05
Total Poland 238 422 239 244 0.05
Portugal100 000 Banco BPI S.A. - Reg 0.250% 22/03/2024 EUR 112 951 119 996 0.02300 000 Banco Santander Totta S.A. - Reg 0.875% 25/04/2024 EUR 369 673 366 303 0.08200 000 Caixa Economica Montepio Geral Caixa Economica
Bancaria S.A. - Reg 0.875% 17/10/2022EUR 238 856 239 169 0.05
Total Portugal 721 480 725 468 0.15
Singapore150 000 Oversea-Chinese Banking Corp. Ltd. - Reg 0.375%
01/03/2023EUR 184 459 178 744 0.04
150 000 United Overseas Bank Ltd. - Reg 0.010% 01/12/2027 EUR 180 720 177 572 0.04
Total Singapore 365 179 356 316 0.08
Slovakia100 000 Vseobecna Uverova Banka A/S - Reg 0.500%
26/06/2029EUR 112 096 121 938 0.03
Total Slovakia 112 096 121 938 0.03
South Korea200 000 KEB Hana Bank - Reg 0.010% 26/01/2026 EUR 244 668 237 065 0.05150 000 Kookmin Bank - Reg 0.052% 15/07/2025 EUR 169 912 177 959 0.04
Total South Korea 414 580 415 024 0.09
Spain100 000 Abanca Corp. Bancaria S.A. - Reg 0.750% 28/05/2029 EUR 111 191 124 505 0.03200 000 AYT Cedulas Cajas Global 4.750% 25/05/2027 EUR 287 649 302 684 0.06500 000 Banco Bilbao Vizcaya Argentaria S.A. 0.625%
18/03/2023EUR 597 711 600 055 0.13
200 000 Banco de Sabadell S.A. - Reg 0.875% 12/11/2021 EUR 238 641 236 926 0.05100 000 Banco de Sabadell S.A. - Reg 1.000% 26/04/2027 EUR 118 995 125 809 0.03
240 Lumyna Funds
Lumyna – Global Debt - Securitised UCITS FundSchedule of investments as at March 31, 2021 (cont.)
The accompanying notes form an integral part of these financial statements.
Audited annual report
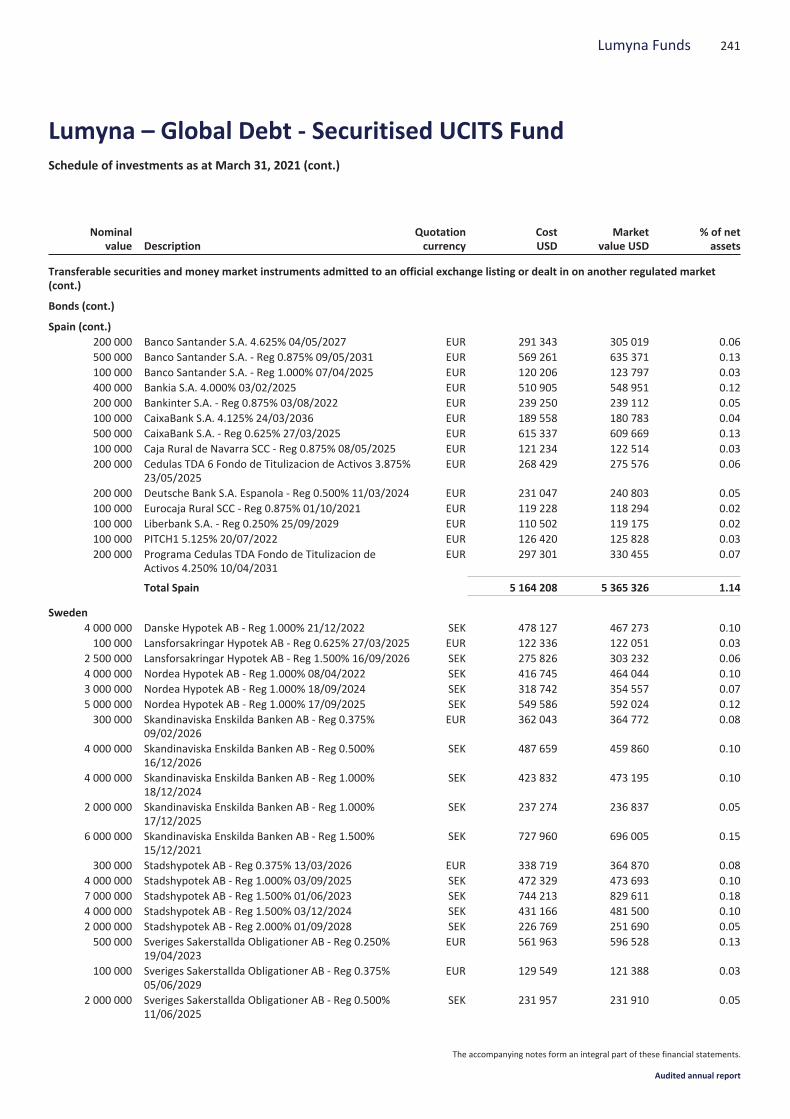
Nominalvalue Description
Quotationcurrency
CostUSD
Marketvalue USD
% of netassets
Transferable securities and money market instruments admitted to an official exchange listing or dealt in on another regulated market(cont.)
Bonds (cont.)
Spain (cont.)200 000 Banco Santander S.A. 4.625% 04/05/2027 EUR 291 343 305 019 0.06500 000 Banco Santander S.A. - Reg 0.875% 09/05/2031 EUR 569 261 635 371 0.13100 000 Banco Santander S.A. - Reg 1.000% 07/04/2025 EUR 120 206 123 797 0.03400 000 Bankia S.A. 4.000% 03/02/2025 EUR 510 905 548 951 0.12200 000 Bankinter S.A. - Reg 0.875% 03/08/2022 EUR 239 250 239 112 0.05100 000 CaixaBank S.A. 4.125% 24/03/2036 EUR 189 558 180 783 0.04500 000 CaixaBank S.A. - Reg 0.625% 27/03/2025 EUR 615 337 609 669 0.13100 000 Caja Rural de Navarra SCC - Reg 0.875% 08/05/2025 EUR 121 234 122 514 0.03200 000 Cedulas TDA 6 Fondo de Titulizacion de Activos 3.875%
23/05/2025EUR 268 429 275 576 0.06
200 000 Deutsche Bank S.A. Espanola - Reg 0.500% 11/03/2024 EUR 231 047 240 803 0.05100 000 Eurocaja Rural SCC - Reg 0.875% 01/10/2021 EUR 119 228 118 294 0.02100 000 Liberbank S.A. - Reg 0.250% 25/09/2029 EUR 110 502 119 175 0.02100 000 PITCH1 5.125% 20/07/2022 EUR 126 420 125 828 0.03200 000 Programa Cedulas TDA Fondo de Titulizacion de
Activos 4.250% 10/04/2031EUR 297 301 330 455 0.07
Total Spain 5 164 208 5 365 326 1.14
Sweden4 000 000 Danske Hypotek AB - Reg 1.000% 21/12/2022 SEK 478 127 467 273 0.10100 000 Lansforsakringar Hypotek AB - Reg 0.625% 27/03/2025 EUR 122 336 122 051 0.03
2 500 000 Lansforsakringar Hypotek AB - Reg 1.500% 16/09/2026 SEK 275 826 303 232 0.064 000 000 Nordea Hypotek AB - Reg 1.000% 08/04/2022 SEK 416 745 464 044 0.103 000 000 Nordea Hypotek AB - Reg 1.000% 18/09/2024 SEK 318 742 354 557 0.075 000 000 Nordea Hypotek AB - Reg 1.000% 17/09/2025 SEK 549 586 592 024 0.12300 000 Skandinaviska Enskilda Banken AB - Reg 0.375%
09/02/2026EUR 362 043 364 772 0.08
4 000 000 Skandinaviska Enskilda Banken AB - Reg 0.500%16/12/2026
SEK 487 659 459 860 0.10
4 000 000 Skandinaviska Enskilda Banken AB - Reg 1.000%18/12/2024
SEK 423 832 473 195 0.10
2 000 000 Skandinaviska Enskilda Banken AB - Reg 1.000%17/12/2025
SEK 237 274 236 837 0.05
6 000 000 Skandinaviska Enskilda Banken AB - Reg 1.500%15/12/2021
SEK 727 960 696 005 0.15
300 000 Stadshypotek AB - Reg 0.375% 13/03/2026 EUR 338 719 364 870 0.084 000 000 Stadshypotek AB - Reg 1.000% 03/09/2025 SEK 472 329 473 693 0.107 000 000 Stadshypotek AB - Reg 1.500% 01/06/2023 SEK 744 213 829 611 0.184 000 000 Stadshypotek AB - Reg 1.500% 03/12/2024 SEK 431 166 481 500 0.102 000 000 Stadshypotek AB - Reg 2.000% 01/09/2028 SEK 226 769 251 690 0.05500 000 Sveriges Sakerstallda Obligationer AB - Reg 0.250%
19/04/2023EUR 561 963 596 528 0.13
100 000 Sveriges Sakerstallda Obligationer AB - Reg 0.375%05/06/2029
EUR 129 549 121 388 0.03
2 000 000 Sveriges Sakerstallda Obligationer AB - Reg 0.500%11/06/2025
SEK 231 957 231 910 0.05
241Lumyna Funds
Lumyna – Global Debt - Securitised UCITS FundSchedule of investments as at March 31, 2021 (cont.)
The accompanying notes form an integral part of these financial statements.
Audited annual report
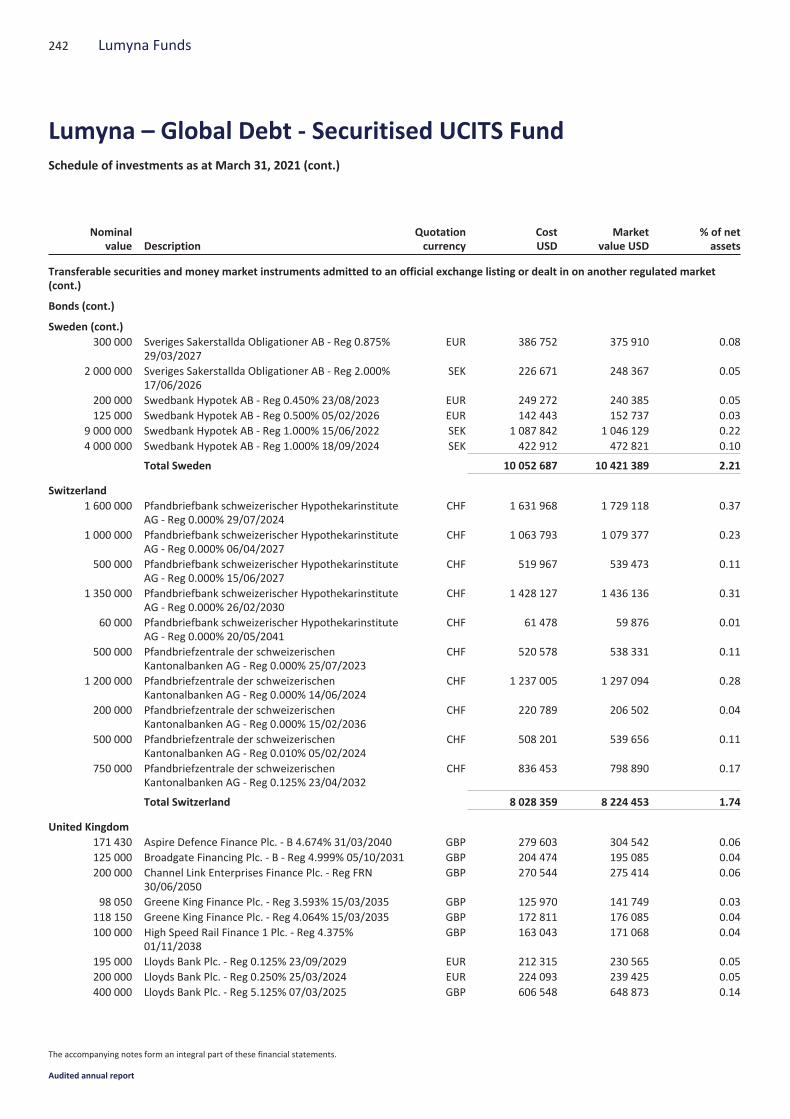
Nominalvalue Description
Quotationcurrency
CostUSD
Marketvalue USD
% of netassets
Transferable securities and money market instruments admitted to an official exchange listing or dealt in on another regulated market(cont.)
Bonds (cont.)
Sweden (cont.)300 000 Sveriges Sakerstallda Obligationer AB - Reg 0.875%
29/03/2027EUR 386 752 375 910 0.08
2 000 000 Sveriges Sakerstallda Obligationer AB - Reg 2.000%17/06/2026
SEK 226 671 248 367 0.05
200 000 Swedbank Hypotek AB - Reg 0.450% 23/08/2023 EUR 249 272 240 385 0.05125 000 Swedbank Hypotek AB - Reg 0.500% 05/02/2026 EUR 142 443 152 737 0.03
9 000 000 Swedbank Hypotek AB - Reg 1.000% 15/06/2022 SEK 1 087 842 1 046 129 0.224 000 000 Swedbank Hypotek AB - Reg 1.000% 18/09/2024 SEK 422 912 472 821 0.10
Total Sweden 10 052 687 10 421 389 2.21
Switzerland1 600 000 Pfandbriefbank schweizerischer Hypothekarinstitute
AG - Reg 0.000% 29/07/2024CHF 1 631 968 1 729 118 0.37
1 000 000 Pfandbriefbank schweizerischer HypothekarinstituteAG - Reg 0.000% 06/04/2027
CHF 1 063 793 1 079 377 0.23
500 000 Pfandbriefbank schweizerischer HypothekarinstituteAG - Reg 0.000% 15/06/2027
CHF 519 967 539 473 0.11
1 350 000 Pfandbriefbank schweizerischer HypothekarinstituteAG - Reg 0.000% 26/02/2030
CHF 1 428 127 1 436 136 0.31
60 000 Pfandbriefbank schweizerischer HypothekarinstituteAG - Reg 0.000% 20/05/2041
CHF 61 478 59 876 0.01
500 000 Pfandbriefzentrale der schweizerischenKantonalbanken AG - Reg 0.000% 25/07/2023
CHF 520 578 538 331 0.11
1 200 000 Pfandbriefzentrale der schweizerischenKantonalbanken AG - Reg 0.000% 14/06/2024
CHF 1 237 005 1 297 094 0.28
200 000 Pfandbriefzentrale der schweizerischenKantonalbanken AG - Reg 0.000% 15/02/2036
CHF 220 789 206 502 0.04
500 000 Pfandbriefzentrale der schweizerischenKantonalbanken AG - Reg 0.010% 05/02/2024
CHF 508 201 539 656 0.11
750 000 Pfandbriefzentrale der schweizerischenKantonalbanken AG - Reg 0.125% 23/04/2032
CHF 836 453 798 890 0.17
Total Switzerland 8 028 359 8 224 453 1.74
United Kingdom171 430 Aspire Defence Finance Plc. - B 4.674% 31/03/2040 GBP 279 603 304 542 0.06125 000 Broadgate Financing Plc. - B - Reg 4.999% 05/10/2031 GBP 204 474 195 085 0.04200 000 Channel Link Enterprises Finance Plc. - Reg FRN
30/06/2050GBP 270 544 275 414 0.06
98 050 Greene King Finance Plc. - Reg 3.593% 15/03/2035 GBP 125 970 141 749 0.03118 150 Greene King Finance Plc. - Reg 4.064% 15/03/2035 GBP 172 811 176 085 0.04100 000 High Speed Rail Finance 1 Plc. - Reg 4.375%
01/11/2038GBP 163 043 171 068 0.04
195 000 Lloyds Bank Plc. - Reg 0.125% 23/09/2029 EUR 212 315 230 565 0.05200 000 Lloyds Bank Plc. - Reg 0.250% 25/03/2024 EUR 224 093 239 425 0.05400 000 Lloyds Bank Plc. - Reg 5.125% 07/03/2025 GBP 606 548 648 873 0.14
242 Lumyna Funds
Lumyna – Global Debt - Securitised UCITS FundSchedule of investments as at March 31, 2021 (cont.)
The accompanying notes form an integral part of these financial statements.
Audited annual report
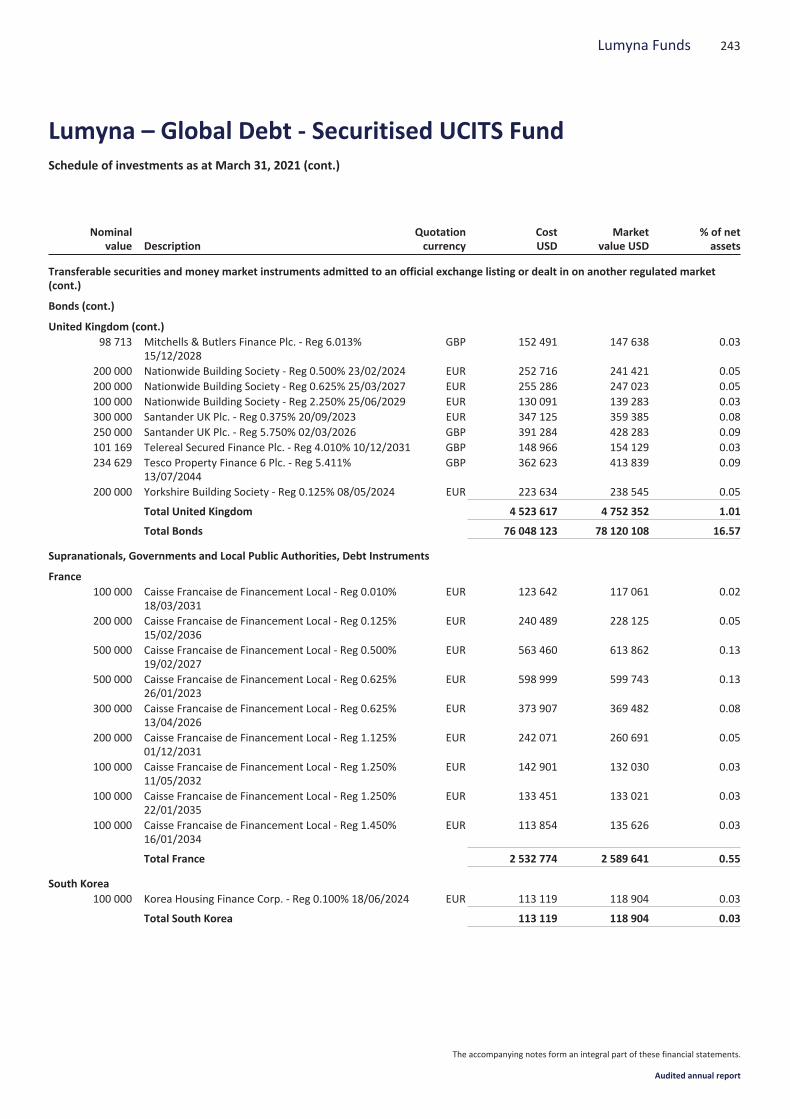
Nominalvalue Description
Quotationcurrency
CostUSD
Marketvalue USD
% of netassets
Transferable securities and money market instruments admitted to an official exchange listing or dealt in on another regulated market(cont.)
Bonds (cont.)
United Kingdom (cont.)98 713 Mitchells & Butlers Finance Plc. - Reg 6.013%
15/12/2028GBP 152 491 147 638 0.03
200 000 Nationwide Building Society - Reg 0.500% 23/02/2024 EUR 252 716 241 421 0.05200 000 Nationwide Building Society - Reg 0.625% 25/03/2027 EUR 255 286 247 023 0.05100 000 Nationwide Building Society - Reg 2.250% 25/06/2029 EUR 130 091 139 283 0.03300 000 Santander UK Plc. - Reg 0.375% 20/09/2023 EUR 347 125 359 385 0.08250 000 Santander UK Plc. - Reg 5.750% 02/03/2026 GBP 391 284 428 283 0.09101 169 Telereal Secured Finance Plc. - Reg 4.010% 10/12/2031 GBP 148 966 154 129 0.03234 629 Tesco Property Finance 6 Plc. - Reg 5.411%
13/07/2044GBP 362 623 413 839 0.09
200 000 Yorkshire Building Society - Reg 0.125% 08/05/2024 EUR 223 634 238 545 0.05
Total United Kingdom 4 523 617 4 752 352 1.01
Total Bonds 76 048 123 78 120 108 16.57
Supranationals, Governments and Local Public Authorities, Debt Instruments
France100 000 Caisse Francaise de Financement Local - Reg 0.010%
18/03/2031EUR 123 642 117 061 0.02
200 000 Caisse Francaise de Financement Local - Reg 0.125%15/02/2036
EUR 240 489 228 125 0.05
500 000 Caisse Francaise de Financement Local - Reg 0.500%19/02/2027
EUR 563 460 613 862 0.13
500 000 Caisse Francaise de Financement Local - Reg 0.625%26/01/2023
EUR 598 999 599 743 0.13
300 000 Caisse Francaise de Financement Local - Reg 0.625%13/04/2026
EUR 373 907 369 482 0.08
200 000 Caisse Francaise de Financement Local - Reg 1.125%01/12/2031
EUR 242 071 260 691 0.05
100 000 Caisse Francaise de Financement Local - Reg 1.250%11/05/2032
EUR 142 901 132 030 0.03
100 000 Caisse Francaise de Financement Local - Reg 1.250%22/01/2035
EUR 133 451 133 021 0.03
100 000 Caisse Francaise de Financement Local - Reg 1.450%16/01/2034
EUR 113 854 135 626 0.03
Total France 2 532 774 2 589 641 0.55
South Korea100 000 Korea Housing Finance Corp. - Reg 0.100% 18/06/2024 EUR 113 119 118 904 0.03
Total South Korea 113 119 118 904 0.03
243Lumyna Funds
Lumyna – Global Debt - Securitised UCITS FundSchedule of investments as at March 31, 2021 (cont.)
The accompanying notes form an integral part of these financial statements.
Audited annual report
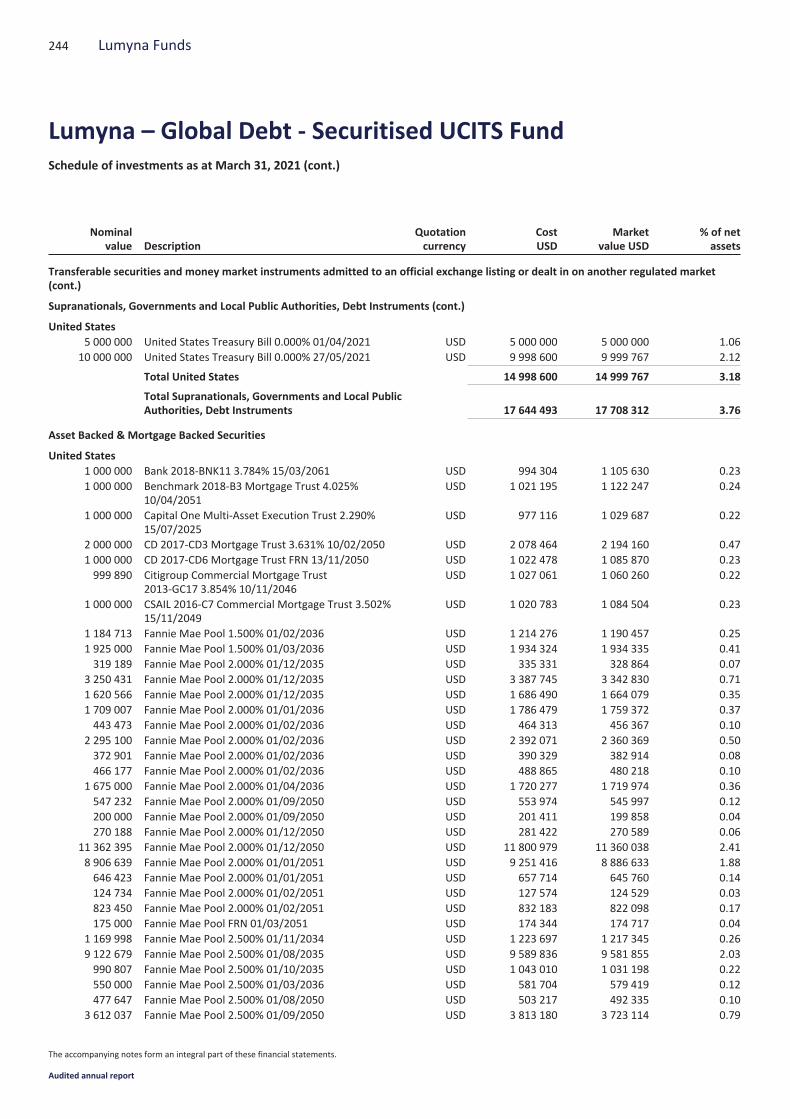
Nominalvalue Description
Quotationcurrency
CostUSD
Marketvalue USD
% of netassets
Transferable securities and money market instruments admitted to an official exchange listing or dealt in on another regulated market(cont.)
Supranationals, Governments and Local Public Authorities, Debt Instruments (cont.)
United States5 000 000 United States Treasury Bill 0.000% 01/04/2021 USD 5 000 000 5 000 000 1.06
10 000 000 United States Treasury Bill 0.000% 27/05/2021 USD 9 998 600 9 999 767 2.12
Total United States 14 998 600 14 999 767 3.18
Total Supranationals, Governments and Local PublicAuthorities, Debt Instruments 17 644 493 17 708 312 3.76
Asset Backed & Mortgage Backed Securities
United States1 000 000 Bank 2018-BNK11 3.784% 15/03/2061 USD 994 304 1 105 630 0.231 000 000 Benchmark 2018-B3 Mortgage Trust 4.025%
10/04/2051USD 1 021 195 1 122 247 0.24
1 000 000 Capital One Multi-Asset Execution Trust 2.290%15/07/2025
USD 977 116 1 029 687 0.22
2 000 000 CD 2017-CD3 Mortgage Trust 3.631% 10/02/2050 USD 2 078 464 2 194 160 0.471 000 000 CD 2017-CD6 Mortgage Trust FRN 13/11/2050 USD 1 022 478 1 085 870 0.23999 890 Citigroup Commercial Mortgage Trust
2013-GC17 3.854% 10/11/2046USD 1 027 061 1 060 260 0.22
1 000 000 CSAIL 2016-C7 Commercial Mortgage Trust 3.502%15/11/2049
USD 1 020 783 1 084 504 0.23
1 184 713 Fannie Mae Pool 1.500% 01/02/2036 USD 1 214 276 1 190 457 0.251 925 000 Fannie Mae Pool 1.500% 01/03/2036 USD 1 934 324 1 934 335 0.41319 189 Fannie Mae Pool 2.000% 01/12/2035 USD 335 331 328 864 0.07
3 250 431 Fannie Mae Pool 2.000% 01/12/2035 USD 3 387 745 3 342 830 0.711 620 566 Fannie Mae Pool 2.000% 01/12/2035 USD 1 686 490 1 664 079 0.351 709 007 Fannie Mae Pool 2.000% 01/01/2036 USD 1 786 479 1 759 372 0.37443 473 Fannie Mae Pool 2.000% 01/02/2036 USD 464 313 456 367 0.10
2 295 100 Fannie Mae Pool 2.000% 01/02/2036 USD 2 392 071 2 360 369 0.50372 901 Fannie Mae Pool 2.000% 01/02/2036 USD 390 329 382 914 0.08466 177 Fannie Mae Pool 2.000% 01/02/2036 USD 488 865 480 218 0.10
1 675 000 Fannie Mae Pool 2.000% 01/04/2036 USD 1 720 277 1 719 974 0.36547 232 Fannie Mae Pool 2.000% 01/09/2050 USD 553 974 545 997 0.12200 000 Fannie Mae Pool 2.000% 01/09/2050 USD 201 411 199 858 0.04270 188 Fannie Mae Pool 2.000% 01/12/2050 USD 281 422 270 589 0.06
11 362 395 Fannie Mae Pool 2.000% 01/12/2050 USD 11 800 979 11 360 038 2.418 906 639 Fannie Mae Pool 2.000% 01/01/2051 USD 9 251 416 8 886 633 1.88646 423 Fannie Mae Pool 2.000% 01/01/2051 USD 657 714 645 760 0.14124 734 Fannie Mae Pool 2.000% 01/02/2051 USD 127 574 124 529 0.03823 450 Fannie Mae Pool 2.000% 01/02/2051 USD 832 183 822 098 0.17175 000 Fannie Mae Pool FRN 01/03/2051 USD 174 344 174 717 0.04
1 169 998 Fannie Mae Pool 2.500% 01/11/2034 USD 1 223 697 1 217 345 0.269 122 679 Fannie Mae Pool 2.500% 01/08/2035 USD 9 589 836 9 581 855 2.03990 807 Fannie Mae Pool 2.500% 01/10/2035 USD 1 043 010 1 031 198 0.22550 000 Fannie Mae Pool 2.500% 01/03/2036 USD 581 704 579 419 0.12477 647 Fannie Mae Pool 2.500% 01/08/2050 USD 503 217 492 335 0.10
3 612 037 Fannie Mae Pool 2.500% 01/09/2050 USD 3 813 180 3 723 114 0.79
244 Lumyna Funds
Lumyna – Global Debt - Securitised UCITS FundSchedule of investments as at March 31, 2021 (cont.)
The accompanying notes form an integral part of these financial statements.
Audited annual report
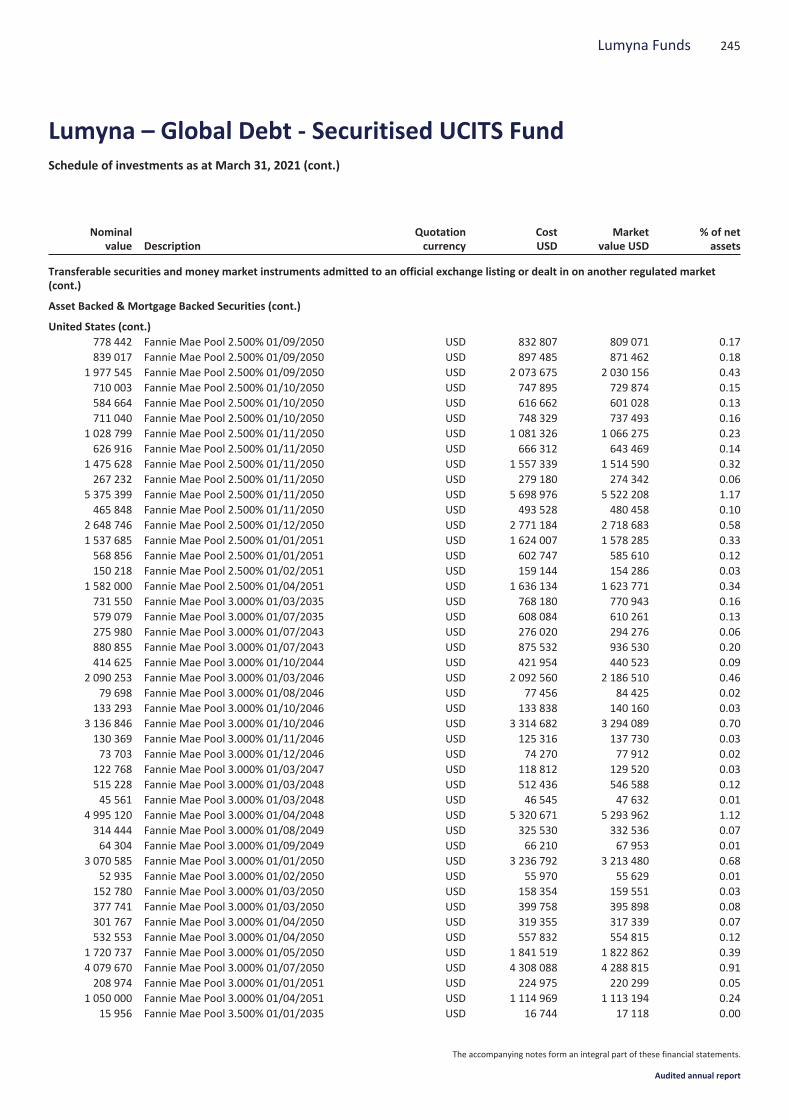
Nominalvalue Description
Quotationcurrency
CostUSD
Marketvalue USD
% of netassets
Transferable securities and money market instruments admitted to an official exchange listing or dealt in on another regulated market(cont.)
Asset Backed & Mortgage Backed Securities (cont.)
United States (cont.)778 442 Fannie Mae Pool 2.500% 01/09/2050 USD 832 807 809 071 0.17839 017 Fannie Mae Pool 2.500% 01/09/2050 USD 897 485 871 462 0.18
1 977 545 Fannie Mae Pool 2.500% 01/09/2050 USD 2 073 675 2 030 156 0.43710 003 Fannie Mae Pool 2.500% 01/10/2050 USD 747 895 729 874 0.15584 664 Fannie Mae Pool 2.500% 01/10/2050 USD 616 662 601 028 0.13711 040 Fannie Mae Pool 2.500% 01/10/2050 USD 748 329 737 493 0.16
1 028 799 Fannie Mae Pool 2.500% 01/11/2050 USD 1 081 326 1 066 275 0.23626 916 Fannie Mae Pool 2.500% 01/11/2050 USD 666 312 643 469 0.14
1 475 628 Fannie Mae Pool 2.500% 01/11/2050 USD 1 557 339 1 514 590 0.32267 232 Fannie Mae Pool 2.500% 01/11/2050 USD 279 180 274 342 0.06
5 375 399 Fannie Mae Pool 2.500% 01/11/2050 USD 5 698 976 5 522 208 1.17465 848 Fannie Mae Pool 2.500% 01/11/2050 USD 493 528 480 458 0.10
2 648 746 Fannie Mae Pool 2.500% 01/12/2050 USD 2 771 184 2 718 683 0.581 537 685 Fannie Mae Pool 2.500% 01/01/2051 USD 1 624 007 1 578 285 0.33568 856 Fannie Mae Pool 2.500% 01/01/2051 USD 602 747 585 610 0.12150 218 Fannie Mae Pool 2.500% 01/02/2051 USD 159 144 154 286 0.03
1 582 000 Fannie Mae Pool 2.500% 01/04/2051 USD 1 636 134 1 623 771 0.34731 550 Fannie Mae Pool 3.000% 01/03/2035 USD 768 180 770 943 0.16579 079 Fannie Mae Pool 3.000% 01/07/2035 USD 608 084 610 261 0.13275 980 Fannie Mae Pool 3.000% 01/07/2043 USD 276 020 294 276 0.06880 855 Fannie Mae Pool 3.000% 01/07/2043 USD 875 532 936 530 0.20414 625 Fannie Mae Pool 3.000% 01/10/2044 USD 421 954 440 523 0.09
2 090 253 Fannie Mae Pool 3.000% 01/03/2046 USD 2 092 560 2 186 510 0.4679 698 Fannie Mae Pool 3.000% 01/08/2046 USD 77 456 84 425 0.02
133 293 Fannie Mae Pool 3.000% 01/10/2046 USD 133 838 140 160 0.033 136 846 Fannie Mae Pool 3.000% 01/10/2046 USD 3 314 682 3 294 089 0.70130 369 Fannie Mae Pool 3.000% 01/11/2046 USD 125 316 137 730 0.0373 703 Fannie Mae Pool 3.000% 01/12/2046 USD 74 270 77 912 0.02
122 768 Fannie Mae Pool 3.000% 01/03/2047 USD 118 812 129 520 0.03515 228 Fannie Mae Pool 3.000% 01/03/2048 USD 512 436 546 588 0.1245 561 Fannie Mae Pool 3.000% 01/03/2048 USD 46 545 47 632 0.01
4 995 120 Fannie Mae Pool 3.000% 01/04/2048 USD 5 320 671 5 293 962 1.12314 444 Fannie Mae Pool 3.000% 01/08/2049 USD 325 530 332 536 0.0764 304 Fannie Mae Pool 3.000% 01/09/2049 USD 66 210 67 953 0.01
3 070 585 Fannie Mae Pool 3.000% 01/01/2050 USD 3 236 792 3 213 480 0.6852 935 Fannie Mae Pool 3.000% 01/02/2050 USD 55 970 55 629 0.01
152 780 Fannie Mae Pool 3.000% 01/03/2050 USD 158 354 159 551 0.03377 741 Fannie Mae Pool 3.000% 01/03/2050 USD 399 758 395 898 0.08301 767 Fannie Mae Pool 3.000% 01/04/2050 USD 319 355 317 339 0.07532 553 Fannie Mae Pool 3.000% 01/04/2050 USD 557 832 554 815 0.12
1 720 737 Fannie Mae Pool 3.000% 01/05/2050 USD 1 841 519 1 822 862 0.394 079 670 Fannie Mae Pool 3.000% 01/07/2050 USD 4 308 088 4 288 815 0.91208 974 Fannie Mae Pool 3.000% 01/01/2051 USD 224 975 220 299 0.05
1 050 000 Fannie Mae Pool 3.000% 01/04/2051 USD 1 114 969 1 113 194 0.2415 956 Fannie Mae Pool 3.500% 01/01/2035 USD 16 744 17 118 0.00
245Lumyna Funds
Lumyna – Global Debt - Securitised UCITS FundSchedule of investments as at March 31, 2021 (cont.)
The accompanying notes form an integral part of these financial statements.
Audited annual report
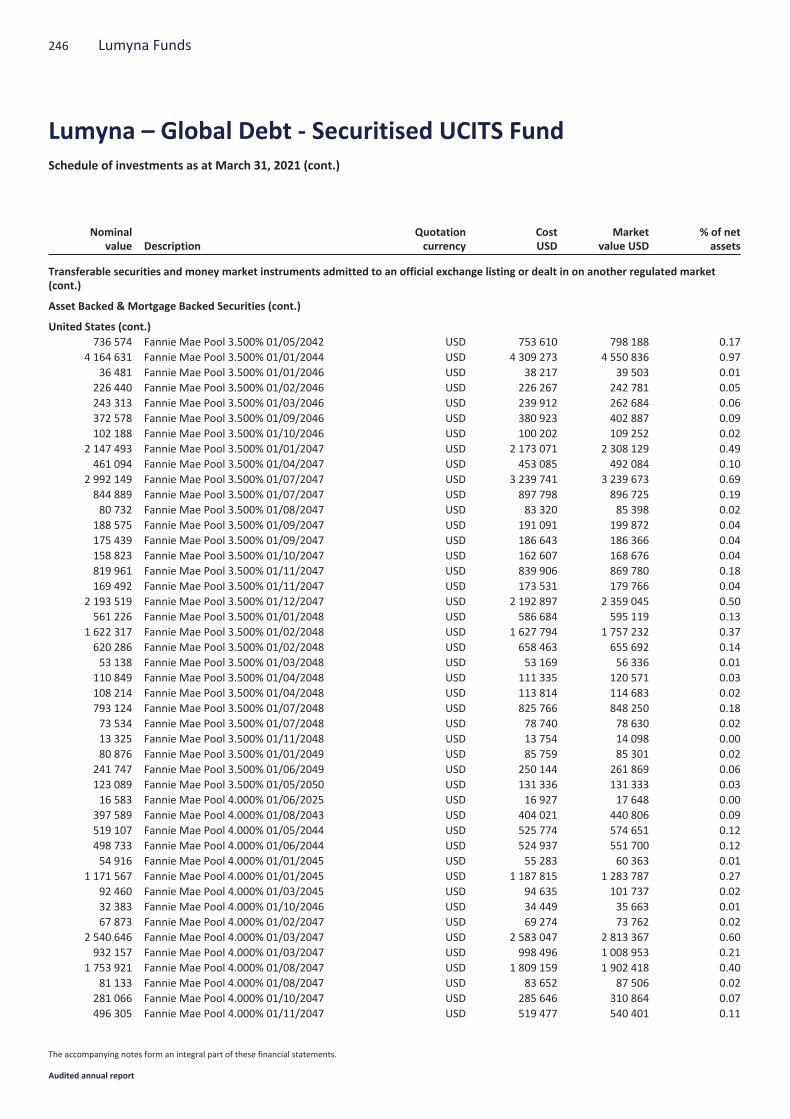
Nominalvalue Description
Quotationcurrency
CostUSD
Marketvalue USD
% of netassets
Transferable securities and money market instruments admitted to an official exchange listing or dealt in on another regulated market(cont.)
Asset Backed & Mortgage Backed Securities (cont.)
United States (cont.)736 574 Fannie Mae Pool 3.500% 01/05/2042 USD 753 610 798 188 0.17
4 164 631 Fannie Mae Pool 3.500% 01/01/2044 USD 4 309 273 4 550 836 0.9736 481 Fannie Mae Pool 3.500% 01/01/2046 USD 38 217 39 503 0.01
226 440 Fannie Mae Pool 3.500% 01/02/2046 USD 226 267 242 781 0.05243 313 Fannie Mae Pool 3.500% 01/03/2046 USD 239 912 262 684 0.06372 578 Fannie Mae Pool 3.500% 01/09/2046 USD 380 923 402 887 0.09102 188 Fannie Mae Pool 3.500% 01/10/2046 USD 100 202 109 252 0.02
2 147 493 Fannie Mae Pool 3.500% 01/01/2047 USD 2 173 071 2 308 129 0.49461 094 Fannie Mae Pool 3.500% 01/04/2047 USD 453 085 492 084 0.10
2 992 149 Fannie Mae Pool 3.500% 01/07/2047 USD 3 239 741 3 239 673 0.69844 889 Fannie Mae Pool 3.500% 01/07/2047 USD 897 798 896 725 0.1980 732 Fannie Mae Pool 3.500% 01/08/2047 USD 83 320 85 398 0.02
188 575 Fannie Mae Pool 3.500% 01/09/2047 USD 191 091 199 872 0.04175 439 Fannie Mae Pool 3.500% 01/09/2047 USD 186 643 186 366 0.04158 823 Fannie Mae Pool 3.500% 01/10/2047 USD 162 607 168 676 0.04819 961 Fannie Mae Pool 3.500% 01/11/2047 USD 839 906 869 780 0.18169 492 Fannie Mae Pool 3.500% 01/11/2047 USD 173 531 179 766 0.04
2 193 519 Fannie Mae Pool 3.500% 01/12/2047 USD 2 192 897 2 359 045 0.50561 226 Fannie Mae Pool 3.500% 01/01/2048 USD 586 684 595 119 0.13
1 622 317 Fannie Mae Pool 3.500% 01/02/2048 USD 1 627 794 1 757 232 0.37620 286 Fannie Mae Pool 3.500% 01/02/2048 USD 658 463 655 692 0.1453 138 Fannie Mae Pool 3.500% 01/03/2048 USD 53 169 56 336 0.01
110 849 Fannie Mae Pool 3.500% 01/04/2048 USD 111 335 120 571 0.03108 214 Fannie Mae Pool 3.500% 01/04/2048 USD 113 814 114 683 0.02793 124 Fannie Mae Pool 3.500% 01/07/2048 USD 825 766 848 250 0.1873 534 Fannie Mae Pool 3.500% 01/07/2048 USD 78 740 78 630 0.0213 325 Fannie Mae Pool 3.500% 01/11/2048 USD 13 754 14 098 0.0080 876 Fannie Mae Pool 3.500% 01/01/2049 USD 85 759 85 301 0.02
241 747 Fannie Mae Pool 3.500% 01/06/2049 USD 250 144 261 869 0.06123 089 Fannie Mae Pool 3.500% 01/05/2050 USD 131 336 131 333 0.0316 583 Fannie Mae Pool 4.000% 01/06/2025 USD 16 927 17 648 0.00
397 589 Fannie Mae Pool 4.000% 01/08/2043 USD 404 021 440 806 0.09519 107 Fannie Mae Pool 4.000% 01/05/2044 USD 525 774 574 651 0.12498 733 Fannie Mae Pool 4.000% 01/06/2044 USD 524 937 551 700 0.1254 916 Fannie Mae Pool 4.000% 01/01/2045 USD 55 283 60 363 0.01
1 171 567 Fannie Mae Pool 4.000% 01/01/2045 USD 1 187 815 1 283 787 0.2792 460 Fannie Mae Pool 4.000% 01/03/2045 USD 94 635 101 737 0.0232 383 Fannie Mae Pool 4.000% 01/10/2046 USD 34 449 35 663 0.0167 873 Fannie Mae Pool 4.000% 01/02/2047 USD 69 274 73 762 0.02
2 540 646 Fannie Mae Pool 4.000% 01/03/2047 USD 2 583 047 2 813 367 0.60932 157 Fannie Mae Pool 4.000% 01/03/2047 USD 998 496 1 008 953 0.21
1 753 921 Fannie Mae Pool 4.000% 01/08/2047 USD 1 809 159 1 902 418 0.4081 133 Fannie Mae Pool 4.000% 01/08/2047 USD 83 652 87 506 0.02
281 066 Fannie Mae Pool 4.000% 01/10/2047 USD 285 646 310 864 0.07496 305 Fannie Mae Pool 4.000% 01/11/2047 USD 519 477 540 401 0.11
246 Lumyna Funds
Lumyna – Global Debt - Securitised UCITS FundSchedule of investments as at March 31, 2021 (cont.)
The accompanying notes form an integral part of these financial statements.
Audited annual report

Nominalvalue Description
Quotationcurrency
CostUSD
Marketvalue USD
% of netassets
Transferable securities and money market instruments admitted to an official exchange listing or dealt in on another regulated market(cont.)
Asset Backed & Mortgage Backed Securities (cont.)
United States (cont.)2 832 264 Fannie Mae Pool 4.000% 01/11/2047 USD 2 975 153 3 092 398 0.66476 303 Fannie Mae Pool 4.000% 01/11/2047 USD 496 145 511 789 0.11158 147 Fannie Mae Pool 4.000% 01/12/2047 USD 164 318 170 687 0.04200 951 Fannie Mae Pool 4.000% 01/03/2049 USD 210 418 218 244 0.0516 058 Fannie Mae Pool 4.000% 01/04/2049 USD 16 959 17 598 0.0033 029 Fannie Mae Pool 4.000% 01/06/2049 USD 34 610 35 871 0.01
260 726 Fannie Mae Pool 4.000% 01/06/2049 USD 272 998 283 518 0.0673 721 Fannie Mae Pool 4.000% 01/05/2050 USD 79 510 79 186 0.0269 911 Fannie Mae Pool 4.500% 01/08/2041 USD 74 188 78 847 0.02
416 198 Fannie Mae Pool 4.500% 01/10/2042 USD 443 460 466 275 0.10274 150 Fannie Mae Pool 4.500% 01/02/2044 USD 290 538 309 860 0.07397 318 Fannie Mae Pool 4.500% 01/02/2046 USD 414 377 444 840 0.09
3 764 782 Fannie Mae Pool 4.500% 01/03/2046 USD 3 984 799 4 236 643 0.90225 002 Fannie Mae Pool 4.500% 01/02/2047 USD 235 084 252 415 0.05
3 873 353 Fannie Mae Pool 4.500% 01/09/2047 USD 4 189 273 4 283 680 0.91238 773 Fannie Mae Pool 4.500% 01/11/2047 USD 252 714 264 386 0.06263 847 Fannie Mae Pool 4.500% 01/06/2048 USD 276 253 293 759 0.06962 635 Fannie Mae Pool 5.000% 01/12/2035 USD 1 035 595 1 103 048 0.23382 209 Fannie Mae Pool 5.000% 01/06/2040 USD 409 316 441 361 0.09488 659 Fannie Mae Pool 5.000% 01/07/2040 USD 527 383 567 913 0.12599 791 Fannie Mae Pool 5.000% 01/09/2040 USD 642 083 697 960 0.15211 508 Fannie Mae Pool 5.000% 01/04/2041 USD 228 303 246 043 0.05
1 535 231 Fannie Mae Pool 5.000% 01/07/2042 USD 1 655 853 1 785 928 0.38202 710 Fannie Mae Pool 5.000% 01/05/2047 USD 216 972 224 681 0.05
1 929 196 Fannie Mae Pool 5.000% 01/06/2047 USD 2 100 906 2 187 548 0.46547 841 Fannie Mae Pool 5.500% 01/09/2041 USD 593 266 643 879 0.14714 603 Fannie Mae Pool 5.500% 01/05/2044 USD 800 634 836 110 0.18
3 078 865 Fannie Mae Pool 6.000% 01/07/2041 USD 3 423 548 3 672 175 0.78762 723 Freddie Mac Gold Pool 3.000% 01/06/2045 USD 758 080 805 731 0.17203 249 Freddie Mac Gold Pool 3.000% 01/12/2045 USD 202 274 213 968 0.05322 209 Freddie Mac Gold Pool 3.000% 01/09/2046 USD 311 625 338 970 0.0754 420 Freddie Mac Gold Pool 3.000% 01/10/2046 USD 52 254 57 538 0.01
305 007 Freddie Mac Gold Pool 3.500% 01/10/2042 USD 300 266 330 696 0.0782 295 Freddie Mac Gold Pool 3.500% 01/09/2044 USD 82 088 88 914 0.02
217 917 Freddie Mac Gold Pool 3.500% 01/10/2044 USD 220 382 234 299 0.05430 990 Freddie Mac Gold Pool 3.500% 01/08/2045 USD 422 860 462 470 0.10870 518 Freddie Mac Gold Pool 3.500% 01/03/2046 USD 901 786 942 669 0.2027 898 Freddie Mac Gold Pool 3.500% 01/08/2046 USD 27 636 30 142 0.0123 367 Freddie Mac Gold Pool 3.500% 01/07/2047 USD 24 109 24 880 0.00
266 259 Freddie Mac Gold Pool 3.500% 01/08/2047 USD 267 154 286 396 0.0650 467 Freddie Mac Gold Pool 3.500% 01/09/2047 USD 50 686 53 554 0.01
768 836 Freddie Mac Gold Pool 3.500% 01/09/2047 USD 770 348 829 275 0.18465 854 Freddie Mac Gold Pool 3.500% 01/11/2047 USD 474 303 493 760 0.10565 705 Freddie Mac Gold Pool 3.500% 01/12/2047 USD 579 832 600 077 0.13433 089 Freddie Mac Gold Pool 3.500% 01/12/2047 USD 443 847 457 713 0.10
247Lumyna Funds
Lumyna – Global Debt - Securitised UCITS FundSchedule of investments as at March 31, 2021 (cont.)
The accompanying notes form an integral part of these financial statements.
Audited annual report
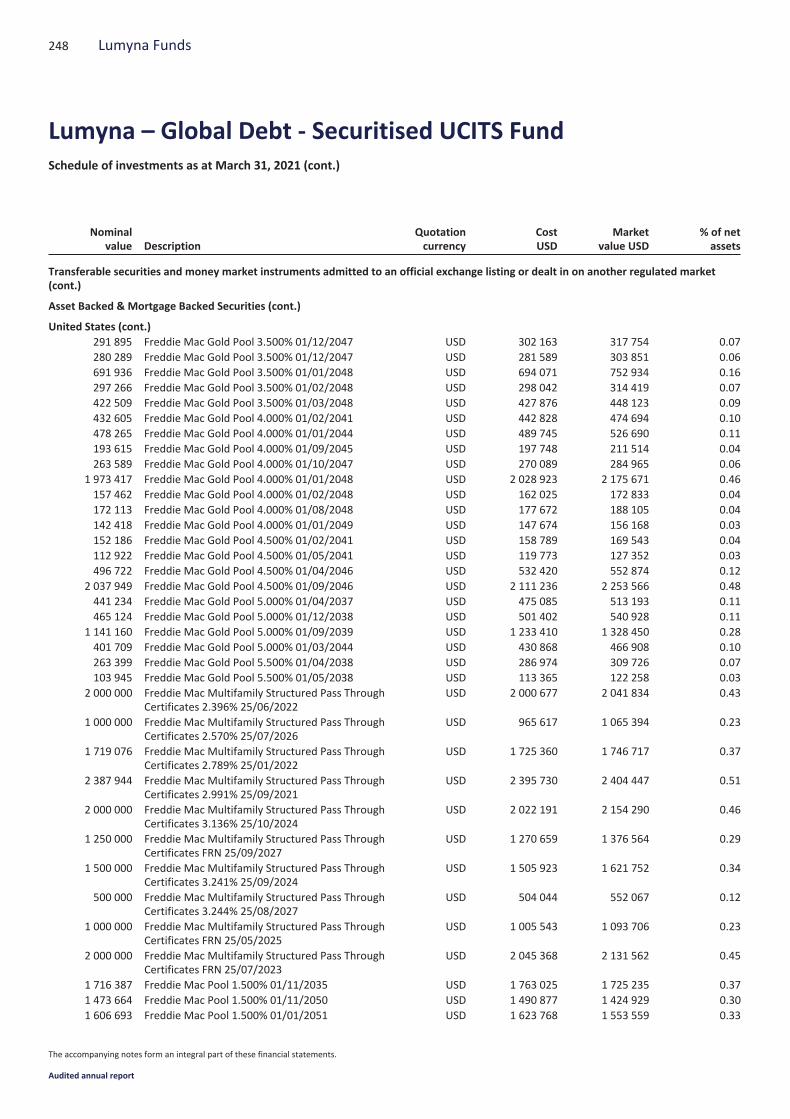
Nominalvalue Description
Quotationcurrency
CostUSD
Marketvalue USD
% of netassets
Transferable securities and money market instruments admitted to an official exchange listing or dealt in on another regulated market(cont.)
Asset Backed & Mortgage Backed Securities (cont.)
United States (cont.)291 895 Freddie Mac Gold Pool 3.500% 01/12/2047 USD 302 163 317 754 0.07280 289 Freddie Mac Gold Pool 3.500% 01/12/2047 USD 281 589 303 851 0.06691 936 Freddie Mac Gold Pool 3.500% 01/01/2048 USD 694 071 752 934 0.16297 266 Freddie Mac Gold Pool 3.500% 01/02/2048 USD 298 042 314 419 0.07422 509 Freddie Mac Gold Pool 3.500% 01/03/2048 USD 427 876 448 123 0.09432 605 Freddie Mac Gold Pool 4.000% 01/02/2041 USD 442 828 474 694 0.10478 265 Freddie Mac Gold Pool 4.000% 01/01/2044 USD 489 745 526 690 0.11193 615 Freddie Mac Gold Pool 4.000% 01/09/2045 USD 197 748 211 514 0.04263 589 Freddie Mac Gold Pool 4.000% 01/10/2047 USD 270 089 284 965 0.06
1 973 417 Freddie Mac Gold Pool 4.000% 01/01/2048 USD 2 028 923 2 175 671 0.46157 462 Freddie Mac Gold Pool 4.000% 01/02/2048 USD 162 025 172 833 0.04172 113 Freddie Mac Gold Pool 4.000% 01/08/2048 USD 177 672 188 105 0.04142 418 Freddie Mac Gold Pool 4.000% 01/01/2049 USD 147 674 156 168 0.03152 186 Freddie Mac Gold Pool 4.500% 01/02/2041 USD 158 789 169 543 0.04112 922 Freddie Mac Gold Pool 4.500% 01/05/2041 USD 119 773 127 352 0.03496 722 Freddie Mac Gold Pool 4.500% 01/04/2046 USD 532 420 552 874 0.12
2 037 949 Freddie Mac Gold Pool 4.500% 01/09/2046 USD 2 111 236 2 253 566 0.48441 234 Freddie Mac Gold Pool 5.000% 01/04/2037 USD 475 085 513 193 0.11465 124 Freddie Mac Gold Pool 5.000% 01/12/2038 USD 501 402 540 928 0.11
1 141 160 Freddie Mac Gold Pool 5.000% 01/09/2039 USD 1 233 410 1 328 450 0.28401 709 Freddie Mac Gold Pool 5.000% 01/03/2044 USD 430 868 466 908 0.10263 399 Freddie Mac Gold Pool 5.500% 01/04/2038 USD 286 974 309 726 0.07103 945 Freddie Mac Gold Pool 5.500% 01/05/2038 USD 113 365 122 258 0.03
2 000 000 Freddie Mac Multifamily Structured Pass ThroughCertificates 2.396% 25/06/2022
USD 2 000 677 2 041 834 0.43
1 000 000 Freddie Mac Multifamily Structured Pass ThroughCertificates 2.570% 25/07/2026
USD 965 617 1 065 394 0.23
1 719 076 Freddie Mac Multifamily Structured Pass ThroughCertificates 2.789% 25/01/2022
USD 1 725 360 1 746 717 0.37
2 387 944 Freddie Mac Multifamily Structured Pass ThroughCertificates 2.991% 25/09/2021
USD 2 395 730 2 404 447 0.51
2 000 000 Freddie Mac Multifamily Structured Pass ThroughCertificates 3.136% 25/10/2024
USD 2 022 191 2 154 290 0.46
1 250 000 Freddie Mac Multifamily Structured Pass ThroughCertificates FRN 25/09/2027
USD 1 270 659 1 376 564 0.29
1 500 000 Freddie Mac Multifamily Structured Pass ThroughCertificates 3.241% 25/09/2024
USD 1 505 923 1 621 752 0.34
500 000 Freddie Mac Multifamily Structured Pass ThroughCertificates 3.244% 25/08/2027
USD 504 044 552 067 0.12
1 000 000 Freddie Mac Multifamily Structured Pass ThroughCertificates FRN 25/05/2025
USD 1 005 543 1 093 706 0.23
2 000 000 Freddie Mac Multifamily Structured Pass ThroughCertificates FRN 25/07/2023
USD 2 045 368 2 131 562 0.45
1 716 387 Freddie Mac Pool 1.500% 01/11/2035 USD 1 763 025 1 725 235 0.371 473 664 Freddie Mac Pool 1.500% 01/11/2050 USD 1 490 877 1 424 929 0.301 606 693 Freddie Mac Pool 1.500% 01/01/2051 USD 1 623 768 1 553 559 0.33
248 Lumyna Funds
Lumyna – Global Debt - Securitised UCITS FundSchedule of investments as at March 31, 2021 (cont.)
The accompanying notes form an integral part of these financial statements.
Audited annual report

Nominalvalue Description
Quotationcurrency
CostUSD
Marketvalue USD
% of netassets
Transferable securities and money market instruments admitted to an official exchange listing or dealt in on another regulated market(cont.)
Asset Backed & Mortgage Backed Securities (cont.)
United States (cont.)451 302 Freddie Mac Pool 2.000% 01/10/2035 USD 473 611 465 400 0.10755 393 Freddie Mac Pool 2.000% 01/11/2035 USD 788 119 775 675 0.16785 282 Freddie Mac Pool 2.000% 01/02/2036 USD 826 421 809 021 0.17518 793 Freddie Mac Pool 2.000% 01/12/2050 USD 538 835 517 943 0.11948 044 Freddie Mac Pool 2.000% 01/02/2051 USD 965 490 947 698 0.20773 332 Freddie Mac Pool 2.000% 01/02/2051 USD 781 533 772 062 0.16374 335 Freddie Mac Pool 2.000% 01/03/2051 USD 379 414 373 649 0.08124 772 Freddie Mac Pool 2.000% 01/03/2051 USD 125 297 124 799 0.03299 000 Freddie Mac Pool 2.000% 01/03/2051 USD 305 807 298 509 0.06
3 100 000 Freddie Mac Pool 2.000% 01/04/2051 USD 3 081 715 3 093 000 0.66480 662 Freddie Mac Pool 2.500% 01/07/2035 USD 509 785 506 256 0.11182 389 Freddie Mac Pool 2.500% 01/06/2050 USD 192 779 187 326 0.04324 683 Freddie Mac Pool 2.500% 01/07/2050 USD 338 252 333 256 0.07790 873 Freddie Mac Pool 2.500% 01/07/2050 USD 841 641 818 572 0.17355 104 Freddie Mac Pool 2.500% 01/08/2050 USD 376 790 366 127 0.08
1 443 576 Freddie Mac Pool 2.500% 01/10/2050 USD 1 520 398 1 483 978 0.31738 069 Freddie Mac Pool 2.500% 01/01/2051 USD 776 660 757 557 0.16224 230 Freddie Mac Pool 2.500% 01/01/2051 USD 237 572 230 820 0.05522 082 Freddie Mac Pool 2.500% 01/01/2051 USD 552 779 536 587 0.11273 179 Freddie Mac Pool 2.500% 01/01/2051 USD 289 646 280 392 0.06293 983 Freddie Mac Pool 3.000% 01/07/2046 USD 310 356 308 277 0.07
1 193 629 Freddie Mac Pool 3.000% 01/11/2049 USD 1 288 877 1 262 304 0.273 319 065 Freddie Mac Pool 3.000% 01/02/2050 USD 3 571 210 3 515 477 0.75
65 044 Freddie Mac Pool 3.000% 01/05/2050 USD 68 796 68 927 0.011 344 012 Freddie Mac Pool 3.000% 01/06/2050 USD 1 412 233 1 404 011 0.30
21 757 Freddie Mac Pool 3.000% 01/07/2050 USD 23 018 22 934 0.0020 561 Freddie Mac Pool 3.000% 01/08/2050 USD 21 667 21 463 0.00
181 337 Freddie Mac Pool 3.000% 01/08/2050 USD 194 022 192 205 0.04672 475 Freddie Mac Pool 3.000% 01/08/2050 USD 708 371 701 065 0.15
4 521 599 Freddie Mac Pool 3.000% 01/11/2050 USD 4 758 522 4 716 990 1.003 261 293 Freddie Mac Pool 3.500% 01/02/2034 USD 3 540 088 3 515 360 0.753 800 473 Freddie Mac Pool 3.500% 01/01/2045 USD 4 067 960 4 091 462 0.87
53 114 Freddie Mac Pool 3.500% 01/01/2047 USD 56 650 56 367 0.01788 761 Freddie Mac Pool 3.500% 01/12/2047 USD 818 703 836 429 0.18
1 169 225 Freddie Mac Pool 3.500% 01/06/2049 USD 1 204 615 1 259 370 0.27347 207 Freddie Mac Pool 3.500% 01/07/2049 USD 356 069 366 410 0.08782 785 Freddie Mac Pool 3.500% 01/09/2049 USD 809 923 826 007 0.17139 385 Freddie Mac Pool 3.500% 01/02/2050 USD 144 121 147 070 0.03358 862 Freddie Mac Pool 3.500% 01/04/2050 USD 379 868 378 878 0.08
10 285 470 Freddie Mac Pool 3.500% 01/05/2050 USD 10 902 085 10 857 175 2.301 345 336 Freddie Mac Pool 4.000% 01/07/2029 USD 1 395 361 1 431 829 0.30100 905 Freddie Mac Pool 4.000% 01/05/2050 USD 108 387 108 089 0.02
1 525 236 Freddie Mac Pool 4.000% 01/06/2050 USD 1 644 880 1 635 230 0.35320 533 Freddie Mac Pool 5.000% 01/10/2049 USD 343 295 354 556 0.0739 159 Ginnie Mae I Pool 4.000% 15/05/2048 USD 41 138 42 044 0.01
249Lumyna Funds
Lumyna – Global Debt - Securitised UCITS FundSchedule of investments as at March 31, 2021 (cont.)
The accompanying notes form an integral part of these financial statements.
Audited annual report
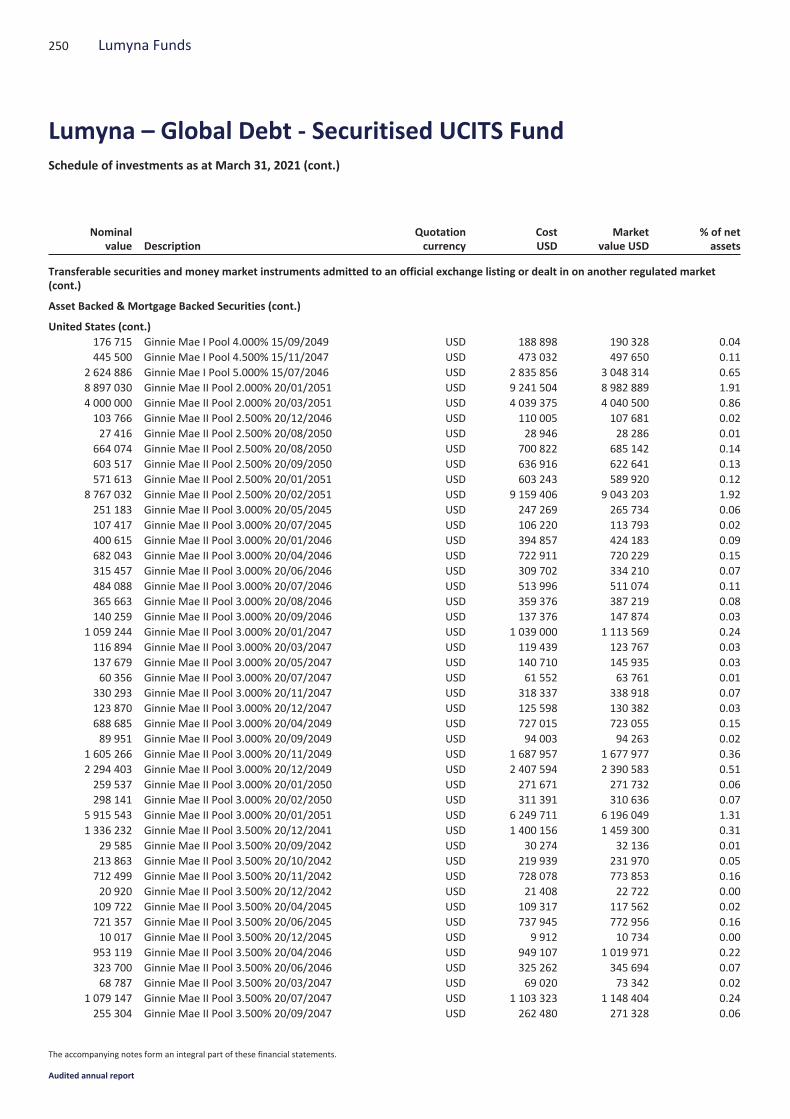
Nominalvalue Description
Quotationcurrency
CostUSD
Marketvalue USD
% of netassets
Transferable securities and money market instruments admitted to an official exchange listing or dealt in on another regulated market(cont.)
Asset Backed & Mortgage Backed Securities (cont.)
United States (cont.)176 715 Ginnie Mae I Pool 4.000% 15/09/2049 USD 188 898 190 328 0.04445 500 Ginnie Mae I Pool 4.500% 15/11/2047 USD 473 032 497 650 0.11
2 624 886 Ginnie Mae I Pool 5.000% 15/07/2046 USD 2 835 856 3 048 314 0.658 897 030 Ginnie Mae II Pool 2.000% 20/01/2051 USD 9 241 504 8 982 889 1.914 000 000 Ginnie Mae II Pool 2.000% 20/03/2051 USD 4 039 375 4 040 500 0.86103 766 Ginnie Mae II Pool 2.500% 20/12/2046 USD 110 005 107 681 0.0227 416 Ginnie Mae II Pool 2.500% 20/08/2050 USD 28 946 28 286 0.01
664 074 Ginnie Mae II Pool 2.500% 20/08/2050 USD 700 822 685 142 0.14603 517 Ginnie Mae II Pool 2.500% 20/09/2050 USD 636 916 622 641 0.13571 613 Ginnie Mae II Pool 2.500% 20/01/2051 USD 603 243 589 920 0.12
8 767 032 Ginnie Mae II Pool 2.500% 20/02/2051 USD 9 159 406 9 043 203 1.92251 183 Ginnie Mae II Pool 3.000% 20/05/2045 USD 247 269 265 734 0.06107 417 Ginnie Mae II Pool 3.000% 20/07/2045 USD 106 220 113 793 0.02400 615 Ginnie Mae II Pool 3.000% 20/01/2046 USD 394 857 424 183 0.09682 043 Ginnie Mae II Pool 3.000% 20/04/2046 USD 722 911 720 229 0.15315 457 Ginnie Mae II Pool 3.000% 20/06/2046 USD 309 702 334 210 0.07484 088 Ginnie Mae II Pool 3.000% 20/07/2046 USD 513 996 511 074 0.11365 663 Ginnie Mae II Pool 3.000% 20/08/2046 USD 359 376 387 219 0.08140 259 Ginnie Mae II Pool 3.000% 20/09/2046 USD 137 376 147 874 0.03
1 059 244 Ginnie Mae II Pool 3.000% 20/01/2047 USD 1 039 000 1 113 569 0.24116 894 Ginnie Mae II Pool 3.000% 20/03/2047 USD 119 439 123 767 0.03137 679 Ginnie Mae II Pool 3.000% 20/05/2047 USD 140 710 145 935 0.0360 356 Ginnie Mae II Pool 3.000% 20/07/2047 USD 61 552 63 761 0.01
330 293 Ginnie Mae II Pool 3.000% 20/11/2047 USD 318 337 338 918 0.07123 870 Ginnie Mae II Pool 3.000% 20/12/2047 USD 125 598 130 382 0.03688 685 Ginnie Mae II Pool 3.000% 20/04/2049 USD 727 015 723 055 0.1589 951 Ginnie Mae II Pool 3.000% 20/09/2049 USD 94 003 94 263 0.02
1 605 266 Ginnie Mae II Pool 3.000% 20/11/2049 USD 1 687 957 1 677 977 0.362 294 403 Ginnie Mae II Pool 3.000% 20/12/2049 USD 2 407 594 2 390 583 0.51259 537 Ginnie Mae II Pool 3.000% 20/01/2050 USD 271 671 271 732 0.06298 141 Ginnie Mae II Pool 3.000% 20/02/2050 USD 311 391 310 636 0.07
5 915 543 Ginnie Mae II Pool 3.000% 20/01/2051 USD 6 249 711 6 196 049 1.311 336 232 Ginnie Mae II Pool 3.500% 20/12/2041 USD 1 400 156 1 459 300 0.31
29 585 Ginnie Mae II Pool 3.500% 20/09/2042 USD 30 274 32 136 0.01213 863 Ginnie Mae II Pool 3.500% 20/10/2042 USD 219 939 231 970 0.05712 499 Ginnie Mae II Pool 3.500% 20/11/2042 USD 728 078 773 853 0.1620 920 Ginnie Mae II Pool 3.500% 20/12/2042 USD 21 408 22 722 0.00
109 722 Ginnie Mae II Pool 3.500% 20/04/2045 USD 109 317 117 562 0.02721 357 Ginnie Mae II Pool 3.500% 20/06/2045 USD 737 945 772 956 0.1610 017 Ginnie Mae II Pool 3.500% 20/12/2045 USD 9 912 10 734 0.00
953 119 Ginnie Mae II Pool 3.500% 20/04/2046 USD 949 107 1 019 971 0.22323 700 Ginnie Mae II Pool 3.500% 20/06/2046 USD 325 262 345 694 0.0768 787 Ginnie Mae II Pool 3.500% 20/03/2047 USD 69 020 73 342 0.02
1 079 147 Ginnie Mae II Pool 3.500% 20/07/2047 USD 1 103 323 1 148 404 0.24255 304 Ginnie Mae II Pool 3.500% 20/09/2047 USD 262 480 271 328 0.06
250 Lumyna Funds
Lumyna – Global Debt - Securitised UCITS FundSchedule of investments as at March 31, 2021 (cont.)
The accompanying notes form an integral part of these financial statements.
Audited annual report
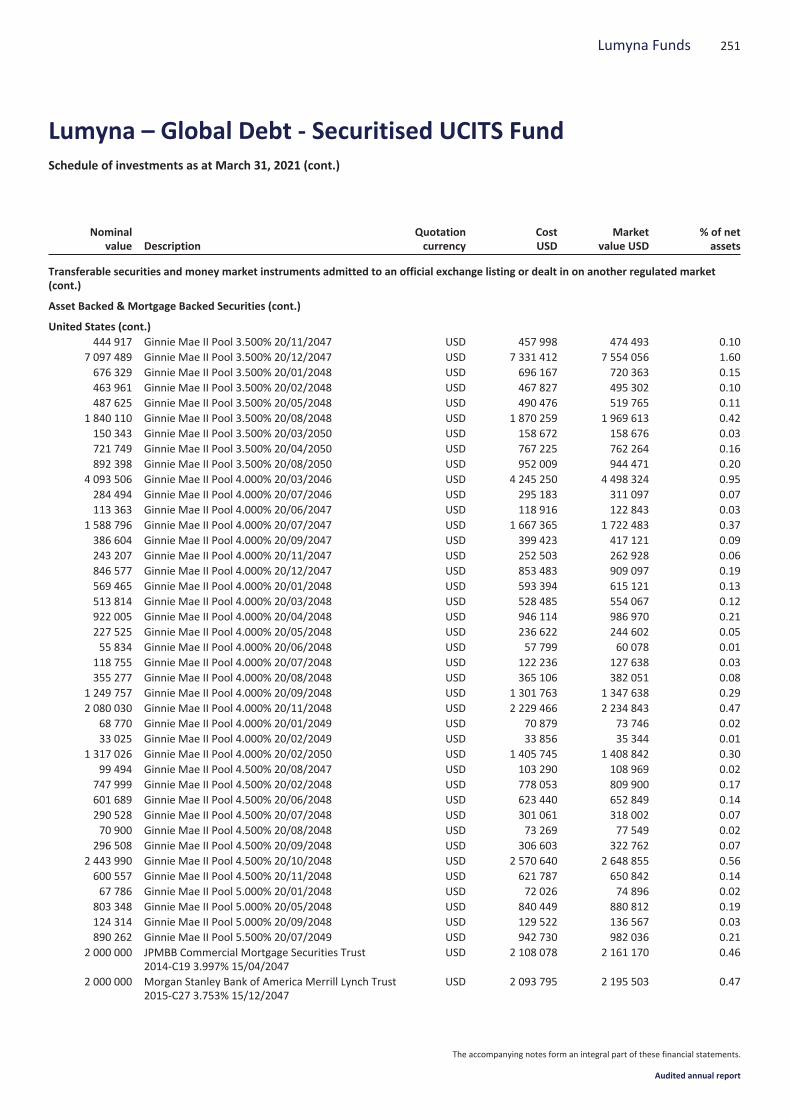
Nominalvalue Description
Quotationcurrency
CostUSD
Marketvalue USD
% of netassets
Transferable securities and money market instruments admitted to an official exchange listing or dealt in on another regulated market(cont.)
Asset Backed & Mortgage Backed Securities (cont.)
United States (cont.)444 917 Ginnie Mae II Pool 3.500% 20/11/2047 USD 457 998 474 493 0.10
7 097 489 Ginnie Mae II Pool 3.500% 20/12/2047 USD 7 331 412 7 554 056 1.60676 329 Ginnie Mae II Pool 3.500% 20/01/2048 USD 696 167 720 363 0.15463 961 Ginnie Mae II Pool 3.500% 20/02/2048 USD 467 827 495 302 0.10487 625 Ginnie Mae II Pool 3.500% 20/05/2048 USD 490 476 519 765 0.11
1 840 110 Ginnie Mae II Pool 3.500% 20/08/2048 USD 1 870 259 1 969 613 0.42150 343 Ginnie Mae II Pool 3.500% 20/03/2050 USD 158 672 158 676 0.03721 749 Ginnie Mae II Pool 3.500% 20/04/2050 USD 767 225 762 264 0.16892 398 Ginnie Mae II Pool 3.500% 20/08/2050 USD 952 009 944 471 0.20
4 093 506 Ginnie Mae II Pool 4.000% 20/03/2046 USD 4 245 250 4 498 324 0.95284 494 Ginnie Mae II Pool 4.000% 20/07/2046 USD 295 183 311 097 0.07113 363 Ginnie Mae II Pool 4.000% 20/06/2047 USD 118 916 122 843 0.03
1 588 796 Ginnie Mae II Pool 4.000% 20/07/2047 USD 1 667 365 1 722 483 0.37386 604 Ginnie Mae II Pool 4.000% 20/09/2047 USD 399 423 417 121 0.09243 207 Ginnie Mae II Pool 4.000% 20/11/2047 USD 252 503 262 928 0.06846 577 Ginnie Mae II Pool 4.000% 20/12/2047 USD 853 483 909 097 0.19569 465 Ginnie Mae II Pool 4.000% 20/01/2048 USD 593 394 615 121 0.13513 814 Ginnie Mae II Pool 4.000% 20/03/2048 USD 528 485 554 067 0.12922 005 Ginnie Mae II Pool 4.000% 20/04/2048 USD 946 114 986 970 0.21227 525 Ginnie Mae II Pool 4.000% 20/05/2048 USD 236 622 244 602 0.0555 834 Ginnie Mae II Pool 4.000% 20/06/2048 USD 57 799 60 078 0.01
118 755 Ginnie Mae II Pool 4.000% 20/07/2048 USD 122 236 127 638 0.03355 277 Ginnie Mae II Pool 4.000% 20/08/2048 USD 365 106 382 051 0.08
1 249 757 Ginnie Mae II Pool 4.000% 20/09/2048 USD 1 301 763 1 347 638 0.292 080 030 Ginnie Mae II Pool 4.000% 20/11/2048 USD 2 229 466 2 234 843 0.47
68 770 Ginnie Mae II Pool 4.000% 20/01/2049 USD 70 879 73 746 0.0233 025 Ginnie Mae II Pool 4.000% 20/02/2049 USD 33 856 35 344 0.01
1 317 026 Ginnie Mae II Pool 4.000% 20/02/2050 USD 1 405 745 1 408 842 0.3099 494 Ginnie Mae II Pool 4.500% 20/08/2047 USD 103 290 108 969 0.02
747 999 Ginnie Mae II Pool 4.500% 20/02/2048 USD 778 053 809 900 0.17601 689 Ginnie Mae II Pool 4.500% 20/06/2048 USD 623 440 652 849 0.14290 528 Ginnie Mae II Pool 4.500% 20/07/2048 USD 301 061 318 002 0.0770 900 Ginnie Mae II Pool 4.500% 20/08/2048 USD 73 269 77 549 0.02
296 508 Ginnie Mae II Pool 4.500% 20/09/2048 USD 306 603 322 762 0.072 443 990 Ginnie Mae II Pool 4.500% 20/10/2048 USD 2 570 640 2 648 855 0.56600 557 Ginnie Mae II Pool 4.500% 20/11/2048 USD 621 787 650 842 0.1467 786 Ginnie Mae II Pool 5.000% 20/01/2048 USD 72 026 74 896 0.02
803 348 Ginnie Mae II Pool 5.000% 20/05/2048 USD 840 449 880 812 0.19124 314 Ginnie Mae II Pool 5.000% 20/09/2048 USD 129 522 136 567 0.03890 262 Ginnie Mae II Pool 5.500% 20/07/2049 USD 942 730 982 036 0.21
2 000 000 JPMBB Commercial Mortgage Securities Trust2014-C19 3.997% 15/04/2047
USD 2 108 078 2 161 170 0.46
2 000 000 Morgan Stanley Bank of America Merrill Lynch Trust2015-C27 3.753% 15/12/2047
USD 2 093 795 2 195 503 0.47
251Lumyna Funds
Lumyna – Global Debt - Securitised UCITS FundSchedule of investments as at March 31, 2021 (cont.)
The accompanying notes form an integral part of these financial statements.
Audited annual report
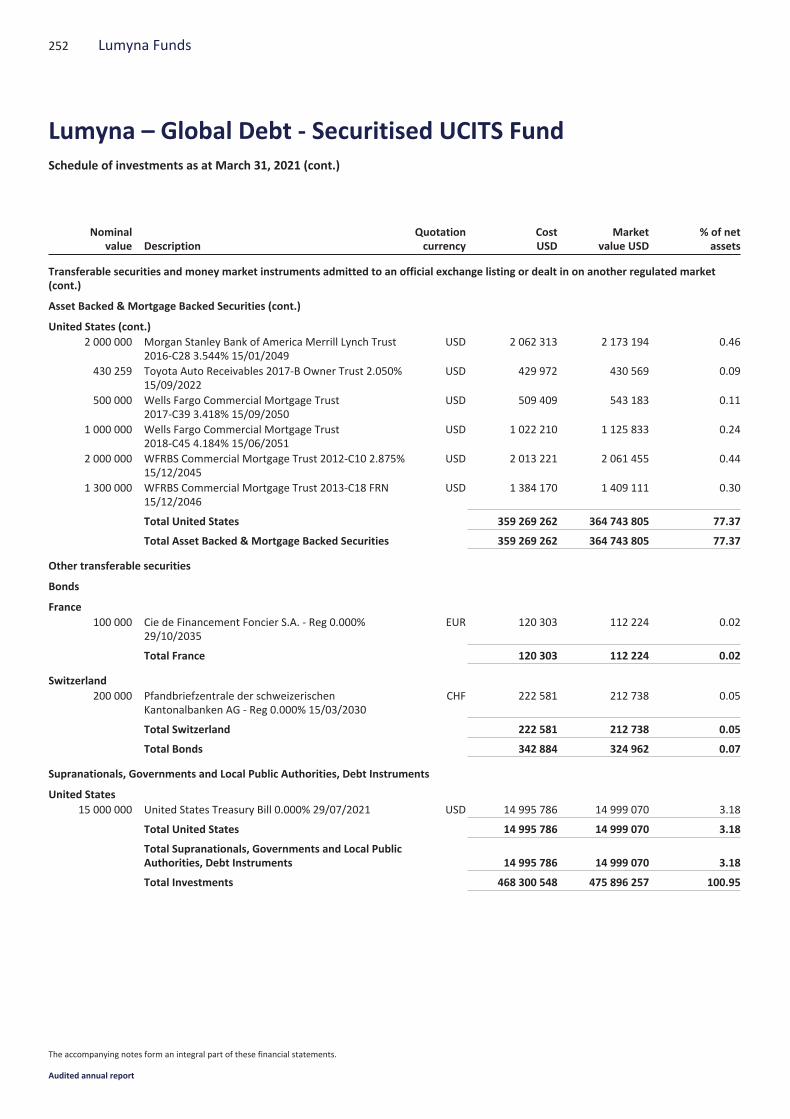
Nominalvalue Description
Quotationcurrency
CostUSD
Marketvalue USD
% of netassets
Transferable securities and money market instruments admitted to an official exchange listing or dealt in on another regulated market(cont.)
Asset Backed & Mortgage Backed Securities (cont.)
United States (cont.)2 000 000 Morgan Stanley Bank of America Merrill Lynch Trust
2016-C28 3.544% 15/01/2049USD 2 062 313 2 173 194 0.46
430 259 Toyota Auto Receivables 2017-B Owner Trust 2.050%15/09/2022
USD 429 972 430 569 0.09
500 000 Wells Fargo Commercial Mortgage Trust2017-C39 3.418% 15/09/2050
USD 509 409 543 183 0.11
1 000 000 Wells Fargo Commercial Mortgage Trust2018-C45 4.184% 15/06/2051
USD 1 022 210 1 125 833 0.24
2 000 000 WFRBS Commercial Mortgage Trust 2012-C10 2.875%15/12/2045
USD 2 013 221 2 061 455 0.44
1 300 000 WFRBS Commercial Mortgage Trust 2013-C18 FRN15/12/2046
USD 1 384 170 1 409 111 0.30
Total United States 359 269 262 364 743 805 77.37
Total Asset Backed & Mortgage Backed Securities 359 269 262 364 743 805 77.37
Other transferable securities
Bonds
France100 000 Cie de Financement Foncier S.A. - Reg 0.000%
29/10/2035EUR 120 303 112 224 0.02
Total France 120 303 112 224 0.02
Switzerland200 000 Pfandbriefzentrale der schweizerischen
Kantonalbanken AG - Reg 0.000% 15/03/2030CHF 222 581 212 738 0.05
Total Switzerland 222 581 212 738 0.05
Total Bonds 342 884 324 962 0.07
Supranationals, Governments and Local Public Authorities, Debt Instruments
United States15 000 000 United States Treasury Bill 0.000% 29/07/2021 USD 14 995 786 14 999 070 3.18
Total United States 14 995 786 14 999 070 3.18
Total Supranationals, Governments and Local PublicAuthorities, Debt Instruments 14 995 786 14 999 070 3.18
Total Investments 468 300 548 475 896 257 100.95
252 Lumyna Funds
Lumyna – Global Debt - Securitised UCITS FundSchedule of investments as at March 31, 2021 (cont.)
The accompanying notes form an integral part of these financial statements.
Audited annual report

Industrial classification of investments(as a percentage of net assets as at March 31, 2021) %
Commercial MBS 35.32FNMA Collateral 18.98GNMA2 Collateral 17.92Banks 13.53Sovereign 6.94FGLMC Collateral 4.03Diversified Financial Services 2.57GNMA Collateral 0.81Credit Card ABS 0.22
Industrial classification of investments(as a percentage of net assets as at March 31, 2021) %
Savings & Loans 0.18Real Estate 0.16Automobile ABS 0.09Beverages 0.07Commercial Services 0.06Transportation 0.04Retail 0.03
100.95
To Be Announced ContractsNominal
value DescriptionQuotationCurrency
CostUSD
Marketvalue USD
% of netassets
1 425 000 Fannie Mae Pool 1.500% 19/04/2036 USD 1 436 703 1 431 012 0.302 550 000 Fannie Mae Pool 1.500% 14/04/2051 USD 2 503 064 2 463 589 0.52
21 000 Fannie Mae Pool 2.000% 19/04/2036 USD 21 646 21 545 0.001 000 000 Fannie Mae Pool 2.500% 19/04/2036 USD 1 044 902 1 040 625 0.223 571 200 Fannie Mae Pool 2.500% 14/04/2051 USD 3 705 574 3 662 084 0.788 225 000 Fannie Mae Pool 3.000% 19/04/2036 USD 8 689 877 8 680 588 1.843 288 200 Fannie Mae Pool 3.000% 14/04/2051 USD 3 449 327 3 424 930 0.732 799 000 Fannie Mae Pool 3.500% 19/04/2036 USD 2 986 183 2 983 825 0.63250 000 Fannie Mae Pool 4.000% 19/04/2036 USD 266 426 266 191 0.0619 456 Fannie Mae Pool 4.000% 14/04/2051 USD 20 938 20 879 0.00
4 975 000 Ginnie Mae II Pool 2.000% 21/04/2051 USD 5 028 842 5 020 572 1.074 100 000 Ginnie Mae II Pool 2.500% 21/04/2051 USD 4 234 727 4 227 404 0.901 247 040 Ginnie Mae II Pool 4.000% 21/04/2051 USD 1 328 489 1 331 215 0.28
40 000 Ginnie Mae II Pool 5.000% 21/04/2051 USD 43 412 43 800 0.01
Total To Be Announced 34 618 259 7.34
Futures contracts
Currencycontract Details Market
Maturitydate Counterparty
Number ofcontracts
bought/(sold)Commitment
USD
Unrealisedappreciation/(depreciation)
USD
USD10 Year US TreasuryNote
Chicago Board ofTrade 21/06/2021
Merrill LynchInternational Ltd. 27 3 535 312 (91 527)
USD 5 Year US Treasury NoteChicago Board ofTrade 30/06/2021
Merrill LynchInternational Ltd. (42) 5 182 734 67 383
USD US Long BondChicago Board ofTrade 21/06/2021
Merrill LynchInternational Ltd. 15 2 155 313 (78 058)
Total Futures contracts 10 873 359 (102 202)
Merrill Lynch International Ltd. is the counterparty to these futures contracts.
Forward foreign exchange contracts
Currencybought
Amountbought
Currencysold Amount sold
Maturitydate Counterparty
Unrealisedappreciation/(depreciation)
USD
CAD 500 000 USD 396 935 06/04/2021 Morgan Stanley & Co. International Plc. 892
253Lumyna Funds
Lumyna – Global Debt - Securitised UCITS FundSchedule of investments as at March 31, 2021 (cont.)
The accompanying notes form an integral part of these financial statements.
Audited annual report
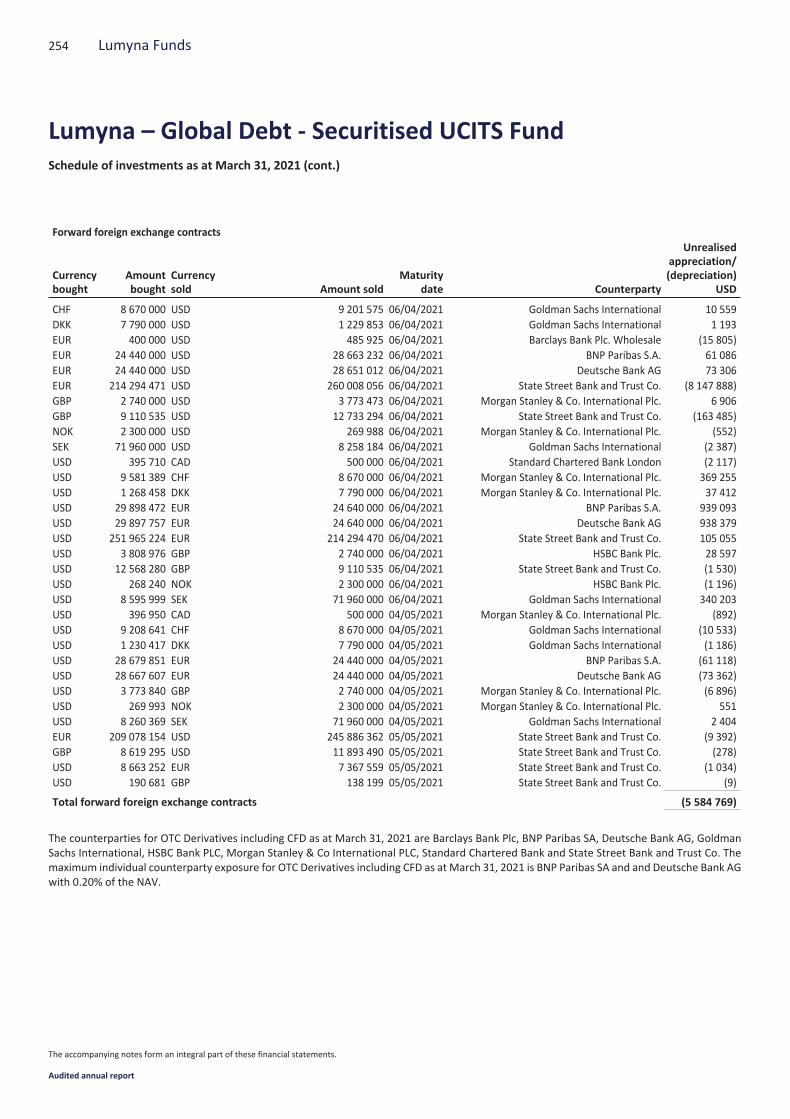
Forward foreign exchange contracts
Currencybought
Amountbought
Currencysold Amount sold
Maturitydate Counterparty
Unrealisedappreciation/(depreciation)
USD
CHF 8 670 000 USD 9 201 575 06/04/2021 Goldman Sachs International 10 559DKK 7 790 000 USD 1 229 853 06/04/2021 Goldman Sachs International 1 193EUR 400 000 USD 485 925 06/04/2021 Barclays Bank Plc. Wholesale (15 805)EUR 24 440 000 USD 28 663 232 06/04/2021 BNP Paribas S.A. 61 086EUR 24 440 000 USD 28 651 012 06/04/2021 Deutsche Bank AG 73 306EUR 214 294 471 USD 260 008 056 06/04/2021 State Street Bank and Trust Co. (8 147 888)GBP 2 740 000 USD 3 773 473 06/04/2021 Morgan Stanley & Co. International Plc. 6 906GBP 9 110 535 USD 12 733 294 06/04/2021 State Street Bank and Trust Co. (163 485)NOK 2 300 000 USD 269 988 06/04/2021 Morgan Stanley & Co. International Plc. (552)SEK 71 960 000 USD 8 258 184 06/04/2021 Goldman Sachs International (2 387)USD 395 710 CAD 500 000 06/04/2021 Standard Chartered Bank London (2 117)USD 9 581 389 CHF 8 670 000 06/04/2021 Morgan Stanley & Co. International Plc. 369 255USD 1 268 458 DKK 7 790 000 06/04/2021 Morgan Stanley & Co. International Plc. 37 412USD 29 898 472 EUR 24 640 000 06/04/2021 BNP Paribas S.A. 939 093USD 29 897 757 EUR 24 640 000 06/04/2021 Deutsche Bank AG 938 379USD 251 965 224 EUR 214 294 470 06/04/2021 State Street Bank and Trust Co. 105 055USD 3 808 976 GBP 2 740 000 06/04/2021 HSBC Bank Plc. 28 597USD 12 568 280 GBP 9 110 535 06/04/2021 State Street Bank and Trust Co. (1 530)USD 268 240 NOK 2 300 000 06/04/2021 HSBC Bank Plc. (1 196)USD 8 595 999 SEK 71 960 000 06/04/2021 Goldman Sachs International 340 203USD 396 950 CAD 500 000 04/05/2021 Morgan Stanley & Co. International Plc. (892)USD 9 208 641 CHF 8 670 000 04/05/2021 Goldman Sachs International (10 533)USD 1 230 417 DKK 7 790 000 04/05/2021 Goldman Sachs International (1 186)USD 28 679 851 EUR 24 440 000 04/05/2021 BNP Paribas S.A. (61 118)USD 28 667 607 EUR 24 440 000 04/05/2021 Deutsche Bank AG (73 362)USD 3 773 840 GBP 2 740 000 04/05/2021 Morgan Stanley & Co. International Plc. (6 896)USD 269 993 NOK 2 300 000 04/05/2021 Morgan Stanley & Co. International Plc. 551USD 8 260 369 SEK 71 960 000 04/05/2021 Goldman Sachs International 2 404EUR 209 078 154 USD 245 886 362 05/05/2021 State Street Bank and Trust Co. (9 392)GBP 8 619 295 USD 11 893 490 05/05/2021 State Street Bank and Trust Co. (278)USD 8 663 252 EUR 7 367 559 05/05/2021 State Street Bank and Trust Co. (1 034)USD 190 681 GBP 138 199 05/05/2021 State Street Bank and Trust Co. (9)
Total forward foreign exchange contracts (5 584 769)
The counterparties for OTC Derivatives including CFD as at March 31, 2021 are Barclays Bank Plc, BNP Paribas SA, Deutsche Bank AG, GoldmanSachs International, HSBC Bank PLC, Morgan Stanley & Co International PLC, Standard Chartered Bank and State Street Bank and Trust Co. Themaximum individual counterparty exposure for OTC Derivatives including CFD as at March 31, 2021 is BNP Paribas SA and and Deutsche Bank AGwith 0.20% of the NAV.
254 Lumyna Funds
Lumyna – Global Debt - Securitised UCITS FundSchedule of investments as at March 31, 2021 (cont.)
The accompanying notes form an integral part of these financial statements.
Audited annual report
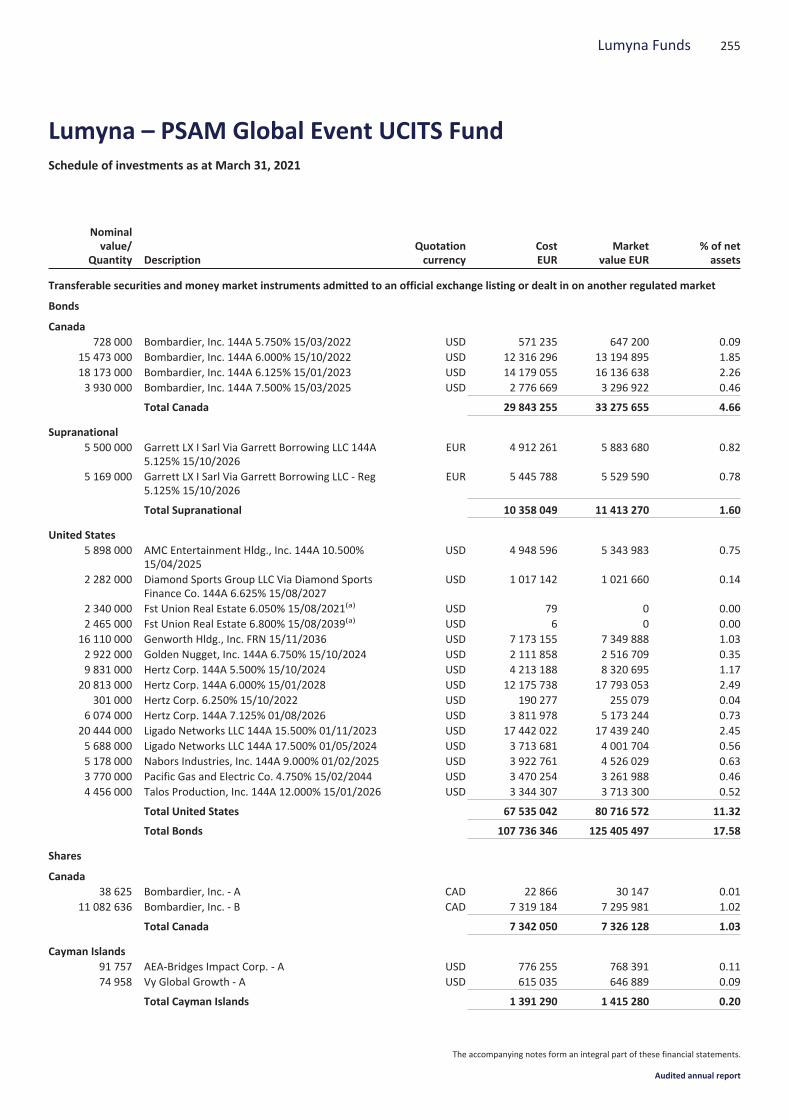
Nominalvalue/
Quantity DescriptionQuotationcurrency
CostEUR
Marketvalue EUR
% of netassets
Transferable securities and money market instruments admitted to an official exchange listing or dealt in on another regulated market
Bonds
Canada728 000 Bombardier, Inc. 144A 5.750% 15/03/2022 USD 571 235 647 200 0.09
15 473 000 Bombardier, Inc. 144A 6.000% 15/10/2022 USD 12 316 296 13 194 895 1.8518 173 000 Bombardier, Inc. 144A 6.125% 15/01/2023 USD 14 179 055 16 136 638 2.263 930 000 Bombardier, Inc. 144A 7.500% 15/03/2025 USD 2 776 669 3 296 922 0.46
Total Canada 29 843 255 33 275 655 4.66
Supranational5 500 000 Garrett LX I Sarl Via Garrett Borrowing LLC 144A
5.125% 15/10/2026EUR 4 912 261 5 883 680 0.82
5 169 000 Garrett LX I Sarl Via Garrett Borrowing LLC - Reg5.125% 15/10/2026
EUR 5 445 788 5 529 590 0.78
Total Supranational 10 358 049 11 413 270 1.60
United States5 898 000 AMC Entertainment Hldg., Inc. 144A 10.500%
15/04/2025USD 4 948 596 5 343 983 0.75
2 282 000 Diamond Sports Group LLC Via Diamond SportsFinance Co. 144A 6.625% 15/08/2027
USD 1 017 142 1 021 660 0.14
2 340 000 Fst Union Real Estate 6.050% 15/08/2021(a) USD 79 0 0.002 465 000 Fst Union Real Estate 6.800% 15/08/2039(a) USD 6 0 0.00
16 110 000 Genworth Hldg., Inc. FRN 15/11/2036 USD 7 173 155 7 349 888 1.032 922 000 Golden Nugget, Inc. 144A 6.750% 15/10/2024 USD 2 111 858 2 516 709 0.359 831 000 Hertz Corp. 144A 5.500% 15/10/2024 USD 4 213 188 8 320 695 1.17
20 813 000 Hertz Corp. 144A 6.000% 15/01/2028 USD 12 175 738 17 793 053 2.49301 000 Hertz Corp. 6.250% 15/10/2022 USD 190 277 255 079 0.04
6 074 000 Hertz Corp. 144A 7.125% 01/08/2026 USD 3 811 978 5 173 244 0.7320 444 000 Ligado Networks LLC 144A 15.500% 01/11/2023 USD 17 442 022 17 439 240 2.455 688 000 Ligado Networks LLC 144A 17.500% 01/05/2024 USD 3 713 681 4 001 704 0.565 178 000 Nabors Industries, Inc. 144A 9.000% 01/02/2025 USD 3 922 761 4 526 029 0.633 770 000 Pacific Gas and Electric Co. 4.750% 15/02/2044 USD 3 470 254 3 261 988 0.464 456 000 Talos Production, Inc. 144A 12.000% 15/01/2026 USD 3 344 307 3 713 300 0.52
Total United States 67 535 042 80 716 572 11.32
Total Bonds 107 736 346 125 405 497 17.58
Shares
Canada38 625 Bombardier, Inc. - A CAD 22 866 30 147 0.01
11 082 636 Bombardier, Inc. - B CAD 7 319 184 7 295 981 1.02
Total Canada 7 342 050 7 326 128 1.03
Cayman Islands91 757 AEA-Bridges Impact Corp. - A USD 776 255 768 391 0.1174 958 Vy Global Growth - A USD 615 035 646 889 0.09
Total Cayman Islands 1 391 290 1 415 280 0.20
255Lumyna Funds
Lumyna – PSAM Global Event UCITS FundSchedule of investments as at March 31, 2021
The accompanying notes form an integral part of these financial statements.
Audited annual report
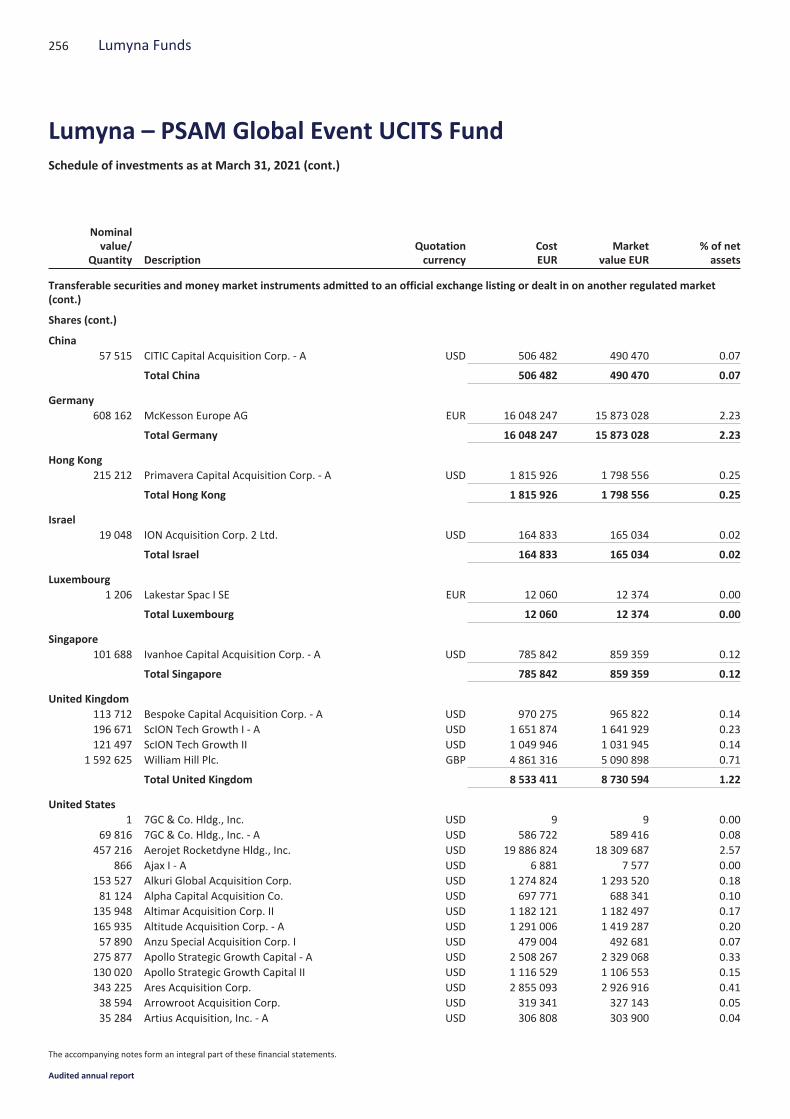
Nominalvalue/
Quantity DescriptionQuotationcurrency
CostEUR
Marketvalue EUR
% of netassets
Transferable securities and money market instruments admitted to an official exchange listing or dealt in on another regulated market(cont.)
Shares (cont.)
China57 515 CITIC Capital Acquisition Corp. - A USD 506 482 490 470 0.07
Total China 506 482 490 470 0.07
Germany608 162 McKesson Europe AG EUR 16 048 247 15 873 028 2.23
Total Germany 16 048 247 15 873 028 2.23
Hong Kong215 212 Primavera Capital Acquisition Corp. - A USD 1 815 926 1 798 556 0.25
Total Hong Kong 1 815 926 1 798 556 0.25
Israel19 048 ION Acquisition Corp. 2 Ltd. USD 164 833 165 034 0.02
Total Israel 164 833 165 034 0.02
Luxembourg1 206 Lakestar Spac I SE EUR 12 060 12 374 0.00
Total Luxembourg 12 060 12 374 0.00
Singapore101 688 Ivanhoe Capital Acquisition Corp. - A USD 785 842 859 359 0.12
Total Singapore 785 842 859 359 0.12
United Kingdom113 712 Bespoke Capital Acquisition Corp. - A USD 970 275 965 822 0.14196 671 ScION Tech Growth I - A USD 1 651 874 1 641 929 0.23121 497 ScION Tech Growth II USD 1 049 946 1 031 945 0.14
1 592 625 William Hill Plc. GBP 4 861 316 5 090 898 0.71
Total United Kingdom 8 533 411 8 730 594 1.22
United States1 7GC & Co. Hldg., Inc. USD 9 9 0.00
69 816 7GC & Co. Hldg., Inc. - A USD 586 722 589 416 0.08457 216 Aerojet Rocketdyne Hldg., Inc. USD 19 886 824 18 309 687 2.57
866 Ajax I - A USD 6 881 7 577 0.00153 527 Alkuri Global Acquisition Corp. USD 1 274 824 1 293 520 0.1881 124 Alpha Capital Acquisition Co. USD 697 771 688 341 0.10
135 948 Altimar Acquisition Corp. II USD 1 182 121 1 182 497 0.17165 935 Altitude Acquisition Corp. - A USD 1 291 006 1 419 287 0.2057 890 Anzu Special Acquisition Corp. I USD 479 004 492 681 0.07
275 877 Apollo Strategic Growth Capital - A USD 2 508 267 2 329 068 0.33130 020 Apollo Strategic Growth Capital II USD 1 116 529 1 106 553 0.15343 225 Ares Acquisition Corp. USD 2 855 093 2 926 916 0.4138 594 Arrowroot Acquisition Corp. USD 319 341 327 143 0.0535 284 Artius Acquisition, Inc. - A USD 306 808 303 900 0.04
256 Lumyna Funds
Lumyna – PSAM Global Event UCITS FundSchedule of investments as at March 31, 2021 (cont.)
The accompanying notes form an integral part of these financial statements.
Audited annual report
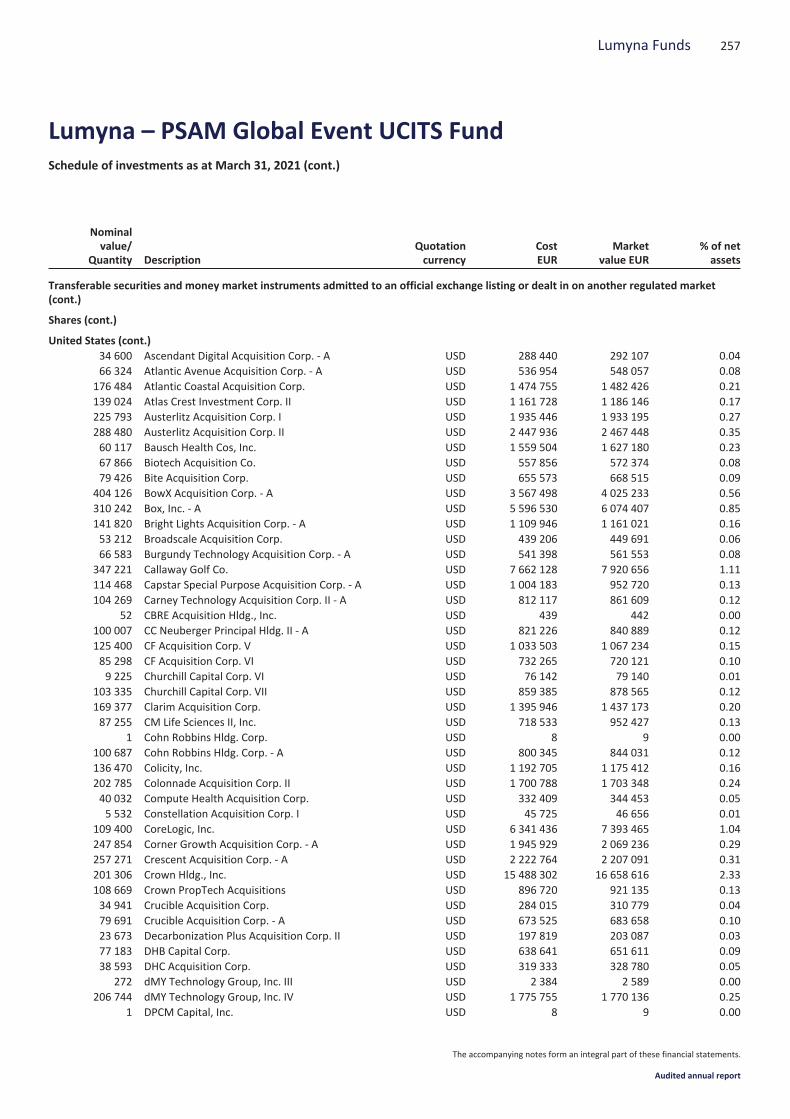
Nominalvalue/
Quantity DescriptionQuotationcurrency
CostEUR
Marketvalue EUR
% of netassets
Transferable securities and money market instruments admitted to an official exchange listing or dealt in on another regulated market(cont.)
Shares (cont.)
United States (cont.)34 600 Ascendant Digital Acquisition Corp. - A USD 288 440 292 107 0.0466 324 Atlantic Avenue Acquisition Corp. - A USD 536 954 548 057 0.08
176 484 Atlantic Coastal Acquisition Corp. USD 1 474 755 1 482 426 0.21139 024 Atlas Crest Investment Corp. II USD 1 161 728 1 186 146 0.17225 793 Austerlitz Acquisition Corp. I USD 1 935 446 1 933 195 0.27288 480 Austerlitz Acquisition Corp. II USD 2 447 936 2 467 448 0.3560 117 Bausch Health Cos, Inc. USD 1 559 504 1 627 180 0.2367 866 Biotech Acquisition Co. USD 557 856 572 374 0.0879 426 Bite Acquisition Corp. USD 655 573 668 515 0.09
404 126 BowX Acquisition Corp. - A USD 3 567 498 4 025 233 0.56310 242 Box, Inc. - A USD 5 596 530 6 074 407 0.85141 820 Bright Lights Acquisition Corp. - A USD 1 109 946 1 161 021 0.1653 212 Broadscale Acquisition Corp. USD 439 206 449 691 0.0666 583 Burgundy Technology Acquisition Corp. - A USD 541 398 561 553 0.08
347 221 Callaway Golf Co. USD 7 662 128 7 920 656 1.11114 468 Capstar Special Purpose Acquisition Corp. - A USD 1 004 183 952 720 0.13104 269 Carney Technology Acquisition Corp. II - A USD 812 117 861 609 0.12
52 CBRE Acquisition Hldg., Inc. USD 439 442 0.00100 007 CC Neuberger Principal Hldg. II - A USD 821 226 840 889 0.12125 400 CF Acquisition Corp. V USD 1 033 503 1 067 234 0.1585 298 CF Acquisition Corp. VI USD 732 265 720 121 0.109 225 Churchill Capital Corp. VI USD 76 142 79 140 0.01
103 335 Churchill Capital Corp. VII USD 859 385 878 565 0.12169 377 Clarim Acquisition Corp. USD 1 395 946 1 437 173 0.2087 255 CM Life Sciences II, Inc. USD 718 533 952 427 0.13
1 Cohn Robbins Hldg. Corp. USD 8 9 0.00100 687 Cohn Robbins Hldg. Corp. - A USD 800 345 844 031 0.12136 470 Colicity, Inc. USD 1 192 705 1 175 412 0.16202 785 Colonnade Acquisition Corp. II USD 1 700 788 1 703 348 0.2440 032 Compute Health Acquisition Corp. USD 332 409 344 453 0.055 532 Constellation Acquisition Corp. I USD 45 725 46 656 0.01
109 400 CoreLogic, Inc. USD 6 341 436 7 393 465 1.04247 854 Corner Growth Acquisition Corp. - A USD 1 945 929 2 069 236 0.29257 271 Crescent Acquisition Corp. - A USD 2 222 764 2 207 091 0.31201 306 Crown Hldg., Inc. USD 15 488 302 16 658 616 2.33108 669 Crown PropTech Acquisitions USD 896 720 921 135 0.1334 941 Crucible Acquisition Corp. USD 284 015 310 779 0.0479 691 Crucible Acquisition Corp. - A USD 673 525 683 658 0.1023 673 Decarbonization Plus Acquisition Corp. II USD 197 819 203 087 0.0377 183 DHB Capital Corp. USD 638 641 651 611 0.0938 593 DHC Acquisition Corp. USD 319 333 328 780 0.05
272 dMY Technology Group, Inc. III USD 2 384 2 589 0.00206 744 dMY Technology Group, Inc. IV USD 1 775 755 1 770 136 0.25
1 DPCM Capital, Inc. USD 8 9 0.00
257Lumyna Funds
Lumyna – PSAM Global Event UCITS FundSchedule of investments as at March 31, 2021 (cont.)
The accompanying notes form an integral part of these financial statements.
Audited annual report
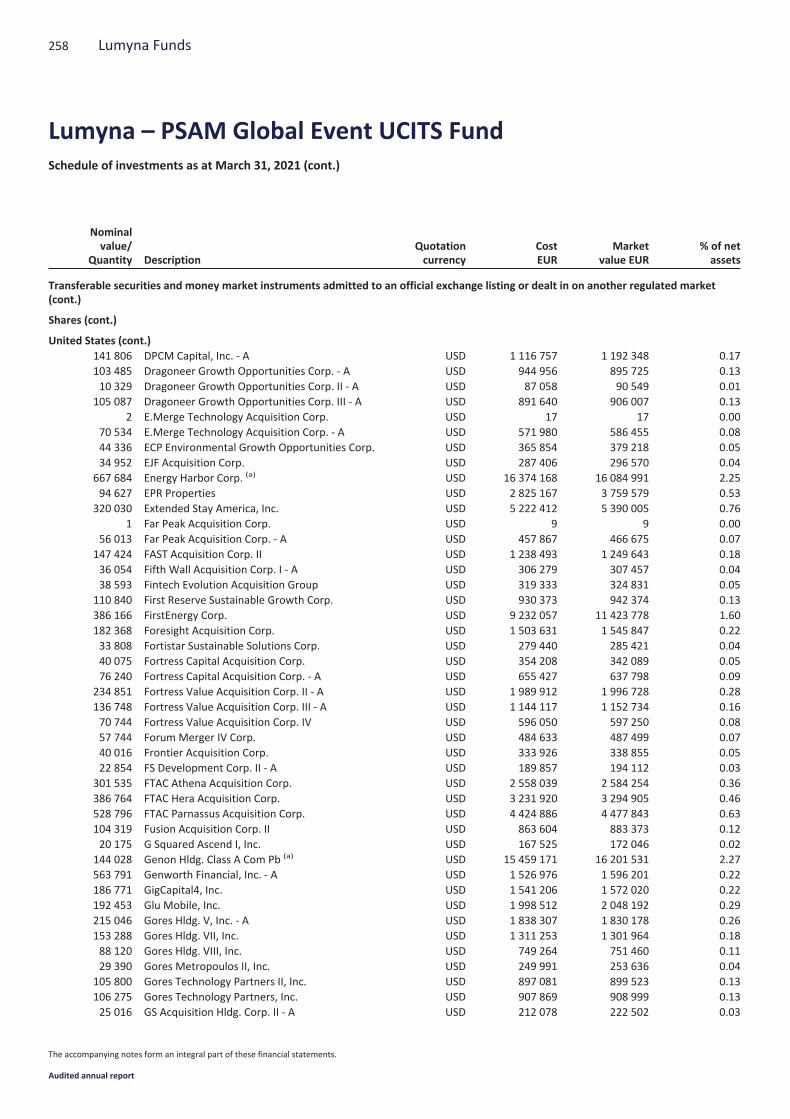
Nominalvalue/
Quantity DescriptionQuotationcurrency
CostEUR
Marketvalue EUR
% of netassets
Transferable securities and money market instruments admitted to an official exchange listing or dealt in on another regulated market(cont.)
Shares (cont.)
United States (cont.)141 806 DPCM Capital, Inc. - A USD 1 116 757 1 192 348 0.17103 485 Dragoneer Growth Opportunities Corp. - A USD 944 956 895 725 0.1310 329 Dragoneer Growth Opportunities Corp. II - A USD 87 058 90 549 0.01
105 087 Dragoneer Growth Opportunities Corp. III - A USD 891 640 906 007 0.132 E.Merge Technology Acquisition Corp. USD 17 17 0.00
70 534 E.Merge Technology Acquisition Corp. - A USD 571 980 586 455 0.0844 336 ECP Environmental Growth Opportunities Corp. USD 365 854 379 218 0.0534 952 EJF Acquisition Corp. USD 287 406 296 570 0.04
667 684 Energy Harbor Corp. (a) USD 16 374 168 16 084 991 2.2594 627 EPR Properties USD 2 825 167 3 759 579 0.53
320 030 Extended Stay America, Inc. USD 5 222 412 5 390 005 0.761 Far Peak Acquisition Corp. USD 9 9 0.00
56 013 Far Peak Acquisition Corp. - A USD 457 867 466 675 0.07147 424 FAST Acquisition Corp. II USD 1 238 493 1 249 643 0.1836 054 Fifth Wall Acquisition Corp. I - A USD 306 279 307 457 0.0438 593 Fintech Evolution Acquisition Group USD 319 333 324 831 0.05
110 840 First Reserve Sustainable Growth Corp. USD 930 373 942 374 0.13386 166 FirstEnergy Corp. USD 9 232 057 11 423 778 1.60182 368 Foresight Acquisition Corp. USD 1 503 631 1 545 847 0.2233 808 Fortistar Sustainable Solutions Corp. USD 279 440 285 421 0.0440 075 Fortress Capital Acquisition Corp. USD 354 208 342 089 0.0576 240 Fortress Capital Acquisition Corp. - A USD 655 427 637 798 0.09
234 851 Fortress Value Acquisition Corp. II - A USD 1 989 912 1 996 728 0.28136 748 Fortress Value Acquisition Corp. III - A USD 1 144 117 1 152 734 0.1670 744 Fortress Value Acquisition Corp. IV USD 596 050 597 250 0.0857 744 Forum Merger IV Corp. USD 484 633 487 499 0.0740 016 Frontier Acquisition Corp. USD 333 926 338 855 0.0522 854 FS Development Corp. II - A USD 189 857 194 112 0.03
301 535 FTAC Athena Acquisition Corp. USD 2 558 039 2 584 254 0.36386 764 FTAC Hera Acquisition Corp. USD 3 231 920 3 294 905 0.46528 796 FTAC Parnassus Acquisition Corp. USD 4 424 886 4 477 843 0.63104 319 Fusion Acquisition Corp. II USD 863 604 883 373 0.1220 175 G Squared Ascend I, Inc. USD 167 525 172 046 0.02
144 028 Genon Hldg. Class A Com Pb (a) USD 15 459 171 16 201 531 2.27563 791 Genworth Financial, Inc. - A USD 1 526 976 1 596 201 0.22186 771 GigCapital4, Inc. USD 1 541 206 1 572 020 0.22192 453 Glu Mobile, Inc. USD 1 998 512 2 048 192 0.29215 046 Gores Hldg. V, Inc. - A USD 1 838 307 1 830 178 0.26153 288 Gores Hldg. VII, Inc. USD 1 311 253 1 301 964 0.1888 120 Gores Hldg. VIII, Inc. USD 749 264 751 460 0.1129 390 Gores Metropoulos II, Inc. USD 249 991 253 636 0.04
105 800 Gores Technology Partners II, Inc. USD 897 081 899 523 0.13106 275 Gores Technology Partners, Inc. USD 907 869 908 999 0.1325 016 GS Acquisition Hldg. Corp. II - A USD 212 078 222 502 0.03
258 Lumyna Funds
Lumyna – PSAM Global Event UCITS FundSchedule of investments as at March 31, 2021 (cont.)
The accompanying notes form an integral part of these financial statements.
Audited annual report
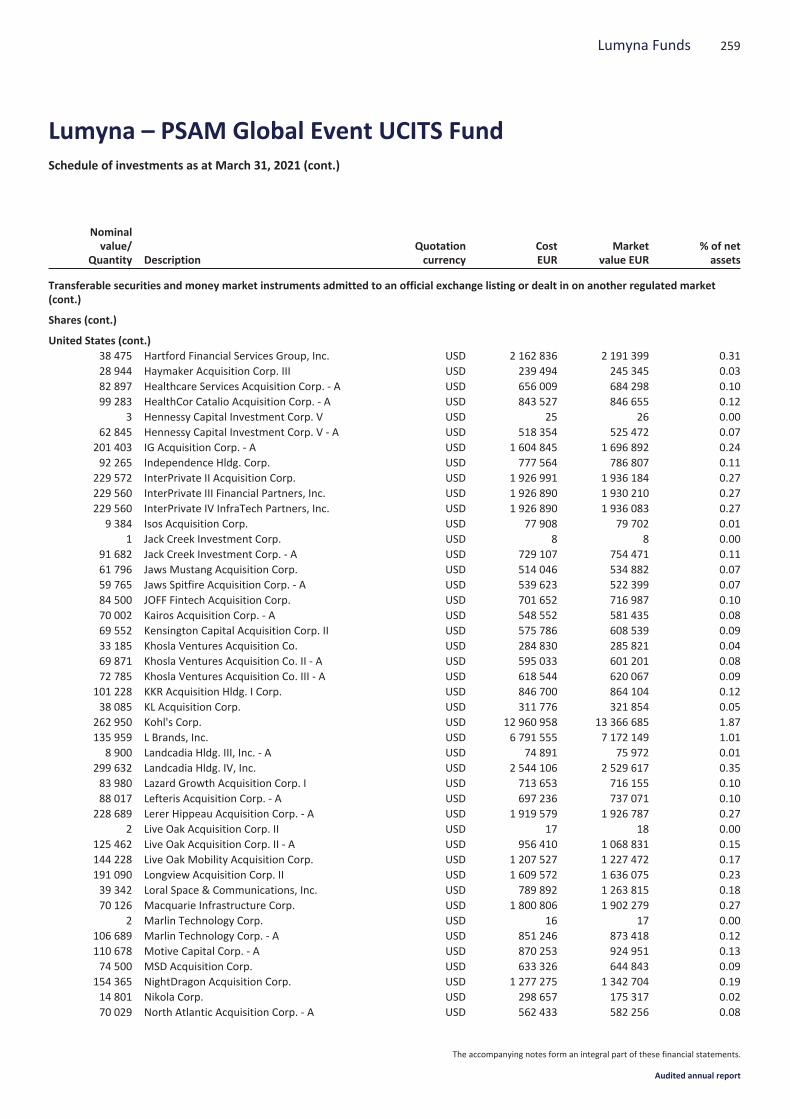
Nominalvalue/
Quantity DescriptionQuotationcurrency
CostEUR
Marketvalue EUR
% of netassets
Transferable securities and money market instruments admitted to an official exchange listing or dealt in on another regulated market(cont.)
Shares (cont.)
United States (cont.)38 475 Hartford Financial Services Group, Inc. USD 2 162 836 2 191 399 0.3128 944 Haymaker Acquisition Corp. III USD 239 494 245 345 0.0382 897 Healthcare Services Acquisition Corp. - A USD 656 009 684 298 0.1099 283 HealthCor Catalio Acquisition Corp. - A USD 843 527 846 655 0.12
3 Hennessy Capital Investment Corp. V USD 25 26 0.0062 845 Hennessy Capital Investment Corp. V - A USD 518 354 525 472 0.07
201 403 IG Acquisition Corp. - A USD 1 604 845 1 696 892 0.2492 265 Independence Hldg. Corp. USD 777 564 786 807 0.11
229 572 InterPrivate II Acquisition Corp. USD 1 926 991 1 936 184 0.27229 560 InterPrivate III Financial Partners, Inc. USD 1 926 890 1 930 210 0.27229 560 InterPrivate IV InfraTech Partners, Inc. USD 1 926 890 1 936 083 0.27
9 384 Isos Acquisition Corp. USD 77 908 79 702 0.011 Jack Creek Investment Corp. USD 8 8 0.00
91 682 Jack Creek Investment Corp. - A USD 729 107 754 471 0.1161 796 Jaws Mustang Acquisition Corp. USD 514 046 534 882 0.0759 765 Jaws Spitfire Acquisition Corp. - A USD 539 623 522 399 0.0784 500 JOFF Fintech Acquisition Corp. USD 701 652 716 987 0.1070 002 Kairos Acquisition Corp. - A USD 548 552 581 435 0.0869 552 Kensington Capital Acquisition Corp. II USD 575 786 608 539 0.0933 185 Khosla Ventures Acquisition Co. USD 284 830 285 821 0.0469 871 Khosla Ventures Acquisition Co. II - A USD 595 033 601 201 0.0872 785 Khosla Ventures Acquisition Co. III - A USD 618 544 620 067 0.09
101 228 KKR Acquisition Hldg. I Corp. USD 846 700 864 104 0.1238 085 KL Acquisition Corp. USD 311 776 321 854 0.05
262 950 Kohl's Corp. USD 12 960 958 13 366 685 1.87135 959 L Brands, Inc. USD 6 791 555 7 172 149 1.01
8 900 Landcadia Hldg. III, Inc. - A USD 74 891 75 972 0.01299 632 Landcadia Hldg. IV, Inc. USD 2 544 106 2 529 617 0.3583 980 Lazard Growth Acquisition Corp. I USD 713 653 716 155 0.1088 017 Lefteris Acquisition Corp. - A USD 697 236 737 071 0.10
228 689 Lerer Hippeau Acquisition Corp. - A USD 1 919 579 1 926 787 0.272 Live Oak Acquisition Corp. II USD 17 18 0.00
125 462 Live Oak Acquisition Corp. II - A USD 956 410 1 068 831 0.15144 228 Live Oak Mobility Acquisition Corp. USD 1 207 527 1 227 472 0.17191 090 Longview Acquisition Corp. II USD 1 609 572 1 636 075 0.2339 342 Loral Space & Communications, Inc. USD 789 892 1 263 815 0.1870 126 Macquarie Infrastructure Corp. USD 1 800 806 1 902 279 0.27
2 Marlin Technology Corp. USD 16 17 0.00106 689 Marlin Technology Corp. - A USD 851 246 873 418 0.12110 678 Motive Capital Corp. - A USD 870 253 924 951 0.1374 500 MSD Acquisition Corp. USD 633 326 644 843 0.09
154 365 NightDragon Acquisition Corp. USD 1 277 275 1 342 704 0.1914 801 Nikola Corp. USD 298 657 175 317 0.0270 029 North Atlantic Acquisition Corp. - A USD 562 433 582 256 0.08
259Lumyna Funds
Lumyna – PSAM Global Event UCITS FundSchedule of investments as at March 31, 2021 (cont.)
The accompanying notes form an integral part of these financial statements.
Audited annual report
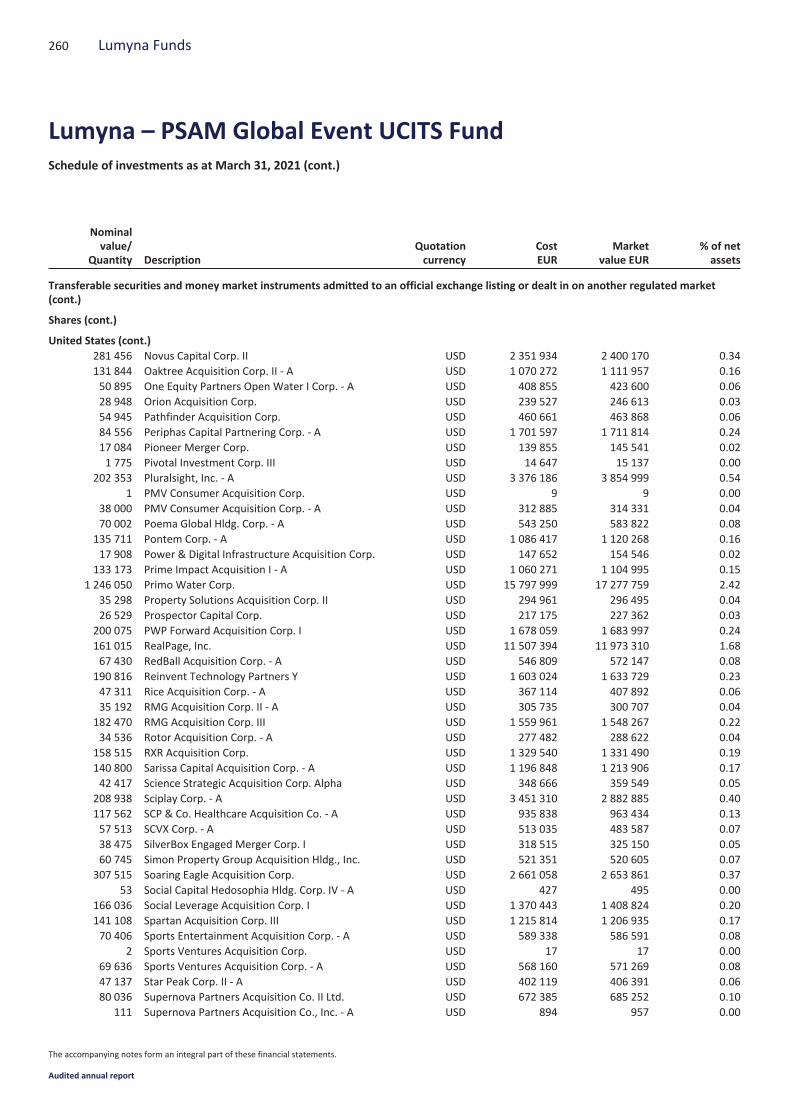
Nominalvalue/
Quantity DescriptionQuotationcurrency
CostEUR
Marketvalue EUR
% of netassets
Transferable securities and money market instruments admitted to an official exchange listing or dealt in on another regulated market(cont.)
Shares (cont.)
United States (cont.)281 456 Novus Capital Corp. II USD 2 351 934 2 400 170 0.34131 844 Oaktree Acquisition Corp. II - A USD 1 070 272 1 111 957 0.1650 895 One Equity Partners Open Water I Corp. - A USD 408 855 423 600 0.0628 948 Orion Acquisition Corp. USD 239 527 246 613 0.0354 945 Pathfinder Acquisition Corp. USD 460 661 463 868 0.0684 556 Periphas Capital Partnering Corp. - A USD 1 701 597 1 711 814 0.2417 084 Pioneer Merger Corp. USD 139 855 145 541 0.021 775 Pivotal Investment Corp. III USD 14 647 15 137 0.00
202 353 Pluralsight, Inc. - A USD 3 376 186 3 854 999 0.541 PMV Consumer Acquisition Corp. USD 9 9 0.00
38 000 PMV Consumer Acquisition Corp. - A USD 312 885 314 331 0.0470 002 Poema Global Hldg. Corp. - A USD 543 250 583 822 0.08
135 711 Pontem Corp. - A USD 1 086 417 1 120 268 0.1617 908 Power & Digital Infrastructure Acquisition Corp. USD 147 652 154 546 0.02
133 173 Prime Impact Acquisition I - A USD 1 060 271 1 104 995 0.151 246 050 Primo Water Corp. USD 15 797 999 17 277 759 2.42
35 298 Property Solutions Acquisition Corp. II USD 294 961 296 495 0.0426 529 Prospector Capital Corp. USD 217 175 227 362 0.03
200 075 PWP Forward Acquisition Corp. I USD 1 678 059 1 683 997 0.24161 015 RealPage, Inc. USD 11 507 394 11 973 310 1.6867 430 RedBall Acquisition Corp. - A USD 546 809 572 147 0.08
190 816 Reinvent Technology Partners Y USD 1 603 024 1 633 729 0.2347 311 Rice Acquisition Corp. - A USD 367 114 407 892 0.0635 192 RMG Acquisition Corp. II - A USD 305 735 300 707 0.04
182 470 RMG Acquisition Corp. III USD 1 559 961 1 548 267 0.2234 536 Rotor Acquisition Corp. - A USD 277 482 288 622 0.04
158 515 RXR Acquisition Corp. USD 1 329 540 1 331 490 0.19140 800 Sarissa Capital Acquisition Corp. - A USD 1 196 848 1 213 906 0.1742 417 Science Strategic Acquisition Corp. Alpha USD 348 666 359 549 0.05
208 938 Sciplay Corp. - A USD 3 451 310 2 882 885 0.40117 562 SCP & Co. Healthcare Acquisition Co. - A USD 935 838 963 434 0.1357 513 SCVX Corp. - A USD 513 035 483 587 0.0738 475 SilverBox Engaged Merger Corp. I USD 318 515 325 150 0.0560 745 Simon Property Group Acquisition Hldg., Inc. USD 521 351 520 605 0.07
307 515 Soaring Eagle Acquisition Corp. USD 2 661 058 2 653 861 0.3753 Social Capital Hedosophia Hldg. Corp. IV - A USD 427 495 0.00
166 036 Social Leverage Acquisition Corp. I USD 1 370 443 1 408 824 0.20141 108 Spartan Acquisition Corp. III USD 1 215 814 1 206 935 0.1770 406 Sports Entertainment Acquisition Corp. - A USD 589 338 586 591 0.08
2 Sports Ventures Acquisition Corp. USD 17 17 0.0069 636 Sports Ventures Acquisition Corp. - A USD 568 160 571 269 0.0847 137 Star Peak Corp. II - A USD 402 119 406 391 0.0680 036 Supernova Partners Acquisition Co. II Ltd. USD 672 385 685 252 0.10
111 Supernova Partners Acquisition Co., Inc. - A USD 894 957 0.00
260 Lumyna Funds
Lumyna – PSAM Global Event UCITS FundSchedule of investments as at March 31, 2021 (cont.)
The accompanying notes form an integral part of these financial statements.
Audited annual report
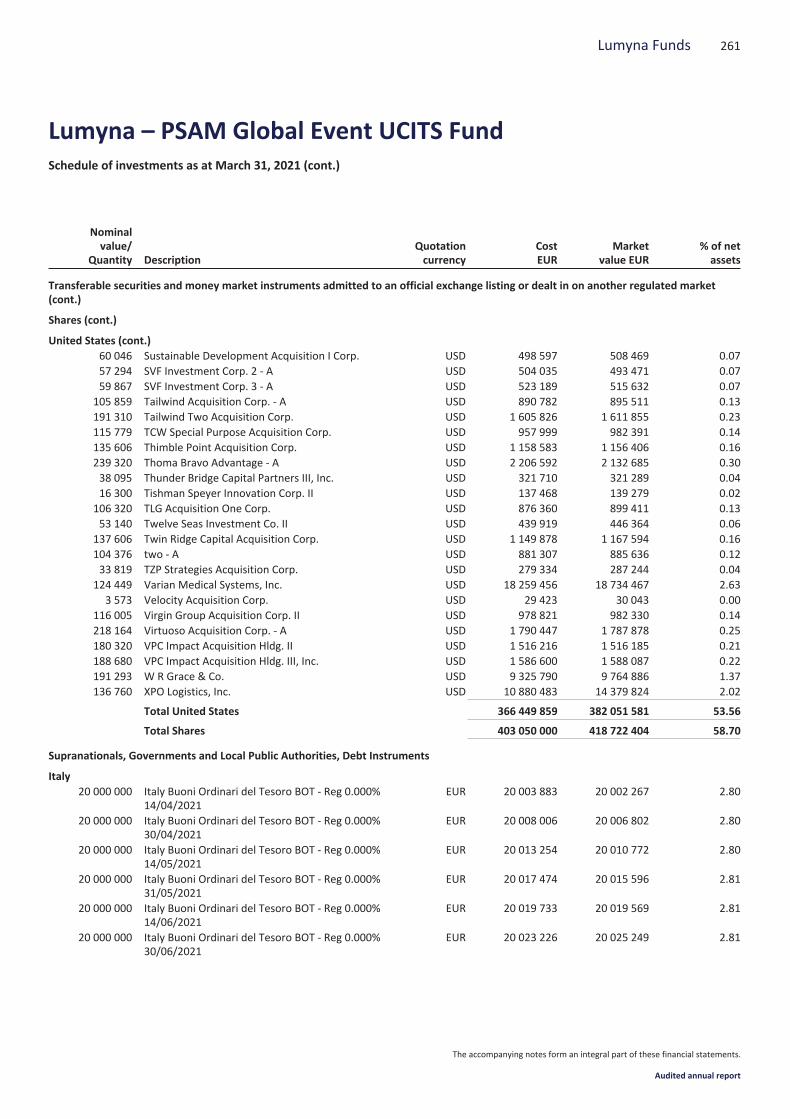
Nominalvalue/
Quantity DescriptionQuotationcurrency
CostEUR
Marketvalue EUR
% of netassets
Transferable securities and money market instruments admitted to an official exchange listing or dealt in on another regulated market(cont.)
Shares (cont.)
United States (cont.)60 046 Sustainable Development Acquisition I Corp. USD 498 597 508 469 0.0757 294 SVF Investment Corp. 2 - A USD 504 035 493 471 0.0759 867 SVF Investment Corp. 3 - A USD 523 189 515 632 0.07
105 859 Tailwind Acquisition Corp. - A USD 890 782 895 511 0.13191 310 Tailwind Two Acquisition Corp. USD 1 605 826 1 611 855 0.23115 779 TCW Special Purpose Acquisition Corp. USD 957 999 982 391 0.14135 606 Thimble Point Acquisition Corp. USD 1 158 583 1 156 406 0.16239 320 Thoma Bravo Advantage - A USD 2 206 592 2 132 685 0.3038 095 Thunder Bridge Capital Partners III, Inc. USD 321 710 321 289 0.0416 300 Tishman Speyer Innovation Corp. II USD 137 468 139 279 0.02
106 320 TLG Acquisition One Corp. USD 876 360 899 411 0.1353 140 Twelve Seas Investment Co. II USD 439 919 446 364 0.06
137 606 Twin Ridge Capital Acquisition Corp. USD 1 149 878 1 167 594 0.16104 376 two - A USD 881 307 885 636 0.1233 819 TZP Strategies Acquisition Corp. USD 279 334 287 244 0.04
124 449 Varian Medical Systems, Inc. USD 18 259 456 18 734 467 2.633 573 Velocity Acquisition Corp. USD 29 423 30 043 0.00
116 005 Virgin Group Acquisition Corp. II USD 978 821 982 330 0.14218 164 Virtuoso Acquisition Corp. - A USD 1 790 447 1 787 878 0.25180 320 VPC Impact Acquisition Hldg. II USD 1 516 216 1 516 185 0.21188 680 VPC Impact Acquisition Hldg. III, Inc. USD 1 586 600 1 588 087 0.22191 293 W R Grace & Co. USD 9 325 790 9 764 886 1.37136 760 XPO Logistics, Inc. USD 10 880 483 14 379 824 2.02
Total United States 366 449 859 382 051 581 53.56
Total Shares 403 050 000 418 722 404 58.70
Supranationals, Governments and Local Public Authorities, Debt Instruments
Italy20 000 000 Italy Buoni Ordinari del Tesoro BOT - Reg 0.000%
14/04/2021EUR 20 003 883 20 002 267 2.80
20 000 000 Italy Buoni Ordinari del Tesoro BOT - Reg 0.000%30/04/2021
EUR 20 008 006 20 006 802 2.80
20 000 000 Italy Buoni Ordinari del Tesoro BOT - Reg 0.000%14/05/2021
EUR 20 013 254 20 010 772 2.80
20 000 000 Italy Buoni Ordinari del Tesoro BOT - Reg 0.000%31/05/2021
EUR 20 017 474 20 015 596 2.81
20 000 000 Italy Buoni Ordinari del Tesoro BOT - Reg 0.000%14/06/2021
EUR 20 019 733 20 019 569 2.81
20 000 000 Italy Buoni Ordinari del Tesoro BOT - Reg 0.000%30/06/2021
EUR 20 023 226 20 025 249 2.81
261Lumyna Funds
Lumyna – PSAM Global Event UCITS FundSchedule of investments as at March 31, 2021 (cont.)
The accompanying notes form an integral part of these financial statements.
Audited annual report
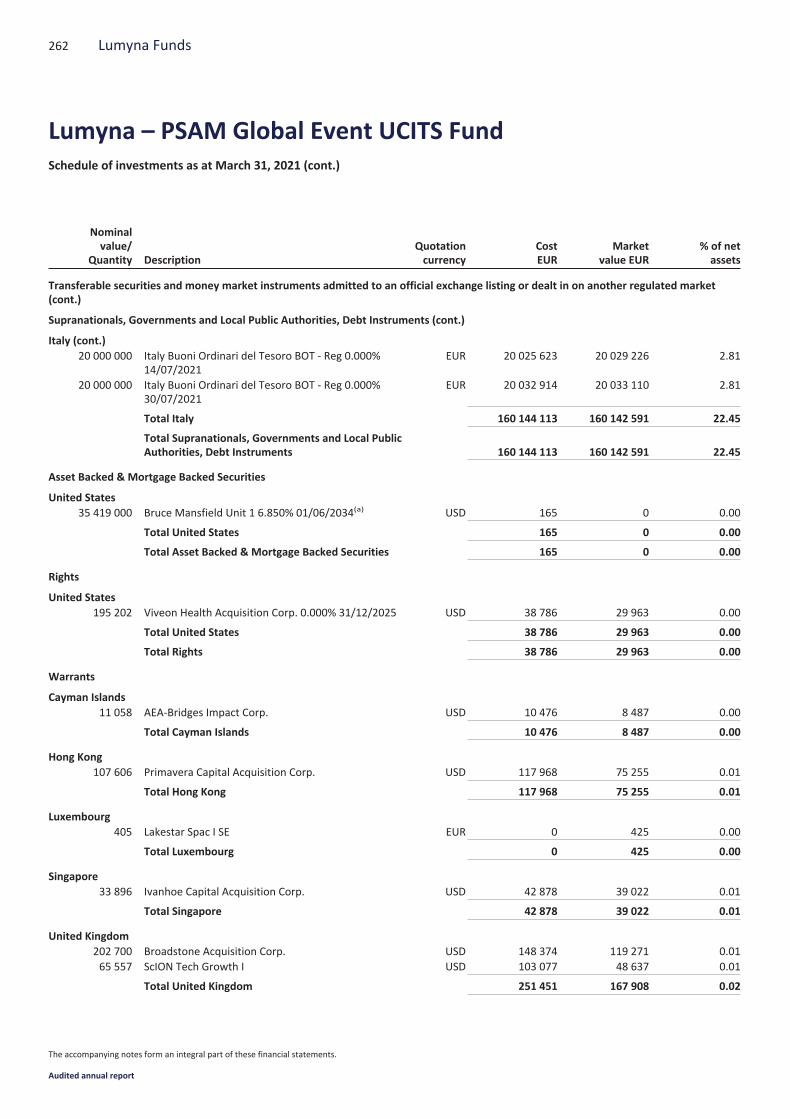
Nominalvalue/
Quantity DescriptionQuotationcurrency
CostEUR
Marketvalue EUR
% of netassets
Transferable securities and money market instruments admitted to an official exchange listing or dealt in on another regulated market(cont.)
Supranationals, Governments and Local Public Authorities, Debt Instruments (cont.)
Italy (cont.)20 000 000 Italy Buoni Ordinari del Tesoro BOT - Reg 0.000%
14/07/2021EUR 20 025 623 20 029 226 2.81
20 000 000 Italy Buoni Ordinari del Tesoro BOT - Reg 0.000%30/07/2021
EUR 20 032 914 20 033 110 2.81
Total Italy 160 144 113 160 142 591 22.45
Total Supranationals, Governments and Local PublicAuthorities, Debt Instruments 160 144 113 160 142 591 22.45
Asset Backed & Mortgage Backed Securities
United States35 419 000 Bruce Mansfield Unit 1 6.850% 01/06/2034(a) USD 165 0 0.00
Total United States 165 0 0.00
Total Asset Backed & Mortgage Backed Securities 165 0 0.00
Rights
United States195 202 Viveon Health Acquisition Corp. 0.000% 31/12/2025 USD 38 786 29 963 0.00
Total United States 38 786 29 963 0.00
Total Rights 38 786 29 963 0.00
Warrants
Cayman Islands11 058 AEA-Bridges Impact Corp. USD 10 476 8 487 0.00
Total Cayman Islands 10 476 8 487 0.00
Hong Kong107 606 Primavera Capital Acquisition Corp. USD 117 968 75 255 0.01
Total Hong Kong 117 968 75 255 0.01
Luxembourg405 Lakestar Spac I SE EUR 0 425 0.00
Total Luxembourg 0 425 0.00
Singapore33 896 Ivanhoe Capital Acquisition Corp. USD 42 878 39 022 0.01
Total Singapore 42 878 39 022 0.01
United Kingdom202 700 Broadstone Acquisition Corp. USD 148 374 119 271 0.0165 557 ScION Tech Growth I USD 103 077 48 637 0.01
Total United Kingdom 251 451 167 908 0.02
262 Lumyna Funds
Lumyna – PSAM Global Event UCITS FundSchedule of investments as at March 31, 2021 (cont.)
The accompanying notes form an integral part of these financial statements.
Audited annual report
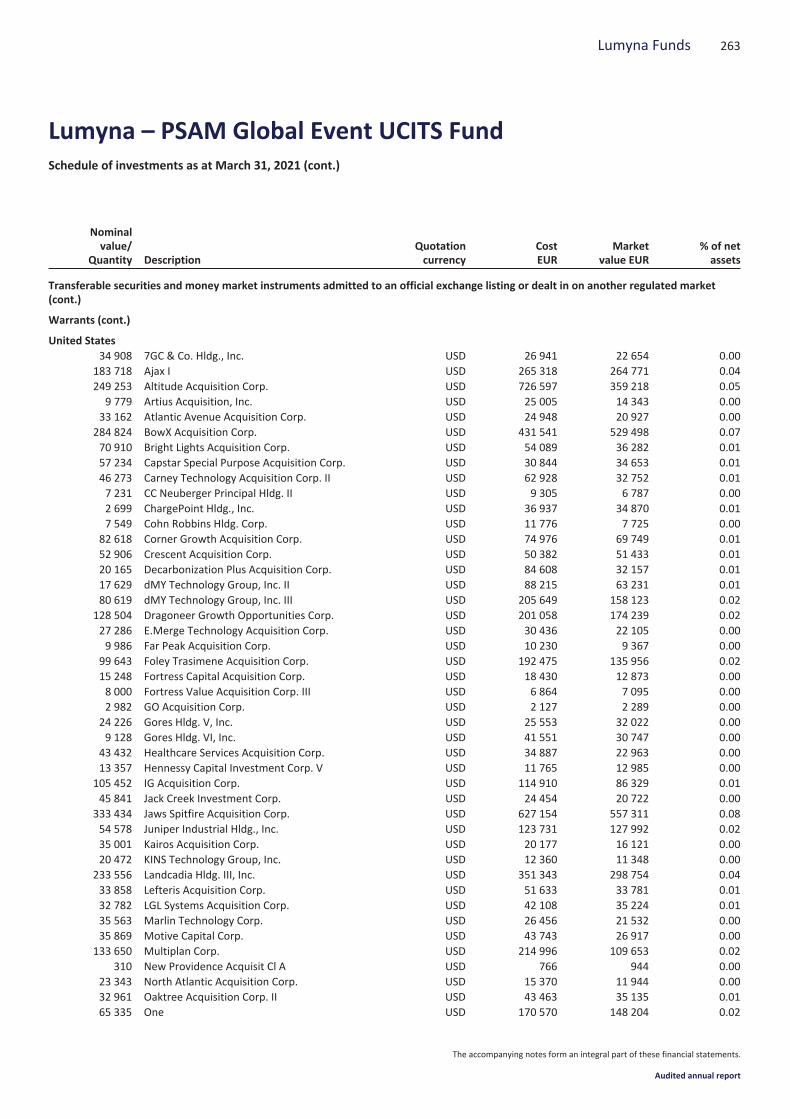
Nominalvalue/
Quantity DescriptionQuotationcurrency
CostEUR
Marketvalue EUR
% of netassets
Transferable securities and money market instruments admitted to an official exchange listing or dealt in on another regulated market(cont.)
Warrants (cont.)
United States34 908 7GC & Co. Hldg., Inc. USD 26 941 22 654 0.00
183 718 Ajax I USD 265 318 264 771 0.04249 253 Altitude Acquisition Corp. USD 726 597 359 218 0.05
9 779 Artius Acquisition, Inc. USD 25 005 14 343 0.0033 162 Atlantic Avenue Acquisition Corp. USD 24 948 20 927 0.00
284 824 BowX Acquisition Corp. USD 431 541 529 498 0.0770 910 Bright Lights Acquisition Corp. USD 54 089 36 282 0.0157 234 Capstar Special Purpose Acquisition Corp. USD 30 844 34 653 0.0146 273 Carney Technology Acquisition Corp. II USD 62 928 32 752 0.017 231 CC Neuberger Principal Hldg. II USD 9 305 6 787 0.002 699 ChargePoint Hldg., Inc. USD 36 937 34 870 0.017 549 Cohn Robbins Hldg. Corp. USD 11 776 7 725 0.00
82 618 Corner Growth Acquisition Corp. USD 74 976 69 749 0.0152 906 Crescent Acquisition Corp. USD 50 382 51 433 0.0120 165 Decarbonization Plus Acquisition Corp. USD 84 608 32 157 0.0117 629 dMY Technology Group, Inc. II USD 88 215 63 231 0.0180 619 dMY Technology Group, Inc. III USD 205 649 158 123 0.02
128 504 Dragoneer Growth Opportunities Corp. USD 201 058 174 239 0.0227 286 E.Merge Technology Acquisition Corp. USD 30 436 22 105 0.009 986 Far Peak Acquisition Corp. USD 10 230 9 367 0.00
99 643 Foley Trasimene Acquisition Corp. USD 192 475 135 956 0.0215 248 Fortress Capital Acquisition Corp. USD 18 430 12 873 0.008 000 Fortress Value Acquisition Corp. III USD 6 864 7 095 0.002 982 GO Acquisition Corp. USD 2 127 2 289 0.00
24 226 Gores Hldg. V, Inc. USD 25 553 32 022 0.009 128 Gores Hldg. VI, Inc. USD 41 551 30 747 0.00
43 432 Healthcare Services Acquisition Corp. USD 34 887 22 963 0.0013 357 Hennessy Capital Investment Corp. V USD 11 765 12 985 0.00
105 452 IG Acquisition Corp. USD 114 910 86 329 0.0145 841 Jack Creek Investment Corp. USD 24 454 20 722 0.00
333 434 Jaws Spitfire Acquisition Corp. USD 627 154 557 311 0.0854 578 Juniper Industrial Hldg., Inc. USD 123 731 127 992 0.0235 001 Kairos Acquisition Corp. USD 20 177 16 121 0.0020 472 KINS Technology Group, Inc. USD 12 360 11 348 0.00
233 556 Landcadia Hldg. III, Inc. USD 351 343 298 754 0.0433 858 Lefteris Acquisition Corp. USD 51 633 33 781 0.0132 782 LGL Systems Acquisition Corp. USD 42 108 35 224 0.0135 563 Marlin Technology Corp. USD 26 456 21 532 0.0035 869 Motive Capital Corp. USD 43 743 26 917 0.00
133 650 Multiplan Corp. USD 214 996 109 653 0.02310 New Providence Acquisit Cl A USD 766 944 0.00
23 343 North Atlantic Acquisition Corp. USD 15 370 11 944 0.0032 961 Oaktree Acquisition Corp. II USD 43 463 35 135 0.0165 335 One USD 170 570 148 204 0.02
263Lumyna Funds
Lumyna – PSAM Global Event UCITS FundSchedule of investments as at March 31, 2021 (cont.)
The accompanying notes form an integral part of these financial statements.
Audited annual report
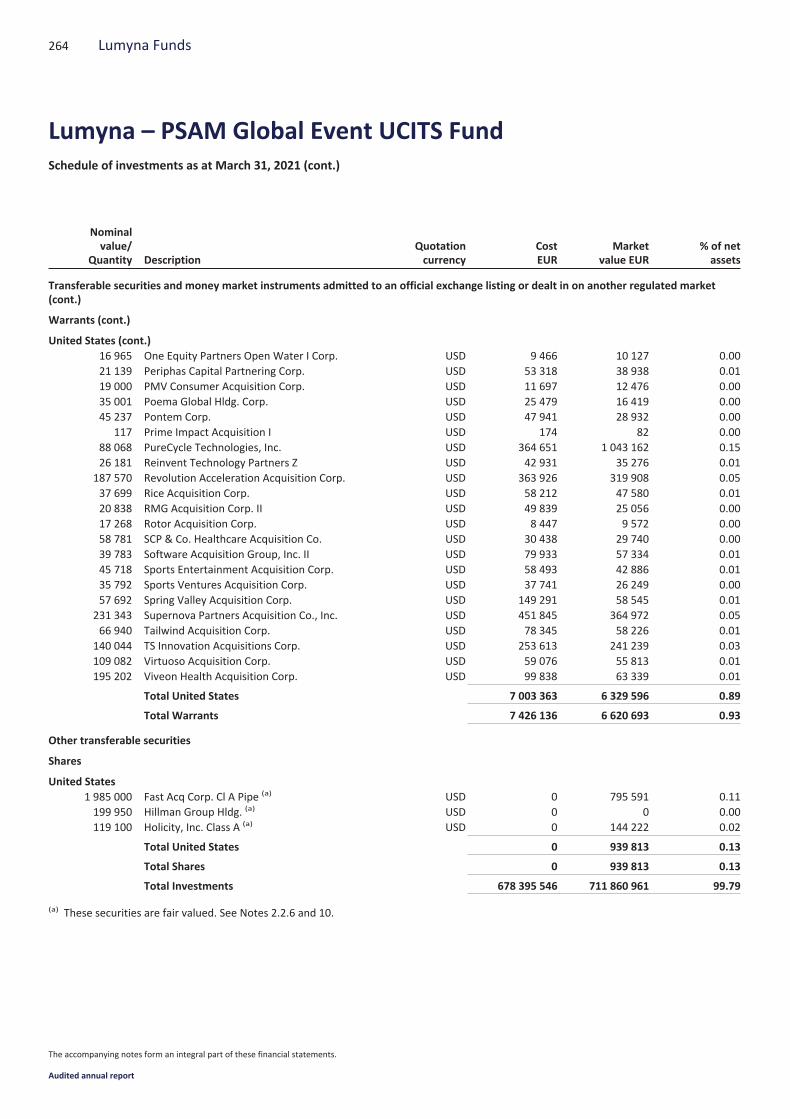
Nominalvalue/
Quantity DescriptionQuotationcurrency
CostEUR
Marketvalue EUR
% of netassets
Transferable securities and money market instruments admitted to an official exchange listing or dealt in on another regulated market(cont.)
Warrants (cont.)
United States (cont.)16 965 One Equity Partners Open Water I Corp. USD 9 466 10 127 0.0021 139 Periphas Capital Partnering Corp. USD 53 318 38 938 0.0119 000 PMV Consumer Acquisition Corp. USD 11 697 12 476 0.0035 001 Poema Global Hldg. Corp. USD 25 479 16 419 0.0045 237 Pontem Corp. USD 47 941 28 932 0.00
117 Prime Impact Acquisition I USD 174 82 0.0088 068 PureCycle Technologies, Inc. USD 364 651 1 043 162 0.1526 181 Reinvent Technology Partners Z USD 42 931 35 276 0.01
187 570 Revolution Acceleration Acquisition Corp. USD 363 926 319 908 0.0537 699 Rice Acquisition Corp. USD 58 212 47 580 0.0120 838 RMG Acquisition Corp. II USD 49 839 25 056 0.0017 268 Rotor Acquisition Corp. USD 8 447 9 572 0.0058 781 SCP & Co. Healthcare Acquisition Co. USD 30 438 29 740 0.0039 783 Software Acquisition Group, Inc. II USD 79 933 57 334 0.0145 718 Sports Entertainment Acquisition Corp. USD 58 493 42 886 0.0135 792 Sports Ventures Acquisition Corp. USD 37 741 26 249 0.0057 692 Spring Valley Acquisition Corp. USD 149 291 58 545 0.01
231 343 Supernova Partners Acquisition Co., Inc. USD 451 845 364 972 0.0566 940 Tailwind Acquisition Corp. USD 78 345 58 226 0.01
140 044 TS Innovation Acquisitions Corp. USD 253 613 241 239 0.03109 082 Virtuoso Acquisition Corp. USD 59 076 55 813 0.01195 202 Viveon Health Acquisition Corp. USD 99 838 63 339 0.01
Total United States 7 003 363 6 329 596 0.89
Total Warrants 7 426 136 6 620 693 0.93
Other transferable securities
Shares
United States1 985 000 Fast Acq Corp. Cl A Pipe (a) USD 0 795 591 0.11199 950 Hillman Group Hldg. (a) USD 0 0 0.00119 100 Holicity, Inc. Class A (a) USD 0 144 222 0.02
Total United States 0 939 813 0.13
Total Shares 0 939 813 0.13
Total Investments 678 395 546 711 860 961 99.79
(a) These securities are fair valued. See Notes 2.2.6 and 10.
264 Lumyna Funds
Lumyna – PSAM Global Event UCITS FundSchedule of investments as at March 31, 2021 (cont.)
The accompanying notes form an integral part of these financial statements.
Audited annual report
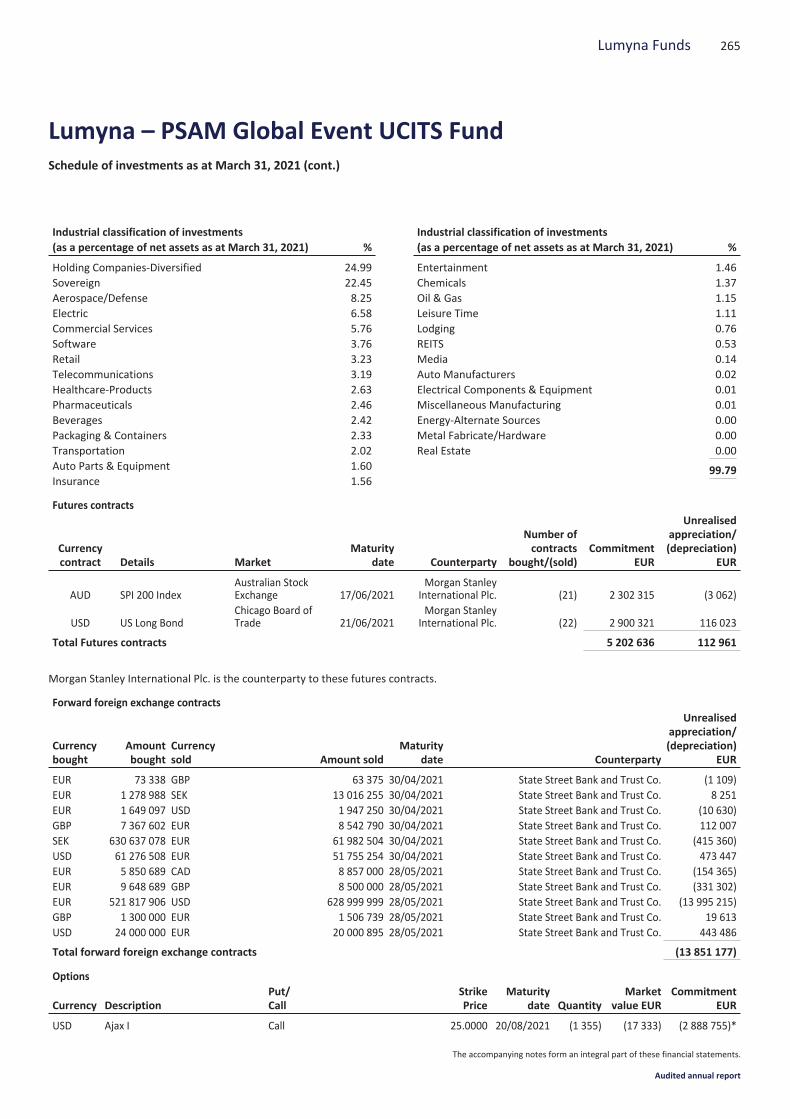
Industrial classification of investments(as a percentage of net assets as at March 31, 2021) %
Holding Companies-Diversified 24.99Sovereign 22.45Aerospace/Defense 8.25Electric 6.58Commercial Services 5.76Software 3.76Retail 3.23Telecommunications 3.19Healthcare-Products 2.63Pharmaceuticals 2.46Beverages 2.42Packaging & Containers 2.33Transportation 2.02Auto Parts & Equipment 1.60Insurance 1.56
Industrial classification of investments(as a percentage of net assets as at March 31, 2021) %
Entertainment 1.46Chemicals 1.37Oil & Gas 1.15Leisure Time 1.11Lodging 0.76REITS 0.53Media 0.14Auto Manufacturers 0.02Electrical Components & Equipment 0.01Miscellaneous Manufacturing 0.01Energy-Alternate Sources 0.00Metal Fabricate/Hardware 0.00Real Estate 0.00
99.79
Futures contracts
Currencycontract Details Market
Maturitydate Counterparty
Number ofcontracts
bought/(sold)Commitment
EUR
Unrealisedappreciation/(depreciation)
EUR
AUD SPI 200 IndexAustralian StockExchange 17/06/2021
Morgan StanleyInternational Plc. (21) 2 302 315 (3 062)
USD US Long BondChicago Board ofTrade 21/06/2021
Morgan StanleyInternational Plc. (22) 2 900 321 116 023
Total Futures contracts 5 202 636 112 961
Morgan Stanley International Plc. is the counterparty to these futures contracts.
Forward foreign exchange contracts
Currencybought
Amountbought
Currencysold Amount sold
Maturitydate Counterparty
Unrealisedappreciation/(depreciation)
EUR
EUR 73 338 GBP 63 375 30/04/2021 State Street Bank and Trust Co. (1 109)EUR 1 278 988 SEK 13 016 255 30/04/2021 State Street Bank and Trust Co. 8 251EUR 1 649 097 USD 1 947 250 30/04/2021 State Street Bank and Trust Co. (10 630)GBP 7 367 602 EUR 8 542 790 30/04/2021 State Street Bank and Trust Co. 112 007SEK 630 637 078 EUR 61 982 504 30/04/2021 State Street Bank and Trust Co. (415 360)USD 61 276 508 EUR 51 755 254 30/04/2021 State Street Bank and Trust Co. 473 447EUR 5 850 689 CAD 8 857 000 28/05/2021 State Street Bank and Trust Co. (154 365)EUR 9 648 689 GBP 8 500 000 28/05/2021 State Street Bank and Trust Co. (331 302)EUR 521 817 906 USD 628 999 999 28/05/2021 State Street Bank and Trust Co. (13 995 215)GBP 1 300 000 EUR 1 506 739 28/05/2021 State Street Bank and Trust Co. 19 613USD 24 000 000 EUR 20 000 895 28/05/2021 State Street Bank and Trust Co. 443 486
Total forward foreign exchange contracts (13 851 177)
Options
Currency DescriptionPut/Call
StrikePrice
Maturitydate Quantity
Marketvalue EUR
CommitmentEUR
USD Ajax I Call 25.0000 20/08/2021 (1 355) (17 333) (2 888 755)*
265Lumyna Funds
Lumyna – PSAM Global Event UCITS FundSchedule of investments as at March 31, 2021 (cont.)
The accompanying notes form an integral part of these financial statements.
Audited annual report
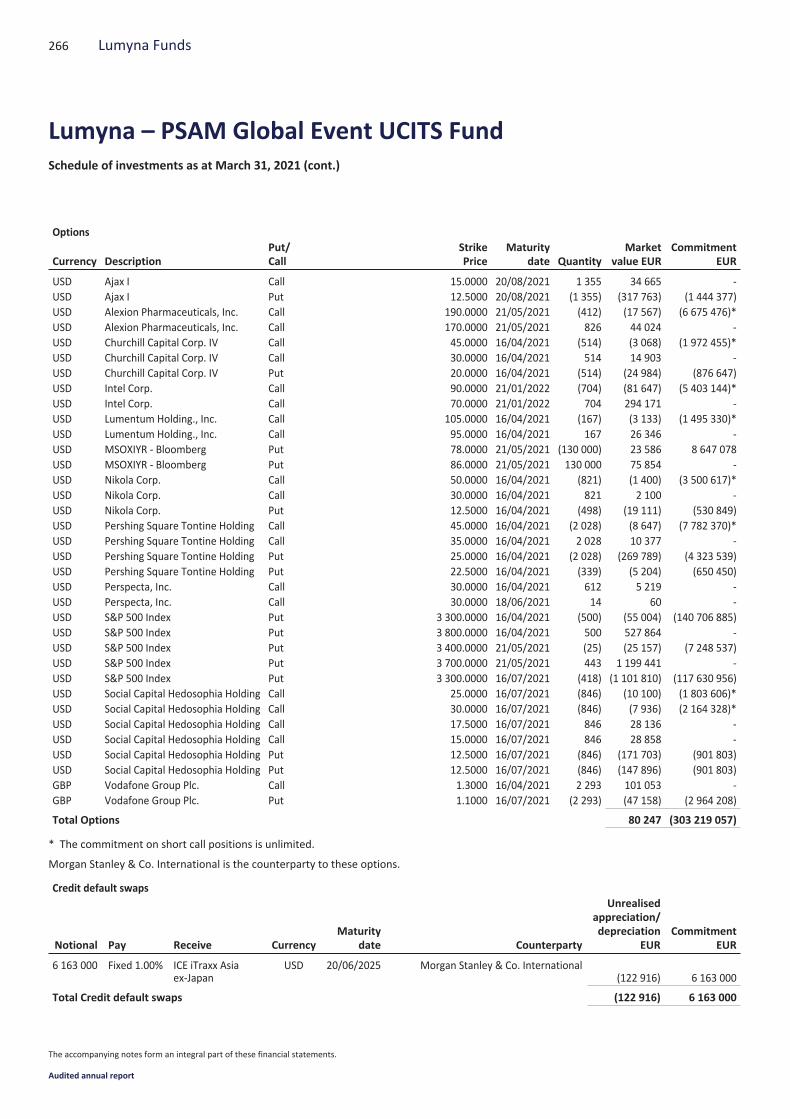
Options
Currency DescriptionPut/Call
StrikePrice
Maturitydate Quantity
Marketvalue EUR
CommitmentEUR
USD Ajax I Call 15.0000 20/08/2021 1 355 34 665 -USD Ajax I Put 12.5000 20/08/2021 (1 355) (317 763) (1 444 377)USD Alexion Pharmaceuticals, Inc. Call 190.0000 21/05/2021 (412) (17 567) (6 675 476)*USD Alexion Pharmaceuticals, Inc. Call 170.0000 21/05/2021 826 44 024 -USD Churchill Capital Corp. IV Call 45.0000 16/04/2021 (514) (3 068) (1 972 455)*USD Churchill Capital Corp. IV Call 30.0000 16/04/2021 514 14 903 -USD Churchill Capital Corp. IV Put 20.0000 16/04/2021 (514) (24 984) (876 647)USD Intel Corp. Call 90.0000 21/01/2022 (704) (81 647) (5 403 144)*USD Intel Corp. Call 70.0000 21/01/2022 704 294 171 -USD Lumentum Holding., Inc. Call 105.0000 16/04/2021 (167) (3 133) (1 495 330)*USD Lumentum Holding., Inc. Call 95.0000 16/04/2021 167 26 346 -USD MSOXIYR - Bloomberg Put 78.0000 21/05/2021 (130 000) 23 586 8 647 078USD MSOXIYR - Bloomberg Put 86.0000 21/05/2021 130 000 75 854 -USD Nikola Corp. Call 50.0000 16/04/2021 (821) (1 400) (3 500 617)*USD Nikola Corp. Call 30.0000 16/04/2021 821 2 100 -USD Nikola Corp. Put 12.5000 16/04/2021 (498) (19 111) (530 849)USD Pershing Square Tontine Holding Call 45.0000 16/04/2021 (2 028) (8 647) (7 782 370)*USD Pershing Square Tontine Holding Call 35.0000 16/04/2021 2 028 10 377 -USD Pershing Square Tontine Holding Put 25.0000 16/04/2021 (2 028) (269 789) (4 323 539)USD Pershing Square Tontine Holding Put 22.5000 16/04/2021 (339) (5 204) (650 450)USD Perspecta, Inc. Call 30.0000 16/04/2021 612 5 219 -USD Perspecta, Inc. Call 30.0000 18/06/2021 14 60 -USD S&P 500 Index Put 3 300.0000 16/04/2021 (500) (55 004) (140 706 885)USD S&P 500 Index Put 3 800.0000 16/04/2021 500 527 864 -USD S&P 500 Index Put 3 400.0000 21/05/2021 (25) (25 157) (7 248 537)USD S&P 500 Index Put 3 700.0000 21/05/2021 443 1 199 441 -USD S&P 500 Index Put 3 300.0000 16/07/2021 (418) (1 101 810) (117 630 956)USD Social Capital Hedosophia Holding Call 25.0000 16/07/2021 (846) (10 100) (1 803 606)*USD Social Capital Hedosophia Holding Call 30.0000 16/07/2021 (846) (7 936) (2 164 328)*USD Social Capital Hedosophia Holding Call 17.5000 16/07/2021 846 28 136 -USD Social Capital Hedosophia Holding Call 15.0000 16/07/2021 846 28 858 -USD Social Capital Hedosophia Holding Put 12.5000 16/07/2021 (846) (171 703) (901 803)USD Social Capital Hedosophia Holding Put 12.5000 16/07/2021 (846) (147 896) (901 803)GBP Vodafone Group Plc. Call 1.3000 16/04/2021 2 293 101 053 -GBP Vodafone Group Plc. Put 1.1000 16/07/2021 (2 293) (47 158) (2 964 208)
Total Options 80 247 (303 219 057)
* The commitment on short call positions is unlimited.
Morgan Stanley & Co. International is the counterparty to these options.
Credit default swaps
Notional Pay Receive CurrencyMaturity
date Counterparty
Unrealisedappreciation/depreciation
EURCommitment
EUR
6 163 000 Fixed 1.00% ICE iTraxx Asiaex-Japan
USD 20/06/2025 Morgan Stanley & Co. International(122 916) 6 163 000
Total Credit default swaps (122 916) 6 163 000
266 Lumyna Funds
Lumyna – PSAM Global Event UCITS FundSchedule of investments as at March 31, 2021 (cont.)
The accompanying notes form an integral part of these financial statements.
Audited annual report
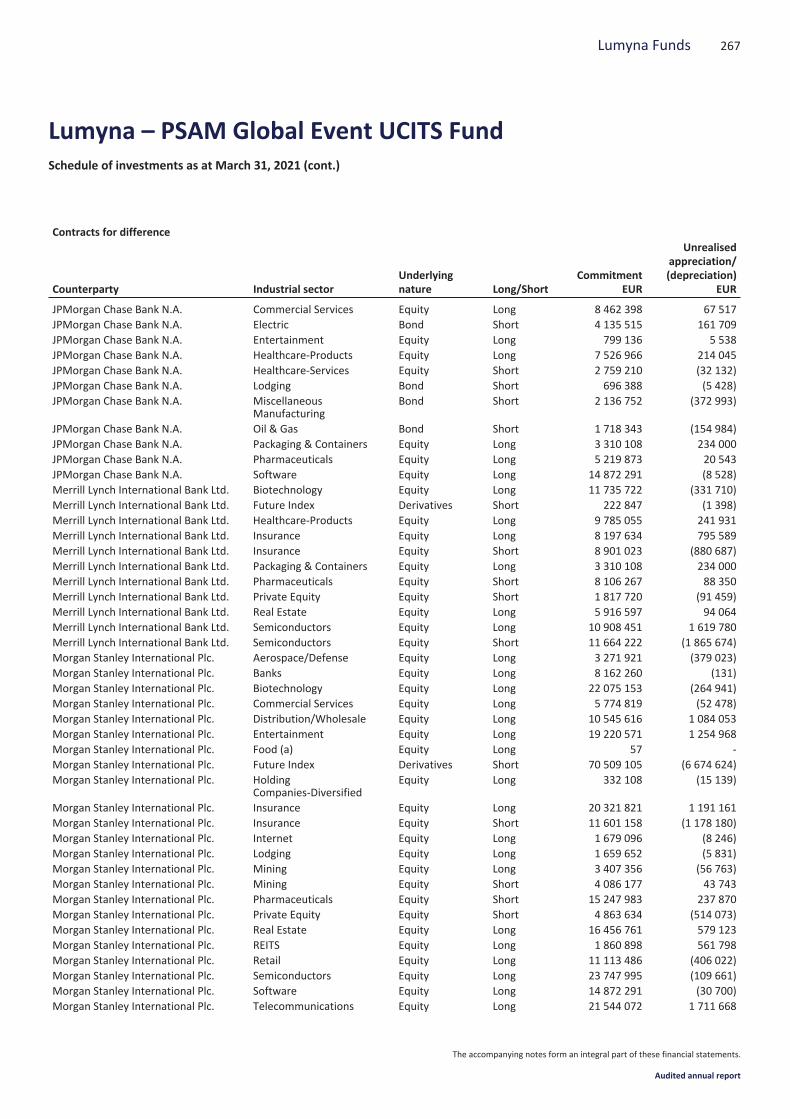
Contracts for difference
Counterparty Industrial sectorUnderlyingnature Long/Short
CommitmentEUR
Unrealisedappreciation/(depreciation)
EUR
JPMorgan Chase Bank N.A. Commercial Services Equity Long 8 462 398 67 517JPMorgan Chase Bank N.A. Electric Bond Short 4 135 515 161 709JPMorgan Chase Bank N.A. Entertainment Equity Long 799 136 5 538JPMorgan Chase Bank N.A. Healthcare-Products Equity Long 7 526 966 214 045JPMorgan Chase Bank N.A. Healthcare-Services Equity Short 2 759 210 (32 132)JPMorgan Chase Bank N.A. Lodging Bond Short 696 388 (5 428)JPMorgan Chase Bank N.A. Miscellaneous
ManufacturingBond Short 2 136 752 (372 993)
JPMorgan Chase Bank N.A. Oil & Gas Bond Short 1 718 343 (154 984)JPMorgan Chase Bank N.A. Packaging & Containers Equity Long 3 310 108 234 000JPMorgan Chase Bank N.A. Pharmaceuticals Equity Long 5 219 873 20 543JPMorgan Chase Bank N.A. Software Equity Long 14 872 291 (8 528)Merrill Lynch International Bank Ltd. Biotechnology Equity Long 11 735 722 (331 710)Merrill Lynch International Bank Ltd. Future Index Derivatives Short 222 847 (1 398)Merrill Lynch International Bank Ltd. Healthcare-Products Equity Long 9 785 055 241 931Merrill Lynch International Bank Ltd. Insurance Equity Long 8 197 634 795 589Merrill Lynch International Bank Ltd. Insurance Equity Short 8 901 023 (880 687)Merrill Lynch International Bank Ltd. Packaging & Containers Equity Long 3 310 108 234 000Merrill Lynch International Bank Ltd. Pharmaceuticals Equity Short 8 106 267 88 350Merrill Lynch International Bank Ltd. Private Equity Equity Short 1 817 720 (91 459)Merrill Lynch International Bank Ltd. Real Estate Equity Long 5 916 597 94 064Merrill Lynch International Bank Ltd. Semiconductors Equity Long 10 908 451 1 619 780Merrill Lynch International Bank Ltd. Semiconductors Equity Short 11 664 222 (1 865 674)Morgan Stanley International Plc. Aerospace/Defense Equity Long 3 271 921 (379 023)Morgan Stanley International Plc. Banks Equity Long 8 162 260 (131)Morgan Stanley International Plc. Biotechnology Equity Long 22 075 153 (264 941)Morgan Stanley International Plc. Commercial Services Equity Long 5 774 819 (52 478)Morgan Stanley International Plc. Distribution/Wholesale Equity Long 10 545 616 1 084 053Morgan Stanley International Plc. Entertainment Equity Long 19 220 571 1 254 968Morgan Stanley International Plc. Food (a) Equity Long 57 -Morgan Stanley International Plc. Future Index Derivatives Short 70 509 105 (6 674 624)Morgan Stanley International Plc. Holding
Companies-DiversifiedEquity Long 332 108 (15 139)
Morgan Stanley International Plc. Insurance Equity Long 20 321 821 1 191 161Morgan Stanley International Plc. Insurance Equity Short 11 601 158 (1 178 180)Morgan Stanley International Plc. Internet Equity Long 1 679 096 (8 246)Morgan Stanley International Plc. Lodging Equity Long 1 659 652 (5 831)Morgan Stanley International Plc. Mining Equity Long 3 407 356 (56 763)Morgan Stanley International Plc. Mining Equity Short 4 086 177 43 743Morgan Stanley International Plc. Pharmaceuticals Equity Short 15 247 983 237 870Morgan Stanley International Plc. Private Equity Equity Short 4 863 634 (514 073)Morgan Stanley International Plc. Real Estate Equity Long 16 456 761 579 123Morgan Stanley International Plc. REITS Equity Long 1 860 898 561 798Morgan Stanley International Plc. Retail Equity Long 11 113 486 (406 022)Morgan Stanley International Plc. Semiconductors Equity Long 23 747 995 (109 661)Morgan Stanley International Plc. Software Equity Long 14 872 291 (30 700)Morgan Stanley International Plc. Telecommunications Equity Long 21 544 072 1 711 668
267Lumyna Funds
Lumyna – PSAM Global Event UCITS FundSchedule of investments as at March 31, 2021 (cont.)
The accompanying notes form an integral part of these financial statements.
Audited annual report
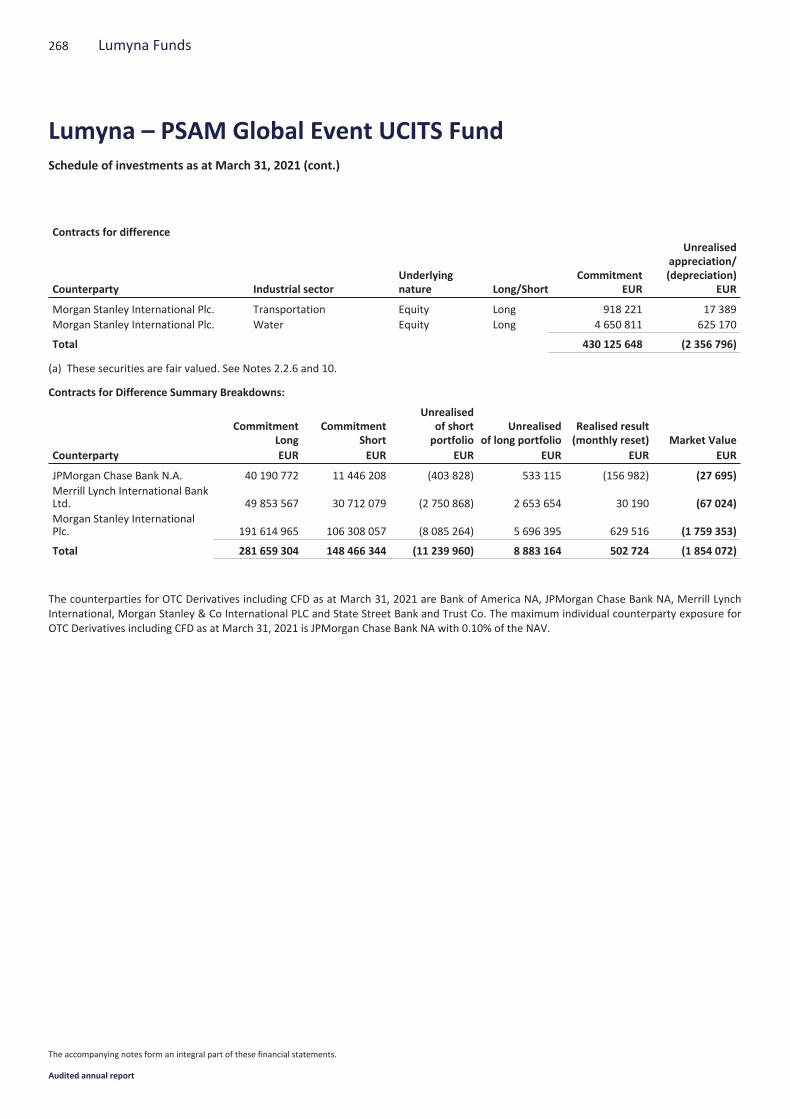
Contracts for difference
Counterparty Industrial sectorUnderlyingnature Long/Short
CommitmentEUR
Unrealisedappreciation/(depreciation)
EUR
Morgan Stanley International Plc. Transportation Equity Long 918 221 17 389Morgan Stanley International Plc. Water Equity Long 4 650 811 625 170
Total 430 125 648 (2 356 796)
(a) These securities are fair valued. See Notes 2.2.6 and 10.
Contracts for Difference Summary Breakdowns:
CommitmentLong
CommitmentShort
Unrealisedof shortportfolio
Unrealisedof long portfolio
Realised result(monthly reset) Market Value
Counterparty EUR EUR EUR EUR EUR EUR
JPMorgan Chase Bank N.A. 40 190 772 11 446 208 (403 828) 533 115 (156 982) (27 695)Merrill Lynch International BankLtd. 49 853 567 30 712 079 (2 750 868) 2 653 654 30 190 (67 024)Morgan Stanley InternationalPlc. 191 614 965 106 308 057 (8 085 264) 5 696 395 629 516 (1 759 353)
Total 281 659 304 148 466 344 (11 239 960) 8 883 164 502 724 (1 854 072)
The counterparties for OTC Derivatives including CFD as at March 31, 2021 are Bank of America NA, JPMorgan Chase Bank NA, Merrill LynchInternational, Morgan Stanley & Co International PLC and State Street Bank and Trust Co. The maximum individual counterparty exposure forOTC Derivatives including CFD as at March 31, 2021 is JPMorgan Chase Bank NA with 0.10% of the NAV.
268 Lumyna Funds
Lumyna – PSAM Global Event UCITS FundSchedule of investments as at March 31, 2021 (cont.)
The accompanying notes form an integral part of these financial statements.
Audited annual report
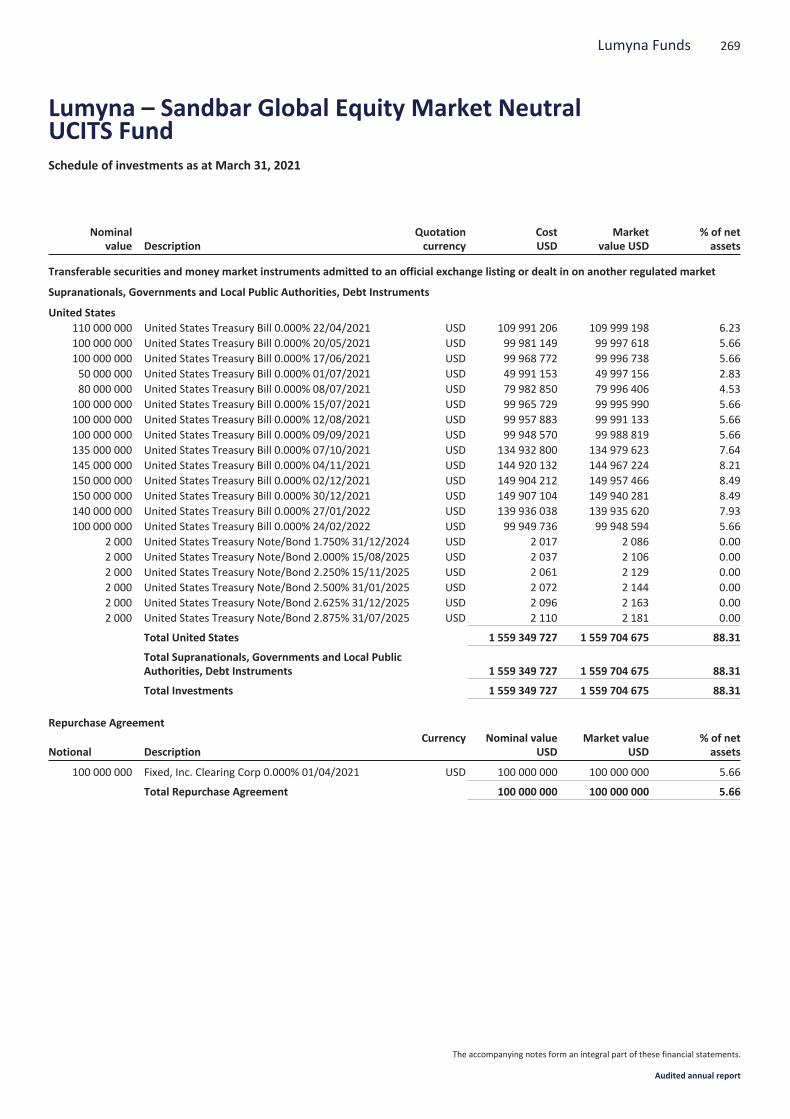
Nominalvalue Description
Quotationcurrency
CostUSD
Marketvalue USD
% of netassets
Transferable securities and money market instruments admitted to an official exchange listing or dealt in on another regulated market
Supranationals, Governments and Local Public Authorities, Debt Instruments
United States110 000 000 United States Treasury Bill 0.000% 22/04/2021 USD 109 991 206 109 999 198 6.23100 000 000 United States Treasury Bill 0.000% 20/05/2021 USD 99 981 149 99 997 618 5.66100 000 000 United States Treasury Bill 0.000% 17/06/2021 USD 99 968 772 99 996 738 5.6650 000 000 United States Treasury Bill 0.000% 01/07/2021 USD 49 991 153 49 997 156 2.8380 000 000 United States Treasury Bill 0.000% 08/07/2021 USD 79 982 850 79 996 406 4.53
100 000 000 United States Treasury Bill 0.000% 15/07/2021 USD 99 965 729 99 995 990 5.66100 000 000 United States Treasury Bill 0.000% 12/08/2021 USD 99 957 883 99 991 133 5.66100 000 000 United States Treasury Bill 0.000% 09/09/2021 USD 99 948 570 99 988 819 5.66135 000 000 United States Treasury Bill 0.000% 07/10/2021 USD 134 932 800 134 979 623 7.64145 000 000 United States Treasury Bill 0.000% 04/11/2021 USD 144 920 132 144 967 224 8.21150 000 000 United States Treasury Bill 0.000% 02/12/2021 USD 149 904 212 149 957 466 8.49150 000 000 United States Treasury Bill 0.000% 30/12/2021 USD 149 907 104 149 940 281 8.49140 000 000 United States Treasury Bill 0.000% 27/01/2022 USD 139 936 038 139 935 620 7.93100 000 000 United States Treasury Bill 0.000% 24/02/2022 USD 99 949 736 99 948 594 5.66
2 000 United States Treasury Note/Bond 1.750% 31/12/2024 USD 2 017 2 086 0.002 000 United States Treasury Note/Bond 2.000% 15/08/2025 USD 2 037 2 106 0.002 000 United States Treasury Note/Bond 2.250% 15/11/2025 USD 2 061 2 129 0.002 000 United States Treasury Note/Bond 2.500% 31/01/2025 USD 2 072 2 144 0.002 000 United States Treasury Note/Bond 2.625% 31/12/2025 USD 2 096 2 163 0.002 000 United States Treasury Note/Bond 2.875% 31/07/2025 USD 2 110 2 181 0.00
Total United States 1 559 349 727 1 559 704 675 88.31
Total Supranationals, Governments and Local PublicAuthorities, Debt Instruments 1 559 349 727 1 559 704 675 88.31
Total Investments 1 559 349 727 1 559 704 675 88.31
Repurchase Agreement
Notional DescriptionCurrency Nominal value
USDMarket value
USD% of netassets
100 000 000 Fixed, Inc. Clearing Corp 0.000% 01/04/2021 USD 100 000 000 100 000 000 5.66
Total Repurchase Agreement 100 000 000 100 000 000 5.66
269Lumyna Funds
Lumyna – Sandbar Global Equity Market NeutralUCITS FundSchedule of investments as at March 31, 2021
The accompanying notes form an integral part of these financial statements.
Audited annual report
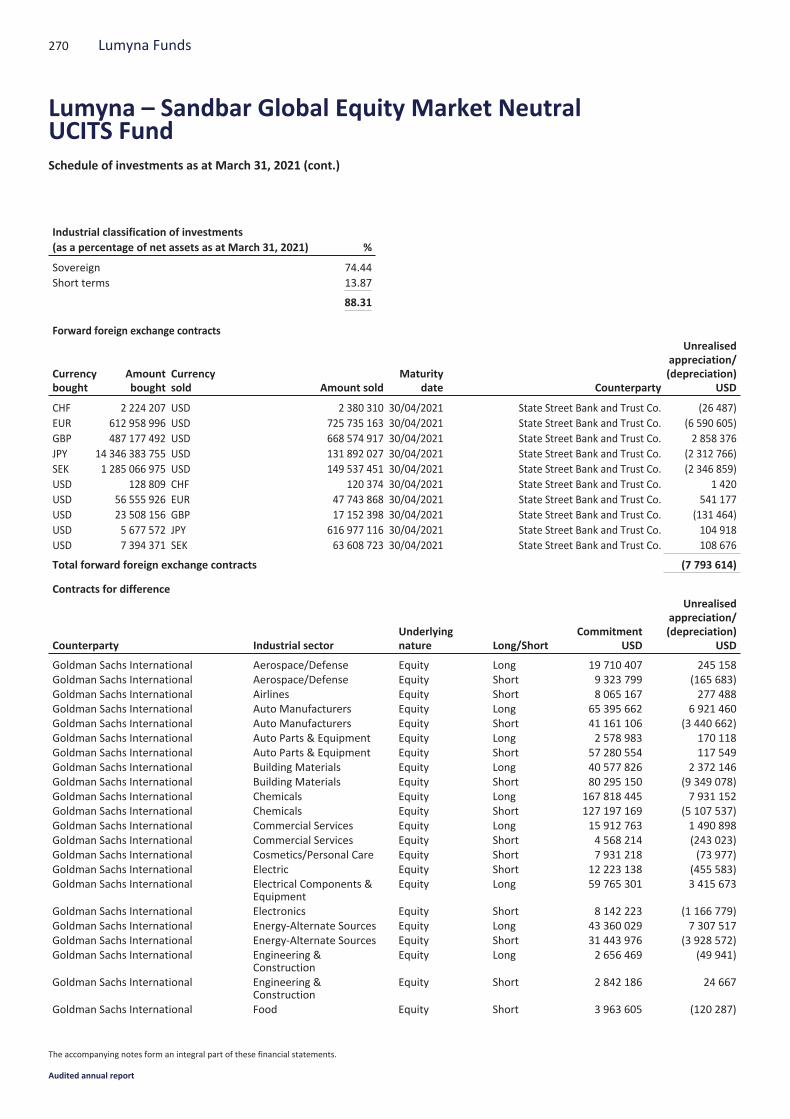
Industrial classification of investments(as a percentage of net assets as at March 31, 2021) %
Sovereign 74.44Short terms 13.87
88.31
Forward foreign exchange contracts
Currencybought
Amountbought
Currencysold Amount sold
Maturitydate Counterparty
Unrealisedappreciation/(depreciation)
USD
CHF 2 224 207 USD 2 380 310 30/04/2021 State Street Bank and Trust Co. (26 487)EUR 612 958 996 USD 725 735 163 30/04/2021 State Street Bank and Trust Co. (6 590 605)GBP 487 177 492 USD 668 574 917 30/04/2021 State Street Bank and Trust Co. 2 858 376JPY 14 346 383 755 USD 131 892 027 30/04/2021 State Street Bank and Trust Co. (2 312 766)SEK 1 285 066 975 USD 149 537 451 30/04/2021 State Street Bank and Trust Co. (2 346 859)USD 128 809 CHF 120 374 30/04/2021 State Street Bank and Trust Co. 1 420USD 56 555 926 EUR 47 743 868 30/04/2021 State Street Bank and Trust Co. 541 177USD 23 508 156 GBP 17 152 398 30/04/2021 State Street Bank and Trust Co. (131 464)USD 5 677 572 JPY 616 977 116 30/04/2021 State Street Bank and Trust Co. 104 918USD 7 394 371 SEK 63 608 723 30/04/2021 State Street Bank and Trust Co. 108 676
Total forward foreign exchange contracts (7 793 614)
Contracts for difference
Counterparty Industrial sectorUnderlyingnature Long/Short
CommitmentUSD
Unrealisedappreciation/(depreciation)
USD
Goldman Sachs International Aerospace/Defense Equity Long 19 710 407 245 158Goldman Sachs International Aerospace/Defense Equity Short 9 323 799 (165 683)Goldman Sachs International Airlines Equity Short 8 065 167 277 488Goldman Sachs International Auto Manufacturers Equity Long 65 395 662 6 921 460Goldman Sachs International Auto Manufacturers Equity Short 41 161 106 (3 440 662)Goldman Sachs International Auto Parts & Equipment Equity Long 2 578 983 170 118Goldman Sachs International Auto Parts & Equipment Equity Short 57 280 554 117 549Goldman Sachs International Building Materials Equity Long 40 577 826 2 372 146Goldman Sachs International Building Materials Equity Short 80 295 150 (9 349 078)Goldman Sachs International Chemicals Equity Long 167 818 445 7 931 152Goldman Sachs International Chemicals Equity Short 127 197 169 (5 107 537)Goldman Sachs International Commercial Services Equity Long 15 912 763 1 490 898Goldman Sachs International Commercial Services Equity Short 4 568 214 (243 023)Goldman Sachs International Cosmetics/Personal Care Equity Short 7 931 218 (73 977)Goldman Sachs International Electric Equity Short 12 223 138 (455 583)Goldman Sachs International Electrical Components &
EquipmentEquity Long 59 765 301 3 415 673
Goldman Sachs International Electronics Equity Short 8 142 223 (1 166 779)Goldman Sachs International Energy-Alternate Sources Equity Long 43 360 029 7 307 517Goldman Sachs International Energy-Alternate Sources Equity Short 31 443 976 (3 928 572)Goldman Sachs International Engineering &
ConstructionEquity Long 2 656 469 (49 941)
Goldman Sachs International Engineering &Construction
Equity Short 2 842 186 24 667
Goldman Sachs International Food Equity Short 3 963 605 (120 287)
270 Lumyna Funds
Lumyna – Sandbar Global Equity Market NeutralUCITS FundSchedule of investments as at March 31, 2021 (cont.)
The accompanying notes form an integral part of these financial statements.
Audited annual report

Contracts for difference
Counterparty Industrial sectorUnderlyingnature Long/Short
CommitmentUSD
Unrealisedappreciation/(depreciation)
USD
Goldman Sachs International Forest Products & Paper Equity Long 17 296 608 (613 989)Goldman Sachs International Forest Products & Paper Equity Short 32 118 597 970 143Goldman Sachs International Hand/Machine Tools Equity Long 22 938 254 736 439Goldman Sachs International Hand/Machine Tools Equity Short 43 324 448 (4 510 067)Goldman Sachs International Healthcare-Products Equity Long 20 052 169 1 241 024Goldman Sachs International Healthcare-Products Equity Short 4 455 542 (381 239)Goldman Sachs International Household
Products/WaresEquity Short 8 041 382 (614 458)
Goldman Sachs International Internet Equity Long 2 303 059 188 727Goldman Sachs International Iron/Steel Equity Long 3 344 307 116 863Goldman Sachs International Machinery-Construction
& MiningEquity Long 15 699 391 321 532
Goldman Sachs International Machinery-Diversified Equity Long 31 720 664 2 100 057Goldman Sachs International Machinery-Diversified Equity Short 67 029 477 (2 899 810)Goldman Sachs International Miscellaneous
ManufacturingEquity Long 15 547 489 557 414
Goldman Sachs International MiscellaneousManufacturing
Equity Short 17 629 550 (441 000)
Goldman Sachs International Semiconductors Equity Long 9 599 908 209 781Goldman Sachs International Shipbuilding Equity Short 35 974 392 1 075 387Goldman Sachs International Transportation Equity Short 30 701 078 (1 664 917)Merrill Lynch International Bank Ltd. Aerospace/Defense Equity Long 27 184 043 1 462 999Merrill Lynch International Bank Ltd. Aerospace/Defense Equity Short 109 333 132 (567 453)Merrill Lynch International Bank Ltd. Airlines Equity Long 17 468 468 (232 203)Merrill Lynch International Bank Ltd. Airlines Equity Short 14 262 759 52 387Merrill Lynch International Bank Ltd. Auto Manufacturers Equity Long 23 728 999 2 605 784Merrill Lynch International Bank Ltd. Auto Manufacturers Equity Short 39 485 226 604 279Merrill Lynch International Bank Ltd. Auto Parts & Equipment Equity Long 27 716 834 965 208Merrill Lynch International Bank Ltd. Auto Parts & Equipment Equity Short 8 376 194 11 698Merrill Lynch International Bank Ltd. Building Materials Equity Long 44 295 765 3 674 096Merrill Lynch International Bank Ltd. Chemicals Equity Long 51 062 398 370 327Merrill Lynch International Bank Ltd. Chemicals Equity Short 23 826 895 (1 376 210)Merrill Lynch International Bank Ltd. Commercial Services Equity Long 2 405 433 (80 406)Merrill Lynch International Bank Ltd. Commercial Services Equity Short 25 788 601 (1 305 343)Merrill Lynch International Bank Ltd. Computers Equity Long 23 612 122 1 312 776Merrill Lynch International Bank Ltd. Cosmetics/Personal Care Equity Long 16 845 681 1 193 441Merrill Lynch International Bank Ltd. Distribution/Wholesale Equity Long 51 955 725 3 473 775Merrill Lynch International Bank Ltd. Distribution/Wholesale Equity Short 12 547 561 (559 377)Merrill Lynch International Bank Ltd. Electrical Components &
EquipmentEquity Long 31 970 450 1 802 199
Merrill Lynch International Bank Ltd. Electrical Components &Equipment
Equity Short 55 530 390 (5 030 046)
Merrill Lynch International Bank Ltd. Electronics Equity Long 4 405 502 36 013Merrill Lynch International Bank Ltd. Energy-Alternate Sources Equity Long 1 713 714 46 767Merrill Lynch International Bank Ltd. Food Equity Long 3 968 102 36 694Merrill Lynch International Bank Ltd. Food Equity Short 8 051 463 (395 841)Merrill Lynch International Bank Ltd. Food Service Equity Long 6 565 619 29 424Merrill Lynch International Bank Ltd. Food Service Equity Short 12 120 528 (242 158)Merrill Lynch International Bank Ltd. Forest Products & Paper Equity Short 21 363 139 (310 336)Merrill Lynch International Bank Ltd. Home Builders Equity Long 11 827 646 1 368 785
271Lumyna Funds
Lumyna – Sandbar Global Equity Market NeutralUCITS FundSchedule of investments as at March 31, 2021 (cont.)
The accompanying notes form an integral part of these financial statements.
Audited annual report
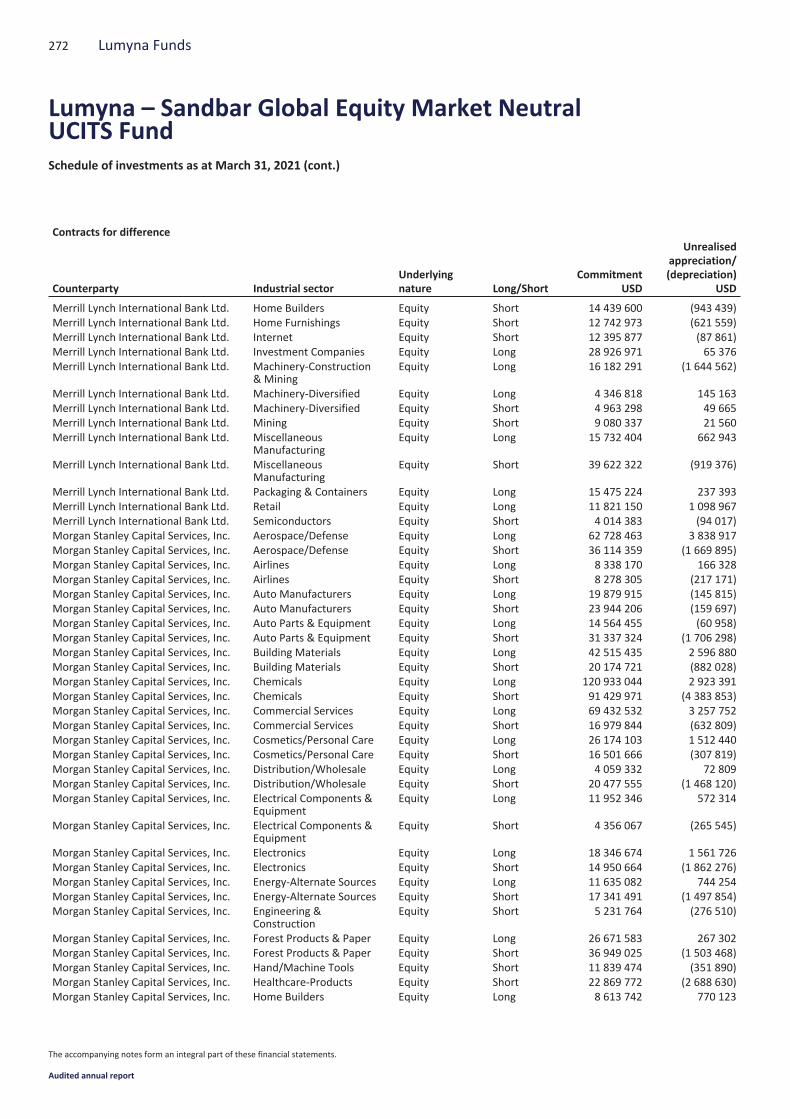
Contracts for difference
Counterparty Industrial sectorUnderlyingnature Long/Short
CommitmentUSD
Unrealisedappreciation/(depreciation)
USD
Merrill Lynch International Bank Ltd. Home Builders Equity Short 14 439 600 (943 439)Merrill Lynch International Bank Ltd. Home Furnishings Equity Short 12 742 973 (621 559)Merrill Lynch International Bank Ltd. Internet Equity Short 12 395 877 (87 861)Merrill Lynch International Bank Ltd. Investment Companies Equity Long 28 926 971 65 376Merrill Lynch International Bank Ltd. Machinery-Construction
& MiningEquity Long 16 182 291 (1 644 562)
Merrill Lynch International Bank Ltd. Machinery-Diversified Equity Long 4 346 818 145 163Merrill Lynch International Bank Ltd. Machinery-Diversified Equity Short 4 963 298 49 665Merrill Lynch International Bank Ltd. Mining Equity Short 9 080 337 21 560Merrill Lynch International Bank Ltd. Miscellaneous
ManufacturingEquity Long 15 732 404 662 943
Merrill Lynch International Bank Ltd. MiscellaneousManufacturing
Equity Short 39 622 322 (919 376)
Merrill Lynch International Bank Ltd. Packaging & Containers Equity Long 15 475 224 237 393Merrill Lynch International Bank Ltd. Retail Equity Long 11 821 150 1 098 967Merrill Lynch International Bank Ltd. Semiconductors Equity Short 4 014 383 (94 017)Morgan Stanley Capital Services, Inc. Aerospace/Defense Equity Long 62 728 463 3 838 917Morgan Stanley Capital Services, Inc. Aerospace/Defense Equity Short 36 114 359 (1 669 895)Morgan Stanley Capital Services, Inc. Airlines Equity Long 8 338 170 166 328Morgan Stanley Capital Services, Inc. Airlines Equity Short 8 278 305 (217 171)Morgan Stanley Capital Services, Inc. Auto Manufacturers Equity Long 19 879 915 (145 815)Morgan Stanley Capital Services, Inc. Auto Manufacturers Equity Short 23 944 206 (159 697)Morgan Stanley Capital Services, Inc. Auto Parts & Equipment Equity Long 14 564 455 (60 958)Morgan Stanley Capital Services, Inc. Auto Parts & Equipment Equity Short 31 337 324 (1 706 298)Morgan Stanley Capital Services, Inc. Building Materials Equity Long 42 515 435 2 596 880Morgan Stanley Capital Services, Inc. Building Materials Equity Short 20 174 721 (882 028)Morgan Stanley Capital Services, Inc. Chemicals Equity Long 120 933 044 2 923 391Morgan Stanley Capital Services, Inc. Chemicals Equity Short 91 429 971 (4 383 853)Morgan Stanley Capital Services, Inc. Commercial Services Equity Long 69 432 532 3 257 752Morgan Stanley Capital Services, Inc. Commercial Services Equity Short 16 979 844 (632 809)Morgan Stanley Capital Services, Inc. Cosmetics/Personal Care Equity Long 26 174 103 1 512 440Morgan Stanley Capital Services, Inc. Cosmetics/Personal Care Equity Short 16 501 666 (307 819)Morgan Stanley Capital Services, Inc. Distribution/Wholesale Equity Long 4 059 332 72 809Morgan Stanley Capital Services, Inc. Distribution/Wholesale Equity Short 20 477 555 (1 468 120)Morgan Stanley Capital Services, Inc. Electrical Components &
EquipmentEquity Long 11 952 346 572 314
Morgan Stanley Capital Services, Inc. Electrical Components &Equipment
Equity Short 4 356 067 (265 545)
Morgan Stanley Capital Services, Inc. Electronics Equity Long 18 346 674 1 561 726Morgan Stanley Capital Services, Inc. Electronics Equity Short 14 950 664 (1 862 276)Morgan Stanley Capital Services, Inc. Energy-Alternate Sources Equity Long 11 635 082 744 254Morgan Stanley Capital Services, Inc. Energy-Alternate Sources Equity Short 17 341 491 (1 497 854)Morgan Stanley Capital Services, Inc. Engineering &
ConstructionEquity Short 5 231 764 (276 510)
Morgan Stanley Capital Services, Inc. Forest Products & Paper Equity Long 26 671 583 267 302Morgan Stanley Capital Services, Inc. Forest Products & Paper Equity Short 36 949 025 (1 503 468)Morgan Stanley Capital Services, Inc. Hand/Machine Tools Equity Short 11 839 474 (351 890)Morgan Stanley Capital Services, Inc. Healthcare-Products Equity Short 22 869 772 (2 688 630)Morgan Stanley Capital Services, Inc. Home Builders Equity Long 8 613 742 770 123
272 Lumyna Funds
Lumyna – Sandbar Global Equity Market NeutralUCITS FundSchedule of investments as at March 31, 2021 (cont.)
The accompanying notes form an integral part of these financial statements.
Audited annual report

Contracts for difference
Counterparty Industrial sectorUnderlyingnature Long/Short
CommitmentUSD
Unrealisedappreciation/(depreciation)
USD
Morgan Stanley Capital Services, Inc. HouseholdProducts/Wares
Equity Short 14 831 768 (777 327)
Morgan Stanley Capital Services, Inc. Housewares Equity Long 4 234 061 549 472Morgan Stanley Capital Services, Inc. Iron/Steel Equity Short 8 988 467 (106 559)Morgan Stanley Capital Services, Inc. Machinery-Construction
& MiningEquity Long 7 992 990 273 425
Morgan Stanley Capital Services, Inc. Machinery-Construction& Mining
Equity Short 19 955 424 (1 188 991)
Morgan Stanley Capital Services, Inc. Machinery-Diversified Equity Long 58 643 618 5 006 807Morgan Stanley Capital Services, Inc. Machinery-Diversified Equity Short 16 287 957 (824 177)Morgan Stanley Capital Services, Inc. Metal
Fabricate/HardwareEquity Long 11 915 169 818 287
Morgan Stanley Capital Services, Inc. MetalFabricate/Hardware
Equity Short 19 678 530 (41 865)
Morgan Stanley Capital Services, Inc. MiscellaneousManufacturing
Equity Long 65 205 607 1 744 348
Morgan Stanley Capital Services, Inc. MiscellaneousManufacturing
Equity Short 55 259 140 (3 950 634)
Morgan Stanley Capital Services, Inc. Packaging & Containers Equity Long 56 053 283 4 420 147Morgan Stanley Capital Services, Inc. Packaging & Containers Equity Short 32 869 188 (90 536)Morgan Stanley Capital Services, Inc. Retail Equity Long 16 079 909 2 256 610Morgan Stanley Capital Services, Inc. Retail Equity Short 14 763 027 (1 878 966)Morgan Stanley Capital Services, Inc. Software Equity Short 16 132 390 (979 072)Morgan Stanley Capital Services, Inc. Transportation Equity Long 42 986 775 2 844 694Morgan Stanley Capital Services, Inc. Transportation Equity Short 40 033 634 (2 129 199)
Total 3 383 677 763 13 632 187
Contracts for Difference Summary Breakdowns:
CommitmentLong
CommitmentShort
Unrealisedof shortportfolio
Unrealisedof long portfolio
Realised result(monthly reset) Market Value
Counterparty USD USD USD USD USD USD
Goldman Sachs International 556 277 734 633 711 971 (32 097 438) 34 662 029 (2 355 114) 209 477Merrill Lynch International BankLtd. 439 211 359 427 944 678 (11 713 427) 18 630 959 903 422 7 820 954Morgan Stanley Capital Services,Inc. 708 956 288 617 575 733 (31 841 189) 35 991 253 (14 023) 4 136 041
Total 1 704 445 381 1 679 232 382 (75 652 054) 89 284 241 (1 465 715) 12 166 472
The counterparties for OTC Derivatives including CFD as atMarch 31, 2021 are Goldman Sachs International, Merrill Lynch International, MorganStanley & Co International PLC and State Street Bank and Trust Co. Themaximum individual counterparty exposure for OTC Derivatives includingCFD as at March 31, 2021 is State Street Bank and Trust Co with 2.40% of the NAV.
273Lumyna Funds
Lumyna – Sandbar Global Equity Market NeutralUCITS FundSchedule of investments as at March 31, 2021 (cont.)
The accompanying notes form an integral part of these financial statements.
Audited annual report
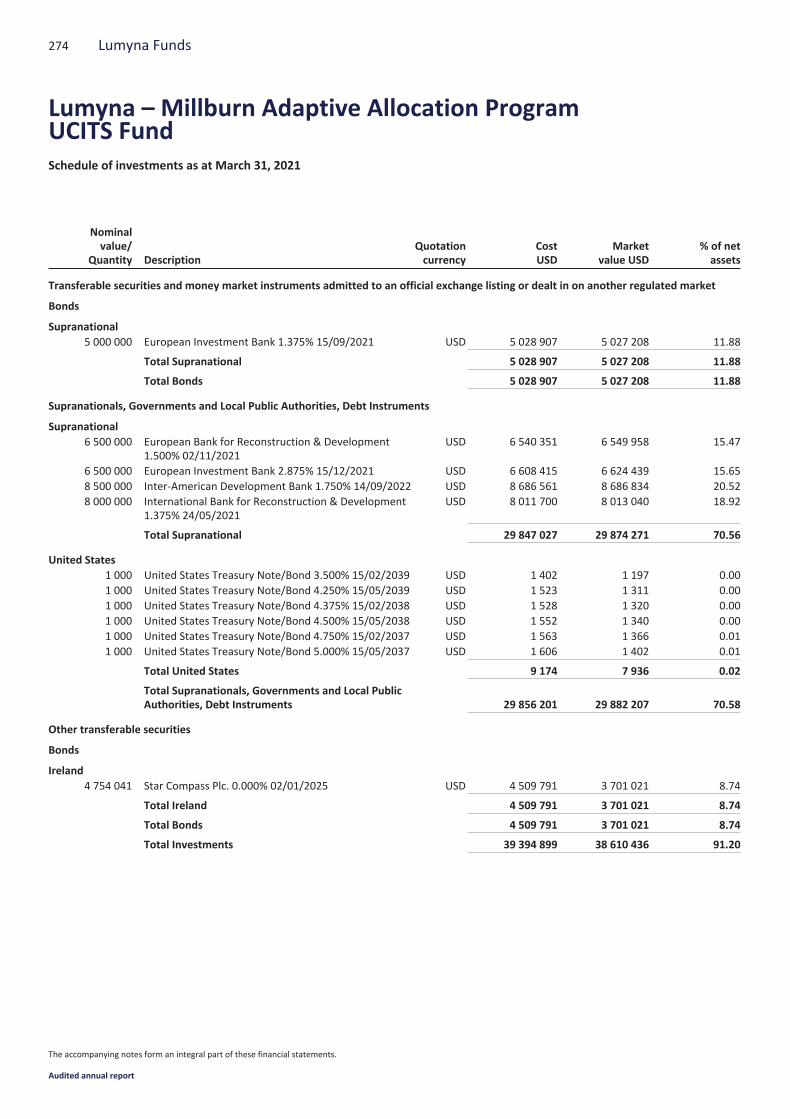
Nominalvalue/
Quantity DescriptionQuotationcurrency
CostUSD
Marketvalue USD
% of netassets
Transferable securities and money market instruments admitted to an official exchange listing or dealt in on another regulated market
Bonds
Supranational5 000 000 European Investment Bank 1.375% 15/09/2021 USD 5 028 907 5 027 208 11.88
Total Supranational 5 028 907 5 027 208 11.88
Total Bonds 5 028 907 5 027 208 11.88
Supranationals, Governments and Local Public Authorities, Debt Instruments
Supranational6 500 000 European Bank for Reconstruction & Development
1.500% 02/11/2021USD 6 540 351 6 549 958 15.47
6 500 000 European Investment Bank 2.875% 15/12/2021 USD 6 608 415 6 624 439 15.658 500 000 Inter-American Development Bank 1.750% 14/09/2022 USD 8 686 561 8 686 834 20.528 000 000 International Bank for Reconstruction & Development
1.375% 24/05/2021USD 8 011 700 8 013 040 18.92
Total Supranational 29 847 027 29 874 271 70.56
United States1 000 United States Treasury Note/Bond 3.500% 15/02/2039 USD 1 402 1 197 0.001 000 United States Treasury Note/Bond 4.250% 15/05/2039 USD 1 523 1 311 0.001 000 United States Treasury Note/Bond 4.375% 15/02/2038 USD 1 528 1 320 0.001 000 United States Treasury Note/Bond 4.500% 15/05/2038 USD 1 552 1 340 0.001 000 United States Treasury Note/Bond 4.750% 15/02/2037 USD 1 563 1 366 0.011 000 United States Treasury Note/Bond 5.000% 15/05/2037 USD 1 606 1 402 0.01
Total United States 9 174 7 936 0.02
Total Supranationals, Governments and Local PublicAuthorities, Debt Instruments 29 856 201 29 882 207 70.58
Other transferable securities
Bonds
Ireland4 754 041 Star Compass Plc. 0.000% 02/01/2025 USD 4 509 791 3 701 021 8.74
Total Ireland 4 509 791 3 701 021 8.74
Total Bonds 4 509 791 3 701 021 8.74
Total Investments 39 394 899 38 610 436 91.20
274 Lumyna Funds
Lumyna – Millburn Adaptive Allocation ProgramUCITS FundSchedule of investments as at March 31, 2021
The accompanying notes form an integral part of these financial statements.
Audited annual report
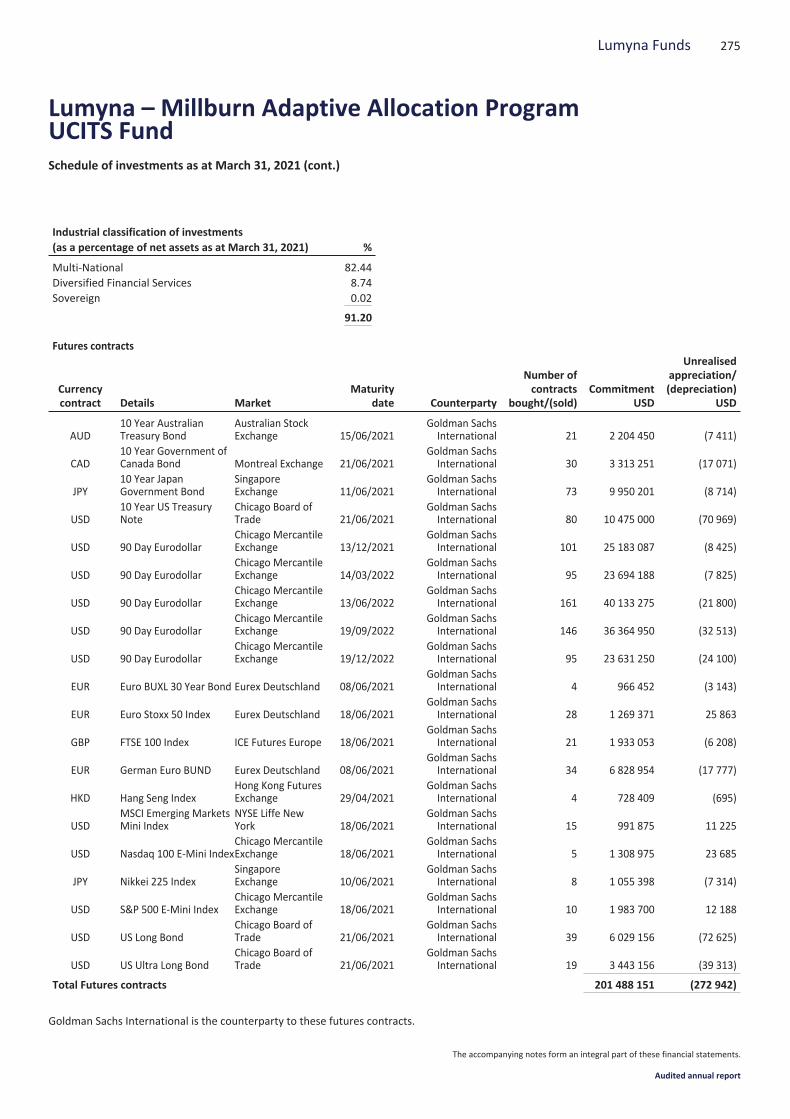
Industrial classification of investments(as a percentage of net assets as at March 31, 2021) %
Multi-National 82.44Diversified Financial Services 8.74Sovereign 0.02
91.20
Futures contracts
Currencycontract Details Market
Maturitydate Counterparty
Number ofcontracts
bought/(sold)Commitment
USD
Unrealisedappreciation/(depreciation)
USD
AUD10 Year AustralianTreasury Bond
Australian StockExchange 15/06/2021
Goldman SachsInternational 21 2 204 450 (7 411)
CAD10 Year Government ofCanada Bond Montreal Exchange 21/06/2021
Goldman SachsInternational 30 3 313 251 (17 071)
JPY10 Year JapanGovernment Bond
SingaporeExchange 11/06/2021
Goldman SachsInternational 73 9 950 201 (8 714)
USD10 Year US TreasuryNote
Chicago Board ofTrade 21/06/2021
Goldman SachsInternational 80 10 475 000 (70 969)
USD 90 Day EurodollarChicago MercantileExchange 13/12/2021
Goldman SachsInternational 101 25 183 087 (8 425)
USD 90 Day EurodollarChicago MercantileExchange 14/03/2022
Goldman SachsInternational 95 23 694 188 (7 825)
USD 90 Day EurodollarChicago MercantileExchange 13/06/2022
Goldman SachsInternational 161 40 133 275 (21 800)
USD 90 Day EurodollarChicago MercantileExchange 19/09/2022
Goldman SachsInternational 146 36 364 950 (32 513)
USD 90 Day EurodollarChicago MercantileExchange 19/12/2022
Goldman SachsInternational 95 23 631 250 (24 100)
EUR Euro BUXL 30 Year Bond Eurex Deutschland 08/06/2021Goldman SachsInternational 4 966 452 (3 143)
EUR Euro Stoxx 50 Index Eurex Deutschland 18/06/2021Goldman SachsInternational 28 1 269 371 25 863
GBP FTSE 100 Index ICE Futures Europe 18/06/2021Goldman SachsInternational 21 1 933 053 (6 208)
EUR German Euro BUND Eurex Deutschland 08/06/2021Goldman SachsInternational 34 6 828 954 (17 777)
HKD Hang Seng IndexHong Kong FuturesExchange 29/04/2021
Goldman SachsInternational 4 728 409 (695)
USDMSCI Emerging MarketsMini Index
NYSE Liffe NewYork 18/06/2021
Goldman SachsInternational 15 991 875 11 225
USD Nasdaq 100 E-Mini IndexChicago MercantileExchange 18/06/2021
Goldman SachsInternational 5 1 308 975 23 685
JPY Nikkei 225 IndexSingaporeExchange 10/06/2021
Goldman SachsInternational 8 1 055 398 (7 314)
USD S&P 500 E-Mini IndexChicago MercantileExchange 18/06/2021
Goldman SachsInternational 10 1 983 700 12 188
USD US Long BondChicago Board ofTrade 21/06/2021
Goldman SachsInternational 39 6 029 156 (72 625)
USD US Ultra Long BondChicago Board ofTrade 21/06/2021
Goldman SachsInternational 19 3 443 156 (39 313)
Total Futures contracts 201 488 151 (272 942)
Goldman Sachs International is the counterparty to these futures contracts.
275Lumyna Funds
Lumyna – Millburn Adaptive Allocation ProgramUCITS FundSchedule of investments as at March 31, 2021 (cont.)
The accompanying notes form an integral part of these financial statements.
Audited annual report

Forward foreign exchange contracts
Currencybought
Amountbought
Currencysold Amount sold
Maturitydate Counterparty
Unrealisedappreciation/(depreciation)
USD
EUR 36 890 291 USD 43 678 364 30/04/2021 State Street Bank and Trust Co. (397 407)USD 1 058 696 EUR 894 881 30/04/2021 State Street Bank and Trust Co. 8 790
Total forward foreign exchange contracts (388 617)
Contracts for difference
Counterparty Industrial sectorUnderlyingnature Long/Short
CommitmentUSD
Unrealisedappreciation/(depreciation)
USD
Goldman Sachs International Future Index Derivatives Long 21 947 372 137 266
Contracts for Difference Summary Breakdowns:
CommitmentLong
CommitmentShort
Unrealisedof shortportfolio
Unrealisedof long portfolio
Realised result(monthly reset) Market Value
Counterparty USD USD USD USD USD USD
Goldman Sachs International 21 947 372 - - 137 266 786 753 924 019
Total 21 947 372 - - 137 266 786 753 924 019
The counterparties for OTC Derivatives including CFD as at March 31, 2021 are Goldman Sachs International and State Street Bank and Trust Co.The maximum individual counterparty exposure for OTC Derivatives including CFD as at March 31, 2021 is Goldman Sachs International with2.46% of the NAV.
276 Lumyna Funds
Lumyna – Millburn Adaptive Allocation ProgramUCITS FundSchedule of investments as at March 31, 2021 (cont.)
The accompanying notes form an integral part of these financial statements.
Audited annual report
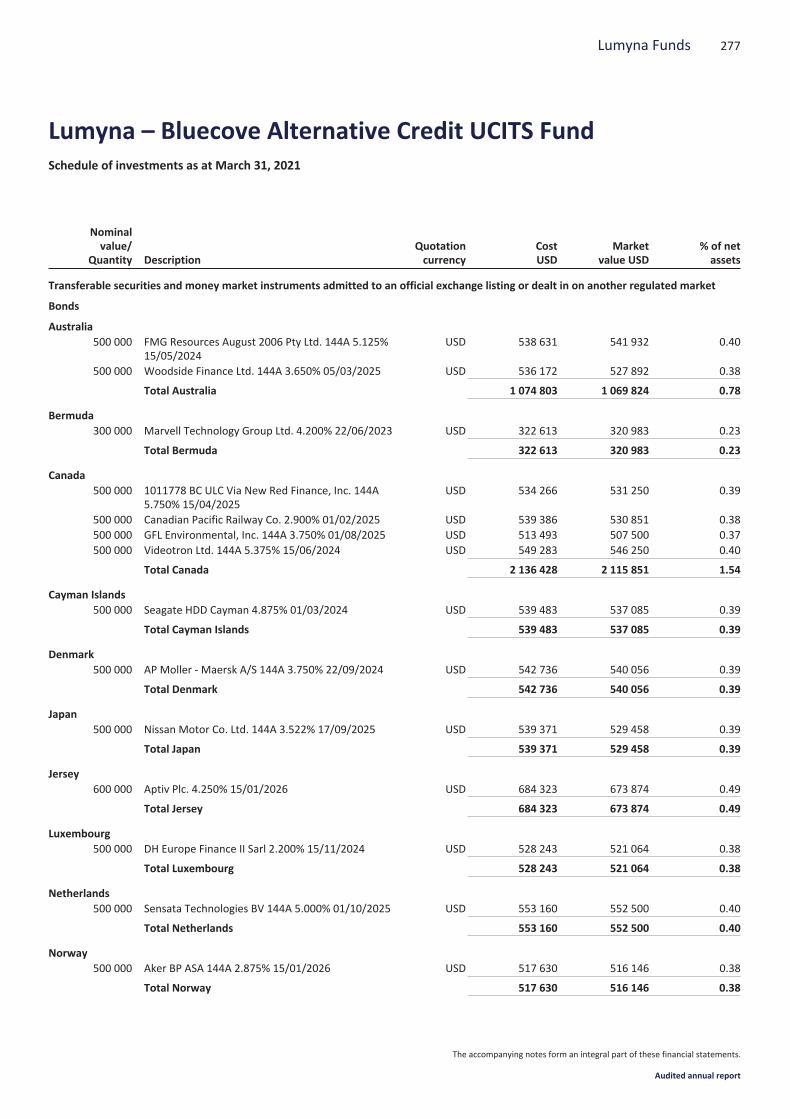
Nominalvalue/
Quantity DescriptionQuotationcurrency
CostUSD
Marketvalue USD
% of netassets
Transferable securities and money market instruments admitted to an official exchange listing or dealt in on another regulated market
Bonds
Australia500 000 FMG Resources August 2006 Pty Ltd. 144A 5.125%
15/05/2024USD 538 631 541 932 0.40
500 000 Woodside Finance Ltd. 144A 3.650% 05/03/2025 USD 536 172 527 892 0.38
Total Australia 1 074 803 1 069 824 0.78
Bermuda300 000 Marvell Technology Group Ltd. 4.200% 22/06/2023 USD 322 613 320 983 0.23
Total Bermuda 322 613 320 983 0.23
Canada500 000 1011778 BC ULC Via New Red Finance, Inc. 144A
5.750% 15/04/2025USD 534 266 531 250 0.39
500 000 Canadian Pacific Railway Co. 2.900% 01/02/2025 USD 539 386 530 851 0.38500 000 GFL Environmental, Inc. 144A 3.750% 01/08/2025 USD 513 493 507 500 0.37500 000 Videotron Ltd. 144A 5.375% 15/06/2024 USD 549 283 546 250 0.40
Total Canada 2 136 428 2 115 851 1.54
Cayman Islands500 000 Seagate HDD Cayman 4.875% 01/03/2024 USD 539 483 537 085 0.39
Total Cayman Islands 539 483 537 085 0.39
Denmark500 000 AP Moller - Maersk A/S 144A 3.750% 22/09/2024 USD 542 736 540 056 0.39
Total Denmark 542 736 540 056 0.39
Japan500 000 Nissan Motor Co. Ltd. 144A 3.522% 17/09/2025 USD 539 371 529 458 0.39
Total Japan 539 371 529 458 0.39
Jersey600 000 Aptiv Plc. 4.250% 15/01/2026 USD 684 323 673 874 0.49
Total Jersey 684 323 673 874 0.49
Luxembourg500 000 DH Europe Finance II Sarl 2.200% 15/11/2024 USD 528 243 521 064 0.38
Total Luxembourg 528 243 521 064 0.38
Netherlands500 000 Sensata Technologies BV 144A 5.000% 01/10/2025 USD 553 160 552 500 0.40
Total Netherlands 553 160 552 500 0.40
Norway500 000 Aker BP ASA 144A 2.875% 15/01/2026 USD 517 630 516 146 0.38
Total Norway 517 630 516 146 0.38
277Lumyna Funds
Lumyna – Bluecove Alternative Credit UCITS FundSchedule of investments as at March 31, 2021
The accompanying notes form an integral part of these financial statements.
Audited annual report
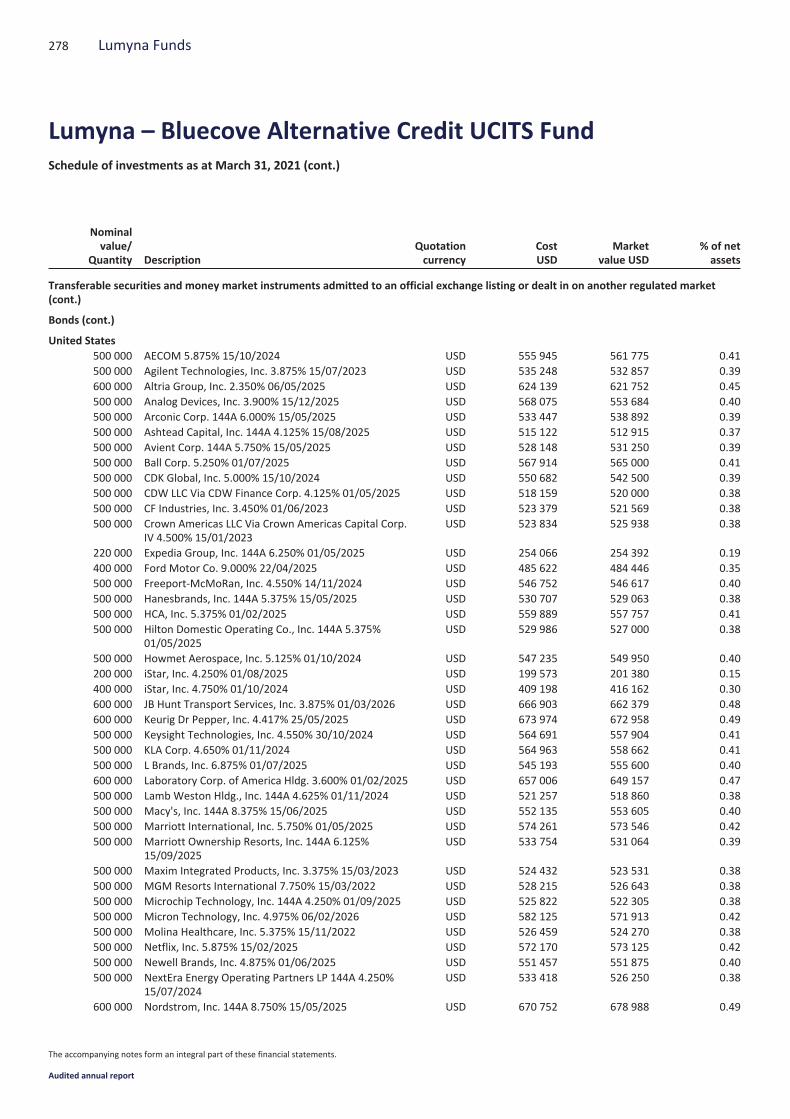
Nominalvalue/
Quantity DescriptionQuotationcurrency
CostUSD
Marketvalue USD
% of netassets
Transferable securities and money market instruments admitted to an official exchange listing or dealt in on another regulated market(cont.)
Bonds (cont.)
United States500 000 AECOM 5.875% 15/10/2024 USD 555 945 561 775 0.41500 000 Agilent Technologies, Inc. 3.875% 15/07/2023 USD 535 248 532 857 0.39600 000 Altria Group, Inc. 2.350% 06/05/2025 USD 624 139 621 752 0.45500 000 Analog Devices, Inc. 3.900% 15/12/2025 USD 568 075 553 684 0.40500 000 Arconic Corp. 144A 6.000% 15/05/2025 USD 533 447 538 892 0.39500 000 Ashtead Capital, Inc. 144A 4.125% 15/08/2025 USD 515 122 512 915 0.37500 000 Avient Corp. 144A 5.750% 15/05/2025 USD 528 148 531 250 0.39500 000 Ball Corp. 5.250% 01/07/2025 USD 567 914 565 000 0.41500 000 CDK Global, Inc. 5.000% 15/10/2024 USD 550 682 542 500 0.39500 000 CDW LLC Via CDW Finance Corp. 4.125% 01/05/2025 USD 518 159 520 000 0.38500 000 CF Industries, Inc. 3.450% 01/06/2023 USD 523 379 521 569 0.38500 000 Crown Americas LLC Via Crown Americas Capital Corp.
IV 4.500% 15/01/2023USD 523 834 525 938 0.38
220 000 Expedia Group, Inc. 144A 6.250% 01/05/2025 USD 254 066 254 392 0.19400 000 Ford Motor Co. 9.000% 22/04/2025 USD 485 622 484 446 0.35500 000 Freeport-McMoRan, Inc. 4.550% 14/11/2024 USD 546 752 546 617 0.40500 000 Hanesbrands, Inc. 144A 5.375% 15/05/2025 USD 530 707 529 063 0.38500 000 HCA, Inc. 5.375% 01/02/2025 USD 559 889 557 757 0.41500 000 Hilton Domestic Operating Co., Inc. 144A 5.375%
01/05/2025USD 529 986 527 000 0.38
500 000 Howmet Aerospace, Inc. 5.125% 01/10/2024 USD 547 235 549 950 0.40200 000 iStar, Inc. 4.250% 01/08/2025 USD 199 573 201 380 0.15400 000 iStar, Inc. 4.750% 01/10/2024 USD 409 198 416 162 0.30600 000 JB Hunt Transport Services, Inc. 3.875% 01/03/2026 USD 666 903 662 379 0.48600 000 Keurig Dr Pepper, Inc. 4.417% 25/05/2025 USD 673 974 672 958 0.49500 000 Keysight Technologies, Inc. 4.550% 30/10/2024 USD 564 691 557 904 0.41500 000 KLA Corp. 4.650% 01/11/2024 USD 564 963 558 662 0.41500 000 L Brands, Inc. 6.875% 01/07/2025 USD 545 193 555 600 0.40600 000 Laboratory Corp. of America Hldg. 3.600% 01/02/2025 USD 657 006 649 157 0.47500 000 Lamb Weston Hldg., Inc. 144A 4.625% 01/11/2024 USD 521 257 518 860 0.38500 000 Macy's, Inc. 144A 8.375% 15/06/2025 USD 552 135 553 605 0.40500 000 Marriott International, Inc. 5.750% 01/05/2025 USD 574 261 573 546 0.42500 000 Marriott Ownership Resorts, Inc. 144A 6.125%
15/09/2025USD 533 754 531 064 0.39
500 000 Maxim Integrated Products, Inc. 3.375% 15/03/2023 USD 524 432 523 531 0.38500 000 MGM Resorts International 7.750% 15/03/2022 USD 528 215 526 643 0.38500 000 Microchip Technology, Inc. 144A 4.250% 01/09/2025 USD 525 822 522 305 0.38500 000 Micron Technology, Inc. 4.975% 06/02/2026 USD 582 125 571 913 0.42500 000 Molina Healthcare, Inc. 5.375% 15/11/2022 USD 526 459 524 270 0.38500 000 Netflix, Inc. 5.875% 15/02/2025 USD 572 170 573 125 0.42500 000 Newell Brands, Inc. 4.875% 01/06/2025 USD 551 457 551 875 0.40500 000 NextEra Energy Operating Partners LP 144A 4.250%
15/07/2024USD 533 418 526 250 0.38
600 000 Nordstrom, Inc. 144A 8.750% 15/05/2025 USD 670 752 678 988 0.49
278 Lumyna Funds
Lumyna – Bluecove Alternative Credit UCITS FundSchedule of investments as at March 31, 2021 (cont.)
The accompanying notes form an integral part of these financial statements.
Audited annual report
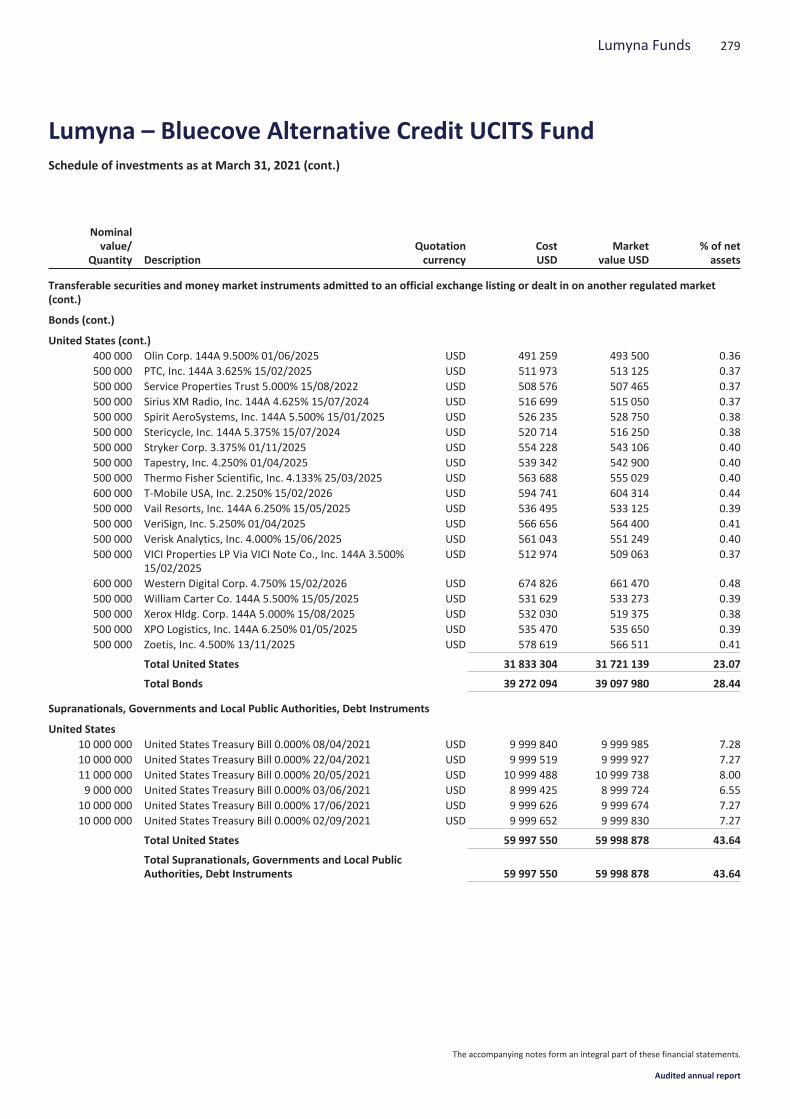
Nominalvalue/
Quantity DescriptionQuotationcurrency
CostUSD
Marketvalue USD
% of netassets
Transferable securities and money market instruments admitted to an official exchange listing or dealt in on another regulated market(cont.)
Bonds (cont.)
United States (cont.)400 000 Olin Corp. 144A 9.500% 01/06/2025 USD 491 259 493 500 0.36500 000 PTC, Inc. 144A 3.625% 15/02/2025 USD 511 973 513 125 0.37500 000 Service Properties Trust 5.000% 15/08/2022 USD 508 576 507 465 0.37500 000 Sirius XM Radio, Inc. 144A 4.625% 15/07/2024 USD 516 699 515 050 0.37500 000 Spirit AeroSystems, Inc. 144A 5.500% 15/01/2025 USD 526 235 528 750 0.38500 000 Stericycle, Inc. 144A 5.375% 15/07/2024 USD 520 714 516 250 0.38500 000 Stryker Corp. 3.375% 01/11/2025 USD 554 228 543 106 0.40500 000 Tapestry, Inc. 4.250% 01/04/2025 USD 539 342 542 900 0.40500 000 Thermo Fisher Scientific, Inc. 4.133% 25/03/2025 USD 563 688 555 029 0.40600 000 T-Mobile USA, Inc. 2.250% 15/02/2026 USD 594 741 604 314 0.44500 000 Vail Resorts, Inc. 144A 6.250% 15/05/2025 USD 536 495 533 125 0.39500 000 VeriSign, Inc. 5.250% 01/04/2025 USD 566 656 564 400 0.41500 000 Verisk Analytics, Inc. 4.000% 15/06/2025 USD 561 043 551 249 0.40500 000 VICI Properties LP Via VICI Note Co., Inc. 144A 3.500%
15/02/2025USD 512 974 509 063 0.37
600 000 Western Digital Corp. 4.750% 15/02/2026 USD 674 826 661 470 0.48500 000 William Carter Co. 144A 5.500% 15/05/2025 USD 531 629 533 273 0.39500 000 Xerox Hldg. Corp. 144A 5.000% 15/08/2025 USD 532 030 519 375 0.38500 000 XPO Logistics, Inc. 144A 6.250% 01/05/2025 USD 535 470 535 650 0.39500 000 Zoetis, Inc. 4.500% 13/11/2025 USD 578 619 566 511 0.41
Total United States 31 833 304 31 721 139 23.07
Total Bonds 39 272 094 39 097 980 28.44
Supranationals, Governments and Local Public Authorities, Debt Instruments
United States10 000 000 United States Treasury Bill 0.000% 08/04/2021 USD 9 999 840 9 999 985 7.2810 000 000 United States Treasury Bill 0.000% 22/04/2021 USD 9 999 519 9 999 927 7.2711 000 000 United States Treasury Bill 0.000% 20/05/2021 USD 10 999 488 10 999 738 8.009 000 000 United States Treasury Bill 0.000% 03/06/2021 USD 8 999 425 8 999 724 6.55
10 000 000 United States Treasury Bill 0.000% 17/06/2021 USD 9 999 626 9 999 674 7.2710 000 000 United States Treasury Bill 0.000% 02/09/2021 USD 9 999 652 9 999 830 7.27
Total United States 59 997 550 59 998 878 43.64
Total Supranationals, Governments and Local PublicAuthorities, Debt Instruments 59 997 550 59 998 878 43.64
279Lumyna Funds
Lumyna – Bluecove Alternative Credit UCITS FundSchedule of investments as at March 31, 2021 (cont.)
The accompanying notes form an integral part of these financial statements.
Audited annual report
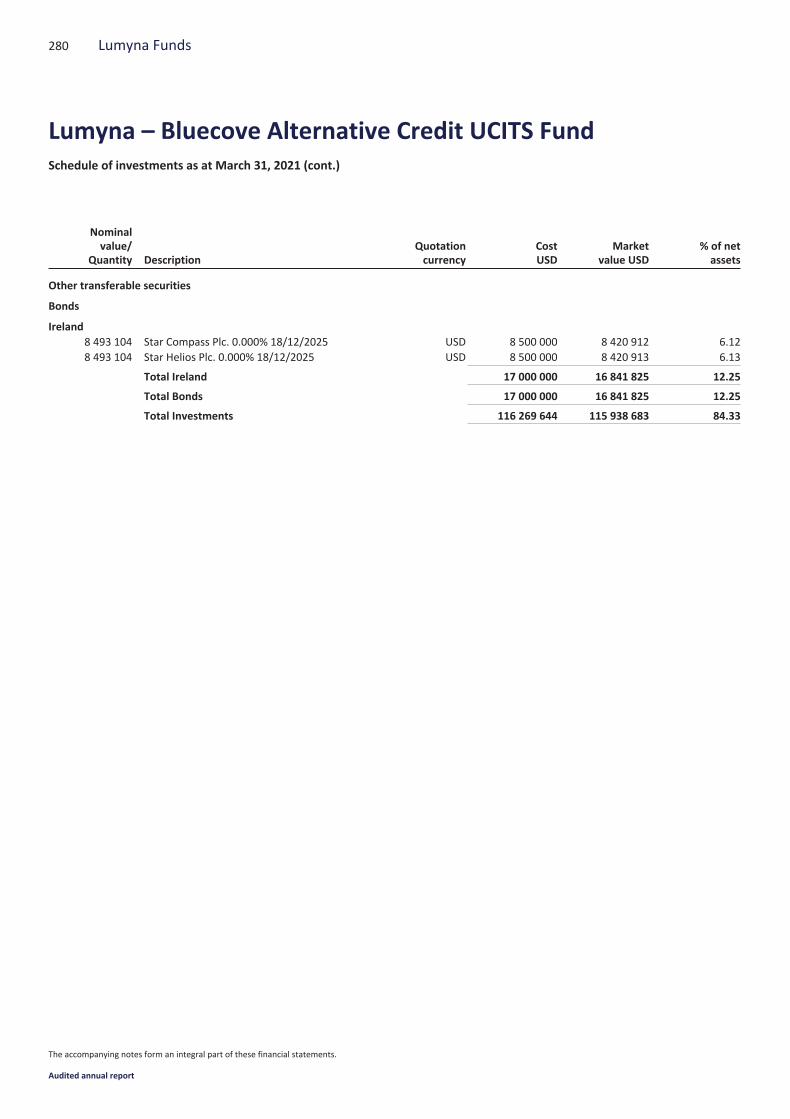
Nominalvalue/
Quantity DescriptionQuotationcurrency
CostUSD
Marketvalue USD
% of netassets
Other transferable securities
Bonds
Ireland8 493 104 Star Compass Plc. 0.000% 18/12/2025 USD 8 500 000 8 420 912 6.128 493 104 Star Helios Plc. 0.000% 18/12/2025 USD 8 500 000 8 420 913 6.13
Total Ireland 17 000 000 16 841 825 12.25
Total Bonds 17 000 000 16 841 825 12.25
Total Investments 116 269 644 115 938 683 84.33
280 Lumyna Funds
Lumyna – Bluecove Alternative Credit UCITS FundSchedule of investments as at March 31, 2021 (cont.)
The accompanying notes form an integral part of these financial statements.
Audited annual report
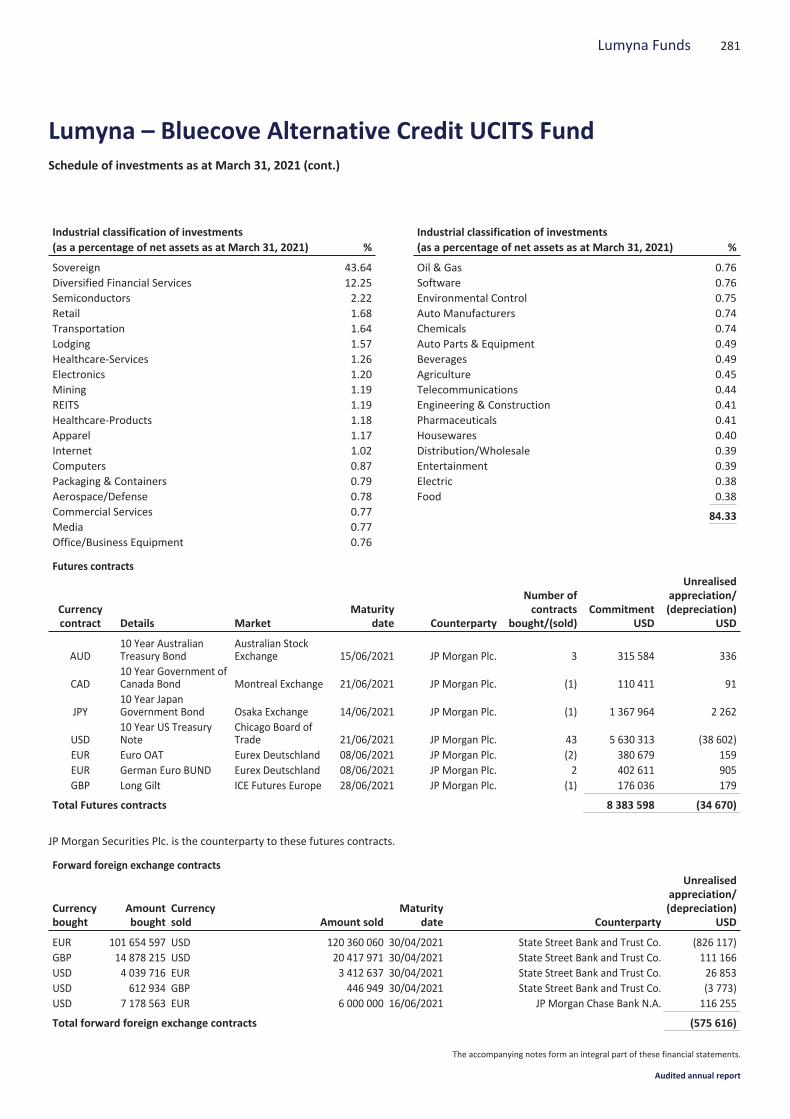
Industrial classification of investments(as a percentage of net assets as at March 31, 2021) %
Sovereign 43.64Diversified Financial Services 12.25Semiconductors 2.22Retail 1.68Transportation 1.64Lodging 1.57Healthcare-Services 1.26Electronics 1.20Mining 1.19REITS 1.19Healthcare-Products 1.18Apparel 1.17Internet 1.02Computers 0.87Packaging & Containers 0.79Aerospace/Defense 0.78Commercial Services 0.77Media 0.77Office/Business Equipment 0.76
Industrial classification of investments(as a percentage of net assets as at March 31, 2021) %
Oil & Gas 0.76Software 0.76Environmental Control 0.75Auto Manufacturers 0.74Chemicals 0.74Auto Parts & Equipment 0.49Beverages 0.49Agriculture 0.45Telecommunications 0.44Engineering & Construction 0.41Pharmaceuticals 0.41Housewares 0.40Distribution/Wholesale 0.39Entertainment 0.39Electric 0.38Food 0.38
84.33
Futures contracts
Currencycontract Details Market
Maturitydate Counterparty
Number ofcontracts
bought/(sold)Commitment
USD
Unrealisedappreciation/(depreciation)
USD
AUD10 Year AustralianTreasury Bond
Australian StockExchange 15/06/2021 JP Morgan Plc. 3 315 584 336
CAD10 Year Government ofCanada Bond Montreal Exchange 21/06/2021 JP Morgan Plc. (1) 110 411 91
JPY10 Year JapanGovernment Bond Osaka Exchange 14/06/2021 JP Morgan Plc. (1) 1 367 964 2 262
USD10 Year US TreasuryNote
Chicago Board ofTrade 21/06/2021 JP Morgan Plc. 43 5 630 313 (38 602)
EUR Euro OAT Eurex Deutschland 08/06/2021 JP Morgan Plc. (2) 380 679 159EUR German Euro BUND Eurex Deutschland 08/06/2021 JP Morgan Plc. 2 402 611 905GBP Long Gilt ICE Futures Europe 28/06/2021 JP Morgan Plc. (1) 176 036 179
Total Futures contracts 8 383 598 (34 670)
JP Morgan Securities Plc. is the counterparty to these futures contracts.
Forward foreign exchange contracts
Currencybought
Amountbought
Currencysold Amount sold
Maturitydate Counterparty
Unrealisedappreciation/(depreciation)
USD
EUR 101 654 597 USD 120 360 060 30/04/2021 State Street Bank and Trust Co. (826 117)GBP 14 878 215 USD 20 417 971 30/04/2021 State Street Bank and Trust Co. 111 166USD 4 039 716 EUR 3 412 637 30/04/2021 State Street Bank and Trust Co. 26 853USD 612 934 GBP 446 949 30/04/2021 State Street Bank and Trust Co. (3 773)USD 7 178 563 EUR 6 000 000 16/06/2021 JP Morgan Chase Bank N.A. 116 255
Total forward foreign exchange contracts (575 616)
281Lumyna Funds
Lumyna – Bluecove Alternative Credit UCITS FundSchedule of investments as at March 31, 2021 (cont.)
The accompanying notes form an integral part of these financial statements.
Audited annual report

Credit default swaps
Notional Pay Receive CurrencyMaturity
date Counterparty
Unrealisedappreciation/depreciation
USDCommitment
USD
1 800 000 Accor 2.38%17/9/2023
Fixed 1.00% EUR 20/06/2026 J.P. Morgan SecuritiesLimited 6 409 1 800 000
3 200 000 Advanced MicroDevices, Inc 7.50%15/7/2022
Fixed 5.00% USD 20/06/2026 J.P. Morgan SecuritiesLLC
(156) 3 200 0003 200 000 Aktiebolaget Volvo
1.63% 26/5/2025Fixed 1.00% EUR 20/06/2026 J.P. Morgan Securities
Limited (2 229) 3 200 0003 700 000 Altria Group, Inc.
4.75% 5/5/2021Fixed 1.00% USD 20/06/2026 J.P. Morgan Securities
LLC 27 858 3 700 0002 200 000 American Airlines
Group Inc 5.00%1/7/2022
Fixed 5.00% USD 20/06/2026 J.P. Morgan SecuritiesLLC
(9 966) 2 200 0001 800 000 Amgen Inc. 3.63%
22/5/2024Fixed 1.00% USD 20/06/2026 J.P. Morgan Securities
LLC 6 632 1 800 0003 400 000 Amkor Technology,
Inc. 6.63%15/09/2027
Fixed 5.00% USD 20/06/2026 J.P. Morgan SecuritiesLLC
17 159 3 400 0002 700 000 Anglo American Plc
4.13% 15/4/2021Fixed 5.00% EUR 20/06/2026 J.P. Morgan Securities
Limited (27 963) 2 700 0002 700 000 ArcelorMittal 1.00%
19/05/2023Fixed 5.00% EUR 20/06/2026 J.P. Morgan Securities
Limited 3 411 2 700 0003 900 000 Avnet, Inc. 4.88%
1/12/2022Fixed 1.00% USD 20/06/2026 J.P. Morgan Securities
LLC 4 408 3 900 0003 100 000 Block Financial LLC
5.50% 1/11/2022Fixed 5.00% USD 20/06/2026 J.P. Morgan Securities
LLC 8 861 3 100 0001 400 000 Carrefour 1.25%
3/6/2025Fixed 1.00% EUR 20/06/2026 J.P. Morgan Securities
Limited 6 747 1 400 0001 900 000 Casino
Guichard-Perrachon1.87% 13/6/2022
Fixed 5.00% EUR 20/06/2026 J.P. Morgan SecuritiesLimited
7 904 1 900 0001 800 000 CCO Holdings, LLC
5.00% 1/2/2028Fixed 5.00% USD 20/06/2026 J.P. Morgan Securities
LLC (775) 1 800 0005 300 000 CDX.NA.HY 36v1 Fixed 5.00% USD 20/06/2026 J.P. Morgan Securities
LLC 19 686 5 300 00014 900 000 CDX.NA.IG 36v1 Fixed 1.00% USD 20/06/2026 J.P. Morgan Securities
LLC 58 347 14 900 0002 700 000 Clariant AG 1.13%
15/4/2026Fixed 1.00% EUR 20/06/2026 J.P. Morgan Securities
Limited 23 431 2 700 0002 700 000 CNH Industrial N .V
2.88% 17/5/2023Fixed 5.00% EUR 20/06/2026 J.P. Morgan Securities
Limited (14 022) 2 700 000800 000 Cooper Tire &
Rubber Company7.63% 15/3/2027
Fixed 5.00% USD 20/12/2025 J.P. Morgan SecuritiesLLC
21 216 800 0002 700 000 Deere & Company
2.60% 8/6/2022Fixed 1.00% USD 20/06/2026 J.P. Morgan Securities
LLC 6 666 2 700 0004 200 000 Devon Energy
Corporation 7.95%15/04/2032
Fixed 1.00% USD 20/06/2026 J.P. Morgan SecuritiesLLC
(35 186) 4 200 0002 600 000 DISH DBS
Corporation 6.75%1/6/2021
Fixed 5.00% USD 20/06/2026 J.P. Morgan SecuritiesLLC
(243) 2 600 0001 400 000 EDP Finance B.V
1.88% 29/09/2023Fixed 1.00% EUR 20/06/2026 J.P. Morgan Securities
Limited (2 429) 1 400 000
282 Lumyna Funds
Lumyna – Bluecove Alternative Credit UCITS FundSchedule of investments as at March 31, 2021 (cont.)
The accompanying notes form an integral part of these financial statements.
Audited annual report
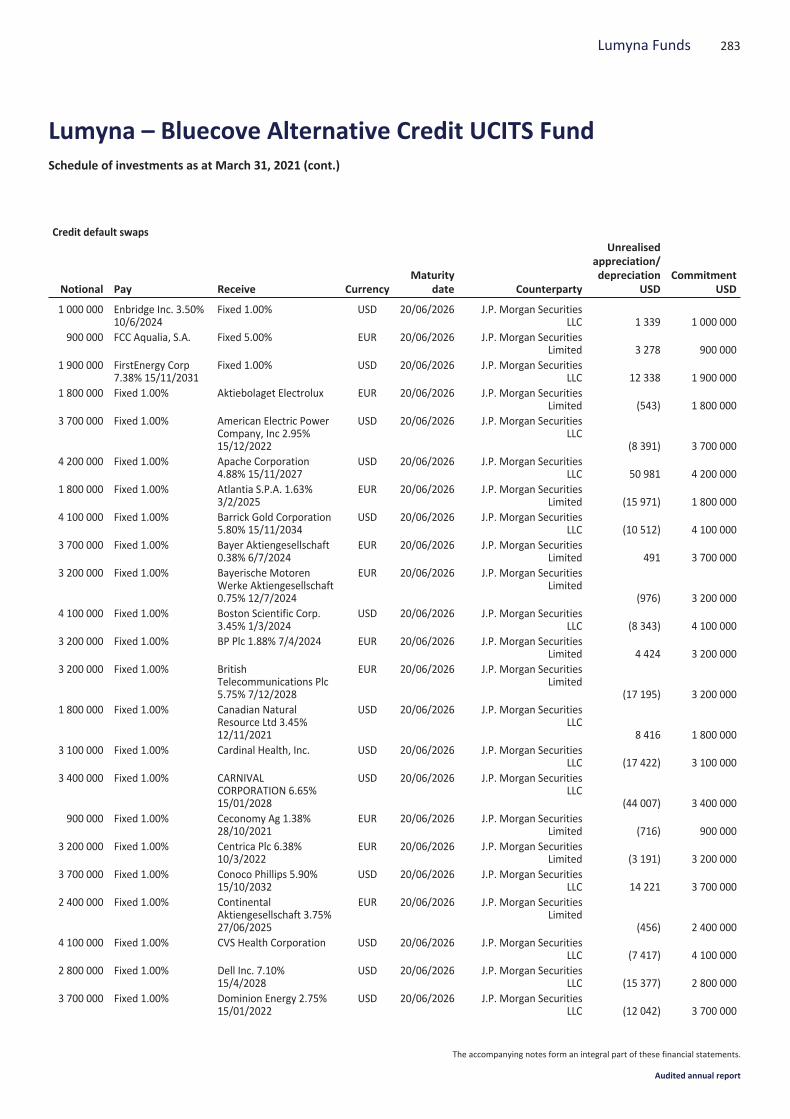
Credit default swaps
Notional Pay Receive CurrencyMaturity
date Counterparty
Unrealisedappreciation/depreciation
USDCommitment
USD
1 000 000 Enbridge Inc. 3.50%10/6/2024
Fixed 1.00% USD 20/06/2026 J.P. Morgan SecuritiesLLC 1 339 1 000 000
900 000 FCC Aqualia, S.A. Fixed 5.00% EUR 20/06/2026 J.P. Morgan SecuritiesLimited 3 278 900 000
1 900 000 FirstEnergy Corp7.38% 15/11/2031
Fixed 1.00% USD 20/06/2026 J.P. Morgan SecuritiesLLC 12 338 1 900 000
1 800 000 Fixed 1.00% Aktiebolaget Electrolux EUR 20/06/2026 J.P. Morgan SecuritiesLimited (543) 1 800 000
3 700 000 Fixed 1.00% American Electric PowerCompany, Inc 2.95%15/12/2022
USD 20/06/2026 J.P. Morgan SecuritiesLLC
(8 391) 3 700 0004 200 000 Fixed 1.00% Apache Corporation
4.88% 15/11/2027USD 20/06/2026 J.P. Morgan Securities
LLC 50 981 4 200 0001 800 000 Fixed 1.00% Atlantia S.P.A. 1.63%
3/2/2025EUR 20/06/2026 J.P. Morgan Securities
Limited (15 971) 1 800 0004 100 000 Fixed 1.00% Barrick Gold Corporation
5.80% 15/11/2034USD 20/06/2026 J.P. Morgan Securities
LLC (10 512) 4 100 0003 700 000 Fixed 1.00% Bayer Aktiengesellschaft
0.38% 6/7/2024EUR 20/06/2026 J.P. Morgan Securities
Limited 491 3 700 0003 200 000 Fixed 1.00% Bayerische Motoren
Werke Aktiengesellschaft0.75% 12/7/2024
EUR 20/06/2026 J.P. Morgan SecuritiesLimited
(976) 3 200 0004 100 000 Fixed 1.00% Boston Scientific Corp.
3.45% 1/3/2024USD 20/06/2026 J.P. Morgan Securities
LLC (8 343) 4 100 0003 200 000 Fixed 1.00% BP Plc 1.88% 7/4/2024 EUR 20/06/2026 J.P. Morgan Securities
Limited 4 424 3 200 0003 200 000 Fixed 1.00% British
Telecommunications Plc5.75% 7/12/2028
EUR 20/06/2026 J.P. Morgan SecuritiesLimited
(17 195) 3 200 0001 800 000 Fixed 1.00% Canadian Natural
Resource Ltd 3.45%12/11/2021
USD 20/06/2026 J.P. Morgan SecuritiesLLC
8 416 1 800 0003 100 000 Fixed 1.00% Cardinal Health, Inc. USD 20/06/2026 J.P. Morgan Securities
LLC (17 422) 3 100 0003 400 000 Fixed 1.00% CARNIVAL
CORPORATION 6.65%15/01/2028
USD 20/06/2026 J.P. Morgan SecuritiesLLC
(44 007) 3 400 000900 000 Fixed 1.00% Ceconomy Ag 1.38%
28/10/2021EUR 20/06/2026 J.P. Morgan Securities
Limited (716) 900 0003 200 000 Fixed 1.00% Centrica Plc 6.38%
10/3/2022EUR 20/06/2026 J.P. Morgan Securities
Limited (3 191) 3 200 0003 700 000 Fixed 1.00% Conoco Phillips 5.90%
15/10/2032USD 20/06/2026 J.P. Morgan Securities
LLC 14 221 3 700 0002 400 000 Fixed 1.00% Continental
Aktiengesellschaft 3.75%27/06/2025
EUR 20/06/2026 J.P. Morgan SecuritiesLimited
(456) 2 400 0004 100 000 Fixed 1.00% CVS Health Corporation USD 20/06/2026 J.P. Morgan Securities
LLC (7 417) 4 100 0002 800 000 Fixed 1.00% Dell Inc. 7.10%
15/4/2028USD 20/06/2026 J.P. Morgan Securities
LLC (15 377) 2 800 0003 700 000 Fixed 1.00% Dominion Energy 2.75%
15/01/2022USD 20/06/2026 J.P. Morgan Securities
LLC (12 042) 3 700 000
283Lumyna Funds
Lumyna – Bluecove Alternative Credit UCITS FundSchedule of investments as at March 31, 2021 (cont.)
The accompanying notes form an integral part of these financial statements.
Audited annual report

Credit default swaps
Notional Pay Receive CurrencyMaturity
date Counterparty
Unrealisedappreciation/depreciation
USDCommitment
USD
3 900 000 Fixed 1.00% Domtar Corporation4.40% 1/4/2022
USD 20/06/2026 J.P. Morgan SecuritiesLLC 5 435 3 900 000
2 700 000 Fixed 1.00% E.ON SE 0.88%22/5/2024
EUR 20/06/2026 J.P. Morgan SecuritiesLimited (592) 2 700 000
2 000 000 Fixed 1.00% Eastman ChemicalCompany 7.60%1/2/2027
USD 20/06/2026 J.P. Morgan SecuritiesLLC
(2 803) 2 000 0002 700 000 Fixed 1.00% Electricite de France
5.63% 21/2/2033EUR 20/06/2026 J.P. Morgan Securities
Limited (8 898) 2 700 0003 200 000 Fixed 1.00% Energy Transfer
Operating, L.P.USD 20/06/2026 J.P. Morgan Securities
LLC (13 893) 3 200 0003 700 000 Fixed 1.00% Engie 1.50% 27/3/2028 EUR 20/06/2026 J.P. Morgan Securities
Limited 16 694 3 700 0003 200 000 Fixed 1.00% ERP Operating Ltd 4.63%
15/12/2021USD 20/06/2026 J.P. Morgan Securities
LLC (2 288) 3 200 0003 700 000 Fixed 1.00% Exelon Corporation USD 20/06/2026 J.P. Morgan Securities
LLC (14 159) 3 700 0003 300 000 Fixed 1.00% Expedia Group, Inc.
4.50% 15/8/2024USD 20/06/2026 J.P. Morgan Securities
LLC (1 083) 3 300 0003 900 000 Fixed 1.00% Halliburton Company USD 20/06/2026 J.P. Morgan Securities
LLC 24 600 3 900 0002 600 000 Fixed 1.00% Host Hotels & Resorts,
L.P.USD 20/06/2026 J.P. Morgan Securities
LLC 8 851 2 600 0002 000 000 Fixed 1.00% Imperial Brand PLC
1.38% 27/1/2025EUR 20/06/2026 J.P. Morgan Securities
Limited (5 907) 2 000 0003 700 000 Fixed 1.00% International Business
Machines CorporationUSD 20/06/2026 J.P. Morgan Securities
LLC (2 537) 3 700 0002 700 000 Fixed 1.00% International Paper
CompanyUSD 20/06/2026 J.P. Morgan Securities
LLC (7 521) 2 700 000200 000 Fixed 1.00% Lagardere SCA 2.75%
13/4/2023EUR 20/06/2026 J.P. Morgan Securities
Limited (1 677) 200 0002 200 000 Fixed 1.00% M.D.C. Holdings, Inc
5.50% 15/1/2024USD 20/06/2026 J.P. Morgan Securities
LLC (7 909) 2 200 000600 000 Fixed 1.00% Murphy Oil Corporation USD 20/06/2026 J.P. Morgan Securities
LLC (1 112) 600 0003 700 000 Fixed 1.00% Newmont Corporation USD 20/06/2026 J.P. Morgan Securities
LLC (6 060) 3 700 0003 700 000 Fixed 1.00% Northrop Grumman
Corporation 7.75%15/02/2031
USD 20/06/2026 J.P. Morgan SecuritiesLLC
(7 327) 3 700 000900 000 Fixed 1.00% Occidental Petroleum
Corporation 5.55%15/03/2026
USD 20/06/2026 J.P. Morgan SecuritiesLLC
(5 737) 900 0003 200 000 Fixed 1.00% Orange 0.75% 11/9/2023 EUR 20/06/2026 J.P. Morgan Securities
Limited (1 228) 3 200 0002 400 000 Fixed 1.00% Pitney Bowes Inc 4.70%
1/4/2023USD 20/06/2026 J.P. Morgan Securities
LLC 22 290 2 400 000900 000 Fixed 1.00% Renault 1.00%
28/11/2025EUR 20/06/2026 J.P. Morgan Securities
Limited (9 115) 900 0001 800 000 Fixed 1.00% Repsol, S.A. 2.25%
10/12/2026EUR 20/06/2026 J.P. Morgan Securities
Limited 13 304 1 800 0003 800 000 Fixed 1.00% Rolls-Royce Plc 2.13%
18/6/2021EUR 20/06/2026 J.P. Morgan Securities
Limited (27 572) 3 800 000
284 Lumyna Funds
Lumyna – Bluecove Alternative Credit UCITS FundSchedule of investments as at March 31, 2021 (cont.)
The accompanying notes form an integral part of these financial statements.
Audited annual report
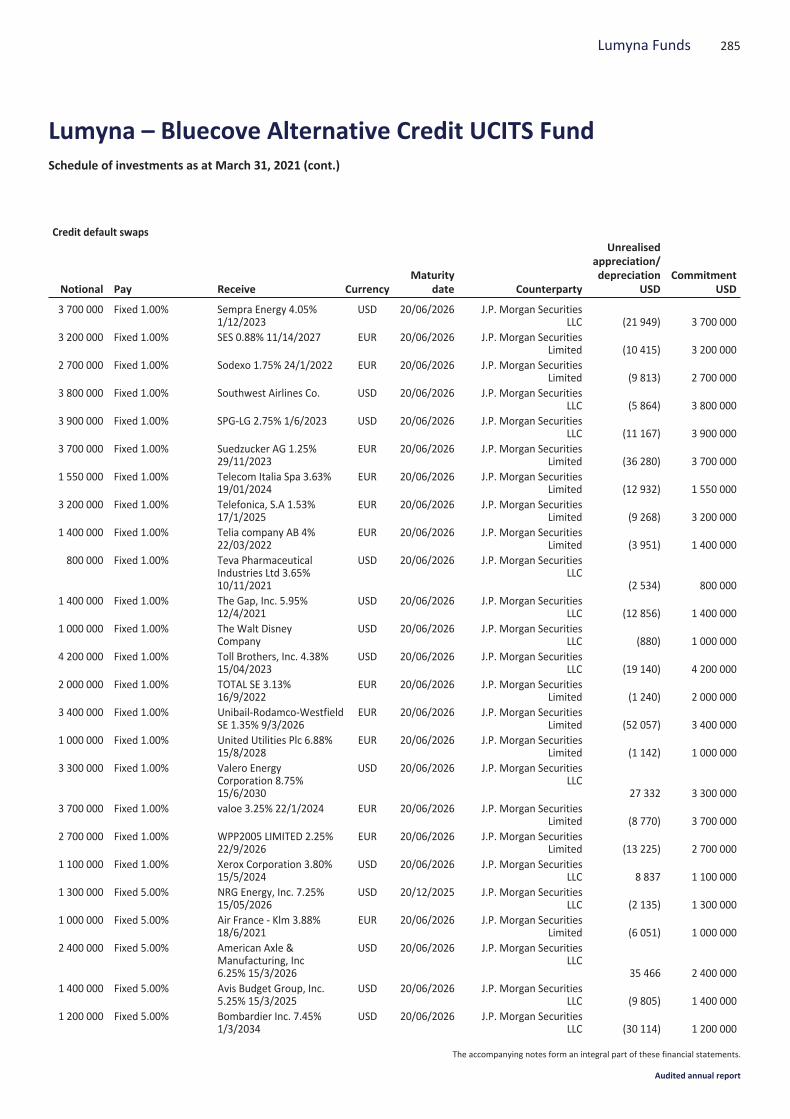
Credit default swaps
Notional Pay Receive CurrencyMaturity
date Counterparty
Unrealisedappreciation/depreciation
USDCommitment
USD
3 700 000 Fixed 1.00% Sempra Energy 4.05%1/12/2023
USD 20/06/2026 J.P. Morgan SecuritiesLLC (21 949) 3 700 000
3 200 000 Fixed 1.00% SES 0.88% 11/14/2027 EUR 20/06/2026 J.P. Morgan SecuritiesLimited (10 415) 3 200 000
2 700 000 Fixed 1.00% Sodexo 1.75% 24/1/2022 EUR 20/06/2026 J.P. Morgan SecuritiesLimited (9 813) 2 700 000
3 800 000 Fixed 1.00% Southwest Airlines Co. USD 20/06/2026 J.P. Morgan SecuritiesLLC (5 864) 3 800 000
3 900 000 Fixed 1.00% SPG-LG 2.75% 1/6/2023 USD 20/06/2026 J.P. Morgan SecuritiesLLC (11 167) 3 900 000
3 700 000 Fixed 1.00% Suedzucker AG 1.25%29/11/2023
EUR 20/06/2026 J.P. Morgan SecuritiesLimited (36 280) 3 700 000
1 550 000 Fixed 1.00% Telecom Italia Spa 3.63%19/01/2024
EUR 20/06/2026 J.P. Morgan SecuritiesLimited (12 932) 1 550 000
3 200 000 Fixed 1.00% Telefonica, S.A 1.53%17/1/2025
EUR 20/06/2026 J.P. Morgan SecuritiesLimited (9 268) 3 200 000
1 400 000 Fixed 1.00% Telia company AB 4%22/03/2022
EUR 20/06/2026 J.P. Morgan SecuritiesLimited (3 951) 1 400 000
800 000 Fixed 1.00% Teva PharmaceuticalIndustries Ltd 3.65%10/11/2021
USD 20/06/2026 J.P. Morgan SecuritiesLLC
(2 534) 800 0001 400 000 Fixed 1.00% The Gap, Inc. 5.95%
12/4/2021USD 20/06/2026 J.P. Morgan Securities
LLC (12 856) 1 400 0001 000 000 Fixed 1.00% The Walt Disney
CompanyUSD 20/06/2026 J.P. Morgan Securities
LLC (880) 1 000 0004 200 000 Fixed 1.00% Toll Brothers, Inc. 4.38%
15/04/2023USD 20/06/2026 J.P. Morgan Securities
LLC (19 140) 4 200 0002 000 000 Fixed 1.00% TOTAL SE 3.13%
16/9/2022EUR 20/06/2026 J.P. Morgan Securities
Limited (1 240) 2 000 0003 400 000 Fixed 1.00% Unibail-Rodamco-Westfield
SE 1.35% 9/3/2026EUR 20/06/2026 J.P. Morgan Securities
Limited (52 057) 3 400 0001 000 000 Fixed 1.00% United Utilities Plc 6.88%
15/8/2028EUR 20/06/2026 J.P. Morgan Securities
Limited (1 142) 1 000 0003 300 000 Fixed 1.00% Valero Energy
Corporation 8.75%15/6/2030
USD 20/06/2026 J.P. Morgan SecuritiesLLC
27 332 3 300 0003 700 000 Fixed 1.00% valoe 3.25% 22/1/2024 EUR 20/06/2026 J.P. Morgan Securities
Limited (8 770) 3 700 0002 700 000 Fixed 1.00% WPP2005 LIMITED 2.25%
22/9/2026EUR 20/06/2026 J.P. Morgan Securities
Limited (13 225) 2 700 0001 100 000 Fixed 1.00% Xerox Corporation 3.80%
15/5/2024USD 20/06/2026 J.P. Morgan Securities
LLC 8 837 1 100 0001 300 000 Fixed 5.00% NRG Energy, Inc. 7.25%
15/05/2026USD 20/12/2025 J.P. Morgan Securities
LLC (2 135) 1 300 0001 000 000 Fixed 5.00% Air France - Klm 3.88%
18/6/2021EUR 20/06/2026 J.P. Morgan Securities
Limited (6 051) 1 000 0002 400 000 Fixed 5.00% American Axle &
Manufacturing, Inc6.25% 15/3/2026
USD 20/06/2026 J.P. Morgan SecuritiesLLC
35 466 2 400 0001 400 000 Fixed 5.00% Avis Budget Group, Inc.
5.25% 15/3/2025USD 20/06/2026 J.P. Morgan Securities
LLC (9 805) 1 400 0001 200 000 Fixed 5.00% Bombardier Inc. 7.45%
1/3/2034USD 20/06/2026 J.P. Morgan Securities
LLC (30 114) 1 200 000
285Lumyna Funds
Lumyna – Bluecove Alternative Credit UCITS FundSchedule of investments as at March 31, 2021 (cont.)
The accompanying notes form an integral part of these financial statements.
Audited annual report
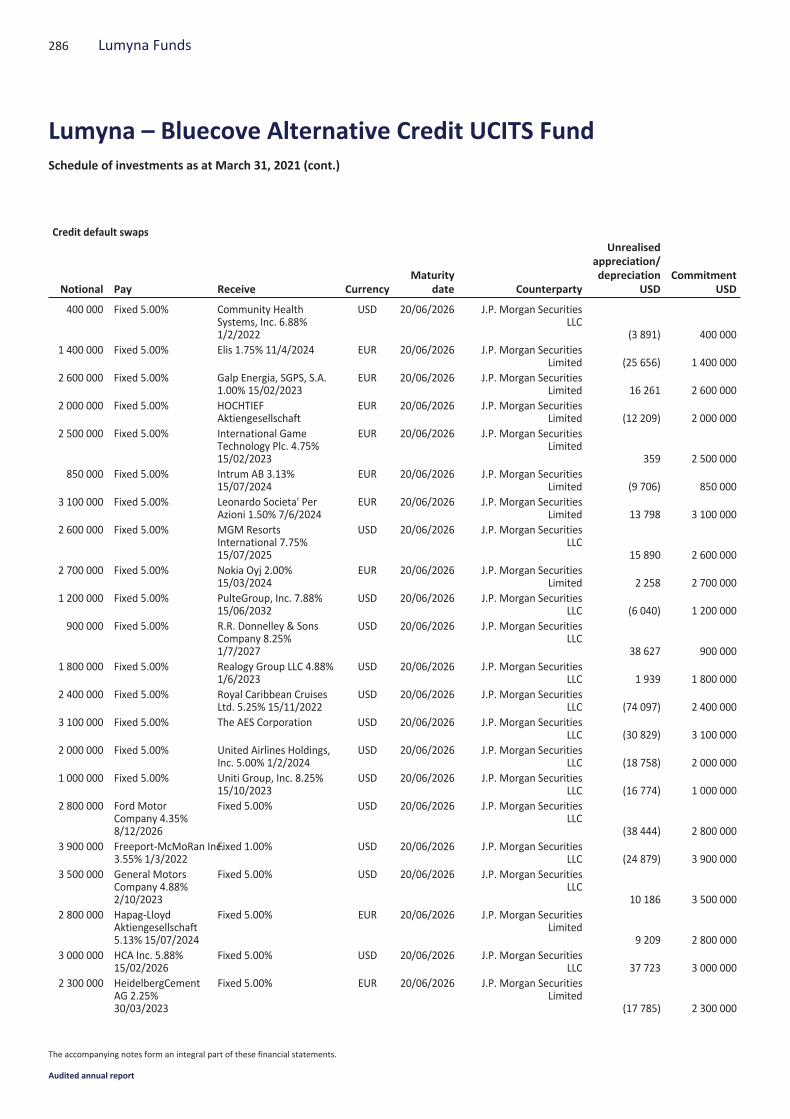
Credit default swaps
Notional Pay Receive CurrencyMaturity
date Counterparty
Unrealisedappreciation/depreciation
USDCommitment
USD
400 000 Fixed 5.00% Community HealthSystems, Inc. 6.88%1/2/2022
USD 20/06/2026 J.P. Morgan SecuritiesLLC
(3 891) 400 0001 400 000 Fixed 5.00% Elis 1.75% 11/4/2024 EUR 20/06/2026 J.P. Morgan Securities
Limited (25 656) 1 400 0002 600 000 Fixed 5.00% Galp Energia, SGPS, S.A.
1.00% 15/02/2023EUR 20/06/2026 J.P. Morgan Securities
Limited 16 261 2 600 0002 000 000 Fixed 5.00% HOCHTIEF
AktiengesellschaftEUR 20/06/2026 J.P. Morgan Securities
Limited (12 209) 2 000 0002 500 000 Fixed 5.00% International Game
Technology Plc. 4.75%15/02/2023
EUR 20/06/2026 J.P. Morgan SecuritiesLimited
359 2 500 000850 000 Fixed 5.00% Intrum AB 3.13%
15/07/2024EUR 20/06/2026 J.P. Morgan Securities
Limited (9 706) 850 0003 100 000 Fixed 5.00% Leonardo Societa' Per
Azioni 1.50% 7/6/2024EUR 20/06/2026 J.P. Morgan Securities
Limited 13 798 3 100 0002 600 000 Fixed 5.00% MGM Resorts
International 7.75%15/07/2025
USD 20/06/2026 J.P. Morgan SecuritiesLLC
15 890 2 600 0002 700 000 Fixed 5.00% Nokia Oyj 2.00%
15/03/2024EUR 20/06/2026 J.P. Morgan Securities
Limited 2 258 2 700 0001 200 000 Fixed 5.00% PulteGroup, Inc. 7.88%
15/06/2032USD 20/06/2026 J.P. Morgan Securities
LLC (6 040) 1 200 000900 000 Fixed 5.00% R.R. Donnelley & Sons
Company 8.25%1/7/2027
USD 20/06/2026 J.P. Morgan SecuritiesLLC
38 627 900 0001 800 000 Fixed 5.00% Realogy Group LLC 4.88%
1/6/2023USD 20/06/2026 J.P. Morgan Securities
LLC 1 939 1 800 0002 400 000 Fixed 5.00% Royal Caribbean Cruises
Ltd. 5.25% 15/11/2022USD 20/06/2026 J.P. Morgan Securities
LLC (74 097) 2 400 0003 100 000 Fixed 5.00% The AES Corporation USD 20/06/2026 J.P. Morgan Securities
LLC (30 829) 3 100 0002 000 000 Fixed 5.00% United Airlines Holdings,
Inc. 5.00% 1/2/2024USD 20/06/2026 J.P. Morgan Securities
LLC (18 758) 2 000 0001 000 000 Fixed 5.00% Uniti Group, Inc. 8.25%
15/10/2023USD 20/06/2026 J.P. Morgan Securities
LLC (16 774) 1 000 0002 800 000 Ford Motor
Company 4.35%8/12/2026
Fixed 5.00% USD 20/06/2026 J.P. Morgan SecuritiesLLC
(38 444) 2 800 0003 900 000 Freeport-McMoRan Inc.
3.55% 1/3/2022Fixed 1.00% USD 20/06/2026 J.P. Morgan Securities
LLC (24 879) 3 900 0003 500 000 General Motors
Company 4.88%2/10/2023
Fixed 5.00% USD 20/06/2026 J.P. Morgan SecuritiesLLC
10 186 3 500 0002 800 000 Hapag-Lloyd
Aktiengesellschaft5.13% 15/07/2024
Fixed 5.00% EUR 20/06/2026 J.P. Morgan SecuritiesLimited
9 209 2 800 0003 000 000 HCA Inc. 5.88%
15/02/2026Fixed 5.00% USD 20/06/2026 J.P. Morgan Securities
LLC 37 723 3 000 0002 300 000 HeidelbergCement
AG 2.25%30/03/2023
Fixed 5.00% EUR 20/06/2026 J.P. Morgan SecuritiesLimited
(17 785) 2 300 000
286 Lumyna Funds
Lumyna – Bluecove Alternative Credit UCITS FundSchedule of investments as at March 31, 2021 (cont.)
The accompanying notes form an integral part of these financial statements.
Audited annual report

Credit default swaps
Notional Pay Receive CurrencyMaturity
date Counterparty
Unrealisedappreciation/depreciation
USDCommitment
USD
4 100 000 HP Inc. 4.65%9/12/2021
Fixed 1.00% USD 20/06/2026 J.P. Morgan SecuritiesLLC (2 103) 4 100 000
2 700 000 Iberdrola S.A 1.13%27/1/2023
Fixed 1.00% EUR 20/06/2026 J.P. Morgan SecuritiesLimited (4 975) 2 700 000
2 500 000 iStar Inc 4.25%1/7/2025
Fixed 5.00% USD 20/06/2026 J.P. Morgan SecuritiesLLC 21 475 2 500 000
11 400 000 iTraxx Europe 35 Fixed 1.00% EUR 20/06/2026 J.P. Morgan SecuritiesLimited 44 277 11 400 000
3 900 000 iTraxx EuropeCrossover Series 35
Fixed 5.00% EUR 20/06/2026 J.P. Morgan SecuritiesLimited 90 788 3 900 000
2 900 000 ITV Plc. 2.13%21/9/2022
Fixed 5.00% EUR 20/06/2026 J.P. Morgan SecuritiesLimited 15 240 2 900 000
3 200 000 Jaguar Land roverAutomotive plc5.00% 15/2/2022
Fixed 5.00% EUR 20/06/2026 J.P. Morgan SecuritiesLimited
49 981 3 200 0003 700 000 Johnson Controls
International Plc.5.00% 30/3/2020
Fixed 1.00% USD 20/06/2026 J.P. Morgan SecuritiesLLC
11 780 3 700 0001 800 000 K. Hovnanian
Enterprises, Inc.8.63% 15/1/2017
Fixed 5.00% USD 20/06/2026 J.P. Morgan SecuritiesLLC
23 255 1 800 000400 000 K+S
Aktiengesellschaft3.35% 18/7/2024
Fixed 5.00% EUR 20/06/2026 J.P. Morgan SecuritiesLimited
7 833 400 0001 400 000 Koninklijke KPN
N.V. 5.63%30/9/2024
Fixed 1.00% EUR 20/06/2026 J.P. Morgan SecuritiesLimited
12 404 1 400 0004 300 000 KSS 4.25%
17/7/2025Fixed 1.00% USD 20/06/2026 J.P. Morgan Securities
LLC 60 308 4 300 0003 300 000 L Brands, Inc 5.63%
15/10/2023Fixed 1.00% USD 20/06/2026 J.P. Morgan Securities
LLC 31 087 3 300 0003 800 000 LafargeHolcim ltd
3.00% 22/11/2022Fixed 1.00% EUR 20/06/2026 J.P. Morgan Securities
Limited 3 644 3 800 0001 400 000 Lamb Weston
Holdings, Inc 4.63%1/11/2024
Fixed 1.00% USD 20/06/2026 J.P. Morgan SecuritiesLLC
6 439 1 400 0001 800 000 LANXESS
Aktiengesellschaft0% 7/10/2021
Fixed 1.00% EUR 20/06/2026 J.P. Morgan SecuritiesLimited
(824) 1 800 0003 500 000 Lennar Corporation Fixed 5.00% USD 20/06/2026 J.P. Morgan Securities
LLC 4 917 3 500 000900 000 Louisiana-Pacific
CorporationFixed 5.00% USD 20/06/2026 J.P. Morgan Securities
LLC (13 883) 900 0003 700 000 Lowe's Companies,
Inc.Fixed 1.00% USD 20/06/2026 J.P. Morgan Securities
LLC 28 124 3 700 0003 200 000 Lvmh Moet
Hennessy LouisVuitton 0%11/2/2026
Fixed 1.00% EUR 20/06/2026 J.P. Morgan SecuritiesLimited
(2 234) 3 200 0001 000 000 Macy's, Inc. 3.63%
1/6/2024Fixed 1.00% USD 20/06/2026 J.P. Morgan Securities
LLC (24 169) 1 000 000
287Lumyna Funds
Lumyna – Bluecove Alternative Credit UCITS FundSchedule of investments as at March 31, 2021 (cont.)
The accompanying notes form an integral part of these financial statements.
Audited annual report
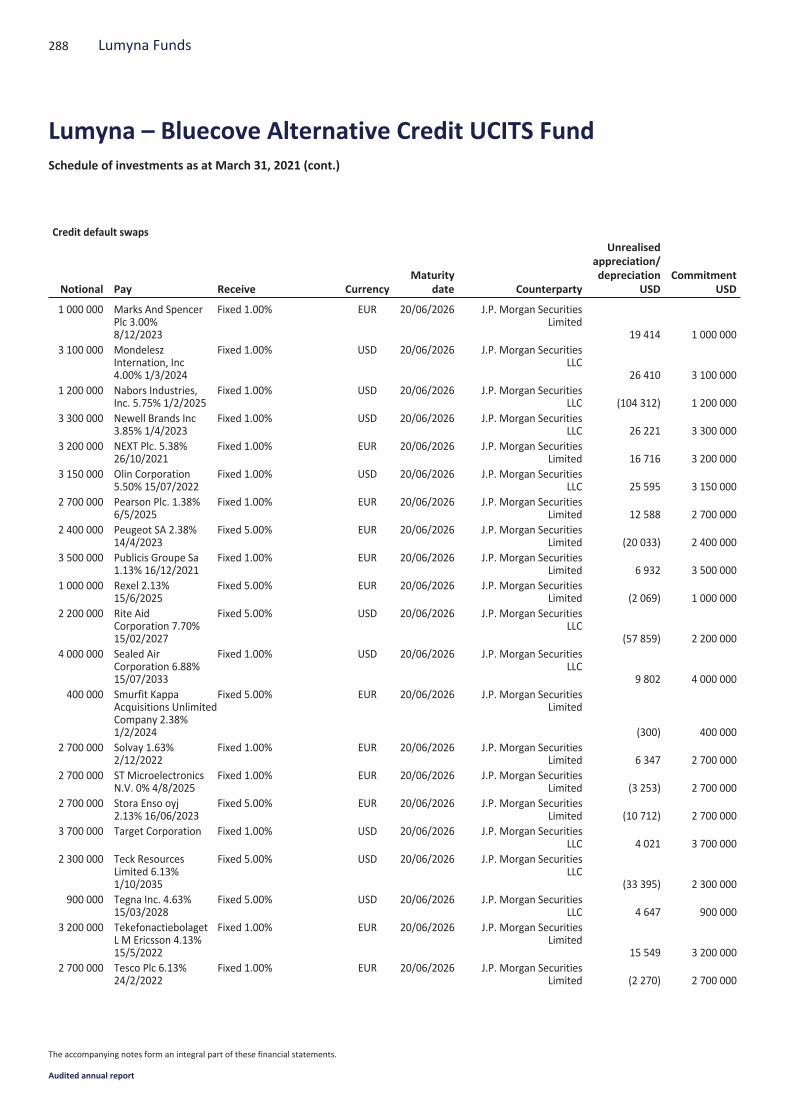
Credit default swaps
Notional Pay Receive CurrencyMaturity
date Counterparty
Unrealisedappreciation/depreciation
USDCommitment
USD
1 000 000 Marks And SpencerPlc 3.00%8/12/2023
Fixed 1.00% EUR 20/06/2026 J.P. Morgan SecuritiesLimited
19 414 1 000 0003 100 000 Mondelesz
Internation, Inc4.00% 1/3/2024
Fixed 1.00% USD 20/06/2026 J.P. Morgan SecuritiesLLC
26 410 3 100 0001 200 000 Nabors Industries,
Inc. 5.75% 1/2/2025Fixed 1.00% USD 20/06/2026 J.P. Morgan Securities
LLC (104 312) 1 200 0003 300 000 Newell Brands Inc
3.85% 1/4/2023Fixed 1.00% USD 20/06/2026 J.P. Morgan Securities
LLC 26 221 3 300 0003 200 000 NEXT Plc. 5.38%
26/10/2021Fixed 1.00% EUR 20/06/2026 J.P. Morgan Securities
Limited 16 716 3 200 0003 150 000 Olin Corporation
5.50% 15/07/2022Fixed 1.00% USD 20/06/2026 J.P. Morgan Securities
LLC 25 595 3 150 0002 700 000 Pearson Plc. 1.38%
6/5/2025Fixed 1.00% EUR 20/06/2026 J.P. Morgan Securities
Limited 12 588 2 700 0002 400 000 Peugeot SA 2.38%
14/4/2023Fixed 5.00% EUR 20/06/2026 J.P. Morgan Securities
Limited (20 033) 2 400 0003 500 000 Publicis Groupe Sa
1.13% 16/12/2021Fixed 1.00% EUR 20/06/2026 J.P. Morgan Securities
Limited 6 932 3 500 0001 000 000 Rexel 2.13%
15/6/2025Fixed 5.00% EUR 20/06/2026 J.P. Morgan Securities
Limited (2 069) 1 000 0002 200 000 Rite Aid
Corporation 7.70%15/02/2027
Fixed 5.00% USD 20/06/2026 J.P. Morgan SecuritiesLLC
(57 859) 2 200 0004 000 000 Sealed Air
Corporation 6.88%15/07/2033
Fixed 1.00% USD 20/06/2026 J.P. Morgan SecuritiesLLC
9 802 4 000 000400 000 Smurfit Kappa
Acquisitions UnlimitedCompany 2.38%1/2/2024
Fixed 5.00% EUR 20/06/2026 J.P. Morgan SecuritiesLimited
(300) 400 0002 700 000 Solvay 1.63%
2/12/2022Fixed 1.00% EUR 20/06/2026 J.P. Morgan Securities
Limited 6 347 2 700 0002 700 000 ST Microelectronics
N.V. 0% 4/8/2025Fixed 1.00% EUR 20/06/2026 J.P. Morgan Securities
Limited (3 253) 2 700 0002 700 000 Stora Enso oyj
2.13% 16/06/2023Fixed 5.00% EUR 20/06/2026 J.P. Morgan Securities
Limited (10 712) 2 700 0003 700 000 Target Corporation Fixed 1.00% USD 20/06/2026 J.P. Morgan Securities
LLC 4 021 3 700 0002 300 000 Teck Resources
Limited 6.13%1/10/2035
Fixed 5.00% USD 20/06/2026 J.P. Morgan SecuritiesLLC
(33 395) 2 300 000900 000 Tegna Inc. 4.63%
15/03/2028Fixed 5.00% USD 20/06/2026 J.P. Morgan Securities
LLC 4 647 900 0003 200 000 Tekefonactiebolaget
L M Ericsson 4.13%15/5/2022
Fixed 1.00% EUR 20/06/2026 J.P. Morgan SecuritiesLimited
15 549 3 200 0002 700 000 Tesco Plc 6.13%
24/2/2022Fixed 1.00% EUR 20/06/2026 J.P. Morgan Securities
Limited (2 270) 2 700 000
288 Lumyna Funds
Lumyna – Bluecove Alternative Credit UCITS FundSchedule of investments as at March 31, 2021 (cont.)
The accompanying notes form an integral part of these financial statements.
Audited annual report
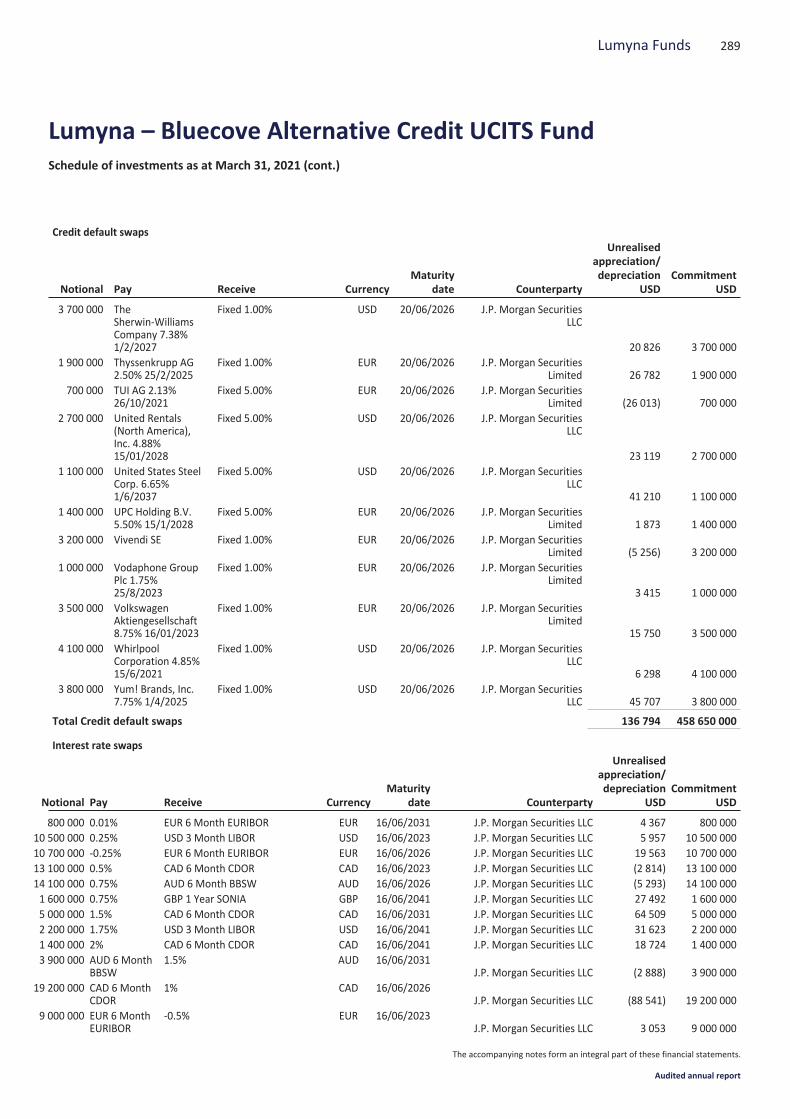
Credit default swaps
Notional Pay Receive CurrencyMaturity
date Counterparty
Unrealisedappreciation/depreciation
USDCommitment
USD
3 700 000 TheSherwin-WilliamsCompany 7.38%1/2/2027
Fixed 1.00% USD 20/06/2026 J.P. Morgan SecuritiesLLC
20 826 3 700 0001 900 000 Thyssenkrupp AG
2.50% 25/2/2025Fixed 1.00% EUR 20/06/2026 J.P. Morgan Securities
Limited 26 782 1 900 000700 000 TUI AG 2.13%
26/10/2021Fixed 5.00% EUR 20/06/2026 J.P. Morgan Securities
Limited (26 013) 700 0002 700 000 United Rentals
(North America),Inc. 4.88%15/01/2028
Fixed 5.00% USD 20/06/2026 J.P. Morgan SecuritiesLLC
23 119 2 700 0001 100 000 United States Steel
Corp. 6.65%1/6/2037
Fixed 5.00% USD 20/06/2026 J.P. Morgan SecuritiesLLC
41 210 1 100 0001 400 000 UPC Holding B.V.
5.50% 15/1/2028Fixed 5.00% EUR 20/06/2026 J.P. Morgan Securities
Limited 1 873 1 400 0003 200 000 Vivendi SE Fixed 1.00% EUR 20/06/2026 J.P. Morgan Securities
Limited (5 256) 3 200 0001 000 000 Vodaphone Group
Plc 1.75%25/8/2023
Fixed 1.00% EUR 20/06/2026 J.P. Morgan SecuritiesLimited
3 415 1 000 0003 500 000 Volkswagen
Aktiengesellschaft8.75% 16/01/2023
Fixed 1.00% EUR 20/06/2026 J.P. Morgan SecuritiesLimited
15 750 3 500 0004 100 000 Whirlpool
Corporation 4.85%15/6/2021
Fixed 1.00% USD 20/06/2026 J.P. Morgan SecuritiesLLC
6 298 4 100 0003 800 000 Yum! Brands, Inc.
7.75% 1/4/2025Fixed 1.00% USD 20/06/2026 J.P. Morgan Securities
LLC 45 707 3 800 000
Total Credit default swaps 136 794 458 650 000
Interest rate swaps
Notional Pay Receive CurrencyMaturity
date Counterparty
Unrealisedappreciation/depreciation
USDCommitment
USD
800 000 0.01% EUR 6 Month EURIBOR EUR 16/06/2031 J.P. Morgan Securities LLC 4 367 800 00010 500 000 0.25% USD 3 Month LIBOR USD 16/06/2023 J.P. Morgan Securities LLC 5 957 10 500 00010 700 000 -0.25% EUR 6 Month EURIBOR EUR 16/06/2026 J.P. Morgan Securities LLC 19 563 10 700 00013 100 000 0.5% CAD 6 Month CDOR CAD 16/06/2023 J.P. Morgan Securities LLC (2 814) 13 100 00014 100 000 0.75% AUD 6 Month BBSW AUD 16/06/2026 J.P. Morgan Securities LLC (5 293) 14 100 0001 600 000 0.75% GBP 1 Year SONIA GBP 16/06/2041 J.P. Morgan Securities LLC 27 492 1 600 0005 000 000 1.5% CAD 6 Month CDOR CAD 16/06/2031 J.P. Morgan Securities LLC 64 509 5 000 0002 200 000 1.75% USD 3 Month LIBOR USD 16/06/2041 J.P. Morgan Securities LLC 31 623 2 200 0001 400 000 2% CAD 6 Month CDOR CAD 16/06/2041 J.P. Morgan Securities LLC 18 724 1 400 0003 900 000 AUD 6 Month
BBSW1.5% AUD 16/06/2031
J.P. Morgan Securities LLC (2 888) 3 900 00019 200 000 CAD 6 Month
CDOR1% CAD 16/06/2026
J.P. Morgan Securities LLC (88 541) 19 200 0009 000 000 EUR 6 Month
EURIBOR-0.5% EUR 16/06/2023
J.P. Morgan Securities LLC 3 053 9 000 000
289Lumyna Funds
Lumyna – Bluecove Alternative Credit UCITS FundSchedule of investments as at March 31, 2021 (cont.)
The accompanying notes form an integral part of these financial statements.
Audited annual report

Interest rate swaps
Notional Pay Receive CurrencyMaturity
date Counterparty
Unrealisedappreciation/depreciation
USDCommitment
USD
1 800 000 EUR 6 MonthEURIBOR
0.25% EUR 16/06/2041J.P. Morgan Securities LLC (21 540) 1 800 000
5 700 000 GBP 1 YearSONIA
0.25% GBP 16/06/2026J.P. Morgan Securities LLC (15 760) 5 700 000
1 500 000 GBP 1 YearSONIA
0.6% GBP 16/06/2031J.P. Morgan Securities LLC (12 733) 1 500 000
2 100 000 USD 3 MonthLIBOR
0.75% USD 16/06/2026J.P. Morgan Securities LLC (5 181) 2 100 000
4 300 000 USD 3 MonthLIBOR
1.25% USD 16/06/2031J.P. Morgan Securities LLC (39 969) 4 300 000
Total Interest rate swaps (19 431) 106 900 000
The counterparties for OTC Derivatives including CFD as at March 31, 2021 are JP Morgan Securities LLC, JPMorgan Chase Bank NA, and StateStreet Bank and Trust Co. The maximum individual counterparty exposure for OTC Derivatives including CFD as at March 31, 2021 is State StreetBank and Trust Co with 2.76% of the NAV.
290 Lumyna Funds
Lumyna – Bluecove Alternative Credit UCITS FundSchedule of investments as at March 31, 2021 (cont.)
The accompanying notes form an integral part of these financial statements.
Audited annual report

1. Activity
Lumyna Funds (the “SICAV”) has been incorporated on November 5, 2007 under Luxembourg laws as a “Société d’Investissementà Capital Variable” (SICAV). The SICAV is governed by the provisions of Part I and it fulfils the provisions of Article 27 of theLuxembourg Law of December 17, 2010 “as amended” relating to Undertakings for Collective Investment, as may be amendedfrom time to time.
The Articles of Incorporation created are deposited with the Register of Commerce and Companies of Luxembourg and have beenpublished in theMémorial C, “Recueil des Sociétés et Associations” (the “Mémorial”) respectively. The SICAV is registered with theRegister of Commerce and Companies of Luxembourg under the number B 133.445.
As at March 31, 2021, fifteen sub-funds were available to investors:
Sub-funds Launch date
Lumyna – Marshall Wace TOPS (Market Neutral) UCITS Fund November 23, 2007
Lumyna – York Asian Event-Driven UCITS Fund November 3, 2010
Lumyna – BOFA Enhanced Equity Volatility Premium UCITS Fund November 27, 2013
Lumyna – BOFA MLCX Commodity Enhanced Beta UCITS Fund May 7, 2014
Lumyna – BOFA MLCX Commodity Alpha UCITS Fund February 19, 2016
Lumyna – Zeal Greater China Long Short UCITS Fund August 29, 2014
Lumyna – Ramius Merger Arbitrage UCITS Fund July 8, 2016
Lumyna – Millburn Diversified UCITS Fund March 8, 2017
Lumyna – Global Debt - Credit UCITS Fund November 24, 2017
Lumyna – Global Debt - Government UCITS Fund November 24, 2017
Lumyna – Global Debt - Securitised UCITS Fund November 24, 2017
Lumyna – PSAM Global Event UCITS Fund June 6, 2019
Lumyna – Sandbar Global Equity Market Neutral UCITS Fund October 16, 2019
Lumyna – Millburn Adaptive Allocation Program UCITS Fund March 2, 2020
Lumyna – Bluecove Alternative Credit UCITS Fund December 17, 2020
During the year ended, the following sub-fund were launched:
Sub-funds Launch date
Lumyna – Bluecove Alternative Credit UCITS Fund December 17, 2020
During the year ended, the following sub-funds were liquidated:
Sub-funds Liquidation date
Lumyna – AQR Global Relative Value UCITS Fund May 29, 2020
Lumyna – York Event-Driven UCITS Fund December 23, 2020
Lumyna – KLS Fixed Income UCITS Fund March 25, 2021
During the year ended, the following share classes were launched:
Sub-Funds Class Launch Date
Lumyna – Sandbar Global Equity Market Neutral UCITS Fund Class JPY X3 (acc) April 8, 2020
Lumyna – Sandbar Global Equity Market Neutral UCITS Fund Class GBP B (acc) May 18, 2020
Lumyna – Sandbar Global Equity Market Neutral UCITS Fund* Class GBP C (acc) May 27, 2020
Lumyna – York Asian Event-Driven UCITS Fund Class CHF B (acc) June 11, 2020
Lumyna – Sandbar Global Equity Market Neutral UCITS Fund Class EUR X4 (acc) June 22, 2020
Lumyna – PSAM Global Event UCITS Fund Class EUR C (acc) October 13, 2020
Lumyna – Sandbar Global Equity Market Neutral UCITS Fund Class EUR C (acc) October 28, 2020
Lumyna – Sandbar Global Equity Market Neutral UCITS Fund Class SEK Z (acc) November 30, 2020
291Lumyna Funds
Notes to the financial statementsas at March 31, 2021
Audited annual report
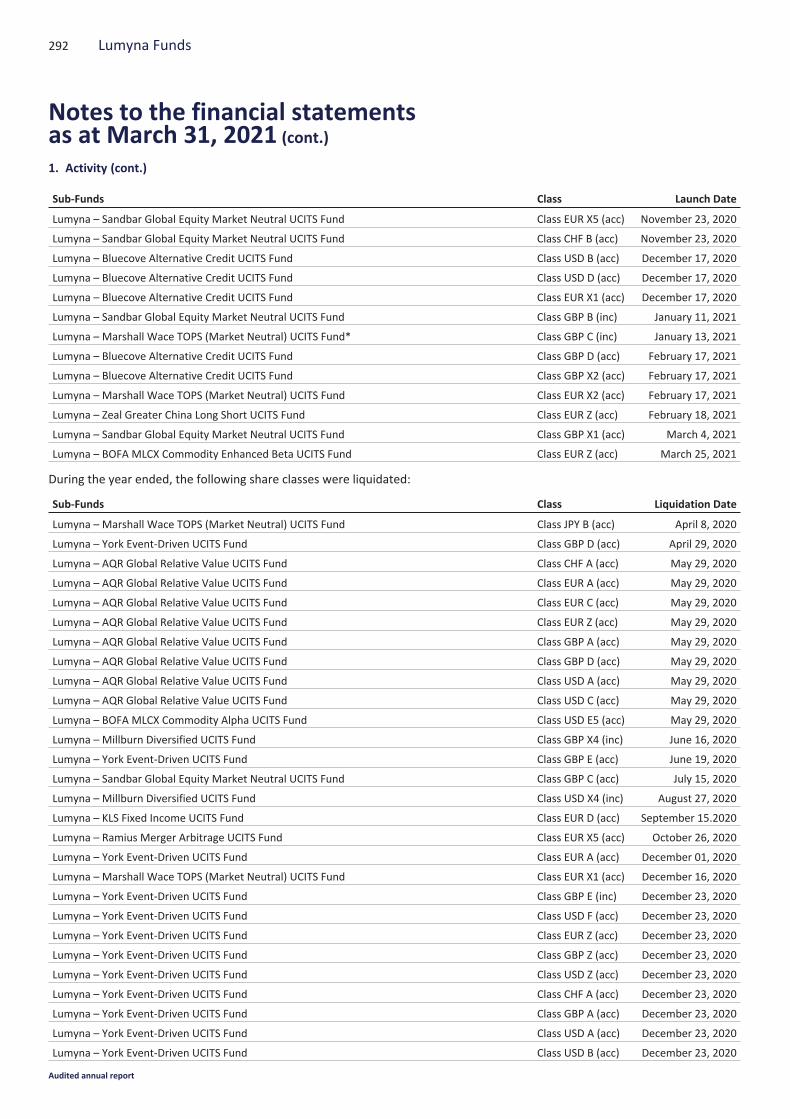
1. Activity (cont.)
Sub-Funds Class Launch Date
Lumyna – Sandbar Global Equity Market Neutral UCITS Fund Class EUR X5 (acc) November 23, 2020
Lumyna – Sandbar Global Equity Market Neutral UCITS Fund Class CHF B (acc) November 23, 2020
Lumyna – Bluecove Alternative Credit UCITS Fund Class USD B (acc) December 17, 2020
Lumyna – Bluecove Alternative Credit UCITS Fund Class USD D (acc) December 17, 2020
Lumyna – Bluecove Alternative Credit UCITS Fund Class EUR X1 (acc) December 17, 2020
Lumyna – Sandbar Global Equity Market Neutral UCITS Fund Class GBP B (inc) January 11, 2021
Lumyna – Marshall Wace TOPS (Market Neutral) UCITS Fund* Class GBP C (inc) January 13, 2021
Lumyna – Bluecove Alternative Credit UCITS Fund Class GBP D (acc) February 17, 2021
Lumyna – Bluecove Alternative Credit UCITS Fund Class GBP X2 (acc) February 17, 2021
Lumyna – Marshall Wace TOPS (Market Neutral) UCITS Fund Class EUR X2 (acc) February 17, 2021
Lumyna – Zeal Greater China Long Short UCITS Fund Class EUR Z (acc) February 18, 2021
Lumyna – Sandbar Global Equity Market Neutral UCITS Fund Class GBP X1 (acc) March 4, 2021
Lumyna – BOFA MLCX Commodity Enhanced Beta UCITS Fund Class EUR Z (acc) March 25, 2021
During the year ended, the following share classes were liquidated:
Sub-Funds Class Liquidation Date
Lumyna – Marshall Wace TOPS (Market Neutral) UCITS Fund Class JPY B (acc) April 8, 2020
Lumyna – York Event-Driven UCITS Fund Class GBP D (acc) April 29, 2020
Lumyna – AQR Global Relative Value UCITS Fund Class CHF A (acc) May 29, 2020
Lumyna – AQR Global Relative Value UCITS Fund Class EUR A (acc) May 29, 2020
Lumyna – AQR Global Relative Value UCITS Fund Class EUR C (acc) May 29, 2020
Lumyna – AQR Global Relative Value UCITS Fund Class EUR Z (acc) May 29, 2020
Lumyna – AQR Global Relative Value UCITS Fund Class GBP A (acc) May 29, 2020
Lumyna – AQR Global Relative Value UCITS Fund Class GBP D (acc) May 29, 2020
Lumyna – AQR Global Relative Value UCITS Fund Class USD A (acc) May 29, 2020
Lumyna – AQR Global Relative Value UCITS Fund Class USD C (acc) May 29, 2020
Lumyna – BOFA MLCX Commodity Alpha UCITS Fund Class USD E5 (acc) May 29, 2020
Lumyna – Millburn Diversified UCITS Fund Class GBP X4 (inc) June 16, 2020
Lumyna – York Event-Driven UCITS Fund Class GBP E (acc) June 19, 2020
Lumyna – Sandbar Global Equity Market Neutral UCITS Fund Class GBP C (acc) July 15, 2020
Lumyna – Millburn Diversified UCITS Fund Class USD X4 (inc) August 27, 2020
Lumyna – KLS Fixed Income UCITS Fund Class EUR D (acc) September 15.2020
Lumyna – Ramius Merger Arbitrage UCITS Fund Class EUR X5 (acc) October 26, 2020
Lumyna – York Event-Driven UCITS Fund Class EUR A (acc) December 01, 2020
Lumyna – Marshall Wace TOPS (Market Neutral) UCITS Fund Class EUR X1 (acc) December 16, 2020
Lumyna – York Event-Driven UCITS Fund Class GBP E (inc) December 23, 2020
Lumyna – York Event-Driven UCITS Fund Class USD F (acc) December 23, 2020
Lumyna – York Event-Driven UCITS Fund Class EUR Z (acc) December 23, 2020
Lumyna – York Event-Driven UCITS Fund Class GBP Z (acc) December 23, 2020
Lumyna – York Event-Driven UCITS Fund Class USD Z (acc) December 23, 2020
Lumyna – York Event-Driven UCITS Fund Class CHF A (acc) December 23, 2020
Lumyna – York Event-Driven UCITS Fund Class GBP A (acc) December 23, 2020
Lumyna – York Event-Driven UCITS Fund Class USD A (acc) December 23, 2020
Lumyna – York Event-Driven UCITS Fund Class USD B (acc) December 23, 2020
292 Lumyna Funds
Notes to the financial statementsas at March 31, 2021 (cont.)
Audited annual report
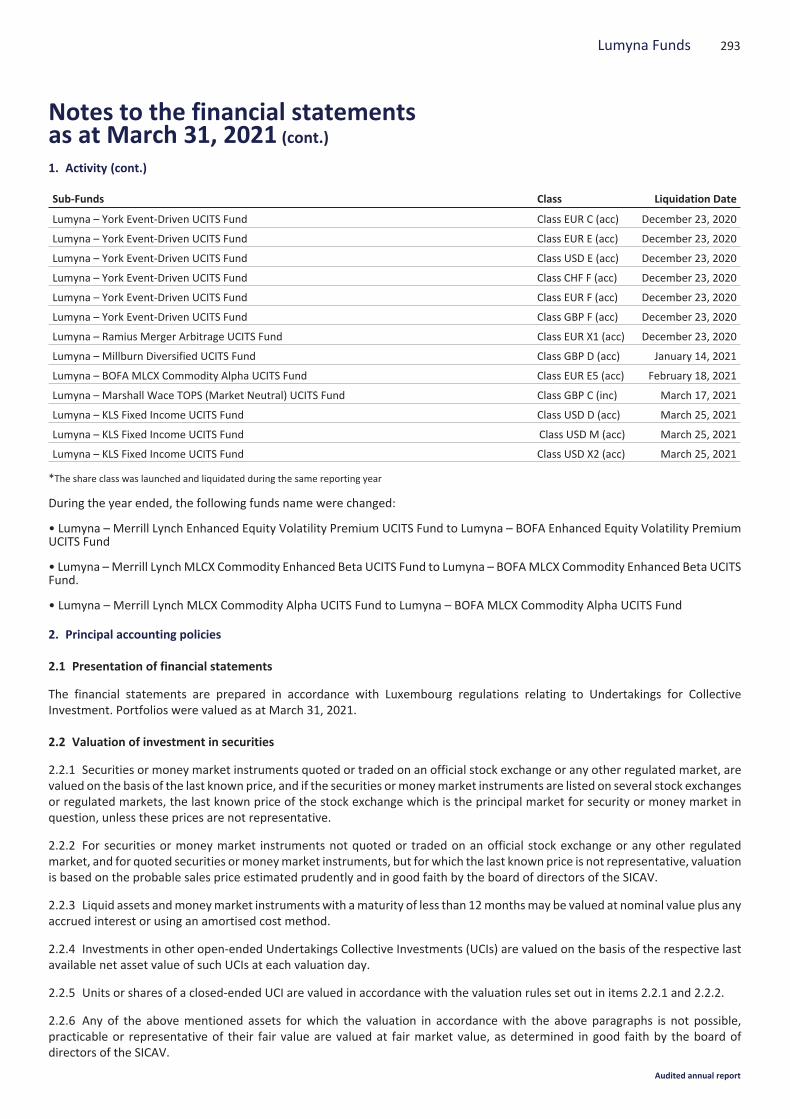
1. Activity (cont.)
Sub-Funds Class Liquidation Date
Lumyna – York Event-Driven UCITS Fund Class EUR C (acc) December 23, 2020
Lumyna – York Event-Driven UCITS Fund Class EUR E (acc) December 23, 2020
Lumyna – York Event-Driven UCITS Fund Class USD E (acc) December 23, 2020
Lumyna – York Event-Driven UCITS Fund Class CHF F (acc) December 23, 2020
Lumyna – York Event-Driven UCITS Fund Class EUR F (acc) December 23, 2020
Lumyna – York Event-Driven UCITS Fund Class GBP F (acc) December 23, 2020
Lumyna – Ramius Merger Arbitrage UCITS Fund Class EUR X1 (acc) December 23, 2020
Lumyna – Millburn Diversified UCITS Fund Class GBP D (acc) January 14, 2021
Lumyna – BOFA MLCX Commodity Alpha UCITS Fund Class EUR E5 (acc) February 18, 2021
Lumyna – Marshall Wace TOPS (Market Neutral) UCITS Fund Class GBP C (inc) March 17, 2021
Lumyna – KLS Fixed Income UCITS Fund Class USD D (acc) March 25, 2021
Lumyna – KLS Fixed Income UCITS Fund Class USD M (acc) March 25, 2021
Lumyna – KLS Fixed Income UCITS Fund Class USD X2 (acc) March 25, 2021
*The share class was launched and liquidated during the same reporting year
During the year ended, the following funds name were changed:
• Lumyna – Merrill Lynch Enhanced Equity Volatility Premium UCITS Fund to Lumyna – BOFA Enhanced Equity Volatility PremiumUCITS Fund
• Lumyna –Merrill LynchMLCX Commodity Enhanced Beta UCITS Fund to Lumyna – BOFAMLCX Commodity Enhanced Beta UCITSFund.
• Lumyna – Merrill Lynch MLCX Commodity Alpha UCITS Fund to Lumyna – BOFA MLCX Commodity Alpha UCITS Fund
2. Principal accounting policies
2.1 Presentation of financial statements
The financial statements are prepared in accordance with Luxembourg regulations relating to Undertakings for CollectiveInvestment. Portfolios were valued as at March 31, 2021.
2.2 Valuation of investment in securities
2.2.1 Securities or money market instruments quoted or traded on an official stock exchange or any other regulated market, arevalued on the basis of the last known price, and if the securities ormoneymarket instruments are listed on several stock exchangesor regulated markets, the last known price of the stock exchange which is the principal market for security or money market inquestion, unless these prices are not representative.
2.2.2 For securities or money market instruments not quoted or traded on an official stock exchange or any other regulatedmarket, and for quoted securities ormoneymarket instruments, but for which the last known price is not representative, valuationis based on the probable sales price estimated prudently and in good faith by the board of directors of the SICAV.
2.2.3 Liquid assets andmoneymarket instruments with amaturity of less than 12monthsmay be valued at nominal value plus anyaccrued interest or using an amortised cost method.
2.2.4 Investments in other open-ended Undertakings Collective Investments (UCIs) are valued on the basis of the respective lastavailable net asset value of such UCIs at each valuation day.
2.2.5 Units or shares of a closed-ended UCI are valued in accordance with the valuation rules set out in items 2.2.1 and 2.2.2.
2.2.6 Any of the above mentioned assets for which the valuation in accordance with the above paragraphs is not possible,practicable or representative of their fair value are valued at fair market value, as determined in good faith by the board ofdirectors of the SICAV.
293Lumyna Funds
Notes to the financial statementsas at March 31, 2021 (cont.)
Audited annual report
2. Principal accounting policies (cont.)
2.3 Valuation of swaps
2.3.1 Credit default swap
A credit default swap is a credit derivative transaction in which two parties enter into an agreement, whereby one party (theprotection buyer) pays the other (the protection seller) a fixed periodic coupon for the specified life of the agreement in return fora payment contingent on a credit event related to the underlying reference obligation.
If a credit event occurs, the protection seller would be obligated tomake a payment, whichmay be either: (i) a net cash settlementequal to the notional amount of the swap less the auction value of the reference obligation or (ii) the notional amount of the swapin exchange for the delivery of the reference obligation. Selling protection effectively adds leverage to a sub-fund’s portfolio up tothe notional amount of swap agreements.
The notional amount represents the maximum potential liability under a contract and is not reflected in the statement of netassets. Potential liabilities under these contracts may be reduced by: the auction rates of the underlying reference obligations;upfront payments received at the inception of a swap; and net amounts received from credit default swaps purchased with theidentical reference obligation.
Credit default swaps are marked to market at each NAV calculation date. Themarket value is based on the valuation elements laiddown in the contracts, and is obtained from third party pricing agents, market makers or internal models.
The unrealised appreciation/(depreciation) is disclosed in the statement of net assets under “Unrealisedappreciation/(depreciation) on swap contracts”. Realised gains/(losses) and change in unrealised appreciation/depreciationresulting there from are included in the statement of operations and changes in net assets respectively under the heading “Netrealised gains/(losses) on swap contracts” and “Change in net unrealized appreciation/depreciation on swap contracts”.
The related interest income or expense is disclosed net of withholding tax in the statement of operations and changes in netassets.
2.3.2 Total return swap
A total return swap is a bilateral agreement in which each party agrees to exchange payments based on the performance of anunderlying instrument represented by a security, basket or index thereof for a fixed or variable rate. One party pays out the totalreturn of a specific reference asset, and in return, receives a regular stream of payments. The total performance will include gainsand losses on the underlying, as well as any interest or dividends during the contract period according to the type of underlying.The cash flows to be exchanged are calculated by reference to an agreed upon notional amount or quantity. To the extent the totalreturn of the reference asset underlying the transaction exceeds or falls short of the offsetting payment, the Fund will receive apayment from or make a payment to the counterparty.
Total return swaps are marked to market at each NAV calculation date. The estimated market value is based on the valuationelements laid down in the contracts, and is obtained from third party pricing agents, market makers or internal models.
The unrealised appreciation/(depreciation) is disclosed in the statement of net assets under “Unrealisedappreciation/(depreciation) on swap contracts”. Realised gains/(losses) and changes in unrealised appreciation/depreciation as aresult thereof are included in the statement of operations and changes in net assets respectively under “Net realised gain/(loss) onswap contracts” and “Net change in unrealised appreciation/depreciation on swaps contracts.”
The related interest income or expense is disclosed net of withholding tax in the statement of operations and changes in netassets.
2.3.3 Interest rate swap
An interest rate swap is a forward contract in which one stream of future interest payments is exchanged for another based on aspecified principal amount. Interest rate swaps usually involve the exchange of a fixed interest rate for a floating rate, or vice versa,to reduce or increase exposure to fluctuations in interest rates or to obtain a marginally lower interest rate than would have beenpossible without the swap.
294 Lumyna Funds
Notes to the financial statementsas at March 31, 2021 (cont.)
Audited annual report
2. Principal accounting policies (cont.)
2.3 Valuation of swaps (cont.)
2.3.3 Interest rate swap (cont.)
Interest rate swaps are marked to market at each NAV calculation date. The estimated market value is based on the valuationelements laid down in the contracts, and is obtained from third party pricing agents, market makers or internal models.
The unrealised appreciation/(depreciation) is disclosed in the statement of net assets under “Unrealisedappreciation/(depreciation) on swap contracts”. Realised gains/(losses) and changes in unrealised appreciation/depreciation as aresult thereof are included in the statement of operations and changes in net assets respectively under “Net realised gain/(loss) onswap contracts” and “Net change in unrealised appreciation/depreciation on swaps contracts.”
The related interest income or expense is disclosed net of withholding tax in the statement of operations and changes in netassets.
2.4 Valuation of contracts for difference
Contracts for differences are contracts entered into between a broker and the sub-fund under which the parties agree to makepayments to each other so as to replicate the economic consequences of holding a long or short position in the underlying securityor index. Contracts for differences also mirror any corporate actions that take place.
Contracts for differences are valued based on the closing market price of the underlying security, less any financing chargesattributable to each contract. Upon entering into contracts for differences, the sub- fund may be required to pledge to the brokeran amount of cash and/or other assets equal to a certain percentage of the contract amount (“initial margin”). Subsequently,payments known as “variation margin” are made or received by the sub-fund periodically, depending on fluctuations in the valueof the underlying security.
The unrealised appreciation/(depreciation) is disclosed in the statement of net assets under “Contracts for difference at marketvalue”. Realised gains/(losses) and changes in unrealised appreciation/depreciation as a result thereof are included in thestatement of operations and changes in net assets respectively under “Net realised gain/(loss) on contracts for differences” and“Change in net unrealised appreciation/(depreciation) on contracts for difference”.
2.5 Valuation of futures contracts
Futures contracts provide for the delayed delivery of the underlying instrument at a fixed price or for a cash amount based on thechange in the value of the underlying instrument at a specific date in the future. Upon entering into a futures contract, thesub-fund is required to deposit with the broker, cash or securities in an amount equal to a certain percentage of the contractamount which is referred to as the initial margin account. Subsequent payments, referred to as variation margin, are made orreceived by the sub-fund periodically and are based on changes in the market value of open futures contracts.
The unrealised appreciation/(depreciation) on futures contracts is disclosed in the statement of net assets under “Unrealisedappreciation/(depreciation) on futures contracts”. Changes in the market value of open futures contracts are recorded asunrealised appreciation/depreciation in the statement of operations and changes in net assets under “Change in net unrealisedappreciation/ depreciation on futures contracts”.
Realised gains or losses, representing the difference between the value of the contract at the time it was opened and the value atthe time it was closed, are reported at the closing or expiration of futures contracts in the statement of operations and changes innet assets under “Net realized gain/(loss) on futures contracts”. Securities deposited as initial margin are designated in thestatement of investments and cash deposited is recorded in the statement of net assets. A receivable and/or a payable to brokersfor the daily variation margin is also recorded in the statement of net assets.
2.6 Valuation of options contracts
A purchaser of a put option has the right, but not the obligation, to sell the underlying instrument at an agreed uponprice (“strikeprice”) to the option seller. A purchaser of a call option has the right, but not the obligation, to purchase the underlying instrumentat the strike price from the option seller.
295Lumyna Funds
Notes to the financial statementsas at March 31, 2021 (cont.)
Audited annual report
2. Principal accounting policies (cont.)
2.6 Valuation of options contracts (cont.)
Premiums paid by the sub-fund for purchased options are included in the statement of net assets as an investment. The option isadjusted daily to reflect the current market value of the option and the change is recorded as unrealised appreciation ordepreciation. If the option is allowed to expire, the fund will lose the entire premium it paid and record a realised loss for thepremium amount. Premiums paid for purchased options which are exercised or closed are added to the amounts paid or offsetagainst the proceeds on the underlying investment transaction to determine the realised gain/loss or cost basis of the security.
Premiums received by the sub-fund for written options are included in the statement of net assets. The amount of the liability isadjusted daily to reflect the current market value of the written option and the change in market value is recorded as unrealisedappreciation or depreciation. Premiums received from written options that expire are treated as realised gains. The sub-fundrecords a realised gain or loss on written options based on whether the cost of the closing transaction exceeds the premiumreceived. If a call option is exercised by the option buyer, the premium received by the sub-fund is added to the proceeds from thesale of the underlying security to the option buyer and compared to the cost of the closing transaction to determinewhether therehas been a realised gain or loss. If a put option is exercised by an option buyer, the premium received by the option seller reducesthe cost basis of the purchased security.
Written uncovered call options expose the sub-fund to unlimited risk of loss.Written covered call options limit the upside potentialof a security above the strike price. Written put options expose the Fund to risk of loss if the value of the security declines belowthe exercise price minus the put premium. The sub-fund is not subject to credit risk on written options as the counterparty hasalready performed its obligation by paying the premium at the inception of the contract.
Outstanding options traded on a regulated market are valued based on the closing price or the last available market price of theinstruments. OTC options are marked to market based upon prices obtained from third party pricing agents and verified againstthe value from the counterparty. The market value of options is included in the statement of net assets under the heading“Options sold at market value”.
The realised gains/(losses) and change in unrealised appreciation/depreciation on options are disclosed in the statement ofoperations and changes in net assets respectively under the headings “Net realised gains/(losses) on options” and “Change in netunrealised appreciation/depreciation on options.”
2.7 Valuation of forward foreign exchange contracts
Forward foreign exchange contracts represent obligations to purchase or sell foreign currency on a specified future date at a pricefixed at the time the contracts are entered into. Non-deliverable forward foreign exchange contracts are settled with thecounterparty in cash without the delivery of foreign currency. The values of the forward foreign exchange contracts are adjusteddaily based on the applicable exchange rate of the underlying currency. Changes in the value of these contracts are recorded asunrealised appreciation or depreciation until the contract settlement date. When the forward contract is closed, the sub-fundrecords a realised gain or loss equal to the difference between the value at the time the contract was opened and the value at thetime it was closed.
The unrealised appreciation/(depreciation) on forward foreign exchange contracts is disclosed in the statement of net assetsunder “Unrealised appreciation/(depreciation) on forward foreign exchange contracts”. Realised gains/(losses) and change inunrealised appreciation/depreciation resulting there from are included in the statement of operations and changes in net assetsrespectively under “Net realised gains/(losses) on forward foreign exchange contracts” and “Change in net unrealisedappreciation/depreciation on forward foreign exchange contracts”.
2.8 Valuation of repurchase agreements and reverse repurchase agreements
Each sub-fund may enter into repurchase transactions which consist in the purchase or sale of securities with a clause reservingthe seller the right or the obligation to repurchase from the acquirer the securities sold at a price and term specified by the twoparties in their contractual arrangement and reverse repurchase transactions, which consist of a forward transaction at thematurity of which the seller (counterparty) has the obligation to repurchase the securities sold and the sub-fund the obligation toreturn the securities received under the transaction (collectively, the “repo transactions”).
296 Lumyna Funds
Notes to the financial statementsas at March 31, 2021 (cont.)
Audited annual report
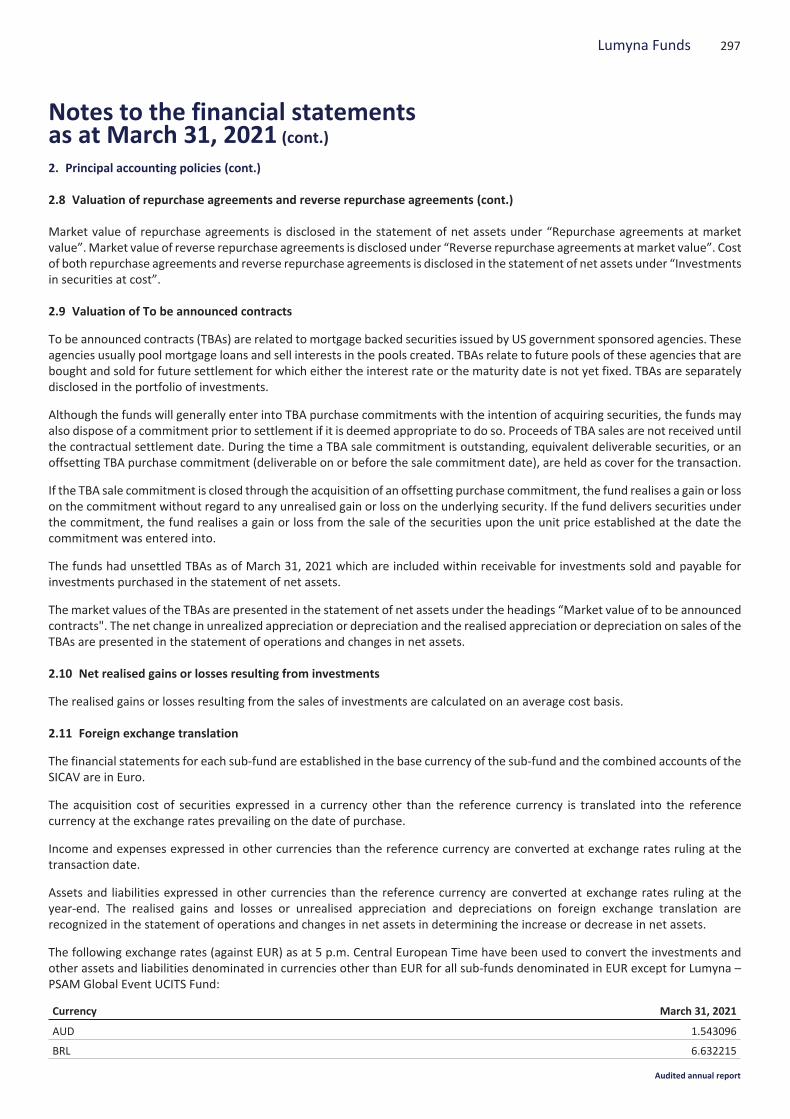
2. Principal accounting policies (cont.)
2.8 Valuation of repurchase agreements and reverse repurchase agreements (cont.)
Market value of repurchase agreements is disclosed in the statement of net assets under “Repurchase agreements at marketvalue”.Market value of reverse repurchase agreements is disclosed under “Reverse repurchase agreements atmarket value”. Costof both repurchase agreements and reverse repurchase agreements is disclosed in the statement of net assets under “Investmentsin securities at cost”.
2.9 Valuation of To be announced contracts
To be announced contracts (TBAs) are related to mortgage backed securities issued by US government sponsored agencies. Theseagencies usually pool mortgage loans and sell interests in the pools created. TBAs relate to future pools of these agencies that arebought and sold for future settlement for which either the interest rate or the maturity date is not yet fixed. TBAs are separatelydisclosed in the portfolio of investments.
Although the funds will generally enter into TBA purchase commitments with the intention of acquiring securities, the funds mayalso dispose of a commitment prior to settlement if it is deemed appropriate to do so. Proceeds of TBA sales are not received untilthe contractual settlement date. During the time a TBA sale commitment is outstanding, equivalent deliverable securities, or anoffsetting TBA purchase commitment (deliverable on or before the sale commitment date), are held as cover for the transaction.
If the TBA sale commitment is closed through the acquisition of an offsetting purchase commitment, the fund realises a gain or losson the commitment without regard to any unrealised gain or loss on the underlying security. If the fund delivers securities underthe commitment, the fund realises a gain or loss from the sale of the securities upon the unit price established at the date thecommitment was entered into.
The funds had unsettled TBAs as of March 31, 2021 which are included within receivable for investments sold and payable forinvestments purchased in the statement of net assets.
The market values of the TBAs are presented in the statement of net assets under the headings “Market value of to be announcedcontracts". The net change in unrealized appreciation or depreciation and the realised appreciation or depreciation on sales of theTBAs are presented in the statement of operations and changes in net assets.
2.10 Net realised gains or losses resulting from investments
The realised gains or losses resulting from the sales of investments are calculated on an average cost basis.
2.11 Foreign exchange translation
The financial statements for each sub-fund are established in the base currency of the sub-fund and the combined accounts of theSICAV are in Euro.
The acquisition cost of securities expressed in a currency other than the reference currency is translated into the referencecurrency at the exchange rates prevailing on the date of purchase.
Income and expenses expressed in other currencies than the reference currency are converted at exchange rates ruling at thetransaction date.
Assets and liabilities expressed in other currencies than the reference currency are converted at exchange rates ruling at theyear-end. The realised gains and losses or unrealised appreciation and depreciations on foreign exchange translation arerecognized in the statement of operations and changes in net assets in determining the increase or decrease in net assets.
The following exchange rates (against EUR) as at 5 p.m. Central European Time have been used to convert the investments andother assets and liabilities denominated in currencies other than EUR for all sub-funds denominated in EUR except for Lumyna –PSAM Global Event UCITS Fund:
Currency March 31, 2021
AUD 1.543096
BRL 6.632215
297Lumyna Funds
Notes to the financial statementsas at March 31, 2021 (cont.)
Audited annual report
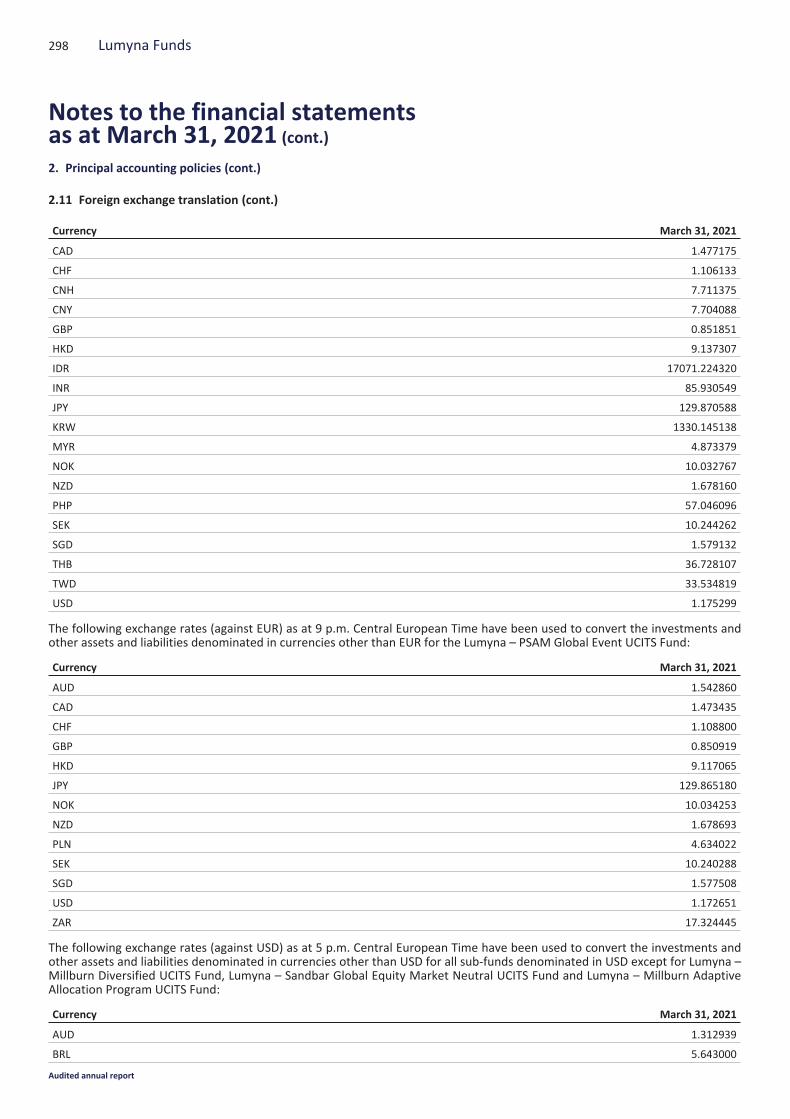
2. Principal accounting policies (cont.)
2.11 Foreign exchange translation (cont.)
Currency March 31, 2021
CAD 1.477175
CHF 1.106133
CNH 7.711375
CNY 7.704088
GBP 0.851851
HKD 9.137307
IDR 17071.224320
INR 85.930549
JPY 129.870588
KRW 1330.145138
MYR 4.873379
NOK 10.032767
NZD 1.678160
PHP 57.046096
SEK 10.244262
SGD 1.579132
THB 36.728107
TWD 33.534819
USD 1.175299
The following exchange rates (against EUR) as at 9 p.m. Central European Time have been used to convert the investments andother assets and liabilities denominated in currencies other than EUR for the Lumyna – PSAM Global Event UCITS Fund:
Currency March 31, 2021
AUD 1.542860
CAD 1.473435
CHF 1.108800
GBP 0.850919
HKD 9.117065
JPY 129.865180
NOK 10.034253
NZD 1.678693
PLN 4.634022
SEK 10.240288
SGD 1.577508
USD 1.172651
ZAR 17.324445
The following exchange rates (against USD) as at 5 p.m. Central European Time have been used to convert the investments andother assets and liabilities denominated in currencies other than USD for all sub-funds denominated in USD except for Lumyna –Millburn Diversified UCITS Fund, Lumyna – Sandbar Global Equity Market Neutral UCITS Fund and Lumyna – Millburn AdaptiveAllocation Program UCITS Fund:
Currency March 31, 2021
AUD 1.312939
BRL 5.643000
298 Lumyna Funds
Notes to the financial statementsas at March 31, 2021 (cont.)
Audited annual report
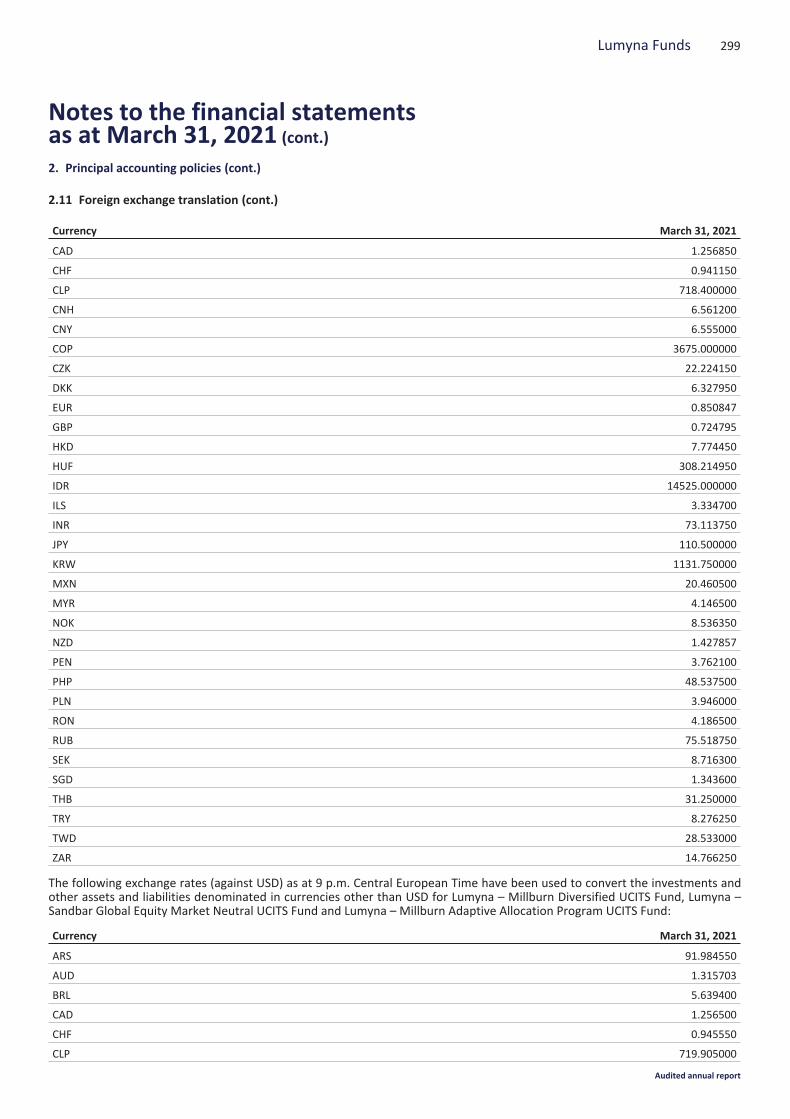
2. Principal accounting policies (cont.)
2.11 Foreign exchange translation (cont.)
Currency March 31, 2021
CAD 1.256850
CHF 0.941150
CLP 718.400000
CNH 6.561200
CNY 6.555000
COP 3675.000000
CZK 22.224150
DKK 6.327950
EUR 0.850847
GBP 0.724795
HKD 7.774450
HUF 308.214950
IDR 14525.000000
ILS 3.334700
INR 73.113750
JPY 110.500000
KRW 1131.750000
MXN 20.460500
MYR 4.146500
NOK 8.536350
NZD 1.427857
PEN 3.762100
PHP 48.537500
PLN 3.946000
RON 4.186500
RUB 75.518750
SEK 8.716300
SGD 1.343600
THB 31.250000
TRY 8.276250
TWD 28.533000
ZAR 14.766250
The following exchange rates (against USD) as at 9 p.m. Central European Time have been used to convert the investments andother assets and liabilities denominated in currencies other than USD for Lumyna – Millburn Diversified UCITS Fund, Lumyna –Sandbar Global Equity Market Neutral UCITS Fund and Lumyna – Millburn Adaptive Allocation Program UCITS Fund:
Currency March 31, 2021
ARS 91.984550
AUD 1.315703
BRL 5.639400
CAD 1.256500
CHF 0.945550
CLP 719.905000
299Lumyna Funds
Notes to the financial statementsas at March 31, 2021 (cont.)
Audited annual report
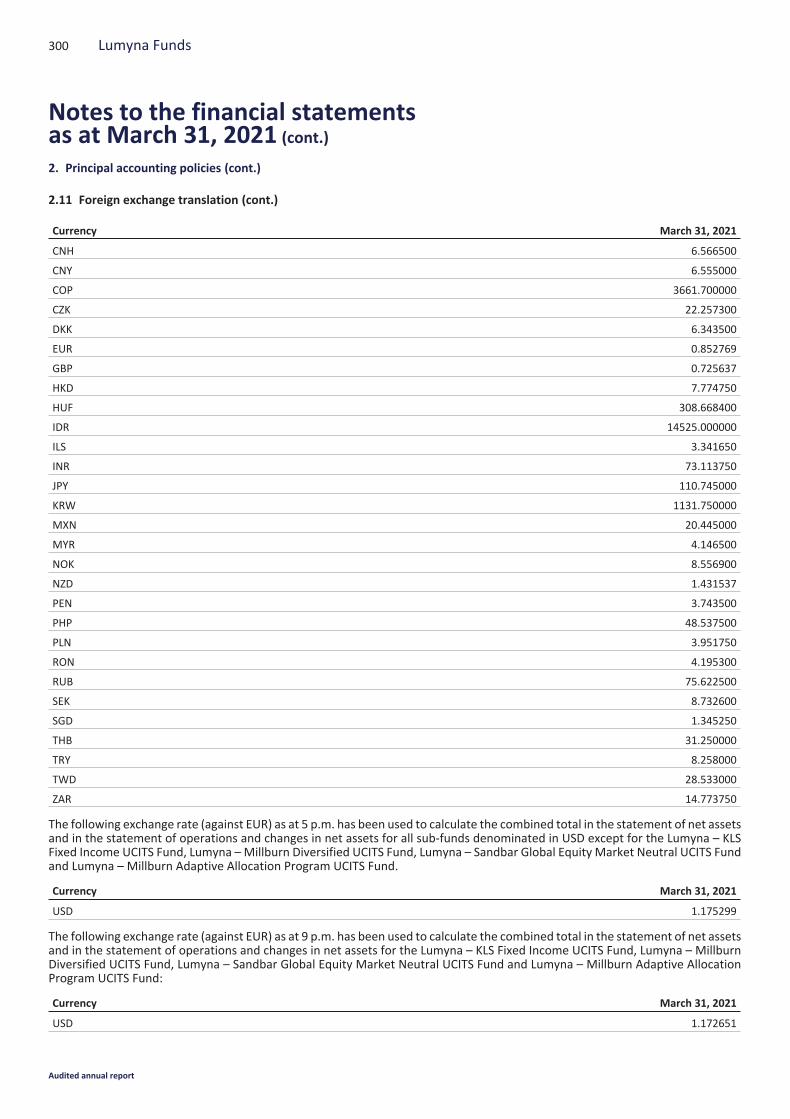
2. Principal accounting policies (cont.)
2.11 Foreign exchange translation (cont.)
Currency March 31, 2021
CNH 6.566500
CNY 6.555000
COP 3661.700000
CZK 22.257300
DKK 6.343500
EUR 0.852769
GBP 0.725637
HKD 7.774750
HUF 308.668400
IDR 14525.000000
ILS 3.341650
INR 73.113750
JPY 110.745000
KRW 1131.750000
MXN 20.445000
MYR 4.146500
NOK 8.556900
NZD 1.431537
PEN 3.743500
PHP 48.537500
PLN 3.951750
RON 4.195300
RUB 75.622500
SEK 8.732600
SGD 1.345250
THB 31.250000
TRY 8.258000
TWD 28.533000
ZAR 14.773750
The following exchange rate (against EUR) as at 5 p.m. has been used to calculate the combined total in the statement of net assetsand in the statement of operations and changes in net assets for all sub-funds denominated in USD except for the Lumyna – KLSFixed Income UCITS Fund, Lumyna –Millburn Diversified UCITS Fund, Lumyna – Sandbar Global Equity Market Neutral UCITS Fundand Lumyna – Millburn Adaptive Allocation Program UCITS Fund.
Currency March 31, 2021
USD 1.175299
The following exchange rate (against EUR) as at 9 p.m. has been used to calculate the combined total in the statement of net assetsand in the statement of operations and changes in net assets for the Lumyna – KLS Fixed Income UCITS Fund, Lumyna – MillburnDiversified UCITS Fund, Lumyna – Sandbar Global Equity Market Neutral UCITS Fund and Lumyna – Millburn Adaptive AllocationProgram UCITS Fund:
Currency March 31, 2021
USD 1.172651
300 Lumyna Funds
Notes to the financial statementsas at March 31, 2021 (cont.)
Audited annual report
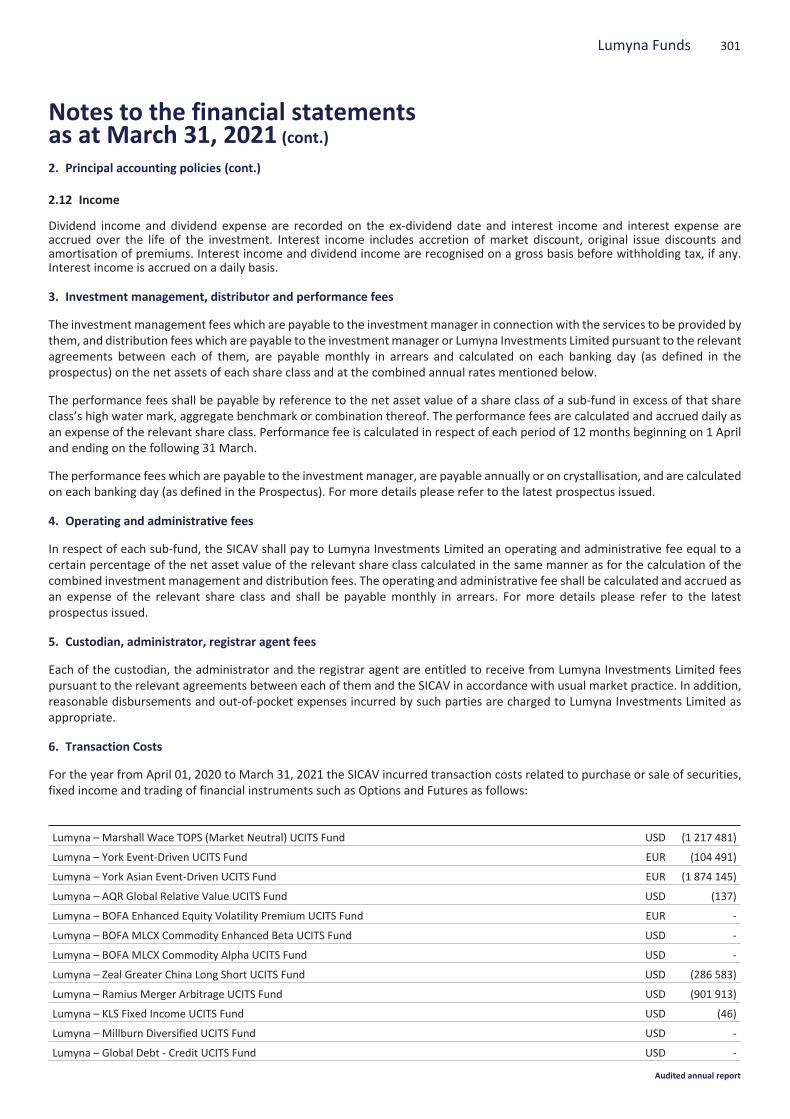
2. Principal accounting policies (cont.)
2.12 Income
Dividend income and dividend expense are recorded on the ex-dividend date and interest income and interest expense areaccrued over the life of the investment. Interest income includes accretion of market discount, original issue discounts andamortisation of premiums. Interest income and dividend income are recognised on a gross basis before withholding tax, if any.Interest income is accrued on a daily basis.
3. Investment management, distributor and performance fees
The investmentmanagement fees which are payable to the investmentmanager in connection with the services to be provided bythem, and distribution fees which are payable to the investmentmanager or Lumyna Investments Limited pursuant to the relevantagreements between each of them, are payable monthly in arrears and calculated on each banking day (as defined in theprospectus) on the net assets of each share class and at the combined annual rates mentioned below.
The performance fees shall be payable by reference to the net asset value of a share class of a sub-fund in excess of that shareclass’s high water mark, aggregate benchmark or combination thereof. The performance fees are calculated and accrued daily asan expense of the relevant share class. Performance fee is calculated in respect of each period of 12 months beginning on 1 Apriland ending on the following 31 March.
The performance fees which are payable to the investment manager, are payable annually or on crystallisation, and are calculatedon each banking day (as defined in the Prospectus). For more details please refer to the latest prospectus issued.
4. Operating and administrative fees
In respect of each sub-fund, the SICAV shall pay to Lumyna Investments Limited an operating and administrative fee equal to acertain percentage of the net asset value of the relevant share class calculated in the same manner as for the calculation of thecombined investment management and distribution fees. The operating and administrative fee shall be calculated and accrued asan expense of the relevant share class and shall be payable monthly in arrears. For more details please refer to the latestprospectus issued.
5. Custodian, administrator, registrar agent fees
Each of the custodian, the administrator and the registrar agent are entitled to receive from Lumyna Investments Limited feespursuant to the relevant agreements between each of them and the SICAV in accordance with usual market practice. In addition,reasonable disbursements and out-of-pocket expenses incurred by such parties are charged to Lumyna Investments Limited asappropriate.
6. Transaction Costs
For the year from April 01, 2020 to March 31, 2021 the SICAV incurred transaction costs related to purchase or sale of securities,fixed income and trading of financial instruments such as Options and Futures as follows:
Lumyna – Marshall Wace TOPS (Market Neutral) UCITS Fund USD (1 217 481)
Lumyna – York Event-Driven UCITS Fund EUR (104 491)
Lumyna – York Asian Event-Driven UCITS Fund EUR (1 874 145)
Lumyna – AQR Global Relative Value UCITS Fund USD (137)
Lumyna – BOFA Enhanced Equity Volatility Premium UCITS Fund EUR -
Lumyna – BOFA MLCX Commodity Enhanced Beta UCITS Fund USD -
Lumyna – BOFA MLCX Commodity Alpha UCITS Fund USD -
Lumyna – Zeal Greater China Long Short UCITS Fund USD (286 583)
Lumyna – Ramius Merger Arbitrage UCITS Fund USD (901 913)
Lumyna – KLS Fixed Income UCITS Fund USD (46)
Lumyna – Millburn Diversified UCITS Fund USD -
Lumyna – Global Debt - Credit UCITS Fund USD -
301Lumyna Funds
Notes to the financial statementsas at March 31, 2021 (cont.)
Audited annual report

6. Transaction Costs (cont.)
Lumyna – Global Debt - Government UCITS Fund USD (38 097)
Lumyna – Global Debt - Securitised UCITS Fund USD -
Lumyna – PSAM Global Event UCITS Fund EUR (1 435 903)
Lumyna – Sandbar Global Equity Market Neutral UCITS Fund USD (5)
Lumyna – Millburn Adaptive Allocation Program UCITS Fund USD -
Lumyna – Bluecove Alternative Credit UCITS Fund USD -
The fees charged by external brokers for OTC derivatives transactions are not included in the above table and are recorded underthe caption “Interest, bank charges and transaction costs” in the Statement of Operations and Changes in Net Assets.
7. Taxation
The SICAV’s assets are subject to subscription tax (“Taxe d’abonnement”) in the Grand Duchy of Luxembourg of 0.05% of the netassets p.a. (except sub-funds or classes of shares reserved to institutional investors that can benefit from the reduced tax rate of0.01% of the net assets p.a. as stipulated in the Prospectus) payable quarterly. The SICAV’s income is not taxable in Luxembourg.No tax will be deducted at source from any dividends paid by the SICAV. Dividend paid by the SICAVmay be subject to withholdingtaxes in the country of origin of the issuer of the security, in respect of which such income is paid.
No duty or tax is payable in Luxembourg in connection with the issue of shares of the SICAV, except for one lump sum capital levyof EUR 75 which is payable at incorporation.
Investment income from dividends and interest received by the SICAV may be subject to withholding taxes at varying rates. Suchwithholding taxes are usually not recoverable.
8. Cash collateral information
The table below provides the cash collateral balances due from / due to the brokers in relations to the futures contracts, swaps,forward foreign exchange contracts, OTC options contracts and contracts for difference held as at March 31, 2021. The cashcollateral balances are included in the statement of net assets respectively under “Due from broker” and “Due to broker”.
Sub-funds
Due from /(Due to)brokers
Investmenttype Currency
Cash collateralbalances
Lumyna – Marshall Wace TOPS (MarketNeutral) UCITS Fund
Due from Exchange Traded Derivatives USD 18 717 277
Due from OTC Derivatives USD 206 097 705
Due to OTC Derivatives USD (30 492 406)
Lumyna – York Asian Event-Driven UCITSFund
Due from Exchange Traded Derivatives EUR 31 612 835
Due to Exchange Traded Derivatives EUR (16 802 792)
Due from OTC Derivatives EUR 38 052 290
Due to OTC Derivatives EUR (15)
Lumyna – BOFA Enhanced Equity VolatilityPremium UCITS Fund
Due from OTC Derivatives EUR 525 000
Lumyna – BOFA MLCX CommodityEnhanced Beta UCITS Fund
Due from OTC Derivatives USD 3 410 000
Lumyna – BOFA MLCX Commodity AlphaUCITS Fund
Due from OTC Derivatives USD 5 720 000
Due to OTC Derivatives USD (2 790 000)
Lumyna – Zeal Greater China Long ShortUCITS Fund
Due from Exchange Traded Derivatives USD 2 196 525
Due to Exchange Traded Derivatives USD (909 851)
Due from OTC Derivatives USD 9 835 986
Due to OTC Derivatives USD (1 951 166)
302 Lumyna Funds
Notes to the financial statementsas at March 31, 2021 (cont.)
Audited annual report
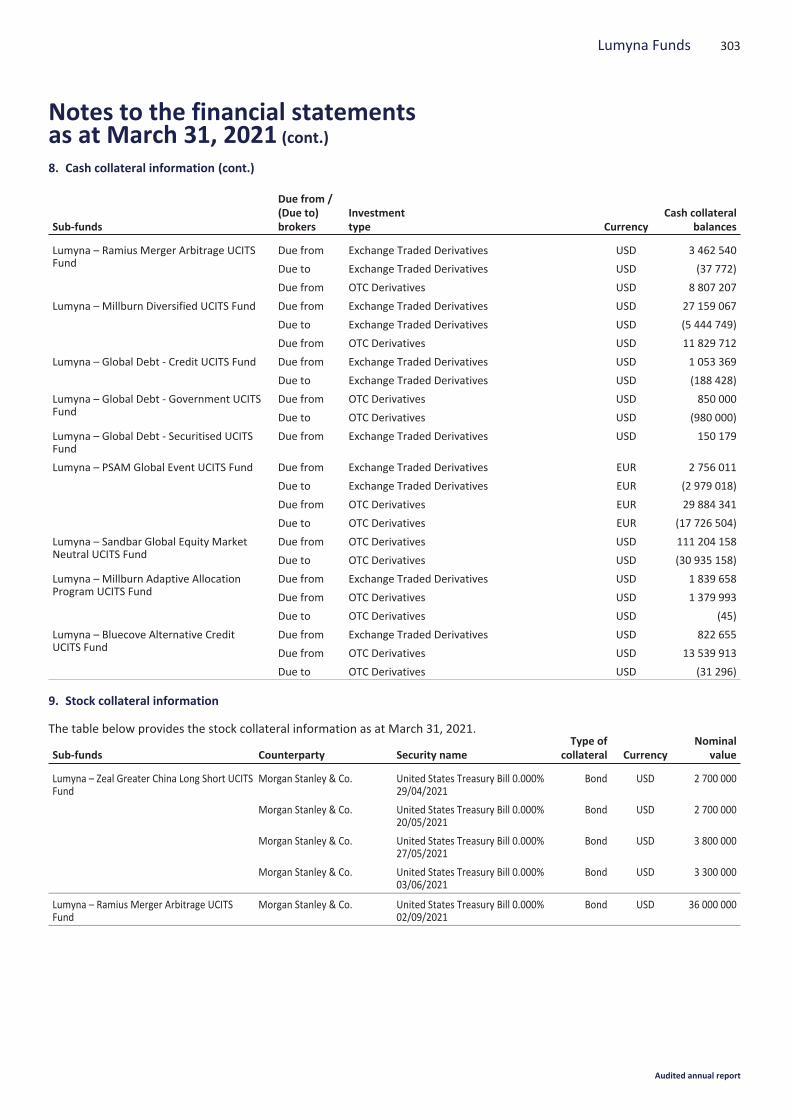
8. Cash collateral information (cont.)
Sub-funds
Due from /(Due to)brokers
Investmenttype Currency
Cash collateralbalances
Lumyna – Ramius Merger Arbitrage UCITSFund
Due from Exchange Traded Derivatives USD 3 462 540
Due to Exchange Traded Derivatives USD (37 772)
Due from OTC Derivatives USD 8 807 207
Lumyna – Millburn Diversified UCITS Fund Due from Exchange Traded Derivatives USD 27 159 067
Due to Exchange Traded Derivatives USD (5 444 749)
Due from OTC Derivatives USD 11 829 712
Lumyna – Global Debt - Credit UCITS Fund Due from Exchange Traded Derivatives USD 1 053 369
Due to Exchange Traded Derivatives USD (188 428)
Lumyna – Global Debt - Government UCITSFund
Due from OTC Derivatives USD 850 000
Due to OTC Derivatives USD (980 000)
Lumyna – Global Debt - Securitised UCITSFund
Due from Exchange Traded Derivatives USD 150 179
Lumyna – PSAM Global Event UCITS Fund Due from Exchange Traded Derivatives EUR 2 756 011
Due to Exchange Traded Derivatives EUR (2 979 018)
Due from OTC Derivatives EUR 29 884 341
Due to OTC Derivatives EUR (17 726 504)
Lumyna – Sandbar Global Equity MarketNeutral UCITS Fund
Due from OTC Derivatives USD 111 204 158
Due to OTC Derivatives USD (30 935 158)
Lumyna – Millburn Adaptive AllocationProgram UCITS Fund
Due from Exchange Traded Derivatives USD 1 839 658
Due from OTC Derivatives USD 1 379 993
Due to OTC Derivatives USD (45)
Lumyna – Bluecove Alternative CreditUCITS Fund
Due from Exchange Traded Derivatives USD 822 655
Due from OTC Derivatives USD 13 539 913
Due to OTC Derivatives USD (31 296)
9. Stock collateral information
The table below provides the stock collateral information as at March 31, 2021.
Sub-funds Counterparty Security nameType of
collateral CurrencyNominal
value
Lumyna – Zeal Greater China Long Short UCITSFund
Morgan Stanley & Co. United States Treasury Bill 0.000%29/04/2021
Bond USD 2 700 000
Morgan Stanley & Co. United States Treasury Bill 0.000%20/05/2021
Bond USD 2 700 000
Morgan Stanley & Co. United States Treasury Bill 0.000%27/05/2021
Bond USD 3 800 000
Morgan Stanley & Co. United States Treasury Bill 0.000%03/06/2021
Bond USD 3 300 000
Lumyna – Ramius Merger Arbitrage UCITSFund
Morgan Stanley & Co. United States Treasury Bill 0.000%02/09/2021
Bond USD 36 000 000
303Lumyna Funds
Notes to the financial statementsas at March 31, 2021 (cont.)
Audited annual report
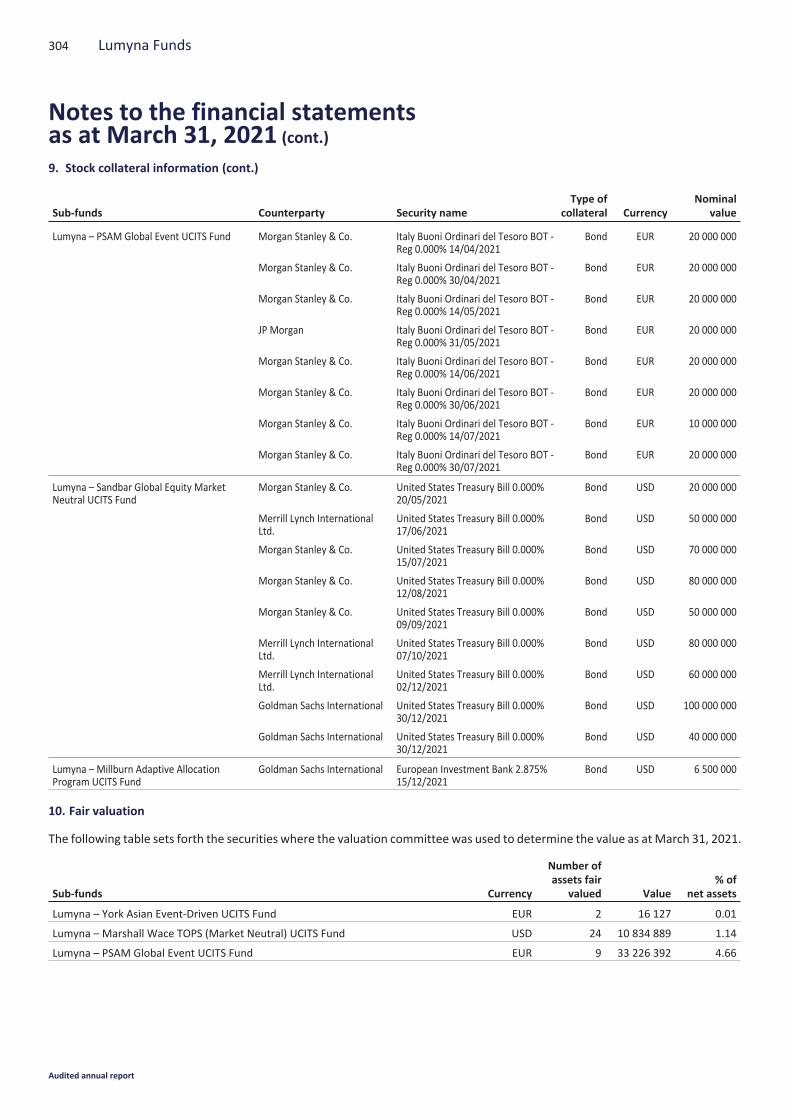
9. Stock collateral information (cont.)
Sub-funds Counterparty Security nameType of
collateral CurrencyNominal
value
Lumyna – PSAM Global Event UCITS Fund Morgan Stanley & Co. Italy Buoni Ordinari del Tesoro BOT -Reg 0.000% 14/04/2021
Bond EUR 20 000 000
Morgan Stanley & Co. Italy Buoni Ordinari del Tesoro BOT -Reg 0.000% 30/04/2021
Bond EUR 20 000 000
Morgan Stanley & Co. Italy Buoni Ordinari del Tesoro BOT -Reg 0.000% 14/05/2021
Bond EUR 20 000 000
JP Morgan Italy Buoni Ordinari del Tesoro BOT -Reg 0.000% 31/05/2021
Bond EUR 20 000 000
Morgan Stanley & Co. Italy Buoni Ordinari del Tesoro BOT -Reg 0.000% 14/06/2021
Bond EUR 20 000 000
Morgan Stanley & Co. Italy Buoni Ordinari del Tesoro BOT -Reg 0.000% 30/06/2021
Bond EUR 20 000 000
Morgan Stanley & Co. Italy Buoni Ordinari del Tesoro BOT -Reg 0.000% 14/07/2021
Bond EUR 10 000 000
Morgan Stanley & Co. Italy Buoni Ordinari del Tesoro BOT -Reg 0.000% 30/07/2021
Bond EUR 20 000 000
Lumyna – Sandbar Global Equity MarketNeutral UCITS Fund
Morgan Stanley & Co. United States Treasury Bill 0.000%20/05/2021
Bond USD 20 000 000
Merrill Lynch InternationalLtd.
United States Treasury Bill 0.000%17/06/2021
Bond USD 50 000 000
Morgan Stanley & Co. United States Treasury Bill 0.000%15/07/2021
Bond USD 70 000 000
Morgan Stanley & Co. United States Treasury Bill 0.000%12/08/2021
Bond USD 80 000 000
Morgan Stanley & Co. United States Treasury Bill 0.000%09/09/2021
Bond USD 50 000 000
Merrill Lynch InternationalLtd.
United States Treasury Bill 0.000%07/10/2021
Bond USD 80 000 000
Merrill Lynch InternationalLtd.
United States Treasury Bill 0.000%02/12/2021
Bond USD 60 000 000
Goldman Sachs International United States Treasury Bill 0.000%30/12/2021
Bond USD 100 000 000
Goldman Sachs International United States Treasury Bill 0.000%30/12/2021
Bond USD 40 000 000
Lumyna – Millburn Adaptive AllocationProgram UCITS Fund
Goldman Sachs International European Investment Bank 2.875%15/12/2021
Bond USD 6 500 000
10. Fair valuation
The following table sets forth the securities where the valuation committee was used to determine the value as atMarch 31, 2021.
Sub-funds Currency
Number ofassets fair
valued Value% of
net assets
Lumyna – York Asian Event-Driven UCITS Fund EUR 2 16 127 0.01
Lumyna – Marshall Wace TOPS (Market Neutral) UCITS Fund USD 24 10 834 889 1.14
Lumyna – PSAM Global Event UCITS Fund EUR 9 33 226 392 4.66
304 Lumyna Funds
Notes to the financial statementsas at March 31, 2021 (cont.)
Audited annual report

11. Distributions
The board of directors resolved to distribute a dividend to shareholders invested into the following classes:
Sub-funds Class Record date Reinvestment date Currency Dividend rate
Lumyna – Millburn Diversified UCITS Fund Class EUR X4 (inc) 08 July 2020 14 July 2020 EUR 0.1899 per share
Lumyna – Millburn Diversified UCITS Fund Class GBP X4 (inc) 08 July 2020 14 July 2020 GBP 0.2699 per share
Lumyna – Millburn Diversified UCITS Fund Class USD X4 (inc) 08 July 2020 14 July 2020 USD 0.1996 per share
Lumyna – Global Debt - Credit UCITS Fund Class EUR B (inc) 08 July 2020 14 July 2020 EUR 2.4801 per share
Lumyna – Global Debt - Credit UCITS Fund Class GBP B (inc) 08 July 2020 14 July 2020 GBP 2.4902 per share
Lumyna – Global Debt - Credit UCITS Fund Class USD B (inc) 08 July 2020 14 July 2020 USD 2.6150 per share
Lumyna – Global Debt - Government UCITS Fund Class EUR B (inc) 08 July 2020 14 July 2020 EUR 1.0307 per share
Lumyna – Global Debt - Government UCITS Fund Class GBP B (inc) 08 July 2020 14 July 2020 GBP 1.0571 per share
Lumyna – Global Debt - Government UCITS Fund Class USD B (inc) 08 July 2020 14 July 2020 USD 1.1099 per share
Lumyna – Global Debt - Securitised UCITS Fund Class EUR B (inc) 08 July 2020 14 July 2020 EUR 2.6951 per share
Lumyna – Global Debt - Securitised UCITS Fund Class GBP B (inc) 08 July 2020 14 July 2020 GBP 2.7146 per share
Lumyna – Global Debt - Securitised UCITS Fund Class USD B (inc) 08 July 2020 14 July 2020 USD 2.8383 per share
12. Director fees
Unaffiliated directors were each paid an annual gross fee of USD 45 000 during the year endedMarch 31, 2021, which were borneby the SICAV.
13. Subsequent events
No subsequent events occurred after end of the year March 31, 2021.
305Lumyna Funds
Notes to the financial statementsas at March 31, 2021 (cont.)
Audited annual report

The Total Expense Ratio (TER) includes all fees but excludes transaction fees and performance fees. TER was calculated using SwissFunds & Asset Management Association (SFAMA) guidelines, now known as AMAS (Asset Management Association Switzerland)following the recent merger between SFAMA and AMP (Asset Management Platform). For classes launched during the year, feeshave been annualised.
The TER calculated for the last 12 months are the following:
Sub-funds Share Class Currency TER %
Lumyna – Marshall Wace TOPS (Market Neutral) UCITS Fund Class EUR B (acc) EUR 1.81%Class EUR B (inc) EUR 1.81%Class EUR C (acc) EUR 2.70%Class EUR C (inc) EUR 2.70%Class EUR G (acc) EUR 1.85%Class EUR X1 (acc)1 EUR 1.19%Class EUR X2 (acc)1 EUR 1.30%Class EUR Z (acc) EUR 1.96%Class GBP B (acc) GBP 1.81%Class GBP B (inc) GBP 1.81%Class GBP C (acc) GBP 2.71%Class GBP C (inc)1 GBP 2.69%Class GBP G (acc) GBP 1.86%Class GBP Management (inc) GBP 0.95%Class GBP Z (acc) GBP 1.96%Class JPY B (acc)1 JPY 1.80%Class USD B (acc) USD 1.82%Class USD C (acc) USD 2.71%Class USD G (acc) USD 1.86%Class USD Z (acc) USD 1.98%
Lumyna – York Asian Event-Driven UCITS Fund Class CHF B (acc)1 CHF 1.95%Class EUR B (acc) EUR 1.96%Class EUR C (acc) EUR 2.80%Class EUR D (acc) EUR 1.68%Class EUR Z (acc) EUR 1.99%Class GBP C (acc) GBP 2.78%Class USD B (acc) USD 1.98%Class USD D (acc) USD 1.72%
Lumyna – BOFA Enhanced Equity Volatility Premium UCITS Fund Class EUR A (acc) EUR 0.61%Class EUR B (acc) EUR 1.01%
Lumyna – BOFA MLCX Commodity Enhanced Beta UCITS Fund Class EUR B (acc) EUR 0.80%Class EUR C (acc) EUR 1.98%Class EUR E (acc) EUR 0.79%Class USD B (acc) USD 0.91%Class USD C (acc) USD 1.95%
Lumyna – BOFA MLCX Commodity Alpha UCITS Fund Class EUR B5 (acc) EUR 0.97%Class EUR C5 (acc) EUR 2.04%Class EUR E5 (acc)1 EUR 0.79%Class GBP B5 (acc) GBP 1.00%Class USD B5 (acc) USD 0.96%Class USD C5 (acc) USD 1.99%Class USD E5 (acc)1 USD 0.76%
1 Refer to Note 1
306
Appendix I – Total Expense Ratio (TER)
Audited annual report
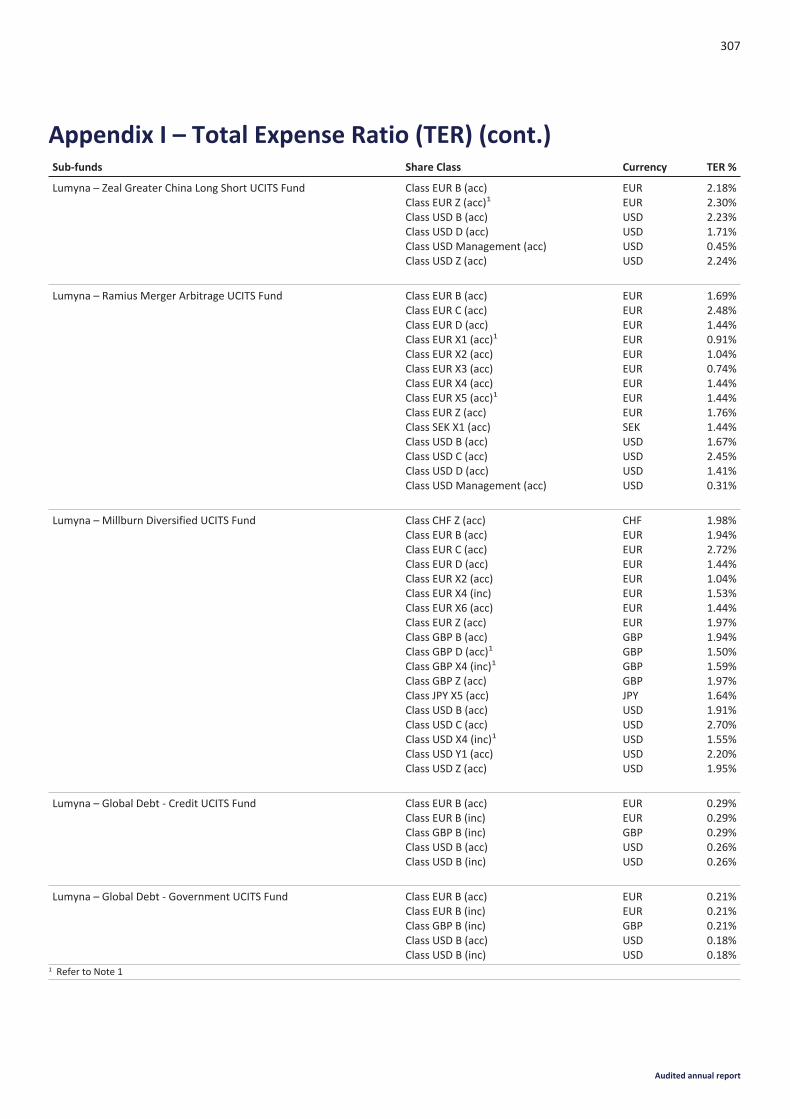
Sub-funds Share Class Currency TER %
Lumyna – Zeal Greater China Long Short UCITS Fund Class EUR B (acc) EUR 2.18%Class EUR Z (acc)1 EUR 2.30%Class USD B (acc) USD 2.23%Class USD D (acc) USD 1.71%Class USD Management (acc) USD 0.45%Class USD Z (acc) USD 2.24%
Lumyna – Ramius Merger Arbitrage UCITS Fund Class EUR B (acc) EUR 1.69%Class EUR C (acc) EUR 2.48%Class EUR D (acc) EUR 1.44%Class EUR X1 (acc)1 EUR 0.91%Class EUR X2 (acc) EUR 1.04%Class EUR X3 (acc) EUR 0.74%Class EUR X4 (acc) EUR 1.44%Class EUR X5 (acc)1 EUR 1.44%Class EUR Z (acc) EUR 1.76%Class SEK X1 (acc) SEK 1.44%Class USD B (acc) USD 1.67%Class USD C (acc) USD 2.45%Class USD D (acc) USD 1.41%Class USD Management (acc) USD 0.31%
Lumyna – Millburn Diversified UCITS Fund Class CHF Z (acc) CHF 1.98%Class EUR B (acc) EUR 1.94%Class EUR C (acc) EUR 2.72%Class EUR D (acc) EUR 1.44%Class EUR X2 (acc) EUR 1.04%Class EUR X4 (inc) EUR 1.53%Class EUR X6 (acc) EUR 1.44%Class EUR Z (acc) EUR 1.97%Class GBP B (acc) GBP 1.94%Class GBP D (acc)1 GBP 1.50%Class GBP X4 (inc)1 GBP 1.59%Class GBP Z (acc) GBP 1.97%Class JPY X5 (acc) JPY 1.64%Class USD B (acc) USD 1.91%Class USD C (acc) USD 2.70%Class USD X4 (inc)1 USD 1.55%Class USD Y1 (acc) USD 2.20%Class USD Z (acc) USD 1.95%
Lumyna – Global Debt - Credit UCITS Fund Class EUR B (acc) EUR 0.29%Class EUR B (inc) EUR 0.29%Class GBP B (inc) GBP 0.29%Class USD B (acc) USD 0.26%Class USD B (inc) USD 0.26%
Lumyna – Global Debt - Government UCITS Fund Class EUR B (acc) EUR 0.21%Class EUR B (inc) EUR 0.21%Class GBP B (inc) GBP 0.21%Class USD B (acc) USD 0.18%Class USD B (inc) USD 0.18%
1 Refer to Note 1
307
Appendix I – Total Expense Ratio (TER) (cont.)
Audited annual report
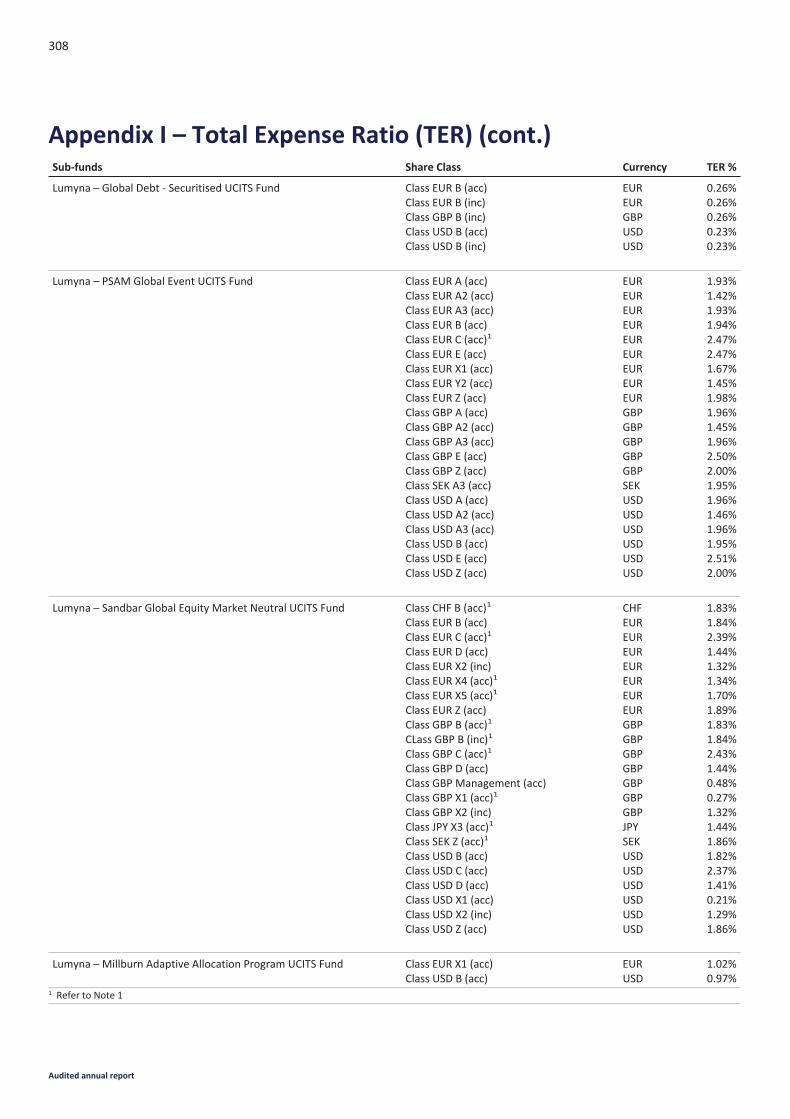
Sub-funds Share Class Currency TER %
Lumyna – Global Debt - Securitised UCITS Fund Class EUR B (acc) EUR 0.26%Class EUR B (inc) EUR 0.26%Class GBP B (inc) GBP 0.26%Class USD B (acc) USD 0.23%Class USD B (inc) USD 0.23%
Lumyna – PSAM Global Event UCITS Fund Class EUR A (acc) EUR 1.93%Class EUR A2 (acc) EUR 1.42%Class EUR A3 (acc) EUR 1.93%Class EUR B (acc) EUR 1.94%Class EUR C (acc)1 EUR 2.47%Class EUR E (acc) EUR 2.47%Class EUR X1 (acc) EUR 1.67%Class EUR Y2 (acc) EUR 1.45%Class EUR Z (acc) EUR 1.98%Class GBP A (acc) GBP 1.96%Class GBP A2 (acc) GBP 1.45%Class GBP A3 (acc) GBP 1.96%Class GBP E (acc) GBP 2.50%Class GBP Z (acc) GBP 2.00%Class SEK A3 (acc) SEK 1.95%Class USD A (acc) USD 1.96%Class USD A2 (acc) USD 1.46%Class USD A3 (acc) USD 1.96%Class USD B (acc) USD 1.95%Class USD E (acc) USD 2.51%Class USD Z (acc) USD 2.00%
Lumyna – Sandbar Global Equity Market Neutral UCITS Fund Class CHF B (acc)1 CHF 1.83%Class EUR B (acc) EUR 1.84%Class EUR C (acc)1 EUR 2.39%Class EUR D (acc) EUR 1.44%Class EUR X2 (inc) EUR 1.32%Class EUR X4 (acc)1 EUR 1.34%Class EUR X5 (acc)1 EUR 1.70%Class EUR Z (acc) EUR 1.89%Class GBP B (acc)1 GBP 1.83%CLass GBP B (inc)1 GBP 1.84%Class GBP C (acc)1 GBP 2.43%Class GBP D (acc) GBP 1.44%Class GBP Management (acc) GBP 0.48%Class GBP X1 (acc)1 GBP 0.27%Class GBP X2 (inc) GBP 1.32%Class JPY X3 (acc)1 JPY 1.44%Class SEK Z (acc)1 SEK 1.86%Class USD B (acc) USD 1.82%Class USD C (acc) USD 2.37%Class USD D (acc) USD 1.41%Class USD X1 (acc) USD 0.21%Class USD X2 (inc) USD 1.29%Class USD Z (acc) USD 1.86%
Lumyna – Millburn Adaptive Allocation Program UCITS Fund Class EUR X1 (acc) EUR 1.02%Class USD B (acc) USD 0.97%
1 Refer to Note 1
308
Appendix I – Total Expense Ratio (TER) (cont.)
Audited annual report
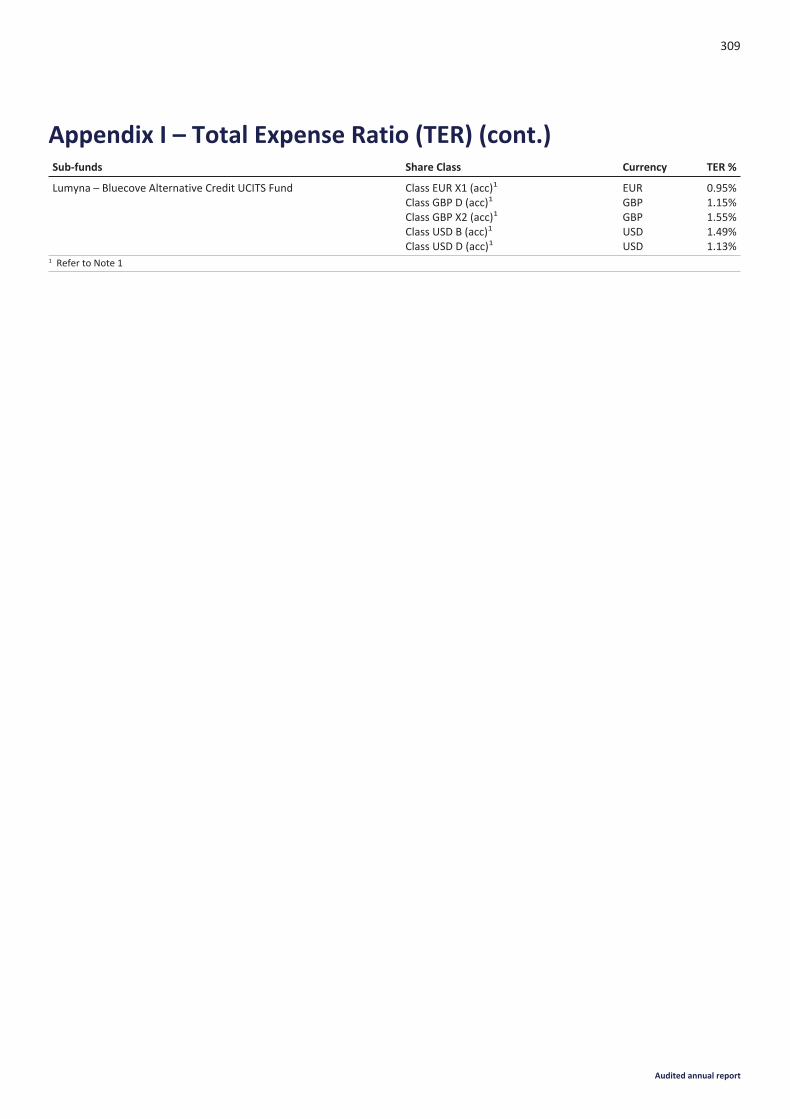
Sub-funds Share Class Currency TER %
Lumyna – Bluecove Alternative Credit UCITS Fund Class EUR X1 (acc)1 EUR 0.95%Class GBP D (acc)1 GBP 1.15%Class GBP X2 (acc)1 GBP 1.55%Class USD B (acc)1 USD 1.49%Class USD D (acc)1 USD 1.13%
1 Refer to Note 1
309
Appendix I – Total Expense Ratio (TER) (cont.)
Audited annual report
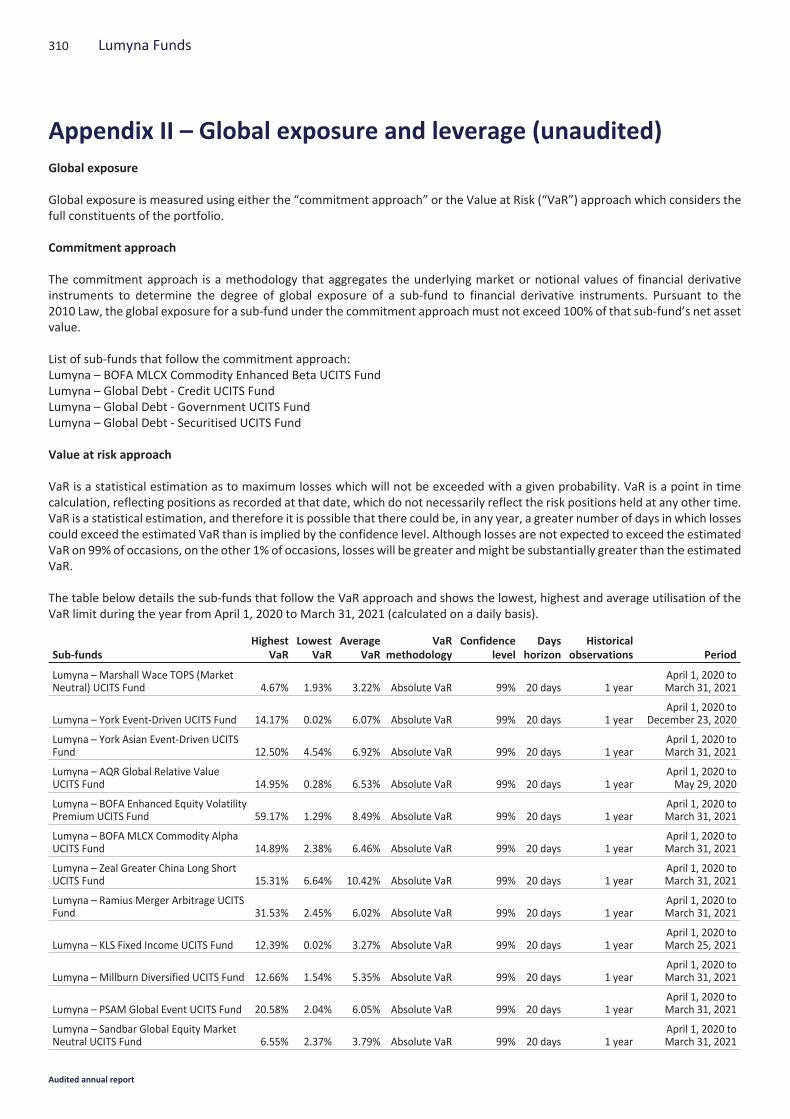
Global exposure
Global exposure is measured using either the “commitment approach” or the Value at Risk (“VaR”) approach which considers thefull constituents of the portfolio.
Commitment approach
The commitment approach is a methodology that aggregates the underlying market or notional values of financial derivativeinstruments to determine the degree of global exposure of a sub-fund to financial derivative instruments. Pursuant to the2010 Law, the global exposure for a sub-fund under the commitment approachmust not exceed 100% of that sub-fund’s net assetvalue.
List of sub-funds that follow the commitment approach:Lumyna – BOFA MLCX Commodity Enhanced Beta UCITS FundLumyna – Global Debt - Credit UCITS FundLumyna – Global Debt - Government UCITS FundLumyna – Global Debt - Securitised UCITS Fund
Value at risk approach
VaR is a statistical estimation as to maximum losses which will not be exceeded with a given probability. VaR is a point in timecalculation, reflecting positions as recorded at that date, which do not necessarily reflect the risk positions held at any other time.VaR is a statistical estimation, and therefore it is possible that there could be, in any year, a greater number of days in which lossescould exceed the estimated VaR than is implied by the confidence level. Although losses are not expected to exceed the estimatedVaR on 99% of occasions, on the other 1% of occasions, losses will be greater andmight be substantially greater than the estimatedVaR.
The table below details the sub-funds that follow the VaR approach and shows the lowest, highest and average utilisation of theVaR limit during the year from April 1, 2020 to March 31, 2021 (calculated on a daily basis).
Sub-fundsHighest
VaRLowest
VaRAverage
VaRVaR
methodologyConfidence
levelDays
horizonHistorical
observations Period
Lumyna – Marshall Wace TOPS (MarketNeutral) UCITS Fund 4.67% 1.93% 3.22% Absolute VaR 99% 20 days 1 year
April 1, 2020 toMarch 31, 2021
Lumyna – York Event-Driven UCITS Fund 14.17% 0.02% 6.07% Absolute VaR 99% 20 days 1 yearApril 1, 2020 to
December 23, 2020
Lumyna – York Asian Event-Driven UCITSFund 12.50% 4.54% 6.92% Absolute VaR 99% 20 days 1 year
April 1, 2020 toMarch 31, 2021
Lumyna – AQR Global Relative ValueUCITS Fund 14.95% 0.28% 6.53% Absolute VaR 99% 20 days 1 year
April 1, 2020 toMay 29, 2020
Lumyna – BOFA Enhanced Equity VolatilityPremium UCITS Fund 59.17% 1.29% 8.49% Absolute VaR 99% 20 days 1 year
April 1, 2020 toMarch 31, 2021
Lumyna – BOFA MLCX Commodity AlphaUCITS Fund 14.89% 2.38% 6.46% Absolute VaR 99% 20 days 1 year
April 1, 2020 toMarch 31, 2021
Lumyna – Zeal Greater China Long ShortUCITS Fund 15.31% 6.64% 10.42% Absolute VaR 99% 20 days 1 year
April 1, 2020 toMarch 31, 2021
Lumyna – Ramius Merger Arbitrage UCITSFund 31.53% 2.45% 6.02% Absolute VaR 99% 20 days 1 year
April 1, 2020 toMarch 31, 2021
Lumyna – KLS Fixed Income UCITS Fund 12.39% 0.02% 3.27% Absolute VaR 99% 20 days 1 yearApril 1, 2020 toMarch 25, 2021
Lumyna – Millburn Diversified UCITS Fund 12.66% 1.54% 5.35% Absolute VaR 99% 20 days 1 yearApril 1, 2020 toMarch 31, 2021
Lumyna – PSAM Global Event UCITS Fund 20.58% 2.04% 6.05% Absolute VaR 99% 20 days 1 yearApril 1, 2020 toMarch 31, 2021
Lumyna – Sandbar Global Equity MarketNeutral UCITS Fund 6.55% 2.37% 3.79% Absolute VaR 99% 20 days 1 year
April 1, 2020 toMarch 31, 2021
310 Lumyna Funds
Appendix II – Global exposure and leverage (unaudited)
Audited annual report

Sub-fundsHighest
VaRLowest
VaRAverage
VaRVaR
methodologyConfidence
levelDays
horizonHistorical
observations Period
Lumyna – Millburn Adaptive AllocationProgram UCITS Fund 9.34% 1.85% 4.02% Absolute VaR 99% 20 days 1 year
April 1, 2020 toMarch 31, 2021
Lumyna – Bluecove Alternative CreditUCITS Fund 1.26% 0.02% 0.75% Absolute VaR 99% 20 days 1 year
December 17,2020 to March 31,
2021
Leverage
Leverage, in this disclosure, is the investment exposure gained through the use of financial derivative instruments. It is calculatedusing the sum of the notional values of all of the financial derivative instruments held by the relevant sub-fund, without netting,and is expressed as a percentage of the NAV.
The table below details the lowest, highest and average sum of the notionals of each sub-fund during the year fromApril 1, 2020 toMarch 31, 2021 (calculated on a daily basis).
Sub-fundsMinimumleverage
Maximumleverage
Averageleverage
Lumyna – Marshall Wace TOPS (Market Neutral) UCITS Fund 237.83% 304.77% 271.22%
Lumyna – York Event-Driven UCITS Fund 1.85% 347.23% 223.64%
Lumyna – York Asian Event-Driven UCITS Fund 173.63% 383.12% 270.29%
Lumyna – AQR Global Relative Value UCITS Fund 0.34% 1 140.93% 553.71%
Lumyna – BOFA Enhanced Equity Volatility Premium UCITS Fund 375.44% 673.20% 486.01%
Lumyna – BOFA MLCX Commodity Alpha UCITS Fund 849.51% 1 083.83% 1 000.69%
Lumyna – Zeal Greater China Long Short UCITS Fund 21.40% 53.75% 37.61%
Lumyna – Ramius Merger Arbitrage UCITS Fund 45.62% 191.06% 111.93%
Lumyna – KLS Fixed Income UCITS Fund 0.00% 4 546.66% 2 613.15%
Lumyna – Millburn Diversified UCITS Fund 340.50% 2 786.01% 1 583.00%
Lumyna – PSAM Global Event UCITS Fund 101.52% 167.32% 129.56%
Lumyna – Sandbar Global Equity Market Neutral UCITS Fund 122.91% 201.73% 172.46%
Lumyna – Millburn Adaptive Allocation Program UCITS Fund 423.38% 1 592.24% 831.19%
Lumyna – Bluecove Alternative Credit UCITS Fund 2.17% 537.64% 403.68%
311Lumyna Funds
Appendix II – Global exposure and leverage (unaudited) (cont.)
Audited annual report
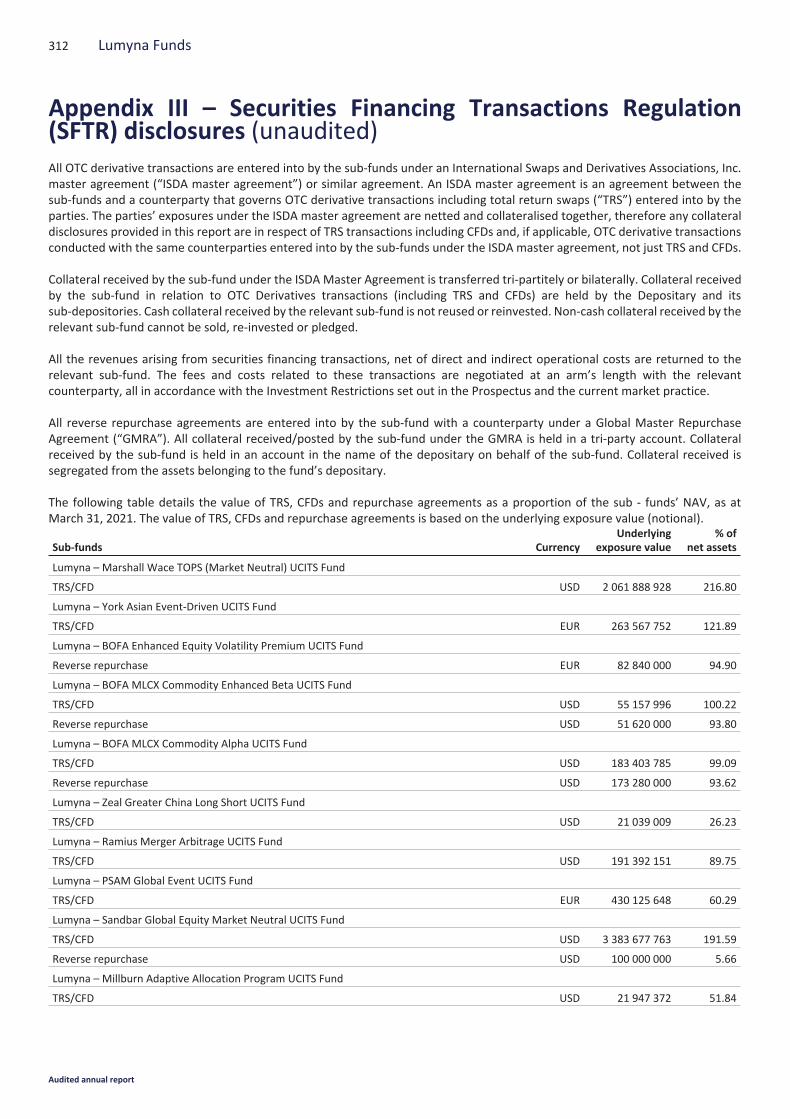
All OTC derivative transactions are entered into by the sub-funds under an International Swaps and Derivatives Associations, Inc.master agreement (“ISDA master agreement”) or similar agreement. An ISDA master agreement is an agreement between thesub-funds and a counterparty that governs OTC derivative transactions including total return swaps (“TRS”) entered into by theparties. The parties’ exposures under the ISDA master agreement are netted and collateralised together, therefore any collateraldisclosures provided in this report are in respect of TRS transactions including CFDs and, if applicable, OTC derivative transactionsconducted with the same counterparties entered into by the sub-funds under the ISDA master agreement, not just TRS and CFDs.
Collateral received by the sub-fund under the ISDA Master Agreement is transferred tri-partitely or bilaterally. Collateral receivedby the sub-fund in relation to OTC Derivatives transactions (including TRS and CFDs) are held by the Depositary and itssub-depositories. Cash collateral received by the relevant sub-fund is not reused or reinvested. Non-cash collateral received by therelevant sub-fund cannot be sold, re-invested or pledged.
All the revenues arising from securities financing transactions, net of direct and indirect operational costs are returned to therelevant sub-fund. The fees and costs related to these transactions are negotiated at an arm’s length with the relevantcounterparty, all in accordance with the Investment Restrictions set out in the Prospectus and the current market practice.
All reverse repurchase agreements are entered into by the sub-fund with a counterparty under a Global Master RepurchaseAgreement (“GMRA”). All collateral received/posted by the sub-fund under the GMRA is held in a tri-party account. Collateralreceived by the sub-fund is held in an account in the name of the depositary on behalf of the sub-fund. Collateral received issegregated from the assets belonging to the fund’s depositary.
The following table details the value of TRS, CFDs and repurchase agreements as a proportion of the sub - funds’ NAV, as atMarch 31, 2021. The value of TRS, CFDs and repurchase agreements is based on the underlying exposure value (notional).
Sub-funds CurrencyUnderlying
exposure value% of
net assets
Lumyna – Marshall Wace TOPS (Market Neutral) UCITS Fund
TRS/CFD USD 2 061 888 928 216.80
Lumyna – York Asian Event-Driven UCITS Fund
TRS/CFD EUR 263 567 752 121.89
Lumyna – BOFA Enhanced Equity Volatility Premium UCITS Fund
Reverse repurchase EUR 82 840 000 94.90
Lumyna – BOFA MLCX Commodity Enhanced Beta UCITS Fund
TRS/CFD USD 55 157 996 100.22
Reverse repurchase USD 51 620 000 93.80
Lumyna – BOFA MLCX Commodity Alpha UCITS Fund
TRS/CFD USD 183 403 785 99.09
Reverse repurchase USD 173 280 000 93.62
Lumyna – Zeal Greater China Long Short UCITS Fund
TRS/CFD USD 21 039 009 26.23
Lumyna – Ramius Merger Arbitrage UCITS Fund
TRS/CFD USD 191 392 151 89.75
Lumyna – PSAM Global Event UCITS Fund
TRS/CFD EUR 430 125 648 60.29
Lumyna – Sandbar Global Equity Market Neutral UCITS Fund
TRS/CFD USD 3 383 677 763 191.59
Reverse repurchase USD 100 000 000 5.66
Lumyna – Millburn Adaptive Allocation Program UCITS Fund
TRS/CFD USD 21 947 372 51.84
312 Lumyna Funds
Appendix III – Securities Financing Transactions Regulation(SFTR) disclosures (unaudited)
Audited annual report
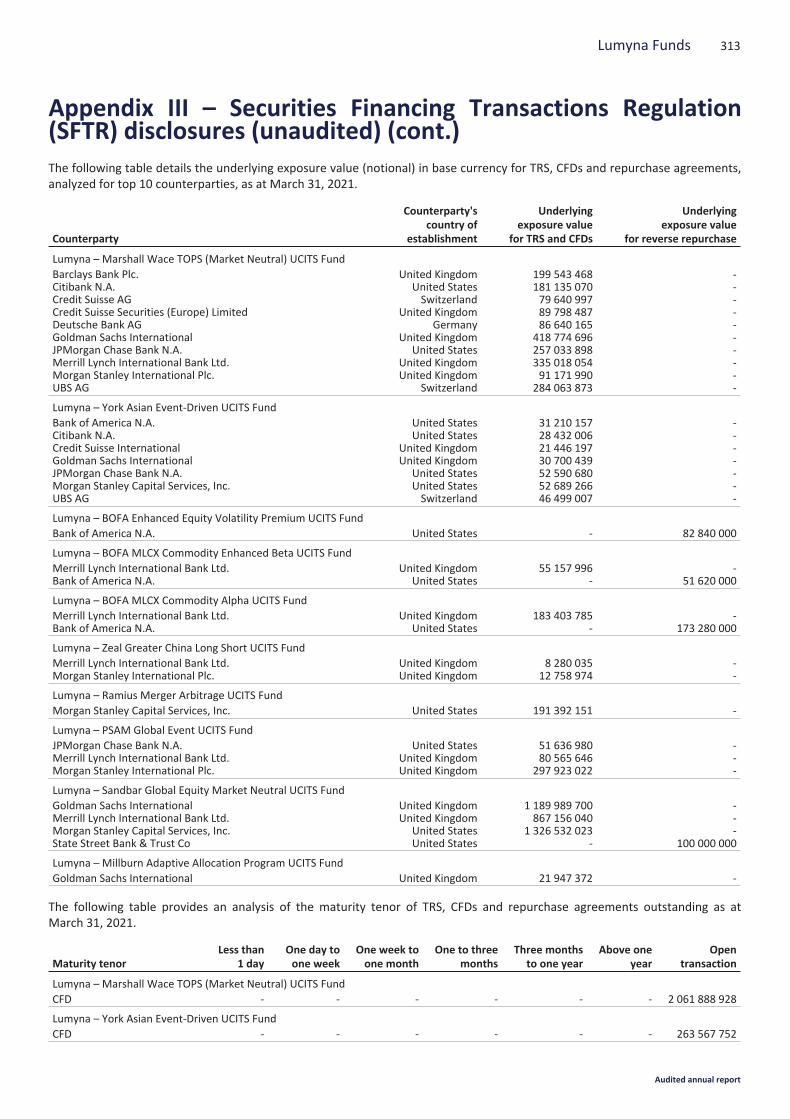
The following table details the underlying exposure value (notional) in base currency for TRS, CFDs and repurchase agreements,analyzed for top 10 counterparties, as at March 31, 2021.
Counterparty
Counterparty'scountry of
establishment
Underlyingexposure value
for TRS and CFDs
Underlyingexposure value
for reverse repurchase
Lumyna – Marshall Wace TOPS (Market Neutral) UCITS FundBarclays Bank Plc.Citibank N.A.Credit Suisse AGCredit Suisse Securities (Europe) LimitedDeutsche Bank AGGoldman Sachs InternationalJPMorgan Chase Bank N.A.Merrill Lynch International Bank Ltd.Morgan Stanley International Plc.UBS AG
United KingdomUnited StatesSwitzerland
United KingdomGermany
United KingdomUnited States
United KingdomUnited Kingdom
Switzerland
199 543 468181 135 07079 640 99789 798 48786 640 165
418 774 696257 033 898335 018 05491 171 990
284 063 873
----------
Lumyna – York Asian Event-Driven UCITS FundBank of America N.A.Citibank N.A.Credit Suisse InternationalGoldman Sachs InternationalJPMorgan Chase Bank N.A.Morgan Stanley Capital Services, Inc.UBS AG
United StatesUnited States
United KingdomUnited Kingdom
United StatesUnited StatesSwitzerland
31 210 15728 432 00621 446 19730 700 43952 590 68052 689 26646 499 007
-------
Lumyna – BOFA Enhanced Equity Volatility Premium UCITS FundBank of America N.A. United States - 82 840 000
Lumyna – BOFA MLCX Commodity Enhanced Beta UCITS FundMerrill Lynch International Bank Ltd.Bank of America N.A.
United KingdomUnited States
55 157 996-
-51 620 000
Lumyna – BOFA MLCX Commodity Alpha UCITS FundMerrill Lynch International Bank Ltd.Bank of America N.A.
United KingdomUnited States
183 403 785-
-173 280 000
Lumyna – Zeal Greater China Long Short UCITS FundMerrill Lynch International Bank Ltd.Morgan Stanley International Plc.
United KingdomUnited Kingdom
8 280 03512 758 974
--
Lumyna – Ramius Merger Arbitrage UCITS FundMorgan Stanley Capital Services, Inc. United States 191 392 151 -
Lumyna – PSAM Global Event UCITS FundJPMorgan Chase Bank N.A.Merrill Lynch International Bank Ltd.Morgan Stanley International Plc.
United StatesUnited KingdomUnited Kingdom
51 636 98080 565 646
297 923 022
---
Lumyna – Sandbar Global Equity Market Neutral UCITS FundGoldman Sachs InternationalMerrill Lynch International Bank Ltd.Morgan Stanley Capital Services, Inc.State Street Bank & Trust Co
United KingdomUnited Kingdom
United StatesUnited States
1 189 989 700867 156 040
1 326 532 023-
---
100 000 000
Lumyna – Millburn Adaptive Allocation Program UCITS FundGoldman Sachs International United Kingdom 21 947 372 -
The following table provides an analysis of the maturity tenor of TRS, CFDs and repurchase agreements outstanding as atMarch 31, 2021.
Maturity tenorLess than
1 dayOne day toone week
One week toone month
One to threemonths
Three monthsto one year
Above oneyear
Opentransaction
Lumyna – Marshall Wace TOPS (Market Neutral) UCITS FundCFD - - - - - - 2 061 888 928
Lumyna – York Asian Event-Driven UCITS FundCFD - - - - - - 263 567 752
313Lumyna Funds
Appendix III – Securities Financing Transactions Regulation(SFTR) disclosures (unaudited) (cont.)
Audited annual report

Maturity tenorLess than
1 dayOne day toone week
One week toone month
One to threemonths
Three monthsto one year
Above oneyear
Opentransaction
Lumyna – BOFA Enhanced Equity Volatility Premium UCITS FundReverse repurchase - 82 840 000 - - - - -
Lumyna – BOFA MLCX Commodity Enhanced Beta UCITS FundTRS - - - - 55 157 996 - -Reverse repurchase - 51 620 000 - - - - -
Lumyna – BOFA MLCX Commodity Alpha UCITS FundTRS - - - - 183 403 785 - -Reverse repurchase - 173 280 000 - - - - -
Lumyna – Zeal Greater China Long Short UCITS FundCFD - - - - - - 21 039 009
Lumyna – Ramius Merger Arbitrage UCITS FundCFD - - - - - - 191 392 151
Lumyna – PSAM Global Event UCITS FundCFD - - - - - - 430 125 648
Lumyna – Sandbar Global Equity Market Neutral UCITS FundCFD - - - - - - 3 383 677 763Reverse repurchase 100 000 000 - - - - - -
Lumyna – Millburn Adaptive Allocation Program UCITS FundCFD - - - - - - 21 947 372
The following table provides an analysis of the maturity tenor of cash collateral posted/(received) as at March 31, 2021.
Maturity tenorLess
than 1 dayOne day
to one weekOne week
to one monthOne to
three monthsThree months
to one yearAbove one
yearOpen
maturity
Lumyna – Marshall Wace TOPS (Market Neutral) UCITS FundUSD - - - - - - 30 492 406
Lumyna – BOFA MLCX Commodity Alpha UCITS FundUSD - - - - - - 2 790 000
Lumyna – Zeal Greater China Long Short UCITS FundUSD - - - - - - 1 951 166
Lumyna – PSAM Global Event UCITS FundEUR - - - - - - 15 486 599
Lumyna – Sandbar Global Equity Market Neutral UCITS FundUSD - - - - - - 31 237 240
Lumyna – Millburn Adaptive Allocation Program UCITS FundUSD - - - - - - 45
The following table provides an analysis of the maturity tenor of the non-cash collateral posted/(received) as at March 31, 2021.
Maturity tenorLess
than 1 dayOne day
to one weekOne week
to one monthOne to
three monthsThree months
to one yearAbove one
yearOpen
maturity
Lumyna – BOFA Enhanced Equity Volatility Premium UCITS FundReverse repurchaseGovernment Bond - - - (13 783 804) (54 621 921) (15 125 284) -
Lumyna – BOFA MLCX Commodity Enhanced Beta UCITS FundReverse repurchaseGovernment Bond - - - (8 697 739) (43 770 967) (16 420) -
Lumyna – BOFA MLCX Commodity Alpha UCITS FundReverse repurchaseGovernment Bond - - - (29 455 216) (148 275 834) - -
Lumyna – Zeal Greater China Long Short UCITS FundTRSGovernment Bond - - 2 699 976 9 799 746 - - -
314 Lumyna Funds
Appendix III – Securities Financing Transactions Regulation(SFTR) disclosures (unaudited) (cont.)
Audited annual report

Maturity tenorLess
than 1 dayOne day
to one weekOne week
to one monthOne to
three monthsThree months
to one yearAbove one
yearOpen
maturity
Lumyna – Ramius Merger Arbitrage UCITS FundTRSGovernment Bond - - - 35 999 388 - - -
Lumyna – PSAM Global Event UCITS FundTRSGovernment Bond - - 40 009 069 60 045 937 50 072 972 - -
Lumyna – Sandbar Global Equity Market Neutral UCITS FundReverse repurchaseGovernment Bond - - - - - (102 000 054) -TRSGovernment Bond - - - 69 997 893 589 900 725 - -
Lumyna – Millburn Adaptive Allocation Program UCITS FundTRSGovernment Bond - - - - 6 624 439 - -
The following table lists the ten largest issuers by value of non-cash collateral received by the funds by way of title transfer inrespect of repurchase agreements as at March 31, 2021.
Issuer Local currencyNon-cash collateral
received
Lumyna – BOFA Enhanced Equity Volatility Premium UCITS FundReverse repurchaseBundesrepublik Deutschland BundesanleiheUnited States Treasury Inflation Indexed BondsJapan Government Ten Year BondUnited States Treasury Bill- When IssuedNetherlands Government BondFrench Republic Government Bond OATSpain Government Bond
EURUSDJPYUSDEUREUREUR
18 892 49013 784 52813 784 50213 783 80413 268 3648 956 4441 060 877
Lumyna – BOFA MLCX Commodity Enhanced Beta UCITS FundReverse repurchaseBundesrepublik Deutschland BundesanleiheBundesschatzanweisungenDutch Treasury CertificateUnited States Treasury Inflation Indexed BondsJapan Government Ten Year BondUnited States Treasury Bill- When IssuedBundesobligation
EUREUREURUSDJPYUSDEUR
8 714 9268 698 5058 698 4998 698 4408 698 1018 697 739278 916
Lumyna – BOFA MLCX Commodity Alpha UCITS FundReverse repurchaseUnited States Treasury Inflation Indexed BondsBundesrepublik Deutschland BundesanleiheJapan Government Ten Year BondUnited States Treasury Bill- When IssuedUnited States Treasury Note/BondGerman Treasury BillNetherlands Government BondUnited States Treasury Bill
USDEURJPYUSDUSDEUREURUSD
30 436 80829 456 07629 455 93729 455 21628 560 28522 388 4696 177 3641 800 895
Lumyna – Sandbar Global Equity Market Neutral UCITS FundReverse repurchaseUnited States Treasury Note/BondUnited States Treasury Note/Bond - When IssuedUnited States Treasury Inflation Indexed Bonds
USDUSDUSD
65 279 95418 360 05418 360 046
315Lumyna Funds
Appendix III – Securities Financing Transactions Regulation(SFTR) disclosures (unaudited) (cont.)
Audited annual report
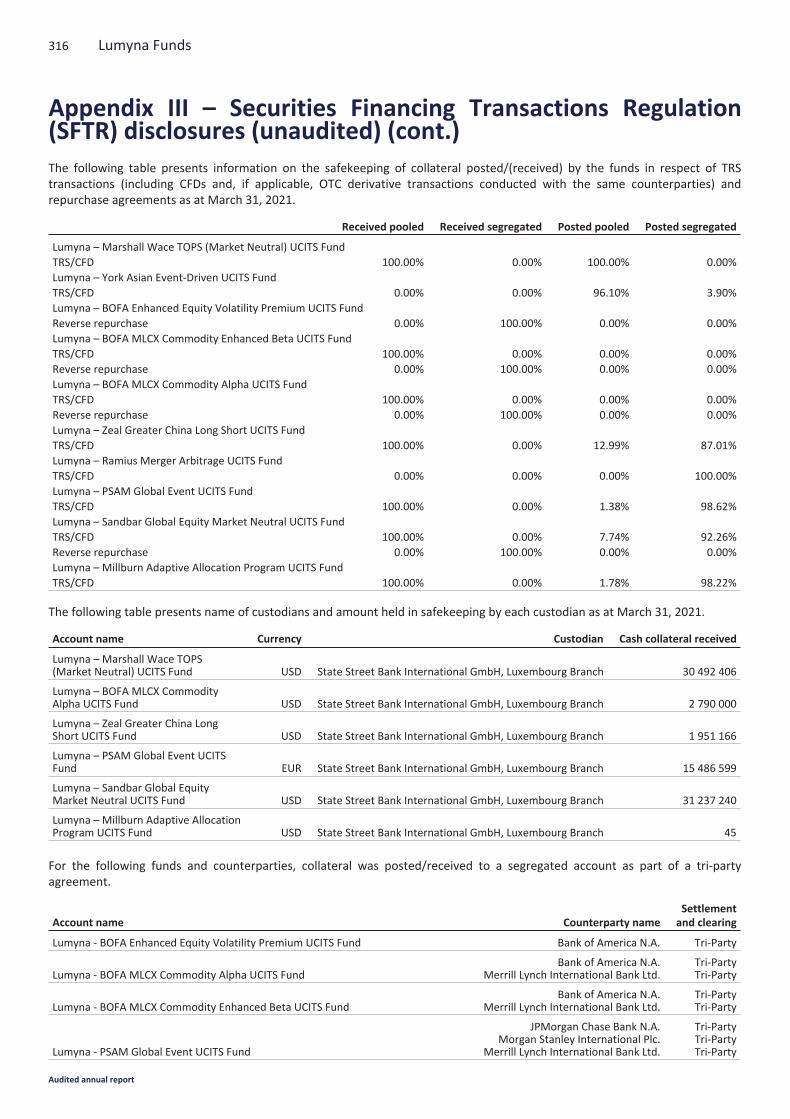
The following table presents information on the safekeeping of collateral posted/(received) by the funds in respect of TRStransactions (including CFDs and, if applicable, OTC derivative transactions conducted with the same counterparties) andrepurchase agreements as at March 31, 2021.
Received pooled Received segregated Posted pooled Posted segregated
Lumyna – Marshall Wace TOPS (Market Neutral) UCITS FundTRS/CFD 100.00% 0.00% 100.00% 0.00%Lumyna – York Asian Event-Driven UCITS FundTRS/CFD 0.00% 0.00% 96.10% 3.90%Lumyna – BOFA Enhanced Equity Volatility Premium UCITS FundReverse repurchase 0.00% 100.00% 0.00% 0.00%Lumyna – BOFA MLCX Commodity Enhanced Beta UCITS FundTRS/CFD 100.00% 0.00% 0.00% 0.00%Reverse repurchase 0.00% 100.00% 0.00% 0.00%Lumyna – BOFA MLCX Commodity Alpha UCITS FundTRS/CFD 100.00% 0.00% 0.00% 0.00%Reverse repurchase 0.00% 100.00% 0.00% 0.00%Lumyna – Zeal Greater China Long Short UCITS FundTRS/CFD 100.00% 0.00% 12.99% 87.01%Lumyna – Ramius Merger Arbitrage UCITS FundTRS/CFD 0.00% 0.00% 0.00% 100.00%Lumyna – PSAM Global Event UCITS FundTRS/CFD 100.00% 0.00% 1.38% 98.62%Lumyna – Sandbar Global Equity Market Neutral UCITS FundTRS/CFD 100.00% 0.00% 7.74% 92.26%Reverse repurchase 0.00% 100.00% 0.00% 0.00%Lumyna – Millburn Adaptive Allocation Program UCITS FundTRS/CFD 100.00% 0.00% 1.78% 98.22%
The following table presents name of custodians and amount held in safekeeping by each custodian as at March 31, 2021.
Account name Currency Custodian Cash collateral received
Lumyna – Marshall Wace TOPS(Market Neutral) UCITS Fund USD State Street Bank International GmbH, Luxembourg Branch 30 492 406
Lumyna – BOFA MLCX CommodityAlpha UCITS Fund USD State Street Bank International GmbH, Luxembourg Branch 2 790 000
Lumyna – Zeal Greater China LongShort UCITS Fund USD State Street Bank International GmbH, Luxembourg Branch 1 951 166
Lumyna – PSAM Global Event UCITSFund EUR State Street Bank International GmbH, Luxembourg Branch 15 486 599
Lumyna – Sandbar Global EquityMarket Neutral UCITS Fund USD State Street Bank International GmbH, Luxembourg Branch 31 237 240
Lumyna – Millburn Adaptive AllocationProgram UCITS Fund USD State Street Bank International GmbH, Luxembourg Branch 45
For the following funds and counterparties, collateral was posted/received to a segregated account as part of a tri-partyagreement.
Account name Counterparty nameSettlementand clearing
Lumyna - BOFA Enhanced Equity Volatility Premium UCITS Fund Bank of America N.A. Tri-Party
Lumyna - BOFA MLCX Commodity Alpha UCITS FundBank of America N.A.
Merrill Lynch International Bank Ltd.Tri-PartyTri-Party
Lumyna - BOFA MLCX Commodity Enhanced Beta UCITS FundBank of America N.A.
Merrill Lynch International Bank Ltd.Tri-PartyTri-Party
Lumyna - PSAM Global Event UCITS Fund
JPMorgan Chase Bank N.A.Morgan Stanley International Plc.
Merrill Lynch International Bank Ltd.
Tri-PartyTri-PartyTri-Party
316 Lumyna Funds
Appendix III – Securities Financing Transactions Regulation(SFTR) disclosures (unaudited) (cont.)
Audited annual report
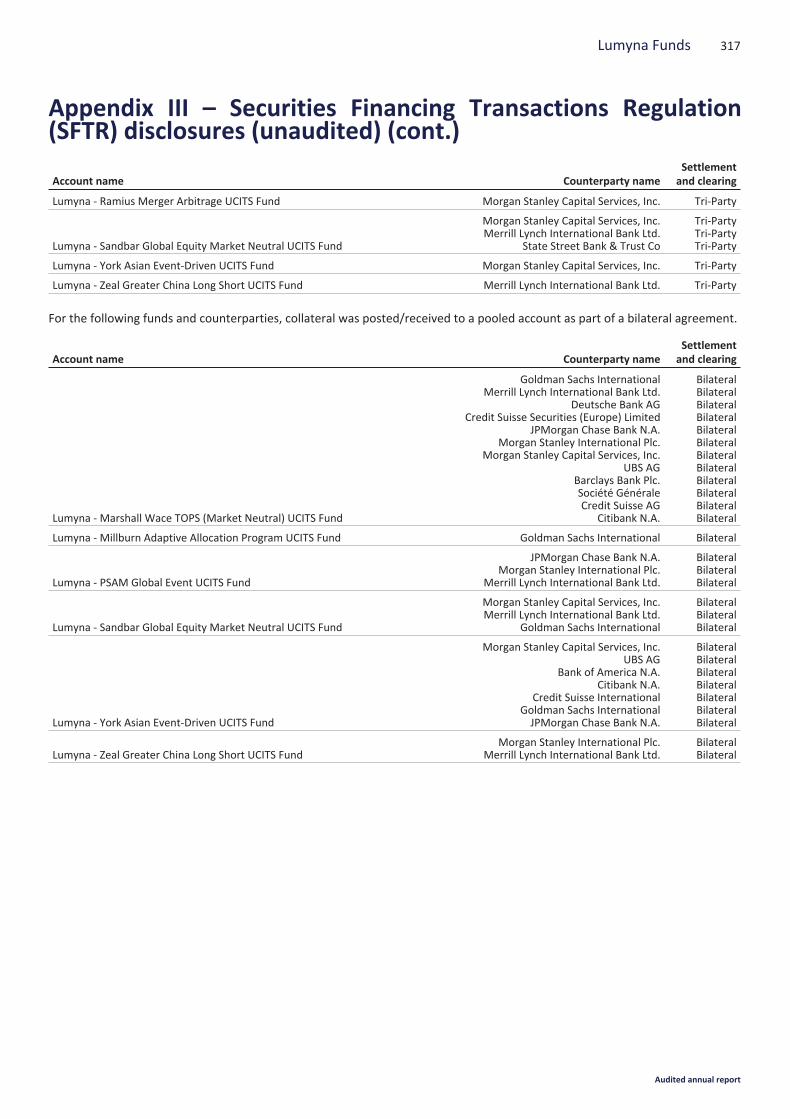
Account name Counterparty nameSettlementand clearing
Lumyna - Ramius Merger Arbitrage UCITS Fund Morgan Stanley Capital Services, Inc. Tri-Party
Lumyna - Sandbar Global Equity Market Neutral UCITS Fund
Morgan Stanley Capital Services, Inc.Merrill Lynch International Bank Ltd.
State Street Bank & Trust Co
Tri-PartyTri-PartyTri-Party
Lumyna - York Asian Event-Driven UCITS Fund Morgan Stanley Capital Services, Inc. Tri-Party
Lumyna - Zeal Greater China Long Short UCITS Fund Merrill Lynch International Bank Ltd. Tri-Party
For the following funds and counterparties, collateral was posted/received to a pooled account as part of a bilateral agreement.
Account name Counterparty nameSettlementand clearing
Lumyna - Marshall Wace TOPS (Market Neutral) UCITS Fund
Goldman Sachs InternationalMerrill Lynch International Bank Ltd.
Deutsche Bank AGCredit Suisse Securities (Europe) Limited
JPMorgan Chase Bank N.A.Morgan Stanley International Plc.
Morgan Stanley Capital Services, Inc.UBS AG
Barclays Bank Plc.Société GénéraleCredit Suisse AG
Citibank N.A.
BilateralBilateralBilateralBilateralBilateralBilateralBilateralBilateralBilateralBilateralBilateralBilateral
Lumyna - Millburn Adaptive Allocation Program UCITS Fund Goldman Sachs International Bilateral
Lumyna - PSAM Global Event UCITS Fund
JPMorgan Chase Bank N.A.Morgan Stanley International Plc.
Merrill Lynch International Bank Ltd.
BilateralBilateralBilateral
Lumyna - Sandbar Global Equity Market Neutral UCITS Fund
Morgan Stanley Capital Services, Inc.Merrill Lynch International Bank Ltd.
Goldman Sachs International
BilateralBilateralBilateral
Lumyna - York Asian Event-Driven UCITS Fund
Morgan Stanley Capital Services, Inc.UBS AG
Bank of America N.A.Citibank N.A.
Credit Suisse InternationalGoldman Sachs InternationalJPMorgan Chase Bank N.A.
BilateralBilateralBilateralBilateralBilateralBilateralBilateral
Lumyna - Zeal Greater China Long Short UCITS FundMorgan Stanley International Plc.
Merrill Lynch International Bank Ltd.BilateralBilateral
317Lumyna Funds
Appendix III – Securities Financing Transactions Regulation(SFTR) disclosures (unaudited) (cont.)
Audited annual report
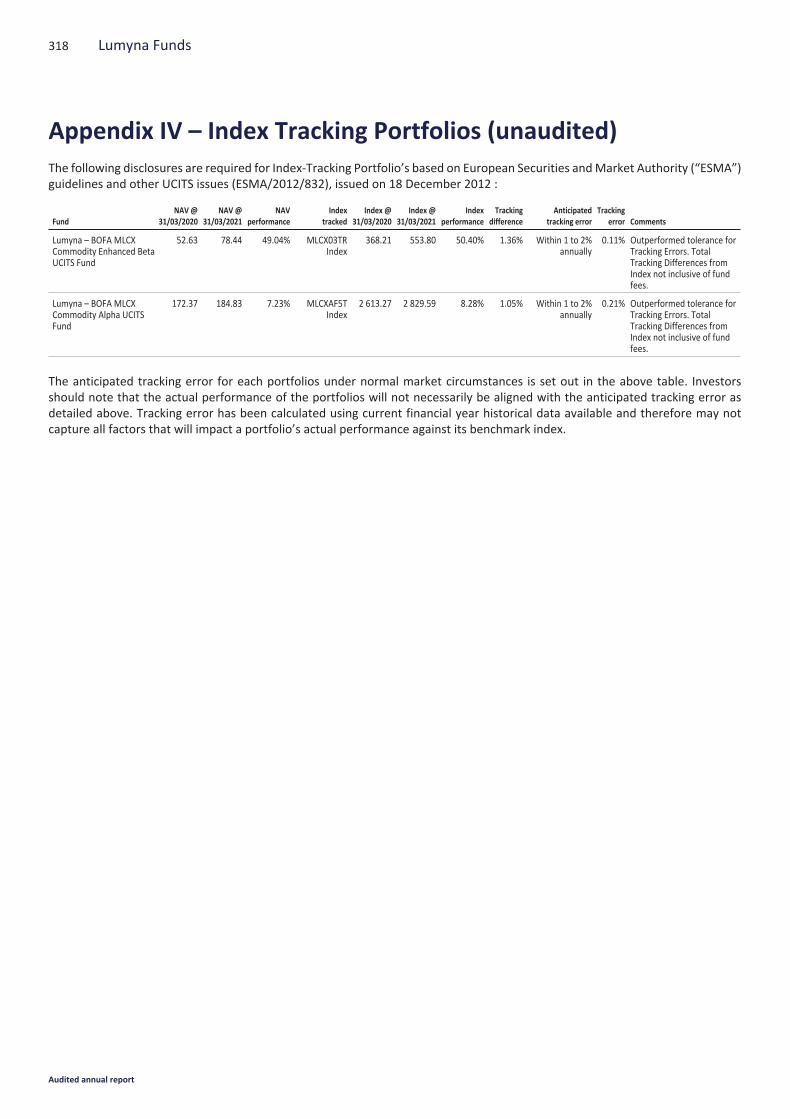
The following disclosures are required for Index-Tracking Portfolio’s based on European Securities andMarket Authority (“ESMA”)guidelines and other UCITS issues (ESMA/2012/832), issued on 18 December 2012 :
FundNAV @
31/03/2020NAV @
31/03/2021NAV
performanceIndex
trackedIndex @
31/03/2020Index @
31/03/2021Index
performanceTracking
differenceAnticipated
tracking errorTracking
error Comments
Lumyna – BOFA MLCXCommodity Enhanced BetaUCITS Fund
52.63 78.44 49.04% MLCX03TRIndex
368.21 553.80 50.40% 1.36% Within 1 to 2%annually
0.11% Outperformed tolerance forTracking Errors. TotalTracking Differences fromIndex not inclusive of fundfees.
Lumyna – BOFA MLCXCommodity Alpha UCITSFund
172.37 184.83 7.23% MLCXAF5TIndex
2 613.27 2 829.59 8.28% 1.05% Within 1 to 2%annually
0.21% Outperformed tolerance forTracking Errors. TotalTracking Differences fromIndex not inclusive of fundfees.
The anticipated tracking error for each portfolios under normal market circumstances is set out in the above table. Investorsshould note that the actual performance of the portfolios will not necessarily be aligned with the anticipated tracking error asdetailed above. Tracking error has been calculated using current financial year historical data available and therefore may notcapture all factors that will impact a portfolio’s actual performance against its benchmark index.
318 Lumyna Funds
Appendix IV – Index Tracking Portfolios (unaudited)
Audited annual report
Management Company UCITS remuneration disclosure
Generali Investments Luxembourg S.A. (Management Company since 14 December 2020)
Generali Investments Luxembourg S.A. (the “Management Company”) has designed and implemented a remuneration policywhich is consistent with and promotes sound and effective risk management by having a business model which by its nature doesnot promote excessive risk taking that is inconsistent with the risk profile of the SICAV. TheManagement Company’s remunerationpolicy integrates governance, pay structure and risk alignment rules that are designed to be consistent with the business strategy,objectives, values and interests of the Management Company, the SICAV and the shareholders of the SICAV, and includesmeasures to avoid conflicts of interest.
Description of the calculation of the remuneration and benefitsThe amount of the fixed remuneration of the employees is determined in the respective individual contracts. The level of fixedremuneration may be, without being required thereto, oriented on the basis of market value and any other applicable standards,as for instance, a statutory minimum social wage or the indications of a collective bargaining agreement as it may be applicablefrom time to time.
The Management Company will, in principle, attribute to eligible employees, a variable compensation if the ManagementCompany has made (for the concerned calendar/financial year) a gross profit, whereby the gross profit is determined at a stagebefore the payment of taxes and elements of the variable remuneration.
A specific personnel evaluation tool is used in order to determine the amount of variable remuneration to be attributed to eacheligible employee. Performance criteria are established for each individual with goals according to performance, effectiveness andengagement perspectives.
Remuneration CommitteeTheManagement Company has appointed a remuneration committee which reports to the Board of Directors of theManagementCompany.
Remuneration disclosureDuring its last accounting year ended December 31, 2020, the Management Company remunerated staff members as follows:
Total remuneration for the financial year ending December 31, 2020 paid to 37 staffof the management company in respect of the management of the SICAV
EUR 3 857 898 made up of:- EUR 3 615 258 of fixed remuneration- EUR 242 640 of variable remuneration
Total remuneration paid to senior management and members of its staff whoseactions have a material impact on the risk profile of the collective investmentschemes managed:
EUR 640 325
Lumyna Investments Limited (Management Company until 13 December 2020)
In accordance with the guidelines set out in the remuneration policy approved by the Lumyna Investments Limited board ofdirectors, staff are remunerated in a way which is consistent with and promotes sound and effective risk management and doesnot encourage risk-taking which is inconsistent with the risk profiles, rules or instruments of incorporation of the funds managedby the company. The remuneration policy has been designed to ensure that it is aligned with the business strategy, objectives,values and interests of the company and the funds it manages or the investors of such funds, and includes measures to avoidconflicts of interest.
Risk Management and Risk Tolerance.
It is the Firm’s policy to promote sound and effective risk management and discourage risk-taking that exceeds the level of risktolerated by the Firm and the UCITS it manages. As such the Firm maintains:
• Strong disclosure practices, which provide investors with the information they need to determine whether to invest in theFund, monitor their investment and make a decision whether to redeem their investment based on the risk profile of theinvestment strategy.
• Robust valuation policies and procedures to provide for clear and consistent valuations of the investments in the Fund’sportfolio, with independent oversight provided by the Fund’s board or other governing body, third party administrators,independent auditors and expert valuation advisers, the latter particularly in the case of hard-to-value assets.
• Comprehensive and independent risk management processes to measure, monitor, report and manage risk, including stresstesting of the portfolio and liquidity risk management.
319Lumyna Funds
Appendix V – Remuneration note (unaudited)
Audited annual report

• Sound operational and regulatory systems and controls.
• A strong culture of compliance, sponsored by the Management Body with specific practices to address conflicts of interest.
Due to the nature of the market, and sensitivity of investors to both risk and performance, the Firm has determined that itsoffering is based on its ability to provide an agreed balance between risk and reward. This balance is respected in the Firm’s riskmanagement and remuneration policies.
Investment managers’ UCITS remuneration disclosure
The delegated investment managers are subject to regulatory requirements on remuneration that Lumyna Funds deem to beequally as effective as those detailed in the UCITS directives. As such Lumyna Funds can reference the delegated investmentmanagers’ standard regulatory remuneration disclosures for this UCITS remuneration disclosure. At this time the delegatedinvestment managers’ standard regulatory remuneration disclosures represent all business activities performed by theinvestment manager. For this reason, remuneration figures have not been disclosed in this report.
320 Lumyna Funds
Appendix V – Remuneration note (unaudited) (continued)
Audited annual report
Additional Information for Investors in the Federal Republic of Germany
Marcard, Stein & Co AG, Ballindamm 36, D-20095 Hamburg, has undertaken the function of Paying and Information Agent for theFederal Republic of Germany (the “German Paying and Information Agent”).
Applications for the redemption and conversion of shares may be sent to the German Paying and Information Agent.
All payments to investors, including redemption proceeds and potential distributions, may, upon request, be paid through theGerman Paying and Information Agent.
The prospectus, the key investor information documents, the articles of incorporation and the annual and semi-annual reportsmay be obtained, free of charge, in hardcopy form at the office of the German Paying and Information Agent during normalopening hours.
The statement of changes in the composition of the investment portfolio is also available free of charge upon request at the officeof the German Paying and Information Agent.
Issue, redemption and conversion prices of shares and any other information to the shareholders are also available, free of charge,from the German Paying and Information Agent.
Fiscal information on taxable income to the shareholders are also available, free of charge, from the German Paying andInformation Agent.
The issue, redemption and conversion prices of shares and the notices to the shareholders will be published on the followingwebsite www.lumyna.com.
Additional information for investors in Switzerland
Representative and agent in Switzerland:
Société Générale Paris, Succursale de ZurichTalacker 50P.O. Box 5070CH-8021 Zurich
The legal documents, including the Prospectus, the KIIDs, the Memorandum and Articles of Association, as well as the annual andsemi-annual reports, and the list of changes in the portfolio during the period may be obtained free of charge, upon request fromthe office of the representative in Switzerland.
321Lumyna Funds
Appendix VI – Supplementary information (unaudited)
Audited annual report
Lumyna Funds
Audited annual reportas at March 31, 2021